Panasonic Toughbook CF-54 (i5-7300U) Rugged Laptop Review
")
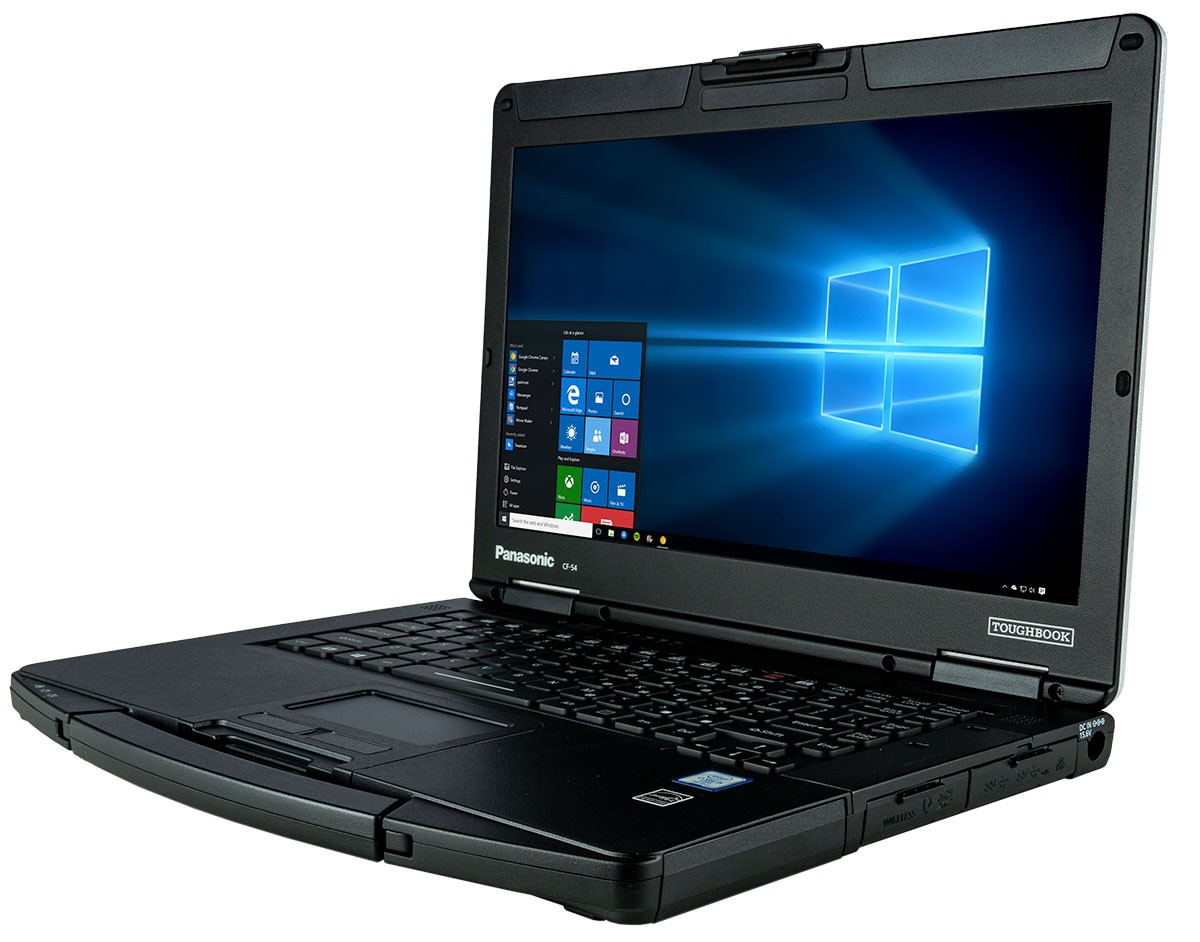
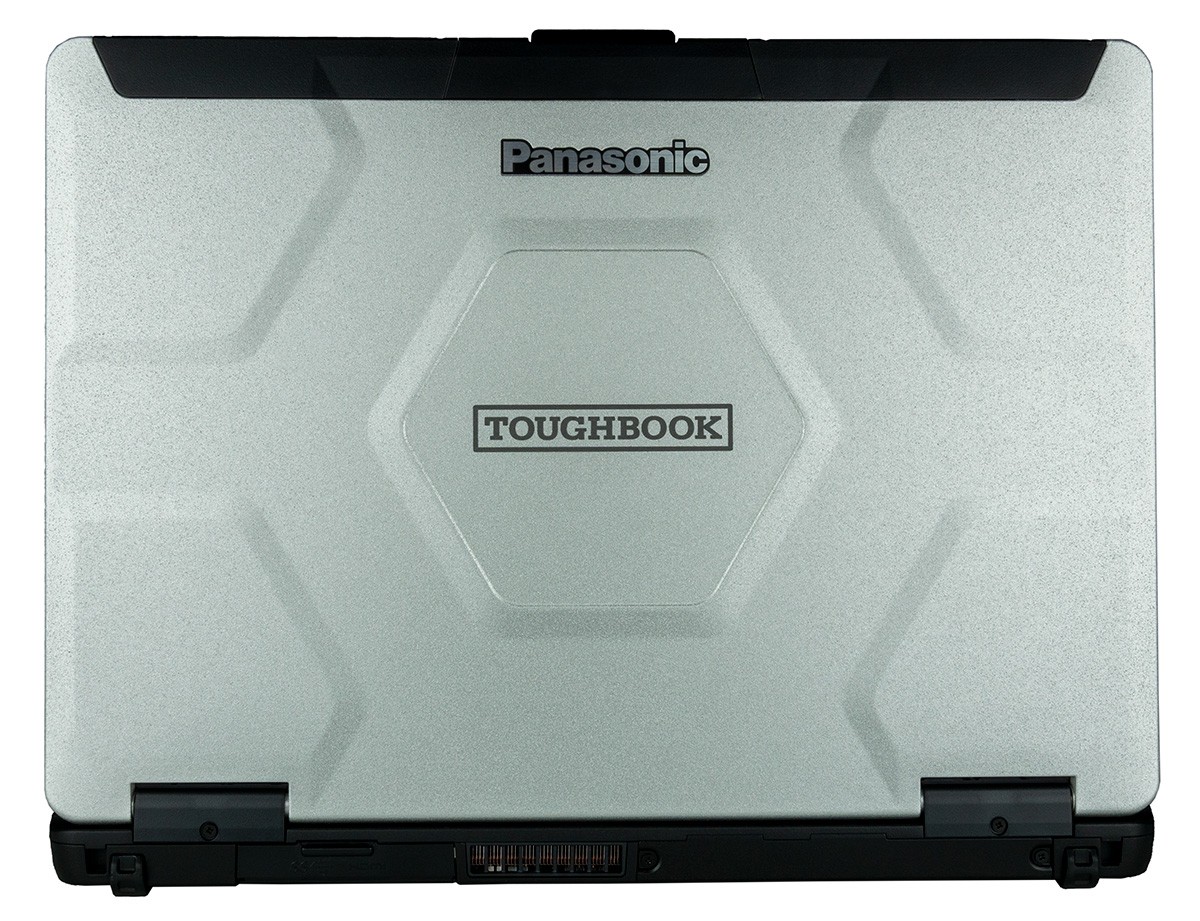
The Toughbook series is home to Panasonic's long line of rugged laptops dating back to 1996. Today's 14-inch Toughbook CF-54 Lite is one of the newest models available and also one of the thinnest in its family for improved portability. For this review, we'll be checking out its performance and how it compares to an average office laptop equipped with similar Kaby Lake CPU options.
The Panasonic Toughbook CF-54 features significantly more interfaces and connectivity options than the typical laptop. See the official specifications sheet here for a full rundown on what it offers. The base Toughbook 54 configuration currently retails for $1400 USD through CUKUSA.com. Lite, Prime, and Performance configurations are available on the CF-54 family.
More Panasonic Toughbook and Toughpad reviews:
Case
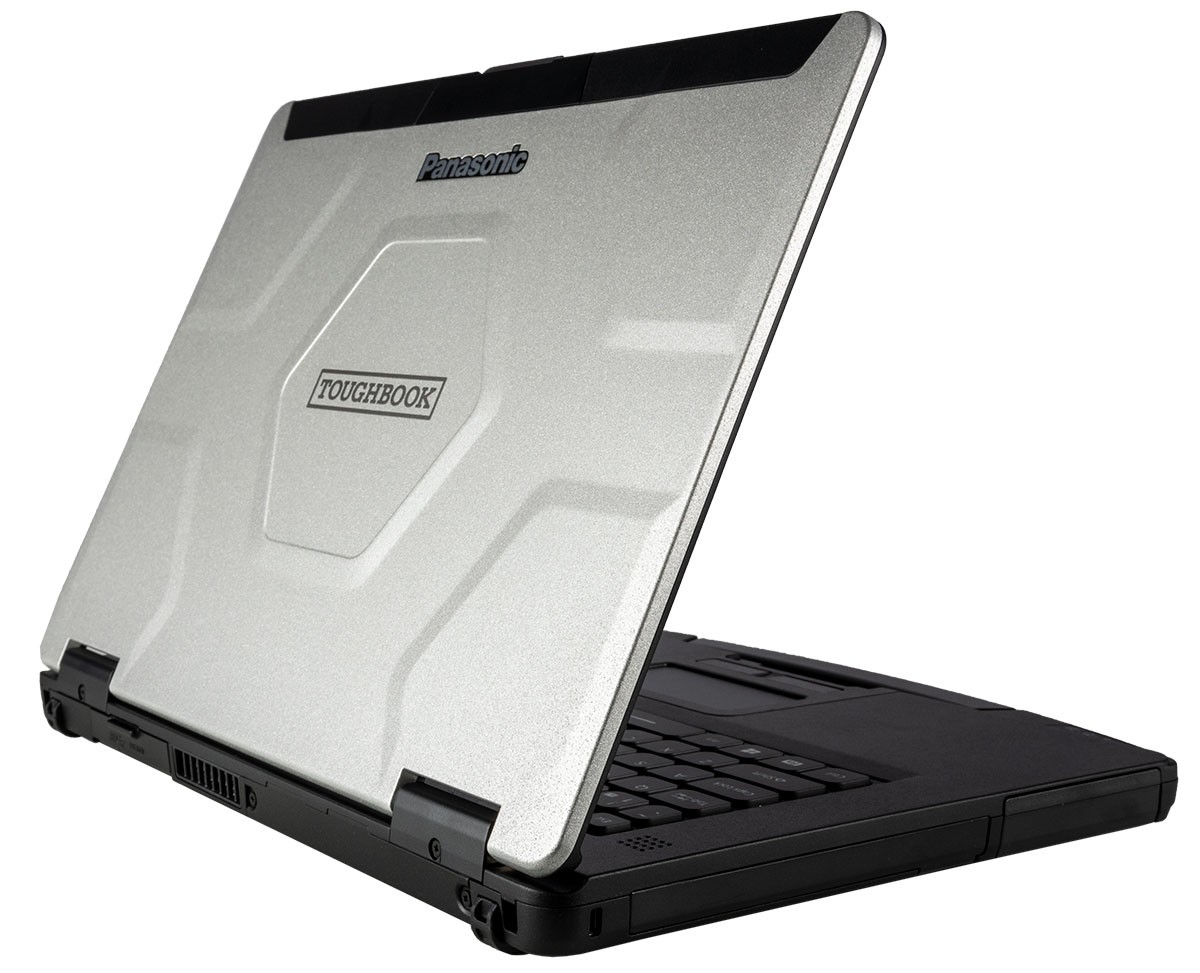
Panasonic advertises the magnesium-clad CF-54 as being the thinnest 14-inch semi-rugged laptop available while still conforming to MIL-STD-810G and IP51 standards. When compared to the 14-inch Dell Latitude 14 Rugged, the Panasonic system is indeed nearly twice as thin and twice as light for an overall size more similar to a traditional Alienware. Its textured surfaces are firm and rigid even towards the center of the keyboard where most other laptops often exhibit flexing. The 180-degree hinges are solid with absolutely no teetering when typing and lid twisting is at a minimum. Despite being much thinner than its predecessors, it doesn't appear that the CF-54 sacrificed construction quality along the way.
A notable weak spot is down the surface of the magnesium outer lid where slight flexing can occur when applying pressure. It's fortunately minimal and of no concern during use.
Connectivity
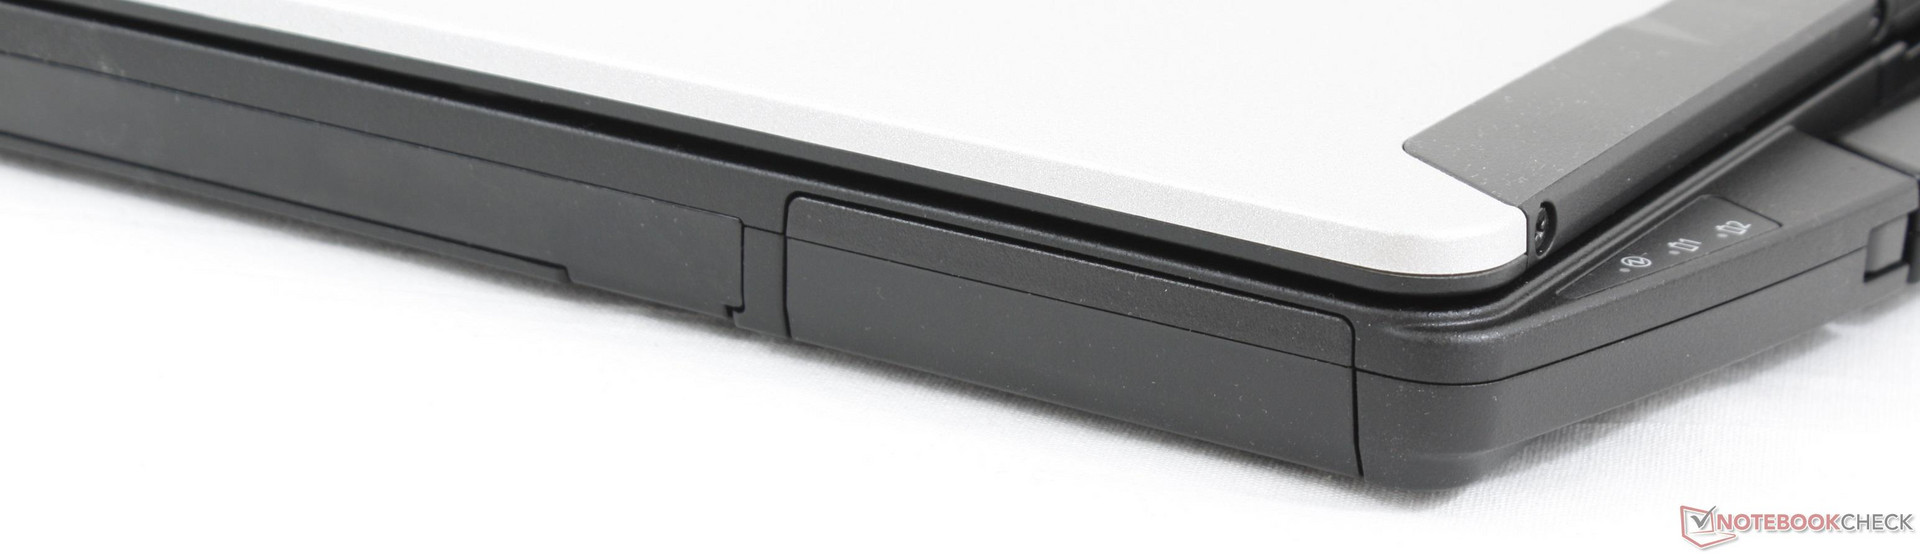
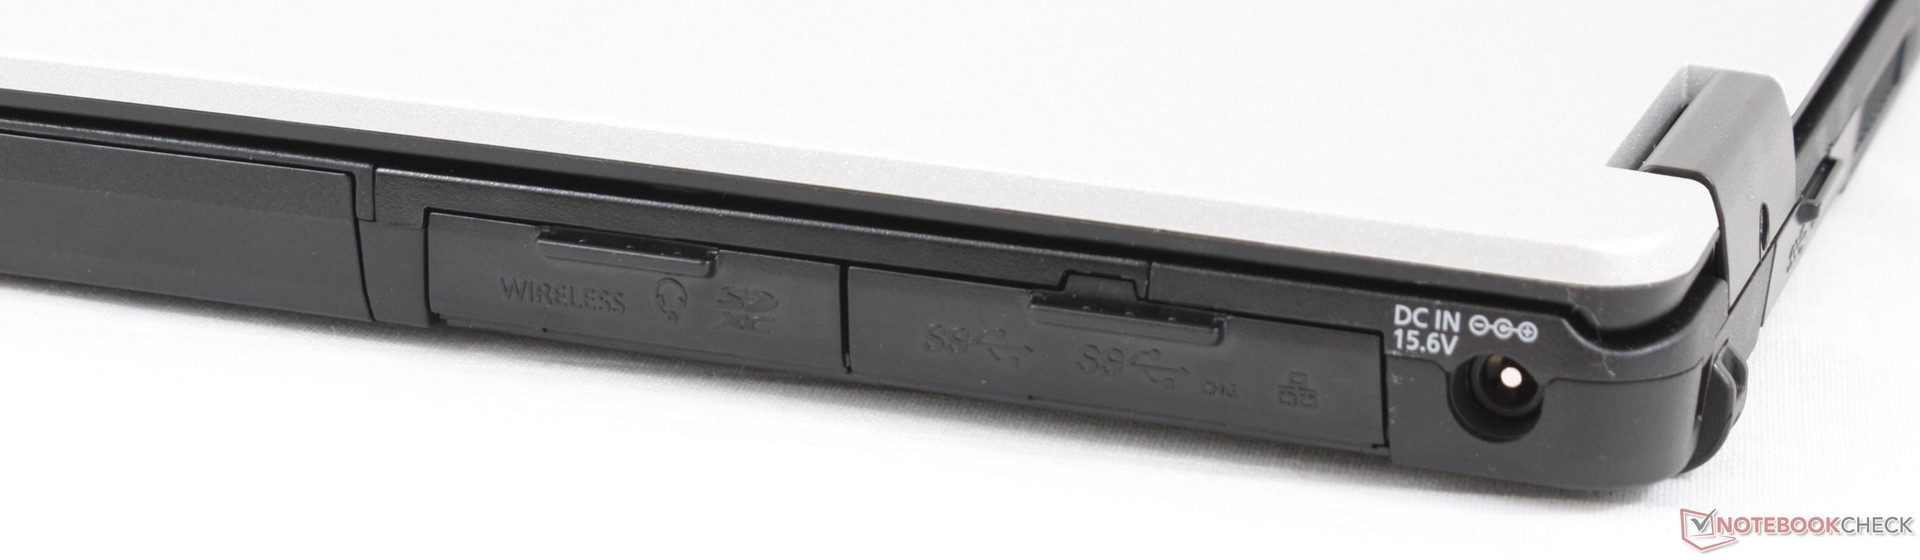
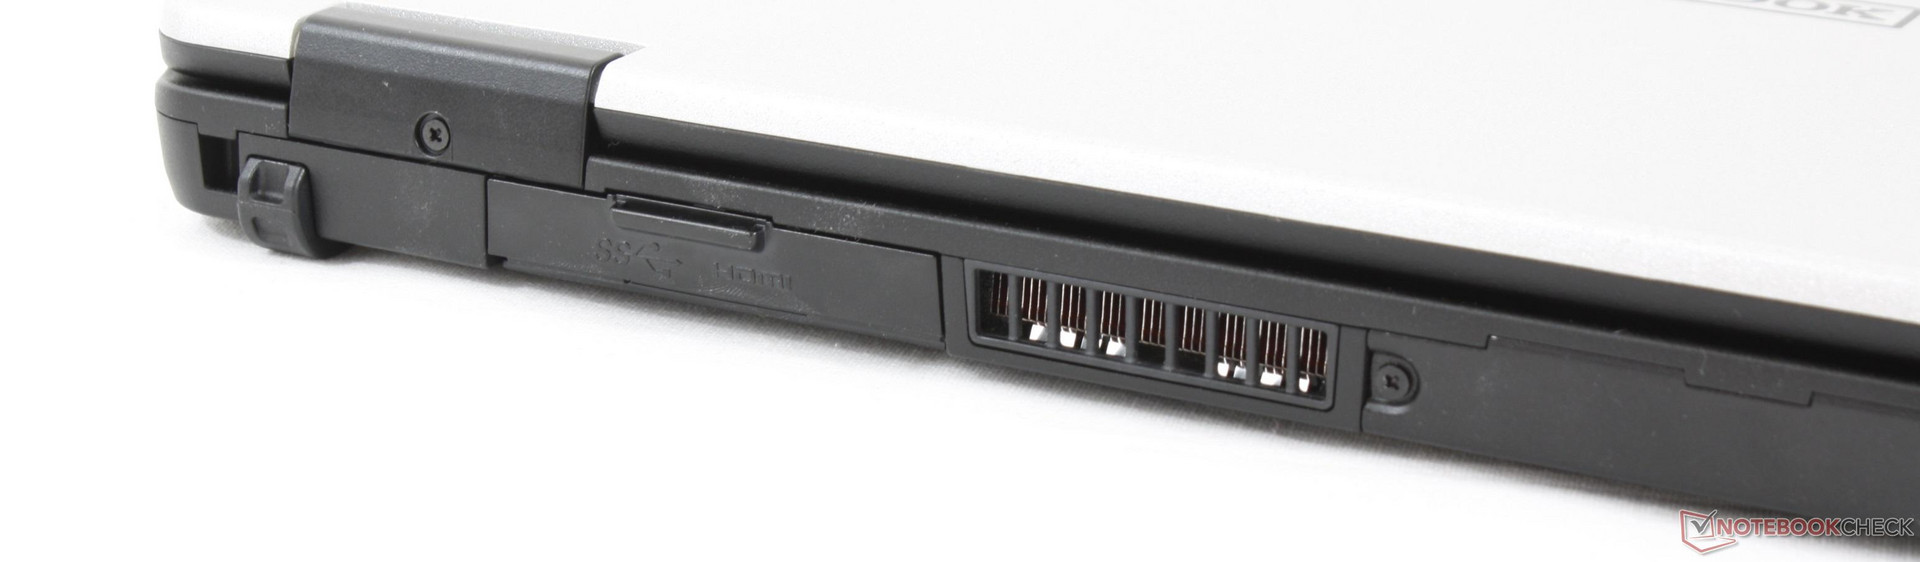
A few major ports are optional on the CF-54 including VGA, 4G LTE-enabled mini-SIM, and PC card. Our test configuration is the base model without these options for a more barebones experience. Port positioning could have been better as many of the ports are close to the AC adapter where cables will inevitably entangle. Meanwhile, no ports are along the left edge of our system.
SD Card Reader
The spring-loaded integrated SD card reader is very fast with an average transfer rate of almost 180 MB/s with our UHS-II test card. Moving 1 GB worth of pictures from our card to desktop takes about 7 seconds.
| SD Card Reader | |
| average JPG Copy Test (av. of 3 runs) | |
| Panasonic Toughbook CF-54G2999VM (Toshiba Exceria Pro SDXC 64 GB UHS-II) | |
| Dell Latitude 7490 (Toshiba Exceria Pro M501 UHS-II) | |
| Dell Latitude 14 7414 Rugged Extreme (Toshiba Exceria Pro SDXC 64 GB UHS-II) | |
| Getac S410 (Toshiba Exceria Pro SDXC 64 GB UHS-II) | |
| Fujitsu LifeBook U748 (Toshiba Exceria Pro SDXC 64 GB UHS-II) | |
| Panasonic Toughbook CF-33 (Toshiba Exceria Pro SDXC 64 GB UHS-II) | |
| maximum AS SSD Seq Read Test (1GB) | |
| Dell Latitude 14 7414 Rugged Extreme (Toshiba Exceria Pro SDXC 64 GB UHS-II) | |
| Dell Latitude 7490 (Toshiba Exceria Pro M501 UHS-II) | |
| Panasonic Toughbook CF-54G2999VM (Toshiba Exceria Pro SDXC 64 GB UHS-II) | |
| Getac S410 (Toshiba Exceria Pro SDXC 64 GB UHS-II) | |
| Fujitsu LifeBook U748 (Toshiba Exceria Pro SDXC 64 GB UHS-II) | |
| Panasonic Toughbook CF-33 (Toshiba Exceria Pro SDXC 64 GB UHS-II) | |
Communication
The system utilizes an Intel 8265 module for WLAN and Bluetooth 4.2 as found on many modern Ultrabooks. We experienced no connectivity issues during our time with the unit. NFC appears to be unavailable on the CF-54.
Security
TPM 2.0, NIST BIOS, and a Kensington Lock come standard across all SKUs. For additional security, higher-end SKUs have a fingerprint reader and SmartCard CAC.
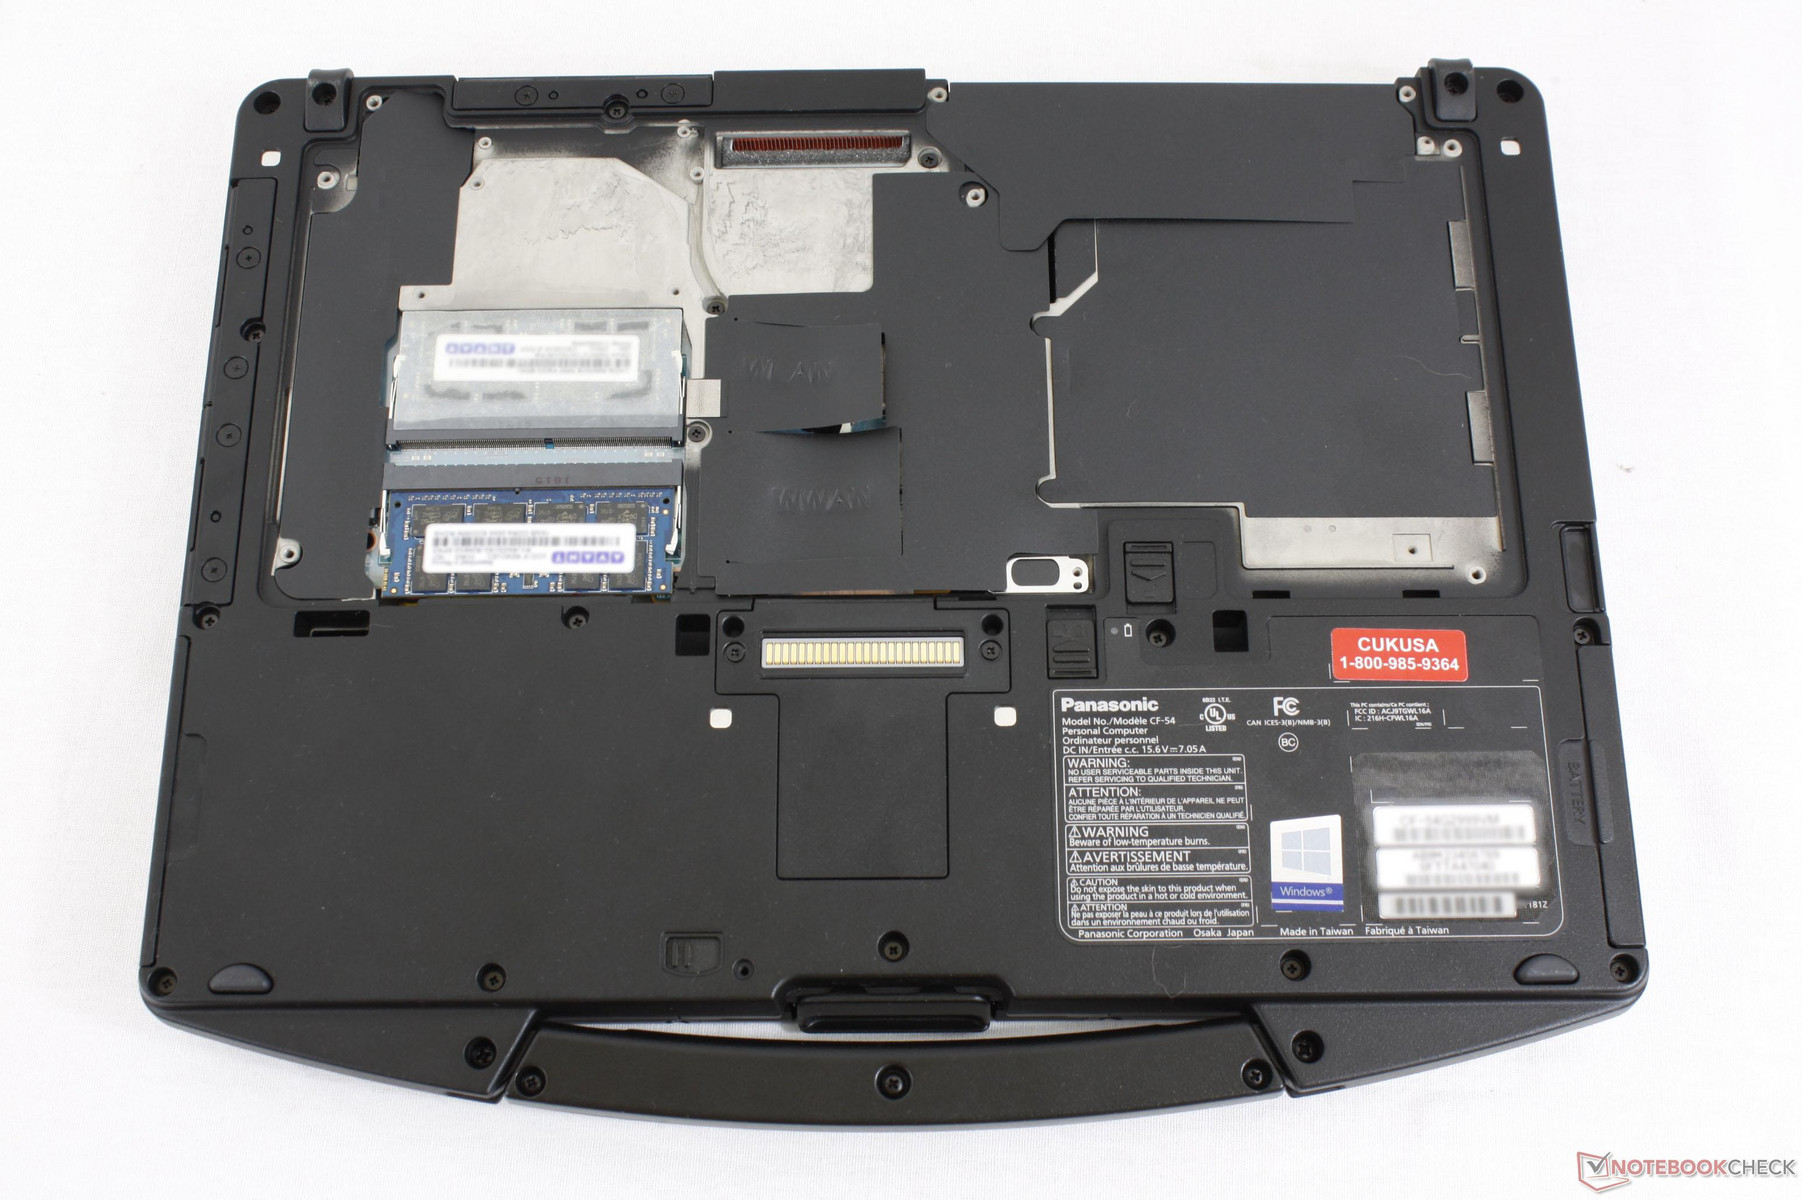
Maintenance
The bottom panel is secured by seven Philips screws and gives direct access to 2x SODIMM slots and both the WLAN and WWAN slots. It also gives access to the optical drive depending on the configuration.
Accessories and Warranty
Proprietary accessories are available that attach to the pins on the bottom of the laptop. Notable options are secondary battery packs and antenna for Verizon-enabled LTE and GPS.
A three-year limited manufacturer warranty applies. Please see our Guarantees, Return policies and Warranties FAQ for country-specific information.
Input Devices
Keyboard
The keyboard (~28 x 10 cm) keys are soft in feedback with relatively quiet clatter when pressed. The small Arrow keys in particular could have been larger as they feel even spongier than the main QWERTY keys. The three-level red keyboard backlight is a nice addition even though it is dimmer than the white backlight as found on most Ultrabooks.
Touchpad
The small trackpad (8 x 4 cm) is cumbersome to use especially for vertical scrolling because of its narrow dimensions. Fortunately, its smooth surface is rigid and responsive as one would expect. Windows does not recognize the trackpad as being Precision-enabled.
The small dedicated mouse keys are quiet and relatively soft in feedback. A firmer click would have been appreciated.
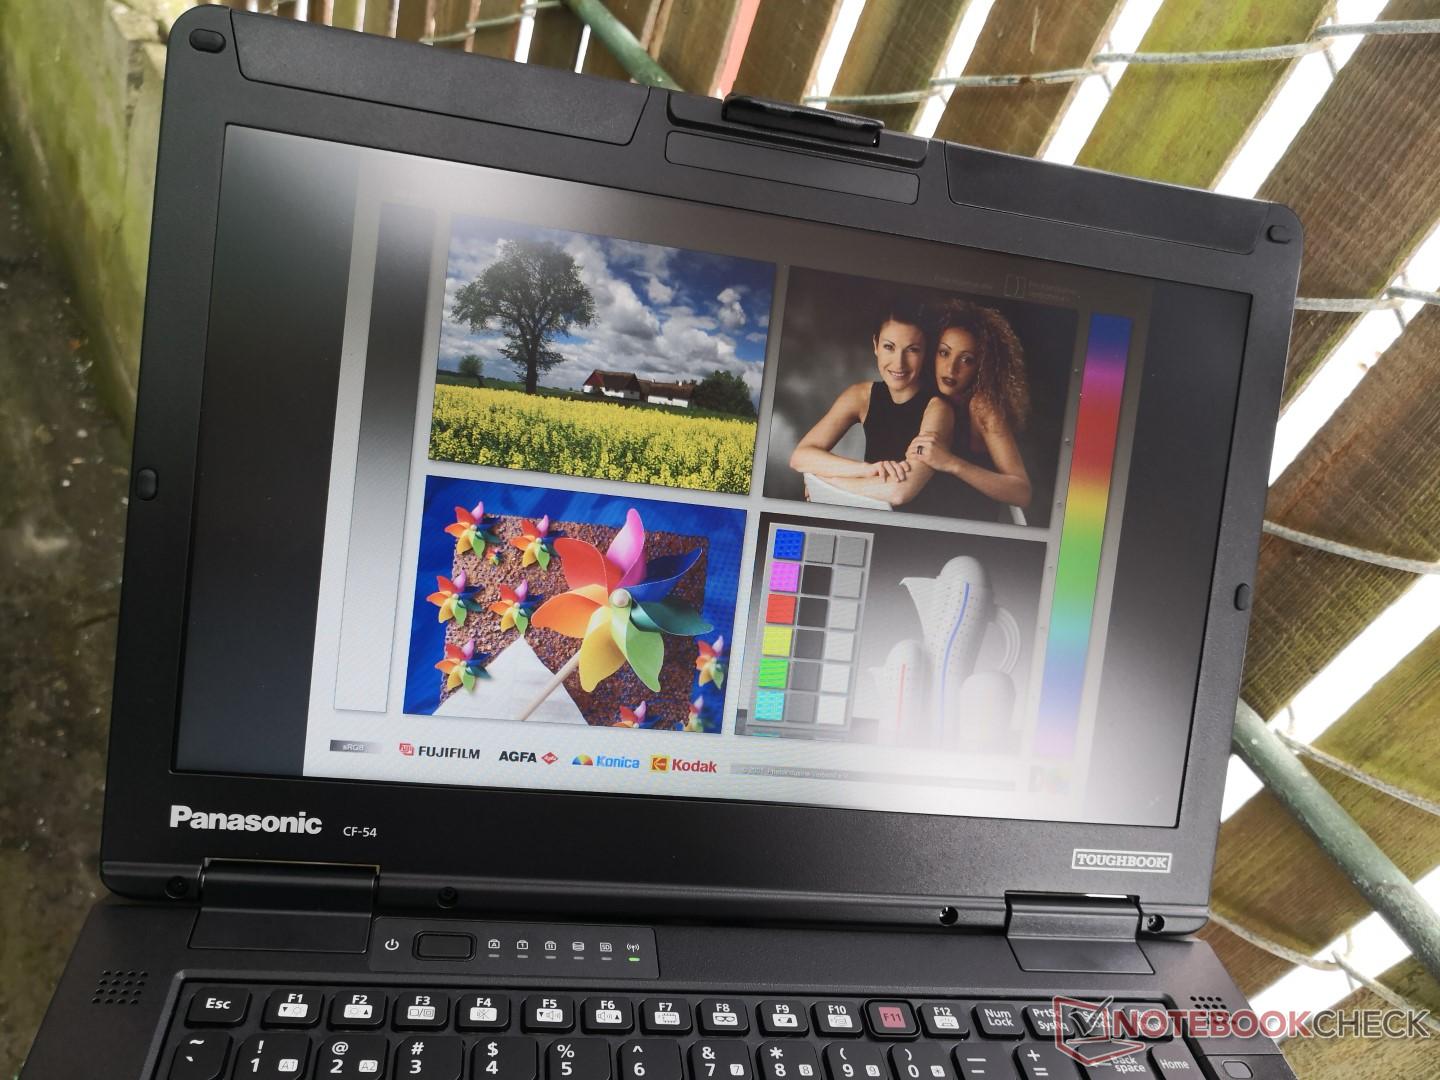
Display
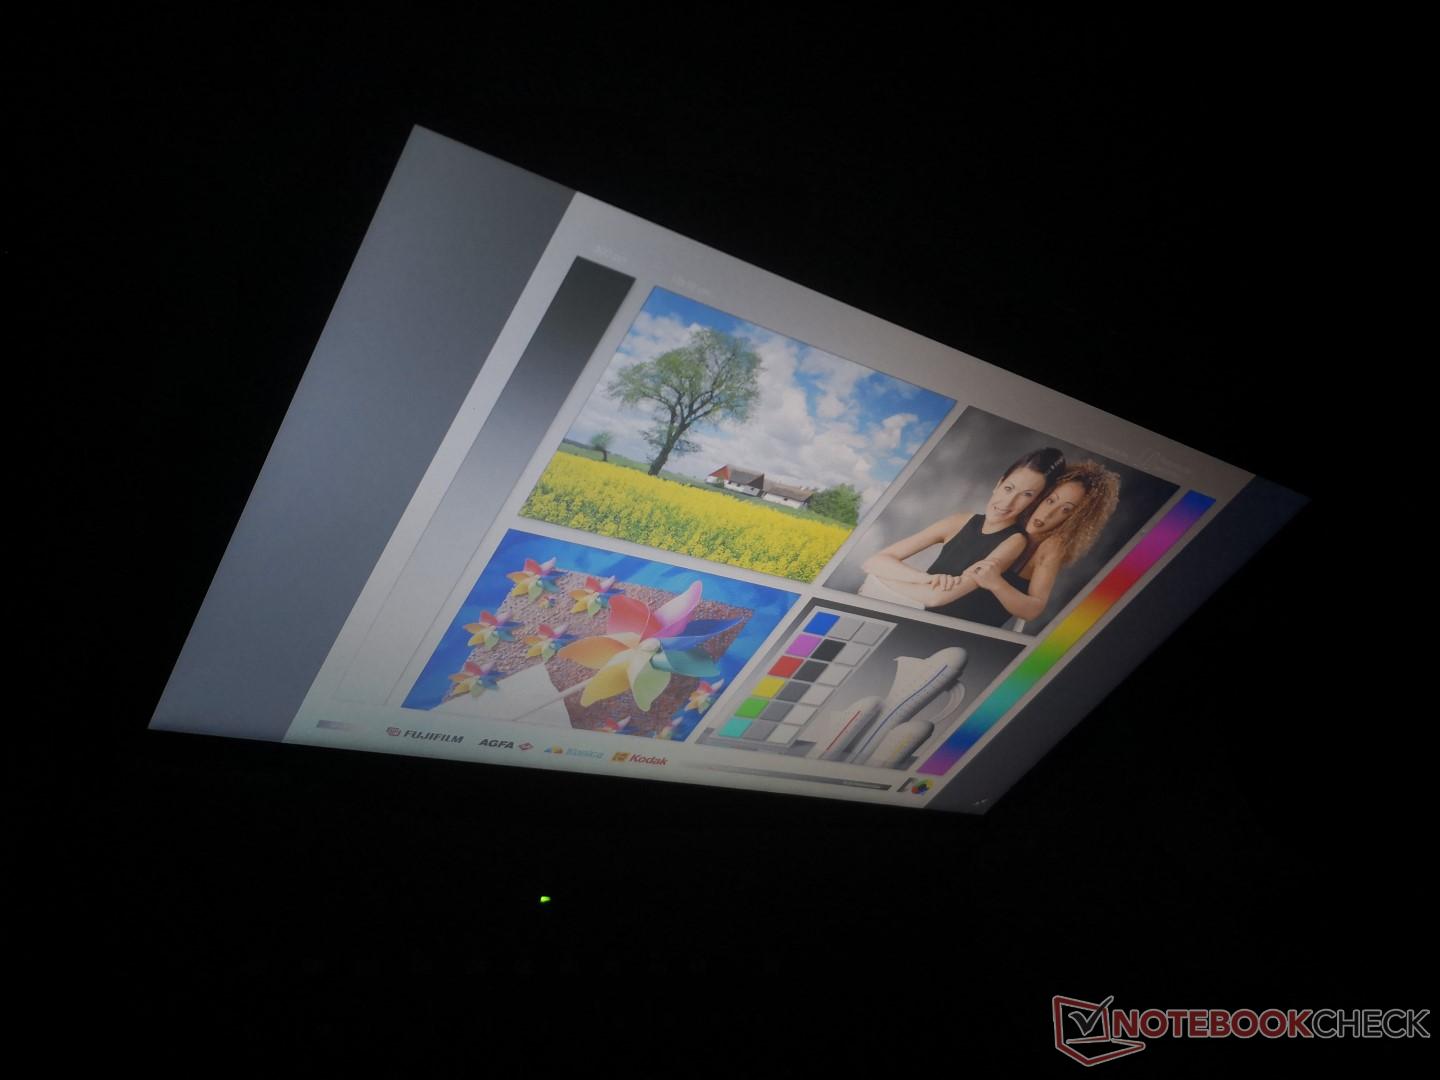
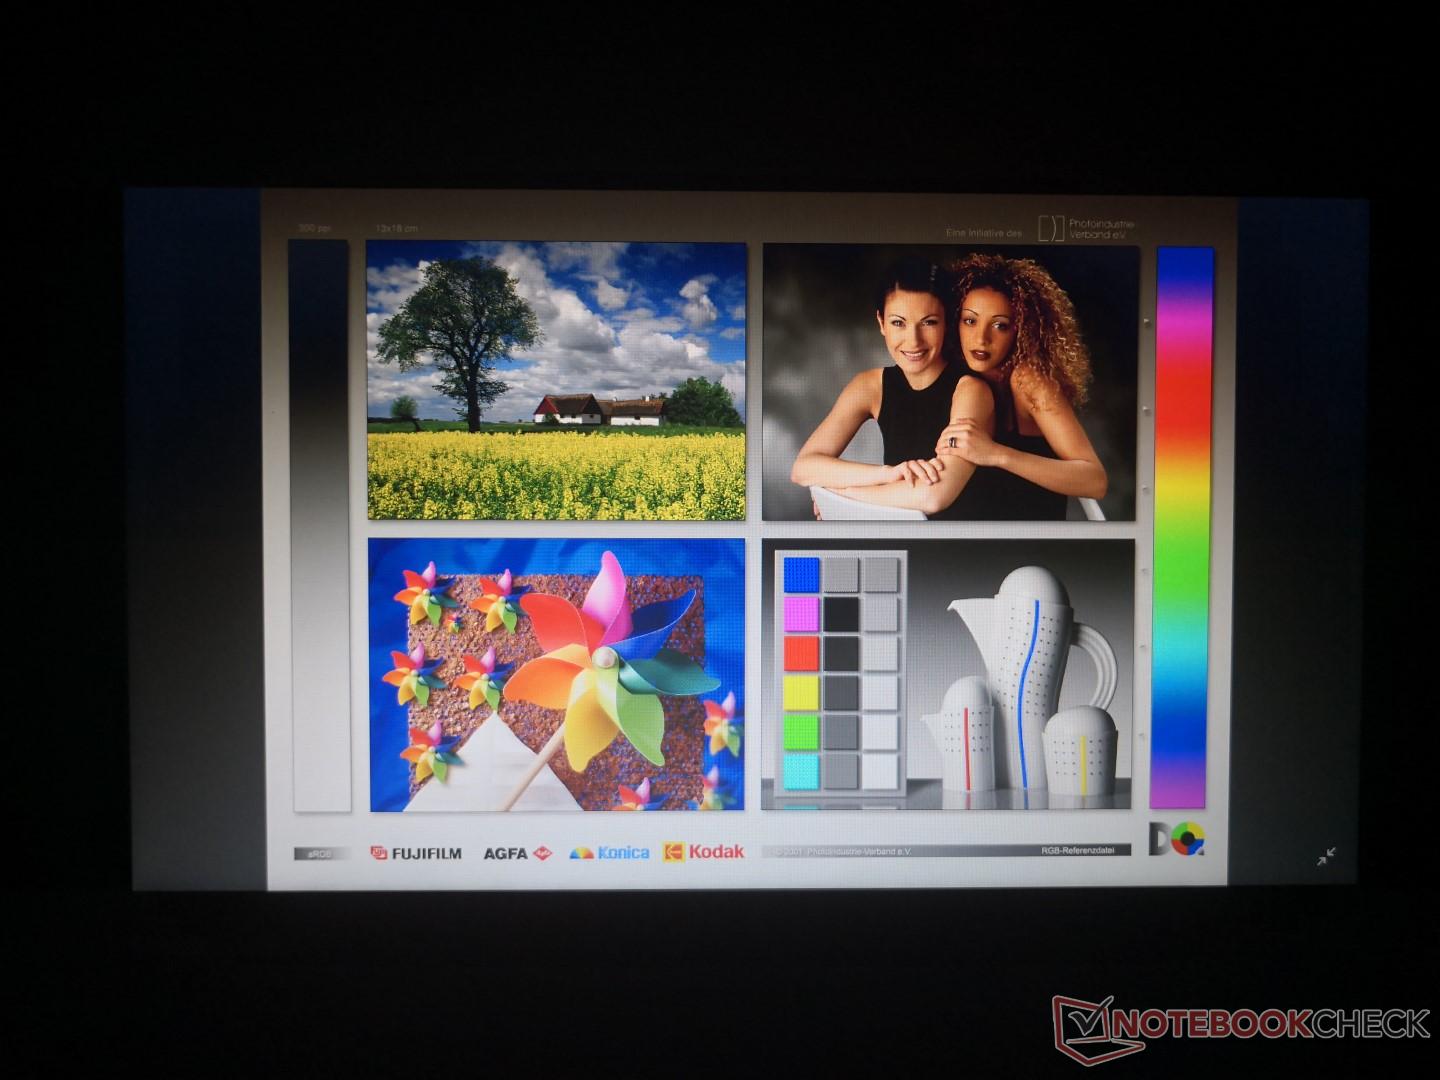
The 768p TN display is very disappointing. Not only are colors extremely inaccurate out of the box, but both contrast and brightness are middling at just under 300:1 and 189 nits maximum, respectively. In comparison, the display on the Latitude 14 7414 Rugged can reach almost 1000:1 in contrast and with a brightness of nearly 500 nits. We spoke to a Panasonic representative who confirmed that the 768p panel is indeed relatively dim even at its maximum brightness setting. Panasonic offers an optional 1000-nit backlight for higher-end SKUs.
It's worth noting that the AU Optronics B140XTN panel on our Panasonic can also be found on the four-year old Rugged Dell Latitude 14 5404. Consequently, both models share similar display properties including contrast ratio and color reproduction.
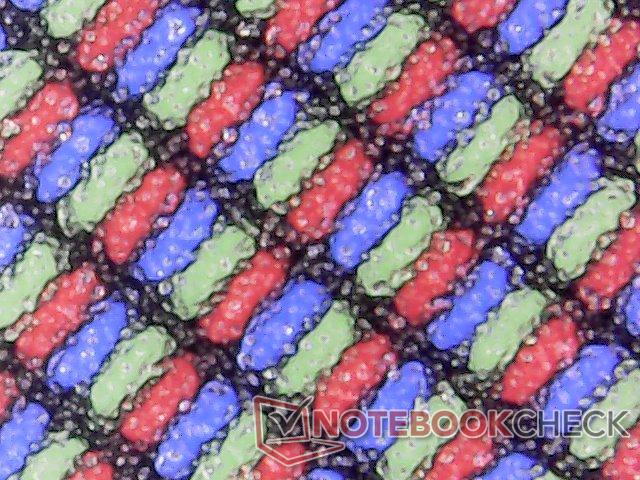
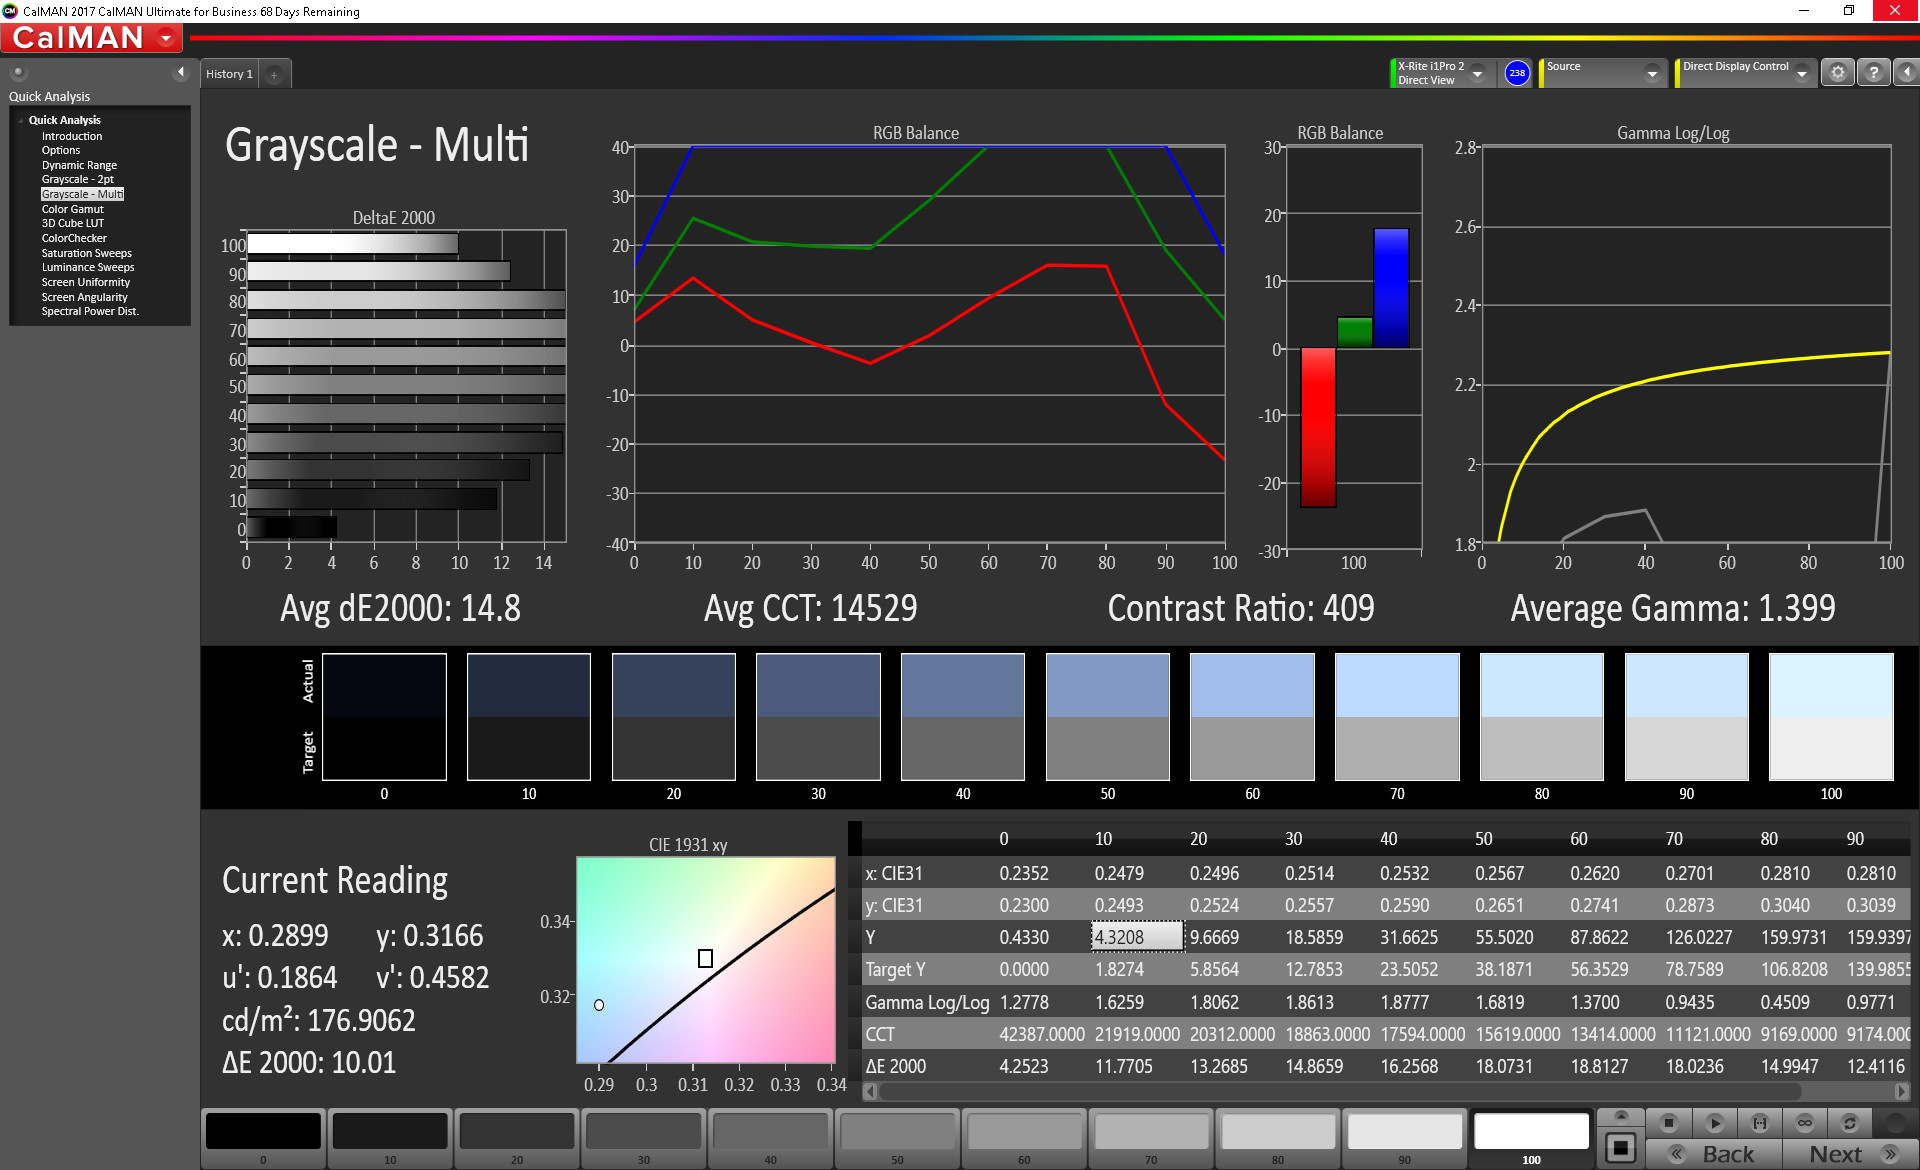
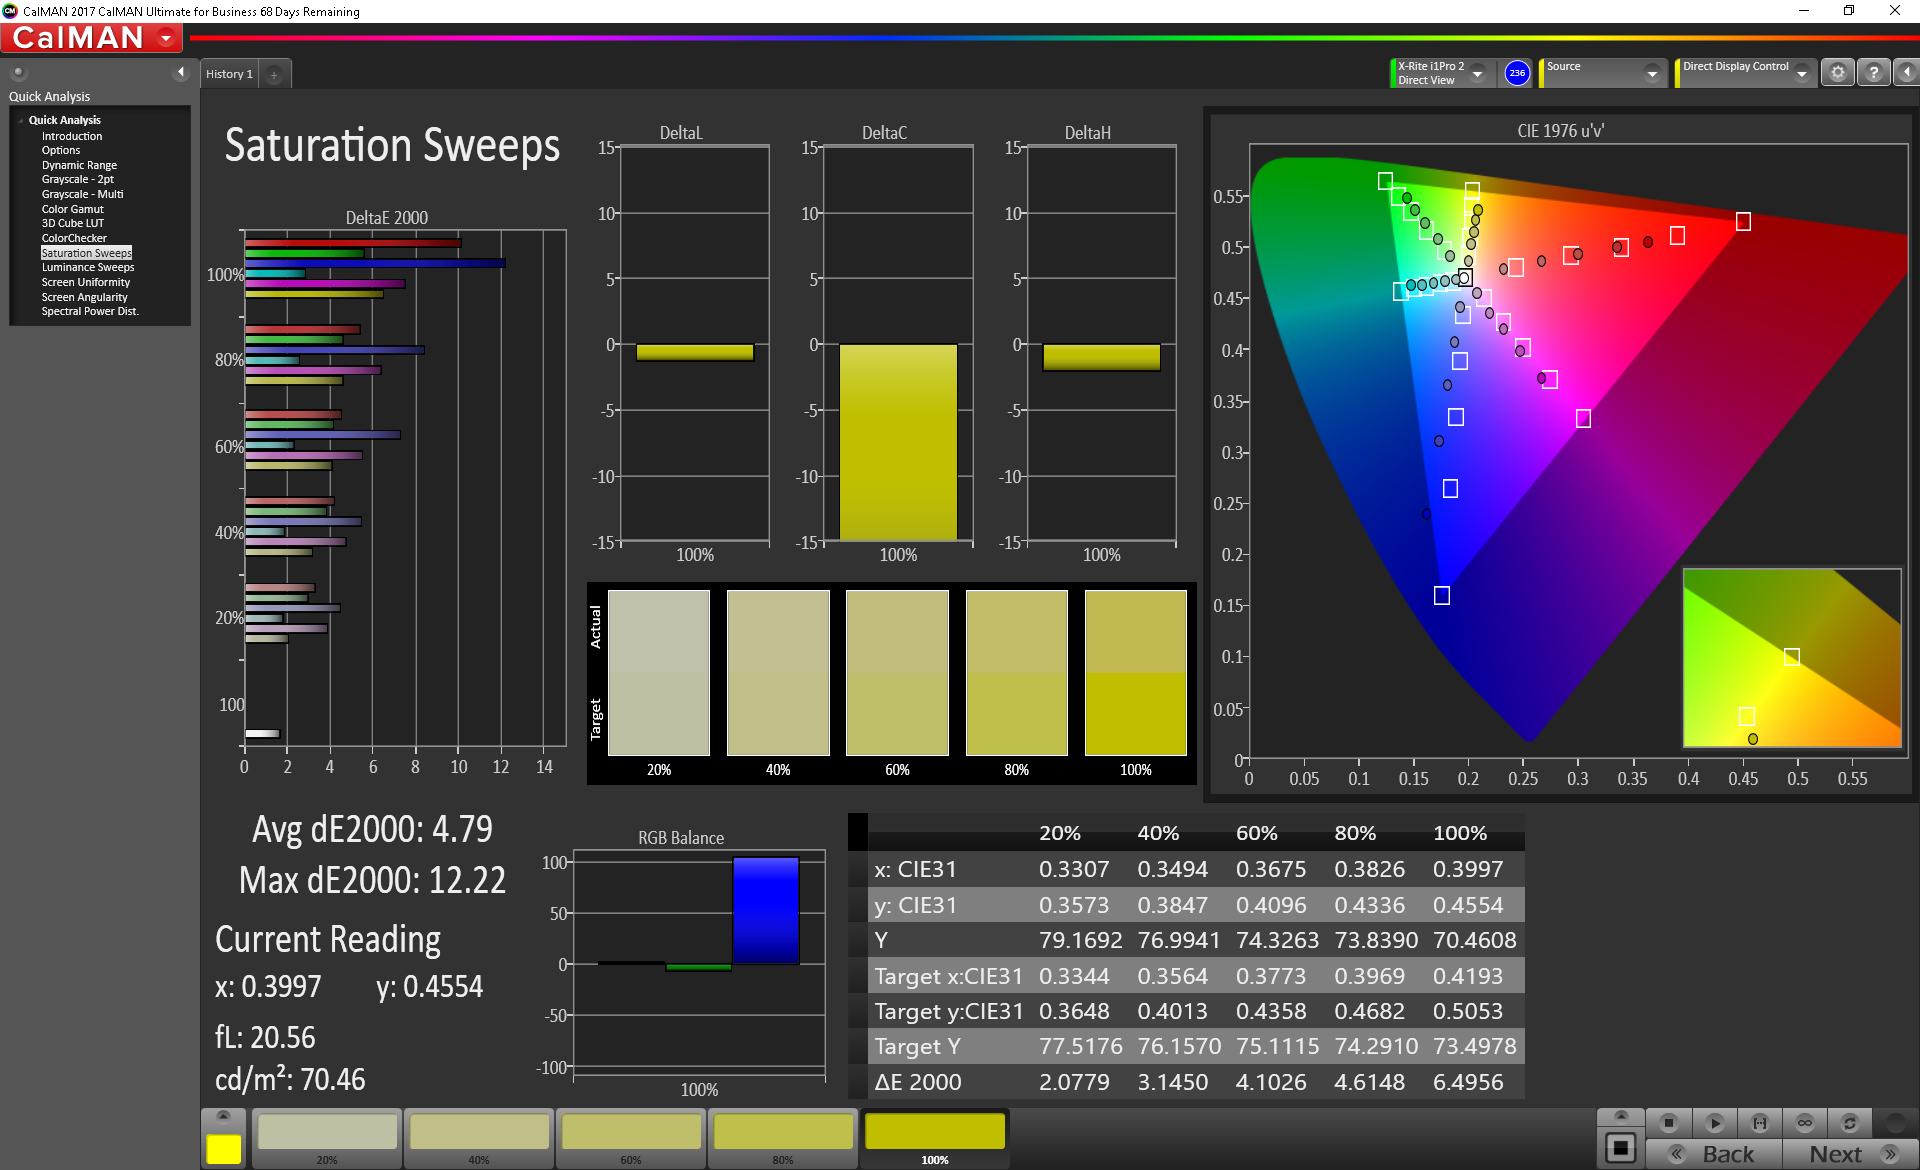
Subjectively, colors appear washed out and overly blue because of the high default color temperature. There is a slight layer of graininess over the screen that makes onscreen content less sharp when compared to glossy overlays.
| |||||||||||||||||||||||||
Brightness Distribution: 71 %
Center on Battery: 174.5 cd/m²
Contrast: 291:1 (Black: 0.6 cd/m²)
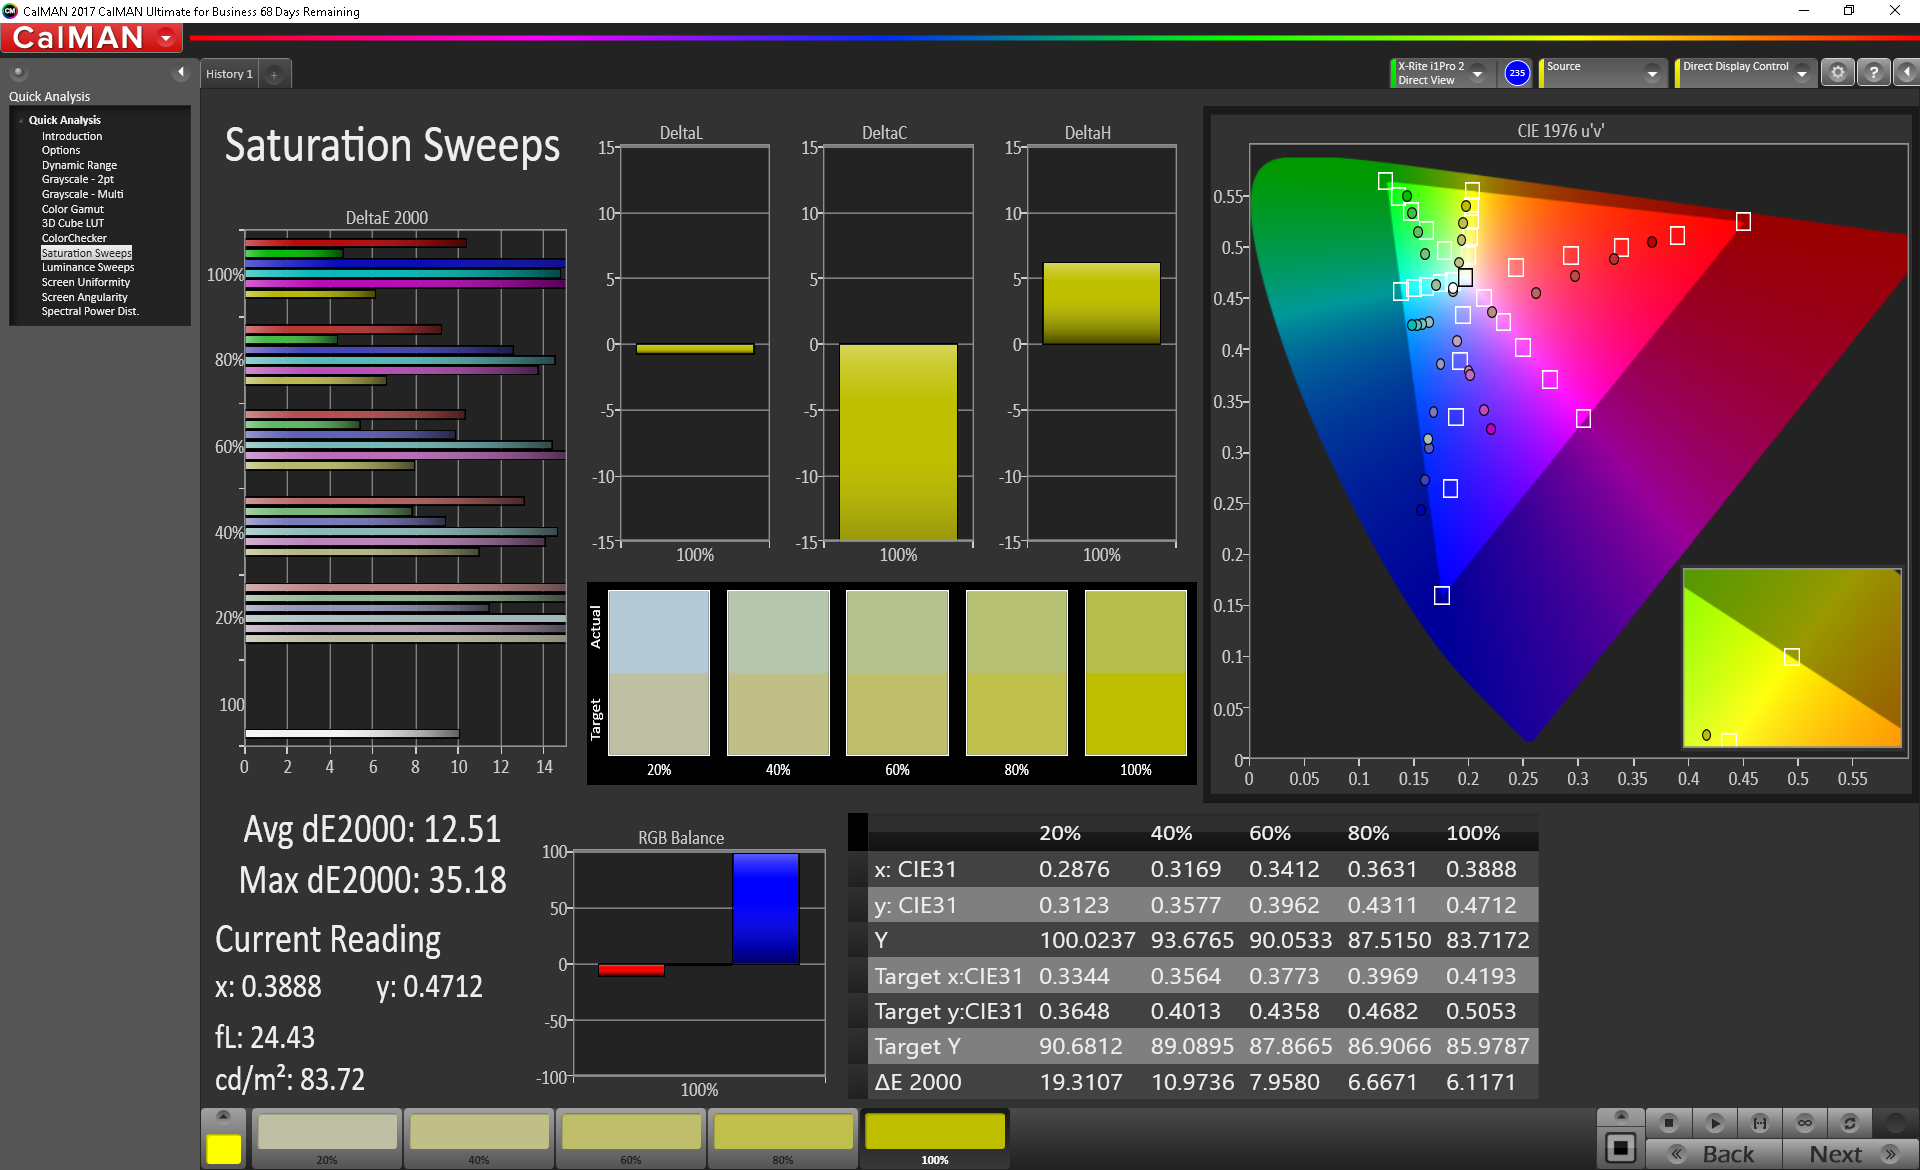
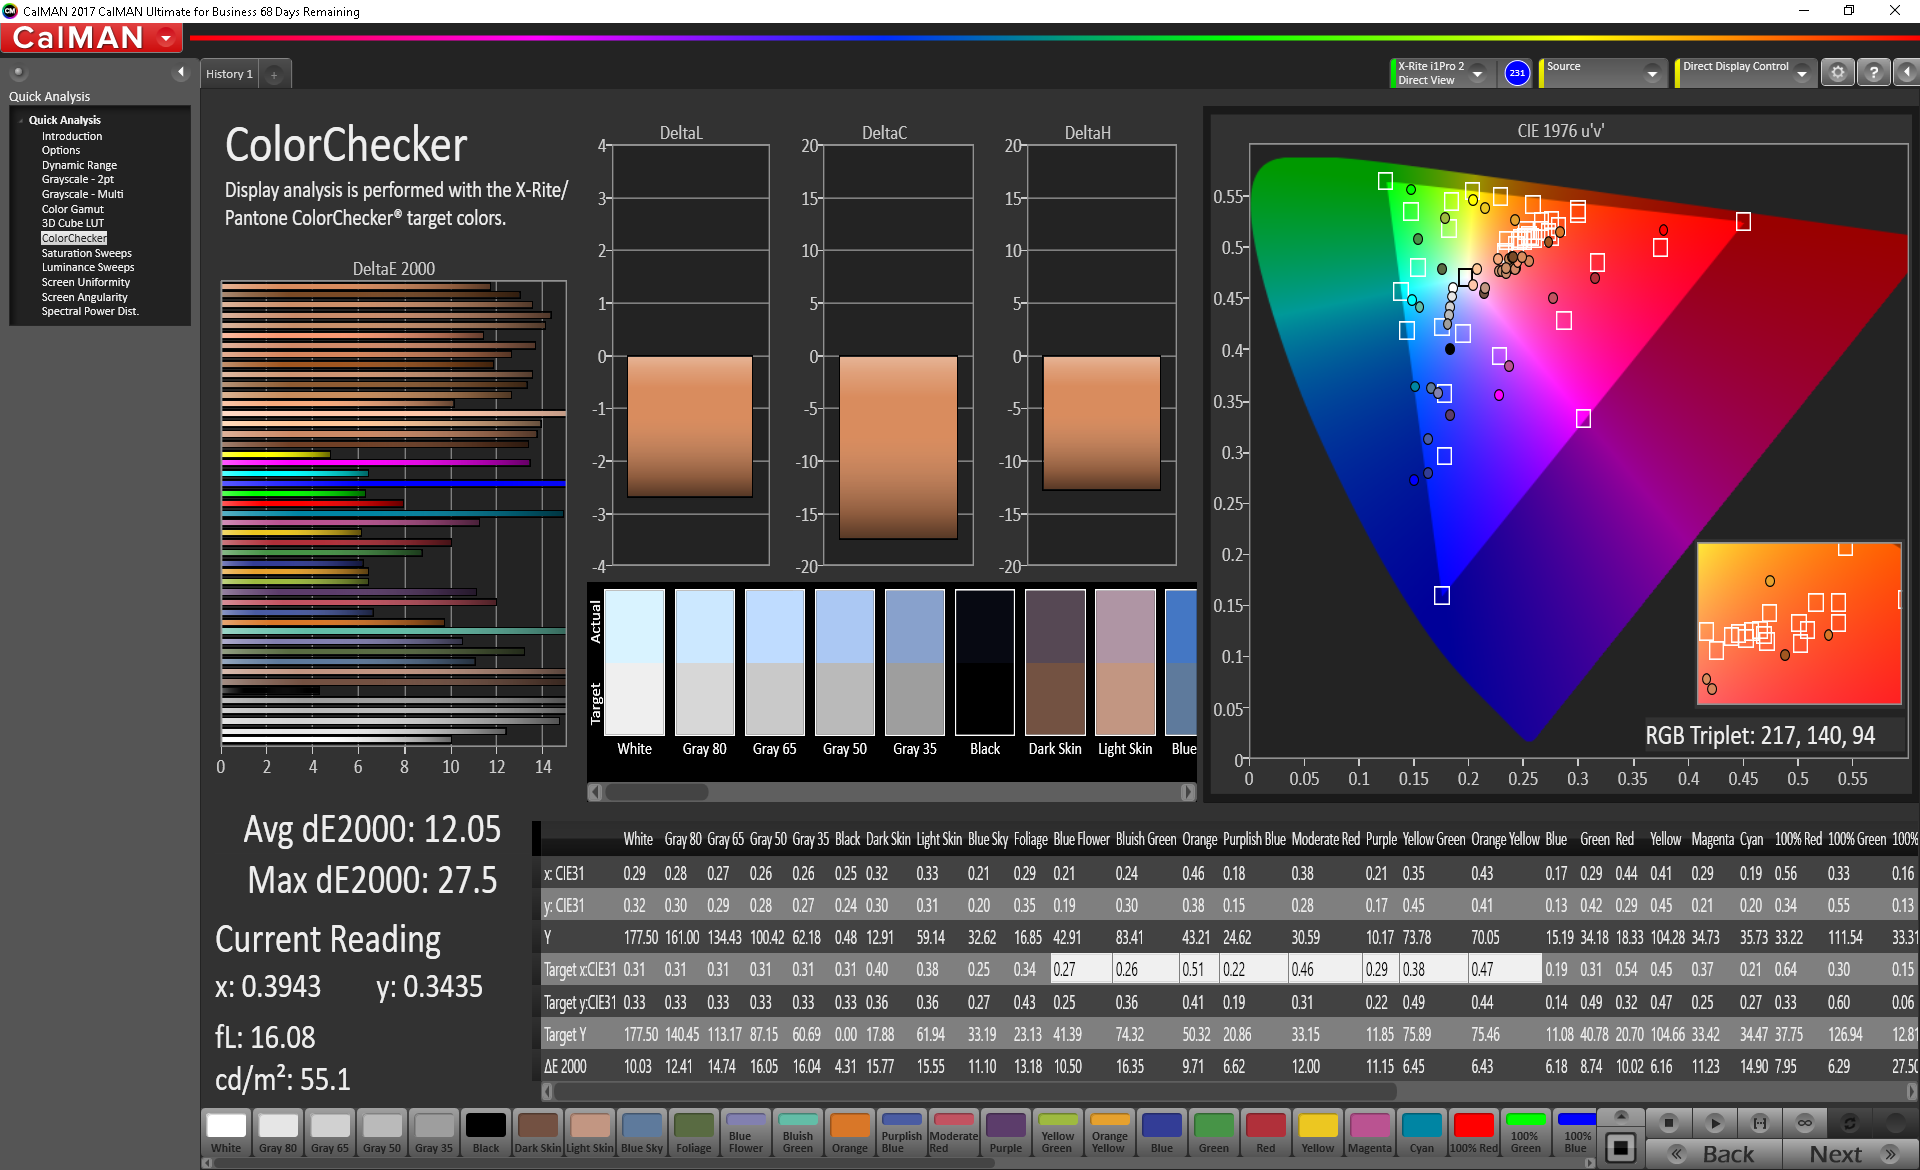
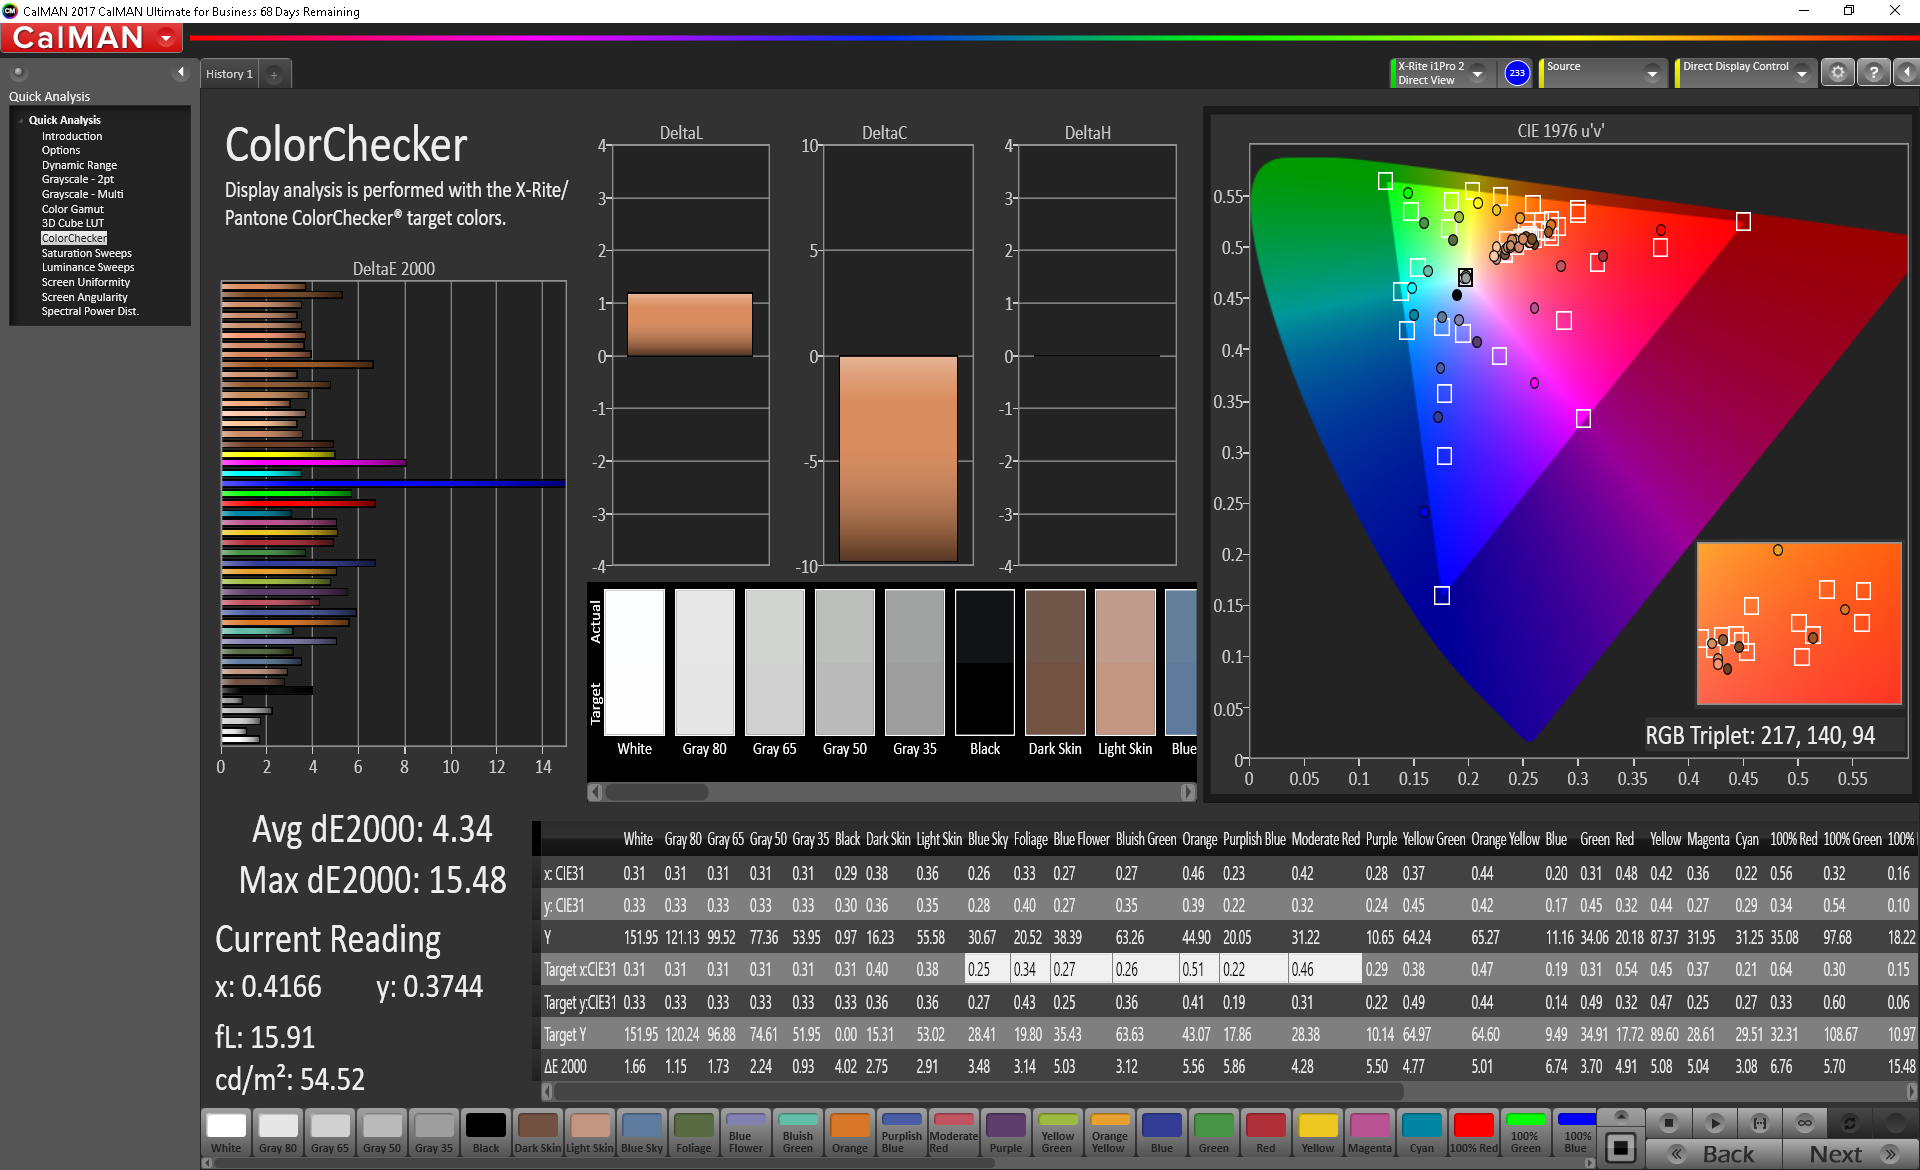
ΔE ColorChecker Calman: 12.05 | ∀{0.5-29.43 Ø4.73}
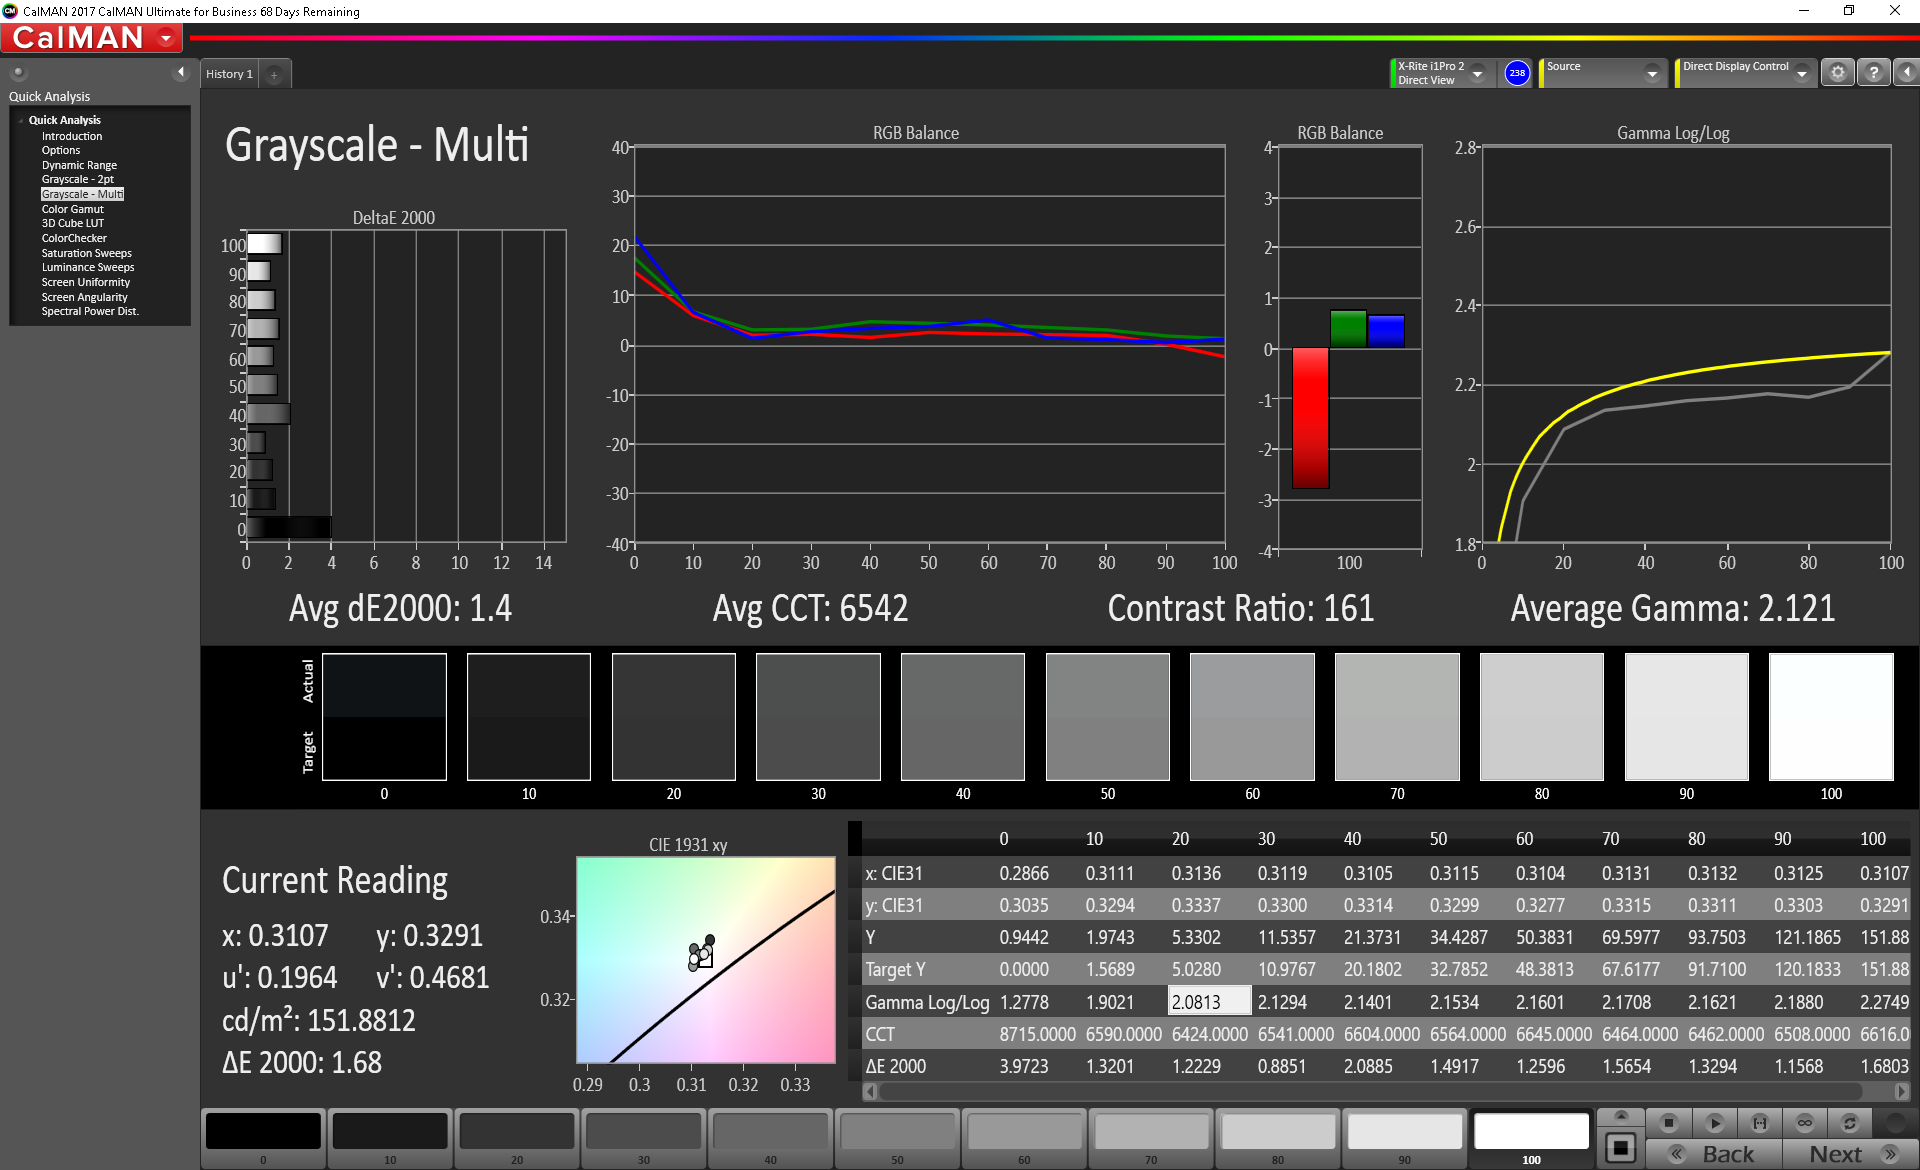
calibrated: 4.34
ΔE Greyscale Calman: 14.8 | ∀{0.09-98 Ø4.97}
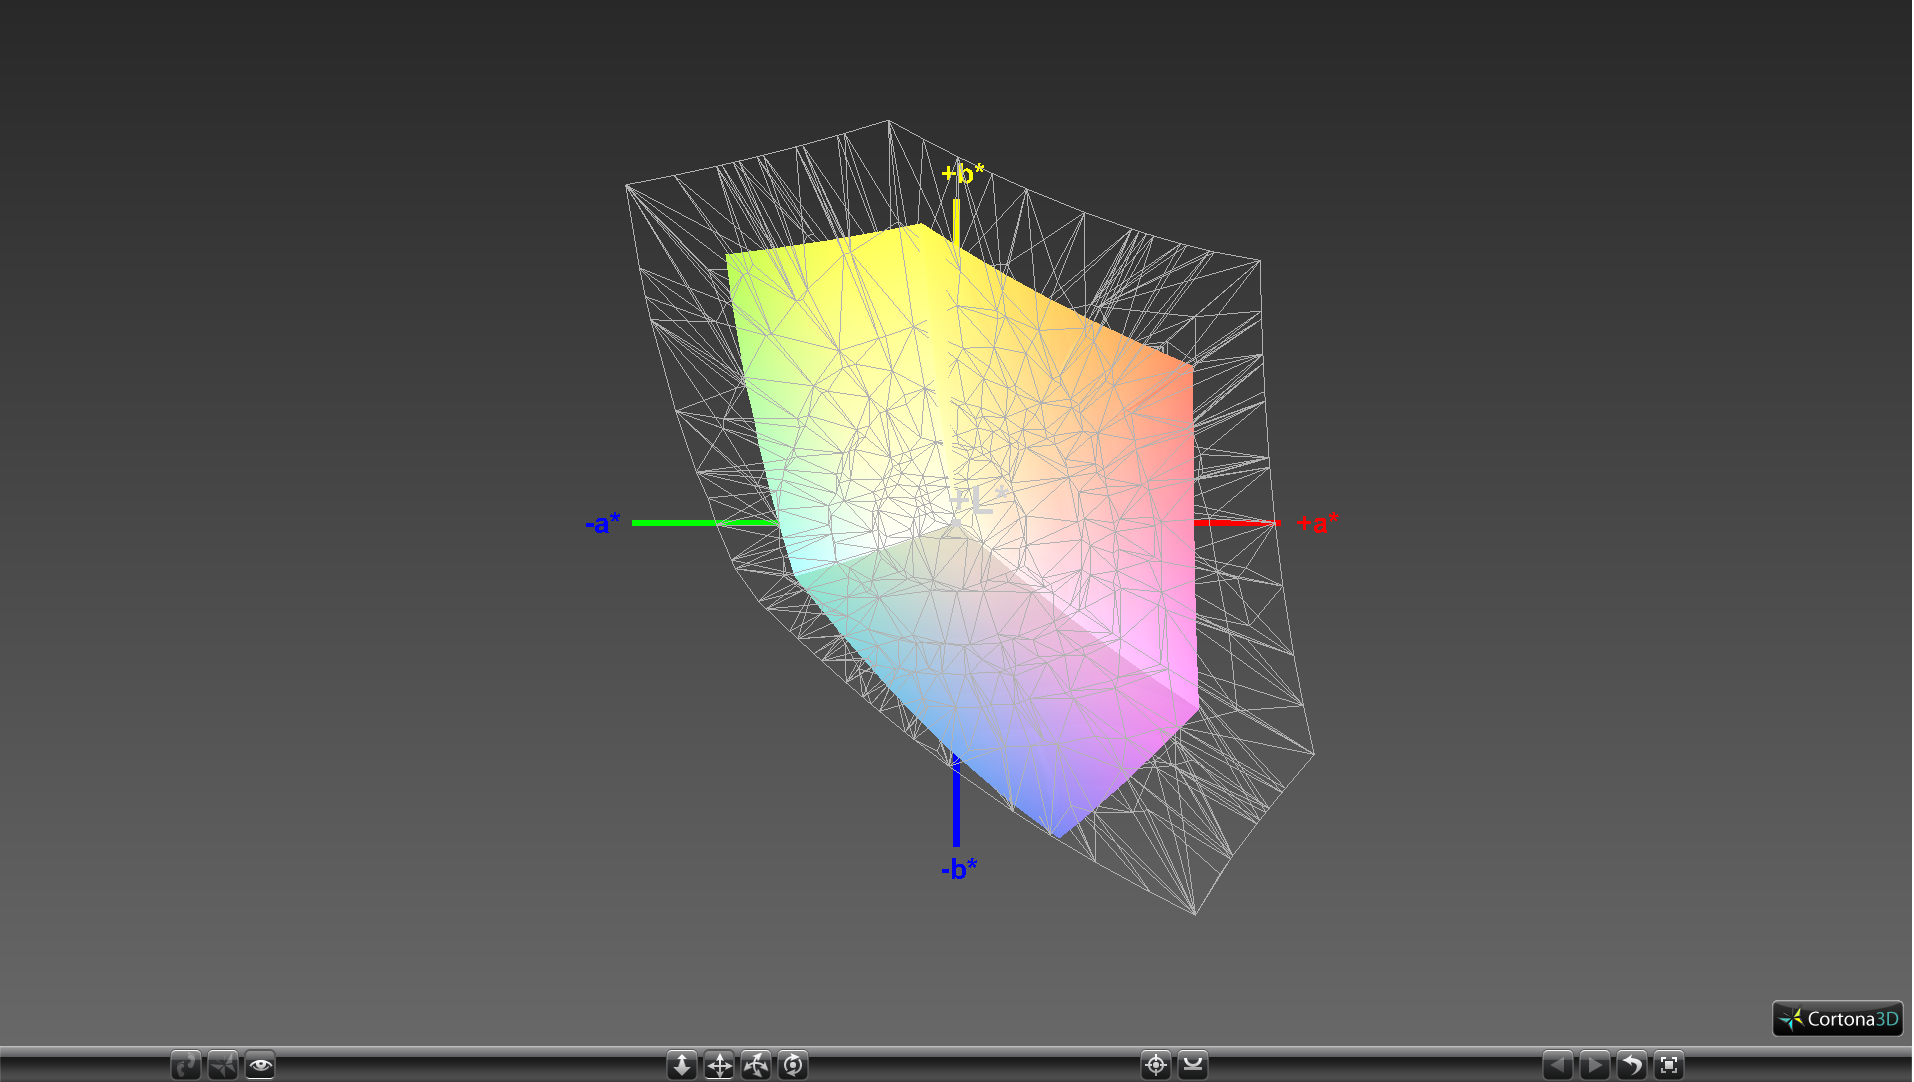
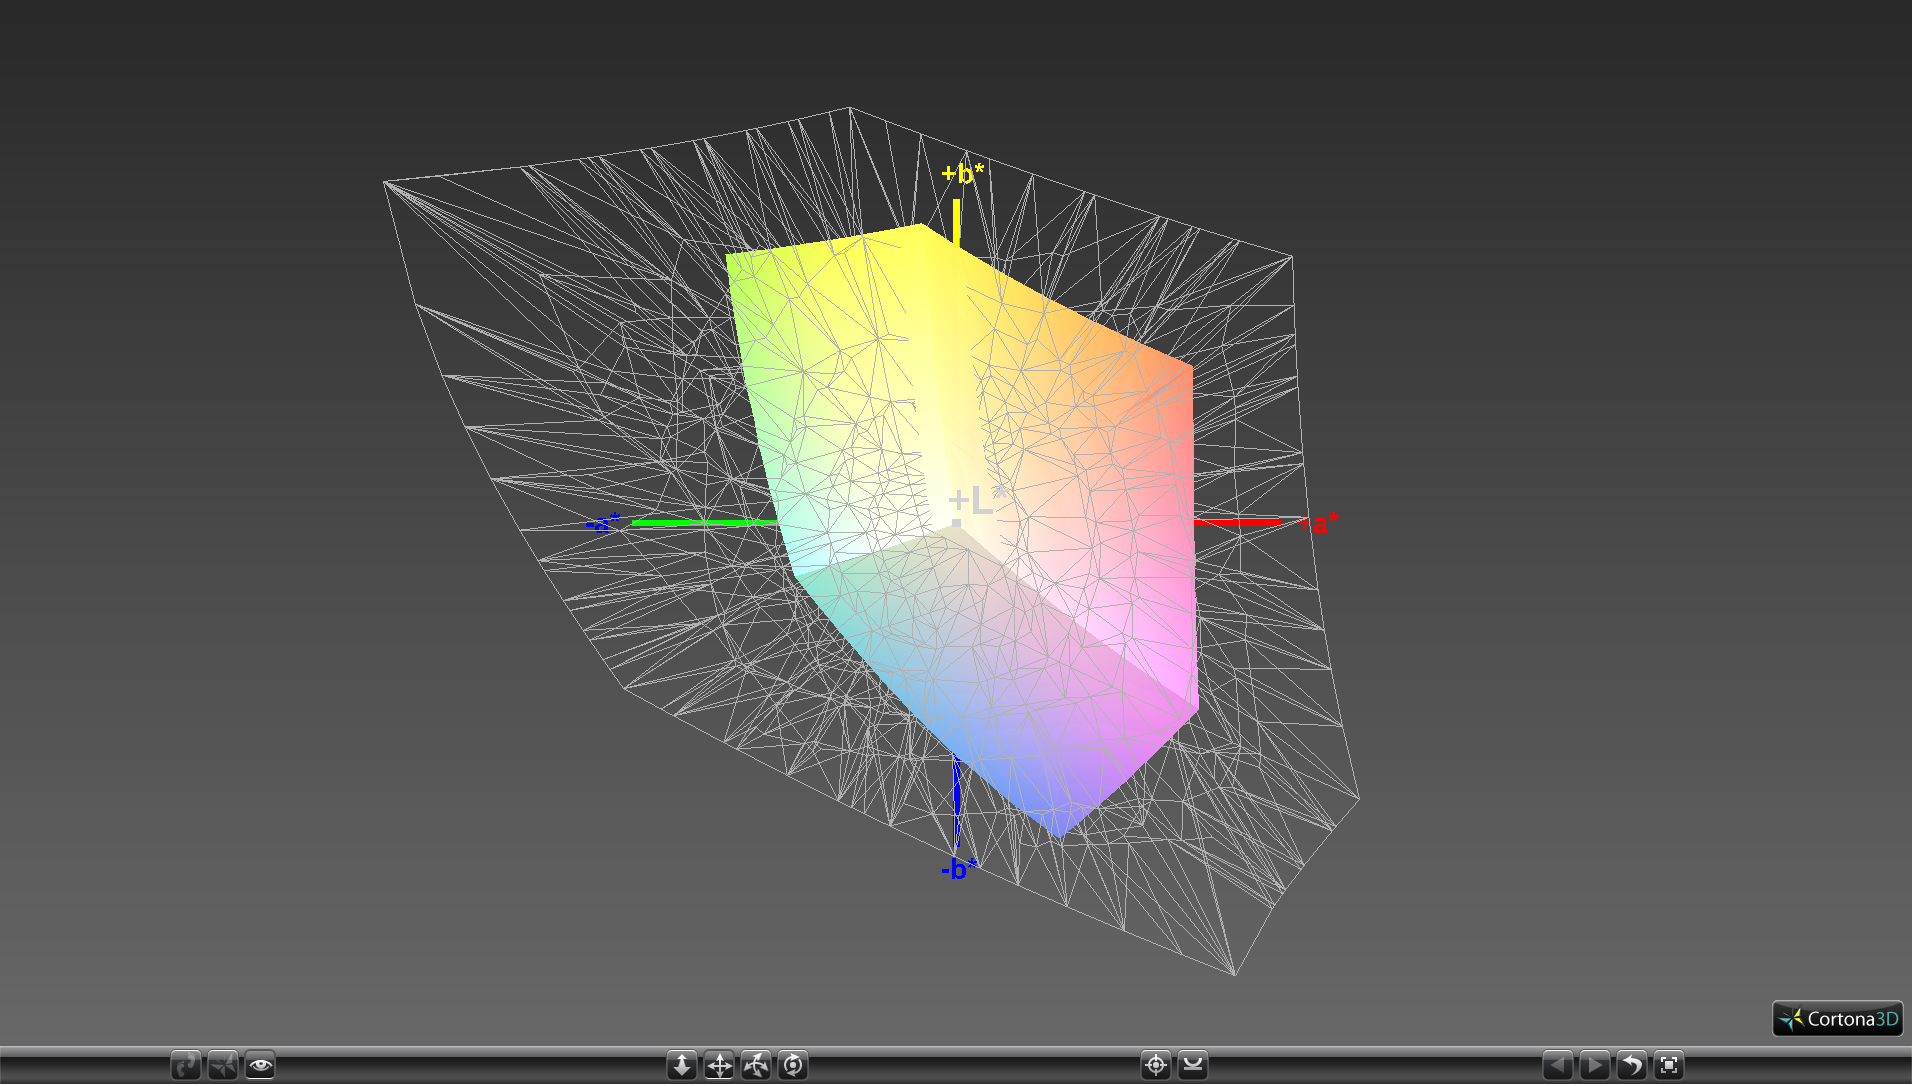
56.2% sRGB (Argyll 1.6.3 3D)
35.7% AdobeRGB 1998 (Argyll 1.6.3 3D)
38.62% AdobeRGB 1998 (Argyll 3D)
56.1% sRGB (Argyll 3D)
37.36% Display P3 (Argyll 3D)
Gamma: 1.4
CCT: 14529 K
| Panasonic Toughbook CF-54G2999VM B140XTN, AUO2E3C, TN LED, 14", 1366x768 | Dell Latitude 14 7414 Rugged Extreme Sharp LQ140K1, IPS, 14", 1366x768 | Dell Latitude 7490 AU Optronics AU0223D, IPS, 14", 1920x1080 | Panasonic Toughbook CF-33 Manufacturer unknown, ID: TMA1200, IPS, 12", 2160x1440 | Samsung Notebook 9 NP900X5T-X01US ID: BOE06E8, Name: BOE HF NV150FHB-N31, IPS, 15", 1920x1080 | Getac S410 CMN N140BGE-E33, TN PED, 14", 1366x768 | |
|---|---|---|---|---|---|---|
| Display | -0% | 65% | 18% | 74% | 8% | |
| Display P3 Coverage (%) | 37.36 | 37.22 0% | 63.6 70% | 44.24 18% | 65.2 75% | 40.46 8% |
| sRGB Coverage (%) | 56.1 | 55.8 -1% | 88.8 58% | 66.7 19% | 97.4 74% | 60.9 9% |
| AdobeRGB 1998 Coverage (%) | 38.62 | 38.49 0% | 64.8 68% | 45.71 18% | 66.8 73% | 41.8 8% |
| Response Times | -29% | -50% | -19% | -39% | 12% | |
| Response Time Grey 50% / Grey 80% * (ms) | 43.2 ? | 43 ? -0% | 48.4 ? -12% | 30 ? 31% | 46 ? -6% | 41.2 ? 5% |
| Response Time Black / White * (ms) | 17.2 ? | 27 ? -57% | 32.4 ? -88% | 29 ? -69% | 29.6 ? -72% | 14 ? 19% |
| PWM Frequency (Hz) | 200 ? | 685 | 2976 ? | 877 ? | ||
| Screen | 68% | 73% | 219% | 114% | 17% | |
| Brightness middle (cd/m²) | 174.5 | 493 183% | 328.2 88% | 571 227% | 558.2 220% | 265.1 52% |
| Brightness (cd/m²) | 164 | 456 178% | 305 86% | 555 238% | 528 222% | 246 50% |
| Brightness Distribution (%) | 71 | 81 14% | 87 23% | 89 25% | 92 30% | 81 14% |
| Black Level * (cd/m²) | 0.6 | 0.53 12% | 0.37 38% | 0.11 82% | 0.46 23% | 0.58 3% |
| Contrast (:1) | 291 | 930 220% | 887 205% | 5191 1684% | 1213 317% | 457 57% |
| Colorchecker dE 2000 * | 12.05 | 11.08 8% | 3.82 68% | 22.7 -88% | 4.41 63% | 14.24 -18% |
| Colorchecker dE 2000 max. * | 27.5 | 15.11 45% | 5.58 80% | 34.14 -24% | 10.91 60% | 26.66 3% |
| Colorchecker dE 2000 calibrated * | 4.34 | 3.5 19% | 3.94 9% | |||
| Greyscale dE 2000 * | 14.8 | 11.99 19% | 3 80% | 13.6 8% | 6.6 55% | 14.2 4% |
| Gamma | 1.4 157% | 4.03 55% | 2.36 93% | 5.51 40% | 2.19 100% | 2.03 108% |
| CCT | 14529 45% | 10872 60% | 6962 93% | 6998 93% | 7615 85% | 17152 38% |
| Color Space (Percent of AdobeRGB 1998) (%) | 35.7 | 36 1% | 58 62% | 42.5 19% | 61.3 72% | 38.7 8% |
| Color Space (Percent of sRGB) (%) | 56.2 | 56 0% | 88 57% | 67.02 19% | 97.2 73% | 61 9% |
| Total Average (Program / Settings) | 13% /
41% | 29% /
56% | 73% /
147% | 50% /
85% | 12% /
15% |
* ... smaller is better
Color space is only 56 percent and 36 percent of the sRGB and AdobeRGB standards, respectively, to indicate a budget panel. Results are not all that different from the displays of the Dell Latitude 14 and Panasonic CF-33 since color accuracy is not priority for these rugged laptops.
Further analyses with a spectrophotometer reveal an overly cool color temperature and a very inaccurate grayscale. Our calibration attempt fixes many of these issues and we strongly recommend applying our ICC profile above to get the most out of the display.
Display Response Times
| ↔ Response Time Black to White | ||
|---|---|---|
| 17.2 ms ... rise ↗ and fall ↘ combined | ↗ 11.2 ms rise | 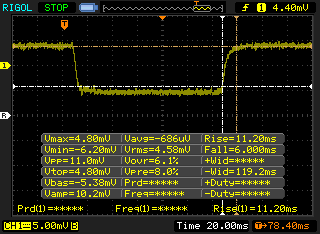 |
| ↘ 6 ms fall | ||
| The screen shows good response rates in our tests, but may be too slow for competitive gamers. In comparison, all tested devices range from 0.1 (minimum) to 240 (maximum) ms. » 39 % of all devices are better. This means that the measured response time is better than the average of all tested devices (19.9 ms). | ||
| ↔ Response Time 50% Grey to 80% Grey | ||
| 43.2 ms ... rise ↗ and fall ↘ combined | ↗ 16.8 ms rise | 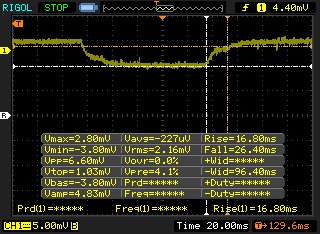 |
| ↘ 26.4 ms fall | ||
| The screen shows slow response rates in our tests and will be unsatisfactory for gamers. In comparison, all tested devices range from 0.165 (minimum) to 636 (maximum) ms. » 72 % of all devices are better. This means that the measured response time is worse than the average of all tested devices (31.1 ms). | ||
Screen Flickering / PWM (Pulse-Width Modulation)
| Screen flickering / PWM not detected | 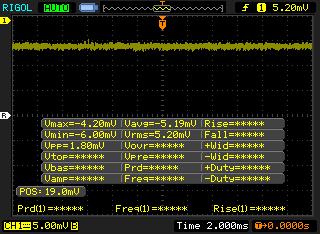 | ||
In comparison: 52 % of all tested devices do not use PWM to dim the display. If PWM was detected, an average of 7794 (minimum: 5 - maximum: 343500) Hz was measured. | |||
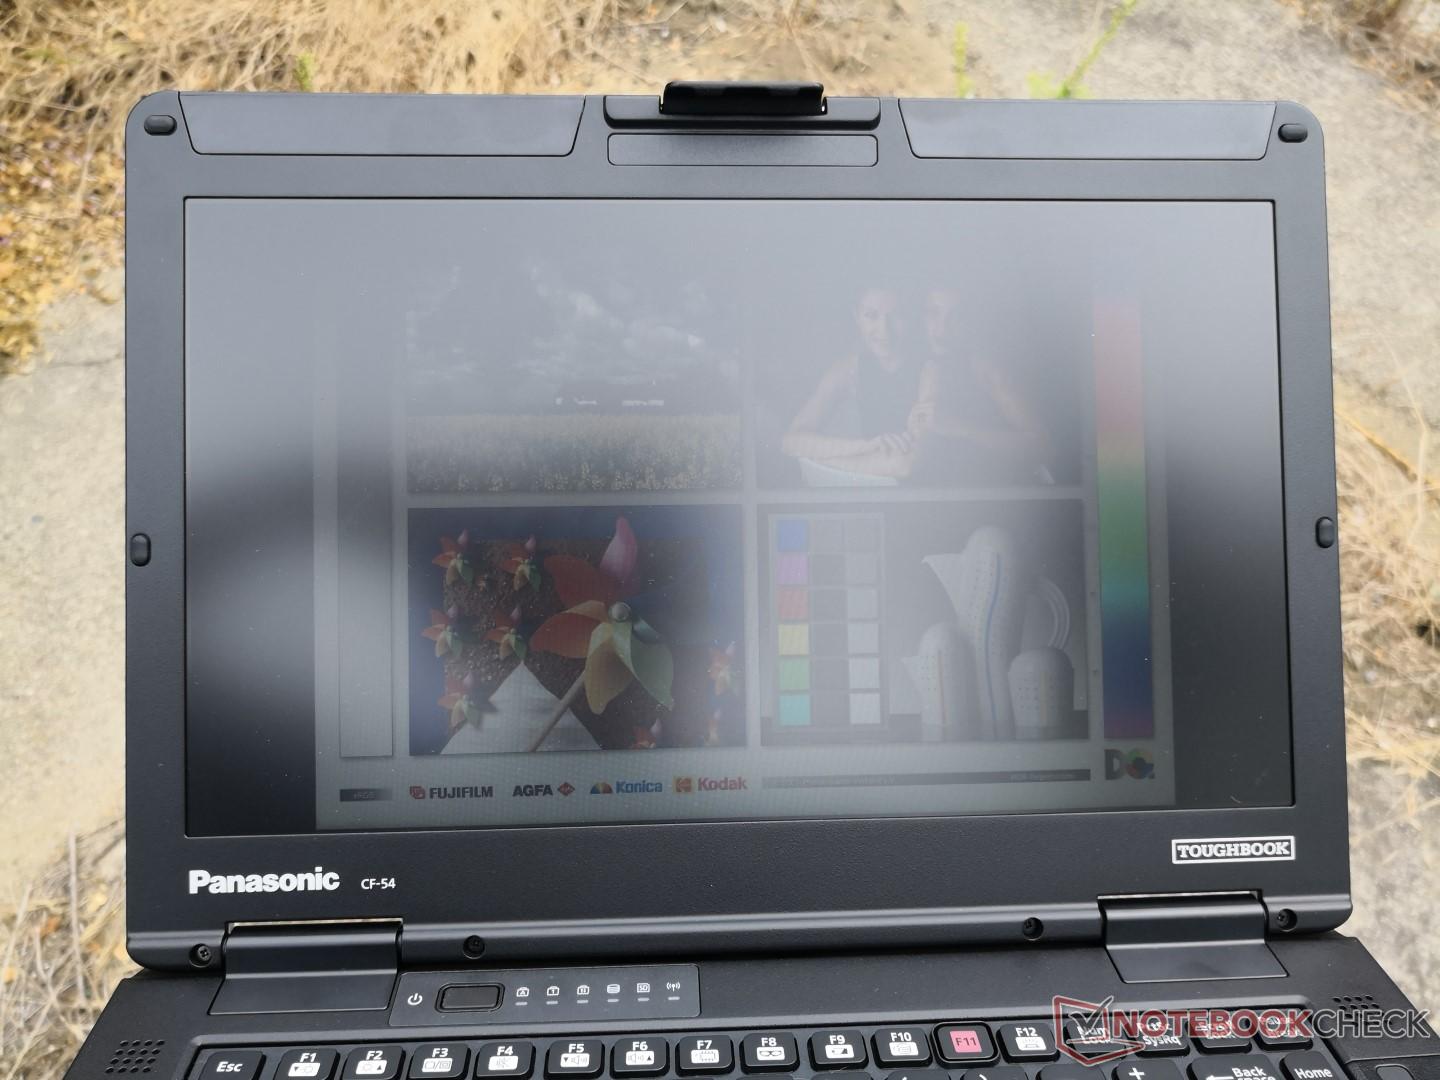
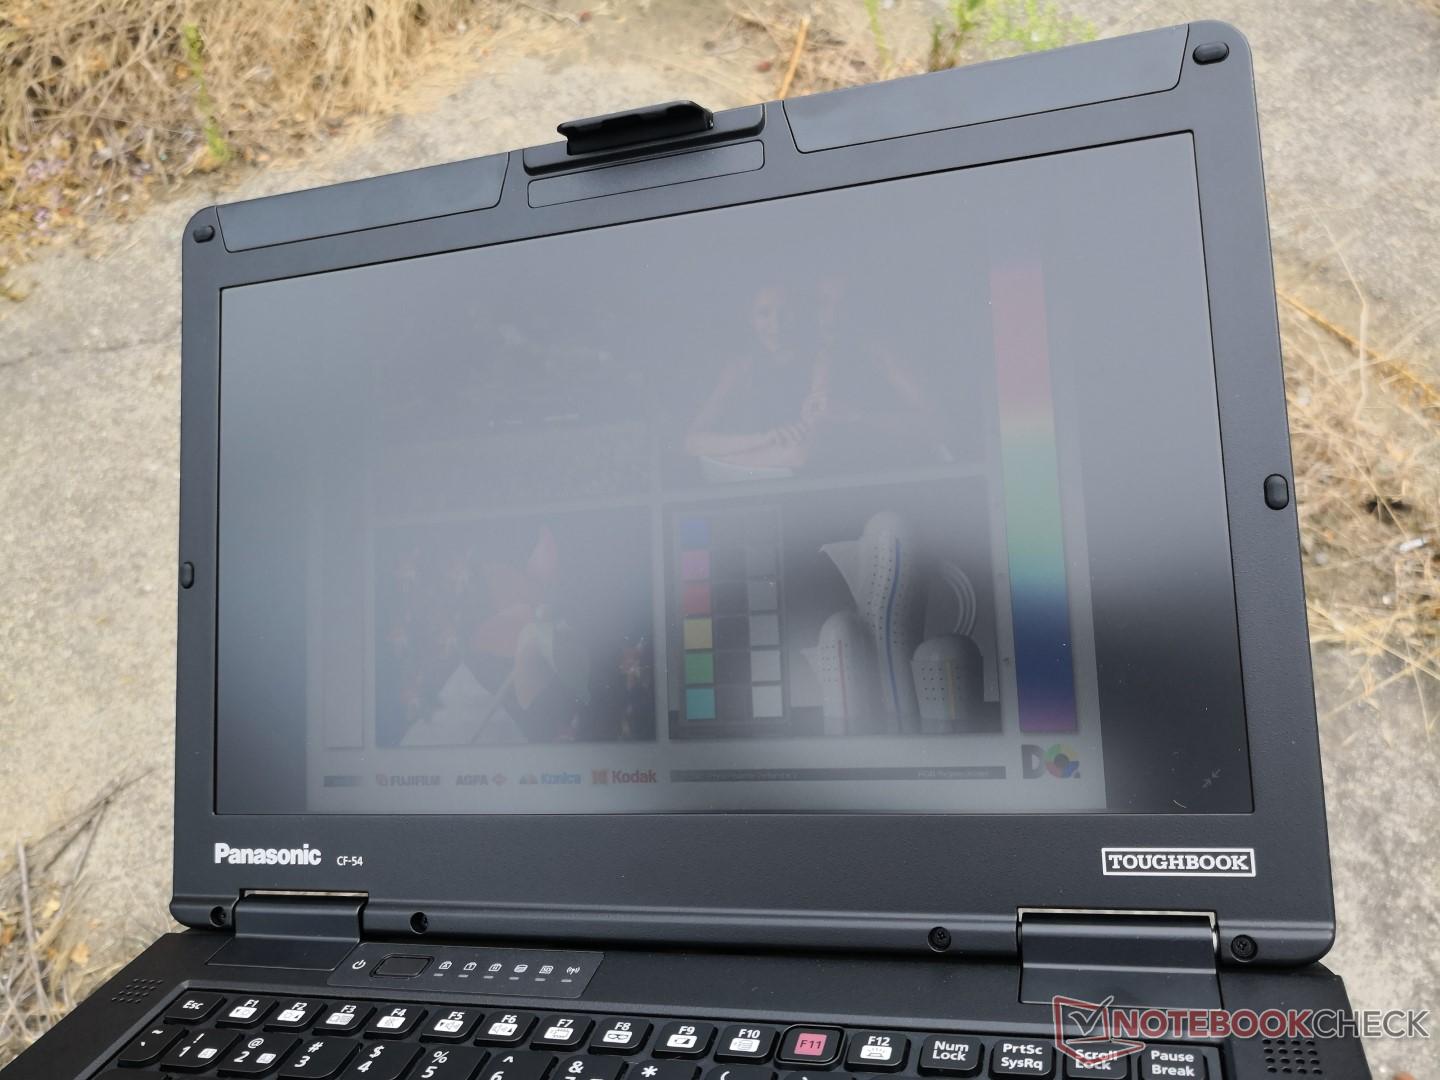
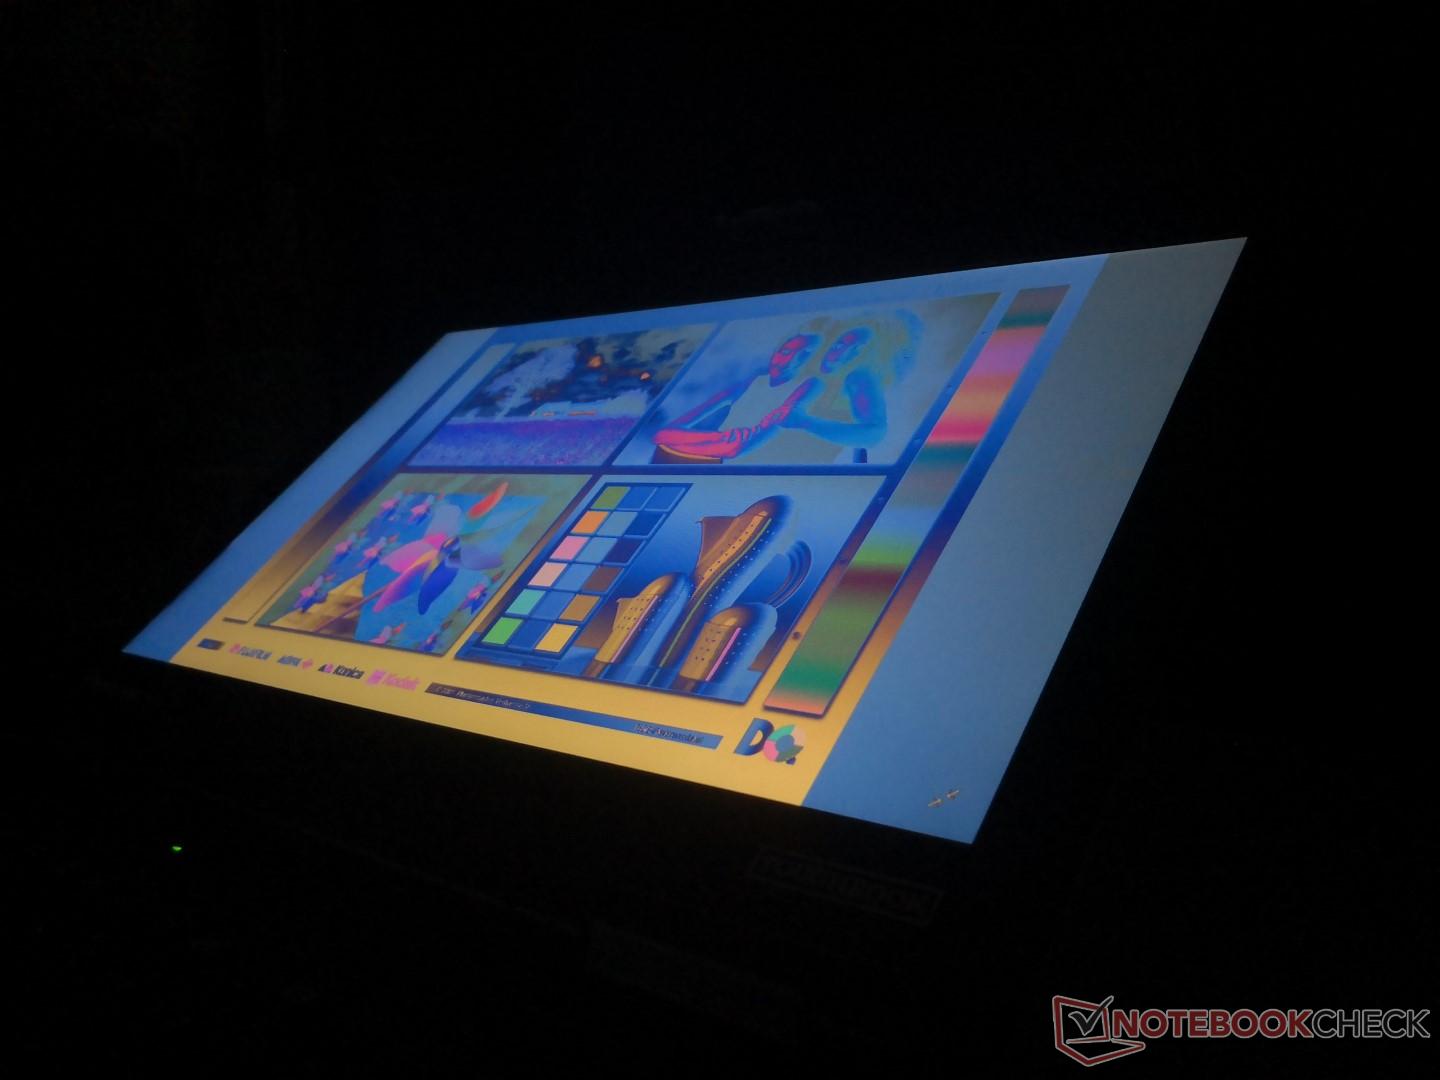
Outdoor visibility is very poor. The backlight is far too weak for comfortable use under sunlight or even shade. The 180-degree hinges do little to help against the narrow viewing angles.
Performance
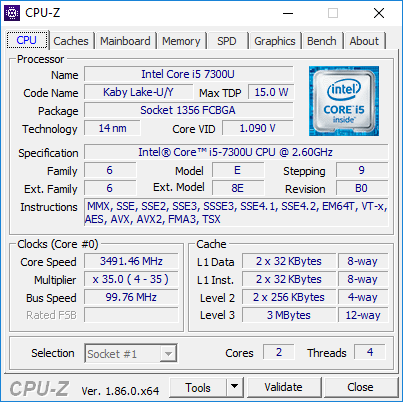
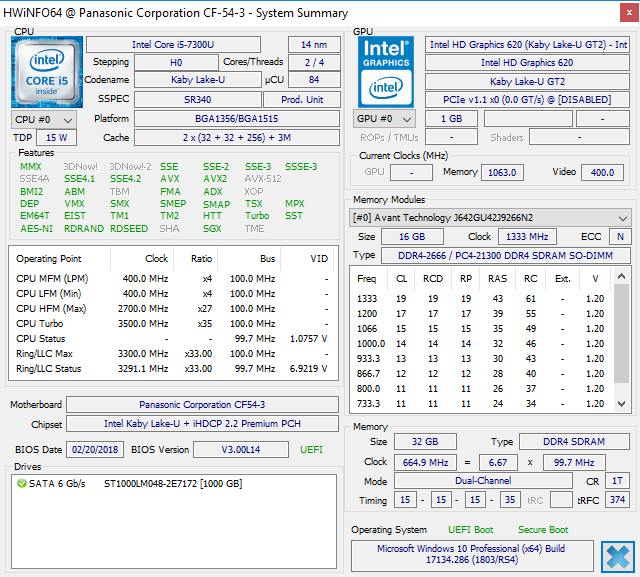
Processor
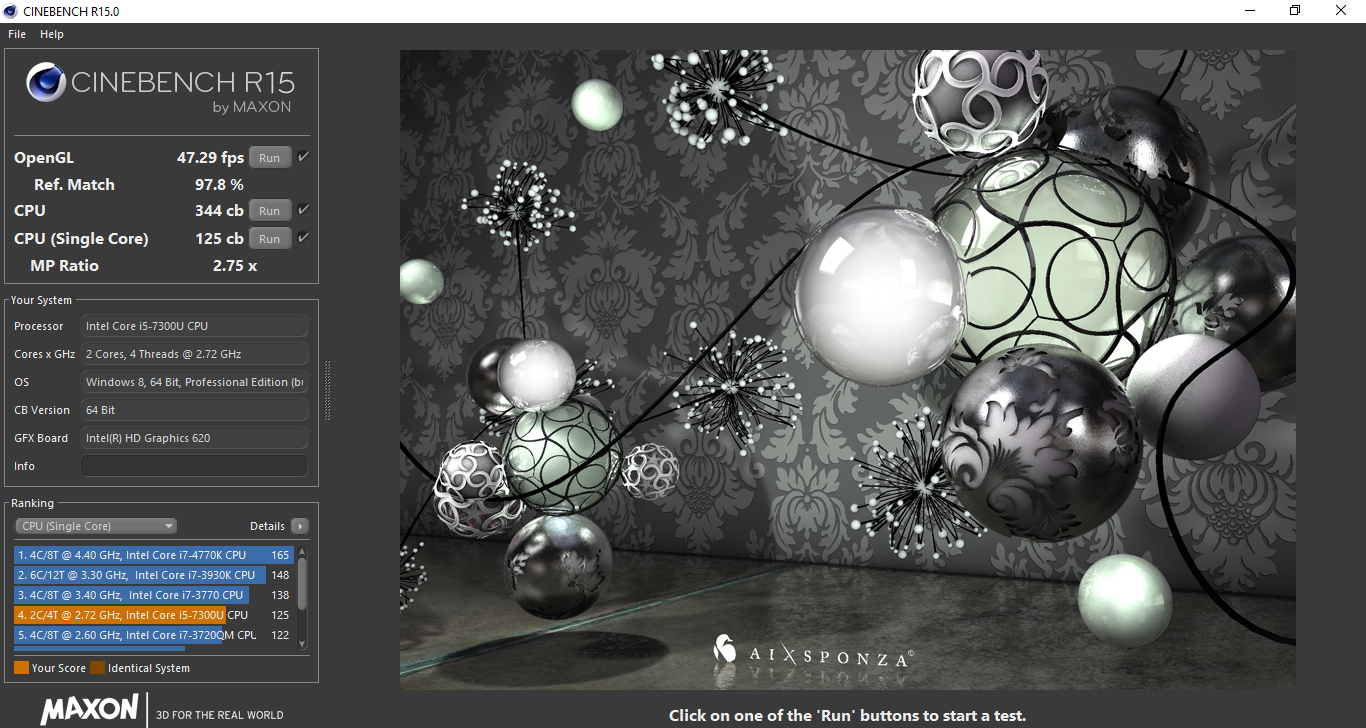
The last generation Core i5-7300U is only 4 percent faster than the i5-7200U and 6 percent slower than the i7-7500U. In other words, the performance differences are so minimal that users are unlikely to notice the advantages in practice. In comparison, jumping between CPU generations will bring much larger benefits. As an example, upgrading from the i5-5200U to the i5-7300U would boost multi-thread performance by 34 percent.
Running CineBench R15 Multi-Thread in a loop shows stable performance from start to finish throughout. Very high Turbo Boost clock rates are short-lived as our Stress Test section below will show.
See our dedicated page on the Core i5-7300U for more technical information and benchmarks.
System Performance
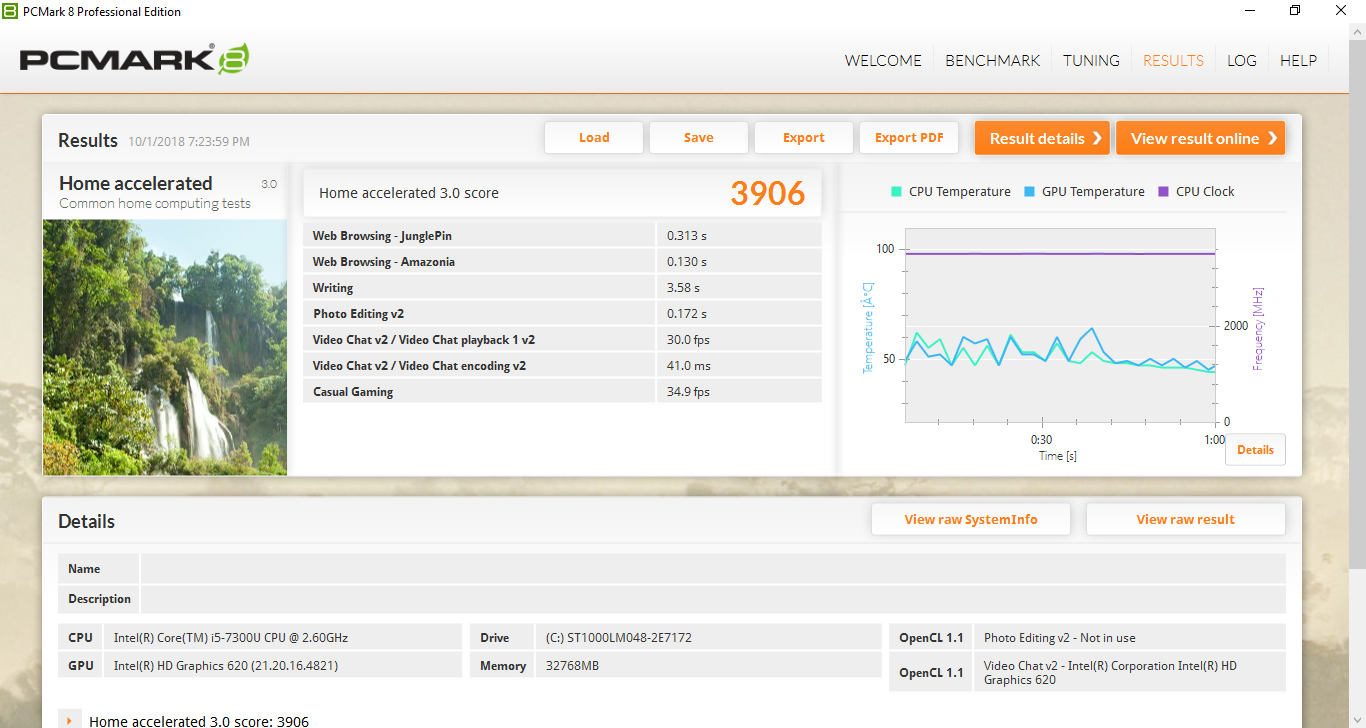
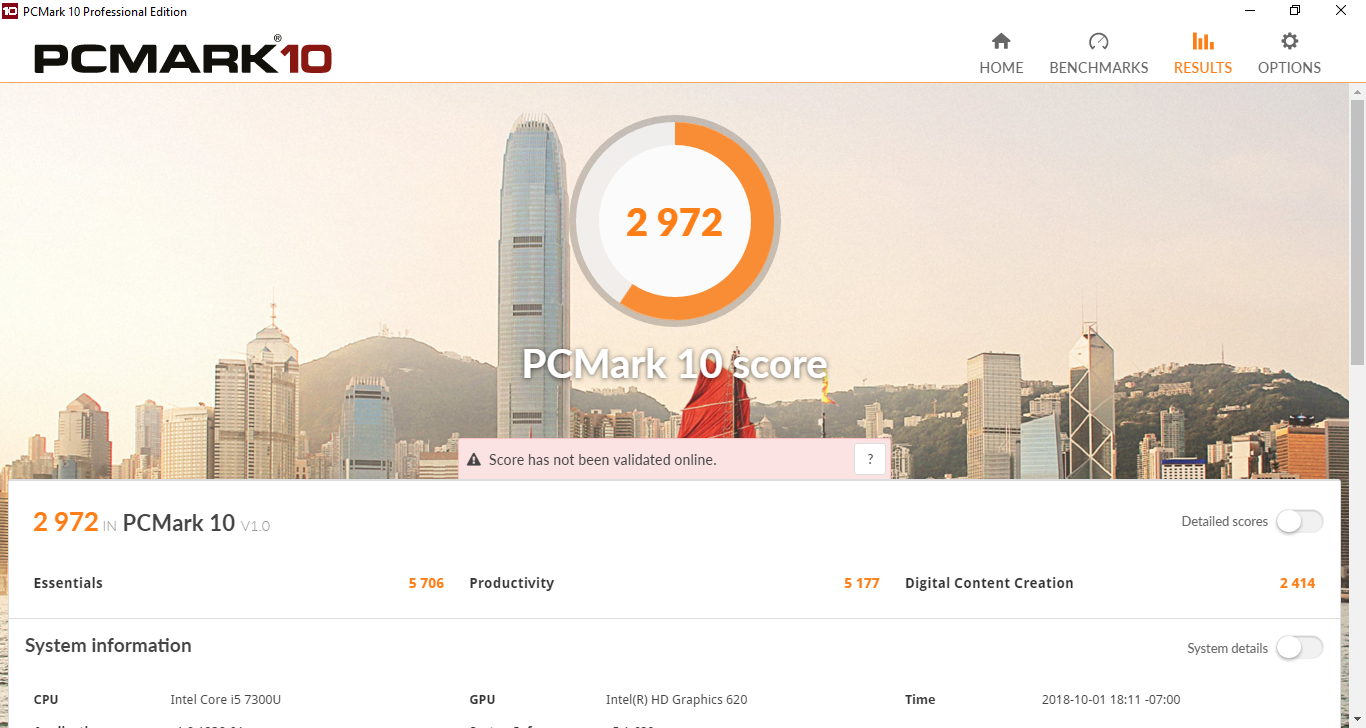
PCMark 10 benchmarks rank the CF-54 just 5 percent below the average Office laptop in our database. The smaller Toughbook CF-33 scores higher largely because of its primary SSD. Subjectively, performance is reliable if not a bit slow from the 5400 RPM HDD.
| PCMark 10 - Score | |
| Average of class Office (2601 - 9298, n=63, last 2 years) | |
| Dell Latitude 7490 | |
| Panasonic Toughbook CF-33 | |
| Panasonic Toughbook CF-54G2999VM | |
| Fujitsu LifeBook U748 | |
| PCMark 8 Home Score Accelerated v2 | 3906 points | |
| PCMark 10 Score | 2972 points | |
Help | ||
Storage Devices
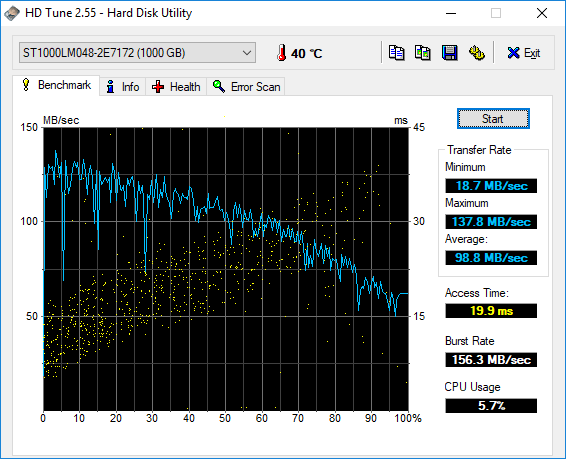
Two internal storage bays are available. The first bay is a convenient quick-release 2.5-inch SATA III slot near the front edge of the notebook. The second slot is an optional solution that requires addition disassembly. Our test unit is equipped with just a single 1 TB Seagate BarraCuda HDD with an average transfer rate of just under 99 MB/s according to HD Tune.
More benchmarks can be found on our table of SSDs and HDDs.
| Panasonic Toughbook CF-54G2999VM Seagate BarraCuda Compute 1TB ST1000LM048 | Lenovo IdeaPad 330-15ARR-81D2005JGE Seagate Mobile HDD 1TB ST1000LM035 | Dell G3 15 3579 Seagate Mobile HDD 1TB ST1000LX015-1U7172 | HP 15-db0500ng Seagate Mobile HDD 1TB ST1000LM035 | Toshiba Tecra A50-C1510W10 Hitachi Travelstar Z7K500 HTS725050A7E630 | Toshiba Satellite Radius 15 P50W-C-102 HGST Travelstar 5K1000 HTS541010A9E680 | |
|---|---|---|---|---|---|---|
| HD Tune Transfer Rate Average | ||||||
| Transfer Rate Average (MB/s) | 98.8 | 84.4 -15% | 97.5 -1% | 98.5 0% | 102.6 4% | 70.5 -29% |

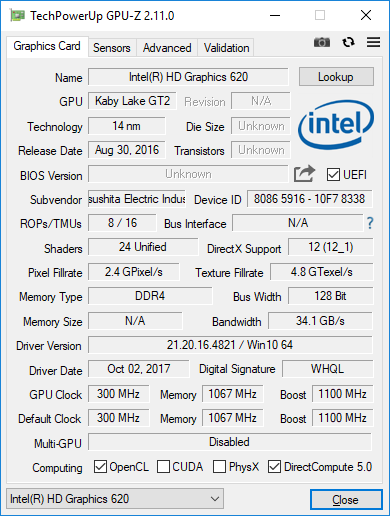
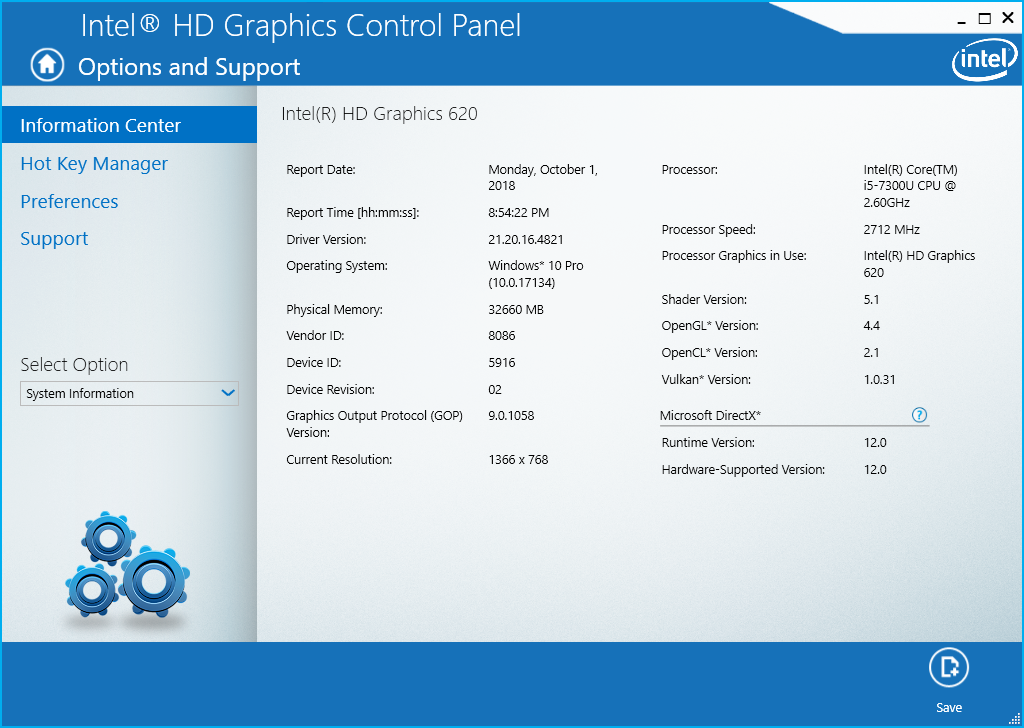
GPU Performance
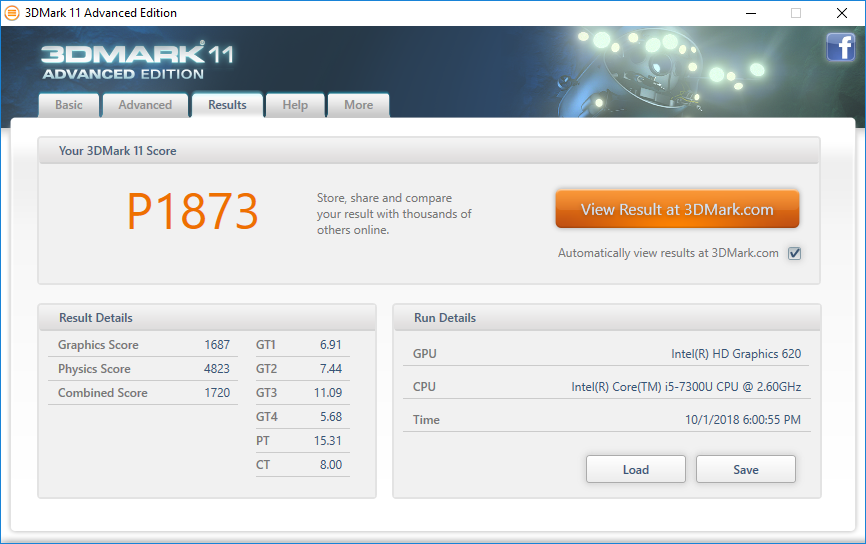
The integrated HD Graphics 620 GPU holds no surprises. Performance is sufficient for 4H UHD video playback but it is otherwise unfit for video editing or gaming. To its credit, it is at least faster than the UHD Graphics 615 in the new Microsoft Surface Go. See our dedicated page on the HD Graphics 620 for more technical information and benchmark comparisons.
Panasonic also offers the Toughbook CF-54 with the discrete Radeon Pro WX 4150 for higher graphics performance.
| 3DMark 11 Performance | 1873 points | |
Help | ||
| low | med. | high | ultra | |
|---|---|---|---|---|
| BioShock Infinite (2013) | 54.7 | 33.5 | 28.9 |
Stress Test
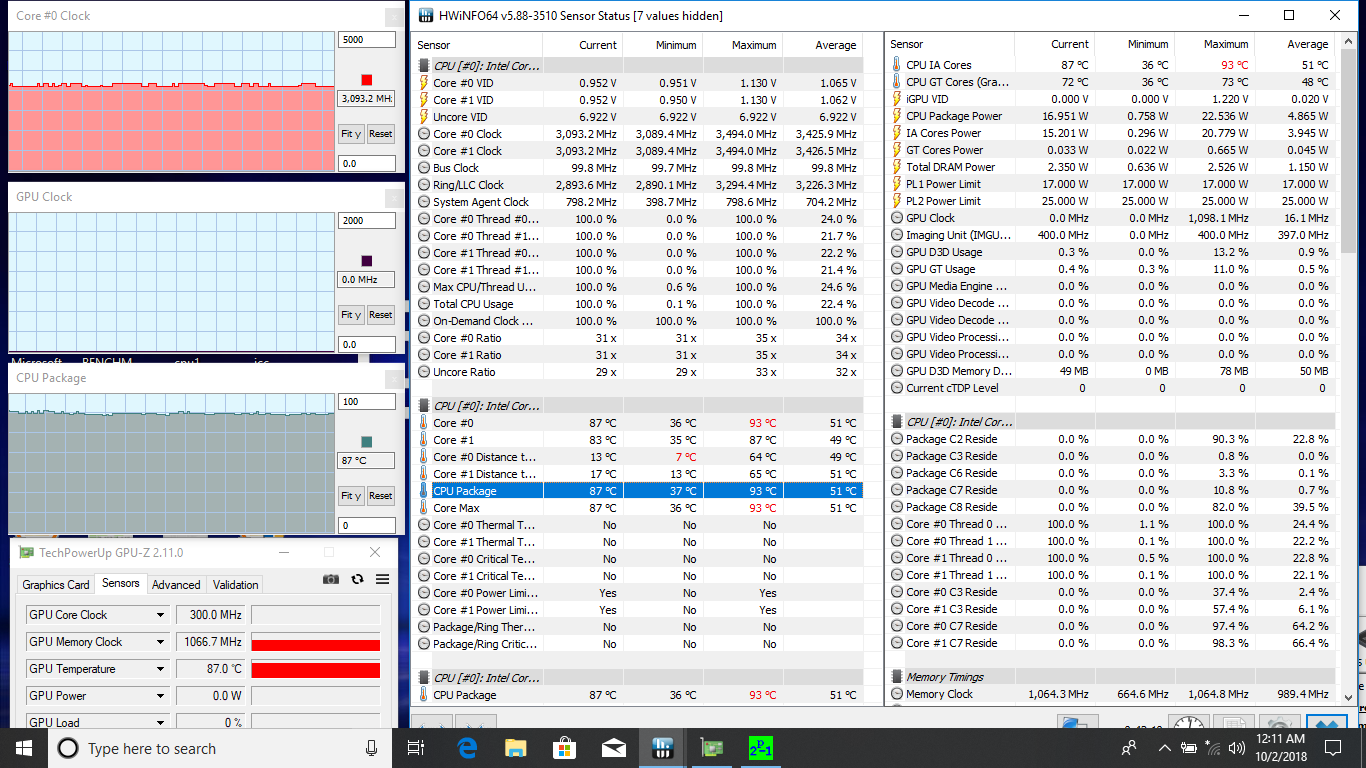
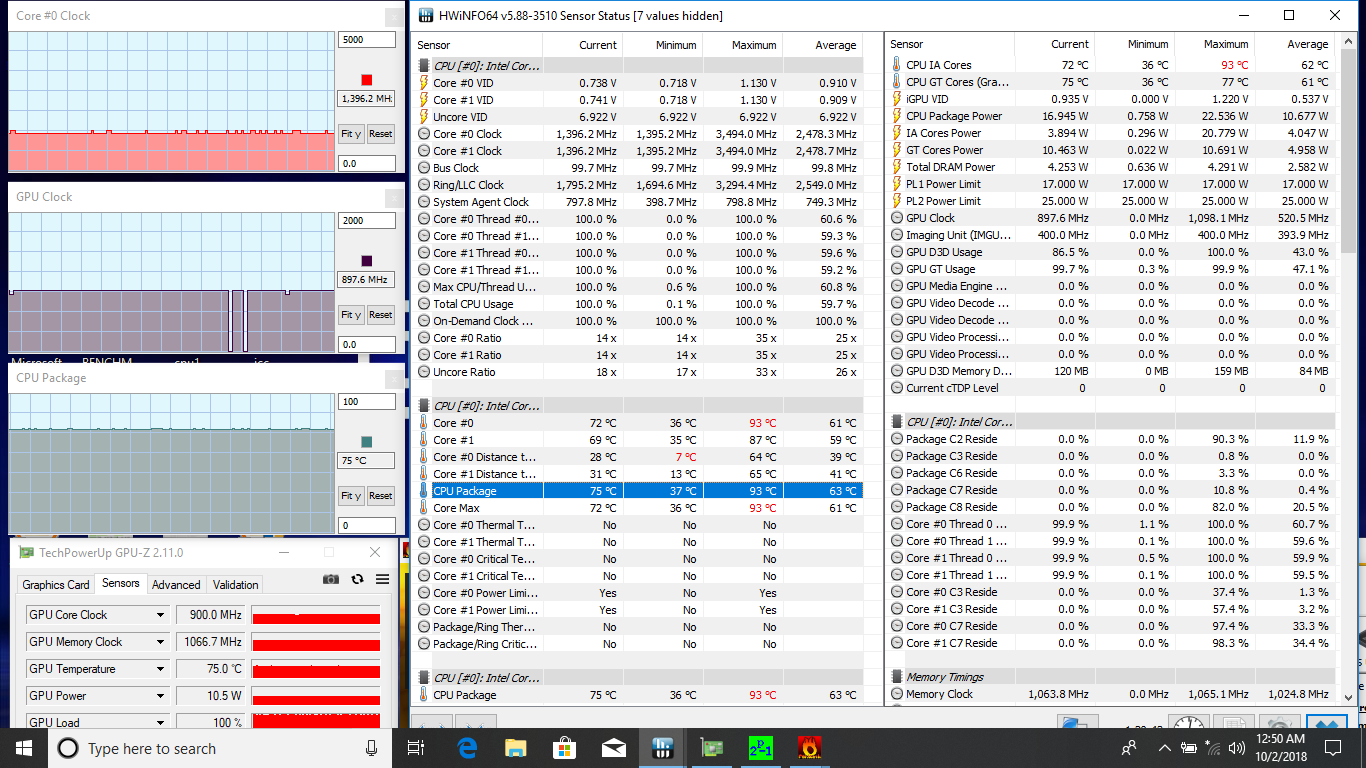
We stress the system with synthetic loads in order identify for any potential throttling or stability issues. When running Prime95, the CPU can be observed operating at up to 3.5 GHz for the first few seconds before reaching a core temperature of 91 C. Thereafter, its clock rate stabilizes at a respectable 3.1 GHz and at a steady core temperature of 87 C. Running both Prime95 and FurMark throttles the CPU even further to just 1.4 GHz.
Running on batteries will not throttle performance. A 3DMark 11 run on batteries returns Physics and Graphics scores that are within just 1 percent of the scores when running on mains.
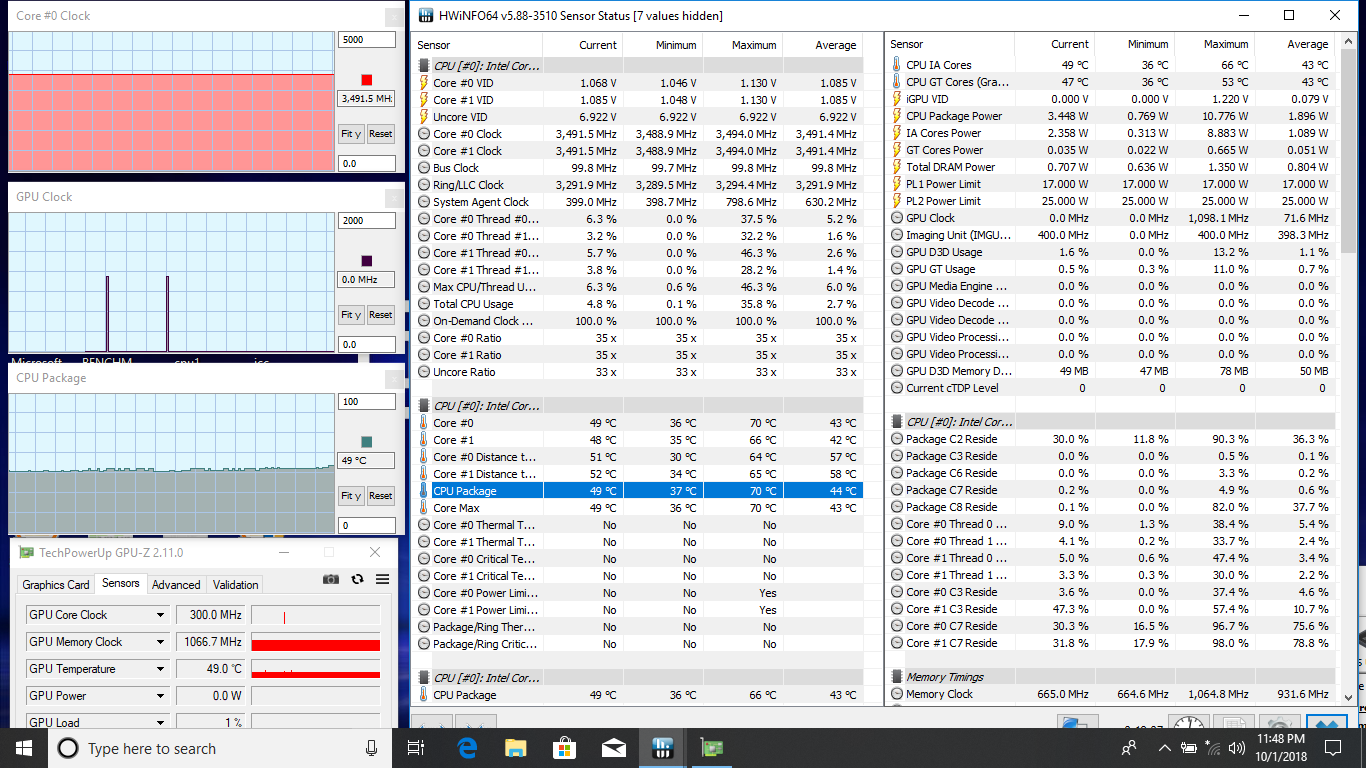

| CPU Clock (GHz) | GPU Clock (MHz) | Average CPU Temperature (°C) | |
| Prime95 Stress | 3.1 | -- | 87 |
| Prime95 + FurMark Stress | 1.4 | 898 | 75 |
Emissions
System Noise
When idling, the system is silent save for the spinning mechanical drive near the front of the system. The main issue arises when higher loads are introduced. When running 3DMark 06, for example, fan noise can spike from as low as 30 dB(A) to 40 dB(A) before immediately falling back down to 30 dB(A). It's an annoying behavior that is more common on gaming laptops than on systems with ULV Intel CPUs like our Panasonic. The competing Getac S410 does not suffer from the same spikes in fan noise.
We can notice no electronic noise or coil whine from our test unit. The slight whir from the mechanical hard drive will be inevitable unless if configured with a SSD instead.
Noise level
| Idle |
| 28.8 / 28.8 / 29.1 dB(A) |
| Load |
| 31.3 / 40 dB(A) |
 | ||
30 dB silent 40 dB(A) audible 50 dB(A) loud |
||
min: | ||
| Panasonic Toughbook CF-54G2999VM HD Graphics 620, i5-7300U, Seagate BarraCuda Compute 1TB ST1000LM048 | Dell Latitude 14 7414 Rugged Extreme HD Graphics 520, 6300U, Liteonit CV3-8D128 | Dell Latitude 7490 UHD Graphics 620, i7-8650U, Samsung PM961 MZVLW256HEHP | Panasonic Toughbook CF-33 HD Graphics 620, i5-7300U, Toshiba SG5 256GB THNSNK256GVN8 | Getac S410 UHD Graphics 620, i5-8550U, CUKUSA 1 TB SATA SSD Q0526A | |
|---|---|---|---|---|---|
| Noise | 1% | -1% | -2% | 4% | |
| off / environment * (dB) | 28.3 | 30.2 -7% | 28.2 -0% | 30.3 -7% | 28.4 -0% |
| Idle Minimum * (dB) | 28.8 | 30.2 -5% | 28.2 2% | 30.3 -5% | 28.4 1% |
| Idle Average * (dB) | 28.8 | 30.2 -5% | 28.2 2% | 30.3 -5% | 28.4 1% |
| Idle Maximum * (dB) | 29.1 | 30.2 -4% | 31.4 -8% | 30.5 -5% | 28.4 2% |
| Load Average * (dB) | 31.3 | 30.2 4% | 31.7 -1% | 30.5 3% | 30.3 3% |
| Load Maximum * (dB) | 40 | 31.7 21% | 41.2 -3% | 36.6 8% | 33.3 17% |
* ... smaller is better
Temperature
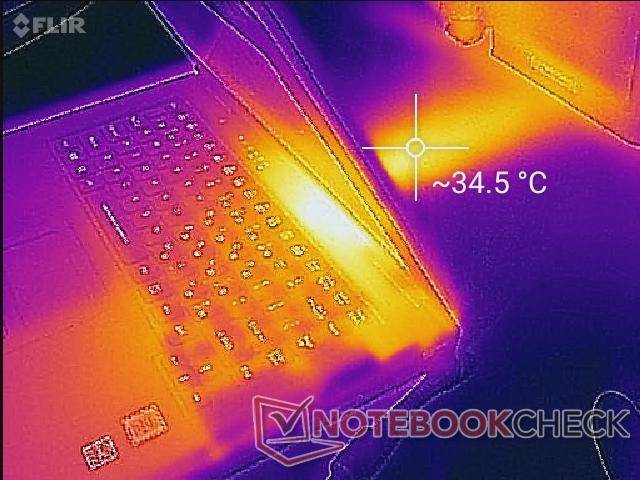
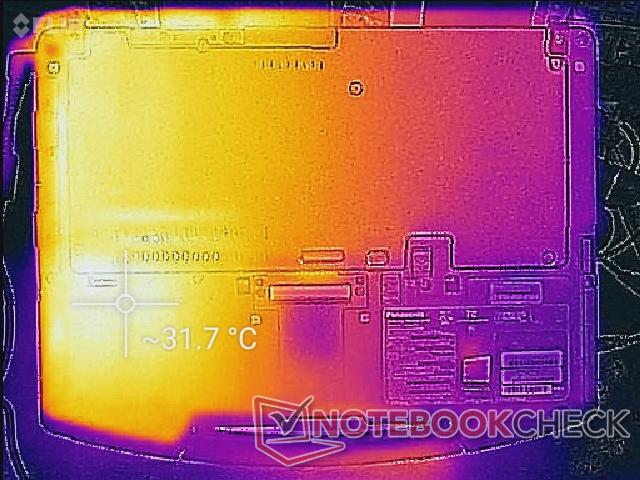
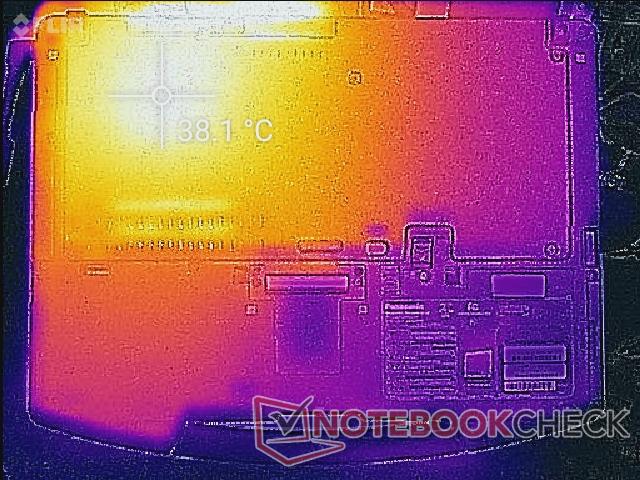
Surface temperatures are generally cool during low loads. The right palm rest, however, can be a few degrees C warmer than the left if the drive is being utilized. If under extreme loads, the right half of the notebook will always be warmer than the left due to the positioning of the processor inside. Surfaces never become uncomfortably warm for typing.
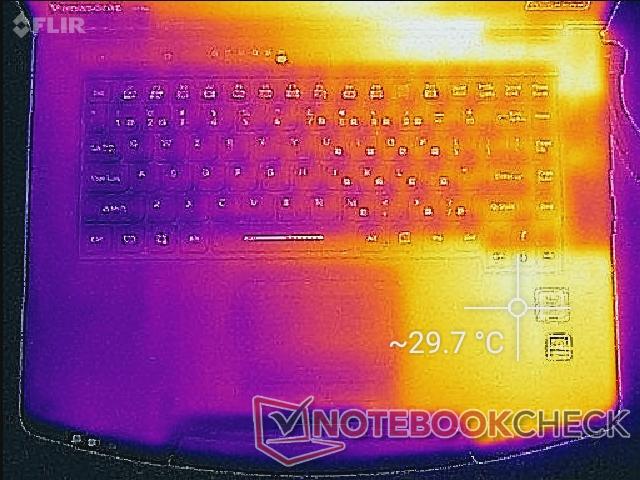
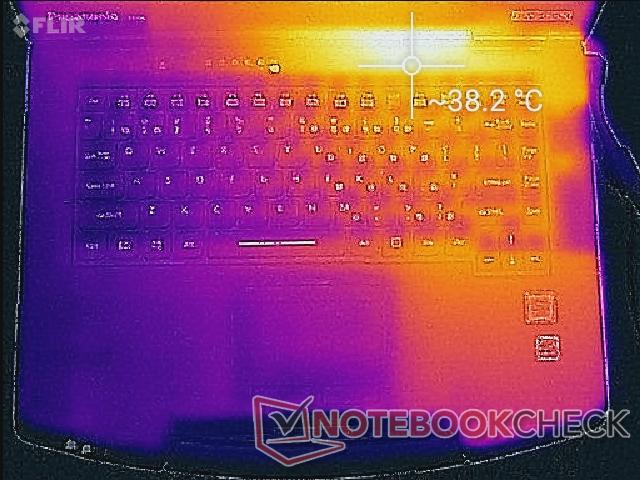
(+) The maximum temperature on the upper side is 38.2 °C / 101 F, compared to the average of 34.3 °C / 94 F, ranging from 21.2 to 62.5 °C for the class Office.
(+) The bottom heats up to a maximum of 38 °C / 100 F, compared to the average of 36.8 °C / 98 F
(+) In idle usage, the average temperature for the upper side is 27.1 °C / 81 F, compared to the device average of 29.5 °C / 85 F.
(+) The palmrests and touchpad are cooler than skin temperature with a maximum of 29.8 °C / 85.6 F and are therefore cool to the touch.
(-) The average temperature of the palmrest area of similar devices was 27.5 °C / 81.5 F (-2.3 °C / -4.1 F).
Speakers

The integrated speakers lack bass as one would expect but are otherwise clear and free of static even when at the maximum volume. Very slight chassis reverberations occur near the speaker grilles.
Panasonic Toughbook CF-54G2999VM audio analysis
(-) | not very loud speakers (65.9 dB)
Bass 100 - 315 Hz
(-) | nearly no bass - on average 25.6% lower than median
(+) | bass is linear (5% delta to prev. frequency)
Mids 400 - 2000 Hz
(±) | higher mids - on average 7.8% higher than median
(-) | mids are not linear (17.3% delta to prev. frequency)
Highs 2 - 16 kHz
(+) | balanced highs - only 4.3% away from median
(±) | linearity of highs is average (7.9% delta to prev. frequency)
Overall 100 - 16.000 Hz
(-) | overall sound is not linear (39.6% difference to median)
Compared to same class
» 99% of all tested devices in this class were better, 1% similar, 1% worse
» The best had a delta of 7%, average was 21%, worst was 53%
Compared to all devices tested
» 95% of all tested devices were better, 0% similar, 5% worse
» The best had a delta of 4%, average was 24%, worst was 134%
Apple MacBook 12 (Early 2016) 1.1 GHz audio analysis
(+) | speakers can play relatively loud (83.6 dB)
Bass 100 - 315 Hz
(±) | reduced bass - on average 11.3% lower than median
(±) | linearity of bass is average (14.2% delta to prev. frequency)
Mids 400 - 2000 Hz
(+) | balanced mids - only 2.4% away from median
(+) | mids are linear (5.5% delta to prev. frequency)
Highs 2 - 16 kHz
(+) | balanced highs - only 2% away from median
(+) | highs are linear (4.5% delta to prev. frequency)
Overall 100 - 16.000 Hz
(+) | overall sound is linear (10.2% difference to median)
Compared to same class
» 7% of all tested devices in this class were better, 2% similar, 91% worse
» The best had a delta of 5%, average was 18%, worst was 53%
Compared to all devices tested
» 5% of all tested devices were better, 1% similar, 94% worse
» The best had a delta of 4%, average was 24%, worst was 134%
Energy Management
Power Consumption
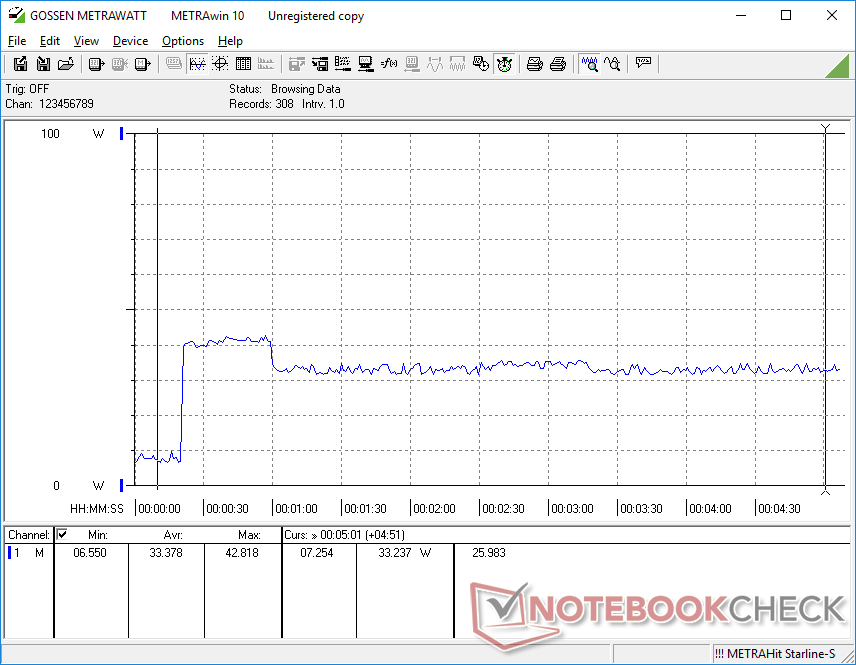
The system demands between 4 W and 7 W when idling on desktop depending on the brightness setting and about 36 W when under high loads. When running Prime95, we are able to record a maximum draw of almost 43 W from the small (~14 x 5.3 x 3.1 cm) 110 W AC adapter. Panasonic could have probably bundled a lighter and less capable AC adapter for better portability without affecting performance.
As shown by our graph to the right, power consumption is highest during the first few seconds of benchmarking before dropping due to limited Turbo Boost.
| Off / Standby | |
| Idle | |
| Load |
|
Key:
min: | |
| Panasonic Toughbook CF-54G2999VM i5-7300U, HD Graphics 620, Seagate BarraCuda Compute 1TB ST1000LM048, TN LED, 1366x768, 14" | Dell Latitude 14 7414 Rugged Extreme 6300U, HD Graphics 520, Liteonit CV3-8D128, IPS, 1366x768, 14" | Fujitsu LifeBook U748 i5-8250U, UHD Graphics 620, Samsung PM961 MZVLW256HEHP, IPS, 1920x1080, 14" | Dell Latitude 7490 i7-8650U, UHD Graphics 620, Samsung PM961 MZVLW256HEHP, IPS, 1920x1080, 14" | Panasonic Toughbook CF-33 i5-7300U, HD Graphics 620, Toshiba SG5 256GB THNSNK256GVN8, IPS, 2160x1440, 12" | Getac S410 i5-8550U, UHD Graphics 620, CUKUSA 1 TB SATA SSD Q0526A, TN PED, 1366x768, 14" | |
|---|---|---|---|---|---|---|
| Power Consumption | -64% | -1% | -4% | 23% | -12% | |
| Idle Minimum * (Watt) | 4.4 | 6.8 -55% | 3.33 24% | 3.1 30% | 3.6 18% | 5.6 -27% |
| Idle Average * (Watt) | 6.3 | 13.4 -113% | 6.9 -10% | 6.5 -3% | 4.6 27% | 7.9 -25% |
| Idle Maximum * (Watt) | 6.5 | 16.8 -158% | 8.2 -26% | 7.6 -17% | 5.15 21% | 8.4 -29% |
| Load Average * (Watt) | 36.3 | 35.2 3% | 29.4 19% | 43 -18% | 27 26% | 32.8 10% |
| Load Maximum * (Watt) | 38.3 | 36.3 5% | 43.4 -13% | 43.8 -14% | 29.2 24% | 34.3 10% |
* ... smaller is better
Battery Life
The removable Li-Ion battery is very small at just 33 Wh compared to 50 Wh and 97 Wh on the Fujitsu LifeBook U748 and Dell Latitude 14 Rugged, respectively. Consequently, users can expect a real-world WLAN runtime of just under 6 hours from the Panasonic compared to 9 hours or more from the aforementioned alternatives. Secondary battery packs are available to extend battery life.
Charging from near empty to full capacity takes just under 1.5 hours.
| Panasonic Toughbook CF-54G2999VM i5-7300U, HD Graphics 620, 33 Wh | Dell Latitude 14 7414 Rugged Extreme 6300U, HD Graphics 520, 97 Wh | Dell Latitude 7490 i7-8650U, UHD Graphics 620, 60 Wh | Panasonic Toughbook CF-33 i5-7300U, HD Graphics 620, 44 Wh | Samsung Notebook 9 NP900X5T-X01US i5-8550U, GeForce MX150, 75 Wh | Getac S410 i5-8550U, UHD Graphics 620, 46.6 Wh | |
|---|---|---|---|---|---|---|
| Battery runtime | 78% | 59% | 34% | 80% | -12% | |
| WiFi v1.3 (h) | 5.9 | 10.5 78% | 9.4 59% | 7.9 34% | 10.6 80% | 5.2 -12% |
| Reader / Idle (h) | 18.6 | 30.2 | ||||
| Load (h) | 1.5 | 2.1 |
Pros
Cons
Verdict

Panasonic offers its Toughbook CF-54 in a very wide range of SKUs to better cater to specific use cases. While we can't cover each and every one, we can definitely recommend which ones to avoid and which ones to consider. More specifically, users intending to use the Toughbook CF-54 outdoors or in automobiles should absolutely invest in the 1000-nit 1080p display backlight option. Without this feature, the display will be too dim for most scenarios.
Additionally, if graphics performance is not a concern, then the Core i5-7300U configuration should be sufficient as there is minimal benefit between the i5-7300U and i7-7600U. The extras dollars saved would be better spent on a primary SSD for a more tangible boost in overall performance.
For future revisions, we hope to see Intel 8th gen CPU options as the older generations are beginning to show their age. Improved port positioning, more gradual fan noise changes, louder internal speakers, and customizable auxiliary keys can all contribute to an even more versatile machine.
Panasonic Toughbook CF-54G2999VM
- 10/05/2018 v6 (old)
Allen Ngo
Price comparison
