Getac S410 (i5-8550U) Rugged Laptop Review
")
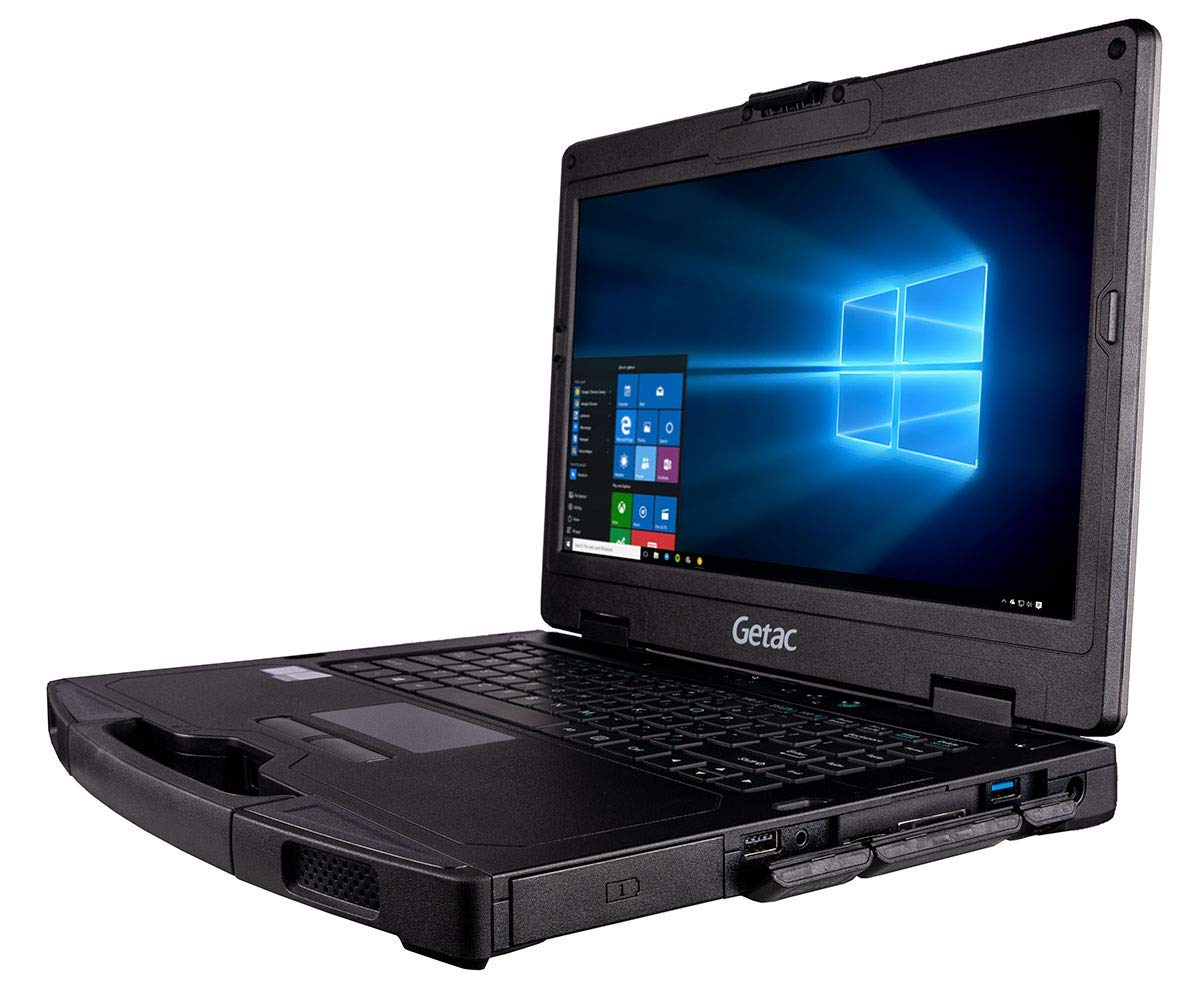
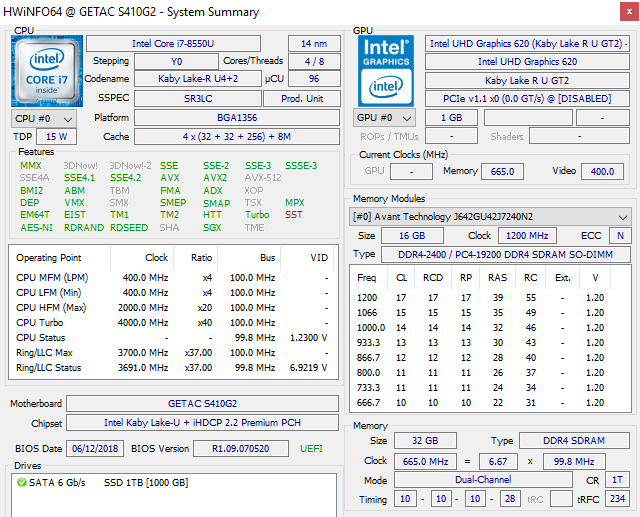
The Getac S410 is a semi-rugged laptop with many of the same CPU and even GPU options as mainstream consumer laptops. The system can be configured with a Core i3-7100U CPU and 768p display or up to a Core i7-8650U CPU with discrete GeForce GTX 950M graphics and an 800-nit 1080p display. Our test unit today is the mid-range Core i7-8550U option with integrated graphics and a 768p display retailing for about $1900 to $2100 USD.
Direct competitors in the 14-inch rugged laptop space include the Panasonic Toughbook CF-54 and Dell Latitude 14 7414 Rugged. For this review, we'll be comparing the Getac S410 against its closest competitors in terms of performance.
For the full list of features, we recommend checking out the official specifications here and here.
Case
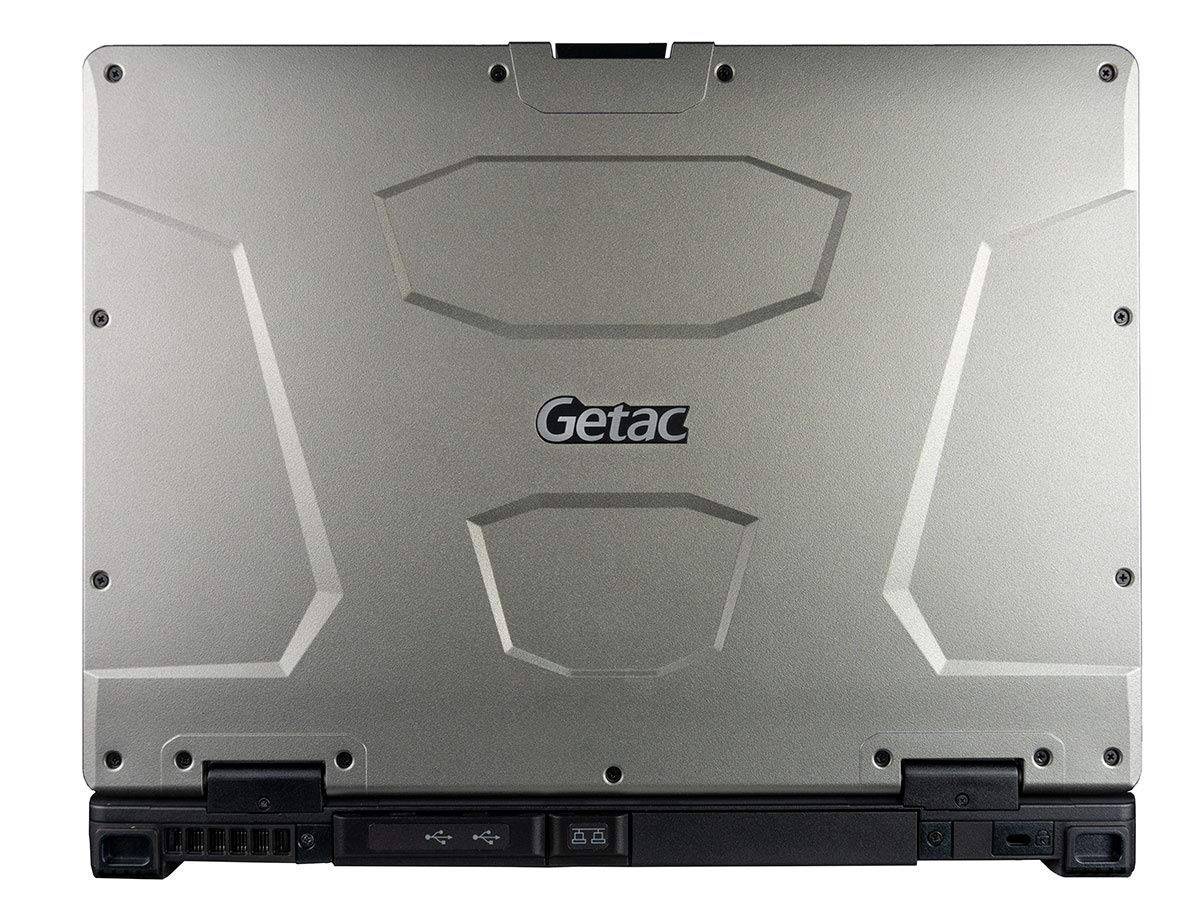
The Getac is both larger and heavier than the Panasonic Toughbook CF-54 in all dimensions. Consequently, its lid is slightly more rigid and less prone to twisting when compared to the Panasonic equivalent. The chassis maintains its MIL-STD-810G and IP52 certifications to withstand extreme temperature ranges, keyboard spills, and physical drops of up to 3 feet.
Construction quality is excellent with no noticeable creaking, defects, or unintended gaps. The 180-degree hinges are firm to prevent teetering when typing and the rubberized carrying handle provides a stronger grip than the metal handle of the Toughbook CF-54.
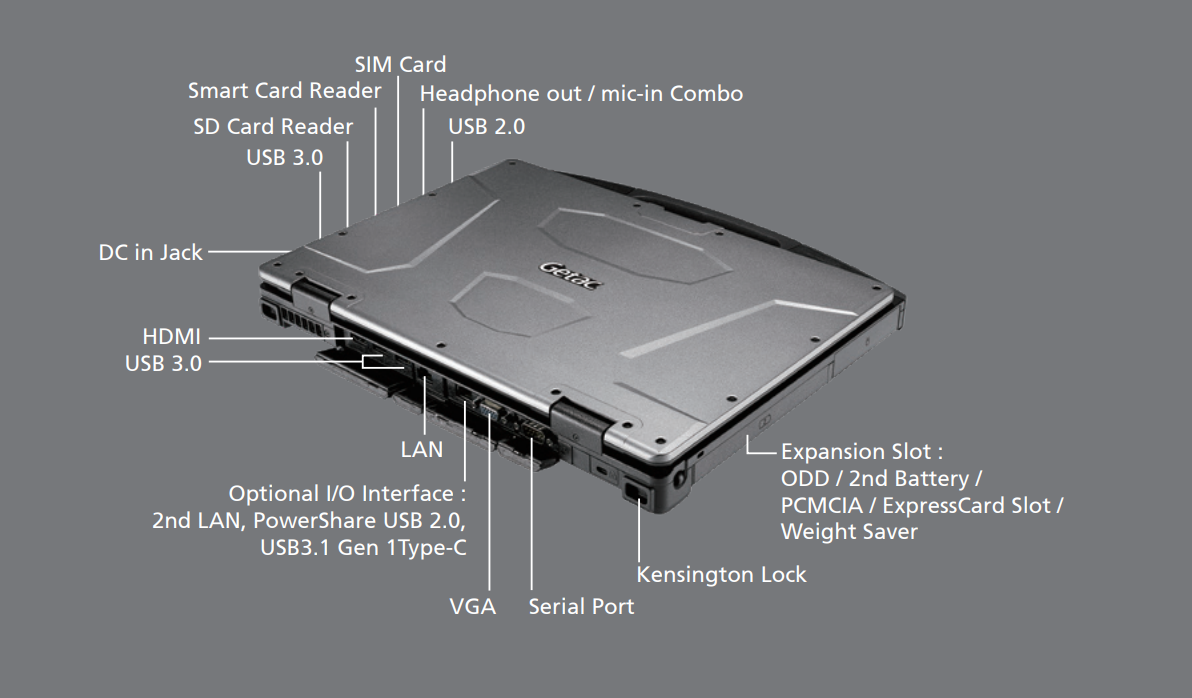
Connectivity
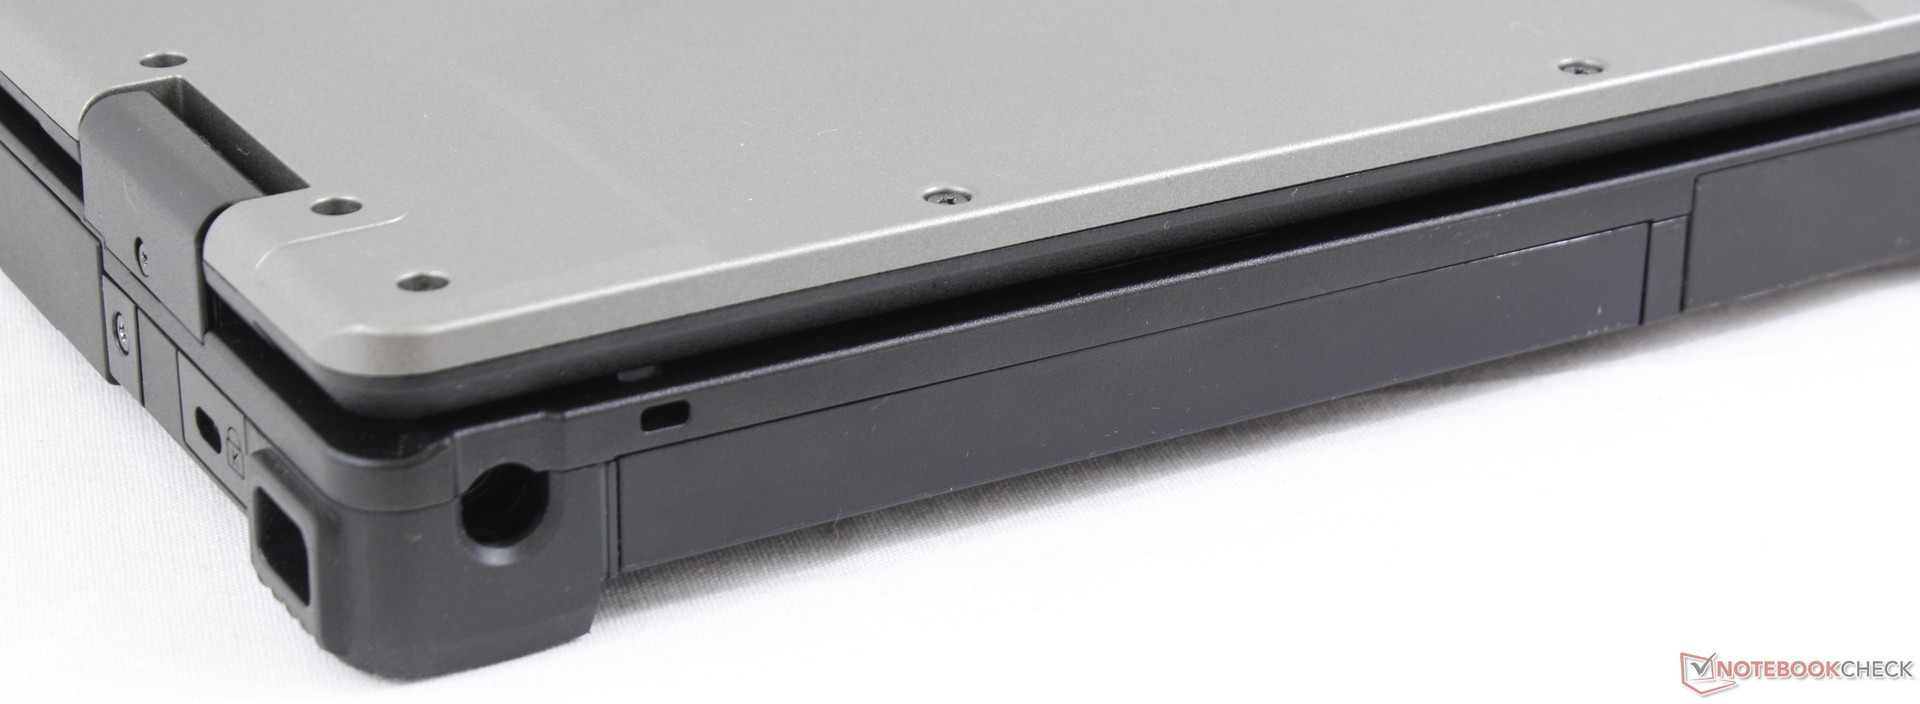
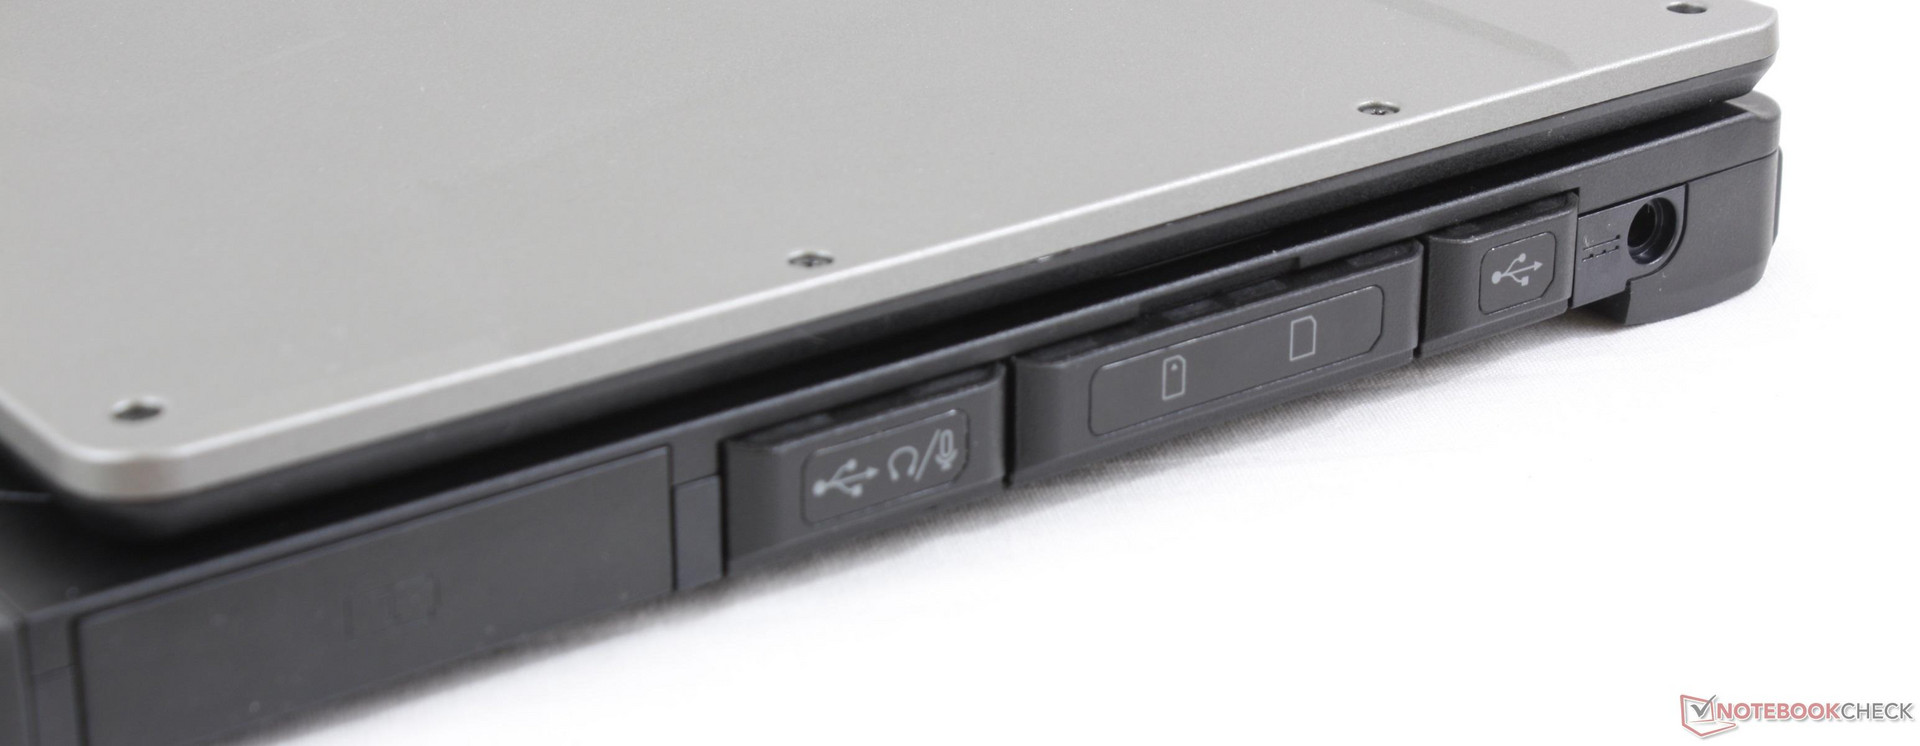
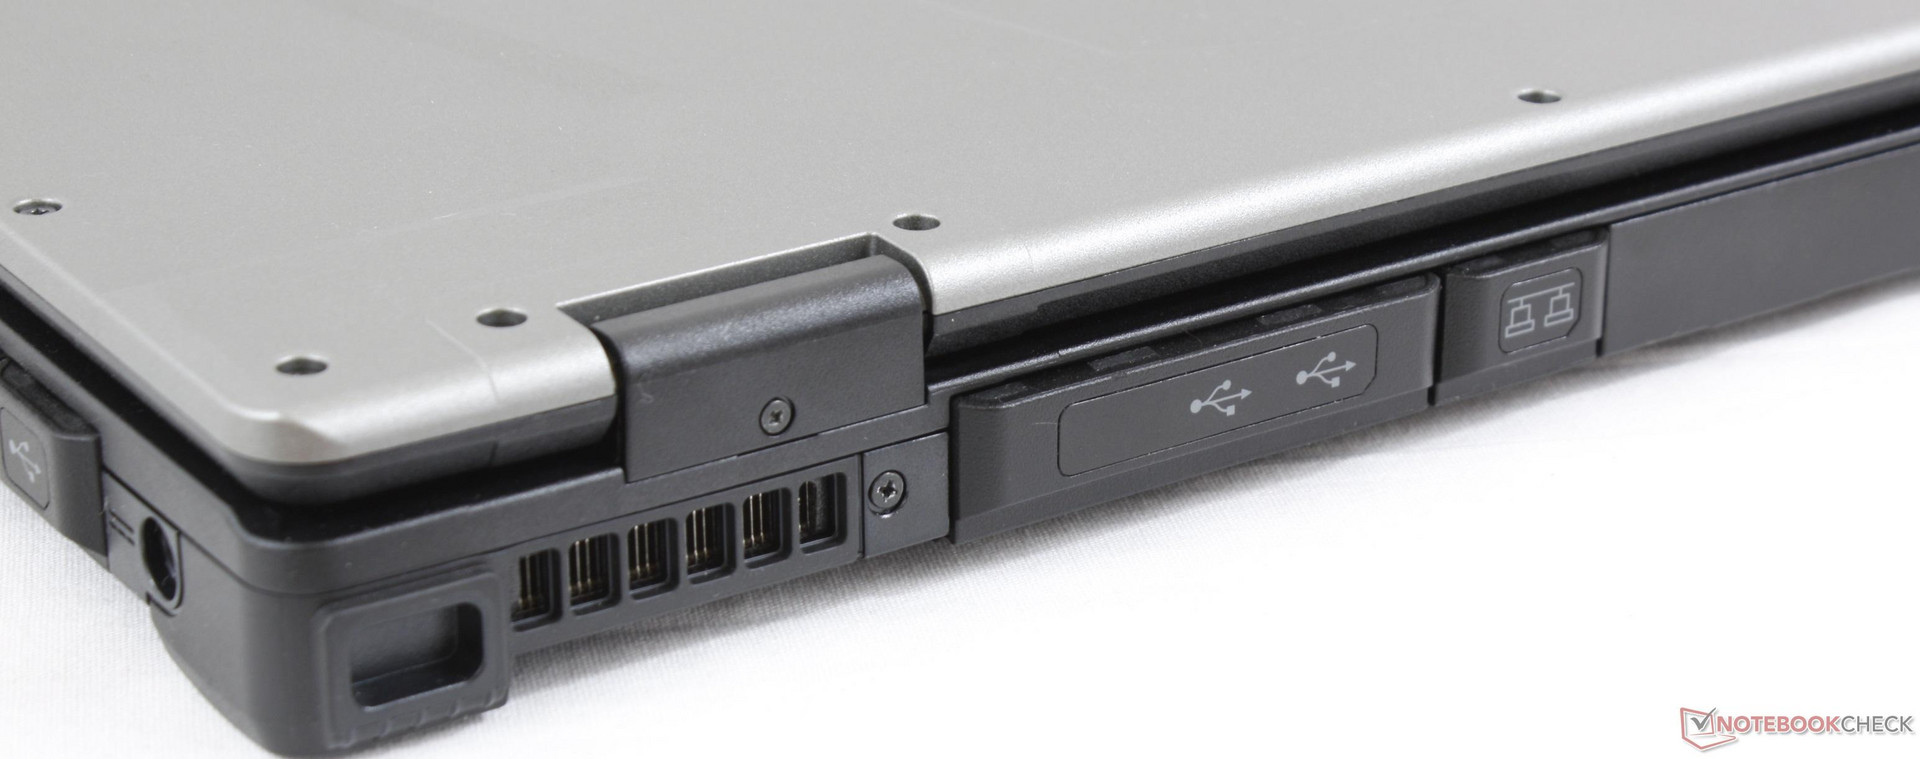
The base configuration integrates USB Type-A, HDMI, 3.5 mm audio, and RJ-45 with options for VGA and mini-SIM. Port positioning is slightly better than the Toughbook CF-54 since its rear ports are not blocked by the AC adapter cable.
SD Card Reader
The integrated card reader is average in speed at about 86 MB/s with our UHS-II test card while the same card reader on the Toughbook CF-54 can be over twice as fast.
| SD Card Reader | |
| average JPG Copy Test (av. of 3 runs) | |
| Panasonic Toughbook CF-54G2999VM (Toshiba Exceria Pro SDXC 64 GB UHS-II) | |
| Dell Latitude 14 7414 Rugged Extreme (Toshiba Exceria Pro SDXC 64 GB UHS-II) | |
| Getac S410 (Toshiba Exceria Pro SDXC 64 GB UHS-II) | |
| Fujitsu LifeBook U748 (Toshiba Exceria Pro SDXC 64 GB UHS-II) | |
| Panasonic Toughbook CF-33 (Toshiba Exceria Pro SDXC 64 GB UHS-II) | |
| maximum AS SSD Seq Read Test (1GB) | |
| Dell Latitude 14 7414 Rugged Extreme (Toshiba Exceria Pro SDXC 64 GB UHS-II) | |
| Panasonic Toughbook CF-54G2999VM (Toshiba Exceria Pro SDXC 64 GB UHS-II) | |
| Getac S410 (Toshiba Exceria Pro SDXC 64 GB UHS-II) | |
| Fujitsu LifeBook U748 (Toshiba Exceria Pro SDXC 64 GB UHS-II) | |
| Panasonic Toughbook CF-33 (Toshiba Exceria Pro SDXC 64 GB UHS-II) | |
Communication
The Getac utilizes the same Intel 8265 module as many modern Ultrabooks for similar WLAN and Bluetooth 4.2 speeds. Mini-SIM is supported for 4G LTE connectivity.
Security
Both TPM 2.0 and a Kensington Lock are included in the base configuration with options for a fingerprint scanner, Smart Card reader, RFID, and Windows Hello.
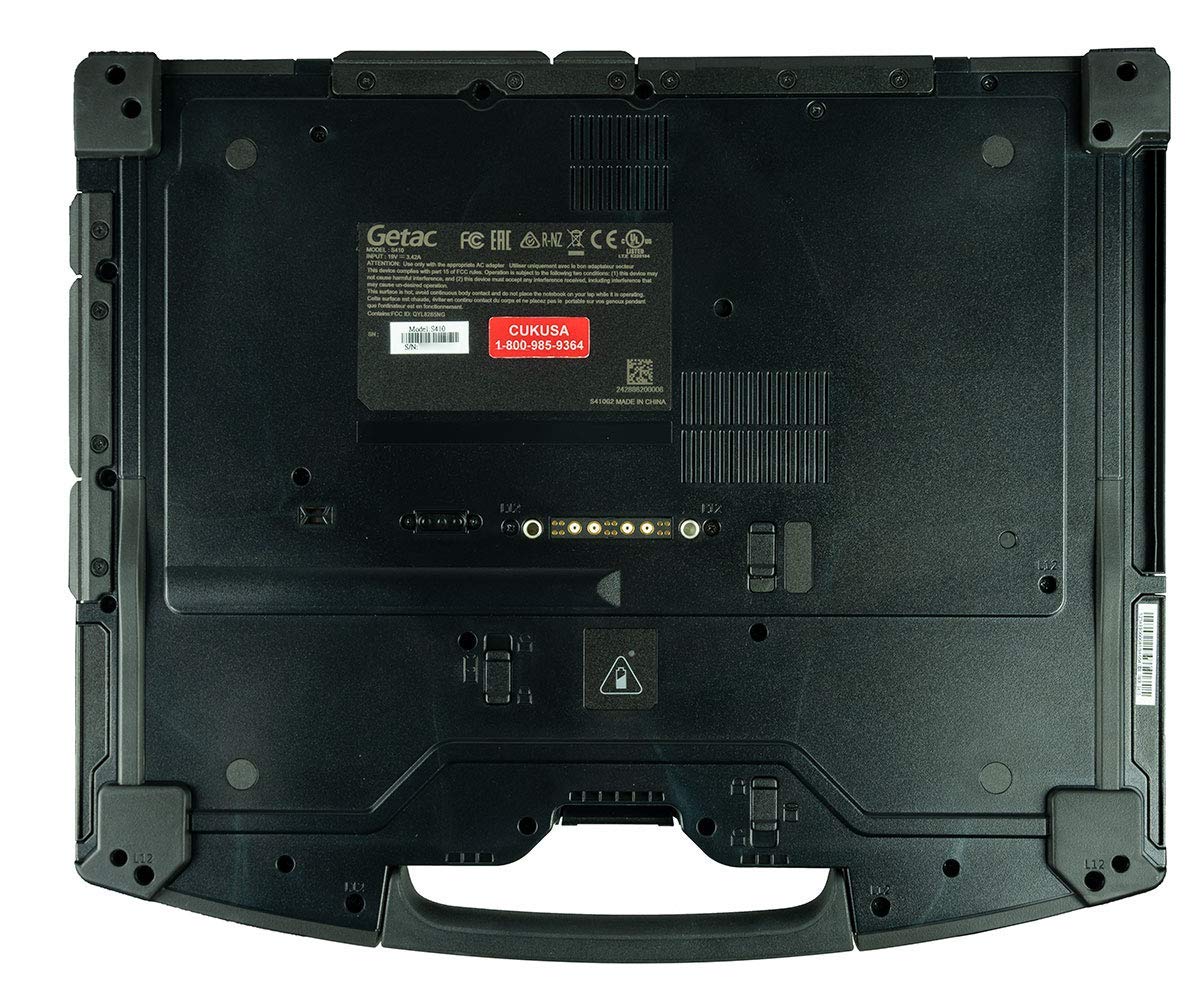
Maintenance
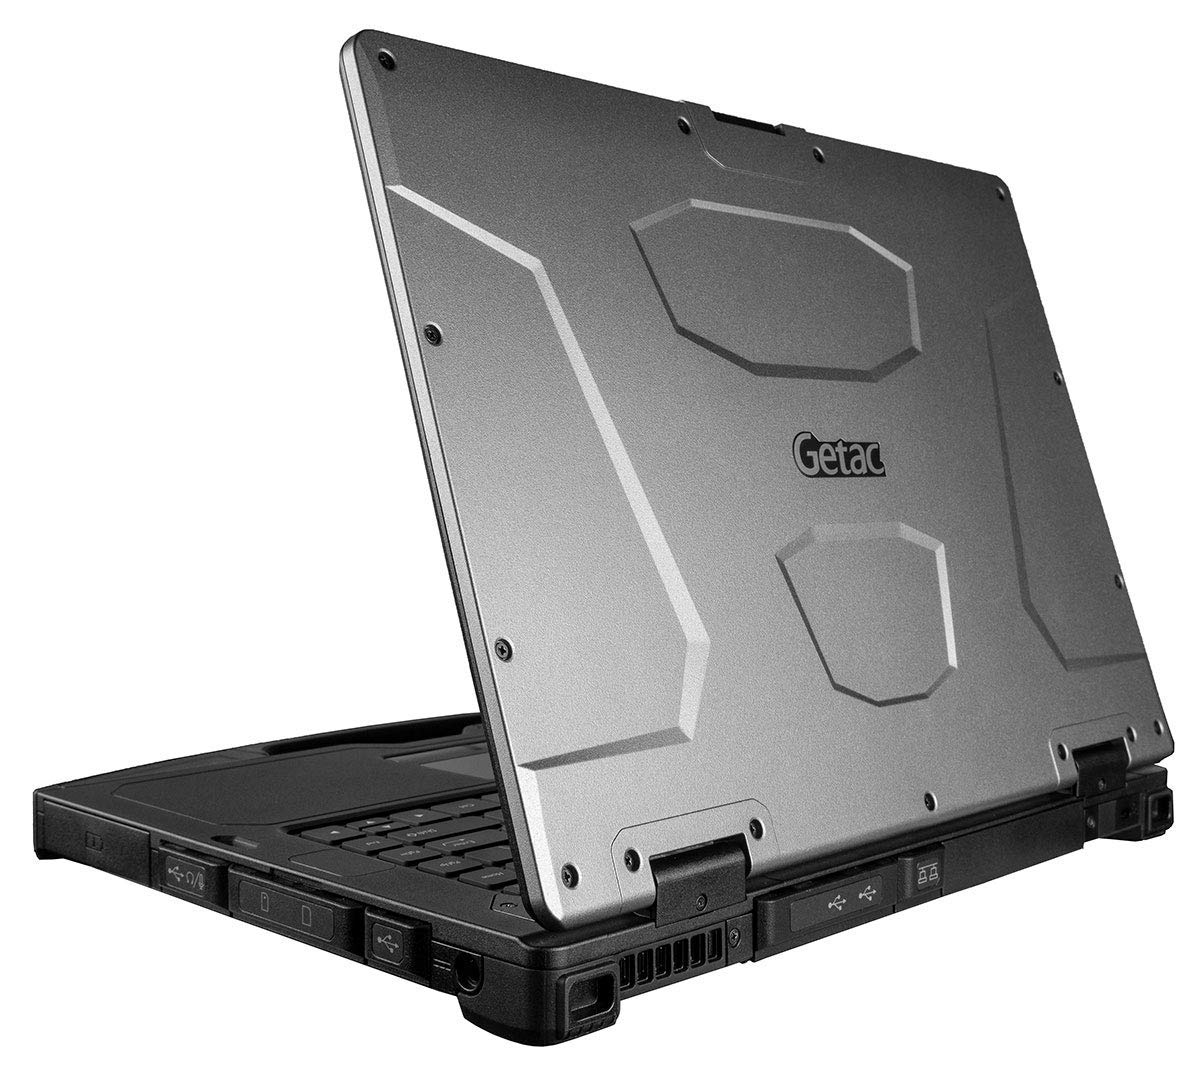
Serviceability is limited as there is no convenient maintenance cover for accessing motherboard components.
Accessories and Warranty
Optional proprietary accessories make use of the pins underneath the system. A full list of compatible attachments can be found here.
A three-year limited warranty comes standard. Please see our Guarantees, Return policies and Warranties FAQ for country-specific information.
Input Devices
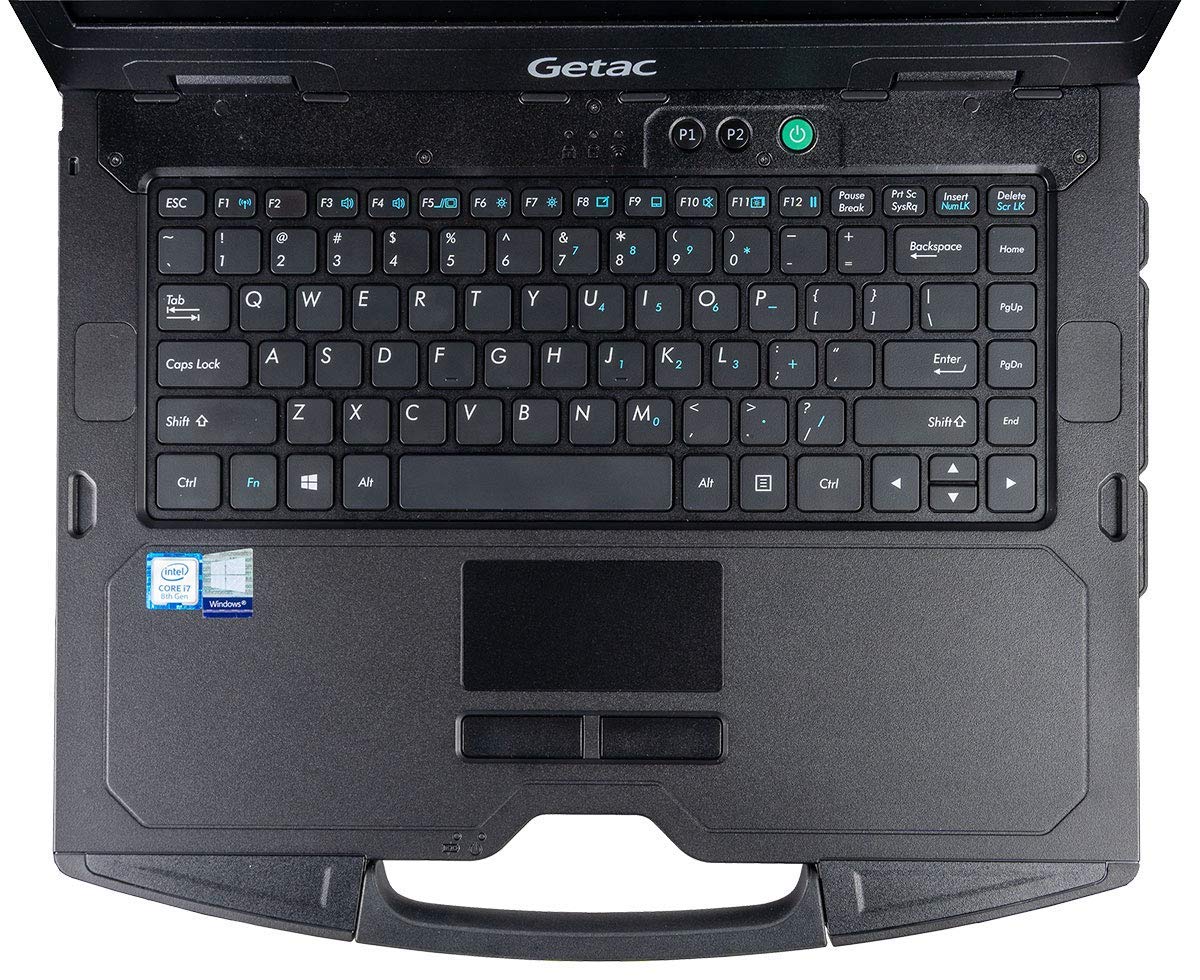
Keyboard
The keyboard keys are firmer and with less clatter than the keys on the Toughbook CF-54. However, the system suffers from the same small Arrow keys and the keyboard backlight is included only on higher configurations.
Additional P1 and P2 auxiliary buttons sit near the Power button. P1 toggles the screen on and off while P2 toggles "Sunlight Readable" mode. We can measure no differences in backlight brightness when "Sunlight Readable" mode is activated since our SKU is not configured to support the feature.
Touchpad
The small trackpad (8.5 x 4 cm) is just slightly larger than the trackpad on the Toughbook CF-54 (8 x 4 cm). Nonetheless, cursor control still feels cramped especially when moving vertically. The trackpad does not appear to support Microsoft Precision features.
The dedicated mouse keys are firmer and louder than the ones on the Toughbook CF-54. Unfortunately, feedback is uneven as the right key is softer and spongier than the left key.
Display
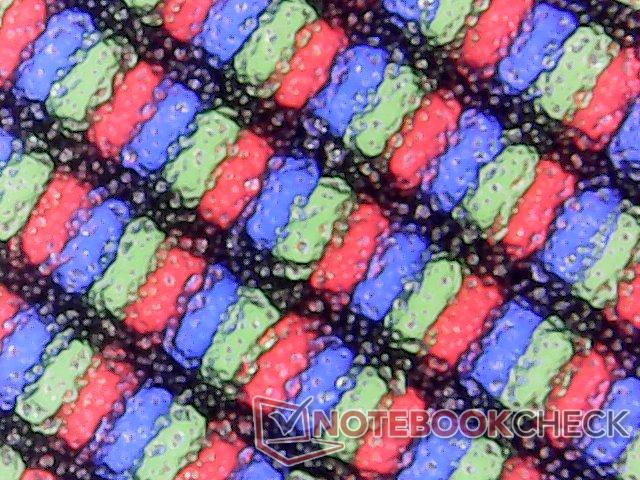
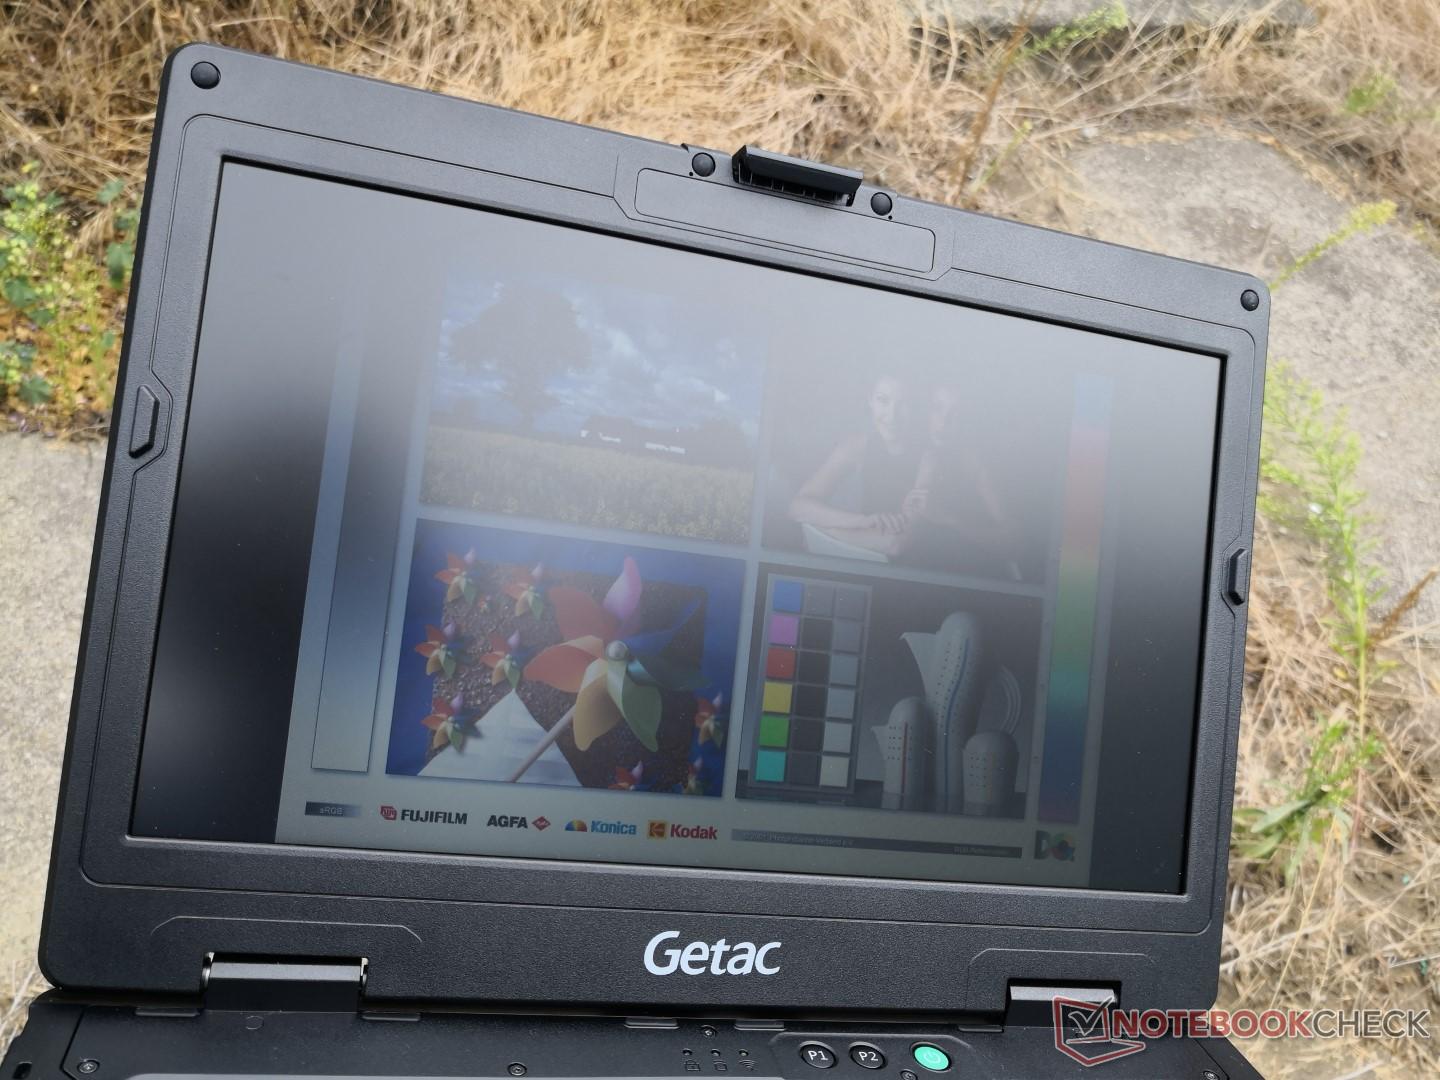
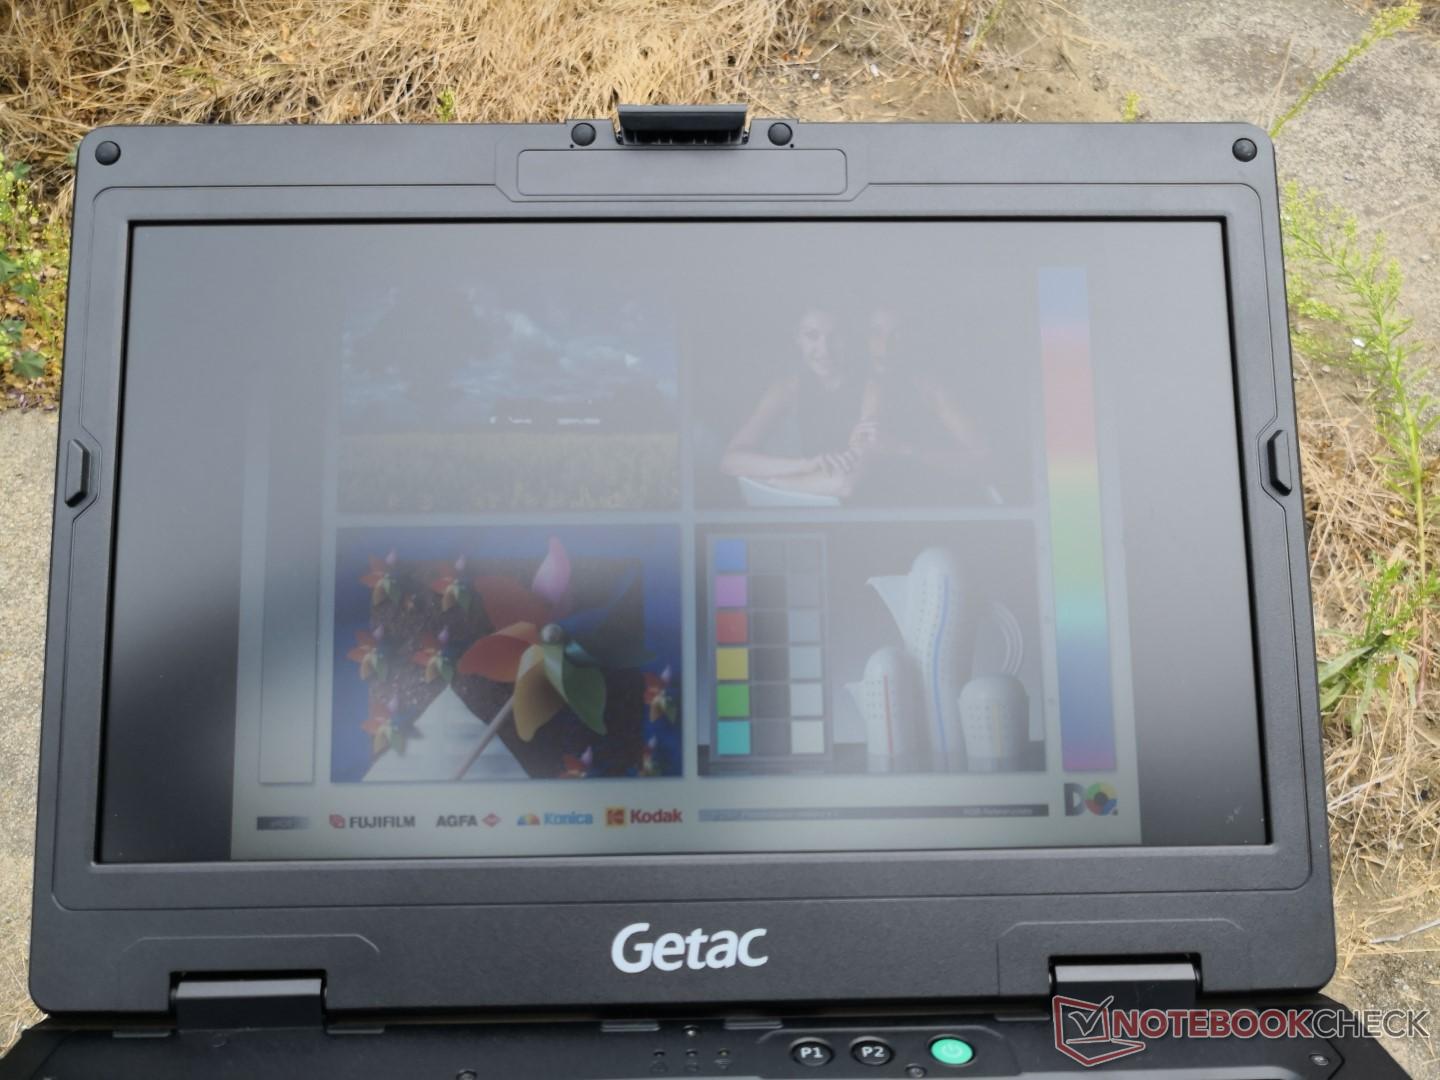
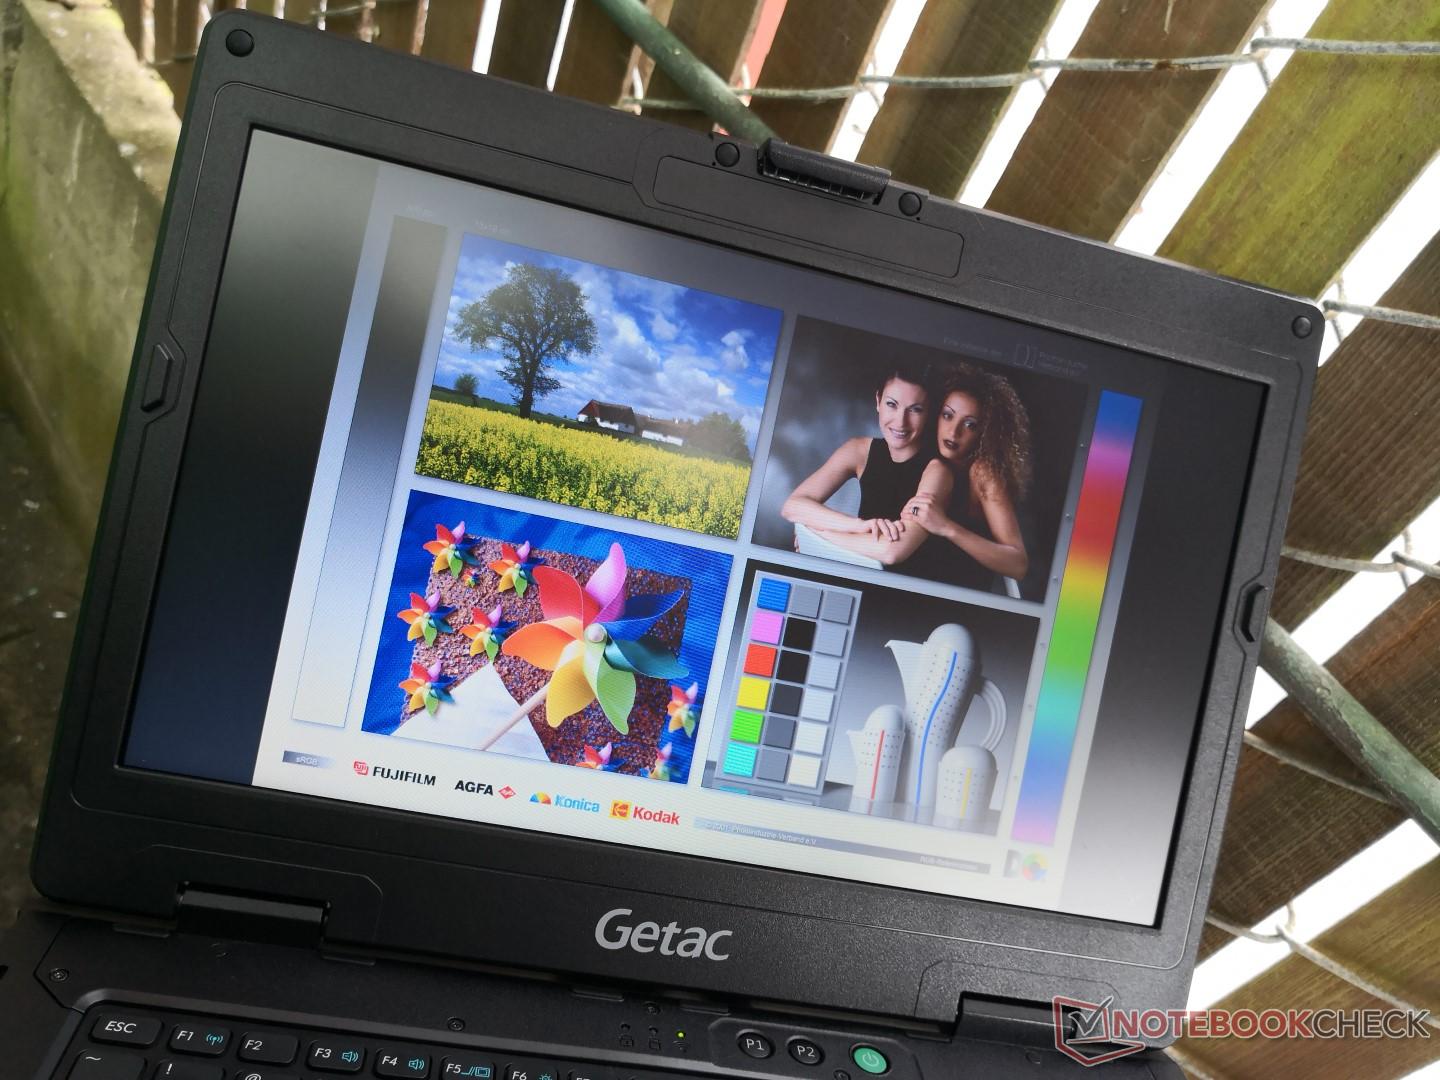
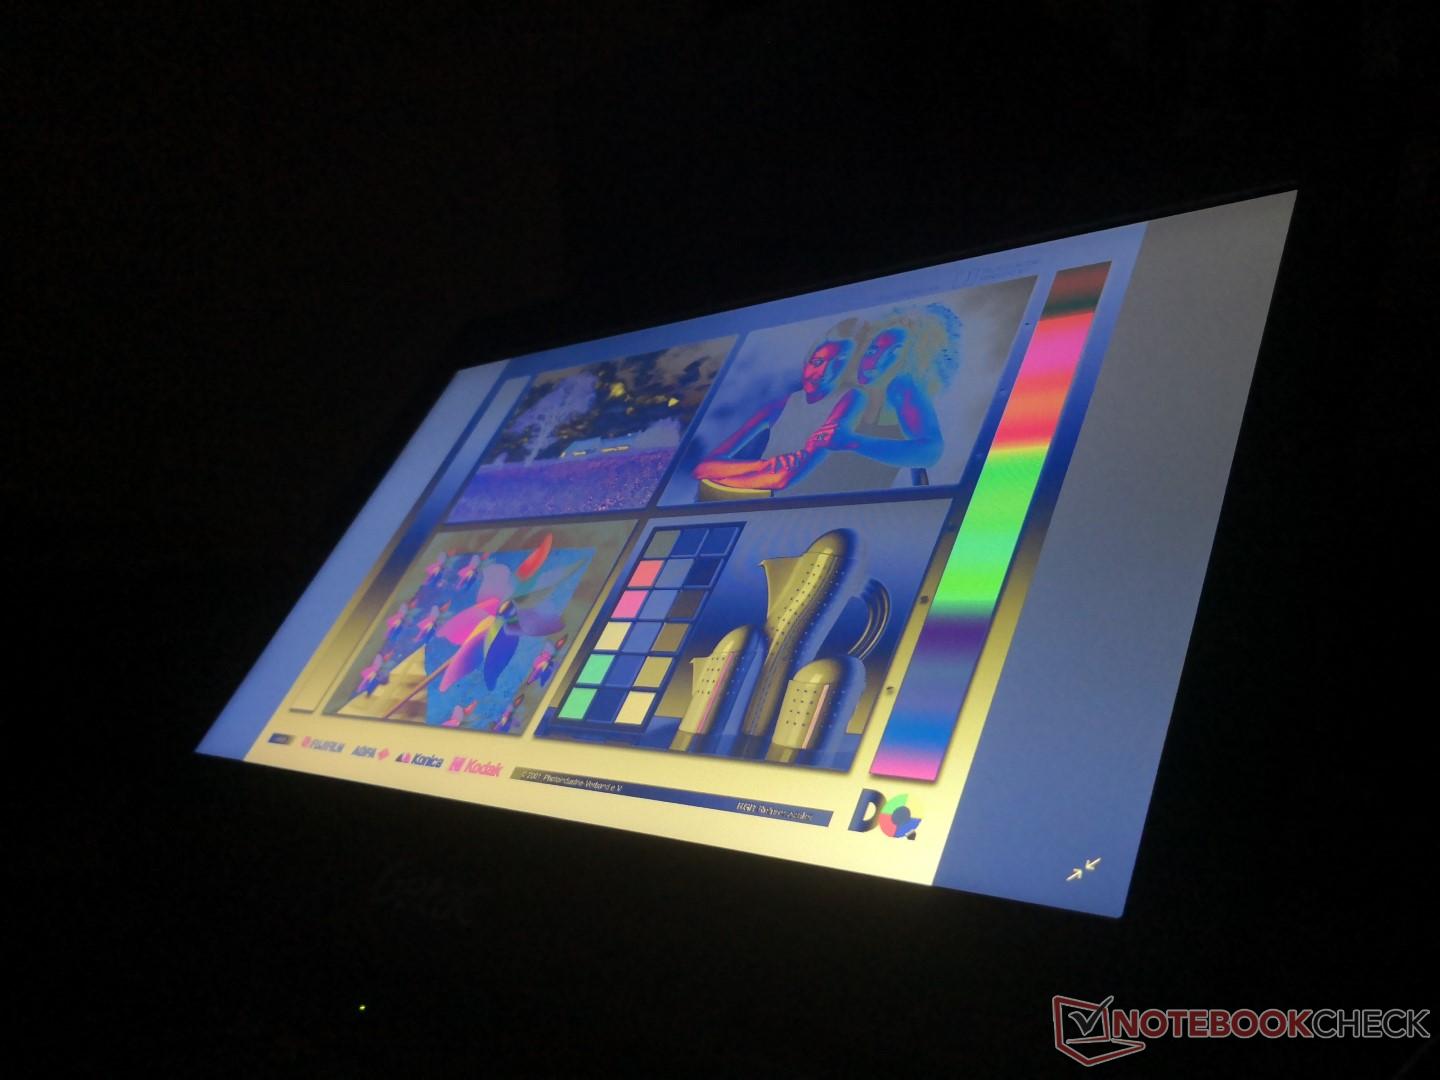
While 800-nit and 1000-nit touchscreen options exist, our configuration utilizes the baseline 768p panel with a maximum brightness of 265 nits according to our own measurements. This is dim even by Ultrabook standards where 300 or 400+ nits is a common find. Users who intend to use the Getac outdoors under sunlight should consider the brighter backlight options.
Contrast and colors are poor on our Getac even before performing any measurements. Similar Chi Mei N140BGE TN panels can also be found on the old Dell Latitude 14 3470, Lenovo IdeaPad S405, and the Asus P45VJ. Consequently, all of these notebooks also exhibit subpar contrast and colors.
| |||||||||||||||||||||||||
Brightness Distribution: 81 %
Center on Battery: 265.1 cd/m²
Contrast: 457:1 (Black: 0.58 cd/m²)
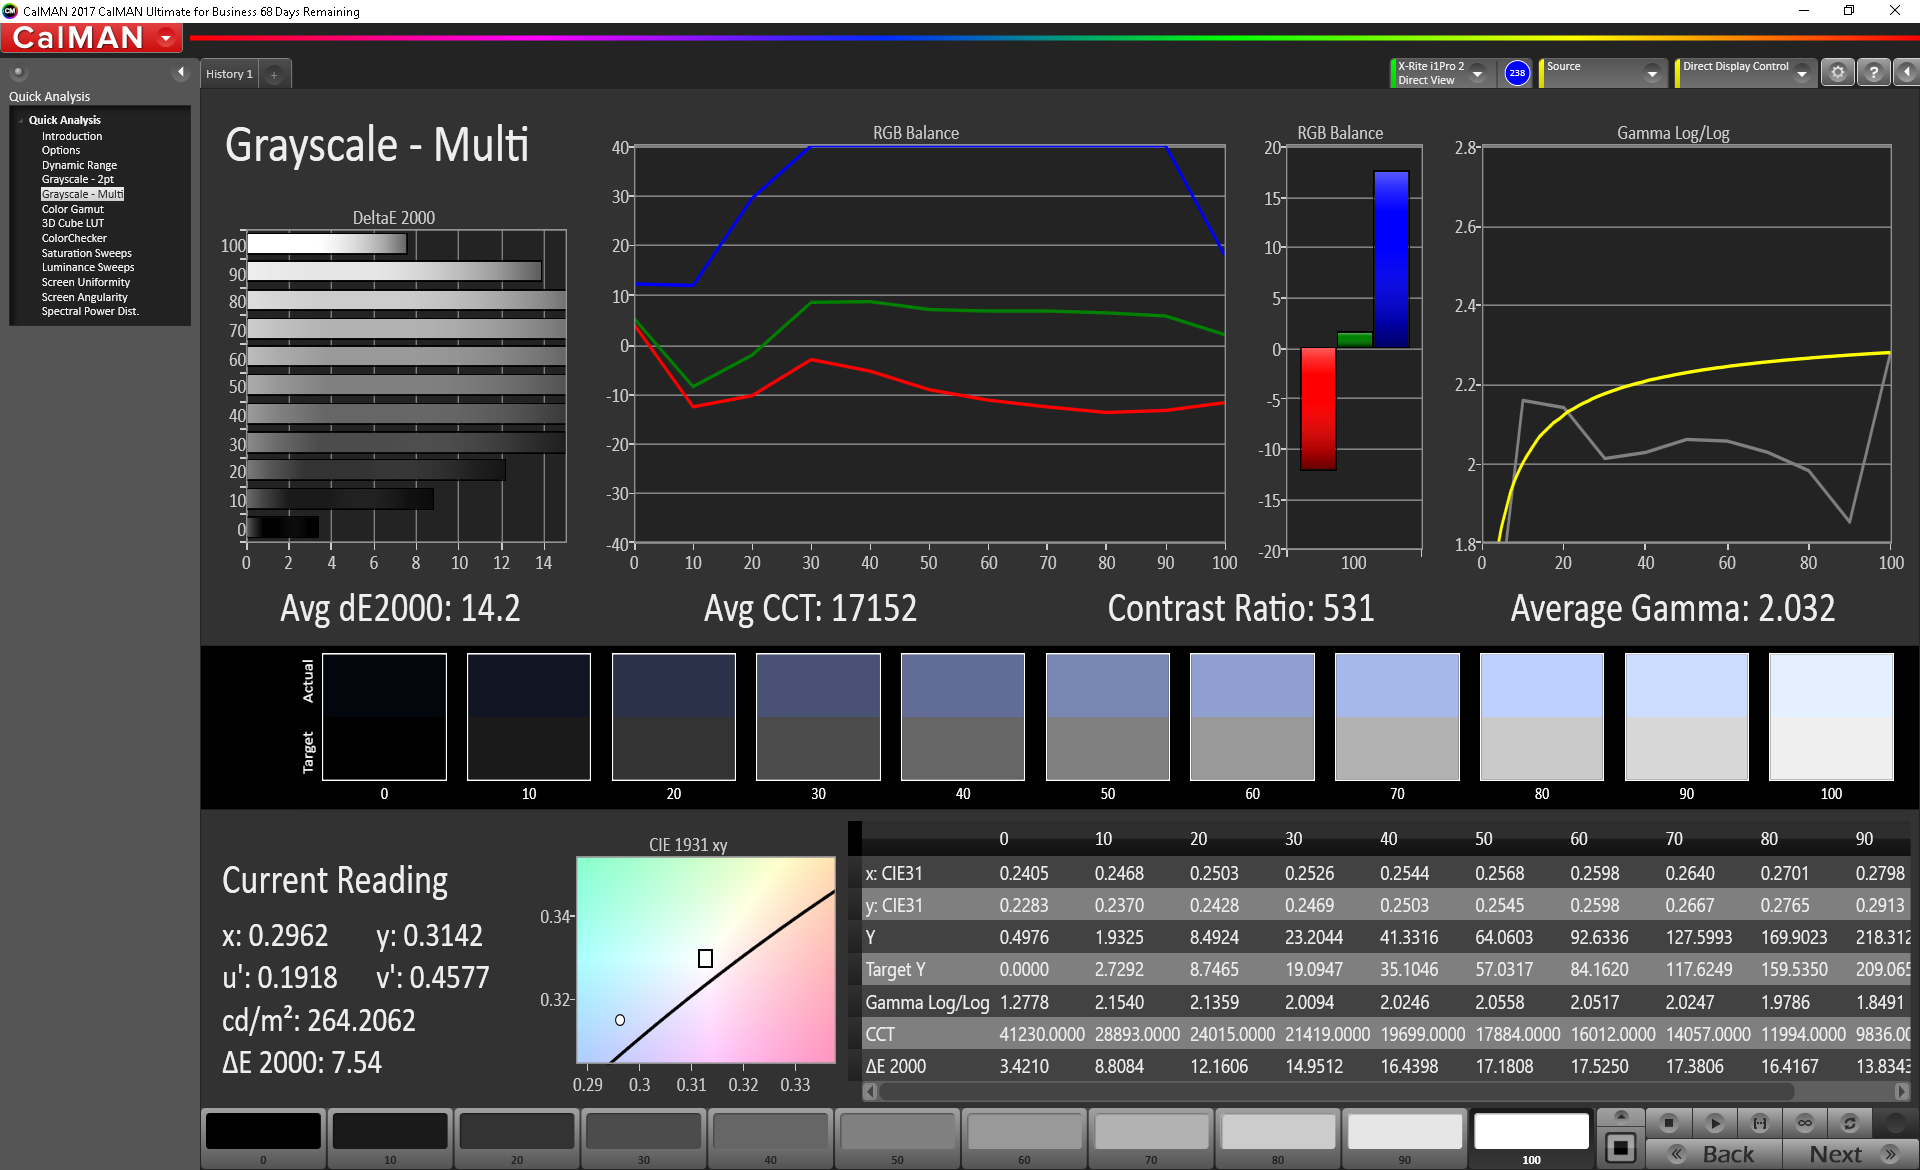
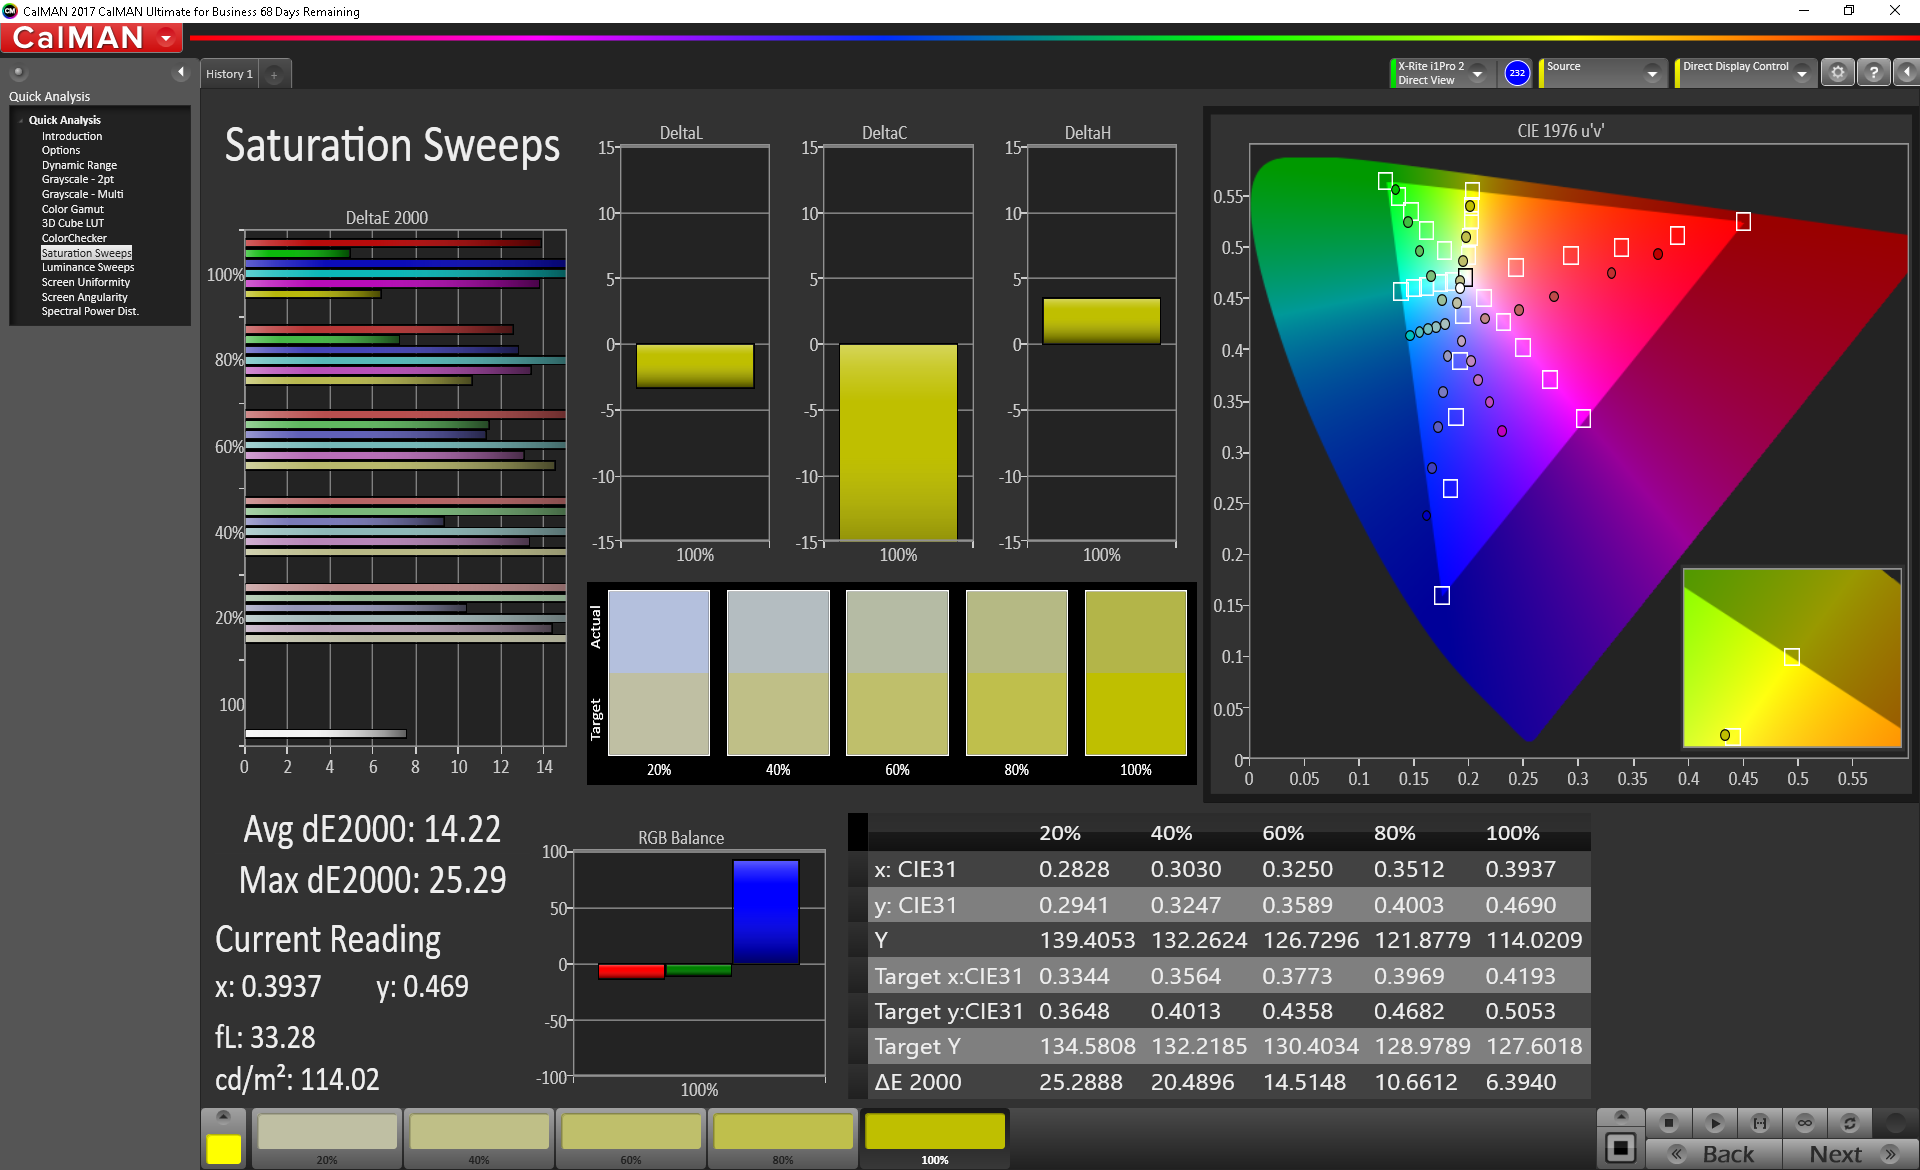
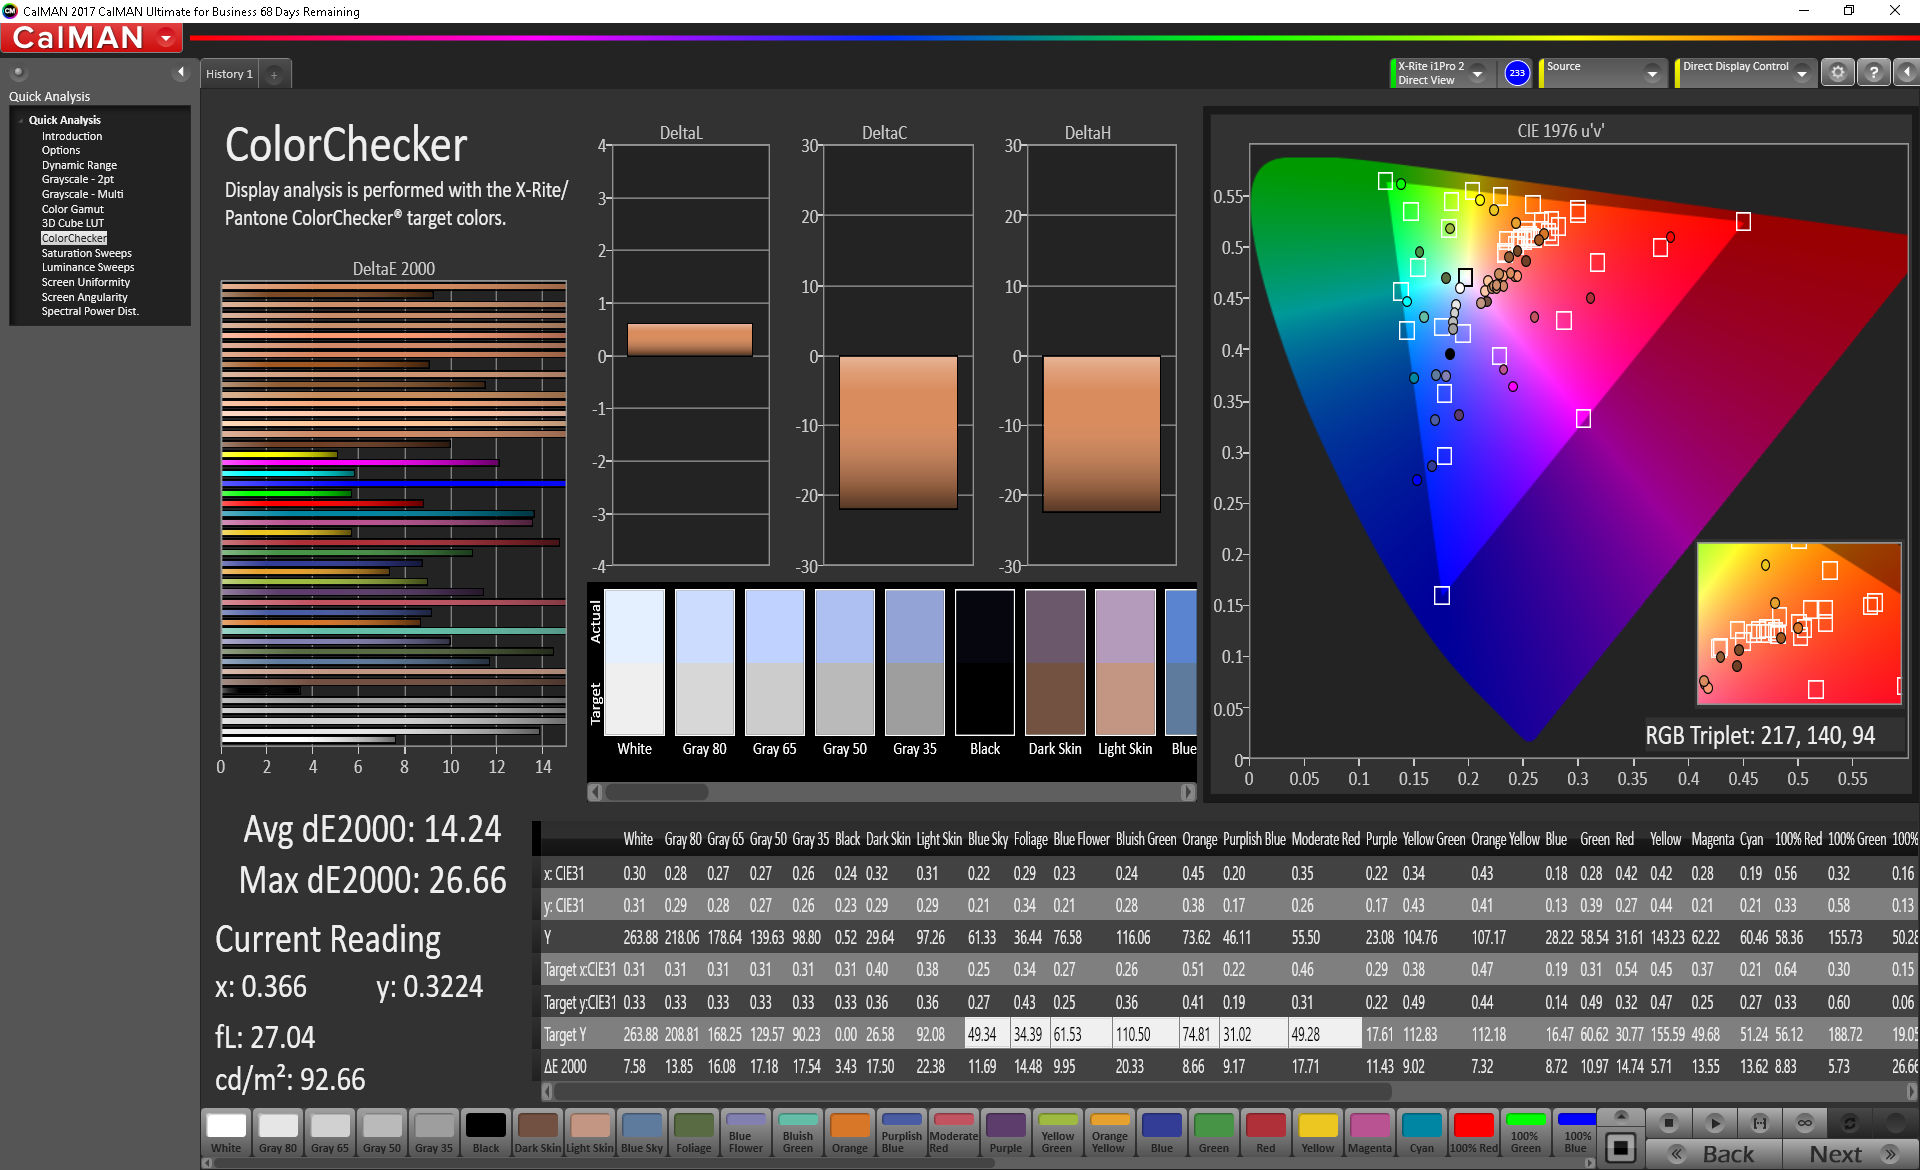
ΔE ColorChecker Calman: 14.24 | ∀{0.5-29.43 Ø4.73}
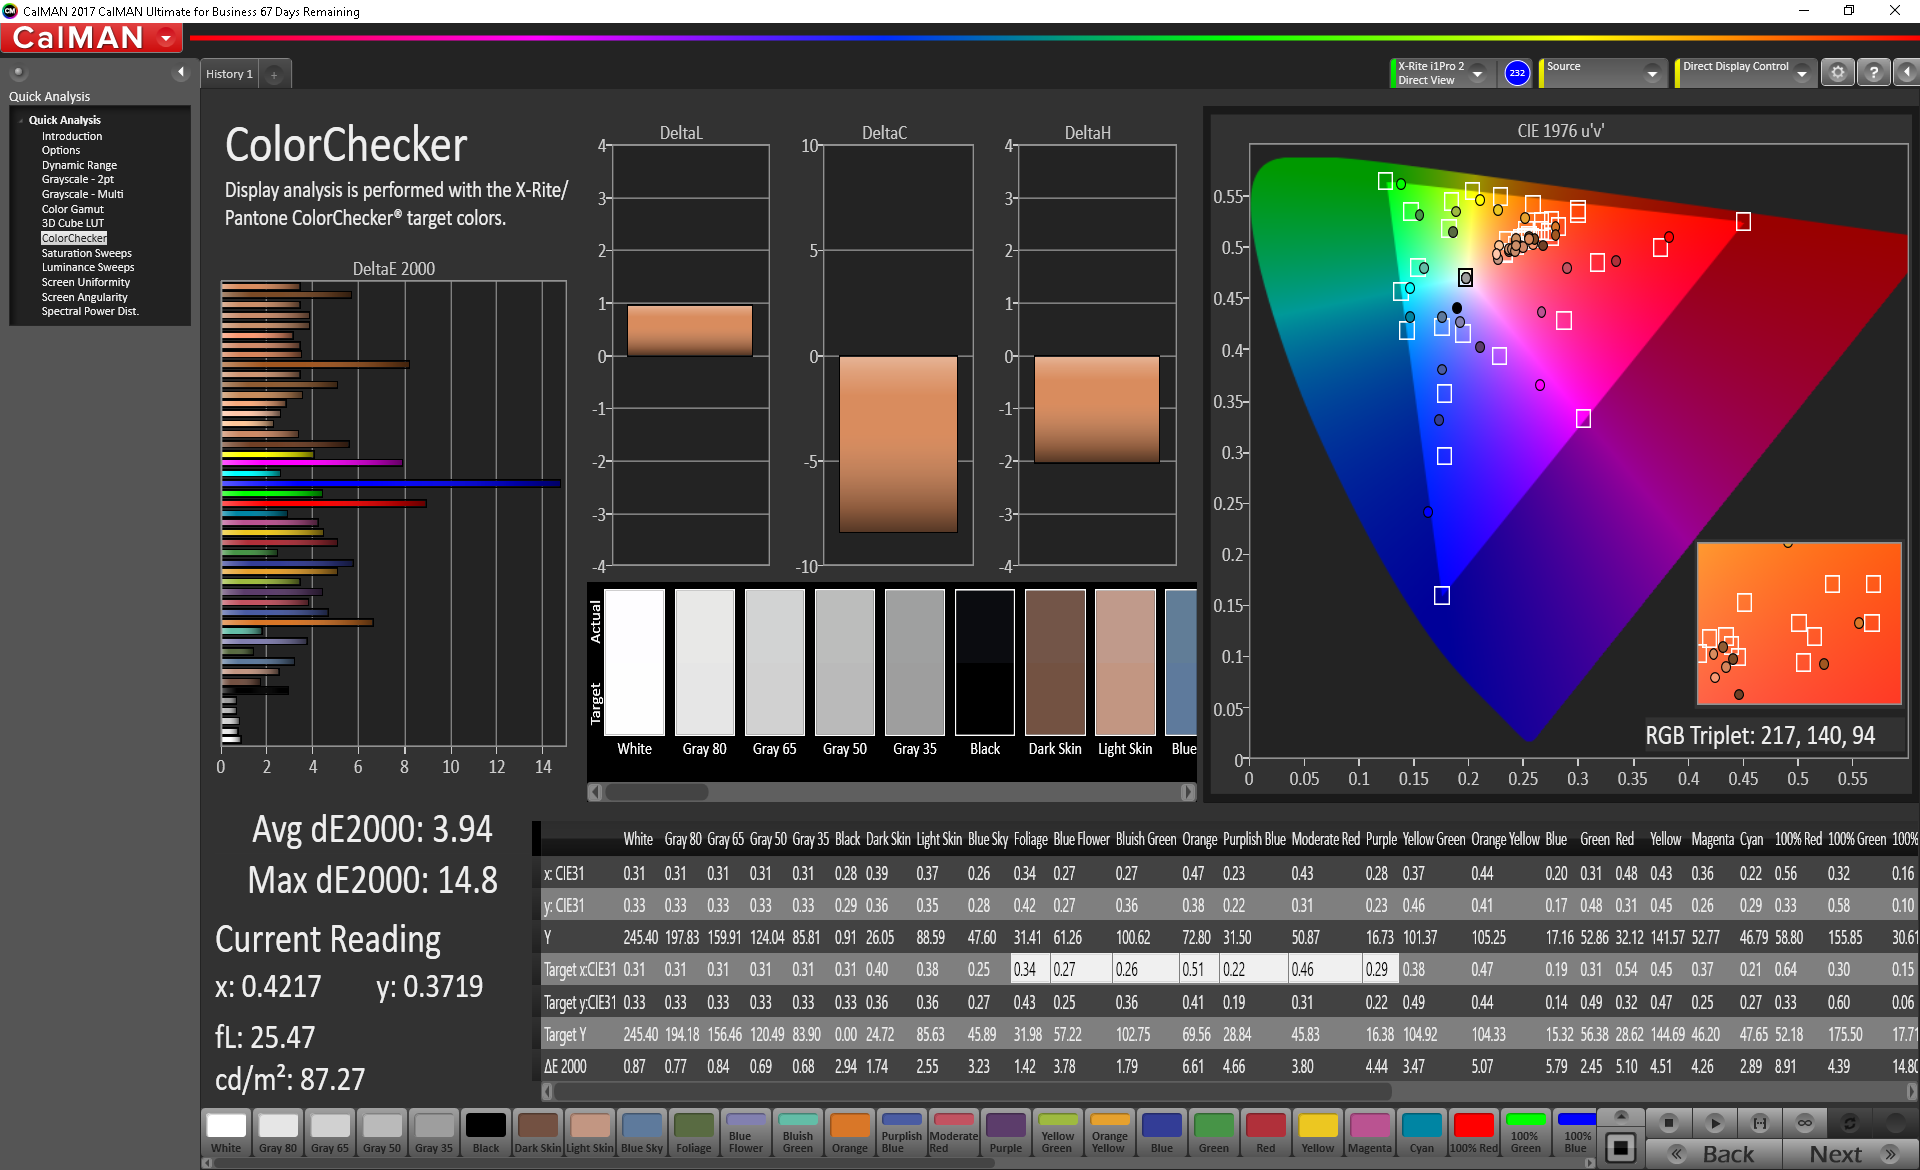
calibrated: 3.94
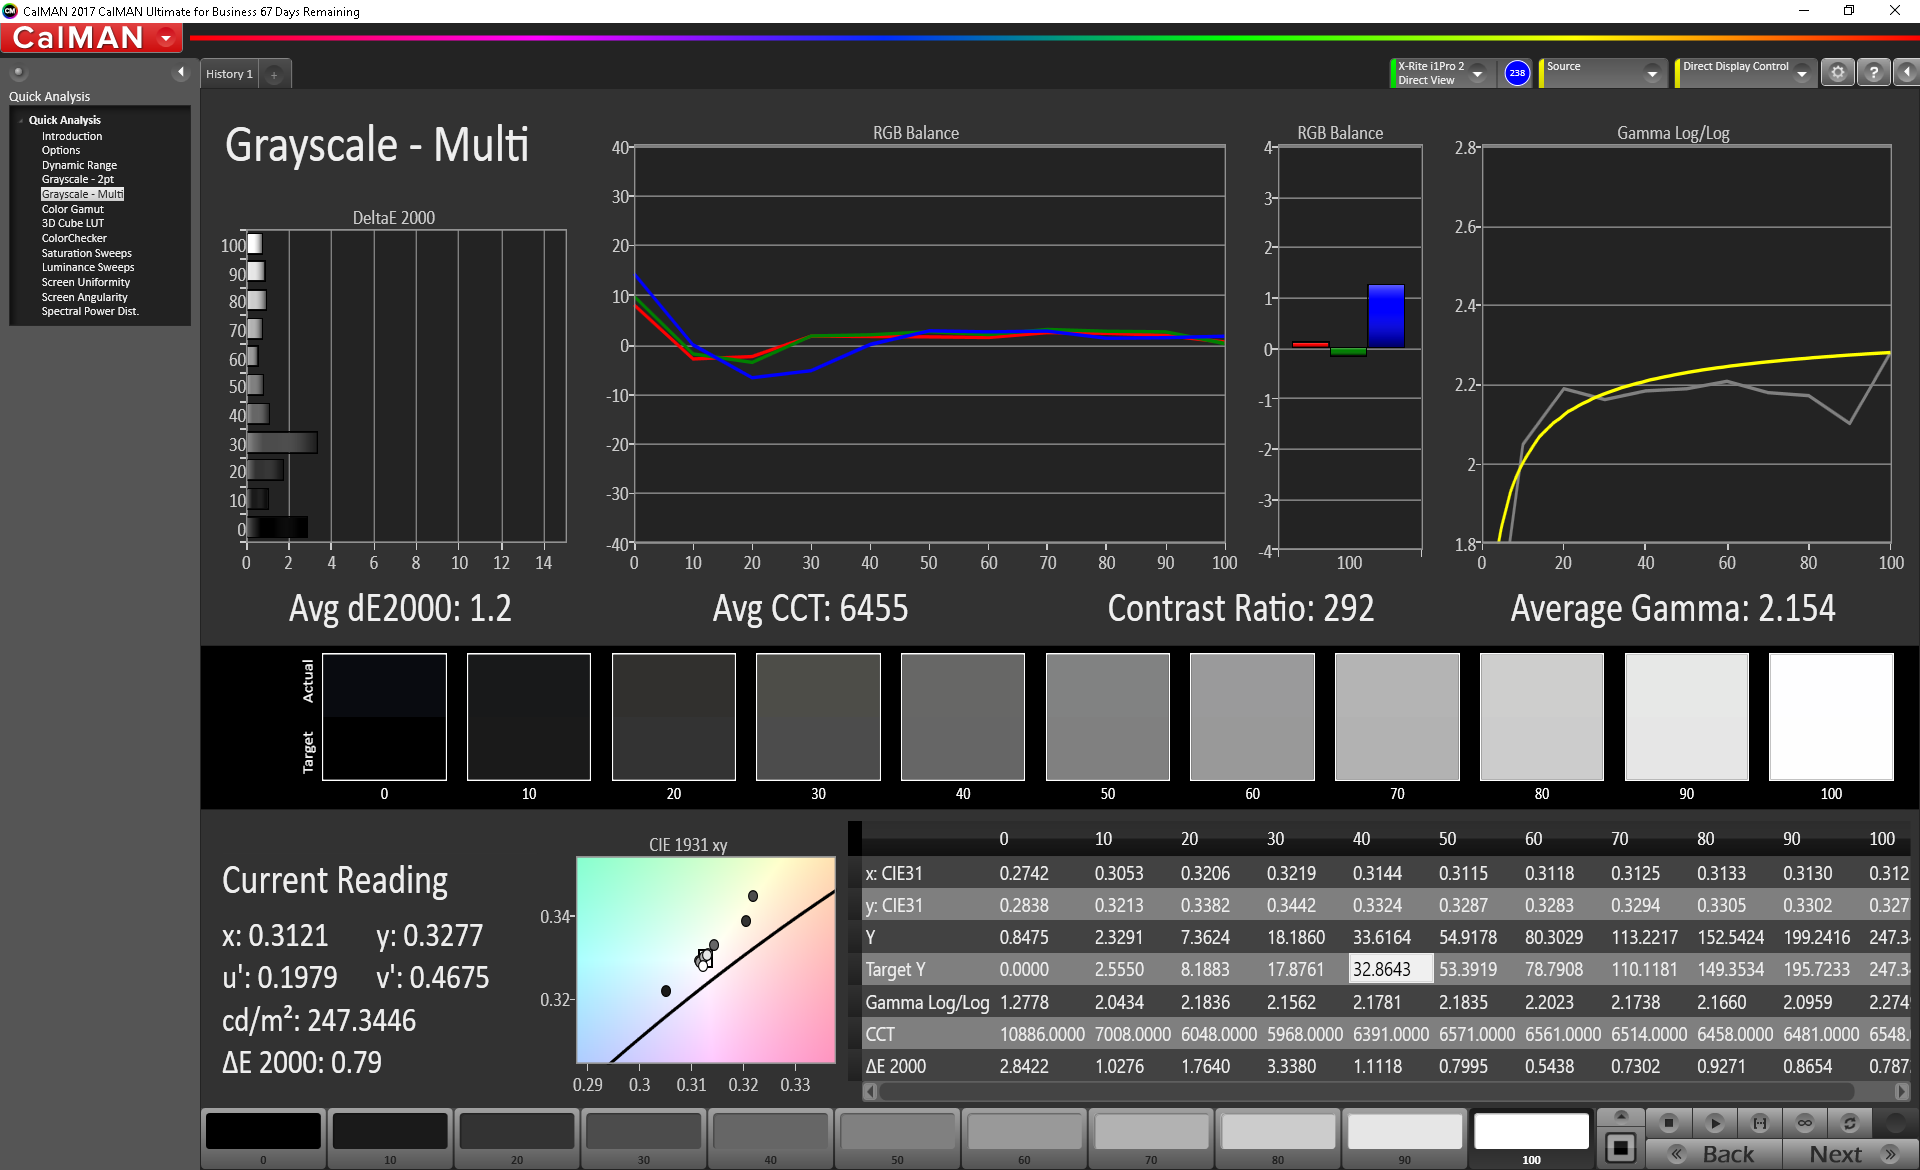
ΔE Greyscale Calman: 14.2 | ∀{0.09-98 Ø4.97}
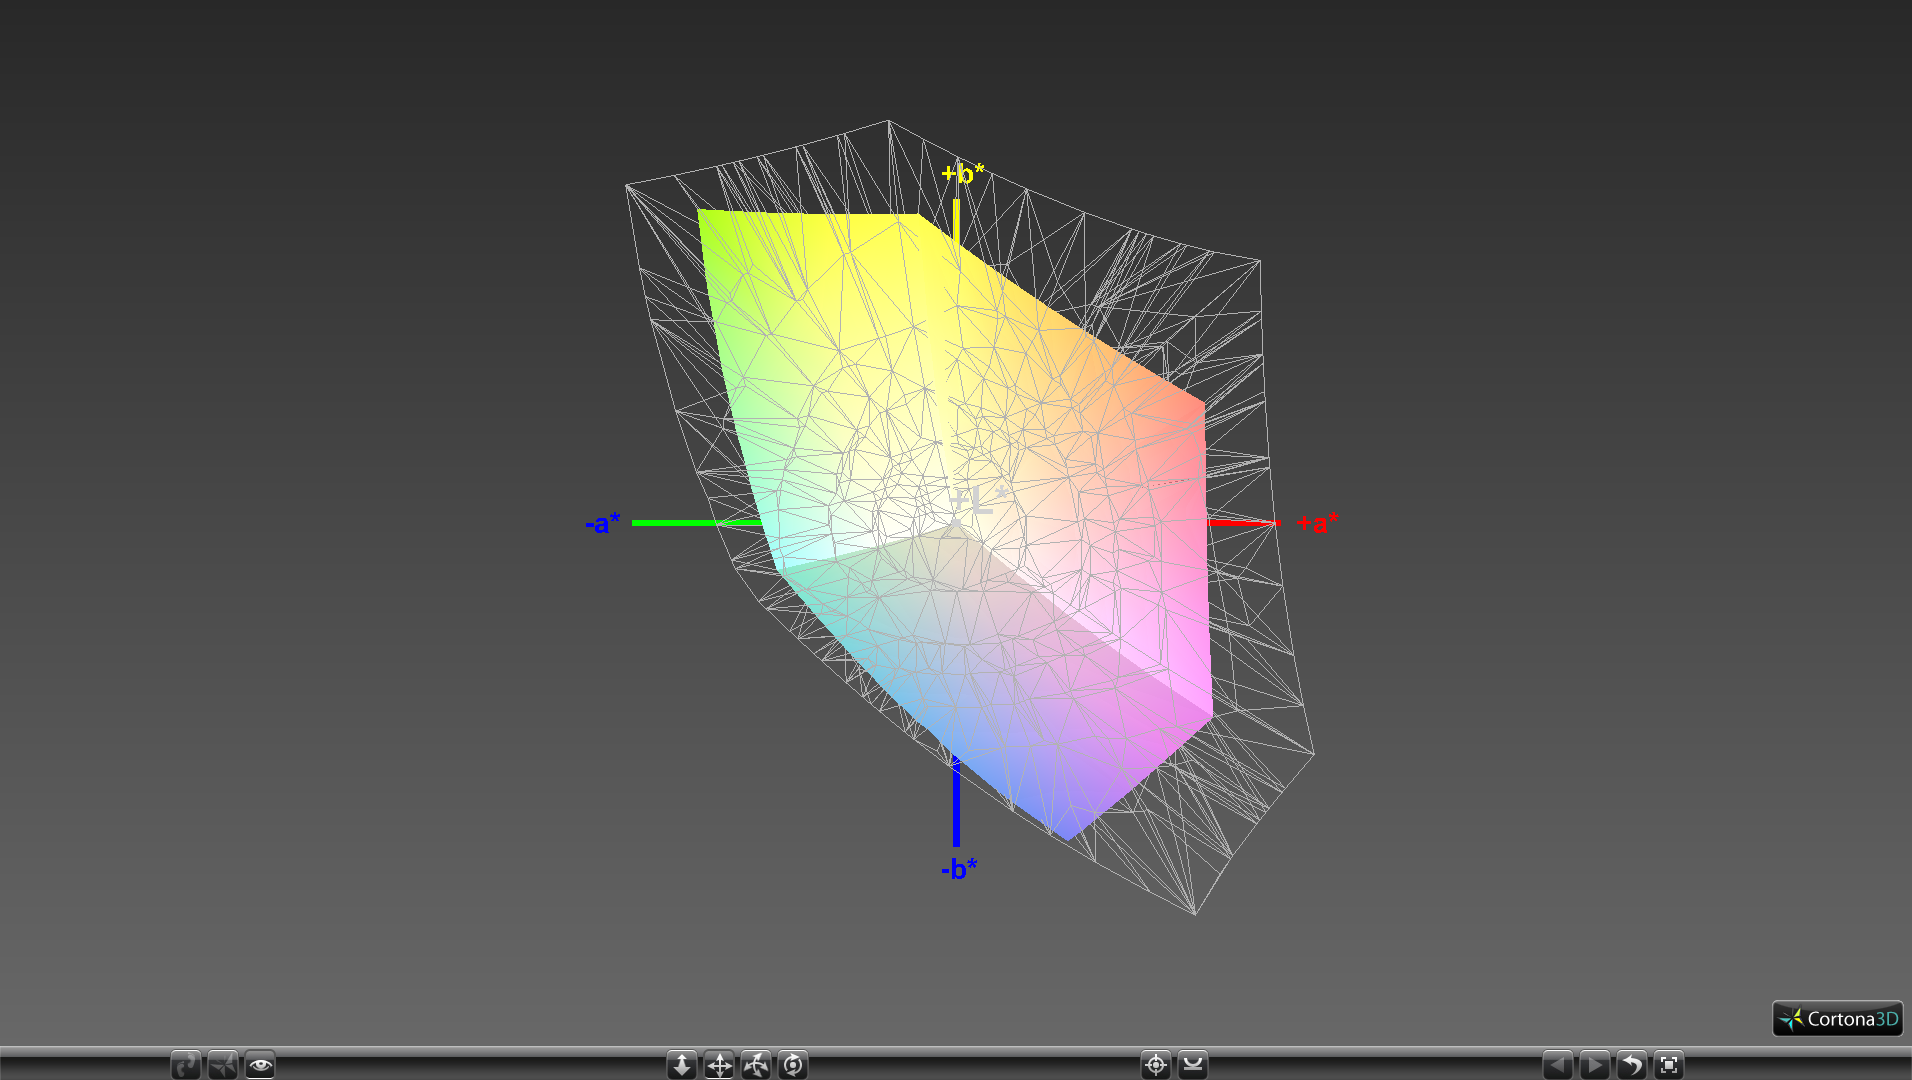
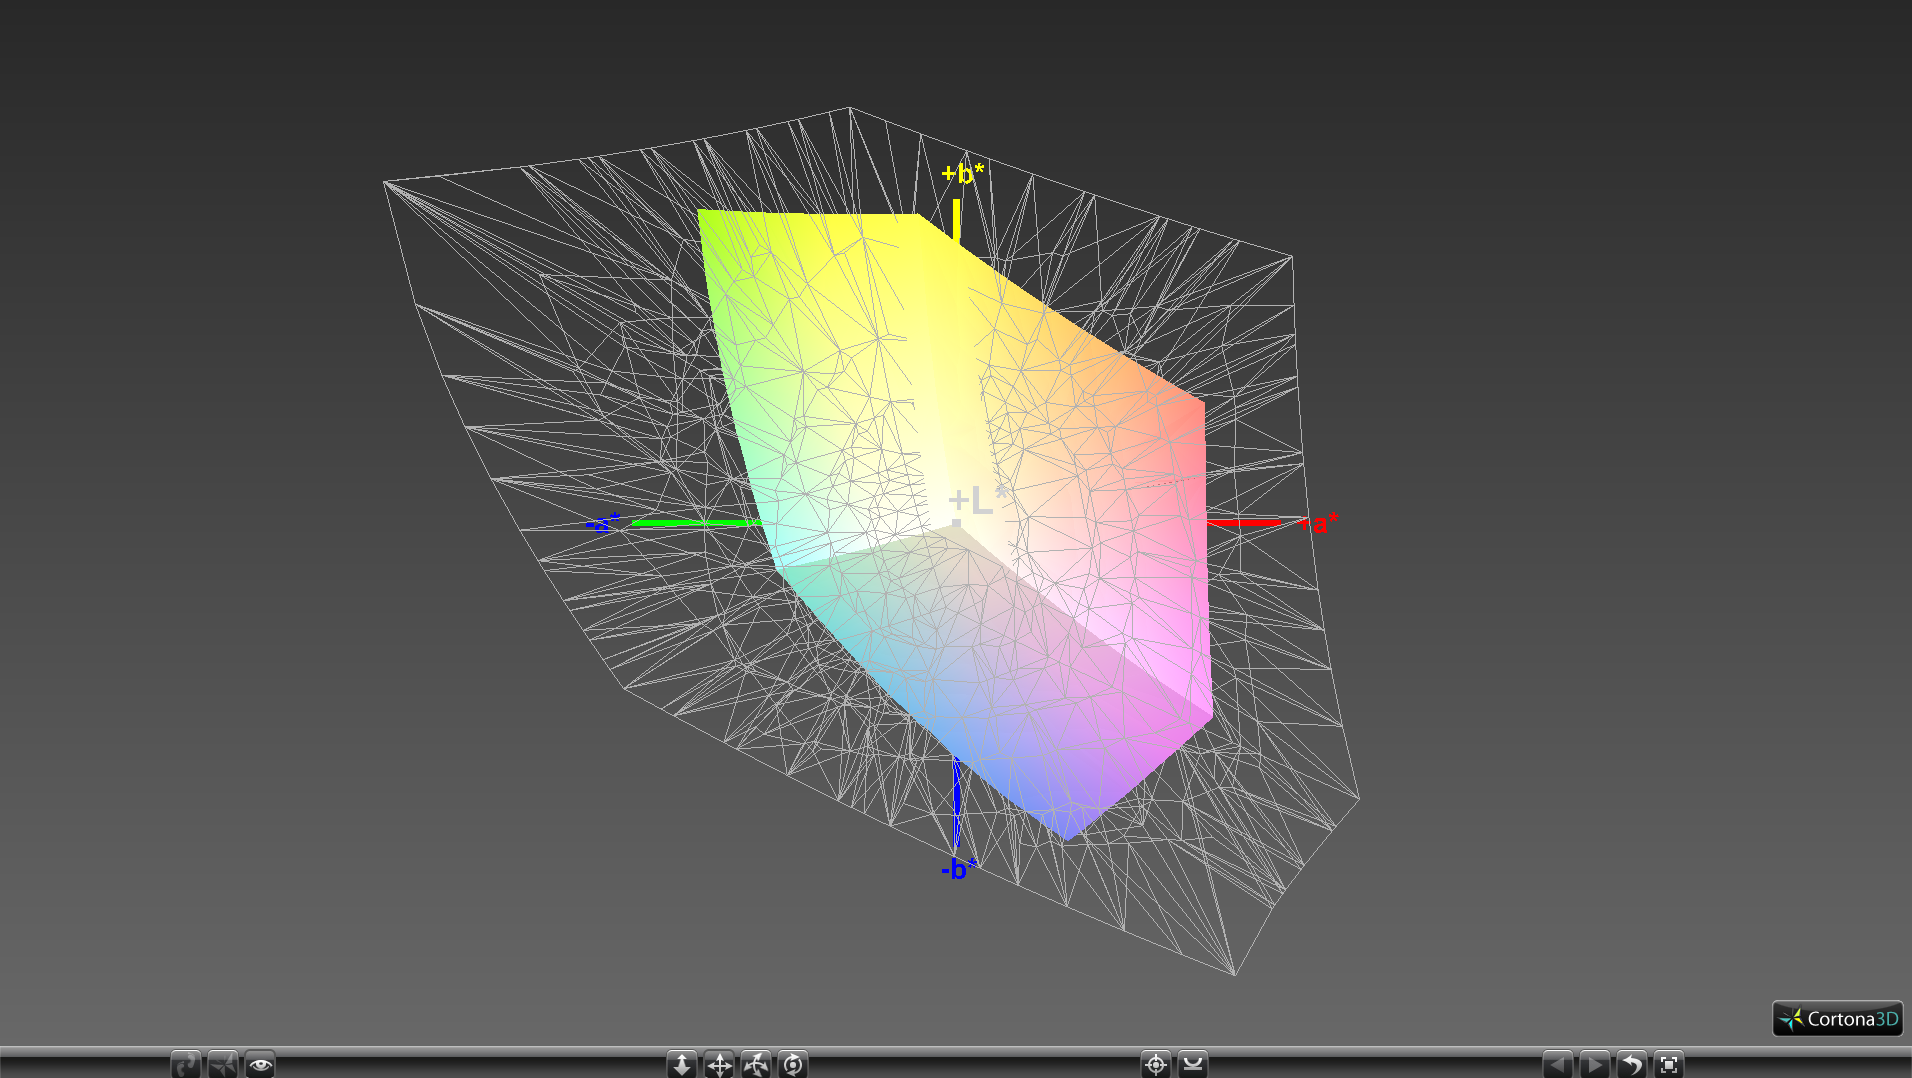
61% sRGB (Argyll 1.6.3 3D)
38.7% AdobeRGB 1998 (Argyll 1.6.3 3D)
41.8% AdobeRGB 1998 (Argyll 3D)
60.9% sRGB (Argyll 3D)
40.46% Display P3 (Argyll 3D)
Gamma: 2.03
CCT: 17152 K
| Getac S410 CMN N140BGE-E33, TN PED, 14", 1366x768 | Panasonic Toughbook CF-54G2999VM B140XTN, AUO2E3C, TN LED, 14", 1366x768 | Dell Latitude 14 7414 Rugged Extreme Sharp LQ140K1, IPS, 14", 1366x768 | Fujitsu LifeBook U748 LG, LP140WF6-SPF1, IPS, 14", 1920x1080 | Panasonic Toughbook CF-33 Manufacturer unknown, ID: TMA1200, IPS, 12", 2160x1440 | Dell Latitude 5491 AU Optronics AUO133D B140HAK, IPS, 14", 1920x1080 | |
|---|---|---|---|---|---|---|
| Display | -8% | -8% | 9% | -12% | ||
| Display P3 Coverage (%) | 40.46 | 37.36 -8% | 37.22 -8% | 44.24 9% | 35.78 -12% | |
| sRGB Coverage (%) | 60.9 | 56.1 -8% | 55.8 -8% | 66.7 10% | 53.8 -12% | |
| AdobeRGB 1998 Coverage (%) | 41.8 | 38.62 -8% | 38.49 -8% | 45.71 9% | 36.96 -12% | |
| Response Times | -14% | -49% | -35% | -40% | -48% | |
| Response Time Grey 50% / Grey 80% * (ms) | 41.2 ? | 43.2 ? -5% | 43 ? -4% | 39.2 ? 5% | 30 ? 27% | 38.4 ? 7% |
| Response Time Black / White * (ms) | 14 ? | 17.2 ? -23% | 27 ? -93% | 24.4 ? -74% | 29 ? -107% | 28.4 ? -103% |
| PWM Frequency (Hz) | 877 ? | 200 ? | 685 | |||
| Screen | -12% | 35% | 53% | 131% | 19% | |
| Brightness middle (cd/m²) | 265.1 | 174.5 -34% | 493 86% | 334 26% | 571 115% | 189.4 -29% |
| Brightness (cd/m²) | 246 | 164 -33% | 456 85% | 313 27% | 555 126% | 196 -20% |
| Brightness Distribution (%) | 81 | 71 -12% | 81 0% | 89 10% | 89 10% | 82 1% |
| Black Level * (cd/m²) | 0.58 | 0.6 -3% | 0.53 9% | 0.41 29% | 0.11 81% | 0.2 66% |
| Contrast (:1) | 457 | 291 -36% | 930 104% | 815 78% | 5191 1036% | 947 107% |
| Colorchecker dE 2000 * | 14.24 | 12.05 15% | 11.08 22% | 2.2 85% | 22.7 -59% | 6.74 53% |
| Colorchecker dE 2000 max. * | 26.66 | 27.5 -3% | 15.11 43% | 5.7 79% | 34.14 -28% | 25.5 4% |
| Colorchecker dE 2000 calibrated * | 3.94 | 4.34 -10% | 4.73 -20% | |||
| Greyscale dE 2000 * | 14.2 | 14.8 -4% | 11.99 16% | 2.9 80% | 13.6 4% | 5.5 61% |
| Gamma | 2.03 108% | 1.4 157% | 4.03 55% | 2.34 94% | 5.51 40% | 2.37 93% |
| CCT | 17152 38% | 14529 45% | 10872 60% | 6855 95% | 6998 93% | 6740 96% |
| Color Space (Percent of AdobeRGB 1998) (%) | 38.7 | 35.7 -8% | 36 -7% | 65.3 69% | 42.5 10% | 37 -4% |
| Color Space (Percent of sRGB) (%) | 61 | 56.2 -8% | 56 -8% | 91.8 50% | 67.02 10% | 53.8 -12% |
| Total Average (Program / Settings) | -11% /
-12% | -7% /
15% | 9% /
39% | 33% /
84% | -14% /
5% |
* ... smaller is better
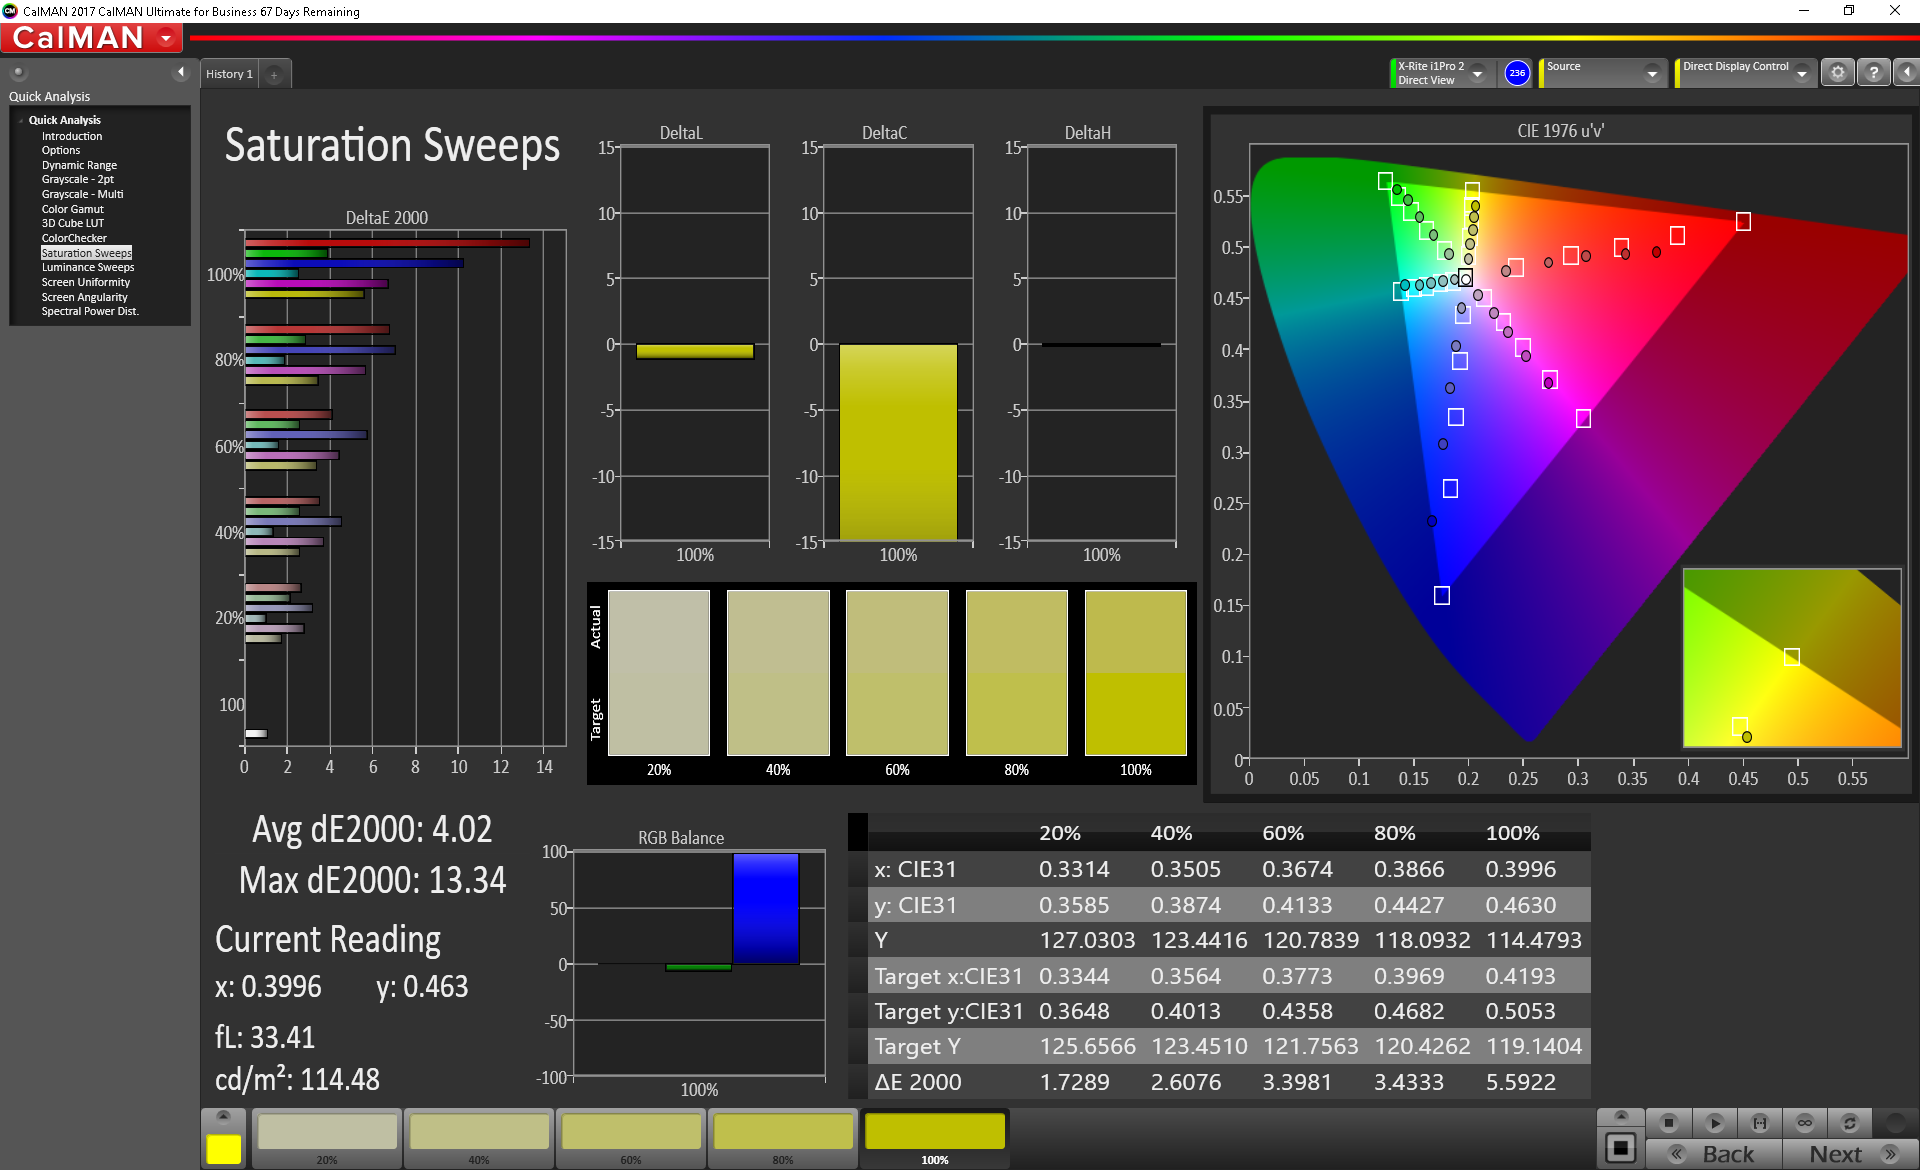
Color space is very limited at just 61 percent and 39 percent of sRGB and AdobeRGB, respectively. Colors are noticeably shallower and less accurate when compared to mainstream consumer laptops.
Further measurements with a X-Rite spectrophotometer reveal inaccurate grayscale and an overly cool color temperature as suspected. We highly recommend applying our calibrated ICC profile above to greatly improve the accuracy of the display.
Display Response Times
| ↔ Response Time Black to White | ||
|---|---|---|
| 14 ms ... rise ↗ and fall ↘ combined | ↗ 9.6 ms rise | 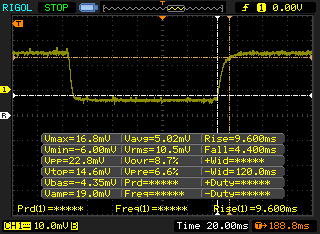 |
| ↘ 4.4 ms fall | ||
| The screen shows good response rates in our tests, but may be too slow for competitive gamers. In comparison, all tested devices range from 0.1 (minimum) to 240 (maximum) ms. » 34 % of all devices are better. This means that the measured response time is better than the average of all tested devices (19.9 ms). | ||
| ↔ Response Time 50% Grey to 80% Grey | ||
| 41.2 ms ... rise ↗ and fall ↘ combined | ↗ 21.6 ms rise | 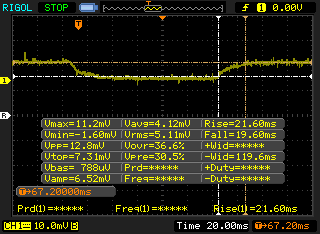 |
| ↘ 19.6 ms fall | ||
| The screen shows slow response rates in our tests and will be unsatisfactory for gamers. In comparison, all tested devices range from 0.165 (minimum) to 636 (maximum) ms. » 66 % of all devices are better. This means that the measured response time is worse than the average of all tested devices (31.1 ms). | ||
Screen Flickering / PWM (Pulse-Width Modulation)
| Screen flickering / PWM detected | 877 Hz | ≤ 99 % brightness setting | 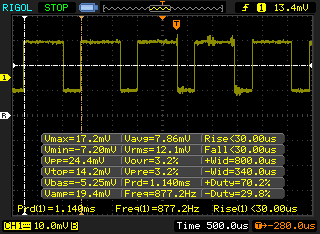 |
The display backlight flickers at 877 Hz (worst case, e.g., utilizing PWM) Flickering detected at a brightness setting of 99 % and below. There should be no flickering or PWM above this brightness setting. The frequency of 877 Hz is quite high, so most users sensitive to PWM should not notice any flickering. In comparison: 52 % of all tested devices do not use PWM to dim the display. If PWM was detected, an average of 7801 (minimum: 5 - maximum: 343500) Hz was measured. | |||
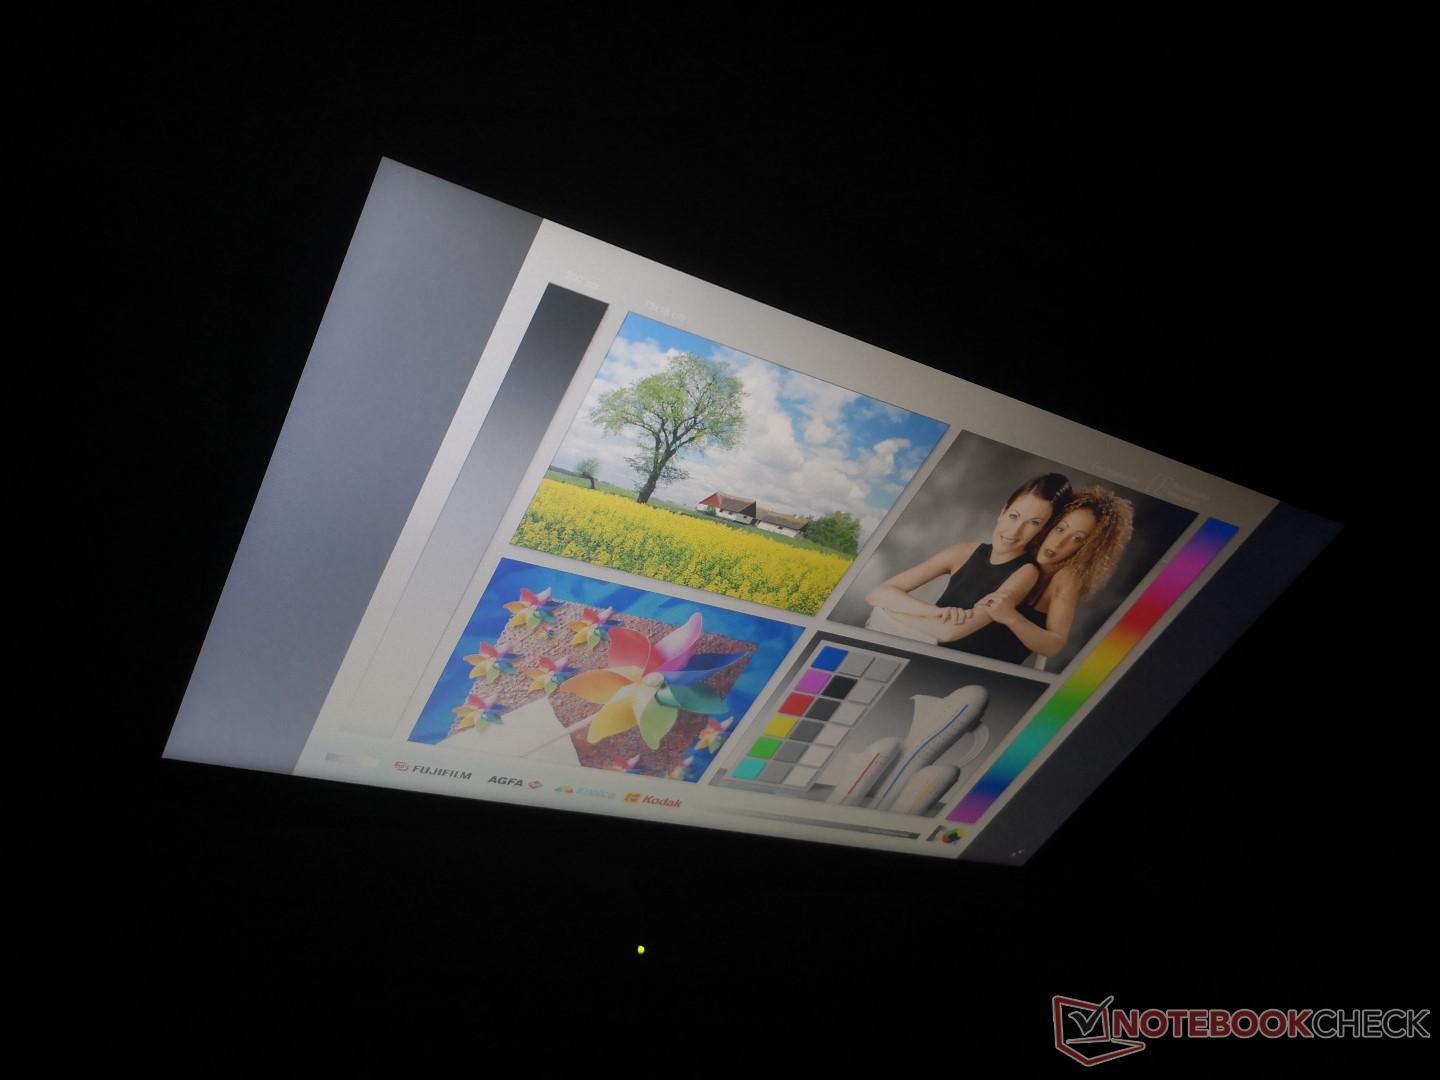
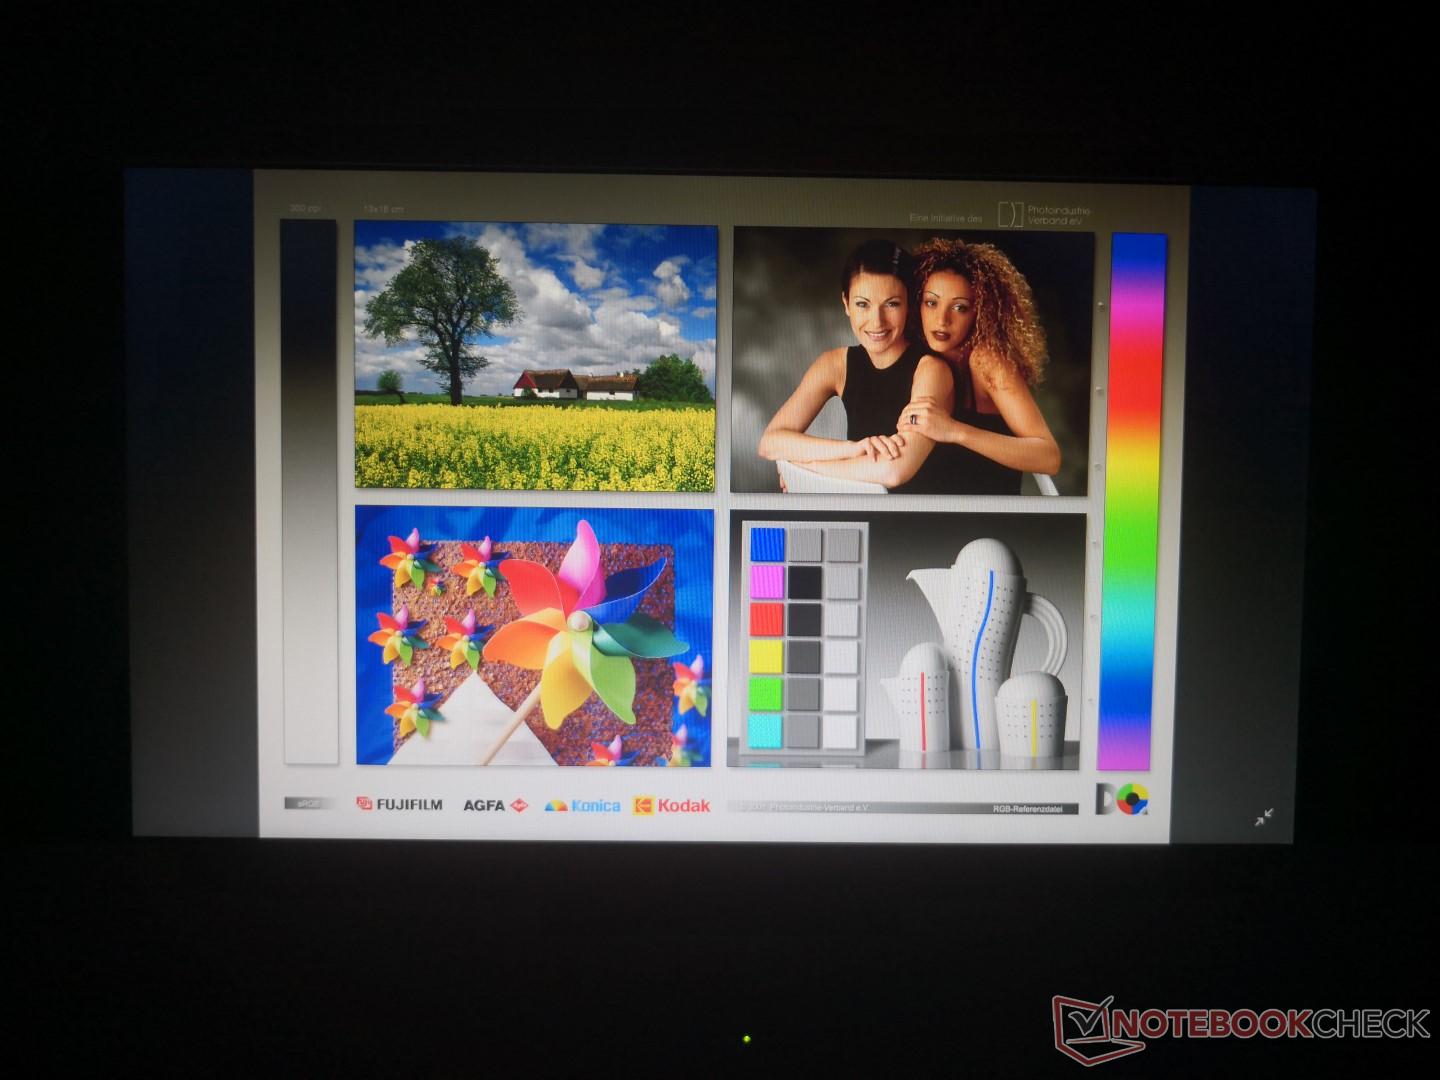
Outdoor visibility is average at best when under shade. Otherwise, ambient light will easily overwhelm and wash out onscreen content. Other rugged devices, like the Toughbook CF-33 or Dell Latitude 14 Rugged, have much brighter displays that are better fit for outdoor use.
Performance
Processor
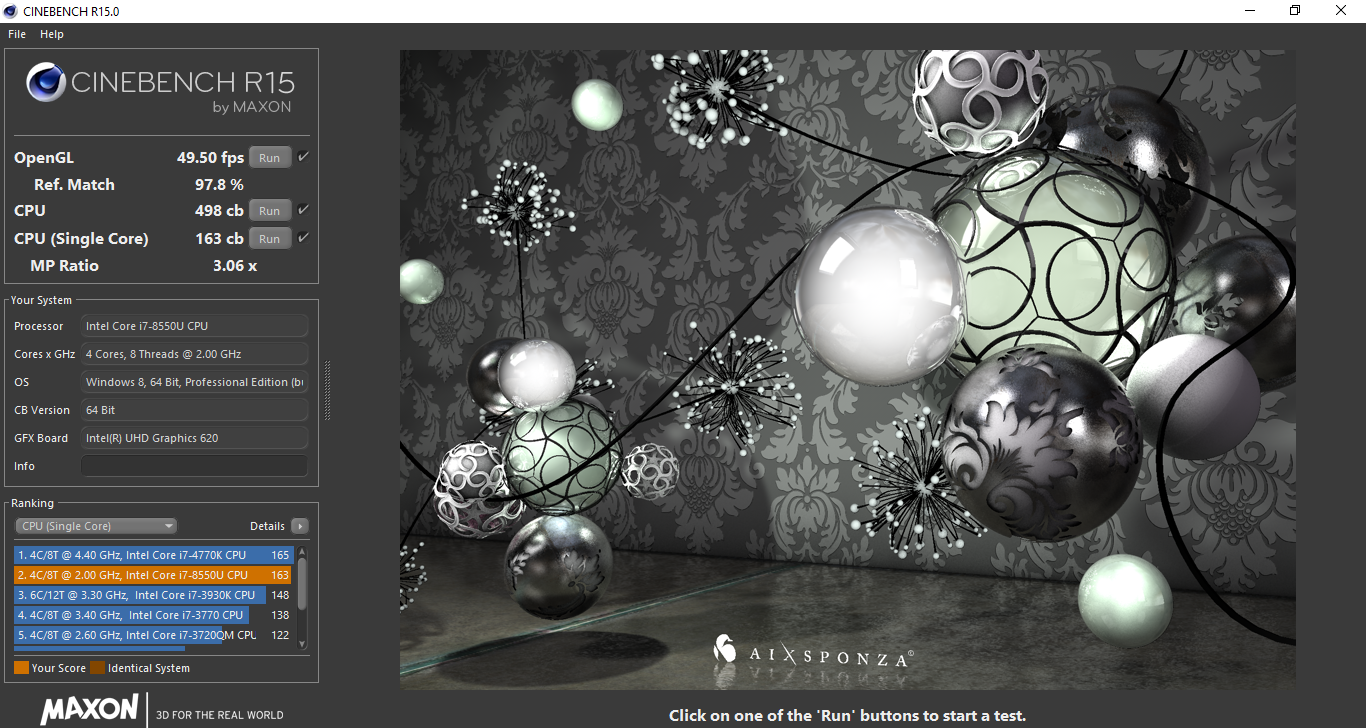
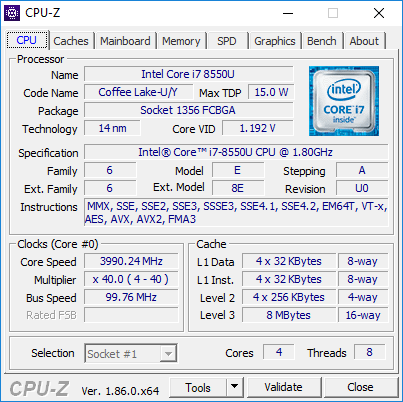
CPU performance is 12 percent slower than the average i7-8550U in our database due to the limited Turbo Boost potential of the Getac as our Stress Test section below will show. Nonetheless, the CPU is still noticeably faster than the last generation i5-7300U as found on the Toughbook CF-54 because of its higher number of simultaneous threads.
When running CineBench R15 Multi-Thread in a loop, the initial score of 538 points drops to about 498 points after just a single loop to suggest a short-lived unsustainable maximum Turbo Boost at the very start of the test.
See our dedicated page on the Core i7-8550U for more technical information and benchmark comparisons.
System Performance
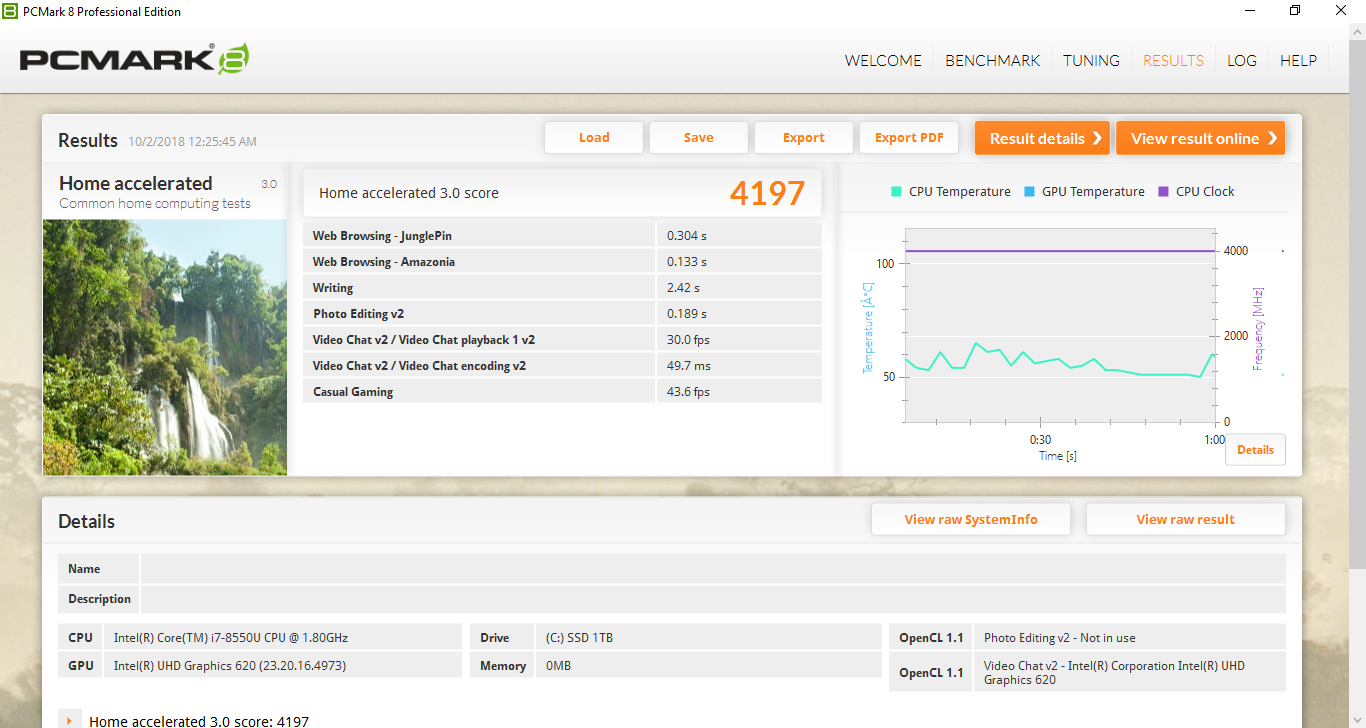
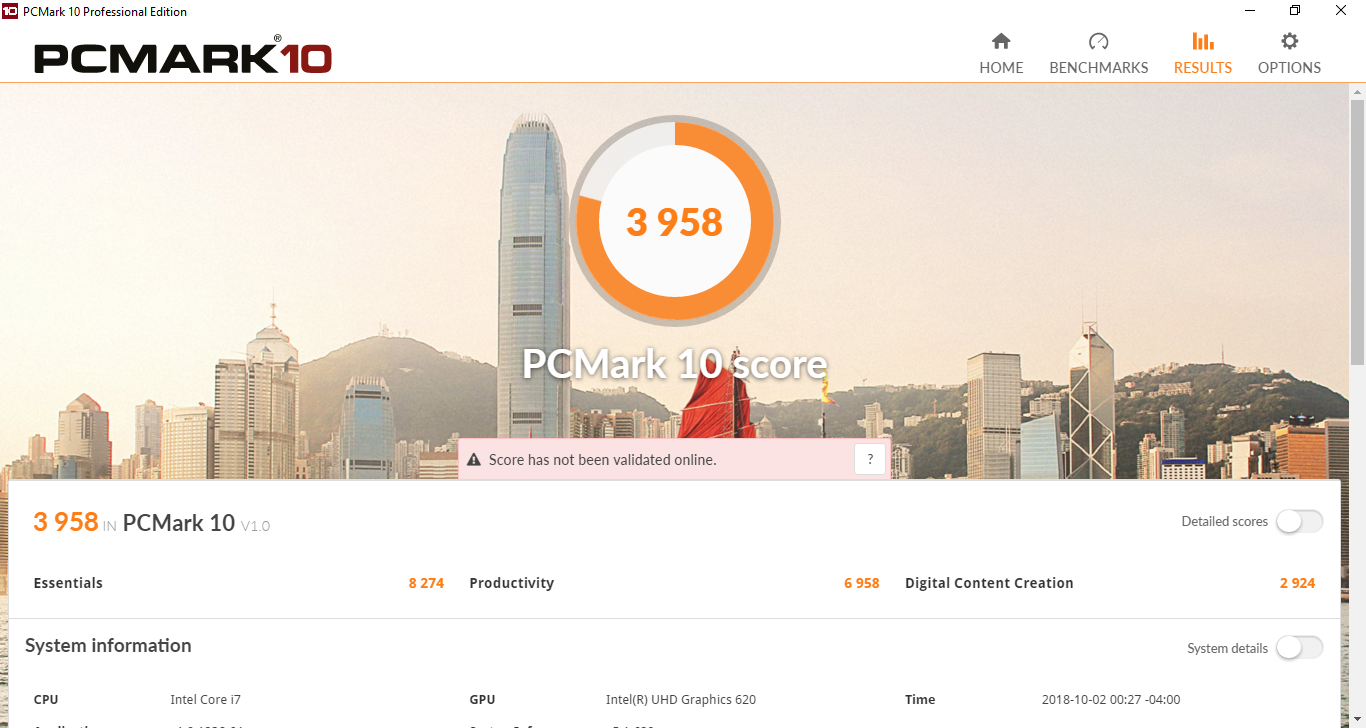
PCMark benchmarks rank our Getac slightly higher than our Toughbook CF-54 due to its faster CPU, primary SSD, and overall smoother performance. We experienced no major software issues during our time with the review unit aside form a single BSOD that we were unable to repeat.
| PCMark 10 - Score | |
| Dell Latitude 5491 | |
| Getac S410 | |
| Panasonic Toughbook CF-33 | |
| Panasonic Toughbook CF-54G2999VM | |
| Fujitsu LifeBook U748 | |
| PCMark 8 - Home Score Accelerated v2 | |
| Getac S410 | |
| Dell Latitude 5491 | |
| Panasonic Toughbook CF-54G2999VM | |
| Dell Latitude 14 7414 Rugged Extreme | |
| Fujitsu LifeBook U748 | |
| Panasonic Toughbook CF-33 | |
| PCMark 8 Home Score Accelerated v2 | 4197 points | |
| PCMark 10 Score | 3958 points | |
Help | ||
Storage Devices
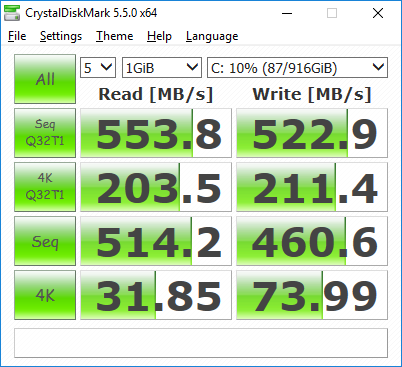
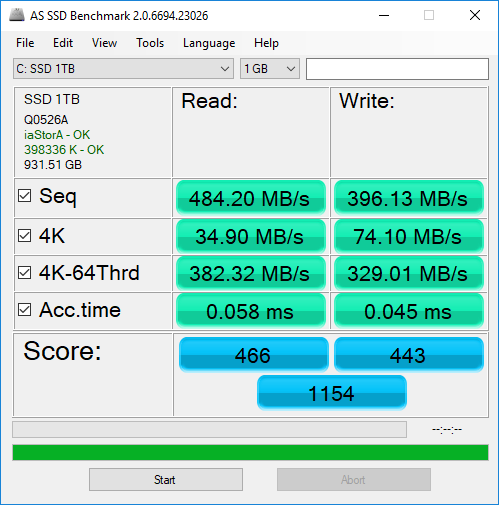
Two internal storage bays are available. The first is a removable 2.5-inch SATA III slot on the left edge of the unit while the second is an optional onboard OPAL SSD. Our test unit is equipped with a removable white label 1 TB SSD with sequential read and write rates on par with standard SATA III SSDs. More benchmark comparisons can be found on our table of SSDs and HDDs.

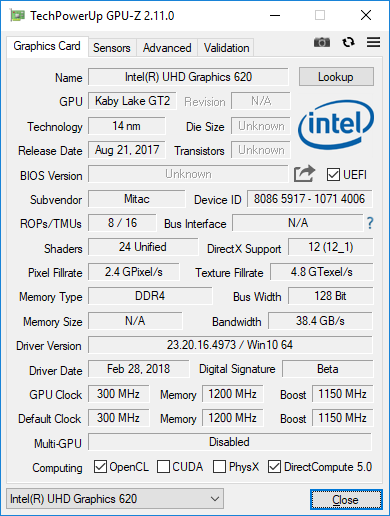
GPU Performance
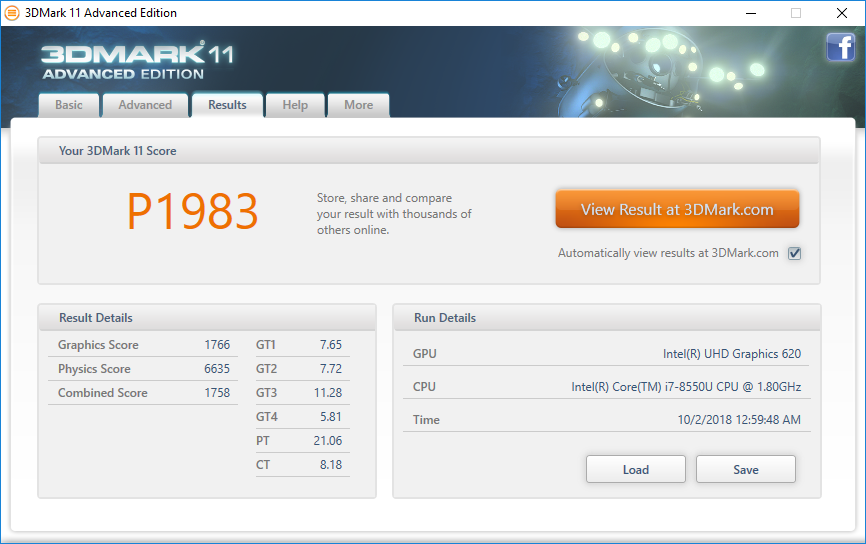
The UHD Graphics 620 is performing exactly where we expect it to be when compared to the average UHD Graphics 620 in our database. In other words, the benefits are marginal at best if upgrading from the last generation HD Graphics 520 or HD Graphics 620. Users who may need more graphics power should consider the GeForce GTX 950M option for a raw graphics boost of over 150 percent.
| 3DMark 11 Performance | 1983 points | |
Help | ||
| low | med. | high | ultra | |
|---|---|---|---|---|
| BioShock Infinite (2013) | 74.6 | 33.1 | 29.4 |
Stress Test
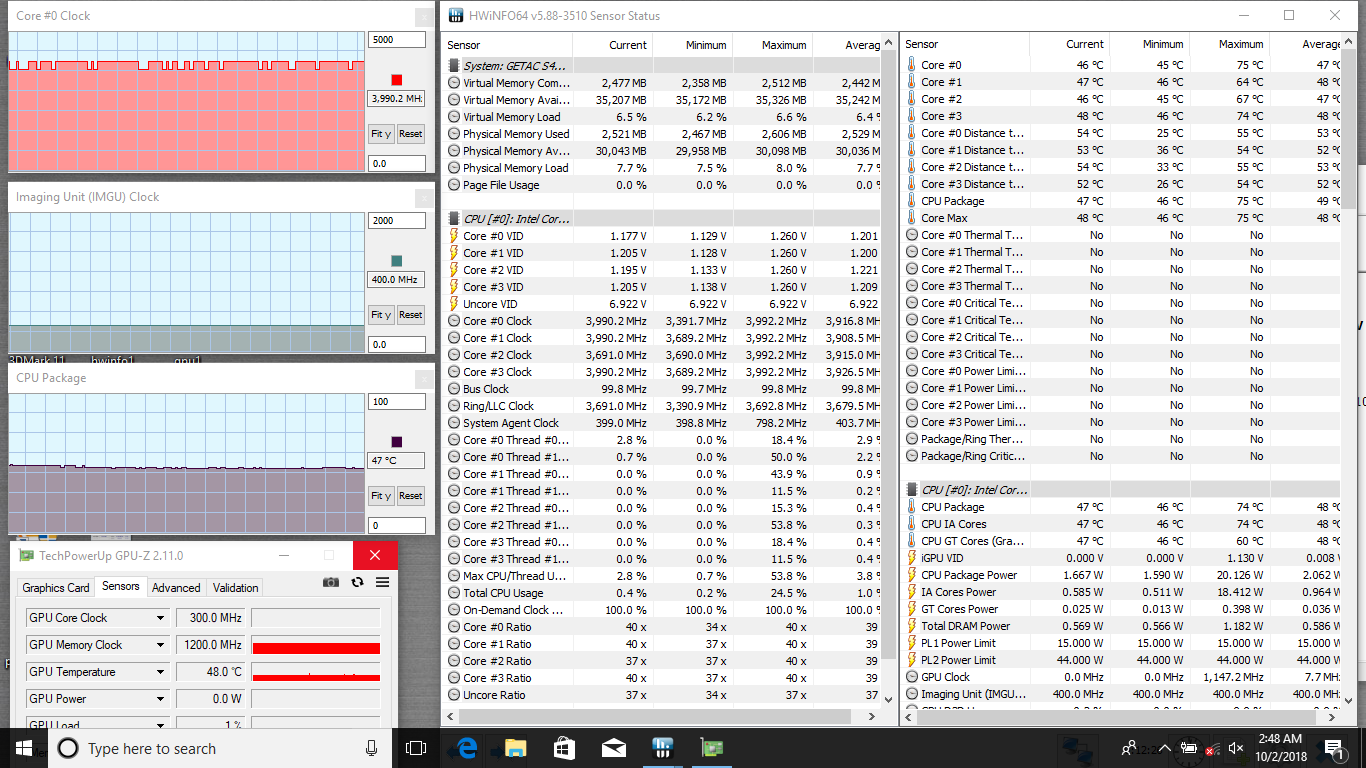
We stress the notebook with synthetic loads to identify for any potential throttling or stability issues. When subjected to Prime95, the CPU can be observed running as high as 3.6 GHz for the first few seconds until hitting a core temperature of 95 C. Thereafter, clock rates throttle to the low 2.0 GHz range in order to maintain a cooler core temperature of 77 C as shown by our screenshots below. When considering that the base clock rate of the i7-8550U is 1.8 GHz, the Getac is able to sustain only minimal Turbo Boost benefits over long periods. Running both Prime95 and FurMark simultaneously will throttle the CPU even further with core temperature plateauing at 78 C.
Running on battery power will throttle CPU performance while leaving GPU performance intact. A 3DMark 11 run on batteries returns Physics and Graphics scores of 4062 points and 1816 points, respectively, compared to 6635 points and 1766 points when on mains.
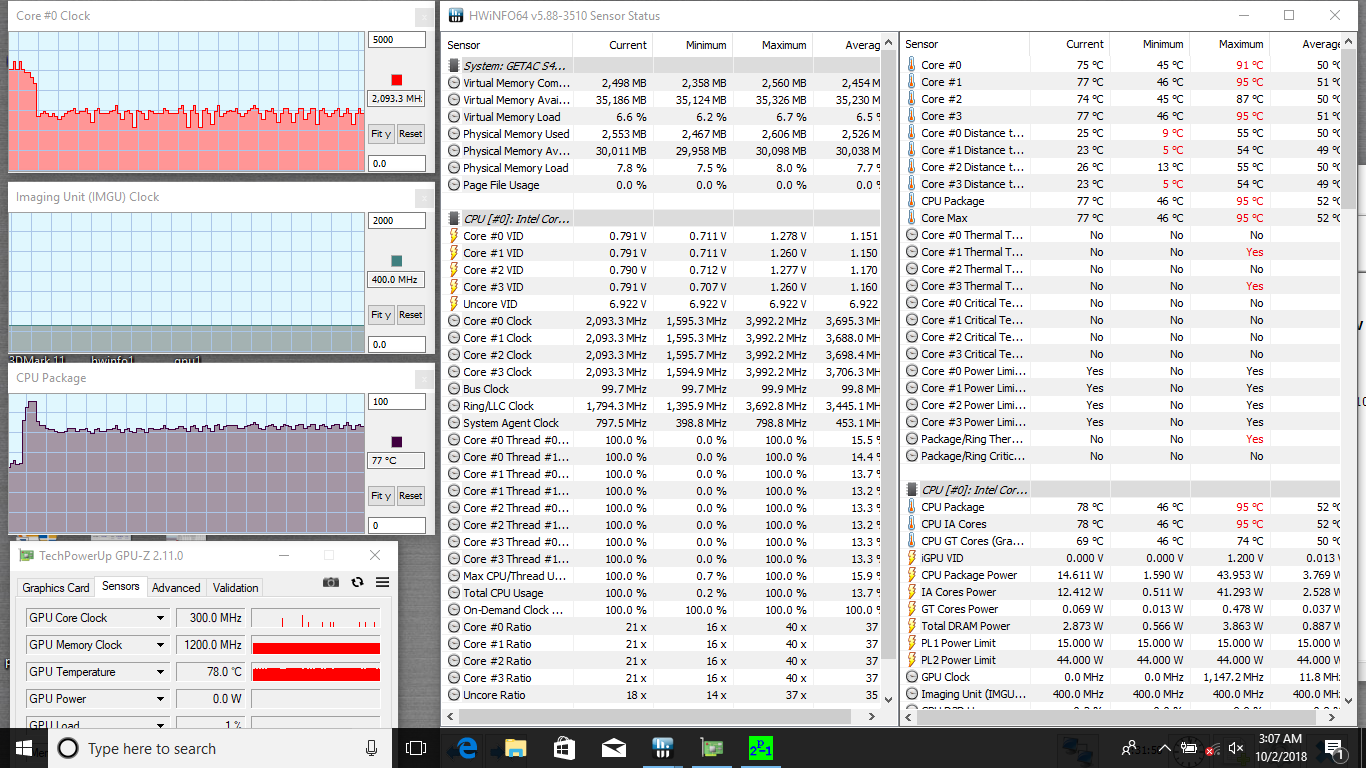
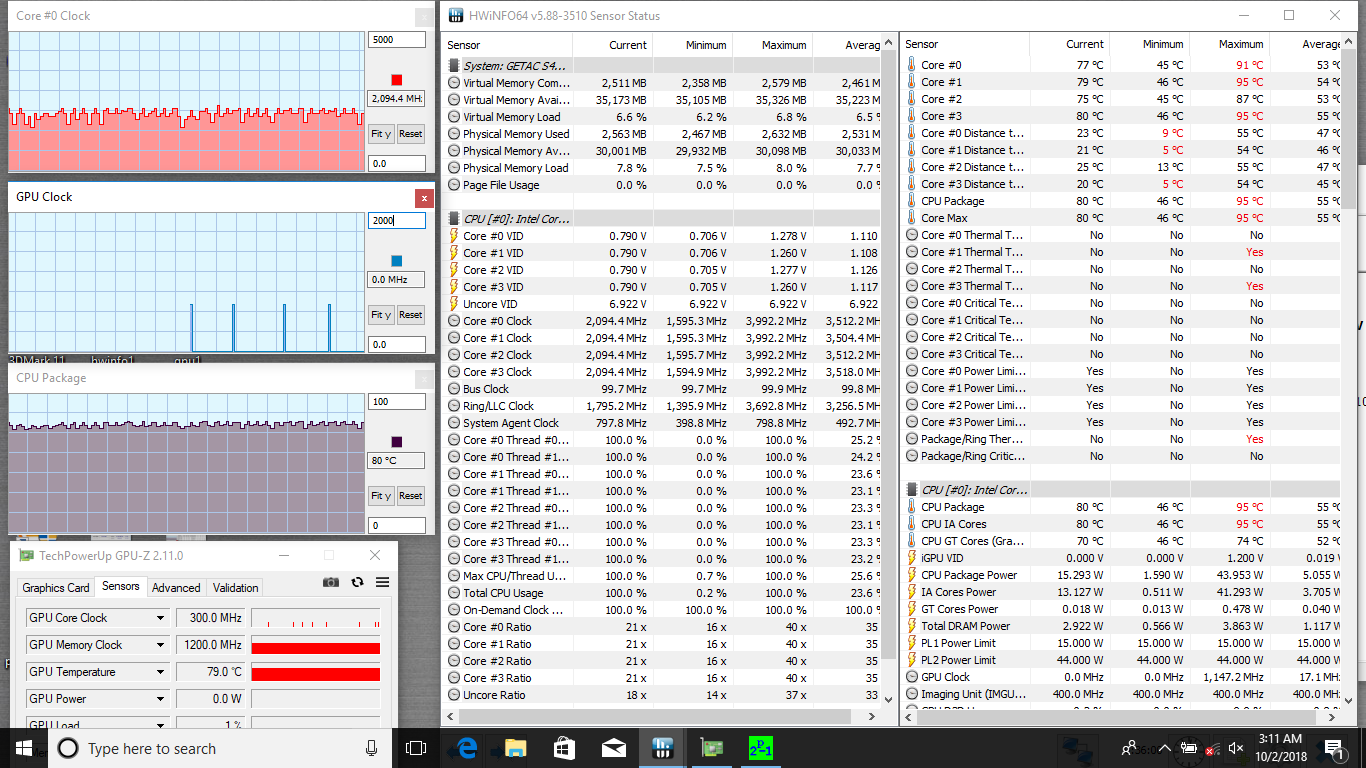
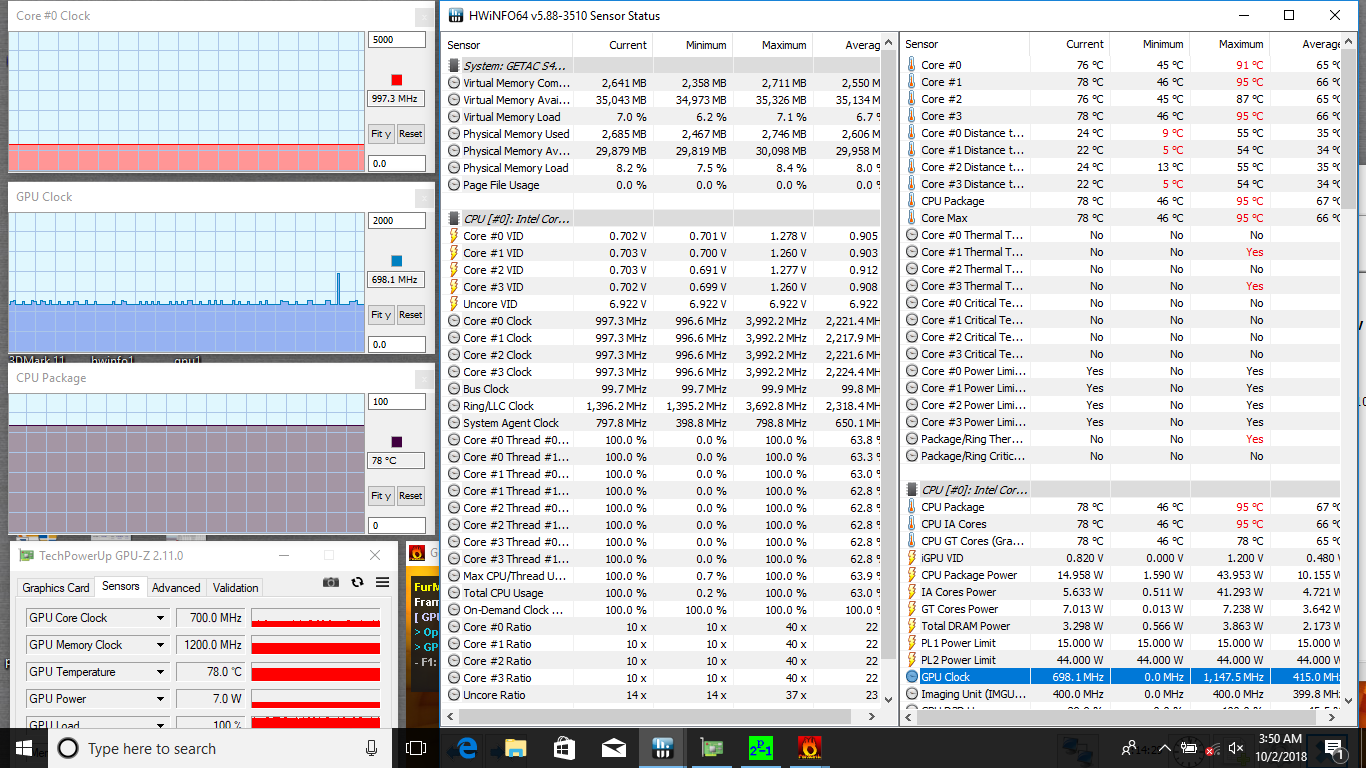
| CPU Clock (GHz) | GPU Clock (MHz) | Average CPU Temperature (°C) | |
| Prime95 Stress | ~2.0 | -- | 80 |
| Prime95 + FurMark Stress | 1.0 | 698 | 78 |
Emissions
System Noise
There is no fan noise when idling or during very low loads. Our unit, however, exhibits slight electronic noise or coil whine that we feel is unacceptable for a system in this price range and category. It's thankfully not noticeable unless if placing an ear near the keyboard keys.
When running 3DMark 06, fan noise jumps to about 30 dB(A). Maximum processing load with Prime95 bumps fan noise to 33 dB(A) which is still rather quiet compared to Ultrabooks. The system never jumps any higher unlike on the Toughbook CF-54 for an overall quieter experience.
Noise level
| Idle |
| 28.4 / 28.4 / 28.4 dB(A) |
| Load |
| 30.3 / 33.3 dB(A) |
 | ||
30 dB silent 40 dB(A) audible 50 dB(A) loud |
||
min: | ||
| Getac S410 UHD Graphics 620, i5-8550U, CUKUSA 1 TB SATA SSD Q0526A | Panasonic Toughbook CF-54G2999VM HD Graphics 620, i5-7300U, Seagate BarraCuda Compute 1TB ST1000LM048 | Dell Latitude 14 7414 Rugged Extreme HD Graphics 520, 6300U, Liteonit CV3-8D128 | Fujitsu LifeBook U748 UHD Graphics 620, i5-8250U, Samsung PM961 MZVLW256HEHP | Panasonic Toughbook CF-33 HD Graphics 620, i5-7300U, Toshiba SG5 256GB THNSNK256GVN8 | Dell Latitude 5491 GeForce MX130, i7-8850H, Toshiba XG5 KXG50ZNV512G | |
|---|---|---|---|---|---|---|
| Noise | -5% | -3% | -5% | -7% | -19% | |
| off / environment * (dB) | 28.4 | 28.3 -0% | 30.2 -6% | 29.3 -3% | 30.3 -7% | 29.5 -4% |
| Idle Minimum * (dB) | 28.4 | 28.8 -1% | 30.2 -6% | 29.3 -3% | 30.3 -7% | 29.5 -4% |
| Idle Average * (dB) | 28.4 | 28.8 -1% | 30.2 -6% | 29.3 -3% | 30.3 -7% | 29.5 -4% |
| Idle Maximum * (dB) | 28.4 | 29.1 -2% | 30.2 -6% | 29.9 -5% | 30.5 -7% | 31.5 -11% |
| Load Average * (dB) | 30.3 | 31.3 -3% | 30.2 -0% | 32.5 -7% | 30.5 -1% | 46.2 -52% |
| Load Maximum * (dB) | 33.3 | 40 -20% | 31.7 5% | 36.6 -10% | 36.6 -10% | 46.2 -39% |
* ... smaller is better
Temperature
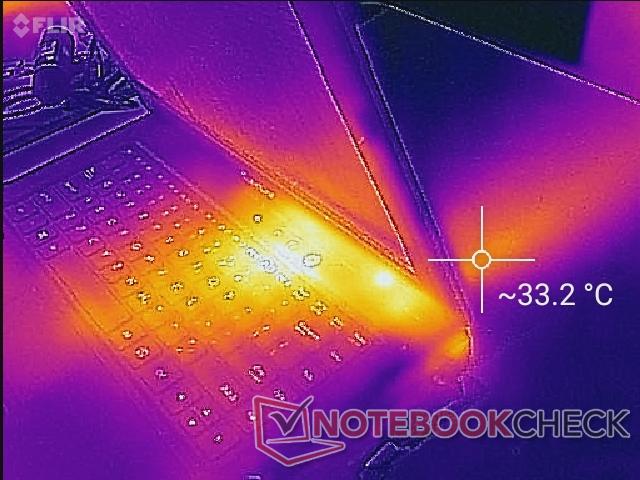
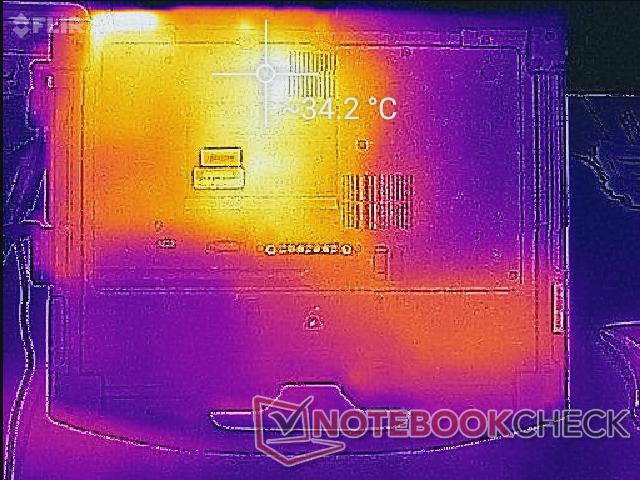
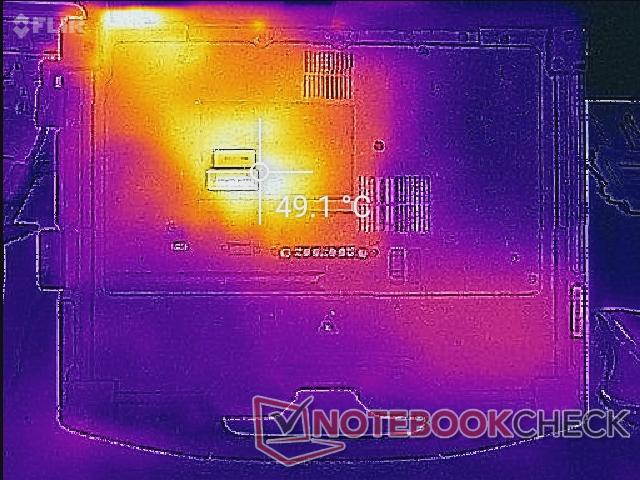
Surface temperatures when idling are actually quite warm at about 30 C and 34 C on the top and bottom, respectively. When under heavy processing load, these same hot spots can reach well over 40 C or over degrees warmer than on the Toughbook CF-54. Fortunately, these spots are towards the rear of the unit away from the palm rests and keyboard keys for comfortable use no matter the load.
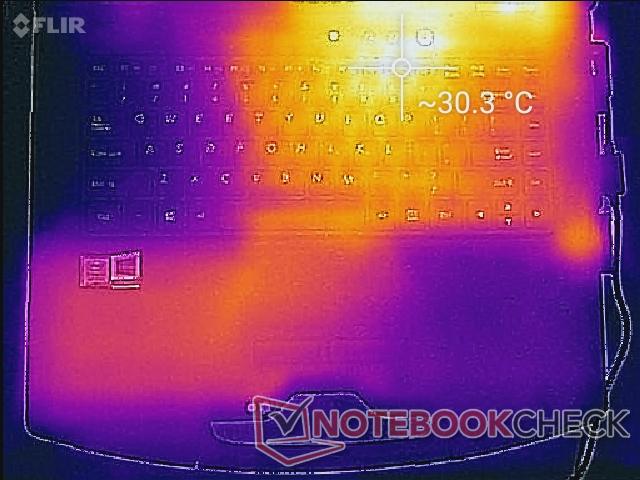
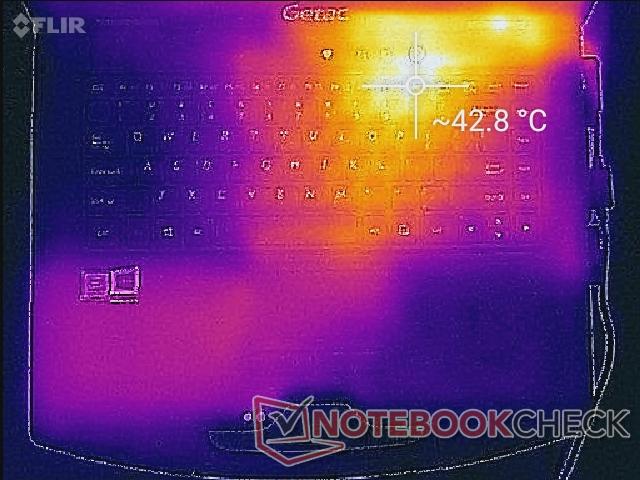
(±) The maximum temperature on the upper side is 42.6 °C / 109 F, compared to the average of 34.3 °C / 94 F, ranging from 21.2 to 62.5 °C for the class Office.
(-) The bottom heats up to a maximum of 49 °C / 120 F, compared to the average of 36.8 °C / 98 F
(+) In idle usage, the average temperature for the upper side is 24.4 °C / 76 F, compared to the device average of 29.5 °C / 85 F.
(+) The palmrests and touchpad are cooler than skin temperature with a maximum of 27 °C / 80.6 F and are therefore cool to the touch.
(±) The average temperature of the palmrest area of similar devices was 27.5 °C / 81.5 F (+0.5 °C / 0.9 F).
Speakers

The stereo speakers are louder than the speakers on the Toughbook CF-54. Bass is still poor as one would expect as shown by our pink noise chart. Maximum volume introduces no static or chassis reverberations.
Getac S410 audio analysis
(±) | speaker loudness is average but good (76.2 dB)
Bass 100 - 315 Hz
(±) | reduced bass - on average 13.6% lower than median
(+) | bass is linear (6.1% delta to prev. frequency)
Mids 400 - 2000 Hz
(±) | higher mids - on average 6.5% higher than median
(±) | linearity of mids is average (8.4% delta to prev. frequency)
Highs 2 - 16 kHz
(+) | balanced highs - only 3.1% away from median
(+) | highs are linear (6.2% delta to prev. frequency)
Overall 100 - 16.000 Hz
(±) | linearity of overall sound is average (19.9% difference to median)
Compared to same class
» 42% of all tested devices in this class were better, 9% similar, 50% worse
» The best had a delta of 7%, average was 21%, worst was 53%
Compared to all devices tested
» 51% of all tested devices were better, 7% similar, 42% worse
» The best had a delta of 4%, average was 24%, worst was 134%
Apple MacBook 12 (Early 2016) 1.1 GHz audio analysis
(+) | speakers can play relatively loud (83.6 dB)
Bass 100 - 315 Hz
(±) | reduced bass - on average 11.3% lower than median
(±) | linearity of bass is average (14.2% delta to prev. frequency)
Mids 400 - 2000 Hz
(+) | balanced mids - only 2.4% away from median
(+) | mids are linear (5.5% delta to prev. frequency)
Highs 2 - 16 kHz
(+) | balanced highs - only 2% away from median
(+) | highs are linear (4.5% delta to prev. frequency)
Overall 100 - 16.000 Hz
(+) | overall sound is linear (10.2% difference to median)
Compared to same class
» 7% of all tested devices in this class were better, 2% similar, 91% worse
» The best had a delta of 5%, average was 18%, worst was 53%
Compared to all devices tested
» 5% of all tested devices were better, 1% similar, 94% worse
» The best had a delta of 4%, average was 24%, worst was 134%
Energy Management
Power Consumption
The Getac is slightly less efficient than the Toughbook CF-54 during low loads due in part to the brighter display. Otherwise, both are very similar on average.
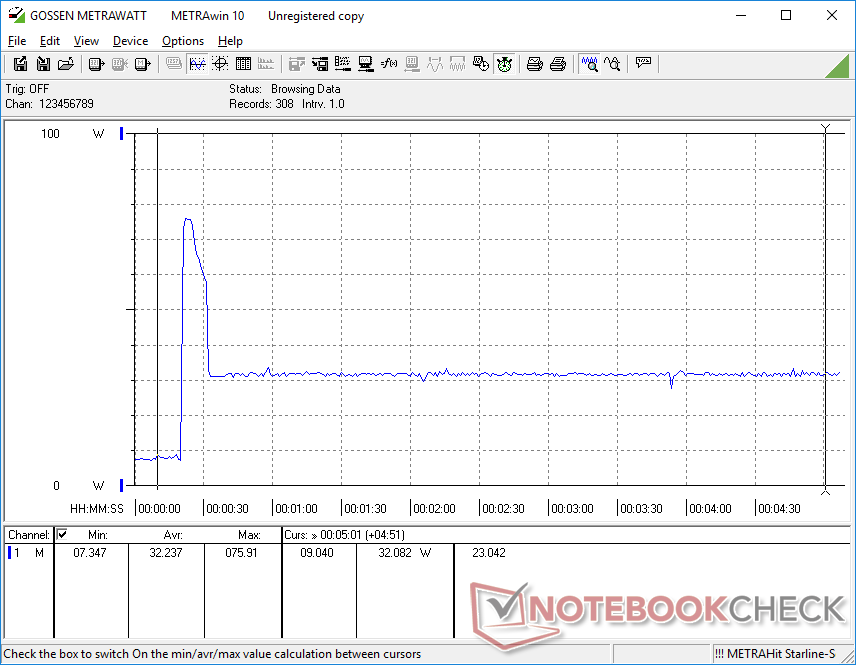
Power consumption when running Prime95 can be as high as 76 W as shown by our graph on the right. This is unsustainable, however, and consumption quickly drops to a steady 32 W. This behavior reflects the Turbo Boost clock rates from our Stress Test section above.
The very small (~11 x 4.5 x 3 cm) 65 W AC adapter is sufficient for the system when taking into account its short Turbo Boost benefits.
| Off / Standby | |
| Idle | |
| Load |
|
Key:
min: | |
| Getac S410 i5-8550U, UHD Graphics 620, CUKUSA 1 TB SATA SSD Q0526A, TN PED, 1366x768, 14" | Panasonic Toughbook CF-54G2999VM i5-7300U, HD Graphics 620, Seagate BarraCuda Compute 1TB ST1000LM048, TN LED, 1366x768, 14" | Dell Latitude 14 7414 Rugged Extreme 6300U, HD Graphics 520, Liteonit CV3-8D128, IPS, 1366x768, 14" | Fujitsu LifeBook U748 i5-8250U, UHD Graphics 620, Samsung PM961 MZVLW256HEHP, IPS, 1920x1080, 14" | Panasonic Toughbook CF-33 i5-7300U, HD Graphics 620, Toshiba SG5 256GB THNSNK256GVN8, IPS, 2160x1440, 12" | |
|---|---|---|---|---|---|
| Power Consumption | 8% | -41% | 8% | 30% | |
| Idle Minimum * (Watt) | 5.6 | 4.4 21% | 6.8 -21% | 3.33 41% | 3.6 36% |
| Idle Average * (Watt) | 7.9 | 6.3 20% | 13.4 -70% | 6.9 13% | 4.6 42% |
| Idle Maximum * (Watt) | 8.4 | 6.5 23% | 16.8 -100% | 8.2 2% | 5.15 39% |
| Load Average * (Watt) | 32.8 | 36.3 -11% | 35.2 -7% | 29.4 10% | 27 18% |
| Load Maximum * (Watt) | 34.3 | 38.3 -12% | 36.3 -6% | 43.4 -27% | 29.2 15% |
* ... smaller is better
Battery Life
The removable 46.6 Wh Li-Ion battery is decent in capacity if not slightly on the small side. Despite being larger than the battery in the Panasonic Toughbook CF-54, runtimes are shorter by about 40 minutes when subjected to the same WLAN loads. Expect a real-world battery life of just over 5 hours. Optional secondary batteries can boost runtimes if needed.
Charging from near empty to full capacity is relatively quick at just under 1.5 hours.
| Getac S410 i5-8550U, UHD Graphics 620, 46.6 Wh | Panasonic Toughbook CF-54G2999VM i5-7300U, HD Graphics 620, 33 Wh | Dell Latitude 14 7414 Rugged Extreme 6300U, HD Graphics 520, 97 Wh | Fujitsu LifeBook U748 i5-8250U, UHD Graphics 620, 50 Wh | Panasonic Toughbook CF-33 i5-7300U, HD Graphics 620, 44 Wh | Dell Latitude 5491 i7-8850H, GeForce MX130, 68 Wh | |
|---|---|---|---|---|---|---|
| Battery runtime | 13% | 102% | 25% | 52% | 85% | |
| WiFi v1.3 (h) | 5.2 | 5.9 13% | 10.5 102% | 6.5 25% | 7.9 52% | 9.6 85% |
| Reader / Idle (h) | 15.6 | 16.8 | ||||
| Load (h) | 1.8 | 1.3 |
Pros
Cons
Verdict

The closest competitor to the Getac S410 at the moment is the Panasonic Toughbook CF-54. The Getac is the stronger option if performance is priority because of its faster CPU and GPU options, more rigid display, quieter fans, louder speakers, and brighter backlight for the base configuration. On the other hand, it falls short on a few key aspects. Serviceability is more difficult and pulse-width modulation is present on nearly all brightness levels which could impact users sensitive to onscreen flickering. Its chassis is also larger and heavier than the Panasonic alternative.
Much like on the Panasonic, display quality is one of the weaker characteristics of the Getac. We can't speak for the higher-end 1080 option, but applying our ICC profile to the base 768p option addresses the poor grayscale and color accuracy of the default settings. Users should consider investing in the brighter "Sunlight Readable" feature if frequent outdoor use is expected.
Modern CPU and GPU hardware in a rugged design for a powerful first impression when compared to its competitors. Hopefully, future revisions will drop the substandard 768p display option for a higher quality and brighter panel on the base configurations.
Getac S410
- 10/08/2018 v6 (old)
Allen Ngo
Price comparison
