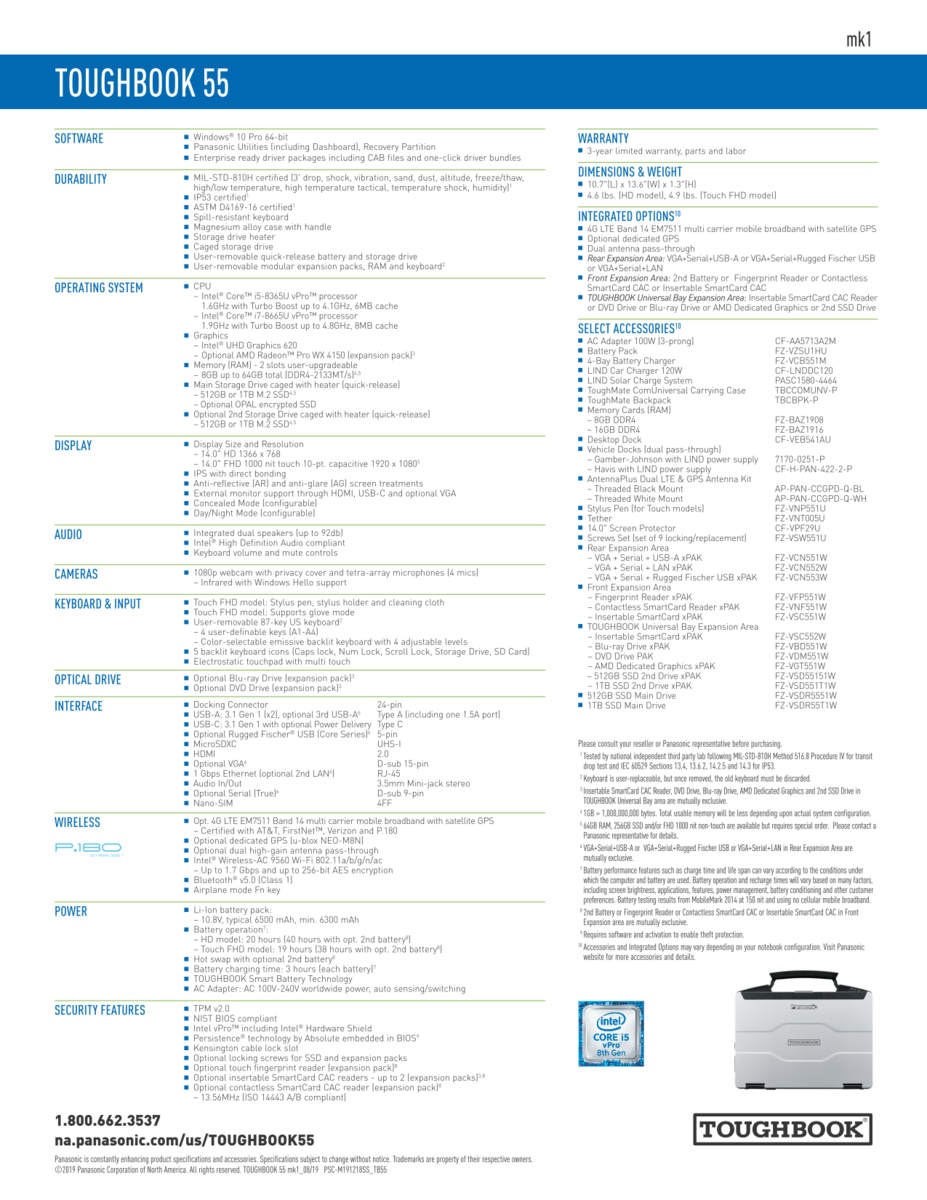
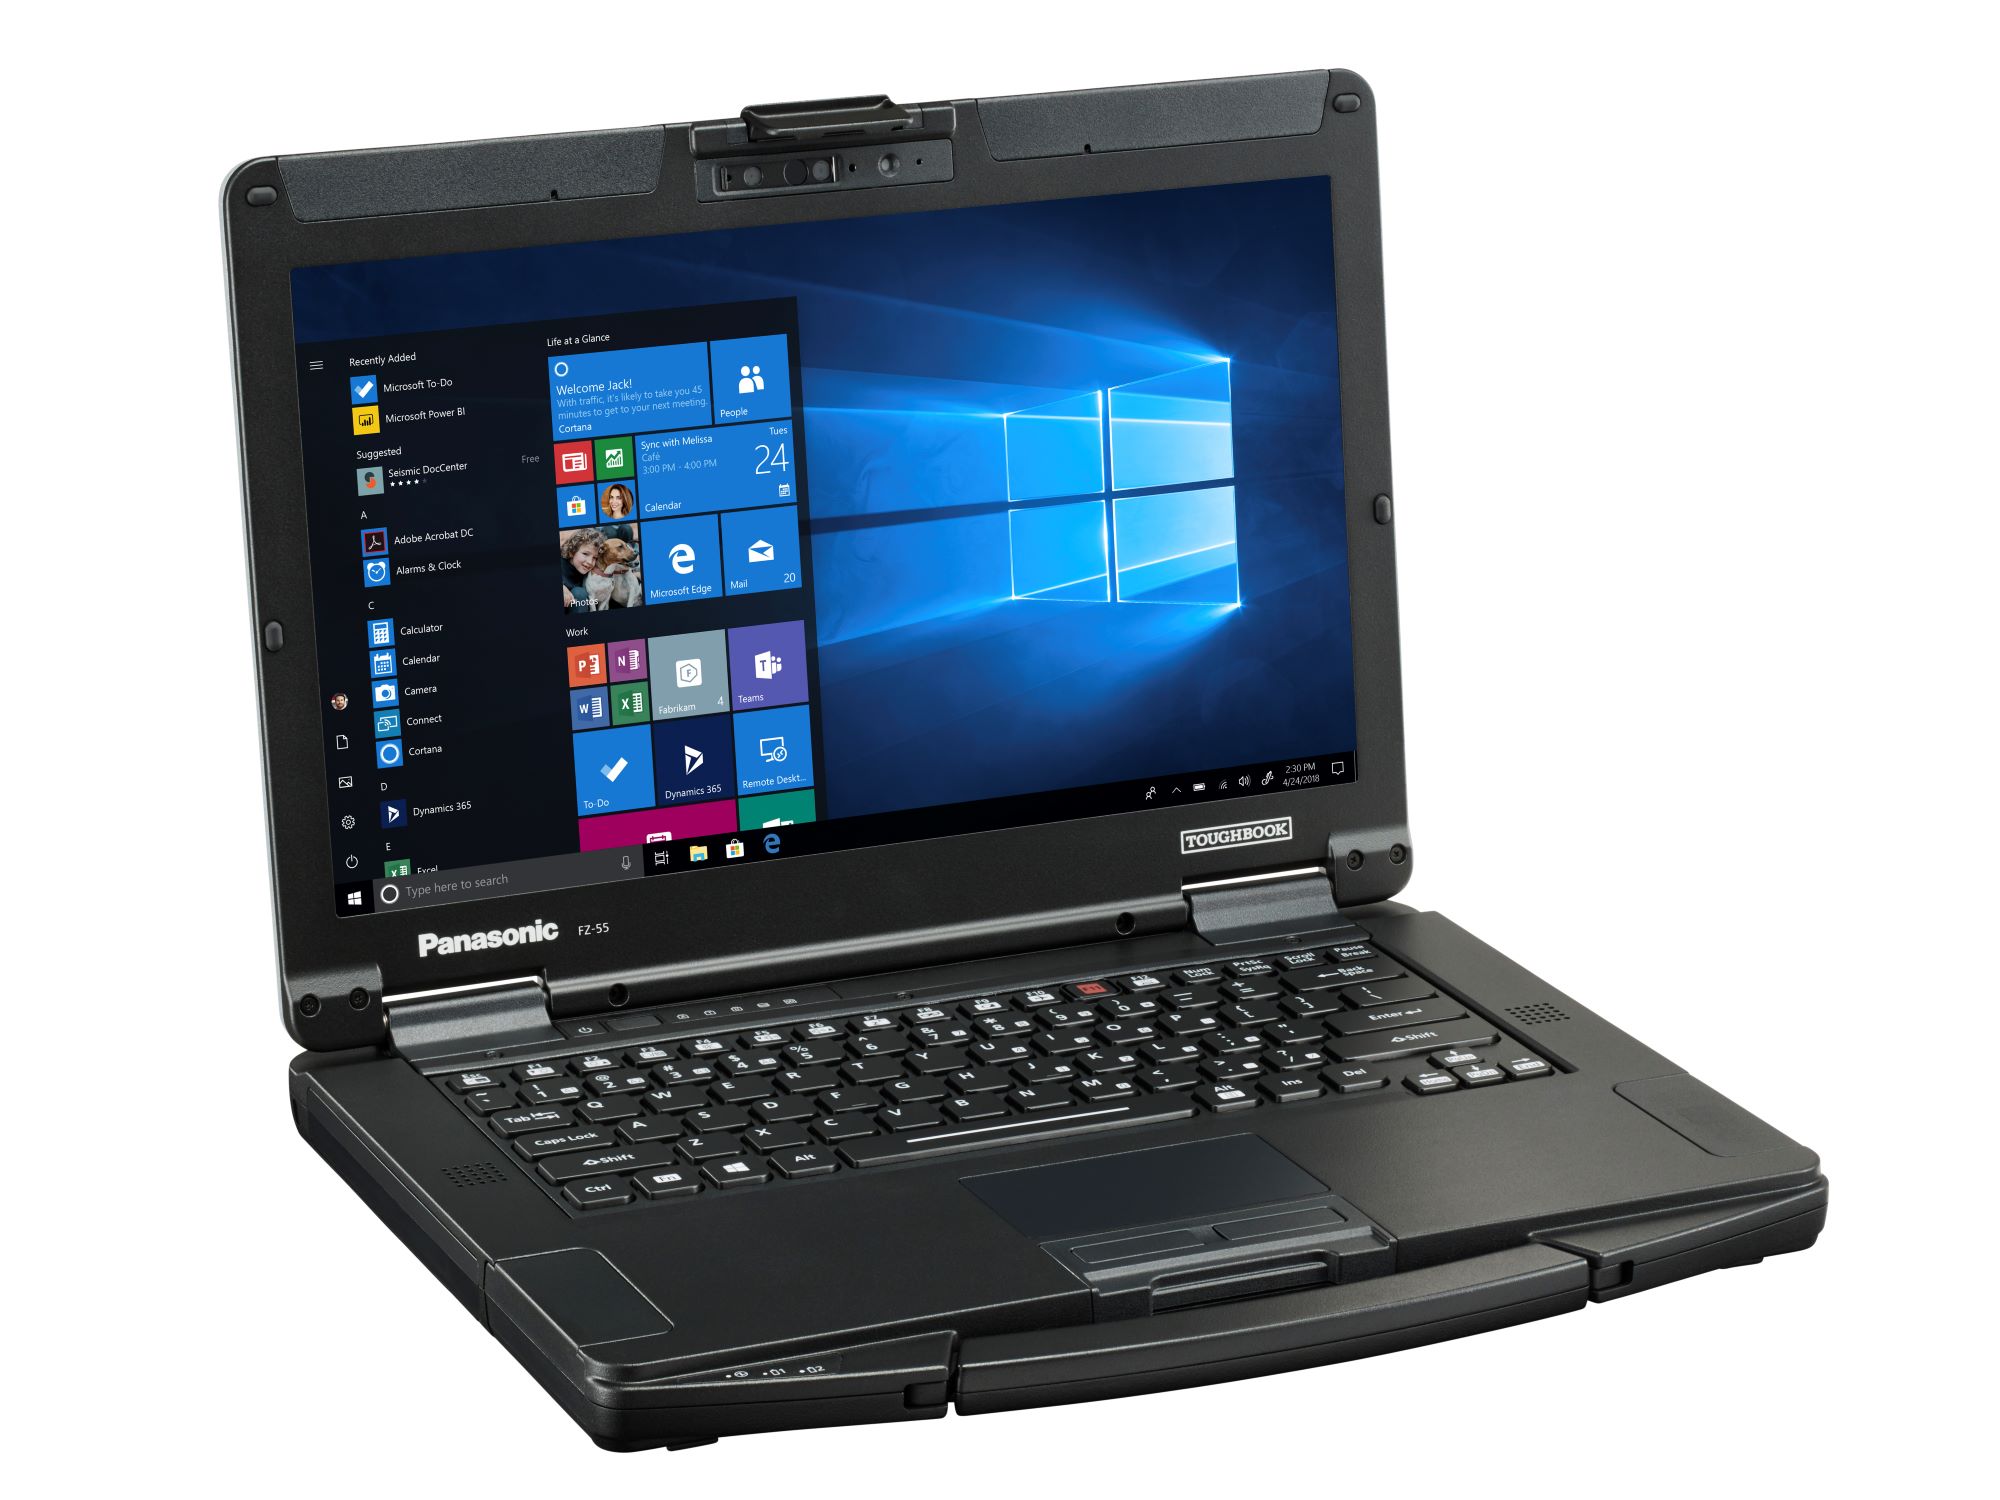
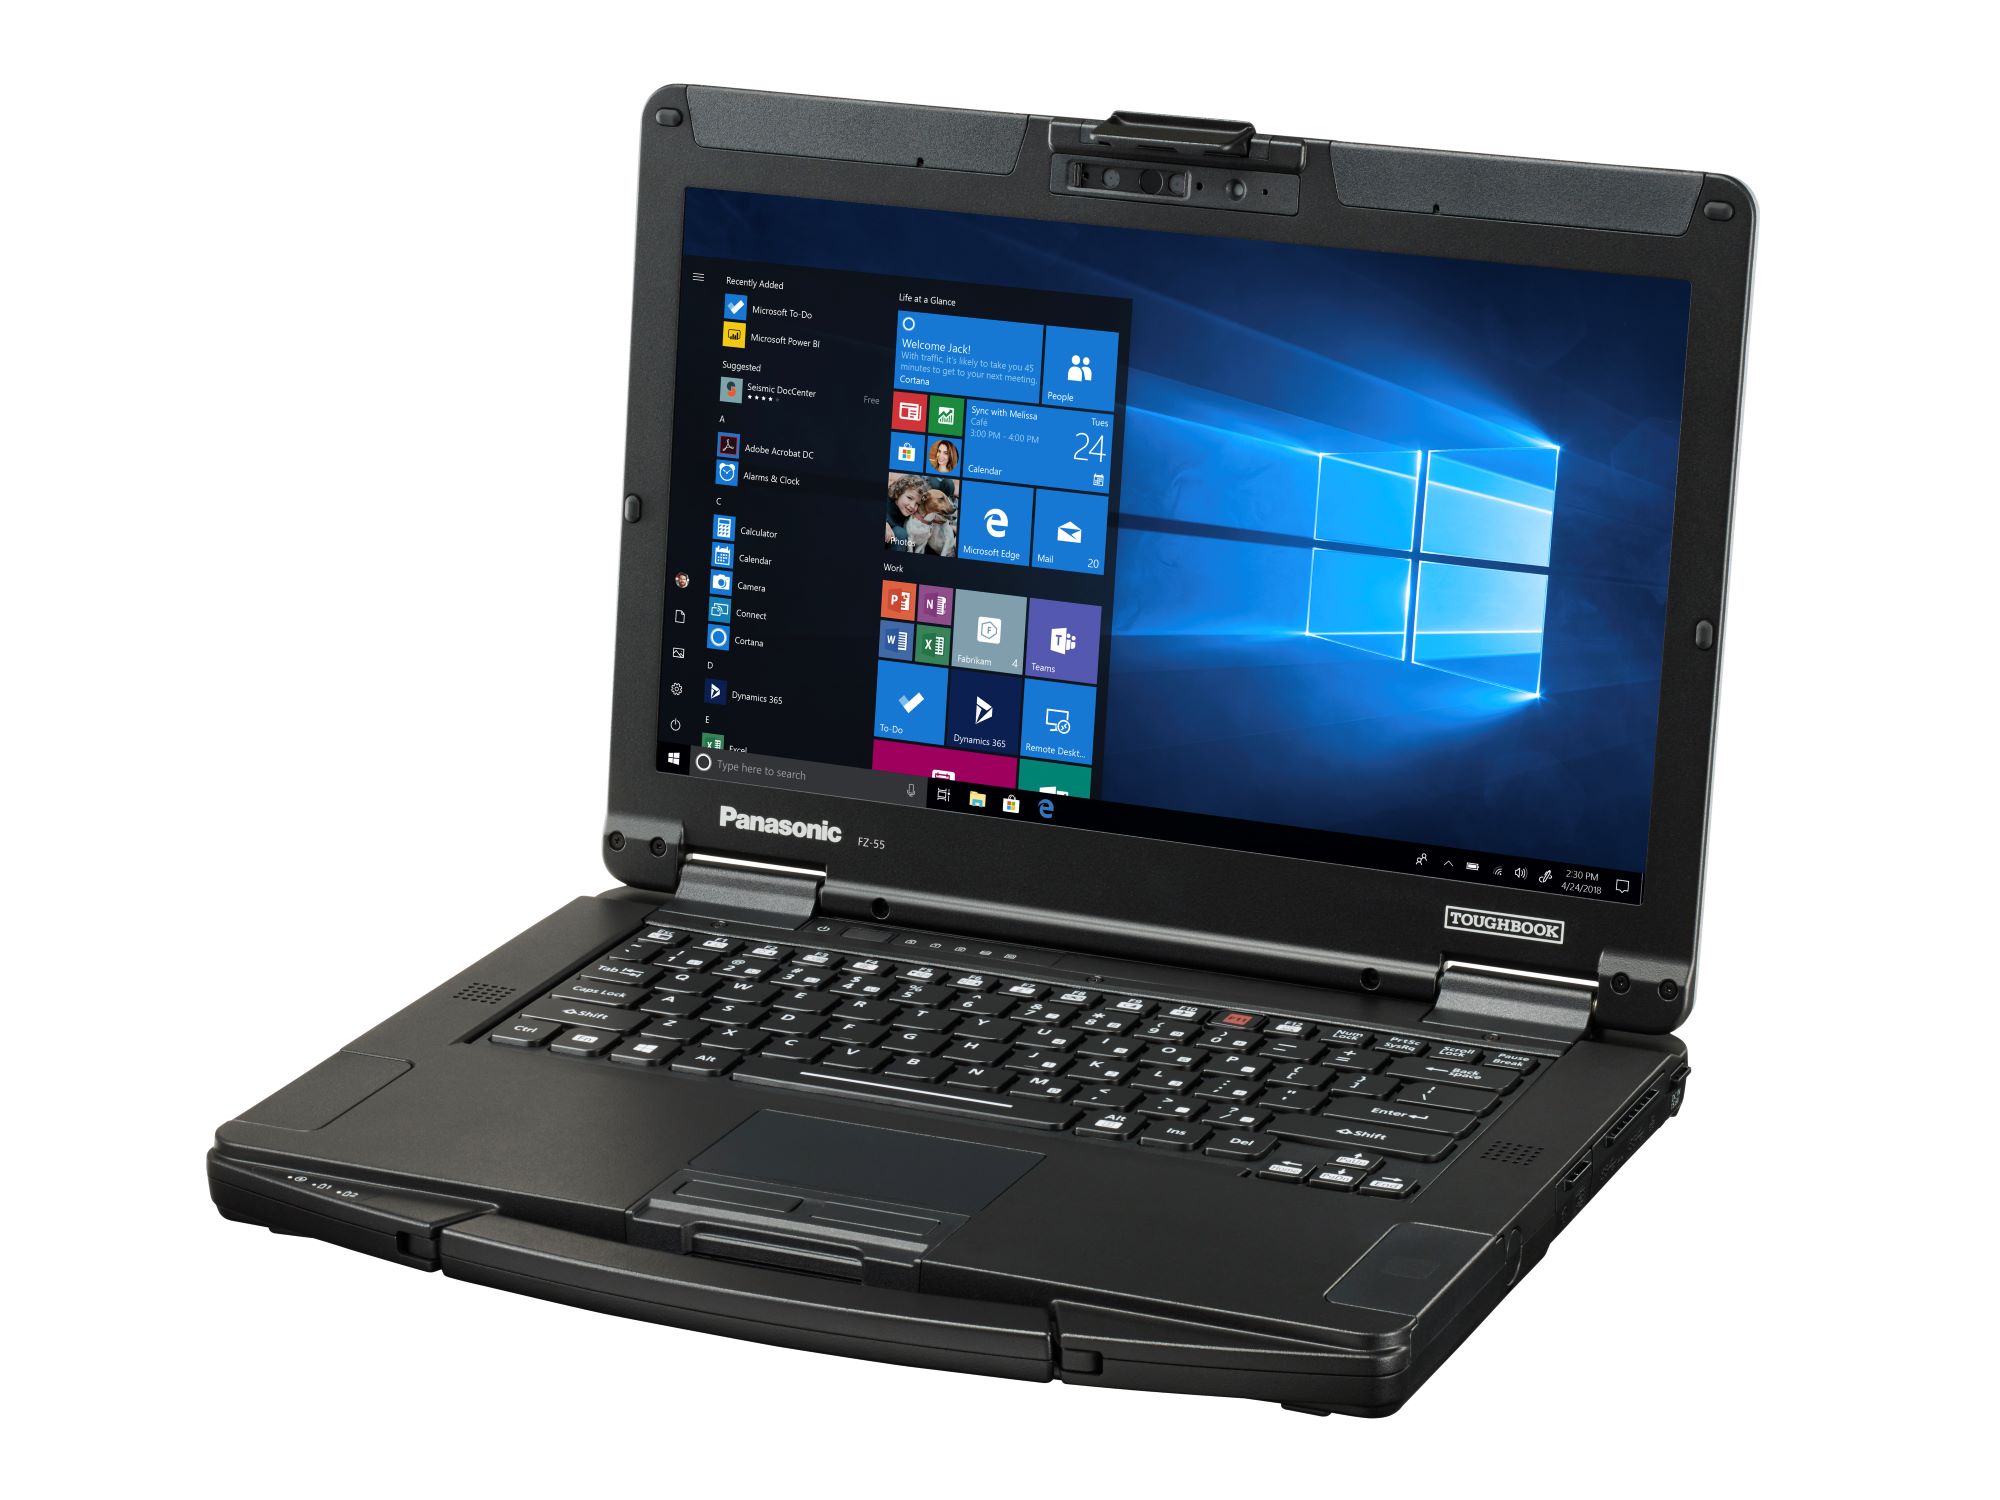
Panasonic Toughbook FZ-55 MK1 Laptop Review
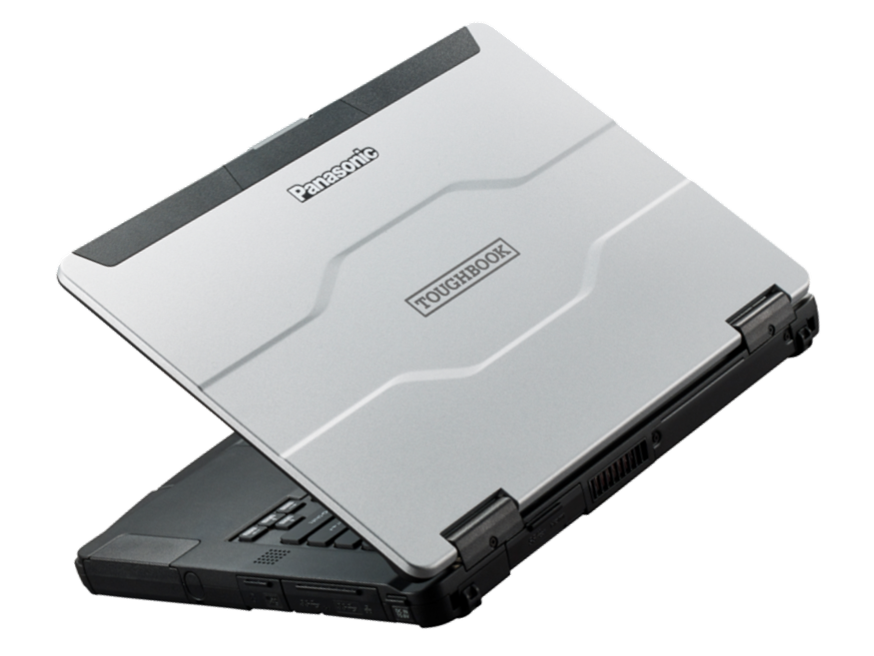
The Panasonic Toughbook 55 MK1 directly succeeds the last generation Toughbook 54 MK3 that we reviewed last year. It introduces a host of changes including new IP ratings and upgraded hardware while keeping the familiar chassis design mostly intact.
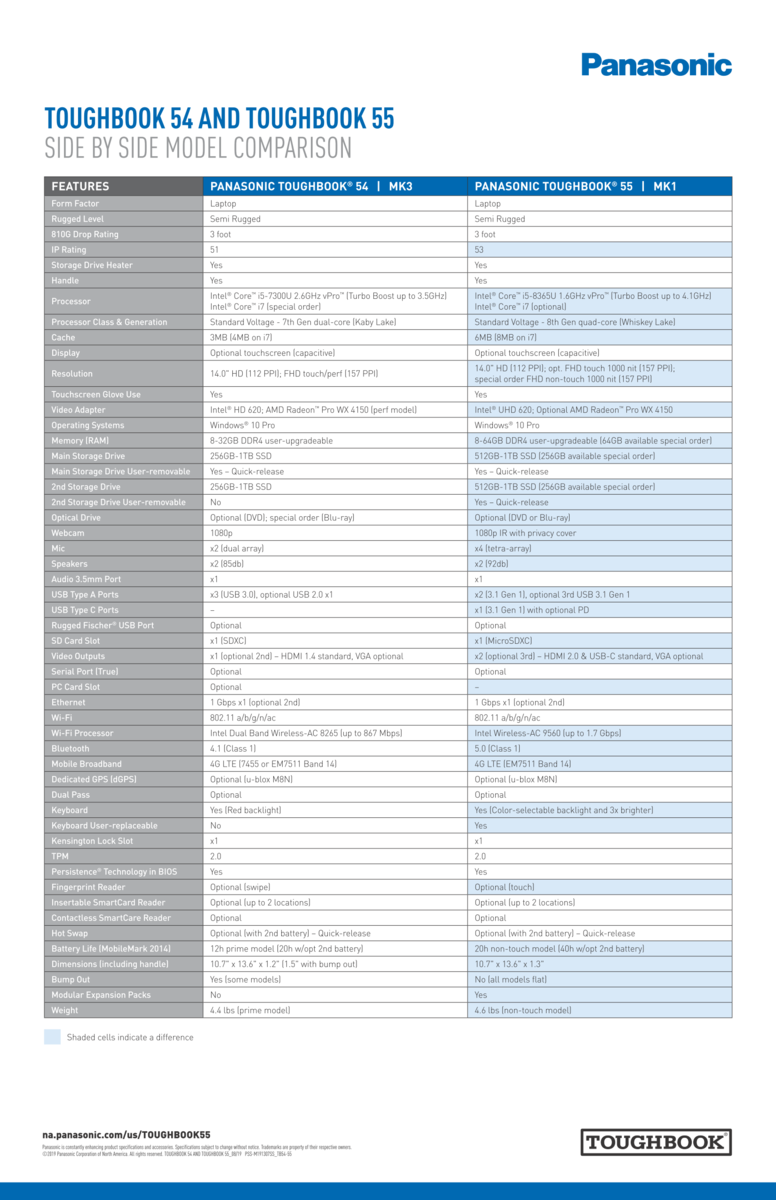
The list of gen-to-gen changes and supported features is enormous as detailed by Panasonic themselves through the official comparison tables below. For this review, we'll be checking out the core characteristics of the Toughbook 55 including its display, performance, and battery life. The system competes directly with other rugged laptops designed for industrial or outdoor environments including the Dell Latitude 7424 Rugged and Getac S410.
See the official Panasonic Toughbook 55 product page here for more information on pricing and features.
More Panasonic reviews:
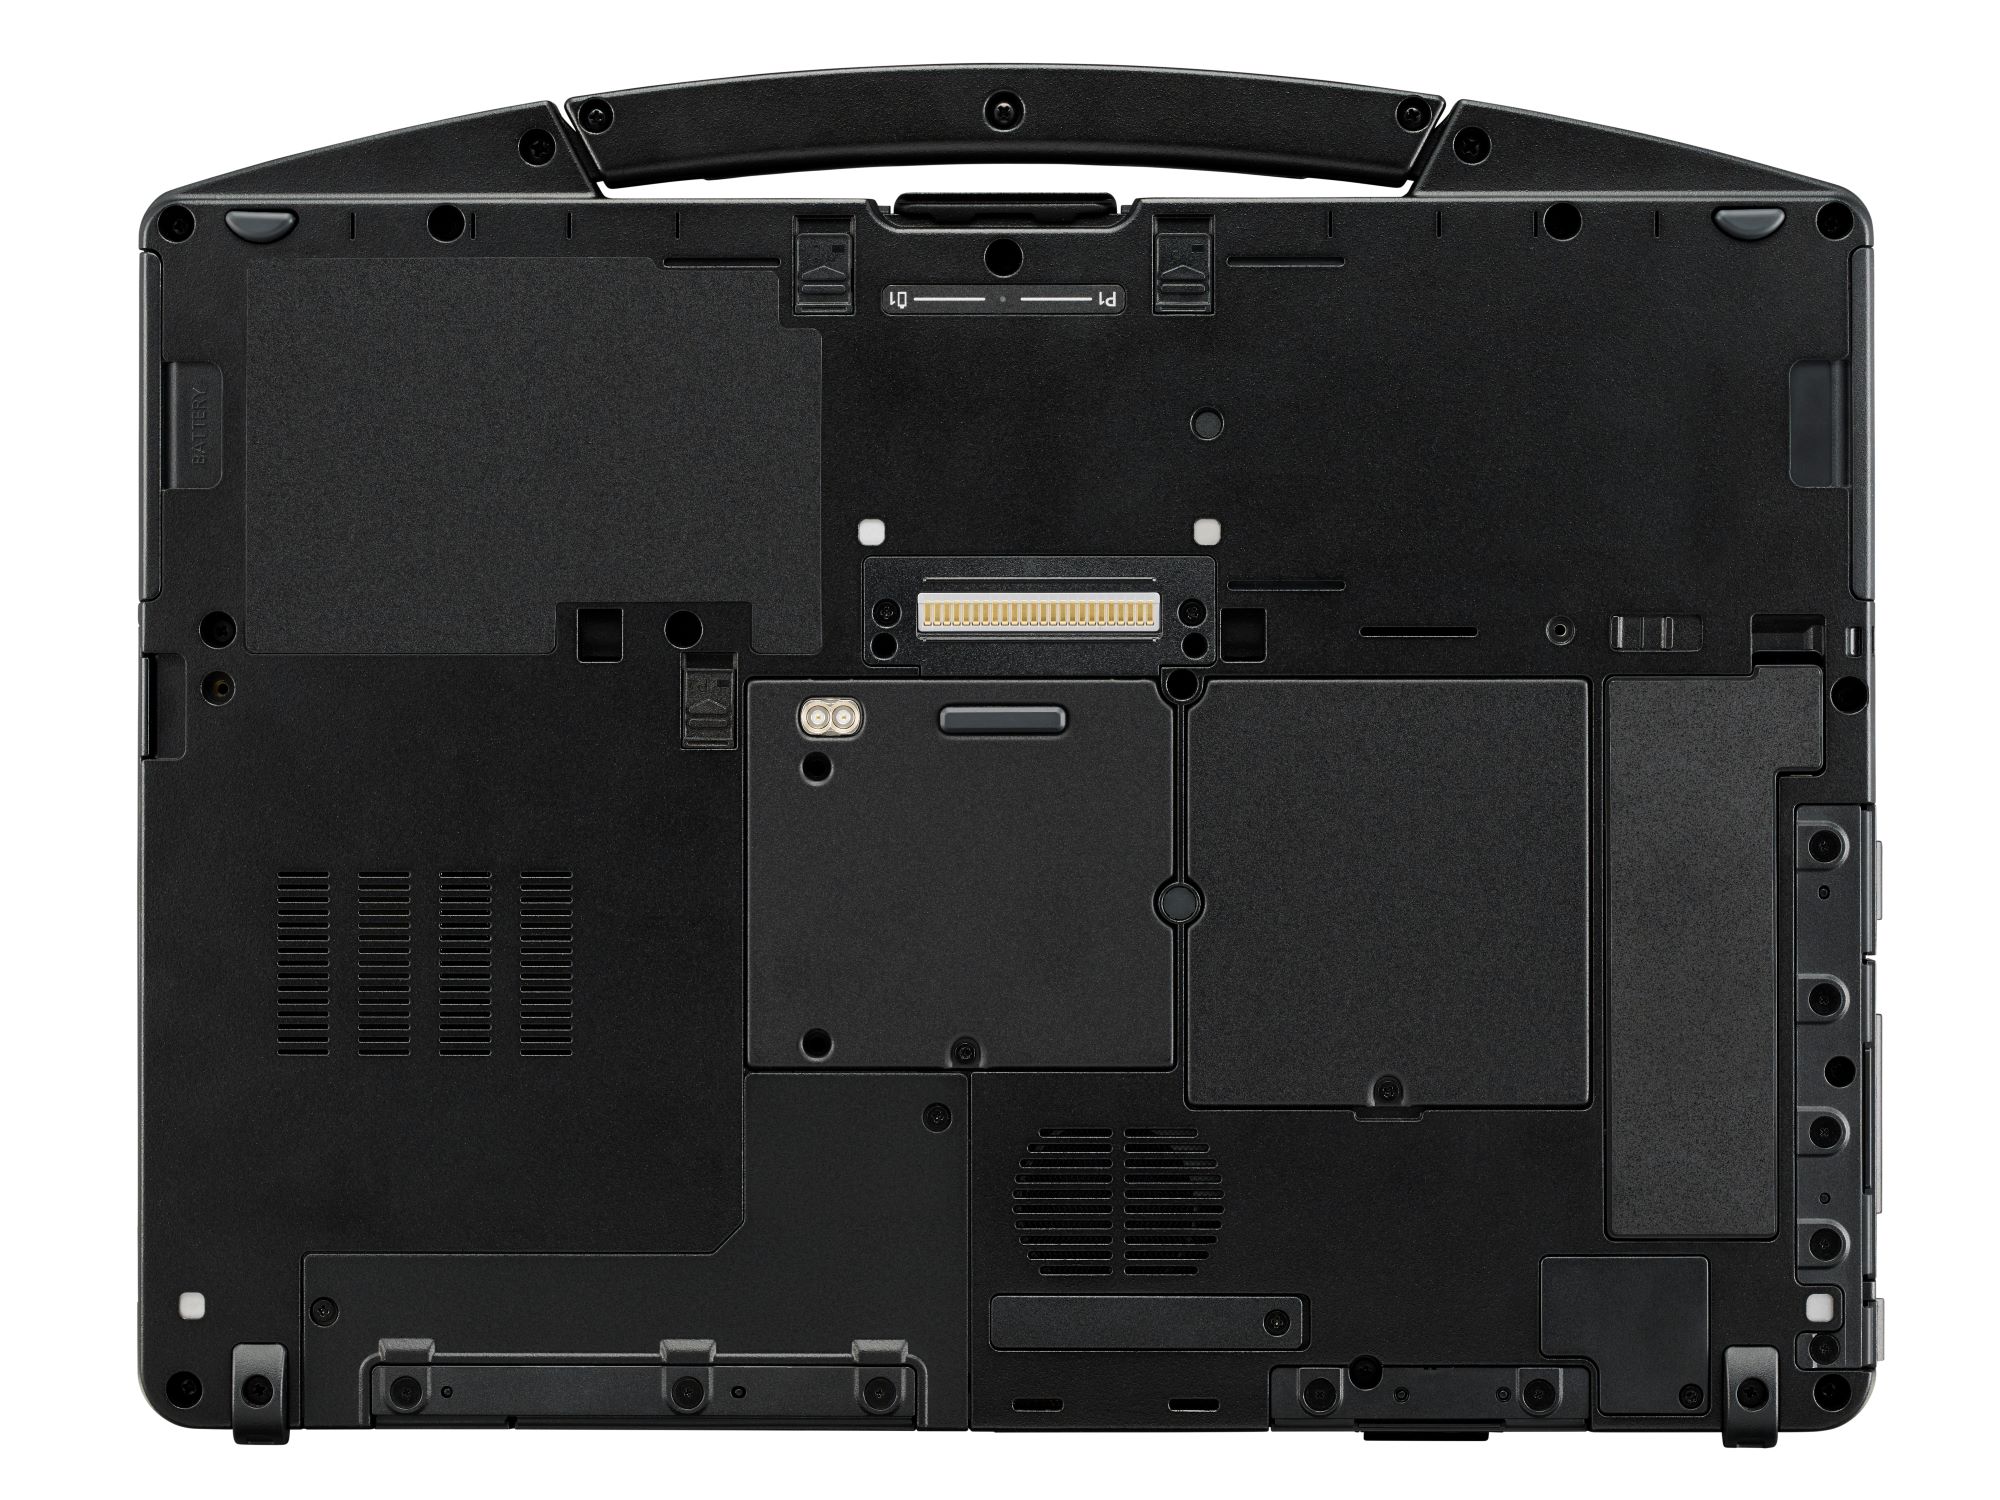
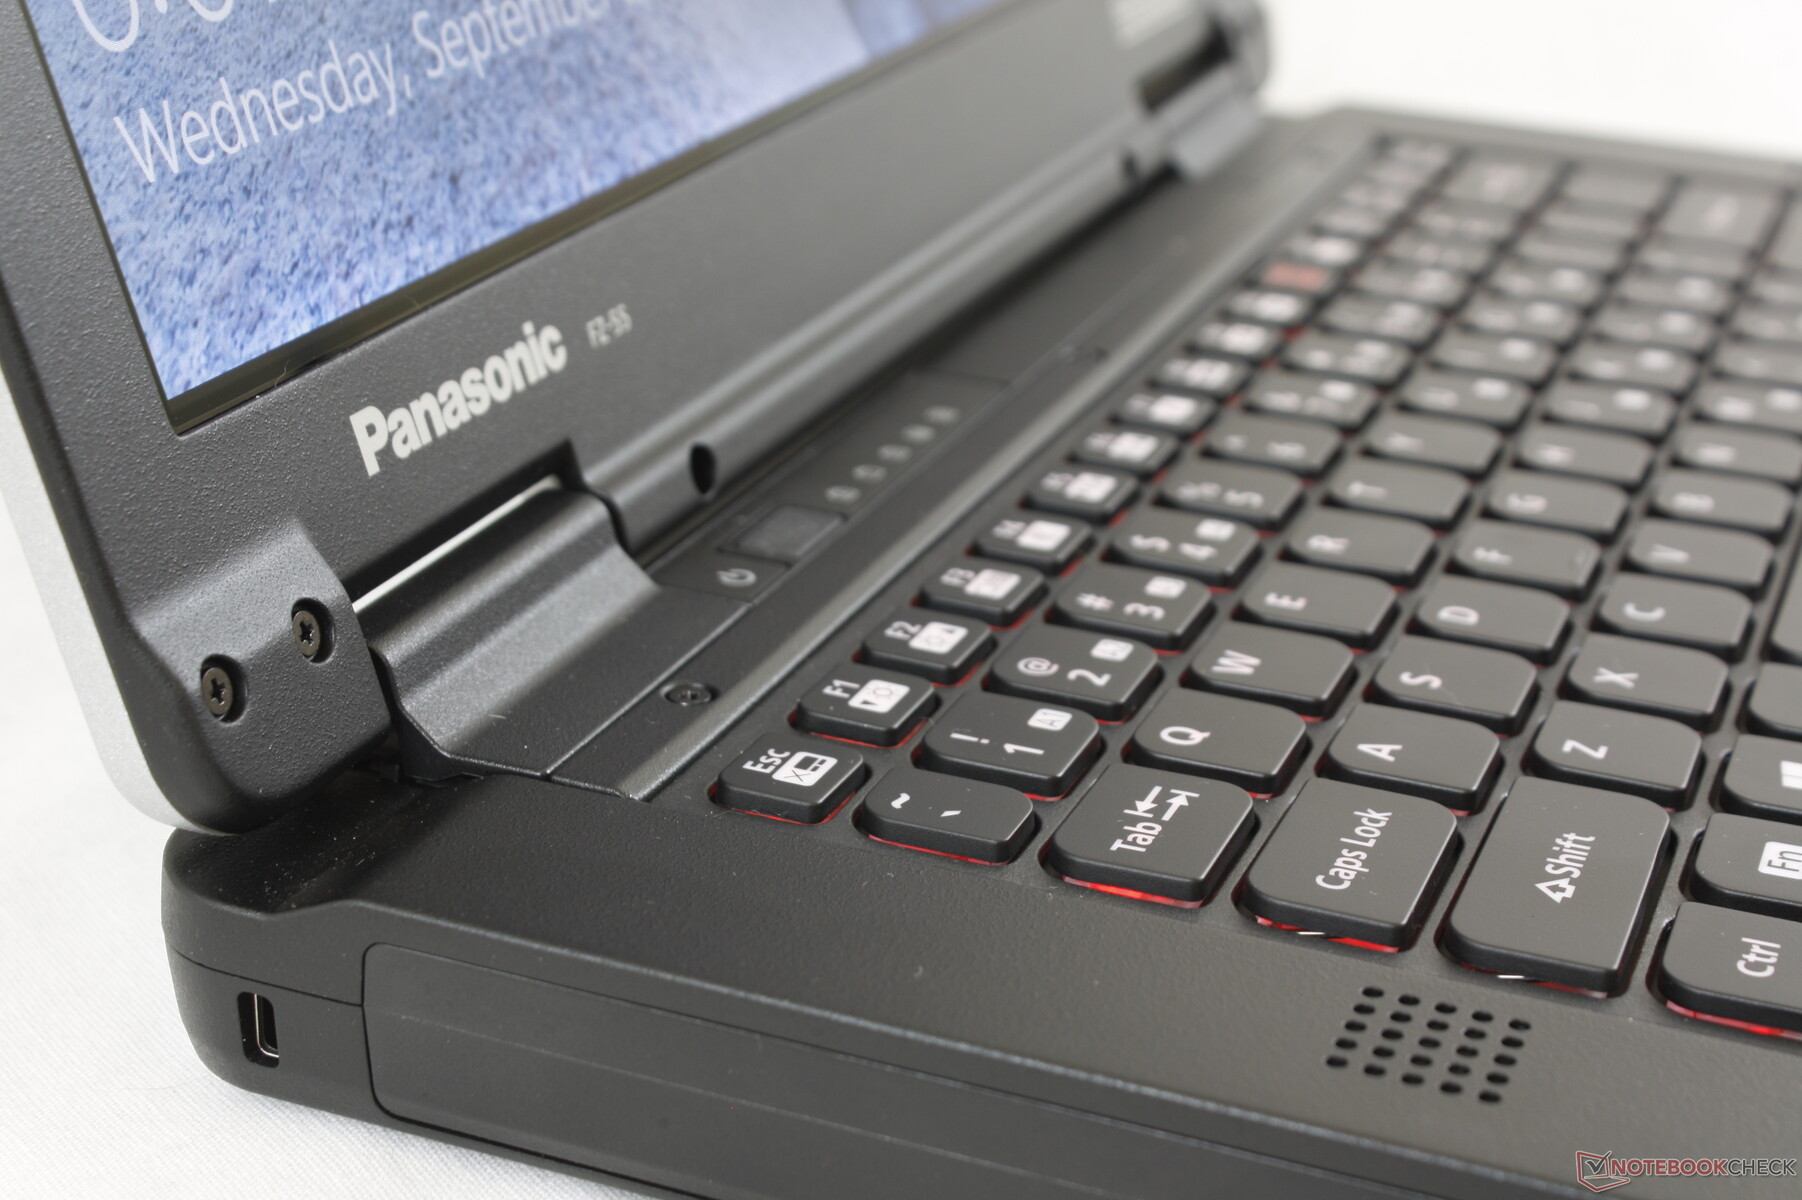
Case
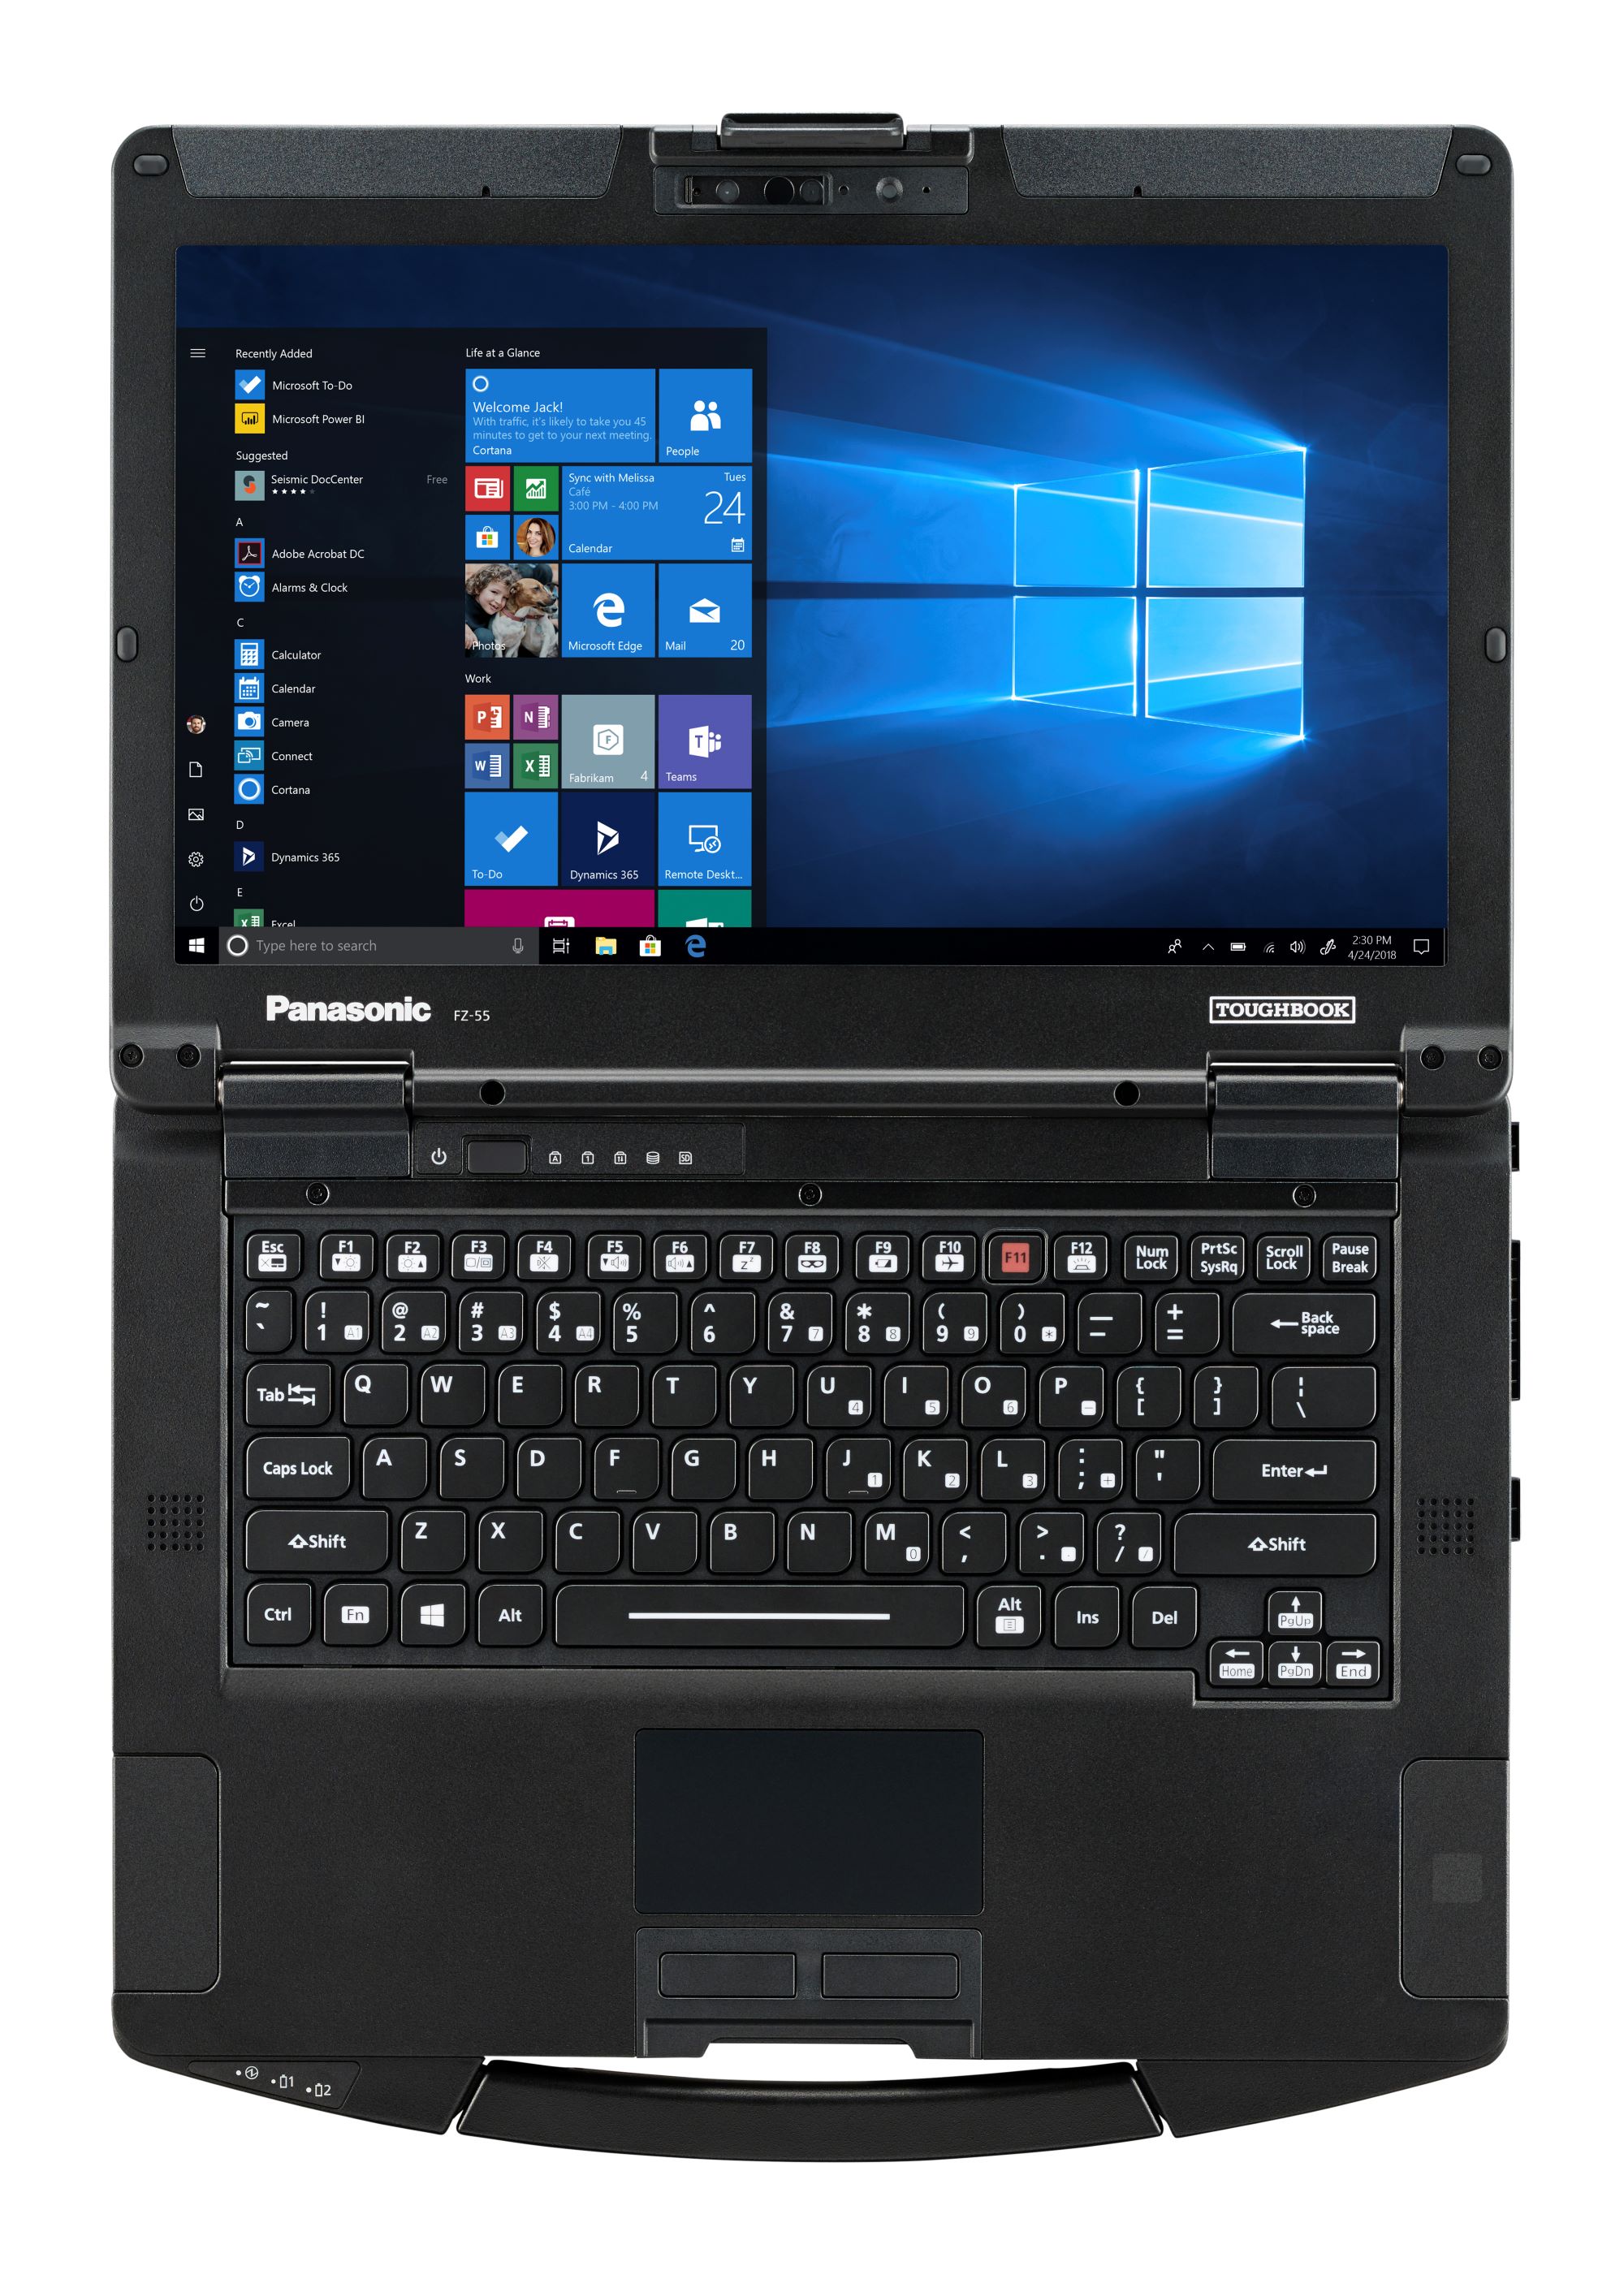
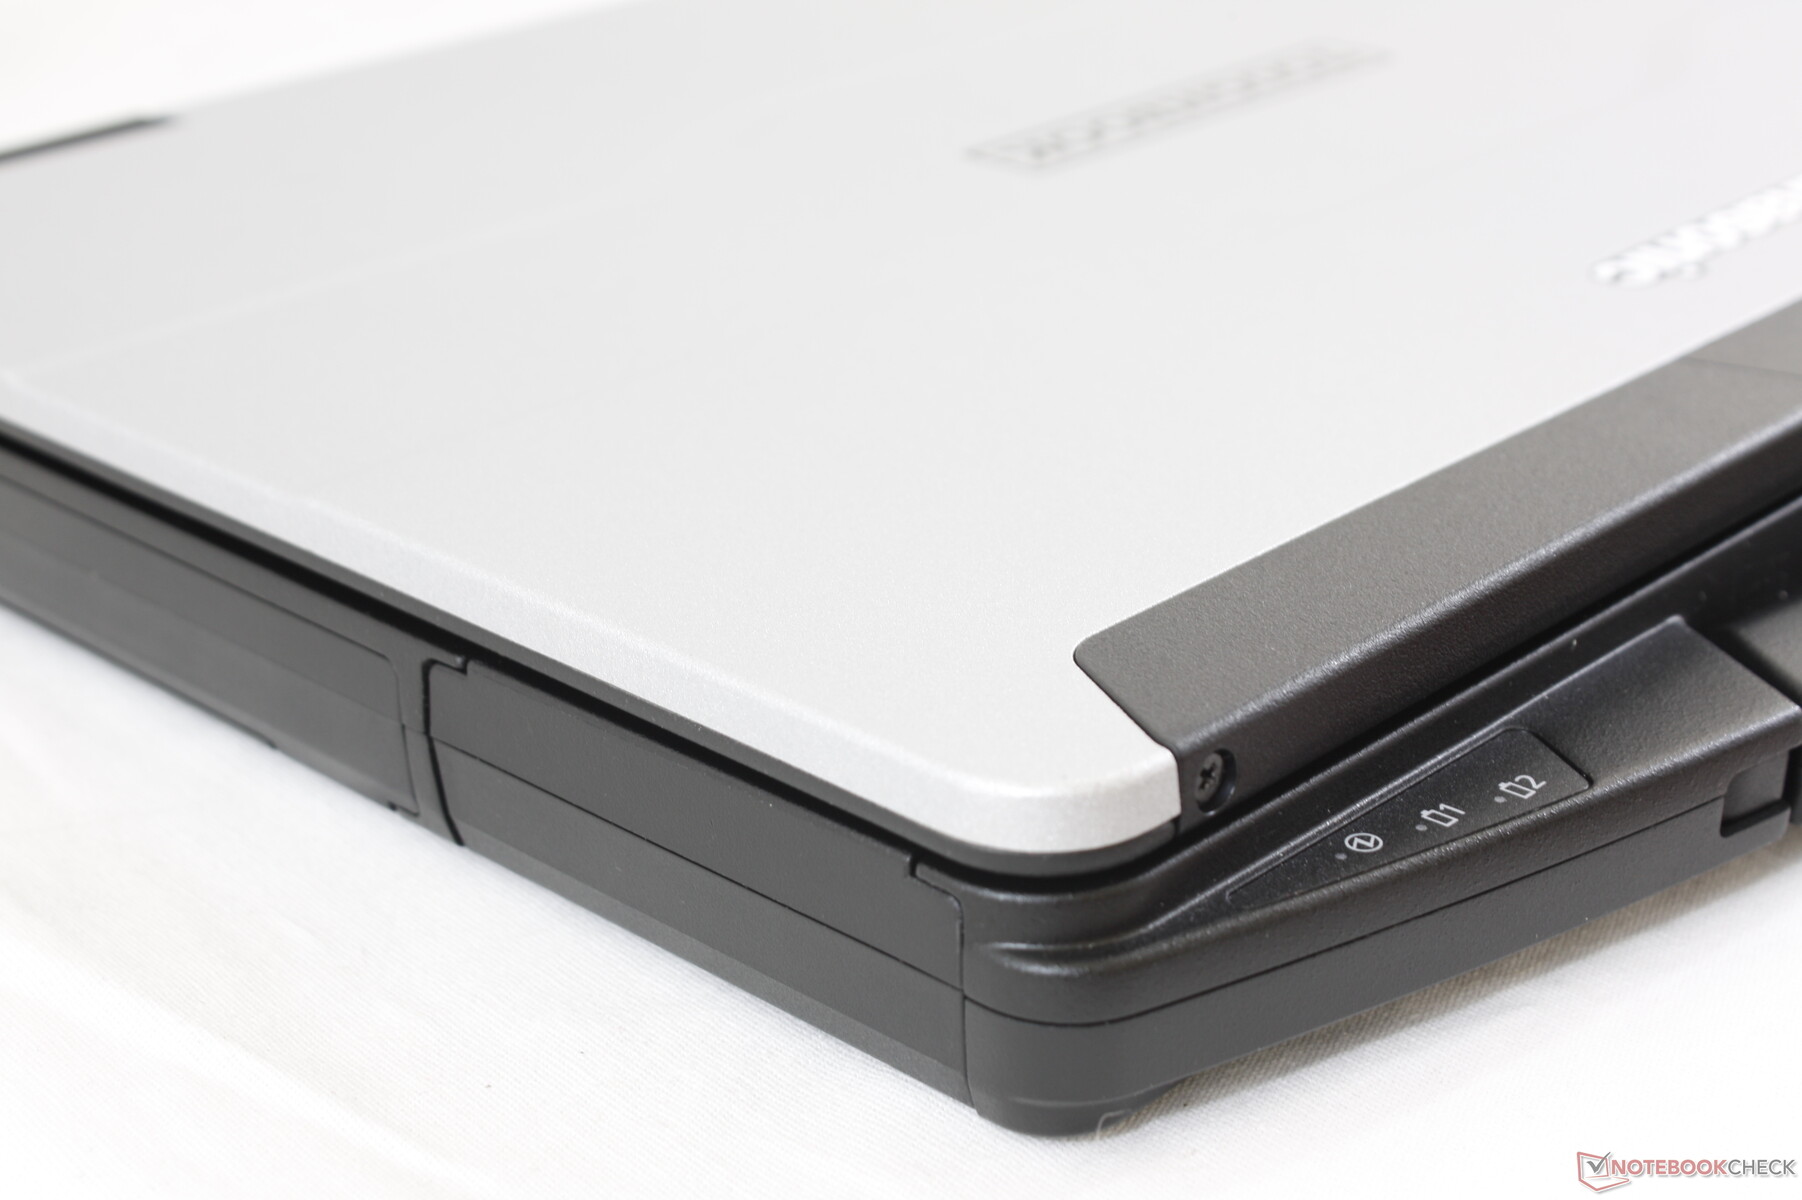
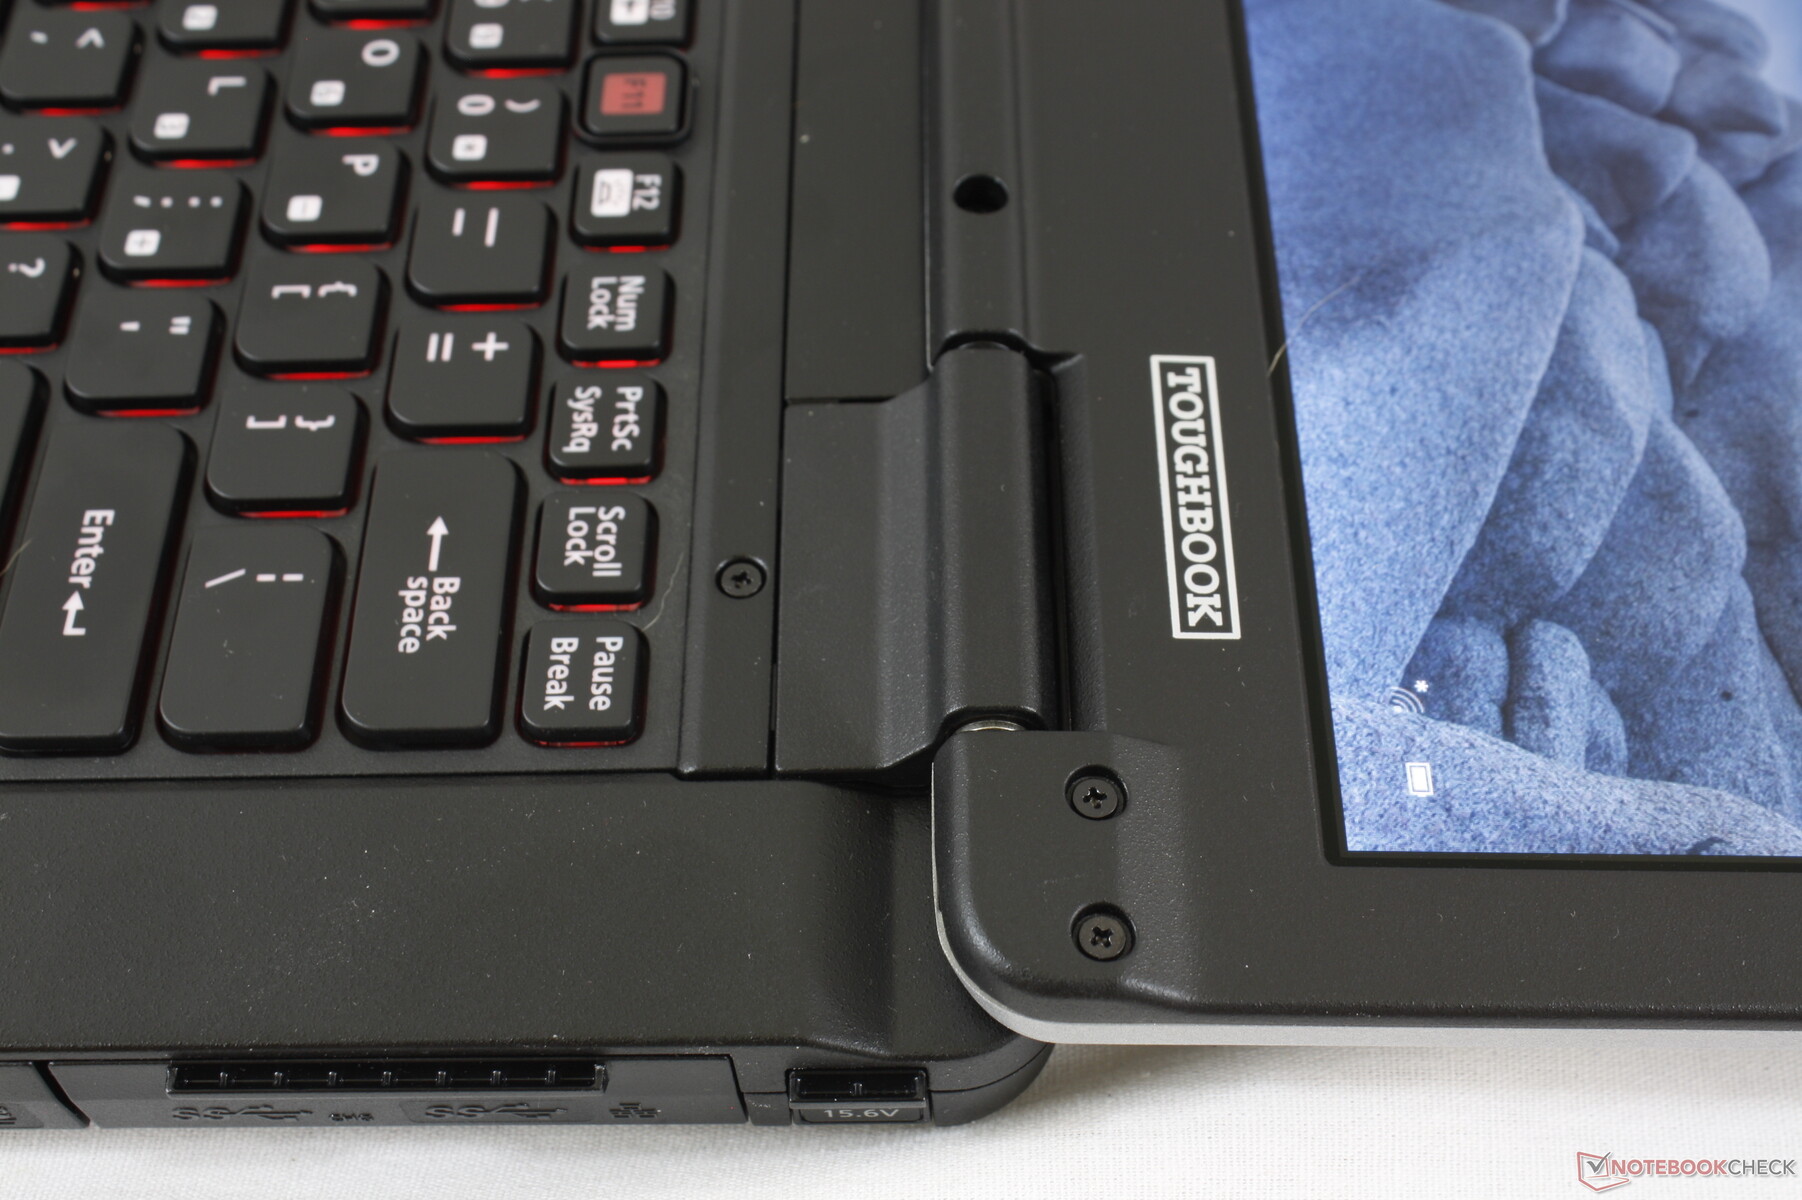
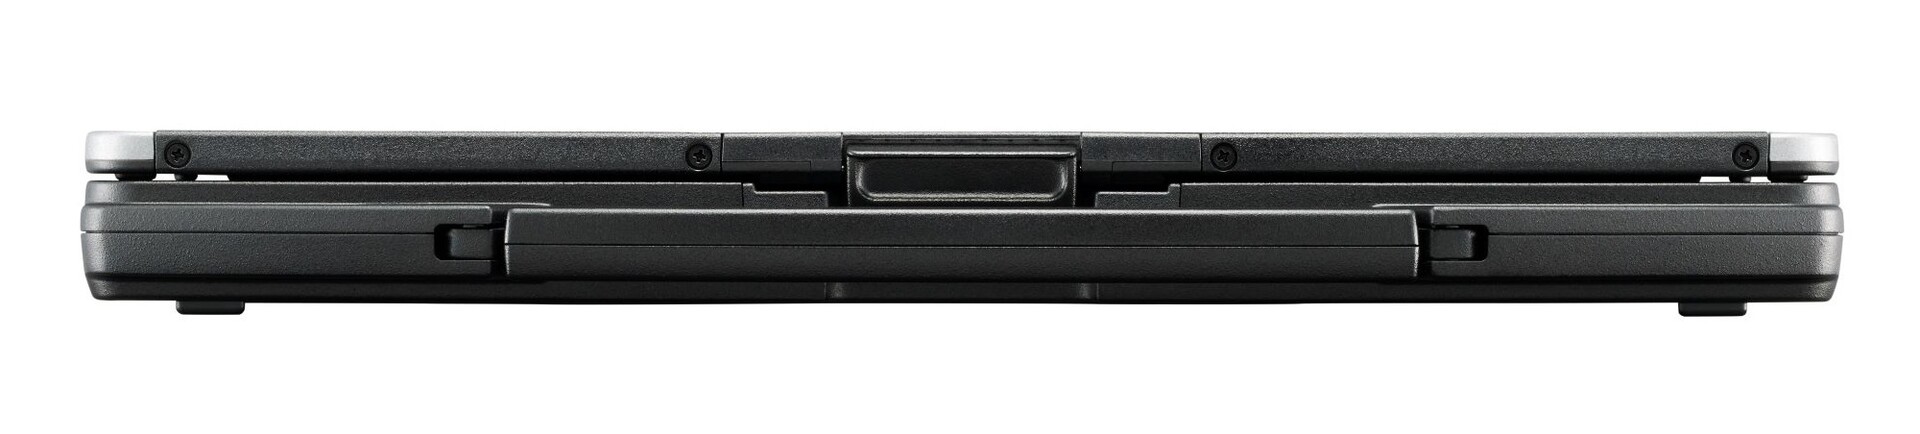
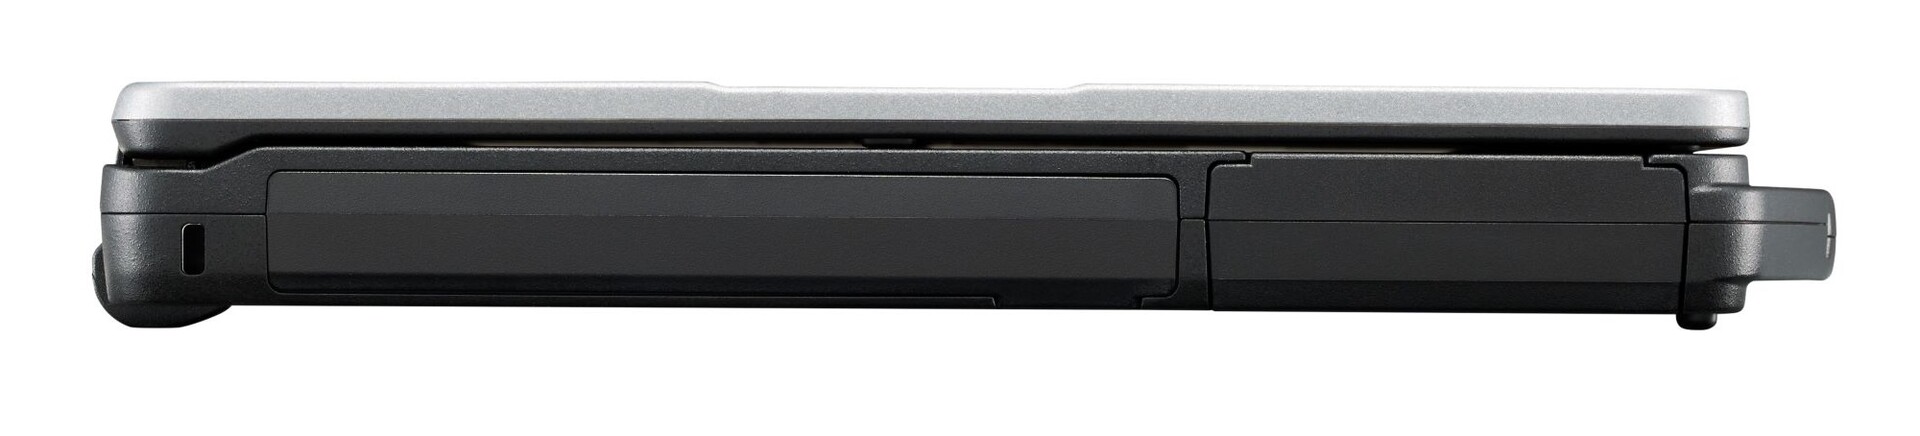
Visually, the magnesium alloy chassis has not changed very much from the Tooughbook 54 as even their dimensions are nearly identical between them. Surfaces and hinges remain rigid and stronger than what you would find on any consumer laptop.
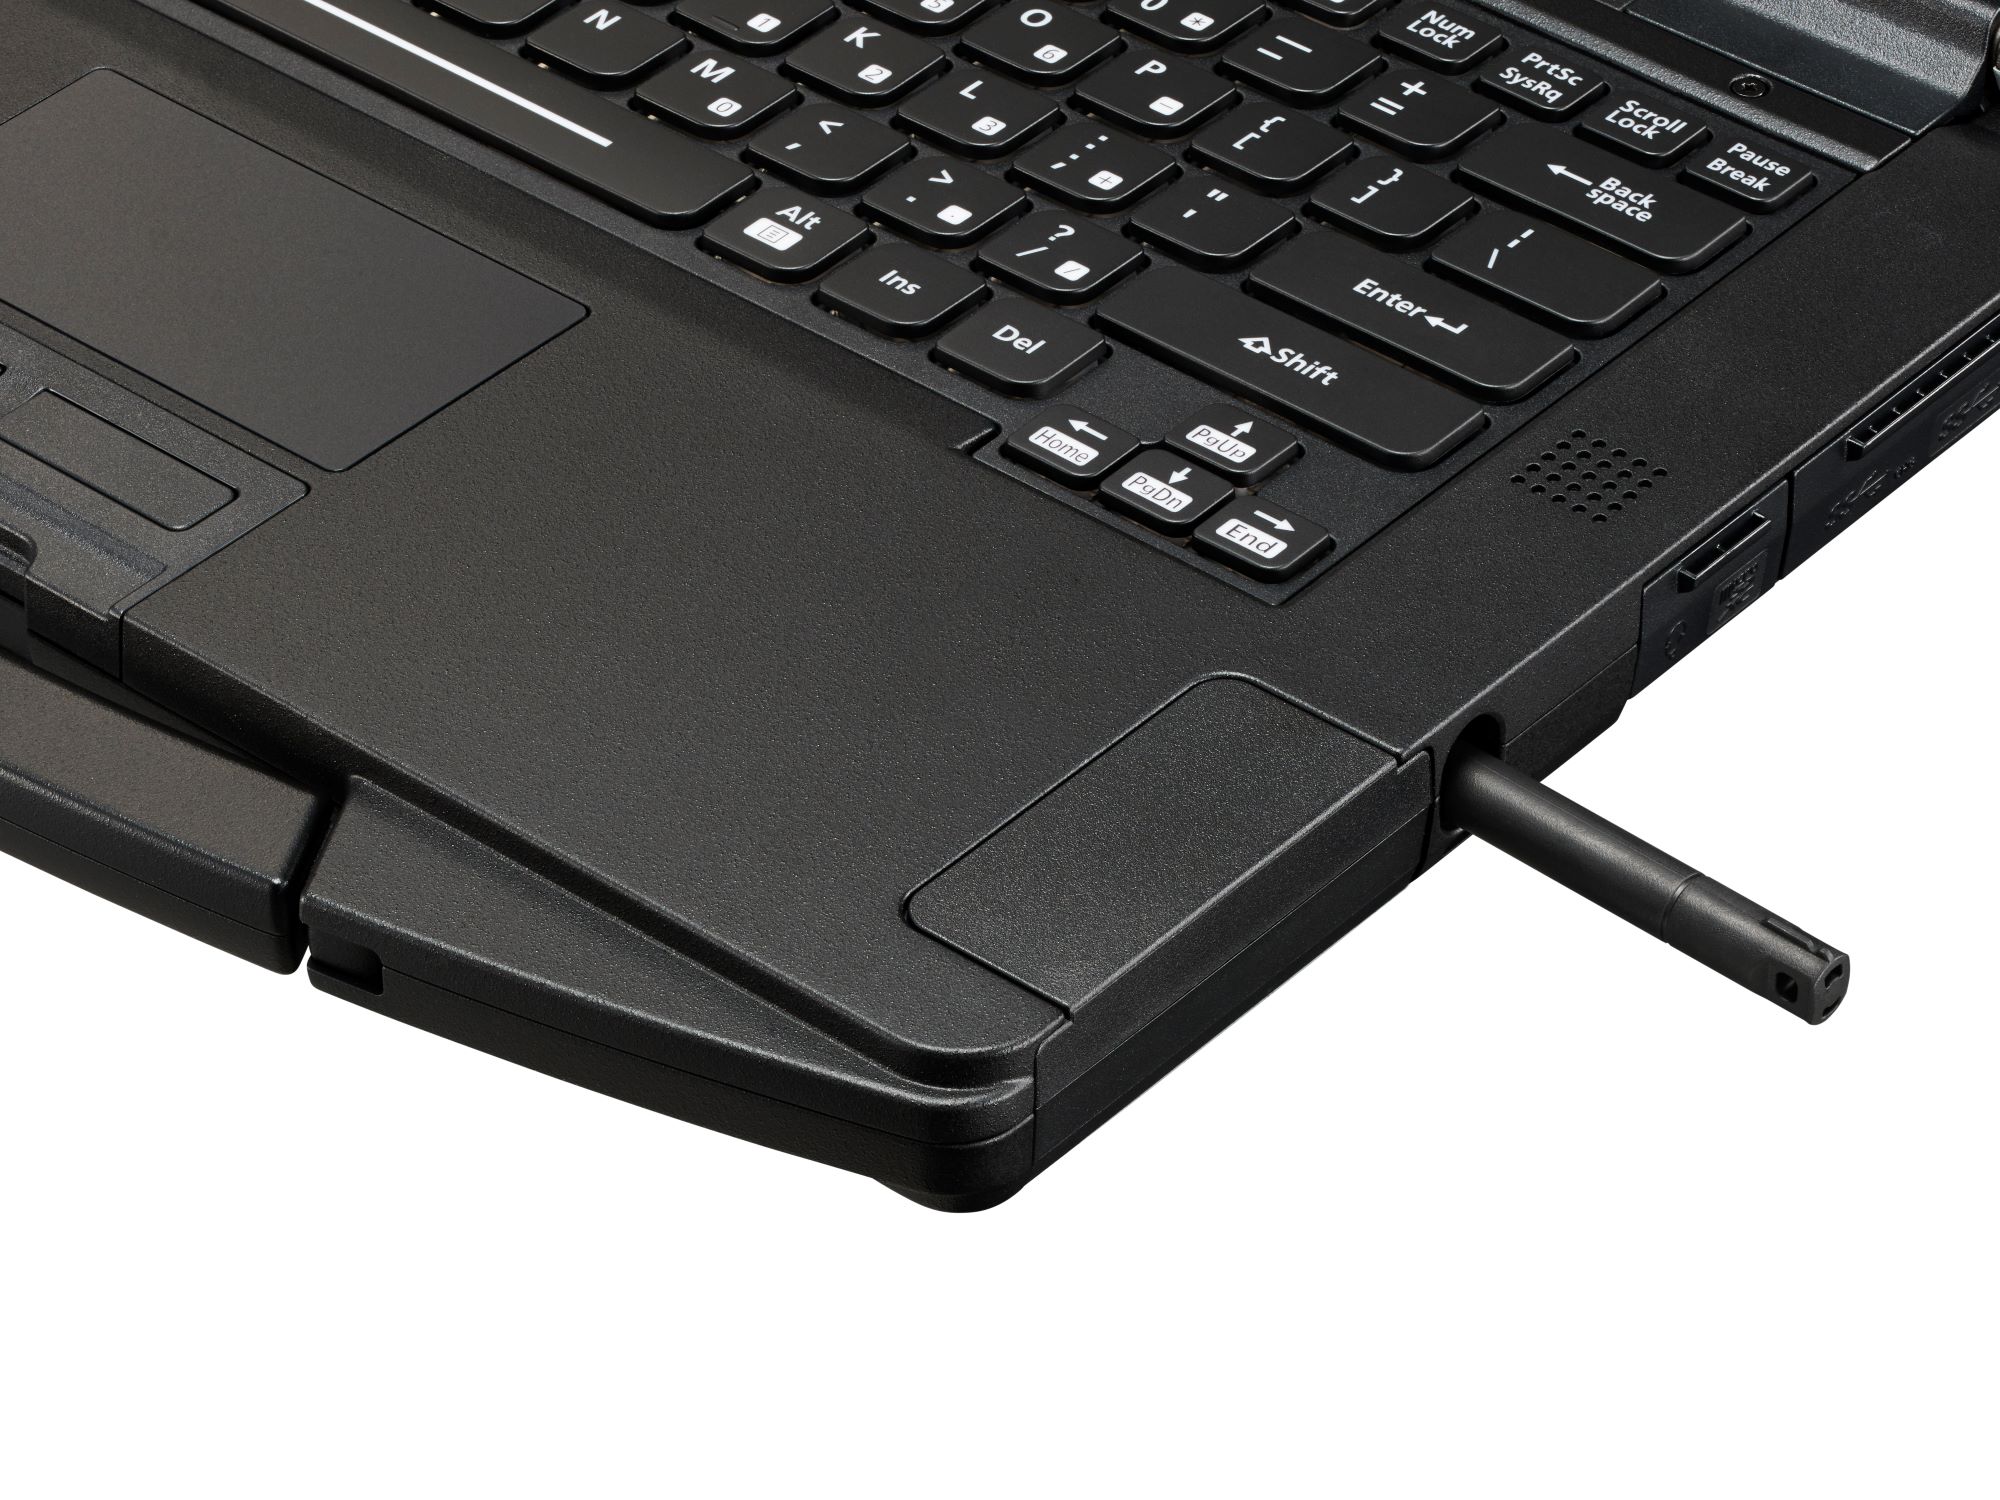
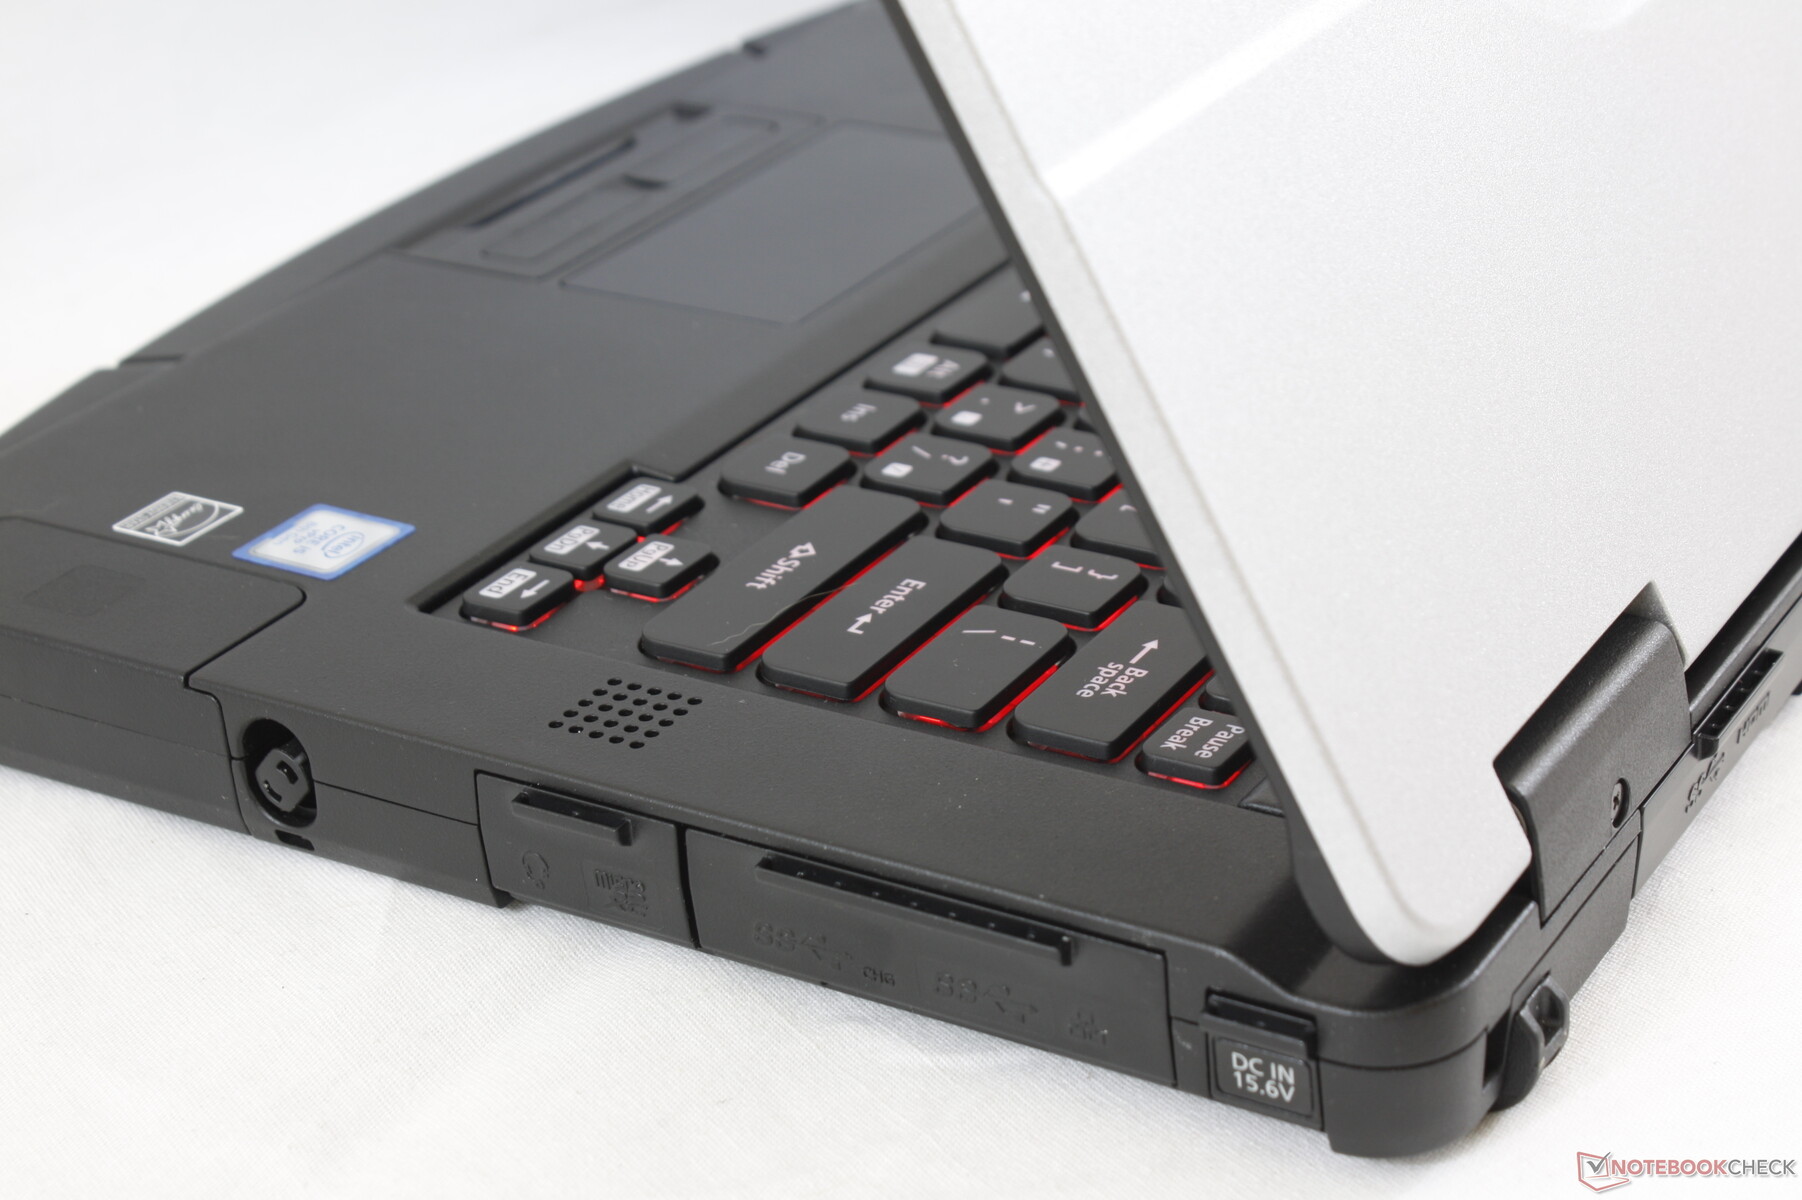
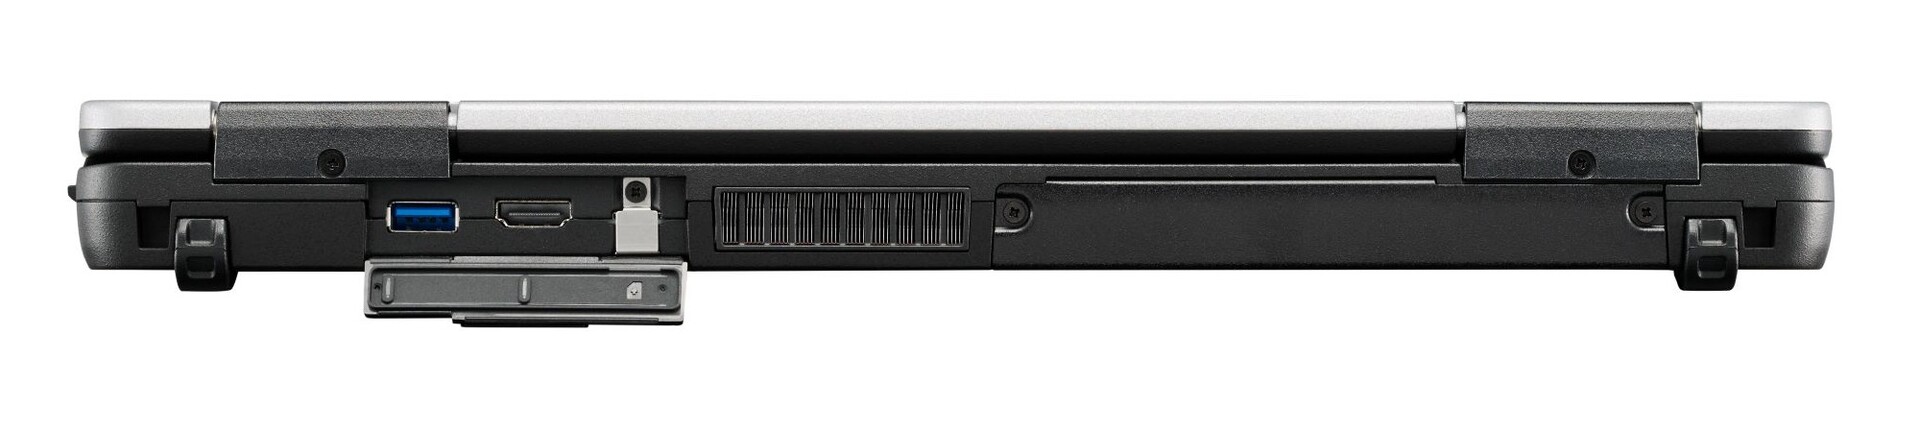
Ports
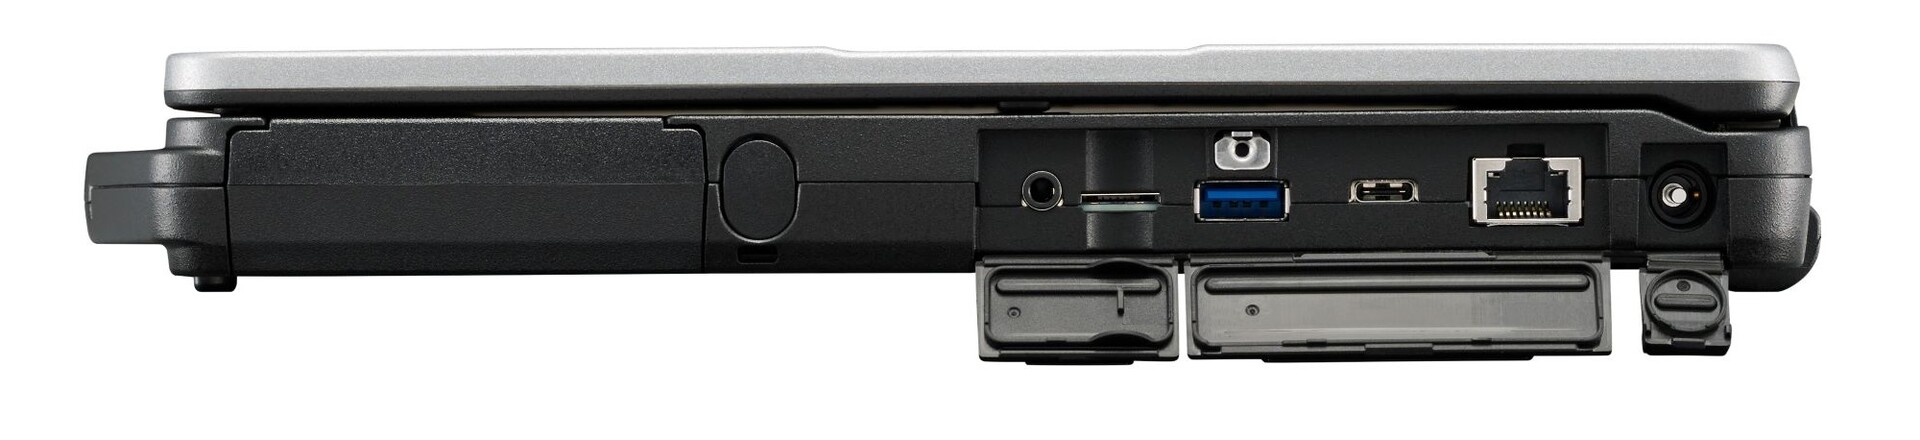
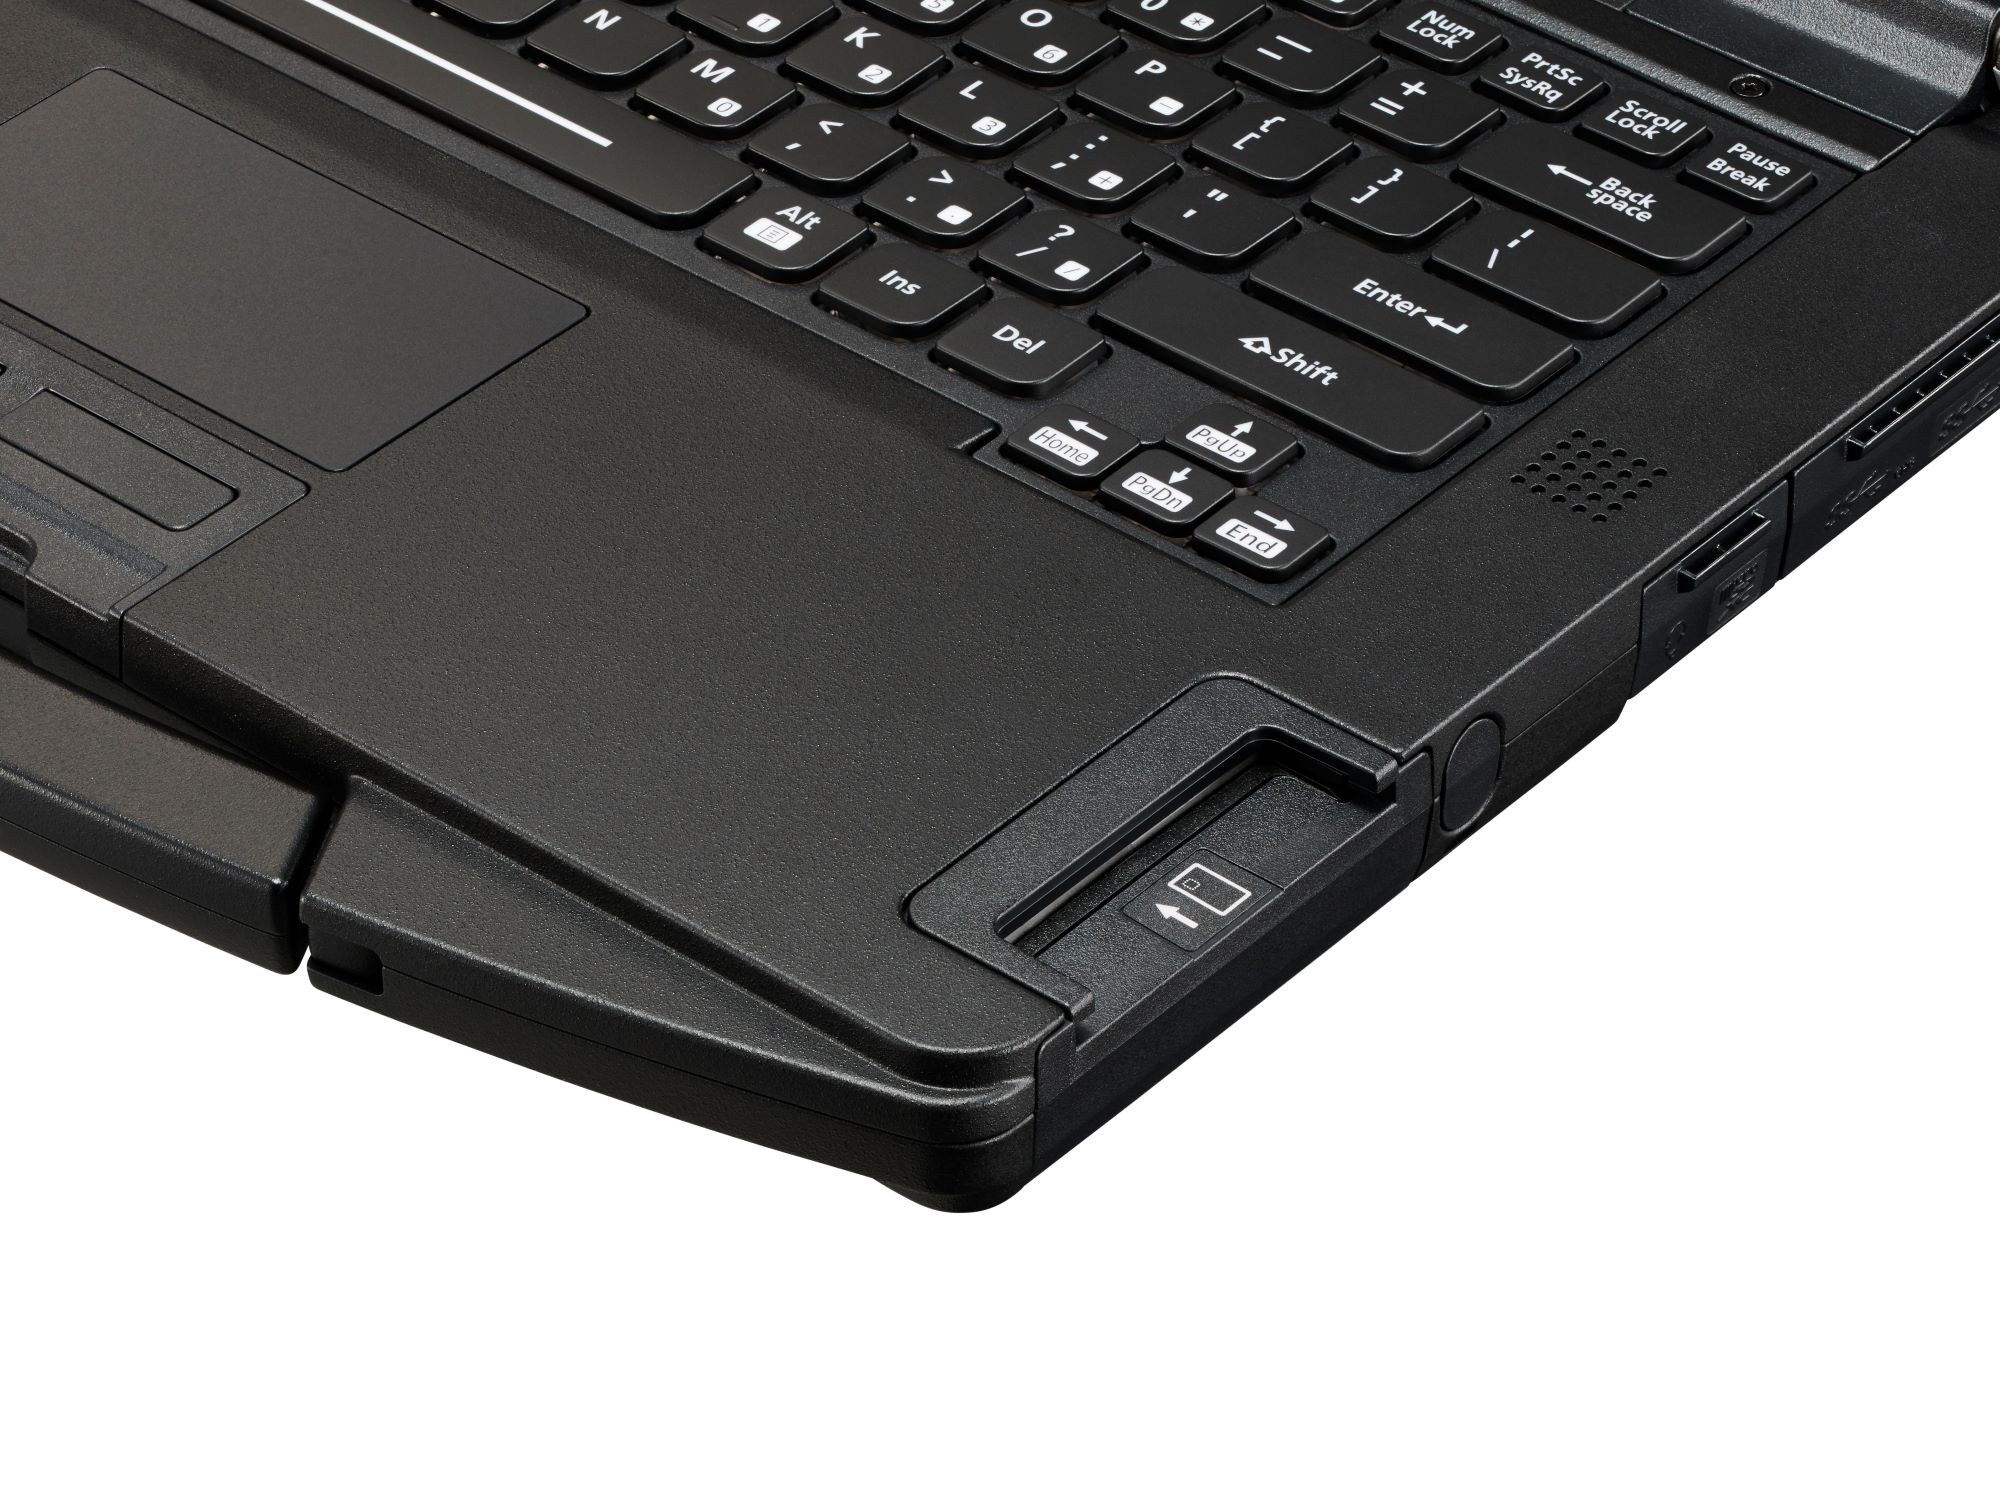
SD Card Reader
Unlike the older Toughbook 54 and its full-size SD reader, the Toughbook 55 uses a smaller and slower spring-loaded MicroSD reader instead. Panasonic says the slightly different dimensions of the new design were partly responsible for the omission of a full-size SD reader. Transfer rates are still good at about 80 MB/s with a UHS-II card.
| SD Card Reader | |
| average JPG Copy Test (av. of 3 runs) | |
| Dell Latitude 5420 Rugged-P85G (Toshiba Exceria Pro SDXC 64 GB UHS-II) | |
| Dell Latitude 7424 Rugged Extreme (Toshiba Exceria Pro SDXC 64 GB UHS-II) | |
| Panasonic Toughbook CF-54G2999VM (Toshiba Exceria Pro SDXC 64 GB UHS-II) | |
| Getac S410 (Toshiba Exceria Pro SDXC 64 GB UHS-II) | |
| Panasonic Toughbook FZ-55 (Toshiba Exceria Pro M501 64 GB UHS-II) | |
| maximum AS SSD Seq Read Test (1GB) | |
| Dell Latitude 5420 Rugged-P85G (Toshiba Exceria Pro SDXC 64 GB UHS-II) | |
| Dell Latitude 7424 Rugged Extreme (Toshiba Exceria Pro SDXC 64 GB UHS-II) | |
| Panasonic Toughbook CF-54G2999VM (Toshiba Exceria Pro SDXC 64 GB UHS-II) | |
| Getac S410 (Toshiba Exceria Pro SDXC 64 GB UHS-II) | |
| Panasonic Toughbook FZ-55 (Toshiba Exceria Pro M501 64 GB UHS-II) | |
Communication
The Intel 9560 module is an upgrade from the Intel 8265 on last year's model by providing both Wi-Fi 5 and Bluetooth 5 connectivity. Strangely, our unit could only connect to an 802.11n network as it is unable to establish a connection to our 802.11ac network. We've never experienced anything similar on other laptops with the same Intel 9560 module.
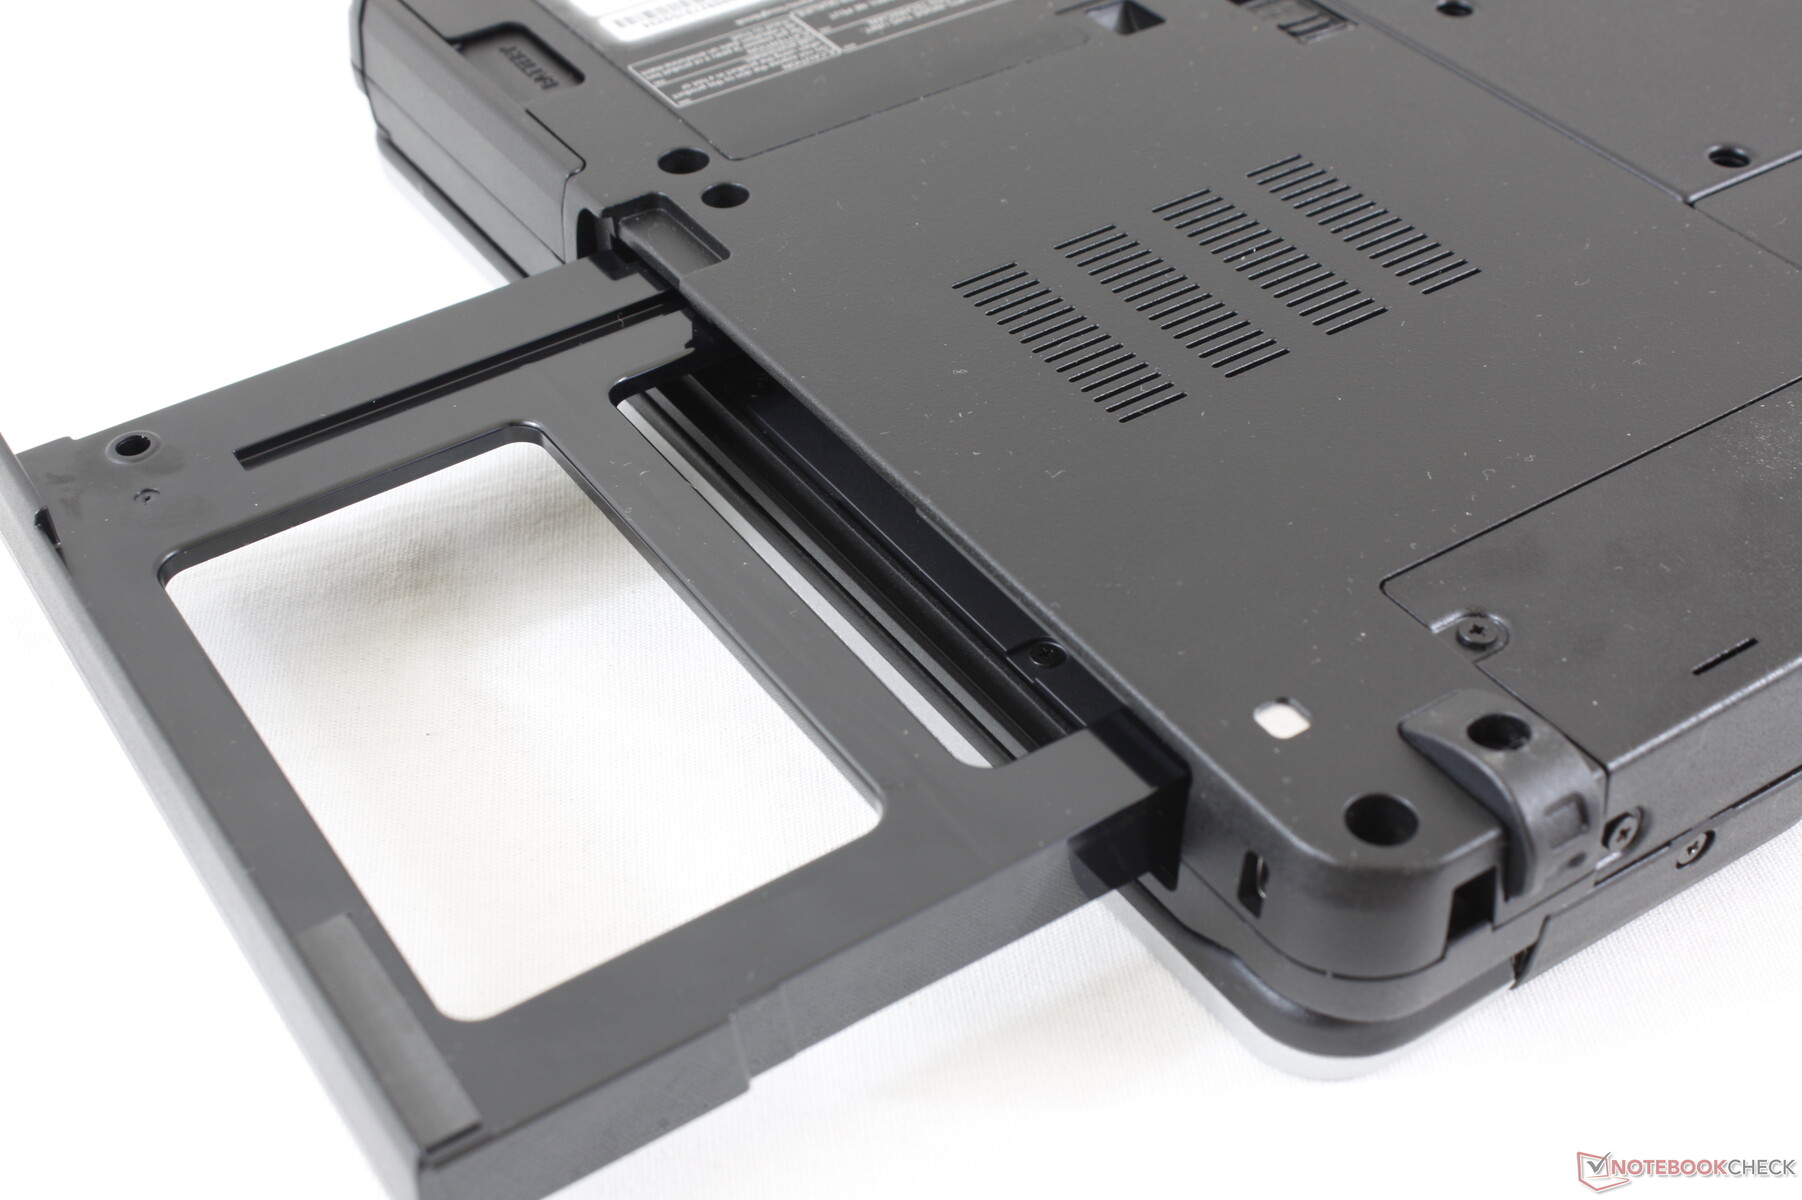
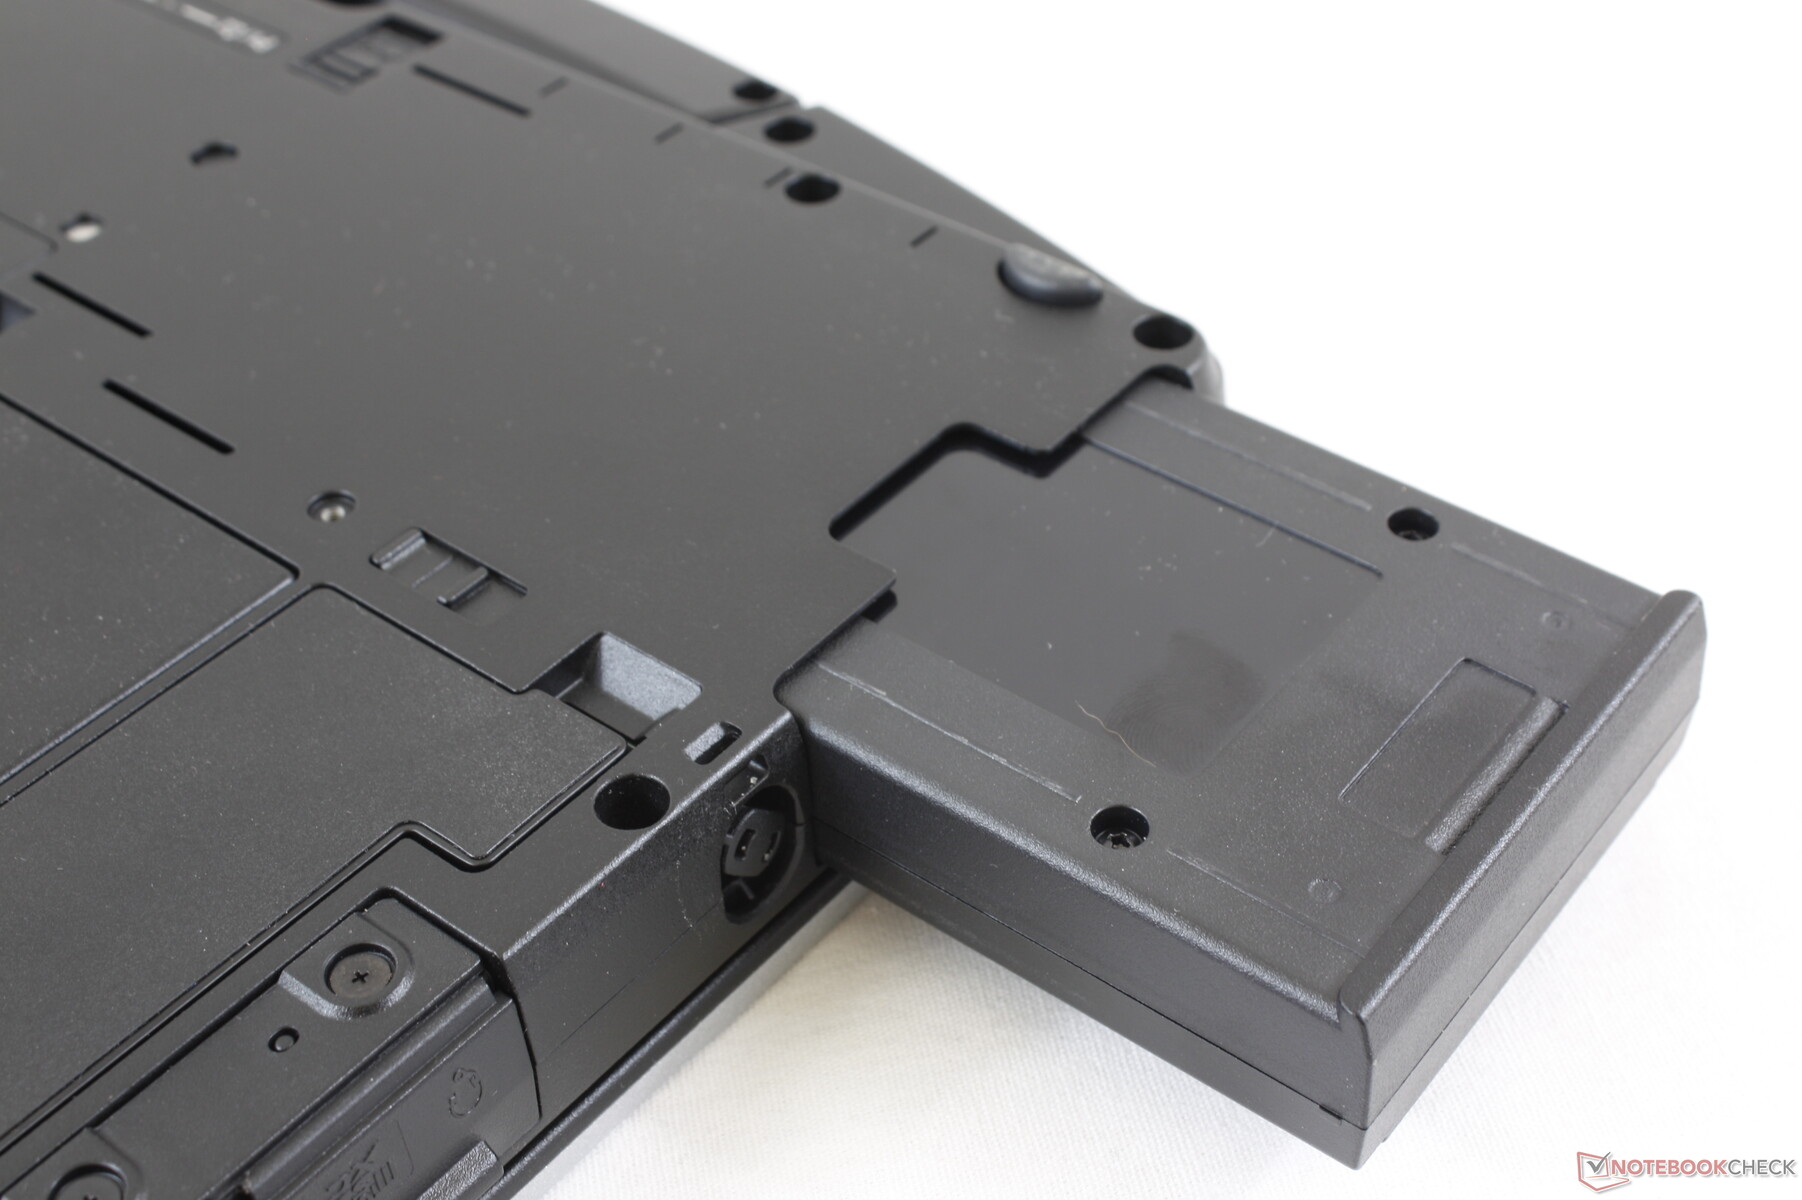
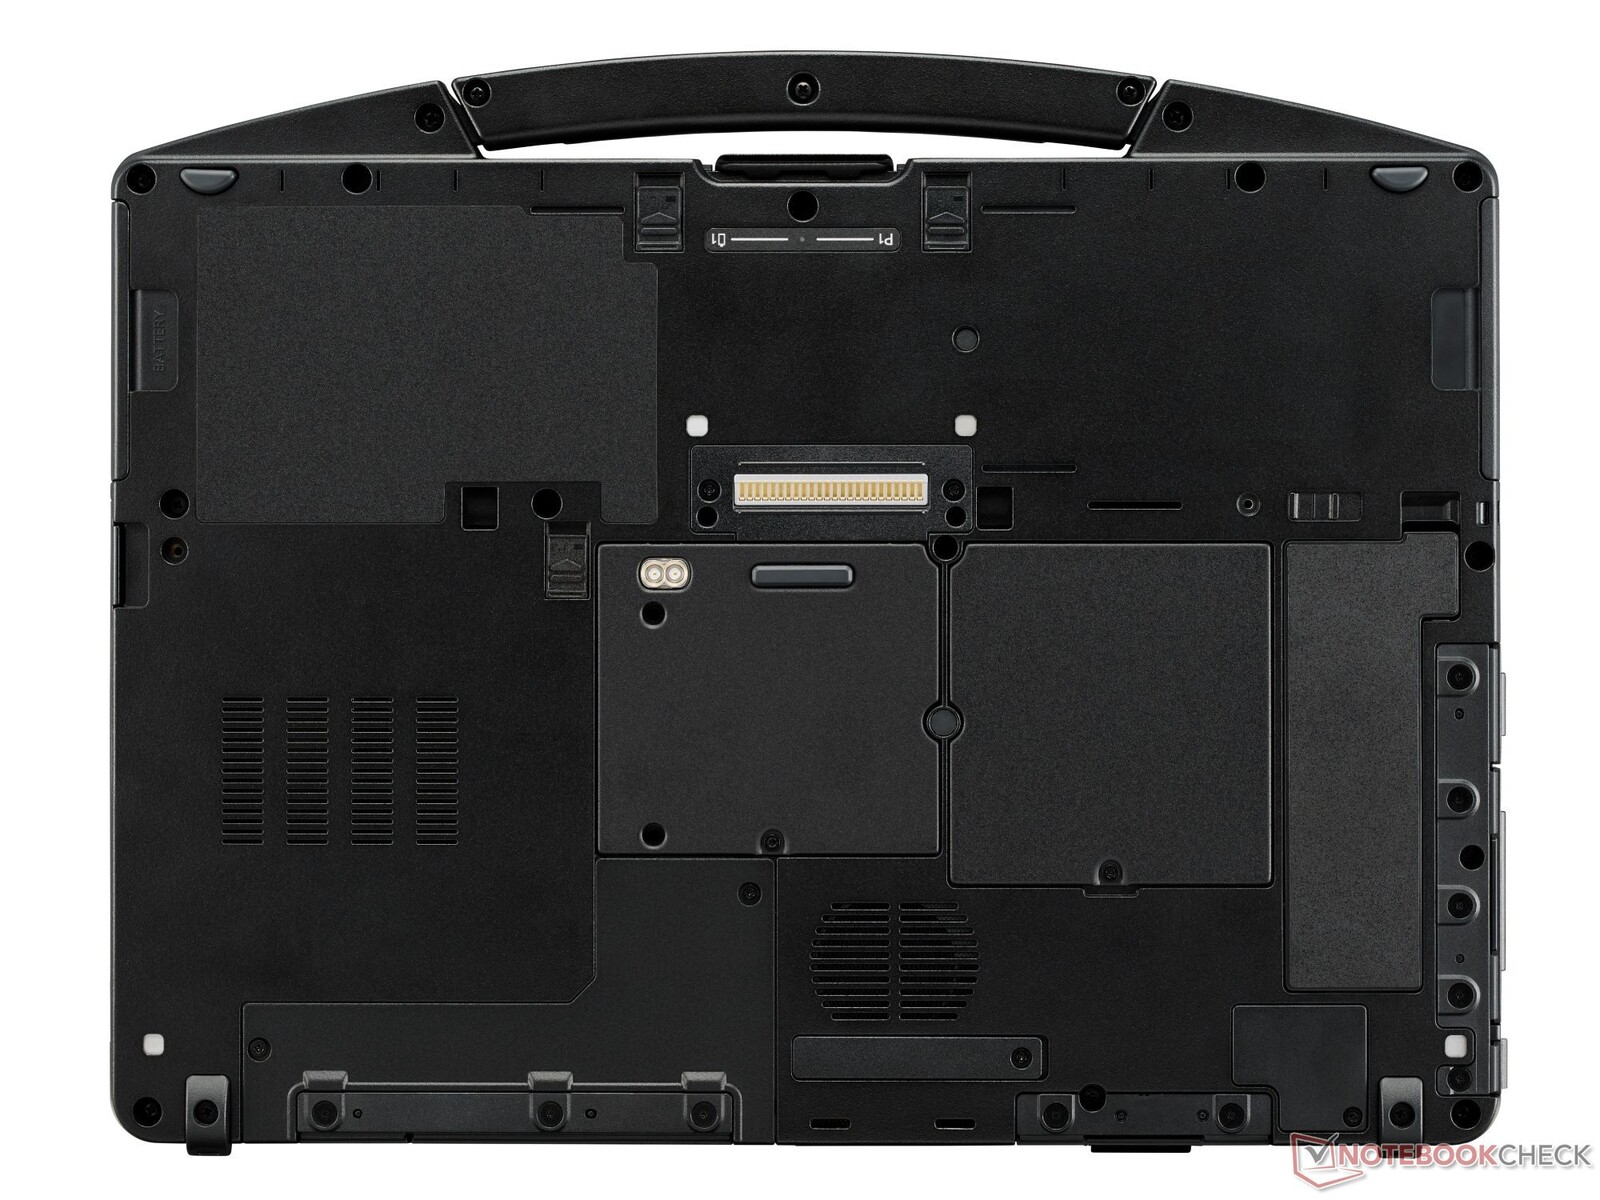
Maintenance
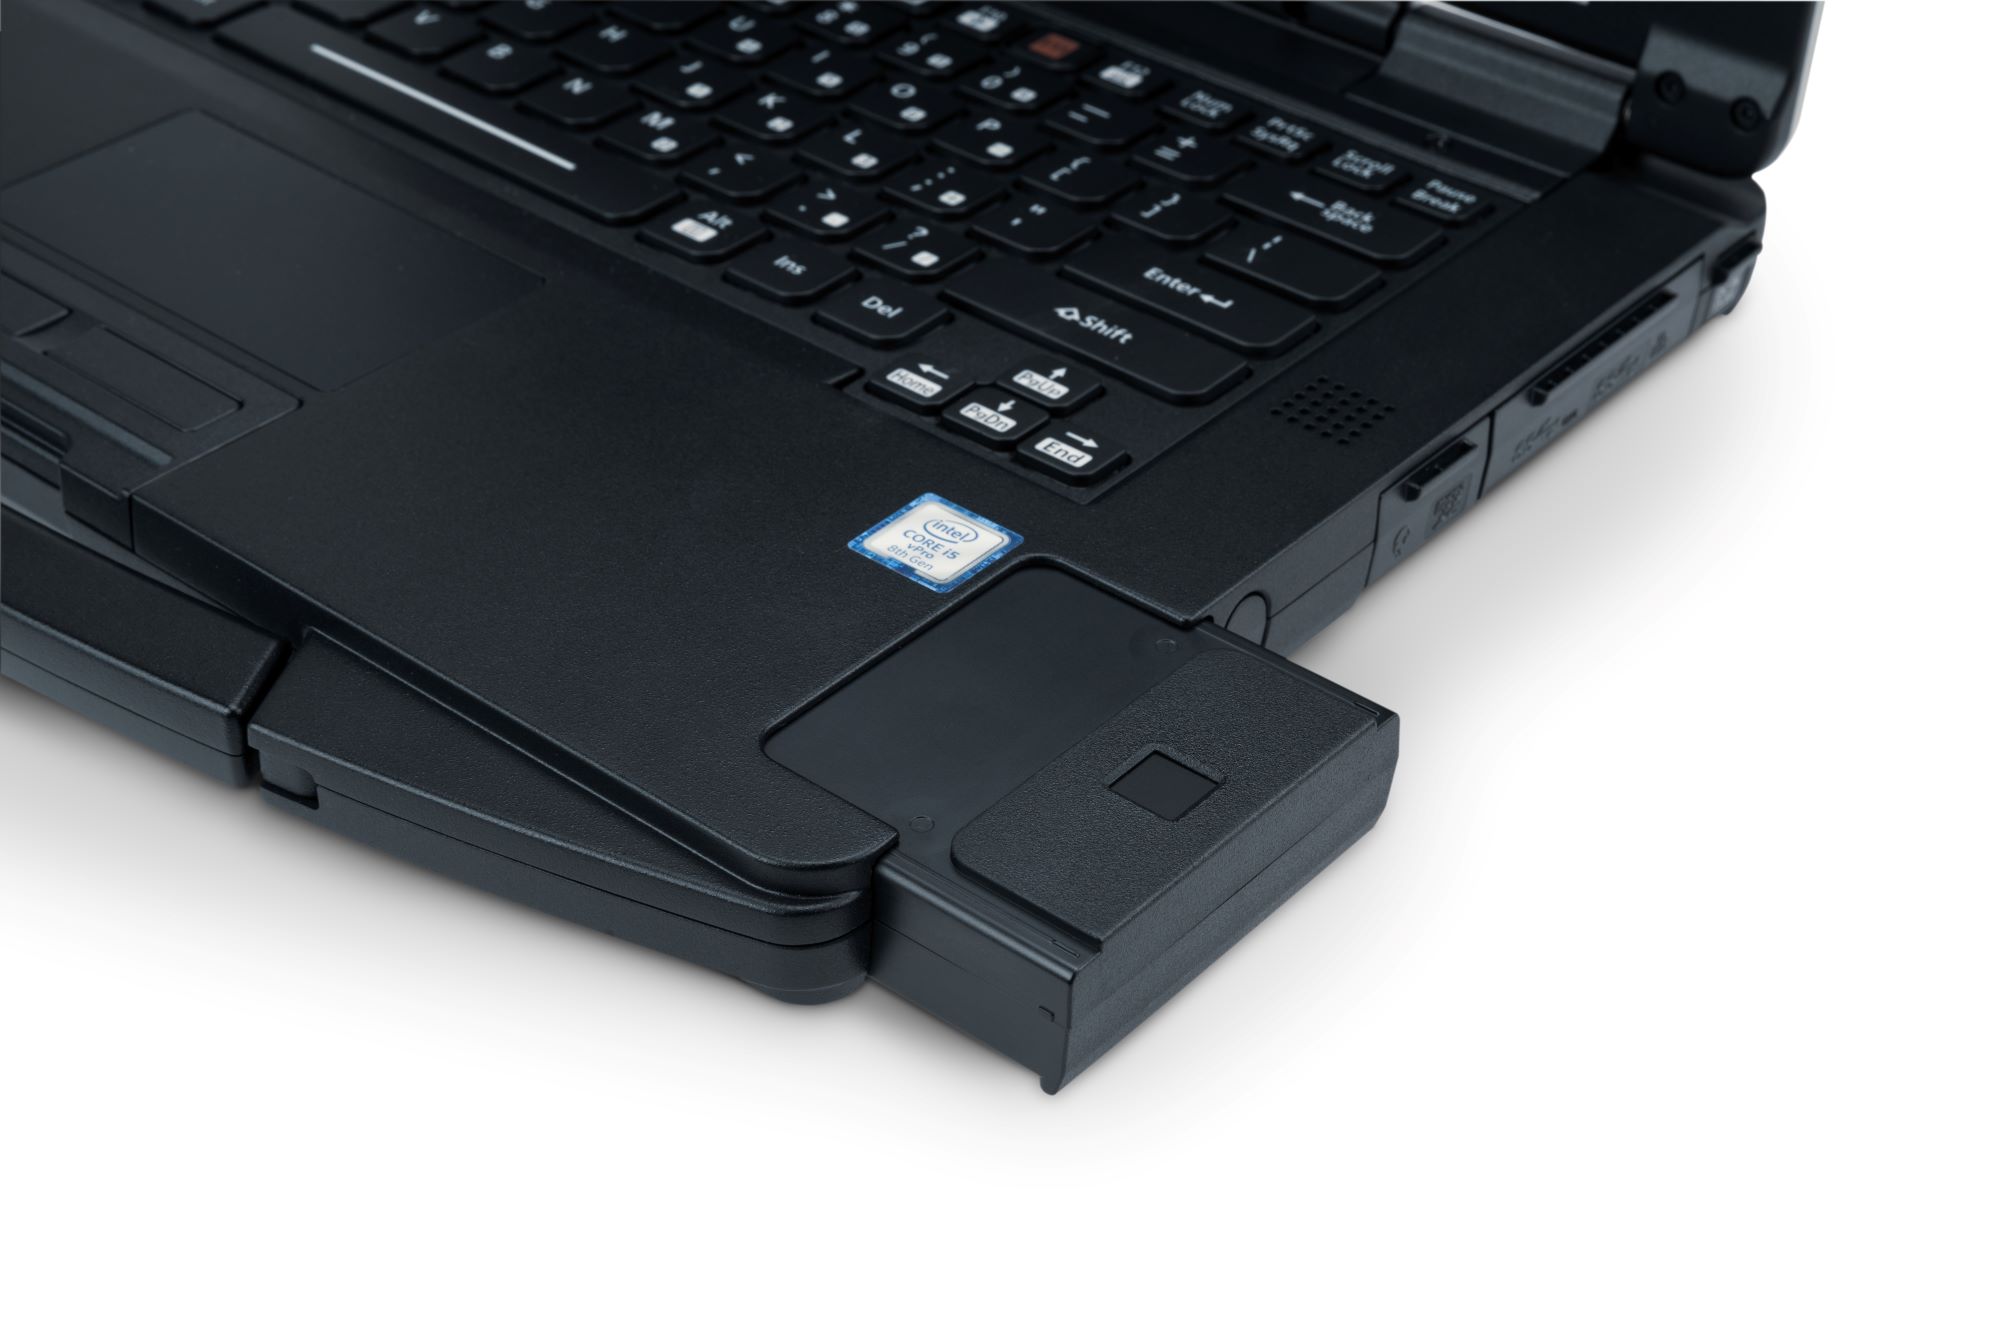
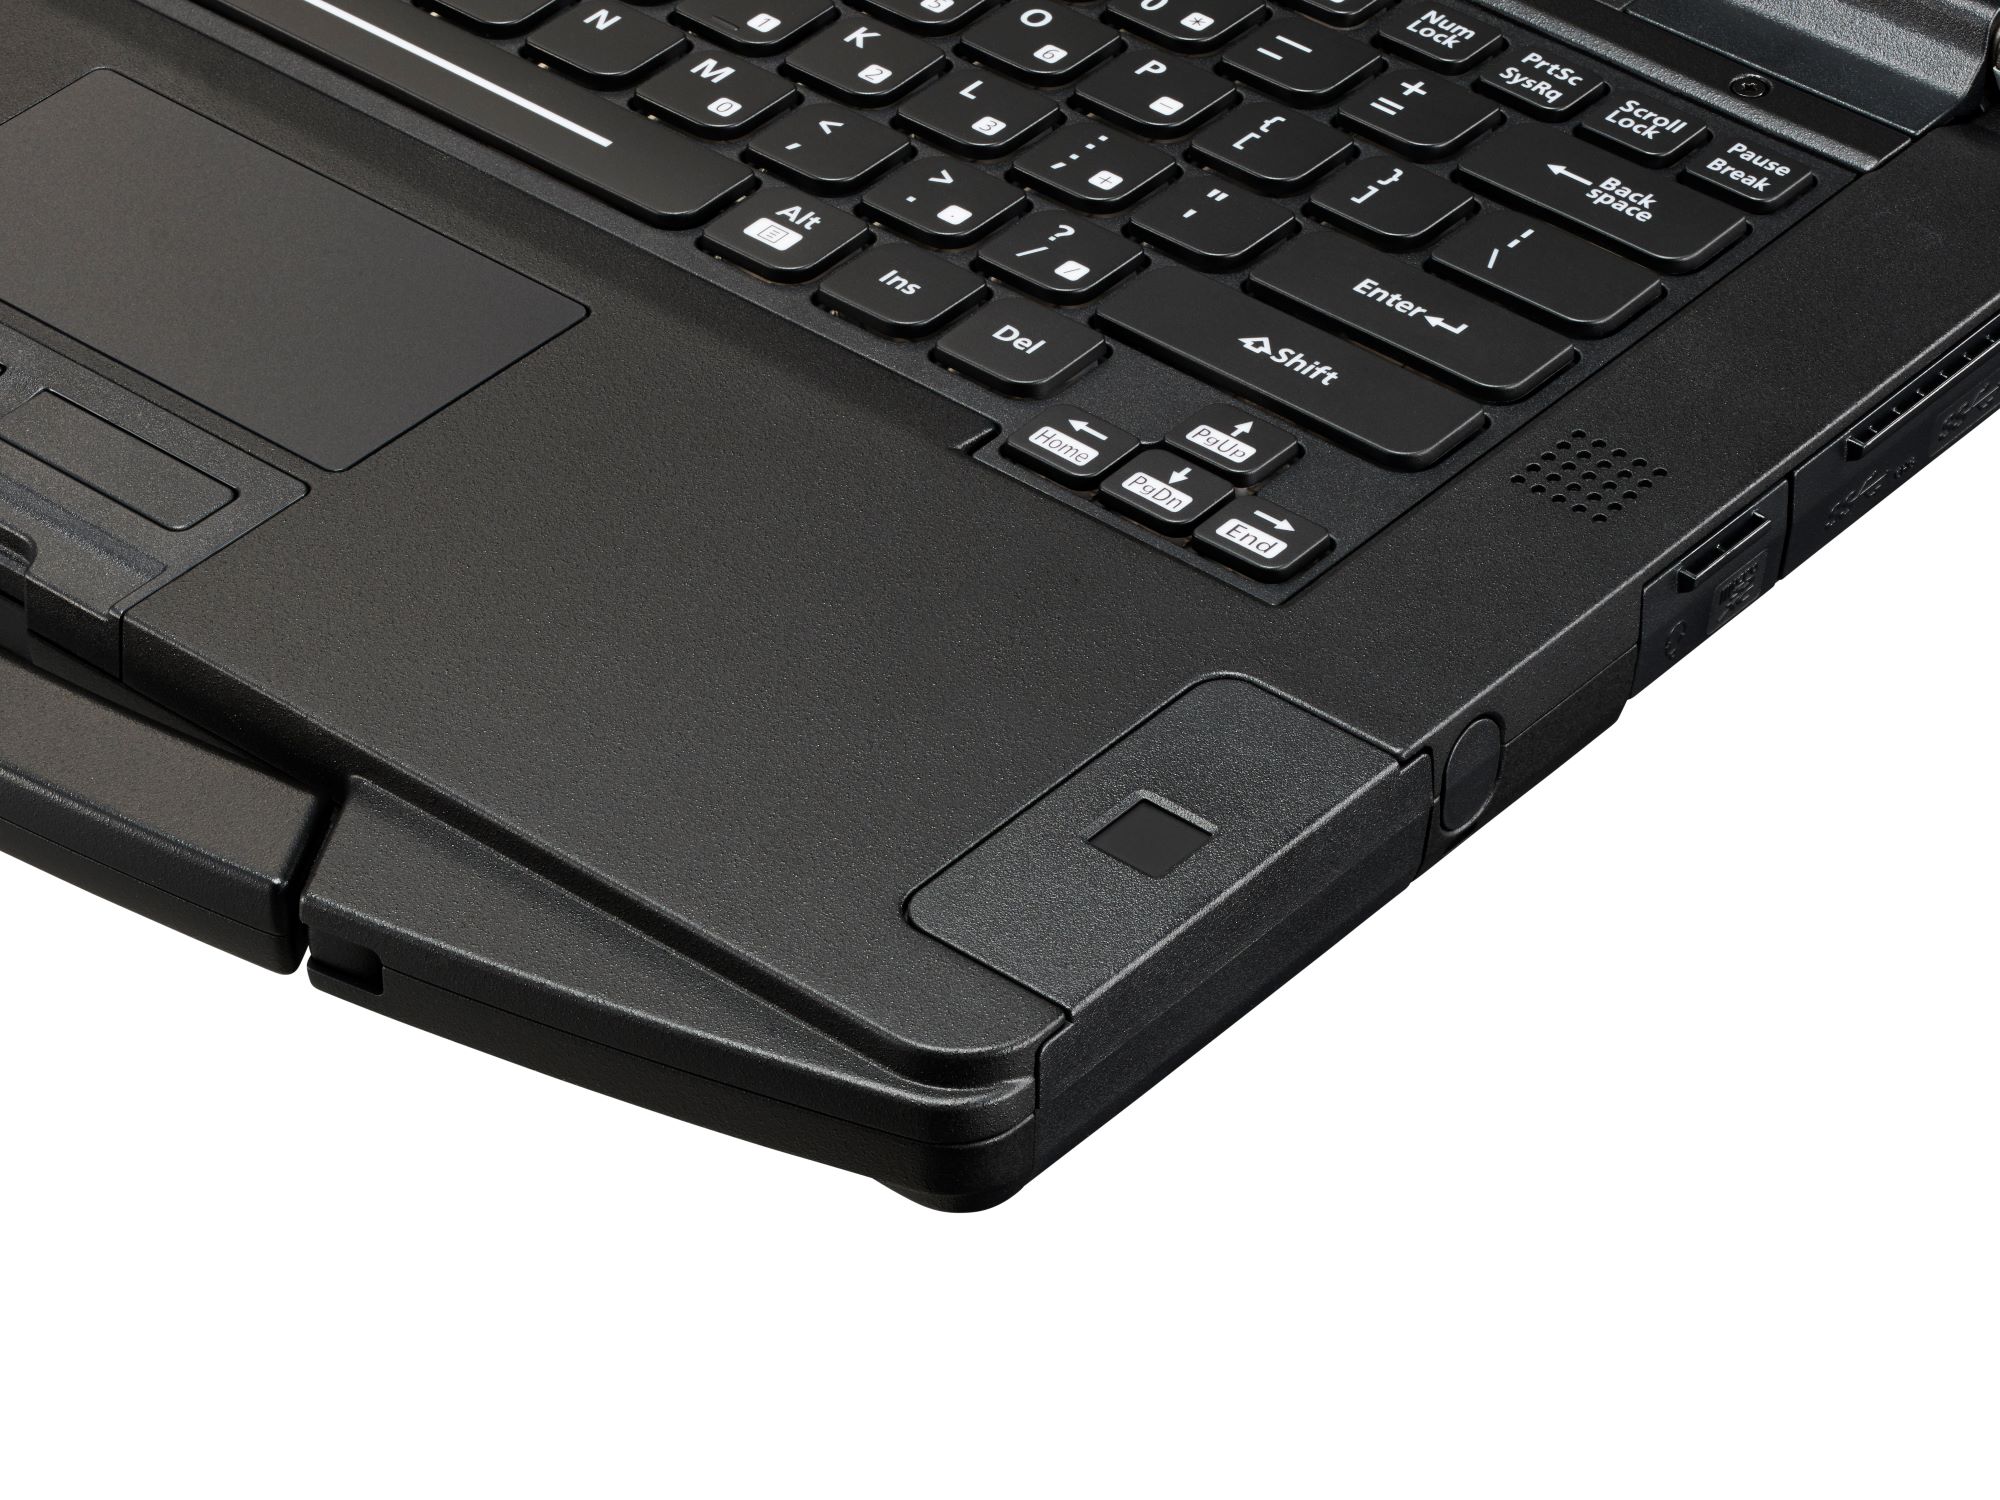
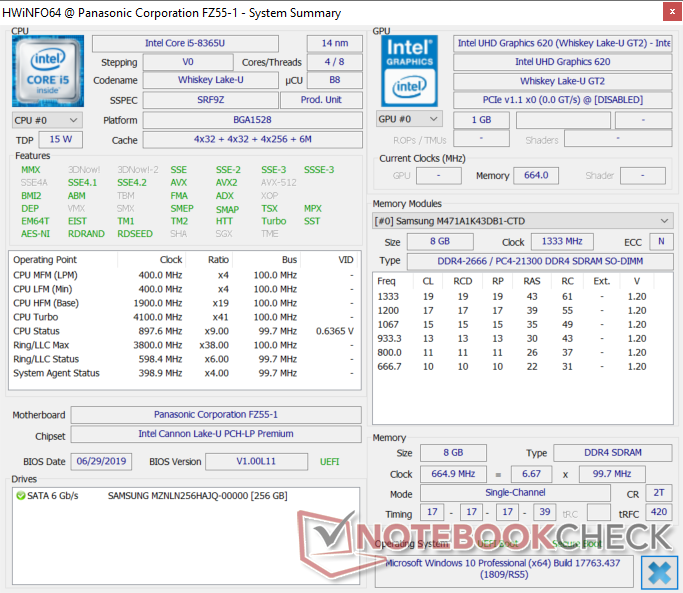
Servicing the SATA bay, M.2 slot, and batteries is easy as only a few latches need to be loosened. Accessing the RAM slots, however, will require a Philips screwdriver. Each SODIMM slots supports 32 GB modules for up to 64 GB maximum.
Accessories and Warranty
The system is compatible with all accessories designed for the Toughbook 54. A limited 3-year manufacturer warranty comes standard.
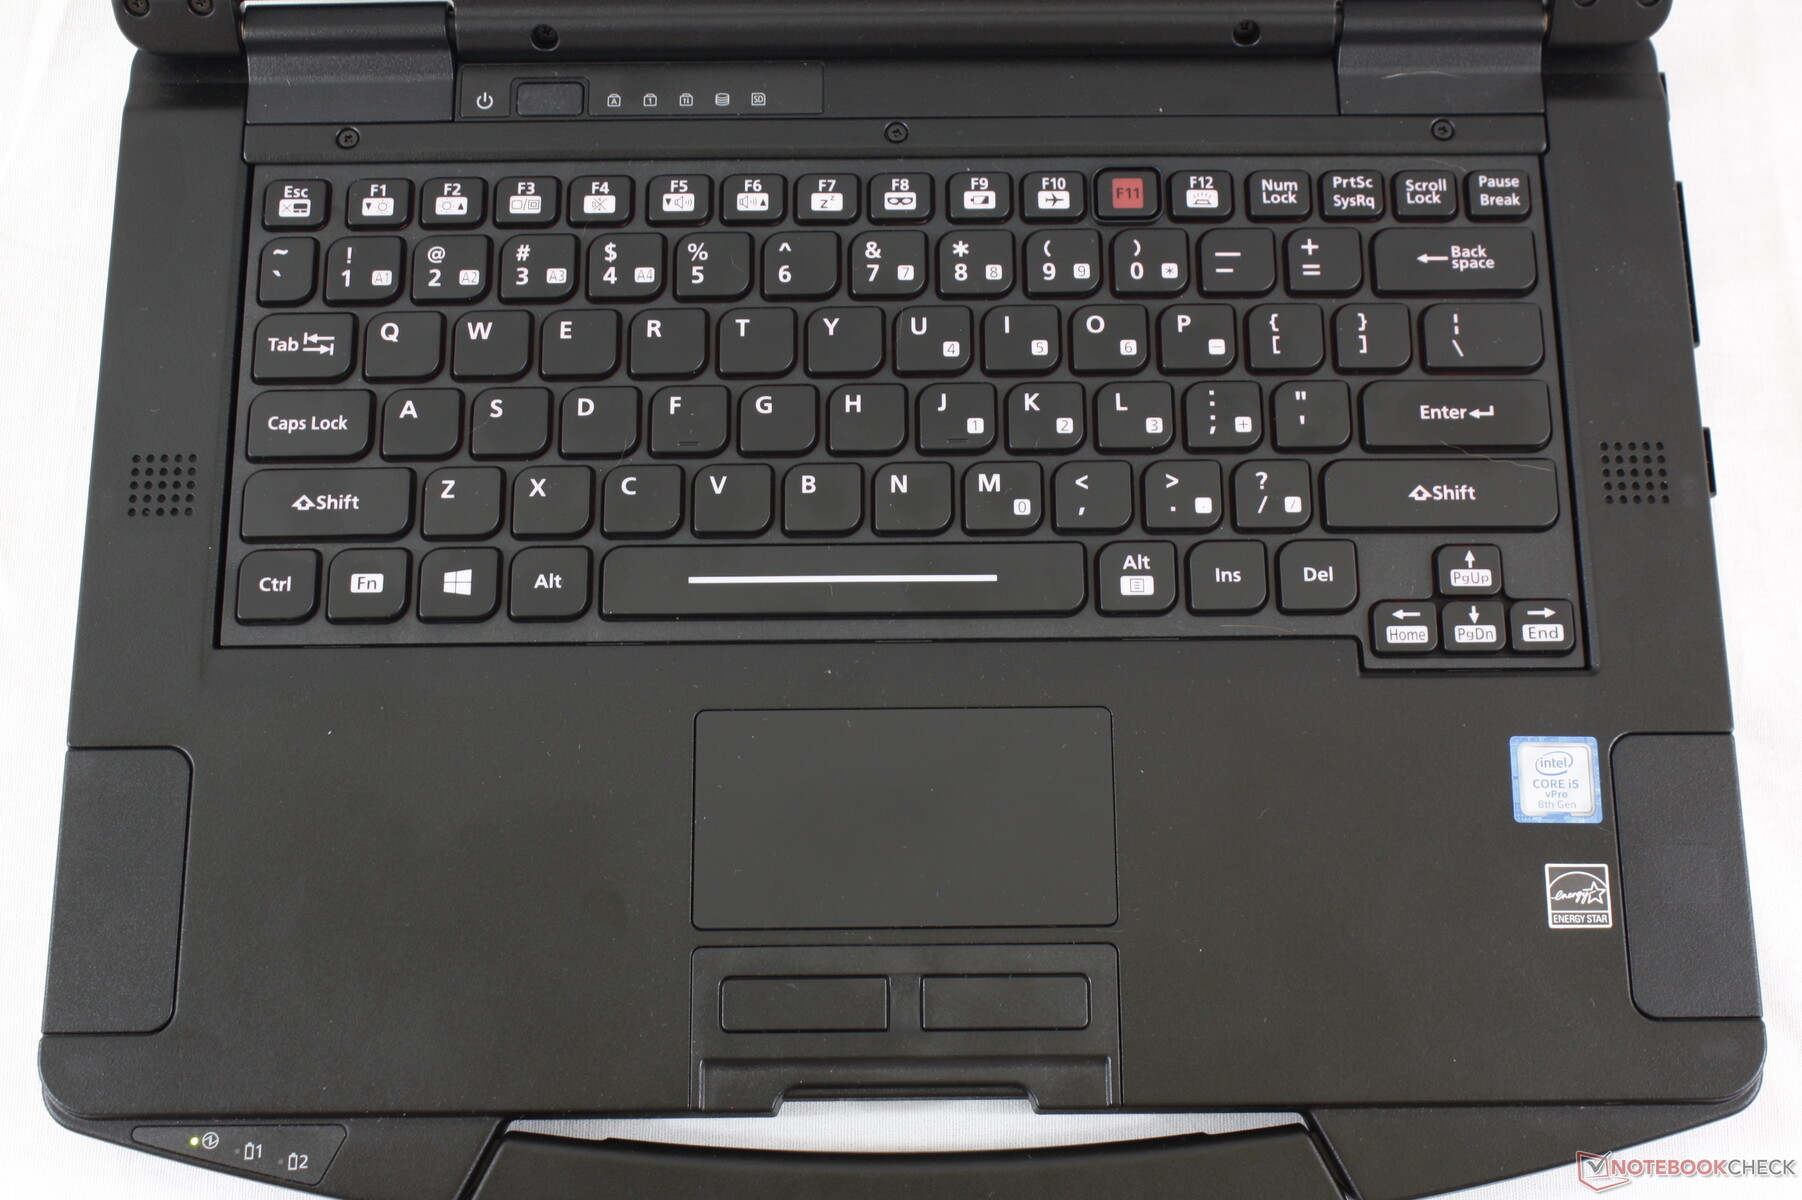
Input Devices
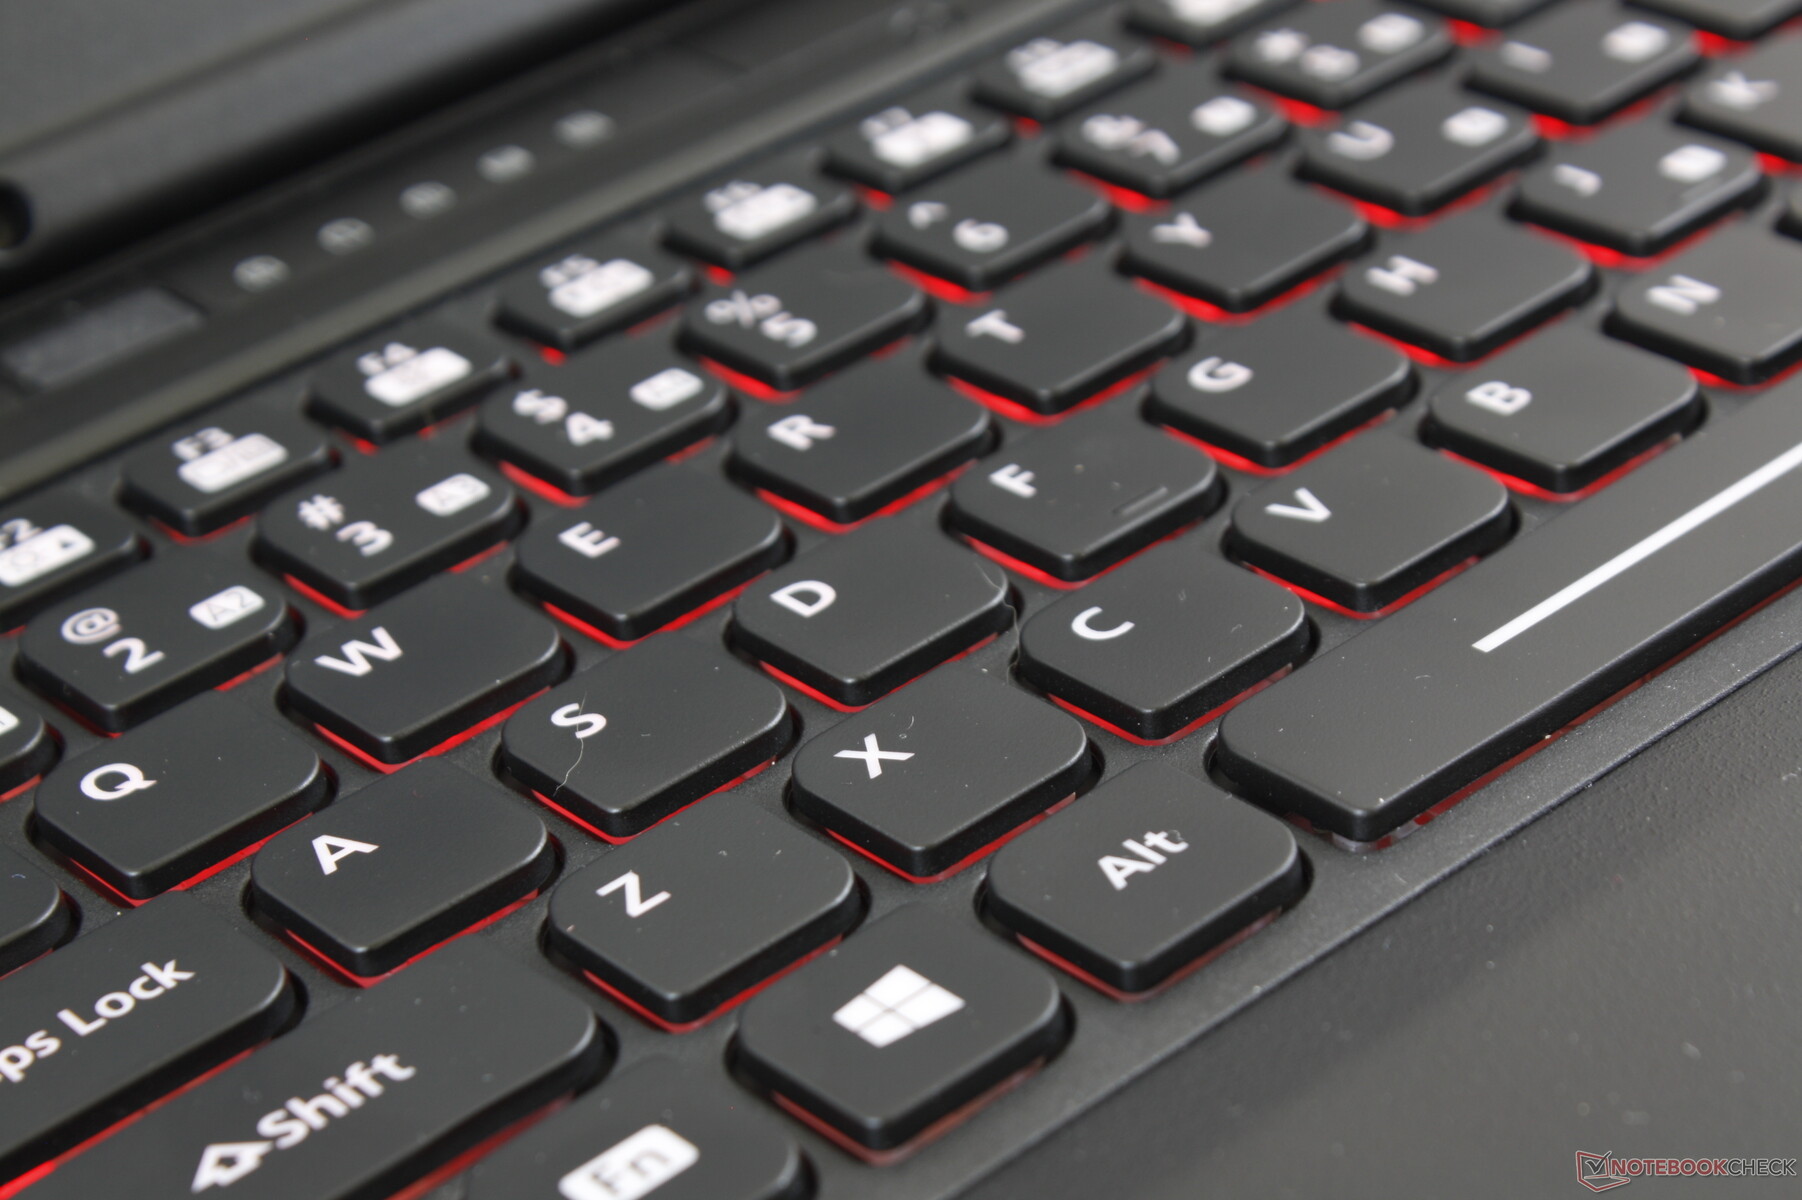
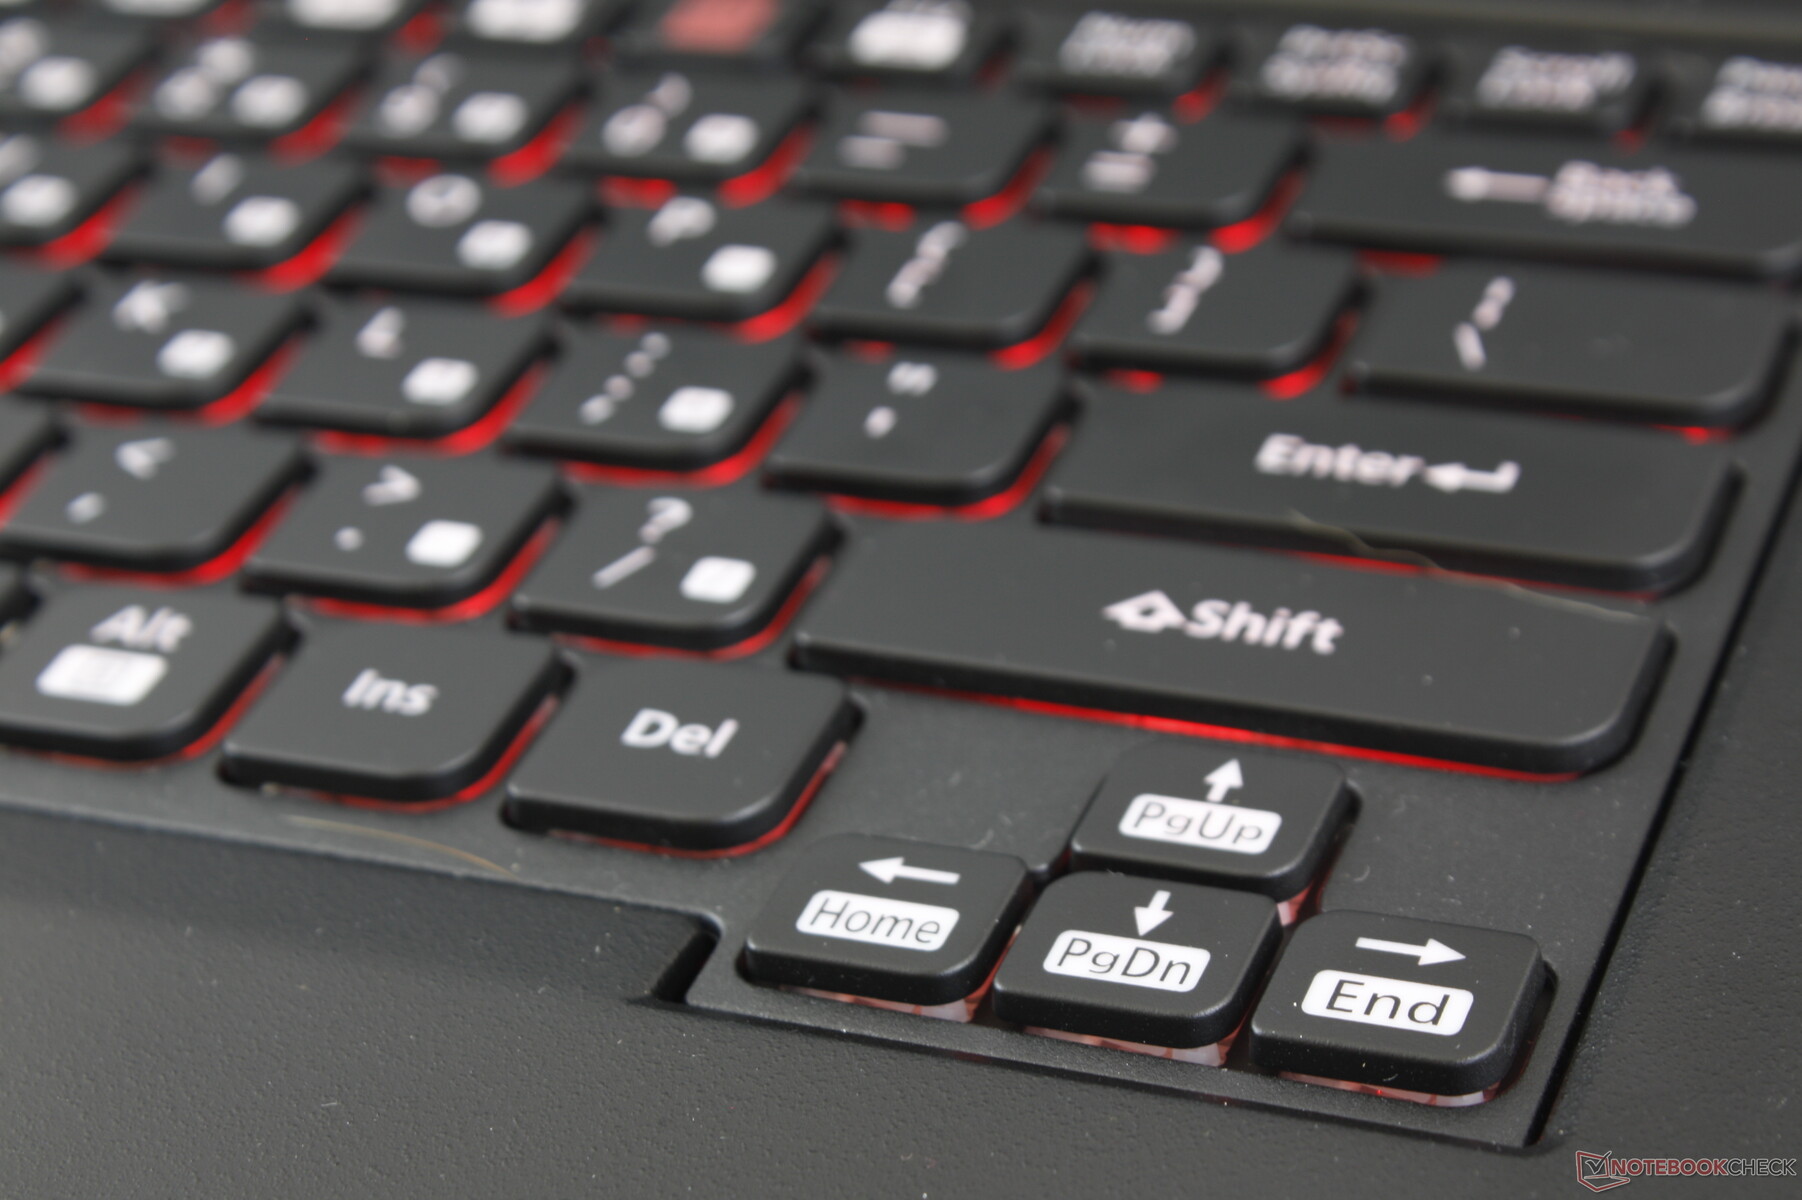
Keyboard
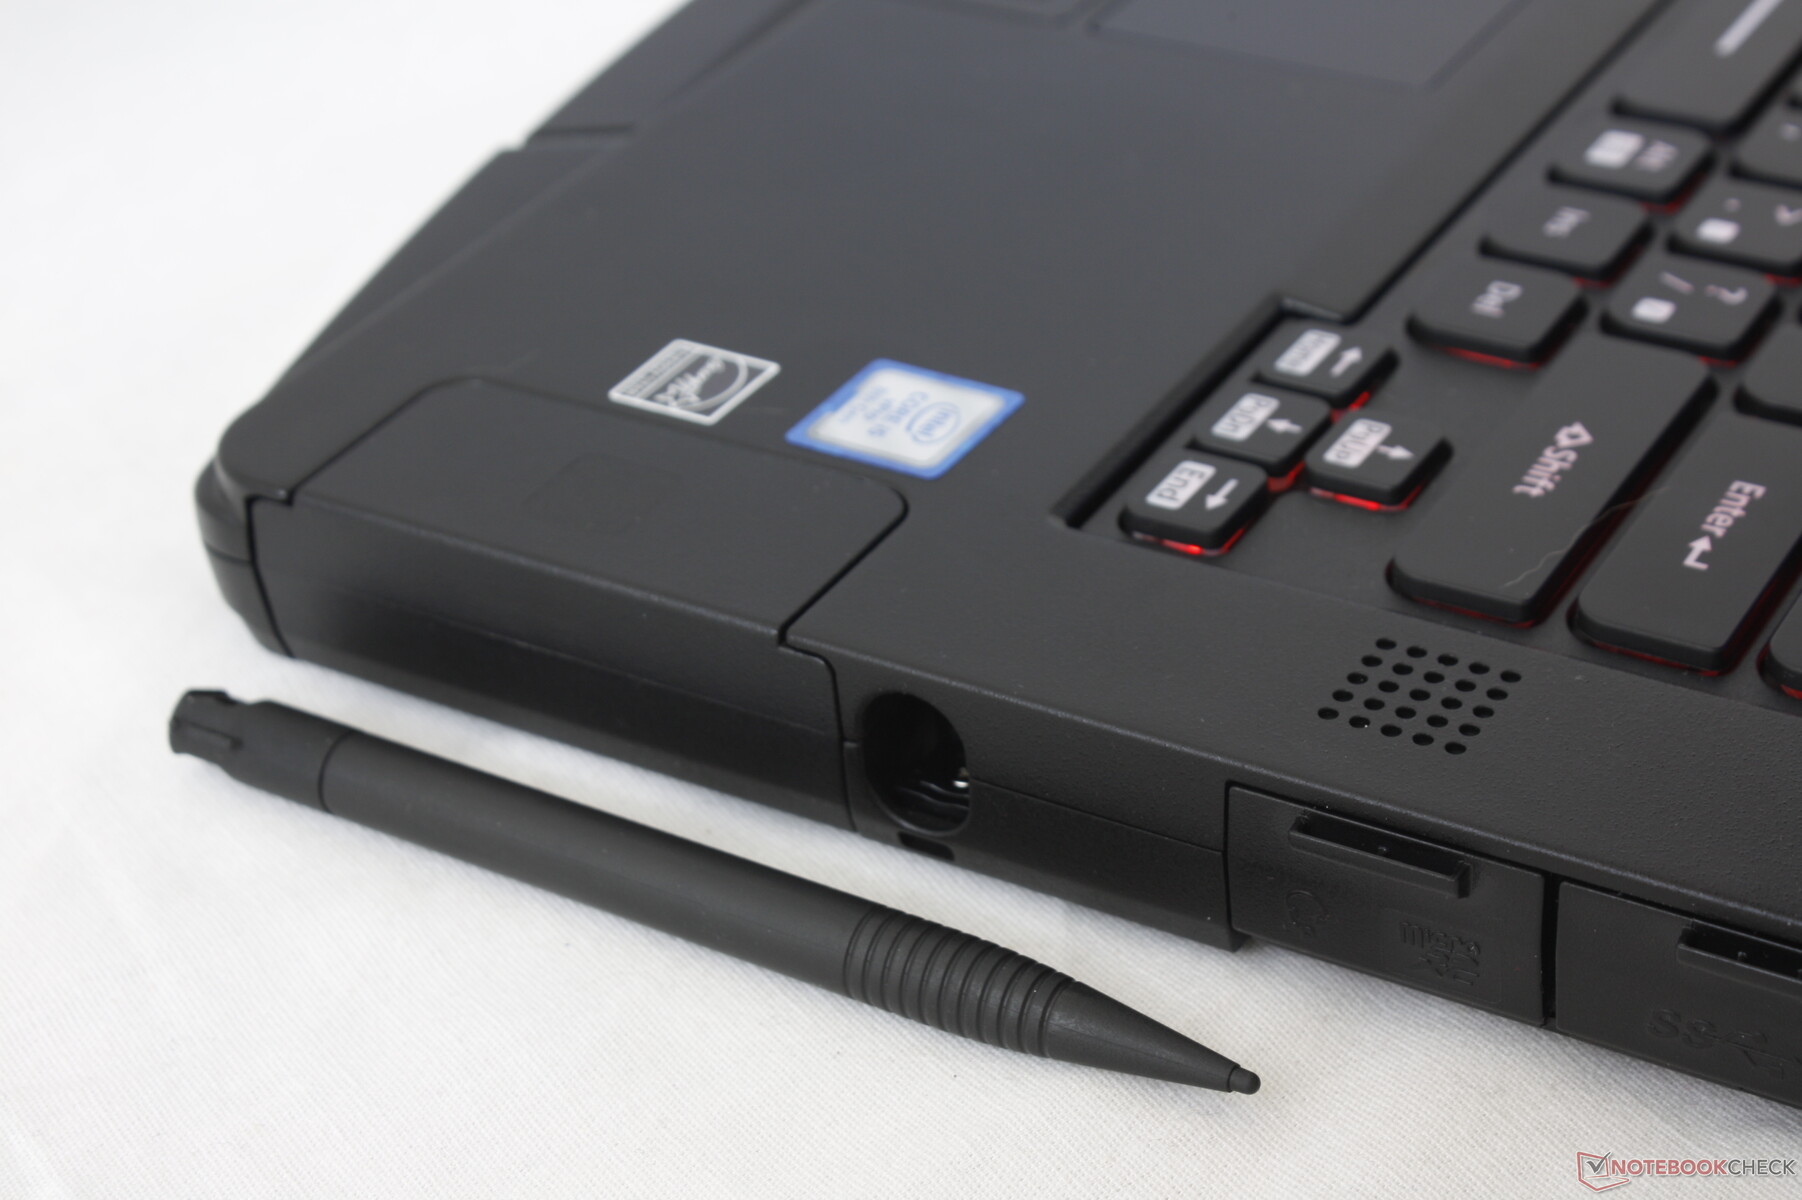
New to the Toughbook 55 is the removable keyboard that can be replaced if needed similar in vein to many ThinkPad laptops. The feel of the keys is otherwise quite similar to the Toughbook 54 including the relatively soft feedback in relation to most consumer and business laptops. It's too bad that the Arrow keys remain small and cramped.
An interesting note is that once the keyboard is removed, the keyboard must be discarded and replaced with a new one according to Panasonic.
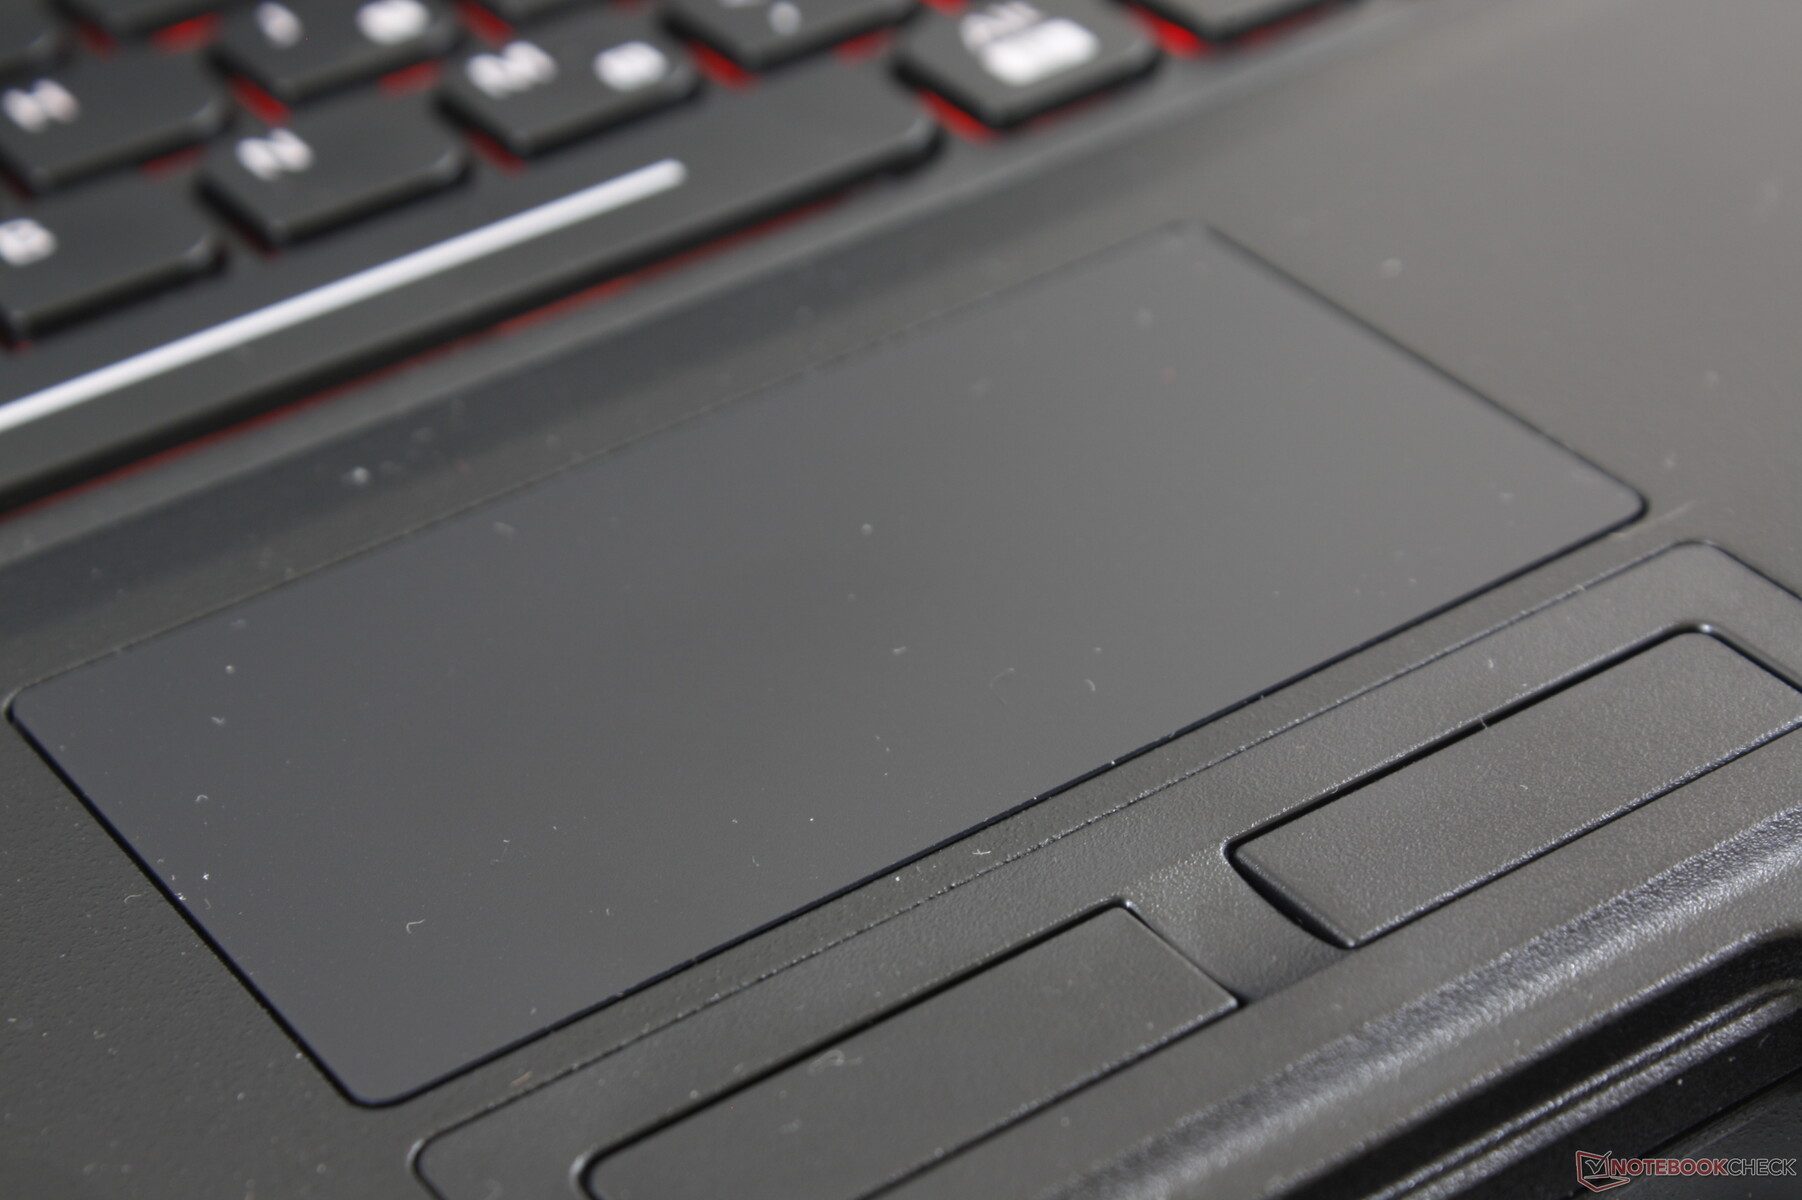
Touchpad
The touchpad (8.5 x 4.5 cm) is slightly larger than the one on last year's Toughbook 54 (8 x 4 cm). Its surface is smooth when moving at medium to fast speeds with only minimal sticking when moving at slow speeds. Unlike on most Ultrabooks, the touchpad is very firm and not susceptible to any depressions or warping.
The dedicated mouse keys are shallow in travel and relatively weak in feedback despite the loud click.
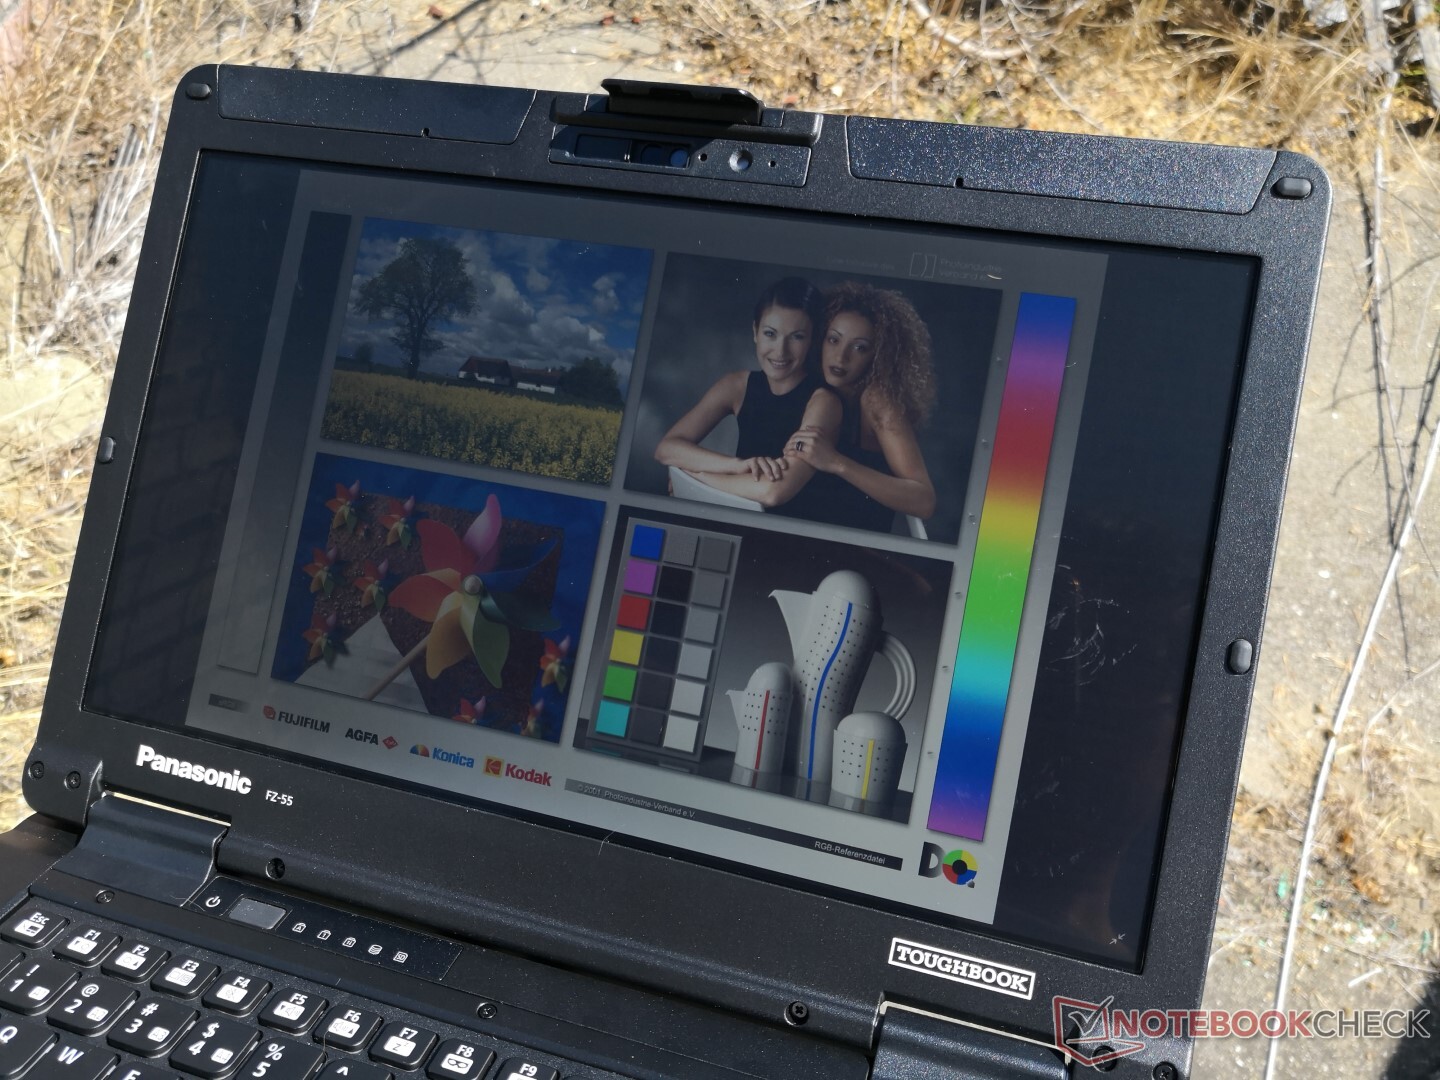
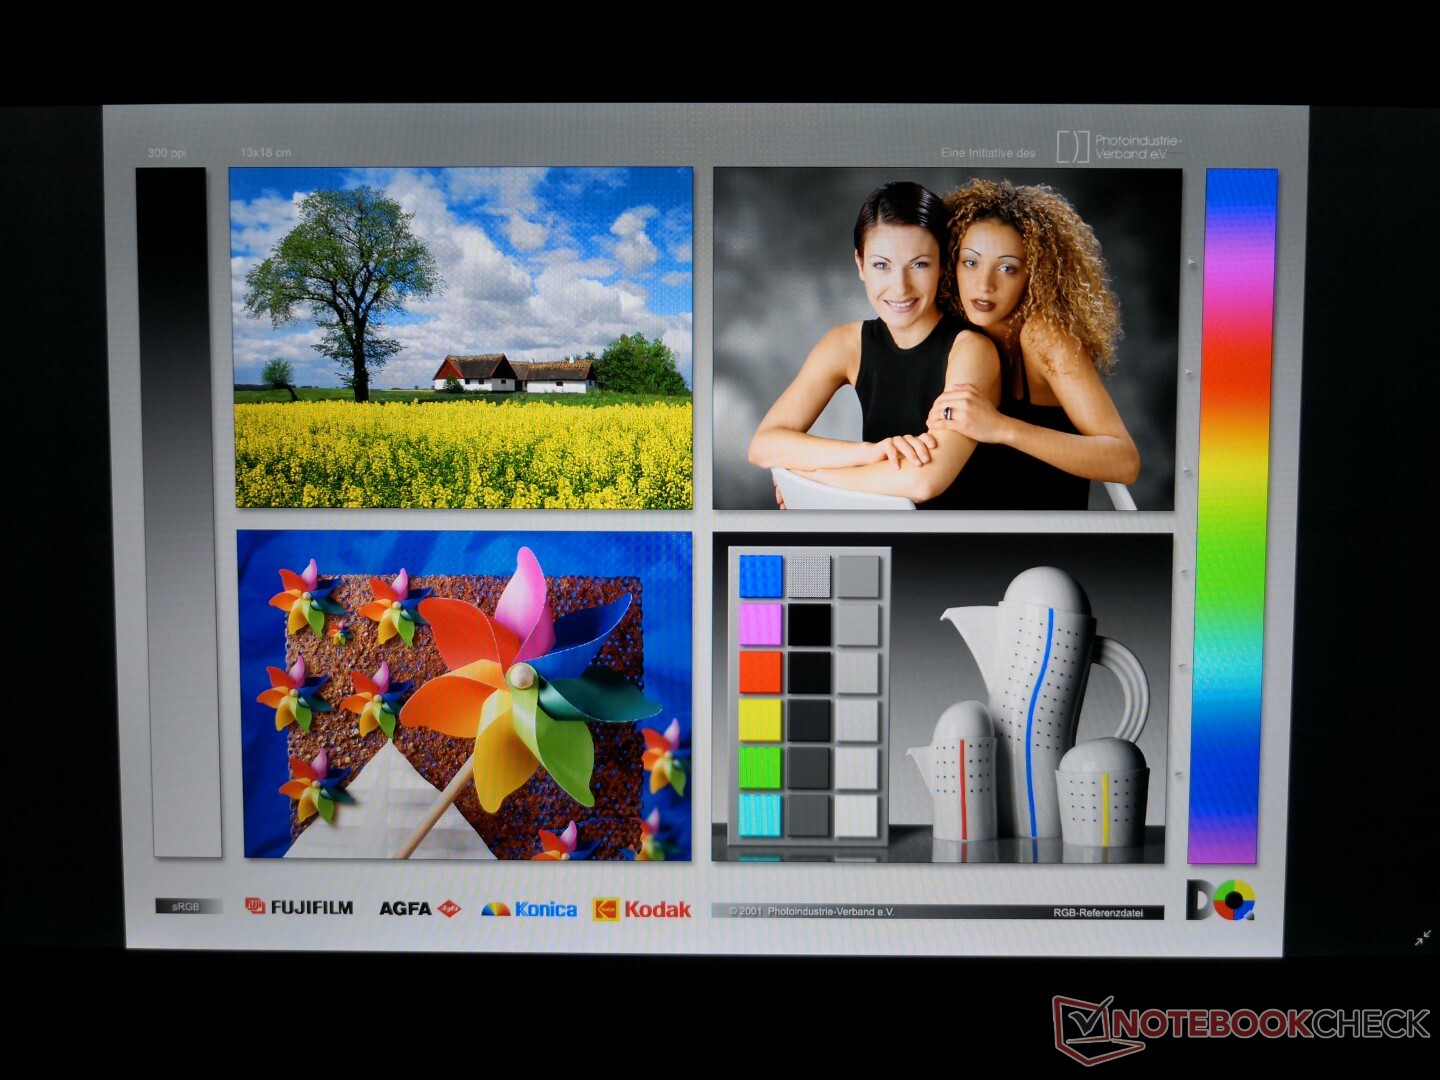
Display
The Toughbook 55 uses an uncommon InfoVision M140NWF5 R3 IPS touchscreen panel. Very few laptops ship with InfoVision panels with one notable example being the Lenovo Yoga 530-14IKB and its InfoVision M140NWF5 R2 panel.
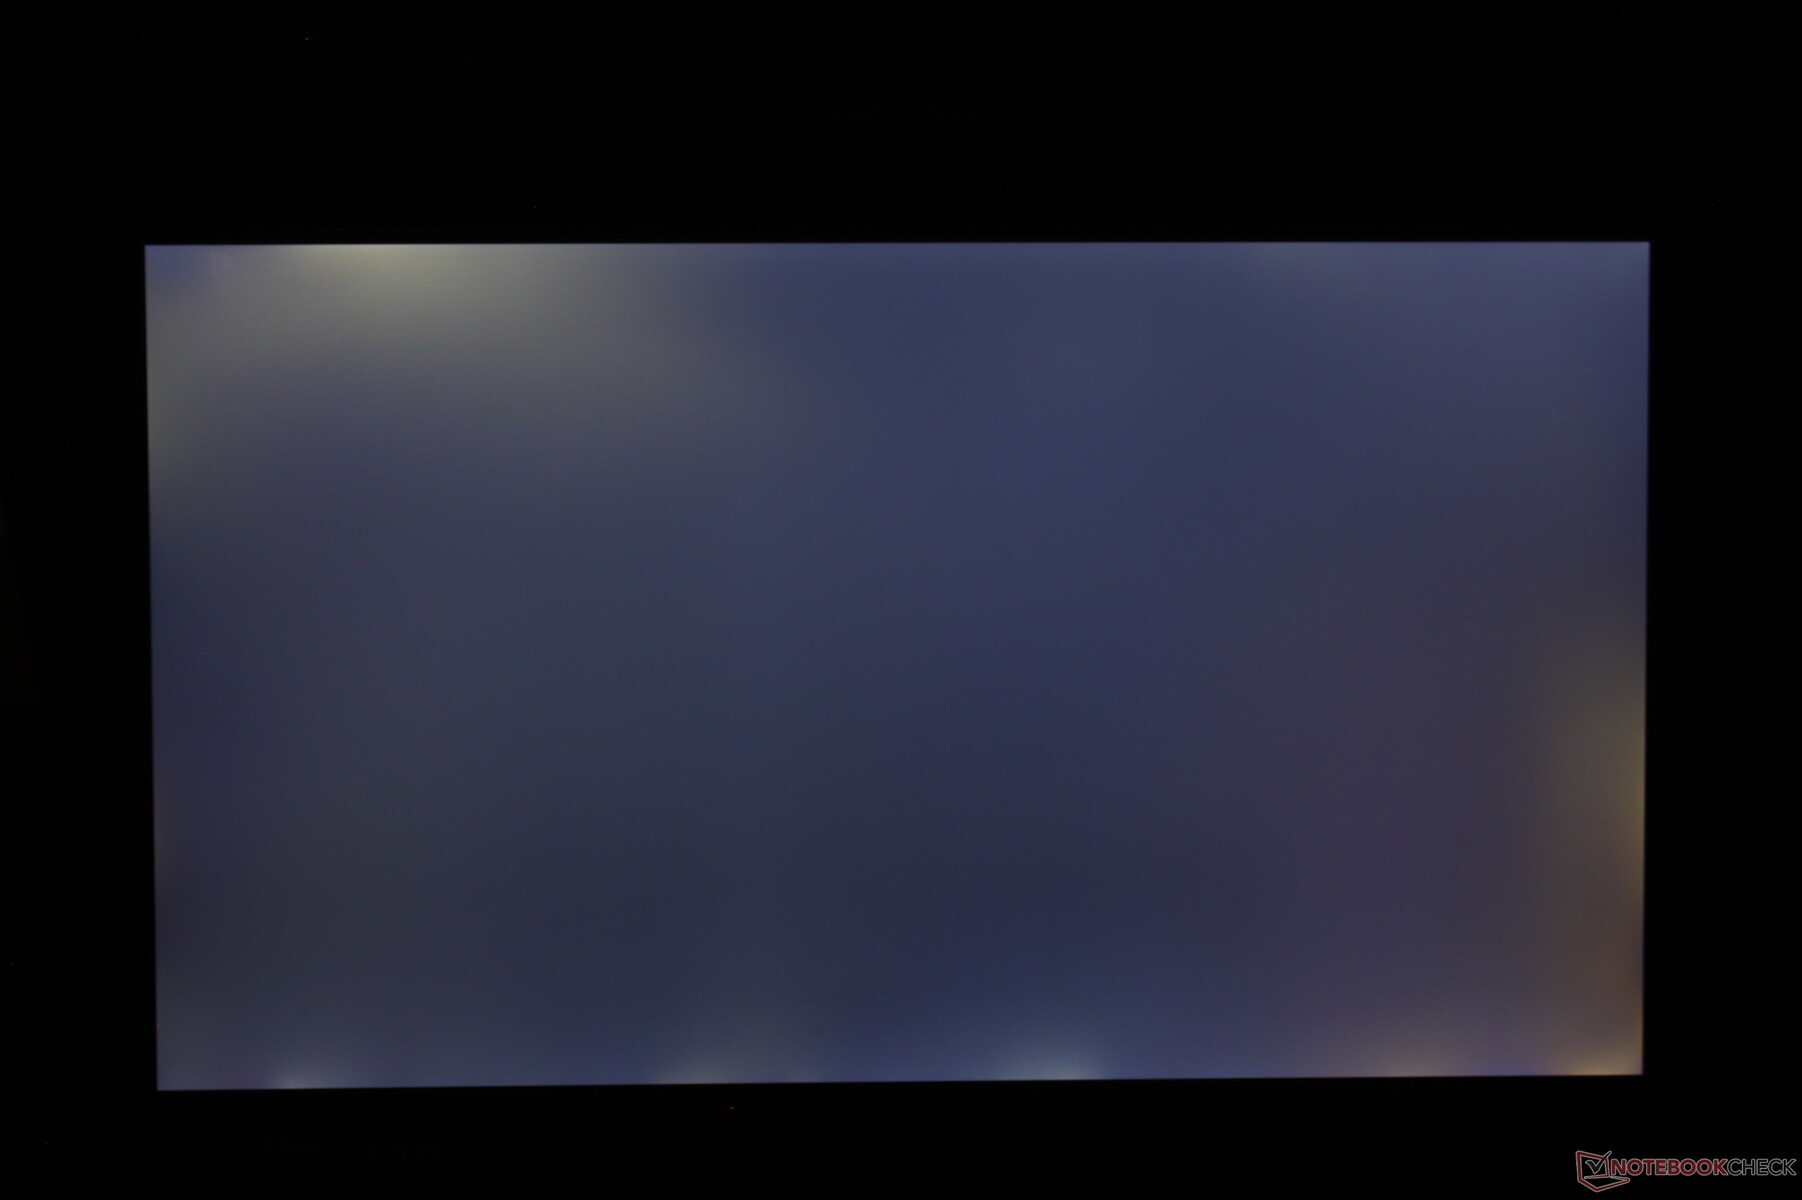
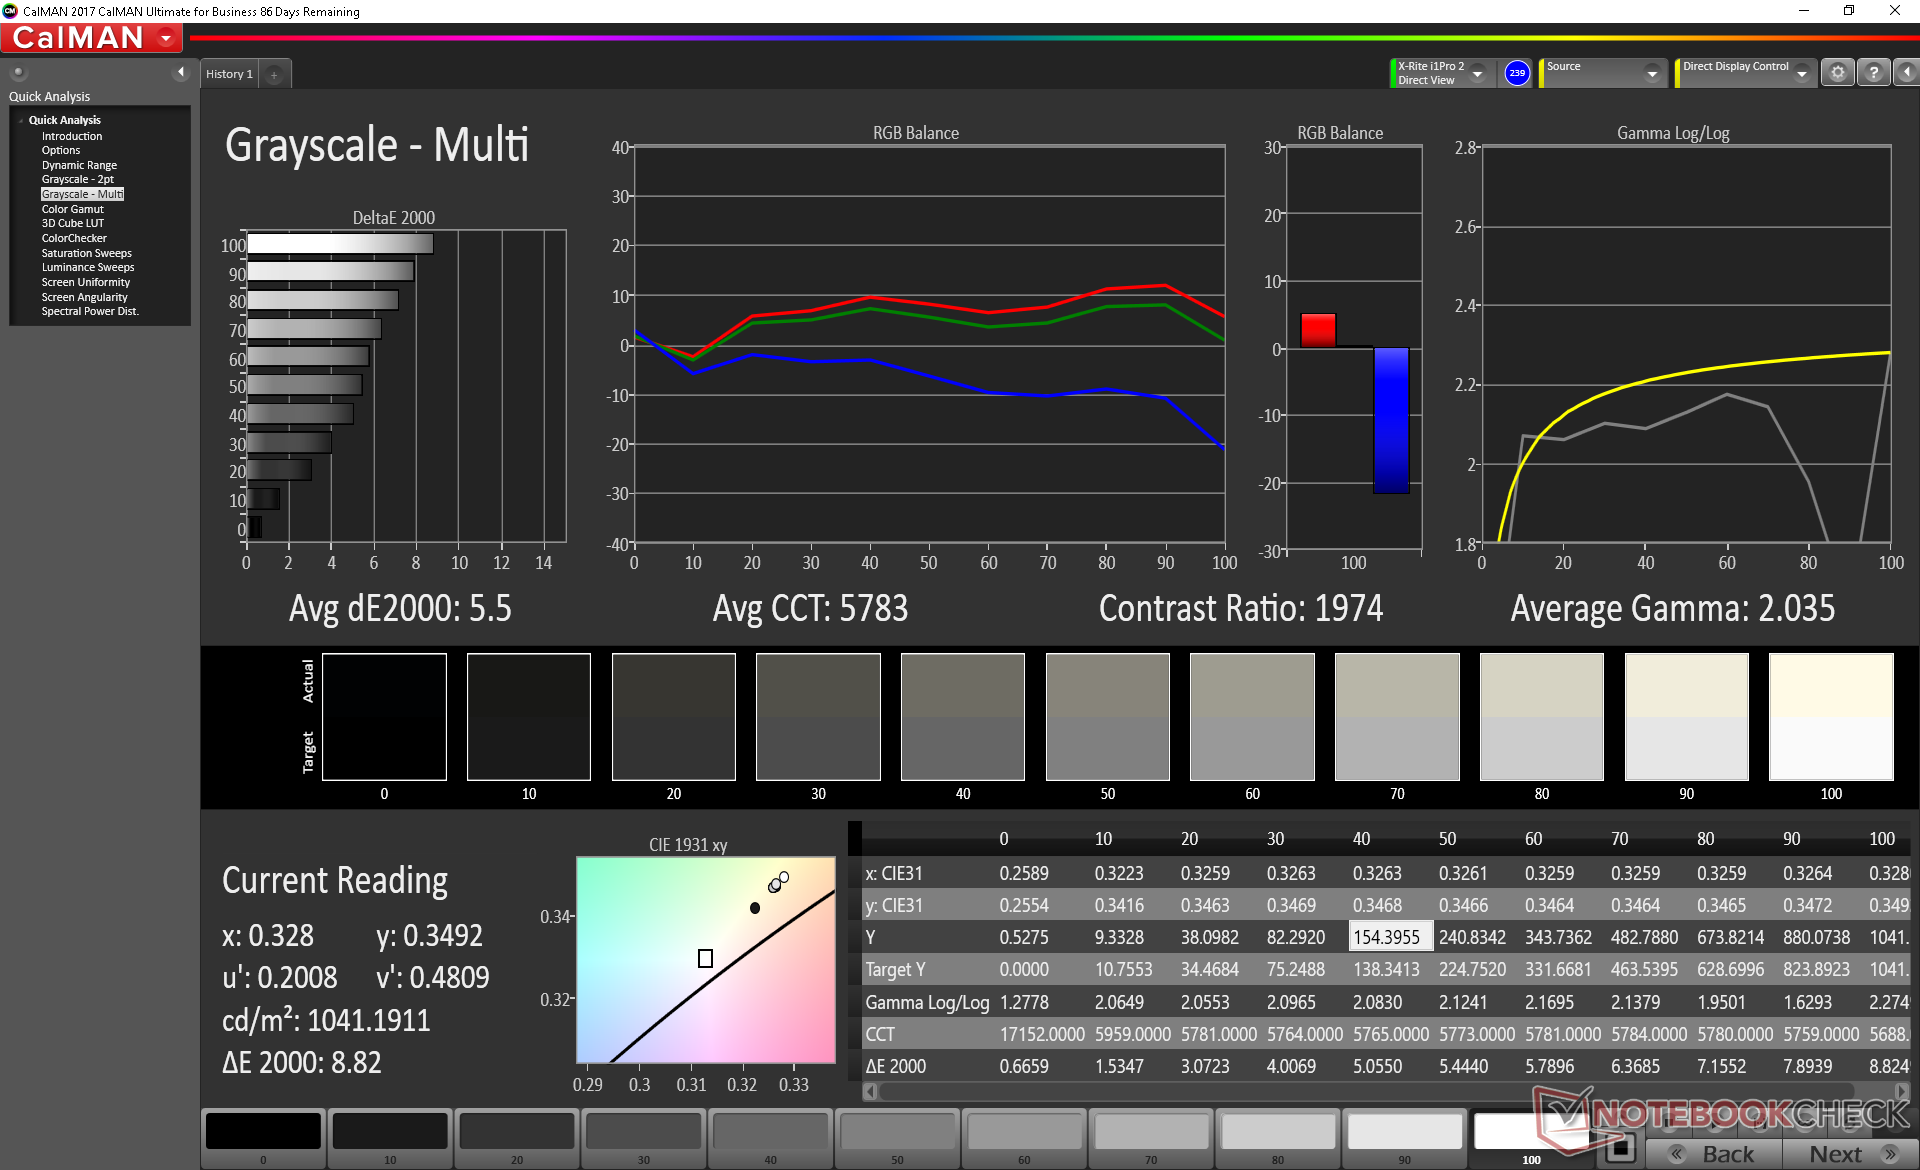
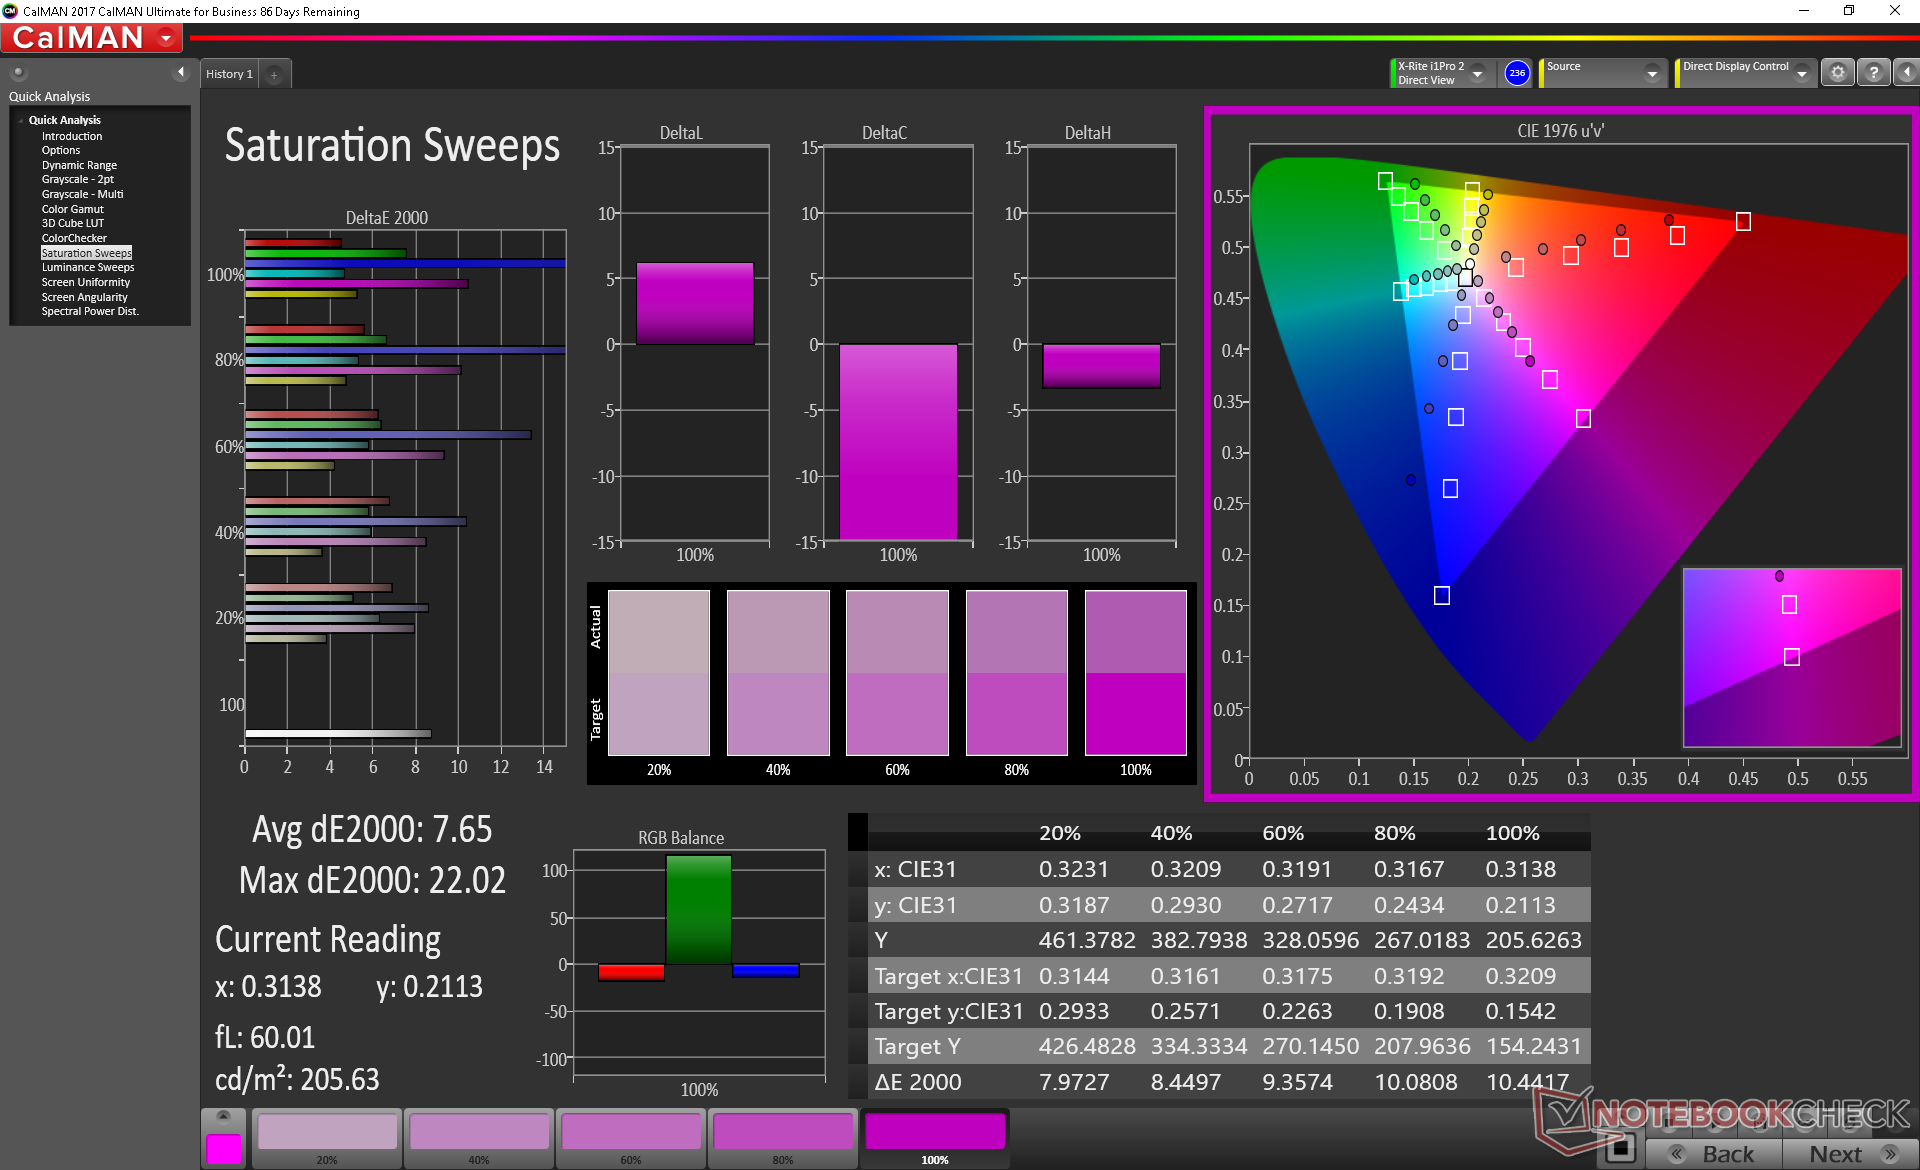
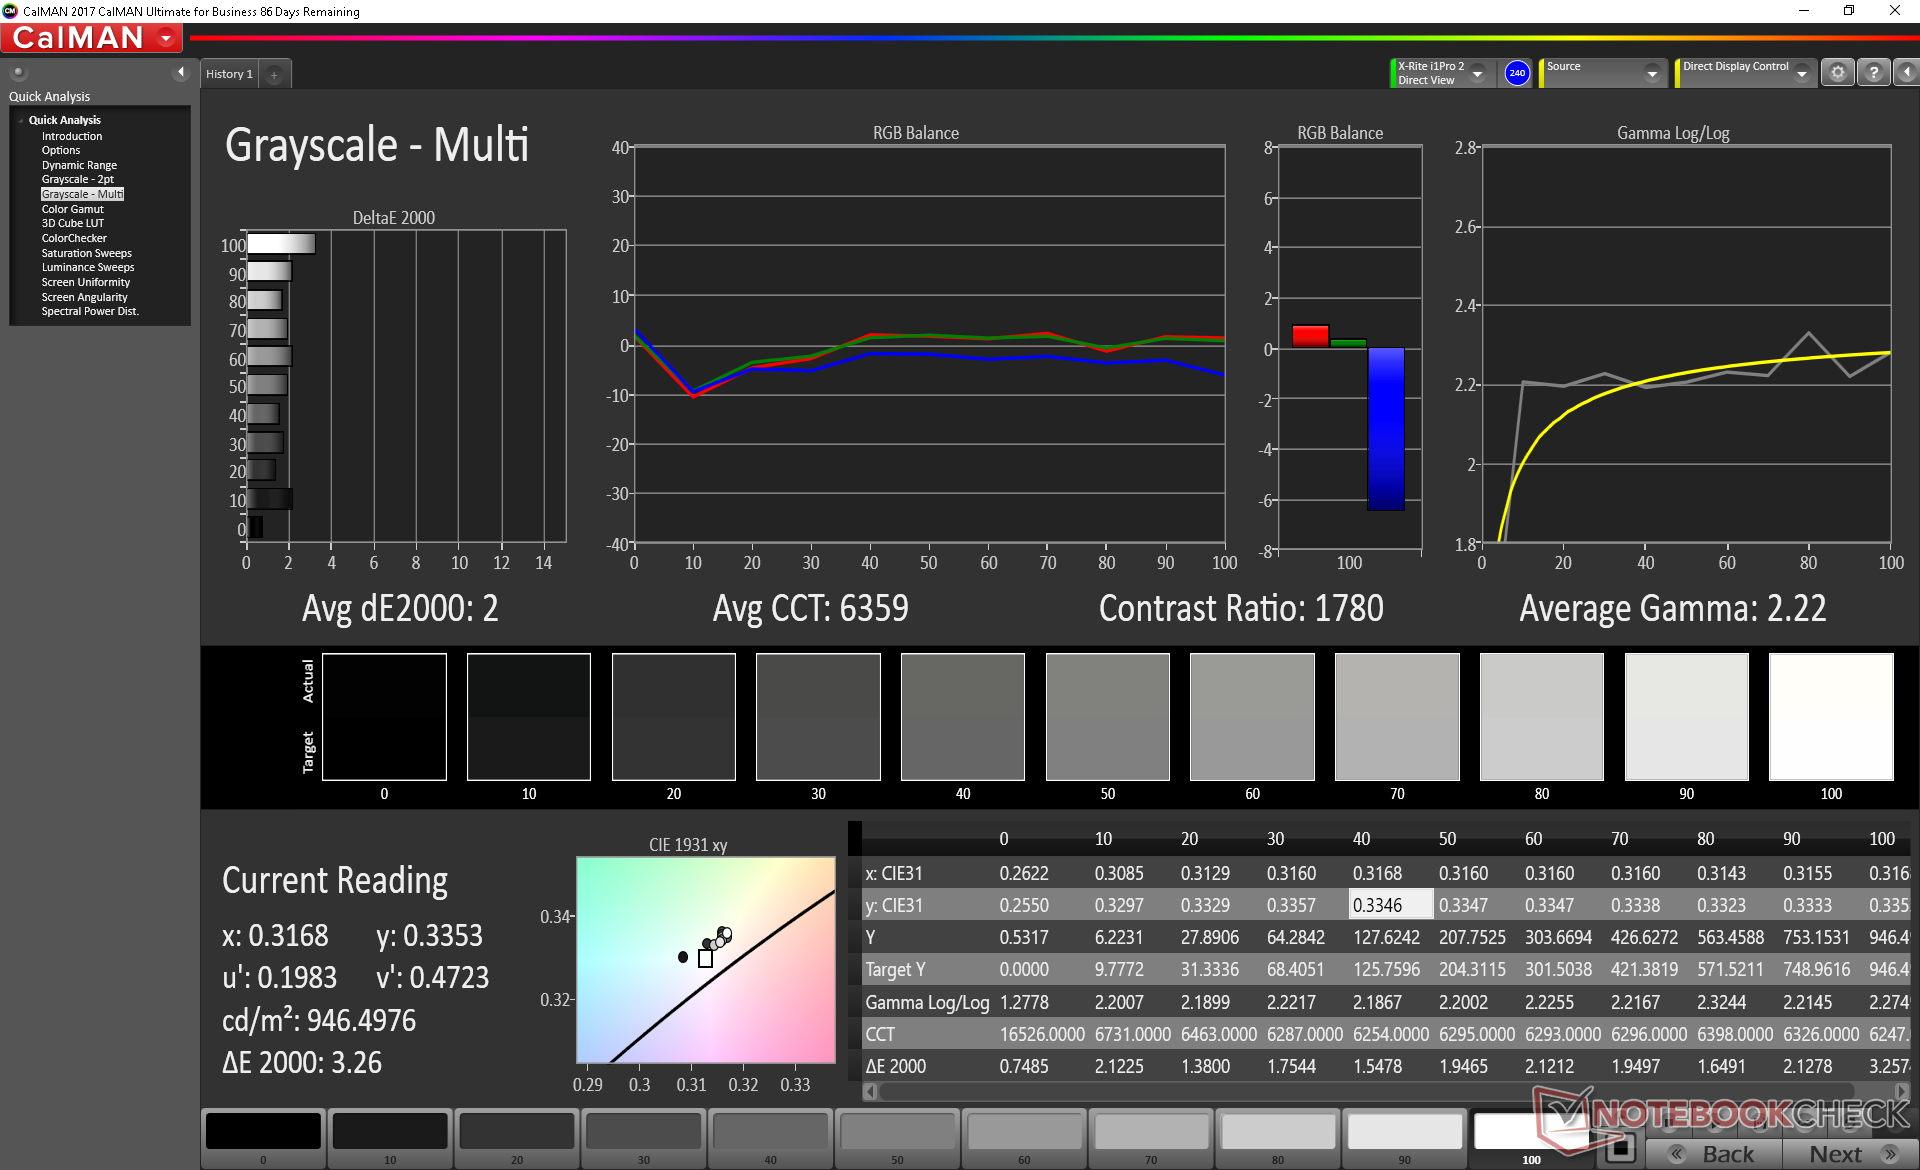
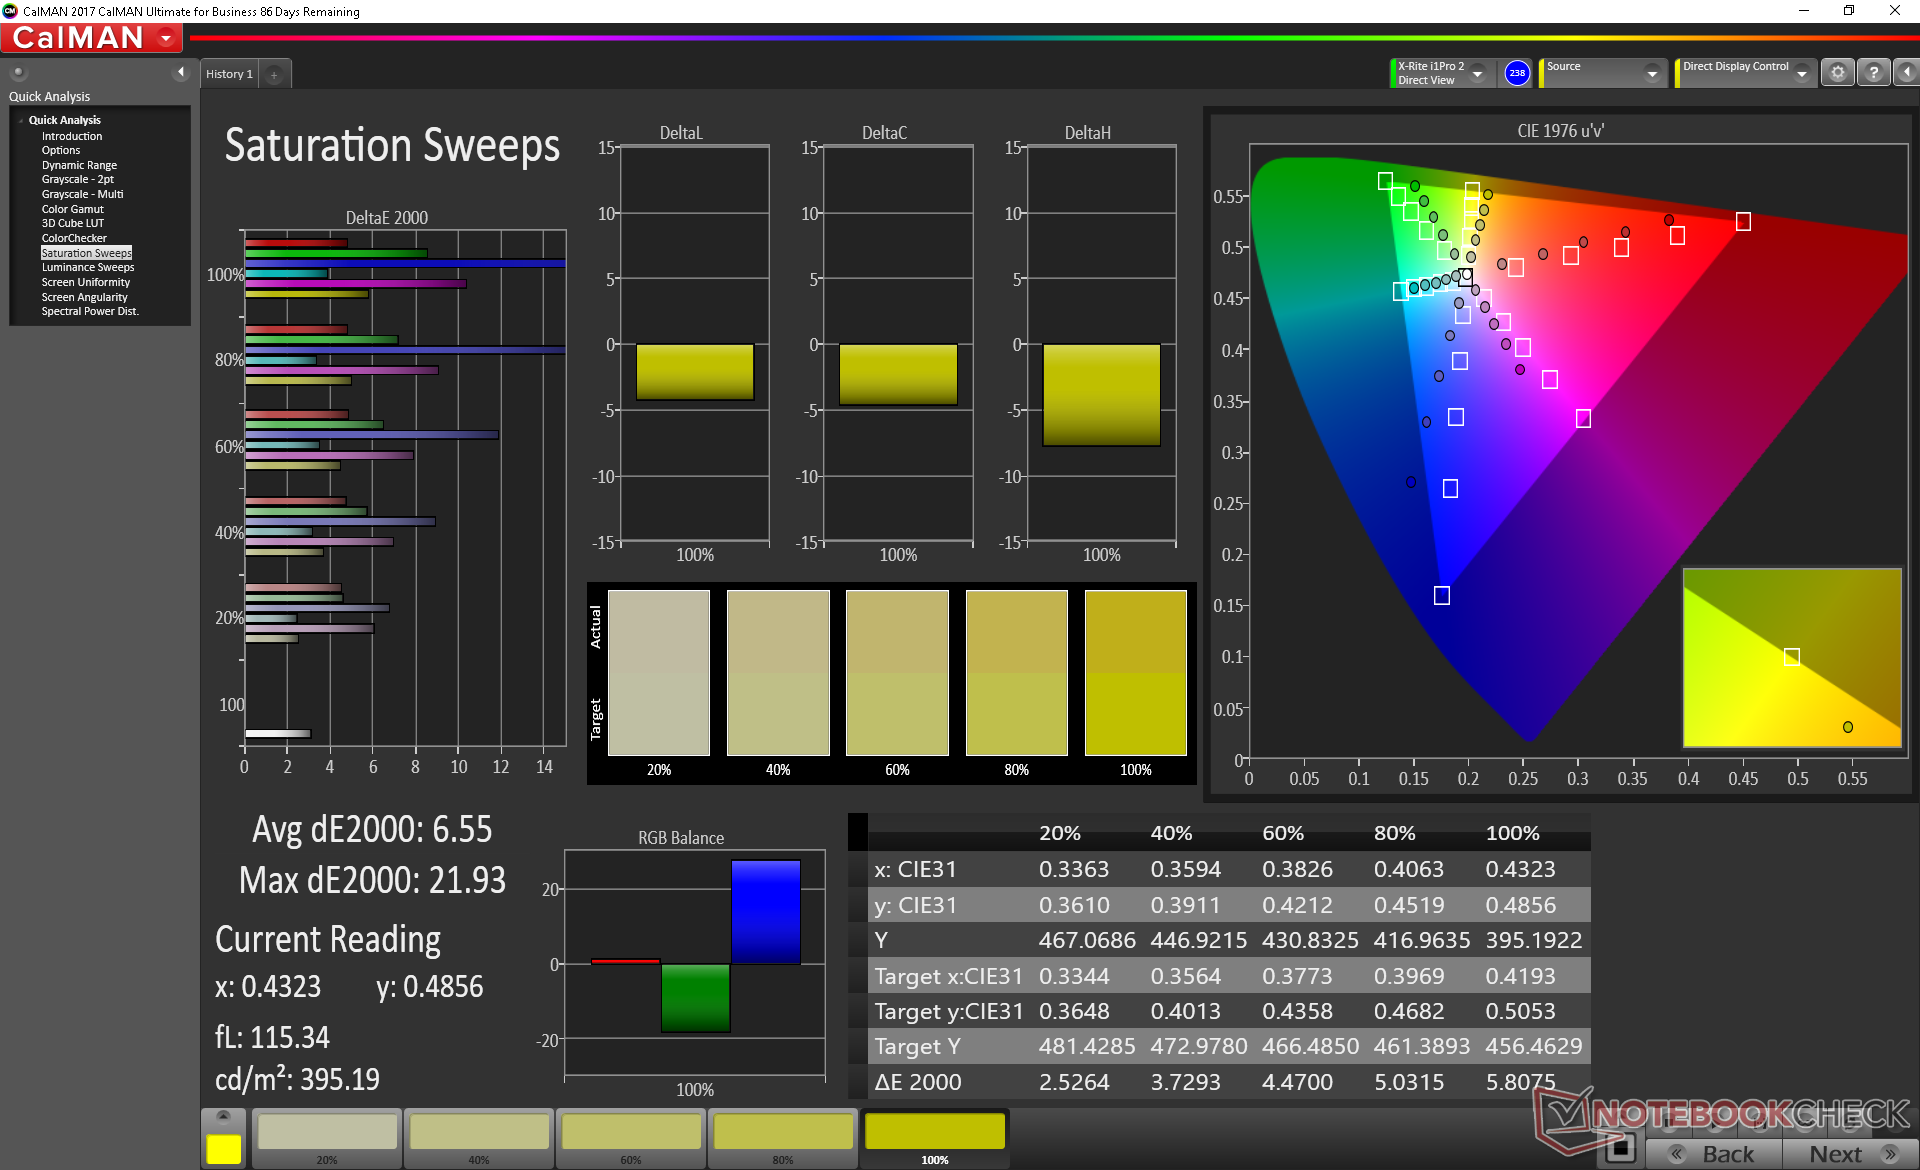
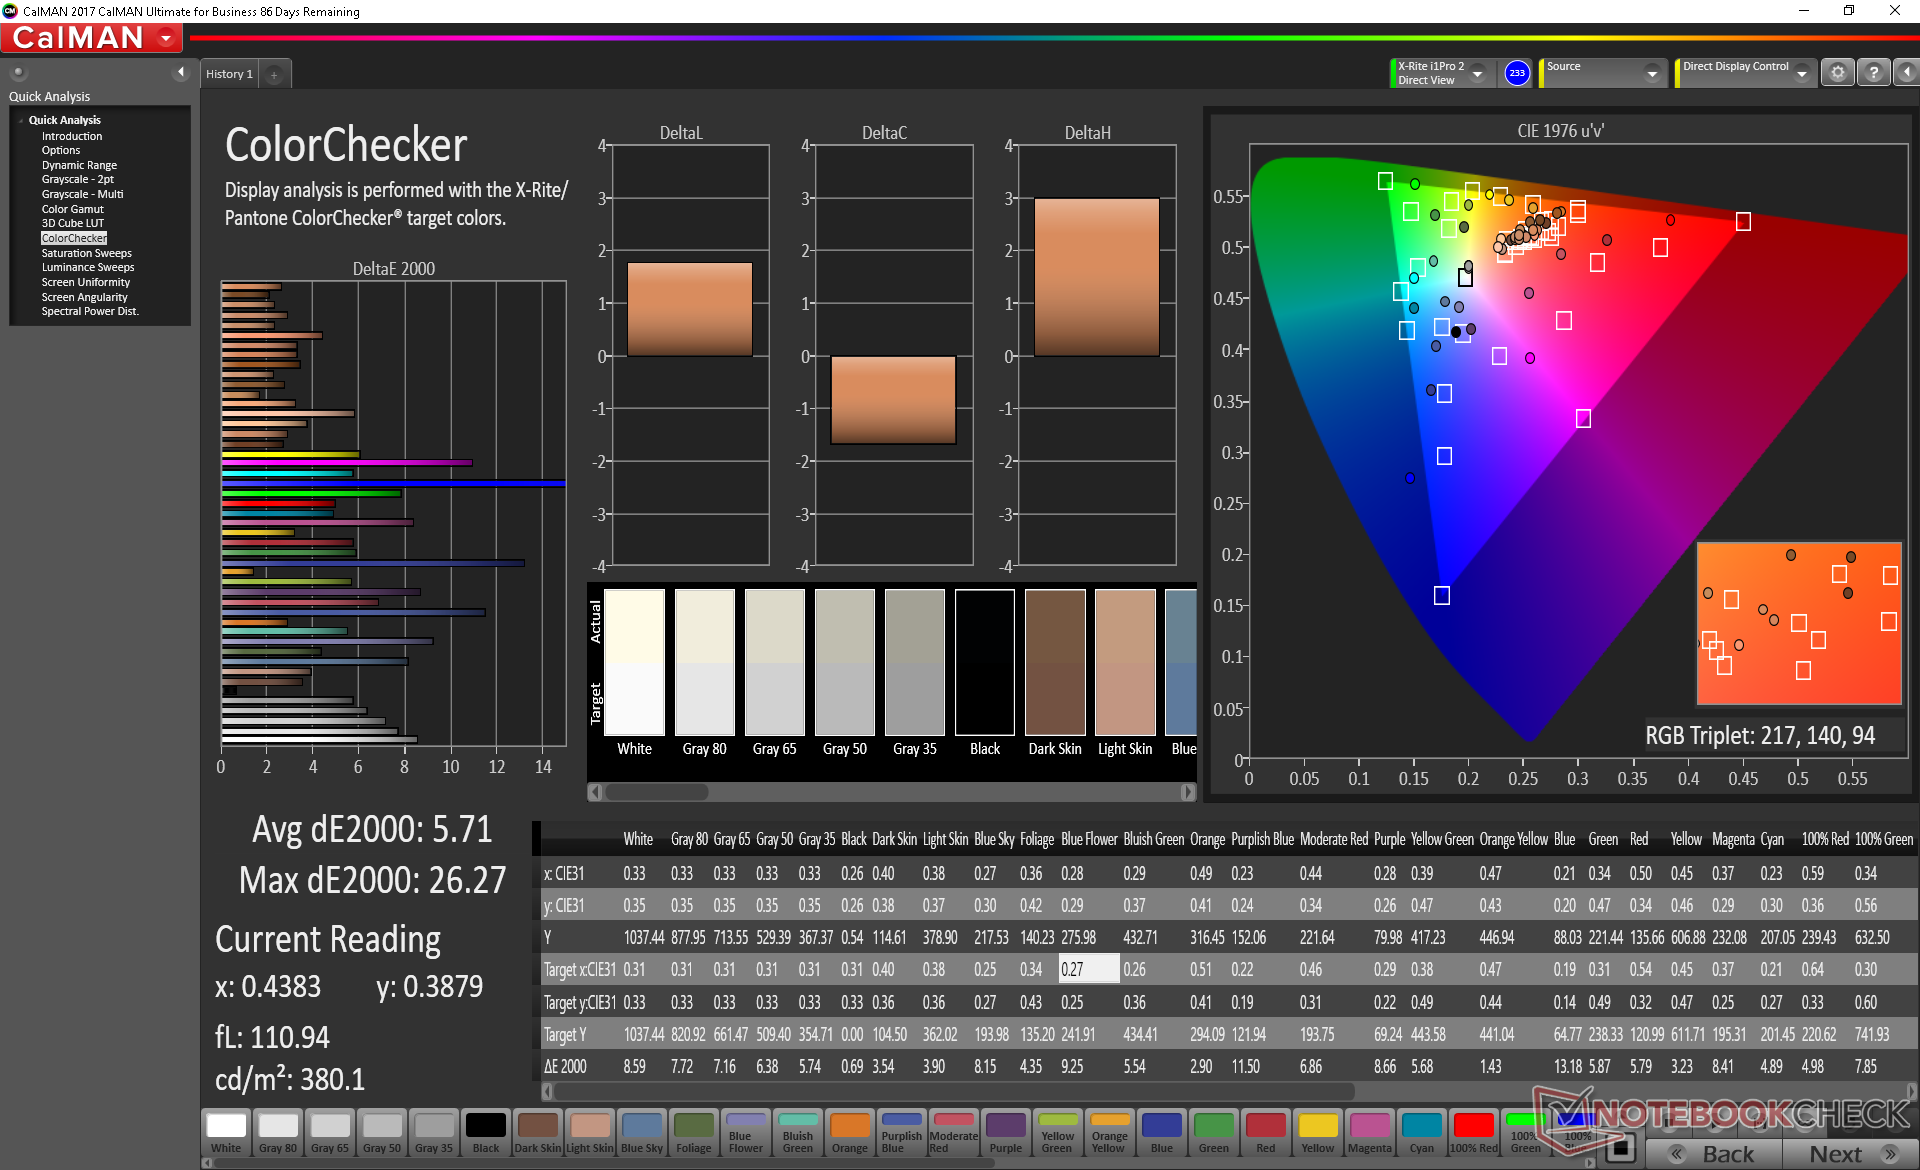
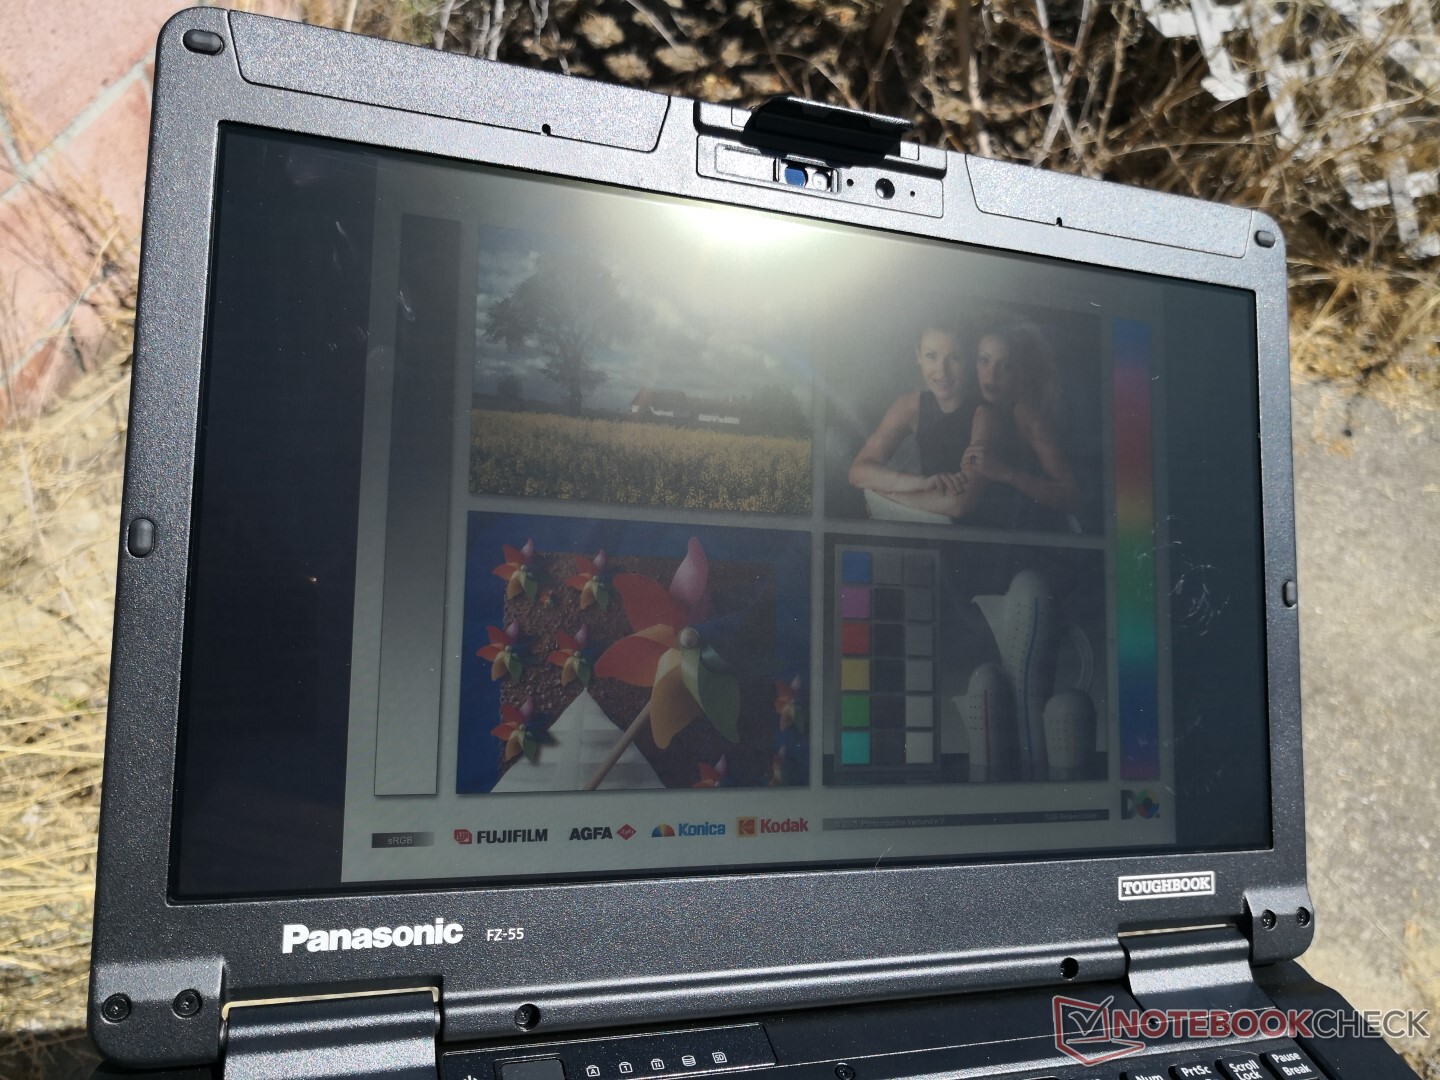
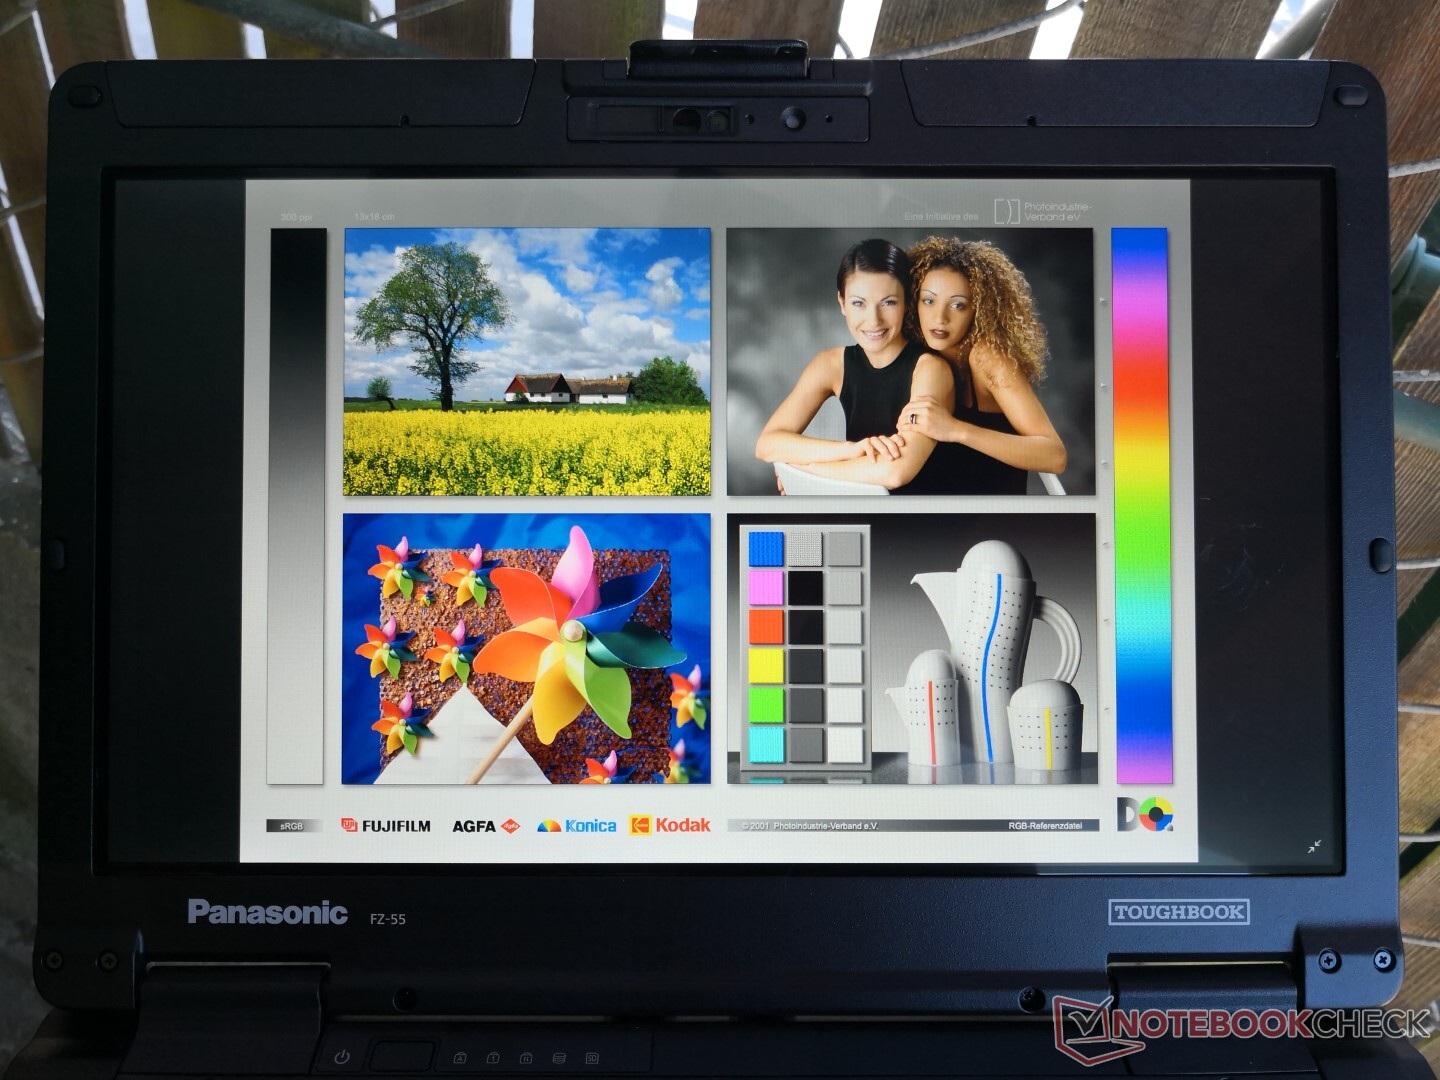
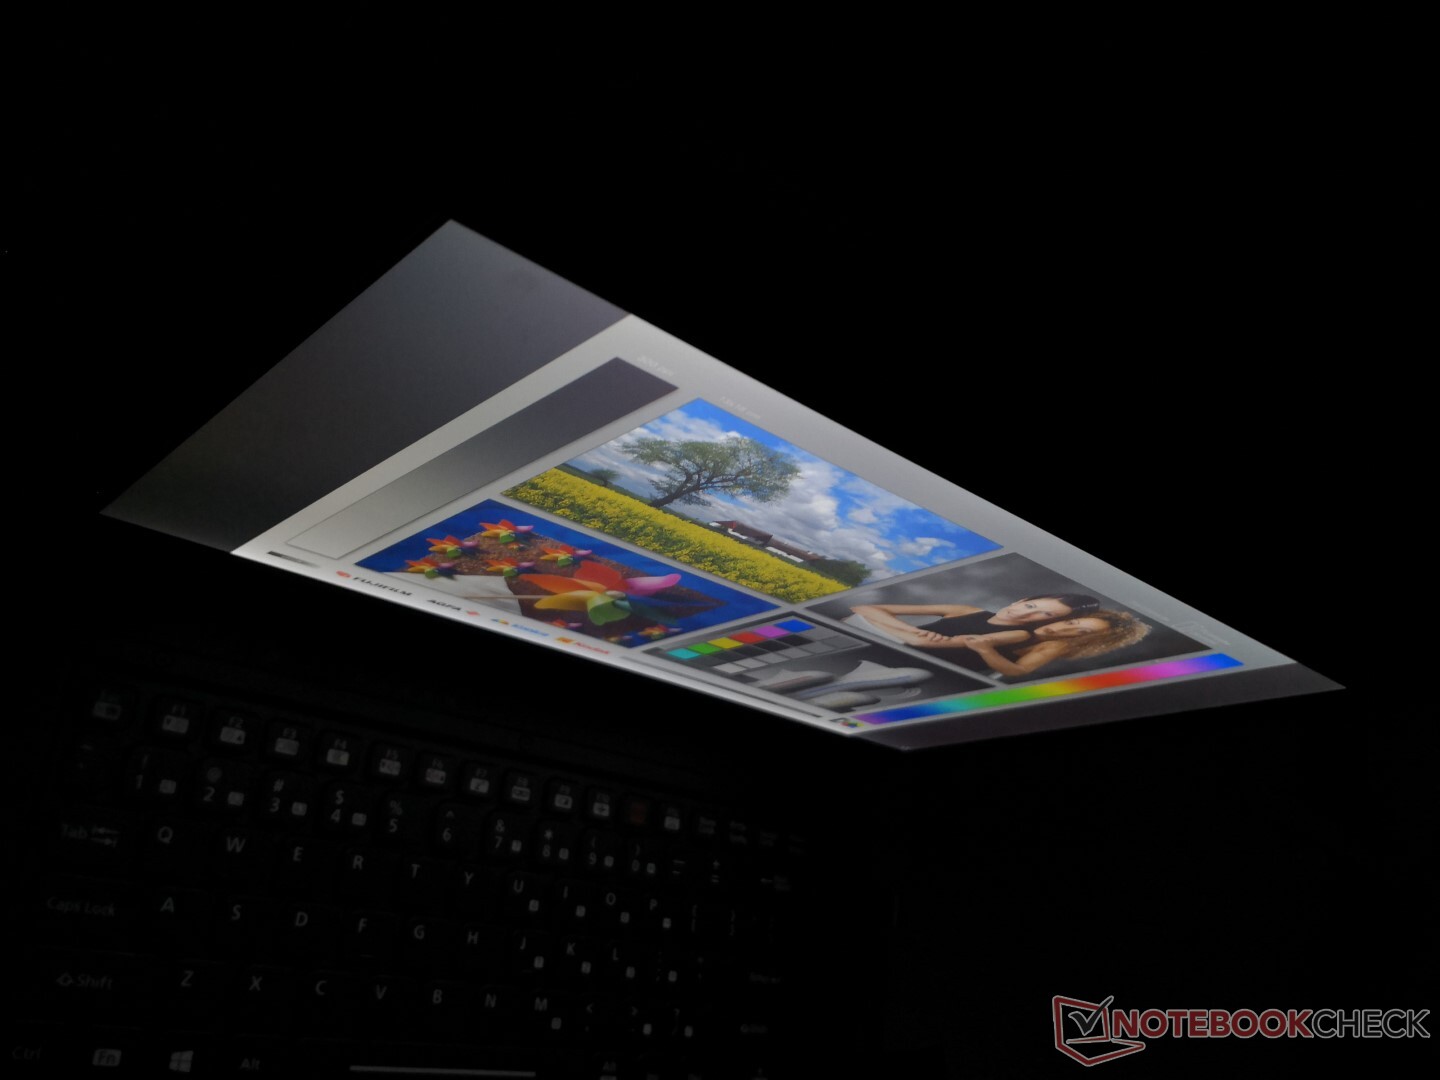
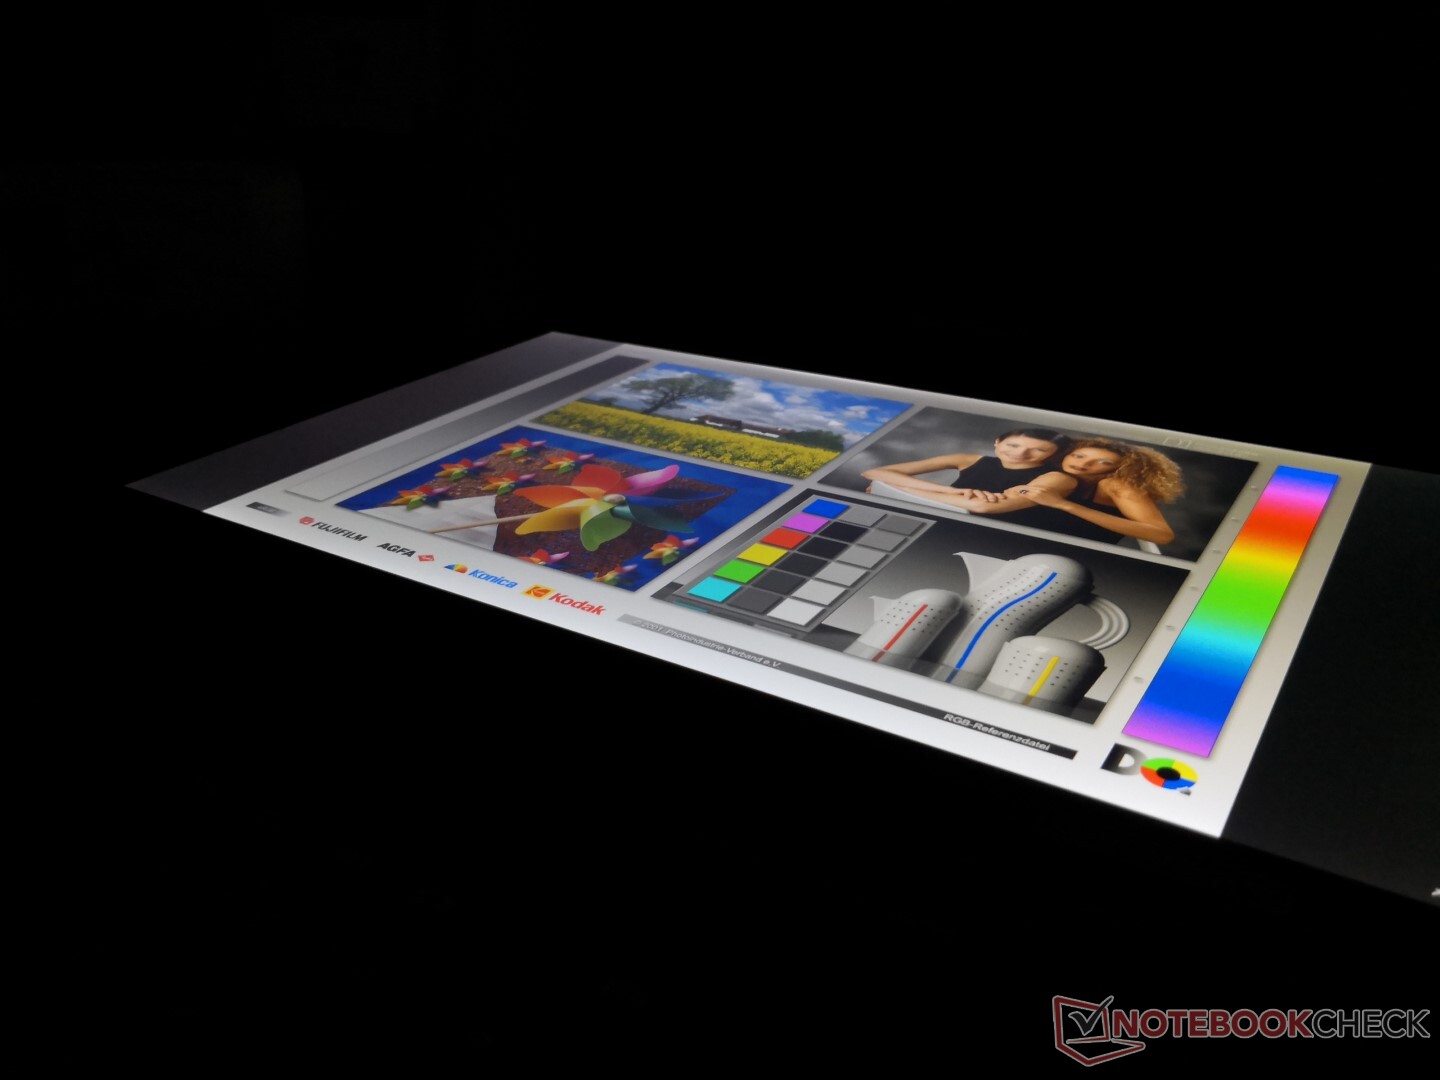
The most notable feature of the display is its super-bright backlight. Panasonic advertises a brightness of 1000 nits and we're able to confirm this with our own independent measurements. Drawbacks, however, include the slow black-white response times and limited color space that fortunately shouldn't impact the target industrial audience.
Perhaps the more notable drawbacks are the moderate-heavy uneven backlight bleeding, pulse-width modulation, and relatively grainy display as shown by our images and data below. The PWM of 694 Hz in particular is present on all brightness levels up to 99 percent which could potentially irritate users sensitive to onscreen flickering. Meanwhile, the grainy display is likely the consequence of having a thicker matte overlay for improved damage resistance.

| |||||||||||||||||||||||||
Brightness Distribution: 76 %
Center on Battery: 1037 cd/m²
Contrast: 1728:1 (Black: 0.6 cd/m²)
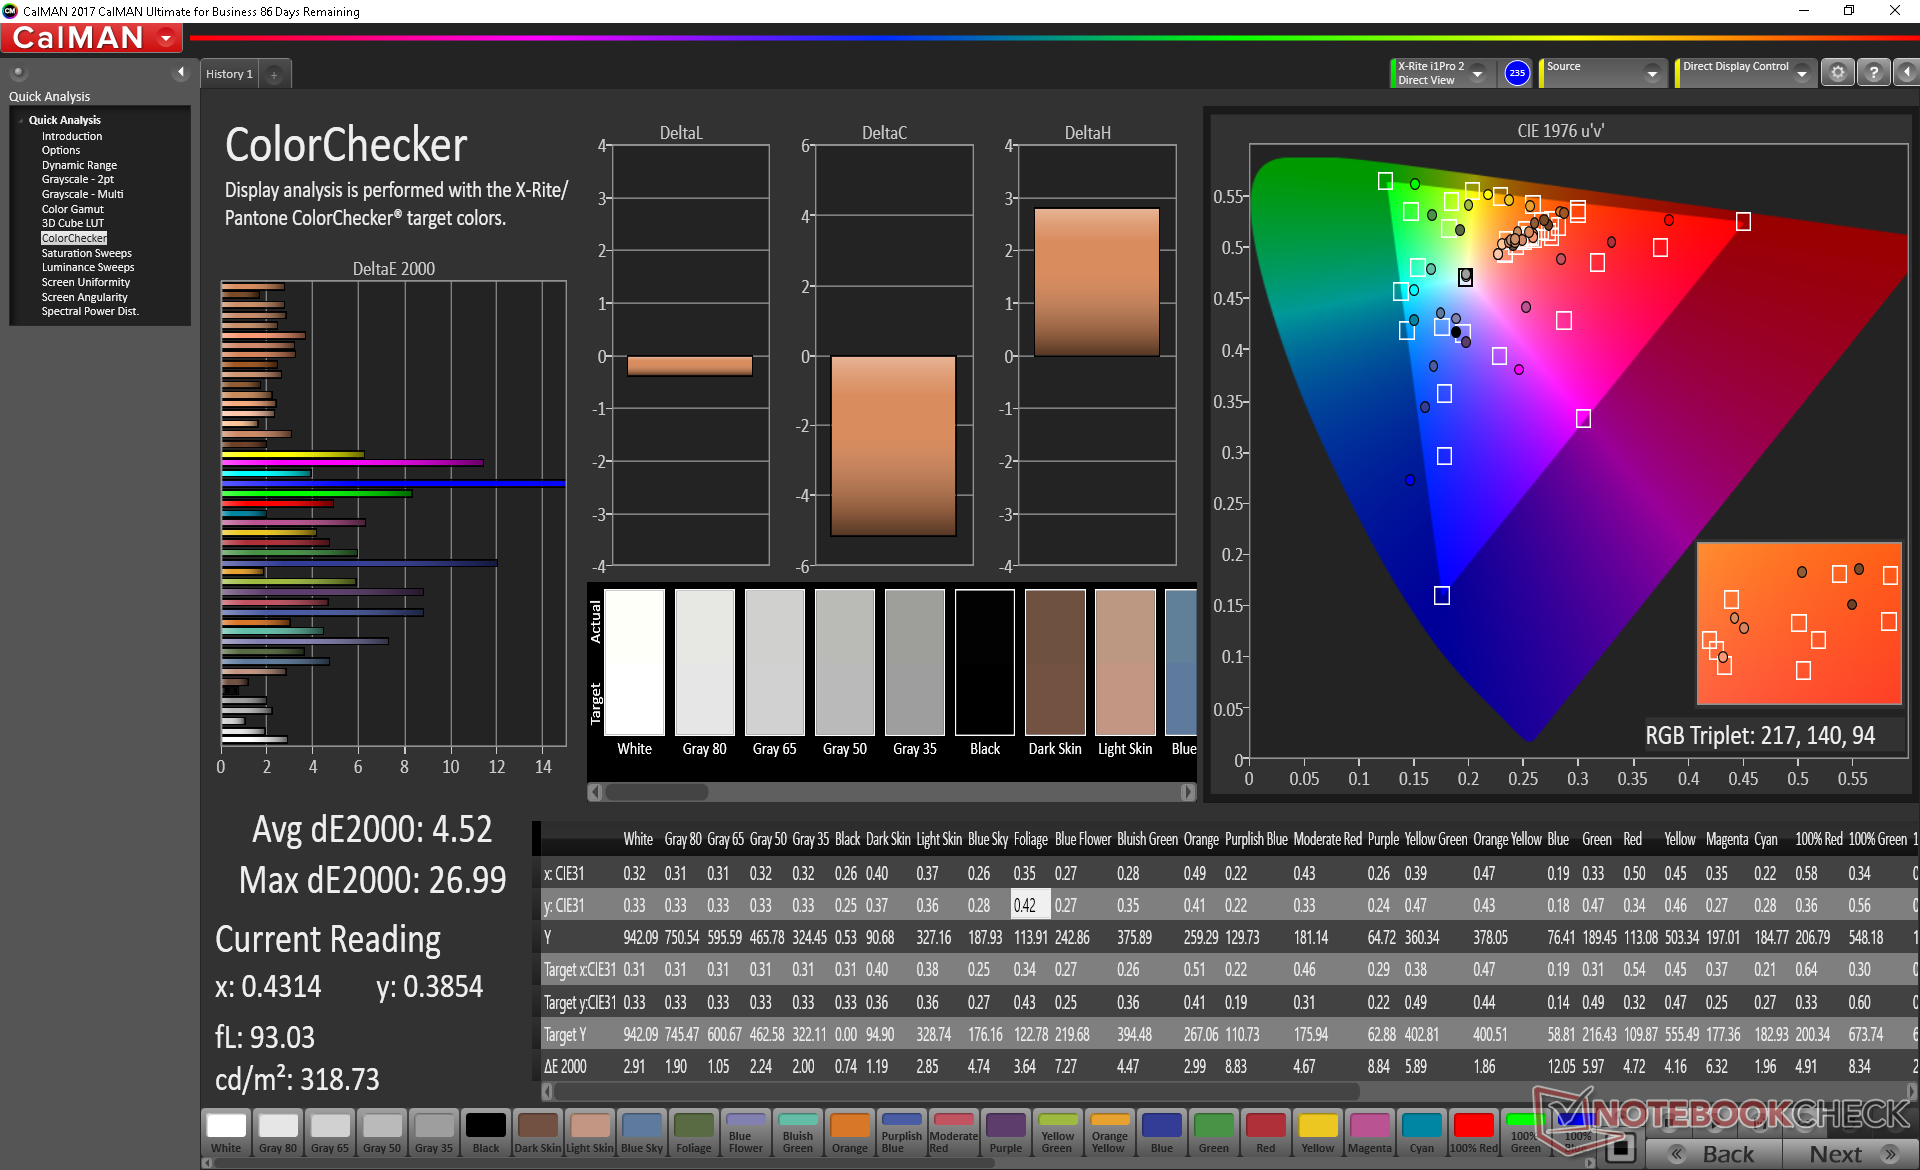
ΔE ColorChecker Calman: 5.71 | ∀{0.5-29.43 Ø4.71}
calibrated: 4.52
ΔE Greyscale Calman: 5.5 | ∀{0.09-98 Ø4.96}
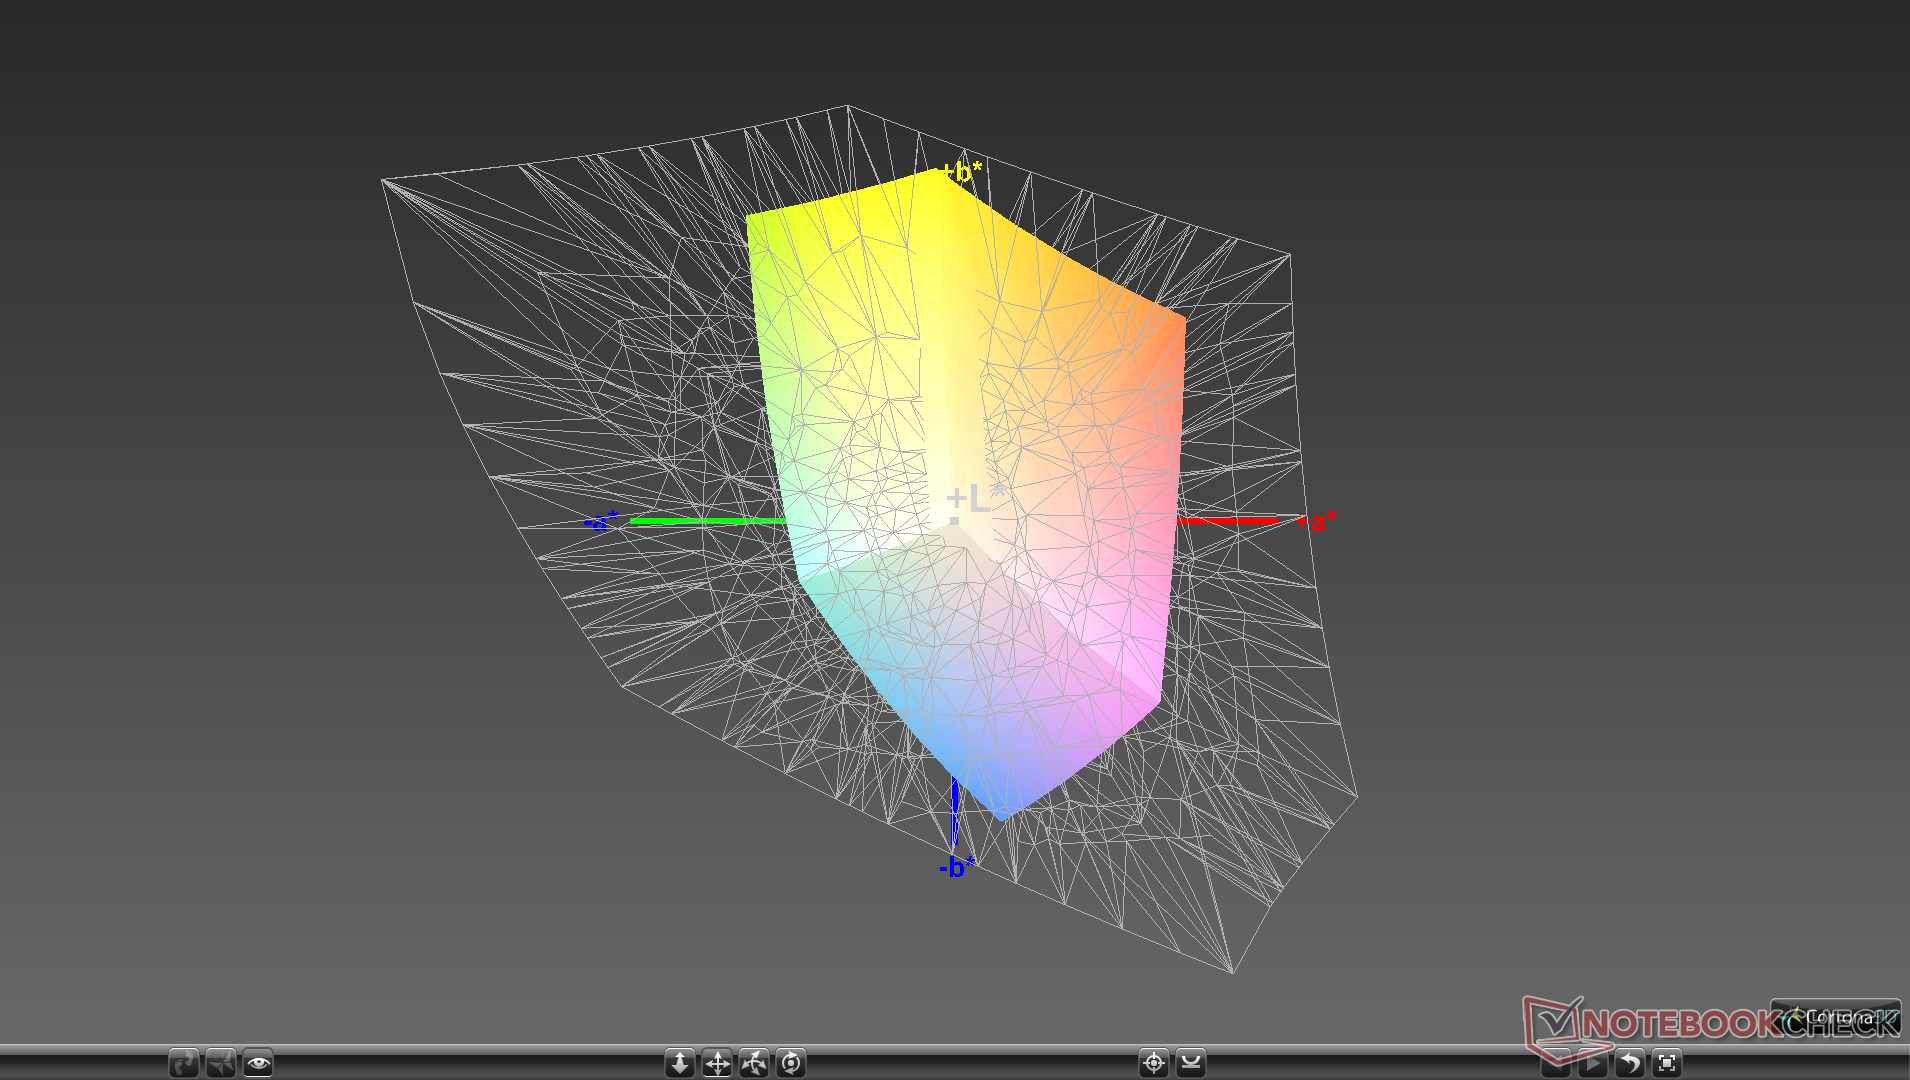
57% sRGB (Argyll 1.6.3 3D)
36.4% AdobeRGB 1998 (Argyll 1.6.3 3D)
39.38% AdobeRGB 1998 (Argyll 3D)
57% sRGB (Argyll 3D)
38.09% Display P3 (Argyll 3D)
Gamma: 2.04
CCT: 5783 K
| Panasonic Toughbook FZ-55 InfoVision M140NWF5 R3, IPS, 14", 1920x1080 | Panasonic Toughbook CF-54G2999VM B140XTN, AUO2E3C, TN LED, 14", 1366x768 | Getac S410 CMN N140BGE-E33, TN PED, 14", 1366x768 | Dell Latitude 5420 Rugged-P85G AU Optronics AUO523D, IPS, 14", 1920x1080 | Dell Latitude 7424 Rugged Extreme AU Optronics AUO523D, IPS, 14", 1920x1080 | Lenovo ThinkPad X1 Carbon 2019-20QE000VGE LP140QH2-SPD1, IPS, 14", 2560x1440 | |
|---|---|---|---|---|---|---|
| Display | -2% | 6% | 63% | 71% | 83% | |
| Display P3 Coverage (%) | 38.09 | 37.36 -2% | 40.46 6% | 62.5 64% | 65.3 71% | 72.5 90% |
| sRGB Coverage (%) | 57 | 56.1 -2% | 60.9 7% | 92.4 62% | 96.9 70% | 97.8 72% |
| AdobeRGB 1998 Coverage (%) | 39.38 | 38.62 -2% | 41.8 6% | 64.2 63% | 67.3 71% | 73.8 87% |
| Response Times | 20% | 28% | -38% | -43% | 20% | |
| Response Time Grey 50% / Grey 80% * (ms) | 42 ? | 43.2 ? -3% | 41.2 ? 2% | 68 ? -62% | 62.8 ? -50% | 33.6 ? 20% |
| Response Time Black / White * (ms) | 29.6 ? | 17.2 ? 42% | 14 ? 53% | 33.6 ? -14% | 40 ? -35% | 24 ? 19% |
| PWM Frequency (Hz) | 694 ? | 877 ? | 735 ? | 763 | ||
| Screen | -49% | -45% | 20% | 20% | 15% | |
| Brightness middle (cd/m²) | 1037 | 174.5 -83% | 265.1 -74% | 1111.7 7% | 844 -19% | 338 -67% |
| Brightness (cd/m²) | 1015 | 164 -84% | 246 -76% | 1026 1% | 793 -22% | 315 -69% |
| Brightness Distribution (%) | 76 | 71 -7% | 81 7% | 80 5% | 88 16% | 88 16% |
| Black Level * (cd/m²) | 0.6 | 0.6 -0% | 0.58 3% | 0.81 -35% | 0.54 10% | 0.43 28% |
| Contrast (:1) | 1728 | 291 -83% | 457 -74% | 1372 -21% | 1563 -10% | 786 -55% |
| Colorchecker dE 2000 * | 5.71 | 12.05 -111% | 14.24 -149% | 3.83 33% | 4.8 16% | 4 30% |
| Colorchecker dE 2000 max. * | 26.27 | 27.5 -5% | 26.66 -1% | 7.85 70% | 11.88 55% | 7.9 70% |
| Colorchecker dE 2000 calibrated * | 4.52 | 4.34 4% | 3.94 13% | 2.98 34% | 1.15 75% | 1.7 62% |
| Greyscale dE 2000 * | 5.5 | 14.8 -169% | 14.2 -158% | 5.6 -2% | 7.6 -38% | 6.2 -13% |
| Gamma | 2.04 108% | 1.4 157% | 2.03 108% | 2.306 95% | 2.334 94% | 2.13 103% |
| CCT | 5783 112% | 14529 45% | 17152 38% | 7676 85% | 6546 99% | 6787 96% |
| Color Space (Percent of AdobeRGB 1998) (%) | 36.4 | 35.7 -2% | 38.7 6% | 59 62% | 62 70% | 68.1 87% |
| Color Space (Percent of sRGB) (%) | 57 | 56.2 -1% | 61 7% | 93 63% | 97 70% | 97.8 72% |
| Total Average (Program / Settings) | -10% /
-32% | -4% /
-26% | 15% /
21% | 16% /
22% | 39% /
28% |
* ... smaller is better
Color space is narrow at just 57 percent of sRGB. This is definitely not the laptop to use for any sort of graphics work or video editing.
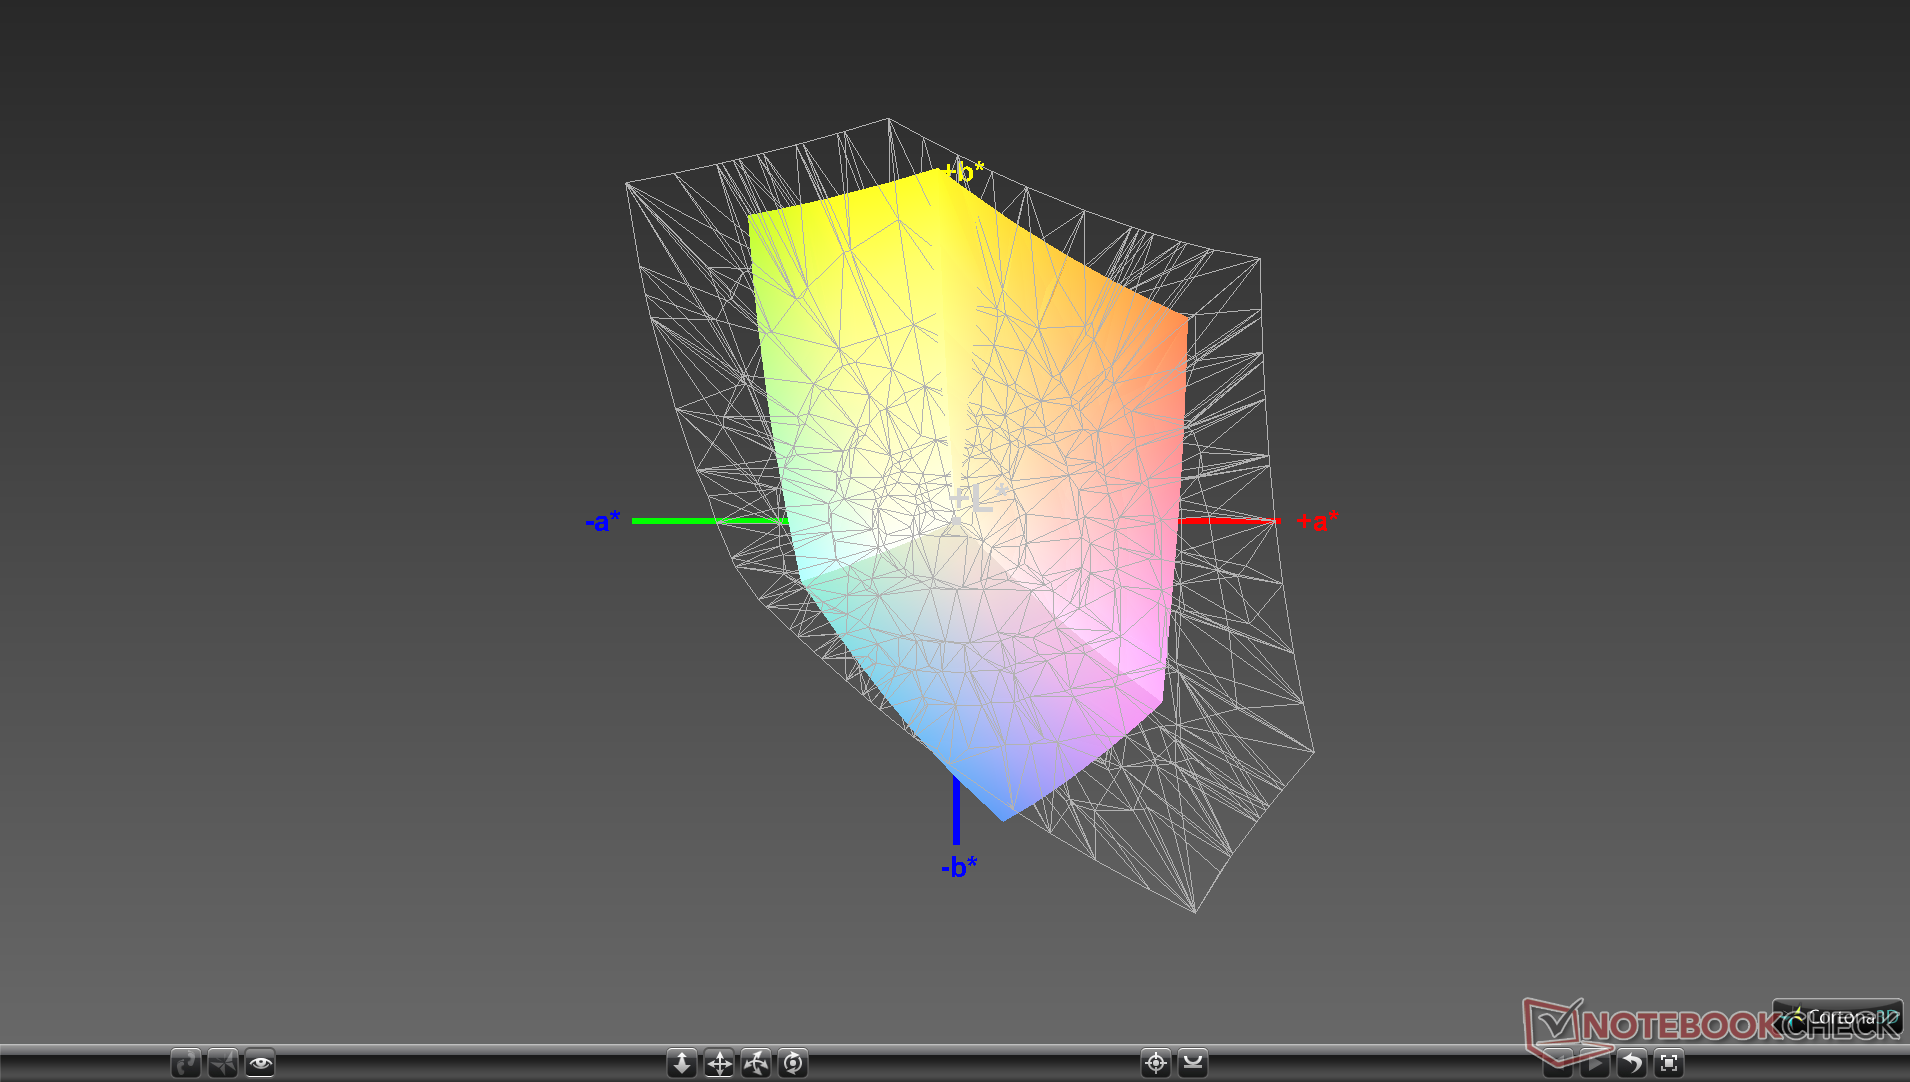
Further measurements with an X-Rite colorimeter reveal generally inaccurate colors and an overly warm grayscale out of the box. Calibration addresses some of the shortcomings and improves grayscale significantly from an average DeltaE value of 5.5 to 2. Colors still become increasingly inaccurate at higher saturation levels due to the narrow gamut of the panel.
Display Response Times
| ↔ Response Time Black to White | ||
|---|---|---|
| 29.6 ms ... rise ↗ and fall ↘ combined | ↗ 13.2 ms rise | 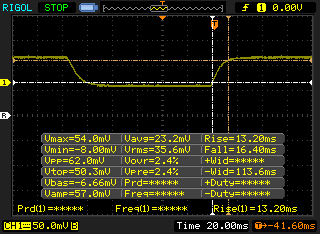 |
| ↘ 16.4 ms fall | ||
| The screen shows relatively slow response rates in our tests and may be too slow for gamers. In comparison, all tested devices range from 0.1 (minimum) to 240 (maximum) ms. » 79 % of all devices are better. This means that the measured response time is worse than the average of all tested devices (19.8 ms). | ||
| ↔ Response Time 50% Grey to 80% Grey | ||
| 42 ms ... rise ↗ and fall ↘ combined | ↗ 20.8 ms rise | 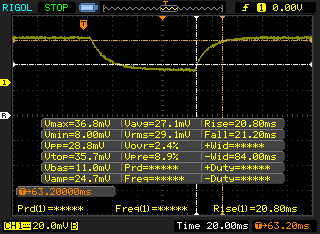 |
| ↘ 21.2 ms fall | ||
| The screen shows slow response rates in our tests and will be unsatisfactory for gamers. In comparison, all tested devices range from 0.165 (minimum) to 636 (maximum) ms. » 67 % of all devices are better. This means that the measured response time is worse than the average of all tested devices (30.9 ms). | ||
Screen Flickering / PWM (Pulse-Width Modulation)
| Screen flickering / PWM detected | 694 Hz | ≤ 99 % brightness setting | 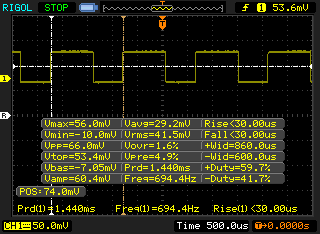 |
The display backlight flickers at 694 Hz (worst case, e.g., utilizing PWM) Flickering detected at a brightness setting of 99 % and below. There should be no flickering or PWM above this brightness setting. The frequency of 694 Hz is quite high, so most users sensitive to PWM should not notice any flickering. In comparison: 52 % of all tested devices do not use PWM to dim the display. If PWM was detected, an average of 7748 (minimum: 5 - maximum: 343500) Hz was measured. | |||
The 1000-nit backlight, matte overlay, 180-degree hinges, and wide IPS viewing angles contribute to the excellent outdoor visibility of the screen. Nonetheless, direct sunlight will still overwhelm the display and so we recommend working under shade if possible. Apparent contrast and colors degrade only if viewing from extreme angles.
Performance
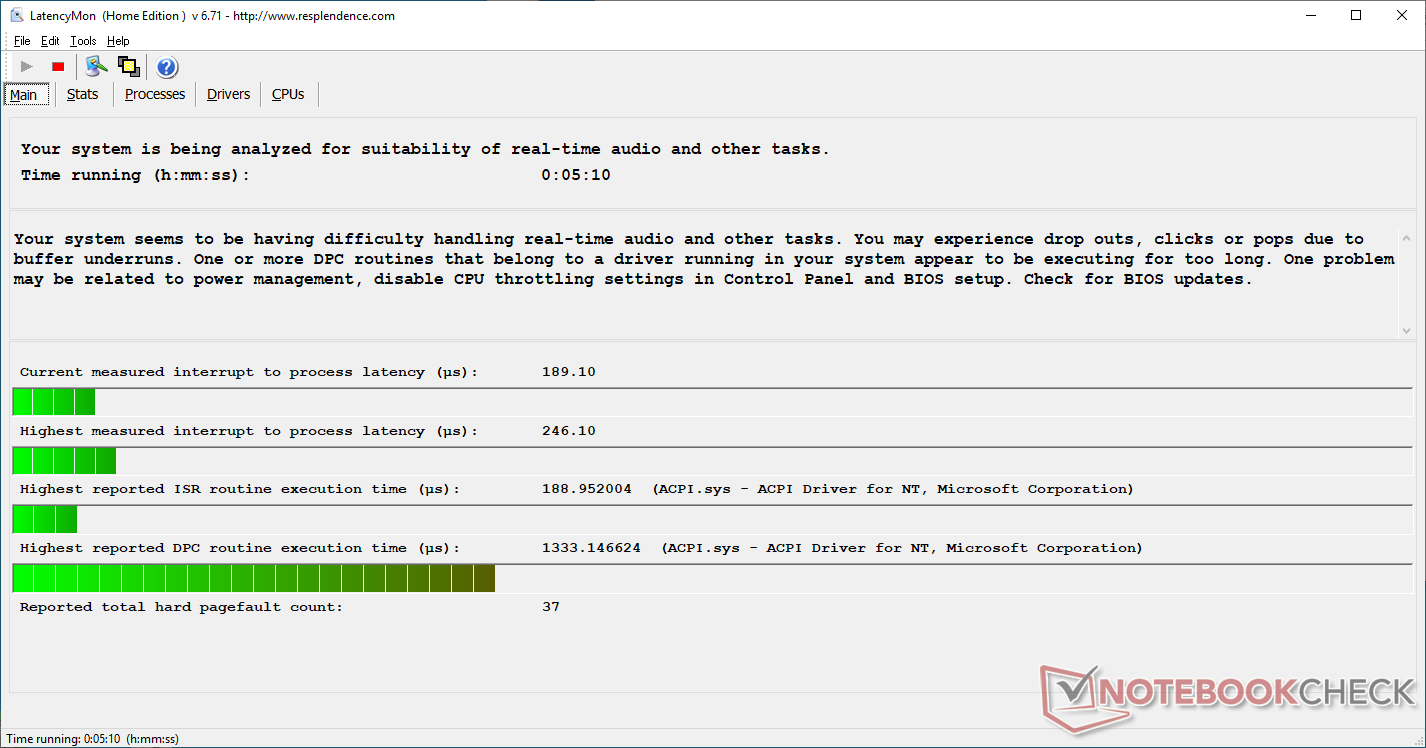
The Intel U-class CPU targets low-power applications while the optional AMD Radeon Pro WX 4150 GPU should provide enough power to run more graphics-intensive applications involving video playback, recording, or very light CAD software. Running LatencyMon shows DPC latency issues even when the wireless is disabled which is unfortunate for a laptop targeting professionals.
Processor
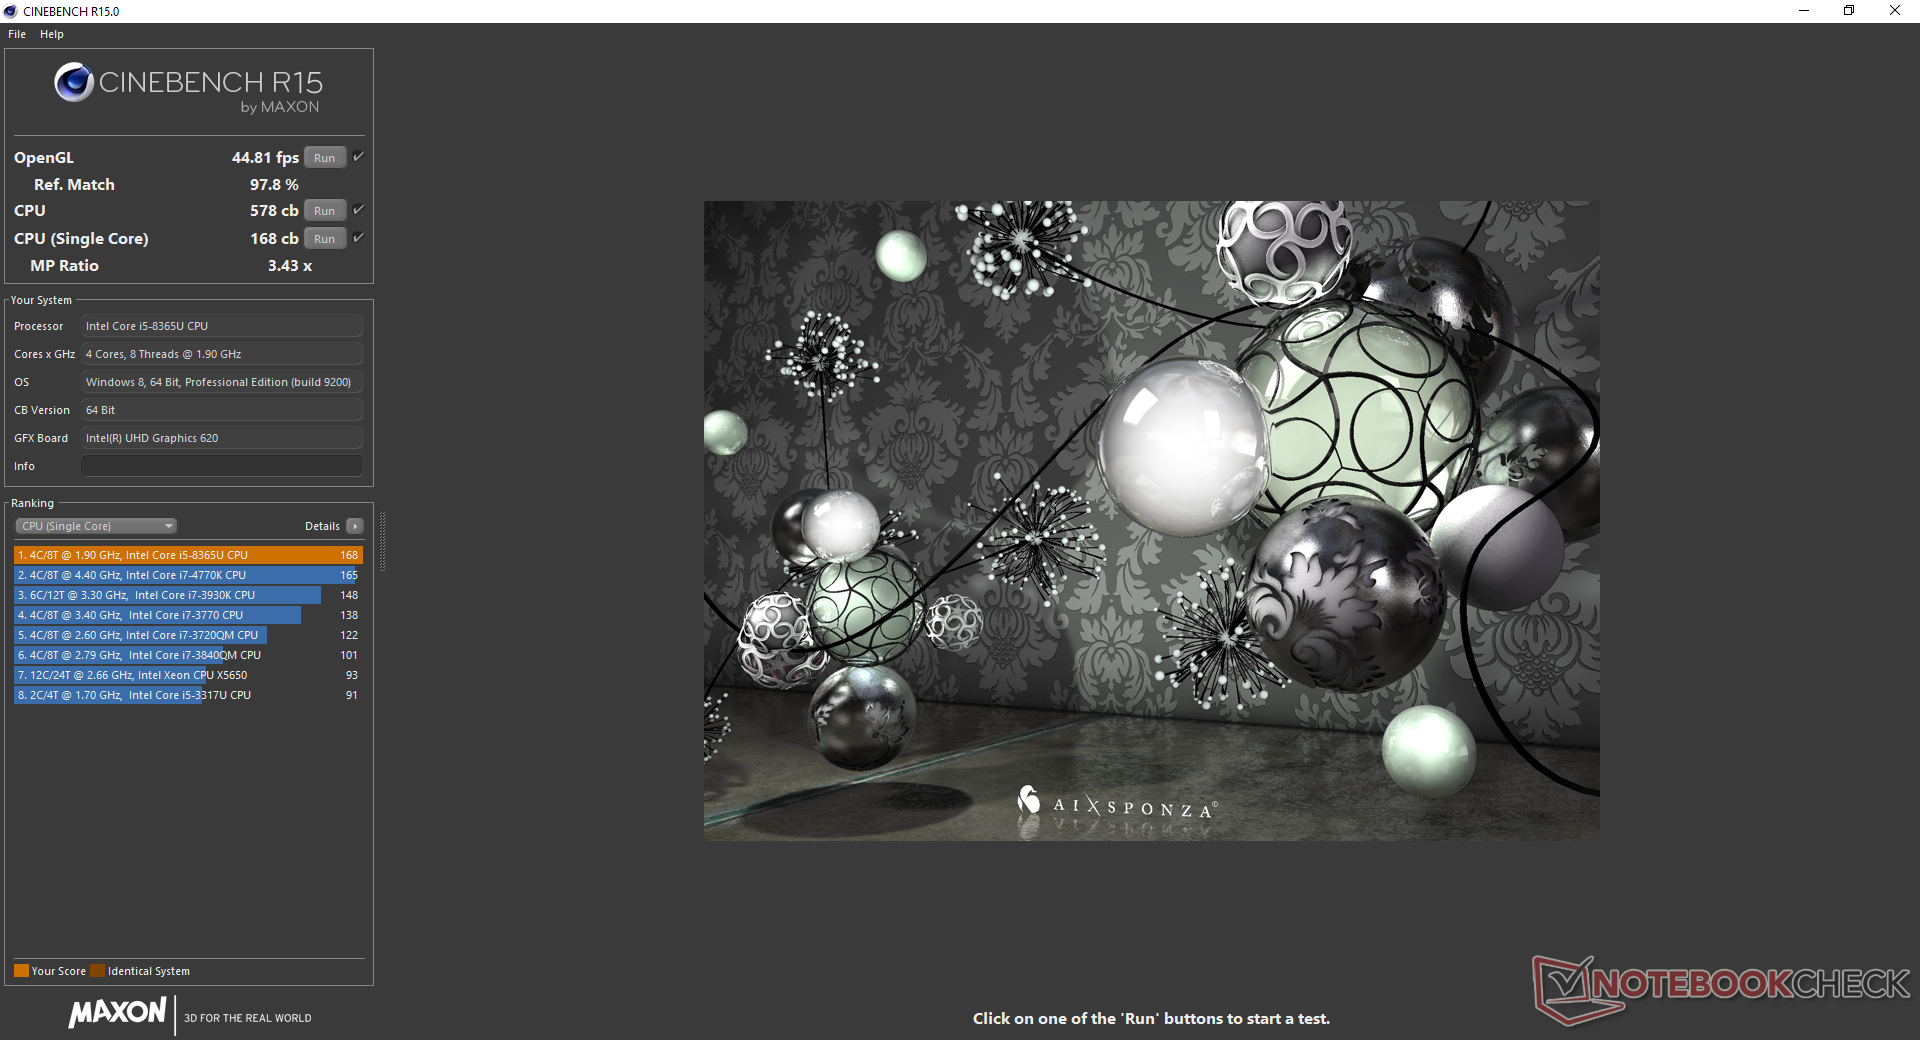
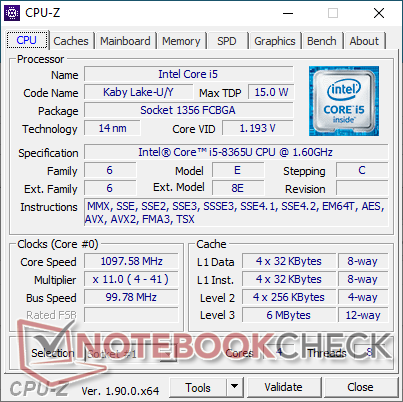
The Core i5-8365U is performing where we expect it to be in relation to other laptops equipped with the same processor. Raw performance drops by only 7 percent when stressed for long periods as exemplified by our CineBench R15 Multi-Thread loop test below. Upgrading to the Core i7-8665U will bring up to 20 percent more CPU performance.
See our dedicated page on the Core i5-8365U for more technical information and benchmark comparisons.
| Cinebench R11.5 | |
| CPU Single 64Bit | |
| Average Intel Core i5-8365U (n=1) | |
| Lenovo ThinkPad L490 20Q6S08600 | |
| Dell Latitude 13 3390 | |
| CPU Multi 64Bit | |
| Average Intel Core i5-8365U (n=1) | |
| Lenovo ThinkPad L490 20Q6S08600 | |
| Dell Latitude 13 3390 | |
| Cinebench R10 | |
| Rendering Multiple CPUs 32Bit | |
| Lenovo Legion Y540-17IRH | |
| Average Intel Core i5-8365U (n=1) | |
| HP ProBook 445 G6 | |
| Rendering Single 32Bit | |
| Average Intel Core i5-8365U (n=1) | |
| Lenovo Legion Y540-17IRH | |
| HP ProBook 445 G6 | |
| wPrime 2.10 - 1024m | |
| Lenovo ThinkPad 13 20J1005TPB | |
| Average Intel Core i5-8365U (n=1) | |
* ... smaller is better
System Performance
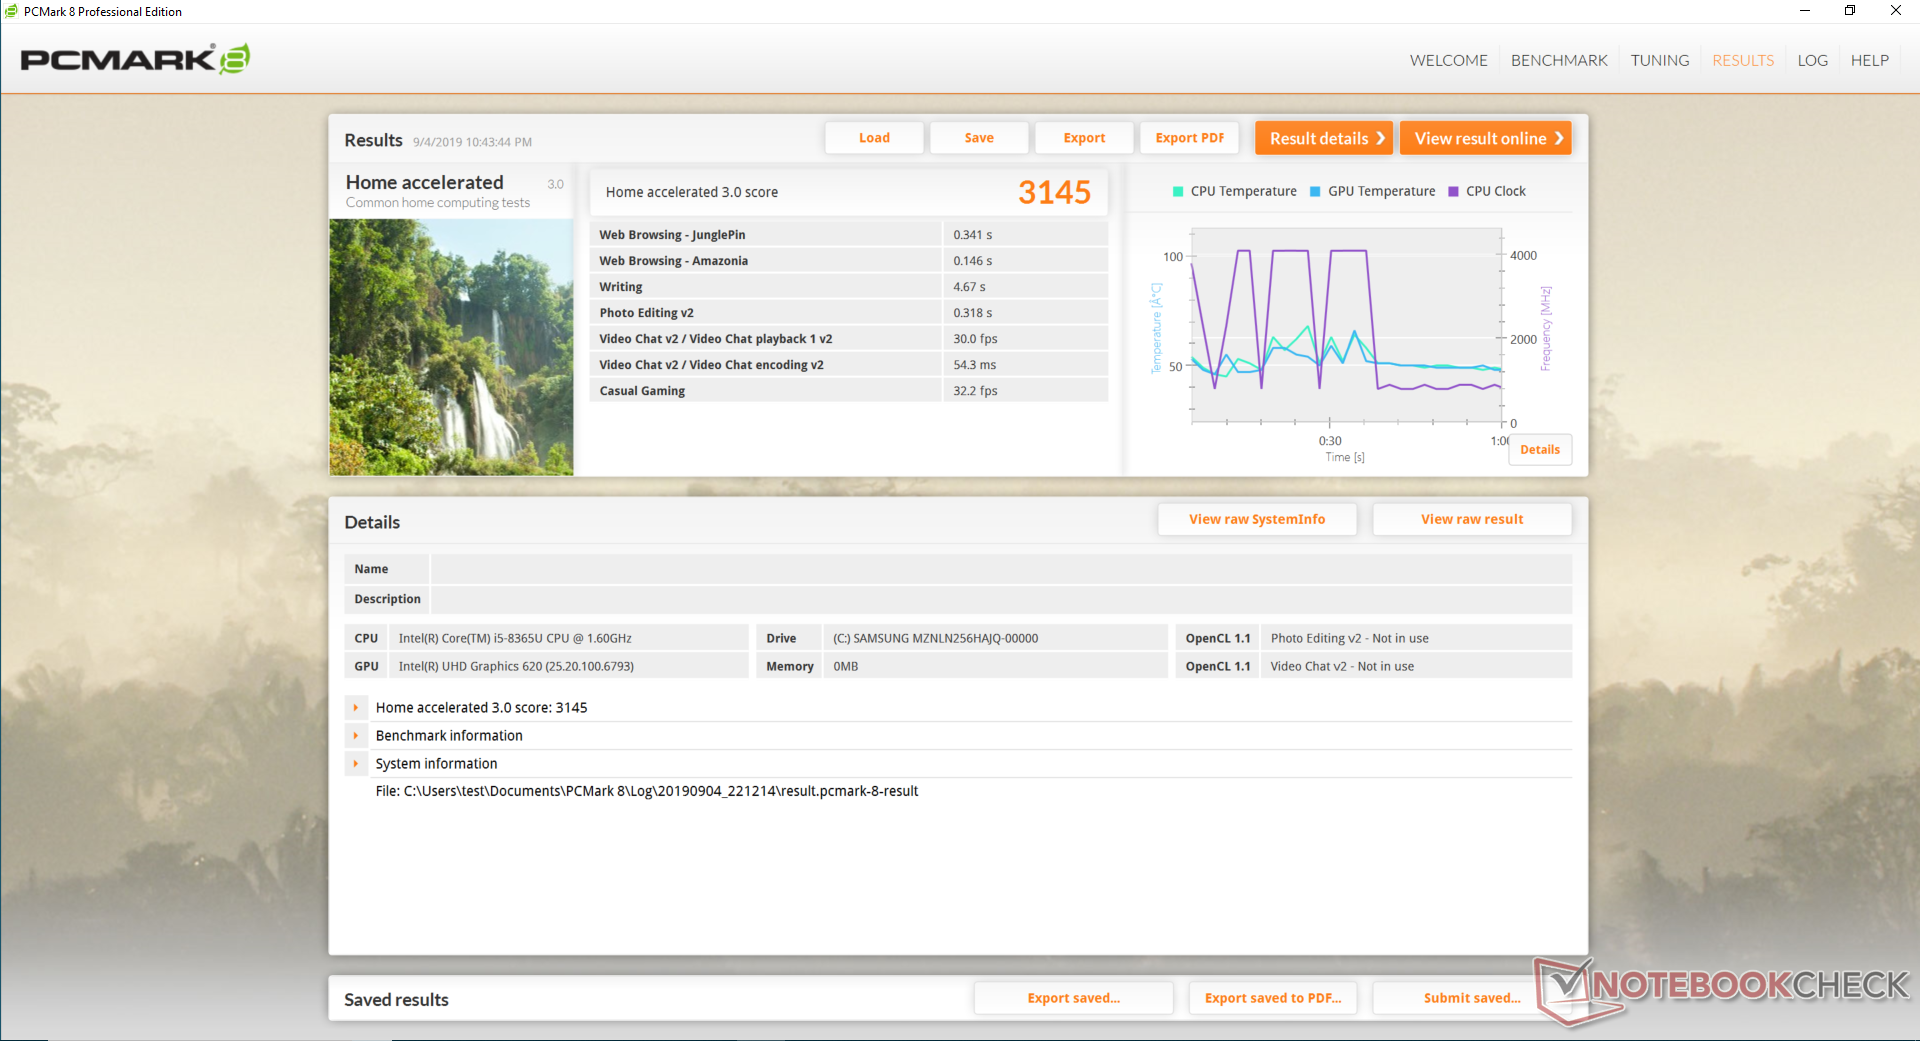
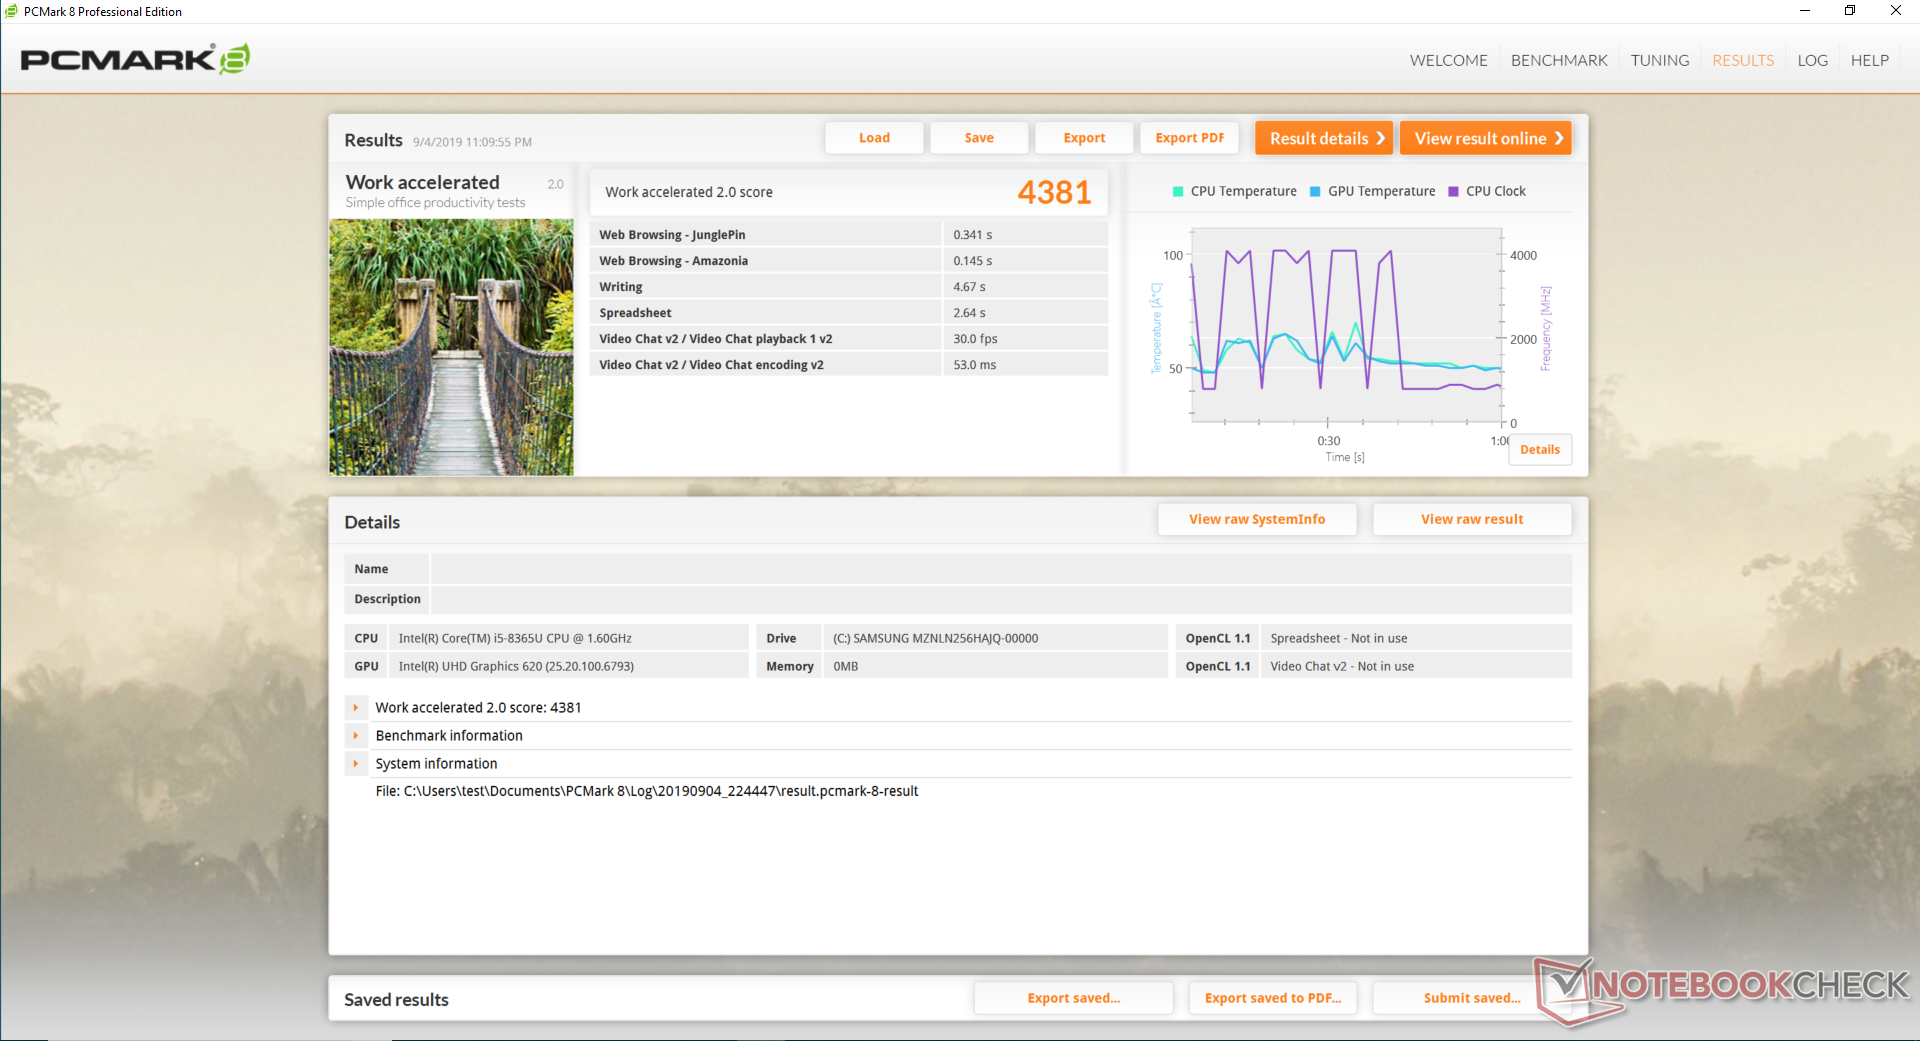
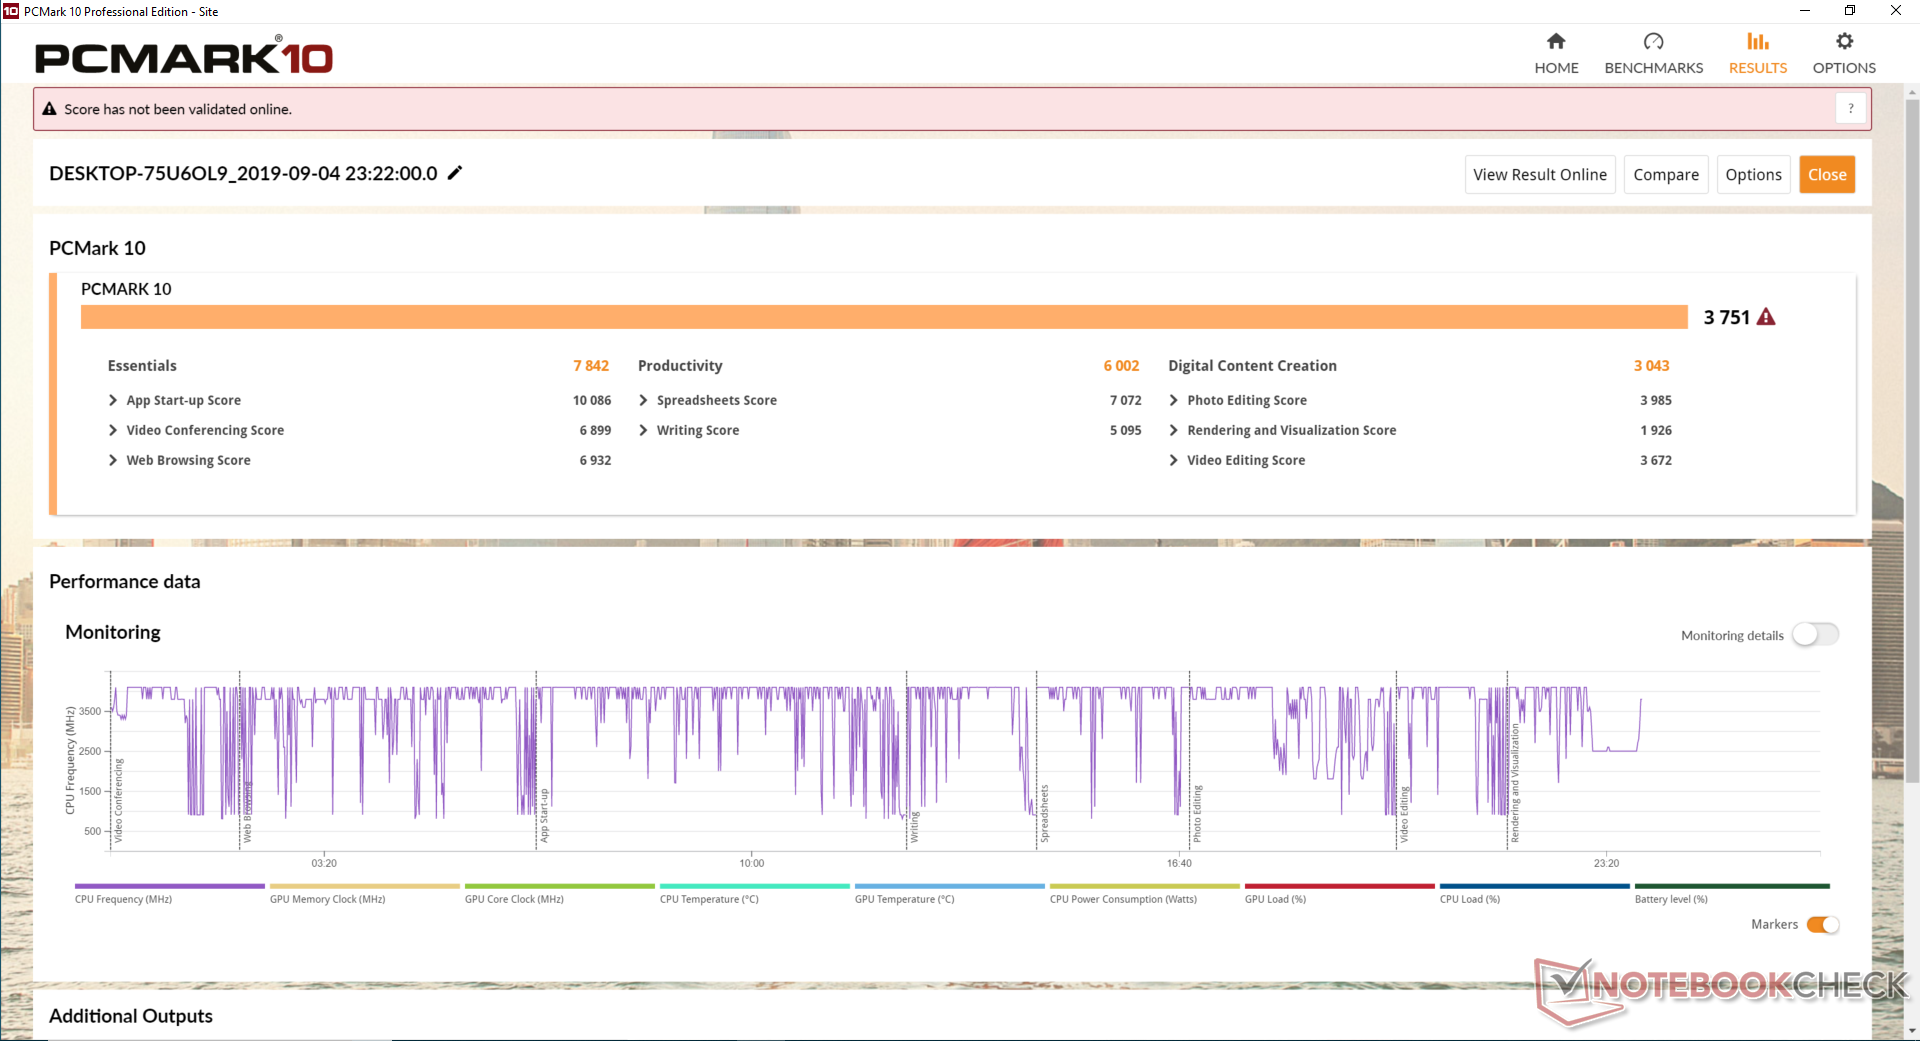
| PCMark 8 Home Score Accelerated v2 | 3146 points | |
| PCMark 8 Work Score Accelerated v2 | 4381 points | |
| PCMark 10 Score | 3751 points | |
Help | ||
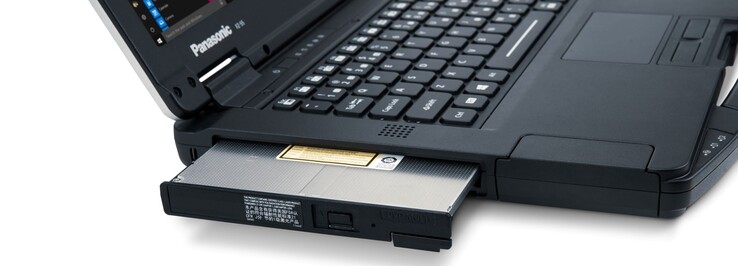
Storage Devices
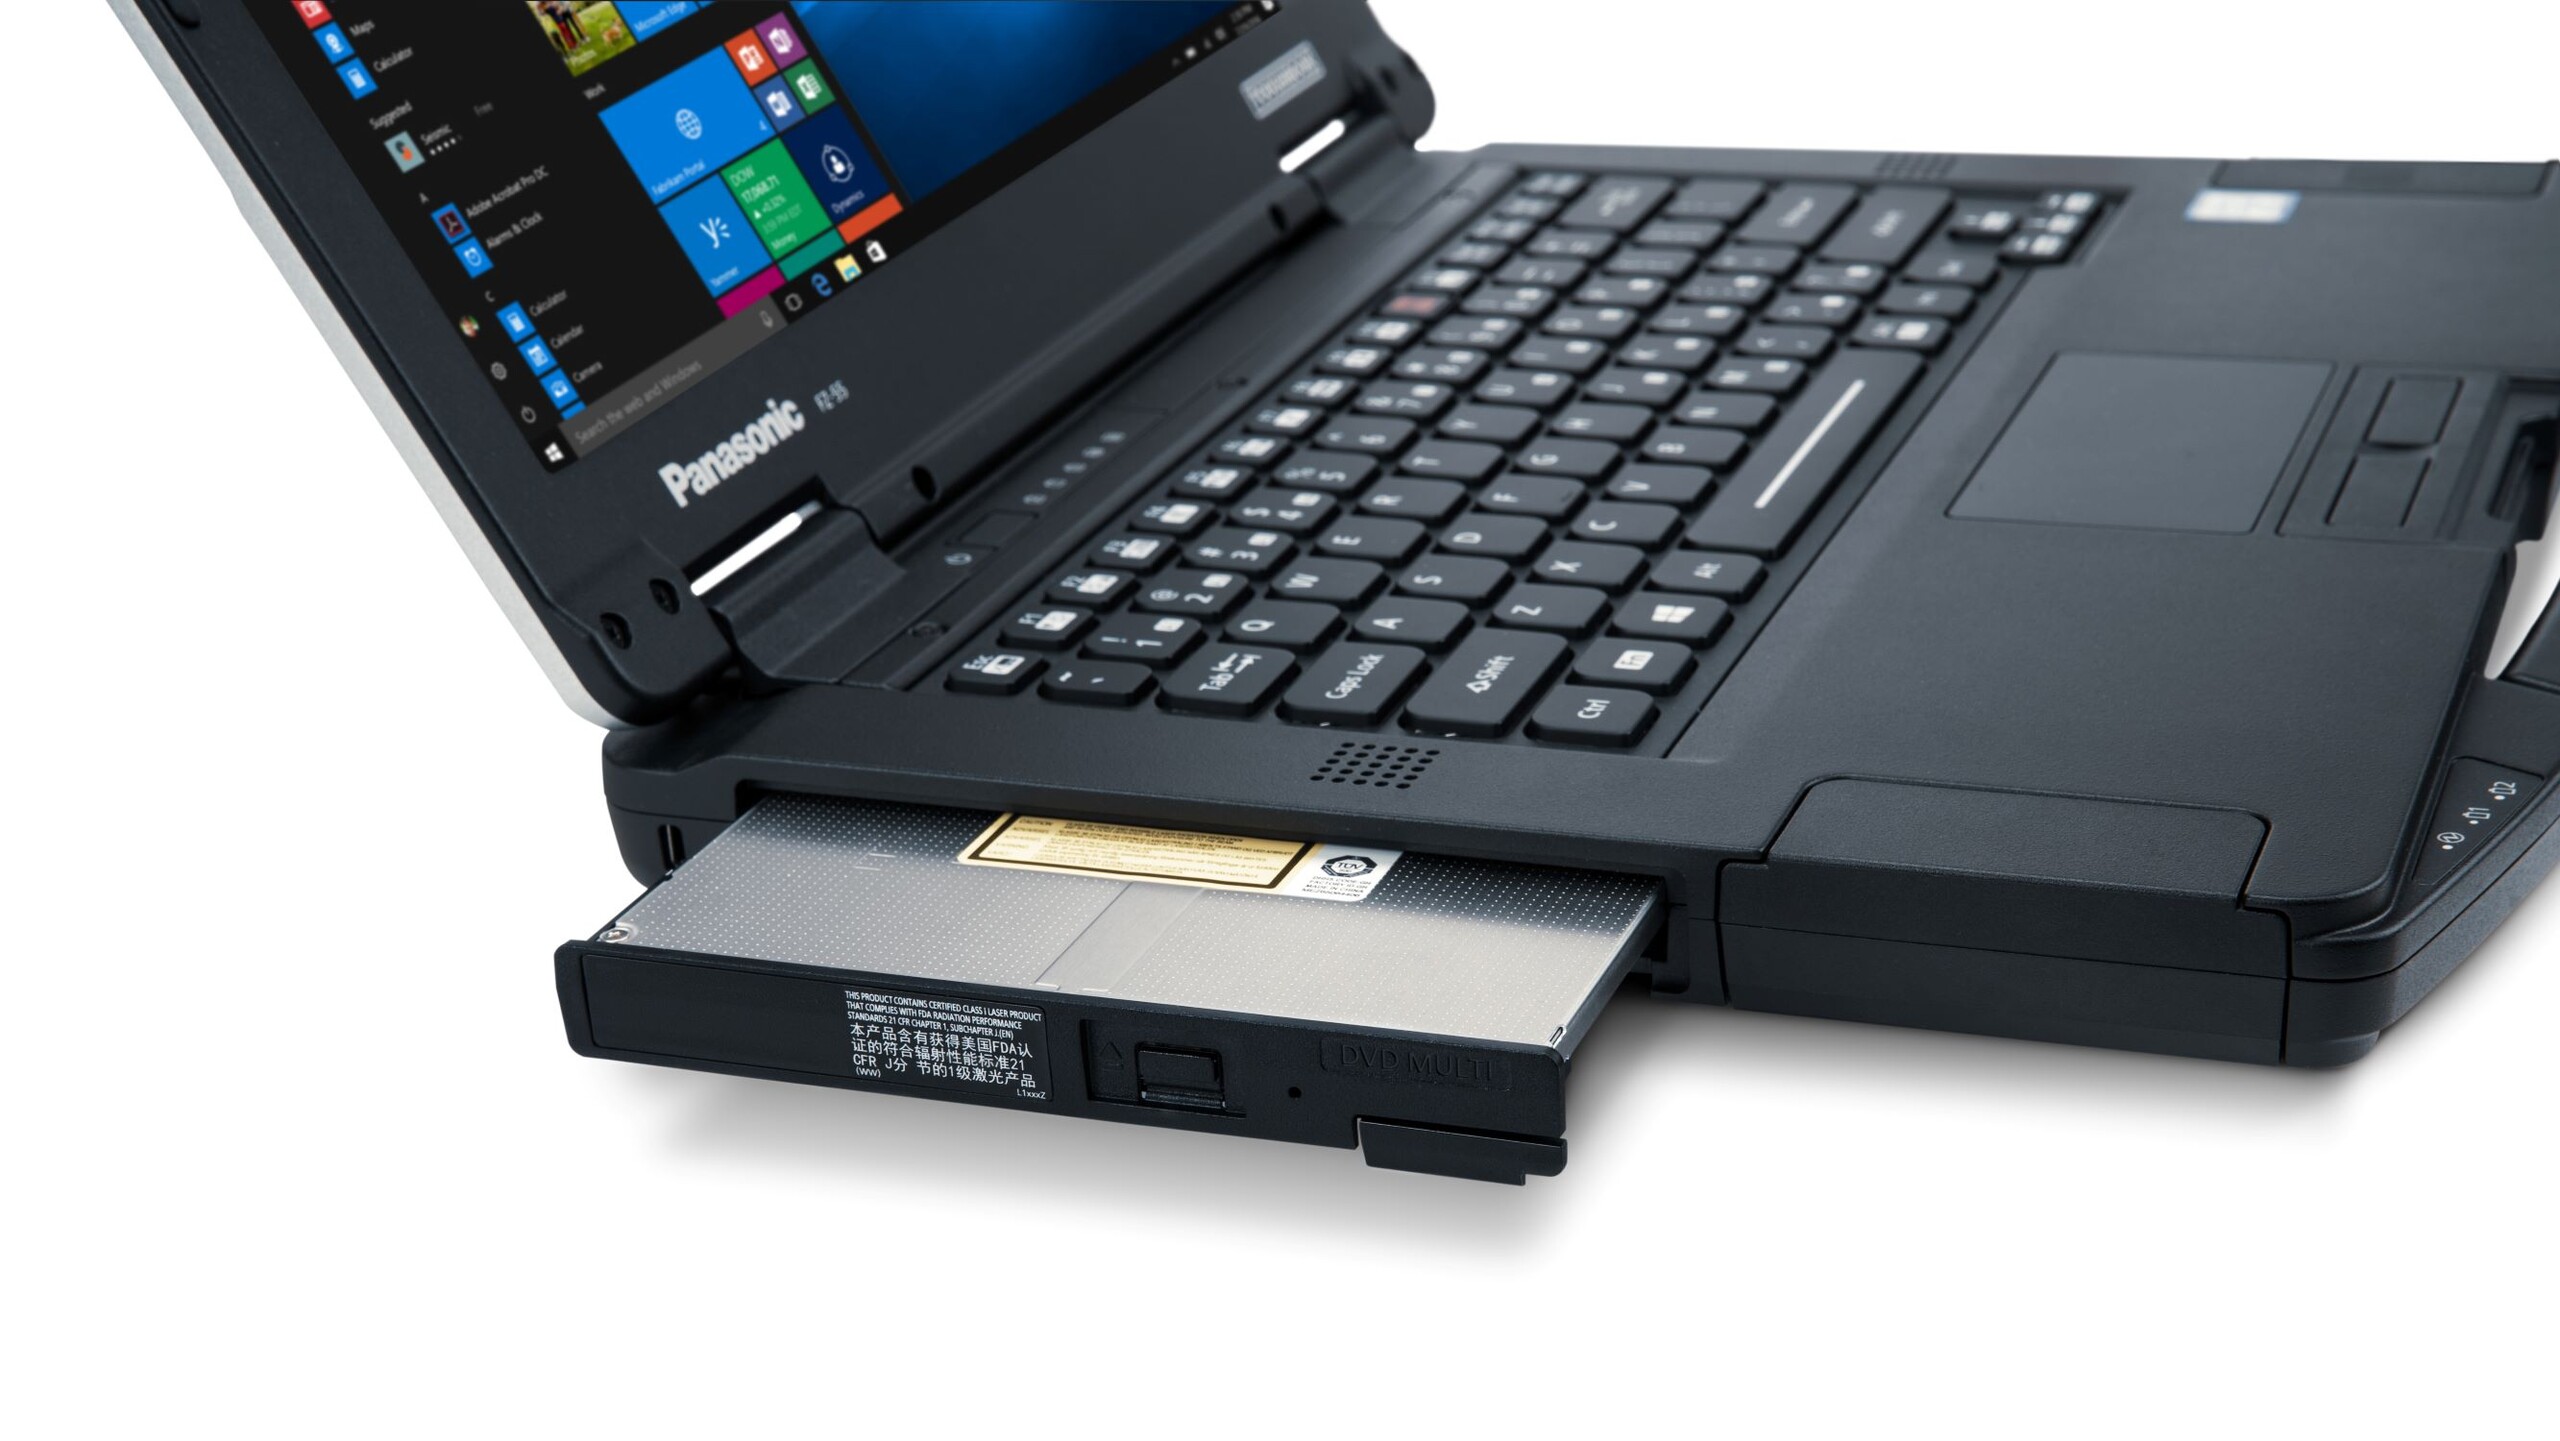
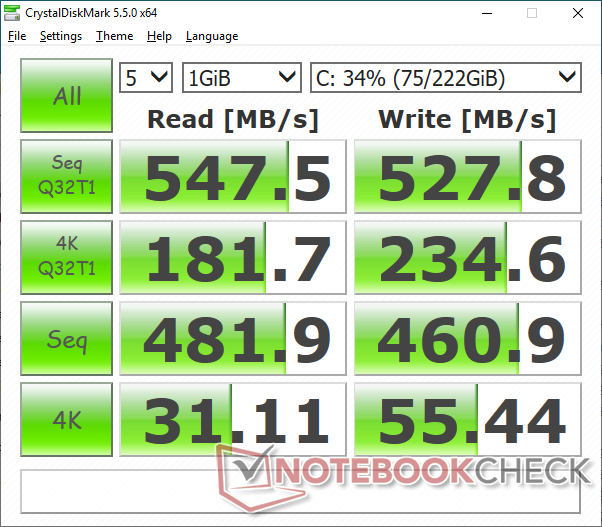
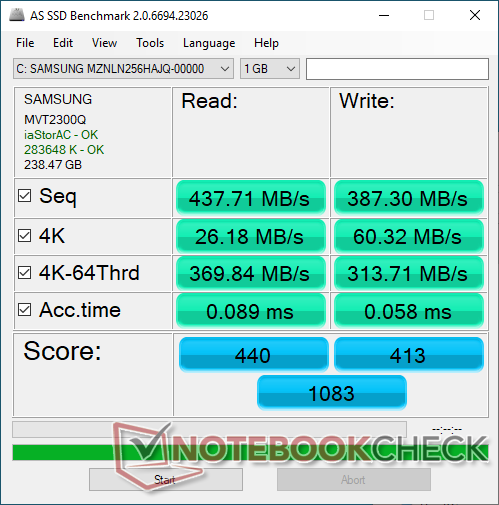
A total of two internal "quick release" storage bays (2x M.2 2280) are available that require no screwdrivers to access. Our test unit comes equipped with a 256 GB Samsung PM871b M.2 SSD that's limited by the SATA III interface.
| Panasonic Toughbook FZ-55 Samsung SSD PM871b MZNLN256HAJQ | Getac S410 CUKUSA 1 TB SATA SSD Q0526A | Dell Latitude 5420 Rugged-P85G SK hynix PC401 NVMe 500 GB | Dell Latitude 7424 Rugged Extreme SK Hynix PC401 512GB M.2 (HFS512GD9TNG) | Lenovo ThinkPad X1 Carbon 2019-20QE000VGE WDC PC SN720 SDAQNTW-512G | |
|---|---|---|---|---|---|
| AS SSD | 52% | 122% | 107% | 268% | |
| Seq Read (MB/s) | 437.7 | 484.2 11% | 2054 369% | 2096 379% | 2978 580% |
| Seq Write (MB/s) | 387.3 | 396.1 2% | 653 69% | 1016 162% | 2287 490% |
| 4K Read (MB/s) | 26.18 | 34.9 33% | 39.34 50% | 39.91 52% | 47.39 81% |
| 4K Write (MB/s) | 60.3 | 74.1 23% | 96.4 60% | 97.9 62% | 175.6 191% |
| 4K-64 Read (MB/s) | 369.8 | 382.3 3% | 677 83% | 636 72% | 1209 227% |
| 4K-64 Write (MB/s) | 313.7 | 329 5% | 982 213% | 604 93% | 1148 266% |
| Access Time Read * (ms) | 0.089 | 0.058 35% | 0.044 51% | 0.044 51% | |
| Access Time Write * (ms) | 0.058 | 0.045 22% | 0.051 12% | 0.051 12% | 0.023 60% |
| Score Read (Points) | 440 | 466 6% | 921 109% | 886 101% | 1554 253% |
| Score Write (Points) | 413 | 443 7% | 1143 177% | 804 95% | 1553 276% |
| Score Total (Points) | 1083 | 1154 7% | 2475 129% | 2099 94% | 3874 258% |
| Copy ISO MB/s (MB/s) | 553 | 2151 289% | 1622 193% | ||
| Copy Program MB/s (MB/s) | 204.7 | 422.8 107% | 378.1 85% | ||
| Copy Game MB/s (MB/s) | 385.9 | 1045 171% | 793 105% |
* ... smaller is better

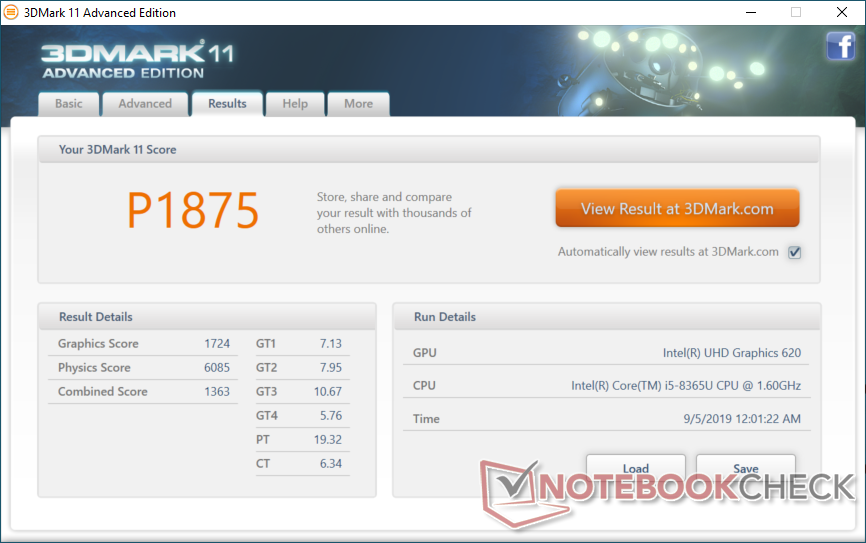
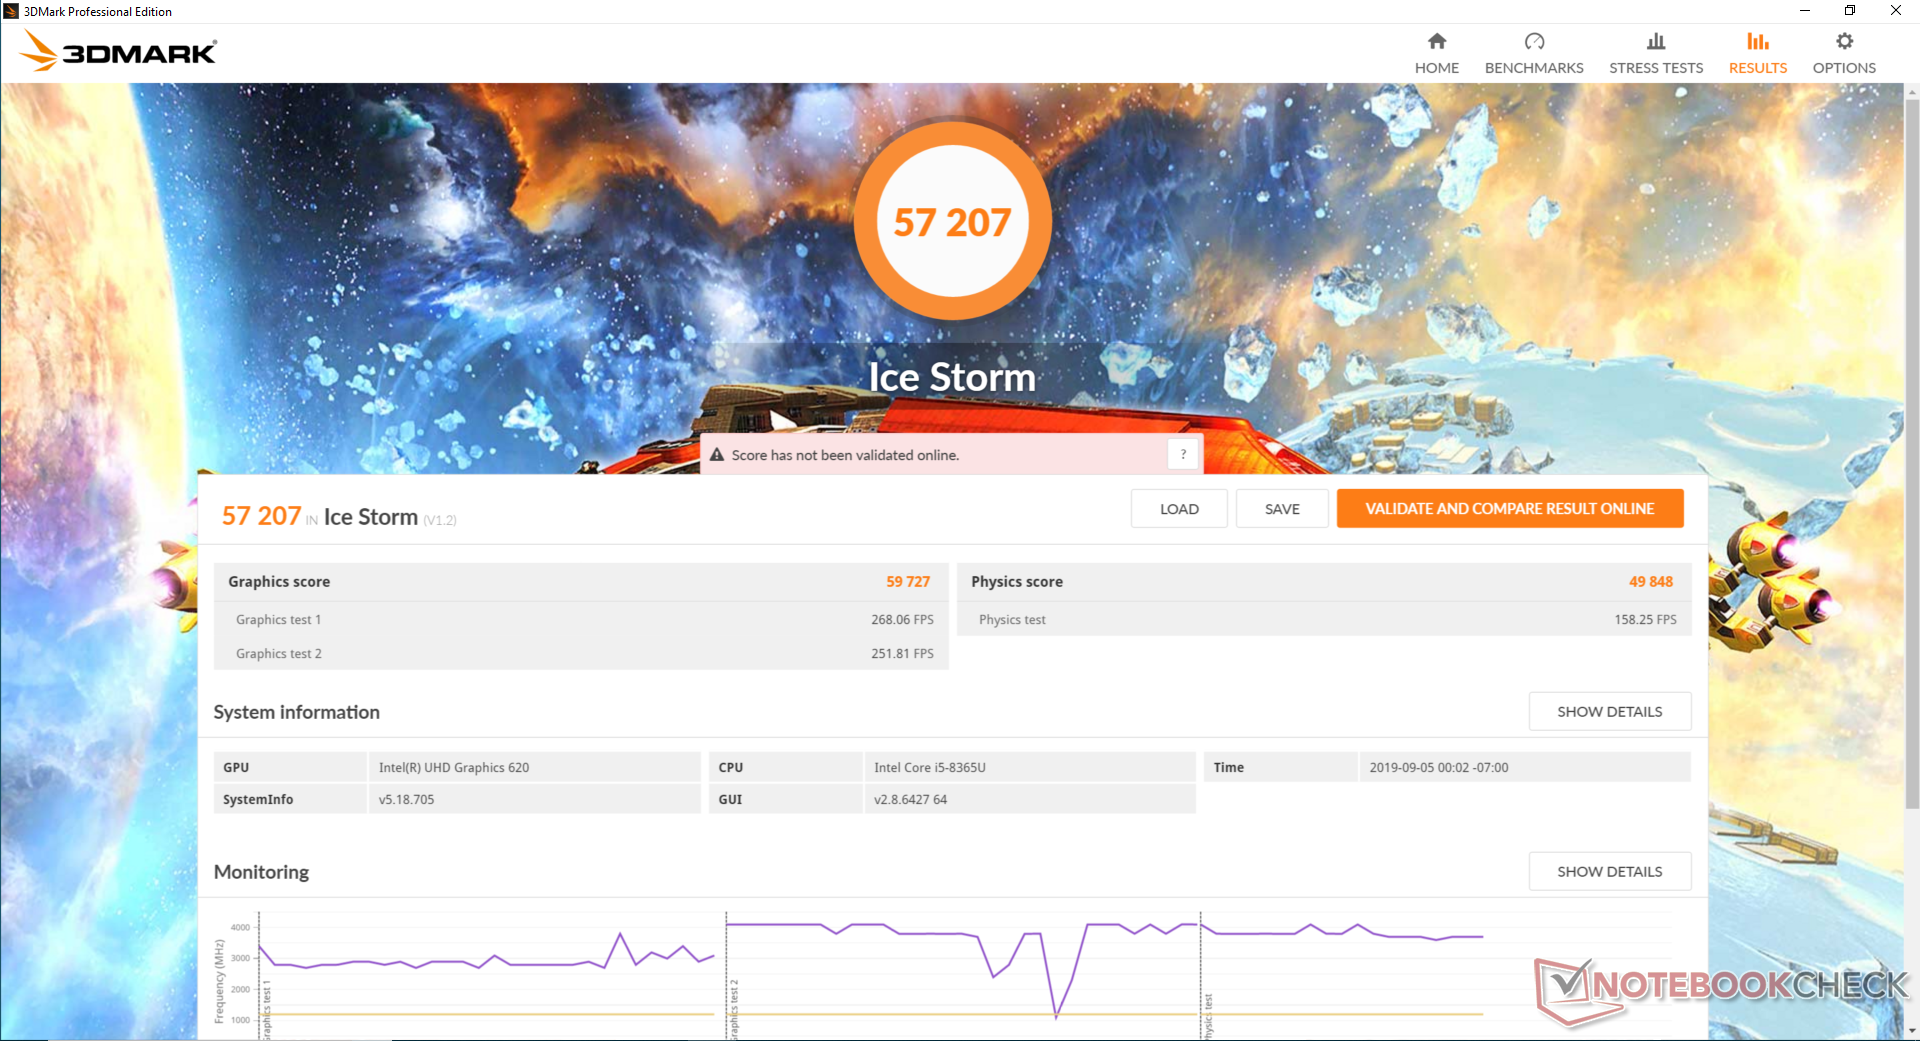
GPU Performance
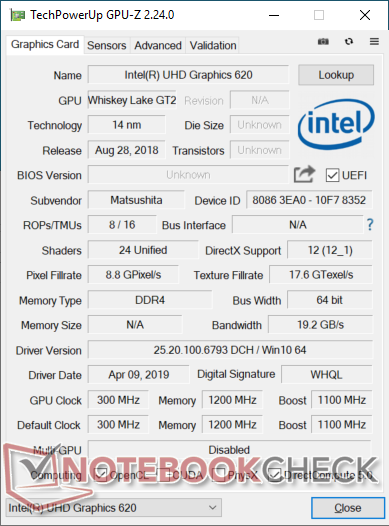
The integrated UHD Graphics 620 is an aging GPU fit for video playback and other undemanding tasks. If you plan on running GPU heavy programs, then the optional Radeon Pro WX 4150 discrete graphics should offer a performance level similar to the Radeon RX 460.
See our dedicated page on the UHD Graphics 620 for more technical information and benchmarks.
| 3DMark 11 | |
| 1280x720 Performance GPU | |
| Asus FX550IU-WSFX | |
| Razer Blade Stealth i7-8565U | |
| HP ProBook 445 G6 | |
| Intel NUC8i7BE | |
| Lenovo ThinkPad X1 Yoga 2019-20QGS00A00 | |
| Average Intel UHD Graphics 620 (1144 - 3432, n=244) | |
| Panasonic Toughbook FZ-55 | |
| Dell Latitude 13 3390 | |
| Lenovo ThinkPad 13 20J1005TPB | |
| Chuwi LapBook Plus | |
| 1280x720 Performance Combined | |
| Razer Blade Stealth i7-8565U | |
| Asus FX550IU-WSFX | |
| Intel NUC8i7BE | |
| HP ProBook 445 G6 | |
| Lenovo ThinkPad X1 Yoga 2019-20QGS00A00 | |
| Average Intel UHD Graphics 620 (927 - 2505, n=244) | |
| Dell Latitude 13 3390 | |
| Panasonic Toughbook FZ-55 | |
| Lenovo ThinkPad 13 20J1005TPB | |
| Chuwi LapBook Plus | |
| 3DMark | |
| 1280x720 Cloud Gate Standard Graphics | |
| Asus FX550IU-WSFX | |
| Razer Blade Stealth i7-8565U | |
| Intel NUC8i7BE | |
| HP ProBook 445 G6 | |
| Lenovo ThinkPad X1 Yoga 2019-20QGS00A00 | |
| Lenovo ThinkPad X1 Yoga 2019-20QGS00A00 | |
| Average Intel UHD Graphics 620 (6205 - 16400, n=225) | |
| Dell Latitude 13 3390 | |
| Panasonic Toughbook FZ-55 | |
| Lenovo ThinkPad 13 20J1005TPB | |
| Chuwi LapBook Plus | |
| 1920x1080 Fire Strike Graphics | |
| Asus FX550IU-WSFX | |
| Razer Blade Stealth i7-8565U | |
| Intel NUC8i7BE | |
| HP ProBook 445 G6 | |
| Lenovo ThinkPad X1 Yoga 2019-20QGS00A00 | |
| Average Intel UHD Graphics 620 (557 - 2608, n=213) | |
| Dell Latitude 13 3390 | |
| Panasonic Toughbook FZ-55 | |
| Lenovo ThinkPad 13 20J1005TPB | |
| 1920x1080 Ice Storm Extreme Graphics | |
| Asus FX550IU-WSFX | |
| HP ProBook 445 G6 | |
| Dell Latitude 13 3390 | |
| Average Intel UHD Graphics 620 (26409 - 59483, n=71) | |
| Panasonic Toughbook FZ-55 | |
| Lenovo ThinkPad 13 20J1005TPB | |
| Chuwi LapBook Plus | |
| 3DMark 11 Performance | 1875 points | |
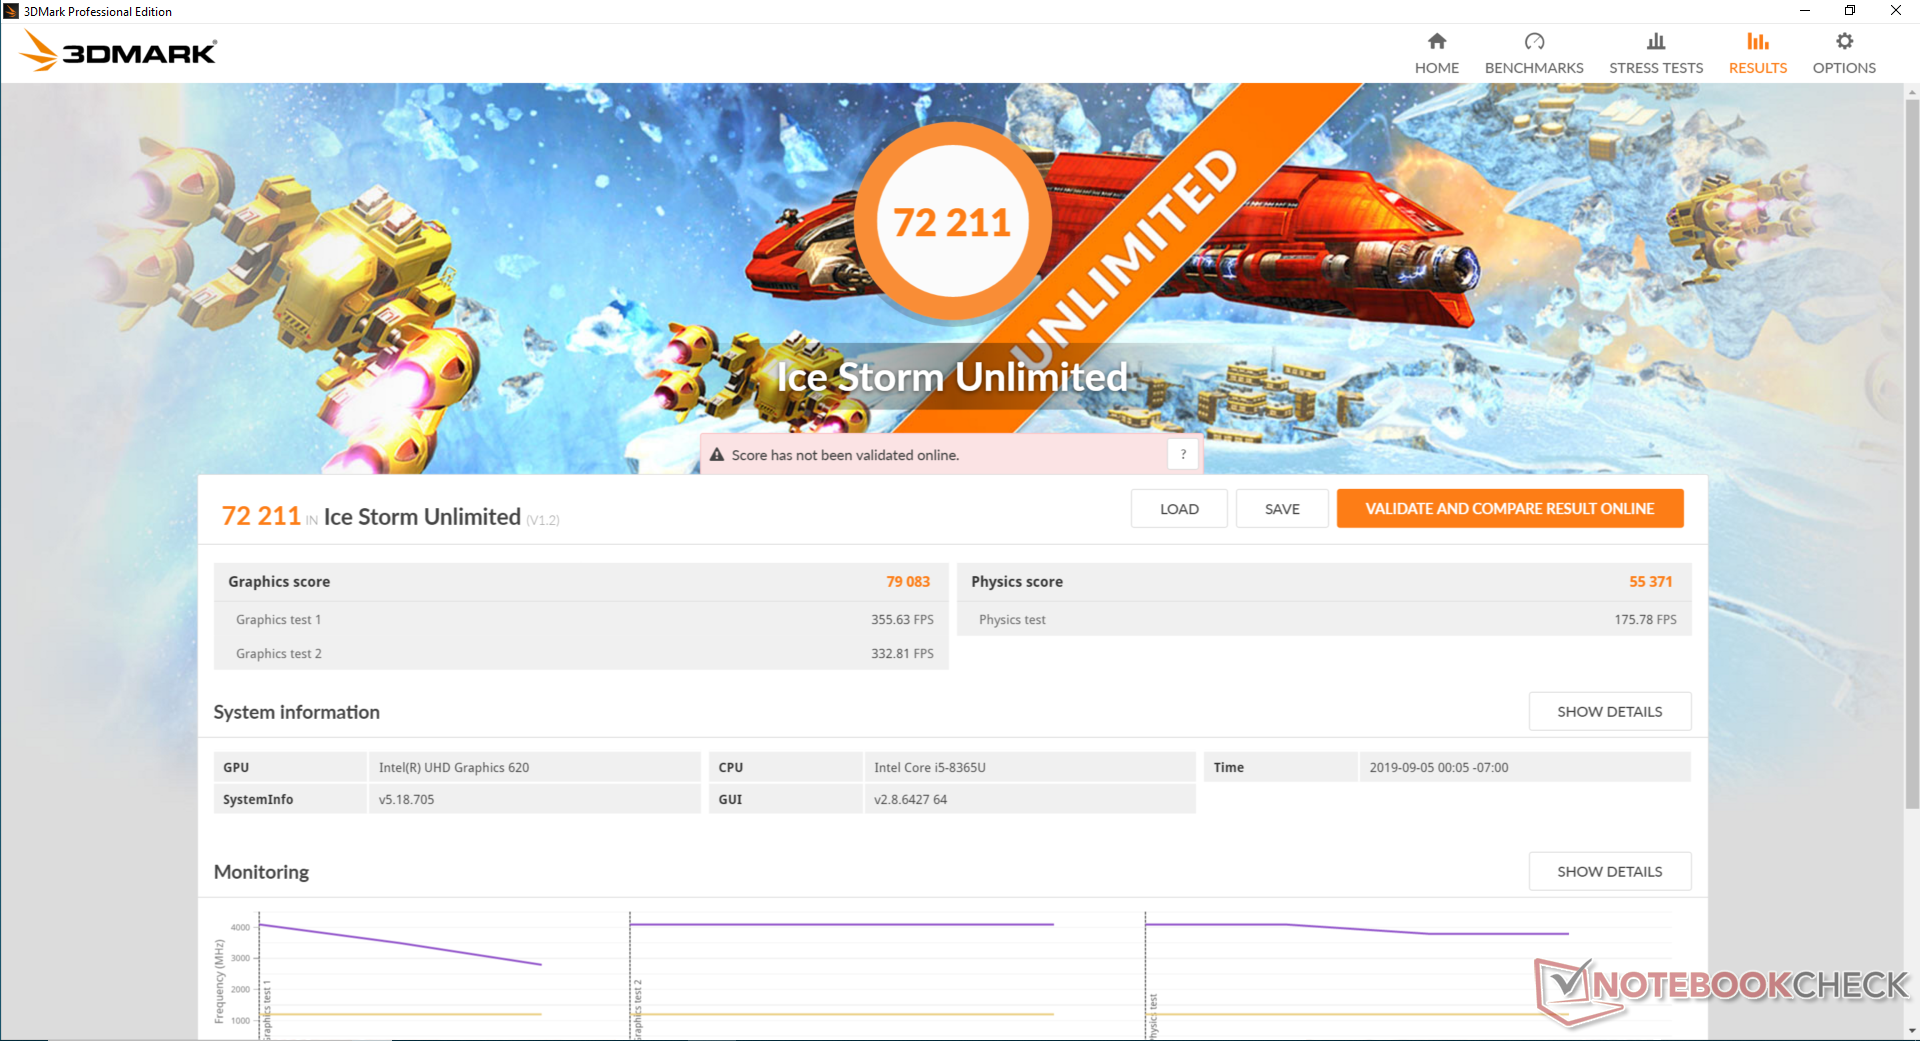
| 3DMark Ice Storm Standard Score | 57207 points | |
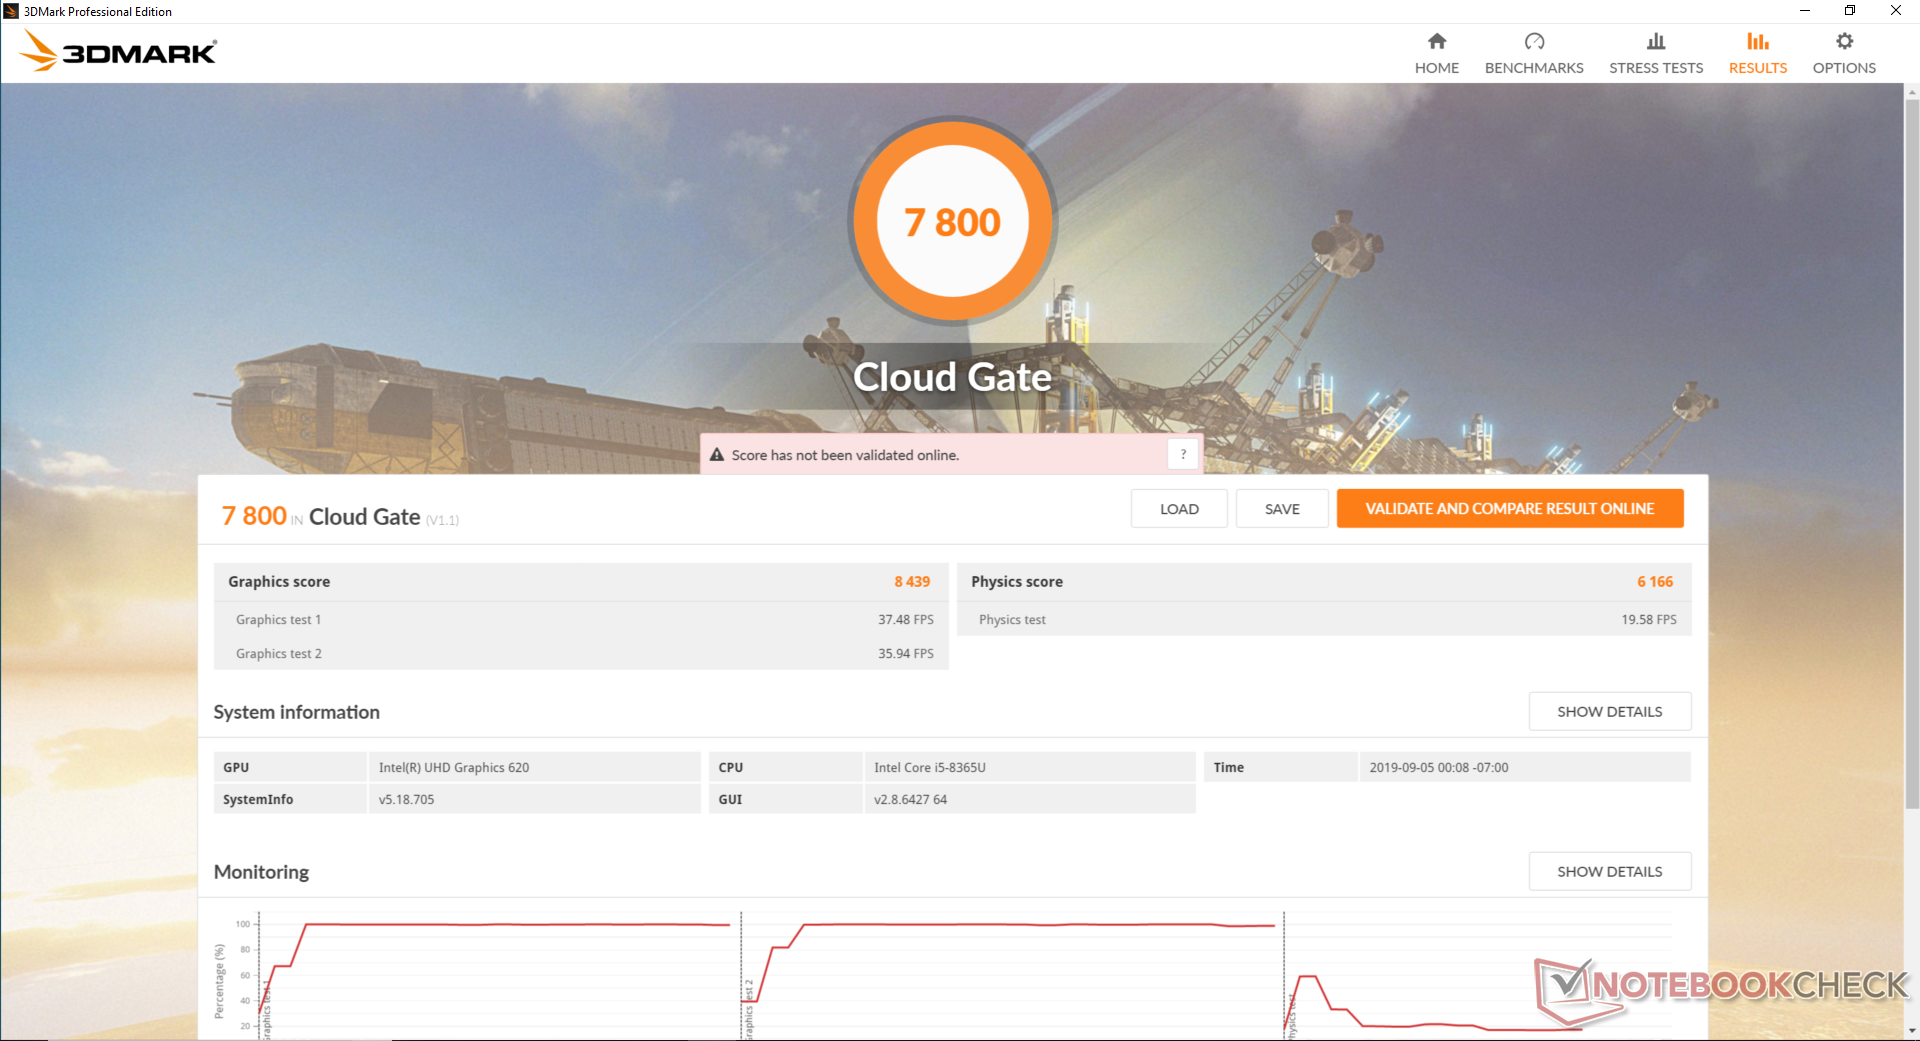
| 3DMark Cloud Gate Standard Score | 7800 points | |
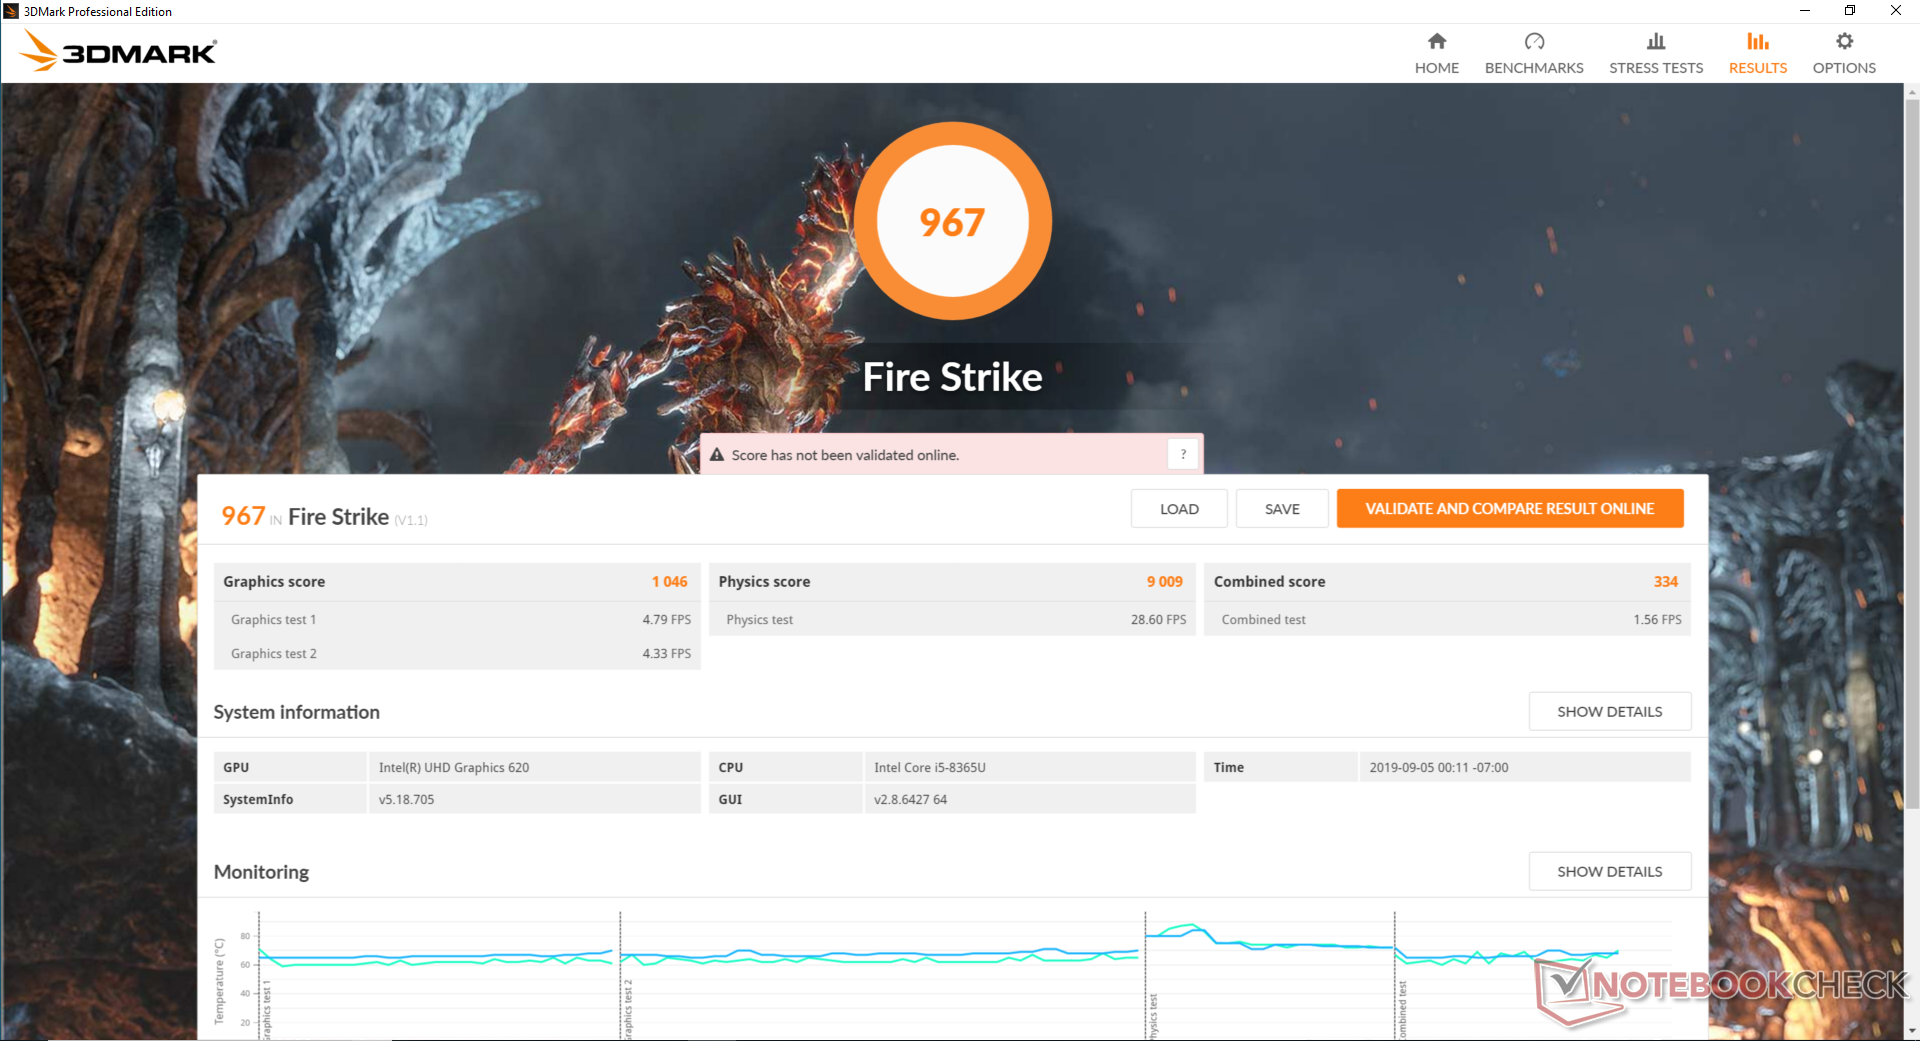
| 3DMark Fire Strike Score | 967 points | |
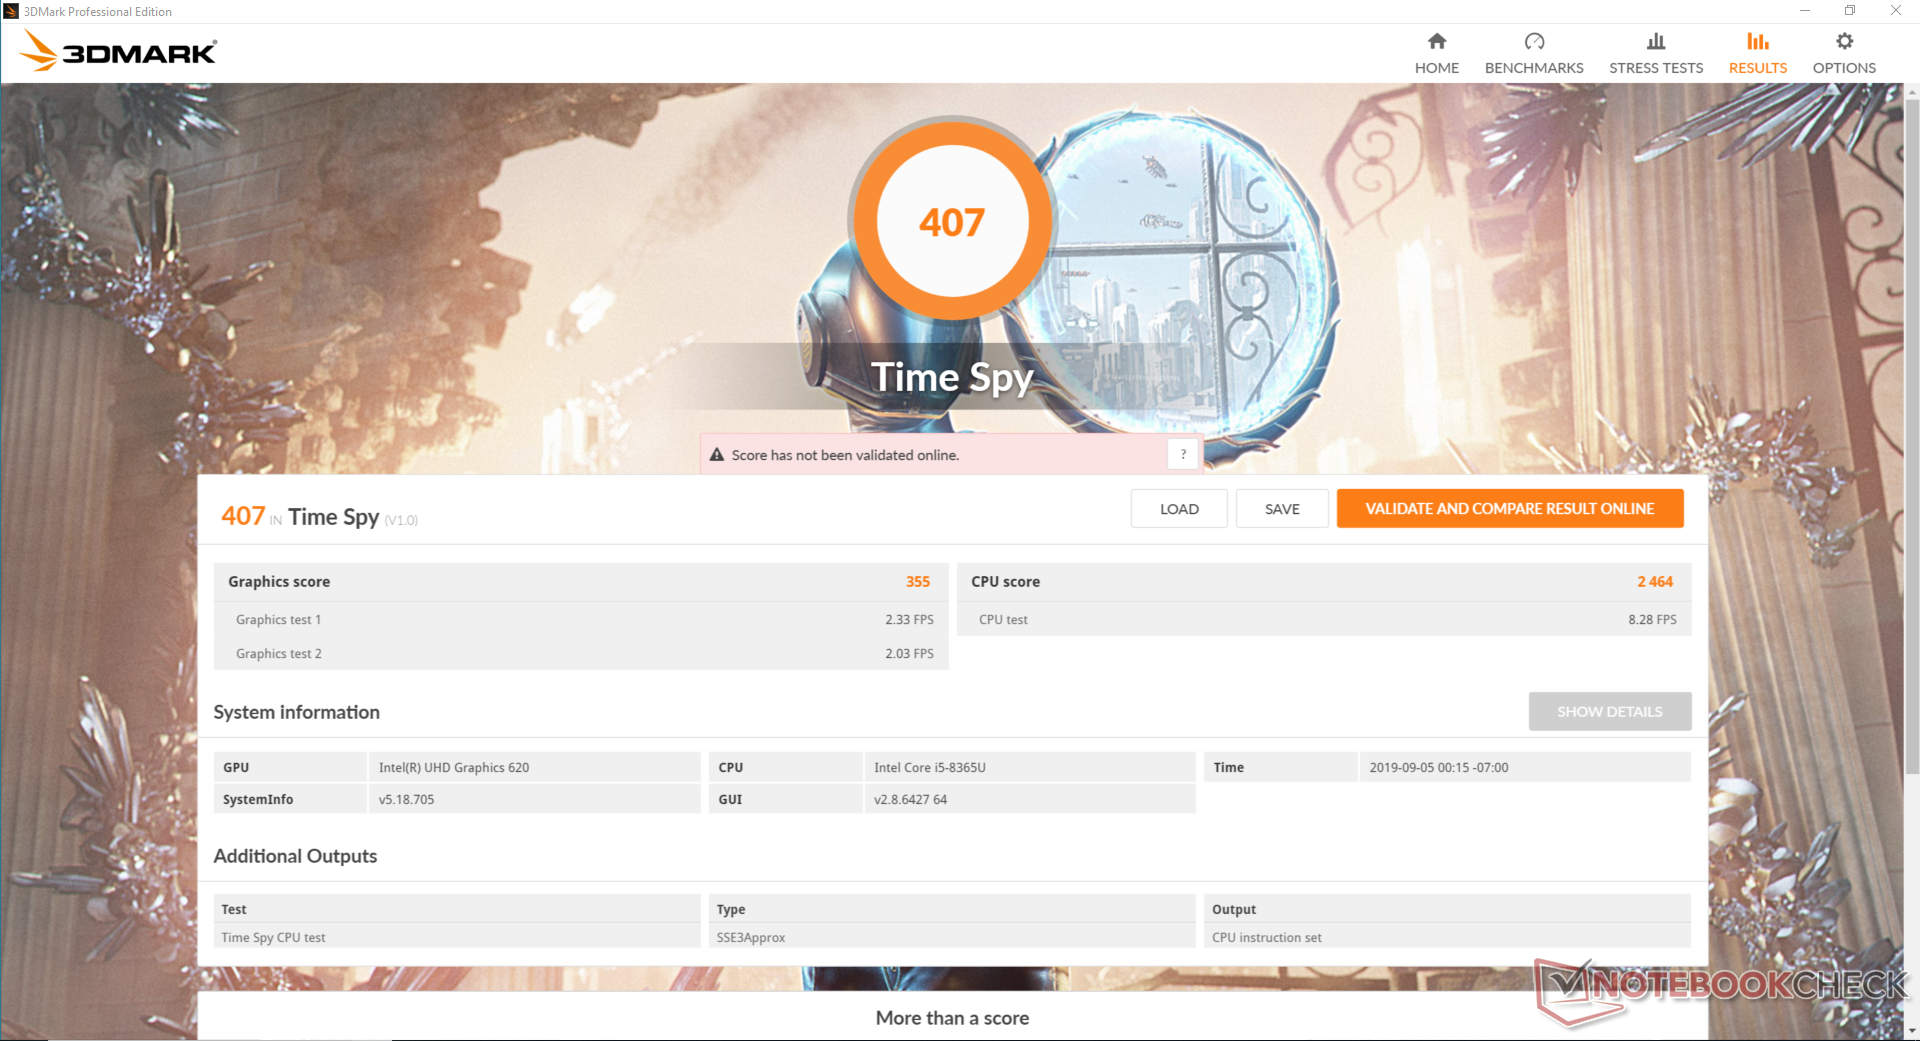
| 3DMark Time Spy Score | 407 points | |
Help | ||
Emissions
System Noise
Fan noise is quiet at the 29 to 30.5 dB(A) range when under low to medium loads. Extreme loads like Prime95 will cause the fan to pulse to 39 dB(A) momentarily before falling and stabilizing at 33.4 dB(A). Perhaps not surprisingly, these results are similar to what we recorded on last year's Toughbook 54 as shown by our comparison table below. Fan noise is audible but also easy to ignore.
We suspect that the SKU with dedicated AMD Radeon graphics will be louder than what we've recorded here since the discrete GPU produces more heat and is more demanding than the Intel U-class CPU.
We can notice very slight electronic noise or coil whine when placing an ear near the keyboard keys. It's thankfully minor enough to not be a cause for concern.
| Panasonic Toughbook FZ-55 UHD Graphics 620, i5-8365U, Samsung SSD PM871b MZNLN256HAJQ | Panasonic Toughbook CF-54G2999VM HD Graphics 620, i5-7300U, Seagate BarraCuda Compute 1TB ST1000LM048 | Getac S410 UHD Graphics 620, i5-8550U, CUKUSA 1 TB SATA SSD Q0526A | Dell Latitude 5420 Rugged-P85G Radeon RX 540, i7-8650U, SK hynix PC401 NVMe 500 GB | Dell Latitude 7424 Rugged Extreme Radeon RX 540, i7-8650U, SK Hynix PC401 512GB M.2 (HFS512GD9TNG) | Lenovo ThinkPad X1 Carbon 2019-20QE000VGE UHD Graphics 620, i7-8665U, WDC PC SN720 SDAQNTW-512G | |
|---|---|---|---|---|---|---|
| Noise | 1% | 5% | 3% | 0% | 4% | |
| off / environment * (dB) | 29 | 28.3 2% | 28.4 2% | 28.3 2% | 28.6 1% | 28.4 2% |
| Idle Minimum * (dB) | 29 | 28.8 1% | 28.4 2% | 28.3 2% | 28.6 1% | 28.4 2% |
| Idle Average * (dB) | 29.6 | 28.8 3% | 28.4 4% | 28.3 4% | 28.6 3% | 28.4 4% |
| Idle Maximum * (dB) | 30.5 | 29.1 5% | 28.4 7% | 28.3 7% | 28.6 6% | 28.6 6% |
| Load Average * (dB) | 30.3 | 31.3 -3% | 30.3 -0% | 29.9 1% | 32.9 -9% | 31.5 -4% |
| Load Maximum * (dB) | 39 | 40 -3% | 33.3 15% | 38 3% | 39 -0% | 33.1 15% |
* ... smaller is better
Noise level
| Idle |
| 29 / 29.6 / 30.5 dB(A) |
| Load |
| 30.3 / 39 dB(A) |
 | ||
30 dB silent 40 dB(A) audible 50 dB(A) loud |
||
min: | ||
Temperature
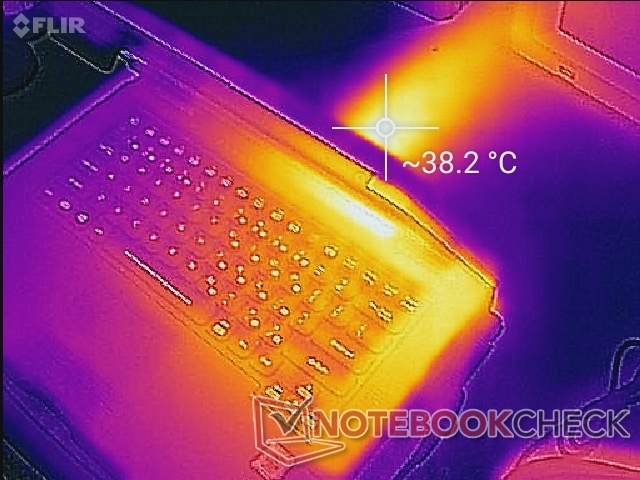
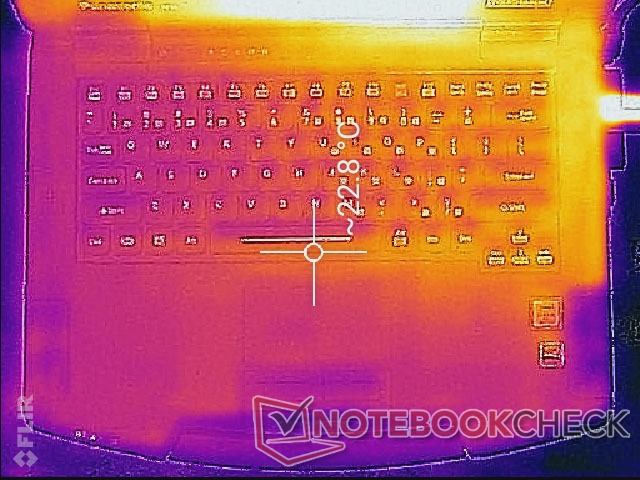
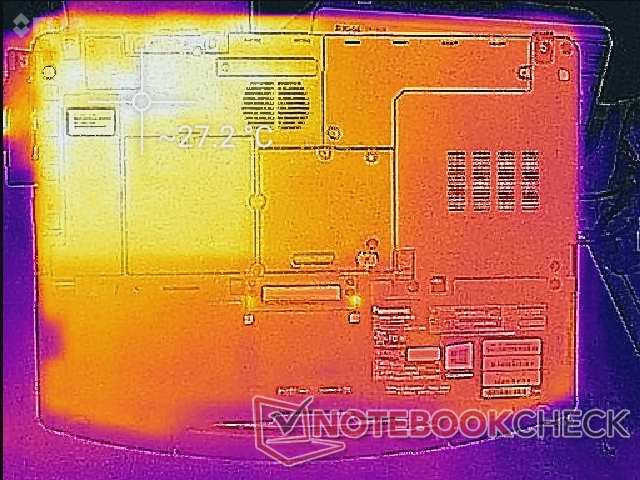
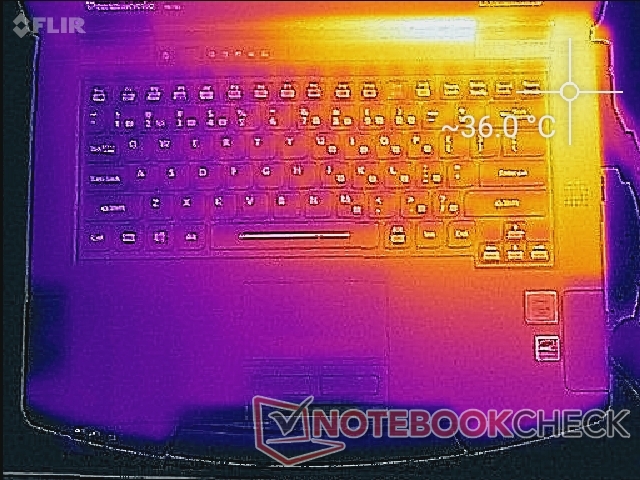
Surface temperatures are generally warmer on the right half of the notebook than the left half since most of the motherboard components are concentrated on this side of the system. At worst, we're able to record a surface temperature of 38 C on areas that are thankfully away from the keyboard keys and palm rests.
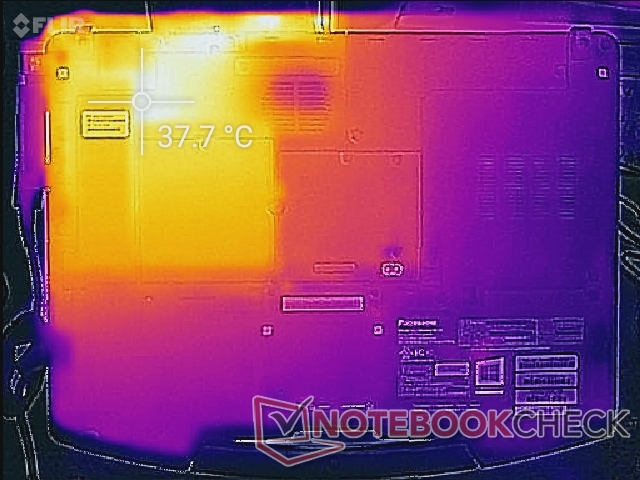
(+) The maximum temperature on the upper side is 36 °C / 97 F, compared to the average of 34.3 °C / 94 F, ranging from 21.2 to 62.5 °C for the class Office.
(+) The bottom heats up to a maximum of 37.8 °C / 100 F, compared to the average of 36.8 °C / 98 F
(+) In idle usage, the average temperature for the upper side is 22.7 °C / 73 F, compared to the device average of 29.5 °C / 85 F.
(+) The palmrests and touchpad are cooler than skin temperature with a maximum of 28.6 °C / 83.5 F and are therefore cool to the touch.
(±) The average temperature of the palmrest area of similar devices was 27.5 °C / 81.5 F (-1.1 °C / -2 F).
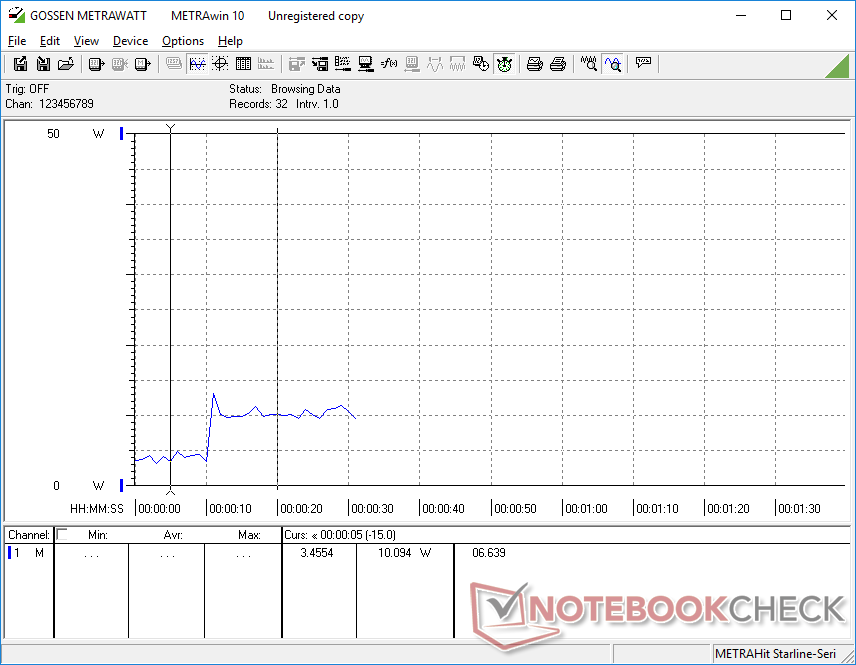
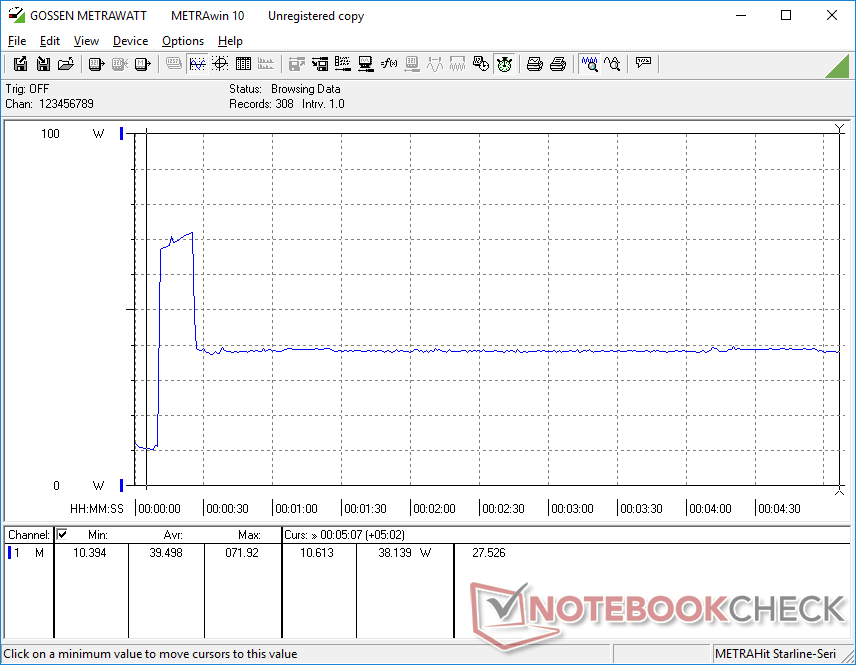
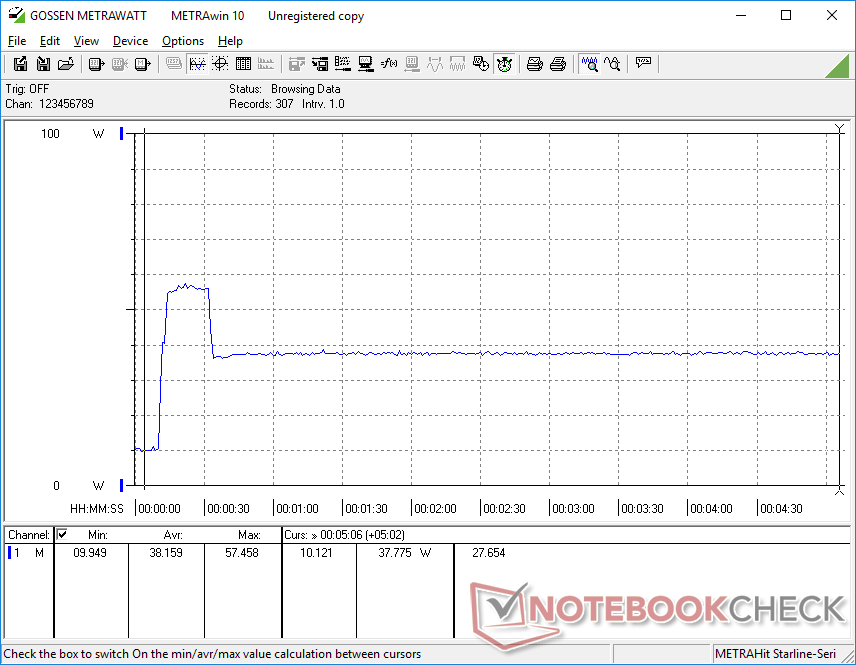
Stress Test
The maximum Turbo Boost of 3.8 GHz is sustainable for just a few seconds until hitting a core temperature of 90 C. Thereafter, clock rates drop to 2.6 to 2.7 GHz in order to maintain a cooler core temperature of 69 C as shown by our screenshots below.
Running on battery power will not impact performance A Cloud Gate run on batteries returns Physics and Graphics scores of 6218 and 8643 points, respectively, compared to 6166 and 8439 points when on mains.
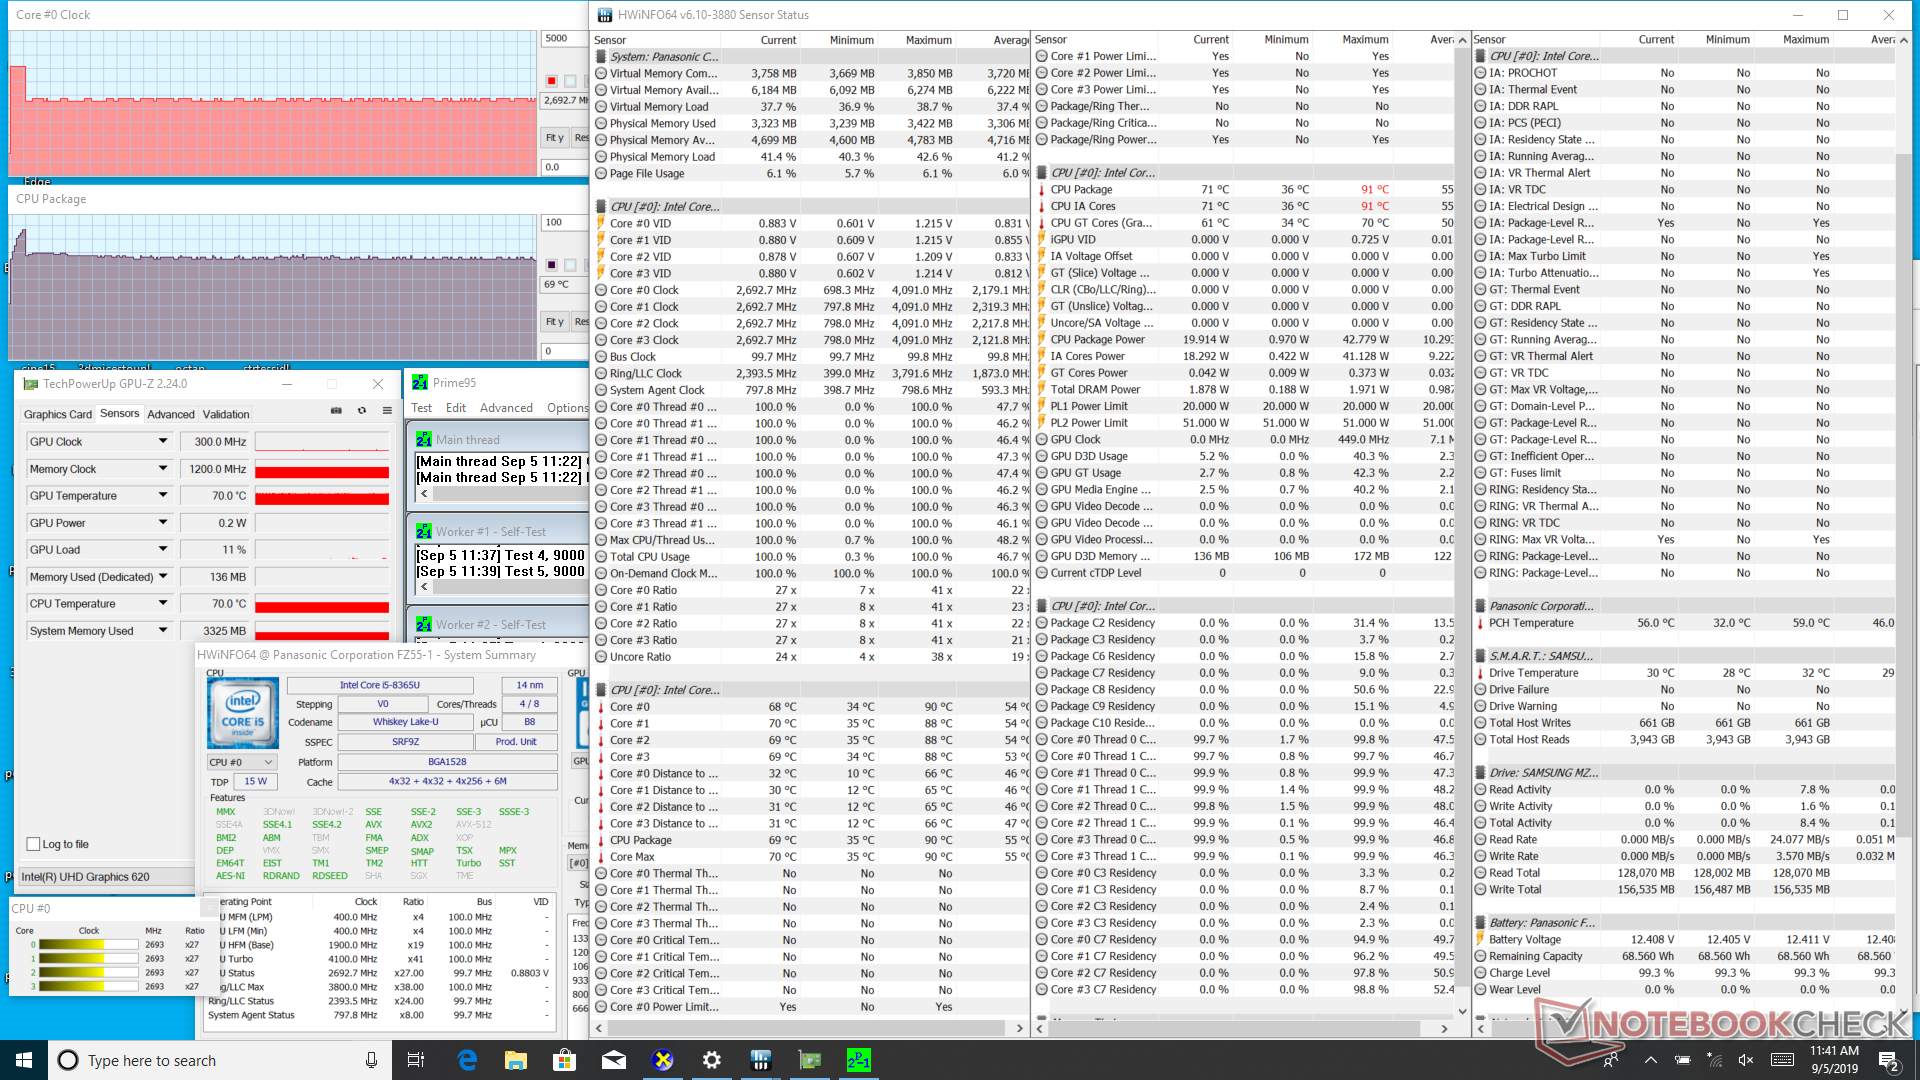
| CPU Clock (GHz) | GPU Clock (MHz) | Average CPU Temperature (°C) | |
| System Idle | -- | -- | 36 |
| Prime95 Stress | 2.6 - 2.7 | -- | 69 |
| Prime95 + FurMark Stress | 1.3 | 1050 | 67 |
Speakers
Panasonic advertises 92 dB stereo speakers while our own independent microphone measurements show a maximum volume of 84 dB when standing 15 cm away from the front of the laptop. Roll off begins at around 1000 Hz compared to 250 Hz or 500 Hz on most Ultrabooks to represent poor bass reproduction on the Toughbook. We can notice no static or vibration issues when on high volume settings which are perhaps more important qualities of a rugged industrial laptop.

Panasonic Toughbook FZ-55 audio analysis
(+) | speakers can play relatively loud (84.3 dB)
Bass 100 - 315 Hz
(-) | nearly no bass - on average 30% lower than median
(+) | bass is linear (6.2% delta to prev. frequency)
Mids 400 - 2000 Hz
(±) | higher mids - on average 6.9% higher than median
(±) | linearity of mids is average (9.7% delta to prev. frequency)
Highs 2 - 16 kHz
(+) | balanced highs - only 0.9% away from median
(+) | highs are linear (3.8% delta to prev. frequency)
Overall 100 - 16.000 Hz
(±) | linearity of overall sound is average (28% difference to median)
Compared to same class
» 88% of all tested devices in this class were better, 3% similar, 9% worse
» The best had a delta of 7%, average was 21%, worst was 53%
Compared to all devices tested
» 85% of all tested devices were better, 3% similar, 12% worse
» The best had a delta of 4%, average was 23%, worst was 134%
Apple MacBook 12 (Early 2016) 1.1 GHz audio analysis
(+) | speakers can play relatively loud (83.6 dB)
Bass 100 - 315 Hz
(±) | reduced bass - on average 11.3% lower than median
(±) | linearity of bass is average (14.2% delta to prev. frequency)
Mids 400 - 2000 Hz
(+) | balanced mids - only 2.4% away from median
(+) | mids are linear (5.5% delta to prev. frequency)
Highs 2 - 16 kHz
(+) | balanced highs - only 2% away from median
(+) | highs are linear (4.5% delta to prev. frequency)
Overall 100 - 16.000 Hz
(+) | overall sound is linear (10.2% difference to median)
Compared to same class
» 7% of all tested devices in this class were better, 2% similar, 90% worse
» The best had a delta of 5%, average was 18%, worst was 53%
Compared to all devices tested
» 5% of all tested devices were better, 1% similar, 94% worse
» The best had a delta of 4%, average was 23%, worst was 134%
Energy Management
Power Consumption
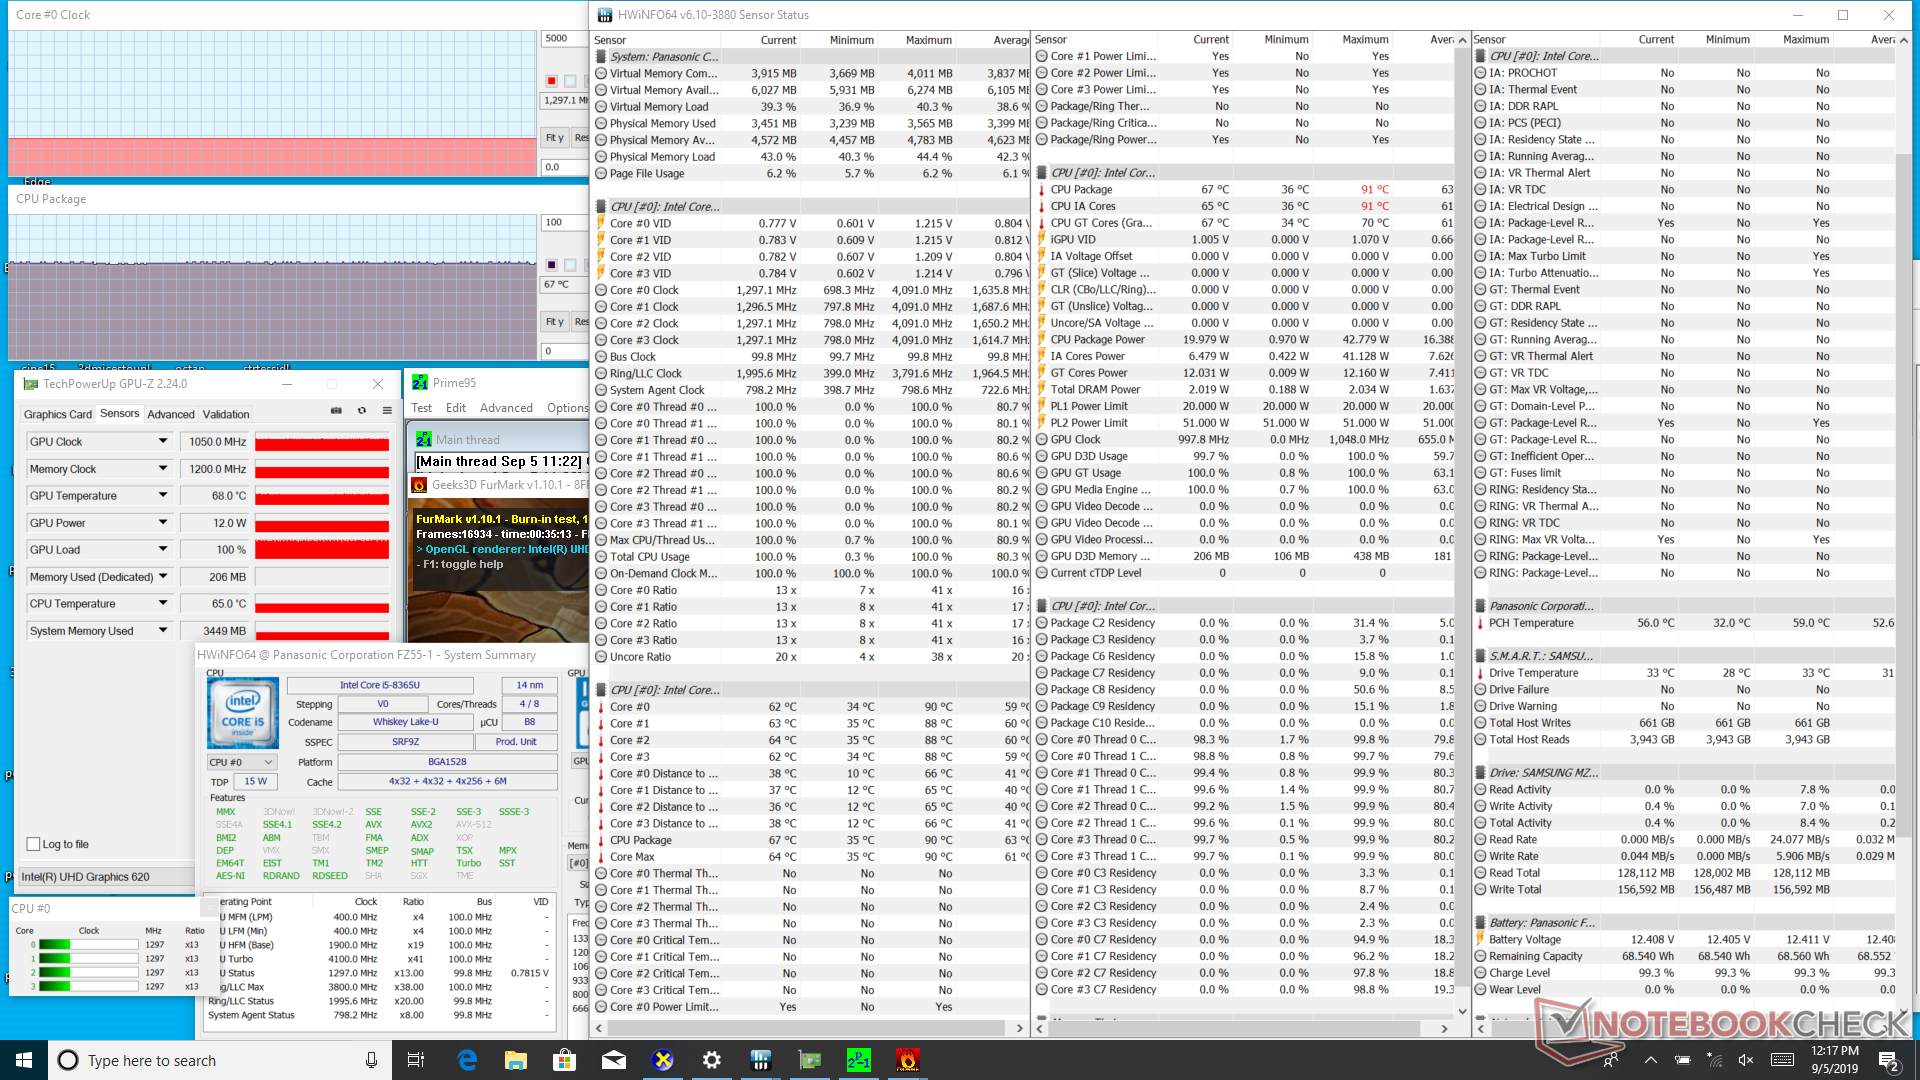
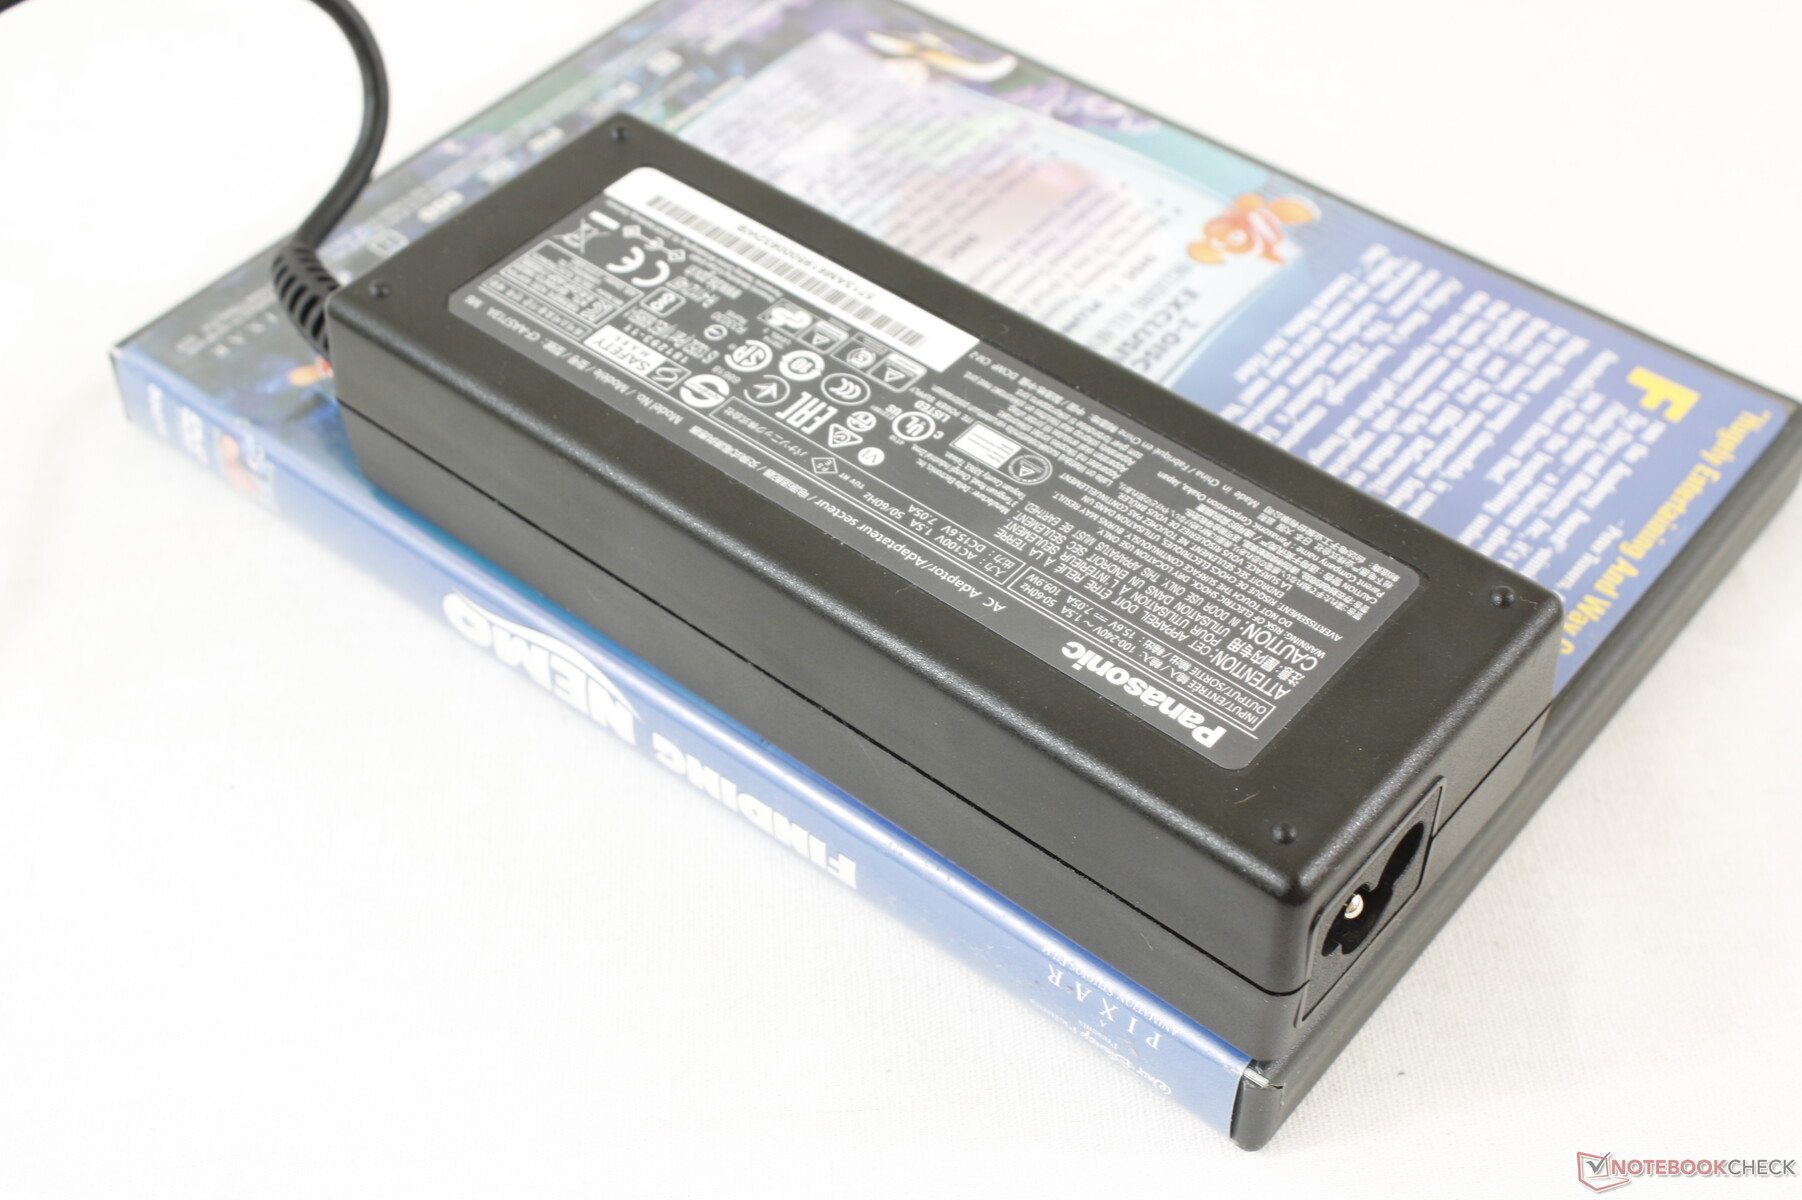
Idling on desktop consumes between 3 W and 11 W depending on the brightness setting and power profile. Jumping from minimum brightness to maximum brightness will increase consumption by about 6 to 7 W. We're able to record a maximum consumption of 72 W from the small-medium (~14 x 5.3 x 3 cm) 110 W AC adapter. Consumption eventually falls and stabilizes at about 38 W when under such extreme processing stress due to thermal limitations.
| Off / Standby | |
| Idle | |
| Load |
|
Key:
min: | |
| Panasonic Toughbook FZ-55 i5-8365U, UHD Graphics 620, Samsung SSD PM871b MZNLN256HAJQ, IPS, 1920x1080, 14" | Panasonic Toughbook CF-54G2999VM i5-7300U, HD Graphics 620, Seagate BarraCuda Compute 1TB ST1000LM048, TN LED, 1366x768, 14" | Getac S410 i5-8550U, UHD Graphics 620, CUKUSA 1 TB SATA SSD Q0526A, TN PED, 1366x768, 14" | Dell Latitude 5420 Rugged-P85G i7-8650U, Radeon RX 540, SK hynix PC401 NVMe 500 GB, IPS, 1920x1080, 14" | Dell Latitude 7424 Rugged Extreme i7-8650U, Radeon RX 540, SK Hynix PC401 512GB M.2 (HFS512GD9TNG), IPS, 1920x1080, 14" | Lenovo ThinkPad X1 Carbon 2019-20QE000VGE i7-8665U, UHD Graphics 620, WDC PC SN720 SDAQNTW-512G, IPS, 2560x1440, 14" | |
|---|---|---|---|---|---|---|
| Power Consumption | 22% | 11% | -41% | -59% | 14% | |
| Idle Minimum * (Watt) | 3.7 | 4.4 -19% | 5.6 -51% | 4.8 -30% | 6.5 -76% | 3 19% |
| Idle Average * (Watt) | 9.6 | 6.3 34% | 7.9 18% | 13.6 -42% | 15.1 -57% | 6.3 34% |
| Idle Maximum * (Watt) | 10.4 | 6.5 37% | 8.4 19% | 13.8 -33% | 16.1 -55% | 8.9 14% |
| Load Average * (Watt) | 40 | 36.3 9% | 32.8 18% | 67.8 -69% | 70.5 -76% | 40.8 -2% |
| Load Maximum * (Watt) | 71.9 | 38.3 47% | 34.3 52% | 93.5 -30% | 95.2 -32% | 67.5 6% |
| Witcher 3 ultra * (Watt) | 69.1 | 68.1 |
* ... smaller is better
Battery Life
Runtimes are very long with the primary battery at over 18 hours of real-world use when looping a web page every 40 seconds. Users can swap or add a secondary battery for even longer runtimes if needed.
Recharging takes approximately 1.5 hours not unlike most Ultrabooks. We attempted to recharge the system via a 130 W USB Type-C AC adapter, but it would not work. USB Type-C with Power Delivery is an option not included on our unit.
| Panasonic Toughbook FZ-55 i5-8365U, UHD Graphics 620, 71 Wh | Panasonic Toughbook CF-54G2999VM i5-7300U, HD Graphics 620, 33 Wh | Getac S410 i5-8550U, UHD Graphics 620, 46.6 Wh | Dell Latitude 5420 Rugged-P85G i7-8650U, Radeon RX 540, 102 Wh | Dell Latitude 7424 Rugged Extreme i7-8650U, Radeon RX 540, 102 Wh | Lenovo ThinkPad X1 Carbon 2019-20QE000VGE i7-8665U, UHD Graphics 620, 51 Wh | |
|---|---|---|---|---|---|---|
| Battery runtime | -68% | -72% | -12% | -36% | -55% | |
| WiFi v1.3 (h) | 18.4 | 5.9 -68% | 5.2 -72% | 16.2 -12% | 11.7 -36% | 8.2 -55% |
| Reader / Idle (h) | 31.4 | |||||
| Load (h) | 3.2 | 2.7 | 1.4 |
Pros
Cons
Verdict
The Toughbook 55 offers 70 percent faster CPU performance than the Toughbook 54 while being backwards compatible with all of its accessories. Battery life is also extraordinarily long at 18 hours of constant WLAN use and the serviceable batteries, M.2 drives, WAN, and SATA expansion all make this a versatile machine when on the field.
There are aspects we think could be better. The slower MicroSD reader is a downgrade from the last generation model and the small Arrow keys are too cramped. Some features that are otherwise standard on most Ultrabooks are optional on the Toughbook including USB Type-C PD and a fingerprint reader. Other features are completely missing like Thunderbolt 3, 4K UHD, and NFC. Furthermore, the bright display could be less grainy with deeper colors, no PWM, and reduced uneven backlight bleeding for a better visual experience.
You'll want the Toughbook 55 for its longevity, bright display, wide range of accessories, and ease of servicing. Just don't expect the best colors or performance as processor options are limited to the Intel U class family with an optional three-year old Radeon GPU.
Panasonic Toughbook FZ-55
- 05/14/2020 v7 (old)
Allen Ngo
