Asus FX550IU (FX-9830P, Radeon RX 460) Laptop Review
2017 is shaping up to be a memorable year for AMD. Ryzen has been well received by critics, Vega is a respectable mid-range alternative to Nvidia, and Ryzen-based laptops are well on the way. Nonetheless, the embarrassing shroud of painfully slow Bristol Ridge and Carrizo notebooks of the previous generation still looms near and such models continue to be in stock across major retailers.
One example model is the Asus FX550UI equipped with one of fastest mobile Bristol Ridge APUs available, the budget-mainstream Polaris Radeon RX 460 GPU, 8 GB of DDR4 RAM, a 128 GB SSD and 1 TB HDD, and a 1080p TN display for just under $700 USD. This particular notebook will likely be one of the last gaming notebooks powered by a 7th generation AMD APU before we begin seeing Ryzen notebooks on store shelves. Unfortunately, even the best that mobile Bristol Ridge has to offer still leads to an overall poor gaming experience. For this review, we will how the FX-9830P-powered Asus stacks up against modern budget gaming notebooks like the popular Inspiron 15 7567, Gigabyte Sabre 15, HP Pavilion 15, Acer Aspire V17, and Asus's own FX553VD.
Case
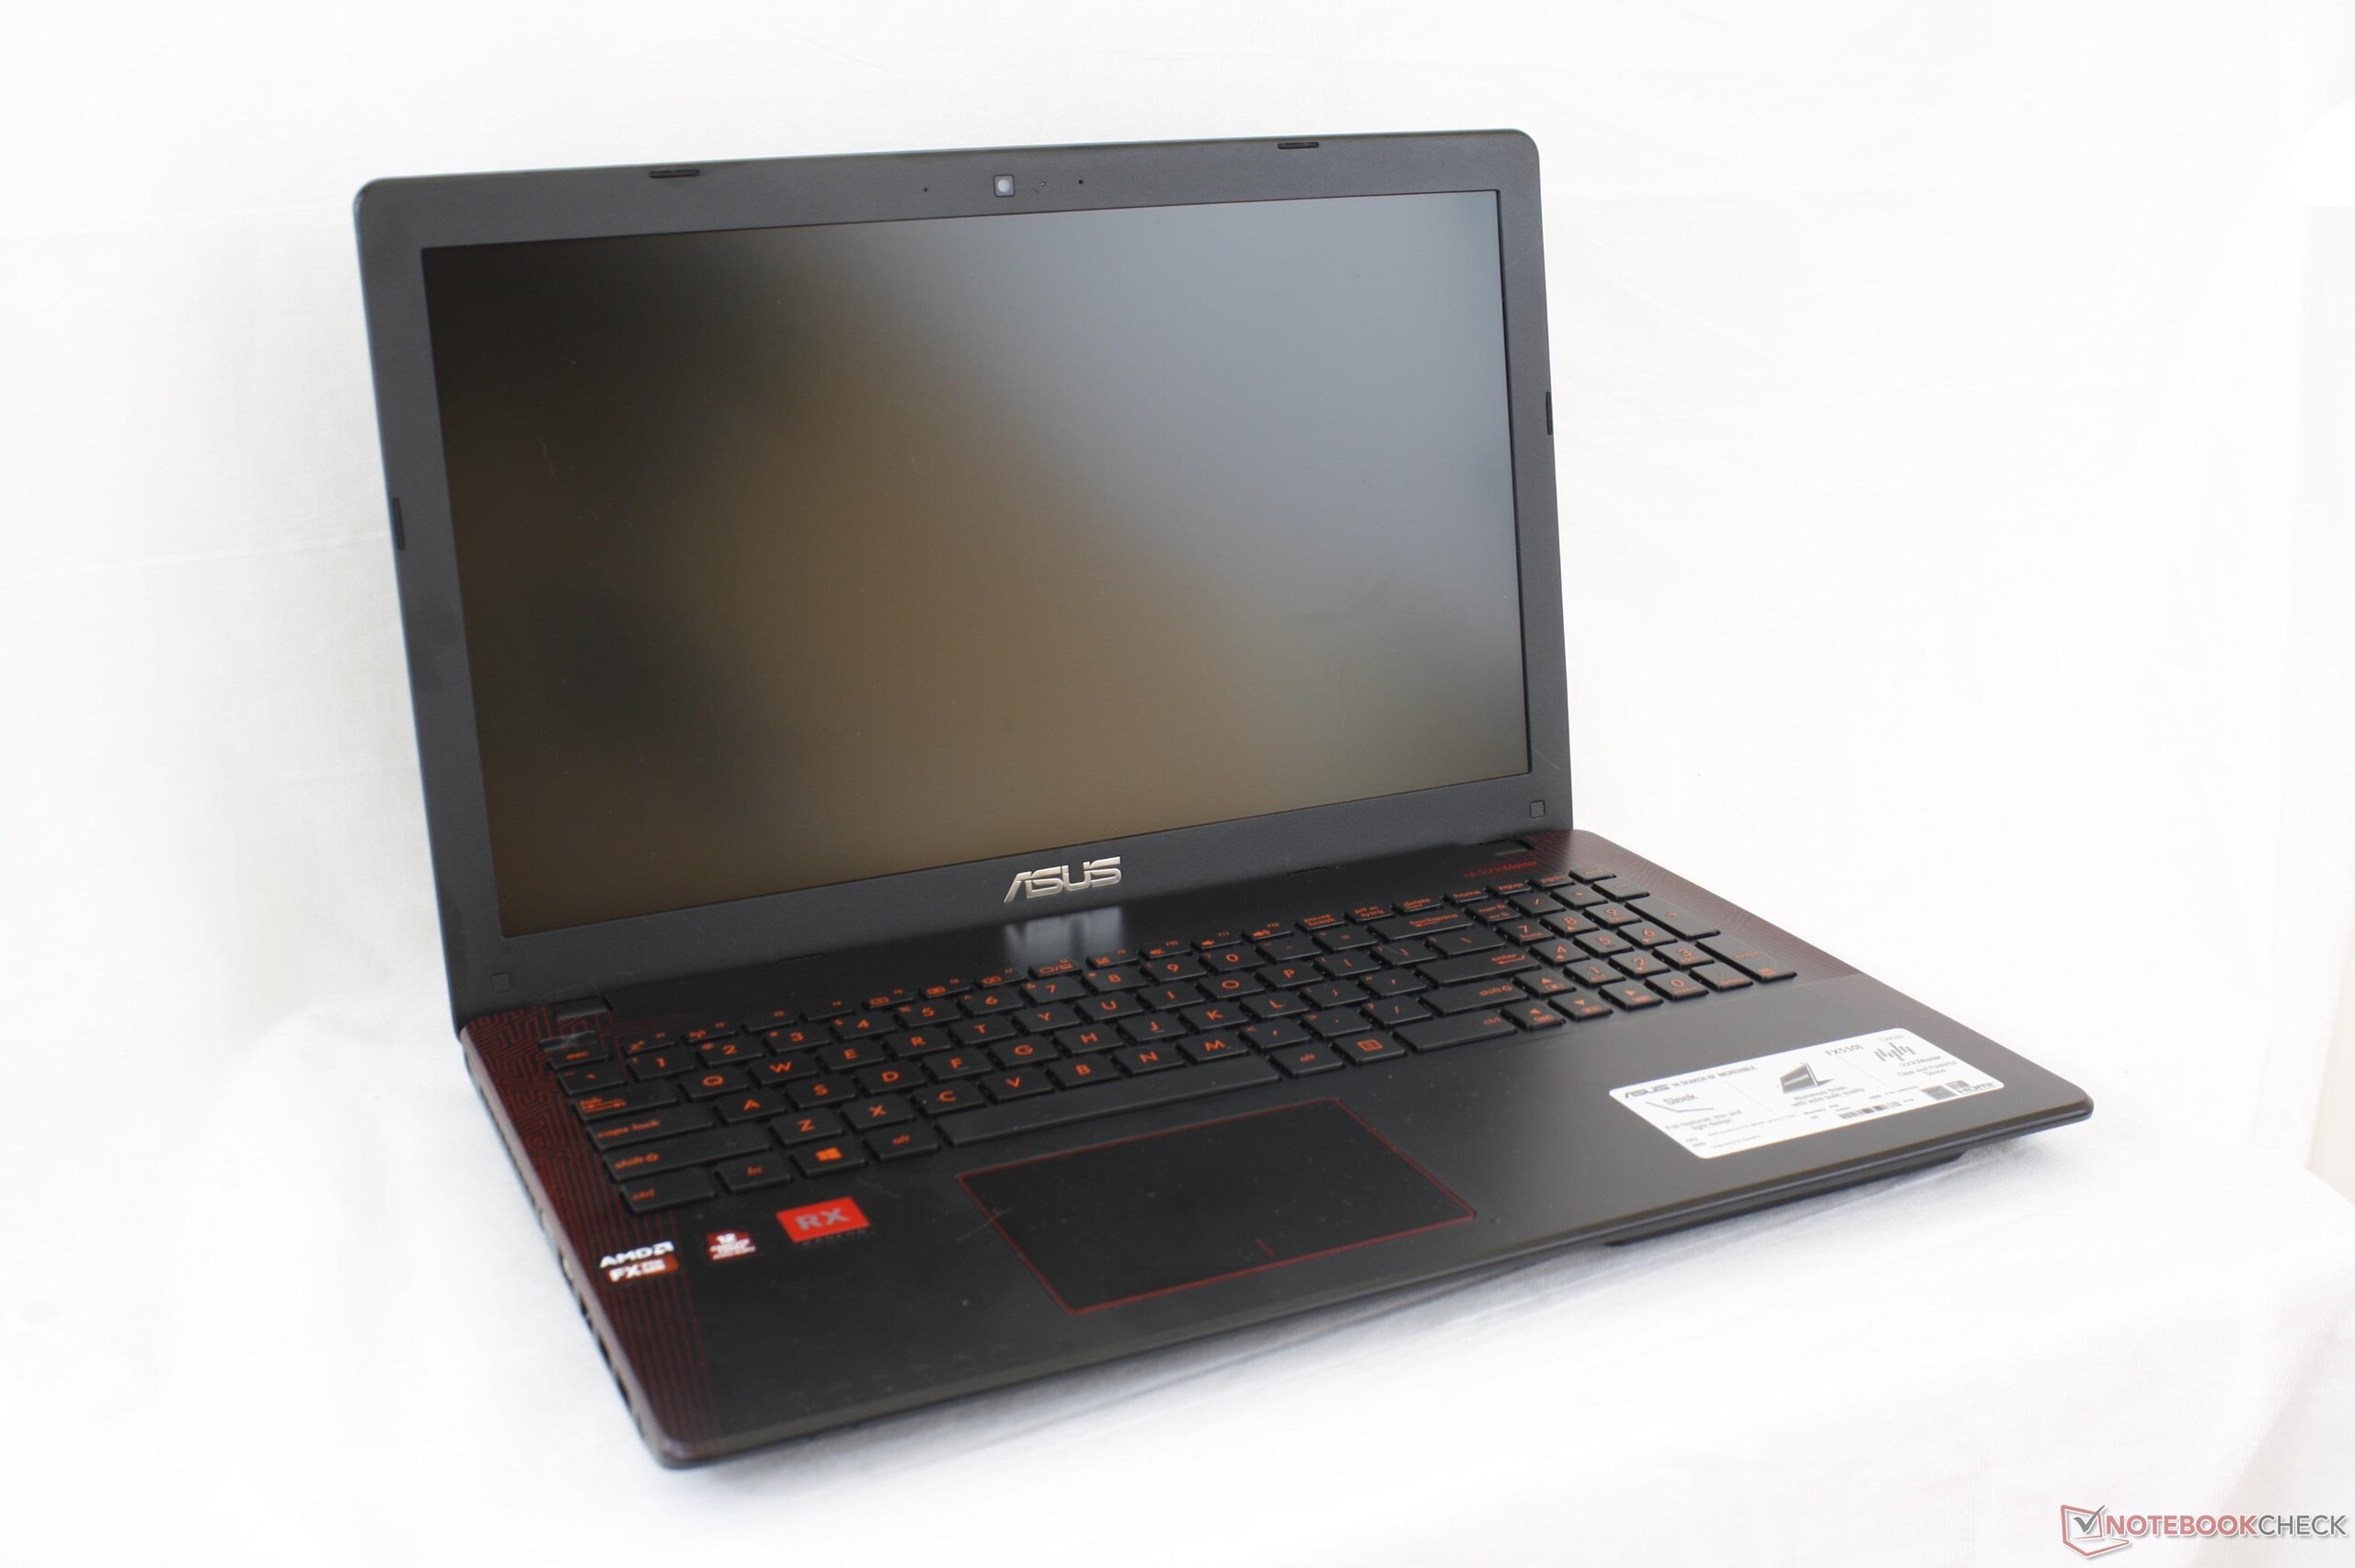
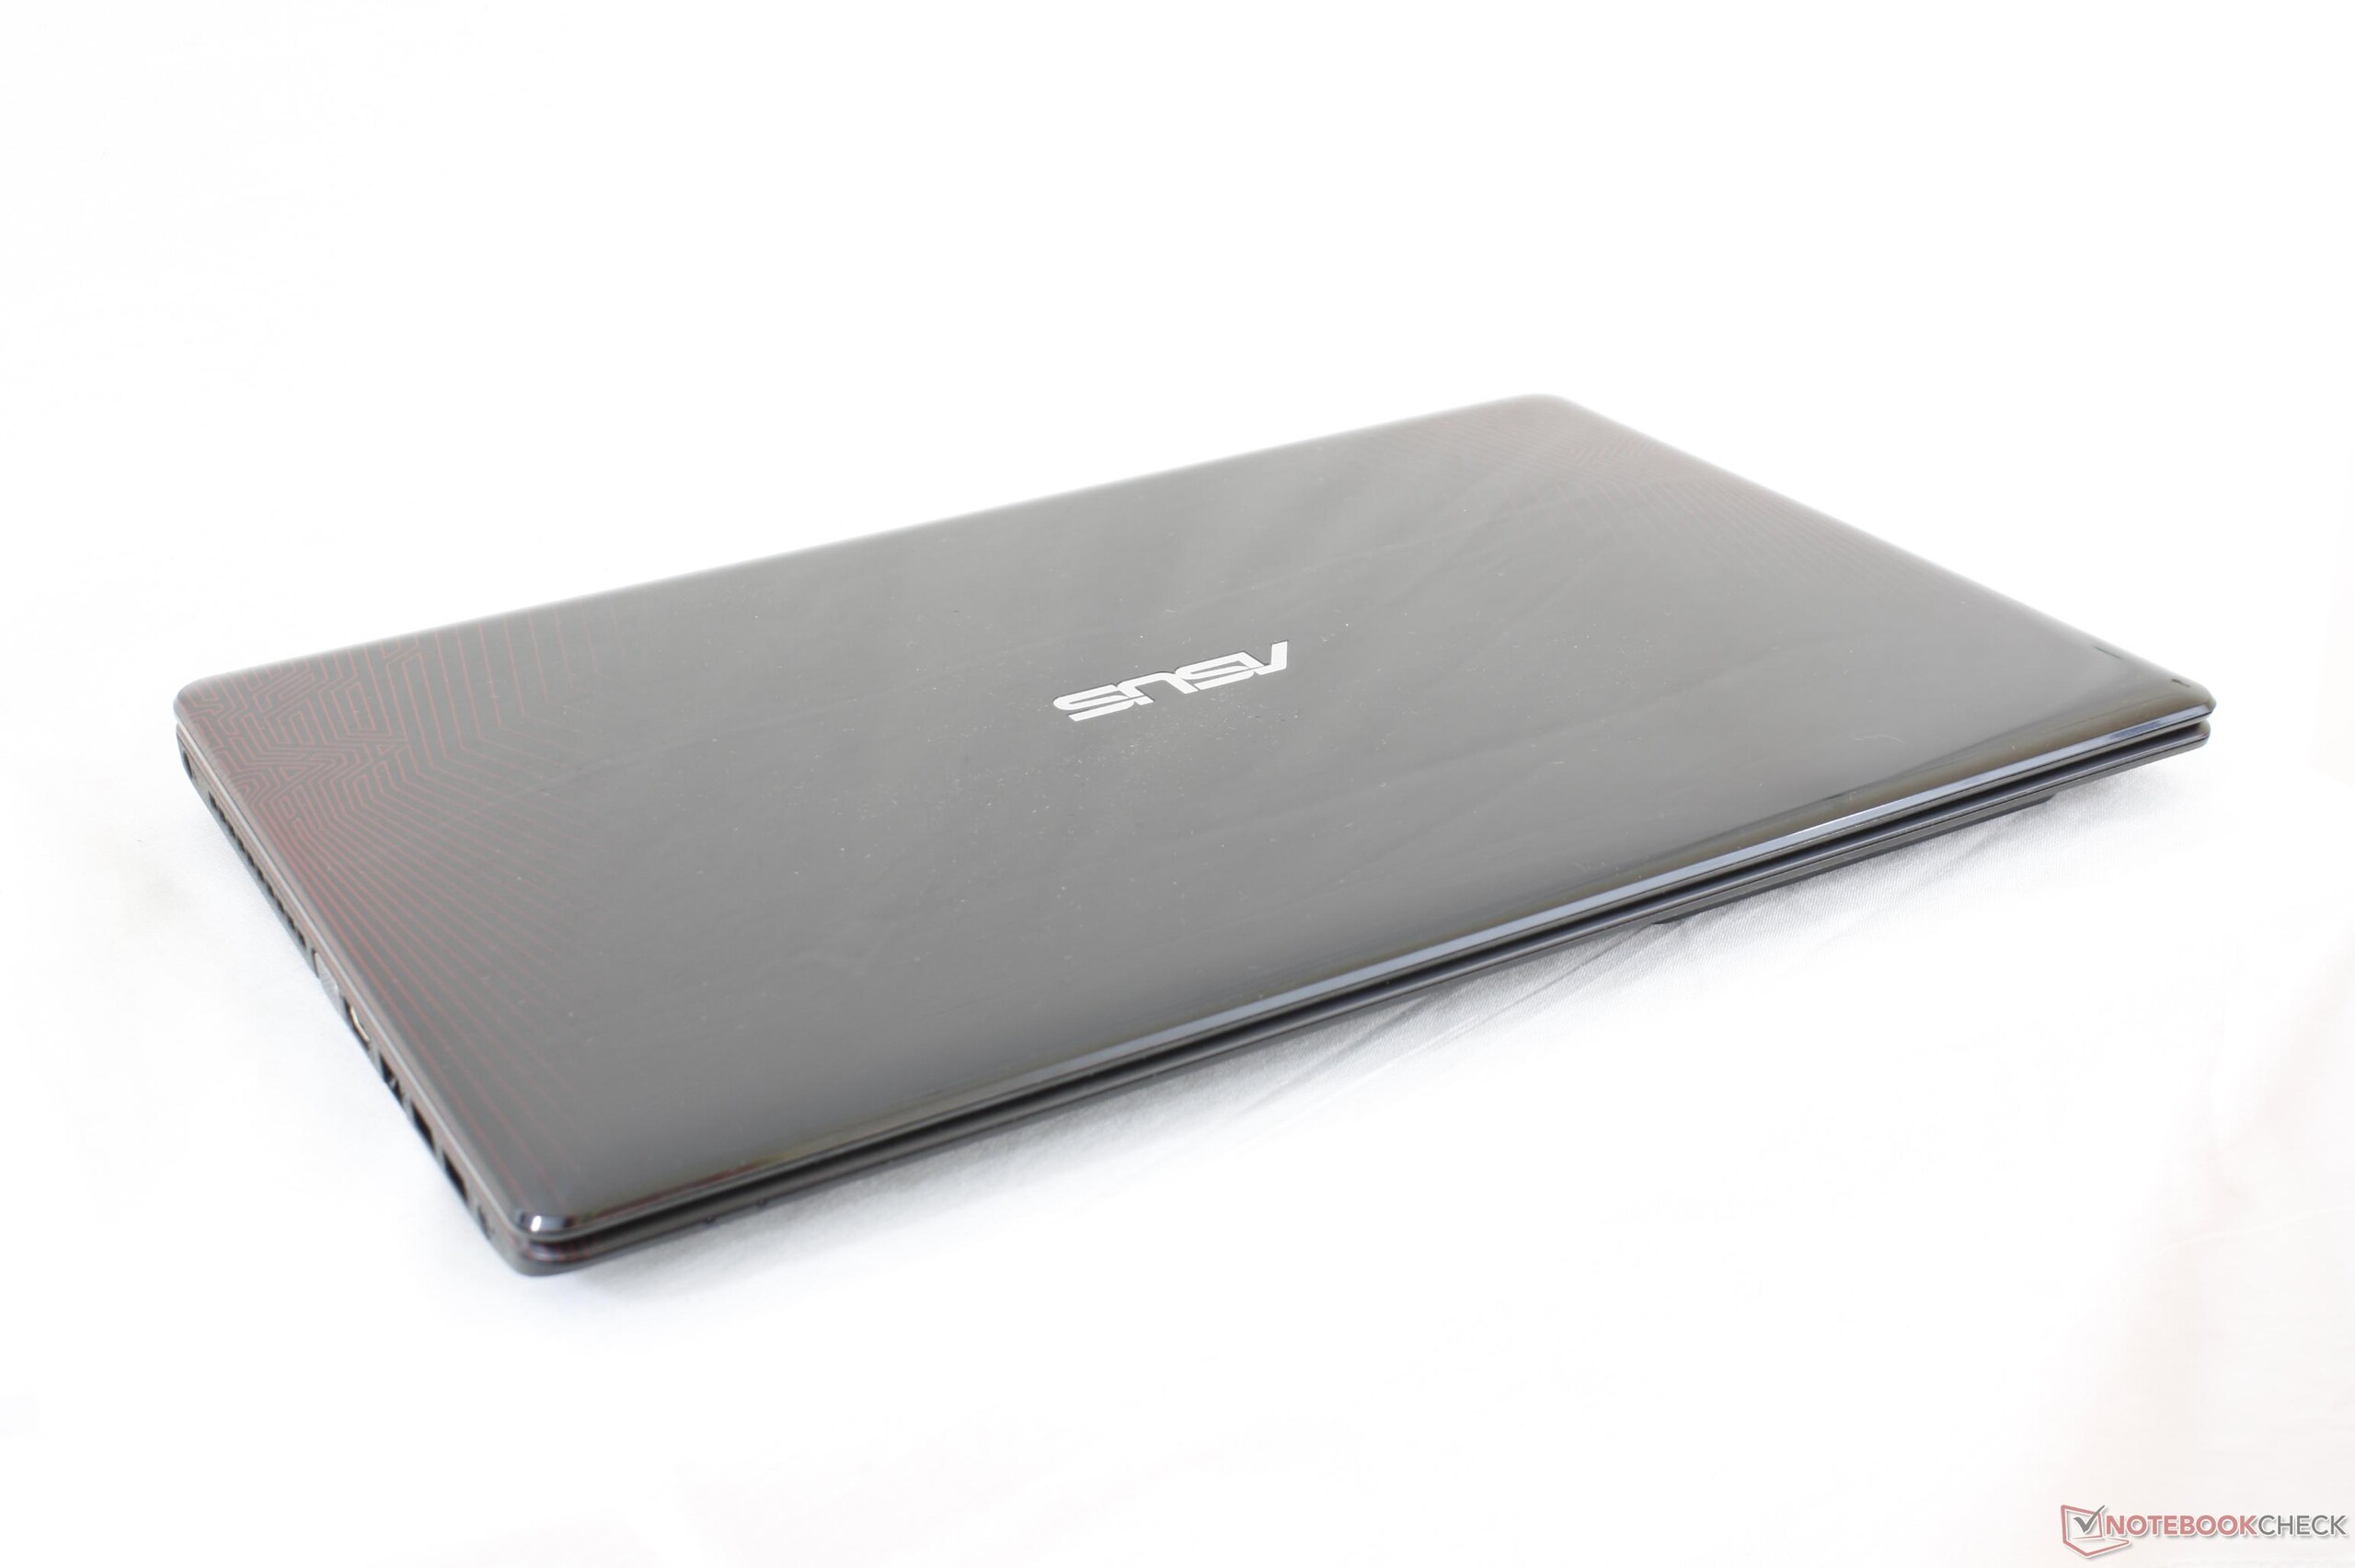
Chassis design is similar to the very old FX550DM that shipped with the Core i5-4200H CPU and GeForce GTX 850M GPU and is a predecessor to the more recent FX553VD with the i7-7700HQ CPU and GTX 1050 GPU. In other words, Asus has simply swapped out the Intel board for an AMD board on the aging FX550DM with seemingly no other external changes.
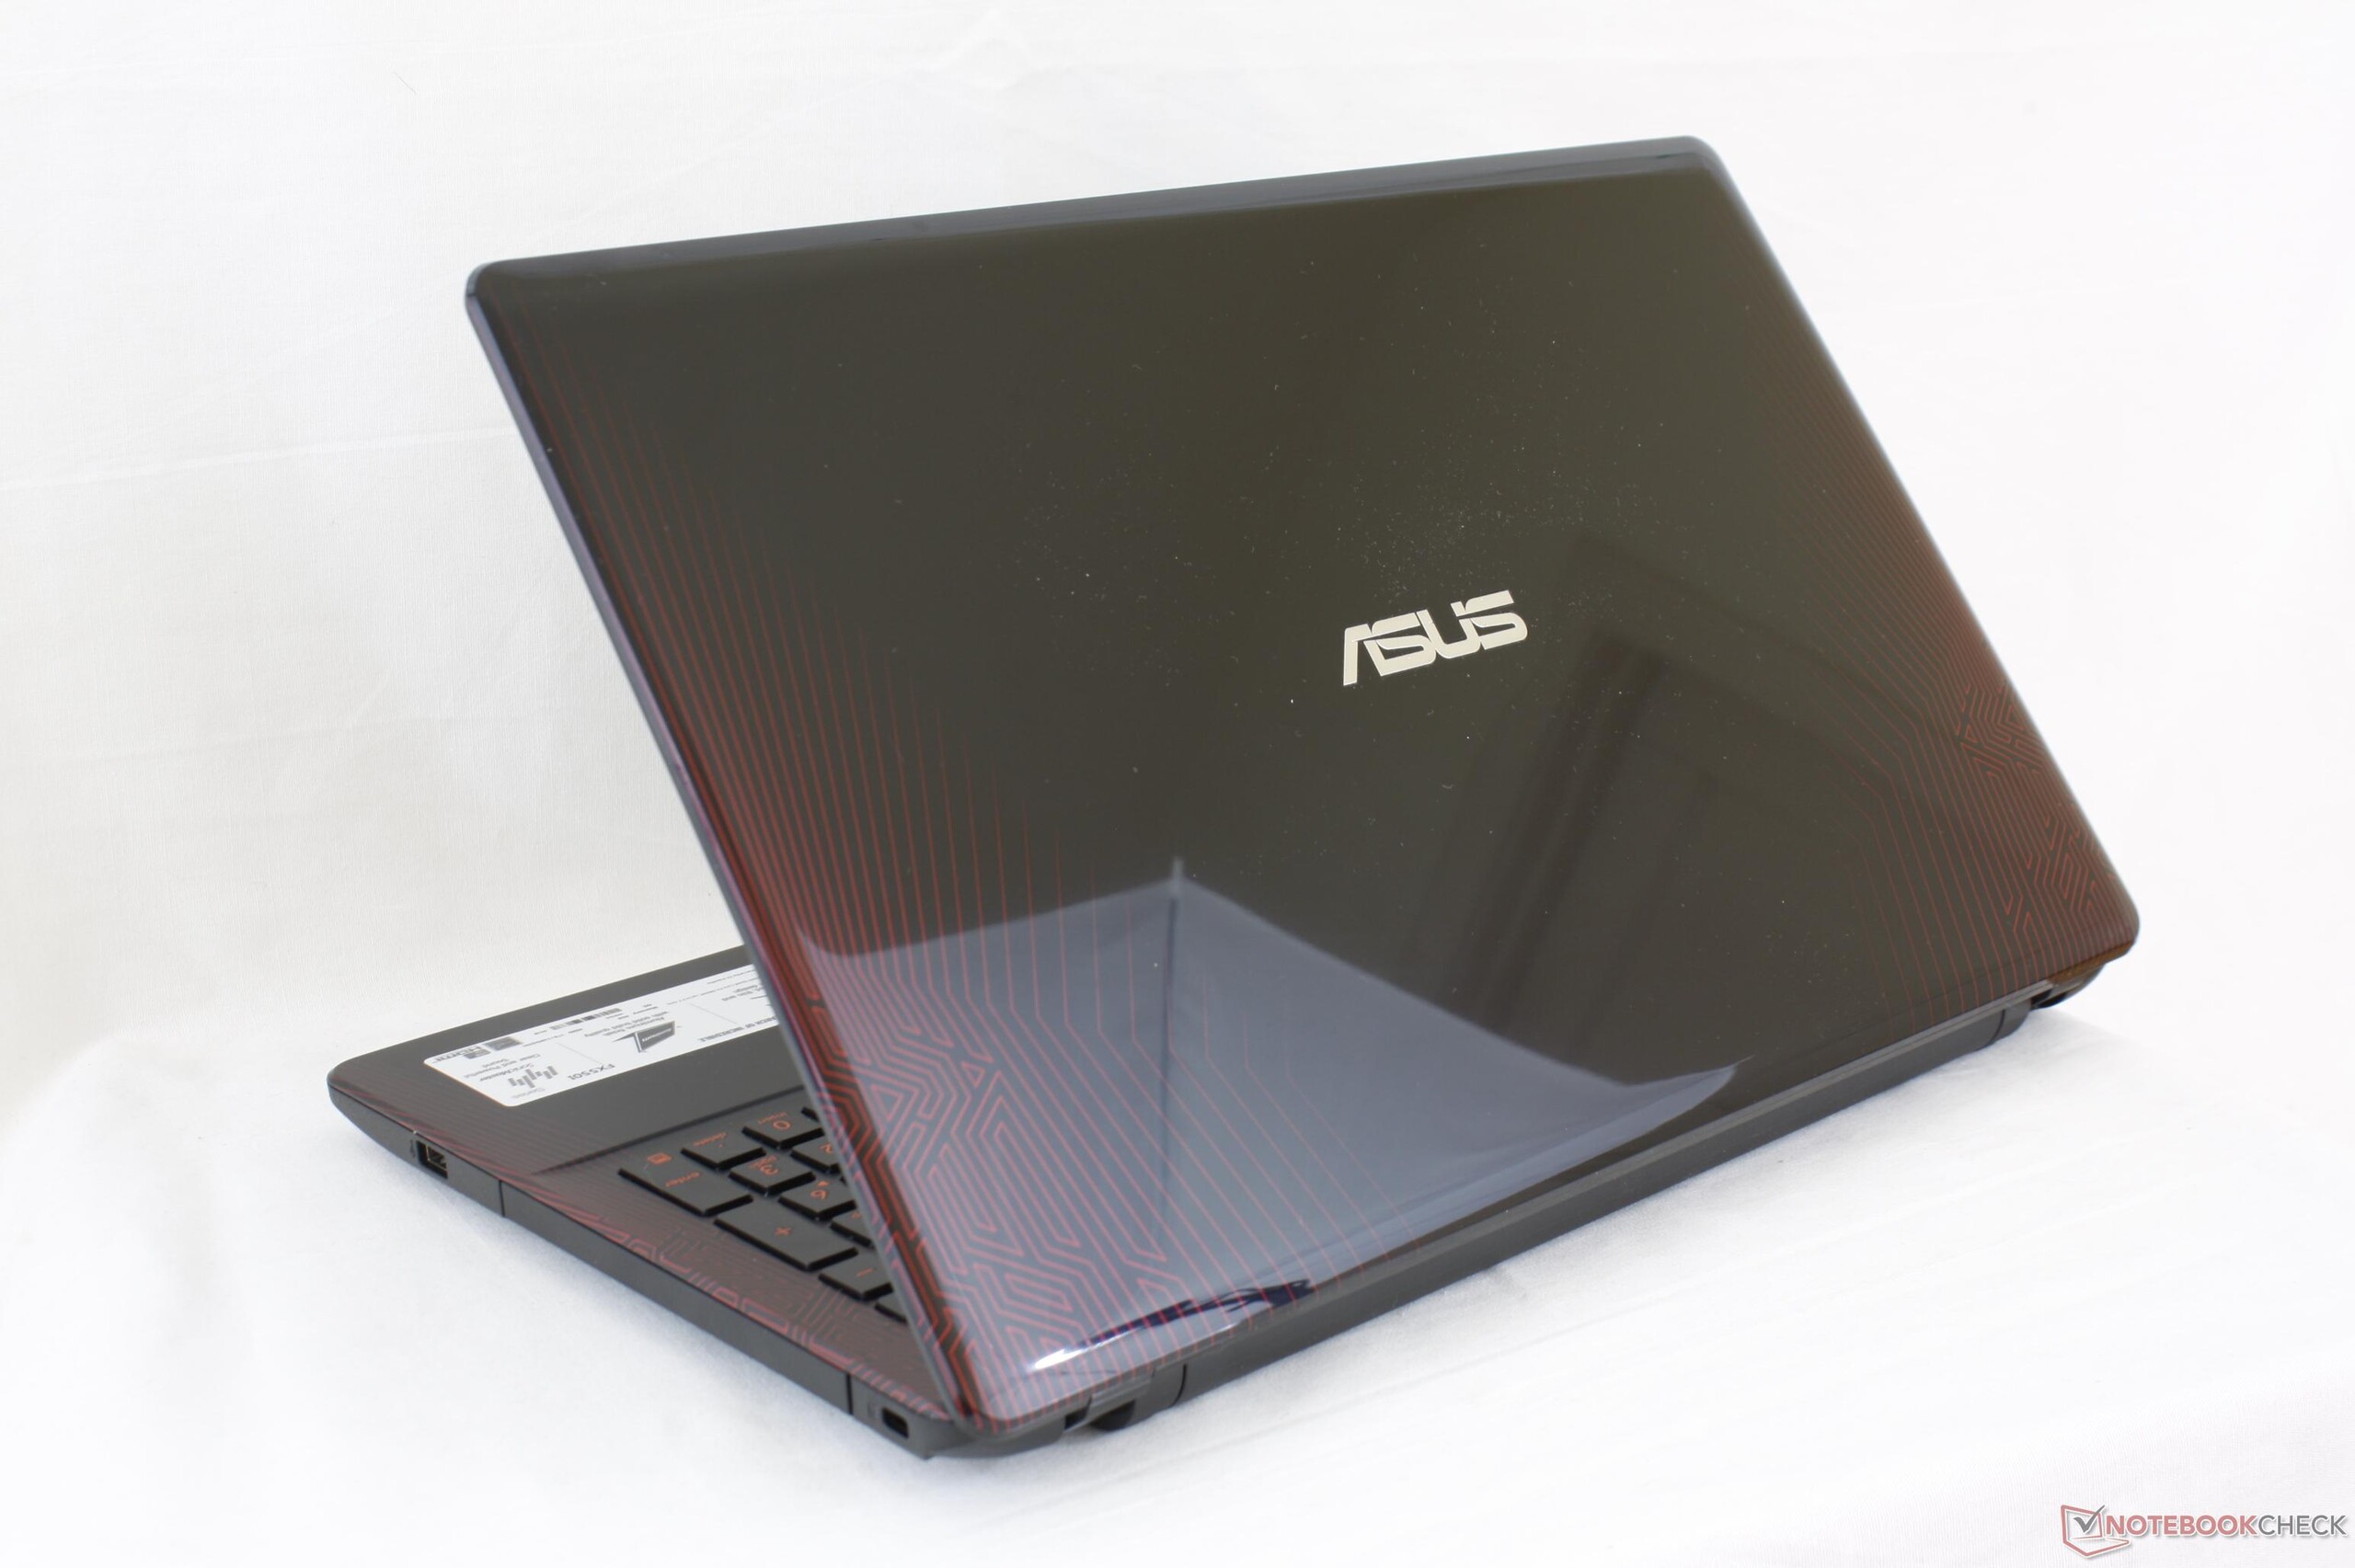
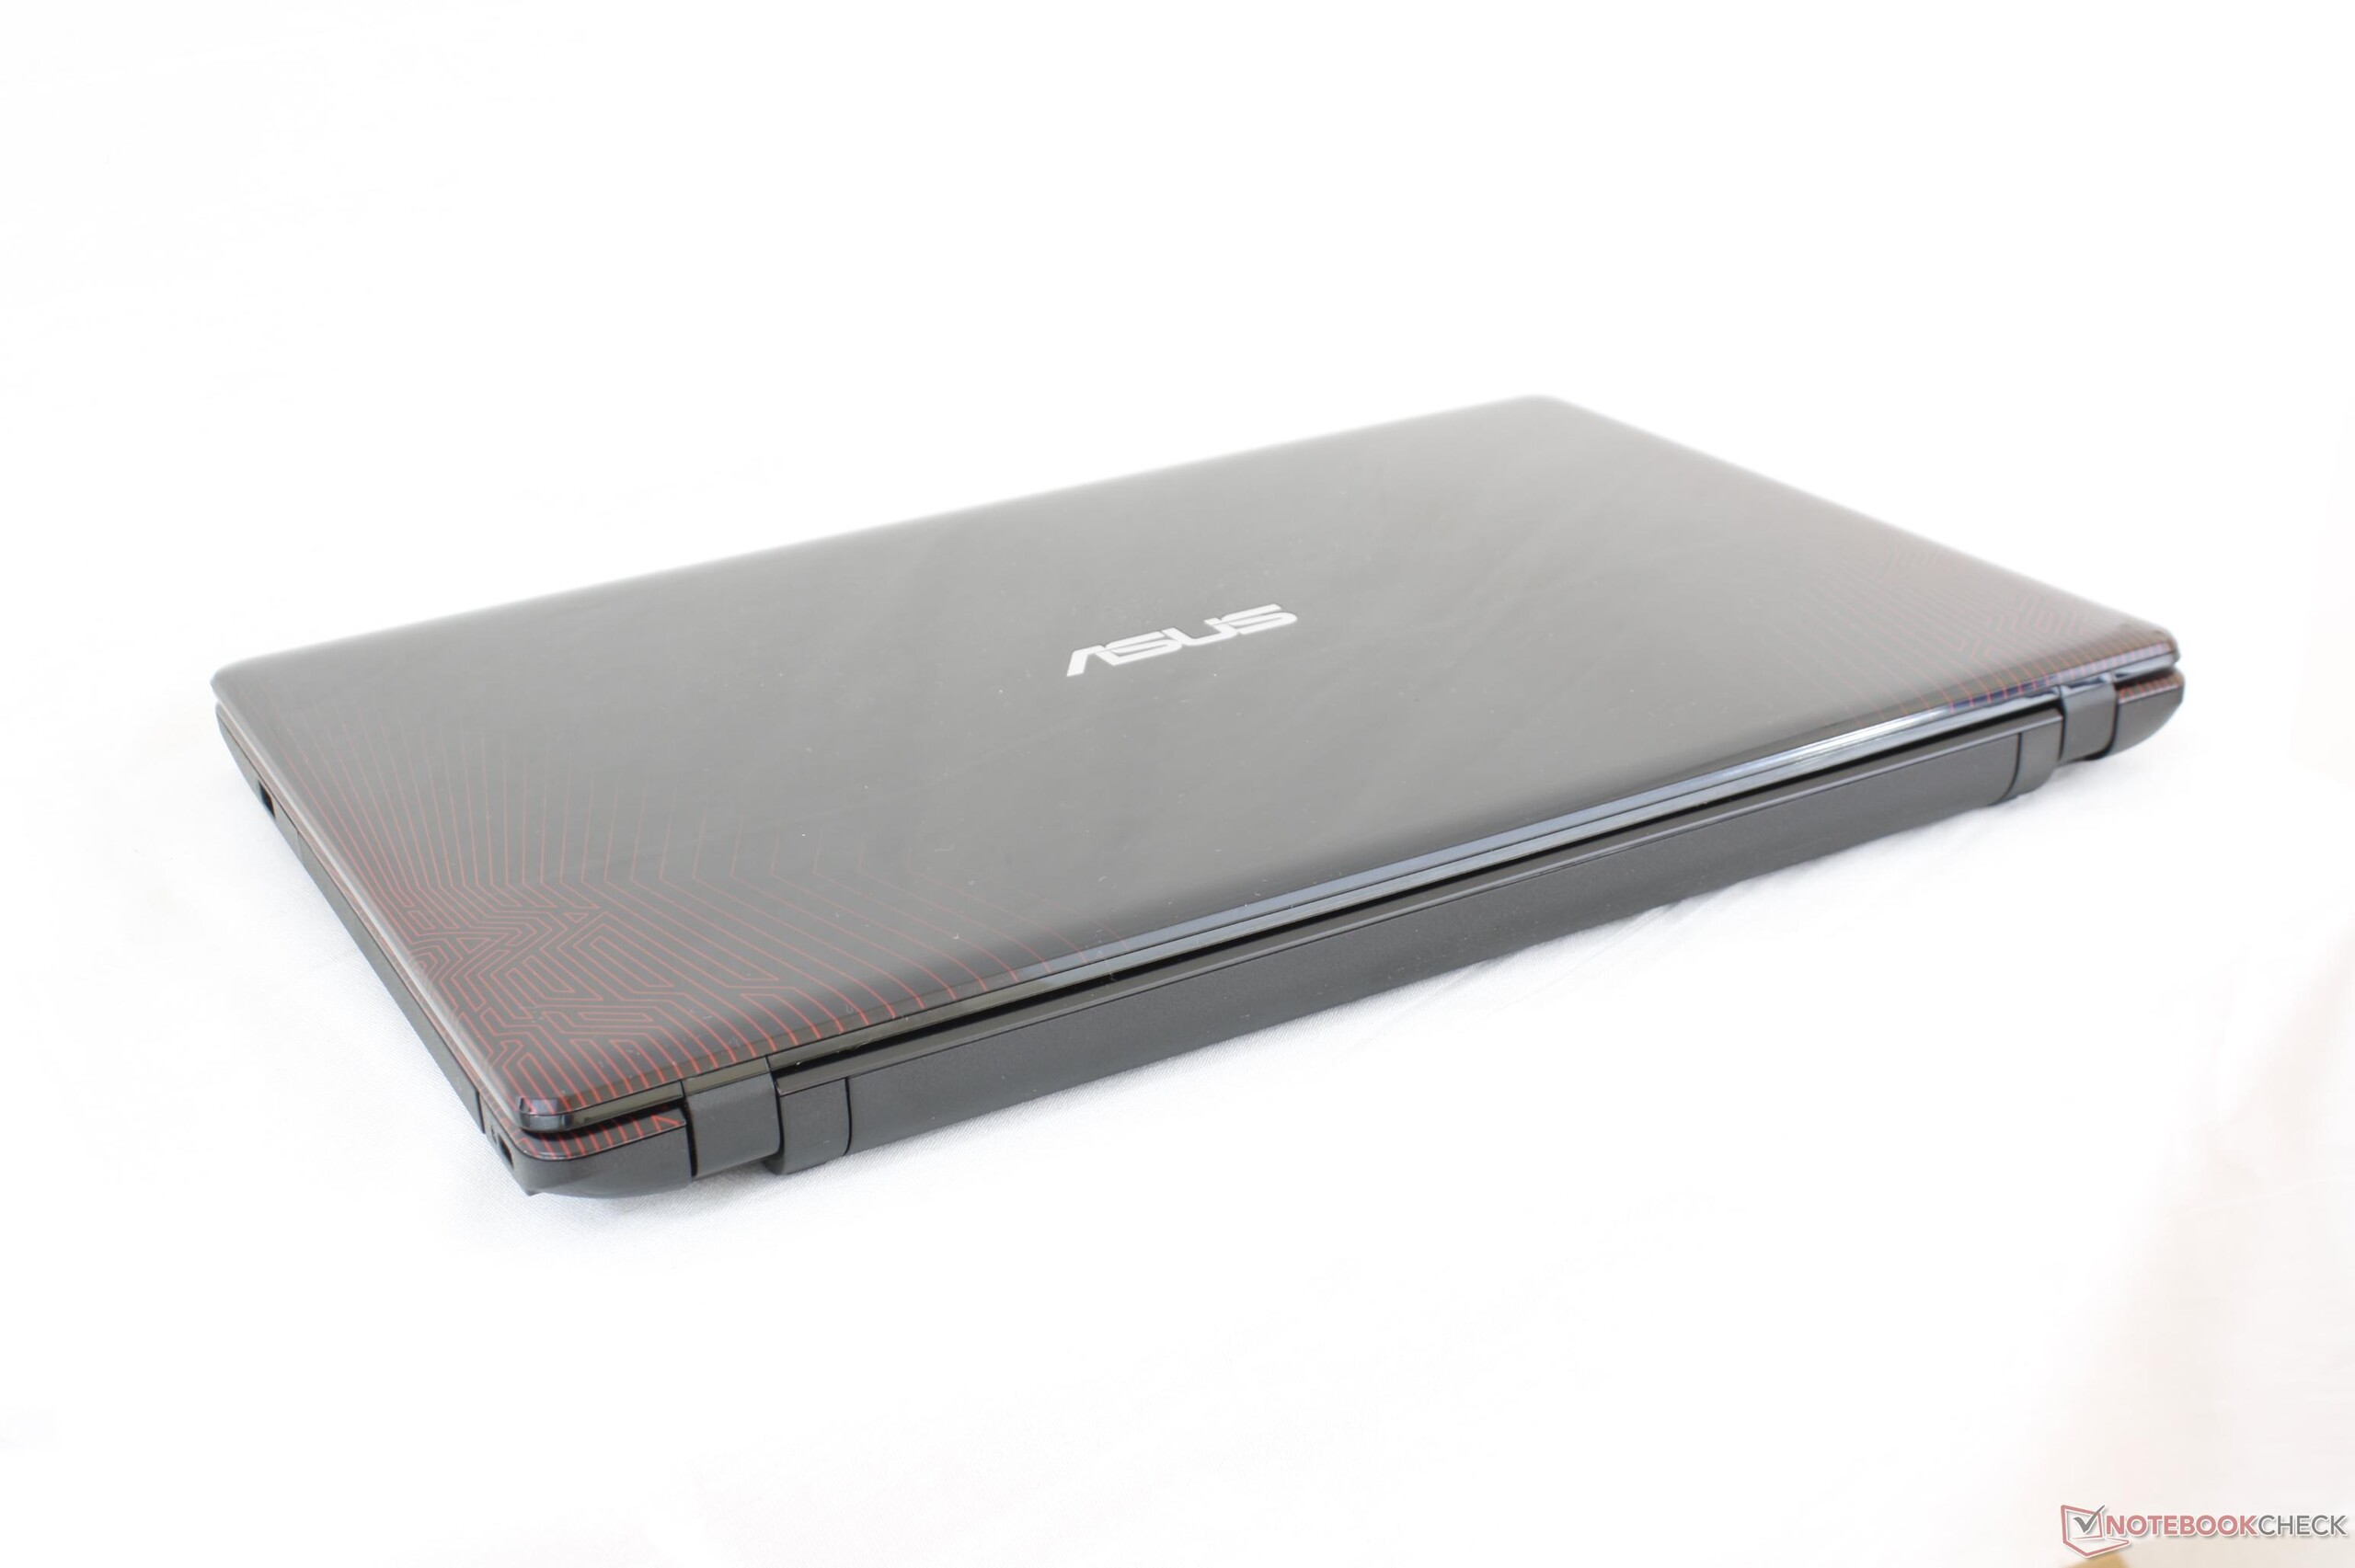
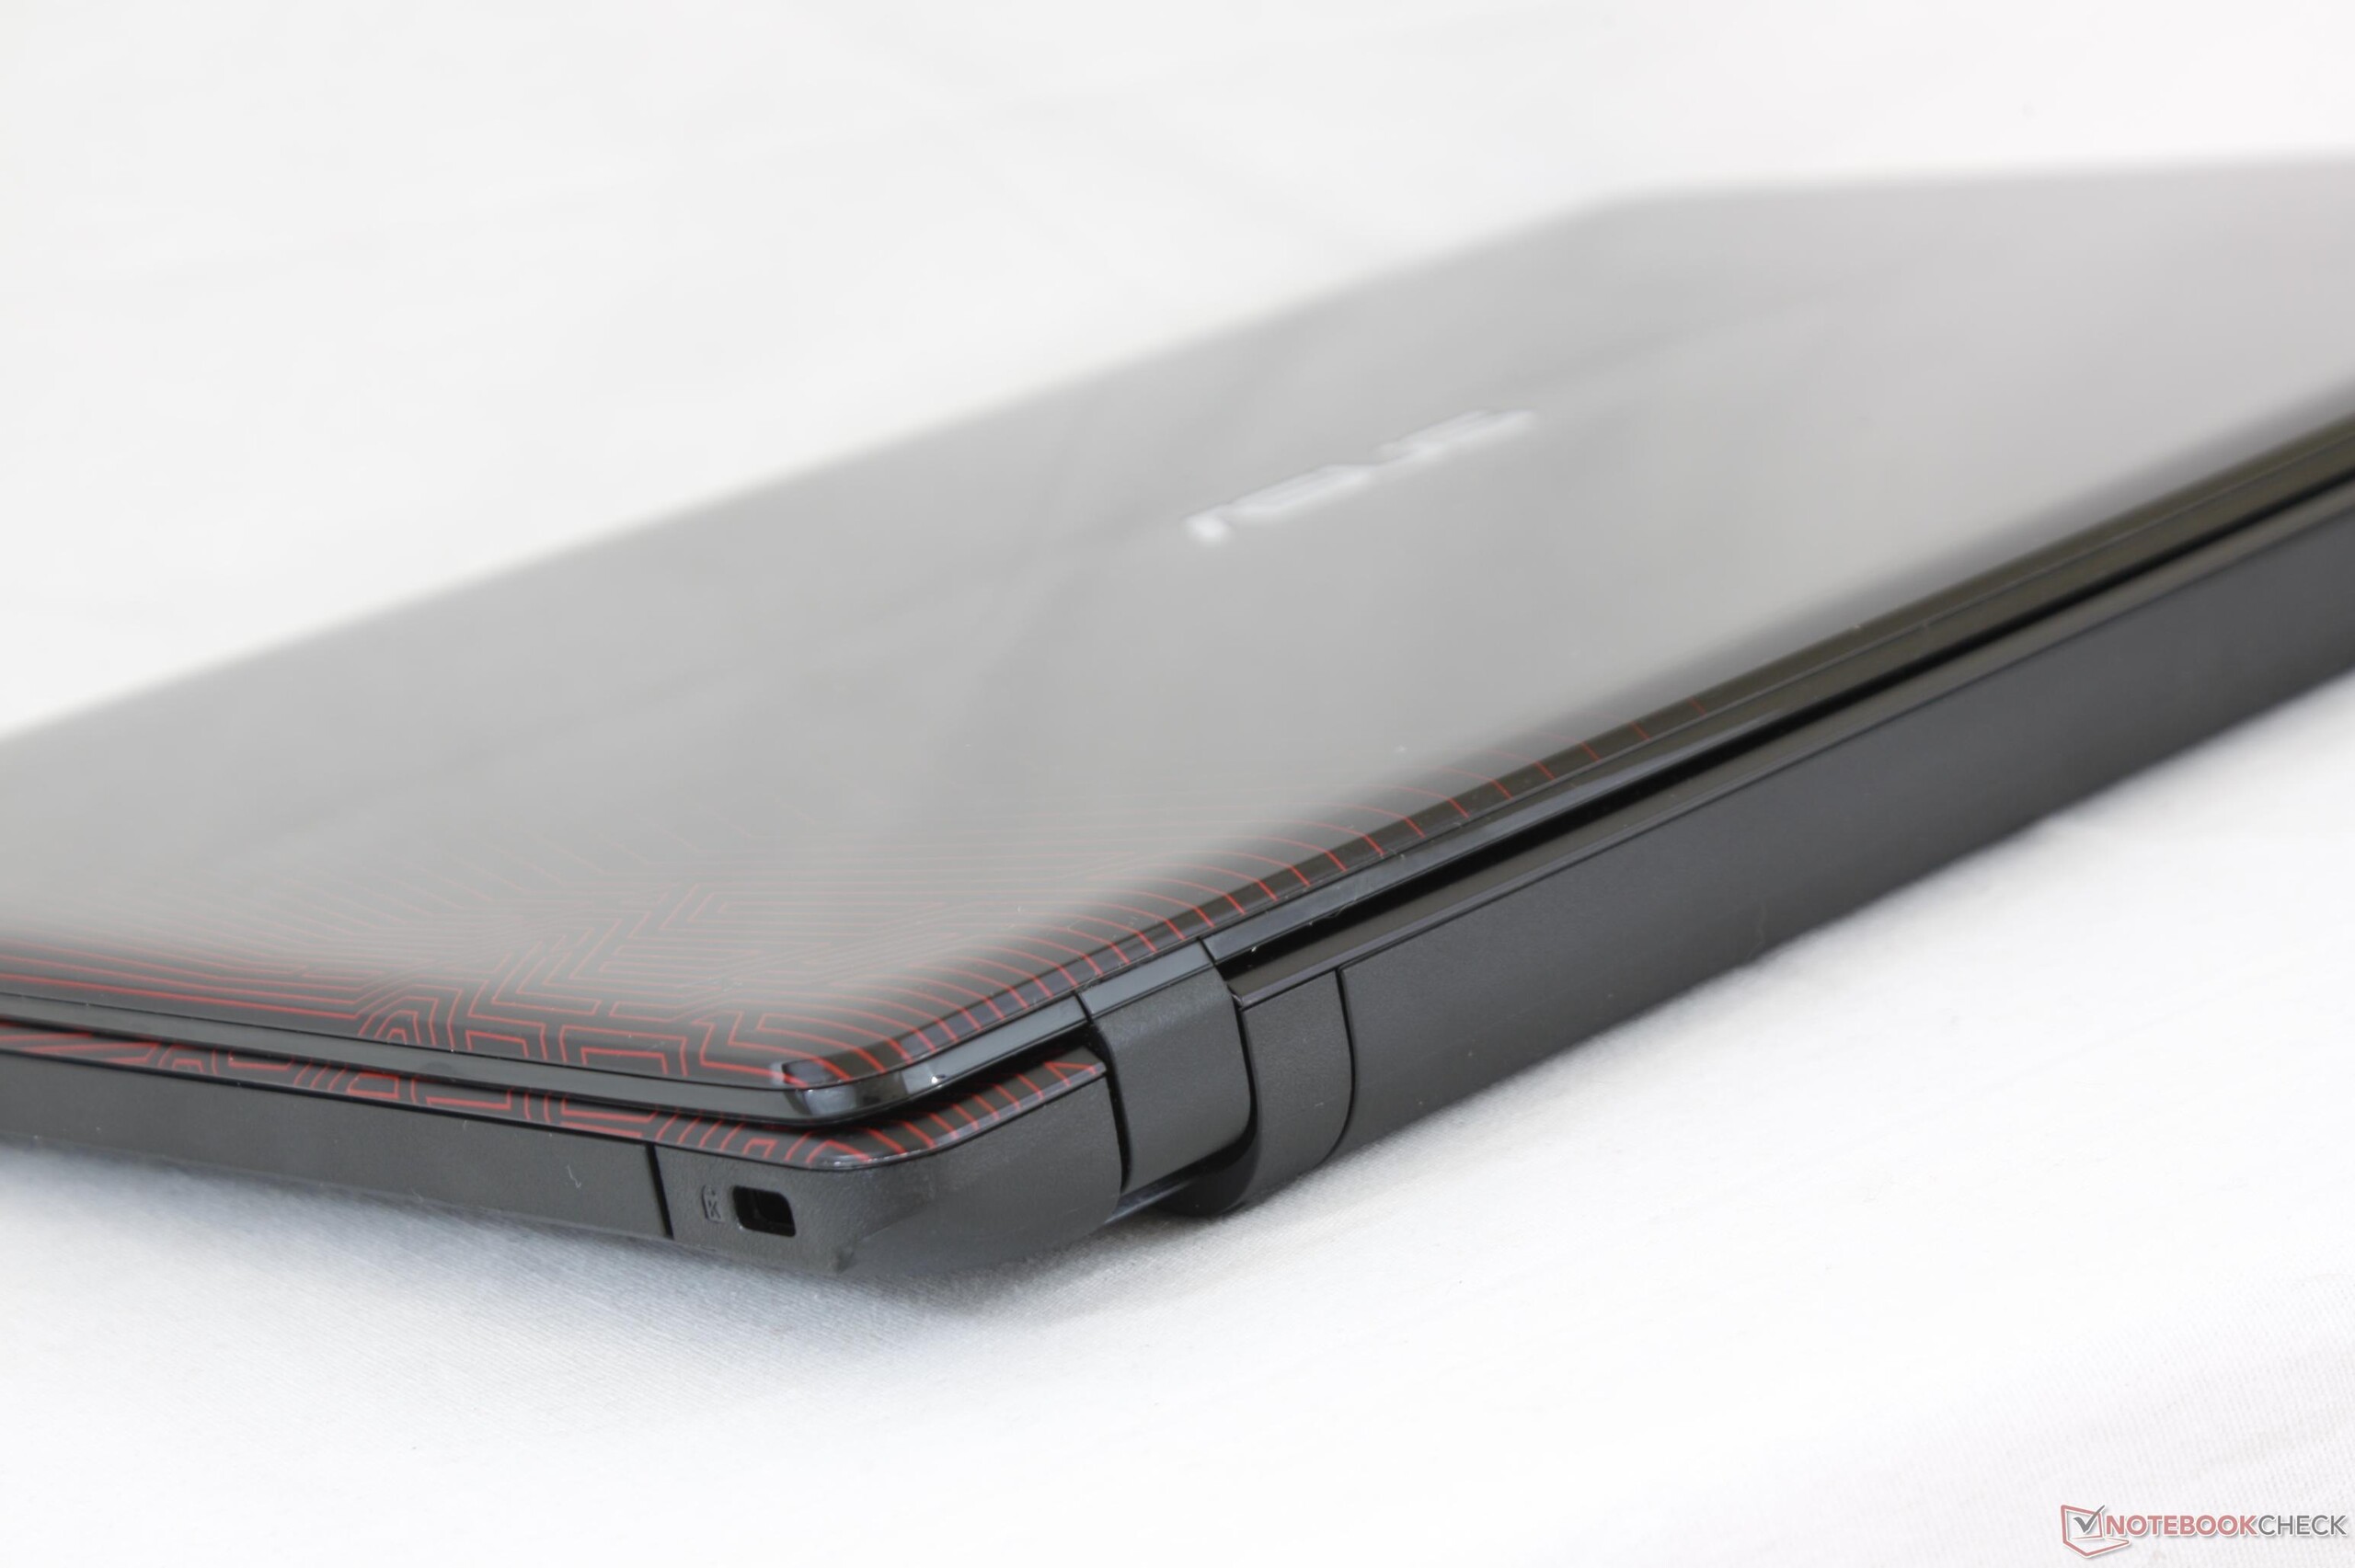
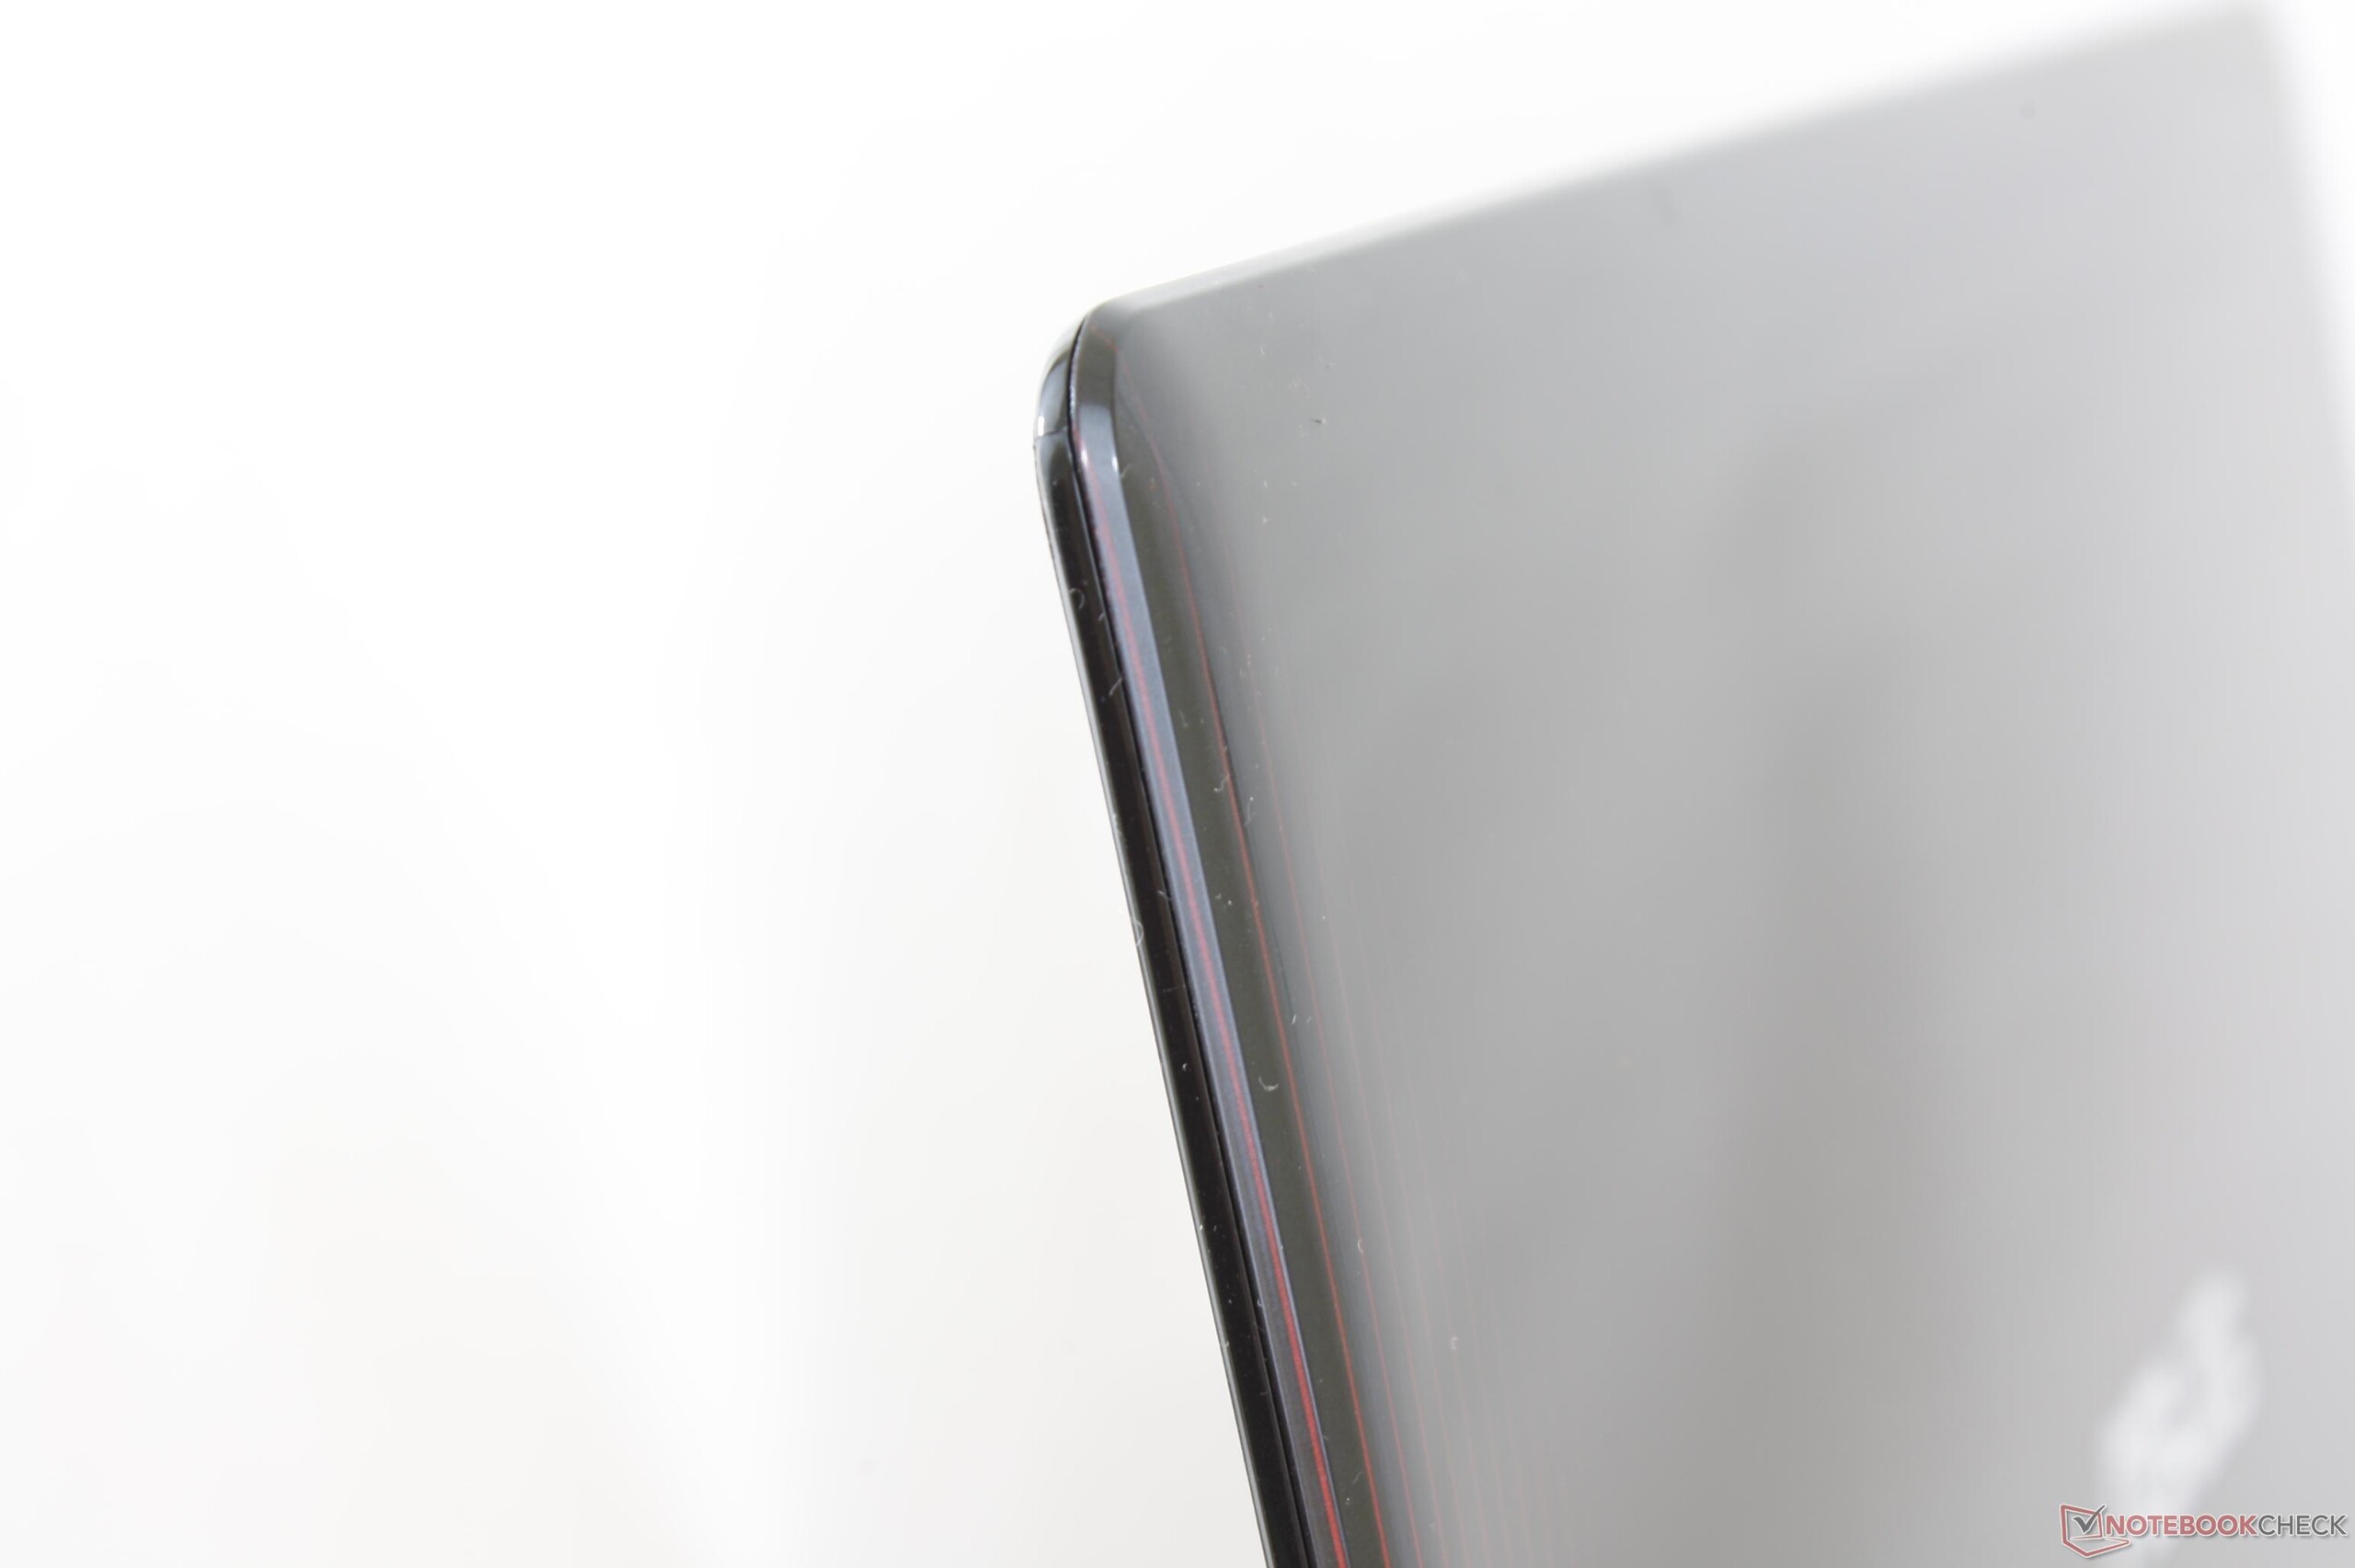
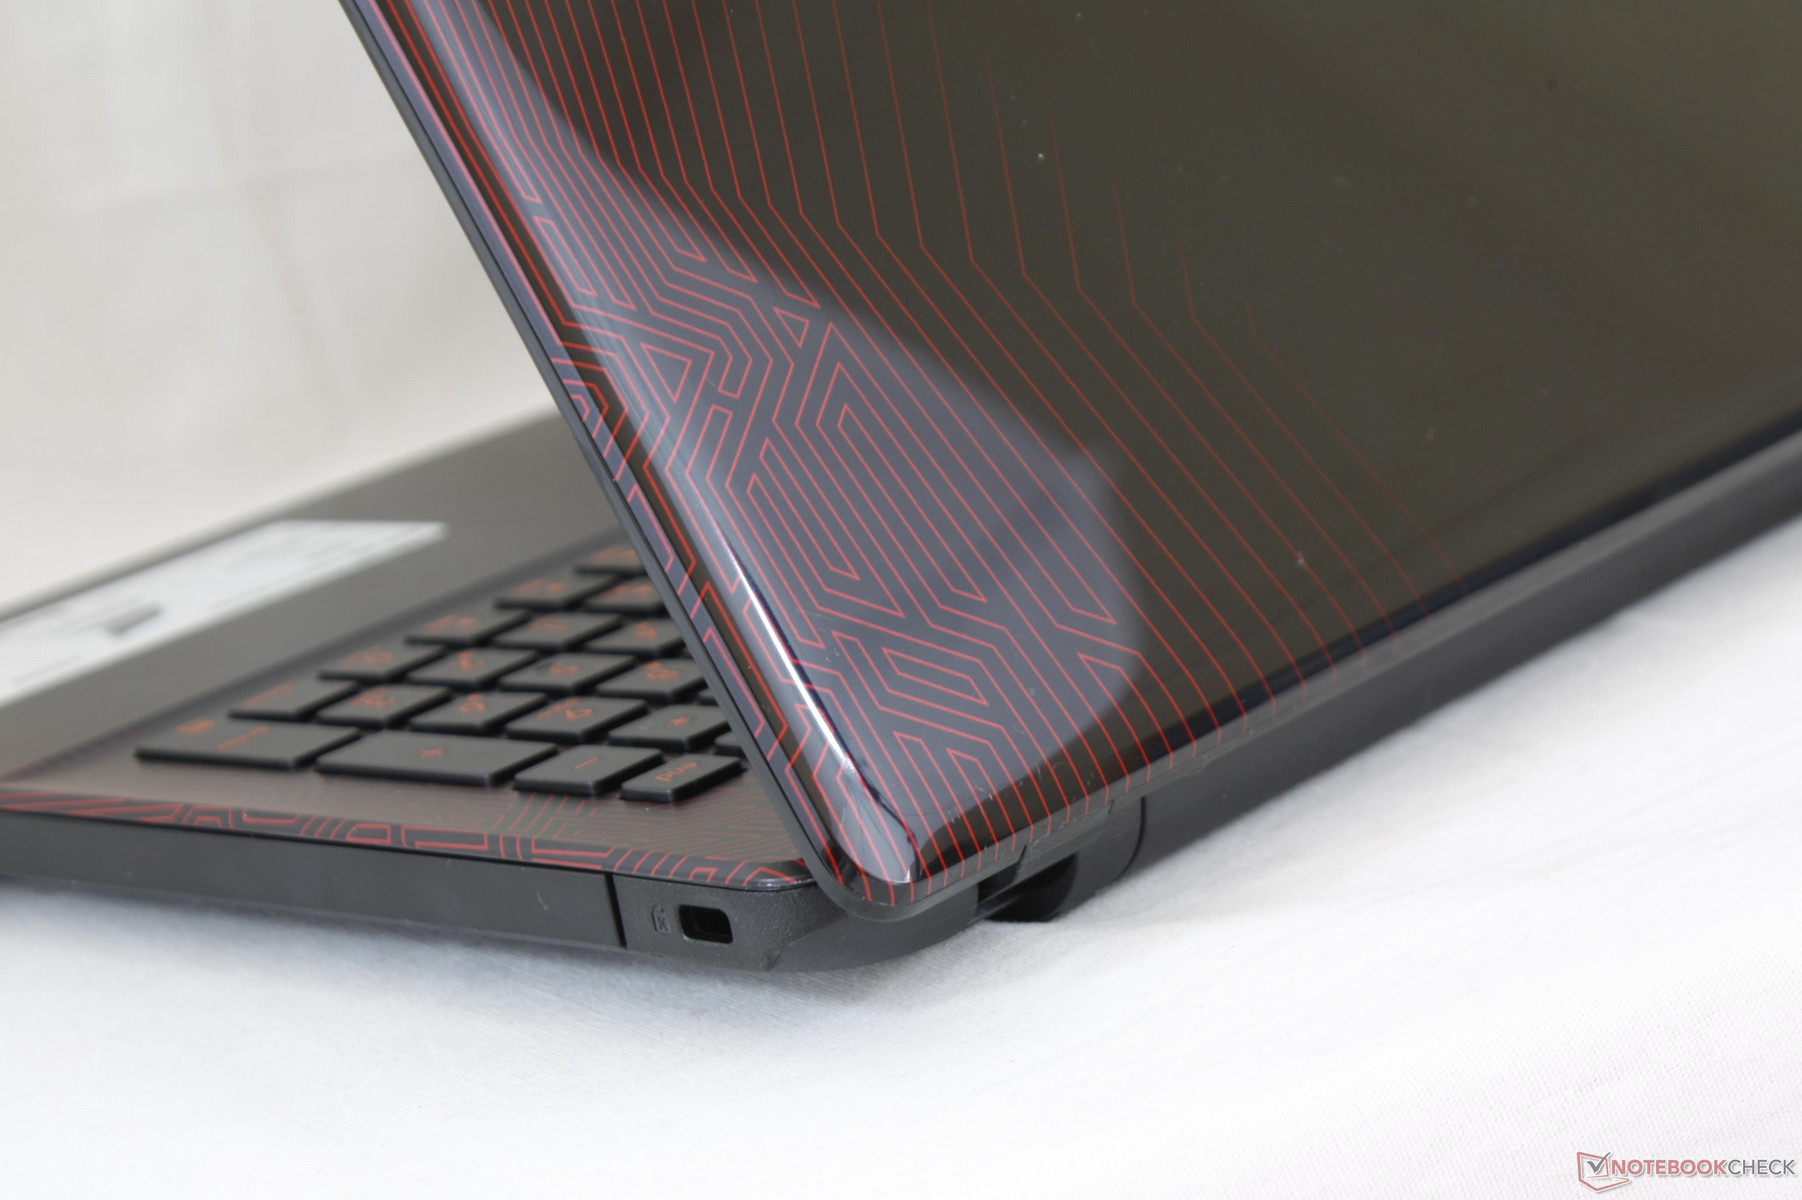
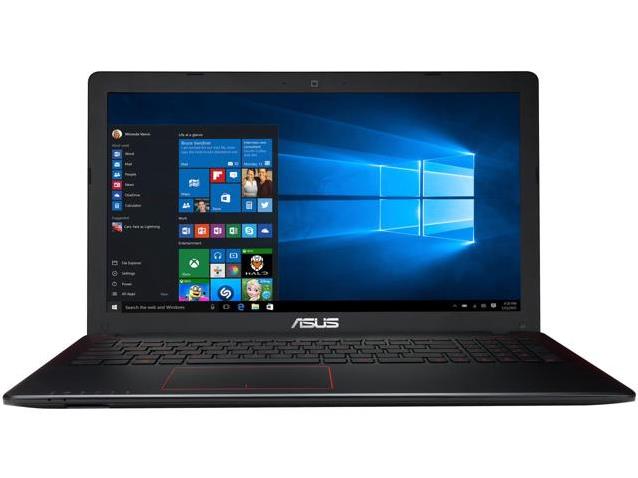
The system looks and feels outdated as a result. The matte plastic palm rests and bezels and super-glossy outer lid are similar in texture to the outdated Pavilion 15 and Pavilion 17 designs prior to the 2016 refresh. Surfaces are very prone to fingerprints and the outer lid in particular will easily scratch. The lid is susceptible to flexing and the palm rests and keyboard surfaces exhibit moderate warping when applying pressure with a finger. The hinges are otherwise with no teetering when typing and the the base is relatively resistant to side-to-side twisting, but there's no doubt that the hollow plasticky feel and slight creaking are indicative of a budget offering.
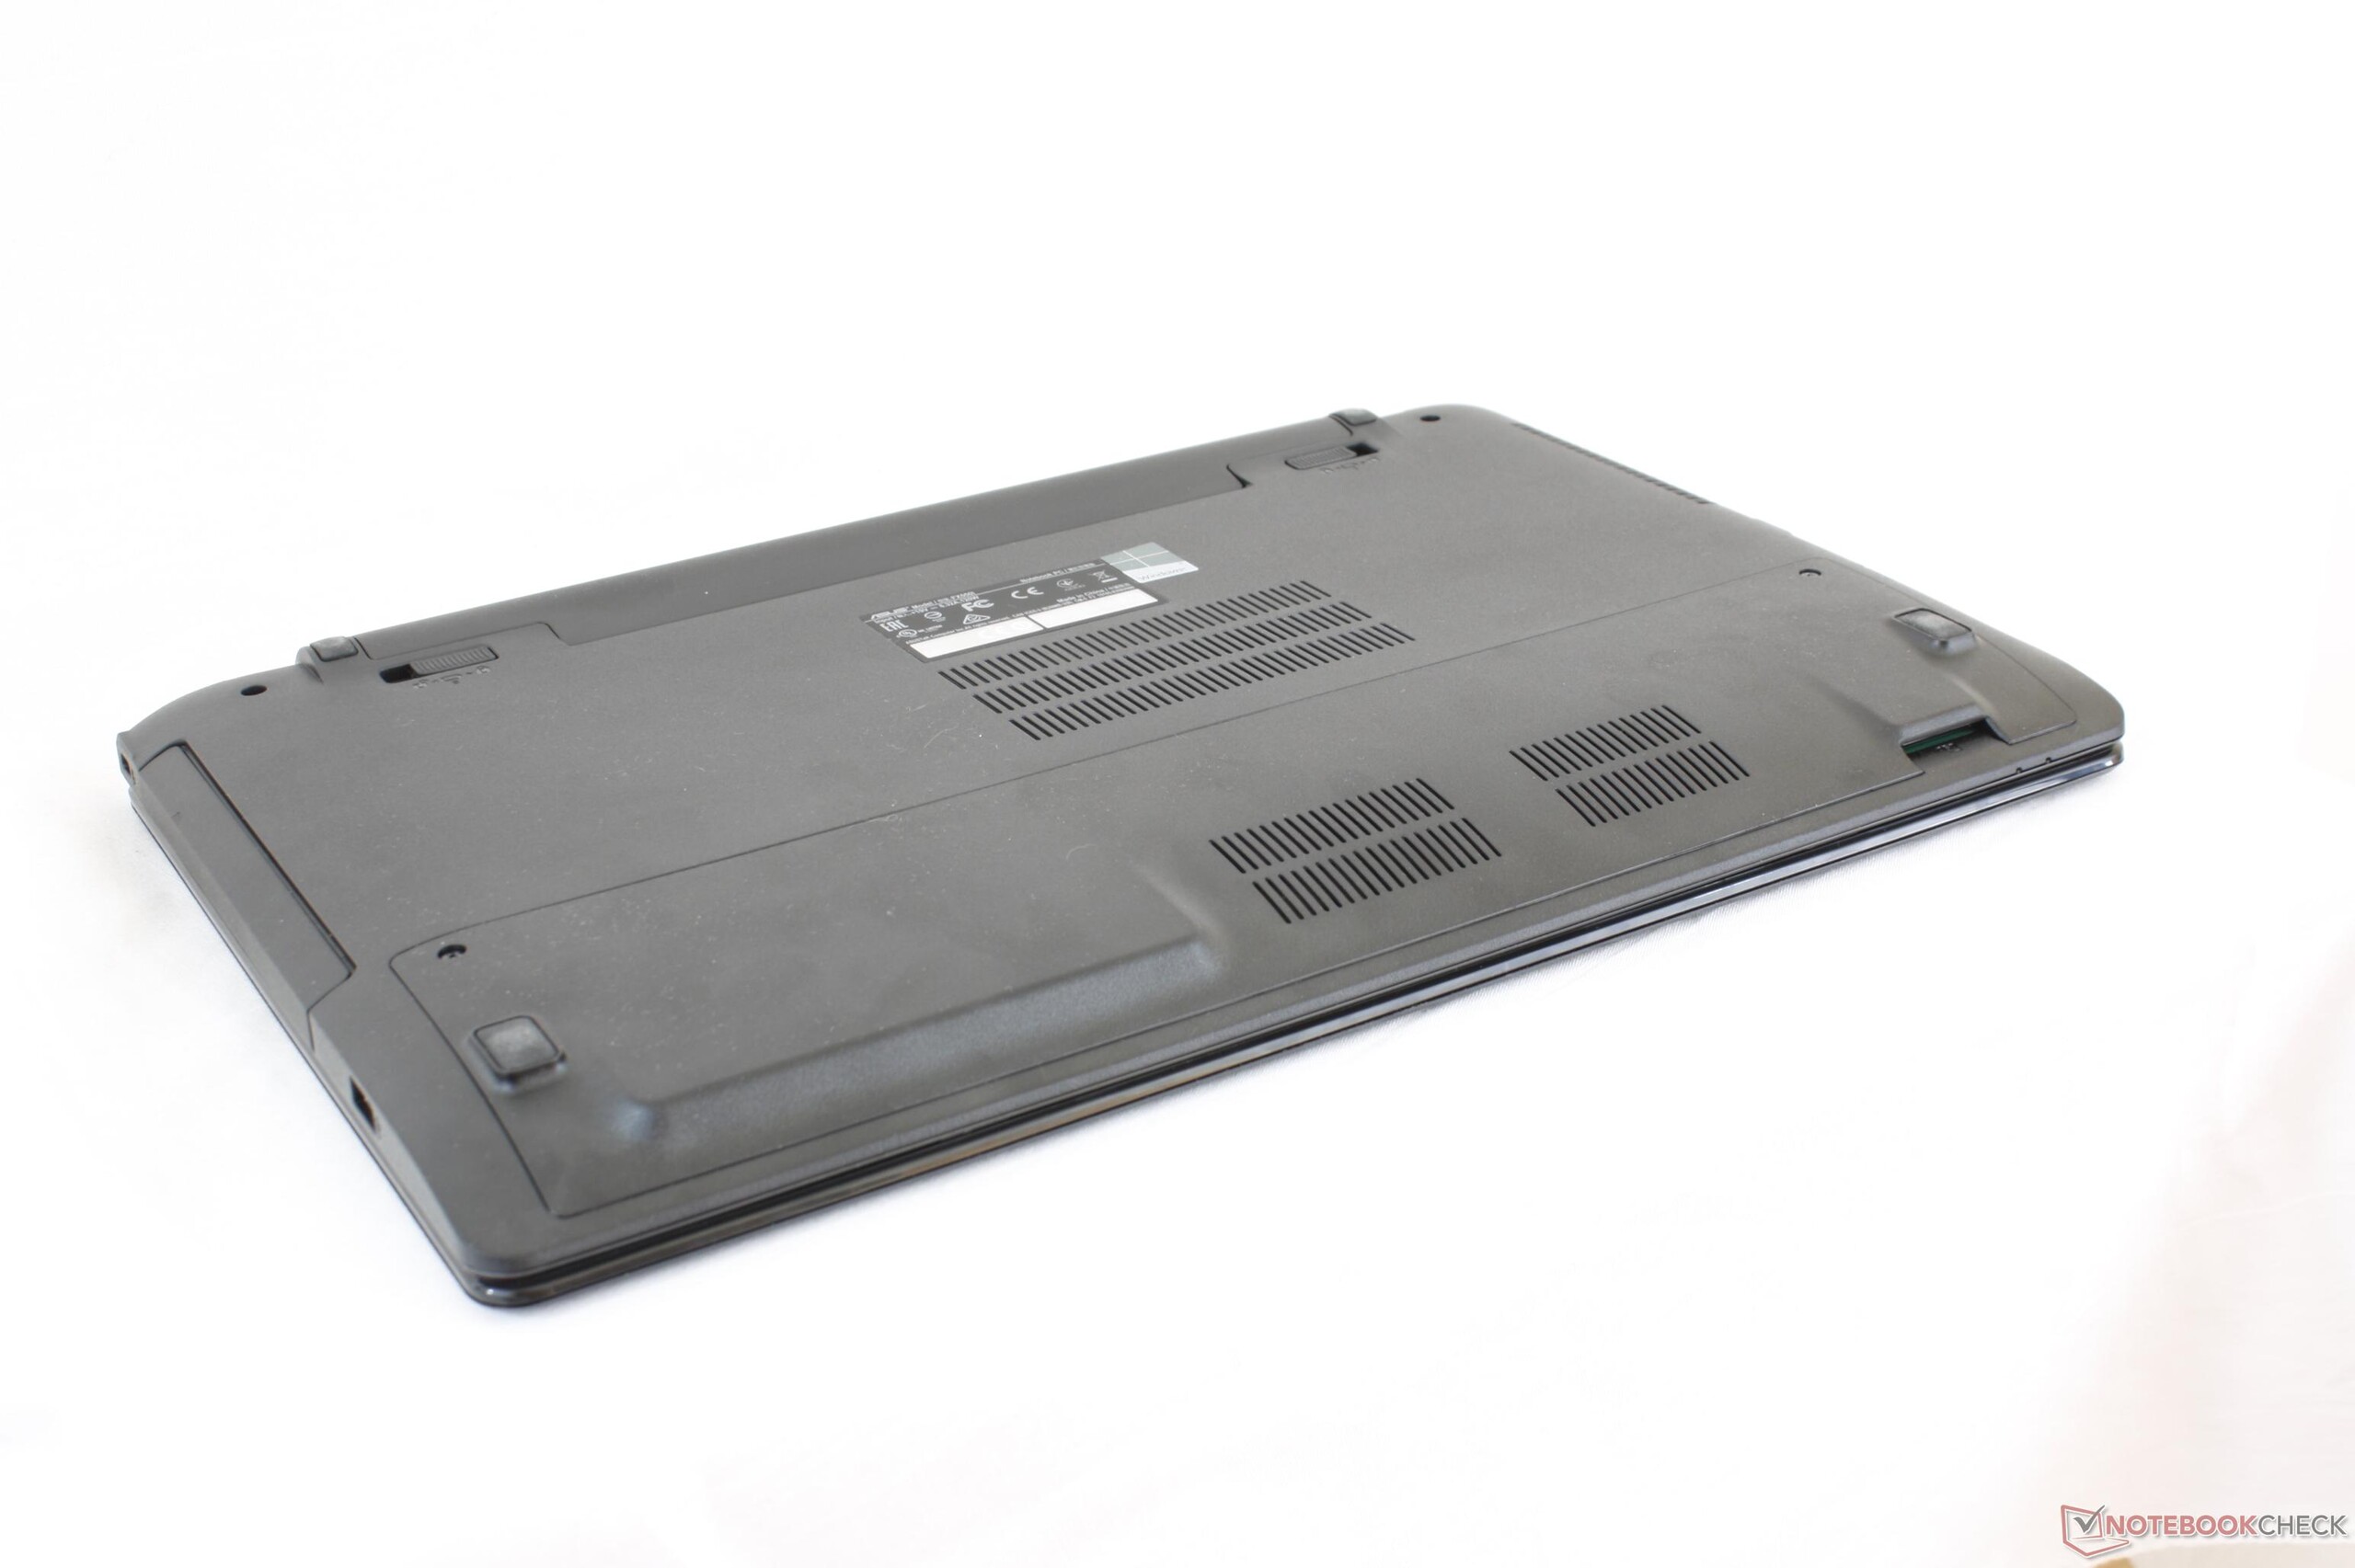
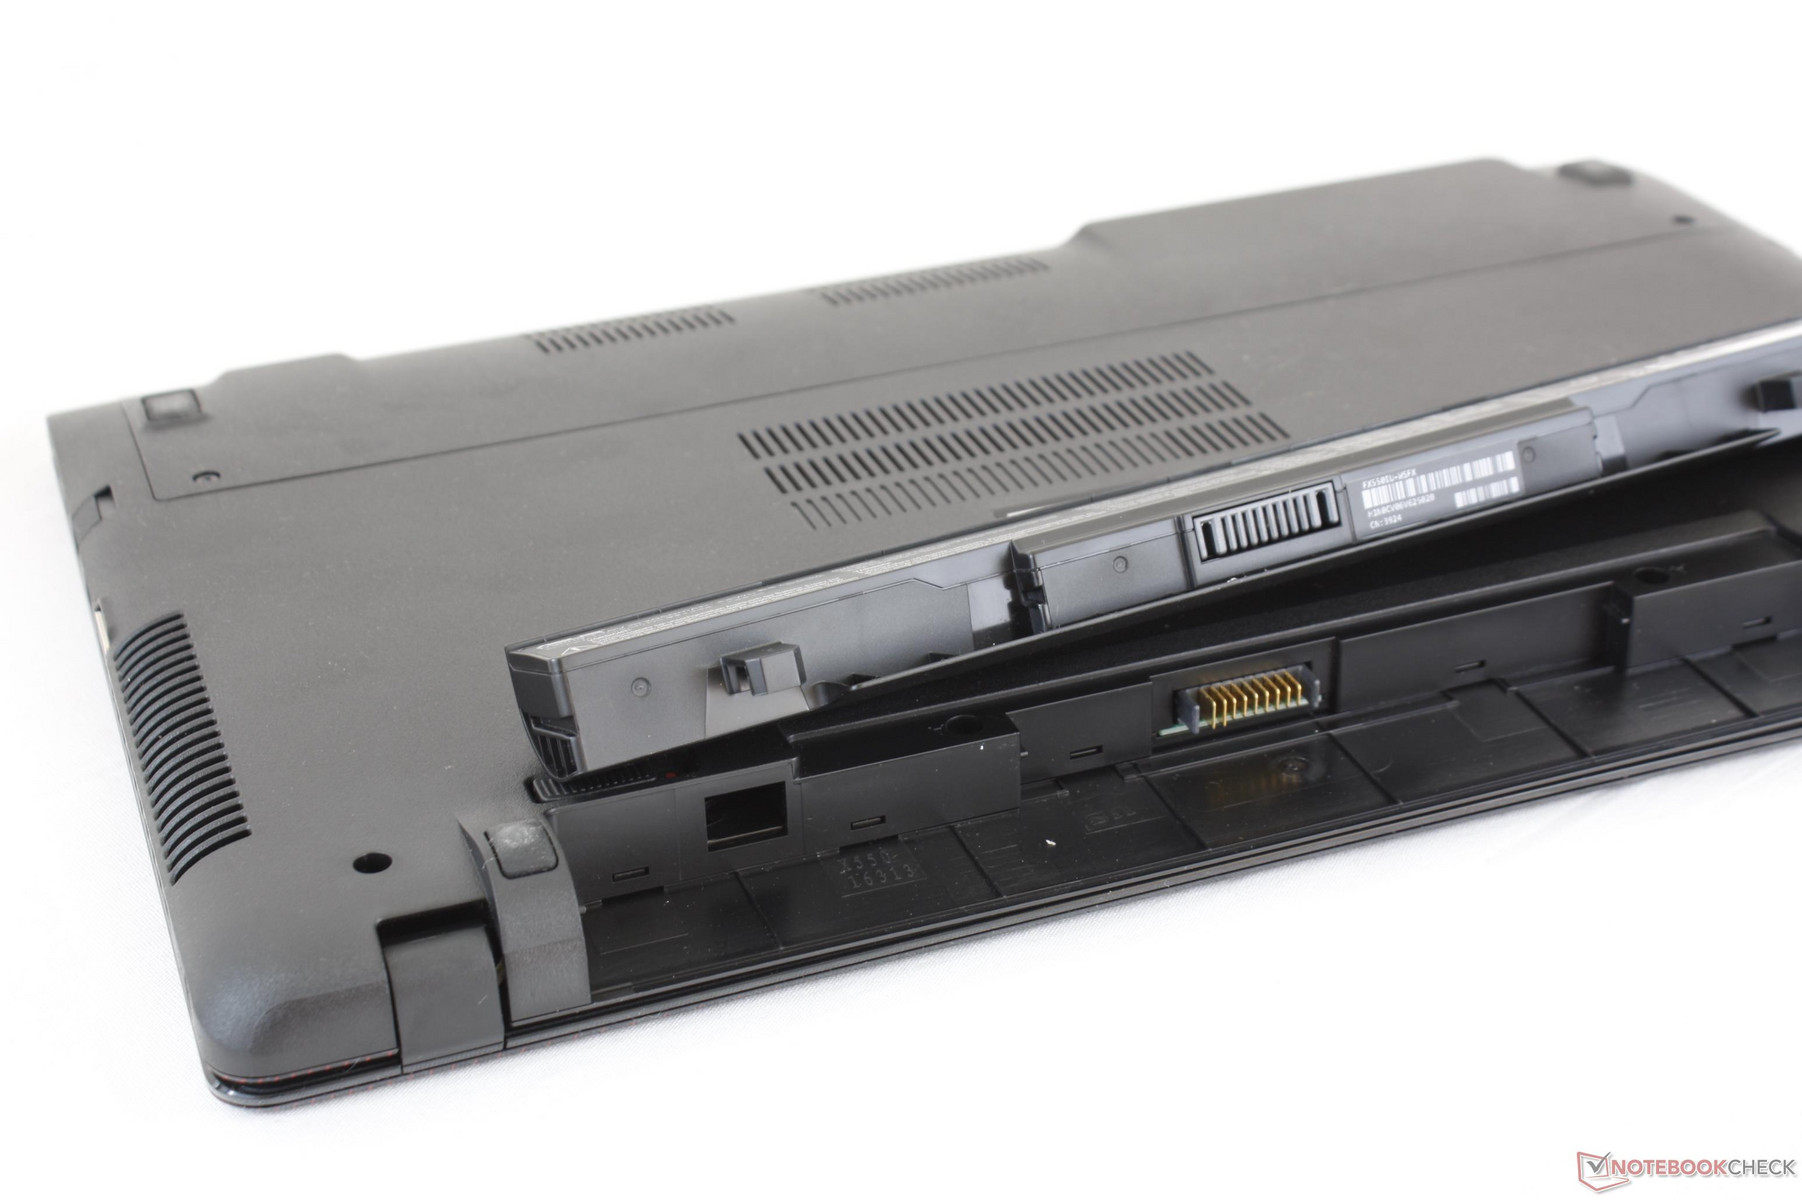
Construction quality is excellent as we can notice no gaps between materials or any defects on our unit. The most awkward design decision, however, is the removal of the optical drive found on the FX550DM with nothing to take its place. This leaves a significantly large empty space inside of the notebook that offers no features or benefits to the end-user whatsoever. In a notebook where every cubic millimeter can be considered valuable space, this is a rather huge letdown.
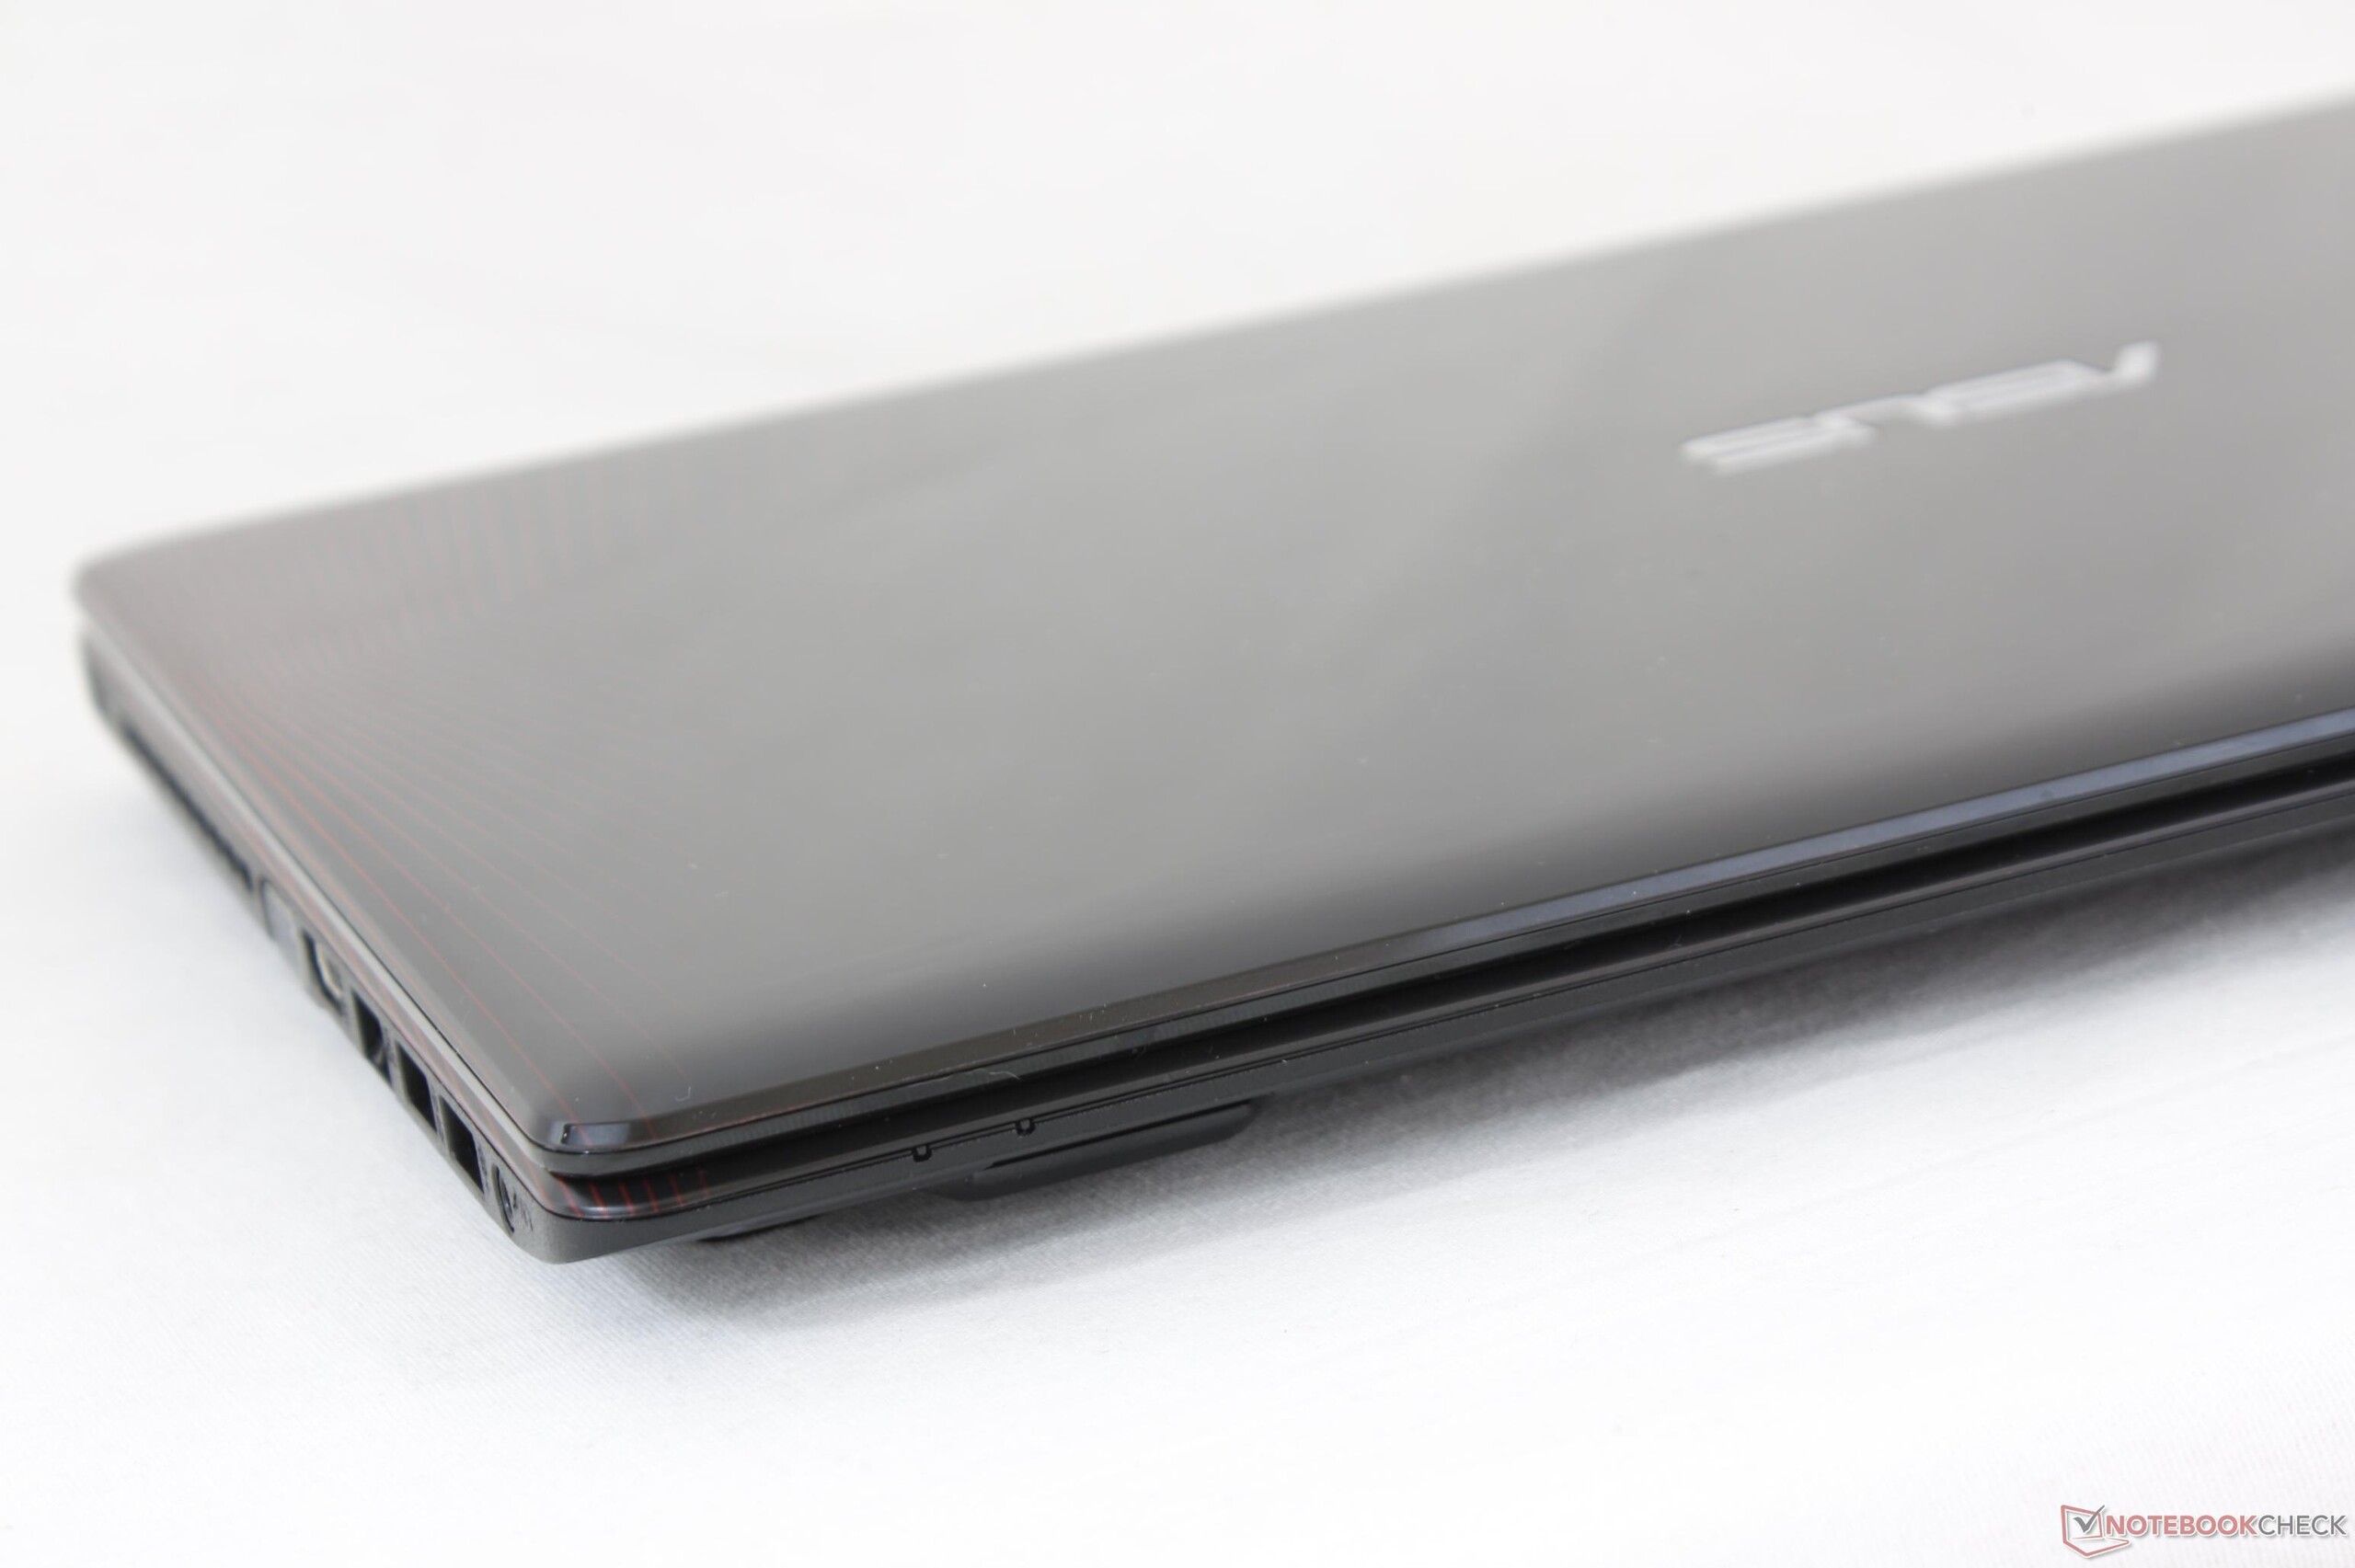
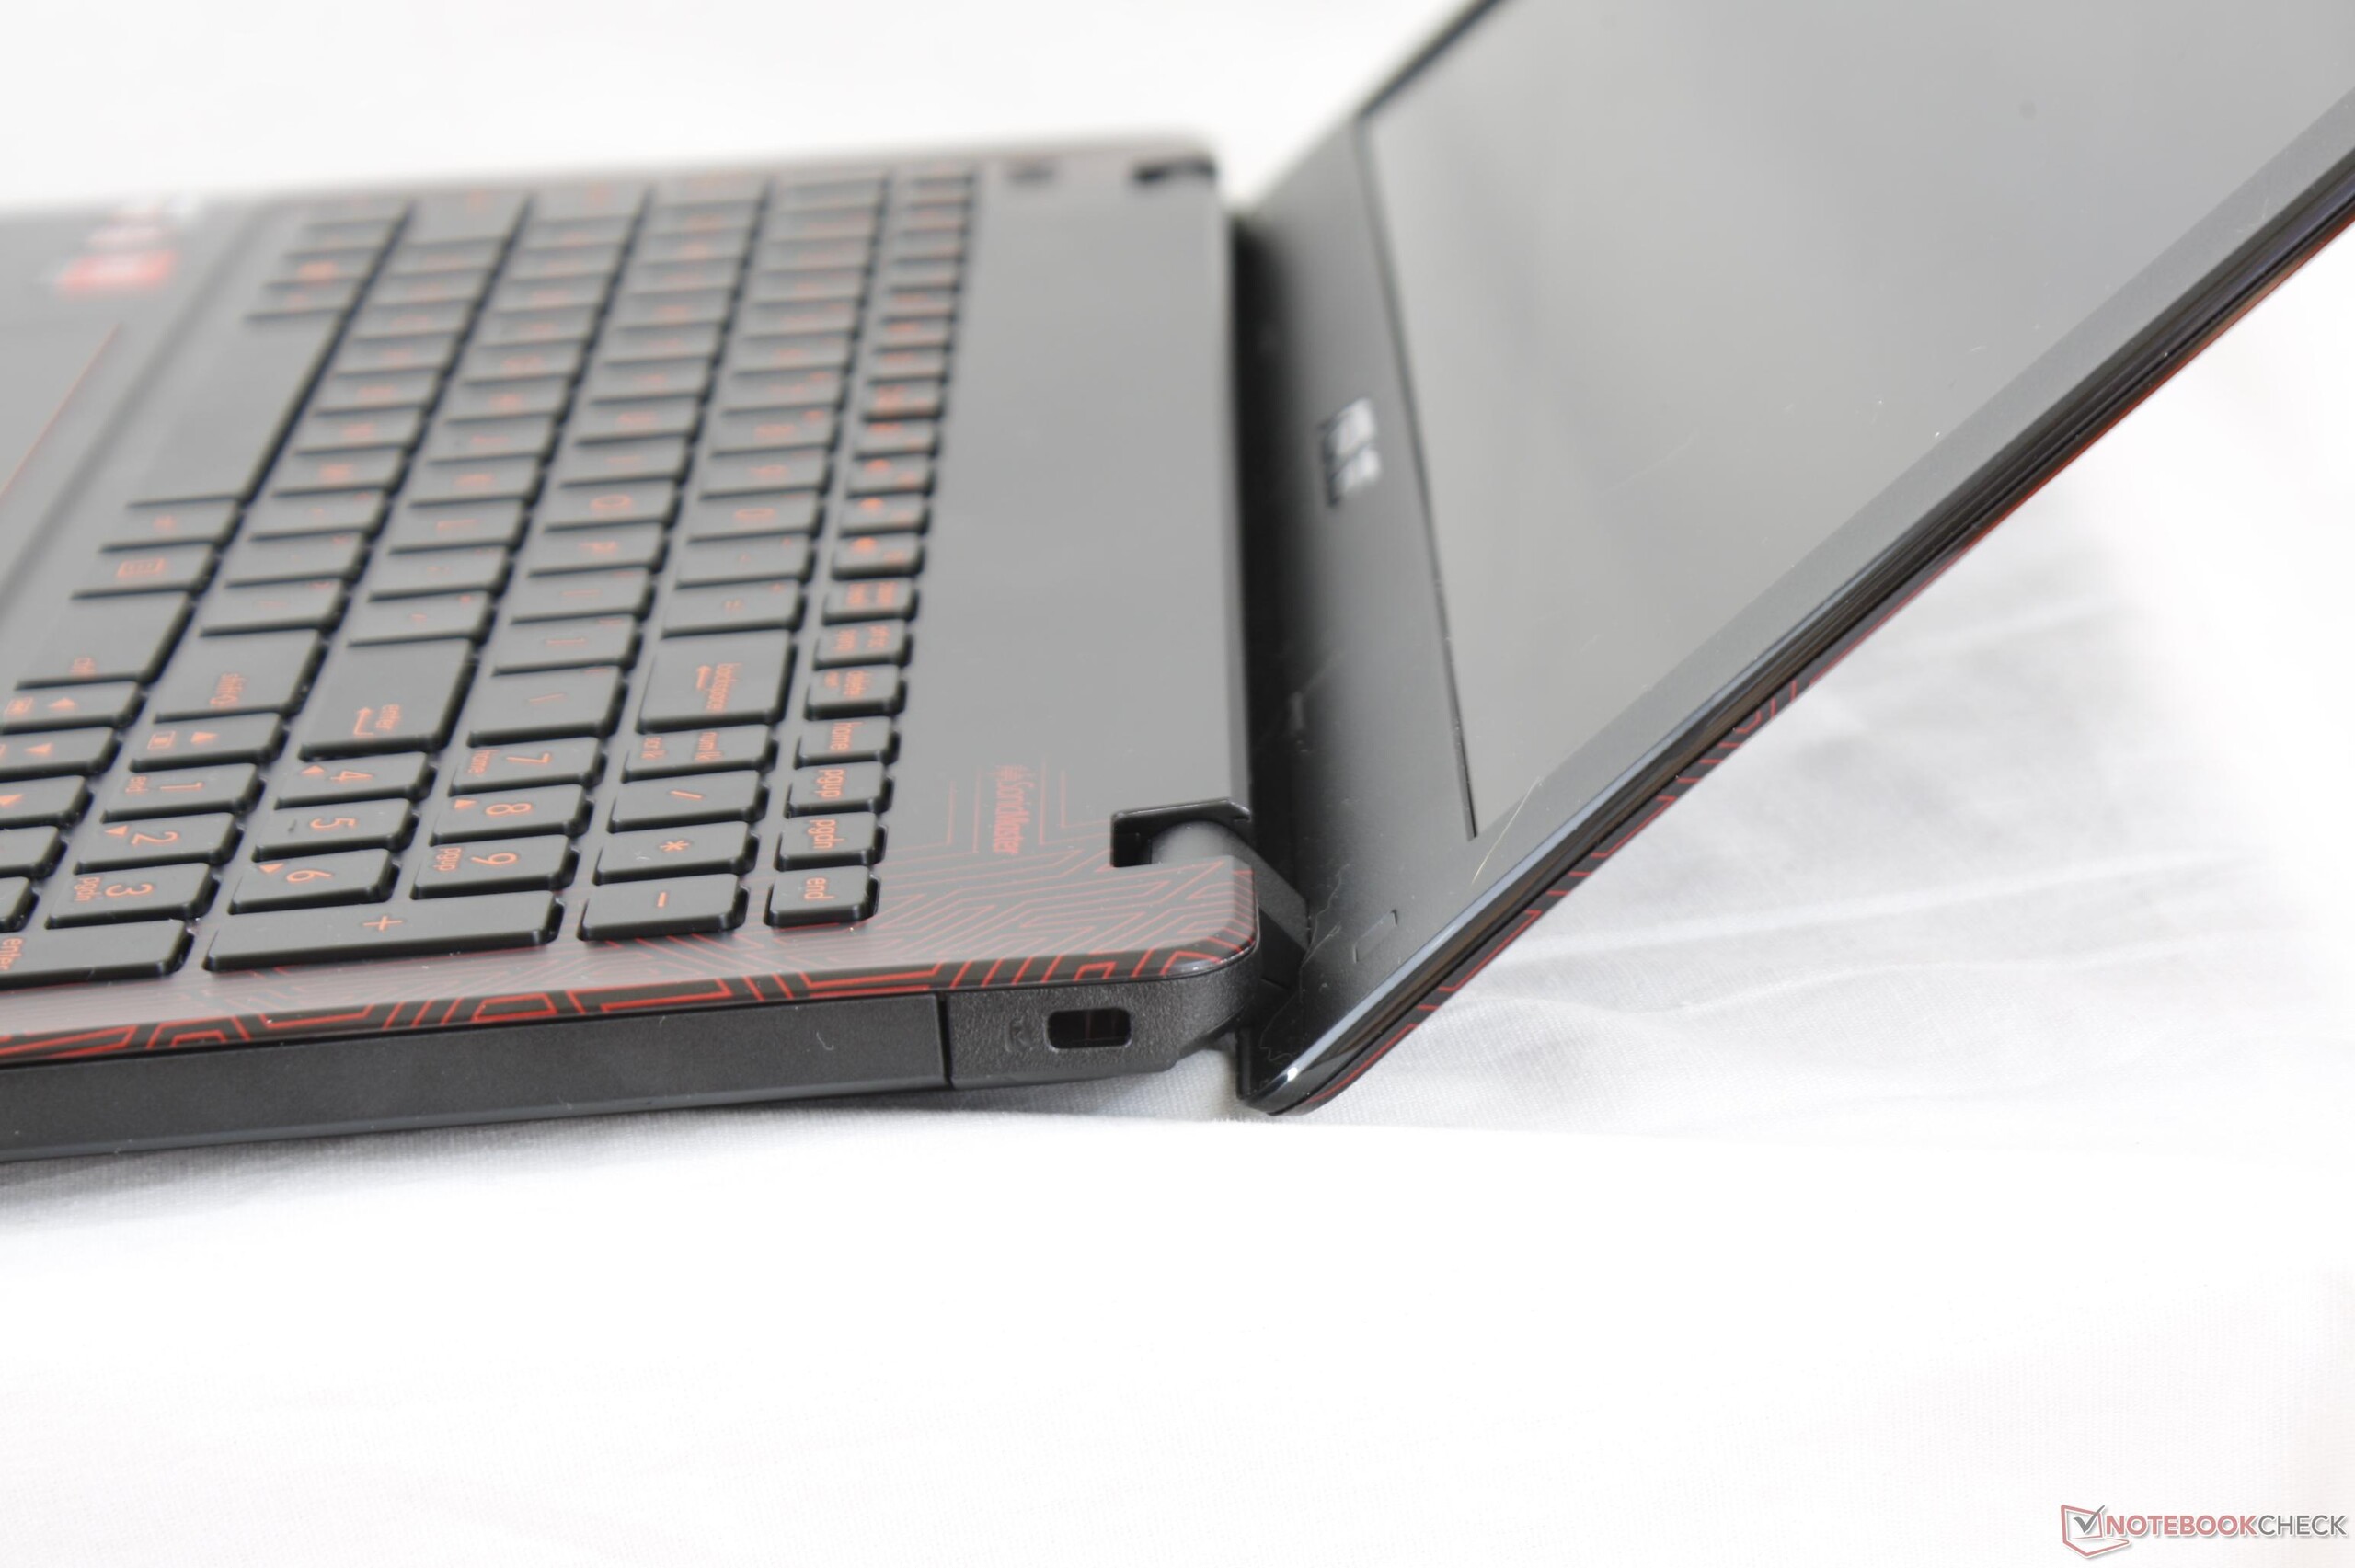
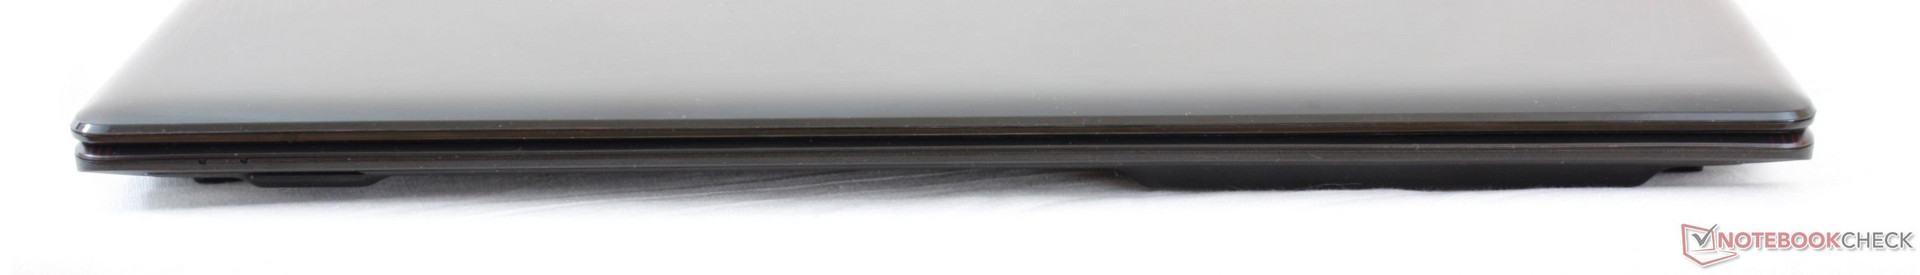
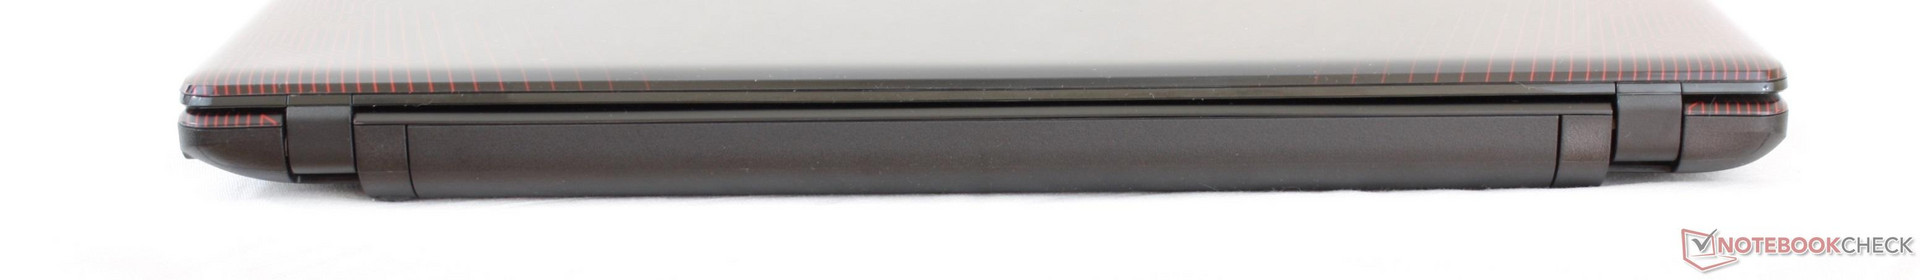
There is nothing particularly special about the size or dimensions of the system. Like most budget notebooks in its class, the FX550 makes no attempt at being the thinnest or lightest and thus weighs about the same as others at around 2.5 kg. Nonetheless, the Asus FX family is noticeably thicker than many modern gaming notebook designs at about 31 mm compared to 27 mm or less on the Sabre 15, Inspiron 15 7567, or Omen 15.
Connectivity
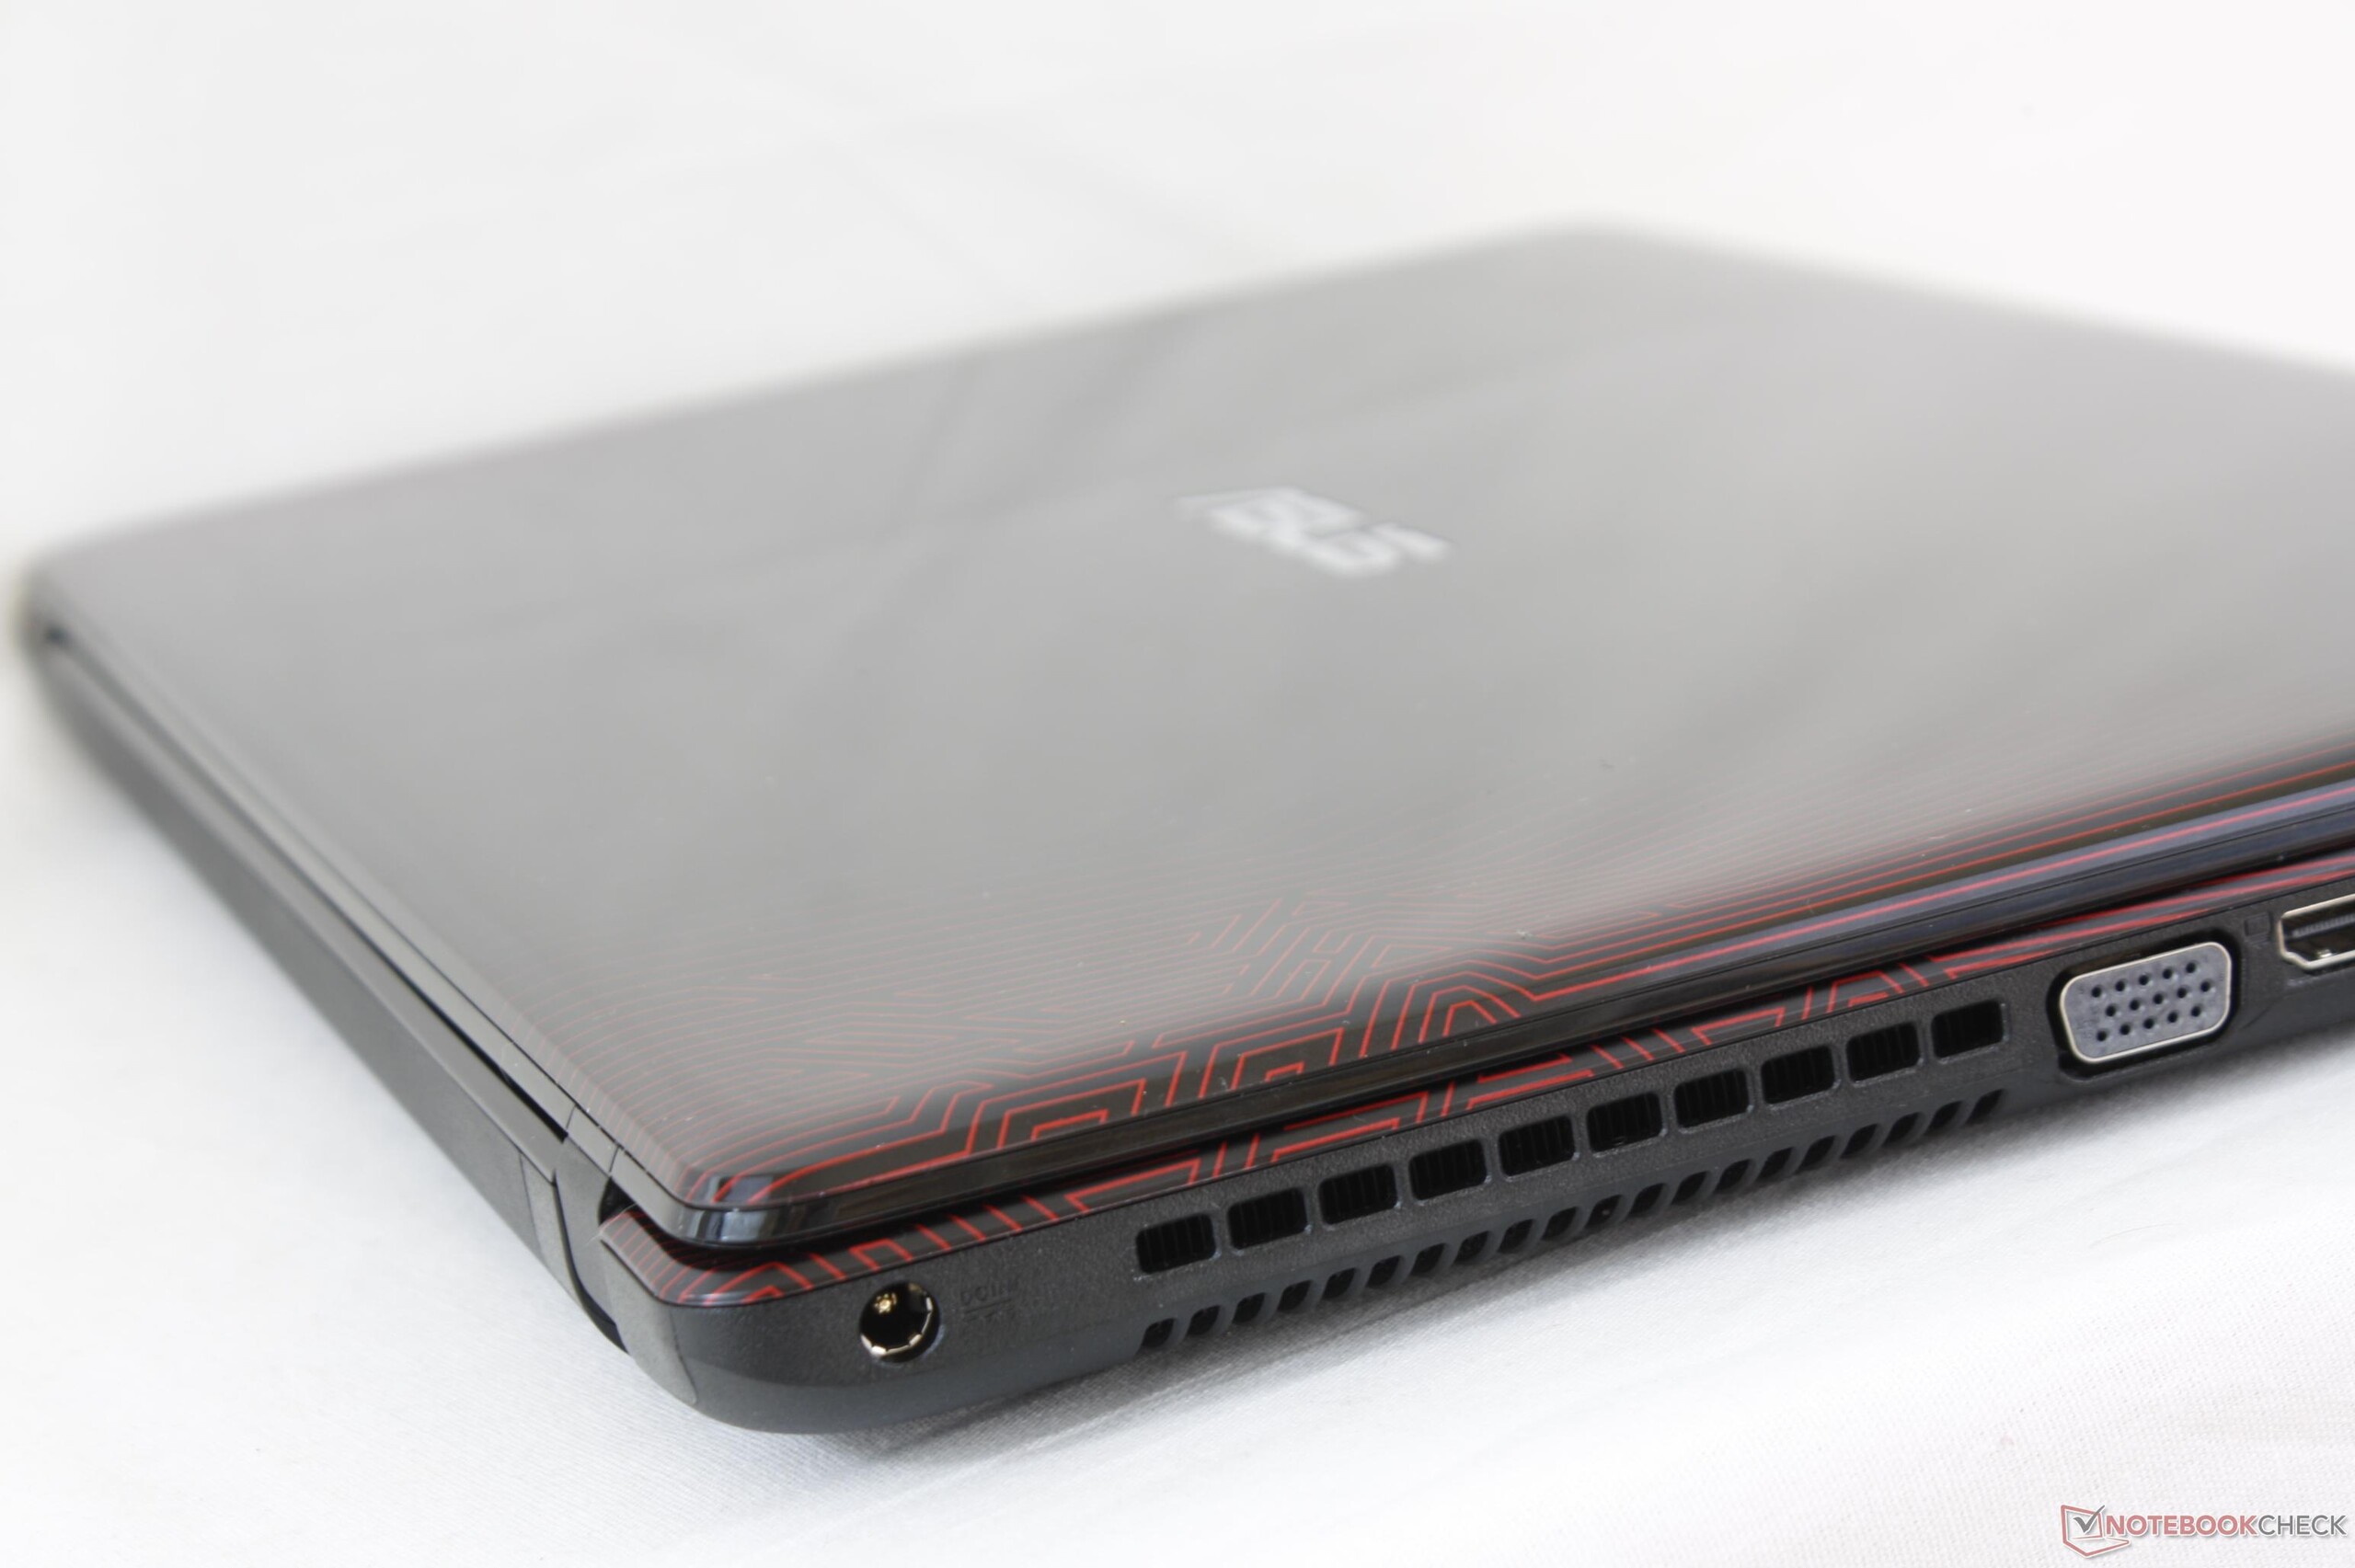
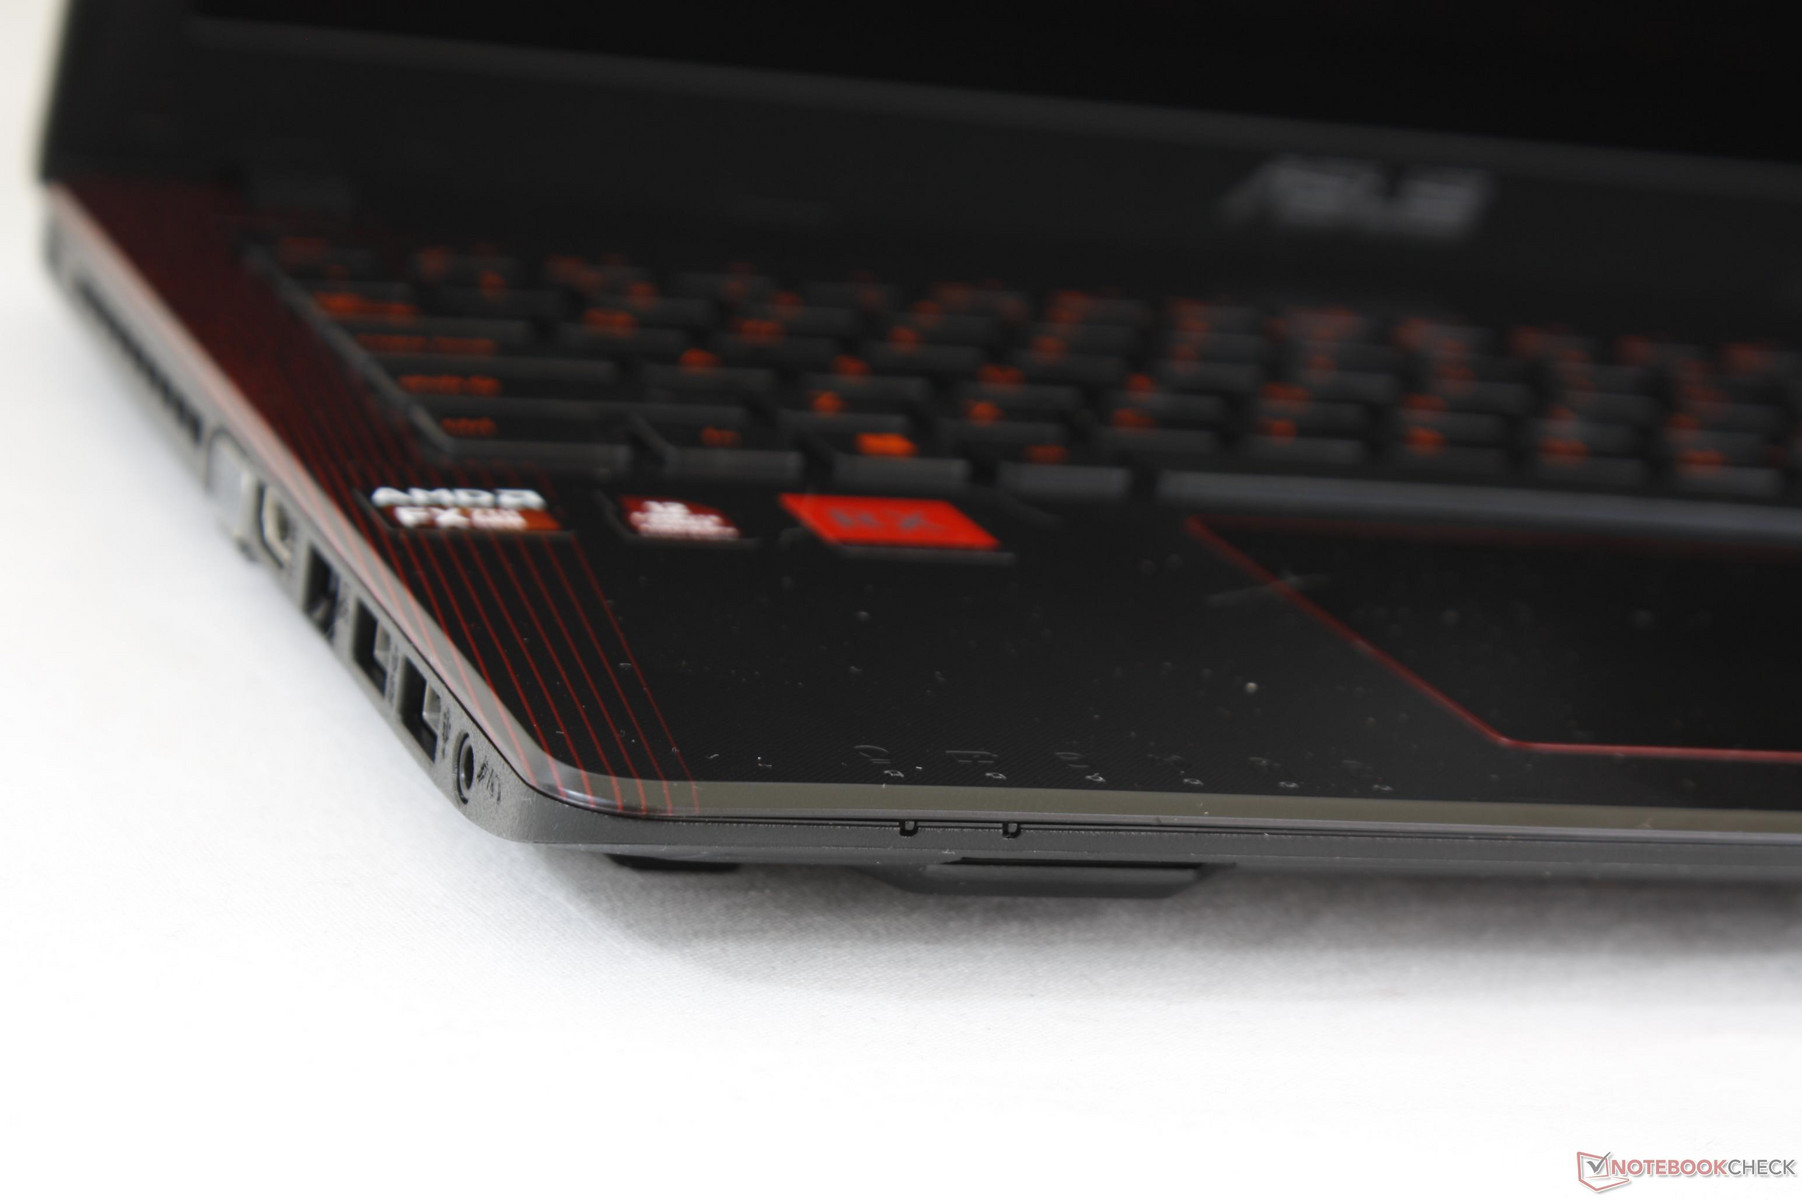
The selection of ports makes the FX550 feel like an antiquated piece of technology. Not only is there no USB Type-C, but a legacy VGA port is present. This would have made more sense for a core business notebook where integrated VGA may still be convenient, but from a gaming perspective, swapping out VGA for mDP, DP, or USB Type-C would have likely benefited more users.
Port positioning clearly favors right-handed users as most ports are located on the left edge. Expect ample desk space to be occupied by thick HDMI, Ethernet, and USB cables. The unused optical bay on the right edge is essentially wasted space.


SD Card Reader
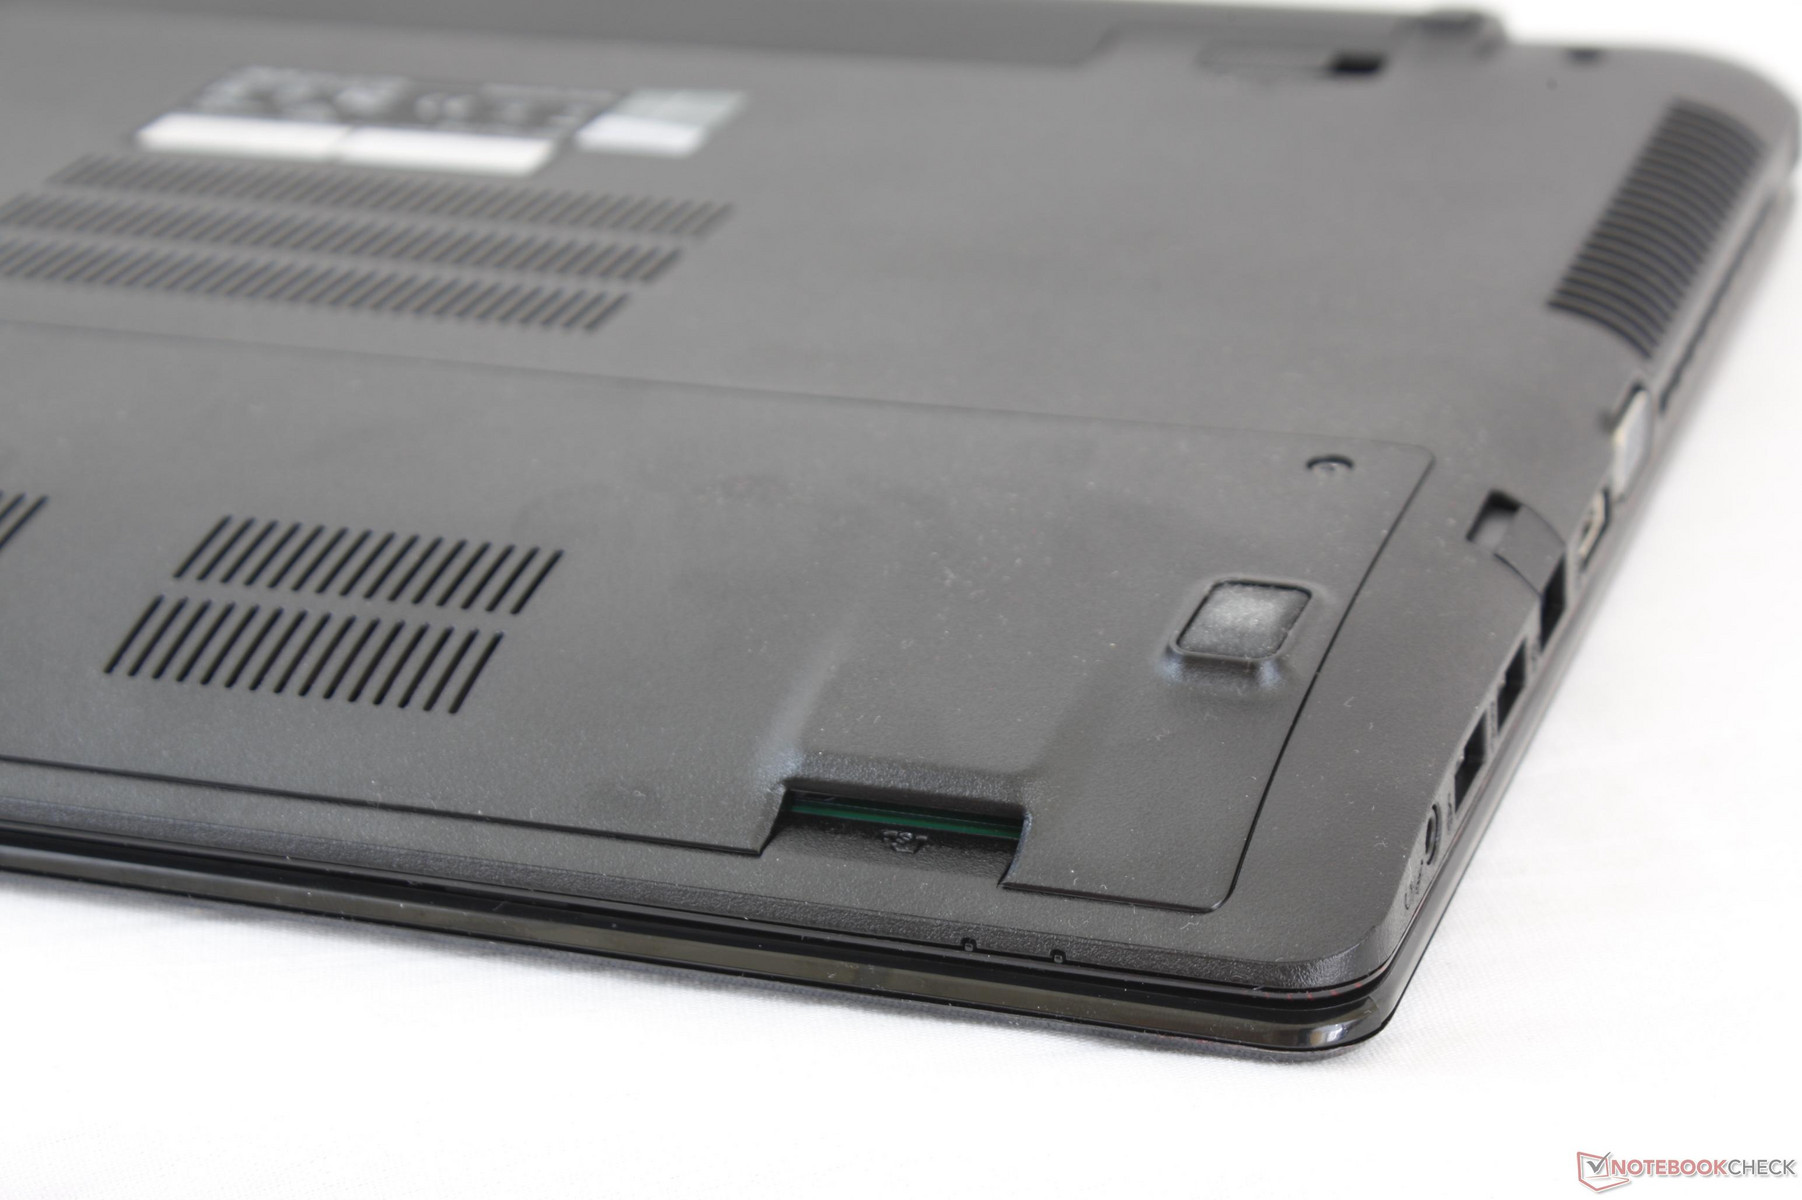
The integrated spring-loaded card reader is slow at just 29 MB/s when using our Toshiba SDXC UHS-II test card. This isn't uncommon on budget gaming notebooks, but users who want a faster card reader capable of up to 86 MB/s may want to consider the Sabre 15 instead. Transferring 1 GB worth of photos from the SD card to desktop takes about 14 seconds.
Perhaps the most annoying aspect of the card reader is its inconvenient location. The slot is tucked underneath the curved front edge of the notebook where it is impossible to reach without first lifting up the entire system or turning it upside down. It's an unnecessary nuisanace especially for those who intend to use the card reader frequently.
| SD Card Reader | |
| average JPG Copy Test (av. of 3 runs) | |
| Asus G701VIK-BA049T | |
| Asus FX550IU-WSFX | |
| Dell Inspiron 15 7000 7567 | |
| maximum AS SSD Seq Read Test (1GB) | |
| Asus G701VIK-BA049T | |
| Asus FX550IU-WSFX | |
| Dell Inspiron 15 7000 7567 | |
Communication
WLAN is provided by a Realtek 8821AE module with integrated Bluetooth 4.0. Connection is stable when paired to our Linksys EA8500 802.11ac network with an average real-world transfer rate of 343 Mbps. Higher-end notebooks with 2x2 WLAN cards are capable of over twice the transfer rates as our AMD Asus.
| Networking | |
| iperf3 transmit AX12 | |
| Dell XPS 15 9560 (i7-7700HQ, UHD) | |
| Gigabyte Sabre 15G | |
| Asus FX550IU-WSFX | |
| iperf3 receive AX12 | |
| Dell XPS 15 9560 (i7-7700HQ, UHD) | |
| Asus FX550IU-WSFX | |
| Gigabyte Sabre 15G | |
Accessories
There are no included extras outside of the AC adapter, warranty card, and user's guide. The manual is also available online through the manufacturer.
Maintenance
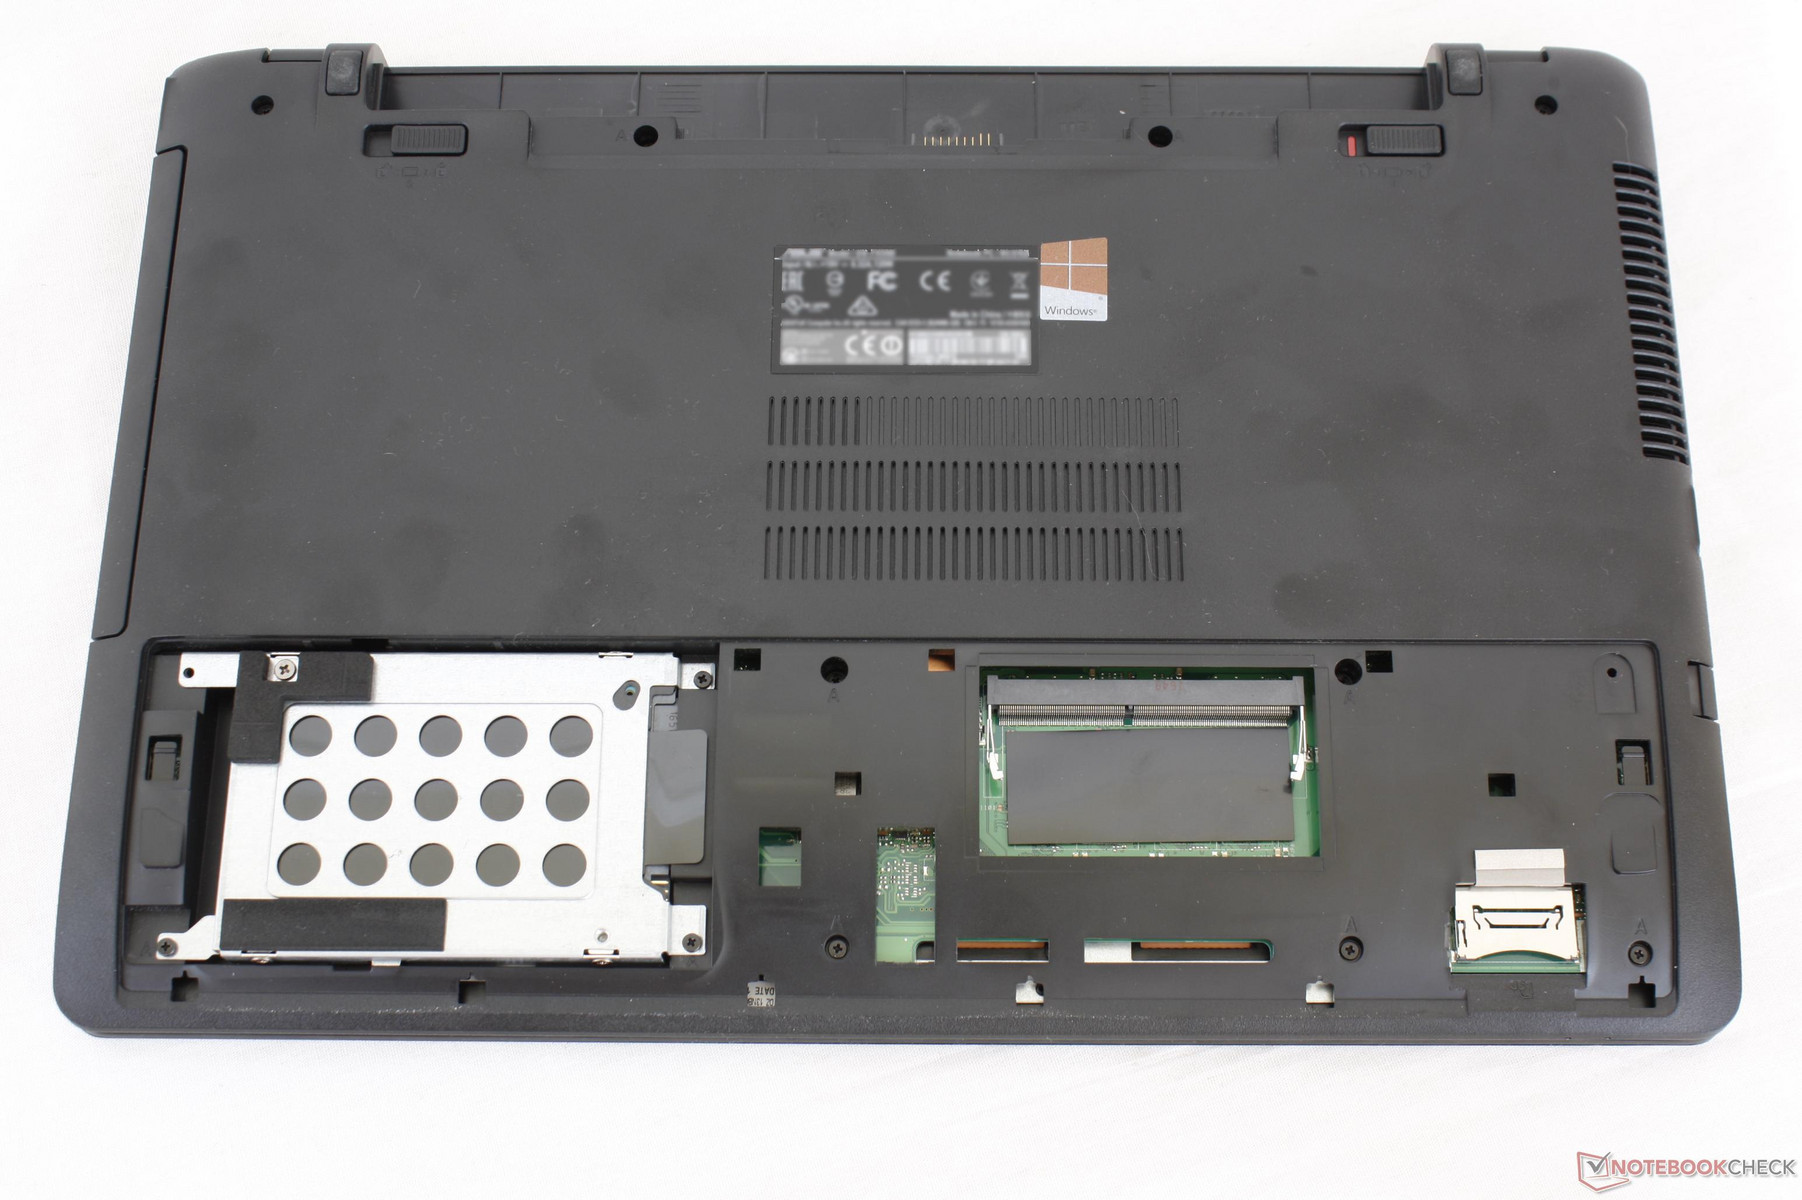
Serviceability is limited to one HDD bay and one DDR4 SODIMM slot via a small hatch on the bottom of the notebook. Removing the entire bottom panel is more difficult and is not detailed in the manual. This is unfortunate because the notebook houses 2x HDD bays and only one is easily accessible.
Warranty
The standard one-year limited manufacturer warranty applies. Resellers may offer additional coverage.
Input Devices
Keyboard
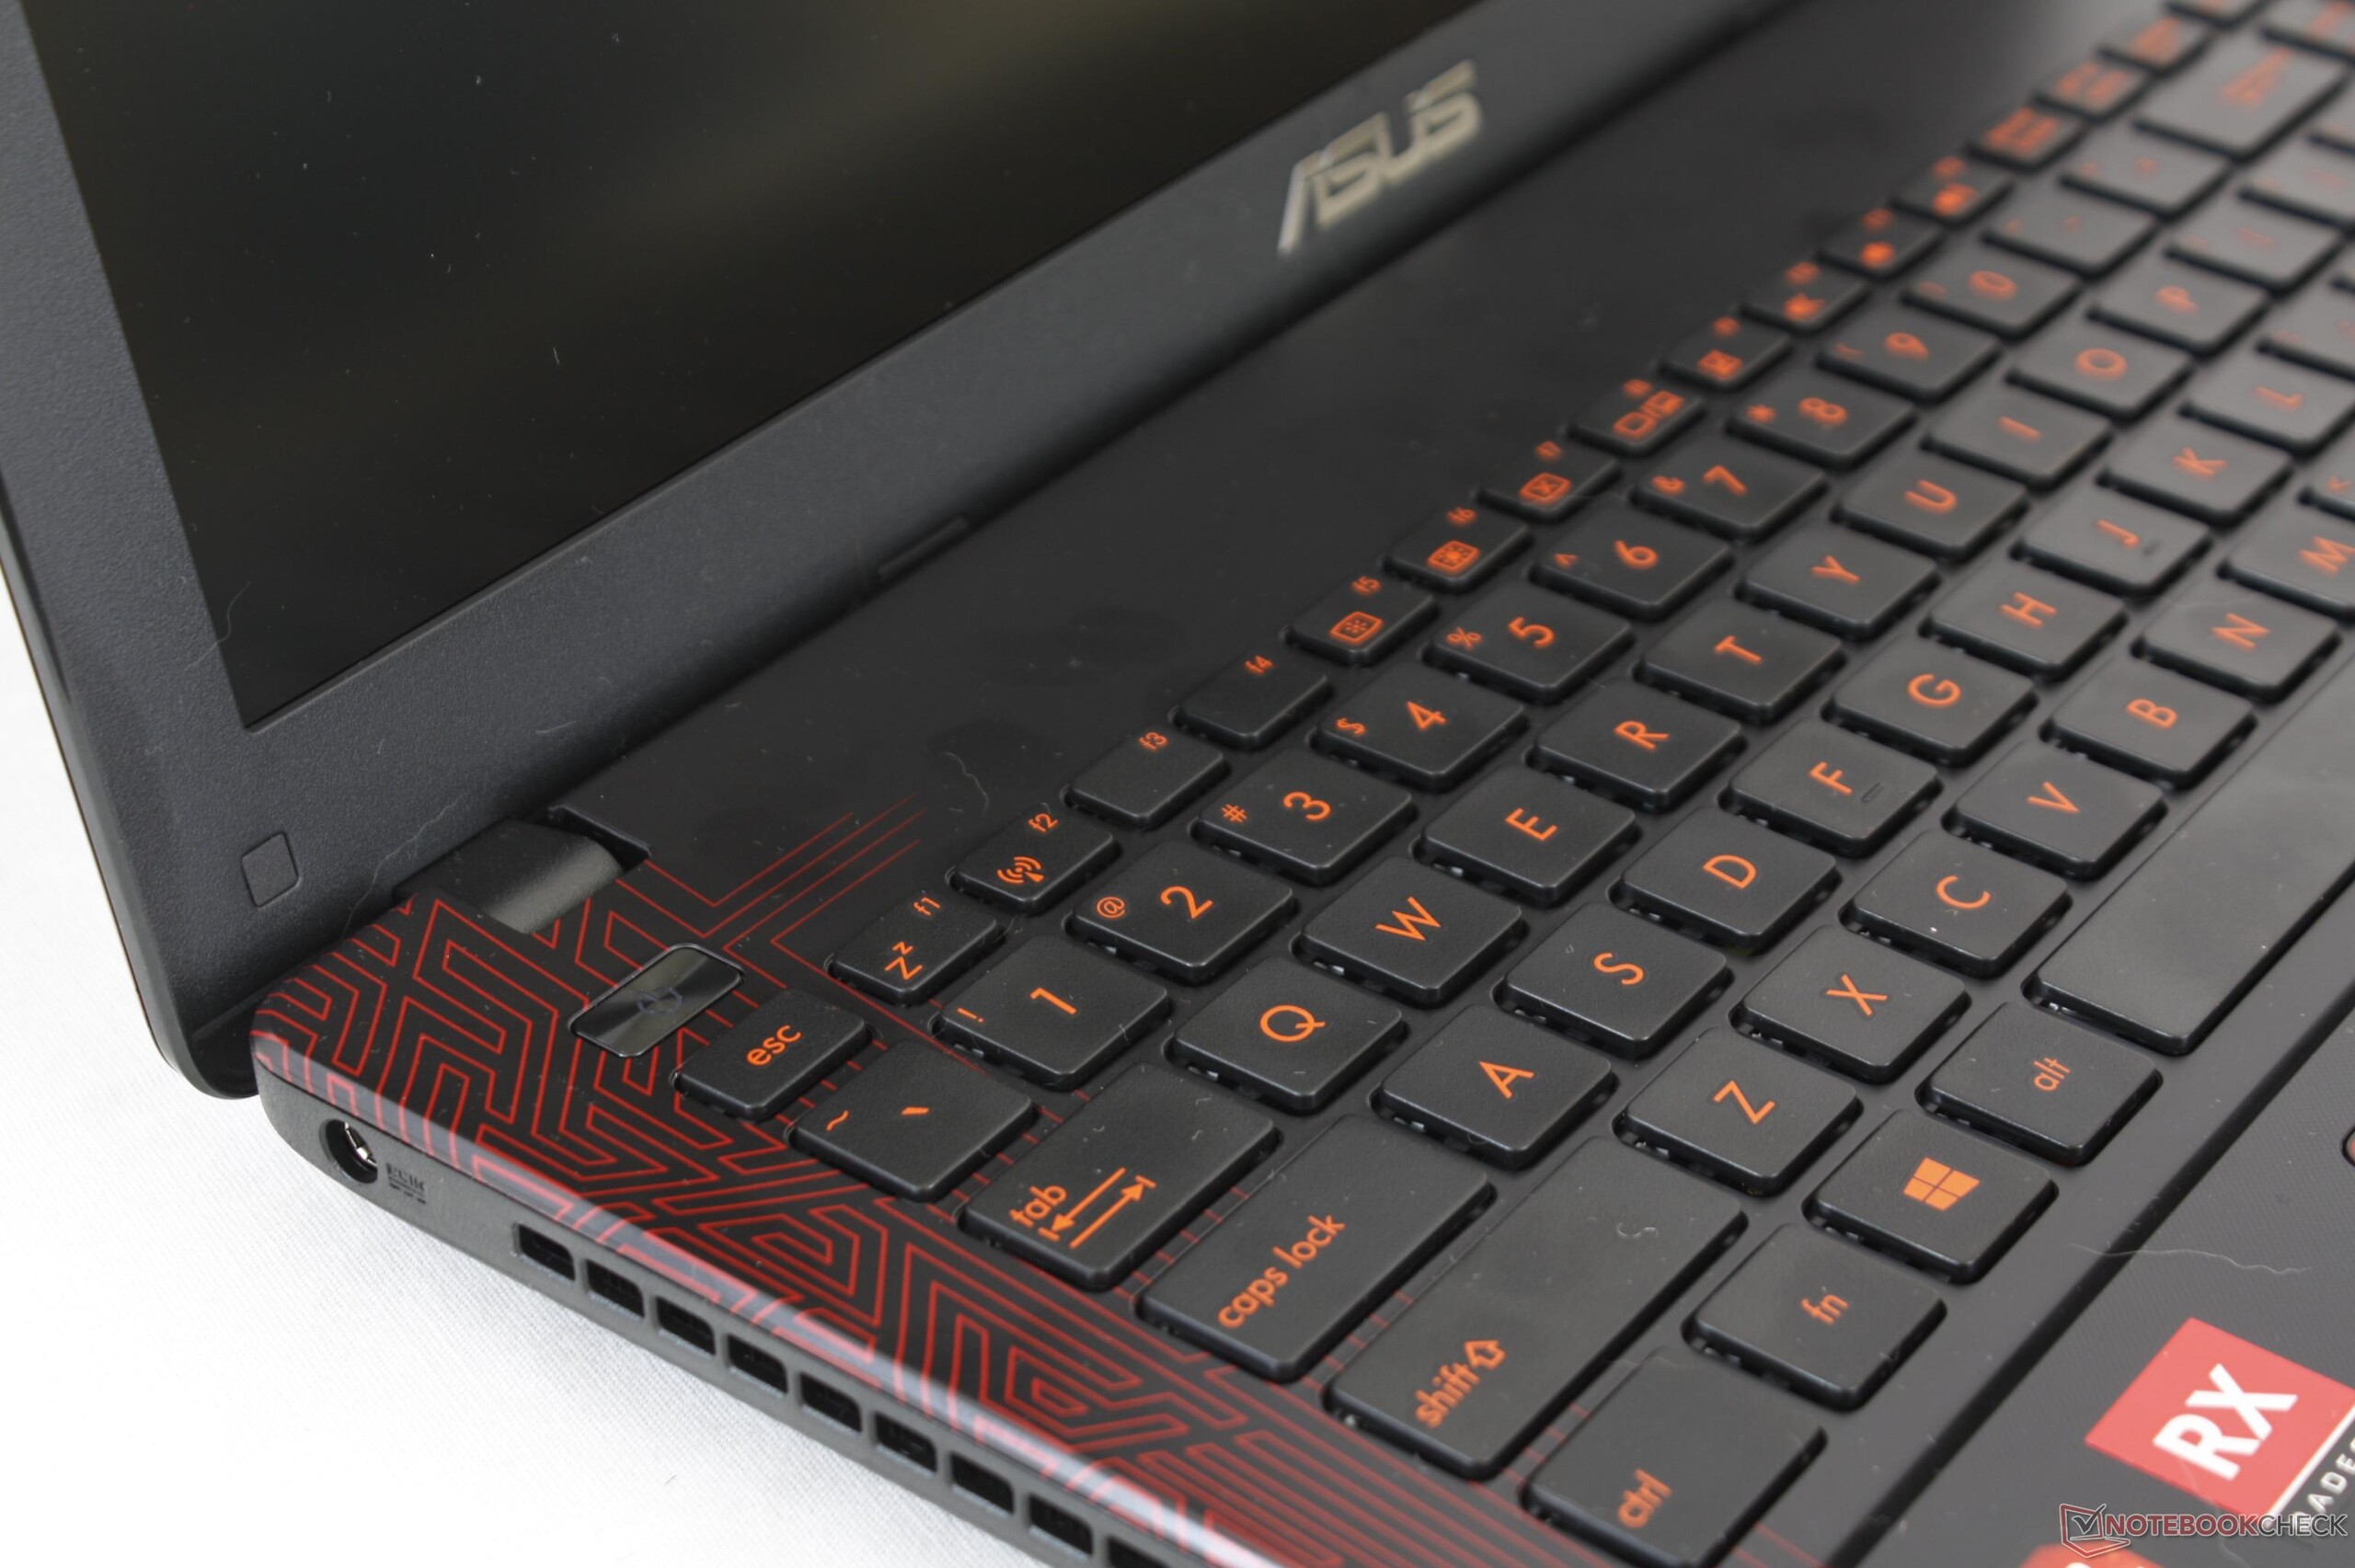
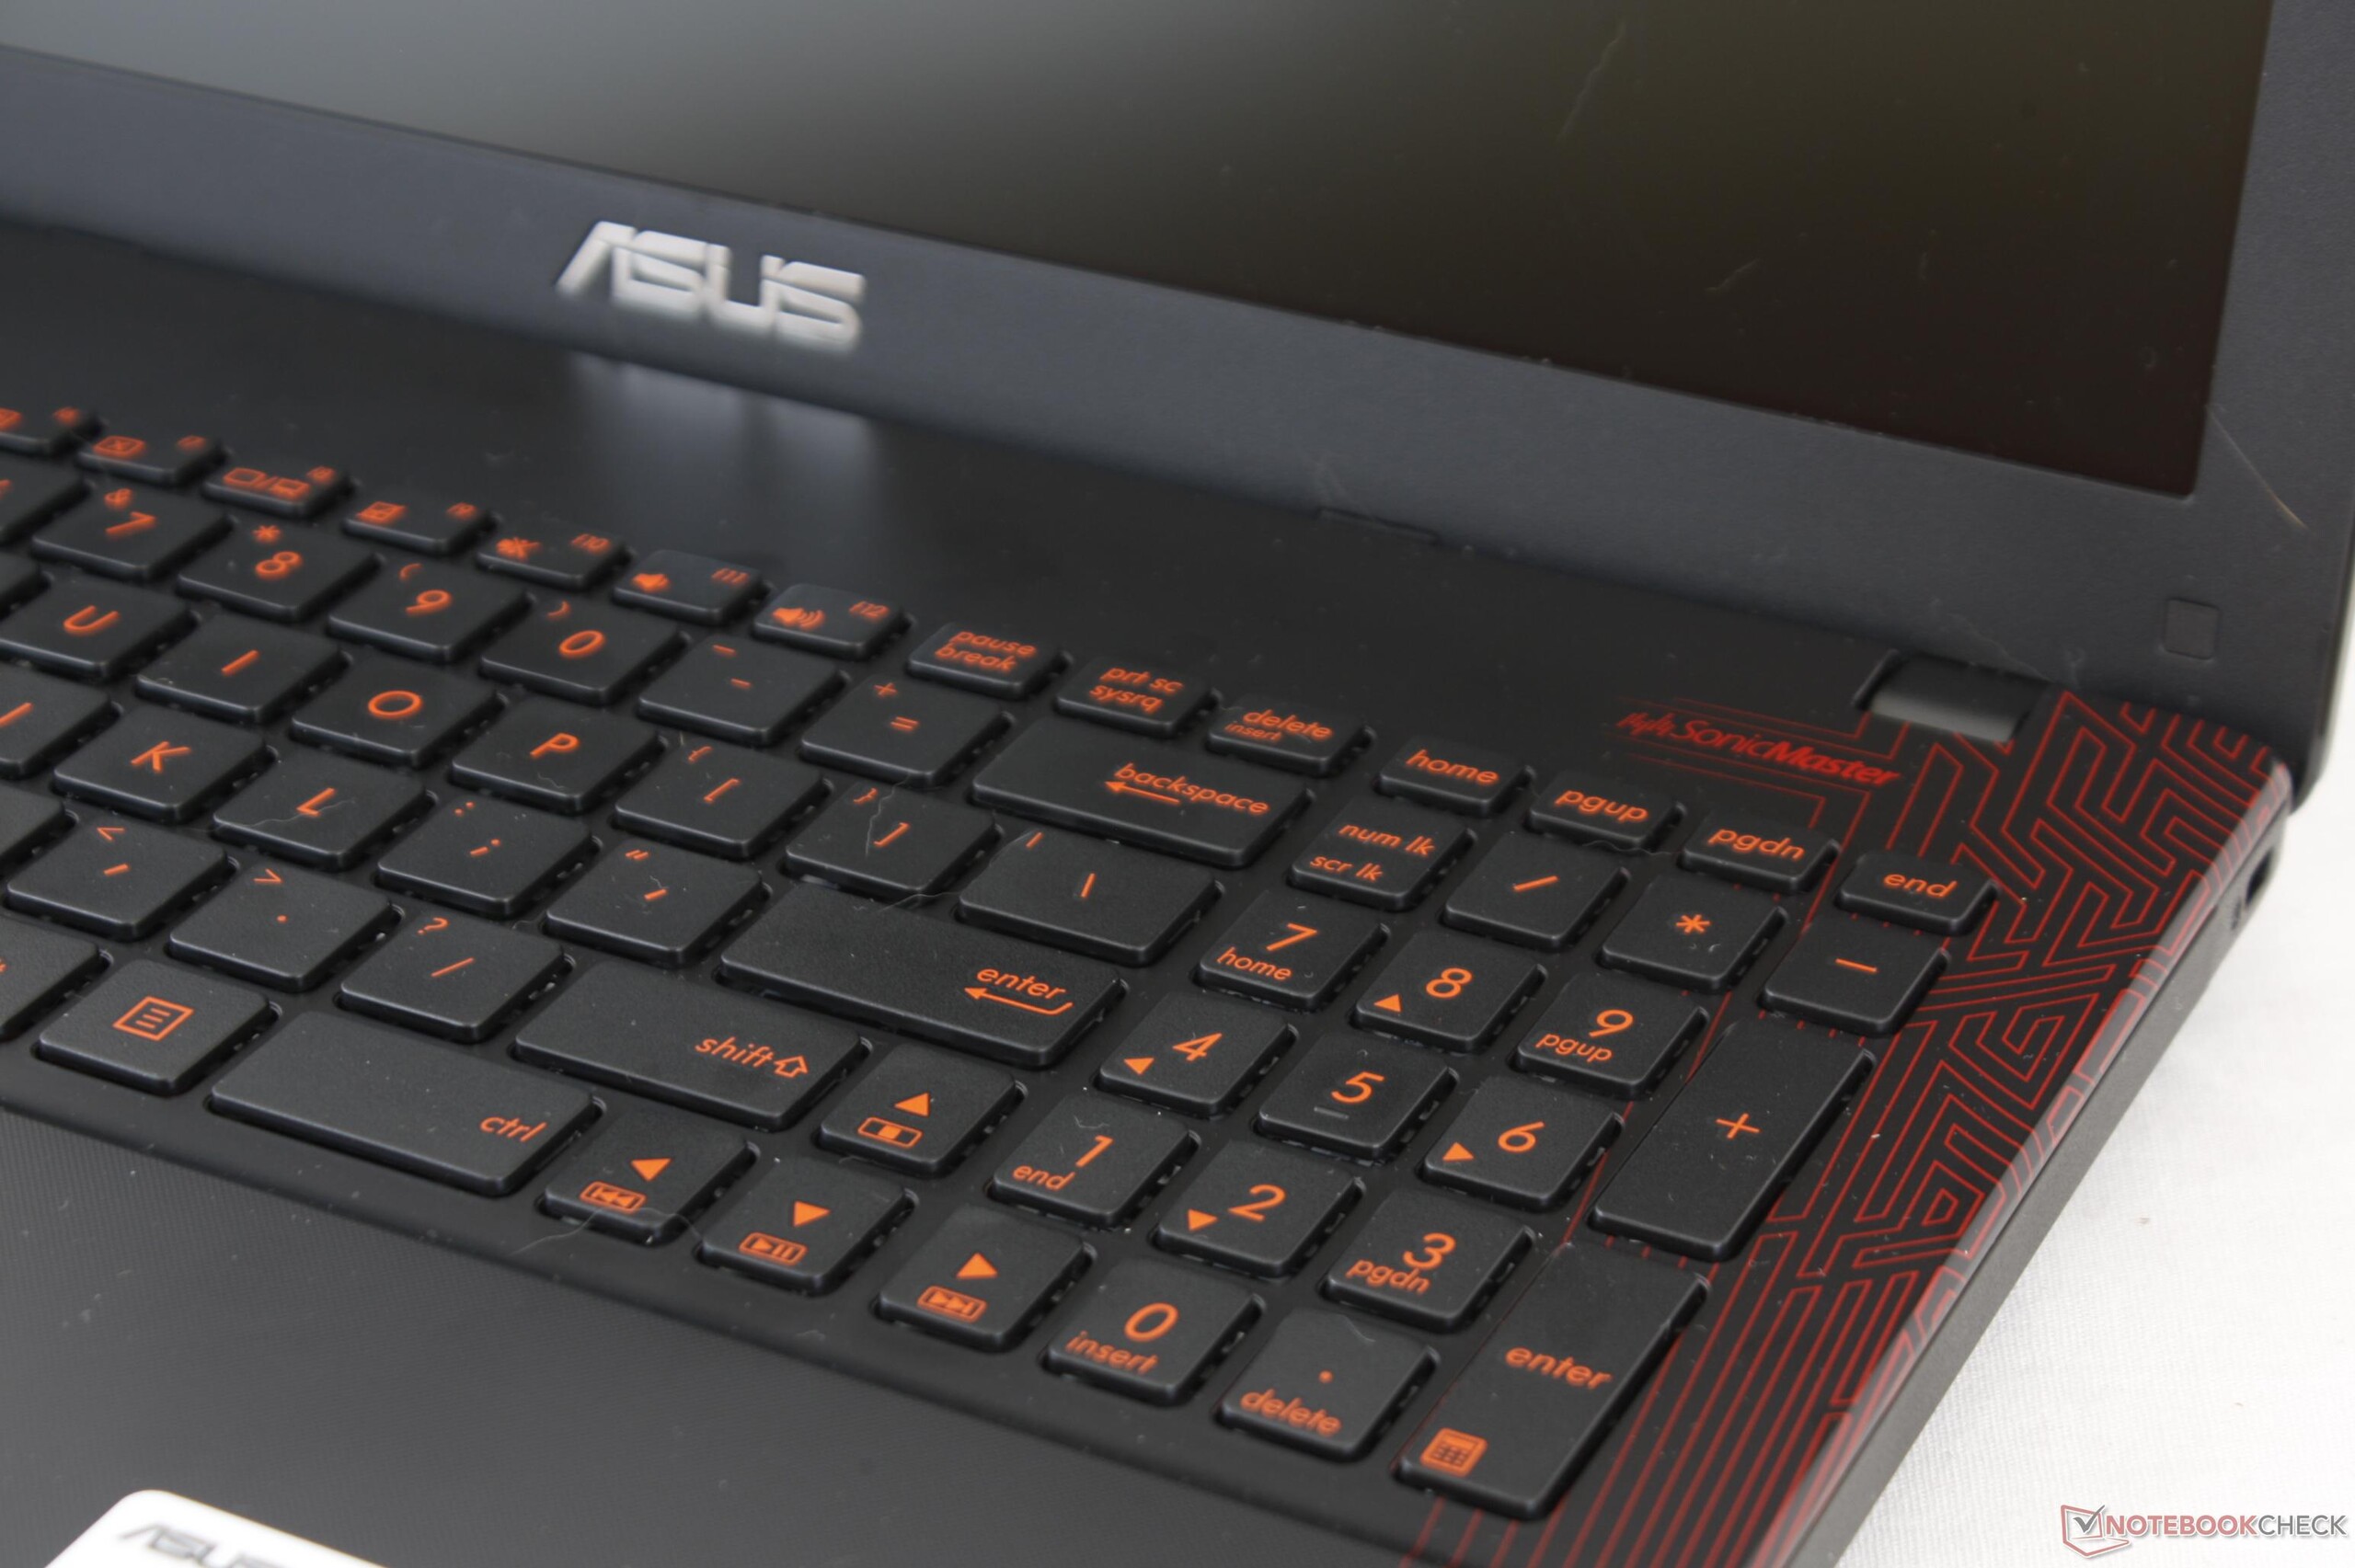
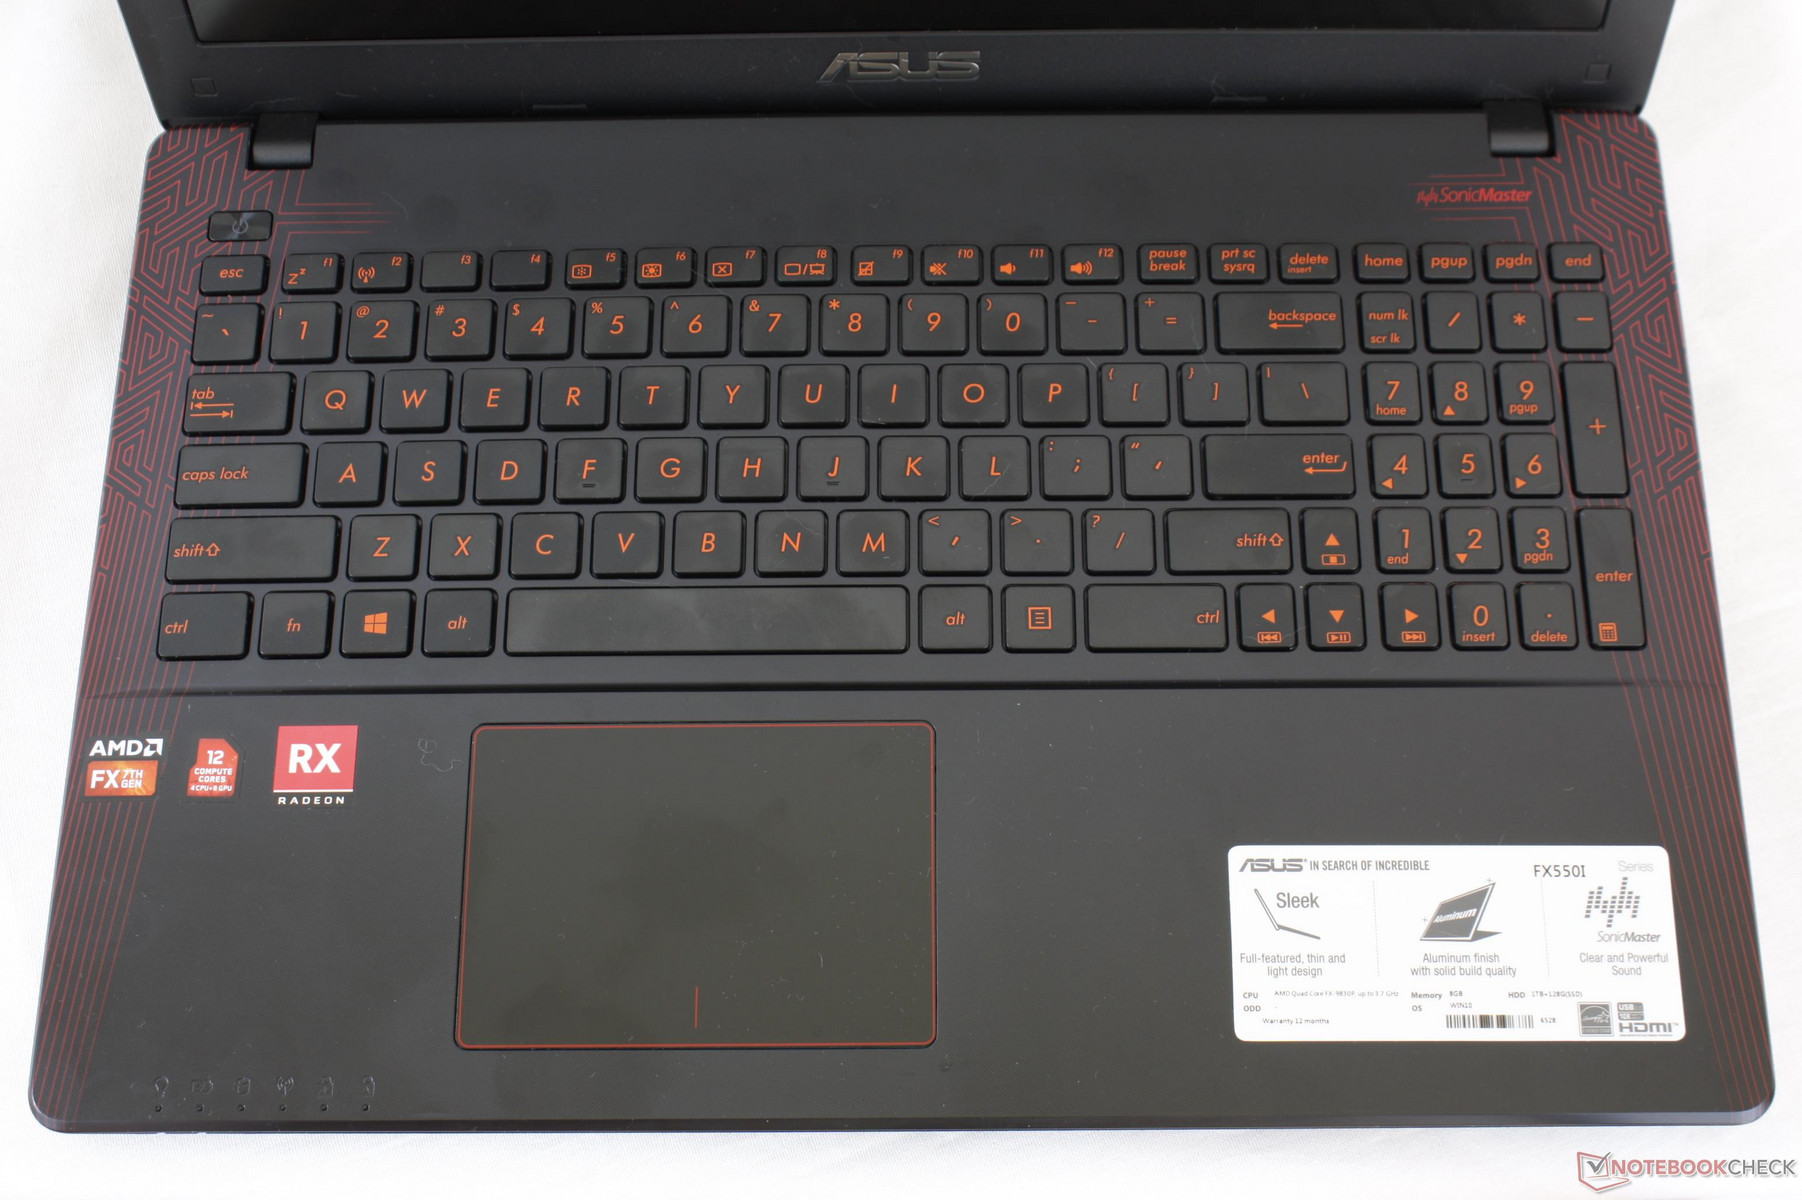
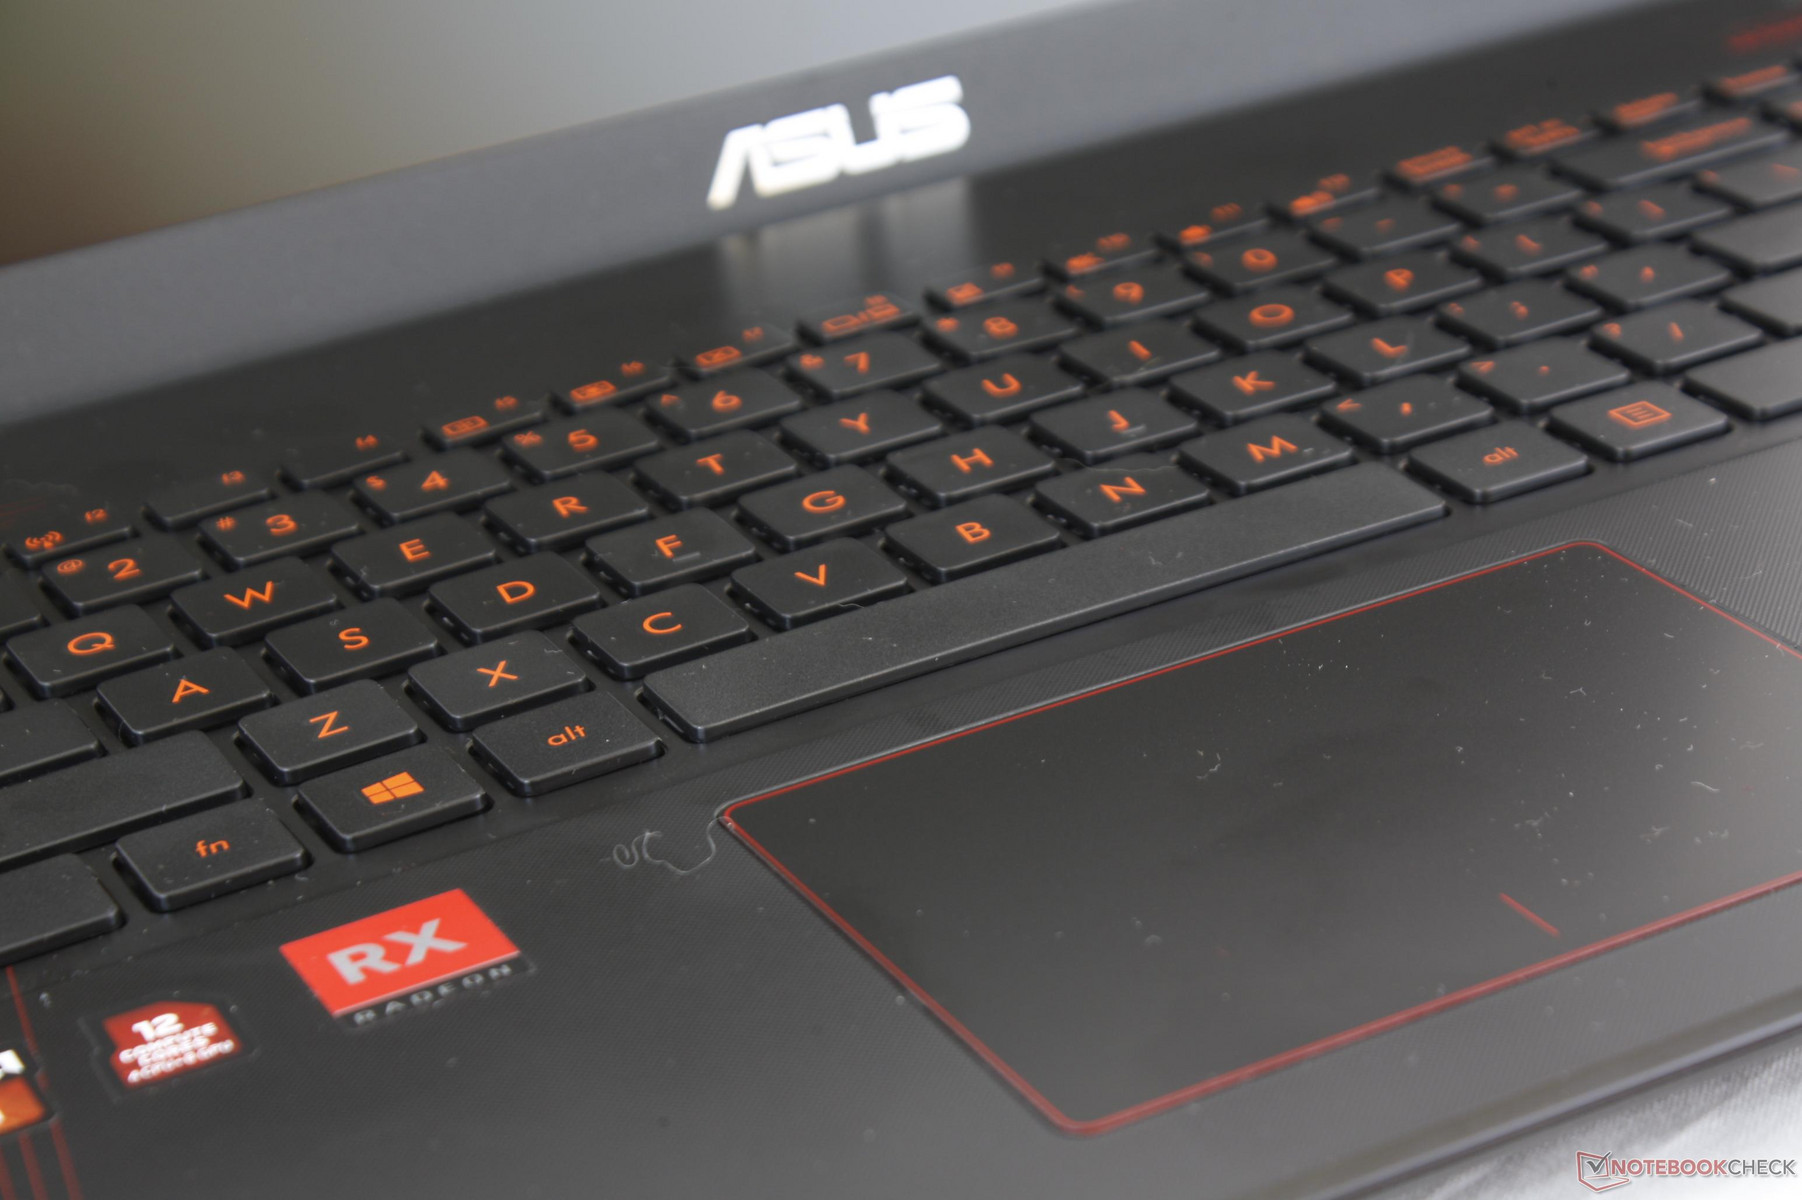
The non-backlit keyboard is mostly comfortable to use due to the firm feedback of the main QWERTY keys. A major drawback is that clatter is louder than on other Ultrabooks and gaming notebooks for a noisier typing experience. The NumPad keys are smaller than the main QWERTY keys and are noticeably softer in feedback since they sit directly above the hollow would-be optical bay. Perhaps a more inflexible chassis would have led to a more even feel across all keys.
No macro keys or dedicated keyboard software are included.
Touchpad
The integrated clickpad (10.5 x 7.5 cm) is slightly smaller than the clickpads on both the XPS 15 (10.5 x 8.5 cm) and Sabre 15 (10.2 x 5.8 cm). In practice, however, we find the surface area to be sufficient for simple scrolling and multi-touch inputs. Cursor control is smooth and reliable with no jittering even at slow speeds. Unfortunately, the firm texture-less plastic surface provides poor gliding for oily or sweaty fingers and feels low budget to the touch. Expect a sheen of grease to buildup over time.
The integrated mouse keys are shallow in travel with loud and firm feedback when pressed. Pushing down on the trackpad requires quite a bit of force unless if the finger is along the very bottom edge of the surface. Thus, we find it much less tiring (and definitely quieter) to simply tap on the surface for inputting mouse clicks.
The Asus Smart Gesture software is able to recognize up to four-finger inputs with support for Mobile Control when connected to a smartphone.
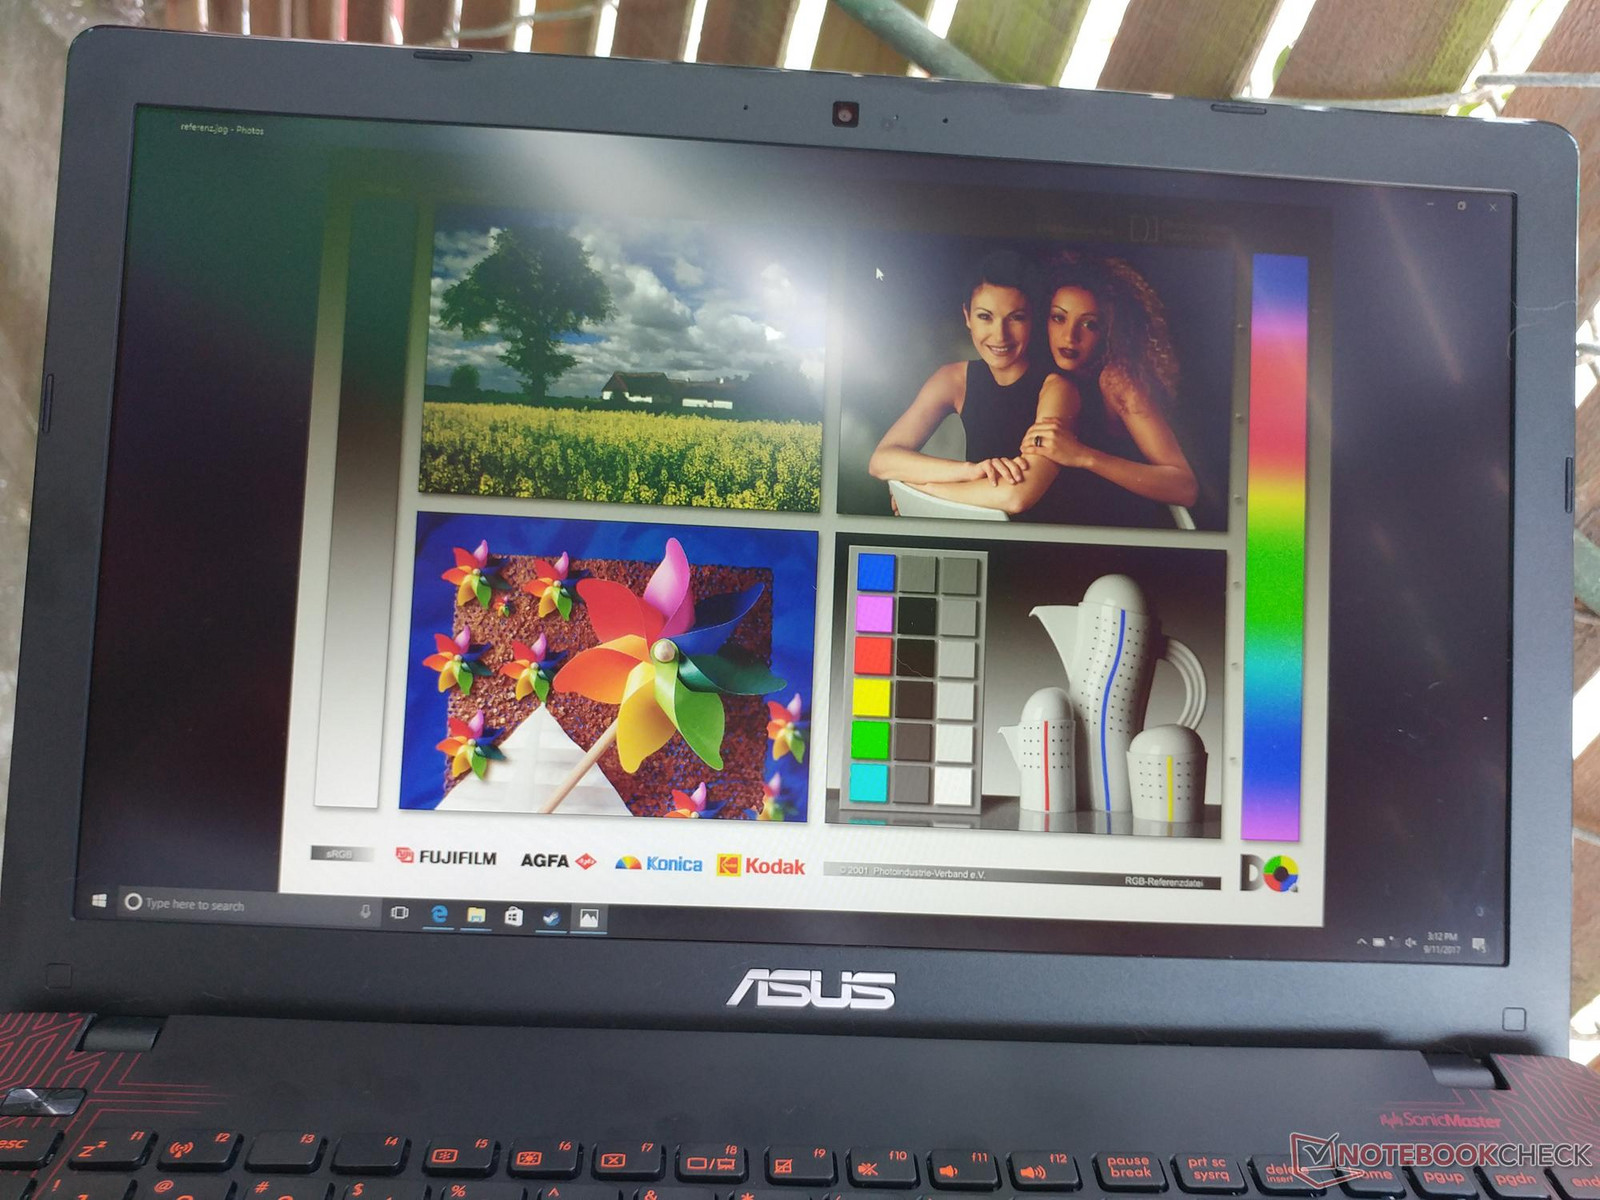
Display
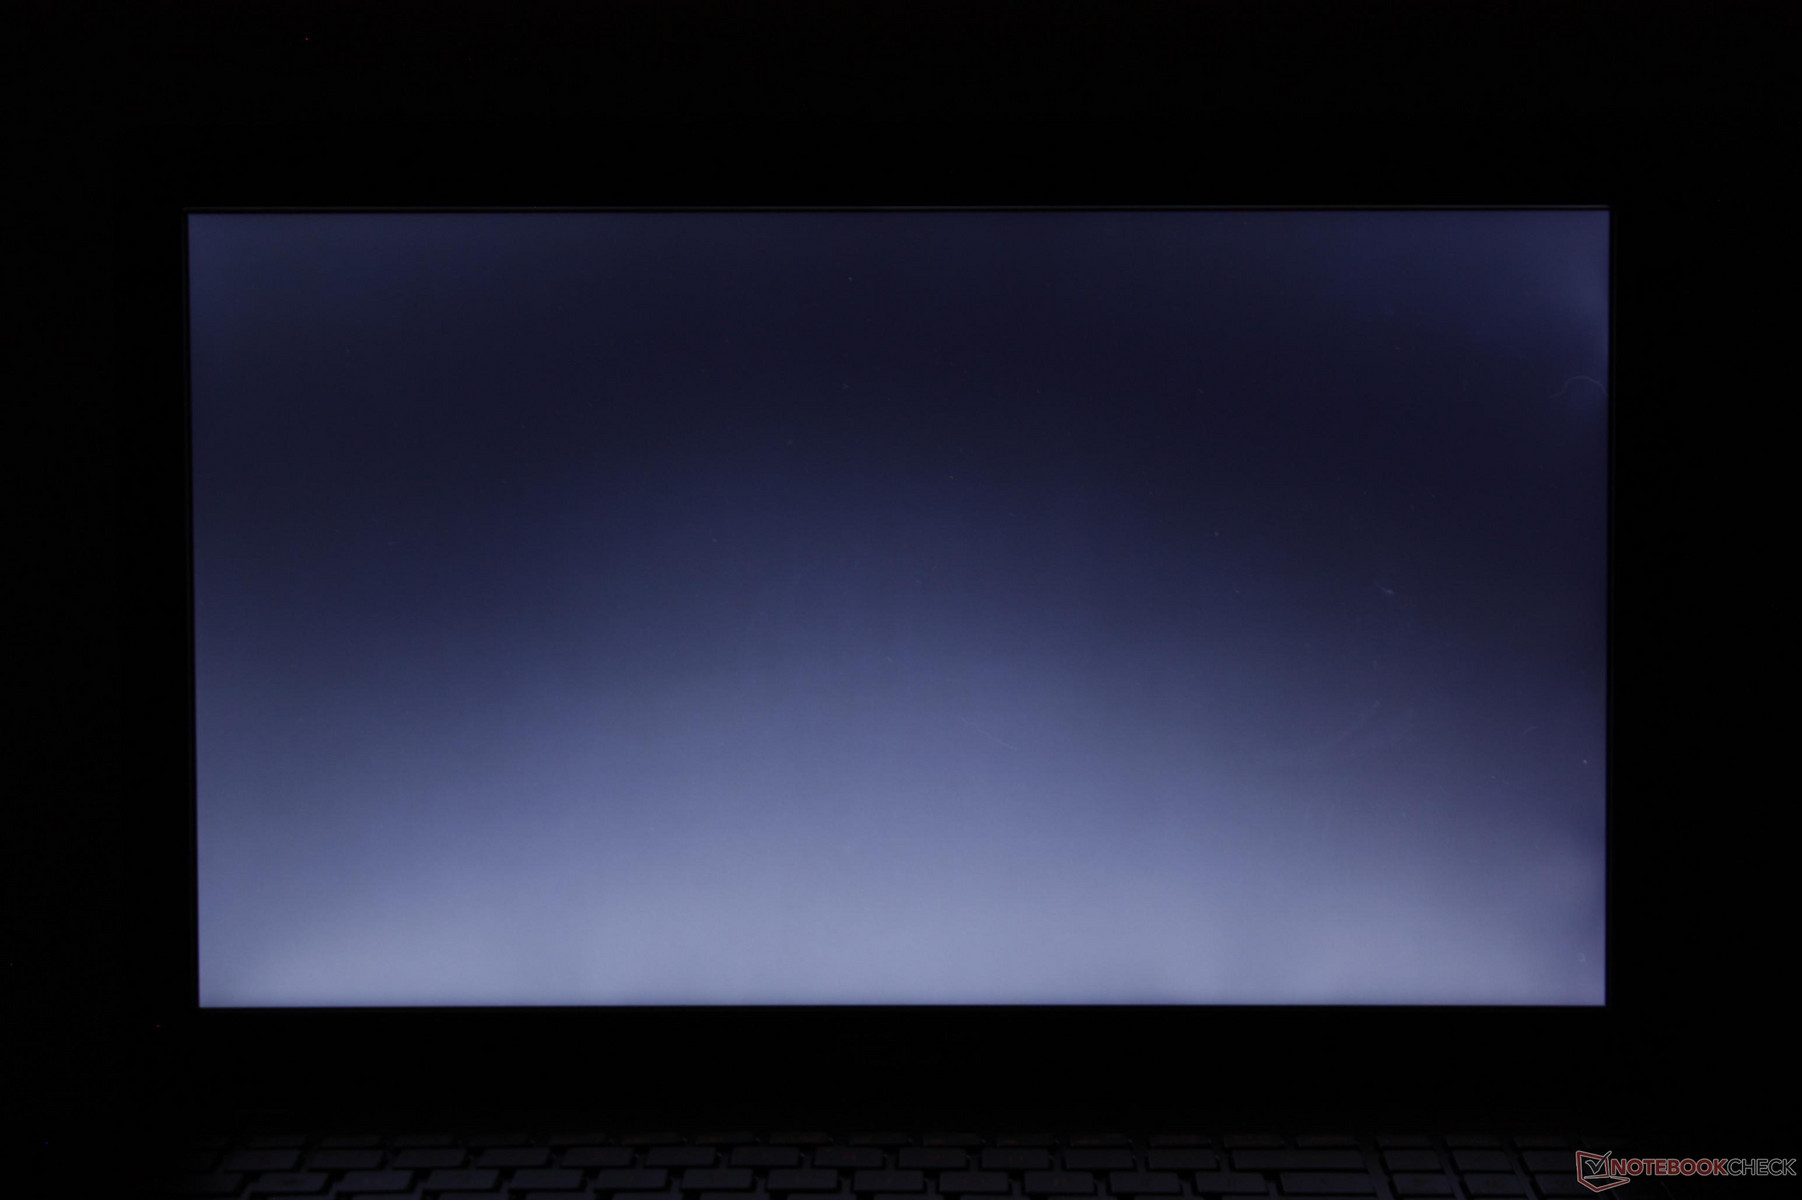
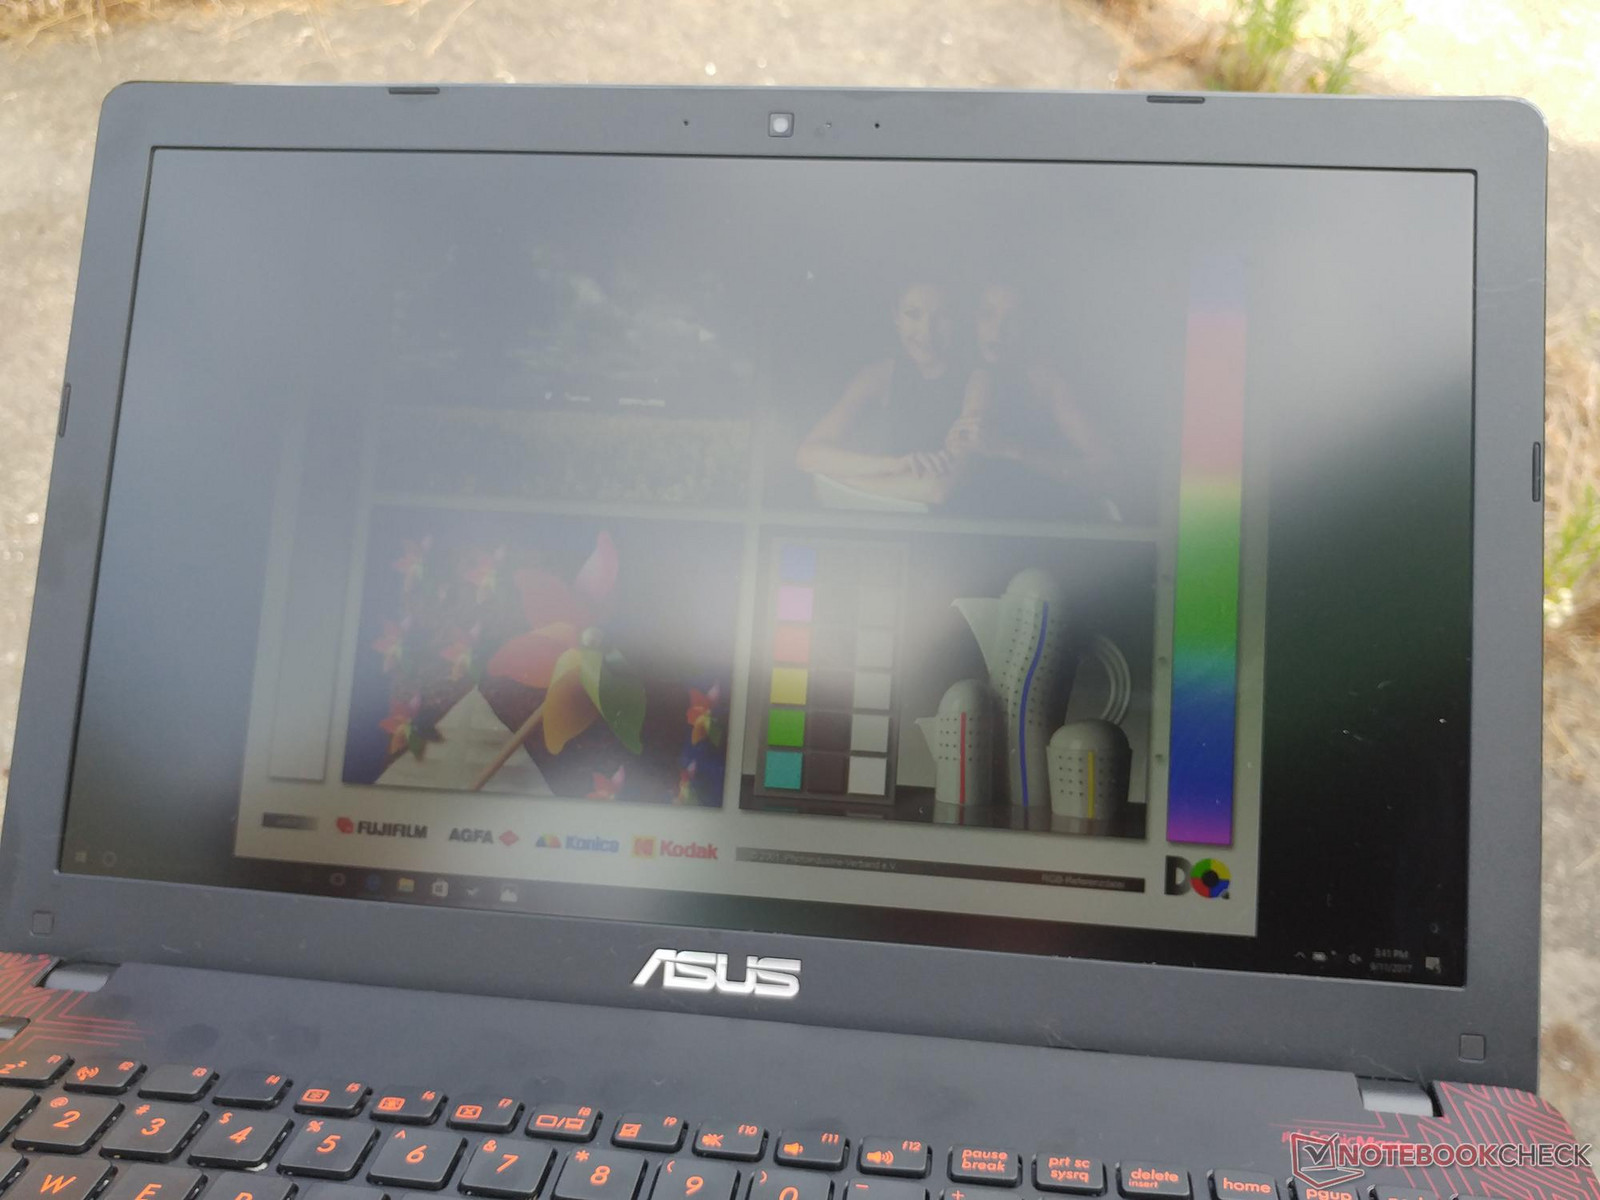
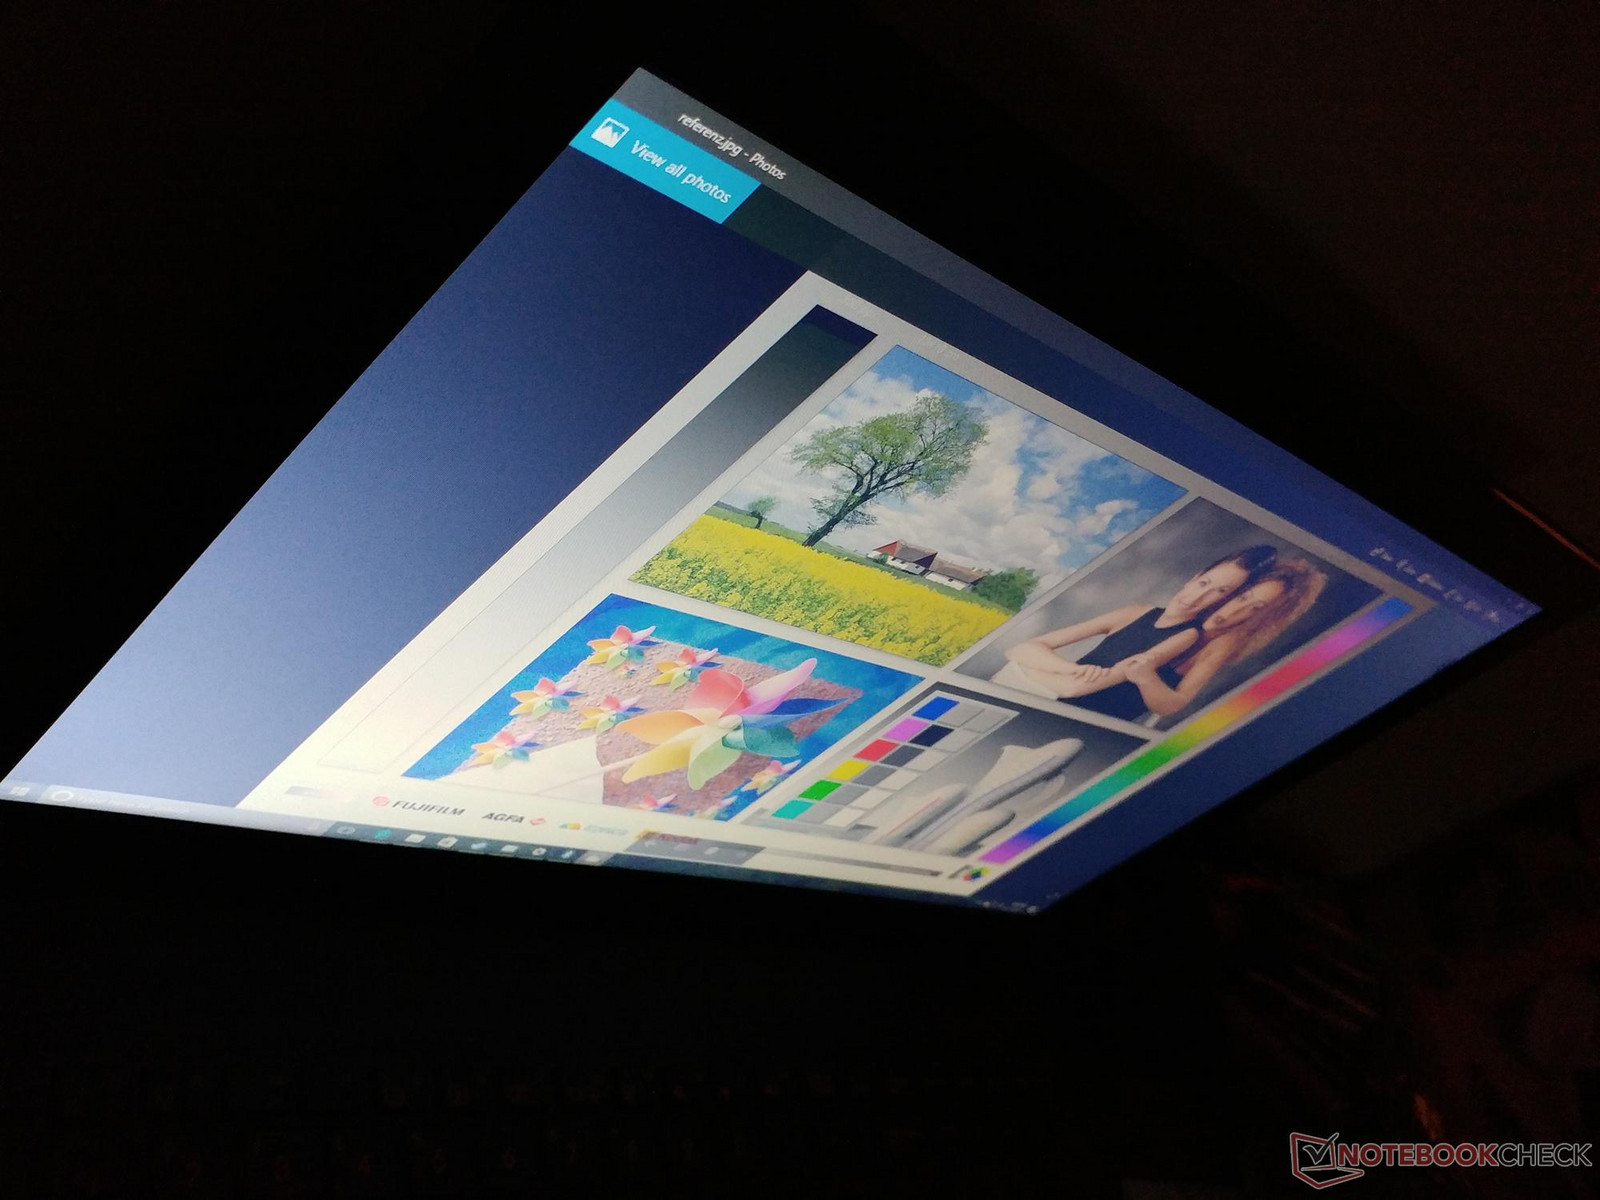
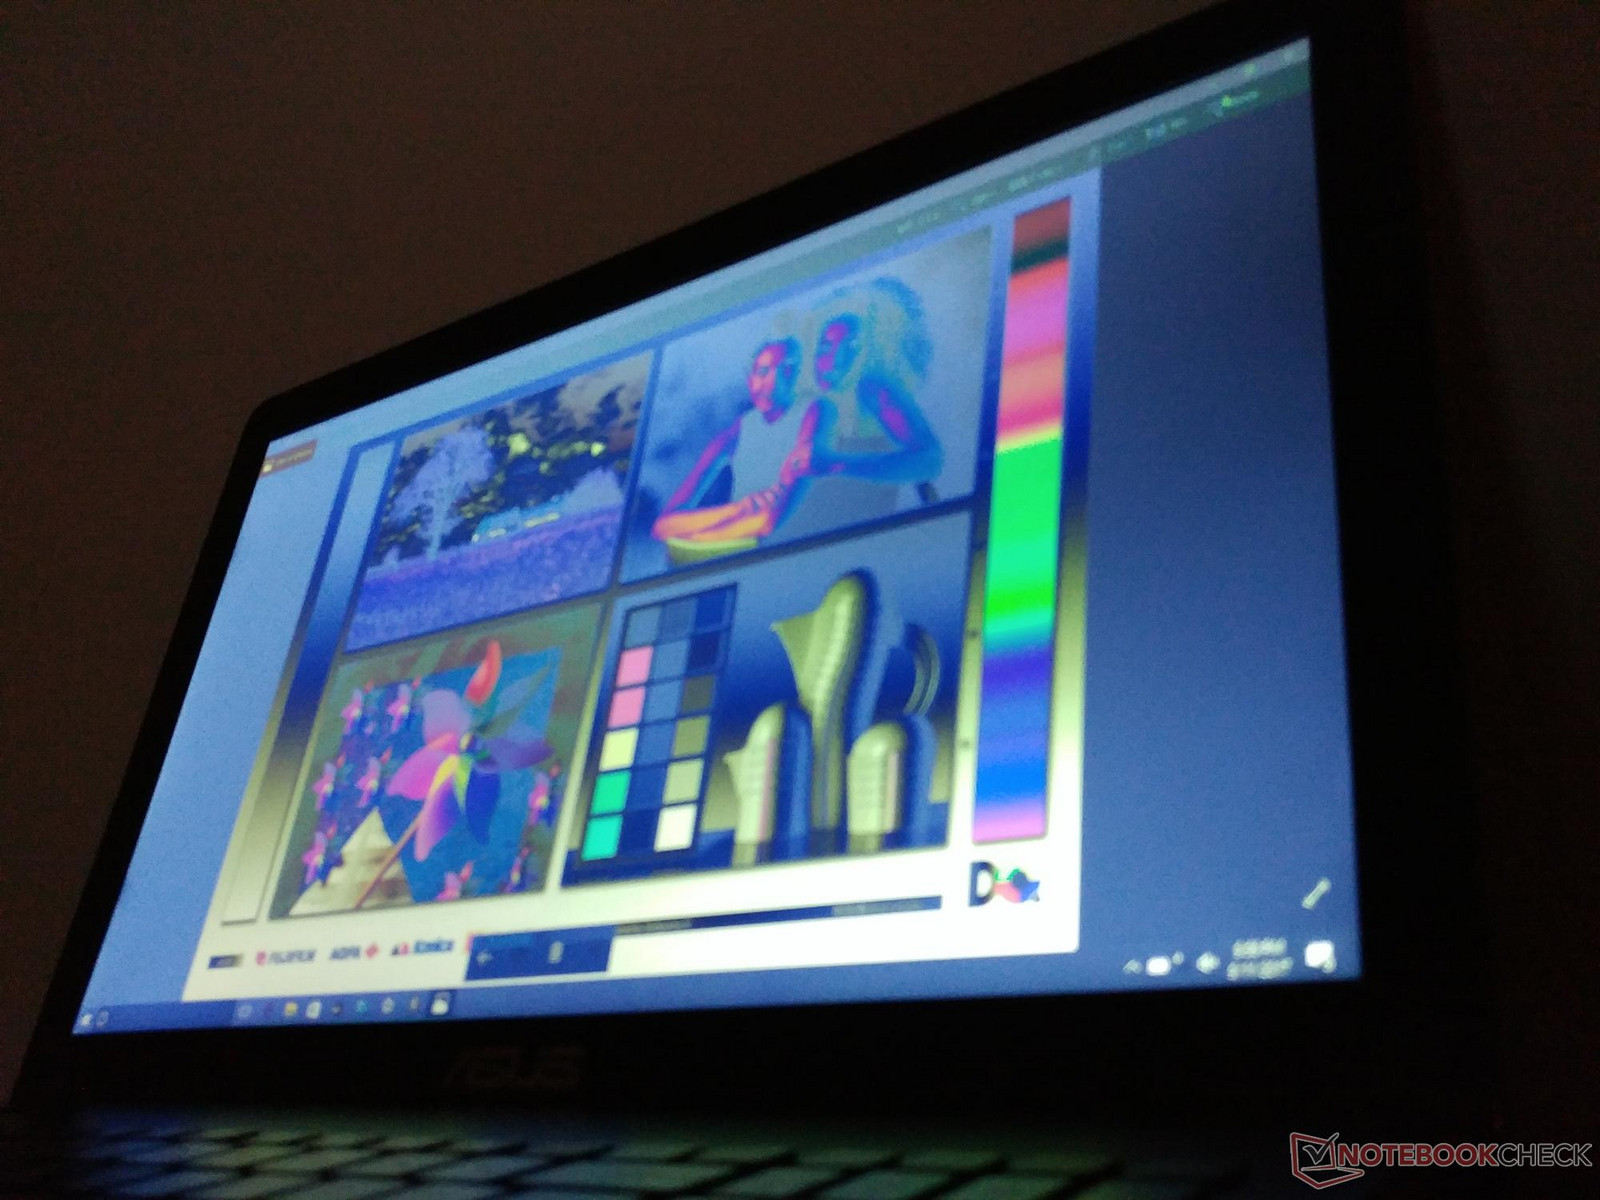
The Asus system is equipped with the same AU Optronics AUO38ED TN panel as found on a handful of other notebooks including the Dell Inspiron 7567, Acer Aspire E5-574, and Aspire E5-552. Unfortunately, this also means that contrast is average and overall quality is very poor. Colors appear bland and faded and the dim backlight is insufficient for comfortable use anywhere outside of an indoor office setting or classroom. On the bright side, the screen doesn't suffer from major graininess issues that can be common on matte panels. Users looking for brighter displays and lower black levels may want to consider the Sabre 15 or Omen 15.

| |||||||||||||||||||||||||
Brightness Distribution: 88 %
Center on Battery: 231.9 cd/m²
Contrast: 515:1 (Black: 0.45 cd/m²)
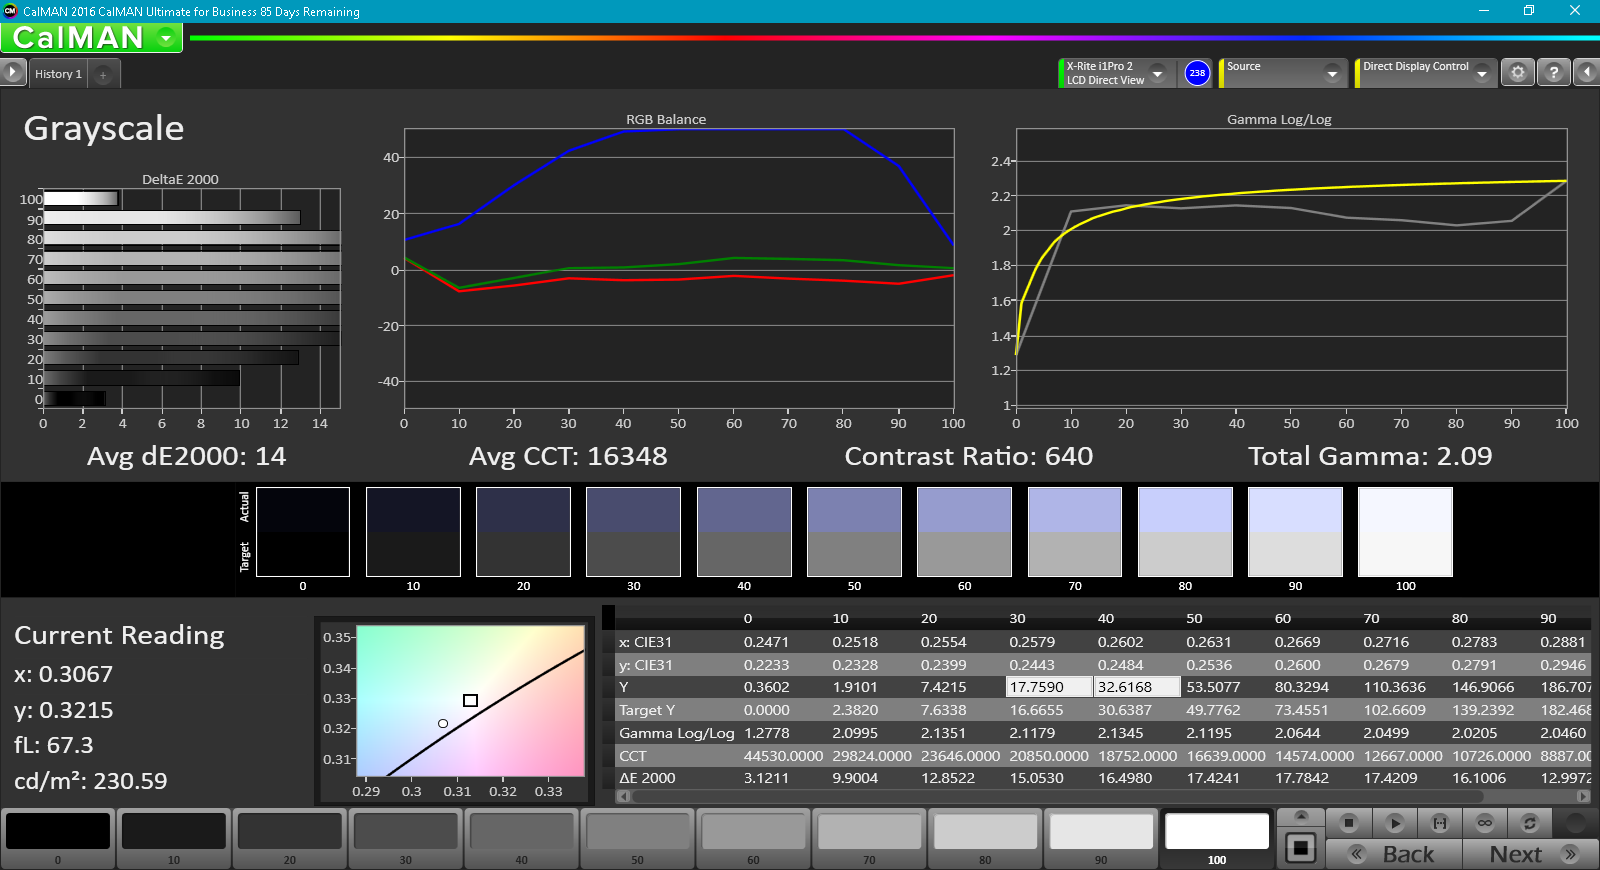
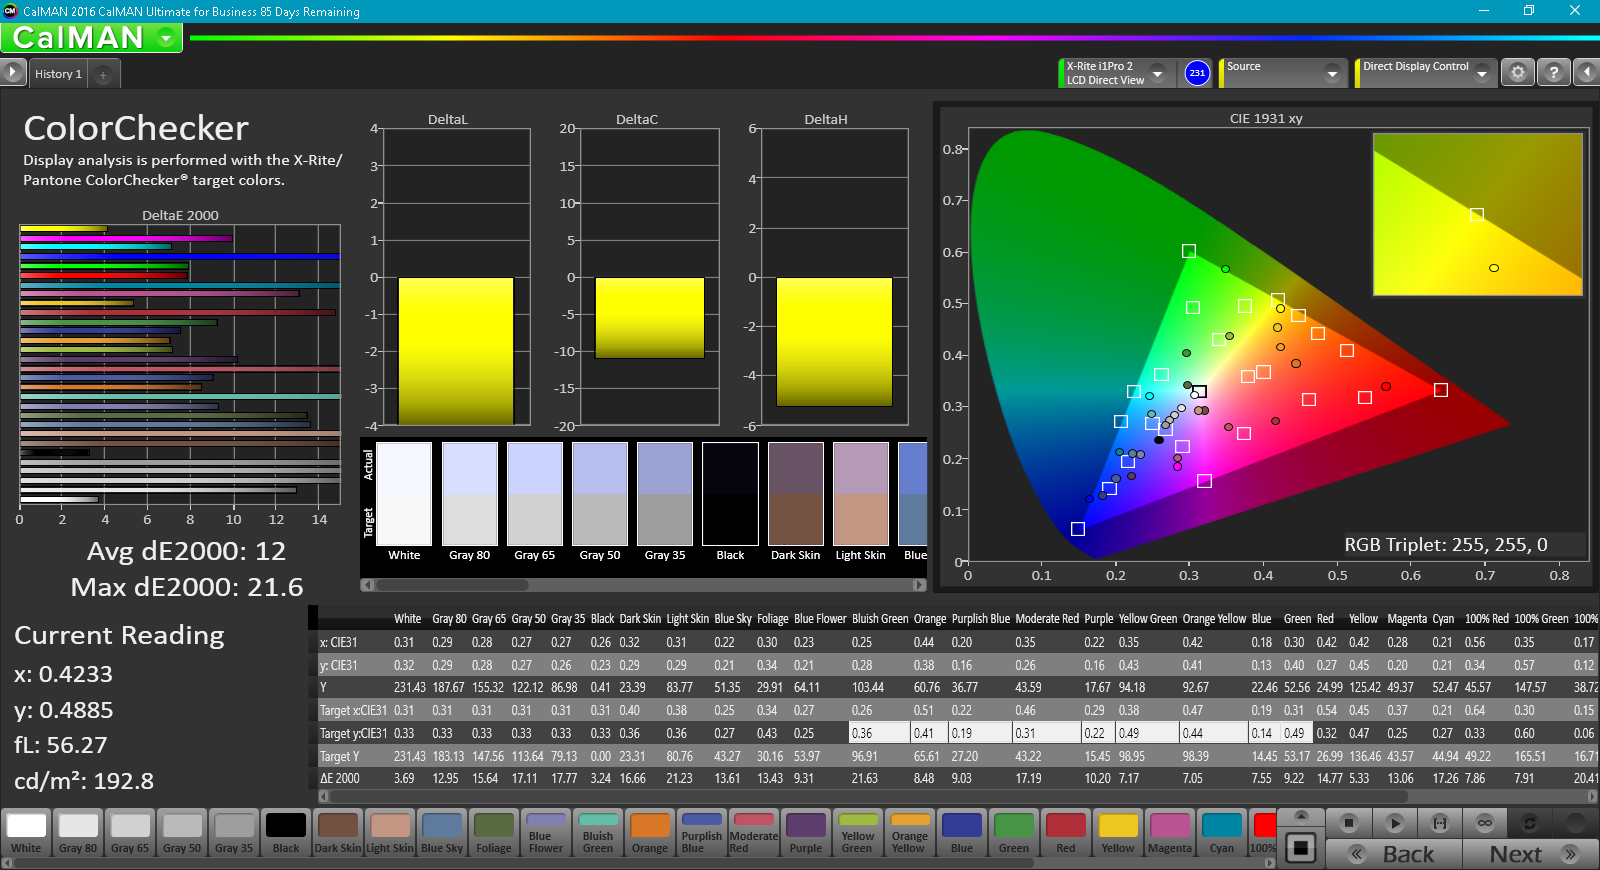
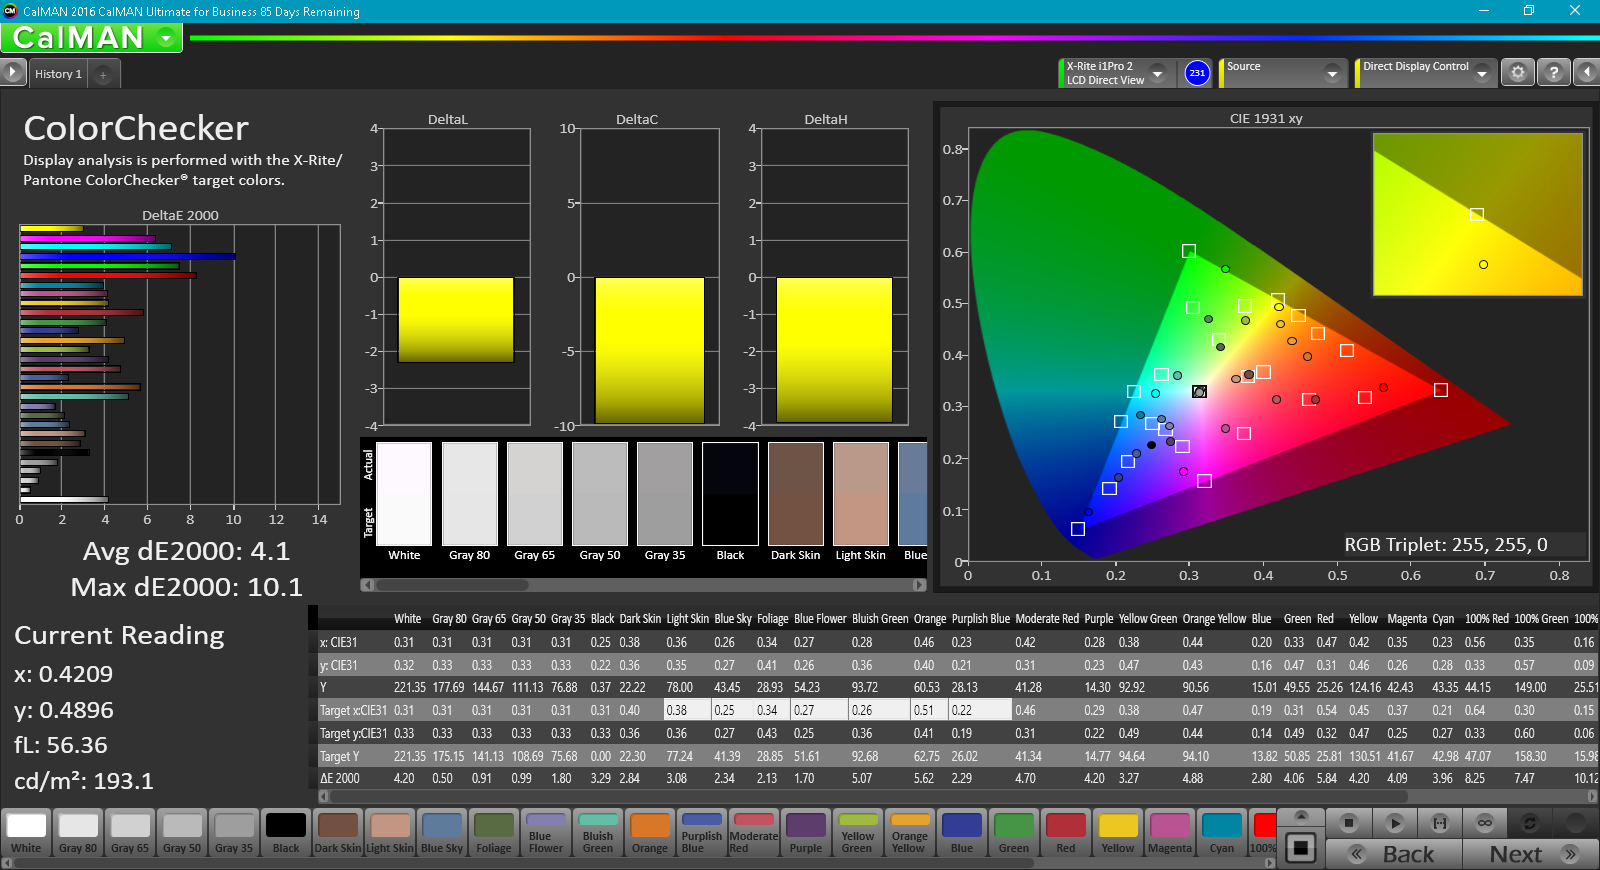
ΔE ColorChecker Calman: 12 | ∀{0.5-29.43 Ø4.72}
ΔE Greyscale Calman: 14 | ∀{0.09-98 Ø4.97}
54.8% sRGB (Argyll 1.6.3 3D)
34.8% AdobeRGB 1998 (Argyll 1.6.3 3D)
37.46% AdobeRGB 1998 (Argyll 3D)
54.6% sRGB (Argyll 3D)
36.26% Display P3 (Argyll 3D)
Gamma: 2.09
CCT: 16348 K
| Asus FX550IU-WSFX ID: AUO38ED, Name: AU Optronics B156HTN03.8, TN LED, 15.6", 1920x1080 | Asus ZenBook Pro UX550VD CMN15E8 (N156HCE-EN1), IPS, 15.6", 1920x1080 | Dell Inspiron 15 7000 7567 AU Optronics AUO38ED B156HTN 28H80, TN, 15.6", 1920x1080 | Gigabyte Sabre 15G ID: LGD0533, Name: LG Display LP156WF6-SPK3, IPS, 15.6", 1920x1080 | HP Omen 15-ce002ng AUO42ED, IPS, 15.6", 1920x1080 | |
|---|---|---|---|---|---|
| Display | 74% | 0% | 7% | 75% | |
| Display P3 Coverage (%) | 36.26 | 65.7 81% | 36.42 0% | 38.97 7% | 65.8 81% |
| sRGB Coverage (%) | 54.6 | 90.3 65% | 54.9 1% | 58.2 7% | 90.9 66% |
| AdobeRGB 1998 Coverage (%) | 37.46 | 65.9 76% | 37.62 0% | 40.3 8% | 66.5 78% |
| Response Times | 1% | -12% | 12% | -13% | |
| Response Time Grey 50% / Grey 80% * (ms) | 39.2 ? | 38.8 ? 1% | 36 ? 8% | 32 ? 18% | 43.2 ? -10% |
| Response Time Black / White * (ms) | 27.2 ? | 27.2 ? -0% | 36 ? -32% | 25.6 ? 6% | 31.2 ? -15% |
| PWM Frequency (Hz) | 25910 ? | 20000 ? | |||
| Screen | 58% | -3% | 19% | 58% | |
| Brightness middle (cd/m²) | 231.9 | 335 44% | 246 6% | 248.4 7% | 304 31% |
| Brightness (cd/m²) | 221 | 313 42% | 235 6% | 241 9% | 289 31% |
| Brightness Distribution (%) | 88 | 83 -6% | 75 -15% | 84 -5% | 86 -2% |
| Black Level * (cd/m²) | 0.45 | 0.27 40% | 0.55 -22% | 0.3 33% | 0.26 42% |
| Contrast (:1) | 515 | 1241 141% | 447 -13% | 828 61% | 1169 127% |
| Colorchecker dE 2000 * | 12 | 4.7 61% | 10.97 9% | 7.5 37% | 3.46 71% |
| Colorchecker dE 2000 max. * | 21.6 | 8.1 63% | 25.2 -17% | 7.72 64% | |
| Greyscale dE 2000 * | 14 | 5.8 59% | 14.25 -2% | 6.5 54% | 2.46 82% |
| Gamma | 2.09 105% | 2.06 107% | 1.83 120% | 2.19 100% | 2.38 92% |
| CCT | 16348 40% | 6518 100% | 11200 58% | 7852 83% | 6915 94% |
| Color Space (Percent of AdobeRGB 1998) (%) | 34.8 | 58.7 69% | 35 1% | 37 6% | 59 70% |
| Color Space (Percent of sRGB) (%) | 54.8 | 90.1 64% | 55 0% | 57.9 6% | 91 66% |
| Total Average (Program / Settings) | 44% /
53% | -5% /
-4% | 13% /
16% | 40% /
52% |
* ... smaller is better
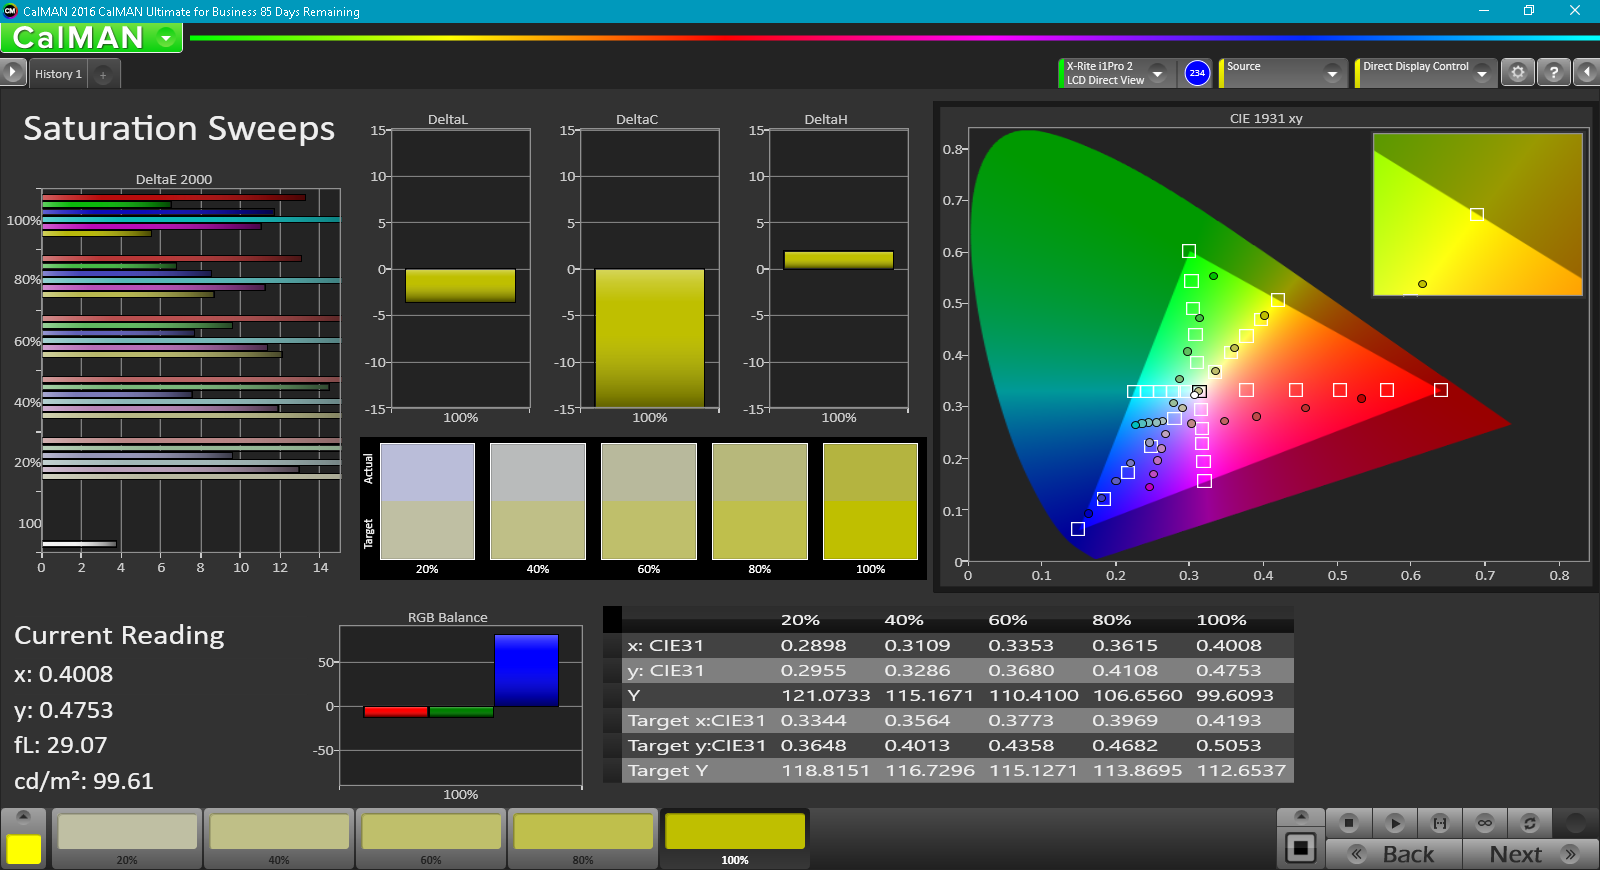
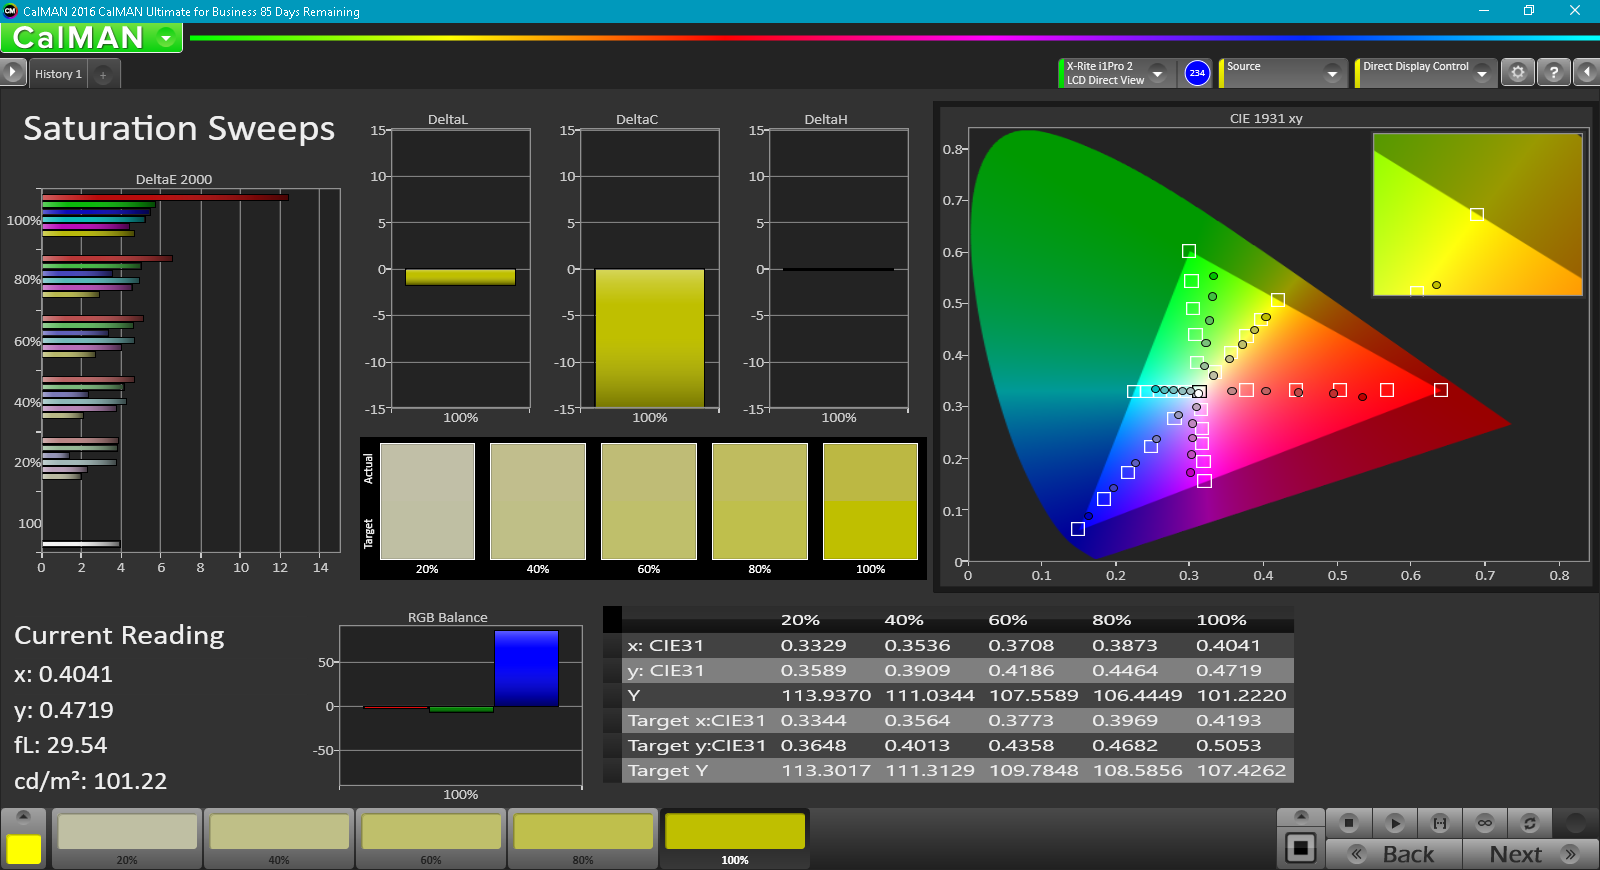
Color coverage is poor at just 35 percent and 55 percent of the AdobeRGB and sRGB standards, respectively. Colors are not as deep or saturated when compared to the IPS panels found on most modern Ultrabooks. If a wider gamut is desired, then a budget gaming notebook like the FX550 is definitely not the right place to look.
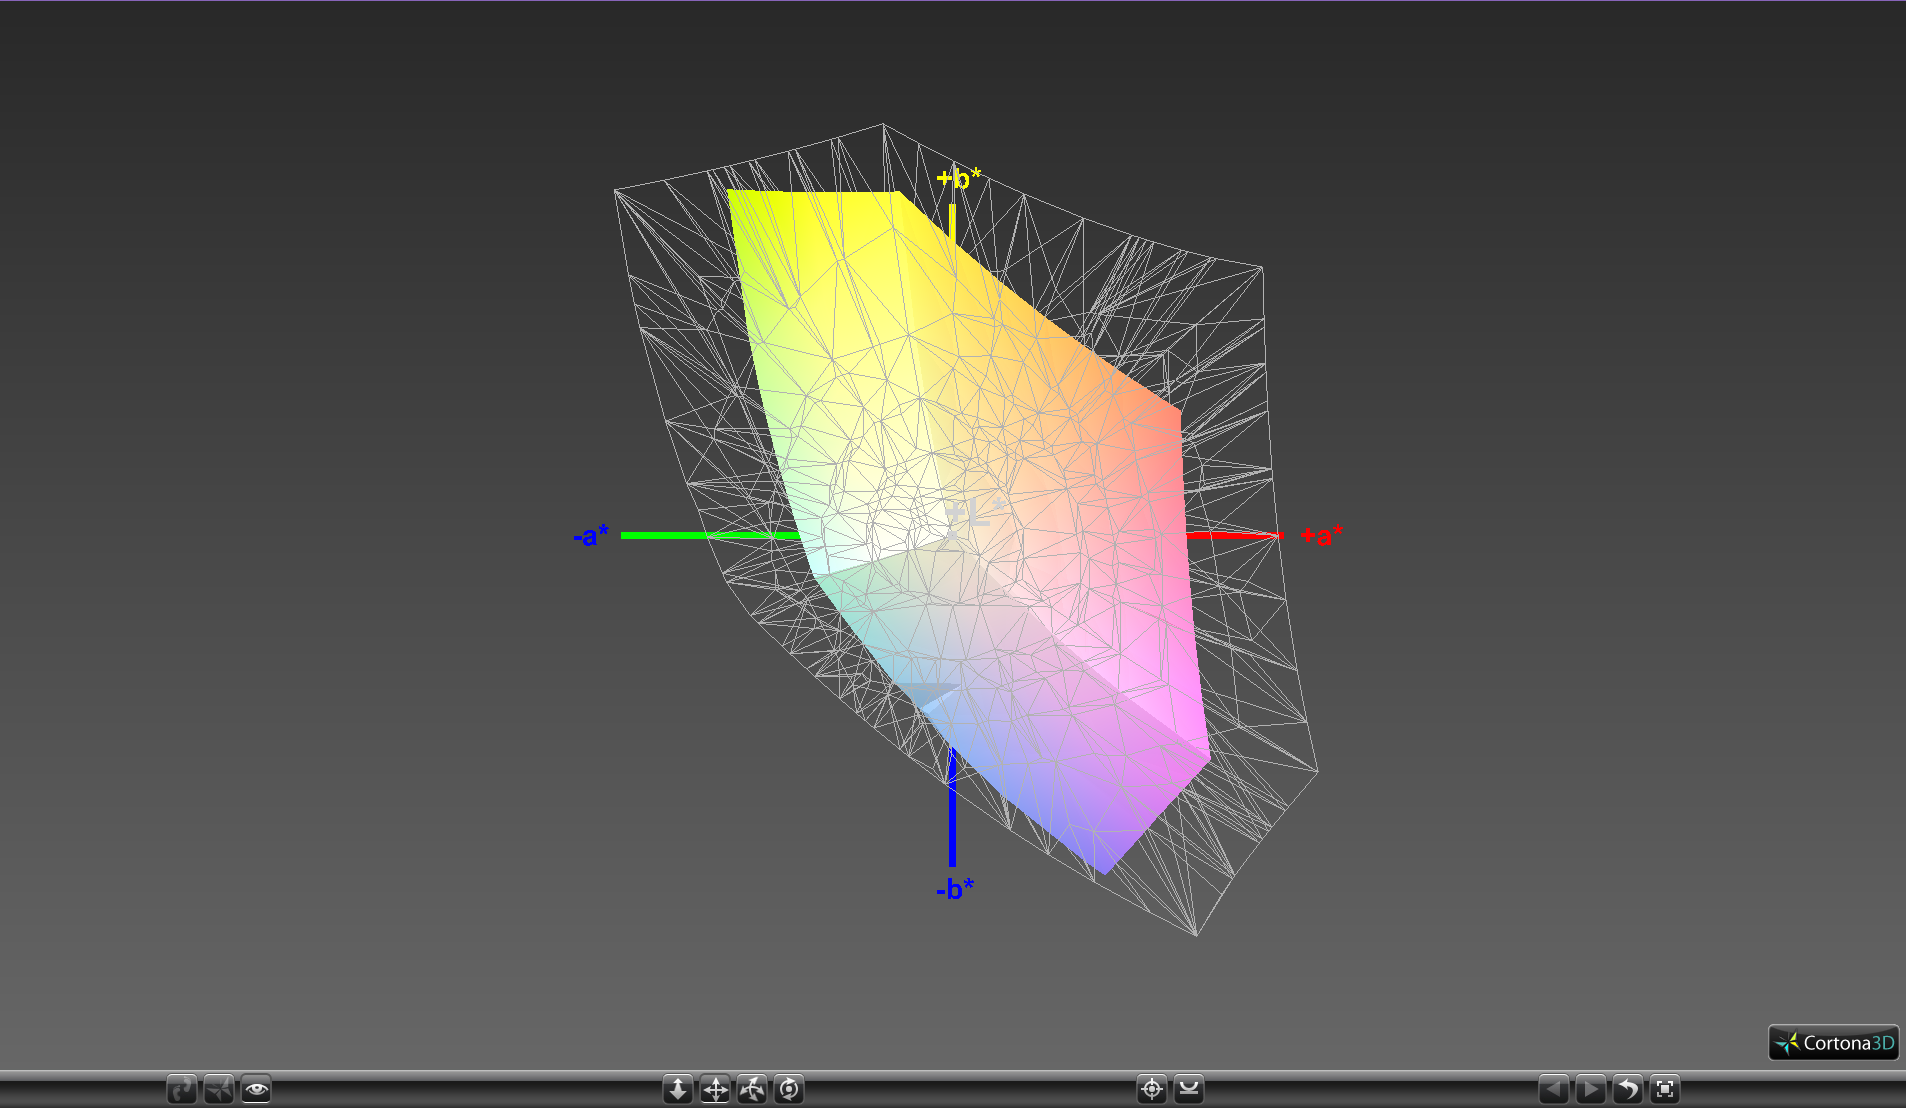
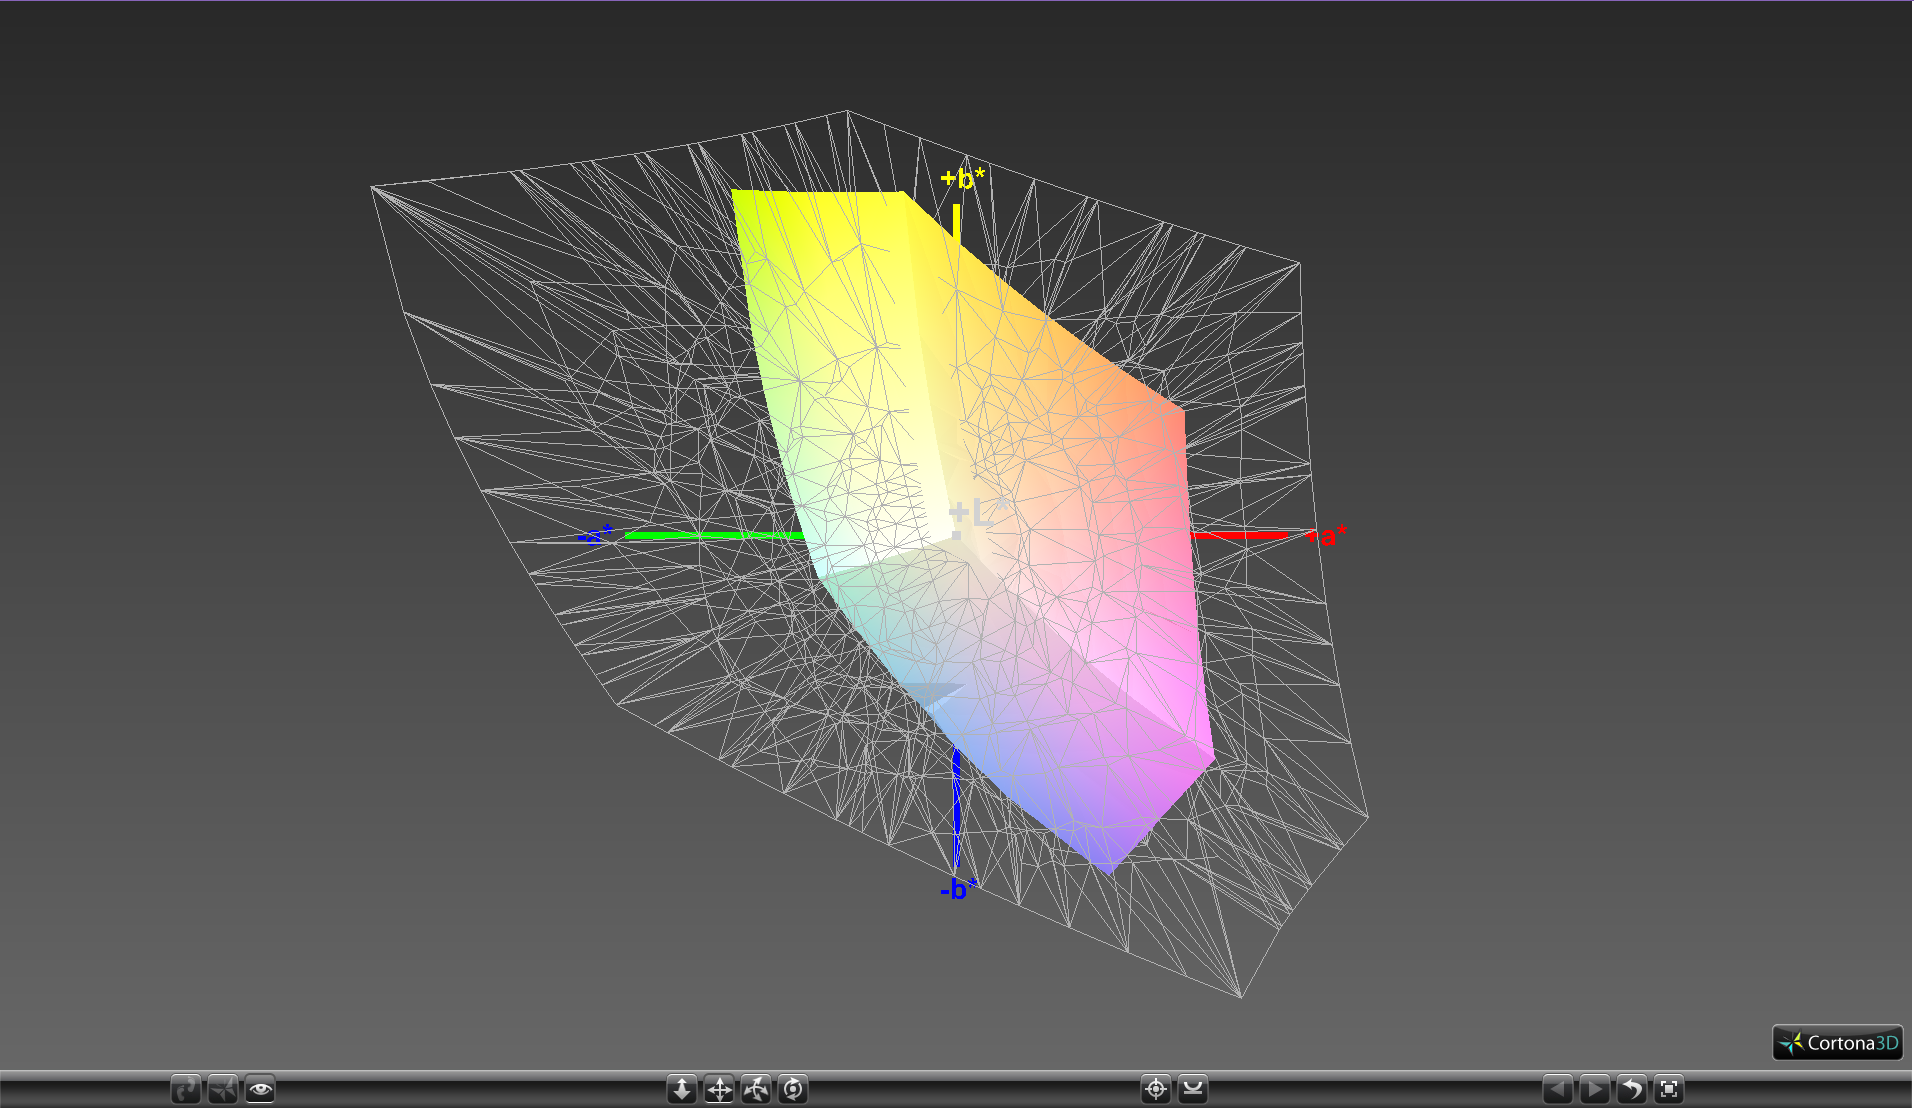
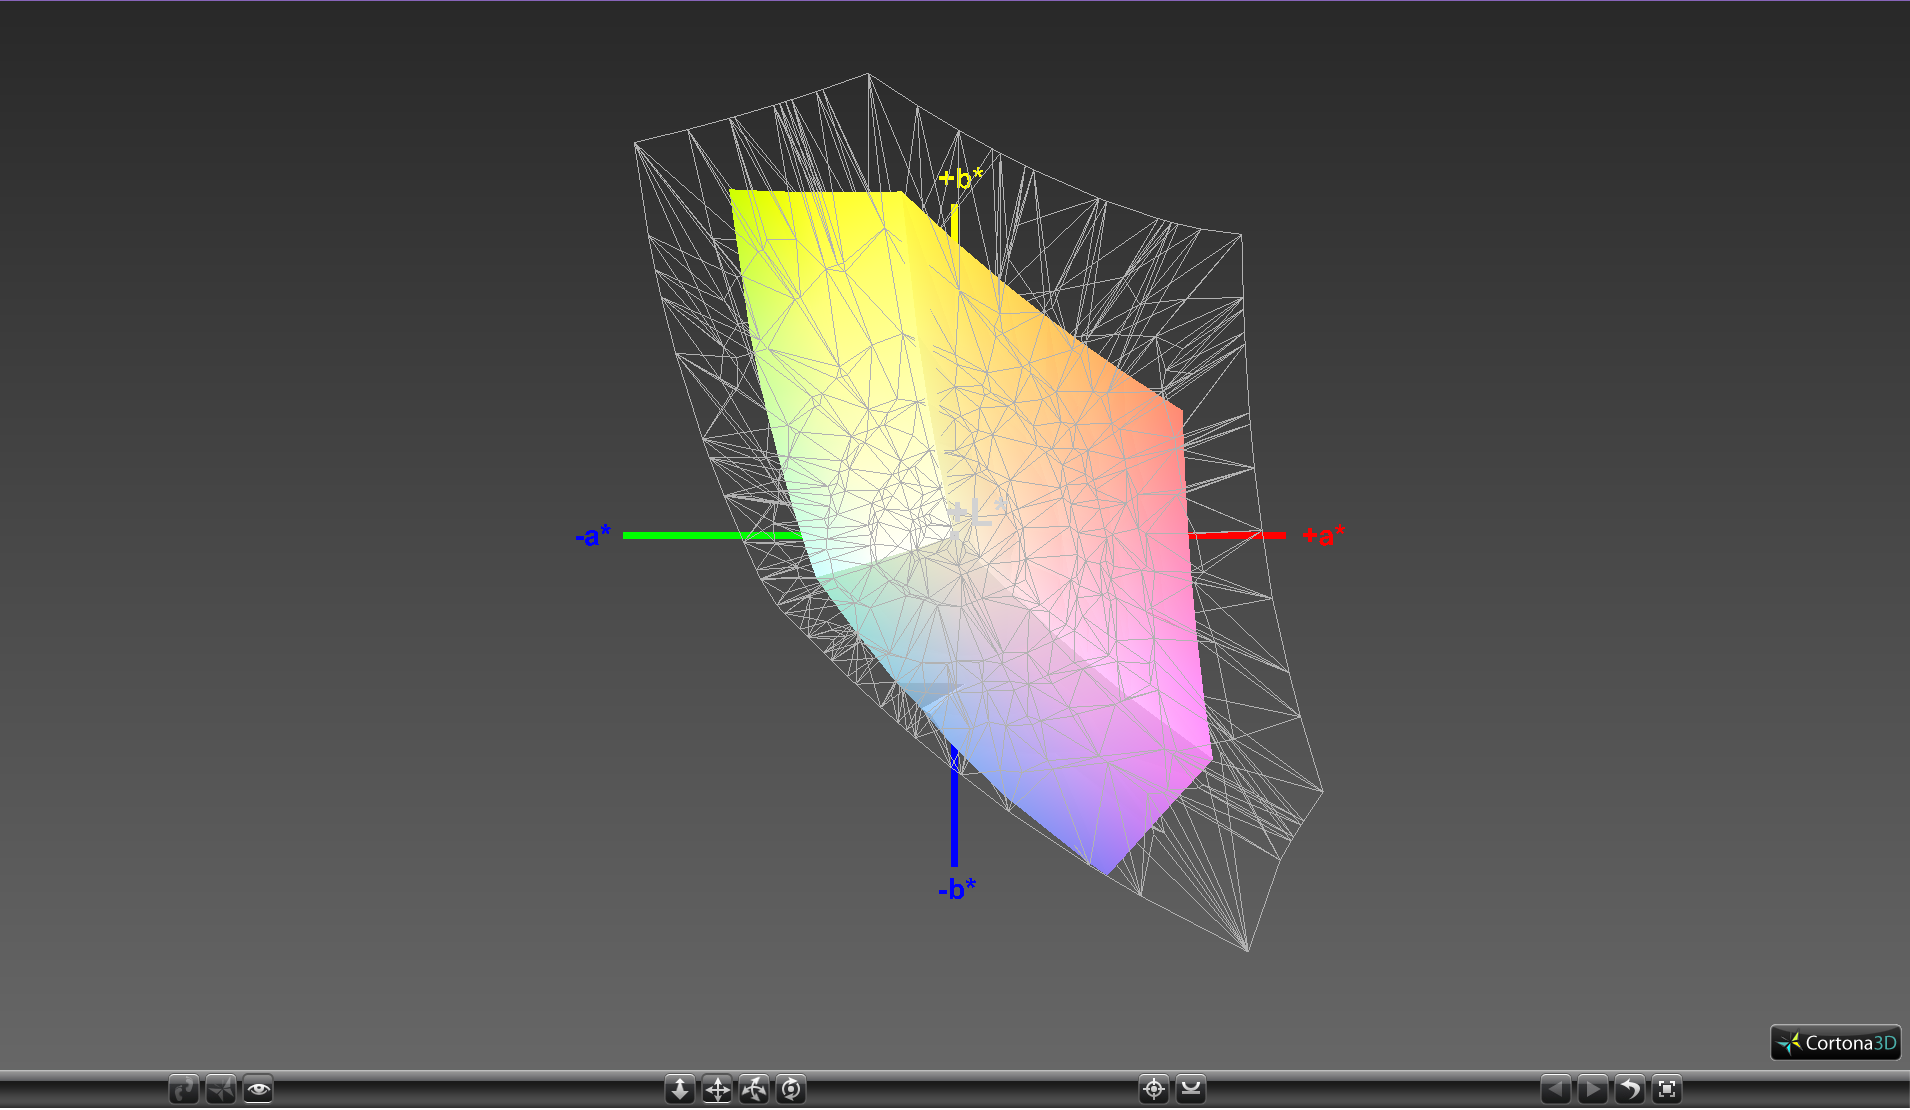
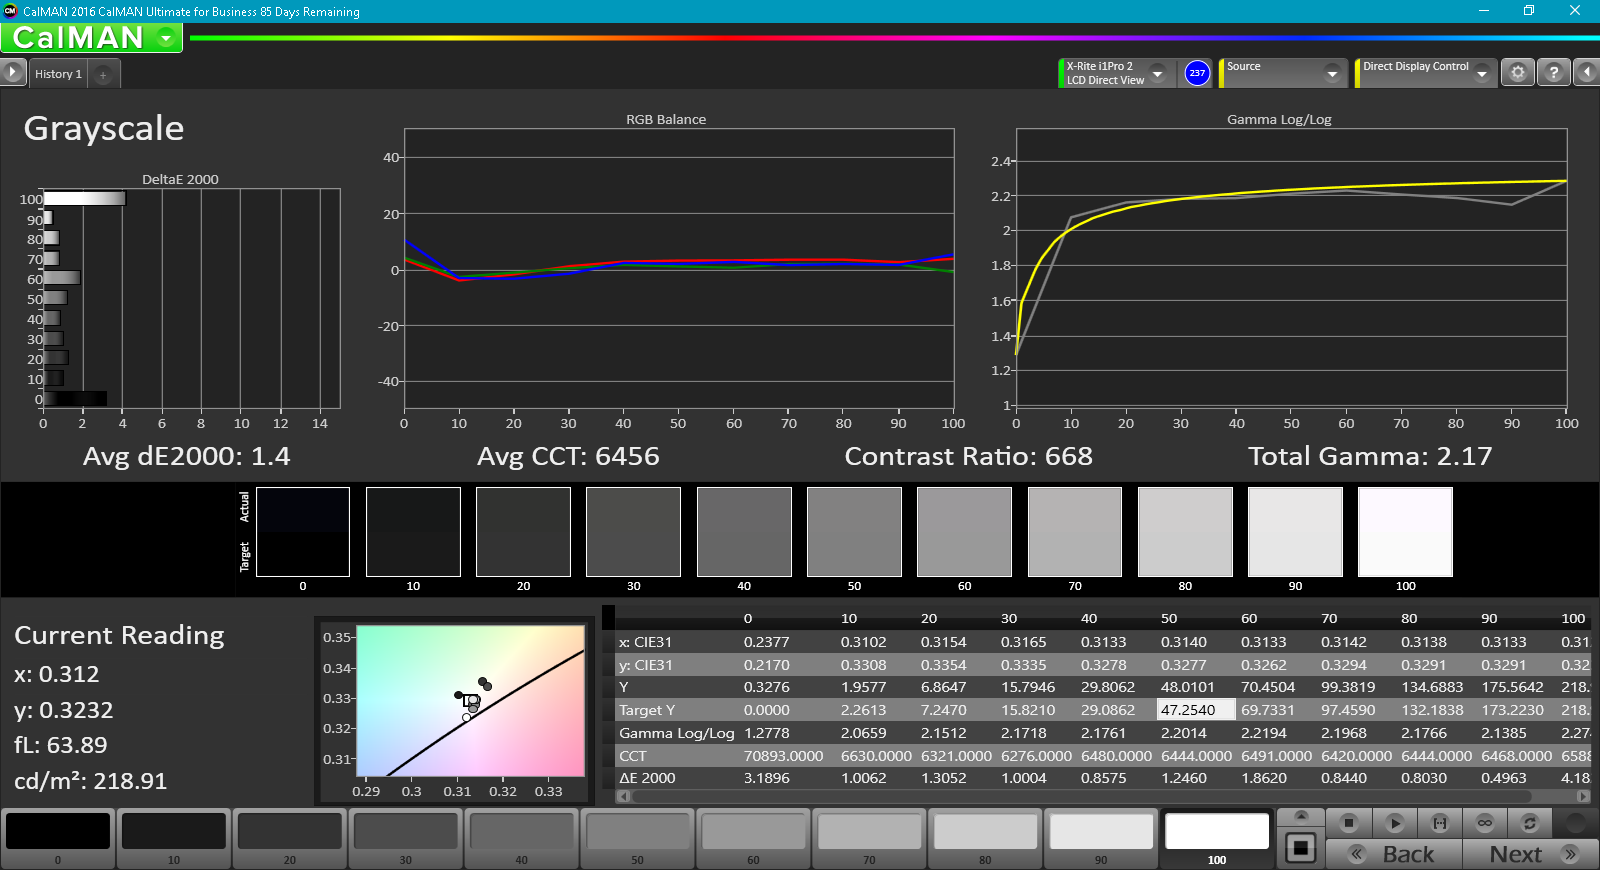
Further measurements with an X-Rite spectrophotometer reveal very inaccurate colors and an overly cool color temperature. There is an obvious blue tint commonly observed on cheap budget notebooks. Our calibration efforts improve grayscale and colors dramatically and we highly recommend applying our ICM color profile in order to get the most out of the display. The muddy blacks and grays when gaming or during video playback are unfortunately unavoidable due to the average contrast.
Display Response Times
| ↔ Response Time Black to White | ||
|---|---|---|
| 27.2 ms ... rise ↗ and fall ↘ combined | ↗ 22.8 ms rise | 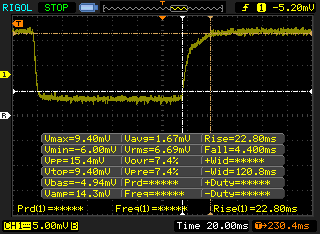 |
| ↘ 4.4 ms fall | ||
| The screen shows relatively slow response rates in our tests and may be too slow for gamers. In comparison, all tested devices range from 0.1 (minimum) to 240 (maximum) ms. » 69 % of all devices are better. This means that the measured response time is worse than the average of all tested devices (19.8 ms). | ||
| ↔ Response Time 50% Grey to 80% Grey | ||
| 39.2 ms ... rise ↗ and fall ↘ combined | ↗ 21.2 ms rise | 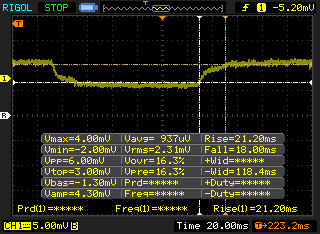 |
| ↘ 18 ms fall | ||
| The screen shows slow response rates in our tests and will be unsatisfactory for gamers. In comparison, all tested devices range from 0.165 (minimum) to 636 (maximum) ms. » 60 % of all devices are better. This means that the measured response time is worse than the average of all tested devices (31 ms). | ||
Screen Flickering / PWM (Pulse-Width Modulation)
| Screen flickering / PWM not detected | 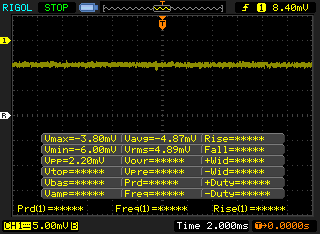 | ||
In comparison: 52 % of all tested devices do not use PWM to dim the display. If PWM was detected, an average of 7747 (minimum: 5 - maximum: 343500) Hz was measured. | |||
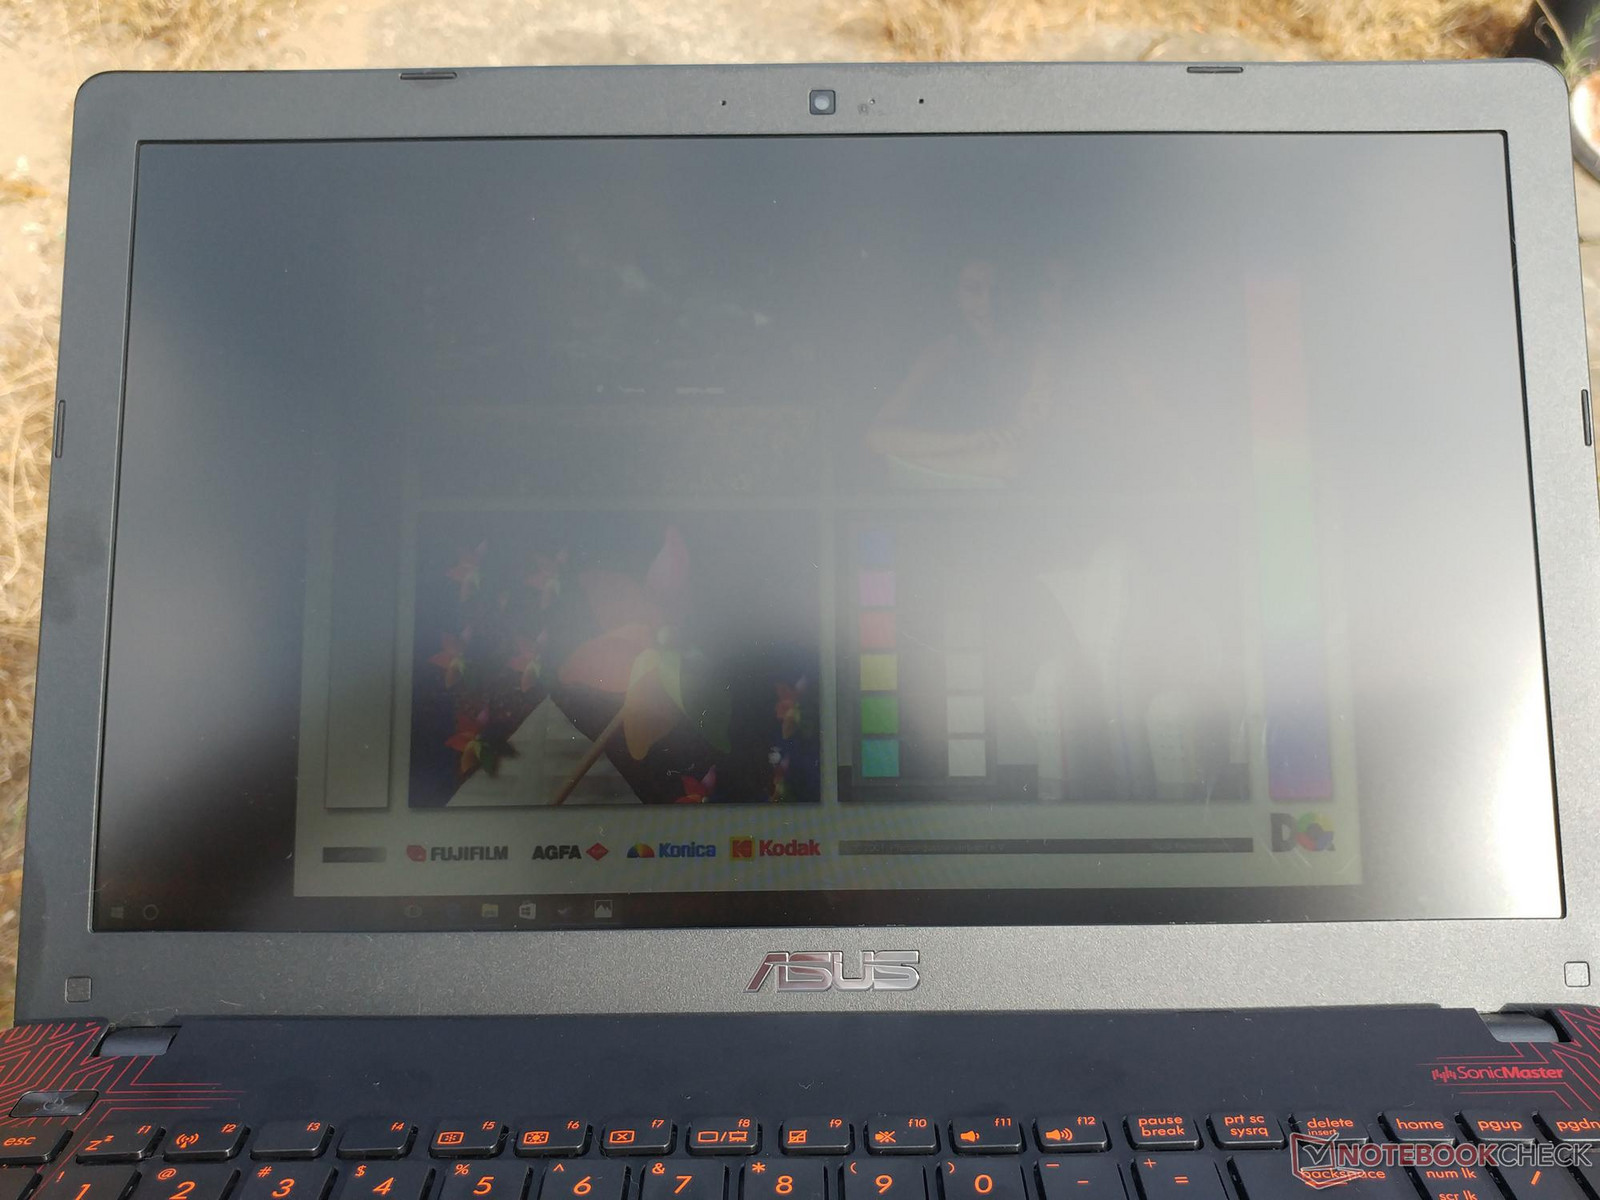
Outdoor visibility is poor because of the narrow TN viewing angles and dim backlight. Colors and texts appear washed out and difficult to comfortably see even when on the maximum brightness setting. The hinges allow for a wide lid angle of up to 160 degrees, but this pairs rather poorly with the aforementioned limited viewing angles.

Performance
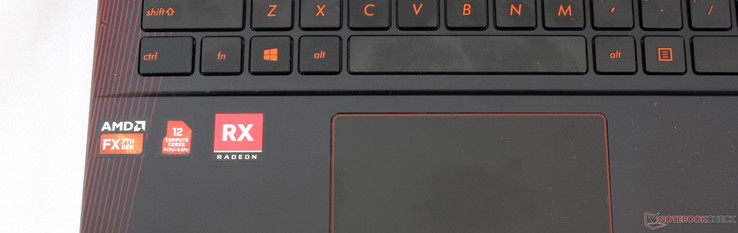
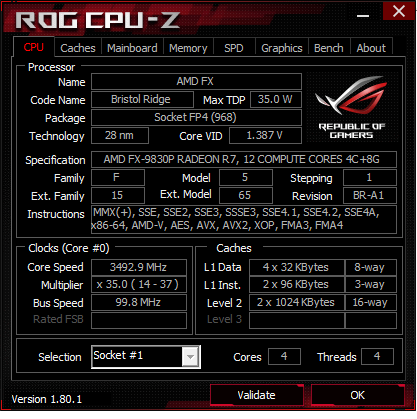
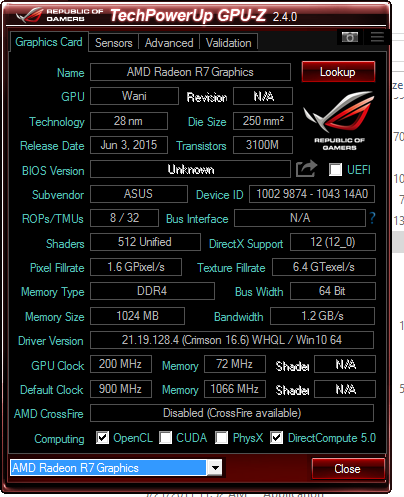
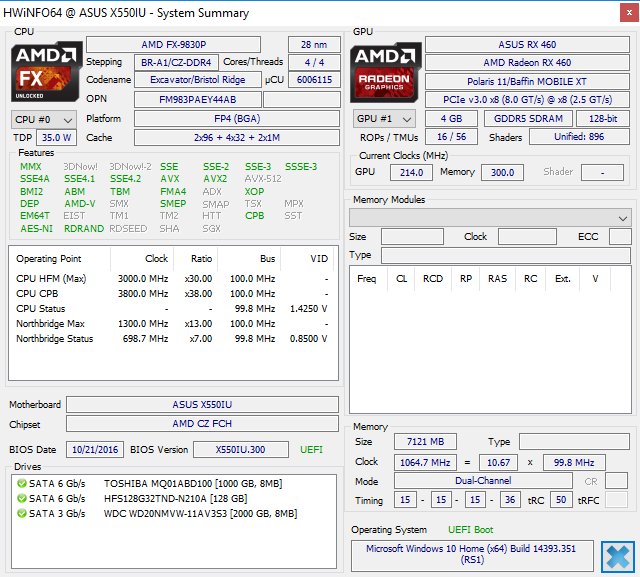
The stars of the show are the 3.0 GHz FX-9830P Bristol Ridge APU and Radeon RX 460 Polaris GPU. It's rare enough to find one of these in a notebook let alone both in the same shell. This particular APU operates in the 25 W to 45 W range to be in between the Intel ULV 15 W U-class and 45 W HQ-class of processors in terms of power consumption. Actual processing performance, however, is far closer to the Intel U-class rather than the HQ-class due in part to the higher power demands of the Radeon R7 GPU compared to the HD Graphics alternative. Users can switch to the integrated Radeon R7 GPU via Switchable Graphics with no Dual Graphics options present.
No other AMD SKUs are available on this particular chassis. We suspect that the market for AMD notebooks is so small compared to Intel that Asus saw no reason to offer multiple AMD FX550 builds.
Processor
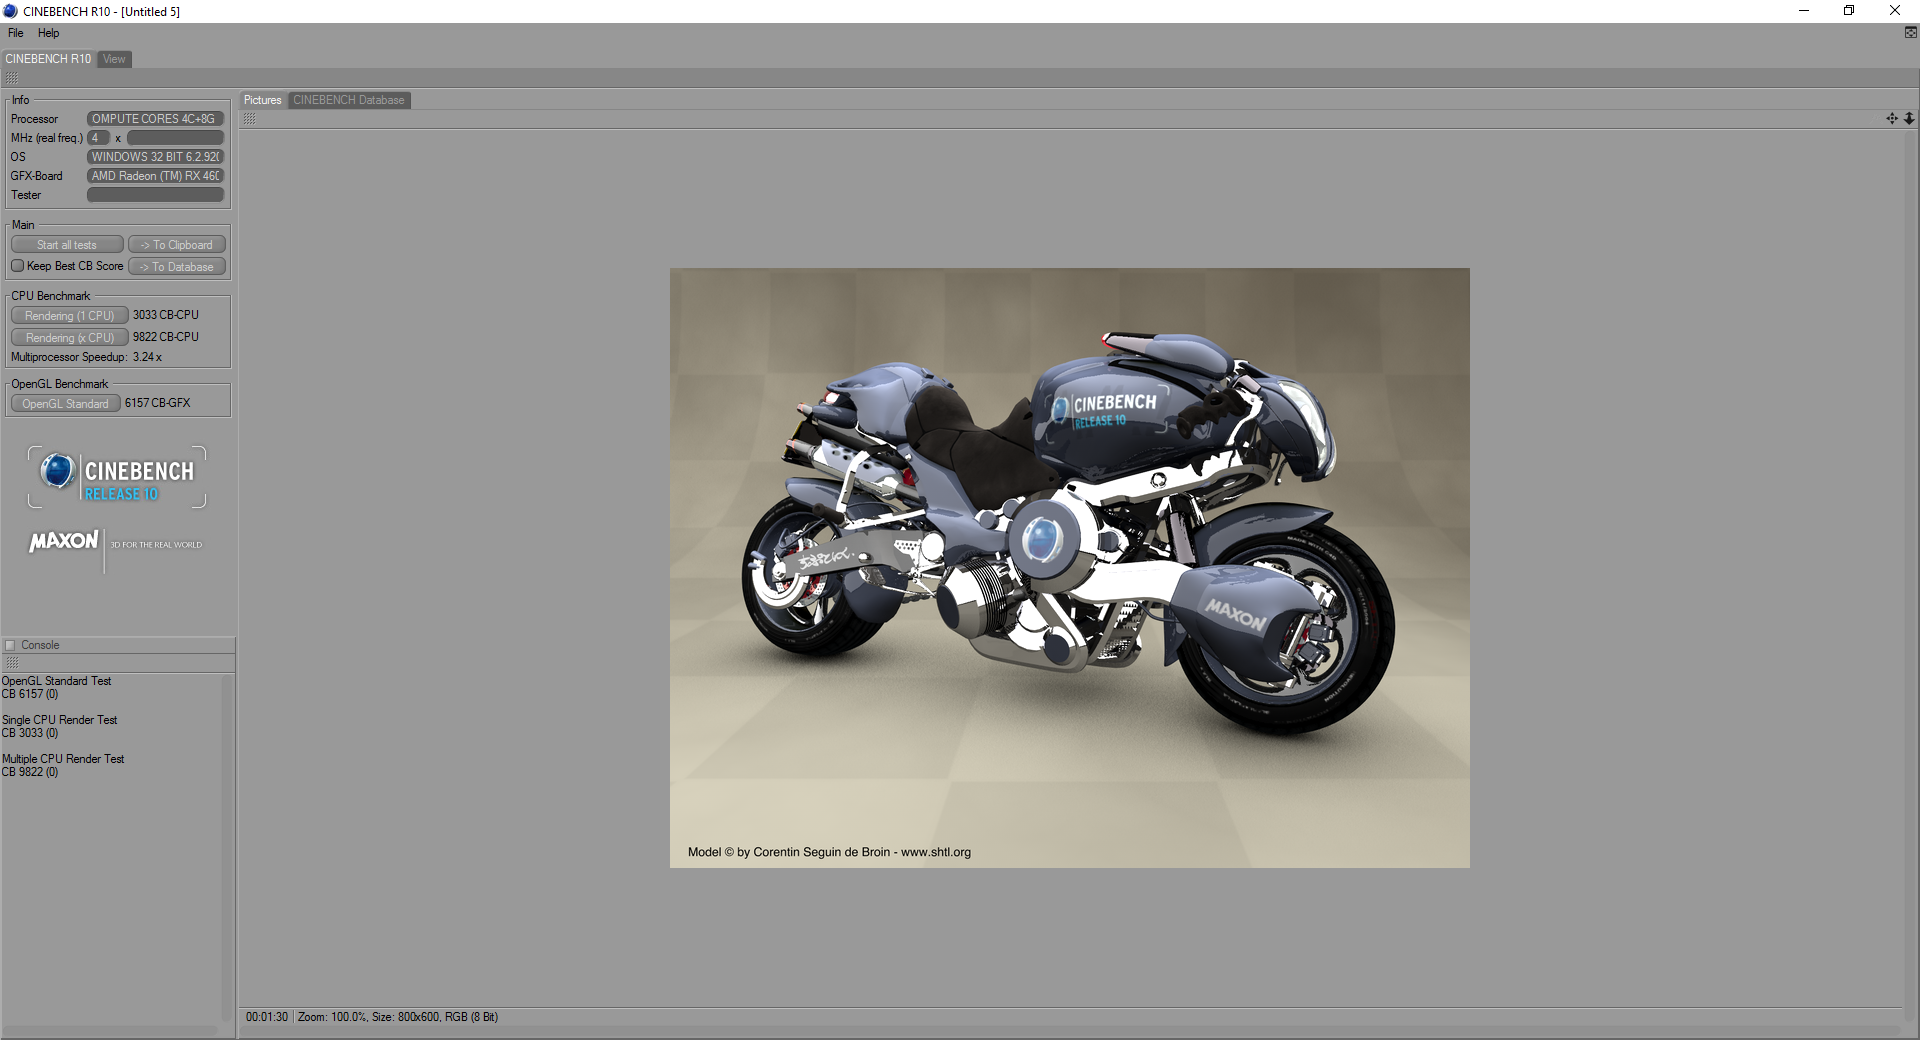
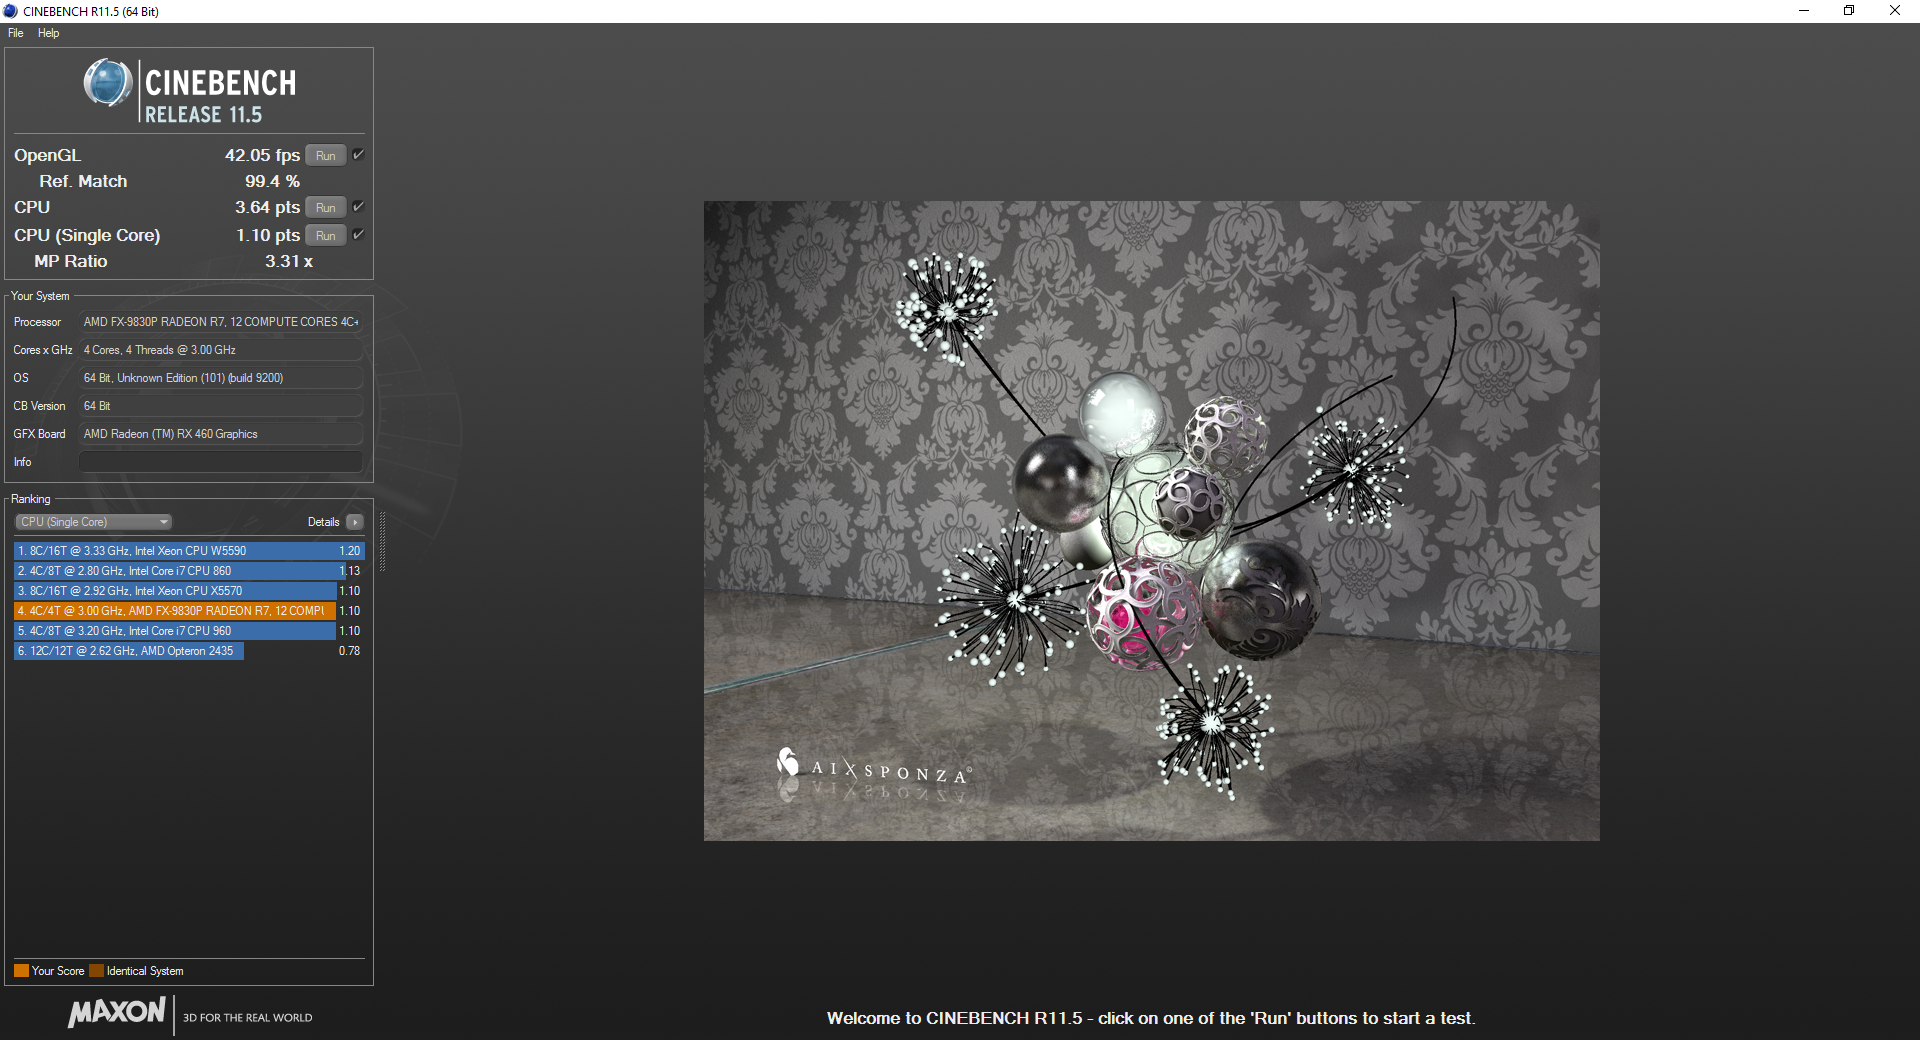
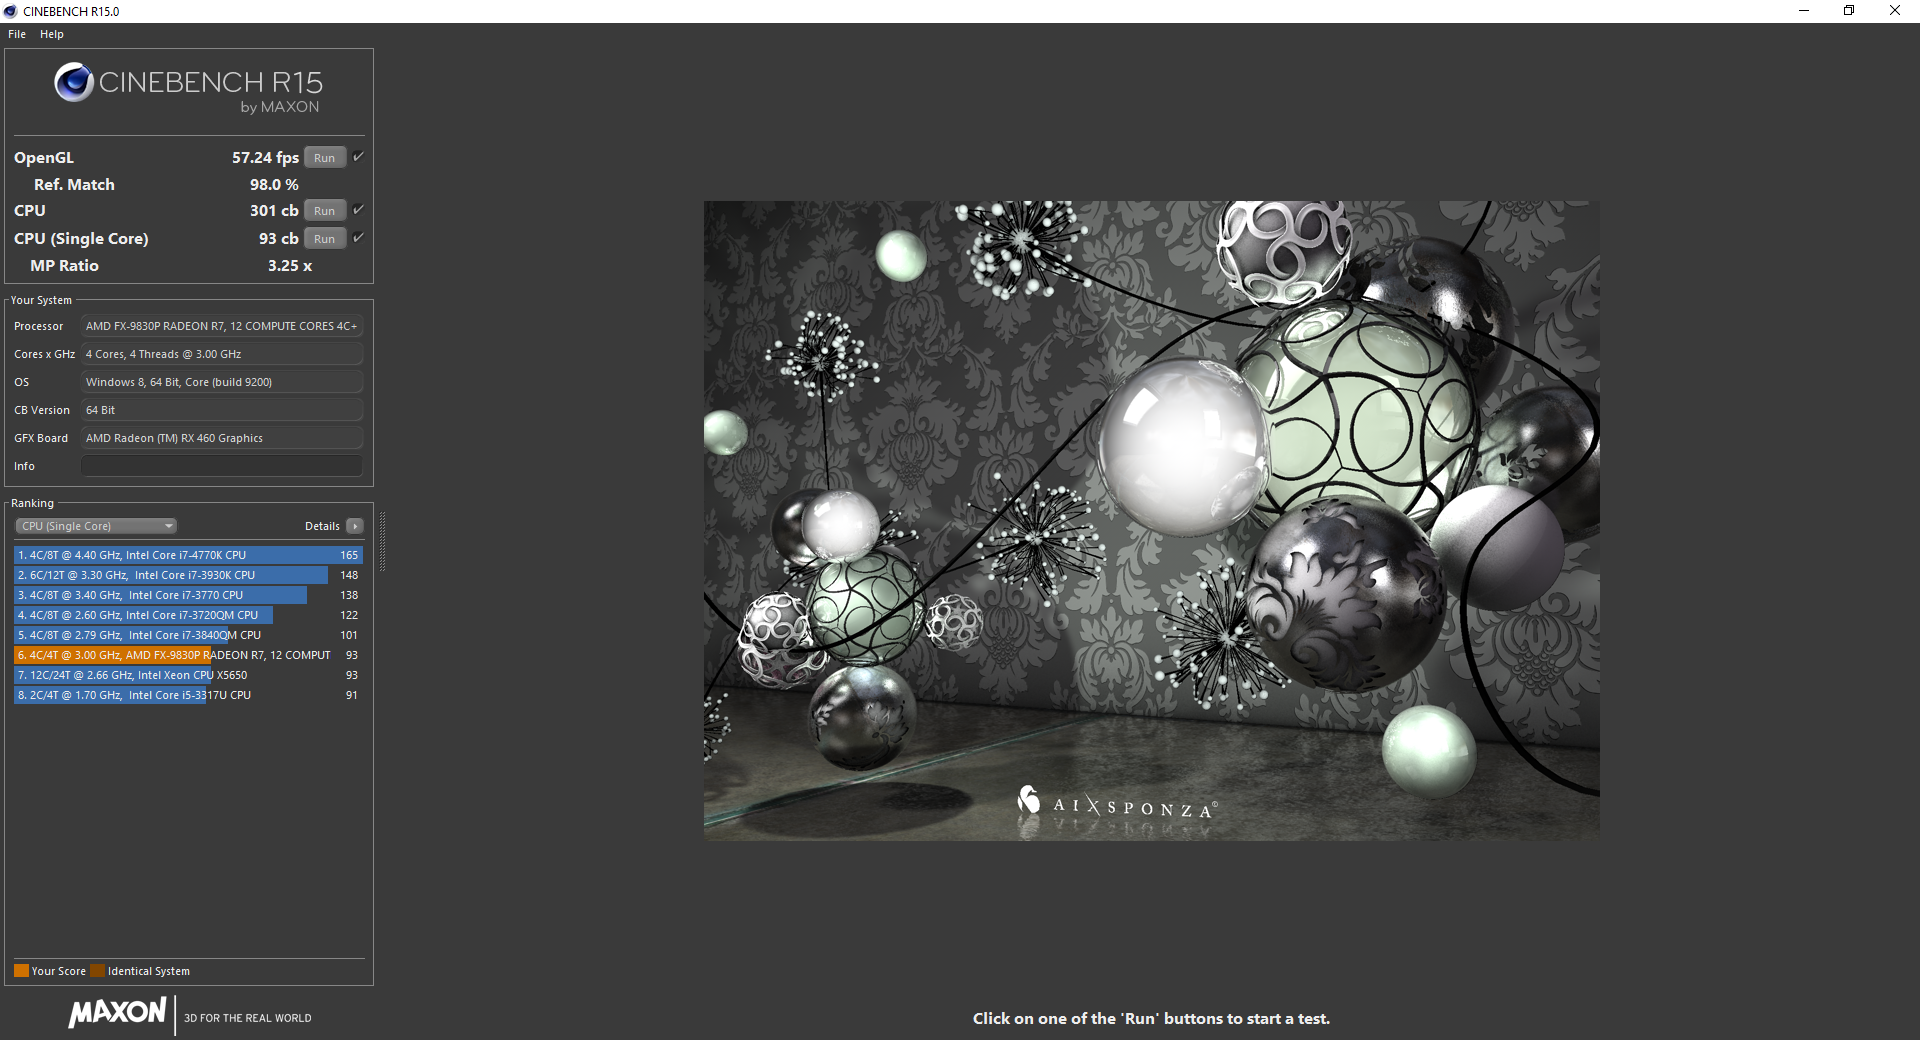
CPU performance is comparable to the low-end Skylake Core i3-6100U and Kaby Lake Core i3-7100U found on some entry-level mainstream systems. When considering that this is the best quad-core Bristol Bridge has to offer for notebooks, overall processor performance is very poor for a budget gaming notebook. Single-core performance is especially poorer than expected as even an i5-7200U can outperform our Asus by about 30 percent according to CineBench R15. The FX-9830P is still faster than the abysmal A10-9620P and A12-9720P in all cases, but certainly not by as much as we were hoping.
CPU performance is steady as shown by our looping CineBench R15 Multi-Thread scores below. This doesn't mean that clock rates are perfectly flat, however, as our Stress Test section will detail. Clock rates fluctuate between 3.2 GHz and 3.5 GHz rapidly enough that performance can be considered smooth over time.
See our dedicated CPU page on the FX-9830P for more technical information and benchmark comparisons.
| wPrime 2.10 - 1024m | |
| Medion Akoya E6422 | |
| Lenovo Thinkpad 13-20J1001BUS | |
| Samsung Notebook 9 NP900X3N-K01US | |
| HP Pavilion 15z-bw000 | |
| HP Pavilion 17z 1EX13AV | |
| Asus FX550IU-WSFX | |
| Acer Spin 5 SP513-52N-566U | |
| Eurocom Q5 | |
* ... smaller is better
System Performance
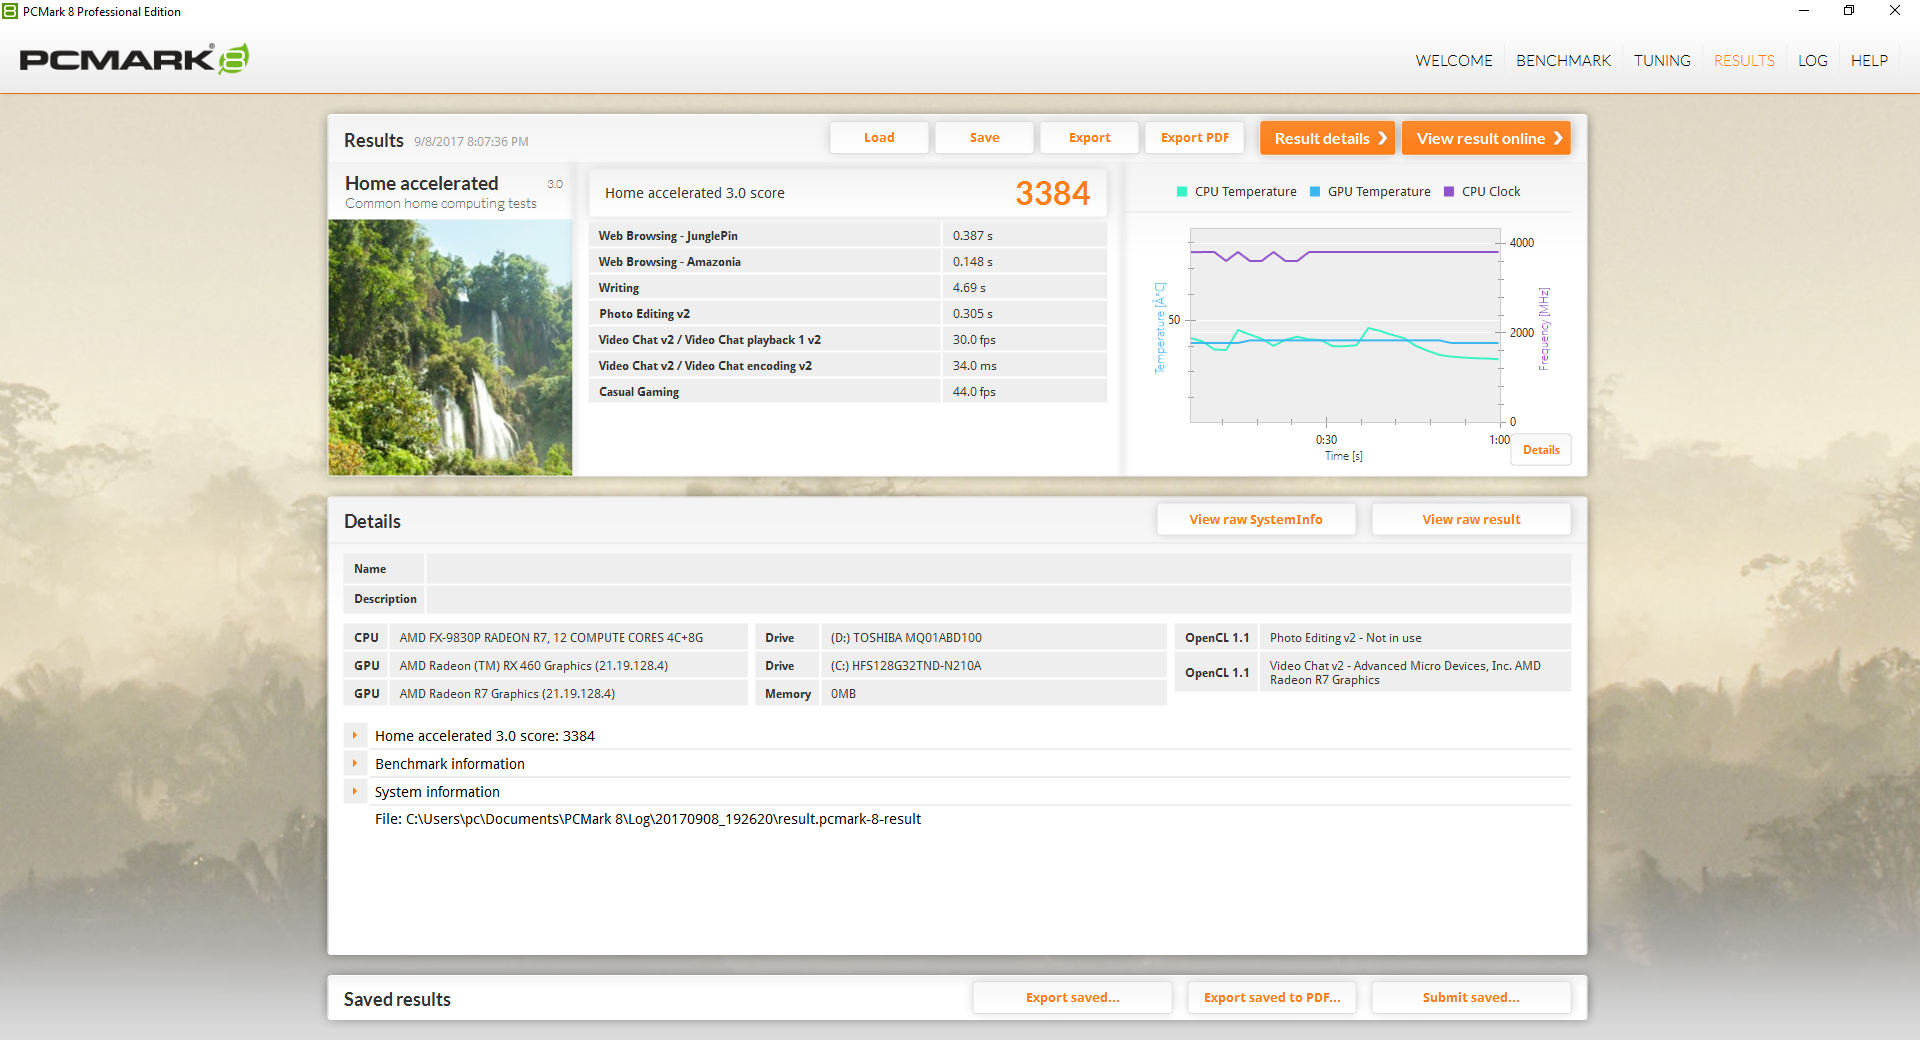
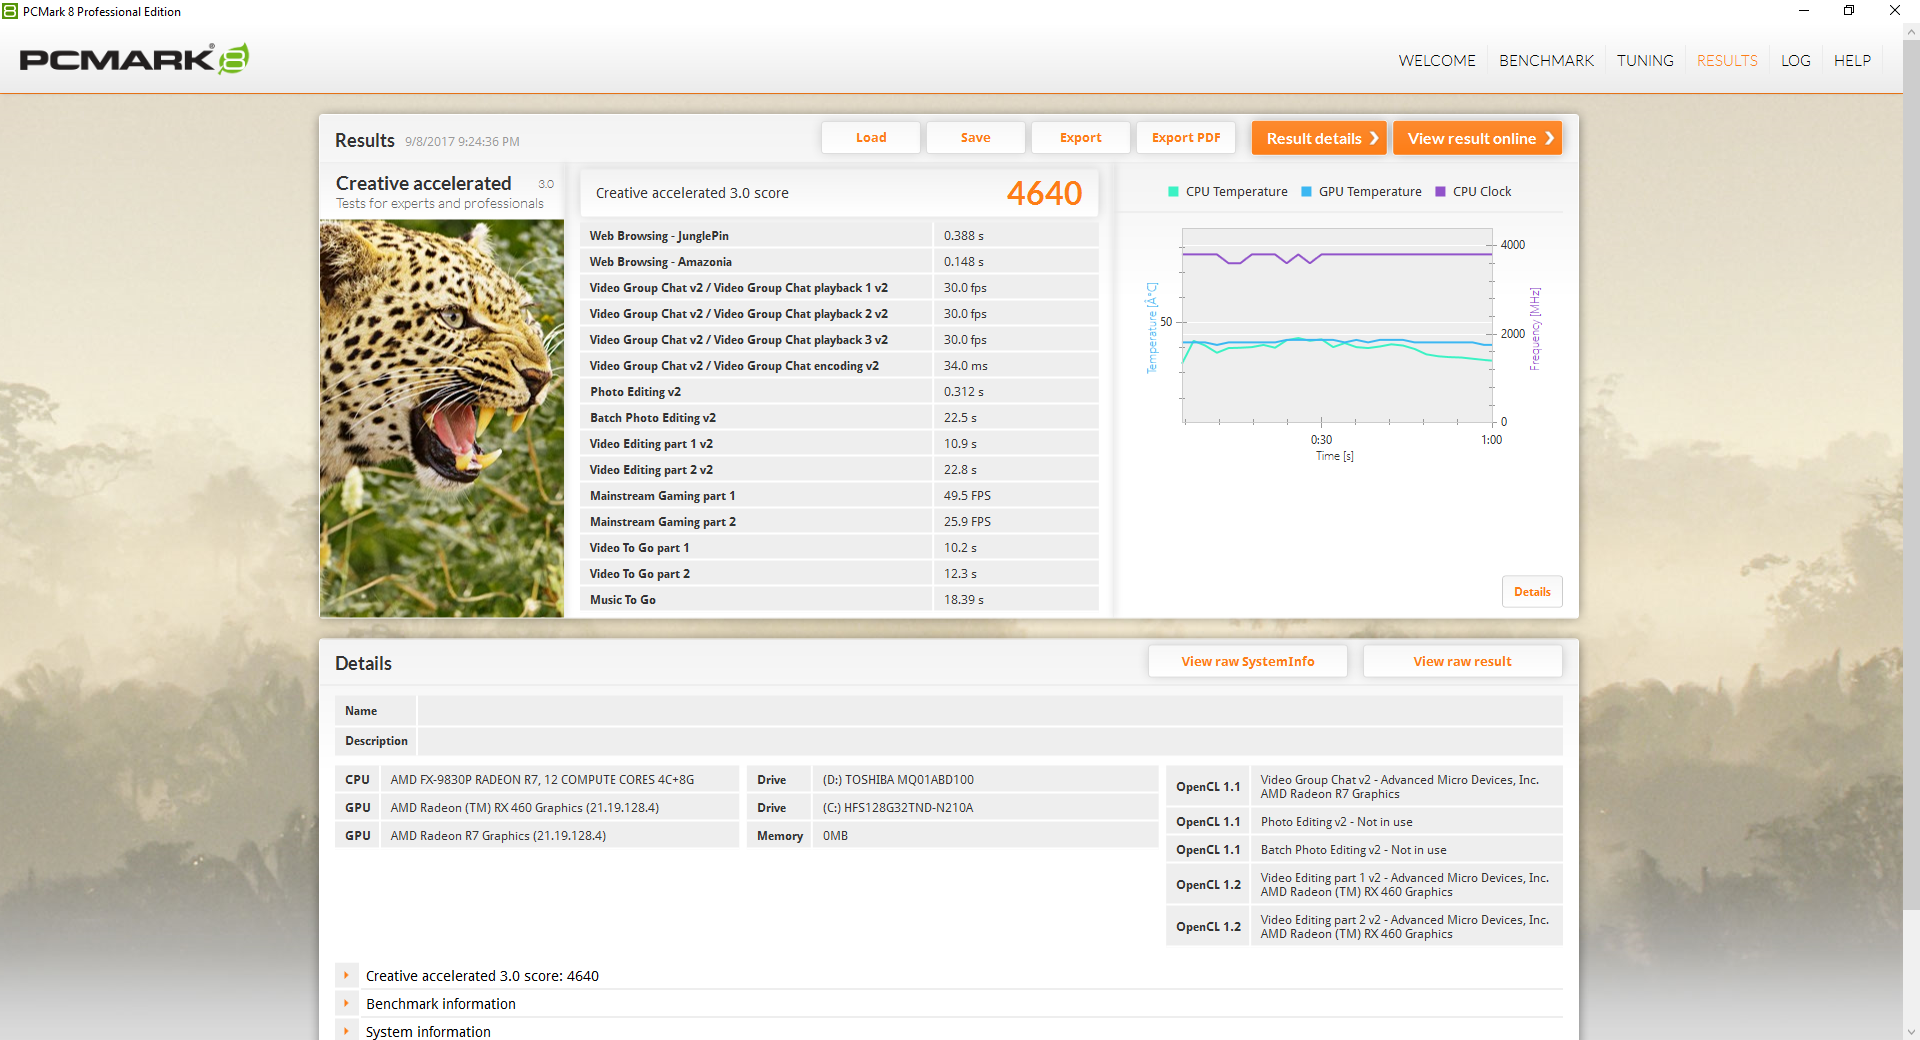
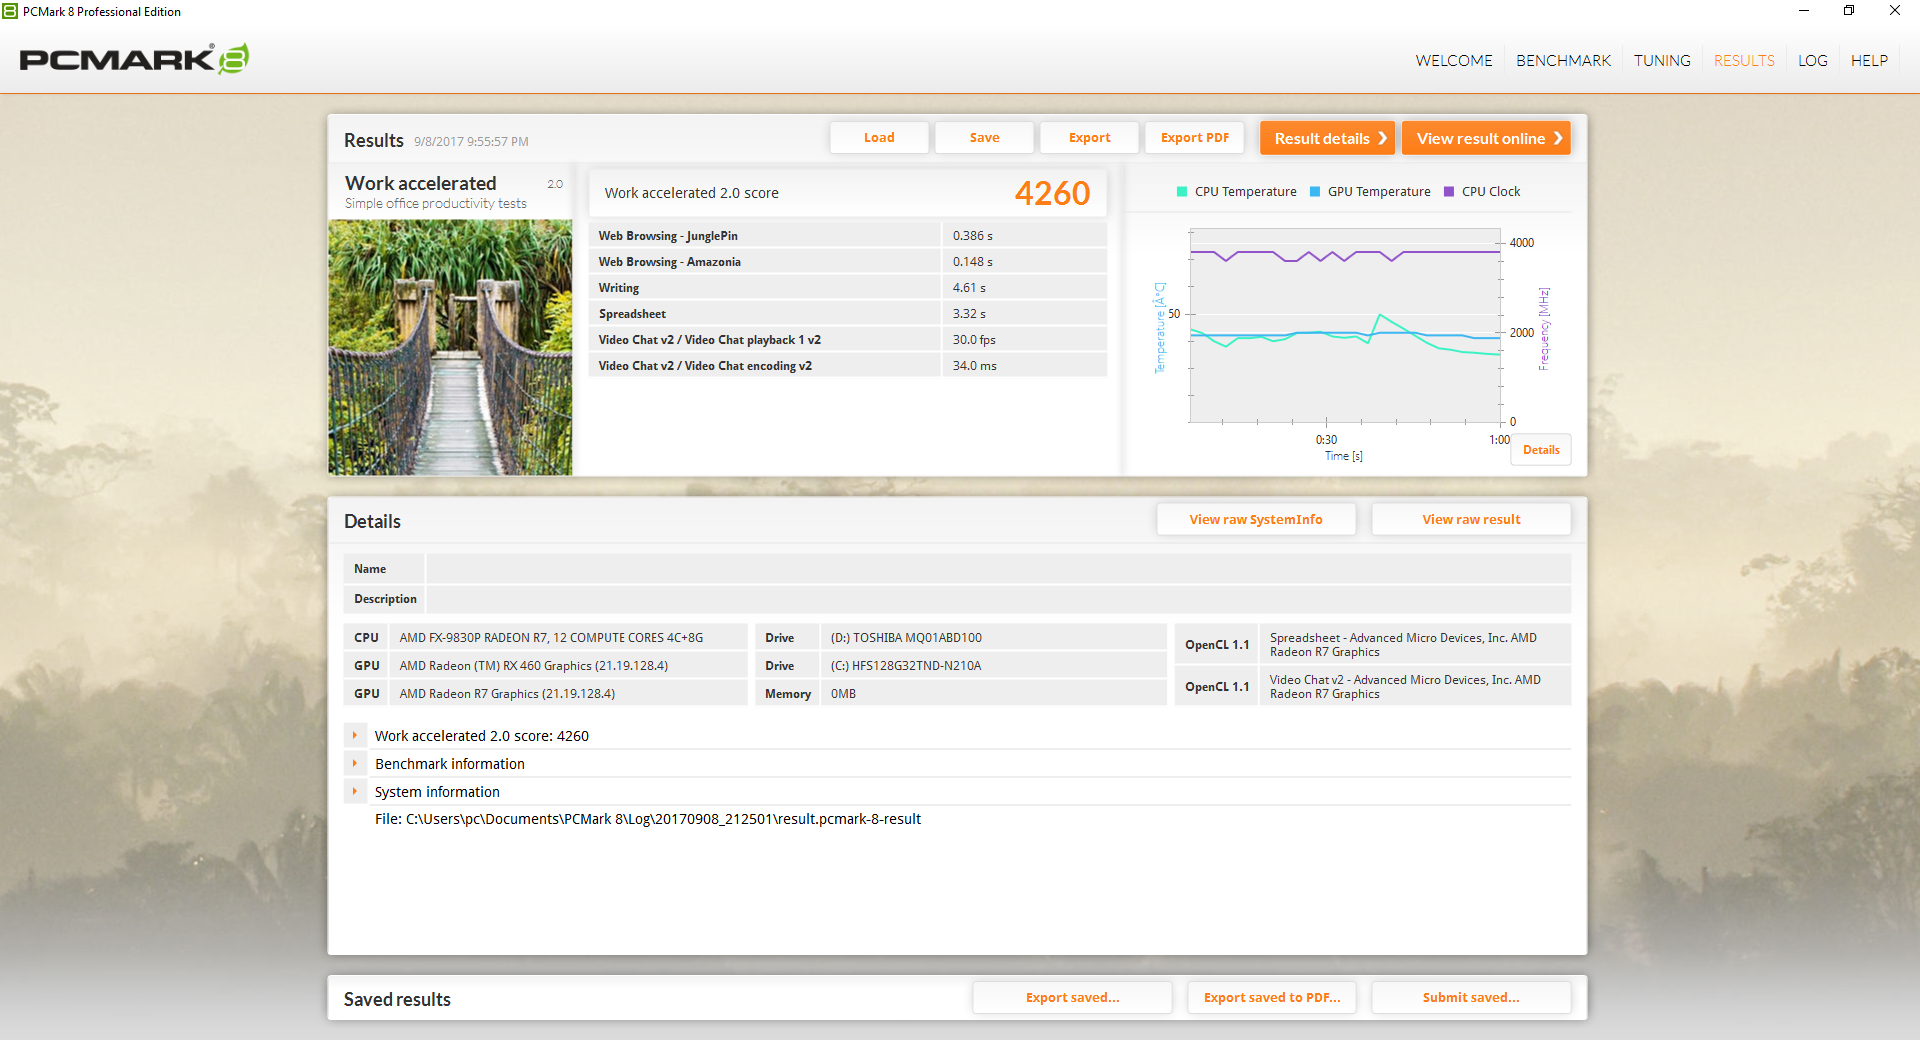
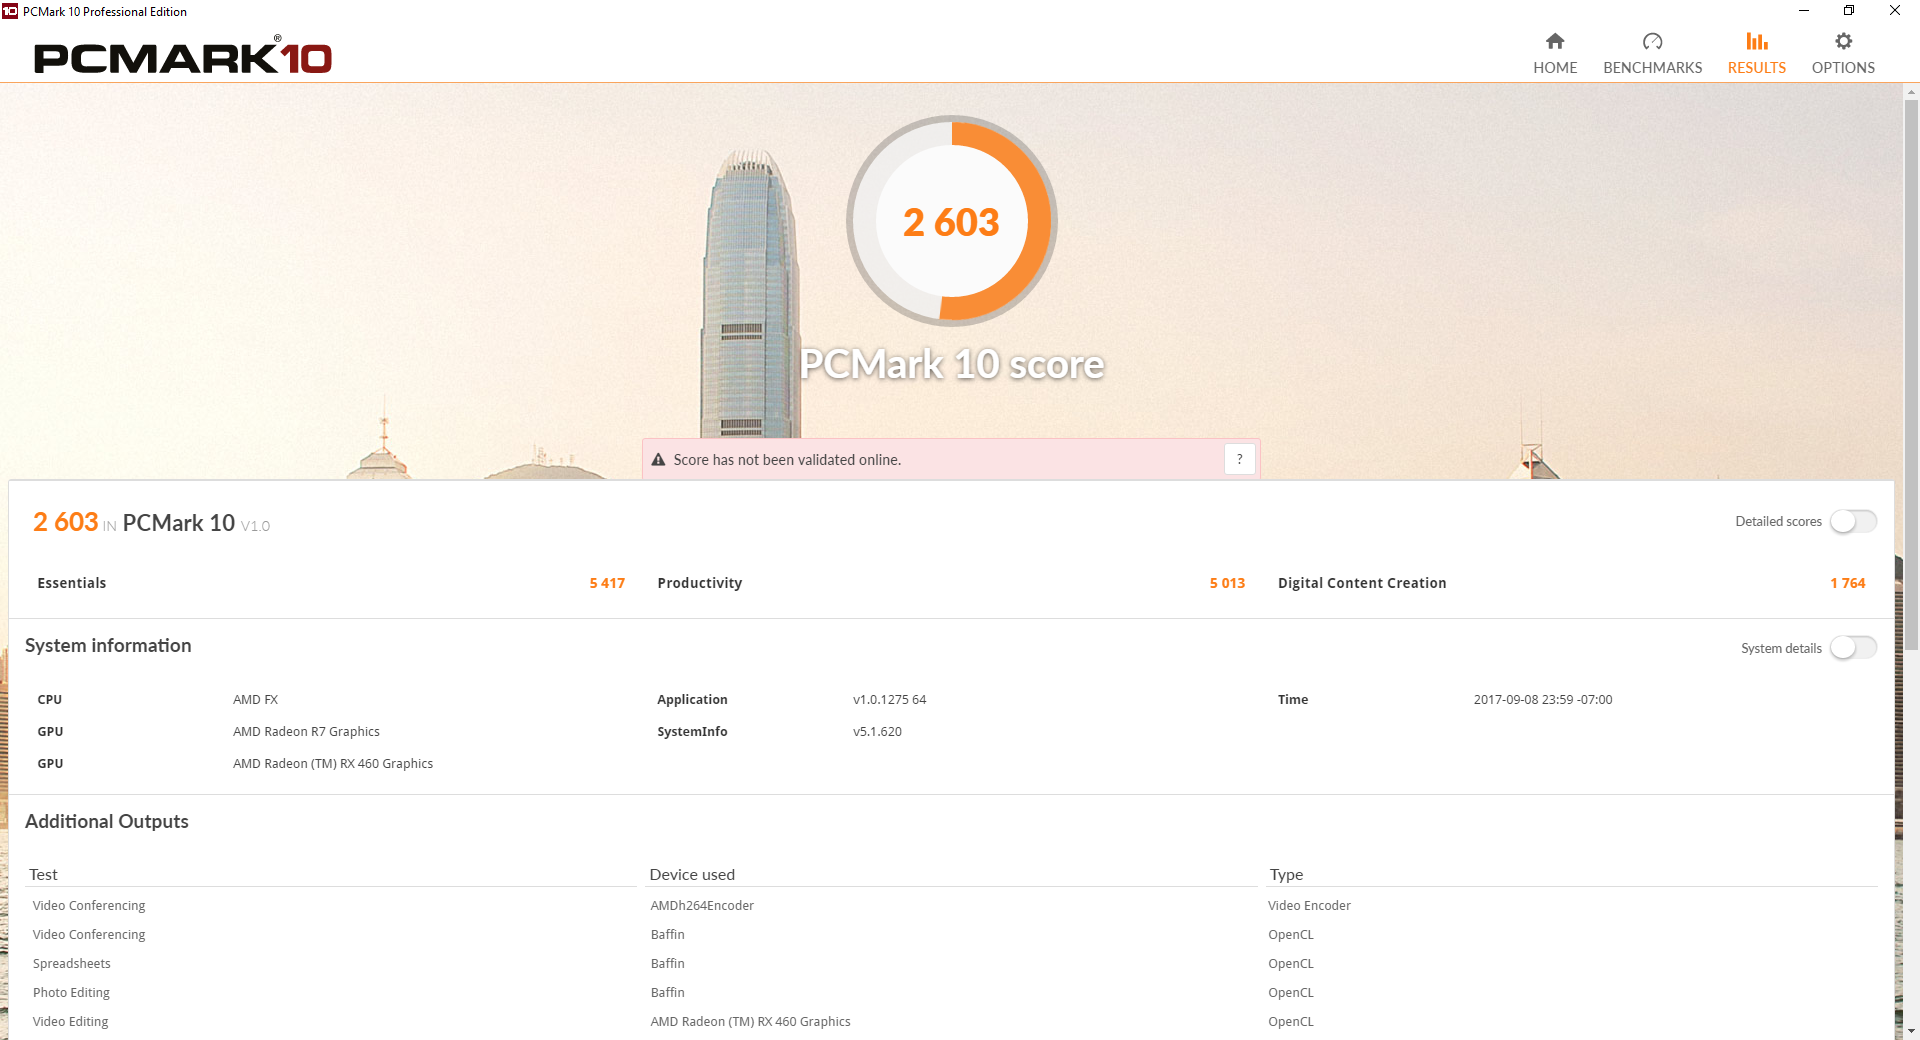
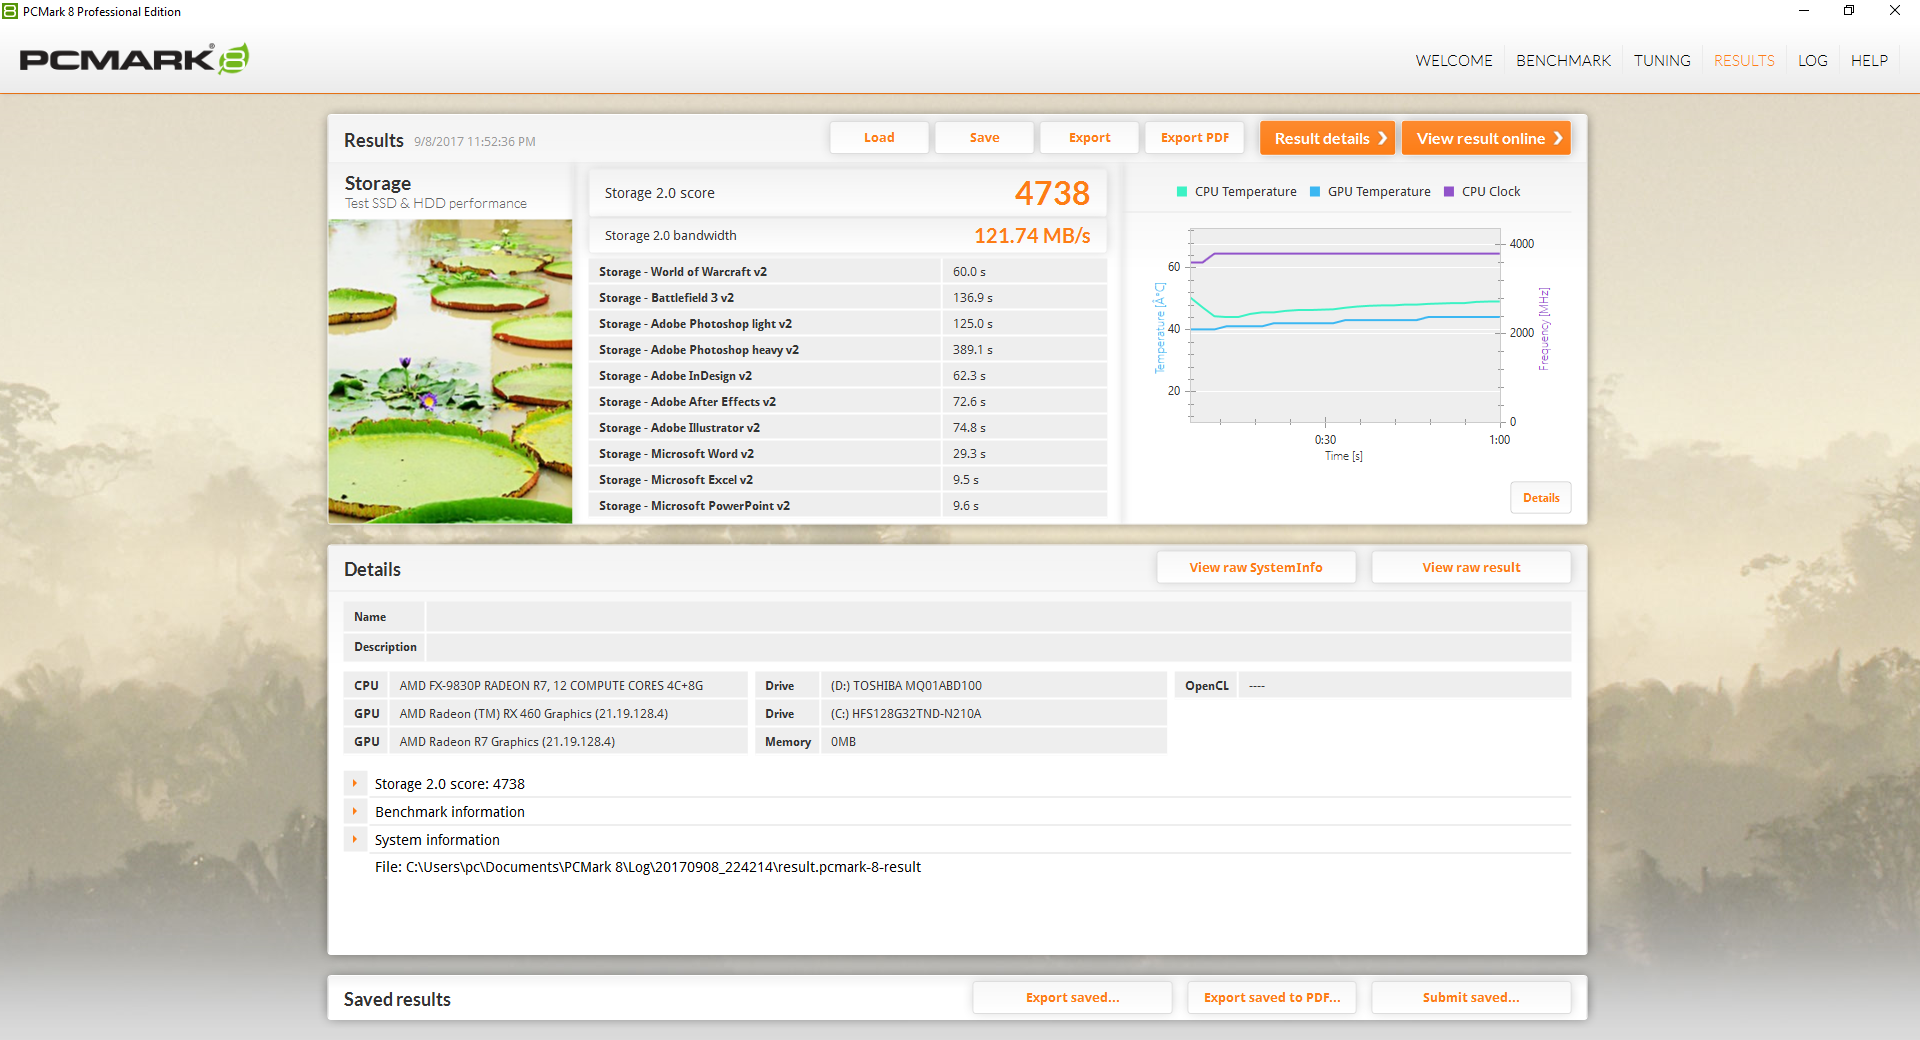
PCMark consistently ranks our AMD Asus below other gaming notebooks equipped with GTX 1050 graphics. The differences in scores only grow larger when running the newer PCMark 10 benchmark. Subjectively, navigating through the operating system is smooth and without issues, but applications (and especially games) take noticeably longer to launch due to the weaker processing power.
| PCMark 8 | |
| Home Score Accelerated v2 | |
| HP Omen 15-ce002ng | |
| Dell Inspiron 15 7000 7567 | |
| Asus FX553VD-DM249T | |
| Gigabyte Sabre 15G | |
| Asus FX550IU-WSFX | |
| Work Score Accelerated v2 | |
| HP Omen 15-ce002ng | |
| Dell Inspiron 15 7000 7567 | |
| Gigabyte Sabre 15G | |
| Asus FX553VD-DM249T | |
| Asus FX550IU-WSFX | |
| PCMark 10 | |
| Essentials | |
| HP Omen 15-ce002ng | |
| Gigabyte Sabre 15G | |
| Asus FX550IU-WSFX | |
| Score | |
| HP Omen 15-ce002ng | |
| Gigabyte Sabre 15G | |
| Asus FX550IU-WSFX | |
| PCMark 8 Home Score Accelerated v2 | 3384 points | |
| PCMark 8 Creative Score Accelerated v2 | 4640 points | |
| PCMark 8 Work Score Accelerated v2 | 4260 points | |
| PCMark 10 Score | 2603 points | |
Help | ||
Storage Devices
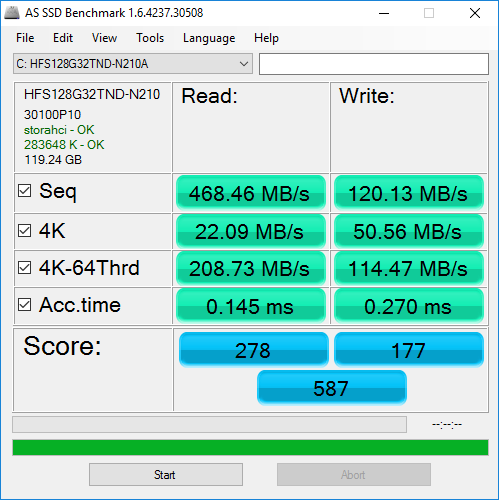
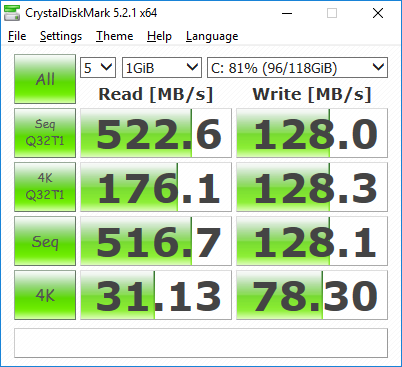
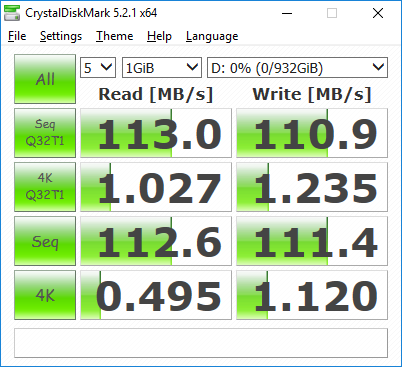
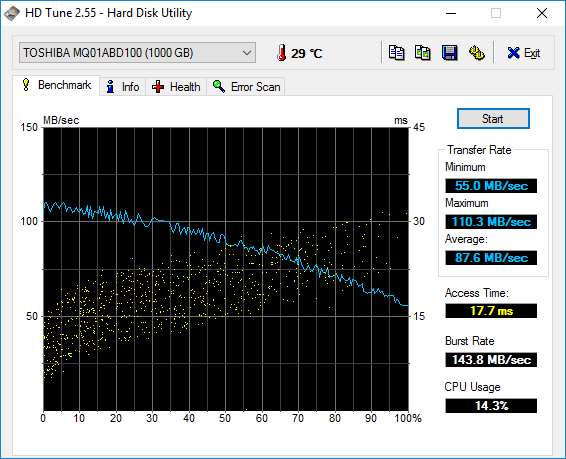
Internal storage bays include 2x 2.5-inch SATA III of which one is easily accessible. Our specific unit ships with a primary 128 GB SK Hynix HFS128G32TND SSD and secondary 1 TB Toshiba MQ01ABD100 HDD. Transfer rates rates from the primary drive are below average even for a SATA III SSD. When compared to the Intel and Lite-On SSDs as found on the Dell Inspiron 7567 and Sabre 15 series, sequential write rates are very slow at just 120 MB/s. The secondary 5400 RPM Toshiba HDD also exhibits average transfer rates of just 87.6 MB/s compared to over 100 MB/s on faster 7200 RPM models. Unsurprisingly, costlier gaming notebooks with NVMe support will be several times faster than what our AMD Asus has to offer.
See our table of HDDs and SSDs for more benchmarks and comparisons.
| Asus FX550IU-WSFX SK Hynix HFS128G32TND | Dell Inspiron 15 7000 7567 Intel SSDSCKKF256H6 | Gigabyte Sabre 15G Liteonit CV3-8D128 | Asus FX553VD-DM249T Hynix HFS128G39TND | MSI GP62 7REX-1045US Toshiba NVMe THNSN5128GP | |
|---|---|---|---|---|---|
| AS SSD | 76% | 79% | 19% | 246% | |
| Copy Game MB/s (MB/s) | 110.6 | 286.2 159% | 323.5 192% | 442.8 300% | |
| Copy Program MB/s (MB/s) | 70.8 | 224 216% | 195.3 176% | 326.3 361% | |
| Copy ISO MB/s (MB/s) | 150.8 | 425.4 182% | 446.8 196% | 1128 648% | |
| Score Total (Points) | 587 | 734 25% | 752 28% | 798 36% | 1829 212% |
| Score Write (Points) | 177 | 227 28% | 234 32% | 175 -1% | 600 239% |
| Score Read (Points) | 278 | 332 19% | 337 21% | 419 51% | 849 205% |
| Access Time Write * (ms) | 0.27 | 0.057 79% | 0.073 73% | 0.273 -1% | 0.034 87% |
| Access Time Read * (ms) | 0.145 | 0.094 35% | 0.141 3% | 0.119 18% | 0.079 46% |
| 4K-64 Write (MB/s) | 114.5 | 118.3 3% | 132.2 15% | 97 -15% | 428.2 274% |
| 4K-64 Read (MB/s) | 208.7 | 258.6 24% | 257 23% | 342.1 64% | 628 201% |
| 4K Write (MB/s) | 50.6 | 66.6 32% | 53.8 6% | 65.5 29% | 112 121% |
| 4K Read (MB/s) | 22.09 | 25.16 14% | 28.3 28% | 26.34 19% | 35.84 62% |
| Seq Write (MB/s) | 120.1 | 416.1 246% | 479.8 300% | 129.1 7% | 601 400% |
| Seq Read (MB/s) | 468.5 | 481.6 3% | 516 10% | 503 7% | 1848 294% |
* ... smaller is better

GPU Performance
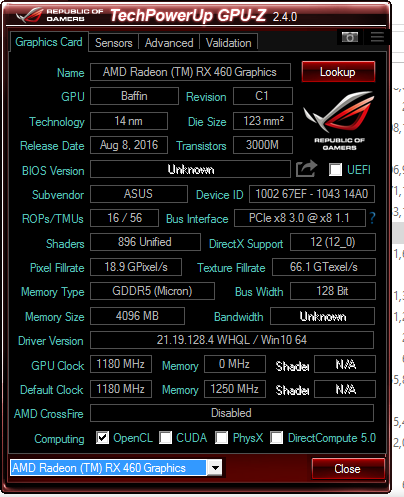
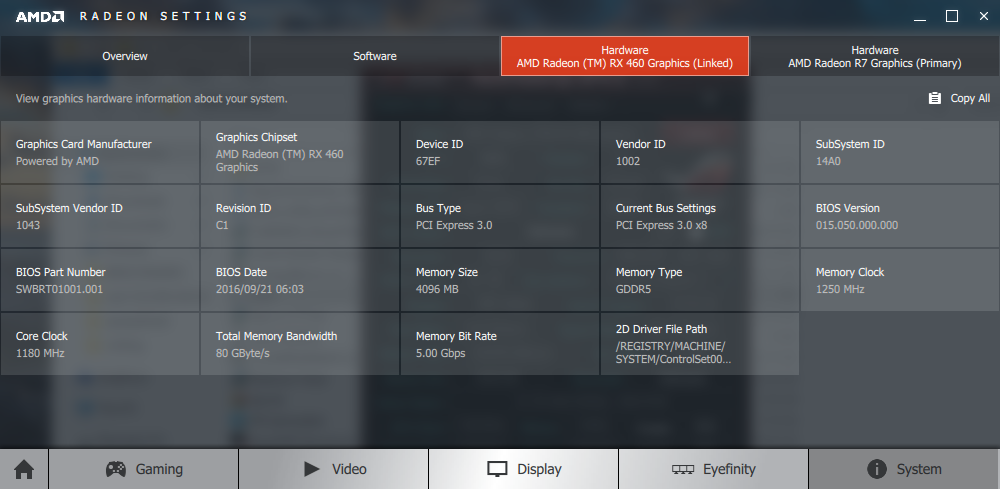
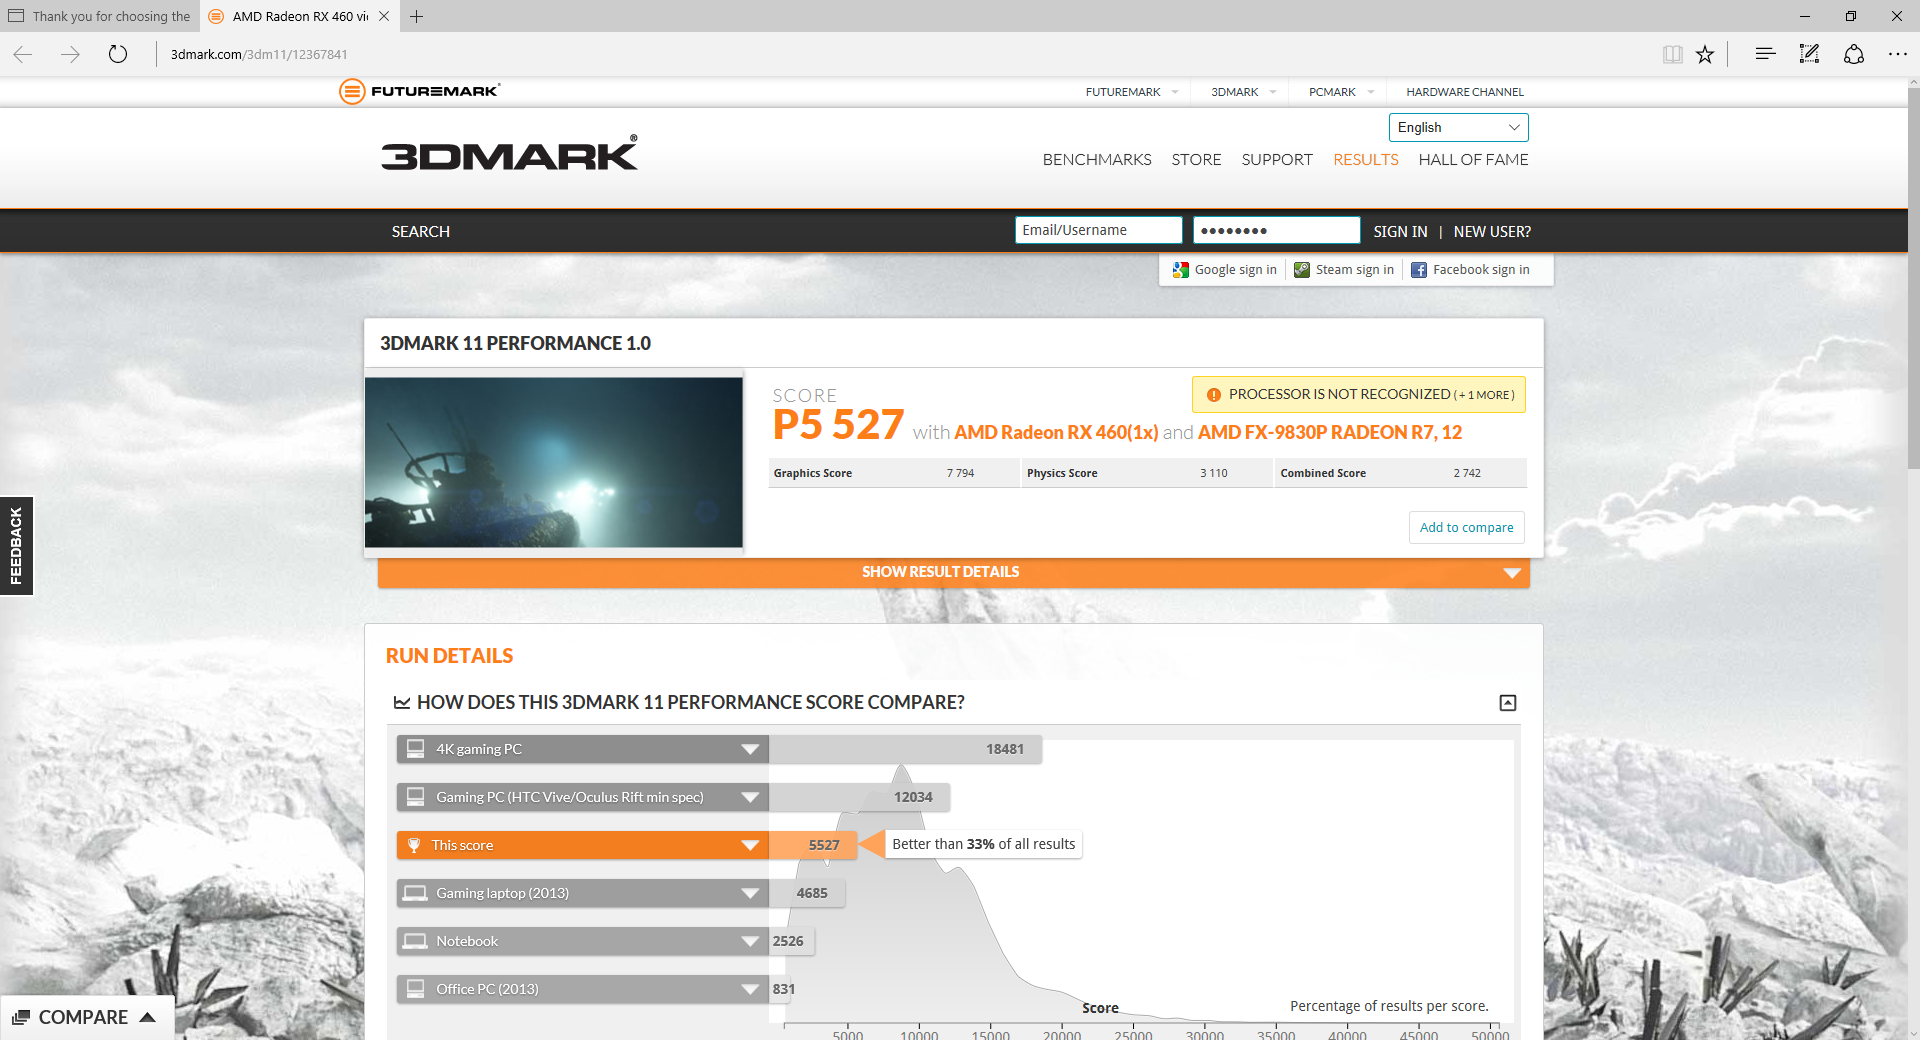
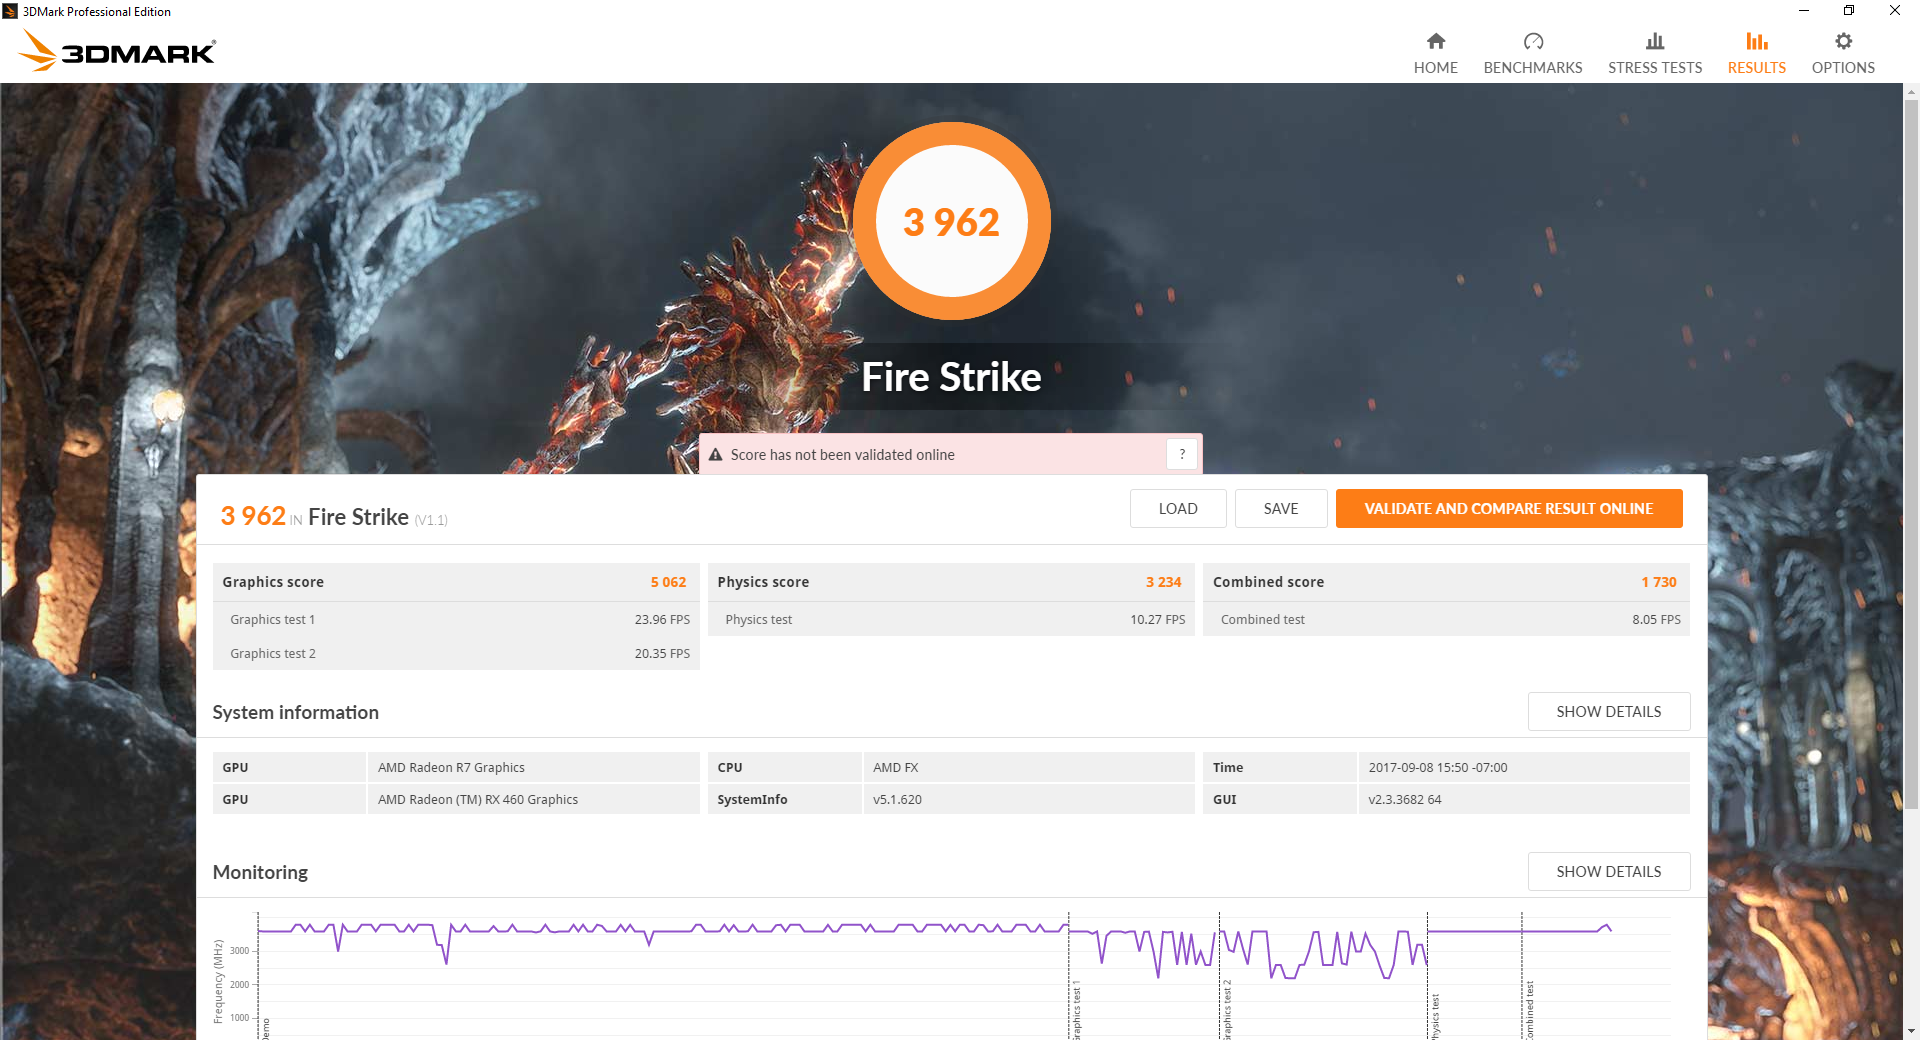
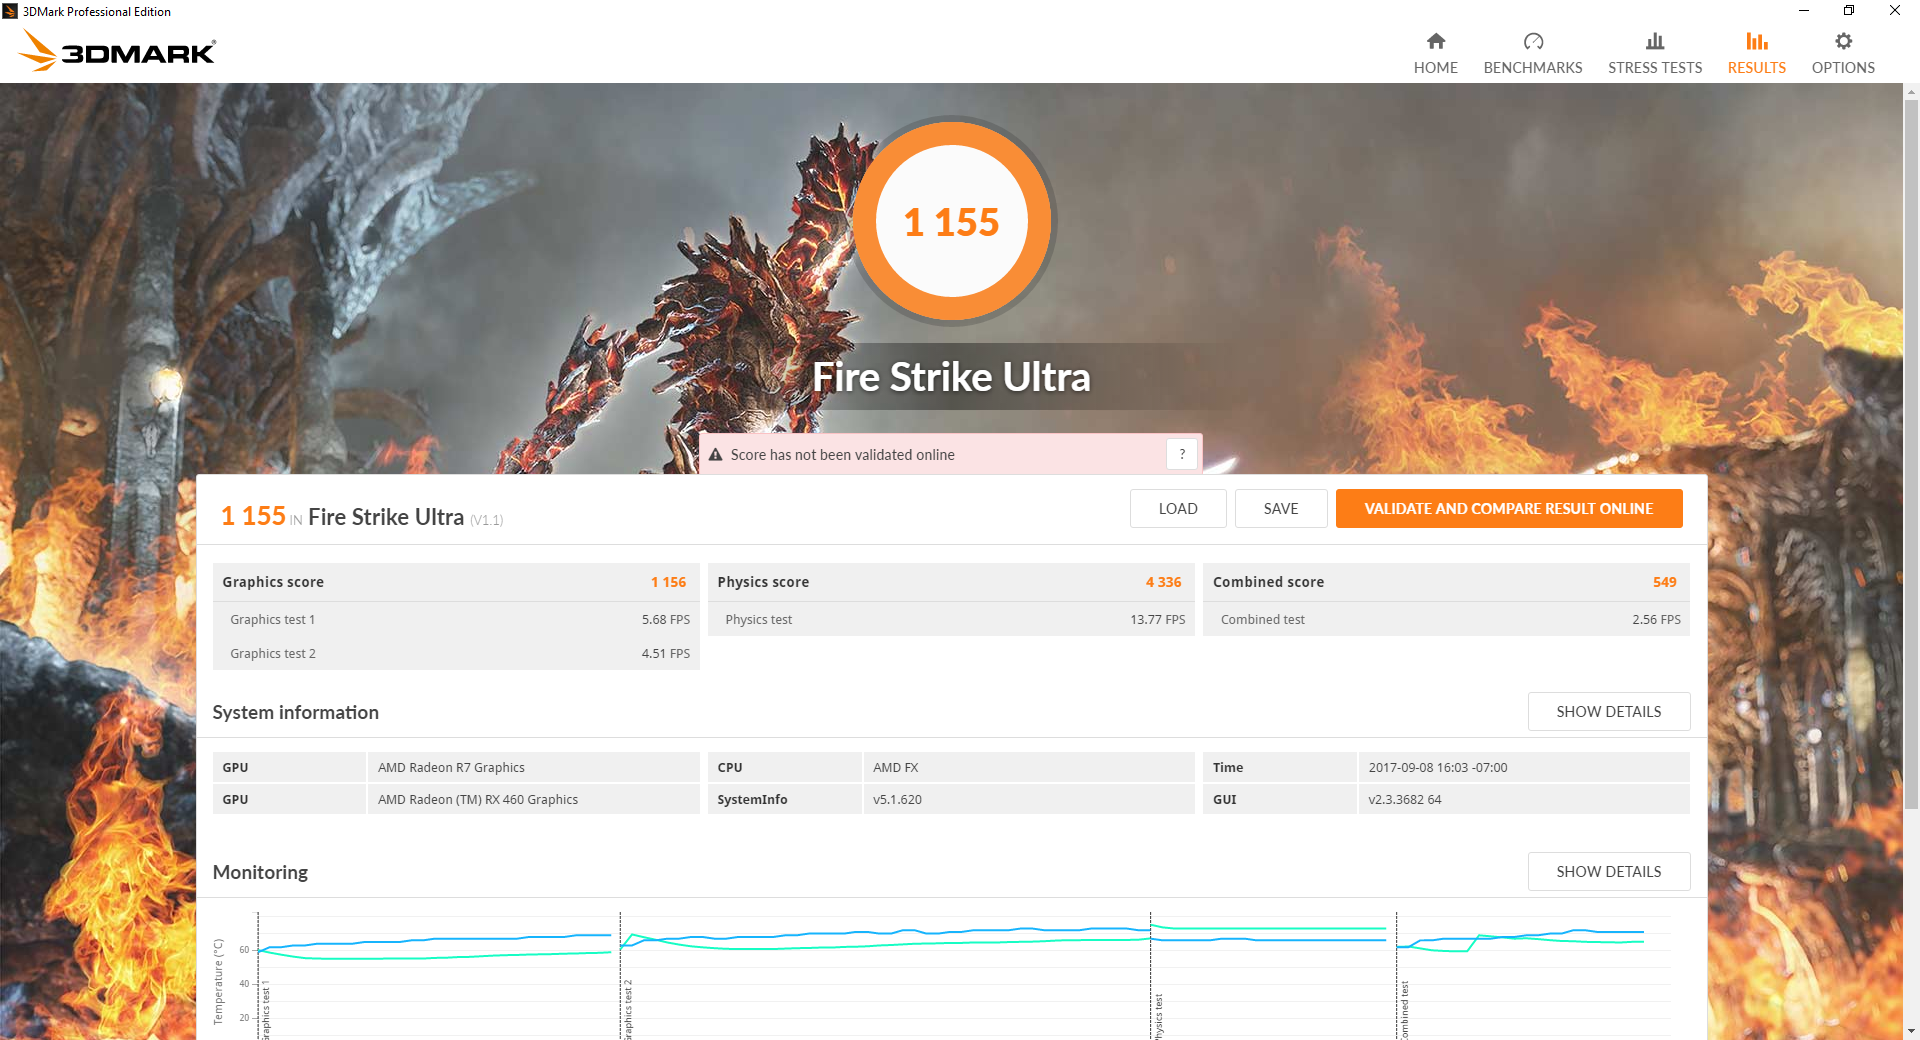
According to 3DMark Fire Strike, the RX 460 in our Asus laptop is 11 percent slower than our reference RX 460 desktop setup. Much of the performance discrepancy can be attributed to the slower clock speed and memory speed on our mobile RX 460 when under load. While the mobile GPU is rated for 1180 MHz to be similar to the 1200 MHz RX 460 desktop, actual clock rates will fluctuate between 866 MHz and 1045 MHz on our Asus notebook.
Raw graphics performance from our mobile RX 460 sits comfortably between the Kepler GTX 960M and GTX 965M. In other words, AMD's budget Polaris 11 offering is roughly equivalent to Nvidia's mid-range offering from the last generation. When compared to the current Pascal lineup, however, the RX 460 is significantly behind in both performance and performance-per-Watt. The increasingly common GTX 1050 outperforms the RX 460 by about 20 to 25 percent.
See our review on the desktop RX 460 for more information on the Polaris series.
| 3DMark | |
| 1280x720 Cloud Gate Standard Graphics | |
| AMD Radeon RX 480 8 GB Reference | |
| Gigabyte Sabre 15G | |
| XFX RX-460P4DFG5 Double Dissipation 4 GB | |
| HP Omen 17-w010ng | |
| Asus FX550IU-WSFX | |
| Asus Zenbook UX510UW-CN044T | |
| Acer Aspire E5-575G-549D | |
| Acer Aspire 5 A515-51G-51RL | |
| Samsung Notebook 9 NP900X5N-X01US | |
| 1920x1080 Fire Strike Graphics | |
| AMD Radeon RX 480 8 GB Reference | |
| Gigabyte Sabre 15G | |
| HP Omen 17-w010ng | |
| XFX RX-460P4DFG5 Double Dissipation 4 GB | |
| Asus FX550IU-WSFX | |
| Asus Zenbook UX510UW-CN044T | |
| Acer Aspire 5 A515-51G-51RL | |
| Acer Aspire E5-575G-549D | |
| Samsung Notebook 9 NP900X5N-X01US | |
| 3DMark 11 | |
| 1280x720 Performance GPU | |
| AMD Radeon RX 480 8 GB Reference | |
| XFX RX-460P4DFG5 Double Dissipation 4 GB | |
| HP Omen 17-w010ng | |
| Asus FX550IU-WSFX | |
| Gigabyte Sabre 15G | |
| Asus Zenbook UX510UW-CN044T | |
| Acer Aspire 5 A515-51G-51RL | |
| Acer Aspire E5-575G-549D | |
| Samsung Notebook 9 NP900X5N-X01US | |
| 1280x720 Performance Combined | |
| AMD Radeon RX 480 8 GB Reference | |
| XFX RX-460P4DFG5 Double Dissipation 4 GB | |
| HP Omen 17-w010ng | |
| Gigabyte Sabre 15G | |
| Asus Zenbook UX510UW-CN044T | |
| Acer Aspire 5 A515-51G-51RL | |
| Acer Aspire E5-575G-549D | |
| Asus FX550IU-WSFX | |
| Samsung Notebook 9 NP900X5N-X01US | |
| 3DMark 11 Performance | 5537 points | |
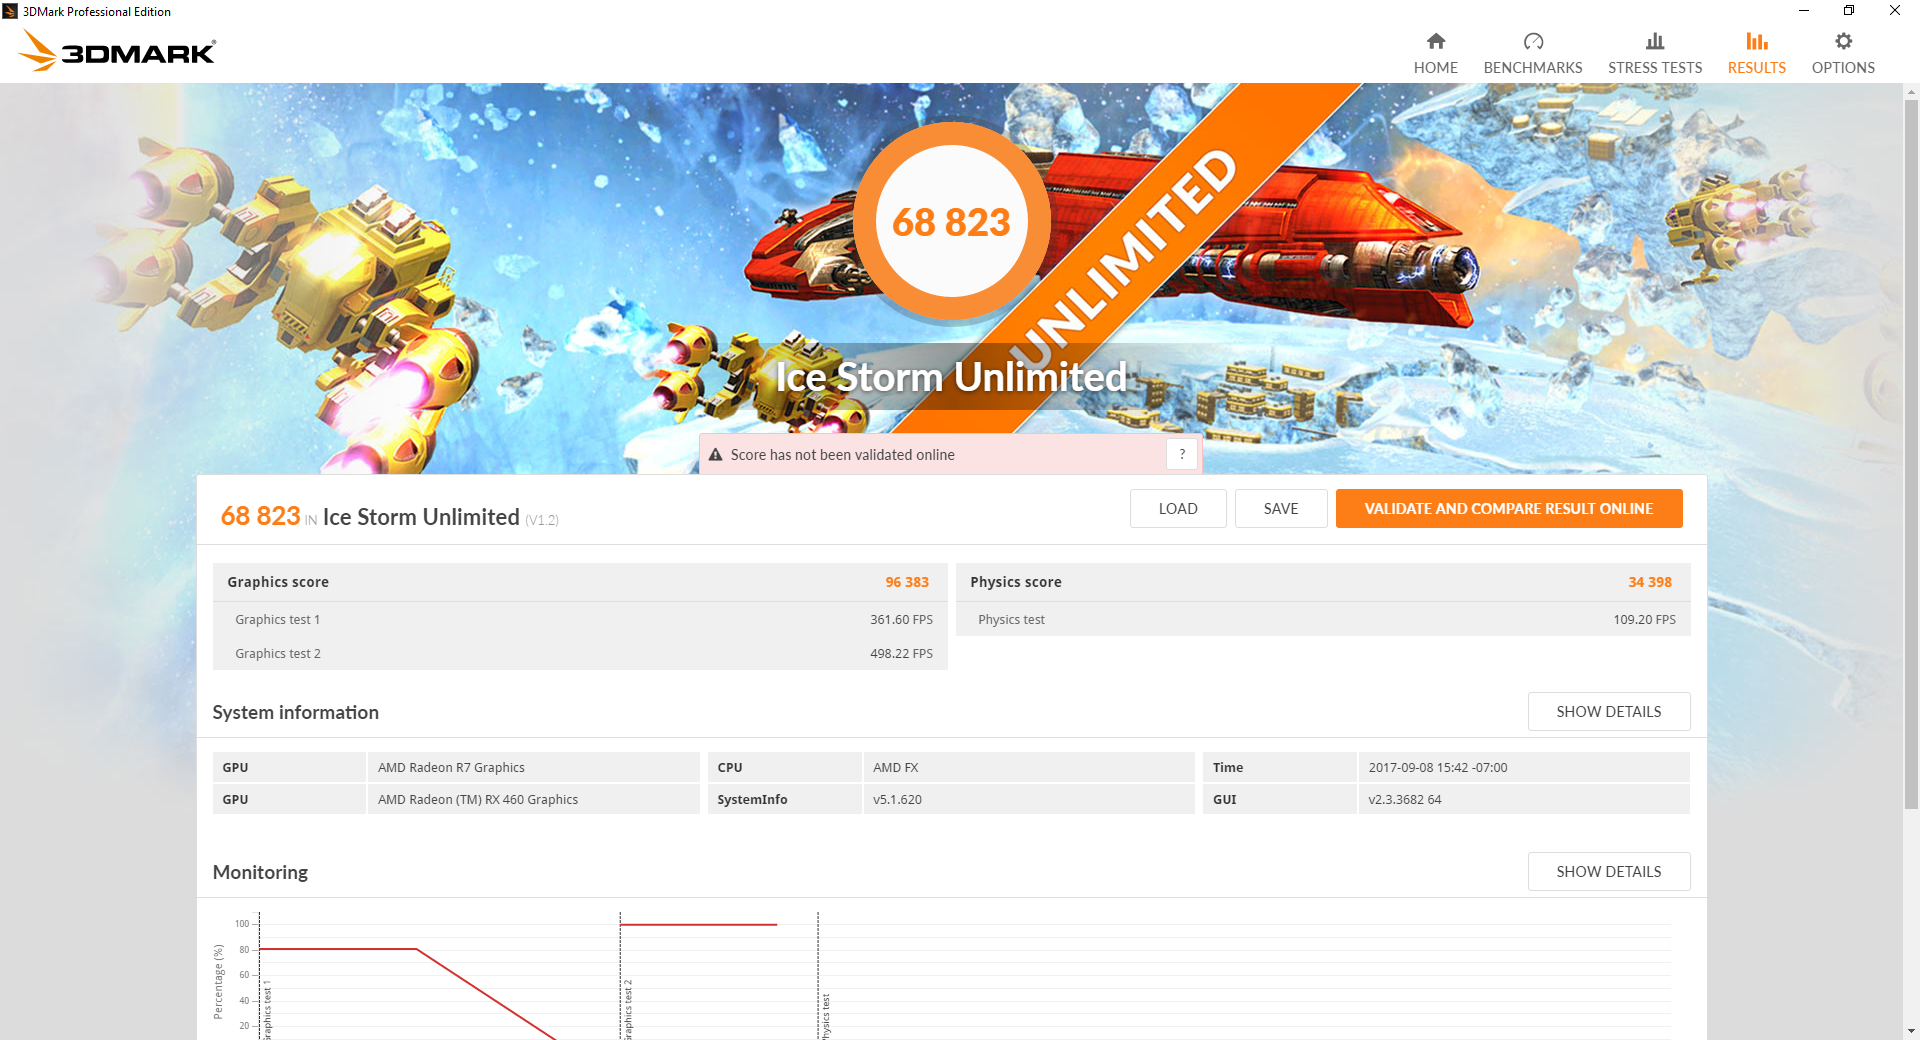
| 3DMark Ice Storm Standard Score | 60282 points | |
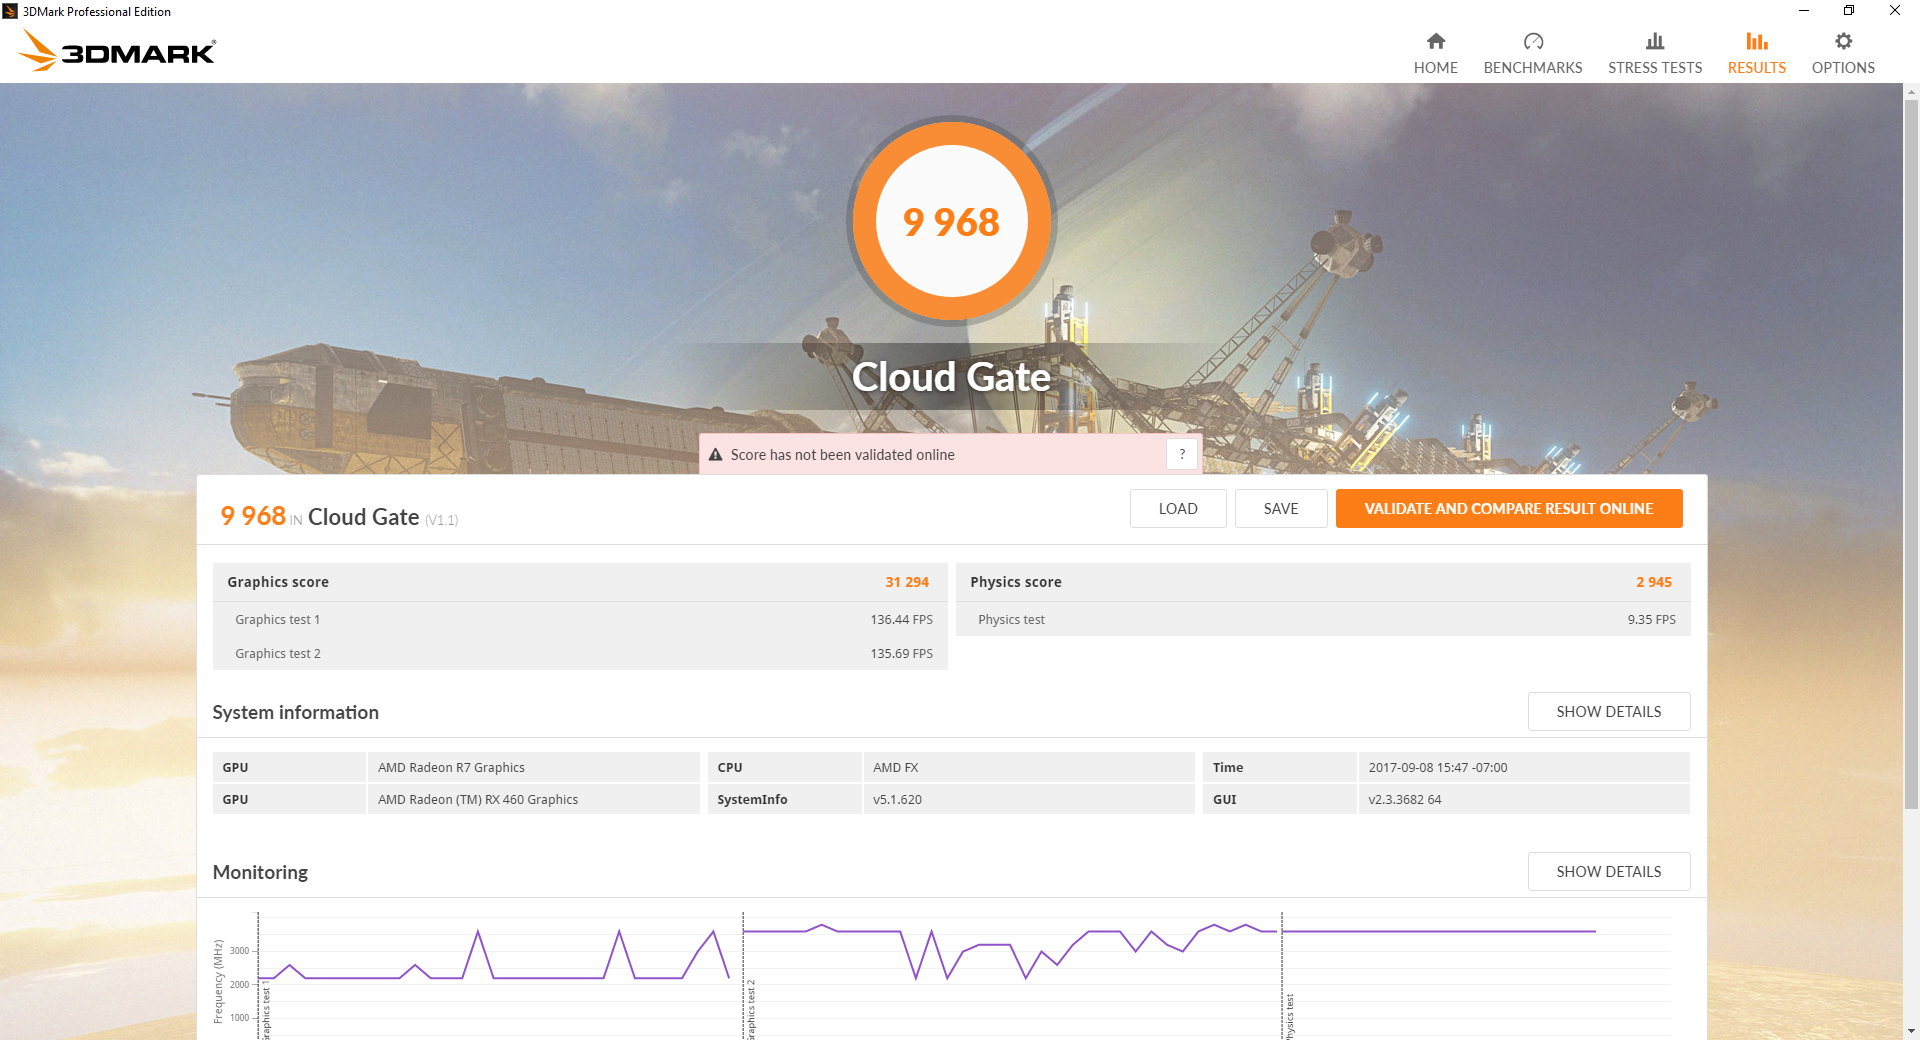
| 3DMark Cloud Gate Standard Score | 9968 points | |
| 3DMark Fire Strike Score | 3962 points | |
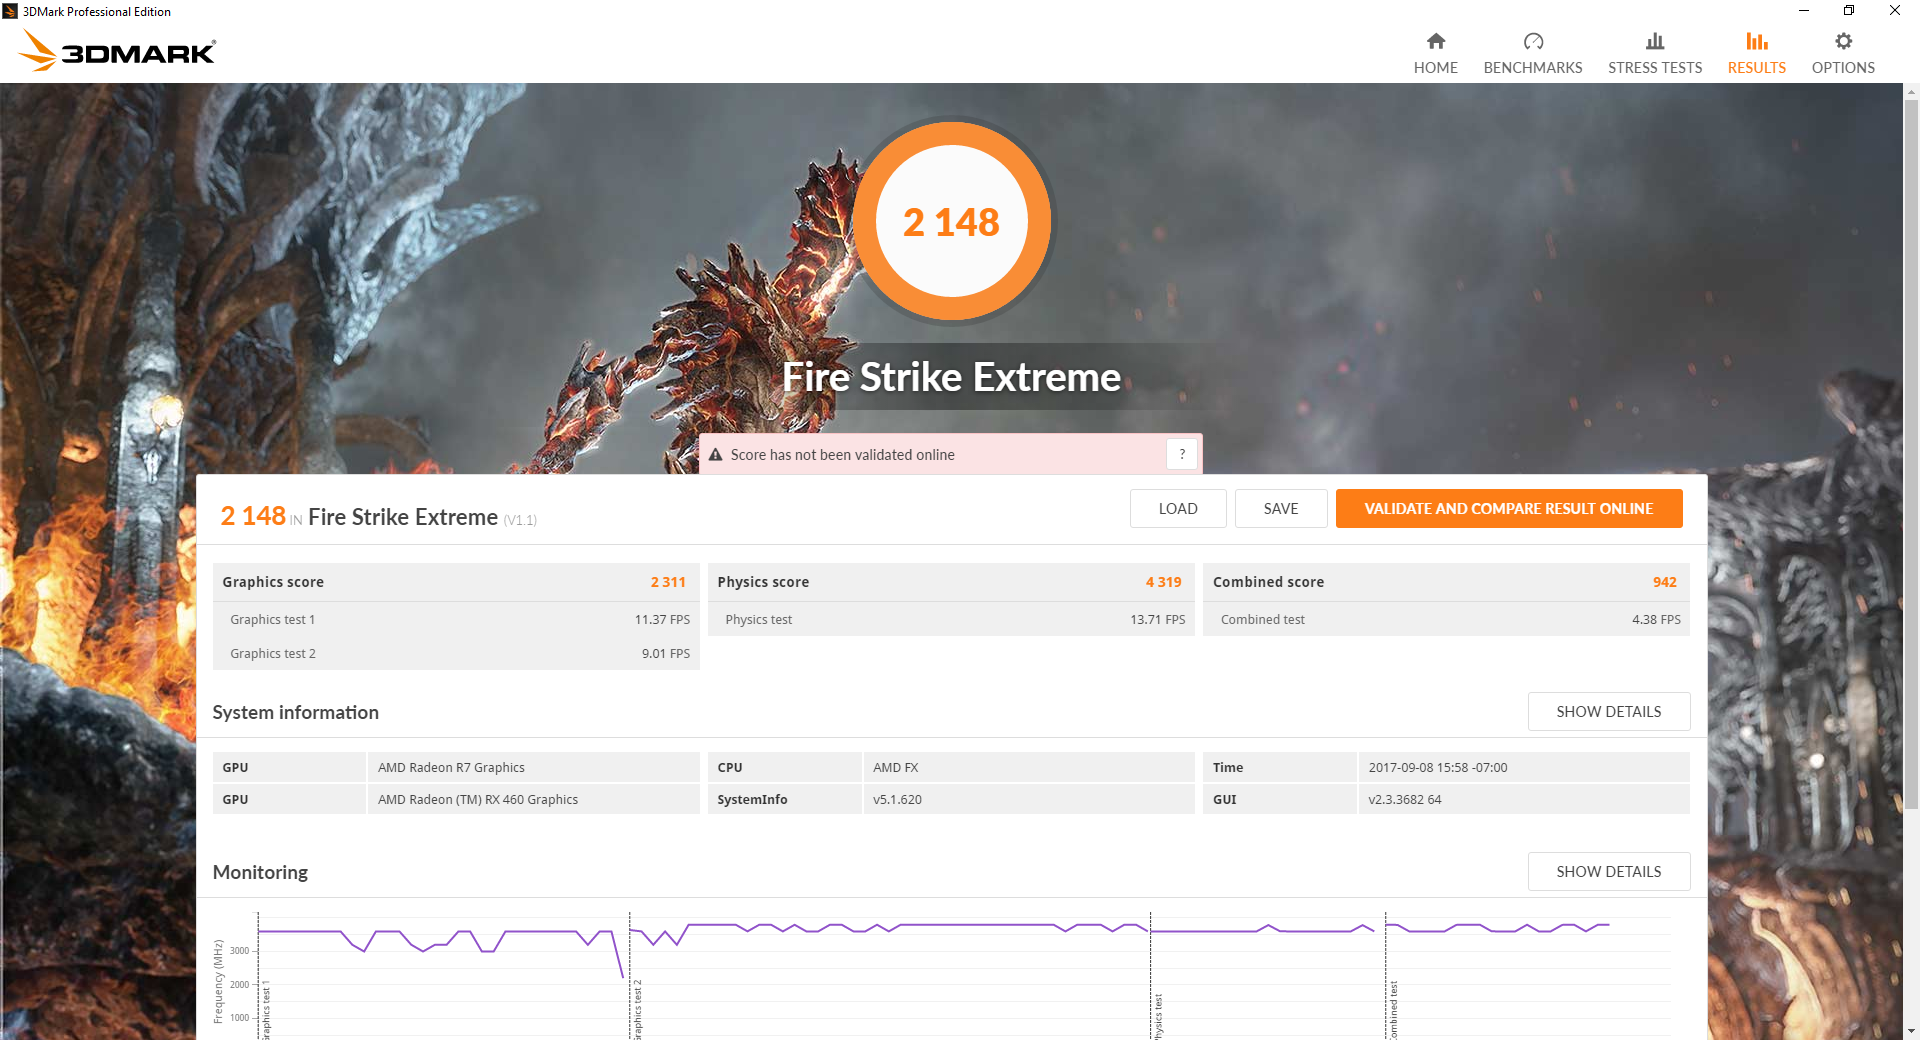
| 3DMark Fire Strike Extreme Score | 2148 points | |
Help | ||
Gaming Performance
The gaming benchmarks below were performed with Radeon Crimson version 16.6 installed. Our attempts to update Crimson or the video drivers resulted in errors each and every time even after a fresh install or reset. While we didn't experience any game-ending issues at 1080p, the GPU was unable to output at 1366 x 768 resolution and we were thus unable to test gaming performance at 768p. Beyond these software issues, users can also expect excruciatingly long loading times since the processing power of the FX-9830P is embarrassingly slow.
In general, gaming performance is between that of the GTX 950M and GTX 960M. Most titles will be playable at the native 1080p resolution so long as other settings are tuned to low-medium. More CPU-intensive games like Ashes of the Singularity will suffer from extreme frame rate dips irregardless of the graphics settings. When compared to the desktop RX 460, the performance gap when gaming is wider than what the 3DMark benchmarks above would suggest due to the CPU bottleneck.
See our dedicated GPU page on the mobile RX 460 for more benchmark comparisons.
| BioShock Infinite - 1920x1080 Ultra Preset, DX11 (DDOF) | |
| Gigabyte Sabre 15G | |
| XFX RX-460P4DFG5 Double Dissipation 4 GB | |
| Gigabyte P55K v5 | |
| MSI GL72 6QF | |
| Asus FX550IU-WSFX | |
| Acer Aspire E5-575G-549D | |
| Acer Aspire 5 A515-51G-51RL | |
| Samsung Notebook 9 NP900X5N-X01US | |
| Apple MacBook Pro 13 2017 | |
| Rise of the Tomb Raider - 1920x1080 Very High Preset AA:FX AF:16x | |
| Gigabyte Sabre 15G | |
| Gigabyte P55K v5 | |
| XFX RX-460P4DFG5 Double Dissipation 4 GB | |
| MSI GL72 6QF | |
| Asus FX550IU-WSFX | |
| Acer Aspire 5 A515-51G-51RL | |
| Acer Aspire E5-575G-549D | |
| low | med. | high | ultra | |
|---|---|---|---|---|
| StarCraft II: Heart of the Swarm (2013) | 175.3 | 48.7 | ||
| BioShock Infinite (2013) | 96 | 41.4 | ||
| Metro: Last Light (2013) | 42.6 | 29.5 | ||
| Thief (2014) | 24.7 | |||
| The Witcher 3 (2015) | 71.7 | 29.6 | 17.2 | |
| Batman: Arkham Knight (2015) | 43 | 35 | ||
| Fallout 4 (2015) | 55.4 | 32.3 | 27.7 | |
| Rise of the Tomb Raider (2016) | 61.5 | 28.4 | 19.7 | |
| Ashes of the Singularity (2016) | 24.2 | 21 | ||
| Overwatch (2016) | 100 | 79.7 | 43 | |
| Prey (2017) | 57.5 | 49.2 | 36.4 | 30.3 |
| Dirt 4 (2017) | 95.4 | 60.7 | 39.6 | 22.4 |
| F1 2017 (2017) | 37 | 27 | 24 | 20 |
Stress Test
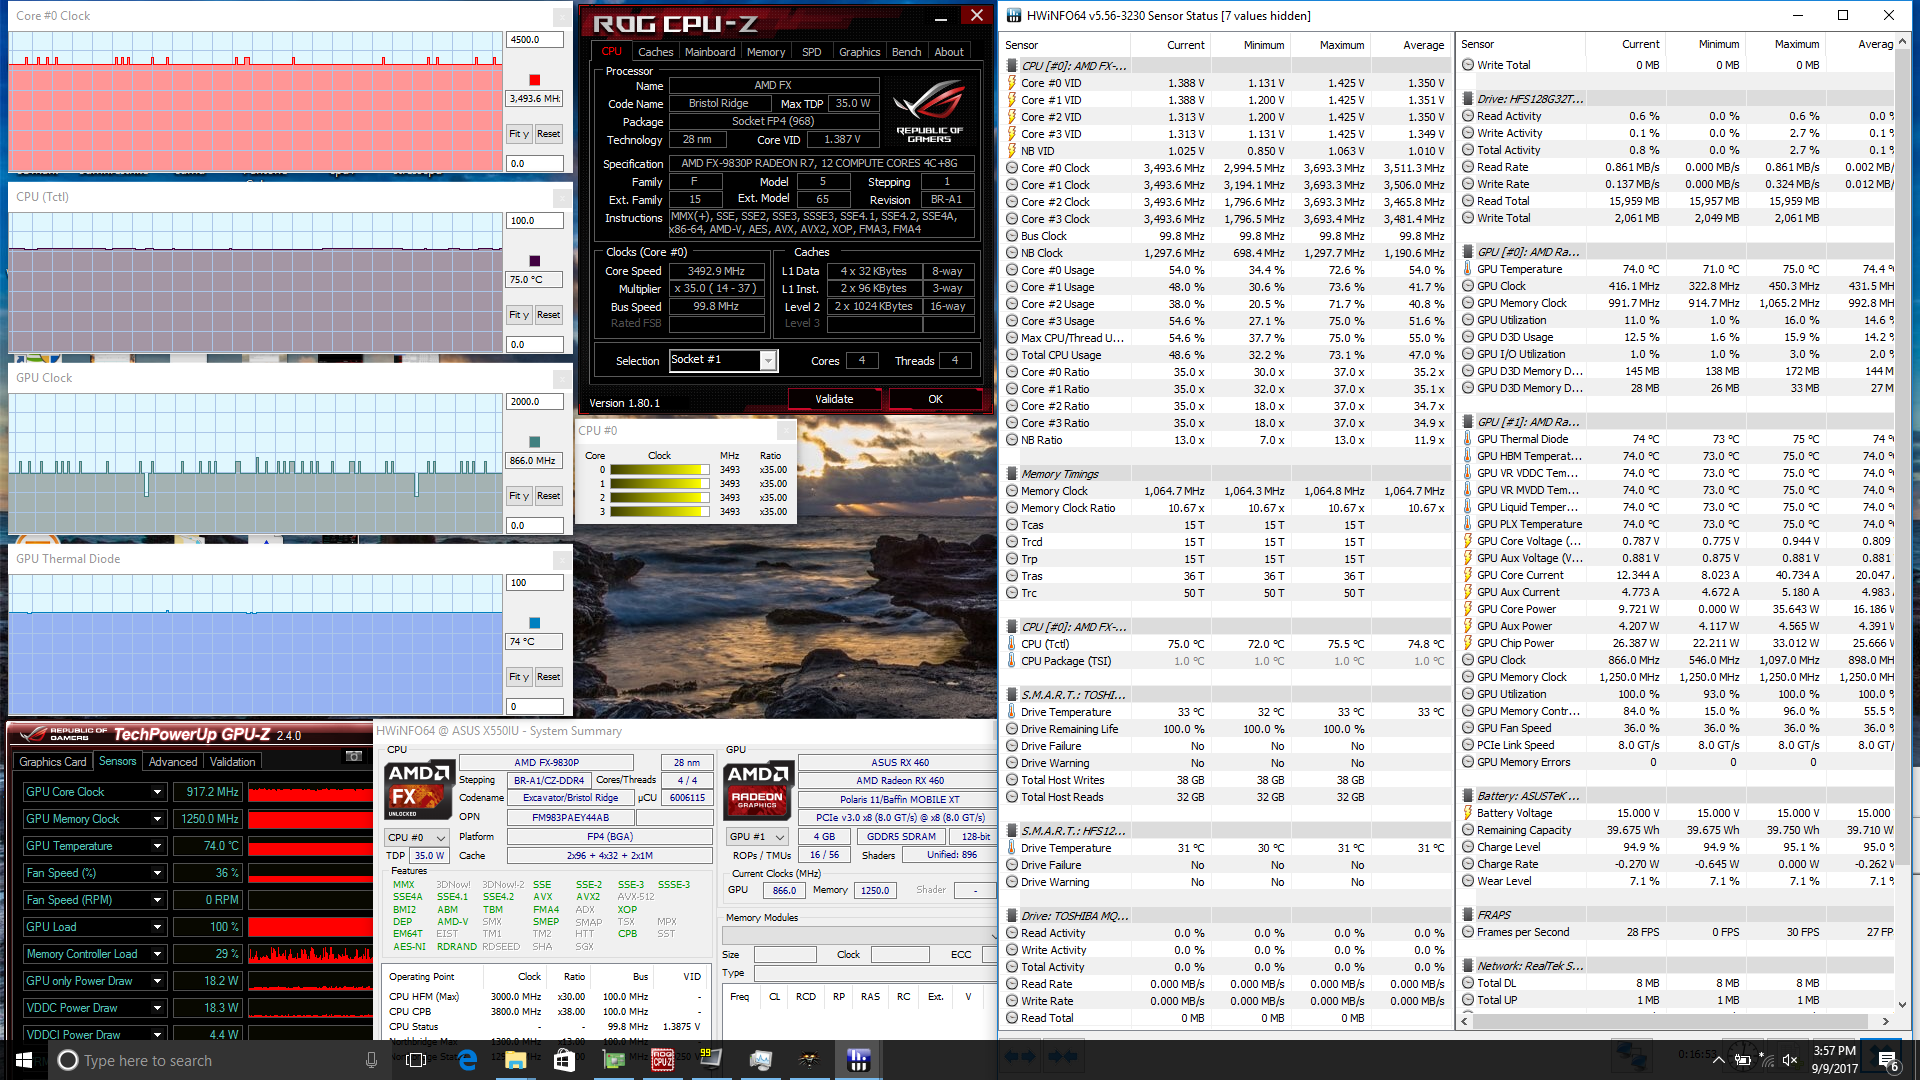
We stress the notebook with unrealistic benchmark loads to test for potential stability or throttling issues. When running Prime95 to stress the CPU, the FX-9830P can be observed alternating between 3.2 GHz and 3.5 GHz in quick succession compared to the base 3.0 GHz clock rate. It's strange that clock rate is not steady at some intermediate value like 3.3 GHz or 3.4 GHz instead of jumping between 3.2 GHz and 3.5 GHz, though this could be for performance reasons. Otherwise, core temperature remains relatively cool at a steady 66 C.
GPU stress with FurMark is less stable in terms of performance. Since the cooling solution is small and shared evenly across the CPU and discrete GPU, the CPU can reach temperatures warmer than 66 C at up to 85 C and will climb back and forth between the two temperatures. Meanwhile, GPU clock rates can range from 546 MHz to 866 MHz in response to the continuous rise and fall of the CPU temperature. GPU temperature is otherwise steady throughout the test. Having GPU performance tied down by CPU temperature is definitely not an ideal condition for a gaming notebook.
Maximum stress (Prime95 + FurMark) will heavily throttle both CPU and GPU clock rates. The CPU will alternate between 1.4 GHz and 3.5 GHz while the GPU can range from as low as 326 MHz up to 866 MHz. CPU and GPU temperatures remain steady at 77 C and 74 C, respectively.
Running Witcher 3 is more representative of real-world gaming loads. When under such conditions, the CPU can be observed maintaining a steady 3.5 GHz clock rate and 75 C core temperature. In contrast, the RX 460 will fluctuate between 866 MHz and 1045 MHz instead of holding steady at 1045 MHz or higher. Our graph below shows frame rates steadily falling over time from 35 FPS to around 29 FPS because the GPU is only able to maintain high clock rates of 1097 MHz for the first few minutes or so before reaching a slower steady state. GPU temperature remains acceptably cool at 74 C.
Running on battery power will throttle CPU and GPU performances. A 3DMark Fire Strike run on batteries returns Physics and Graphics scores of 2337 and 3895 points, respectively, compared to 3234 and 5062 points when on mains.
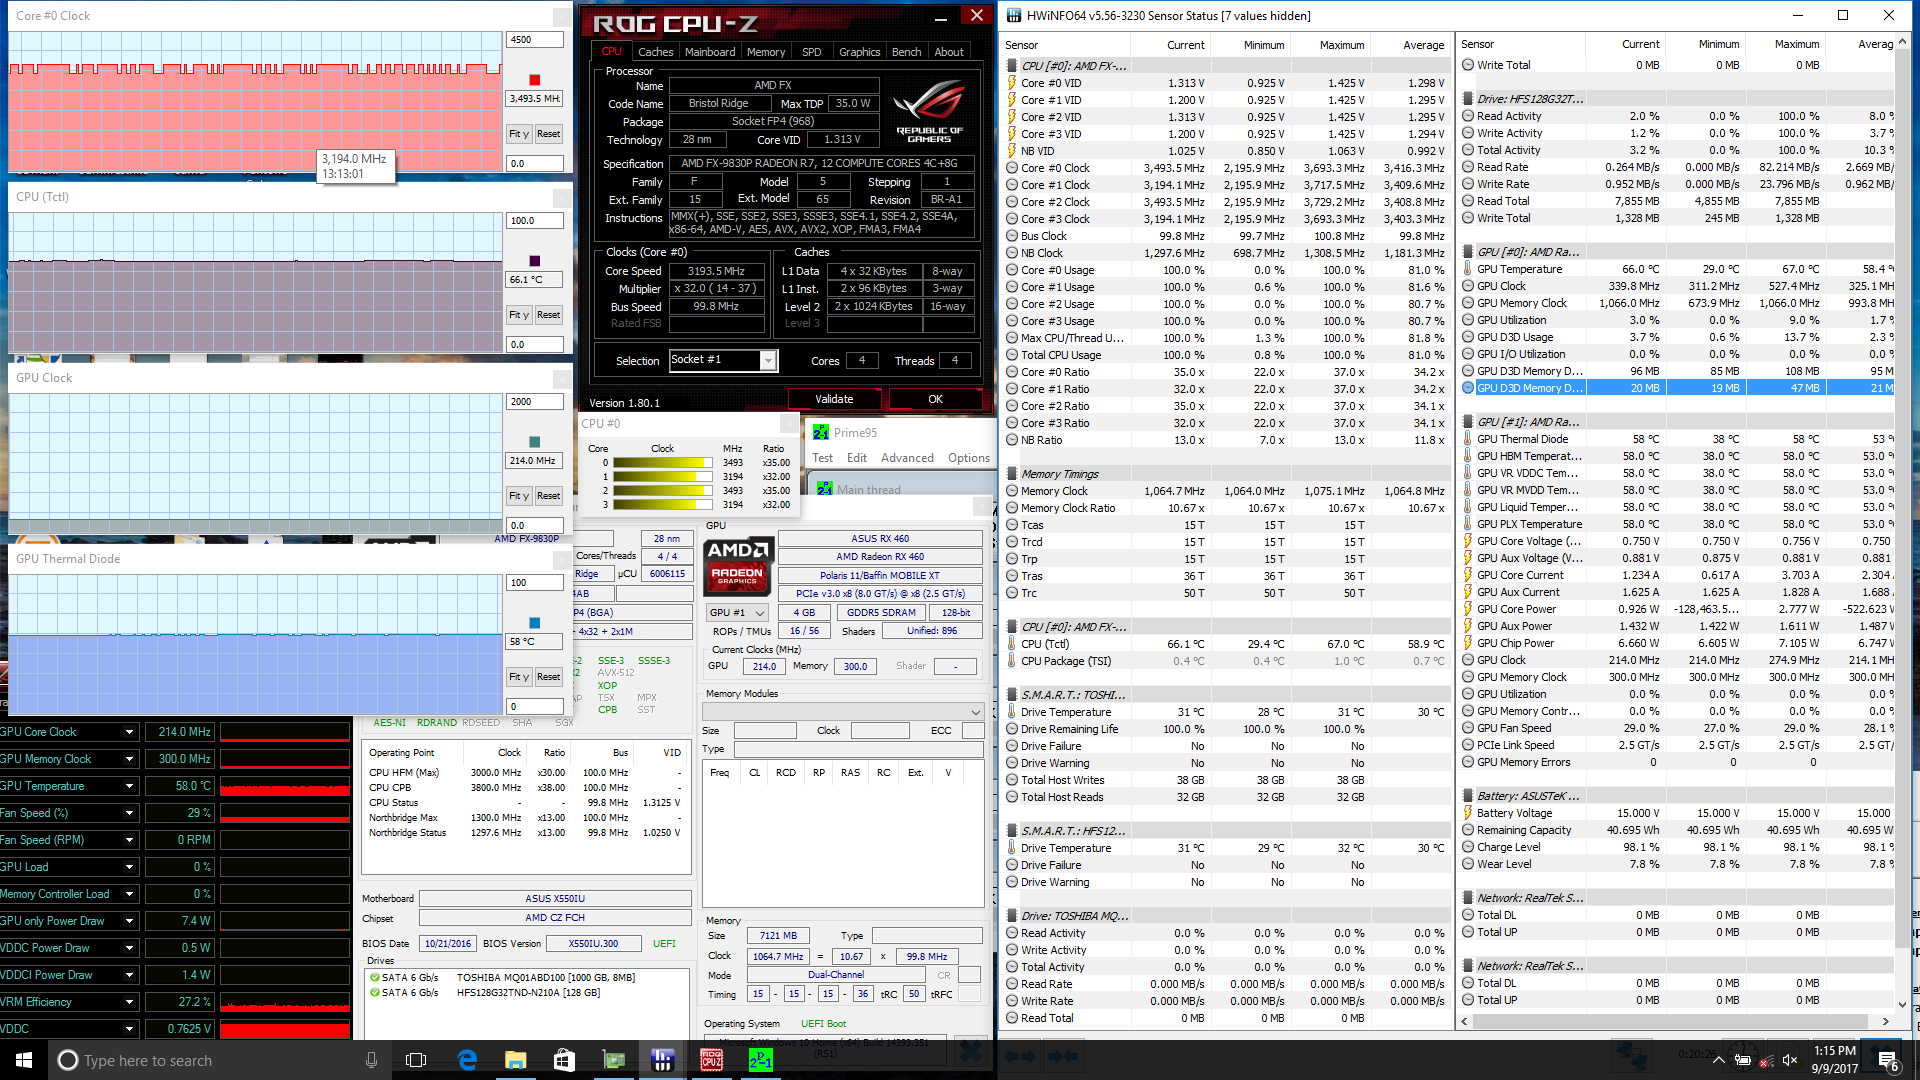
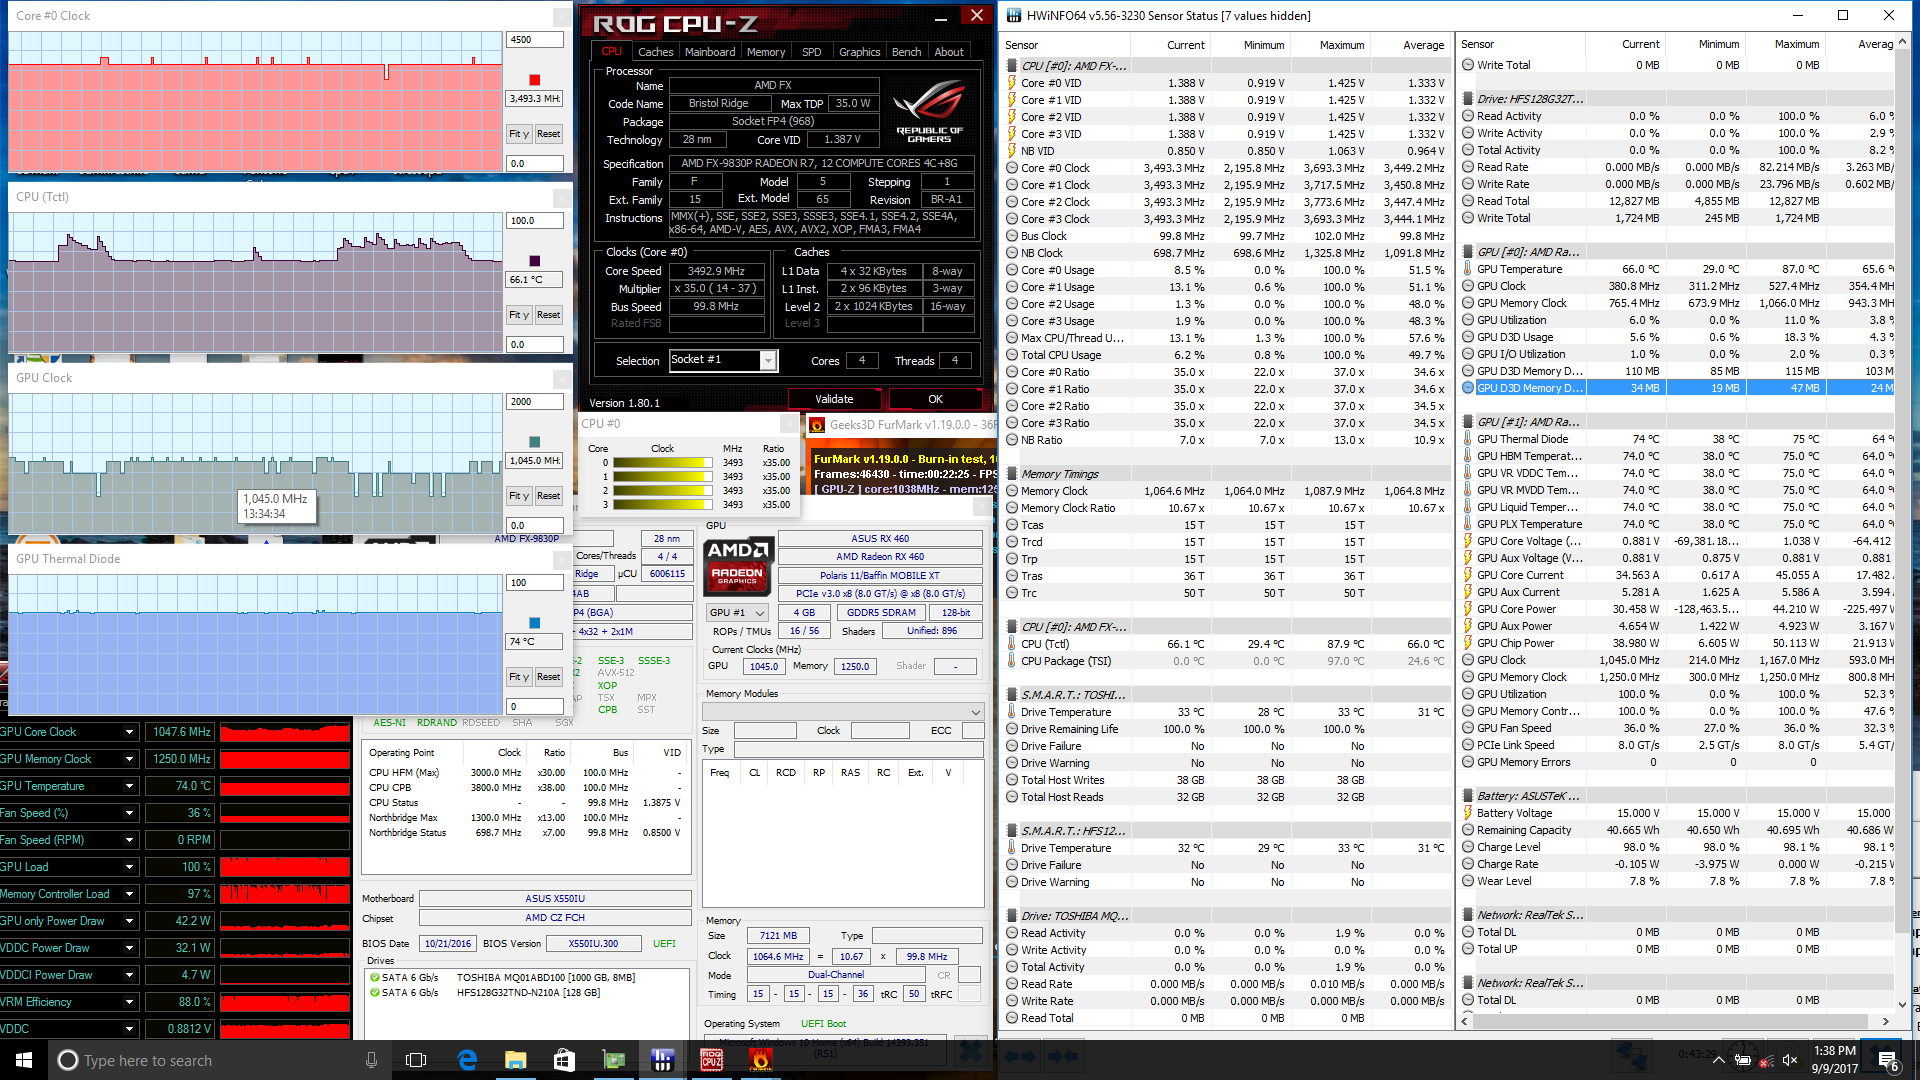
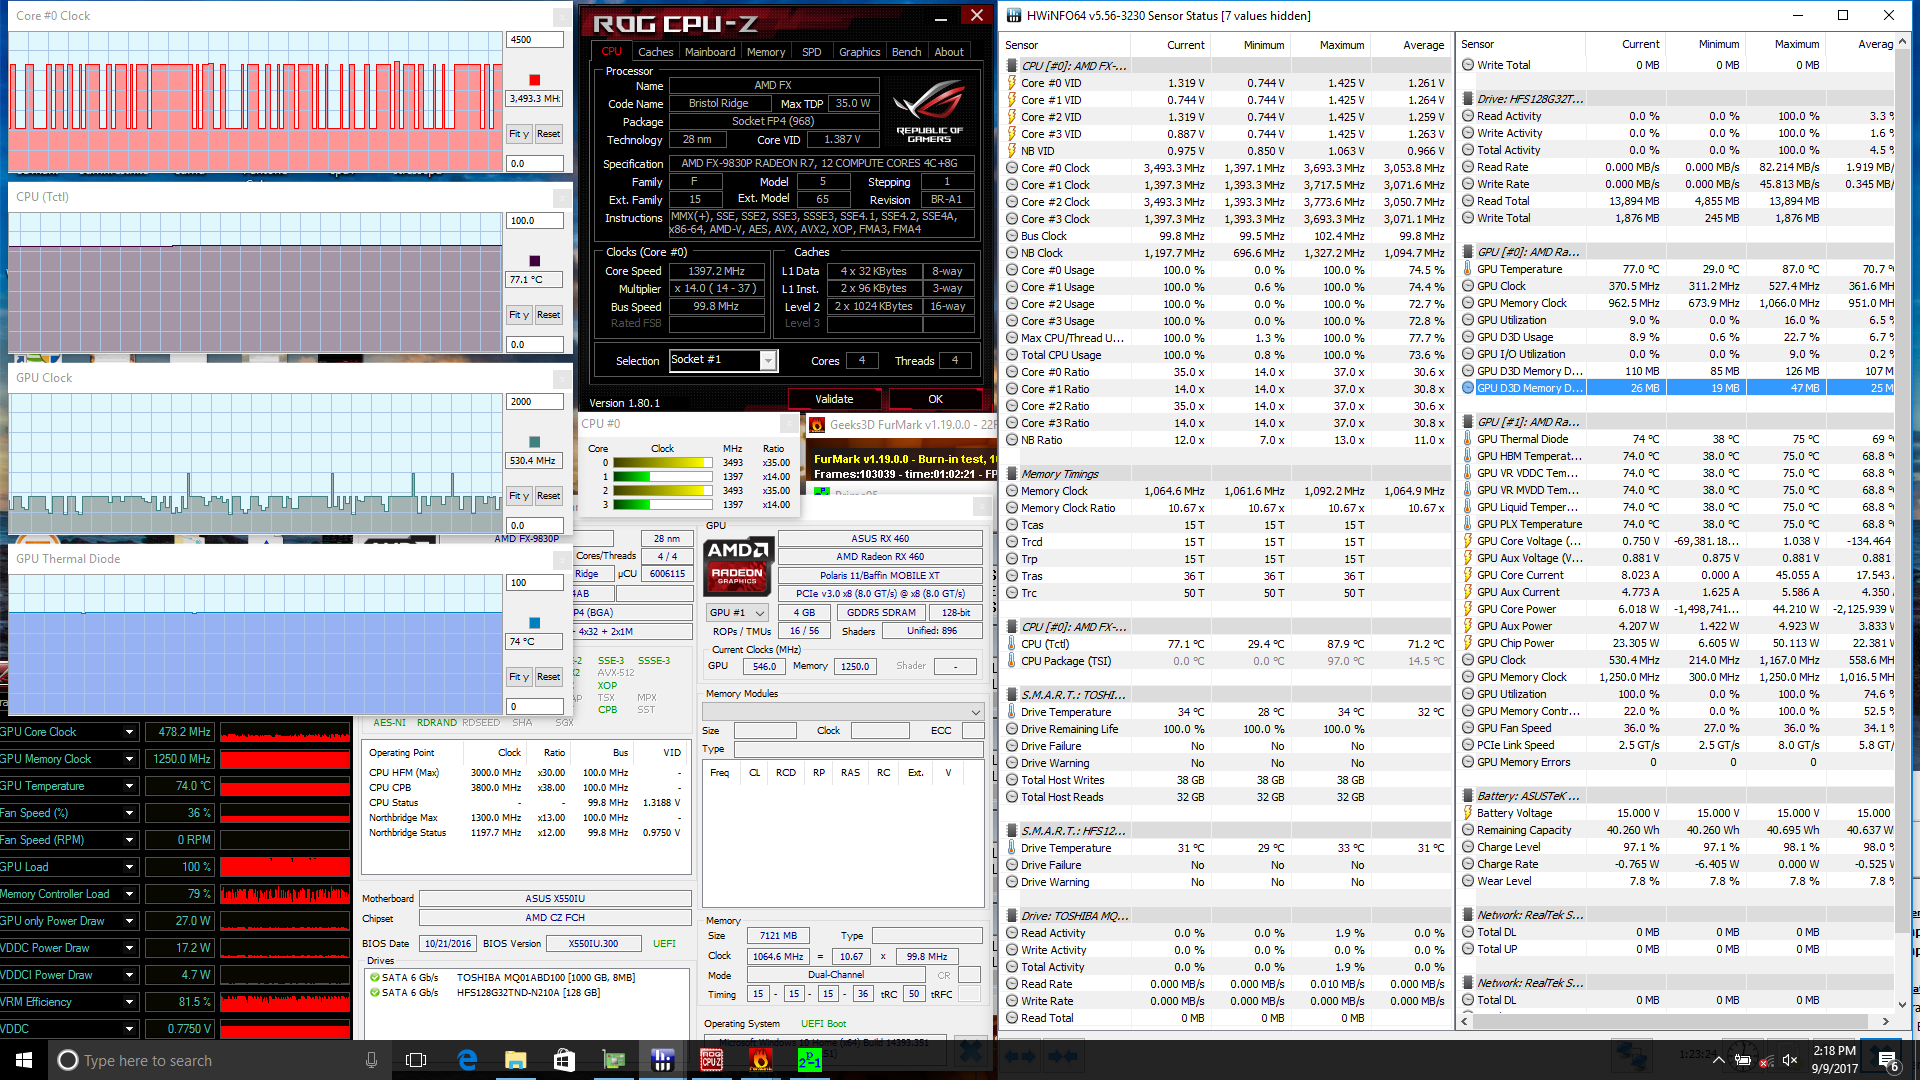
| CPU Clock (GHz) | GPU Clock (MHz) | Average CPU Temperature (°C) | Average GPU Temperature (°C) | |
| Prime95 Stress | 3.2 - 3.5 | -- | 66 | 58 |
| FurMark Stress | -- | 866 - 1045 | 66 - 85 | 74 |
| Prime95 + FurMark Stress | 1.4 - 3.5 | 326 - 866 | 77 | 74 |
| Witcher 3 Stress | 3.5 | 866 - 1045 | 75 | 74 |
Emissions
System Noise
The system fan is always active no matter the load. At its quietest, fan noise is barely audible at about 30 dB(A) and light tasks may bump this up to 33 dB(A). The fan is more likely to stabilize at 33 dB(A) if on the High Performance profile and so we recommend running on Power Saver if noise is a concern. Fortunately, fan RPM will not pulsate frequently during use.
Medium load with 3DMark06 will bump fan noise to a steady 41.6 dB(A) and gaming load will be even noisier at 43.7 dB(A). While still very load, the system is no louder than most notebooks with GTX 1050 graphics and is even quieter than the newer Asus FX553 or Sabre 15. Max-Q notebooks are both quieter and more powerful, but they currently retail for over twice the price of our FX550UI.
Noise level
| Idle |
| 30.2 / 30.3 / 30.3 dB(A) |
| Load |
| 41.6 / 45.3 dB(A) |
 | ||
30 dB silent 40 dB(A) audible 50 dB(A) loud |
||
min: | ||
| Asus FX550IU-WSFX Radeon RX 460 (Laptop), FX-9830P, SK Hynix HFS128G32TND | Dell Inspiron 15 7000 7567 GeForce GTX 1050 Ti Mobile, i7-7700HQ, Intel SSDSCKKF256H6 | Gigabyte Sabre 15G GeForce GTX 1050 Mobile, i7-7700HQ, Liteonit CV3-8D128 | HP Omen 15-ce002ng GeForce GTX 1060 Max-Q, i7-7700HQ, Samsung PM961 MZVLW256HEHP | Asus FX553VD-DM249T GeForce GTX 1050 Mobile, i7-7700HQ, Hynix HFS128G39TND | |
|---|---|---|---|---|---|
| Noise | -5% | -10% | -6% | -8% | |
| off / environment * (dB) | 28.2 | 30.3 -7% | 28.2 -0% | 30 -6% | 30.8 -9% |
| Idle Minimum * (dB) | 30.2 | 30.9 -2% | 33 -9% | 30 1% | 32.9 -9% |
| Idle Average * (dB) | 30.3 | 30.9 -2% | 33.3 -10% | 33 -9% | 32.9 -9% |
| Idle Maximum * (dB) | 30.3 | 31 -2% | 34.7 -15% | 37 -22% | 33.5 -11% |
| Load Average * (dB) | 41.6 | 46.5 -12% | 44.5 -7% | 41 1% | 43.7 -5% |
| Witcher 3 ultra * (dB) | 43.7 | 49.2 -13% | 42 4% | 46.2 -6% | |
| Load Maximum * (dB) | 45.3 | 46.8 -3% | 52.8 -17% | 50 -10% | 47 -4% |
* ... smaller is better
Temperature
Surface temperature measurements reveal that the left half of the notebook will become warmer than the right half when under load conditions. This behavior is not unusual for notebooks with optical drives. Higher-end gaming notebooks tend to favor symmetrically arranged fans and heat pipes for more even temperature development. As shown by our temperature maps below, users can expect the center of the keyboard to be significantly warmer than the rest of the notebook during medium or higher loads at up to 47 C. At the very least, the palm rests and NumPad should never become uncomfortably warm.
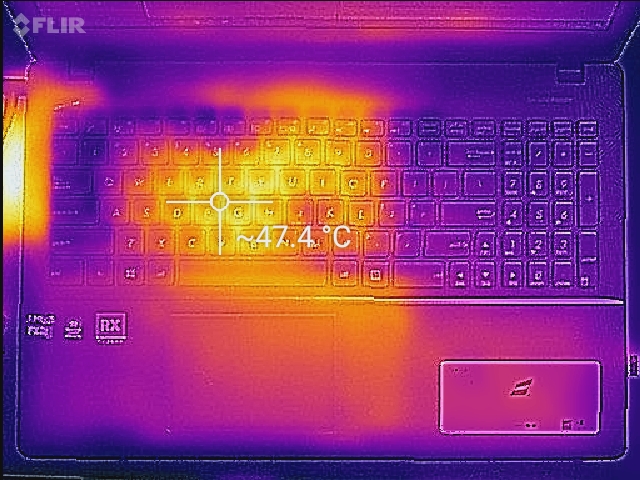
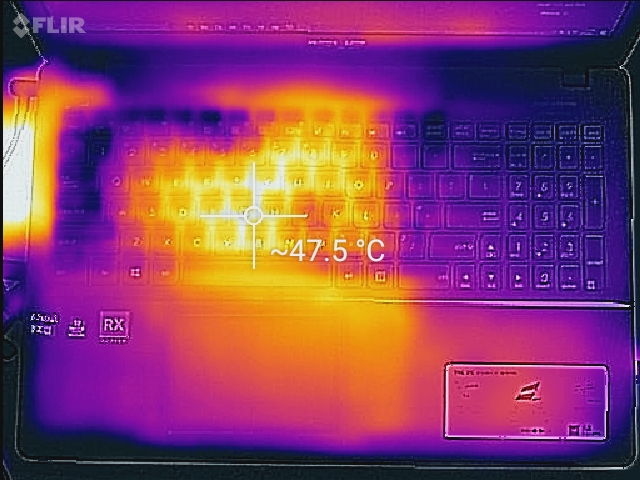
(-) The maximum temperature on the upper side is 46.2 °C / 115 F, compared to the average of 40.4 °C / 105 F, ranging from 21.2 to 68.8 °C for the class Gaming.
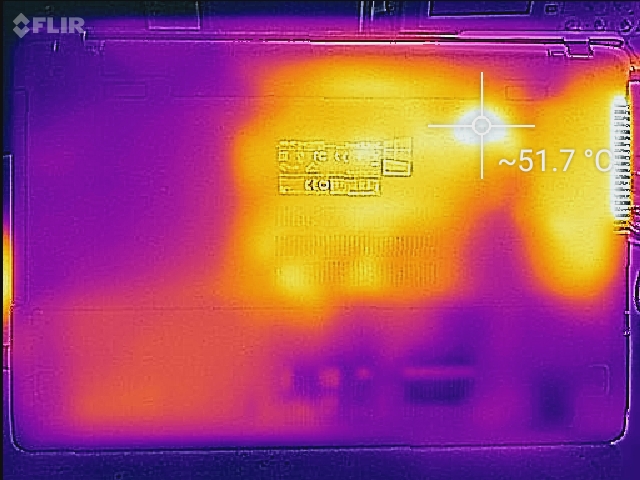
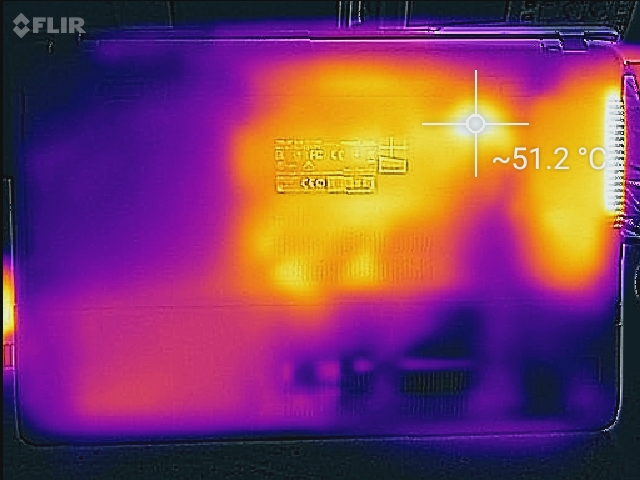
(-) The bottom heats up to a maximum of 51.2 °C / 124 F, compared to the average of 43.2 °C / 110 F
(+) In idle usage, the average temperature for the upper side is 26.6 °C / 80 F, compared to the device average of 33.9 °C / 93 F.
(±) Playing The Witcher 3, the average temperature for the upper side is 35.7 °C / 96 F, compared to the device average of 33.9 °C / 93 F.
(±) The palmrests and touchpad can get very hot to the touch with a maximum of 36.2 °C / 97.2 F.
(-) The average temperature of the palmrest area of similar devices was 28.8 °C / 83.8 F (-7.4 °C / -13.4 F).
Speakers
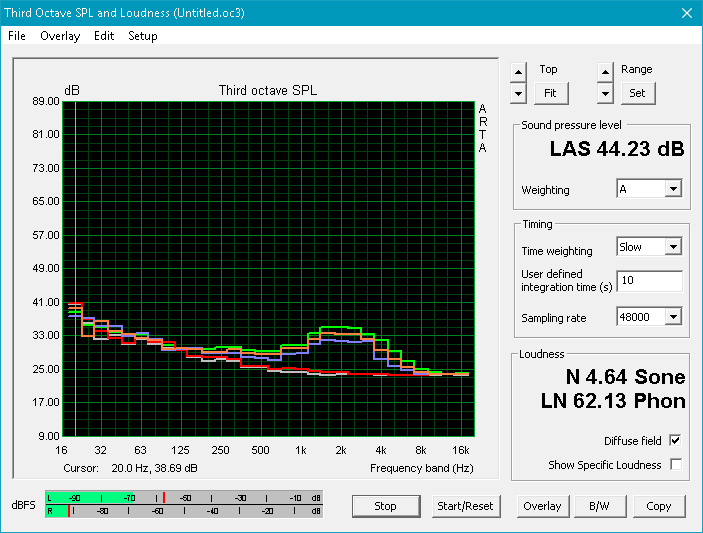
Sound quality is not bad for a budget gaming notebook. There is an apparent lack of bass as expected from most notebooks without dedicated subwoofers and treble is overemphasized at higher volume settings. Other 15.6-inch notebooks like the XPS 15 or Legion Y520 have wider pink noise curves that extend to lower frequencies for better bass reproduction. We can otherwise observe no static or major chassis vibrations from audio playback. Headphones are still recommended when gaming due to the relatively loud fan noise.
")


Asus FX550IU-WSFX audio analysis
(-) | not very loud speakers (66.3 dB)
Bass 100 - 315 Hz
(-) | nearly no bass - on average 18.5% lower than median
(±) | linearity of bass is average (9.4% delta to prev. frequency)
Mids 400 - 2000 Hz
(+) | balanced mids - only 2.3% away from median
(±) | linearity of mids is average (9.4% delta to prev. frequency)
Highs 2 - 16 kHz
(±) | higher highs - on average 6.6% higher than median
(±) | linearity of highs is average (7.9% delta to prev. frequency)
Overall 100 - 16.000 Hz
(±) | linearity of overall sound is average (29.9% difference to median)
Compared to same class
» 95% of all tested devices in this class were better, 2% similar, 3% worse
» The best had a delta of 6%, average was 18%, worst was 132%
Compared to all devices tested
» 88% of all tested devices were better, 3% similar, 9% worse
» The best had a delta of 4%, average was 23%, worst was 134%
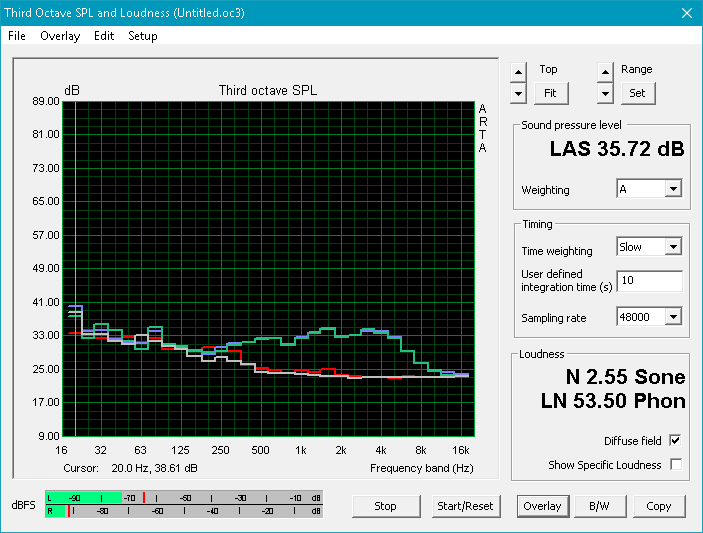
Apple MacBook 12 (Early 2016) 1.1 GHz audio analysis
(+) | speakers can play relatively loud (83.6 dB)
Bass 100 - 315 Hz
(±) | reduced bass - on average 11.3% lower than median
(±) | linearity of bass is average (14.2% delta to prev. frequency)
Mids 400 - 2000 Hz
(+) | balanced mids - only 2.4% away from median
(+) | mids are linear (5.5% delta to prev. frequency)
Highs 2 - 16 kHz
(+) | balanced highs - only 2% away from median
(+) | highs are linear (4.5% delta to prev. frequency)
Overall 100 - 16.000 Hz
(+) | overall sound is linear (10.2% difference to median)
Compared to same class
» 7% of all tested devices in this class were better, 2% similar, 90% worse
» The best had a delta of 5%, average was 18%, worst was 53%
Compared to all devices tested
» 5% of all tested devices were better, 1% similar, 94% worse
» The best had a delta of 4%, average was 23%, worst was 134%
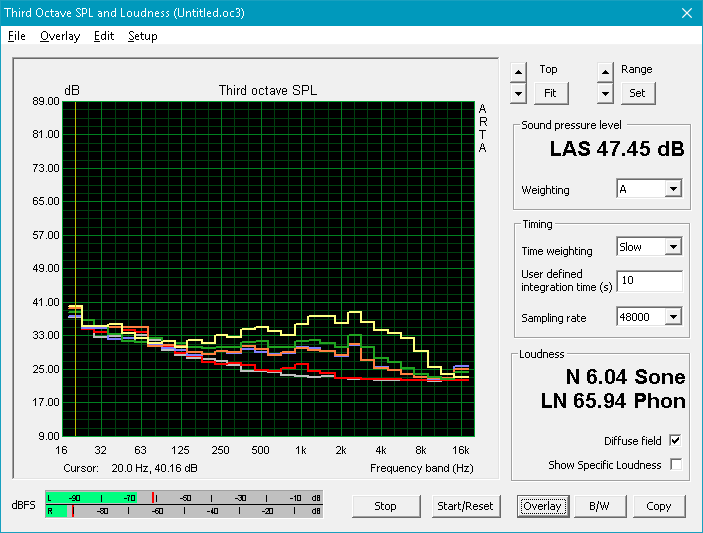
Frequency Comparison (Checkbox selectable!)
Graph 1: Pink Noise 100% Vol.; Graph 2: Audio off
Energy Management
Power Consumption
We've shown that the RX 460 in our Asus can be about 20 percent slower than the GTX 1050 in a competing notebook according to our above Fire Strike benchmarks. Will this translate to lower power consumption readings as well? Unfortunately for AMD, the answer is a resounding no. Our table below reveals a demand of 78 W and 112 W when running 3DMark06 and Witcher 3, respectively, whereas the more powerful 15.6-inch alternatives with Intel HQ-class CPUs and mainstream GTX 1050 options are about the same if not even more efficient than our AMD Asus when gaming. The last generation Zenbook UX510 with i7-6500U and GTX 960M graphics is more efficient still, albeit at the small cost of graphics performance.
Maximum load with both Prime95 and FurMark will draw about 117 W from a medium-sized power adapter (~16 x 7.6 x 2.6 cm) rated for 137 W. The power consumption difference when running Witcher 3 and Prime95+FurMark is very minimal, so expect fan noise and surface temperatures to be near maximum levels when gaming.
| Off / Standby | |
| Idle | |
| Load |
|
Key:
min: | |
| Asus FX550IU-WSFX FX-9830P, Radeon RX 460 (Laptop), SK Hynix HFS128G32TND, TN LED, 1920x1080, 15.6" | Dell Inspiron 15 7000 7567 Gaming (Core i5-7300HQ, GTX 1050) i5-7300HQ, GeForce GTX 1050 Mobile, Toshiba MQ02ABD100H, TN, 1920x1080, 15.6" | MSI GP62 7REX-1045US i7-7700HQ, GeForce GTX 1050 Ti Mobile, Toshiba NVMe THNSN5128GP, TN LED, 1920x1080, 15.6" | HP Omen 15-ce002ng i7-7700HQ, GeForce GTX 1060 Max-Q, Samsung PM961 MZVLW256HEHP, IPS, 1920x1080, 15.6" | Asus FX553VD-DM249T i7-7700HQ, GeForce GTX 1050 Mobile, Hynix HFS128G39TND, TN, 1920x1080, 15.6" | Asus Zenbook UX510UW-CN044T 6500U, GeForce GTX 960M, SanDisk SD8SNAT256G1002, IPS, 1920x1080, 15.6" | |
|---|---|---|---|---|---|---|
| Power Consumption | -13% | -56% | -101% | 14% | 9% | |
| Idle Minimum * (Watt) | 5.9 | 9.1 -54% | 14.6 -147% | 18 -205% | 4 32% | 5 15% |
| Idle Average * (Watt) | 8.8 | 10.3 -17% | 17.2 -95% | 23 -161% | 6.7 24% | 8.9 -1% |
| Idle Maximum * (Watt) | 9.7 | 13 -34% | 17.3 -78% | 30 -209% | 9.6 1% | 11.8 -22% |
| Load Average * (Watt) | 78.1 | 75.6 3% | 82.7 -6% | 85 -9% | 81 -4% | 55 30% |
| Witcher 3 ultra * (Watt) | 112.4 | 83.8 25% | 107 5% | 96 15% | 90 20% | |
| Load Maximum * (Watt) | 117 | 115.2 2% | 136.7 -17% | 158 -35% | 107 9% | 93 21% |
* ... smaller is better
Battery Life
Runtimes from the removable 44 Wh battery are average at best for a gaming notebook at just four hours of constant WLAN use when on the Balanced profile setting. Battery capacity is smaller than most other mainstream 15.6-inch alternatives where 70 Wh or higher can be common. The more powerful Gigabyte Sabre 15 and Asus FX553VD have longer runtimes than our AMD-powered notebook despite having very similar battery capacities between them.
Charging from near empty to full capacity will take just over two hours.
| Asus FX550IU-WSFX FX-9830P, Radeon RX 460 (Laptop), 44 Wh | Asus ZenBook Pro UX550VD i7-7700HQ, GeForce GTX 1050 Mobile, 73 Wh | Dell Inspiron 15 7000 7567 i7-7700HQ, GeForce GTX 1050 Ti Mobile, 74 Wh | Gigabyte Sabre 15G i7-7700HQ, GeForce GTX 1050 Mobile, 47 Wh | HP Omen 15-ce002ng i7-7700HQ, GeForce GTX 1060 Max-Q, 70 Wh | Asus FX553VD-DM249T i7-7700HQ, GeForce GTX 1050 Mobile, 48 Wh | |
|---|---|---|---|---|---|---|
| Battery runtime | 82% | 108% | 14% | -10% | 18% | |
| Reader / Idle (h) | 9.1 | 17.7 95% | 19.6 115% | 8.2 -10% | 4.3 -53% | 9.8 8% |
| WiFi v1.3 (h) | 4.1 | 8.9 117% | 10.4 154% | 4.4 7% | 3.3 -20% | 6 46% |
| Load (h) | 0.9 | 1.2 33% | 1.4 56% | 1.3 44% | 1.3 44% | 0.9 0% |
| Witcher 3 ultra (h) | 1.1 |
Pros
Cons
Verdict
The FX550UI suffers from a lot of the same issues as older AMD-based gaming notebooks. In this case, the slow-performing FX-9830P APU is a bottleneck to the otherwise decent RX 460 GPU and the performance-per-Watt of the system is far inferior to current Nvidia offerings. Power consumption is similar to competing notebooks with more powerful Intel HQ-class CPUs and GTX 1050 graphics. Thus, the FX550UI is not necessarily running any cooler, longer, or quieter than a current Intel/Nvidia alternative even though it is the weaker performer.
The mismatched Bristol Ridge and Polaris 11 pairing isn't the only thing to blame. The fact that the FX550UI is a gutted version of the much older FX550DM makes the entire notebook feel like an afterthought. The empty optical bay is a waste of space and the TN display is subpar. AMD certainly deserves better hardware from Asus akin to the UX550 or ROG Strix G501 series. We're beginning to see bigger investments in AMD notebooks now that the GL702ZC is available and we're hoping that this will trickle down to future mainstream AMD offerings.
Price continues to be the biggest advantage of the FX550UI over Nvidia alternatives. At $700 USD, the Asus is about $200 to $300 cheaper than a Pavilion 15 or Sabre 15 with i7-7700HQ and GTX 1050 graphics. Those who choose to invest in a mainstream Nvidia system will see massive gains over the FX550UI, especially in CPU power.
It's tough to recommend the FX550UI due to the cheap plastic chassis, slow processor performance, and poor TN display. Gamers on very tight budgets are better off saving a couple hundred more for a newer GTX 1050 notebook or an older and less expensive GTX 965M notebook.
Asus FX550IU-WSFX
- 09/16/2017 v6 (old)
Allen Ngo
Price comparison
