Gigabyte P55K v5 Notebook Review
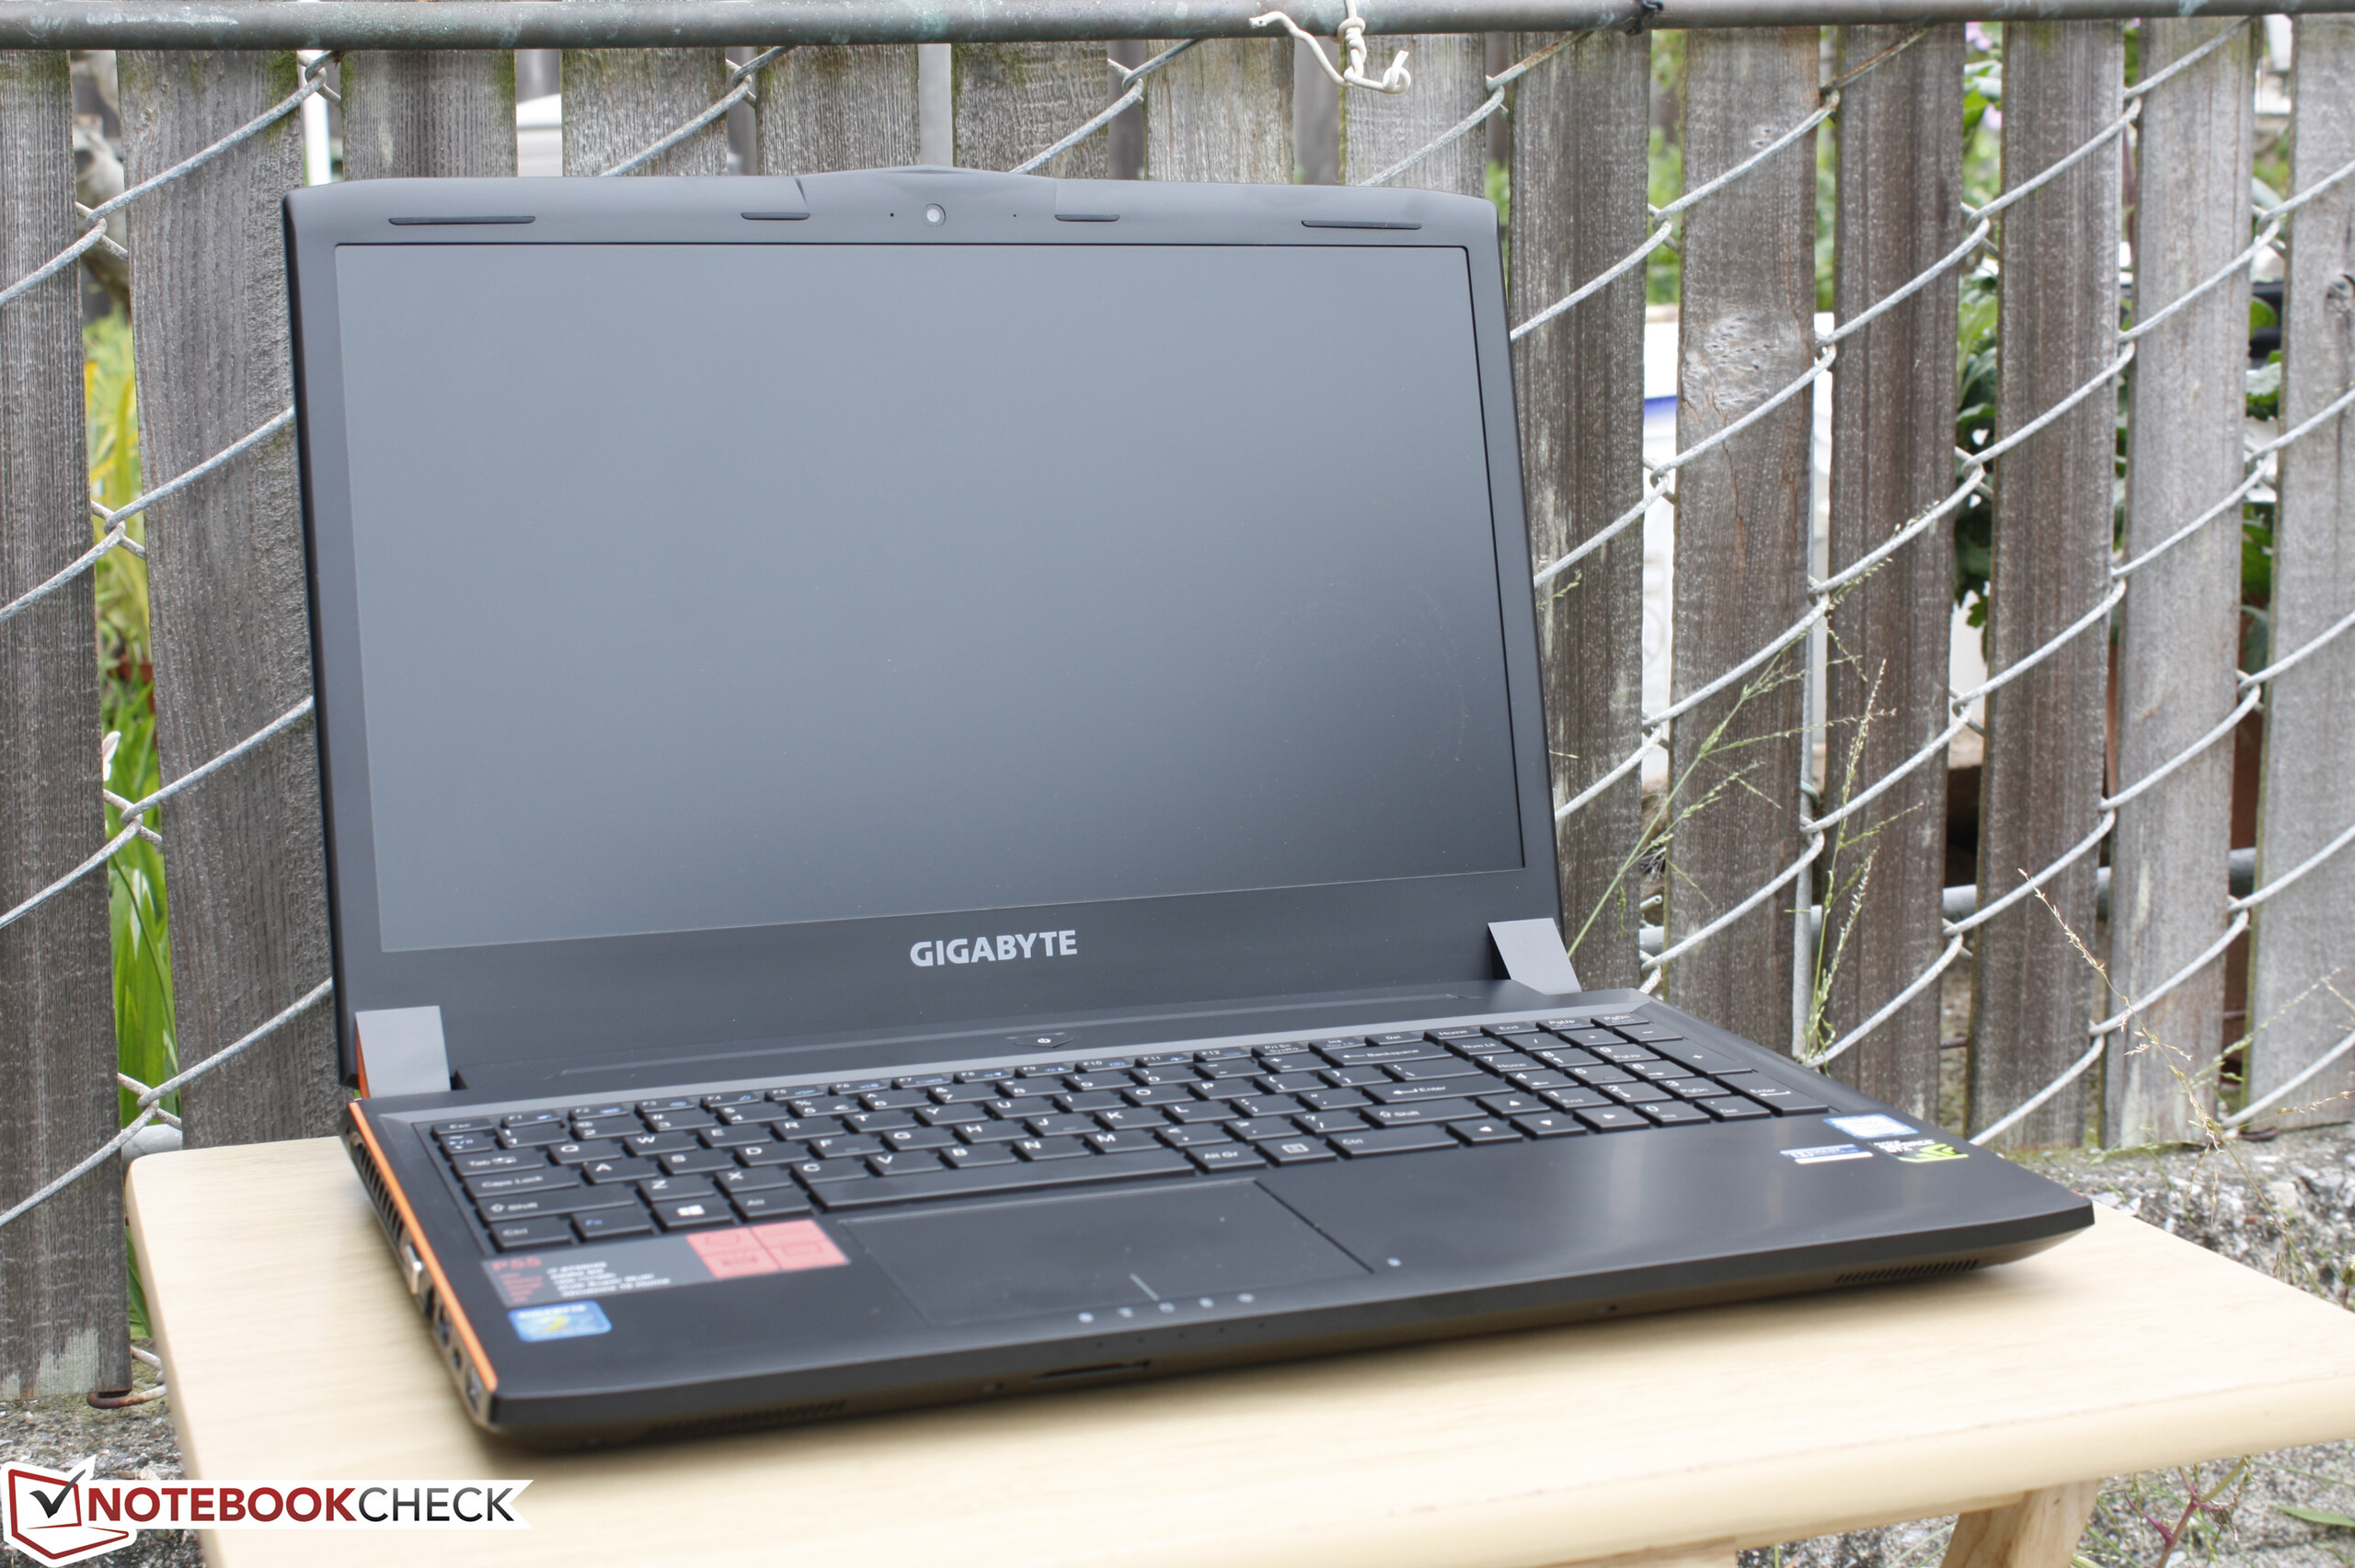
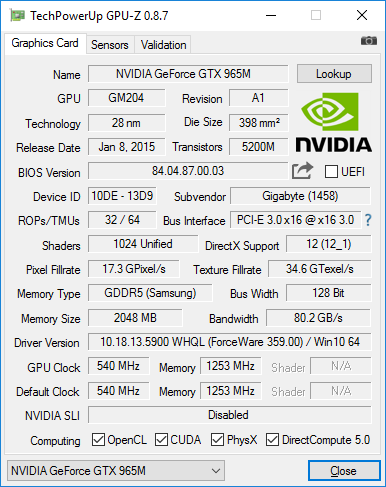
Our third look at the Gigabyte P55 series brings us to the P55K v5. The model brings a number of important hardware updates compared to the P55W v4 as covered in our P55W v5 review, but is otherwise nearly identical to the P55W v5 with differences in the display panel and the GPU. The P55K v5 sports the less common GTX 965M, so its performance should hopefully satisfy gamers on a tighter budget.
We recommend checking out our previous review on the P55W v5 as the P55K v5 shares the same chassis, features, connectivity options, input devices, and most other physical qualities. We'll instead focus on the performance of the P55K v5 and how the GTX 965M compares to the GTX 960M and GTX 970M.
Case
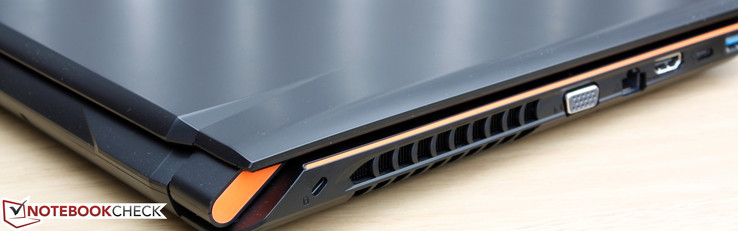
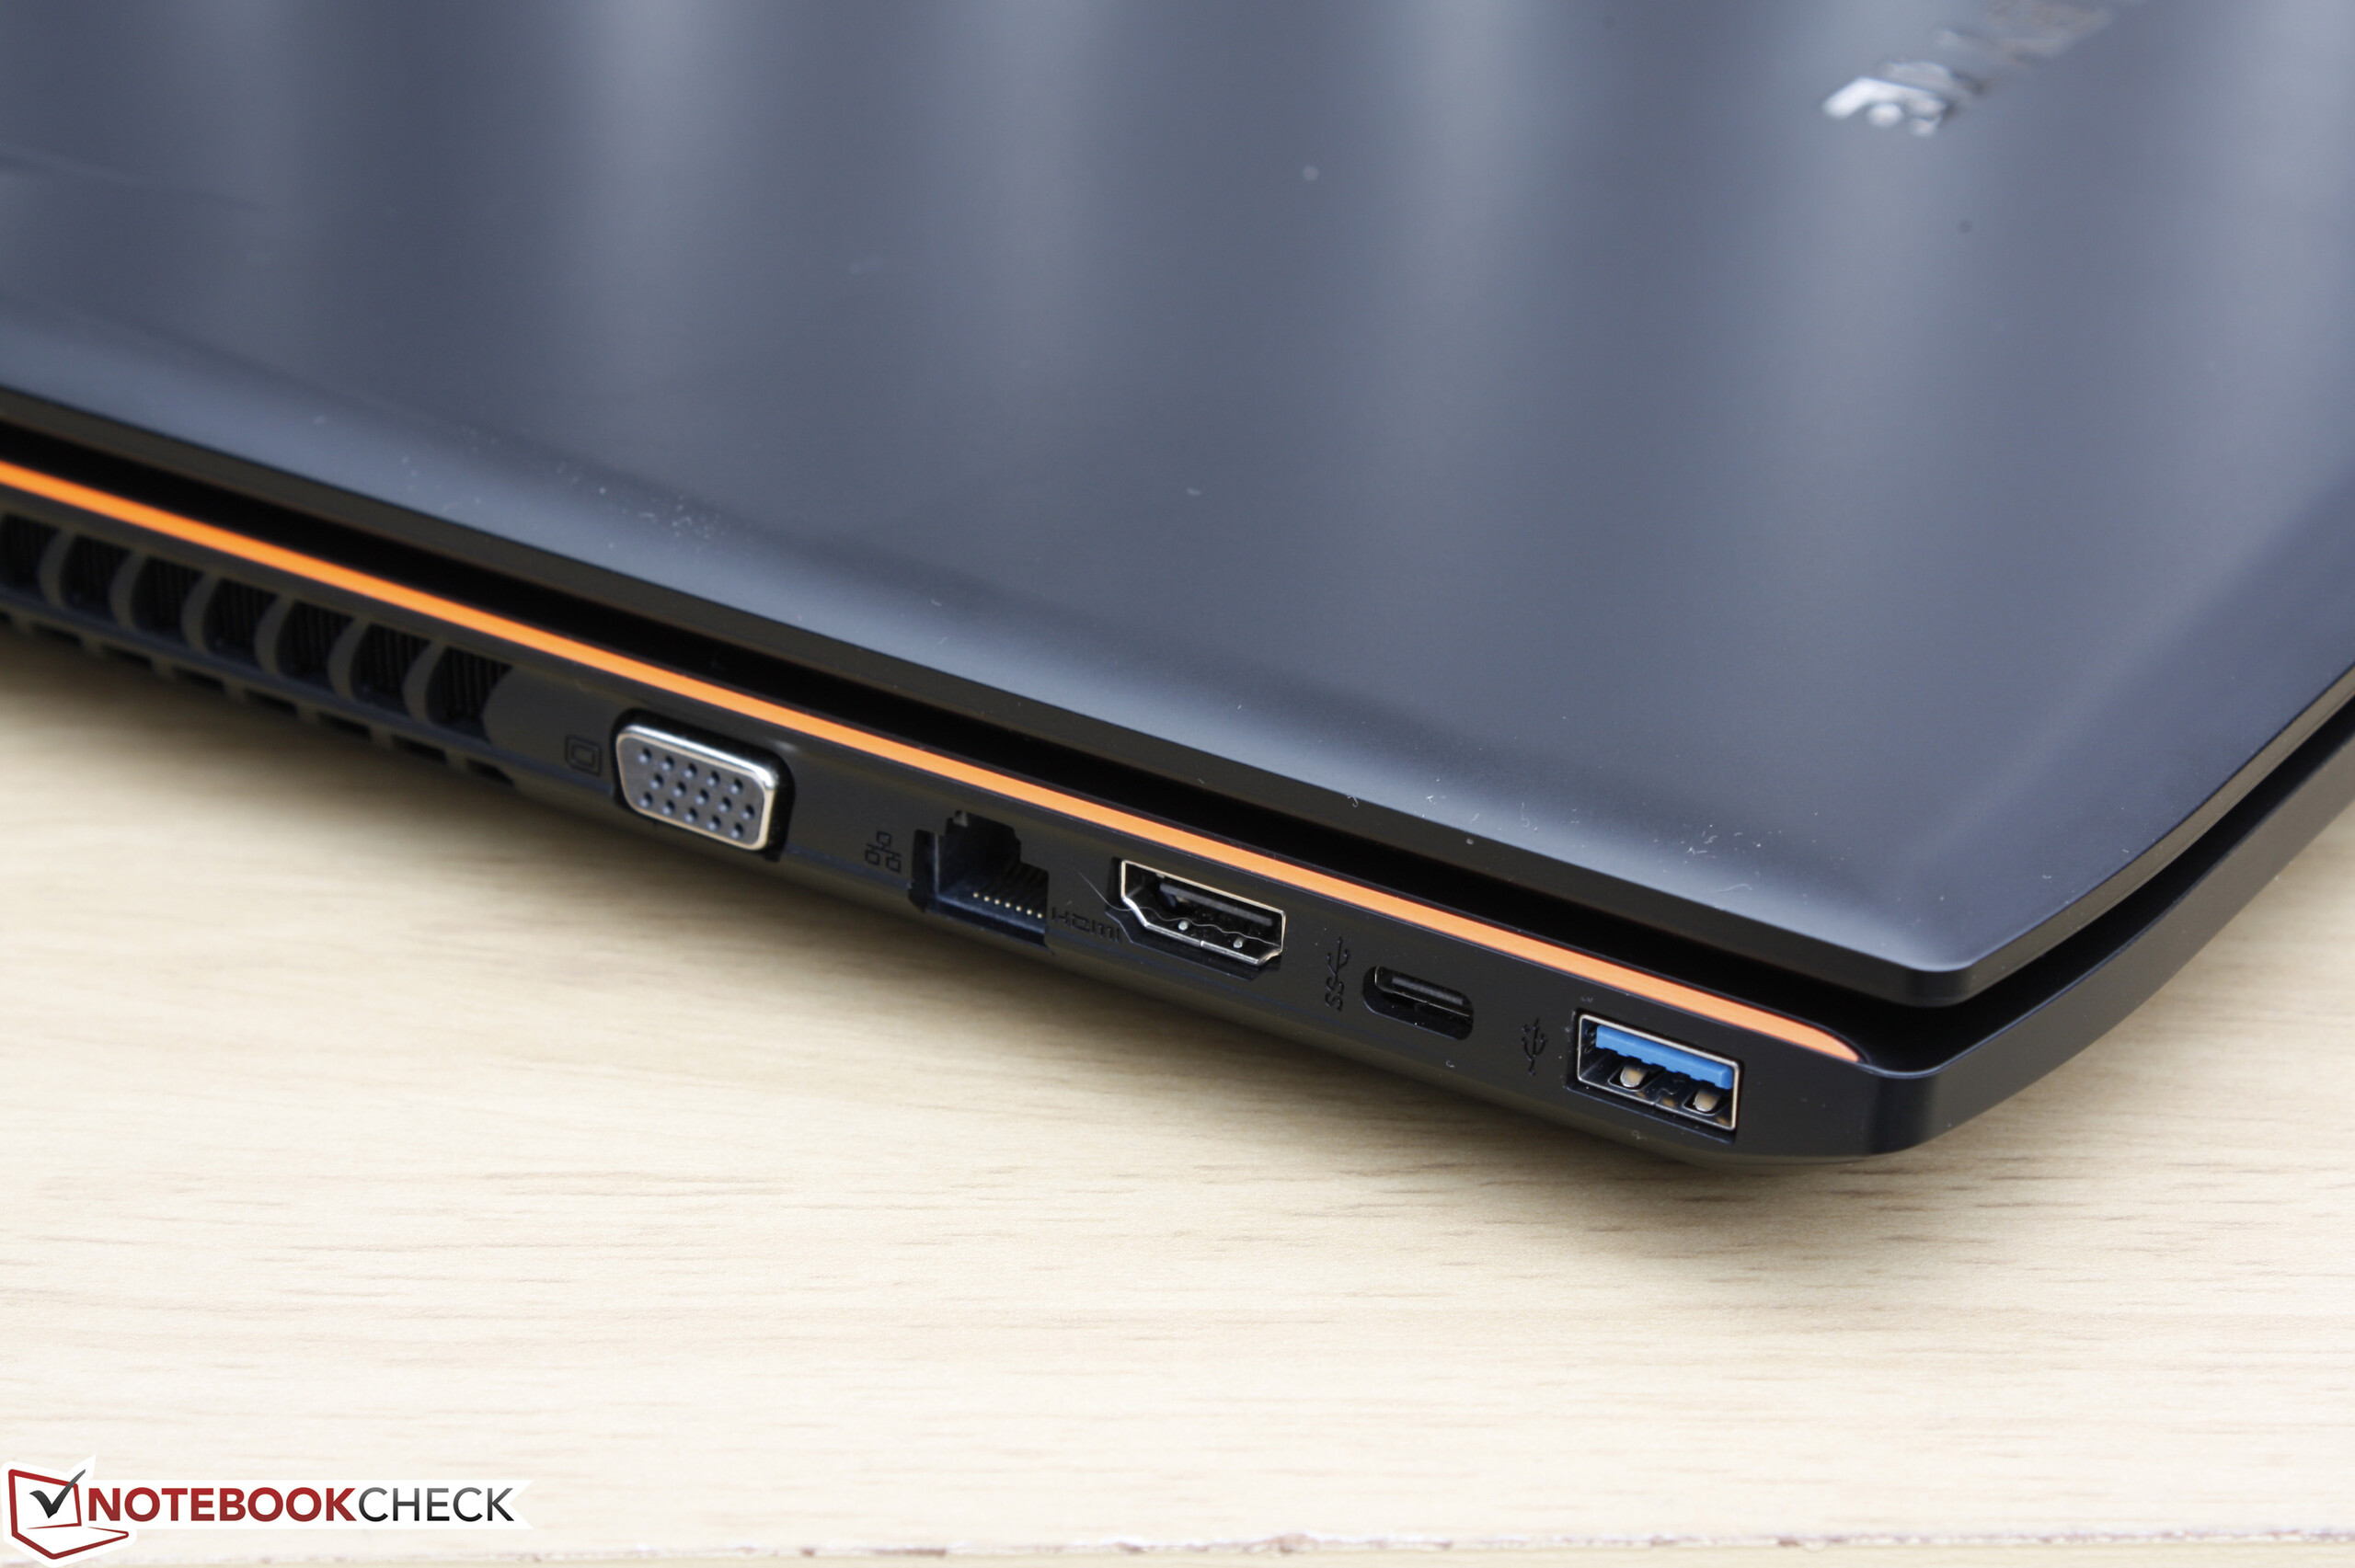
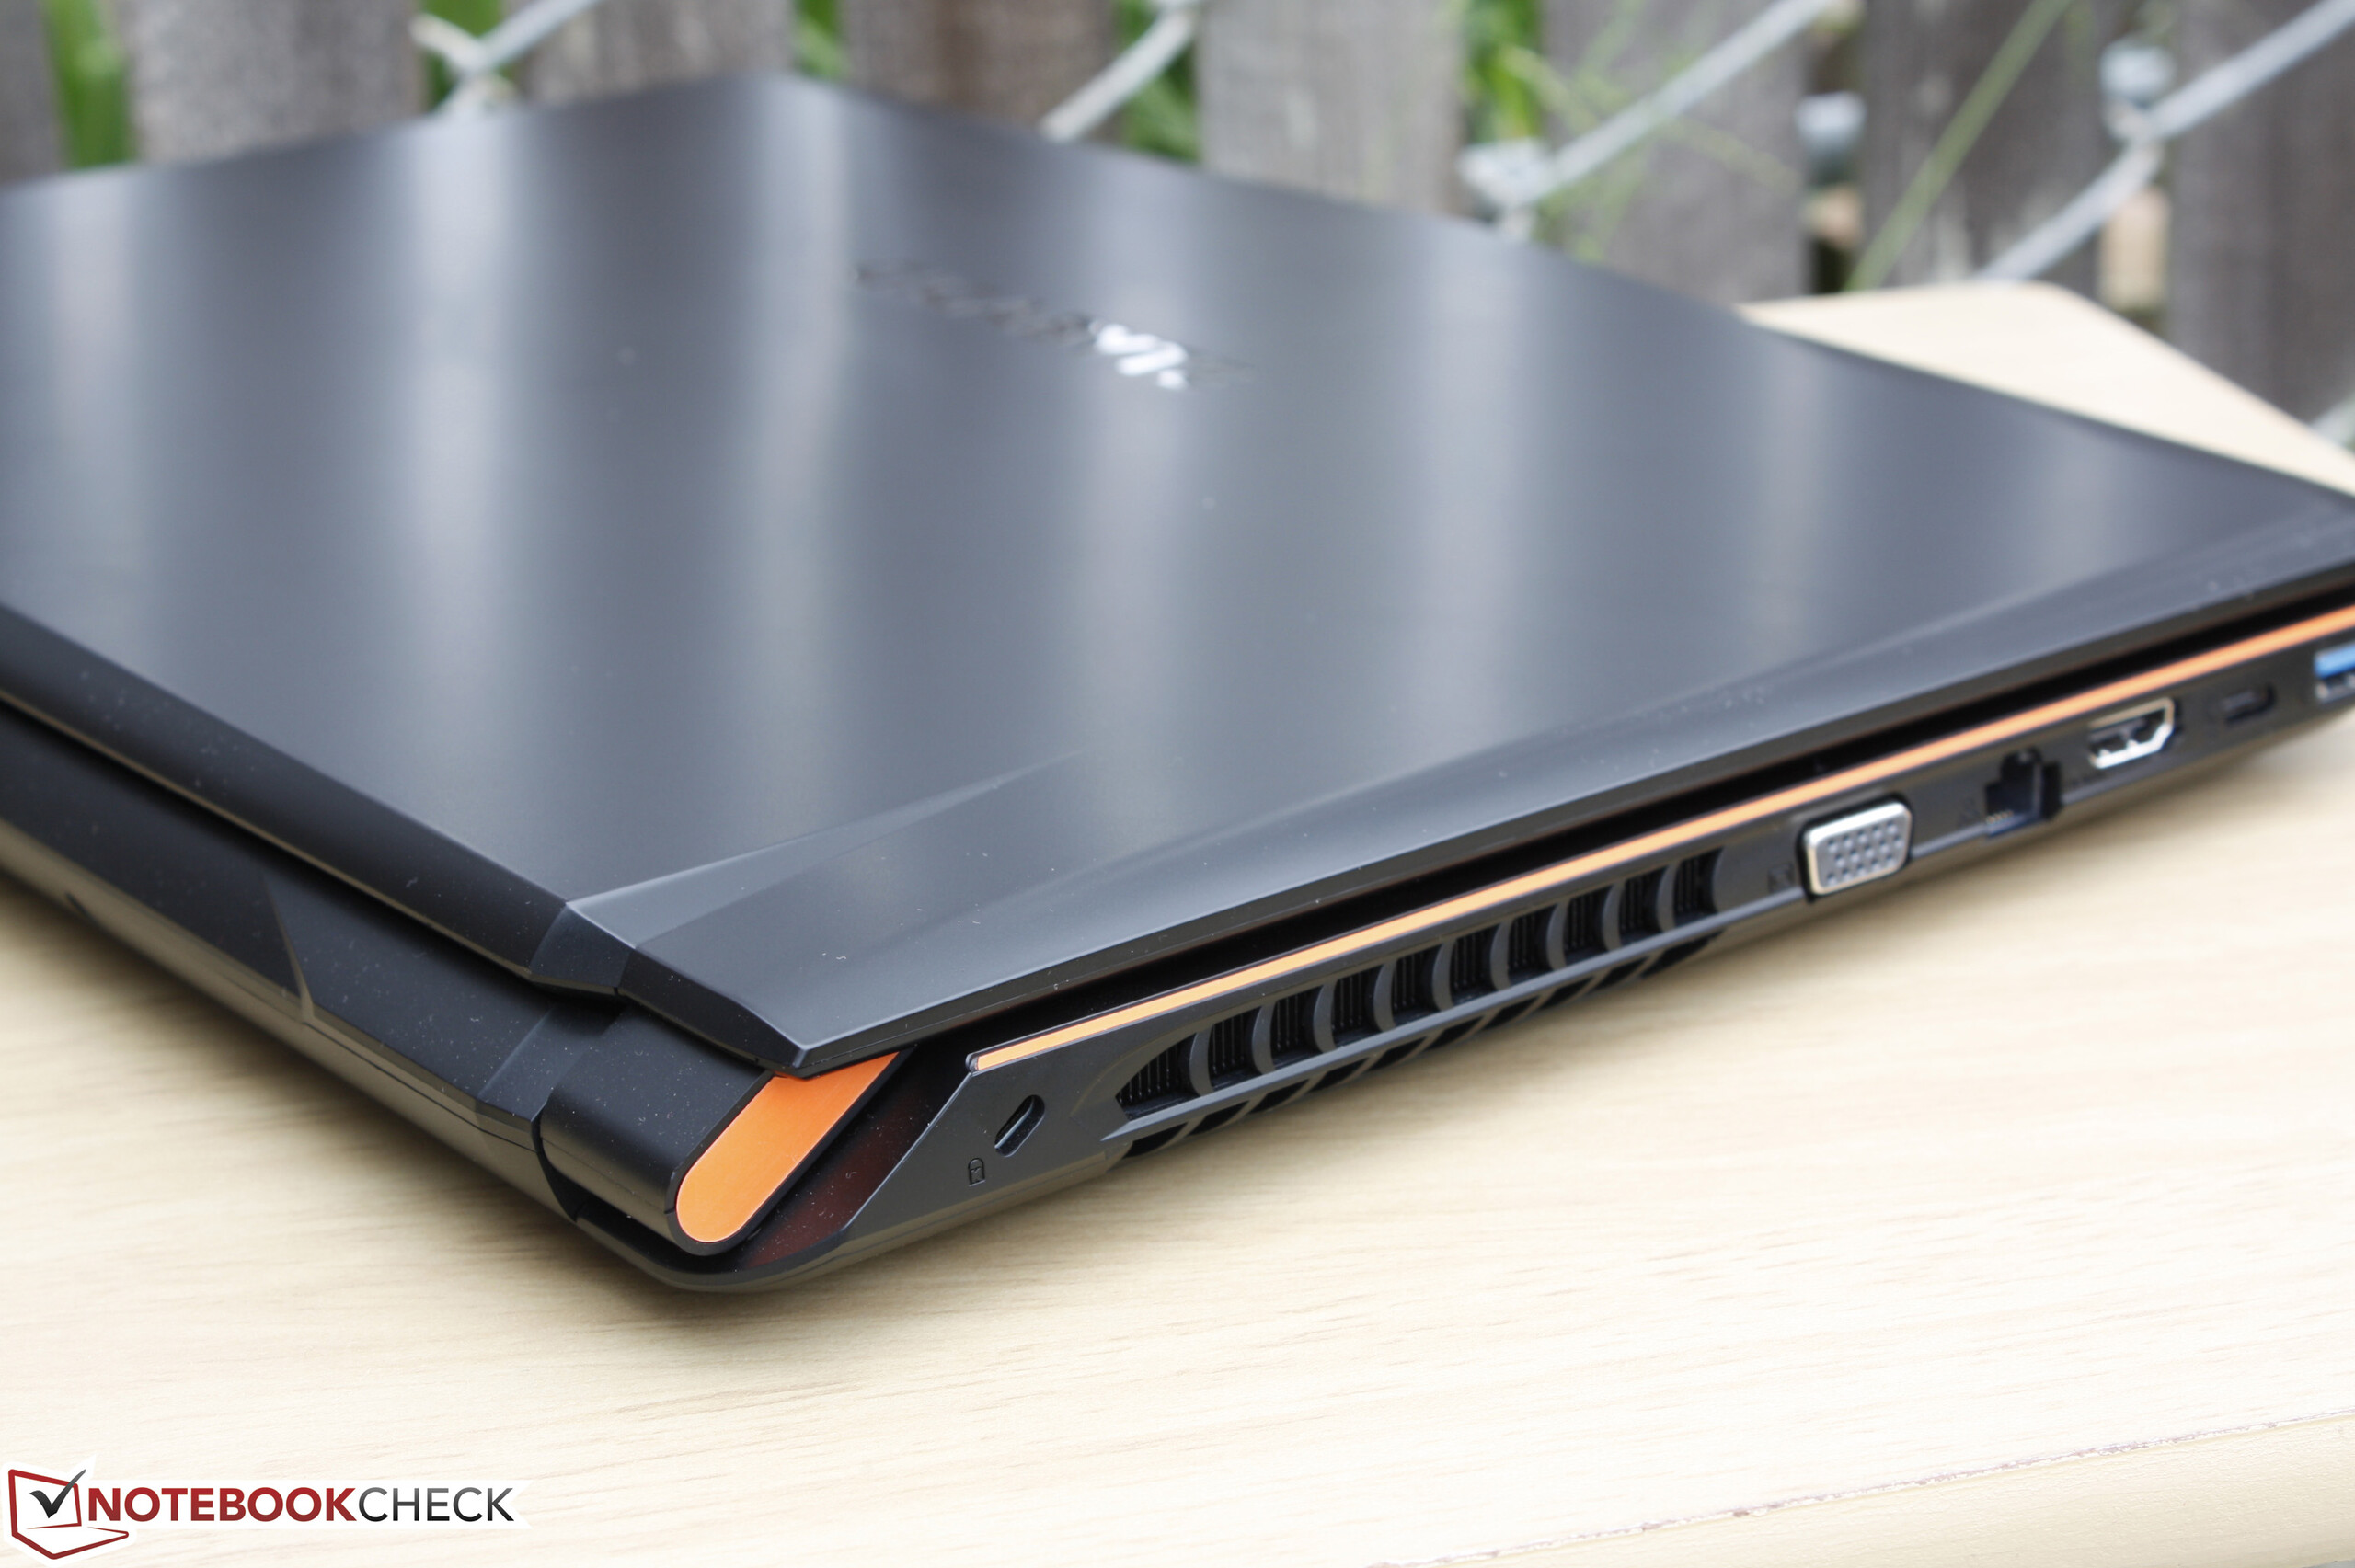
The easiest way to distinguish between a P55 v4 model and a P55 v5 model is the presence of a USB Type-C port on the left edge of the notebook. The chassis is otherwise the same including the glow-in-the-dark orange accents along the left- and right-hand edges. For future revisions, we would like to see improvements on the outer lid and center of the keyboard where its surfaces can more easily warp.
Connectivity
Aside from the HDMI 2.0 and USB Type-C Gen. 2 ports, the Gigabyte system is one of the few notebooks with legacy VGA as well. This may or may not make up for the lack of Thunderbolt 3 and DisplayPort options depending on the needs of the user. Another minor complaint is the positioning of the SD card reader as it can be difficult to access without first lifting up the notebook for a better angle.


Communication
WLAN is provided by an Intel Wireless-AC 8260 M.2 2230 module with dual-band (2x2) capabilities and both integrated Bluetooth and WiDi. The WLAN card is an upgrade from the Intel 7265 on the P55 v4, but is otherwise the same as on the P55W v5. There are no WWAN or GPS options available for the gaming notebook.
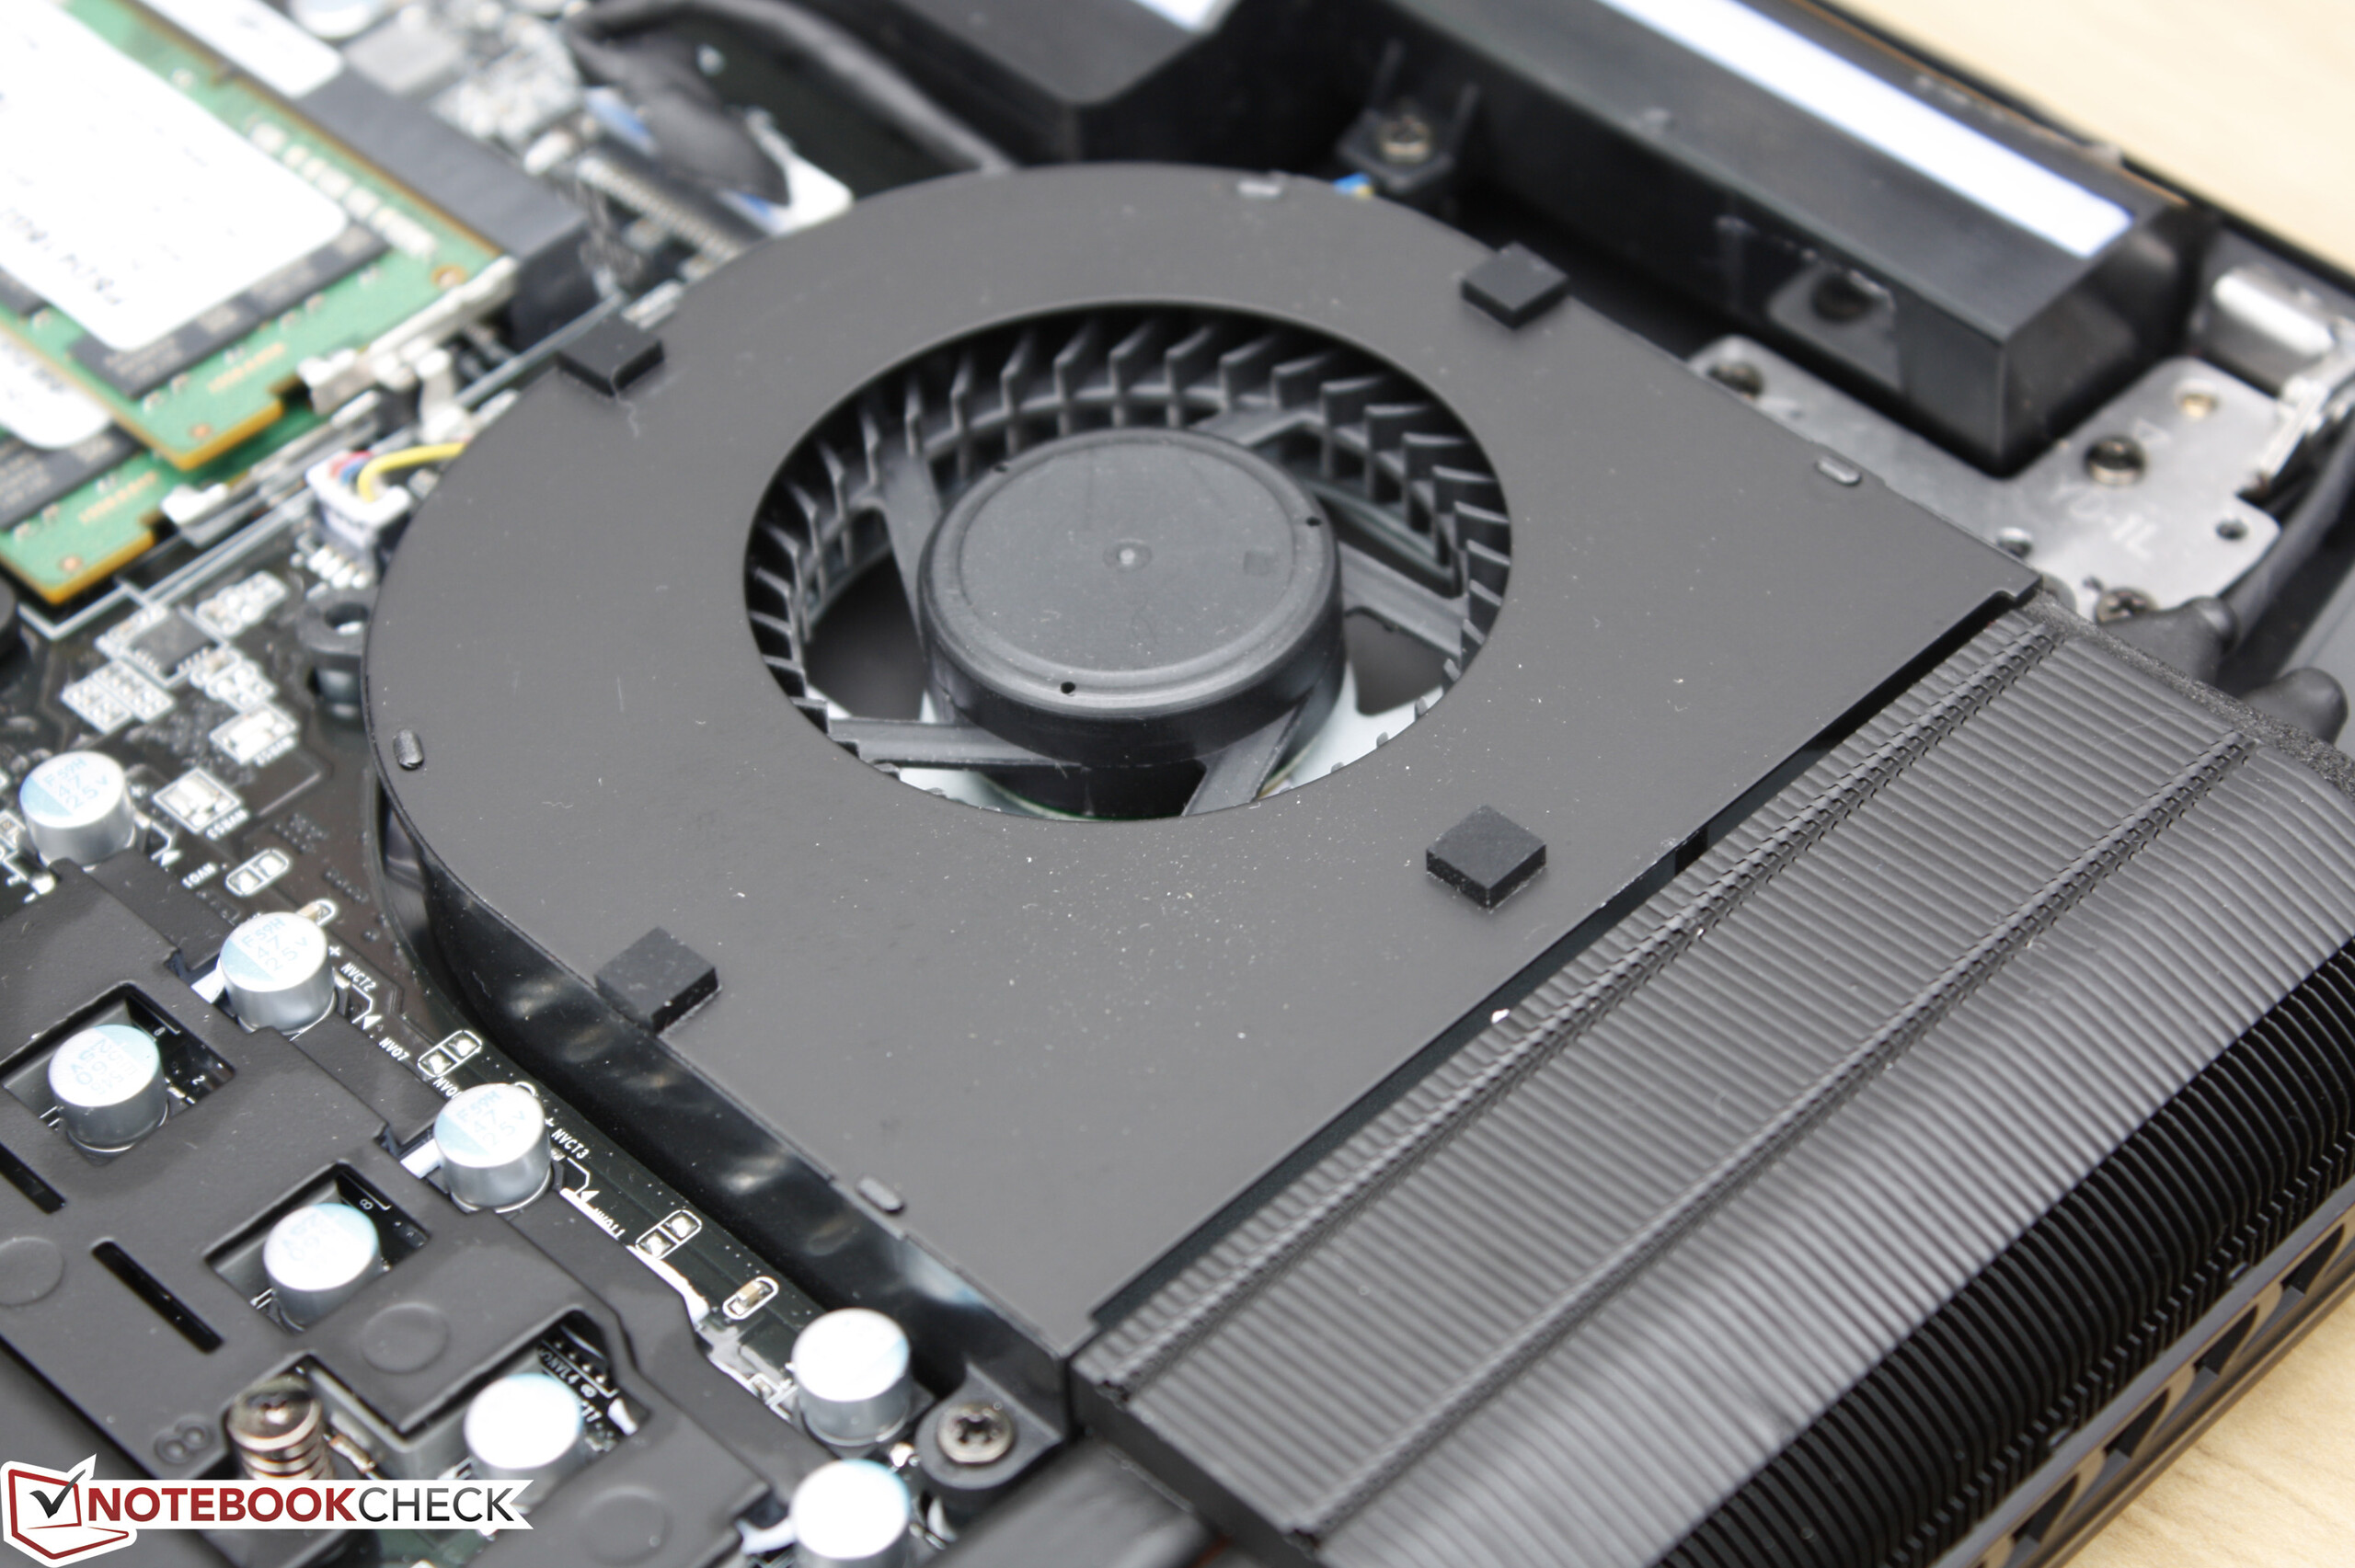
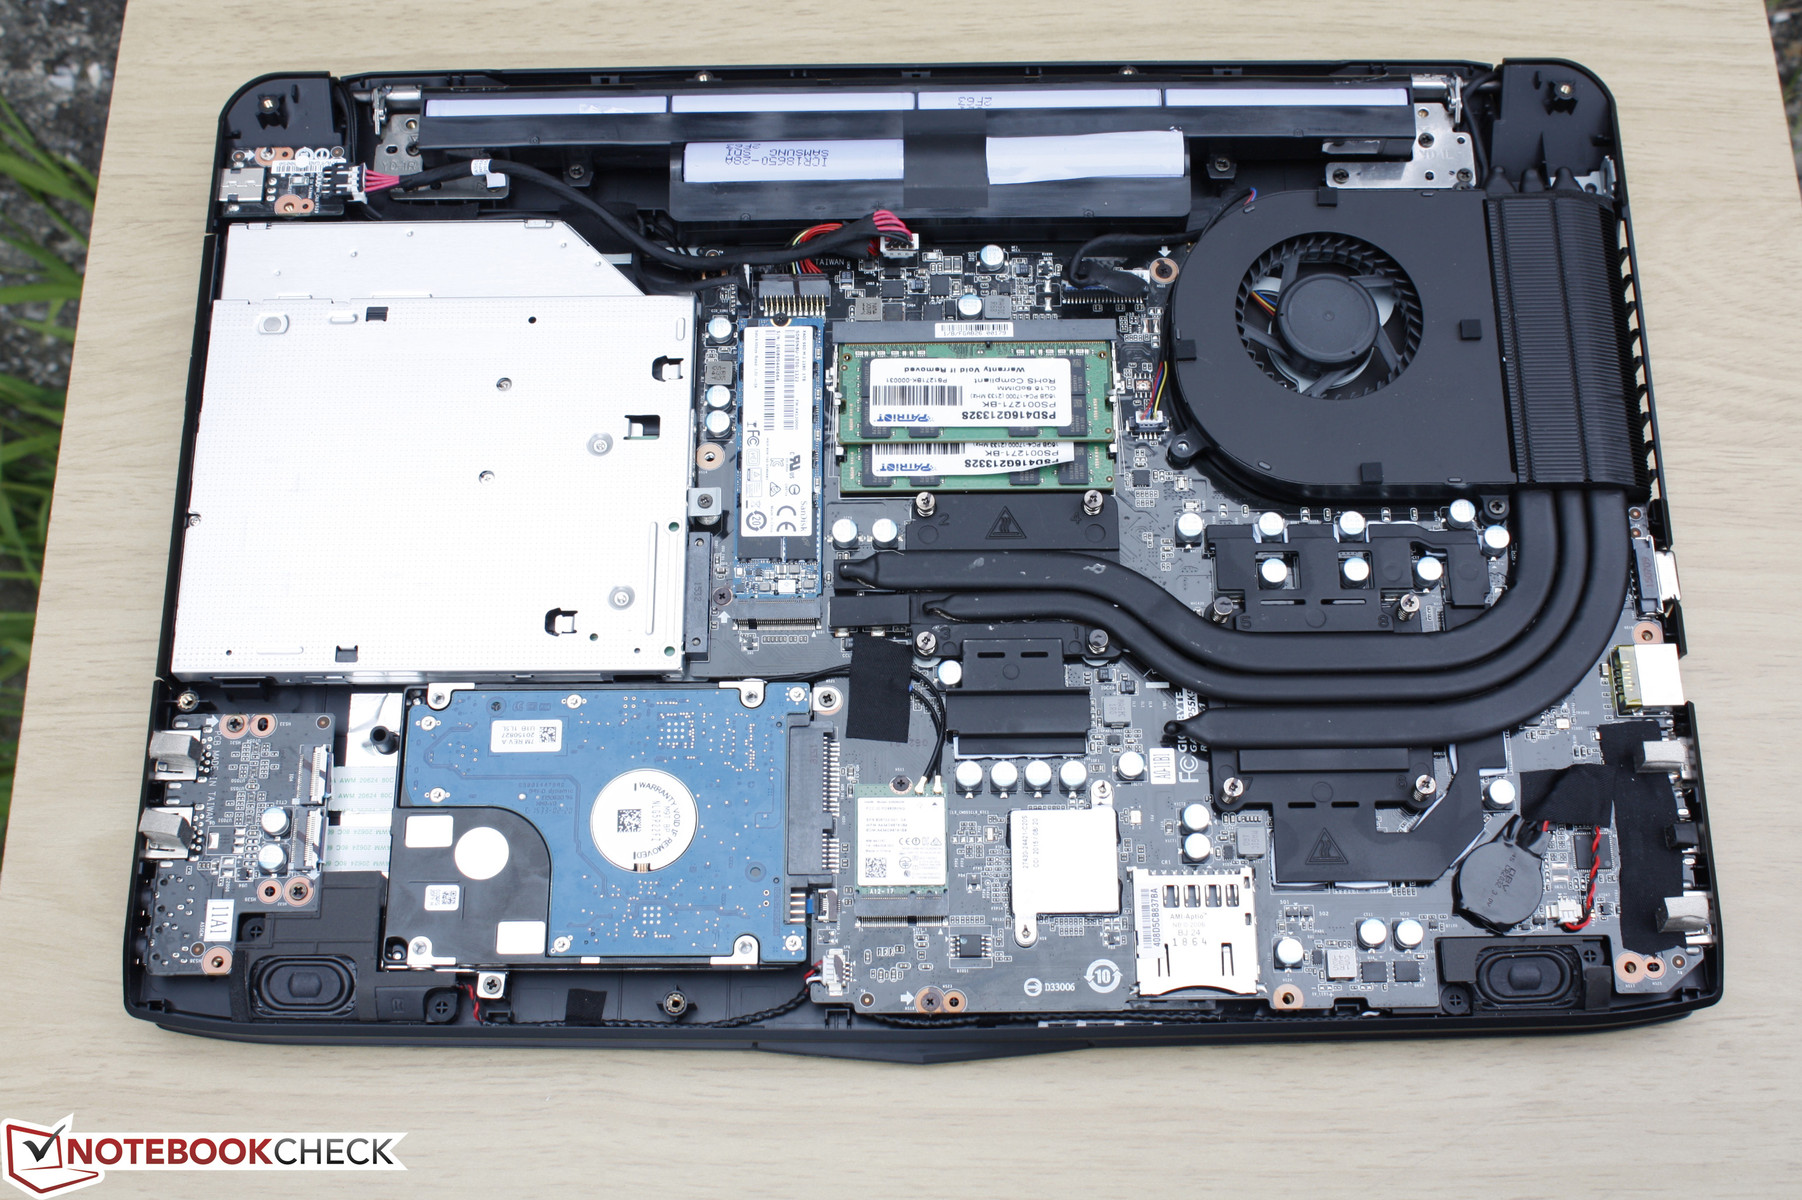
Maintenance
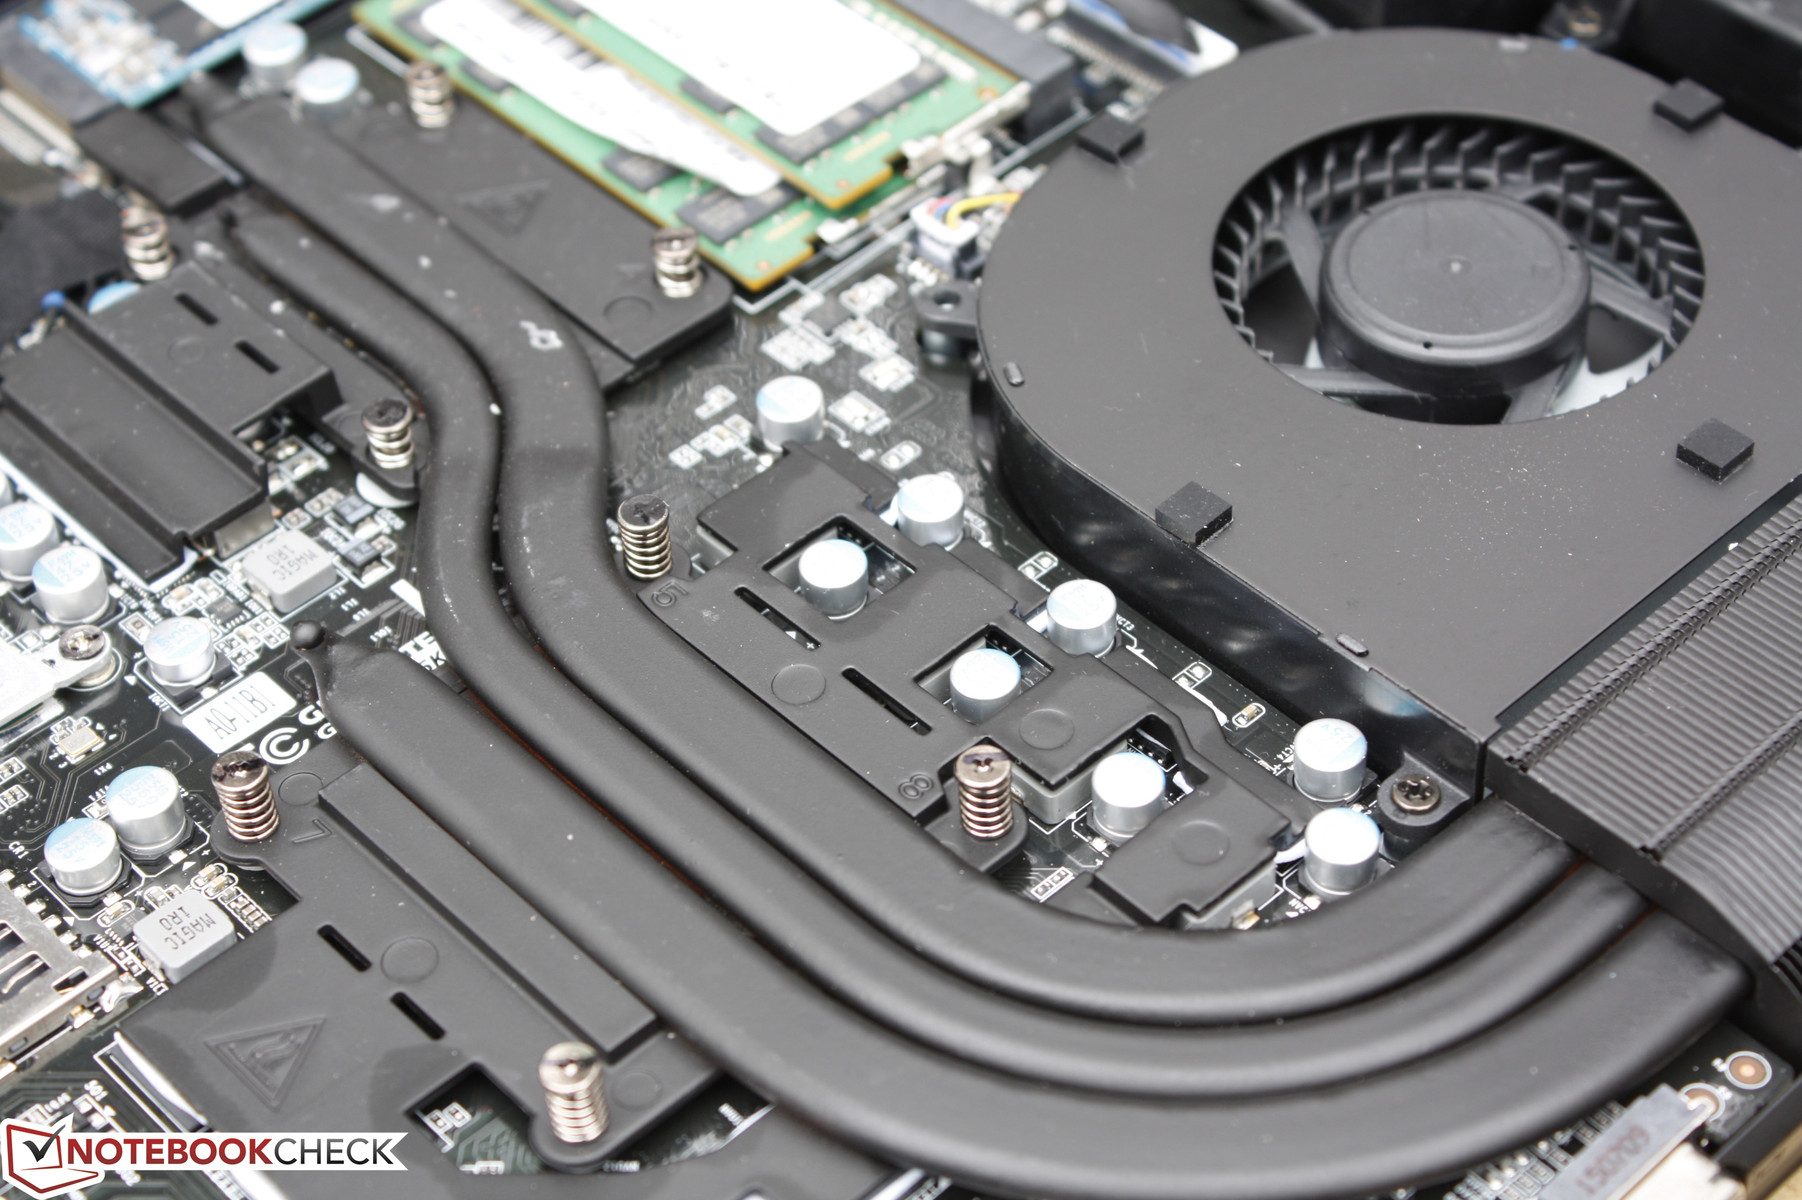
Serviceability is relatively simple as all that is required is a Philips screwdriver to remove the bottom panel. Users are granted direct access to core components including the 6-cell battery, optical drive, WLAN card, and others. Both the CPU and GPU are soldered and non-removable unlike on a number of larger gaming systems like the GT72 or Eurocom DLX7.
Warranty
Gigabyte provides a global 24-month warranty as standard across its lineup of gaming notebooks compared to just 12 months in the U.S. for many other brands. Additionally, any aftermarket or additional components installed by CUKUSA are automatically covered by the online retailer for a total of three years with free diagnostic support.
Input Devices
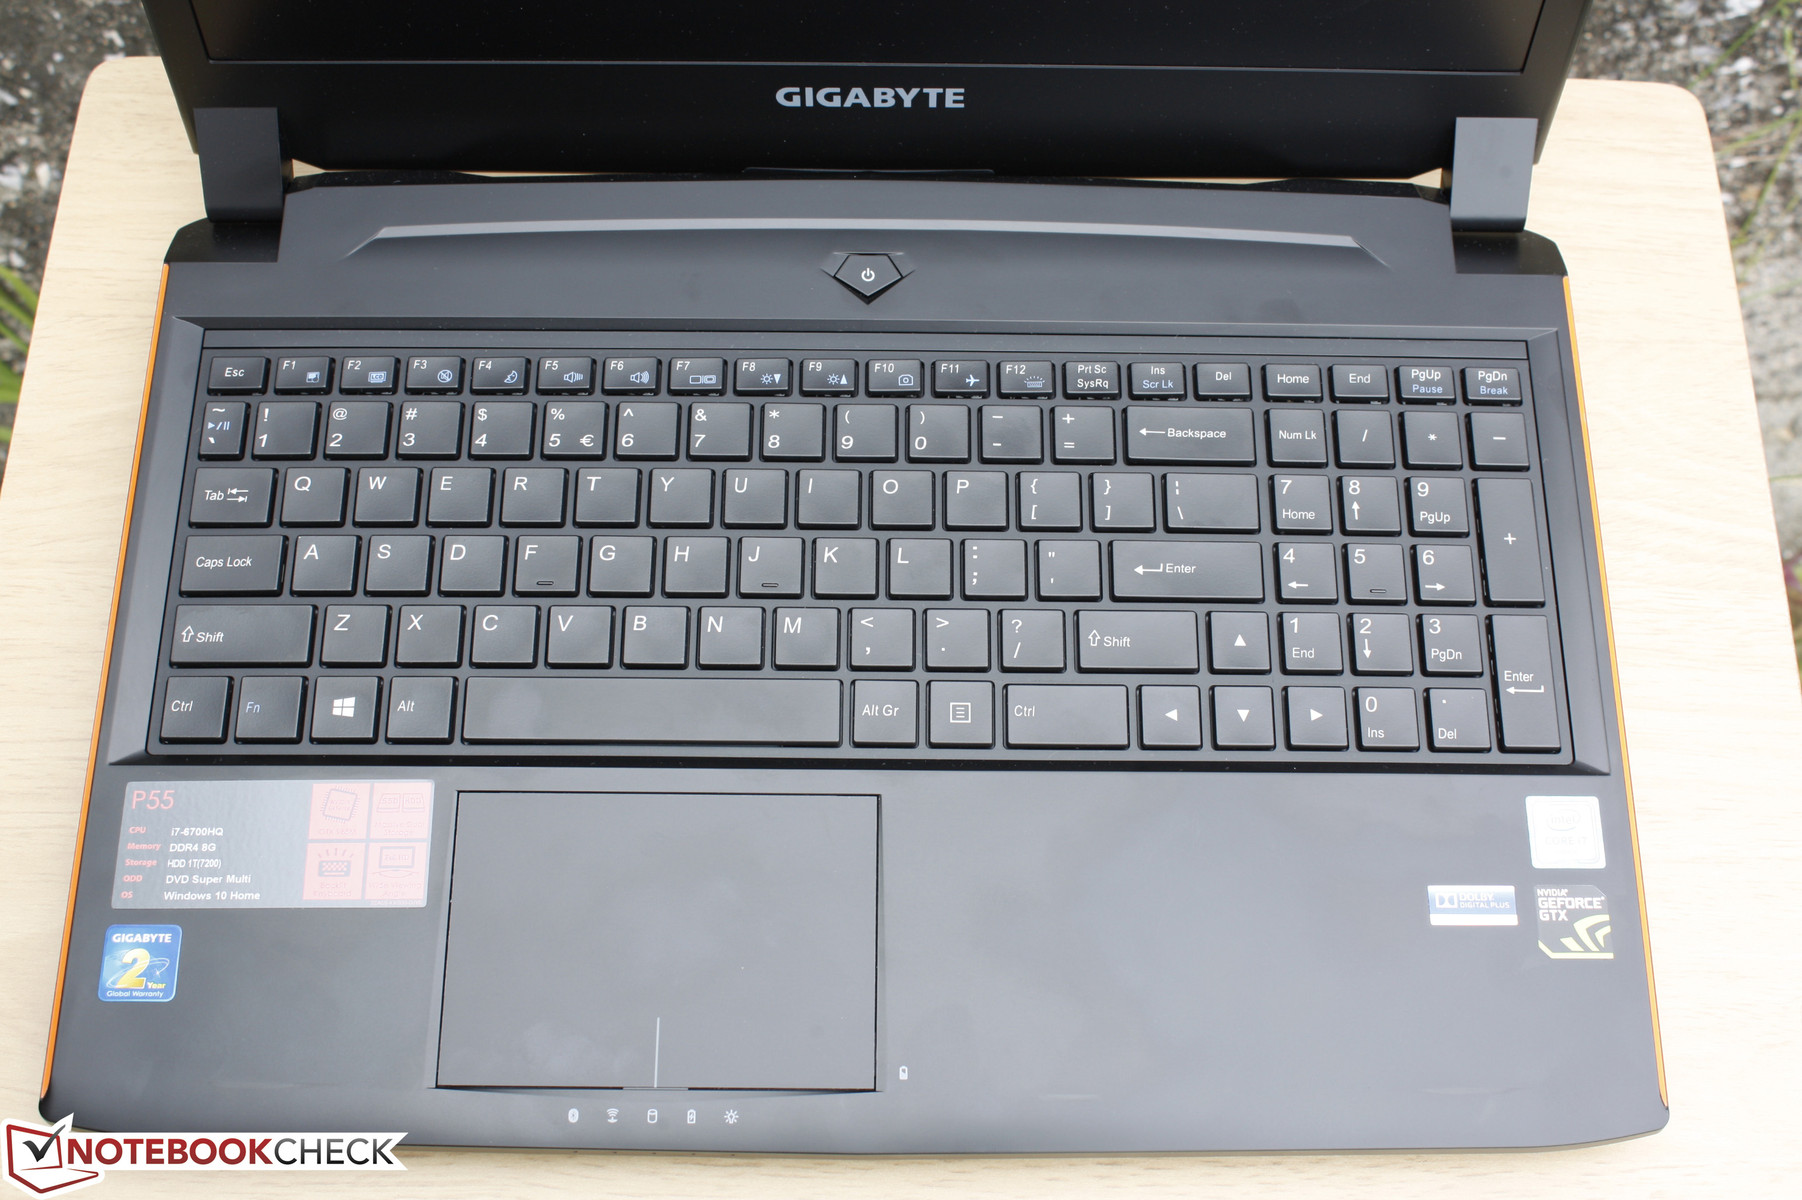
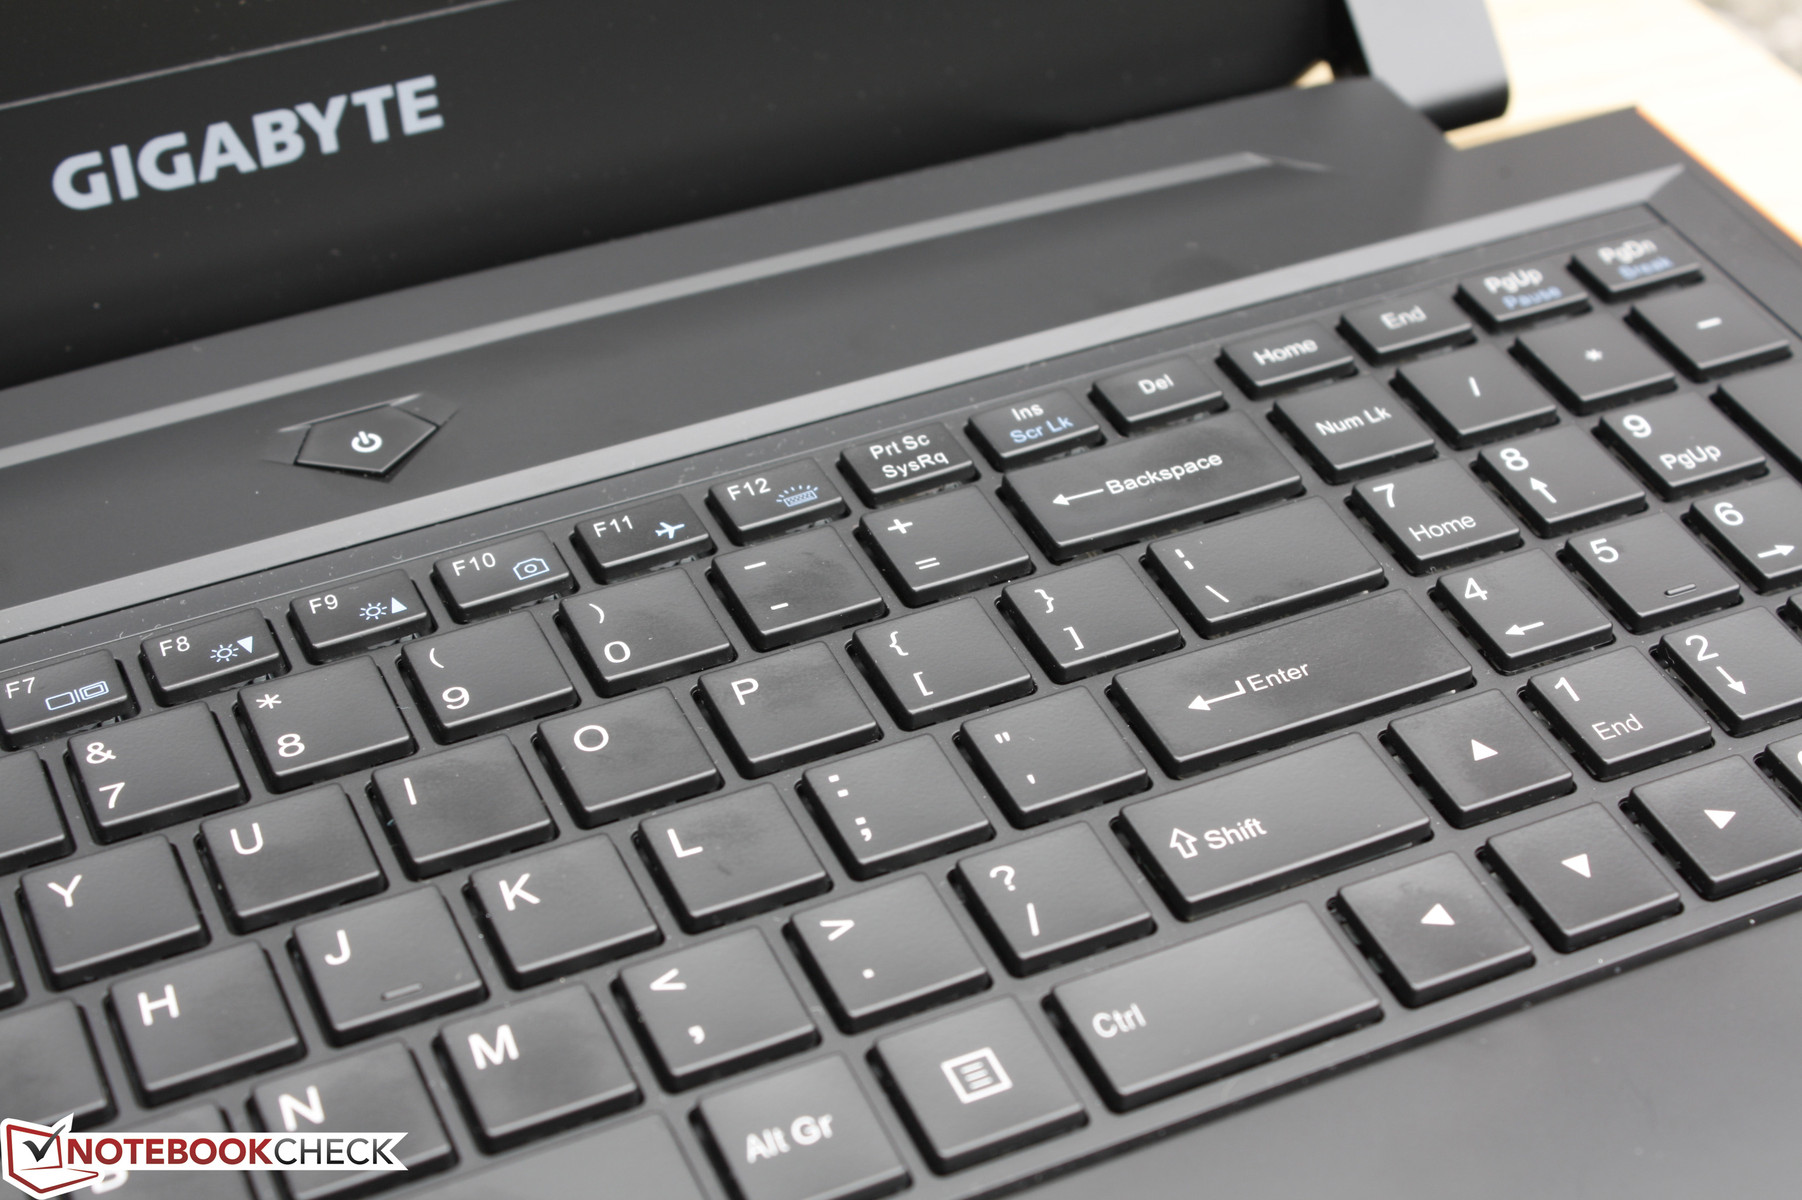
Keyboard
The Chiclet keyboard is notable for providing a long travel of 2.2 mm compared to about 1.5 mm on most notebooks. The individual keys are much taller than usual and feel much closer to a desktop keyboard as a result. When combined with the firm feedback, the general typing experience is one of the best for a notebook outside of perhaps the integrated mechanical keys of the gargantuan MSI GT80.
Touchpad
No changes have been made to the touchpad either, which is a shame as it doesn't impress nearly as much as the keyboard. Available surface area for cursor control is smaller than it appears since the bottom portion is reserved for mouse clicks only. Additionally, the mouse clicks themselves are uncomfortable to use since the input force required is comparatively higher than on other notebooks.
Display
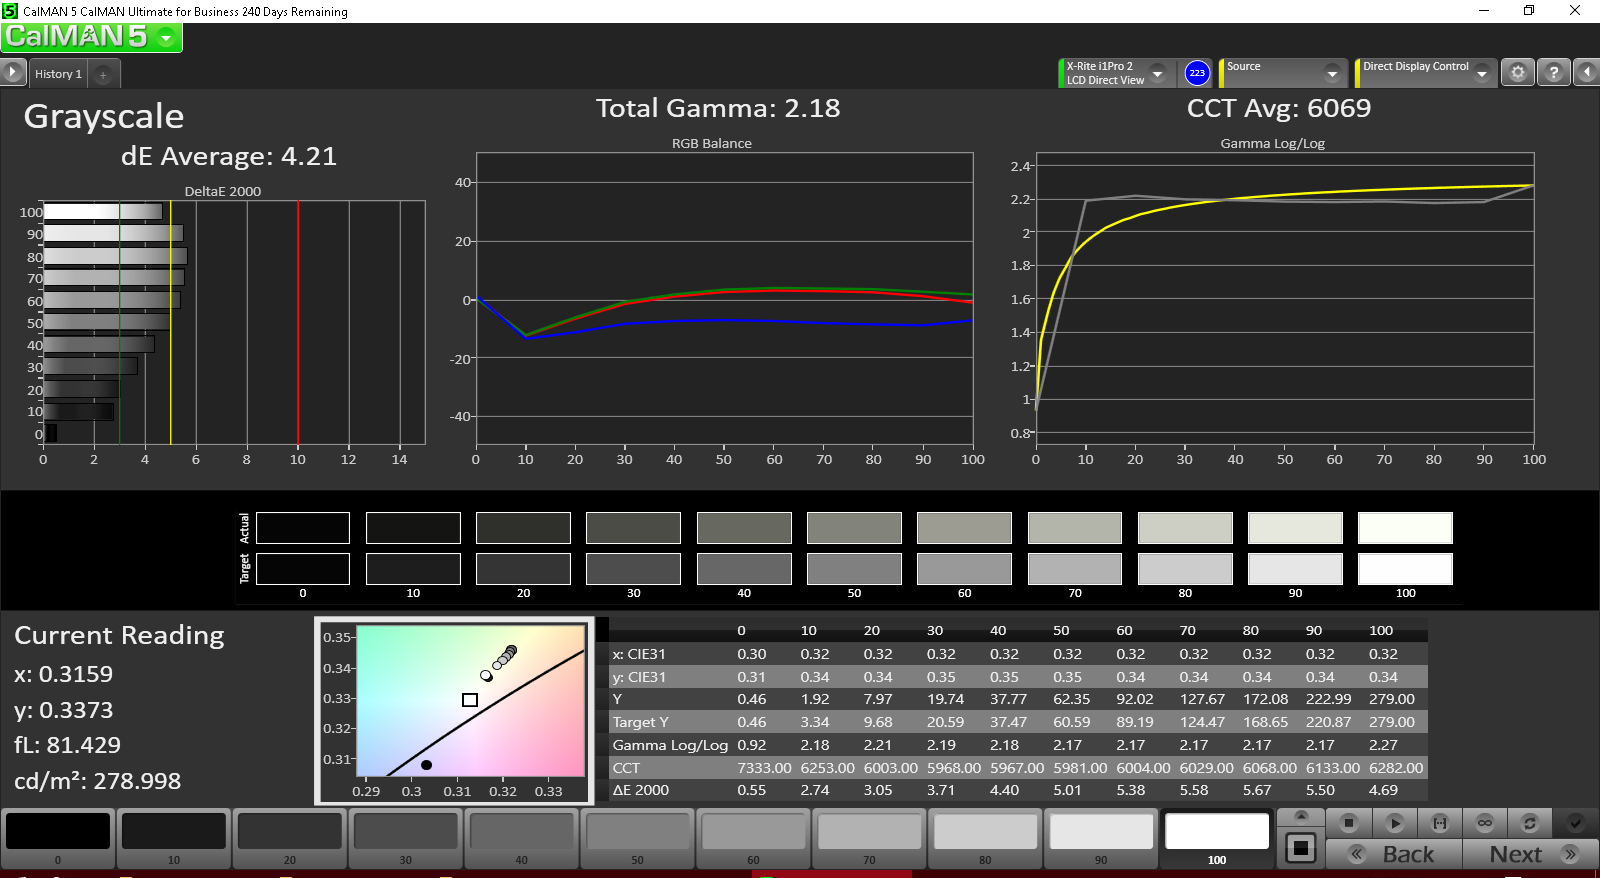
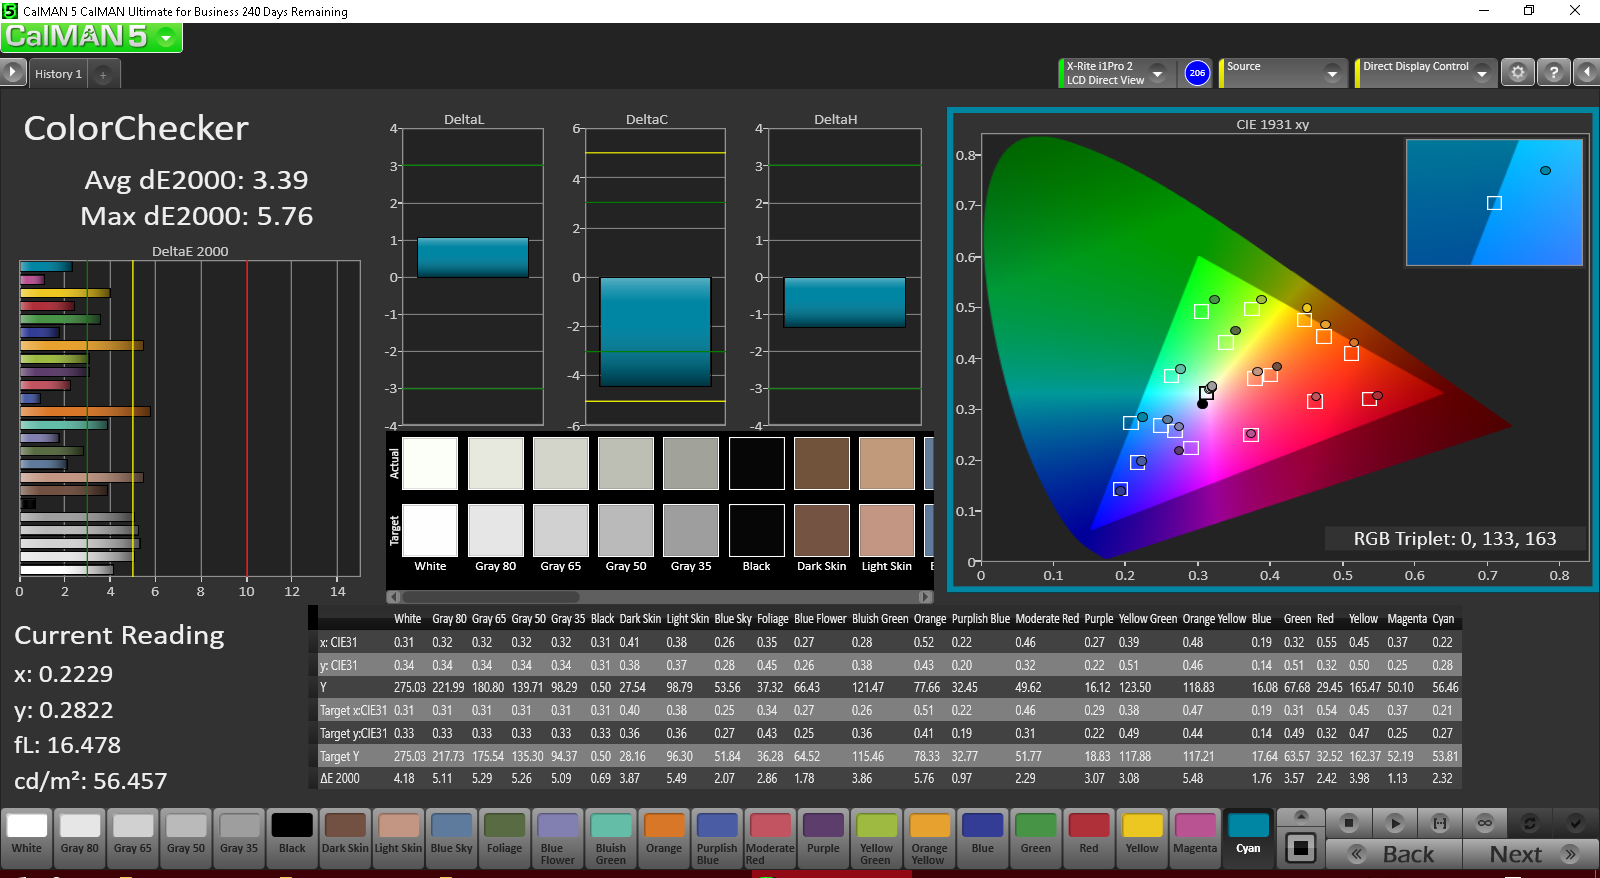
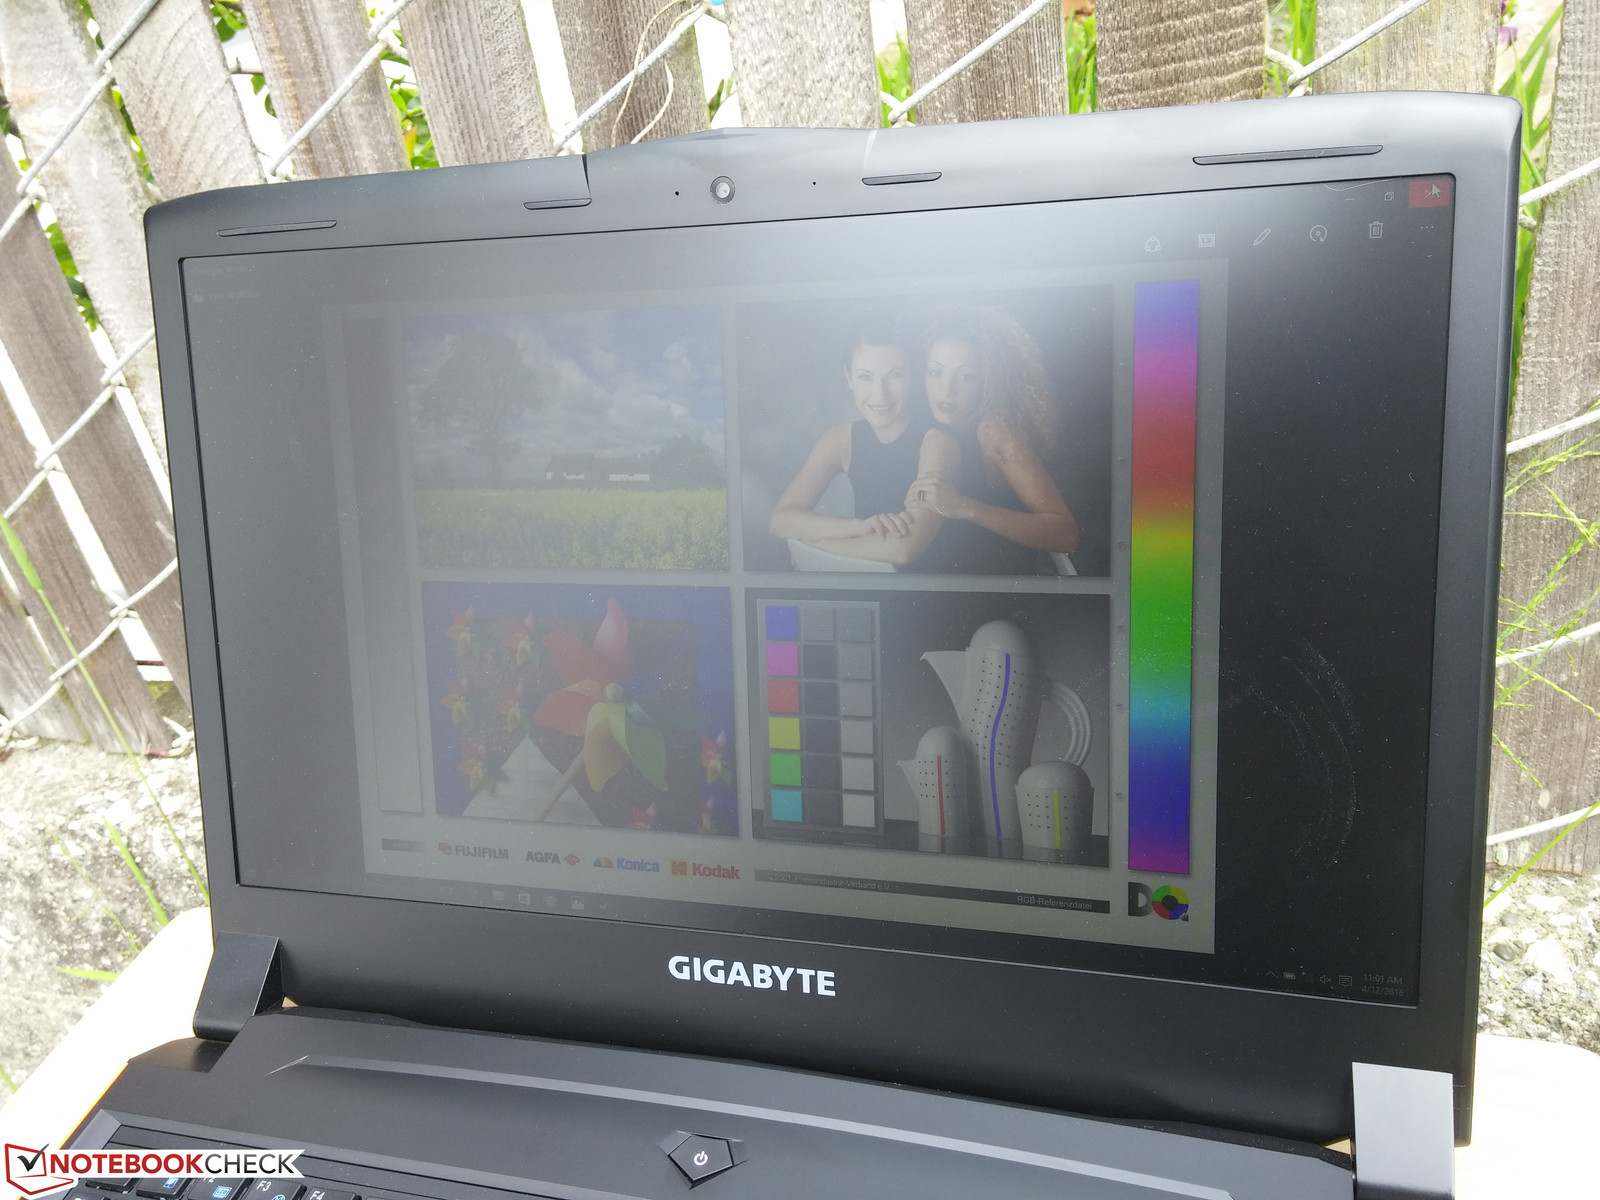
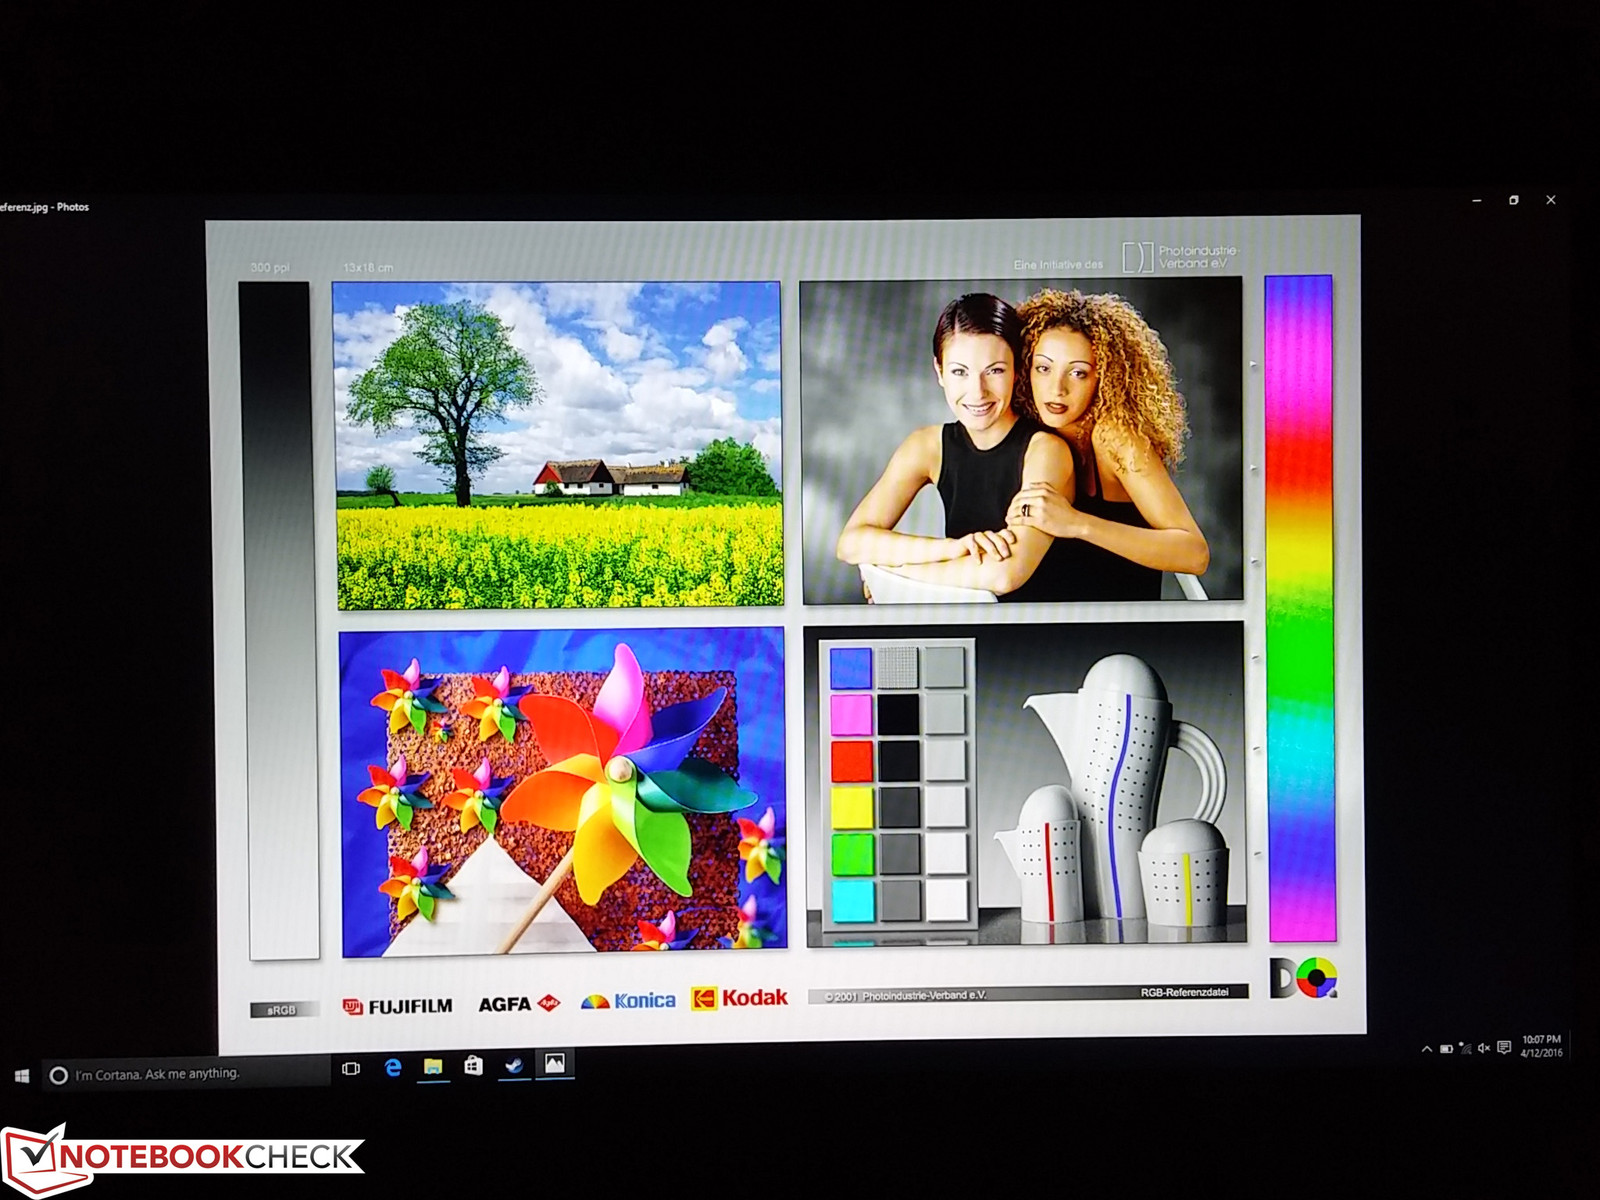
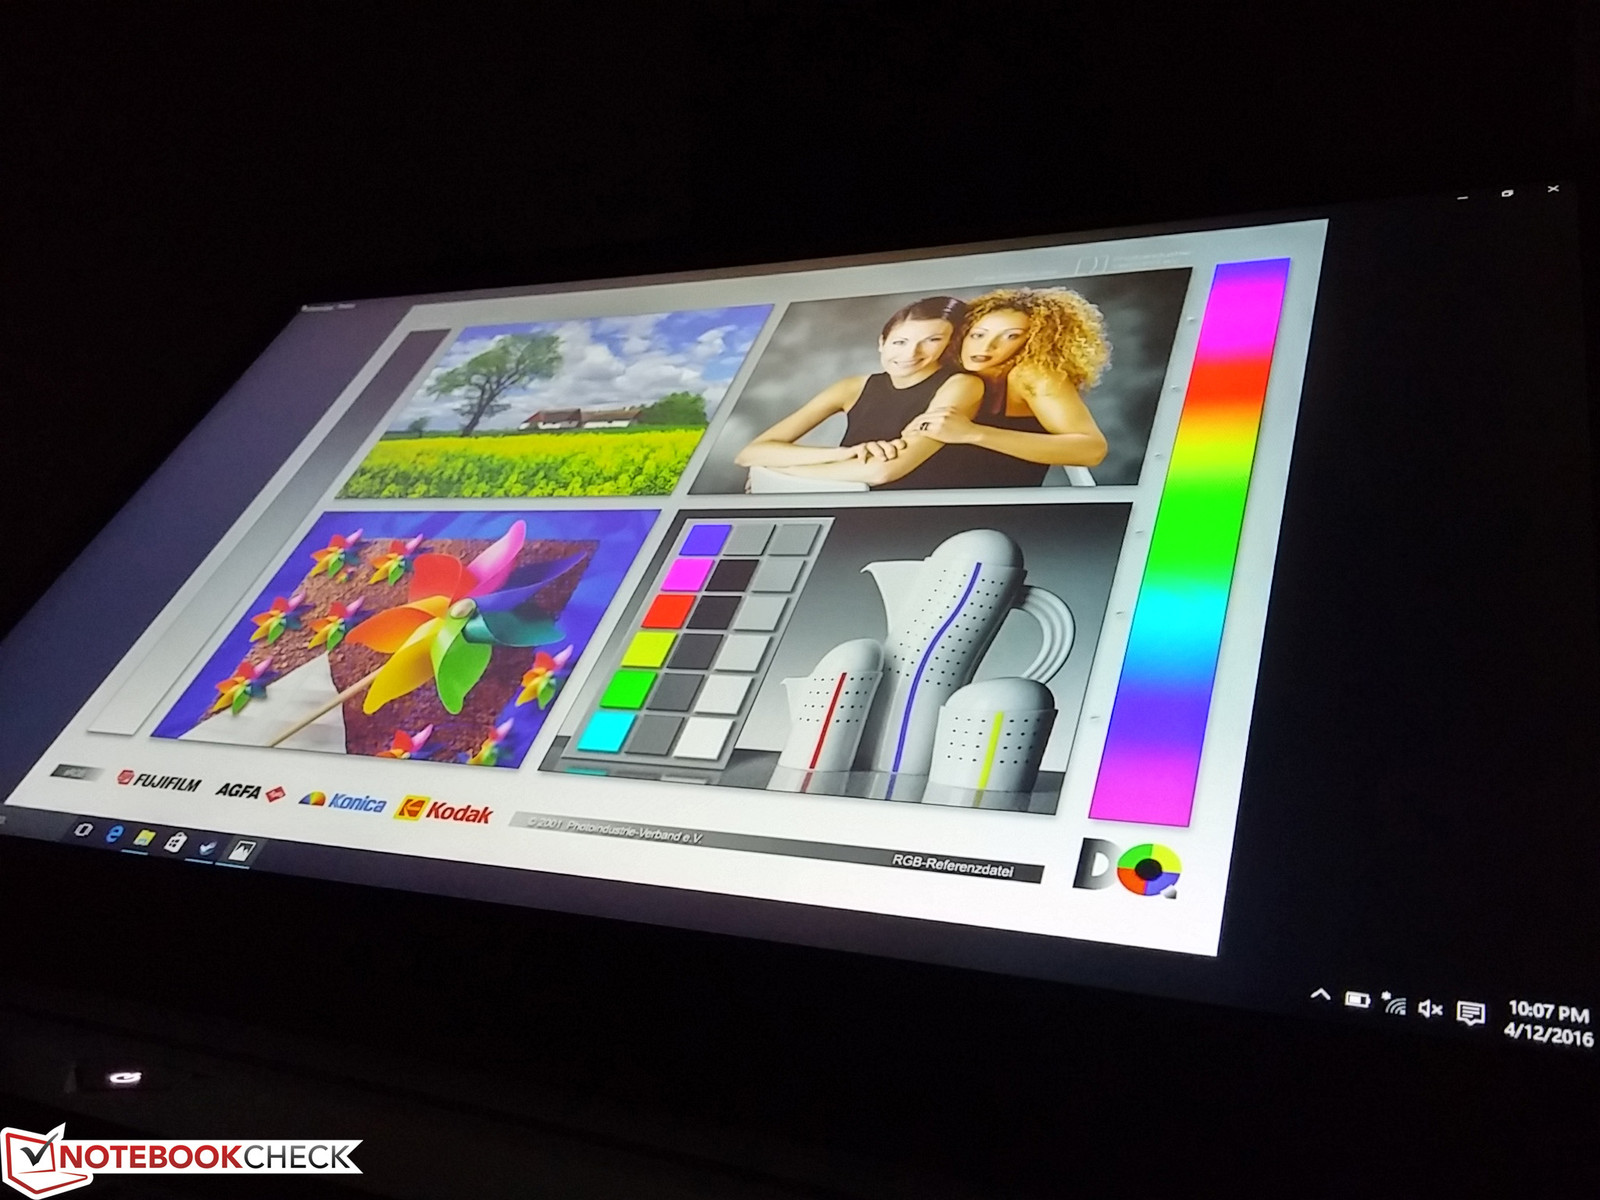
The 1080p matte screen utilizes a different AU Optronics B156HAN01.2 panel compared to the LG Philips LP156WF4-SPH1 panel as found on our P55W v5 test unit. While the AUO panel is indeed more accurate in terms of color reproduction, its contrast and backlight brightness are oddly less uniform on our P55K v5 test unit. This is still a high-end IPS panel nonetheless and the exact same panel can also be found on a number of other performance notebooks including 15.6-inch Clevo barebones and the Acer Aspire V5-573G.
Uneven backlight bleeding is present around the edges and is most noticeable near the bottom right corner. Users may notice the effect when watching movies with black borders or during dimly lit scenes.

| |||||||||||||||||||||||||
Brightness Distribution: 72 %
Center on Battery: 274.9 cd/m²
Contrast: 749:1 (Black: 0.367 cd/m²)
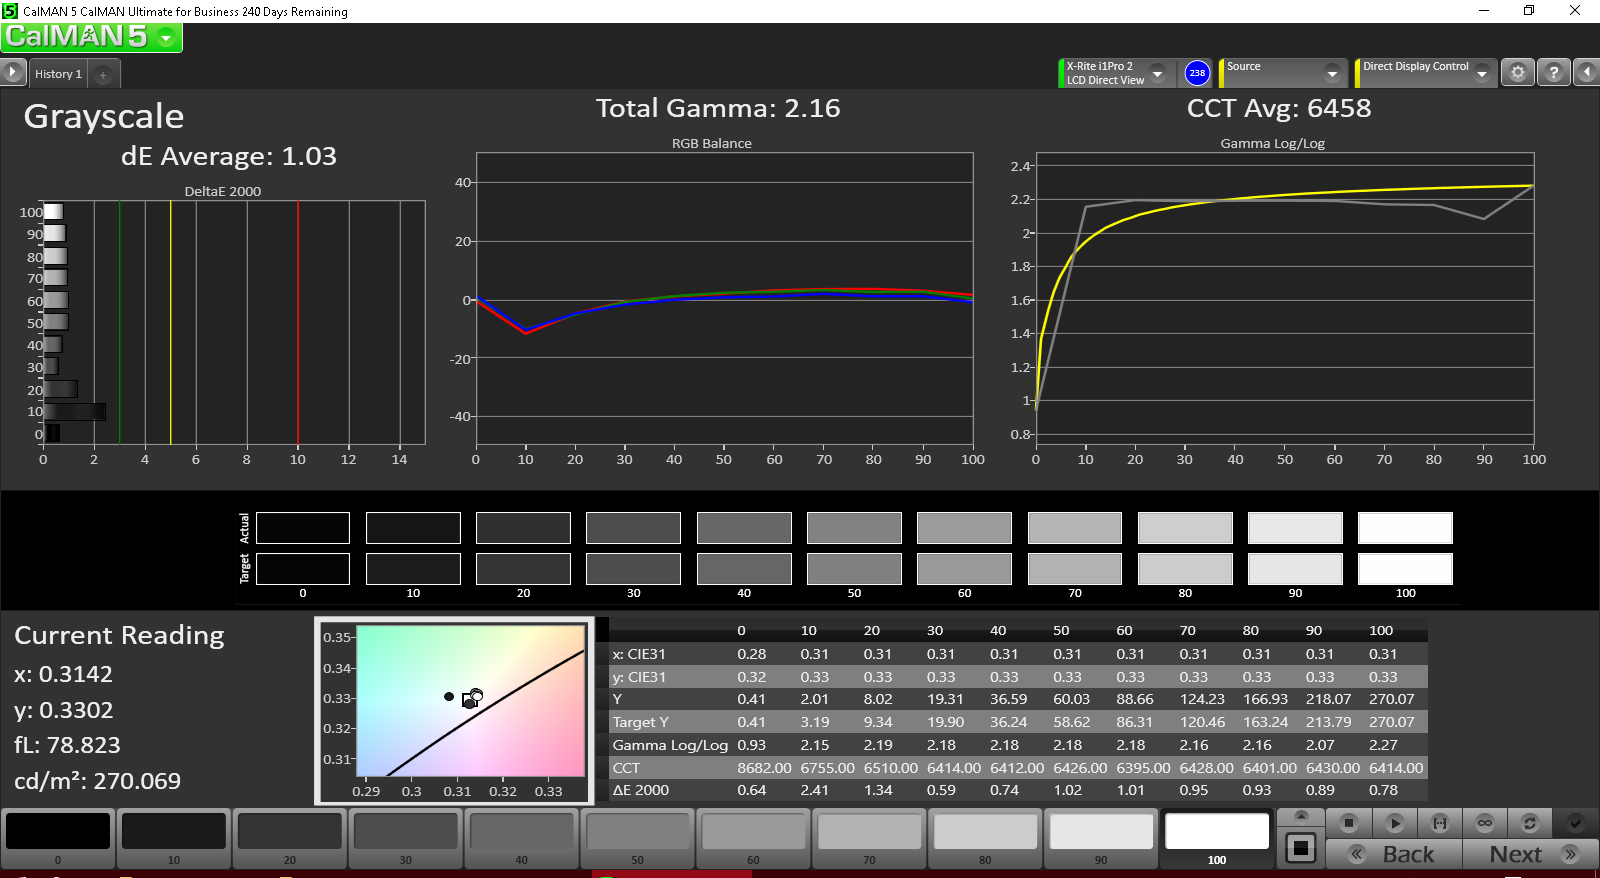
ΔE ColorChecker Calman: 3.39 | ∀{0.5-29.43 Ø4.72}
ΔE Greyscale Calman: 4.21 | ∀{0.09-98 Ø4.97}
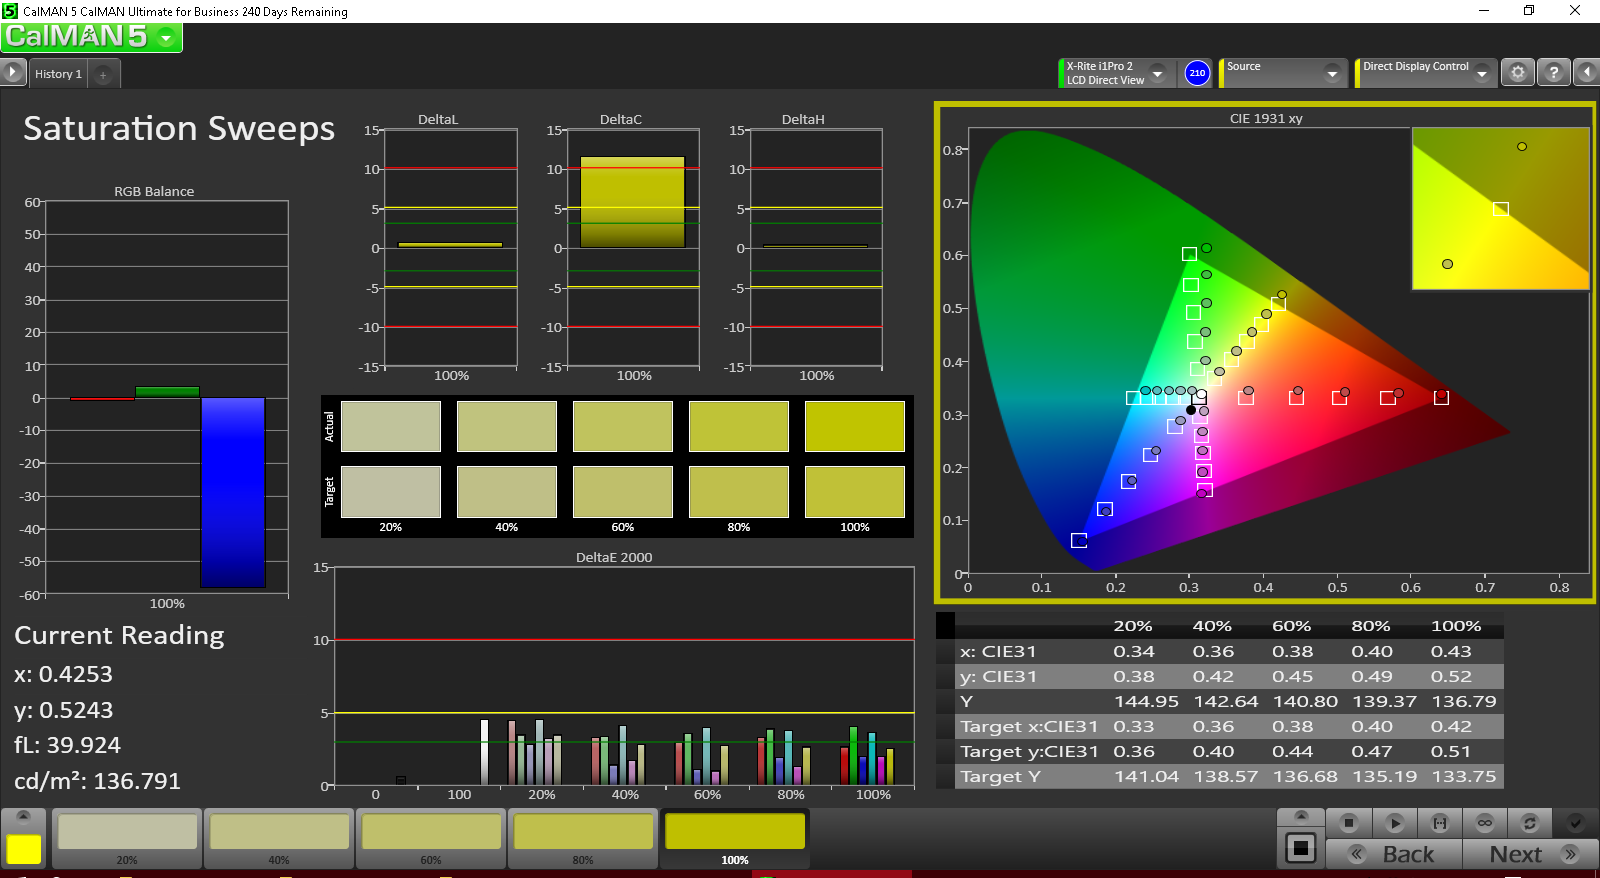
90.9% sRGB (Argyll 1.6.3 3D)
59.2% AdobeRGB 1998 (Argyll 1.6.3 3D)
91% sRGB (Argyll 3D)
65.9% Display P3 (Argyll 3D)
Gamma: 2.18
CCT: 6069 K
| Gigabyte P55K v5 15.6", 1920x1080 | Dell XPS 15 9550 i7 FHD 15.6", 1920x1080 | MSI GS60-6QE4K16H21 15.6", 3840x2160 | Asus GL552JX-CN154H 15.6", 1920x1080 | Acer Aspire V15 Nitro BE VN7-592G-79DV 15.6", 3840x2160 | |
|---|---|---|---|---|---|
| Display | 6% | -16% | 5% | 21% | |
| Display P3 Coverage (%) | 65.9 | 68.5 4% | 53.1 -19% | 67.8 3% | 86.2 31% |
| sRGB Coverage (%) | 91 | 97.2 7% | 80 -12% | 97.5 7% | 100 10% |
| AdobeRGB 1998 Coverage (%) | 70.4 | 54.8 | 70 | 99.5 | |
| Response Times | -72% | 2% | -9% | ||
| Response Time Grey 50% / Grey 80% * (ms) | 37.2 ? | 64 ? -72% | 40 ? -8% | 49 ? -32% | |
| Response Time Black / White * (ms) | 29.2 ? | 50 ? -71% | 26 ? 11% | 25 ? 14% | |
| PWM Frequency (Hz) | 1316 ? | 1000 ? | |||
| Screen | 2% | -33% | 10% | 27% | |
| Brightness middle (cd/m²) | 274.9 | 371.5 35% | 212 -23% | 326 19% | 303 10% |
| Brightness (cd/m²) | 259 | 356 37% | 197 -24% | 317 22% | 291 12% |
| Brightness Distribution (%) | 72 | 92 28% | 78 8% | 91 26% | 83 15% |
| Black Level * (cd/m²) | 0.367 | 0.252 31% | 0.49 -34% | 0.31 16% | 0.22 40% |
| Contrast (:1) | 749 | 1474 97% | 433 -42% | 1052 40% | 1377 84% |
| Colorchecker dE 2000 * | 3.39 | 5.55 -64% | 7.8 -130% | 4.14 -22% | 3.47 -2% |
| Colorchecker dE 2000 max. * | 5.76 | 10.95 -90% | 6.79 -18% | ||
| Greyscale dE 2000 * | 4.21 | 7.1 -69% | 5.23 -24% | 5.46 -30% | 1.17 72% |
| Gamma | 2.18 101% | 2.1 105% | 3.05 72% | 2.44 90% | 2.35 94% |
| CCT | 6069 107% | 6693 97% | 7574 86% | 6658 98% | |
| Color Space (Percent of AdobeRGB 1998) (%) | 59.2 | 63.4 7% | 50 -16% | 64 8% | 86 45% |
| Color Space (Percent of sRGB) (%) | 90.9 | 97.9 8% | 80 -12% | 97 7% | 100 10% |
| Total Average (Program / Settings) | -21% /
-8% | -16% /
-25% | 8% /
9% | 13% /
21% |
* ... smaller is better
Color coverage is measured to be 59.2 percent and 90.9 percent of the AdobeRGB and sRGB standards, respectively. This is compared to our P55W v5 test unit and its sRGB coverage of just 73 percent. Color precision means less to gamers compared to other factors like response times, but professional digital artists will appreciate the wider gamut available from this particular AU Optronics panel. Most gaming notebooks do not aim for full sRGB coverage.
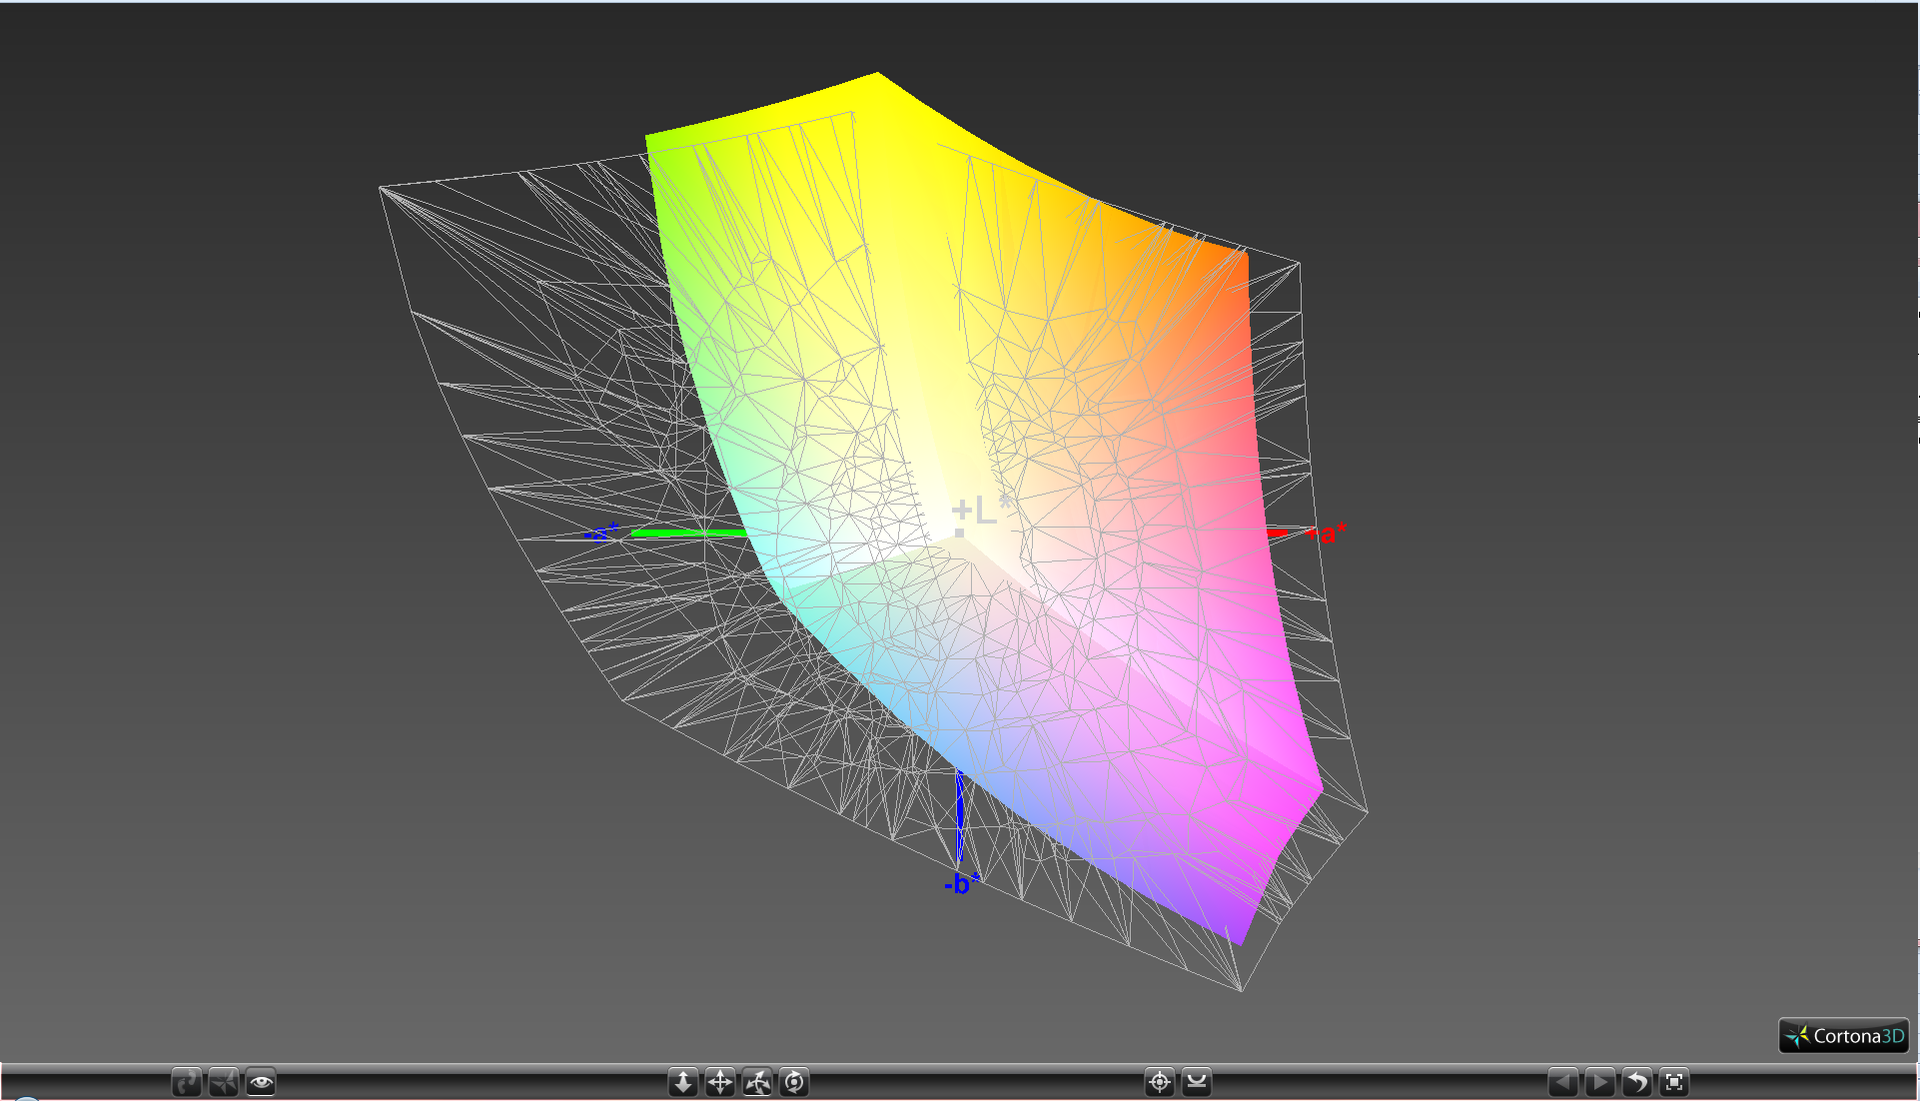
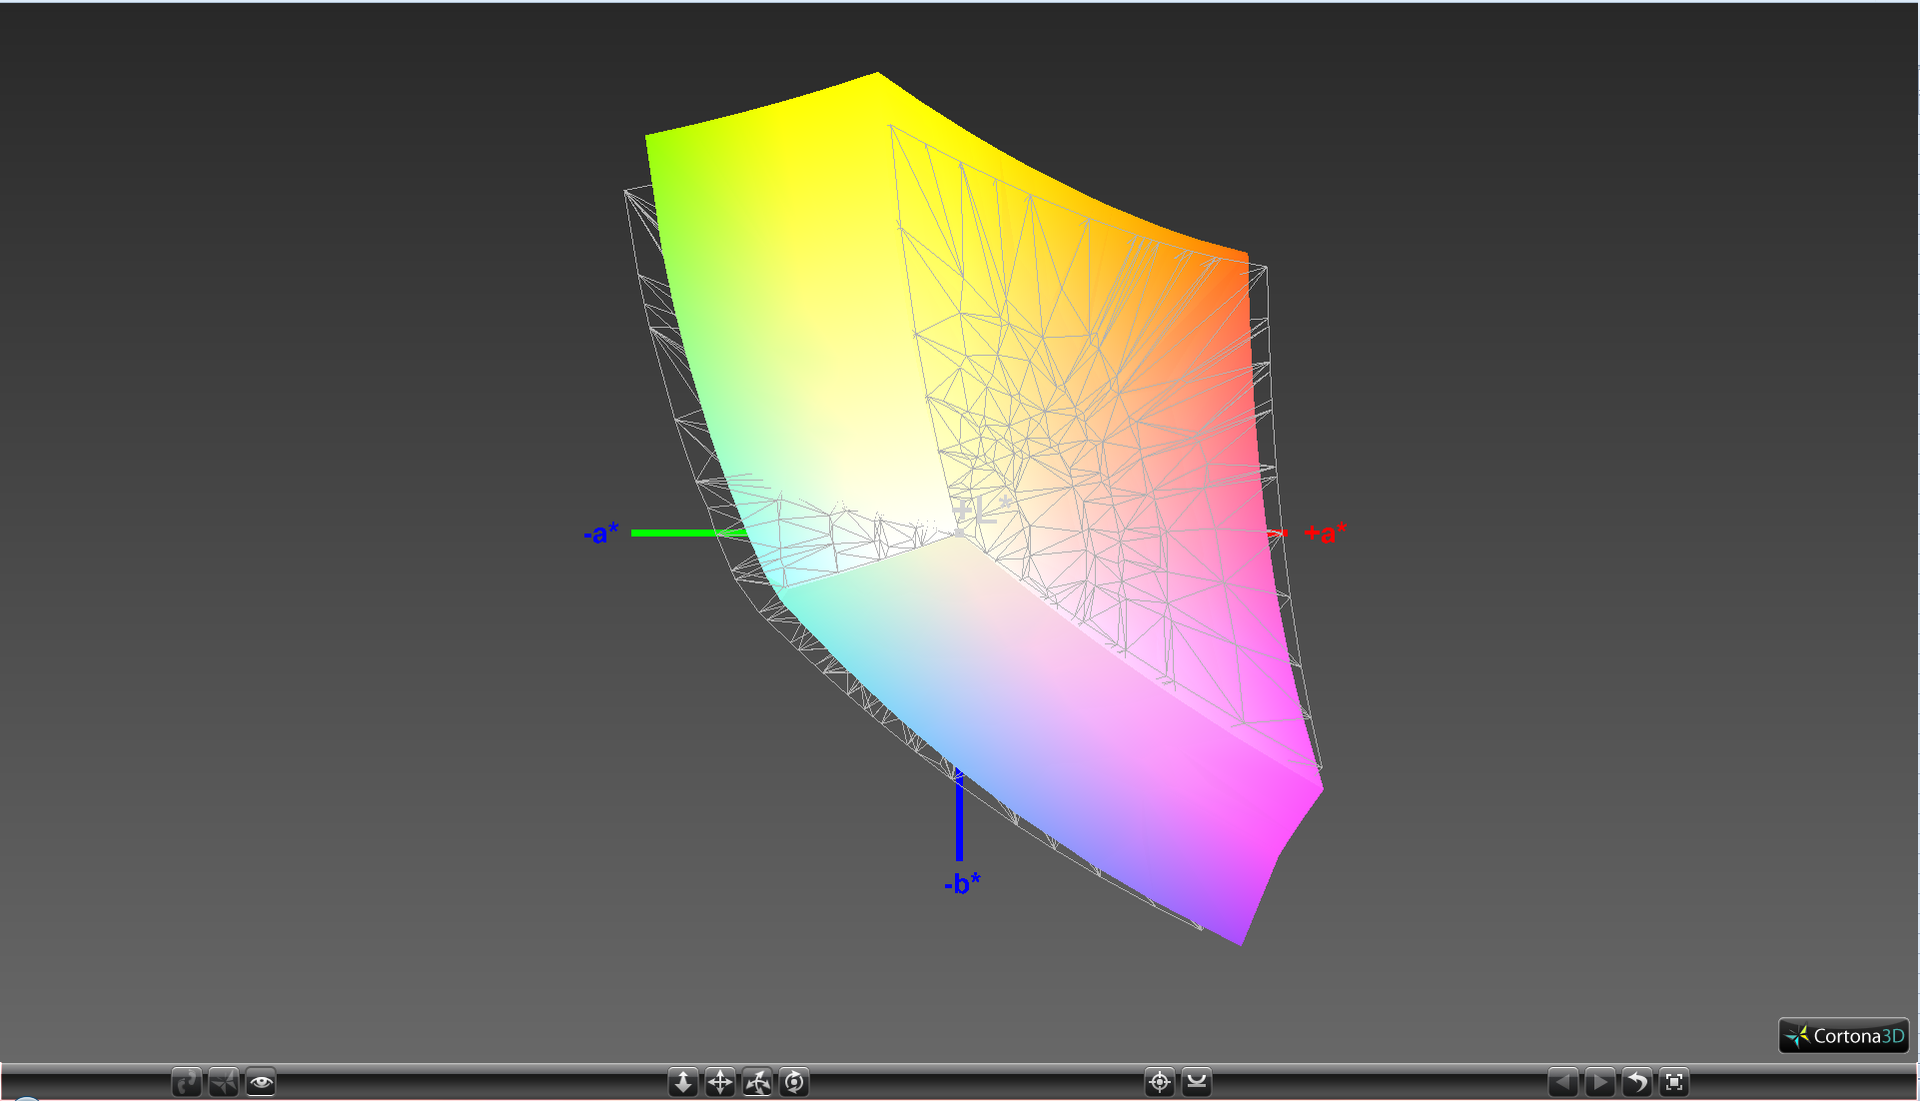
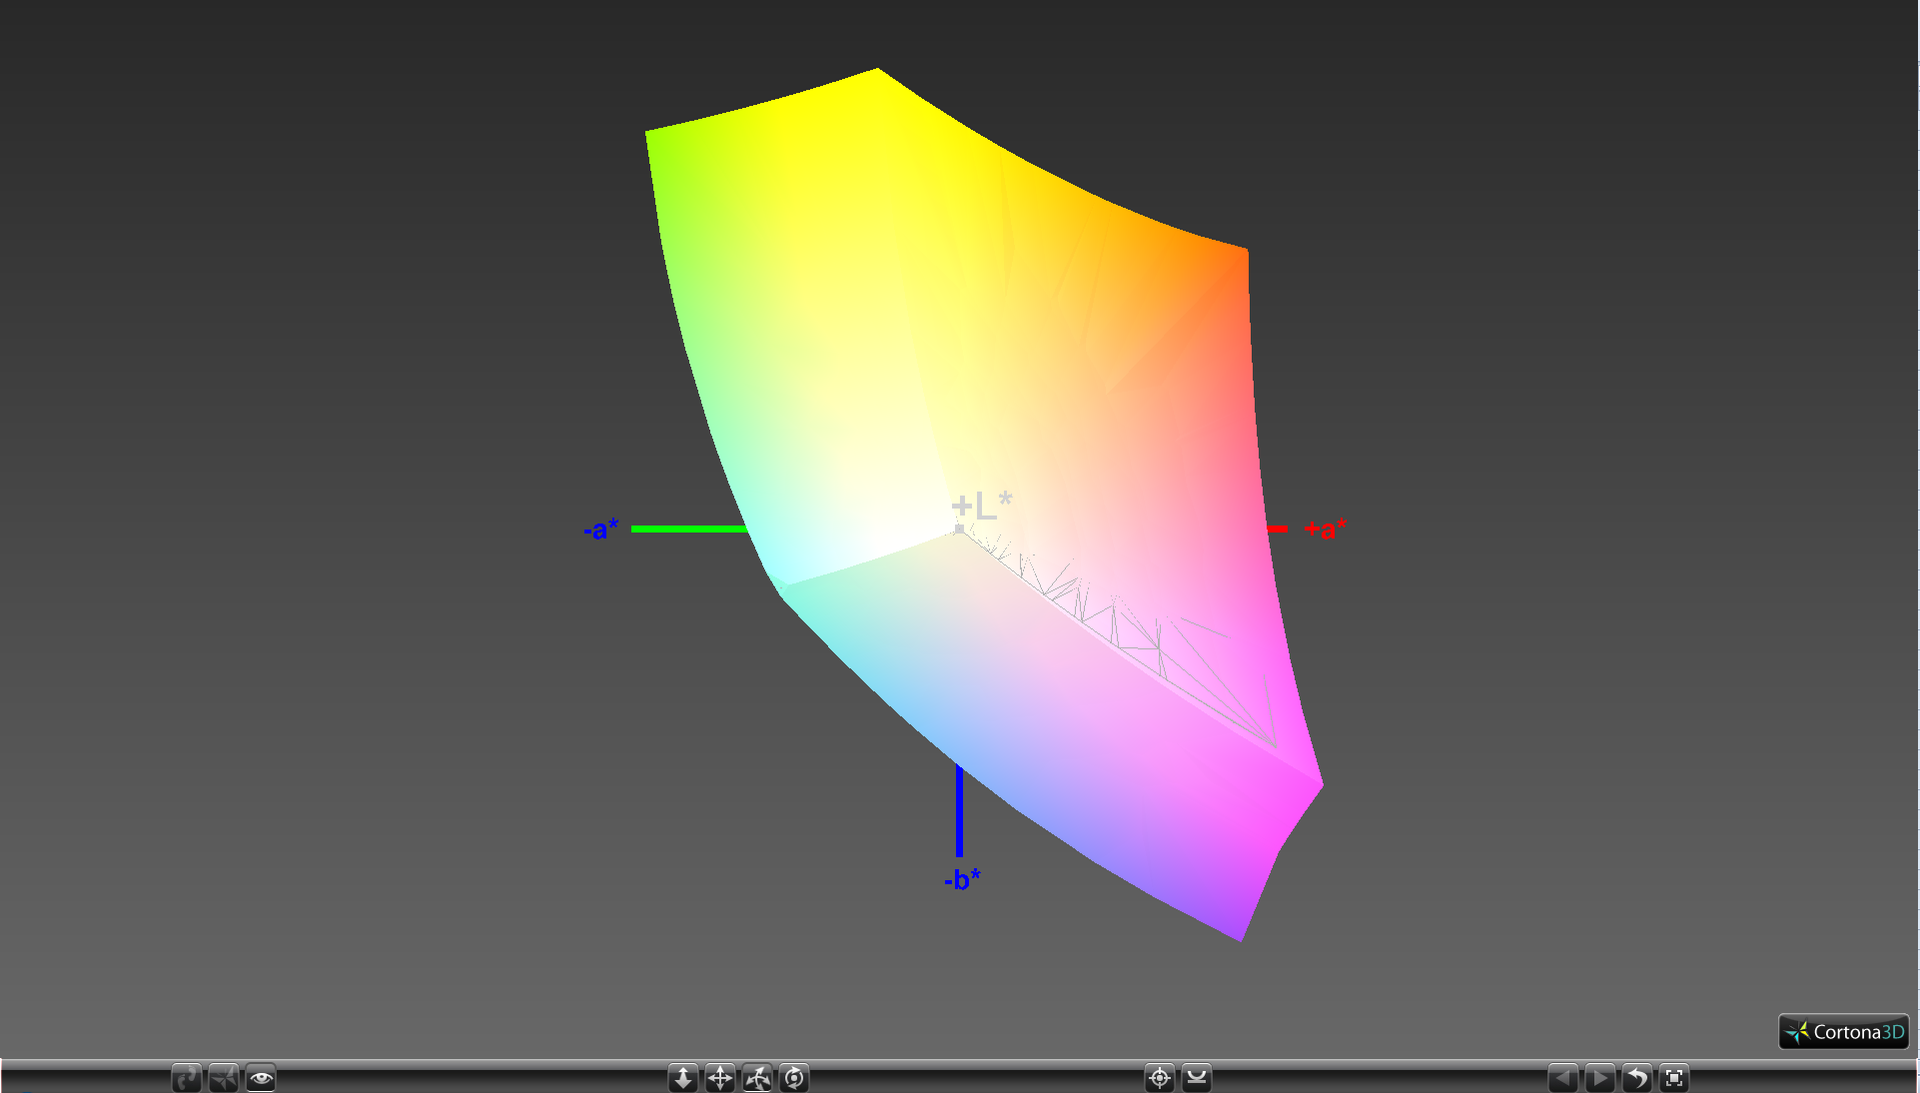
Grayscale and color reproduction are both very good across the board and become even better after a quick calibration. Colors are more accurate than the LG Philips panel used for our P55W v5 test unit, but accuracy still decreases with increasing saturation levels due to the panel's imperfect sRGB coverage.
Display Response Times
| ↔ Response Time Black to White | ||
|---|---|---|
| 29.2 ms ... rise ↗ and fall ↘ combined | ↗ 12 ms rise | 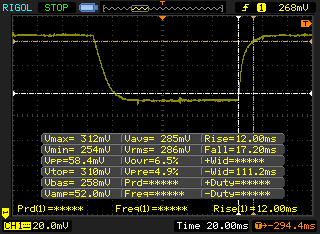 |
| ↘ 17.2 ms fall | ||
| The screen shows relatively slow response rates in our tests and may be too slow for gamers. In comparison, all tested devices range from 0.1 (minimum) to 240 (maximum) ms. » 78 % of all devices are better. This means that the measured response time is worse than the average of all tested devices (19.8 ms). | ||
| ↔ Response Time 50% Grey to 80% Grey | ||
| 37.2 ms ... rise ↗ and fall ↘ combined | ↗ 16 ms rise | 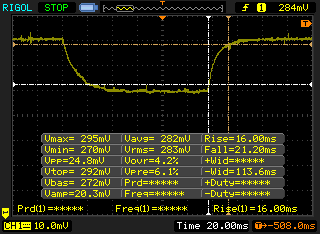 |
| ↘ 21.2 ms fall | ||
| The screen shows slow response rates in our tests and will be unsatisfactory for gamers. In comparison, all tested devices range from 0.165 (minimum) to 636 (maximum) ms. » 54 % of all devices are better. This means that the measured response time is worse than the average of all tested devices (31 ms). | ||
Screen Flickering / PWM (Pulse-Width Modulation)
| Screen flickering / PWM not detected | 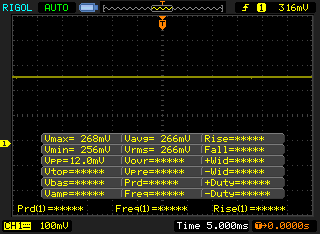 | ||
In comparison: 52 % of all tested devices do not use PWM to dim the display. If PWM was detected, an average of 7763 (minimum: 5 - maximum: 343500) Hz was measured. | |||
Outdoor usability is limited as the backlight is not strong enough to overcome ambient lighting. Though glare isn't an issue with the matte panel, texts and images are easily washed out even on an overcast day. The wide IPS viewing angles do little to alleviate the problem and the notebook is largely an indoors-only solution with just the occasional use outdoors when necessary.
Performance
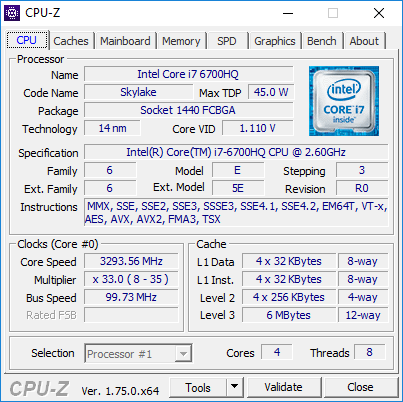
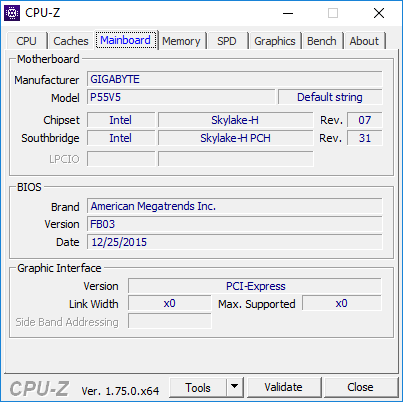
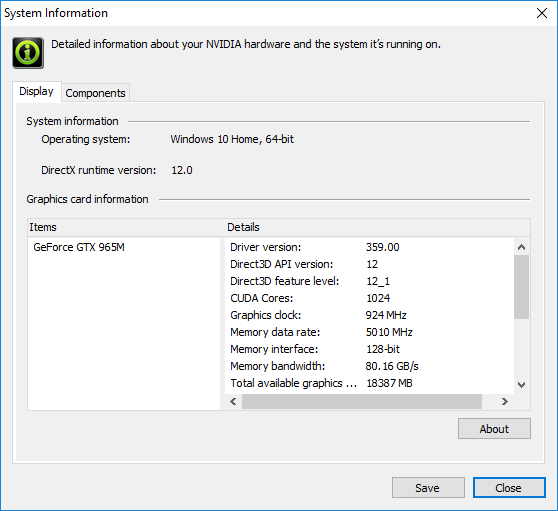
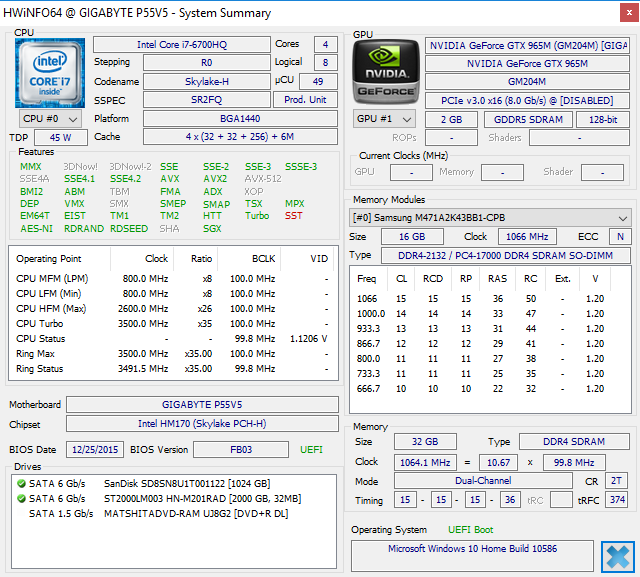
Moving from a P55 v4 to a P55 v5 will net a couple of hardware benefits including Skylake options, DDR4, and USB Type-C amongst others. When comparing the P55K v5 to the P55W v5, however, changes are minimal with the core difference being the soldered GTX 965M GPU instead of the more powerful GTX 970M. The two systems otherwise carry the same i7-6700HQ CPU with two DDR4 SODIMM slots for a total of up to 32 GB of RAM.
Nvidia Optimus is supported for graphics switching to the integrated HD Graphics 530.
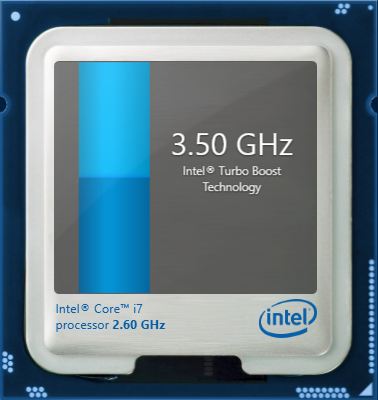
Processor
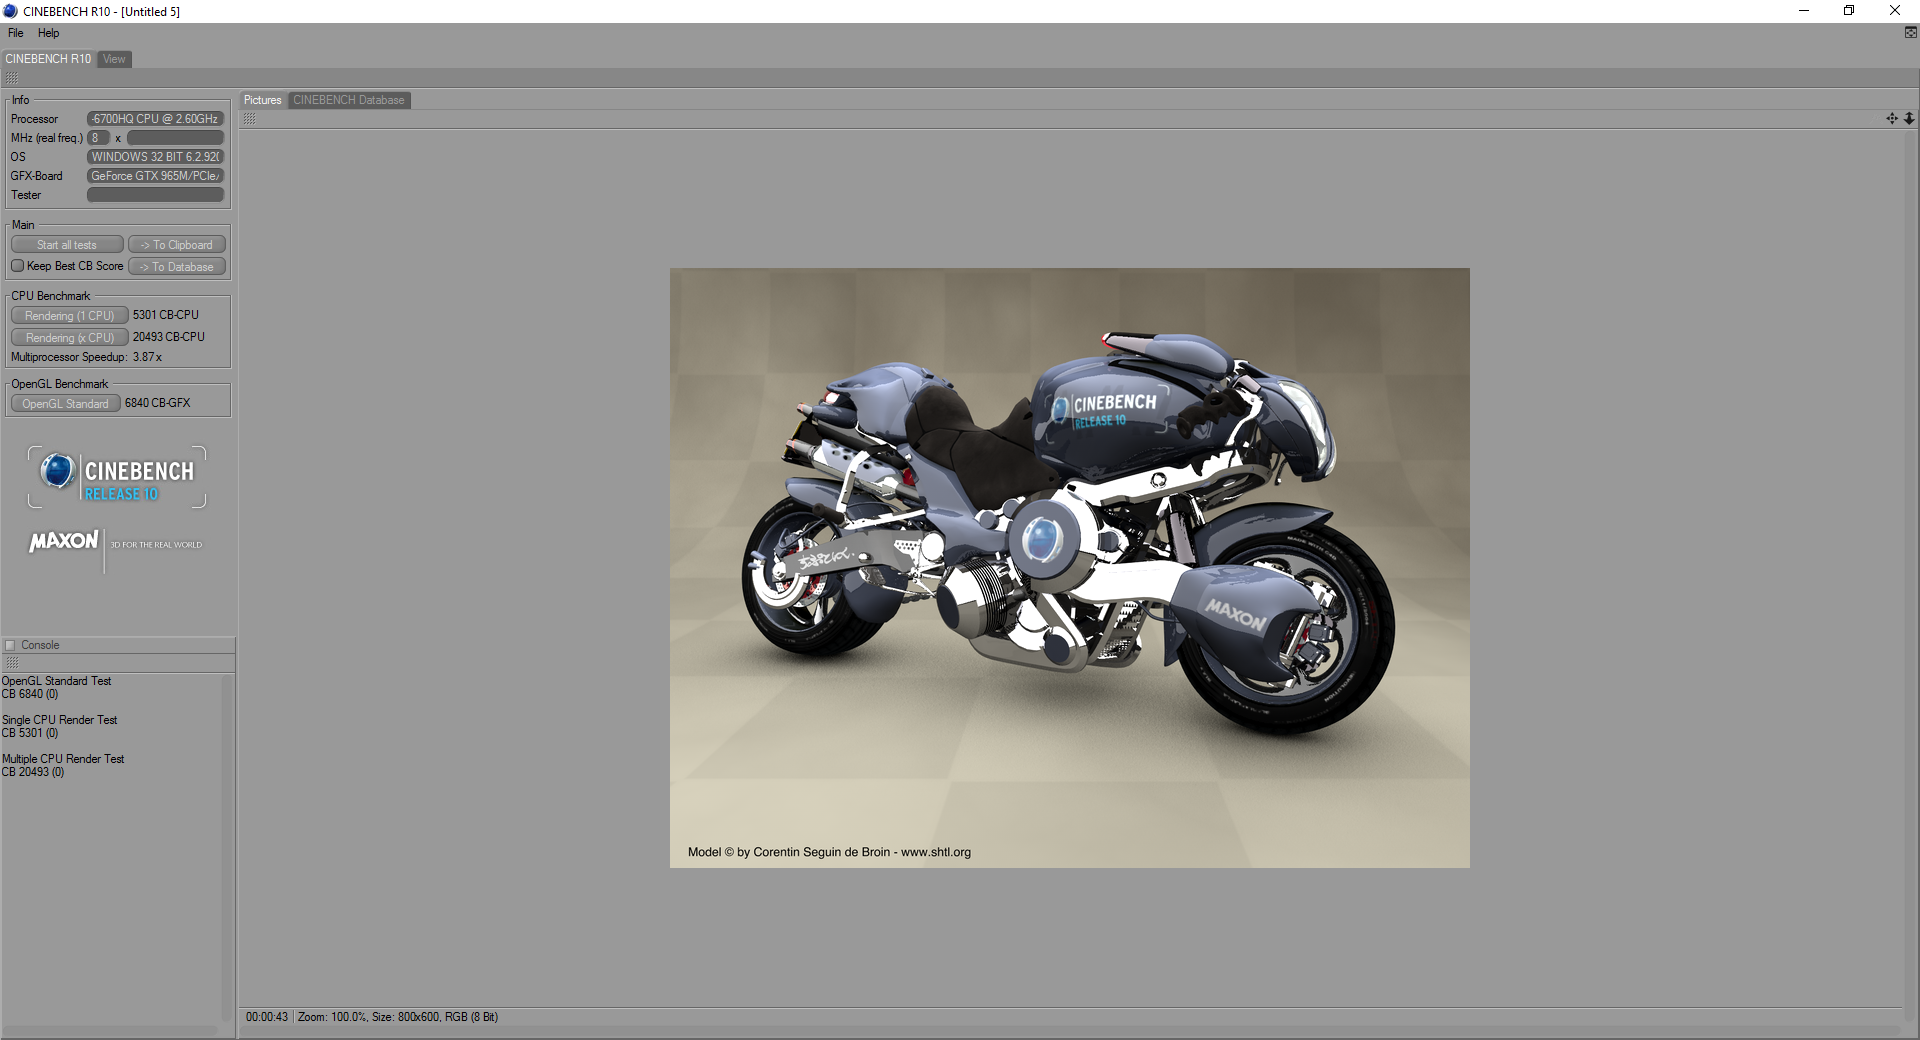
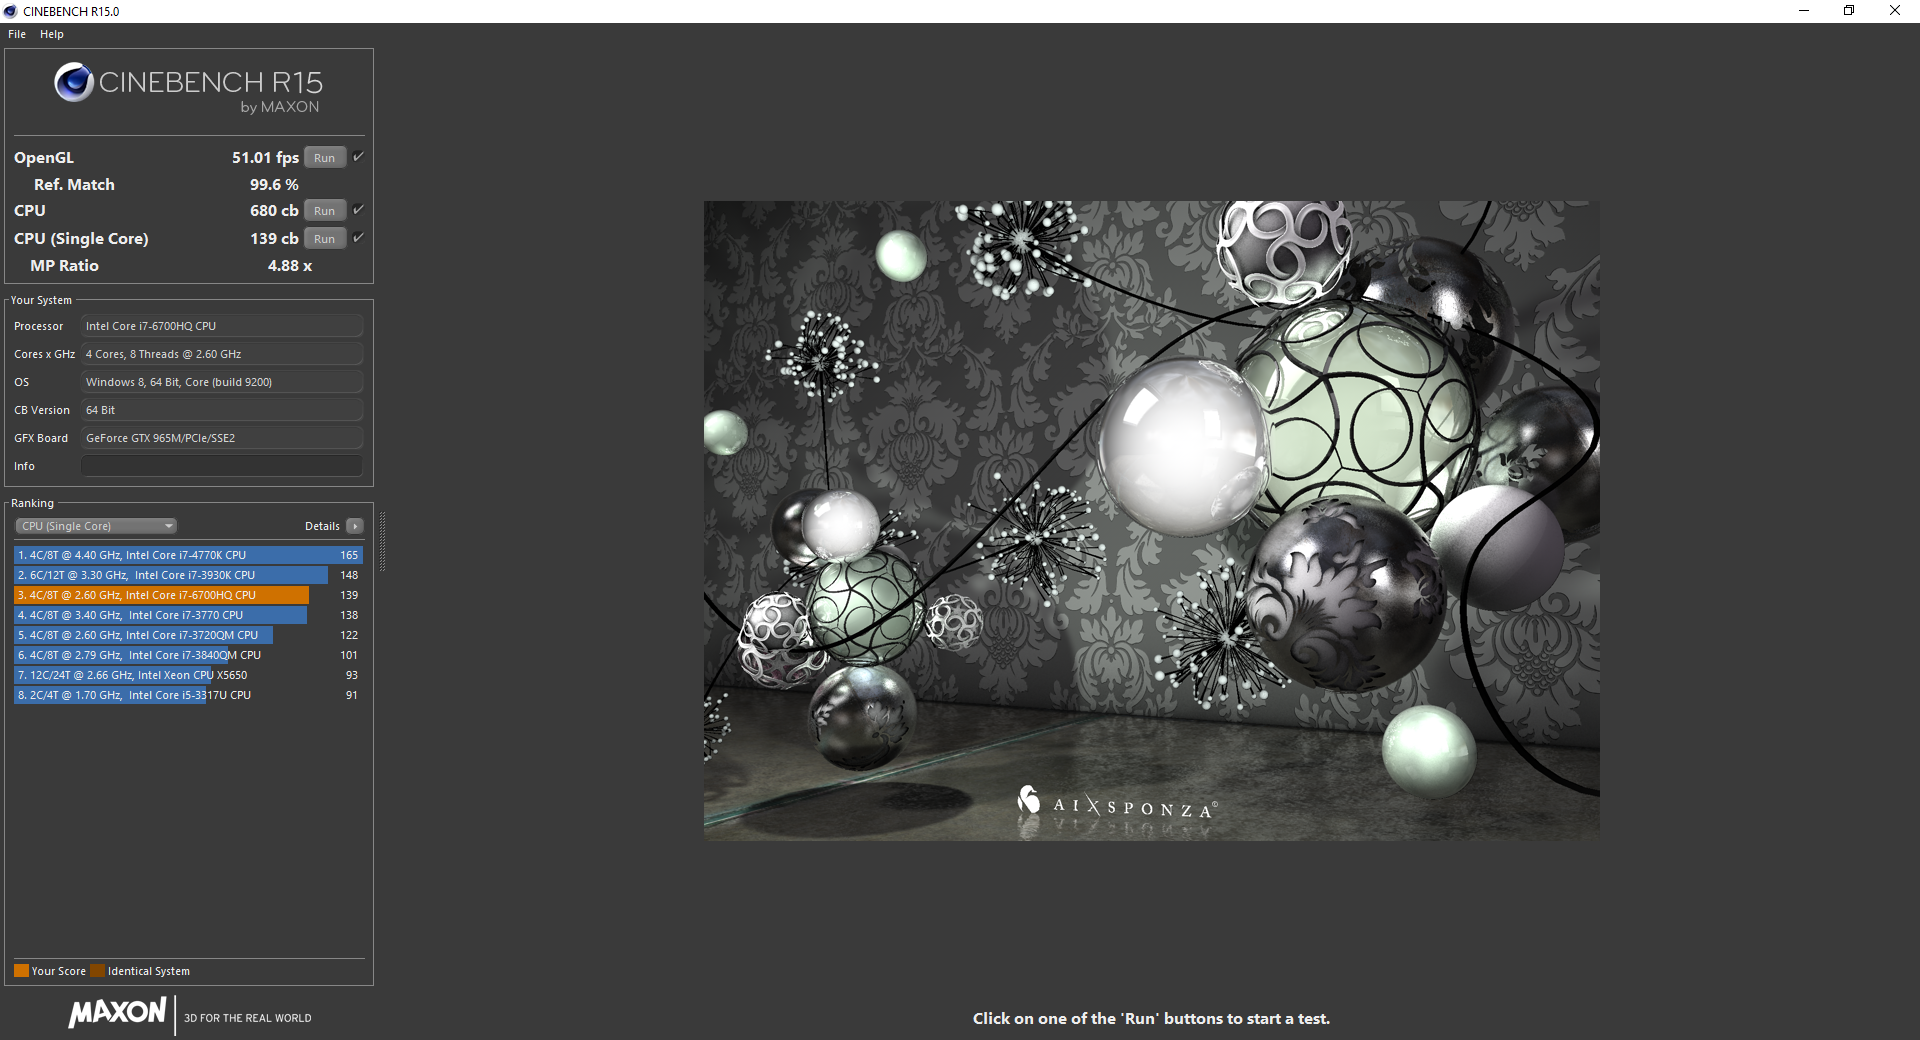
CPU performance is handily above the older Haswell i7-4700HQ in both single-core and multi-core processes while being not all that different from the Broadwell i7-5700HQ according to CineBench benchmarks. While still very fast for a mobile CPU, a proper desktop CPU like the Skylake i7-6700K is roughly 30 percent faster than the i7-6700HQ at over twice the rated TDP (45 W vs. 91 W).
See our dedicated CPU page on the Core i7-6700HQ for more benchmarks and comparisons.
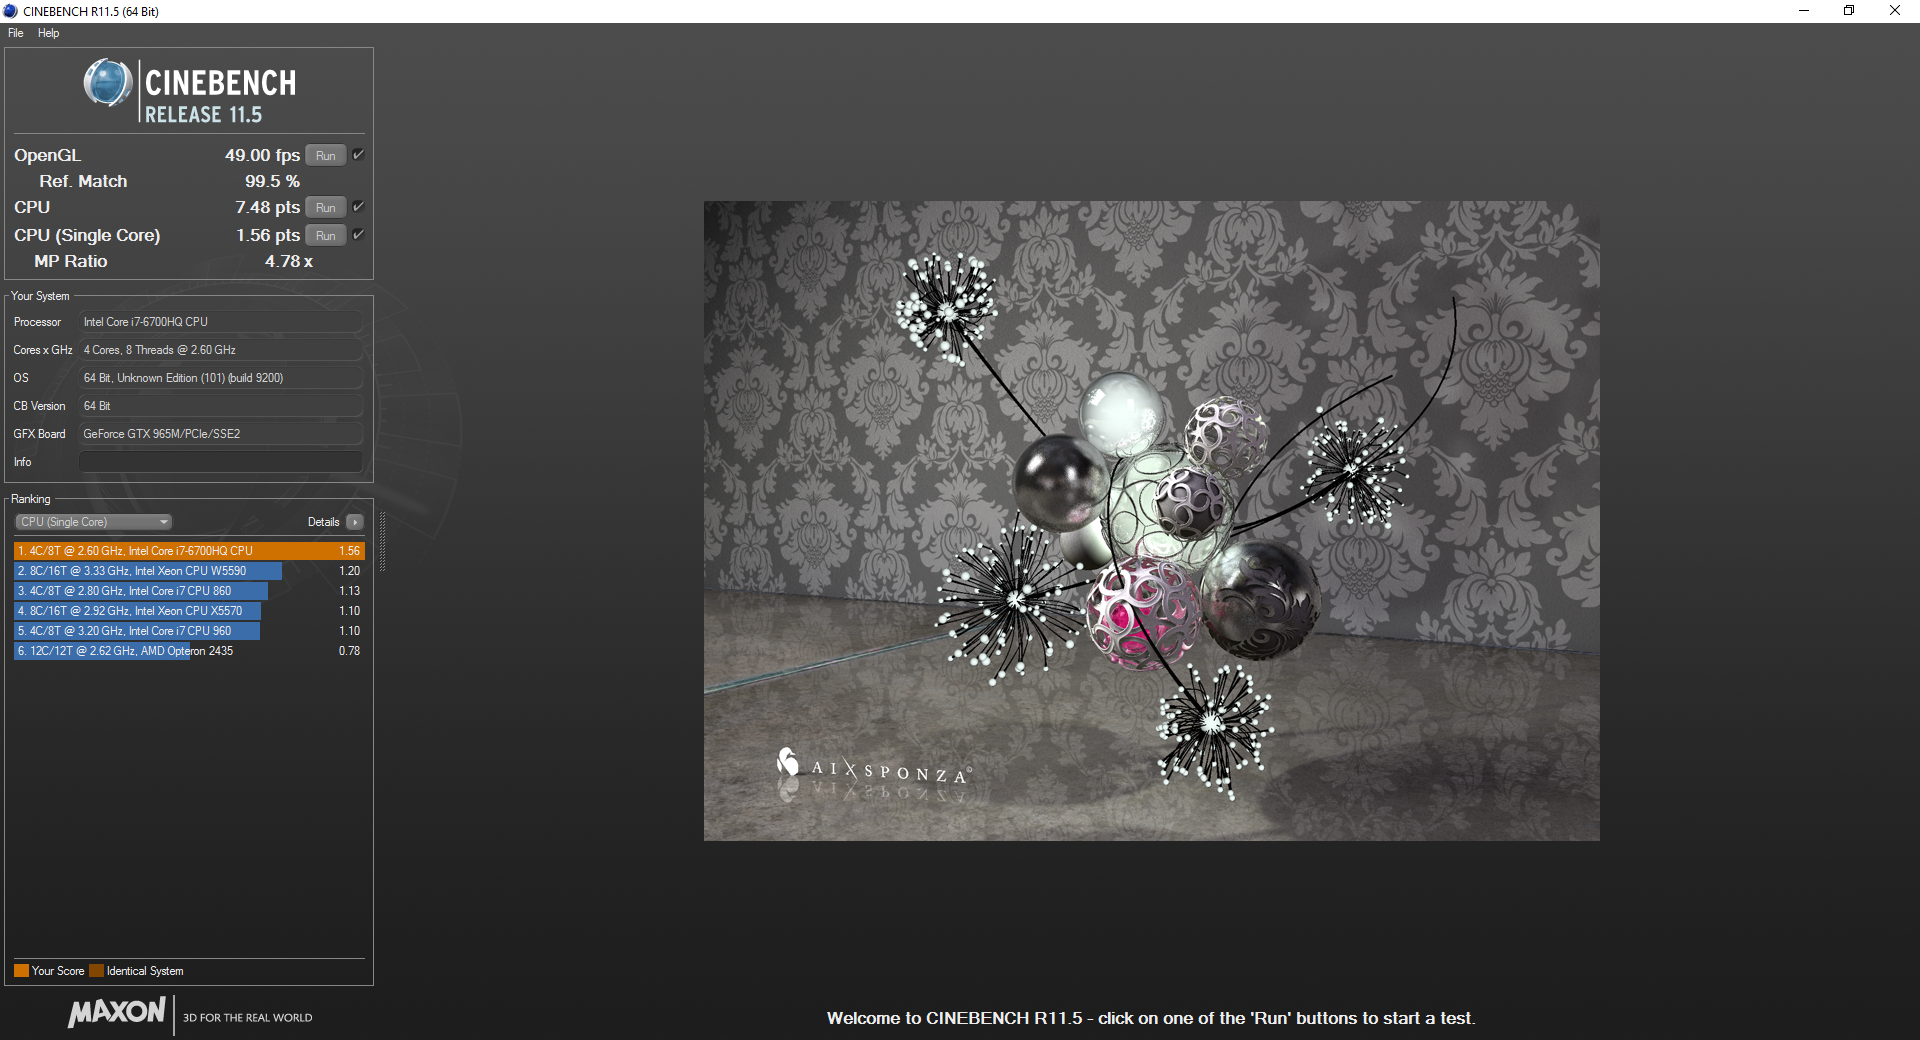
| Cinebench R11.5 | |
| CPU Single 64Bit (sort by value) | |
| Gigabyte P55K v5 | |
| Eurocom Sky DLX7 | |
| Aorus X7 Pro v5 | |
| MSI PX60 QD-034US | |
| Lenovo IdeaPad Y50 | |
| CPU Multi 64Bit (sort by value) | |
| Gigabyte P55K v5 | |
| Eurocom Sky DLX7 | |
| Aorus X7 Pro v5 | |
| MSI PX60 QD-034US | |
| Lenovo IdeaPad Y50 | |
| Cinebench R10 | |
| Rendering Multiple CPUs 32Bit (sort by value) | |
| Gigabyte P55K v5 | |
| Eurocom Sky DLX7 | |
| Aorus X7 Pro v5 | |
| MSI PX60 QD-034US | |
| Lenovo IdeaPad Y50 | |
| Rendering Single 32Bit (sort by value) | |
| Gigabyte P55K v5 | |
| Eurocom Sky DLX7 | |
| Aorus X7 Pro v5 | |
| MSI PX60 QD-034US | |
| Lenovo IdeaPad Y50 | |
| wPrime 2.10 - 1024m (sort by value) | |
| Gigabyte P55K v5 | |
| Eurocom Sky DLX7 | |
| MSI PX60 QD-034US | |
| Lenovo IdeaPad Y50 | |
| Super Pi Mod 1.5 XS 32M - 32M (sort by value) | |
| Gigabyte P55K v5 | |
| Eurocom Sky DLX7 | |
| MSI PX60 QD-034US | |
| Lenovo IdeaPad Y50 | |
* ... smaller is better
System Performance
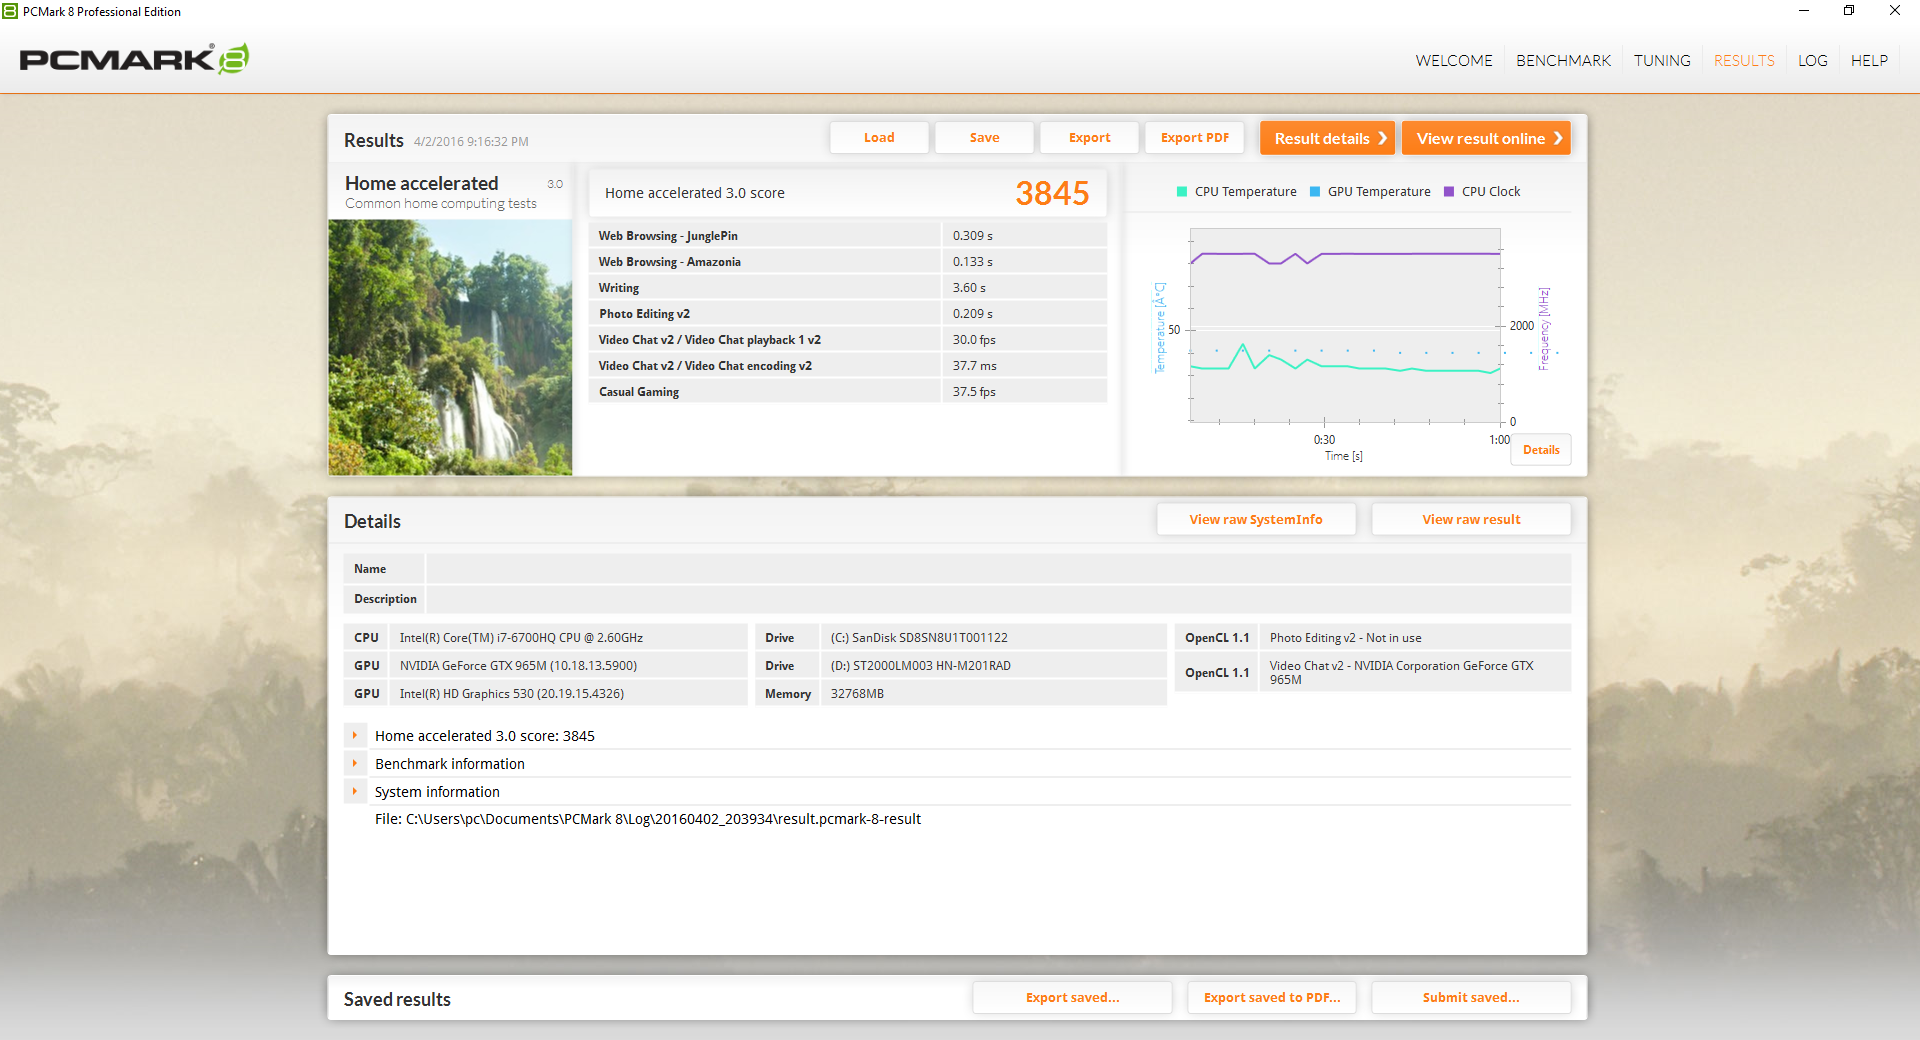
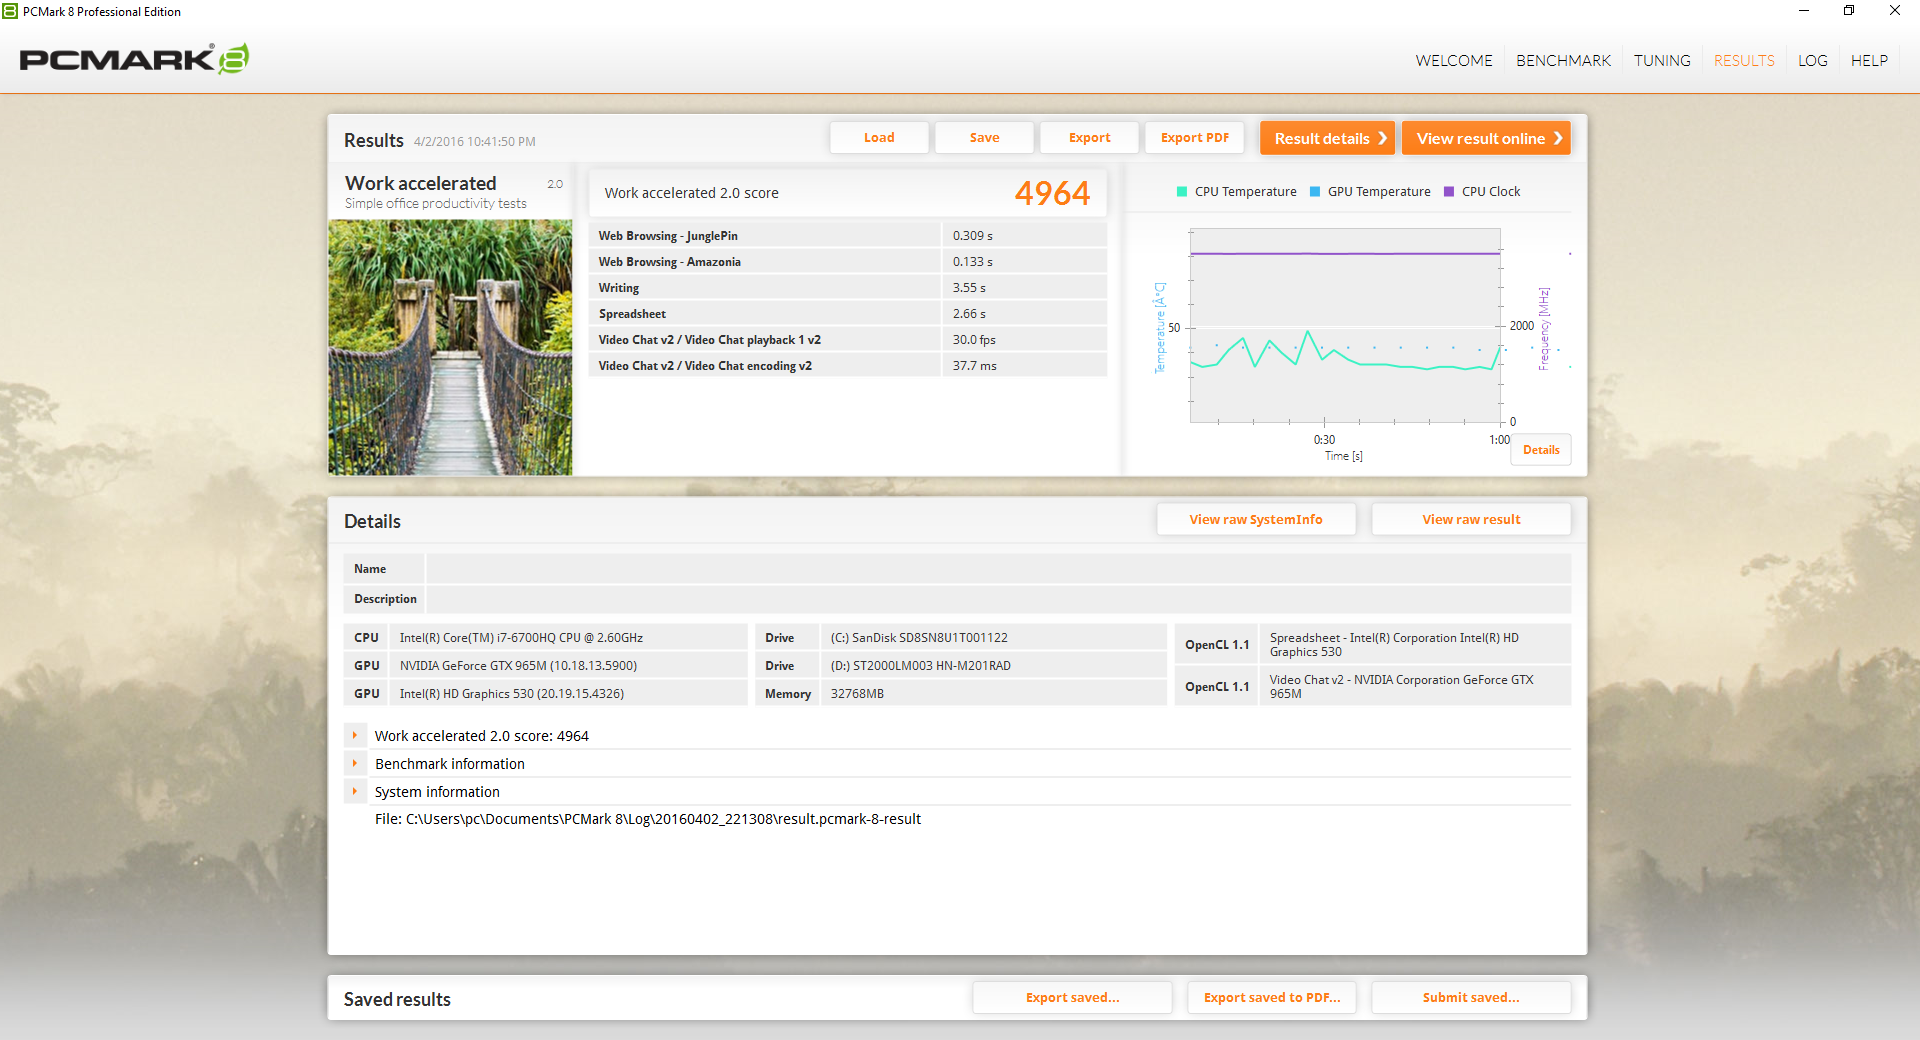
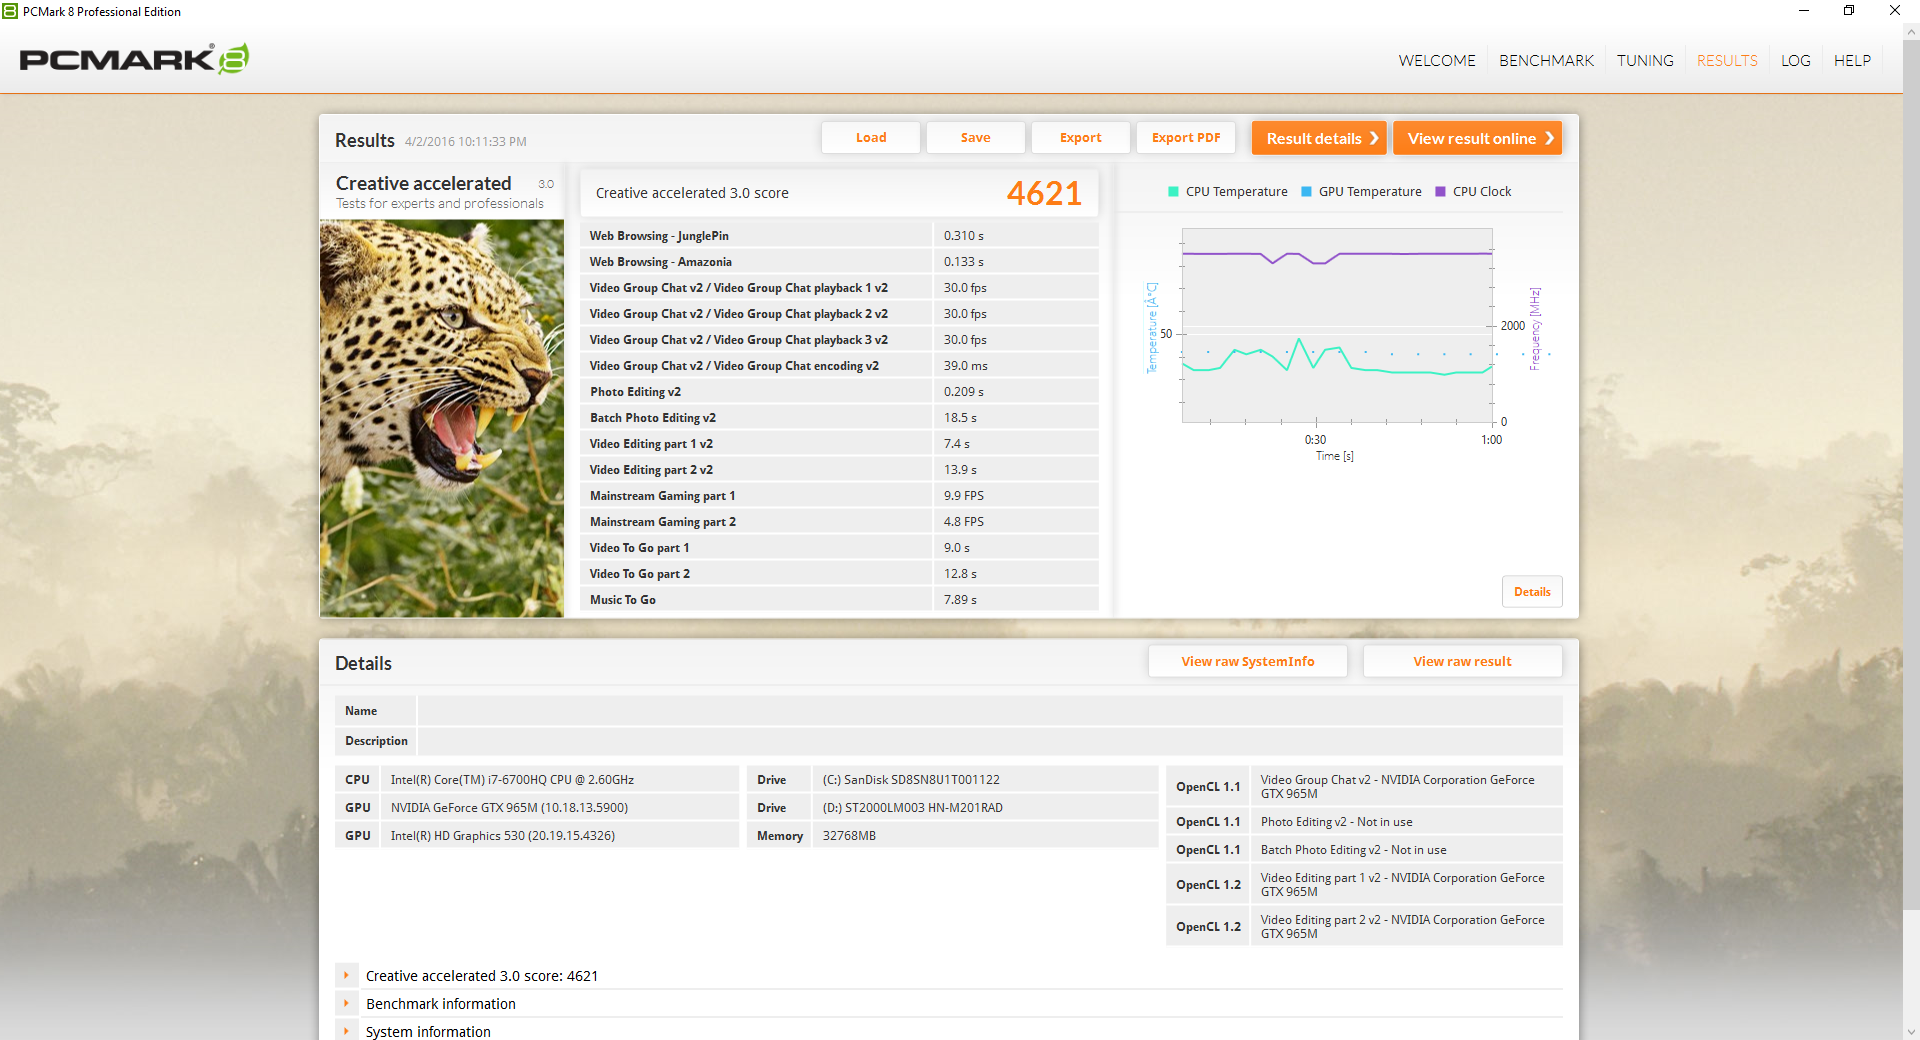
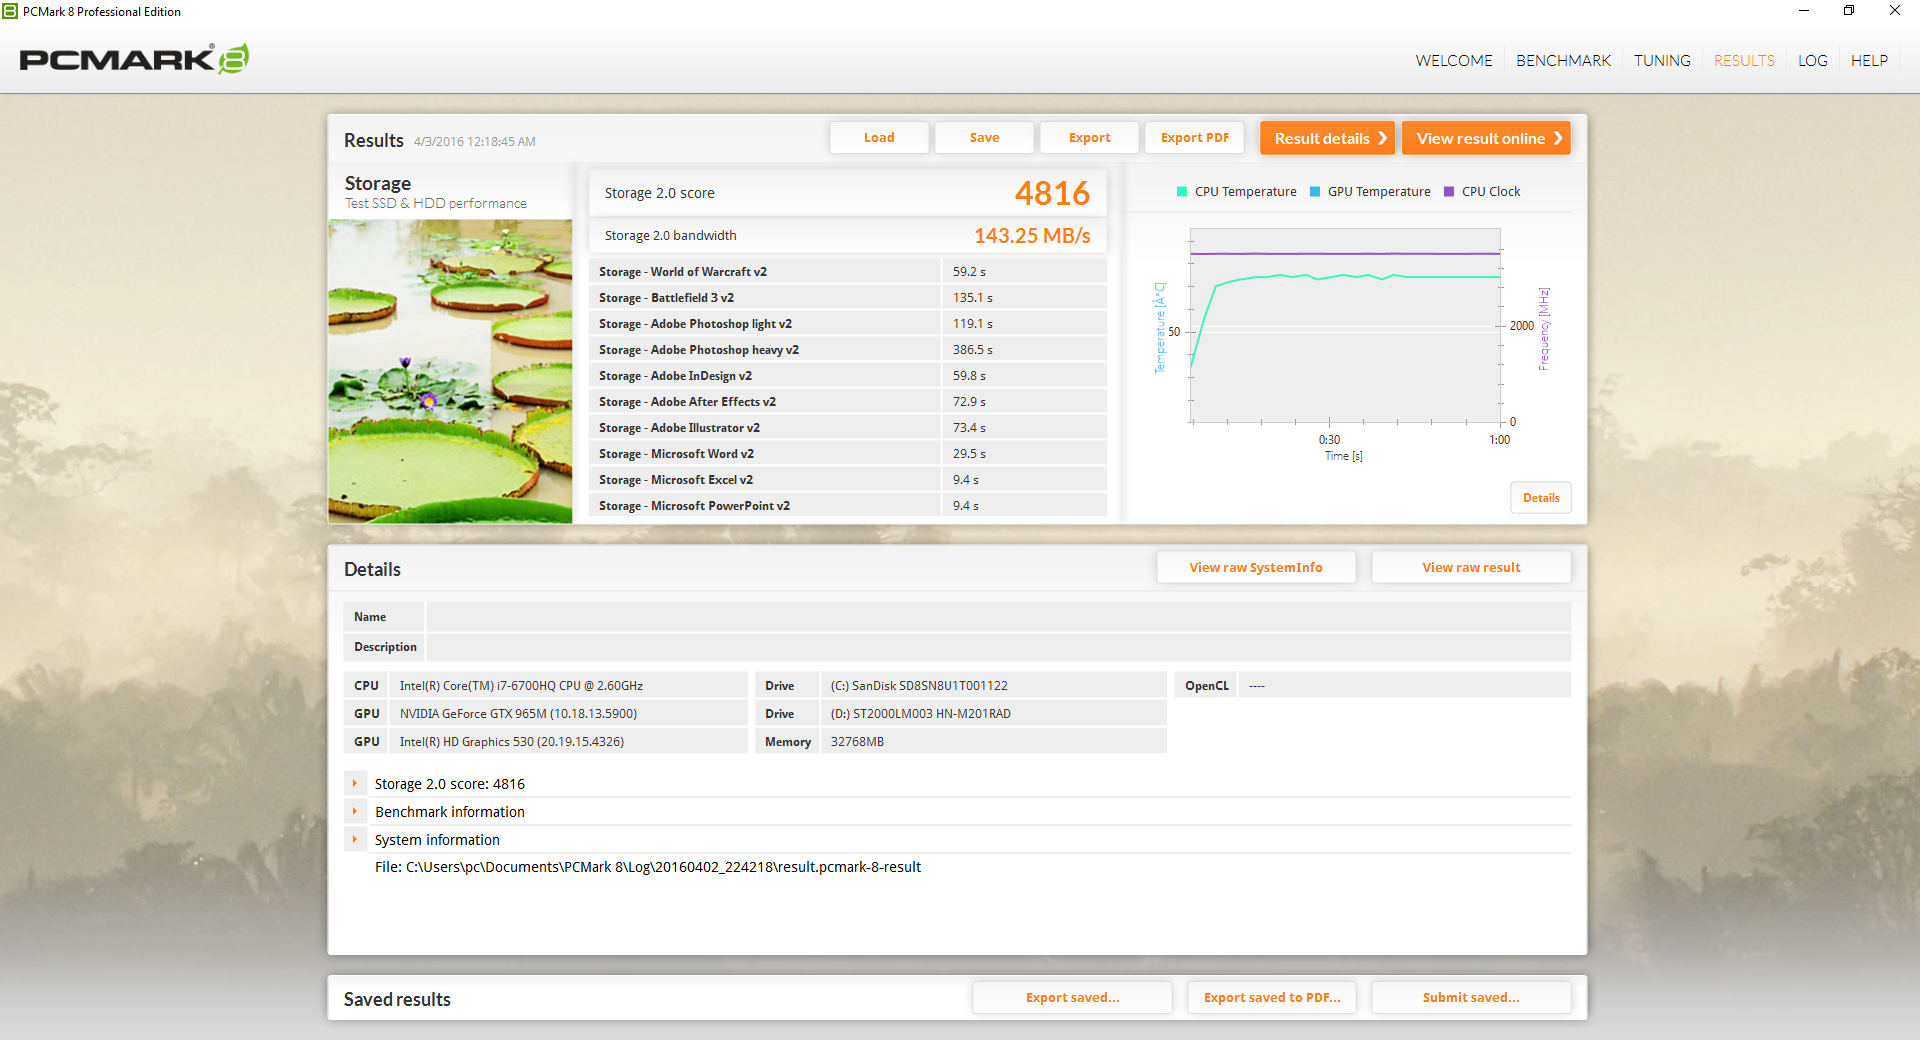
PCMark 8 ranks our system in the same ballpark as other gaming systems like the Asus GL552 and Acer Aspire V15 Nitro. We experienced no notable software or hardware glitches during our time with the Gigabyte test unit.
| PCMark 8 | |
| Home Score Accelerated v2 (sort by value) | |
| Gigabyte P55K v5 | |
| Asus GL552VW-DH74 | |
| Dell XPS 15 9550 i7 FHD | |
| MSI GS60-6QE4K16H21 | |
| Acer Aspire V15 Nitro BE VN7-592G-79DV | |
| Work Score Accelerated v2 (sort by value) | |
| Gigabyte P55K v5 | |
| Asus GL552VW-DH74 | |
| Dell XPS 15 9550 i7 FHD | |
| Acer Aspire V15 Nitro BE VN7-592G-79DV | |
| Creative Score Accelerated v2 (sort by value) | |
| Gigabyte P55K v5 | |
| Asus GL552VW-DH74 | |
| Dell XPS 15 9550 i7 FHD | |
| Acer Aspire V15 Nitro BE VN7-592G-79DV | |
| PCMark 8 Home Score Accelerated v2 | 3845 points | |
| PCMark 8 Creative Score Accelerated v2 | 4621 points | |
| PCMark 8 Work Score Accelerated v2 | 4964 points | |
Help | ||
Storage Devices
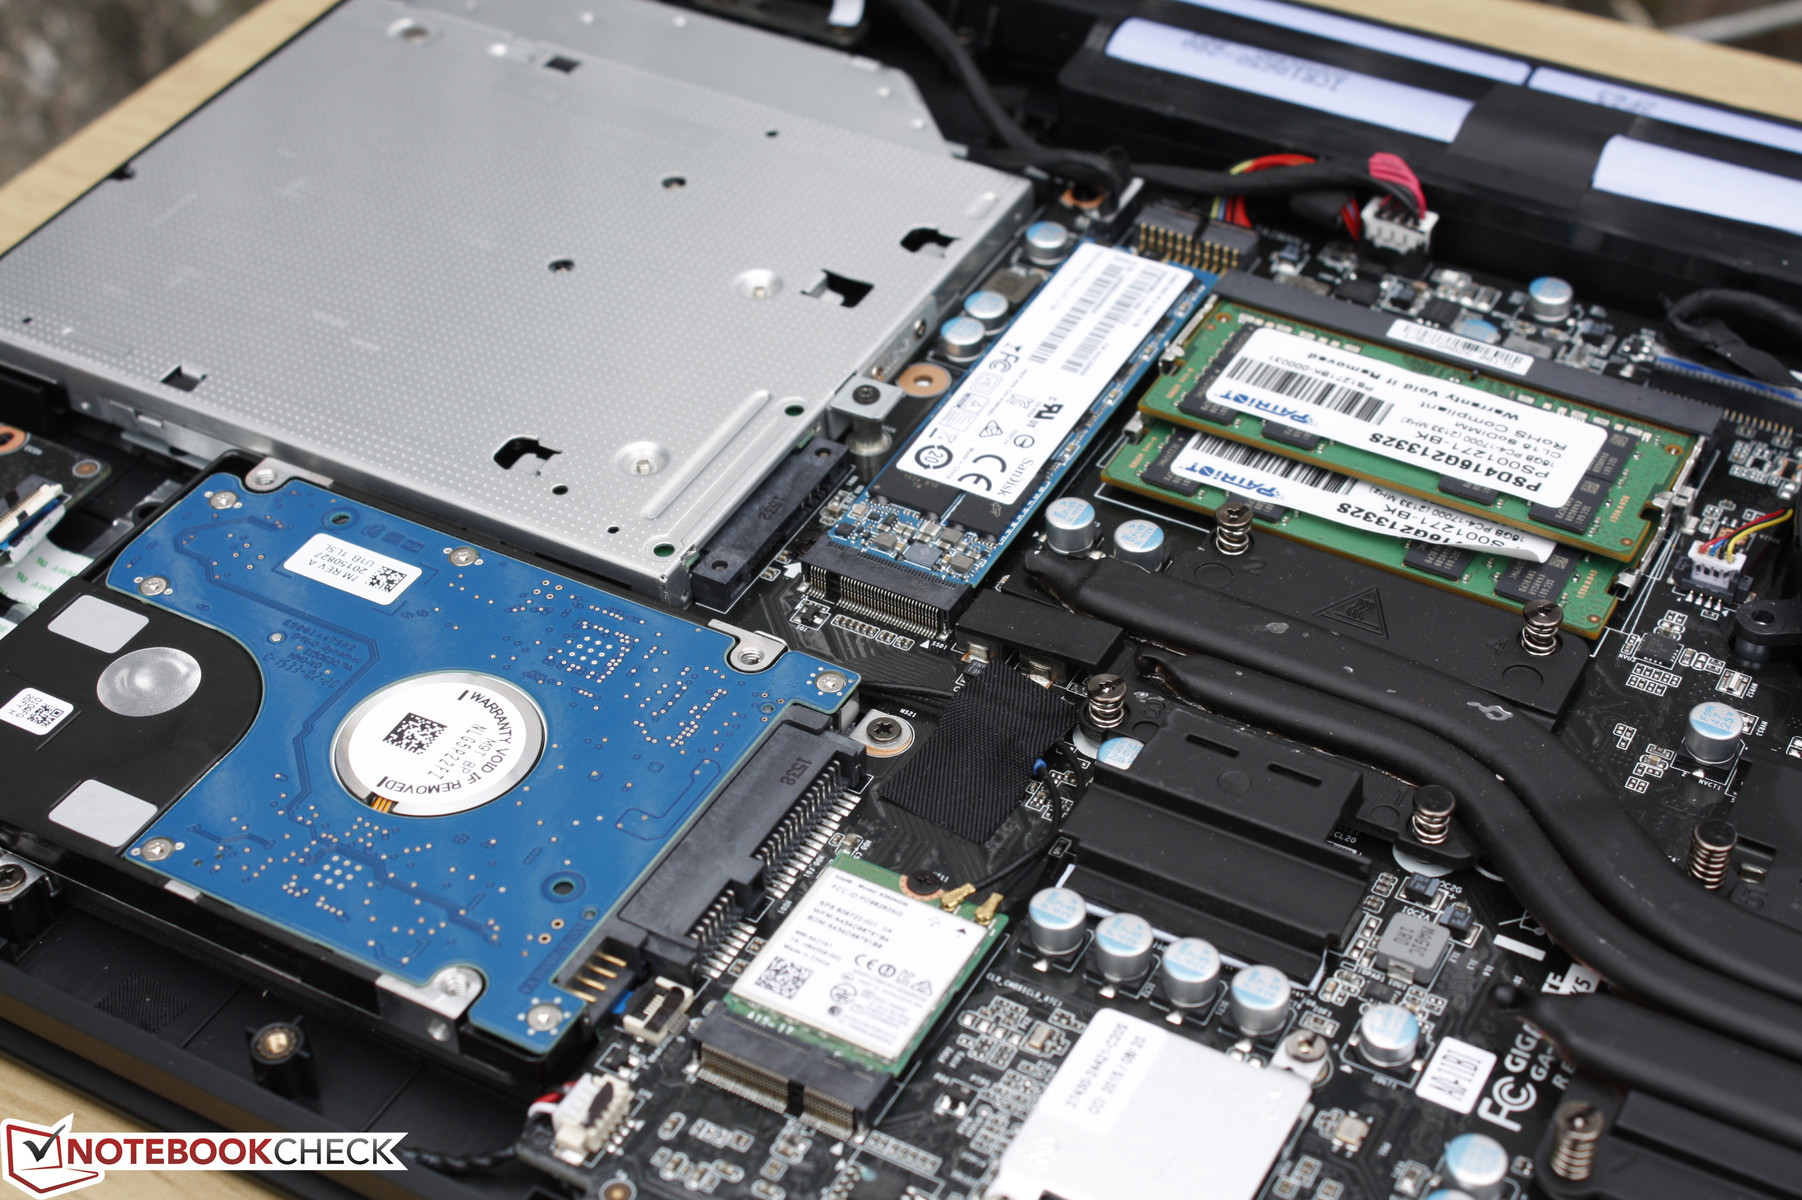
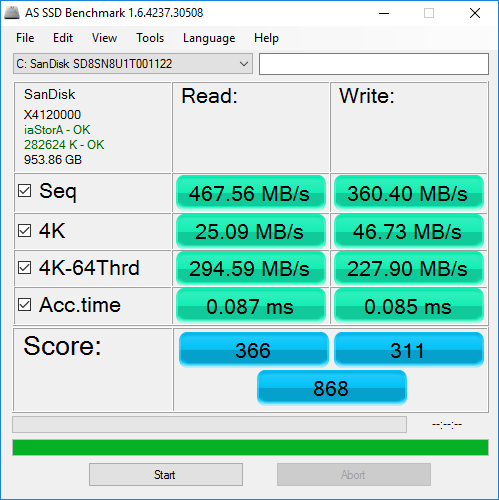
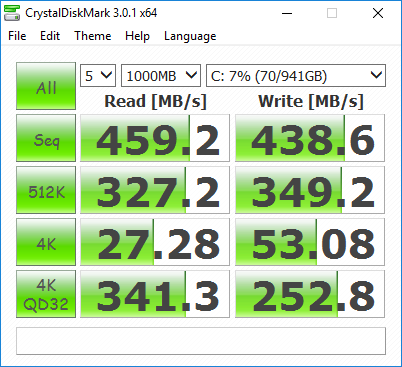
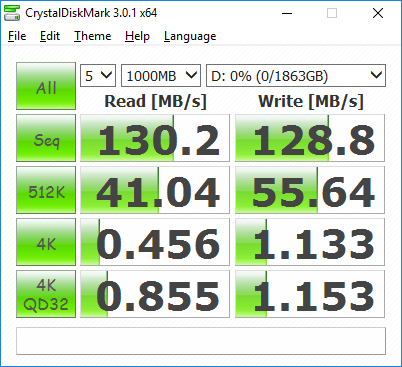
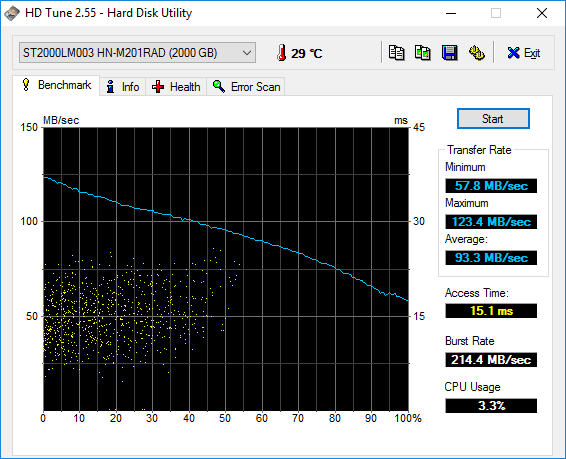
Two storage bays are available via a single 2.5-inch SATA III bay and a single M.2 2280 slot. There is no RAID compatibility between them and the optical drive is not designed to be quickly swapped for use as a third storage bay. Our test unit comes equipped with a primary SanDisk SD8SN8U1T001122 M.2 SSD and a secondary 2 TB Samsung Spinpoint ST2000LM003 HDD.
Unlike our P55W v5 unit, the M.2 SSD in our P55K v5 is not an NVMe drive. Thus, transfer rates and performance pale in comparison to systems like the XPS 15 9550 and Asus UX501. Meanwhile, performance from the mechanical drive is very good for a 5400 RPM HDD with an average transfer rate of 93 MB/s according to HD Tune. The system accepts both 7 mm and 9.5 mm thick SATA III drives.
| Gigabyte P55K v5 GeForce GTX 965M, 6700HQ, SanDisk SD8SN8U1T001122 | Gigabyte P55W v5 GeForce GTX 970M, 6700HQ, Samsung SM951 MZVPV128 NVMe | Dell XPS 15 9550 i7 FHD GeForce GTX 960M, 6700HQ, Samsung PM951 NVMe 512 GB | MSI GS60-6QE4K16H21 GeForce GTX 970M, 6700HQ, Hynix HFS256G3MND | Acer Aspire V15 Nitro BE VN7-592G-79DV GeForce GTX 960M, 6700HQ, Lite-On CV1-8B512 M.2 512 GB | |
|---|---|---|---|---|---|
| AS SSD | 100% | 133% | 12% | 14% | |
| Copy Game MB/s (MB/s) | 377.5 | 463.7 23% | 805 113% | 346.1 -8% | |
| Copy Program MB/s (MB/s) | 178.2 | 278.4 56% | 325.3 83% | 276.5 55% | |
| Copy ISO MB/s (MB/s) | 354.5 | 558 57% | 1127 218% | 457.1 29% | |
| Score Total (Points) | 868 | 2201 154% | 2410 178% | 998 15% | 859 -1% |
| Score Write (Points) | 311 | 342 10% | 675 117% | 352 13% | 354 14% |
| Score Read (Points) | 366 | 1265 246% | 1180 222% | 425 16% | 333 -9% |
| Access Time Write * (ms) | 0.085 | 0.033 61% | 0.035 59% | 0.112 -32% | 0.053 38% |
| Access Time Read * (ms) | 0.087 | 0.066 24% | 0.038 56% | 0.089 -2% | 0.071 18% |
| 4K-64 Write (MB/s) | 227.9 | 175.5 -23% | 513 125% | 232.2 2% | 243.8 7% |
| 4K-64 Read (MB/s) | 294.6 | 1045 255% | 990 236% | 344.7 17% | 259.4 -12% |
| 4K Write (MB/s) | 46.73 | 112.7 141% | 105.4 126% | 80.9 73% | 67.9 45% |
| 4K Read (MB/s) | 25.09 | 45.15 80% | 31.86 27% | 28.77 15% | 21.75 -13% |
| Seq Write (MB/s) | 360.4 | 536 49% | 570 58% | 389.3 8% | 424.8 18% |
| Seq Read (MB/s) | 467.6 | 1739 272% | 1579 238% | 516 10% | 514 10% |
* ... smaller is better

GPU Performance
The GTX 965M is on the fence line between a mainstream dedicated GPU and an enthusiast GPU. Thus, the Nvidia solution caters well to gamers who want a high-end gaming notebook but who aren't exactly willing to pay for a GTX 970M or GTX 980M setup. The GTX 965M is also more cost efficient for smooth 1080p30 gameplay at High or Very High settings since the GTX 970M or GTX 980M are more appropriate for systems with higher native resolution displays.
| 3DMark 11 | |
| 1280x720 Performance Combined (sort by value) | |
| Gigabyte P55K v5 | |
| DogHouse Systems Mobius SS | |
| Gigabyte P55W v5 | |
| Asus GL552VW-DH74 | |
| Asus N752VX-GC131T | |
| 1280x720 Performance GPU (sort by value) | |
| Gigabyte P55K v5 | |
| DogHouse Systems Mobius SS | |
| Gigabyte P55W v5 | |
| Asus GL552VW-DH74 | |
| Asus N752VX-GC131T | |
| 1280x720 Performance (sort by value) | |
| Gigabyte P55K v5 | |
| DogHouse Systems Mobius SS | |
| Gigabyte P55W v5 | |
| Asus GL552VW-DH74 | |
| Asus N752VX-GC131T | |
| 3DMark | |
| Fire Strike Extreme Combined (sort by value) | |
| Gigabyte P55K v5 | |
| DogHouse Systems Mobius SS | |
| Asus GL552VW-DH74 | |
| Asus N752VX-GC131T | |
| Fire Strike Extreme Graphics (sort by value) | |
| Gigabyte P55K v5 | |
| DogHouse Systems Mobius SS | |
| Asus GL552VW-DH74 | |
| Asus N752VX-GC131T | |
| 1920x1080 Fire Strike Combined (sort by value) | |
| Gigabyte P55K v5 | |
| DogHouse Systems Mobius SS | |
| Gigabyte P55W v5 | |
| Asus GL552VW-DH74 | |
| Asus N752VX-GC131T | |
| 1920x1080 Fire Strike Graphics (sort by value) | |
| Gigabyte P55K v5 | |
| DogHouse Systems Mobius SS | |
| Gigabyte P55W v5 | |
| Asus GL552VW-DH74 | |
| Asus N752VX-GC131T | |
| Fire Strike Extreme Score (sort by value) | |
| Gigabyte P55K v5 | |
| DogHouse Systems Mobius SS | |
| Asus GL552VW-DH74 | |
| Asus N752VX-GC131T | |
| 1920x1080 Fire Strike Score (sort by value) | |
| Gigabyte P55K v5 | |
| DogHouse Systems Mobius SS | |
| Gigabyte P55W v5 | |
| Asus GL552VW-DH74 | |
| Asus N752VX-GC131T | |
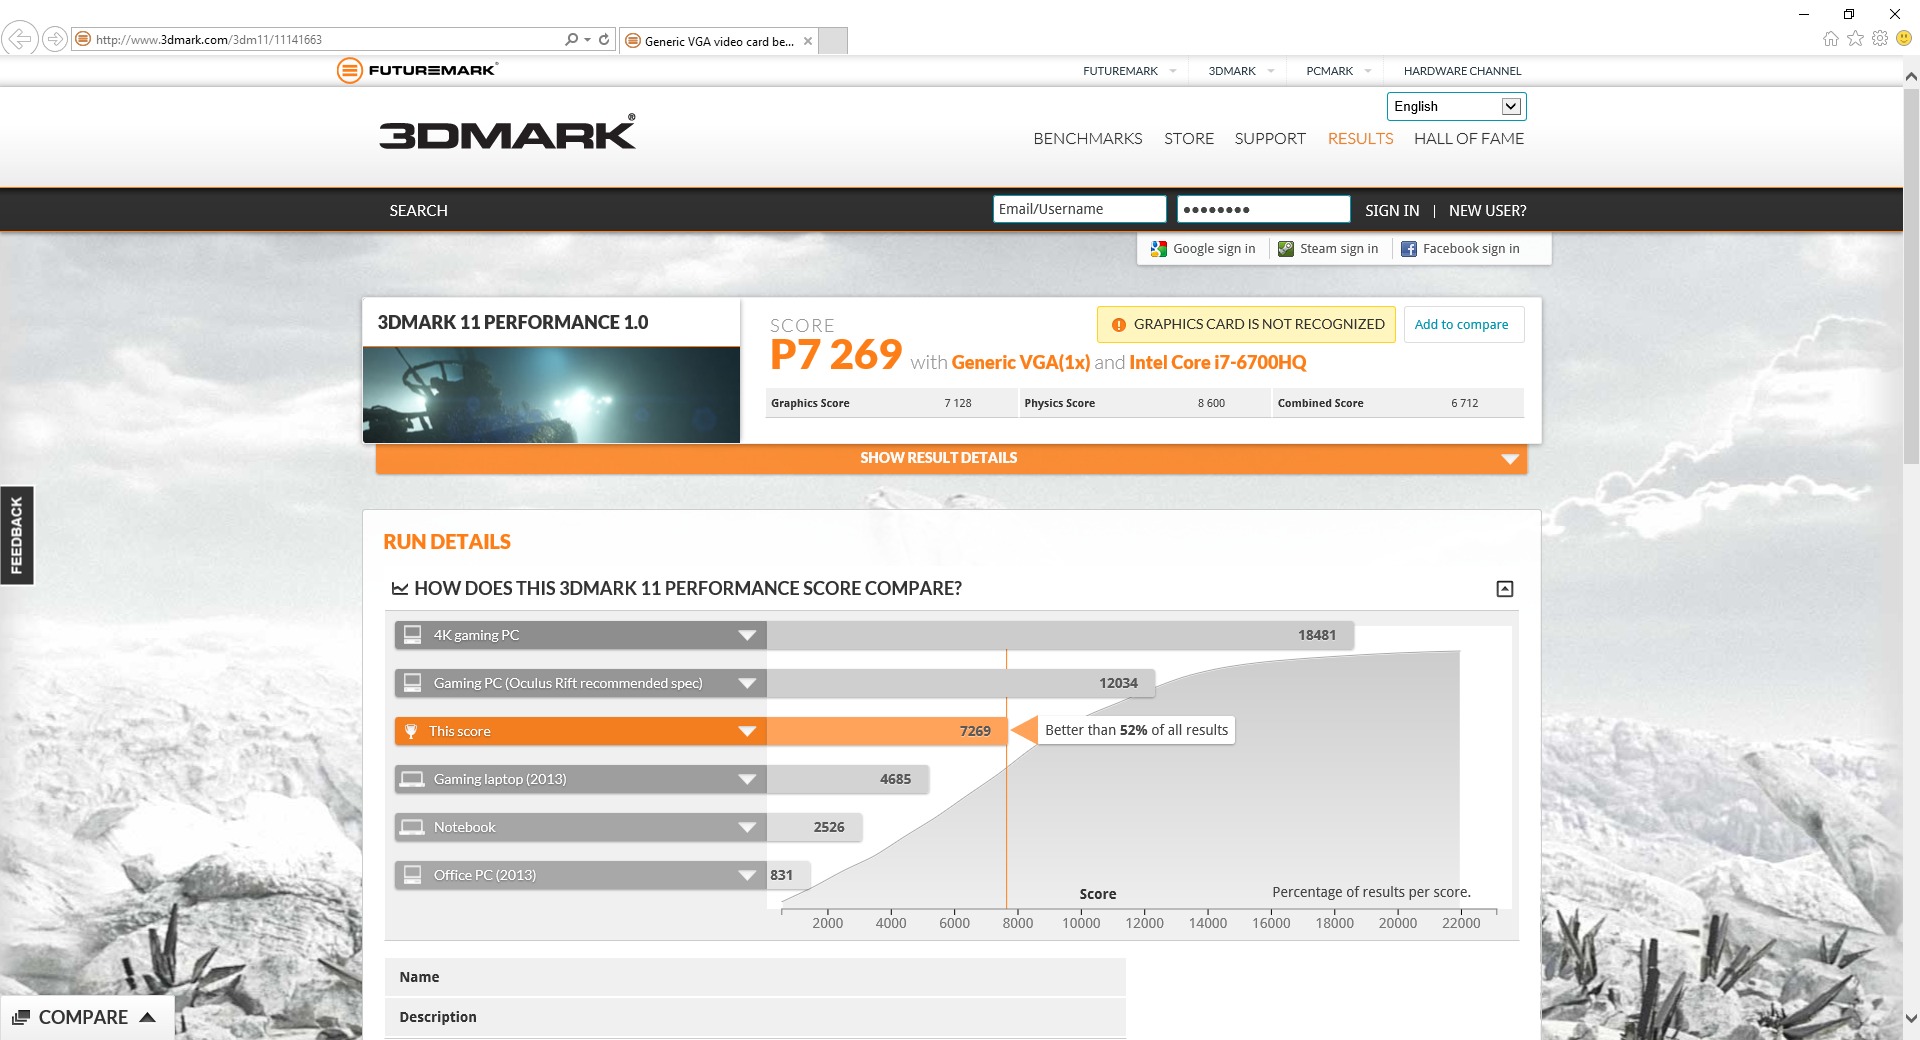
| 3DMark 11 Performance | 7269 points | |
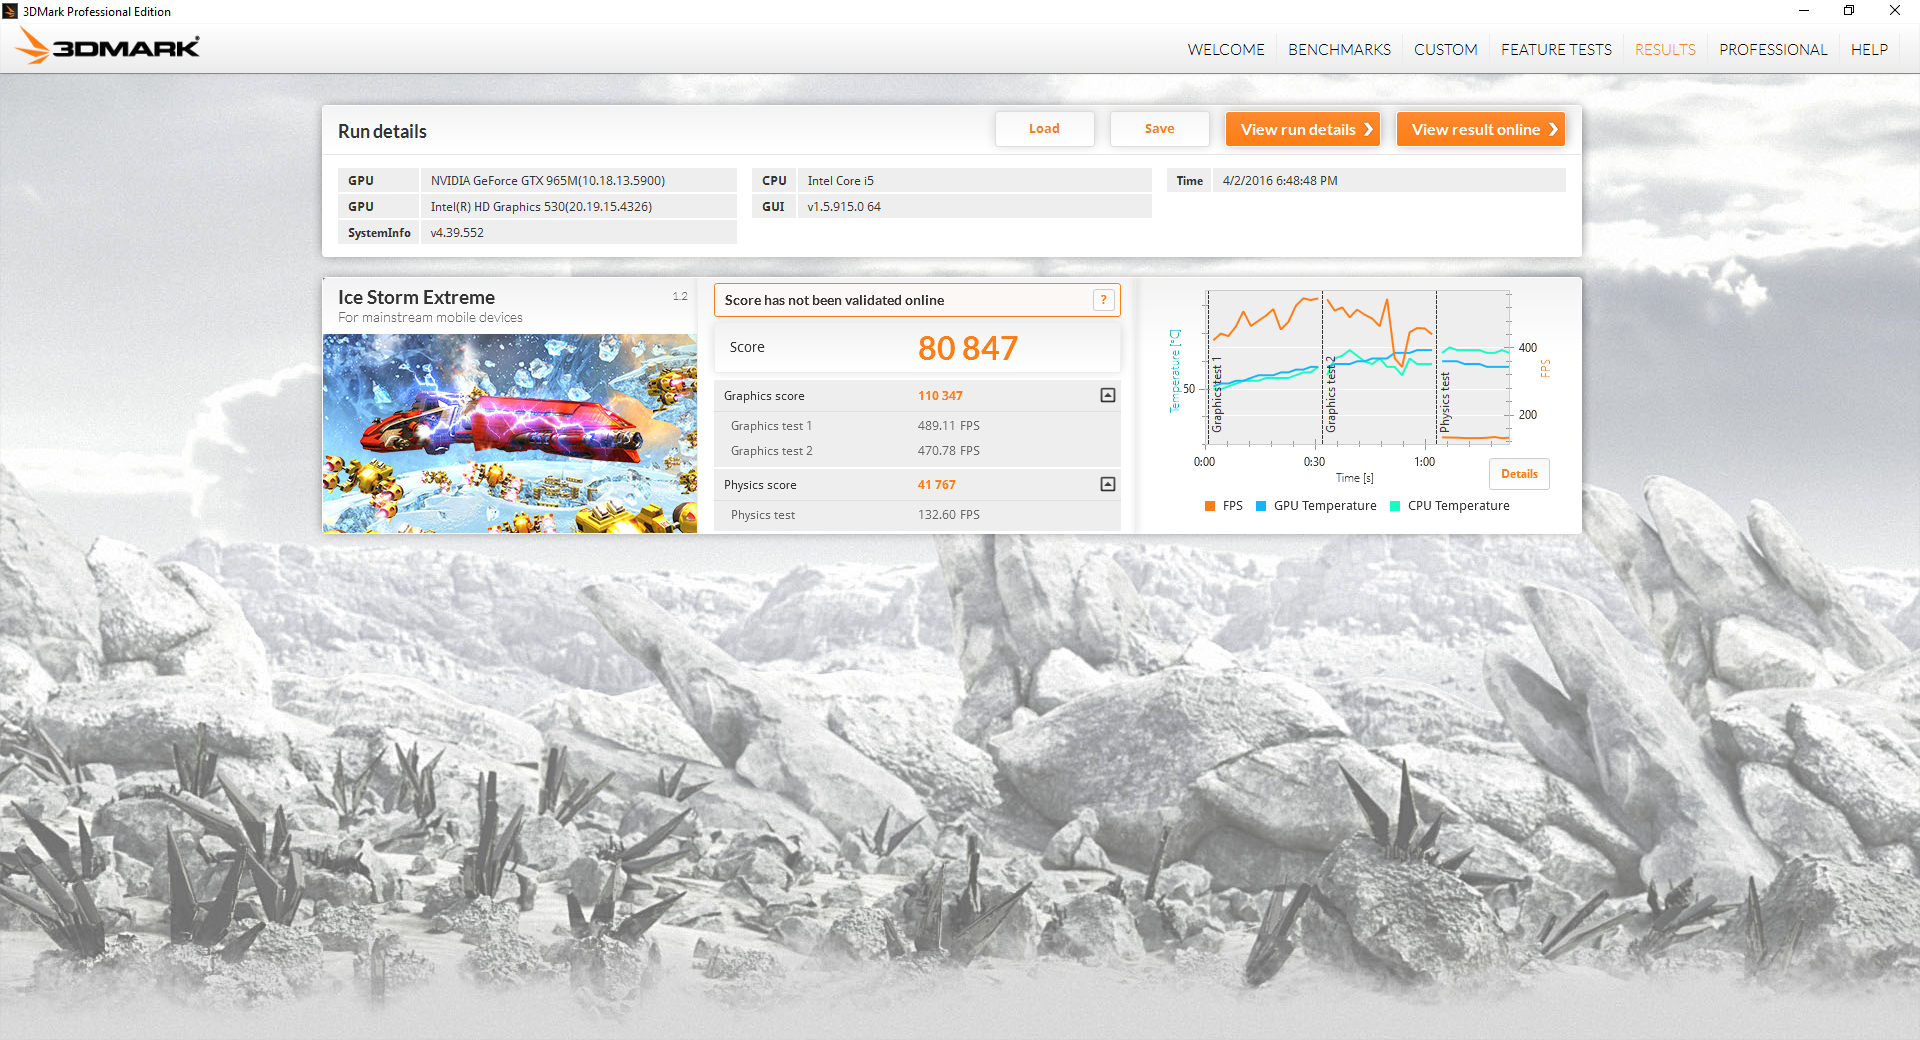
| 3DMark Ice Storm Standard Score | 83531 points | |
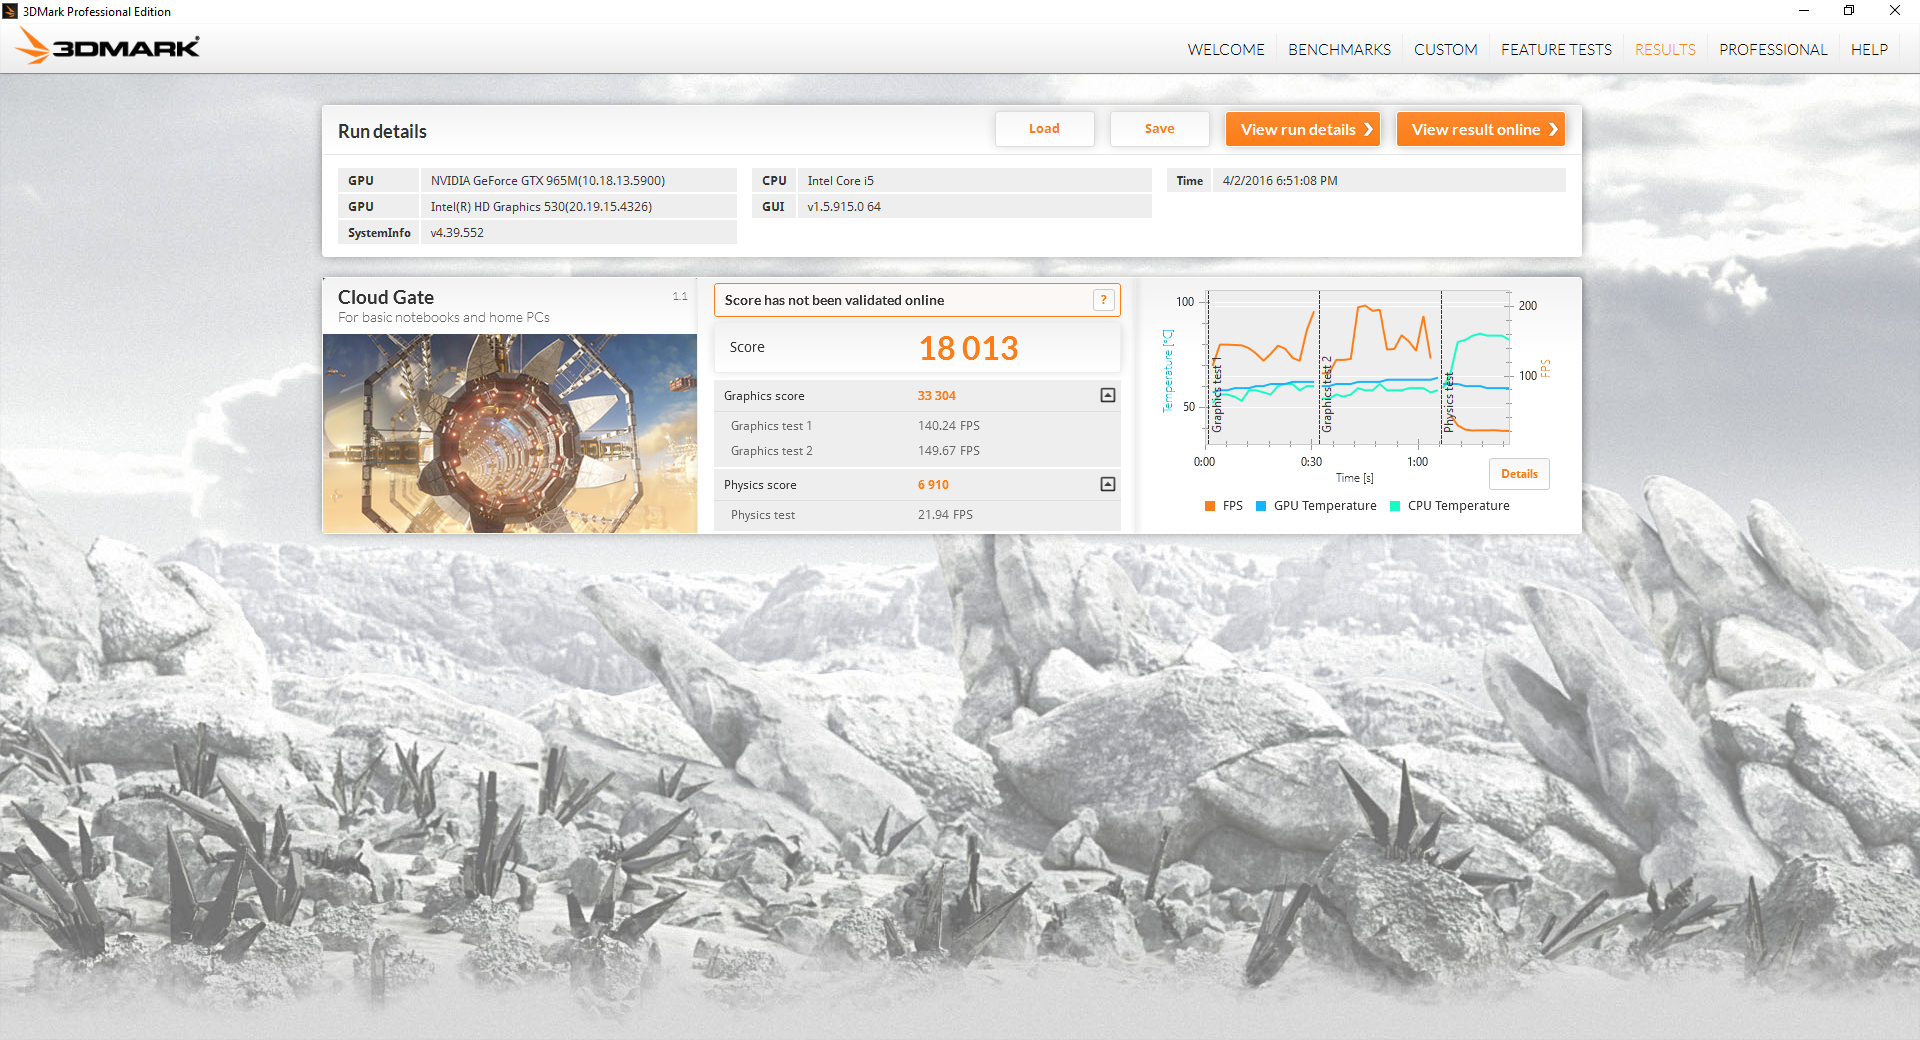
| 3DMark Cloud Gate Standard Score | 18013 points | |
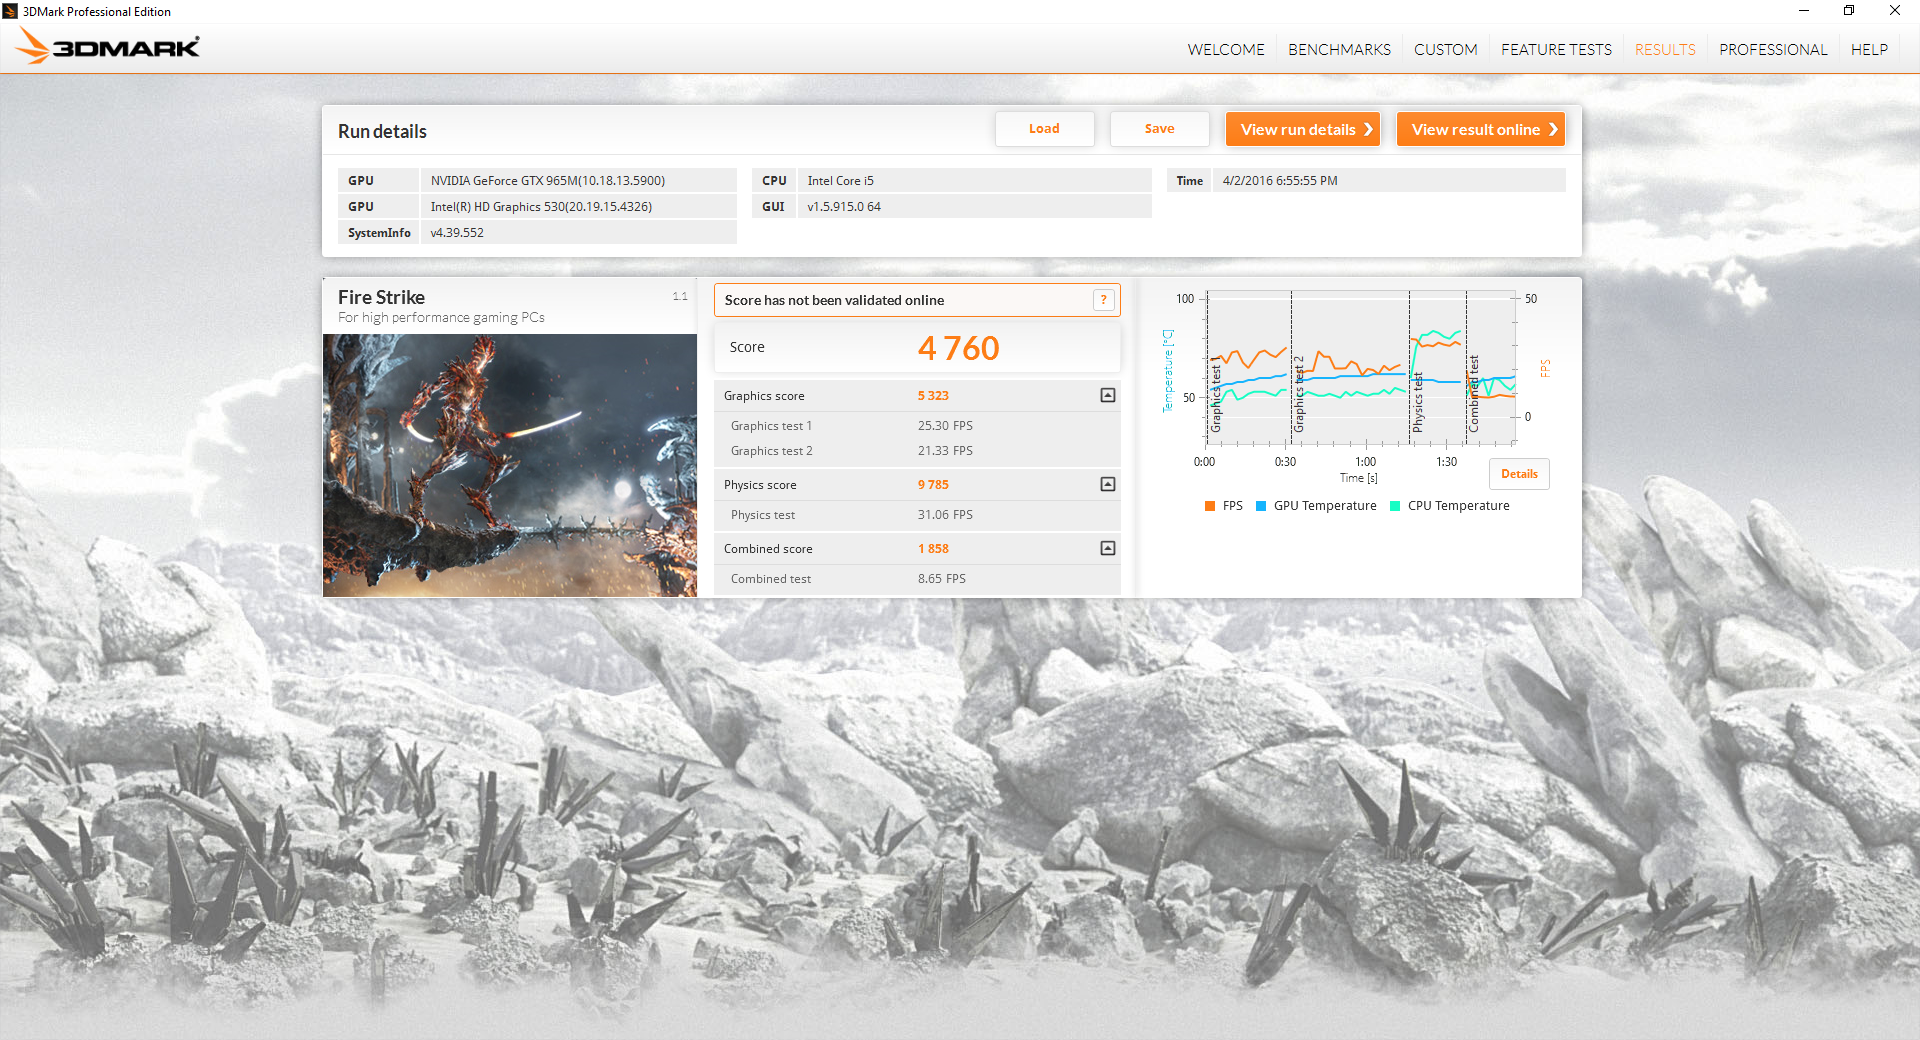
| 3DMark Fire Strike Score | 4760 points | |
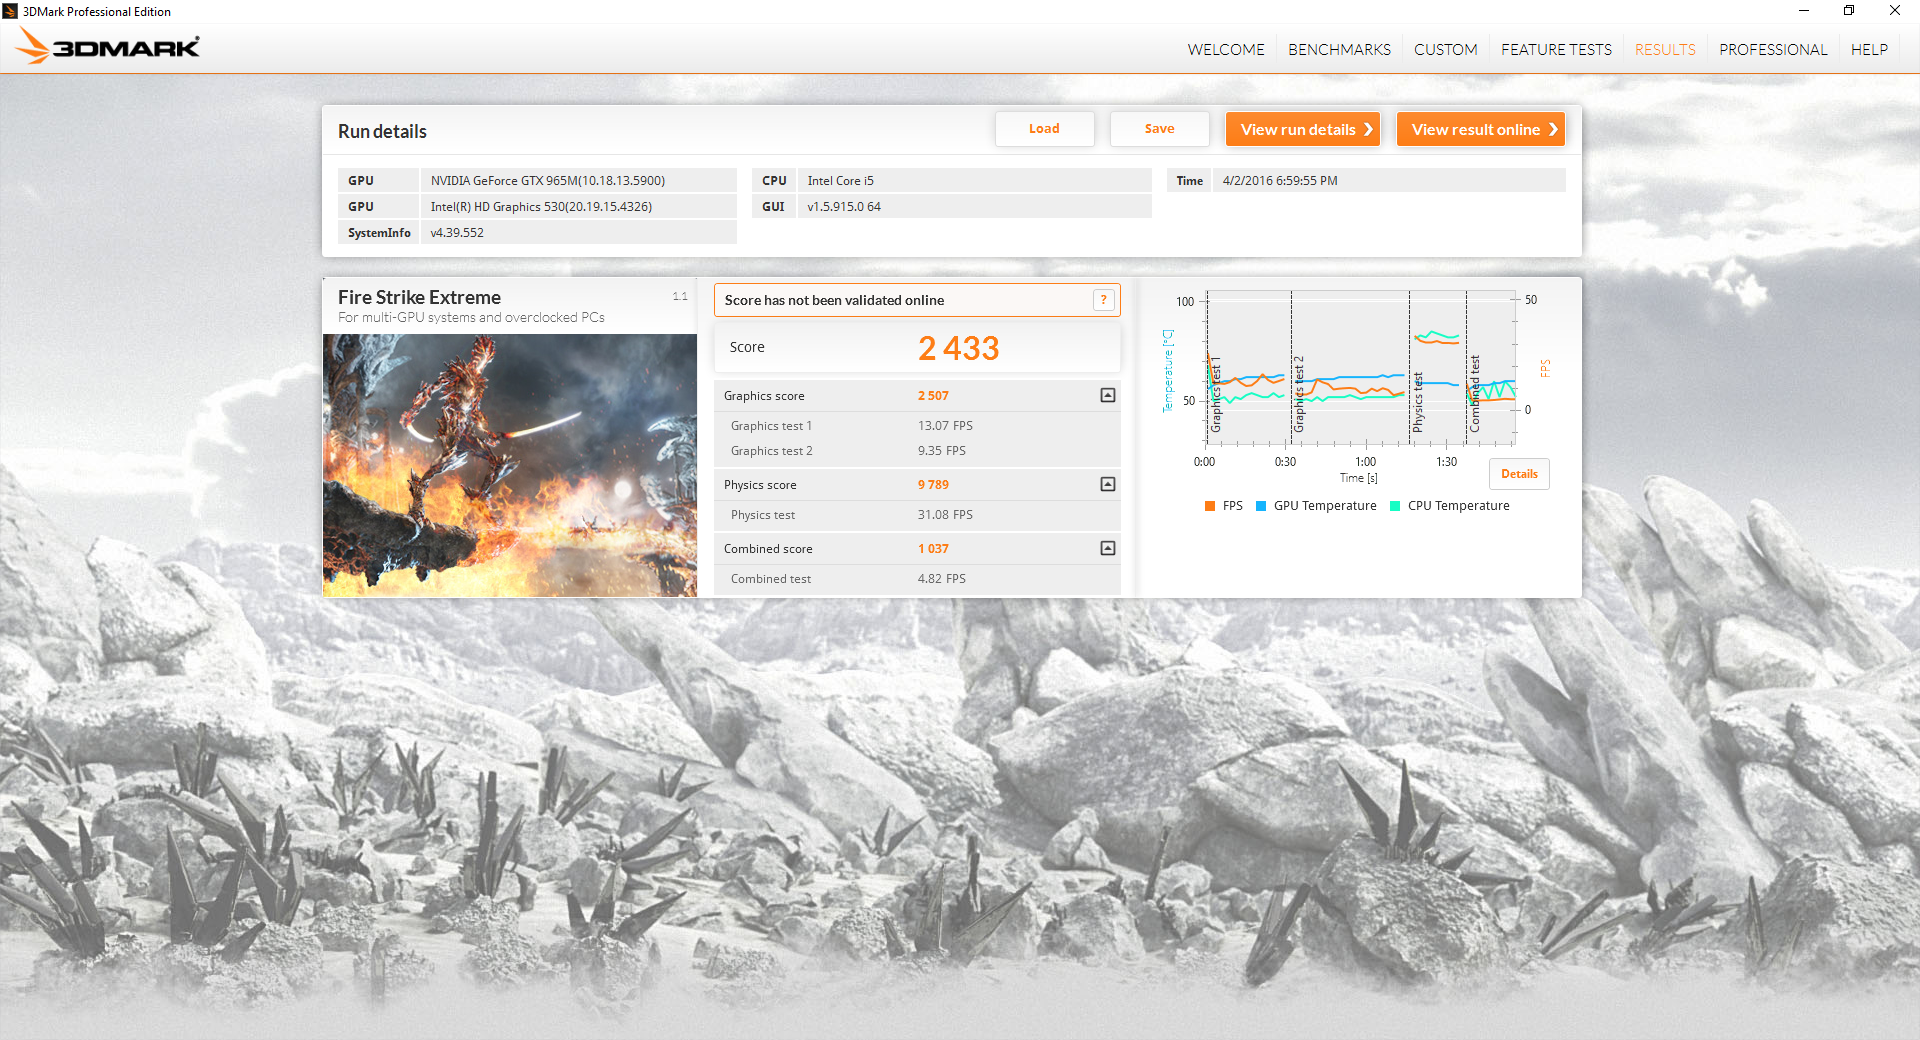
| 3DMark Fire Strike Extreme Score | 2433 points | |
Help | ||
Gaming Performance
Frame rate performance sits comfortably in between the GTX 960M and GTX 970M. In almost all tested cases, however, the GTX 965M lies just a step closer to the GTX 960M than the GTX 970M. Thus, jumping from a system with the GTX 965M to the GTX 970M will net users a larger boost in gaming performance than jumping from a system with the GTX 960M to the GTX 965M.
See our dedicated GPU page on the GTX 965M Nvidia GeForce GTX 965M 2016 Refresh (N16E-GR) Reviewfor more benchmarks and comparisons.
| Sleeping Dogs | |
| 1366x768 High Preset AA:High | |
| DogHouse Systems Mobius SS | |
| Aorus X3 Plus v5 | |
| Gigabyte P55K v5 | |
| Lenovo Ideapad Y700 15ISK 80NV | |
| MSI PX60 QD-034US | |
| 1920x1080 Extreme Preset AA:Extreme | |
| DogHouse Systems Mobius SS | |
| Aorus X3 Plus v5 | |
| Gigabyte P55K v5 | |
| Lenovo Ideapad Y700 15ISK 80NV | |
| MSI PX60 QD-034US | |
| BioShock Infinite | |
| 1366x768 High Preset | |
| DogHouse Systems Mobius SS | |
| Aorus X3 Plus v5 | |
| Gigabyte P55K v5 | |
| Lenovo Ideapad Y700 15ISK 80NV | |
| MSI PX60 QD-034US | |
| 1920x1080 Ultra Preset, DX11 (DDOF) | |
| DogHouse Systems Mobius SS | |
| Aorus X3 Plus v5 | |
| Gigabyte P55K v5 | |
| Lenovo Ideapad Y700 15ISK 80NV | |
| MSI PX60 QD-034US | |
| Metro: Last Light | |
| 1366x768 High (DX11) AF:16x | |
| DogHouse Systems Mobius SS | |
| Aorus X3 Plus v5 | |
| Gigabyte P55K v5 | |
| Lenovo Ideapad Y700 15ISK 80NV | |
| MSI PX60 QD-034US | |
| 1920x1080 Very High (DX11) AF:16x | |
| DogHouse Systems Mobius SS | |
| Aorus X3 Plus v5 | |
| Gigabyte P55K v5 | |
| Lenovo Ideapad Y700 15ISK 80NV | |
| MSI PX60 QD-034US | |
| Thief | |
| 1366x768 High Preset AA:FXAA & Low SS AF:4x | |
| DogHouse Systems Mobius SS | |
| Aorus X3 Plus v5 | |
| Gigabyte P55K v5 | |
| Lenovo Ideapad Y700 15ISK 80NV | |
| MSI PX60 QD-034US | |
| 1920x1080 Very High Preset AA:FXAA & High SS AF:8x | |
| DogHouse Systems Mobius SS | |
| Aorus X3 Plus v5 | |
| Gigabyte P55K v5 | |
| Lenovo Ideapad Y700 15ISK 80NV | |
| MSI PX60 QD-034US | |
| Batman: Arkham Knight | |
| 1920x1080 High / On (Interactive Smoke & Paper Debris Off) AA:SM AF:8x | |
| DogHouse Systems Mobius SS | |
| Aorus X3 Plus v5 | |
| Gigabyte P55K v5 | |
| Lenovo Ideapad Y700 15ISK 80NV | |
| 1920x1080 High / On AA:SM AF:16x | |
| DogHouse Systems Mobius SS | |
| Lenovo Ideapad Y700 15ISK 80NV | |
| Gigabyte P55K v5 | |
| Metal Gear Solid V | |
| 1920x1080 High / On | |
| DogHouse Systems Mobius SS | |
| Gigabyte P55K v5 | |
| Aorus X3 Plus v5 | |
| Lenovo Ideapad Y700 15ISK 80NV | |
| MSI PX60 QD-034US | |
| 1920x1080 Extra High / On | |
| DogHouse Systems Mobius SS | |
| Aorus X3 Plus v5 | |
| Gigabyte P55K v5 | |
| Lenovo Ideapad Y700 15ISK 80NV | |
| MSI PX60 QD-034US | |
| Fallout 4 | |
| 1920x1080 High Preset AA:T AF:16x | |
| DogHouse Systems Mobius SS | |
| Aorus X3 Plus v5 | |
| Gigabyte P55K v5 | |
| Lenovo Ideapad Y700 15ISK 80NV | |
| 1920x1080 Ultra Preset AA:T AF:16x | |
| DogHouse Systems Mobius SS | |
| Aorus X3 Plus v5 | |
| Gigabyte P55K v5 | |
| Lenovo Ideapad Y700 15ISK 80NV | |
| Rise of the Tomb Raider | |
| 1920x1080 High Preset AA:FX AF:4x | |
| DogHouse Systems Mobius SS | |
| Gigabyte P55K v5 | |
| 1920x1080 Very High Preset AA:FX AF:16x | |
| DogHouse Systems Mobius SS | |
| Gigabyte P55K v5 | |
| low | med. | high | ultra | |
|---|---|---|---|---|
| Sleeping Dogs (2012) | 150.1 | 105.8 | 32.9 | |
| BioShock Infinite (2013) | 148.1 | 132.2 | 52.4 | |
| Metro: Last Light (2013) | 115.6 | 74 | 39.2 | |
| Thief (2014) | 75.9 | 66.2 | 34.8 | |
| Batman: Arkham Knight (2015) | 75 | 39 | 24 | |
| Metal Gear Solid V (2015) | 60 | 60 | 47.1 | |
| Fallout 4 (2015) | 60.2 | 39.3 | 30.7 | |
| Rise of the Tomb Raider (2016) | 60.8 | 36.6 | 28.3 |
Stress Test
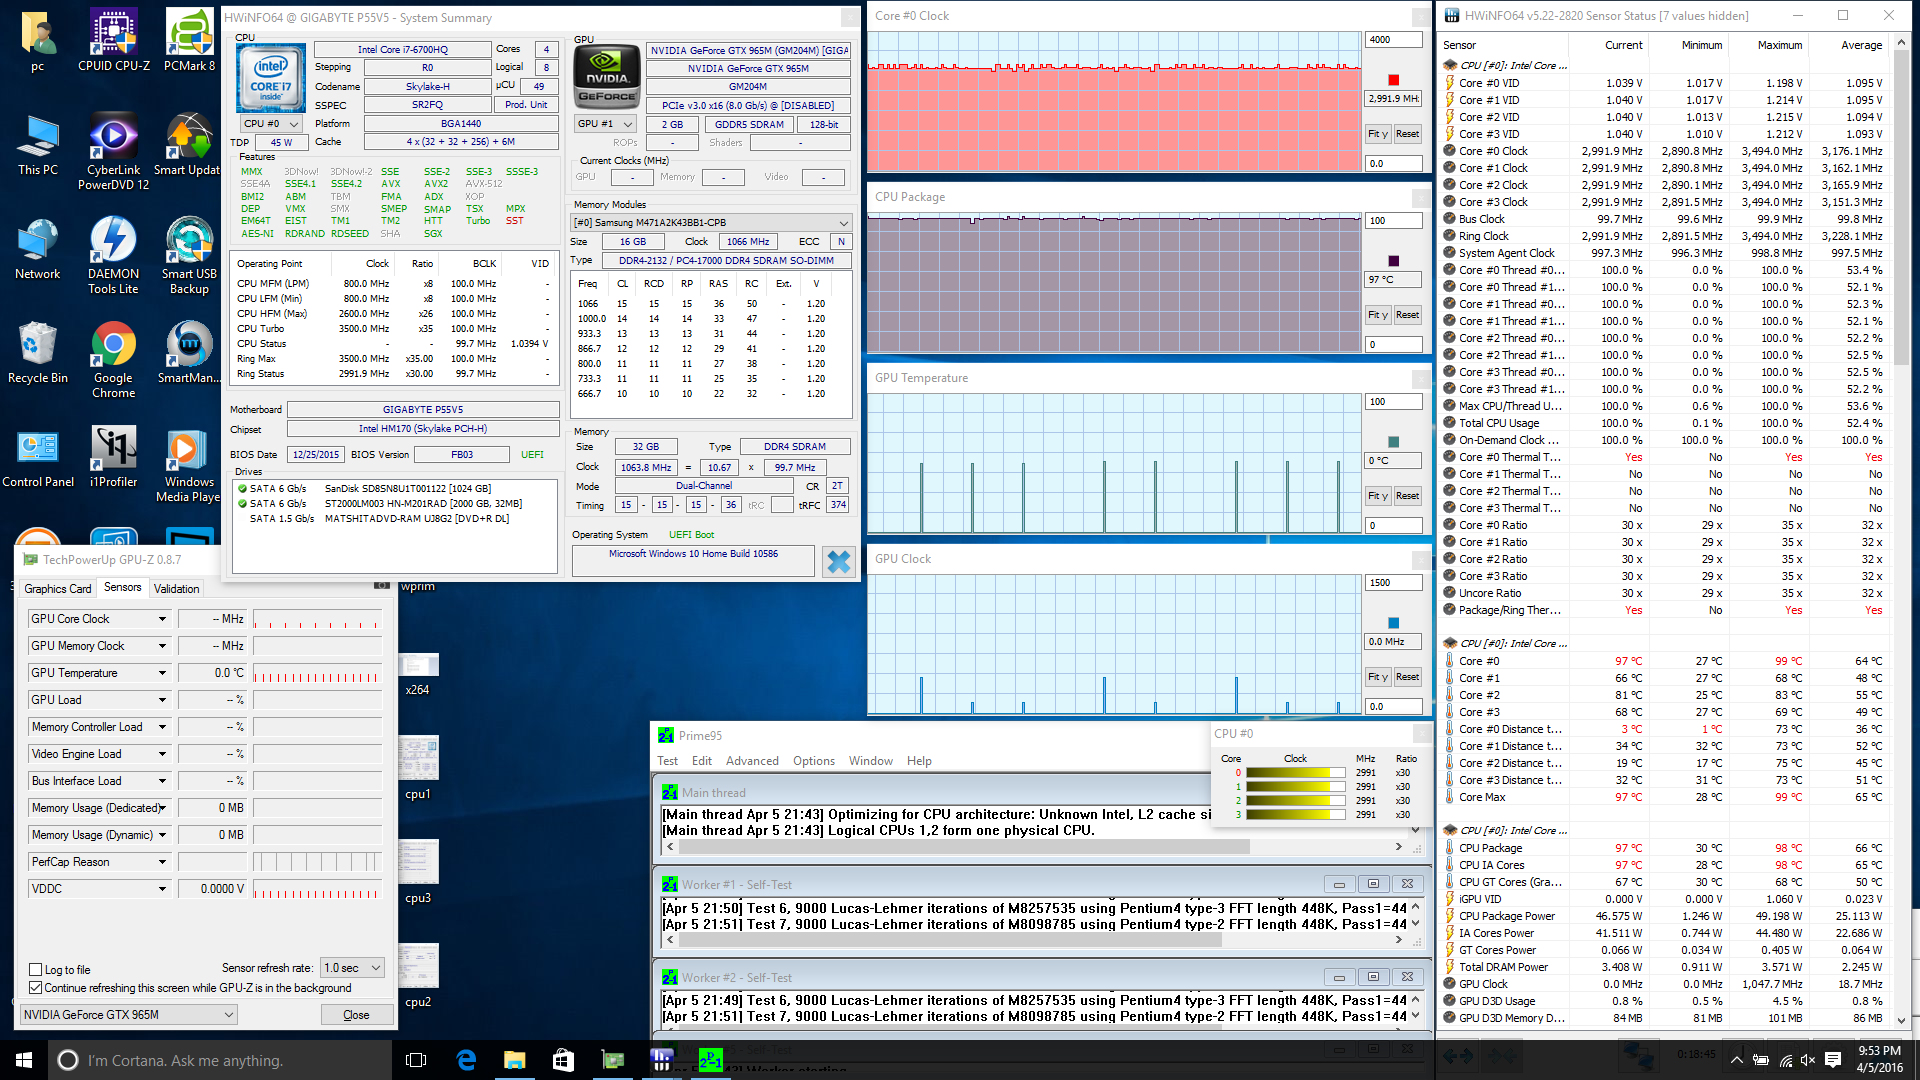
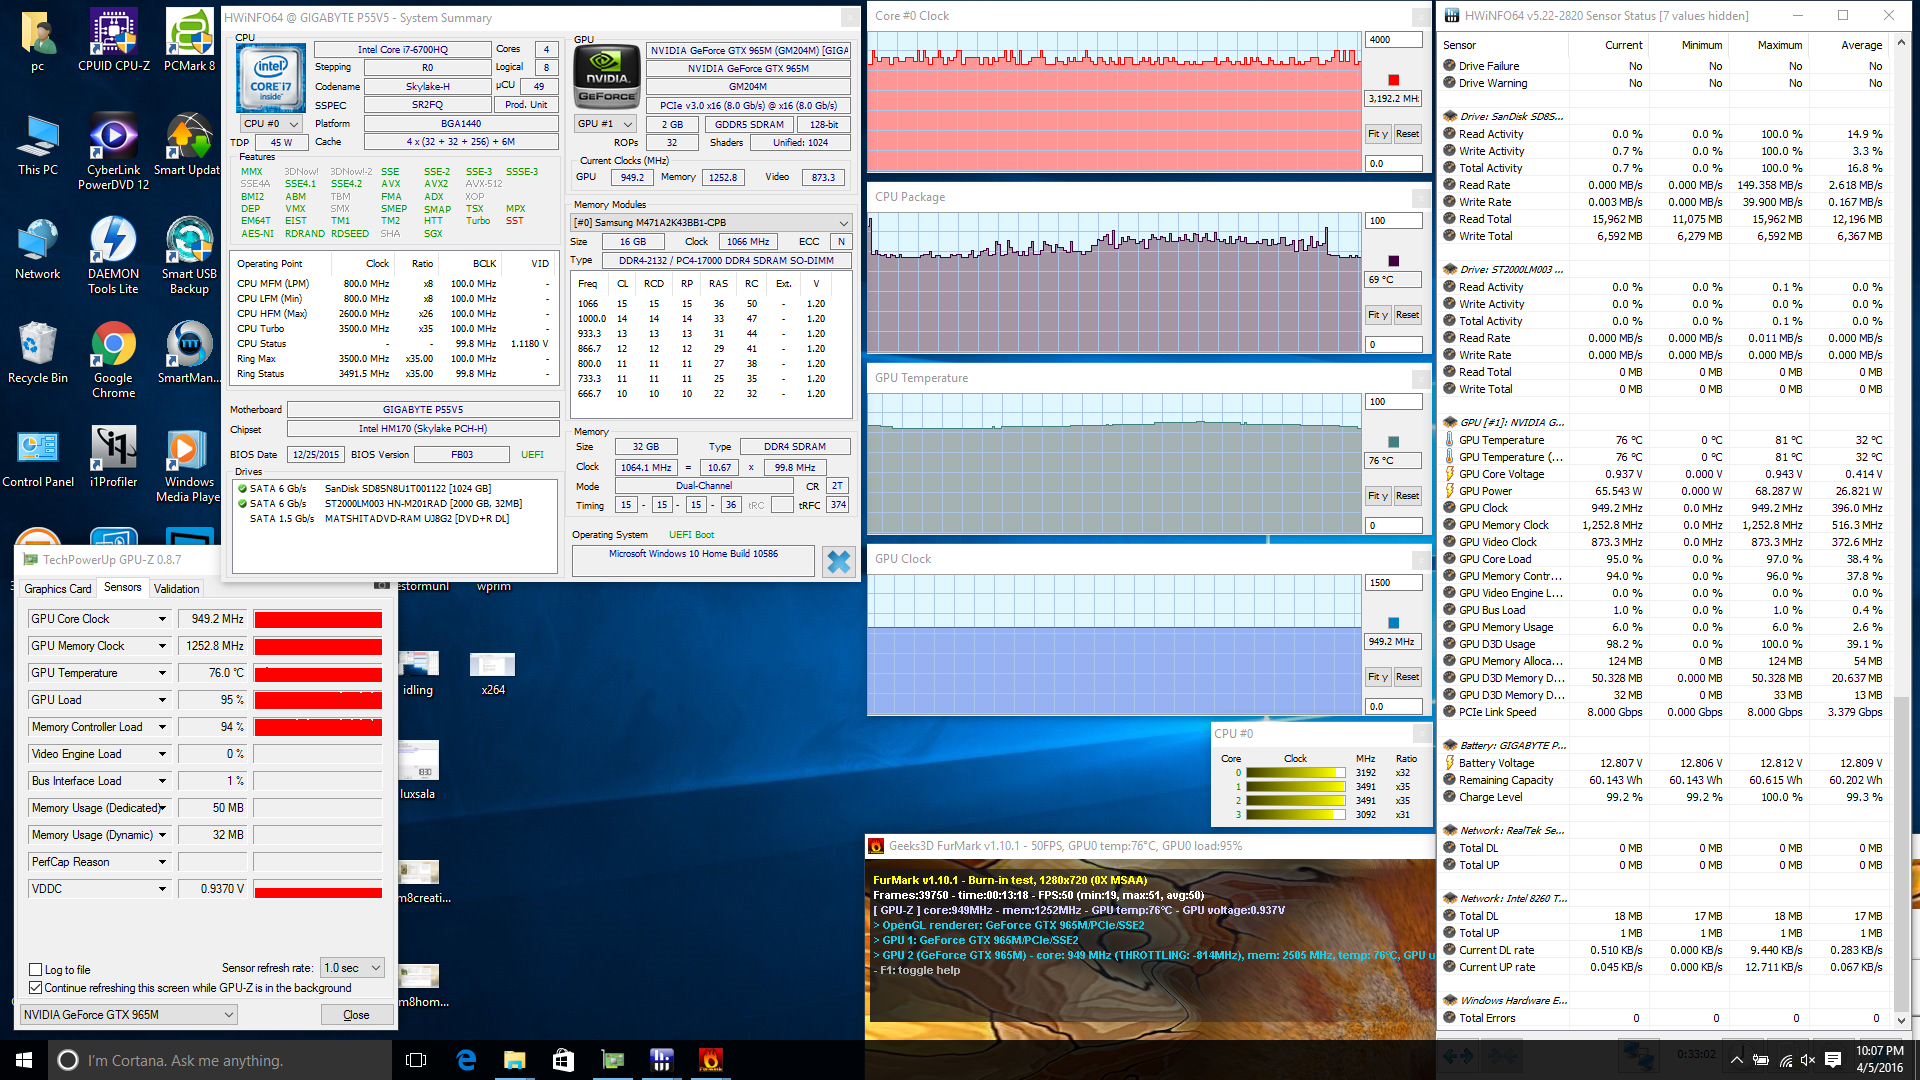
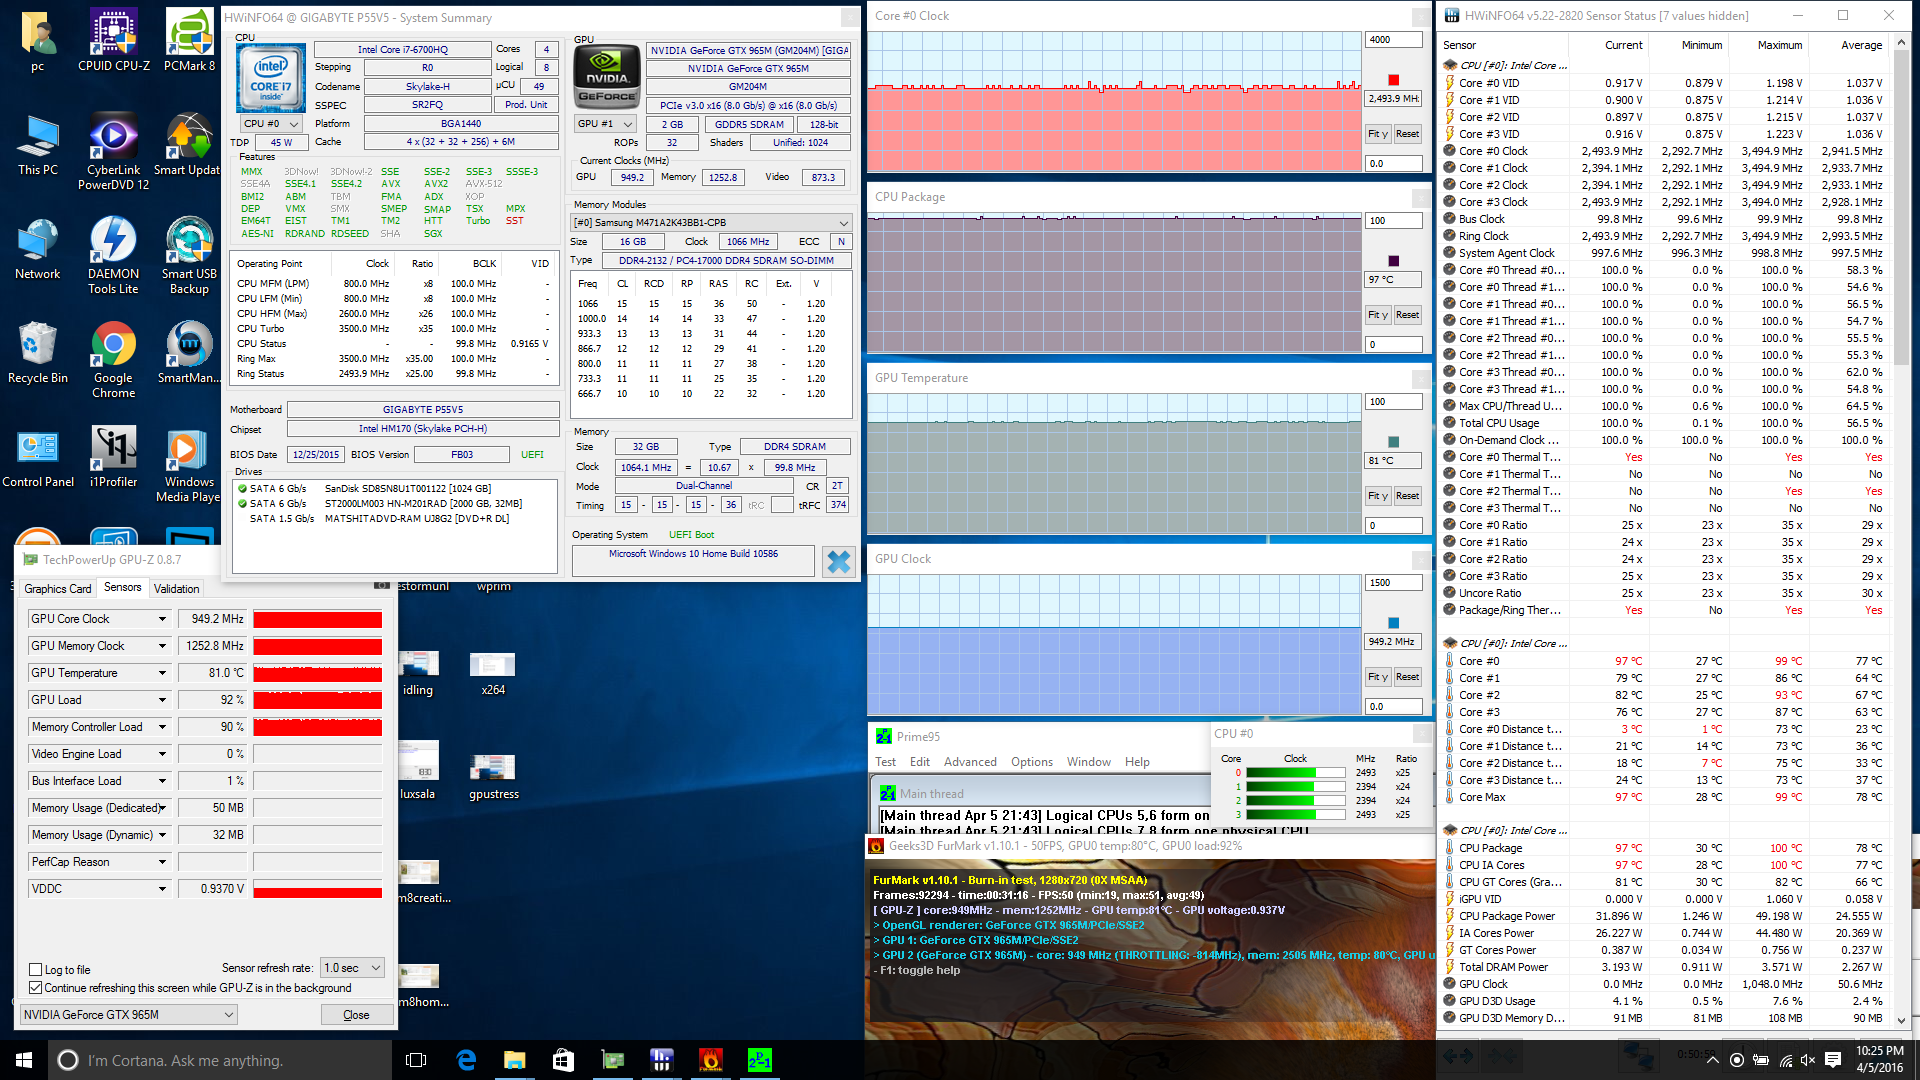
The Gigabyte system performs very well when under stress. Nonetheless, the CPU levels off at a core temperature very close to an uncomfortable 100 C, which is a common trait amongst Gigabyte and Aorus systems in order to squeeze out as much processor performance as possible. Running both Prime95 and FurMark simultaneously will throttle the CPU just slightly while the GPU remains above its base clock rate of 924 MHz.
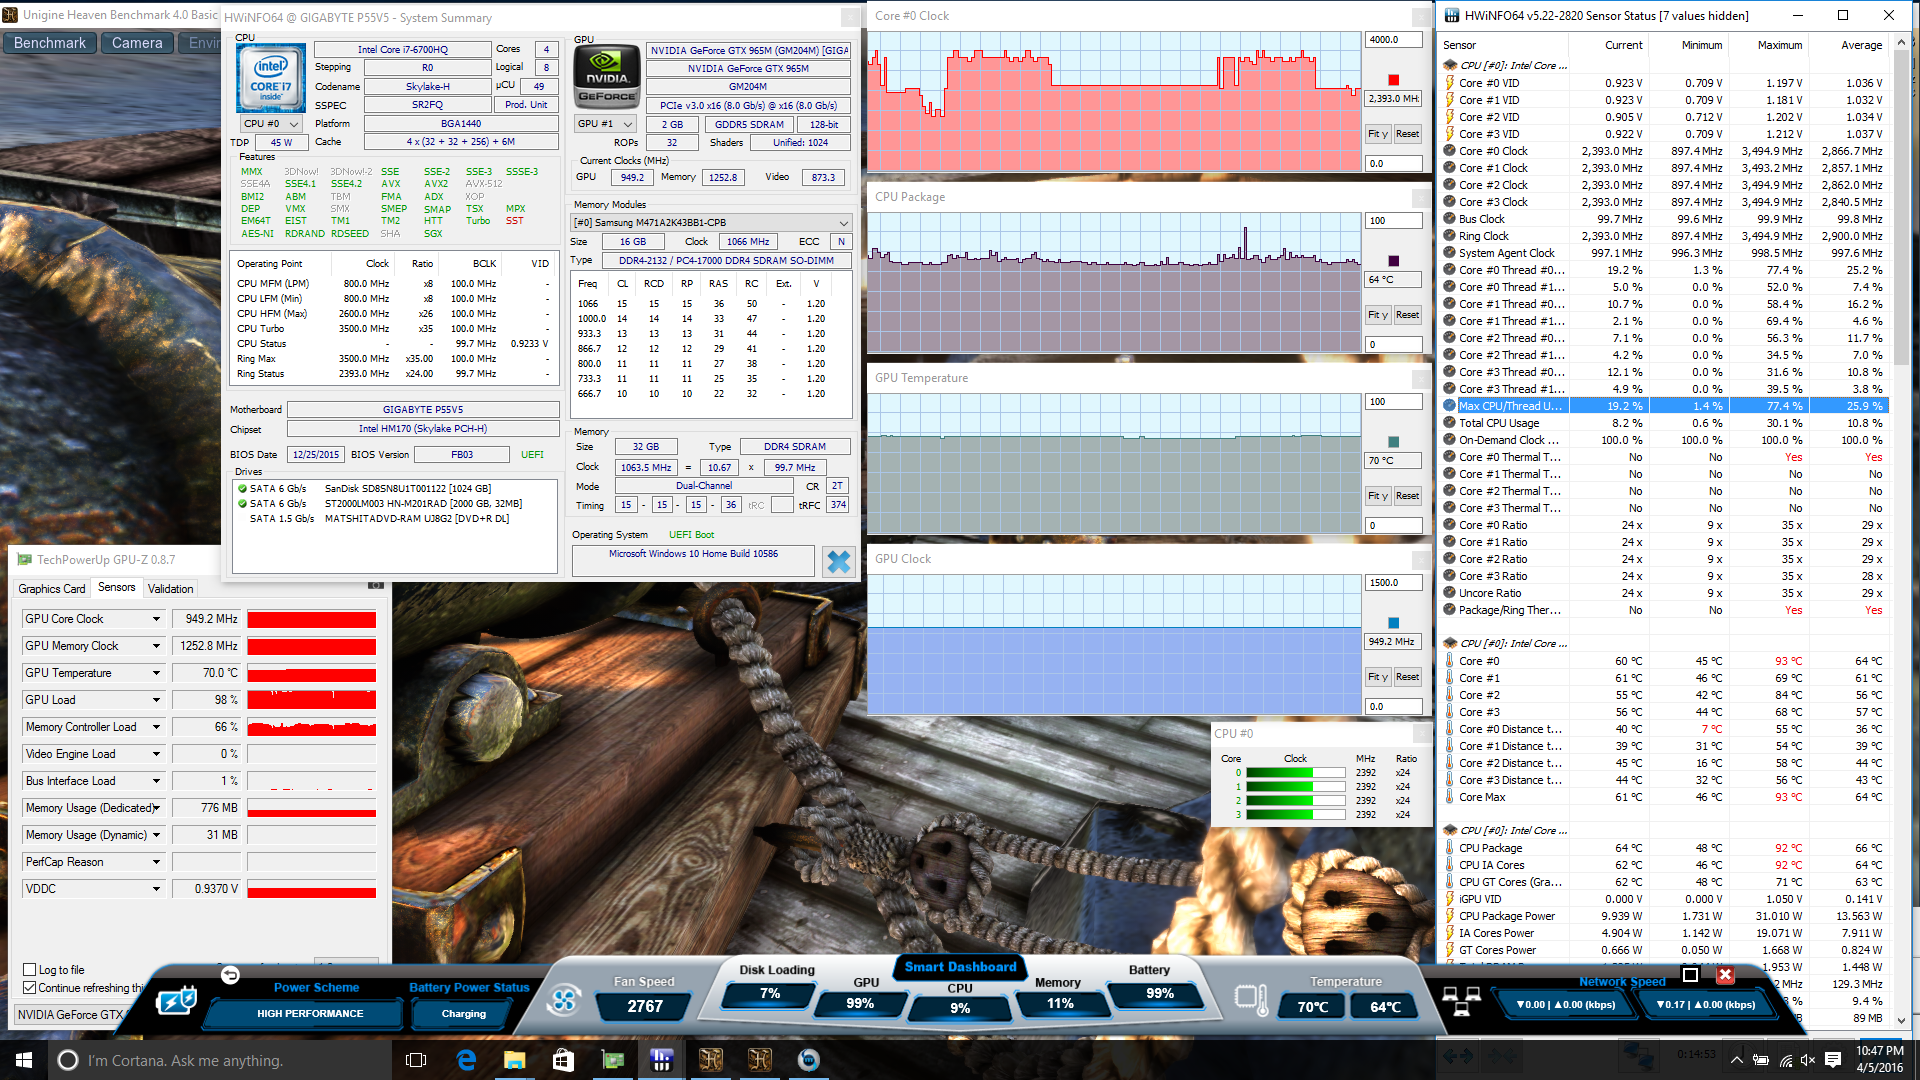
Running Unigine Heaven will put the GPU at a stable Boost clock rate of 1253 MHz and the CPU anywhere between 2.4 to 3.5 GHz as needed. Core temperatures stabilize in the much lower 70 C range. Unlike the majority of notebooks, the system fan will pulsate more frequently under Unigine Heaven load and is much more sensitive to onscreen content, so system noise will not be constant when gaming.
| CPU Clock (GHz) | GPU Clock (MHz) | Average CPU Temperature (C) | Average GPU Temperature (C) | |
Prime95 Stress |
3.0 | -- | ~97 | -- |
FurMark Stress |
-- | 949 | -- | ~76 |
Prime95 + FurMark Stress |
2.3 - 2.5 | 949 | ~97 | ~81 |
Unigine Heaven Stress |
2.4+ | 1253 | ~64 | ~70 |
Emissions
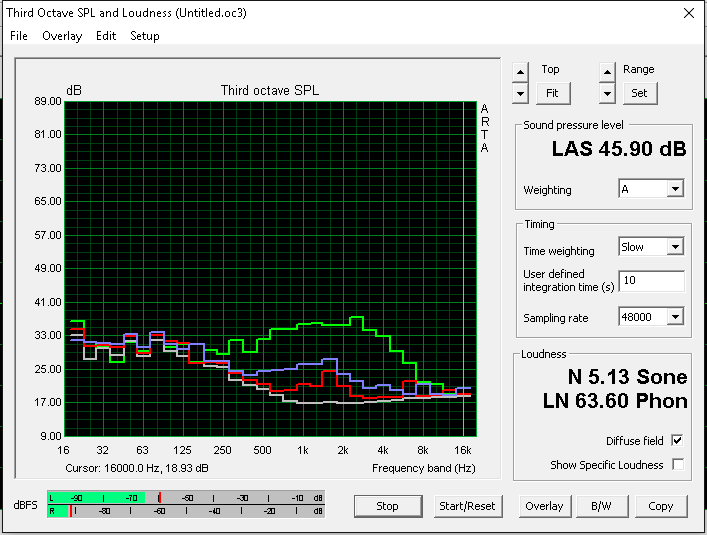
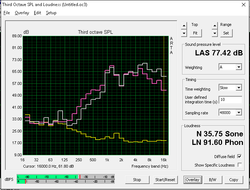
System Noise
Fan characteristics are unlike the P55 v4 since the cooling system remains unchanged. In other words, the fan never idles and is essentially always audible even on the Power Saver profile. Fan noise is generally louder than the XPS 15 9550 and softer than the super-thin and more powerful MSI GS60 during low loads. Running Unigine Heaven will bump fan noise to the low 40 dB(A) range, which is common for a gaming notebook. Unfortunately, the fan here may occasionally pulsate to an even louder 43 dB(A) for brief moments when gaming as mentioned in the previous section.
| Gigabyte P55K v5 GeForce GTX 965M, 6700HQ, SanDisk SD8SN8U1T001122 | Dell XPS 15 9550 i7 FHD GeForce GTX 960M, 6700HQ, Samsung PM951 NVMe 512 GB | MSI GS60-6QE4K16H21 GeForce GTX 970M, 6700HQ, Hynix HFS256G3MND | Acer Aspire V15 Nitro BE VN7-592G-79DV GeForce GTX 960M, 6700HQ, Lite-On CV1-8B512 M.2 512 GB | Gigabyte P35X v5 GeForce GTX 980M, 6700HQ, Samsung SM951 MZVPV256HDGL m.2 PCI-e | |
|---|---|---|---|---|---|
| Noise | 9% | -6% | -3% | -3% | |
| off / environment * (dB) | 29 | 31.3 -8% | |||
| Idle Minimum * (dB) | 32 | 29.2 9% | 35 -9% | 31.2 2% | 32.2 -1% |
| Idle Average * (dB) | 33 | 29.3 11% | 36 -9% | 31.2 5% | 32.3 2% |
| Idle Maximum * (dB) | 33 | 29.5 11% | 37 -12% | 36.2 -10% | 32.6 1% |
| Load Average * (dB) | 41 | 36.5 11% | 40 2% | 45.3 -10% | 44.4 -8% |
| Load Maximum * (dB) | 50 | 47.7 5% | 50 -0% | 47.3 5% | 54.6 -9% |
* ... smaller is better
Noise level
| Idle |
| 32 / 33 / 33 dB(A) |
| DVD |
| 37 / dB(A) |
| Load |
| 41 / 50 dB(A) |
 | ||
30 dB silent 40 dB(A) audible 50 dB(A) loud |
||
min: | ||
Temperature
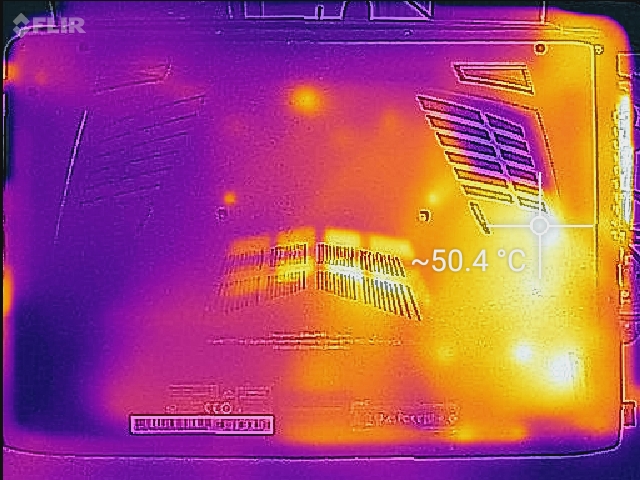
Surface temperatures are flat on both sides when the system is idling. When under heavy loads, the left half of the notebook becomes much warmer than the right due to the positioning of the heat pipes and fan over the CPU and GPU. This means that the QWERTY keys are generally always warmer than the NumPad and that the delta will only increase when gaming or running benchmarks.
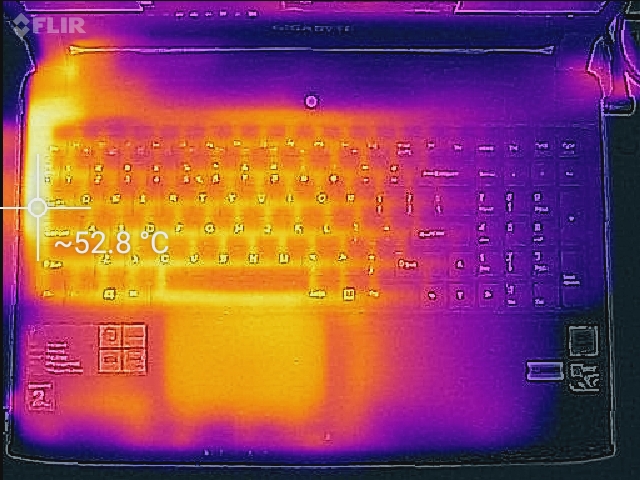
(-) The maximum temperature on the upper side is 52.6 °C / 127 F, compared to the average of 40.4 °C / 105 F, ranging from 21.2 to 68.8 °C for the class Gaming.
(-) The bottom heats up to a maximum of 50.2 °C / 122 F, compared to the average of 43.2 °C / 110 F
(+) In idle usage, the average temperature for the upper side is 21.7 °C / 71 F, compared to the device average of 33.9 °C / 93 F.
(-) The palmrests and touchpad can get very hot to the touch with a maximum of 44.6 °C / 112.3 F.
(-) The average temperature of the palmrest area of similar devices was 28.8 °C / 83.8 F (-15.8 °C / -28.5 F).
Speakers
The 2 W stereo speakers haven't changed since the last P55 v4 revision. Our microphone measurements show that lower frequencies are not well reproduced due to the system's weak bass. Unlike thicker multimedia and gaming notebooks, the P55 series does not incorporate a dedicated subwoofer for a better balance. In other words, sound quality is still better than most Ultrabooks and a step below larger gaming systems.
Energy Management
Power Consumption
The P55K v5 is not unlike the P55W v5 in power demands. In particular, the P55K draws slightly less power than the P55W when under stress. Other systems with the less powerful GTX 960M draw even less power under similar conditions.
| Gigabyte P55K v5 GeForce GTX 965M, 6700HQ, SanDisk SD8SN8U1T001122 | Gigabyte P55W v5 GeForce GTX 970M, 6700HQ, Samsung SM951 MZVPV128 NVMe | Dell XPS 15-9550 i7 GeForce GTX 960M, 6700HQ, Samsung PM951 NVMe 512 GB | MSI GS60 6QE-046XPL GeForce GTX 970M, 6700HQ, Toshiba HG6 THNSNJ256G8NU | Acer Aspire V15 Nitro BE VN7-592G-79DV GeForce GTX 960M, 6700HQ, Lite-On CV1-8B512 M.2 512 GB | |
|---|---|---|---|---|---|
| Power Consumption | -2% | -26% | -45% | 1% | |
| Idle Minimum * (Watt) | 10.1 | 9 11% | 12.5 -24% | 12.8 -27% | 8.9 12% |
| Idle Average * (Watt) | 13.3 | 13 2% | 19.6 -47% | 19.1 -44% | 13.9 -5% |
| Idle Maximum * (Watt) | 15.4 | 17 -10% | 22.8 -48% | 23.6 -53% | 15.6 -1% |
| Load Average * (Watt) | 75.8 | 81 -7% | 102 -35% | 147.9 -95% | 89 -17% |
| Load Maximum * (Watt) | 144 | 152 -6% | 107 26% | 155.9 -8% | 118 18% |
* ... smaller is better
| Off / Standby | |
| Idle | |
| Load |
|
Key:
min: | |
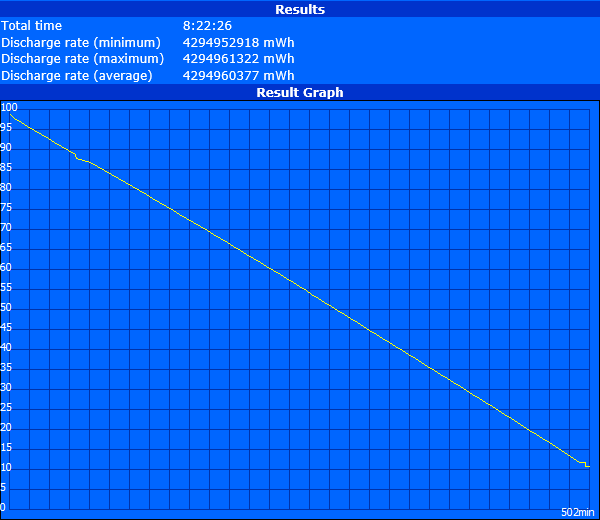
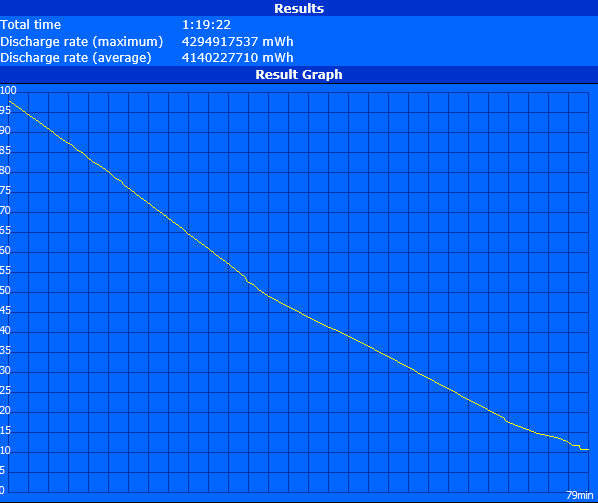
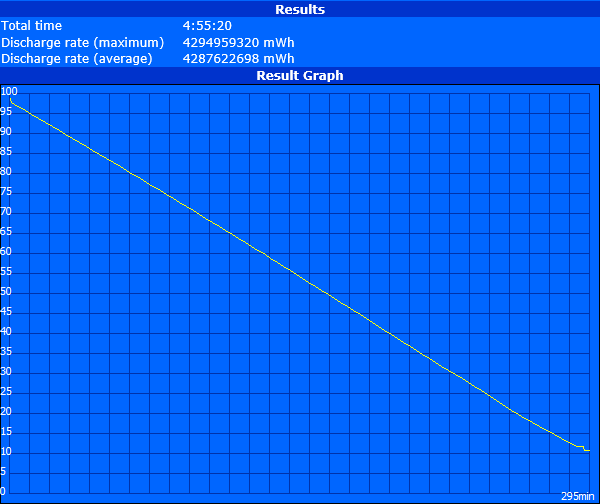
Battery Life
Users can expect just under 5 hours of constant WLAN use at a brightness setting of 150 nits. Runtimes are overall shorter than our P55W v5 test unit and about average for a high-end gaming machine. The larger battery capacity of the XPS 15 9550 gives it much longer runtimes than our Gigabyte and most other gaming notebooks of the same size class.
Charging from near empty to 100 percent will take roughly 2 to 2.5 hours.
| Gigabyte P55K v5 61 Wh | Gigabyte P55W v5 61 Wh | Dell XPS 15 9550 i7 FHD 84 Wh | MSI GS60-6QE4K16H21 47 Wh | Acer Aspire V15 Nitro BE VN7-592G-79DV 52 Wh | |
|---|---|---|---|---|---|
| Battery runtime | 20% | 73% | -42% | -7% | |
| Reader / Idle (h) | 8.4 | 10.1 20% | 16.3 94% | 3.6 -57% | 8.8 5% |
| WiFi v1.3 (h) | 4.9 | 5.8 18% | 9.1 86% | 2.6 -47% | 3.6 -27% |
| Load (h) | 1.3 | 1.6 23% | 1.8 38% | 1 -23% | 1.3 0% |
Pros
Cons
Verdict

The Gigabyte P55K v5 is defined by its GTX 965M GPU and lower starting prices compared to its P55W v5 counterpart. Users can expect about a 25 percent decrease in FPS performance when moving from the GTX 970M to the GTX 965M while potentially saving hundreds of dollars. Overall horsepower will still be good enough for 1080p gameplay on High to Ultra settings at a smooth 30 FPS with a few exceptions. If this is more than acceptable, then the P55K is an easier recommendation.
Aside from the performance hit, we were hoping to see reduced fan noise, longer runtimes, and lower core temperatures than its more powerful P55W v5 sibling. This is unfortunately not the case as we were unable to reproduce any consistent results to prove that the less powerful P55K is any quieter or cooler under similar conditions. The display panel, however, is measurably more accurate than the one on our P55W test unit, so digital artists may want to cherry pick specific SKUs for the higher sRGB coverage as well.
The GTX 965M in the P55K v5 lies comfortably between the GTX 960M and GTX 970M, though the system overall does not necessarily run any quieter, cooler, or longer than its more powerful P55W v5 SKU.
Gigabyte P55K v5
- 04/29/2016 v5.1 (old)
Allen Ngo
Price comparison
