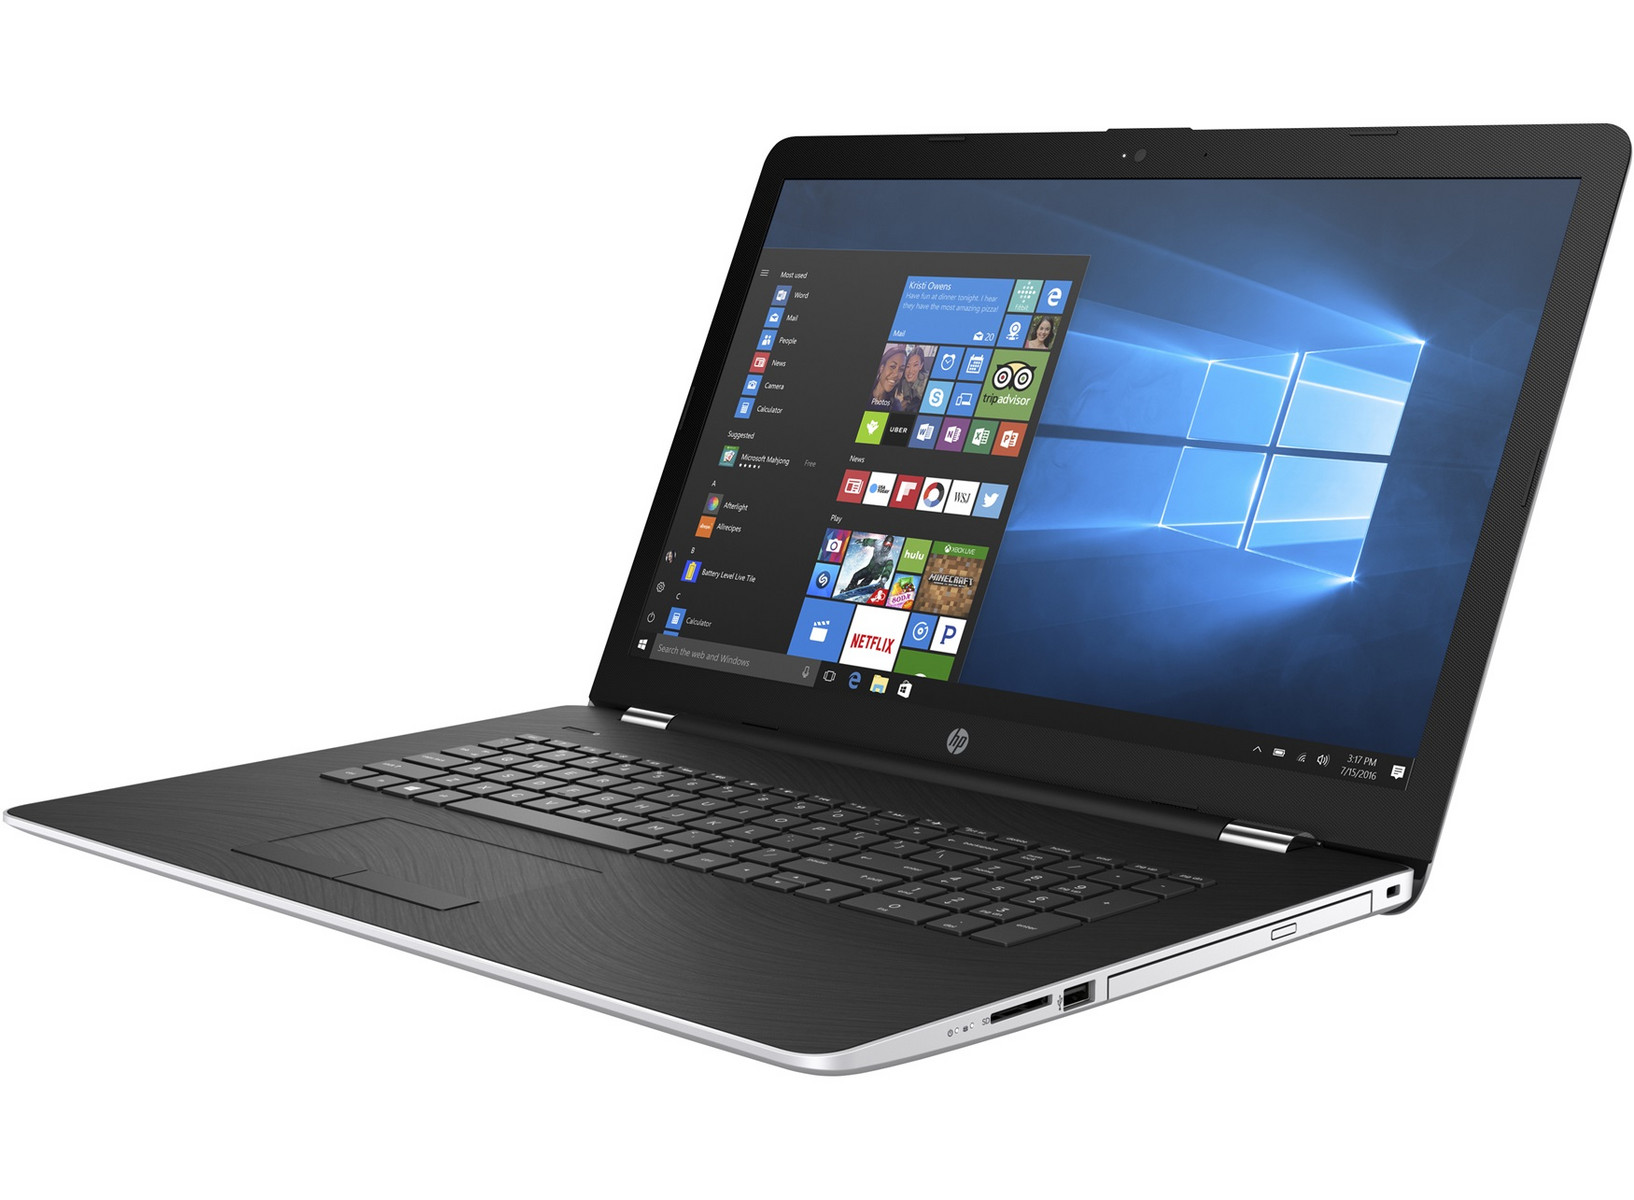
HP Pavilion 17z (A12-9720P, Radeon R7 M340) Laptop Review
Announced in April of 2016, it took the Stoney Ridge and Bristol Ridge platforms almost half a year before the first notebooks started shipping with the new 7th generation AMD A-series APU. Our unit today is the first in our database with the quad-core A12-9720P as provided by CUKUSA.com and we're definitely eager to see how it performs after the excruciatingly long wait.
It's not too surprising to see the APU make its debut through HP. The manufacturer has been a staunch supporter of providing users with both AMD and Intel options throughout its Pavilion, ProBook, and EliteBook families. The AMD variants are typically hundreds of Dollars cheaper and the Pavilion 17z today is no exception. This pits the notebook directly against budget 17-inch notebooks including the Acer Aspire E5 series, the Lenovo G series and IdeaPad 110 series, and the Asus F series.
Beyond the unique processor and Radeon R7 M340 GPU, the chassis is largely the familiar Pavilion we've come to know. More information on the quality and design of the Pavilion 17 can be found on our existing reviews of the model as listed below.
Case
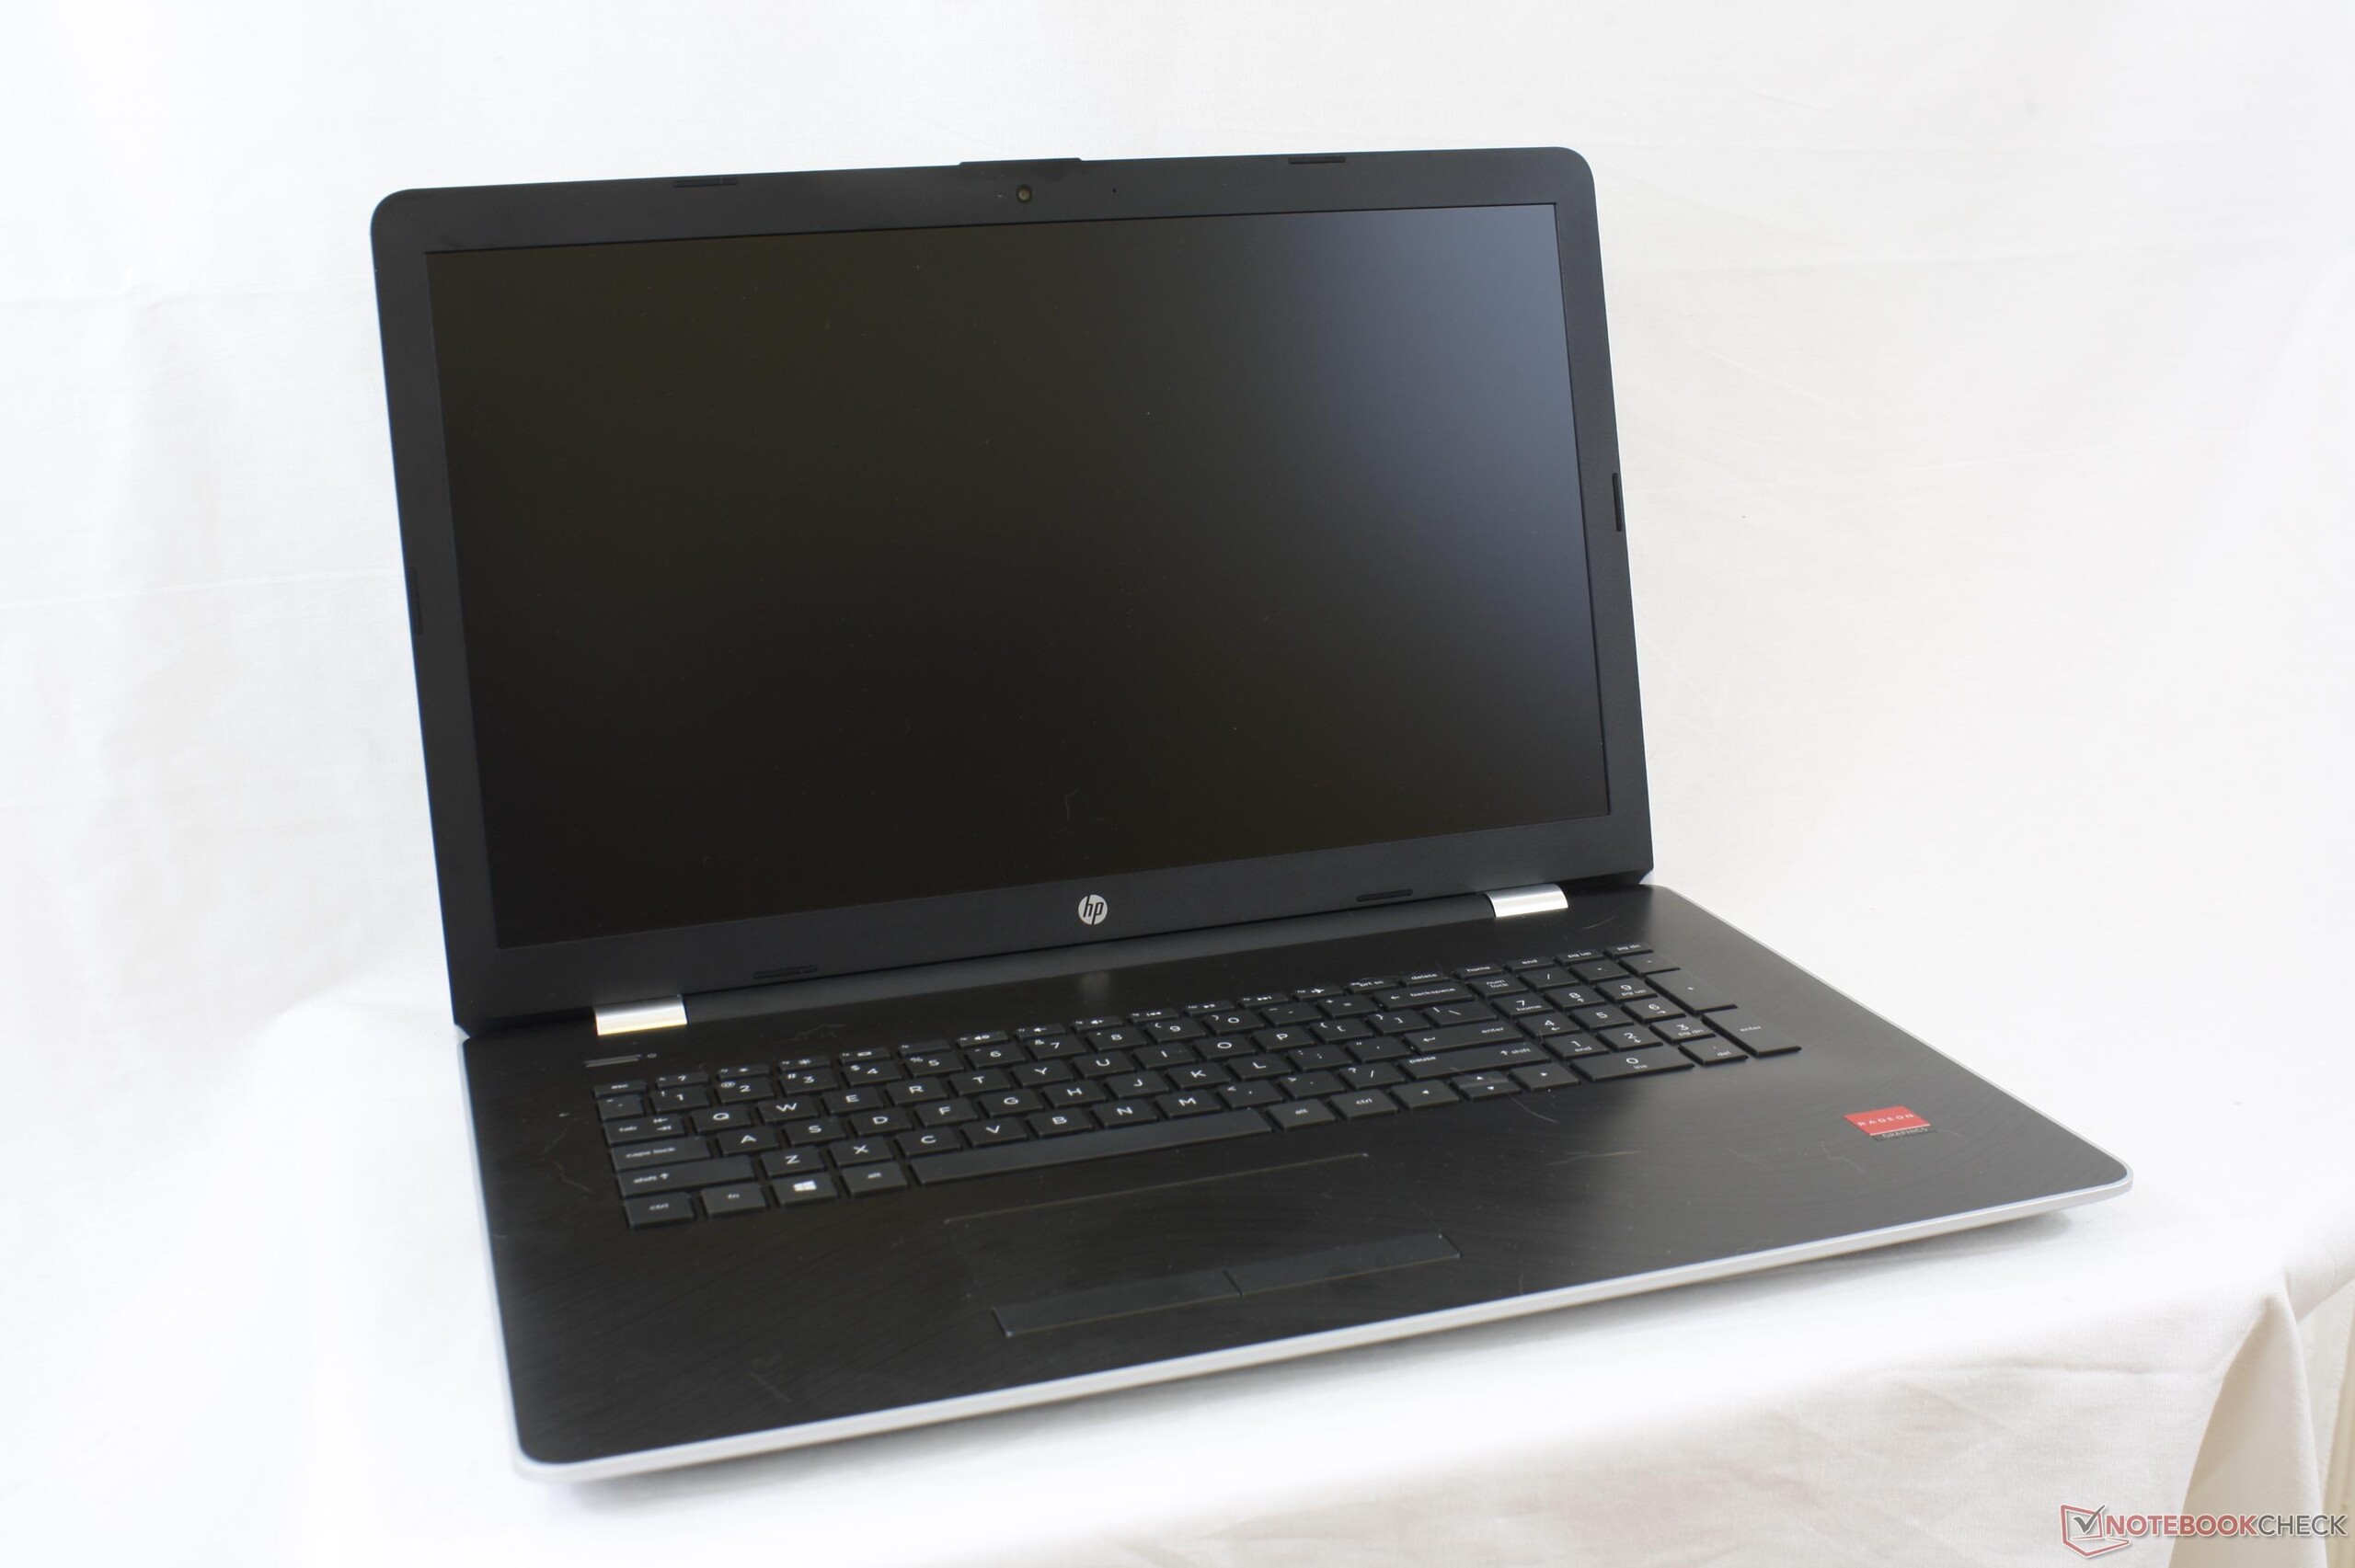
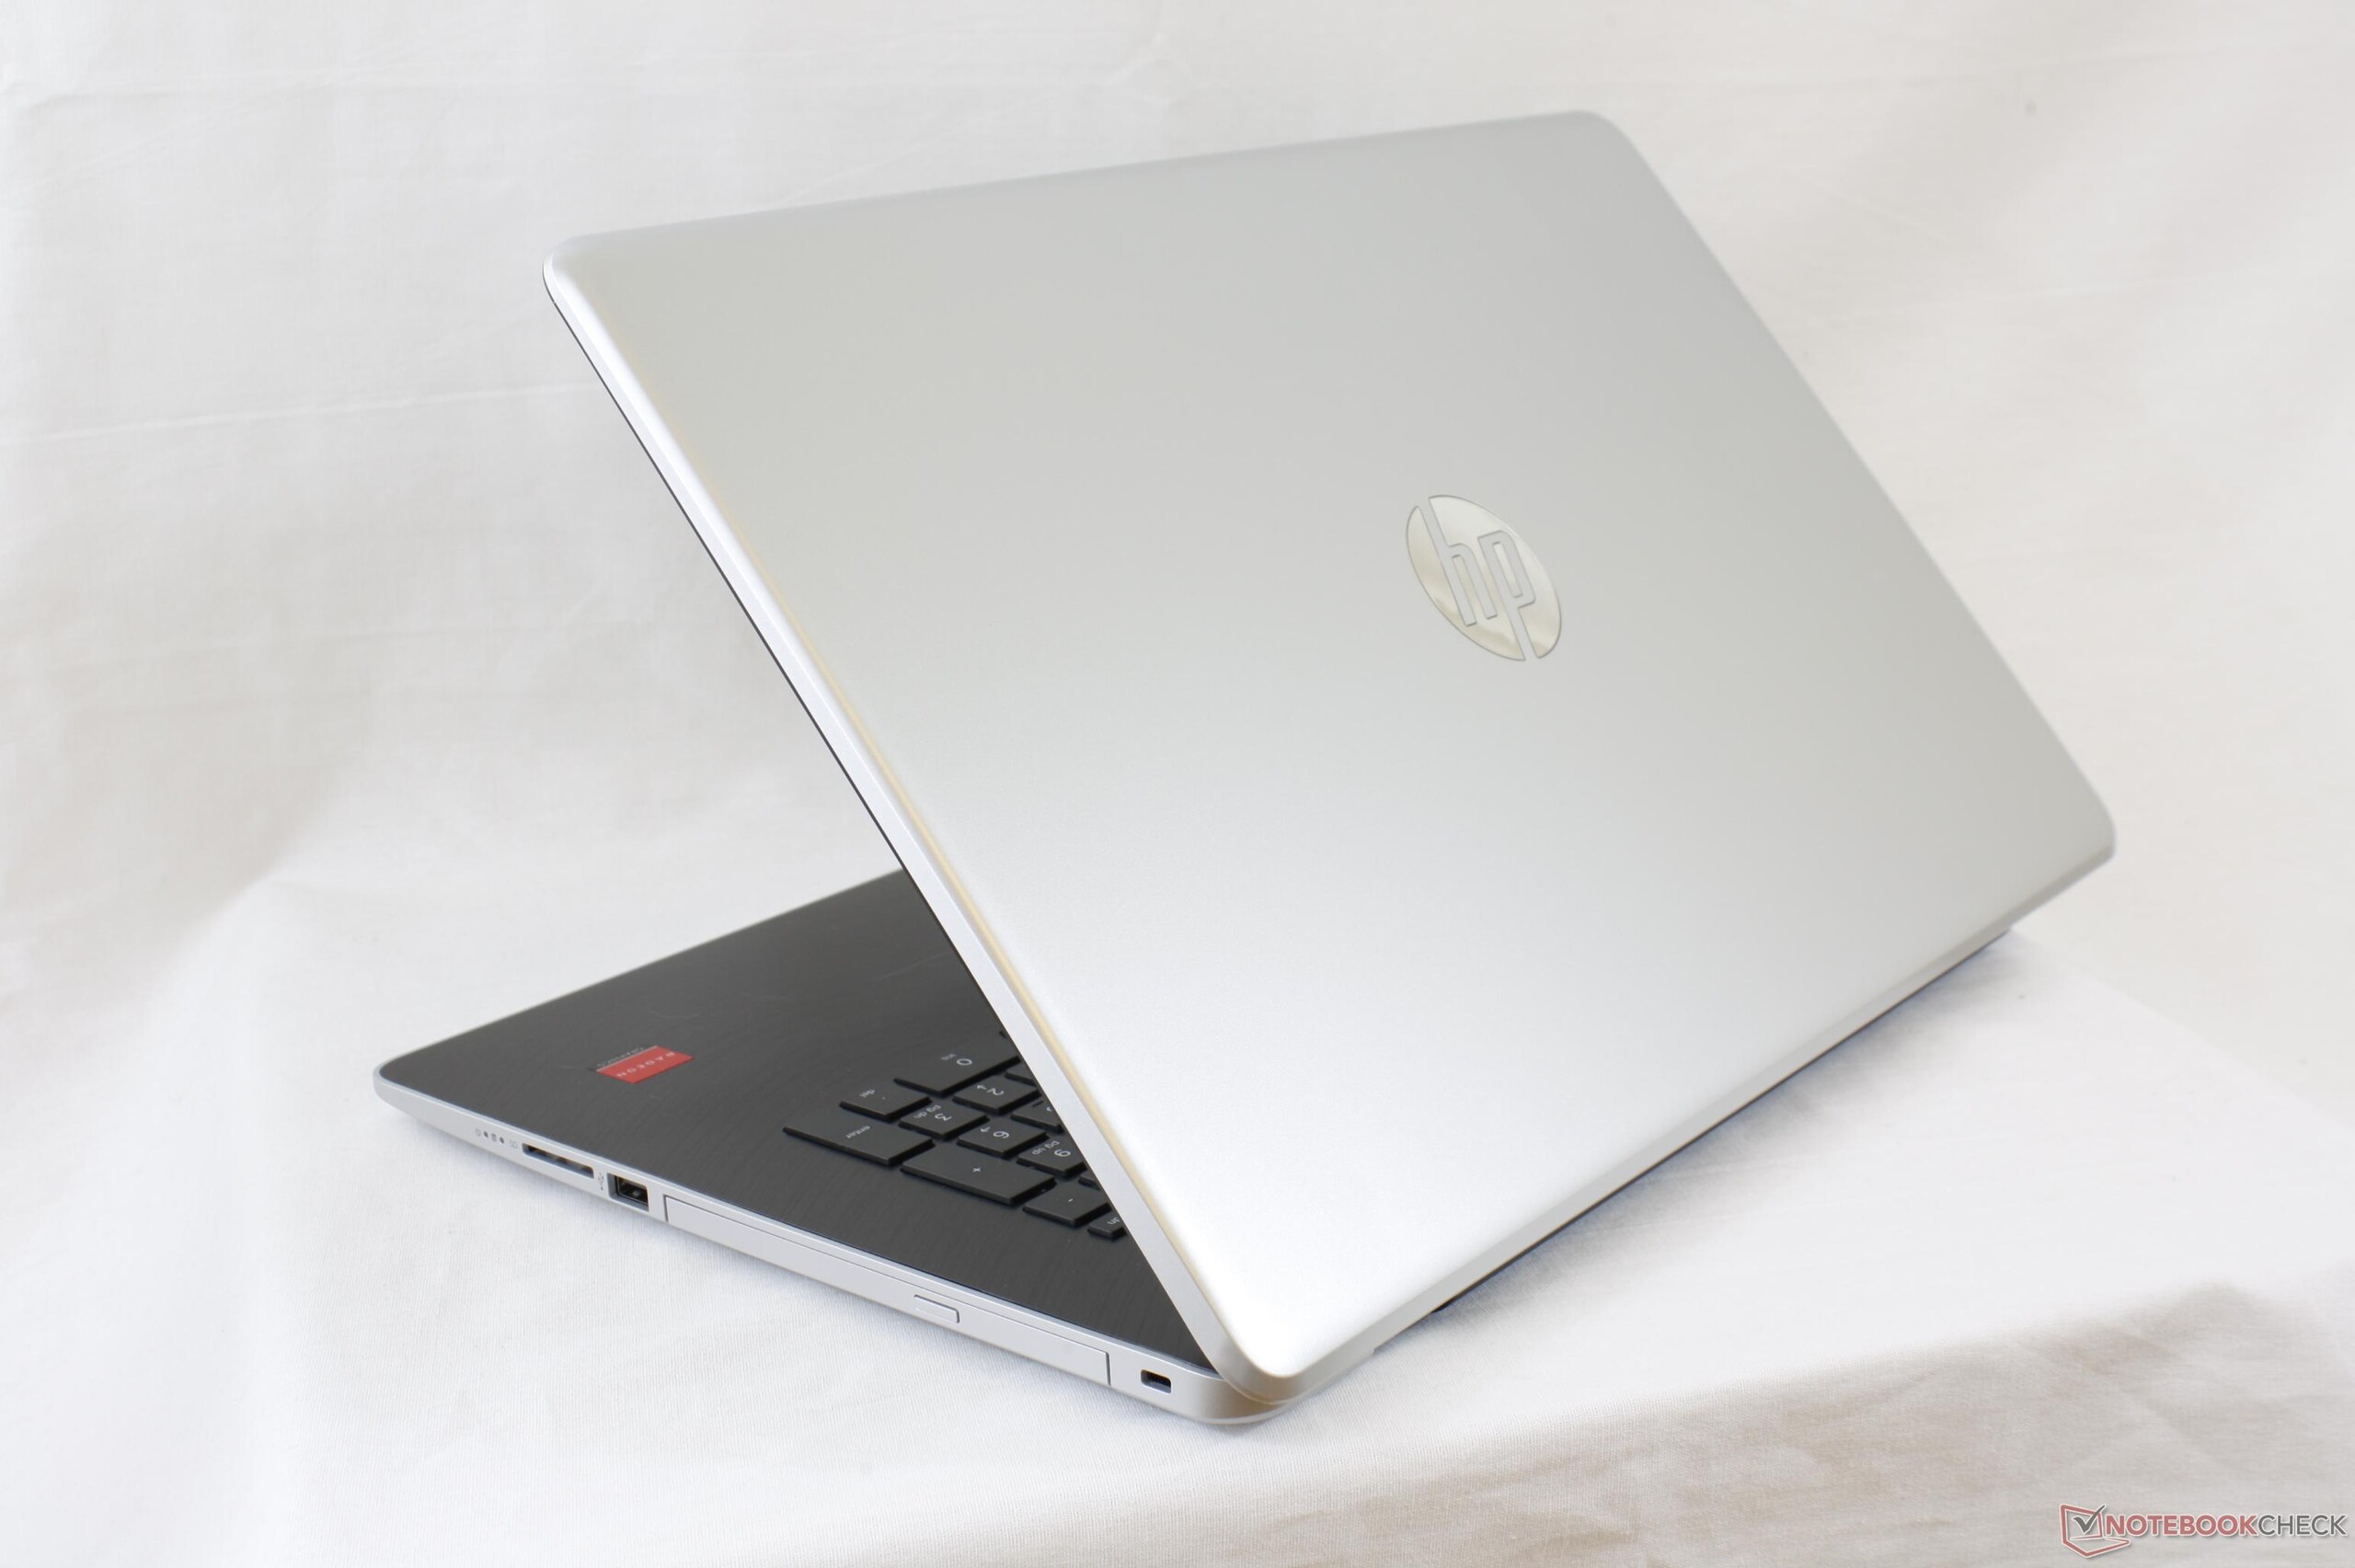
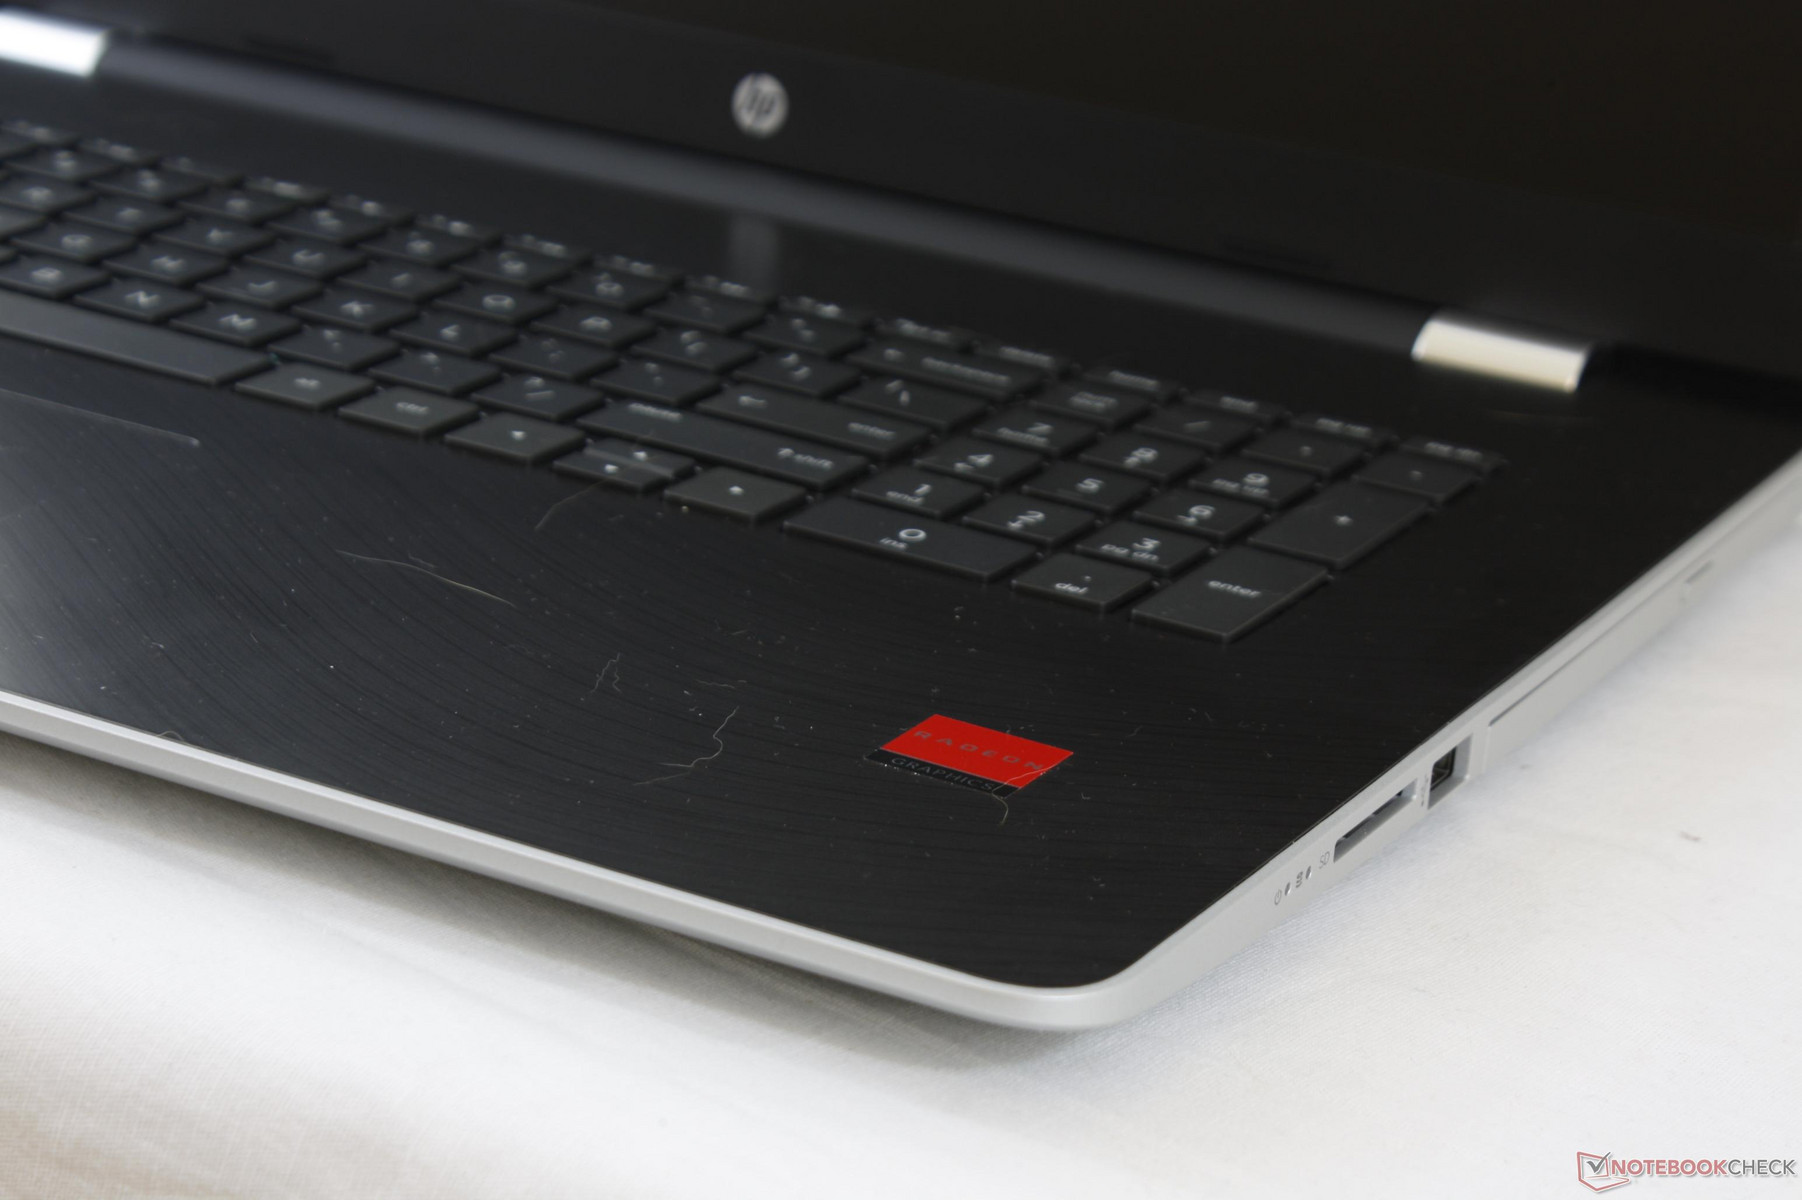
The basic Pavilion chassis changes only slightly from year to year. The base portion is essentially identical to the Pavilion 17-x110ng with its texture-less plastic surfaces and moderate creaking when attempting to twist its sides. Its design is uninspiring and even feels quite cheap and hollow to hold. To HP's credit, the palm rests and center of the keyboard are actually quite rigid and resistant to warping when applying pressure.
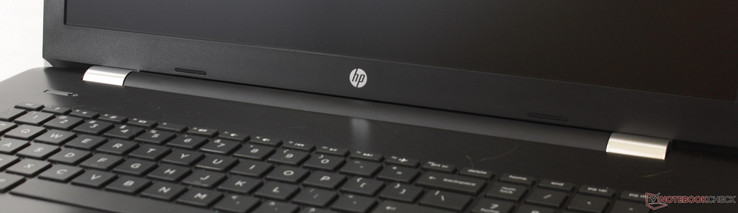
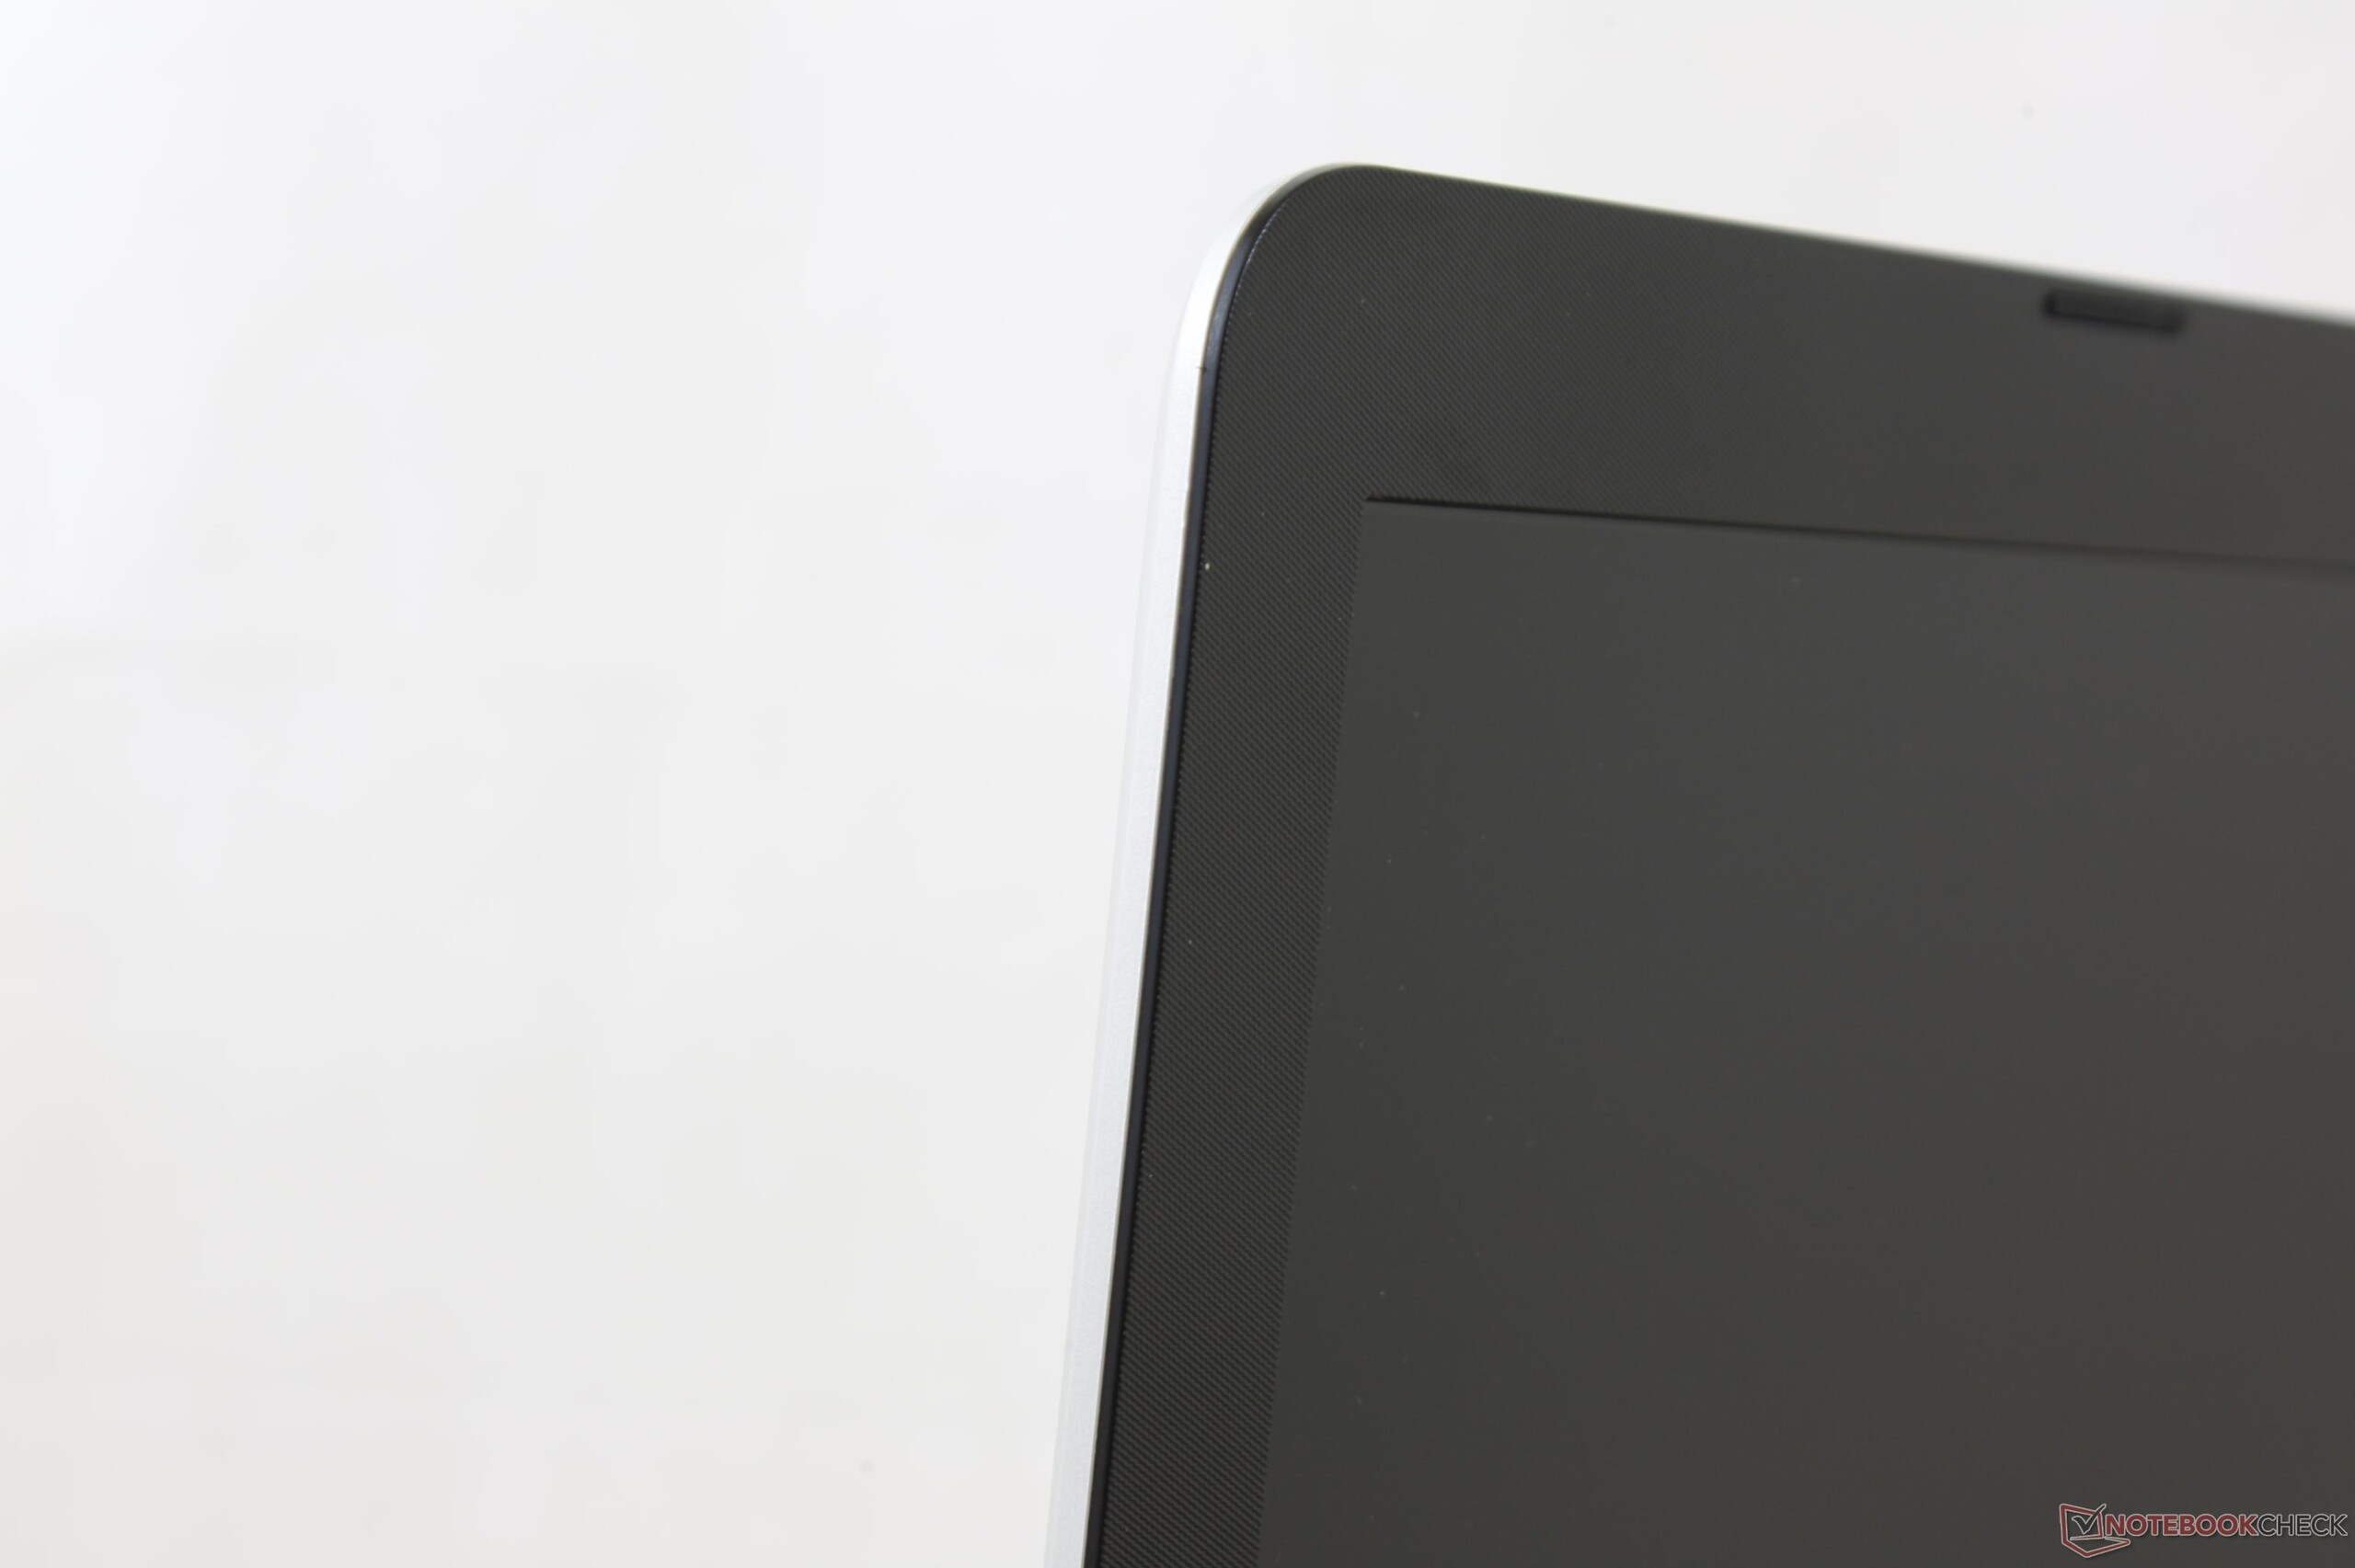
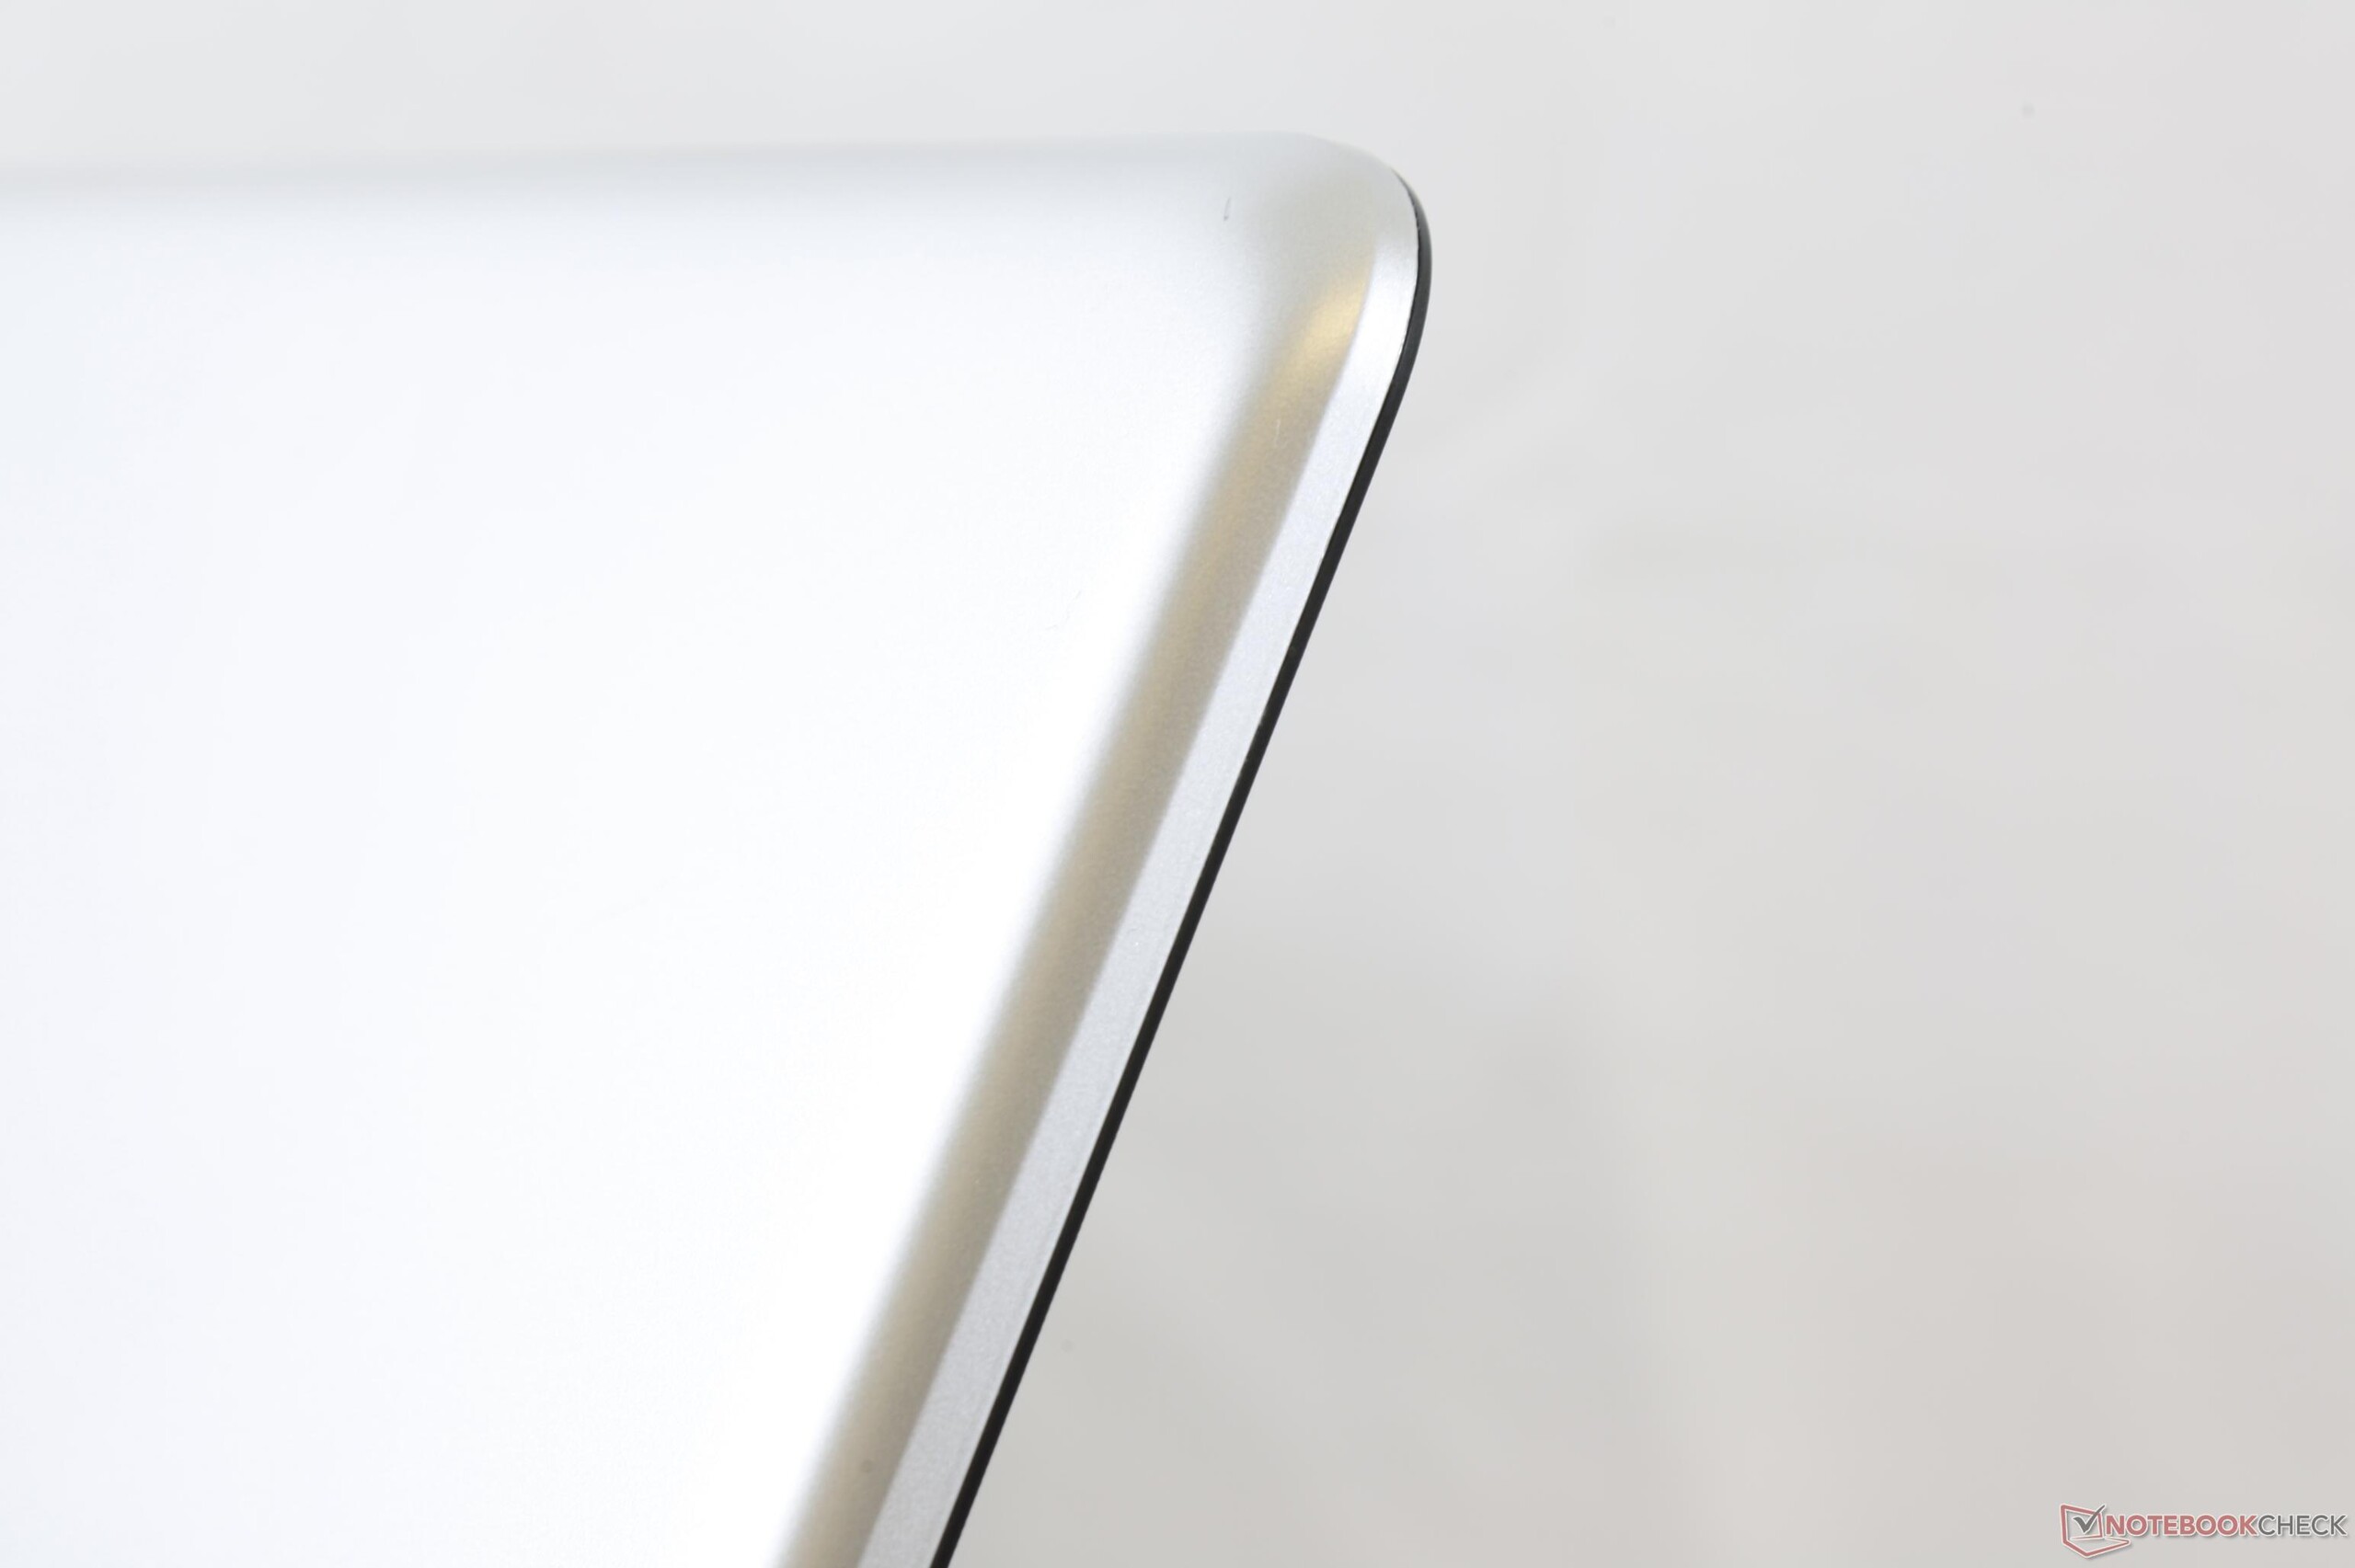
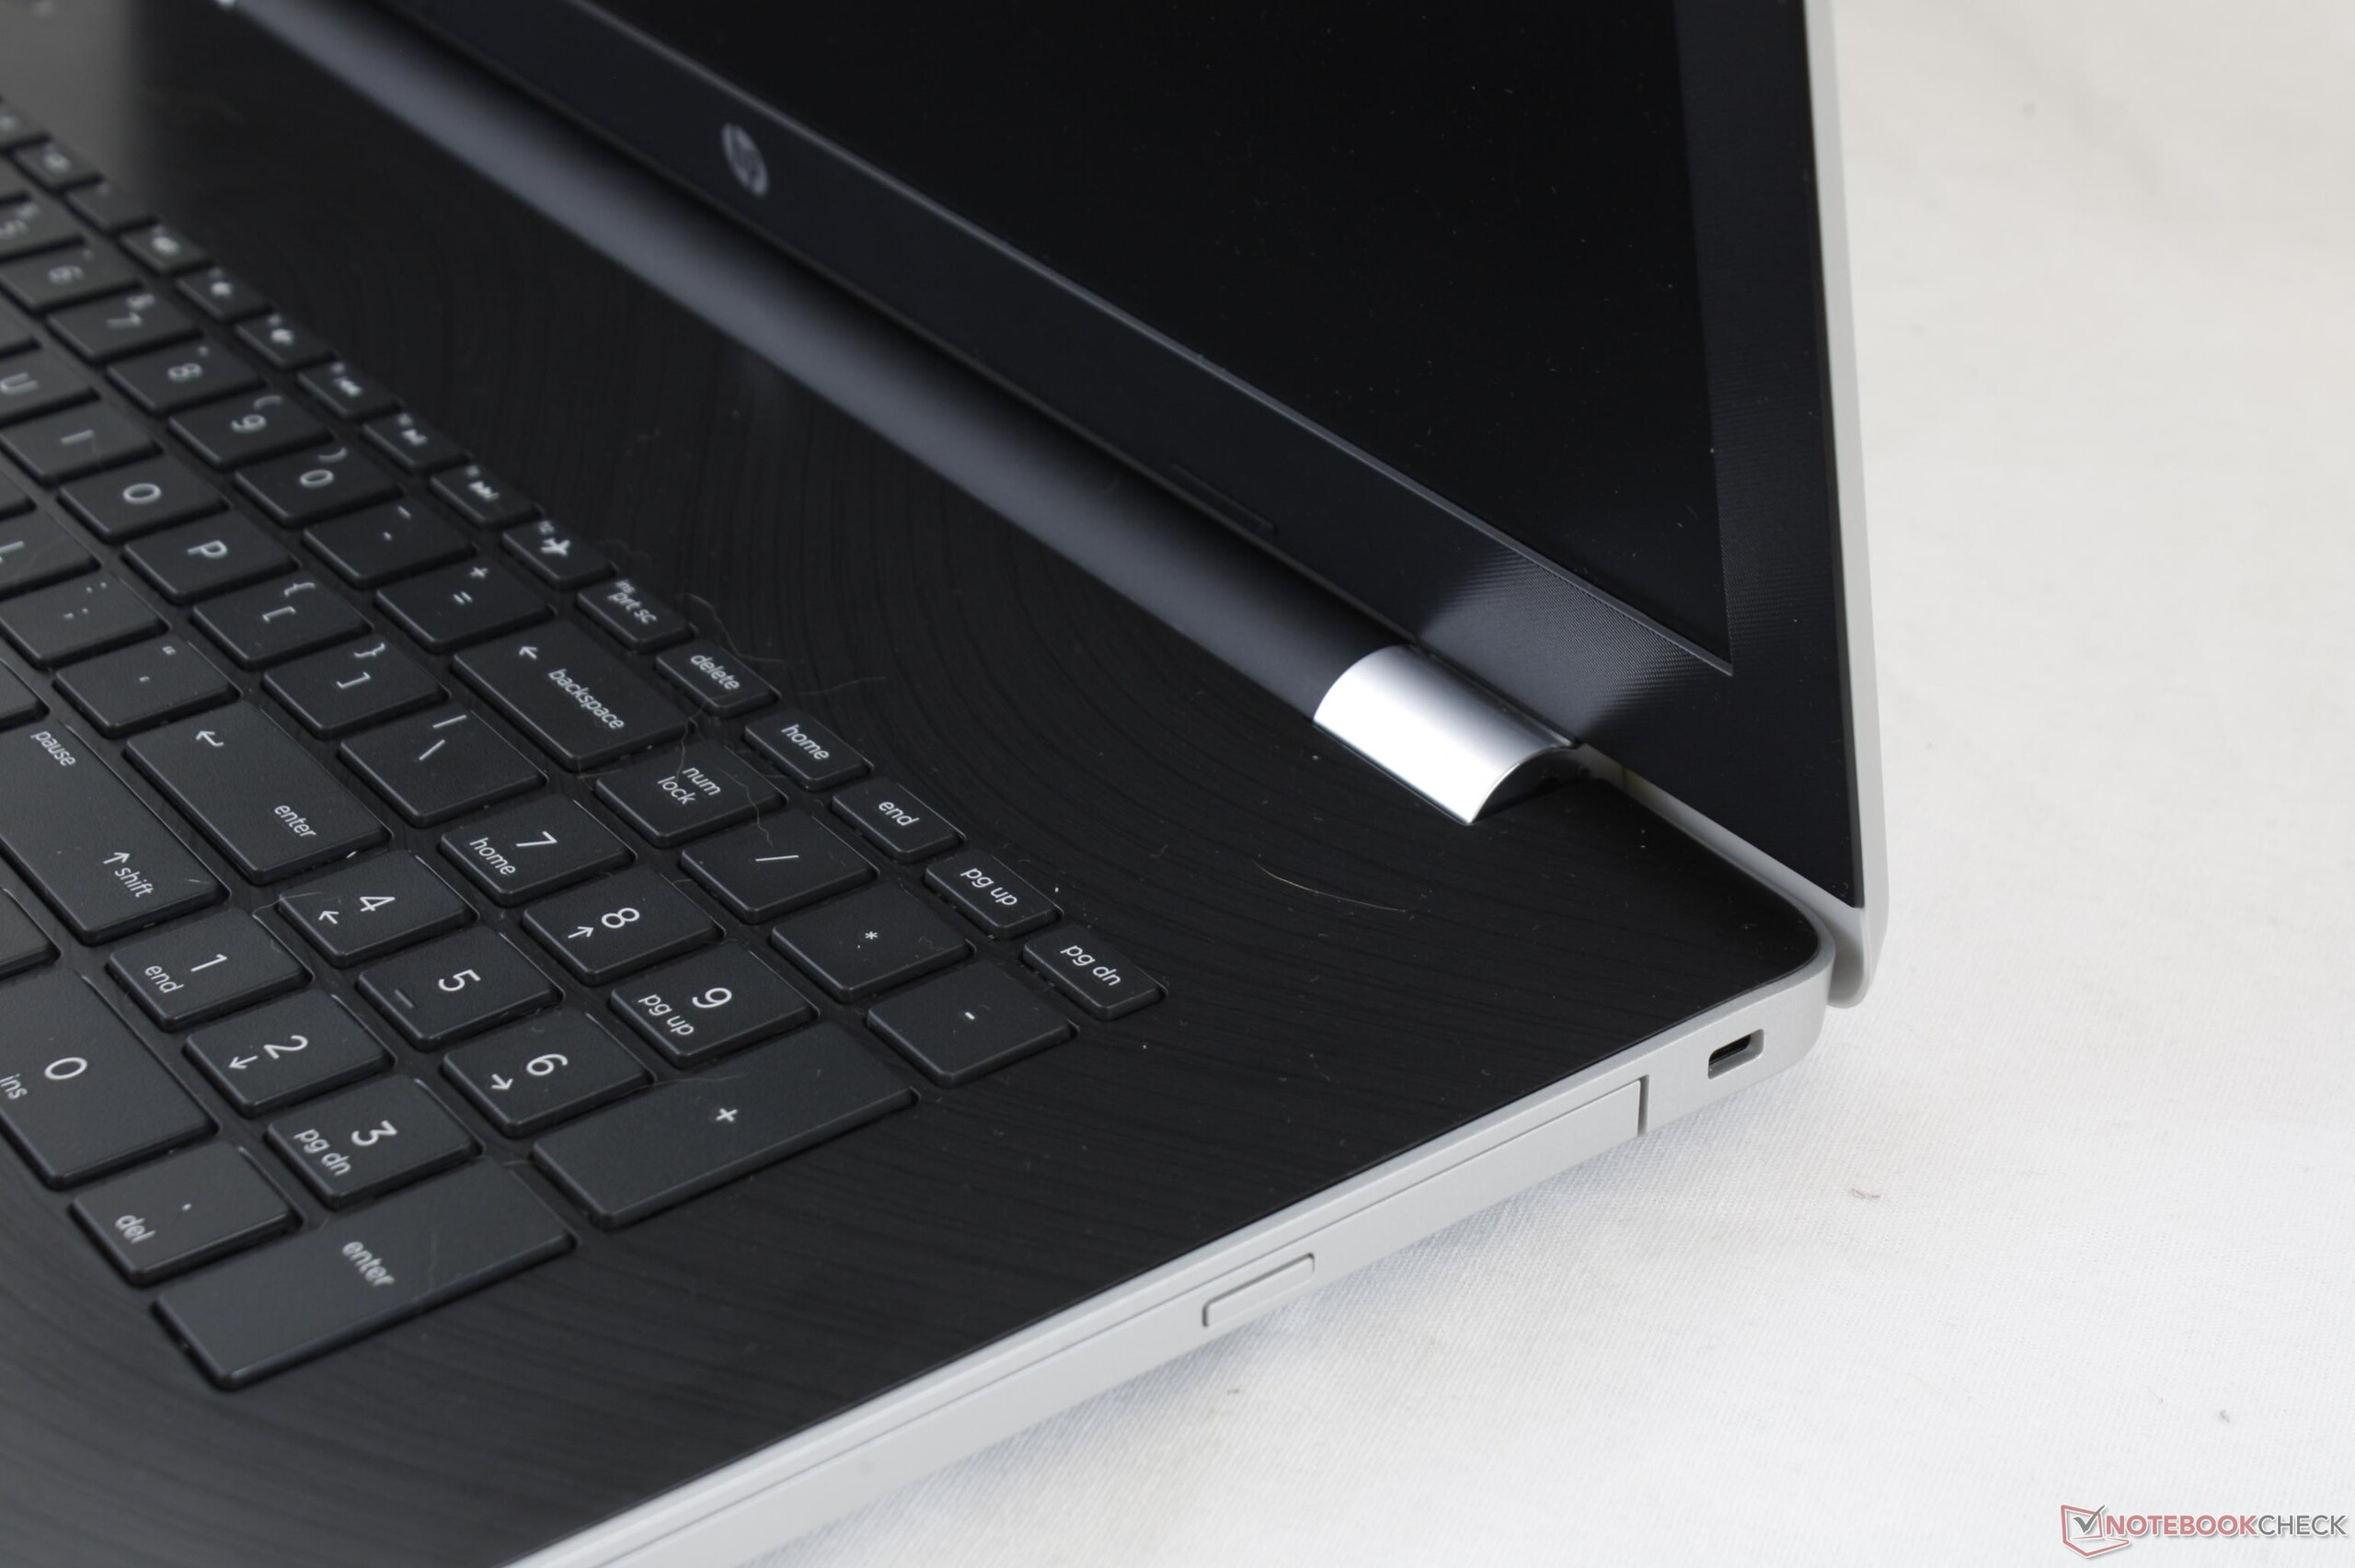
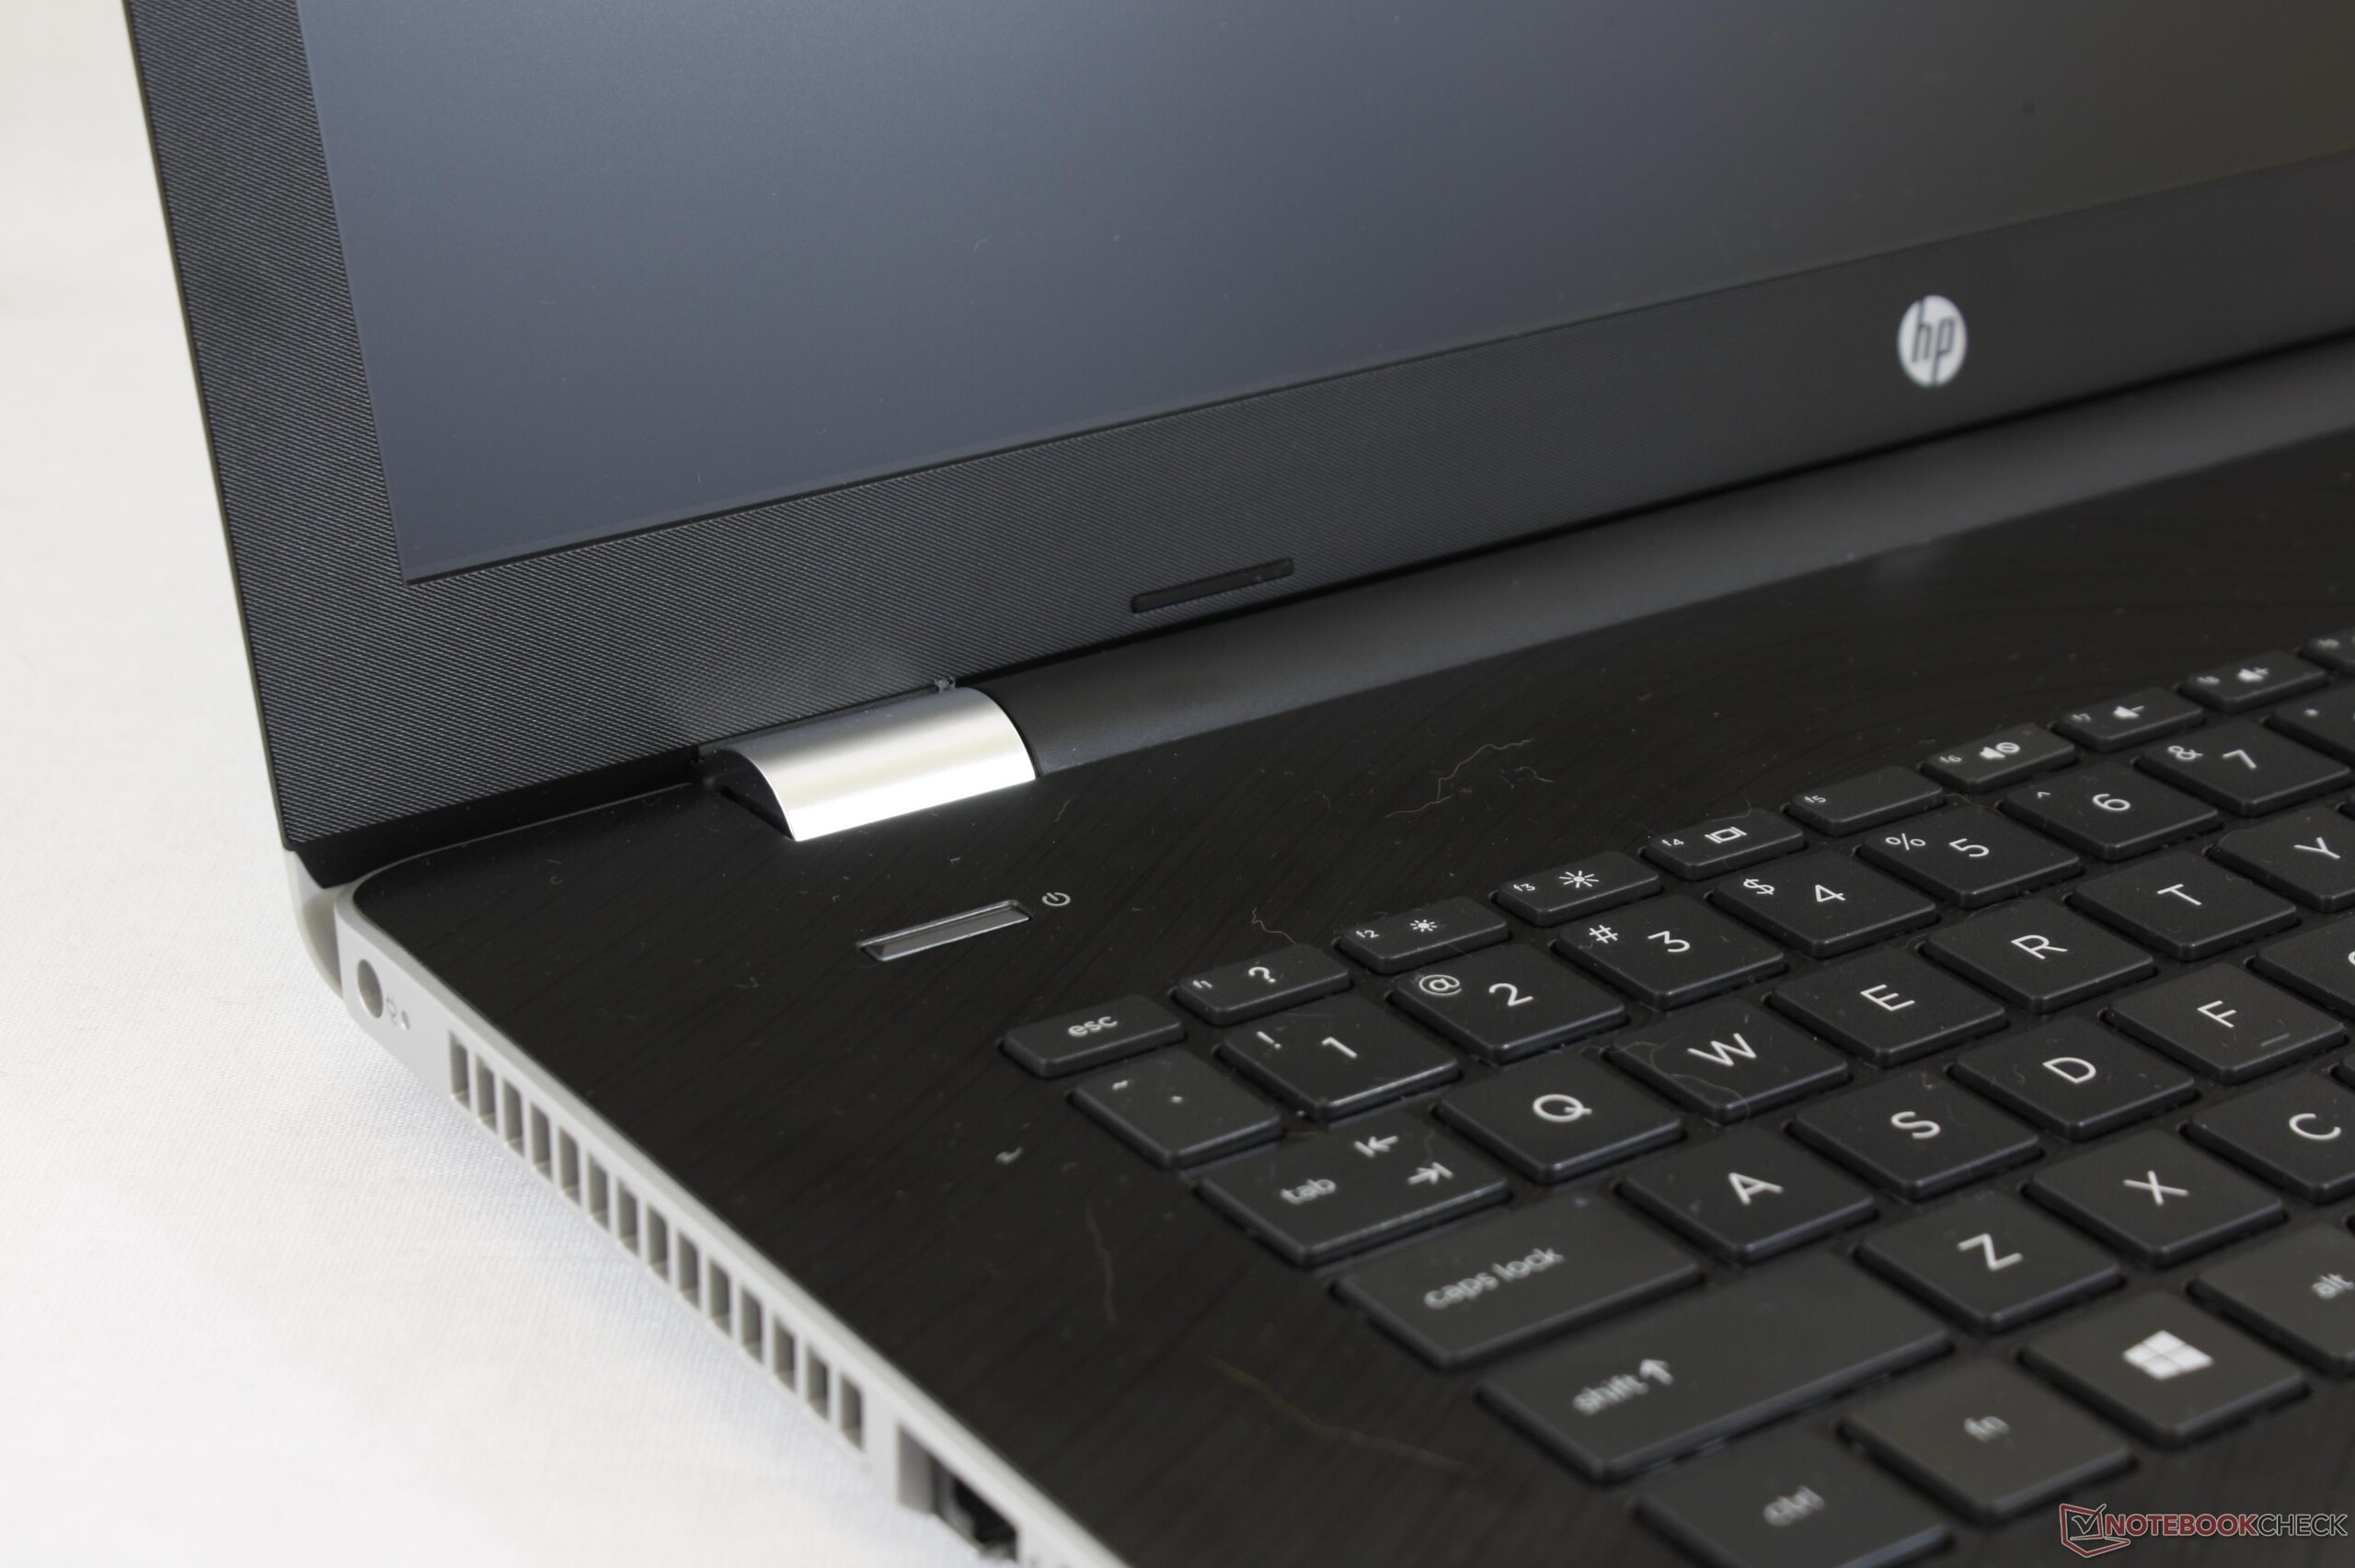
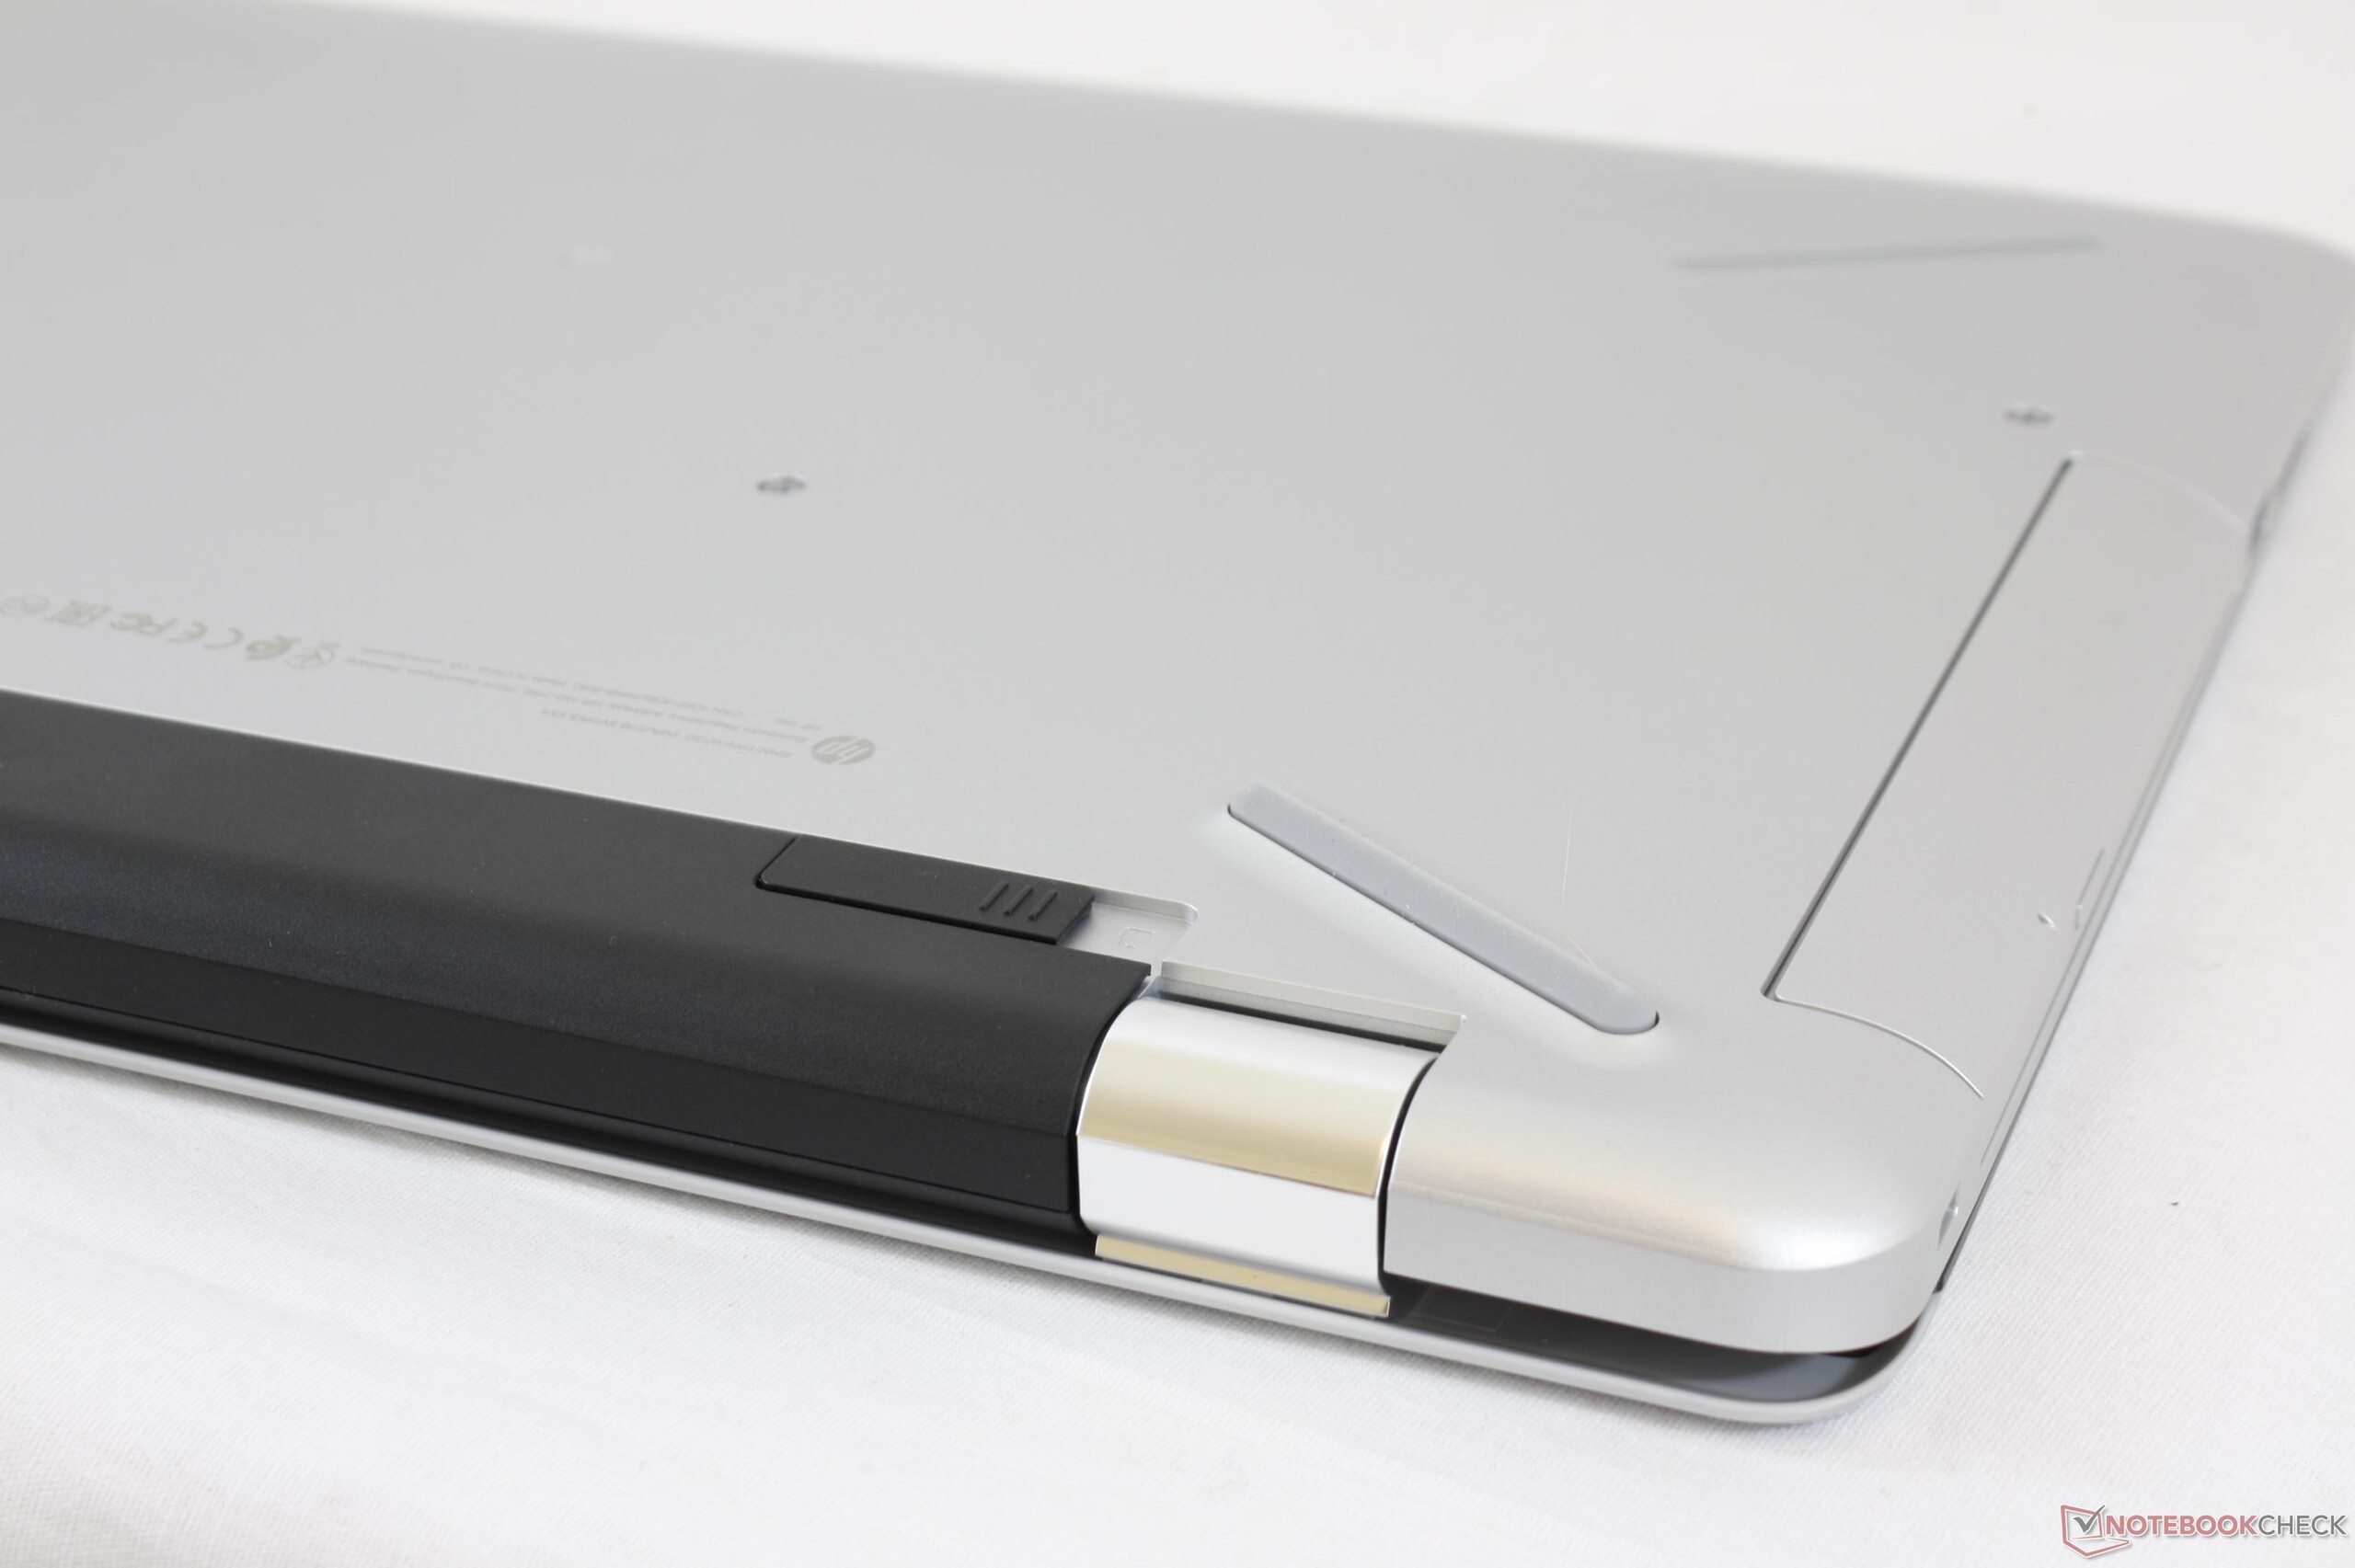
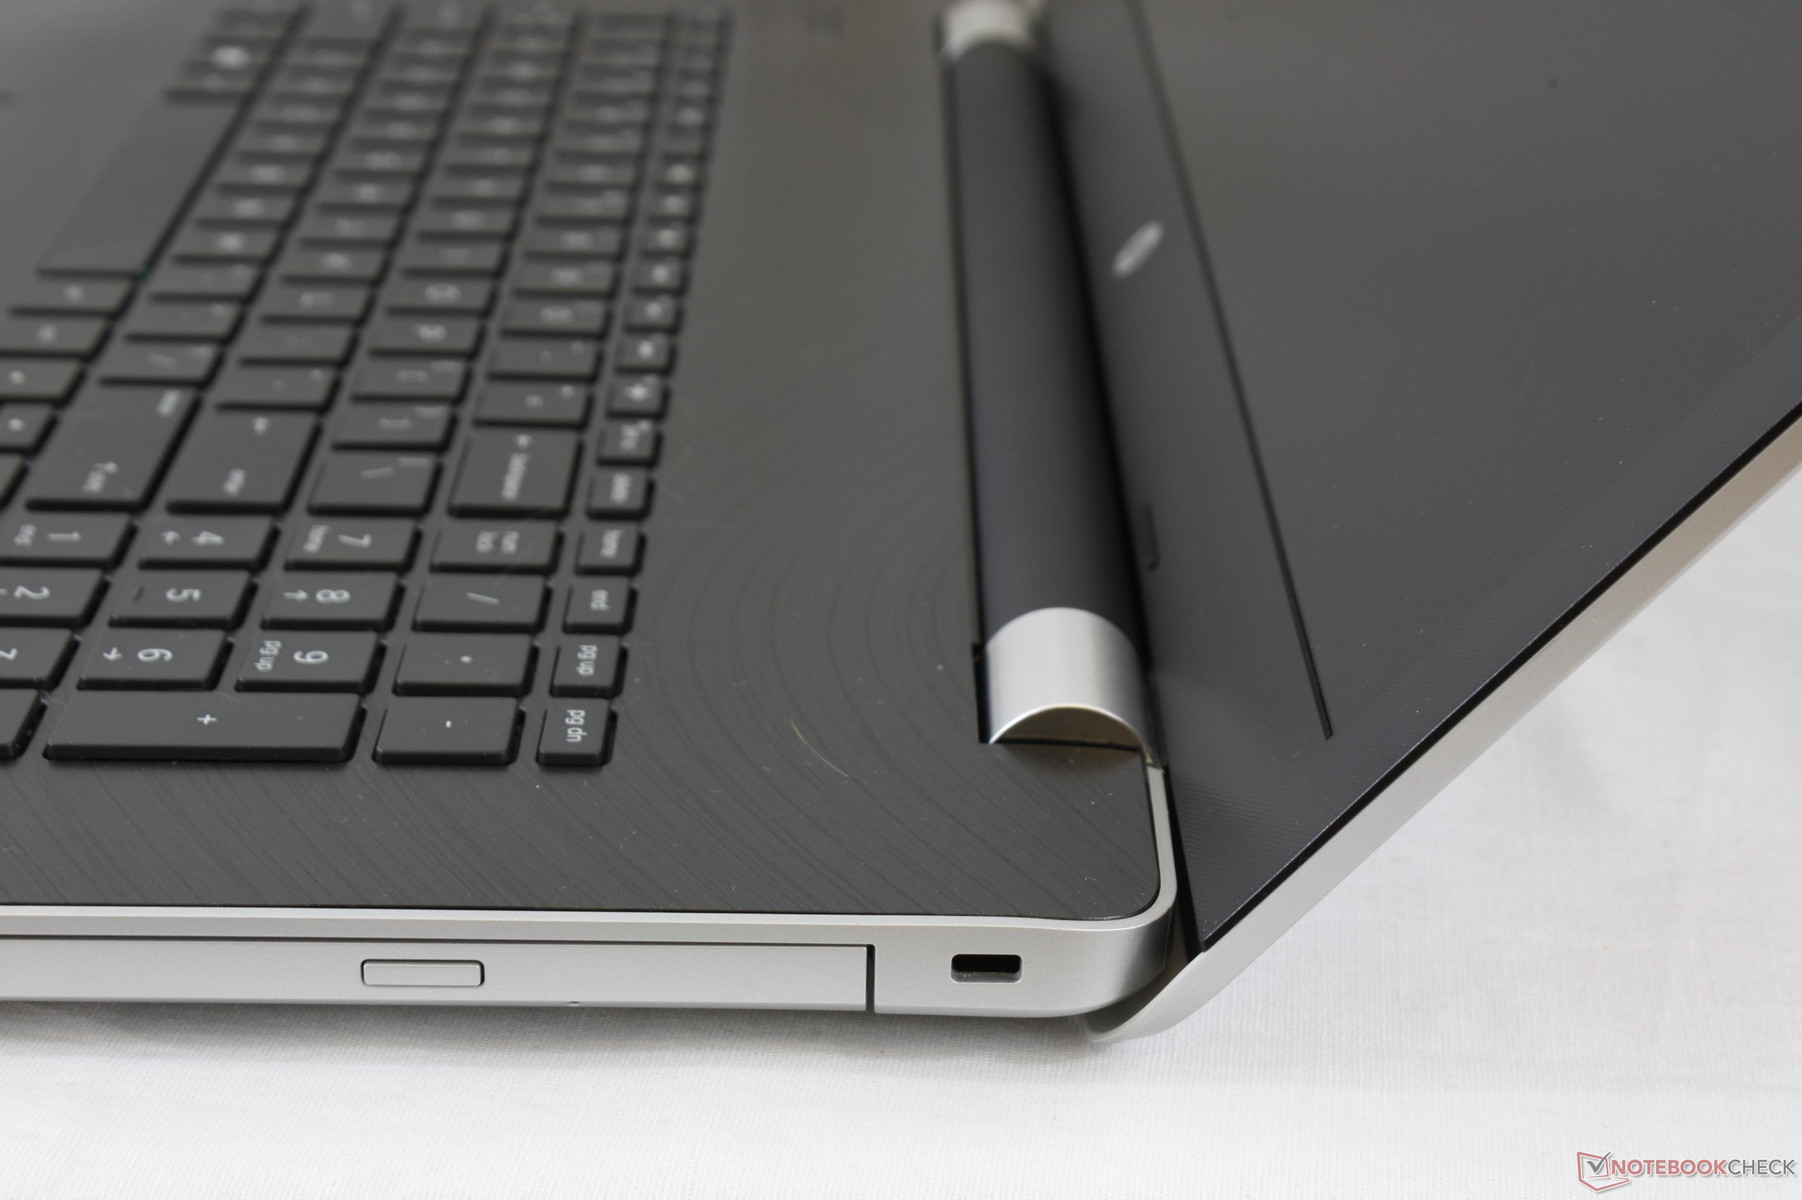
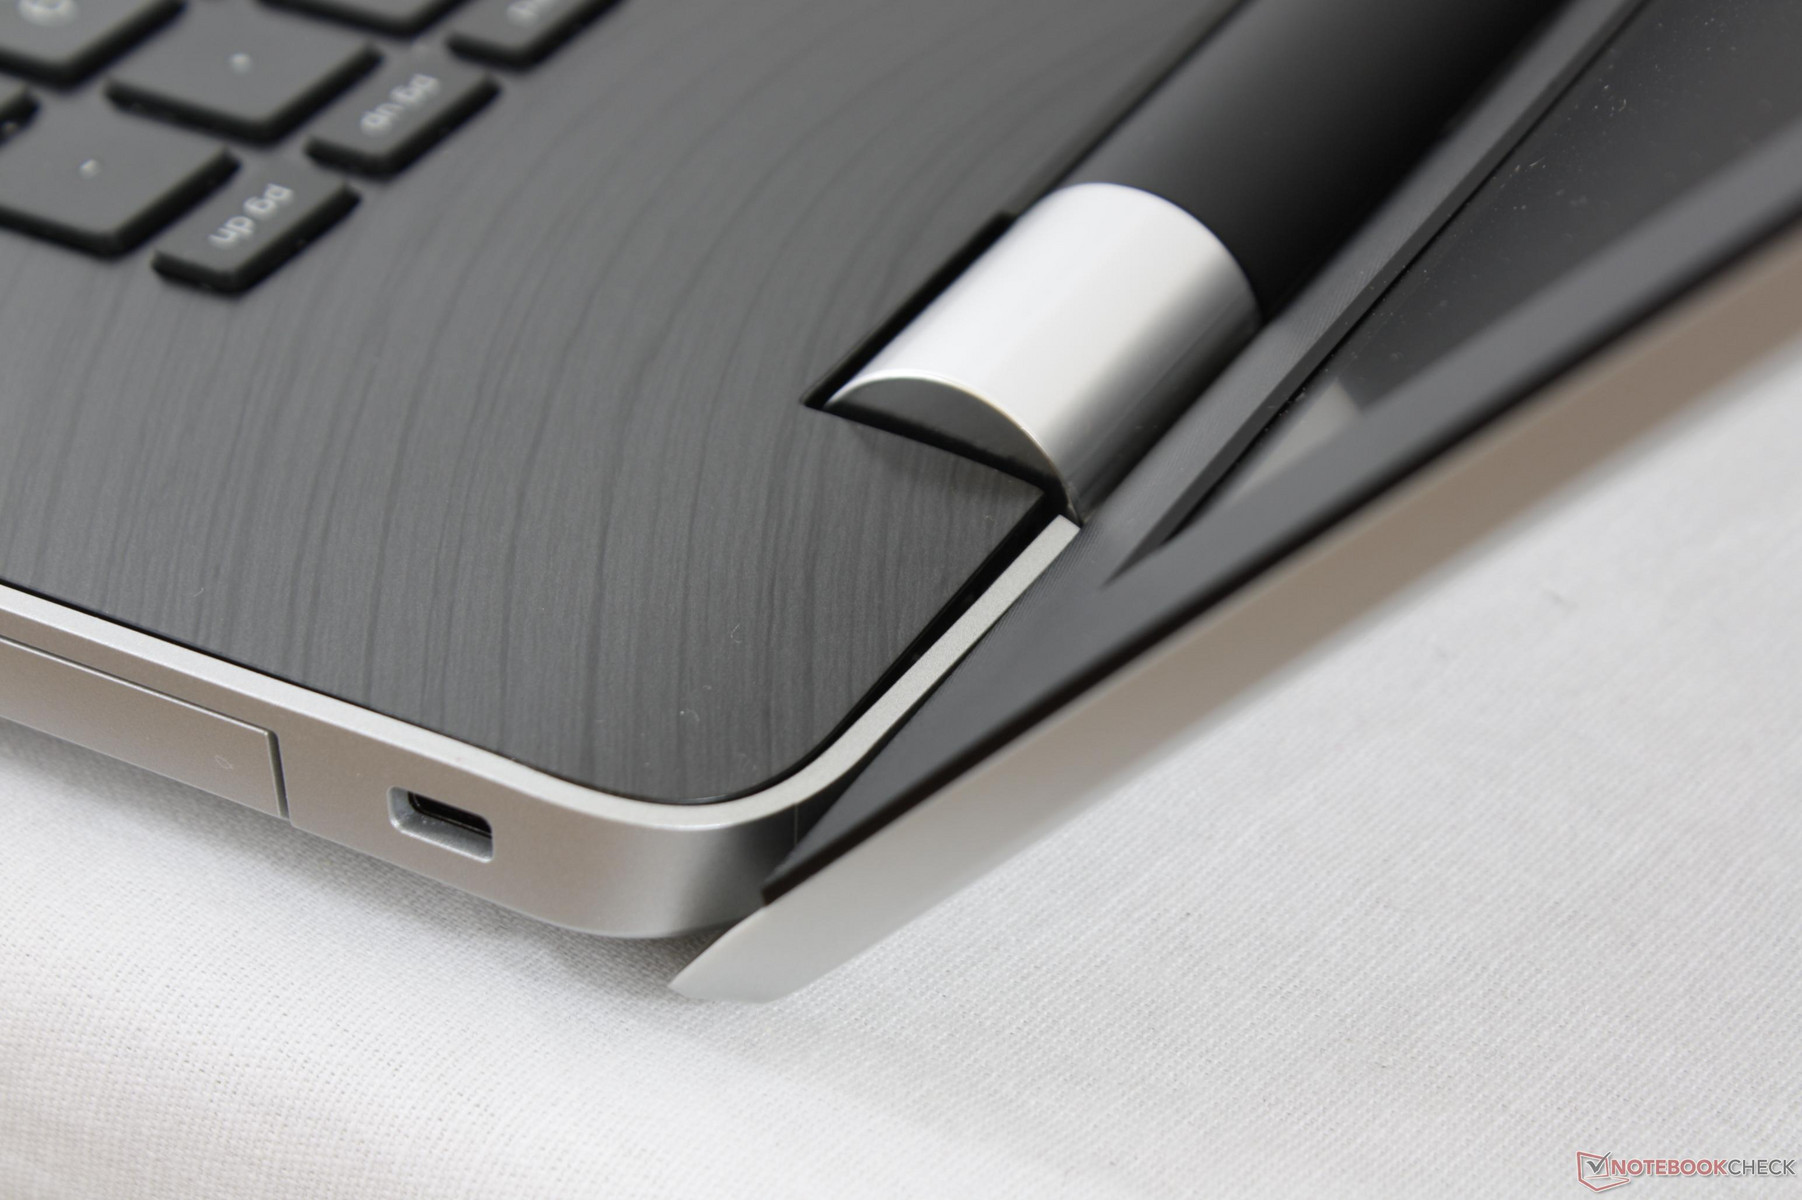
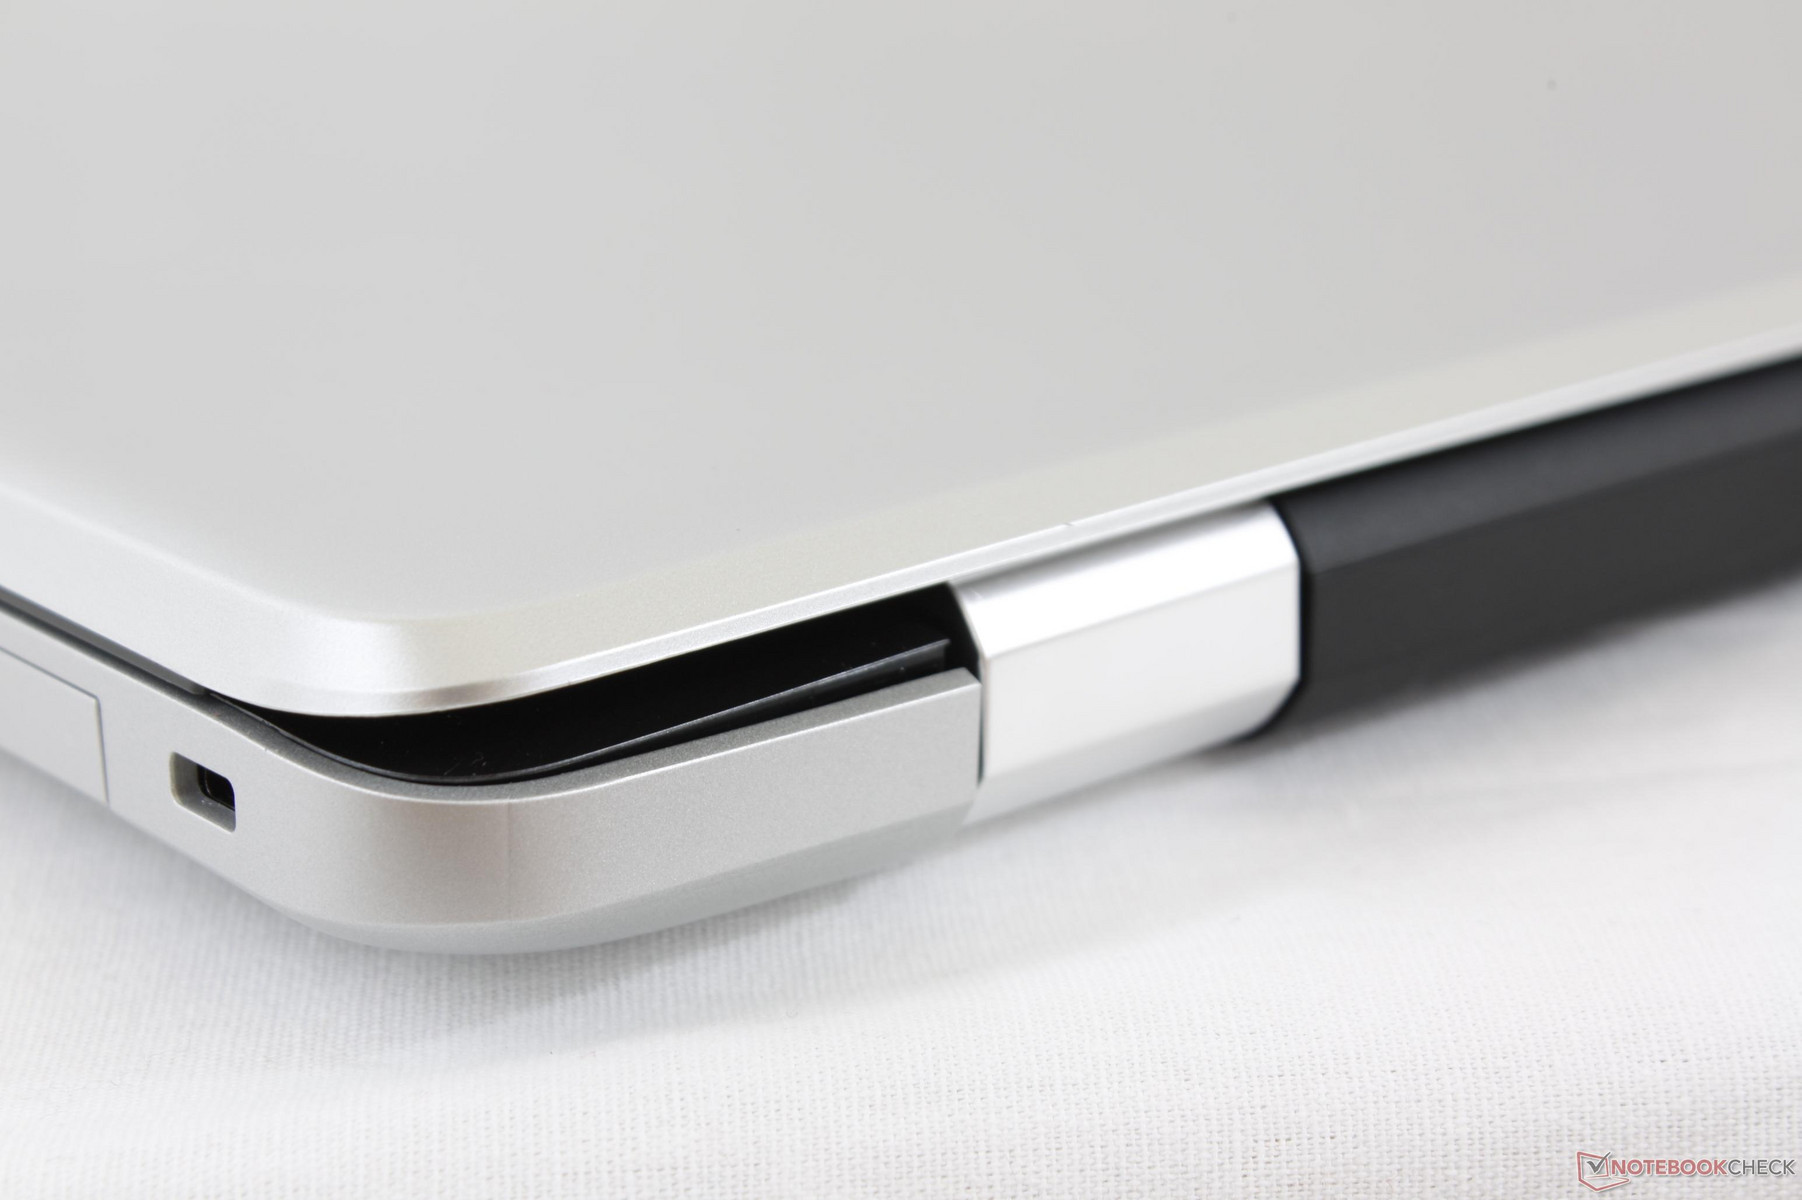
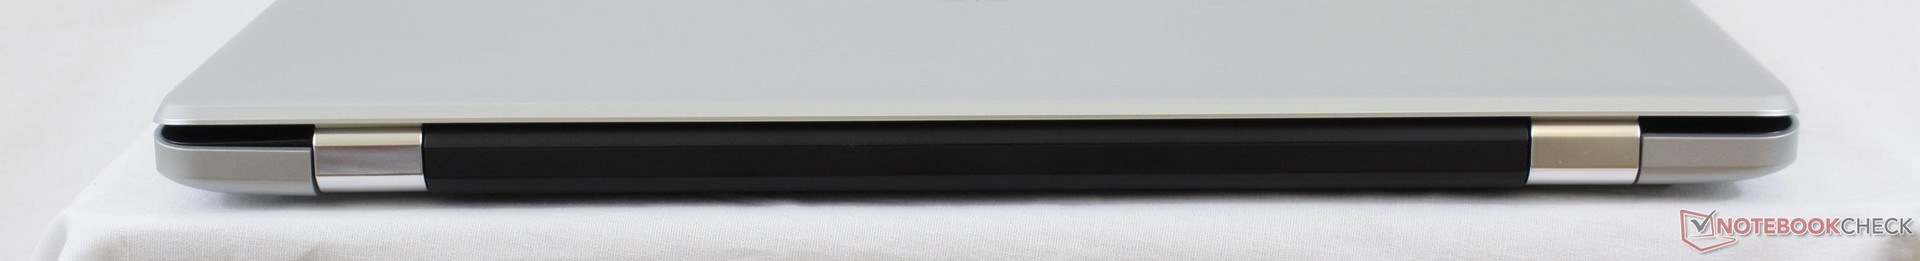
HP has always been making small adjustments to the hinges from model to model. The dual chrome hinges on this particular 17z are now slightly larger and rounder with acceptable rigidity to prevent shaking when typing. Some teetering will still occur when adjusting the display angle, but we don't find this to be of any concern. The lid itself, however, is moderately flexible both from its two front corners and down its outer center. Its thin plastic surface and lack of Gorilla Glass protection only add to the budget feel of the overall unit.
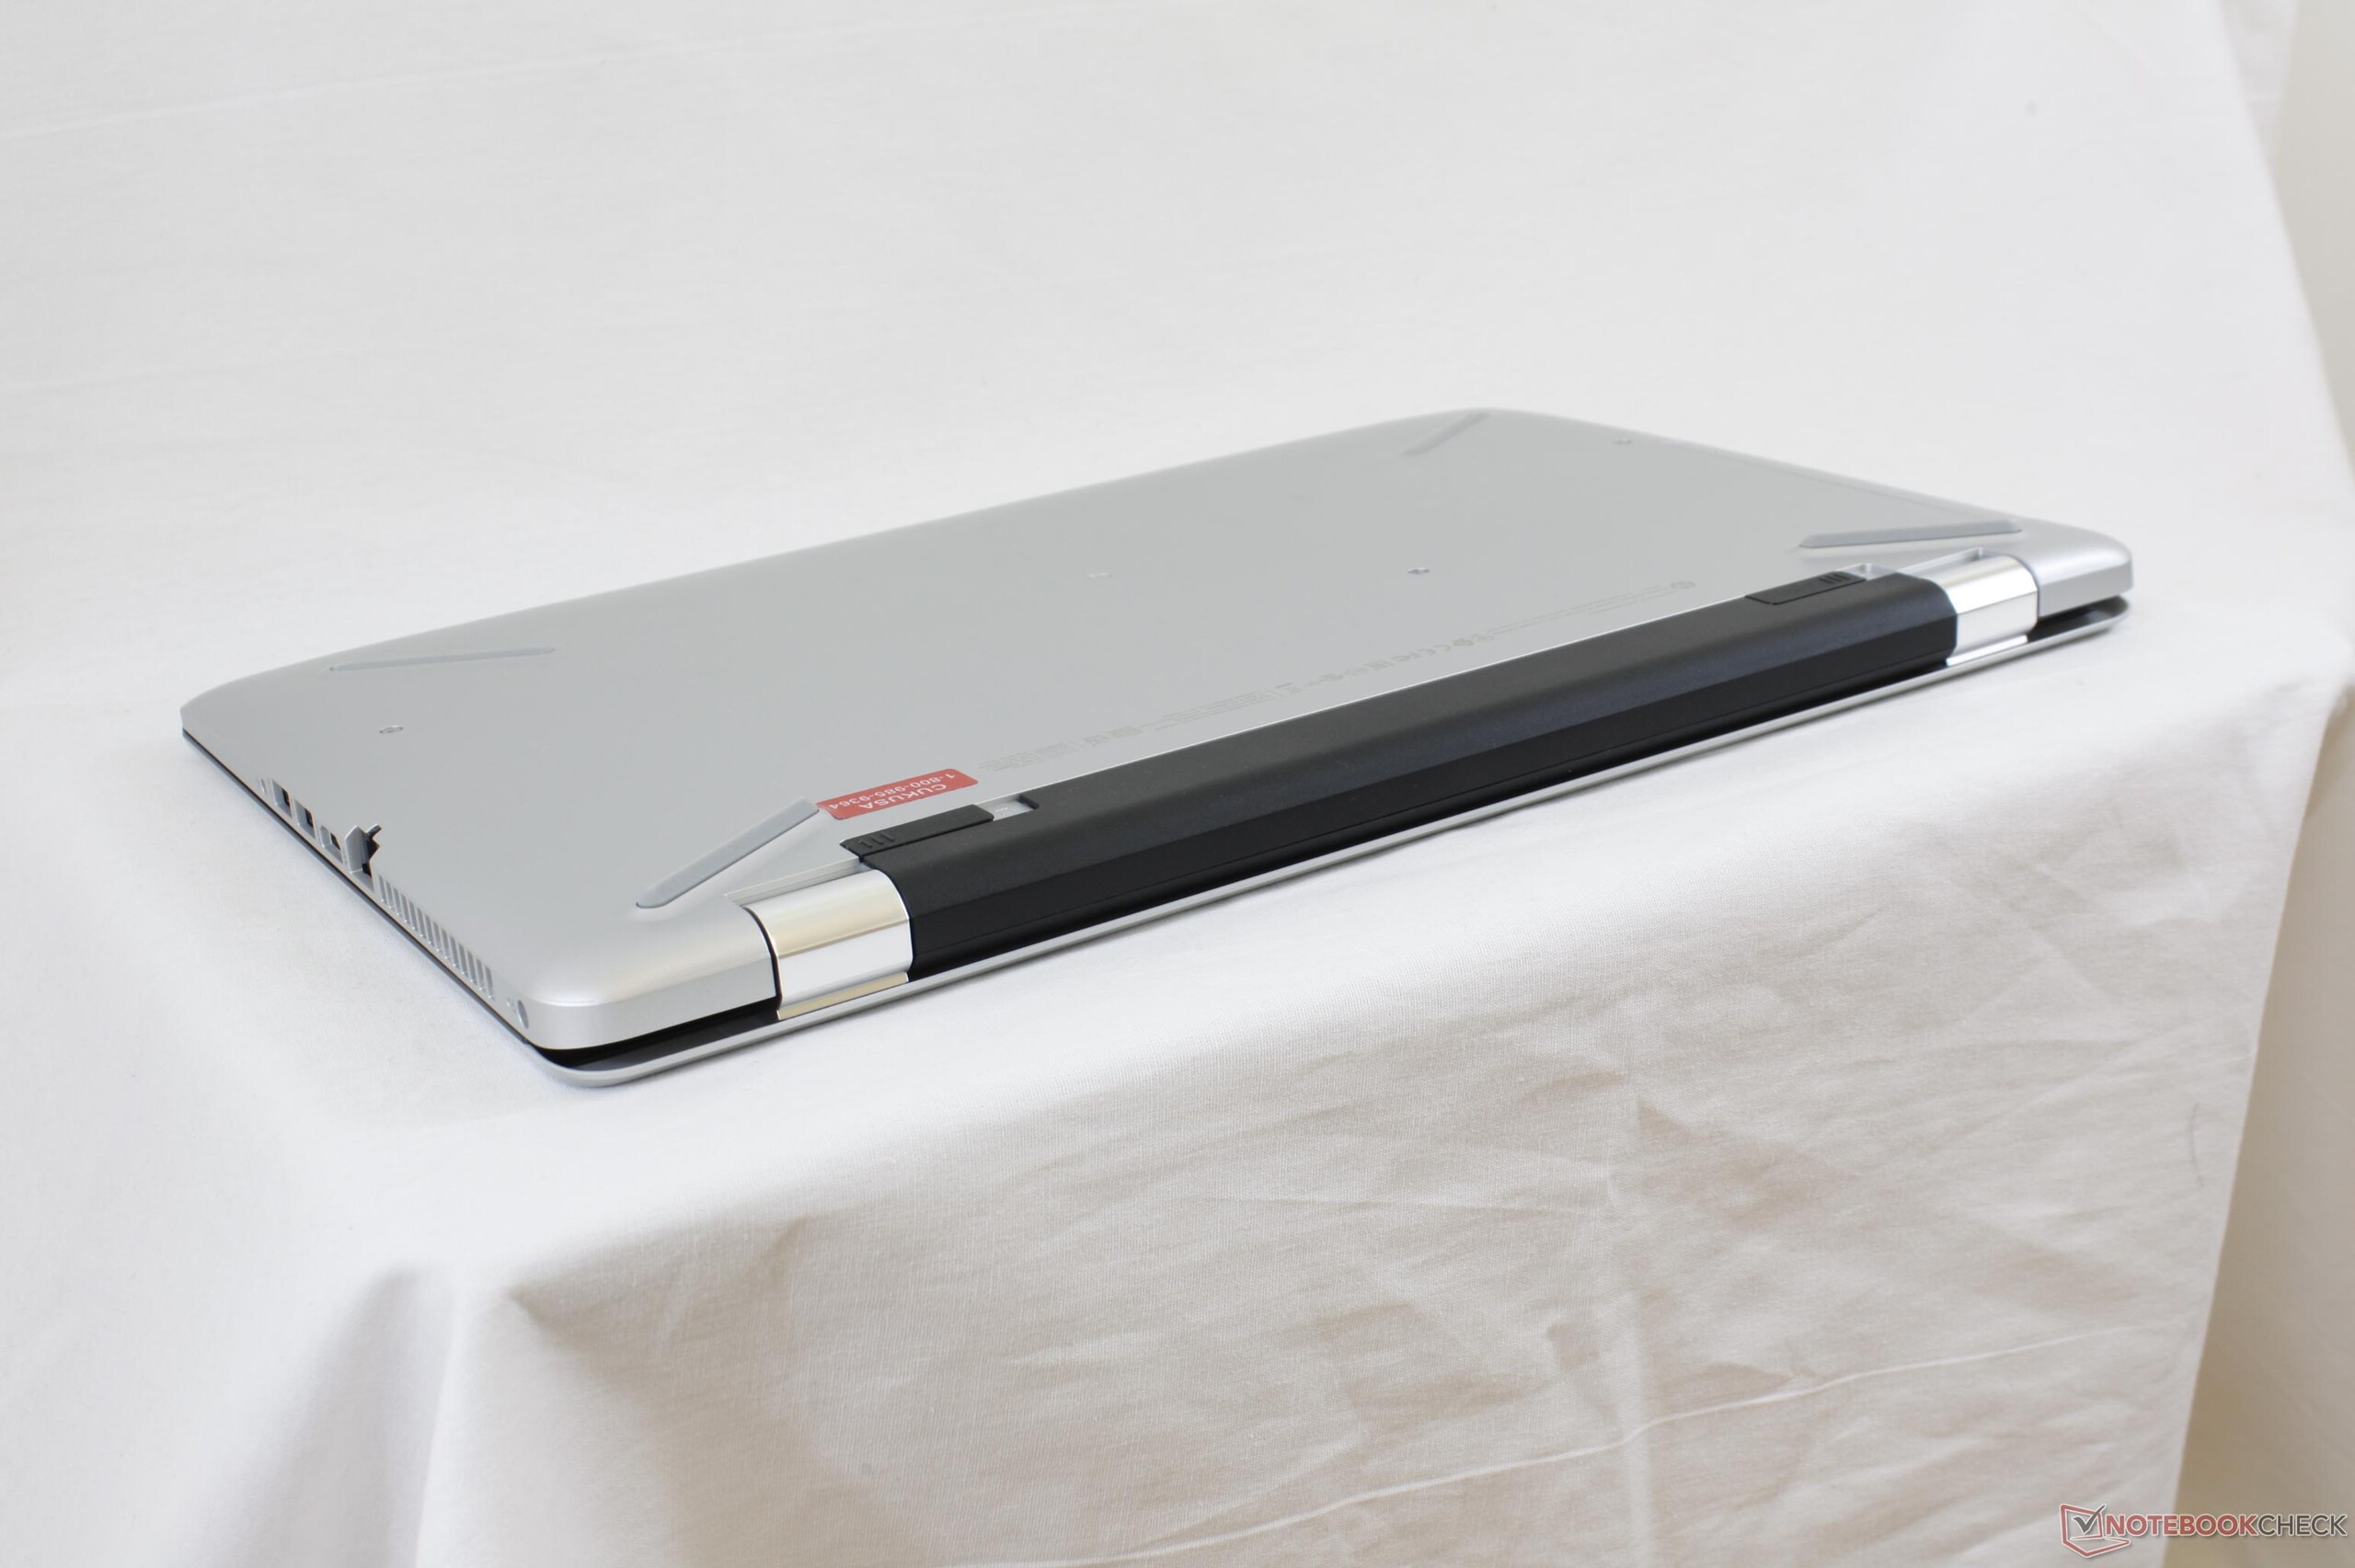
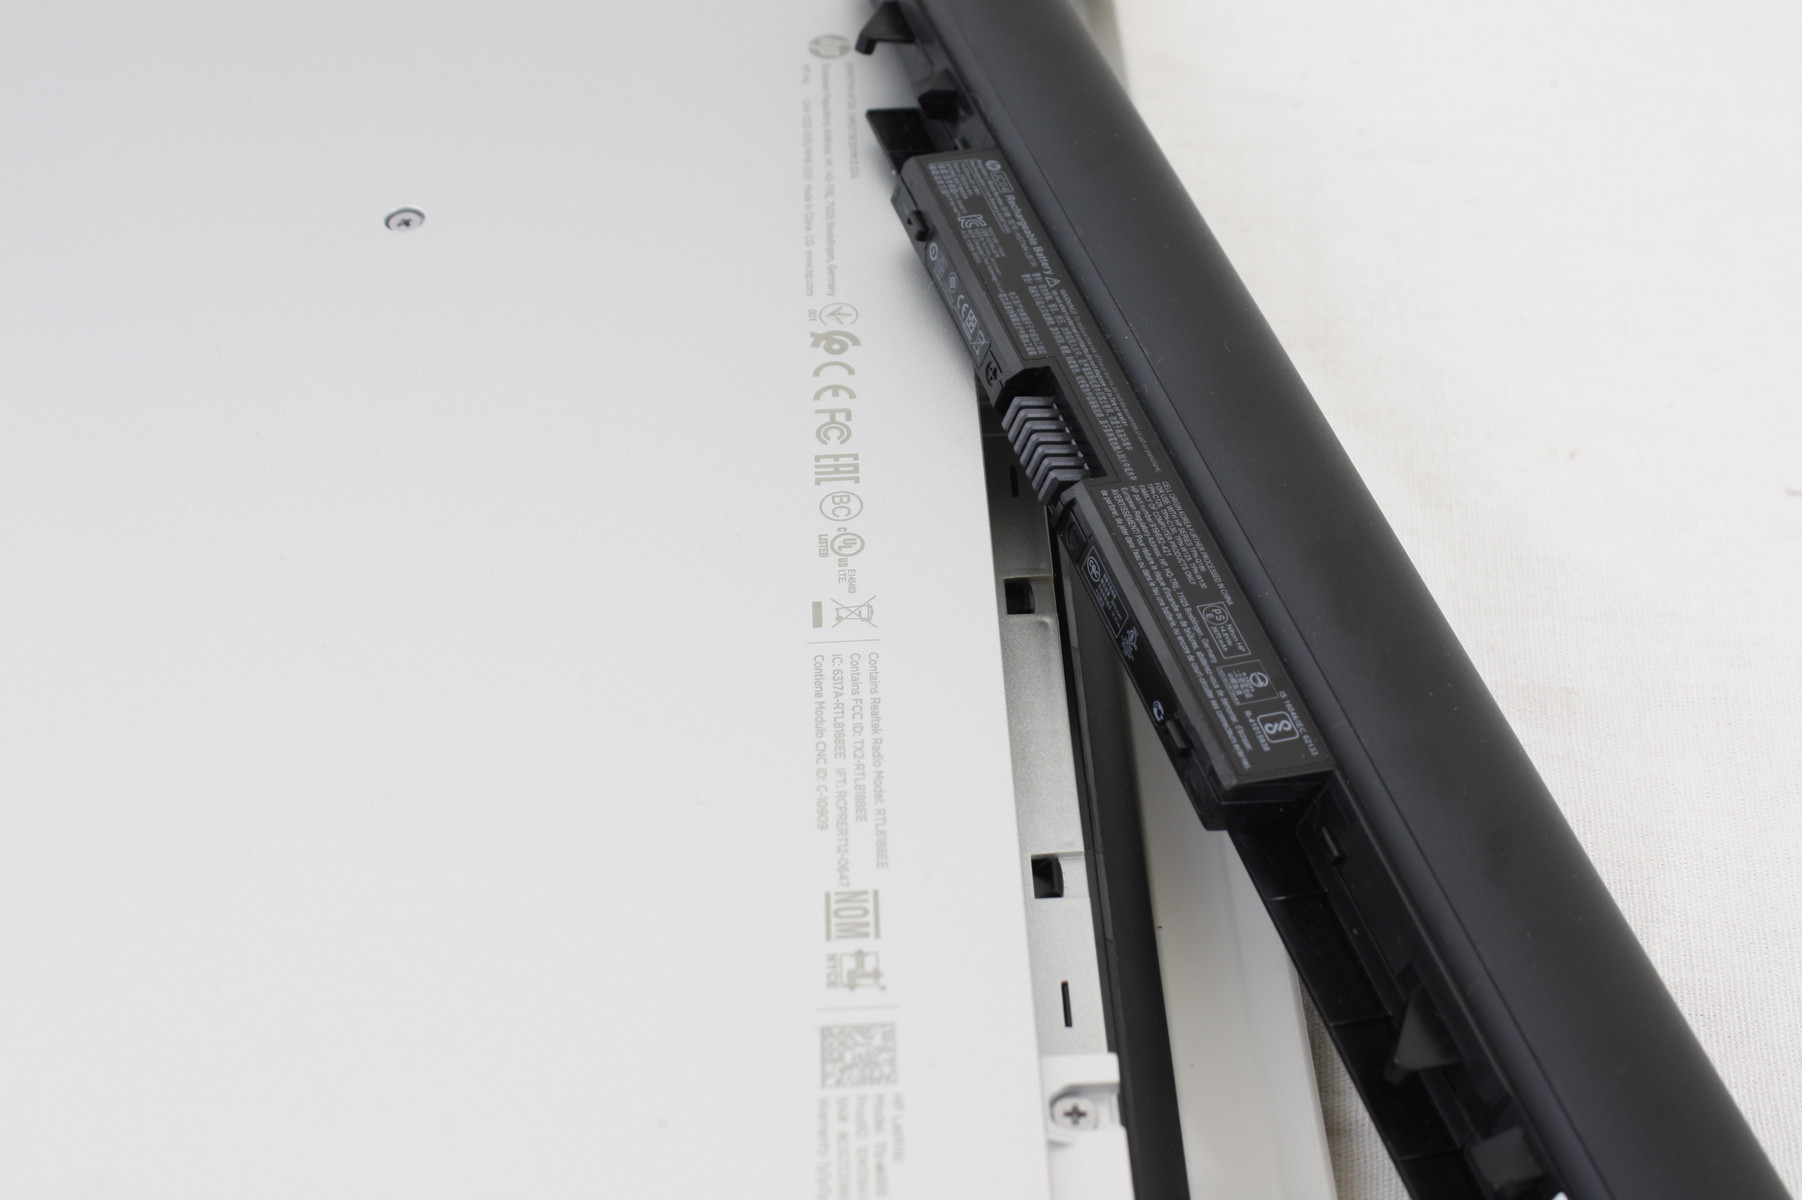
Build quality is not perfect on our test unit. As shown by the images below, there is a gap near the right hinge between the surfaces of the base and curved bottom panel. It's quite noticeable and the rear end of the unit is slightly uneven as a result.
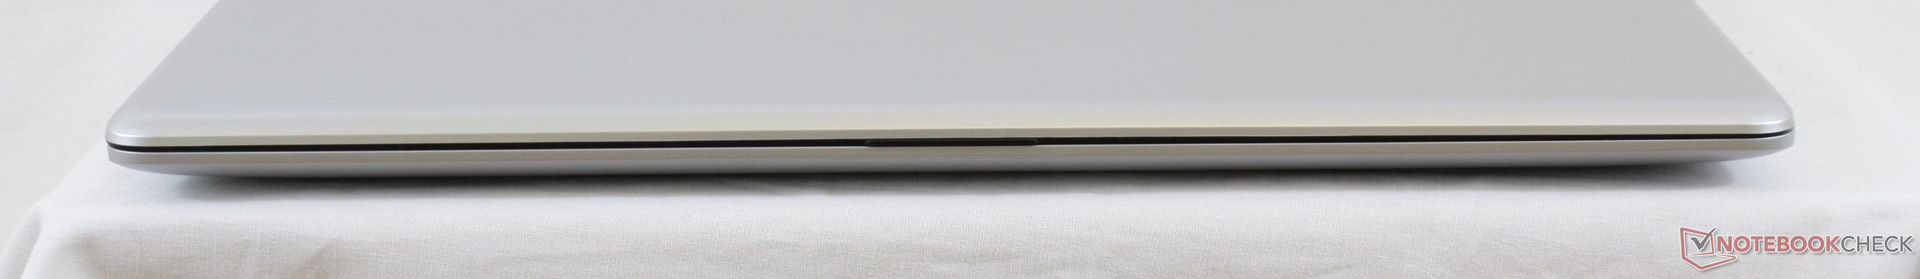
Size and weight are just slightly thinner and lighter, respectively, than some of the system's closest competitors in the budget space. The Ideapad 110 and Aspire F17, for example, are each a couple hundred grams heavier and a few millimeters thicker. The small advantage here isn't significant enough to be a make-or-break deal for users wanting something noticeably lighter and more portable. In this case, the sleeker Pavilion refresh may be a more worthwhile investment.
Connectivity
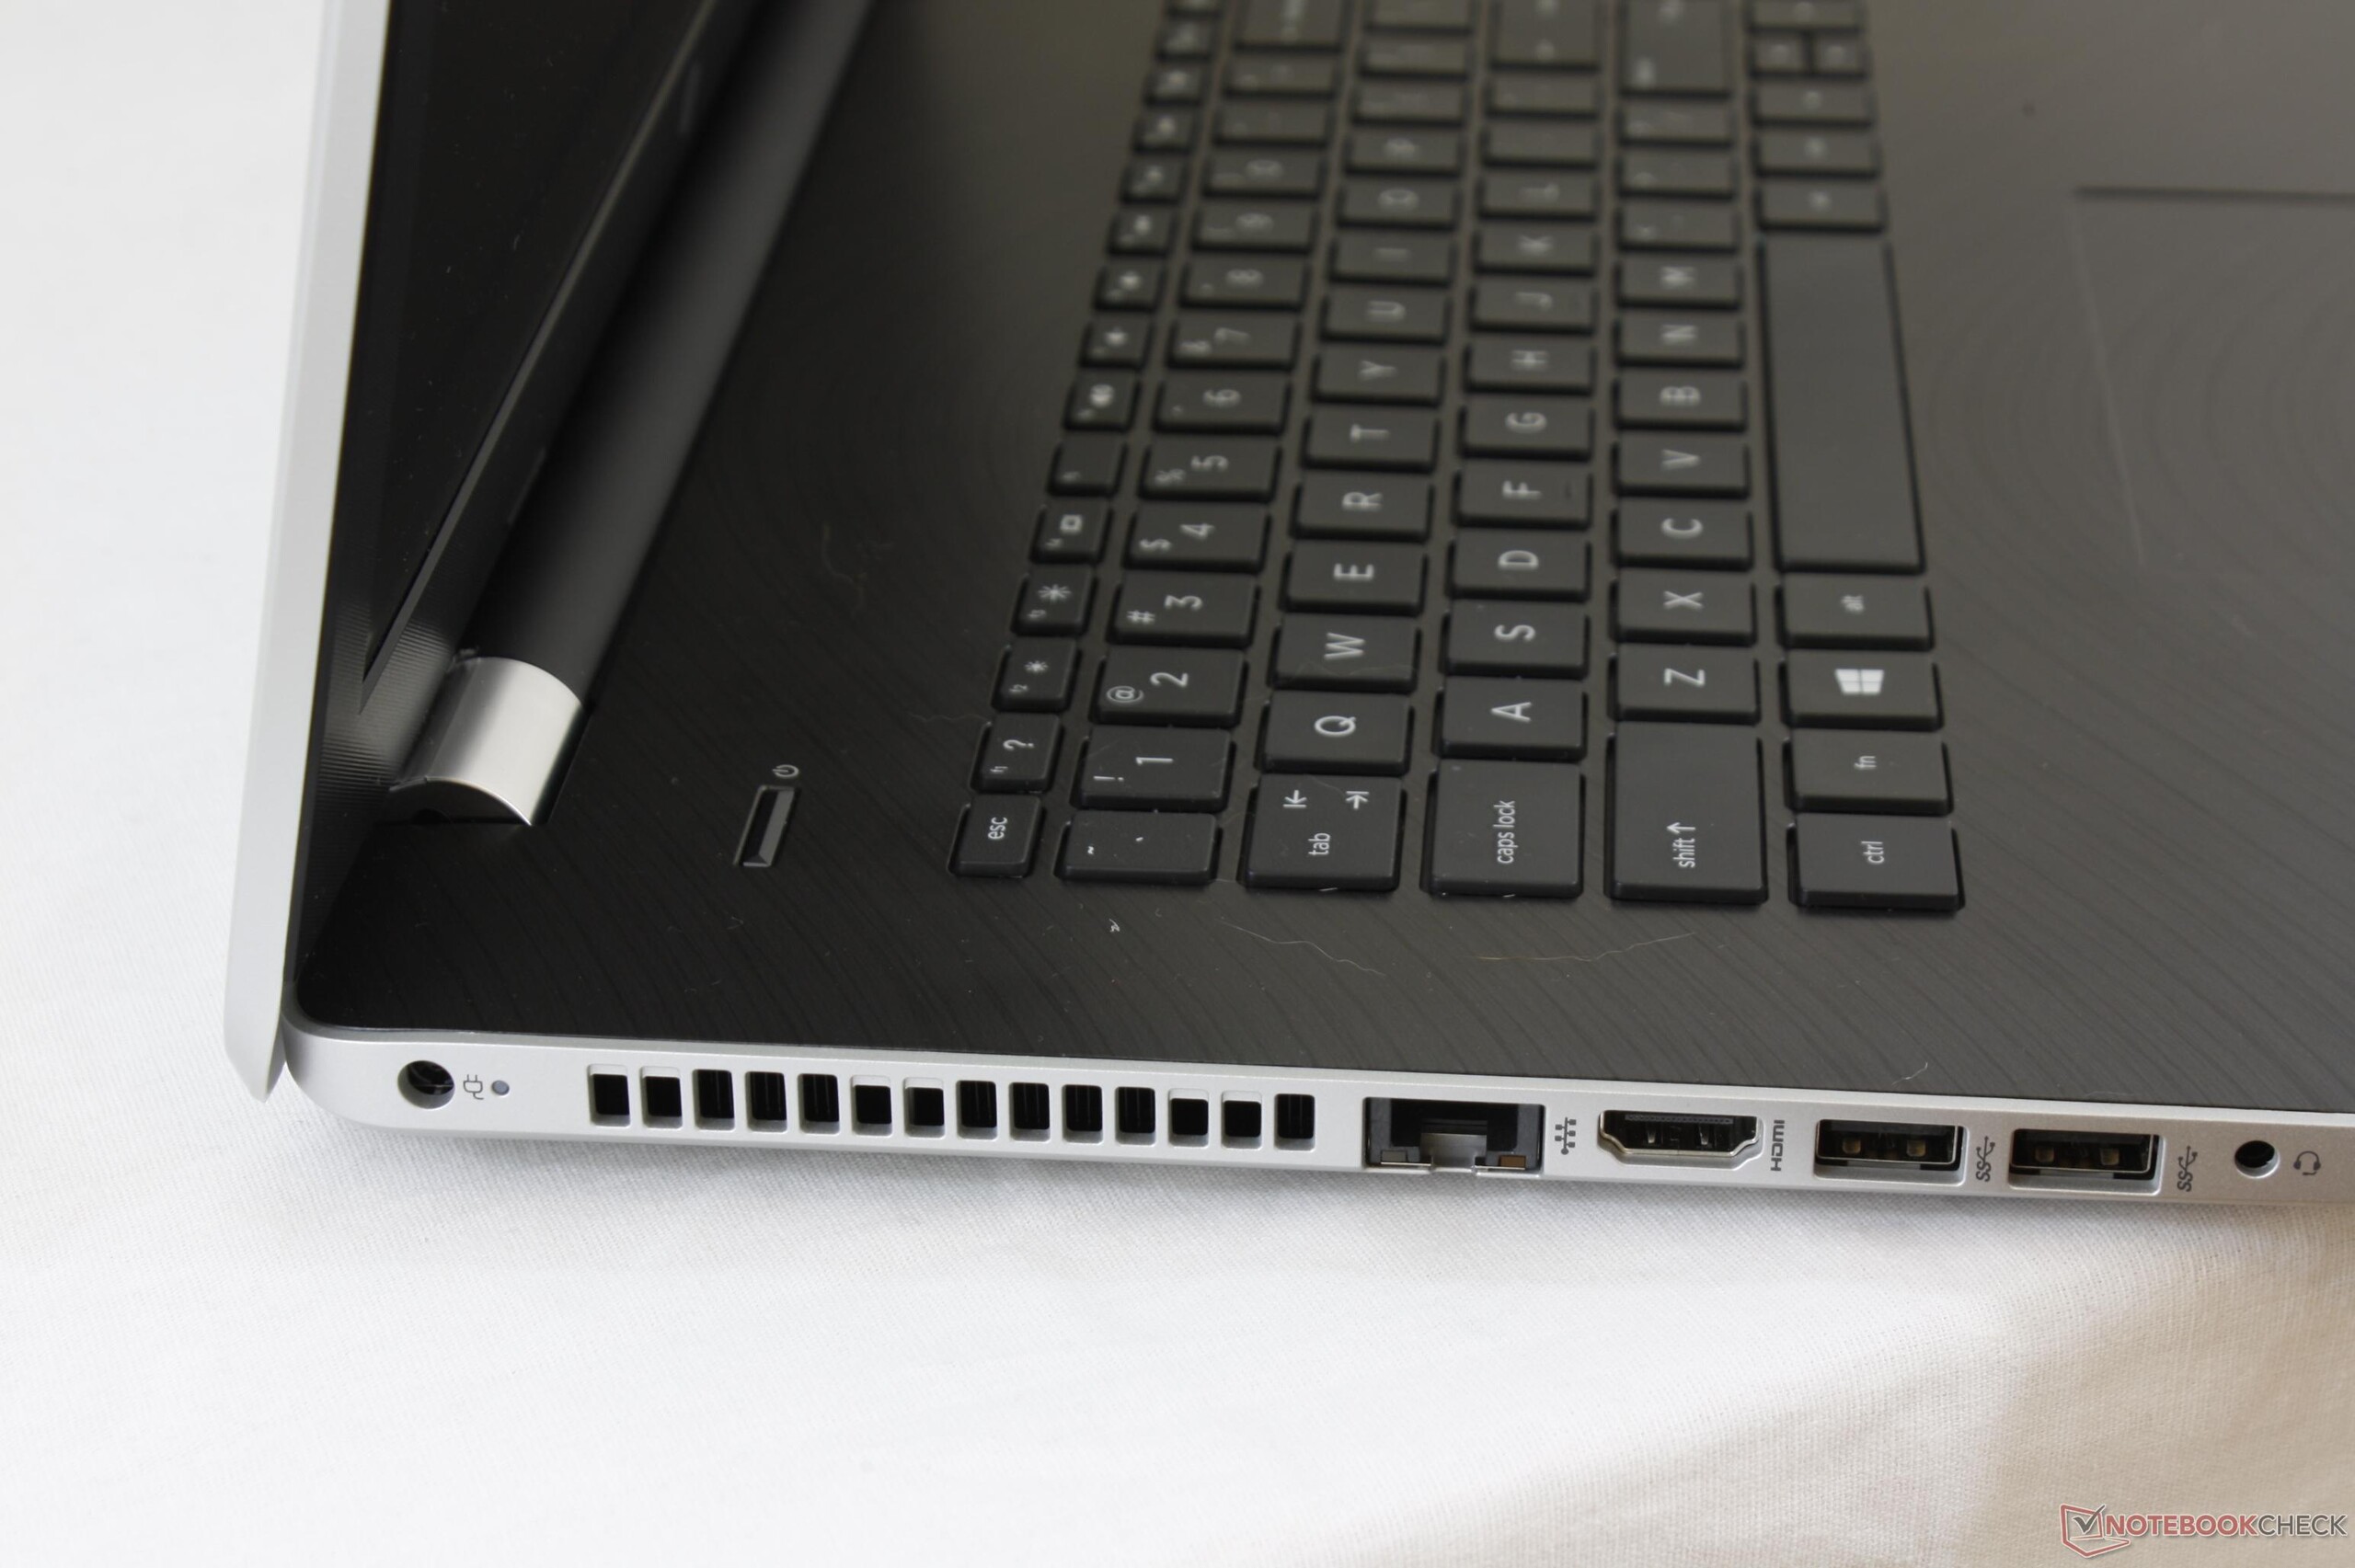
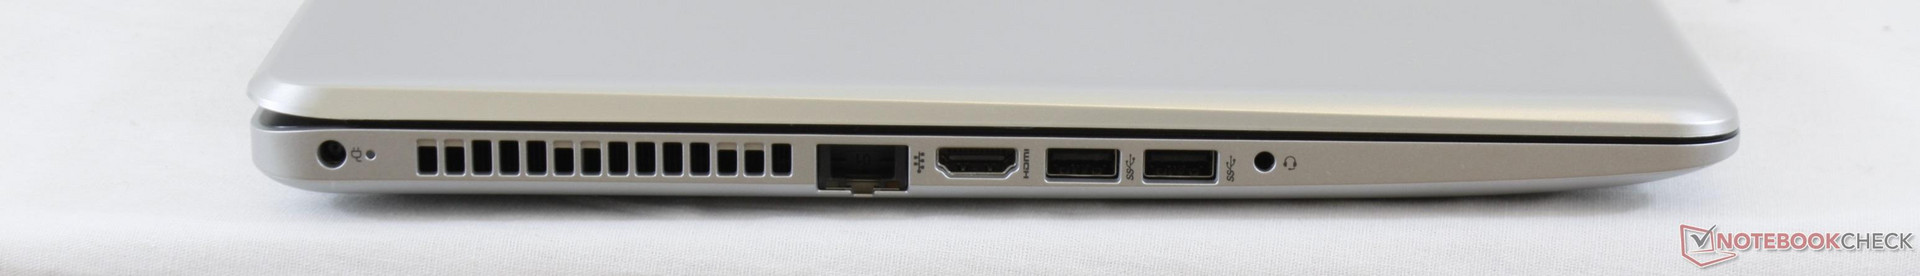
Port options are standard if not limited considering the large 17-inch screen size. The lack of any USB Type-C ports in particular is becoming more difficult to forgive. In comparison, the Asus F756UX throws in everything our Pavilion 17z carries plus VGA and USB Type-C. All ports are otherwise quite close to the front edges of the notebook and are easy to reach.
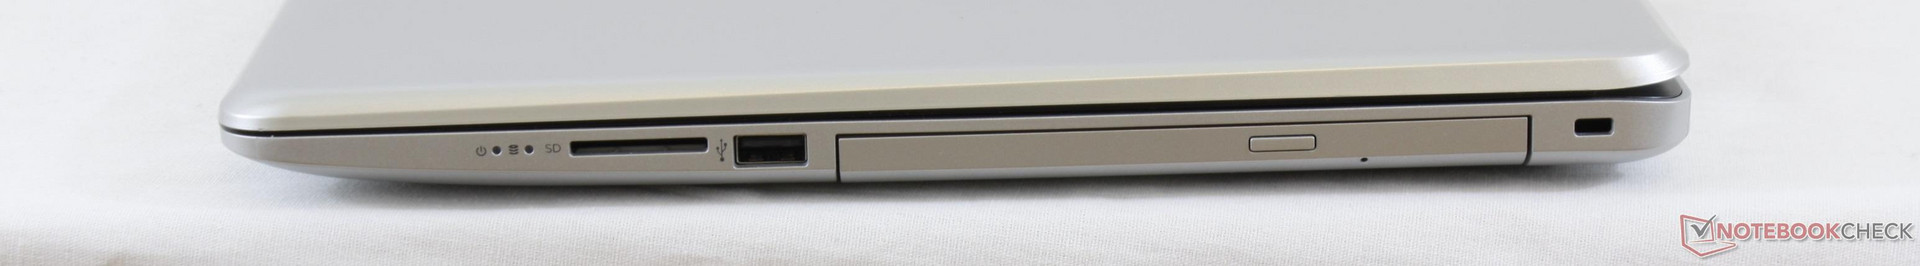
SD Card Reader
Transfer rates from the integrated card reader only average about 27 MB/s with our Toshiba UHS-II SDXC test card. Transferring 1 GB worth of images from the card to desktop will take around 40 seconds. Annoyingly, pulling out the SD card can prove difficult because the slot is not spring loaded and the card will set almost flush against the edge.
| SD Card Reader | |
| average JPG Copy Test (av. of 3 runs) | |
| Dell XPS 15 9560 (i7-7700HQ, UHD) | |
| HP Pavilion 17z 1EX13AV | |
| Dell Inspiron 17 5759-5118 | |
| maximum AS SSD Seq Read Test (1GB) | |
| Dell XPS 15 9560 (i7-7700HQ, UHD) | |
| HP Pavilion 17z 1EX13AV | |
| Dell Inspiron 17 5759-5118 | |
Communication
Wireless performance from the RealTek RTL8188E is steady with no notable issues when connected to an 802.11n network. Transfer rates can be an order of magnitude slower than a 2x2 802.11ac module at an average of just 47 Mbps when standing only one meter away from our Linksys EA8500 test router. Bluetooth features are not included on our specific configuration.
| Networking | |
| iperf3 transmit AX12 | |
| Lenovo Ideapad 110-17IKB 80VK0001GE | |
| HP Pavilion 17-x110ng | |
| HP Pavilion 17z 1EX13AV | |
| iperf3 receive AX12 | |
| Lenovo Ideapad 110-17IKB 80VK0001GE | |
| HP Pavilion 17z 1EX13AV | |
| HP Pavilion 17-x110ng | |
Accessories
There are no proprietary accessories or included extras outside of the warranty card and Quick Start guide. Users will need to rely on generic carrying cases and USB accessories.
Maintenance
HP Pavilion systems are usually more difficult to service and the 17z is no different. There are at least 7 Philips screws on the bottom and while they are easy to remove, the bottom panel itself is latched on very tightly around the edges and corners of the base. It's clear that HP has no intention to design the consumer Pavilion series to be as easily accessible as the ProBook or EliteBook series.
Warranty
The standard one-year limited warranty applies if purchased from HP.com with extensions of up to three years. Please see our Guarantees, Return policies and Warranties FAQ for country-specific information.
Input Devices
Keyboard
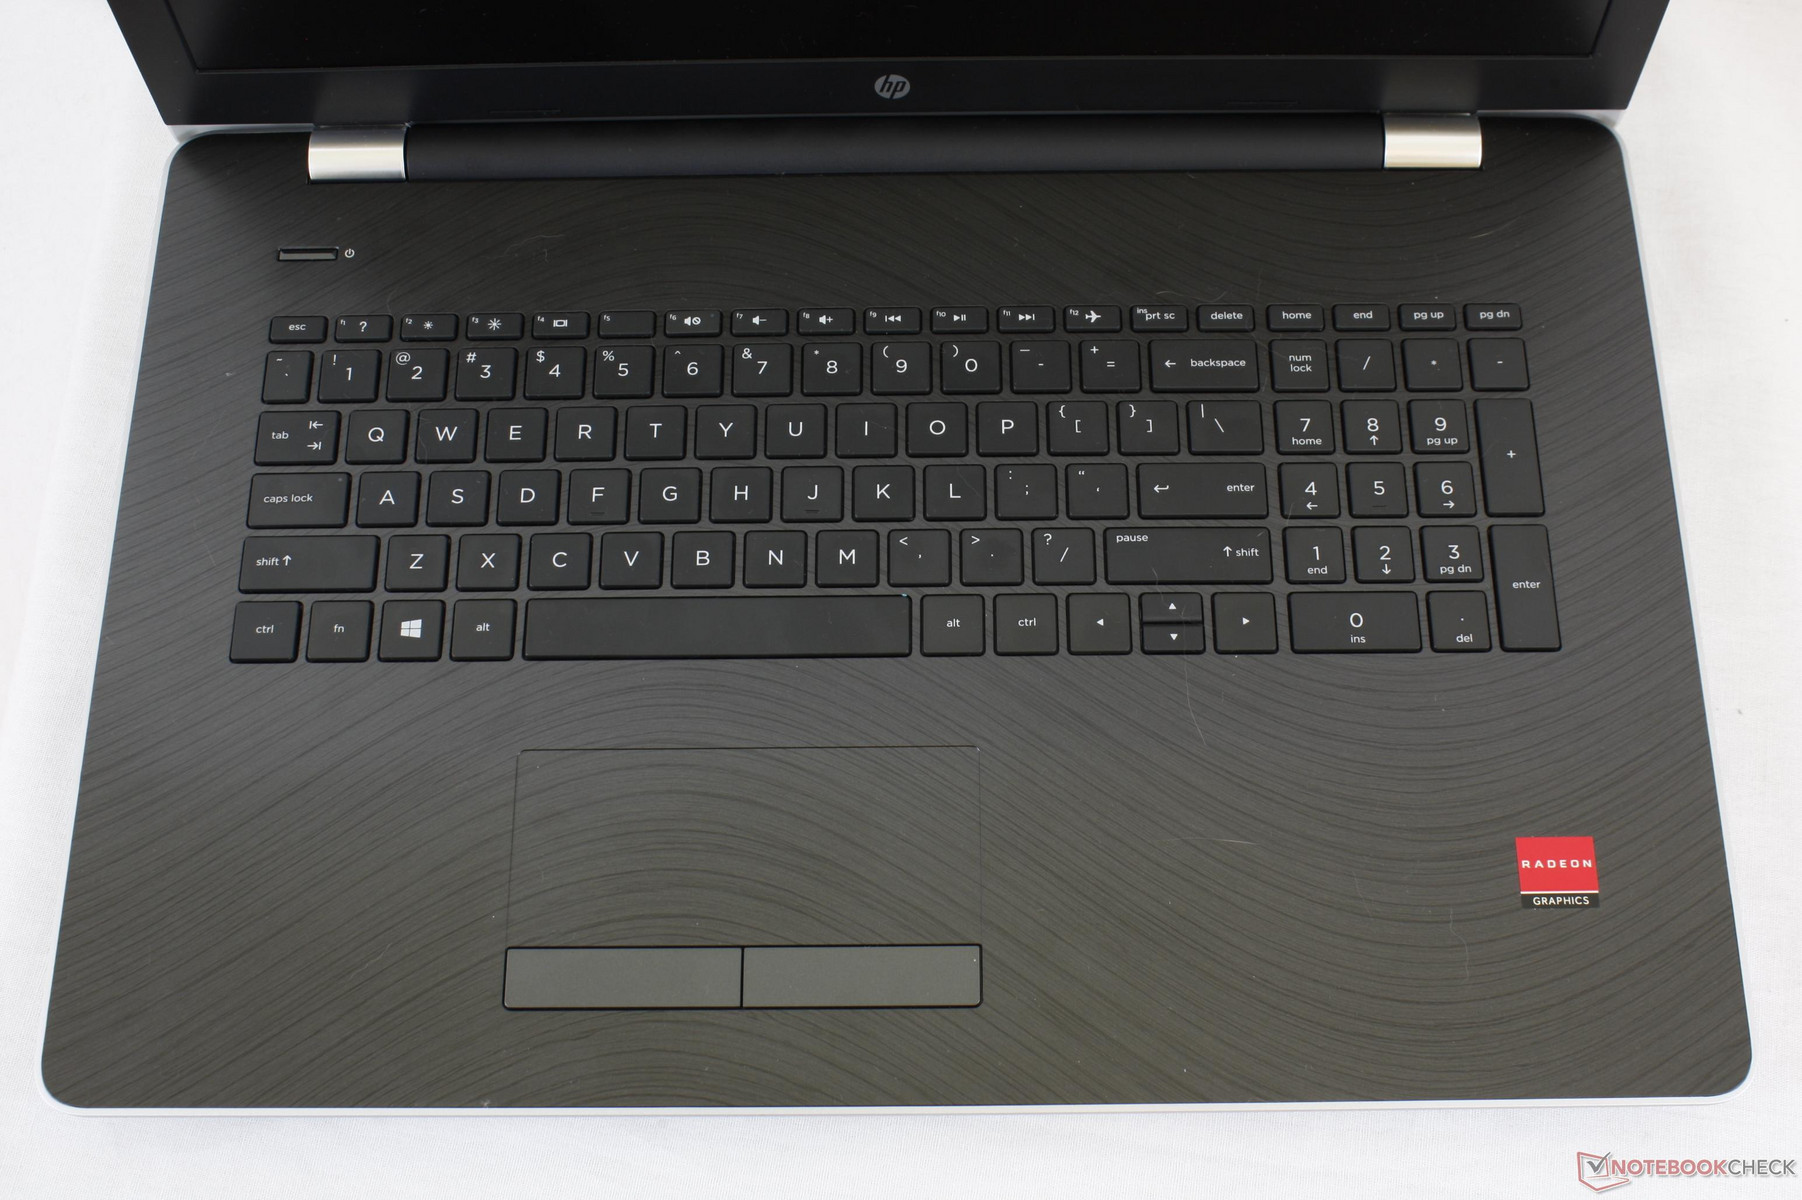
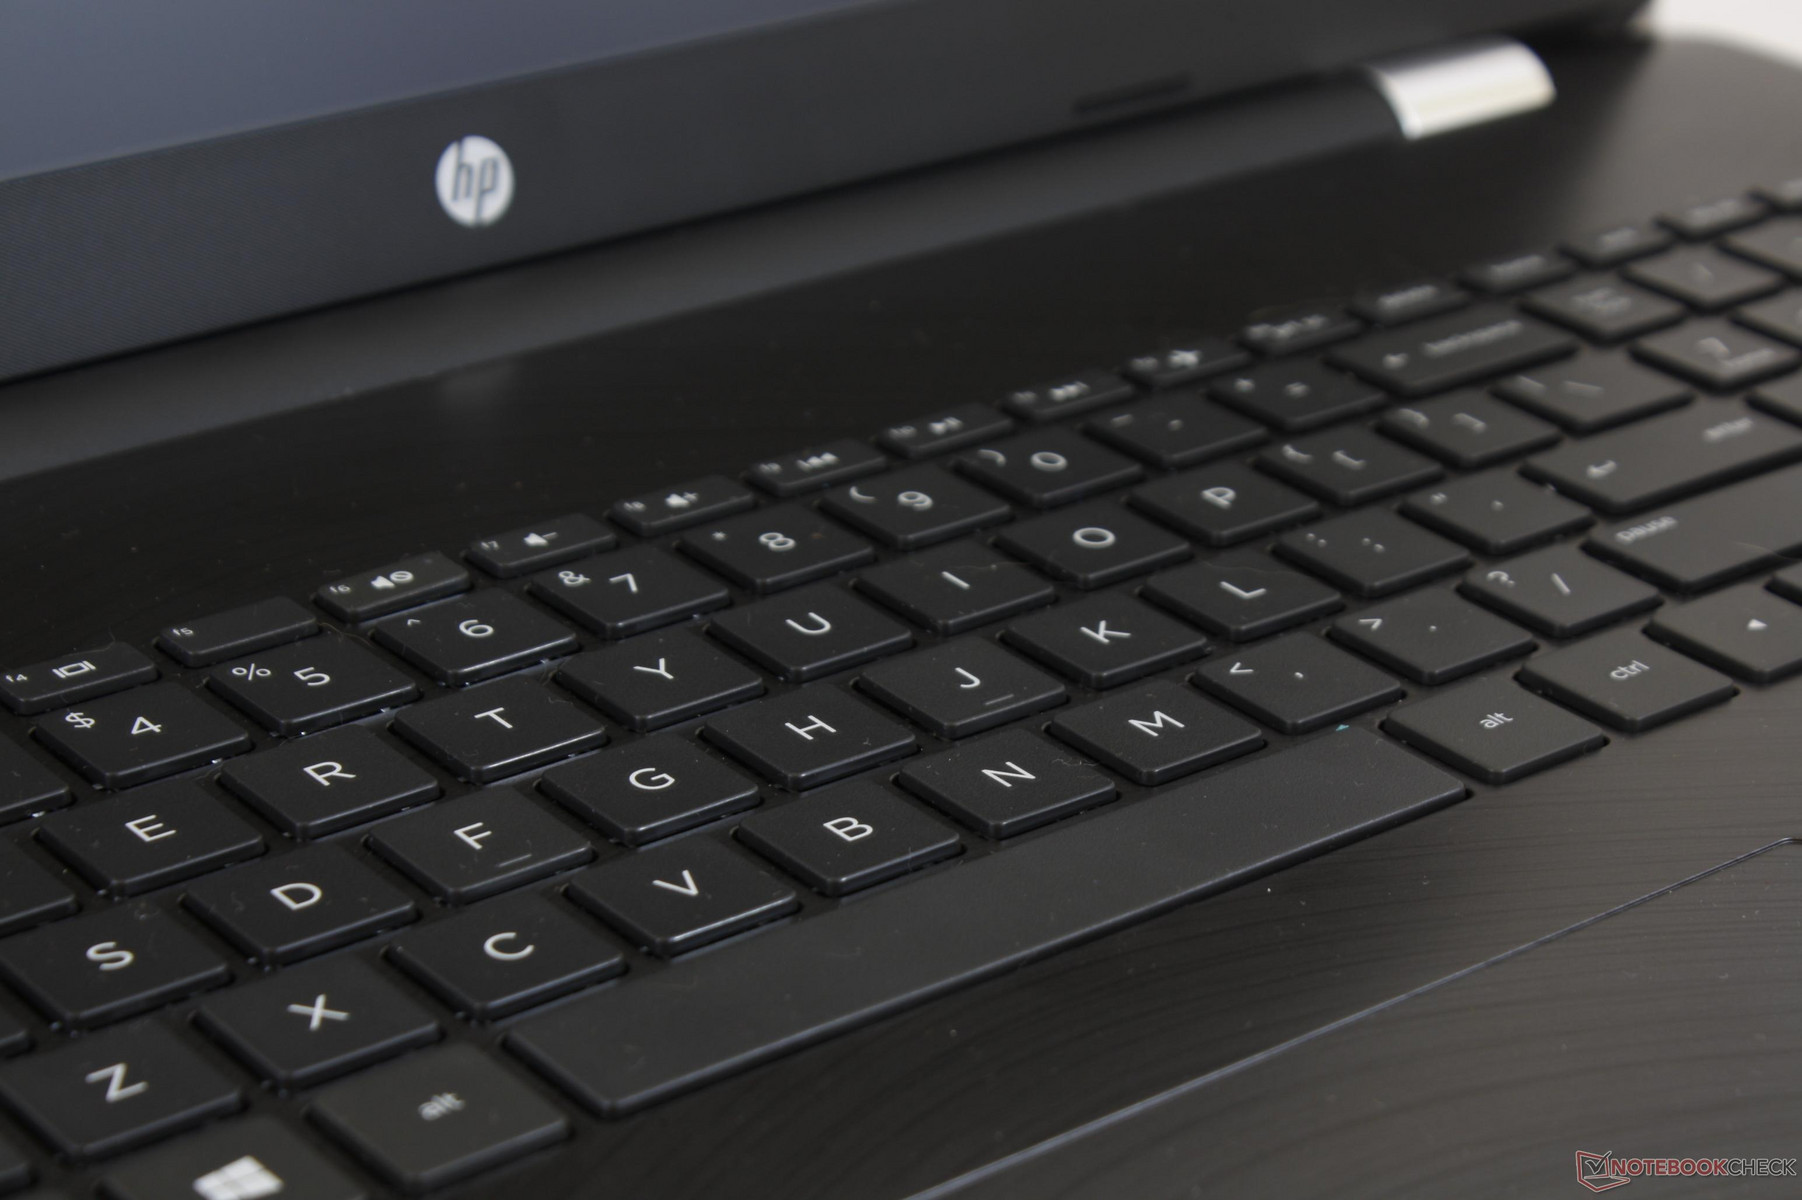
The slightly roughened plastic keys are shallow in travel and very light in feedback. We find their biggest drawback to be the loud clatter when typing compared to the quieter keyboards on the XPS 15 or ThinkPad T series. The overall hollow feel of the base likely has some influence on the loud keys. Users who have no qualms about the noise will find a uniform typing experience across all the keys save for the half-sized Arrow keys.
A keyboard backlight is not available on this particular Pavilion 17z series. The backlight toggle button on the F5 key is overtly missing whereas the icon is present on this very same key for the Spectre series and above.
Touchpad
The trackpad (11.5 x 5.0 cm) is slightly wider than on most other notebooks including the XPS 15 (10.5 x 8.5 cm) but is actually smaller than the trackpad on the 15.6-inch Pavilion 15 Power (11.5 x 6.0 cm). The very narrow length makes vertical cursor movement feel restricted compared to any horizontal movement. Aside from the tight dimensions, the Elan software can recognize up to four-finger inputs with automatic palm detection and both glide and responsiveness are smooth. Applying strong pressure on the center of the trackpad will only warp the surface very slightly.
The dedicated mouse keys are shallow in travel with firm and very loud feedback. The right mouse key is actually slightly softer in both feedback and noise compared to the left mouse key, so there is some asymmetry when inputting a click. There is some tension or "give" to the keys before an input is registered and so the keys are not completely rigid.
Display
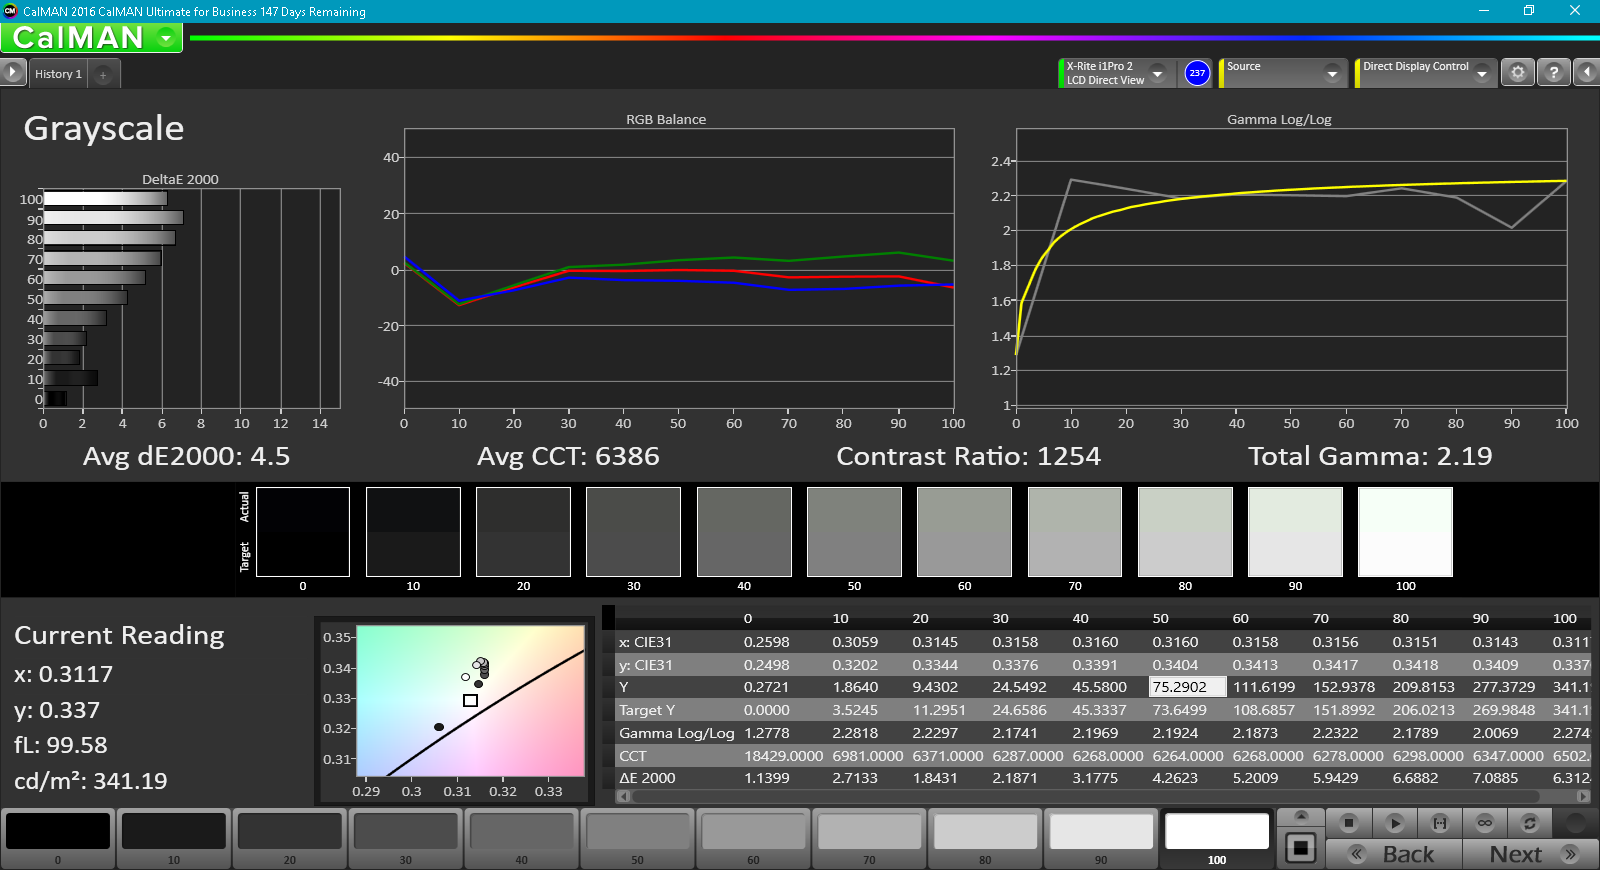
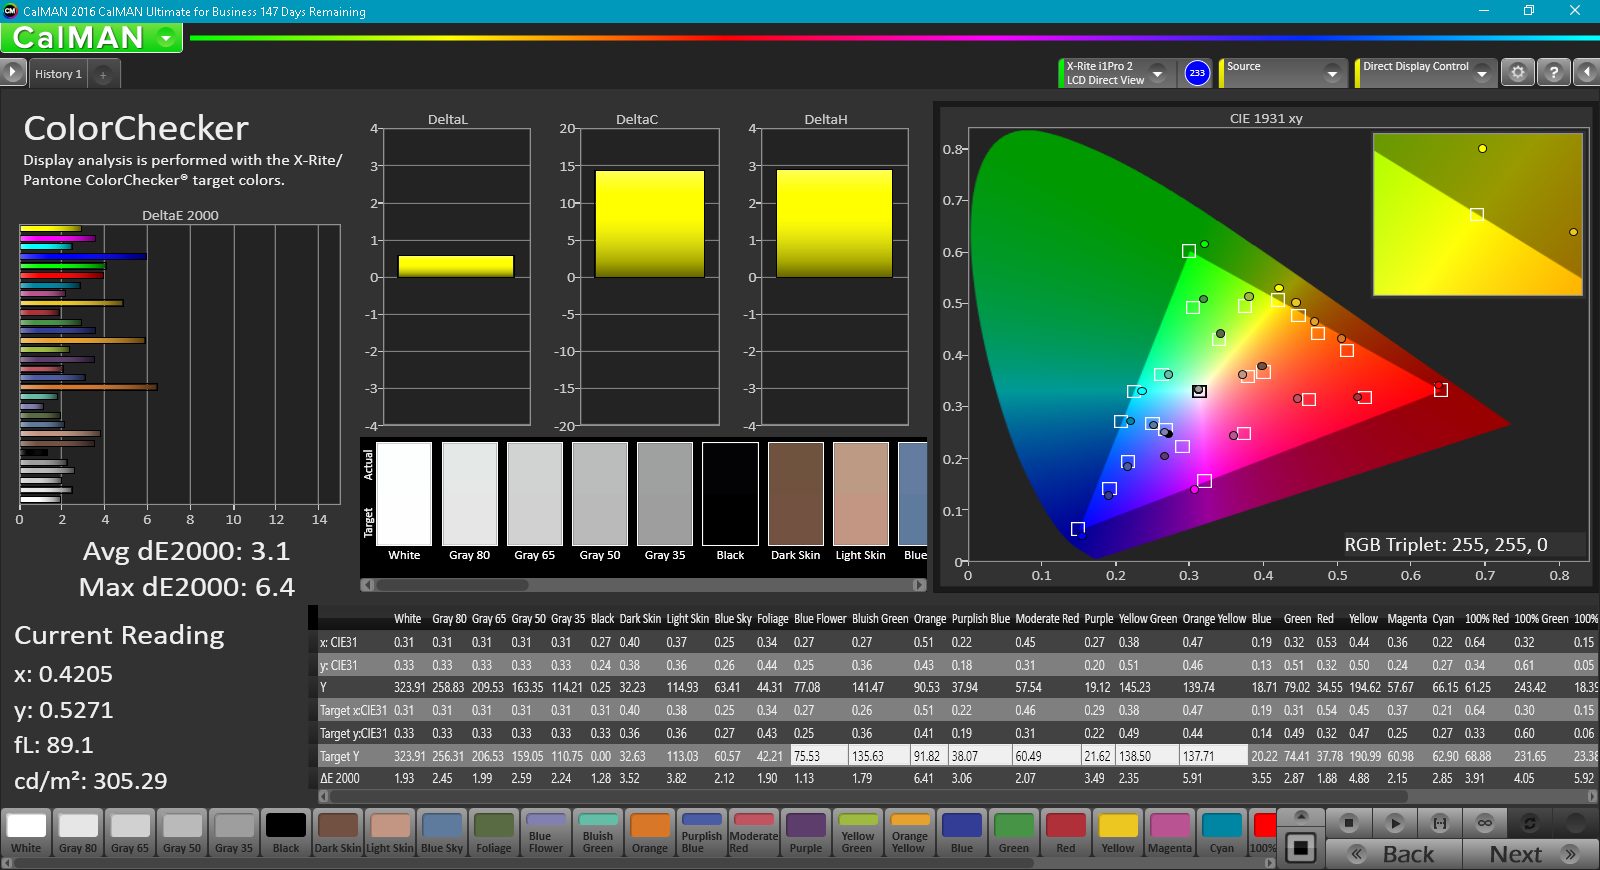
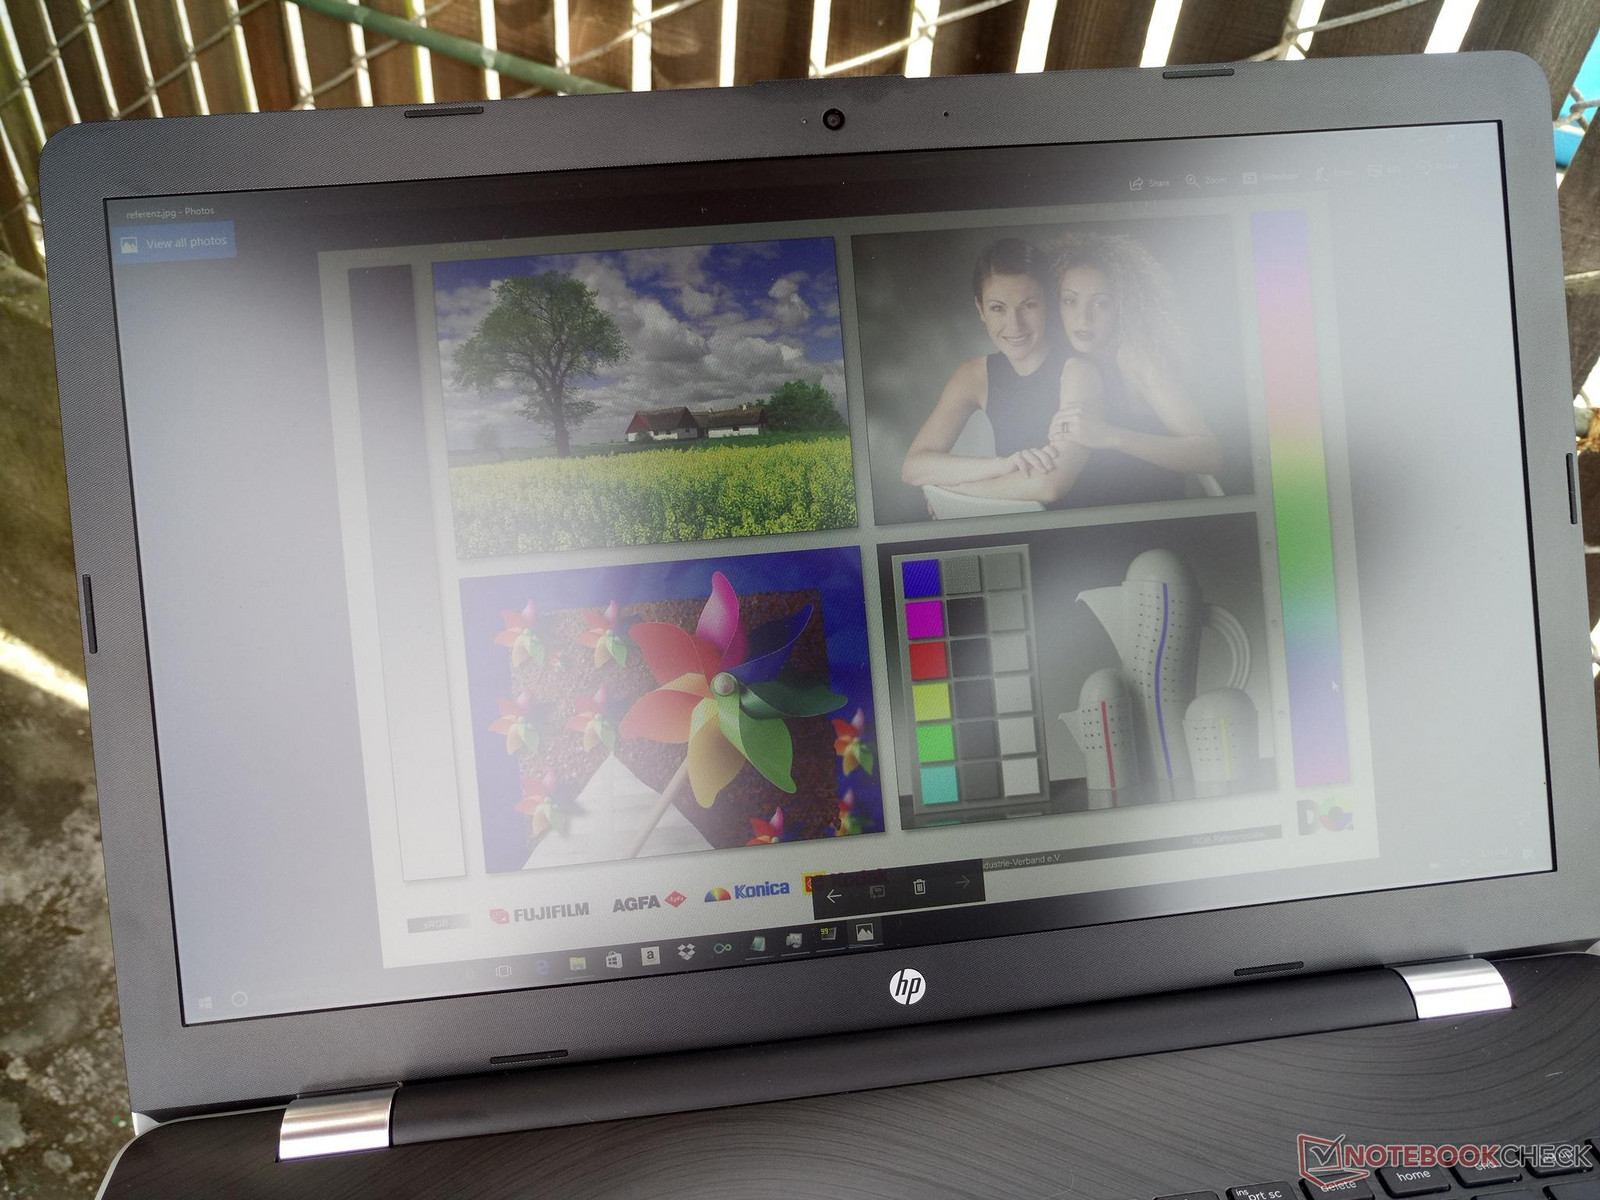
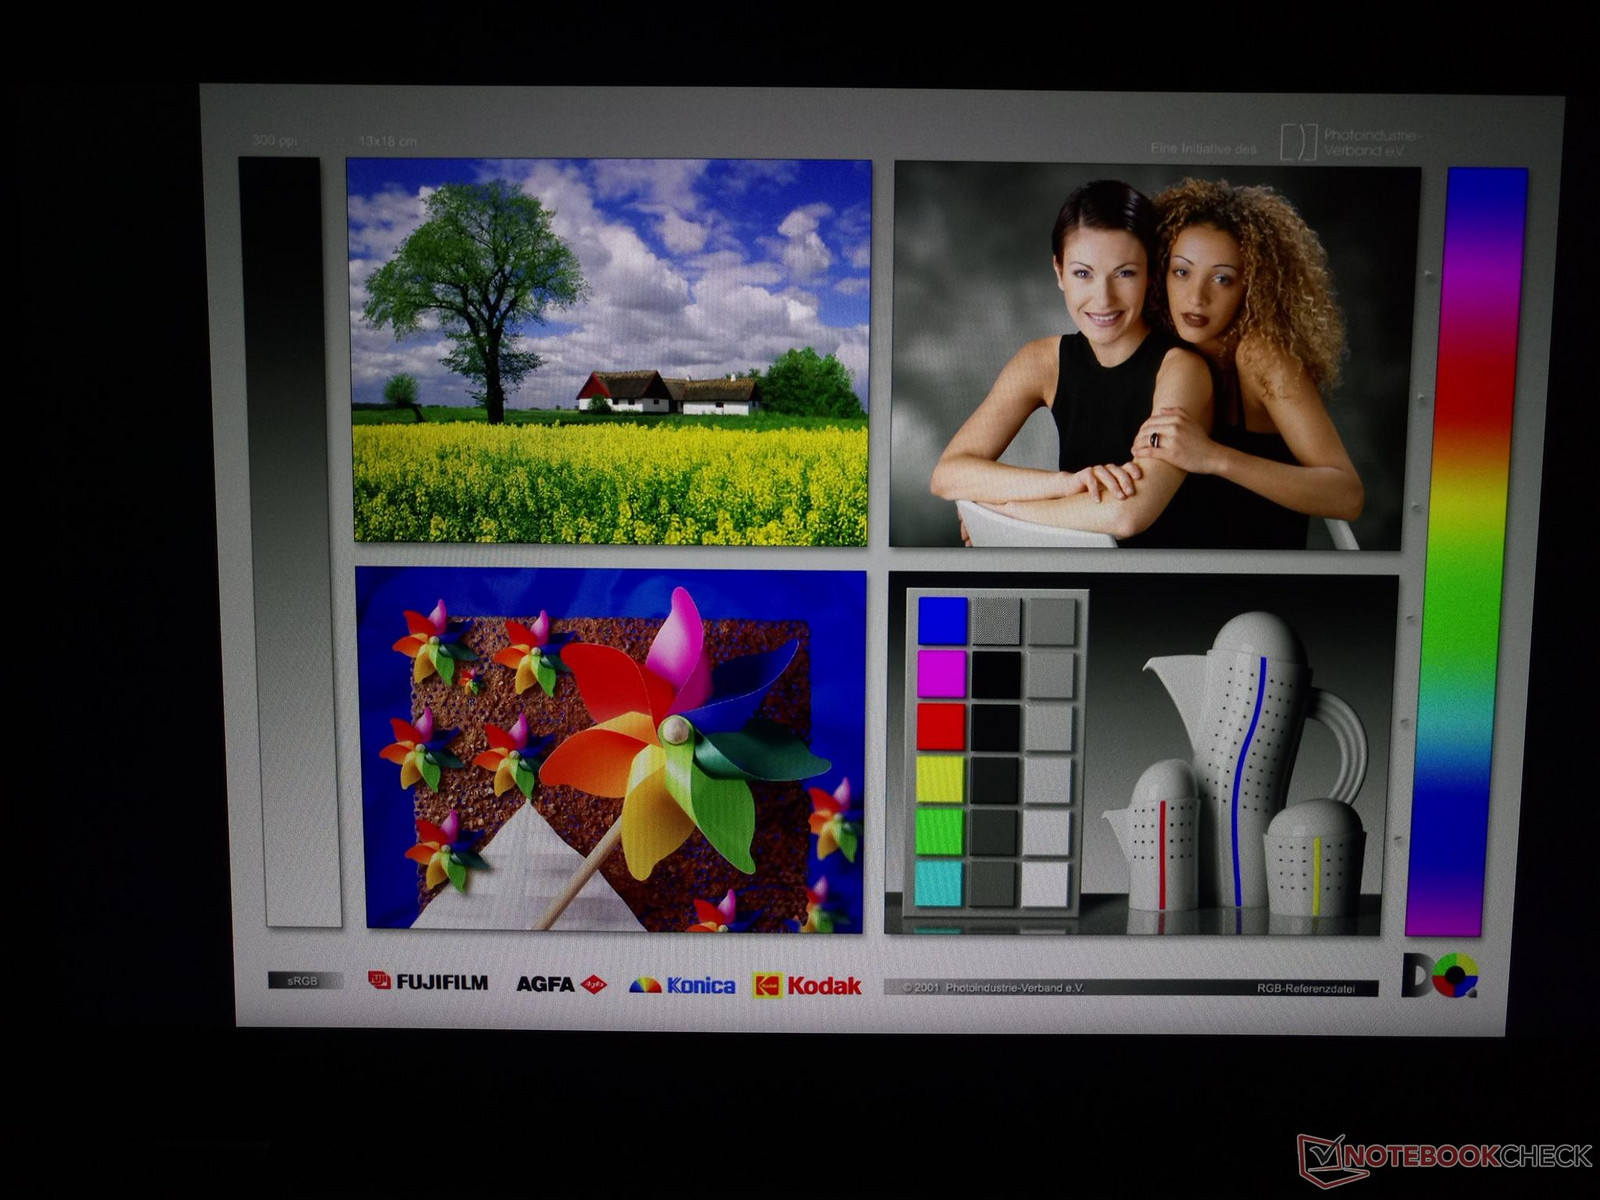
Our Pavilion 17z configuration uses a similar AU Optronics AUO109D IPS panel as the ProBook 470 G4. Contrast and brightness levels are excellent especially when considering the low price of the system. The cheaper TN panels of the IdeaPad 110 and Inspiron 17 5759 are far inferior with an overly cool color temperature while the Pavilion 17z manages to be surprisingly close to the 6500K sRGB target before any calibration attempts.
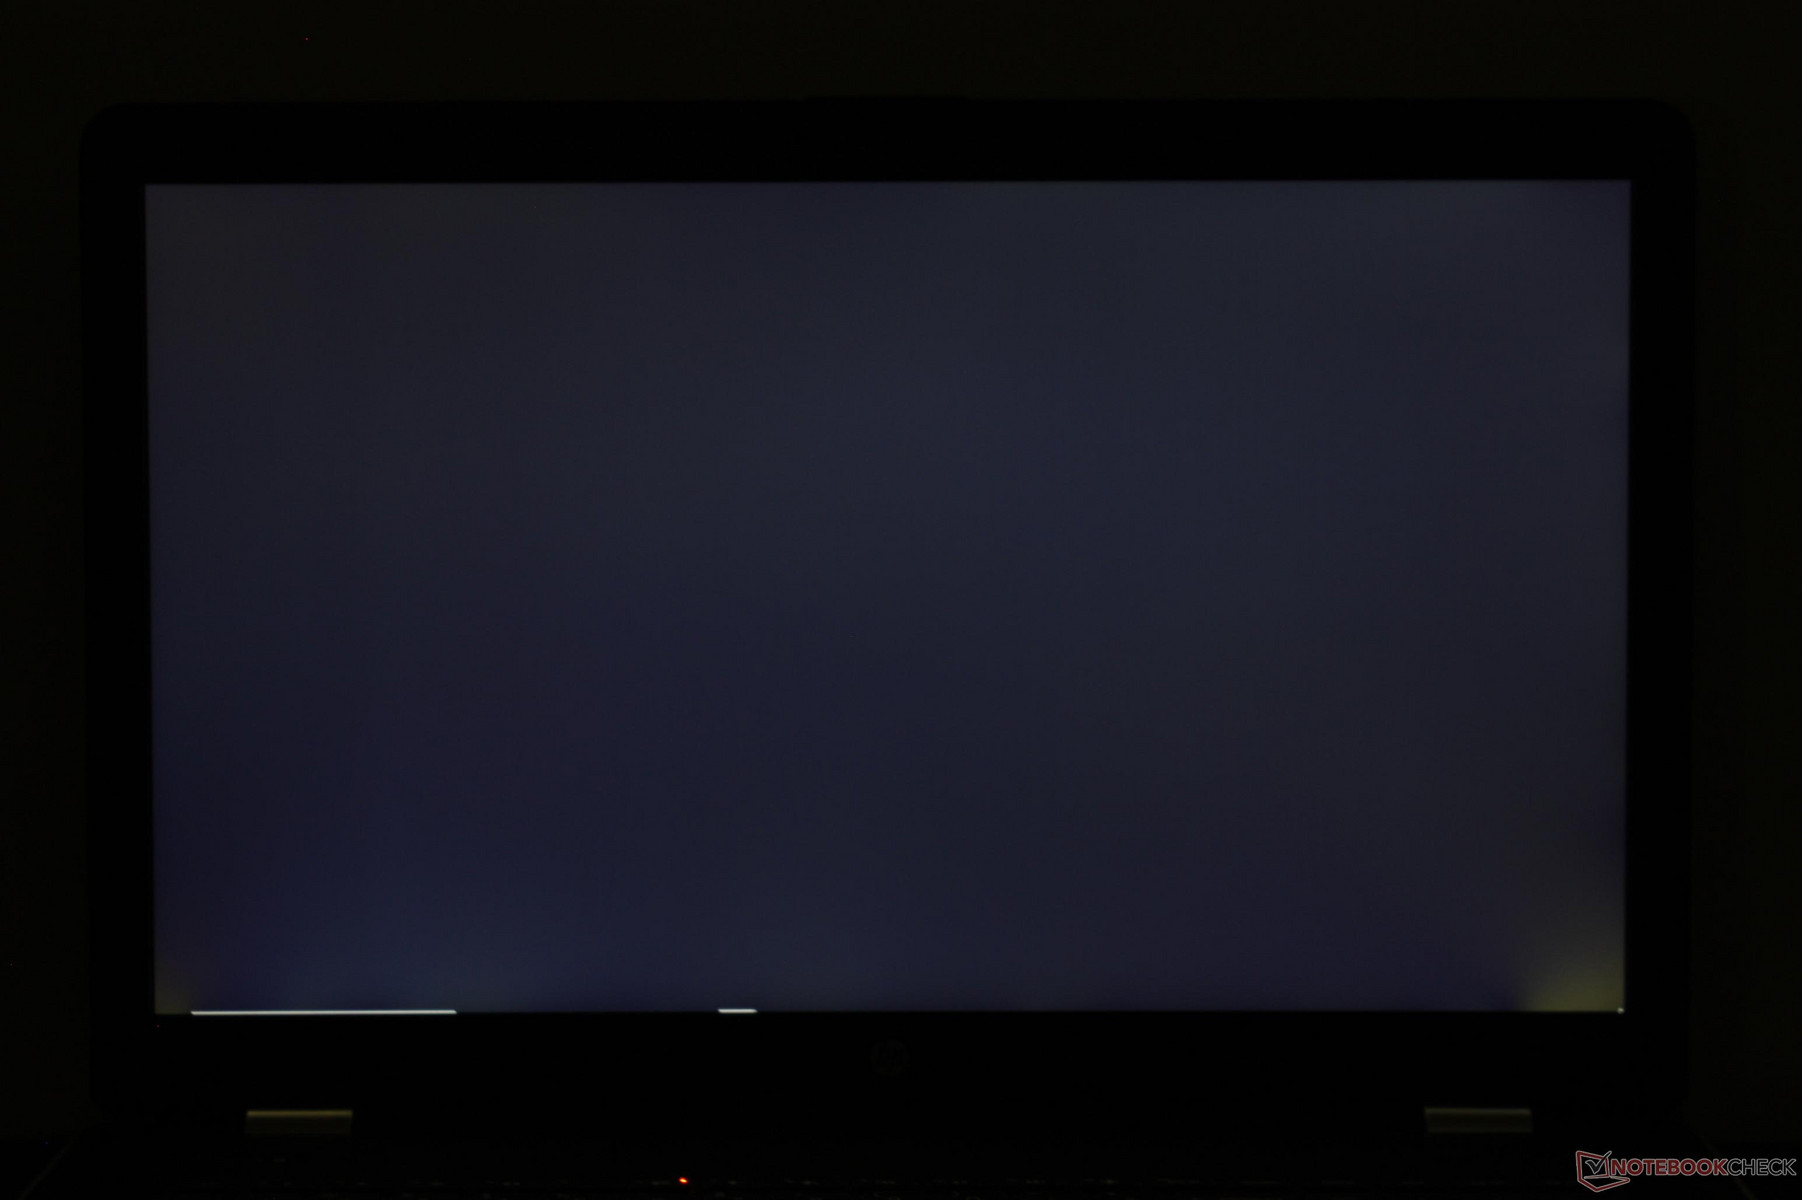
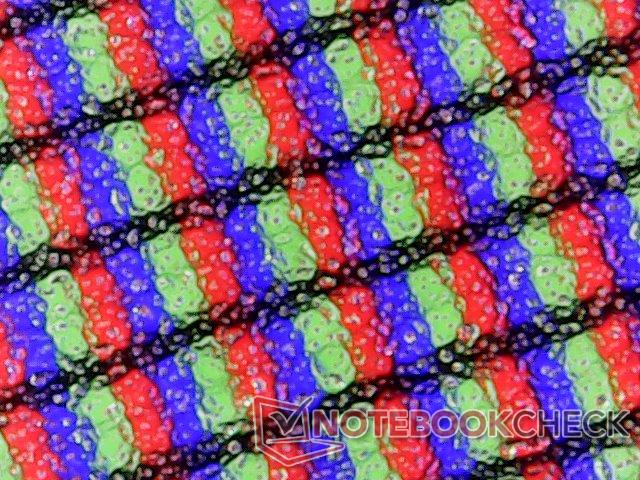
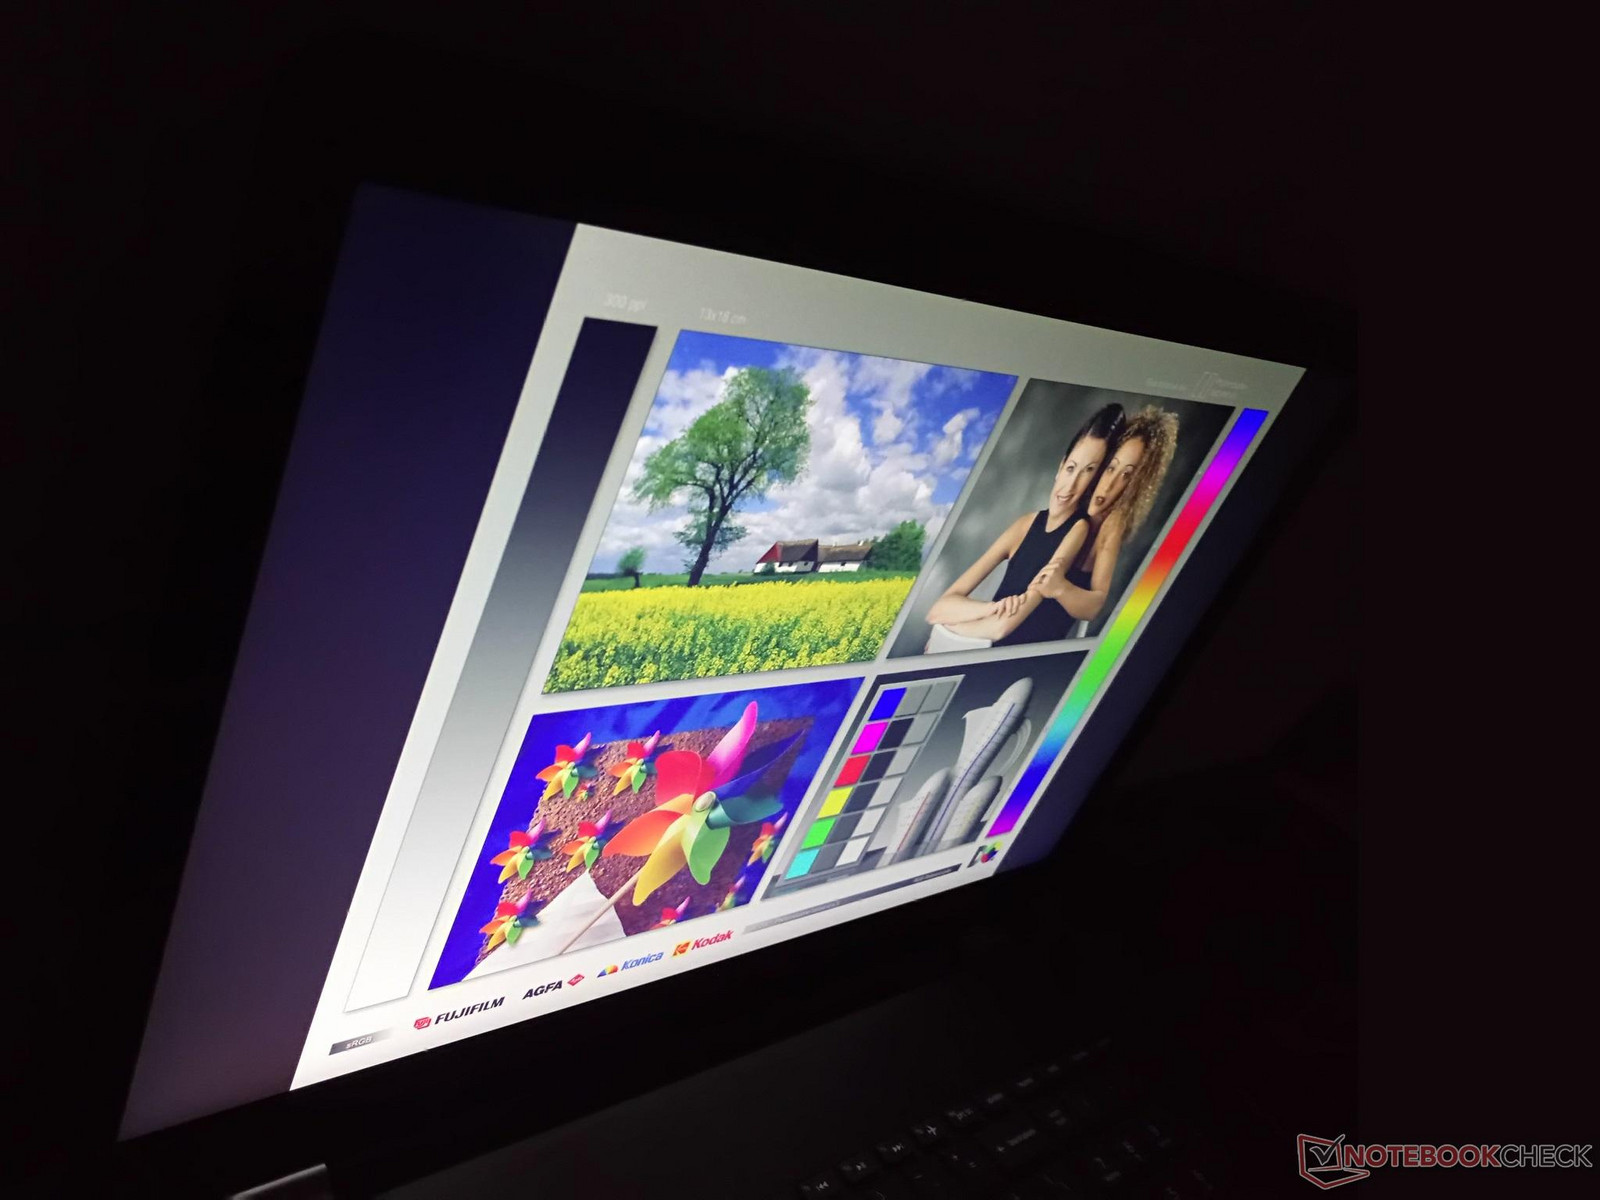
Subjectively, the matte panel suffers from a very grainy overlay. This becomes easier to see when on higher brightness levels and when displaying white backgrounds such as email or word processing windows. Texts and images are not as crisp as a result even if the colors are actually quite deep. Backlight bleeding is moderate around the bottom corners and is only noticeable if viewing movies with black borders.
| |||||||||||||||||||||||||
Brightness Distribution: 91 %
Center on Battery: 333.5 cd/m²
Contrast: 1042:1 (Black: 0.32 cd/m²)
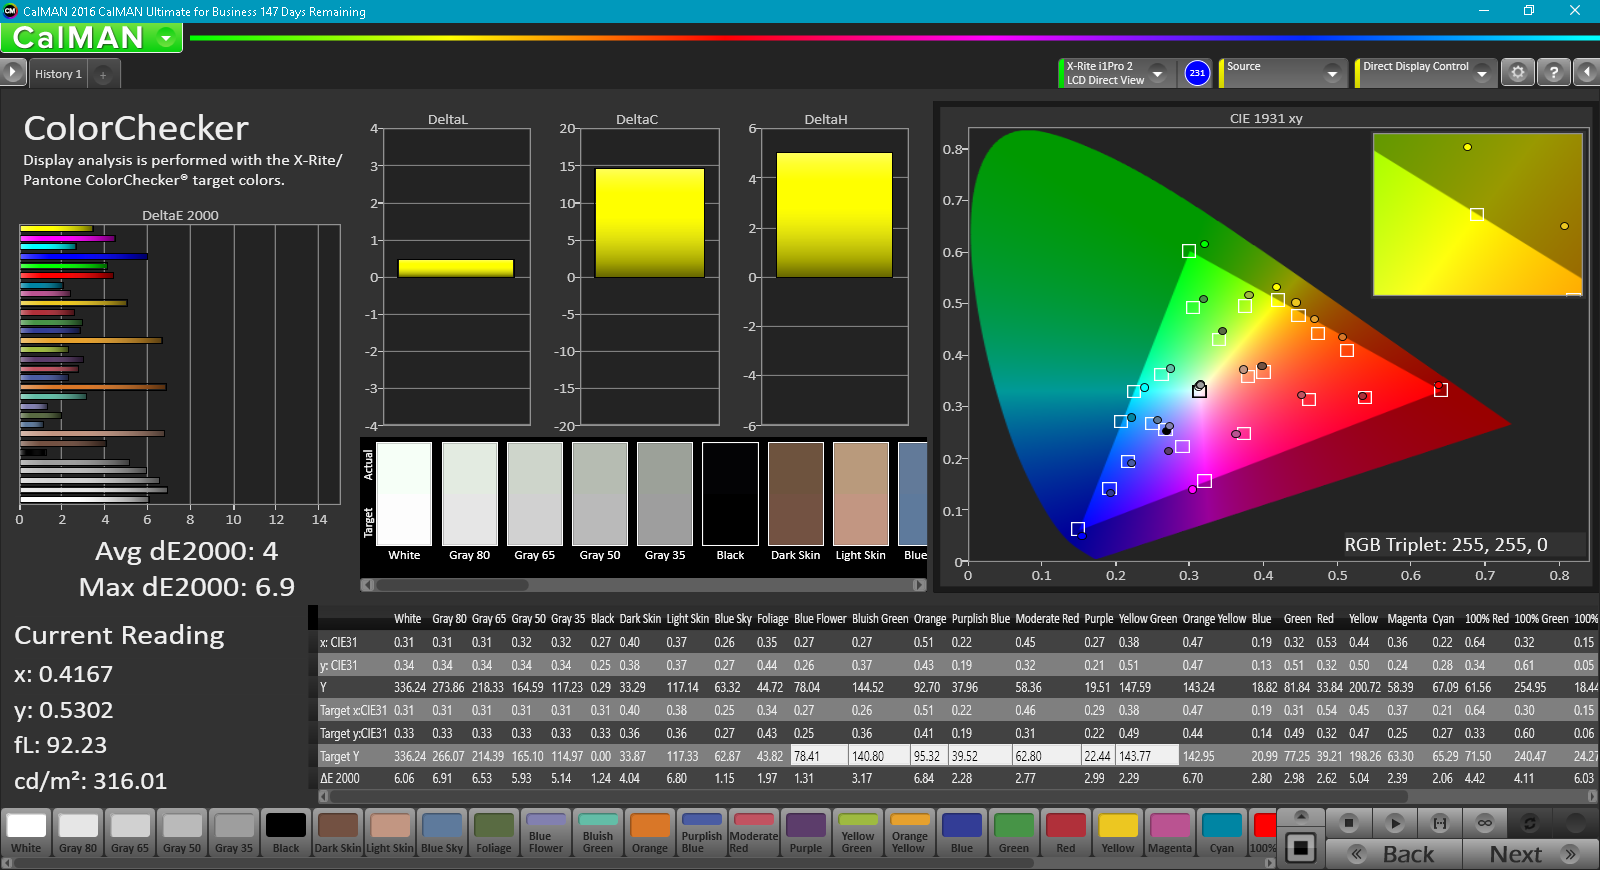
ΔE ColorChecker Calman: 4 | ∀{0.5-29.43 Ø4.71}
ΔE Greyscale Calman: 4.5 | ∀{0.09-98 Ø4.96}
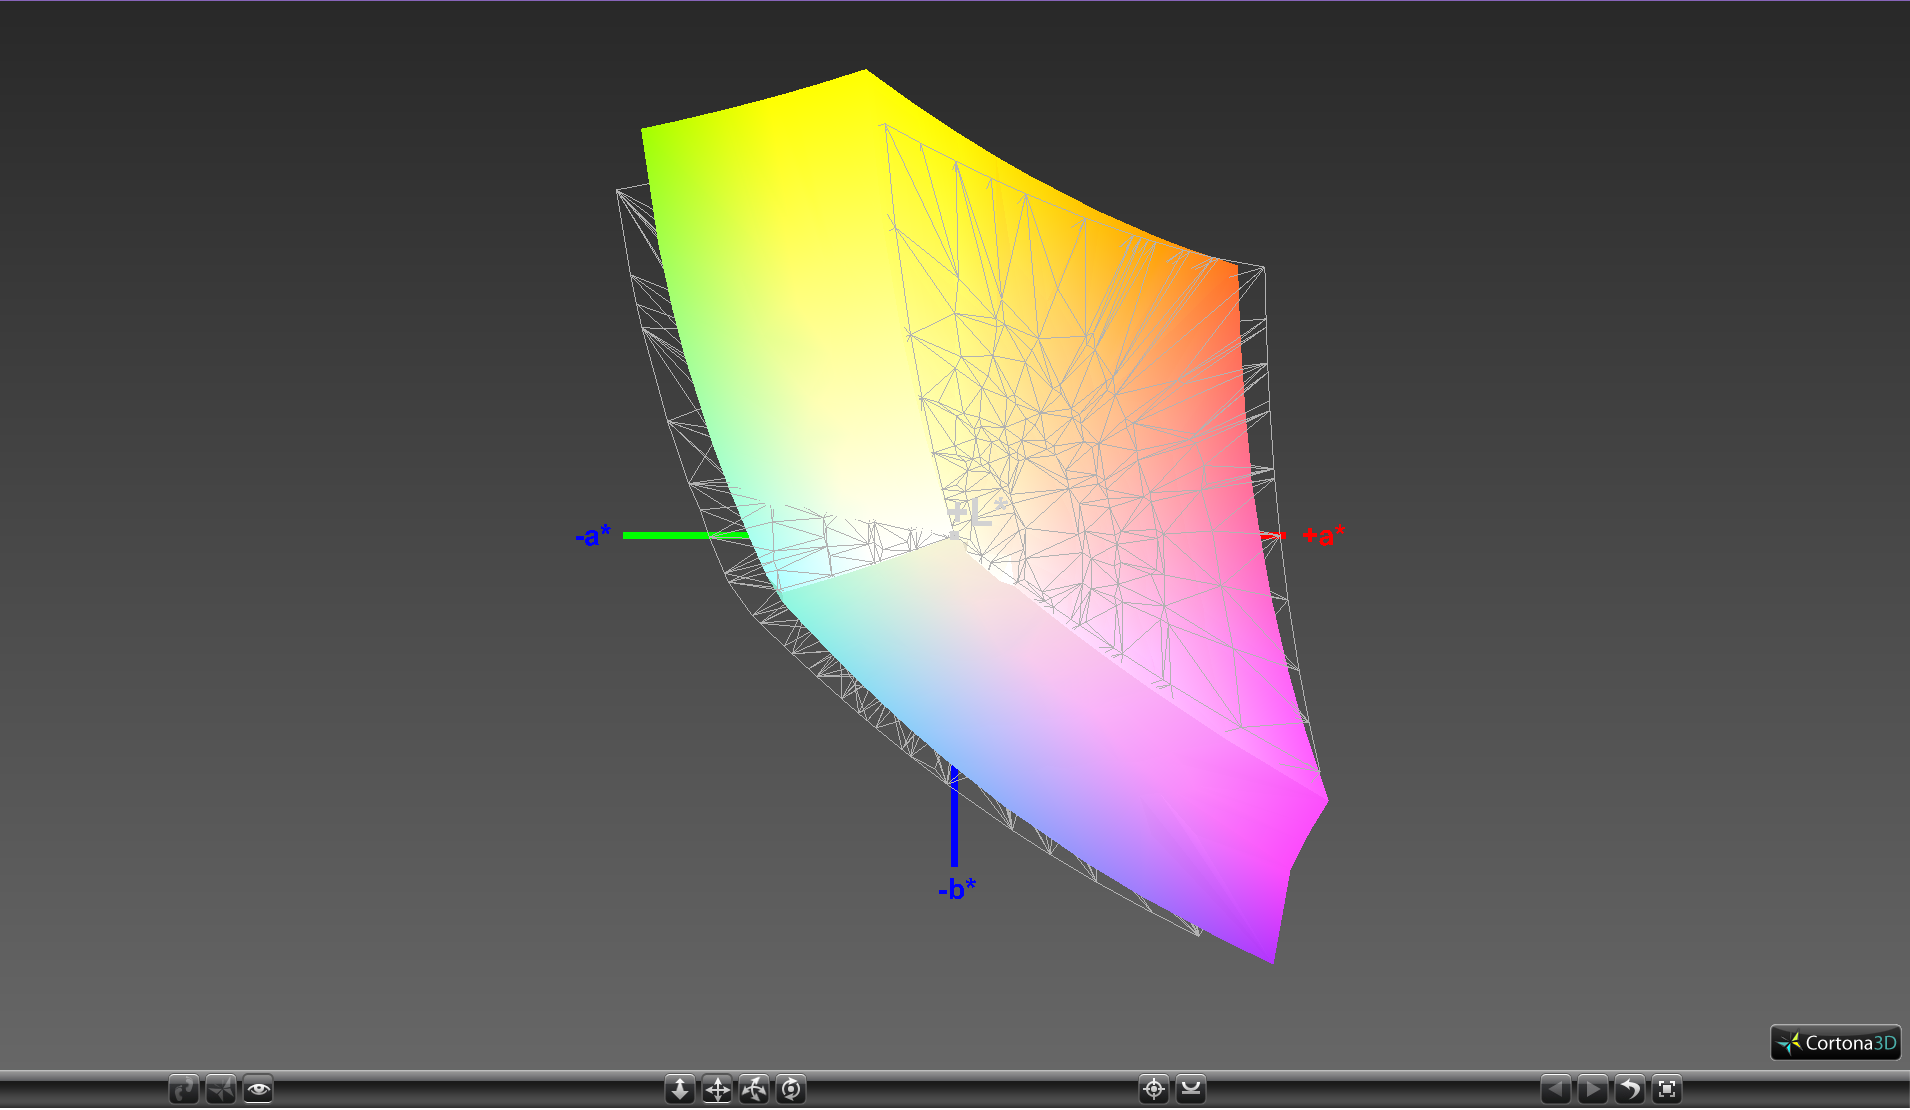
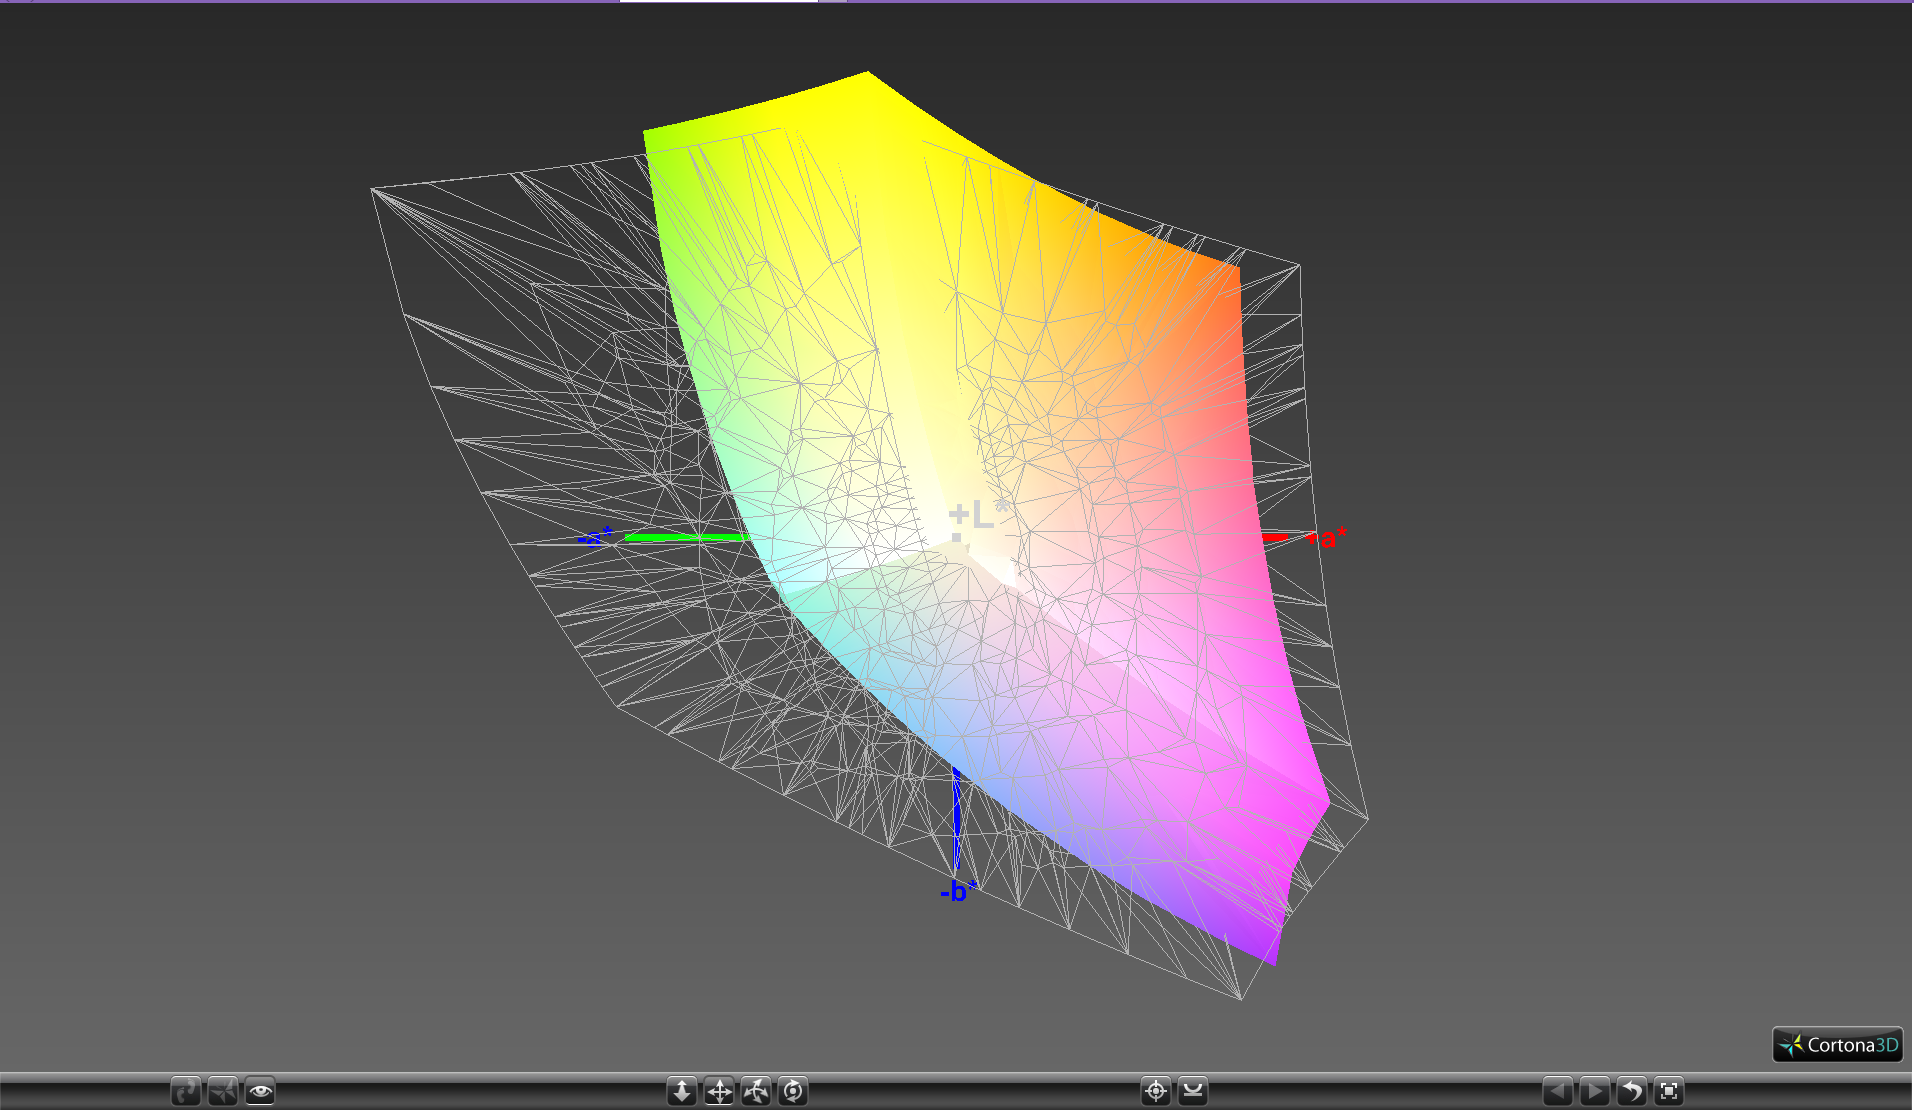
88.1% sRGB (Argyll 1.6.3 3D)
57.5% AdobeRGB 1998 (Argyll 1.6.3 3D)
64.6% AdobeRGB 1998 (Argyll 3D)
88.5% sRGB (Argyll 3D)
64.3% Display P3 (Argyll 3D)
Gamma: 2.19
CCT: 6386 K
| HP Pavilion 17z 1EX13AV ID: AUO109D, Name: AU Optronics B173HW01 V0, IPS, 17.3", 1920x1080 | HP Pavilion 17-x110ng Chi Mei CMN1738, IPS, WLED, 17.3", 1920x1080 | Lenovo Ideapad 110-17IKB 80VK0001GE AU Optronics B173RTN02.2, TN LED, 17.3", 1600x900 | Asus F756UX-T7013T Chi Mei CMN1735 / N173HGE-E11, TN LED, 17.3", 1920x1080 | Dell Inspiron 17 5759-5118 AU Optronics B173HTN, TN LED, 17.3", 1920x1080 | MSI GL72 7RDX-602 Chi Mei CMN1735 N173HGE-E11, TN LED, 17.3", 1920x1080 | |
|---|---|---|---|---|---|---|
| Display | -2% | -19% | 2% | 4% | 3% | |
| Display P3 Coverage (%) | 64.3 | 63.6 -1% | 51.1 -21% | 63.9 -1% | 69.3 8% | 65.2 1% |
| sRGB Coverage (%) | 88.5 | 86.5 -2% | 73.4 -17% | 93.7 6% | 90.6 2% | 94.3 7% |
| AdobeRGB 1998 Coverage (%) | 64.6 | 63.3 -2% | 52.6 -19% | 64.6 0% | 66.3 3% | 65.6 2% |
| Response Times | -7% | -3% | 9% | -51% | 16% | |
| Response Time Grey 50% / Grey 80% * (ms) | 40.8 ? | 41 ? -0% | 50 ? -23% | 42 ? -3% | 86 ? -111% | 29 ? 29% |
| Response Time Black / White * (ms) | 26.4 ? | 30 ? -14% | 22 ? 17% | 21 ? 20% | 24 ? 9% | 26 ? 2% |
| PWM Frequency (Hz) | 200 ? | 50 ? | 1000 ? | 200 ? | 961 | |
| Screen | -23% | -65% | -17% | -43% | -59% | |
| Brightness middle (cd/m²) | 333.5 | 288 -14% | 231 -31% | 268 -20% | 304 -9% | 299 -10% |
| Brightness (cd/m²) | 323 | 285 -12% | 210 -35% | 255 -21% | 292 -10% | 274 -15% |
| Brightness Distribution (%) | 91 | 88 -3% | 83 -9% | 83 -9% | 84 -8% | 80 -12% |
| Black Level * (cd/m²) | 0.32 | 0.61 -91% | 0.37 -16% | 0.17 47% | 0.37 -16% | 0.25 22% |
| Contrast (:1) | 1042 | 472 -55% | 624 -40% | 1576 51% | 822 -21% | 1196 15% |
| Colorchecker dE 2000 * | 4 | 4.56 -14% | 9.83 -146% | 7.18 -80% | 10.62 -166% | 12.92 -223% |
| Colorchecker dE 2000 max. * | 6.9 | 7.76 -12% | 18.35 -166% | 11.67 -69% | 19.91 -189% | |
| Greyscale dE 2000 * | 4.5 | 4.95 -10% | 12.46 -177% | 7.97 -77% | 11.78 -162% | 13.16 -192% |
| Gamma | 2.19 100% | 2.48 89% | 2.43 91% | 2.34 94% | 2.39 92% | 2.36 93% |
| CCT | 6386 102% | 7669 85% | 13115 50% | 8541 76% | 12997 50% | 15046 43% |
| Color Space (Percent of AdobeRGB 1998) (%) | 57.5 | 48 -17% | 59 3% | 59 3% | 60 4% | |
| Color Space (Percent of sRGB) (%) | 88.1 | 93 6% | 73 -17% | 94 7% | 90 2% | 94 7% |
| Total Average (Program / Settings) | -11% /
-16% | -29% /
-48% | -2% /
-10% | -30% /
-34% | -13% /
-37% |
* ... smaller is better
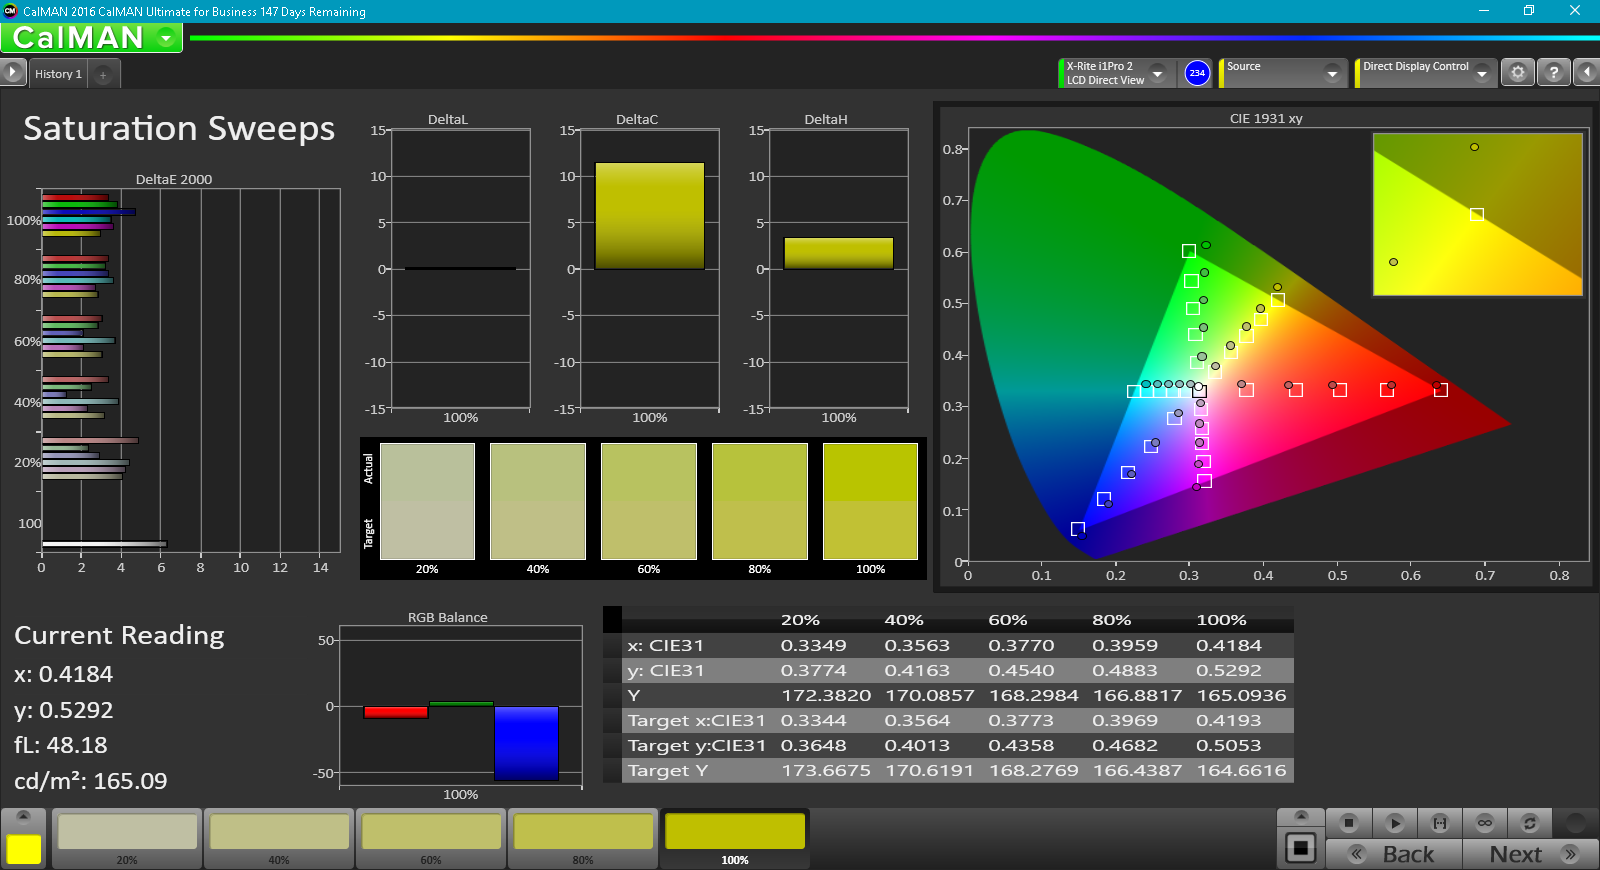
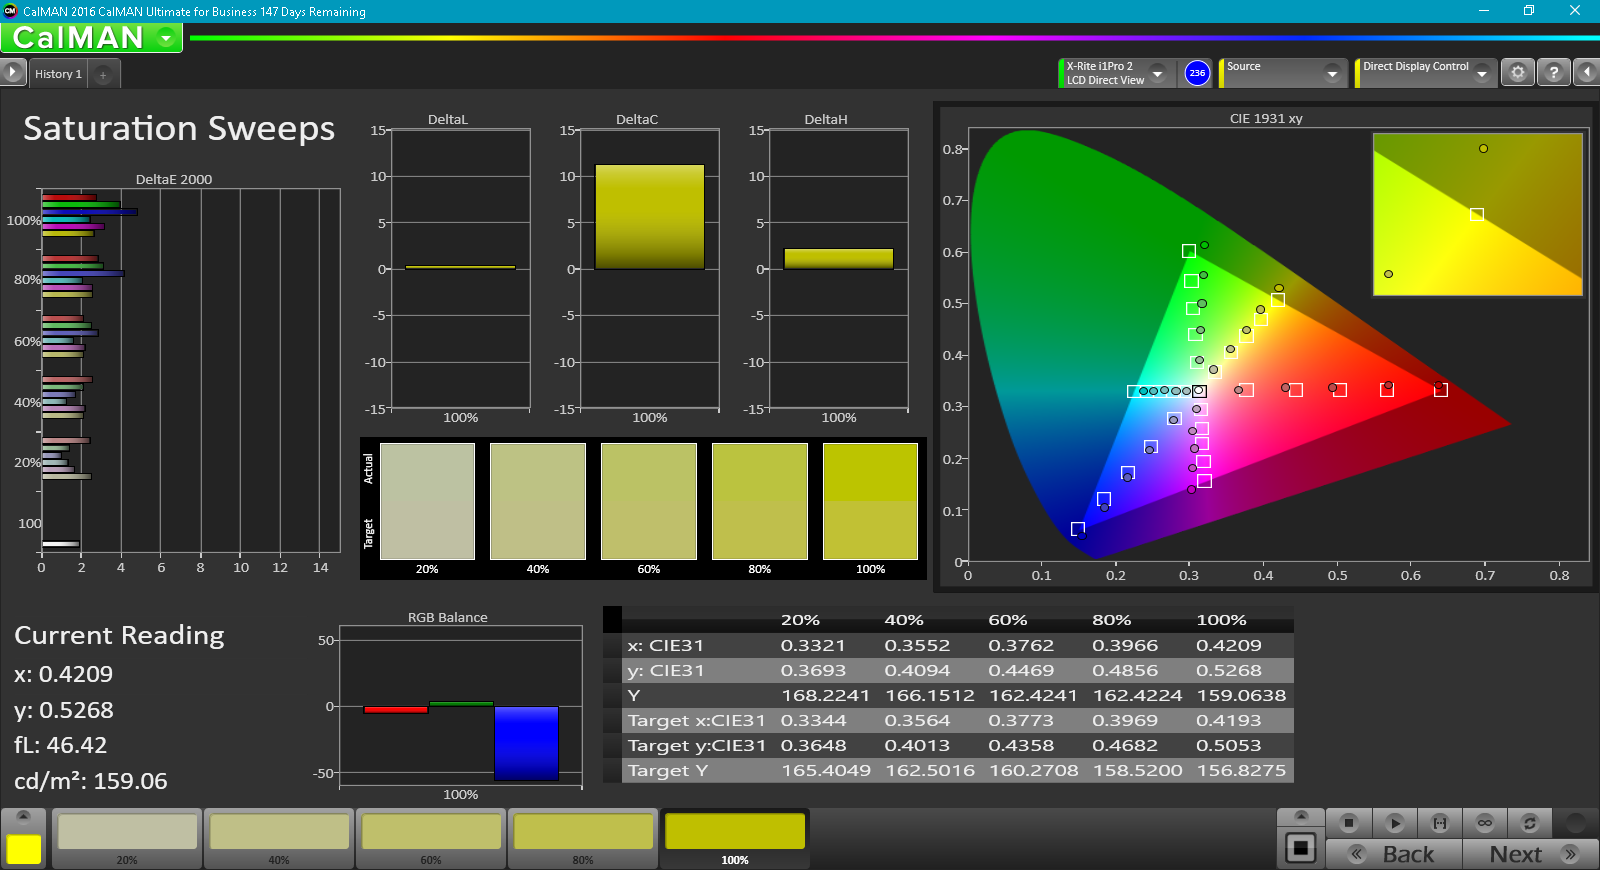
Color coverage is approximately 58 percent and 88 percent of the AdobeRGB and sRGB standards, respectively. This is wider than average considering the low price of the notebook and is essentially as wide as the display on the more expensive Asus UX501. The HP system does not suffer from poor or shallow colors as may happen on many budget notebooks.

Further measurements with an X-Rite spectrophotometer show poor grayscale out of the box. A calibration improves the average grayscale DeltaE from 4.5 to 1.7 with slightly better colors, too. Orange and Blue colors in particular are represented less accurately than others.

Display Response Times
| ↔ Response Time Black to White | ||
|---|---|---|
| 26.4 ms ... rise ↗ and fall ↘ combined | ↗ 14 ms rise | 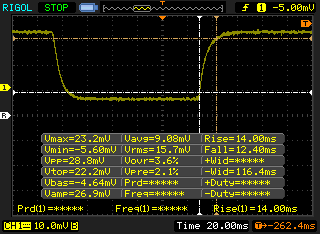 |
| ↘ 12.4 ms fall | ||
| The screen shows relatively slow response rates in our tests and may be too slow for gamers. In comparison, all tested devices range from 0.1 (minimum) to 240 (maximum) ms. » 66 % of all devices are better. This means that the measured response time is worse than the average of all tested devices (19.8 ms). | ||
| ↔ Response Time 50% Grey to 80% Grey | ||
| 40.8 ms ... rise ↗ and fall ↘ combined | ↗ 22 ms rise | 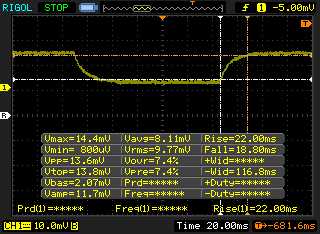 |
| ↘ 18.8 ms fall | ||
| The screen shows slow response rates in our tests and will be unsatisfactory for gamers. In comparison, all tested devices range from 0.165 (minimum) to 636 (maximum) ms. » 64 % of all devices are better. This means that the measured response time is worse than the average of all tested devices (31 ms). | ||
Screen Flickering / PWM (Pulse-Width Modulation)
| Screen flickering / PWM not detected | 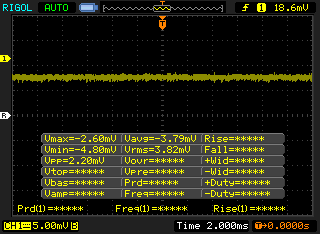 | ||
In comparison: 52 % of all tested devices do not use PWM to dim the display. If PWM was detected, an average of 7757 (minimum: 5 - maximum: 343500) Hz was measured. | |||
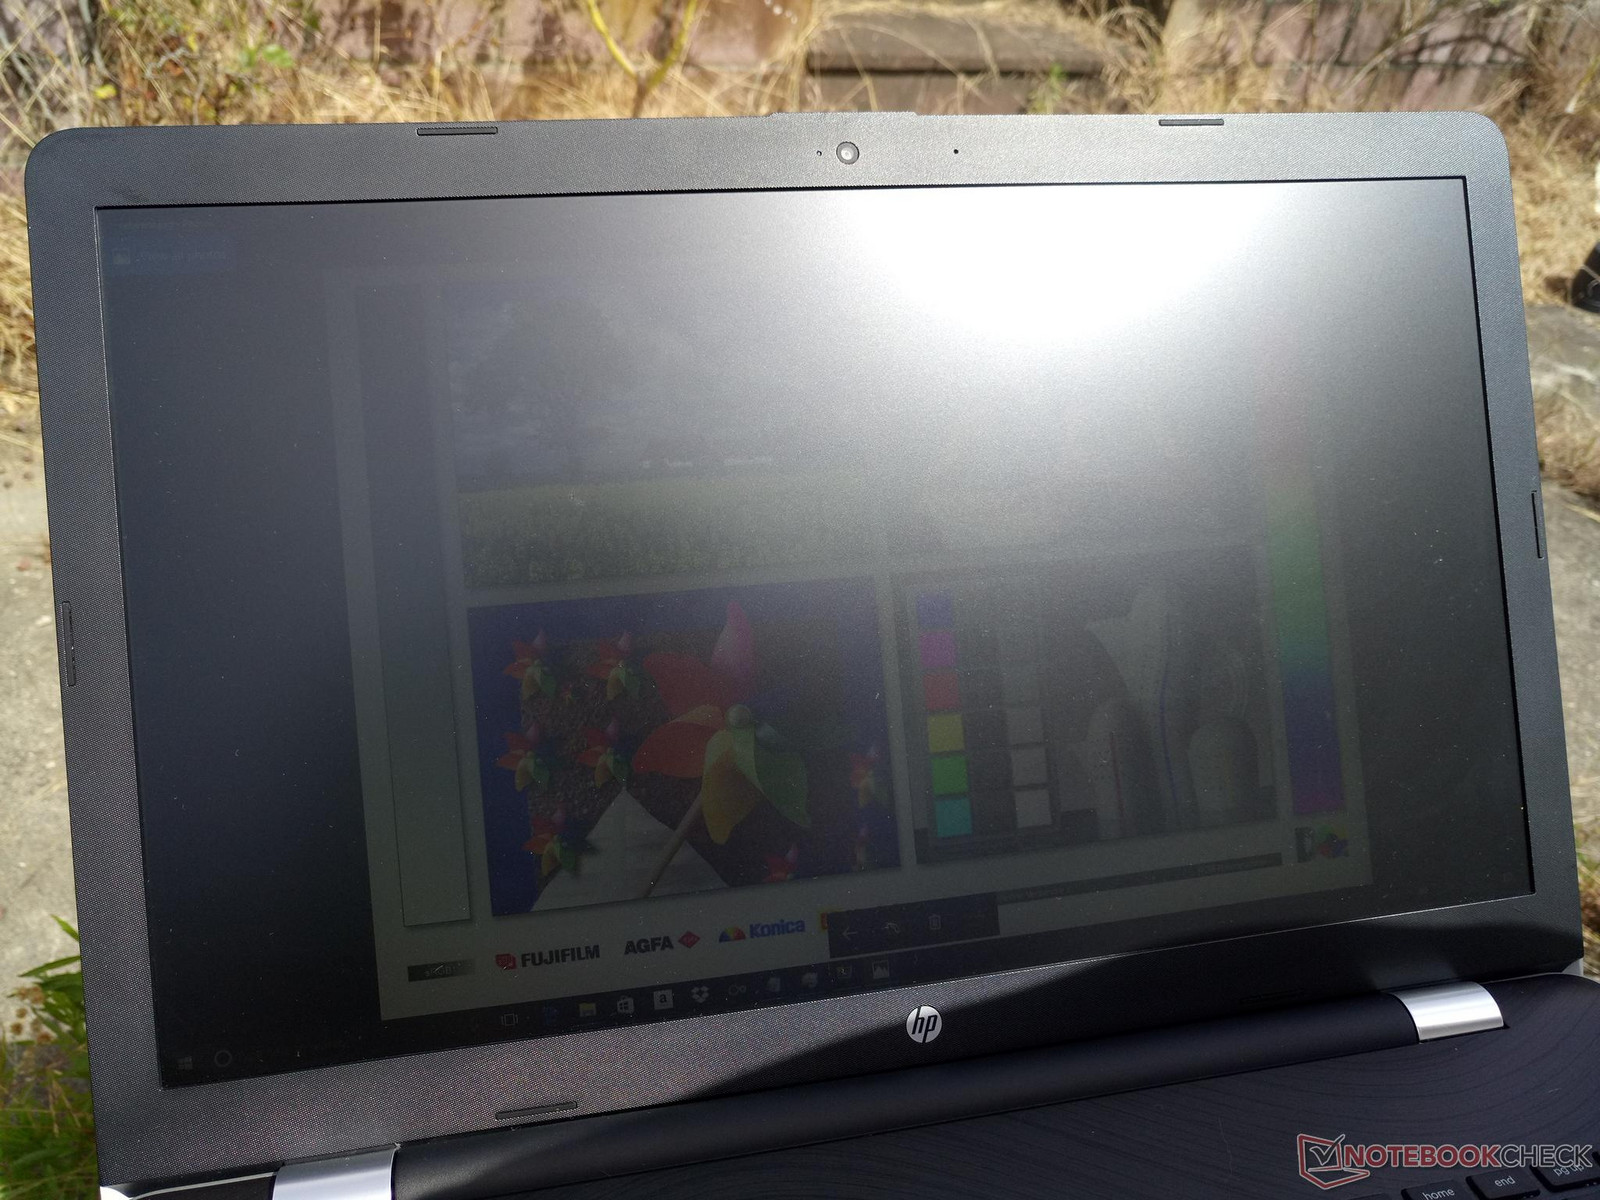
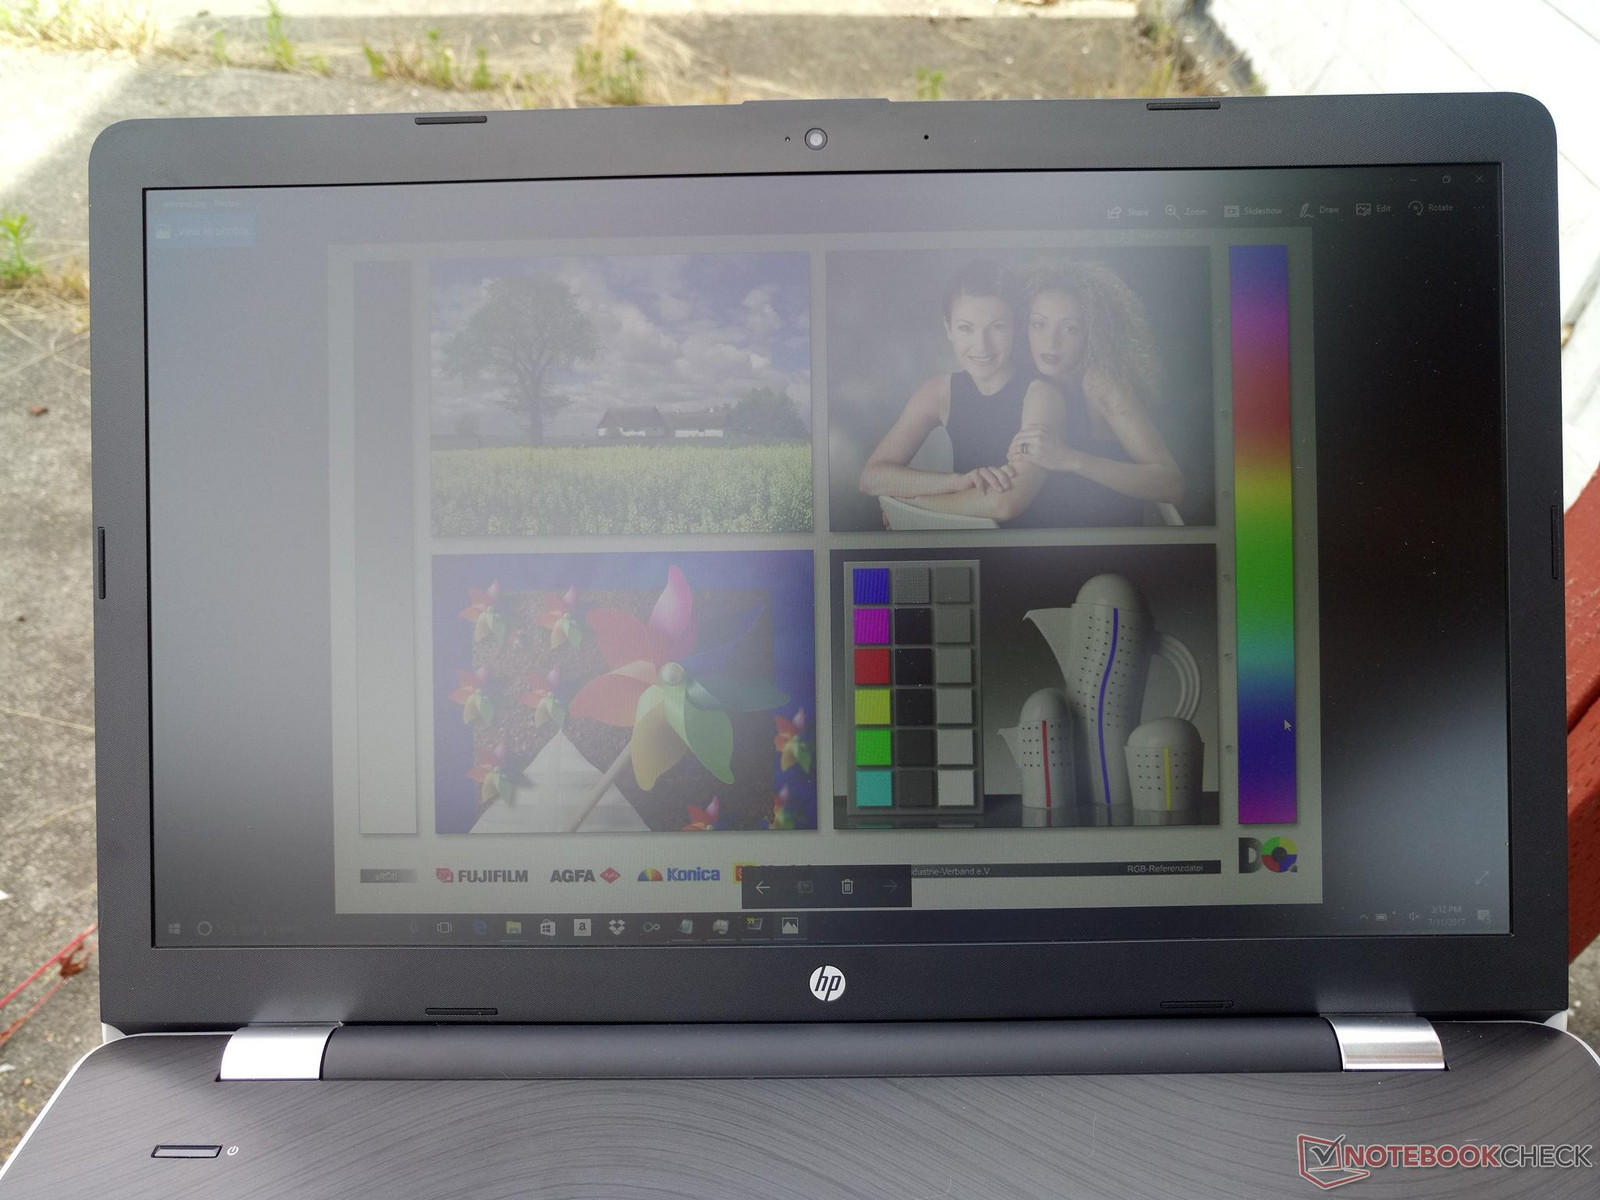
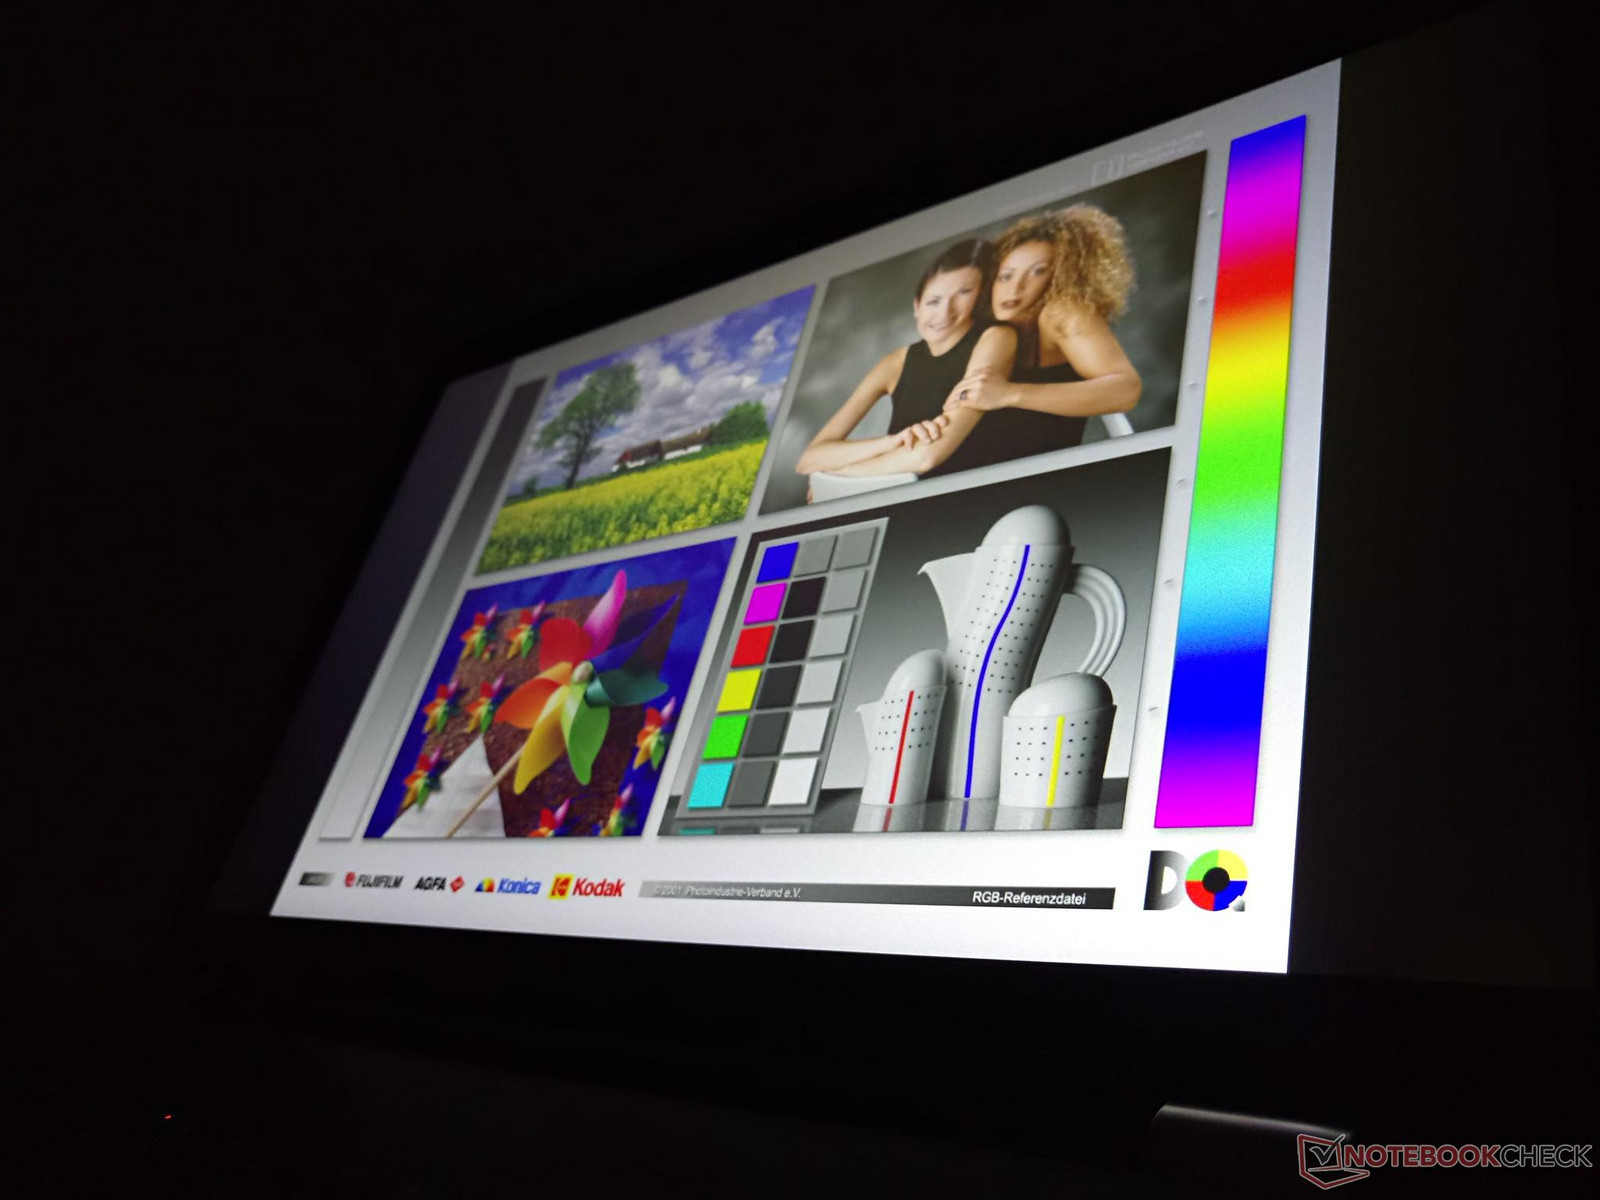
Outdoor visibility is average at best when under shade. Any brighter, however, and colors quickly wash out to become very difficult to see even if the matte panel is keeping glare at a minimum. Larger panels require a stronger backlight compared to smaller tablets and the Pavilion 17z is simply not designed for use under direct sunlight.
Performance
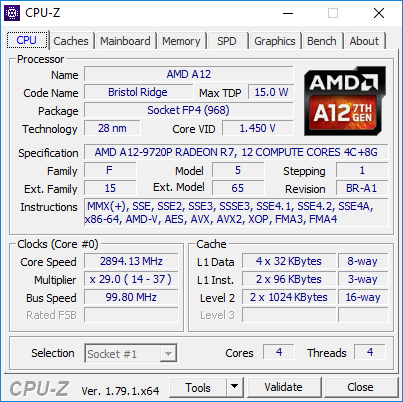
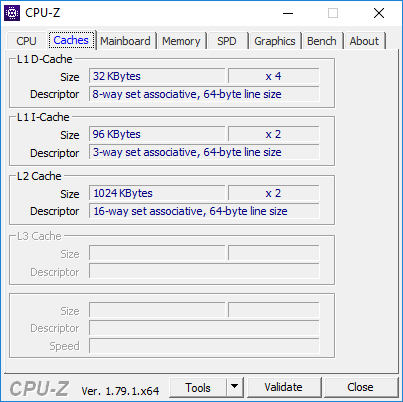
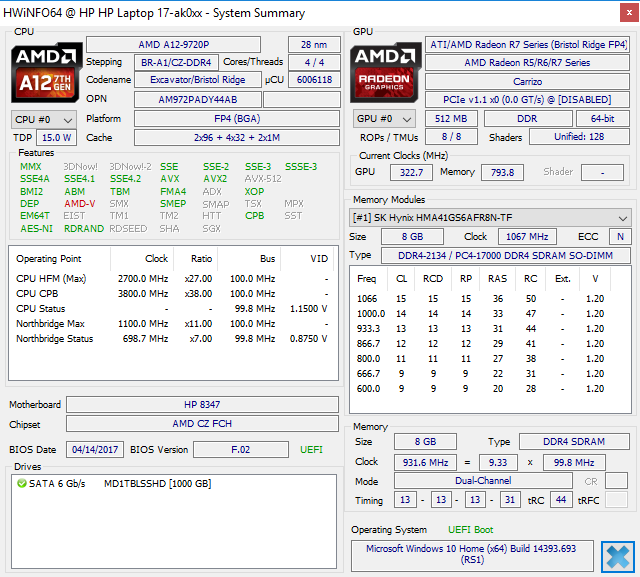
The AMD A12-9720P APU is what separates our Pavilion 17z from most other notebooks in the market. This quad-core 15 W processor from the Bristol Ridge family supplants the older Carrizo family of APUs while sharing the same Excavator architecture. It's very roughly comparable to the "tock" in Intel's now-defunct "tick-tock" design model and is likely going to be AMD's final mobile Excavator processor before moving onto the Zen architecture. Slower SKUs comprising of the A10 series and dual-core Stoney Ridge A9 series are also available.
See our overviews of the Bristol Ridge and Stoney Ridge architecture and features for more technical information on the AMD 7th generation APUs.
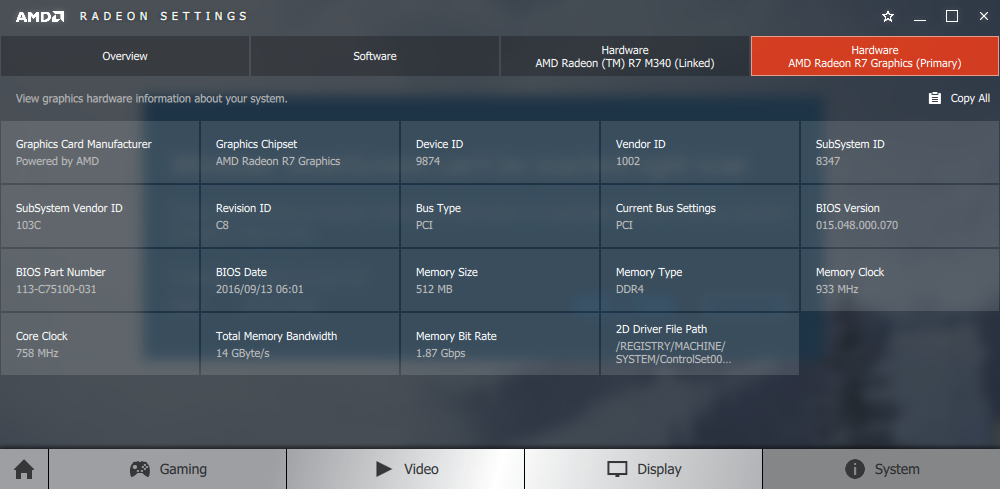
(July 20, 2017 update: All benchmarks were performed with Dual Graphics enabled between the integrated Radeon R7 (Bristol Ridge) GPU and discrete R7 M340. Pavilion 17z configurations without Dual Graphics is also available through the A9 APU.)
Processor
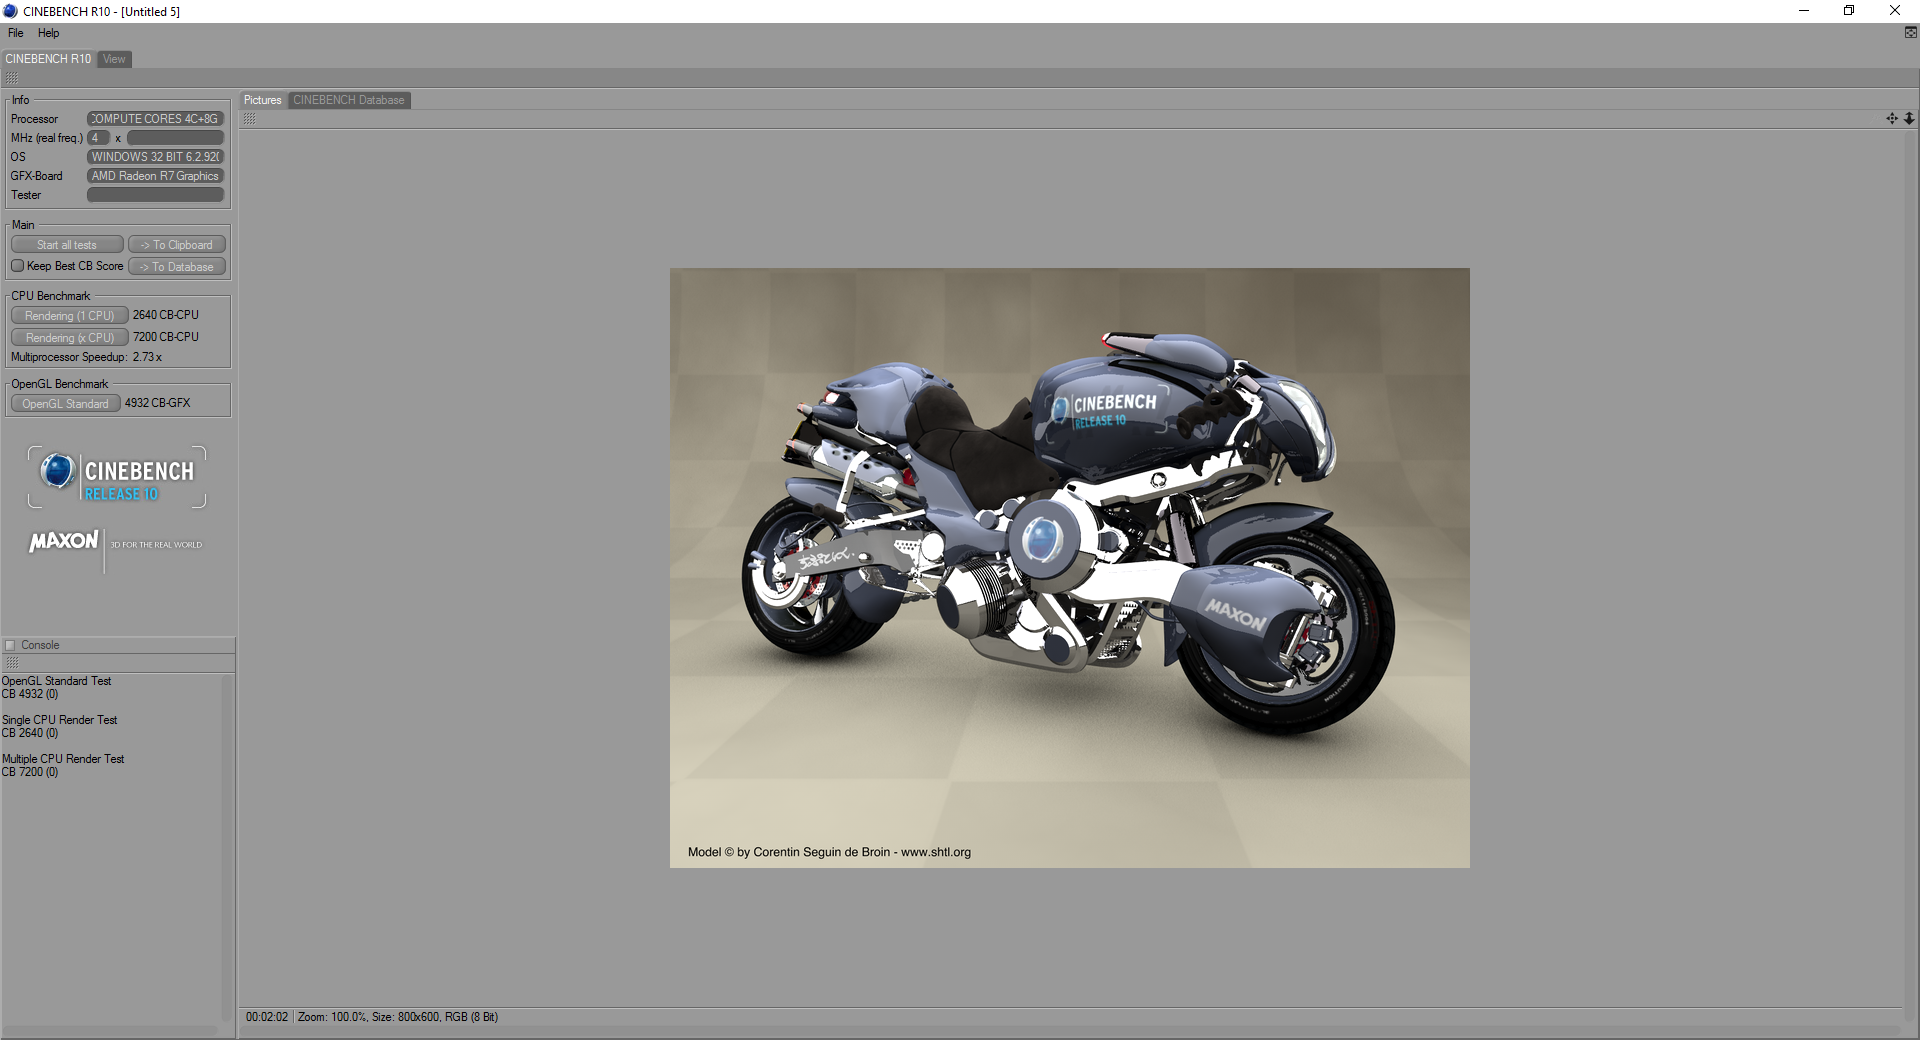
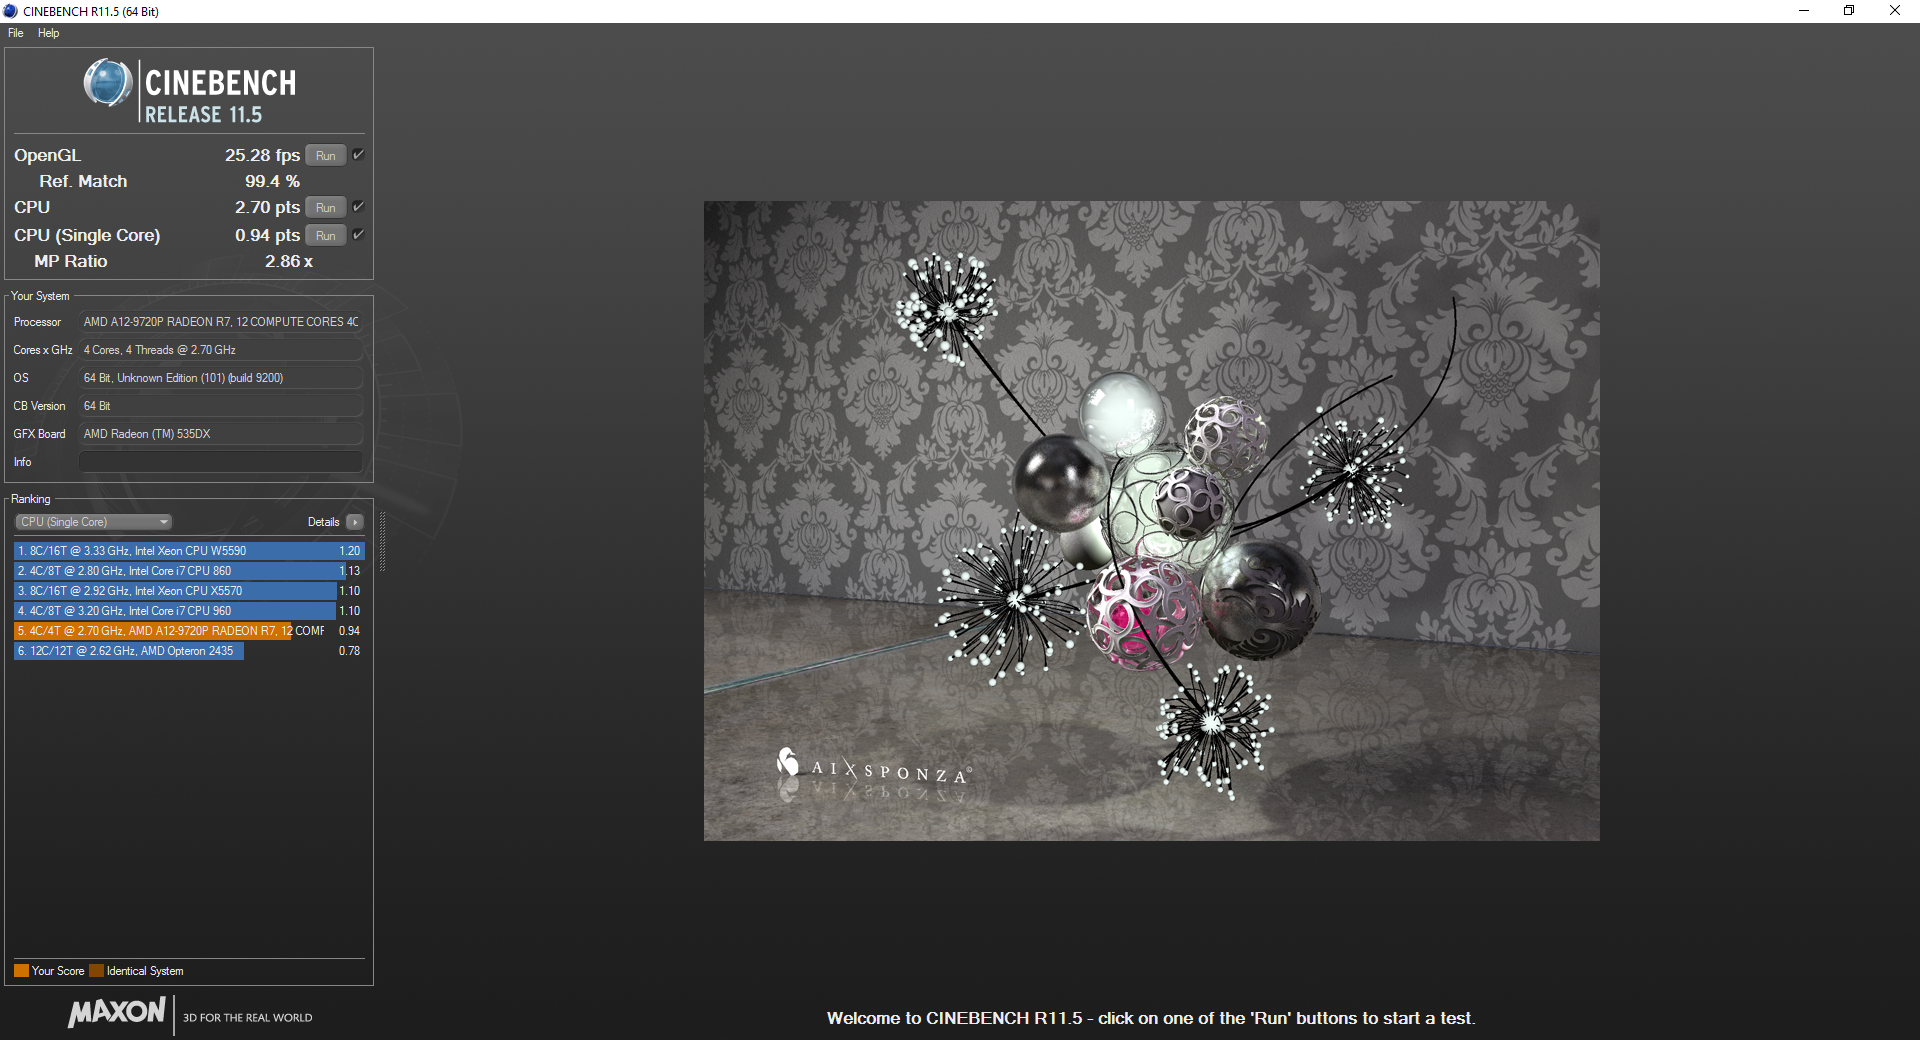
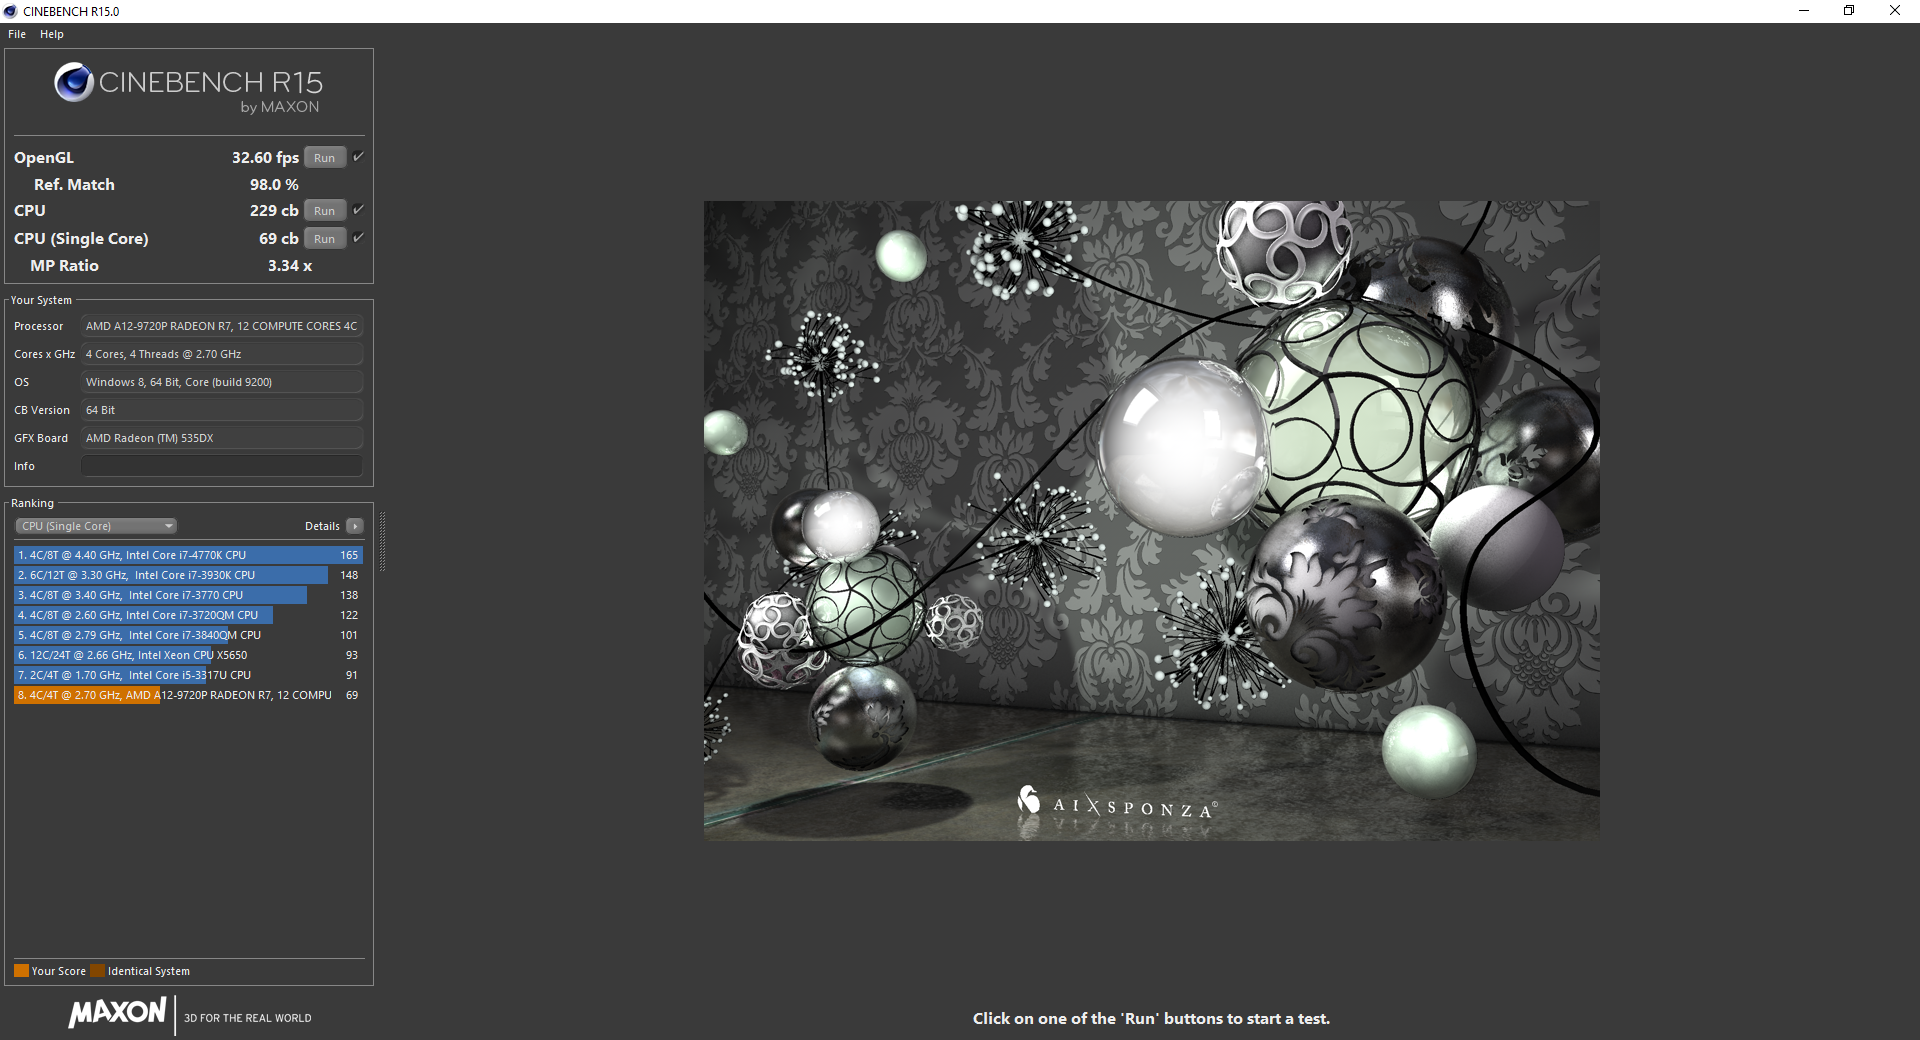
The quad-core A12-9720P is disappointing to say the least. Not only is it significantly slower than the common i5-6200U and i5-7200U, but it offers no CPU performance advantages over AMD's own A12-9700P according to CineBench benchmarks despite the higher base clock rate (2.7 GHz vs. 2.5 GHz). Even the passively-cooled Core i5-7Y54 can outperform and match the A12-9720P in single-threaded and multi-threaded loads, respectively. Overall performance sits roughly between the generations old Core i3-4010U and i3-5010U commonly found on NUCs and mini PCs.
Running CineBench R15 Multi-Thread in a loop results in a performance drop of about 6 to 7 percent after the first two to three consecutive runs. Users are not likely to notice during day-to-day use, but we prefer to have as much performance out of the processor as possible given that it is already very slow to begin with.
See our dedicated page on the A12-9720P APU for more benchmarks.
| wPrime 2.10 - 1024m | |
| Lenovo ThinkPad X1 Tablet Gen 2 | |
| HP Pavilion 14t-ab000 K9E07AV | |
| Asus X555DA-BB11 | |
| HP Pavilion 17z 1EX13AV | |
* ... smaller is better
System Performance
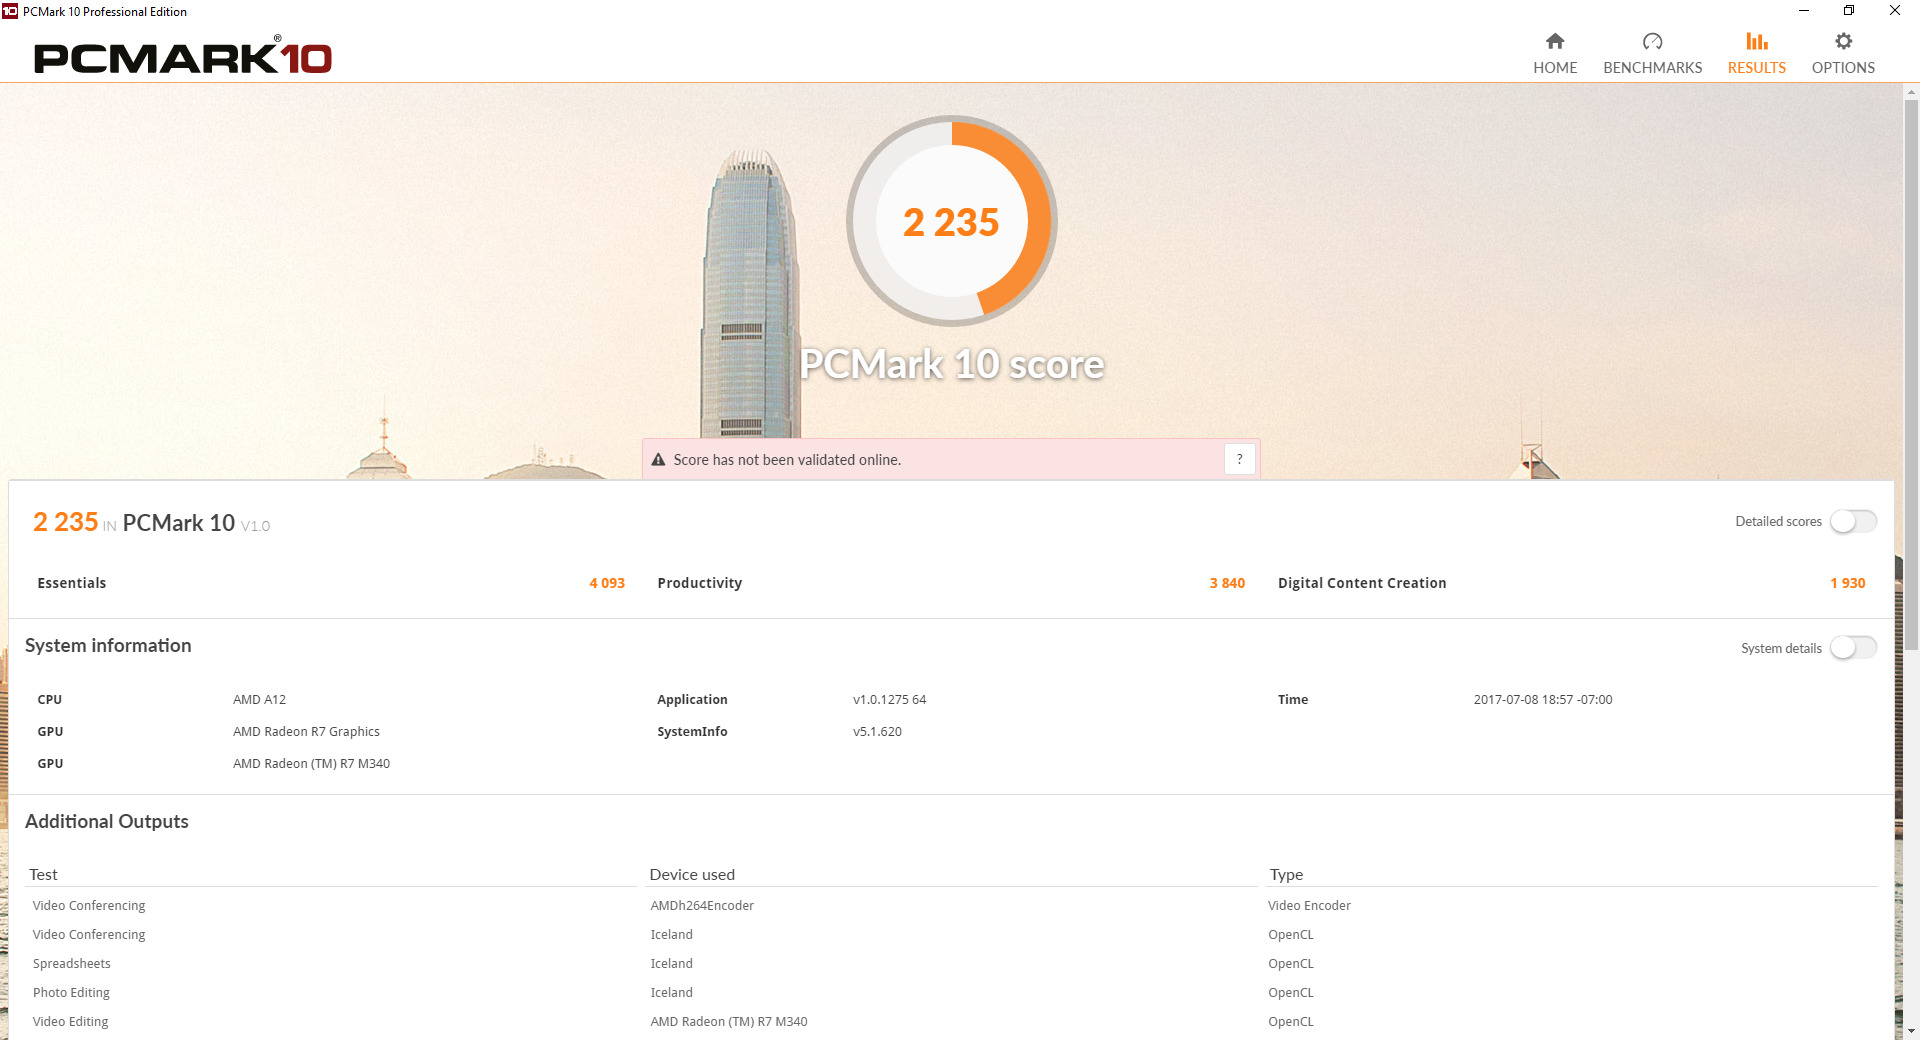
PCMark benchmark scores are well below ULV Intel notebooks but above Intel Core Y notebooks like the Yoga 3 Pro 13. Subjectively, however, system performance is excruciatingly slow as simple actions that are expected to be instantaneous can often take seconds. Opening Windows Explorer, toggling WiFi, and even the Task Manager and Radeon Settings will all take a bit of time to launch. Browsers, installations, and larger applications are even worse. Despite the slow system response, we never experienced any actual crashes during our time with the unit.
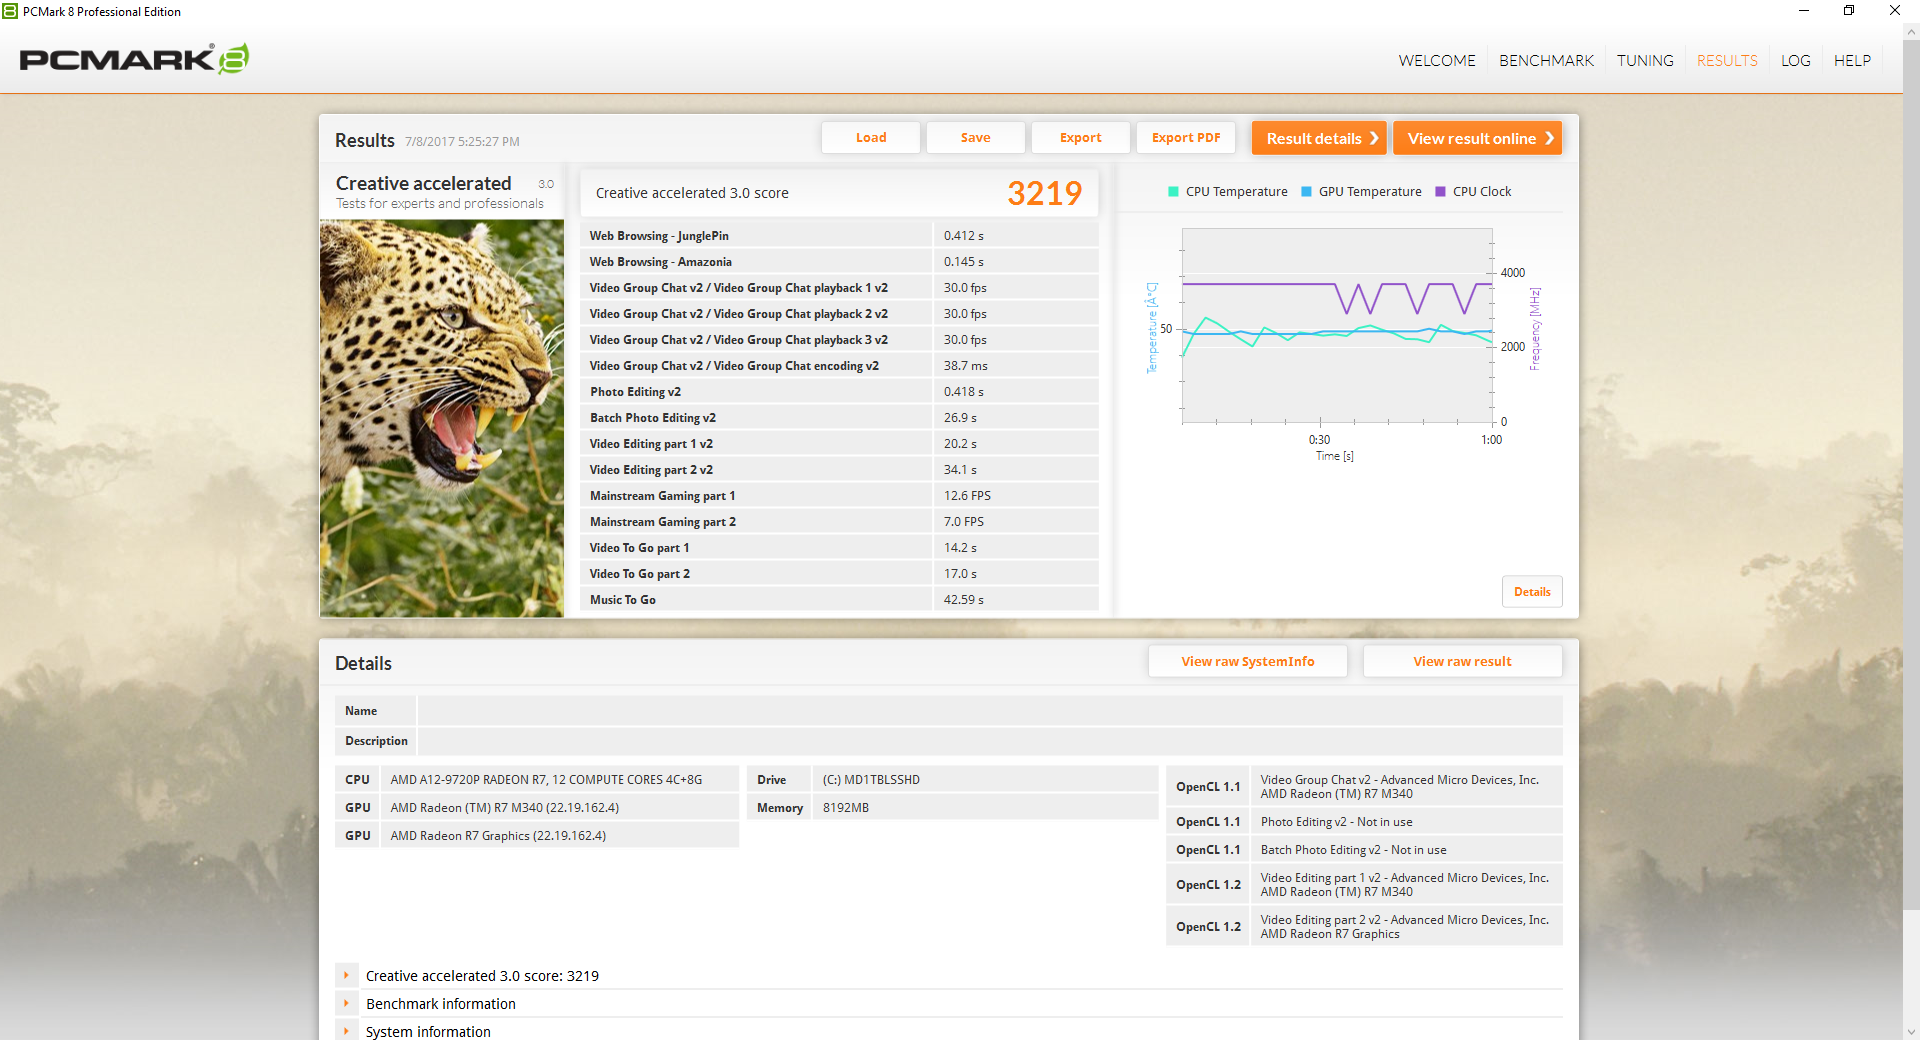
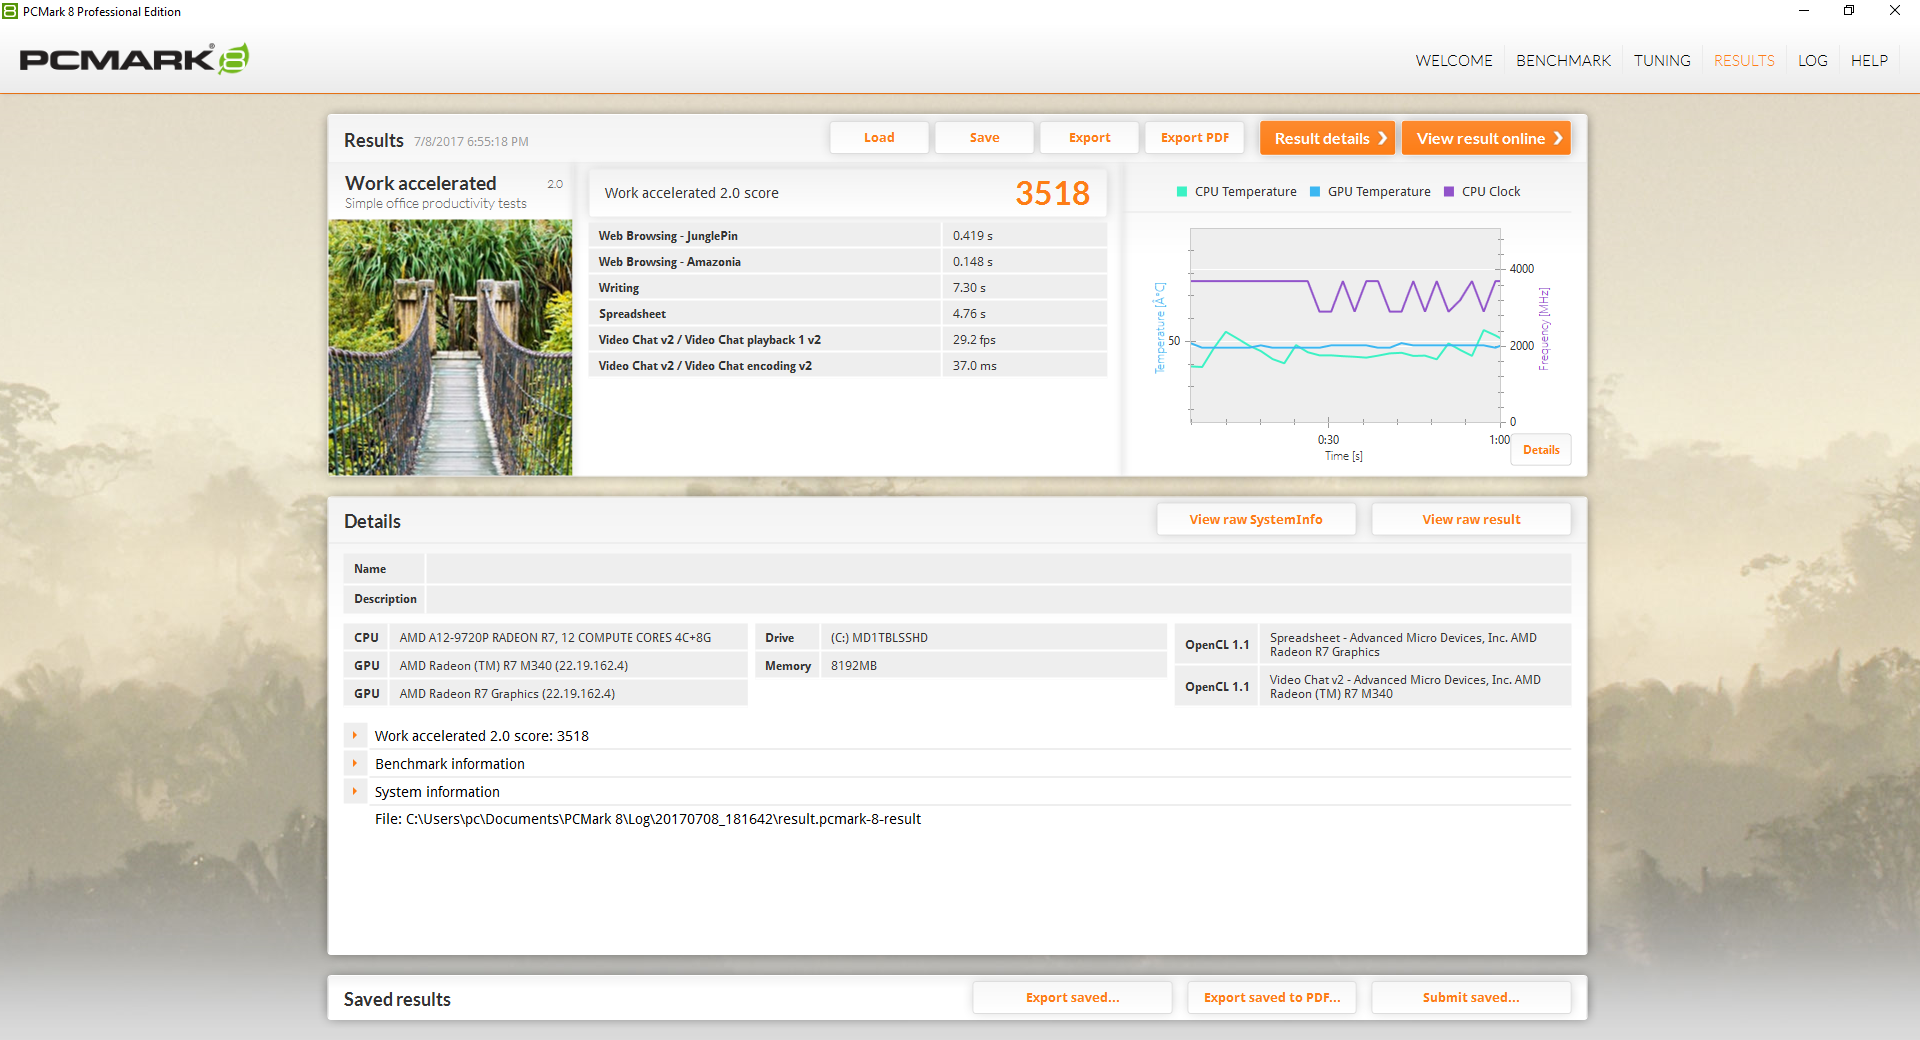
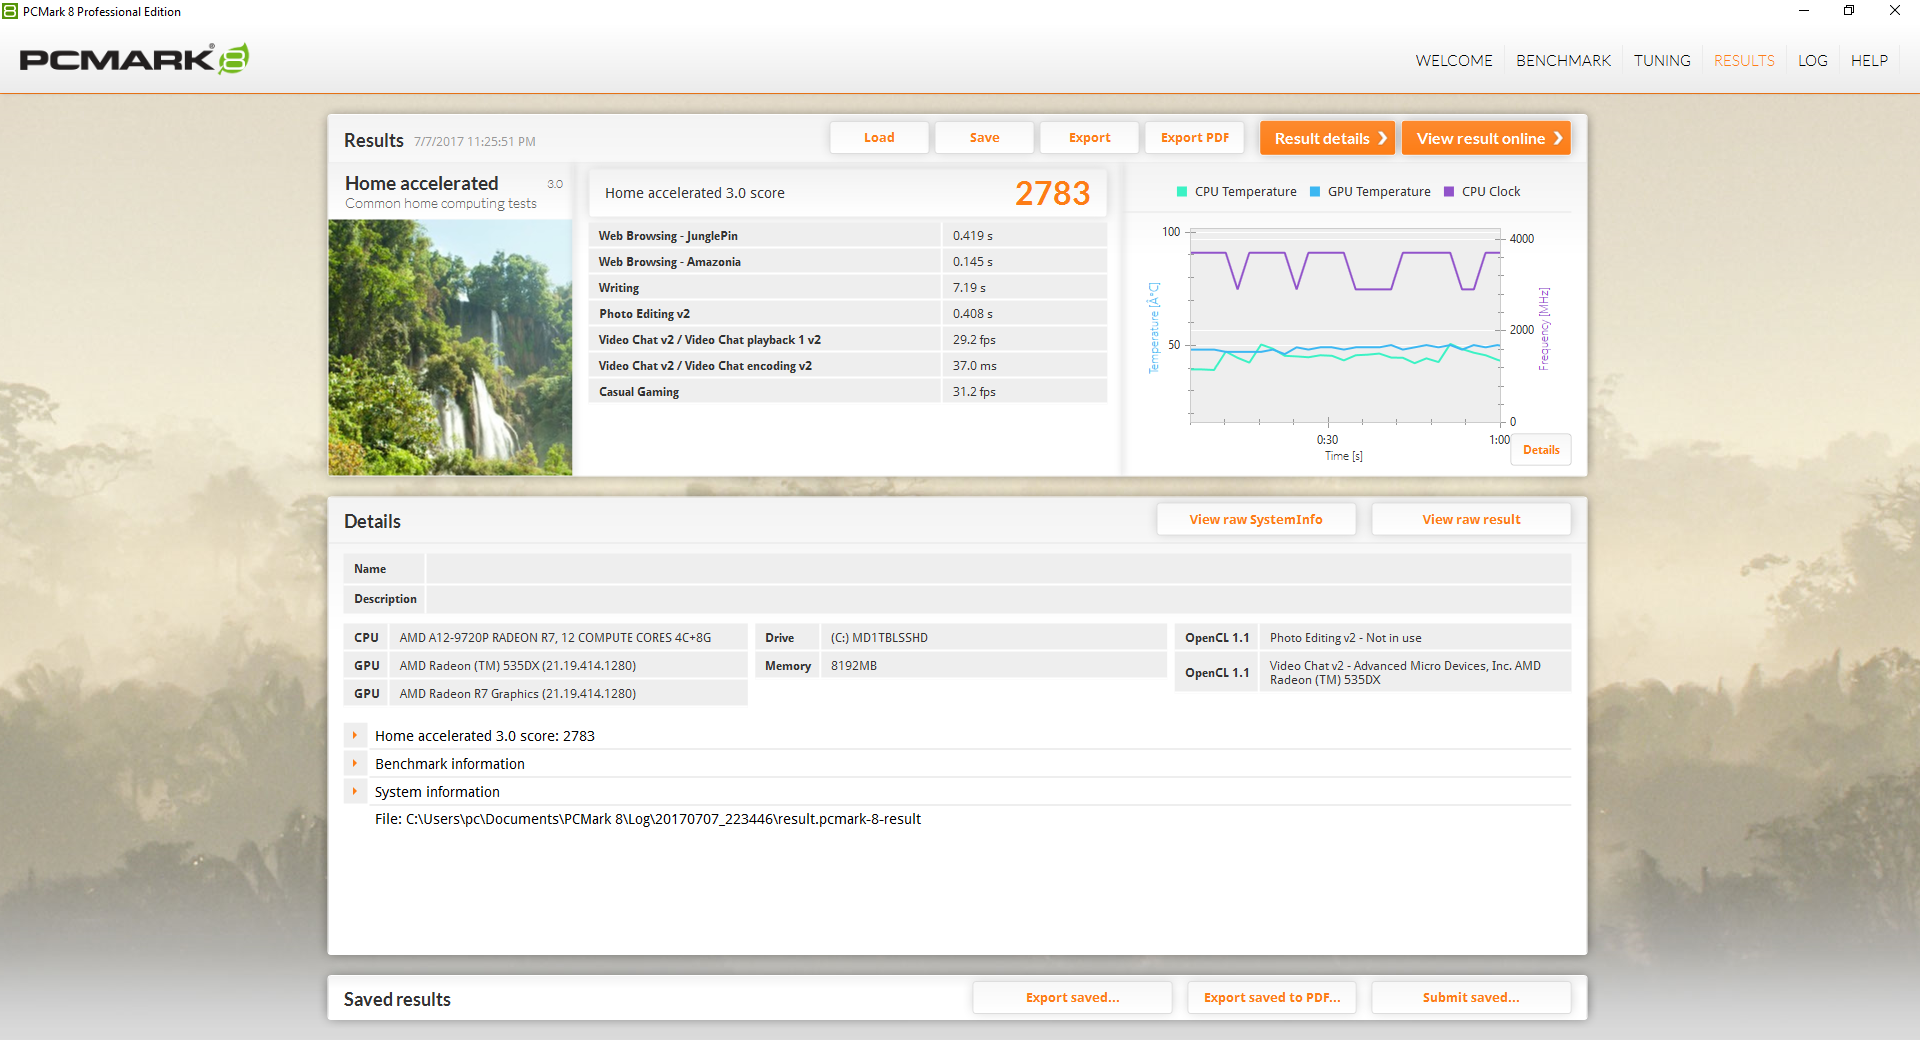
| PCMark 8 Home Score Accelerated v2 | 2783 points | |
| PCMark 8 Creative Score Accelerated v2 | 3219 points | |
| PCMark 8 Work Score Accelerated v2 | 3518 points | |
| PCMark 10 Score | 2235 points | |
Help | ||
Storage Devices
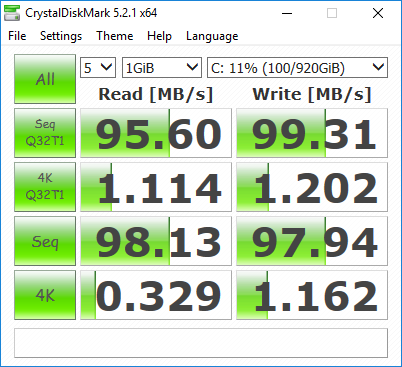
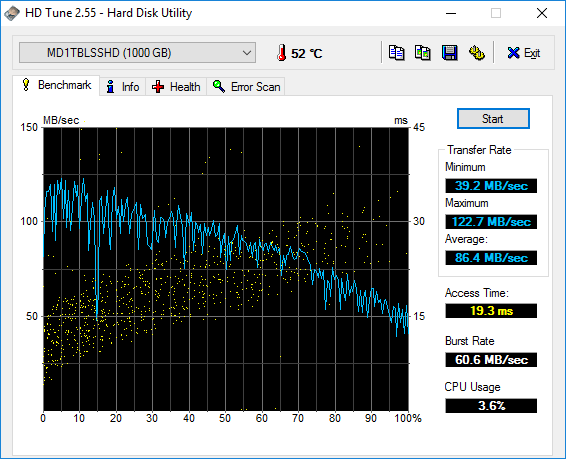
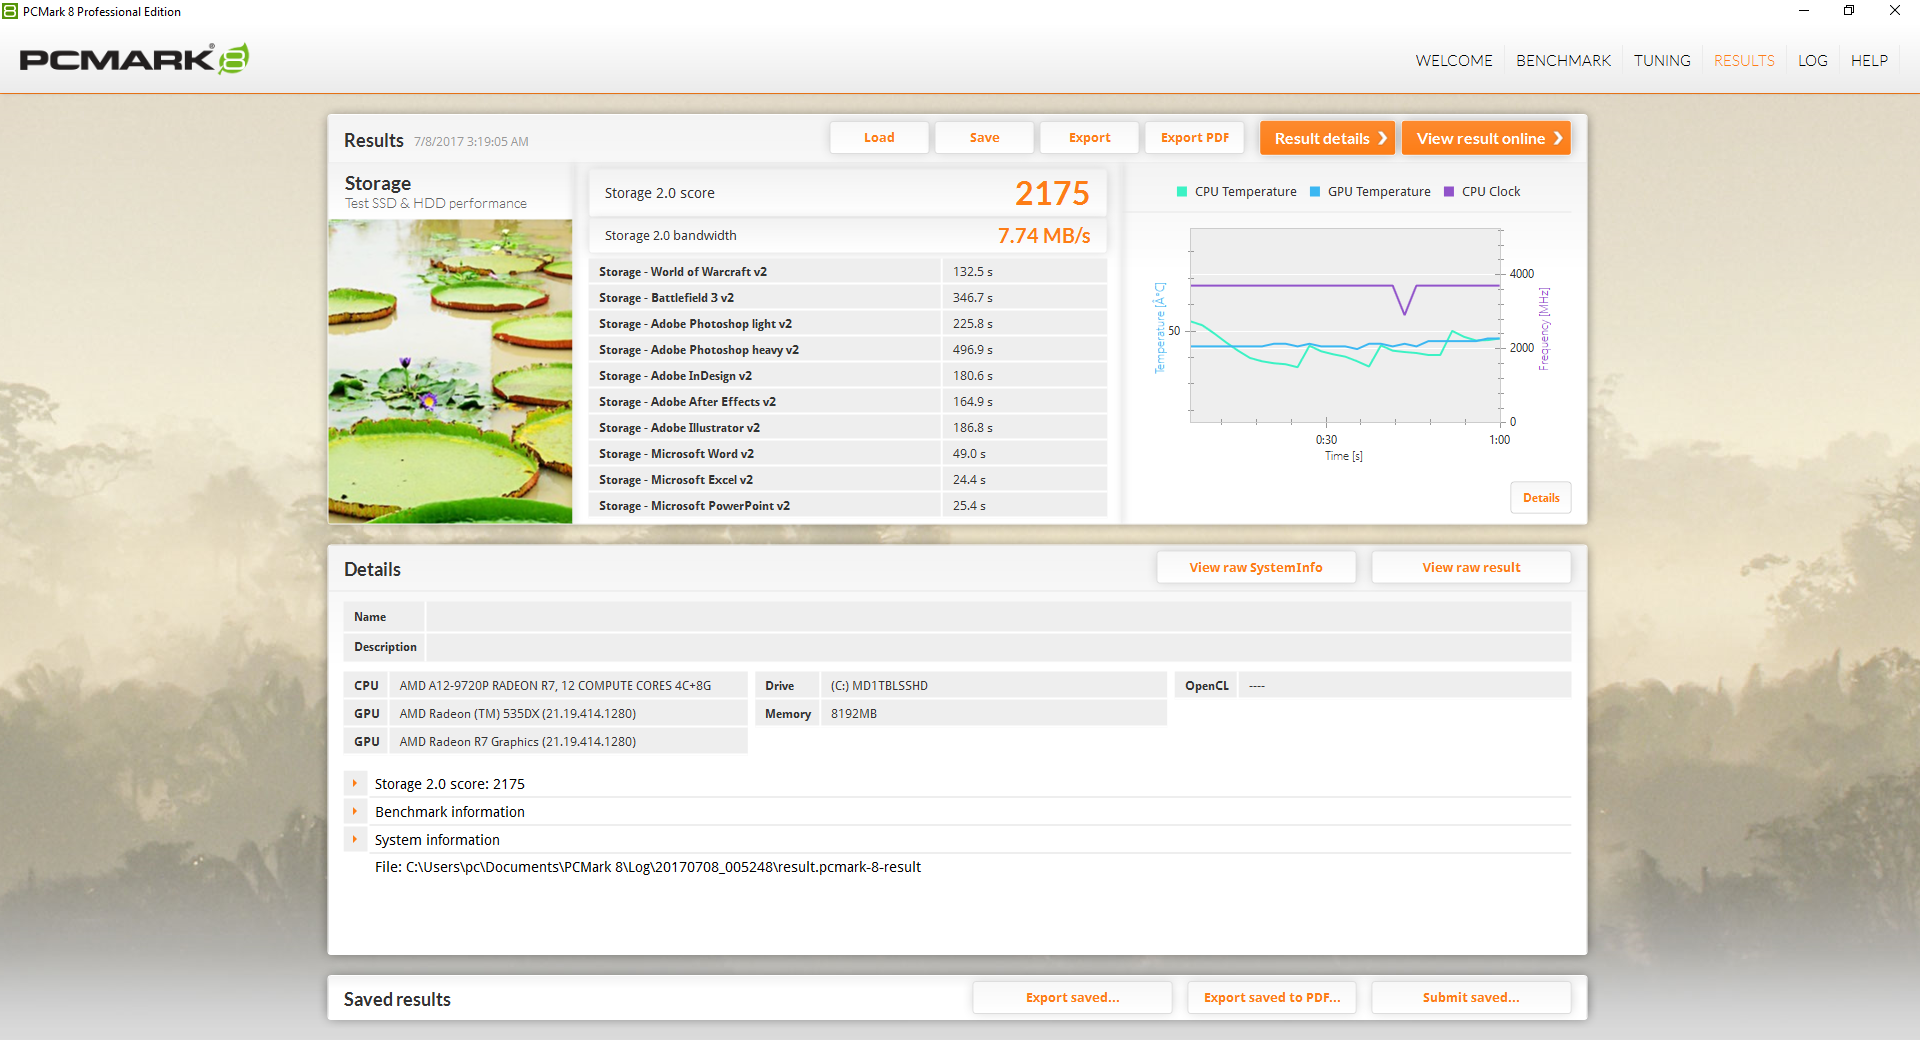
Only a single internal 2.5-inch SATA III slot is available with no secondary options. Our unit from Cukusa comes equipped with a 1 TB Avolusion MD1TBLSSHD HDD that is commonly found on Playstation 4 systems but not on many laptops. Transfer rates are average for a 5400 RPM drive at 86 MB/s according to HD Tune whereas a 7200 RPM HDD can clock in just over 100 MB/s. See our table of HDDs and SSDs for more benchmark comparisons.
| HP Pavilion 17z 1EX13AV WDC Scorpio Blue WD10JPVX-60JC3T1 | HP Pavilion 17-x110ng SanDisk Z400s SD8SNAT-256G | Lenovo Ideapad 110-17IKB 80VK0001GE WDC Scorpio Blue WD10JPCX-24UE4T0 | Asus F756UX-T7013T HGST Travelstar 5K1000 HTS541010A9E680 | Dell Inspiron 17 5759-5118 Seagate Momentus SpinPoint M8 ST1000LM024 HN-M101MBB | |
|---|---|---|---|---|---|
| CrystalDiskMark 3.0 | 8313% | 45% | 22% | -9% | |
| Read Seq (MB/s) | 90 | 500 456% | 110.3 23% | 105.8 18% | 91.8 2% |
| Write Seq (MB/s) | 90.3 | 325.1 260% | 109 21% | 105 16% | 84.7 -6% |
| Read 512 (MB/s) | 28.47 | 290.2 919% | 39.19 38% | 33.33 17% | 26.59 -7% |
| Write 512 (MB/s) | 47.07 | 300.3 538% | 52.9 12% | 39.12 -17% | 32.7 -31% |
| Read 4k (MB/s) | 0.31 | 11.24 3526% | 0.45 45% | 0.413 33% | 0.288 -7% |
| Write 4k (MB/s) | 0.3997 | 86 21416% | 1.201 200% | 0.947 137% | 0.638 60% |
| Read 4k QD32 (MB/s) | 1.021 | 145.4 14141% | 1.079 6% | 0.812 -20% | 0.59 -42% |
| Write 4k QD32 (MB/s) | 1.076 | 272.7 25244% | 1.234 15% | 0.968 -10% | 0.642 -40% |

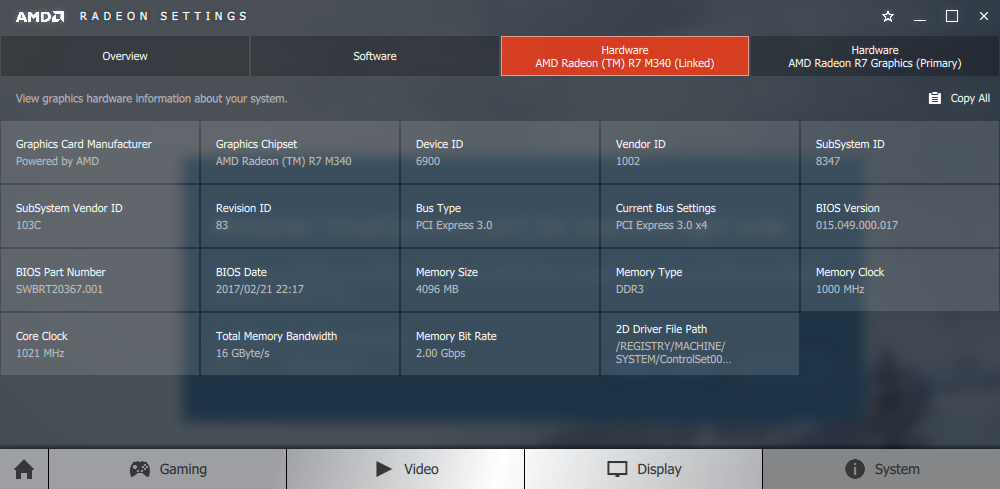
GPU Performance
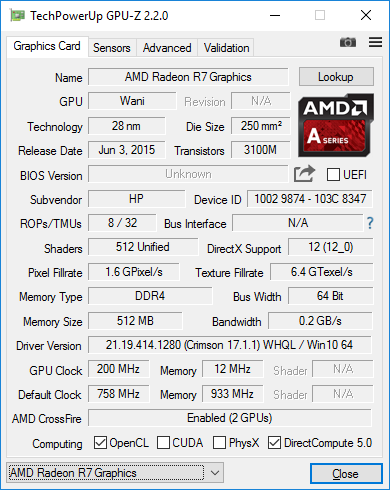
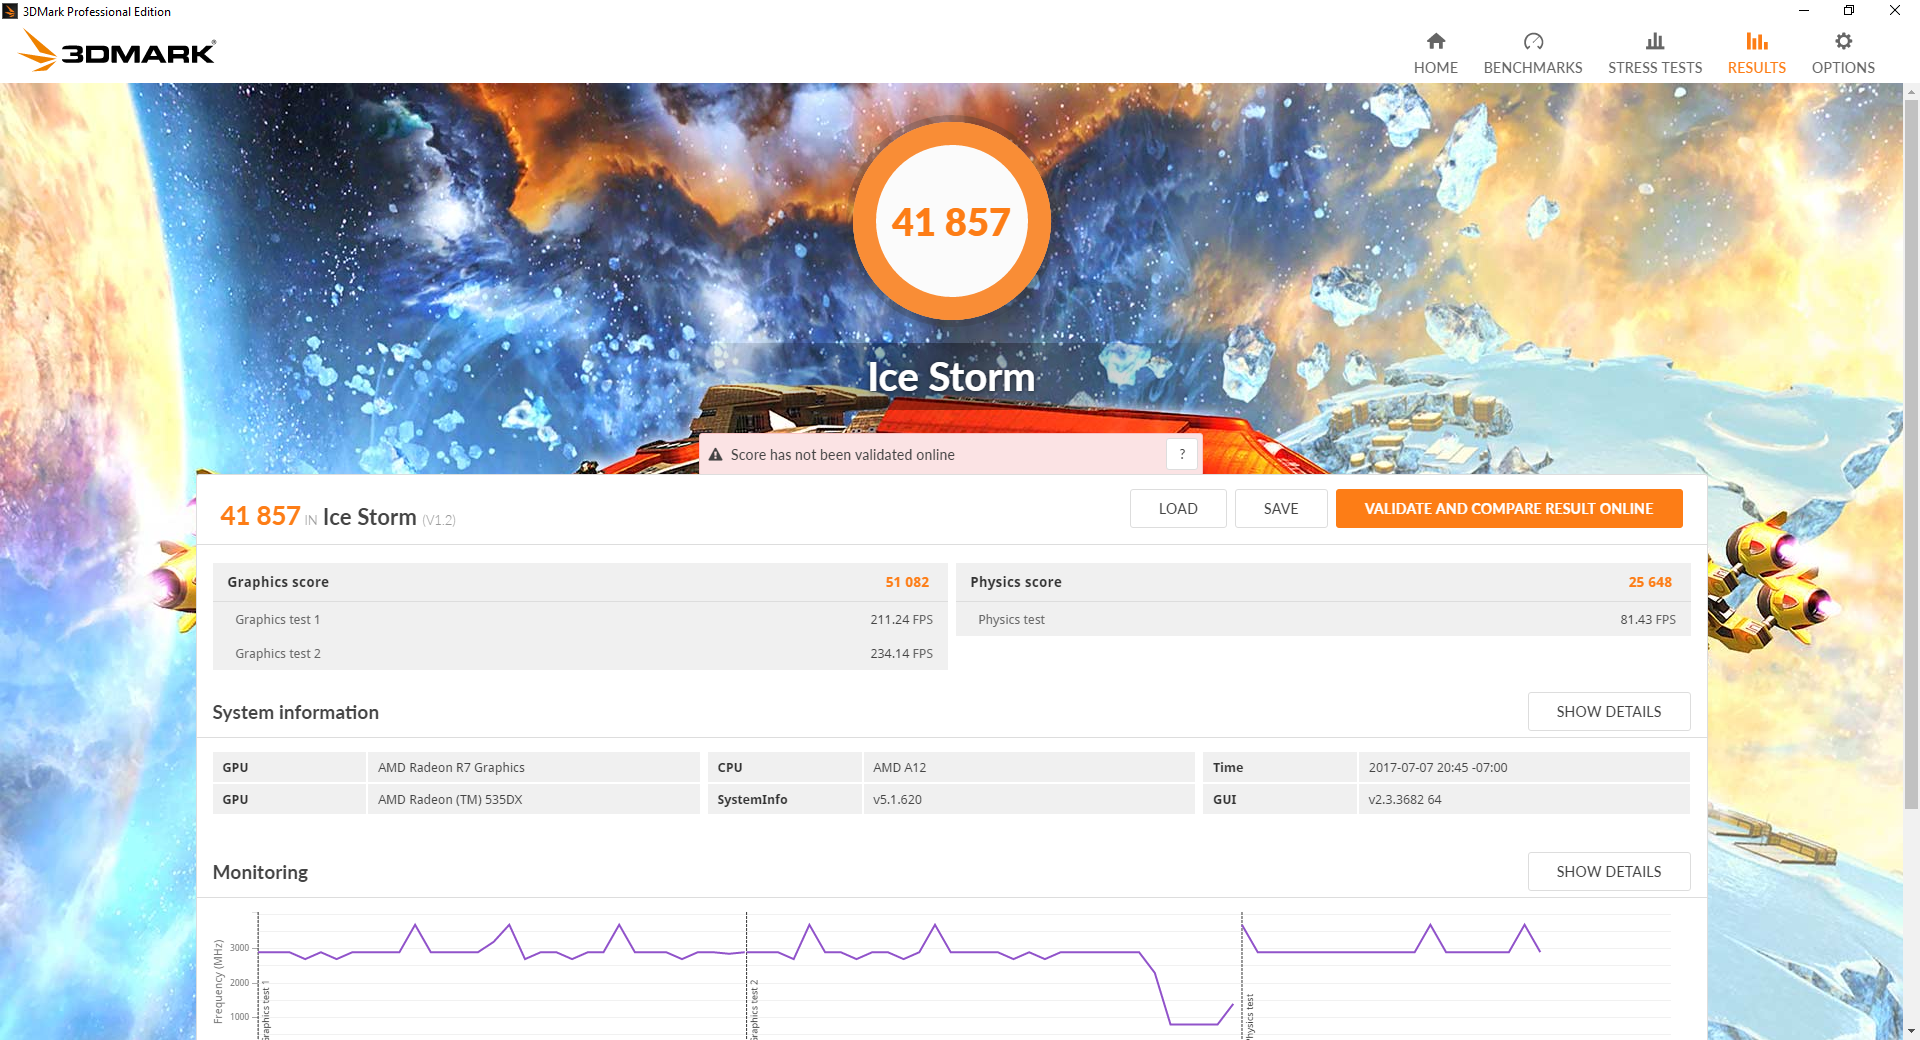
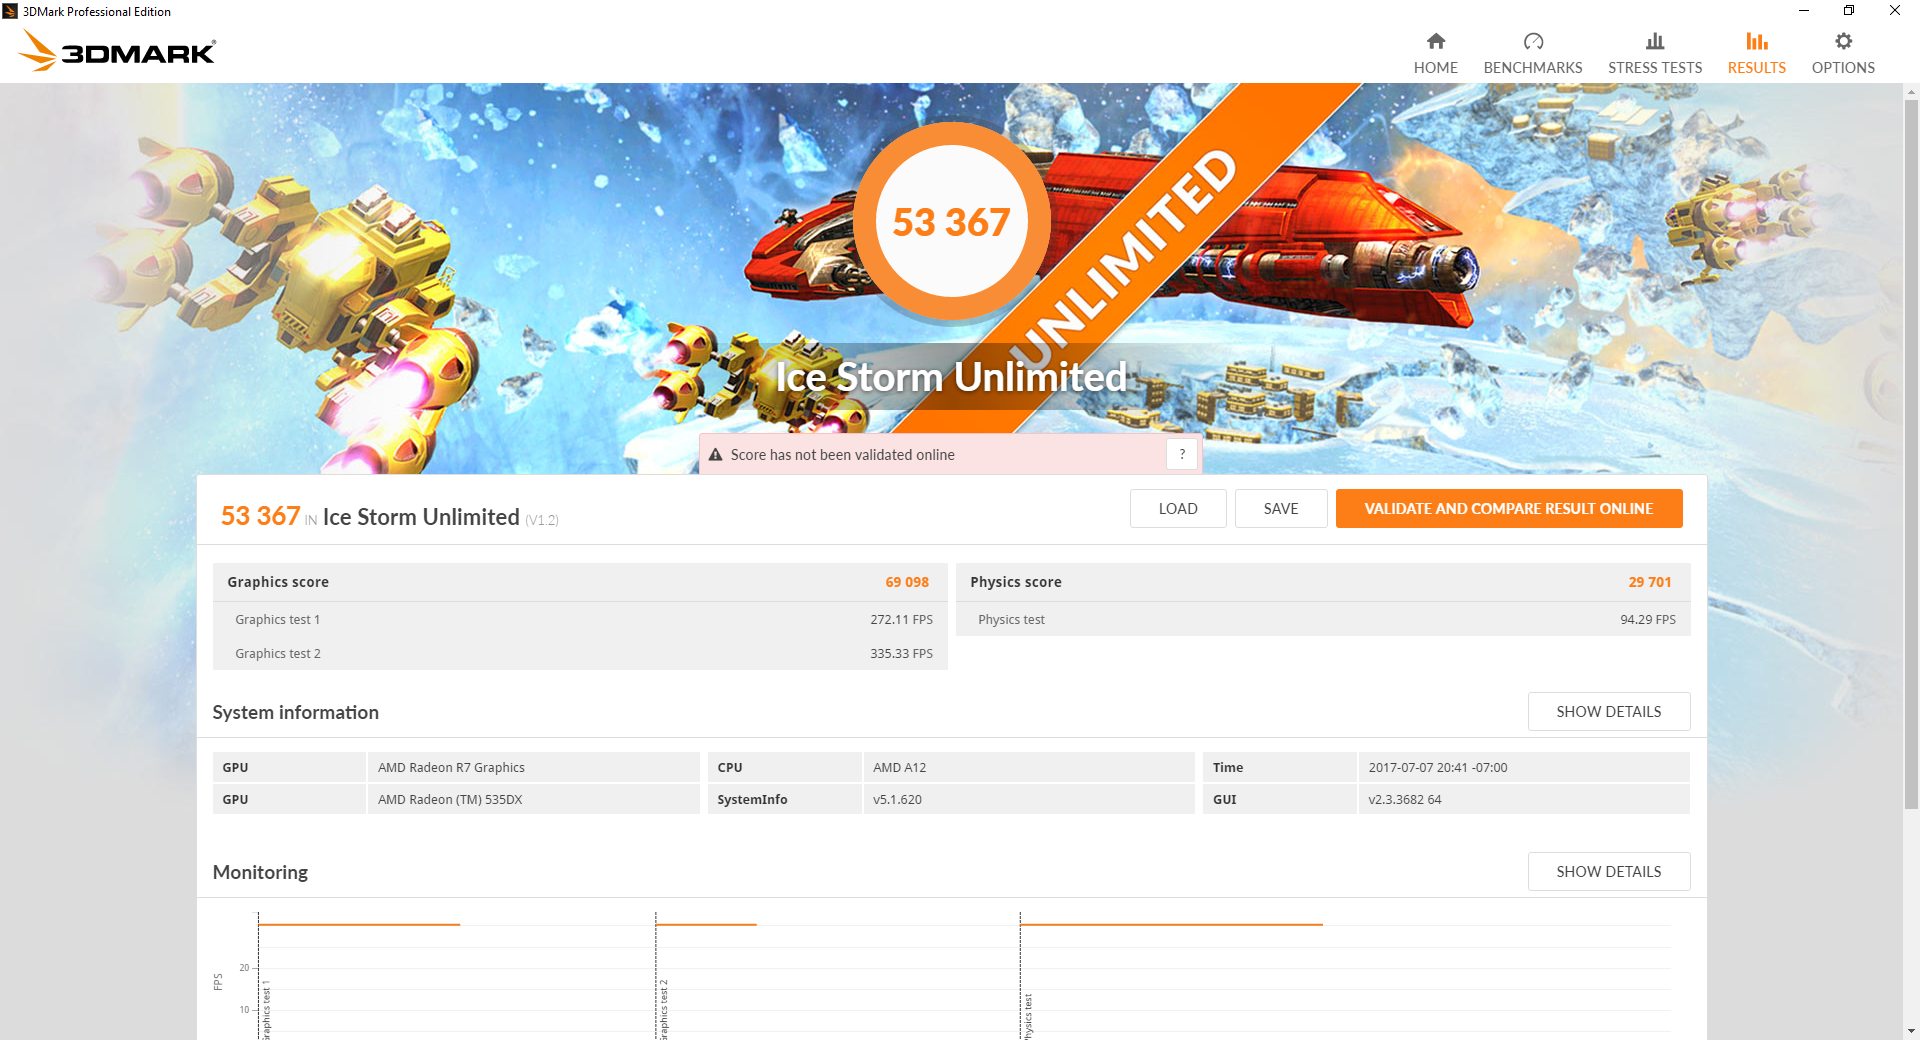
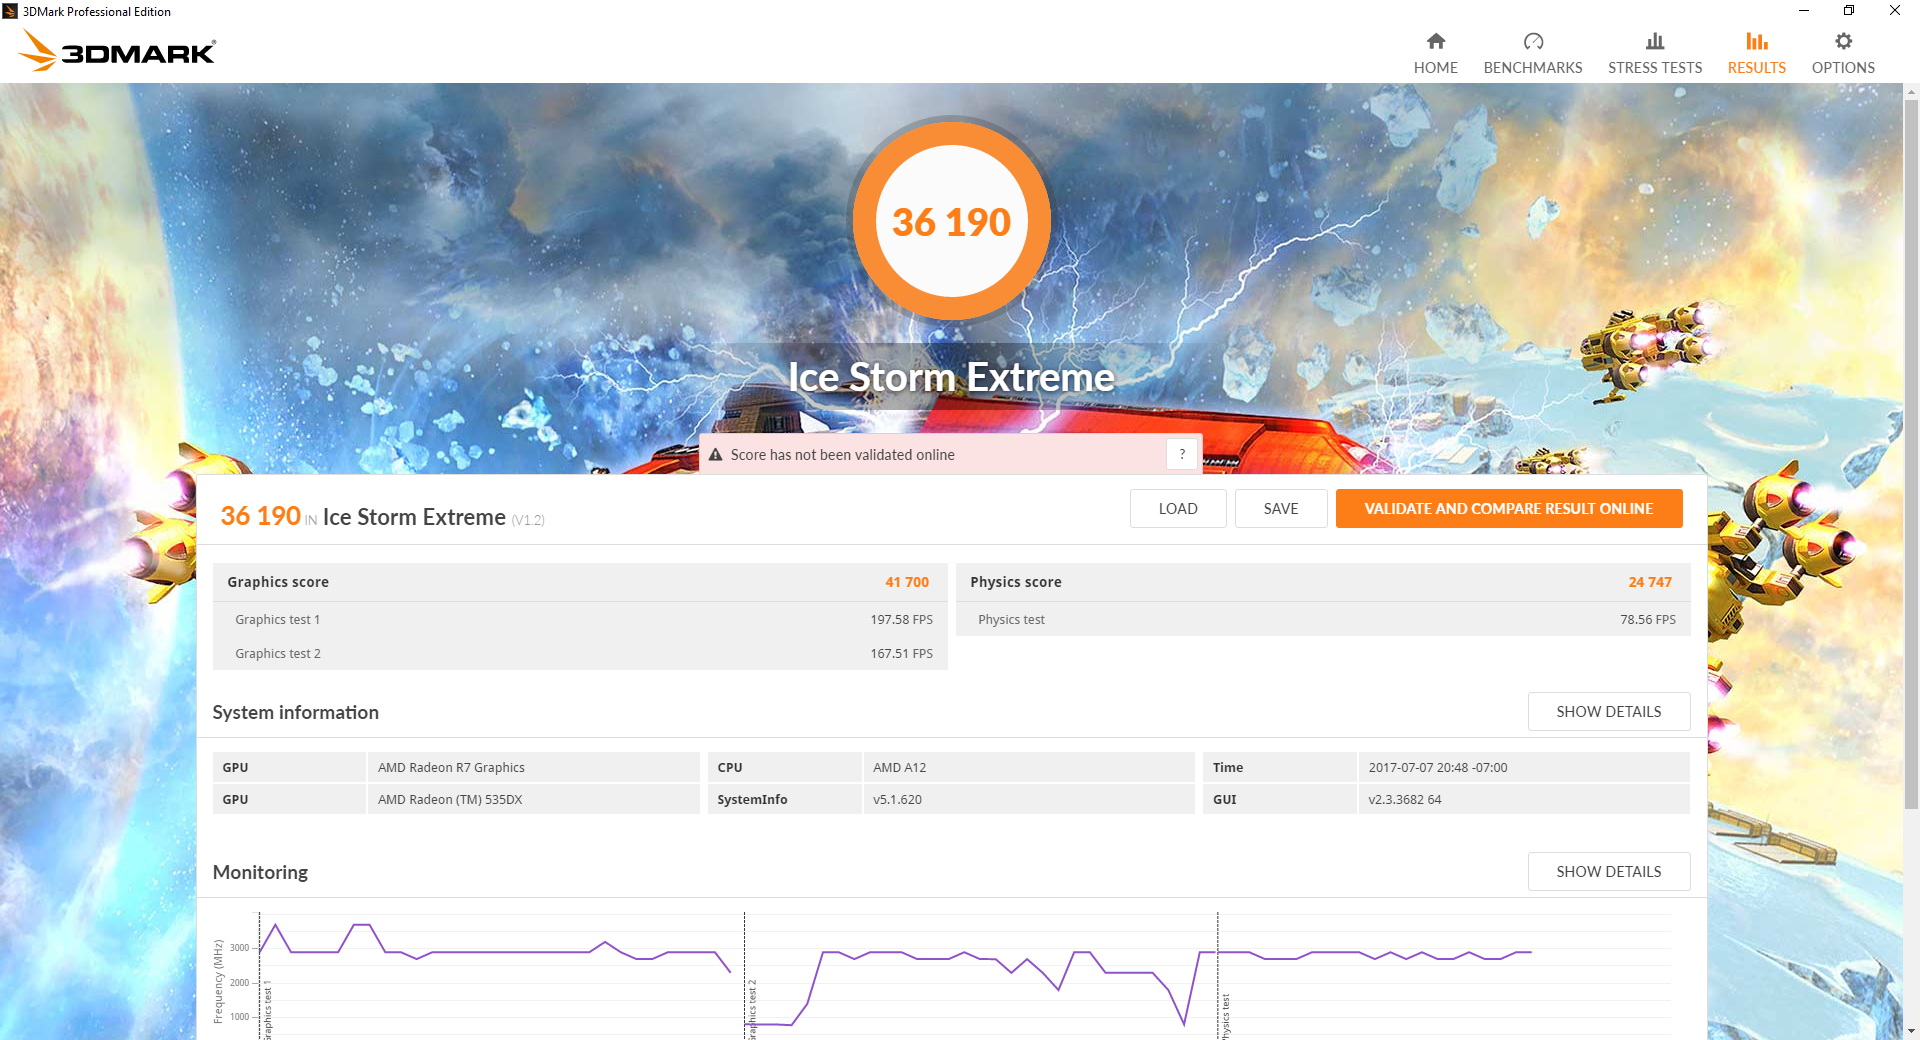
The R7 M340 returns respectable scores when compared to the Intel HD Graphics family and even the Iris Plus Graphics 650 in the newest MacBook Pro 13. These Intel alternatives, however, are integrated GPUs and the discrete R7 M340 is somewhat disappointing when compared to other discrete offerings. 3DMark benchmarks rank the R7 M340 in between the last generation GeForce 940MX and GTX 950M in raw graphics power. This is still about twice as fast as the integrated Radeon R7 Bristol Ridge, but the performance jump is not nearly enough to run most modern games as our next section will show.
Furthermore, the GPU is tied down by the very poor A12-9720P processor performance. The combined (CPU + GPU) 3DMark 11 score, for example, ranks our Pavilion 17z slightly below the TravelMate P249 (i5-6200U, HD Graphics 520) since the CPU in the Acer is faster even though it is not as graphically capable.
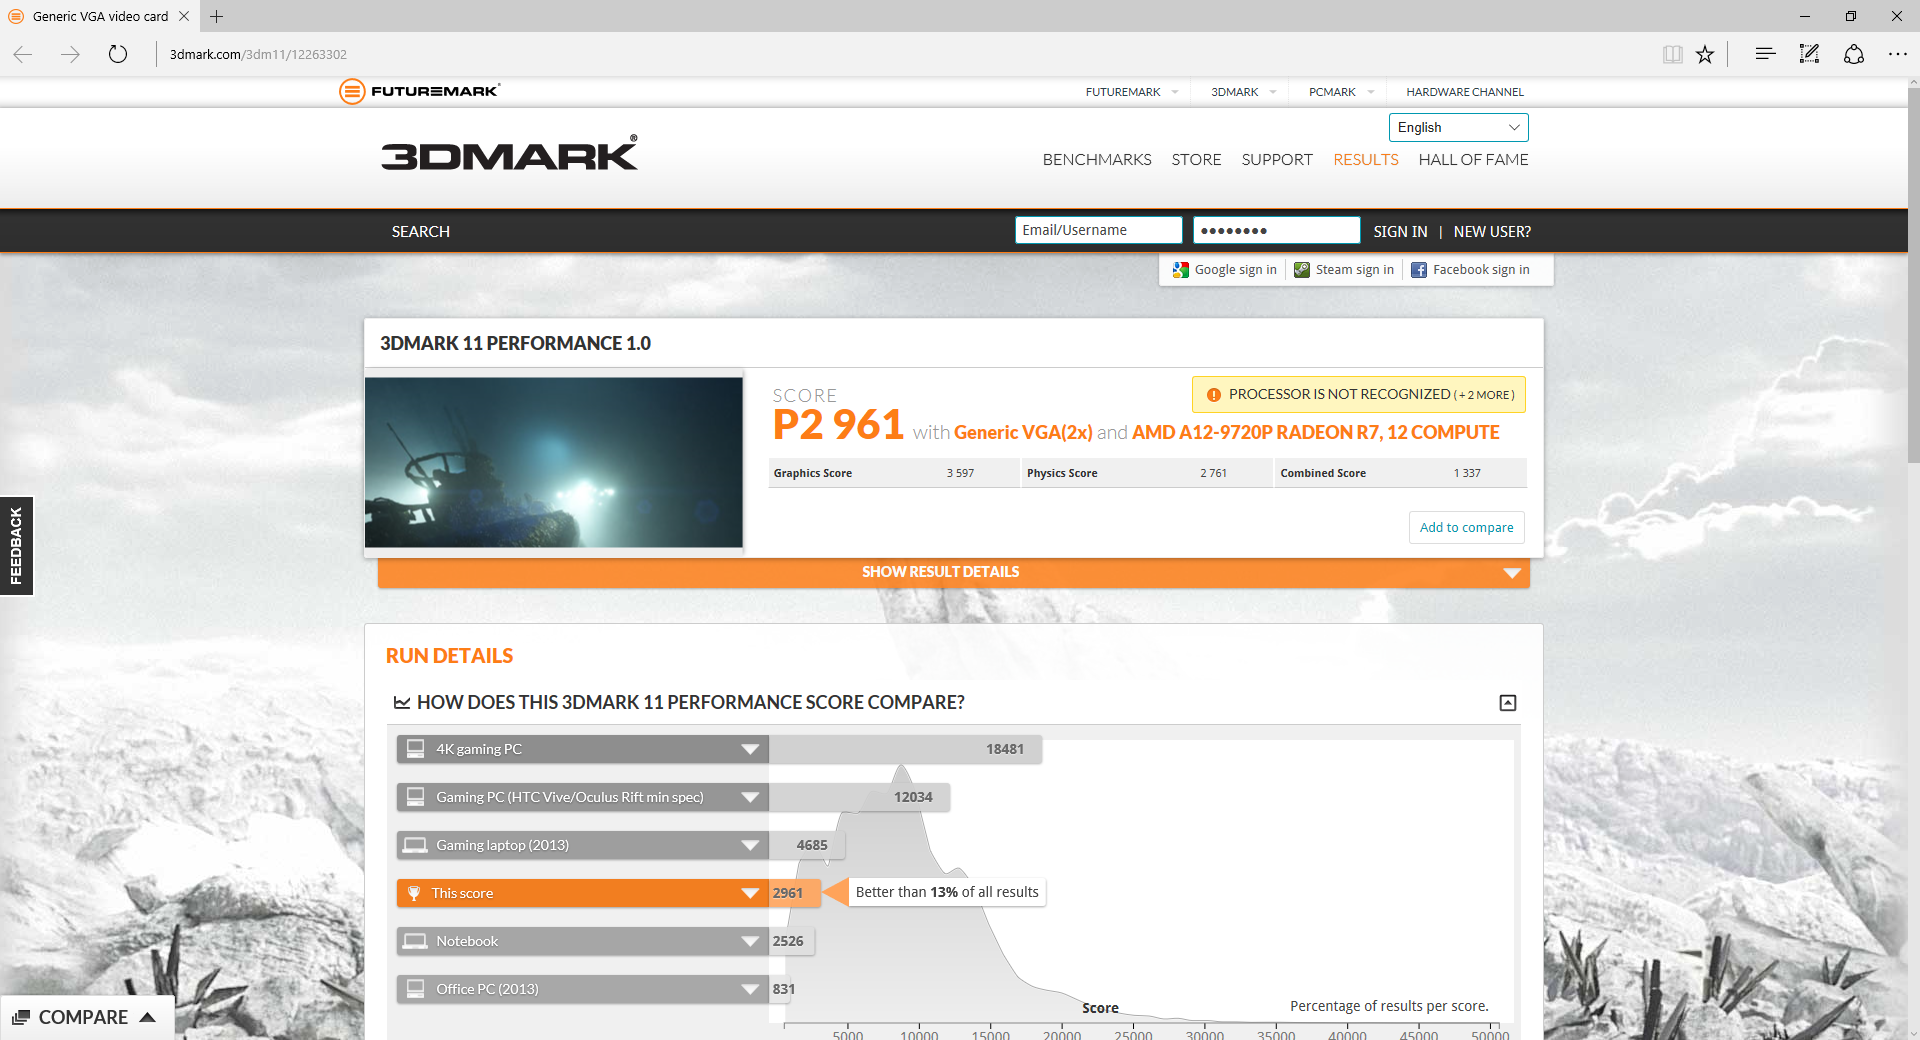
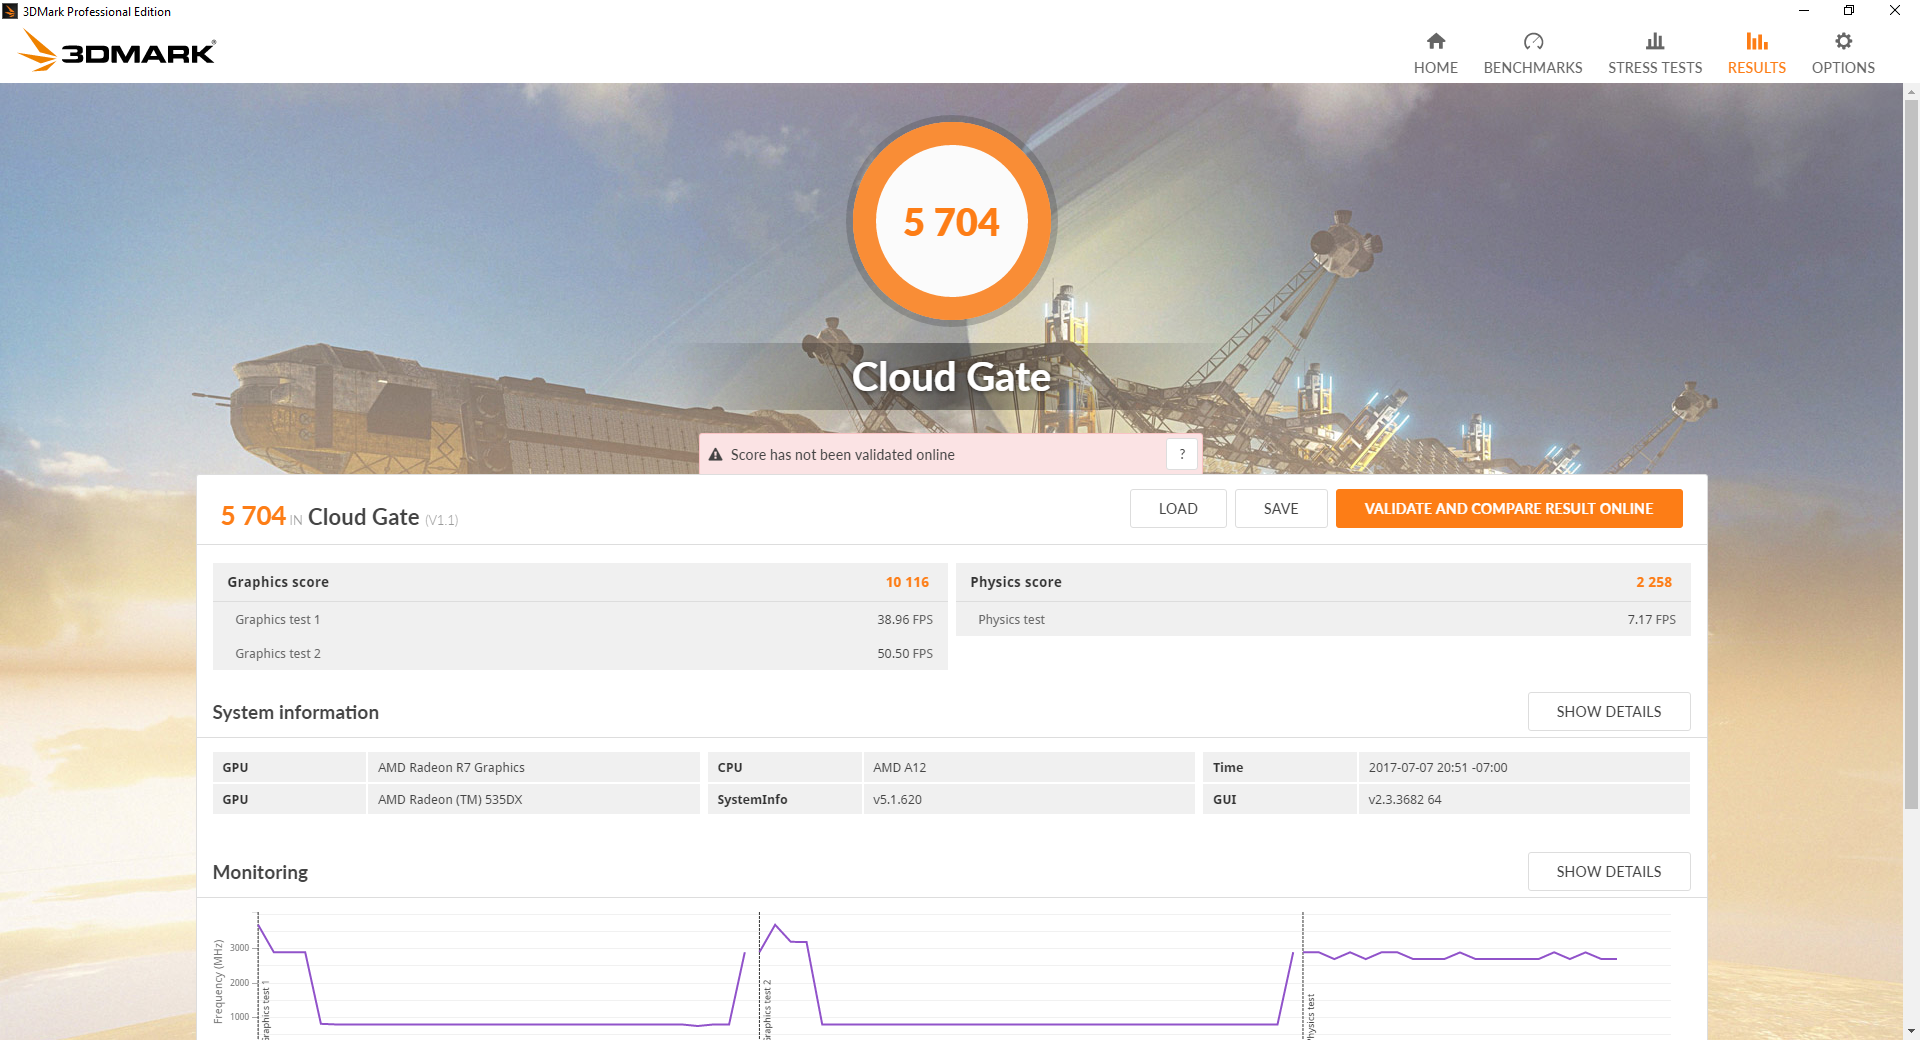
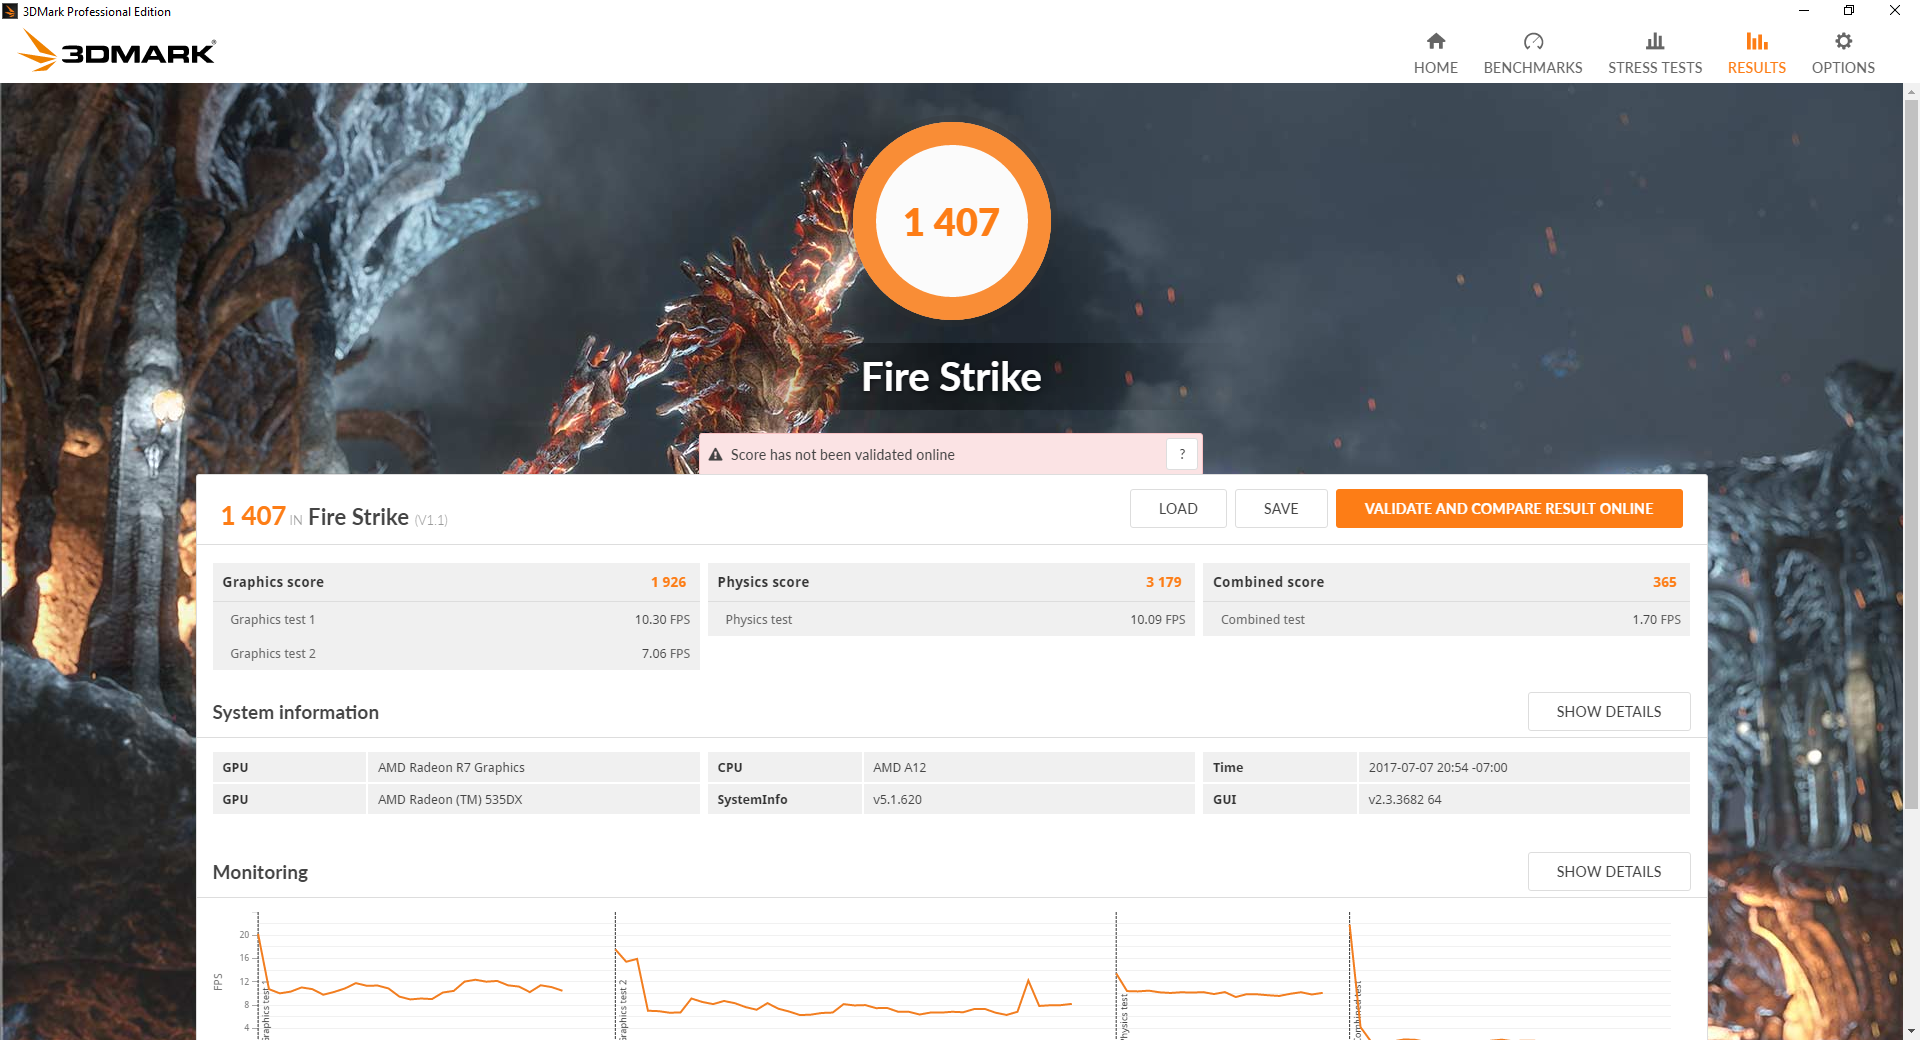
| 3DMark 11 Performance | 2961 points | |
| 3DMark Ice Storm Standard Score | 41857 points | |
| 3DMark Cloud Gate Standard Score | 5704 points | |
| 3DMark Fire Strike Score | 1407 points | |
Help | ||
Gaming Performance
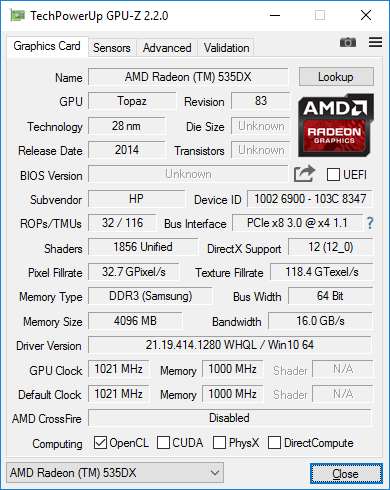
Performance in games is far below what the 3DMark benchmarks suggest. Whereas 3DMark 11 Graphics places the Radeon R7 M340 right below the GTX 950M, real-world performance in games is closer to the GeForce 920MX or 930MX instead. This means that notebooks with the GTX 950M can output over 150 percent faster frame rates than our AMD Pavilion in certain cases. The slower performance can be attributed to both the DDR3 VRAM instead of GDDR5 and the slow processor that the graphics chip is unfortunately paired with.
See our dedicated page on the Radeon RX M340 GPU for more technical information and benchmark comparisons.
| Rise of the Tomb Raider - 1024x768 Lowest Preset | |
| Acer Aspire E5-575G-549D | |
| Samsung Notebook 9 NP900X5N-X01US | |
| HP Pavilion 17z 1EX13AV | |
| Microsoft Surface Pro (2017) i7 | |
| Asus X302UV-FN016T | |
| Dell Latitude 5280 | |
| low | med. | high | ultra | |
|---|---|---|---|---|
| StarCraft II: Heart of the Swarm (2013) | 61 | 35.5 | 21.5 | |
| BioShock Infinite (2013) | 74.5 | 43.5 | 34.1 | 11.8 |
| Metro: Last Light (2013) | 32.6 | 26 | 18.9 | |
| Thief (2014) | 20.3 | |||
| The Witcher 3 (2015) | 19 | |||
| Batman: Arkham Knight (2015) | 19 | |||
| Metal Gear Solid V (2015) | 57 | 40 | 14 | |
| Dota 2 Reborn (2015) | 46 | 38 | 21 | 18 |
| Fallout 4 (2015) | 25.6 | |||
| Rise of the Tomb Raider (2016) | 28.2 | 15 | ||
| Doom (2016) | 20.2 | |||
| Overwatch (2016) | 54.8 | 44.9 | ||
| Prey (2017) | 38.4 | 14.7 |
Stress Test
We stress the notebook to identify for any potential throttling or hardware issues. With only Prime95 active to stress the CPU, we can observe the processor running at or above the base 2.7 GHz clock rate before steadily falling to 2.3 GHz after the first half minute of stress testing. This is extremely disappointing as not only is the CPU unable to maintain any Turbo Core clock rate benefits, but it will actually throttle to speeds slower than the advertised base clock rate. The processor appears to automatically throttle once core temperatures reach 64 C in an attempt to maintain a cooler temperature of 54 C.
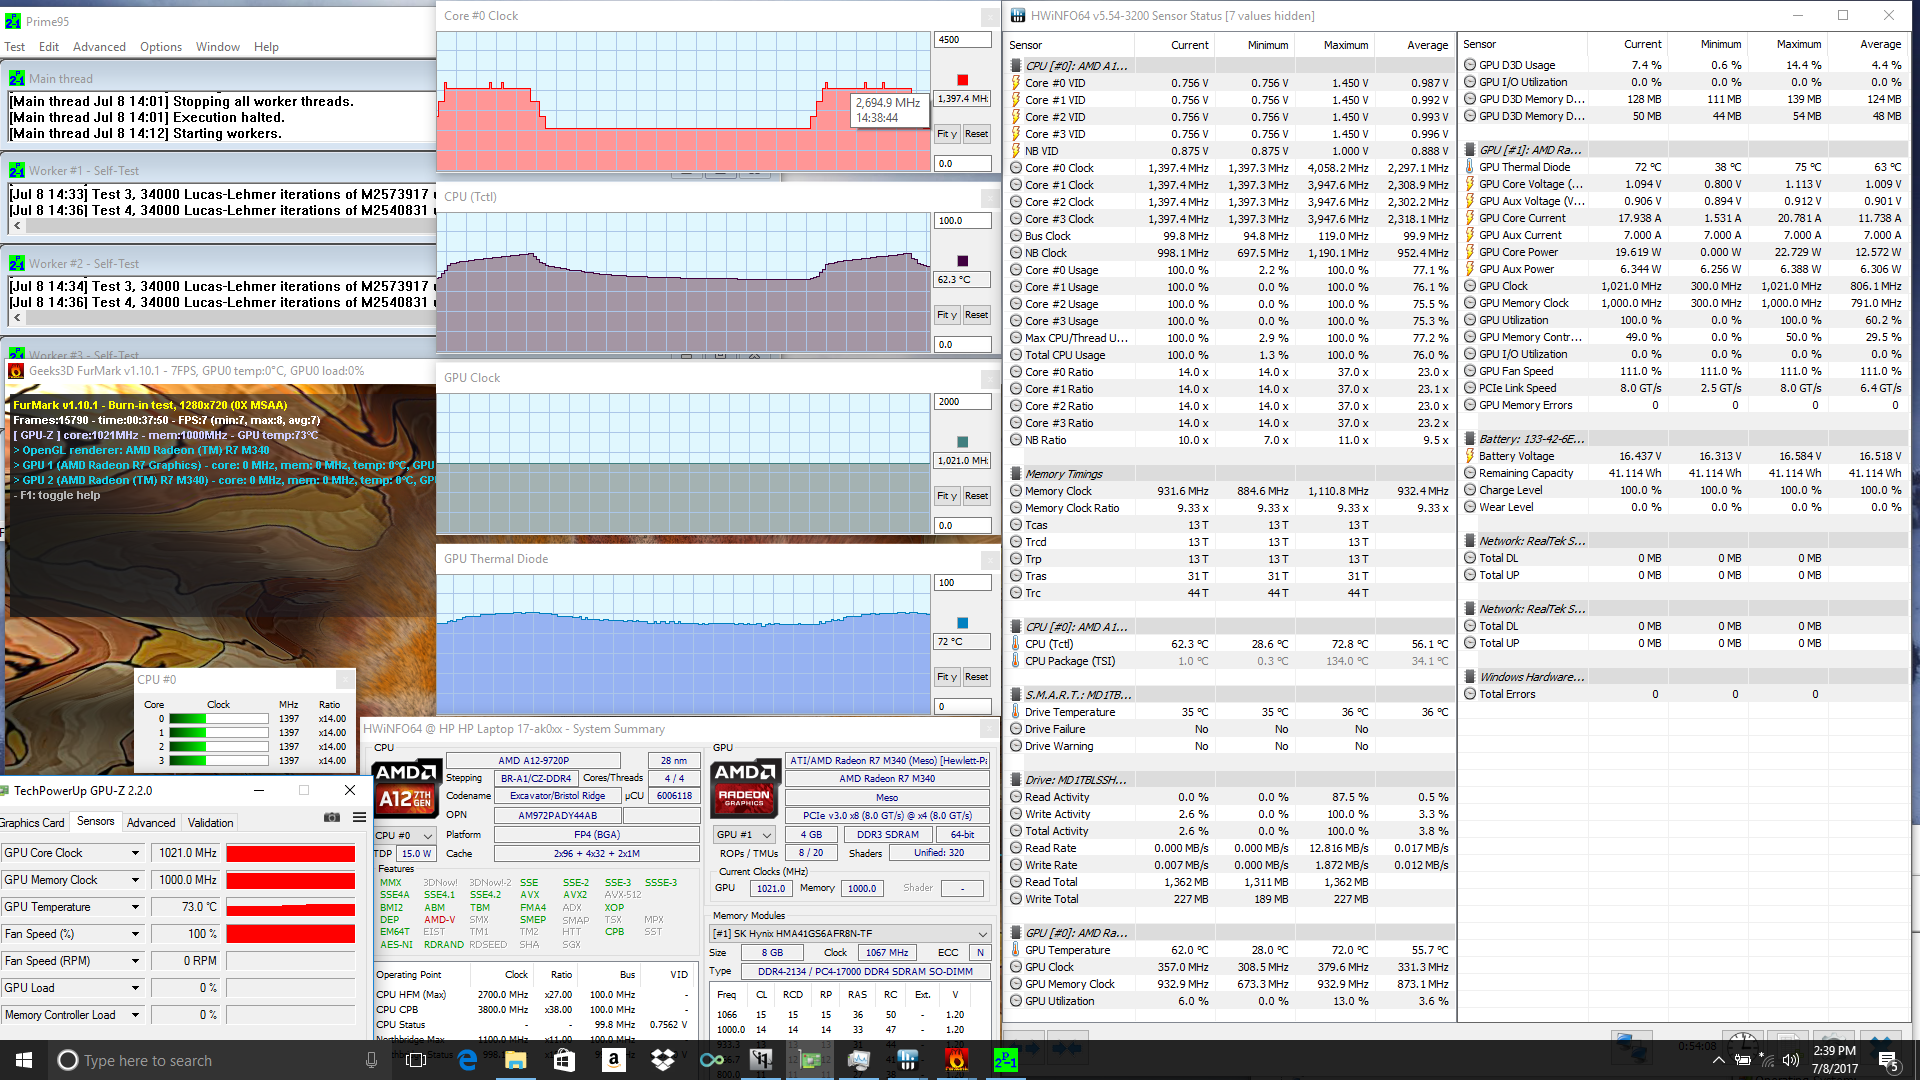
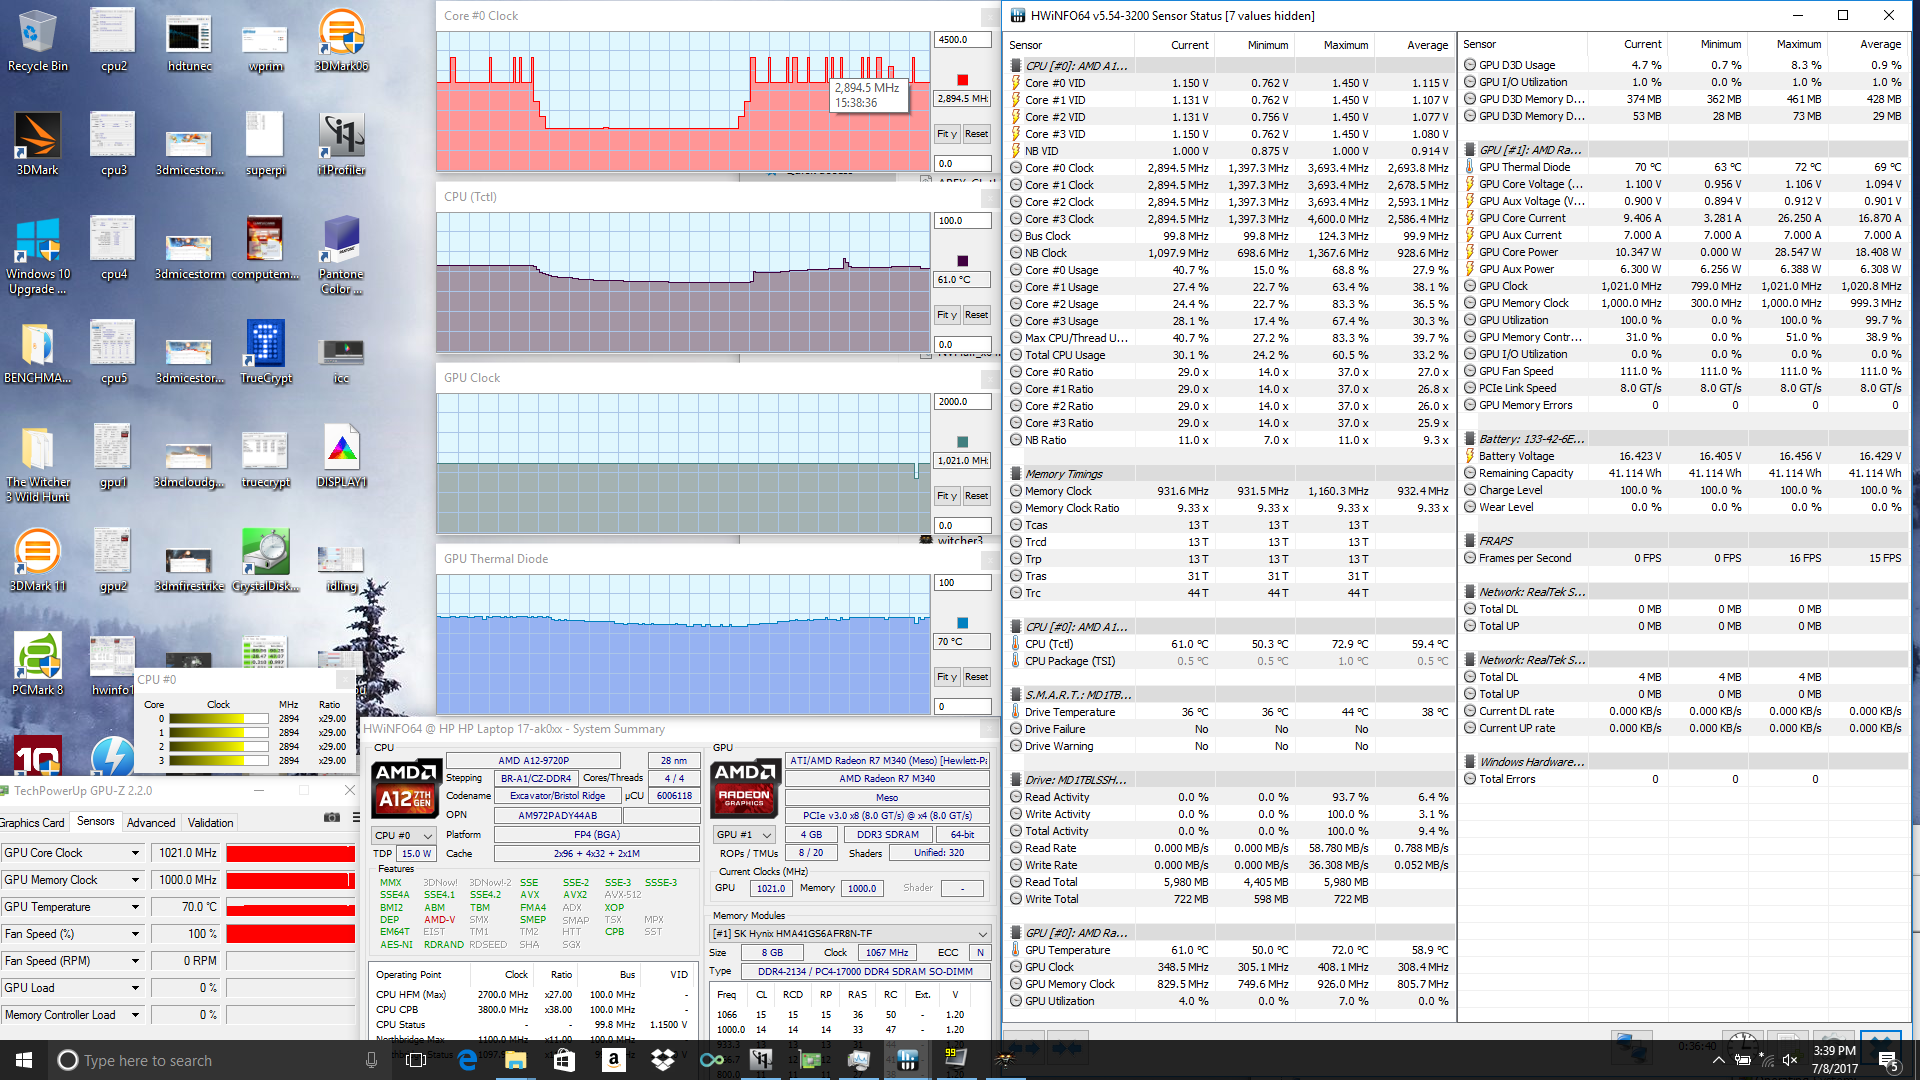
Running FurMark to stress the dedicated GPU will result in a constant clock rate and temperature of 1021 MHz and 62 C, respectively. Things start to get interesting again when running both Prime95 and FurMark as CPU clock rates and temperature cycle between 1.4 GHz and 2.7 GHz and 62 C to 73 C, respectively. There is clearly an imposed CPU temperature ceiling of about 73 C before heavy throttling kicks in when the system is fully stressed. Meanwhile, GPU clock rate is steady at 1021 MHz with core temperatures hovering in the low 70 C range.
Witcher 3 is more representative of gaming loads. Running the game will result in a cooler CPU temperature with a wider range of cycling core clock rates. The clock rate cycling is periodic and not based on the onscreen loads of the game. Frame rates remain steady without any notable dips throughout an entire hour of running Witcher 3.
Running on battery power will throttle the GPU while leaving CPU performance intact. A 3DMark 11 run on batteries returns Physics and Graphics scores of 2768 and 3196 points, respectively, compared to 2761 and 3597 points when on mains.
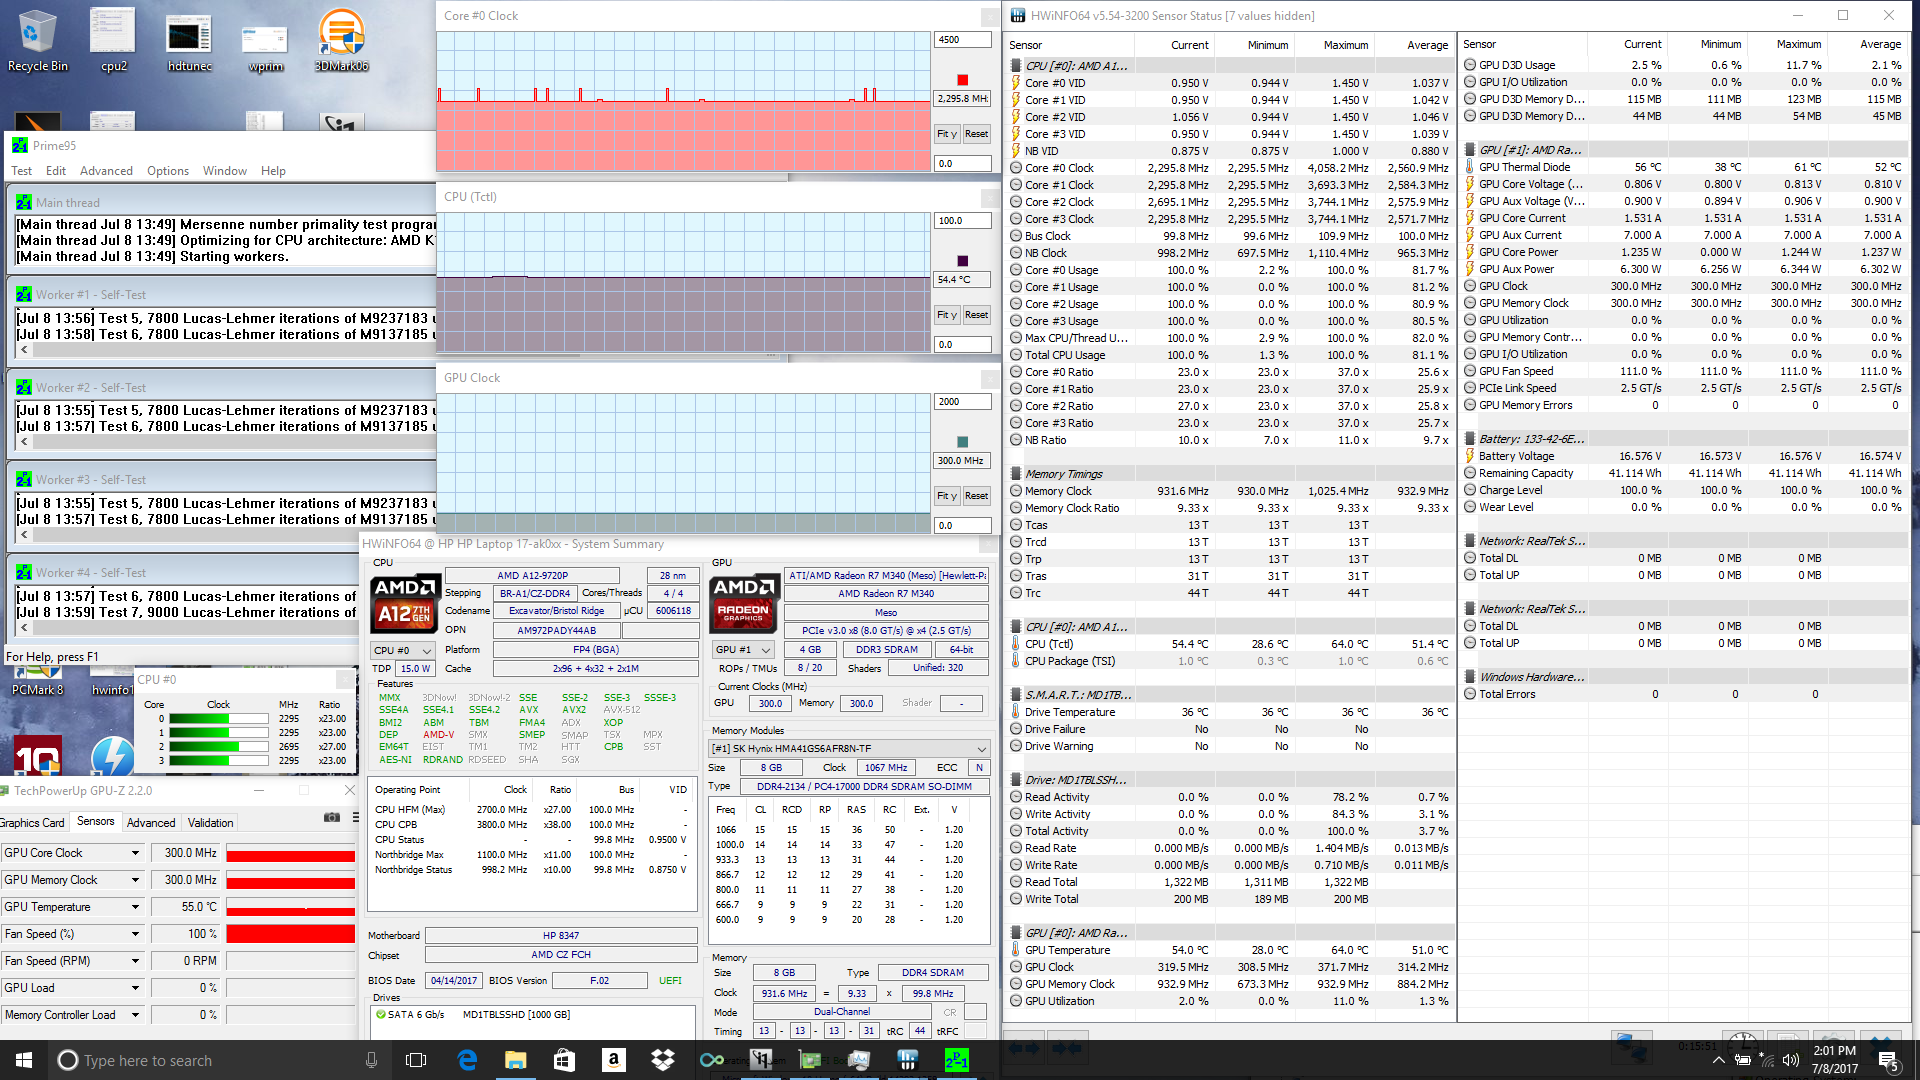
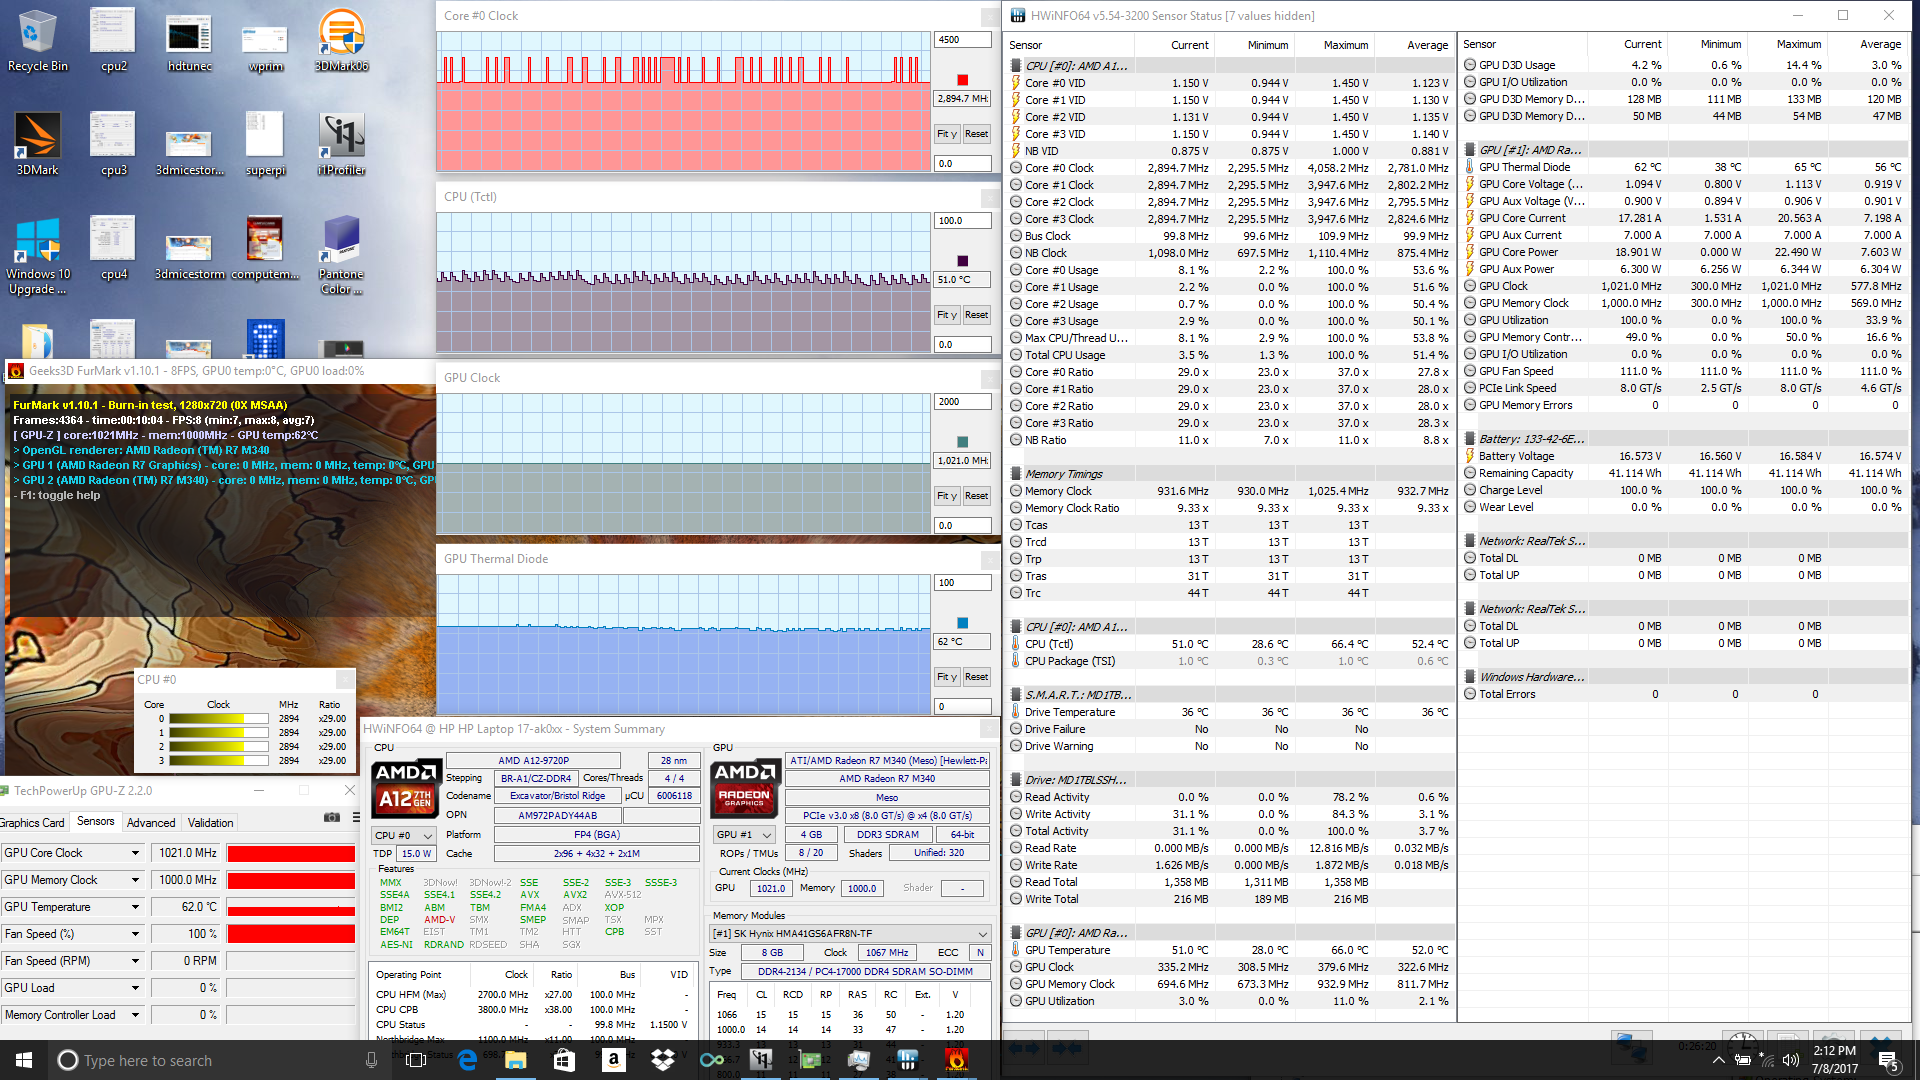
| CPU Clock (GHz) | GPU Clock (MHz) | Average CPU Temperature (°C) | Average GPU Temperature (°C) | |
| Prime95 Stress | 2.3 | -- | 54 | 56 |
| FurMark Stress | -- | 1021 | 51 | 62 |
| Prime95 + FurMark Stress | 1.4 - 2.7 | 1021 | 62 - 73 | 68 - 72 |
| Witcher 3 Stress | 1.4 - 2.9 | 1021 | 59 - 61 | 68 - 71 |
Emissions
System Noise
The system fan is always active no matter the onscreen load at a quiet and steady 30.5 dB(A). Light loads like browsing or video streaming will not cause the fan to pulsate and so the constant fan noise is never distracting. In fact, we find the loud key clatter to be more distracting than the actual fan if word processing or working in a classroom. A true "silent mode" option for very low loads would have been useful for this particular category of notebook.
Medium loads as represented by 3DMark06 will bump the fan from a lowly 30.5 dB(A) up to a steady 41.5 dB(A). This is even louder than the Asus F756UX and MSI GL72 when subjected to similar conditions and these systems are even equipped with dedicated Nvidia GeForce graphics. Maximum load with both Prime95 and FurMark running simultaneously will induce an even louder fan noise of 48.2 dB(A), but such levels are unrepresentative of real-world use. In short, fan noise is acceptably low during low loads but will quickly become loud when gaming.
Noise level
| Idle |
| 30.4 / 30.5 / 30.5 dB(A) |
| Load |
| 41.5 / 48.2 dB(A) |
 | ||
30 dB silent 40 dB(A) audible 50 dB(A) loud |
||
min: | ||
| HP Pavilion 17z 1EX13AV Radeon R7 M340, A12-9720P, WDC Scorpio Blue WD10JPVX-60JC3T1 | HP Pavilion 17-x110ng Radeon R7 M440, i5-7200U, SanDisk Z400s SD8SNAT-256G | Lenovo Ideapad 110-17IKB 80VK0001GE Radeon R5 M430, i5-7200U, WDC Scorpio Blue WD10JPCX-24UE4T0 | Asus F756UX-T7013T GeForce GTX 950M, 6200U, HGST Travelstar 5K1000 HTS541010A9E680 | Dell Inspiron 17 5759-5118 Radeon R5 M335, 6200U, Seagate Momentus SpinPoint M8 ST1000LM024 HN-M101MBB | MSI GL72 7RDX-602 GeForce GTX 1050 Mobile, i7-7700HQ, HGST Travelstar 7K1000 HTS721010A9E630 | |
|---|---|---|---|---|---|---|
| Noise | 3% | 1% | -5% | -6% | -3% | |
| off / environment * (dB) | 28 | 29 -4% | 30.5 -9% | 31.2 -11% | 30.8 -10% | |
| Idle Minimum * (dB) | 30.4 | 31 -2% | 32.5 -7% | 32.4 -7% | 33.9 -12% | 32.4 -7% |
| Idle Average * (dB) | 30.5 | 31 -2% | 32.5 -7% | 32.6 -7% | 33.9 -11% | 32.4 -6% |
| Idle Maximum * (dB) | 30.5 | 31 -2% | 32.5 -7% | 32.6 -7% | 33.9 -11% | 32.8 -8% |
| Load Average * (dB) | 41.5 | 33.8 19% | 34.6 17% | 42 -1% | 43.8 -6% | 40.9 1% |
| Witcher 3 ultra * (dB) | 41.8 | |||||
| Load Maximum * (dB) | 48.2 | 44.8 7% | 38.3 21% | 45.2 6% | 44.2 8% | 43.6 10% |
* ... smaller is better
Temperature
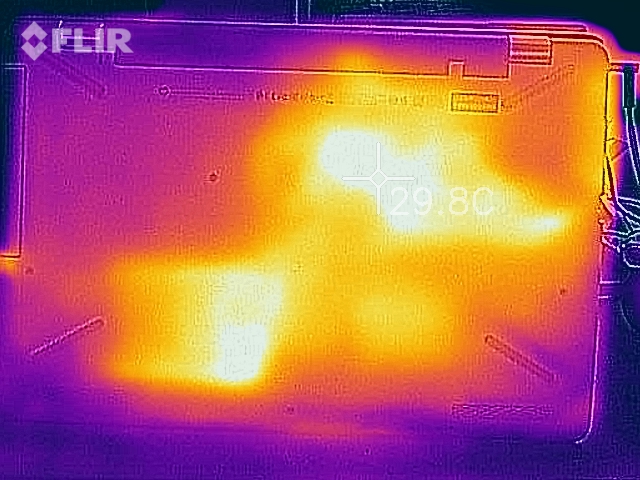
Surface temperatures are generally cool during low loads with some notable warm spots. In particular, the right palm rest will always be warmer than the left since the HDD is located directly underneath and this can become somewhat uncomfortable when typing. Switching to a primary SSD would partly mitigate this issue for a less sweaty hand. The rear of the notebook nearest the ventilation grilles can be as warm as 37 C even when the system is idling compared to less than 30 C on ULV Intel equivalents.
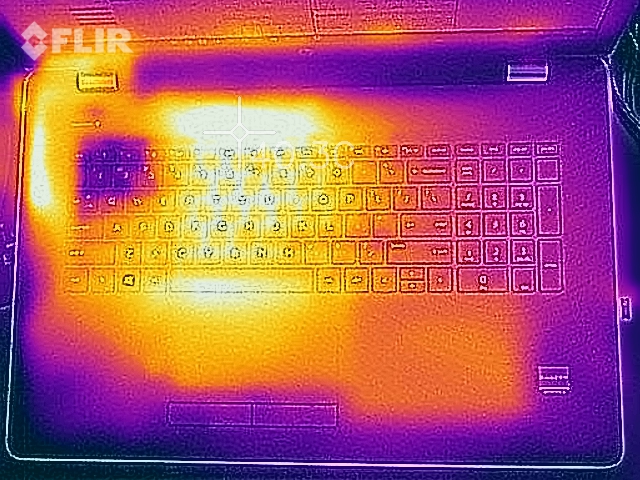
Extreme loads will warm the left side of the notebook while the right will remain relatively cool because of the hollow optical drive underneath the NumPad. Since air is drawn through the top left corner of the keyboard, the WASD keys are actually quite cool for gaming whereas the main center QWERTY keys can be as warm as 40 C. This asymmetric temperature development is common on many multimedia machines with optical drives and removable batteries.
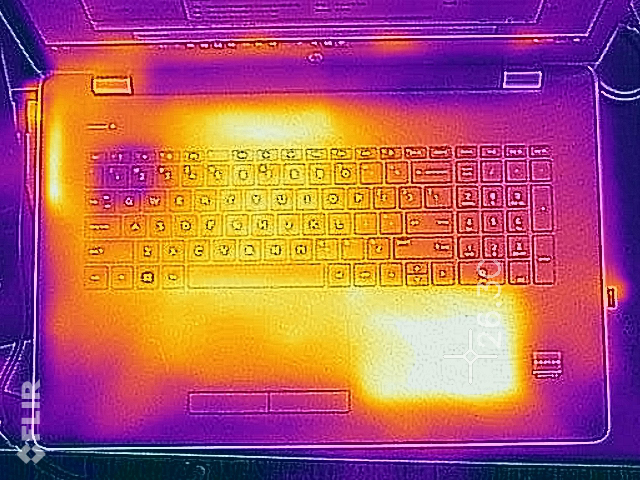
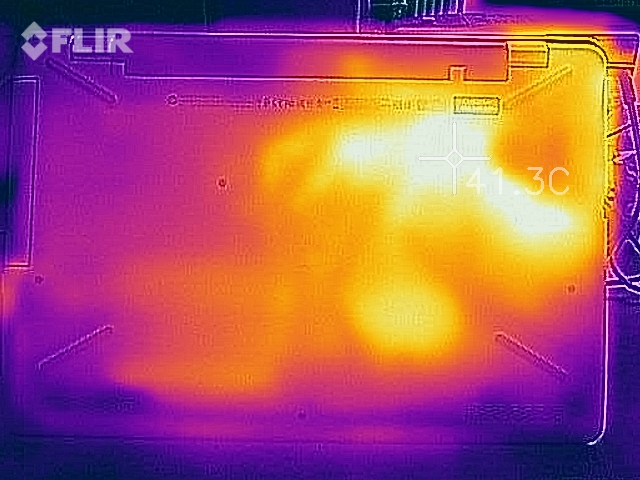
(±) The maximum temperature on the upper side is 40.8 °C / 105 F, compared to the average of 36.8 °C / 98 F, ranging from 21 to 71 °C for the class Multimedia.
(±) The bottom heats up to a maximum of 41.6 °C / 107 F, compared to the average of 39.1 °C / 102 F
(+) In idle usage, the average temperature for the upper side is 23.3 °C / 74 F, compared to the device average of 31.3 °C / 88 F.
(±) Playing The Witcher 3, the average temperature for the upper side is 33.2 °C / 92 F, compared to the device average of 31.3 °C / 88 F.
(+) The palmrests and touchpad are reaching skin temperature as a maximum (32.8 °C / 91 F) and are therefore not hot.
(-) The average temperature of the palmrest area of similar devices was 28.7 °C / 83.7 F (-4.1 °C / -7.3 F).
Speakers
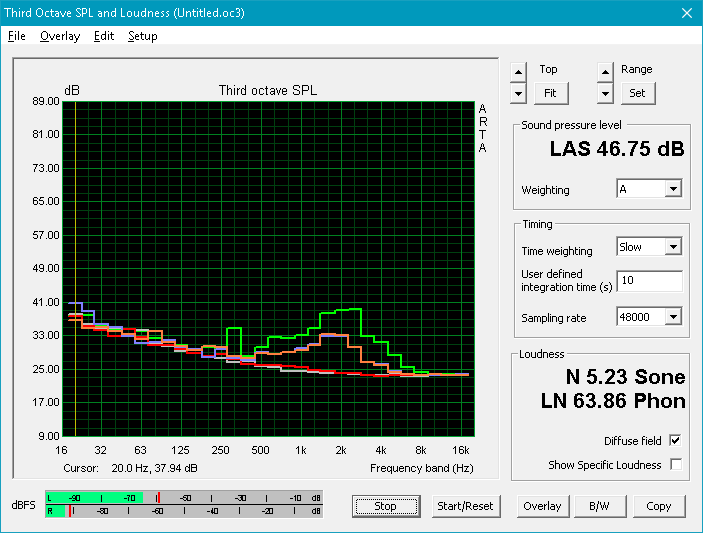
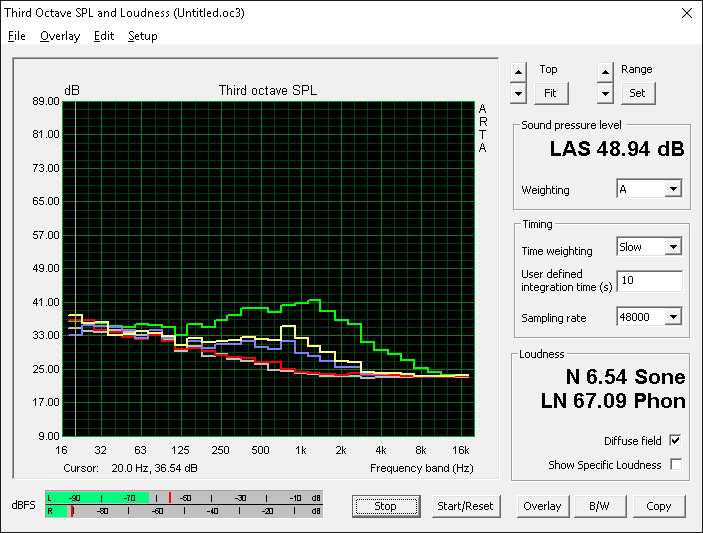
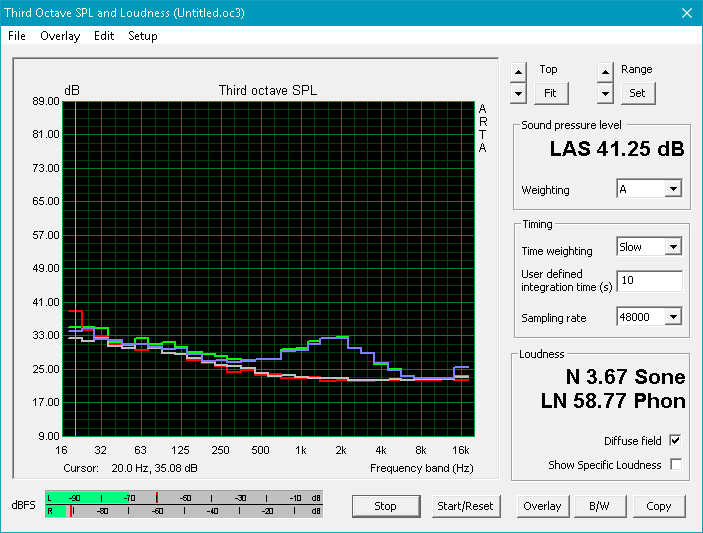
Sound quality from the stereo speakers is average for a multimedia machine. Maximum volume is sufficiently loud to fill a small room and will not introduce any static or major imbalances. The palm rests vibrate only slightly and bass is adequate enough for video and music playback should earphones be unavailable. The pink noise curve is strangely quite "bumpy" as shown by our microphone measurements below. A flatter curve, like the one for the Spectre x360 15, is closer to the ideal for a more even reproduction of bass and treble frequencies.


HP Pavilion 17z 1EX13AV audio analysis
(-) | not very loud speakers (64.1 dB)
Bass 100 - 315 Hz
(±) | reduced bass - on average 13.7% lower than median
(-) | bass is not linear (16.5% delta to prev. frequency)
Mids 400 - 2000 Hz
(+) | balanced mids - only 3.5% away from median
(-) | mids are not linear (17.3% delta to prev. frequency)
Highs 2 - 16 kHz
(+) | balanced highs - only 4.6% away from median
(-) | highs are not linear (18.5% delta to prev. frequency)
Overall 100 - 16.000 Hz
(±) | linearity of overall sound is average (27.5% difference to median)
Compared to same class
» 93% of all tested devices in this class were better, 2% similar, 5% worse
» The best had a delta of 5%, average was 17%, worst was 45%
Compared to all devices tested
» 84% of all tested devices were better, 3% similar, 13% worse
» The best had a delta of 4%, average was 23%, worst was 134%
Apple MacBook 12 (Early 2016) 1.1 GHz audio analysis
(+) | speakers can play relatively loud (83.6 dB)
Bass 100 - 315 Hz
(±) | reduced bass - on average 11.3% lower than median
(±) | linearity of bass is average (14.2% delta to prev. frequency)
Mids 400 - 2000 Hz
(+) | balanced mids - only 2.4% away from median
(+) | mids are linear (5.5% delta to prev. frequency)
Highs 2 - 16 kHz
(+) | balanced highs - only 2% away from median
(+) | highs are linear (4.5% delta to prev. frequency)
Overall 100 - 16.000 Hz
(+) | overall sound is linear (10.2% difference to median)
Compared to same class
» 7% of all tested devices in this class were better, 2% similar, 90% worse
» The best had a delta of 5%, average was 18%, worst was 53%
Compared to all devices tested
» 5% of all tested devices were better, 1% similar, 94% worse
» The best had a delta of 4%, average was 23%, worst was 134%
Frequency Comparison (Checkbox selectable!)
Graph 1: Pink Noise 100% Vol.; Graph 2: Audio off
Energy Management
Power Consumption
The Bristol Ridge series is manufactured in 28 nm compared to 14 nm on the competing Skylake and Kaby Lake series and the power efficiency disadvantages are clear. The HP Pavilion 17 with the i7-7200U CPU and somewhat similar Radeon R7 M440 GPU is significantly less demanding under all tested conditions. Medium load with 3DMark06, for example, will draw 33 W from the Intel-equipped Pavilion 17 compared to 57 W on the AMD-equipped Pavilion 17z while still providing faster raw CPU power. Even worse for AMD, the Asus F756UX with its i7-6200U CPU and GTX 950M GPU is much more graphically capable without necessarily demanding as much power when under medium to gaming loads.
Maximum load with both Prime95 and FurMark will draw about 62 W from a small AC power adapter (11.0 x 4.5 x 3.0 cm) rated for up to 65 W. There is almost no overhead and a more powerful adapter would have been appreciated to prevent any potential power delivery bottlenecks.
| Off / Standby | |
| Idle | |
| Load |
|
Key:
min: | |
| HP Pavilion 17z 1EX13AV A12-9720P, Radeon R7 M340, WDC Scorpio Blue WD10JPVX-60JC3T1, IPS, 1920x1080, 17.3" | HP Pavilion 17-x110ng i5-7200U, Radeon R7 M440, SanDisk Z400s SD8SNAT-256G, IPS, WLED, 1920x1080, 17.3" | Lenovo Ideapad 110-17IKB 80VK0001GE i5-7200U, Radeon R5 M430, WDC Scorpio Blue WD10JPCX-24UE4T0, TN LED, 1600x900, 17.3" | Asus F756UX-T7013T 6200U, GeForce GTX 950M, HGST Travelstar 5K1000 HTS541010A9E680, TN LED, 1920x1080, 17.3" | Dell Inspiron 17 5759-5118 6200U, Radeon R5 M335, Seagate Momentus SpinPoint M8 ST1000LM024 HN-M101MBB, TN LED, 1920x1080, 17.3" | MSI GL72 7RDX-602 i7-7700HQ, GeForce GTX 1050 Mobile, HGST Travelstar 7K1000 HTS721010A9E630, TN LED, 1920x1080, 17.3" | |
|---|---|---|---|---|---|---|
| Power Consumption | 8% | 26% | 5% | 19% | -49% | |
| Idle Minimum * (Watt) | 7.8 | 7.7 1% | 6.9 12% | 5.8 26% | 6.2 21% | 9.6 -23% |
| Idle Average * (Watt) | 11.7 | 14 -20% | 9.6 18% | 11.2 4% | 11.6 1% | 15 -28% |
| Idle Maximum * (Watt) | 15.7 | 15.1 4% | 11.7 25% | 11.9 24% | 12.3 22% | 16.5 -5% |
| Load Average * (Watt) | 57.4 | 33 43% | 29 49% | 54 6% | 36 37% | 104 -81% |
| Witcher 3 ultra * (Watt) | 53.3 | |||||
| Load Maximum * (Watt) | 62.3 | 54.6 12% | 45.4 27% | 84 -35% | 55 12% | 129 -107% |
* ... smaller is better
Battery Life
Runtimes from the removable 41 Wh Li-Ion battery are very short at just under 7 hours at best. This means allowing the system to idle on desktop at the lowest possible brightness setting on the Power Saver profile until automatic shutdown - hardly a real-world situation. Instead, users can expect a little less than 4 hours of actual WLAN usage compared to over 5.5 hours from the Intel-based Pavilion 17 under similar conditions. While battery life is expected to be short given the small battery, it's almost humiliating to see that the IdeaPad 110 can outlast the HP with an even smaller 32 Wh battery pack.
Recharging from near empty to full capacity takes only about 1.5 hours compared to 2 to 2.5 hours on most other notebooks with Li-Ion polymer batteries.
| HP Pavilion 17z 1EX13AV A12-9720P, Radeon R7 M340, 41.6 Wh | HP Pavilion 17-x110ng i5-7200U, Radeon R7 M440, 41 Wh | Lenovo Ideapad 110-17IKB 80VK0001GE i5-7200U, Radeon R5 M430, 32 Wh | Asus F756UX-T7013T 6200U, GeForce GTX 950M, 38 Wh | Dell Inspiron 17 5759-5118 6200U, Radeon R5 M335, 40 Wh | MSI GL72 7RDX-602 i7-7700HQ, GeForce GTX 1050 Mobile, 43.2 Wh | |
|---|---|---|---|---|---|---|
| Battery runtime | 34% | 5% | 7% | 23% | -25% | |
| Reader / Idle (h) | 6.8 | 8.8 29% | 8.2 21% | 9.6 41% | 5.5 -19% | |
| WiFi v1.3 (h) | 3.9 | 5.8 49% | 4.1 5% | 3.6 -8% | 5 28% | 3.4 -13% |
| Load (h) | 1.2 | 1.5 25% | 1.3 8% | 1.2 0% | 0.7 -42% |
Pros
Cons
Verdict

The A12-9720P APU is a strong example of how far behind AMD has been in the CPU race prior to the advent of Ryzen and the Zen architecture. Normally when a processor runs hotter and louder than an alternative, you'd expect it to perform faster. This is not so for the A12-9720P as it runs warmer, louder, and slower than the two generations old Core i3-5010U. Programs are slow to launch and install even for a HDD-based system.
As for the GPU side, the Radeon R7 M340 is actually not too bad since it's almost up there with the GTX 950M in raw graphics horsepower. The main issue is that it's chained to a very slow CPU to the point where real-world gaming performance is significantly slower than a proper GTX 950M notebook. This bottleneck imbalance prevents the Pavilion 17z from being a budget-mainstream gaming machine and makes us question the inclusion of the R7 M340 in the first place. The GPU is simply drawing more power, adding more heat, and reducing battery life without really benefiting the user to its full potential. Simply put, Ryzen notebooks can't come soon enough.
Outside of our AMD complaints, the Pavilion 17z hardware is decent, if not unspectacular, considering the low price. Colors and contrast are very good for a budget offering, but most everything else about the notebook from the grainy panel to the feel of the plastic surfaces is a step below the mainstream.
You get what you pay for. The AMD-powered Pavilion 17z is certainly less expensive than an Intel equivalent, but the hit to performance and battery life is too big to swallow.
HP Pavilion 17z 1EX13AV
- 07/14/2017 v6 (old)
Allen Ngo
Price comparison
