HP Pavilion 17t (7700HQ, UHD, GTX 1050) Laptop Review
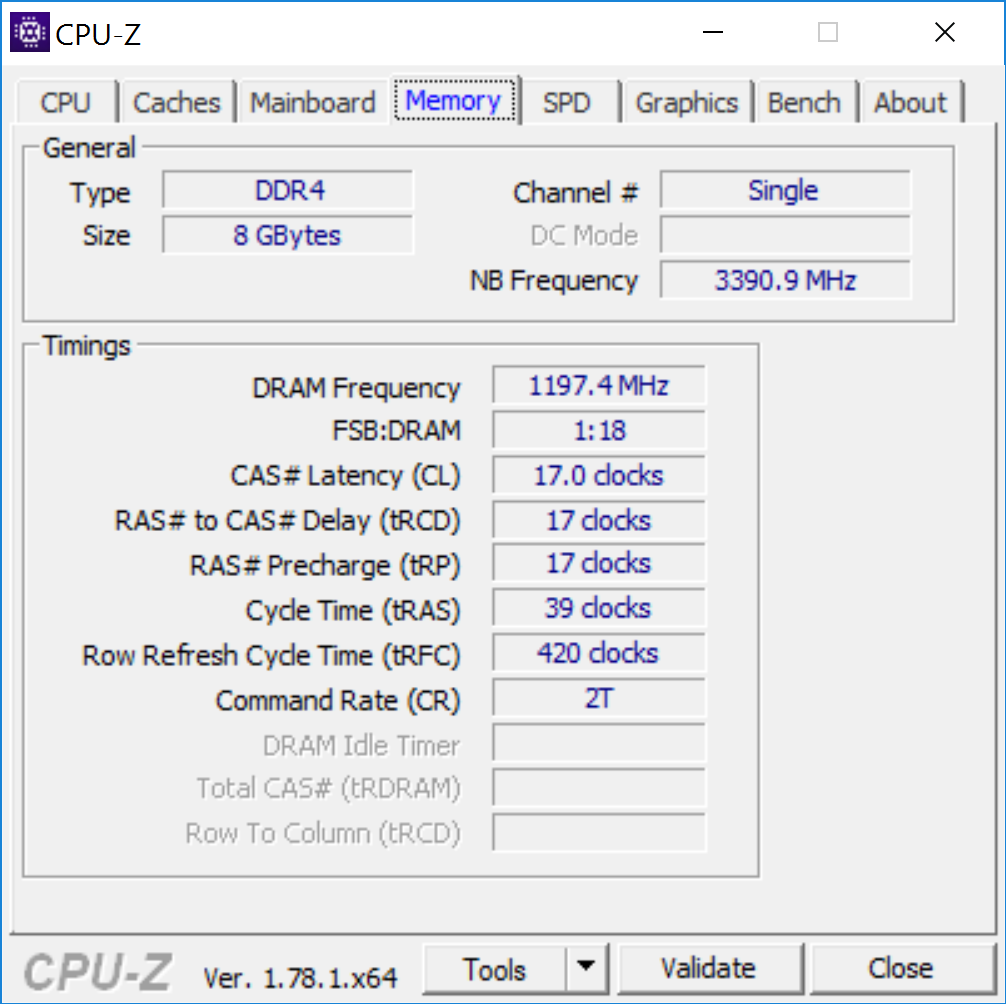
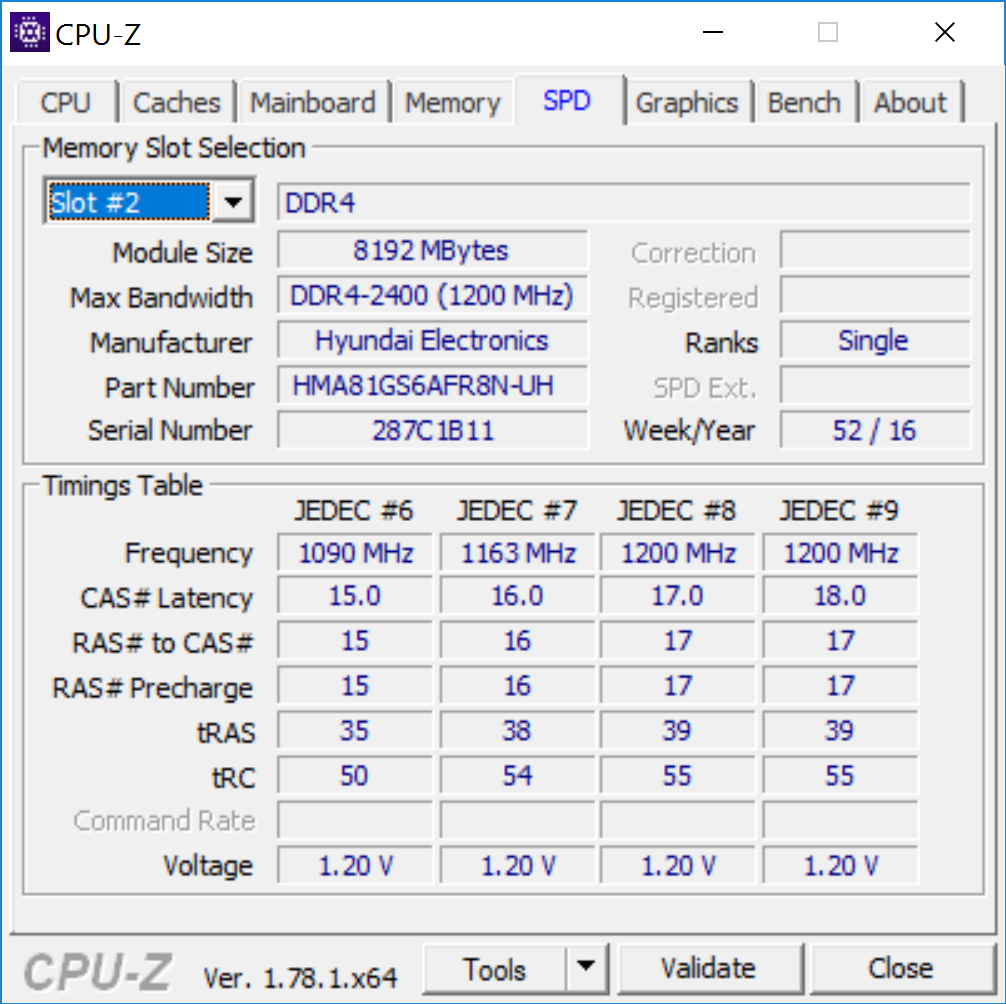
Just last month, we took a detailed look at the HP Pavilion 17t-ab200, which featured an Intel Core i7-7700HQ CPU and an NVIDIA GeForce GTX 1050 GPU. Today’s model is nearly identical in most every way except for a few key differences: the SSD is different (an Intel 256 GB model), it only includes half the RAM (8 GB DDR4 single-channel), and the display panel has seen a significant bump up to 4K resolution (from 1080p previously). Apart from that, nearly everything else about the machine remains consistent.
The GTX 1050 can certainly push basic video at 4K resolution, but whether or not it can handle any sort of gaming at that level is another question entirely. Let’s take a quick look at what’s new with this Pavilion 17t, after which we’ll dive more deeply into the question of gaming performance.
Since many components, such as casing, connectivity, and input devices have not changed since our previous review, we will not be covering those items again today. For much more information on any of those aspects of the Pavilion 17t, please see our review from last month.
Display
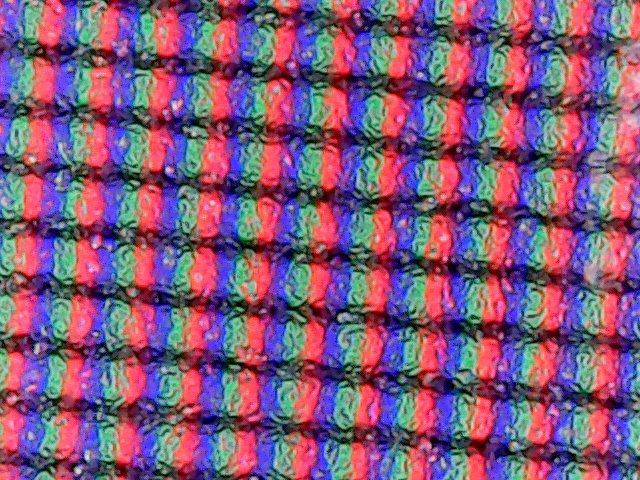
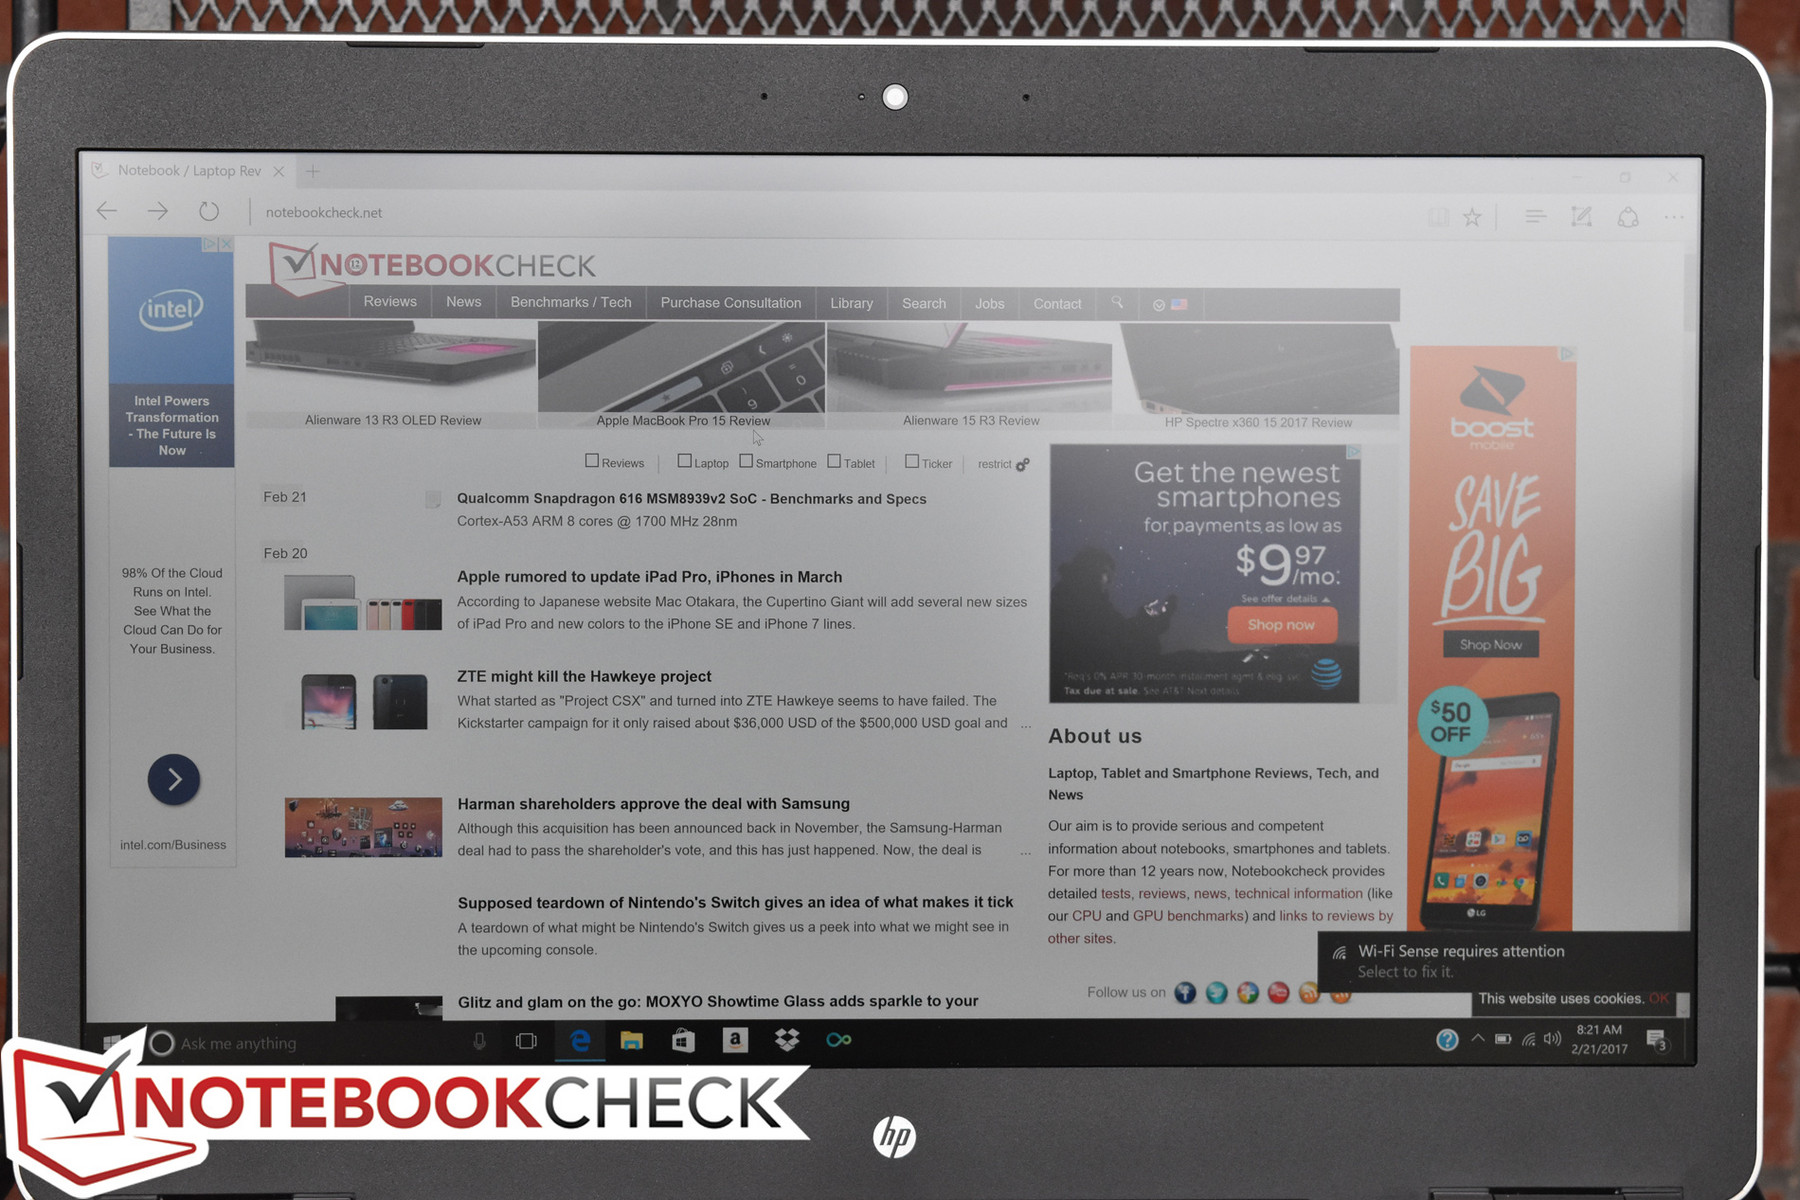
There is little doubt upon first glance that the Pavilion 17t’s UHD display looks much nicer than the 1080p panel we evaluated in our previous review. That isn’t to say that the 1080p display was bad, but it’s immediately obvious that the UHD version features better maximum brightness—and, of course, its contents appear much sharper, since it features a pixel density of 255 (much more reasonable than the 127 PPI of the previous model). At a screen size of 17.3 inches, a UHD panel really makes a difference.
| |||||||||||||||||||||||||
Brightness Distribution: 90 %
Center on Battery: 325.7 cd/m²
Contrast: 880:1 (Black: 0.37 cd/m²)
ΔE ColorChecker Calman: 6.5 | ∀{0.5-29.43 Ø4.73}
ΔE Greyscale Calman: 5.6 | ∀{0.09-98 Ø4.97}
100% sRGB (Argyll 1.6.3 3D)
87% AdobeRGB 1998 (Argyll 1.6.3 3D)
99.4% AdobeRGB 1998 (Argyll 3D)
99.9% sRGB (Argyll 3D)
87.1% Display P3 (Argyll 3D)
Gamma: 2.59
CCT: 5860 K
| HP Pavilion 17t-ab200 UHD AUO119B, IPS, 17.3", 3840x2160 | HP Pavilion 17t-ab200 AUO109D, IPS, 17.3", 1920x1080 | Gigabyte P57X v7 SHP145E, IPS, 17.3", 3840x2160 | MSI GT73VR 6RF IPS, 17.3", 3840x2160 | |
|---|---|---|---|---|
| Display | -24% | 0% | -22% | |
| Display P3 Coverage (%) | 87.1 | 65.2 -25% | 87.8 1% | 63.6 -27% |
| sRGB Coverage (%) | 99.9 | 87.6 -12% | 100 0% | 95.8 -4% |
| AdobeRGB 1998 Coverage (%) | 99.4 | 64.1 -36% | 98.9 -1% | 65.7 -34% |
| Response Times | 22% | -25% | 22% | |
| Response Time Grey 50% / Grey 80% * (ms) | 50.8 | 36.8 28% | 55.6 ? -9% | 33.6 ? 34% |
| Response Time Black / White * (ms) | 33.2 | 28 16% | 46.8 ? -41% | 30 ? 10% |
| PWM Frequency (Hz) | 1000 ? | |||
| Screen | -8% | 10% | -0% | |
| Brightness middle (cd/m²) | 325.7 | 278.8 -14% | 441.3 35% | 334.8 3% |
| Brightness (cd/m²) | 309 | 265 -14% | 408 32% | 316 2% |
| Brightness Distribution (%) | 90 | 91 1% | 86 -4% | 87 -3% |
| Black Level * (cd/m²) | 0.37 | 0.28 24% | 0.44 -19% | 0.422 -14% |
| Contrast (:1) | 880 | 996 13% | 1003 14% | 793 -10% |
| Colorchecker dE 2000 * | 6.5 | 5.8 11% | 5.1 22% | 4.11 37% |
| Colorchecker dE 2000 max. * | 9.6 | 10.6 -10% | 9.8 -2% | 7.8 19% |
| Greyscale dE 2000 * | 5.6 | 8.3 -48% | 4.3 23% | 5.74 -3% |
| Gamma | 2.59 85% | 2.1 105% | 2.08 106% | 2.3 96% |
| CCT | 5860 111% | 5723 114% | 7345 88% | 5987 109% |
| Color Space (Percent of AdobeRGB 1998) (%) | 87 | 57 -34% | 87 0% | 60.5 -30% |
| Color Space (Percent of sRGB) (%) | 100 | 87 -13% | 100 0% | 96 -4% |
| Total Average (Program / Settings) | -3% /
-8% | -5% /
3% | 0% /
-2% |
* ... smaller is better
We measured a peak brightness of 325.7 cd/m² and an average of 308.6 cd/m², well above the 1080p panel’s 265 cd/m². Thanks to a higher black level of 0.37 cd/m², contrast has actually decreased a bit to 880:1 (down from 996:1), but it isn’t really noticeable and it still looks great. Brightness distribution remains nearly identical at 90%, which is very good.
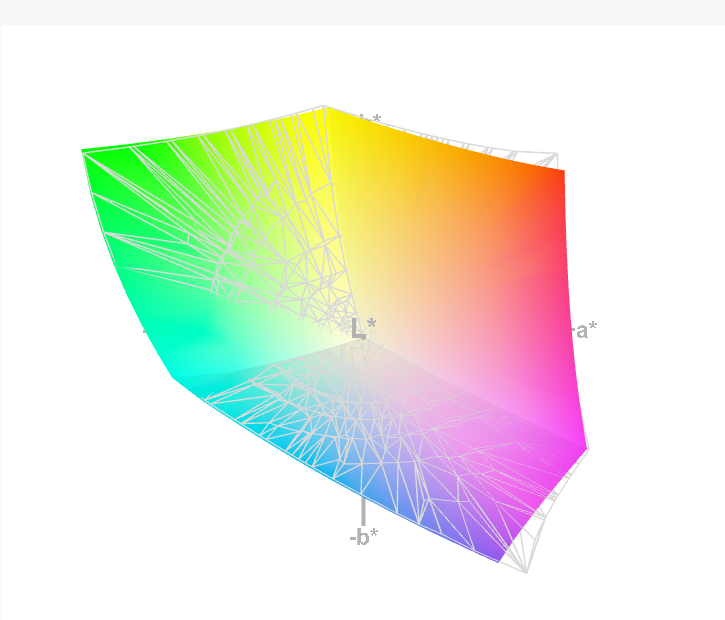
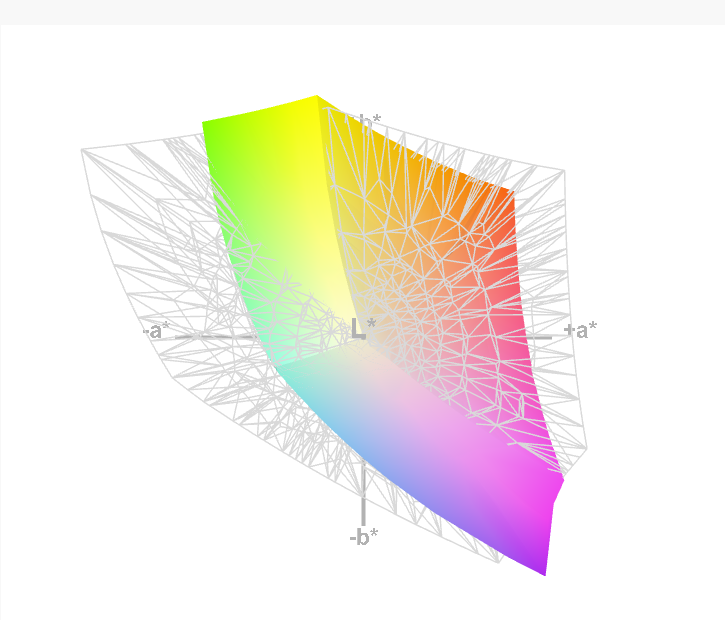
sRGB results have also improved. Whereas the previous HP Pavilion 17t managed an acceptable 87% coverage of the sRGB spectrum, the UHD iteration manages to cover the entire gamut (100%). AdobeRGB is even 87% covered, an excellent result which, pending an acceptable color accuracy performance, renders the Pavilion 17t UHD an appropriate candidate for graphics and photo editing enthusiasts.
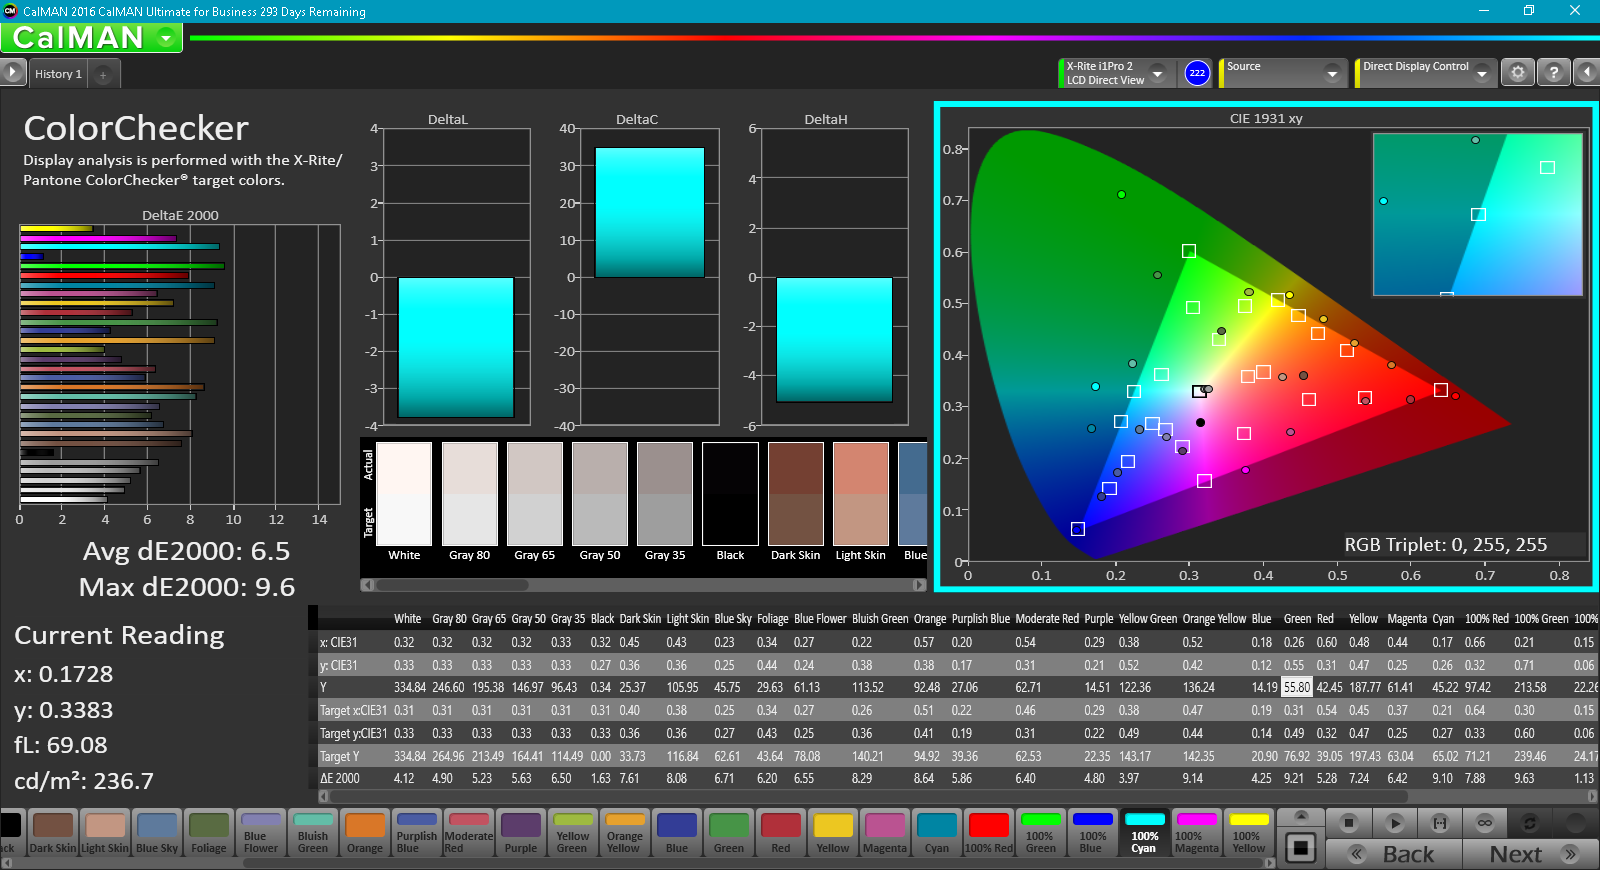
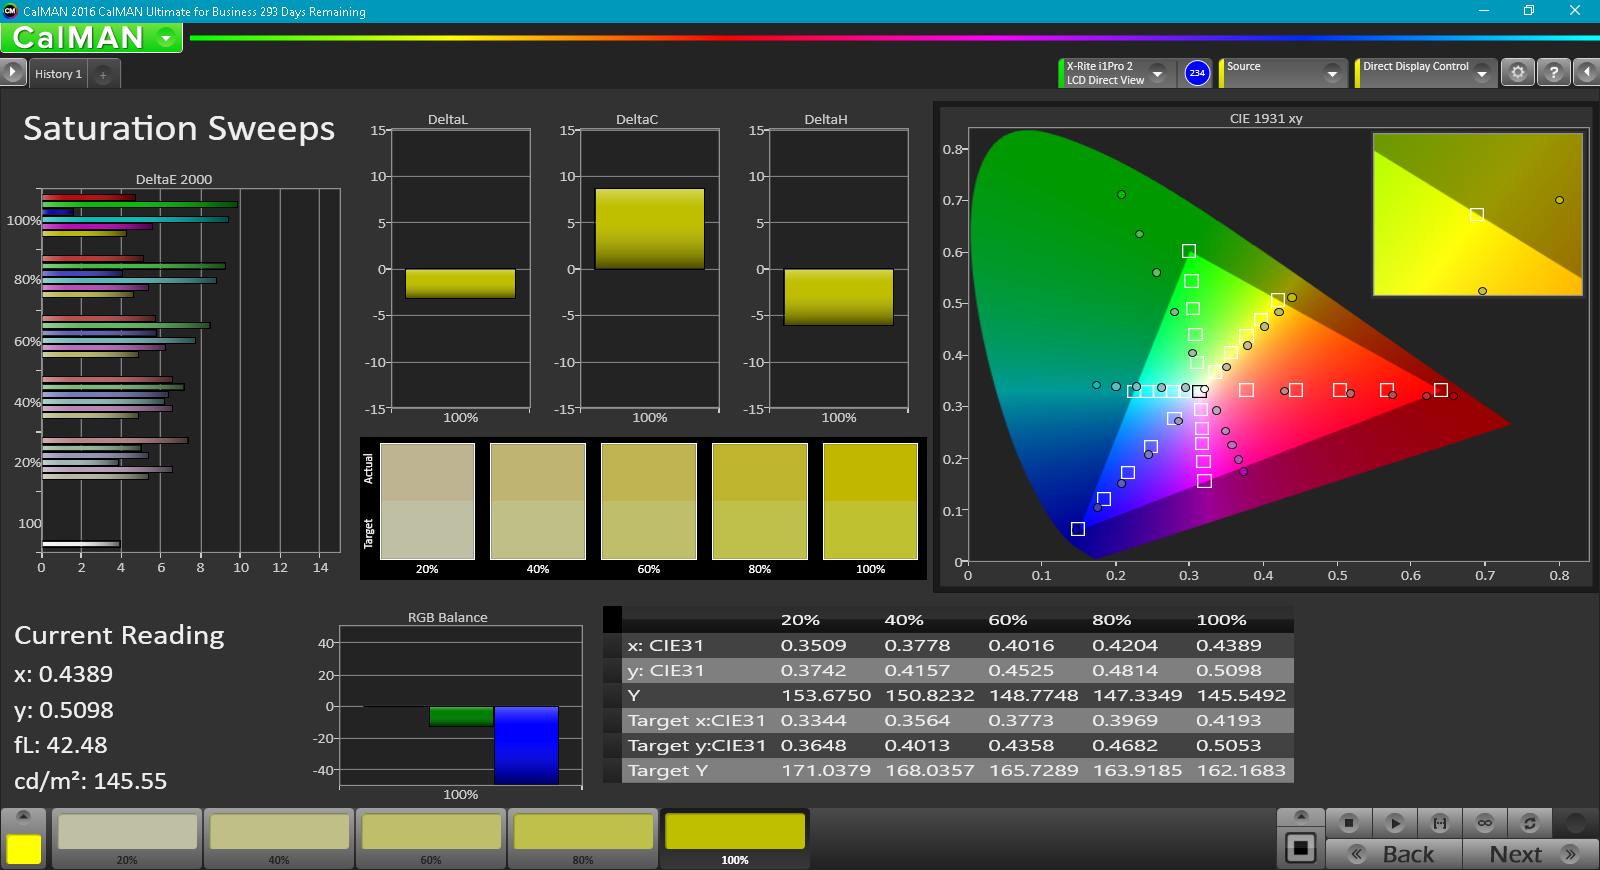
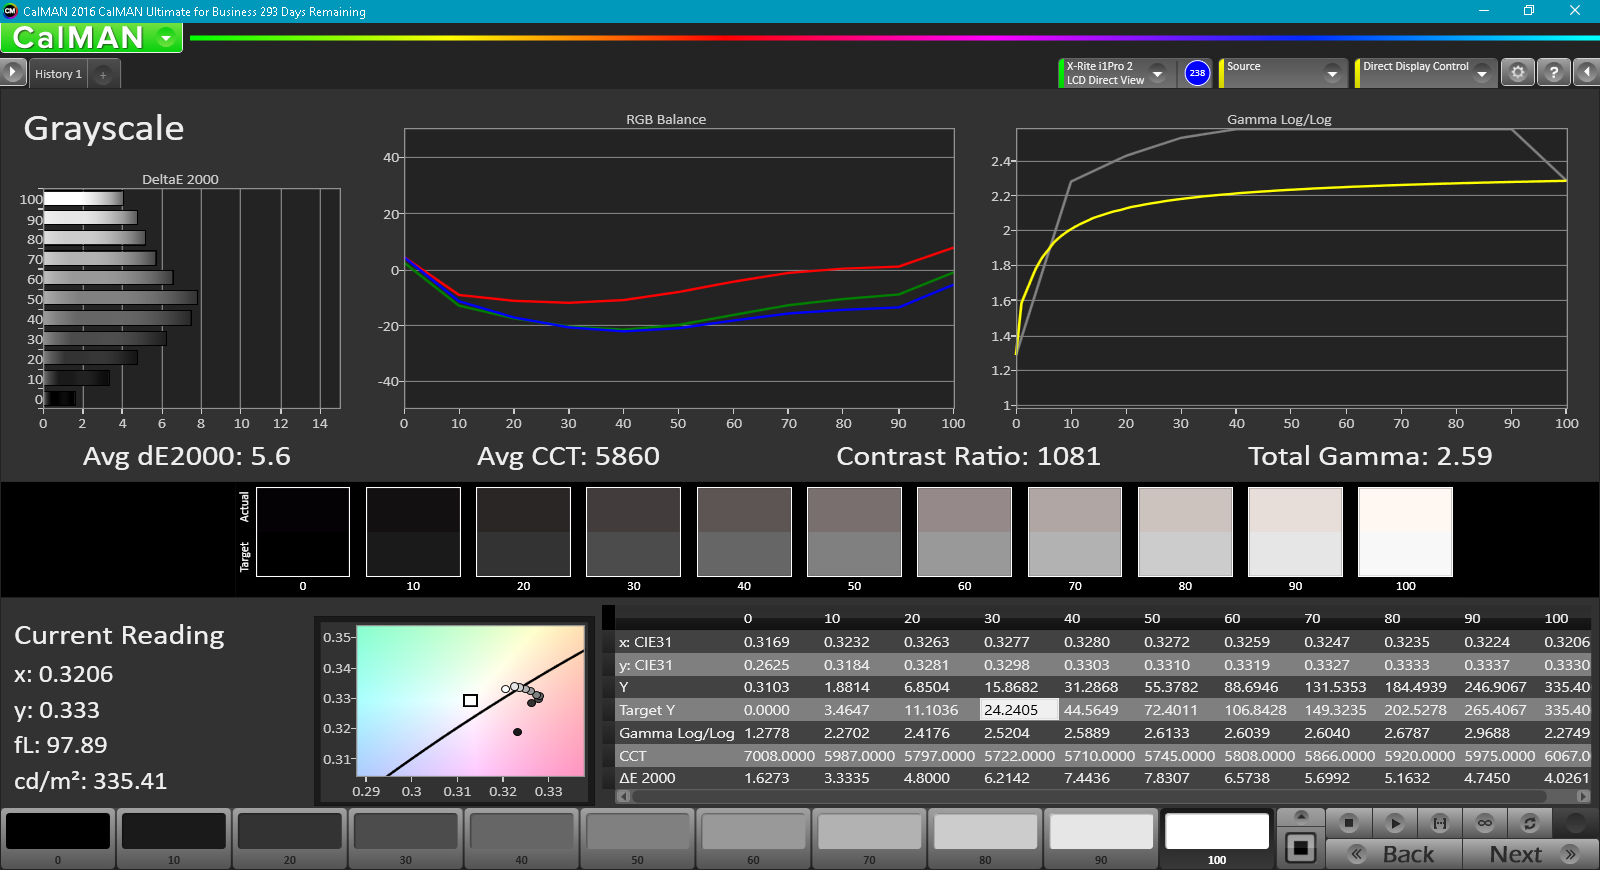
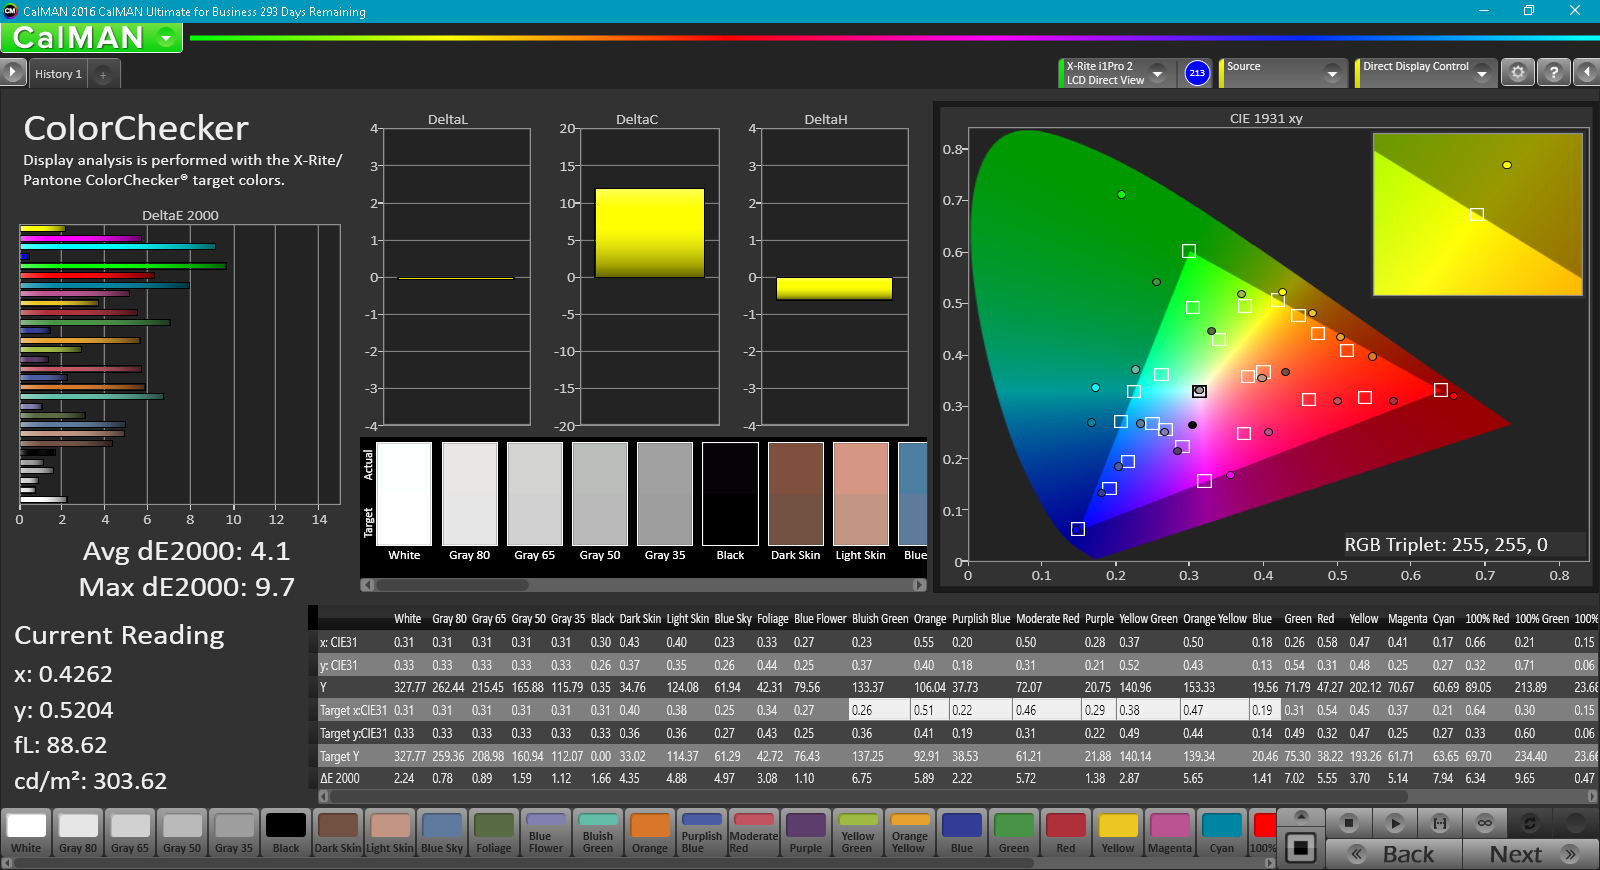
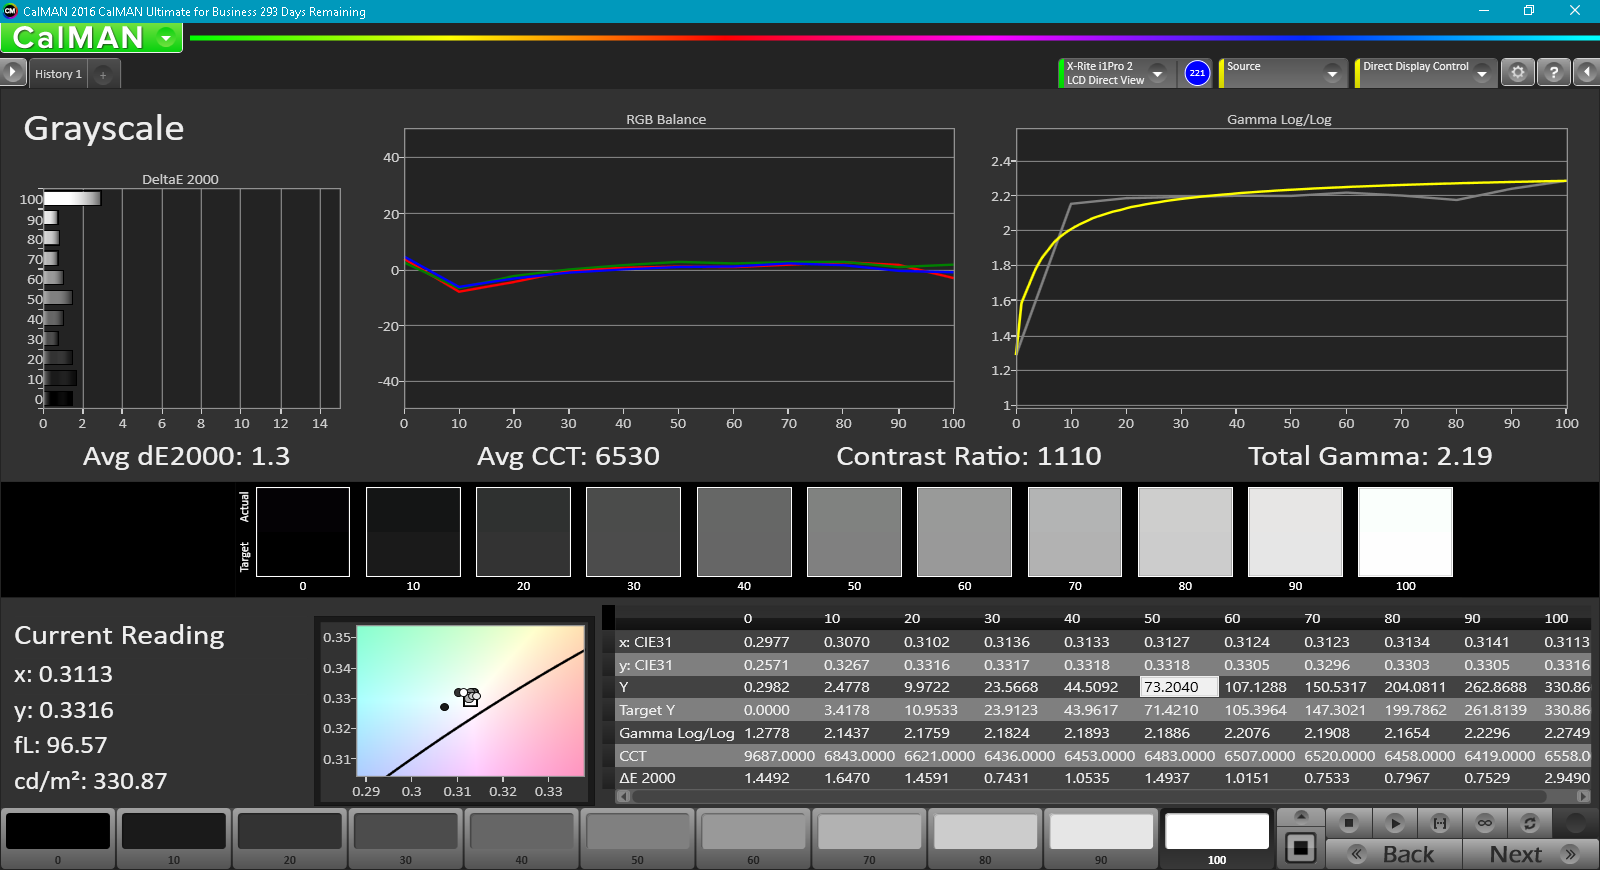
To that end, CalMAN 5 revealed a ColorChecker DeltaE2000 of 6.5 and a Greyscale DeltaE2000 of 5.6, neither of which are great results—but at least those values can be calibrated downward (we managed to get them down to 4.1 and 1.3, respectively post-calibration). The CCT Average of 5860 is a bit on the warm side (ideal: 6500), and the total gamma of 2.59 is also somewhat high (ideal: 2.2).
Display Response Times
| ↔ Response Time Black to White | ||
|---|---|---|
| 33.2 ms ... rise ↗ and fall ↘ combined | ↗ ms rise | 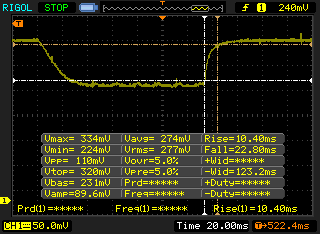 |
| ↘ ms fall | ||
| The screen shows slow response rates in our tests and will be unsatisfactory for gamers. In comparison, all tested devices range from 0.1 (minimum) to 240 (maximum) ms. » 90 % of all devices are better. This means that the measured response time is worse than the average of all tested devices (19.9 ms). | ||
| ↔ Response Time 50% Grey to 80% Grey | ||
| 50.8 ms ... rise ↗ and fall ↘ combined | ↗ ms rise | 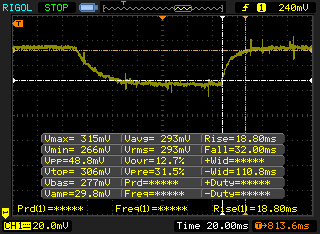 |
| ↘ ms fall | ||
| The screen shows slow response rates in our tests and will be unsatisfactory for gamers. In comparison, all tested devices range from 0.165 (minimum) to 636 (maximum) ms. » 87 % of all devices are better. This means that the measured response time is worse than the average of all tested devices (31.1 ms). | ||
Screen Flickering / PWM (Pulse-Width Modulation)
| Screen flickering / PWM not detected | 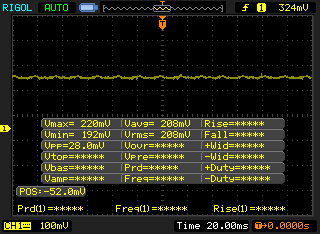 | ||
In comparison: 52 % of all tested devices do not use PWM to dim the display. If PWM was detected, an average of 7798 (minimum: 5 - maximum: 343500) Hz was measured. | |||
Outdoors, the machine does fairly well thanks to a good brightness/contrast and an anti-glare panel finish. Viewing angles are also excellent, as is always the case for IPS screens.

Performance
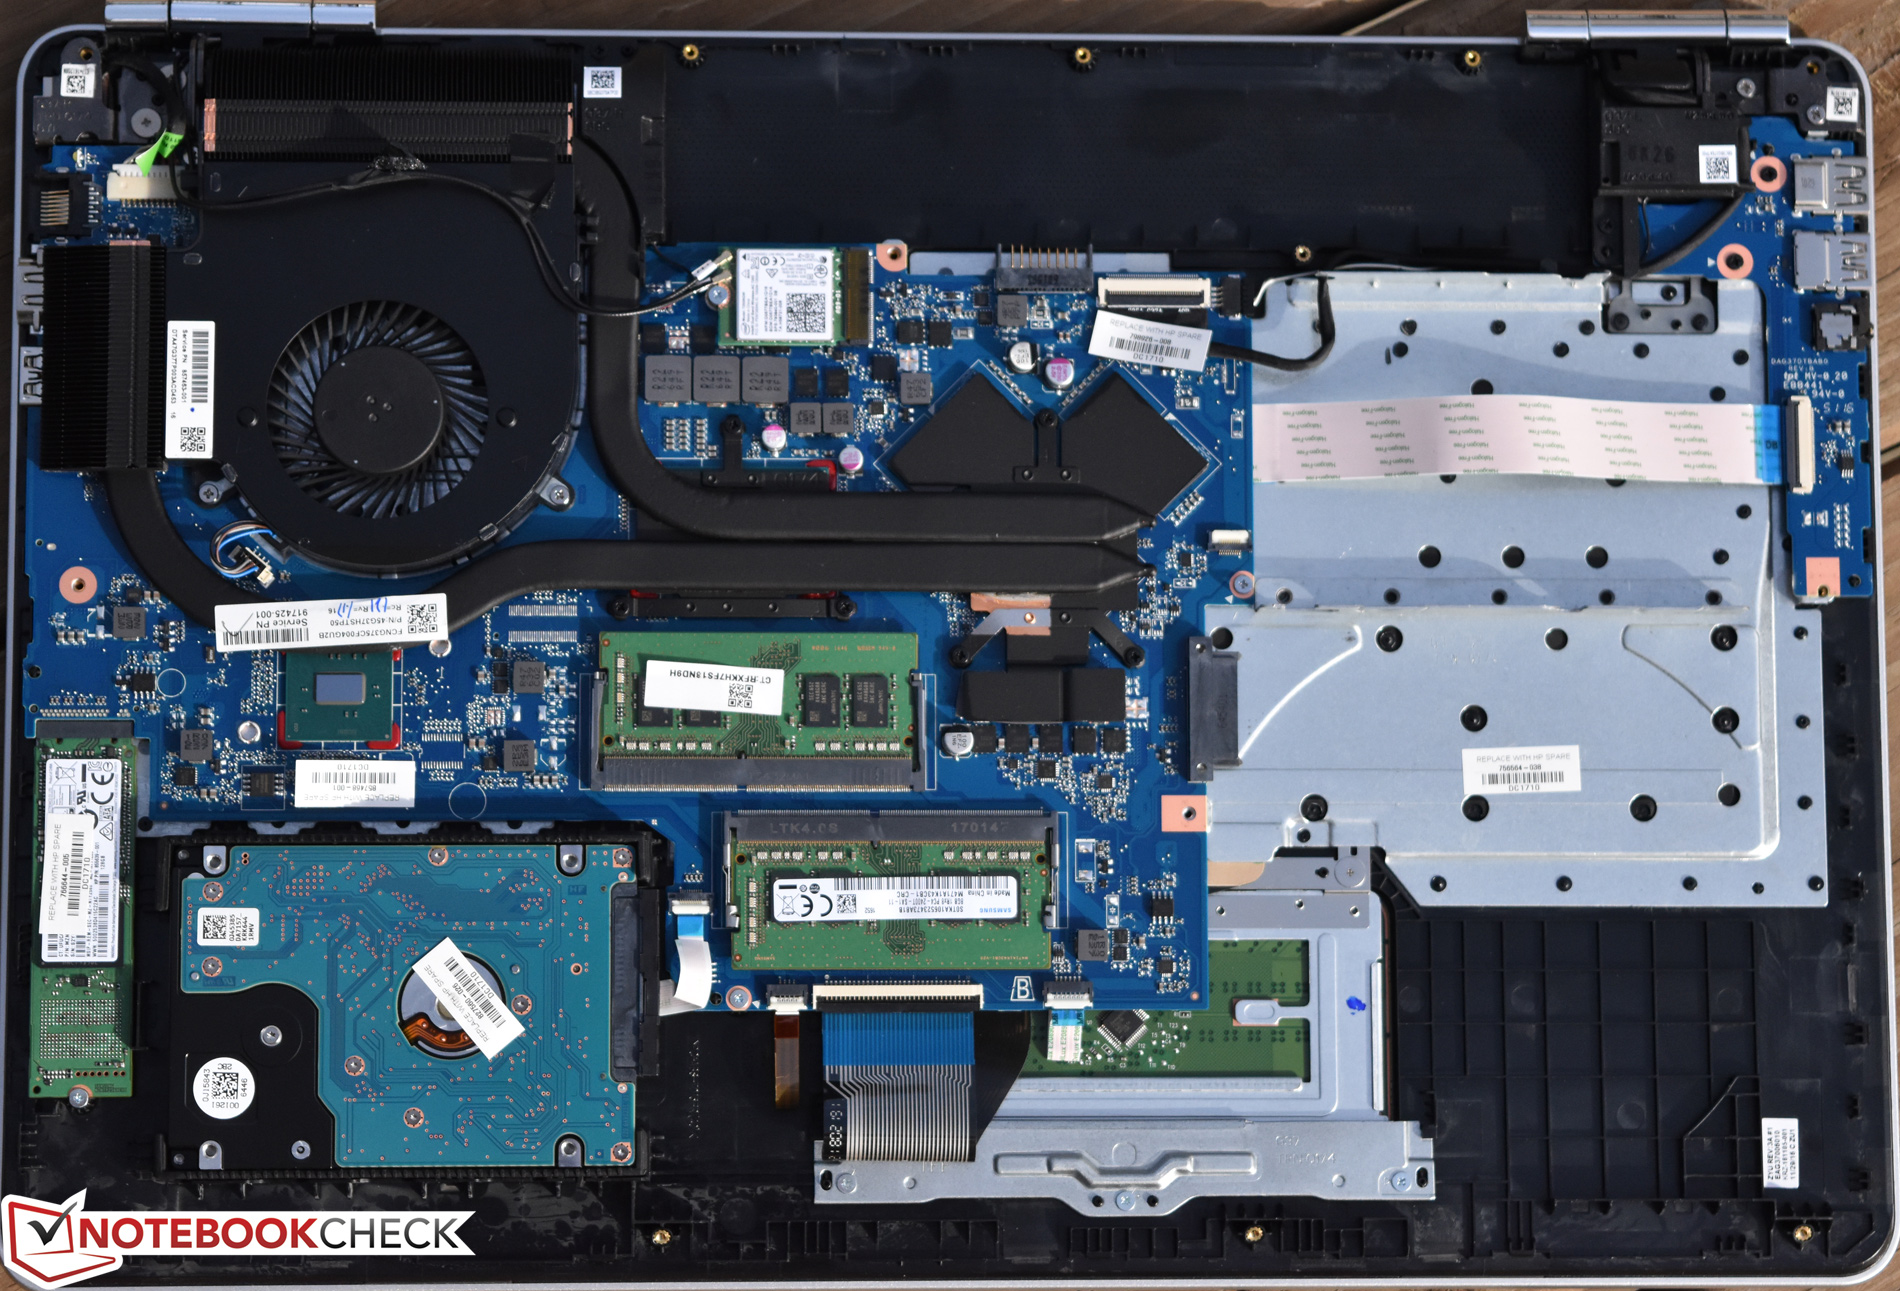
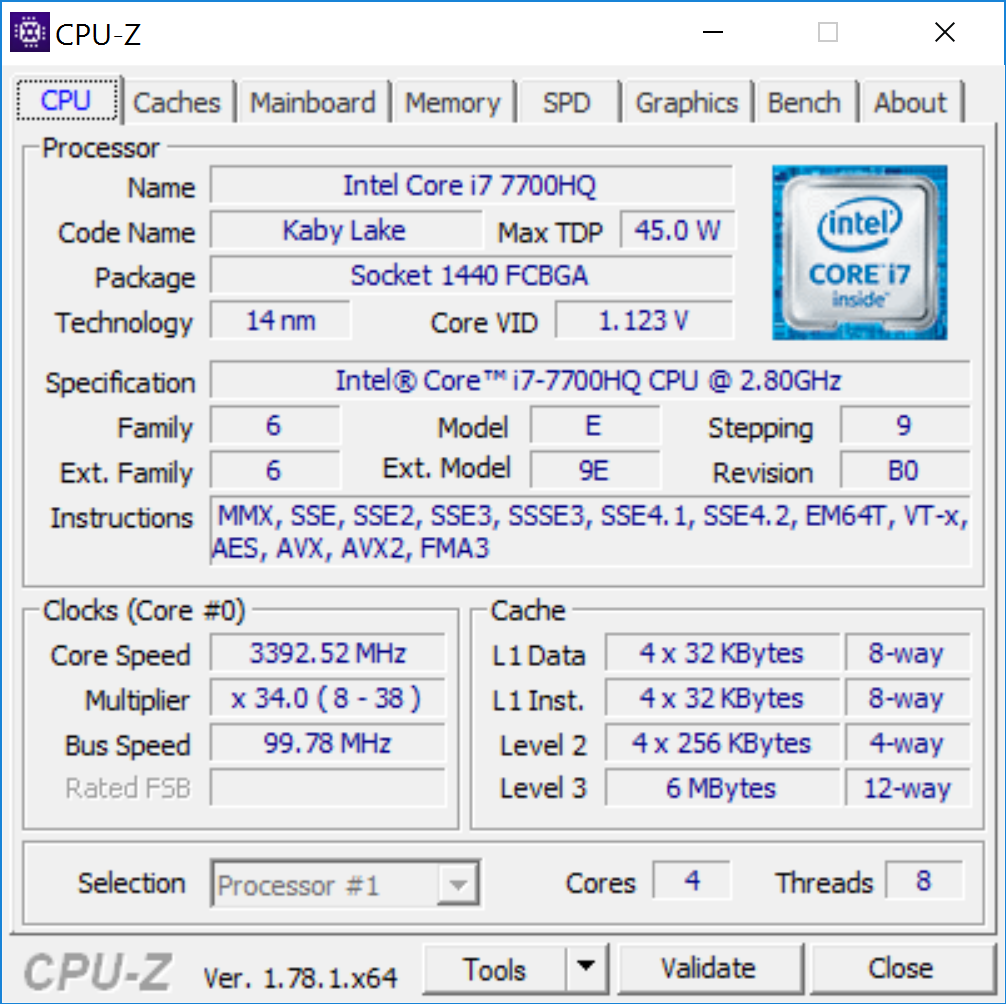
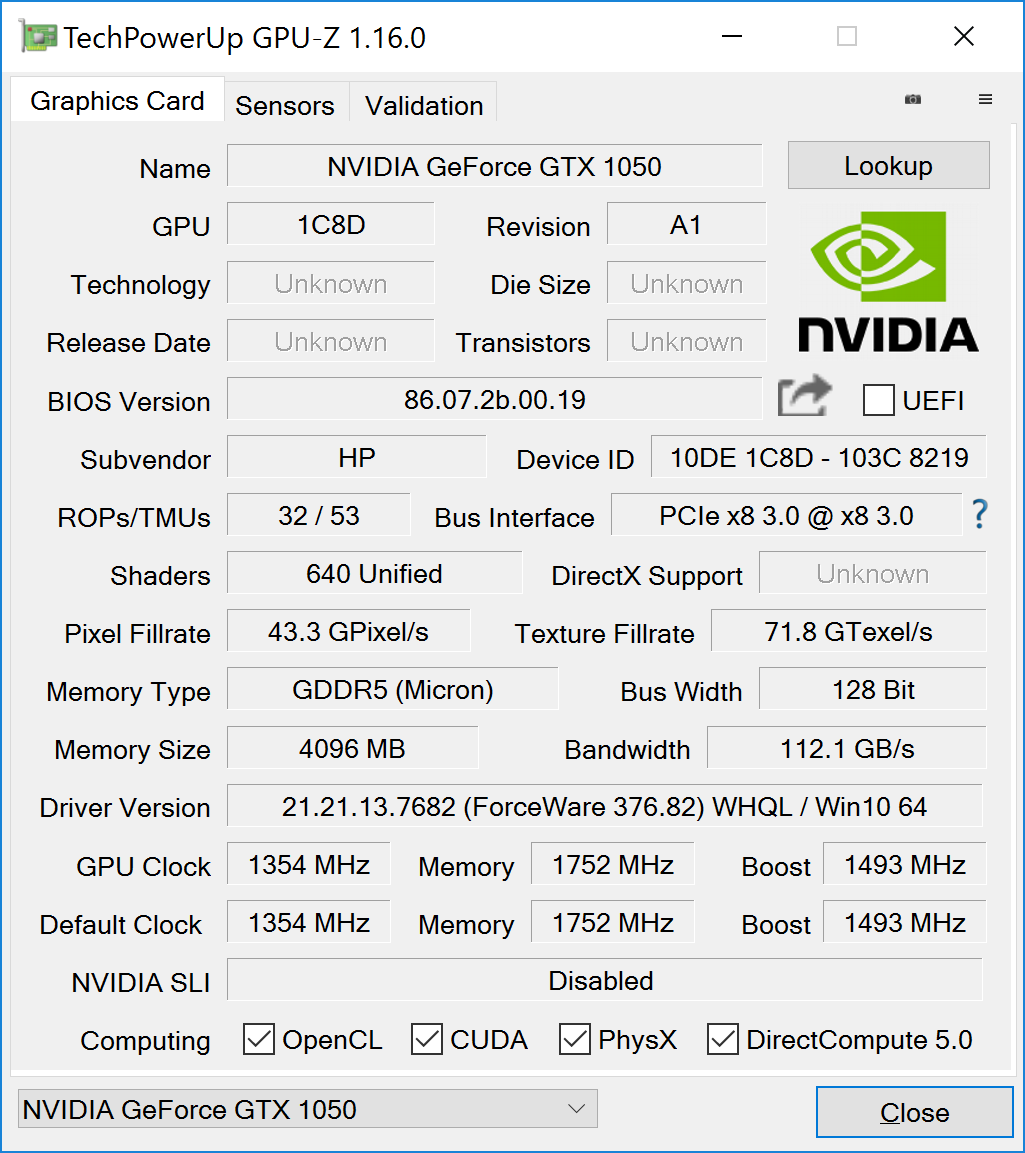
The CPU and GPU in the Pavilion 17t-ab200 configuration we are reviewing today are both identical to those of the previous model: the Kaby Lake quad-core Intel Core i7-7700HQ and NVIDIA GeForce GTX 1050, both of which are more than capable. However, two significant differences exist elsewhere: RAM (which is now 8 GB single-channel versus 16 dual-channel previously) and storage (which has seen a jump to a 256 GB Intel SSD model over the previous 128 GB Samsung SSD). We will see how these changes affect performance in the coming sections.
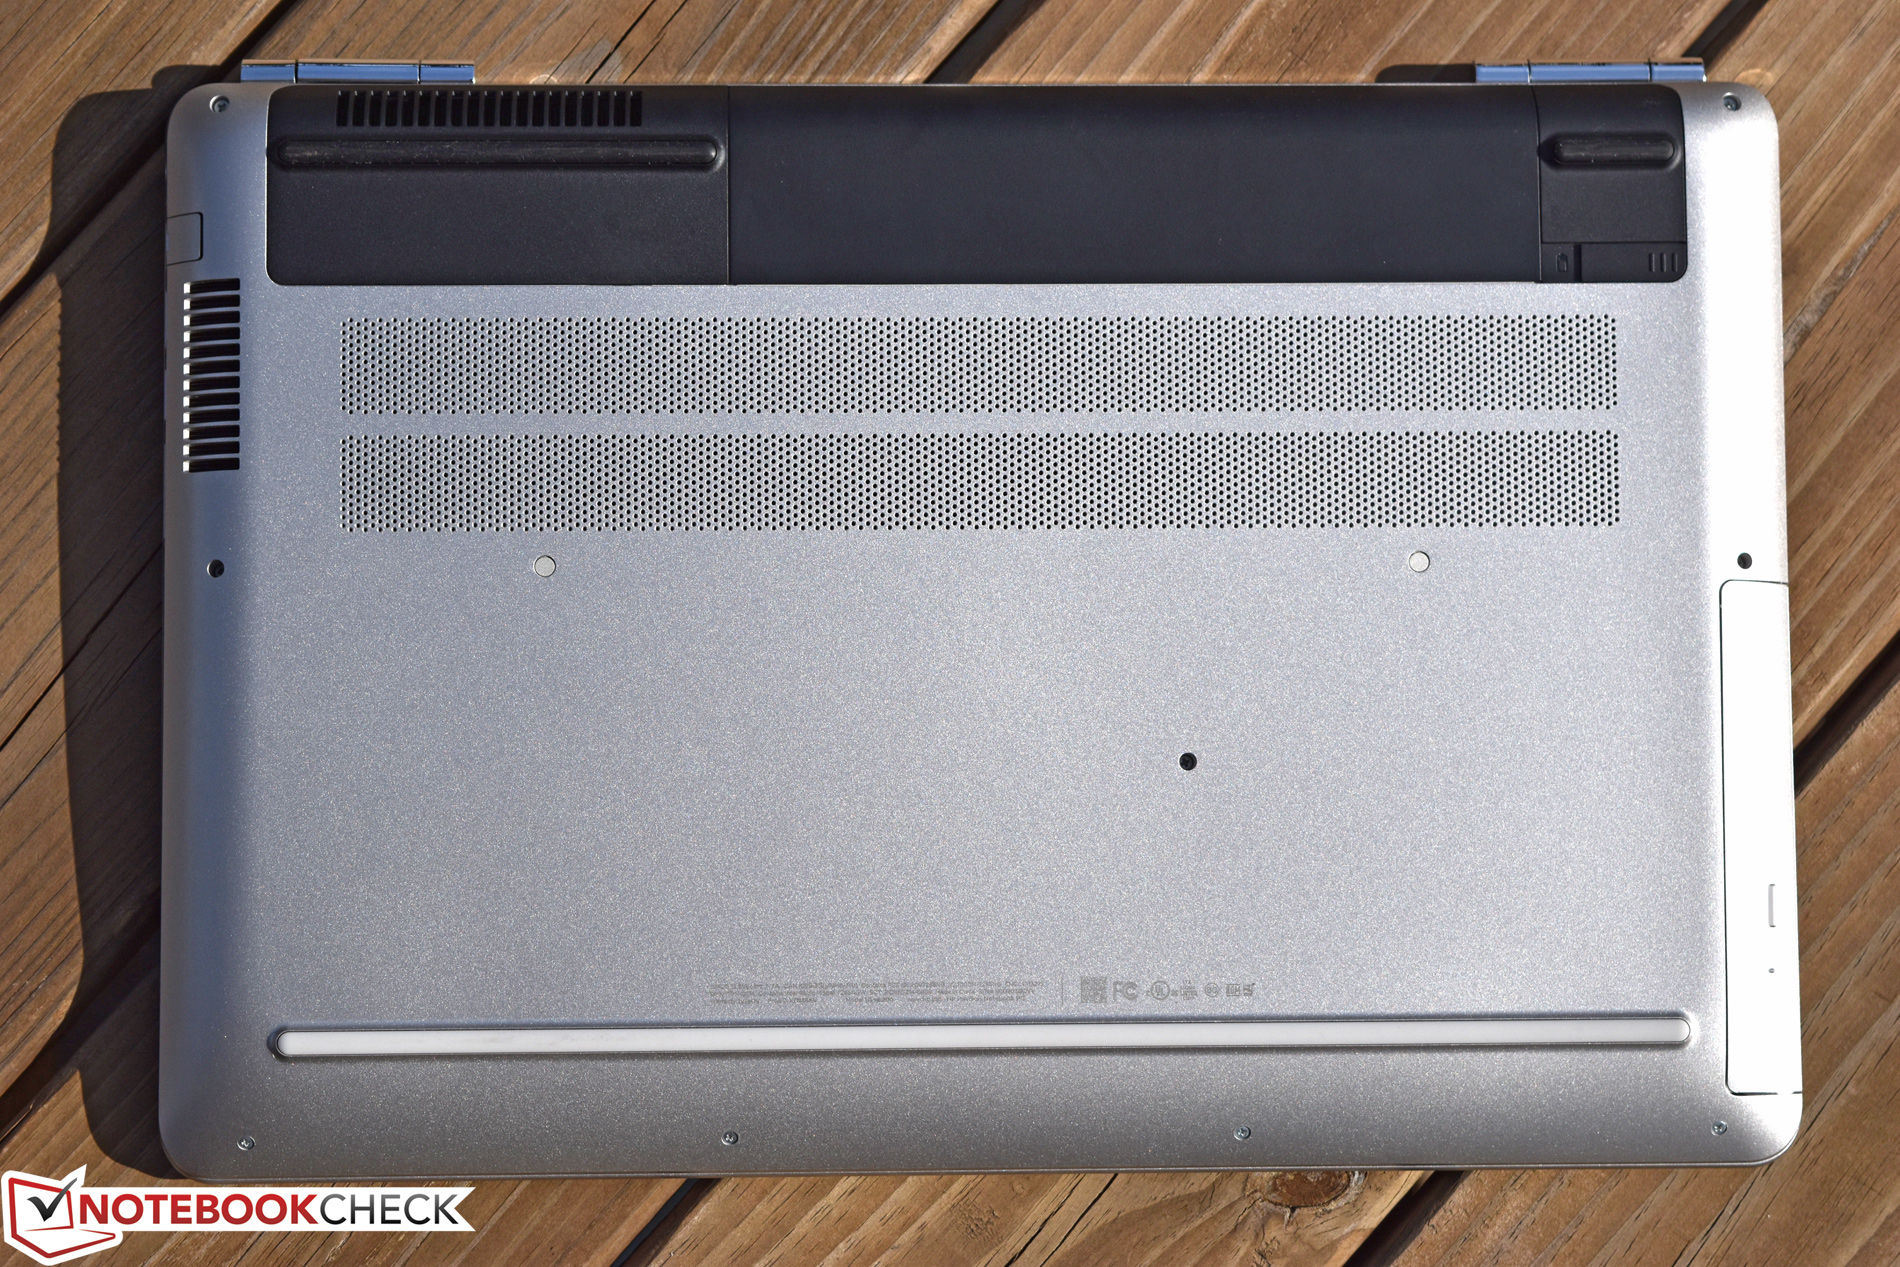
A quick note about upgradeability: although we didn’t cover maintenance and upgrades in this article, the topic remains a challenge, as it was during our time with the previous configuration. Although it is indeed possible to upgrade the RAM and other components, disassembly of the Pavilion 17t is a rather delicate process thanks to the thin plastic from which the machine is constructed. For much more detail on this subject, please see our previous article.
Processor
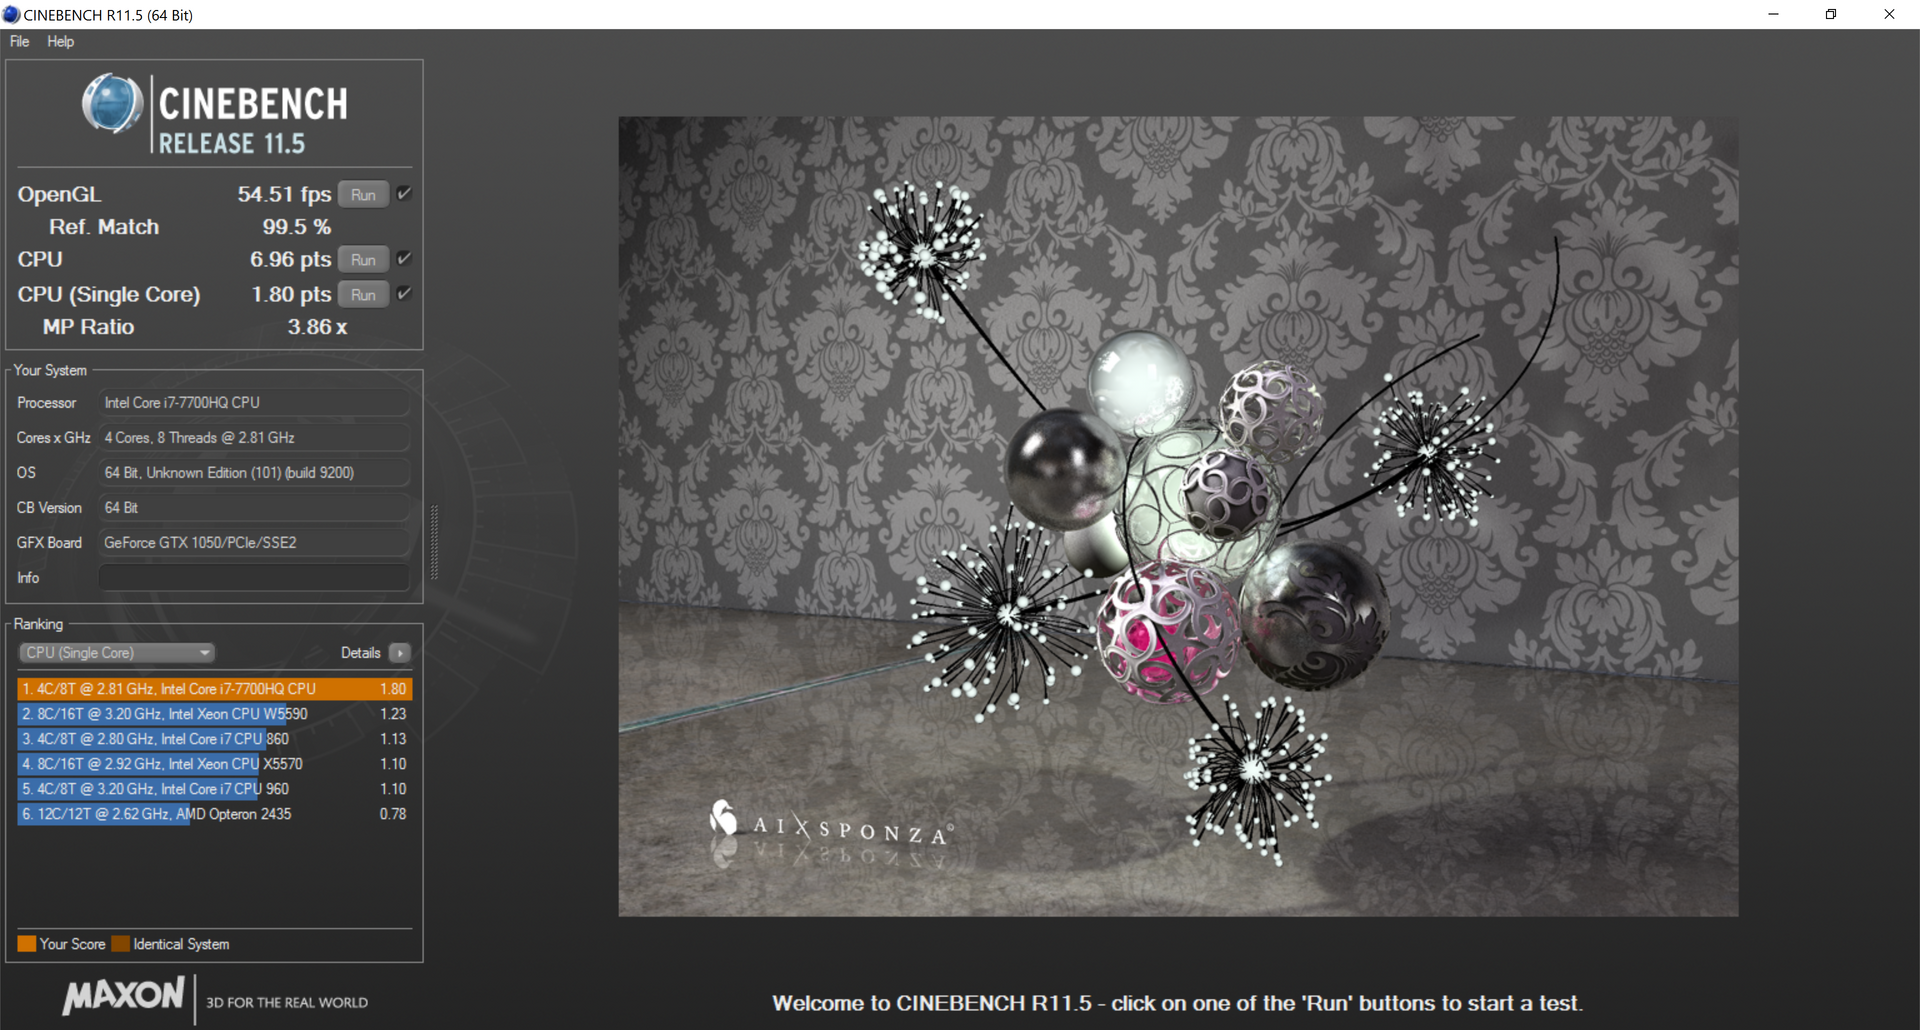
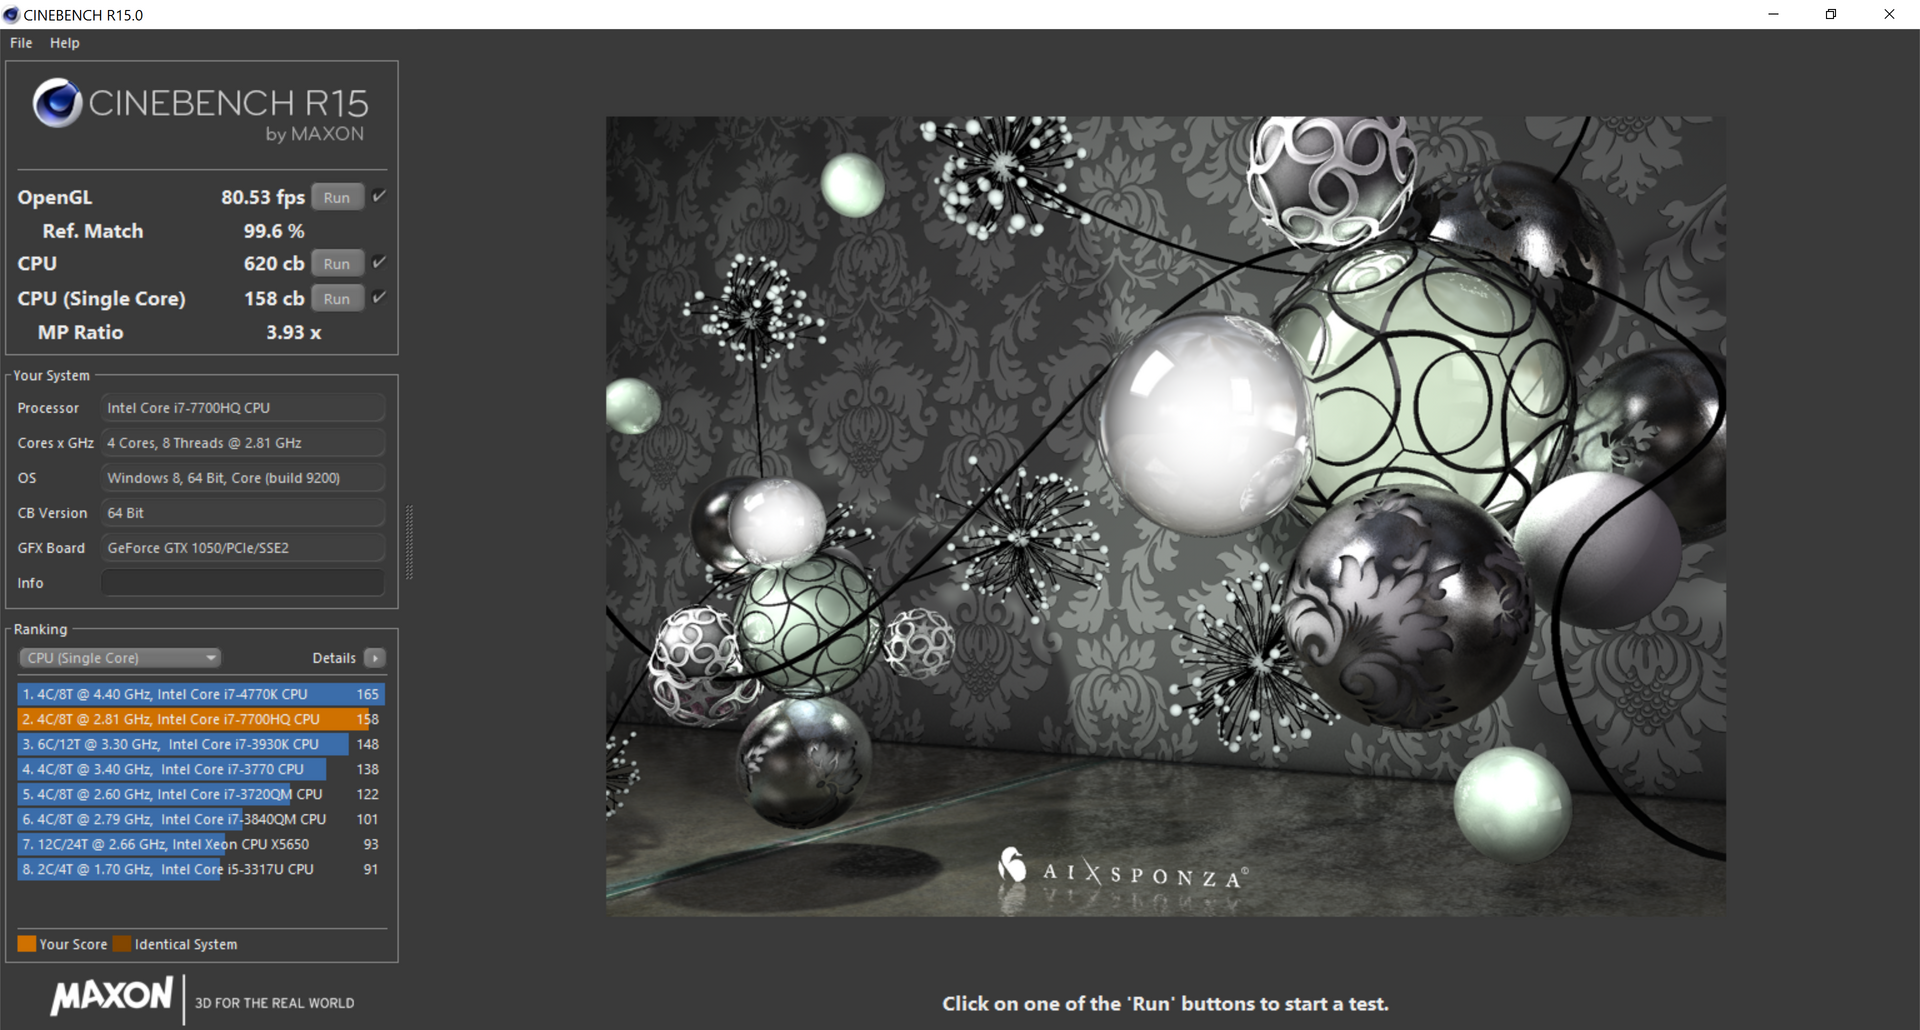
In our CPU benchmarks, the Pavilion 17t-ab200 UHD didn’t do quite as well as its 1080p predecessor. Although the machine topped the charts among Core i7-7700HQ-equipped models in the Cinebench R15 single-core test, multi-core saw it drop down to the bottom spot with “just” 620 points. Similar results were seen from the R11.5 benchmarks, with a difference of between 17 and 19 percent separating the 1080p Pavilion and the UHD model we are evaluating today in single-core benchmarks. In Super Pi and wPrime, the gap was much smaller, at an almost negligible 3 percent. Regardless of what implications this might suggest in terms of real-world performance, it is important to note that these results are still very good overall, and that the average user is unlikely to really notice the difference even if one does happen to exist during their usage of the machine.
| Cinebench R11.5 | |
| CPU Single 64Bit | |
| MSI GT73VR 6RF | |
| HP Pavilion 17t-ab200 UHD | |
| Gigabyte P57X v7 | |
| HP Pavilion 17t-ab200 | |
| CPU Multi 64Bit | |
| MSI GT73VR 6RF | |
| HP Pavilion 17t-ab200 | |
| Gigabyte P57X v7 | |
| HP Pavilion 17t-ab200 UHD | |
| wPrime 2.10 - 1024m | |
| Gigabyte P57X v7 | |
| HP Pavilion 17t-ab200 UHD | |
| HP Pavilion 17t-ab200 | |
* ... smaller is better
System Performance
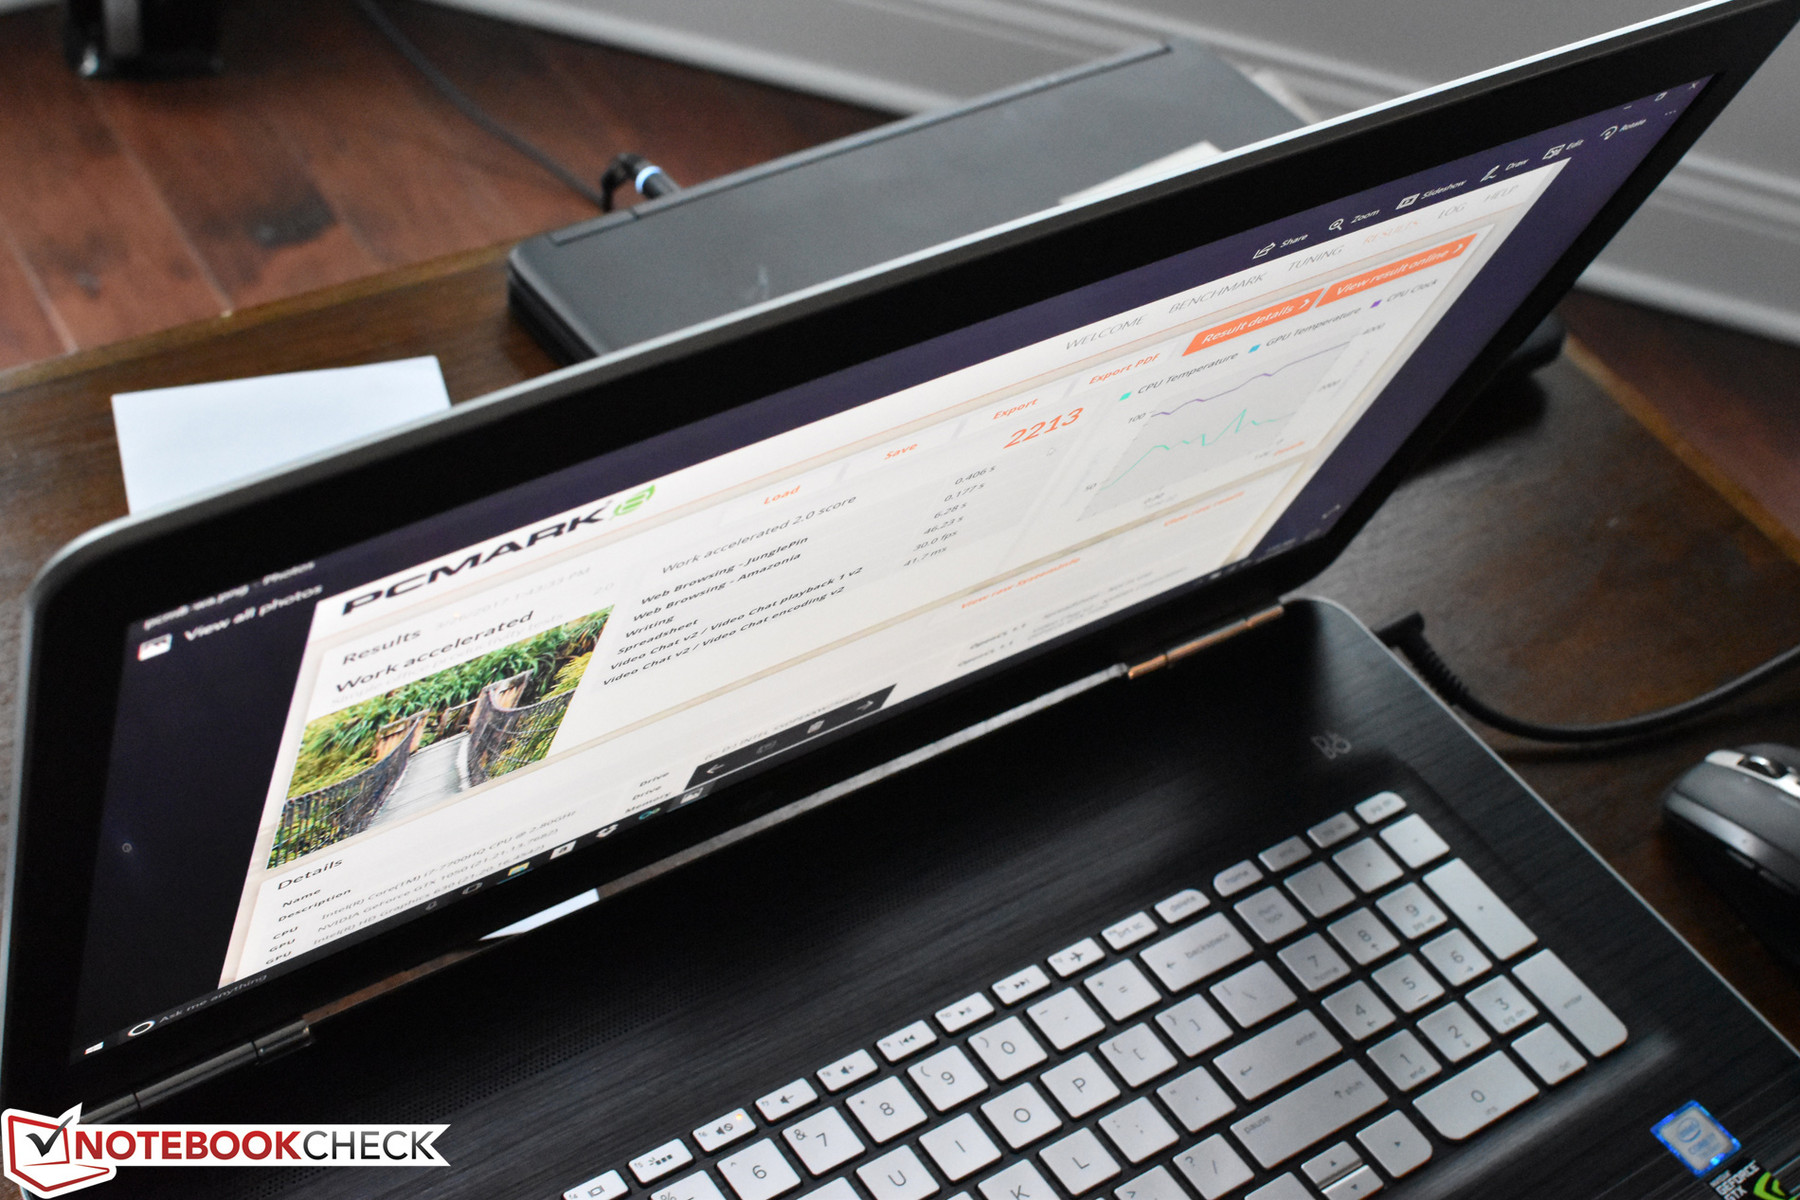
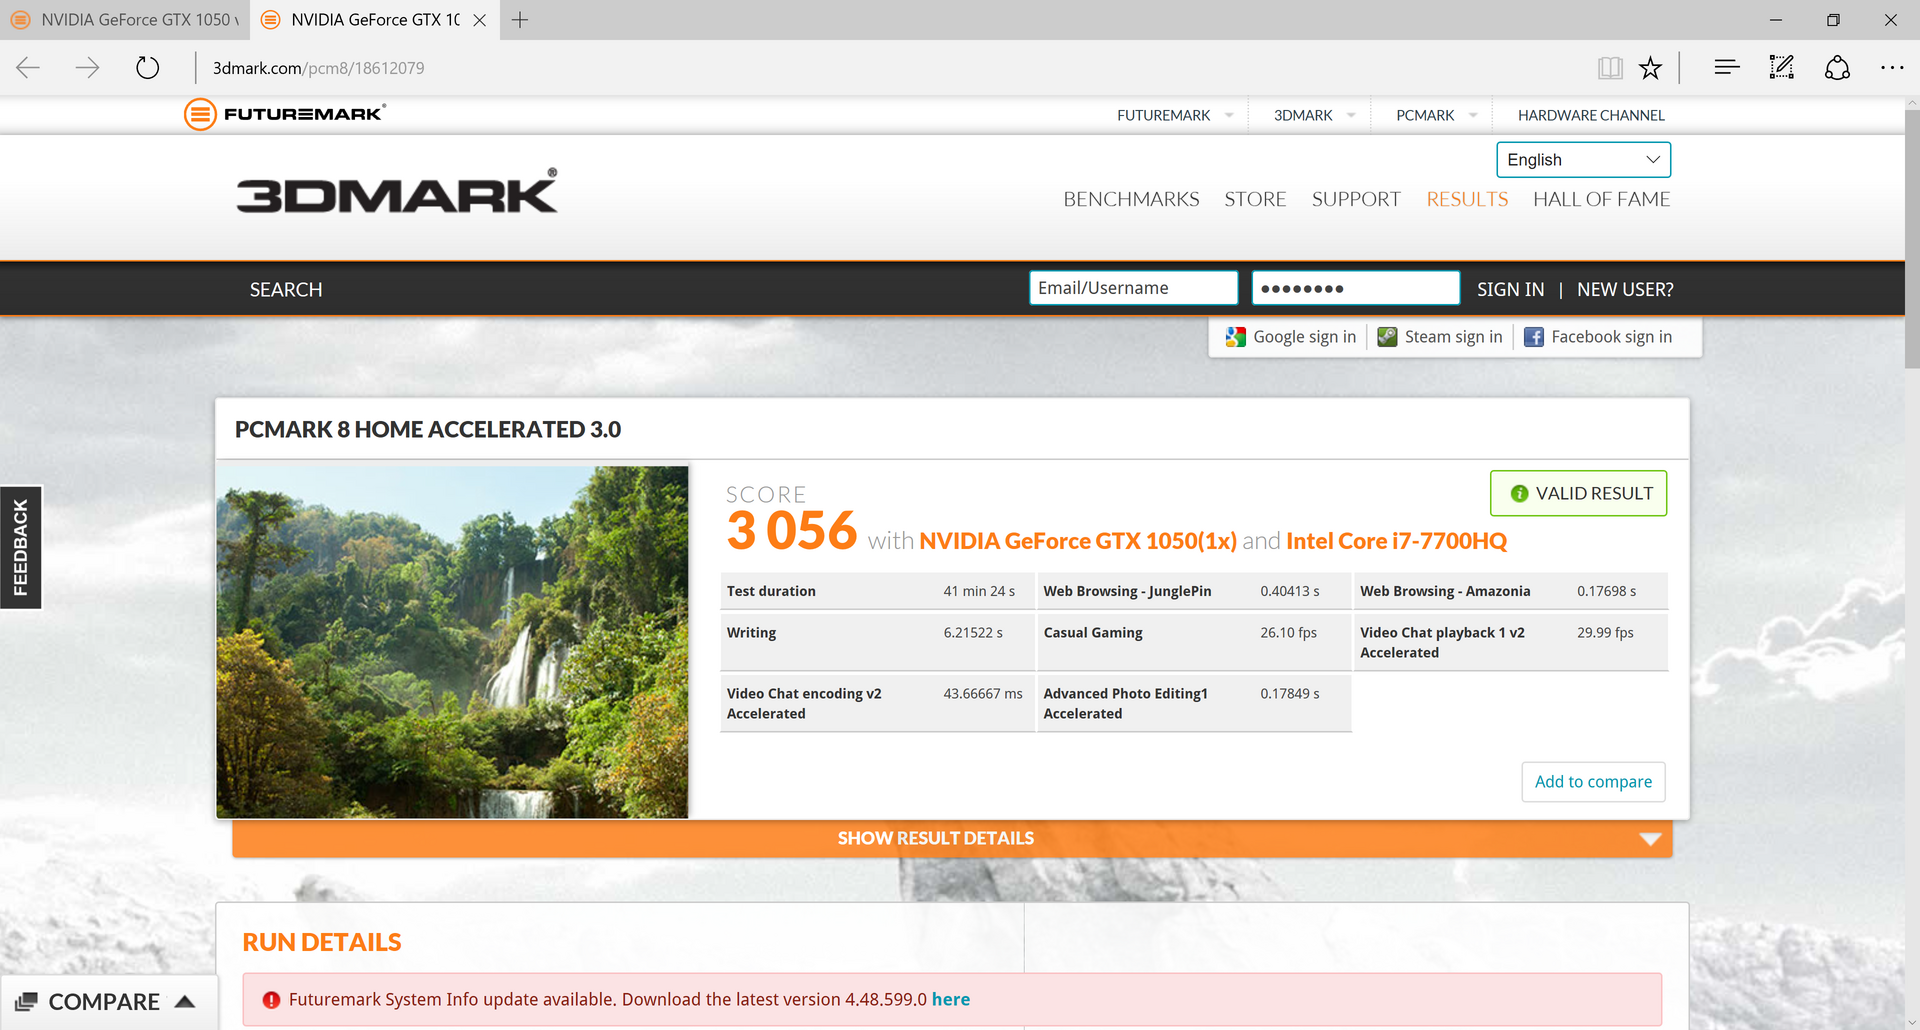
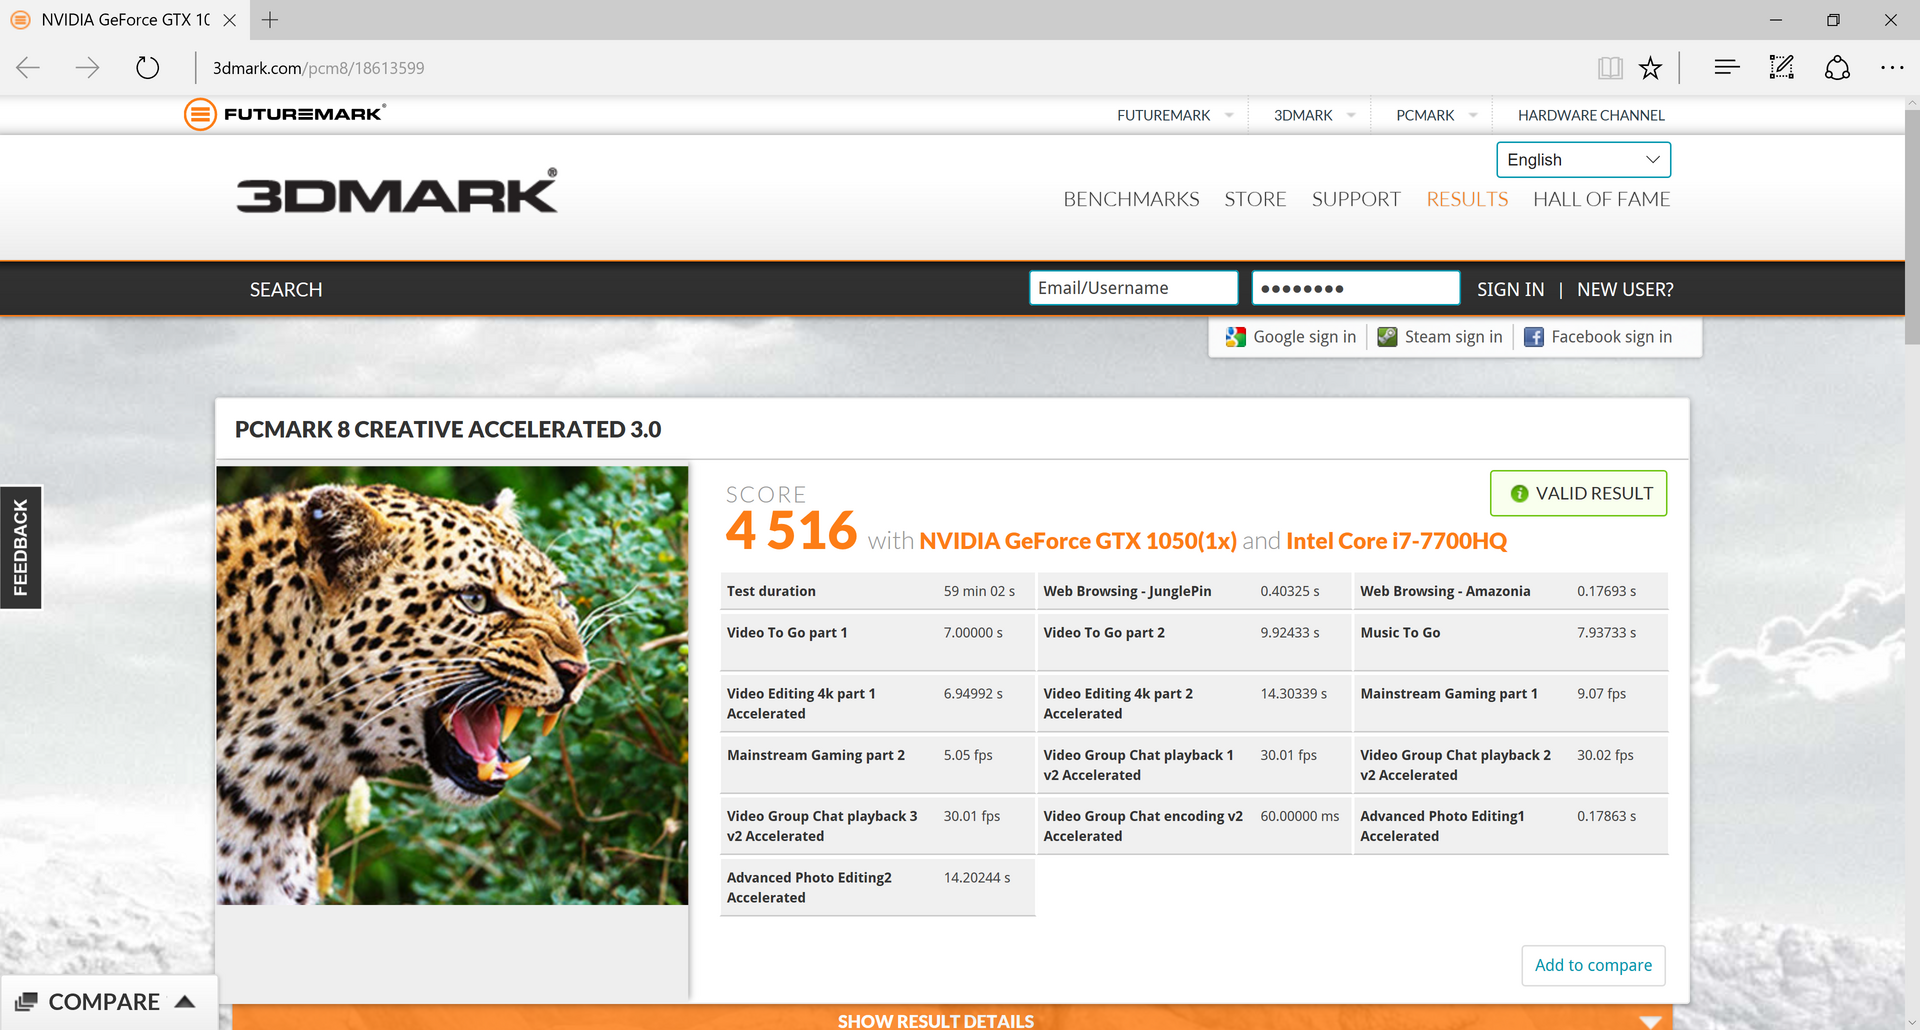
Similar results were encountered during our PCMark synthetic benchmarks. PCMark 8 scored the Pavilion 17t UHD model between 18 and 38 percent lower than it did the 1080p counterpart in Creative and Home Accelerated v2 benchmarks. Work Accelerated was even lower, with a puzzling score of just 2213 (however, this is consistent with other Pavilions we are currently reviewing, so it seems to be accurate). It should be noted that these benchmarks are known to penalize higher-resolution configurations, so the results must be taken with a grain of salt.
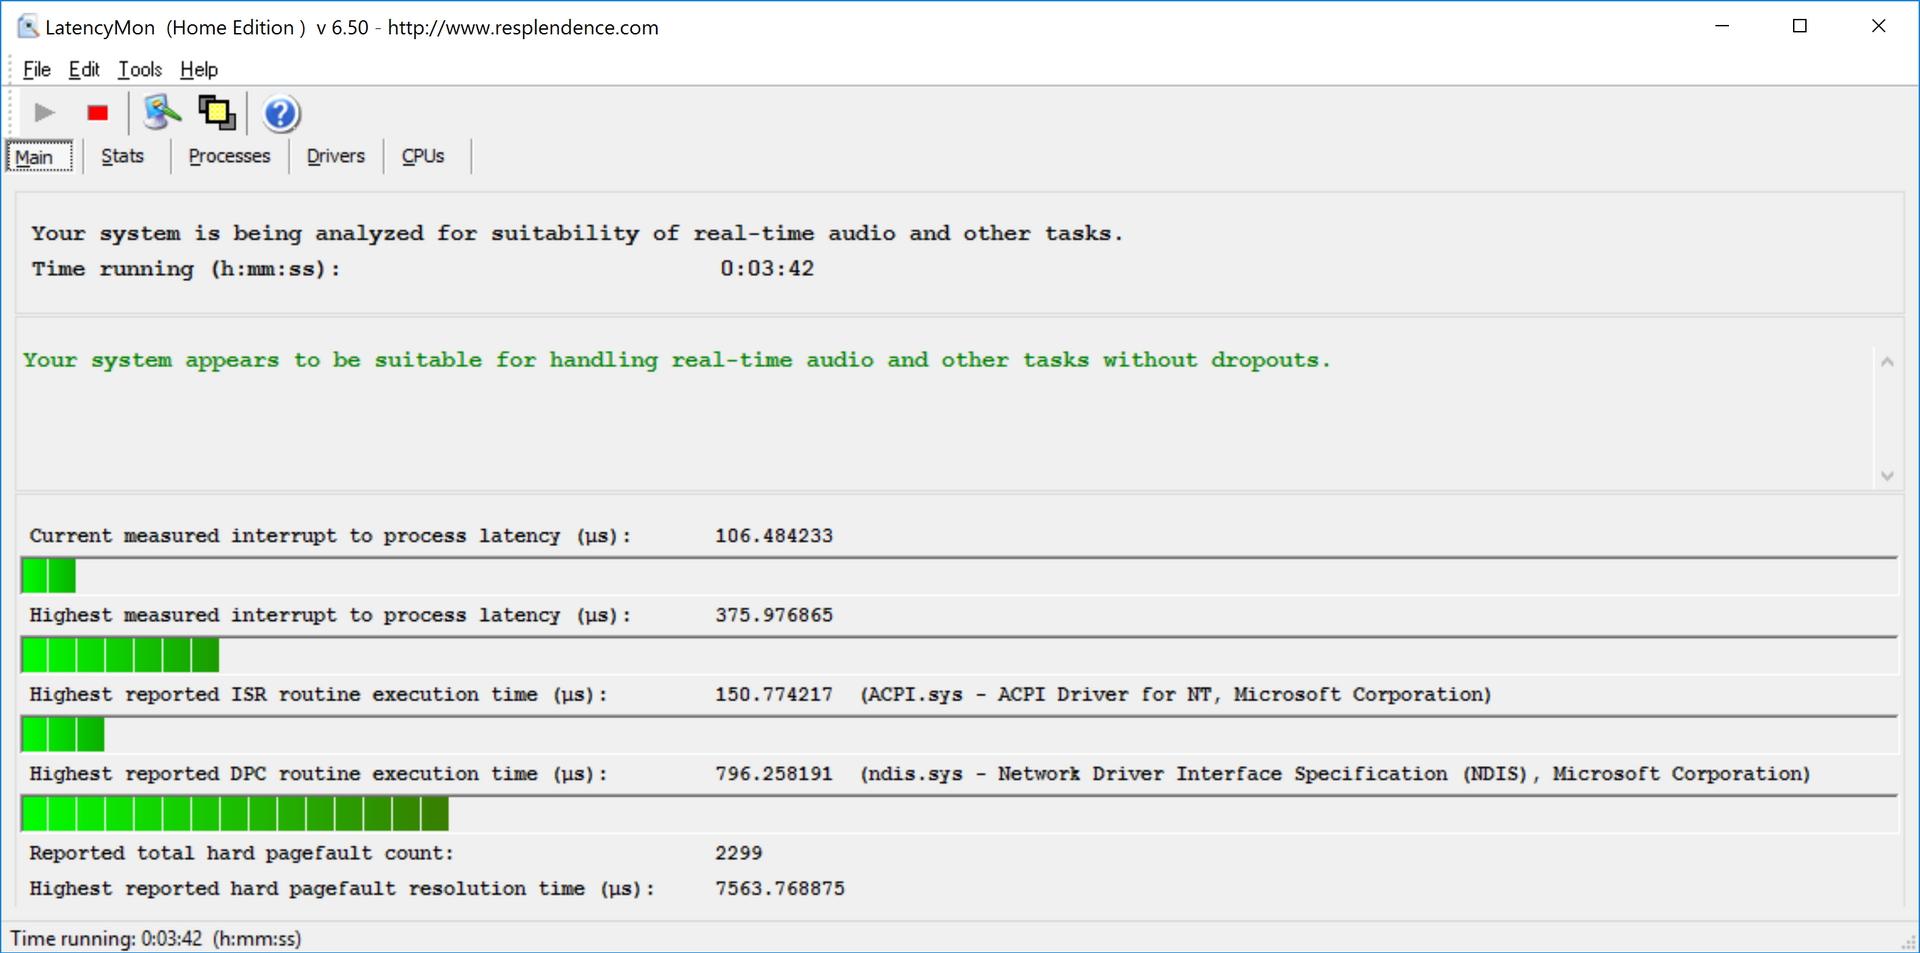
Instead, a much more disconcerting observation was derived from our actual time spent using the machine. In our review of the 1080p model, we mentioned conspicuous hiccups during general operation of the machine during periods of moderate stress (normal operation), where the mouse cursor would periodically stop responding for a fraction of a second. This happened fairly frequently also on our 17t UHD configuration, as well as on a third Pavilion we are currently evaluating—the Pavilion 15t. This leads us to conclude that there must, in fact, be some sort of problem with these machines from the factory which is hampering performance and producing these irritating hiccups.
Furthermore, we were completely unable to provoke the machine to complete a battery benchmark; when unplugged, the device would simply crash, throwing a DRIVER_POWER_STATE_FAILURE error, which is often indicative of a driver or hardware issue, but which also can reference a firmware-level problem (such as switchable graphics handling issues or S3 sleep state transition troubles).
After a bit of research and digging through Event Logs and other sources of evidence, we encountered no useful solutions. Eventually, the problems were mostly resolved however (at least, the stability-oriented ones), and the solution was the F.35 BIOS update (posted March 22, 2017) on the official HP Support and Drivers page for these models. After applying the update to all of the machines, the battery benchmarks completed normally, though the incidence of hangs and other random hiccups was seemingly unaffected.
| PCMark 8 | |
| Home Score Accelerated v2 | |
| MSI GT73VR 6RF | |
| HP Pavilion 17t-ab200 | |
| Gigabyte P57X v7 | |
| HP Pavilion 17t-ab200 UHD | |
| Acer Aspire V17 Nitro BE VN7-793G-706L | |
| Work Score Accelerated v2 | |
| HP Pavilion 17t-ab200 | |
| MSI GT73VR 6RF | |
| Gigabyte P57X v7 | |
| HP Pavilion 17t-ab200 UHD | |
| Creative Score Accelerated v2 | |
| MSI GT73VR 6RF | |
| HP Pavilion 17t-ab200 | |
| Gigabyte P57X v7 | |
| HP Pavilion 17t-ab200 UHD | |
| PCMark 8 Home Score Accelerated v2 | 3056 points | |
| PCMark 8 Creative Score Accelerated v2 | 4516 points | |
| PCMark 8 Work Score Accelerated v2 | 2213 points | |
Help | ||
Storage Devices
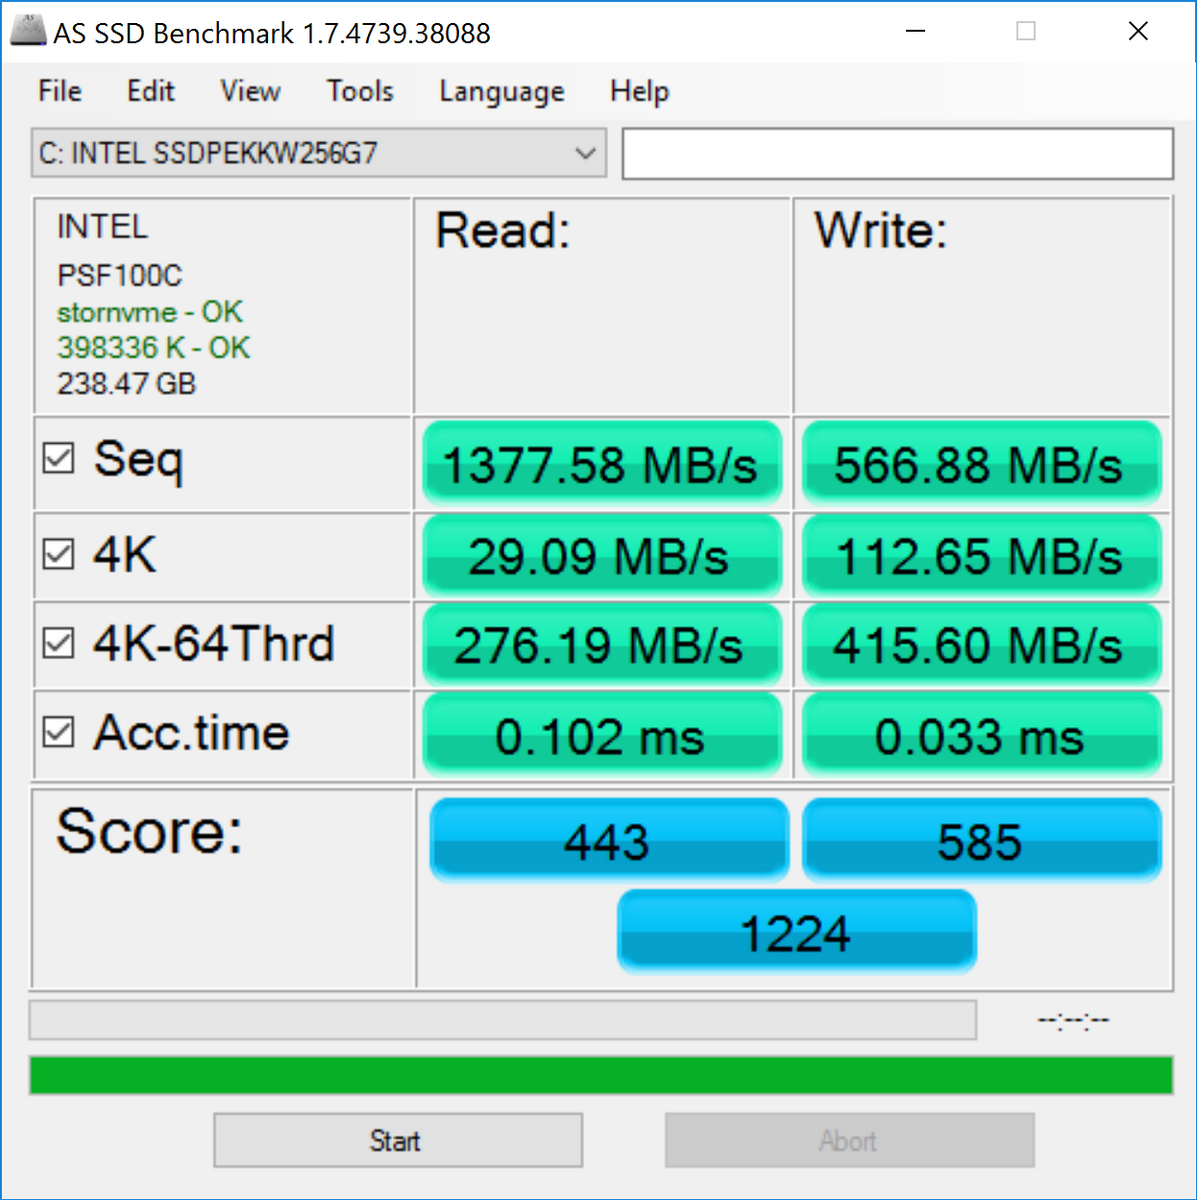
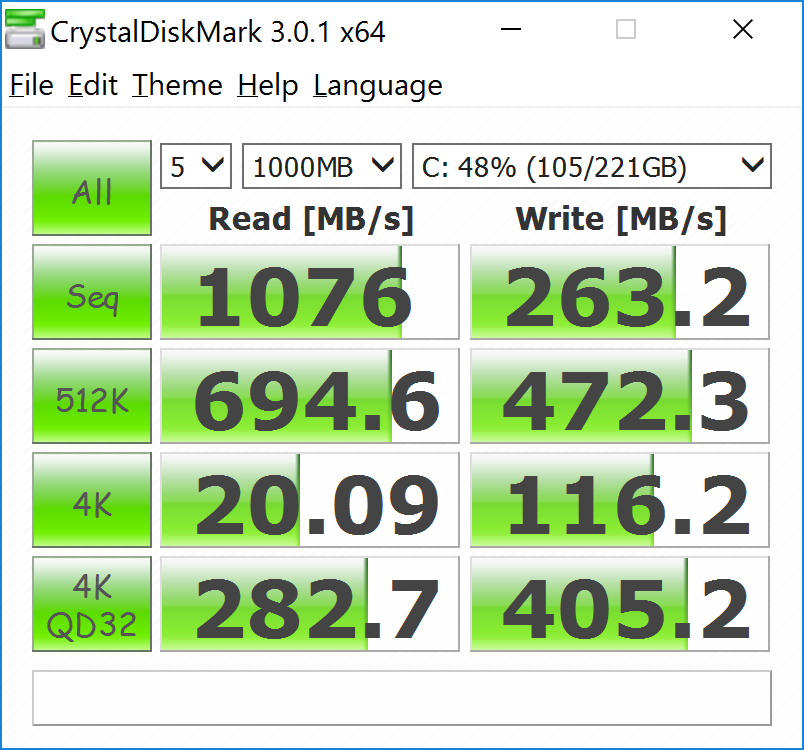
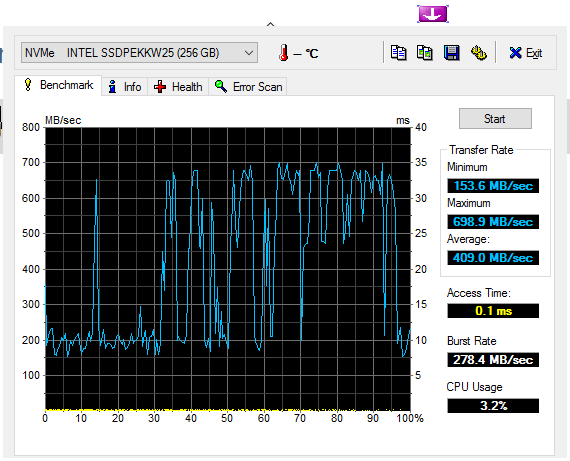
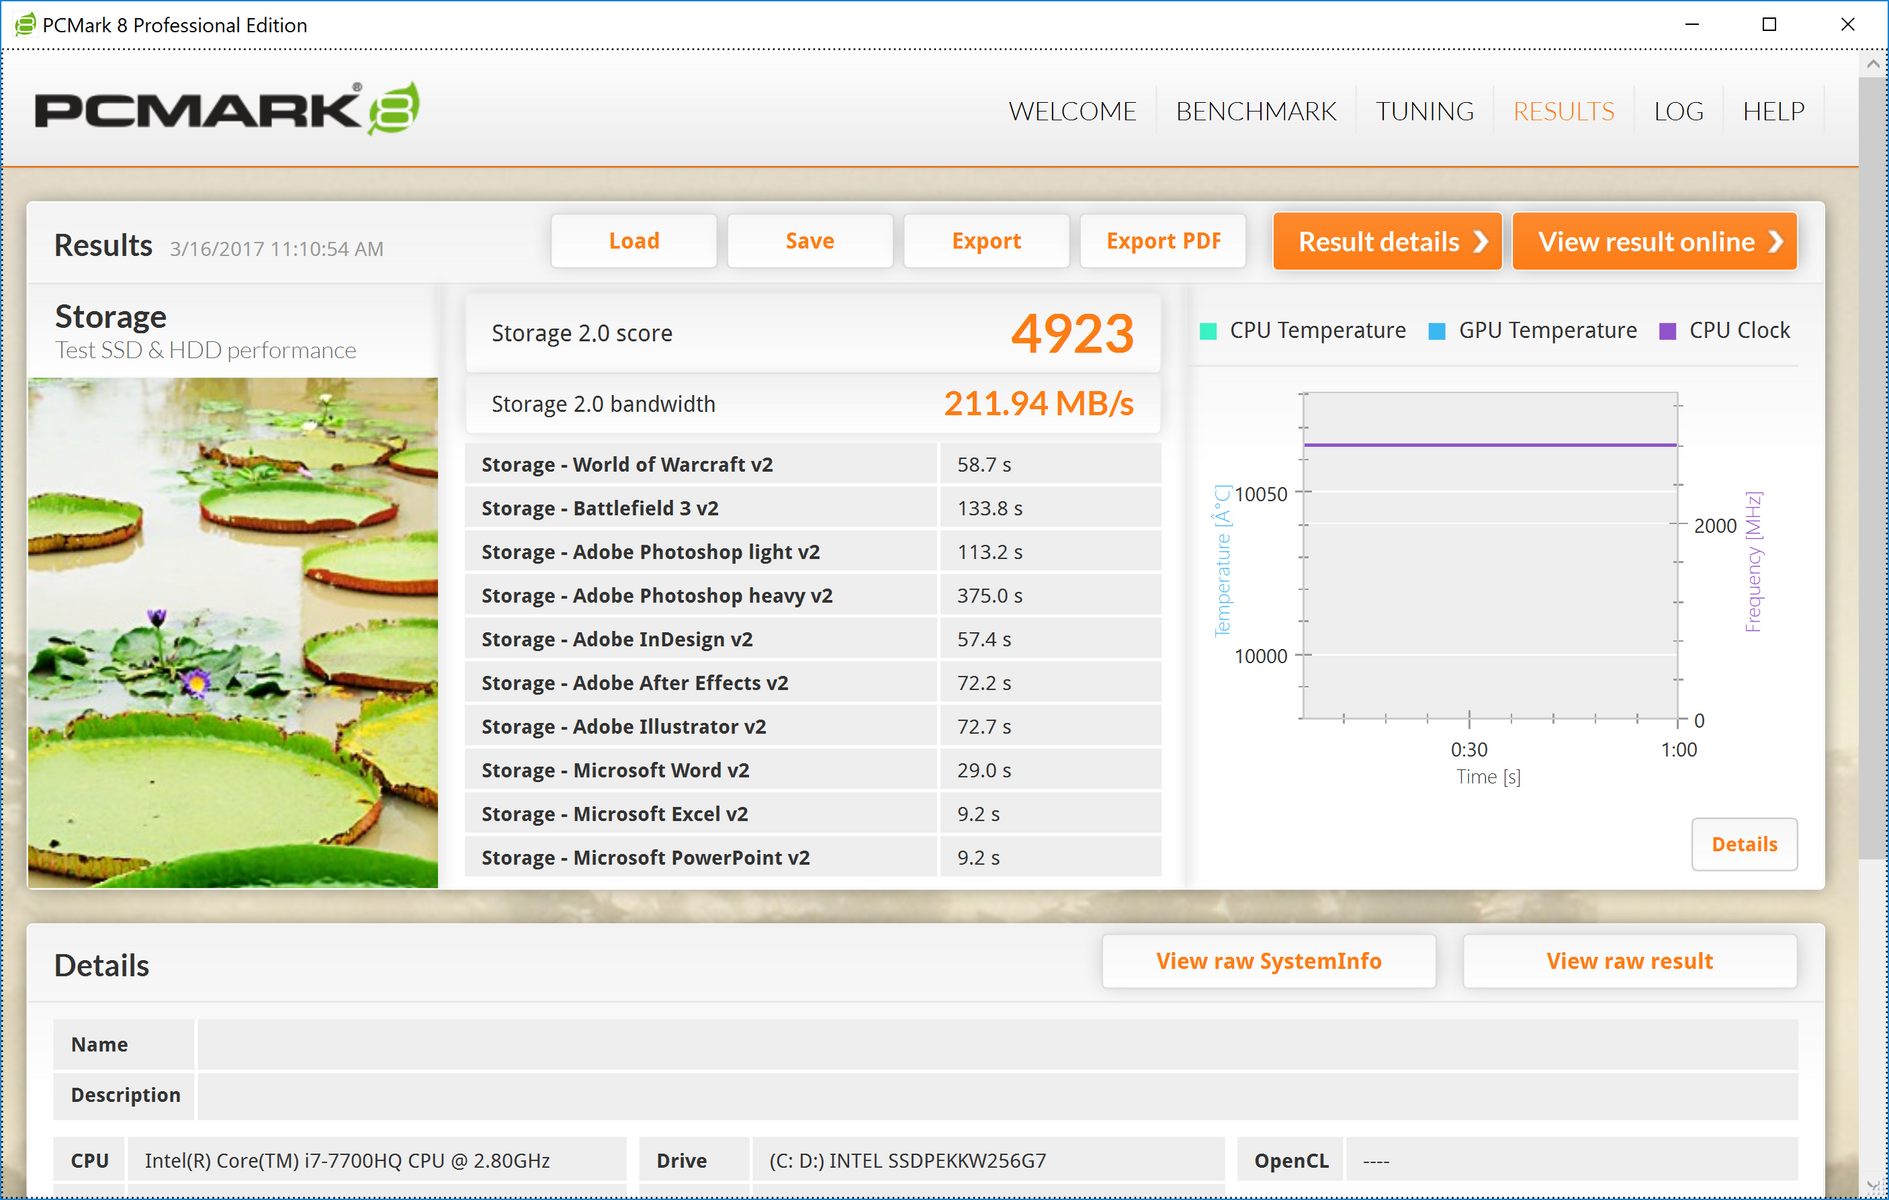
As previously mentioned, one of the other differences between today’s configuration and the previous 1080p model we evaluated is the storage drive. Here, replacing the previous Samsung CM871a SSD, we have an Intel 600p SSDPEKKW256G7, which is a 256 GB M.2 80mm PCIe 3.0 x4 drive. Though it doesn’t post as impressive sequential read/write numbers as the Toshiba and SanDisk NVMe drives in the Acer and MSI competitors, its 4K performance is commendable, and it is a notable step up regardless from the Samsung CM871a in the 1080p Pavilion 17t.
Sequential read/write as measured by AS SSD was 1378 MB/s and 567 MB/s respectively. While not the fastest we’ve seen, those are great results by any measure.
| HP Pavilion 17t-ab200 UHD Intel SSD 600p SSDPEKKW256G7 | HP Pavilion 17t-ab200 Samsung CM871a MZNTY128HDHP | Gigabyte P57X v7 Transcend MTS800 256GB M.2 (TS256GMTS800) | Acer Aspire V17 Nitro BE VN7-793G-706L Toshiba NVMe THNSN5512GPU7 | MSI GT73VR 6RF 2x SanDisk X400 1TB M.2 SD8SN8U1T001122 (RAID 0) | |
|---|---|---|---|---|---|
| CrystalDiskMark 3.0 | -16% | -19% | 59% | 50% | |
| Read Seq (MB/s) | 1076 | 520 -52% | 517 -52% | 1172 9% | 914 -15% |
| Write Seq (MB/s) | 263.2 | 353.6 34% | 305.7 16% | 1073 308% | 916 248% |
| Read 512 (MB/s) | 695 | 376.2 -46% | 315 -55% | 760 9% | 698 0% |
| Write 512 (MB/s) | 472.3 | 118.5 -75% | 306.1 -35% | 878 86% | 916 94% |
| Read 4k (MB/s) | 20.09 | 32.7 63% | 26.04 30% | 21.04 5% | 31.37 56% |
| Write 4k (MB/s) | 116.2 | 85.3 -27% | 82.3 -29% | 59.8 -49% | 65.7 -43% |
| Read 4k QD32 (MB/s) | 282.7 | 399 41% | 281.3 0% | 573 103% | 425 50% |
| Write 4k QD32 (MB/s) | 405.2 | 132.5 -67% | 296 -27% | 419.8 4% | 441.8 9% |

GPU Performance
We provided lower-resolution benchmarks with more reasonable settings in our previous Pavilion 17t review, and since both machines share the same CPU (Core i7-7700HQ) and GPU (NVIDIA GeForce GTX 1050), we focused today on benchmarks at the native resolution of the upgraded panel in this configuration. Specifically, to review, that’s 4K—and as we touched upon earlier, we doubt that the GTX 1050 can handle most games at this resolution.
Indeed, apart from BioShock Infinite (101 fps), Batman: Arkham Knight, DOOM, and Rise of the Tomb Raider all came in at under 15 fps while equipped with our typical 4K benchmark settings (High/Ultra depending on the game). This calls into question the appeal of the upgraded panel unless the user really just feels the need for the increased resolution and somewhat superior picture quality elsewhere—because it isn’t likely that they’ll be playing any games above 1080p resolution anyway.
| 3DMark 11 | |
| 1280x720 Performance GPU | |
| MSI GT73VR 6RF | |
| Gigabyte P57X v7 | |
| Acer Aspire V17 Nitro BE VN7-793G-706L | |
| HP Pavilion 17t-ab200 UHD | |
| HP Pavilion 17t-ab200 | |
| 1280x720 Performance Combined | |
| Gigabyte P57X v7 | |
| MSI GT73VR 6RF | |
| HP Pavilion 17t-ab200 | |
| HP Pavilion 17t-ab200 UHD | |
| Acer Aspire V17 Nitro BE VN7-793G-706L | |
| 3DMark | |
| 1280x720 Cloud Gate Standard Graphics | |
| MSI GT73VR 6RF | |
| Gigabyte P57X v7 | |
| HP Pavilion 17t-ab200 | |
| Acer Aspire V17 Nitro BE VN7-793G-706L | |
| HP Pavilion 17t-ab200 UHD | |
| 1920x1080 Fire Strike Graphics | |
| MSI GT73VR 6RF | |
| Gigabyte P57X v7 | |
| Acer Aspire V17 Nitro BE VN7-793G-706L | |
| HP Pavilion 17t-ab200 UHD | |
| HP Pavilion 17t-ab200 | |
| 3DMark 06 Standard Score | 25817 points | |
| 3DMark 11 Performance | 7554 points | |
| 3DMark Ice Storm Standard Score | 11692 points | |
| 3DMark Cloud Gate Standard Score | 11173 points | |
| 3DMark Fire Strike Score | 5383 points | |
Help | ||
| Rise of the Tomb Raider - 3840x2160 High Preset AA:FX AF:4x (sort by value) | |
| HP Pavilion 17t-ab200 UHD | |
| Gigabyte P57X v7 | |
| Acer Aspire V17 Nitro BE VN7-793G-706L | |
| MSI GT73VR 6RF | |
| Doom - 3840x2160 High Preset AA:FX (sort by value) | |
| HP Pavilion 17t-ab200 UHD | |
| MSI GT73VR 6RF | |
| Batman: Arkham Knight - 3840x2160 High / On (Interactive Smoke & Paper Debris Off) AA:SM AF:8x (sort by value) | |
| HP Pavilion 17t-ab200 UHD | |
| Gigabyte P57X v7 | |
| MSI GT73VR 6RF | |
| low | med. | high | ultra | 4K | |
|---|---|---|---|---|---|
| Batman: Arkham Knight (2015) | 13 | ||||
| Rise of the Tomb Raider (2016) | 12 | ||||
| Doom (2016) | 15 |
Stress Test
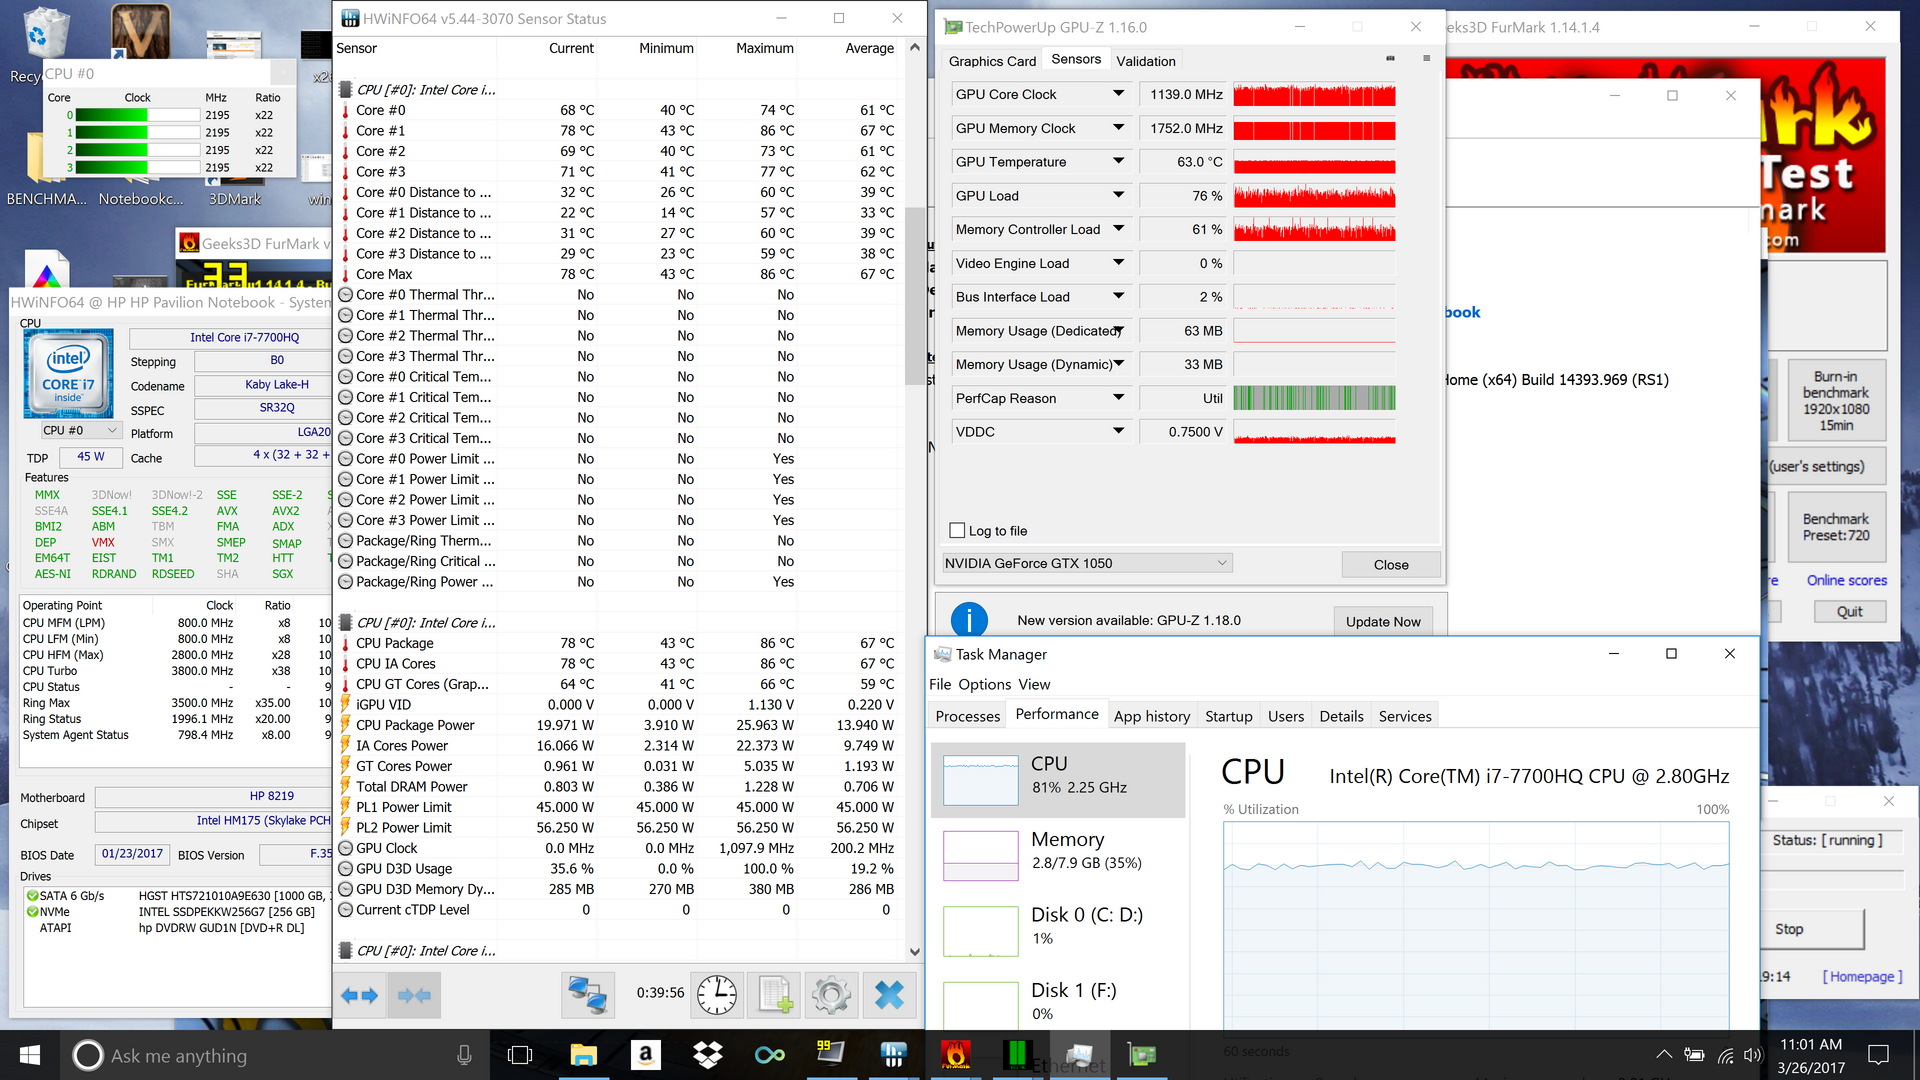
Our stress tests revealed an inability to maintain Turbo clock rates for any significant period of time when met with synthetic stress from FurMark and Prime95. The CPU alone when stressed achieved just 2.7 GHz (dipping shortly thereafter to 2.5 GHz), and when combined, it settled at 2.2 GHz with the GPU wildly jumping around in the 1100 MHz to 1350 MHz range. Temperatures throughout this process remained thoroughly reasonable at just 69 °C for the CPU and 63 °C for GPU.
A more realistic, recent addition to our testing repertoire is a series of consecutive Cinebench R15 multi-CPU benchmarks. We perform the tests one after another for a lengthy period of time—around half an hour—and chart the trends in terms of overall score differences. Any decrease over time in the score should indicate a likely inability to maintain high performance during lengthier periods of real-world stress. Unfortunately, the Pavilion 17t suffers this fate, with an initial score of 555.64 immediately giving way to scores in the 508 – 517 range. That’s a decrease of around 8 percent, which seems consistent with our observations during the synthetic stress testing. Even stranger, however, is the fact that none of these scores is as high as the original score we received of 620. These laptops seem to be subject to random firmware-level limitations in terms of CPU and GPU performance that are both puzzling and terribly unfortunate—and the latest BIOS seemingly has failed to correct this problem.
| CPU Clock (GHz) | GPU Clock (MHz) | Average CPU Temperature (°C) | Average GPU Temperature (°C) | |
| Prime95 Stress | 2.5 | - | 69 | - |
| FurMark Stress | - | 1100 | - | 63 |
| Prime95 + FurMark Stress | 2.2 | 1100 | 69 | 63 |
Emissions
System Noise
The Pavilion 17t we reviewed last month was a very noisy machine, and this latest configuration, even with the updated firmware, provides no solace. While merely idling, the machine produced some 34.5 dB(A) on average with a 36.6 dB(A) maximum—some roughly 5 to 7 dB(A) above environmental noise levels. Under load, it’s of course quite a bit louder than that, with an average of 46.6 dB(A) and a maximum of 52.3 dB(A), the latter of which is the highest of any of the machines in today’s comparison. As before, we should expect such aggressively high fan speeds to produce correspondingly lower surface temperatures, which we’ll explore in our next section.
Noise level
| Idle |
| 34.5 / 34.5 / 36.6 dB(A) |
| DVD |
| 36.6 / dB(A) |
| Load |
| 46.6 / 52.3 dB(A) |
 | ||
30 dB silent 40 dB(A) audible 50 dB(A) loud |
||
min: | ||
| HP Pavilion 17t-ab200 UHD GeForce GTX 1050 Mobile, i7-7700HQ, Intel SSD 600p SSDPEKKW256G7 | HP Pavilion 17t-ab200 GeForce GTX 1050 Mobile, i7-7700HQ, Samsung CM871a MZNTY128HDHP | Gigabyte P57X v7 GeForce GTX 1070 Mobile, i7-7700HQ, Transcend MTS800 256GB M.2 (TS256GMTS800) | MSI GT73VR 6RF GeForce GTX 1080 Mobile, 6820HK, 2x SanDisk X400 1TB M.2 SD8SN8U1T001122 (RAID 0) | |
|---|---|---|---|---|
| Noise | -1% | 6% | -2% | |
| off / environment * (dB) | 29.6 | 30.8 -4% | 29 2% | 29.2 1% |
| Idle Minimum * (dB) | 34.5 | 35.3 -2% | 30.4 12% | 32 7% |
| Idle Average * (dB) | 34.5 | 35.4 -3% | 32.1 7% | 32 7% |
| Idle Maximum * (dB) | 36.6 | 35.4 3% | 32.1 12% | 35 4% |
| Load Average * (dB) | 46.6 | 48.6 -4% | 45.6 2% | 50 -7% |
| Load Maximum * (dB) | 52.3 | 49.8 5% | 51.5 2% | 64 -22% |
* ... smaller is better
Temperature
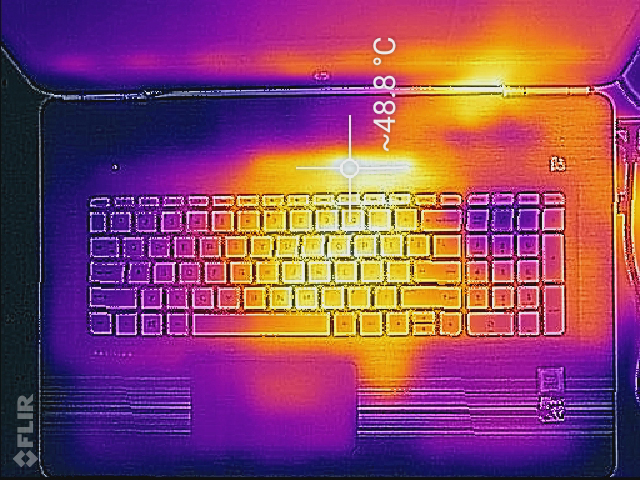
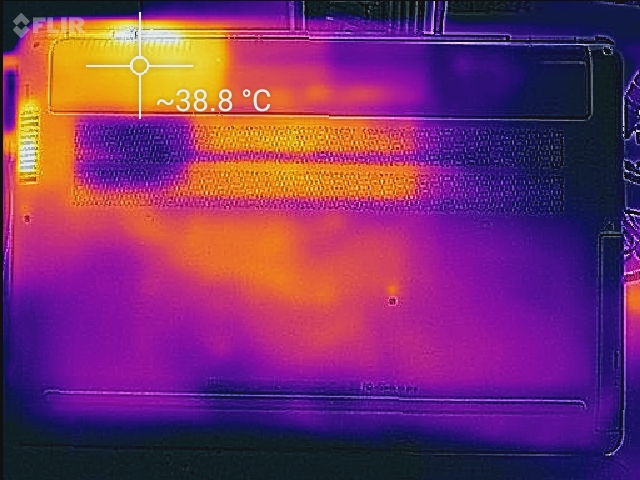
Thankfully, that is indeed the case. Barring two isolated hot spots on the top center of the base unit (coming in at 48.8 °C and 46.4 °C), average temperature readings on the top and bottom of the unit during stress were still just 32.6 °C and 26.9 °C, respectively. Those same regions exhibited a nearly-indiscernible increase over environmental room temperatures while idling, with just 22.2 °C and 21.9 °C (as compared to a 20 °C room temperature, which makes for average margins of just 2.2 °C and 1.9 °C—practically nothing at all).
(-) The maximum temperature on the upper side is 48.8 °C / 120 F, compared to the average of 36.8 °C / 98 F, ranging from 21 to 71 °C for the class Multimedia.
(+) The bottom heats up to a maximum of 38.4 °C / 101 F, compared to the average of 39.1 °C / 102 F
(+) In idle usage, the average temperature for the upper side is 22.2 °C / 72 F, compared to the device average of 31.3 °C / 88 F.
(+) The palmrests and touchpad are cooler than skin temperature with a maximum of 31 °C / 87.8 F and are therefore cool to the touch.
(-) The average temperature of the palmrest area of similar devices was 28.7 °C / 83.7 F (-2.3 °C / -4.1 F).
Speakers
As before, the Pavilion 17t’s speakers are nothing special. We noted weak bass and passable highs with a decent reproduction of midrange frequencies. Most devices in this category fare notably better, and the various options for post-processing only marginally affect the overall experience on the 17t. Volume levels are at least fairly good, however.
HP Pavilion 17t-ab200 UHD audio analysis
(±) | speaker loudness is average but good (73.9 dB)
Bass 100 - 315 Hz
(±) | reduced bass - on average 13.3% lower than median
(±) | linearity of bass is average (10.8% delta to prev. frequency)
Mids 400 - 2000 Hz
(+) | balanced mids - only 3.1% away from median
(+) | mids are linear (5.4% delta to prev. frequency)
Highs 2 - 16 kHz
(+) | balanced highs - only 3.5% away from median
(±) | linearity of highs is average (7.8% delta to prev. frequency)
Overall 100 - 16.000 Hz
(±) | linearity of overall sound is average (23.7% difference to median)
Compared to same class
» 83% of all tested devices in this class were better, 6% similar, 10% worse
» The best had a delta of 5%, average was 17%, worst was 45%
Compared to all devices tested
» 71% of all tested devices were better, 6% similar, 23% worse
» The best had a delta of 4%, average was 24%, worst was 134%
MSI GT73VR 6RF audio analysis
(±) | speaker loudness is average but good (79.1 dB)
Bass 100 - 315 Hz
(±) | reduced bass - on average 8.2% lower than median
(±) | linearity of bass is average (8% delta to prev. frequency)
Mids 400 - 2000 Hz
(+) | balanced mids - only 3.3% away from median
(+) | mids are linear (6.4% delta to prev. frequency)
Highs 2 - 16 kHz
(+) | balanced highs - only 4.6% away from median
(±) | linearity of highs is average (9.9% delta to prev. frequency)
Overall 100 - 16.000 Hz
(±) | linearity of overall sound is average (19.9% difference to median)
Compared to same class
» 70% of all tested devices in this class were better, 6% similar, 24% worse
» The best had a delta of 6%, average was 18%, worst was 132%
Compared to all devices tested
» 51% of all tested devices were better, 7% similar, 42% worse
» The best had a delta of 4%, average was 24%, worst was 134%
Frequency Comparison (Checkbox selectable!)
Graph 1: Pink Noise 100% Vol.; Graph 2: Audio off
Energy Management
Power Consumption
The brighter and higher-resolution UHD panel in our newest Pavilion 17t review unit is a rather lopsided exchange in terms of energy consumption for the reduction in a mere single stick of DDR4 memory otherwise. Thus, predictably, the newer 17t is a much hungrier unit overall—at least, while idling, where we measured a minimum power consumption of 13.3 W and an average of 18.5 W (much higher than the 8.2 W / 11 W seen on our 1080p-equipped 17t, and much closer to the Gigabyte P57X v7, which also packs a 4K display). Load averages and maximums do not show any increase, however, suggesting a firmware-level limitation of power consumption. Nevertheless, we are thus likely to see an appreciable decrease in normal-use battery life (while web surfing, etc.) even if load results don’t show much of a variance.
| Off / Standby | |
| Idle | |
| Load |
|
Key:
min: | |
| HP Pavilion 17t-ab200 UHD i7-7700HQ, GeForce GTX 1050 Mobile, Intel SSD 600p SSDPEKKW256G7, IPS, 3840x2160, 17.3" | HP Pavilion 17t-ab200 i7-7700HQ, GeForce GTX 1050 Mobile, Samsung CM871a MZNTY128HDHP, IPS, 1920x1080, 17.3" | Gigabyte P57X v7 i7-7700HQ, GeForce GTX 1070 Mobile, Transcend MTS800 256GB M.2 (TS256GMTS800), IPS, 3840x2160, 17.3" | MSI GT73VR 6RF 6820HK, GeForce GTX 1080 Mobile, 2x SanDisk X400 1TB M.2 SD8SN8U1T001122 (RAID 0), IPS, 3840x2160, 17.3" | |
|---|---|---|---|---|
| Power Consumption | 24% | -62% | -122% | |
| Idle Minimum * (Watt) | 13.3 | 8.2 38% | 15.7 -18% | 28.9 -117% |
| Idle Average * (Watt) | 18.5 | 11 41% | 23.4 -26% | 30.6 -65% |
| Idle Maximum * (Watt) | 19 | 11.1 42% | 23.5 -24% | 33.1 -74% |
| Load Average * (Watt) | 78 | 77 1% | 184.6 -137% | 224.4 -188% |
| Load Maximum * (Watt) | 113.4 | 116.9 -3% | 233.1 -106% | 302.6 -167% |
* ... smaller is better
Battery Life
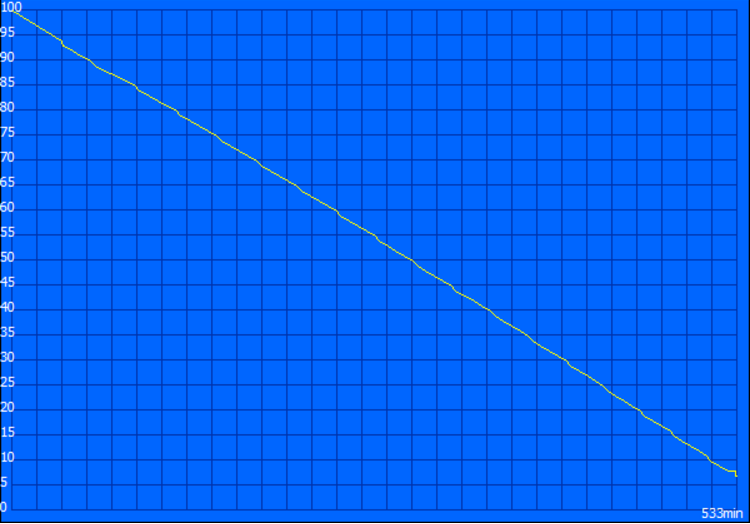
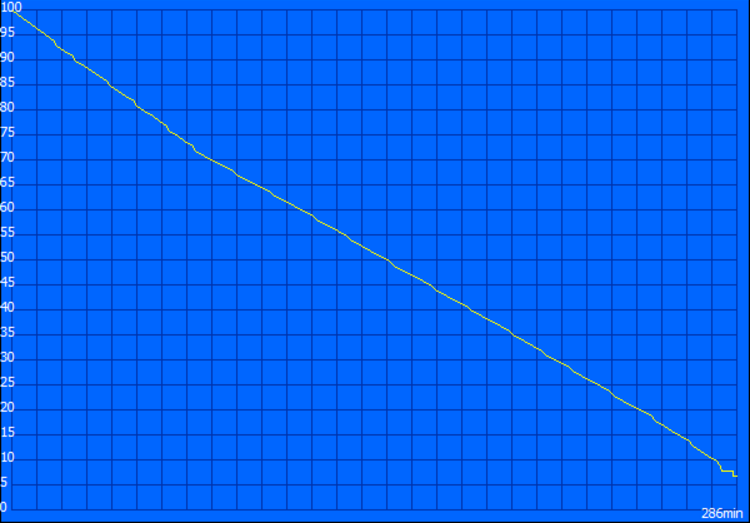
And that’s precisely what transpires. After struggling through some serious challenges with our battery benchmarks related to system stability (see the System Performance section above for more details on this), we eventually received reliable battery runtime results for the Pavilion 17t UHD and other affected models (oddly enough, we experienced no such struggles with the previous 17t, though the performance hiccups were still present). Battery life is quite a bit shorter than that of the 1080p-equipped model, as expected, under general use. However, under load, both machines manage similar runtimes—which is in line with our previous power consumption measurements/observations.
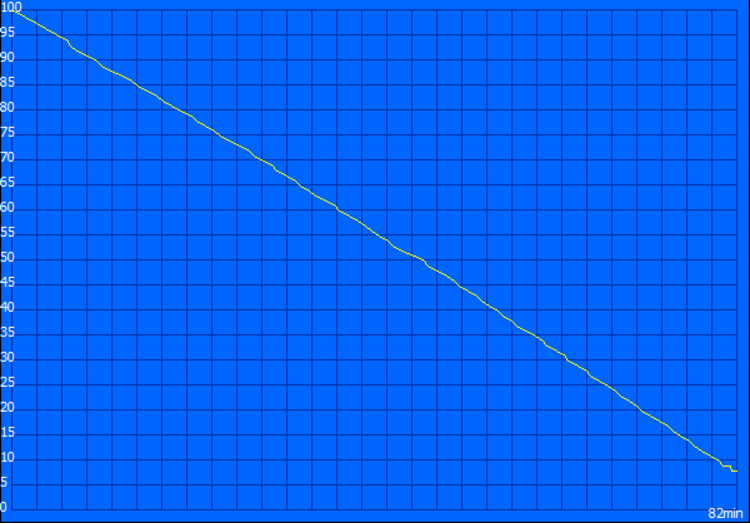
| HP Pavilion 17t-ab200 UHD i7-7700HQ, GeForce GTX 1050 Mobile, 63 Wh | HP Pavilion 17t-ab200 i7-7700HQ, GeForce GTX 1050 Mobile, 62 Wh | Gigabyte P57X v7 i7-7700HQ, GeForce GTX 1070 Mobile, 75.81 Wh | Acer Aspire V17 Nitro BE VN7-793G-706L i7-7700HQ, GeForce GTX 1060 Mobile, 69 Wh | MSI GT73VR 6RF 6820HK, GeForce GTX 1080 Mobile, 75.2 Wh | |
|---|---|---|---|---|---|
| Battery runtime | 31% | -28% | -21% | -32% | |
| Reader / Idle (h) | 8.9 | 11.5 29% | 4.3 -52% | 5.1 -43% | |
| WiFi v1.3 (h) | 4.8 | 6.8 42% | 2.6 -46% | 3.8 -21% | 3.3 -31% |
| Load (h) | 1.4 | 1.7 21% | 1.6 14% | 1.1 -21% |
Pros
Cons
Verdict

Whereas the Pavilion 17t we reviewed last month, for all its struggles, seemed a plausible candidate for a mobile gaming enthusiast on a serious budget, this latest machine comes off as considerably more lopsided in terms of its strengths and weaknesses. Although the GPU and other components remain mostly consistent with those of the previous configuration, some power/firmware limitations result in lower performance than what we measured on the 1080p model, and the higher-resolution screen—while undeniably more attractive—means that gaming at native resolution with respectable settings and frame rates is a near-impossibility with the GTX 1050 at the helm. This is a great example of a situation where more is less—since the very specific slice of the market which would be likely to find the Pavilion 17t appealing for one of their interests would probably not see any reason to pay a substantially higher price for a panel upgrade which they would not be able to leverage during gaming anyway.
Then comes the question of photo and video editing enthusiasts, since the UHD panel does provide very good color gamut coverage and much better brightness and resolution than its 1080p counterpart. However, far better machines exist for such purposes, and considering the relatively severe stability issues we’ve encountered with the 17t during our testing period (including the performance hiccups, which still remain to some degree even after the firmware upgrade), if you’re going to shell out a moderate investment to help support a photo or video editing hobby, you’d be wise not to settle for a machine with a history of other related problems no matter what the savings.
If, even after taking into account its myriad issues, the Pavilion 17t is still being considered, it is imperative to apply BIOS F.35 REV A at the outset to correct some of the most glaring stability problems.
And let’s not forget about all of the other negatives which plague this particular model, including the thin plastic casing, challenging maintenance, poor touchpad, weak port selection, and noisy operation. The bottom line is that you don’t even have to look any further than other HP machines to find far better options for just about any purpose—anything from an HP Spectre to a Dell XPS 15 or Lenovo Yoga 720, while notably pricier, would be a much better choice for the purpose. The Pavilion 17t is one laptop which we can enthusiastically encourage you to skip.
HP Pavilion 17t-ab200 UHD
- 03/27/2017 v6 (old)
Steve Schardein
Price comparison
