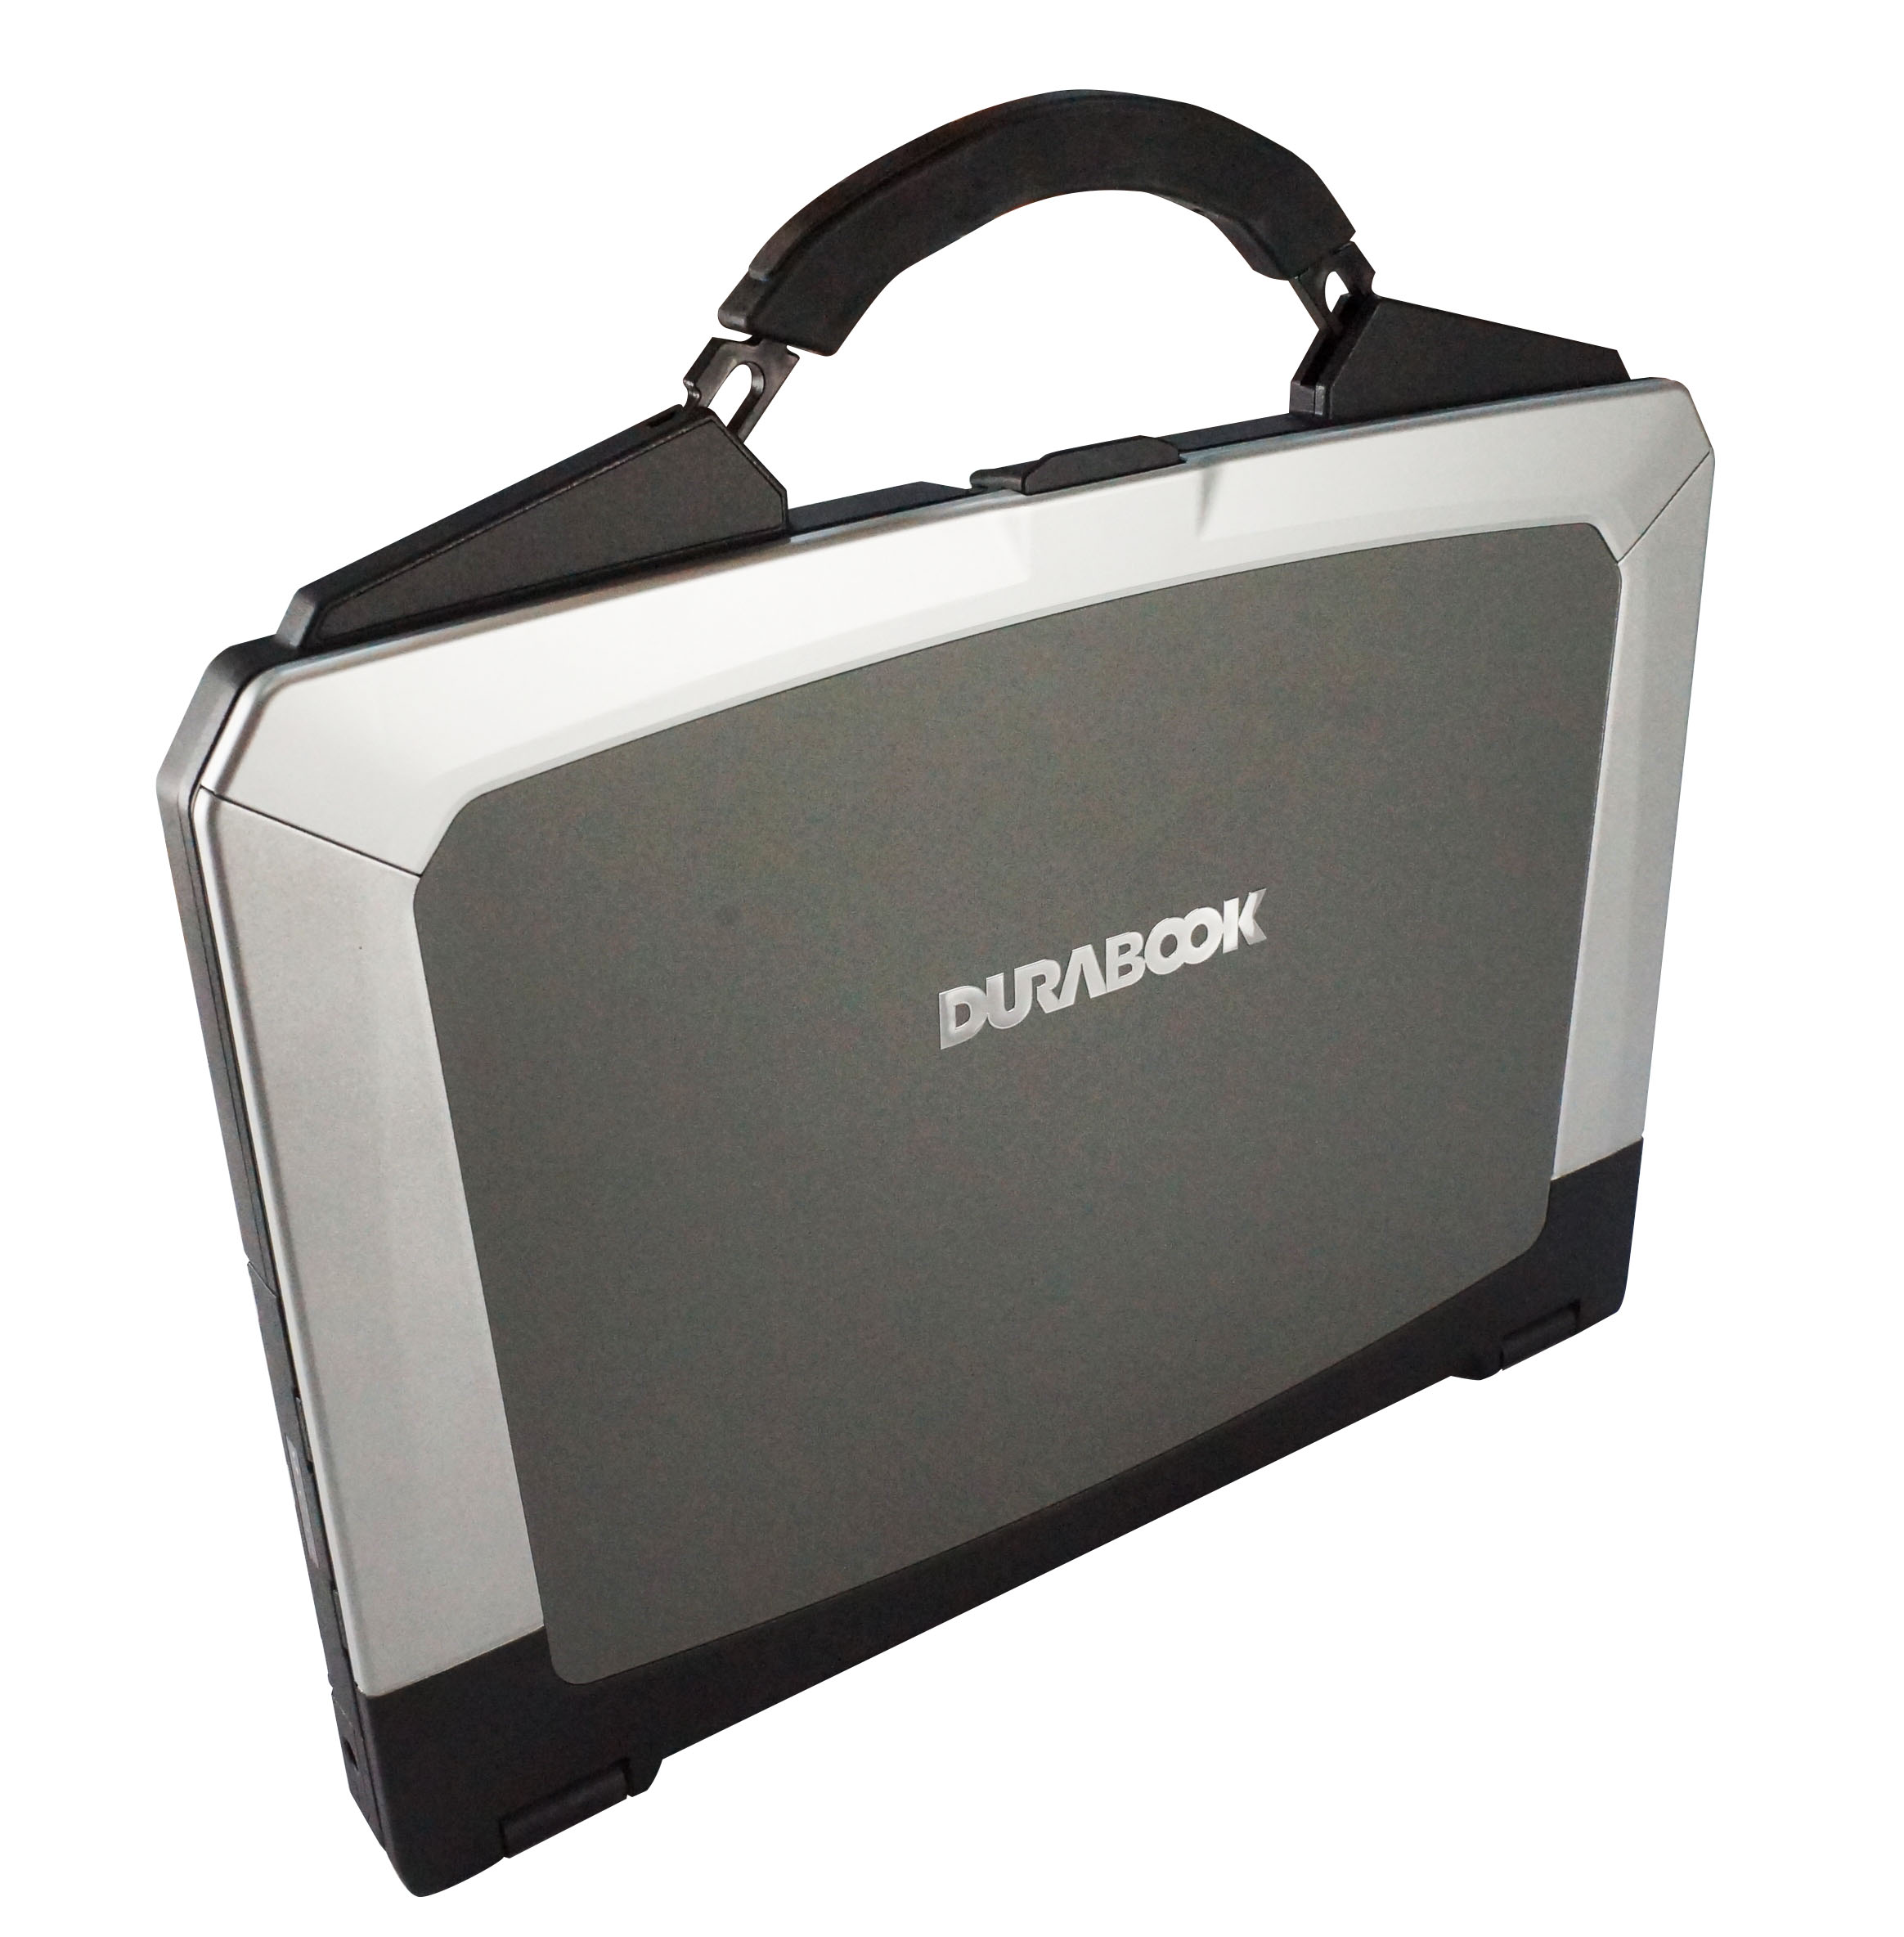
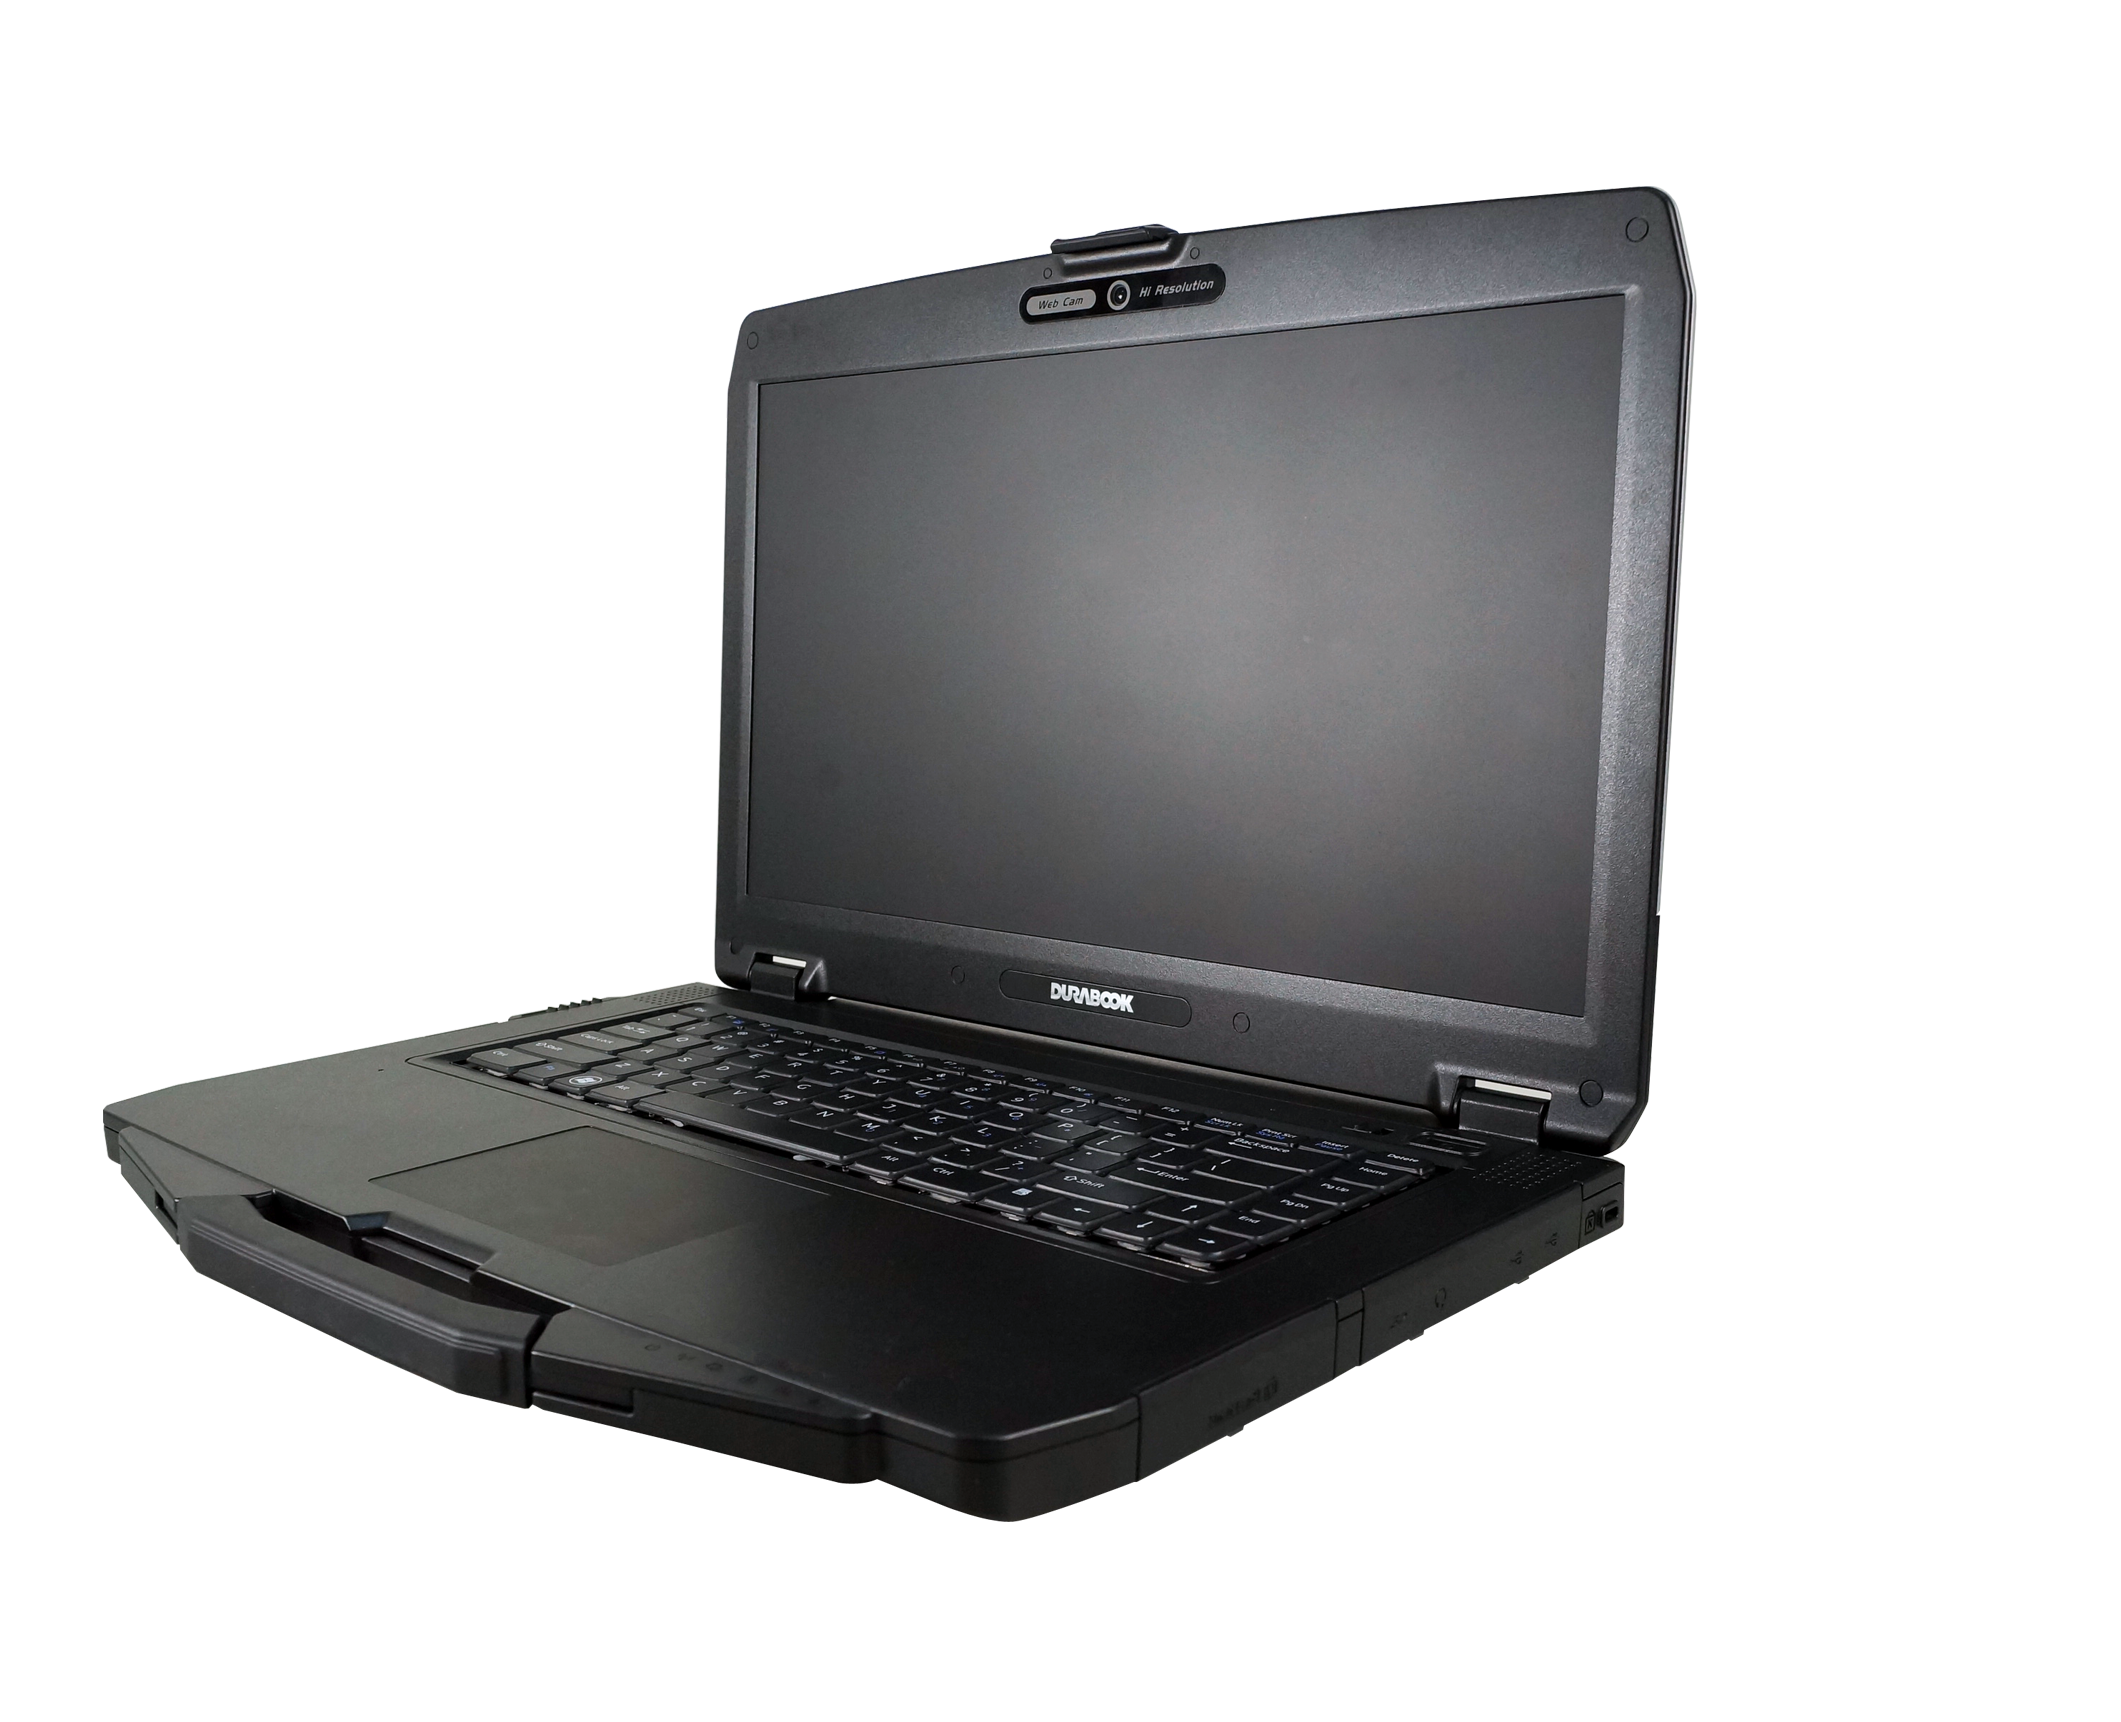
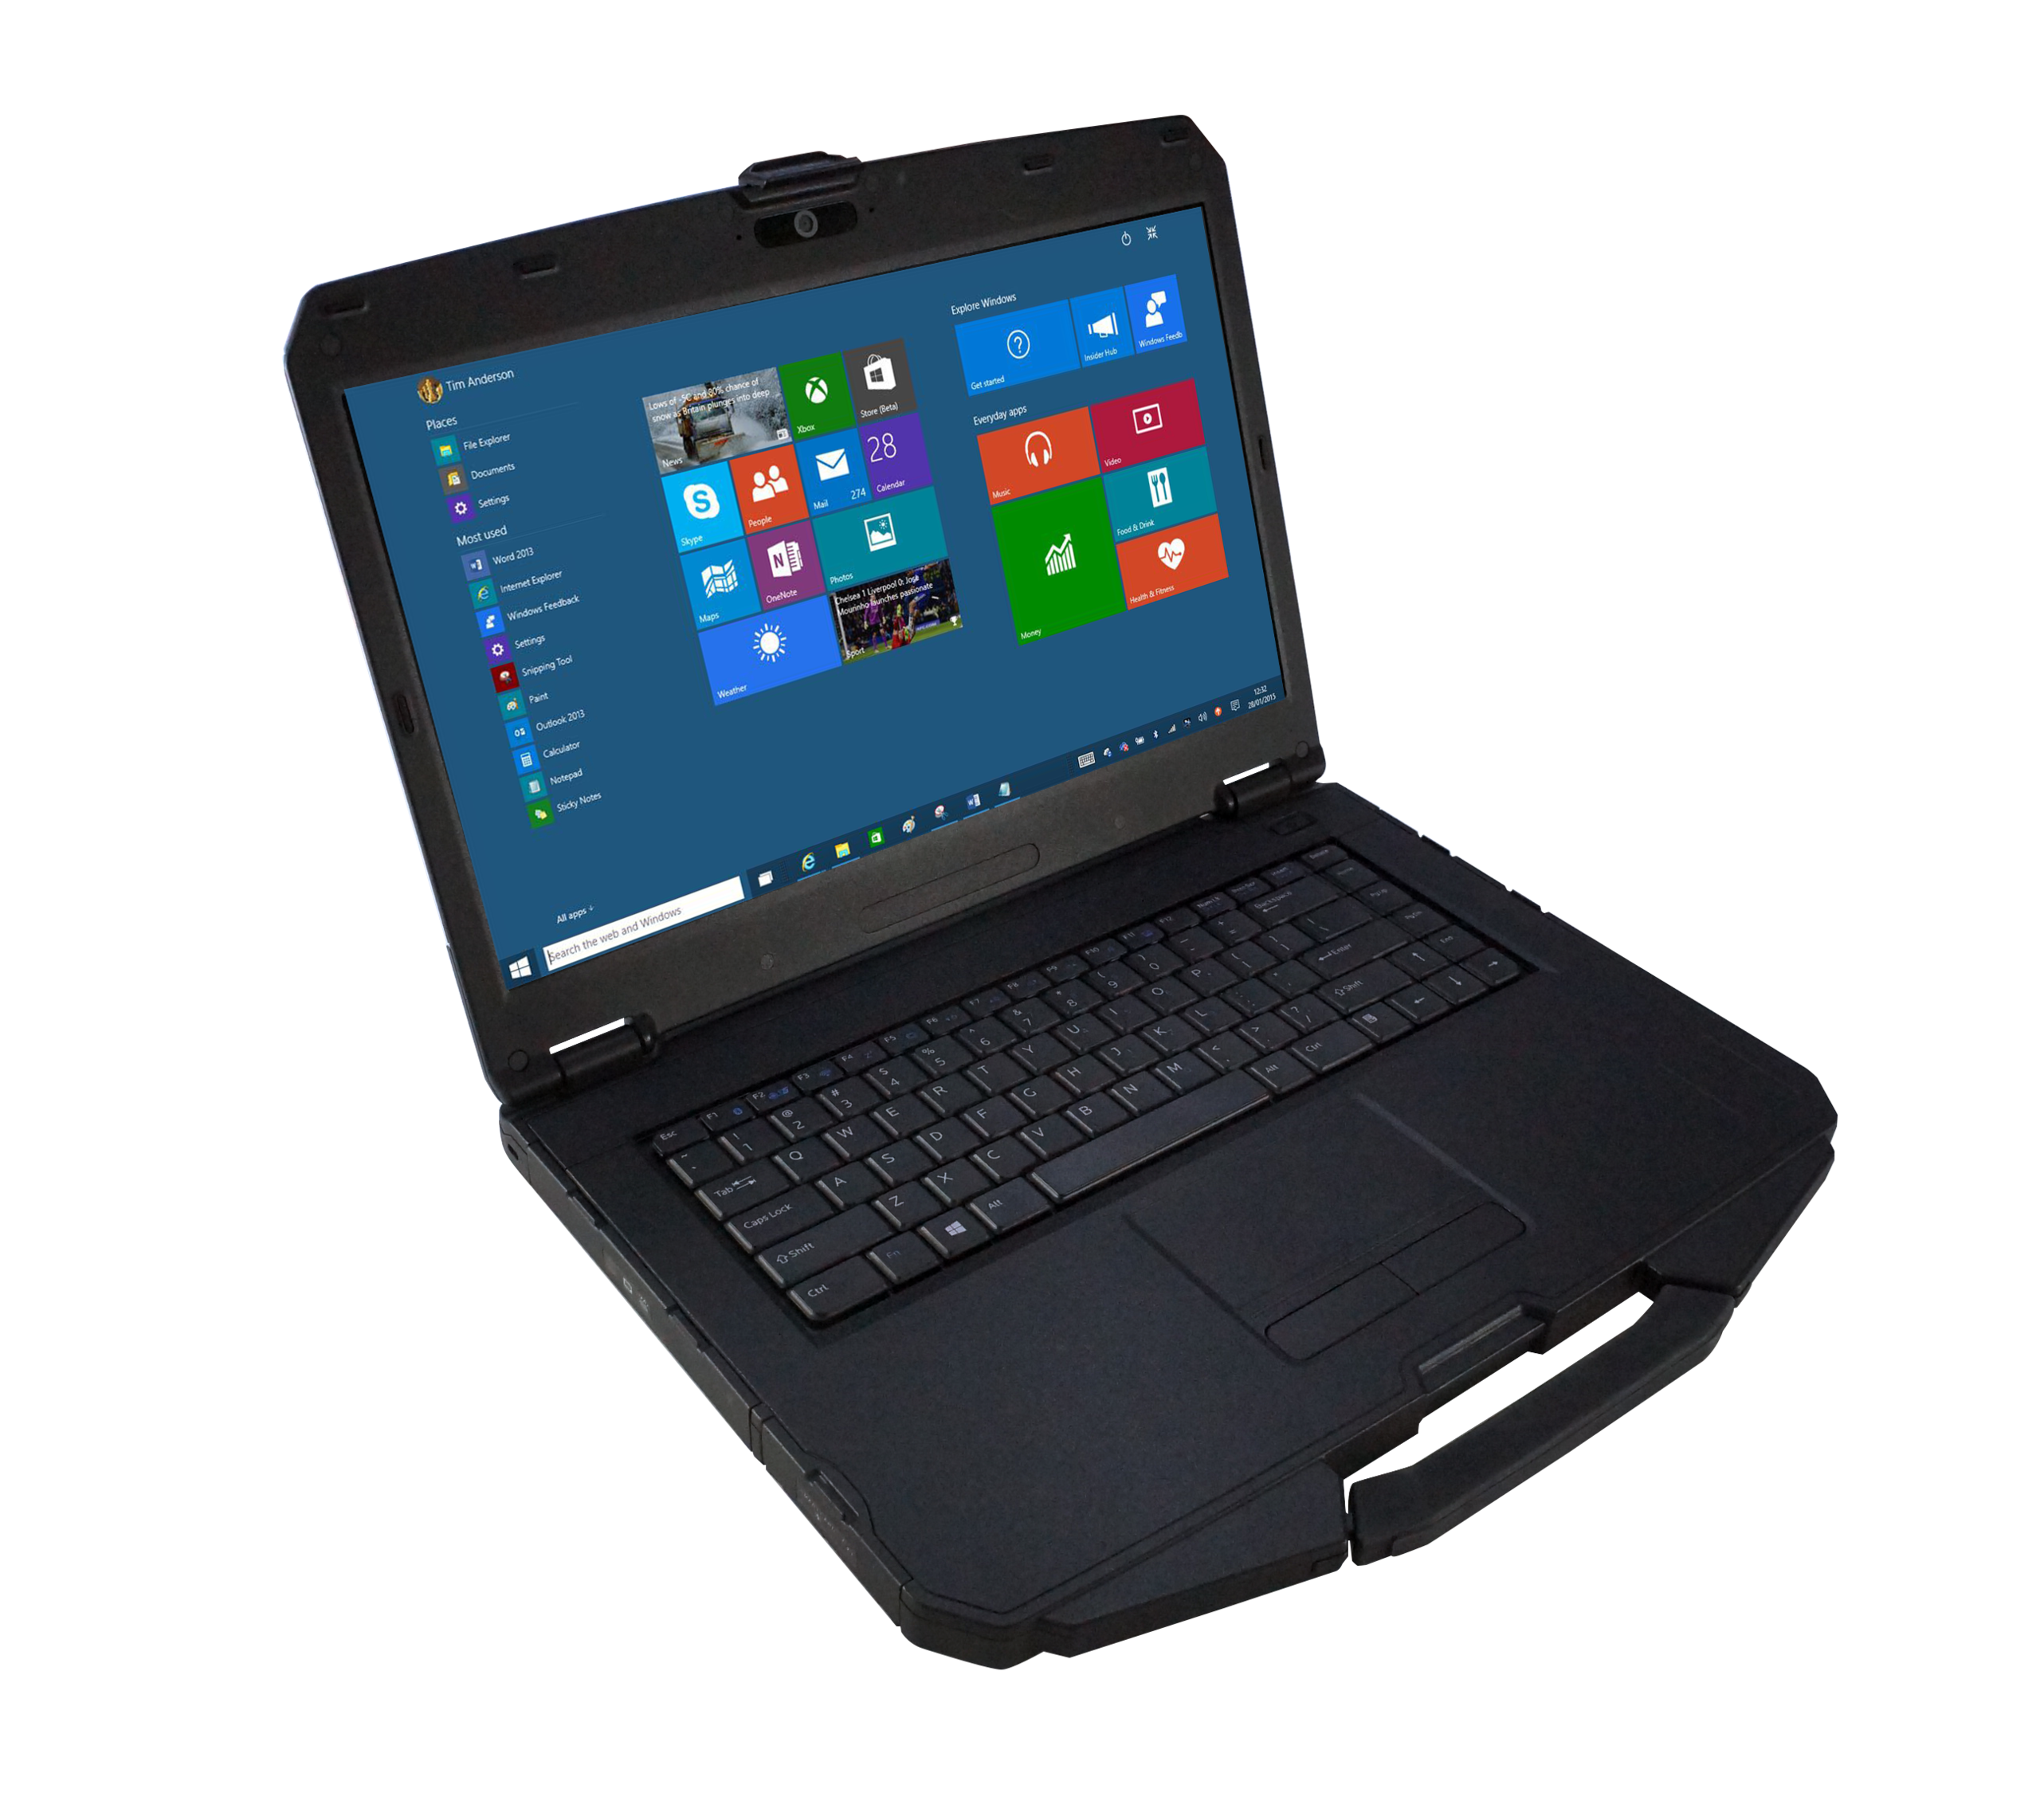
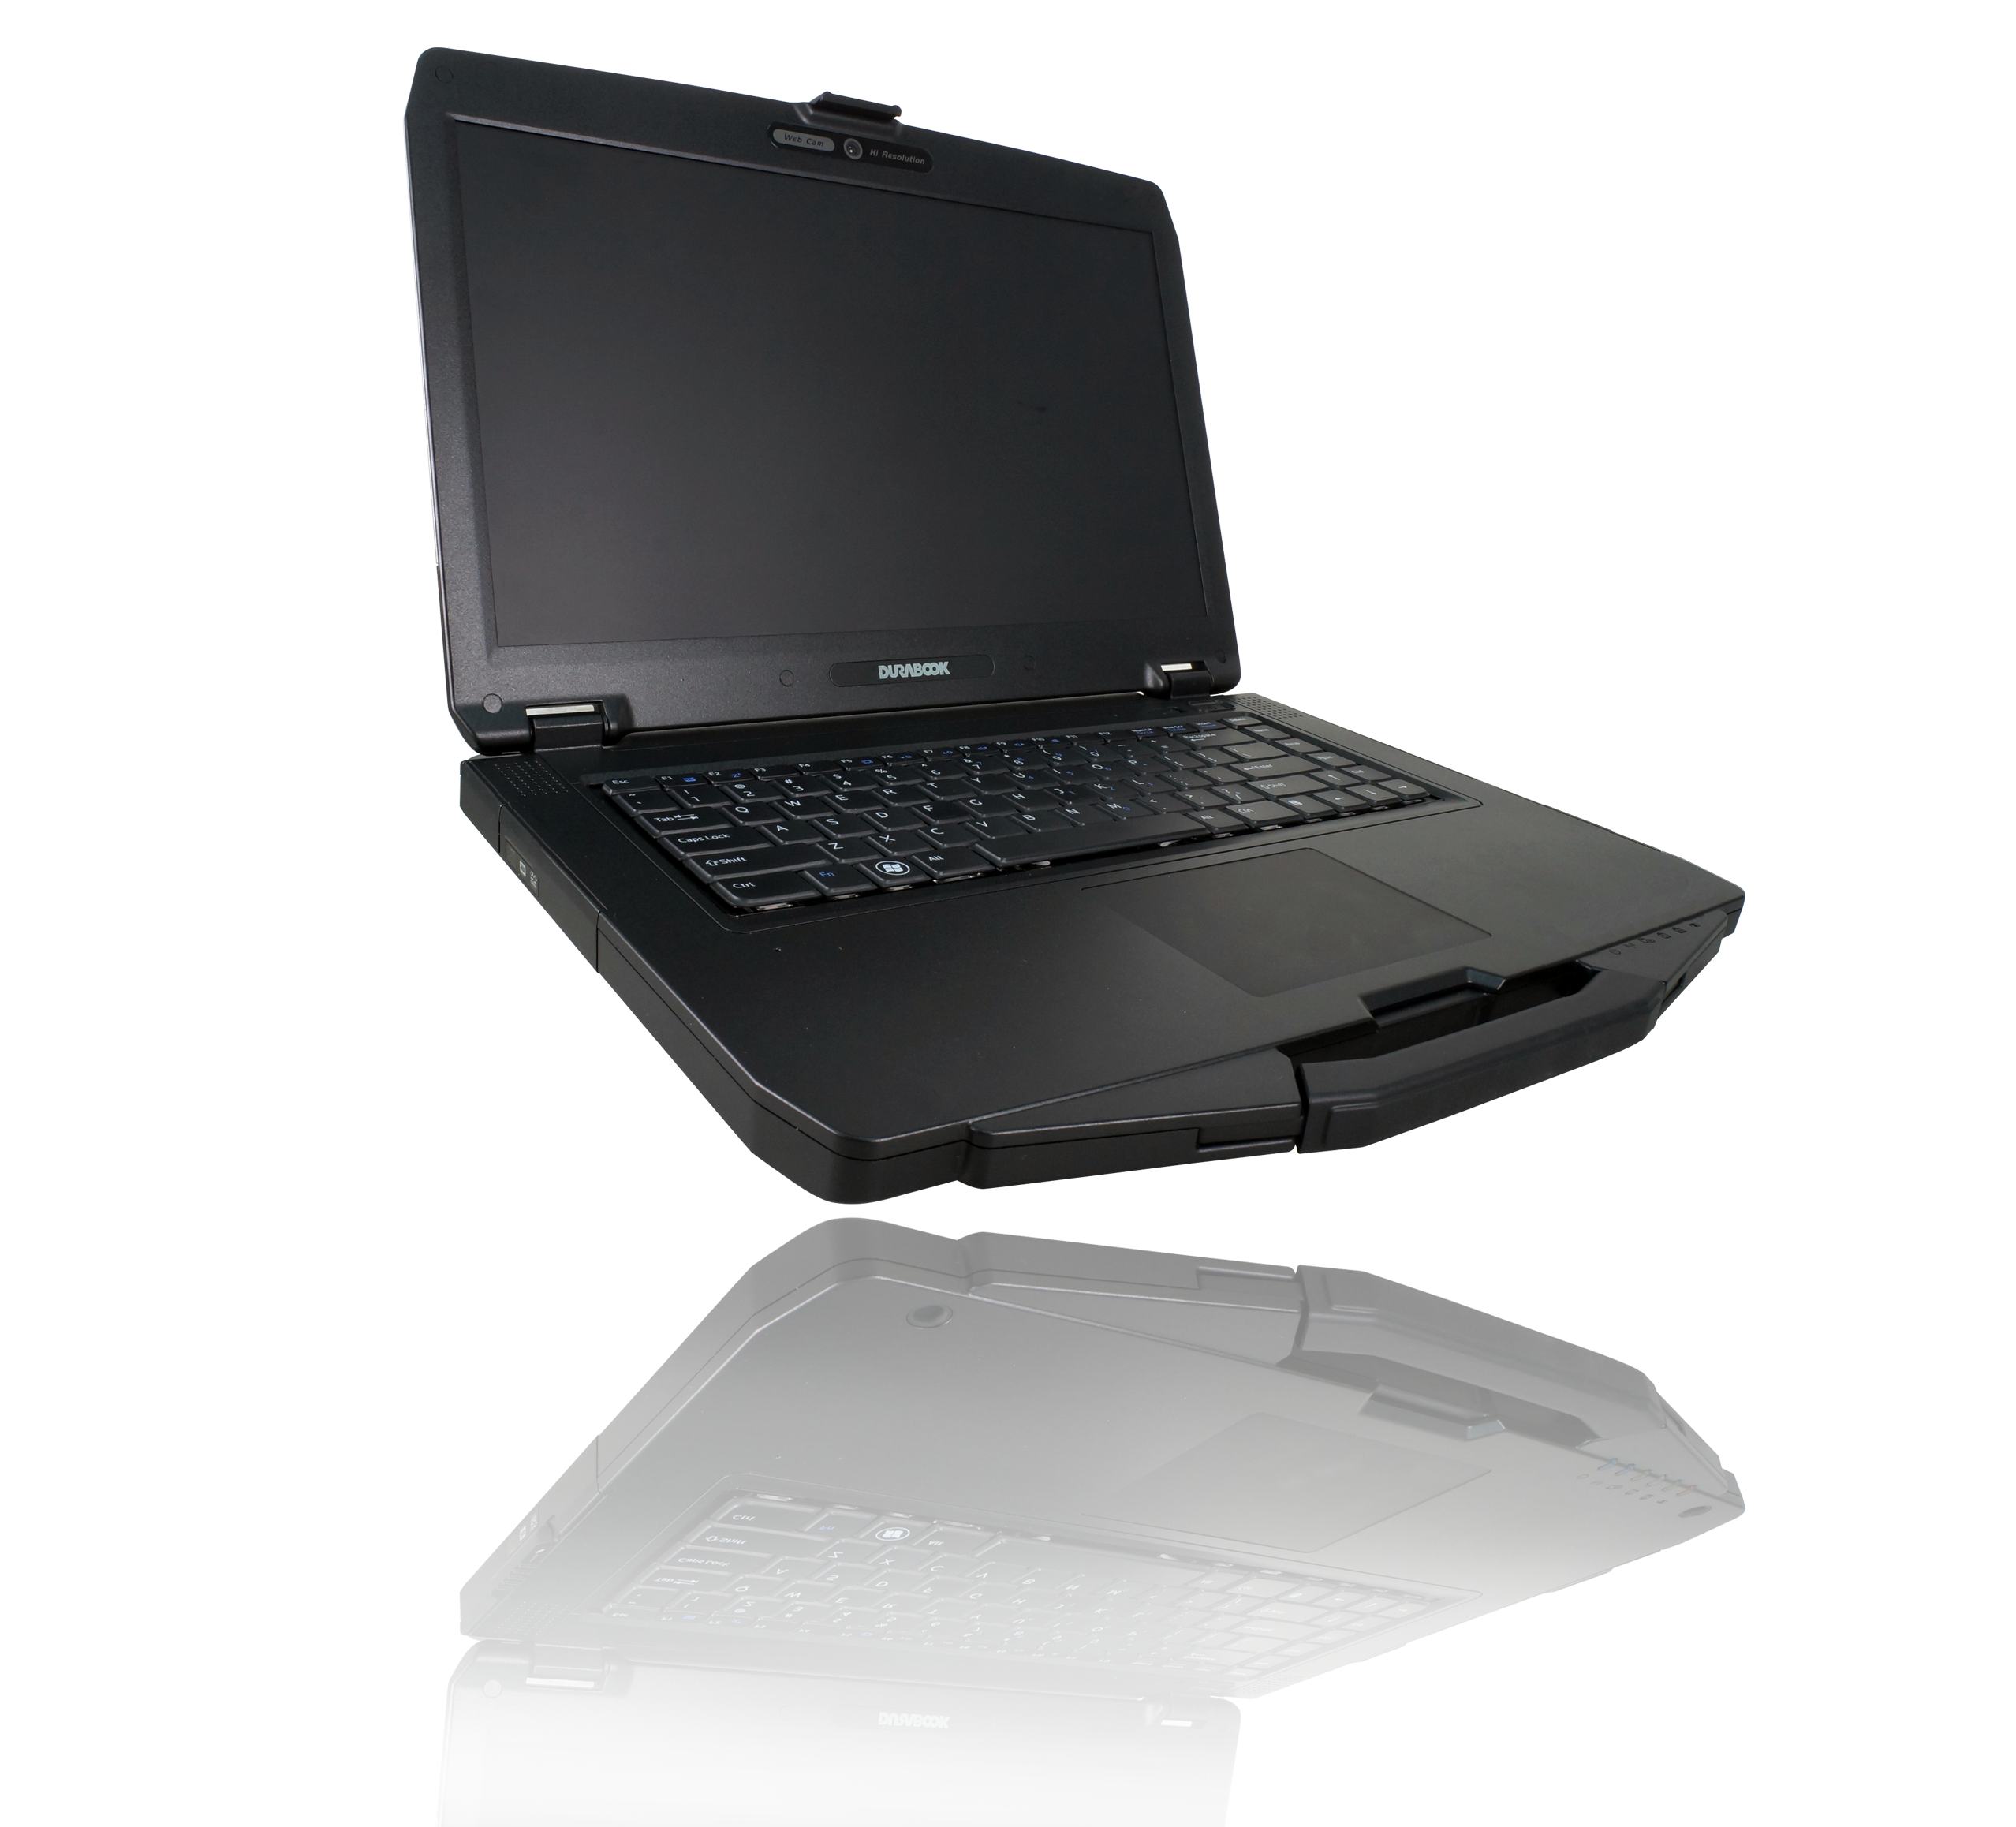
Durabook S15AB Rugged Laptop Review
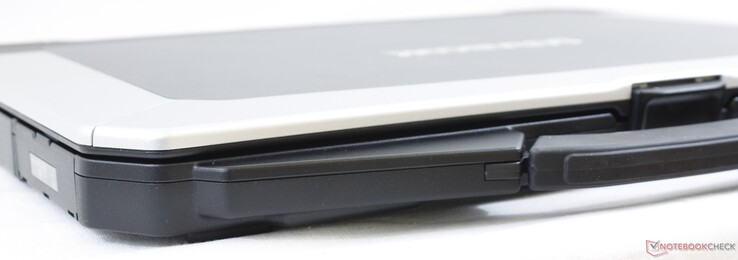
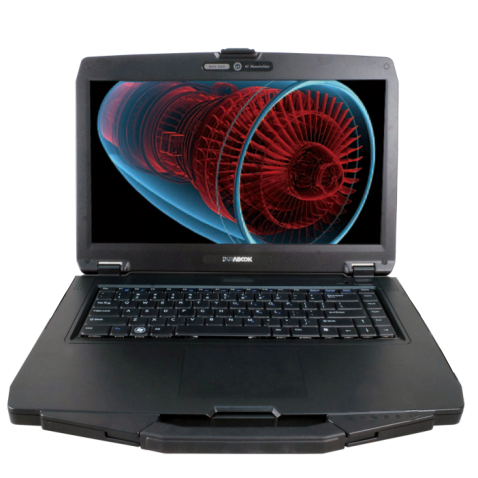
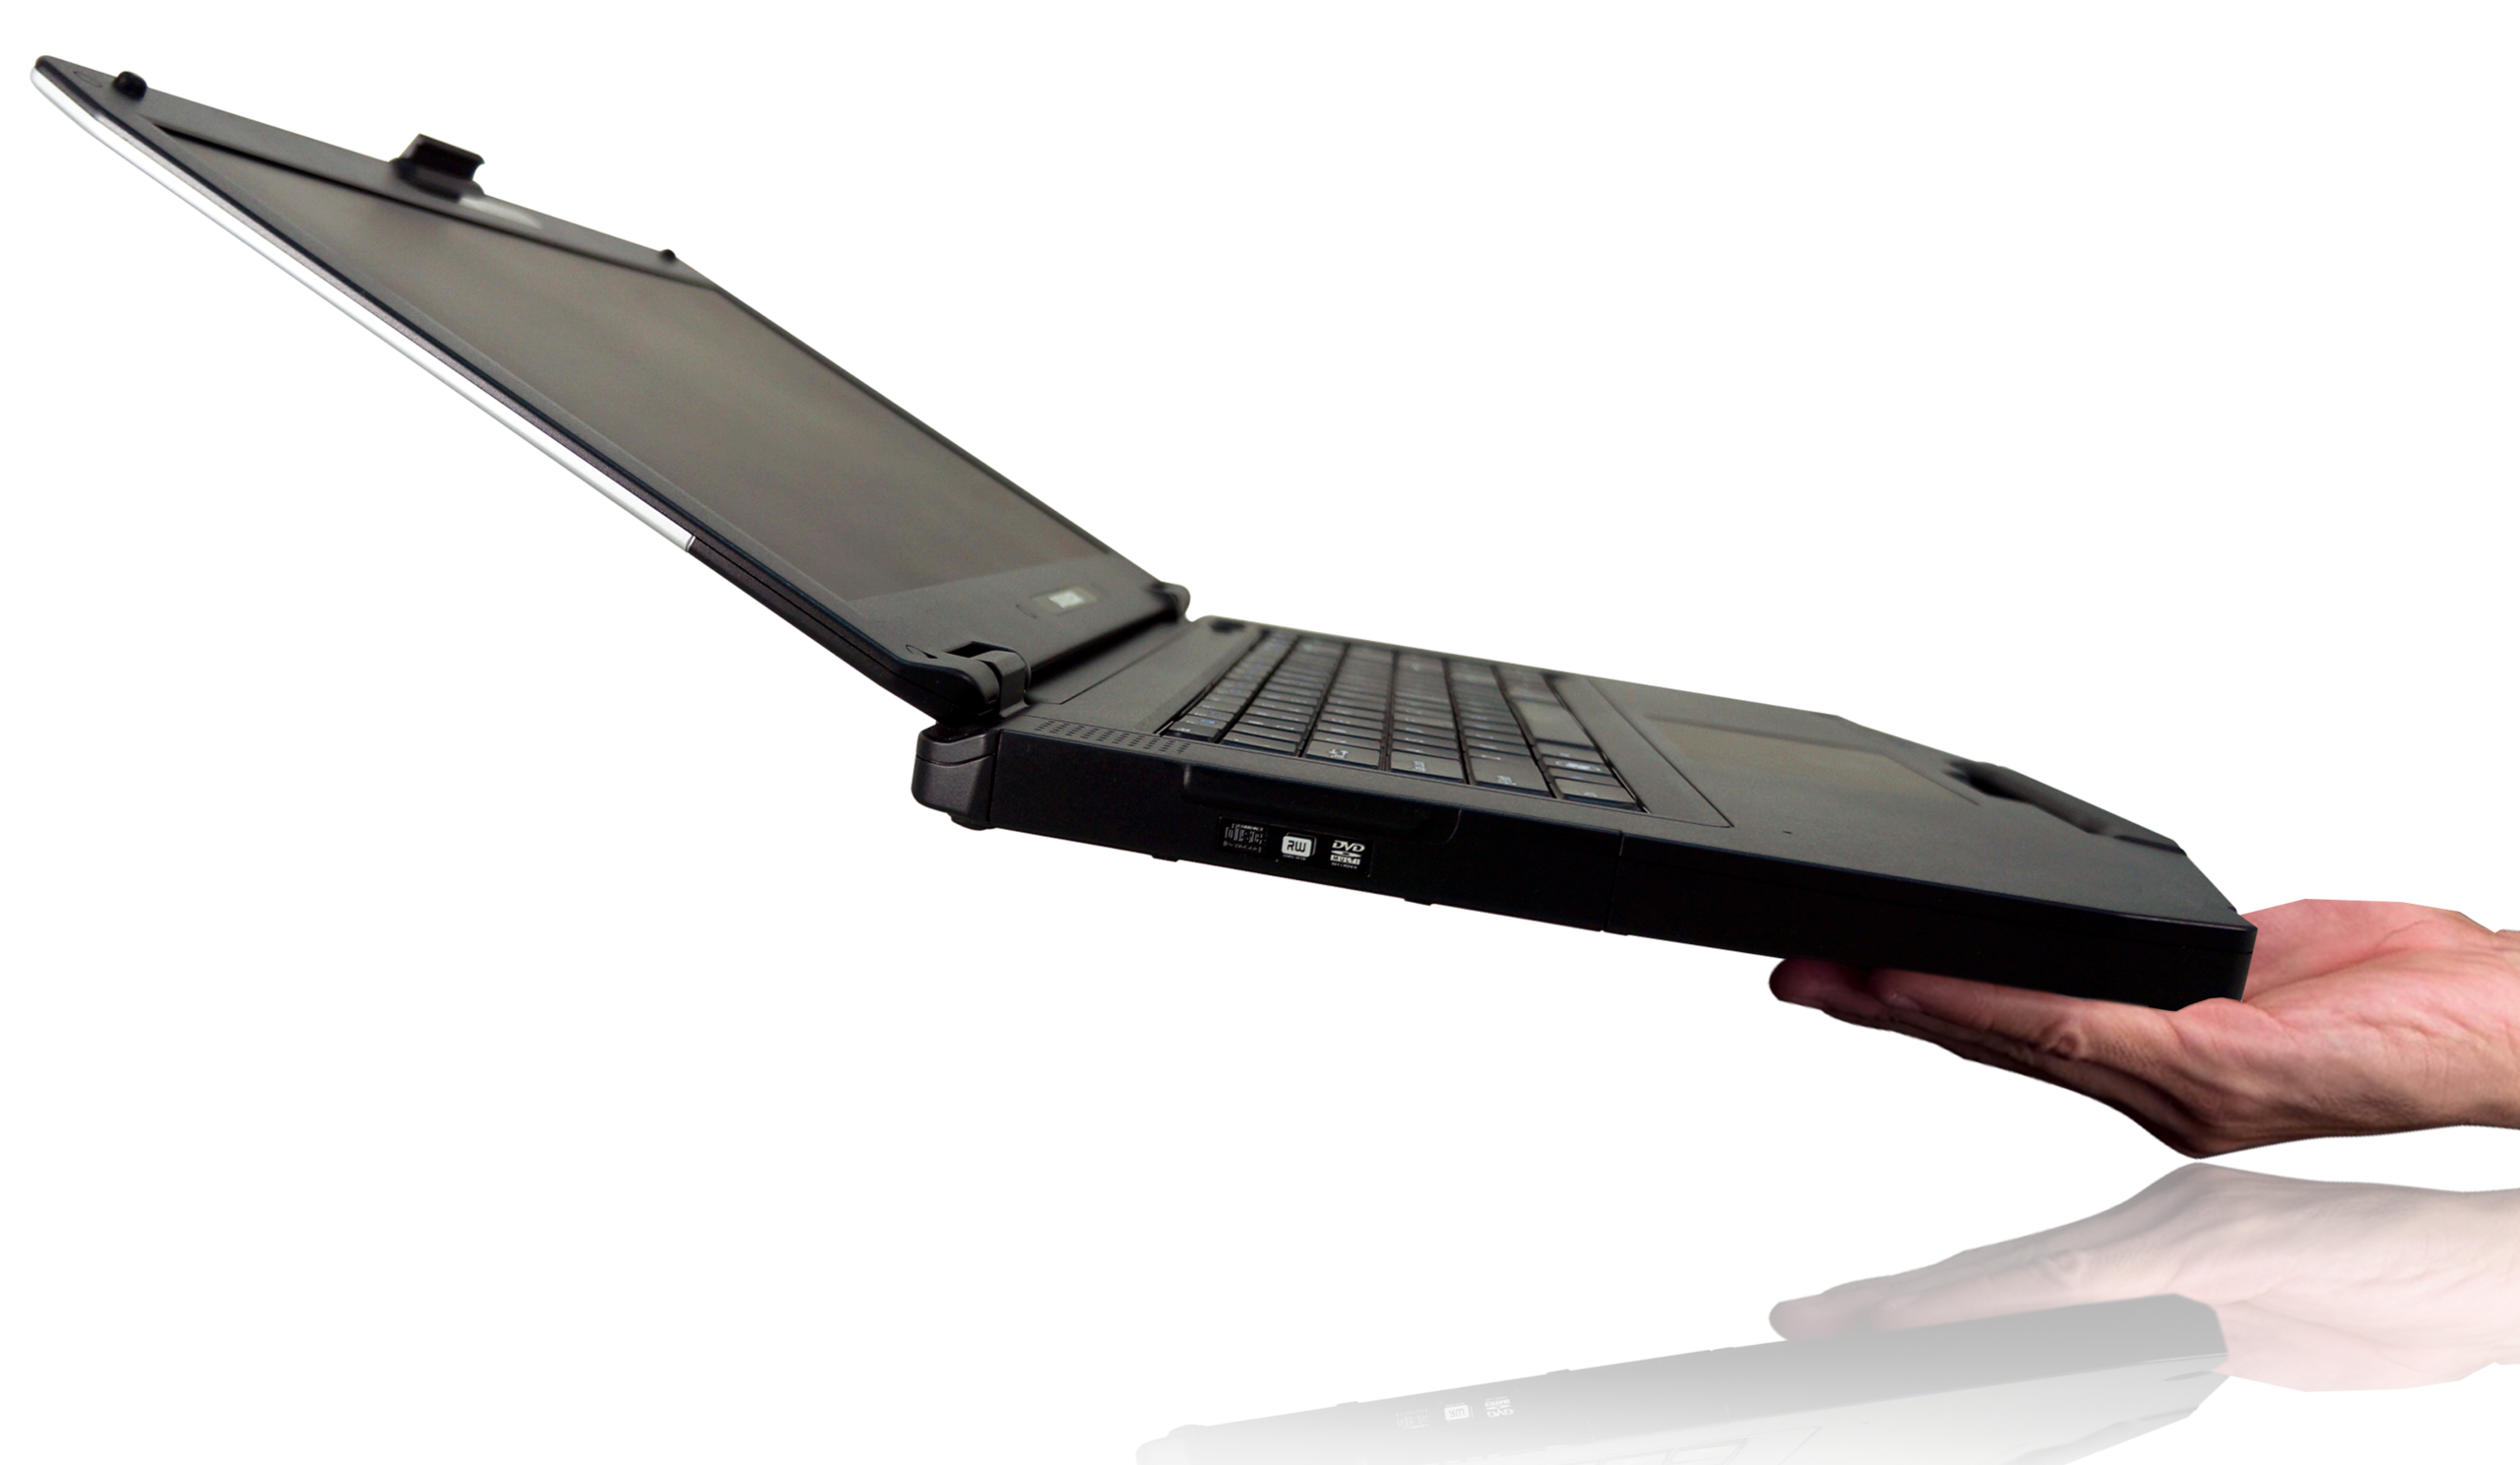
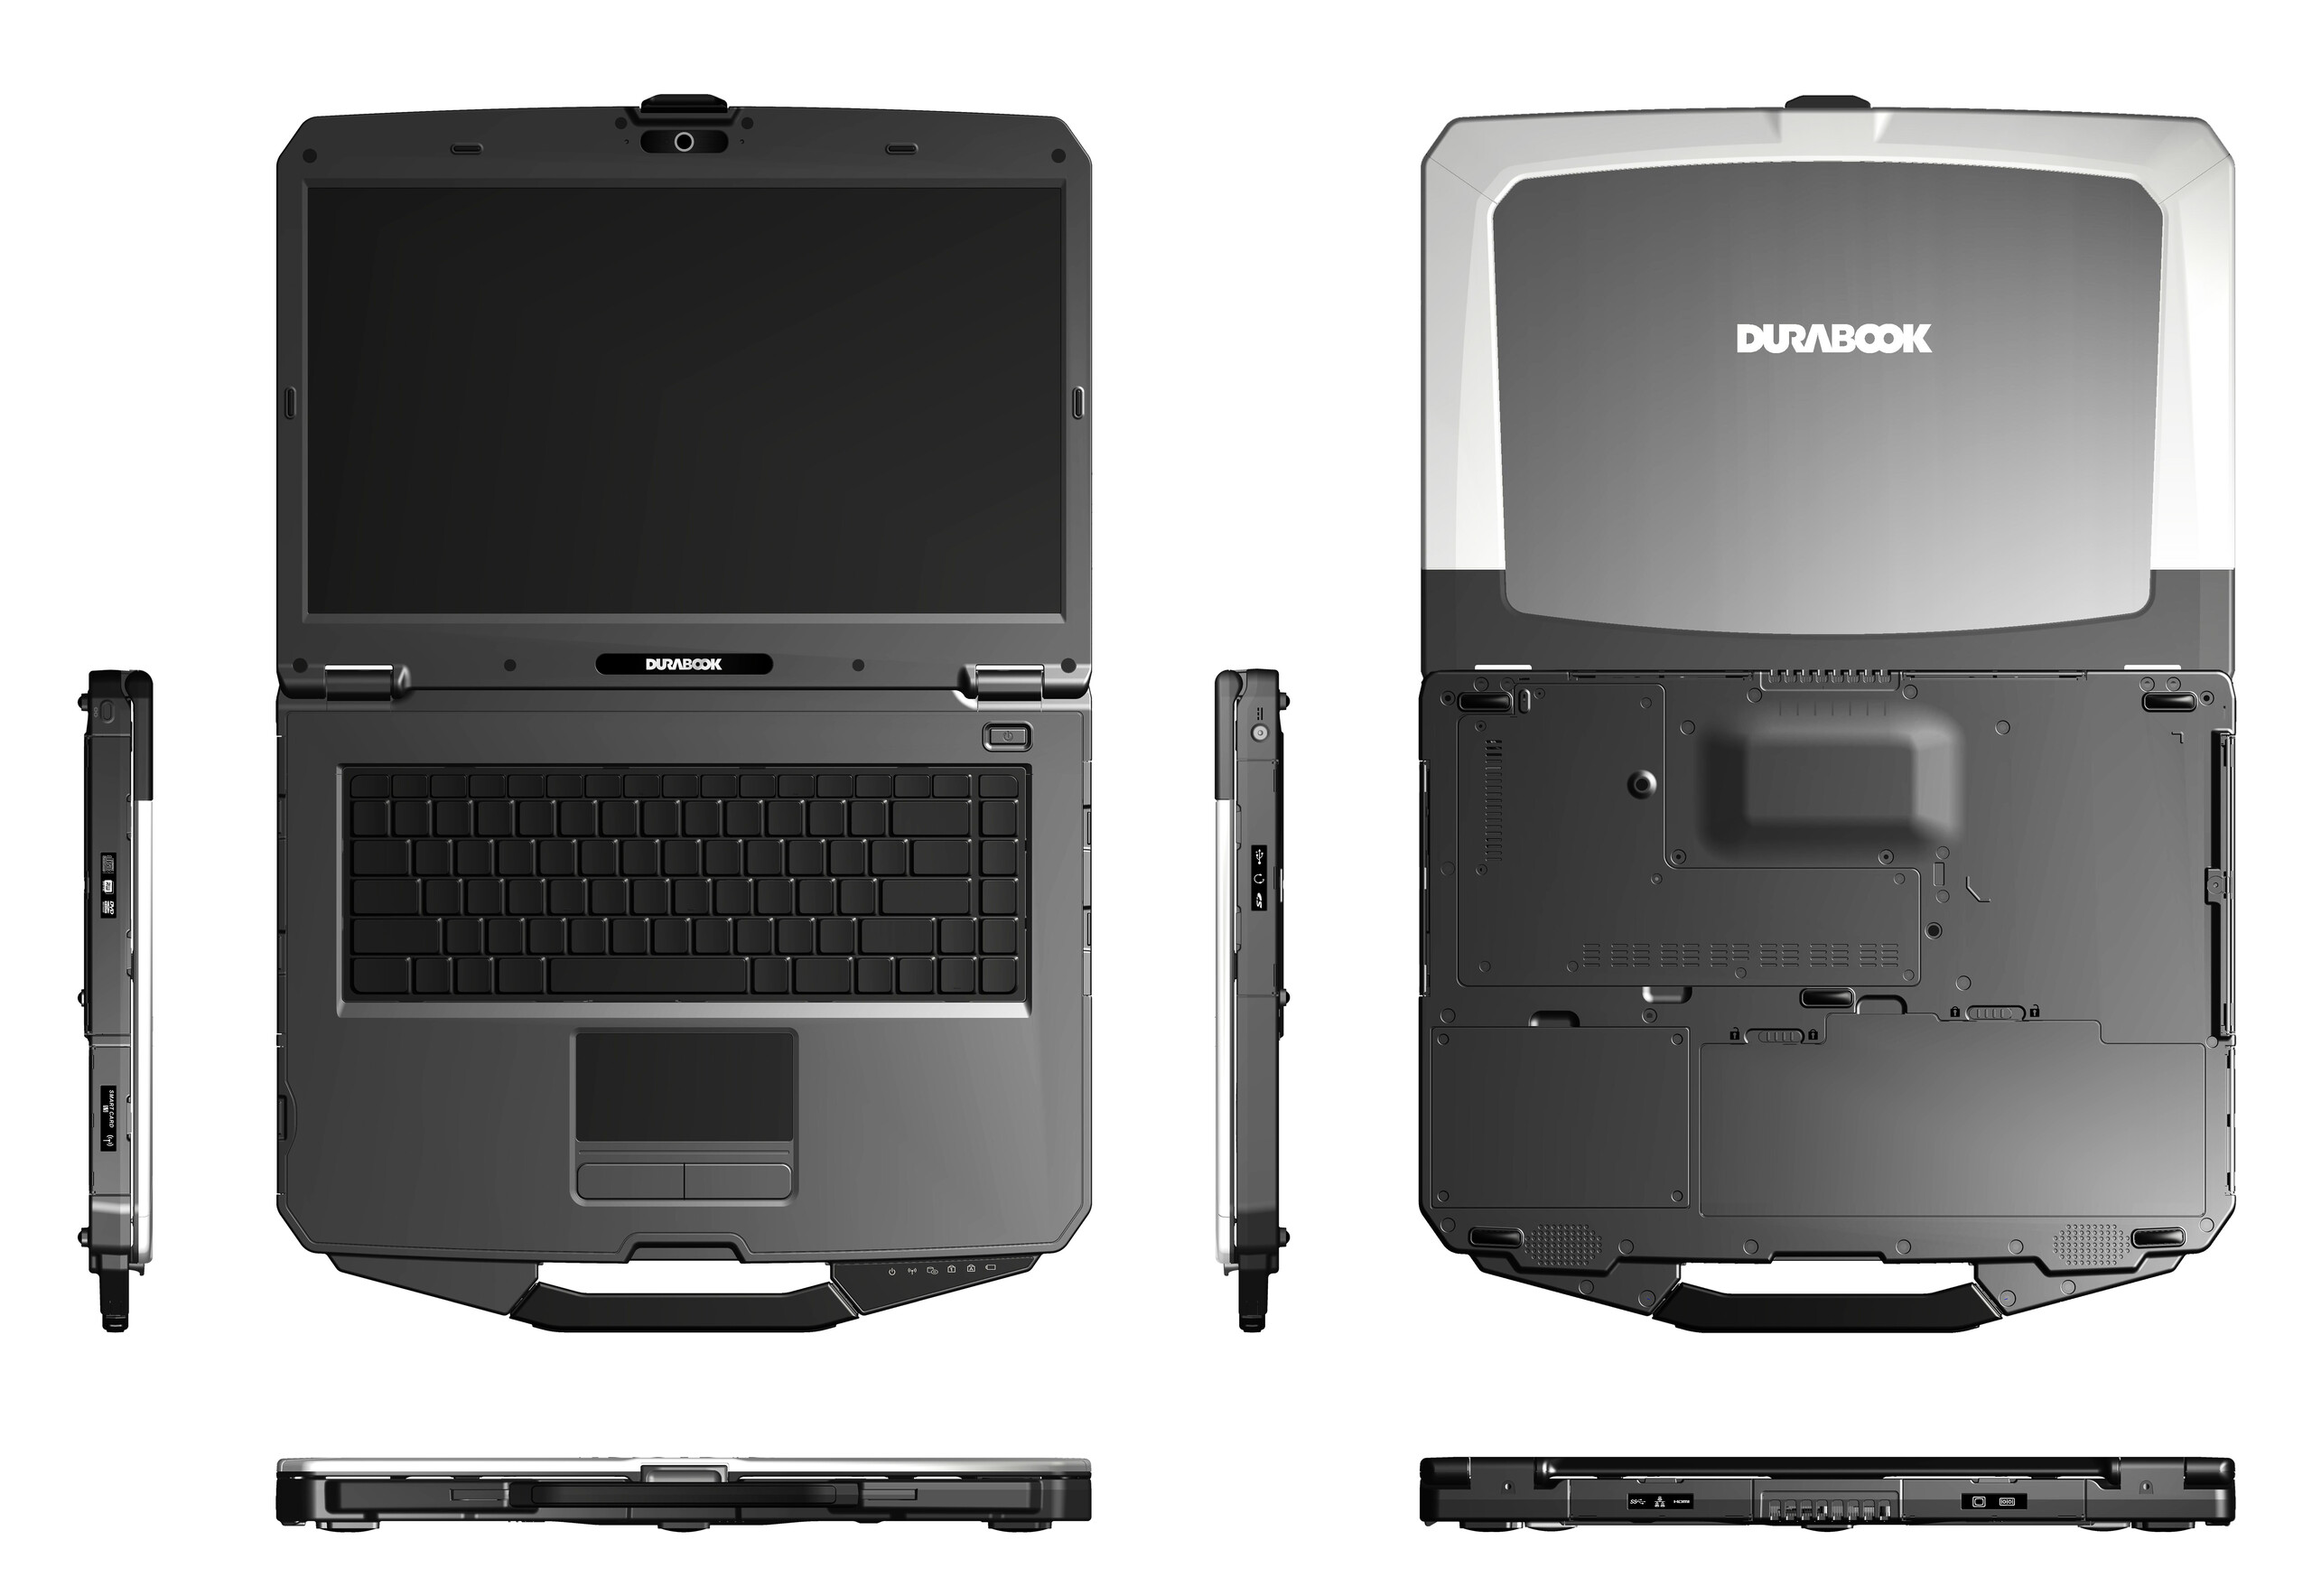
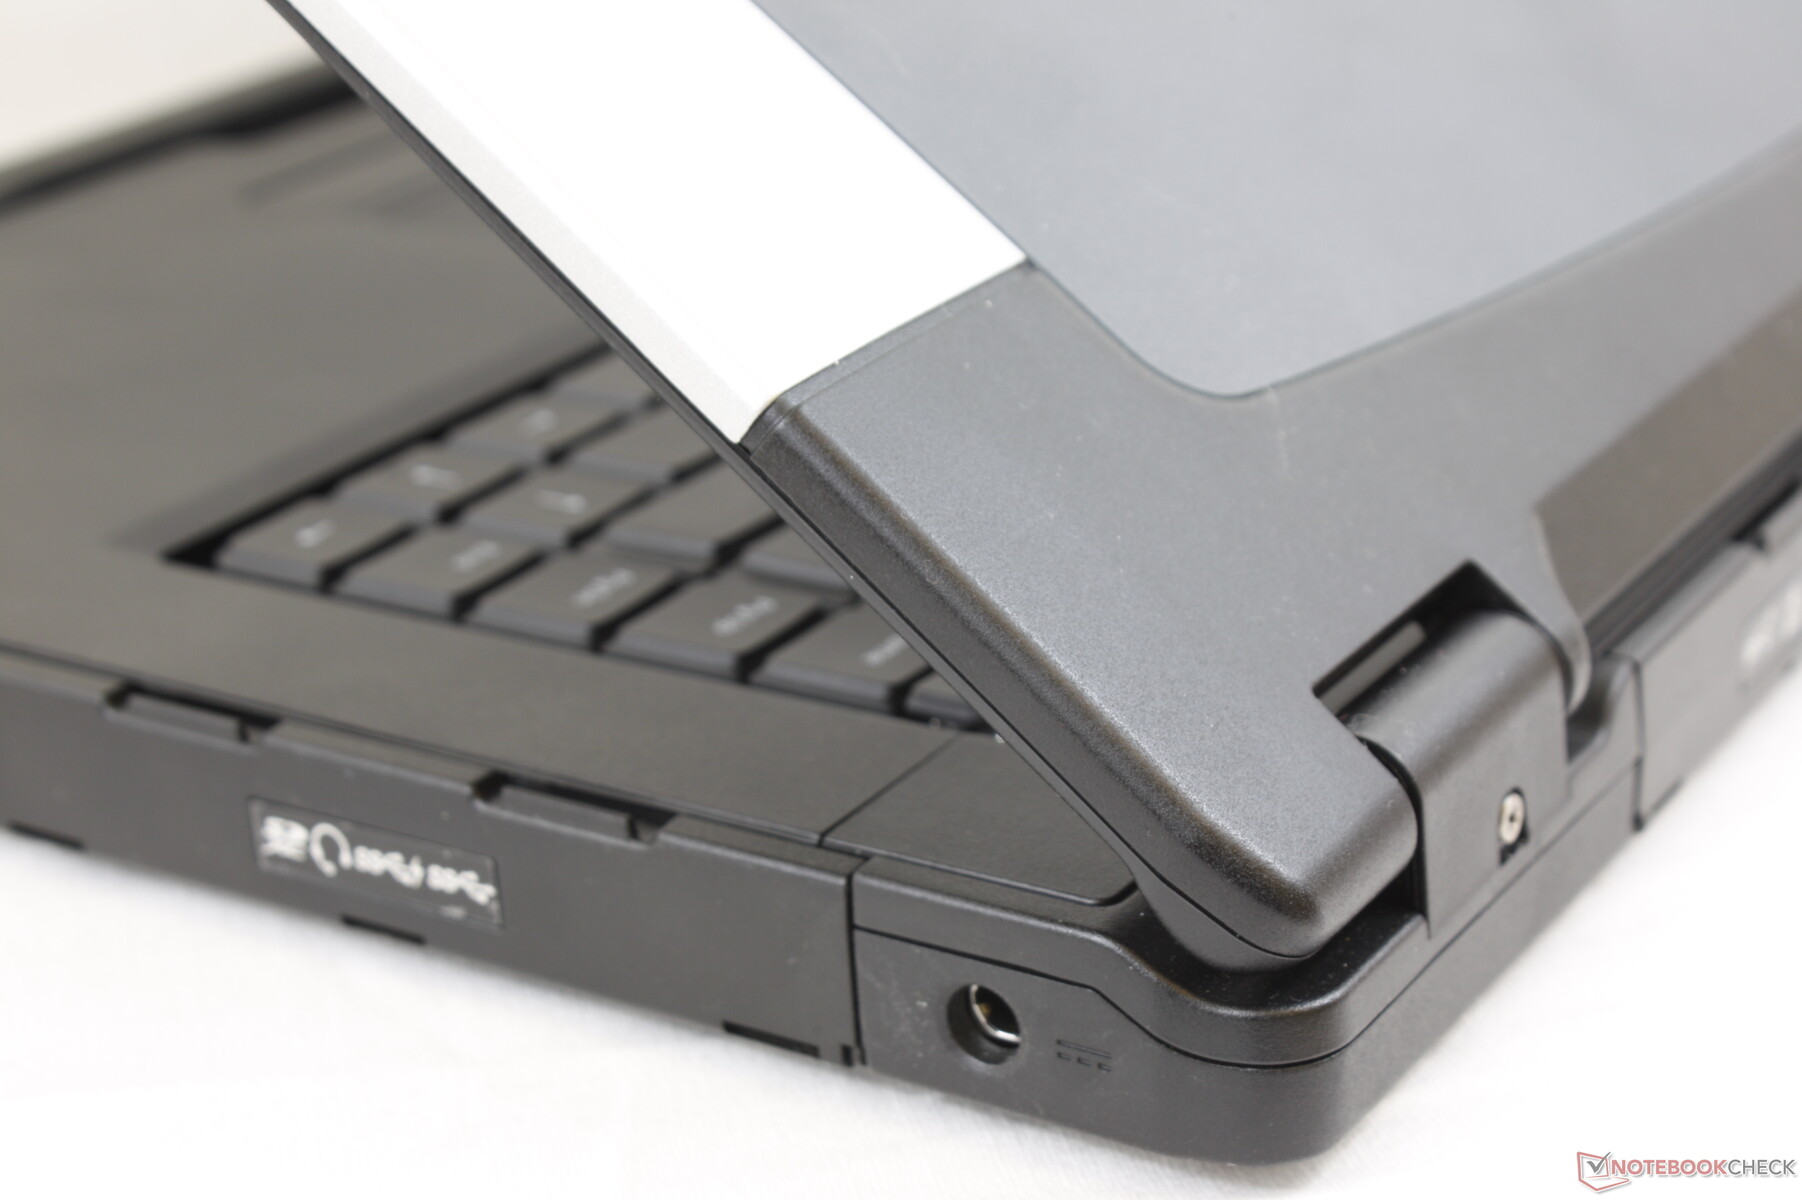
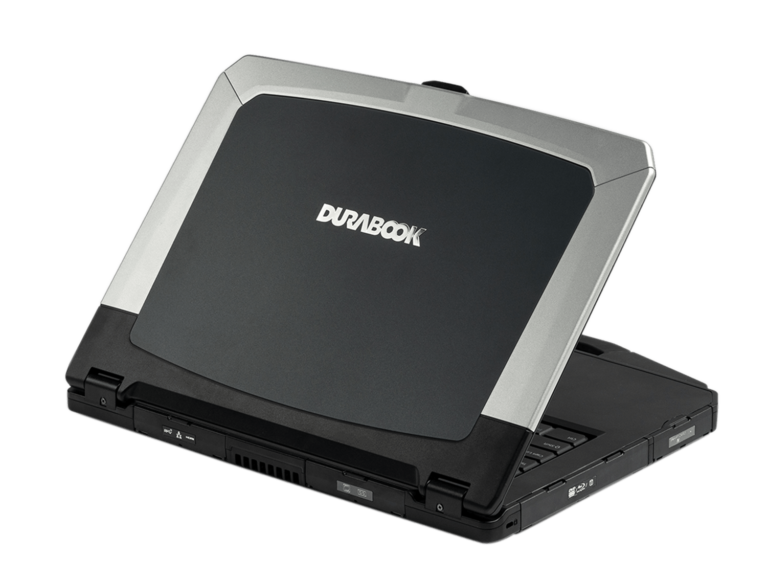
The Durabook S15AB is a semi-rugged 15.6-inch laptop designed for industrial environments or field technicians. These types of systems are typically jam-packed with ports and customizeable options with thick form factors that favor functionality over visual design.
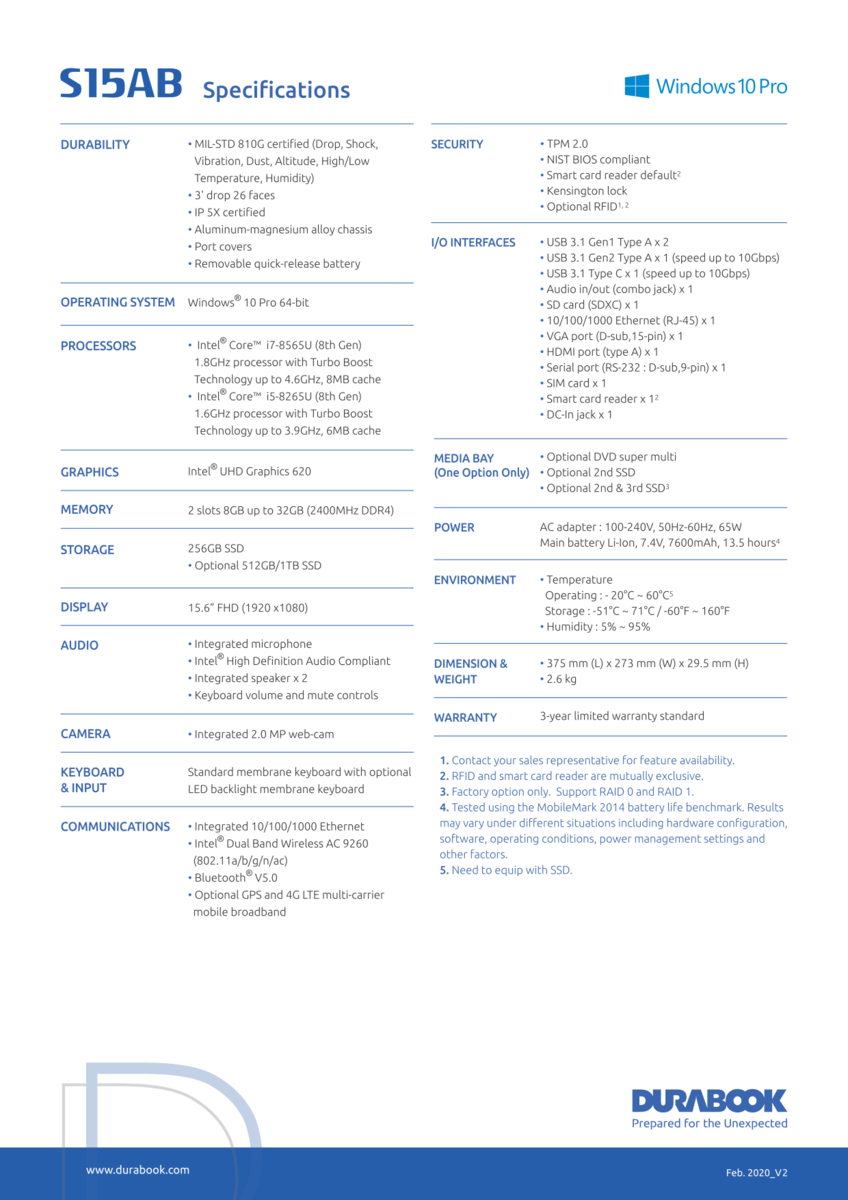
More information on the Durabook S15AB can be found on its official product page here and the specifications sheet below. Direct competitors to the S15AB include other rugged laptops like the Panasonic Toughbook, the Dell Latitude Rugged, or the Getac S series.
Rating | Date | Model | Weight | Height | Size | Resolution | Price |
|---|---|---|---|---|---|---|---|
| 78.3 % v7 (old) | 04 / 2020 | Durabook S15ABG2 i5-8265U, UHD Graphics 620 | 2.6 kg | 30 mm | 15.60" | 1920x1080 | |
| 84.3 % v6 (old) | 03 / 2019 | Dell Latitude 7424 Rugged Extreme i7-8650U, Radeon RX 540 | 3.5 kg | 59.3 mm | 14.00" | 1920x1080 | |
| 80.9 % v7 (old) | 09 / 2019 | Panasonic Toughbook FZ-55 i5-8365U, UHD Graphics 620 | 2.2 kg | 33 mm | 14.00" | 1920x1080 | |
| 83.9 % v6 (old) | 10 / 2018 | Fujitsu Lifebook A357-A3570MPH06DE i5-7200U, HD Graphics 620 | 2.2 kg | 30.9 mm | 15.60" | 1920x1080 | |
| 81.9 % v6 (old) | 10 / 2018 | Getac S410 i5-8550U, UHD Graphics 620 | 3.2 kg | 34.9 mm | 14.00" | 1366x768 |
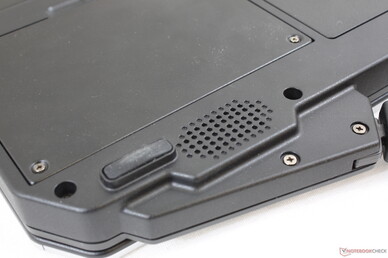
Case
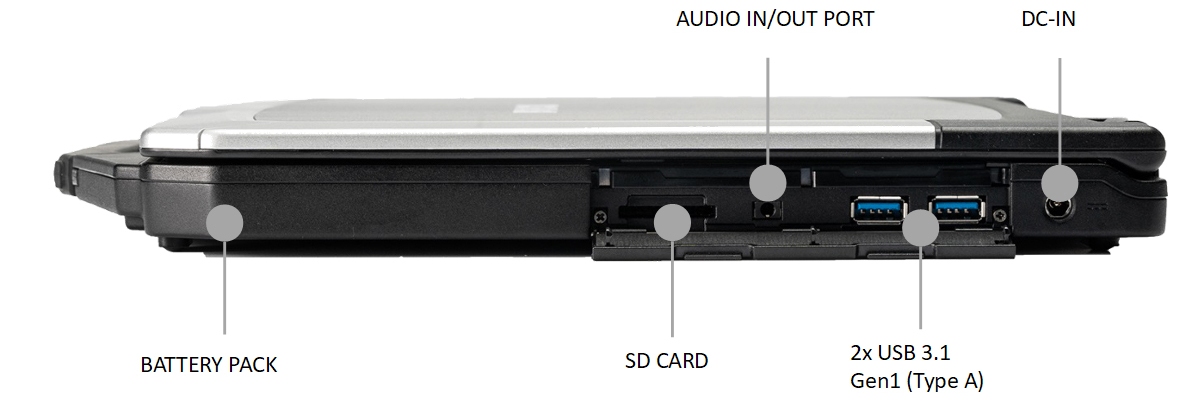
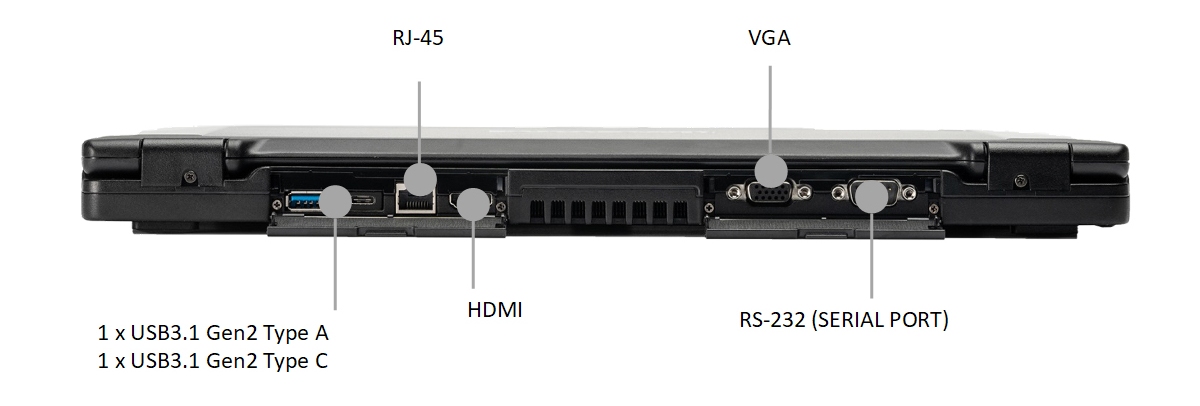
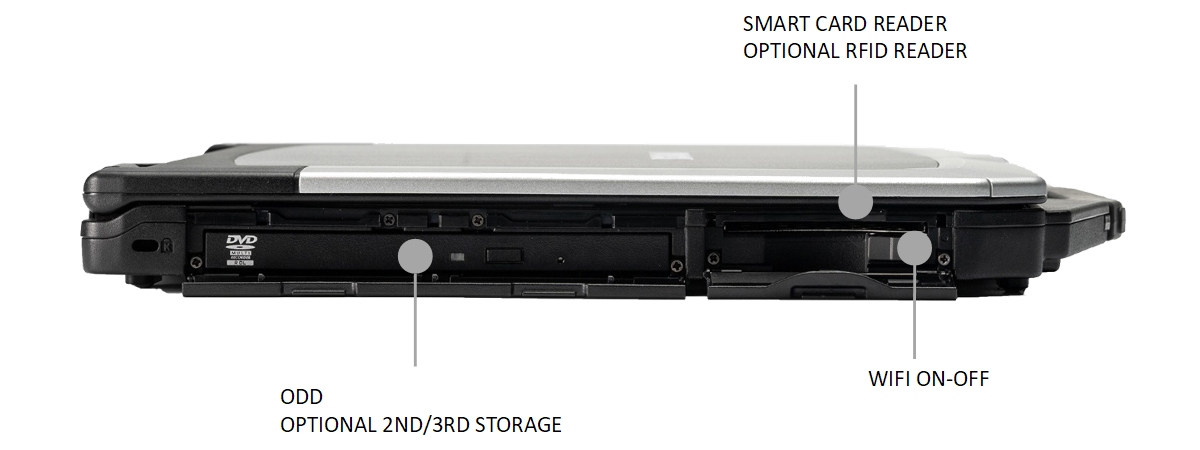
Connectivity
SD Card Reader
| SD Card Reader | |
| average JPG Copy Test (av. of 3 runs) | |
| Dell Latitude 5420 Rugged-P85G (Toshiba Exceria Pro SDXC 64 GB UHS-II) | |
| Dell Latitude 7424 Rugged Extreme (Toshiba Exceria Pro SDXC 64 GB UHS-II) | |
| Fujitsu Celsius H780 (Toshiba Exceria Pro SDXC 64 GB UHS-II) | |
| Fujitsu Lifebook A357-A3570MPH06DE (Toshiba Exceria Pro SDXC 64 GB UHS-II) | |
| Panasonic Toughbook FZ-55 (Toshiba Exceria Pro M501 64 GB UHS-II) | |
| Durabook S15ABG2 (Toshiba Exceria Pro SDXC 64 GB UHS-II) | |
| maximum AS SSD Seq Read Test (1GB) | |
| Dell Latitude 5420 Rugged-P85G (Toshiba Exceria Pro SDXC 64 GB UHS-II) | |
| Dell Latitude 7424 Rugged Extreme (Toshiba Exceria Pro SDXC 64 GB UHS-II) | |
| Fujitsu Celsius H780 (Toshiba Exceria Pro SDXC 64 GB UHS-II) | |
| Fujitsu Lifebook A357-A3570MPH06DE (Toshiba Exceria Pro SDXC 64 GB UHS-II) | |
| Panasonic Toughbook FZ-55 (Toshiba Exceria Pro M501 64 GB UHS-II) | |
| Durabook S15ABG2 (Toshiba Exceria Pro SDXC 64 GB UHS-II) | |
Communication
We experienced no connectivity issues when connected to our Netgear RAX200 router. Both transmit and receive rates are stable with the included Intel 9260 Wi-Fi 5 module. Durabook offers no Wi-Fi 6 options at the moment.
| Networking | |
| iperf3 transmit AX12 | |
| Asus Zephyrus G14 GA401IV | |
| Lenovo ThinkPad X1 Yoga 20SA000GUS | |
| Durabook S15ABG2 | |
| MSI GF75 Thin 10SCXR | |
| iperf3 receive AX12 | |
| MSI GF75 Thin 10SCXR | |
| Asus Zephyrus G14 GA401IV | |
| Lenovo ThinkPad X1 Yoga 20SA000GUS | |
| Durabook S15ABG2 | |
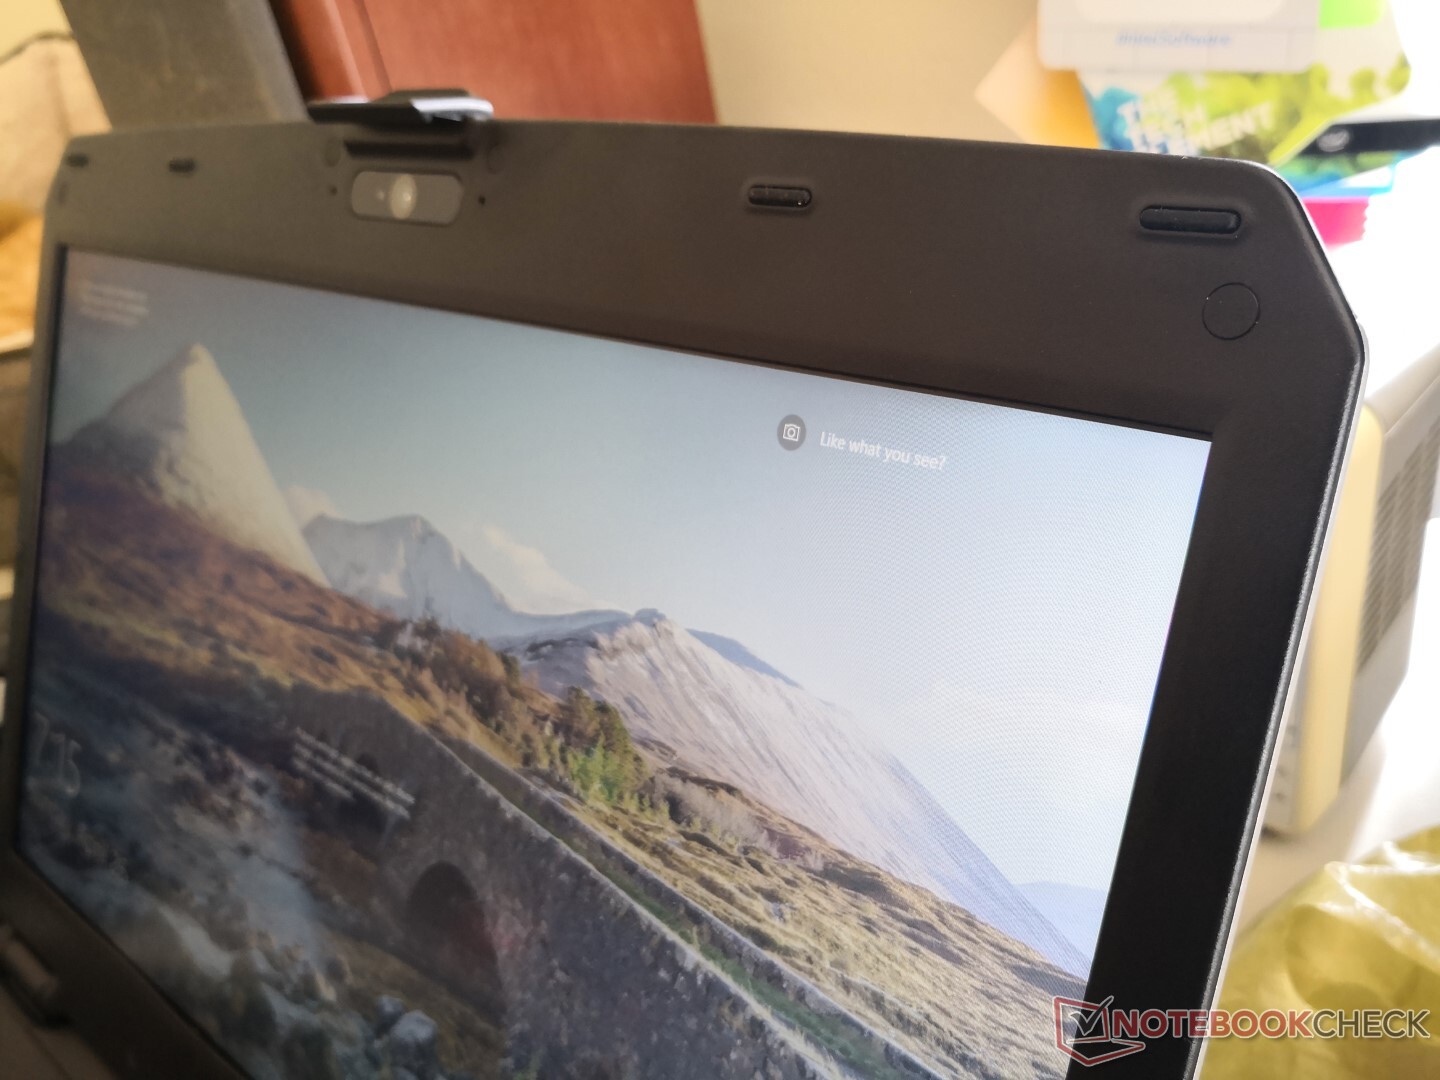
Webcam


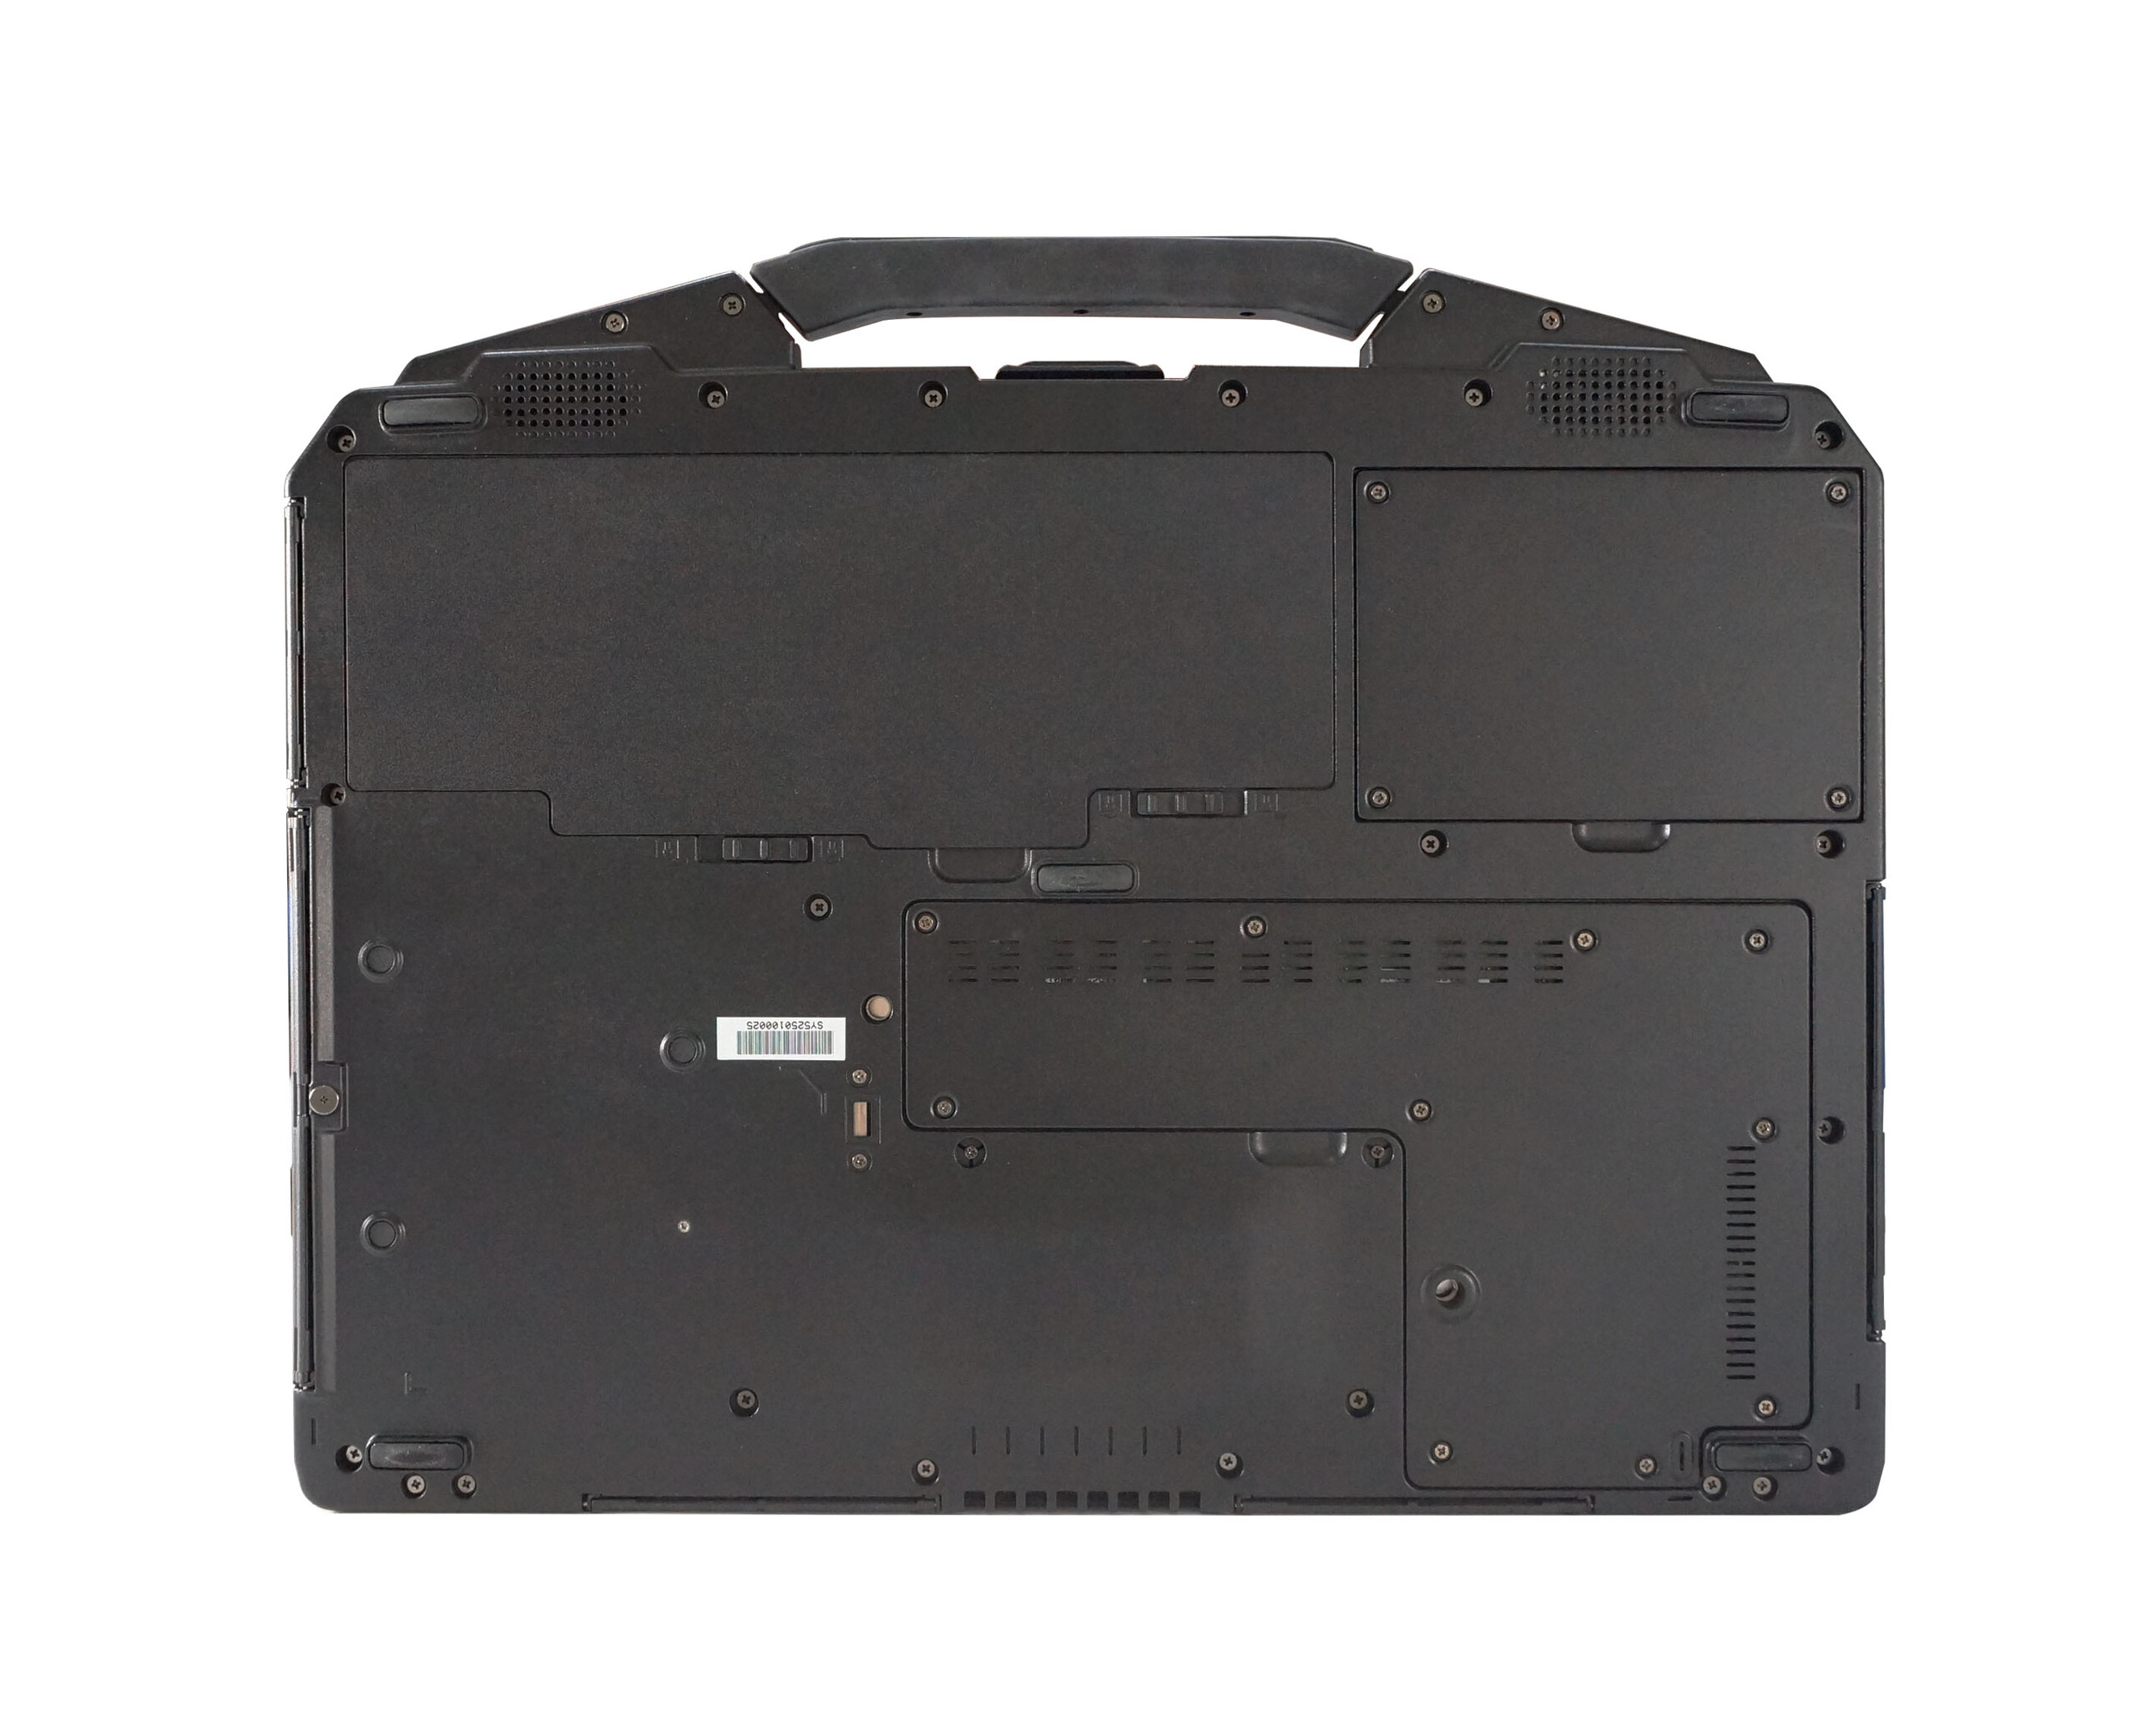
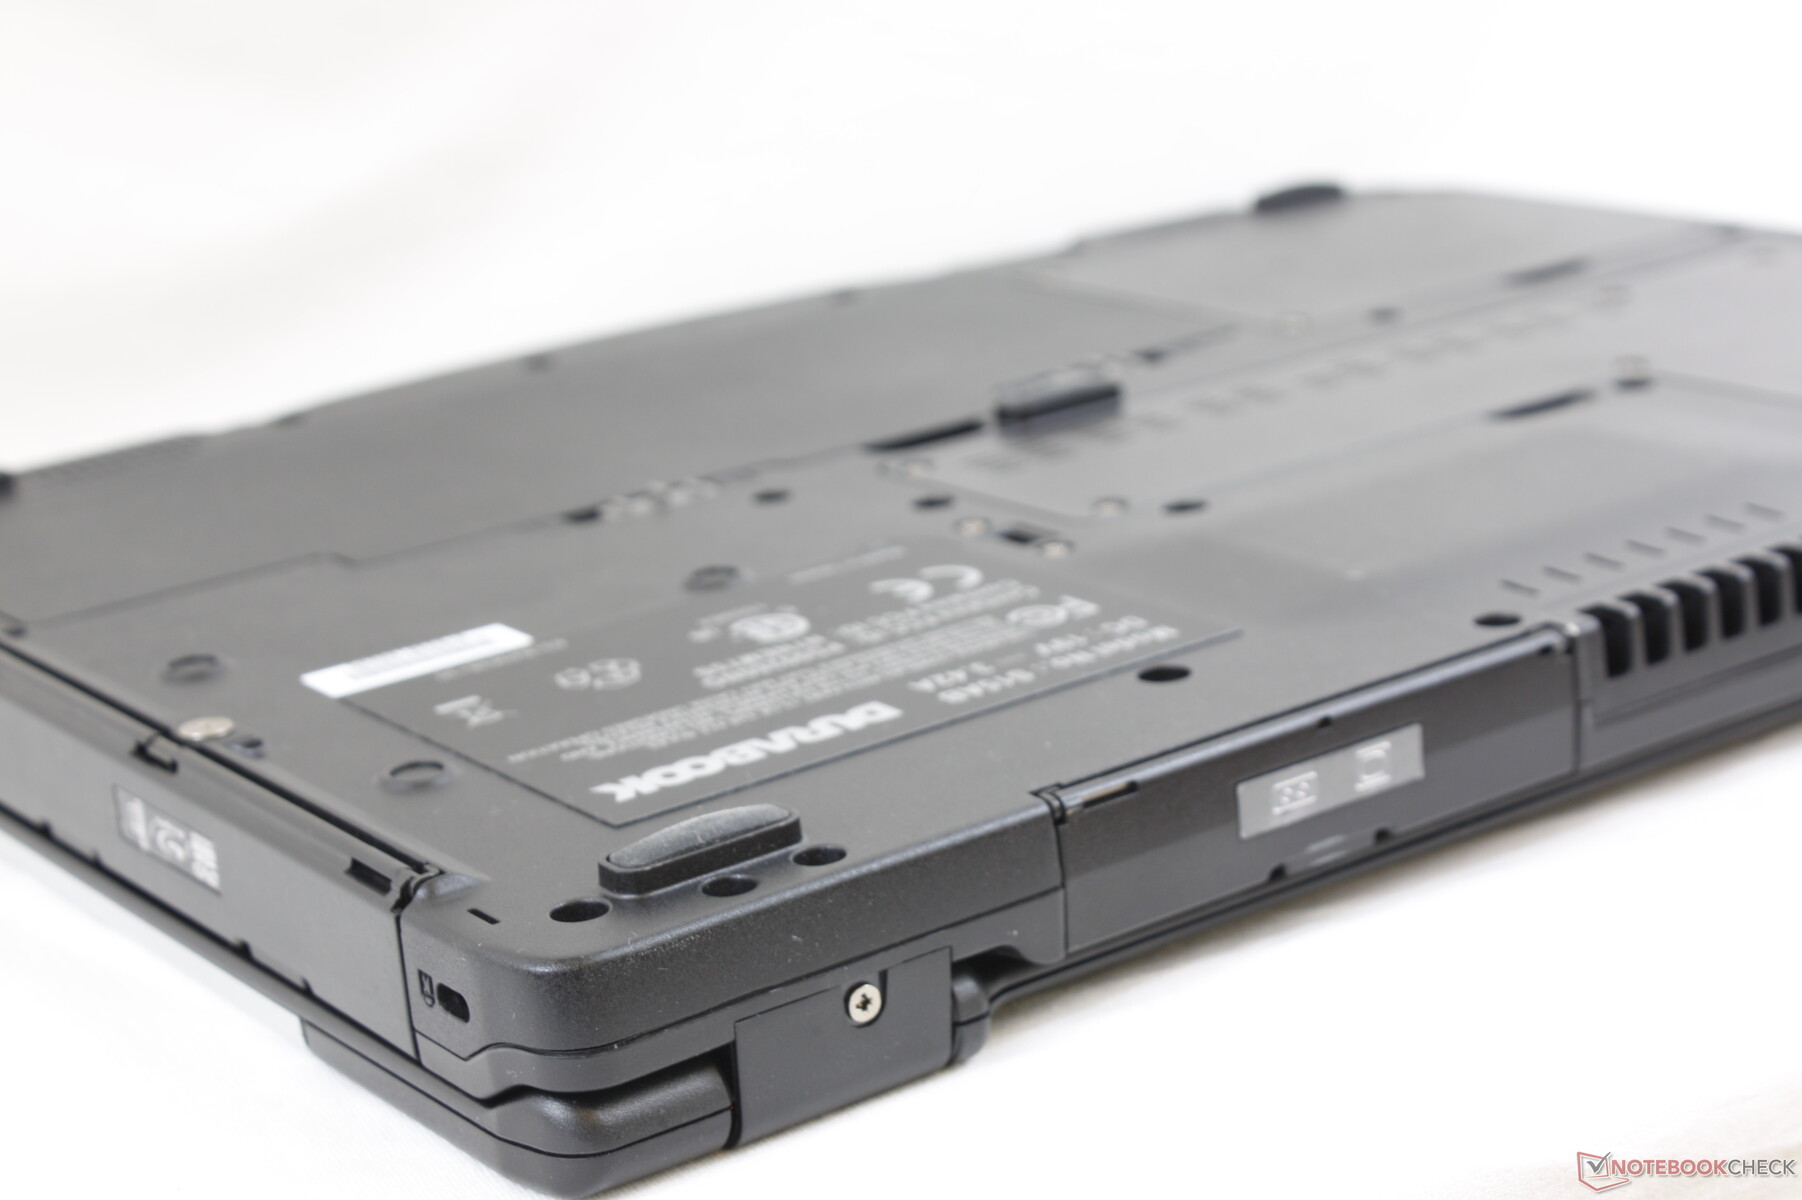
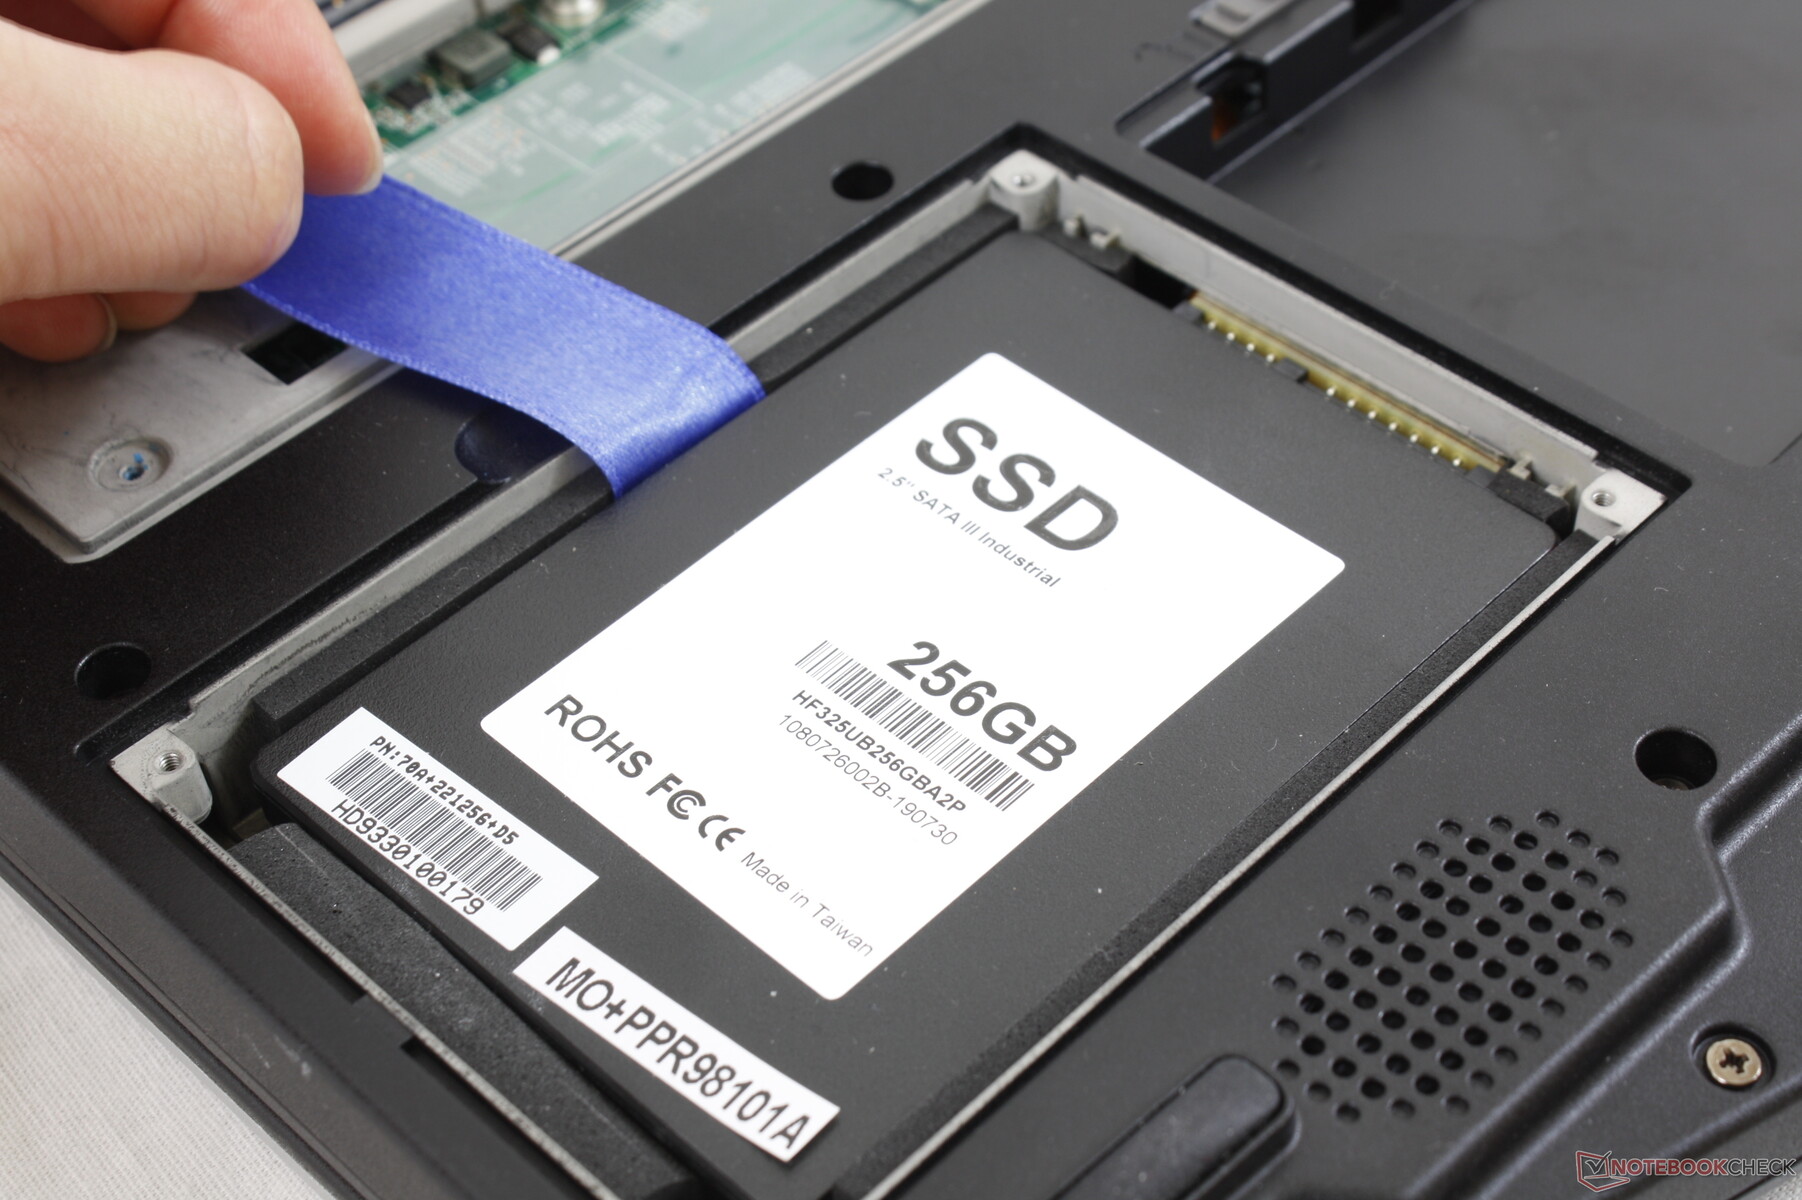
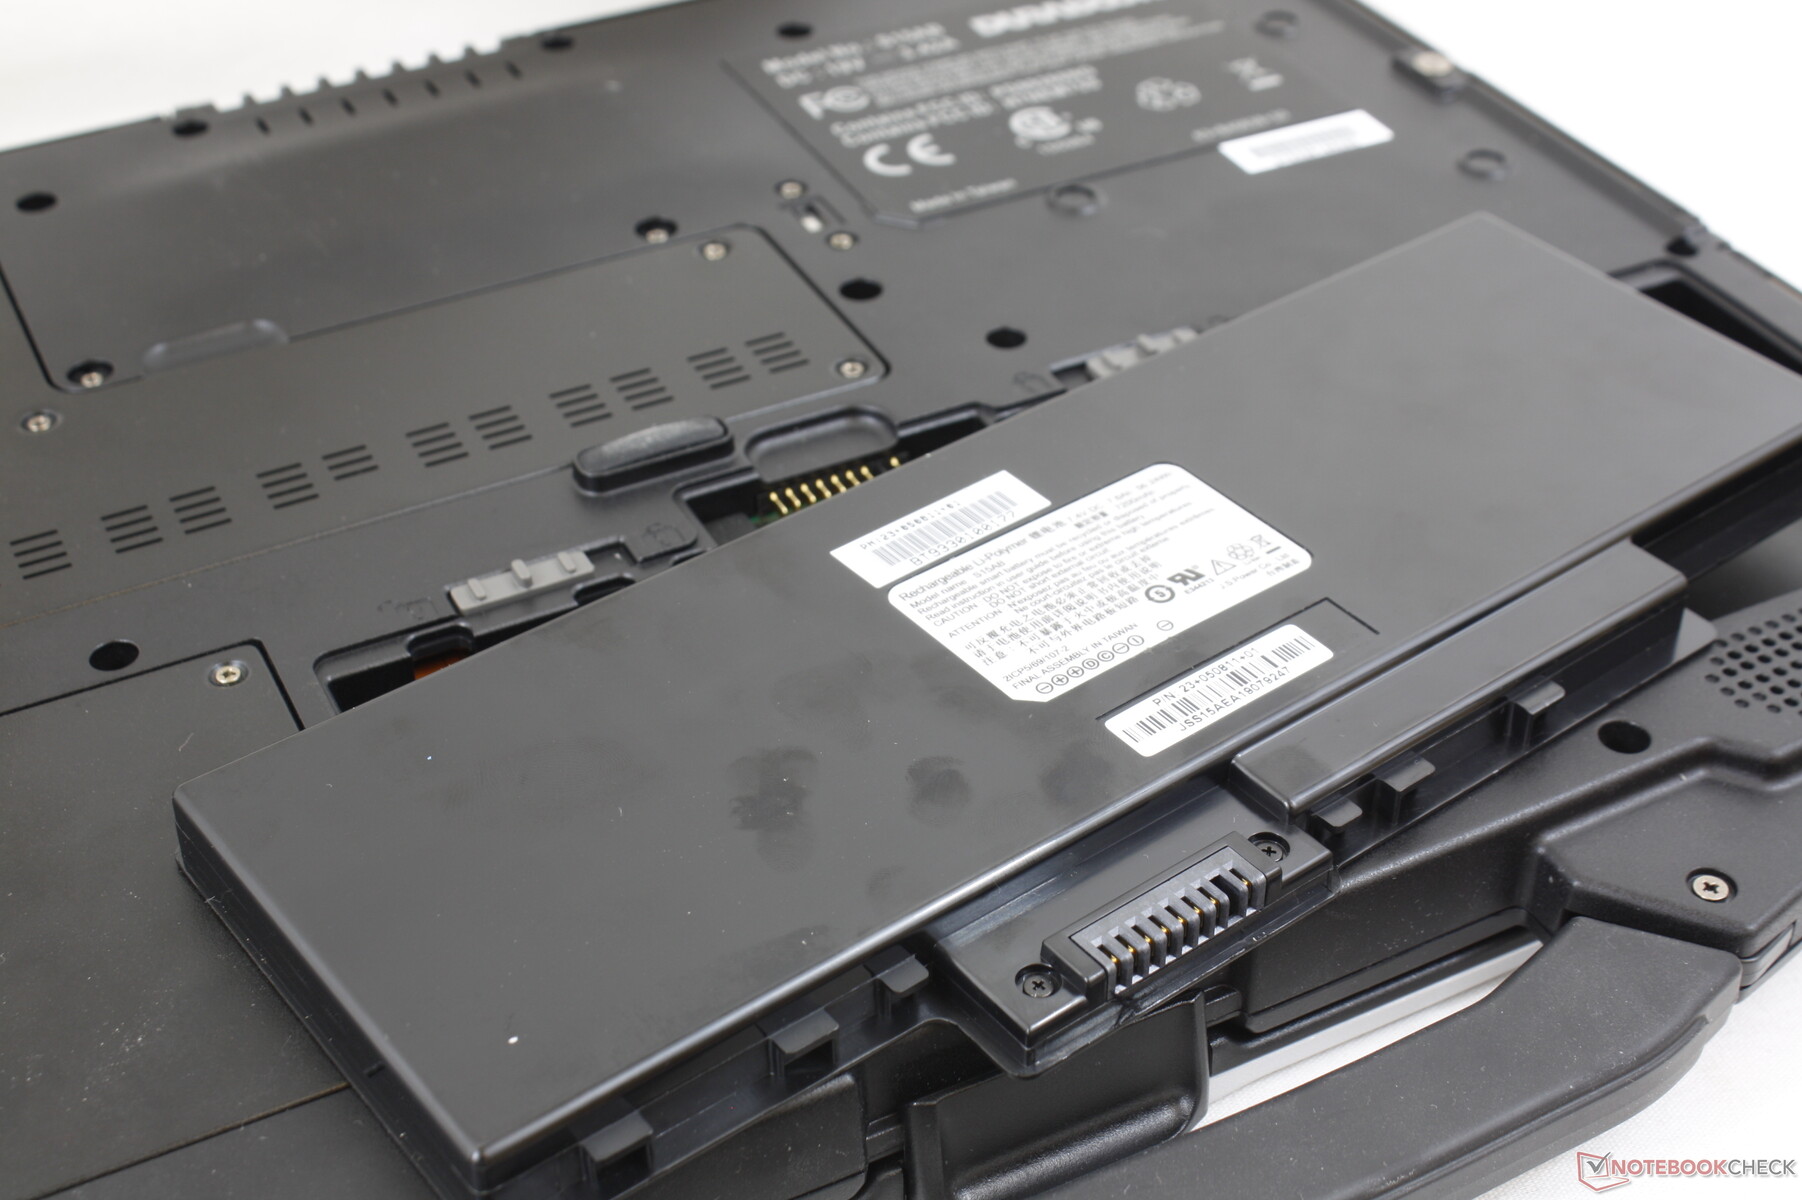
Maintenance
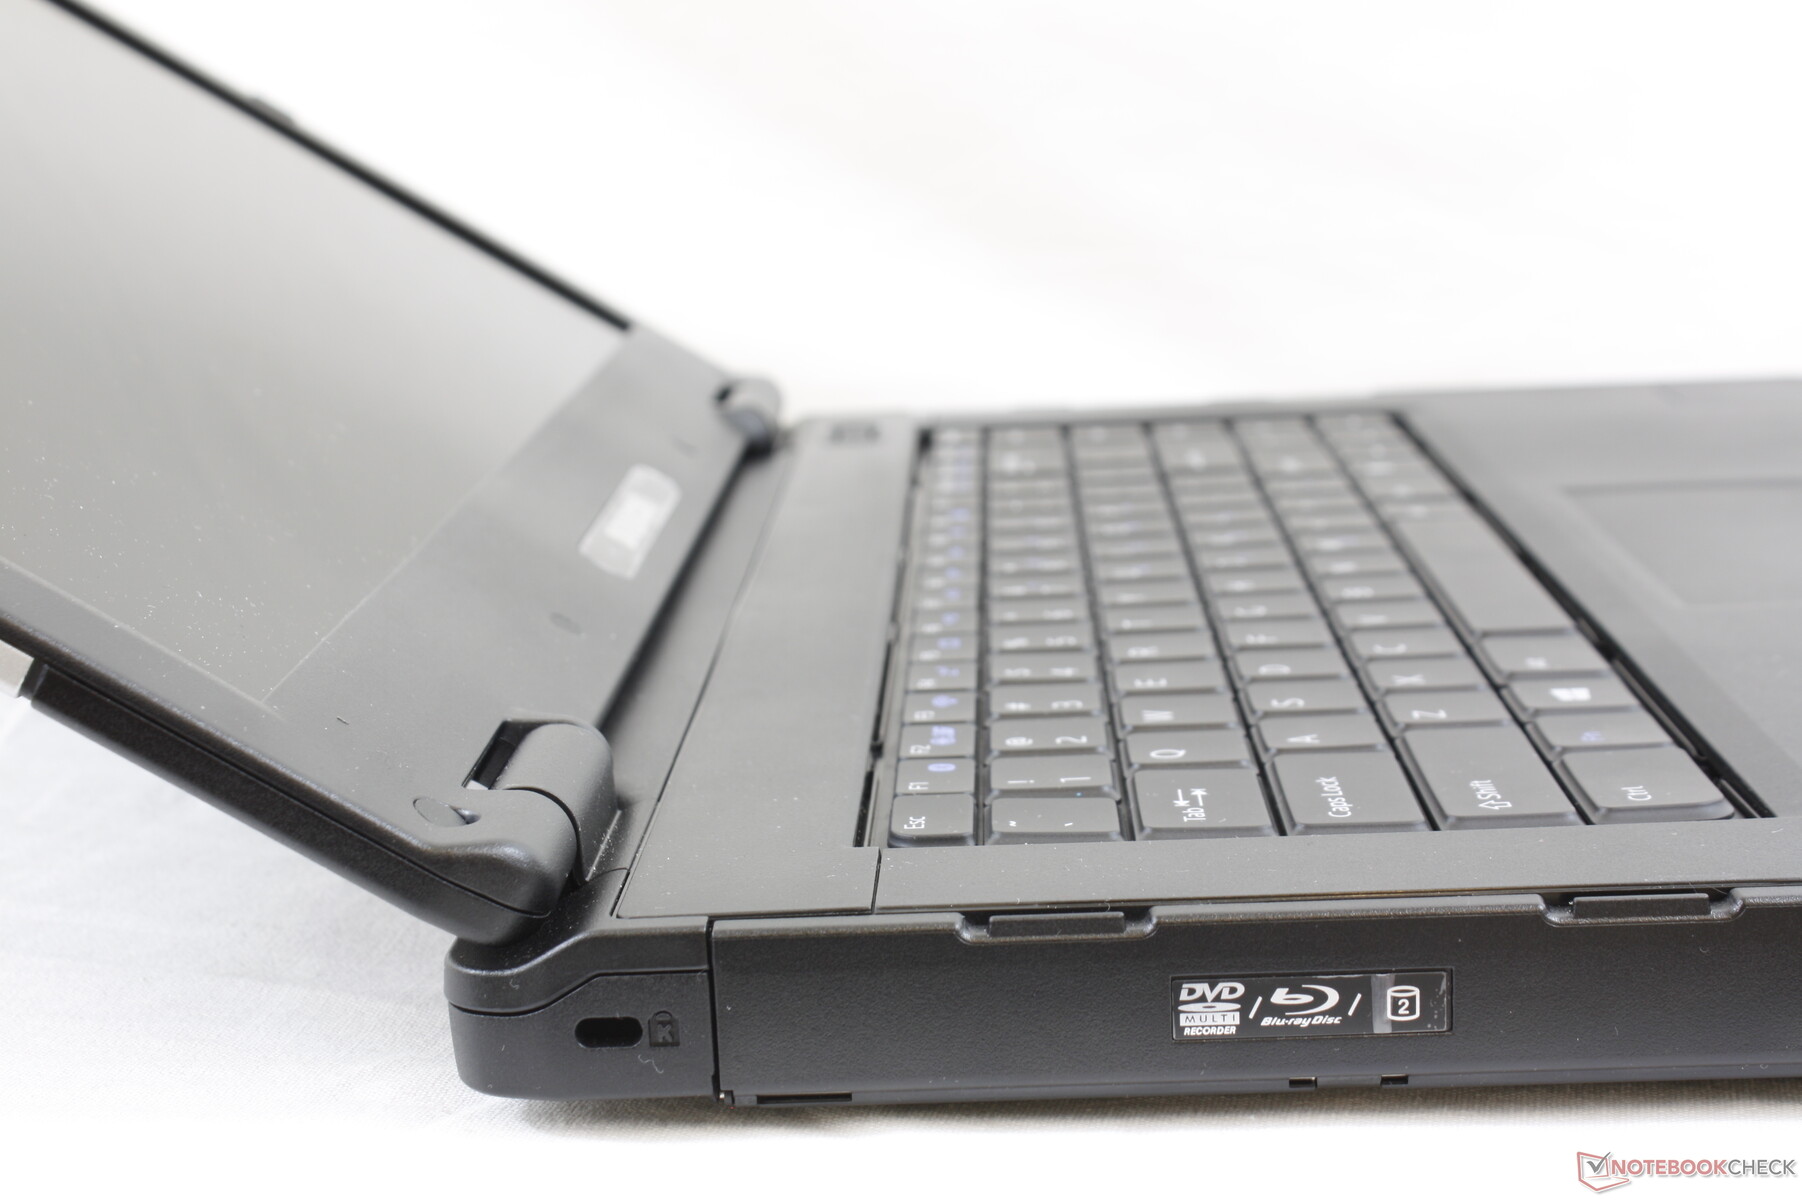
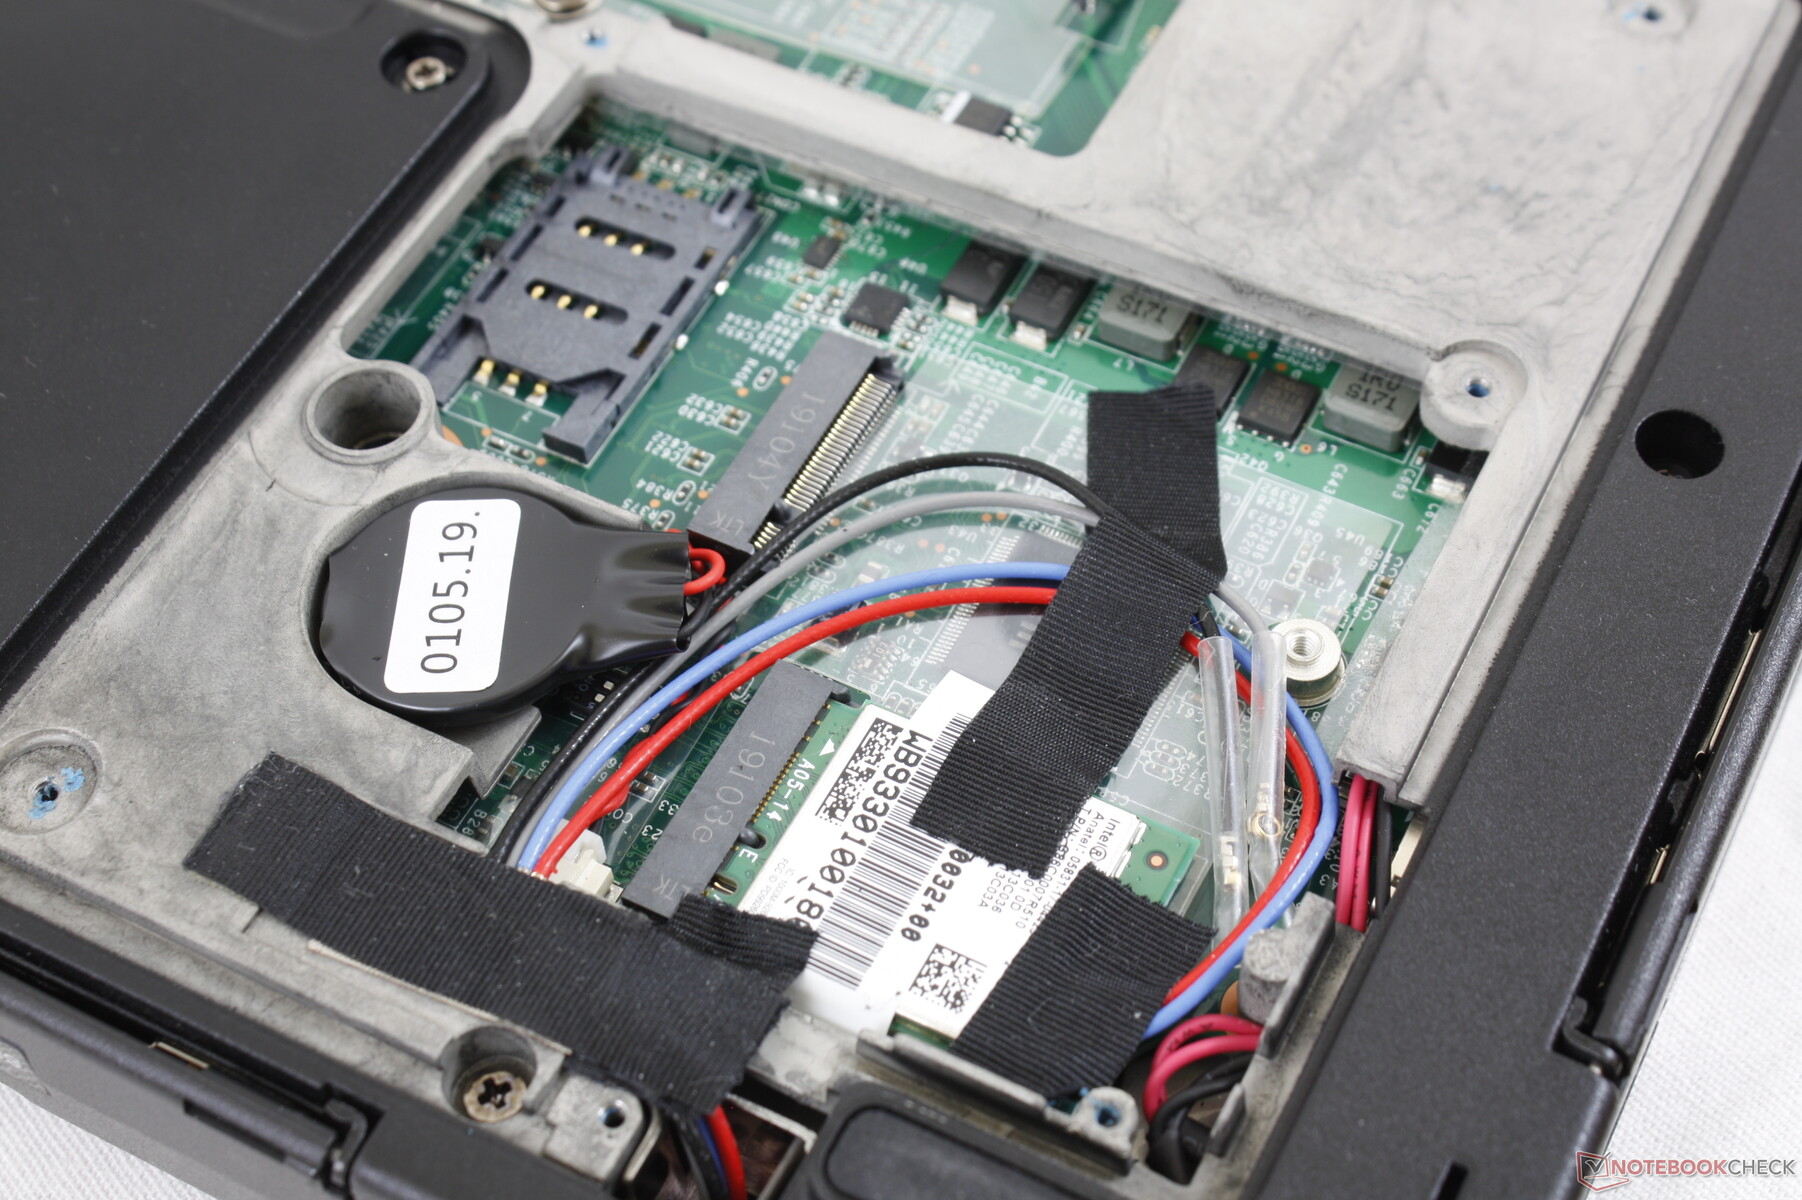
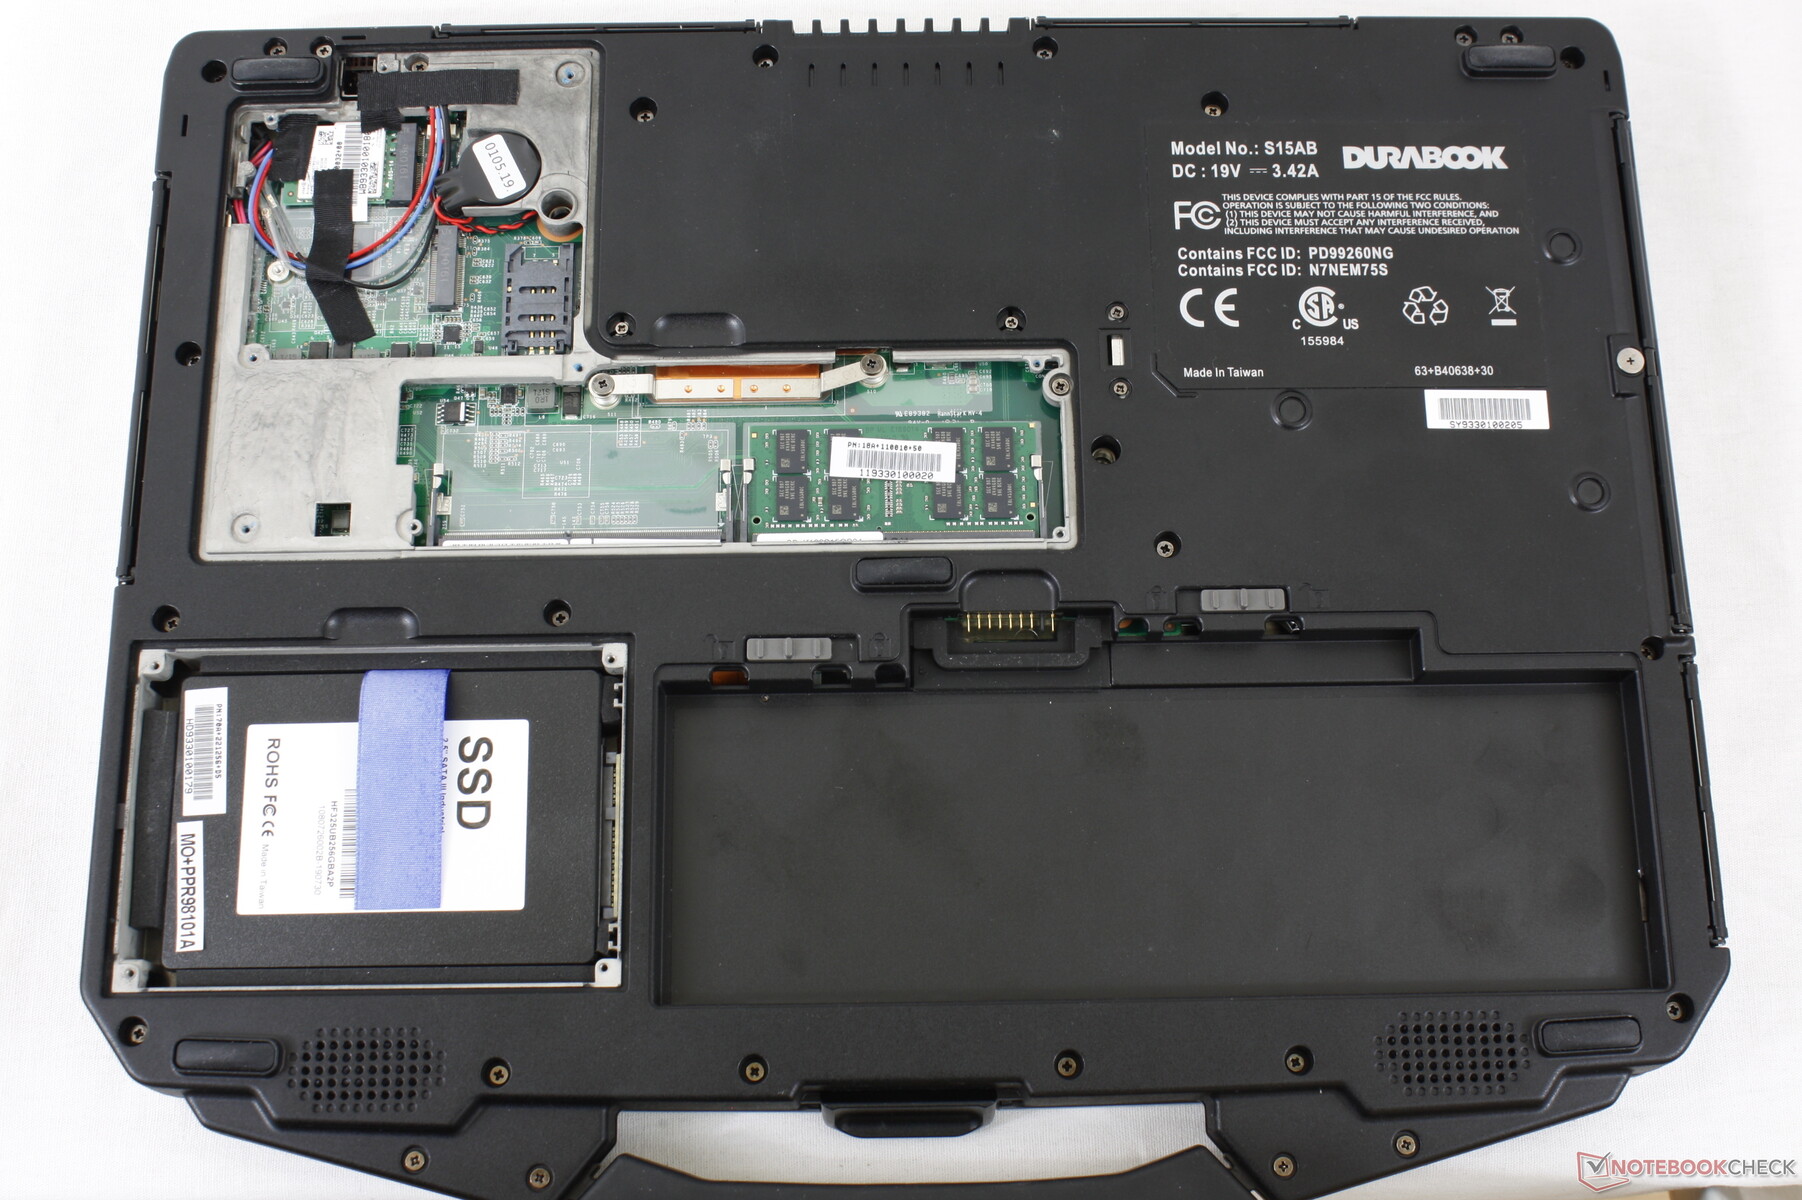
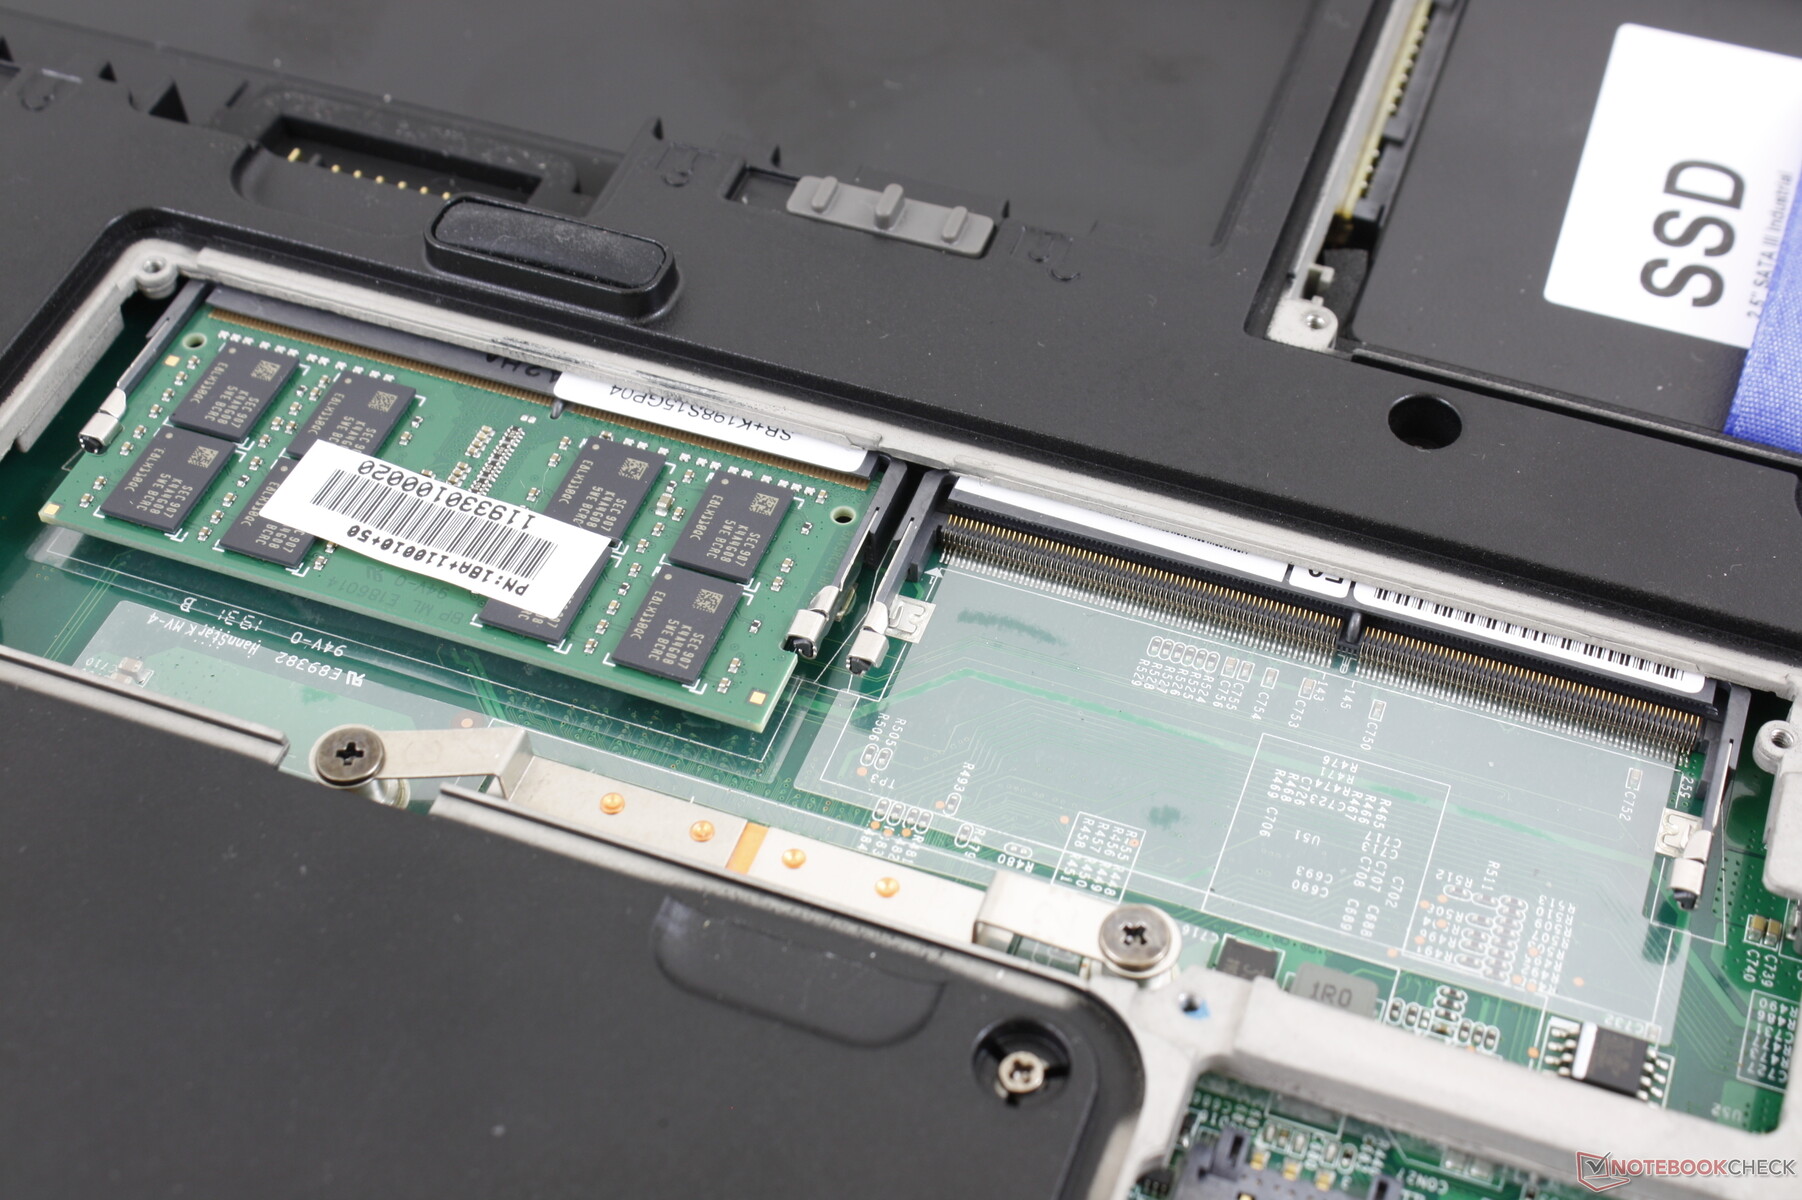
Two panels on the bottom cover the SSD, WAN module, SIM slot, WLAN module, and two SODIMM slots. The optical drive can be removed and replaced with additional drives if desired.
Warranty
Three-year warranty comes standard as opposed to only one or two years on most other laptops.
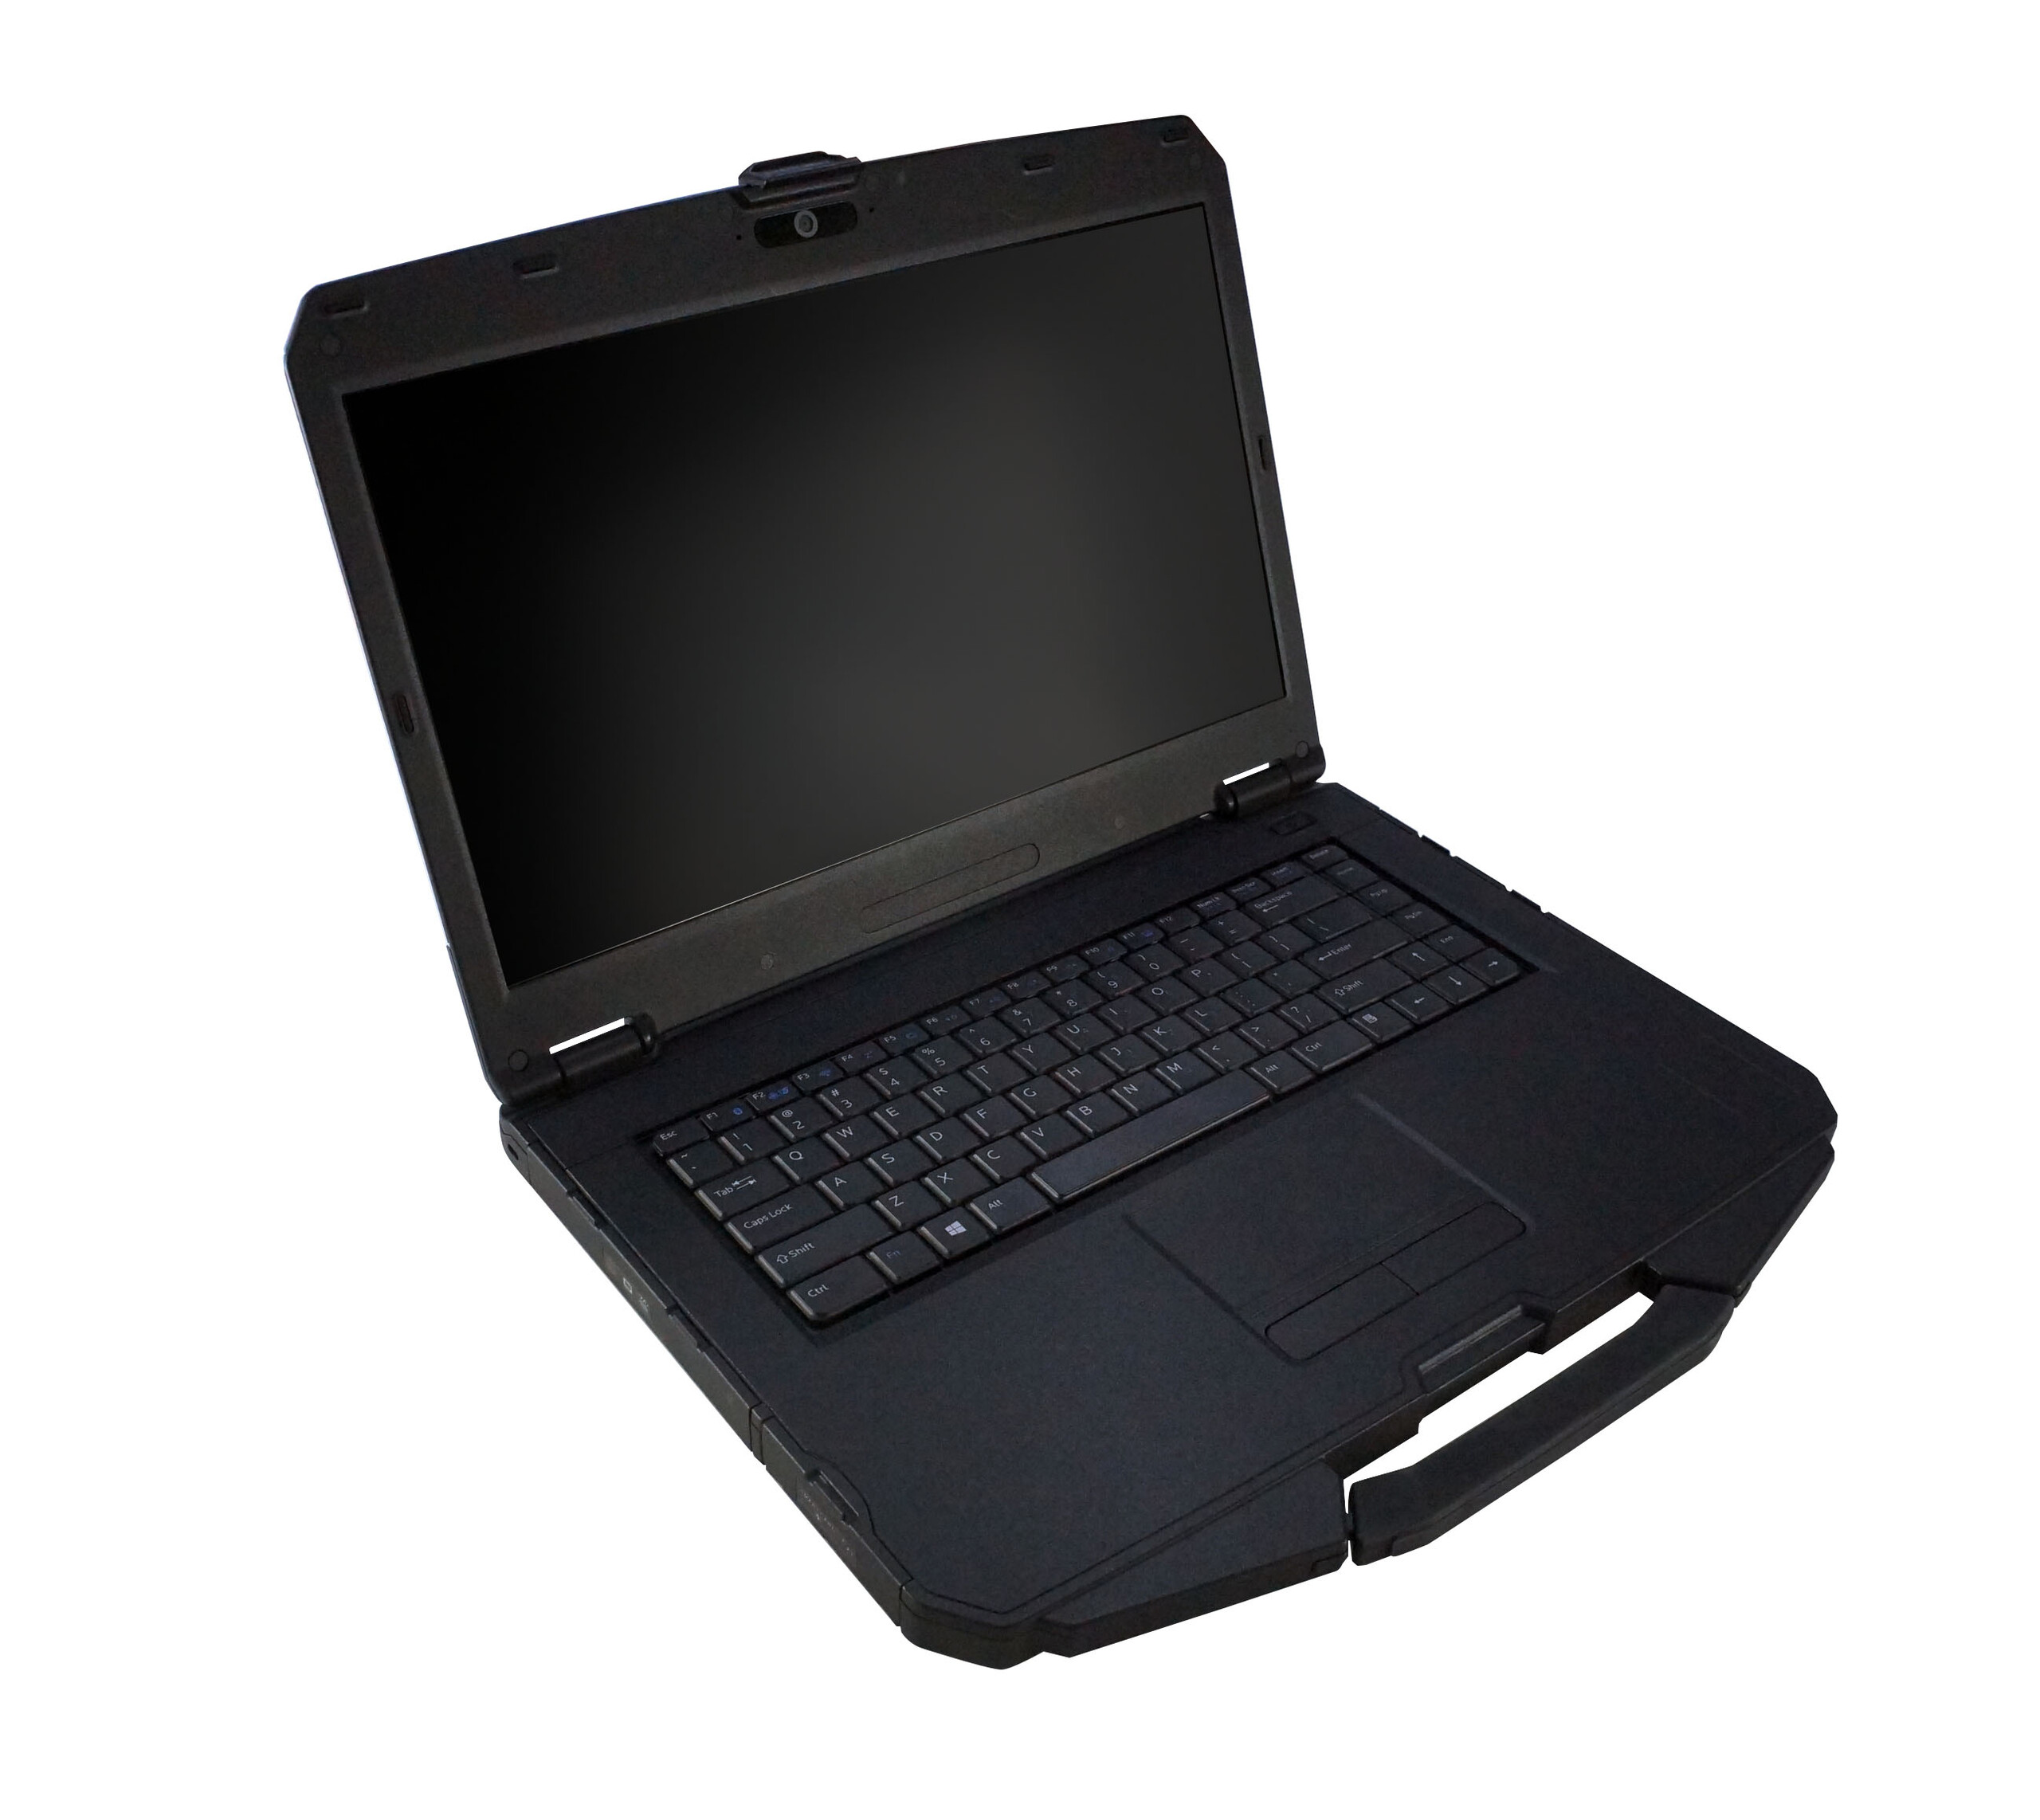
Input Devices
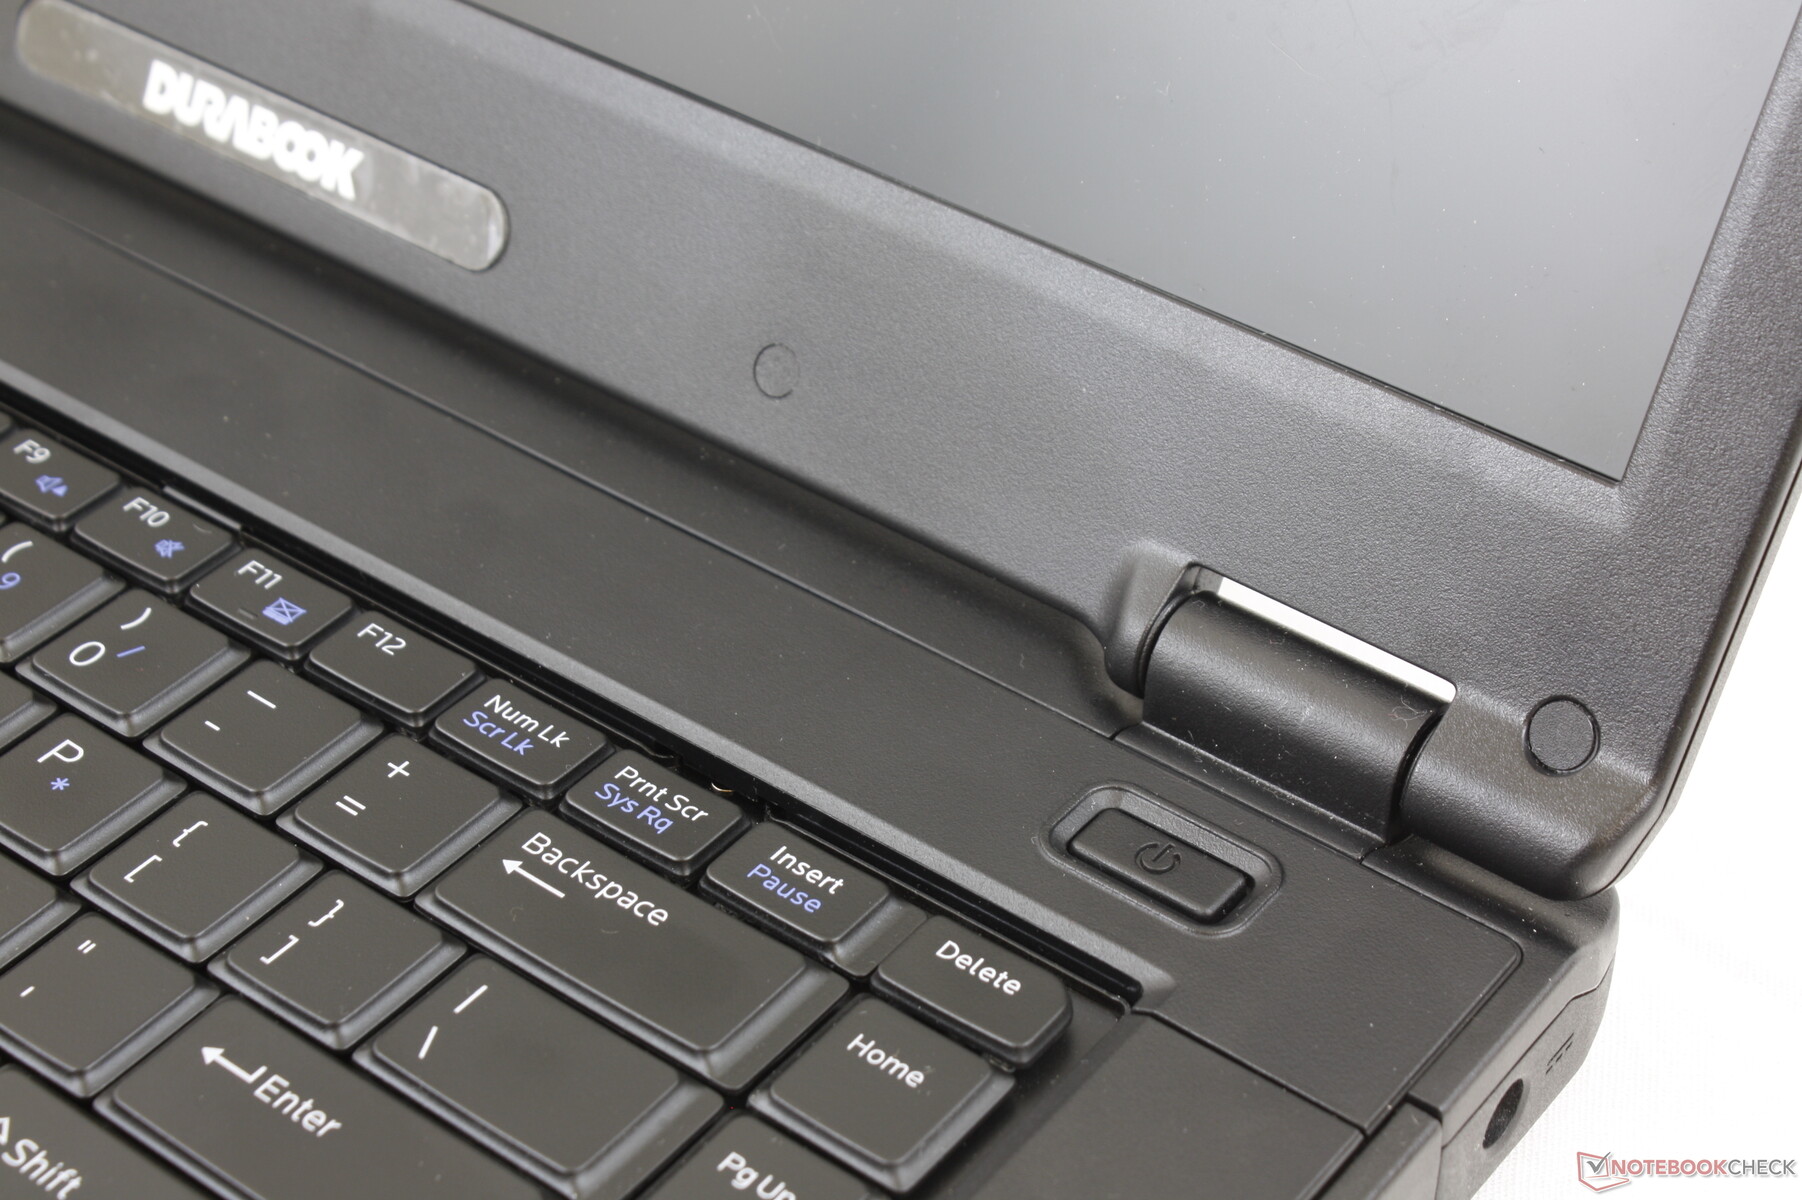
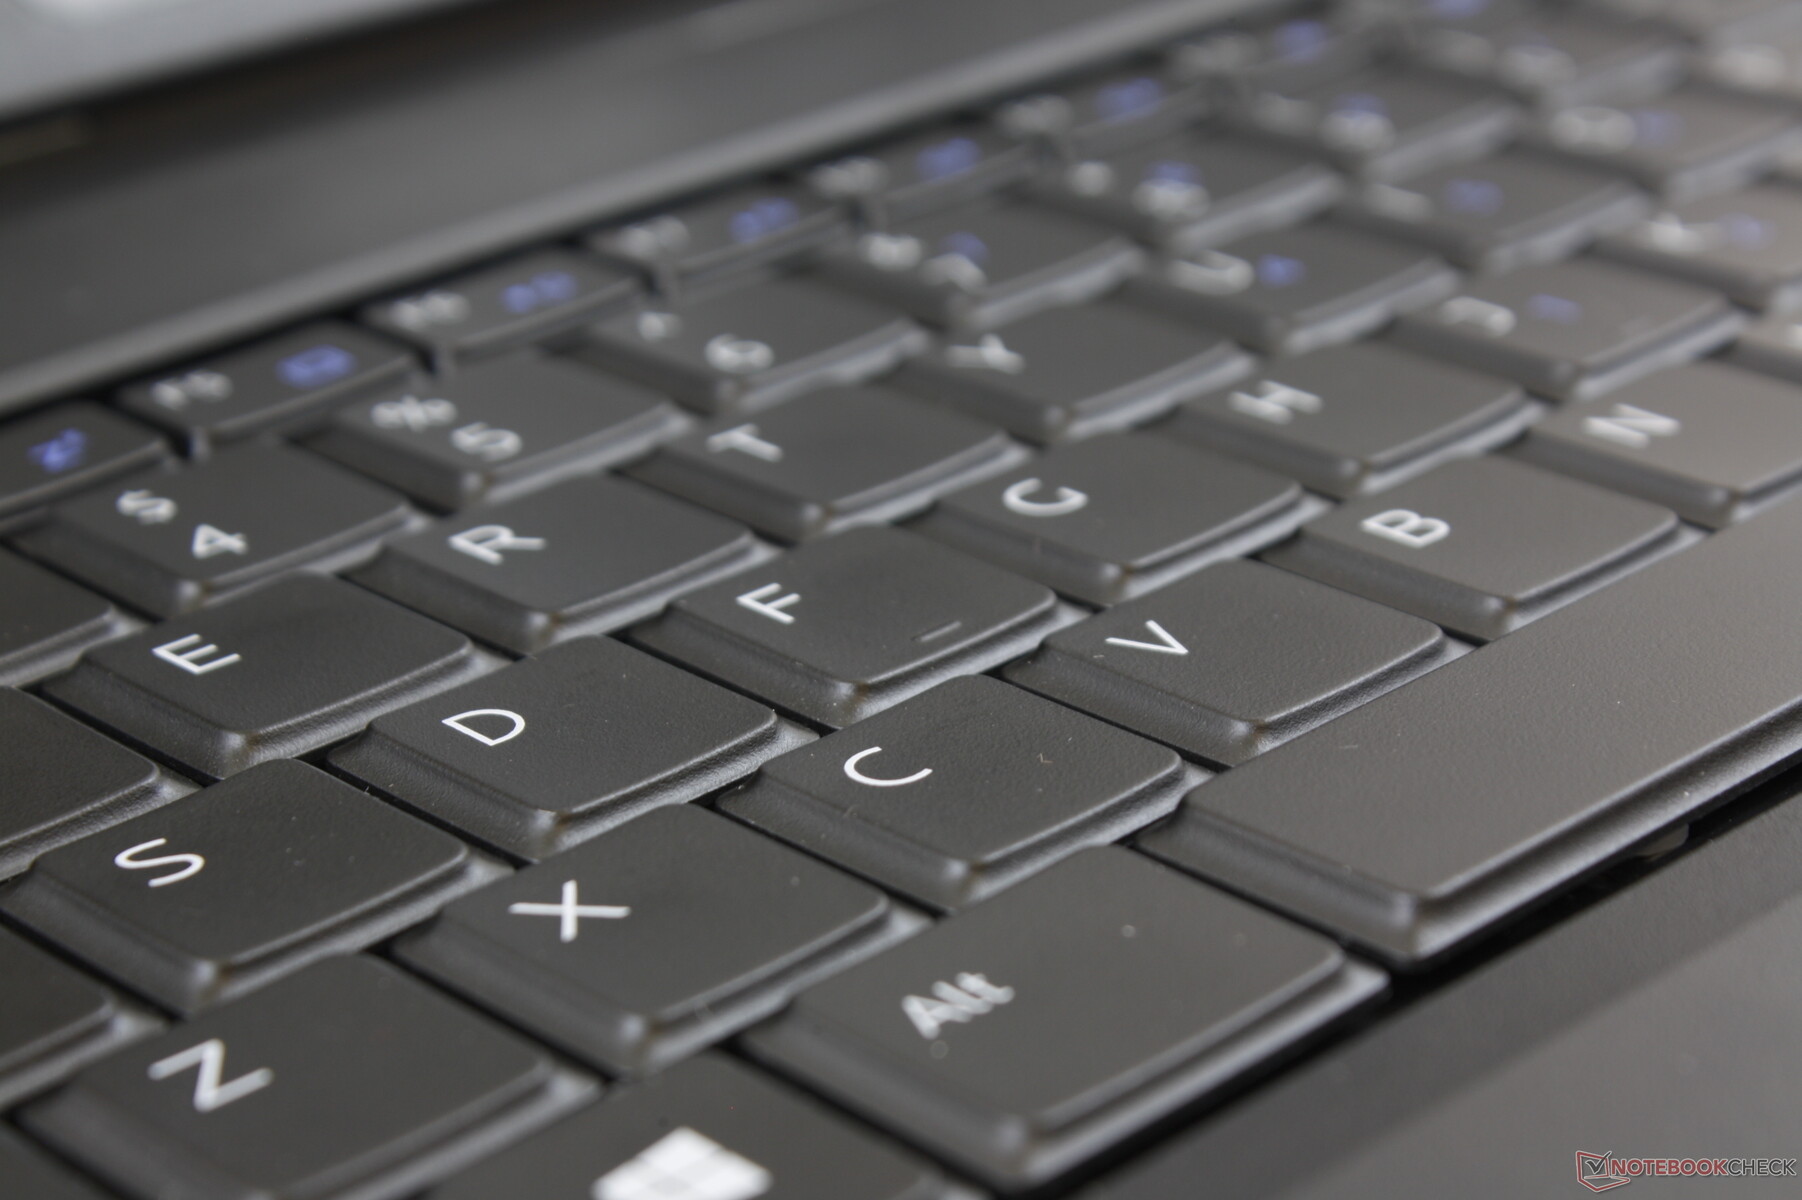
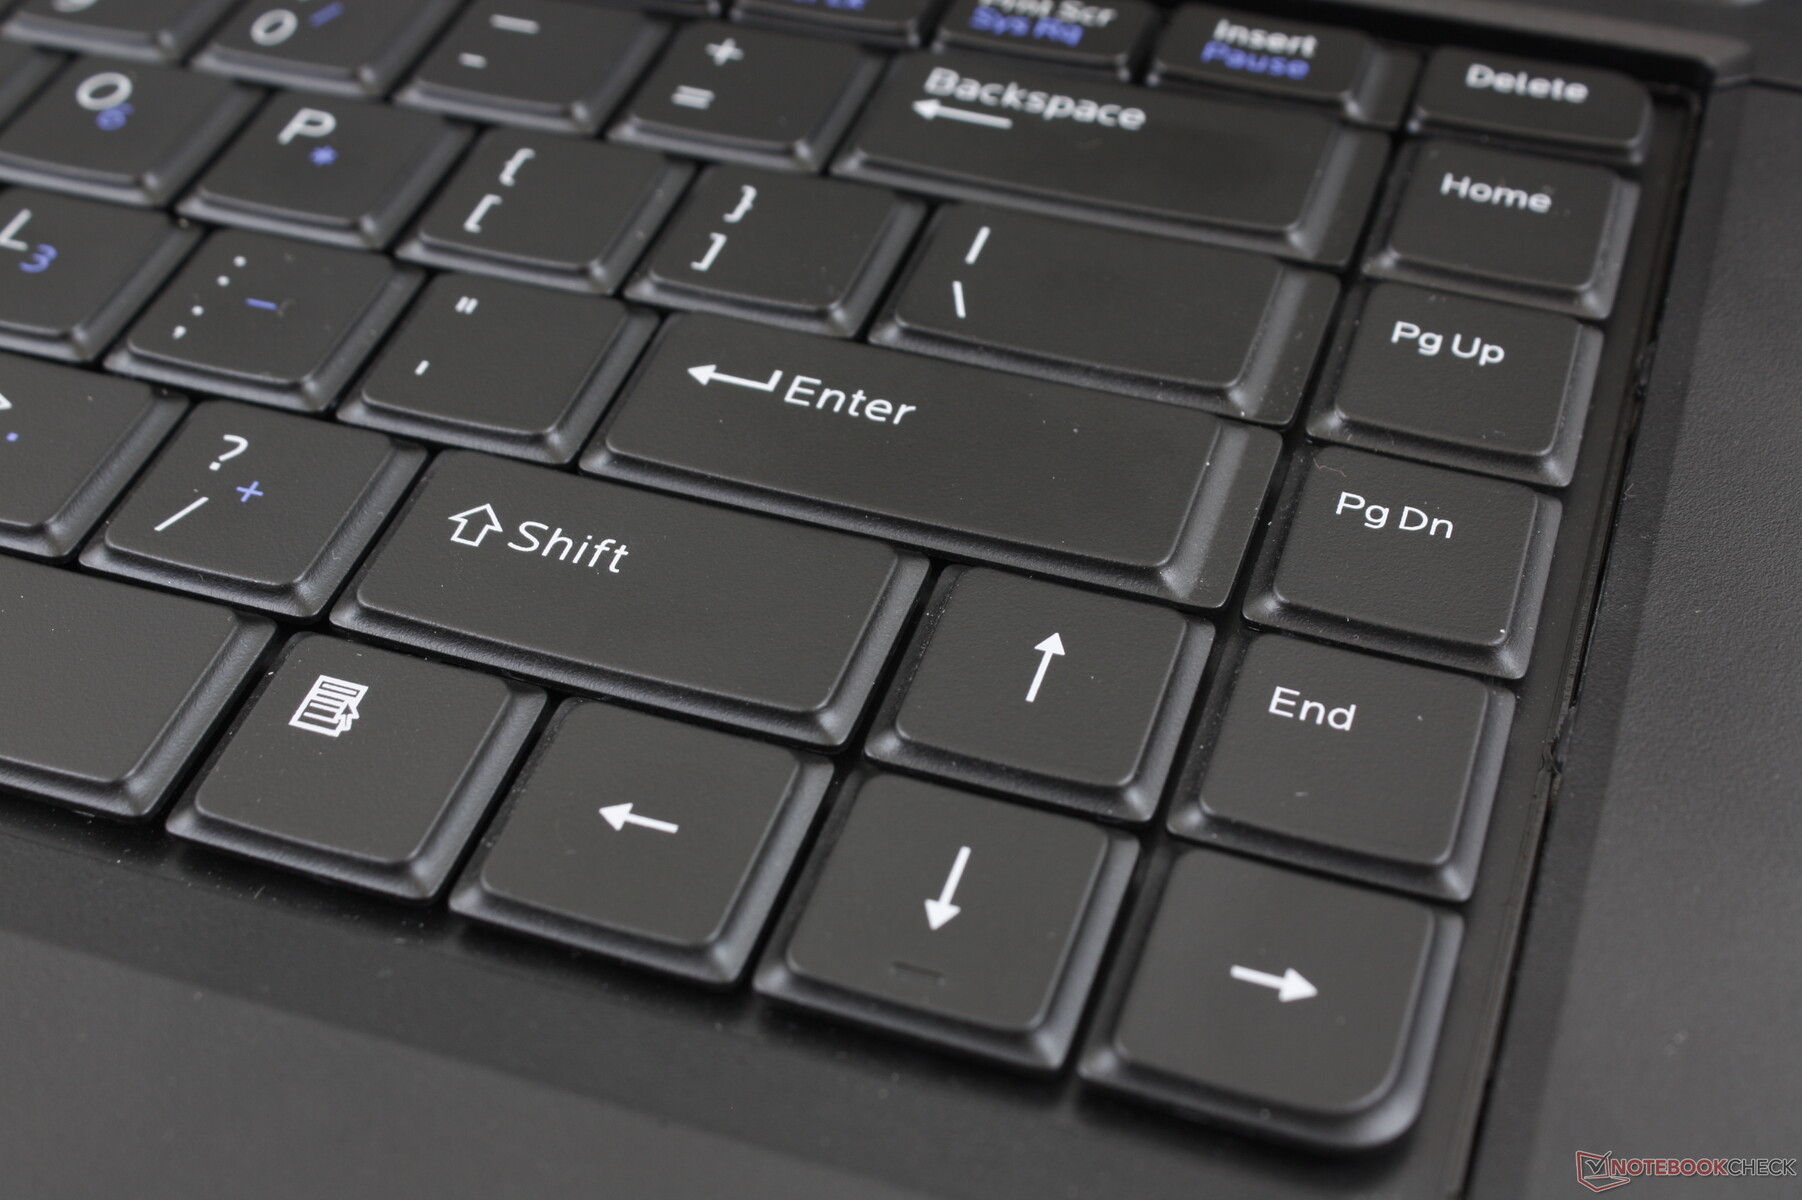
Keyboard
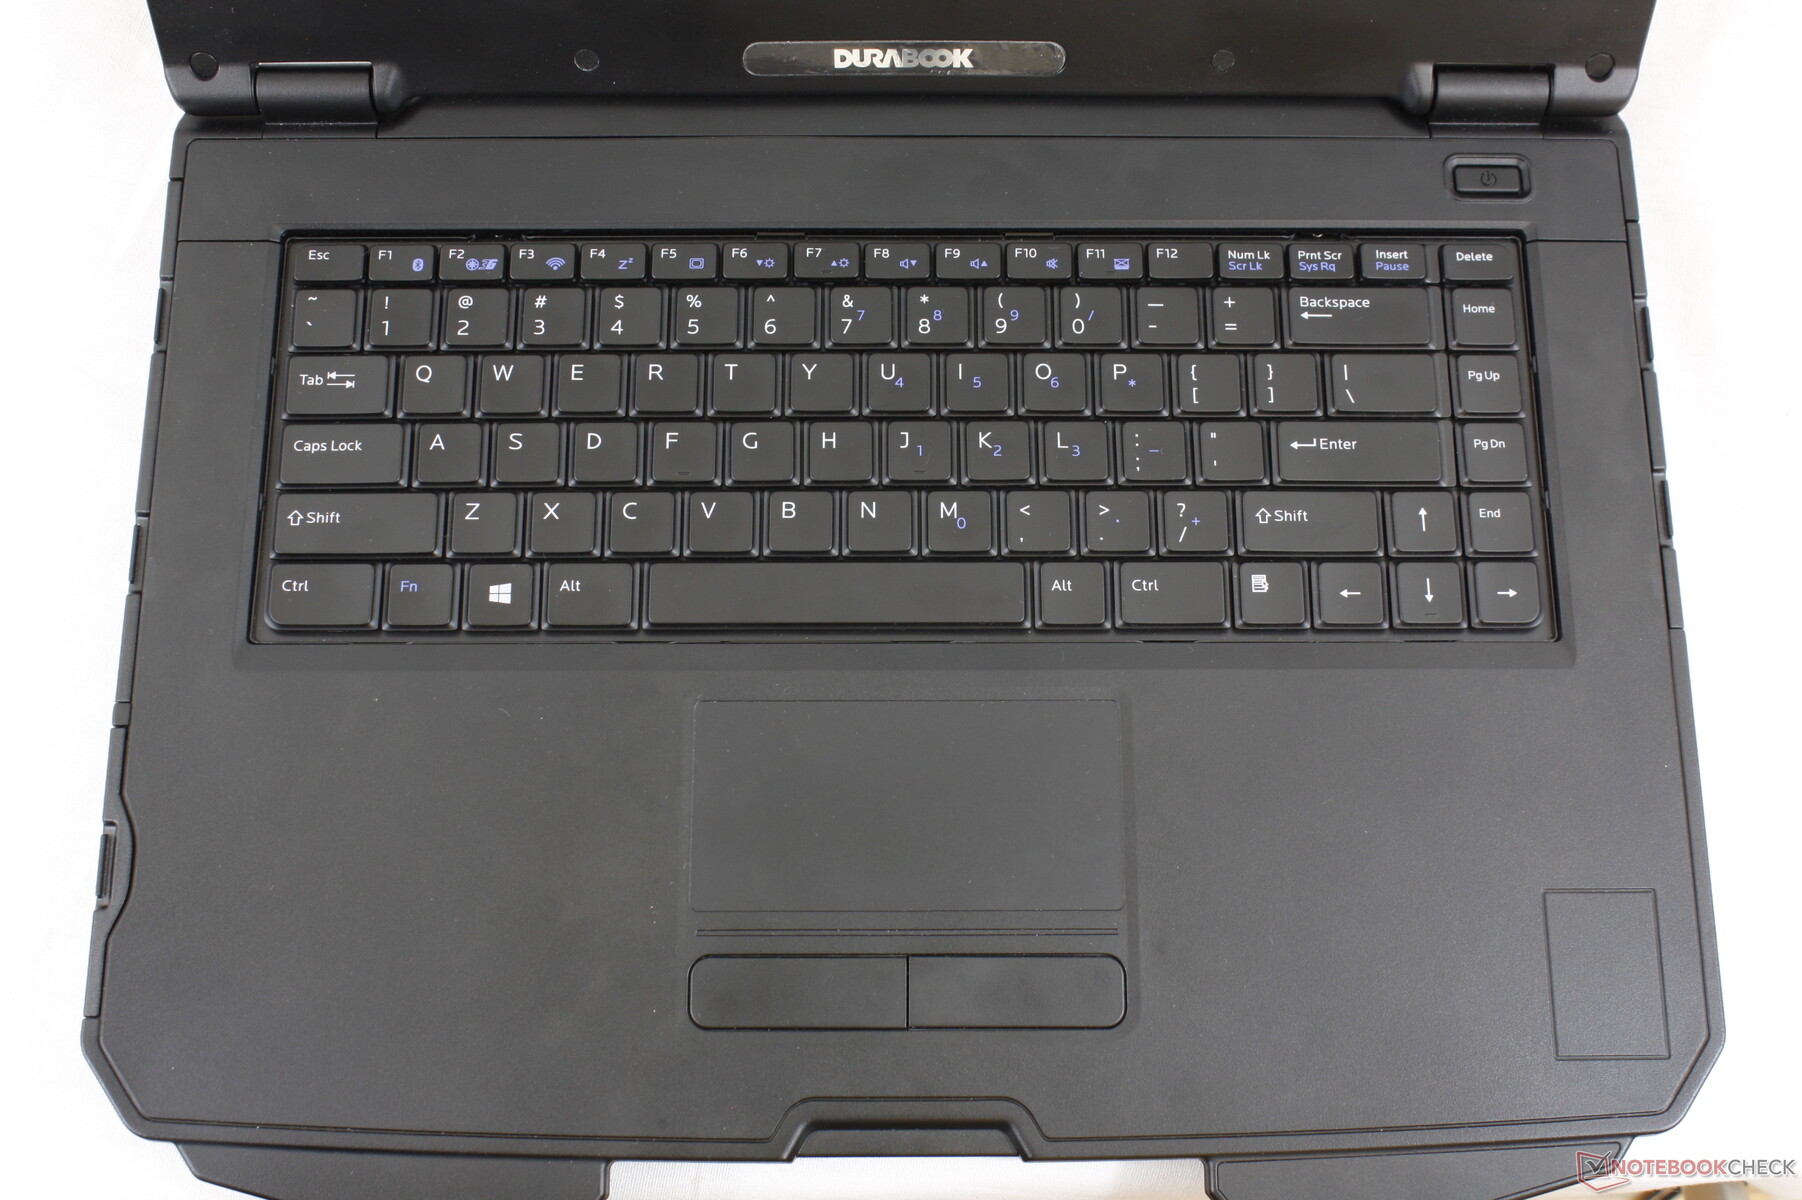
The removable keyboard is excellent and easy to type on. Keys have adequate travel with crisper feedback than most Ultrabooks. Clatter, however, is loud when typing.
Dedicated auxiliary keys for volume or brightness would have been useful especially for this particular category.
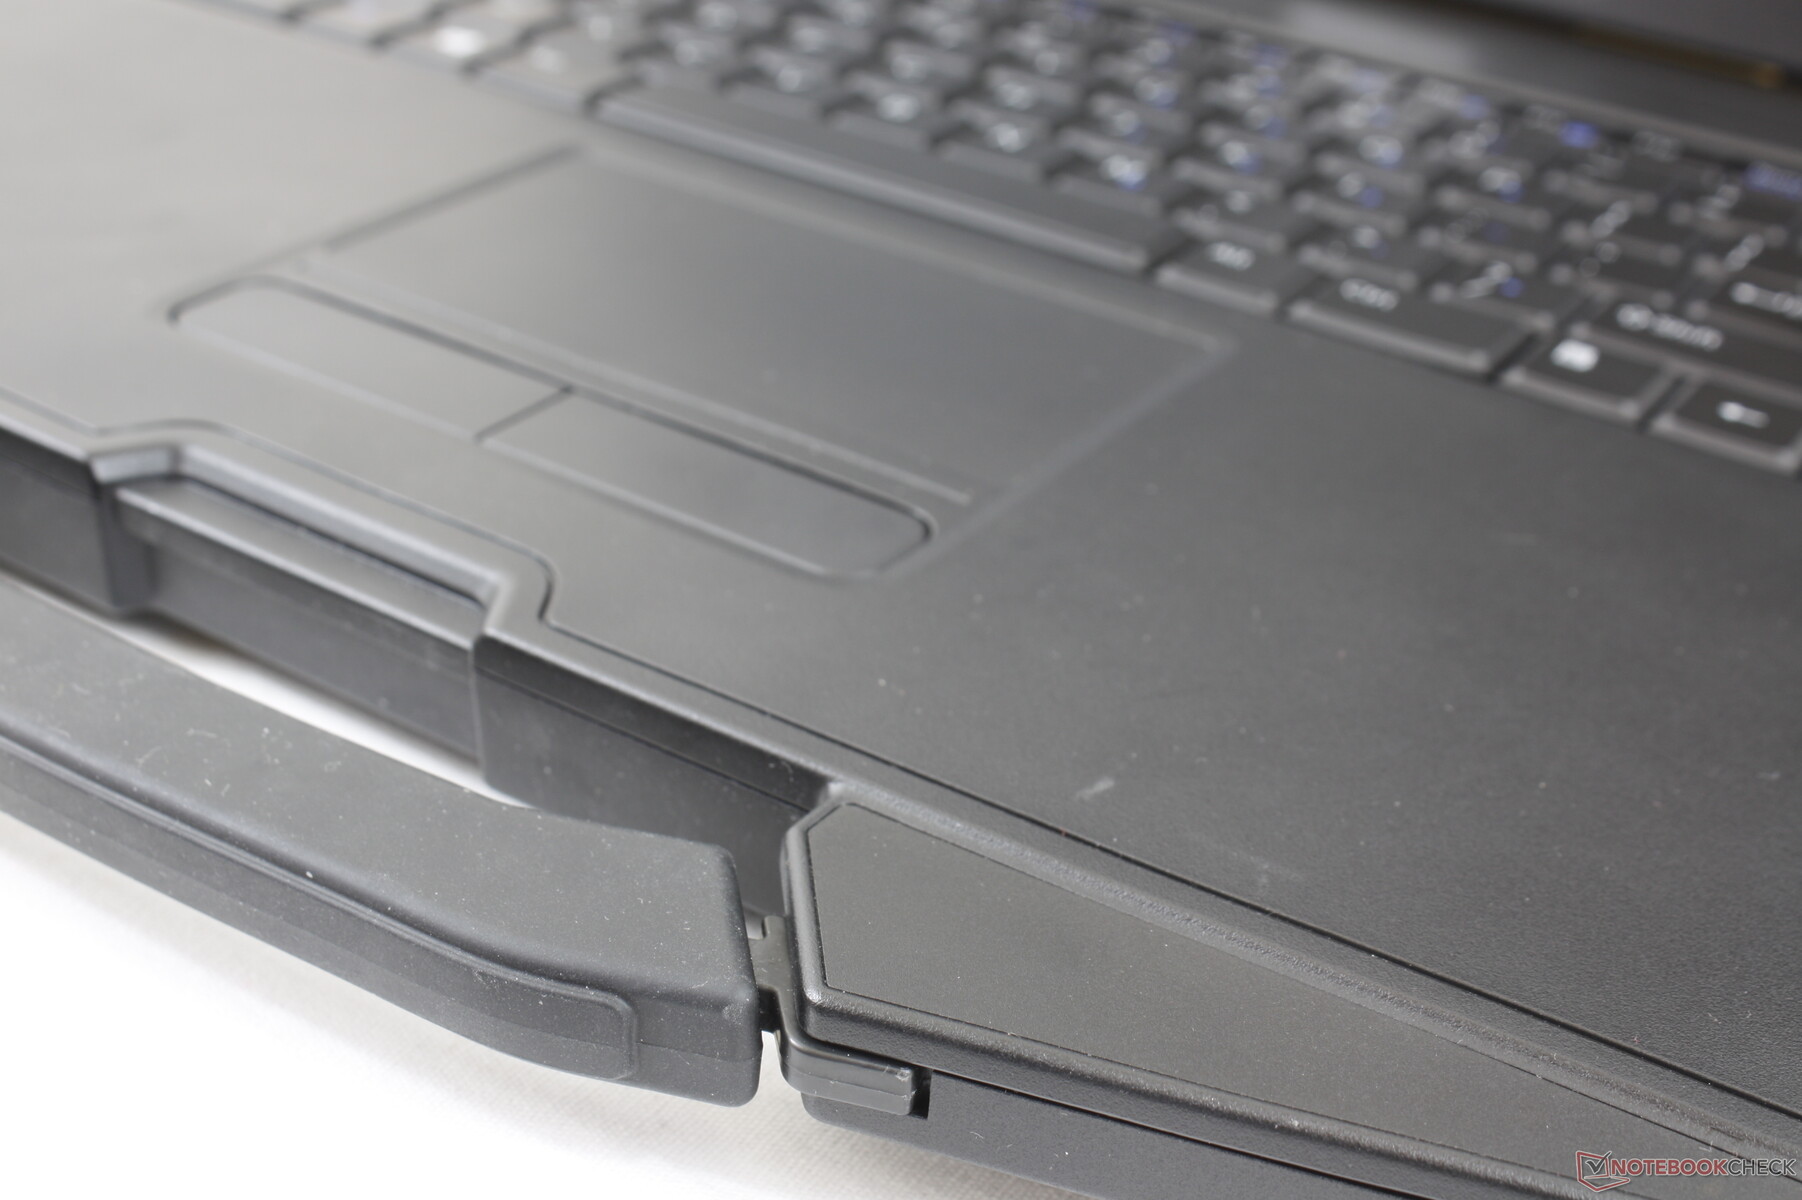
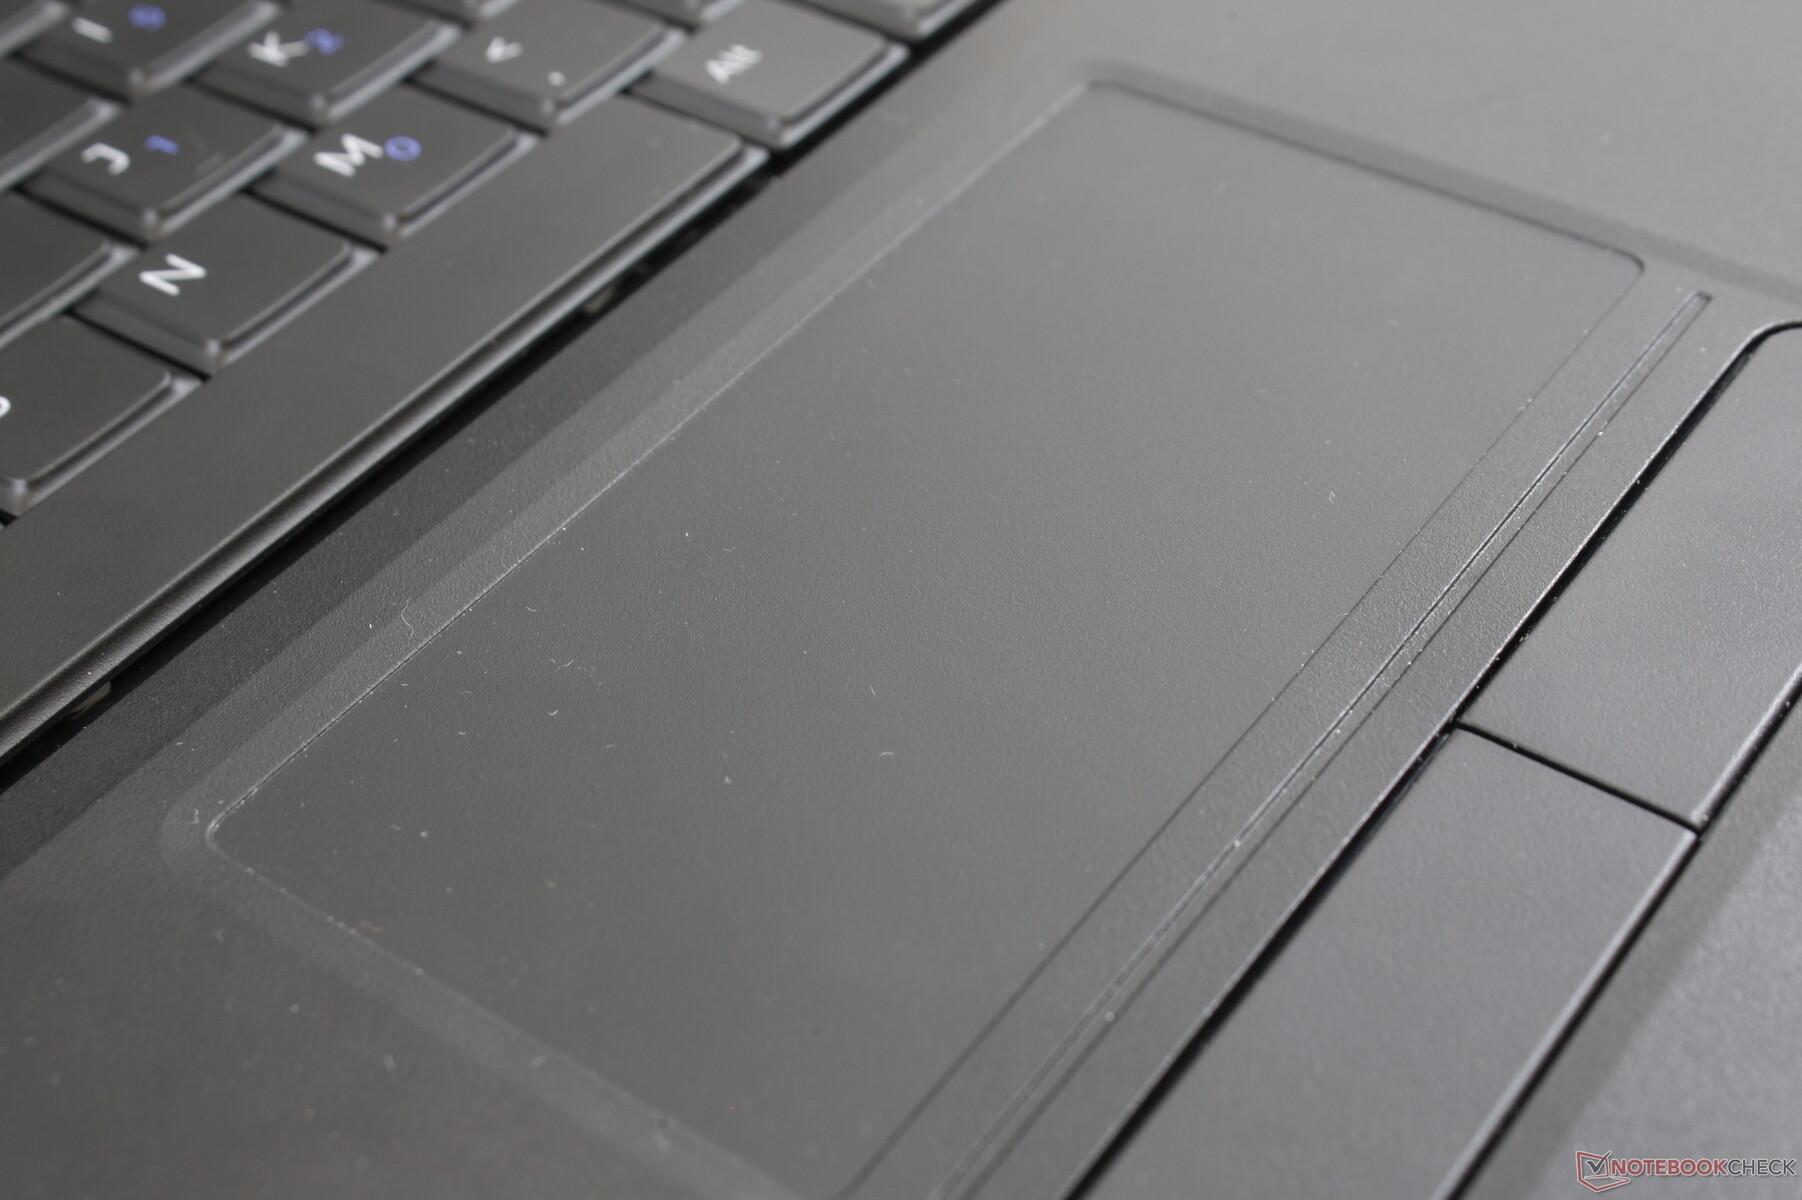
Touchpad
The touchpad (10 x 5 cm) is not Precision enabled. Two-finger inputs like scrolling and zooming are still supported, but they are slow and unreliable. Furthermore, the cursor moves at a lower frame rate when compared to using an external mouse. We recommend using an external mouse whenever possible for more accurate and reliable clicks.
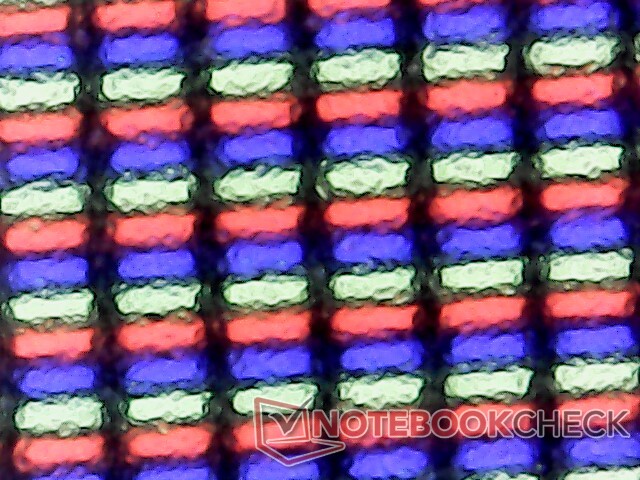
Display
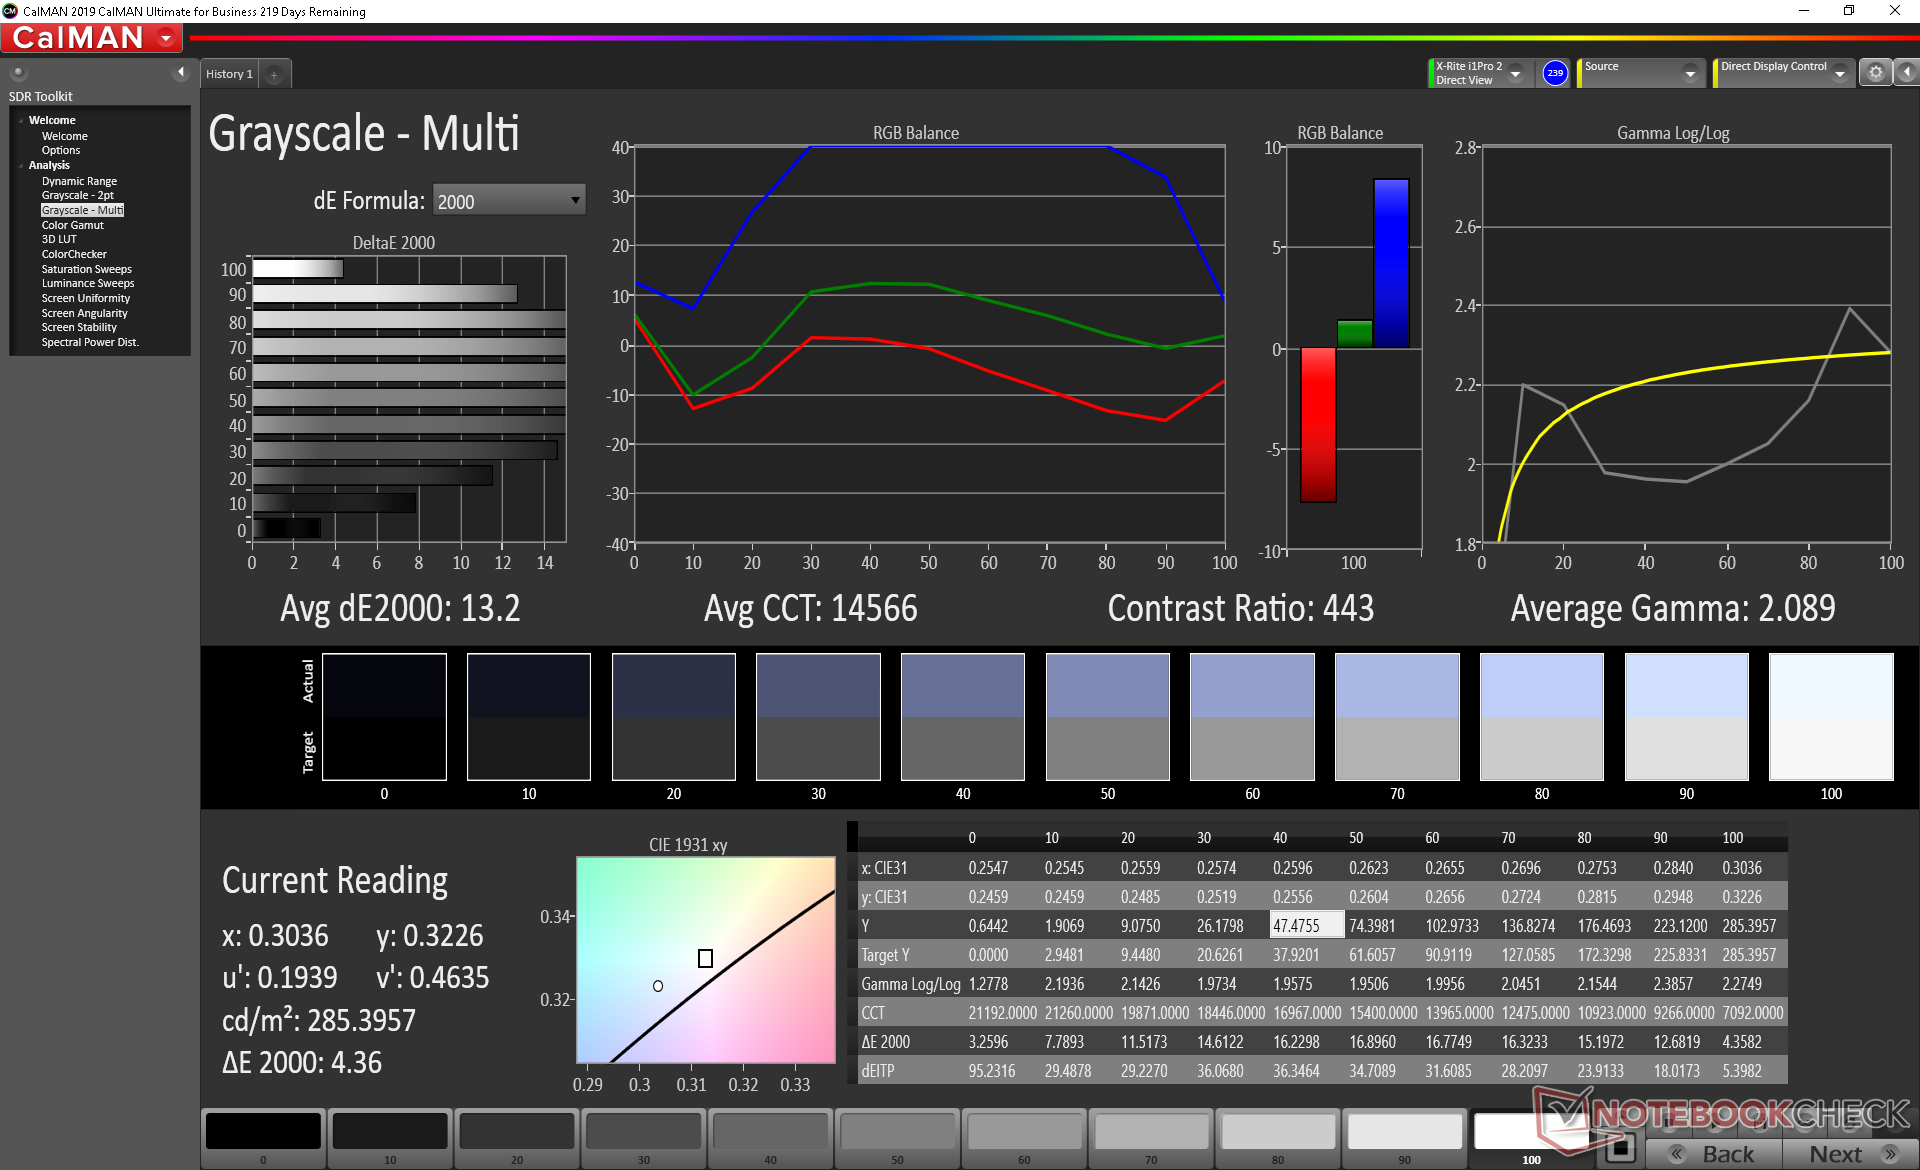
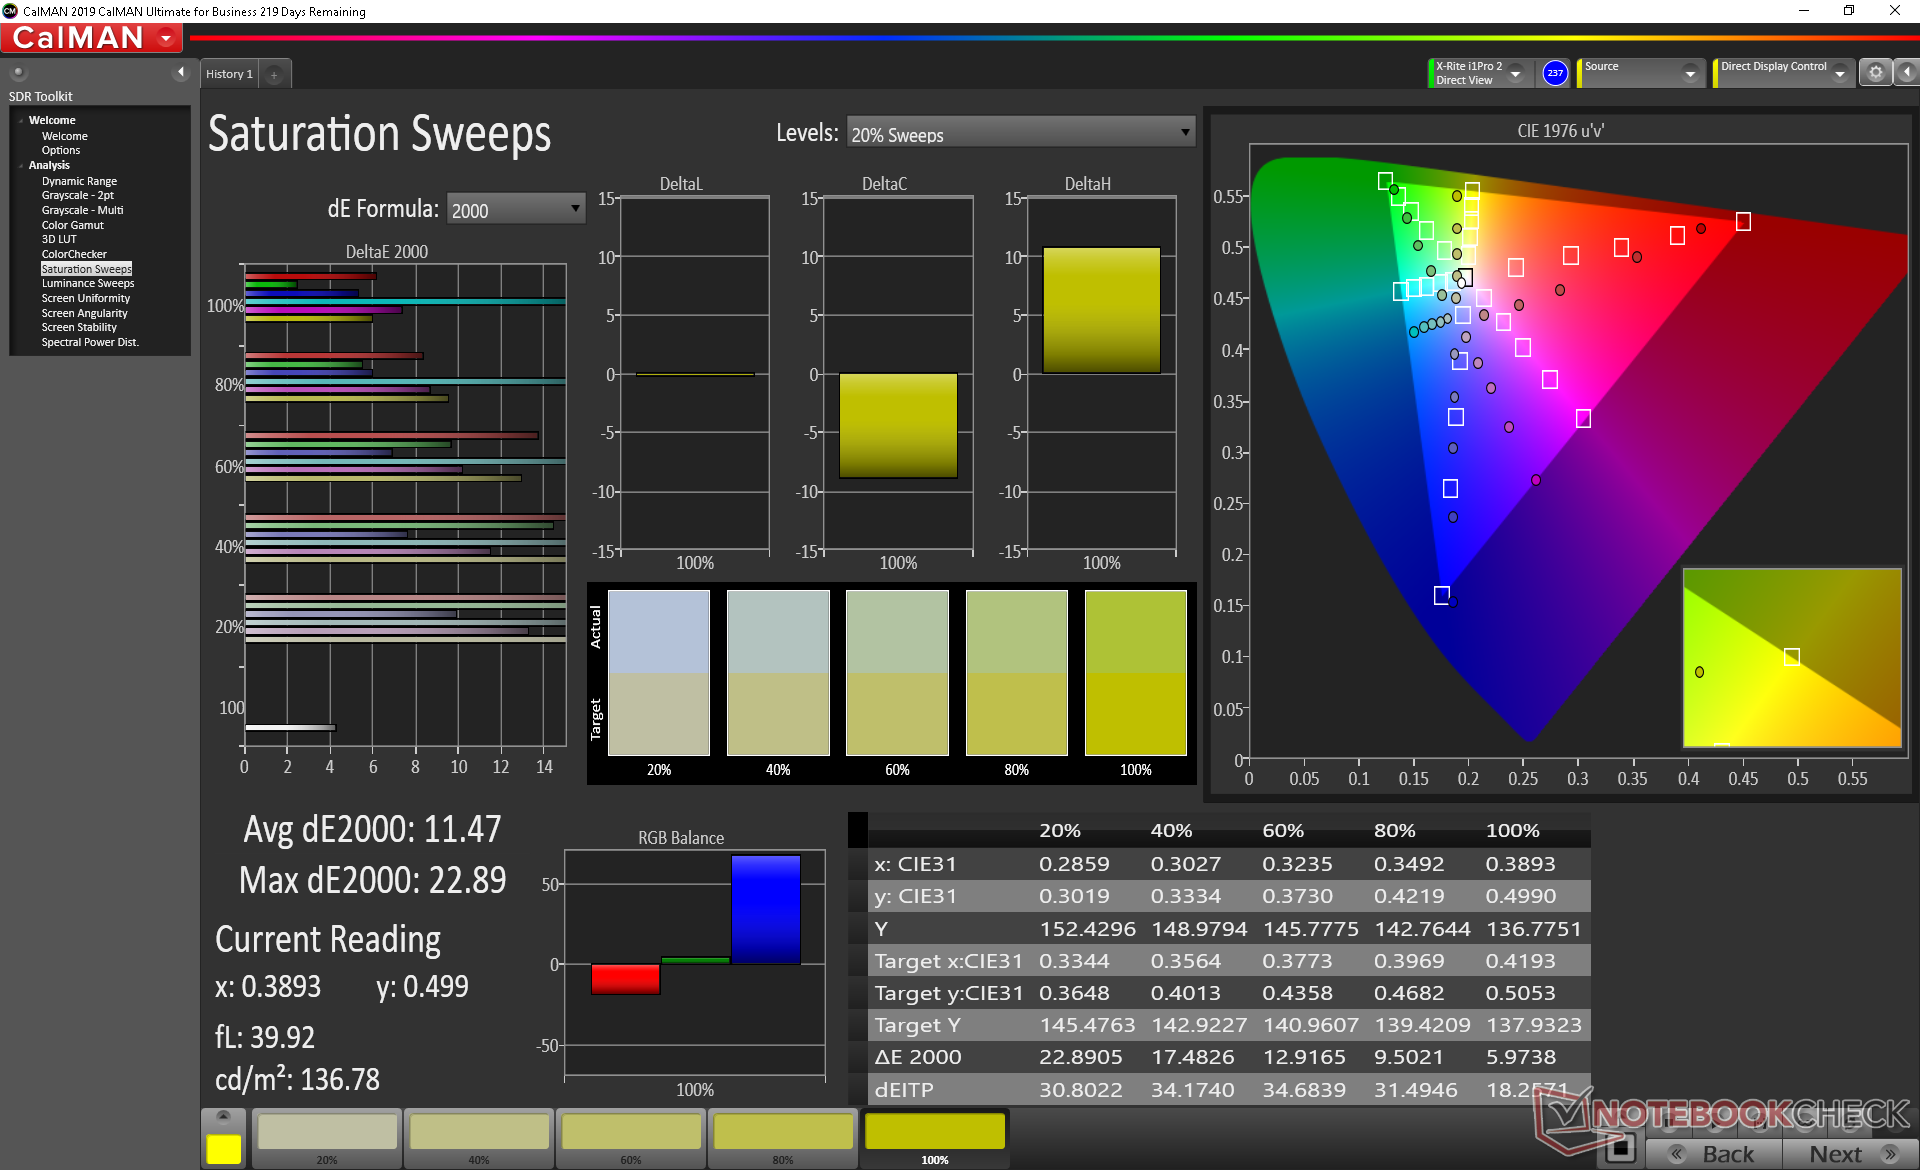
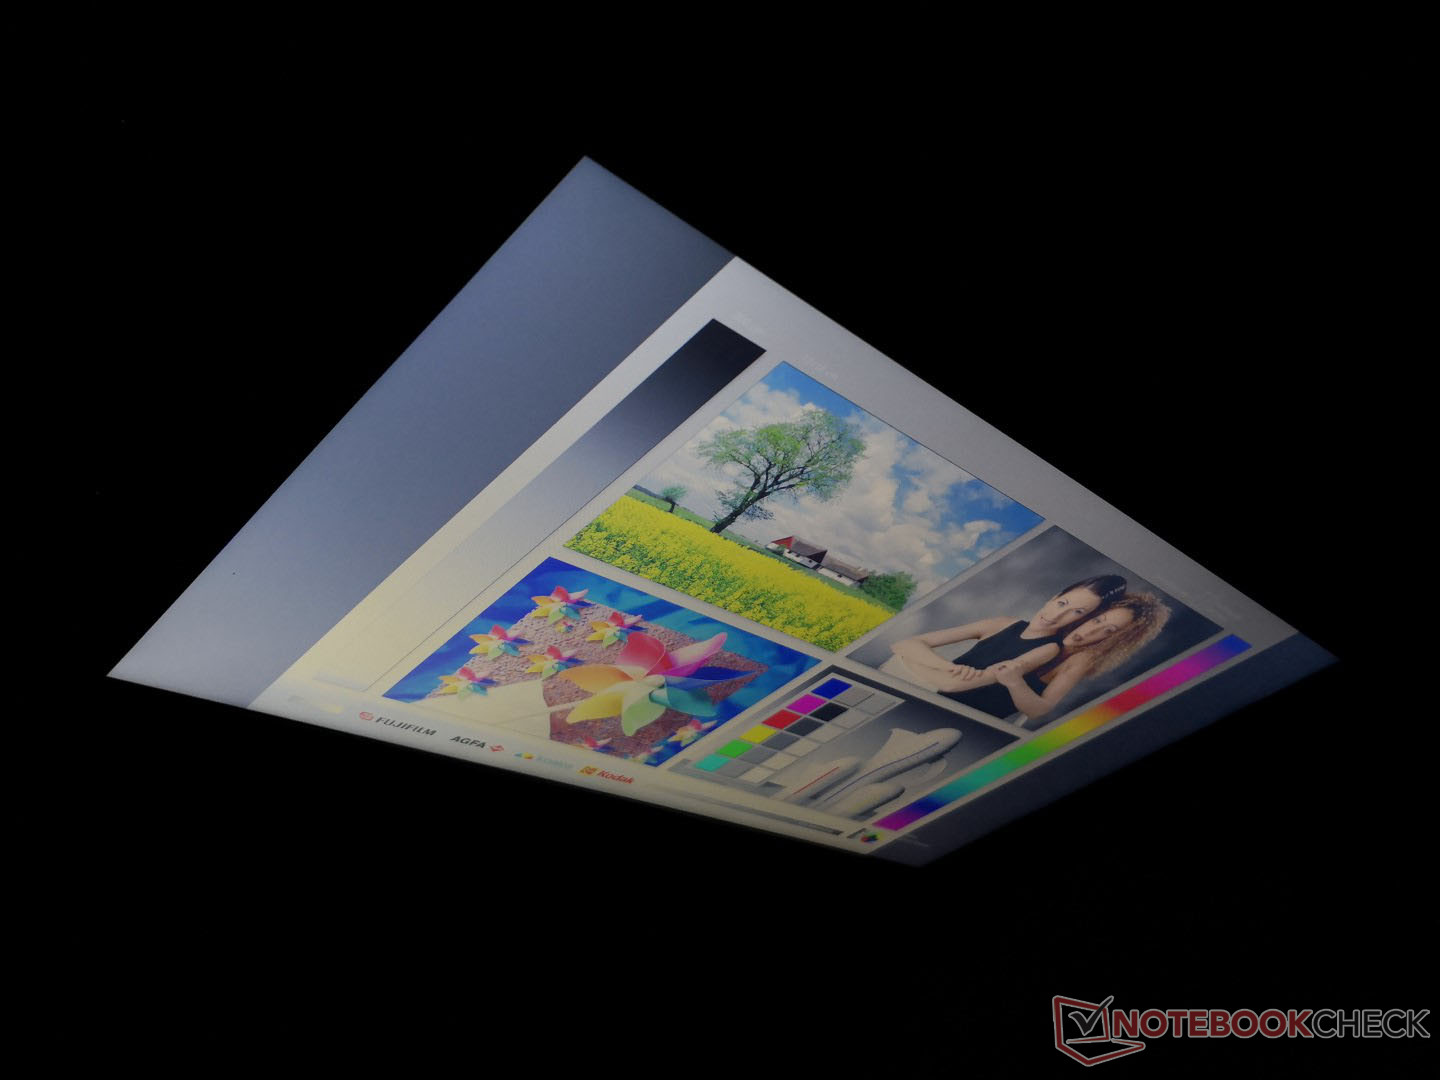
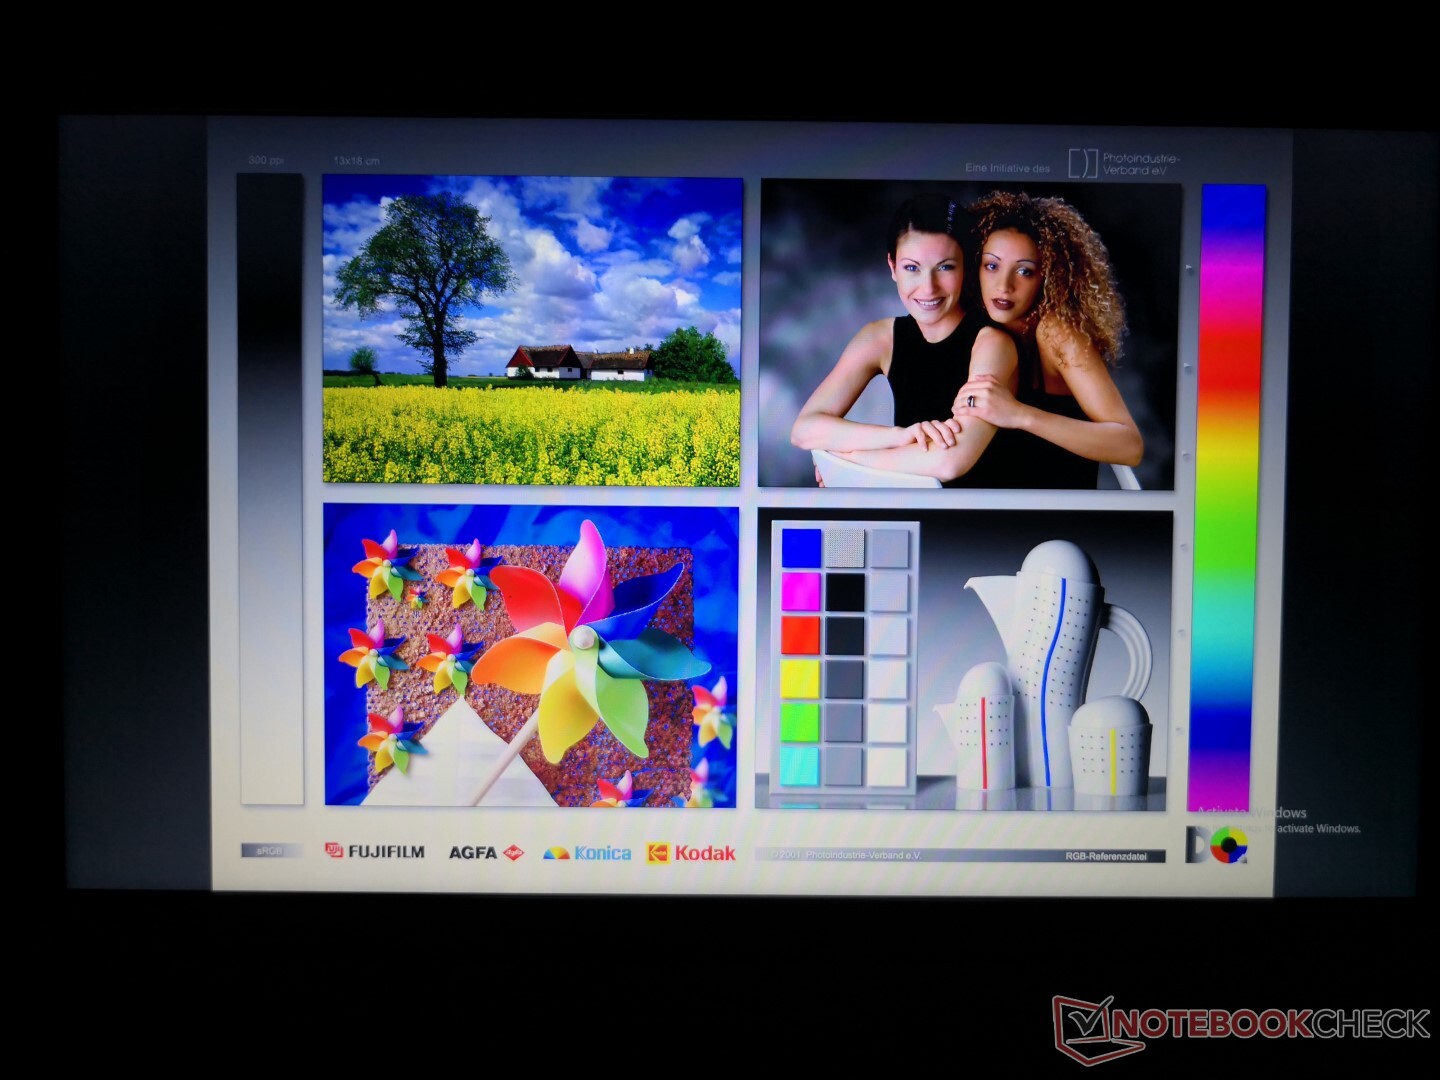
The Chi Mei N156HGE-EA2 panel on our test unit can also be found on the Acer Aspire E5-551G and Lenovo ThinkPad T550. The problem is that these laptops are from 2014 which means the DuraBook is using a six-year old TN panel. Colors are way off and contrast is low for a poor visual experience out of the box. We understand that the system is not designed for editing or watching movies, but it's still far behind the curve in its own category as most other rugged laptops now come with higher quality IPS panels instead.
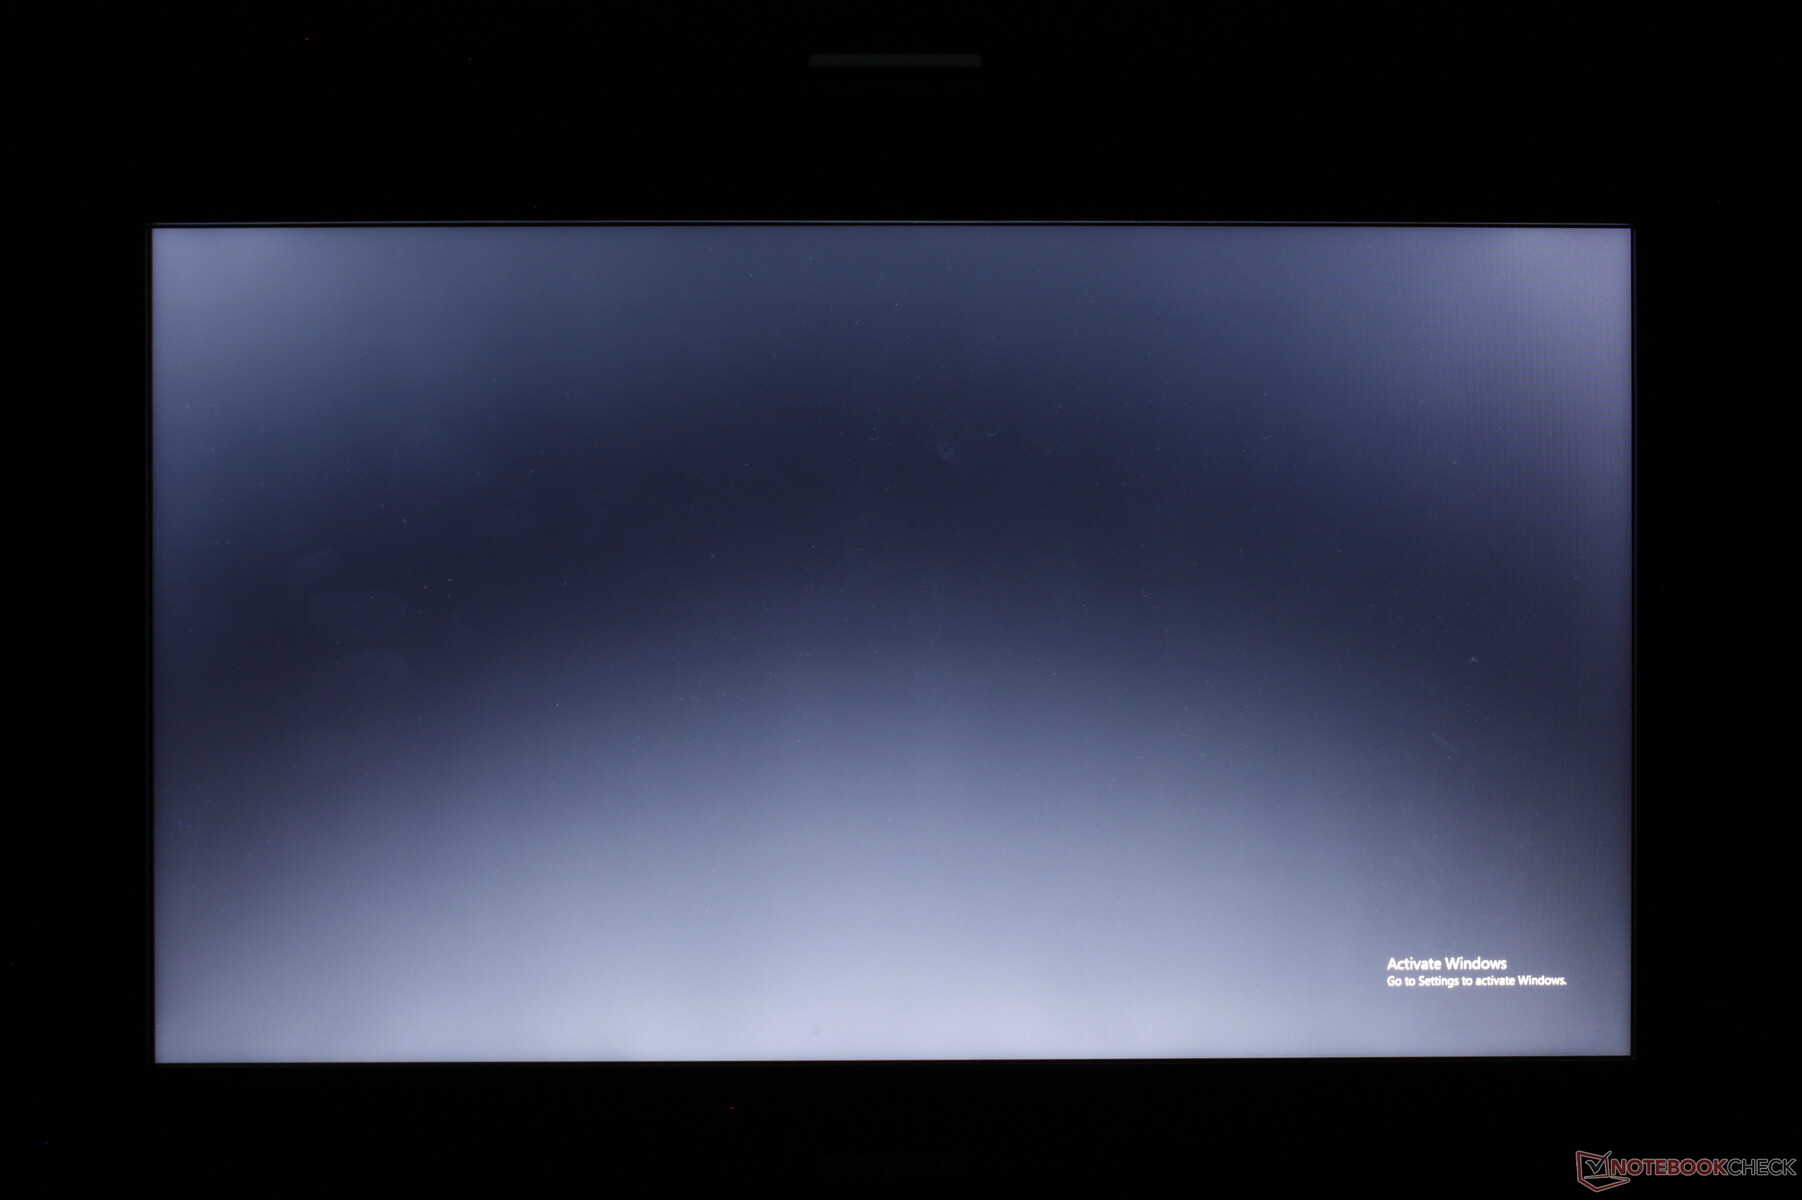
Brightness is average as we're able to record a maximum of only 284 nits. Pulse-width modulation is present on all brightness levels up to 99 percent which might impact users who are sensitive to onscreen flickering.
| |||||||||||||||||||||||||
Brightness Distribution: 86 %
Center on Battery: 284.8 cd/m²
Contrast: 407:1 (Black: 0.7 cd/m²)
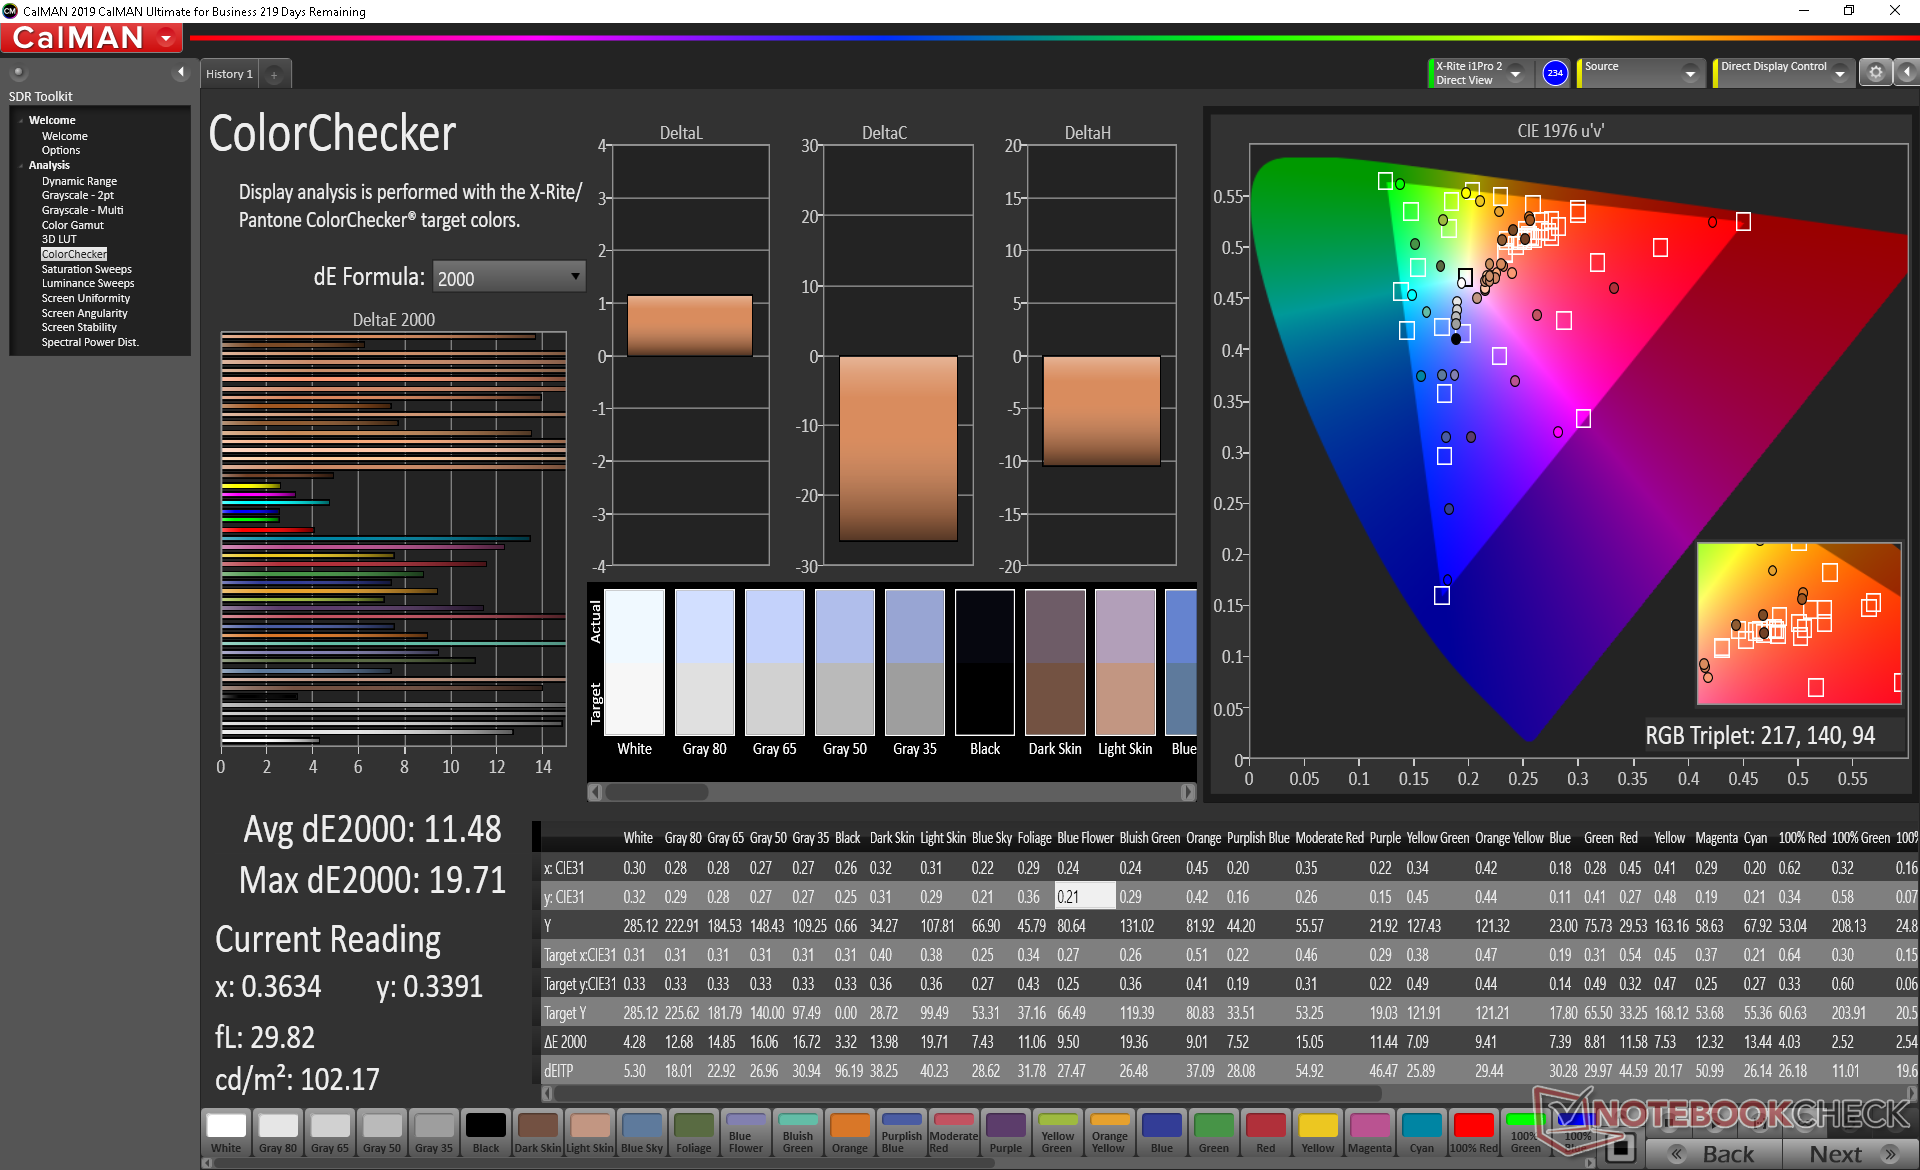
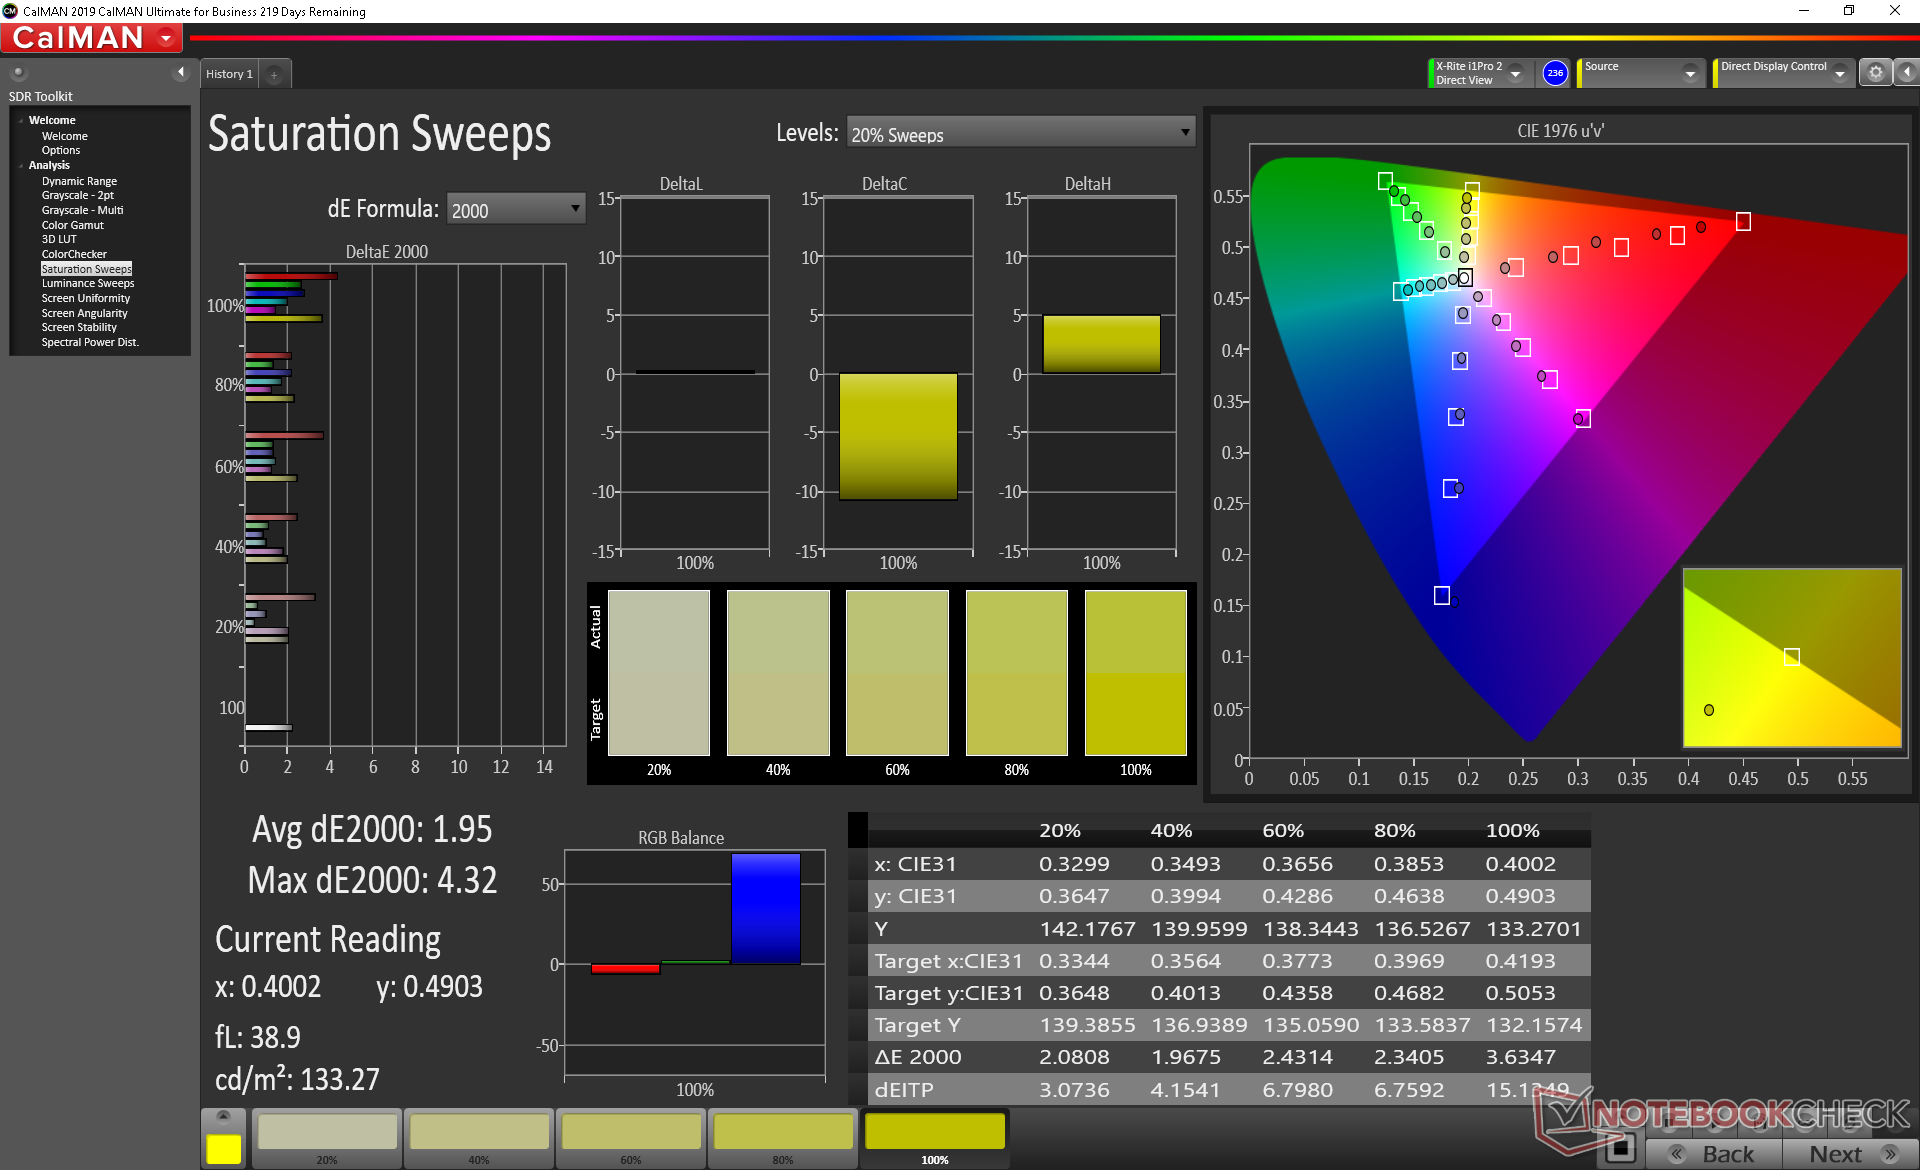
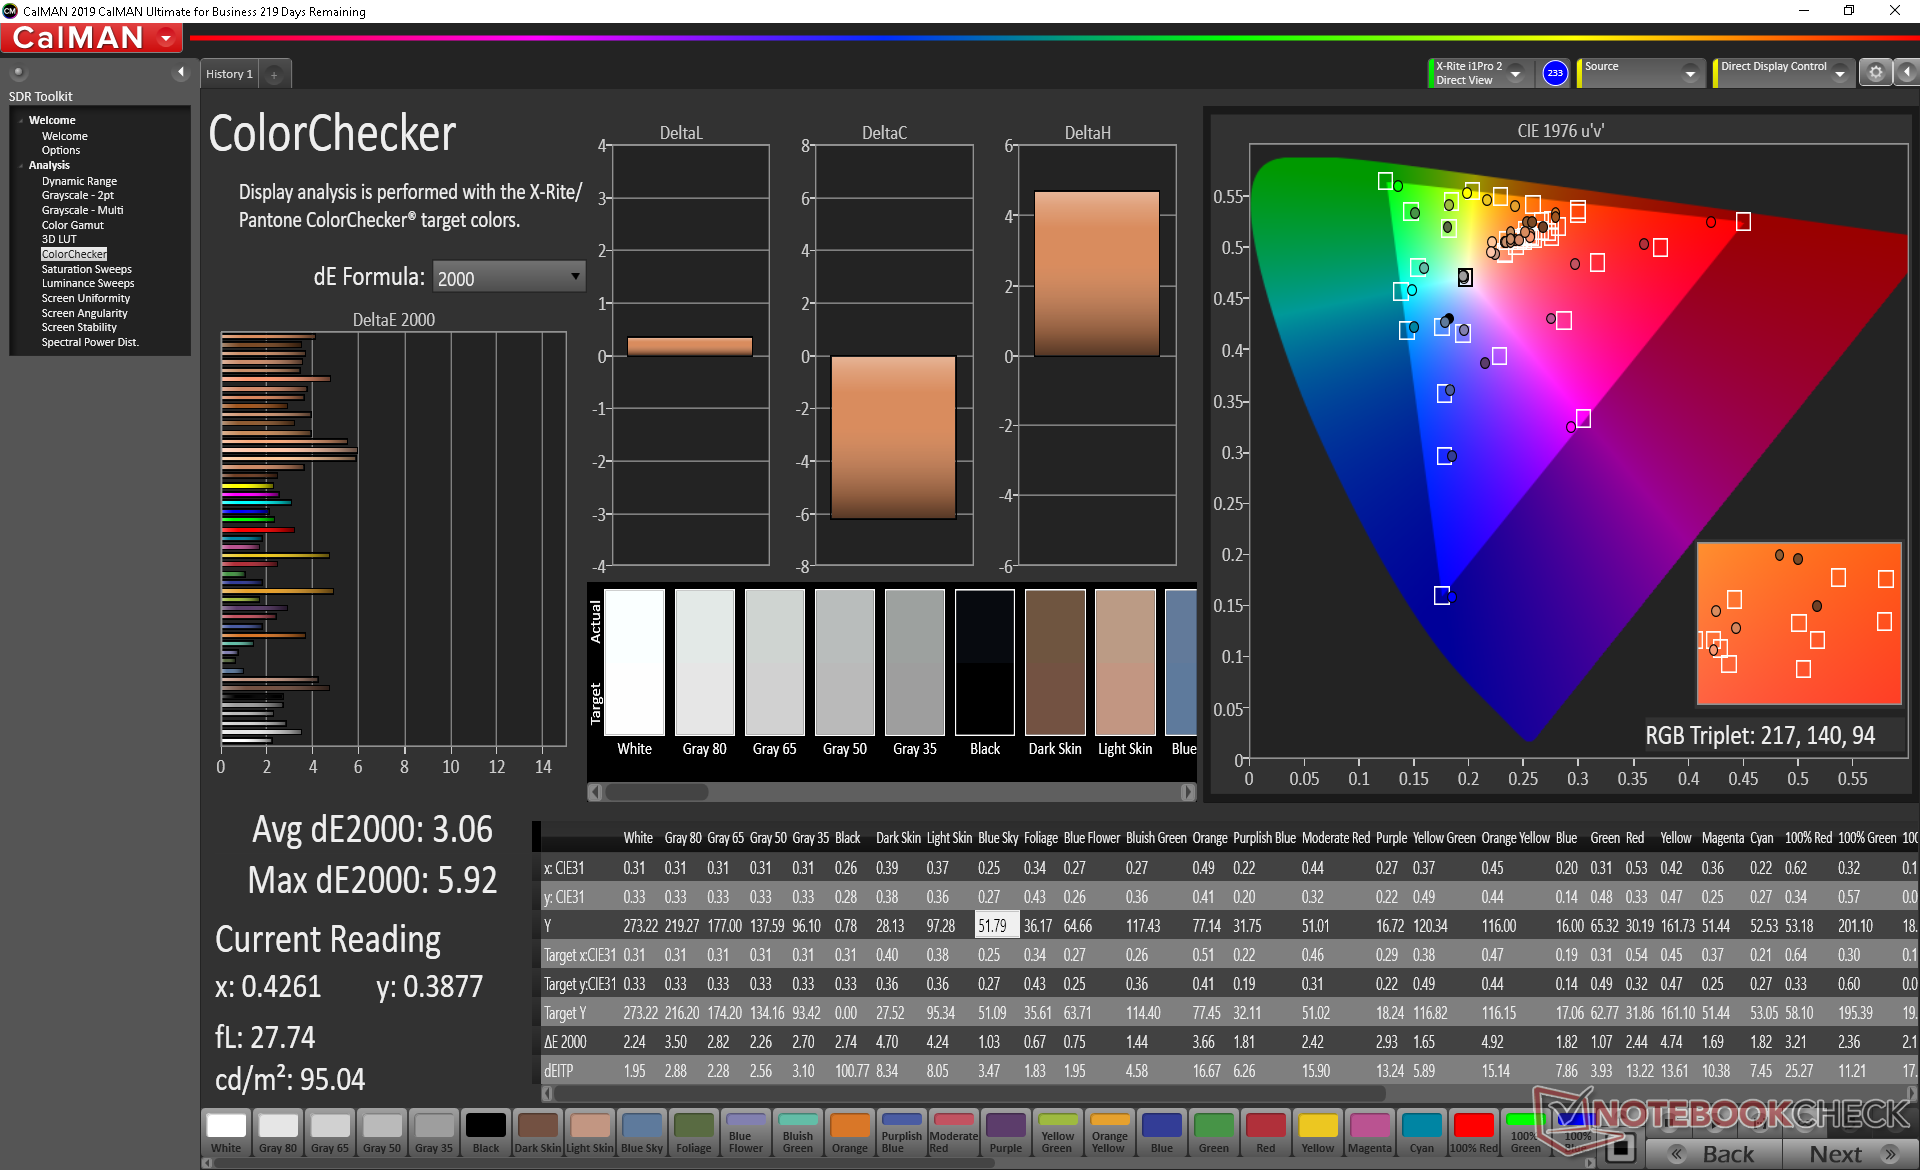
ΔE ColorChecker Calman: 11.48 | ∀{0.5-29.43 Ø4.71}
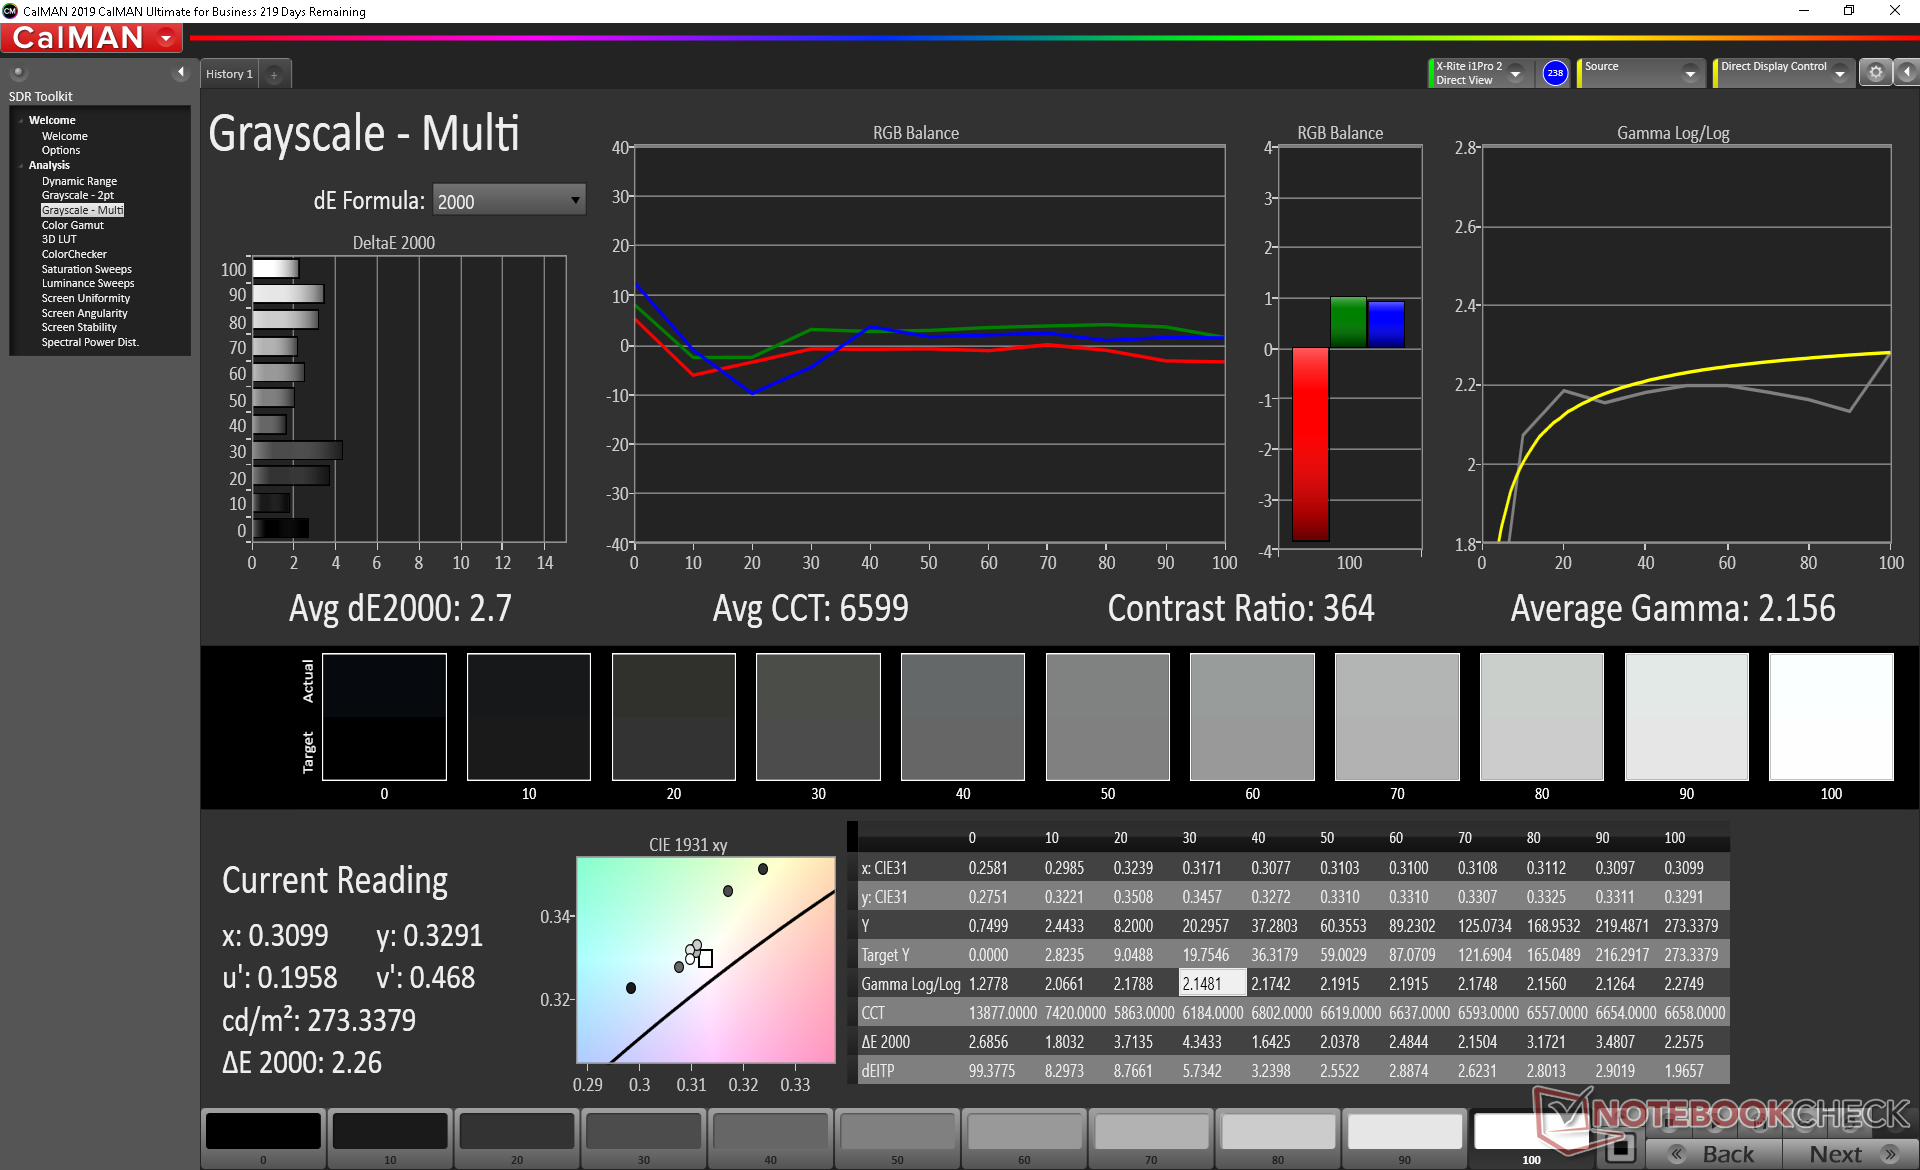
calibrated: 3.06
ΔE Greyscale Calman: 13.2 | ∀{0.09-98 Ø4.96}
76.8% sRGB (Argyll 1.6.3 3D)
48.8% AdobeRGB 1998 (Argyll 1.6.3 3D)
52.9% AdobeRGB 1998 (Argyll 3D)
77.1% sRGB (Argyll 3D)
51.4% Display P3 (Argyll 3D)
Gamma: 2.09
CCT: 14566 K
| Durabook S15ABG2 Chi Mei N156HGE-EA2, TN LED, 15.6", 1920x1080 | Dell Latitude 7424 Rugged Extreme AU Optronics AUO523D, IPS, 14", 1920x1080 | Dell Latitude 5420 Rugged-P85G AU Optronics AUO523D, IPS, 14", 1920x1080 | Panasonic Toughbook FZ-55 InfoVision M140NWF5 R3, IPS, 14", 1920x1080 | Fujitsu Celsius H780 LP156WF6-SPP1, IPS LED, 15.6", 1920x1080 | Fujitsu Lifebook A357-A3570MPH06DE LG Philips LP156WFB-SPB1, IPS, 15.6", 1920x1080 | |
|---|---|---|---|---|---|---|
| Display | 27% | 21% | -26% | 20% | -31% | |
| Display P3 Coverage (%) | 51.4 | 65.3 27% | 62.5 22% | 38.09 -26% | 66.3 29% | 35.37 -31% |
| sRGB Coverage (%) | 77.1 | 96.9 26% | 92.4 20% | 57 -26% | 85.9 11% | 53.2 -31% |
| AdobeRGB 1998 Coverage (%) | 52.9 | 67.3 27% | 64.2 21% | 39.38 -26% | 62.8 19% | 36.54 -31% |
| Response Times | -131% | -125% | -62% | -47% | -47% | |
| Response Time Grey 50% / Grey 80% * (ms) | 24.4 ? | 62.8 ? -157% | 68 ? -179% | 42 ? -72% | 38 ? -56% | 38 ? -56% |
| Response Time Black / White * (ms) | 19.6 ? | 40 ? -104% | 33.6 ? -71% | 29.6 ? -51% | 26.8 ? -37% | 27 ? -38% |
| PWM Frequency (Hz) | 301.2 ? | 763 | 735 ? | 694 ? | 20830 ? | |
| Screen | 87% | 93% | 77% | 37% | 16% | |
| Brightness middle (cd/m²) | 284.8 | 844 196% | 1111.7 290% | 1037 264% | 271 -5% | 260 -9% |
| Brightness (cd/m²) | 267 | 793 197% | 1026 284% | 1015 280% | 260 -3% | 241 -10% |
| Brightness Distribution (%) | 86 | 88 2% | 80 -7% | 76 -12% | 86 0% | 87 1% |
| Black Level * (cd/m²) | 0.7 | 0.54 23% | 0.81 -16% | 0.6 14% | 0.29 59% | 0.39 44% |
| Contrast (:1) | 407 | 1563 284% | 1372 237% | 1728 325% | 934 129% | 667 64% |
| Colorchecker dE 2000 * | 11.48 | 4.8 58% | 3.83 67% | 5.71 50% | 3.9 66% | 5.23 54% |
| Colorchecker dE 2000 max. * | 19.71 | 11.88 40% | 7.85 60% | 26.27 -33% | 10.2 48% | 7.73 61% |
| Colorchecker dE 2000 calibrated * | 3.06 | 1.15 62% | 2.98 3% | 4.52 -48% | 2.9 5% | 4.2 -37% |
| Greyscale dE 2000 * | 13.2 | 7.6 42% | 5.6 58% | 5.5 58% | 2.6 80% | 4.22 68% |
| Gamma | 2.09 105% | 2.334 94% | 2.306 95% | 2.04 108% | 2.29 96% | 2.62 84% |
| CCT | 14566 45% | 6546 99% | 7676 85% | 5783 112% | 6517 100% | 6104 106% |
| Color Space (Percent of AdobeRGB 1998) (%) | 48.8 | 62 27% | 59 21% | 36.4 -25% | 56.1 15% | 34 -30% |
| Color Space (Percent of sRGB) (%) | 76.8 | 97 26% | 93 21% | 57 -26% | 85.8 12% | 53 -31% |
| Total Average (Program / Settings) | -6% /
49% | -4% /
52% | -4% /
40% | 3% /
23% | -21% /
-1% |
* ... smaller is better
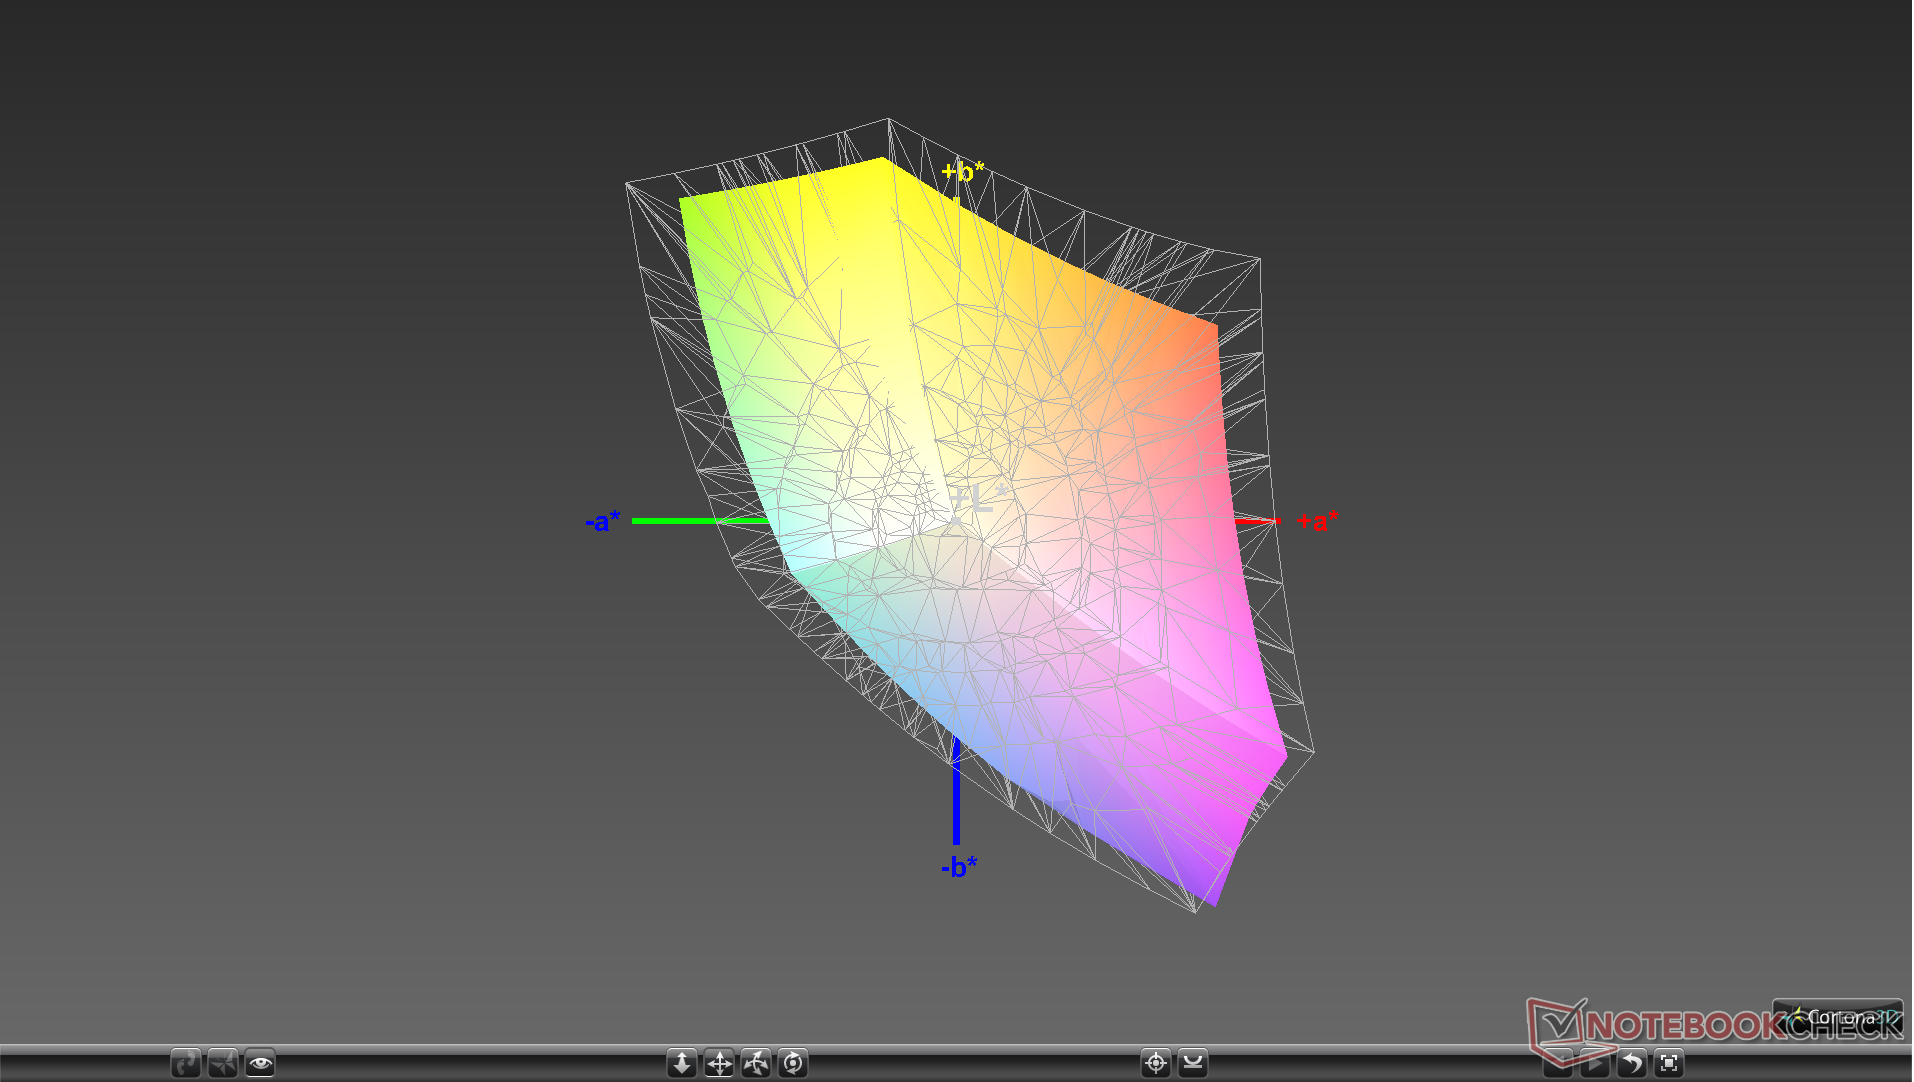
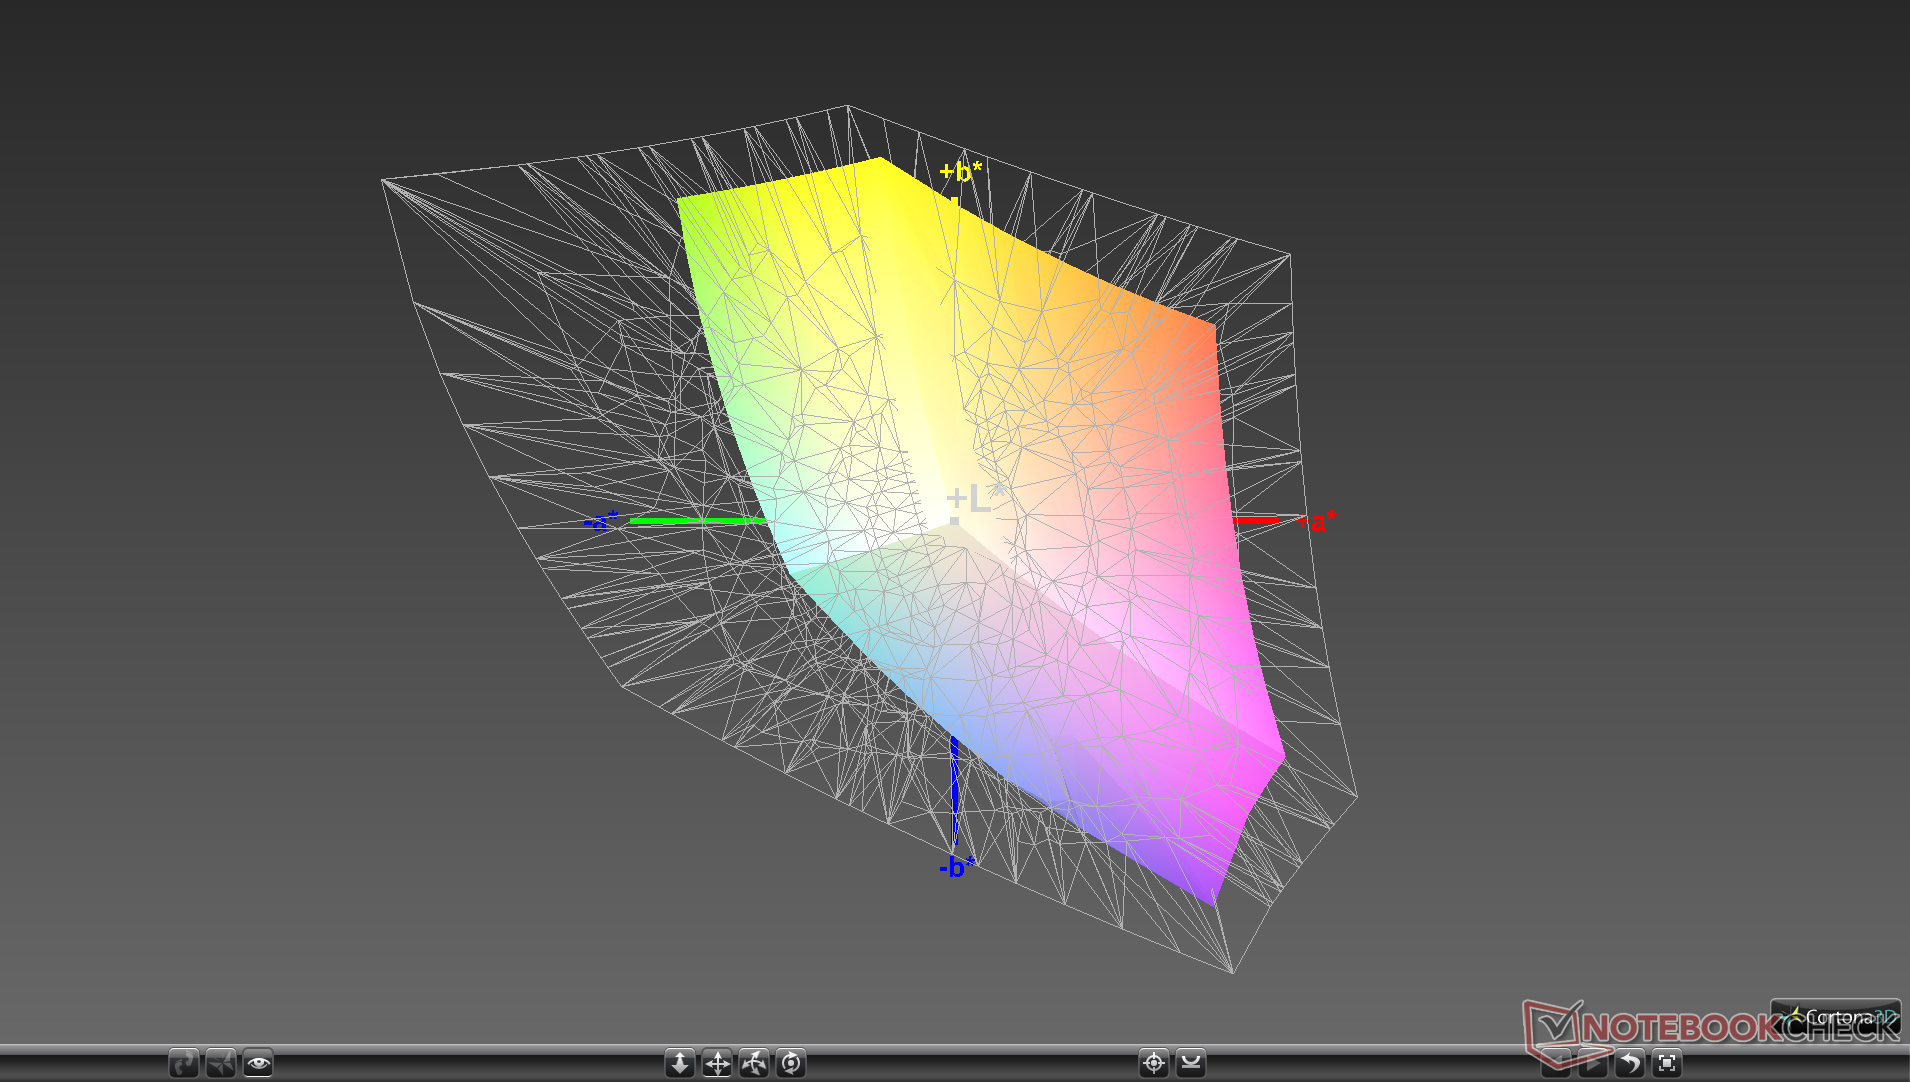
Further measurements with an X-Rite colorimeter reveal an overly cool color temperature with inaccurate colors as a result. Once we calibrated the display, however, colors and grayscale would improve dramatically. We recommend calibrating the display if possible because the visual experience will improve noticeably.
Display Response Times
| ↔ Response Time Black to White | ||
|---|---|---|
| 19.6 ms ... rise ↗ and fall ↘ combined | ↗ 14.4 ms rise | 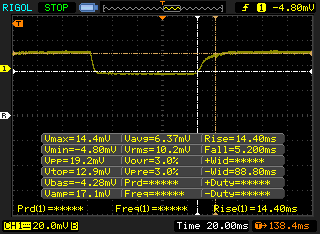 |
| ↘ 5.2 ms fall | ||
| The screen shows good response rates in our tests, but may be too slow for competitive gamers. In comparison, all tested devices range from 0.1 (minimum) to 240 (maximum) ms. » 43 % of all devices are better. This means that the measured response time is similar to the average of all tested devices (19.8 ms). | ||
| ↔ Response Time 50% Grey to 80% Grey | ||
| 24.4 ms ... rise ↗ and fall ↘ combined | ↗ 12.8 ms rise | 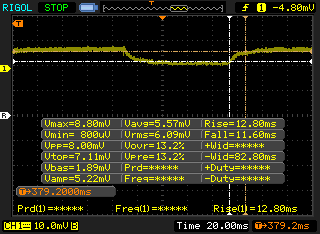 |
| ↘ 11.6 ms fall | ||
| The screen shows good response rates in our tests, but may be too slow for competitive gamers. In comparison, all tested devices range from 0.165 (minimum) to 636 (maximum) ms. » 35 % of all devices are better. This means that the measured response time is better than the average of all tested devices (31 ms). | ||
Screen Flickering / PWM (Pulse-Width Modulation)
| Screen flickering / PWM detected | 301.2 Hz | ≤ 99 % brightness setting | 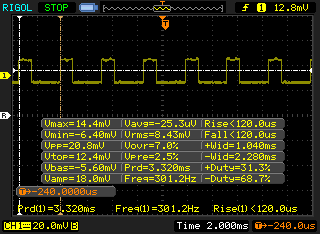 |
The display backlight flickers at 301.2 Hz (worst case, e.g., utilizing PWM) Flickering detected at a brightness setting of 99 % and below. There should be no flickering or PWM above this brightness setting. The frequency of 301.2 Hz is relatively high, so most users sensitive to PWM should not notice any flickering. However, there are reports that some users are still sensitive to PWM at 500 Hz and above, so be aware. In comparison: 52 % of all tested devices do not use PWM to dim the display. If PWM was detected, an average of 7747 (minimum: 5 - maximum: 343500) Hz was measured. | |||
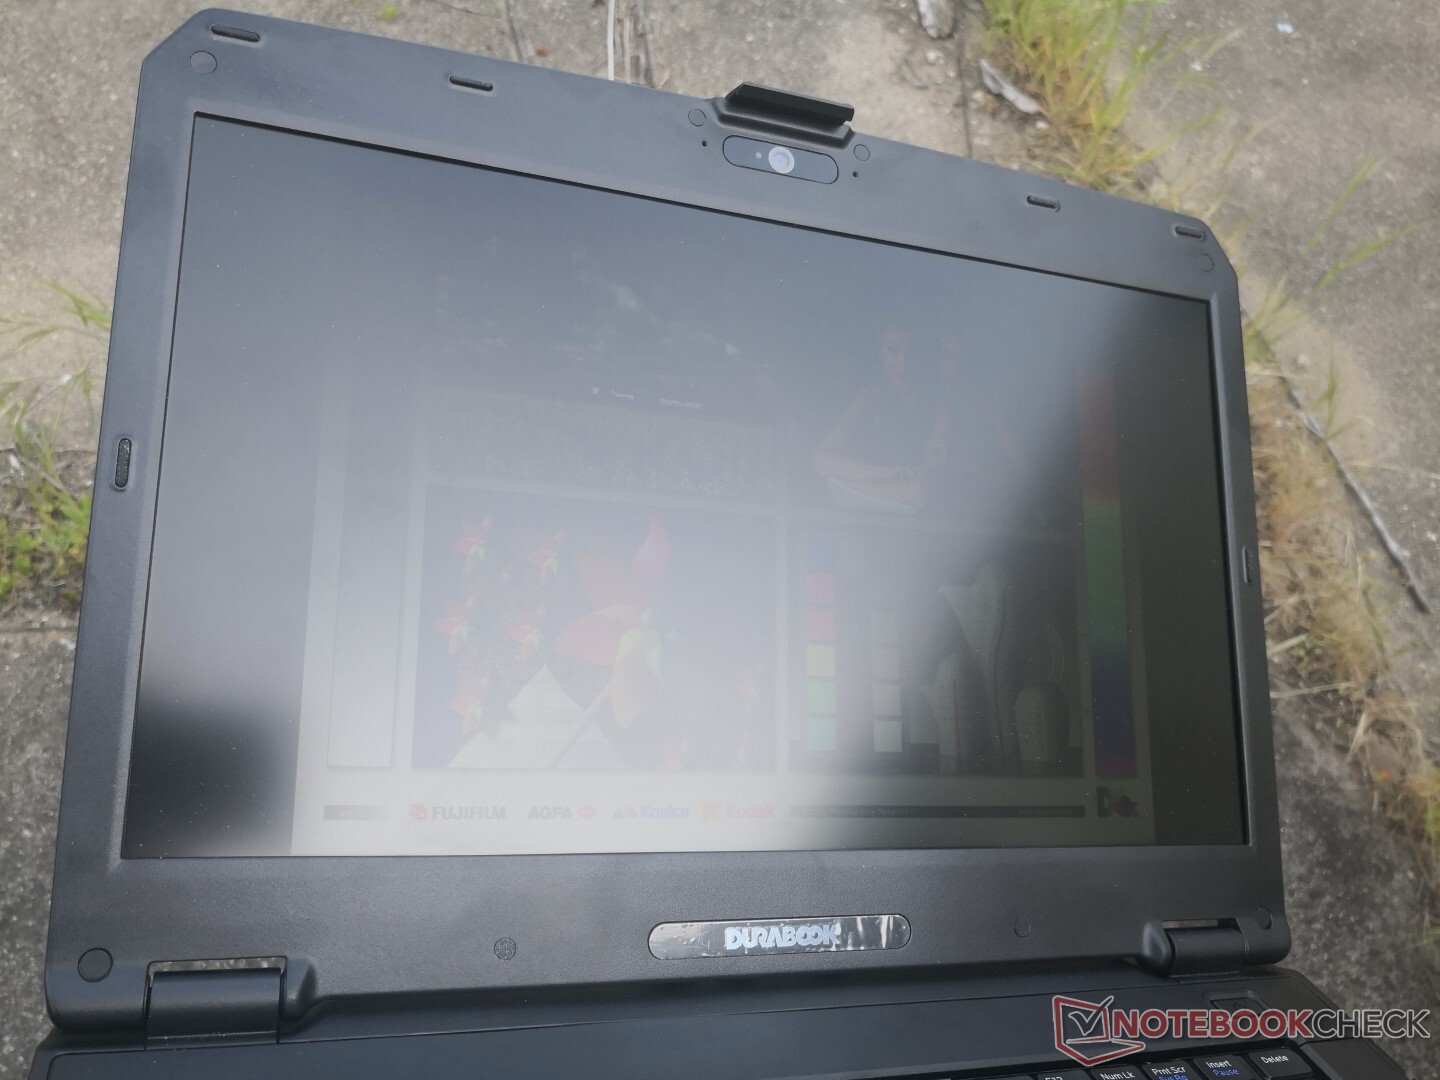
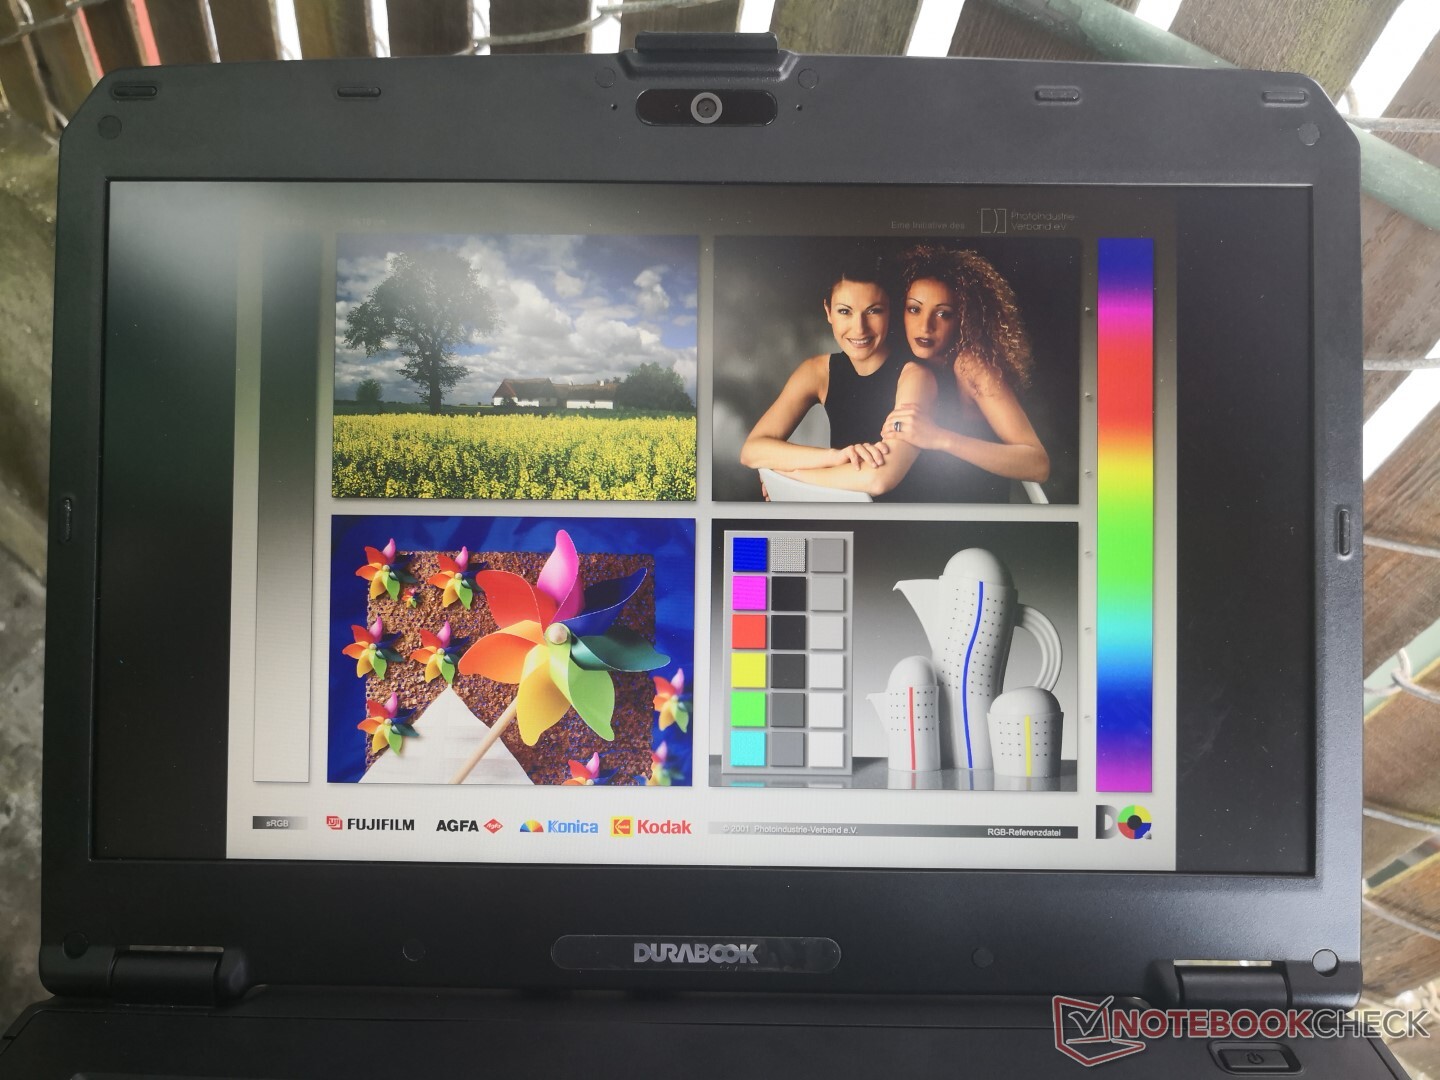
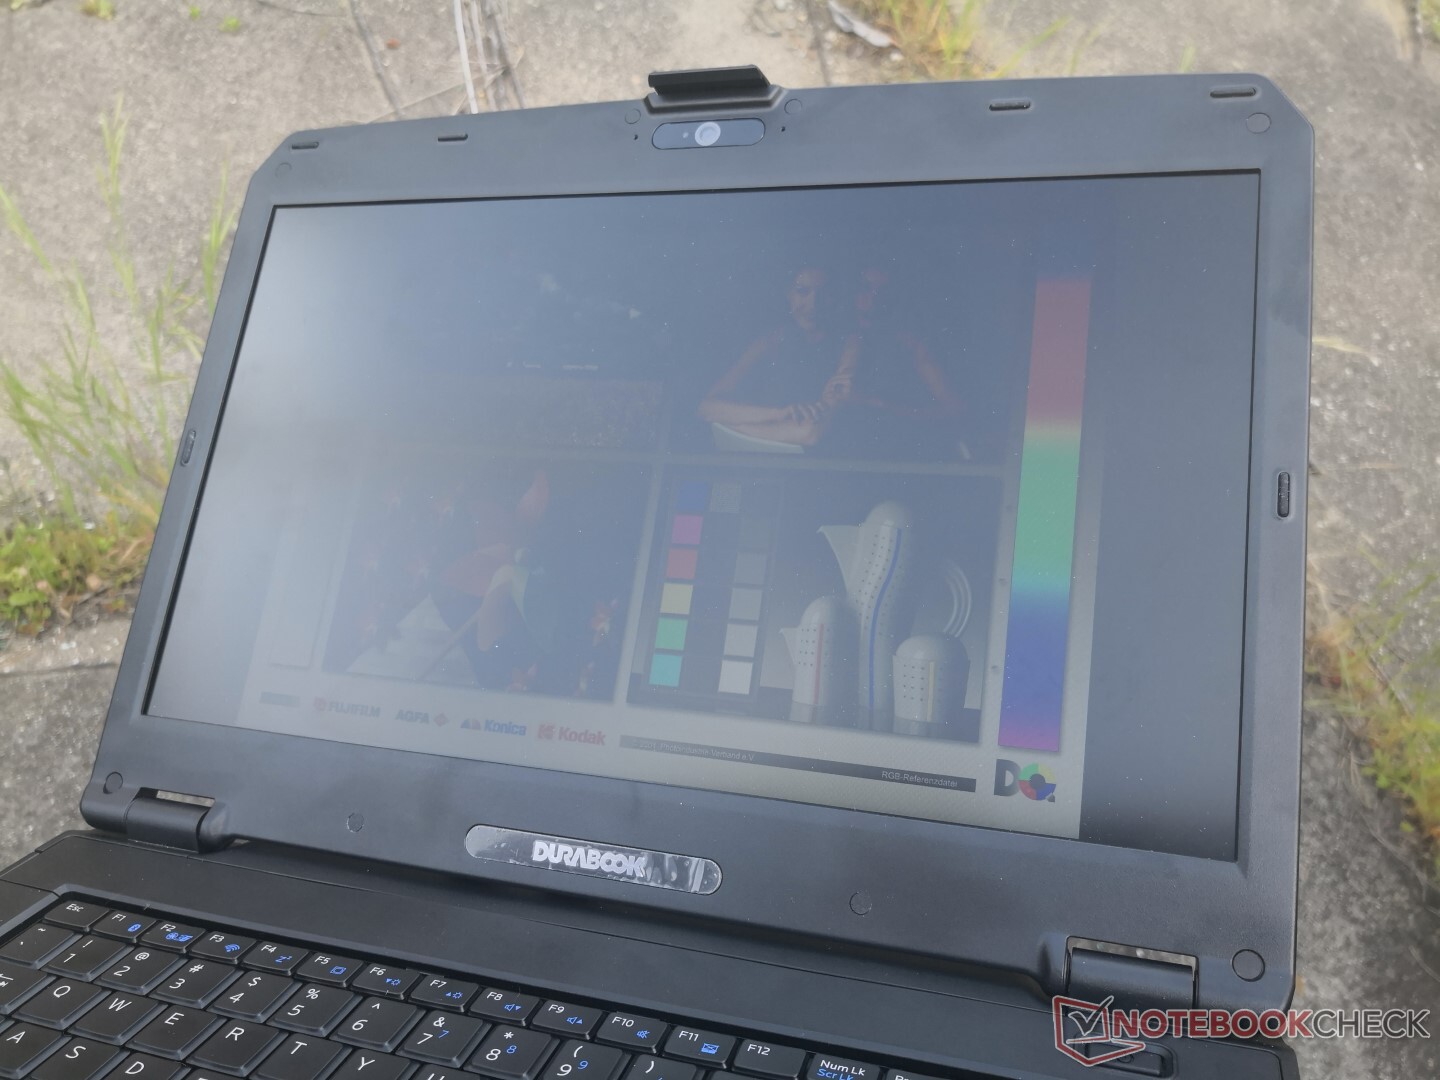
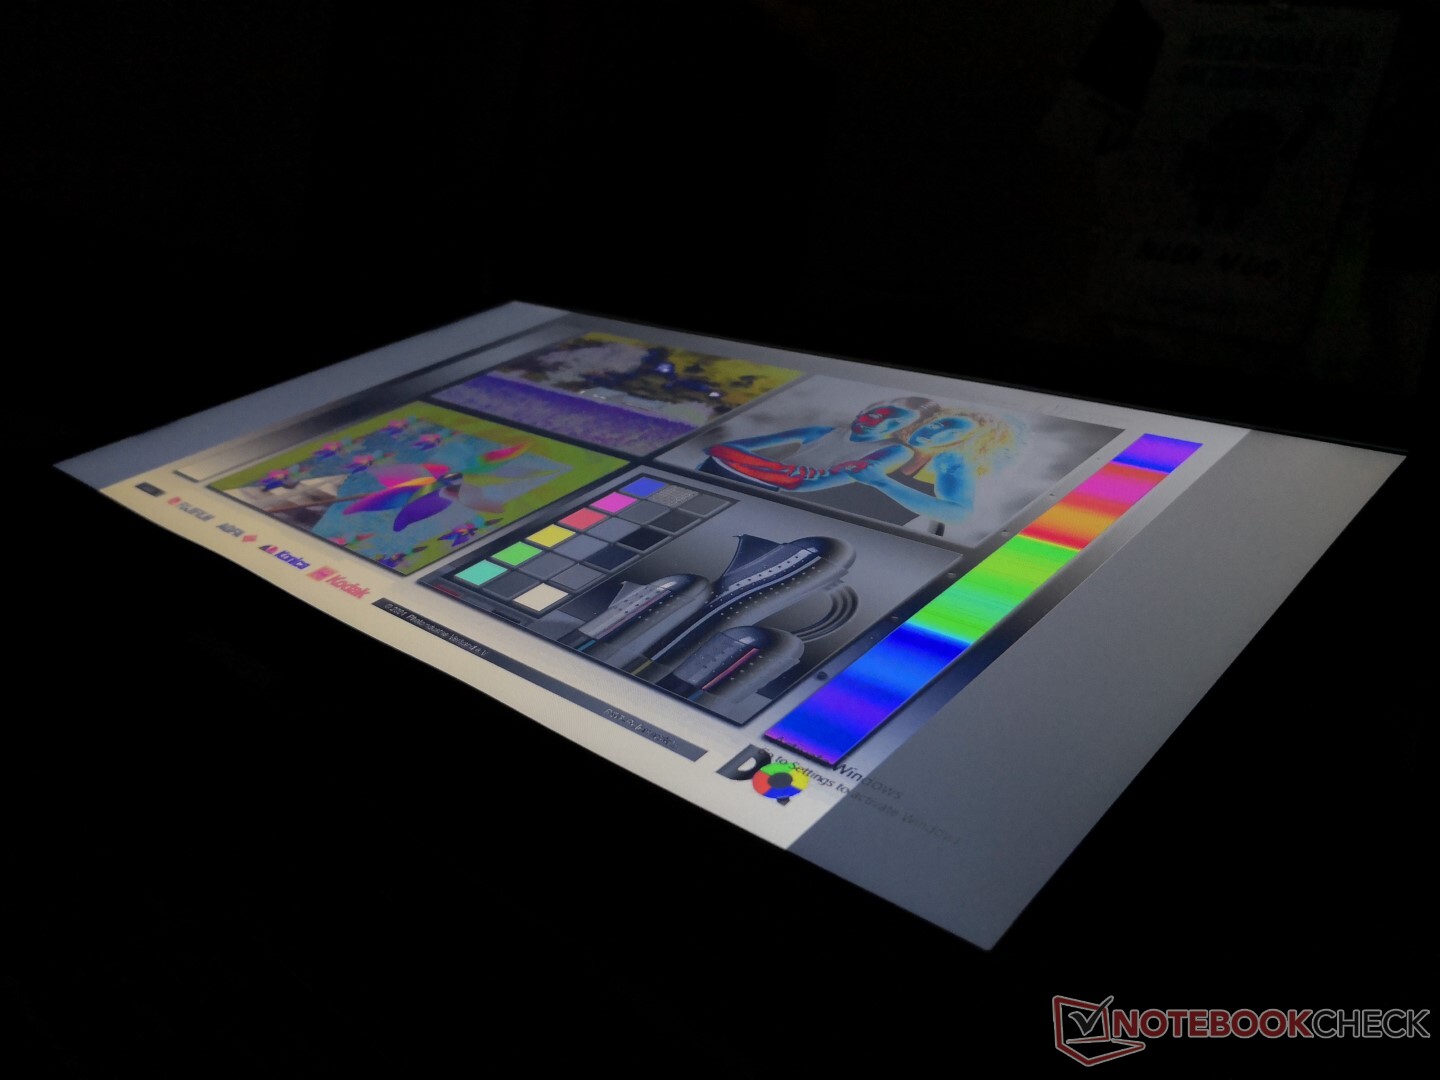
Outdoor visibility is poor due to both the limited brightness and limited viewing angles of the TN panel. The matte display helps to reduce glare, but it can only do so much on its own.
Performance
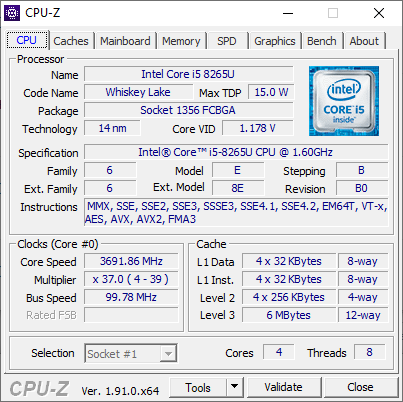
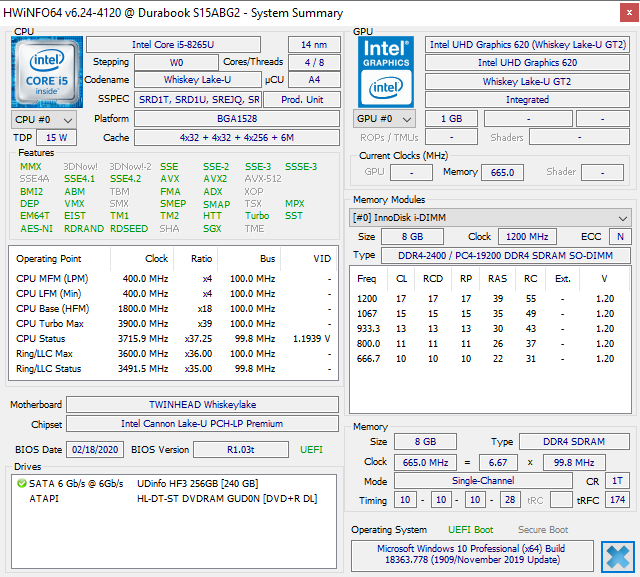
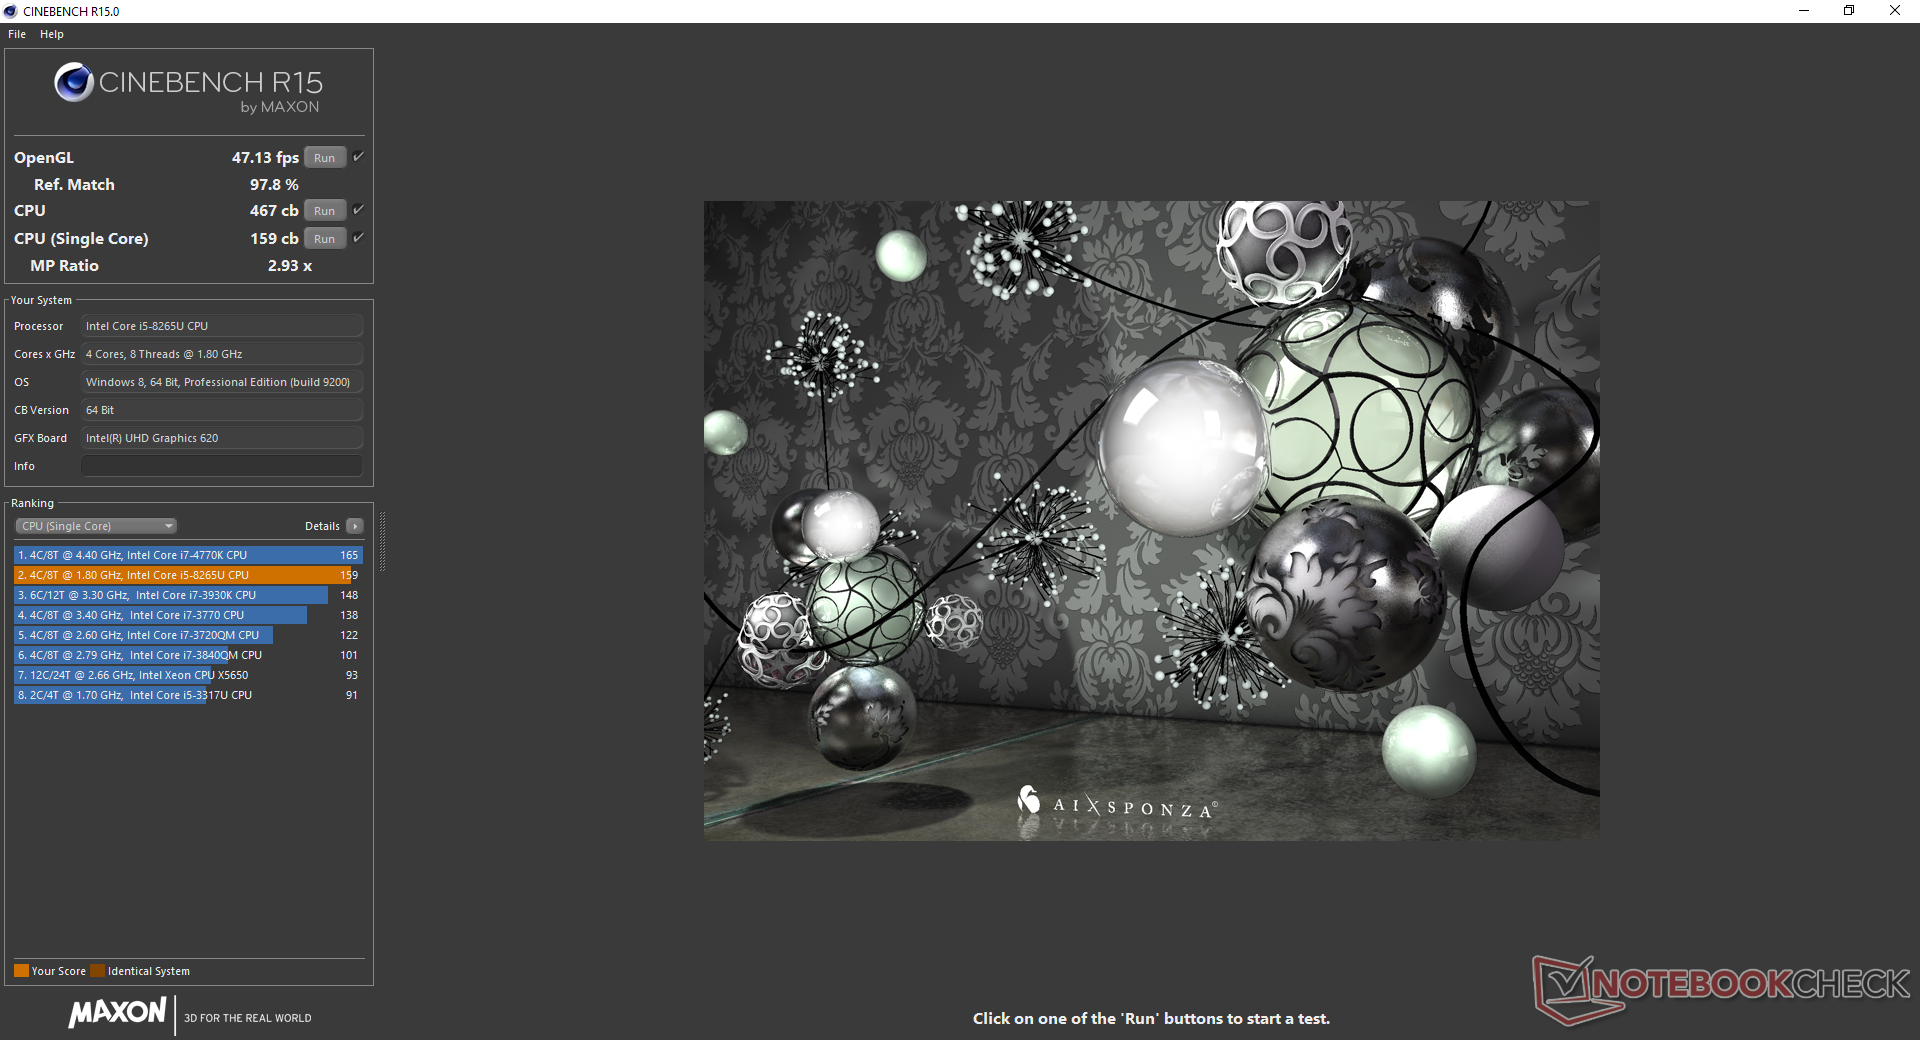
Processor
CPU performance is below average. When compared to the 36 other laptops in our database all equipped with the same Core i5-8265U processor, the one in our Durabook is roughly 22 percent slower in multi-thread performance. Running CineBench R15 Multi-Thread in a loop shows a performance drop of 12 percent over time.
See our dedicated page on the Core i5-8265U for more technical information and benchmark comparisons.
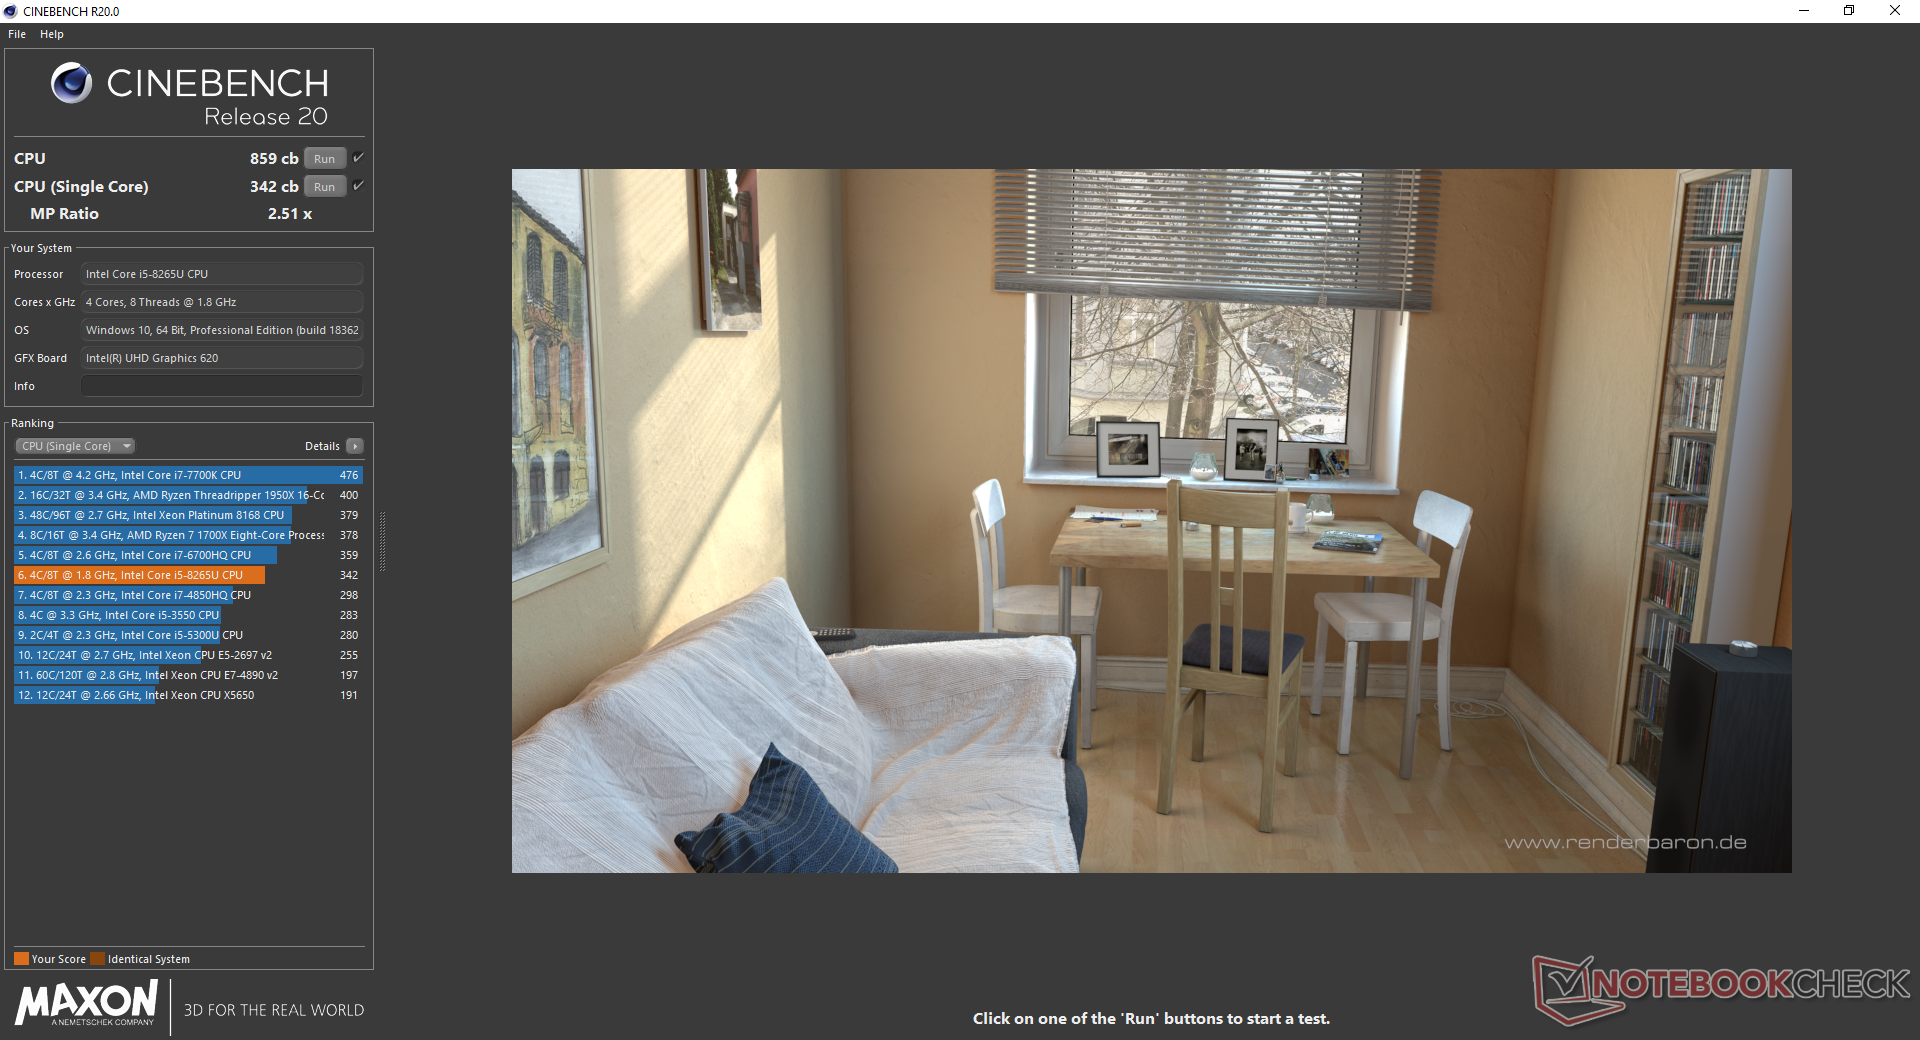
Cinebench R20: CPU (Multi Core) | CPU (Single Core)
Blender: v2.79 BMW27 CPU
7-Zip 18.03: 7z b 4 -mmt1 | 7z b 4
Geekbench 5.5: Single-Core | Multi-Core
HWBOT x265 Benchmark v2.2: 4k Preset
LibreOffice : 20 Documents To PDF
R Benchmark 2.5: Overall mean
| Cinebench R20 / CPU (Multi Core) | |
| Lenovo ThinkPad T590-20N4002VGE | |
| Huawei MateBook D 15-53010TUY | |
| Dell Inspiron 15 5000 5585 | |
| Average Intel Core i5-8265U (972 - 1564, n=16) | |
| Dynabook Portégé X30-F-10N | |
| HP Elite Dragonfly-8MK79EA | |
| Durabook S15ABG2 | |
| Cinebench R20 / CPU (Single Core) | |
| Lenovo ThinkPad T590-20N4002VGE | |
| Durabook S15ABG2 | |
| Average Intel Core i5-8265U (325 - 403, n=16) | |
| Dynabook Portégé X30-F-10N | |
| HP Elite Dragonfly-8MK79EA | |
| Huawei MateBook D 15-53010TUY | |
| Dell Inspiron 15 5000 5585 | |
| Blender / v2.79 BMW27 CPU | |
| Durabook S15ABG2 | |
| HP Elite Dragonfly-8MK79EA | |
| Average Intel Core i5-8265U (769 - 1098, n=15) | |
| Lenovo ThinkPad T590-20N4002VGE | |
| Huawei MateBook D 15-53010TUY | |
| Fujitsu Celsius H780 | |
| 7-Zip 18.03 / 7z b 4 -mmt1 | |
| Lenovo ThinkPad T590-20N4002VGE | |
| Fujitsu Celsius H780 | |
| Durabook S15ABG2 | |
| Average Intel Core i5-8265U (3780 - 4195, n=15) | |
| HP Elite Dragonfly-8MK79EA | |
| Huawei MateBook D 15-53010TUY | |
| 7-Zip 18.03 / 7z b 4 | |
| Fujitsu Celsius H780 | |
| Lenovo ThinkPad T590-20N4002VGE | |
| Huawei MateBook D 15-53010TUY | |
| Average Intel Core i5-8265U (13731 - 18802, n=15) | |
| HP Elite Dragonfly-8MK79EA | |
| Durabook S15ABG2 | |
| Geekbench 5.5 / Single-Core | |
| Durabook S15ABG2 | |
| Average Intel Core i5-8265U (1024 - 1047, n=4) | |
| Huawei MateBook D 15-53010TUY | |
| Geekbench 5.5 / Multi-Core | |
| Average Intel Core i5-8265U (3442 - 3986, n=4) | |
| Durabook S15ABG2 | |
| Huawei MateBook D 15-53010TUY | |
| HWBOT x265 Benchmark v2.2 / 4k Preset | |
| Fujitsu Celsius H780 | |
| Lenovo ThinkPad T590-20N4002VGE | |
| Average Intel Core i5-8265U (3.38 - 4.8, n=15) | |
| Huawei MateBook D 15-53010TUY | |
| HP Elite Dragonfly-8MK79EA | |
| Durabook S15ABG2 | |
| LibreOffice / 20 Documents To PDF | |
| Durabook S15ABG2 | |
| Average Intel Core i5-8265U (59.4 - 67.8, n=4) | |
| R Benchmark 2.5 / Overall mean | |
| Huawei MateBook D 15-53010TUY | |
| Average Intel Core i5-8265U (0.72 - 0.754, n=4) | |
| Durabook S15ABG2 | |
* ... smaller is better
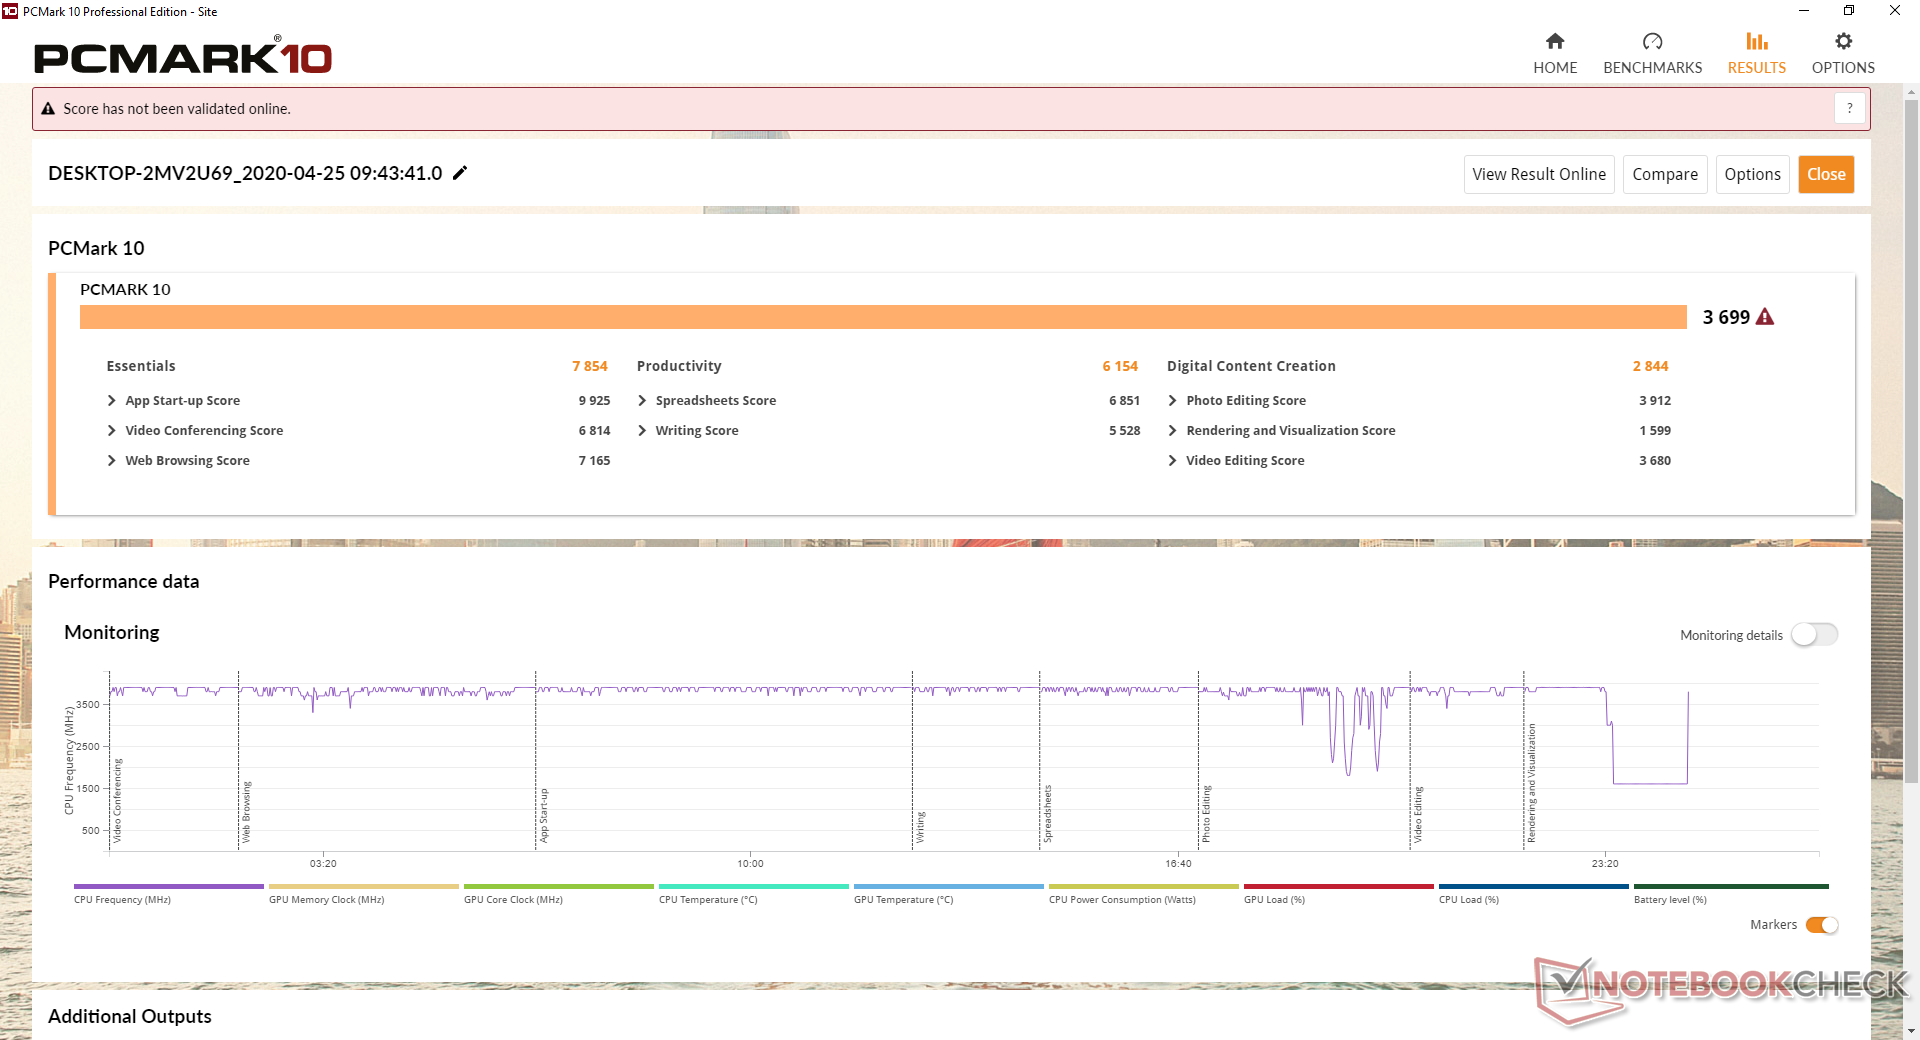
System Performance
PCMark benchmarks are within a few percentage points of the average Core i5-8265U in our database despite the slower-than-average CPU performance recorded in our Processor section above. We experienced no software issues or random crashes during our time with the test unit.
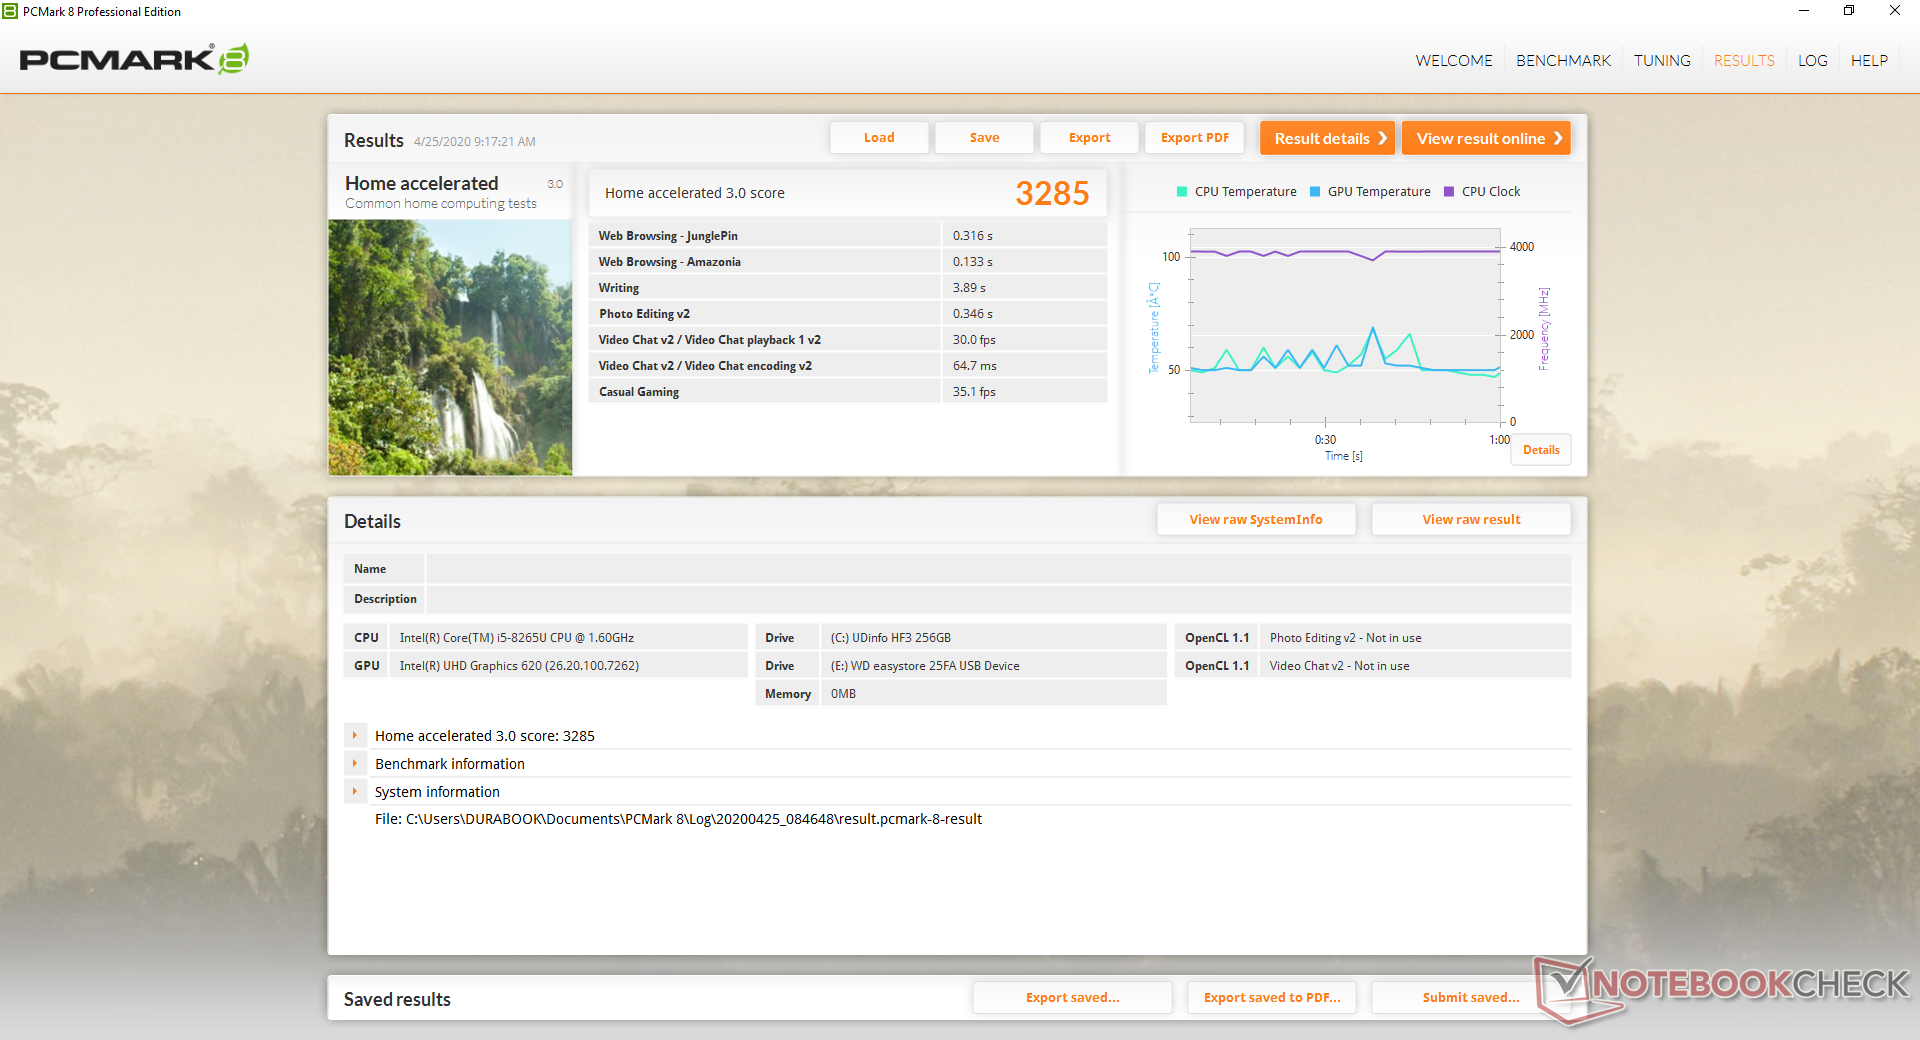
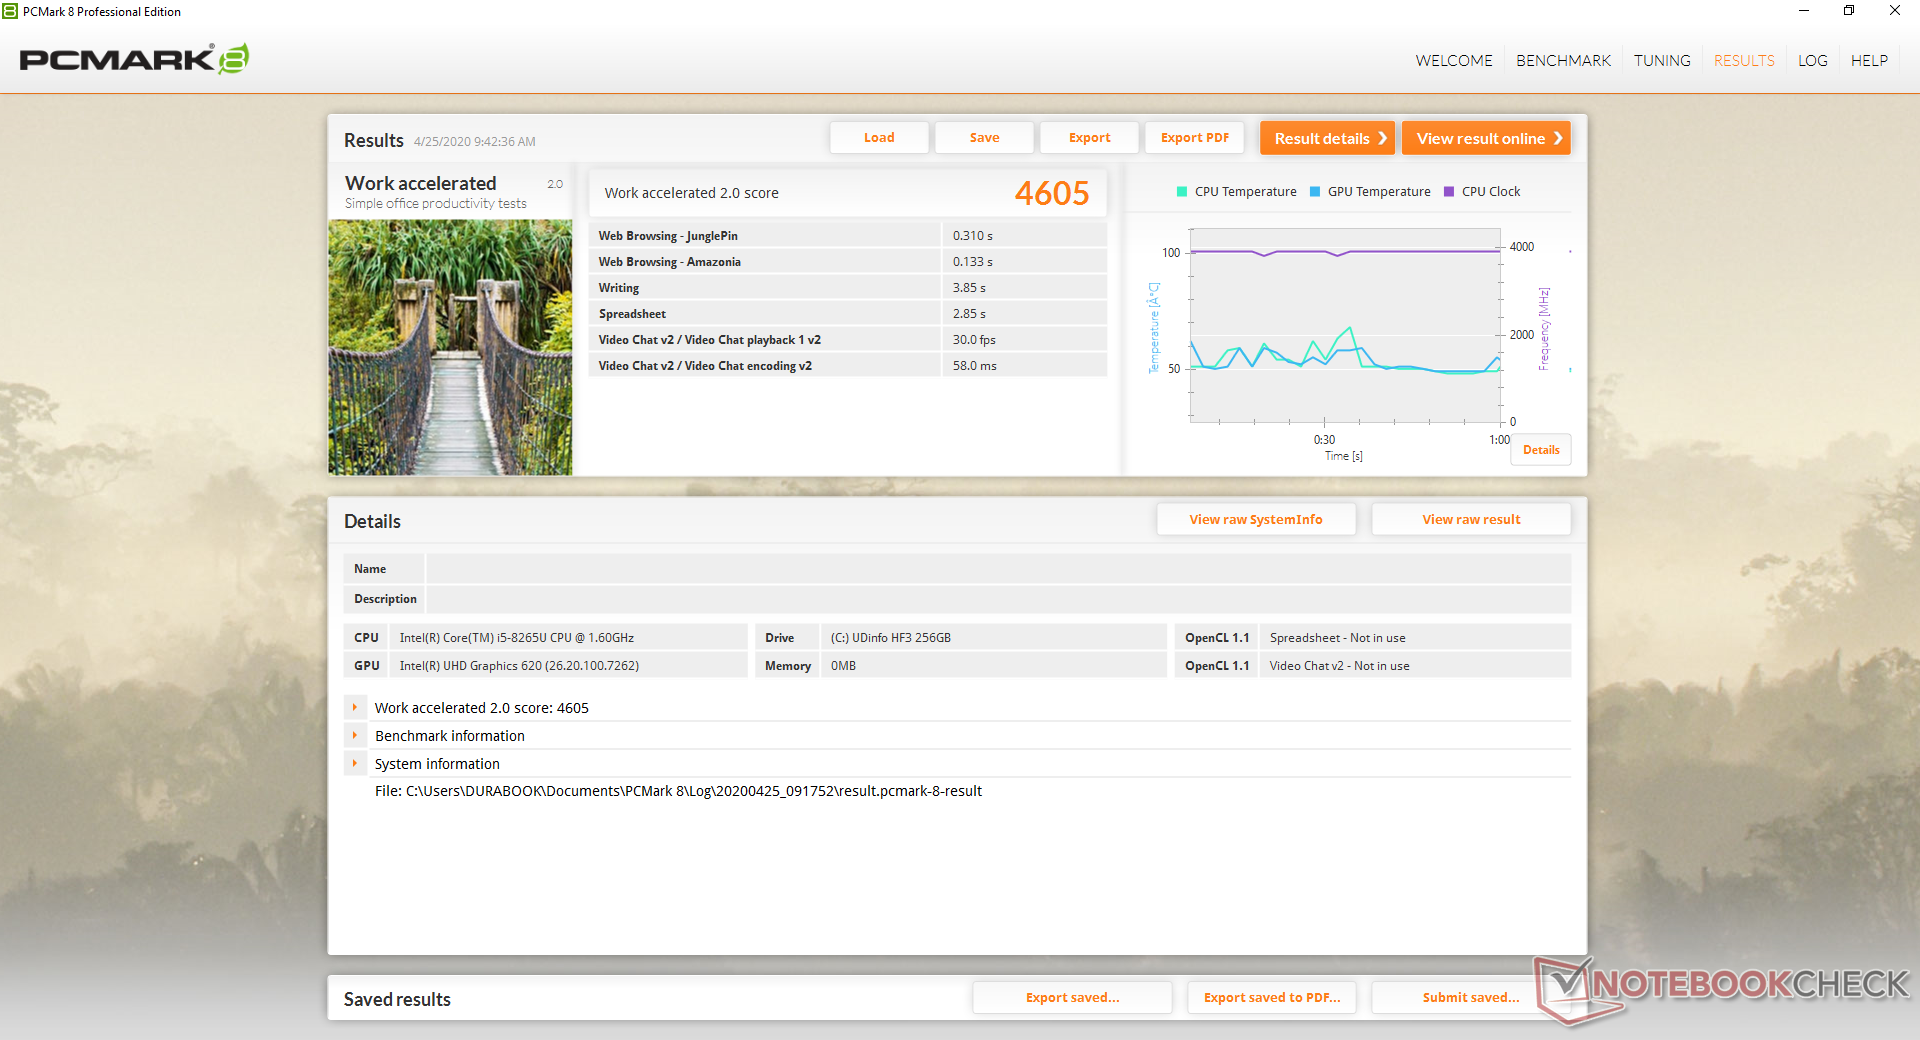
| PCMark 8 Home Score Accelerated v2 | 3285 points | |
| PCMark 8 Work Score Accelerated v2 | 4605 points | |
| PCMark 10 Score | 3699 points | |
Help | ||
DPC Latency
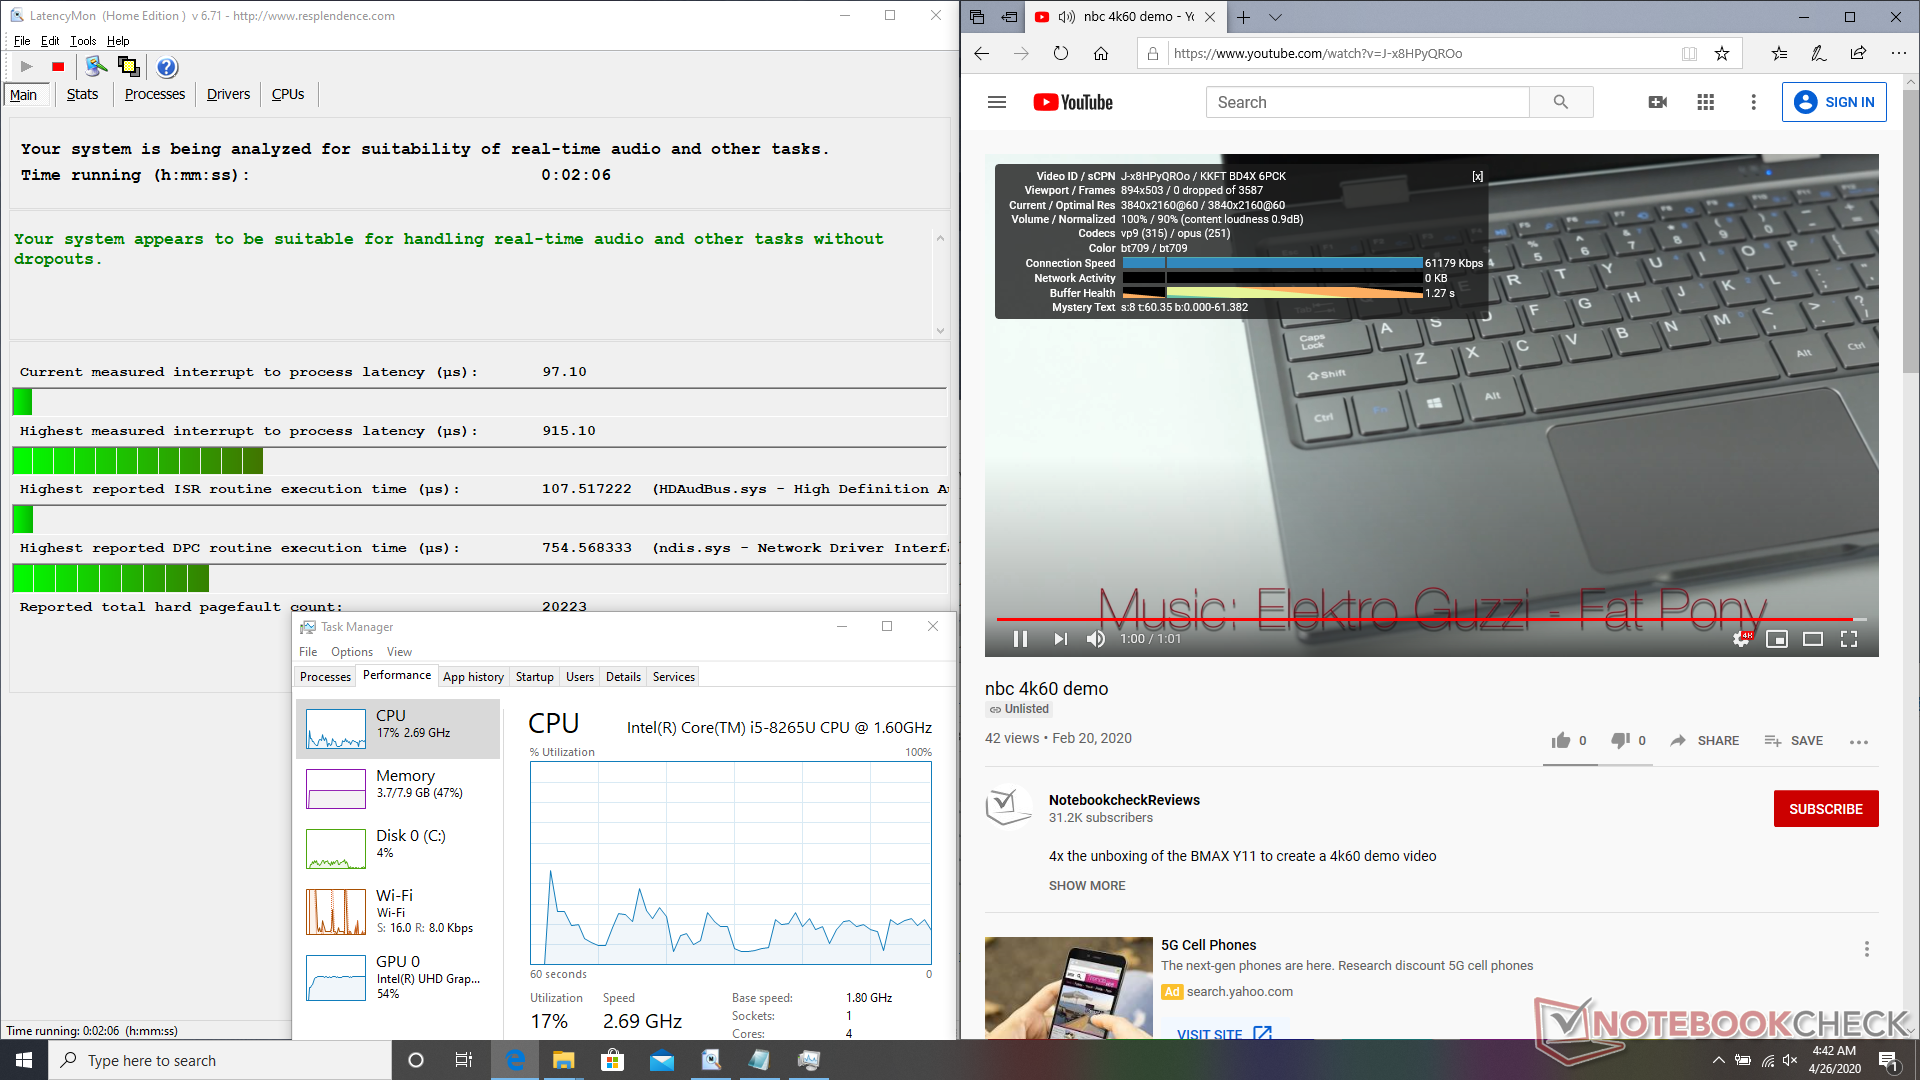
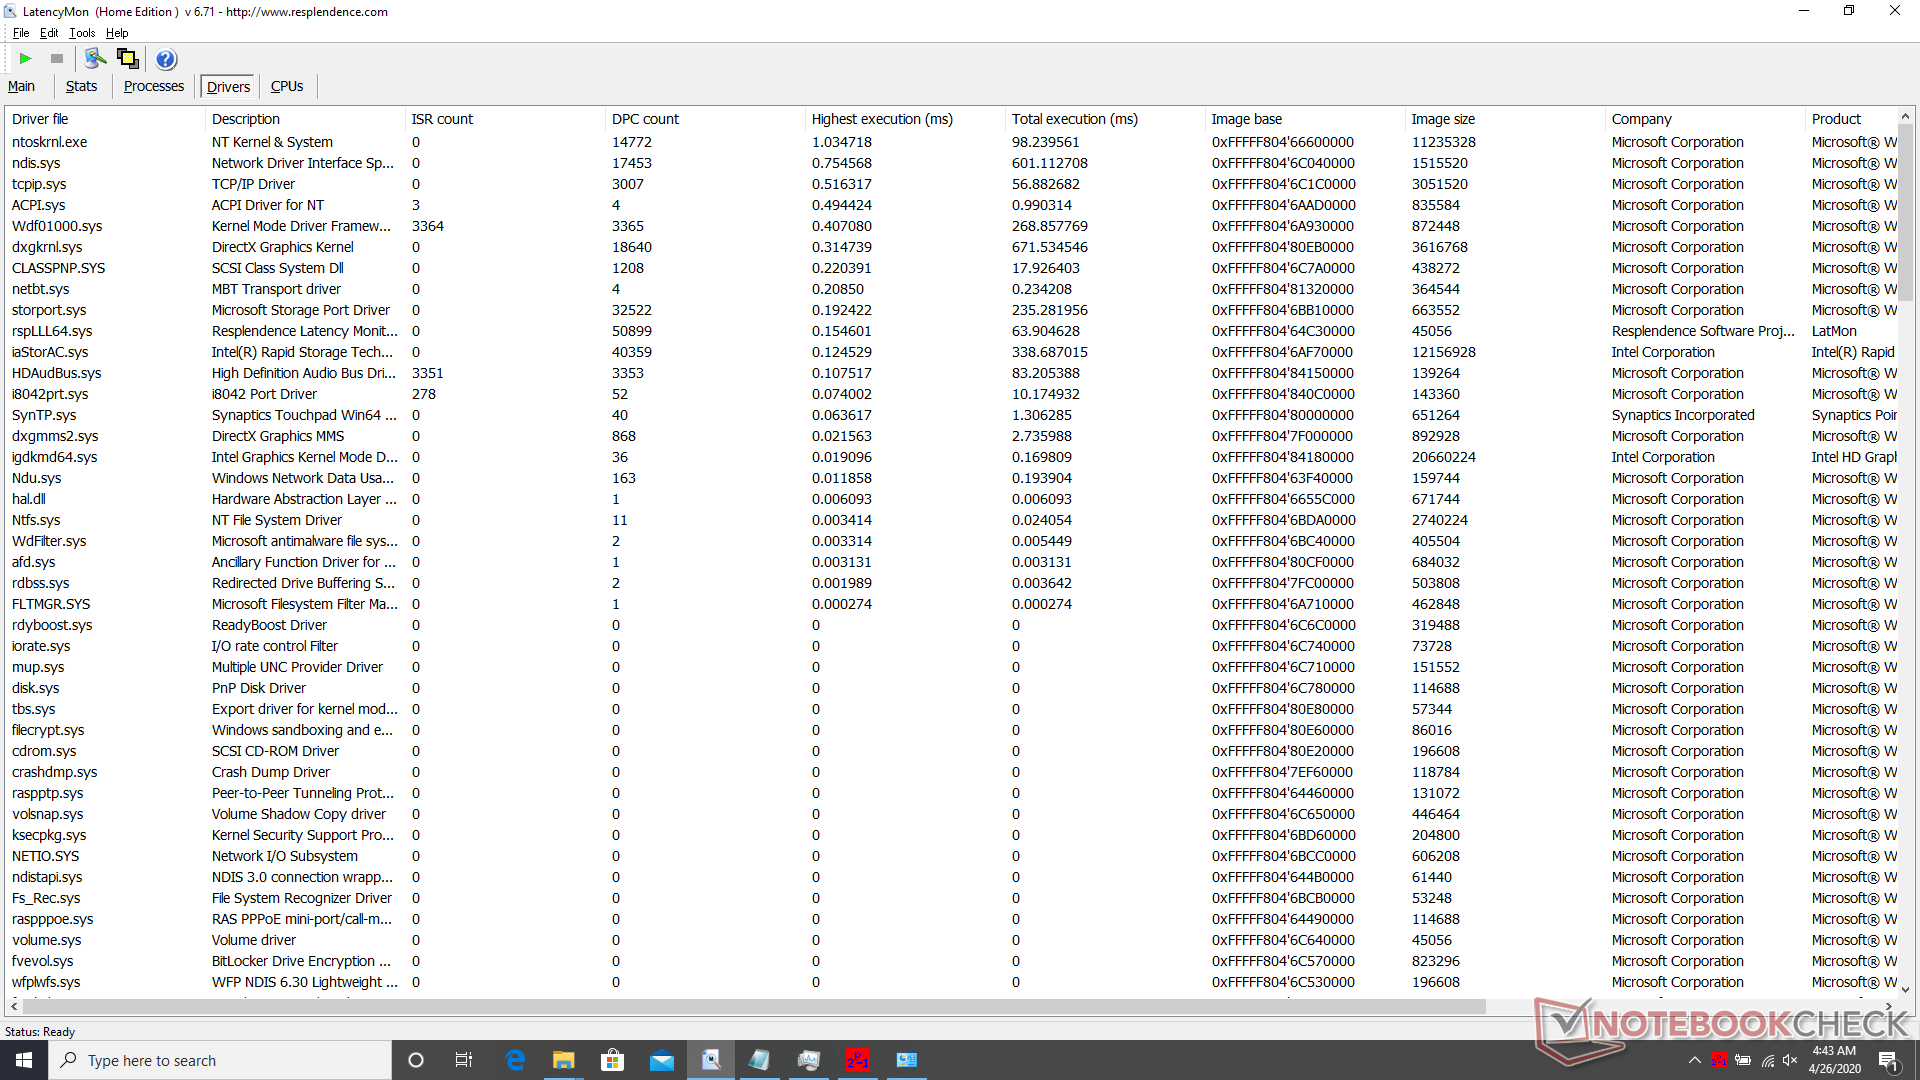
LatencyMon shows DPC latency issues when running Prime95 with a DPC routine execution time of 1034 μs. Otherwise, the system runs smoothly when opening multiple browser tabs and playing 4K UHD video. Our minute-long test video on YouTube returns no dropped frames.
| DPC Latencies / LatencyMon - interrupt to process latency (max), Web, Youtube, Prime95 | |
| Durabook S15ABG2 | |
* ... smaller is better
Storage Devices
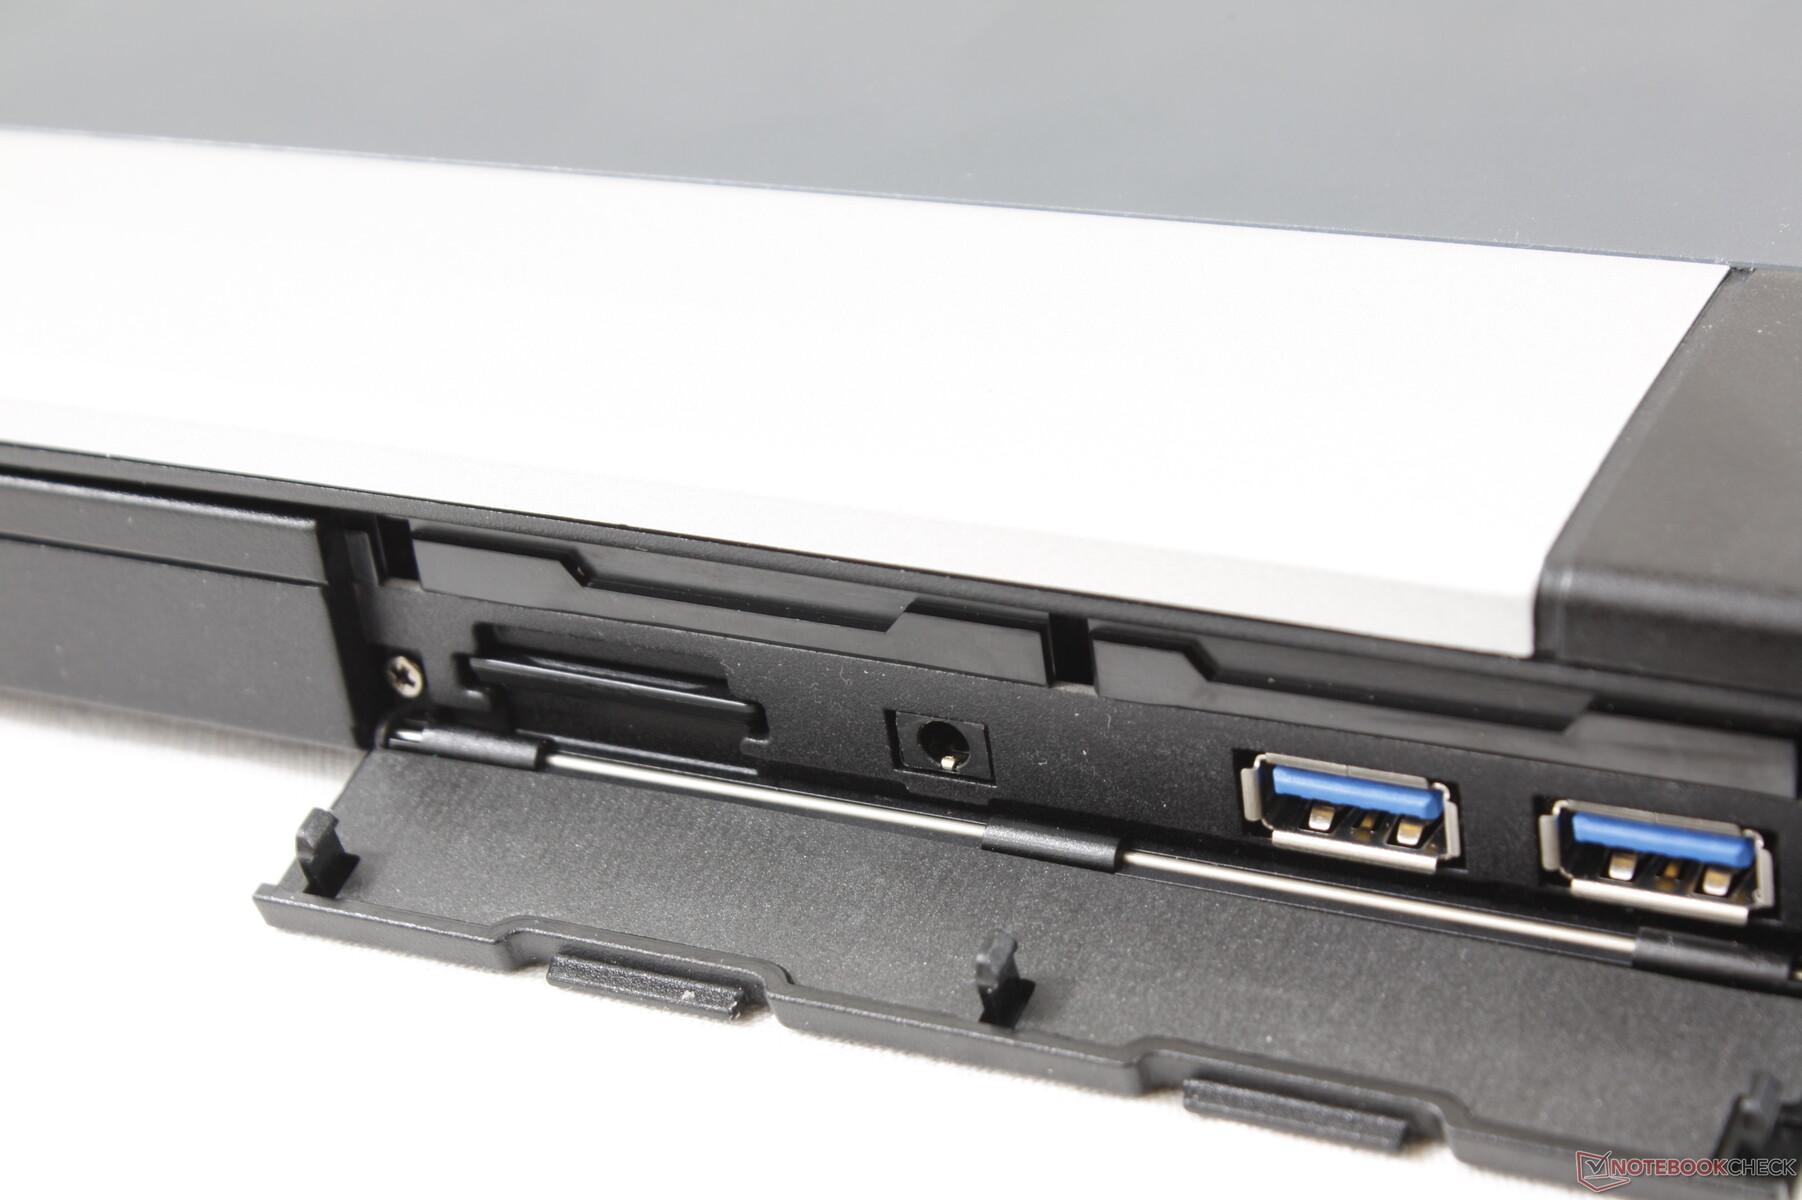
Two internal storage bays are available: one standard 2.5-inch SATA III bay and one proprietary side-loaded bay. The side-loaded bay can house up to two storage drives for up to three drives in total.
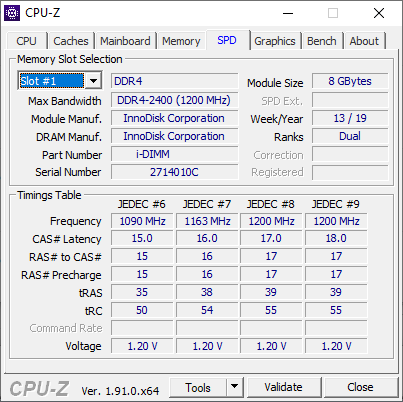
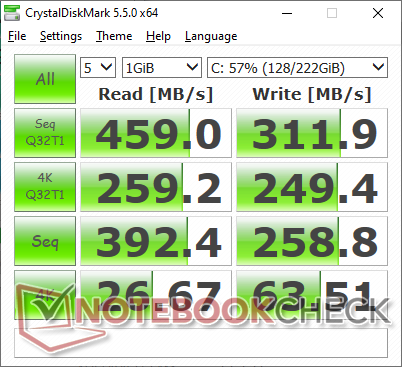
Our test unit comes with a 256 GB SATA III SSD whereas other laptops have moved on to faster and smaller PCIe drives.
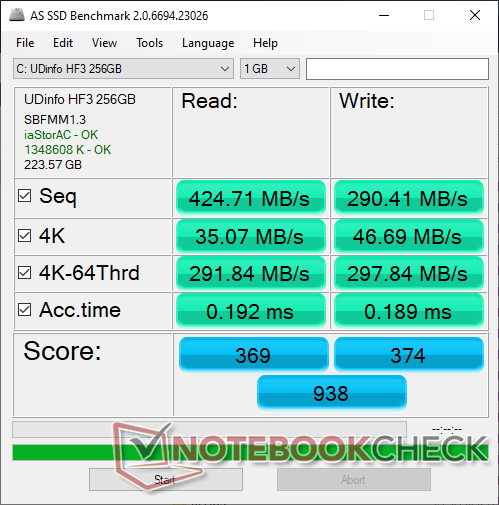
| Durabook S15ABG2 UDinfo HF3-25UB HF325UB256GBA2P | Dell Latitude 7424 Rugged Extreme SK Hynix PC401 512GB M.2 (HFS512GD9TNG) | Dell Latitude 5420 Rugged-P85G SK hynix PC401 NVMe 500 GB | Panasonic Toughbook FZ-55 Samsung SSD PM871b MZNLN256HAJQ | Fujitsu Celsius H780 Samsung SSD PM981 MZVLB512HAJQ | Fujitsu Lifebook A357-A3570MPH06DE Micron SSD 1100 SED 256GB MTFDDAK256TBN | |
|---|---|---|---|---|---|---|
| AS SSD | 138% | 188% | 36% | 306% | 10% | |
| Seq Read (MB/s) | 424.7 | 2096 394% | 2054 384% | 437.7 3% | 1049 147% | 494.3 16% |
| Seq Write (MB/s) | 290.4 | 1016 250% | 653 125% | 387.3 33% | 1882 548% | 341.5 18% |
| 4K Read (MB/s) | 35.07 | 39.91 14% | 39.34 12% | 26.18 -25% | 48.35 38% | 23.9 -32% |
| 4K Write (MB/s) | 46.69 | 97.9 110% | 96.4 106% | 60.3 29% | 102.5 120% | 65.9 41% |
| 4K-64 Read (MB/s) | 291.8 | 636 118% | 677 132% | 369.8 27% | 1395 378% | 236.1 -19% |
| 4K-64 Write (MB/s) | 297.8 | 604 103% | 982 230% | 313.7 5% | 1789 501% | 258.3 -13% |
| Access Time Read * (ms) | 0.192 | 0.044 77% | 0.044 77% | 0.089 54% | 0.066 66% | 0.115 40% |
| Access Time Write * (ms) | 0.189 | 0.051 73% | 0.051 73% | 0.058 69% | 0.037 80% | 0.057 70% |
| Score Read (Points) | 369 | 886 140% | 921 150% | 440 19% | 1549 320% | 309 -16% |
| Score Write (Points) | 374 | 804 115% | 1143 206% | 413 10% | 2080 456% | 358 -4% |
| Score Total (Points) | 938 | 2099 124% | 2475 164% | 1083 15% | 4469 376% | 827 -12% |
| Copy ISO MB/s (MB/s) | 371.3 | 1622 337% | 553 49% | 1547 317% | 311.7 -16% | |
| Copy Program MB/s (MB/s) | 151.3 | 378.1 150% | 204.7 35% | 405.9 168% | 149.6 -1% | |
| Copy Game MB/s (MB/s) | 134.7 | 793 489% | 385.9 186% | 1170 769% | 229.6 70% | |
| CrystalDiskMark 5.2 / 6 | 220% | 152% | 20% | 237% | 11% | |
| Write 4K (MB/s) | 63.5 | 114.4 80% | 98.8 56% | 55.4 -13% | 98.3 55% | 72.1 14% |
| Read 4K (MB/s) | 26.67 | 43.86 64% | 38.51 44% | 31.11 17% | 40.18 51% | 25 -6% |
| Write Seq (MB/s) | 258.8 | 1281 395% | 843 226% | 460.9 78% | 1777 587% | 413.2 60% |
| Read Seq (MB/s) | 392.4 | 1918 389% | 1282 227% | 481.9 23% | 1247 218% | 488.9 25% |
| Write 4K Q32T1 (MB/s) | 249.4 | 422.5 69% | 355.5 43% | 234.6 -6% | 344.7 38% | 161.5 -35% |
| Read 4K Q32T1 (MB/s) | 259.2 | 260.6 1% | 241.4 -7% | 181.7 -30% | 383.1 48% | 184.8 -29% |
| Write Seq Q32T1 (MB/s) | 311.9 | 1282 311% | 893 186% | 528 69% | 2019 547% | 432.3 39% |
| Read Seq Q32T1 (MB/s) | 459 | 2515 448% | 2478 440% | 548 19% | 2076 352% | 531 16% |
| Write 4K Q8T8 (MB/s) | 1751 | |||||
| Read 4K Q8T8 (MB/s) | 1568 | |||||
| Total Average (Program / Settings) | 179% /
172% | 170% /
175% | 28% /
30% | 272% /
281% | 11% /
10% |
* ... smaller is better

GPU Performance
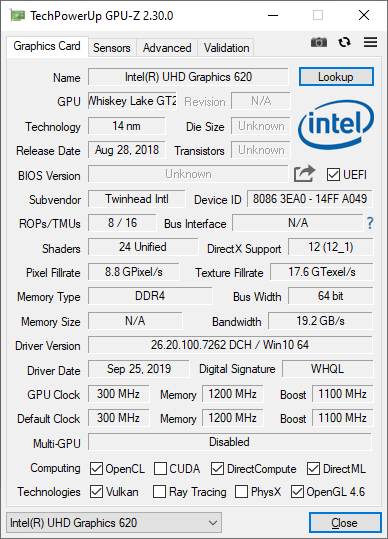
The integrated UHD Graphics 620 holds no surprises. The years-old GPU is unfit for any graphics-heavy workloads as one would expect. This particular model does not offer any discrete graphics options either unlike the Dell Latitude 7424 and its more capable Radeon RX 540 GPU.
See our dedicated page on the UHD Graphics 620 for more technical information and benchmarks.
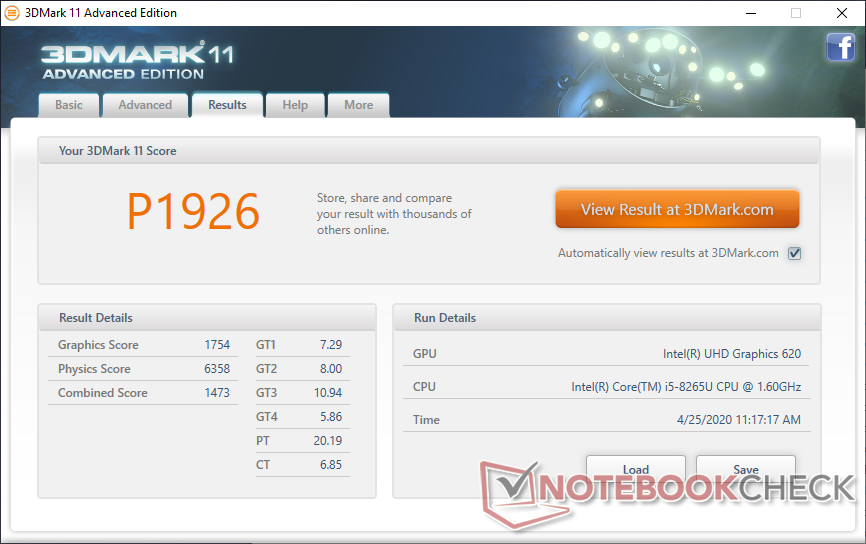
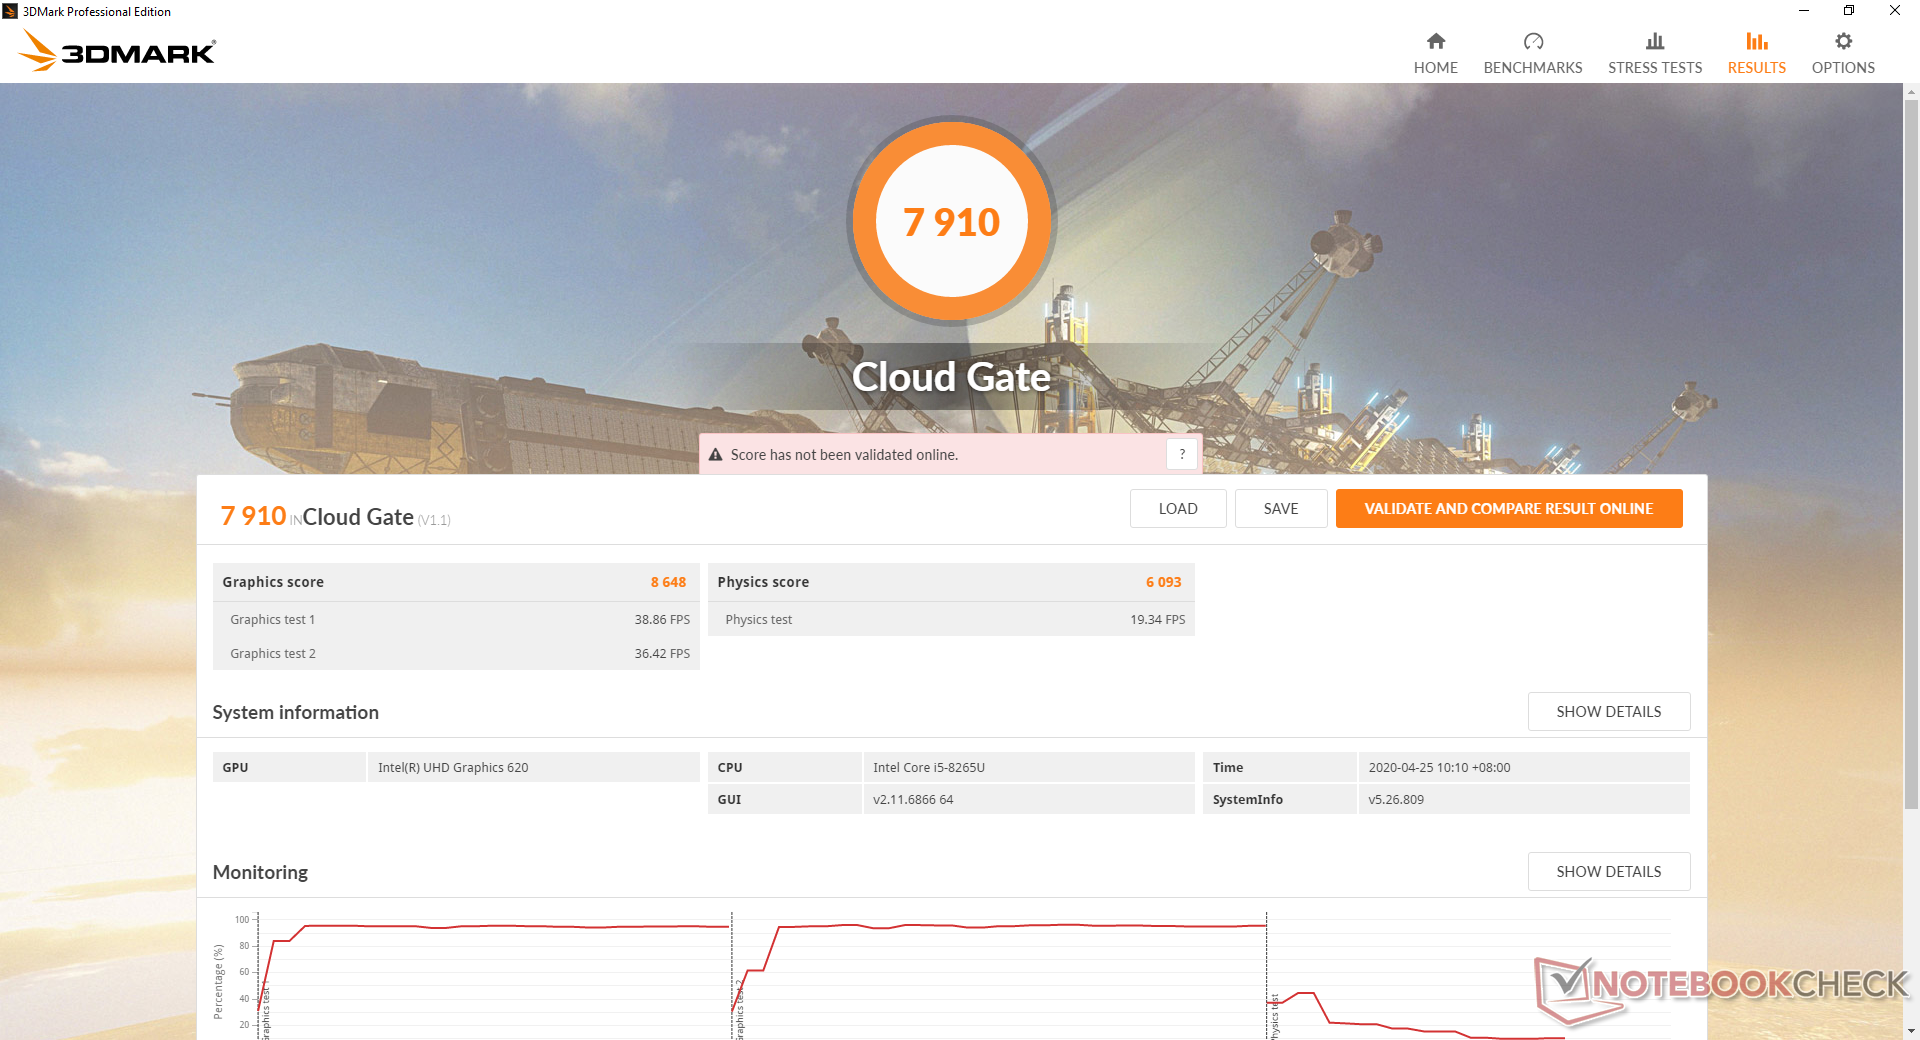
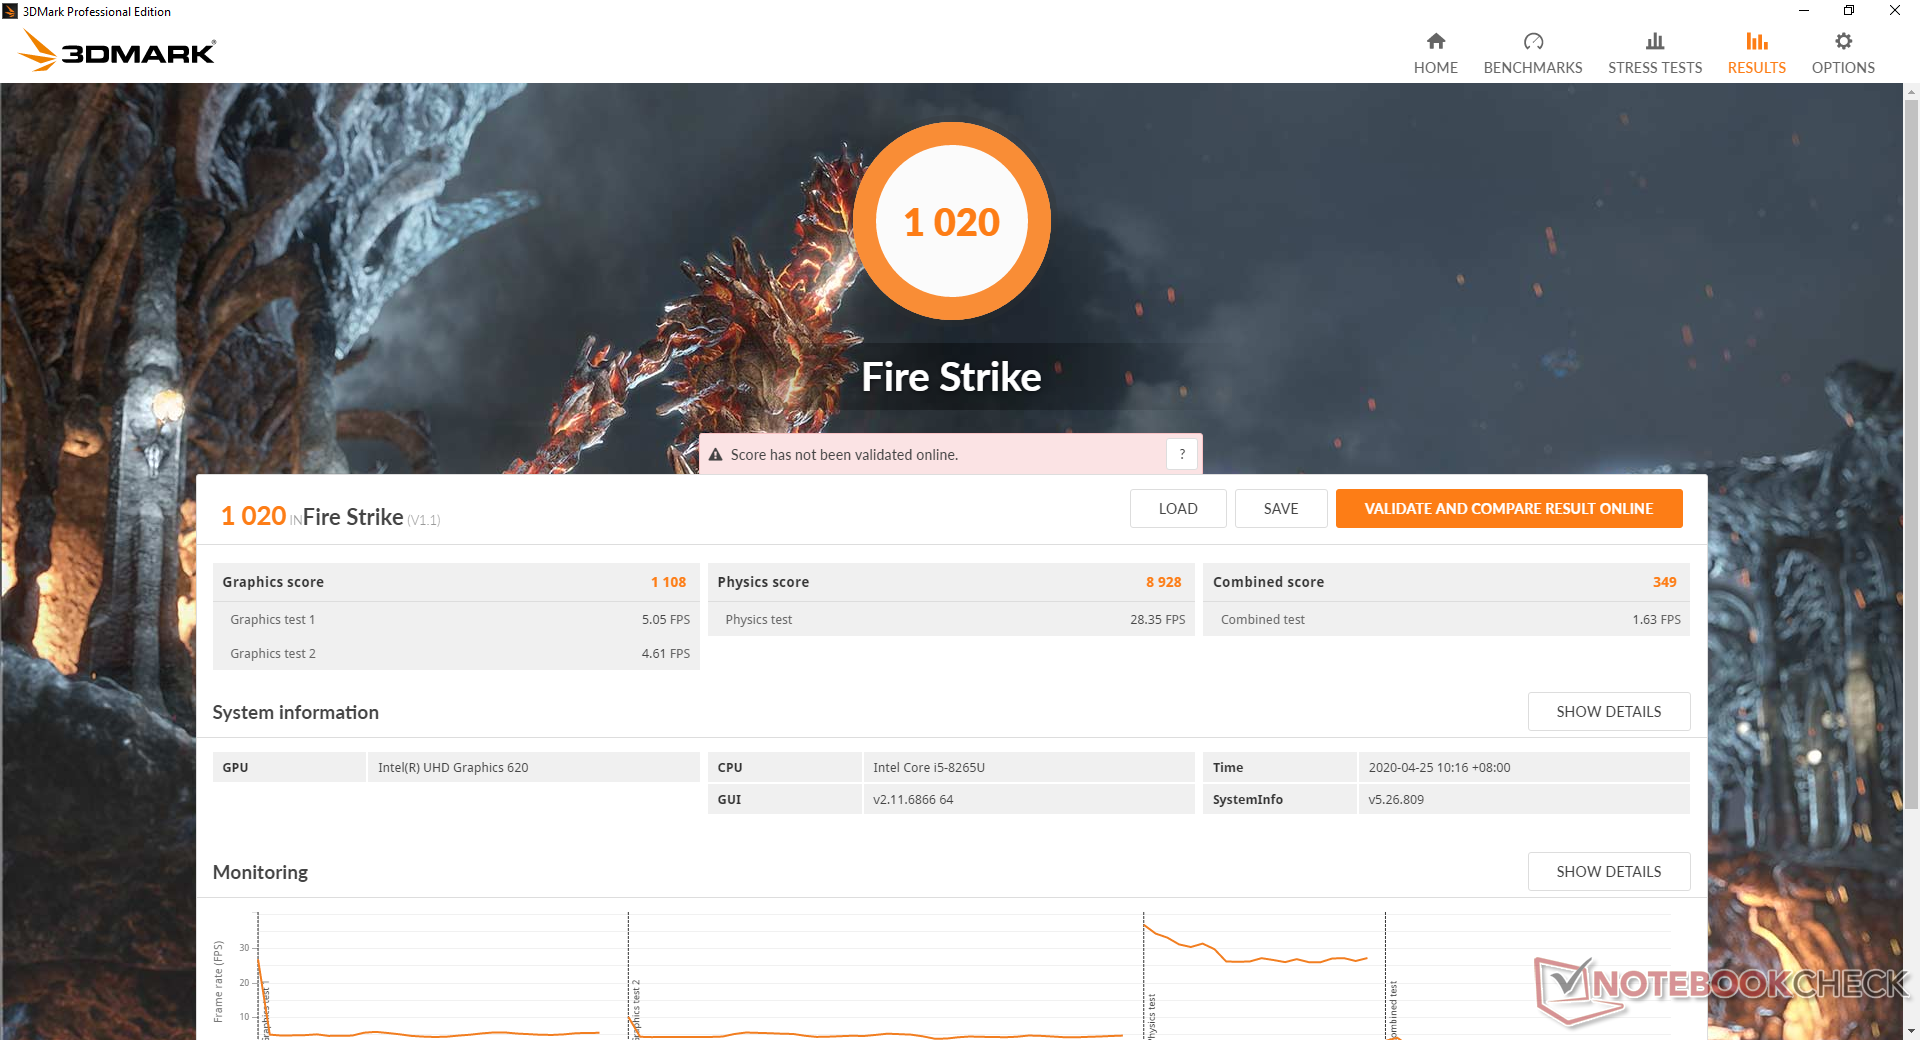
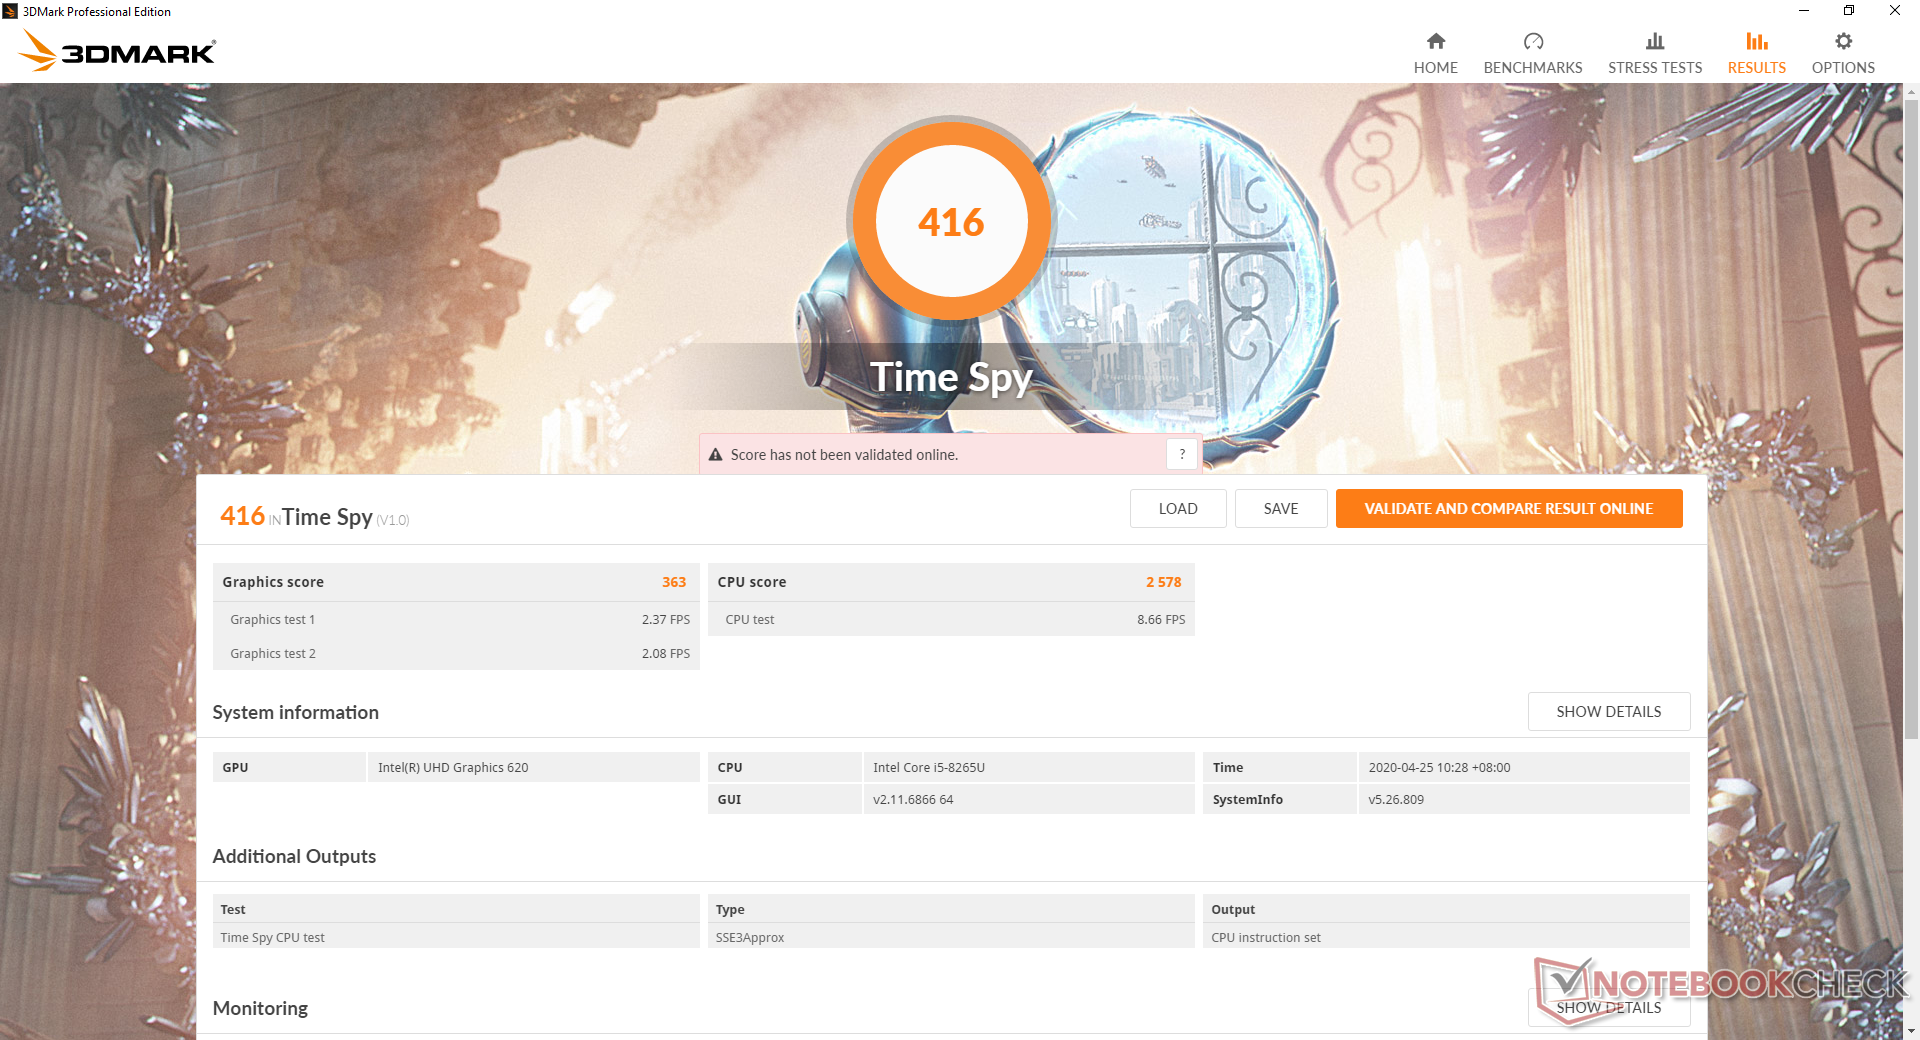
| 3DMark 11 Performance | 1926 points | |
| 3DMark Cloud Gate Standard Score | 7910 points | |
| 3DMark Fire Strike Score | 1020 points | |
| 3DMark Time Spy Score | 416 points | |
Help | ||
| low | med. | high | ultra | |
|---|---|---|---|---|
| Dota 2 Reborn (2015) | 71.3 | 42.3 | 19.1 | 16.7 |
| X-Plane 11.11 (2018) | 20.9 | 14.2 | 12.8 |
Emissions
System Noise
The fan will idle during low loads like word processing. If browsing or video streaming, fan noise will jump from a silent 29.3 dB(A) to 31.7 dB(A). If running higher loads like gaming, fan noise will increase to 35.5 dB(A) to be audible but not bothersome. The fan tends to pulse when running medium loads instead of remaining constant.
Running extreme loads like Prime95 will induce a fan noise of up to 38 dB(A) temporarily before it drops back down to a constant 35.5 dB(A).
We can notice no major electronic noise or coil whine on our unit.
| Durabook S15ABG2 UHD Graphics 620, i5-8265U, UDinfo HF3-25UB HF325UB256GBA2P | Dell Latitude 7424 Rugged Extreme Radeon RX 540, i7-8650U, SK Hynix PC401 512GB M.2 (HFS512GD9TNG) | Panasonic Toughbook FZ-55 UHD Graphics 620, i5-8365U, Samsung SSD PM871b MZNLN256HAJQ | Fujitsu Lifebook A357-A3570MPH06DE HD Graphics 620, i5-7200U, Micron SSD 1100 SED 256GB MTFDDAK256TBN | Dell Latitude 5420 Rugged-P85G Radeon RX 540, i7-8650U, SK hynix PC401 NVMe 500 GB | |
|---|---|---|---|---|---|
| Noise | 2% | 2% | -2% | 5% | |
| off / environment * (dB) | 29.3 | 28.6 2% | 29 1% | 30.3 -3% | 28.3 3% |
| Idle Minimum * (dB) | 29.3 | 28.6 2% | 29 1% | 30.3 -3% | 28.3 3% |
| Idle Average * (dB) | 29.3 | 28.6 2% | 29.6 -1% | 30.3 -3% | 28.3 3% |
| Idle Maximum * (dB) | 29.3 | 28.6 2% | 30.5 -4% | 30.3 -3% | 28.3 3% |
| Load Average * (dB) | 35.5 | 32.9 7% | 30.3 15% | 37 -4% | 29.9 16% |
| Load Maximum * (dB) | 38 | 39 -3% | 39 -3% | 36.9 3% | 38 -0% |
* ... smaller is better
Noise level
| Idle |
| 29.3 / 29.3 / 29.3 dB(A) |
| Load |
| 35.5 / 38 dB(A) |
 | ||
30 dB silent 40 dB(A) audible 50 dB(A) loud |
||
min: | ||
Temperature
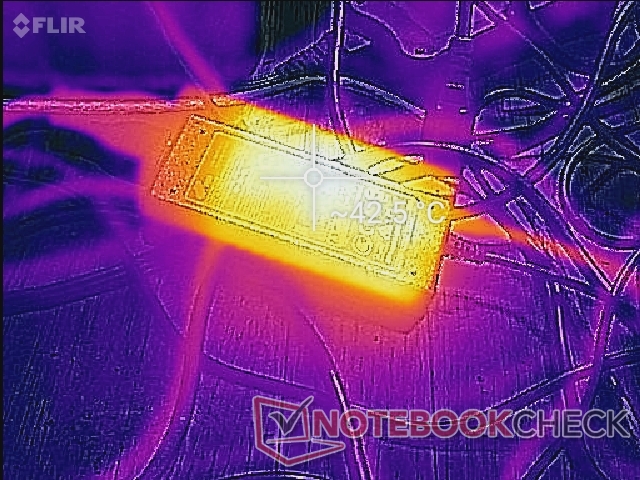
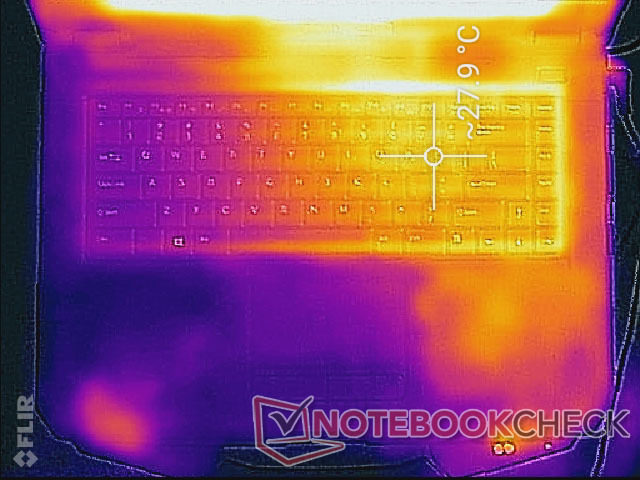
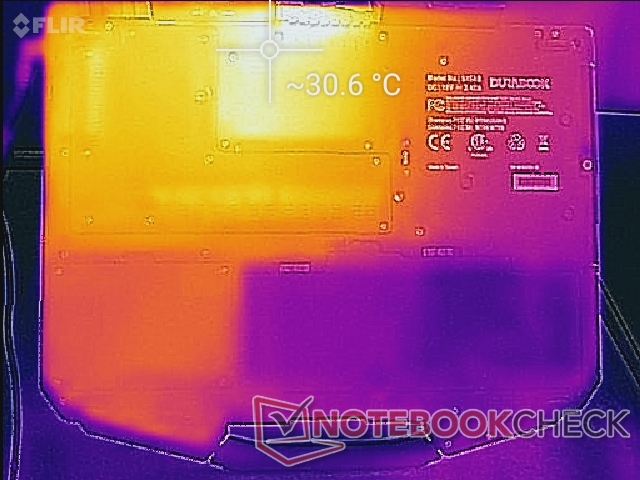
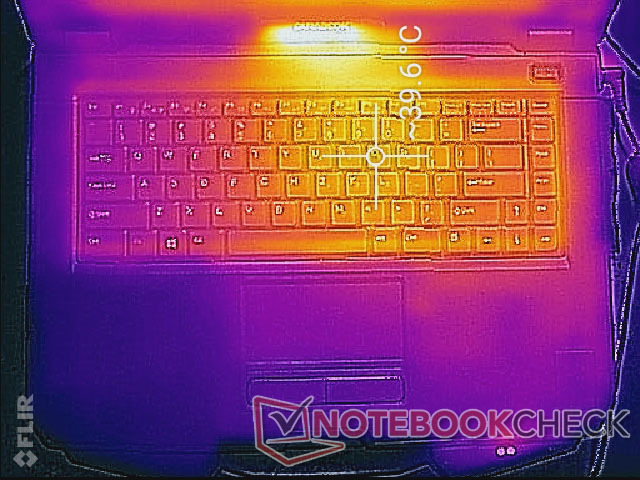
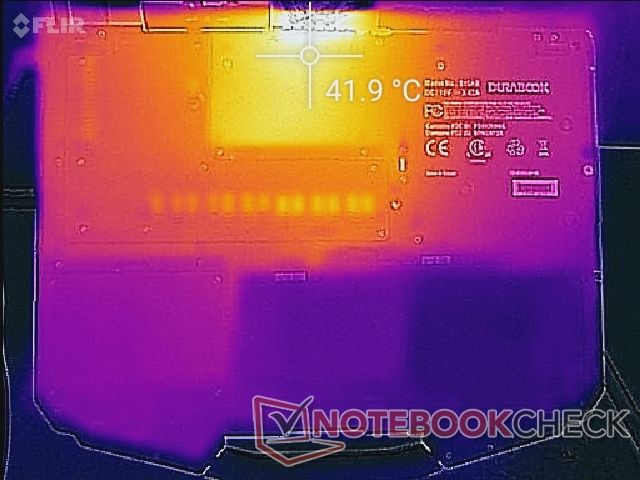
Surface temperatures are not an issue no matter the load due to the ULV CPU and thick build. At worst, hot spots toward the rear of the system can become as warm as 42 C after running Prime95 and FurMark for an hour as shown by the temperature maps below.
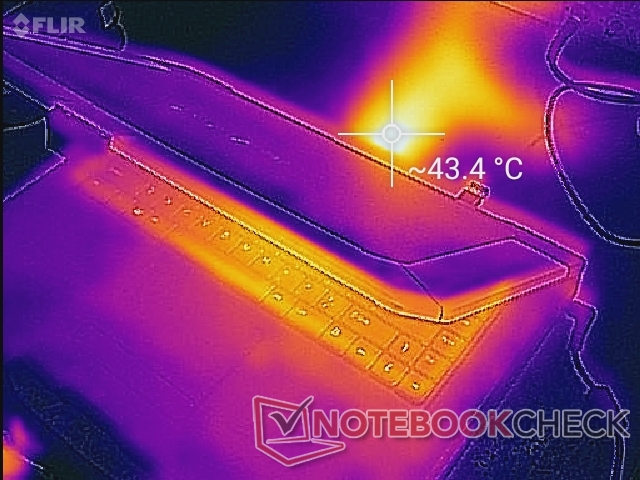
(±) The maximum temperature on the upper side is 44 °C / 111 F, compared to the average of 34.3 °C / 94 F, ranging from 21.2 to 62.5 °C for the class Office.
(±) The bottom heats up to a maximum of 42 °C / 108 F, compared to the average of 36.8 °C / 98 F
(+) In idle usage, the average temperature for the upper side is 26.4 °C / 80 F, compared to the device average of 29.5 °C / 85 F.
(+) The palmrests and touchpad are cooler than skin temperature with a maximum of 30.6 °C / 87.1 F and are therefore cool to the touch.
(-) The average temperature of the palmrest area of similar devices was 27.5 °C / 81.5 F (-3.1 °C / -5.6 F).
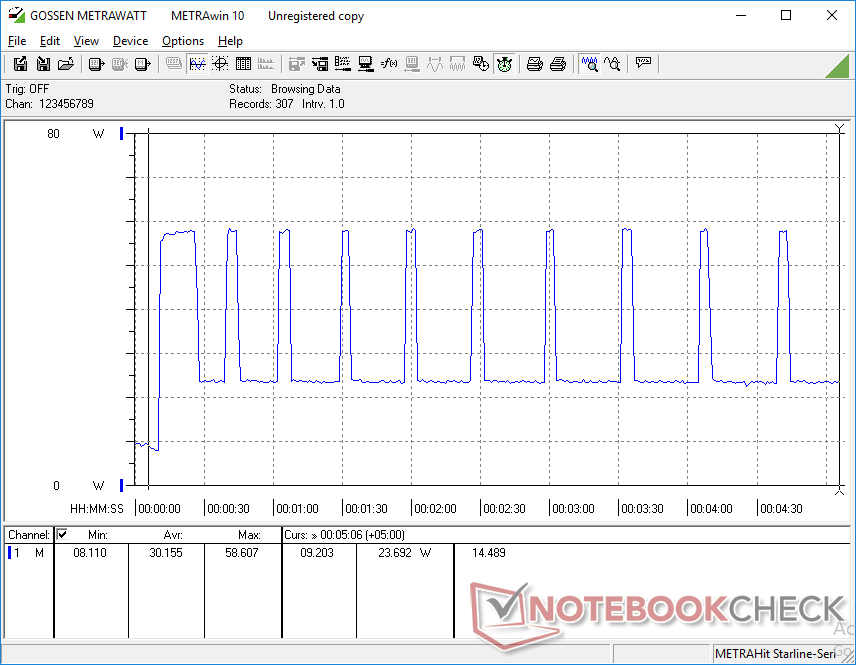
Stress Test
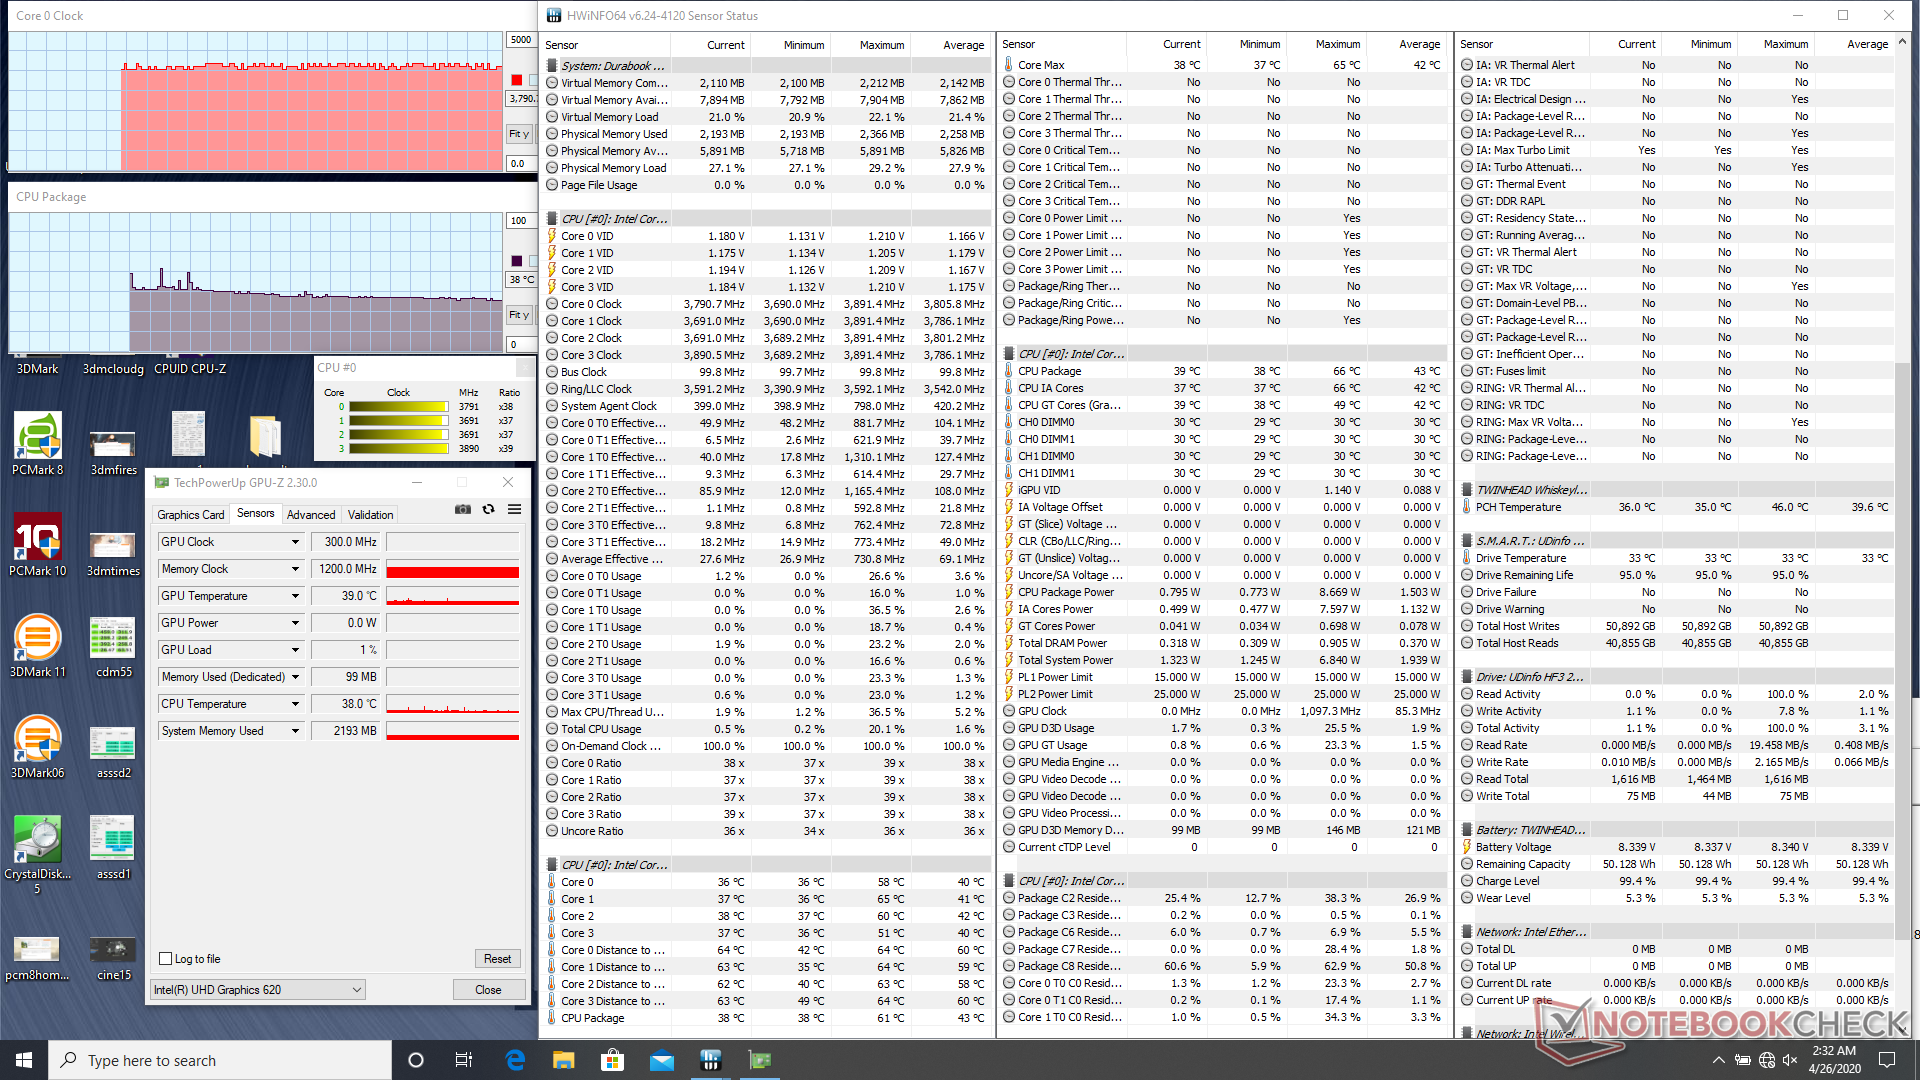
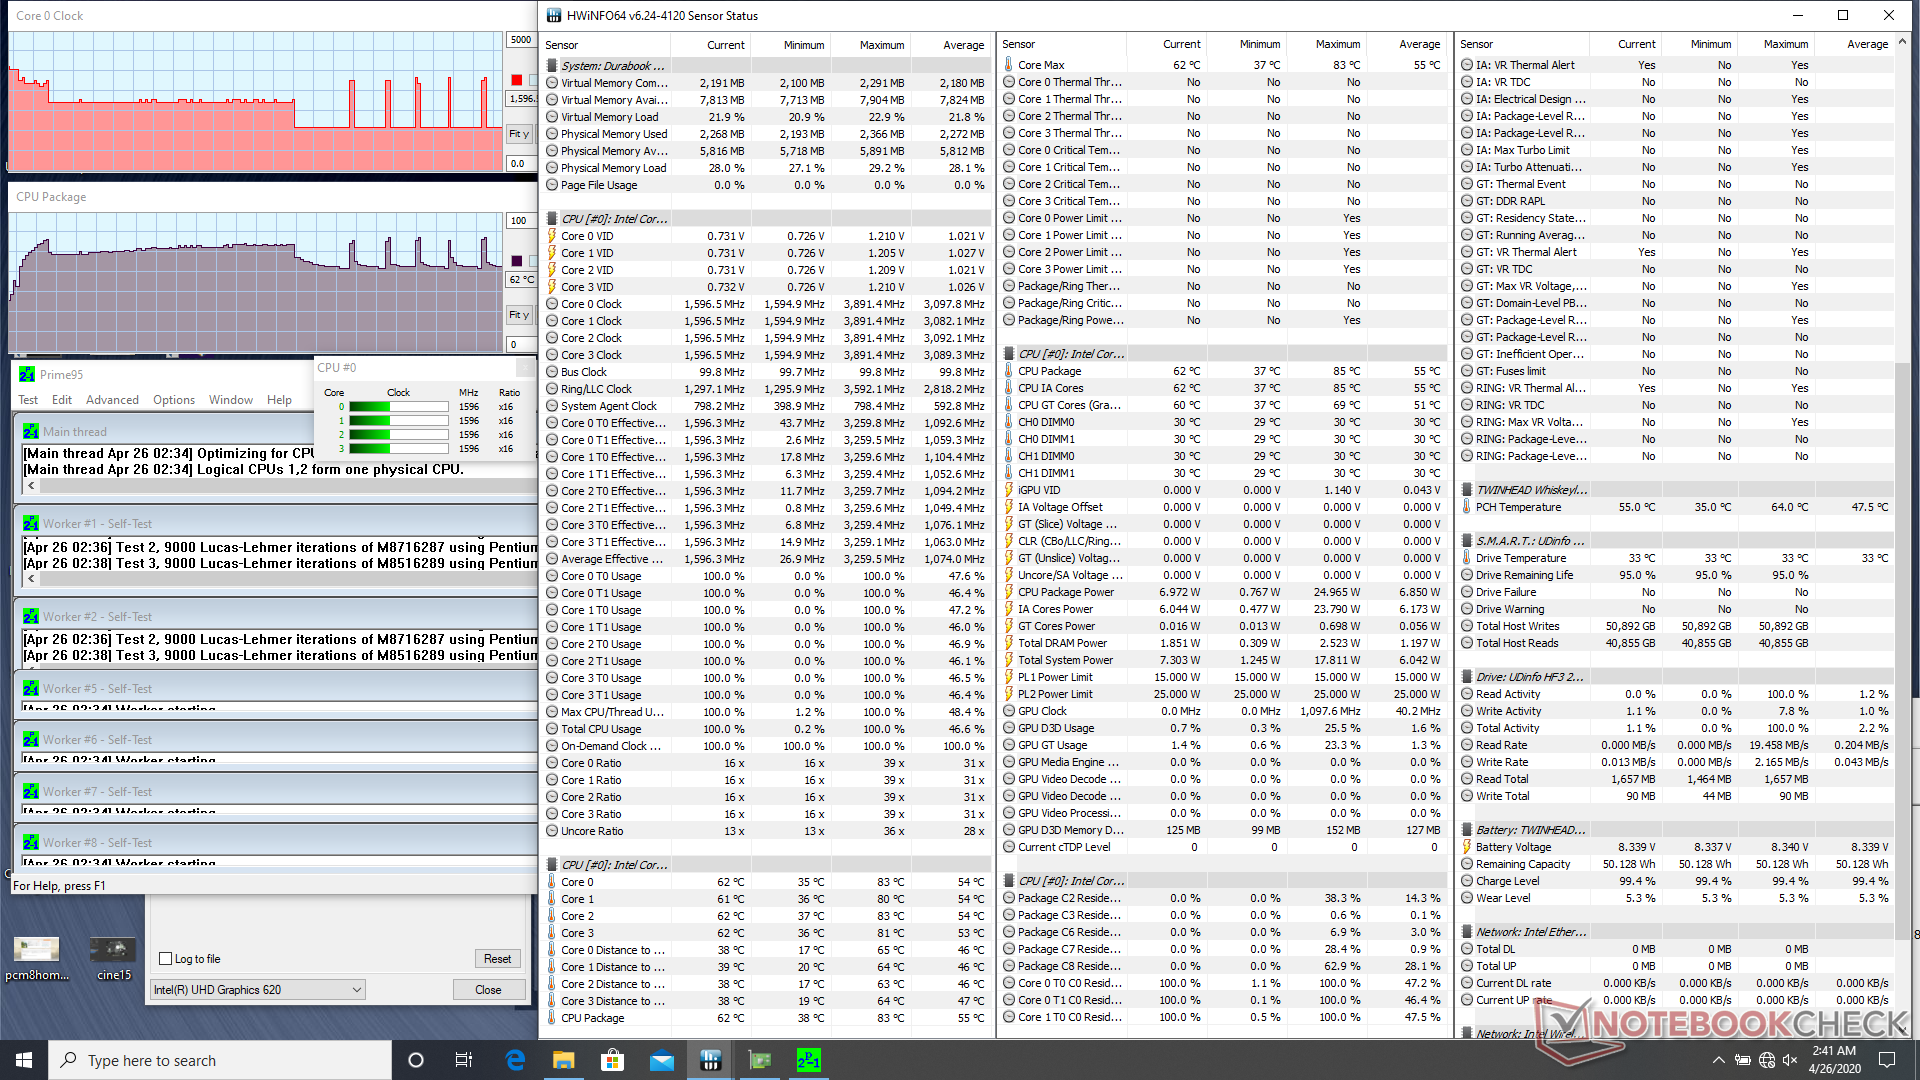
We stress the system with synthetic loads to identify for any potential throttling or stability issues. When running Prime95, the CPU would spike up to 3.2 GHz for a few seconds until hitting a core temperature of 82 C. Thereafter, clock rates would drop to a constant 2.5 GHz and 72 C for a few minutes. Eventually, however, clock rates will drop even further to 1.6 GHz with short-lived spikes to 3.3 GHz as shown by our screenshot below. The sudden spikes in clock rate correlate with the short spikes in power consumption that we recorded in the next section below.
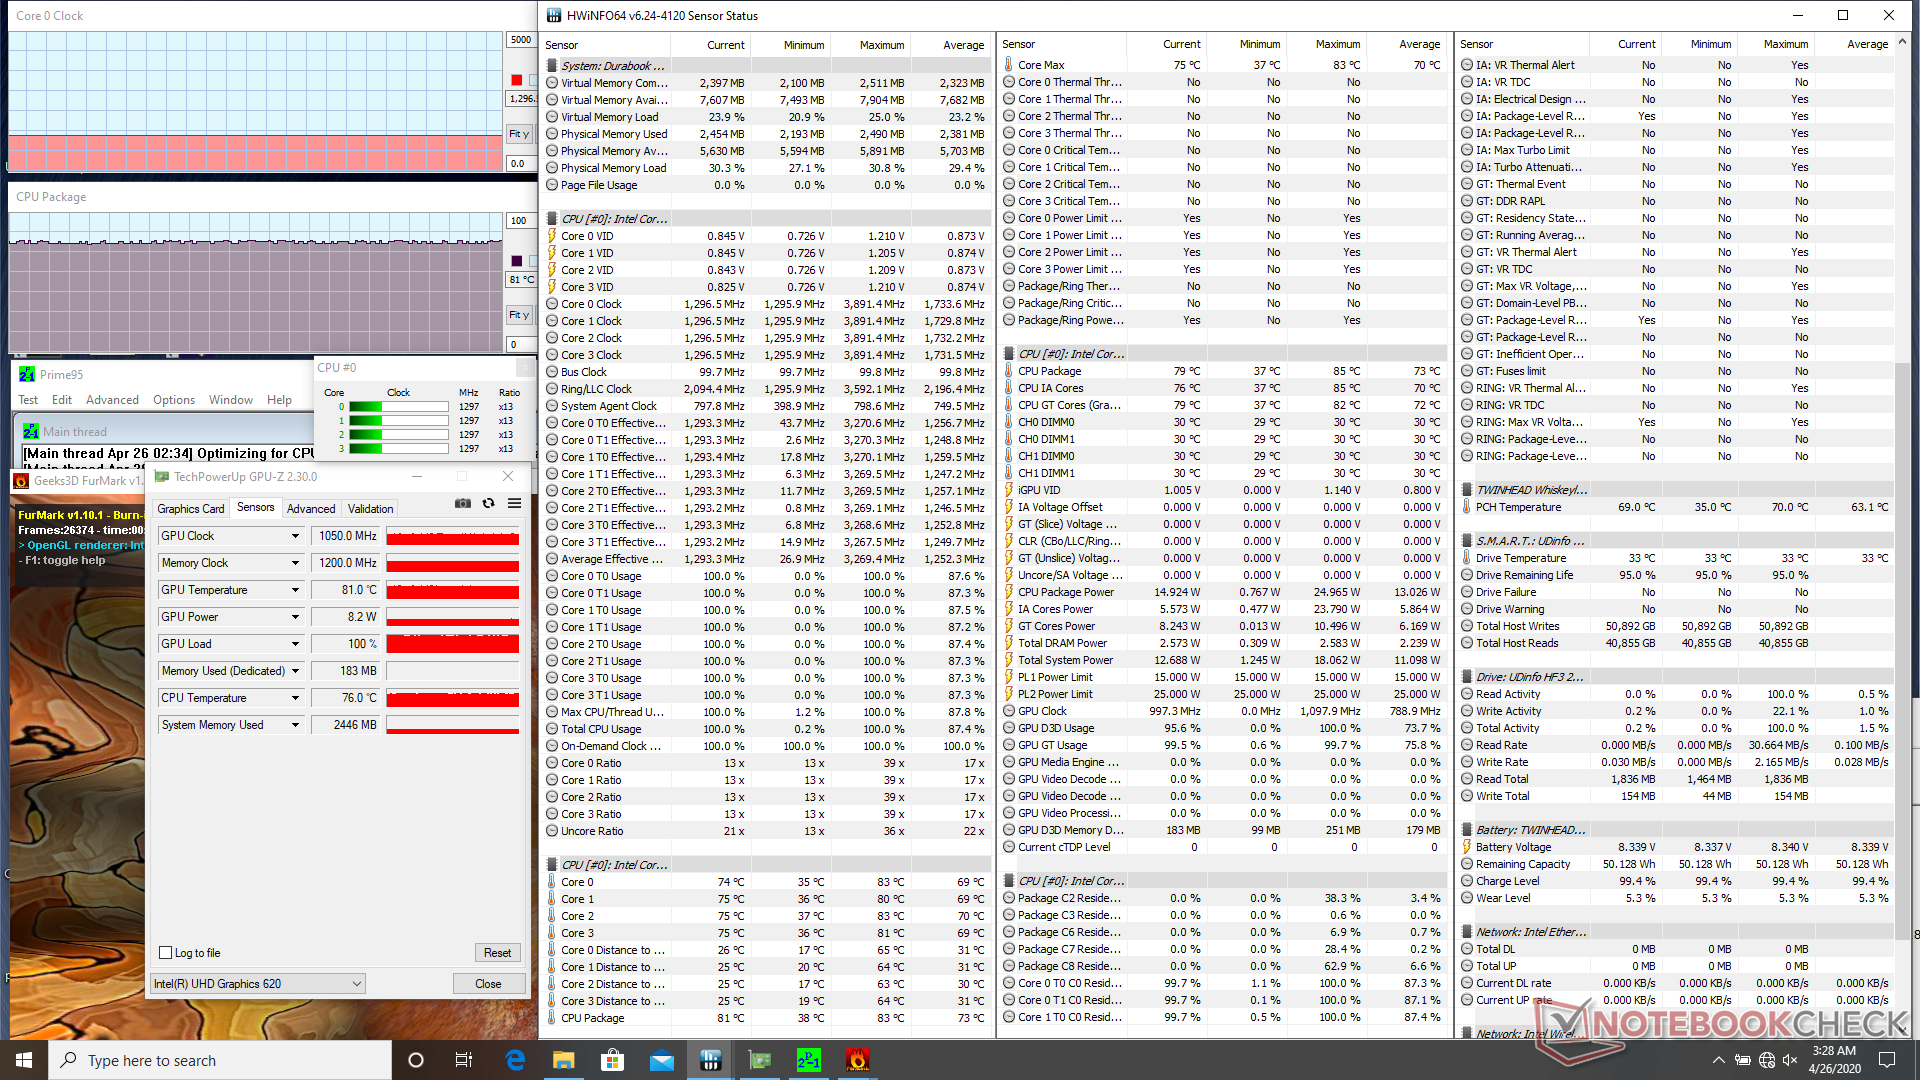
Running both Prime95 and FurMark will throttle the CPU down to 1.3 GHz and a core temperature of 81 C.
Performance will drop if running on battery power even when set to the High Performance profile. A 3DMark 11 test on batteries returns Physics and Graphics scores of 1616 and 1557 points, respectively, compared to 6358 and 1754 points when on mains.
| CPU Clock (GHz) | GPU Clock (MHz) | Average CPU Temperature (°C) | |
| System Idle | -- | -- | 38 |
| Prime95 Stress | 1.6 - 3.3 | -- | 61 - 81 |
| Prime95 + FurMark Stress | 1.3 | 1050 | 81 |
Speakers
Audio is sufficient as the limited bass shouldn't be an issue for the target audience. However, we're able to notice slight crackling noises from the speakers when setting the volume to maximum.

Durabook S15ABG2 audio analysis
(+) | speakers can play relatively loud (84.2 dB)
Bass 100 - 315 Hz
(-) | nearly no bass - on average 29% lower than median
(+) | bass is linear (4.9% delta to prev. frequency)
Mids 400 - 2000 Hz
(±) | higher mids - on average 8.4% higher than median
(±) | linearity of mids is average (12.6% delta to prev. frequency)
Highs 2 - 16 kHz
(+) | balanced highs - only 4% away from median
(±) | linearity of highs is average (11.8% delta to prev. frequency)
Overall 100 - 16.000 Hz
(-) | overall sound is not linear (32.5% difference to median)
Compared to same class
» 95% of all tested devices in this class were better, 2% similar, 4% worse
» The best had a delta of 7%, average was 21%, worst was 53%
Compared to all devices tested
» 92% of all tested devices were better, 2% similar, 7% worse
» The best had a delta of 4%, average was 23%, worst was 134%
Apple MacBook 12 (Early 2016) 1.1 GHz audio analysis
(+) | speakers can play relatively loud (83.6 dB)
Bass 100 - 315 Hz
(±) | reduced bass - on average 11.3% lower than median
(±) | linearity of bass is average (14.2% delta to prev. frequency)
Mids 400 - 2000 Hz
(+) | balanced mids - only 2.4% away from median
(+) | mids are linear (5.5% delta to prev. frequency)
Highs 2 - 16 kHz
(+) | balanced highs - only 2% away from median
(+) | highs are linear (4.5% delta to prev. frequency)
Overall 100 - 16.000 Hz
(+) | overall sound is linear (10.2% difference to median)
Compared to same class
» 7% of all tested devices in this class were better, 2% similar, 90% worse
» The best had a delta of 5%, average was 18%, worst was 53%
Compared to all devices tested
» 5% of all tested devices were better, 1% similar, 94% worse
» The best had a delta of 4%, average was 23%, worst was 134%
Energy Management
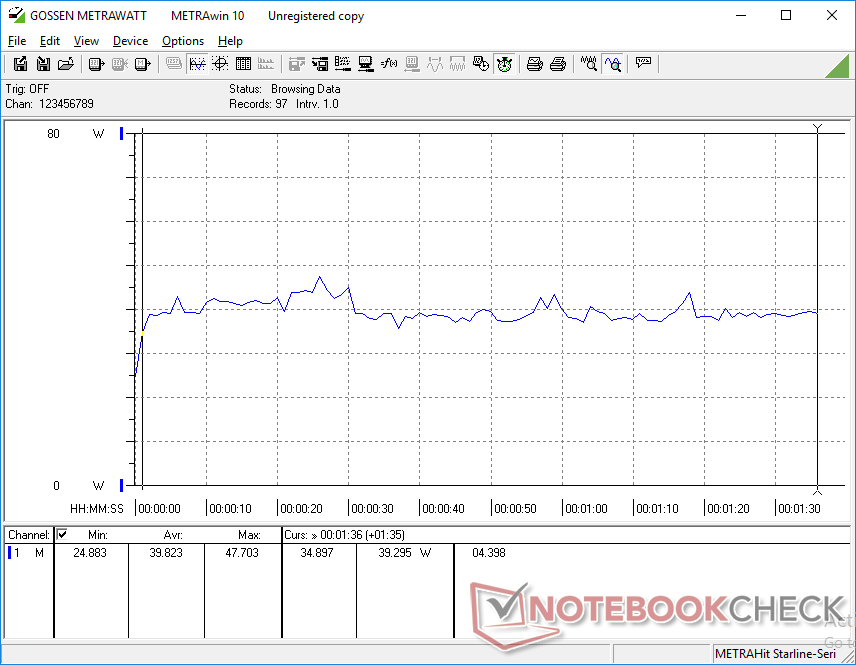
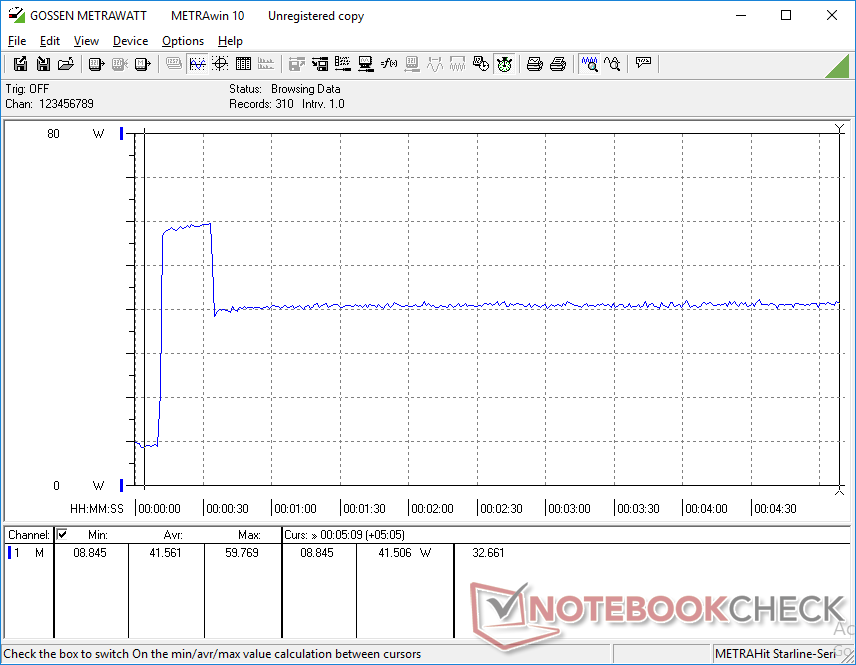
Power Consumption
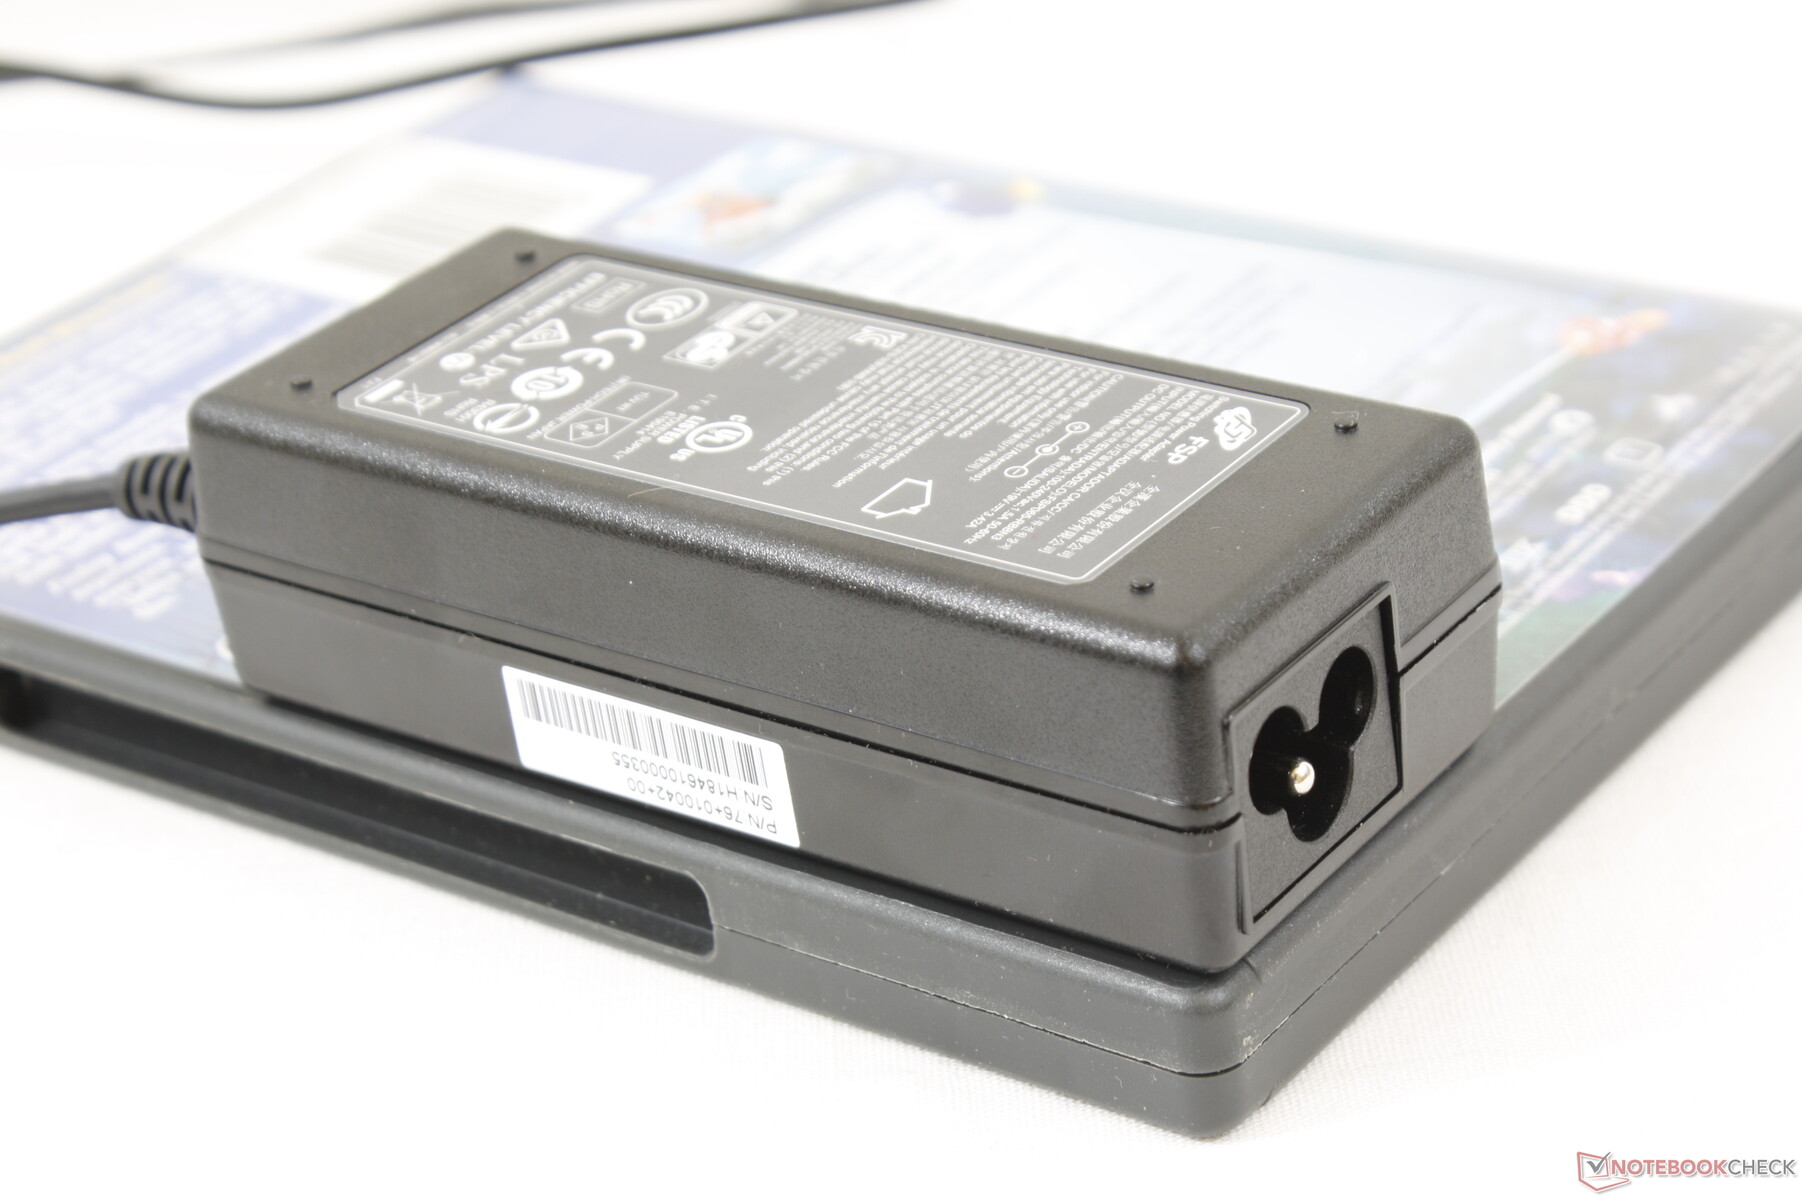
Idling on desktop consumes between 3 W and 9 W while higher loads like 3DMark 06 will consume about 40 W. We're able to record a maximum of 59.8 W from the small (~10.5 x 4.5 x 3 cm) 65 W AC adapter when stressing the processor to 100 percent utilization.
| Off / Standby | |
| Idle | |
| Load |
|
Key:
min: | |
| Durabook S15ABG2 i5-8265U, UHD Graphics 620, UDinfo HF3-25UB HF325UB256GBA2P, TN LED, 1920x1080, 15.6" | Dell Latitude 7424 Rugged Extreme i7-8650U, Radeon RX 540, SK Hynix PC401 512GB M.2 (HFS512GD9TNG), IPS, 1920x1080, 14" | Dell Latitude 5420 Rugged-P85G i7-8650U, Radeon RX 540, SK hynix PC401 NVMe 500 GB, IPS, 1920x1080, 14" | Panasonic Toughbook FZ-55 i5-8365U, UHD Graphics 620, Samsung SSD PM871b MZNLN256HAJQ, IPS, 1920x1080, 14" | Fujitsu Celsius H780 i7-8850H, Quadro P2000, Samsung SSD PM981 MZVLB512HAJQ, IPS LED, 1920x1080, 15.6" | Fujitsu Lifebook A357-A3570MPH06DE i5-7200U, HD Graphics 620, Micron SSD 1100 SED 256GB MTFDDAK256TBN, IPS, 1920x1080, 15.6" | |
|---|---|---|---|---|---|---|
| Power Consumption | -78% | -58% | -13% | -114% | 21% | |
| Idle Minimum * (Watt) | 3.5 | 6.5 -86% | 4.8 -37% | 3.7 -6% | 9.1 -160% | 3.65 -4% |
| Idle Average * (Watt) | 7.9 | 15.1 -91% | 13.6 -72% | 9.6 -22% | 13.2 -67% | 6.8 14% |
| Idle Maximum * (Watt) | 9 | 16.1 -79% | 13.8 -53% | 10.4 -16% | 14.04 -56% | 6.9 23% |
| Load Average * (Watt) | 39.8 | 70.5 -77% | 67.8 -70% | 40 -1% | 78.8 -98% | 29.1 27% |
| Load Maximum * (Watt) | 59.8 | 95.2 -59% | 93.5 -56% | 71.9 -20% | 172.5 -188% | 34 43% |
| Witcher 3 ultra * (Watt) | 68.1 | 69.1 |
* ... smaller is better
Battery Life
The removable battery pack offers just under 7 hours of real-world WLAN use. Charging from empty to full capacity takes about 2 hours. The system cannot be recharged via USB Type-C.
| Durabook S15ABG2 i5-8265U, UHD Graphics 620, 56 Wh | Dell Latitude 7424 Rugged Extreme i7-8650U, Radeon RX 540, 102 Wh | Dell Latitude 5420 Rugged-P85G i7-8650U, Radeon RX 540, 102 Wh | Panasonic Toughbook FZ-55 i5-8365U, UHD Graphics 620, 71 Wh | Fujitsu Lifebook A357-A3570MPH06DE i5-7200U, HD Graphics 620, 49 Wh | Dell Latitude 14 7414 Rugged Extreme 6300U, HD Graphics 520, 97 Wh | |
|---|---|---|---|---|---|---|
| Battery runtime | 70% | 135% | 167% | 14% | 52% | |
| WiFi v1.3 (h) | 6.9 | 11.7 70% | 16.2 135% | 18.4 167% | 7.9 14% | 10.5 52% |
| Load (h) | 2.7 | 3.2 | ||||
| Reader / Idle (h) | 31.4 |
Pros
Cons
Verdict
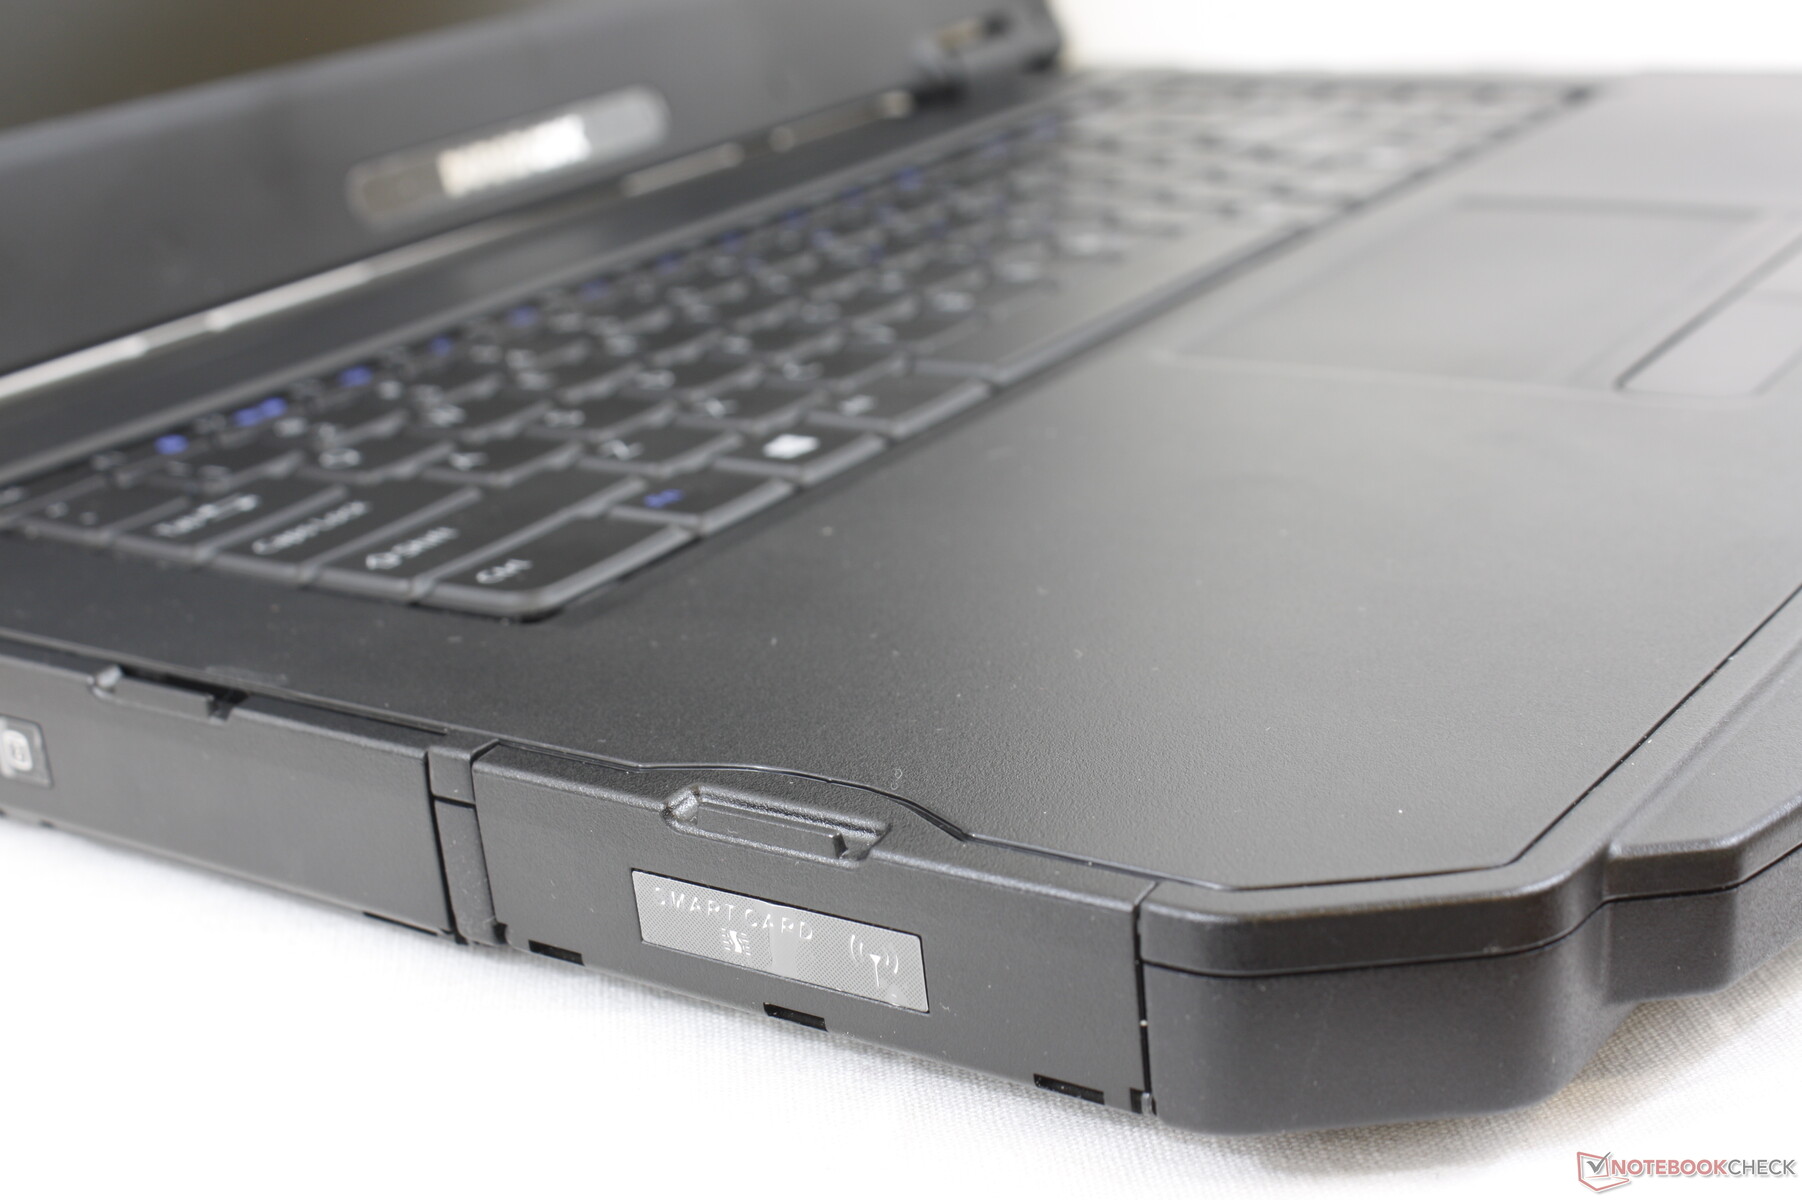
Our favorite aspect of the Durabook S15AB is the crisp feedback of the keyboard keys when typing and easy access to ports and internal upgrades. The protective flaps covering the ports on the Panasonic Toughbook FZ-55 and Getac S410, for example, are comparatively more difficult to open and finicky to access.
The one aspect that could use the most improvement would be the TN display and the fickle touchpad control. This is an an old display panel that doesn't hold up very well by today's IPS standards and it isn't bright enough to be used outdoors without needing to squint. The presence of pulse-width modulation could impact nighttime usage as well where lower brightness settings are desirable.
Users can customize and get a quote on the Durabook S15AB through the product page here.
Durabook S15ABG2
- 04/27/2020 v7 (old)
Allen Ngo
Price comparison
