Durabook S15 rugged laptop review: Surprisingly thin and light for the category

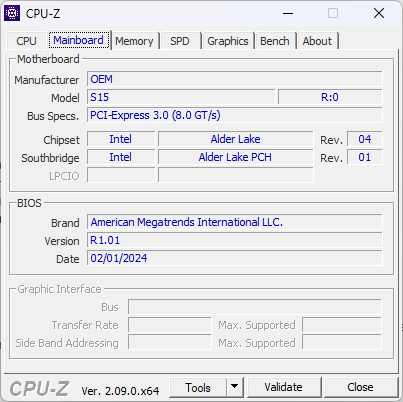
The 2024 S15 is the latest 15.6-inch rugged laptop from Durabook succeeding the older 2020 S15 design. It entails a handful of external changes alongside newer vPro-ready Alder Lake CPUs to replace the older 2020 Whiskey Lake-U options.
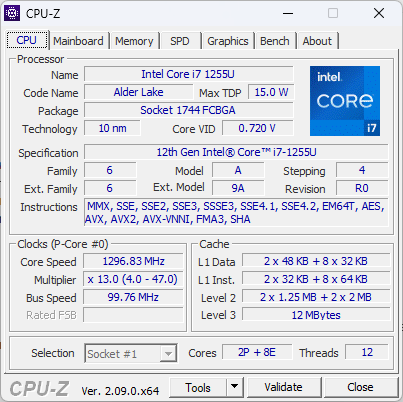
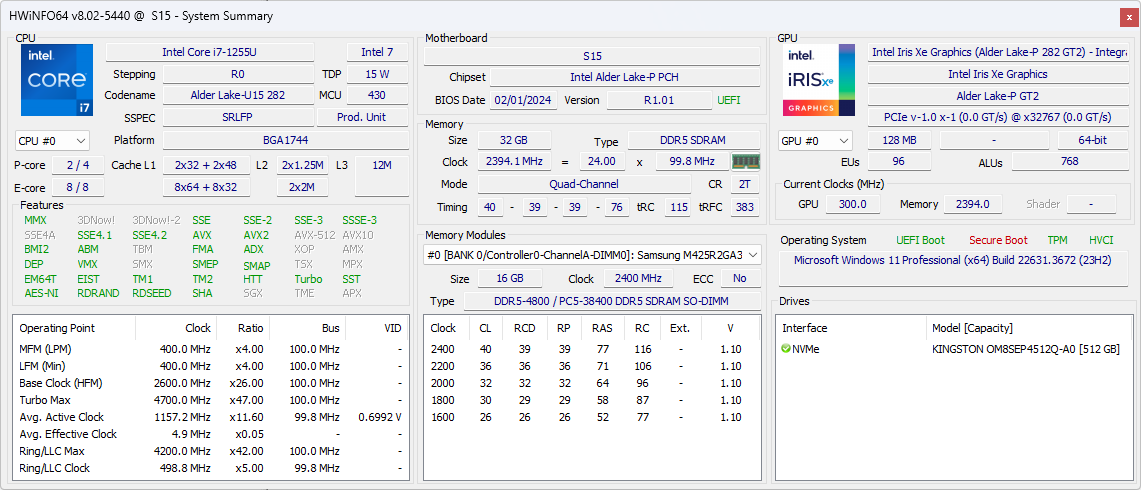
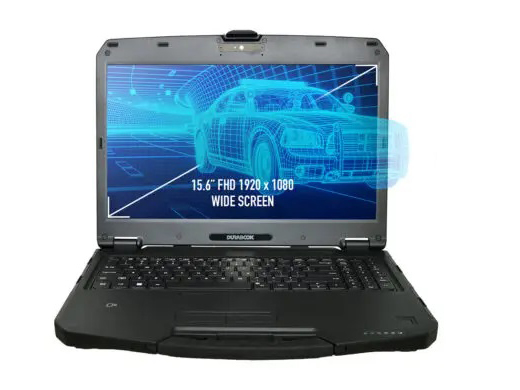
Our unit in review comes with the 12th gen Core i7-1255U CPU, integrated Iris Xe graphics, and 1000-nit 1080p IPS display while other SKUs may offer the slower Core i5-1235U, faster discrete Quadro T1000 graphics, or dimmer display. The full specifications sheet can be found here.
More Durabook reviews:
Potential Competitors in Comparison
Rating | Version | Date | Model | Weight | Height | Size | Resolution | Price |
|---|---|---|---|---|---|---|---|---|
| 80.5 % | v8 | 06 / 2024 | Durabook S15 i7-1255U, Iris Xe G7 96EUs | 2.7 kg | 29.5 mm | 15.60" | 1920x1080 | |
| 78.3 % v7 (old) | v7 (old) | 04 / 2020 | Durabook S15ABG2 i5-8265U, UHD Graphics 620 | 2.6 kg | 30 mm | 15.60" | 1920x1080 | |
v (old) | 07 / 2022 | Panasonic Toughbook 40 i7-1185G7, Iris Xe G7 96EUs | 3.9 kg | 53.4 mm | 14.00" | 1920x1080 | ||
| 82.9 % v7 (old) | v7 (old) | 06 / 2024 | Getac S410 G5 i5-1350P, Iris Xe G7 80EUs | 2.9 kg | 34.9 mm | 14.00" | 1920x1080 | |
| 89.2 % v6 (old) | v6 (old) | 03 / 2019 | Dell Latitude 5420 Rugged-P85G i7-8650U, Radeon RX 540 | 2.8 kg | 32.9 mm | 14.00" | 1920x1080 | |
| 82.4 % v7 (old) | v7 (old) | 12 / 2021 | Acer Enduro Urban N3 EUN314 i7-1165G7, Iris Xe G7 96EUs | 1.8 kg | 21.95 mm | 14.00" | 1920x1080 |
Note: We have recently updated our rating system and the results of version 8 are not comparable with the results of version 7. More information is available here .
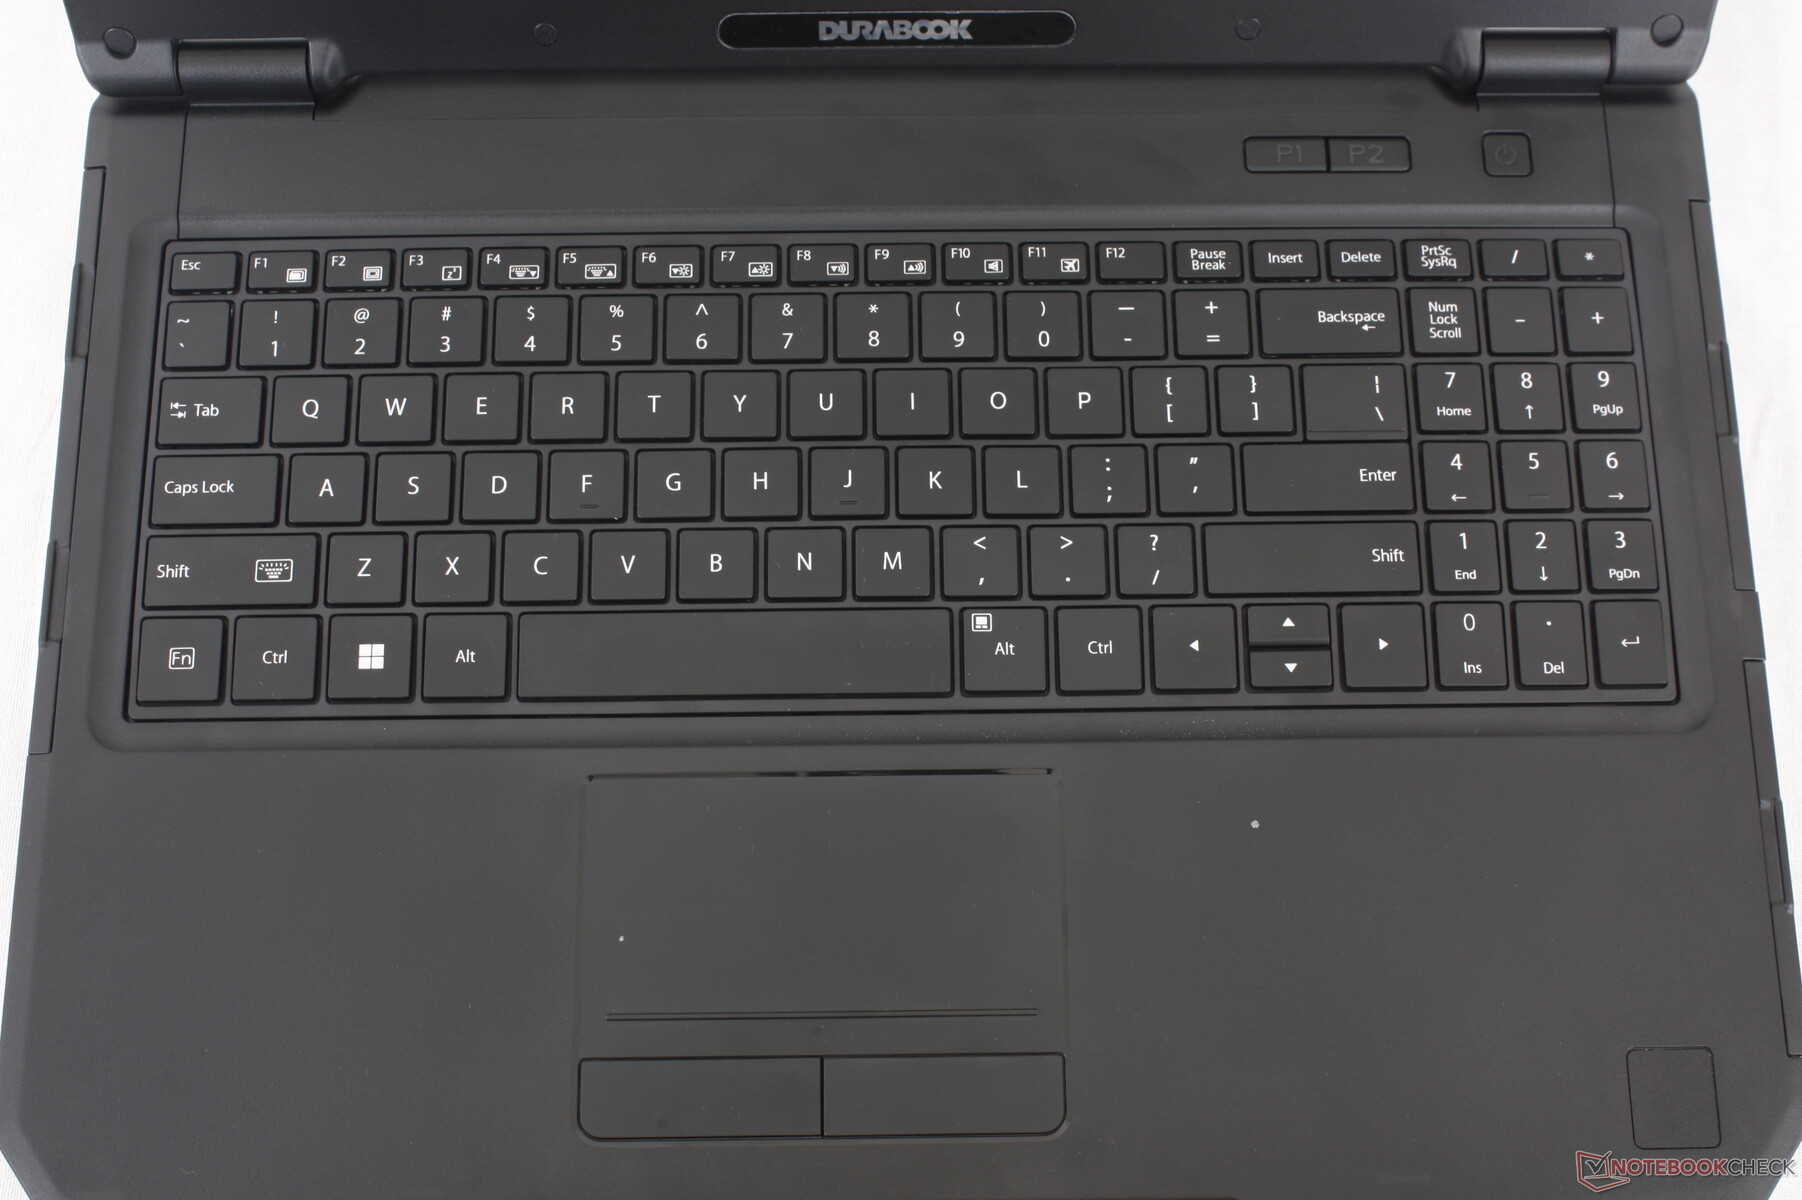
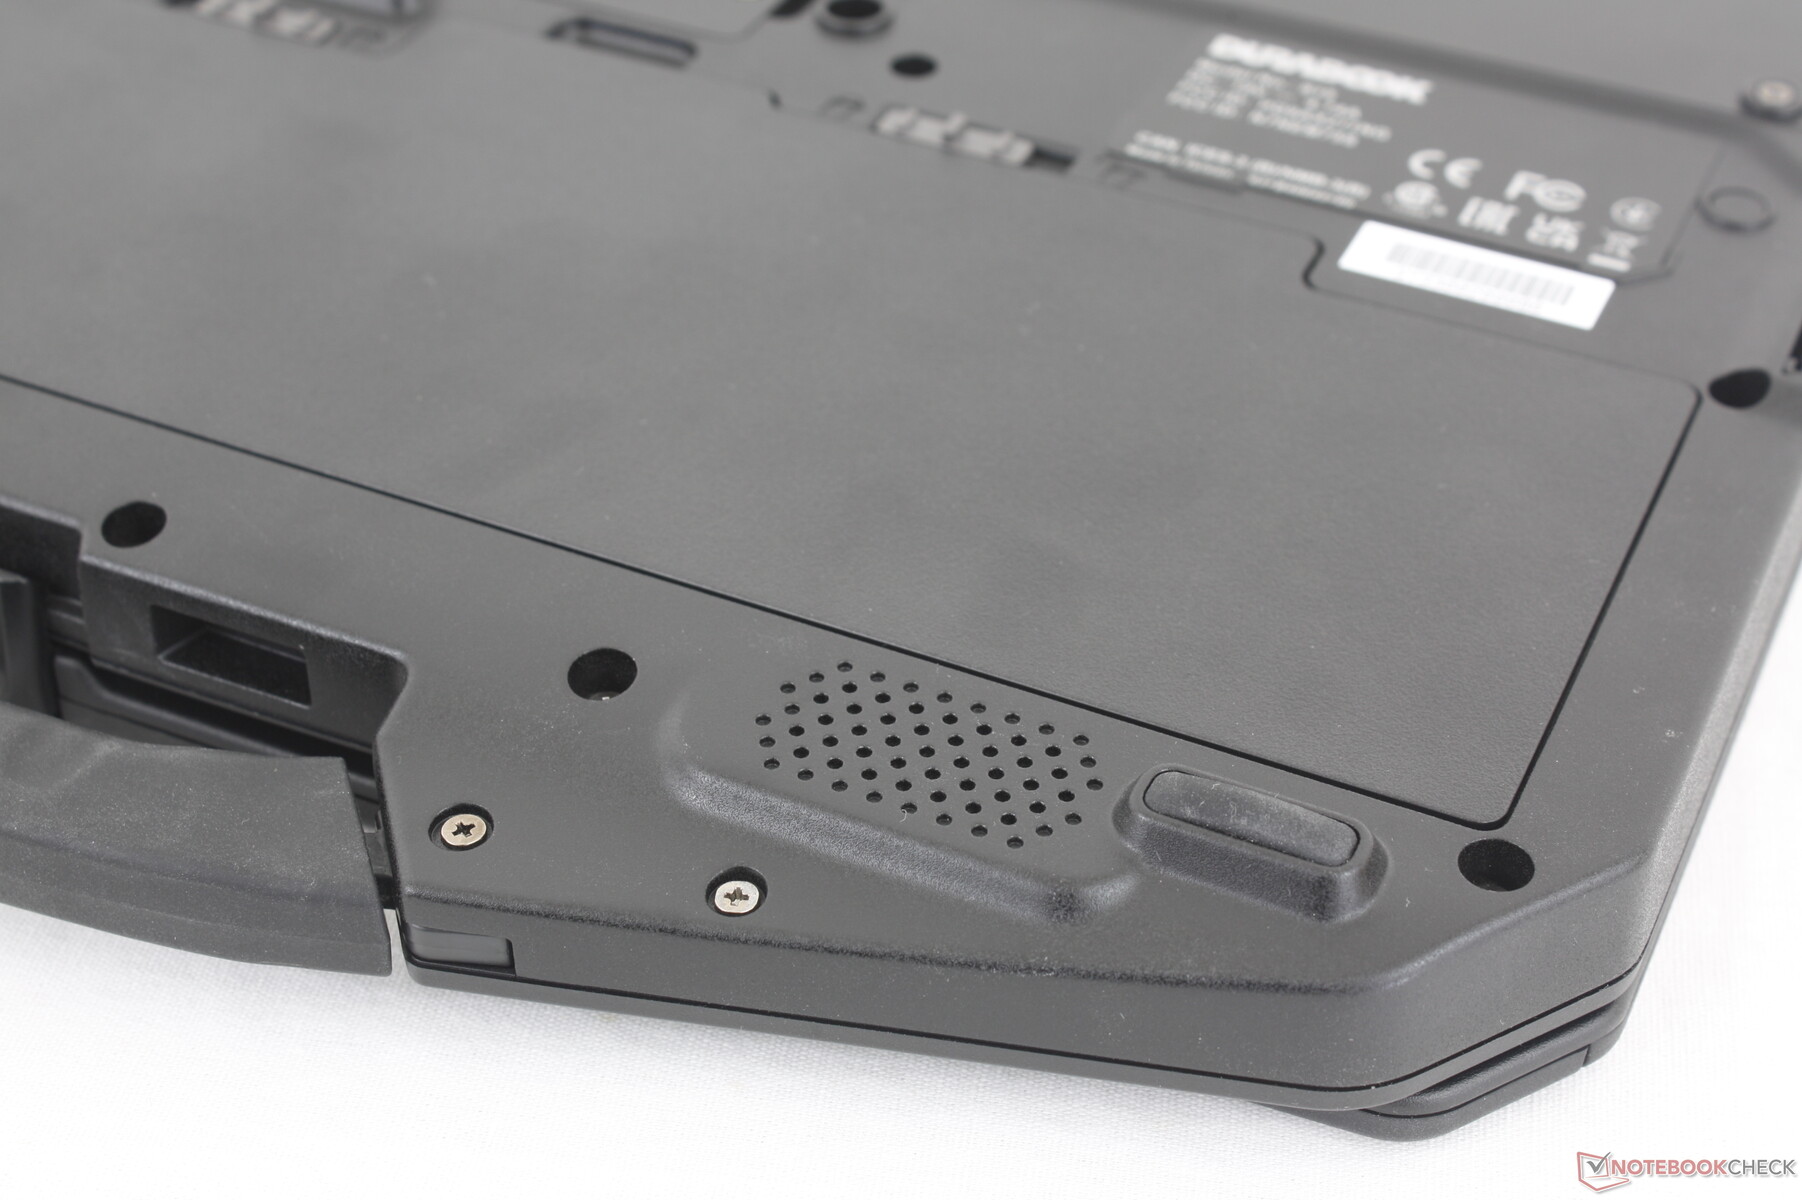
Case — MIL-STD-810H Certified
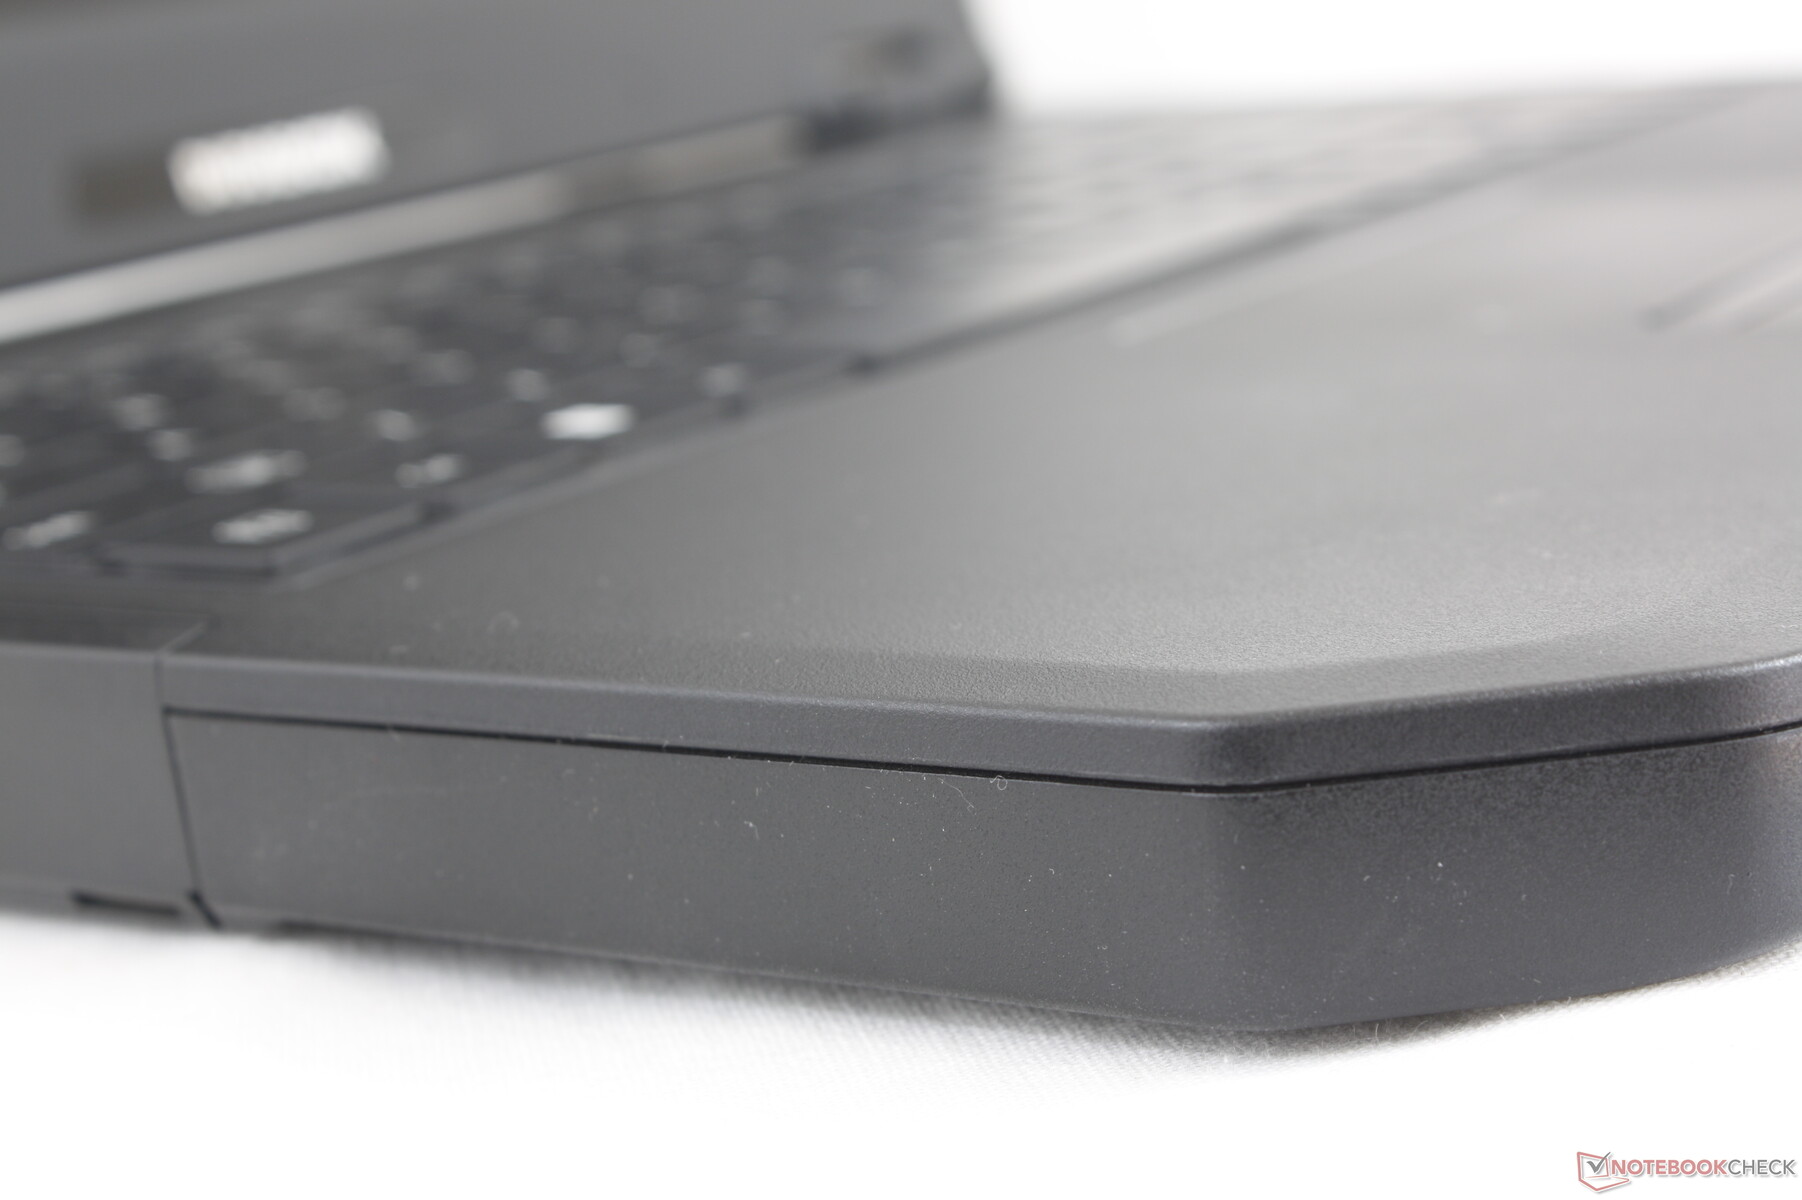
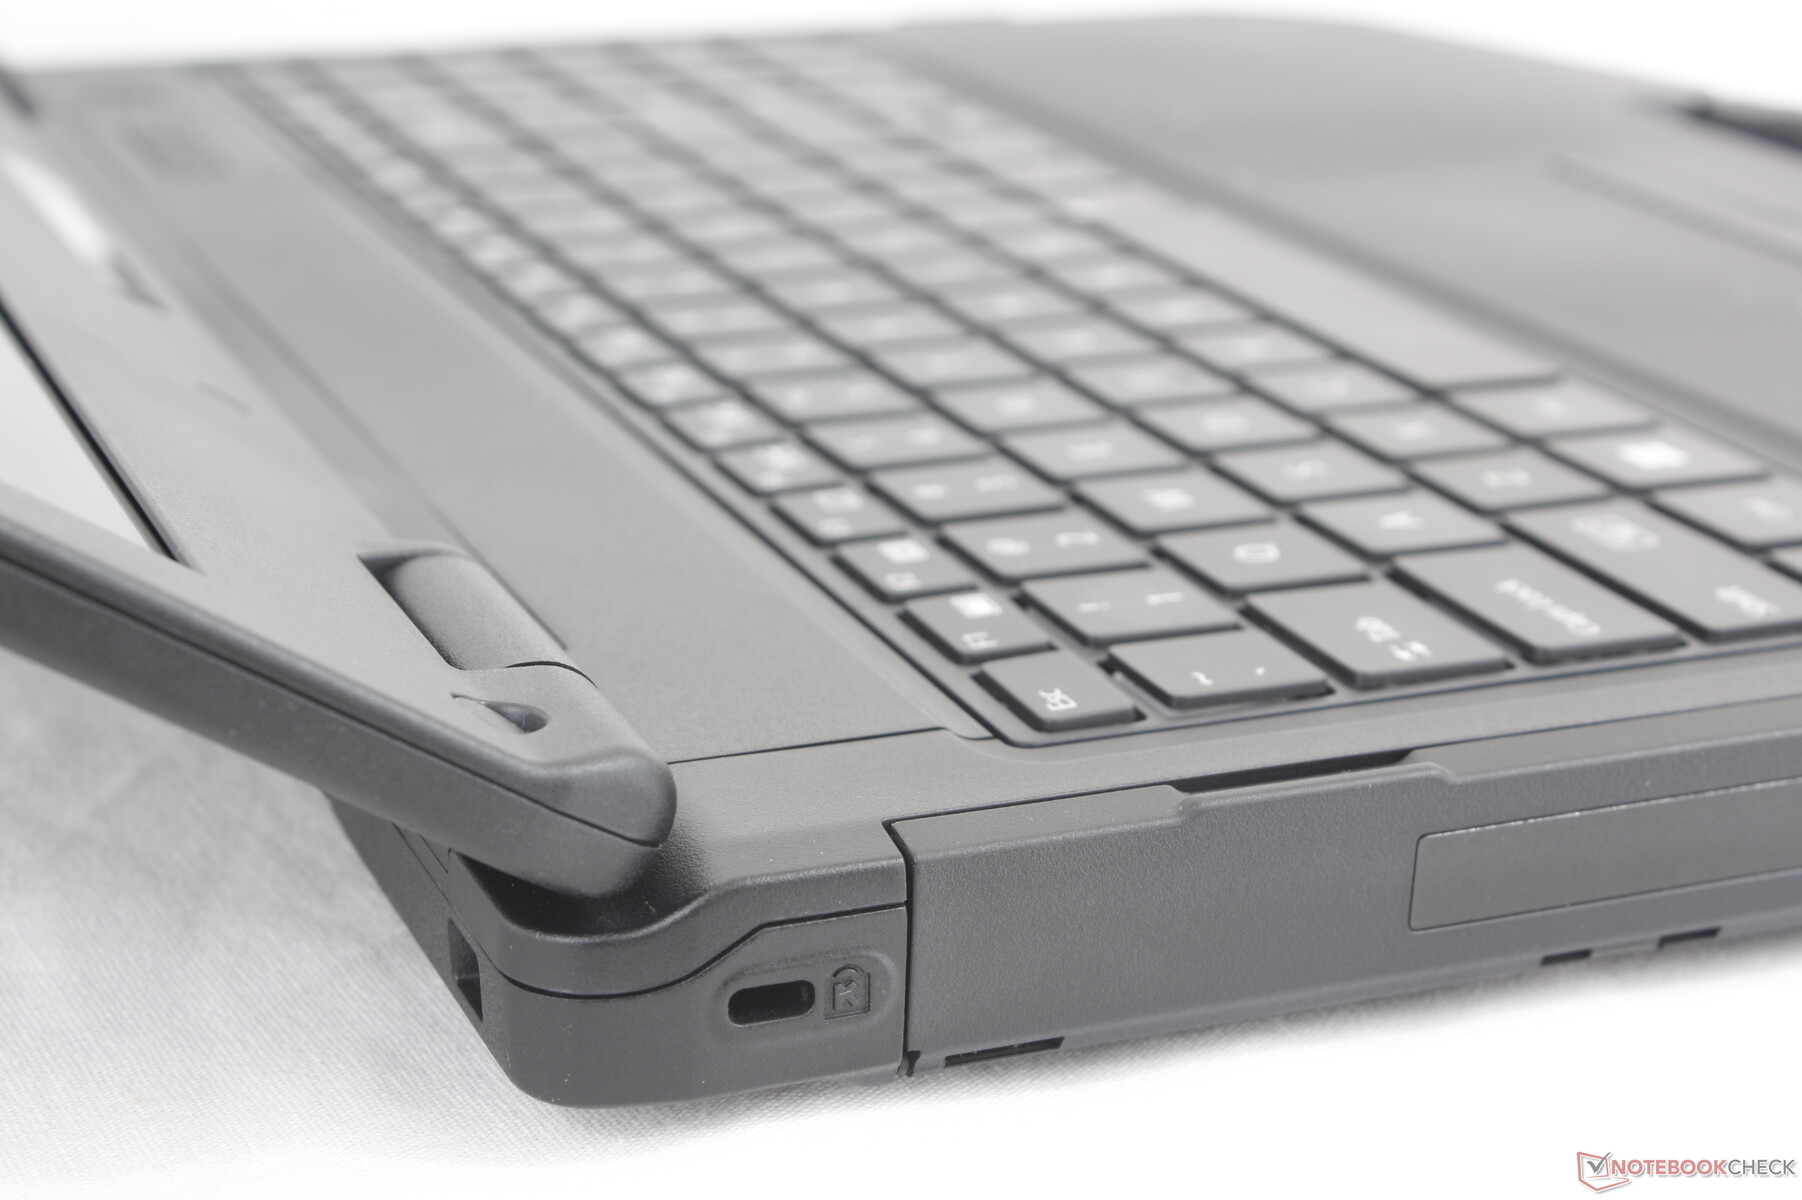
Visually, some tweaks have been made to the chassis including the new uniform black color, larger keyboard with numpad, smoother surface transition between the keyboard deck and carrying handle, and revised port positioning due to all the internal changes to the motherboard. Chassis quality remains excellent just like before save for the numpad portion of the keyboard where the surface tends to warp much more readily when applying pressure. We find the thicker Getac S410 to be sturdier especially around the corners since the Durabook is not rubberized for better fall protection.
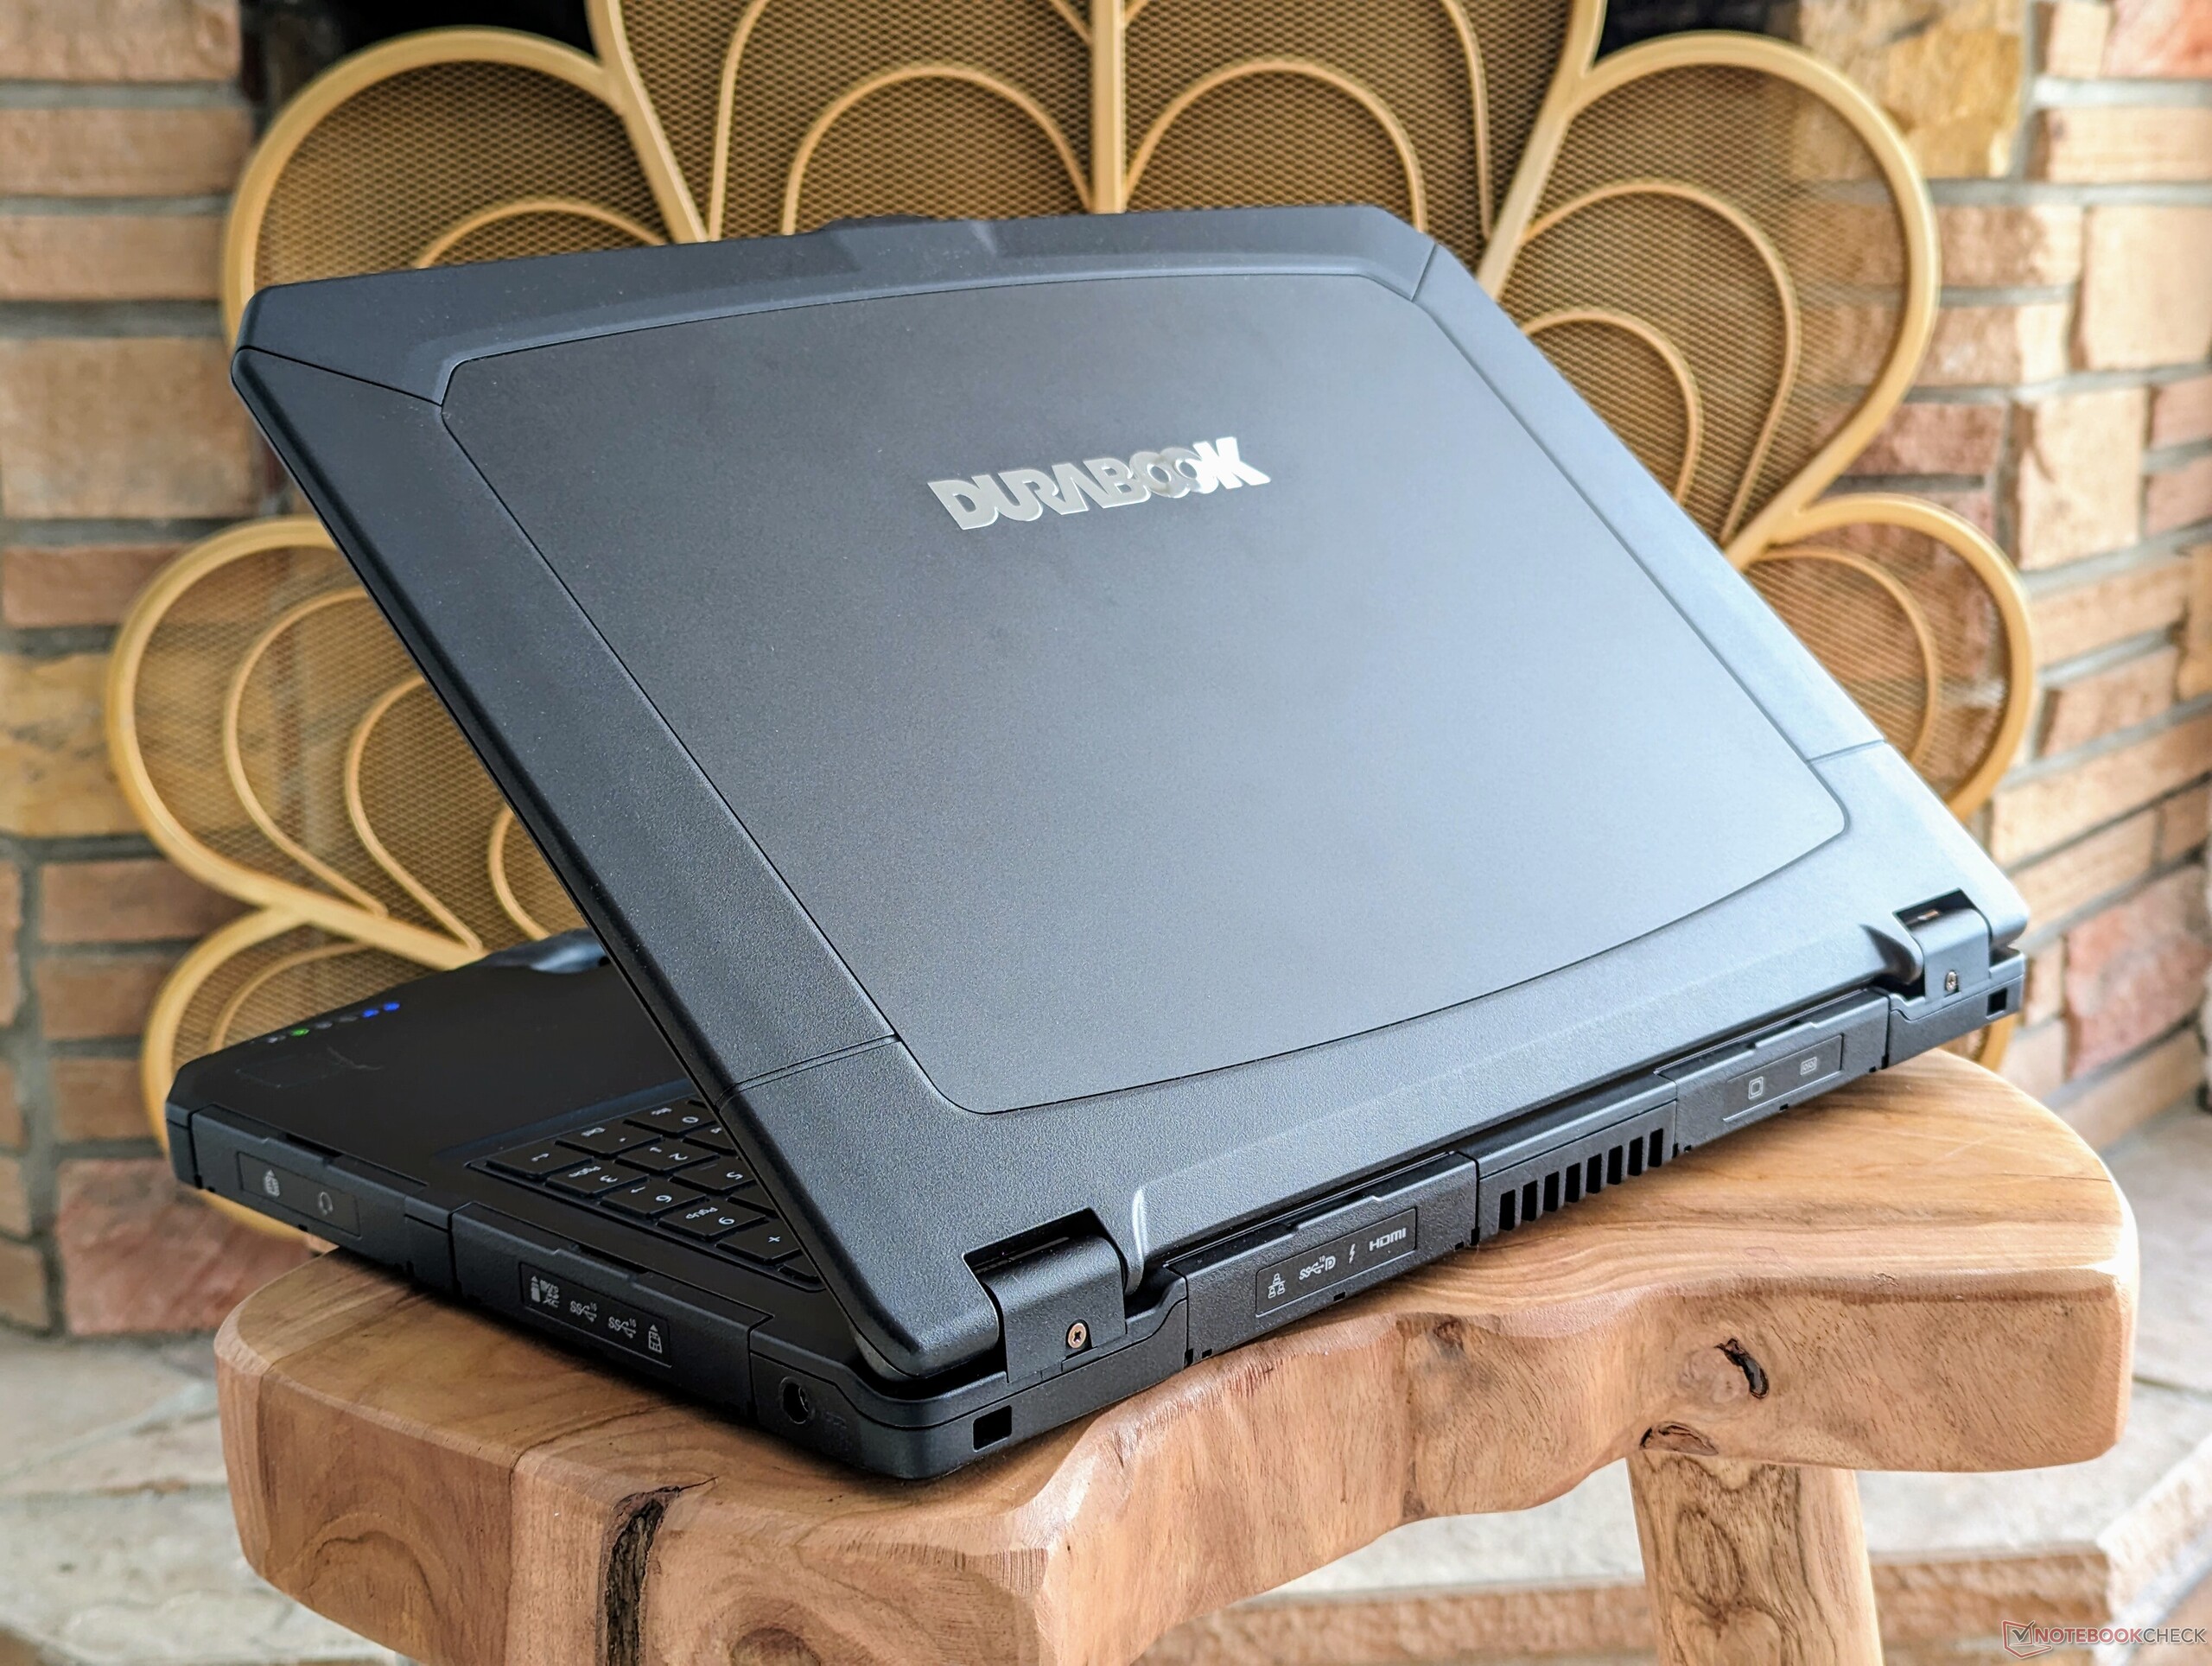
Weight and dimensions are essentially identical to the 2020 design to preserve compatibility with as many accessories as possible. The older design was already very portable for the category and this still remains true for the 2024 S15 where the manufacturer is boasting the title for "thinnest and lightest". The 14-inch Getac S410 G5, for example, is both heavier and thicker than the S15 even though the Durabook offers a a larger 15.6-inch screen.
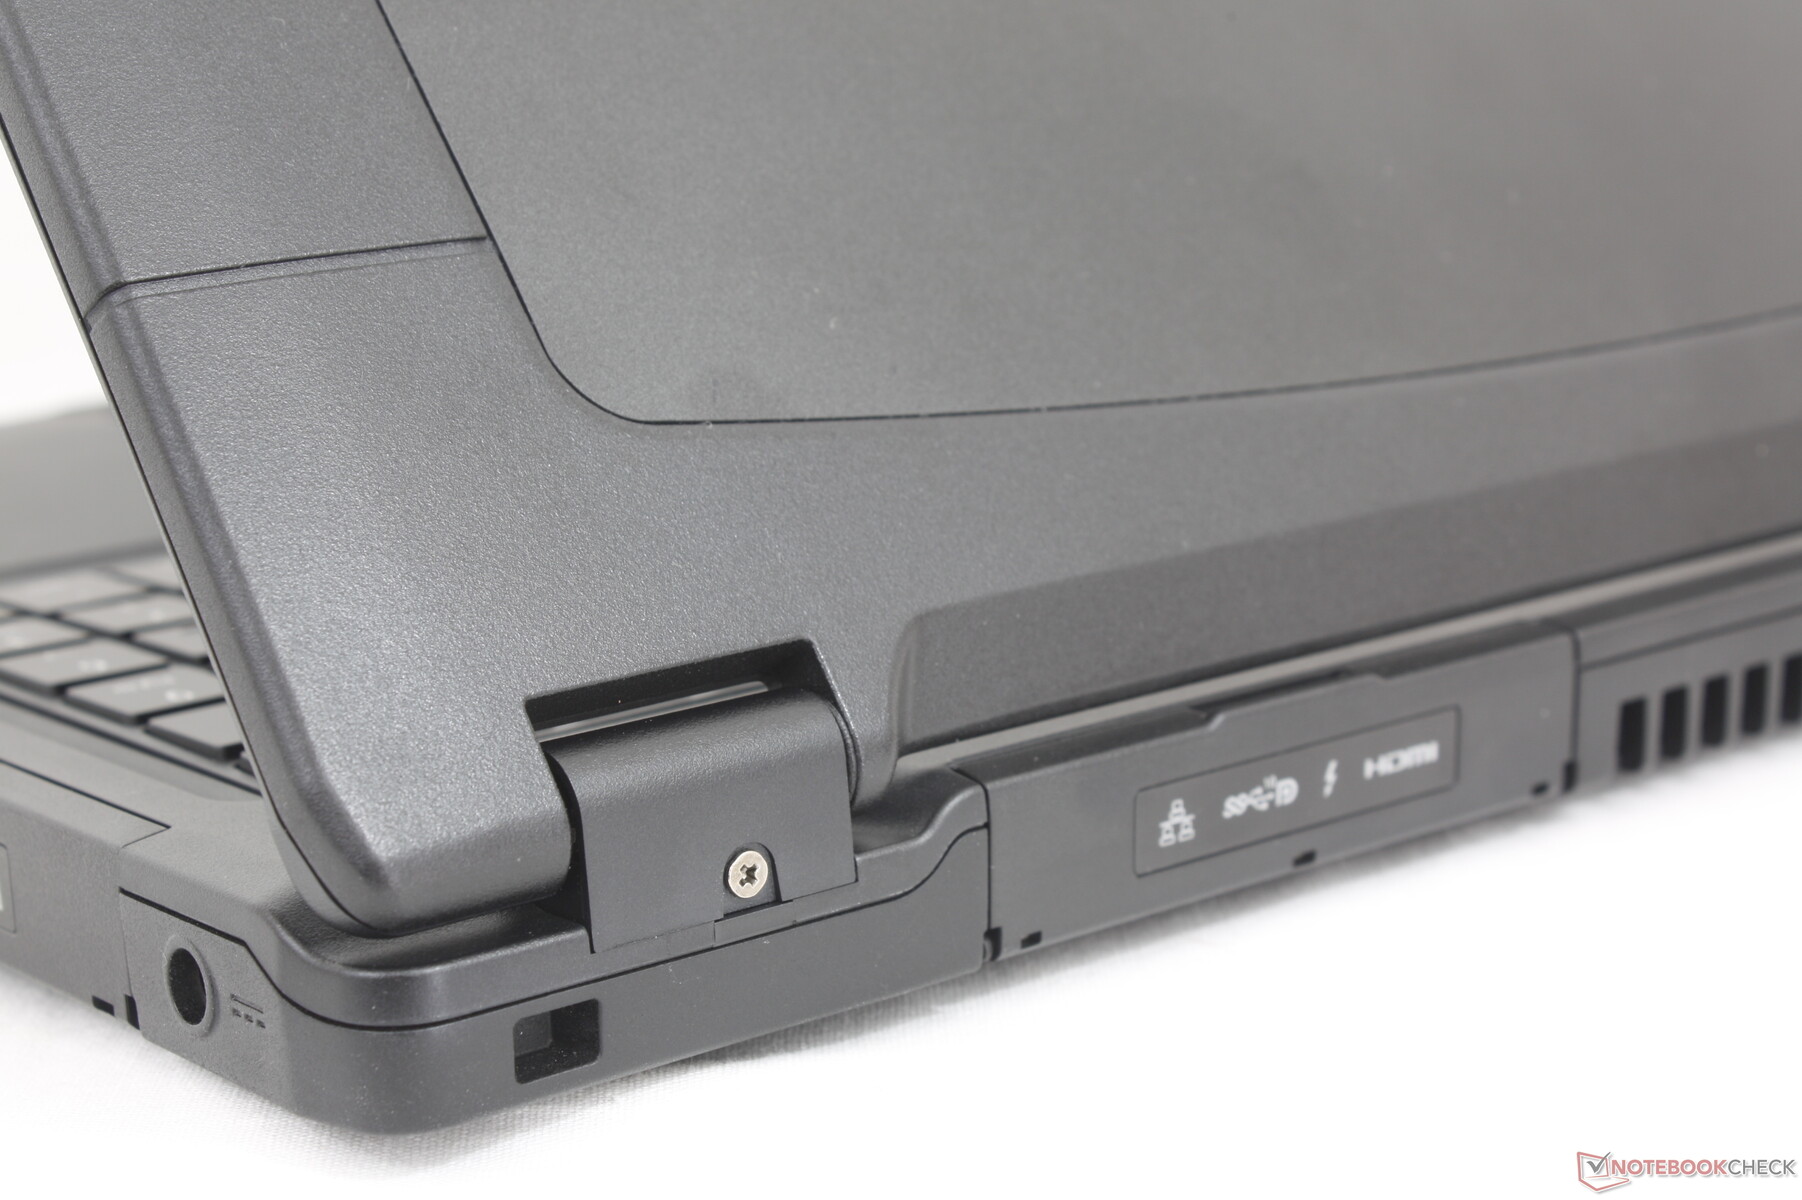
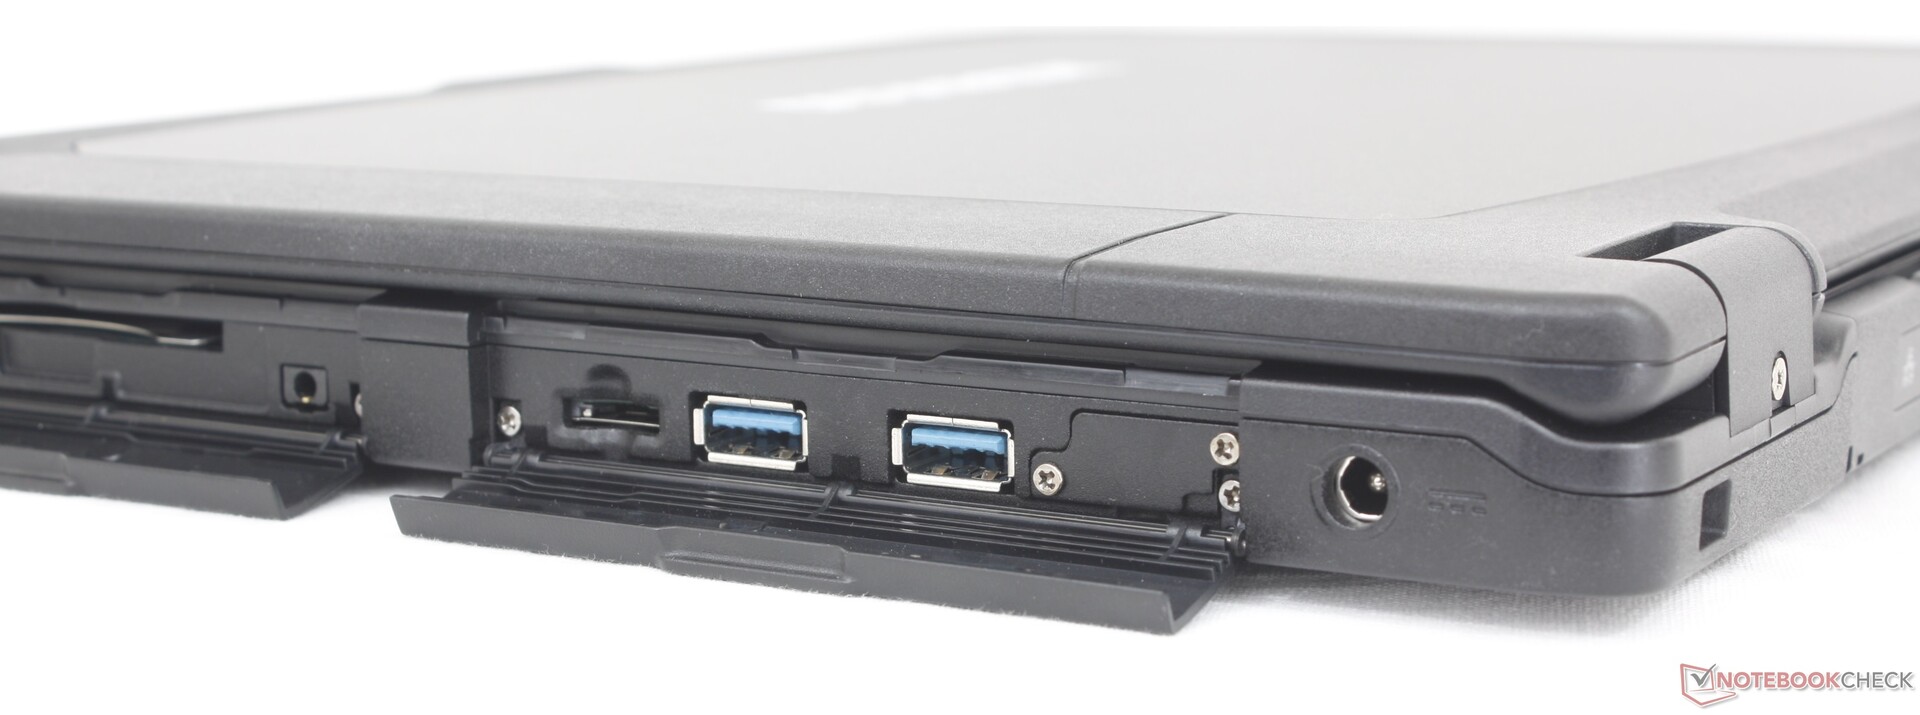
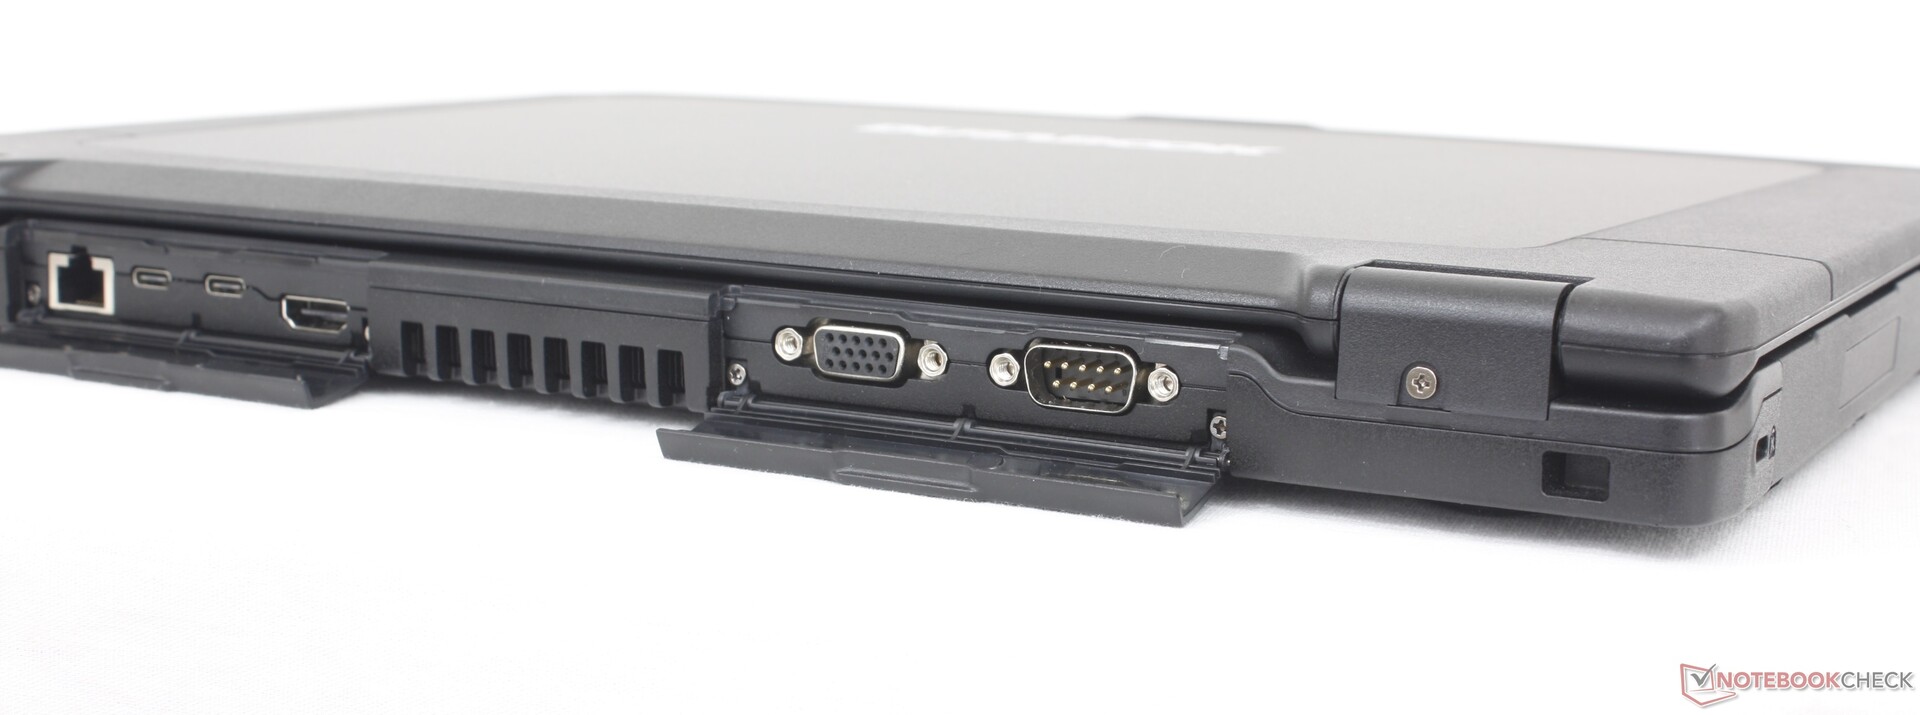
Connectivity — Now With More USB-C Ports
Port variety is excellent with all of the same options returning from the thicker S15AB. Most notable is the addition of a second USB-C port for Thunderbolt support and the handy ODD slot for hot-swapping additional storage or specialized accessories. Note that while both USB-C ports support DisplayPort, only the Thunderbolt-compatible port supports Power Delivery for charging the unit.
The protective flaps covering the ports are notably easier to open and close that the flaps on the Getac S410. It's a small detail that makes the Durabook a bit more friendly to use when on the field.


SD Card Reader
SD card transfer rates have not improved. We recommend checking out the Dell Latitude Rugged series which tend to integrate much faster SD card readers if transfer rates are a priority.
| SD Card Reader | |
| average JPG Copy Test (av. of 3 runs) | |
| Dell Latitude 5420 Rugged-P85G (Toshiba Exceria Pro SDXC 64 GB UHS-II) | |
| Getac S410 G5 (AV Pro V60) | |
| Panasonic Toughbook 40 (AV Pro V60) | |
| Durabook S15ABG2 (Toshiba Exceria Pro SDXC 64 GB UHS-II) | |
| Durabook S15 (AV Pro V60) | |
| Acer Enduro Urban N3 EUN314 (AV Pro V60) | |
| maximum AS SSD Seq Read Test (1GB) | |
| Dell Latitude 5420 Rugged-P85G (Toshiba Exceria Pro SDXC 64 GB UHS-II) | |
| Getac S410 G5 (AV Pro V60) | |
| Durabook S15 (AV Pro V60) | |
| Durabook S15ABG2 (Toshiba Exceria Pro SDXC 64 GB UHS-II) | |
| Panasonic Toughbook 40 (AV Pro V60) | |
| Acer Enduro Urban N3 EUN314 (AV Pro V60) | |
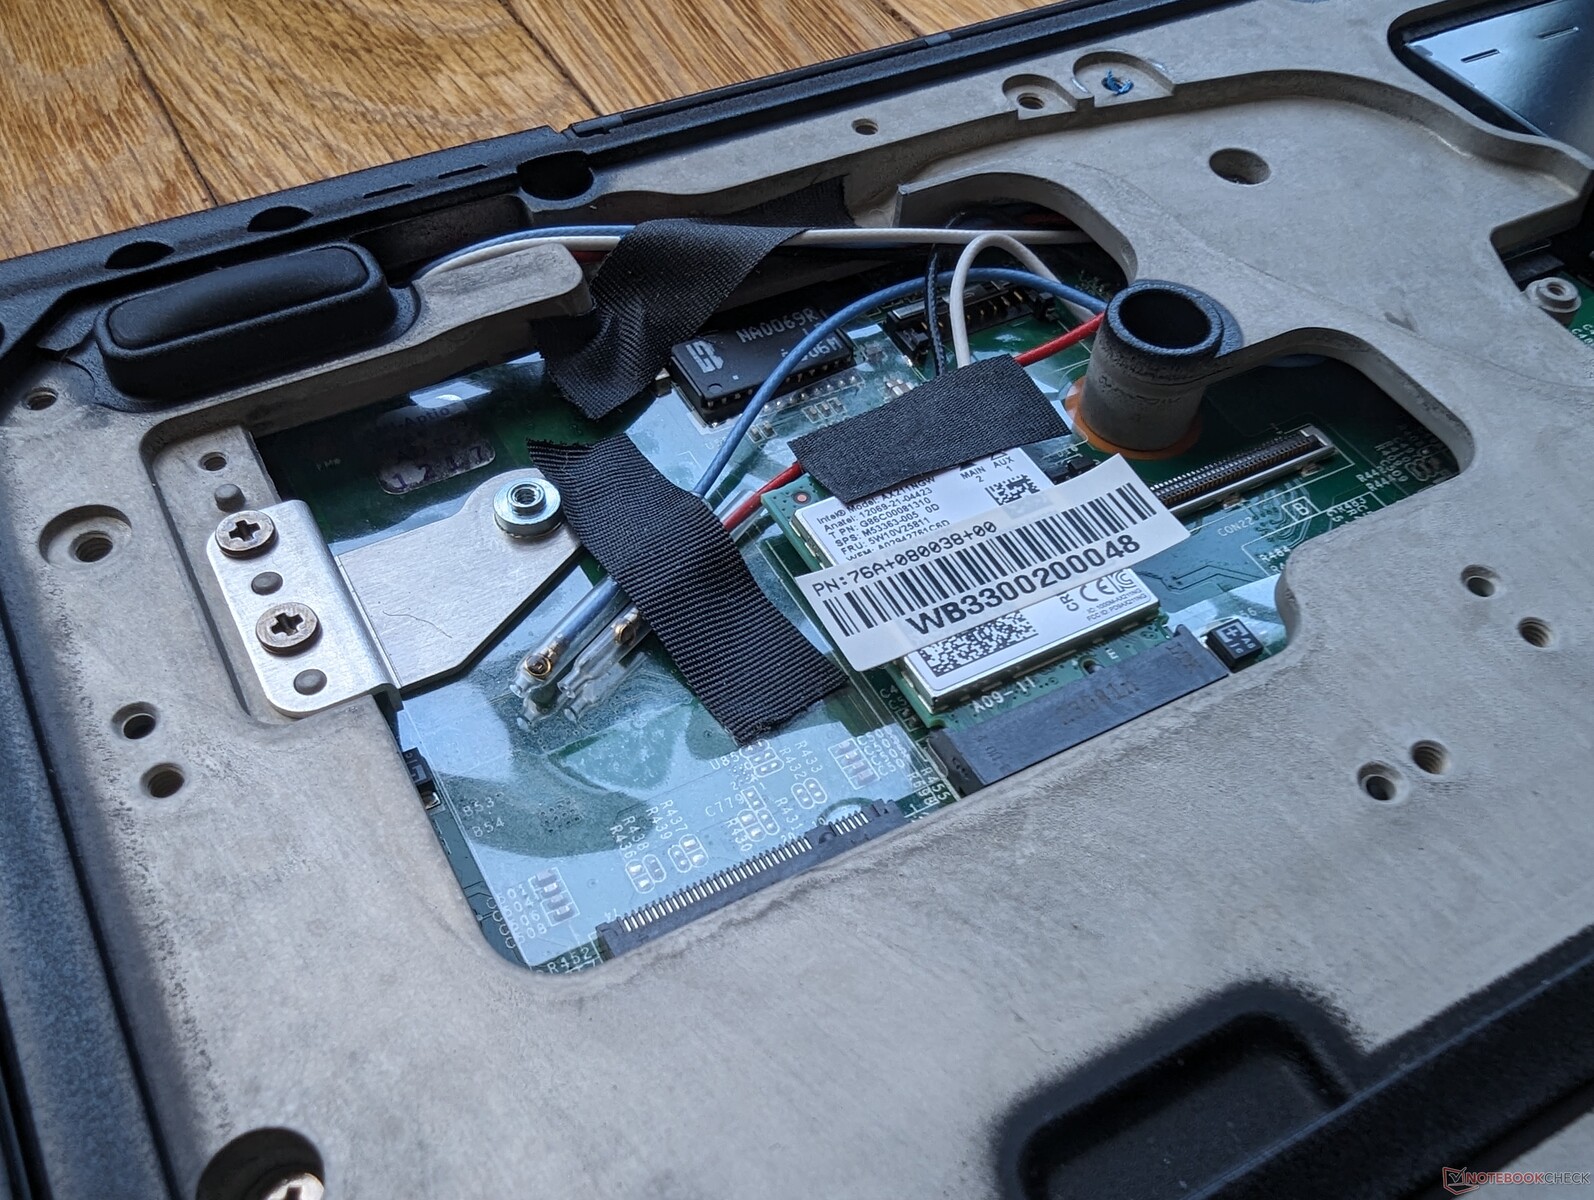
Communication
Our unit ships with an Intel AX211 for Wi-Fi 6E and Bluetooth 5.3 connectivity. Transfer rates are excellent and surprisingly steady when paired to our Asus AXE11000 test router.
| Networking | |
| iperf3 transmit AX12 | |
| Acer Enduro Urban N3 EUN314 | |
| Durabook S15ABG2 | |
| Dell Latitude 5420 Rugged-P85G | |
| iperf3 receive AX12 | |
| Acer Enduro Urban N3 EUN314 | |
| Durabook S15ABG2 | |
| Dell Latitude 5420 Rugged-P85G | |
| iperf3 transmit AXE11000 | |
| Durabook S15 | |
| Panasonic Toughbook 40 | |
| Getac S410 G5 | |
| iperf3 receive AXE11000 | |
| Panasonic Toughbook 40 | |
| Durabook S15 | |
| Getac S410 G5 | |
| iperf3 transmit AXE11000 6GHz | |
| Durabook S15 | |
| Getac S410 G5 | |
| iperf3 receive AXE11000 6GHz | |
| Durabook S15 | |
| Getac S410 G5 | |
Webcam
The webcam can be configured at 2 MP, 5 MP, or none at all depending on the user application. Our unit includes a 5 MP sensor with built-in IR for Hello support. A physical sliding shutter comes standard for privacy concerns.


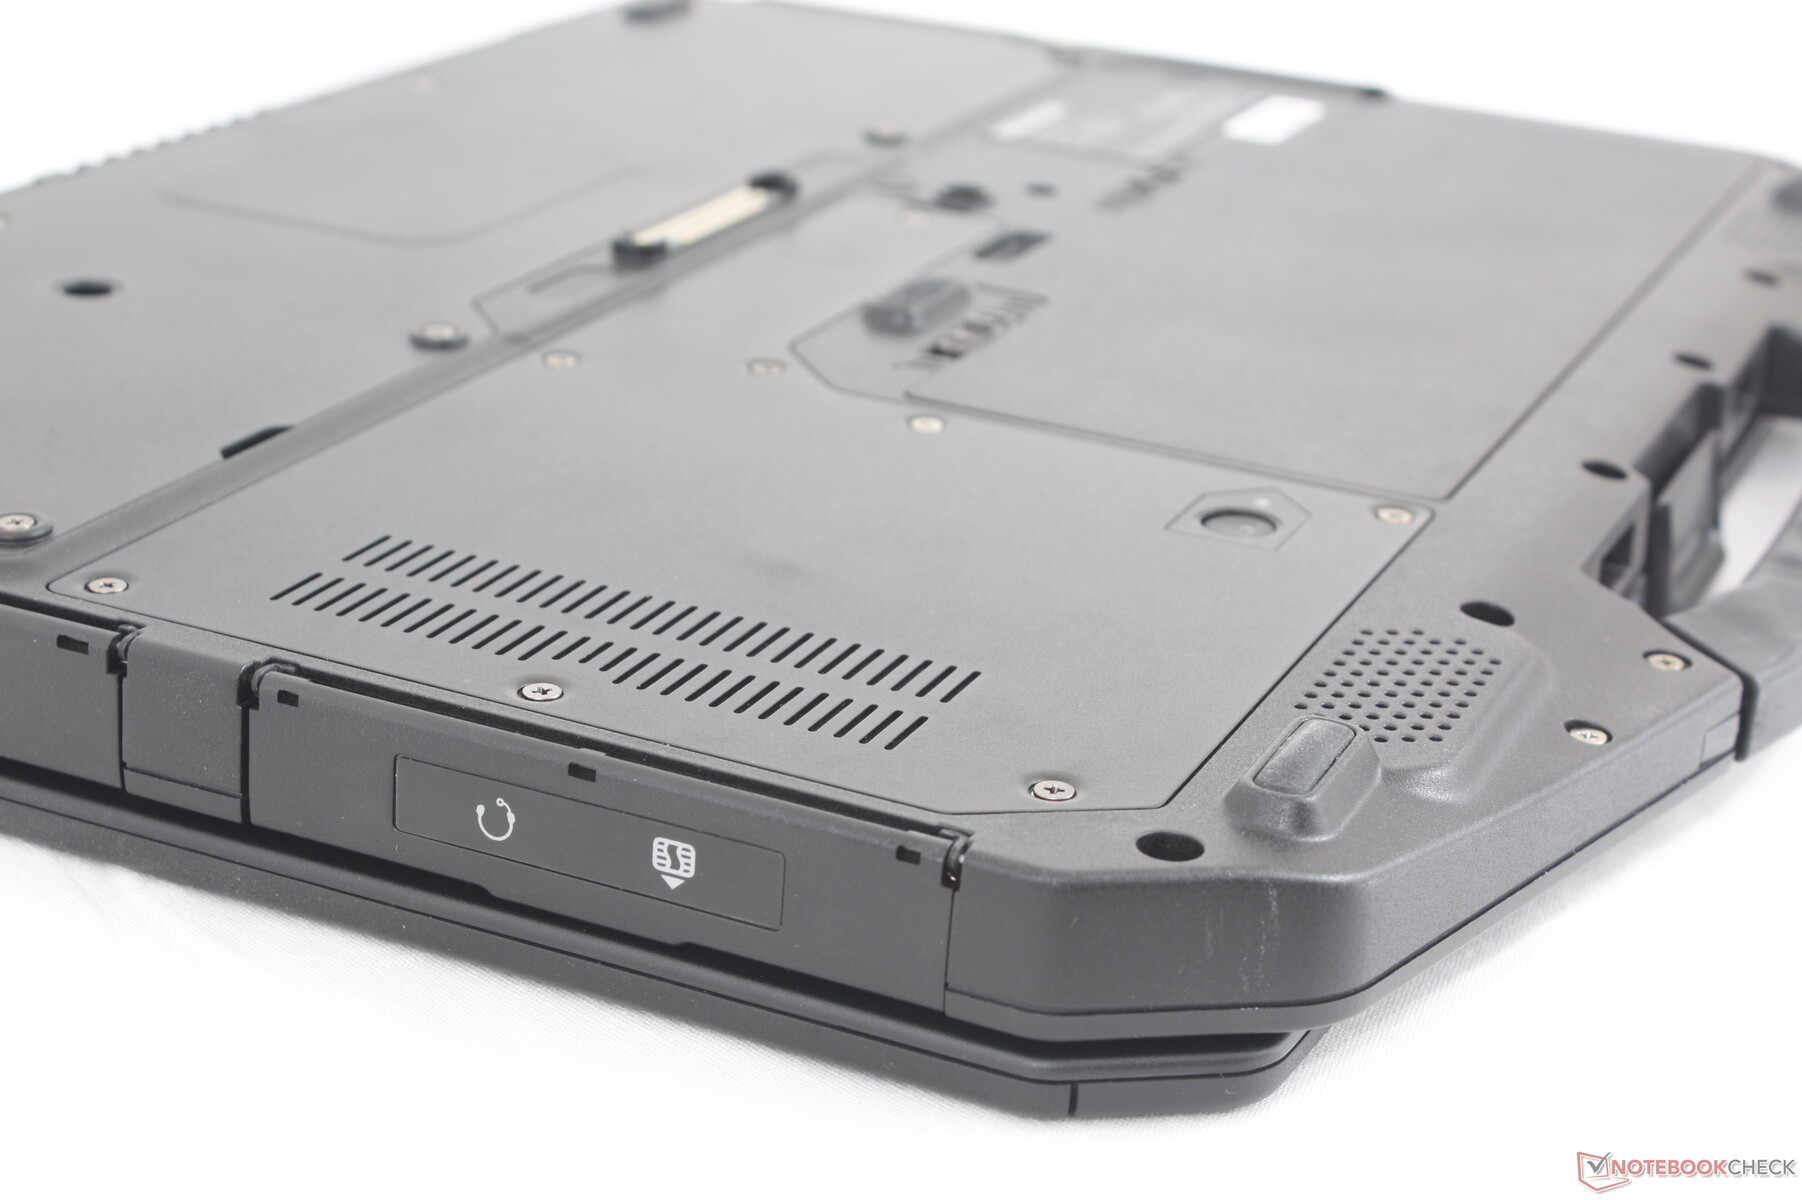
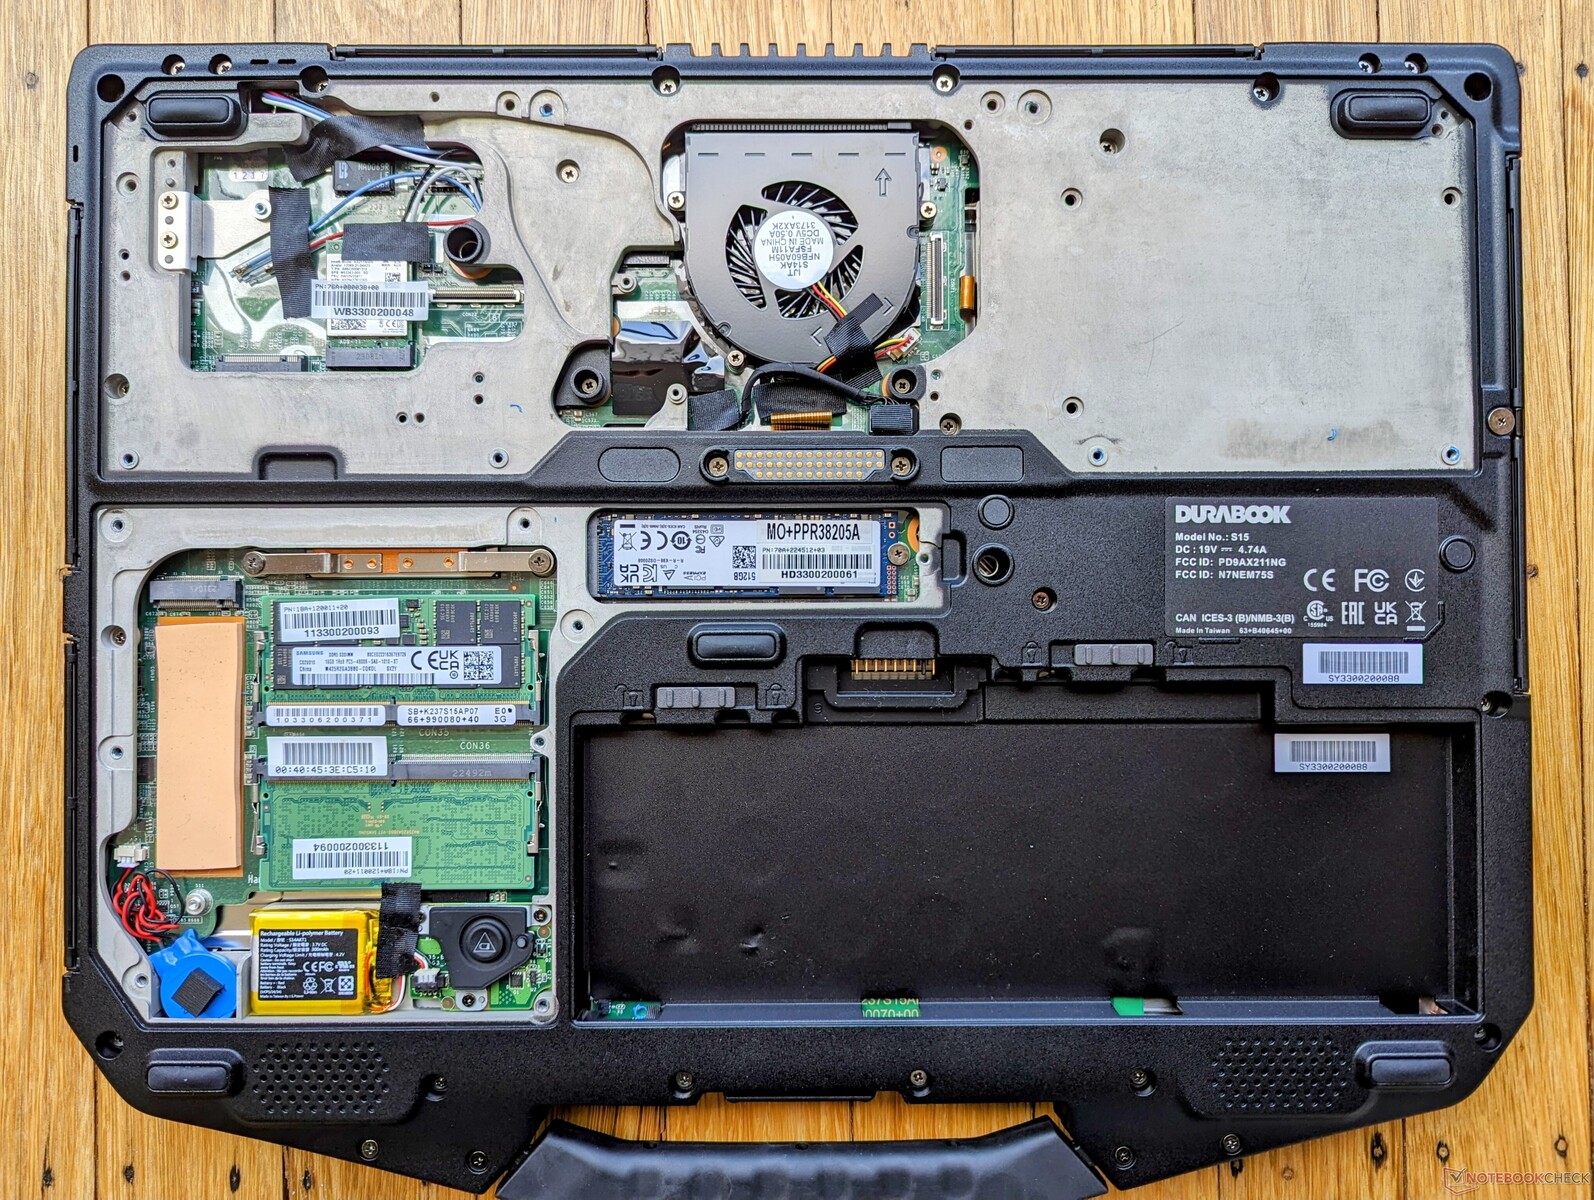
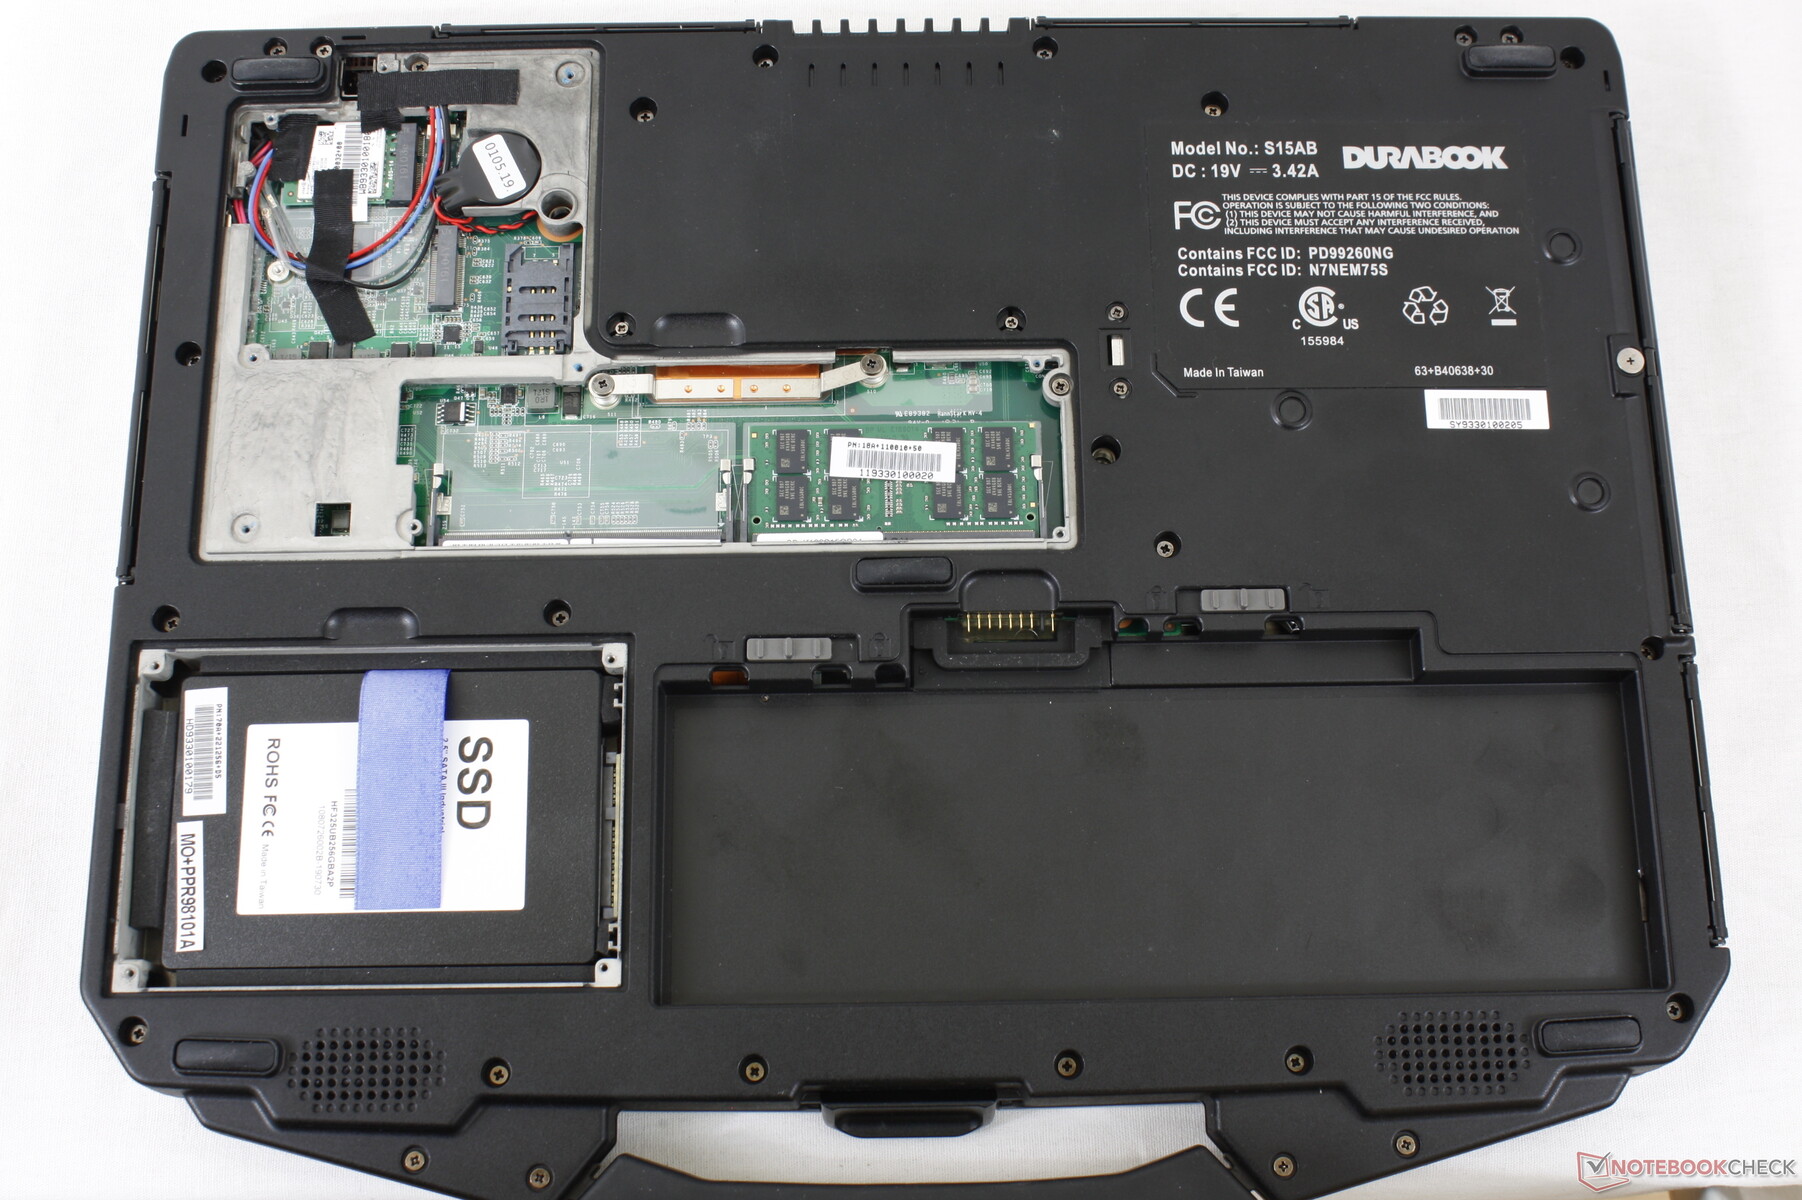
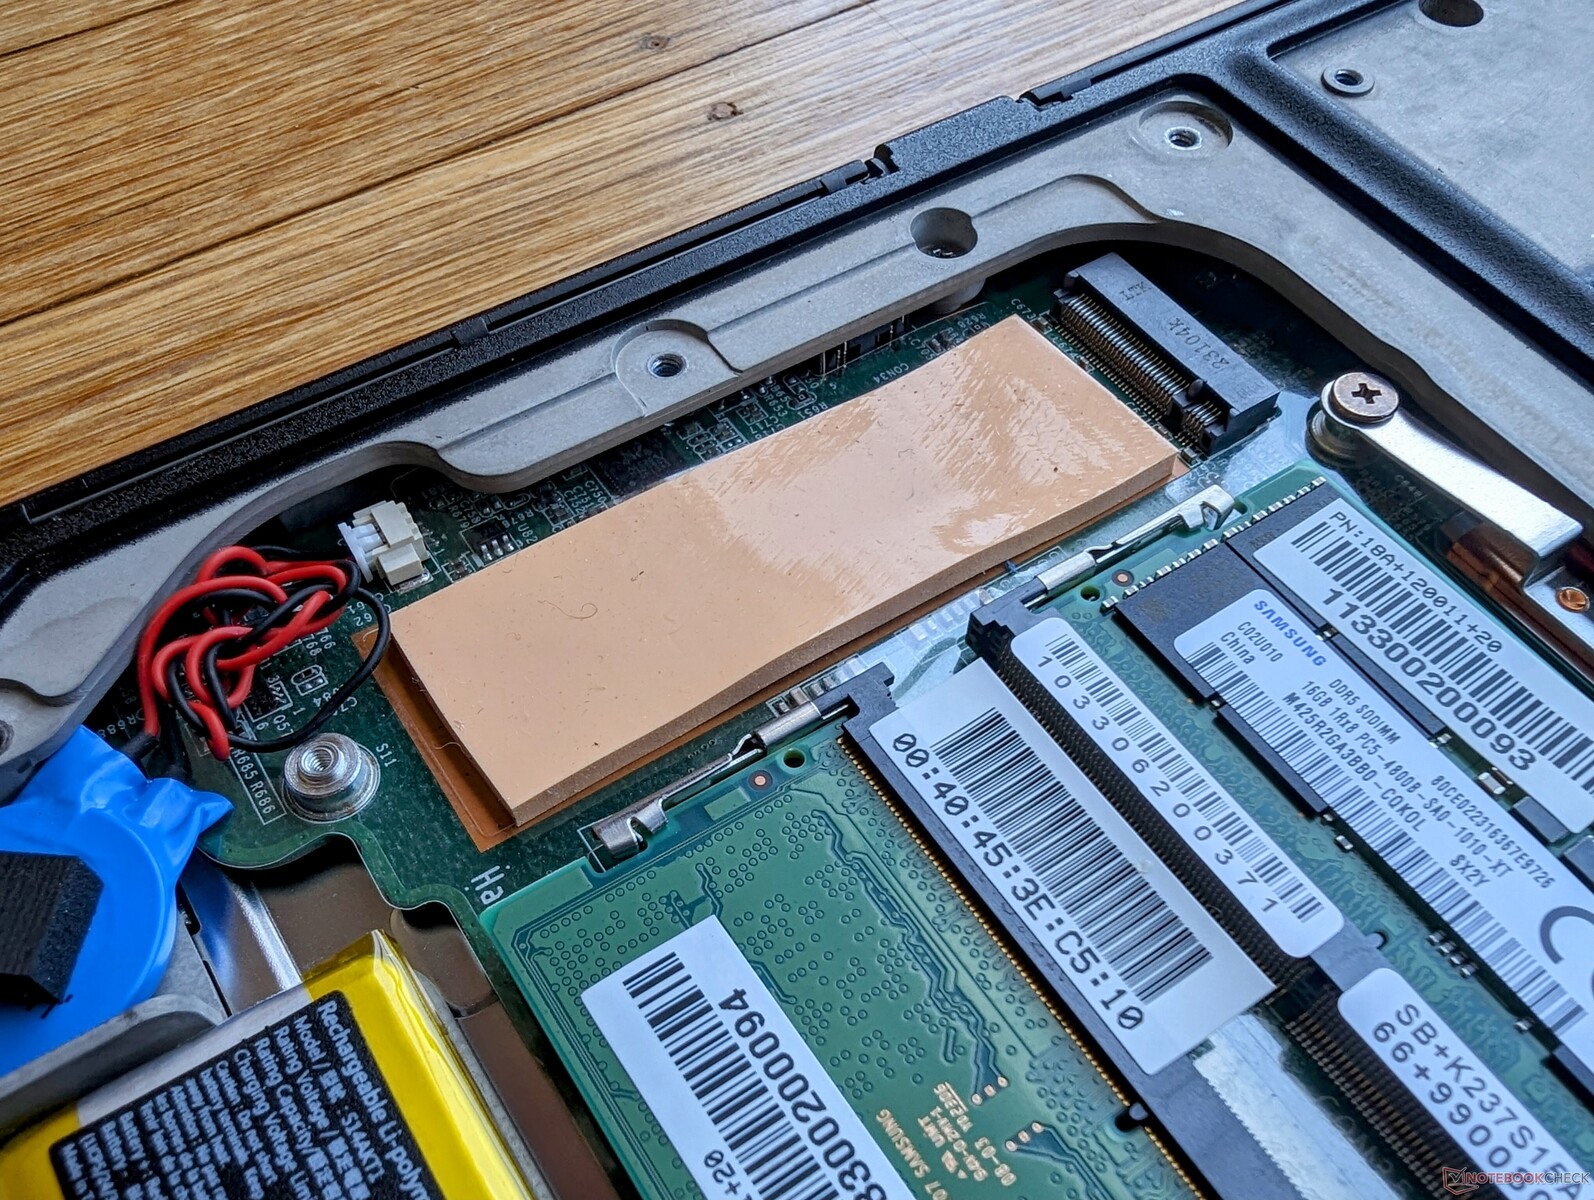
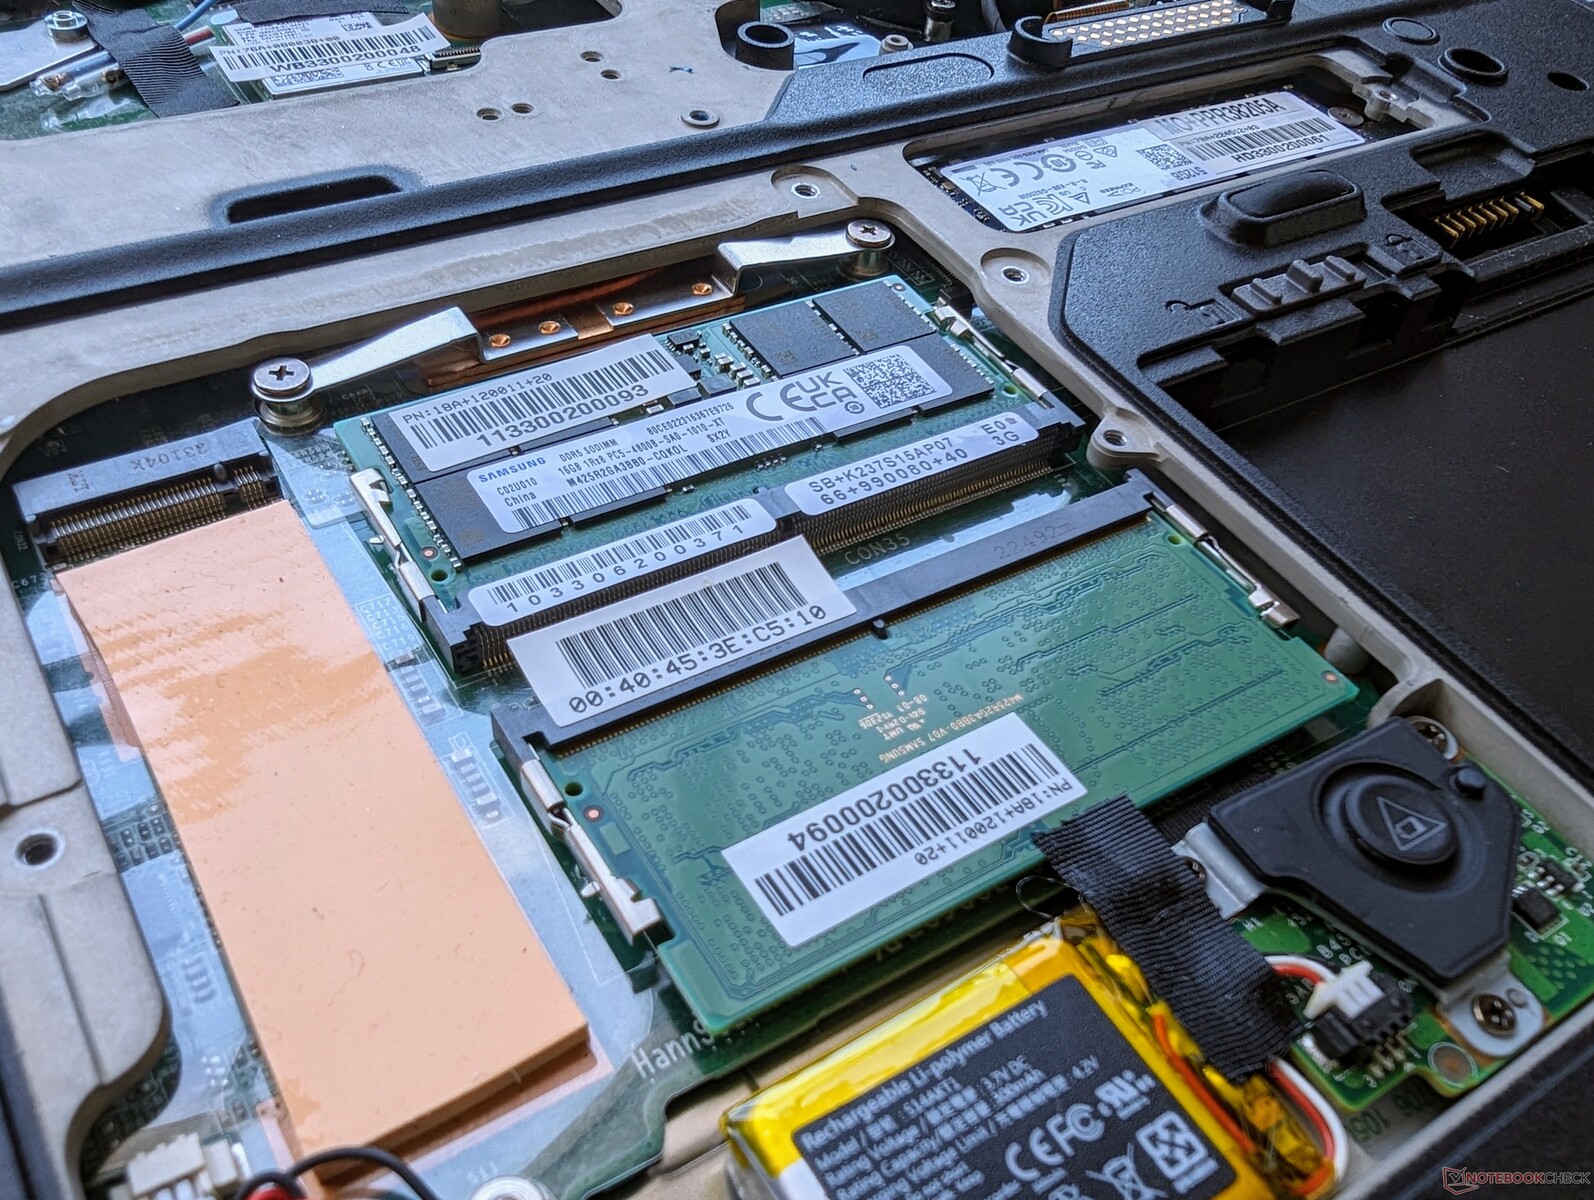
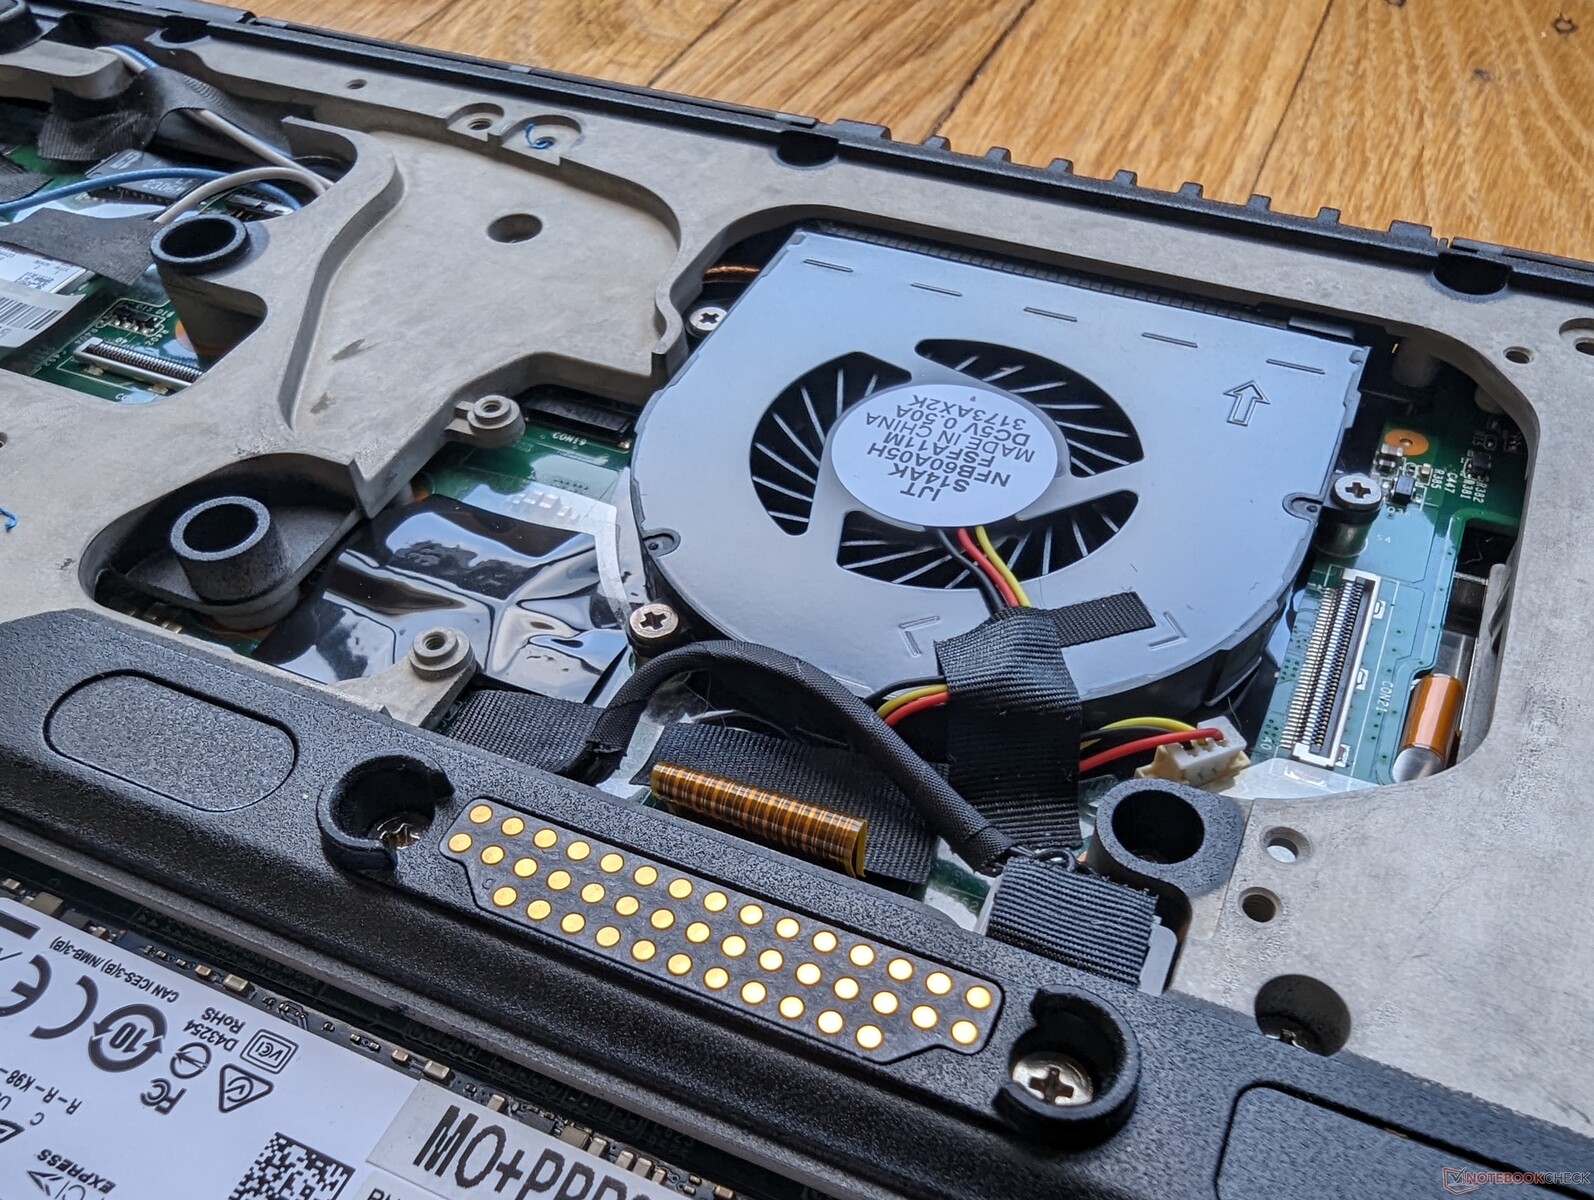
Maintenance
The bottom side (D panel) has been almost completely redesigned. Gone is the old 2.5-inch SATA III slot in favor of a secondary M.2 2280 slot while the internal fan is now much easier to access for cleaning or servicing purposes.
Accessories And Warranty
Durabook offers several optional accessories including expansion media bays, car cigarette adapters, docking stations, and spare batteries. Note that there is no pen or stylus since touchscreen is not an option.
A three-year limited manufacturer manufacturer warranty comes standard.
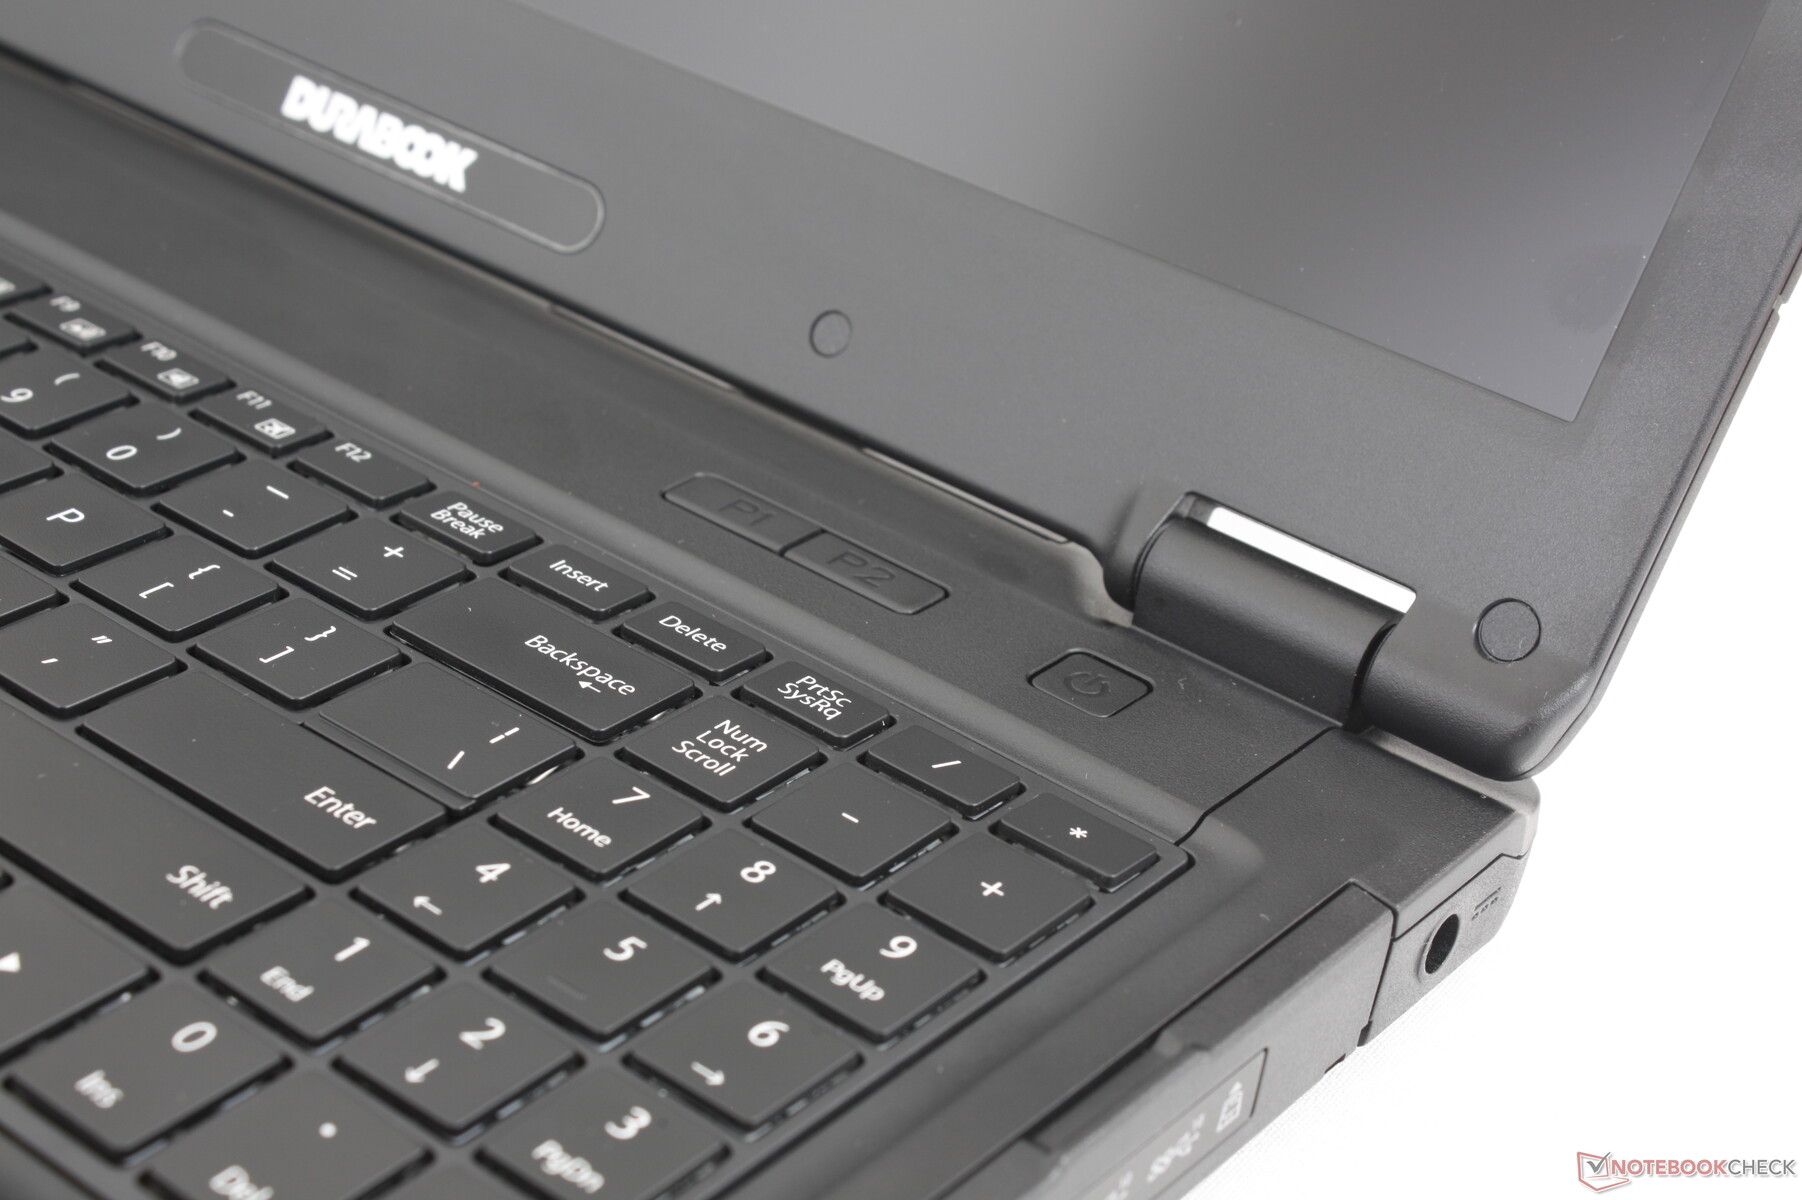
Input Devices — Poor Keyboard Paired With a Great Touchpad
Keyboard
The keyboard is unfortunately a mixed bag. While spacious with an integrated numpad, key feedback is weak and travel is too shallow even when compared to thinner consumer-level laptops like the HP Pavilion or Lenovo IdeaPad. The Space key in particular feels spongy when pressed when it is traditionally firmer and clickier than the main QWERTY keys. The aforementioned warping when pressing down on the numpad doesn't help with key feedback, either. Typing can therefore feel unsatisfying on the S15.
Touchpad
The usable touchpad area is identical to the touchpad on the 2020 S15AB at 10 x 5 cm. We have to say "usable" because the actual surface area of the trackpad appears slightly larger, but the narrow section between the raised bar and dedicated mouse buttons is just dead space. Surface area is slightly textured with excellent responsiveness whereas the trackpads on other rugged laptops like the Getac S410 or Panasonic Toughbook 40 can often skip or misregister inputs. This is one of the better trackpads we've seen for the category.
Meanwhile, the dedicated mouse buttons are firm and loud when pressed for a satisfying feel. Travel could have been a little deeper, however.


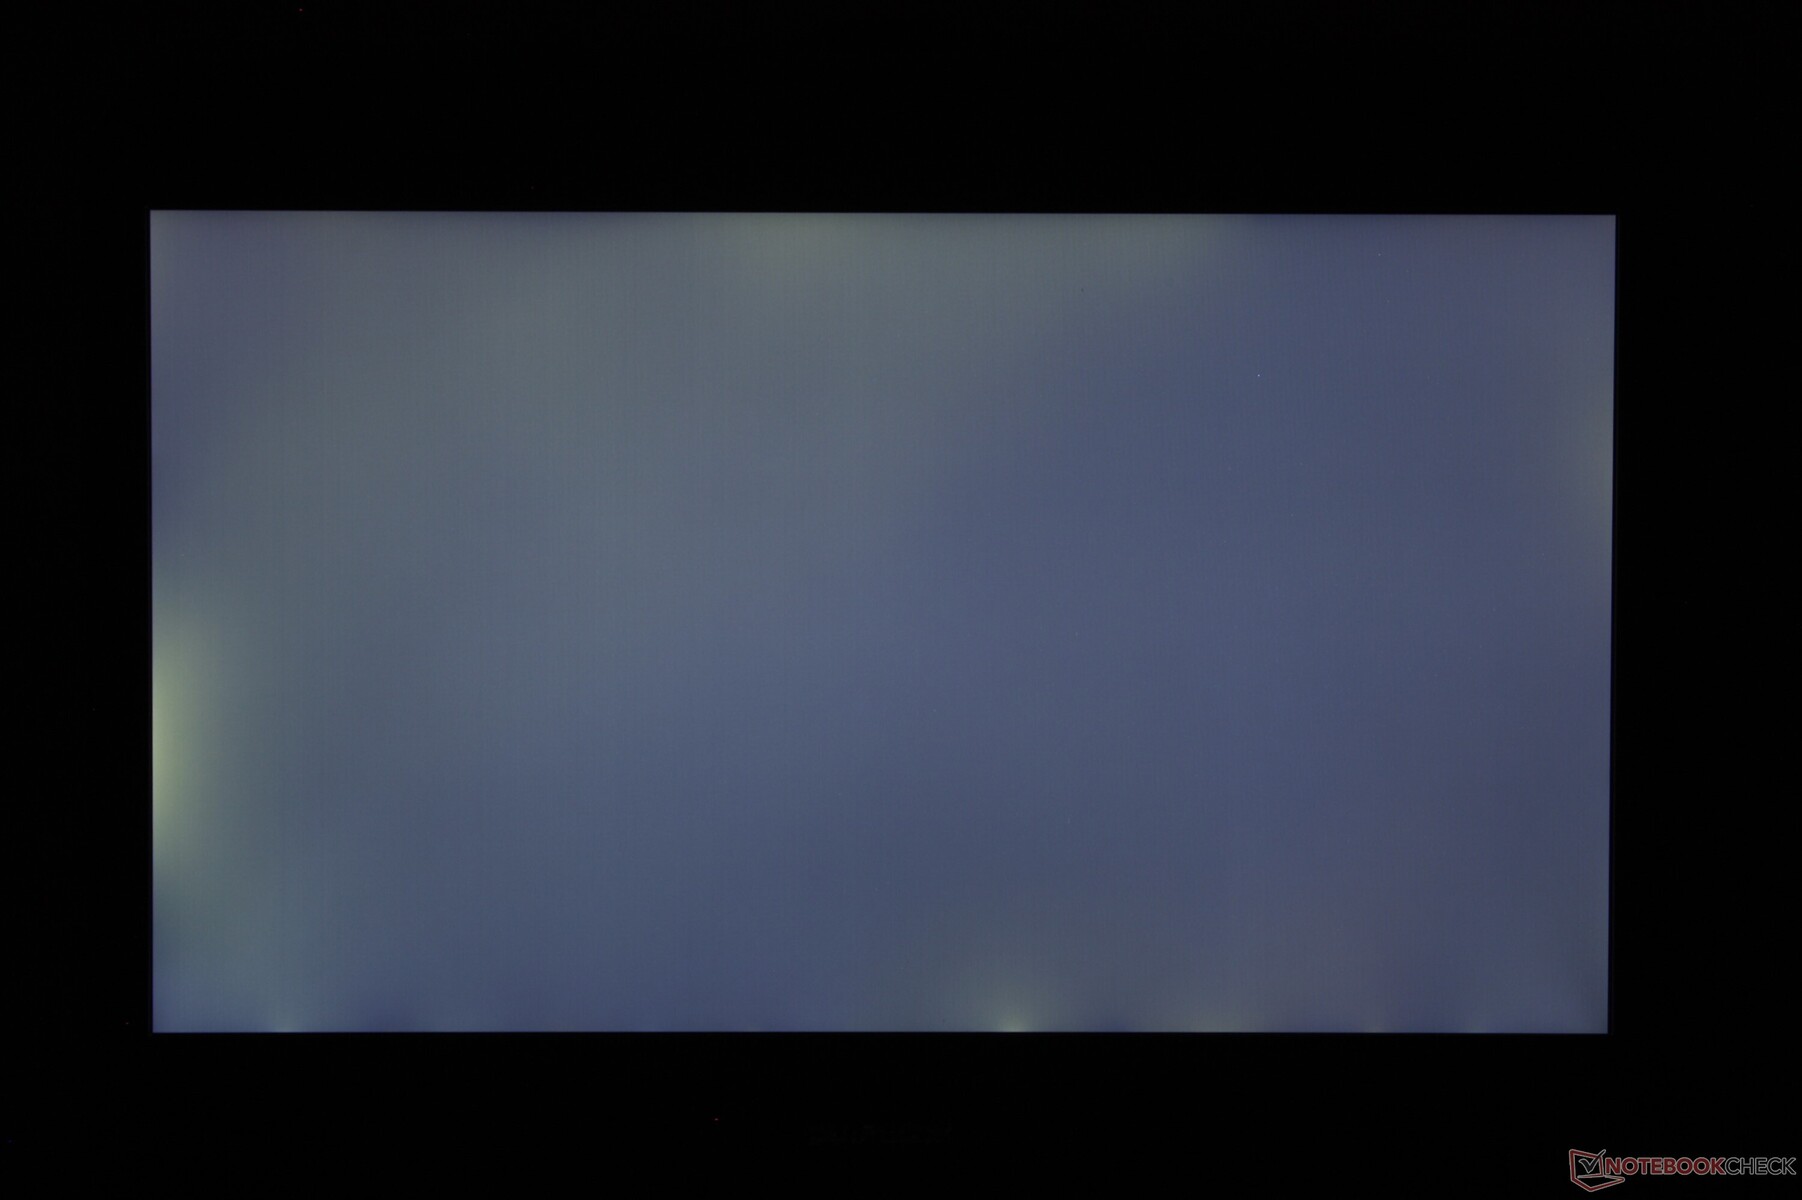
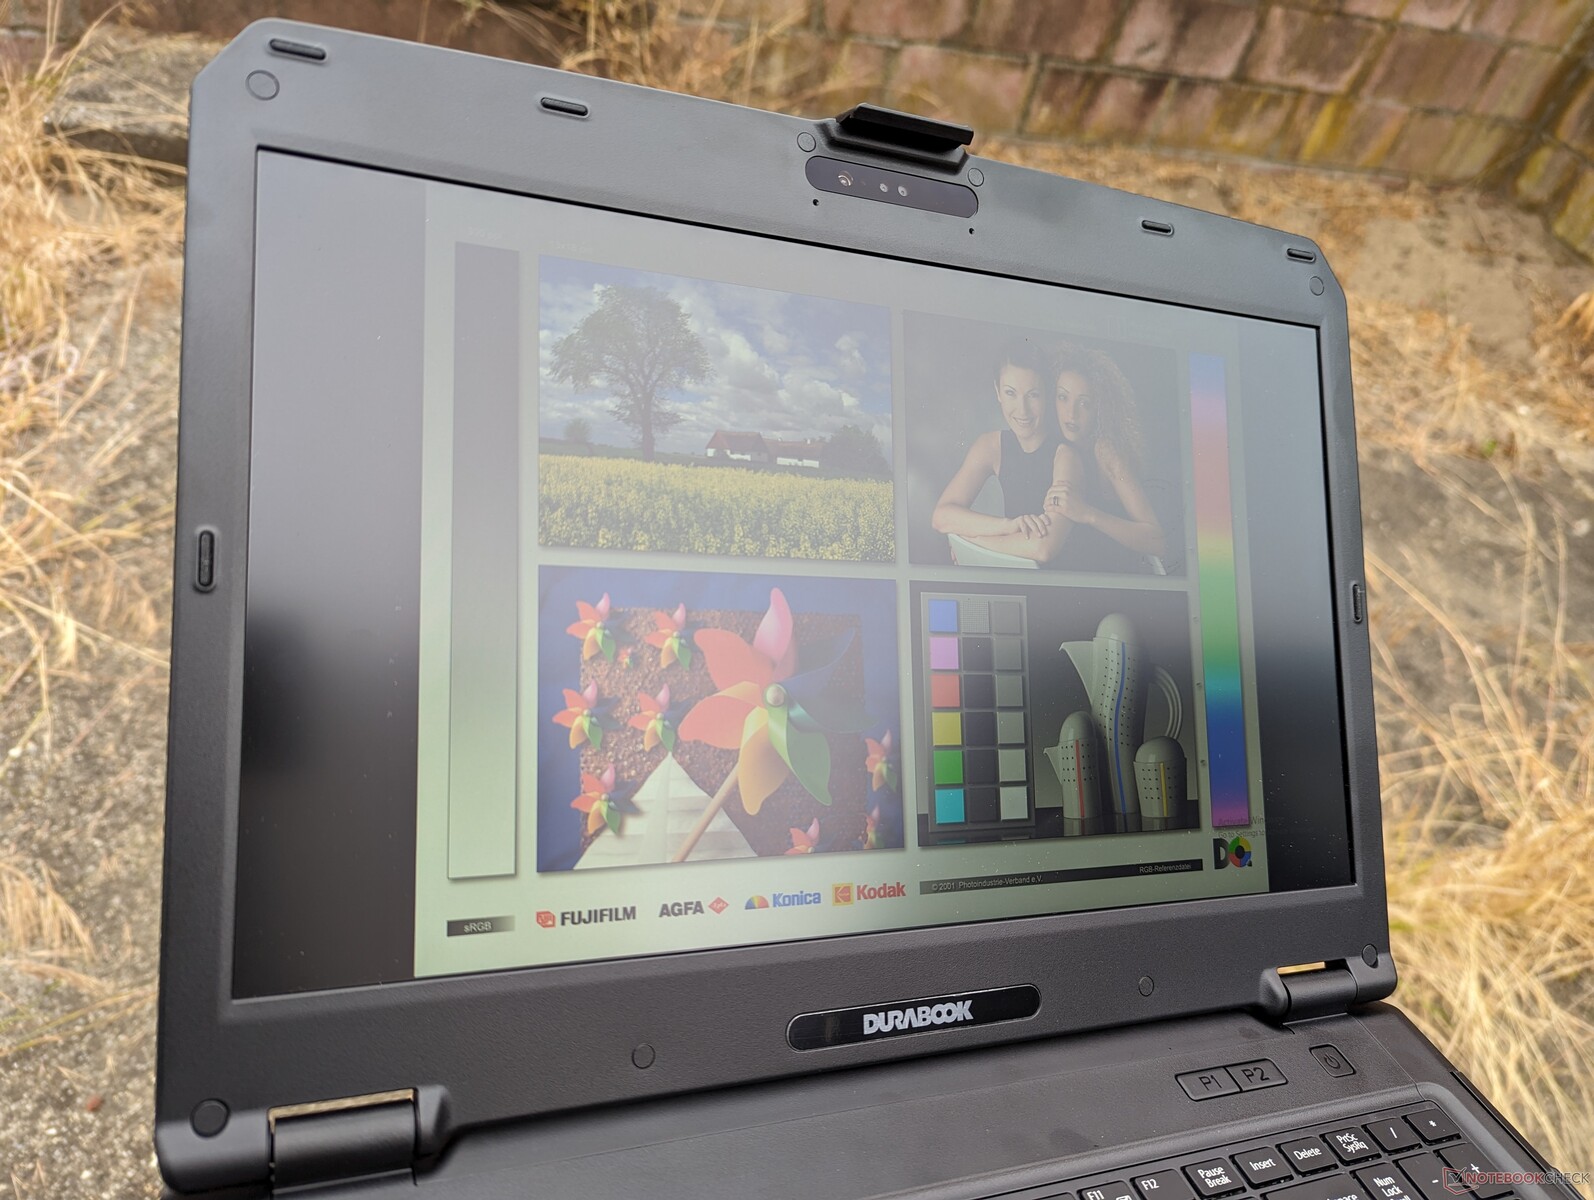
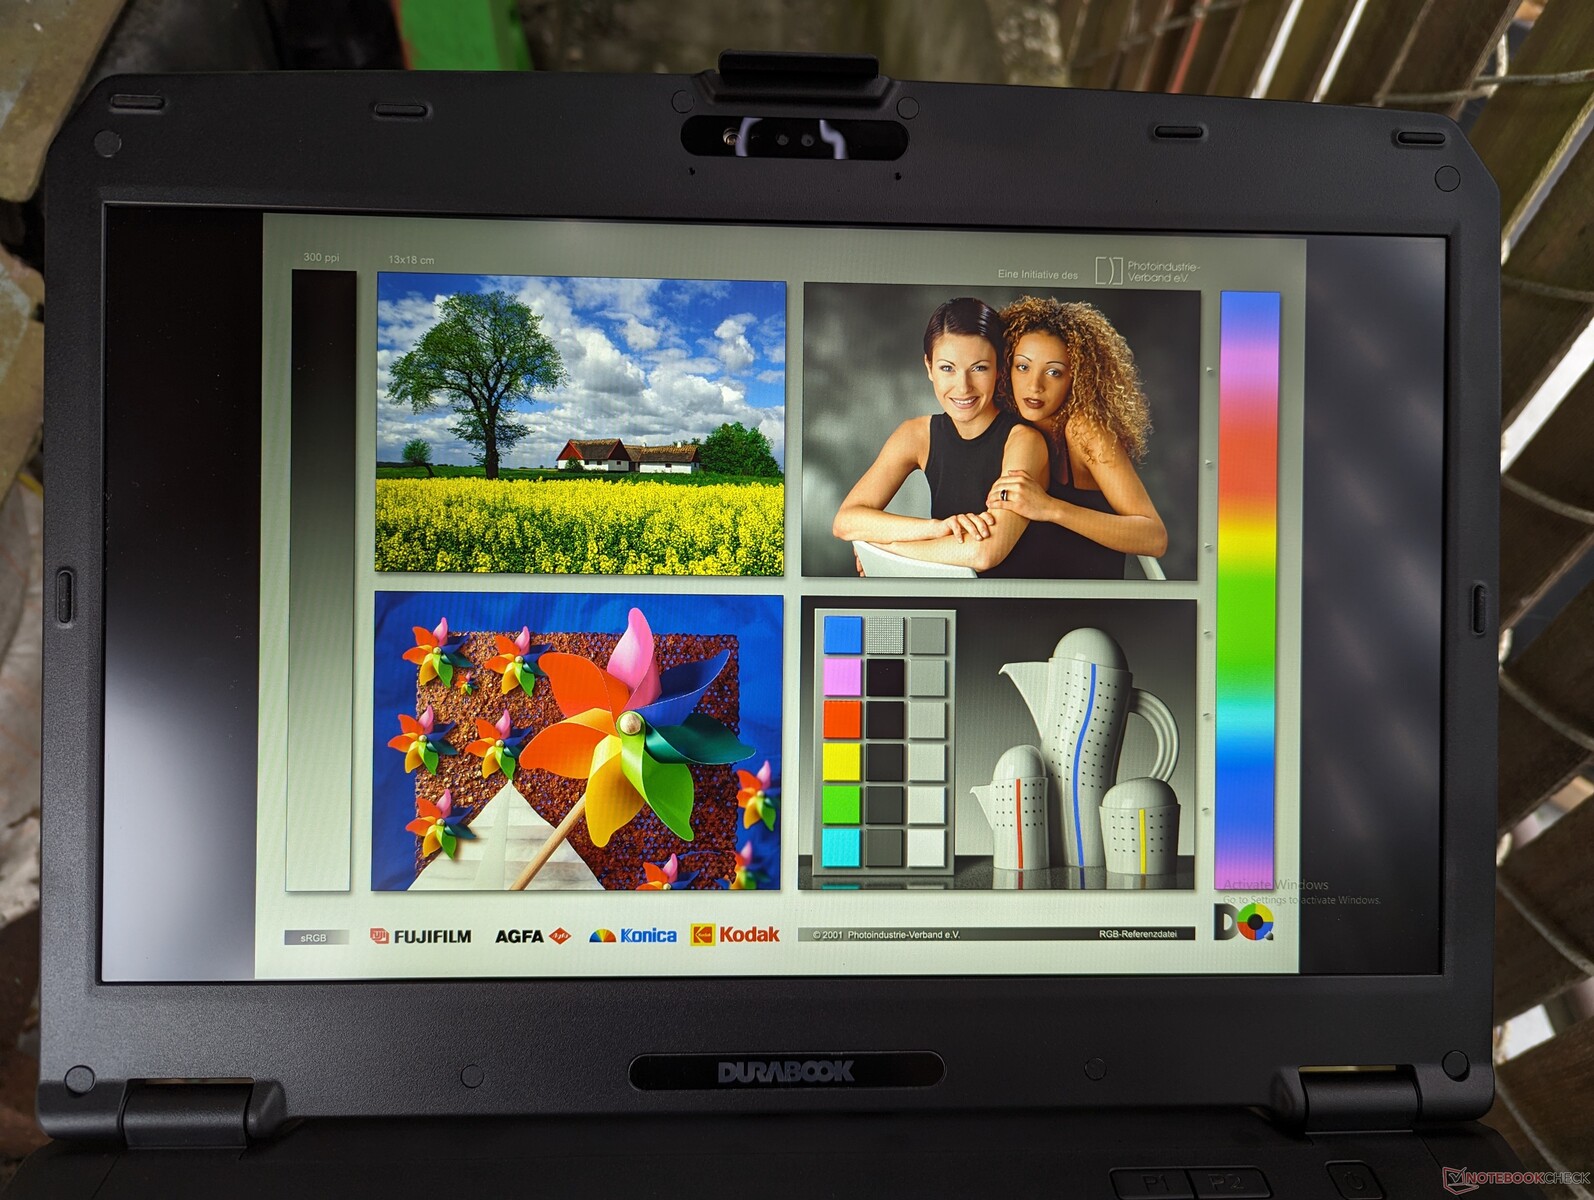
Display — Bright 1000-nit IPS
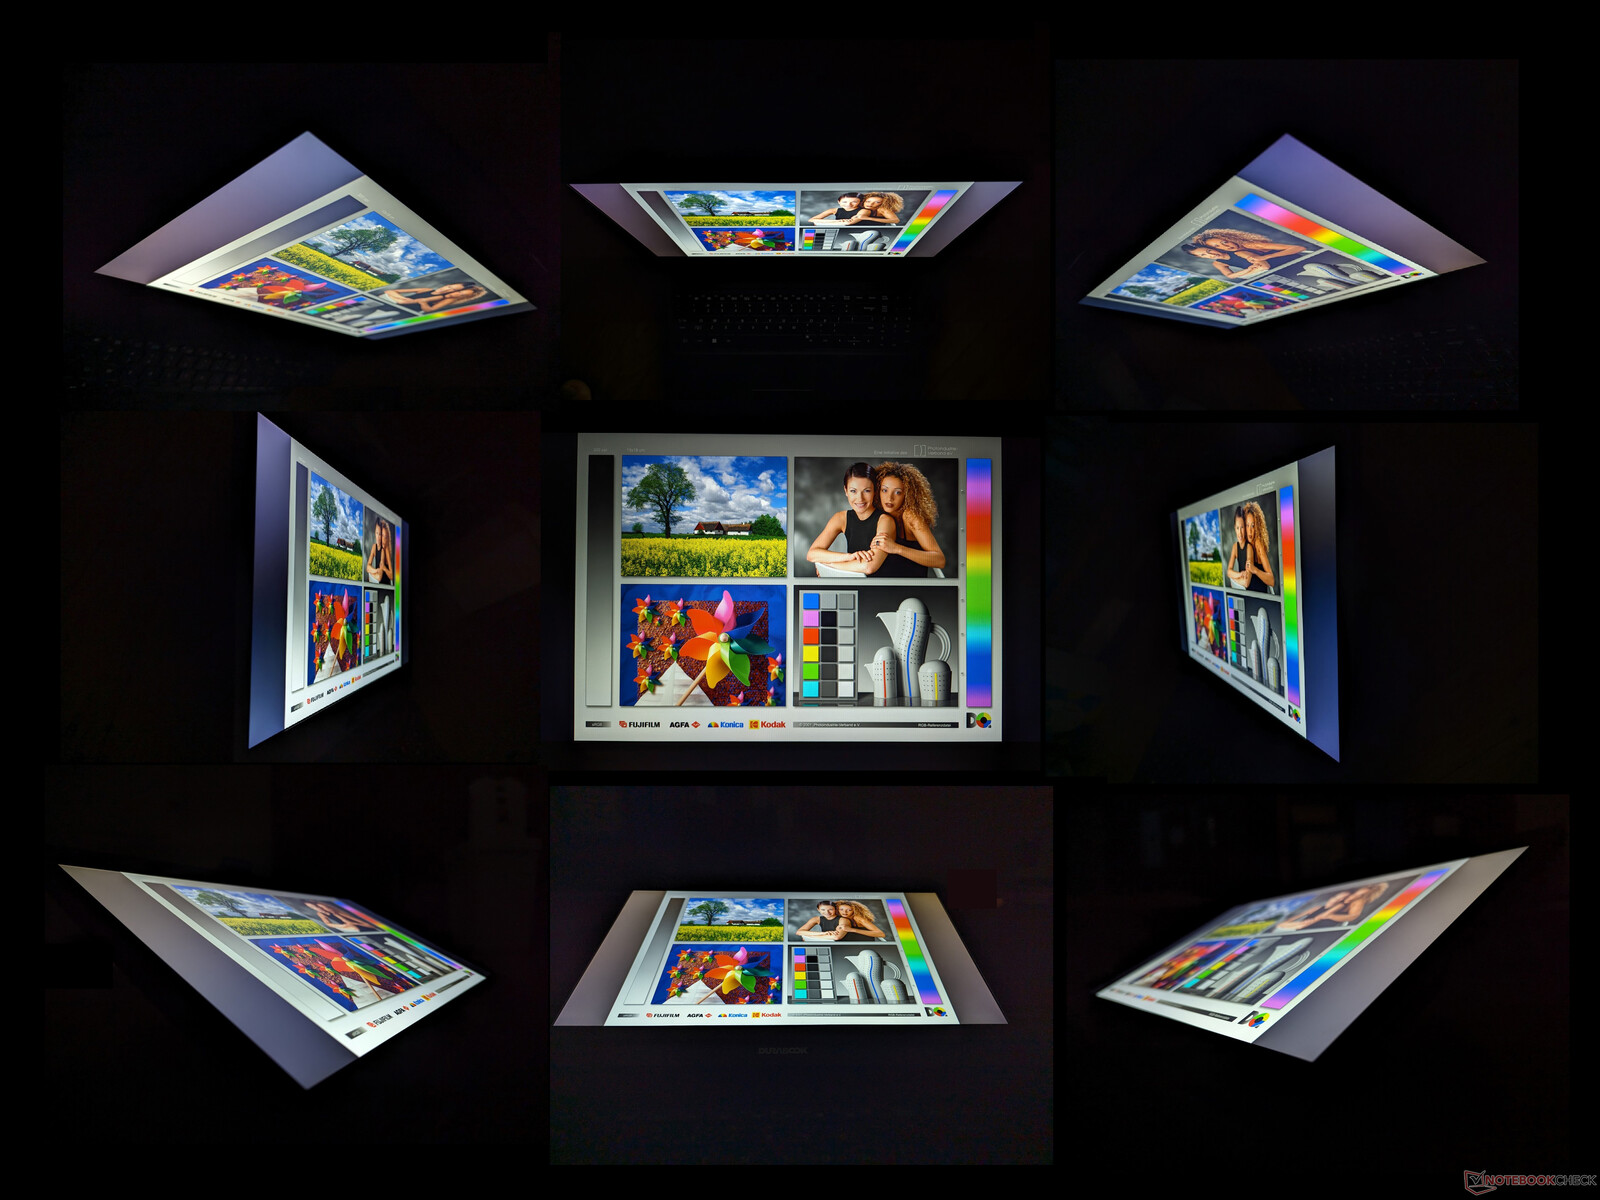
The S15 is the first model in our database to carry the HKC MB156CS01'2 IPS panel. It's a significant improvement over the Chi Mei TN panel on the older S15ABG2 in terms of viewing angles, contrast, and brightness while other aspects like response times and colors are largely the same. Other rugged models like the Dell Latitude 5420 Rugged or Acer Enduro Urban offer panels with more sRGB coverage for more vibrant colors.


| |||||||||||||||||||||||||
Brightness Distribution: 84 %
Center on Battery: 1087.3 cd/m²
Contrast: 1066:1 (Black: 1.02 cd/m²)
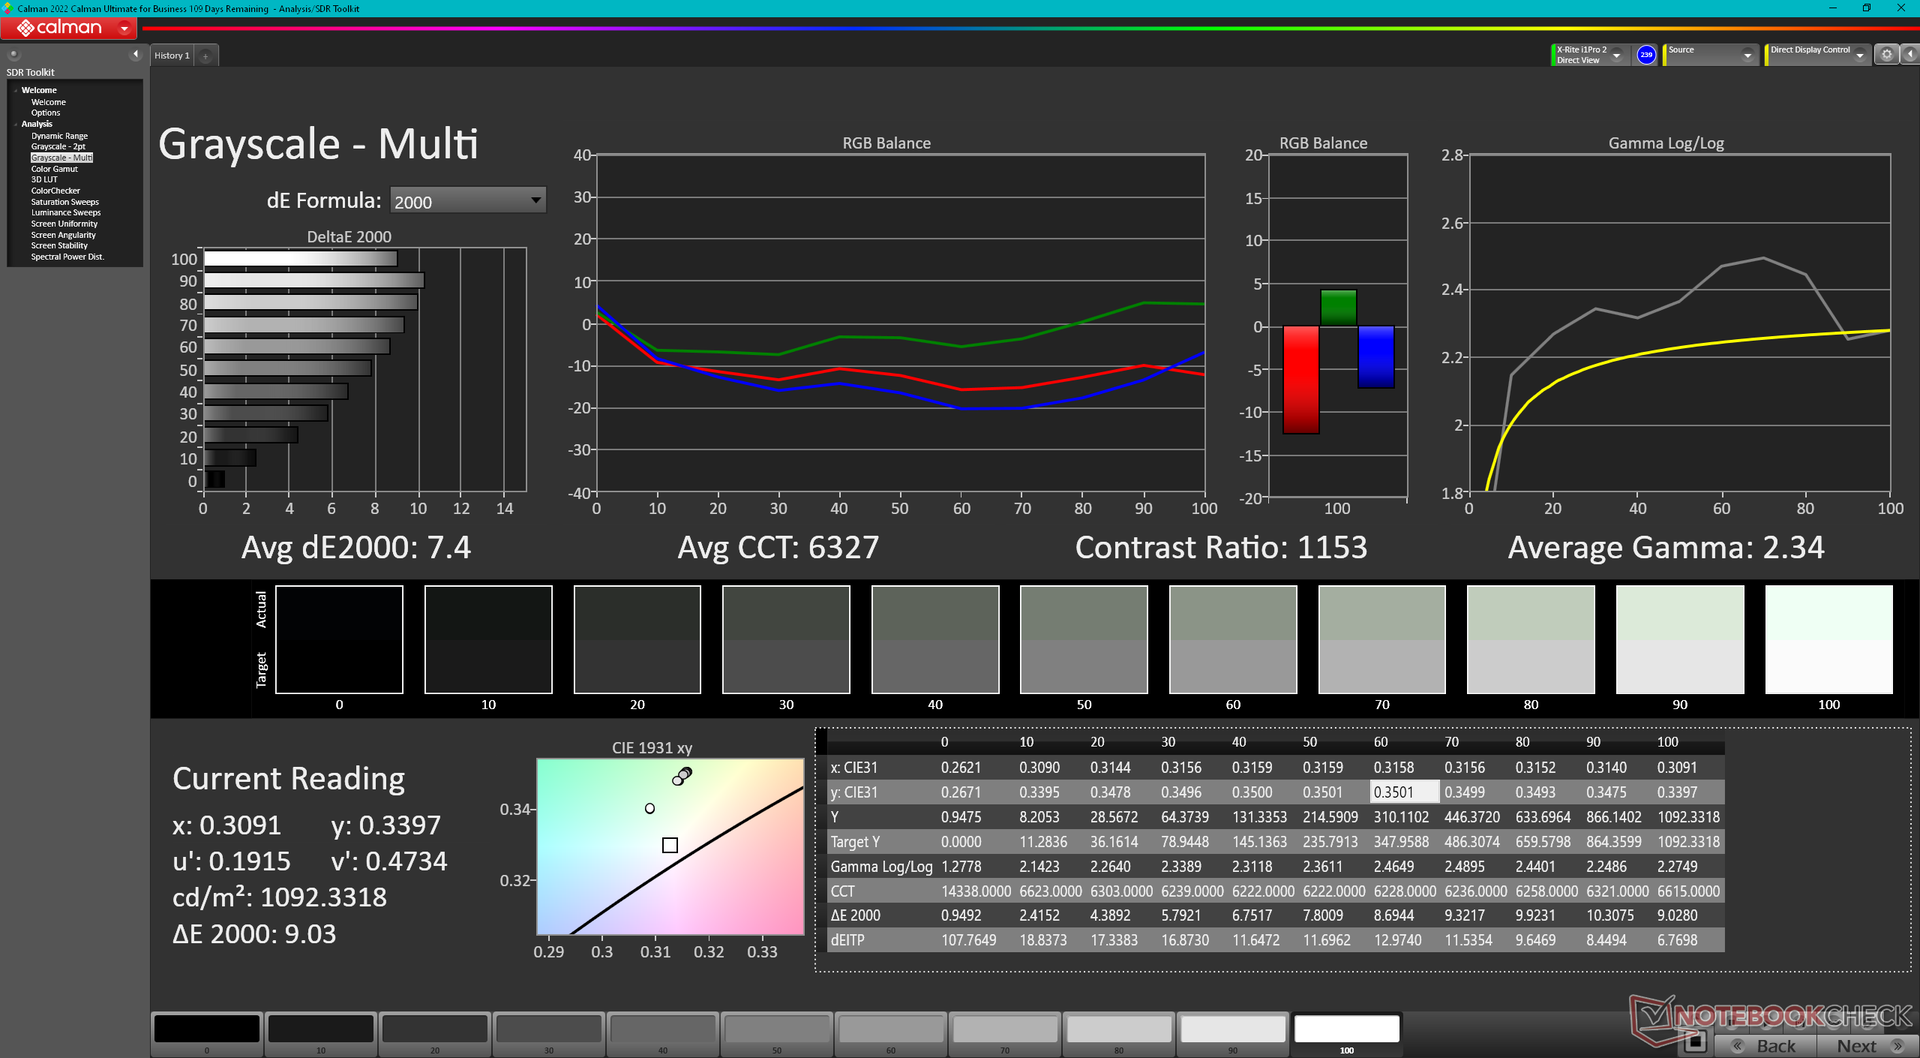
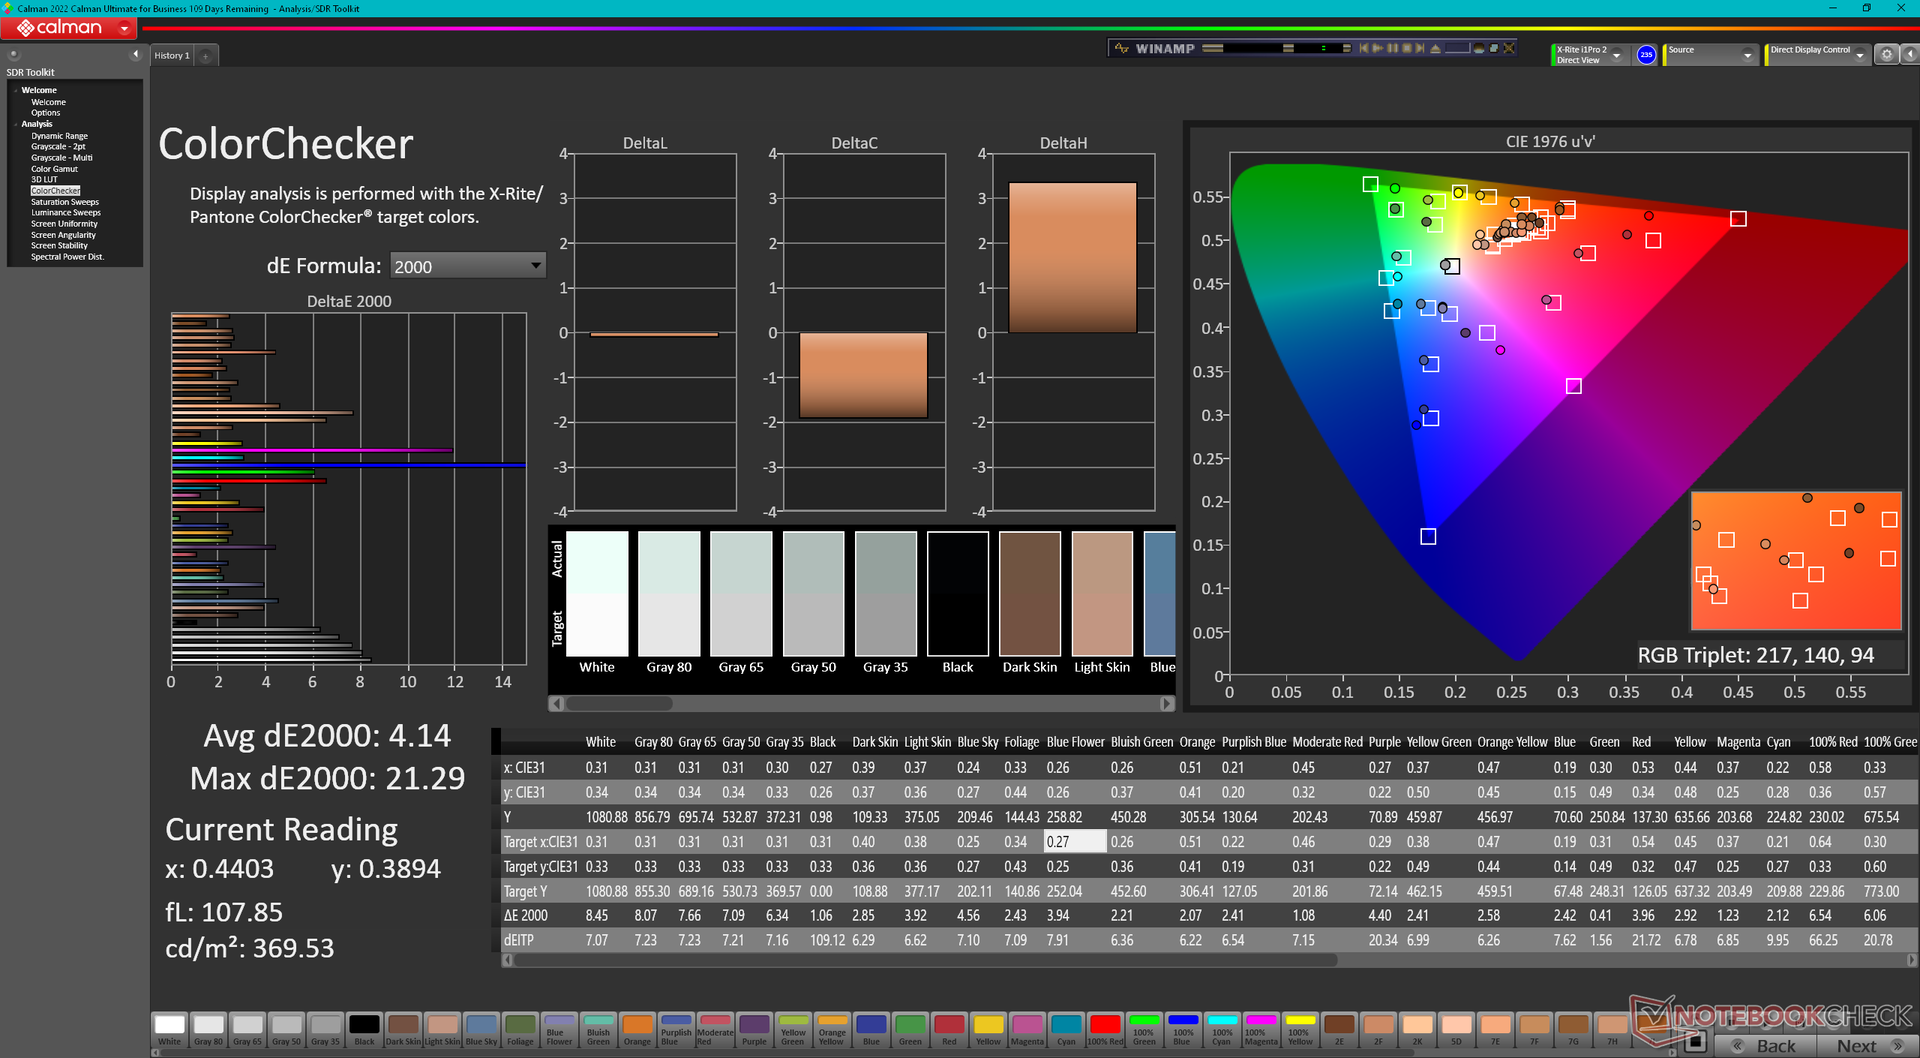
ΔE ColorChecker Calman: 7.23 | ∀{0.5-29.43 Ø4.72}
calibrated: 4.14
ΔE Greyscale Calman: 7.4 | ∀{0.09-98 Ø4.97}
41.2% AdobeRGB 1998 (Argyll 3D)
59% sRGB (Argyll 3D)
39.9% Display P3 (Argyll 3D)
Gamma: 2.34
CCT: 6327 K
| Durabook S15 HKC MY MB156CS01'2, IPS, 1920x1080, 15.6" | Durabook S15ABG2 Chi Mei N156HGE-EA2, TN LED, 1920x1080, 15.6" | Panasonic Toughbook 40 InfoVision M140NWF5 R3, IPS, 1920x1080, 14" | Getac S410 G5 CSOT T9 SNE001BS1-1, IPS, 1920x1080, 14" | Dell Latitude 5420 Rugged-P85G AU Optronics AUO523D, IPS, 1920x1080, 14" | Acer Enduro Urban N3 EUN314 XR140EA6T, IPS, 1920x1080, 14" | |
|---|---|---|---|---|---|---|
| Display | 29% | -10% | -3% | 57% | 58% | |
| Display P3 Coverage (%) | 39.9 | 51.4 29% | 35.8 -10% | 38.5 -4% | 62.5 57% | 63.5 59% |
| sRGB Coverage (%) | 59 | 77.1 31% | 53.8 -9% | 57.9 -2% | 92.4 57% | 91.9 56% |
| AdobeRGB 1998 Coverage (%) | 41.2 | 52.9 28% | 37 -10% | 39.8 -3% | 64.2 56% | 65.5 59% |
| Response Times | -22% | -108% | -29% | -168% | -147% | |
| Response Time Grey 50% / Grey 80% * (ms) | 22.4 ? | 24.4 ? -9% | 50.4 ? -125% | 29 ? -29% | 68 ? -204% | 56 ? -150% |
| Response Time Black / White * (ms) | 14.5 ? | 19.6 ? -35% | 27.6 ? -90% | 18.6 ? -28% | 33.6 ? -132% | 35.2 ? -143% |
| PWM Frequency (Hz) | 300 ? | 301.2 ? | 694.4 ? | 876 ? | 735 ? | 1000 ? |
| Screen | -31% | 28% | 16% | 24% | 6% | |
| Brightness middle (cd/m²) | 1087.3 | 284.8 -74% | 1284.3 18% | 958.4 -12% | 1111.7 2% | 487.8 -55% |
| Brightness (cd/m²) | 997 | 267 -73% | 1289 29% | 978 -2% | 1026 3% | 464 -53% |
| Brightness Distribution (%) | 84 | 86 2% | 82 -2% | 86 2% | 80 -5% | 89 6% |
| Black Level * (cd/m²) | 1.02 | 0.7 31% | 0.89 13% | 0.96 6% | 0.81 21% | 0.48 53% |
| Contrast (:1) | 1066 | 407 -62% | 1443 35% | 998 -6% | 1372 29% | 1016 -5% |
| Colorchecker dE 2000 * | 7.23 | 11.48 -59% | 4.67 35% | 4.95 32% | 3.83 47% | 6.51 10% |
| Colorchecker dE 2000 max. * | 21.91 | 19.71 10% | 19.85 9% | 16.88 23% | 7.85 64% | 11.36 48% |
| Colorchecker dE 2000 calibrated * | 4.14 | 3.06 26% | 2.21 47% | 1.96 53% | 2.98 28% | 1.77 57% |
| Greyscale dE 2000 * | 7.4 | 13.2 -78% | 2.7 64% | 3.9 47% | 5.6 24% | 7.8 -5% |
| Gamma | 2.34 94% | 2.09 105% | 1.97 112% | 2.14 103% | 2.306 95% | 2.28 96% |
| CCT | 6327 103% | 14566 45% | 6222 104% | 7174 91% | 7676 85% | 8102 80% |
| Color Space (Percent of AdobeRGB 1998) (%) | 48.8 | 59 | ||||
| Color Space (Percent of sRGB) (%) | 76.8 | 93 | ||||
| Total Average (Program / Settings) | -8% /
-17% | -30% /
0% | -5% /
6% | -29% /
3% | -28% /
-5% |
* ... smaller is better
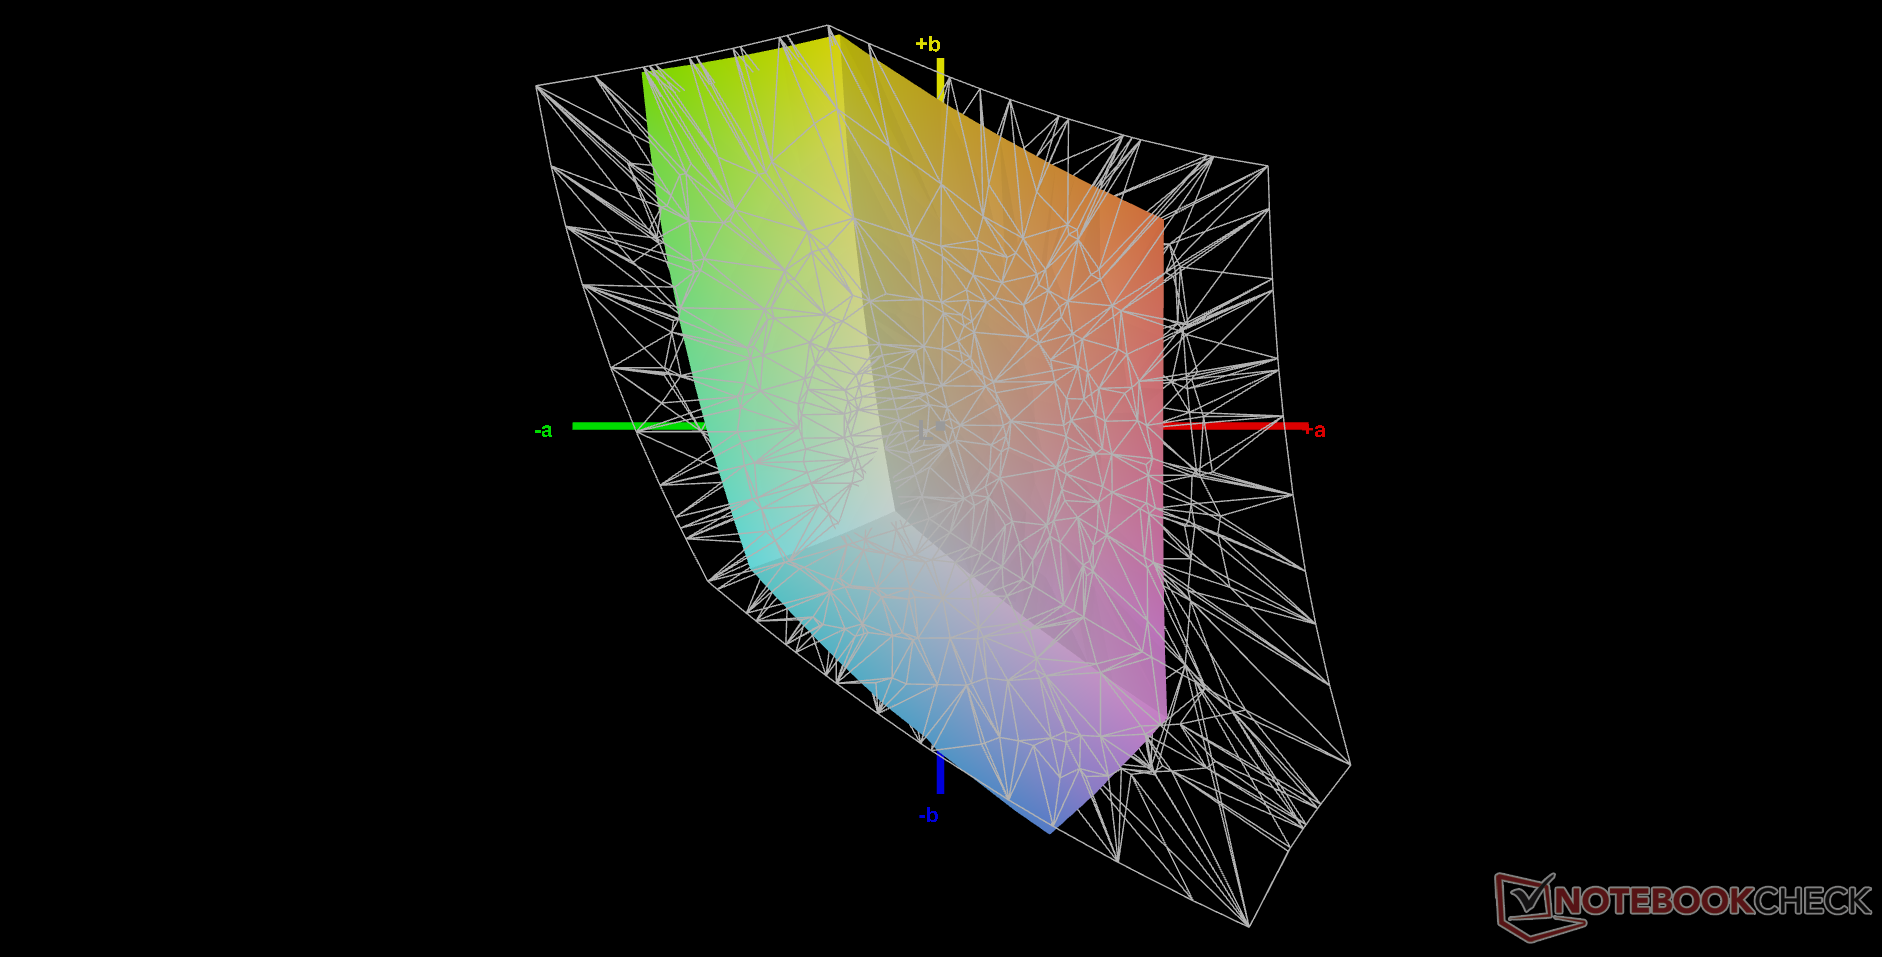
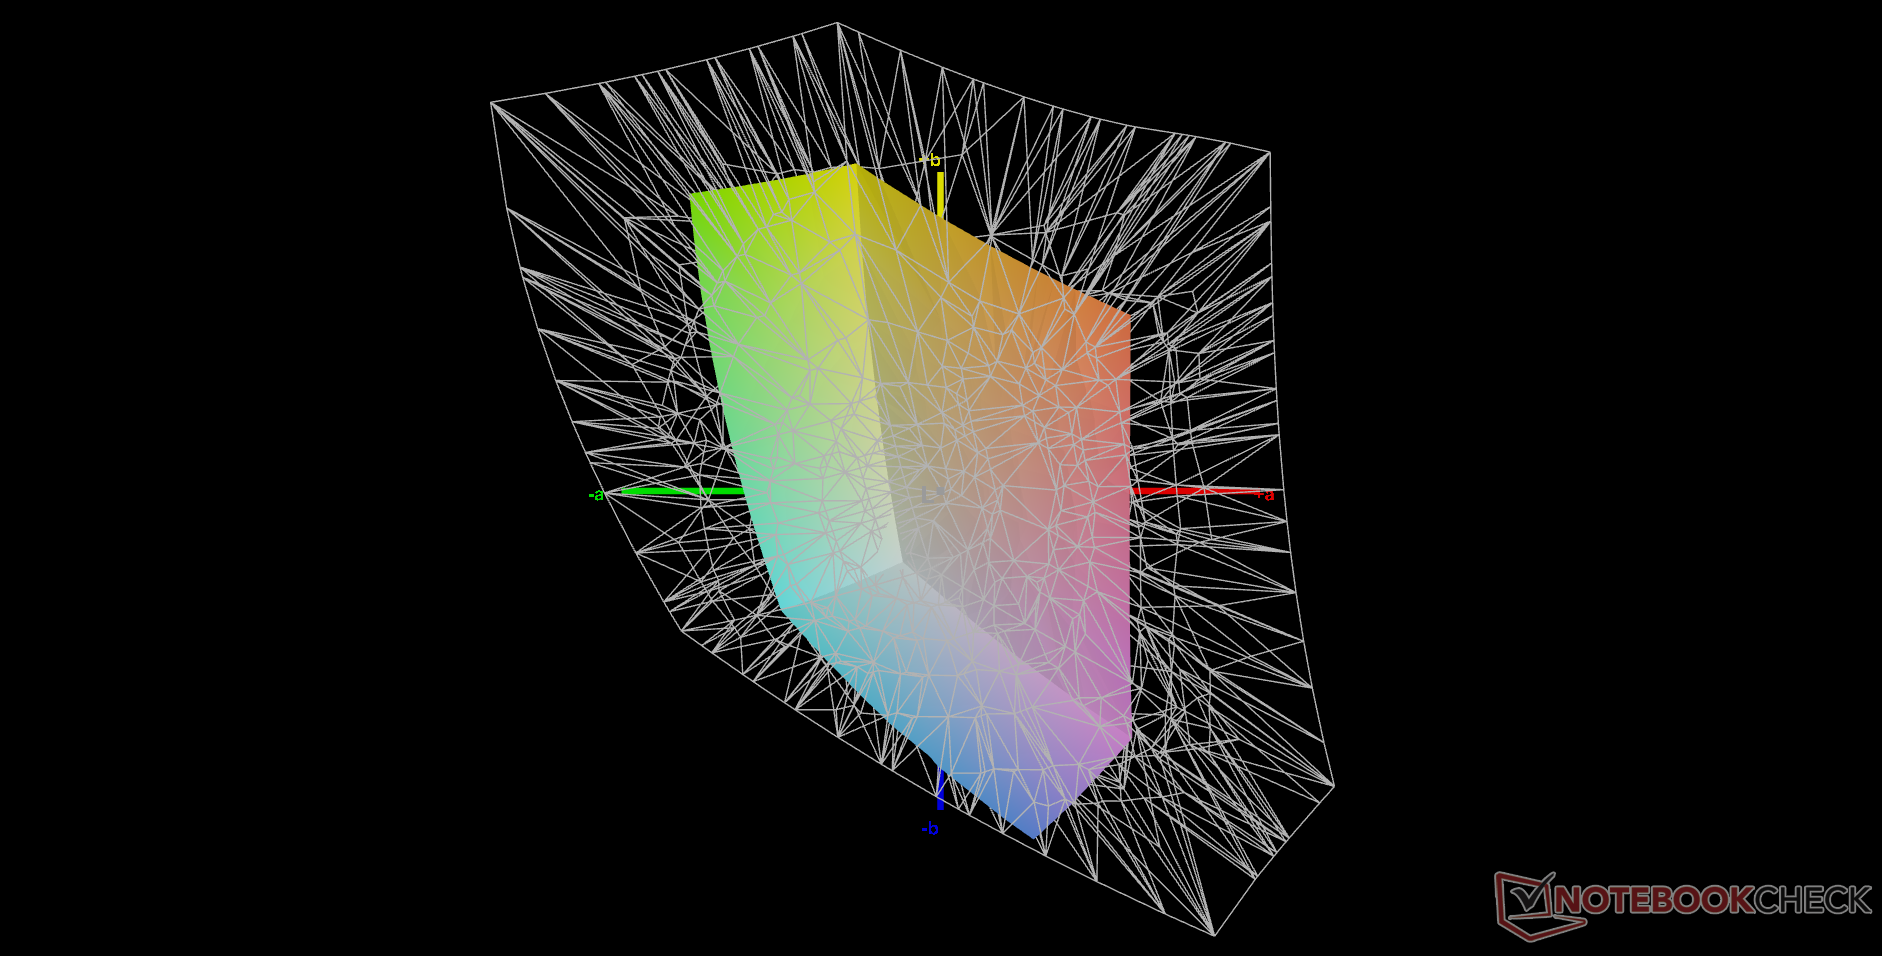
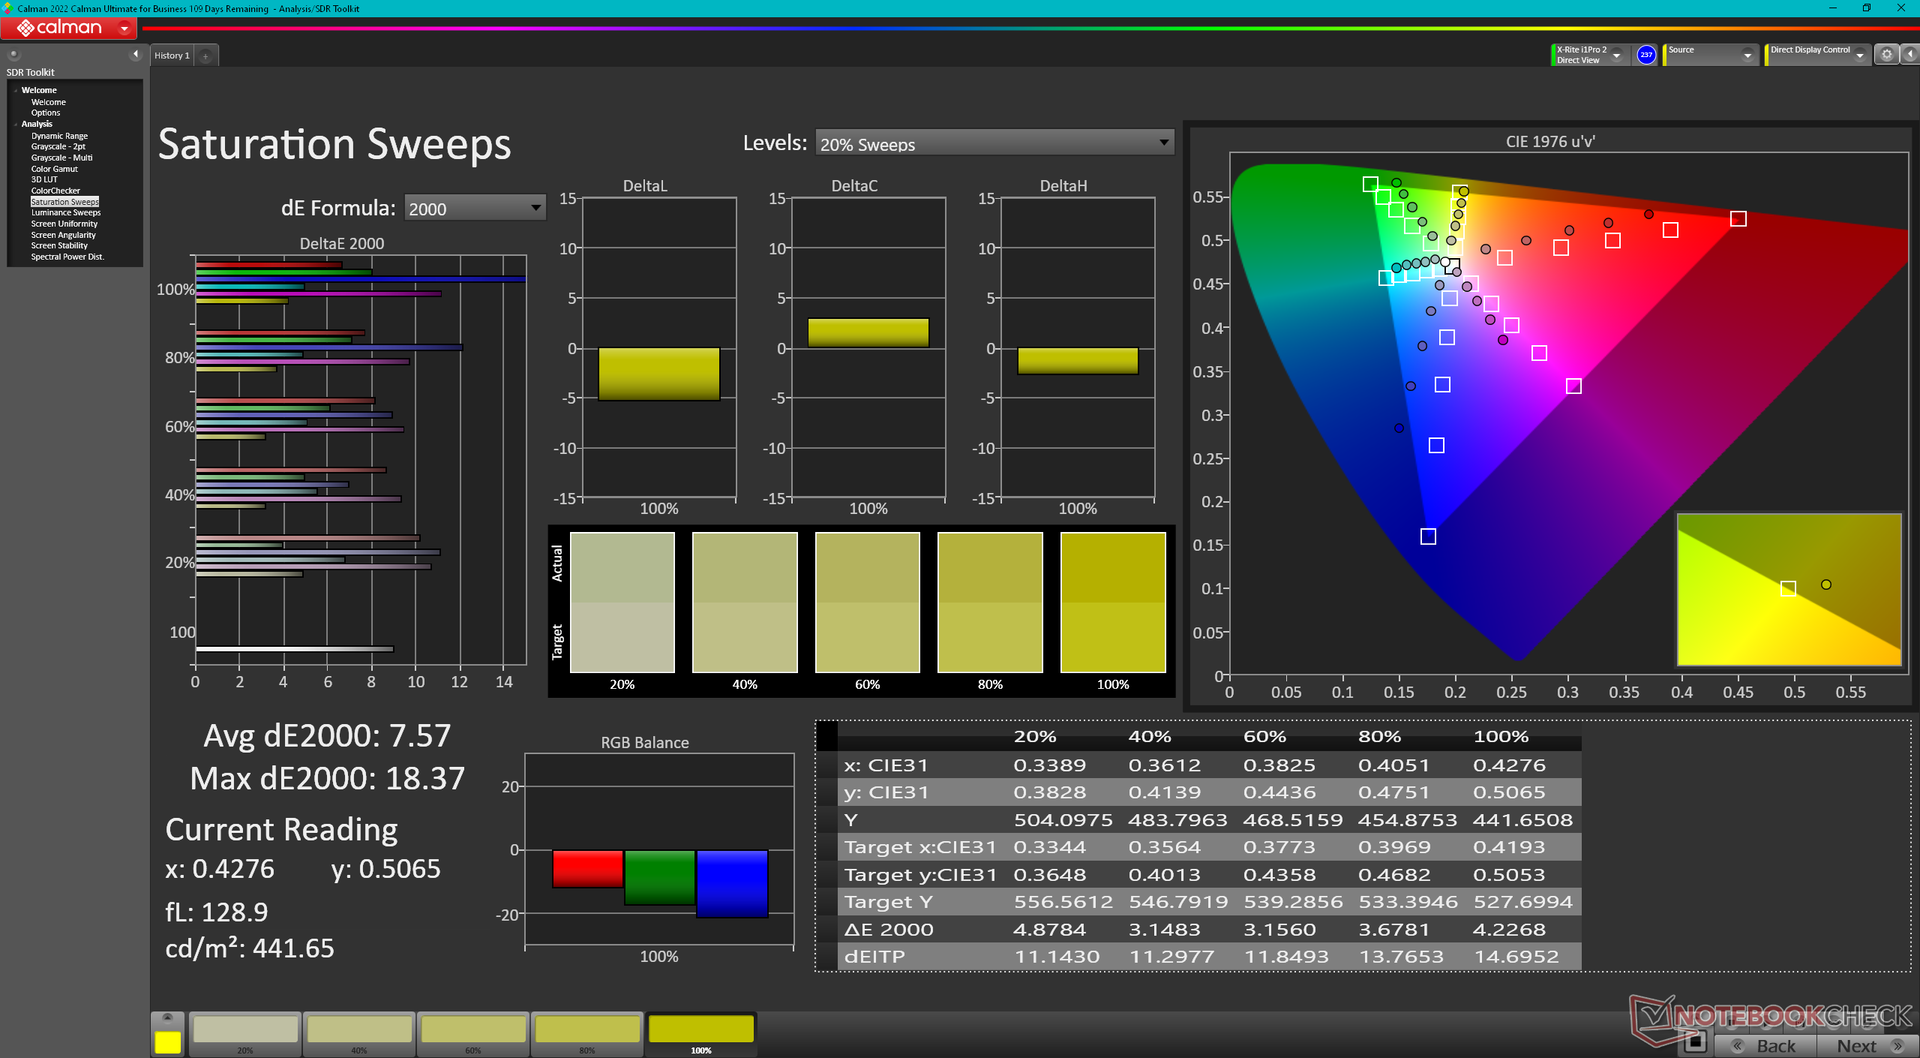
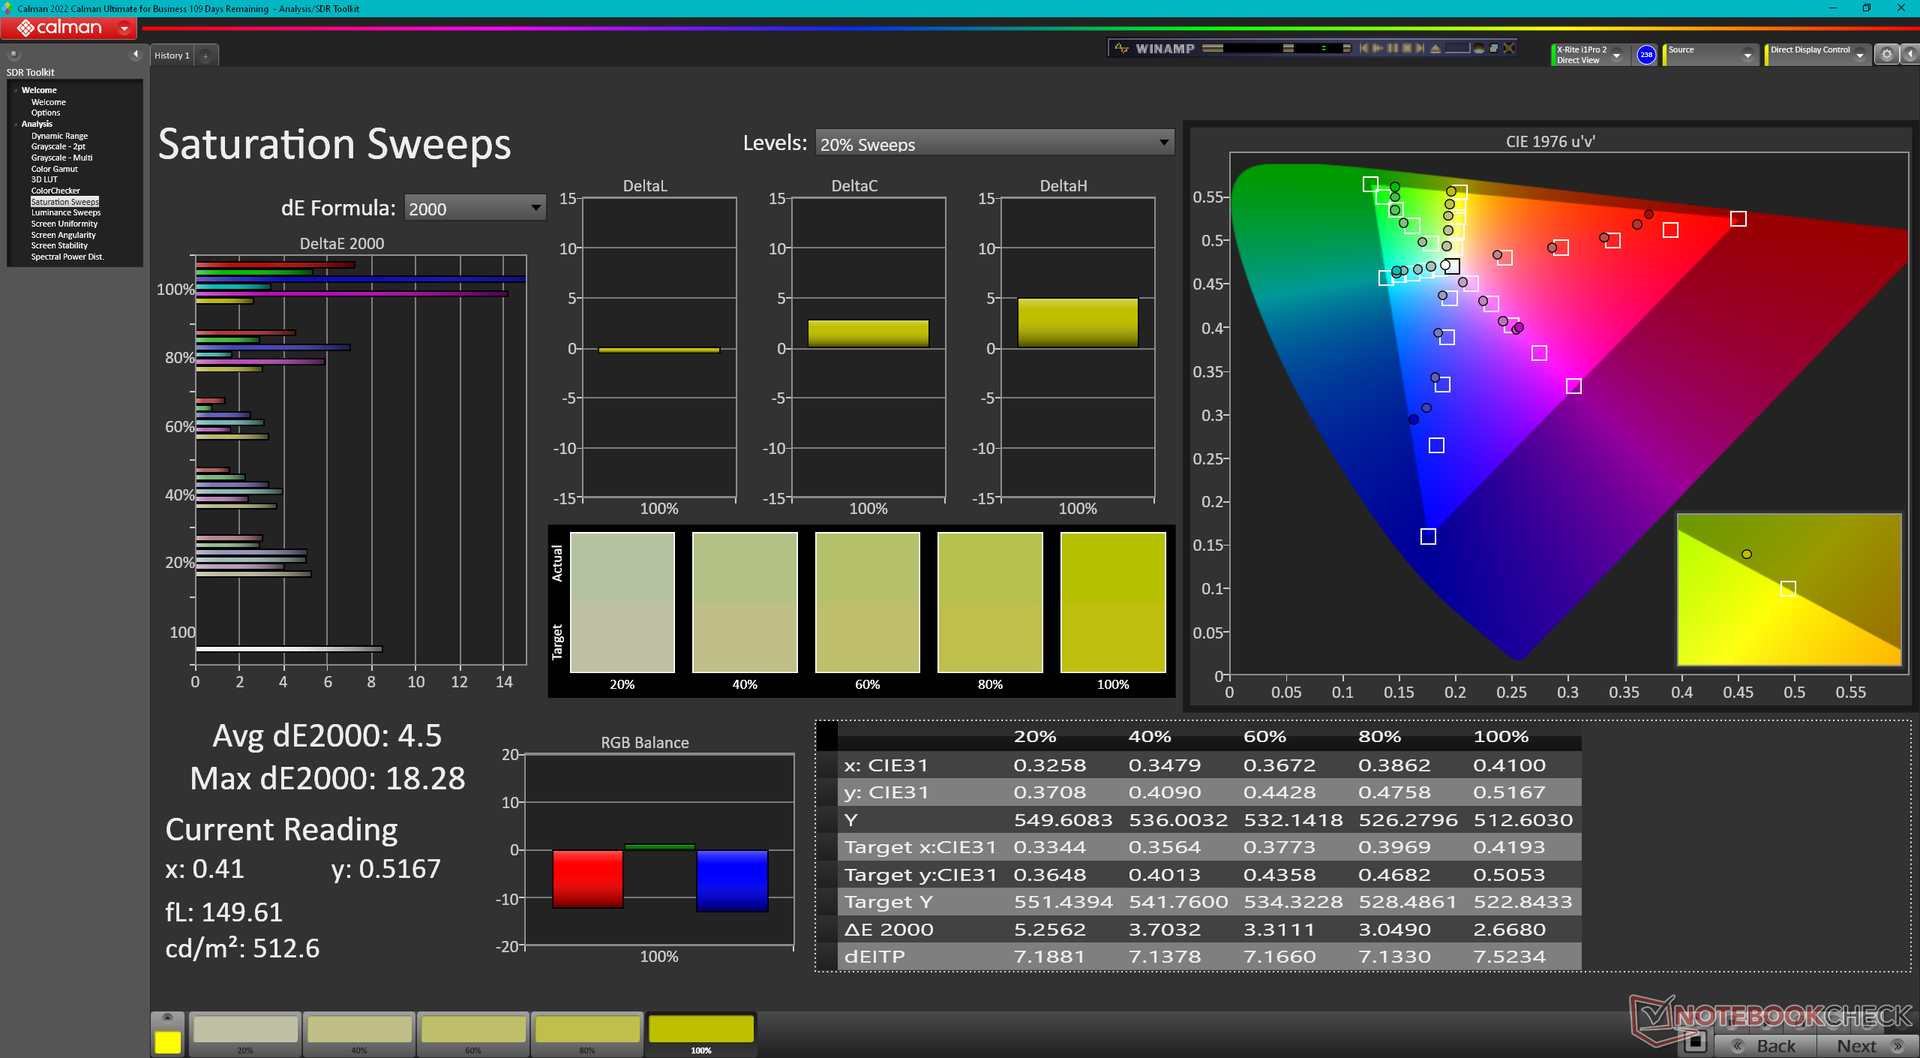
The display comes poorly calibrated out of the box with relatively high average grayscale and color deltaE values of 7.4 and 7.23, respectively. Calibrating the display ourselves would improve things somewhat, but colors still become increasingly inaccurate the higher the saturation level due to the aforementioned limited sRGB coverage. Accurate colors are usually not priority on these types of laptops, anyway.


Display Response Times
| ↔ Response Time Black to White | ||
|---|---|---|
| 14.5 ms ... rise ↗ and fall ↘ combined | ↗ 7 ms rise | 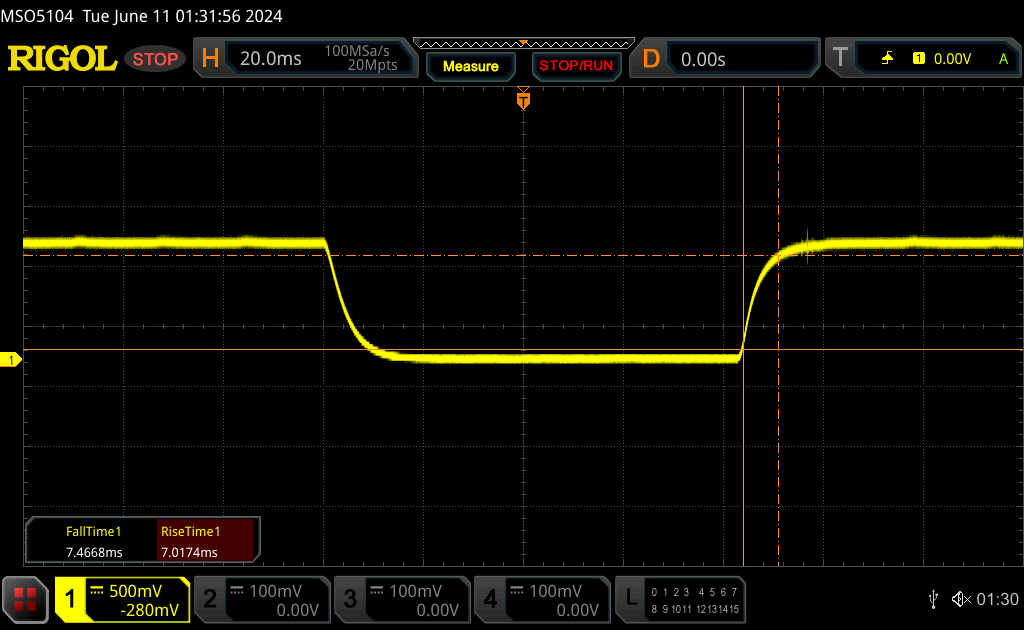 |
| ↘ 7.5 ms fall | ||
| The screen shows good response rates in our tests, but may be too slow for competitive gamers. In comparison, all tested devices range from 0.1 (minimum) to 240 (maximum) ms. » 36 % of all devices are better. This means that the measured response time is better than the average of all tested devices (19.8 ms). | ||
| ↔ Response Time 50% Grey to 80% Grey | ||
| 22.4 ms ... rise ↗ and fall ↘ combined | ↗ 10 ms rise | 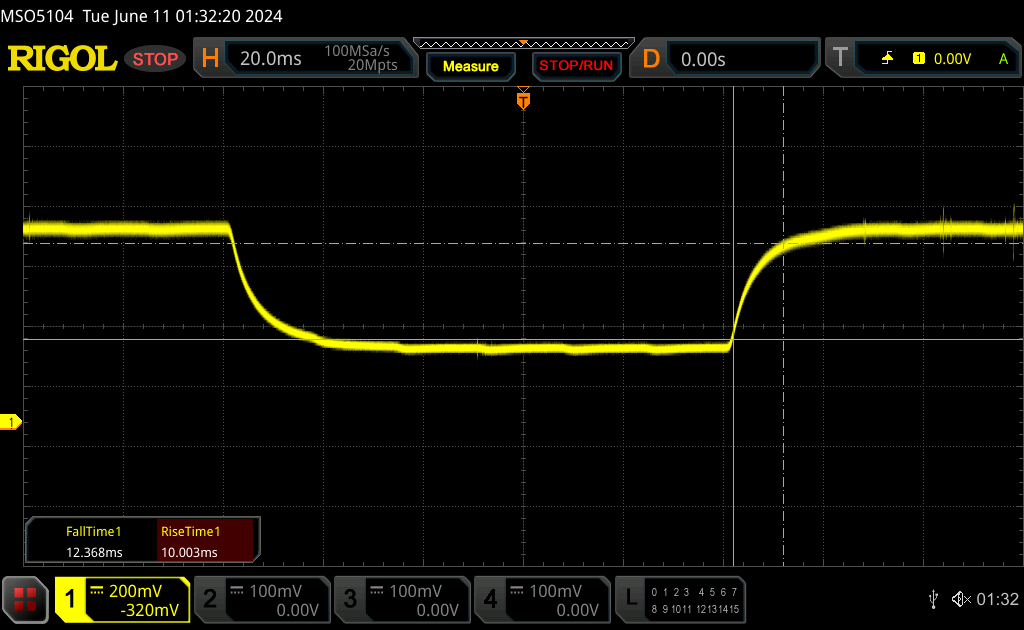 |
| ↘ 12.4 ms fall | ||
| The screen shows good response rates in our tests, but may be too slow for competitive gamers. In comparison, all tested devices range from 0.165 (minimum) to 636 (maximum) ms. » 34 % of all devices are better. This means that the measured response time is better than the average of all tested devices (31 ms). | ||
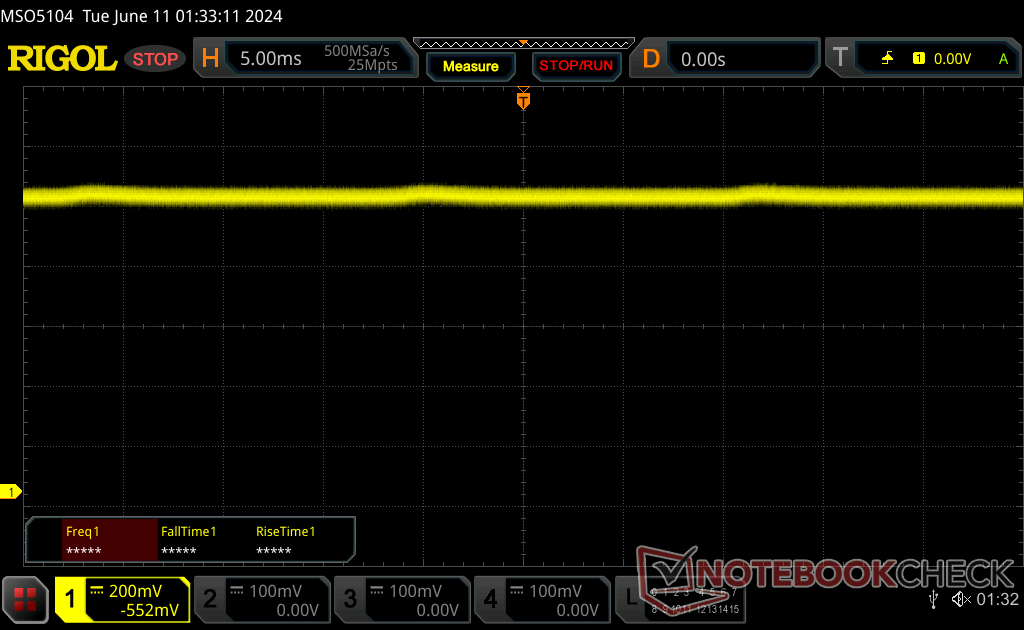
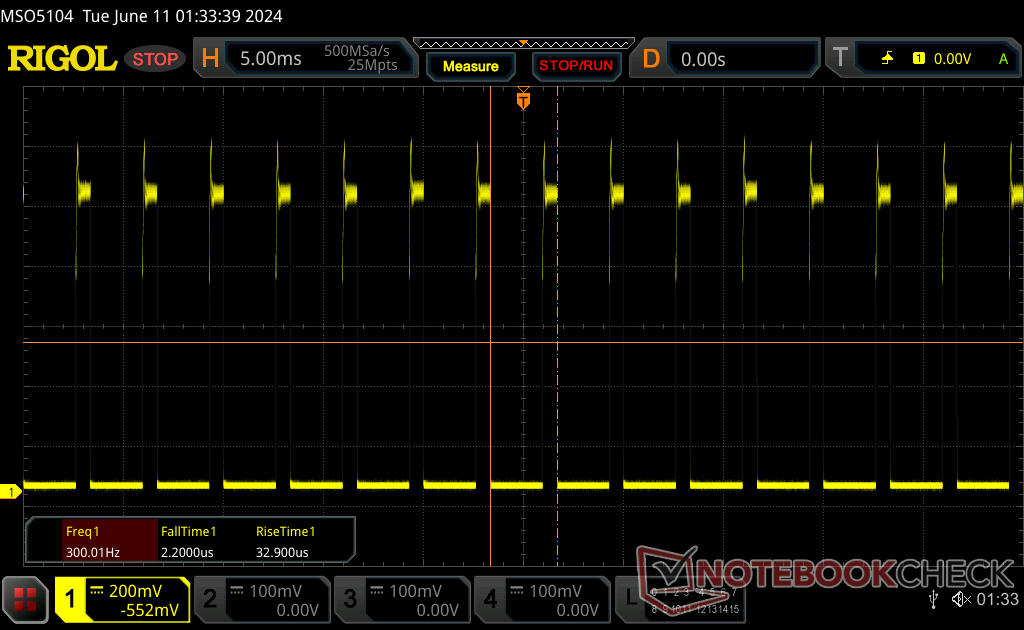
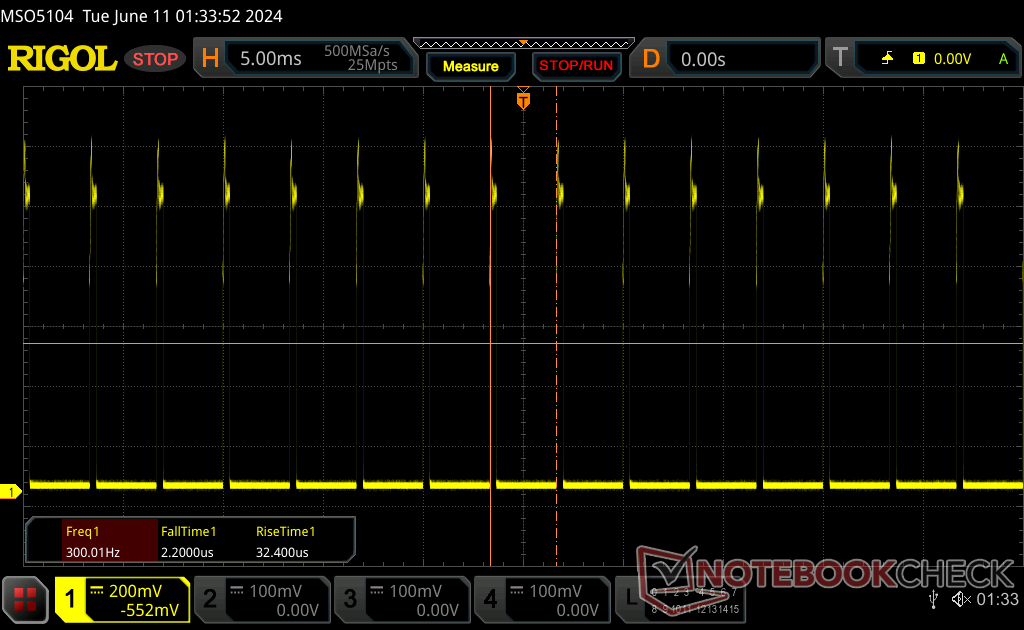
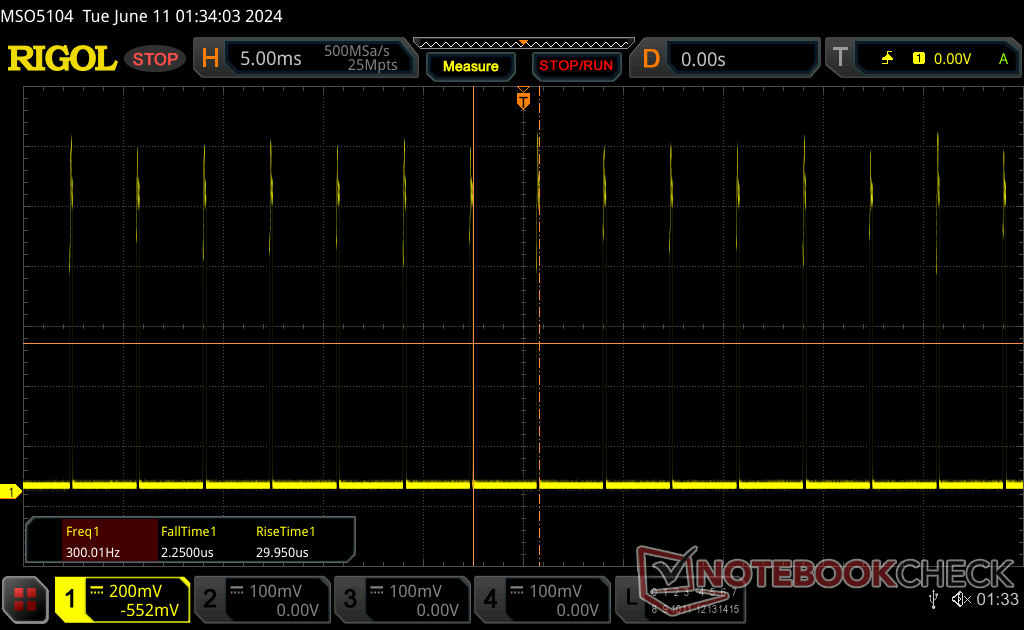
Screen Flickering / PWM (Pulse-Width Modulation)
| Screen flickering / PWM detected | 300 Hz | ≤ 99 % brightness setting | 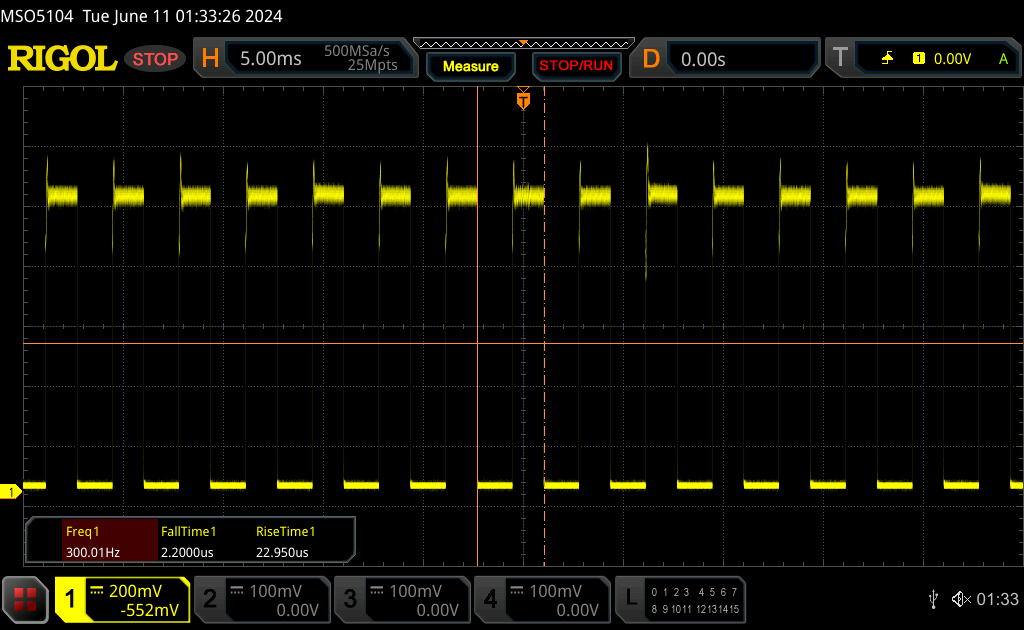 |
The display backlight flickers at 300 Hz (worst case, e.g., utilizing PWM) Flickering detected at a brightness setting of 99 % and below. There should be no flickering or PWM above this brightness setting. The frequency of 300 Hz is relatively high, so most users sensitive to PWM should not notice any flickering. However, there are reports that some users are still sensitive to PWM at 500 Hz and above, so be aware. In comparison: 52 % of all tested devices do not use PWM to dim the display. If PWM was detected, an average of 7747 (minimum: 5 - maximum: 343500) Hz was measured. | |||
Pulse-width modulation is present on all brightness levels except maximum. Its frequency is constant at 300 Hz from 0 to 99 percent brightness meaning users who are sensitive to onscreen flickering may want to avoid using the Durabook for long periods of time.
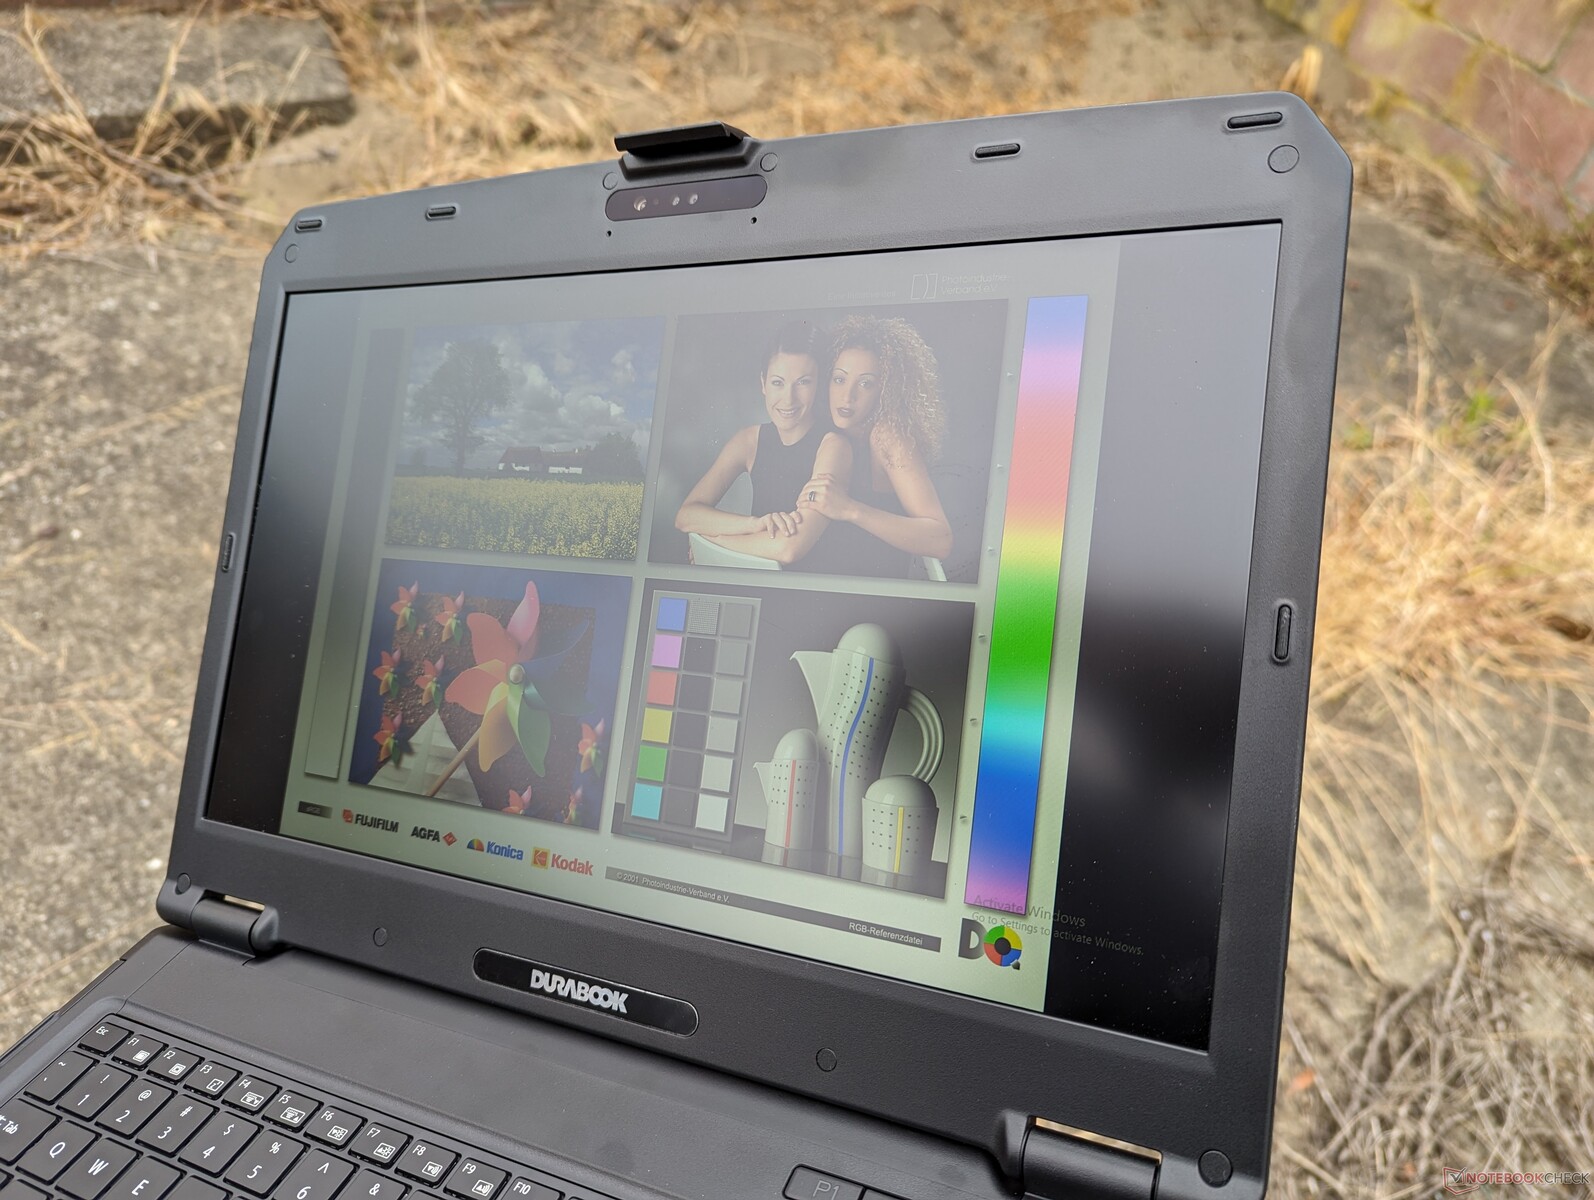
Outdoor visibility is excellent when under shade and usable when under sunlight or bright overcast. Some glare will be present, but the 1000-nit backlight helps to mitigate the bright ambient lighting to make texts more easily readable.
Performance — Intel 12th Gen With vPro
Testing Conditions
We set Windows to Performance mode prior to running the benchmarks below.
Processor
CPU performance is well ahead of the Core i5-8265U in the older S15ABG2 as to be expected and also slightly faster than the Core i7 Tiger Lake processors as found on the Panasonic Toughbook FZ or Acer Enduro Urban. On the flip side, however, it's also noticeably slower than the average laptop in our database equipped with the same Core i7-1255U CPU by about 20 to 25 percent. This suggests that the S15 is running the processor conservatively to improve performance consistency and reliability.
For a more significant boost in performance, we recommend taking a look at the Getac S410 G5 which comes with 13th gen Raptor Lake-P CPU options for up to 60 to 70 percent faster multi-thread performance than our Core i7-1255U.
Cinebench R15 Multi Loop
Cinebench R23: Multi Core | Single Core
Cinebench R20: CPU (Multi Core) | CPU (Single Core)
Cinebench R15: CPU Multi 64Bit | CPU Single 64Bit
Blender: v2.79 BMW27 CPU
7-Zip 18.03: 7z b 4 | 7z b 4 -mmt1
Geekbench 6.7: Multi-Core | Single-Core
Geekbench 5.5: Multi-Core | Single-Core
HWBOT x265 Benchmark v2.2: 4k Preset
LibreOffice : 20 Documents To PDF
R Benchmark 2.5: Overall mean
| CPU Performance rating | |
| Getac S410 G5 | |
| Average Intel Core i7-1255U | |
| Durabook S15 | |
| Dell Latitude 7330 Rugged Extreme -2! | |
| Acer Enduro Urban N3 EUN314 -2! | |
| Panasonic Toughbook FZ-55 MK2 -4! | |
| Getac S410 Gen 4 -2! | |
| Panasonic Toughbook 40 -2! | |
| Durabook S14I -2! | |
| Getac B360 -3! | |
| Getac S410 -14! | |
| Dell Latitude 5420 Rugged-P85G -14! | |
| Durabook S15ABG2 -4! | |
| Cinebench R23 / Multi Core | |
| Getac S410 G5 | |
| Average Intel Core i7-1255U (5269 - 9628, n=11) | |
| Durabook S15 | |
| Dell Latitude 7330 Rugged Extreme | |
| Panasonic Toughbook FZ-55 MK2 | |
| Acer Enduro Urban N3 EUN314 | |
| Getac S410 Gen 4 | |
| Panasonic Toughbook 40 | |
| Getac B360 | |
| Durabook S14I | |
| Cinebench R23 / Single Core | |
| Getac S410 G5 | |
| Average Intel Core i7-1255U (1408 - 1775, n=11) | |
| Dell Latitude 7330 Rugged Extreme | |
| Panasonic Toughbook FZ-55 MK2 | |
| Acer Enduro Urban N3 EUN314 | |
| Getac S410 Gen 4 | |
| Durabook S15 | |
| Panasonic Toughbook 40 | |
| Durabook S14I | |
| Getac B360 | |
| Cinebench R20 / CPU (Multi Core) | |
| Getac S410 G5 | |
| Average Intel Core i7-1255U (2095 - 3702, n=11) | |
| Durabook S15 | |
| Dell Latitude 7330 Rugged Extreme | |
| Panasonic Toughbook FZ-55 MK2 | |
| Acer Enduro Urban N3 EUN314 | |
| Getac S410 Gen 4 | |
| Panasonic Toughbook 40 | |
| Getac B360 | |
| Durabook S14I | |
| Durabook S15ABG2 | |
| Cinebench R20 / CPU (Single Core) | |
| Getac S410 G5 | |
| Average Intel Core i7-1255U (550 - 682, n=11) | |
| Durabook S15 | |
| Dell Latitude 7330 Rugged Extreme | |
| Acer Enduro Urban N3 EUN314 | |
| Panasonic Toughbook FZ-55 MK2 | |
| Getac S410 Gen 4 | |
| Durabook S14I | |
| Panasonic Toughbook 40 | |
| Getac B360 | |
| Durabook S15ABG2 | |
| Cinebench R15 / CPU Multi 64Bit | |
| Getac S410 G5 | |
| Average Intel Core i7-1255U (919 - 1577, n=11) | |
| Durabook S15 | |
| Acer Enduro Urban N3 EUN314 | |
| Dell Latitude 7330 Rugged Extreme | |
| Panasonic Toughbook FZ-55 MK2 | |
| Getac S410 Gen 4 | |
| Panasonic Toughbook 40 | |
| Getac B360 | |
| Durabook S14I | |
| Getac S410 | |
| Durabook S15ABG2 | |
| Dell Latitude 5420 Rugged-P85G | |
| Cinebench R15 / CPU Single 64Bit | |
| Getac S410 G5 | |
| Average Intel Core i7-1255U (161 - 251, n=12) | |
| Durabook S15 | |
| Dell Latitude 7330 Rugged Extreme | |
| Panasonic Toughbook FZ-55 MK2 | |
| Acer Enduro Urban N3 EUN314 | |
| Getac S410 Gen 4 | |
| Durabook S14I | |
| Panasonic Toughbook 40 | |
| Getac B360 | |
| Getac S410 | |
| Durabook S15ABG2 | |
| Dell Latitude 5420 Rugged-P85G | |
| Blender / v2.79 BMW27 CPU | |
| Durabook S15ABG2 | |
| Durabook S14I | |
| Getac B360 | |
| Panasonic Toughbook 40 | |
| Getac S410 Gen 4 | |
| Panasonic Toughbook FZ-55 MK2 | |
| Acer Enduro Urban N3 EUN314 | |
| Dell Latitude 7330 Rugged Extreme | |
| Durabook S15 | |
| Average Intel Core i7-1255U (372 - 601, n=11) | |
| Getac S410 G5 | |
| 7-Zip 18.03 / 7z b 4 -mmt1 | |
| Dell Latitude 7330 Rugged Extreme | |
| Acer Enduro Urban N3 EUN314 | |
| Average Intel Core i7-1255U (5059 - 5529, n=11) | |
| Panasonic Toughbook FZ-55 MK2 | |
| Durabook S14I | |
| Getac S410 G5 | |
| Durabook S15 | |
| Panasonic Toughbook 40 | |
| Getac S410 Gen 4 | |
| Getac B360 | |
| Durabook S15ABG2 | |
| Geekbench 6.7 / Multi-Core | |
| Getac S410 G5 | |
| Average Intel Core i7-1255U (7914 - 8632, n=2) | |
| Durabook S15 | |
| Geekbench 6.7 / Single-Core | |
| Getac S410 G5 | |
| Average Intel Core i7-1255U (2313 - 2325, n=2) | |
| Durabook S15 | |
| Geekbench 5.5 / Multi-Core | |
| Getac S410 G5 | |
| Average Intel Core i7-1255U (4463 - 8821, n=12) | |
| Durabook S15 | |
| Dell Latitude 7330 Rugged Extreme | |
| Acer Enduro Urban N3 EUN314 | |
| Getac S410 Gen 4 | |
| Panasonic Toughbook 40 | |
| Getac B360 | |
| Durabook S14I | |
| Durabook S15ABG2 | |
| Geekbench 5.5 / Single-Core | |
| Getac S410 G5 | |
| Durabook S15 | |
| Average Intel Core i7-1255U (1560 - 1712, n=12) | |
| Dell Latitude 7330 Rugged Extreme | |
| Acer Enduro Urban N3 EUN314 | |
| Durabook S14I | |
| Getac S410 Gen 4 | |
| Panasonic Toughbook 40 | |
| Getac B360 | |
| Durabook S15ABG2 | |
| HWBOT x265 Benchmark v2.2 / 4k Preset | |
| Getac S410 G5 | |
| Average Intel Core i7-1255U (6.31 - 10.1, n=11) | |
| Dell Latitude 7330 Rugged Extreme | |
| Durabook S15 | |
| Panasonic Toughbook FZ-55 MK2 | |
| Acer Enduro Urban N3 EUN314 | |
| Getac S410 Gen 4 | |
| Panasonic Toughbook 40 | |
| Getac B360 | |
| Durabook S14I | |
| Durabook S15ABG2 | |
| LibreOffice / 20 Documents To PDF | |
| Durabook S15ABG2 | |
| Acer Enduro Urban N3 EUN314 | |
| Panasonic Toughbook 40 | |
| Durabook S15 | |
| Getac S410 Gen 4 | |
| Dell Latitude 7330 Rugged Extreme | |
| Panasonic Toughbook FZ-55 MK2 | |
| Average Intel Core i7-1255U (35.6 - 52.5, n=11) | |
| Durabook S14I | |
| Getac S410 G5 | |
| R Benchmark 2.5 / Overall mean | |
| Durabook S15ABG2 | |
| Getac B360 | |
| Panasonic Toughbook 40 | |
| Getac S410 Gen 4 | |
| Durabook S14I | |
| Acer Enduro Urban N3 EUN314 | |
| Panasonic Toughbook FZ-55 MK2 | |
| Dell Latitude 7330 Rugged Extreme | |
| Average Intel Core i7-1255U (0.4688 - 0.558, n=11) | |
| Getac S410 G5 | |
| Durabook S15 | |
Cinebench R23: Multi Core | Single Core
Cinebench R20: CPU (Multi Core) | CPU (Single Core)
Cinebench R15: CPU Multi 64Bit | CPU Single 64Bit
Blender: v2.79 BMW27 CPU
7-Zip 18.03: 7z b 4 | 7z b 4 -mmt1
Geekbench 6.7: Multi-Core | Single-Core
Geekbench 5.5: Multi-Core | Single-Core
HWBOT x265 Benchmark v2.2: 4k Preset
LibreOffice : 20 Documents To PDF
R Benchmark 2.5: Overall mean
* ... smaller is better
AIDA64: FP32 Ray-Trace | FPU Julia | CPU SHA3 | CPU Queen | FPU SinJulia | FPU Mandel | CPU AES | CPU ZLib | FP64 Ray-Trace | CPU PhotoWorxx
| Performance rating | |
| Getac S410 G5 | |
| Average Intel Core i7-1255U | |
| Acer Enduro Urban N3 EUN314 | |
| Durabook S15 | |
| Panasonic Toughbook 40 | |
| Durabook S15ABG2 | |
| AIDA64 / FP32 Ray-Trace | |
| Getac S410 G5 | |
| Acer Enduro Urban N3 EUN314 | |
| Average Intel Core i7-1255U (4313 - 8127, n=11) | |
| Panasonic Toughbook 40 | |
| Durabook S15 | |
| Durabook S15ABG2 | |
| AIDA64 / FPU Julia | |
| Getac S410 G5 | |
| Average Intel Core i7-1255U (19813 - 41353, n=11) | |
| Acer Enduro Urban N3 EUN314 | |
| Durabook S15 | |
| Panasonic Toughbook 40 | |
| Durabook S15ABG2 | |
| AIDA64 / CPU SHA3 | |
| Getac S410 G5 | |
| Acer Enduro Urban N3 EUN314 | |
| Average Intel Core i7-1255U (1325 - 2135, n=11) | |
| Panasonic Toughbook 40 | |
| Durabook S15 | |
| Durabook S15ABG2 | |
| AIDA64 / CPU Queen | |
| Getac S410 G5 | |
| Average Intel Core i7-1255U (61375 - 65892, n=11) | |
| Durabook S15 | |
| Acer Enduro Urban N3 EUN314 | |
| Panasonic Toughbook 40 | |
| Durabook S15ABG2 | |
| AIDA64 / FPU SinJulia | |
| Getac S410 G5 | |
| Acer Enduro Urban N3 EUN314 | |
| Average Intel Core i7-1255U (3577 - 5095, n=11) | |
| Panasonic Toughbook 40 | |
| Durabook S15ABG2 | |
| Durabook S15 | |
| AIDA64 / FPU Mandel | |
| Getac S410 G5 | |
| Acer Enduro Urban N3 EUN314 | |
| Average Intel Core i7-1255U (11759 - 20187, n=11) | |
| Panasonic Toughbook 40 | |
| Durabook S15 | |
| Durabook S15ABG2 | |
| AIDA64 / CPU AES | |
| Acer Enduro Urban N3 EUN314 | |
| Getac S410 G5 | |
| Average Intel Core i7-1255U (27900 - 67458, n=11) | |
| Panasonic Toughbook 40 | |
| Durabook S15 | |
| Durabook S15ABG2 | |
| AIDA64 / CPU ZLib | |
| Getac S410 G5 | |
| Average Intel Core i7-1255U (393 - 640, n=11) | |
| Durabook S15 | |
| Acer Enduro Urban N3 EUN314 | |
| Panasonic Toughbook 40 | |
| Durabook S15ABG2 | |
| AIDA64 / FP64 Ray-Trace | |
| Getac S410 G5 | |
| Acer Enduro Urban N3 EUN314 | |
| Average Intel Core i7-1255U (2474 - 4400, n=11) | |
| Panasonic Toughbook 40 | |
| Durabook S15 | |
| Durabook S15ABG2 | |
| AIDA64 / CPU PhotoWorxx | |
| Getac S410 G5 | |
| Durabook S15 | |
| Average Intel Core i7-1255U (13899 - 44054, n=11) | |
| Acer Enduro Urban N3 EUN314 | |
| Panasonic Toughbook 40 | |
| Durabook S15ABG2 | |
Stress Test
The CPU would boost to 2.4 GHz and 34 W when initiating Prime95 stress. After reaching a core temperature of 85 C a few seconds later, however, the processor would drop to 1.3 GHz and 15 W in order to maintain a slightly cooler temperature of 80 C. This temperature range is similar to what we recorded on the 2020 S15ABG2.
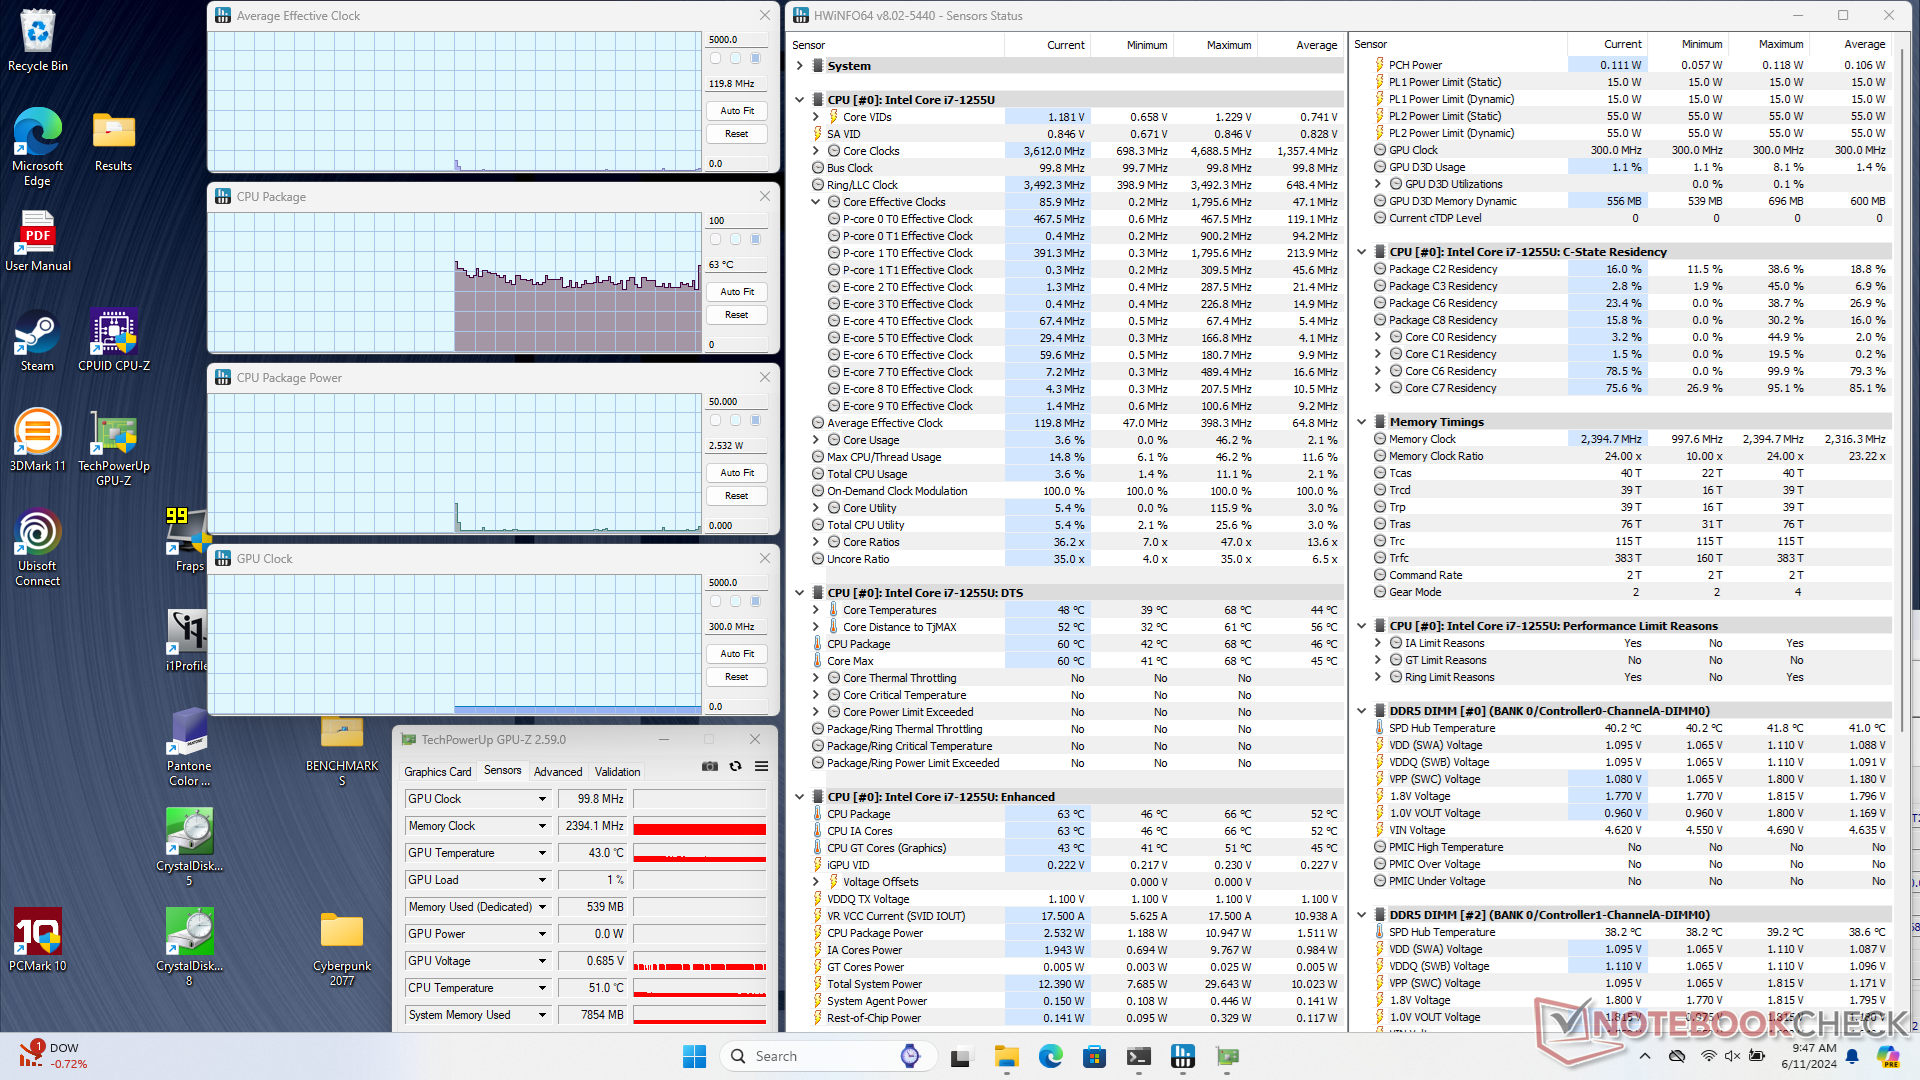


| Average CPU Clock (GHz) | GPU Clock (MHz) | Average CPU Temperature (°C) | |
| System Idle | -- | -- | 60 |
| Prime95 Stress | 1.6 | -- | 76 |
| Prime95 + FurMark Stress | 1.1 | 499 | 80 |
| Witcher 3 Stress | 0.5 | 948 | 80 |
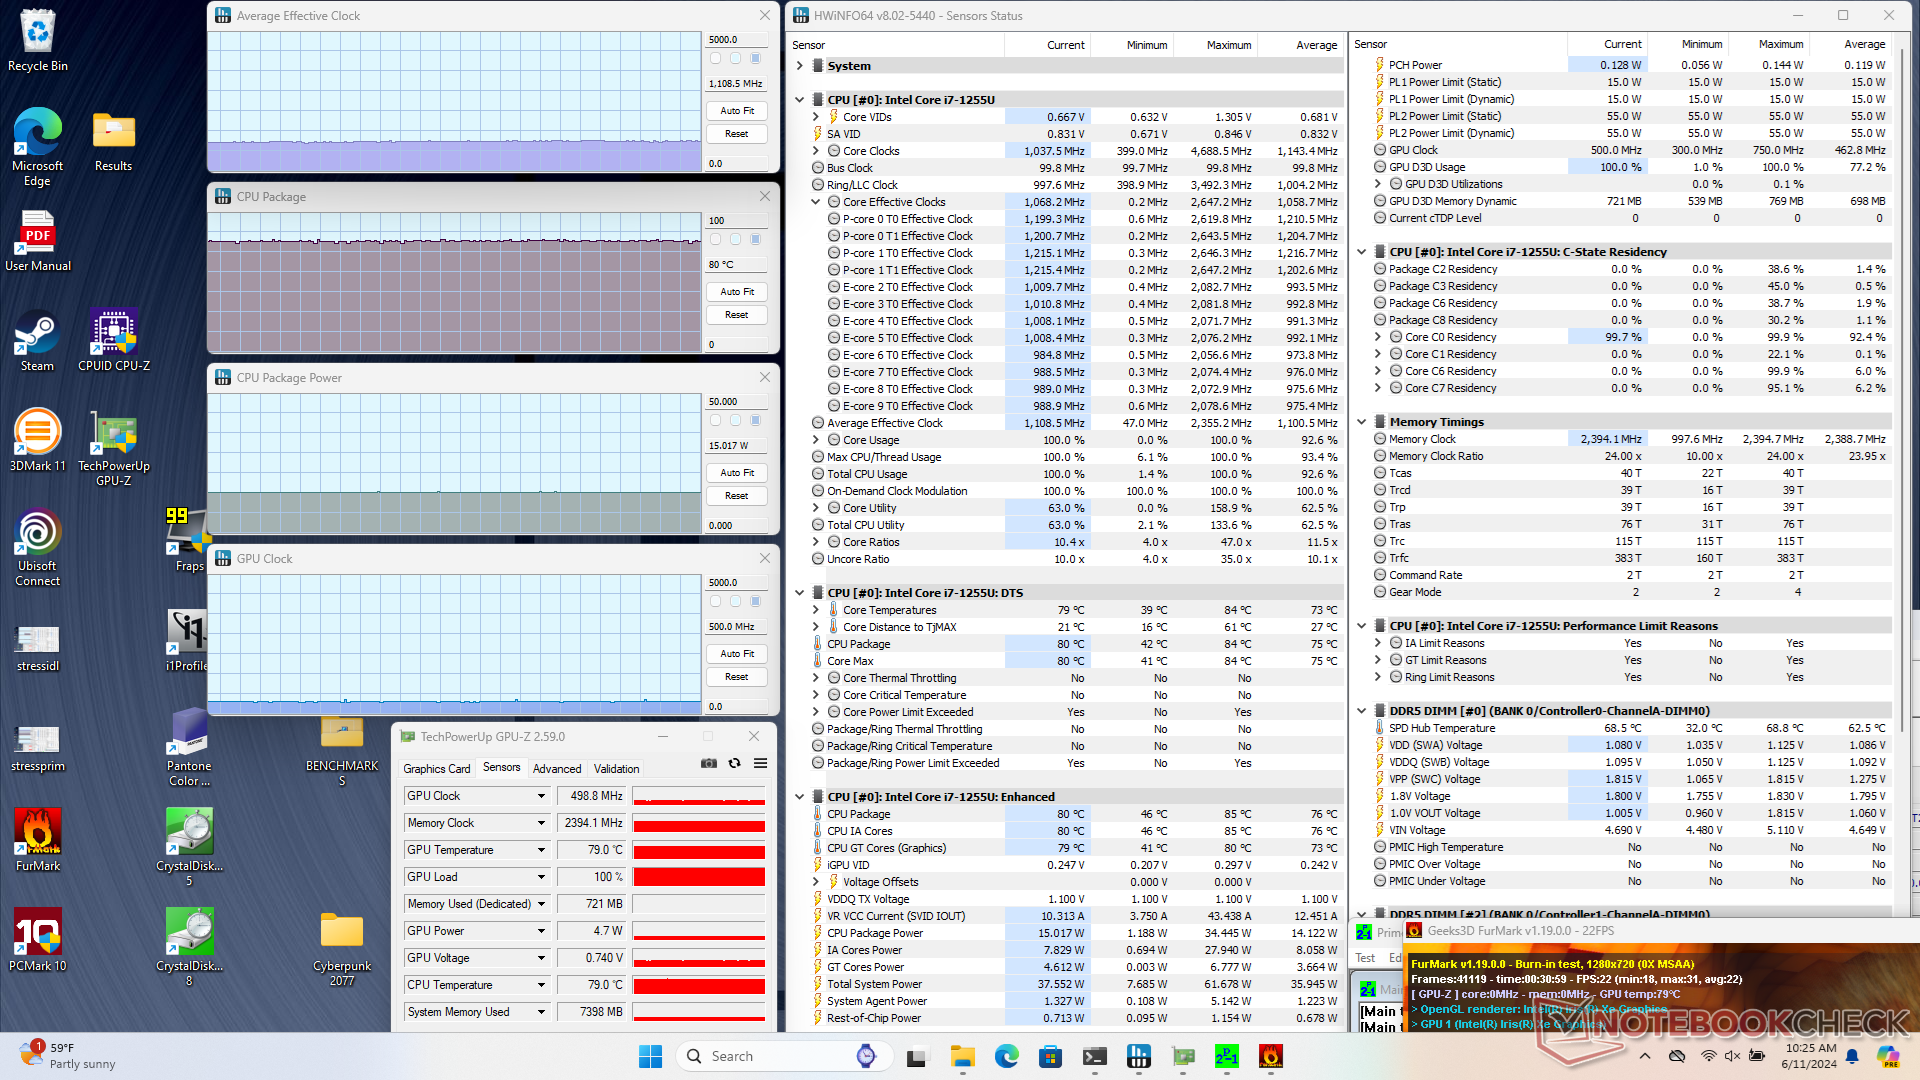
System Performance
PCMark scores are ahead of most other rugged laptops running on older 11th gen or 10th gen Intel platforms. Perhaps most notably, it is well ahead of the older 2020 S15ABG2 in the Digital Content Creation subtest where GPU performance matters most.
CrossMark: Overall | Productivity | Creativity | Responsiveness
WebXPRT 3: Overall
WebXPRT 4: Overall
Mozilla Kraken 1.1: Total
| PCMark 10 / Score | |
| Getac S410 G5 | |
| Average Intel Core i7-1255U, Intel Iris Xe Graphics G7 96EUs (4676 - 5523, n=9) | |
| Durabook S15 | |
| Panasonic Toughbook 40 | |
| Durabook S14I | |
| Acer Enduro Urban N3 EUN314 | |
| Dell Latitude 5420 Rugged-P85G | |
| Durabook S15ABG2 | |
| PCMark 10 / Essentials | |
| Average Intel Core i7-1255U, Intel Iris Xe Graphics G7 96EUs (9381 - 11654, n=9) | |
| Durabook S15 | |
| Durabook S14I | |
| Getac S410 G5 | |
| Panasonic Toughbook 40 | |
| Acer Enduro Urban N3 EUN314 | |
| Dell Latitude 5420 Rugged-P85G | |
| Durabook S15ABG2 | |
| PCMark 10 / Productivity | |
| Dell Latitude 5420 Rugged-P85G | |
| Getac S410 G5 | |
| Durabook S14I | |
| Average Intel Core i7-1255U, Intel Iris Xe Graphics G7 96EUs (6530 - 7418, n=9) | |
| Durabook S15 | |
| Panasonic Toughbook 40 | |
| Durabook S15ABG2 | |
| Acer Enduro Urban N3 EUN314 | |
| PCMark 10 / Digital Content Creation | |
| Getac S410 G5 | |
| Durabook S15 | |
| Average Intel Core i7-1255U, Intel Iris Xe Graphics G7 96EUs (4498 - 6203, n=9) | |
| Panasonic Toughbook 40 | |
| Acer Enduro Urban N3 EUN314 | |
| Durabook S14I | |
| Dell Latitude 5420 Rugged-P85G | |
| Durabook S15ABG2 | |
| CrossMark / Overall | |
| Average Intel Core i7-1255U, Intel Iris Xe Graphics G7 96EUs (1329 - 1573, n=9) | |
| Getac S410 G5 | |
| Durabook S15 | |
| Panasonic Toughbook 40 | |
| CrossMark / Productivity | |
| Average Intel Core i7-1255U, Intel Iris Xe Graphics G7 96EUs (1364 - 1554, n=9) | |
| Getac S410 G5 | |
| Durabook S15 | |
| Panasonic Toughbook 40 | |
| CrossMark / Creativity | |
| Getac S410 G5 | |
| Average Intel Core i7-1255U, Intel Iris Xe Graphics G7 96EUs (1372 - 1660, n=9) | |
| Durabook S15 | |
| Panasonic Toughbook 40 | |
| CrossMark / Responsiveness | |
| Durabook S15 | |
| Average Intel Core i7-1255U, Intel Iris Xe Graphics G7 96EUs (1117 - 1434, n=9) | |
| Getac S410 G5 | |
| Panasonic Toughbook 40 | |
| WebXPRT 3 / Overall | |
| Average Intel Core i7-1255U, Intel Iris Xe Graphics G7 96EUs (200 - 366, n=9) | |
| Getac S410 G5 | |
| Durabook S14I | |
| Panasonic Toughbook 40 | |
| Acer Enduro Urban N3 EUN314 | |
| Durabook S15ABG2 | |
| WebXPRT 4 / Overall | |
| Getac S410 G5 | |
| Durabook S15 | |
| Average Intel Core i7-1255U, Intel Iris Xe Graphics G7 96EUs (183.4 - 249, n=9) | |
| Mozilla Kraken 1.1 / Total | |
| Dell Latitude 5420 Rugged-P85G | |
| Durabook S15ABG2 | |
| Acer Enduro Urban N3 EUN314 | |
| Panasonic Toughbook 40 | |
| Durabook S14I | |
| Average Intel Core i7-1255U, Intel Iris Xe Graphics G7 96EUs (476 - 727, n=10) | |
| Durabook S15 | |
| Getac S410 G5 | |
* ... smaller is better
| PCMark 10 Score | 5286 points | |
Help | ||
| AIDA64 / Memory Copy | |
| Durabook S15 | |
| Getac S410 G5 | |
| Average Intel Core i7-1255U (22846 - 67017, n=11) | |
| Acer Enduro Urban N3 EUN314 | |
| Panasonic Toughbook 40 | |
| Durabook S15ABG2 | |
| AIDA64 / Memory Read | |
| Durabook S15 | |
| Getac S410 G5 | |
| Average Intel Core i7-1255U (22877 - 67398, n=11) | |
| Acer Enduro Urban N3 EUN314 | |
| Panasonic Toughbook 40 | |
| Durabook S15ABG2 | |
| AIDA64 / Memory Write | |
| Durabook S15 | |
| Getac S410 G5 | |
| Average Intel Core i7-1255U (22883 - 65839, n=11) | |
| Acer Enduro Urban N3 EUN314 | |
| Panasonic Toughbook 40 | |
| Durabook S15ABG2 | |
| AIDA64 / Memory Latency | |
| Getac S410 G5 | |
| Panasonic Toughbook 40 | |
| Durabook S15 | |
| Average Intel Core i7-1255U (76 - 163.2, n=11) | |
| Acer Enduro Urban N3 EUN314 | |
| Durabook S15ABG2 | |
* ... smaller is better
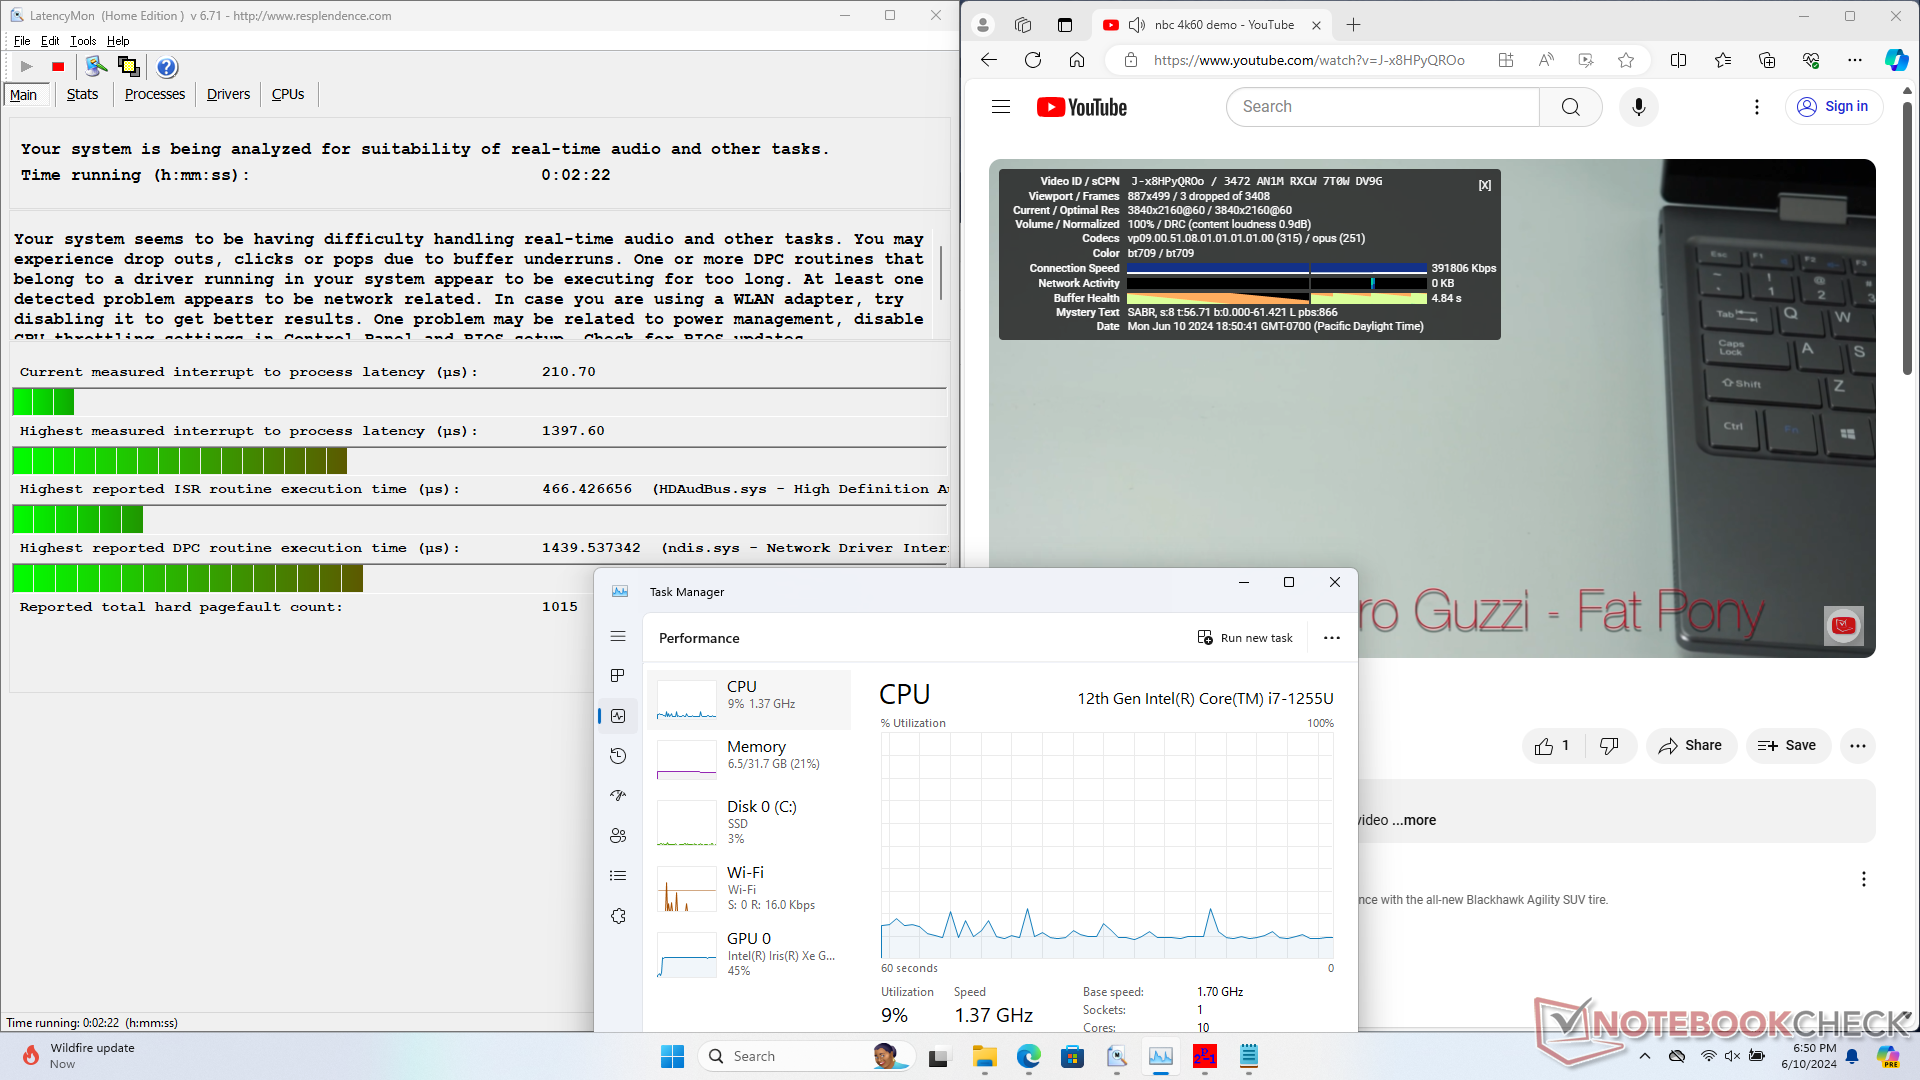
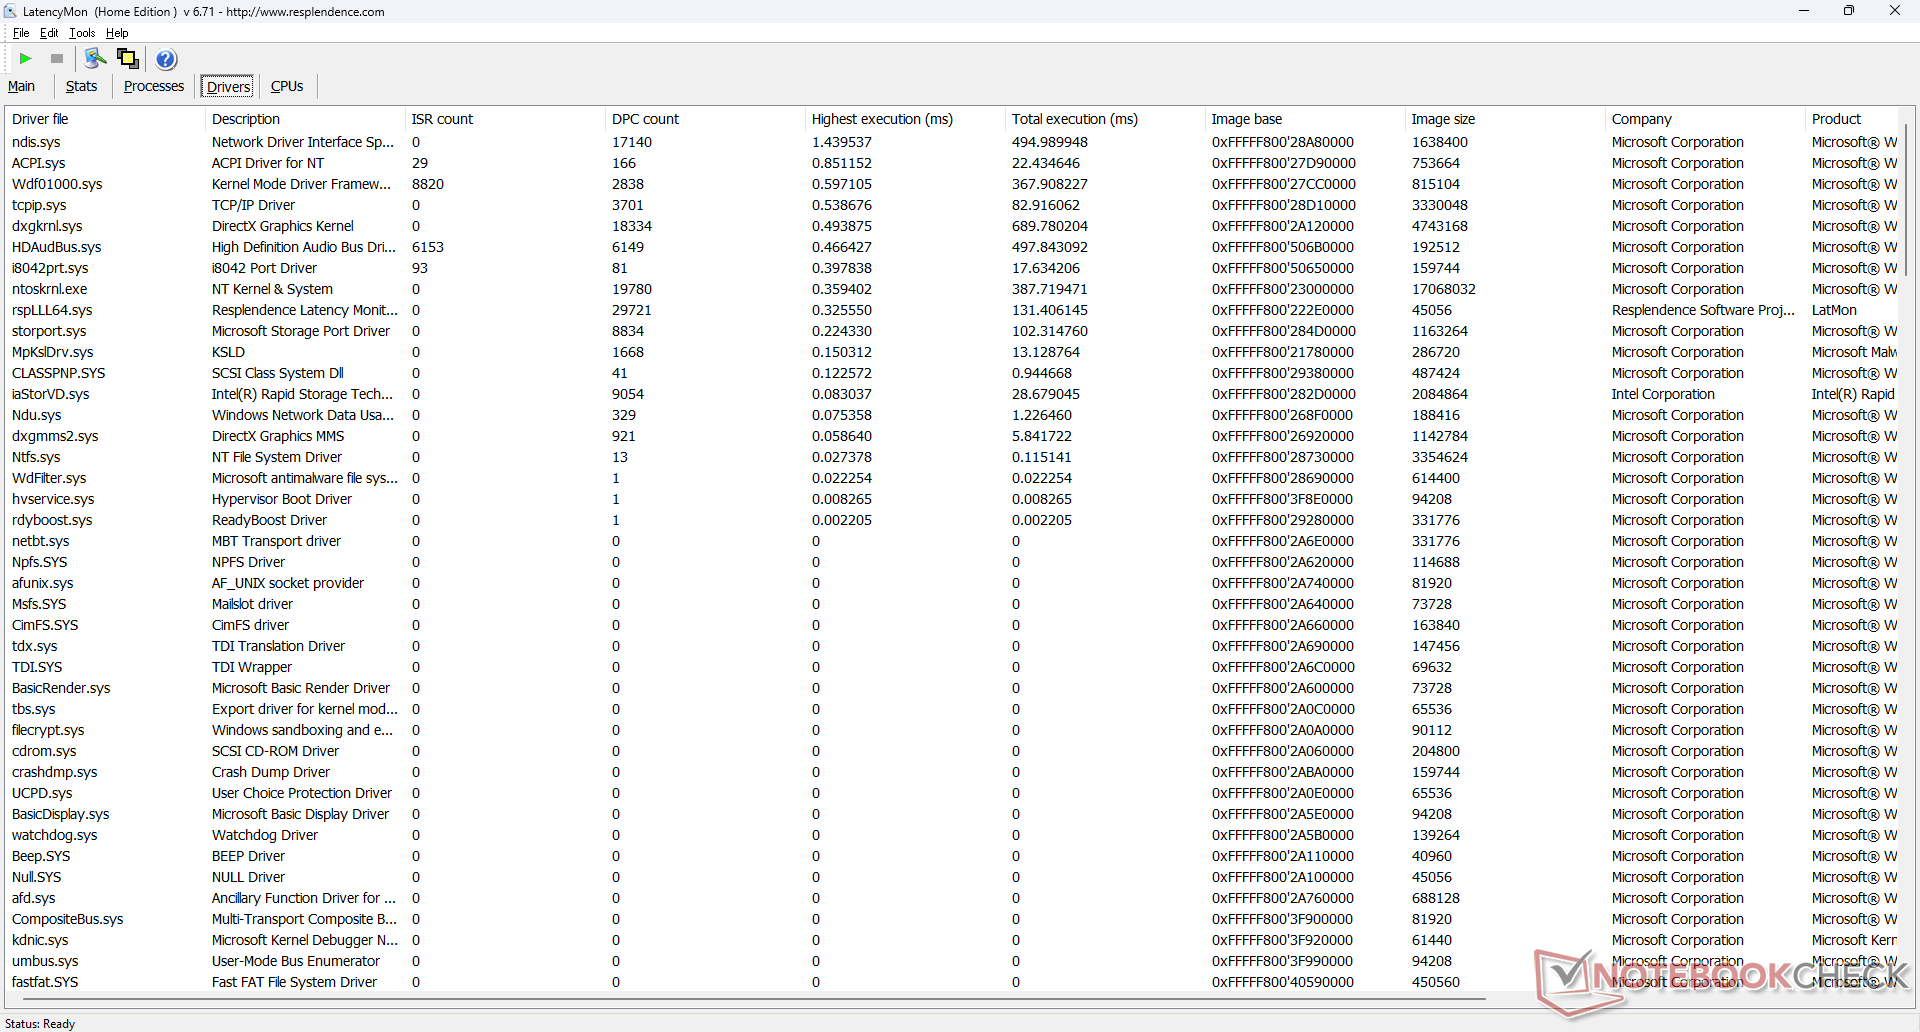
DPC Latency
LatencyMon reveals minor DPC issues when opening multiple browser tabs of our homepage. 4K video playback at 60 FPS is imperfect as well with at least a couple of skipped frames during a 60-second time window even after multiple retries.
| DPC Latencies / LatencyMon - interrupt to process latency (max), Web, Youtube, Prime95 | |
| Acer Enduro Urban N3 EUN314 | |
| Getac S410 G5 | |
| Durabook S15 | |
| Panasonic Toughbook 40 | |
| Durabook S15ABG2 | |
* ... smaller is better
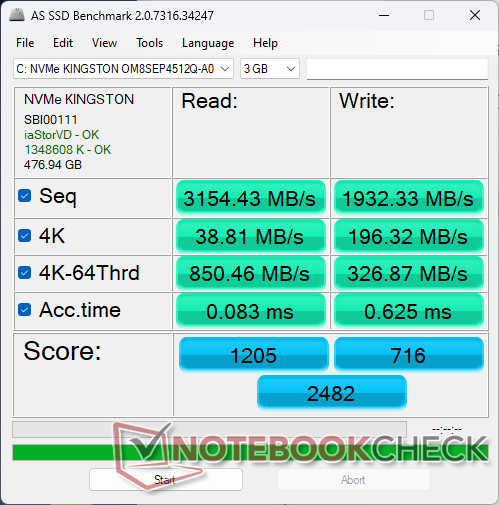
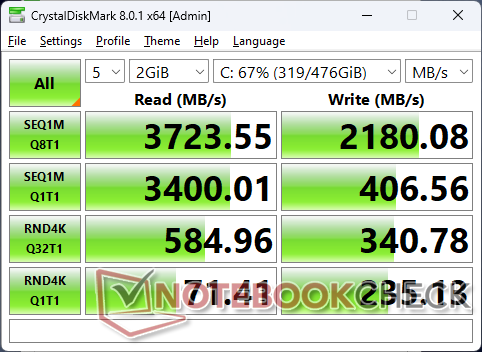
Storage Devices
Our unit ships with the Kingston OM8SEP4512Q-AA PCIe4 NVMe SSD for sequential read and write rates about 3300 MB/s and 2200 MB/s, respectively. The drive would exhibit no issues maintaining these maximum speeds under stress.


| Drive Performance rating - Percent | |
| Acer Enduro Urban N3 EUN314 | |
| Getac S410 G5 | |
| Panasonic Toughbook 40 | |
| Durabook S15 | |
| Dell Latitude 5420 Rugged-P85G -8! | |
| Durabook S15ABG2 | |
* ... smaller is better
Disk Throttling: DiskSpd Read Loop, Queue Depth 8
GPU Performance — Iris Xe Is Starting To Show Its Age
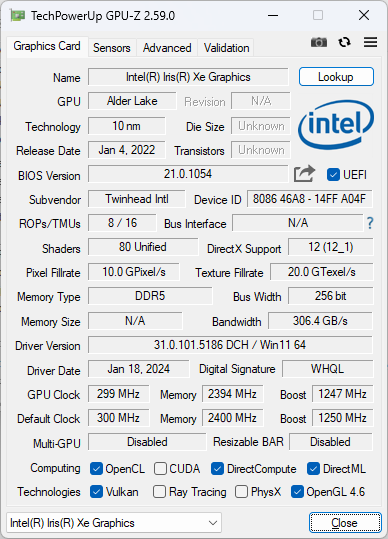
The model utilizes the same integrated Iris Xe GPU as on the older S14I for only a slight boost to overall graphics performance. Most rugged laptops have yet to make the transition to Meteor Lake for the much-improved integrated Arc series, but the 2024 S15 is nonetheless significantly ahead of the now ancient UHD Graphics 620 by 2x to 4x.
The Nvidia Quadro T1000 is optional for those who demand discrete graphics.
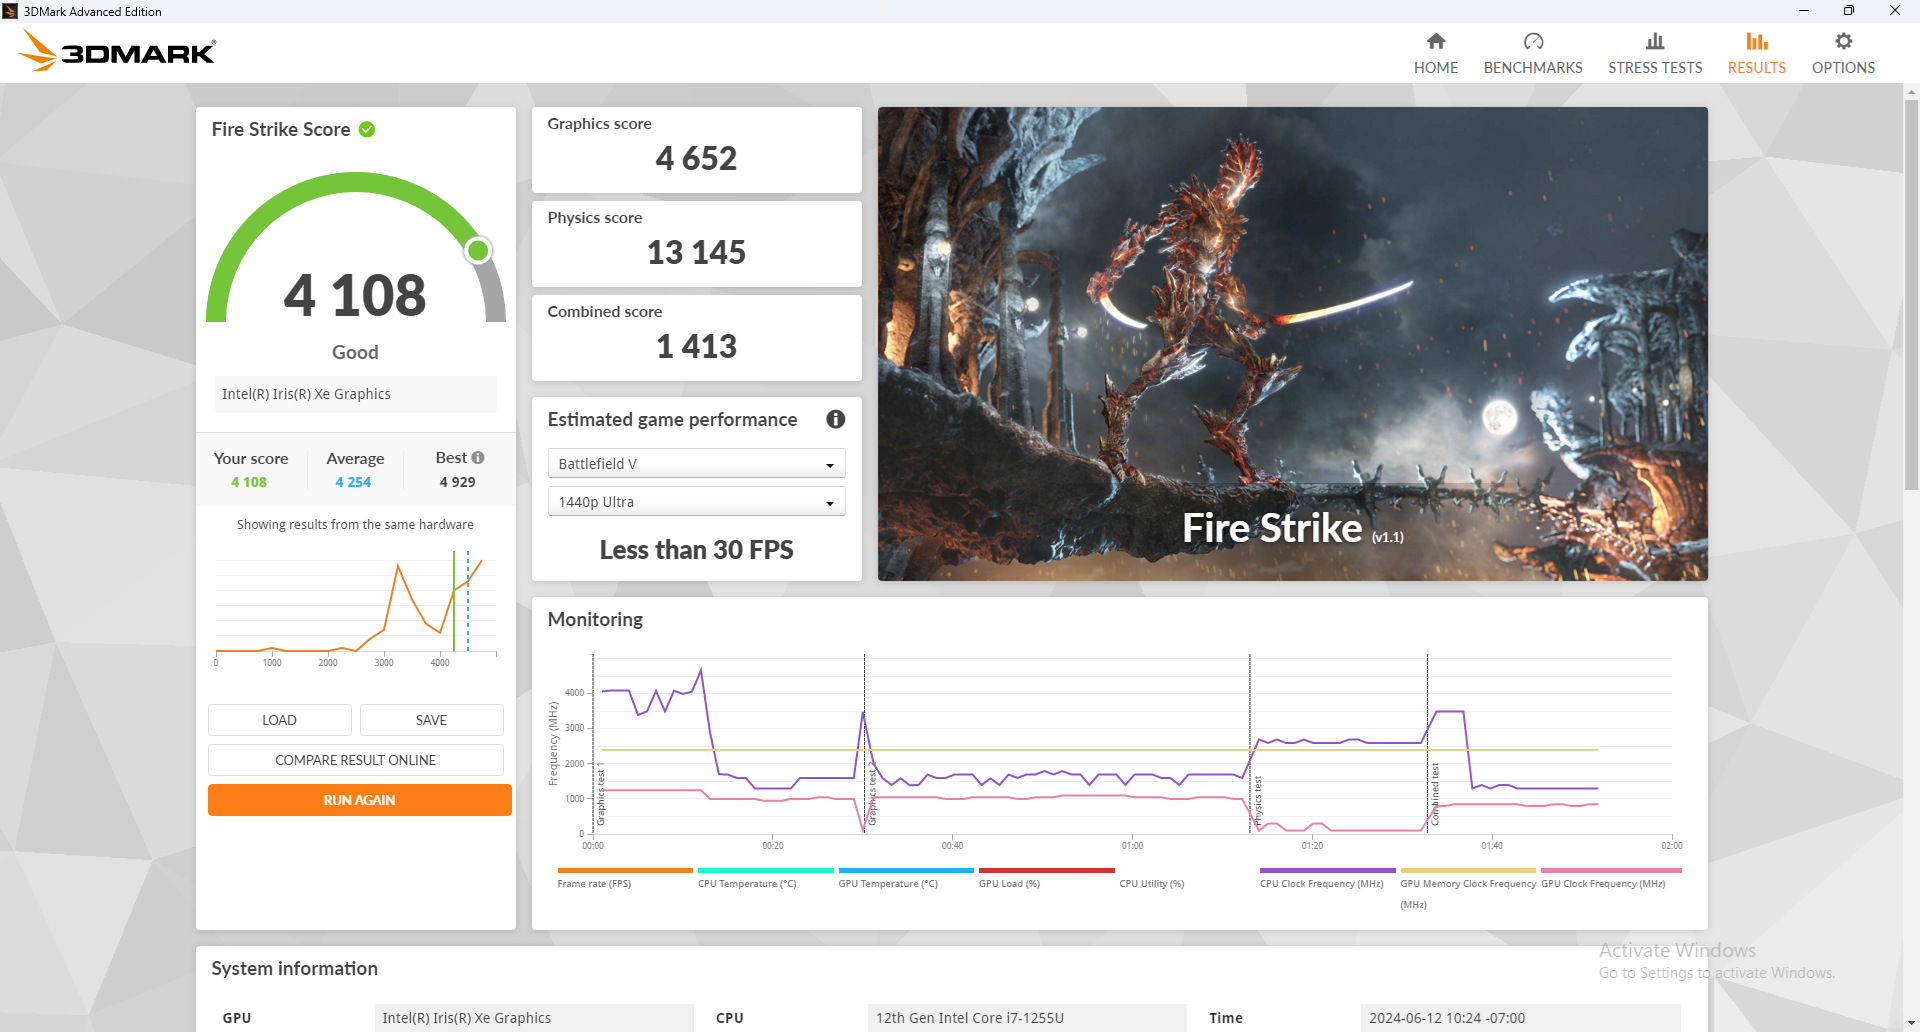
| Power Profile | Graphics Score | Physics Score | Combined Score |
| Performance Mode | 4652 | 13145 | 1413 |
| Balanced Mode | 4119 (-15%) | 11865 (-10%) | 1312 (-7%) |
| Battery Power | 3958 (-15%) | 12722 (-3%) | 1314 (-7%) |
Running on Balanced mode or battery power may impact performance by up to 10 to 15 percent as shown by our Fire Strike results table above.
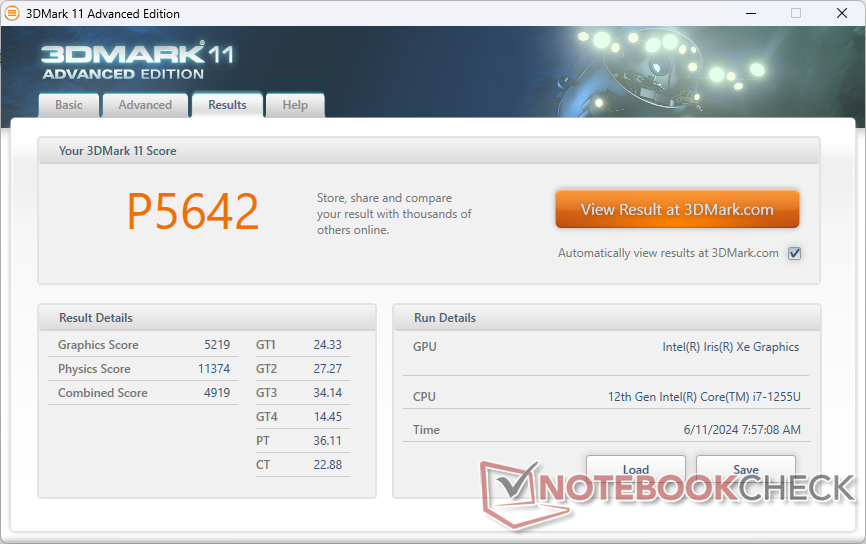
| 3DMark 11 Performance | 5642 points | |
| 3DMark Cloud Gate Standard Score | 14383 points | |
| 3DMark Fire Strike Score | 4108 points | |
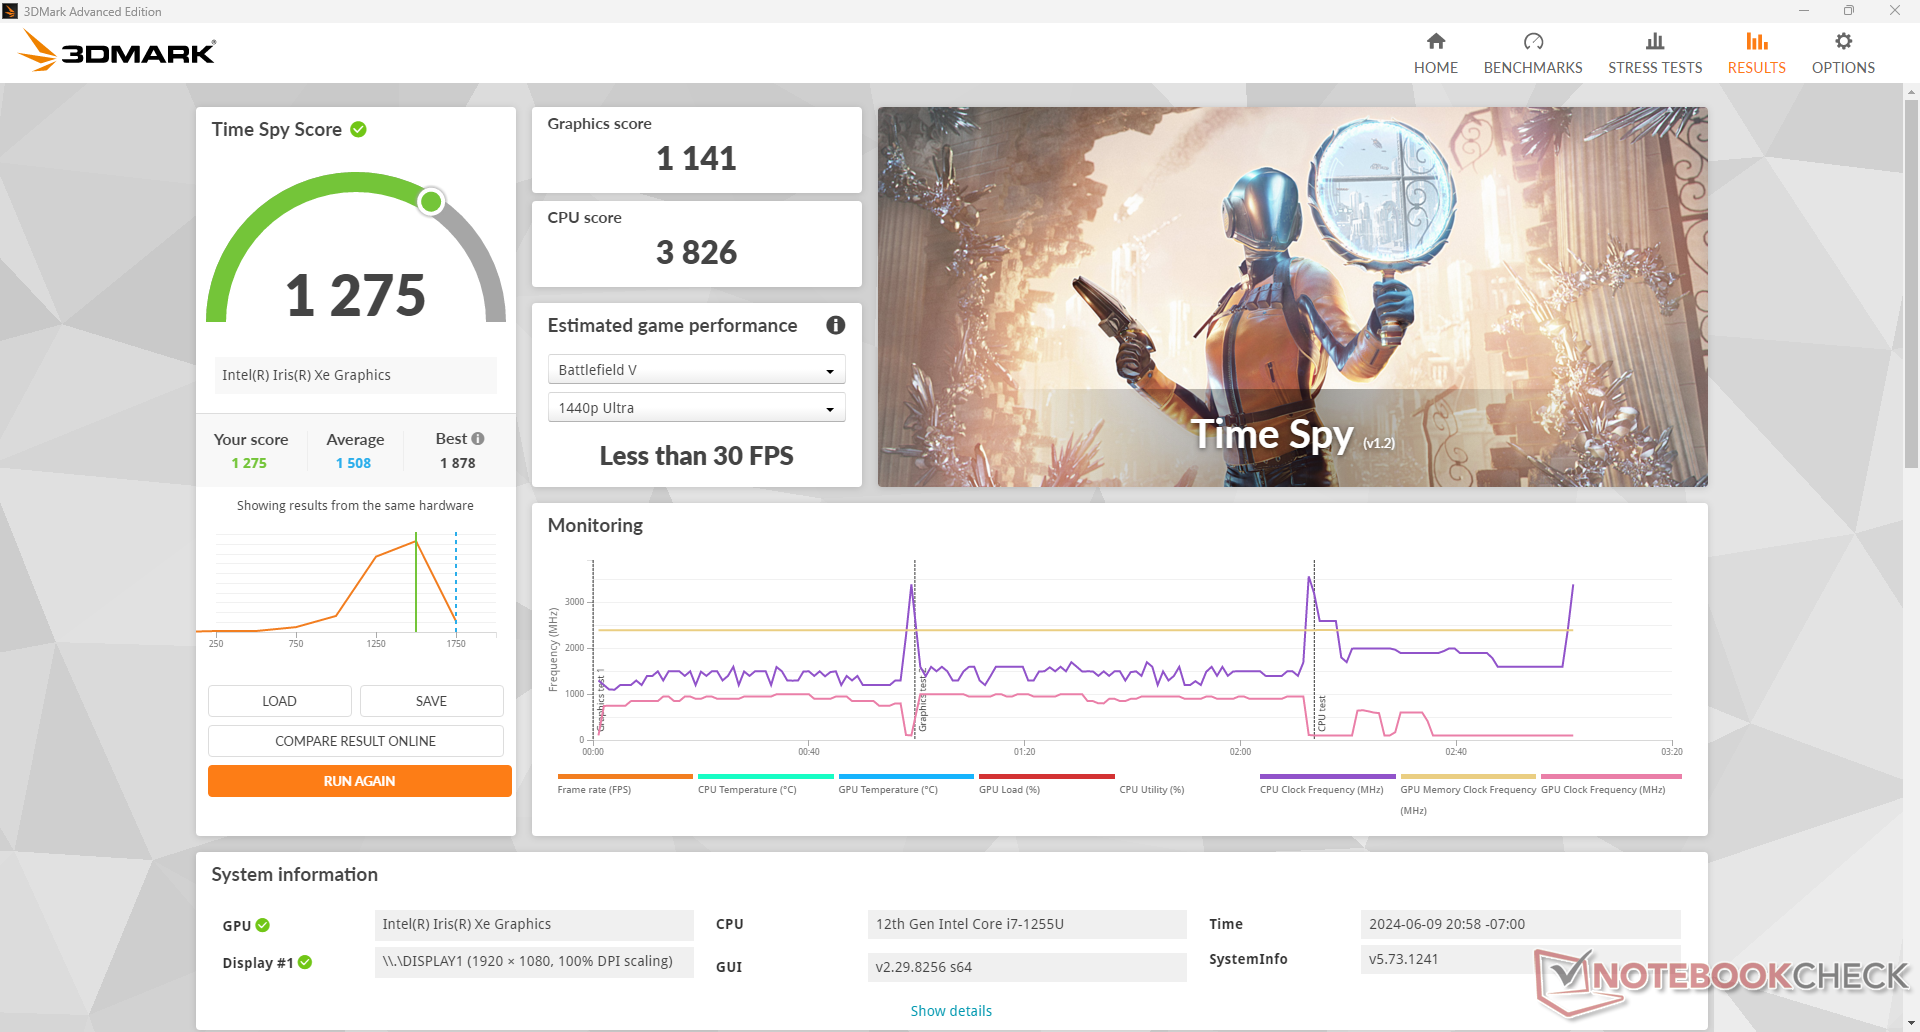
| 3DMark Time Spy Score | 1275 points | |
Help | ||
| Blender - v3.3 Classroom CPU | |
| Durabook S15 | |
| Average Intel Iris Xe Graphics G7 96EUs (336 - 1259, n=109) | |
| Getac S410 G5 | |
* ... smaller is better
| Performance rating - Percent | |
| Getac S410 G5 | |
| Acer Enduro Urban N3 EUN314 | |
| Panasonic Toughbook 40 -2! | |
| Durabook S15 -1! | |
| Durabook S15ABG2 -4! | |
| Dell Latitude 5420 Rugged-P85G -4! | |
| The Witcher 3 - 1920x1080 Ultra Graphics & Postprocessing (HBAO+) | |
| Getac S410 G5 | |
| Panasonic Toughbook 40 | |
| Acer Enduro Urban N3 EUN314 | |
| Durabook S15 | |
| Dell Latitude 5420 Rugged-P85G | |
| GTA V - 1920x1080 Highest AA:4xMSAA + FX AF:16x | |
| Getac S410 G5 | |
| Acer Enduro Urban N3 EUN314 | |
| Final Fantasy XV Benchmark - 1920x1080 High Quality | |
| Acer Enduro Urban N3 EUN314 | |
| Getac S410 G5 | |
| Panasonic Toughbook 40 | |
| Durabook S15 | |
| Dell Latitude 5420 Rugged-P85G | |
| Strange Brigade - 1920x1080 ultra AA:ultra AF:16 | |
| Getac S410 G5 | |
| Acer Enduro Urban N3 EUN314 | |
| Durabook S15 | |
| Dota 2 Reborn - 1920x1080 ultra (3/3) best looking | |
| Panasonic Toughbook 40 | |
| Getac S410 G5 | |
| Durabook S15 | |
| Acer Enduro Urban N3 EUN314 | |
| Durabook S15ABG2 | |
| X-Plane 11.11 - 1920x1080 high (fps_test=3) | |
| Acer Enduro Urban N3 EUN314 | |
| Getac S410 G5 | |
| Durabook S15 | |
| Panasonic Toughbook 40 | |
| Durabook S15ABG2 | |
| Far Cry 5 | |
| 1280x720 Low Preset AA:T | |
| Acer Enduro Urban N3 EUN314 | |
| Average Intel Iris Xe Graphics G7 96EUs (23 - 75, n=93) | |
| Dell Latitude 5420 Rugged-P85G | |
| Durabook S15 | |
| 1920x1080 Medium Preset AA:T | |
| Average Intel Iris Xe Graphics G7 96EUs (14 - 39, n=91) | |
| Dell Latitude 5420 Rugged-P85G | |
| Acer Enduro Urban N3 EUN314 | |
| Durabook S15 | |
| 1920x1080 High Preset AA:T | |
| Average Intel Iris Xe Graphics G7 96EUs (10 - 35, n=89) | |
| Dell Latitude 5420 Rugged-P85G | |
| Acer Enduro Urban N3 EUN314 | |
| Durabook S15 | |
| 1920x1080 Ultra Preset AA:T | |
| Average Intel Iris Xe Graphics G7 96EUs (11 - 33, n=75) | |
| Acer Enduro Urban N3 EUN314 | |
| Durabook S15 | |
| Dell Latitude 5420 Rugged-P85G | |
| Strange Brigade | |
| 1280x720 lowest AF:1 | |
| Getac S410 G5 | |
| Average Intel Iris Xe Graphics G7 96EUs (48.5 - 115.1, n=172) | |
| Acer Enduro Urban N3 EUN314 | |
| Getac S410 Gen 4 | |
| Durabook S15 | |
| 1920x1080 medium AA:medium AF:4 | |
| Getac S410 G5 | |
| Average Intel Iris Xe Graphics G7 96EUs (18.2 - 51.4, n=170) | |
| Acer Enduro Urban N3 EUN314 | |
| Durabook S15 | |
| Getac S410 Gen 4 | |
| 1920x1080 high AA:high AF:8 | |
| Getac S410 G5 | |
| Average Intel Iris Xe Graphics G7 96EUs (15.4 - 39.8, n=169) | |
| Acer Enduro Urban N3 EUN314 | |
| Getac S410 Gen 4 | |
| Durabook S15 | |
| 1920x1080 ultra AA:ultra AF:16 | |
| Getac S410 G5 | |
| Average Intel Iris Xe Graphics G7 96EUs (13.2 - 31.7, n=167) | |
| Acer Enduro Urban N3 EUN314 | |
| Getac S410 Gen 4 | |
| Durabook S15 | |
| Tiny Tina's Wonderlands | |
| 1280x720 Lowest Preset (DX12) | |
| Average Intel Iris Xe Graphics G7 96EUs (25.9 - 67.3, n=32) | |
| Durabook S15 | |
| 1920x1080 Low Preset (DX12) | |
| Average Intel Iris Xe Graphics G7 96EUs (22.3 - 53, n=32) | |
| Durabook S15 | |
| F1 22 | |
| 1280x720 Ultra Low Preset AA:T AF:16x | |
| Average Intel Iris Xe Graphics G7 96EUs (57.4 - 94.9, n=53) | |
| Durabook S15 | |
| 1920x1080 Low Preset AA:T AF:16x | |
| Average Intel Iris Xe Graphics G7 96EUs (33.3 - 57.2, n=58) | |
| Durabook S15 | |
| 1920x1080 Medium Preset AA:T AF:16x | |
| Average Intel Iris Xe Graphics G7 96EUs (28 - 52.3, n=58) | |
| Durabook S15 | |
| Baldur's Gate 3 | |
| 1280x720 Low Preset AA:SM | |
| Average Intel Iris Xe Graphics G7 96EUs (14.5 - 66.1, n=13) | |
| Durabook S15 | |
| 1920x1080 Low Preset AA:SM | |
| Average Intel Iris Xe Graphics G7 96EUs (9.4 - 29.3, n=13) | |
| Durabook S15 | |
| Cyberpunk 2077 | |
| 1280x720 Low Preset (FSR off) | |
| Average Intel Iris Xe Graphics G7 96EUs (21.4 - 37.3, n=17) | |
| Durabook S15 | |
| 1920x1080 Low Preset (FSR off) | |
| Average Intel Iris Xe Graphics G7 96EUs (13.1 - 22.5, n=17) | |
| Durabook S15 | |
Witcher 3 FPS Chart
| low | med. | high | ultra | |
|---|---|---|---|---|
| The Witcher 3 (2015) | 60.2 | 46 | 24.9 | 12.5 |
| Dota 2 Reborn (2015) | 93.7 | 65.7 | 51.8 | 46.8 |
| Final Fantasy XV Benchmark (2018) | 35.2 | 20.1 | 14.7 | |
| X-Plane 11.11 (2018) | 44.8 | 33.3 | 30.2 | |
| Far Cry 5 (2018) | 23 | 22 | 19 | 19 |
| Strange Brigade (2018) | 73 | 32.4 | 26.7 | 21.9 |
| Tiny Tina's Wonderlands (2022) | 23.4 | |||
| F1 22 (2022) | 34.7 | 29.1 | 22.1 | |
| Baldur's Gate 3 (2023) | 9.4 | |||
| Cyberpunk 2077 (2023) | 14.4 |
Emissions
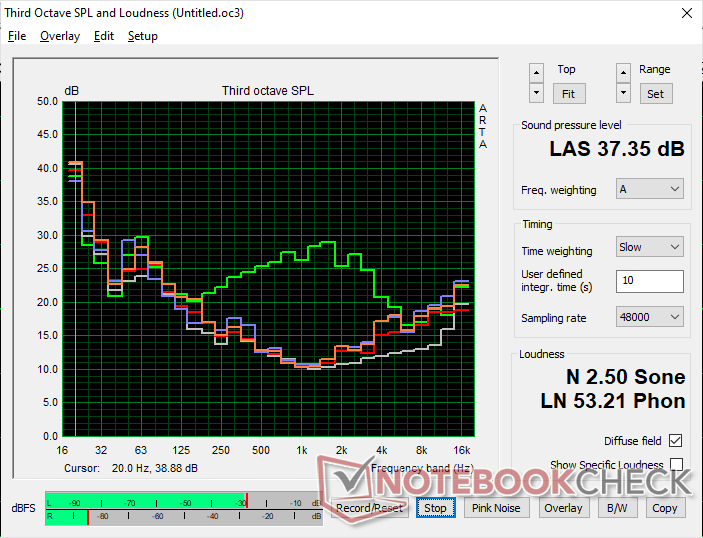
System Noise
Fan noise is one of the quietest for any laptop in the rugged category. When running very demanding loads like games or Prime95, fan noise may reach a maximum of 37 dB(A) before quickly falling back down to the near-silent 28 dB(A) range. This very conservative approach complements the below-average CPU performance mentioned above. When considering the audience of government or scientific applications, the quieter fan noise is likely preferable even if it means reduced performance.
Noise level
| Idle |
| 26.3 / 26.3 / 26.8 dB(A) |
| Load |
| 27.7 / 37.4 dB(A) |
 | ||
30 dB silent 40 dB(A) audible 50 dB(A) loud |
||
min: | ||
| Durabook S15 Iris Xe G7 96EUs, i7-1255U, Kingston OM8SEP4512Q-AA | Durabook S15ABG2 UHD Graphics 620, i5-8265U, UDinfo HF3-25UB HF325UB256GBA2P | Panasonic Toughbook 40 Iris Xe G7 96EUs, i7-1185G7, Samsung PM991 MZVLQ1T0HALB | Getac S410 G5 Iris Xe G7 80EUs, i5-1350P, SSSTC CL4-8D512 | Dell Latitude 5420 Rugged-P85G Radeon RX 540, i7-8650U, SK hynix PC401 NVMe 500 GB | Acer Enduro Urban N3 EUN314 Iris Xe G7 96EUs, i7-1165G7, Samsung PM991 MZVLQ1T0HALB | |
|---|---|---|---|---|---|---|
| Noise | -13% | -10% | -12% | -8% | -1% | |
| off / environment * (dB) | 24.6 | 29.3 -19% | 22.8 7% | 23.4 5% | 28.3 -15% | 23.8 3% |
| Idle Minimum * (dB) | 26.3 | 29.3 -11% | 26 1% | 23.4 11% | 28.3 -8% | 24.1 8% |
| Idle Average * (dB) | 26.3 | 29.3 -11% | 26 1% | 25.9 2% | 28.3 -8% | 24.1 8% |
| Idle Maximum * (dB) | 26.8 | 29.3 -9% | 26 3% | 26 3% | 28.3 -6% | 24.1 10% |
| Load Average * (dB) | 27.7 | 35.5 -28% | 37.6 -36% | 38.7 -40% | 29.9 -8% | 27.9 -1% |
| Witcher 3 ultra * (dB) | 27.4 | 37.8 -38% | 42.1 -54% | 35.7 -30% | ||
| Load Maximum * (dB) | 37.4 | 38 -2% | 40.3 -8% | 42.1 -13% | 38 -2% | 38.6 -3% |
* ... smaller is better
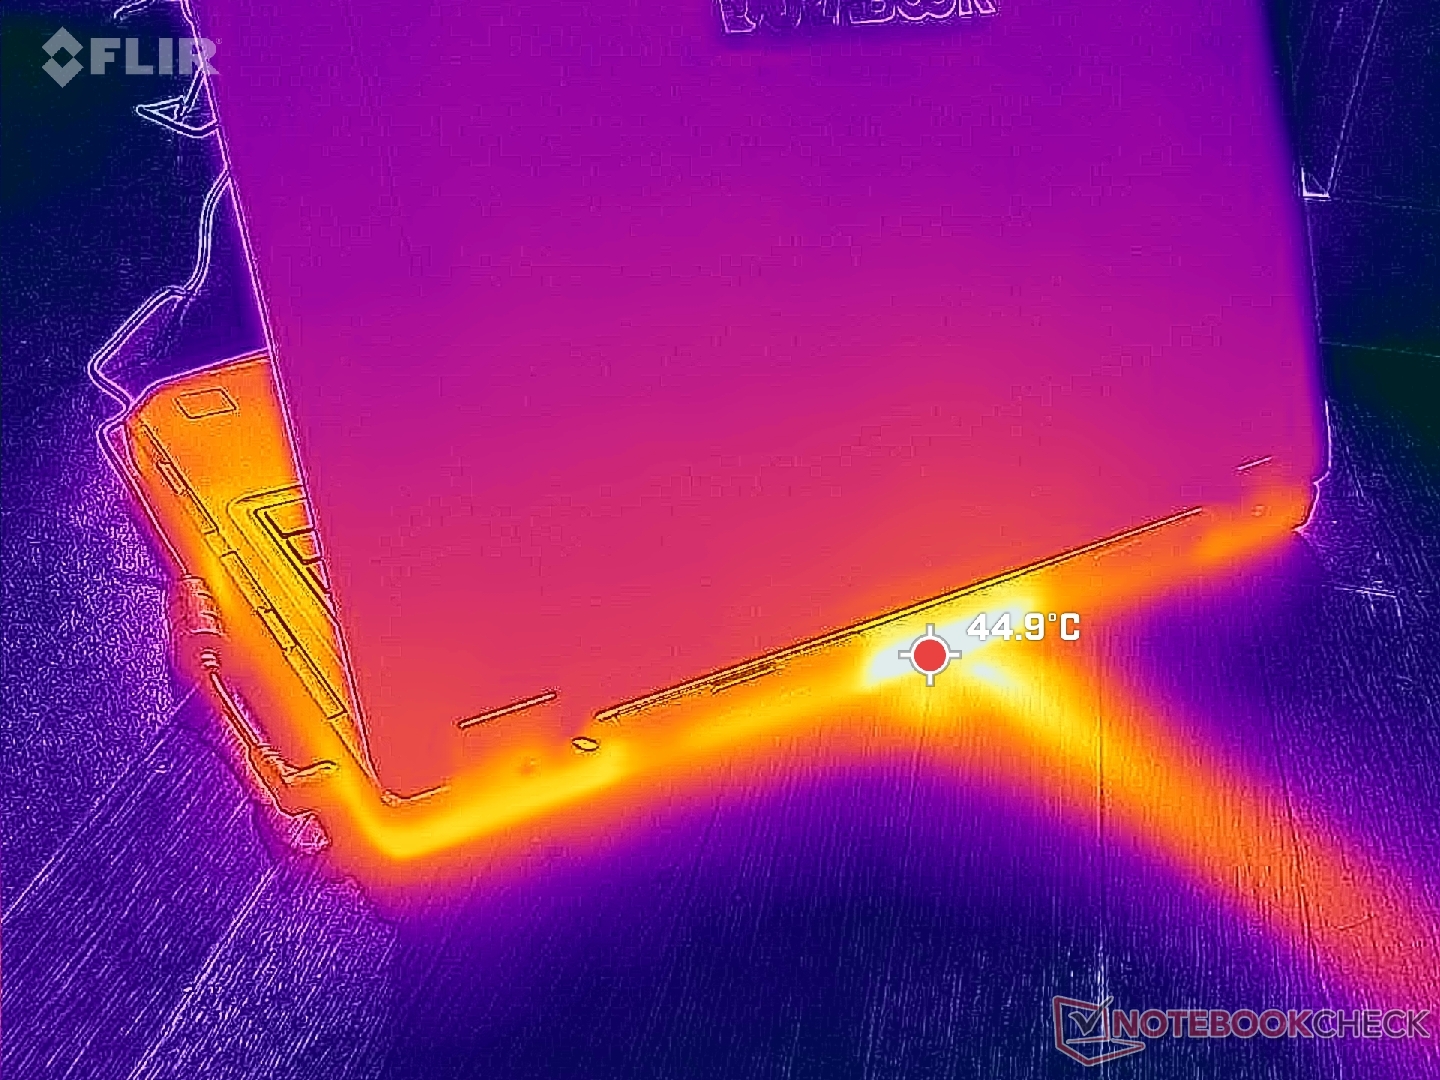
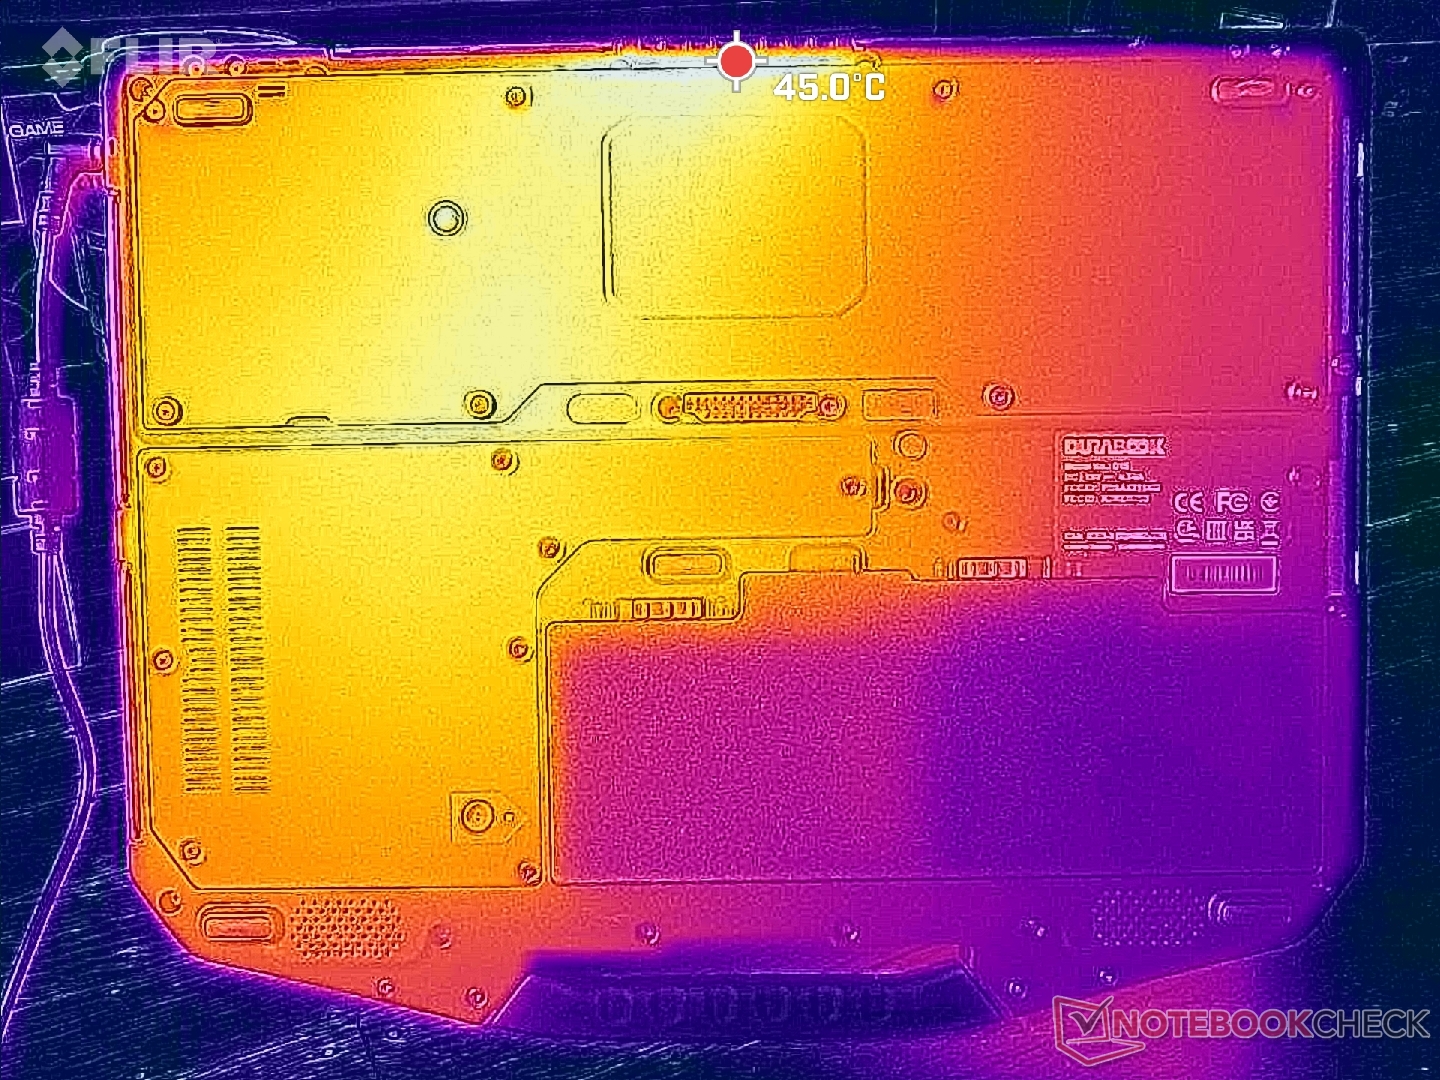
Temperature
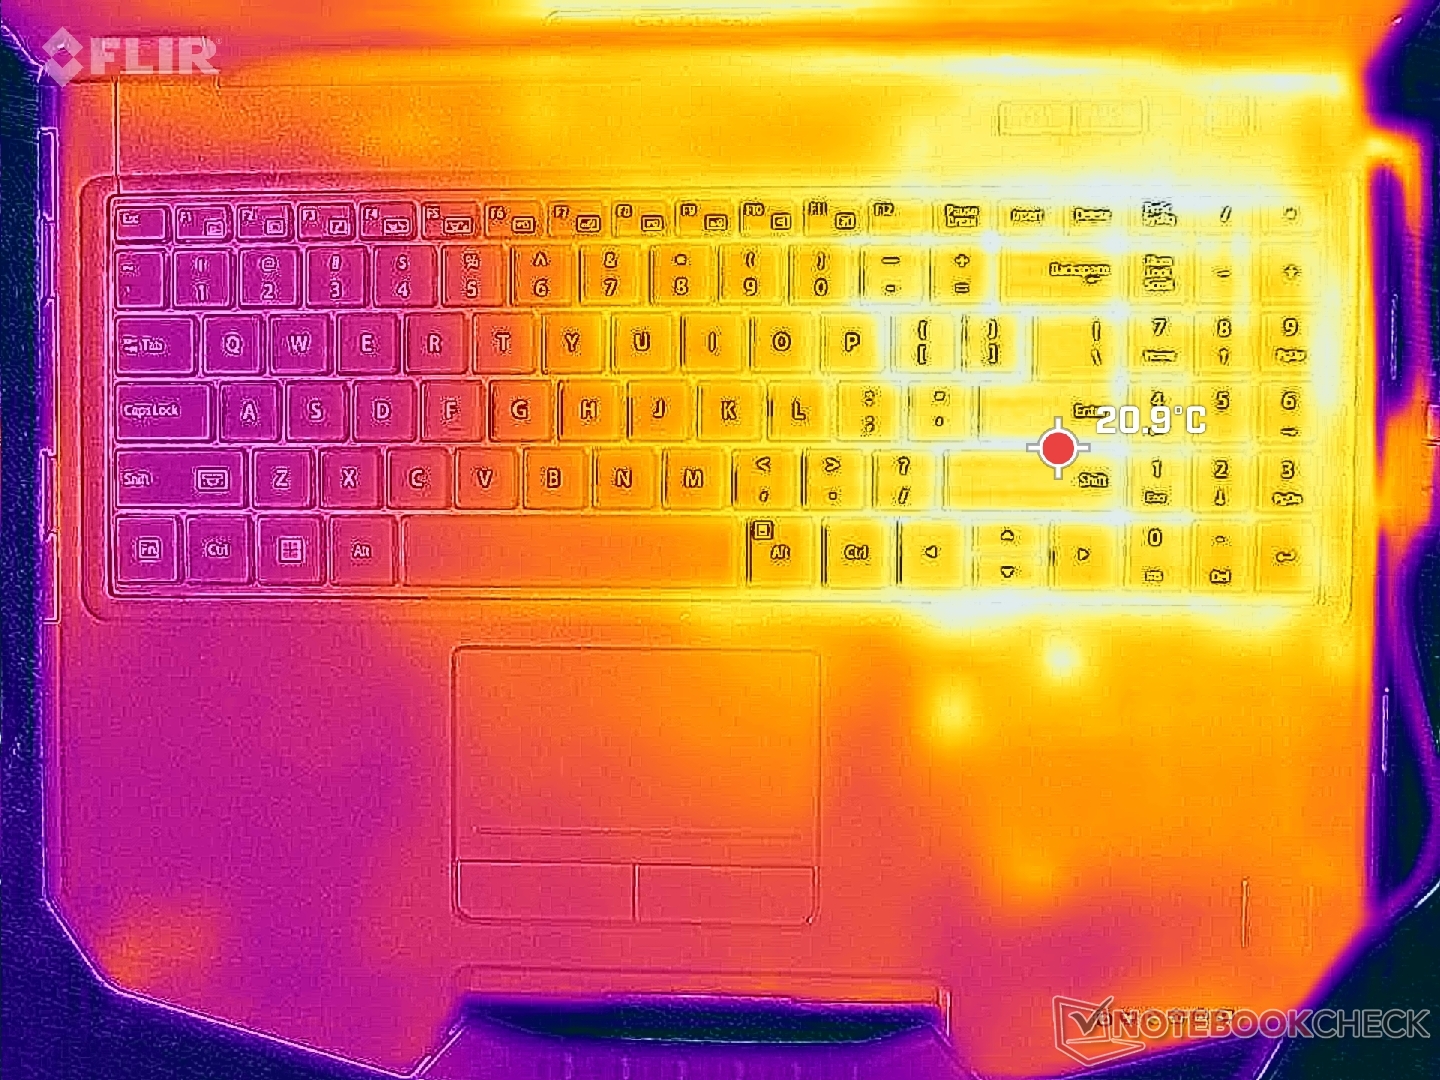
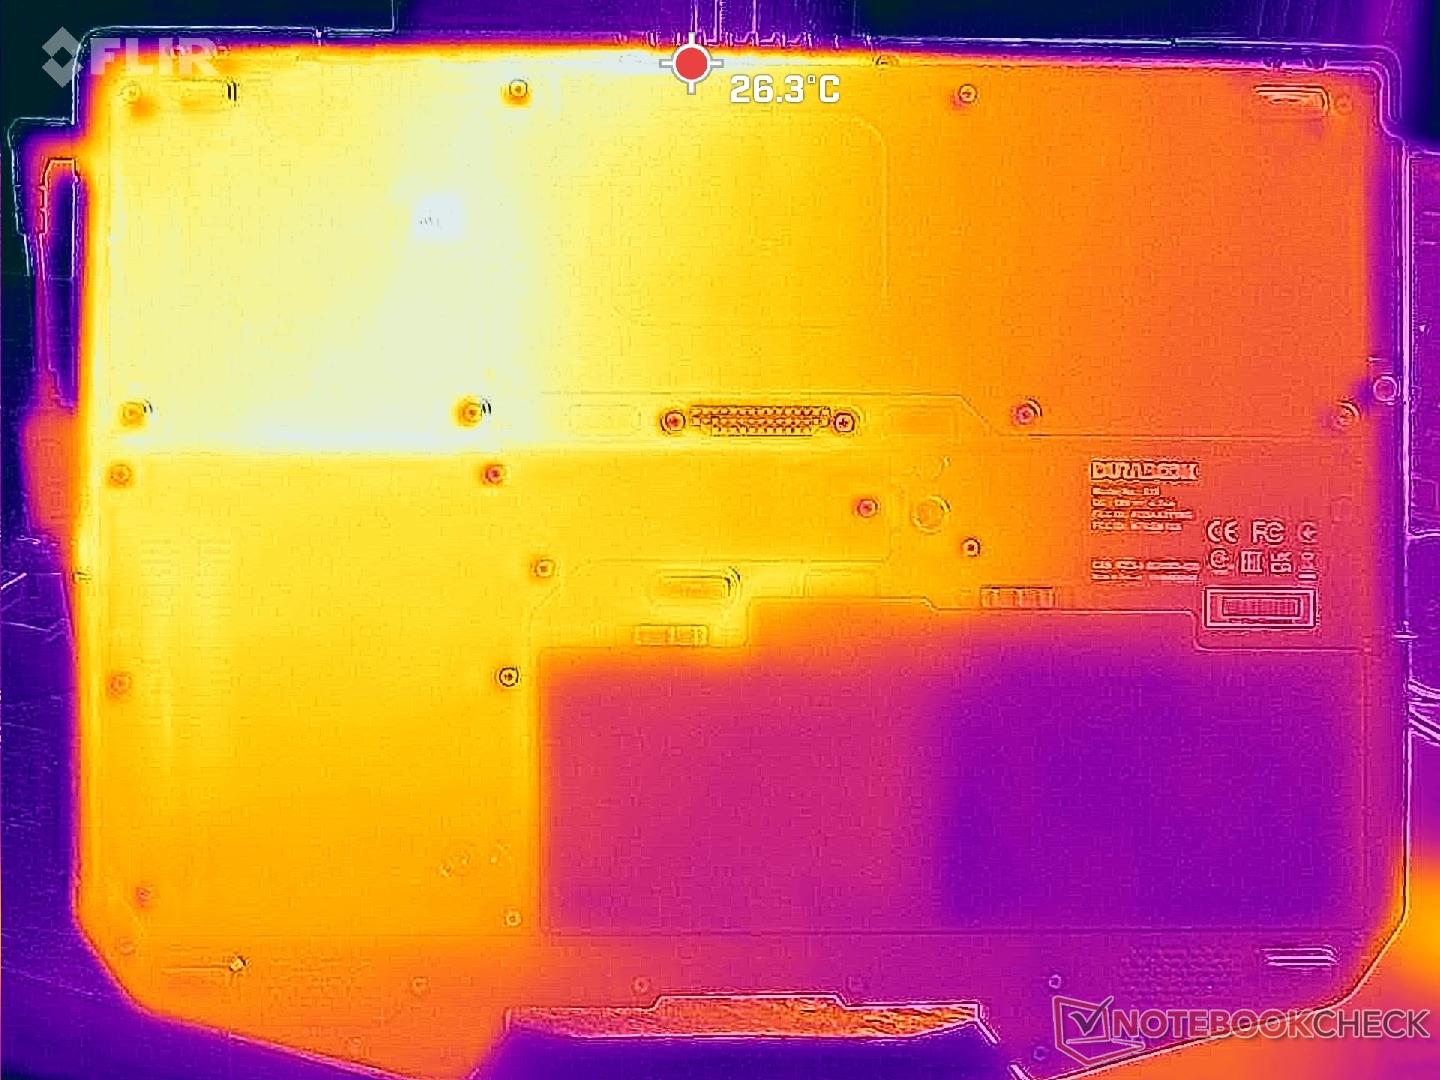
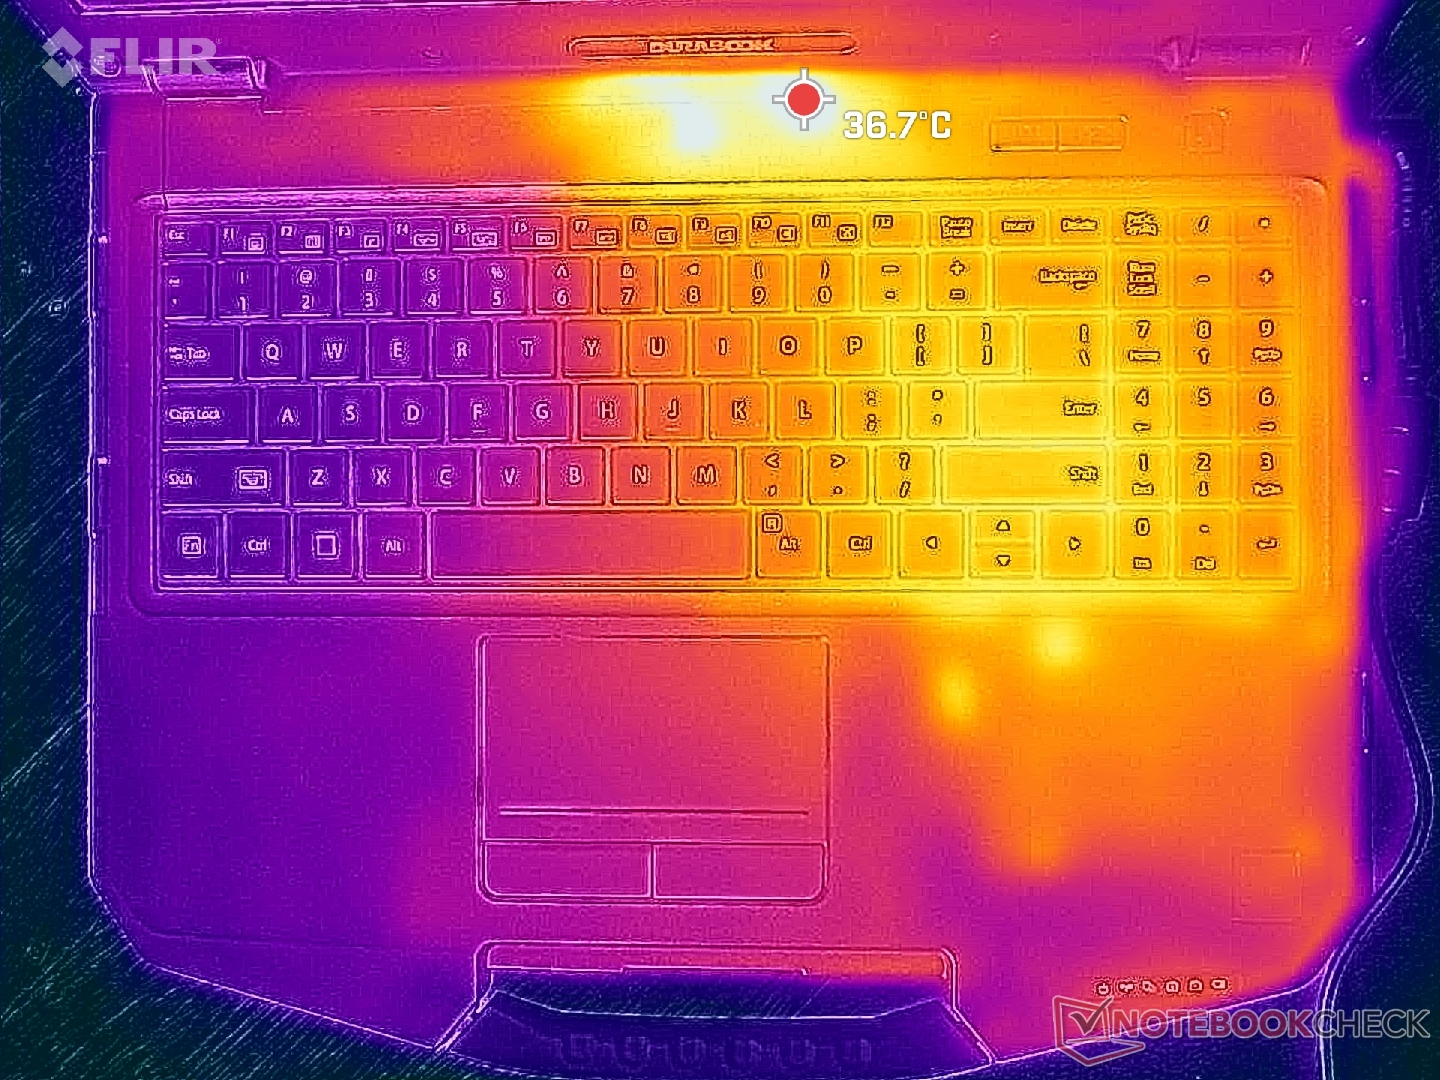
The right half of the system will always be warmer than the left due to the positioning of the battery and cooling solution. Hot spots on the bottom can reach just over 40 C similar to the thicker and heavier Panasonic Toughbook 40 or older Durabook S15ABG2.
(+) The maximum temperature on the upper side is 38.6 °C / 101 F, compared to the average of 34.3 °C / 94 F, ranging from 21.2 to 62.5 °C for the class Office.
(±) The bottom heats up to a maximum of 41 °C / 106 F, compared to the average of 36.8 °C / 98 F
(+) In idle usage, the average temperature for the upper side is 26.6 °C / 80 F, compared to the device average of 29.5 °C / 85 F.
(+) The palmrests and touchpad are reaching skin temperature as a maximum (32.6 °C / 90.7 F) and are therefore not hot.
(-) The average temperature of the palmrest area of similar devices was 27.5 °C / 81.5 F (-5.1 °C / -9.2 F).
| Durabook S15 Intel Core i7-1255U, Intel Iris Xe Graphics G7 96EUs | Durabook S15ABG2 Intel Core i5-8265U, Intel UHD Graphics 620 | Panasonic Toughbook 40 Intel Core i7-1185G7, Intel Iris Xe Graphics G7 96EUs | Getac S410 G5 Intel Core i5-1350P, Intel Iris Xe Graphics G7 80EUs | Dell Latitude 5420 Rugged-P85G Intel Core i7-8650U, AMD Radeon RX 540 | Acer Enduro Urban N3 EUN314 Intel Core i7-1165G7, Intel Iris Xe Graphics G7 96EUs | |
|---|---|---|---|---|---|---|
| Heat | -3% | 4% | -1% | -6% | 1% | |
| Maximum Upper Side * (°C) | 38.6 | 44 -14% | 35.6 8% | 37 4% | 42.2 -9% | 37.8 2% |
| Maximum Bottom * (°C) | 41 | 42 -2% | 40 2% | 42.2 -3% | 42 -2% | 45.8 -12% |
| Idle Upper Side * (°C) | 28.8 | 28 3% | 28.6 1% | 28.8 -0% | 31.6 -10% | 26.4 8% |
| Idle Bottom * (°C) | 31.4 | 30.6 3% | 29.4 6% | 33 -5% | 31.8 -1% | 30.2 4% |
* ... smaller is better
Speakers
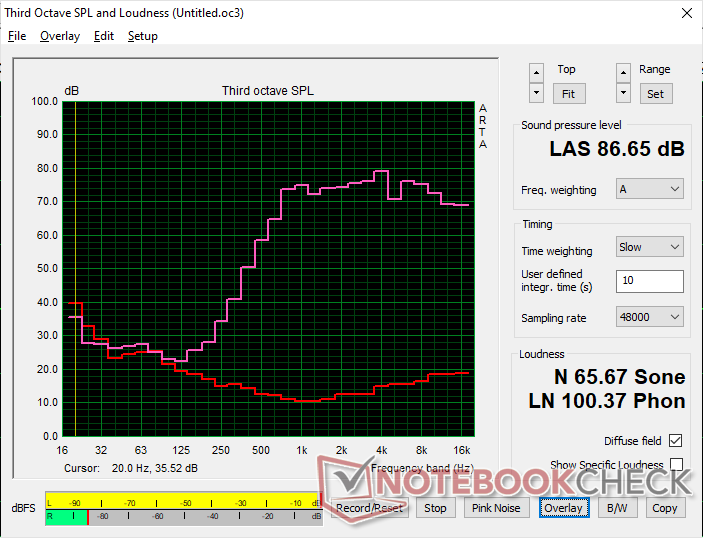
Durabook S15 audio analysis
(+) | speakers can play relatively loud (86.7 dB)
Bass 100 - 315 Hz
(-) | nearly no bass - on average 41.6% lower than median
(+) | bass is linear (6.3% delta to prev. frequency)
Mids 400 - 2000 Hz
(±) | reduced mids - on average 6.7% lower than median
(±) | linearity of mids is average (8.8% delta to prev. frequency)
Highs 2 - 16 kHz
(+) | balanced highs - only 4.4% away from median
(+) | highs are linear (5.7% delta to prev. frequency)
Overall 100 - 16.000 Hz
(±) | linearity of overall sound is average (25.8% difference to median)
Compared to same class
» 79% of all tested devices in this class were better, 7% similar, 15% worse
» The best had a delta of 7%, average was 21%, worst was 53%
Compared to all devices tested
» 79% of all tested devices were better, 4% similar, 17% worse
» The best had a delta of 4%, average was 23%, worst was 134%
Apple MacBook Pro 16 2021 M1 Pro audio analysis
(+) | speakers can play relatively loud (84.7 dB)
Bass 100 - 315 Hz
(+) | good bass - only 3.8% away from median
(+) | bass is linear (5.2% delta to prev. frequency)
Mids 400 - 2000 Hz
(+) | balanced mids - only 1.3% away from median
(+) | mids are linear (2.1% delta to prev. frequency)
Highs 2 - 16 kHz
(+) | balanced highs - only 1.9% away from median
(+) | highs are linear (2.7% delta to prev. frequency)
Overall 100 - 16.000 Hz
(+) | overall sound is linear (4.6% difference to median)
Compared to same class
» 0% of all tested devices in this class were better, 0% similar, 100% worse
» The best had a delta of 5%, average was 17%, worst was 45%
Compared to all devices tested
» 0% of all tested devices were better, 0% similar, 100% worse
» The best had a delta of 4%, average was 23%, worst was 134%
Energy Management
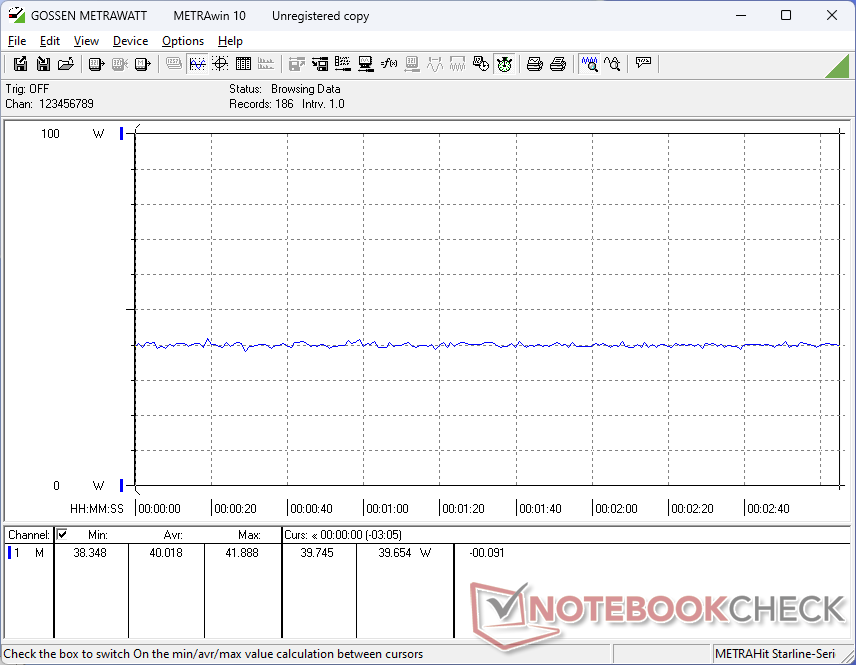
Power Consumption
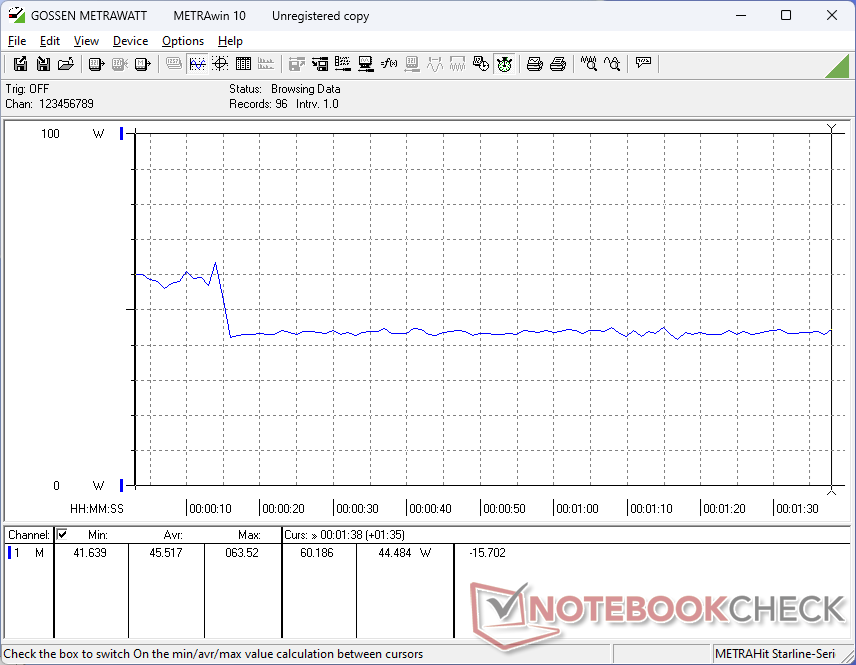
Idling on desktop demands between 4 W and 16 W to be noticeably higher than the 2020 S15ABG2. However, the increased consumption can be attributed to the much brighter display of our S15 where the difference between minimum brightness and maximum brightness is about 10 W.
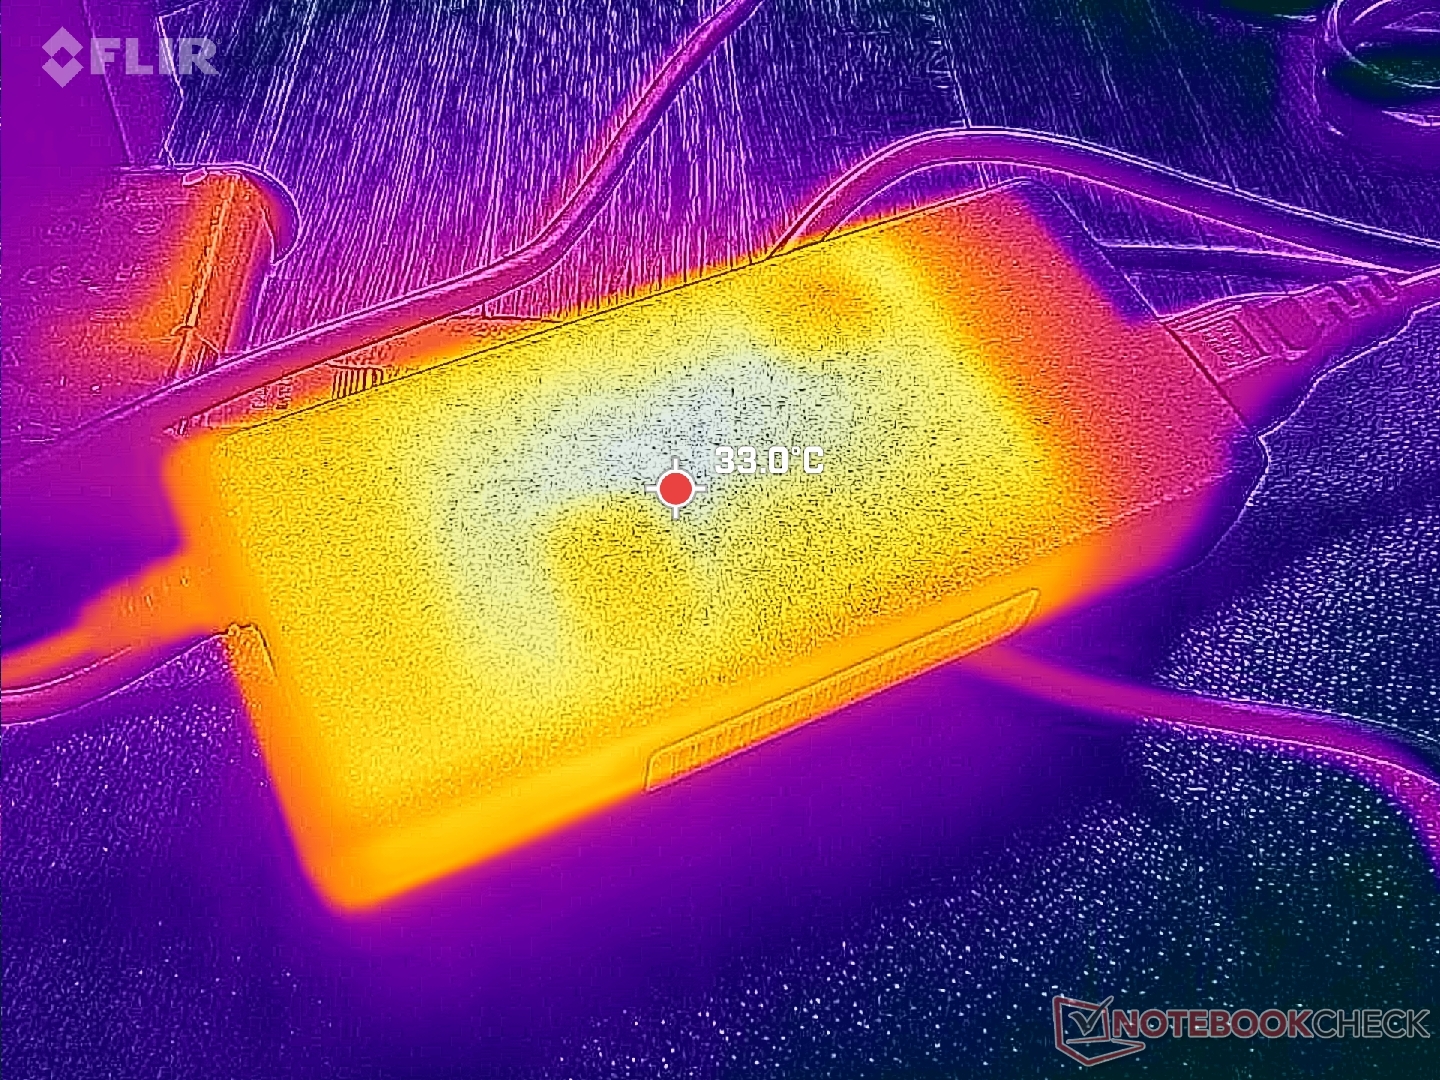
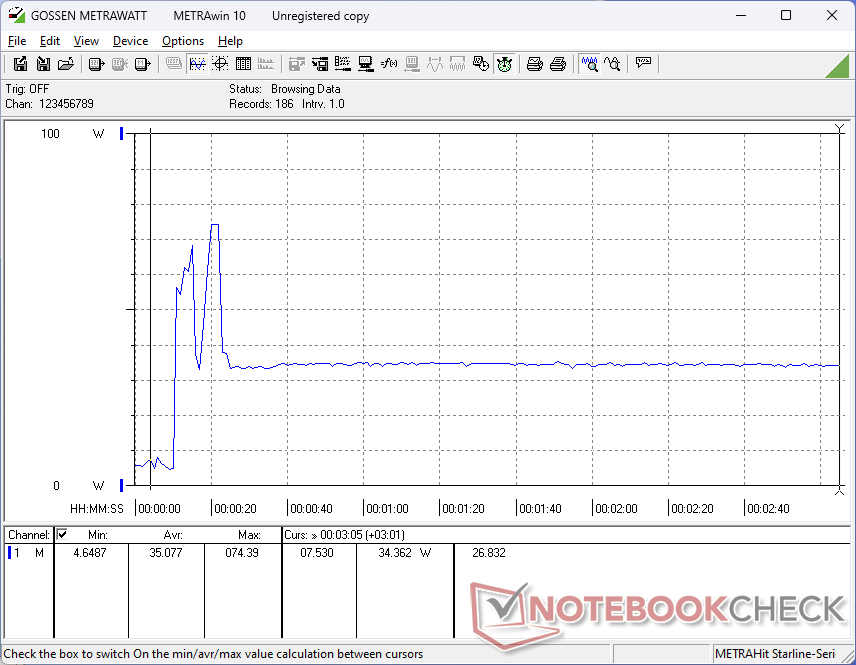
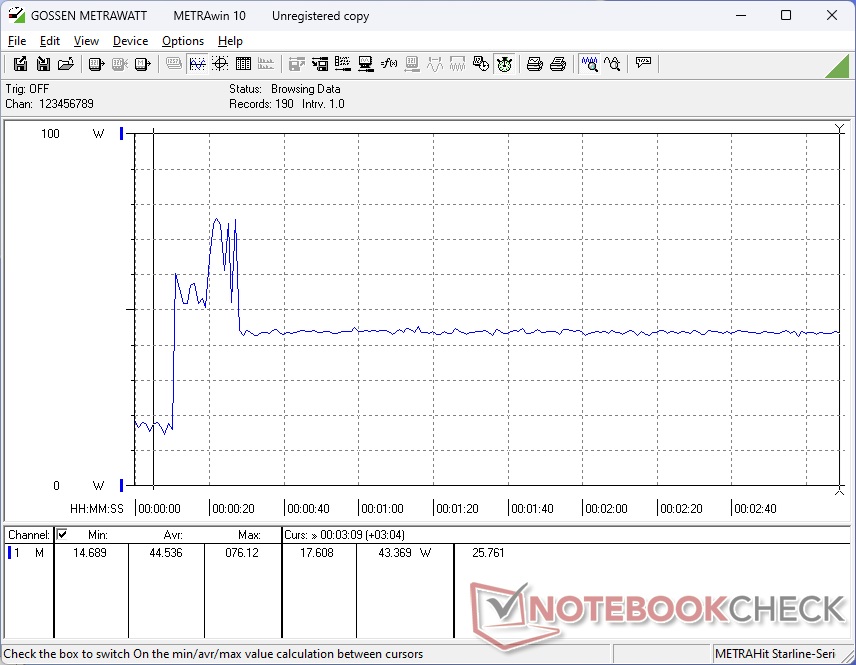
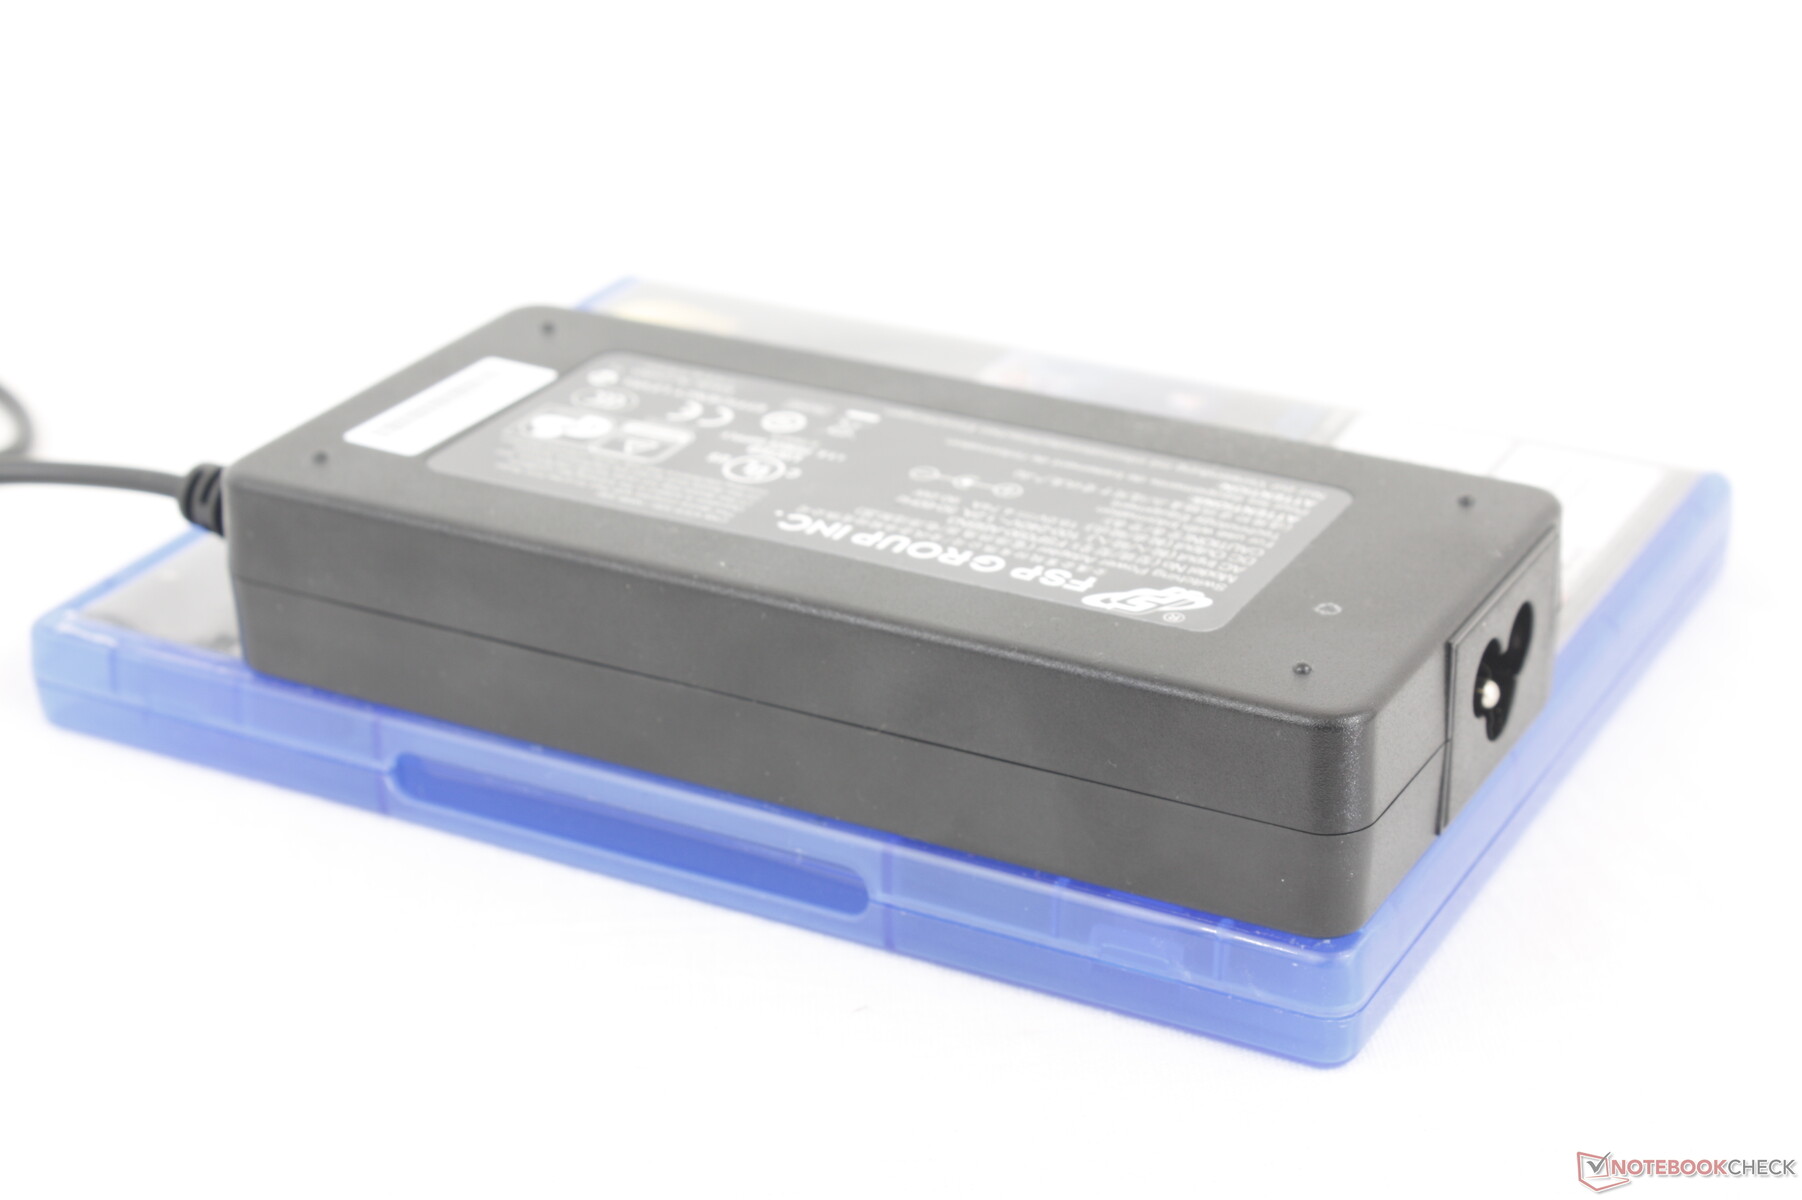
Overall consumption when running higher loads is slightly lower than on the Getac S410 G5 which sports a faster Core-P series CPU. Maximum draw can temporarily be up to 77 W when the CPU is stressed before thermal limitations kick in as shown by the graphs below. The system is compatible with most generic USB-C AC adapters and so the proprietary 90 W AC barrel adapter (~15 x 6.4 x 2.6 cm) that ships in the box is not absolutely necessary.
| Off / Standby | |
| Idle | |
| Load |
|
Key:
min: | |
| Durabook S15 i7-1255U, Iris Xe G7 96EUs, Kingston OM8SEP4512Q-AA, IPS, 1920x1080, 15.6" | Durabook S15ABG2 i5-8265U, UHD Graphics 620, UDinfo HF3-25UB HF325UB256GBA2P, TN LED, 1920x1080, 15.6" | Panasonic Toughbook 40 i7-1185G7, Iris Xe G7 96EUs, Samsung PM991 MZVLQ1T0HALB, IPS, 1920x1080, 14" | Getac S410 G5 i5-1350P, Iris Xe G7 80EUs, SSSTC CL4-8D512, IPS, 1920x1080, 14" | Dell Latitude 5420 Rugged-P85G i7-8650U, Radeon RX 540, SK hynix PC401 NVMe 500 GB, IPS, 1920x1080, 14" | Acer Enduro Urban N3 EUN314 i7-1165G7, Iris Xe G7 96EUs, Samsung PM991 MZVLQ1T0HALB, IPS, 1920x1080, 14" | |
|---|---|---|---|---|---|---|
| Power Consumption | 29% | -5% | -29% | -22% | 30% | |
| Idle Minimum * (Watt) | 4.4 | 3.5 20% | 4.9 -11% | 7.9 -80% | 4.8 -9% | 3.8 14% |
| Idle Average * (Watt) | 14.9 | 7.9 47% | 12.3 17% | 14.4 3% | 13.6 9% | 8 46% |
| Idle Maximum * (Watt) | 15.6 | 9 42% | 14 10% | 15.2 3% | 13.8 12% | 8.7 44% |
| Load Average * (Watt) | 45.5 | 39.8 13% | 54 -19% | 58.4 -28% | 67.8 -49% | 34.6 24% |
| Witcher 3 ultra * (Watt) | 40 | 46.3 -16% | 53.7 -34% | 69.1 -73% | 35.4 11% | |
| Load Maximum * (Watt) | 76.2 | 59.8 22% | 83.6 -10% | 106.5 -40% | 93.5 -23% | 45.4 40% |
* ... smaller is better
Power Consumption Witcher 3 / Stresstest
Power Consumption external Monitor
Battery Life
The internal battery is relatively small at 54 Wh for a real-world WLAN runtime of about 8 hours similar to the older 2020 model when both are set to 150 nit brightness. Secondary battery options are available to increase battery life.
Charging from empty to full capacity is relatively slow at just over 2 hours compared to 1.5 hours on most consumer laptops.
| Durabook S15 i7-1255U, Iris Xe G7 96EUs, 56 Wh | Durabook S15ABG2 i5-8265U, UHD Graphics 620, 56 Wh | Panasonic Toughbook 40 i7-1185G7, Iris Xe G7 96EUs, 136 Wh | Getac S410 G5 i5-1350P, Iris Xe G7 80EUs, 150 Wh | Dell Latitude 5420 Rugged-P85G i7-8650U, Radeon RX 540, 102 Wh | Acer Enduro Urban N3 EUN314 i7-1165G7, Iris Xe G7 96EUs, 50.3 Wh | |
|---|---|---|---|---|---|---|
| Battery runtime | -14% | 138% | 119% | 93% | -20% | |
| Reader / Idle (h) | 17.2 | 31.4 83% | ||||
| WiFi v1.3 (h) | 8 | 6.9 -14% | 19 138% | 17.5 119% | 16.2 103% | 6.4 -20% |
| Load (h) | 3.2 |
Pros
Cons
Verdict — Updated Internals Make All The Difference
The 2024 Durabook S15 builds on top of the design we reviewed in 2020 to bring the series up to speed while retaining all the core qualities of the original. The familiar external features are sound but with new hardware specifications like Wi- Fi 6E, 1000-nit display options, larger keyboard, Thunderbolt 4, and of course, faster processor performance. Some users, however, may be upset with the dropped 2.5-inch SATA III slot and the lack of touchscreen. A few competing models like the Getac S410 Gen 5 have touchscreen, stylus, and faster Core-P options in comparison.
The 2024 Durabook S15 may look the same from the outside, but the inside has been almost completely revised to bring in modern features and options while maintaining backwards compatibility with most accessories.
The presence of PWM for brightness control and the uneven key feedback between the left and righthand sides of the keyboard should be improved upon for future revisions. The speakers could have been louder while the side docking bay still requires a screwdriver to access which can be inconvenient when on the field. The vast majority of the latest laptops have also made the transition to 16:10 or 16-inch screens whereas the S15 is starting to feel dated with its 16:9 15.6-inch form factor. Despite these drawbacks, it's impressive that the model remains one of the most portable in the category even after all these years.
Price and Availability
Quotes are available if configured and purchased directly from the manufacturer.
Note: We have recently updated our rating system and the results of version 8 are not comparable with the results of version 7. More information is available here .
Durabook S15
- 06/17/2024 v8
Allen Ngo
Transparency
The selection of devices to be reviewed is made by our editorial team. The test sample was provided to the author as a loan by the manufacturer or retailer for the purpose of this review. The lender had no influence on this review, nor did the manufacturer receive a copy of this review before publication. There was no obligation to publish this review. As an independent media company, Notebookcheck is not subjected to the authority of manufacturers, retailers or publishers.
This is how Notebookcheck is testing
Every year, Notebookcheck independently reviews hundreds of laptops and smartphones using standardized procedures to ensure that all results are comparable. We have continuously developed our test methods for around 20 years and set industry standards in the process. In our test labs, high-quality measuring equipment is utilized by experienced technicians and editors. These tests involve a multi-stage validation process. Our complex rating system is based on hundreds of well-founded measurements and benchmarks, which maintains objectivity. Further information on our test methods can be found here.
Price comparison
