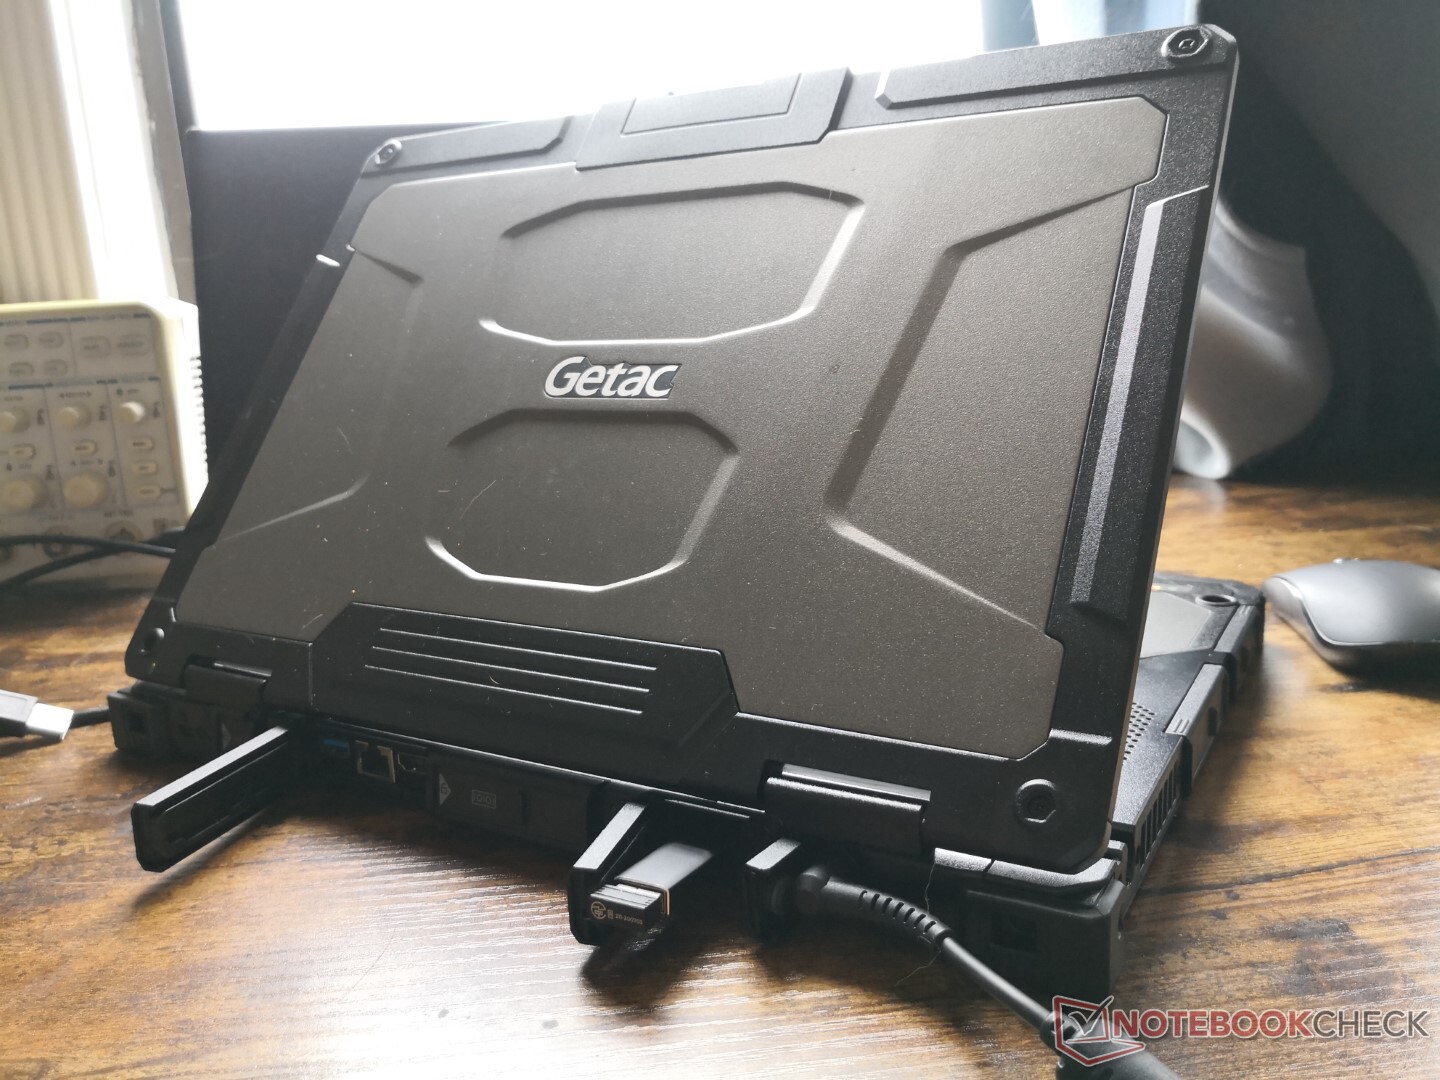
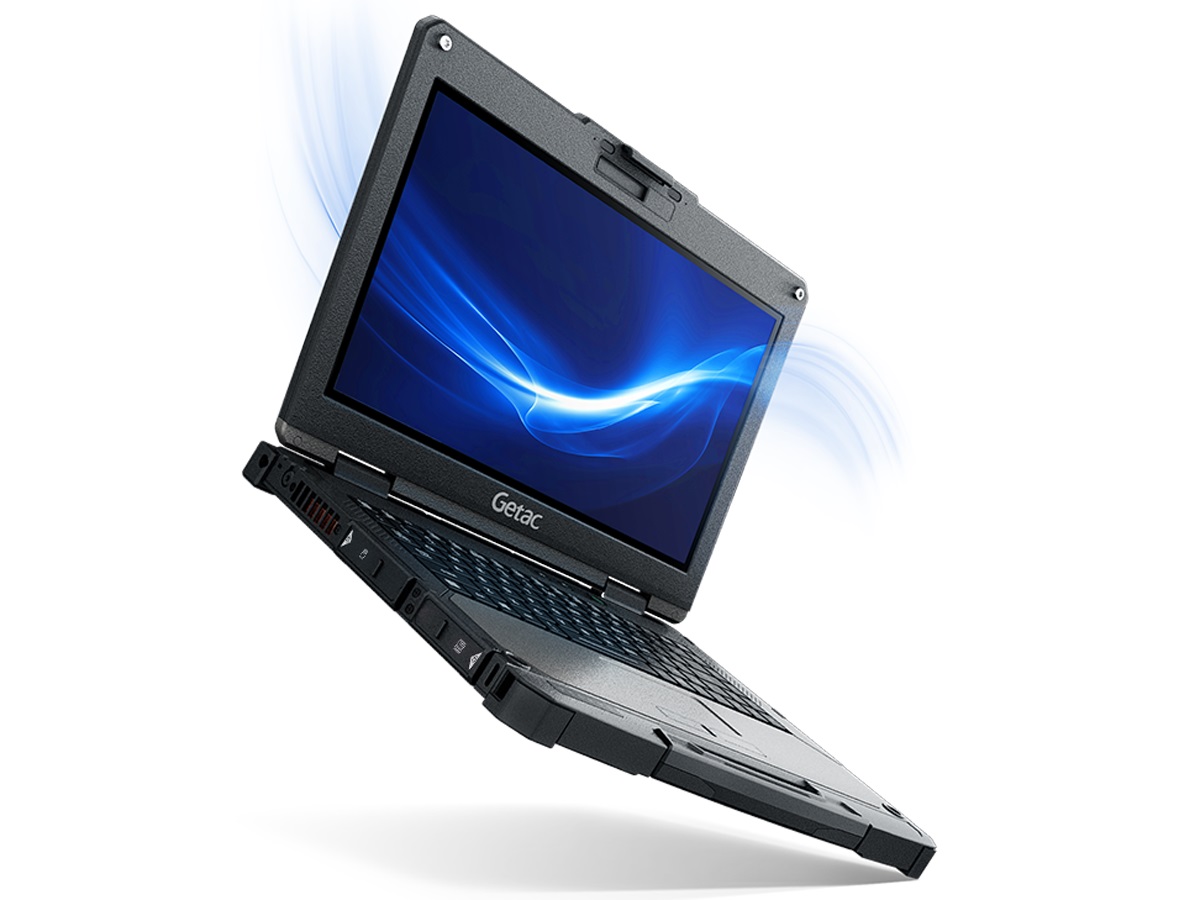
Getac B360 rugged laptop review: Bright 1400-nit touchscreen
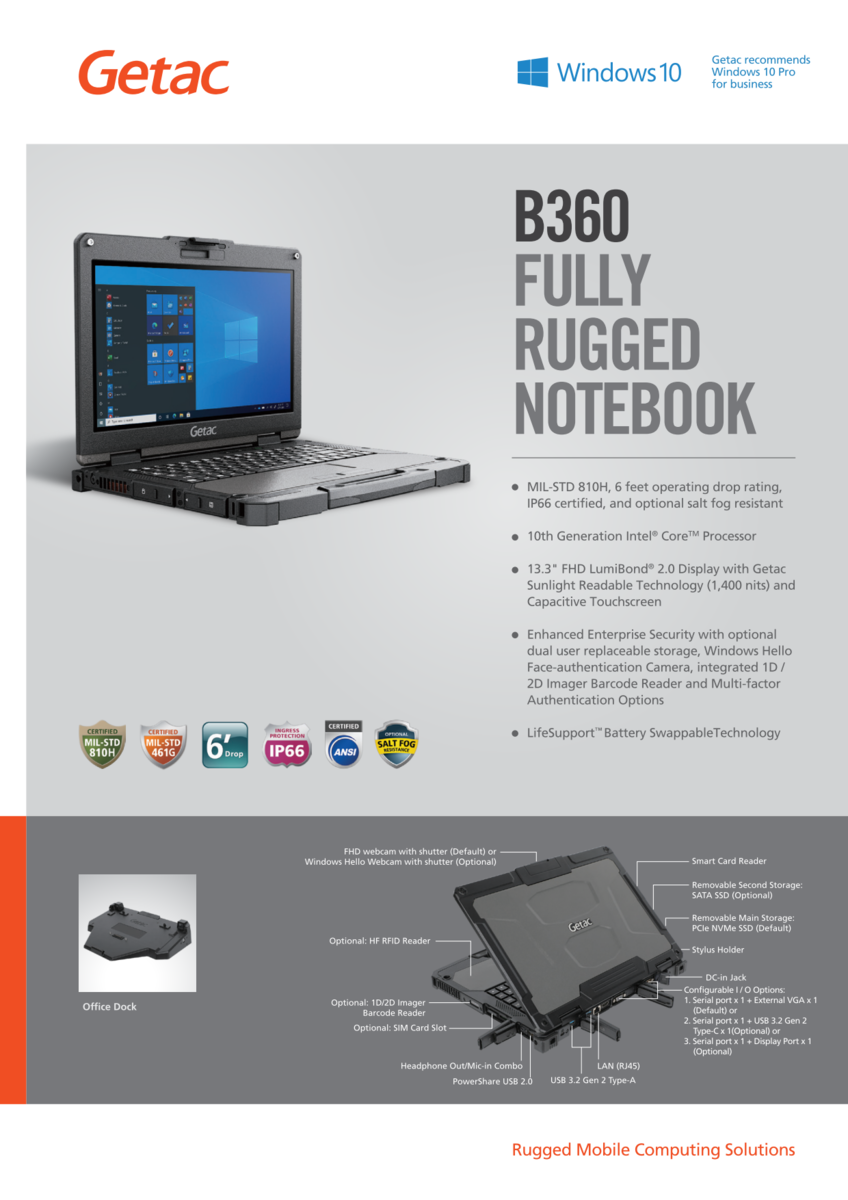
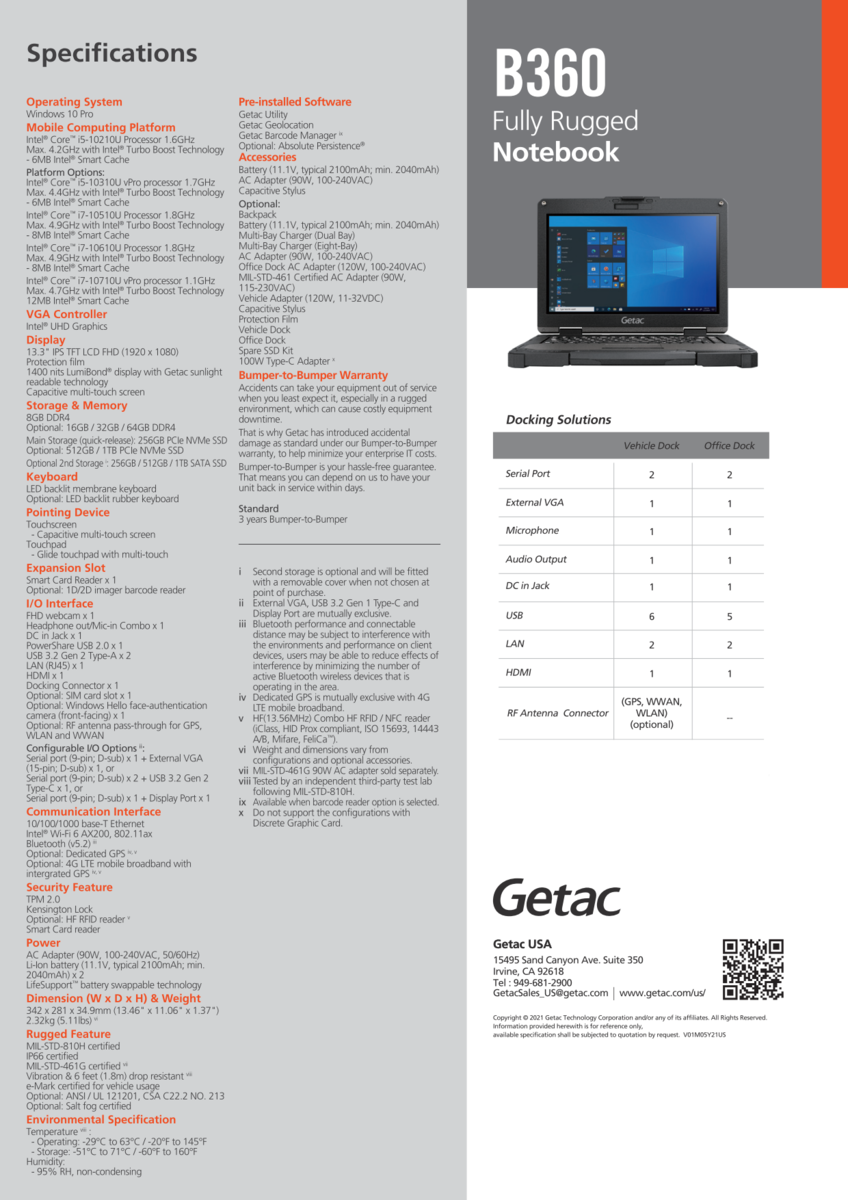
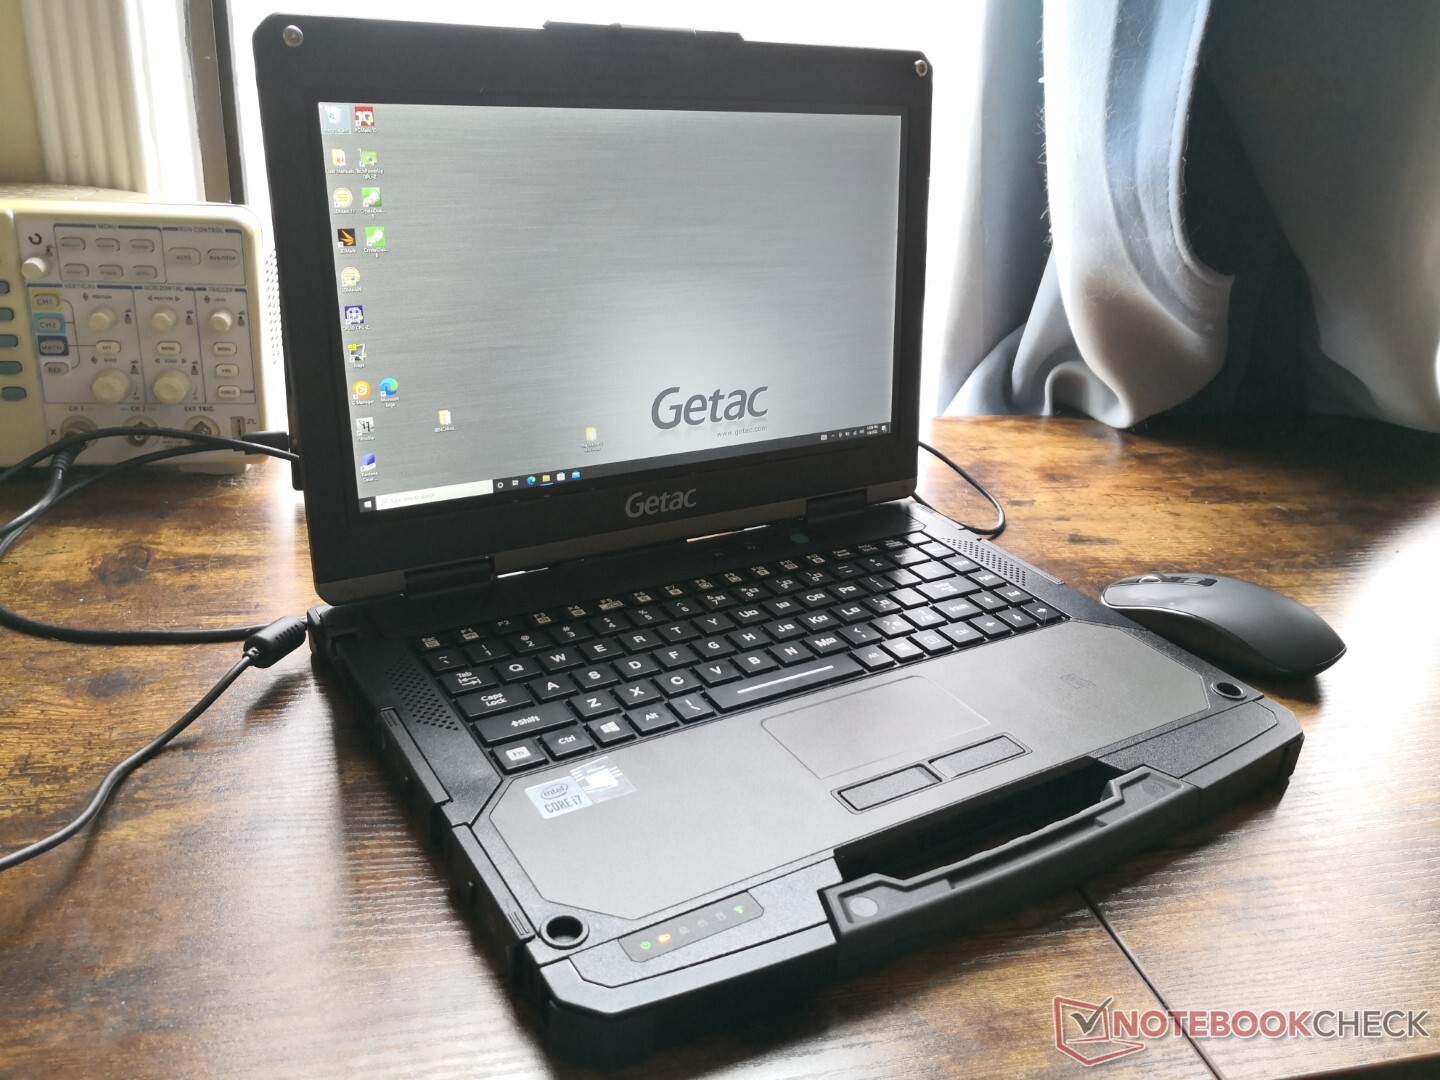
The Getac B360 is a fully-rugged 13.3-inch laptop that integrates many of the modern connectivity features and upgrades we've come to expect from consumer devices. It's the first rugged laptop in our database for this particular size class since most rugged models are typically 14-inches or larger. We recommend checking out the official product page here or the full specifications sheet below for all available options beyond the one unit we have here for review.
More Getac reviews:
Potential Competitors in Comparison
Rating | Date | Model | Weight | Height | Size | Resolution | Price |
|---|---|---|---|---|---|---|---|
| 83.8 % v7 (old) | 01 / 2022 | Getac B360 i7-10710U, UHD Graphics 620 | 2.4 kg | 34.9 mm | 13.30" | 1920x1080 | |
| 89.2 % v6 (old) | 03 / 2019 | Dell Latitude 5420 Rugged-P85G i7-8650U, Radeon RX 540 | 2.8 kg | 32.9 mm | 14.00" | 1920x1080 | |
| 81.9 % v6 (old) | 10 / 2018 | Getac S410 i5-8550U, UHD Graphics 620 | 3.2 kg | 34.9 mm | 14.00" | 1366x768 | |
| 82.4 % v7 (old) | 12 / 2021 | Acer Enduro Urban N3 EUN314 i7-1165G7, Iris Xe G7 96EUs | 1.8 kg | 21.95 mm | 14.00" | 1920x1080 | |
| 83.9 % v7 (old) | 09 / 2021 | Panasonic Toughbook FZ-55 MK2 i7-1185G7, Iris Xe G7 96EUs | 2.3 kg | 33 mm | 14.00" | 1920x1080 | |
v (old) | 04 / 2021 | Durabook S14I i7-1165G7, Iris Xe G7 96EUs | 3 kg | 38.1 mm | 14.00" | 1920x1080 |
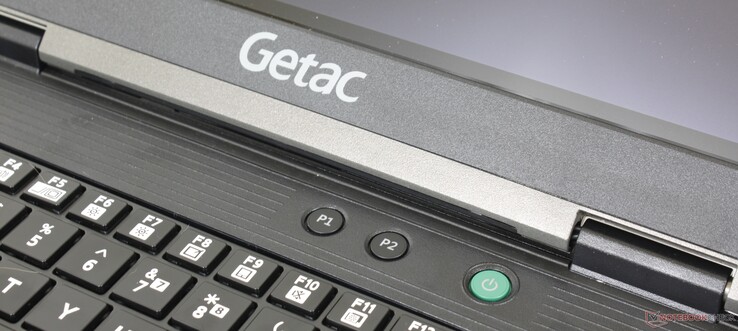
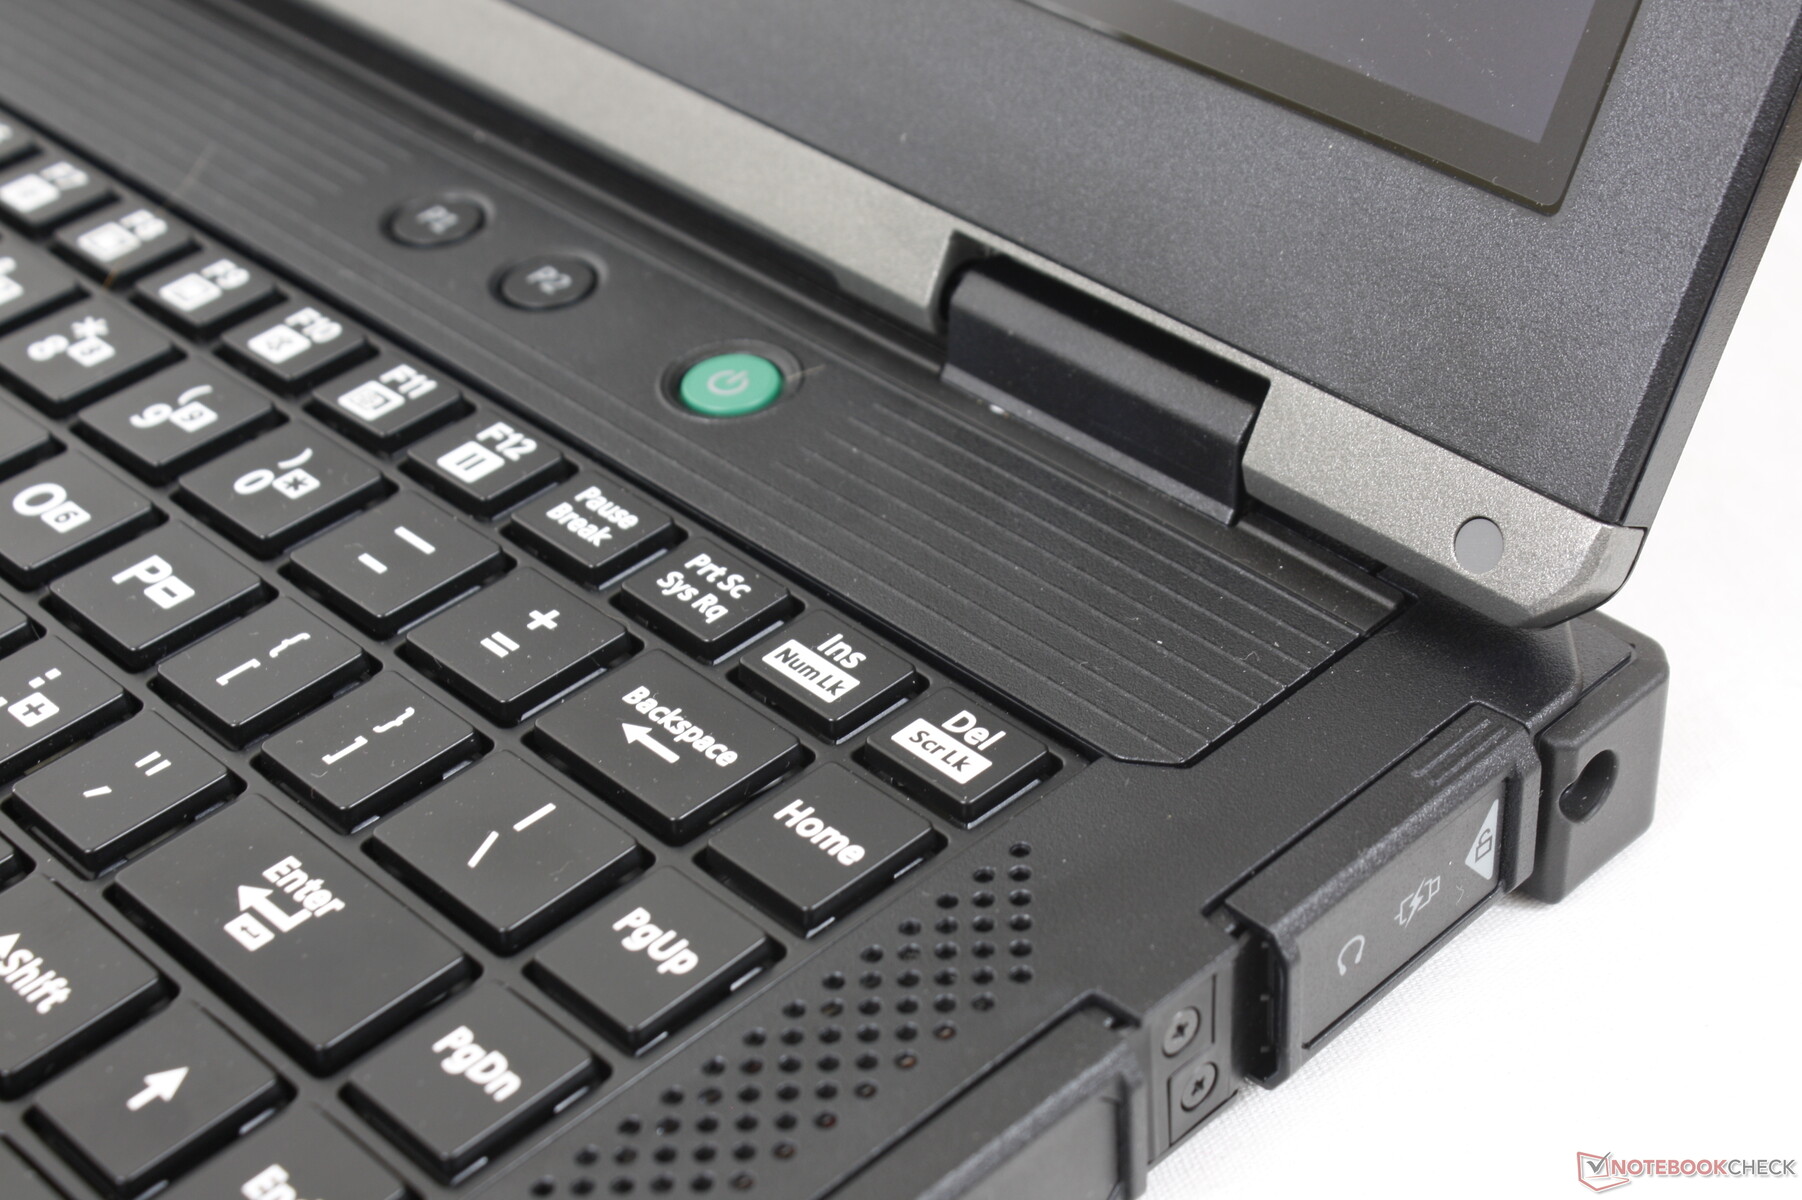
Case
Despite offering a smaller screen size than the 14-inch Panasonic Toughbook FZ-55 or Getac S410, the B360 is actually both heavier and thicker than either model. The B360 is fully rugged whereas the others are semi-rugged, however, which explains the discrepancy. The chassis passes MIL-STD 810H and IP66 certifications.
Connectivity
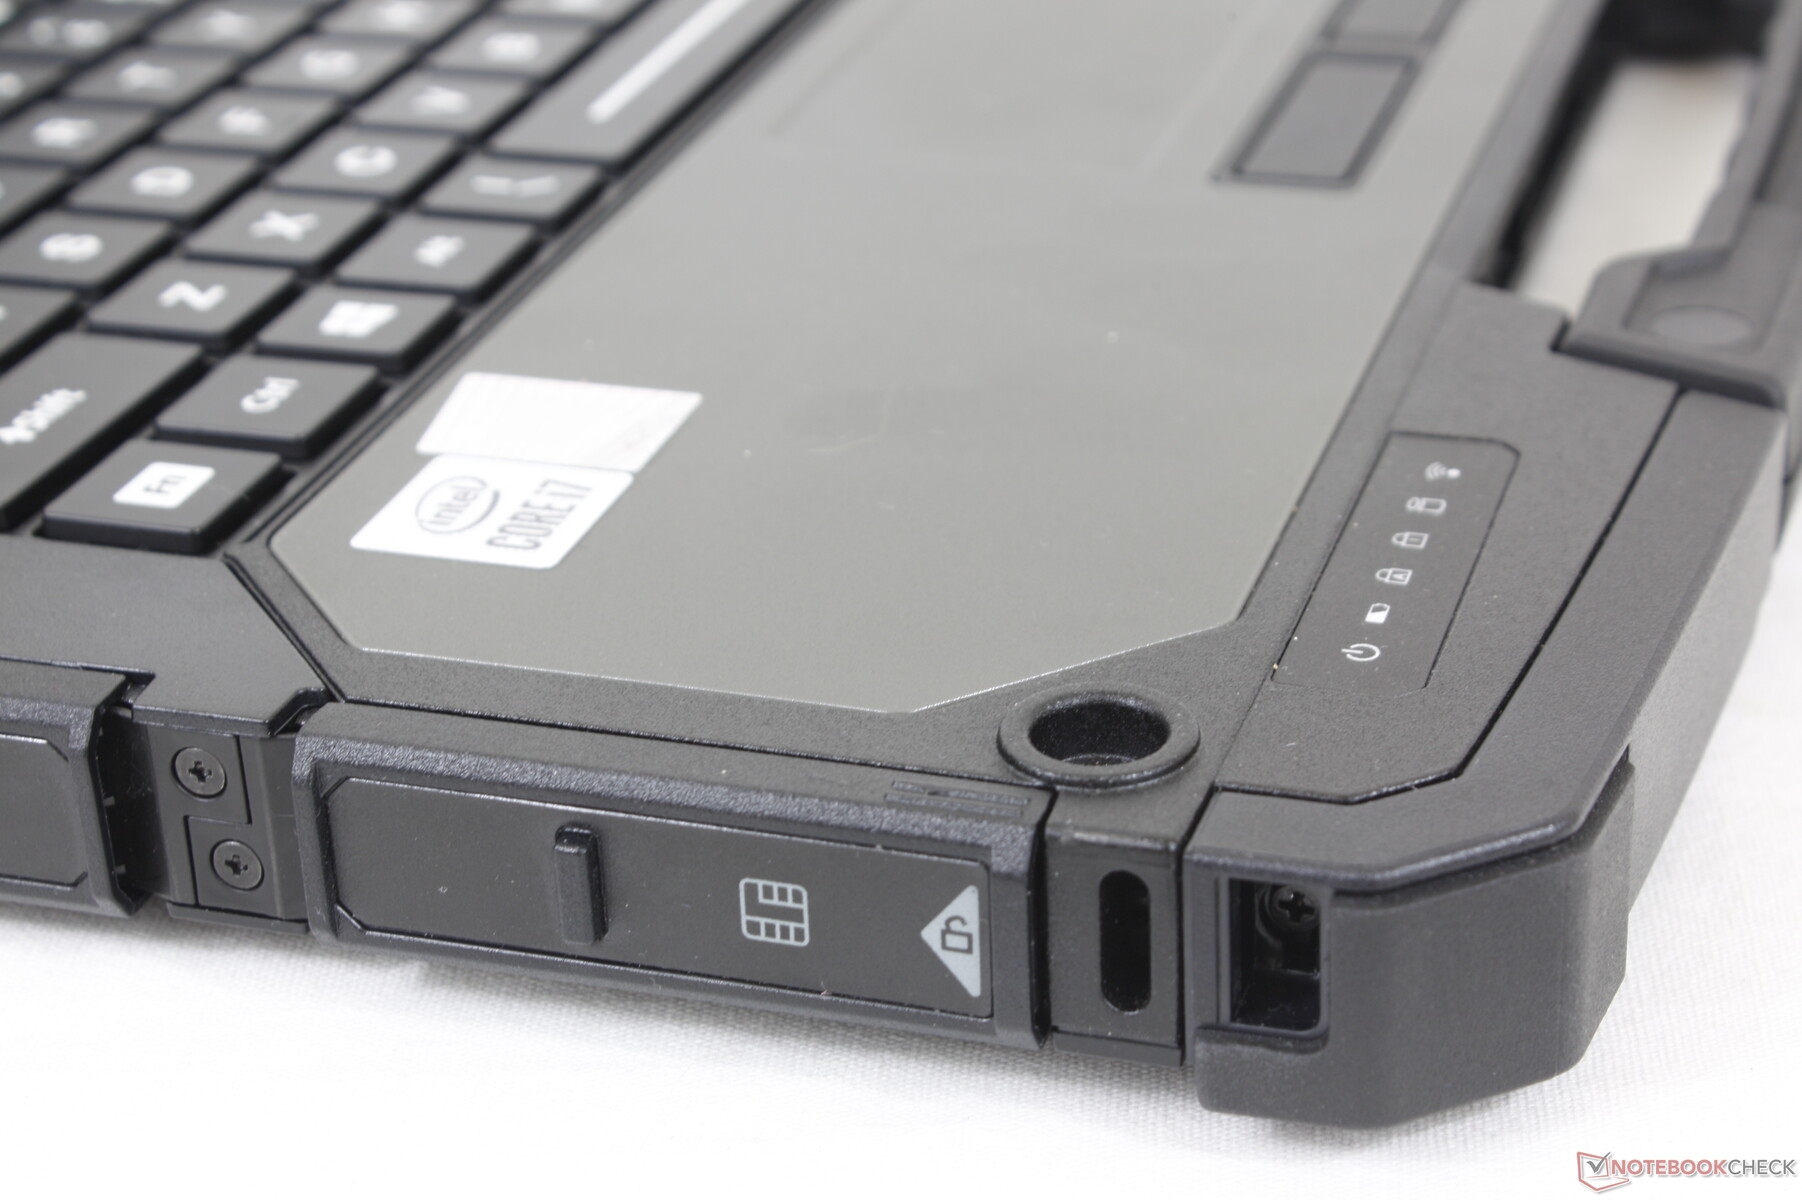
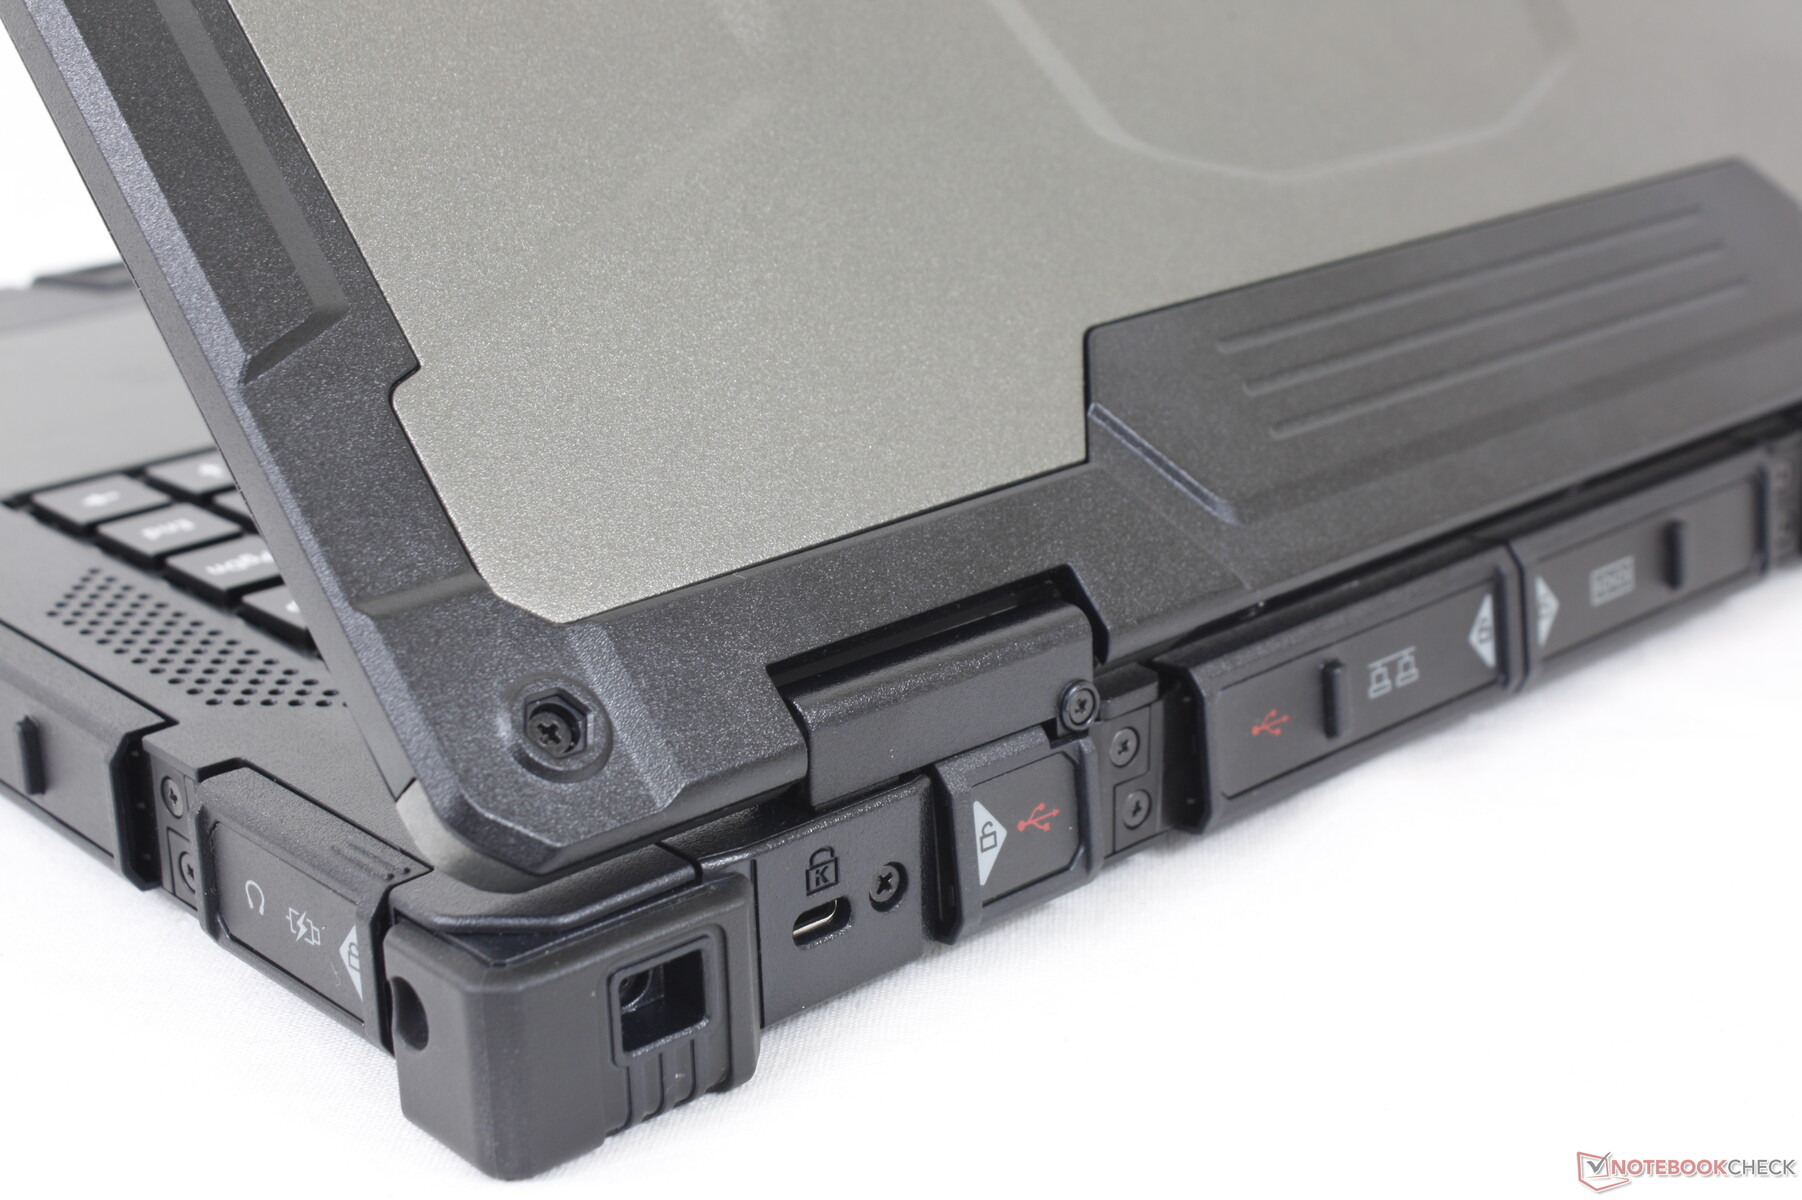
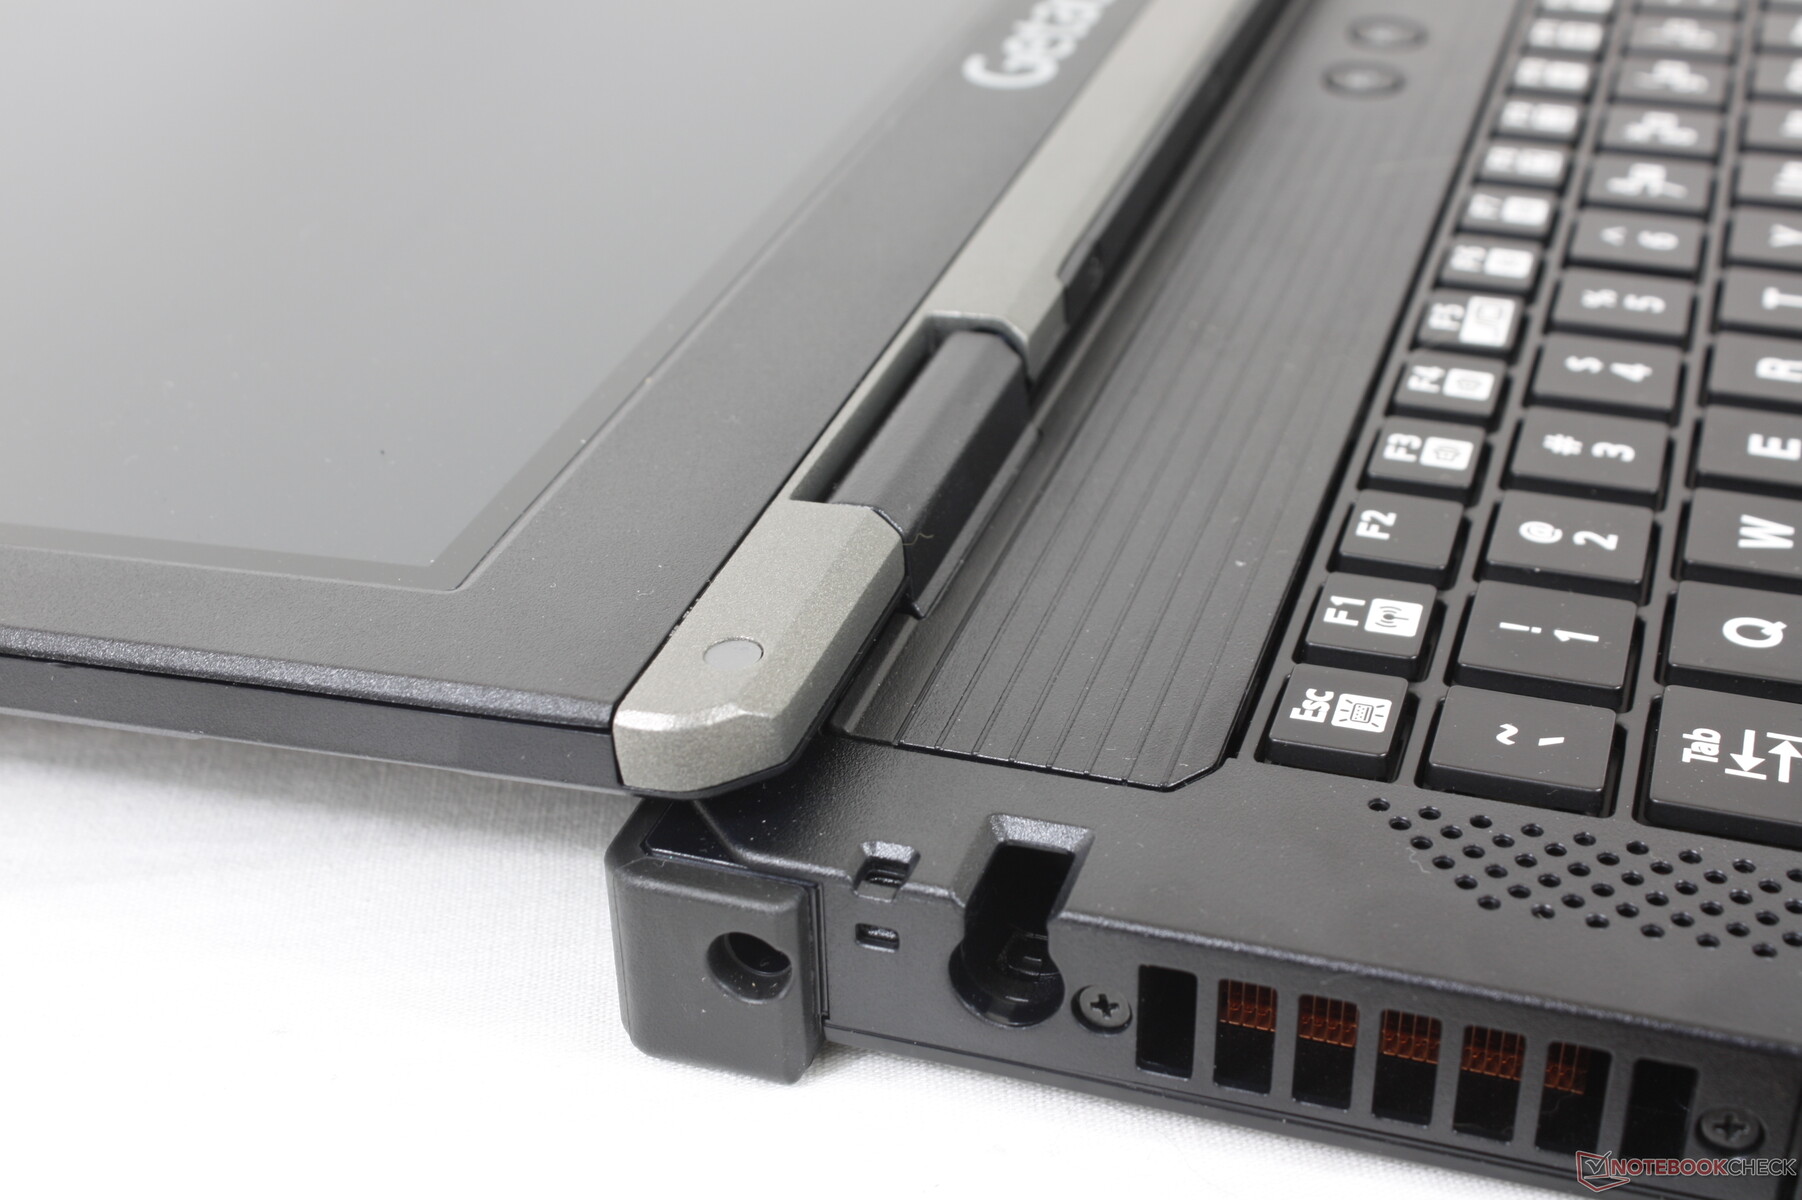
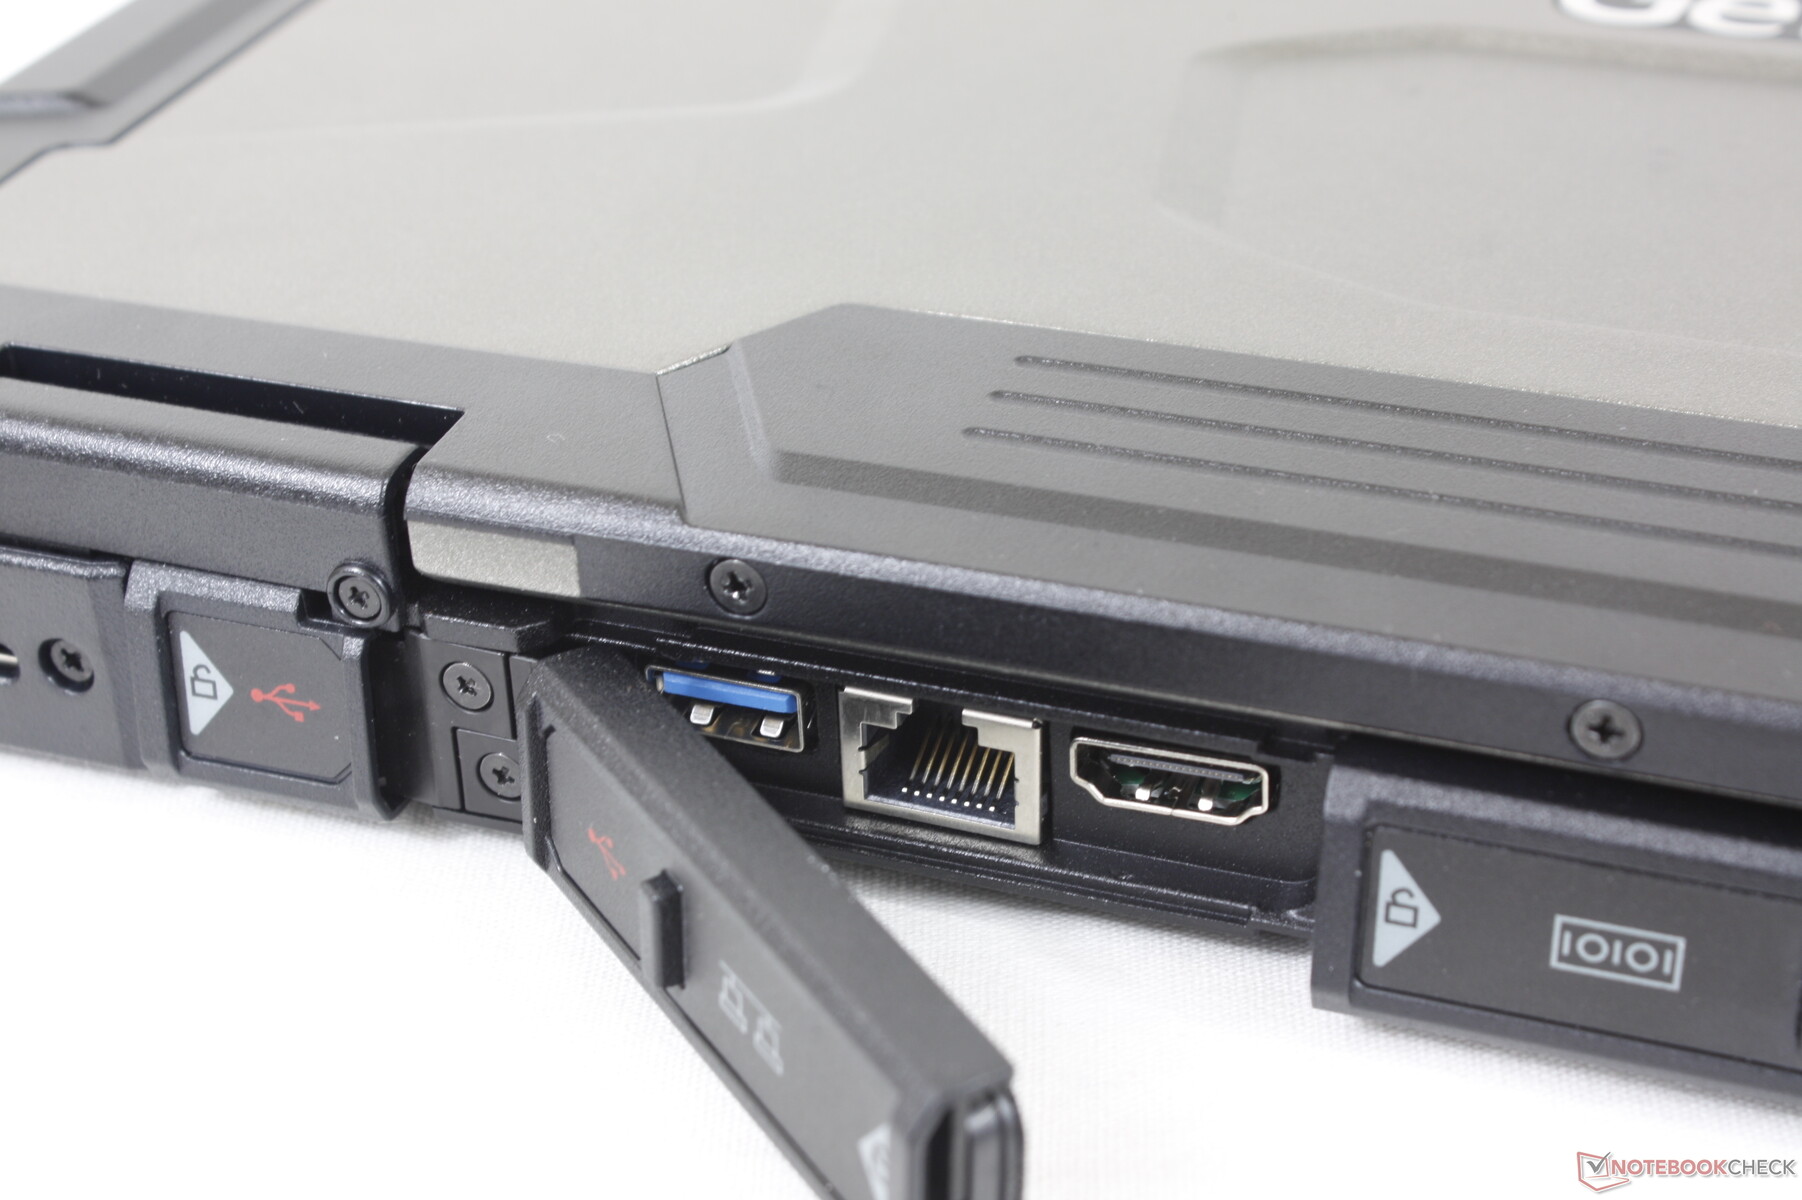
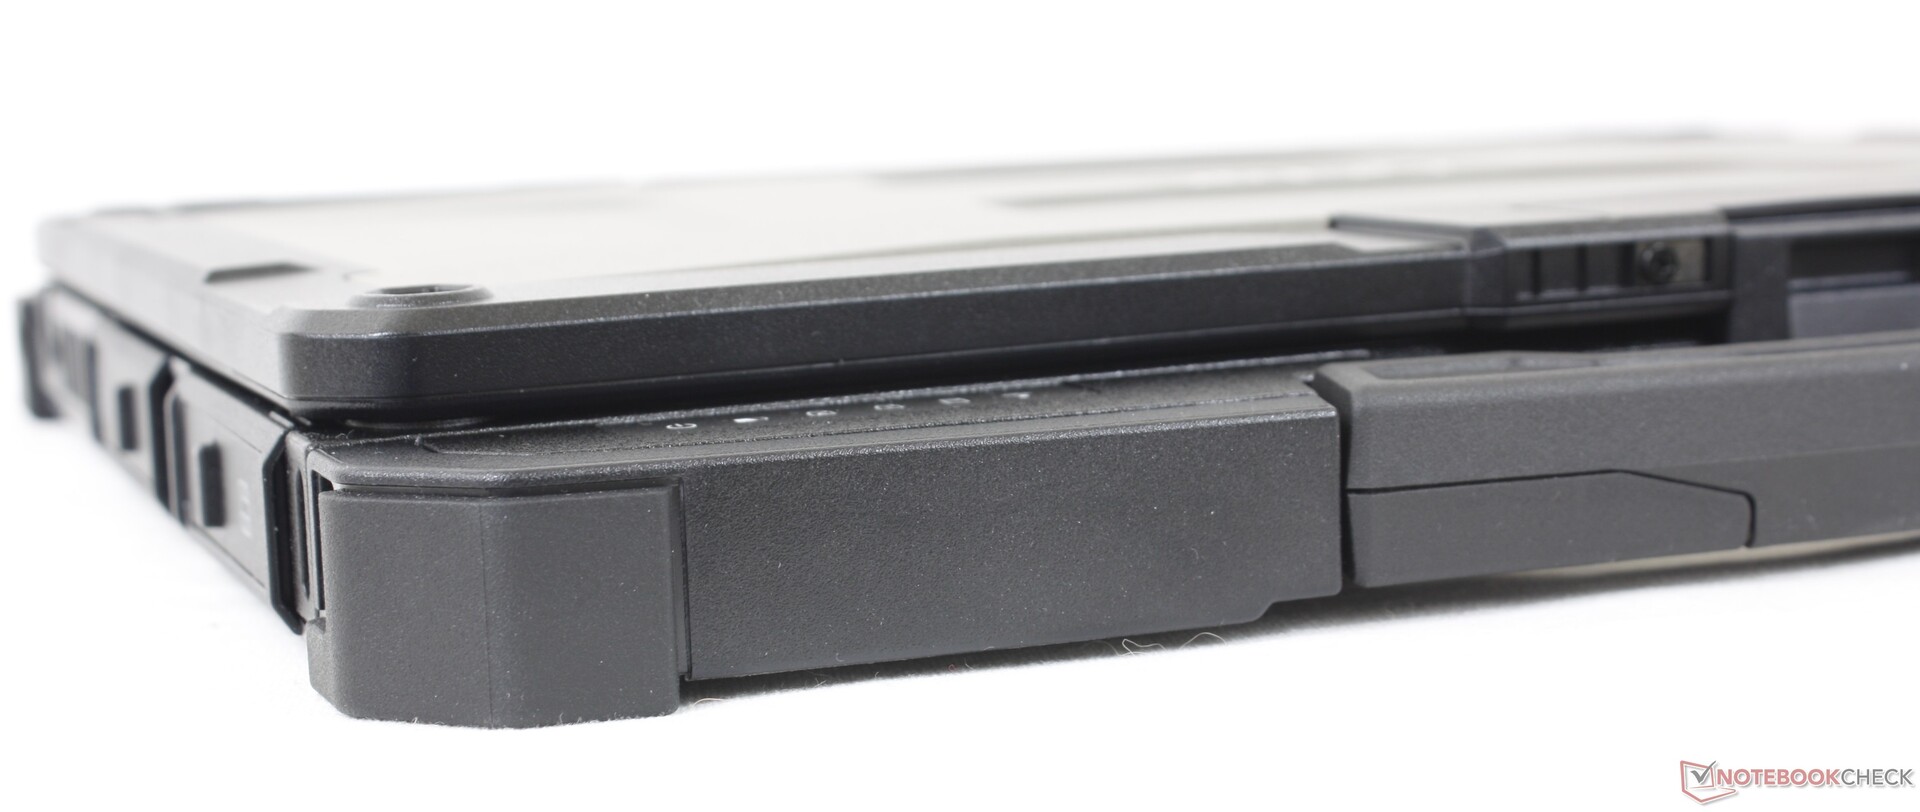
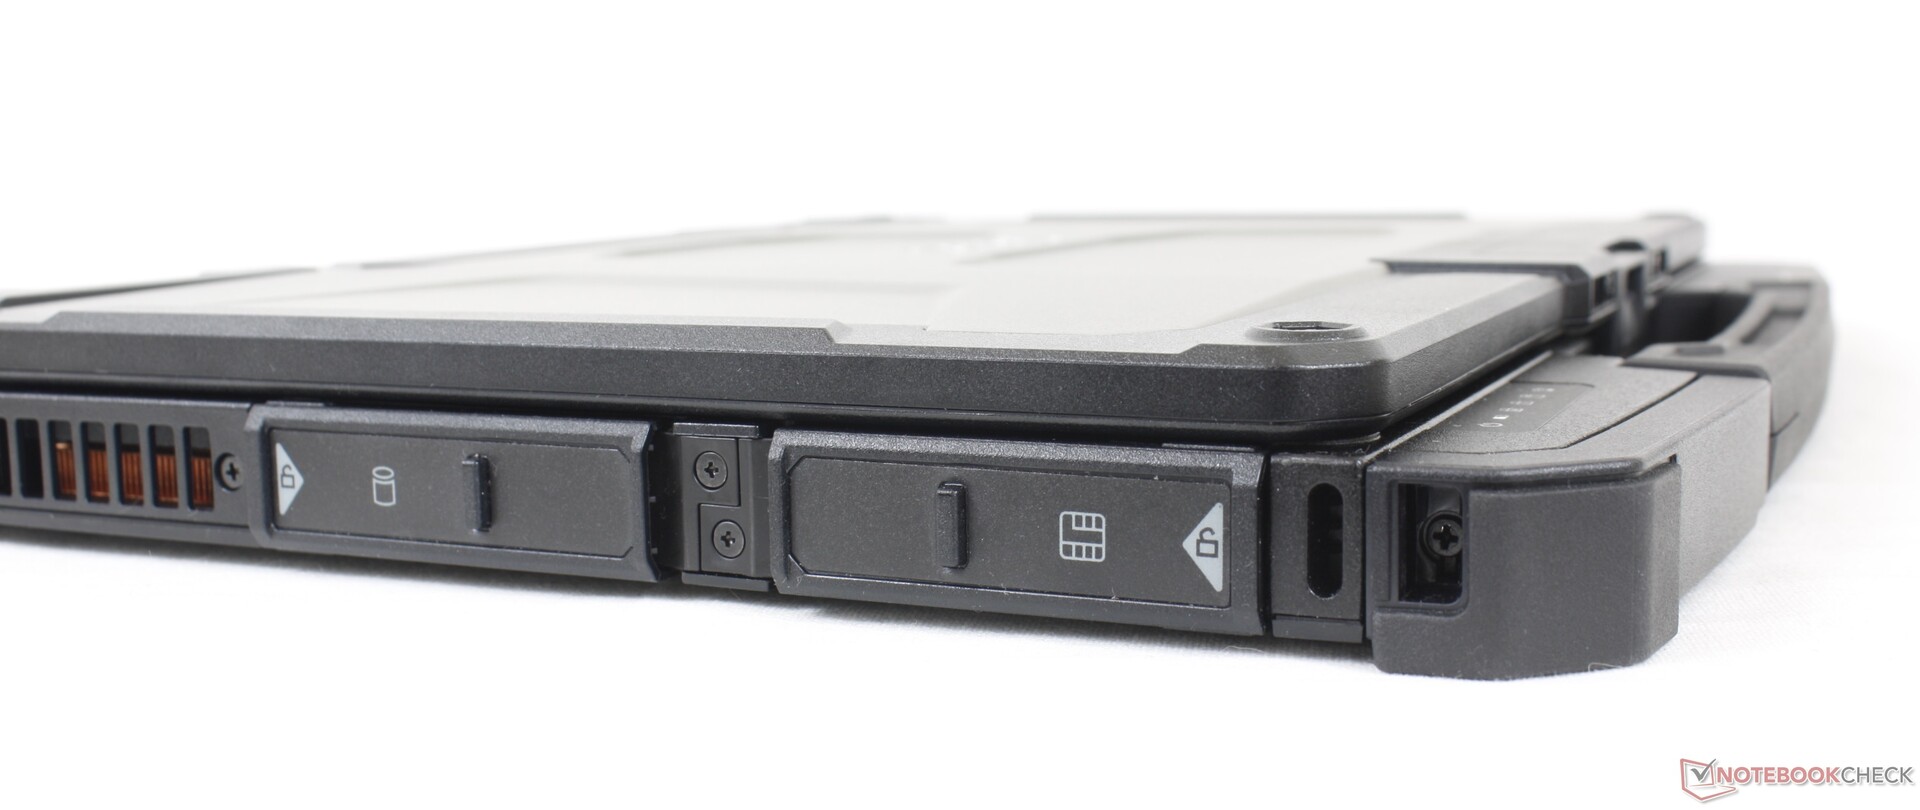
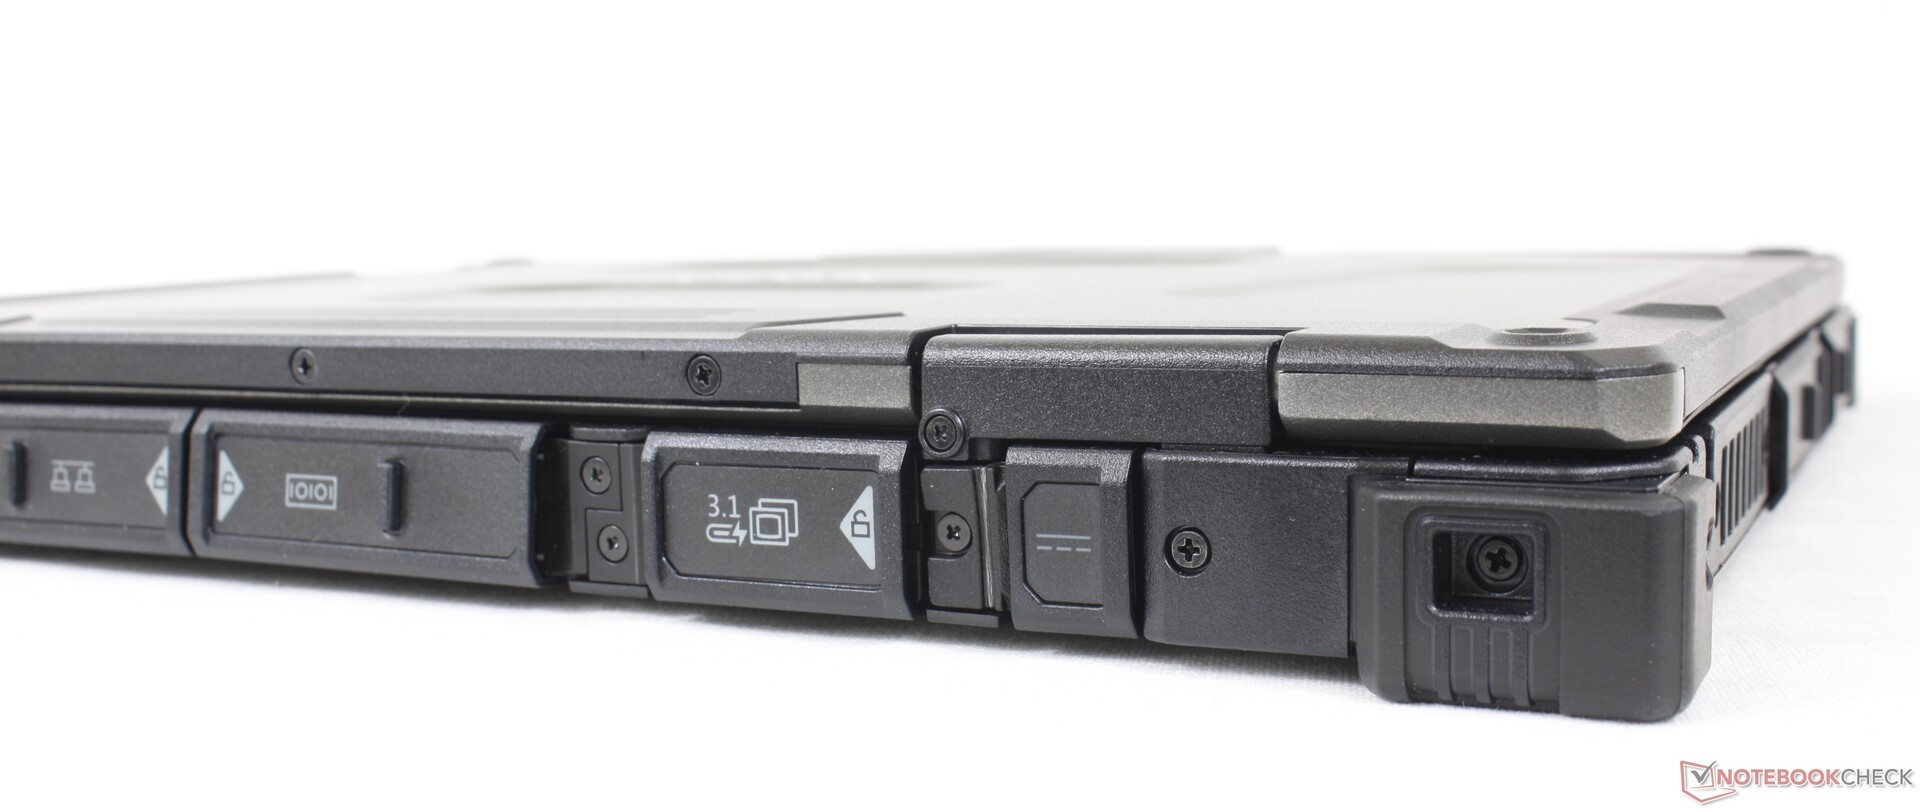
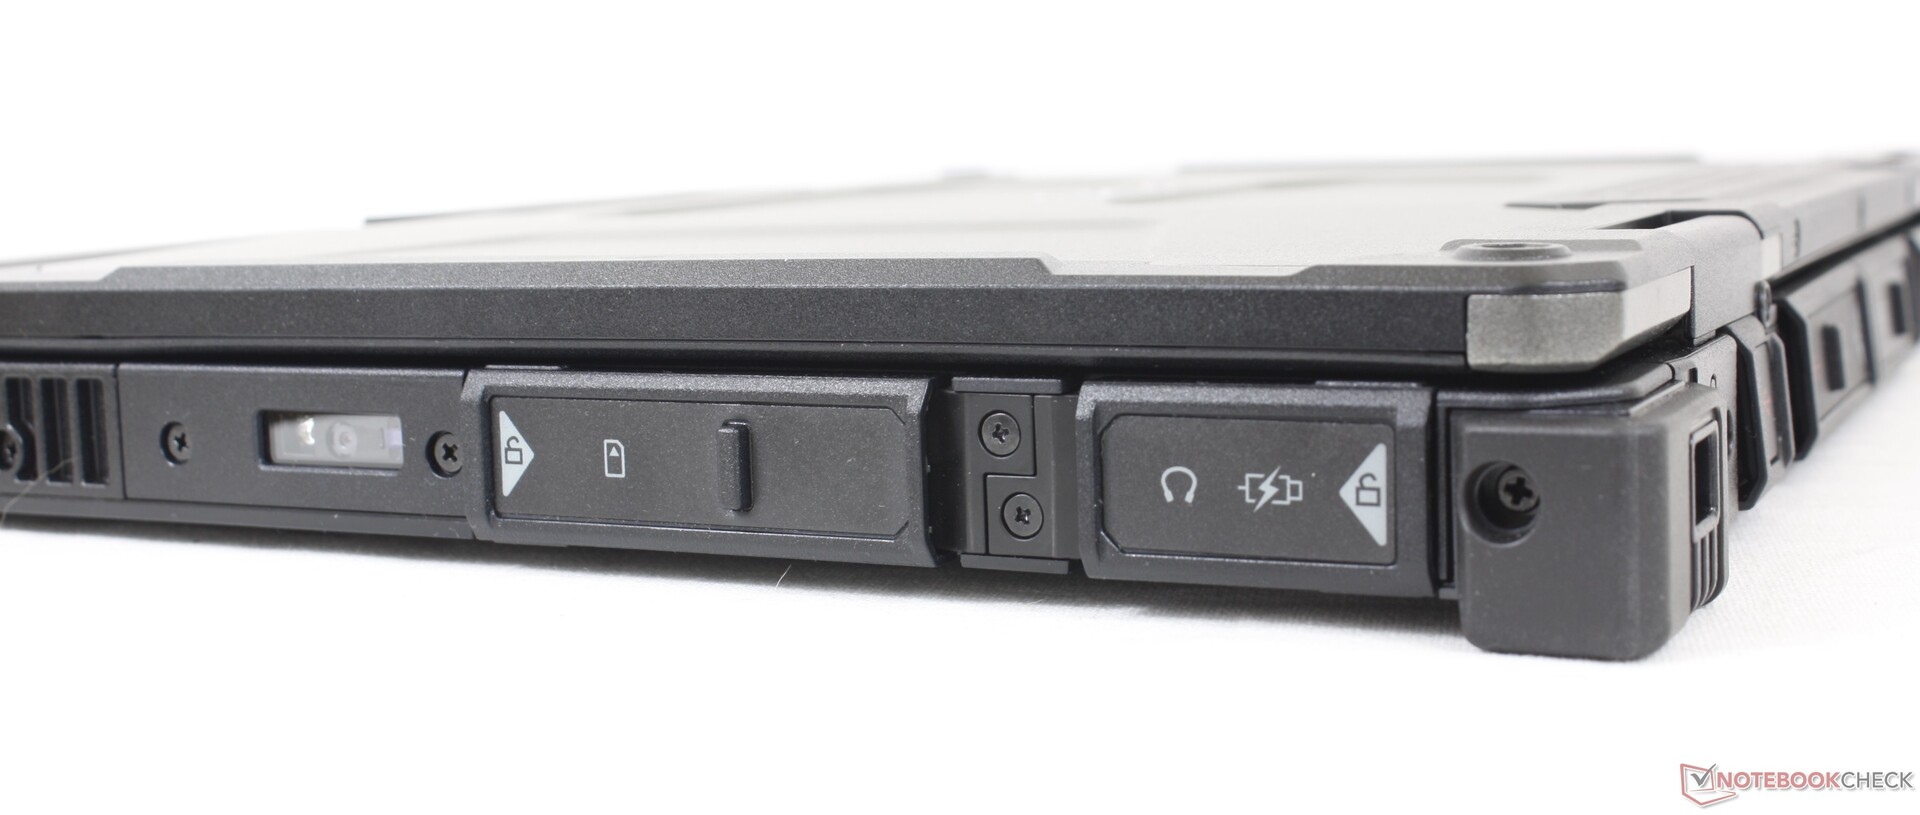
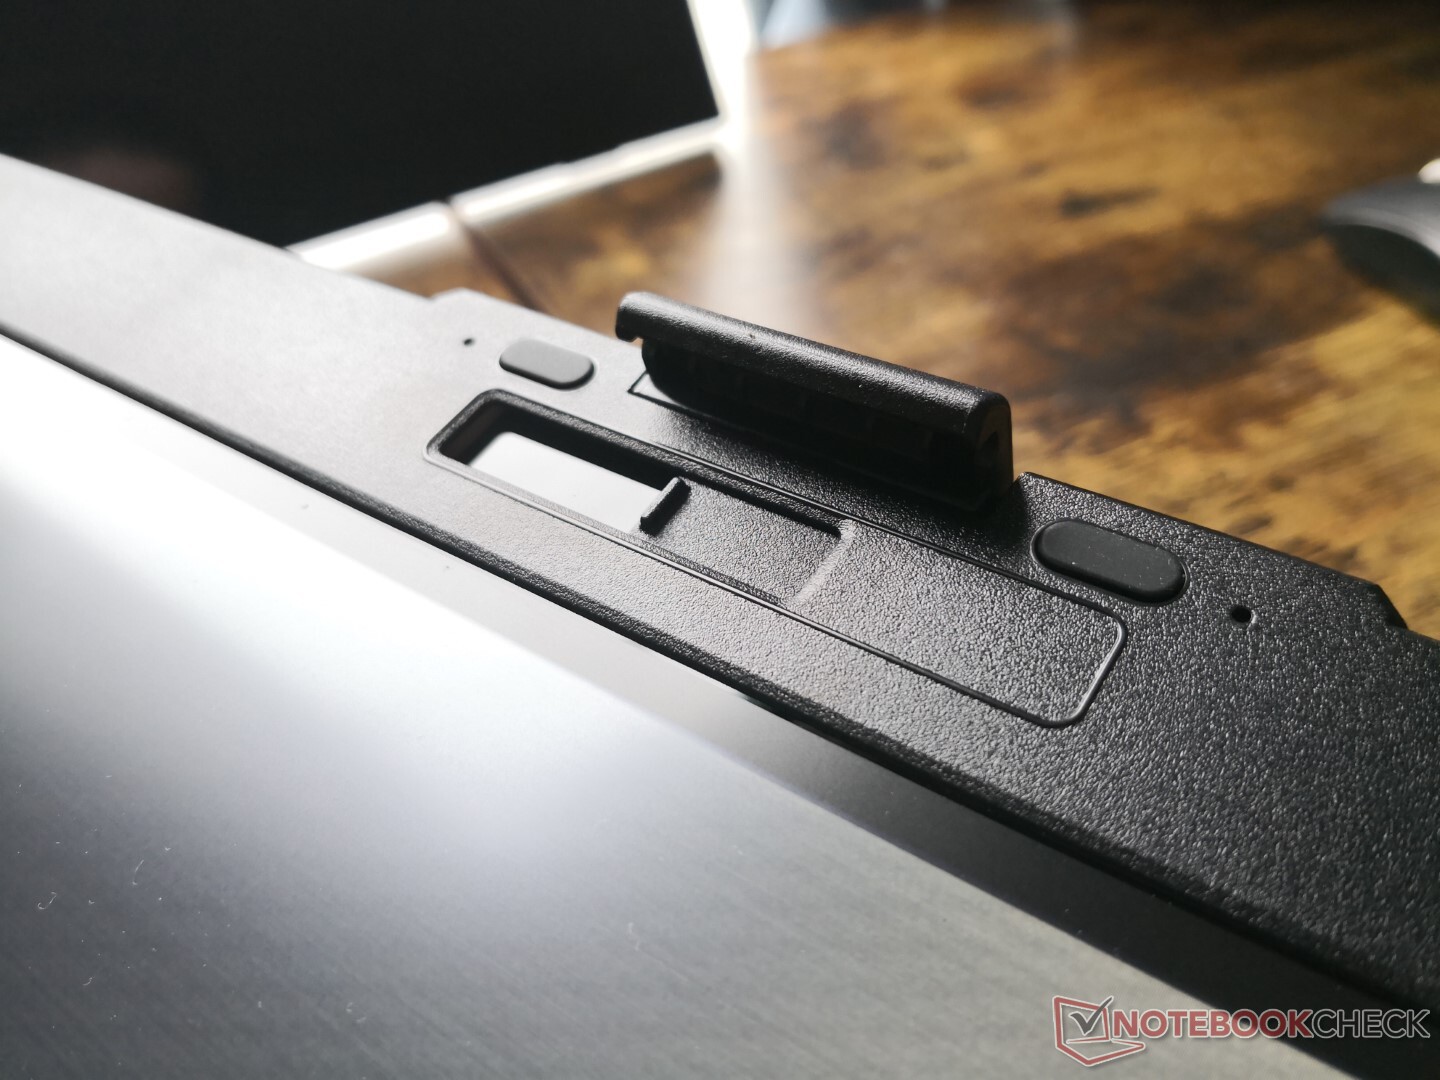
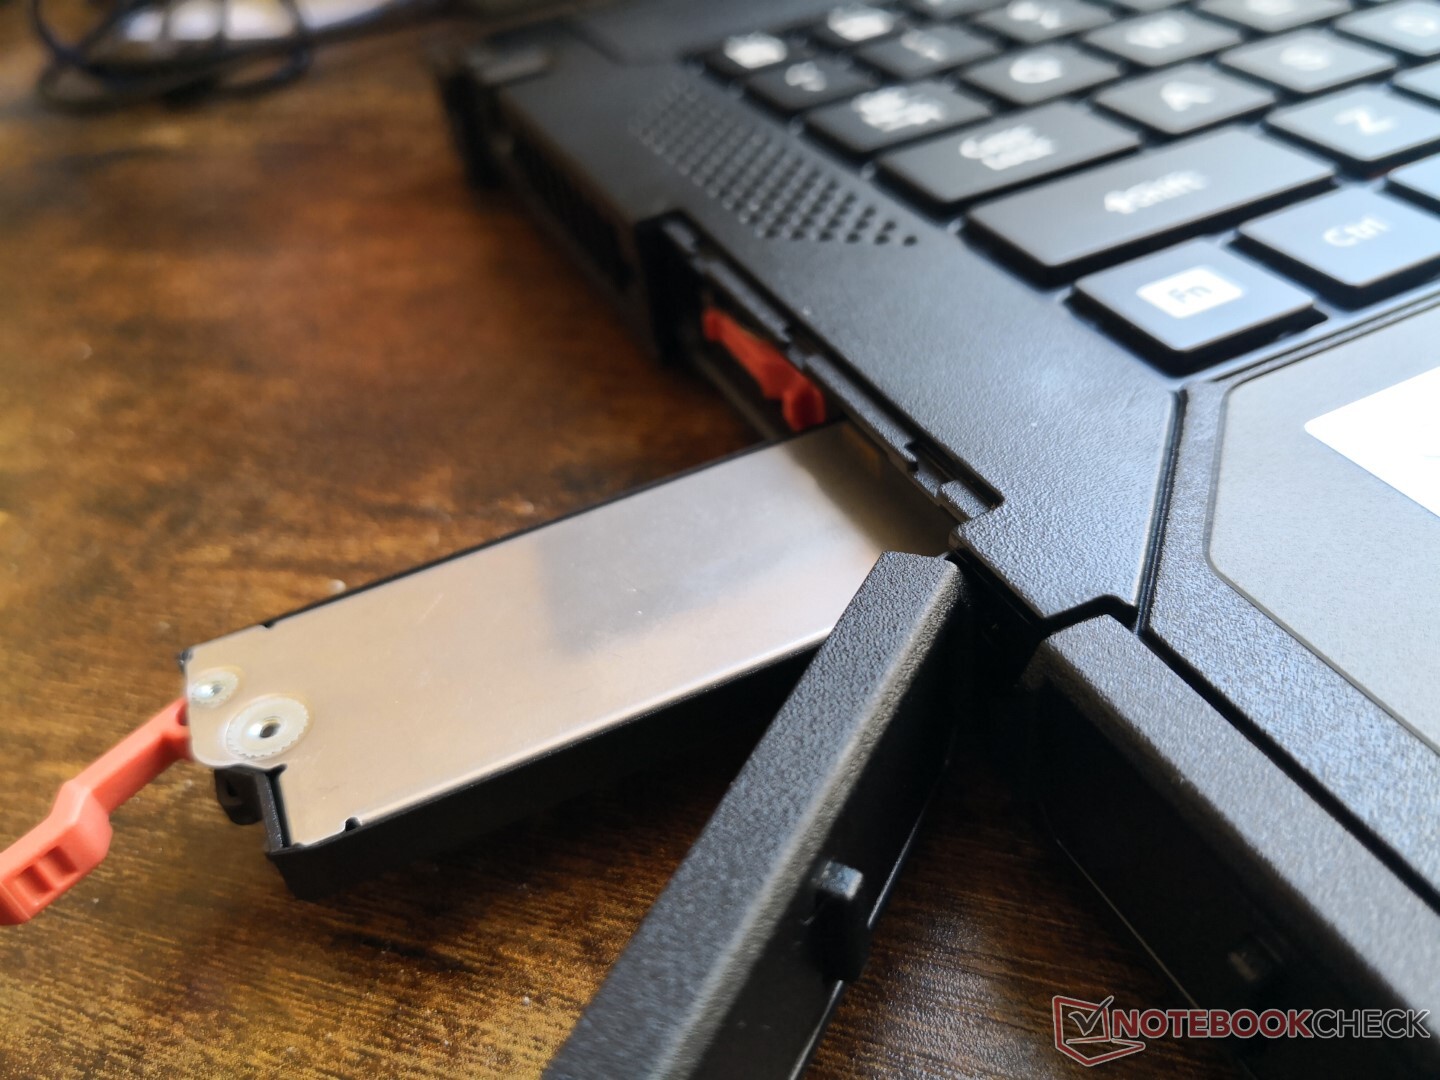
Unique to the B360 are the two M.2 2280 compartments accessible along the left edge of the system which replace the 2.5-inch compartment on the larger S410. Most of the other ports are along the rear of the system and can be difficult to reach especially since they are protected by small covers that are difficult to grip.
Communication
Webcam
A 1080p webcam comes standard to be of higher resolution than the usual 720p webcams on most other laptops. Colors remain subpar and IR is optional for Windows Hello support.


Maintenance
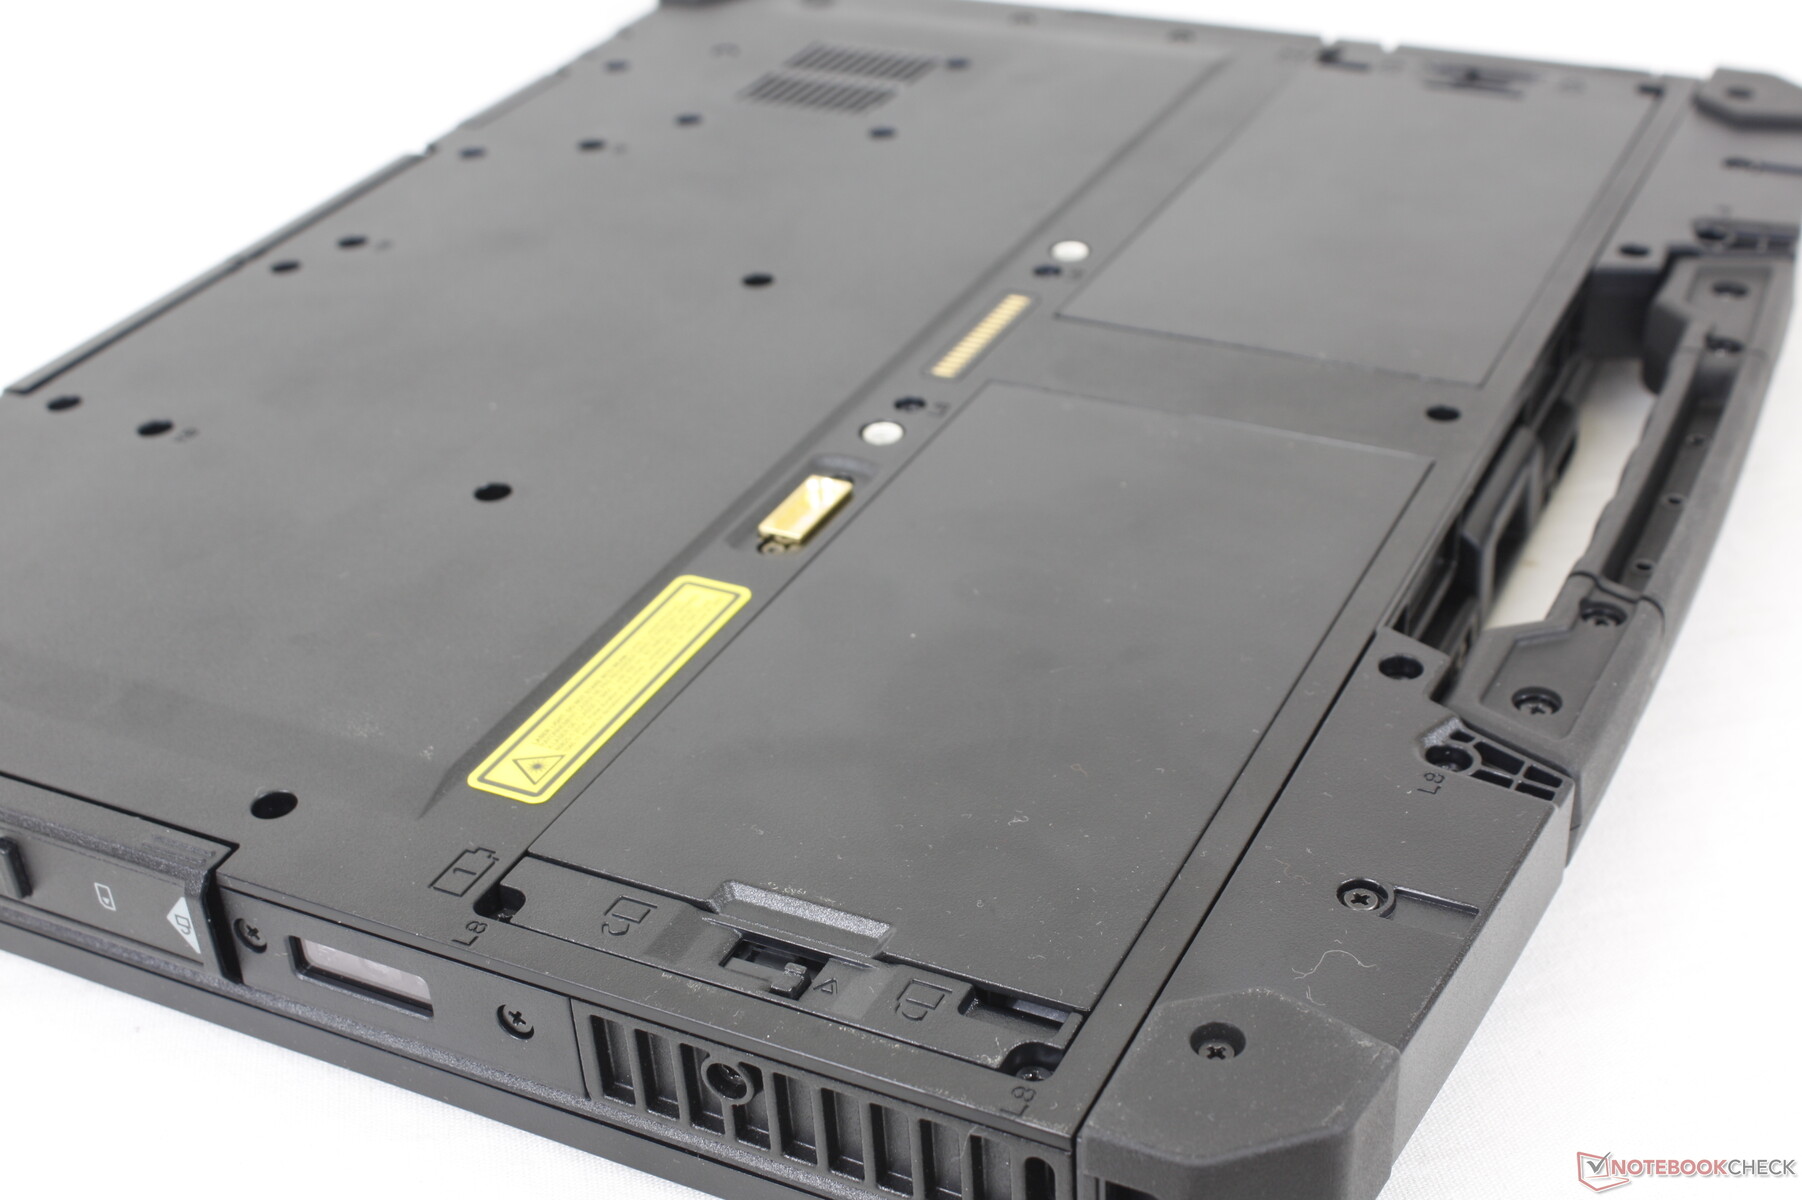
Getac does not recommend removing the bottom panel for any sort of servicing or upgrades. The fact that the bottom is secured by no less than 34 (!) screws is already a hint that the manufacturer is discouraging end-user tinkering.
Accessories and Warranty
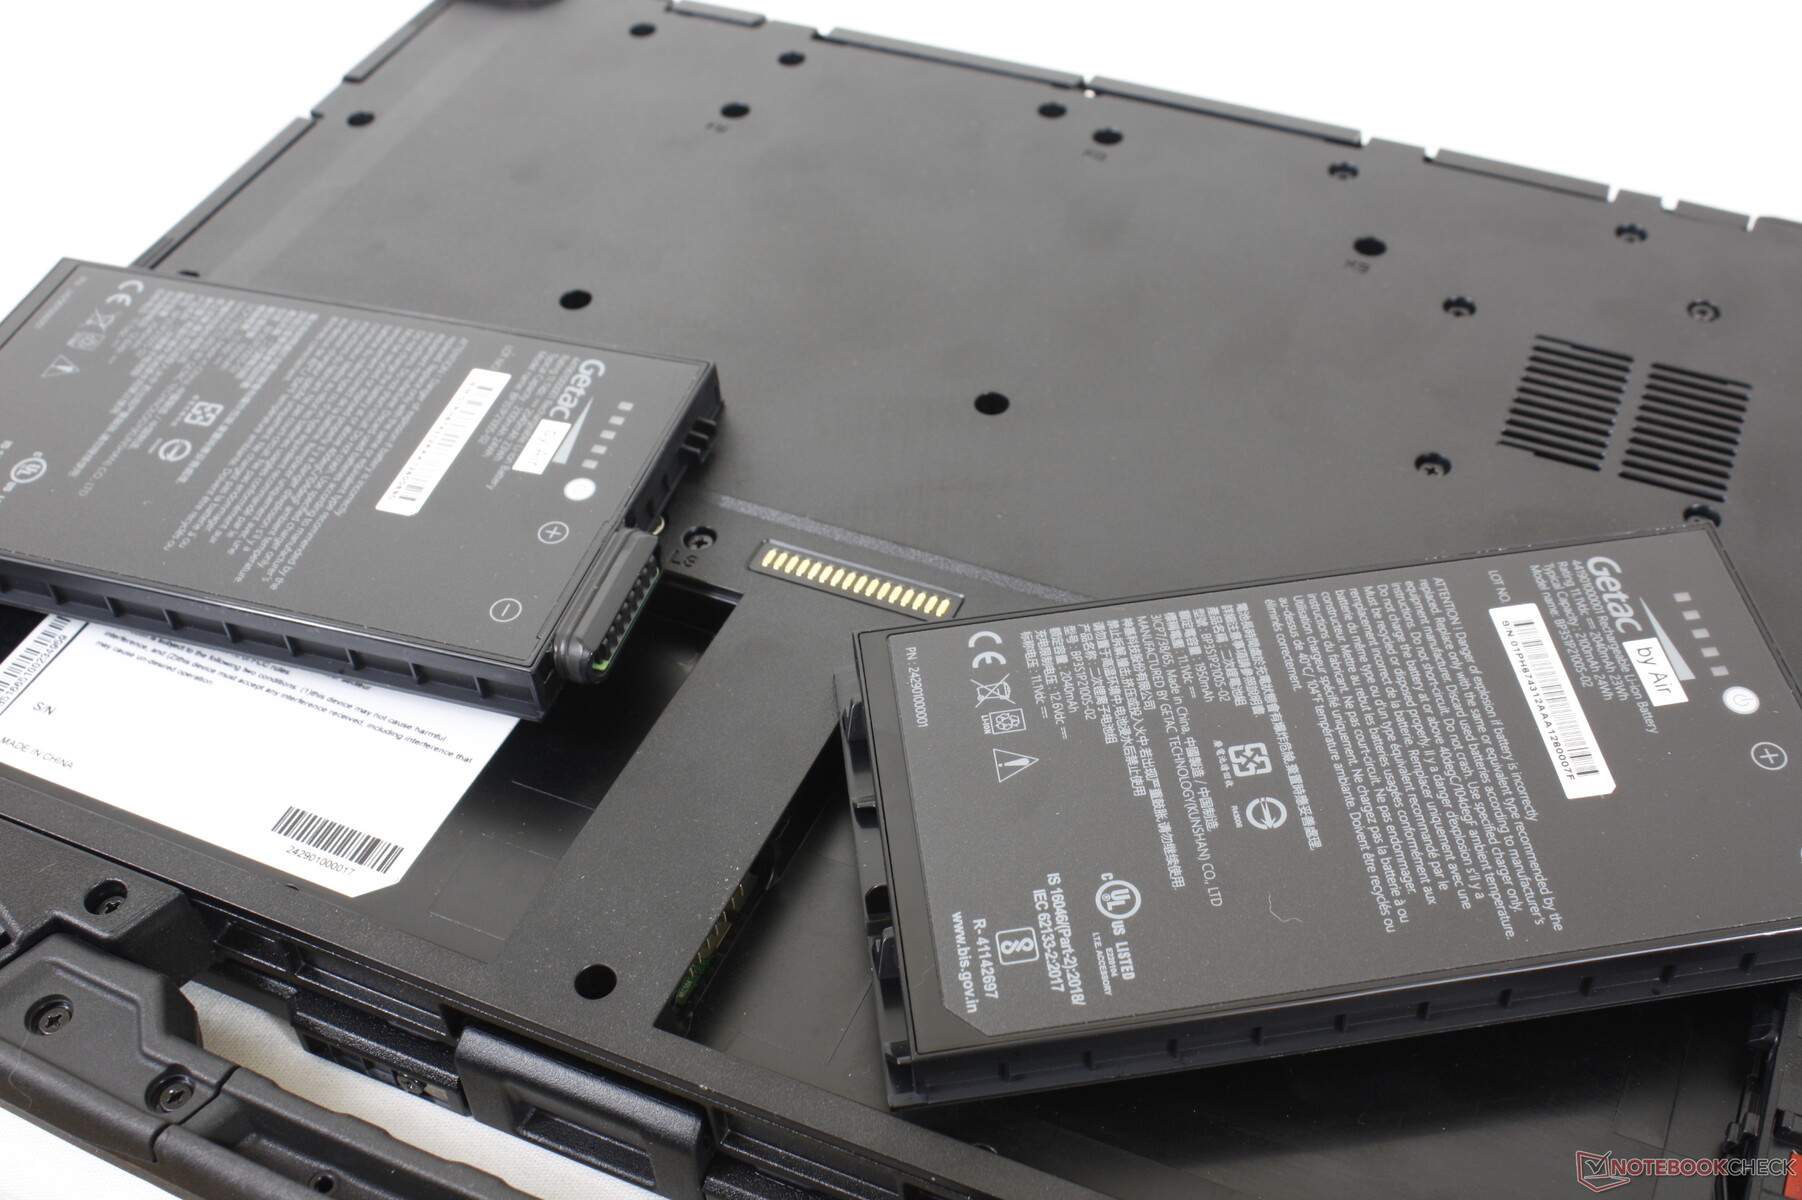
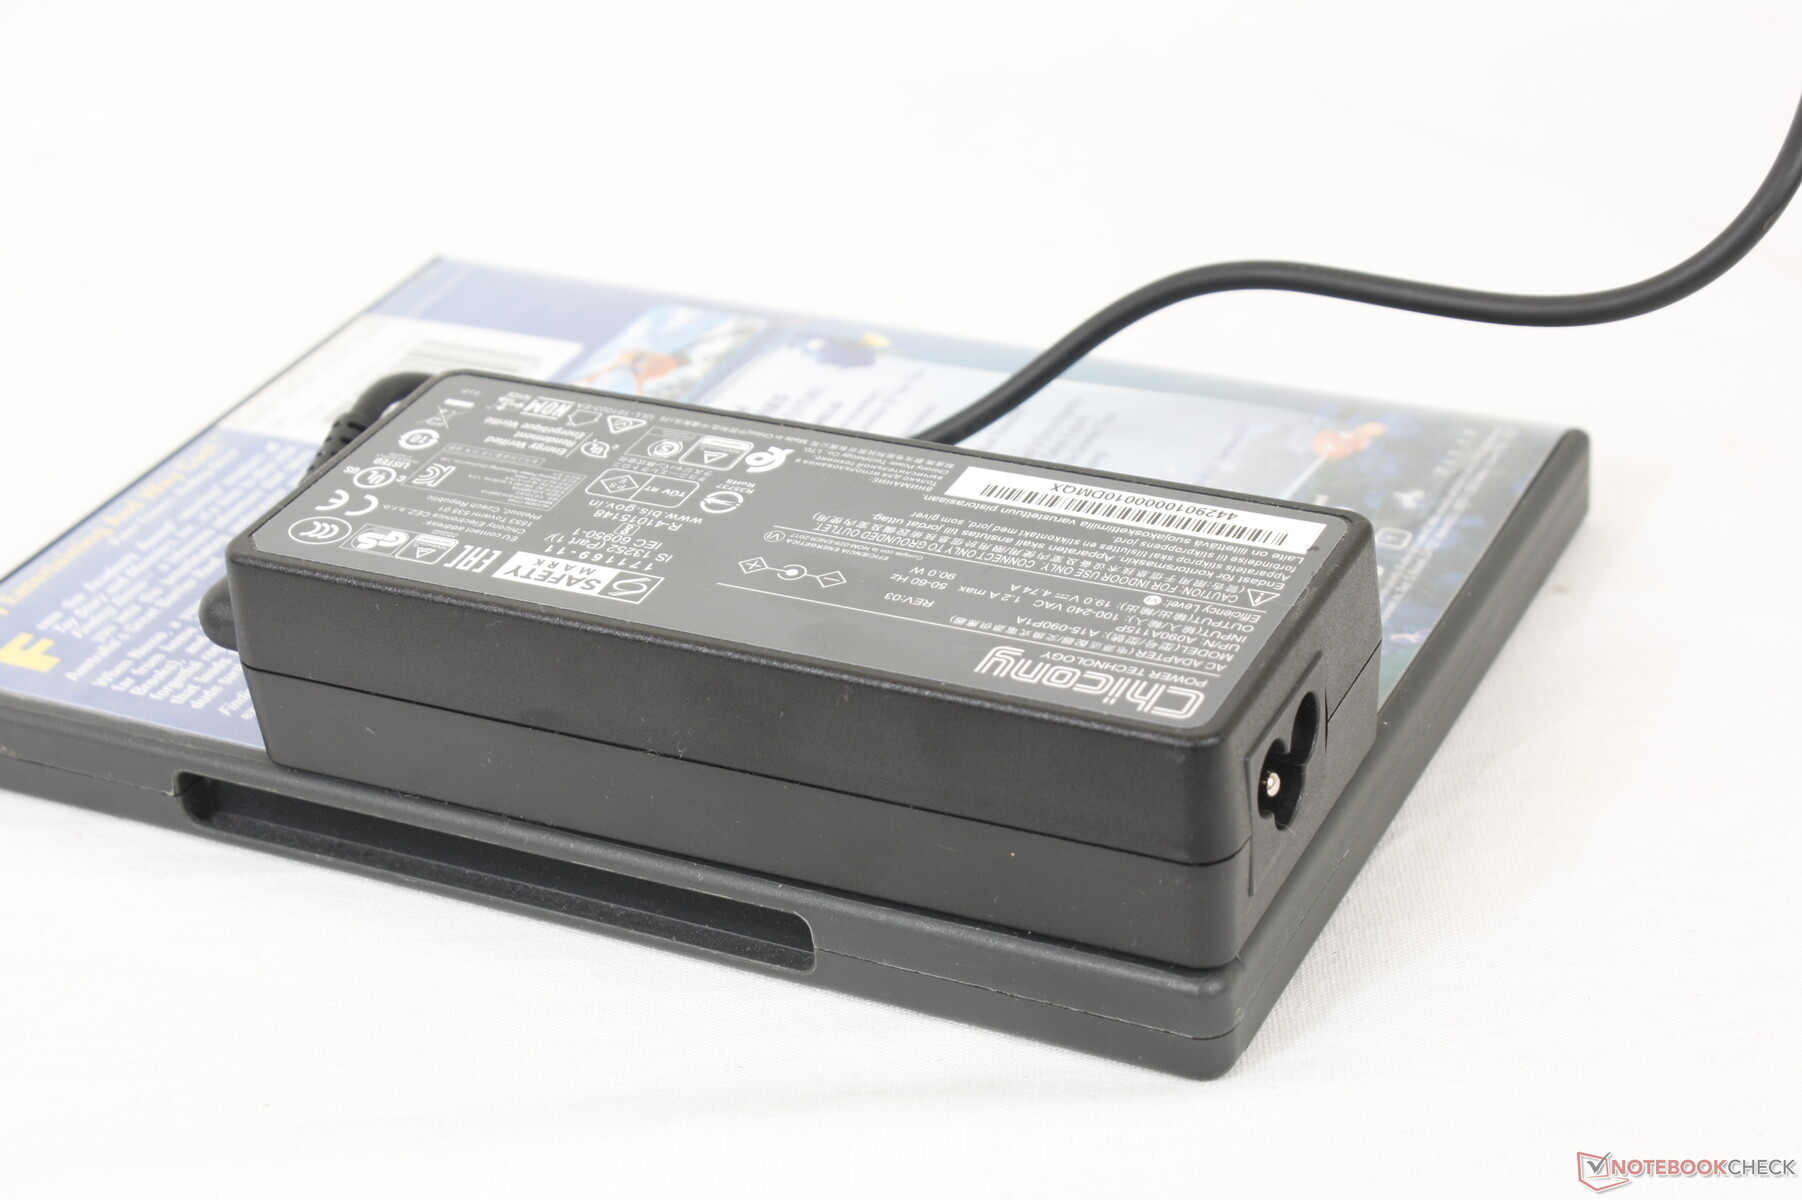
The base packaging includes a passive stylus pen, the two removable batteries, and the usual paperwork and AC adapter. A 3-year limited warranty comes standard.
Additional accessories are available which take advantage of the proprietary pins on the bottom of the unit.
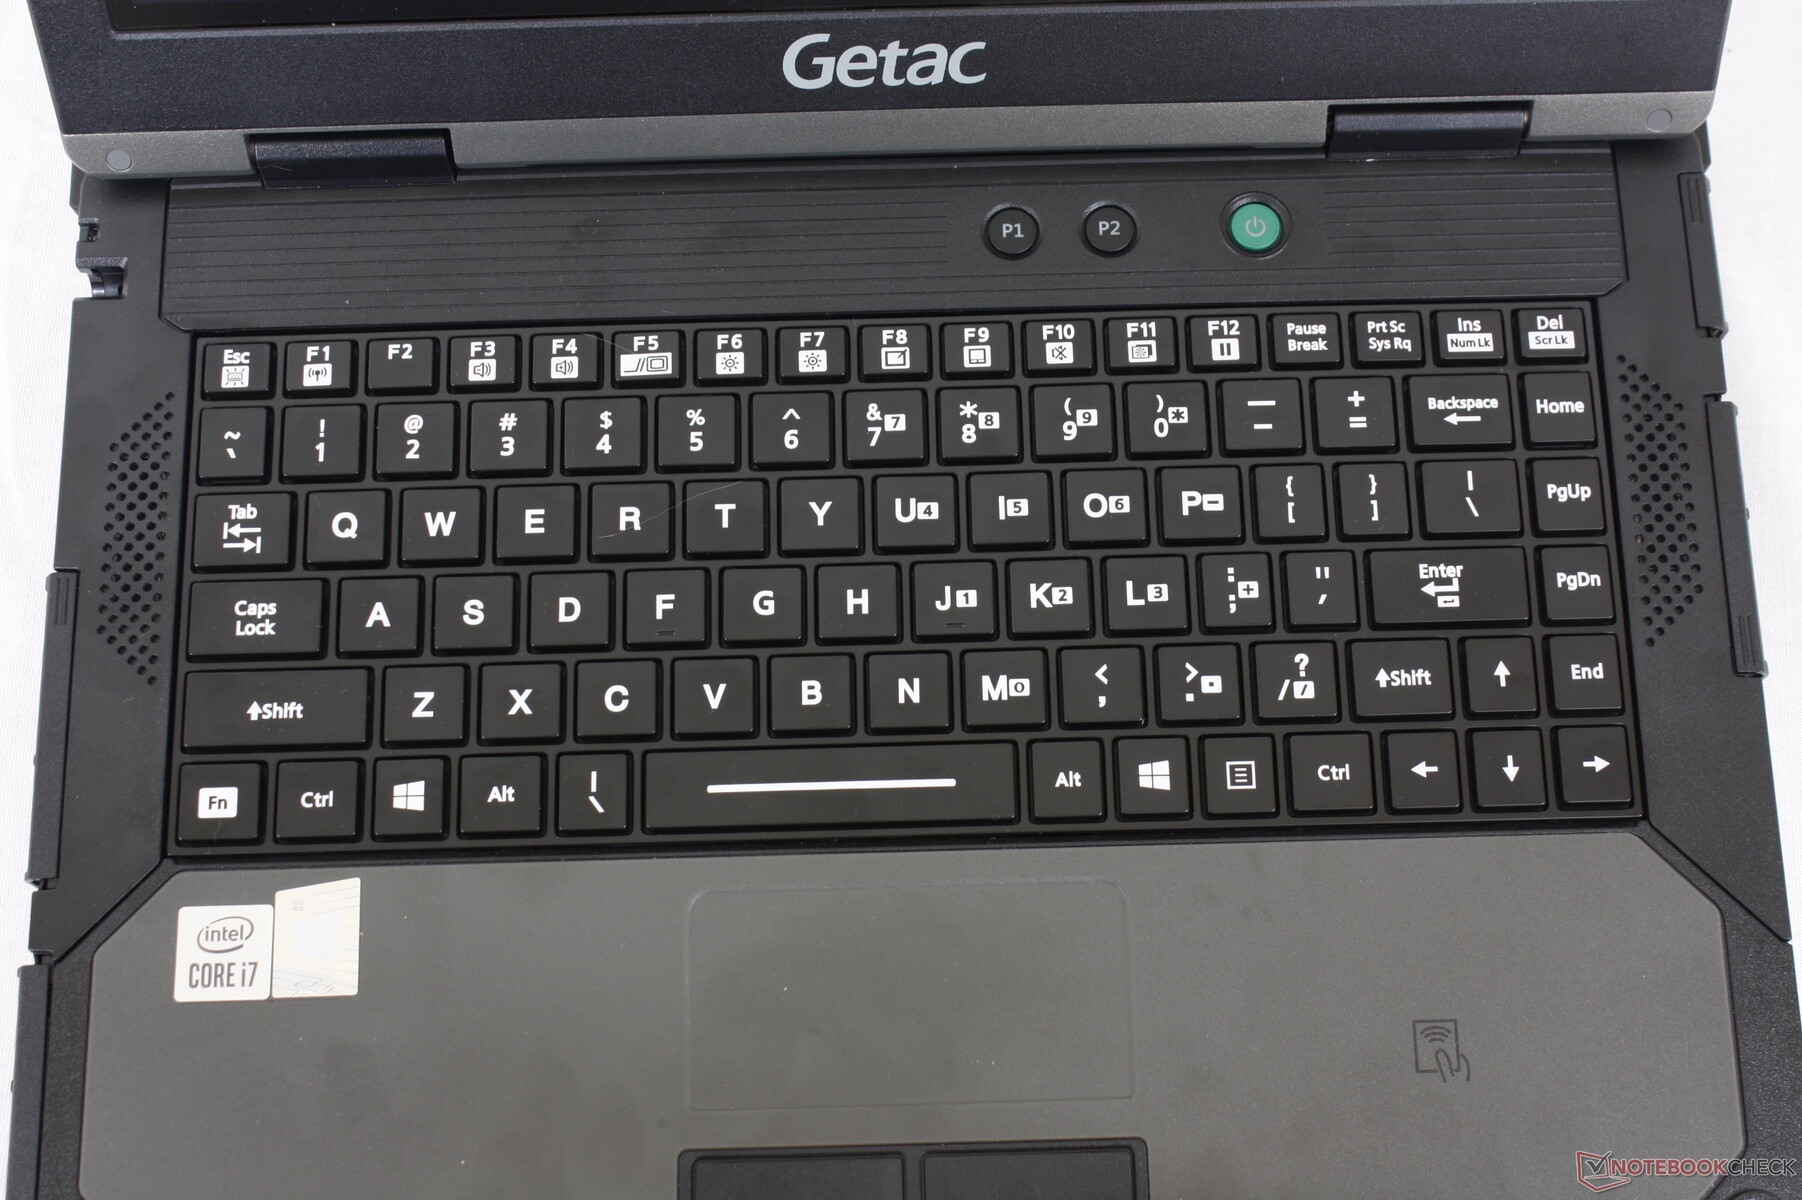
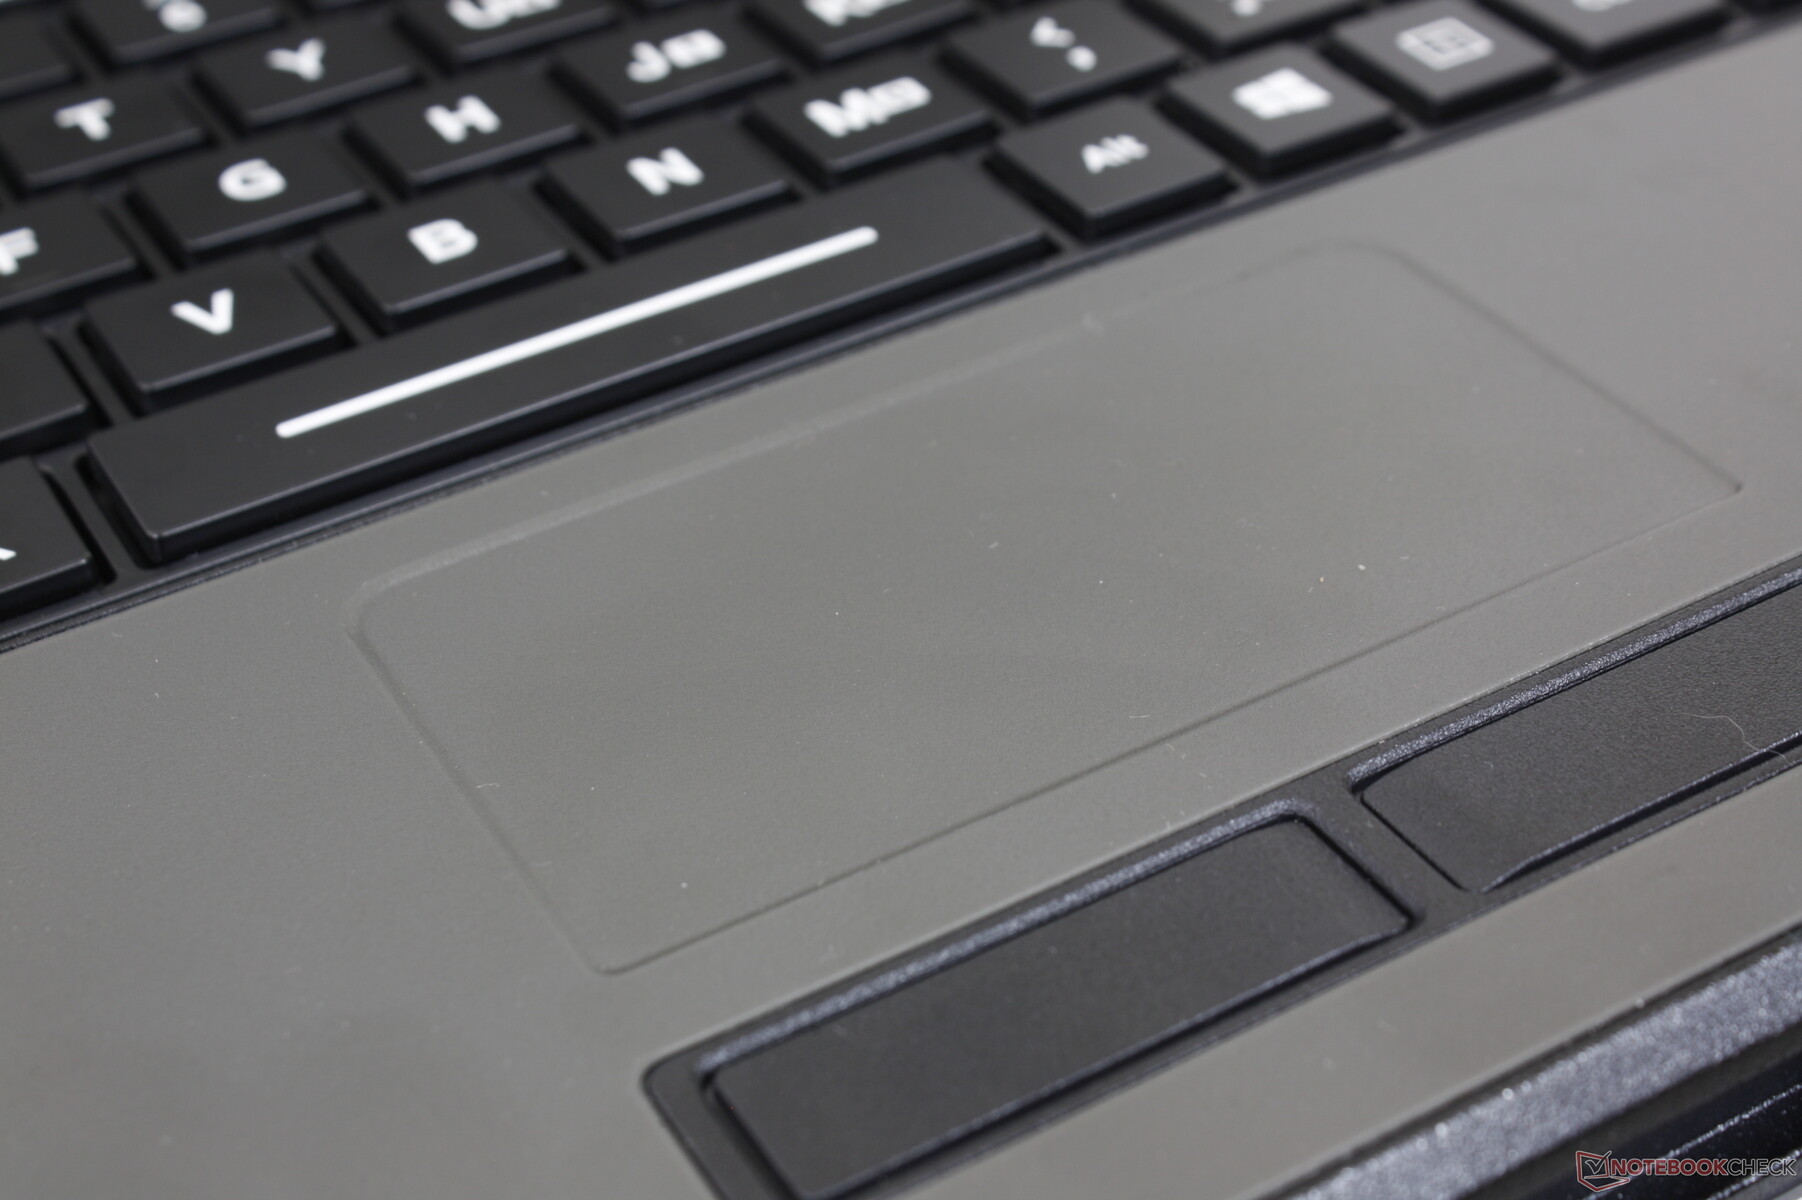
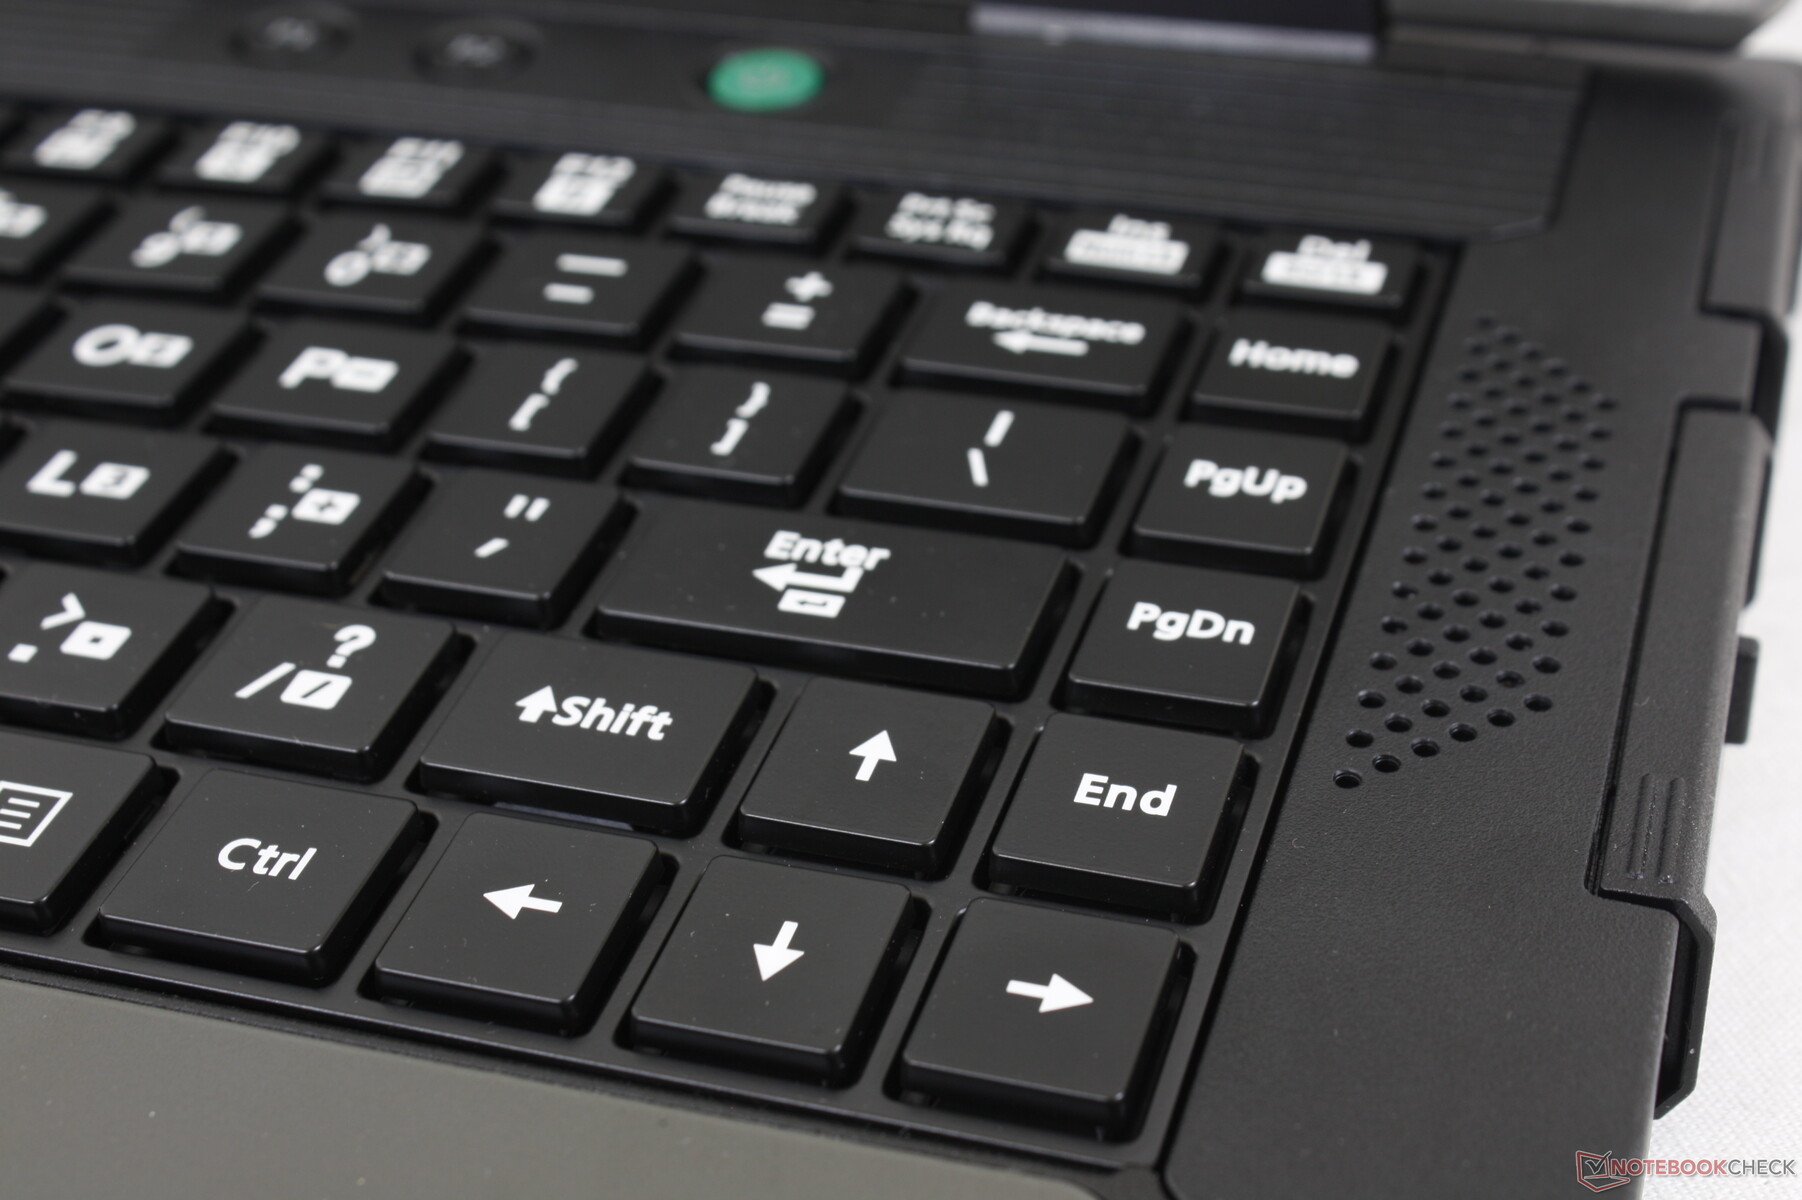
Input Devices

Display
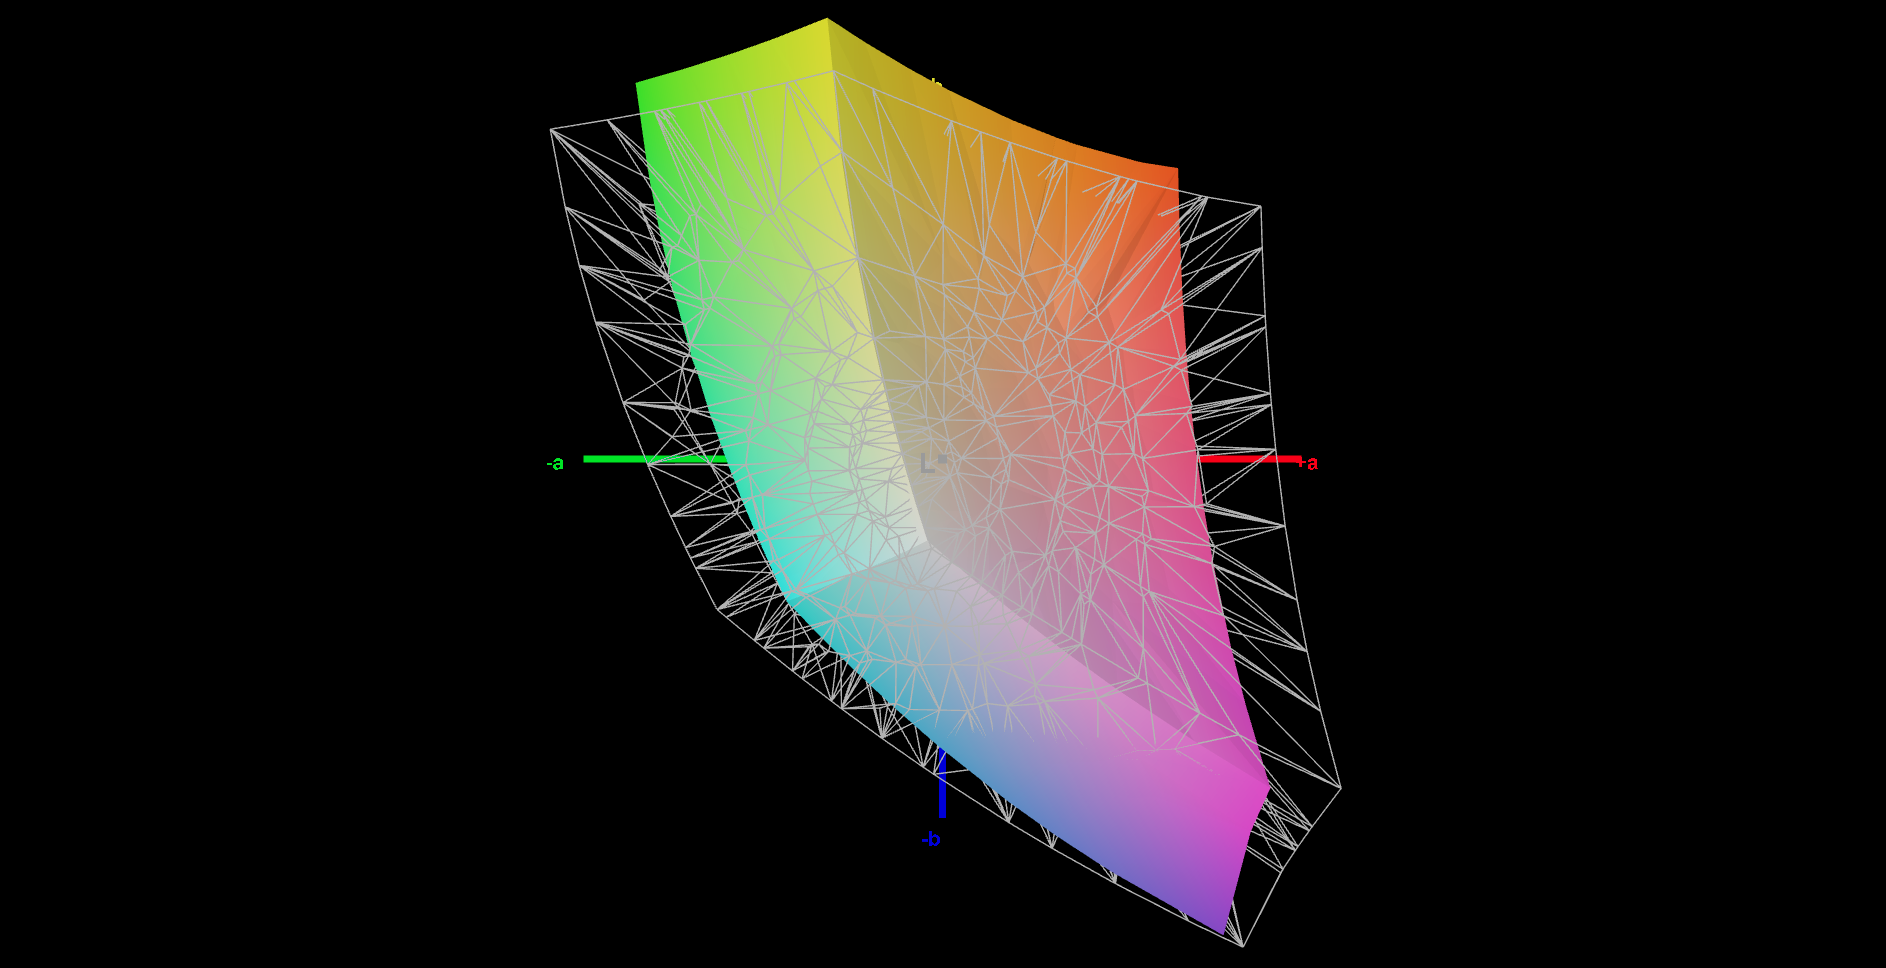
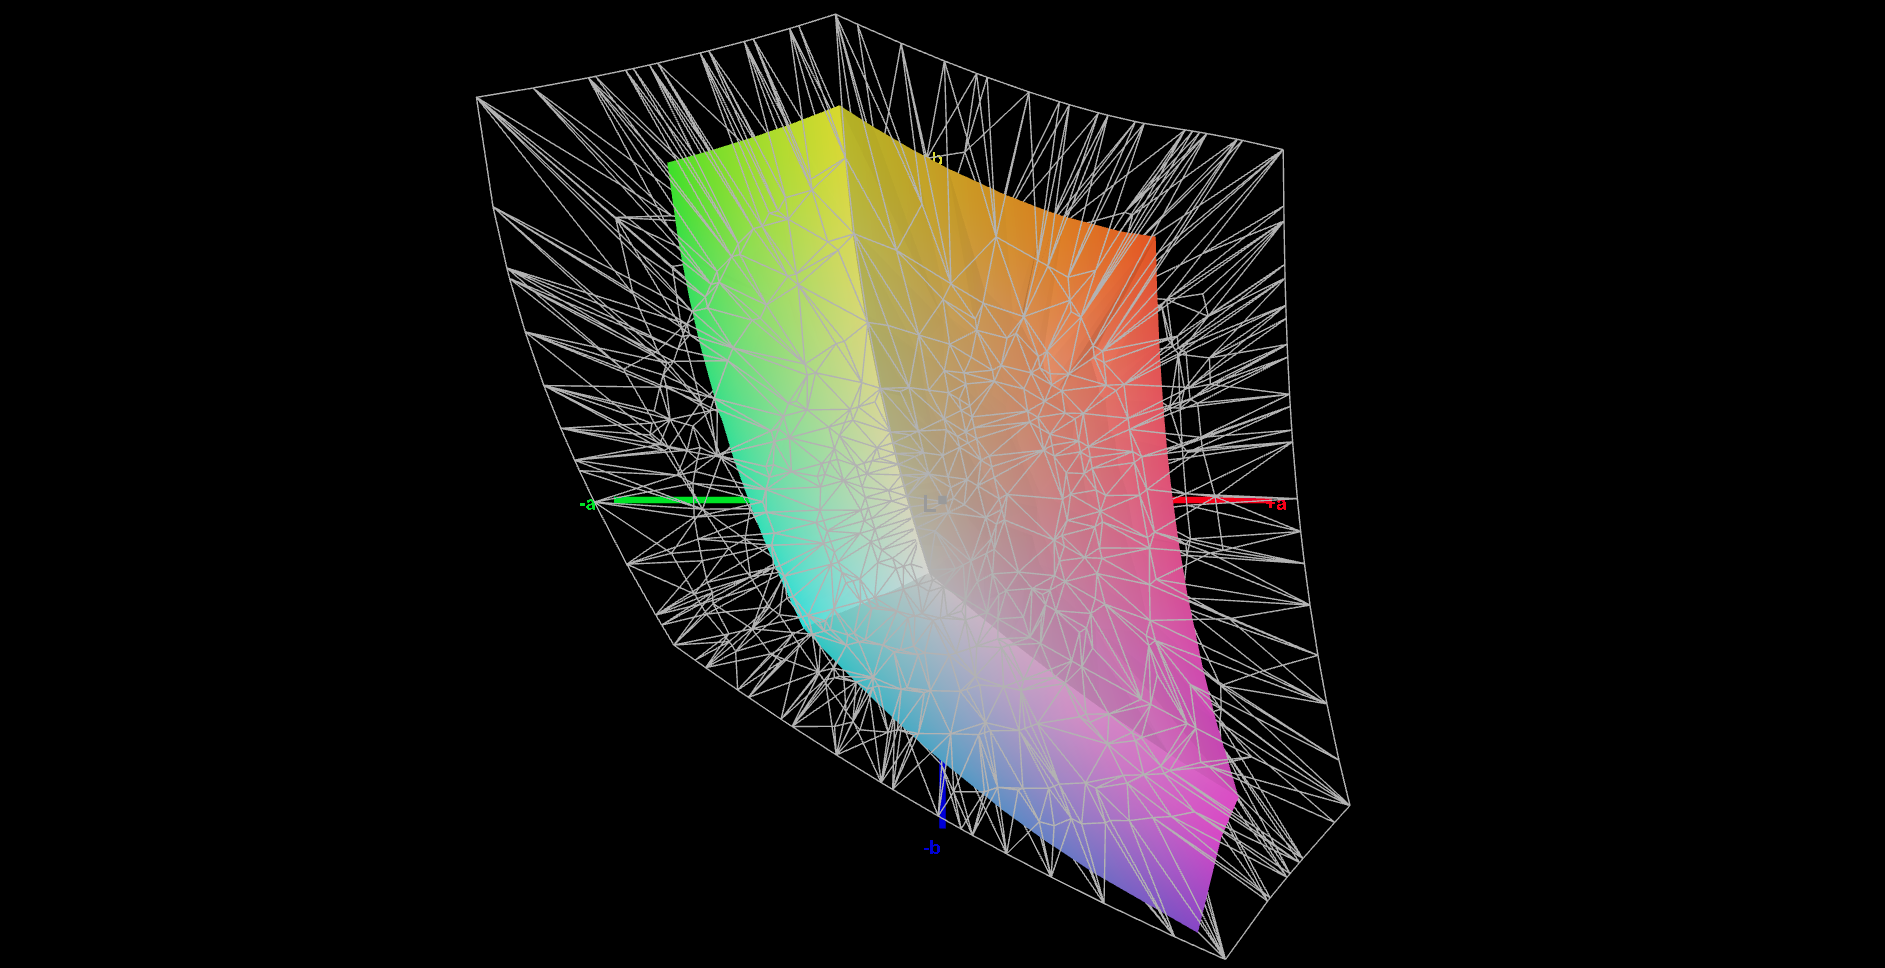
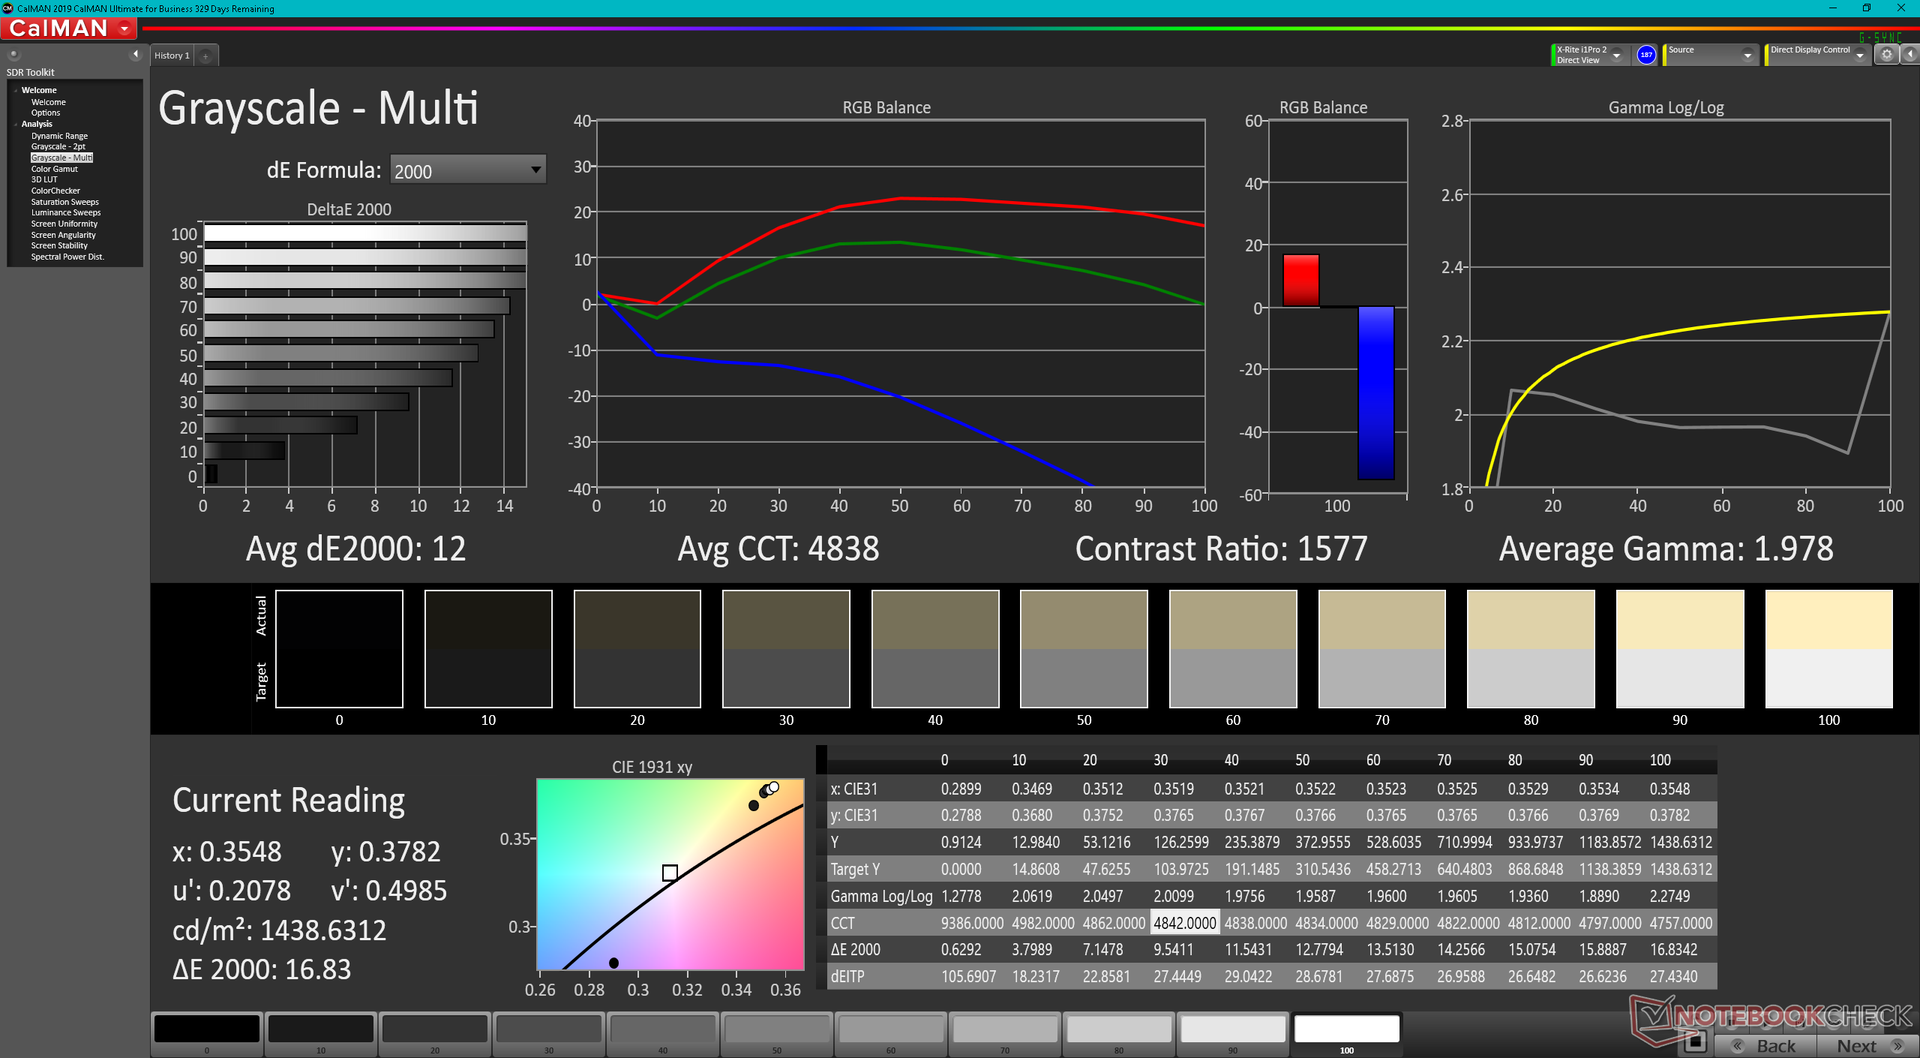
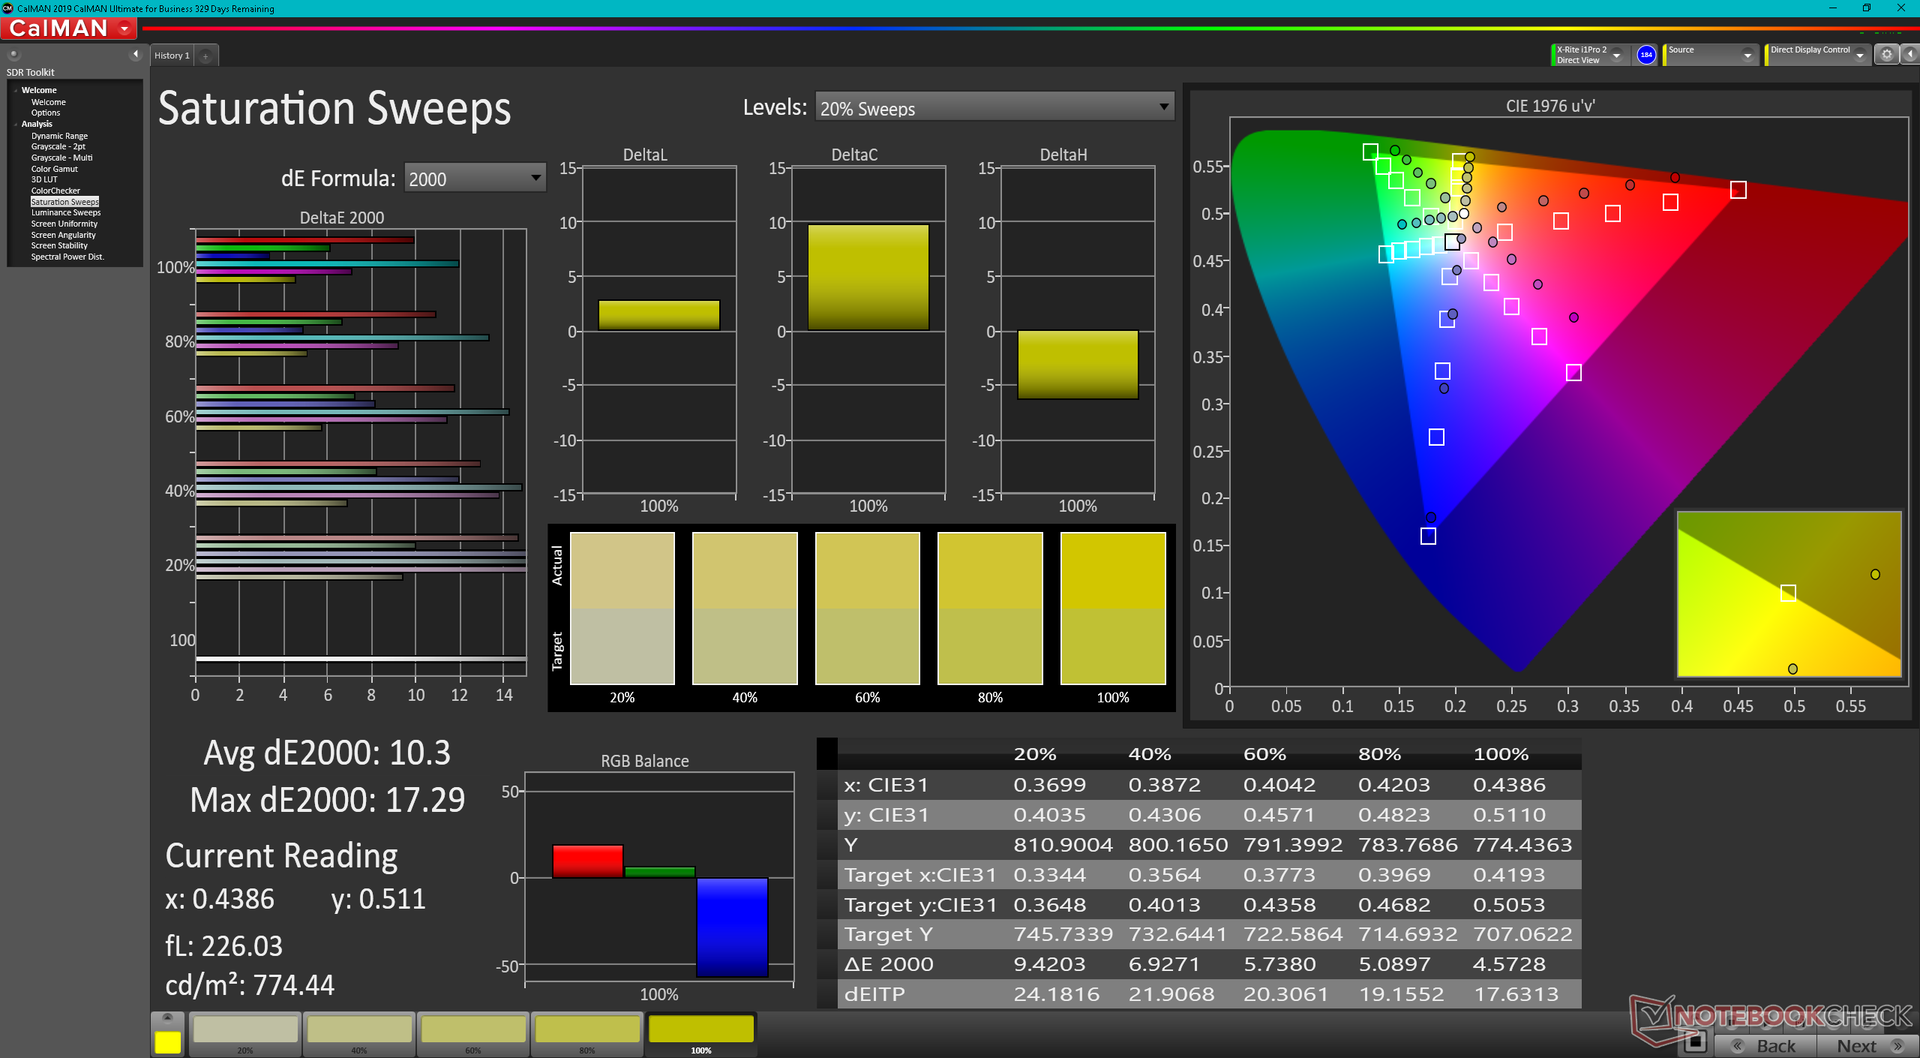
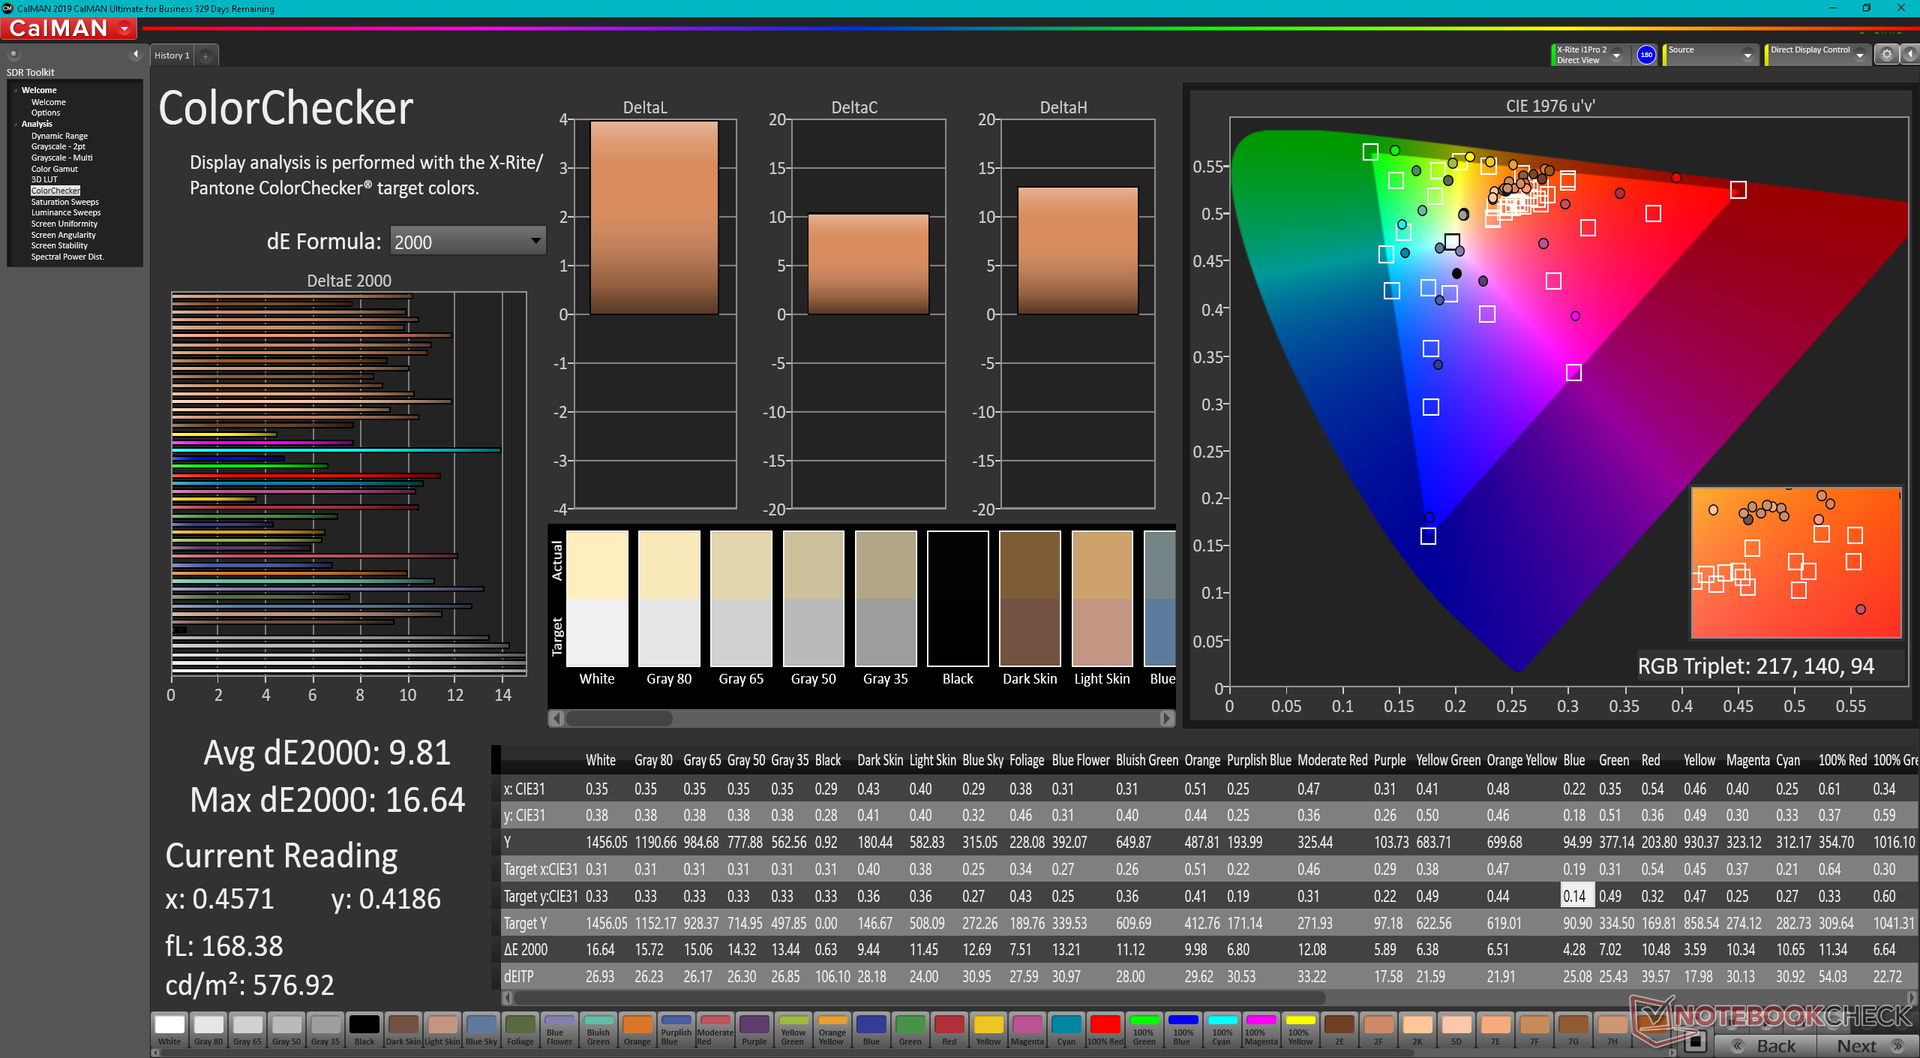
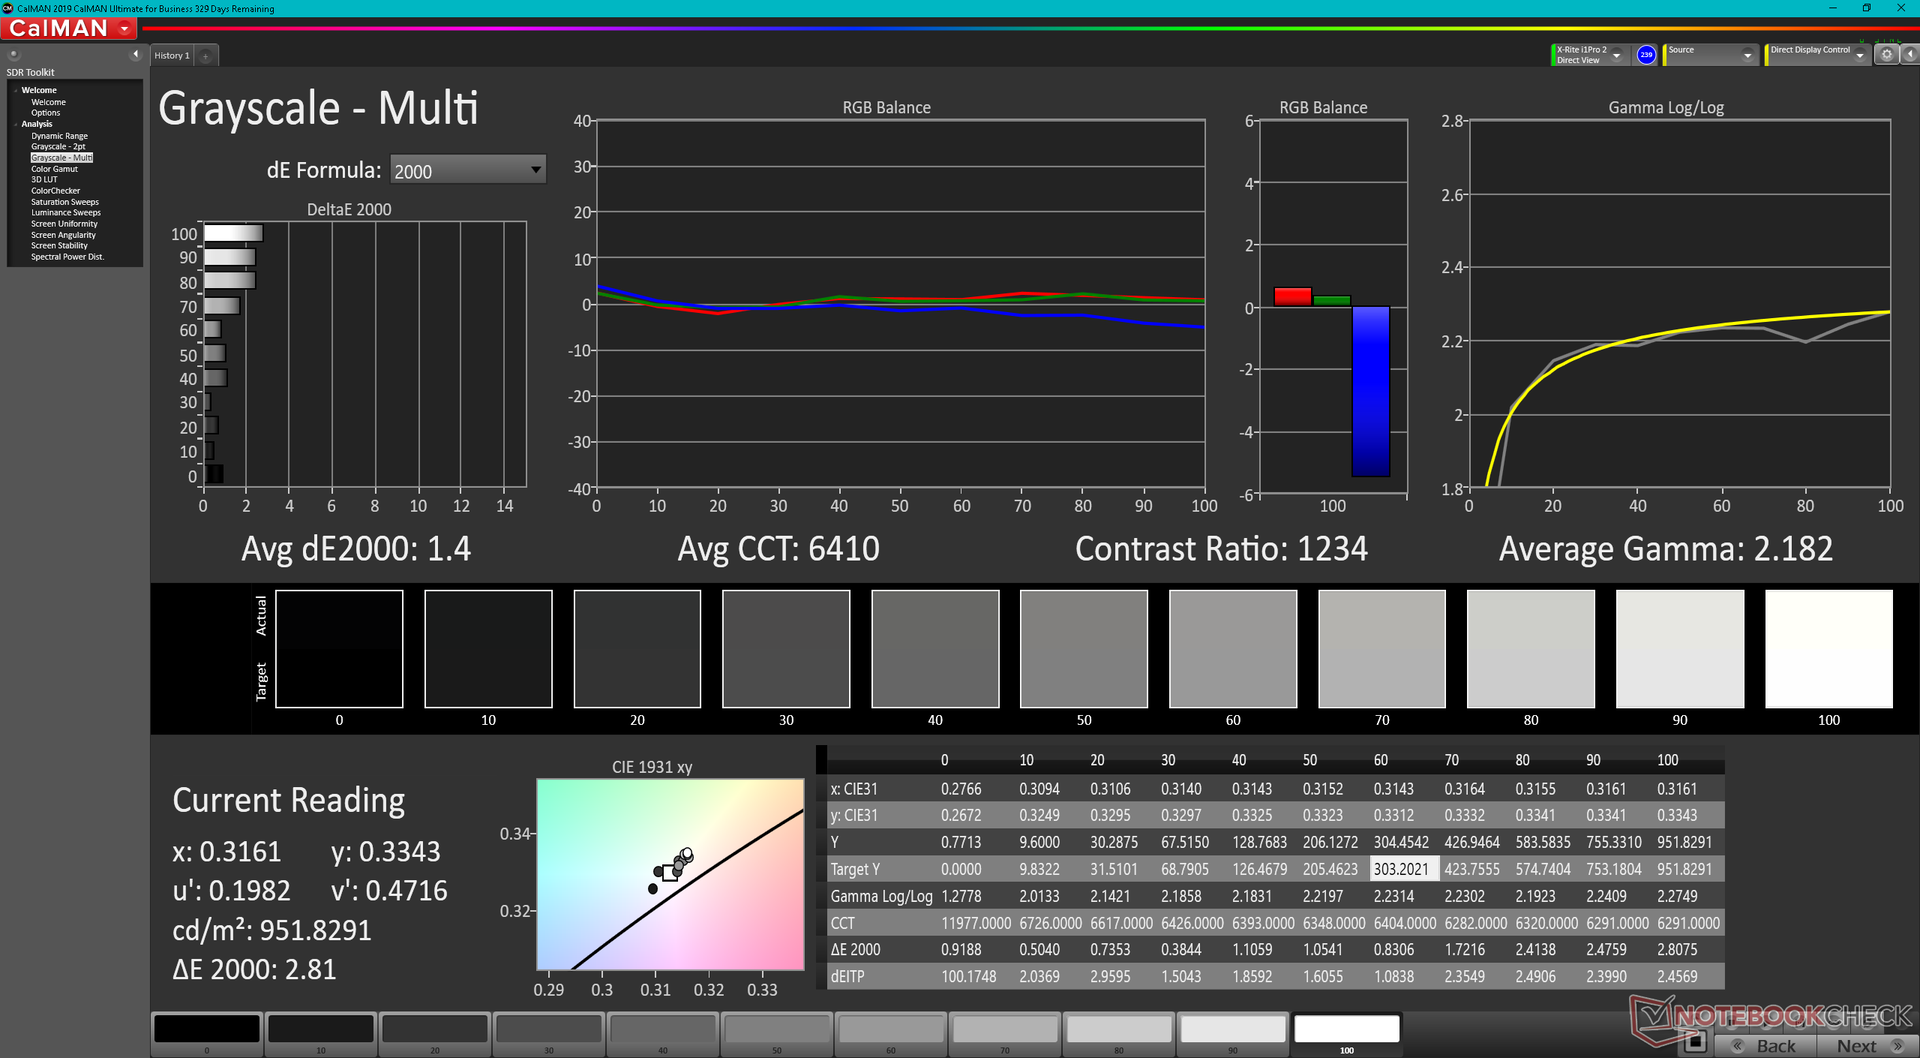
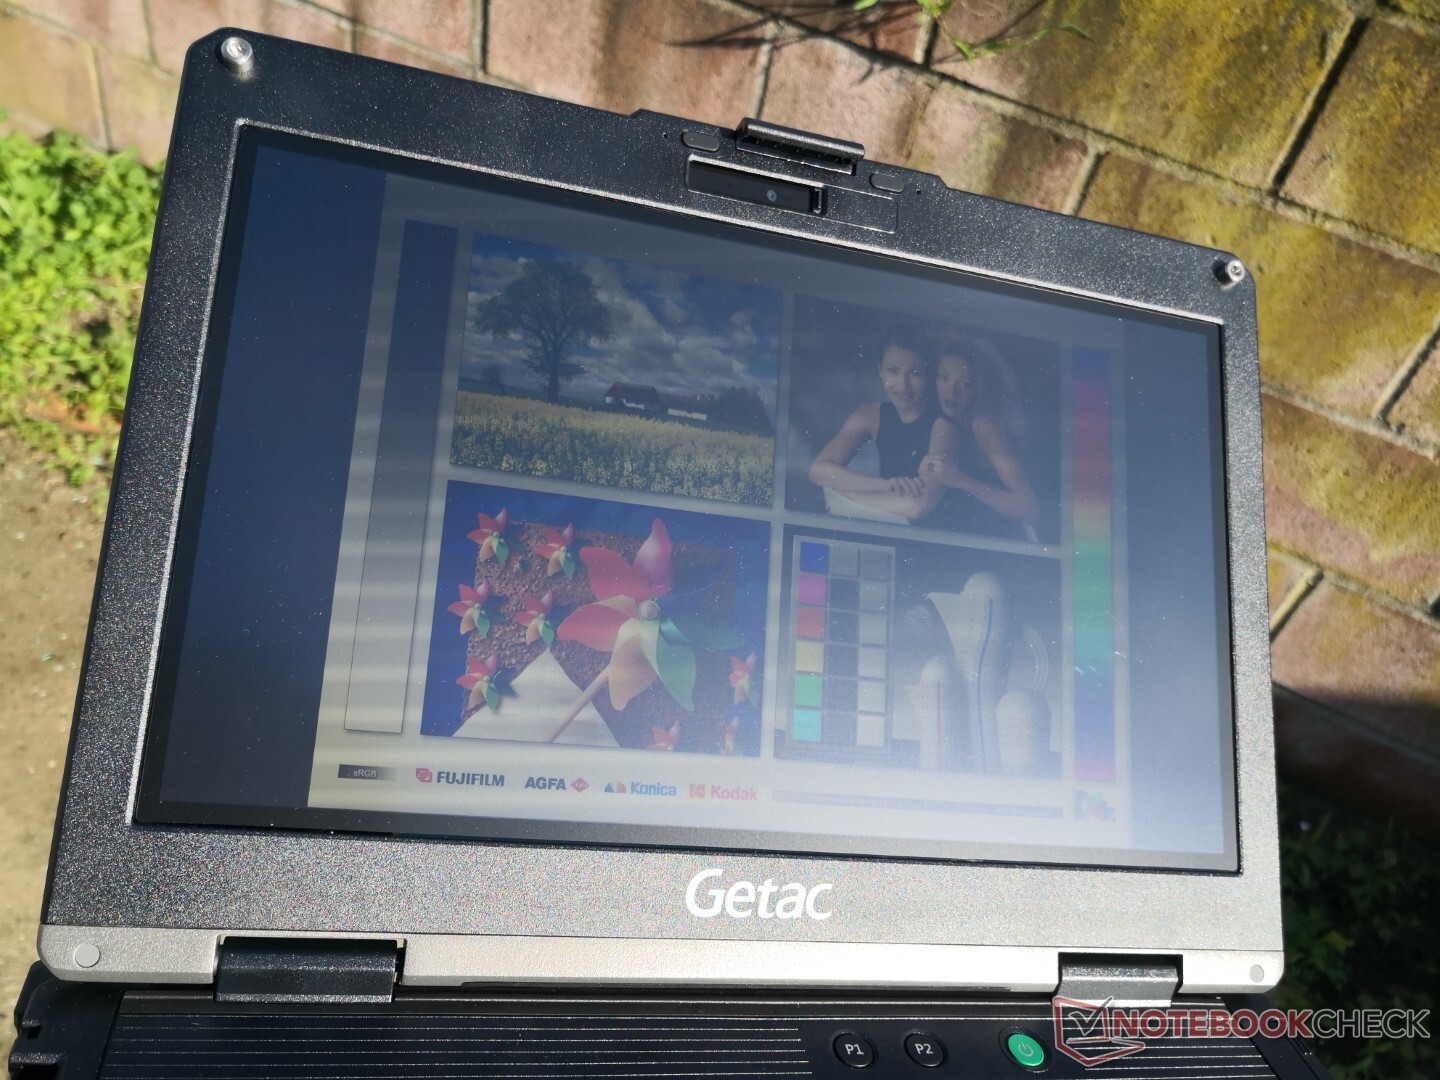
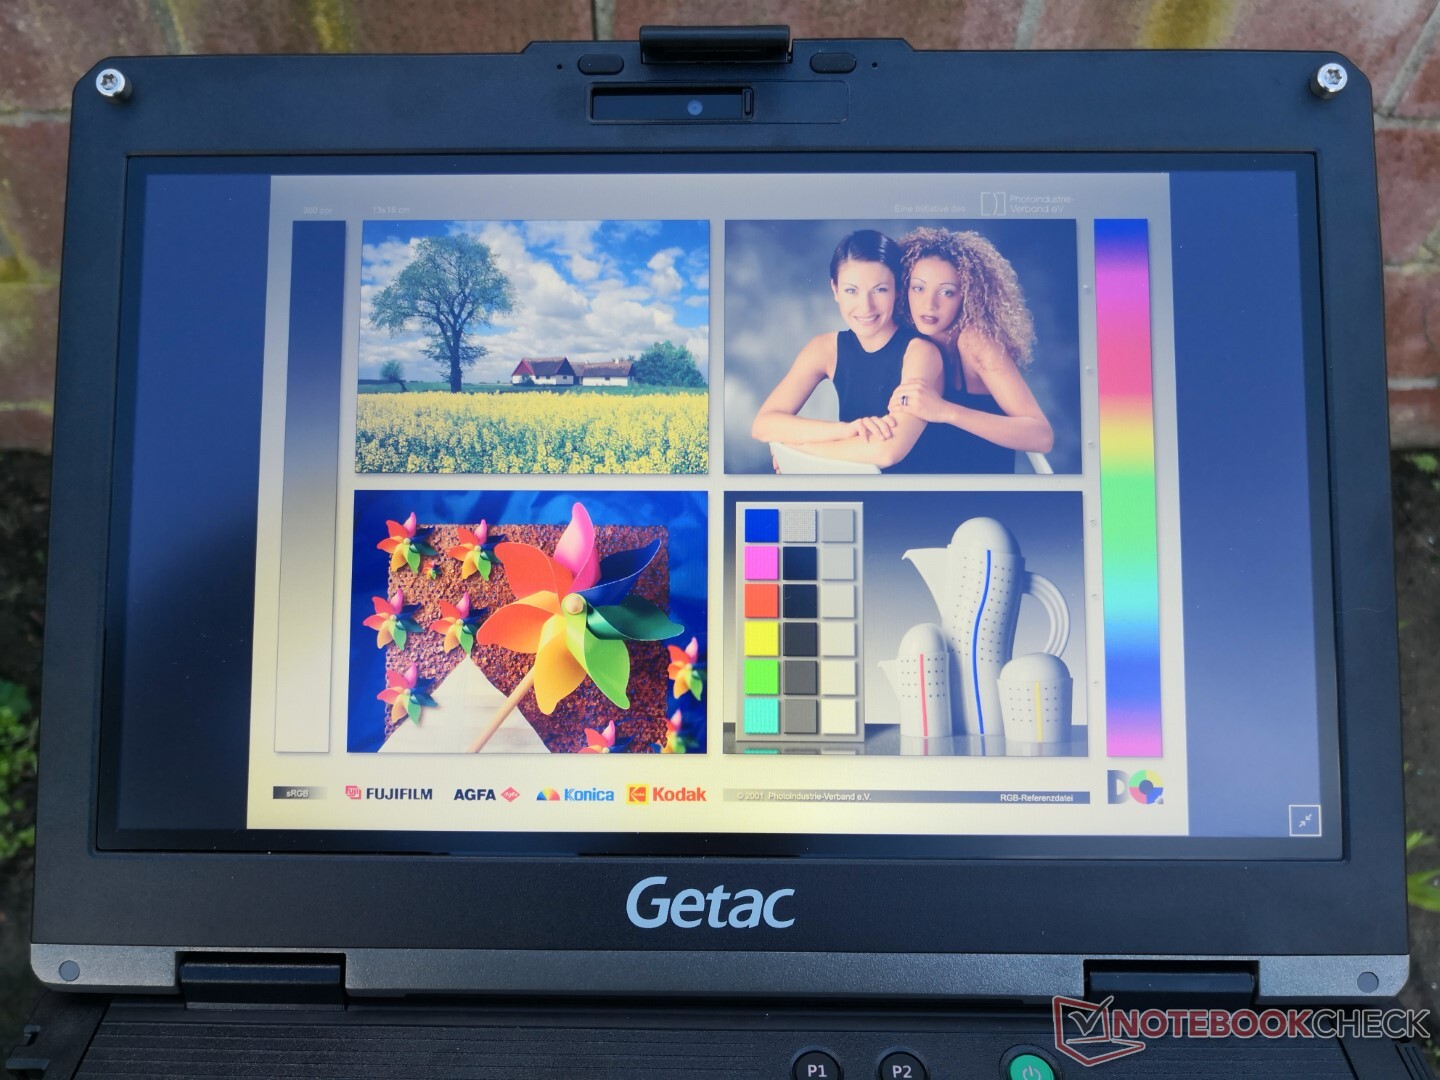
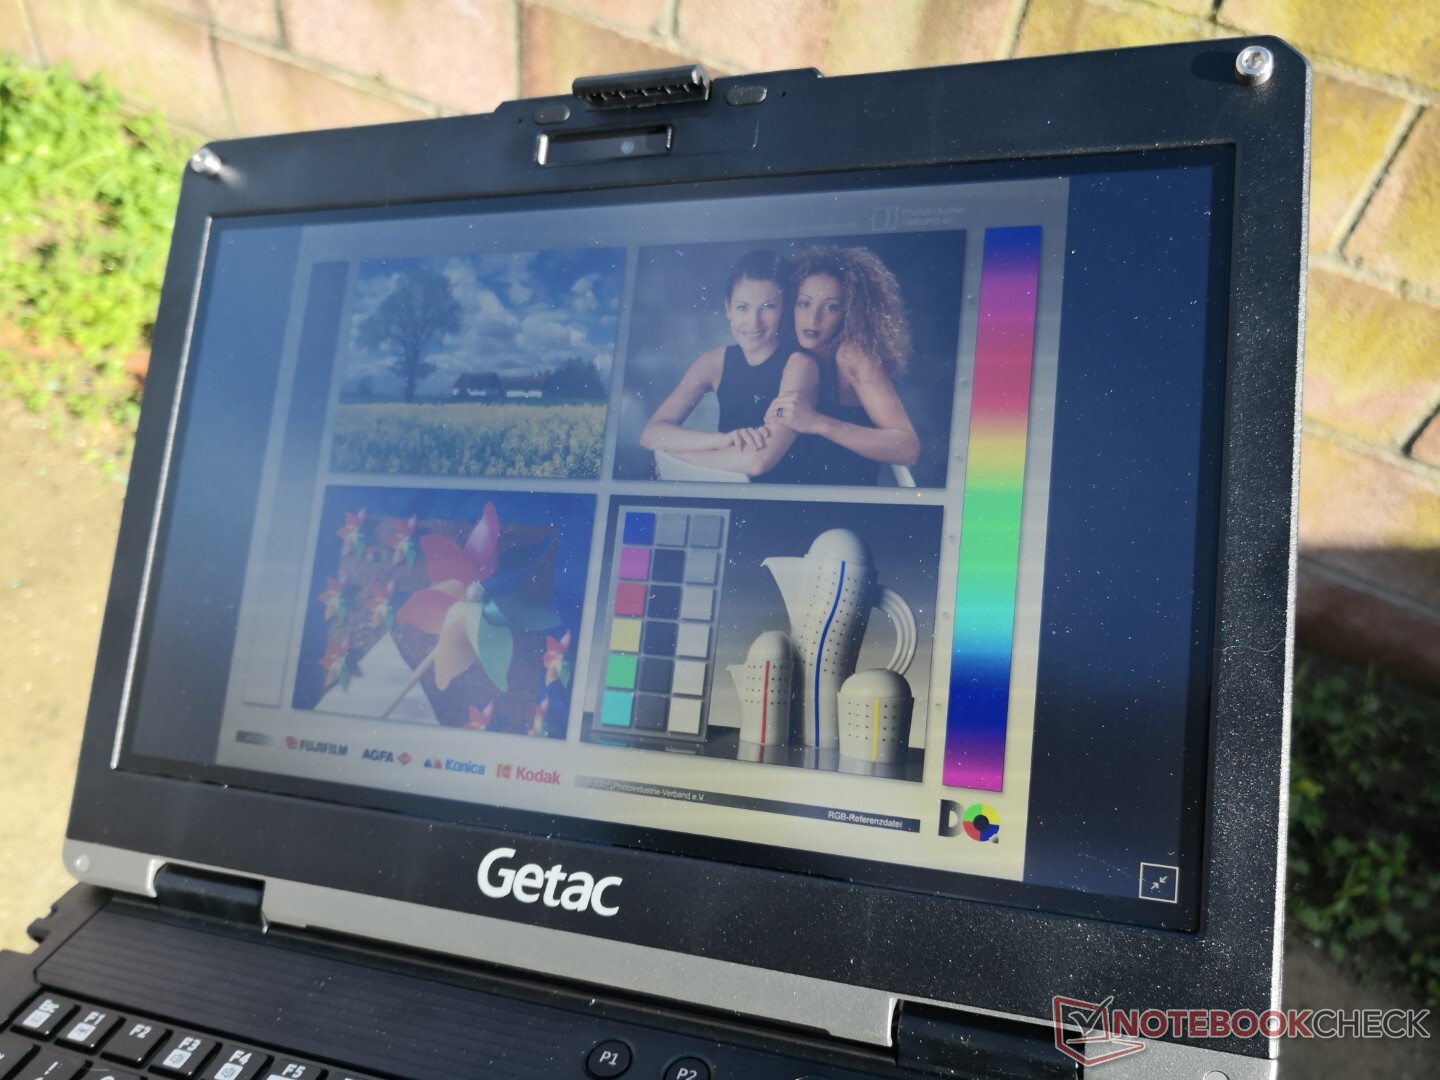
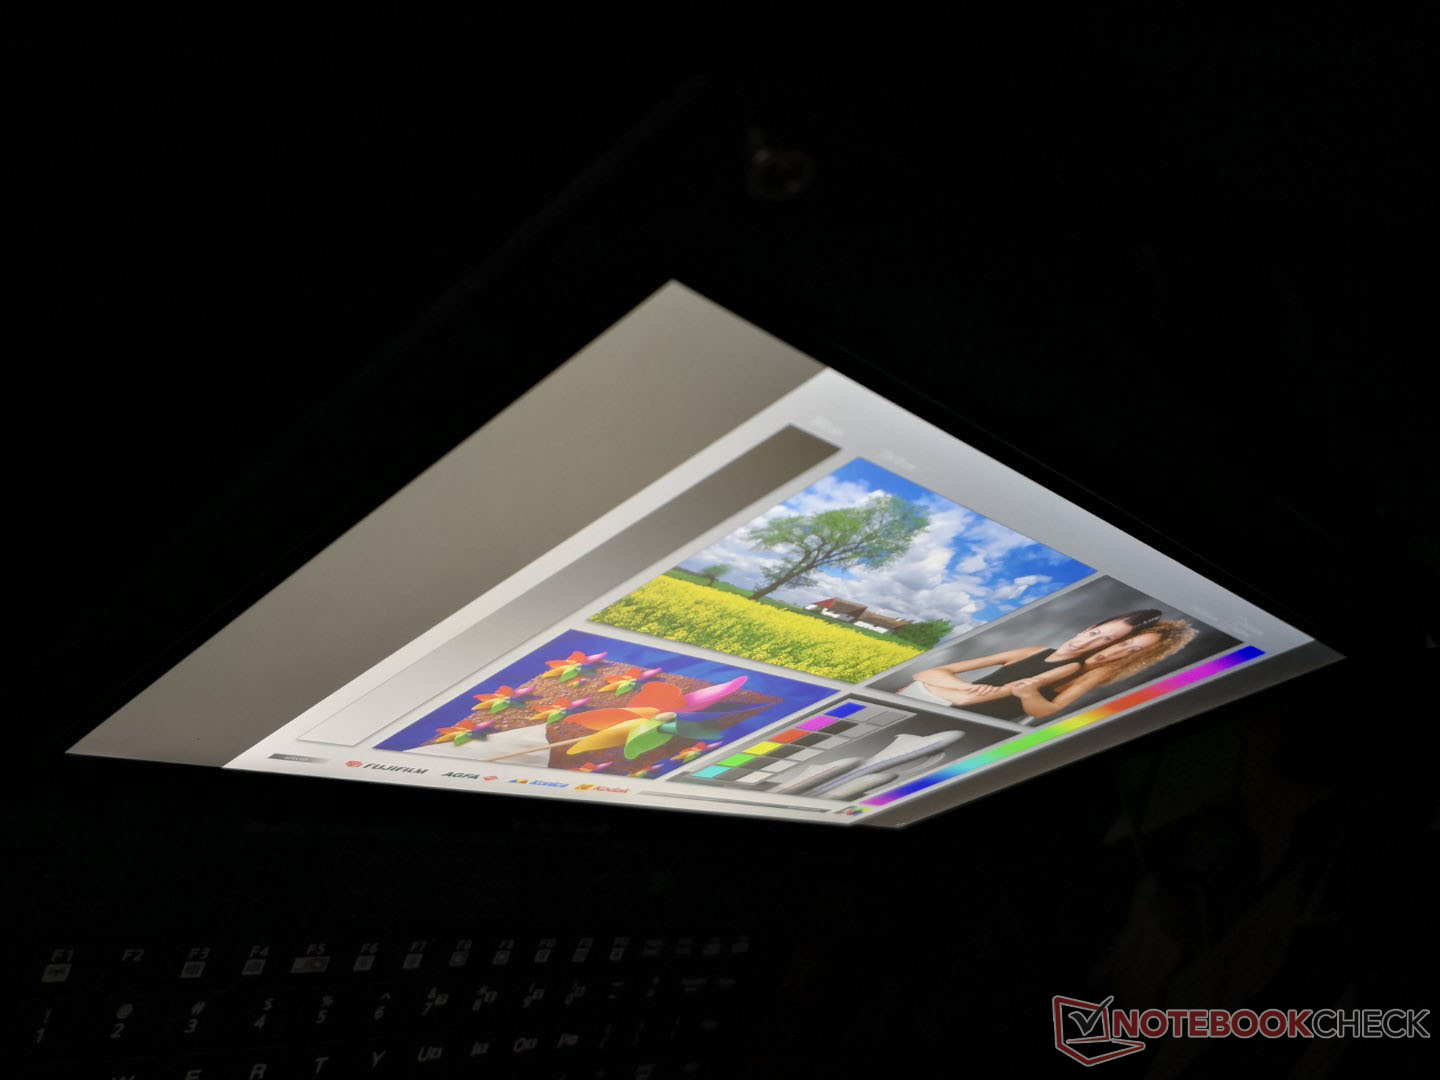
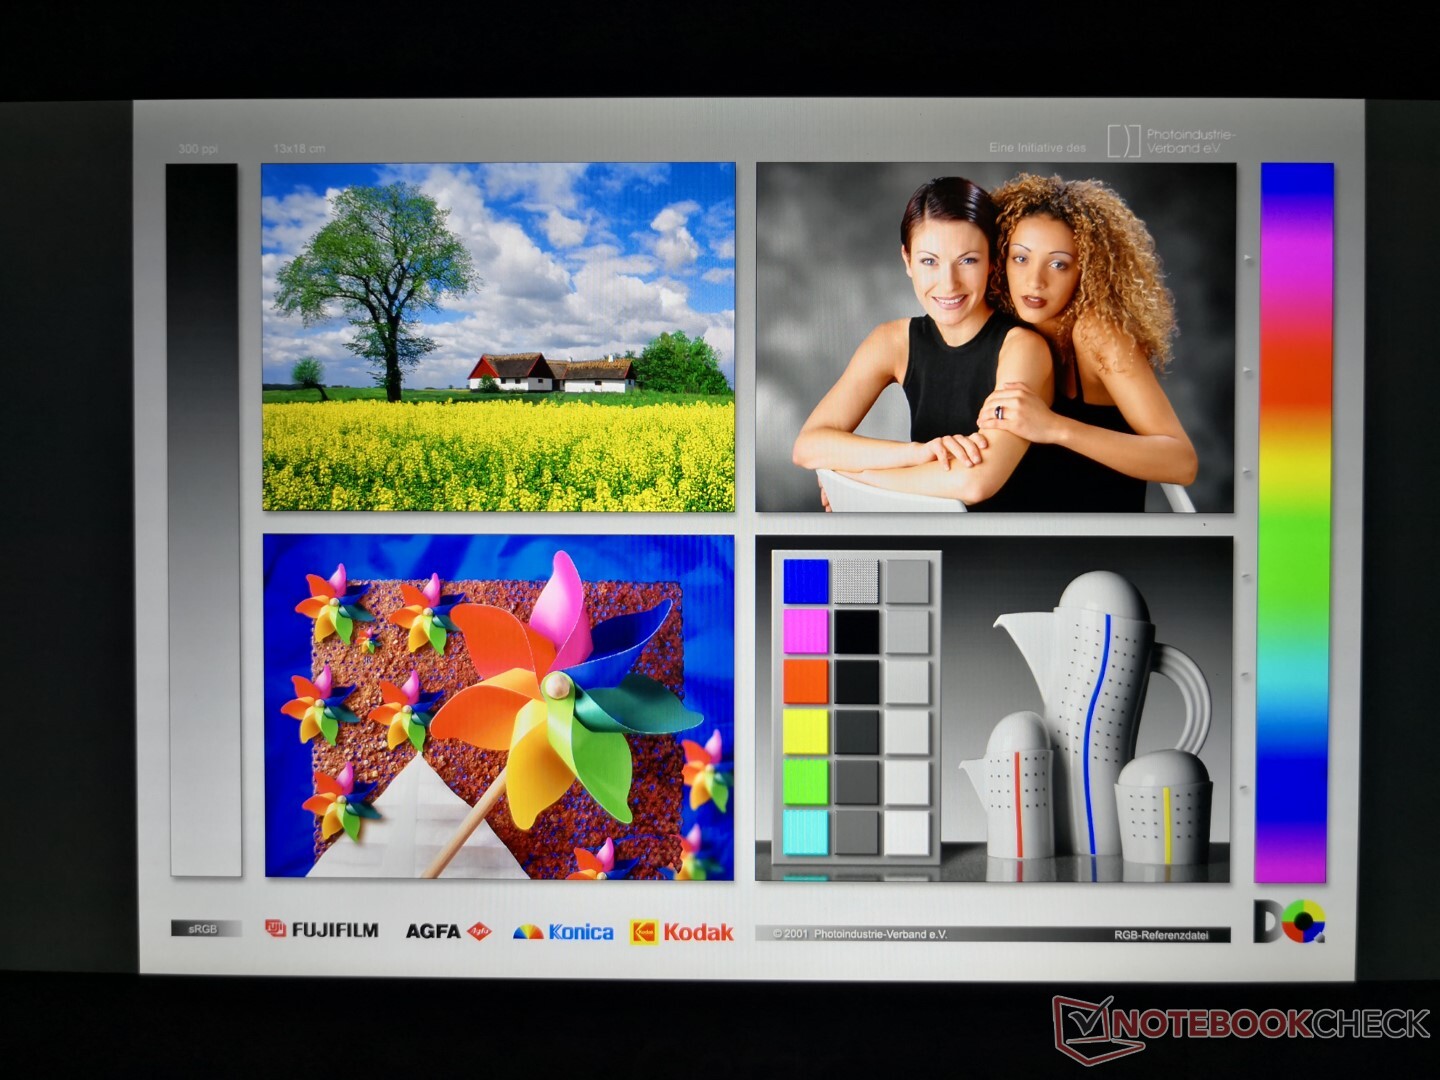
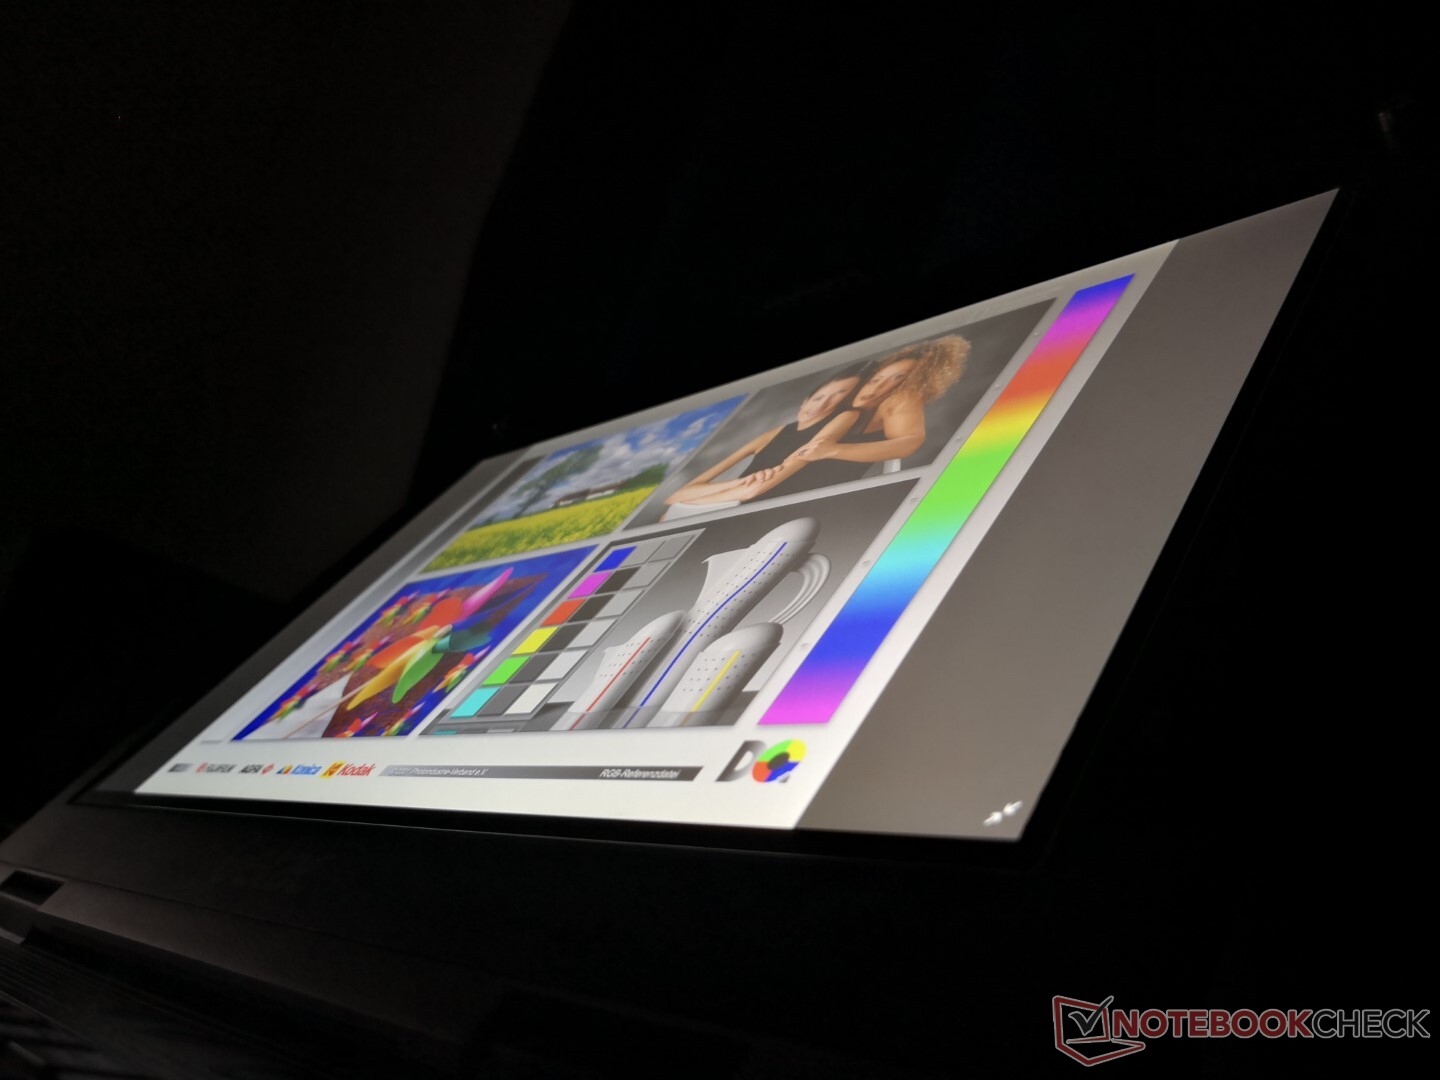
The manufacturer claims a brightness of 1400 nits to be one of the brightest laptops regardless of category which we can confirm with our own independent measurements. Perhaps more impressive is the relatively deep contrast ratio of ~1500:1 which is again better than on most other rugged models.
Three key drawbacks to the display are its limited color reproduction, slow black-white response times, and presence of pulse-width modulation at all brightness levels. The first two aren't issues as the B360 isn't meant for professional photo editing or gaming, but the latter can be troublesome for users who may be sensitive to flickering lights.


| |||||||||||||||||||||||||
Brightness Distribution: 86 %
Center on Battery: 1505.6 cd/m²
Contrast: 1585:1 (Black: 0.95 cd/m²)
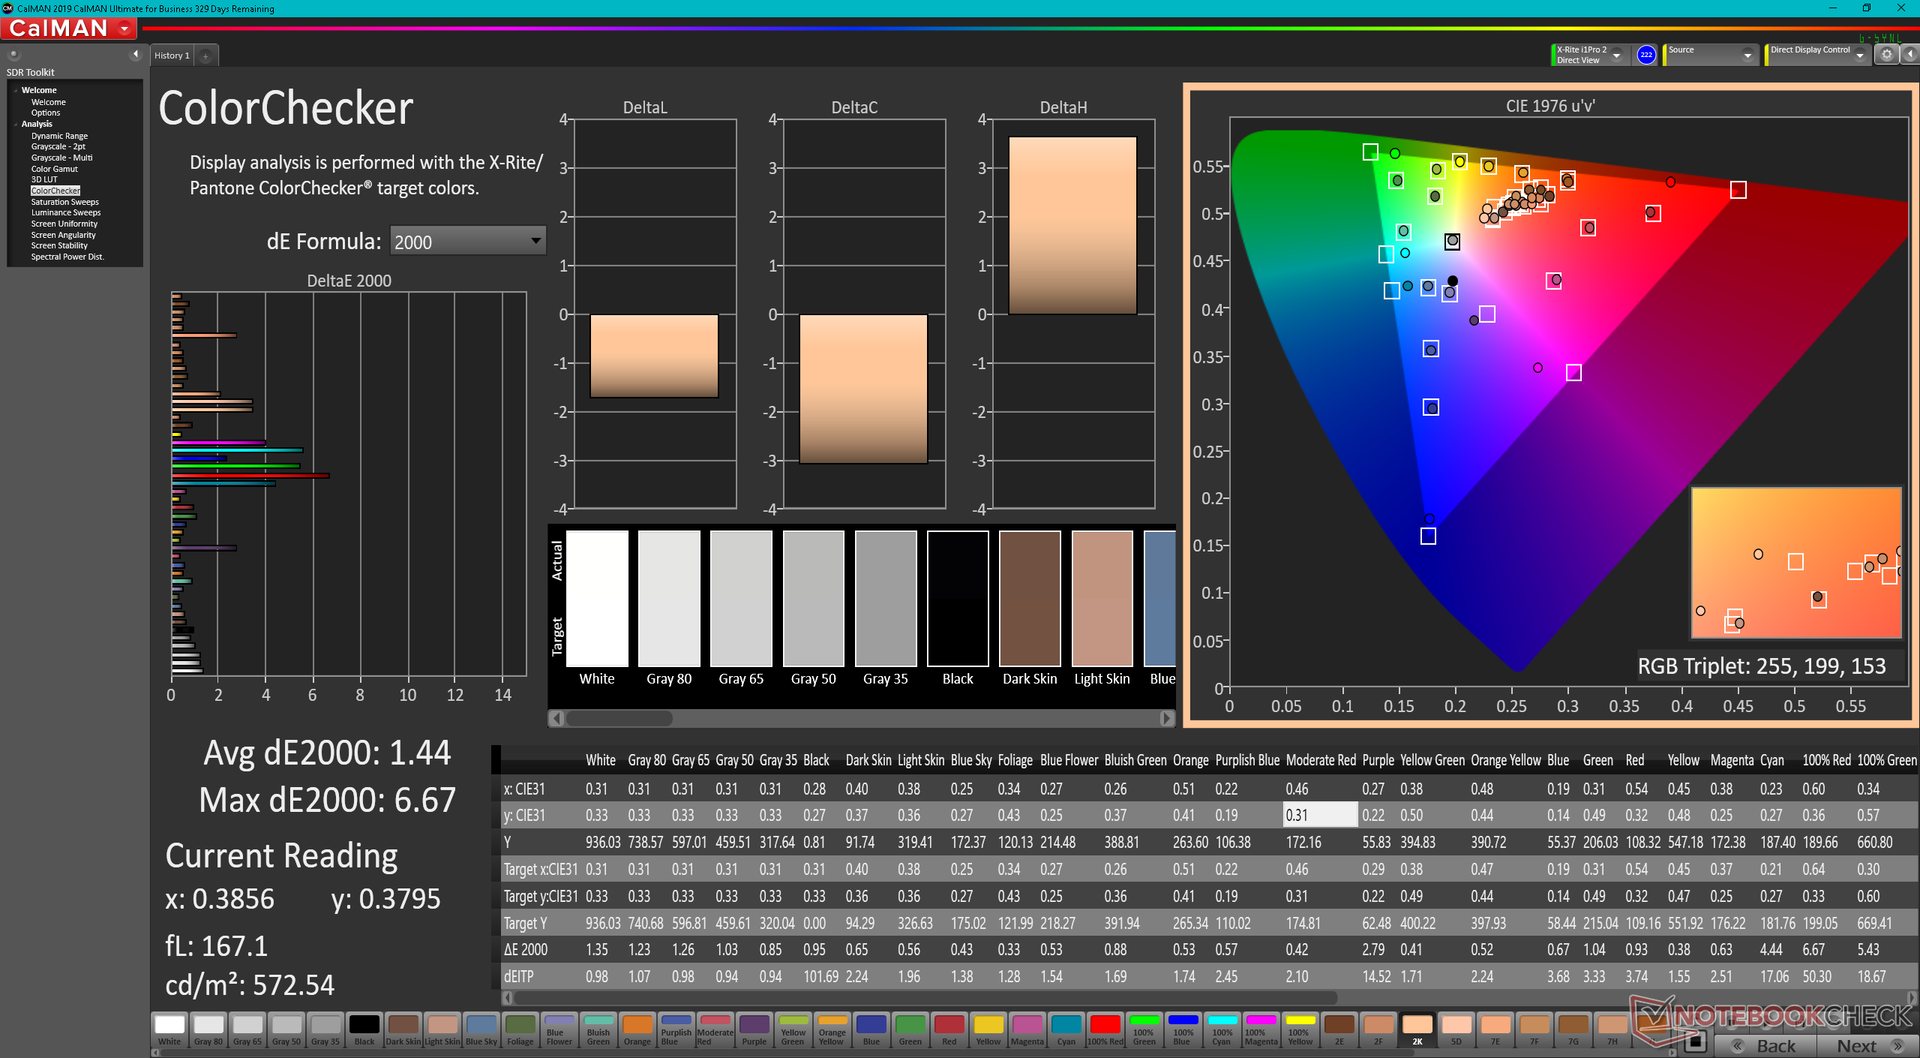
ΔE ColorChecker Calman: 9.81 | ∀{0.5-29.43 Ø4.73}
calibrated: 1.44
ΔE Greyscale Calman: 12 | ∀{0.09-98 Ø4.97}
52.2% AdobeRGB 1998 (Argyll 3D)
72% sRGB (Argyll 3D)
51.3% Display P3 (Argyll 3D)
Gamma: 1.98
CCT: 4838 K
| Getac B360 AU Optronics AUO572D, IPS, 1920x1080, 13.3" | Dell Latitude 5420 Rugged-P85G AU Optronics AUO523D, IPS, 1920x1080, 14" | Getac S410 CMN N140BGE-E33, TN PED, 1366x768, 14" | Acer Enduro Urban N3 EUN314 XR140EA6T, IPS, 1920x1080, 14" | Panasonic Toughbook FZ-55 MK2 InfoVision M140NWF5 R3, IPS, 1920x1080, 14" | Durabook S14I KD140N0730A01, TN, 1920x1080, 14" | |
|---|---|---|---|---|---|---|
| Display | 24% | -19% | 26% | -30% | -13% | |
| Display P3 Coverage (%) | 51.3 | 62.5 22% | 40.46 -21% | 63.5 24% | 34.8 -32% | 43.55 -15% |
| sRGB Coverage (%) | 72 | 92.4 28% | 60.9 -15% | 91.9 28% | 52.2 -27% | 65.4 -9% |
| AdobeRGB 1998 Coverage (%) | 52.2 | 64.2 23% | 41.8 -20% | 65.5 25% | 36 -31% | 45 -14% |
| Response Times | -47% | 20% | -31% | 19% | 39% | |
| Response Time Grey 50% / Grey 80% * (ms) | 33 ? | 68 ? -106% | 41.2 ? -25% | 56 ? -70% | 28.4 ? 14% | 30.4 ? 8% |
| Response Time Black / White * (ms) | 38.8 ? | 33.6 ? 13% | 14 ? 64% | 35.2 ? 9% | 30 ? 23% | 11.8 ? 70% |
| PWM Frequency (Hz) | 870 ? | 735 ? | 877 ? | 1000 ? | 685 ? | 304.9 ? |
| Screen | 0% | -55% | -4% | -2% | -47% | |
| Brightness middle (cd/m²) | 1505.6 | 1111.7 -26% | 265.1 -82% | 487.8 -68% | 1061.1 -30% | 1180.7 -22% |
| Brightness (cd/m²) | 1383 | 1026 -26% | 246 -82% | 464 -66% | 997 -28% | 1102 -20% |
| Brightness Distribution (%) | 86 | 80 -7% | 81 -6% | 89 3% | 76 -12% | 89 3% |
| Black Level * (cd/m²) | 0.95 | 0.81 15% | 0.58 39% | 0.48 49% | 0.7 26% | 1.91 -101% |
| Contrast (:1) | 1585 | 1372 -13% | 457 -71% | 1016 -36% | 1516 -4% | 618 -61% |
| Colorchecker dE 2000 * | 9.81 | 3.83 61% | 14.24 -45% | 6.51 34% | 4.64 53% | 13.45 -37% |
| Colorchecker dE 2000 max. * | 16.64 | 7.85 53% | 26.66 -60% | 11.36 32% | 20.92 -26% | 22.52 -35% |
| Colorchecker dE 2000 calibrated * | 1.44 | 2.98 -107% | 3.94 -174% | 1.77 -23% | 2.52 -75% | 3.19 -122% |
| Greyscale dE 2000 * | 12 | 5.6 53% | 14.2 -18% | 7.8 35% | 2.8 77% | 15.4 -28% |
| Gamma | 1.98 111% | 2.306 95% | 2.03 108% | 2.28 96% | 2.08 106% | 1.97 112% |
| CCT | 4838 134% | 7676 85% | 17152 38% | 8102 80% | 6364 102% | 21134 31% |
| Color Space (Percent of AdobeRGB 1998) (%) | 59 | 38.7 | 41.6 | |||
| Color Space (Percent of sRGB) (%) | 93 | 61 | 65.5 | |||
| Total Average (Program / Settings) | -8% /
-1% | -18% /
-37% | -3% /
-2% | -4% /
-5% | -7% /
-27% |
* ... smaller is better
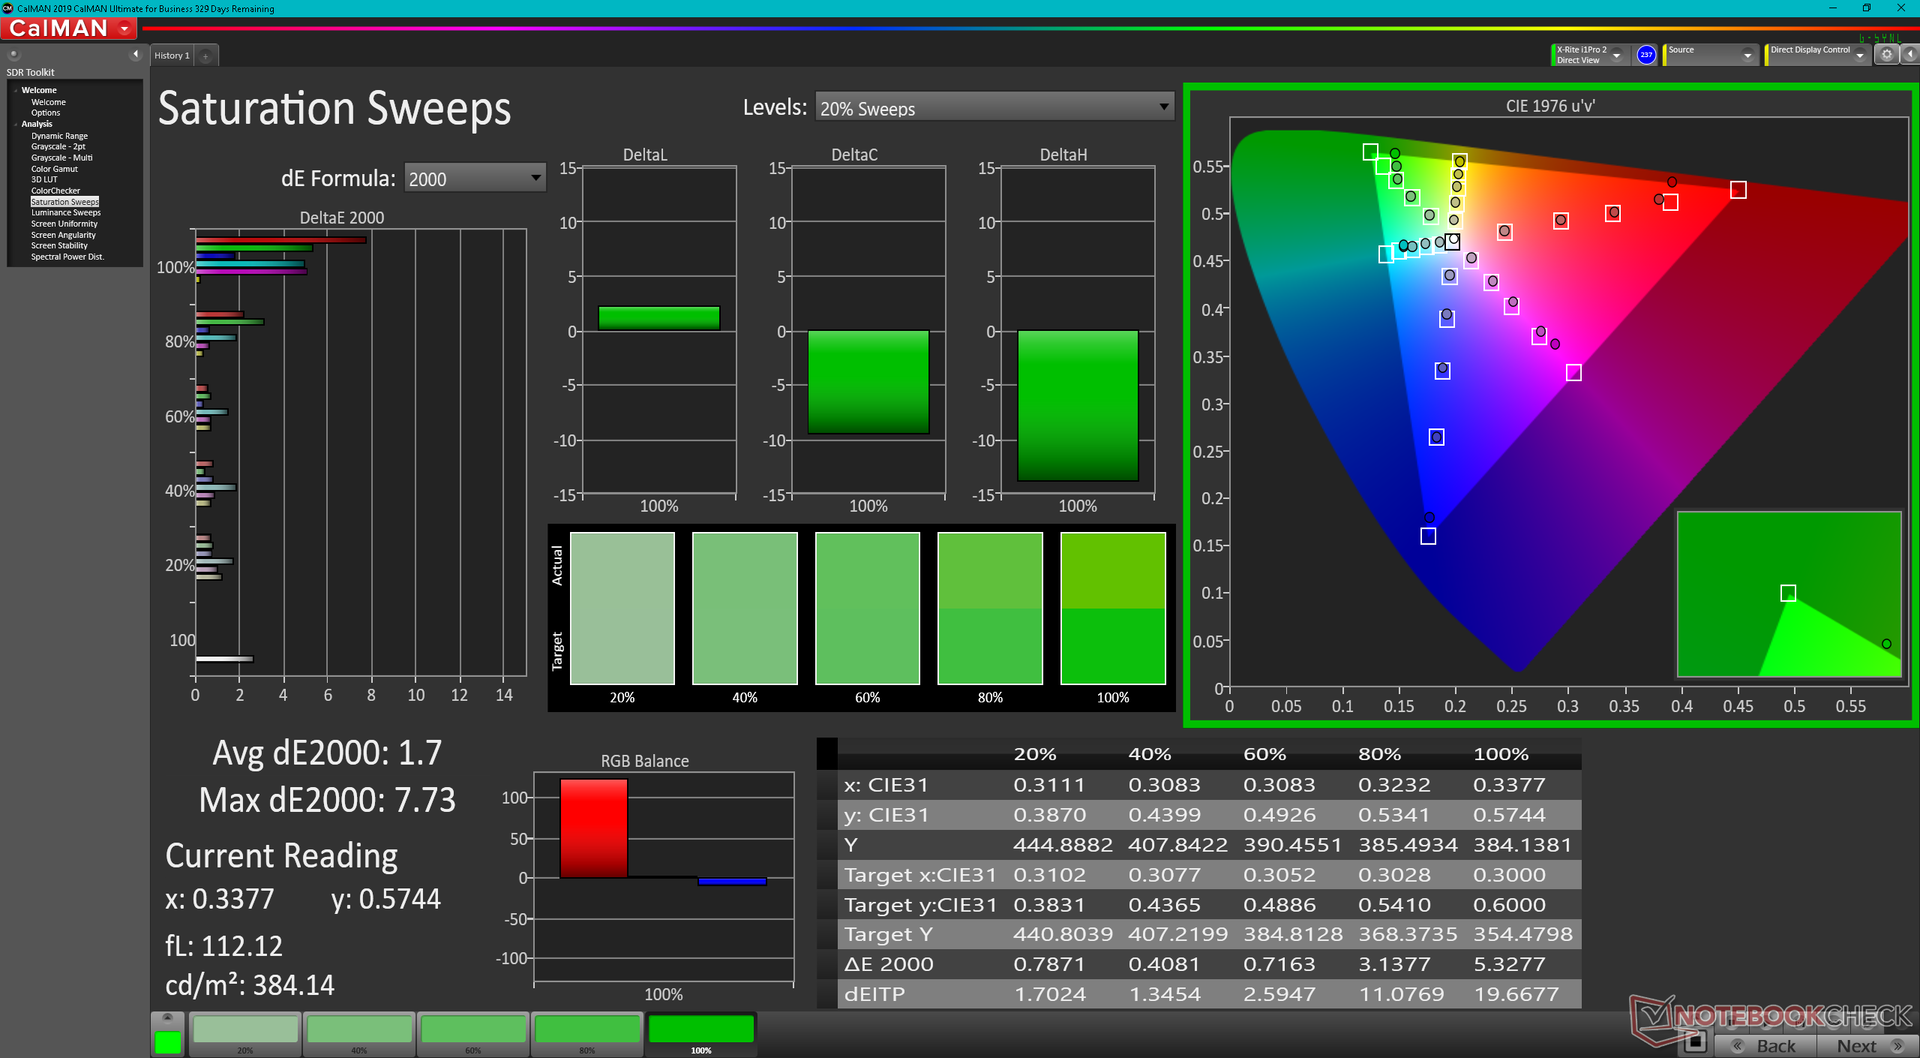
Color space is narrow at just 72 percent of sRGB to be unfit for most graphics editing.
Color temperature is very warm out of the box to the point where average deltaE values can approach double digits. Calibrating the panel addresses this issue for significantly more accurate colors especially at lower saturation levels.
Display Response Times
| ↔ Response Time Black to White | ||
|---|---|---|
| 38.8 ms ... rise ↗ and fall ↘ combined | ↗ 15.6 ms rise | 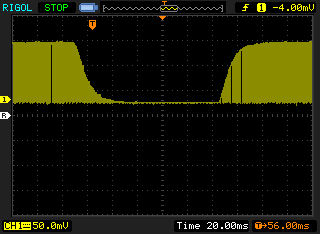 |
| ↘ 23.2 ms fall | ||
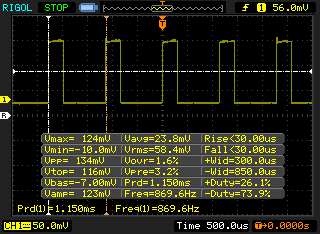
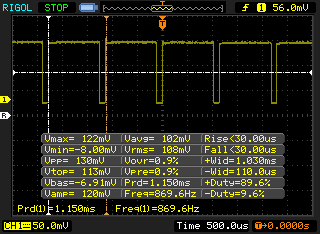
| The screen shows slow response rates in our tests and will be unsatisfactory for gamers. In comparison, all tested devices range from 0.1 (minimum) to 240 (maximum) ms. » 96 % of all devices are better. This means that the measured response time is worse than the average of all tested devices (19.9 ms). | ||
| ↔ Response Time 50% Grey to 80% Grey | ||
| 33 ms ... rise ↗ and fall ↘ combined | ↗ 16 ms rise | 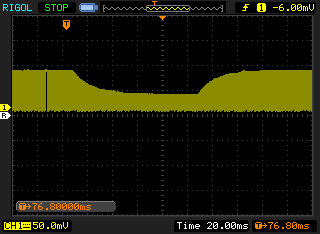 |
| ↘ 17 ms fall | ||
| The screen shows slow response rates in our tests and will be unsatisfactory for gamers. In comparison, all tested devices range from 0.165 (minimum) to 636 (maximum) ms. » 45 % of all devices are better. This means that the measured response time is similar to the average of all tested devices (31.1 ms). | ||
Screen Flickering / PWM (Pulse-Width Modulation)
| Screen flickering / PWM detected | 870 Hz | ≤ 100 % brightness setting |  |
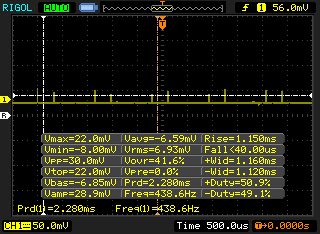
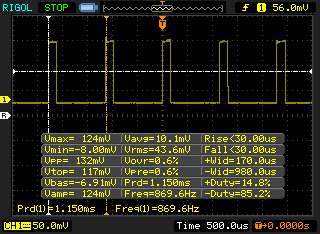
The display backlight flickers at 870 Hz (worst case, e.g., utilizing PWM) Flickering detected at a brightness setting of 100 % and below. There should be no flickering or PWM above this brightness setting. The frequency of 870 Hz is quite high, so most users sensitive to PWM should not notice any flickering. In comparison: 52 % of all tested devices do not use PWM to dim the display. If PWM was detected, an average of 7798 (minimum: 5 - maximum: 343500) Hz was measured. | |||

The display is viewable under most outdoor conditions, but users will still want to avoid direct sunlight to limit glare and washed out colors.
Performance
Testing Conditions
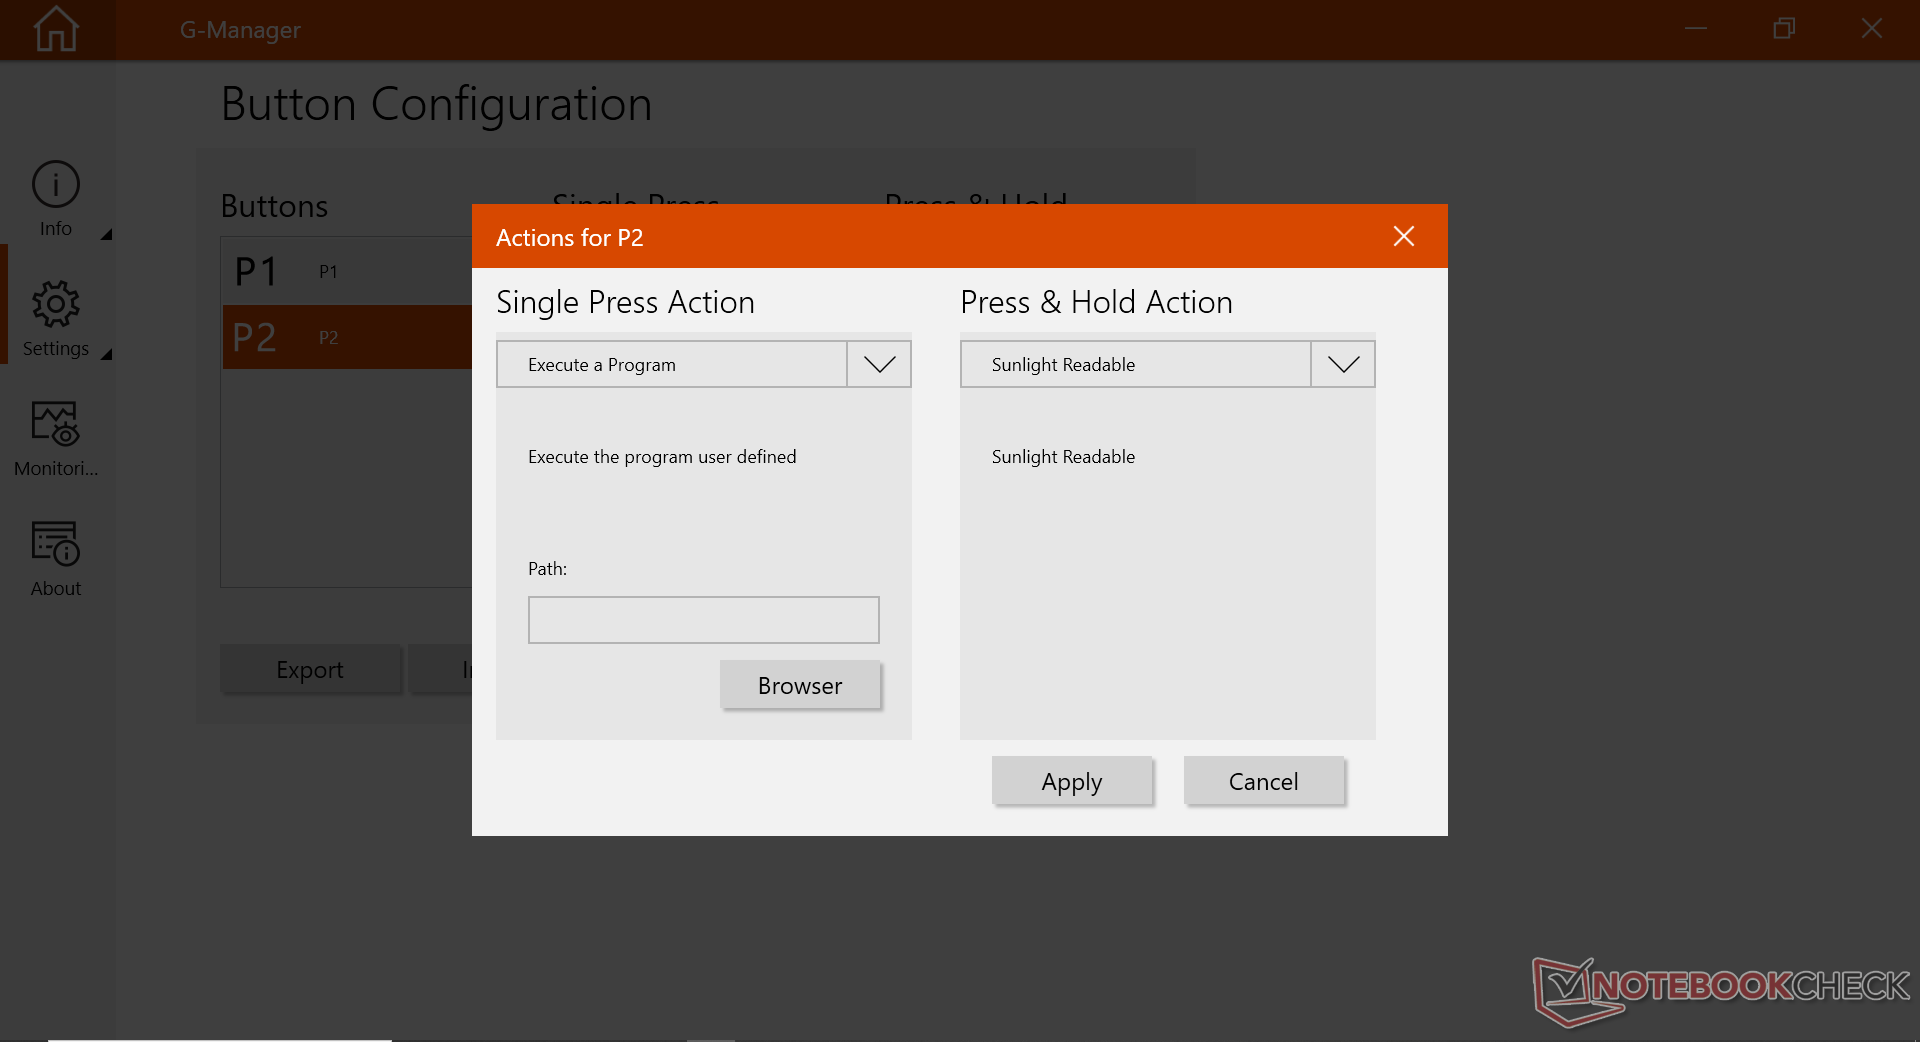
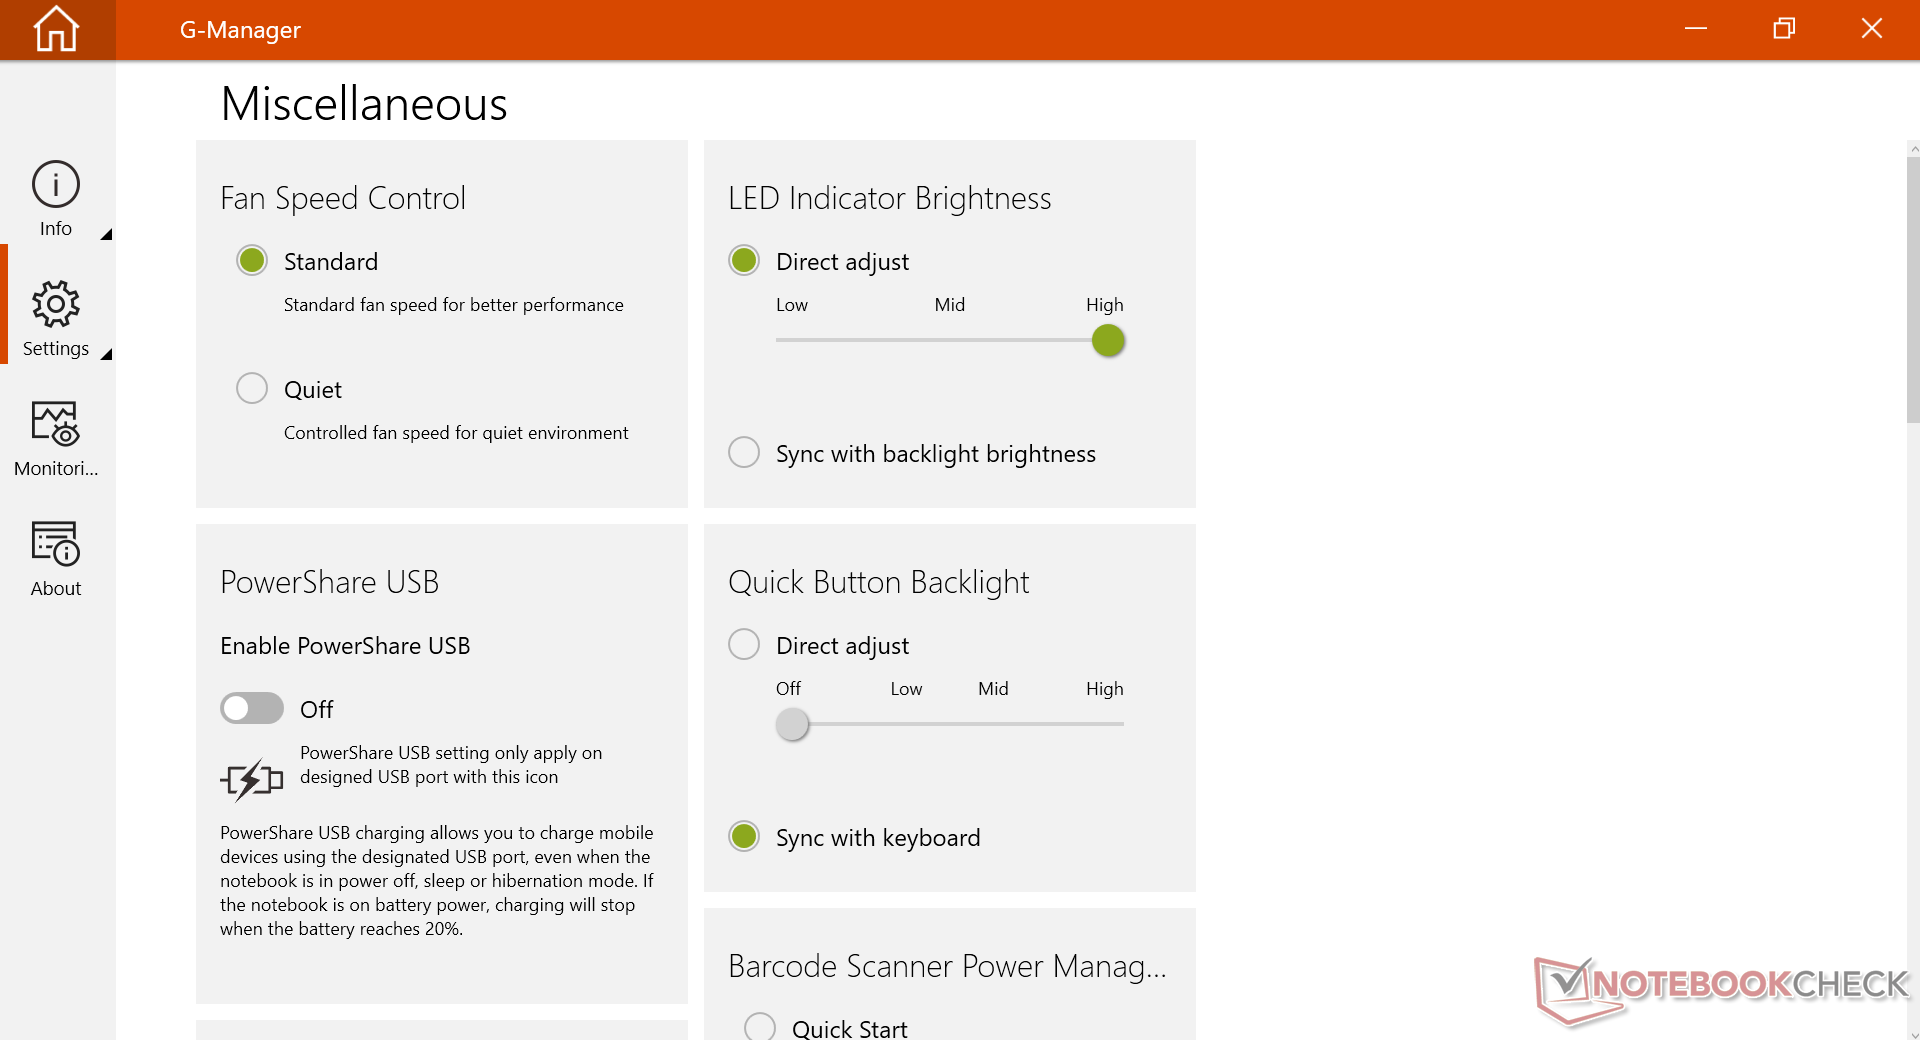
Our unit was set to Extreme mode prior to running any benchmarks for the highest possible scores. Users should become familiar with the pre-installed G-Manager software as many Getac-specific customization features are toggled here.
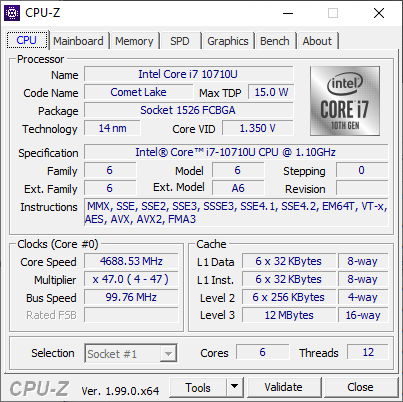
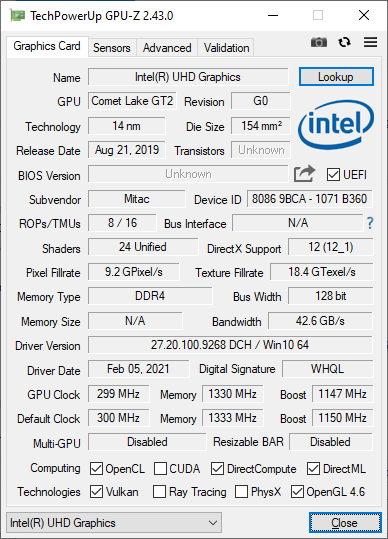
Processor
Multi-thread CPU performance is about 20 to 30 percent slower than the average laptop in our database equipped with the same Core i7-10710U processor. This is not uncommon for rugged laptops likely to boost overall stability and reliability at the cost of some raw performance.
Cinebench R15 Multi Loop
Cinebench R23: Multi Core | Single Core
Cinebench R15: CPU Multi 64Bit | CPU Single 64Bit
Blender: v2.79 BMW27 CPU
7-Zip 18.03: 7z b 4 | 7z b 4 -mmt1
Geekbench 5.5: Multi-Core | Single-Core
HWBOT x265 Benchmark v2.2: 4k Preset
LibreOffice : 20 Documents To PDF
R Benchmark 2.5: Overall mean
| Cinebench R23 / Multi Core | |
| Lenovo Yoga 6 13ALC6 | |
| Lenovo IdeaPad 5 15ALC05 | |
| Panasonic Toughbook FZ-55 MK2 | |
| Acer Enduro Urban N3 EUN314 | |
| Honor MagicBook Pro 10210U | |
| Getac B360 | |
| Average Intel Core i7-10710U (n=1) | |
| Durabook S14I | |
| Infinix INBook X2 | |
| Cinebench R23 / Single Core | |
| Panasonic Toughbook FZ-55 MK2 | |
| Acer Enduro Urban N3 EUN314 | |
| Durabook S14I | |
| Lenovo Yoga 6 13ALC6 | |
| Lenovo IdeaPad 5 15ALC05 | |
| Honor MagicBook Pro 10210U | |
| Infinix INBook X2 | |
| Getac B360 | |
| Average Intel Core i7-10710U (n=1) | |
| Geekbench 5.5 / Multi-Core | |
| Lenovo IdeaPad 5 15ALC05 | |
| Acer Enduro Urban N3 EUN314 | |
| Average Intel Core i7-10710U (4575 - 5839, n=2) | |
| Getac B360 | |
| Lenovo ThinkPad P15s Gen1-20T4000JGE | |
| Lenovo ThinkPad L14-20U50003GE | |
| Durabook S14I | |
| Honor MagicBook Pro 10210U | |
| Infinix INBook X2 | |
| Asus ZenBook 14 UX434FL-DB77 | |
| Geekbench 5.5 / Single-Core | |
| Acer Enduro Urban N3 EUN314 | |
| Durabook S14I | |
| Average Intel Core i7-10710U (1225 - 1229, n=2) | |
| Getac B360 | |
| Lenovo ThinkPad P15s Gen1-20T4000JGE | |
| Infinix INBook X2 | |
| Asus ZenBook 14 UX434FL-DB77 | |
| Lenovo IdeaPad 5 15ALC05 | |
| Lenovo ThinkPad L14-20U50003GE | |
| Honor MagicBook Pro 10210U | |
| HWBOT x265 Benchmark v2.2 / 4k Preset | |
| Lenovo Yoga 6 13ALC6 | |
| Lenovo IdeaPad 5 15ALC05 | |
| Lenovo ThinkPad L14-20U50003GE | |
| Panasonic Toughbook FZ-55 MK2 | |
| Acer Enduro Urban N3 EUN314 | |
| Average Intel Core i7-10710U (4.2 - 7.95, n=4) | |
| Honor MagicBook Pro 10210U | |
| Getac B360 | |
| Lenovo ThinkPad P15s Gen1-20T4000JGE | |
| Durabook S14I | |
| Asus ZenBook 14 UX434FL-DB77 | |
| Infinix INBook X2 | |
Cinebench R23: Multi Core | Single Core
Cinebench R15: CPU Multi 64Bit | CPU Single 64Bit
Blender: v2.79 BMW27 CPU
7-Zip 18.03: 7z b 4 | 7z b 4 -mmt1
Geekbench 5.5: Multi-Core | Single-Core
HWBOT x265 Benchmark v2.2: 4k Preset
LibreOffice : 20 Documents To PDF
R Benchmark 2.5: Overall mean
* ... smaller is better
AIDA64: FP32 Ray-Trace | FPU Julia | CPU SHA3 | CPU Queen | FPU SinJulia | FPU Mandel | CPU AES | CPU ZLib | FP64 Ray-Trace | CPU PhotoWorxx
| Performance rating | |
| Acer Enduro Urban N3 EUN314 | |
| Panasonic Toughbook FZ-55 MK2 | |
| Getac B360 | |
| Durabook S14I | |
| Average Intel Core i7-10710U | |
| AIDA64 / FP32 Ray-Trace | |
| Acer Enduro Urban N3 EUN314 | |
| Panasonic Toughbook FZ-55 MK2 | |
| Durabook S14I | |
| Getac B360 | |
| Average Intel Core i7-10710U (3674 - 4992, n=2) | |
| AIDA64 / FPU Julia | |
| Acer Enduro Urban N3 EUN314 | |
| Panasonic Toughbook FZ-55 MK2 | |
| Getac B360 | |
| Average Intel Core i7-10710U (21776 - 26990, n=2) | |
| Durabook S14I | |
| AIDA64 / CPU SHA3 | |
| Acer Enduro Urban N3 EUN314 | |
| Panasonic Toughbook FZ-55 MK2 | |
| Durabook S14I | |
| Getac B360 | |
| Average Intel Core i7-10710U (883 - 1289, n=2) | |
| AIDA64 / CPU Queen | |
| Getac B360 | |
| Average Intel Core i7-10710U (37935 - 64609, n=2) | |
| Acer Enduro Urban N3 EUN314 | |
| Durabook S14I | |
| Panasonic Toughbook FZ-55 MK2 | |
| AIDA64 / FPU SinJulia | |
| Acer Enduro Urban N3 EUN314 | |
| Getac B360 | |
| Panasonic Toughbook FZ-55 MK2 | |
| Average Intel Core i7-10710U (3580 - 4770, n=2) | |
| Durabook S14I | |
| AIDA64 / FPU Mandel | |
| Acer Enduro Urban N3 EUN314 | |
| Panasonic Toughbook FZ-55 MK2 | |
| Durabook S14I | |
| Getac B360 | |
| Average Intel Core i7-10710U (9533 - 12867, n=2) | |
| AIDA64 / CPU AES | |
| Acer Enduro Urban N3 EUN314 | |
| Durabook S14I | |
| Panasonic Toughbook FZ-55 MK2 | |
| Getac B360 | |
| Average Intel Core i7-10710U (13808 - 18491, n=2) | |
| AIDA64 / CPU ZLib | |
| Acer Enduro Urban N3 EUN314 | |
| Getac B360 | |
| Panasonic Toughbook FZ-55 MK2 | |
| Average Intel Core i7-10710U (242 - 300, n=2) | |
| Durabook S14I | |
| AIDA64 / FP64 Ray-Trace | |
| Acer Enduro Urban N3 EUN314 | |
| Panasonic Toughbook FZ-55 MK2 | |
| Durabook S14I | |
| Getac B360 | |
| Average Intel Core i7-10710U (1994 - 2672, n=2) | |
| AIDA64 / CPU PhotoWorxx | |
| Acer Enduro Urban N3 EUN314 | |
| Panasonic Toughbook FZ-55 MK2 | |
| Getac B360 | |
| Average Intel Core i7-10710U (10842 - 21733, n=2) | |
| Durabook S14I | |
System Performance
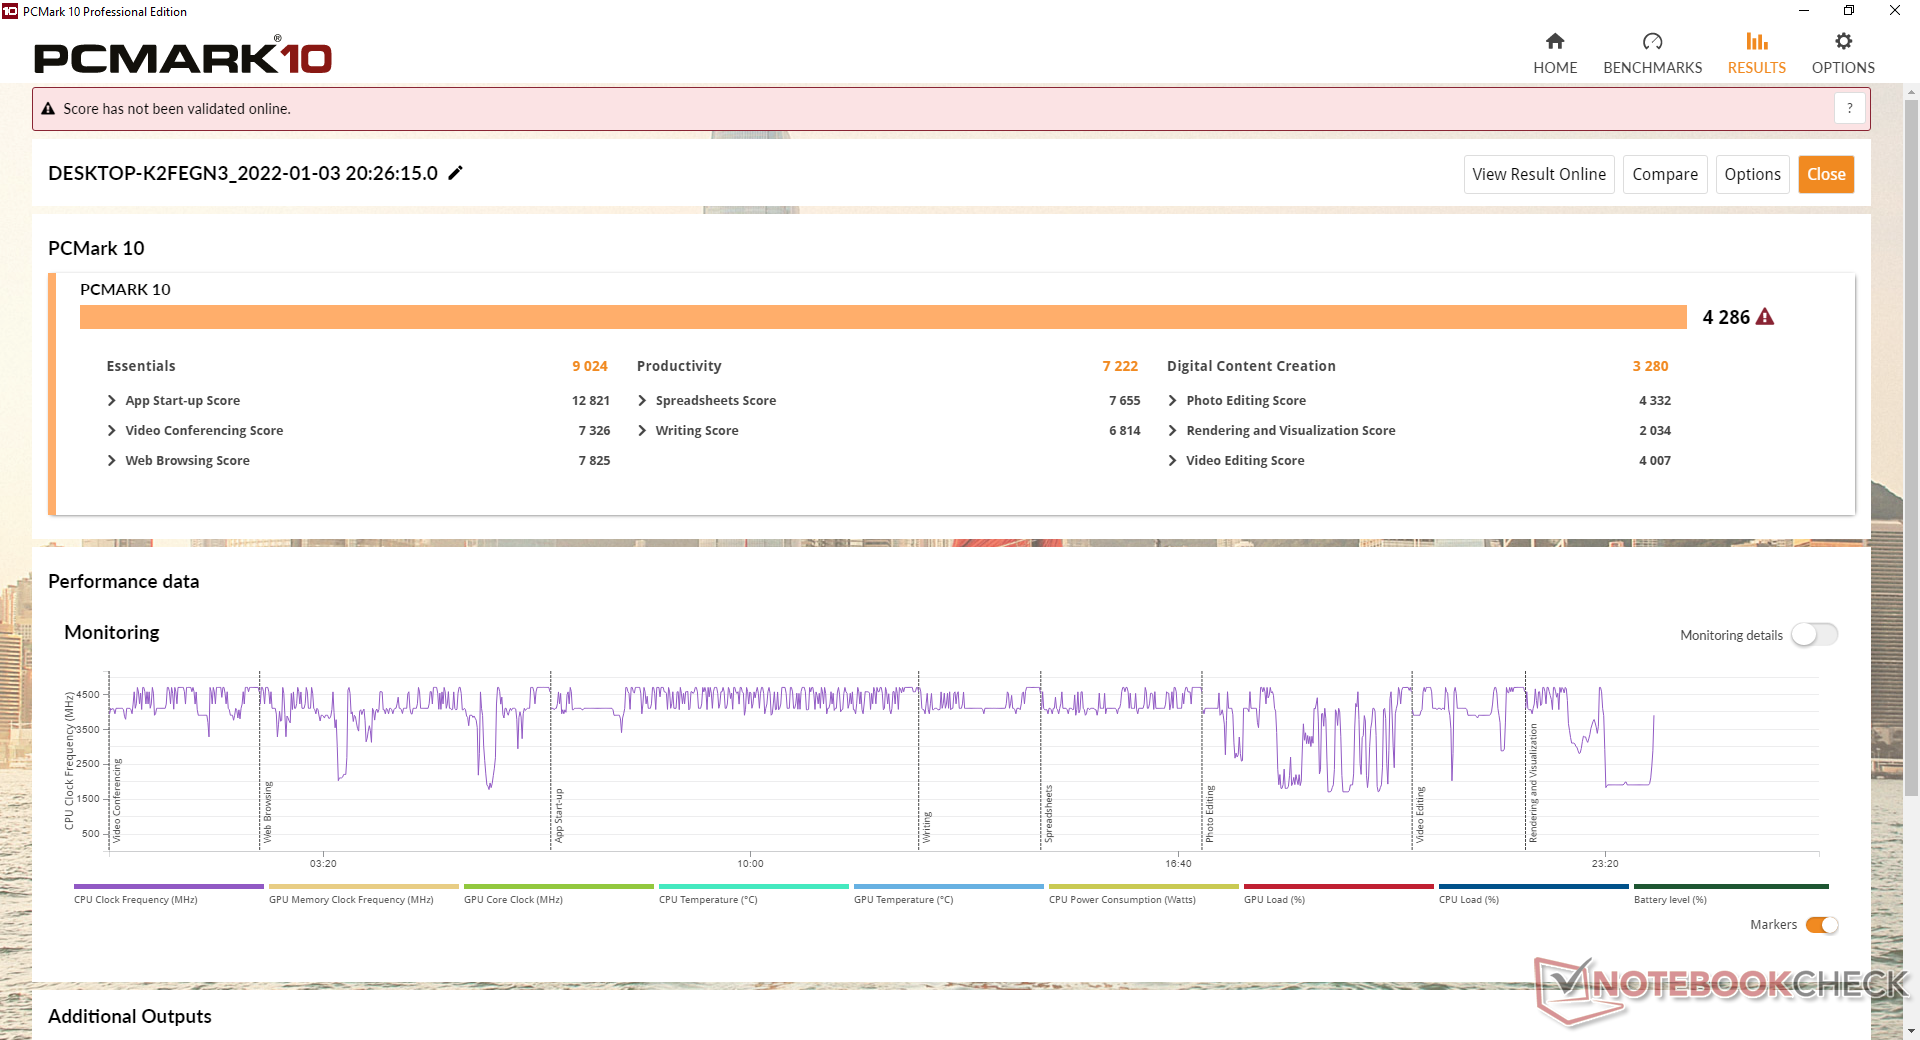
| PCMark 10 / Score | |
| Panasonic Toughbook FZ-55 MK2 | |
| Durabook S14I | |
| Average Intel Core i7-10710U (4161 - 5150, n=6) | |
| Acer Enduro Urban N3 EUN314 | |
| Dell Latitude 5420 Rugged-P85G | |
| Getac B360 | |
| Getac S410 | |
| PCMark 10 / Essentials | |
| Panasonic Toughbook FZ-55 MK2 | |
| Durabook S14I | |
| Acer Enduro Urban N3 EUN314 | |
| Getac B360 | |
| Average Intel Core i7-10710U (8785 - 9160, n=6) | |
| Dell Latitude 5420 Rugged-P85G | |
| Getac S410 | |
| PCMark 10 / Productivity | |
| Dell Latitude 5420 Rugged-P85G | |
| Getac B360 | |
| Durabook S14I | |
| Getac S410 | |
| Panasonic Toughbook FZ-55 MK2 | |
| Average Intel Core i7-10710U (5816 - 7222, n=6) | |
| Acer Enduro Urban N3 EUN314 | |
| PCMark 10 / Digital Content Creation | |
| Panasonic Toughbook FZ-55 MK2 | |
| Acer Enduro Urban N3 EUN314 | |
| Average Intel Core i7-10710U (3280 - 6248, n=6) | |
| Durabook S14I | |
| Dell Latitude 5420 Rugged-P85G | |
| Getac B360 | |
| Getac S410 | |
| PCMark 10 Score | 4286 points | |
Help | ||
| AIDA64 / Memory Copy | |
| Acer Enduro Urban N3 EUN314 | |
| Panasonic Toughbook FZ-55 MK2 | |
| Getac B360 | |
| Durabook S14I | |
| AIDA64 / Memory Read | |
| Acer Enduro Urban N3 EUN314 | |
| Panasonic Toughbook FZ-55 MK2 | |
| Getac B360 | |
| Durabook S14I | |
| AIDA64 / Memory Write | |
| Acer Enduro Urban N3 EUN314 | |
| Panasonic Toughbook FZ-55 MK2 | |
| Getac B360 | |
| Durabook S14I | |
| AIDA64 / Memory Latency | |
| Acer Enduro Urban N3 EUN314 | |
| Panasonic Toughbook FZ-55 MK2 | |
| Durabook S14I | |
| Getac B360 | |
* ... smaller is better
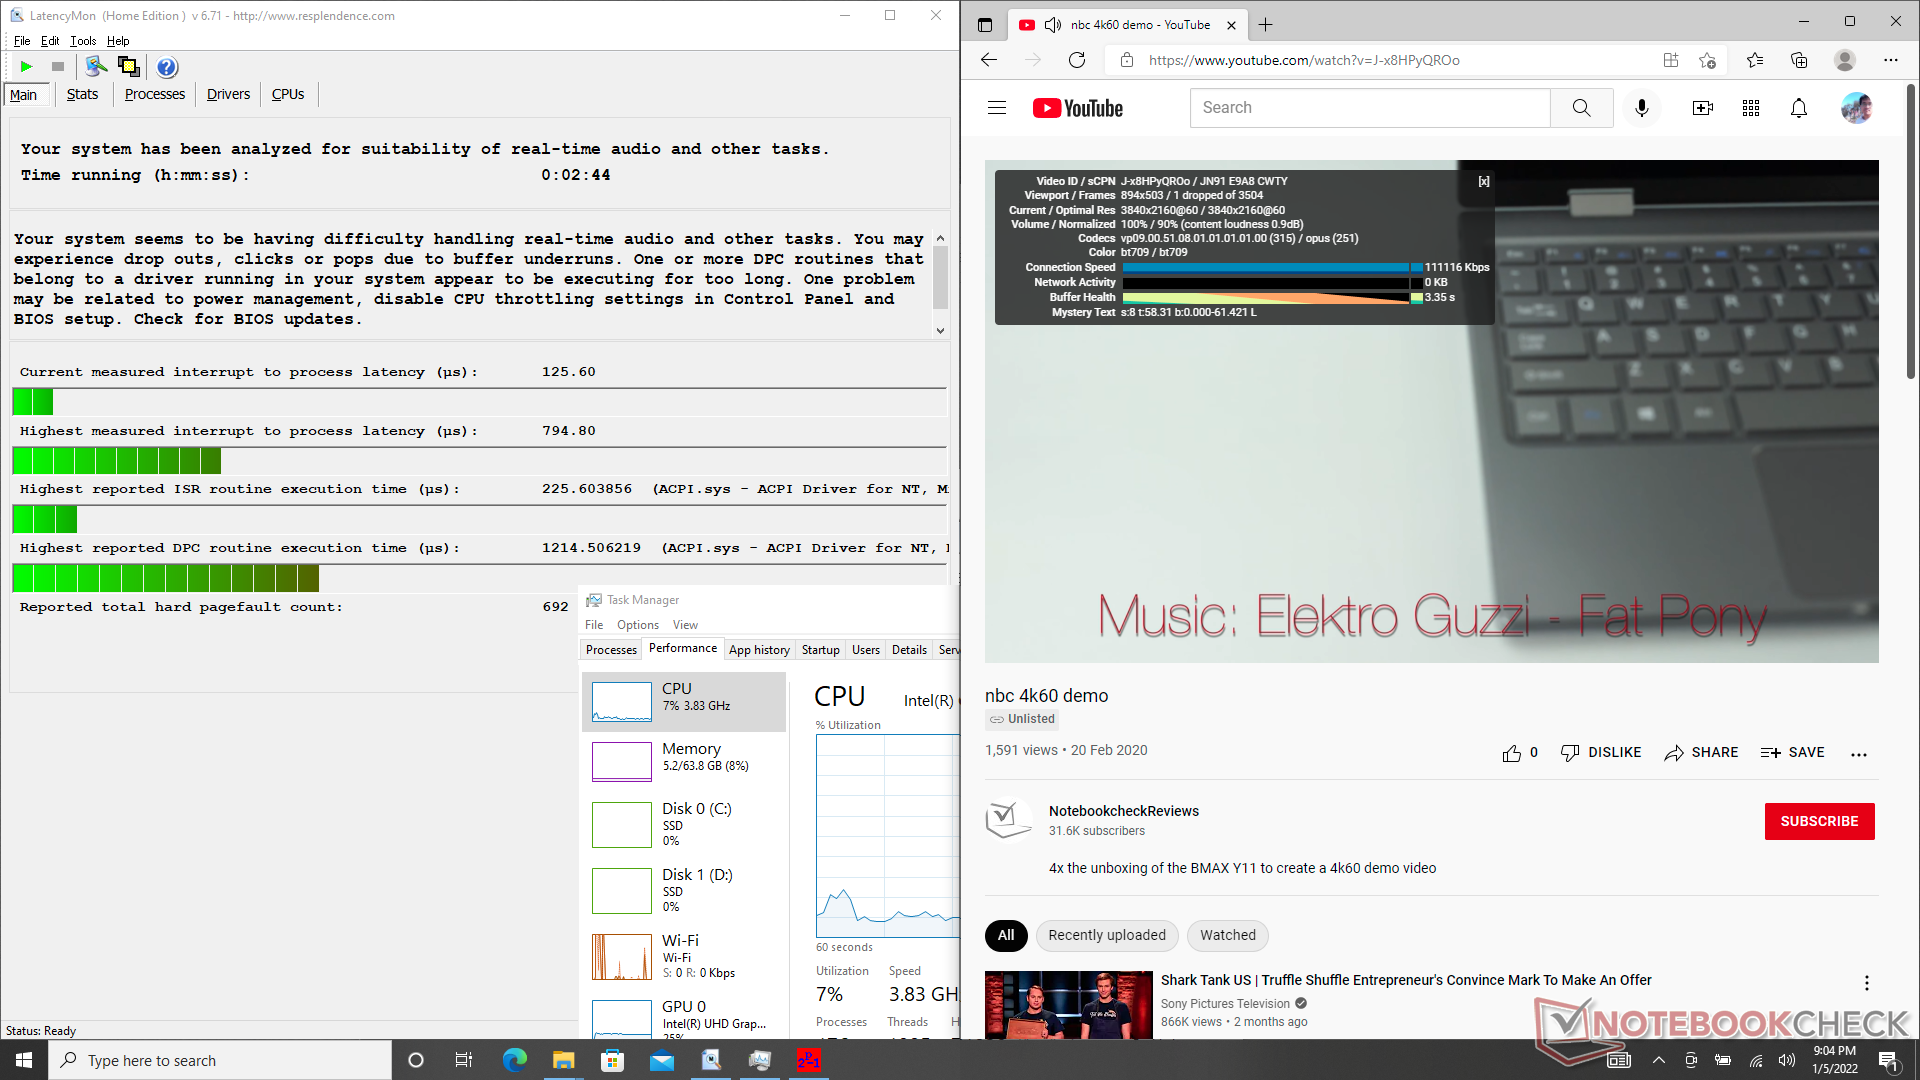
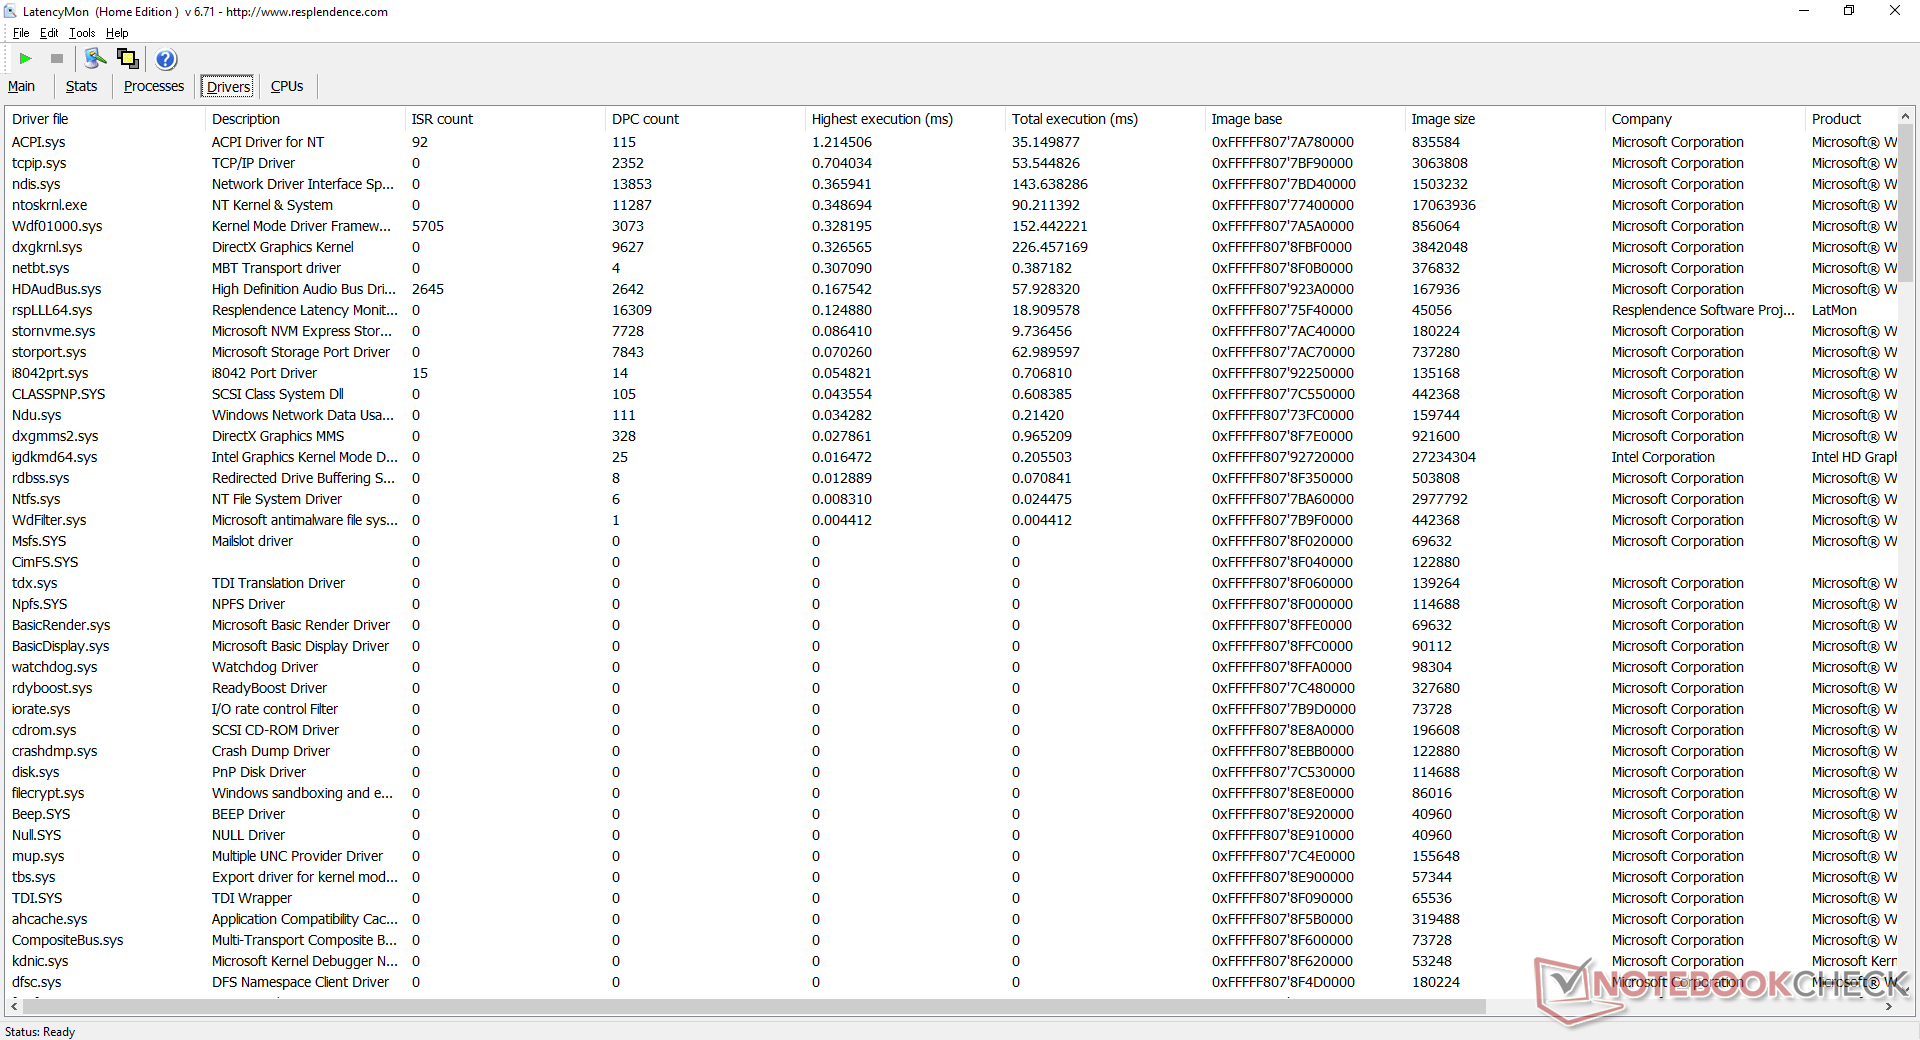
DPC Latency
Our unit exhibits slight latency issues when opening multiple tabs on our homepage. 4K video playback at 60 FPS is otherwise smooth and just a single dropped frame during our minute-long video test.
| DPC Latencies / LatencyMon - interrupt to process latency (max), Web, Youtube, Prime95 | |
| Acer Enduro Urban N3 EUN314 | |
| Panasonic Toughbook FZ-55 MK2 | |
| Durabook S14I | |
| Getac B360 | |
* ... smaller is better
Storage Devices
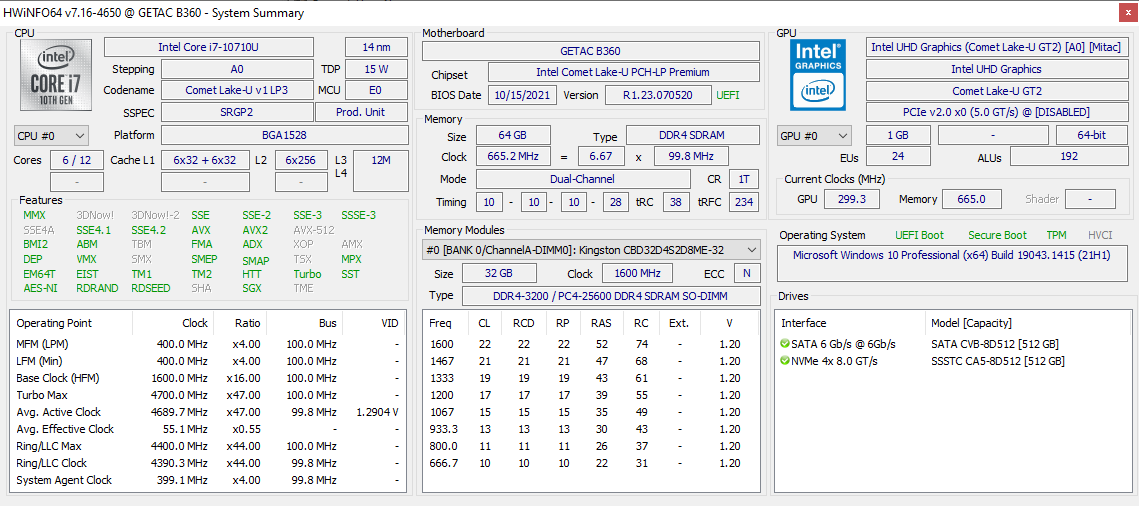
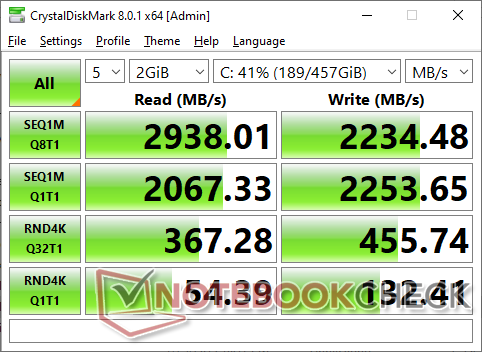
Up to two M.2 drives are supported (1x PCIe + 1x SATA). The second drive, however, is an optional upgrade. Both slots are accessible via two orange latches along the left edge of the chassis. These removable modules connect to the laptop via USB-C meaning you can technically connect these modules to other laptops, but Getac doesn't recommend it. Our specific review unit comes with a 512 GB Lite-On CA5-8D512 PCIe3 x4 NVMe SSD.
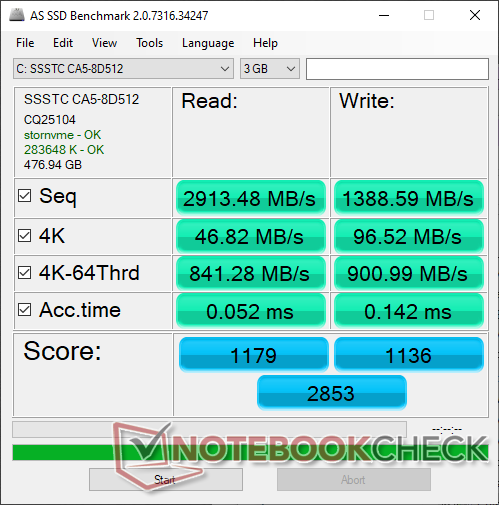

| Drive Performance rating - Percent | |
| Getac B360 | |
| Acer Enduro Urban N3 EUN314 | |
| Durabook S14I | |
| Dell Latitude 5420 Rugged-P85G -8! | |
| Panasonic Toughbook FZ-55 MK2 | |
| Getac S410 -8! | |
* ... smaller is better
Disk Throttling: DiskSpd Read Loop, Queue Depth 8
GPU Performance
The UHD Graphics 620 has become outdated. Expect performance to be far behind the latest integrated GPUs from the AMD Zen series or the Intel Ice Lake or Tiger Lake series.
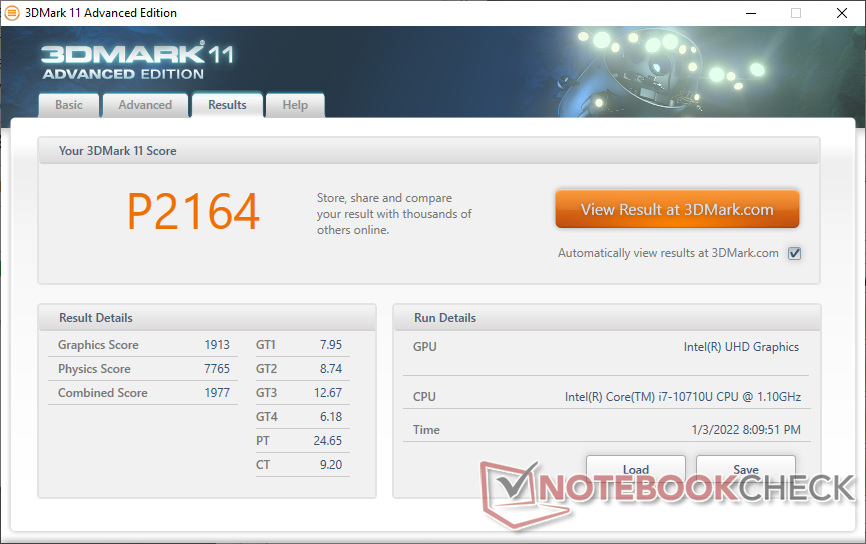

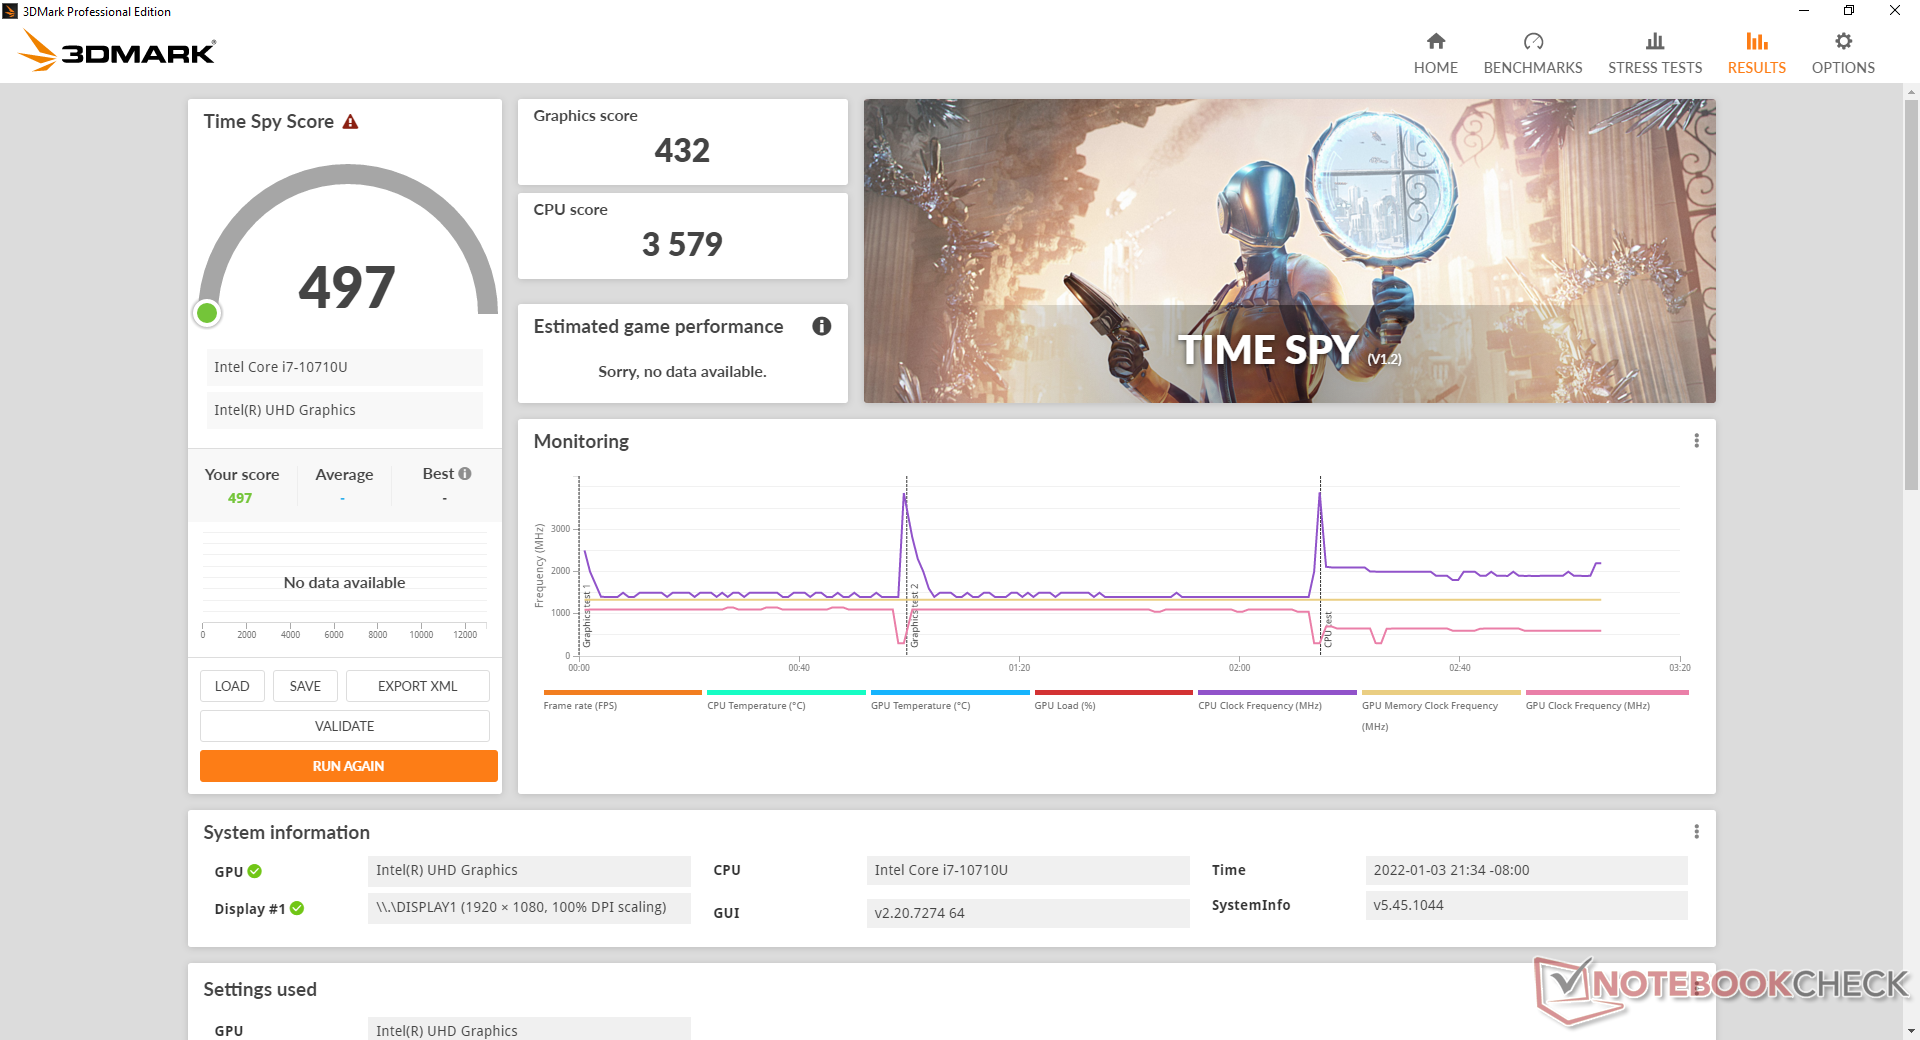
| 3DMark 11 Performance | 2164 points | |
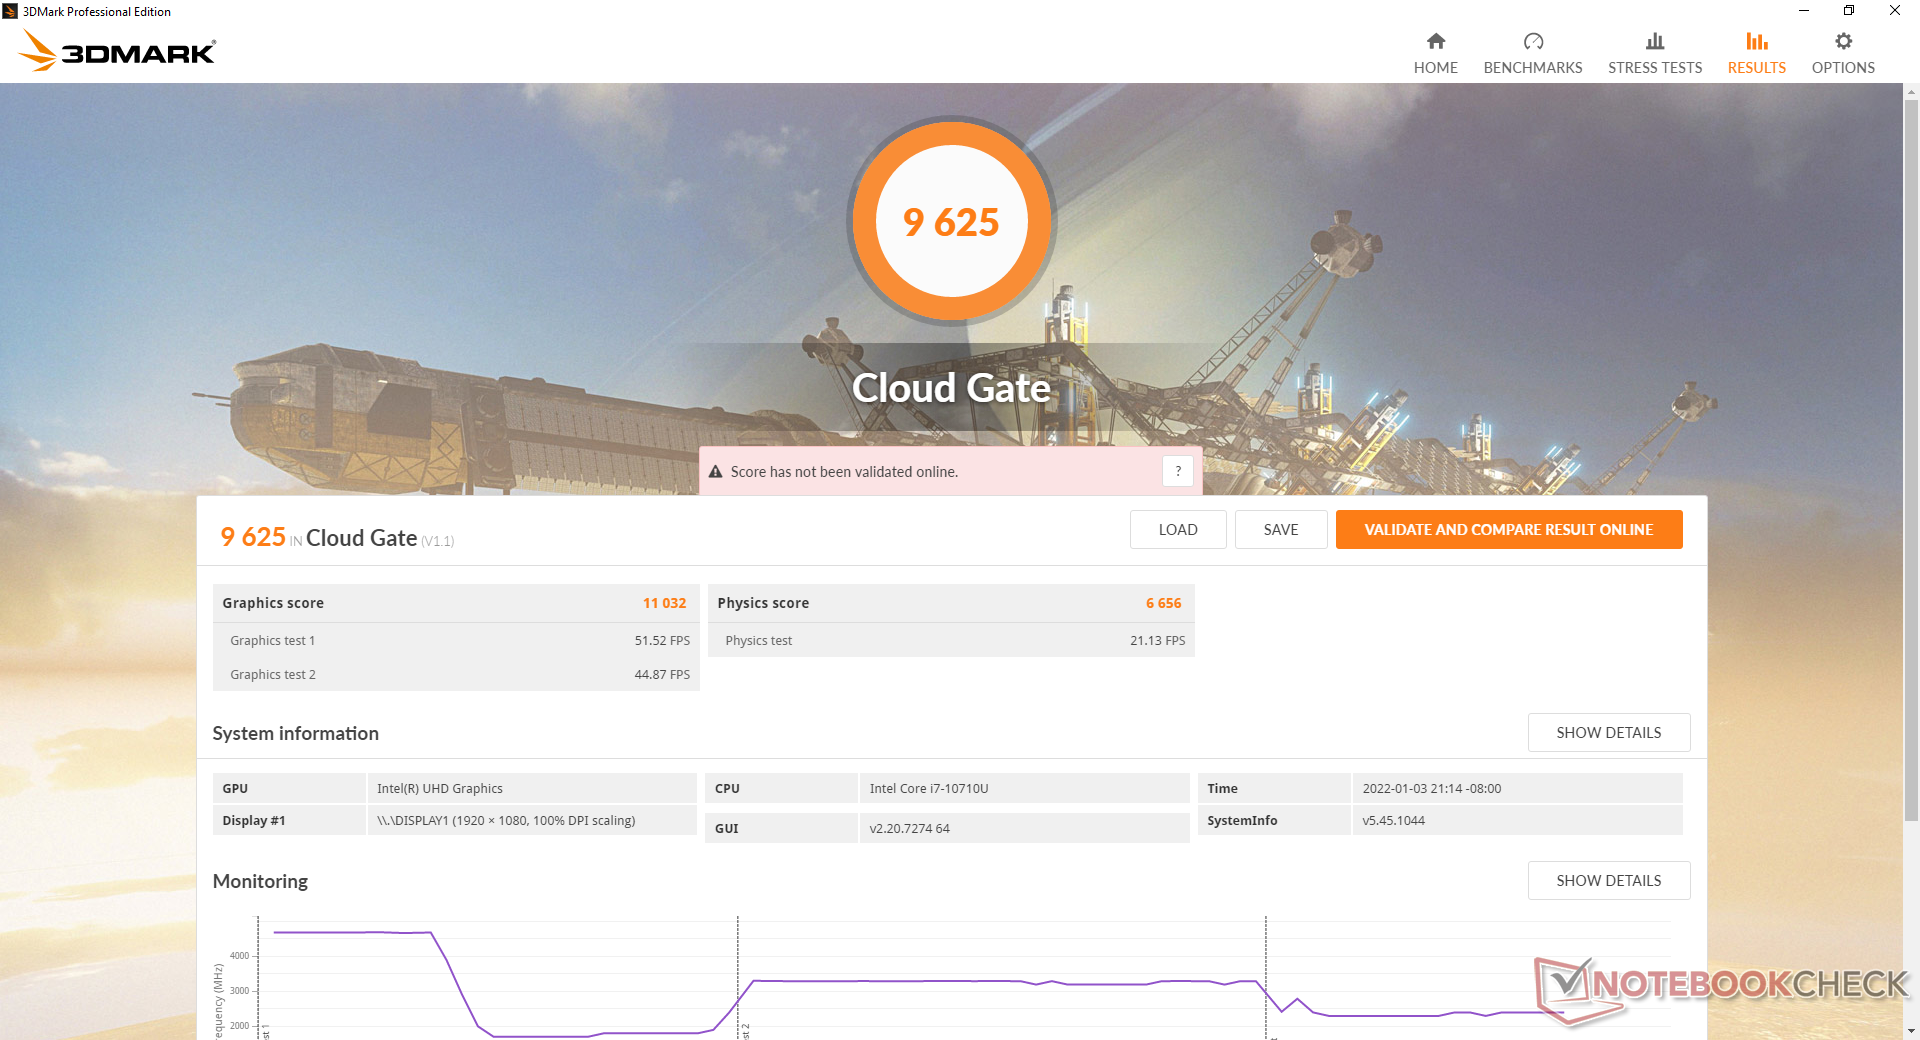
| 3DMark Cloud Gate Standard Score | 9625 points | |
| 3DMark Fire Strike Score | 1286 points | |
| 3DMark Time Spy Score | 497 points | |
Help | ||
Witcher 3 FPS Chart
| low | med. | high | ultra | |
|---|---|---|---|---|
| The Witcher 3 (2015) | 20.7 | 14.3 | 8.4 | 4.8 |
| Dota 2 Reborn (2015) | 85.9 | 56 | 22.8 | 20.3 |
| Final Fantasy XV Benchmark (2018) | 14.2 | 6.77 | 5.05 | |
| X-Plane 11.11 (2018) | 13.2 | 13.8 | 12.4 |
Emissions
System Noise
Maximum fan noise is relatively quiet at just 31 dB(A), but the high pitch makes it more noticeable than we would like when in a quiet environment. Users won't likely notice the fan at all if working outdoors or on the field.
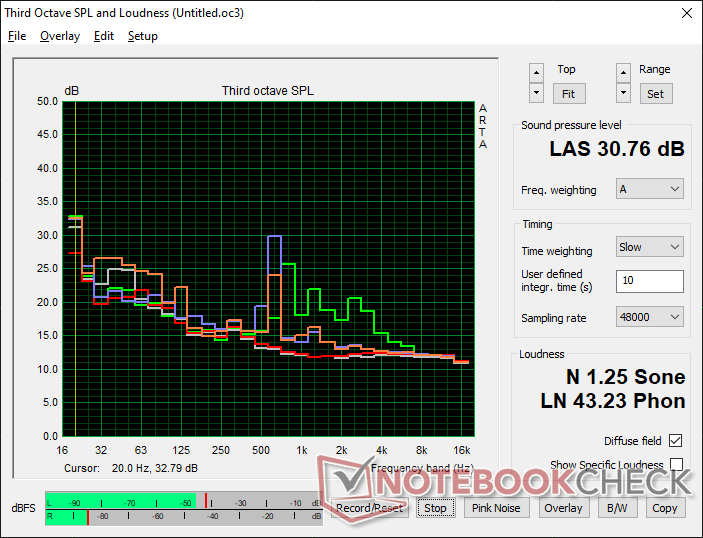
Noise level
| Idle |
| 24.5 / 24.5 / 24.6 dB(A) |
| Load |
| 29.8 / 30.8 dB(A) |
 | ||
30 dB silent 40 dB(A) audible 50 dB(A) loud |
||
min: | ||
| Getac B360 UHD Graphics 620, i7-10710U, Lite-On CA5-8D512 | Dell Latitude 5420 Rugged-P85G Radeon RX 540, i7-8650U, SK hynix PC401 NVMe 500 GB | Getac S410 UHD Graphics 620, i5-8550U, CUKUSA 1 TB SATA SSD Q0526A | Acer Enduro Urban N3 EUN314 Iris Xe G7 96EUs, i7-1165G7, Samsung PM991 MZVLQ1T0HALB | Panasonic Toughbook FZ-55 MK2 Iris Xe G7 96EUs, i7-1185G7, Toshiba KIOXIA KBG4AZNV512G M.2 2280 OPAL | Durabook S14I Iris Xe G7 96EUs, i7-1165G7, UDinfo M2P M2P80DE512GBAEP | |
|---|---|---|---|---|---|---|
| Noise | -14% | -12% | -6% | -3% | -14% | |
| off / environment * (dB) | 24.3 | 28.3 -16% | 28.4 -17% | 23.8 2% | 23.8 2% | 25.2 -4% |
| Idle Minimum * (dB) | 24.5 | 28.3 -16% | 28.4 -16% | 24.1 2% | 24 2% | 25.2 -3% |
| Idle Average * (dB) | 24.5 | 28.3 -16% | 28.4 -16% | 24.1 2% | 24 2% | 25.2 -3% |
| Idle Maximum * (dB) | 24.6 | 28.3 -15% | 28.4 -15% | 24.1 2% | 24 2% | 34.5 -40% |
| Load Average * (dB) | 29.8 | 29.9 -0% | 30.3 -2% | 27.9 6% | 26.7 10% | 34.5 -16% |
| Witcher 3 ultra * (dB) | 27.3 | 35.7 -31% | ||||
| Load Maximum * (dB) | 30.8 | 38 -23% | 33.3 -8% | 38.6 -25% | 41.7 -35% | 36.2 -18% |
* ... smaller is better
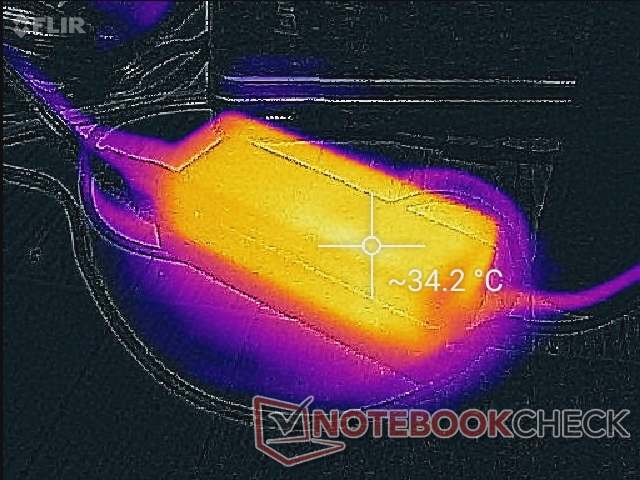
Temperature
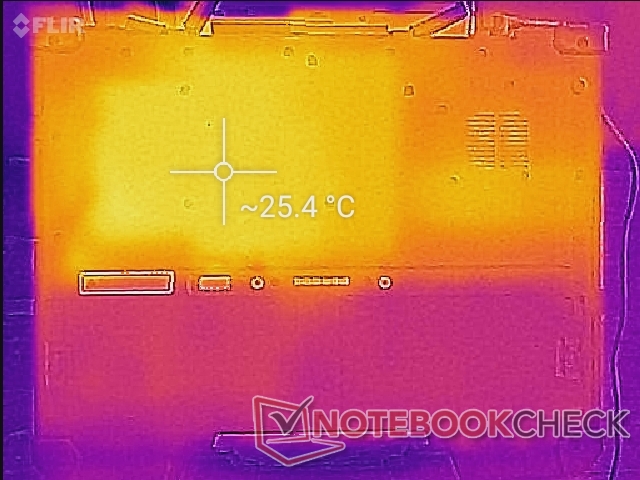
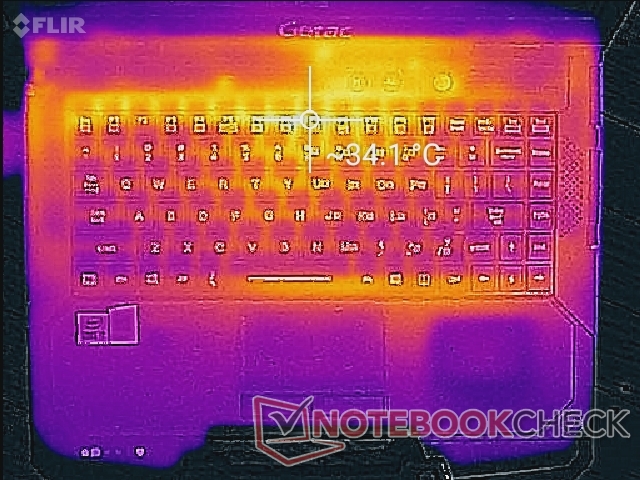
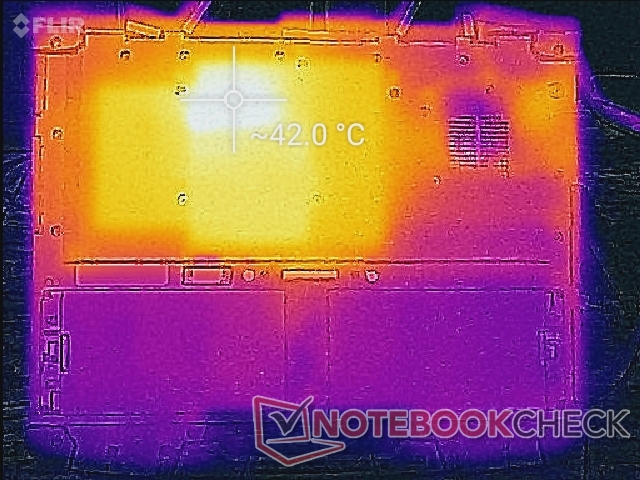
Surface temperatures aren't an issue since you have an ULV CPU in a chassis that's at least 2x or 3x thicker than most Ultrabooks. We're able to record hot spots of 34 C and 42 C on the top and bottom surfaces when running demanding loads.
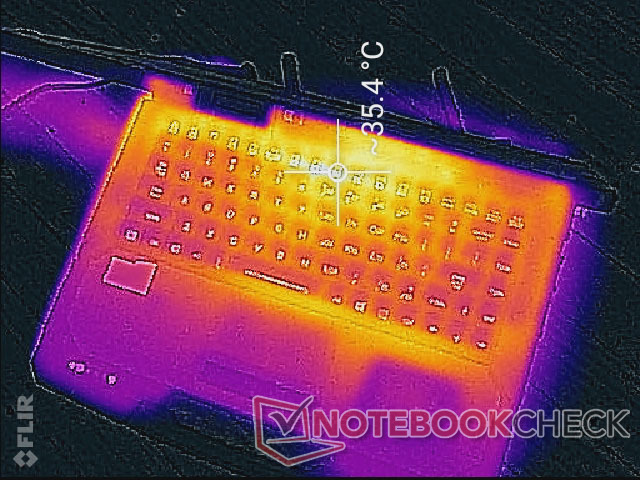
(+) The maximum temperature on the upper side is 33.4 °C / 92 F, compared to the average of 34.3 °C / 94 F, ranging from 21.2 to 62.5 °C for the class Office.
(±) The bottom heats up to a maximum of 42.6 °C / 109 F, compared to the average of 36.8 °C / 98 F
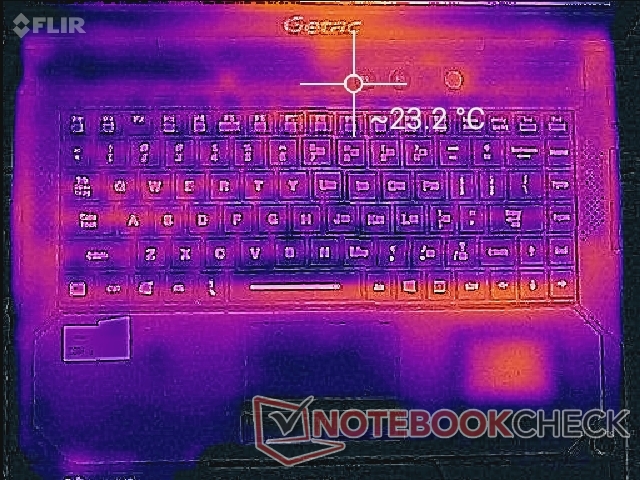
(+) In idle usage, the average temperature for the upper side is 23.2 °C / 74 F, compared to the device average of 29.5 °C / 85 F.
(+) The palmrests and touchpad are cooler than skin temperature with a maximum of 24.2 °C / 75.6 F and are therefore cool to the touch.
(+) The average temperature of the palmrest area of similar devices was 27.5 °C / 81.5 F (+3.3 °C / 5.9 F).
| Getac B360 Intel Core i7-10710U, Intel UHD Graphics 620 | Dell Latitude 5420 Rugged-P85G Intel Core i7-8650U, AMD Radeon RX 540 | Getac S410 Intel Core i7-8550U, Intel UHD Graphics 620 | Acer Enduro Urban N3 EUN314 Intel Core i7-1165G7, Intel Iris Xe Graphics G7 96EUs | Panasonic Toughbook FZ-55 MK2 Intel Core i7-1185G7, Intel Iris Xe Graphics G7 96EUs | Durabook S14I Intel Core i7-1165G7, Intel Iris Xe Graphics G7 96EUs | |
|---|---|---|---|---|---|---|
| Heat | -19% | -25% | -11% | -16% | -16% | |
| Maximum Upper Side * (°C) | 33.4 | 42.2 -26% | 42.6 -28% | 37.8 -13% | 36.2 -8% | 36.4 -9% |
| Maximum Bottom * (°C) | 42.6 | 42 1% | 49 -15% | 45.8 -8% | 42.2 1% | 38.6 9% |
| Idle Upper Side * (°C) | 24.2 | 31.6 -31% | 30.8 -27% | 26.4 -9% | 31 -28% | 32.6 -35% |
| Idle Bottom * (°C) | 26.2 | 31.8 -21% | 34.4 -31% | 30.2 -15% | 34 -30% | 33.8 -29% |
* ... smaller is better
Stress Test
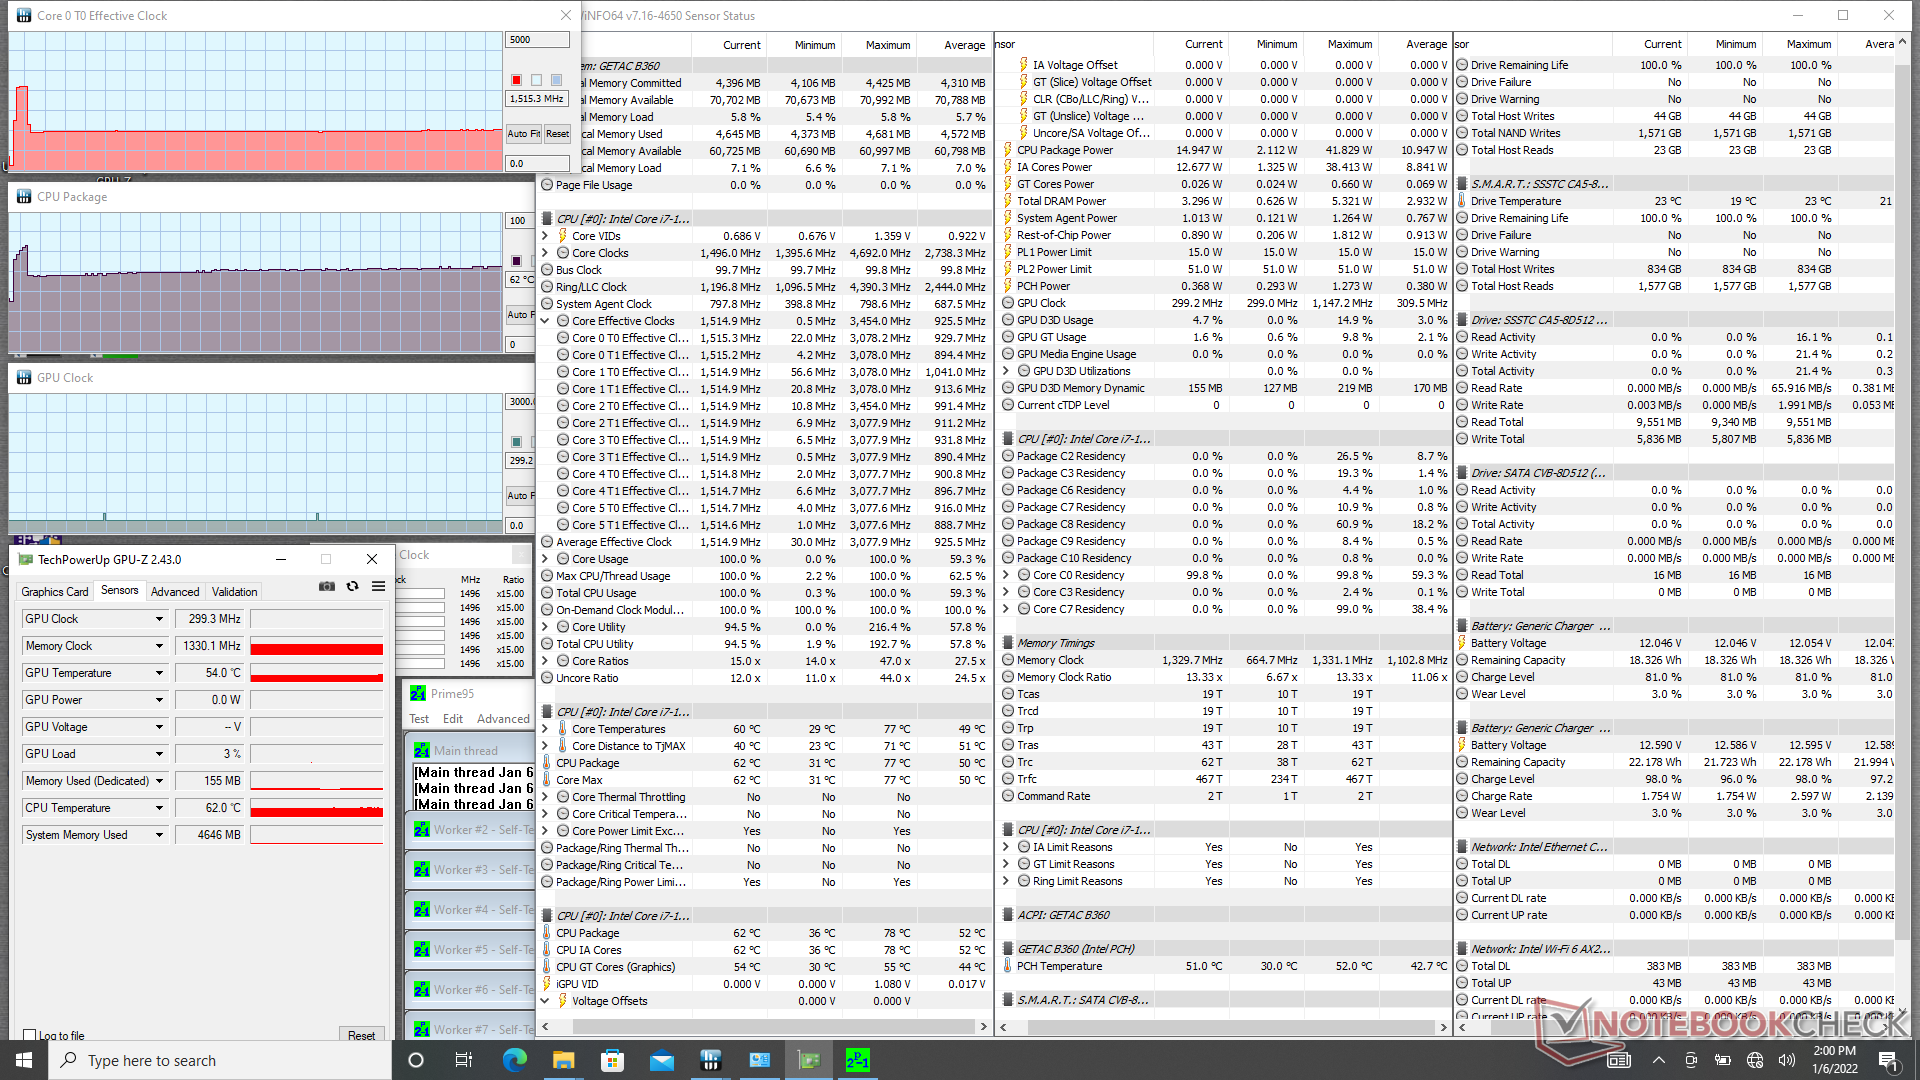
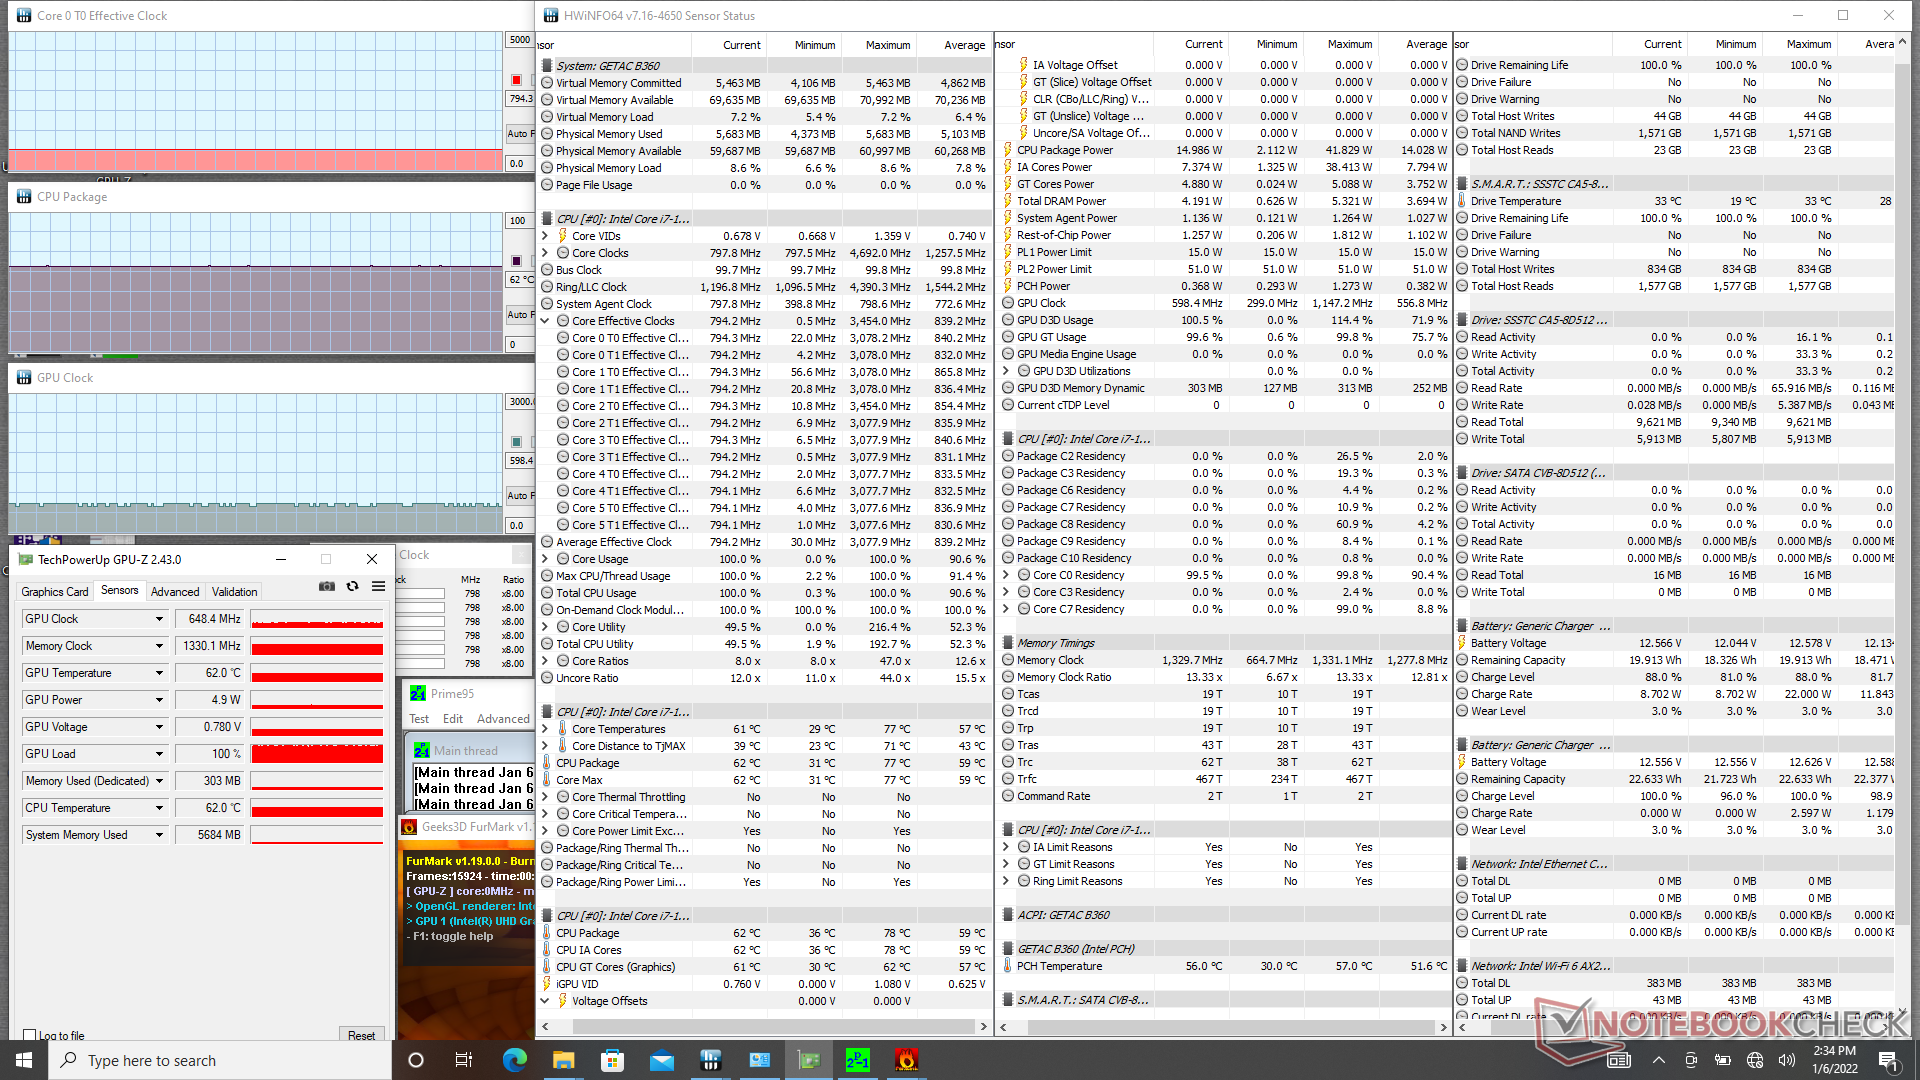
When running Prime95, CPU clock rates would boost to 3 GHz for just the first few seconds until hitting a core temperature of 77 C. Clock rates would then fall and stabilize at just 1.5 GHz and 62 C, respectively. The mid 60 C range appears to be the sweet spot for this system when running demanding loads.
Running on battery power will not impact performance. A 3DMark 11 test on batteries would return Physics and Graphics scores of 7884 and 1906 points, respectively, compared to 7765 and 1913 points when on mains.
| CPU Clock (GHz) | GPU Clock (MHz) | Average CPU Temperature (°C) | |
| System Idle | -- | -- | 34 |
| Prime95 Stress | 1.5 | -- | 62 |
| Prime95 + FurMark Stress | 0.8 | 598 - 648 | 62 |
| Witcher 3 Stress | ~0.4 | 1047 | 66 |
Speakers
Getac B360 audio analysis
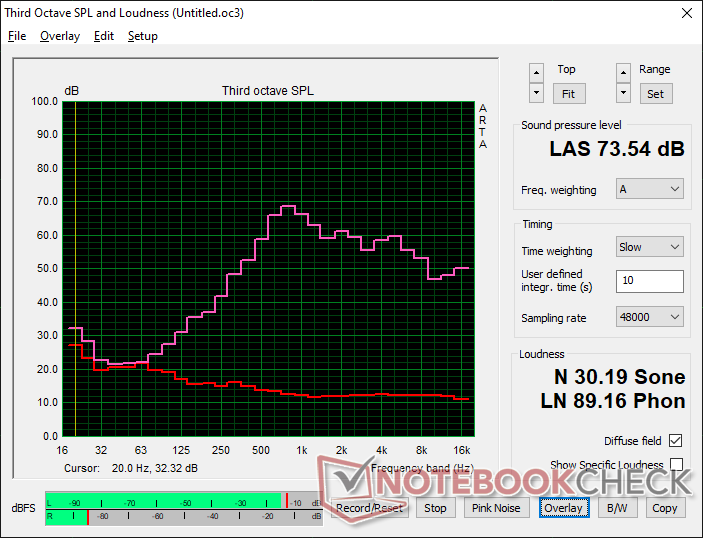
(±) | speaker loudness is average but good (73.5 dB)
Bass 100 - 315 Hz
(-) | nearly no bass - on average 18.6% lower than median
(±) | linearity of bass is average (9.3% delta to prev. frequency)
Mids 400 - 2000 Hz
(±) | higher mids - on average 7.2% higher than median
(±) | linearity of mids is average (9.1% delta to prev. frequency)
Highs 2 - 16 kHz
(+) | balanced highs - only 3.1% away from median
(±) | linearity of highs is average (7.4% delta to prev. frequency)
Overall 100 - 16.000 Hz
(±) | linearity of overall sound is average (22.9% difference to median)
Compared to same class
» 63% of all tested devices in this class were better, 8% similar, 29% worse
» The best had a delta of 7%, average was 21%, worst was 53%
Compared to all devices tested
» 68% of all tested devices were better, 6% similar, 26% worse
» The best had a delta of 4%, average was 24%, worst was 134%
Apple MacBook Pro 16 2021 M1 Pro audio analysis
(+) | speakers can play relatively loud (84.7 dB)
Bass 100 - 315 Hz
(+) | good bass - only 3.8% away from median
(+) | bass is linear (5.2% delta to prev. frequency)
Mids 400 - 2000 Hz
(+) | balanced mids - only 1.3% away from median
(+) | mids are linear (2.1% delta to prev. frequency)
Highs 2 - 16 kHz
(+) | balanced highs - only 1.9% away from median
(+) | highs are linear (2.7% delta to prev. frequency)
Overall 100 - 16.000 Hz
(+) | overall sound is linear (4.6% difference to median)
Compared to same class
» 0% of all tested devices in this class were better, 0% similar, 100% worse
» The best had a delta of 5%, average was 17%, worst was 45%
Compared to all devices tested
» 0% of all tested devices were better, 0% similar, 100% worse
» The best had a delta of 4%, average was 24%, worst was 134%
Energy Management
Power Consumption
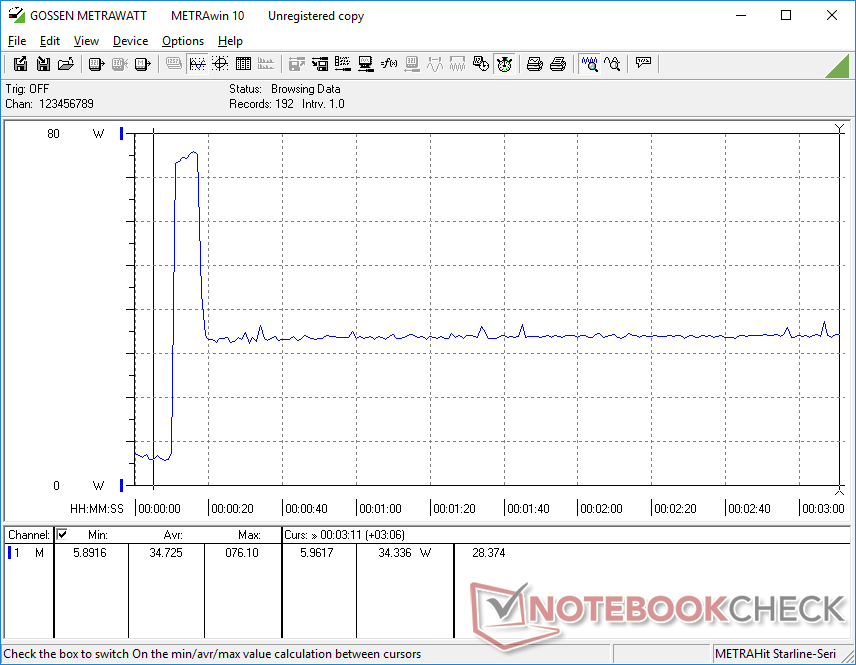
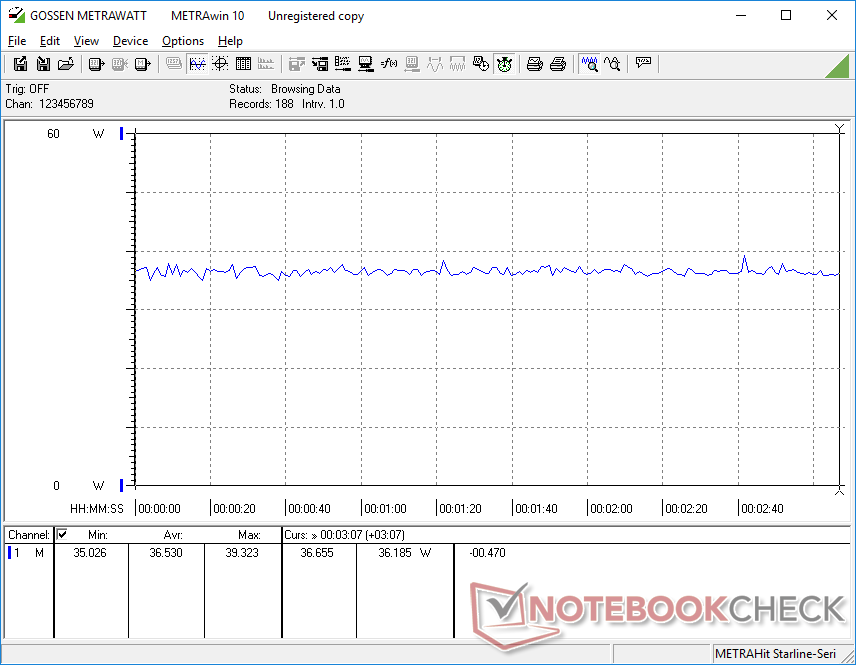
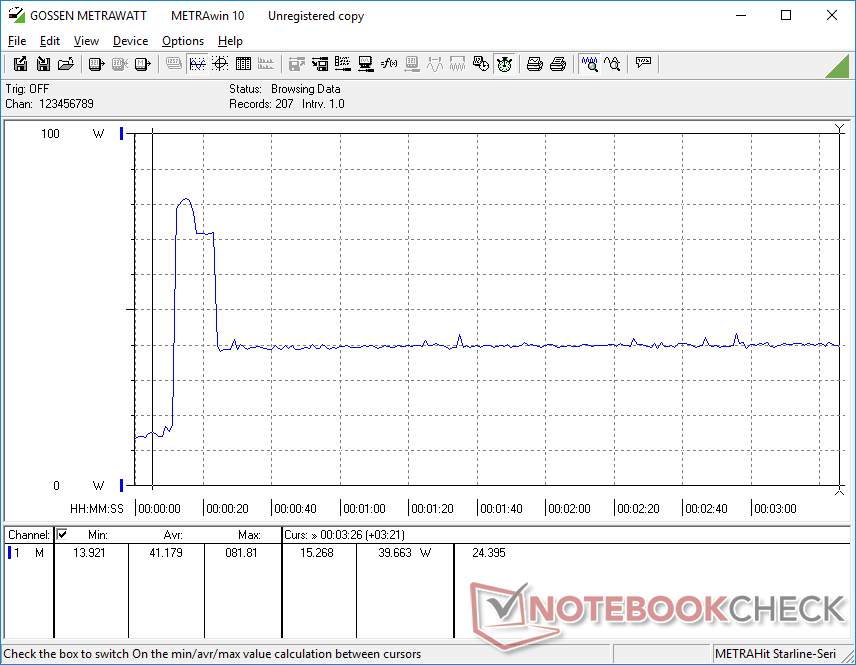
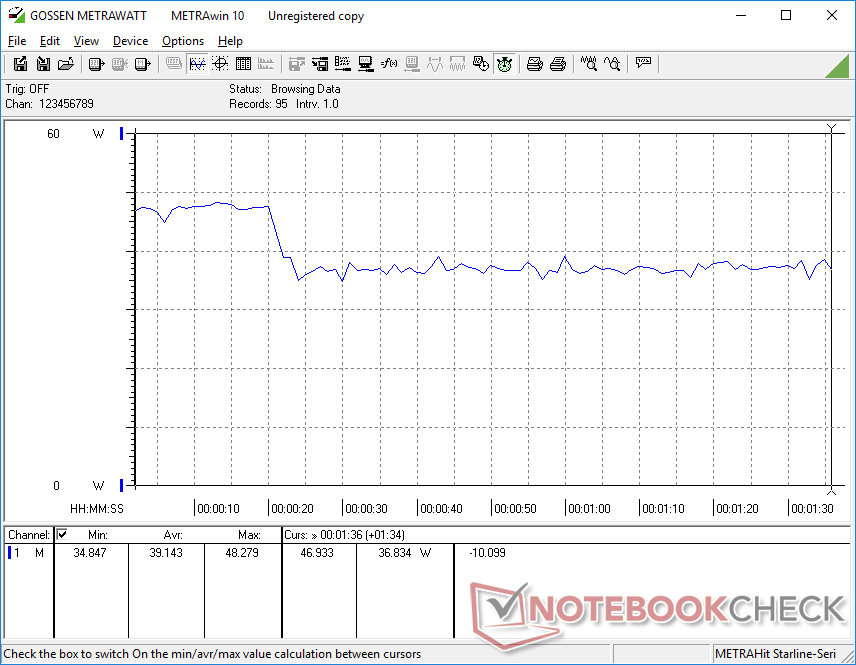
Idling on desktop will consume about 5 W on the lowest brightness setting or up to 13 W if on the highest brightness setting. The 8 W difference is higher than on a typical Ultrabook since the Getac display can be significantly brighter.
Running medium or high loads will demand about 36 W to 40 W to be comparable to most laptops running on newer 11th gen Core processors despite the massive GPU disadvantage of our UHD Graphics 620. However, we do appreciate that the system ships with a 90 W (~12.8 x 5.2 x 3 cm) AC adapter whereas many other laptops with ULV CPUs typically come with 60 W adapters or lower.
| Off / Standby | |
| Idle | |
| Load |
|
Key:
min: | |
| Getac B360 i7-10710U, UHD Graphics 620, Lite-On CA5-8D512, IPS, 1920x1080, 13.3" | Dell Latitude 5420 Rugged-P85G i7-8650U, Radeon RX 540, SK hynix PC401 NVMe 500 GB, IPS, 1920x1080, 14" | Getac S410 i5-8550U, UHD Graphics 620, CUKUSA 1 TB SATA SSD Q0526A, TN PED, 1366x768, 14" | Acer Enduro Urban N3 EUN314 i7-1165G7, Iris Xe G7 96EUs, Samsung PM991 MZVLQ1T0HALB, IPS, 1920x1080, 14" | Panasonic Toughbook FZ-55 MK2 i7-1185G7, Iris Xe G7 96EUs, Toshiba KIOXIA KBG4AZNV512G M.2 2280 OPAL, IPS, 1920x1080, 14" | Durabook S14I i7-1165G7, Iris Xe G7 96EUs, UDinfo M2P M2P80DE512GBAEP, TN, 1920x1080, 14" | |
|---|---|---|---|---|---|---|
| Power Consumption | -31% | 28% | 26% | 2% | -17% | |
| Idle Minimum * (Watt) | 5.4 | 4.8 11% | 5.6 -4% | 3.8 30% | 3.5 35% | 6.8 -26% |
| Idle Average * (Watt) | 12.2 | 13.6 -11% | 7.9 35% | 8 34% | 10.4 15% | 16.4 -34% |
| Idle Maximum * (Watt) | 12.6 | 13.8 -10% | 8.4 33% | 8.7 31% | 10.5 17% | 16.9 -34% |
| Load Average * (Watt) | 39.1 | 67.8 -73% | 32.8 16% | 34.6 12% | 45.4 -16% | 39.2 -0% |
| Witcher 3 ultra * (Watt) | 36.5 | 69.1 -89% | 35.4 3% | 43 -18% | ||
| Load Maximum * (Watt) | 81.8 | 93.5 -14% | 34.3 58% | 45.4 44% | 99.3 -21% | 73.1 11% |
* ... smaller is better
Power Consumption Witcher 3 / Stresstest
Power Consumption external Monitor
Battery Life
We're able to squeeze about 8 hours of real-world WLAN use when both removable battery packs (2 x 23 Wh) are installed. Recharging from empty to full capacity is somewhat slow at about 2.5 hours compared to 1.5 hours on most other laptops. Users can also recharge the laptop with third party USB-C adapters.
| Getac B360 i7-10710U, UHD Graphics 620, 46 Wh | Dell Latitude 5420 Rugged-P85G i7-8650U, Radeon RX 540, 102 Wh | Getac S410 i5-8550U, UHD Graphics 620, 46.6 Wh | Acer Enduro Urban N3 EUN314 i7-1165G7, Iris Xe G7 96EUs, 50.3 Wh | Panasonic Toughbook FZ-55 MK2 i7-1185G7, Iris Xe G7 96EUs, 71 Wh | Durabook S14I i7-1165G7, Iris Xe G7 96EUs, 50 Wh | |
|---|---|---|---|---|---|---|
| Battery runtime | 100% | -36% | -21% | 68% | -32% | |
| WiFi v1.3 (h) | 8.1 | 16.2 100% | 5.2 -36% | 6.4 -21% | 13.6 68% | 5.5 -32% |
| Reader / Idle (h) | 31.4 | |||||
| Load (h) | 3.2 |
Pros
Cons
Verdict
The B360 does some notable things right that many other rugged laptops miss or ignore. Its display, for example, has deeper colors and higher contrast than expected for a better visual experience even though the system wasn't designed for any sort of graphics editing. The touchpad is also much more responsive when not wearing gloves unlike on the Durabook S14I and its jumpy touchpad. Combine these with the comfortable and clicky keyboard keys and you have an agreeable, no-nonsense user experience that any rugged device should be aiming for.
Surprisingly good IPS display for a rugged model in terms of brightness, colors, and contrast. The older Intel 10th gen CPU, however, is beginning to show its age.
There is a lot of room for improvement. Pulse-width modulation is present on all brightness levels which may affect users sensitive to onscreen flickering. The port covers are very annoying to lock and unlock especially since they tend to pop out on their own after locking. The lack of newer Intel 11th gen CPU options means owners will be missing out on PCIe4, Thunderbolt, and significantly higher performance-per-watt. RAM is difficult to access while maximum volume is softer than expected. A larger fan could have potentially mitigated the high-pitched fan noise when running demanding loads. We fully expect the eventual next generation model to make the jump to Intel Tiger Lake for the performance boost much like on the faster Durabook S14I or Acer Enduro Urban N3.
Price and Availability
Configuration and quotes can be requested directly from Getac.
Getac B360
- 01/10/2022 v7 (old)
Allen Ngo
Price comparison
