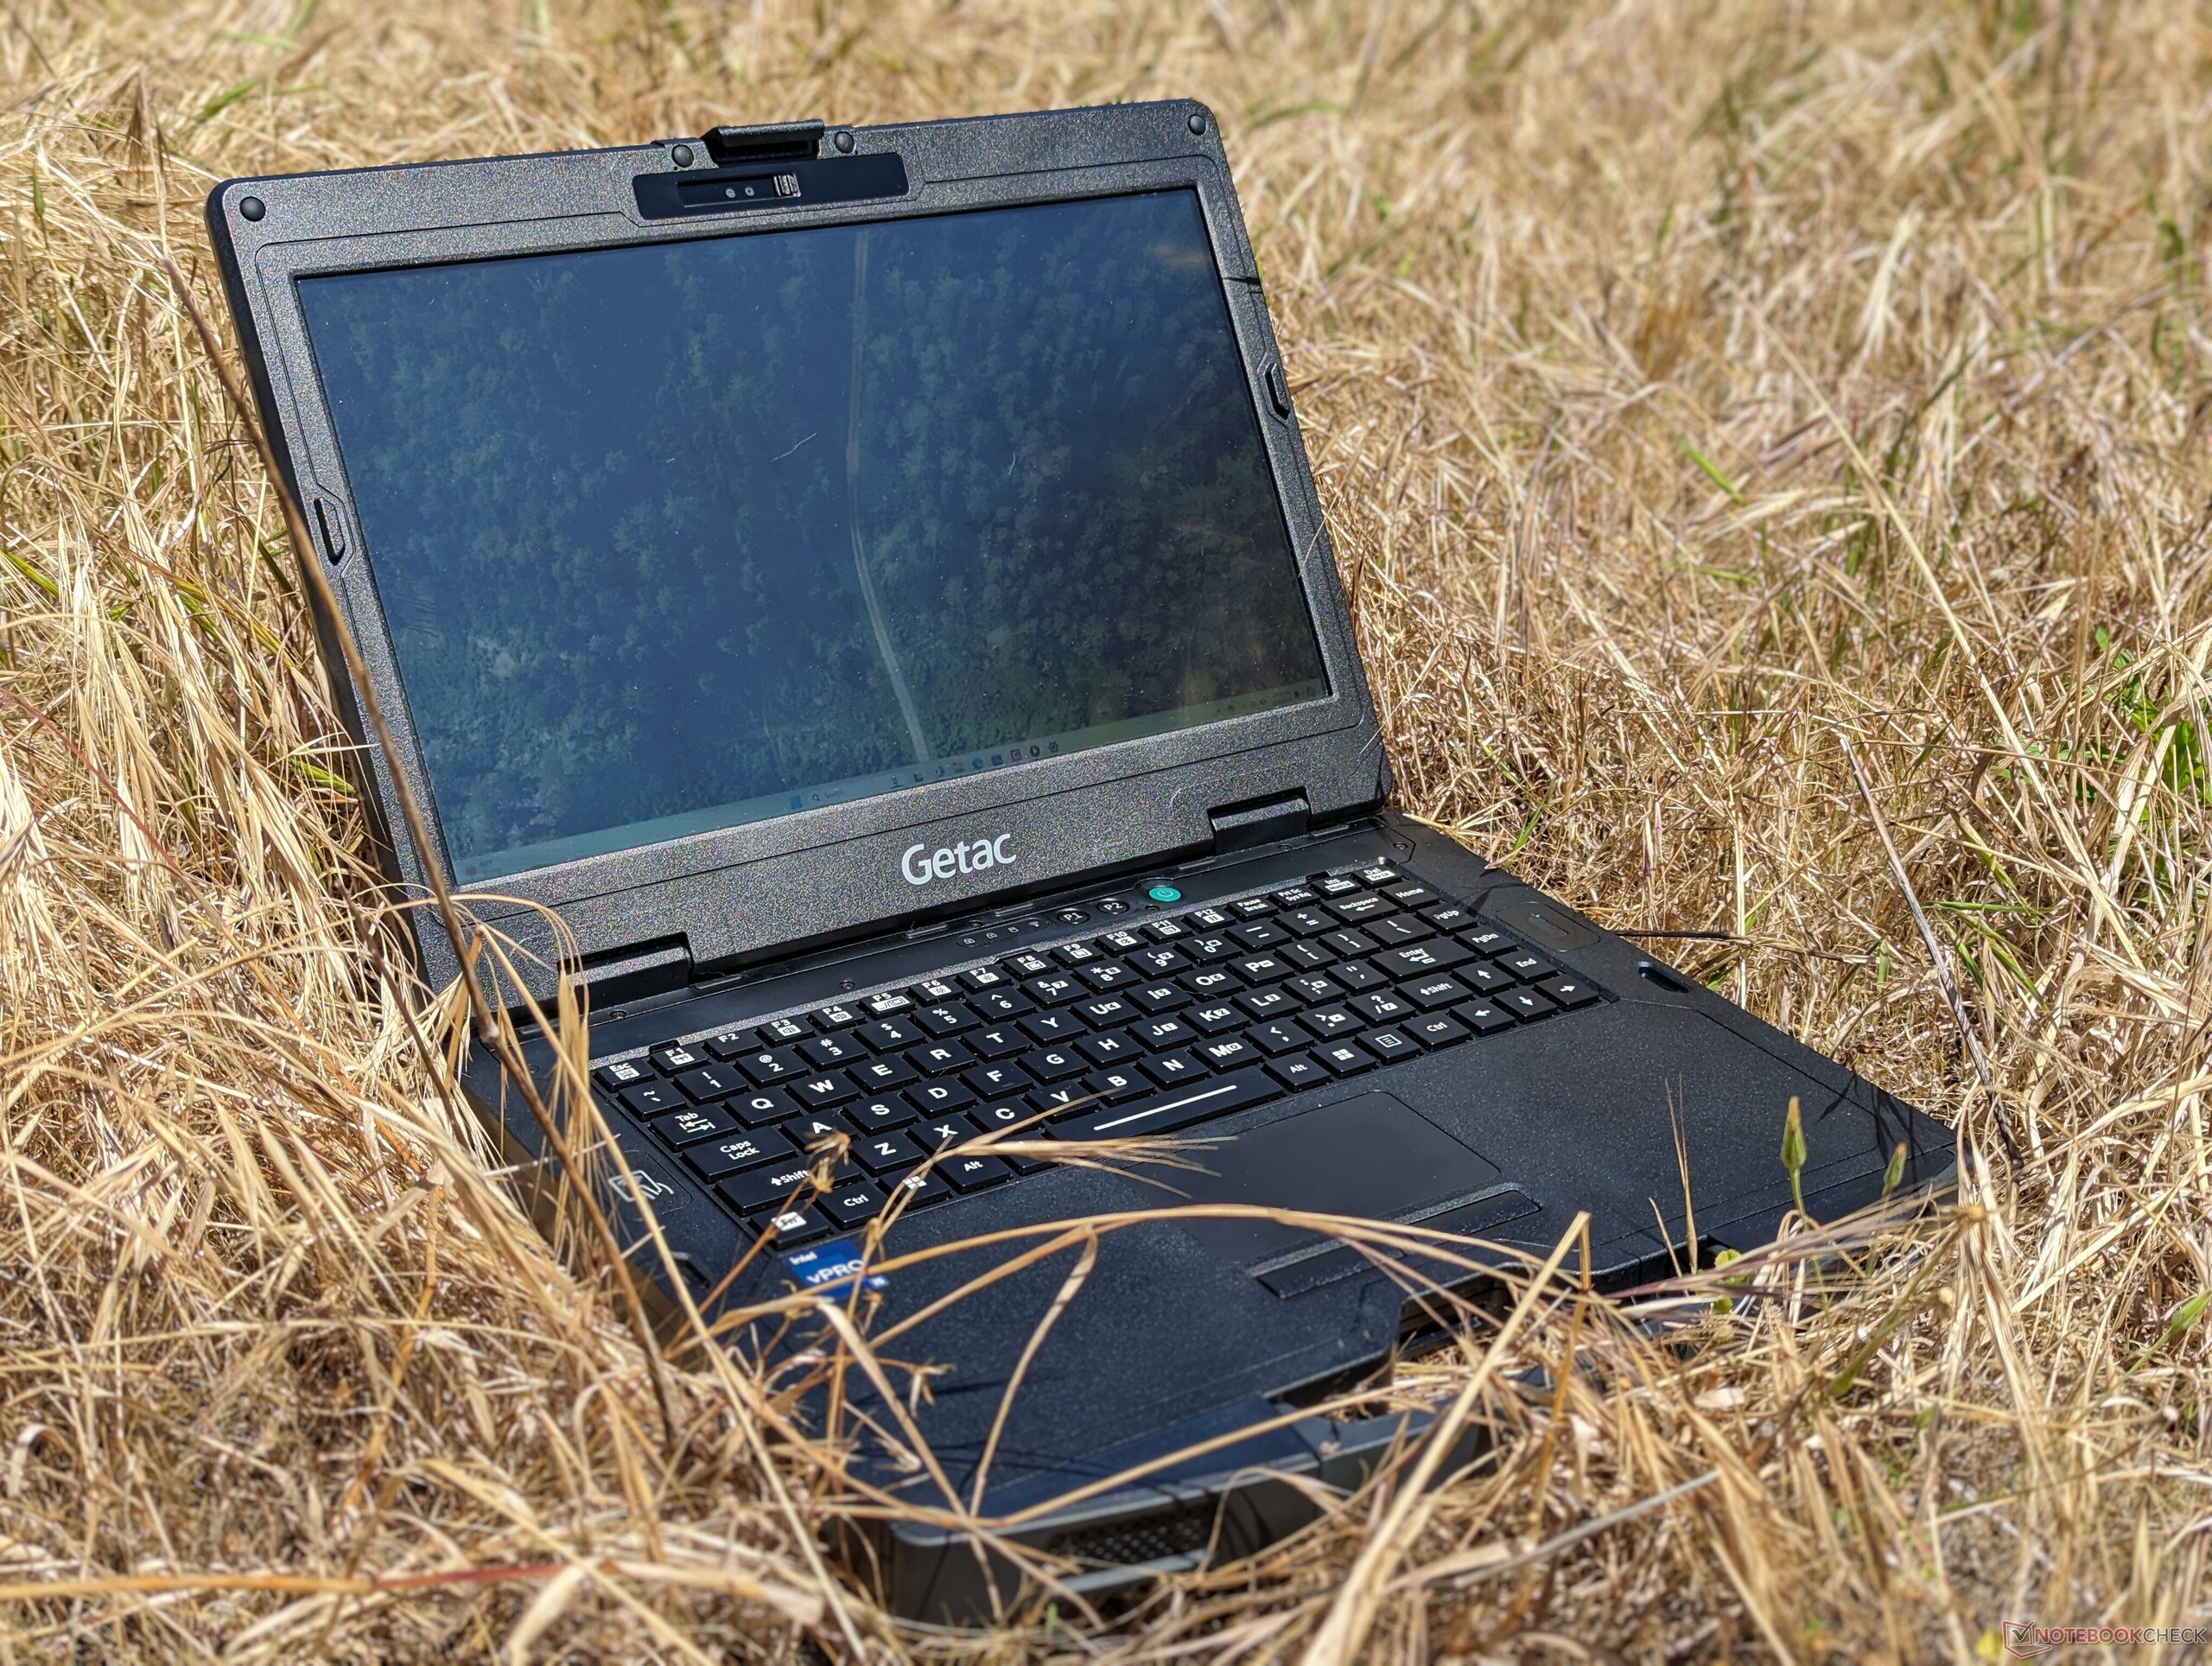
Getac S410 Gen 5 rugged laptop review: Raptor Lake-P for extra performance

The S410 is back this year as a 5th gen model sporting the same physical features as the previous four iterations. Its internals have been updated to include Raptor Lake-P vPro processors which succeed the older Tiger Lake-U options. We recommend checking out our reviews on the S410 G4 and original 2018 S410 to learn more about the chassis and features of the S410 G5 since very little has changed to maintain compatibility with parts and accessories. This review will instead focus on any performance differences between the S410 G5 and its alternatives and predecessors.
More information on the S410 G5 and its long list of customizable features can be found on the official PDF product page here.
More Getac reviews:
Potential Competitors in Comparison
Rating | Date | Model | Weight | Height | Size | Resolution | Price |
|---|---|---|---|---|---|---|---|
| 82.9 % v7 (old) | 06 / 2024 | Getac S410 G5 i5-1350P, Iris Xe G7 80EUs | 2.9 kg | 34.9 mm | 14.00" | 1920x1080 | |
| 81.7 % v7 (old) | 05 / 2022 | Getac S410 Gen 4 i7-1185G7, Iris Xe G7 96EUs | 3.2 kg | 34.9 mm | 14.00" | 1920x1080 | |
v (old) | 04 / 2021 | Durabook S14I i7-1165G7, Iris Xe G7 96EUs | 3 kg | 38.1 mm | 14.00" | 1920x1080 | |
| 84.8 % v7 (old) | 01 / 2022 | Dell Latitude 14 5420-D2G5W i5-1135G7, Iris Xe G7 80EUs | 1.5 kg | 20.9 mm | 14.00" | 1920x1080 | |
v (old) | 04 / 2022 | Dell Latitude 7330 Rugged Extreme i7-1185G7, Iris Xe G7 96EUs | 2.7 kg | 36.5 mm | 13.30" | 1920x1080 | |
v (old) | 07 / 2022 | Panasonic Toughbook 40 i7-1185G7, Iris Xe G7 96EUs | 3.9 kg | 53.4 mm | 14.00" | 1920x1080 |
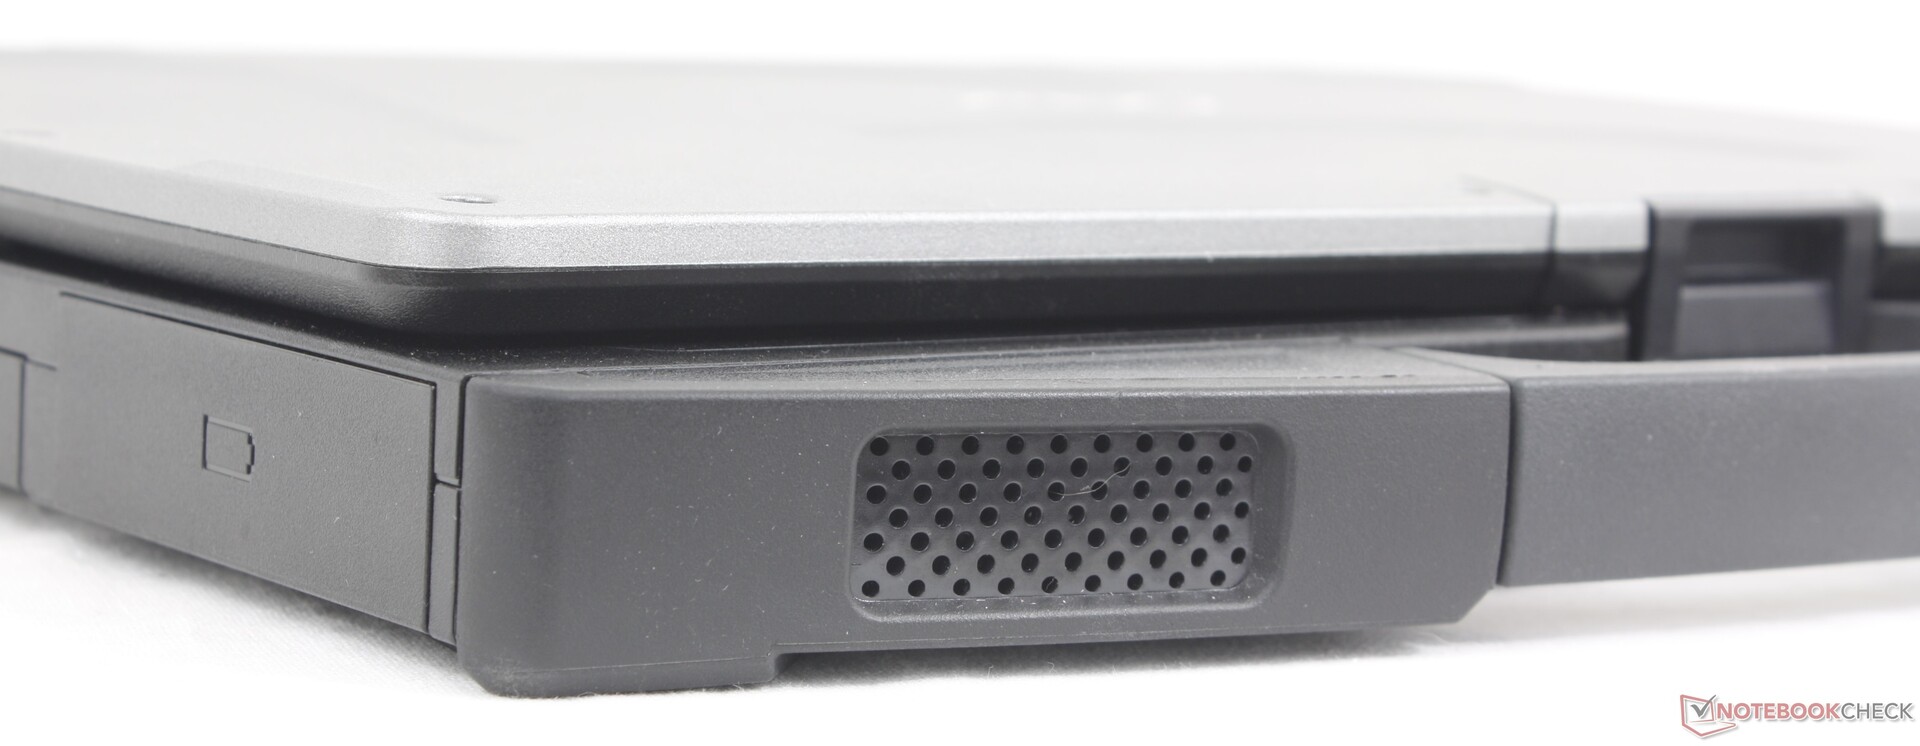
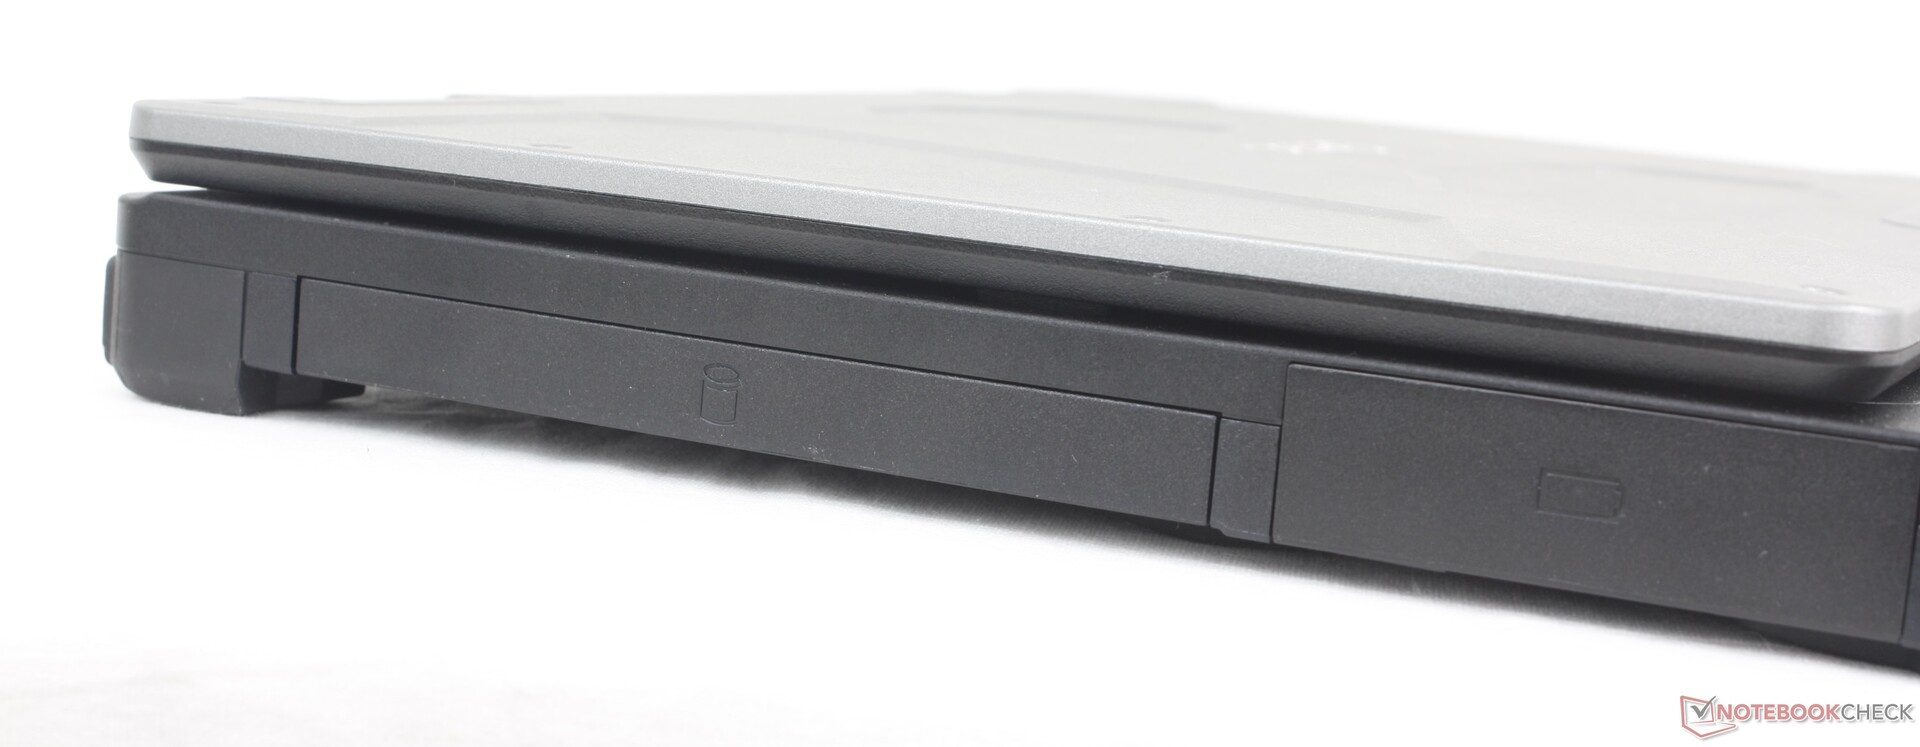
Case — Rugged With MIL-STD-810H and IP53 Certification
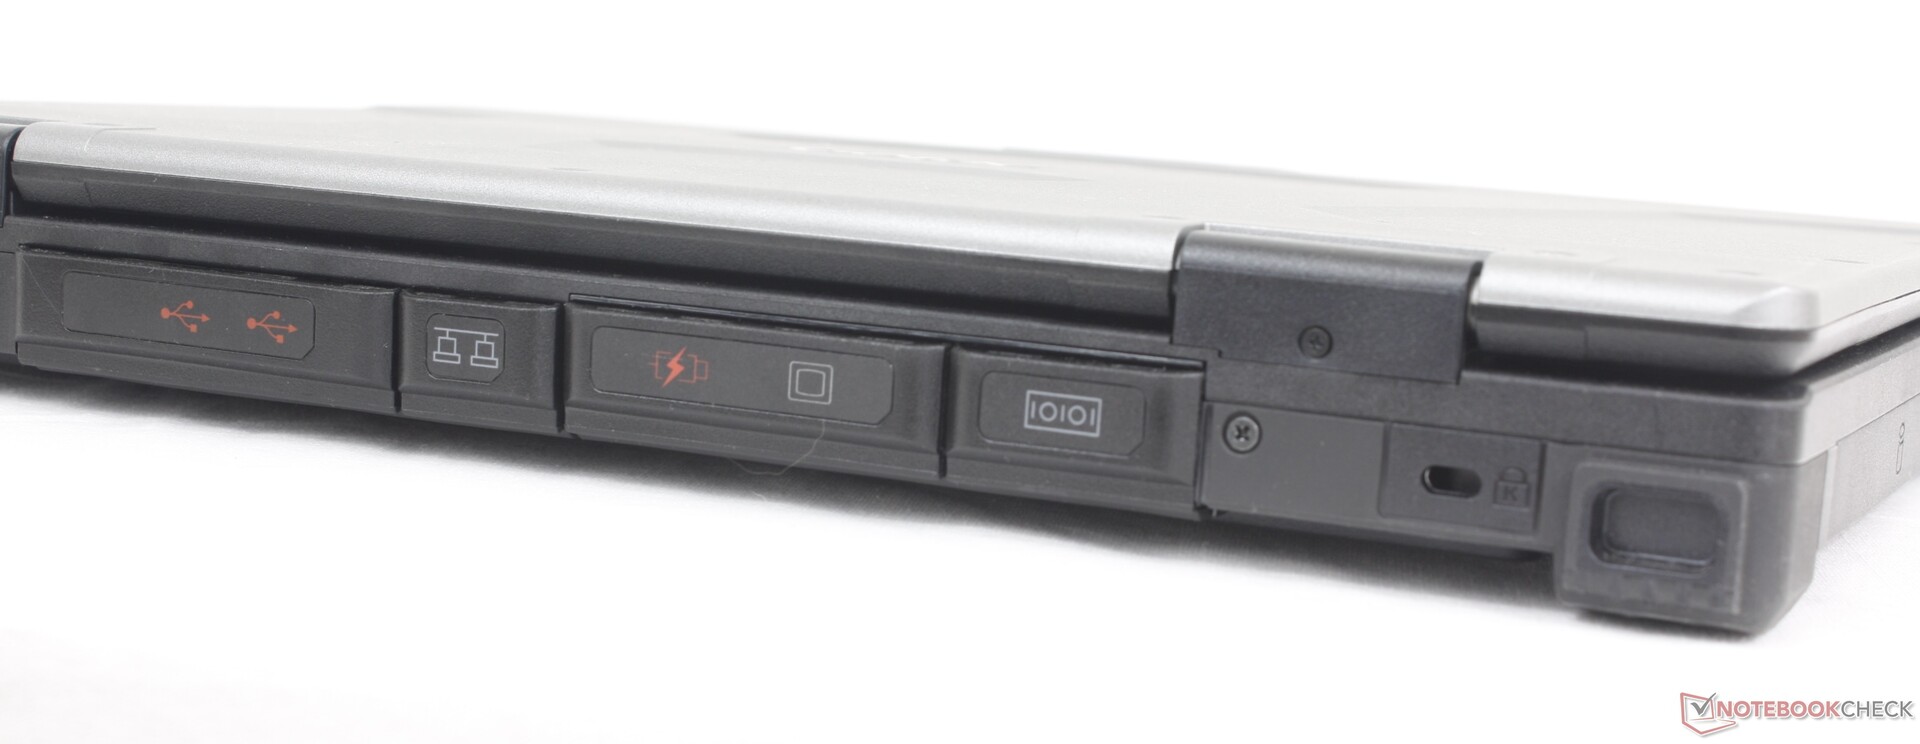
Connectivity
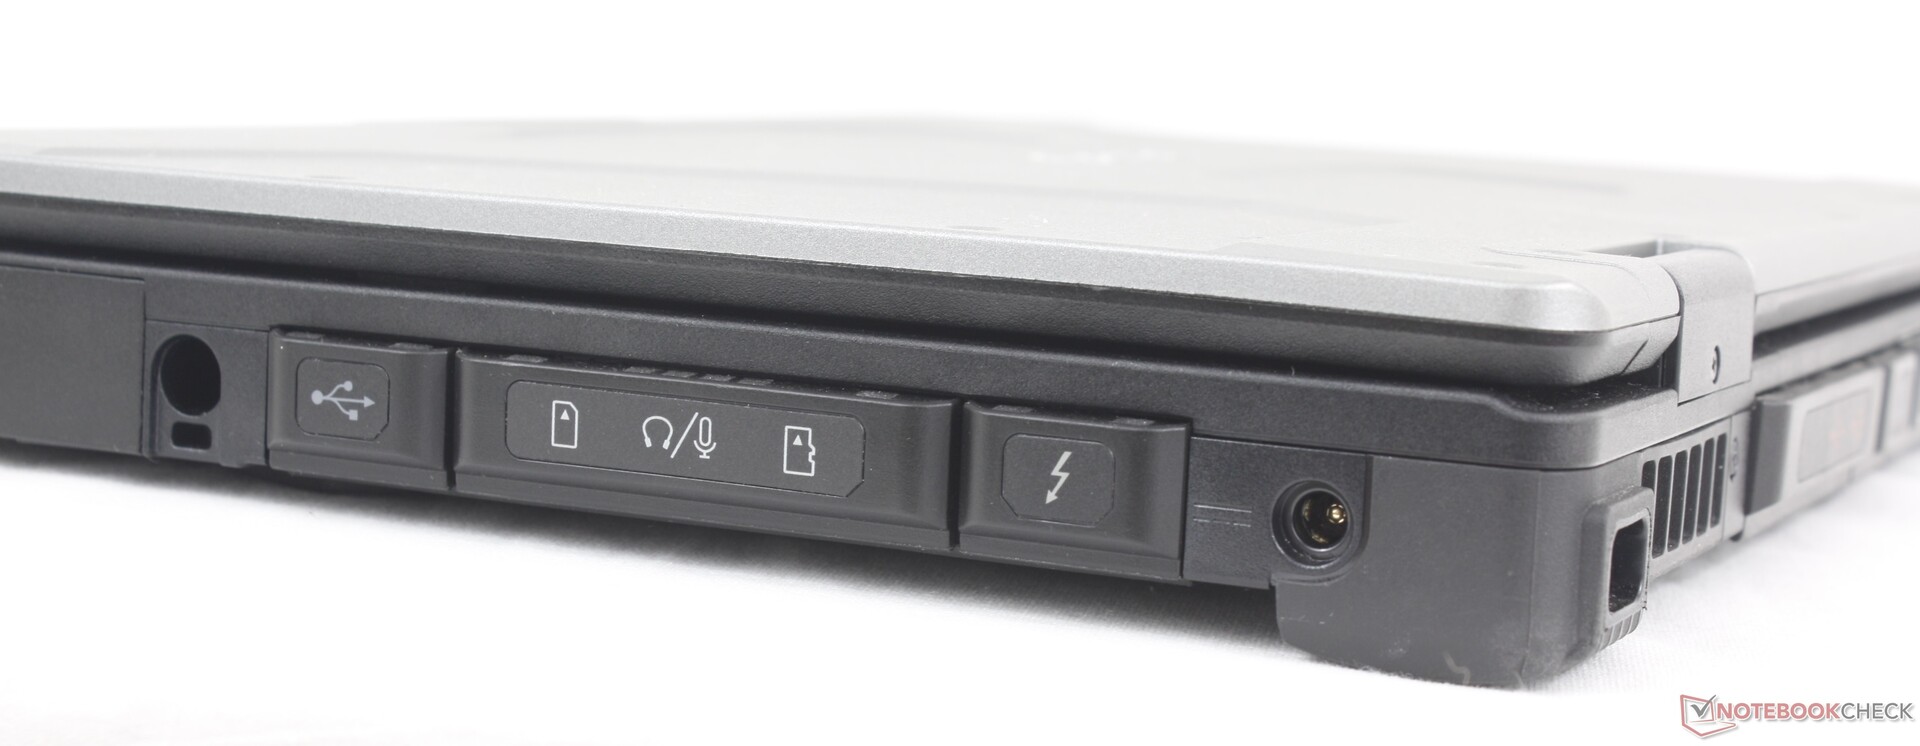
SD Card Reader
| SD Card Reader | |
| average JPG Copy Test (av. of 3 runs) | |
| Dell Latitude 14 5420-D2G5W (AV Pro SD microSD 128 GB V60) | |
| Dell Latitude 7330 Rugged Extreme (AV Pro V60) | |
| Getac S410 G5 (AV Pro V60) | |
| Panasonic Toughbook 40 (AV Pro V60) | |
| Durabook S14I (Angelbird 128GB AV Pro UHS-II) | |
| maximum AS SSD Seq Read Test (1GB) | |
| Dell Latitude 7330 Rugged Extreme (AV Pro V60) | |
| Dell Latitude 14 5420-D2G5W (AV Pro SD microSD 128 GB V60) | |
| Getac S410 G5 (AV Pro V60) | |
| Panasonic Toughbook 40 (AV Pro V60) | |
| Durabook S14I (Angelbird 128GB AV Pro UHS-II) | |
Communication
WLAN has been upgraded from the Intel AX201 to the AX211 to support Wi-Fi 6E speeds.
| Networking | |
| iperf3 transmit AX12 | |
| Durabook S14I | |
| Dell Latitude 7330 Rugged Extreme | |
| Getac S410 Gen 4 | |
| Dell Latitude 14 5420-D2G5W | |
| iperf3 receive AX12 | |
| Durabook S14I | |
| Getac S410 Gen 4 | |
| Dell Latitude 7330 Rugged Extreme | |
| Dell Latitude 14 5420-D2G5W | |
| iperf3 transmit AXE11000 | |
| Panasonic Toughbook 40 | |
| Getac S410 G5 | |
| iperf3 receive AXE11000 | |
| Panasonic Toughbook 40 | |
| Getac S410 G5 | |
| iperf3 transmit AXE11000 6GHz | |
| Getac S410 G5 | |
| iperf3 receive AXE11000 6GHz | |
| Getac S410 G5 | |
Webcam
Our test unit has been configured with a 5 MP webcam to be a huge upgrade over the 1 MP webcam on the S410 G4. Windows Hello facial recognition is supported.


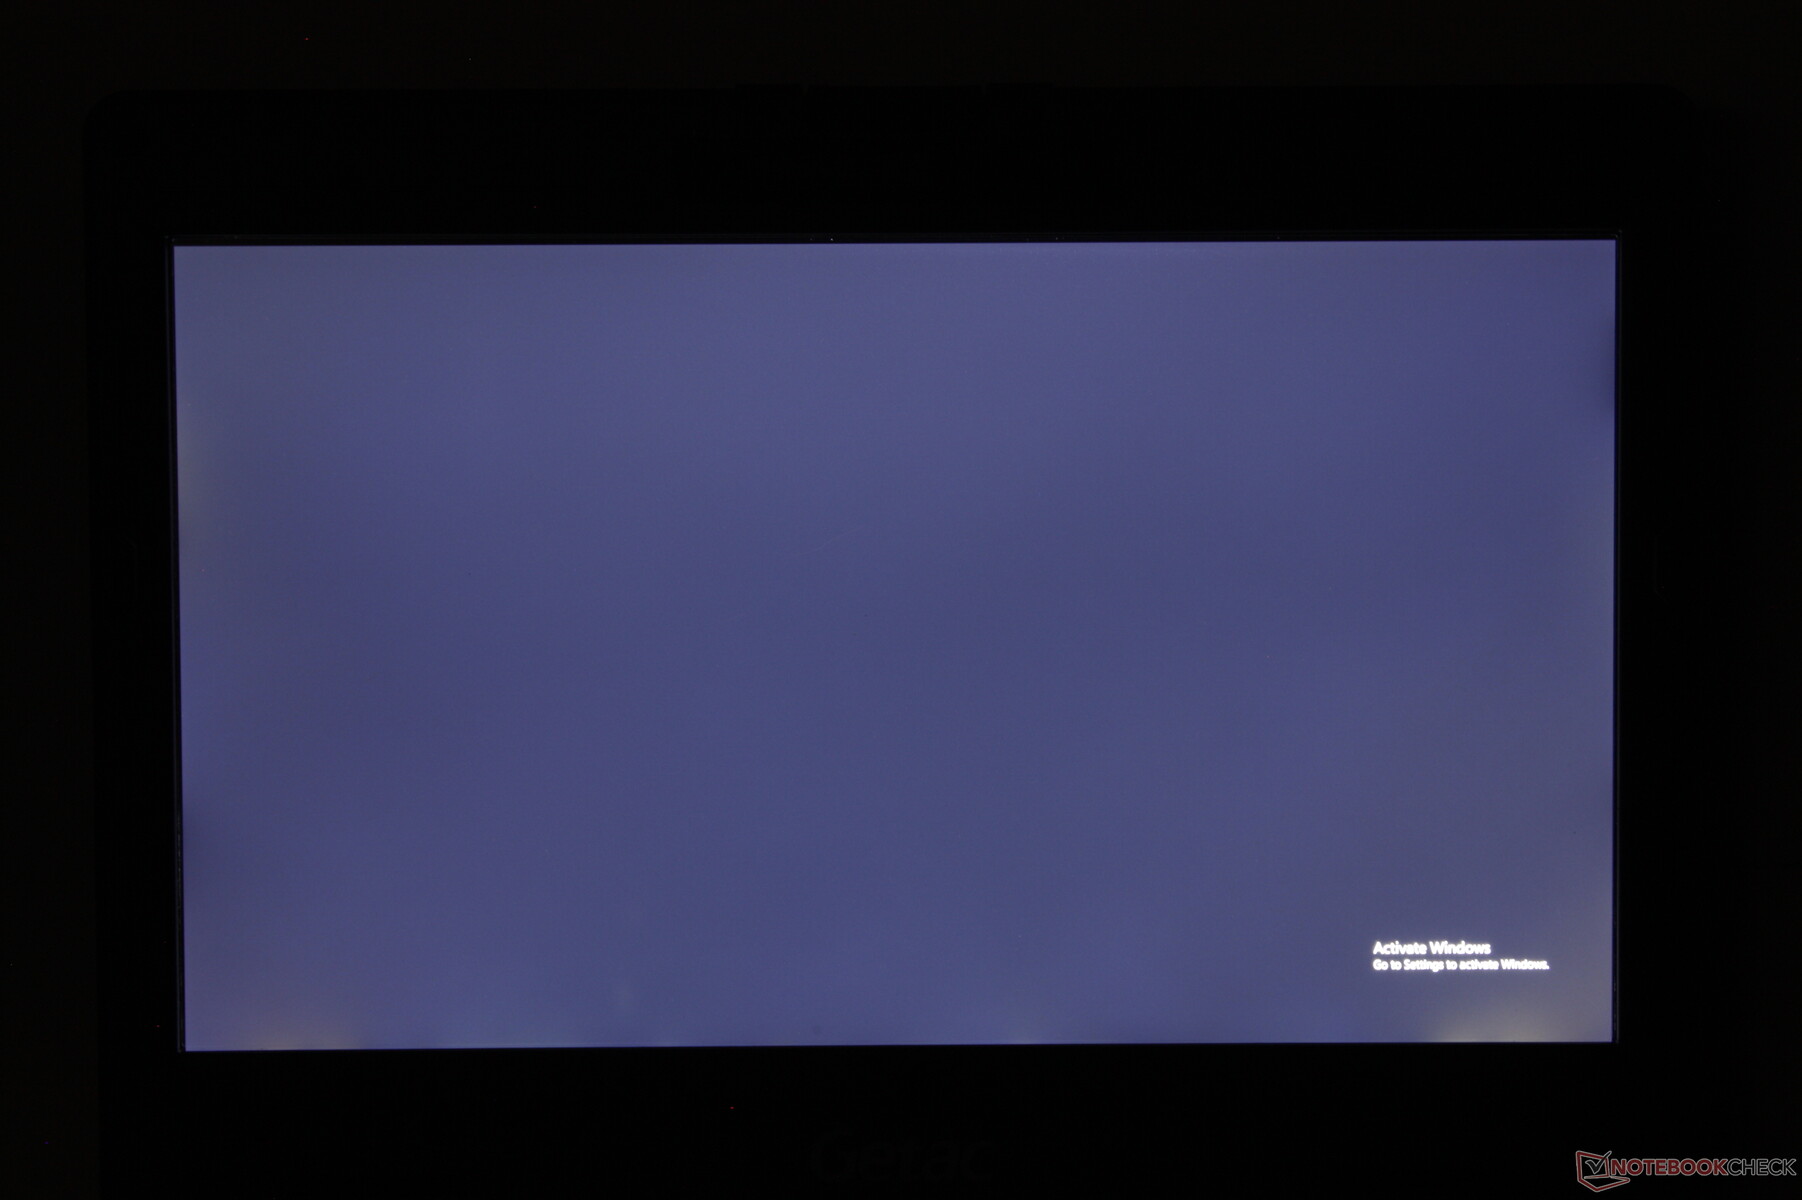
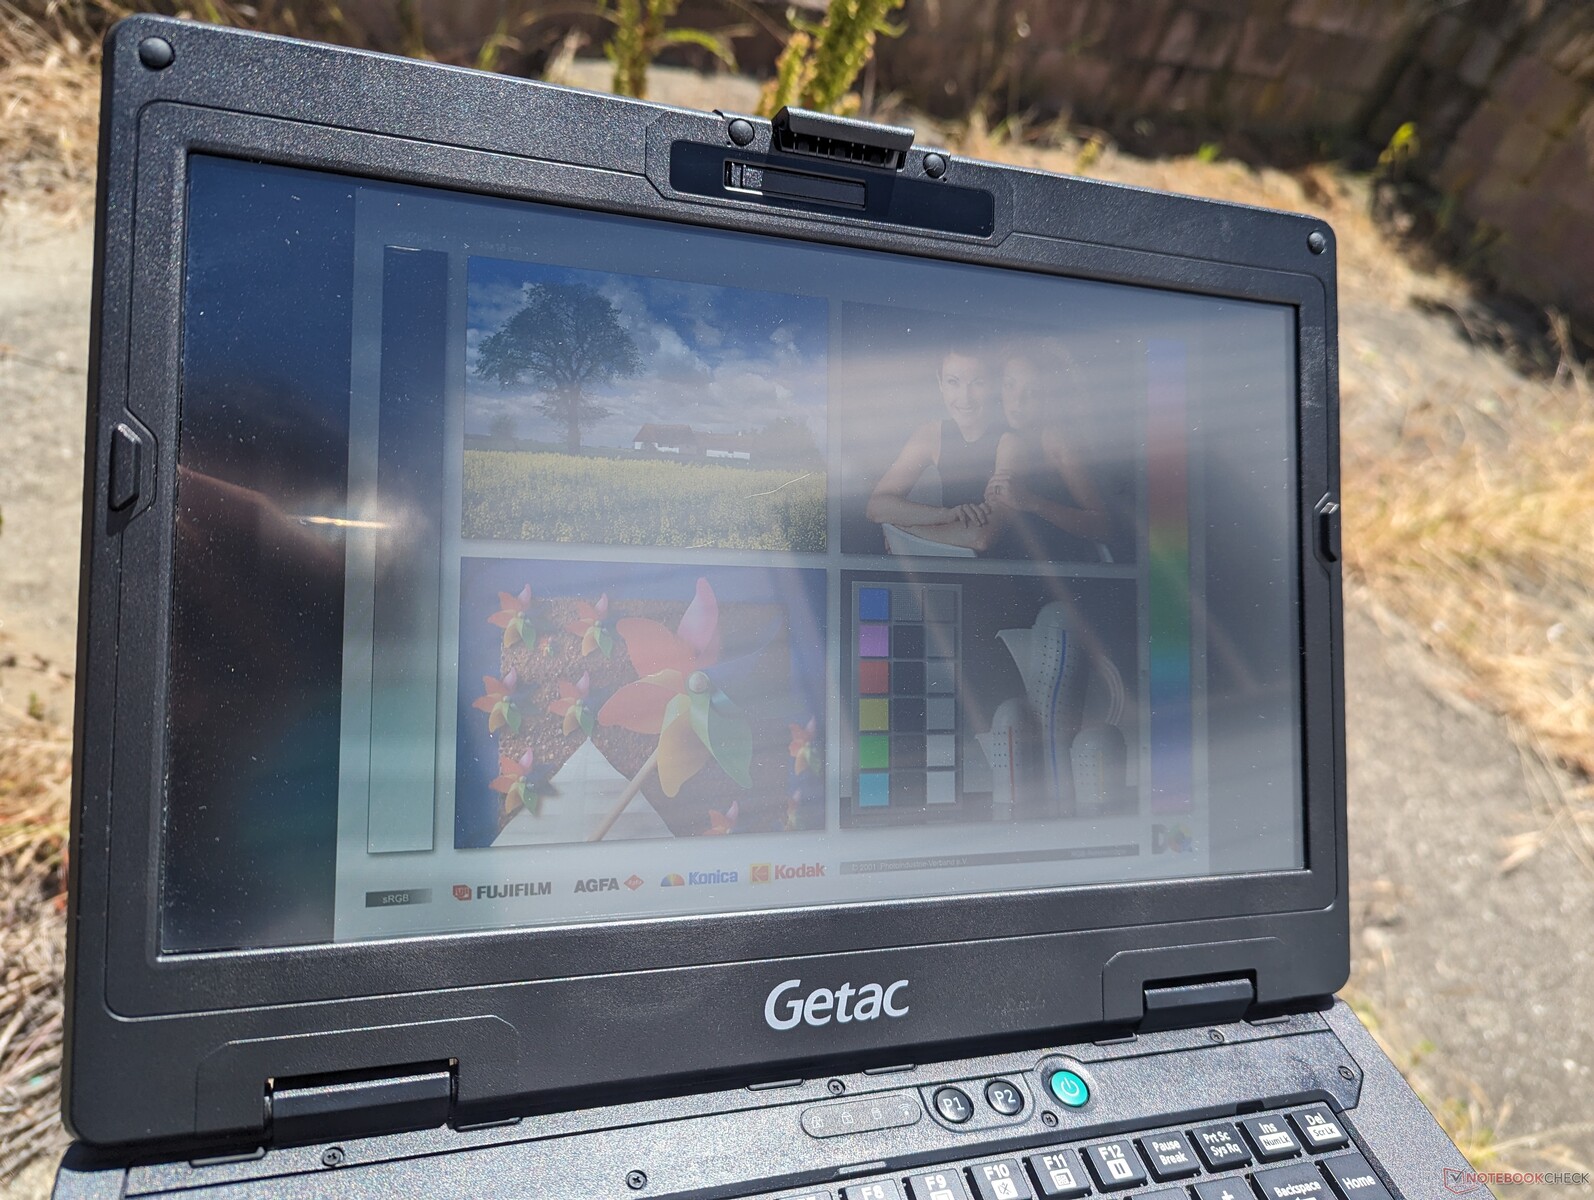
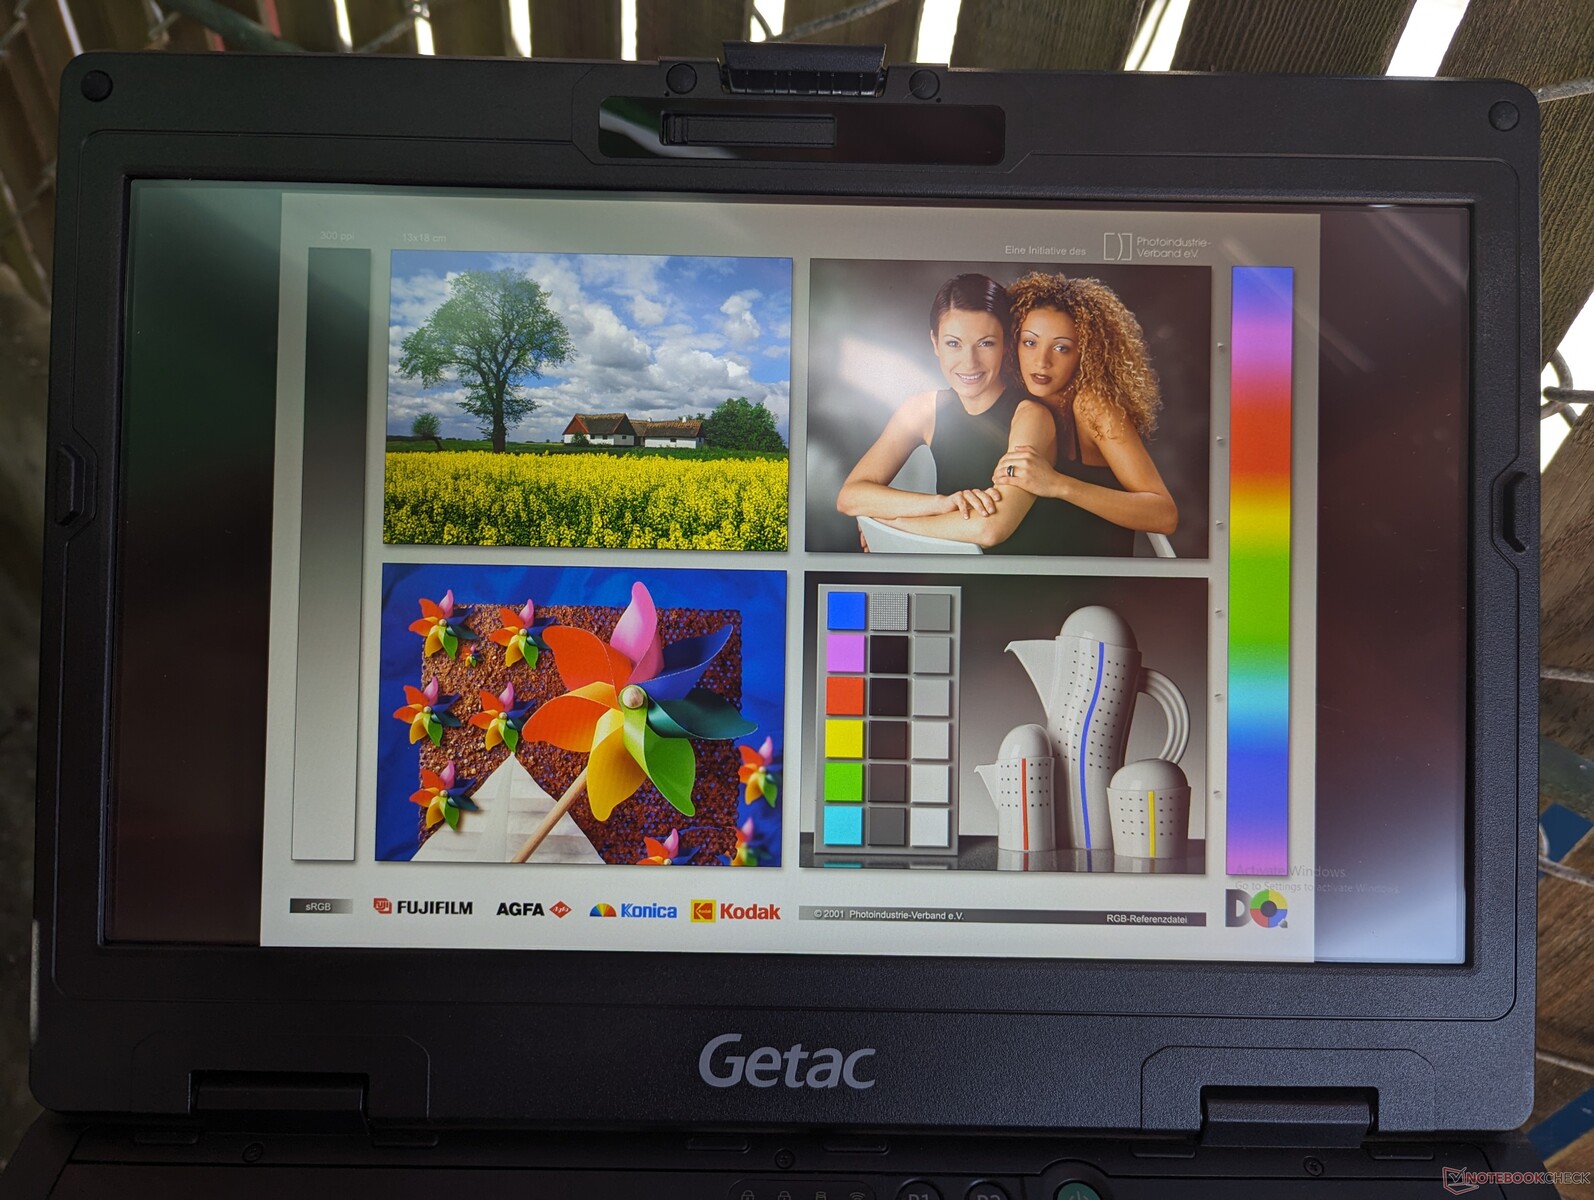
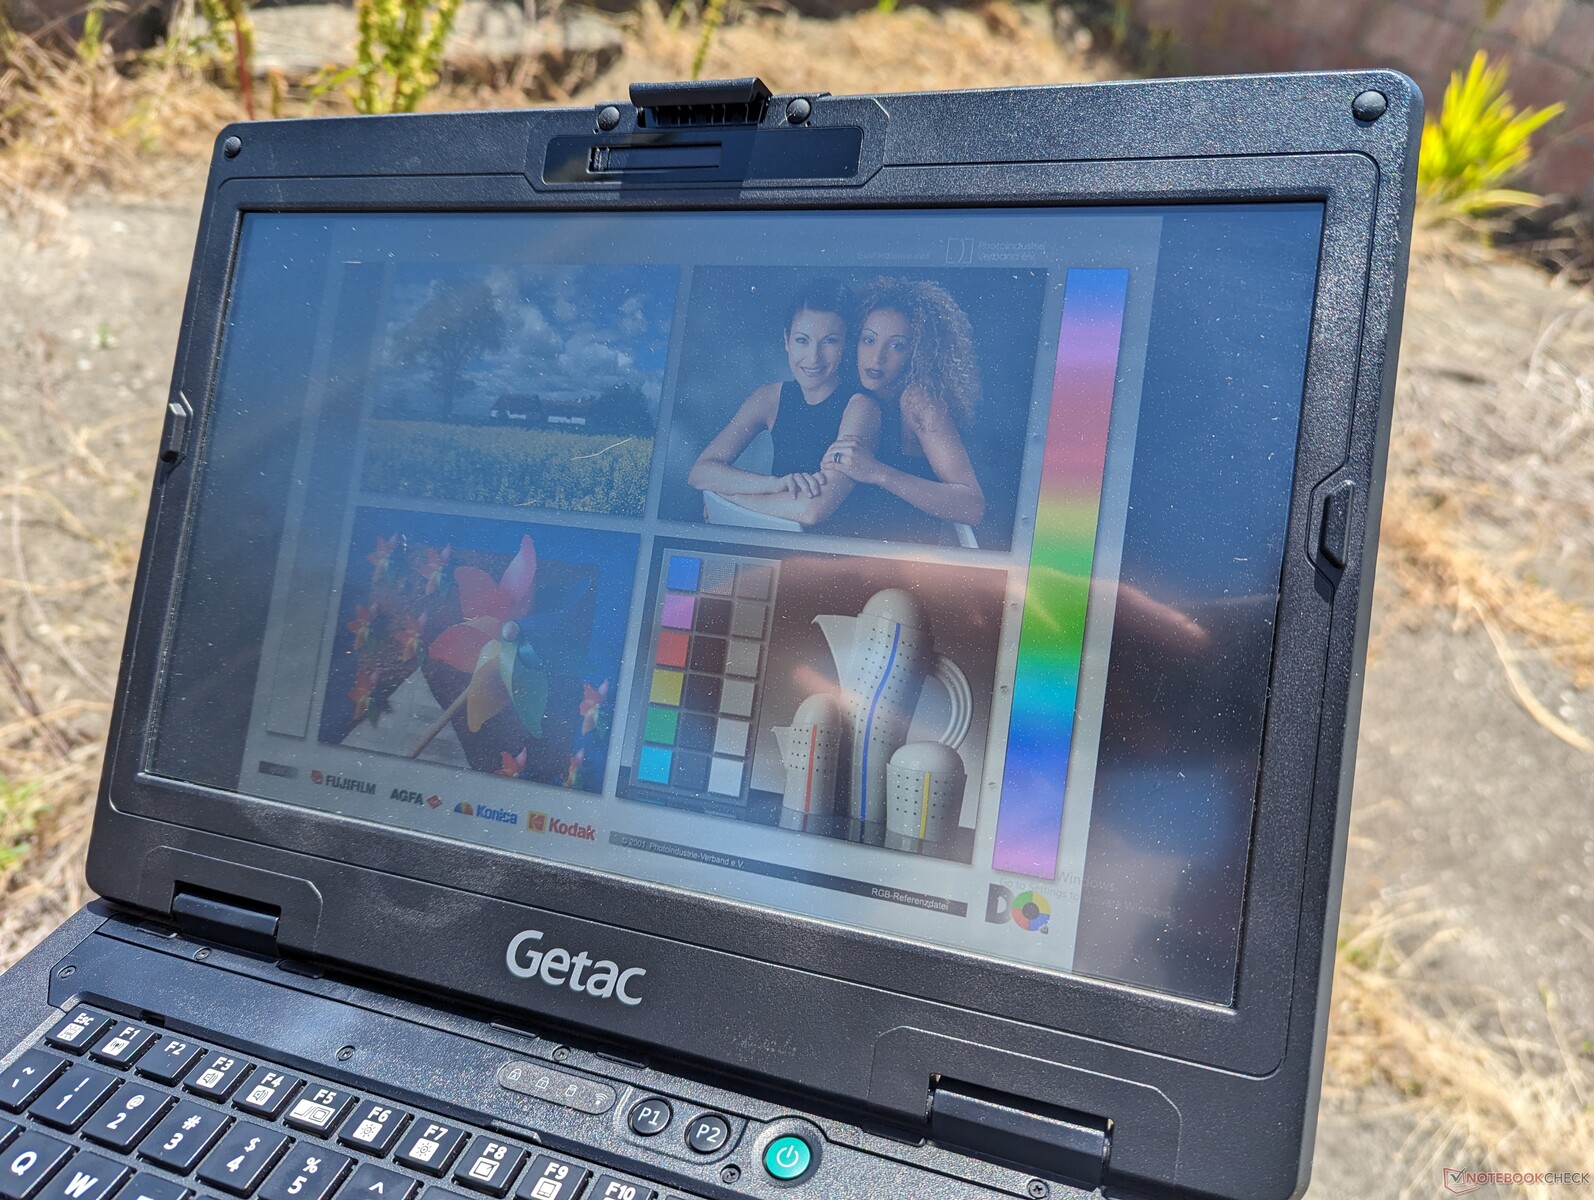
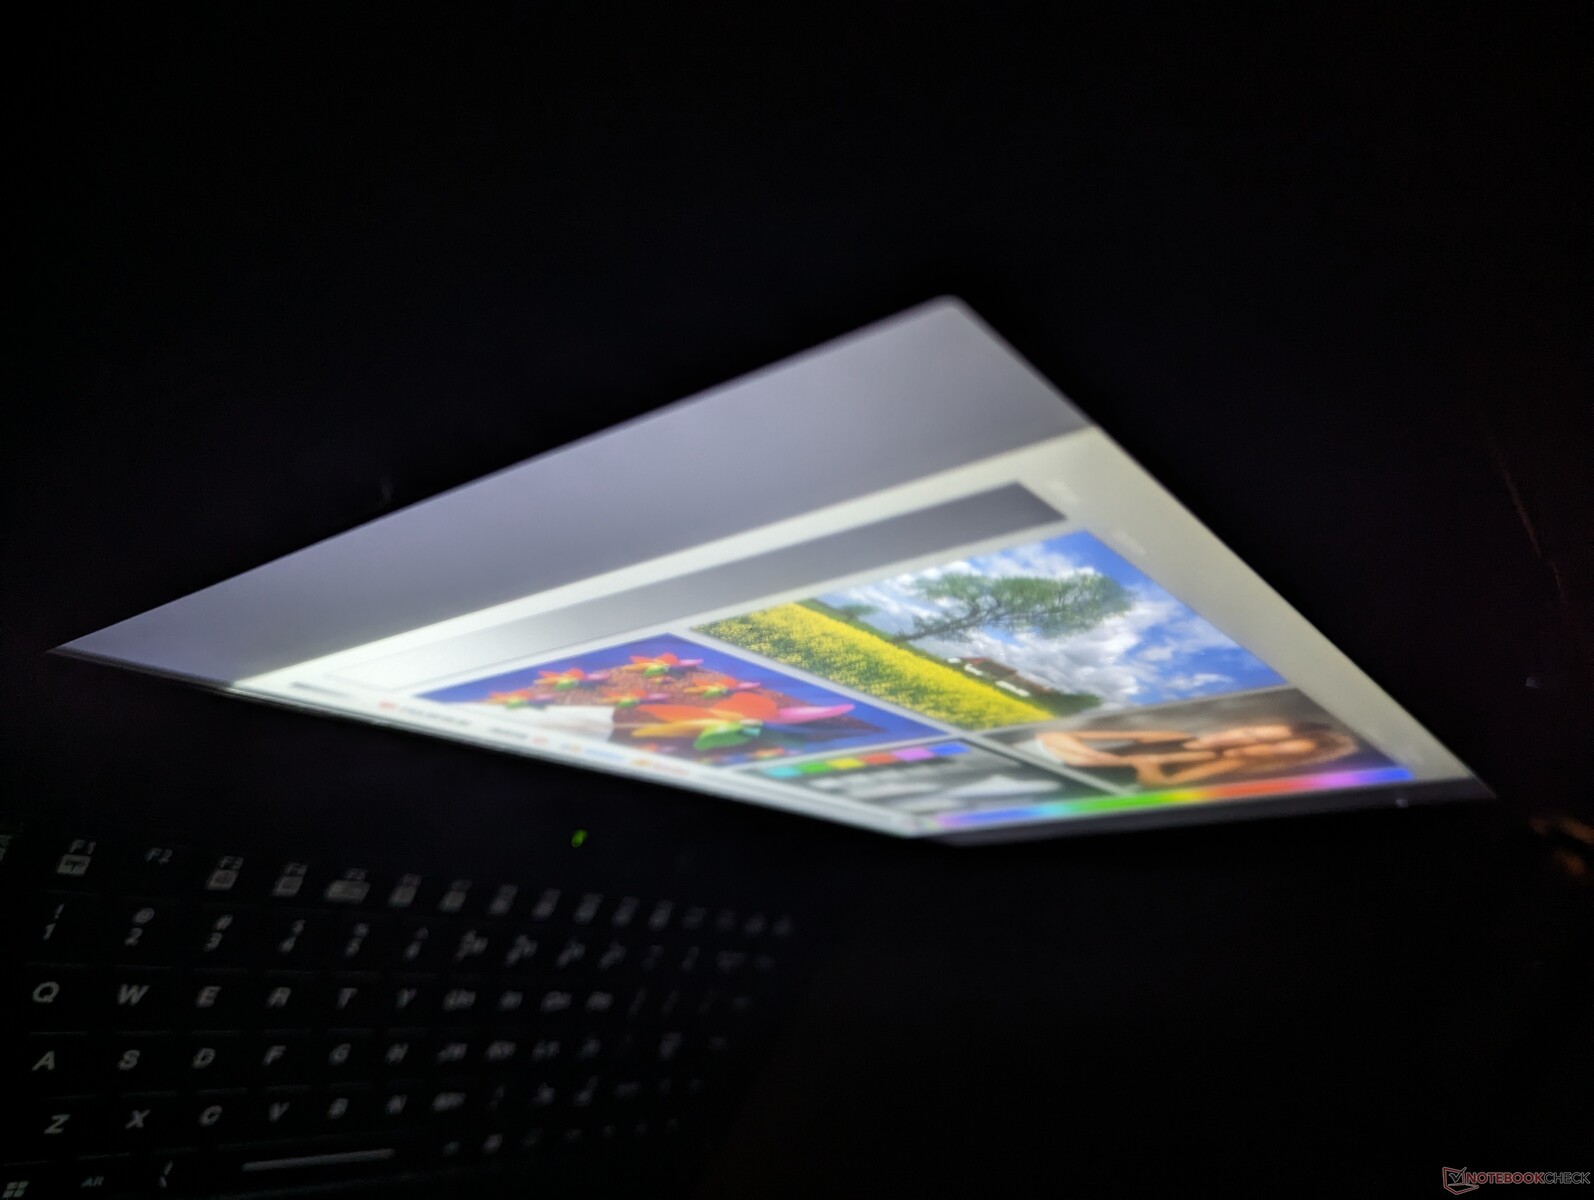
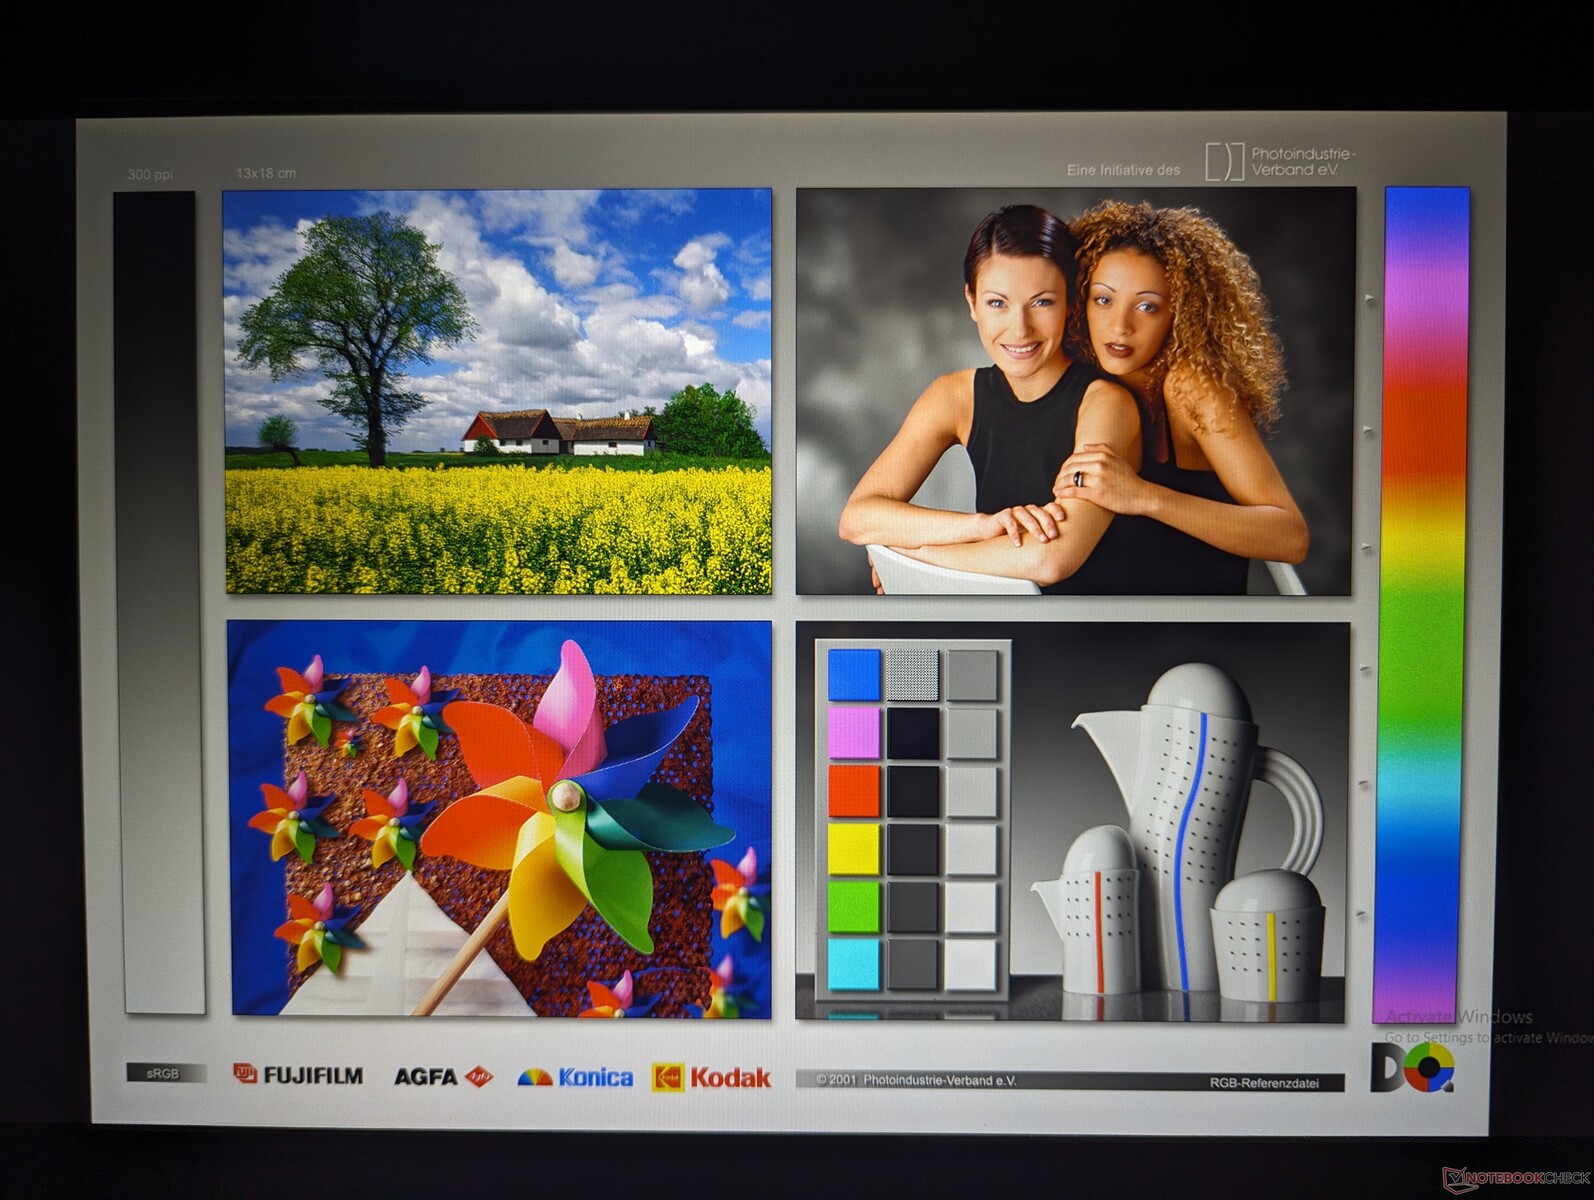
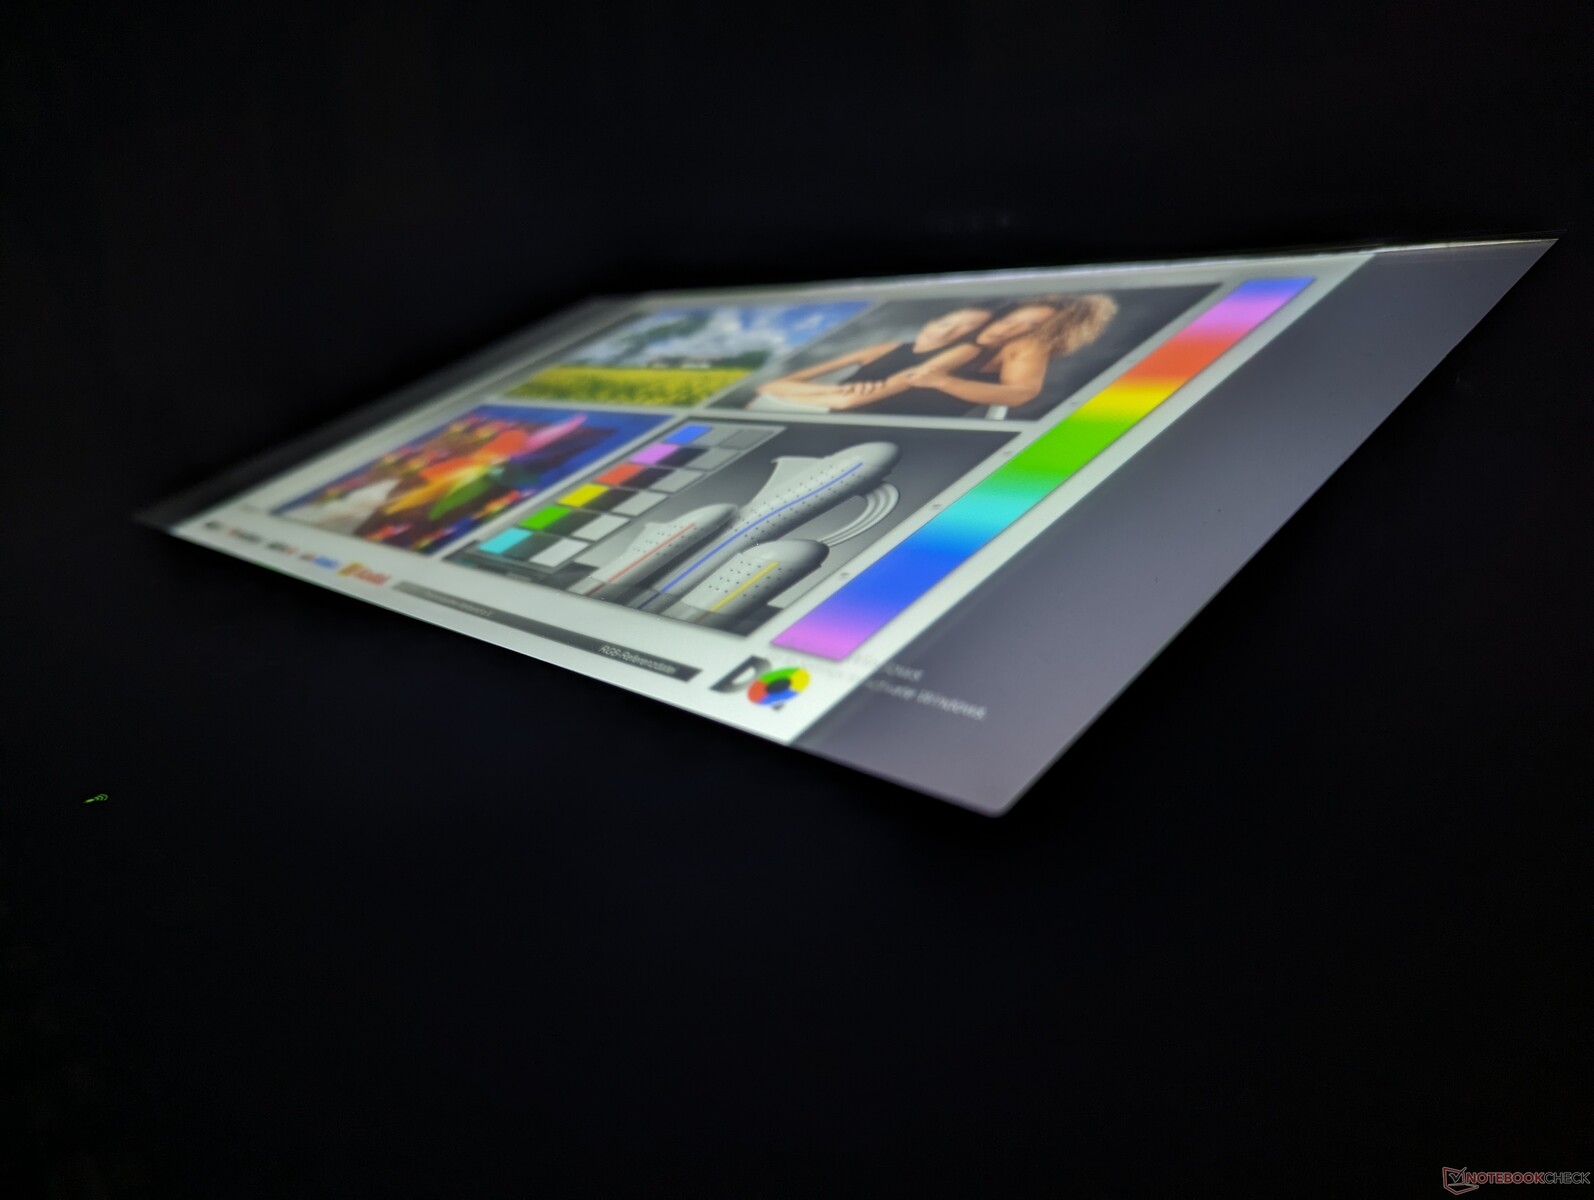
Display — Faster Black-White Response Times
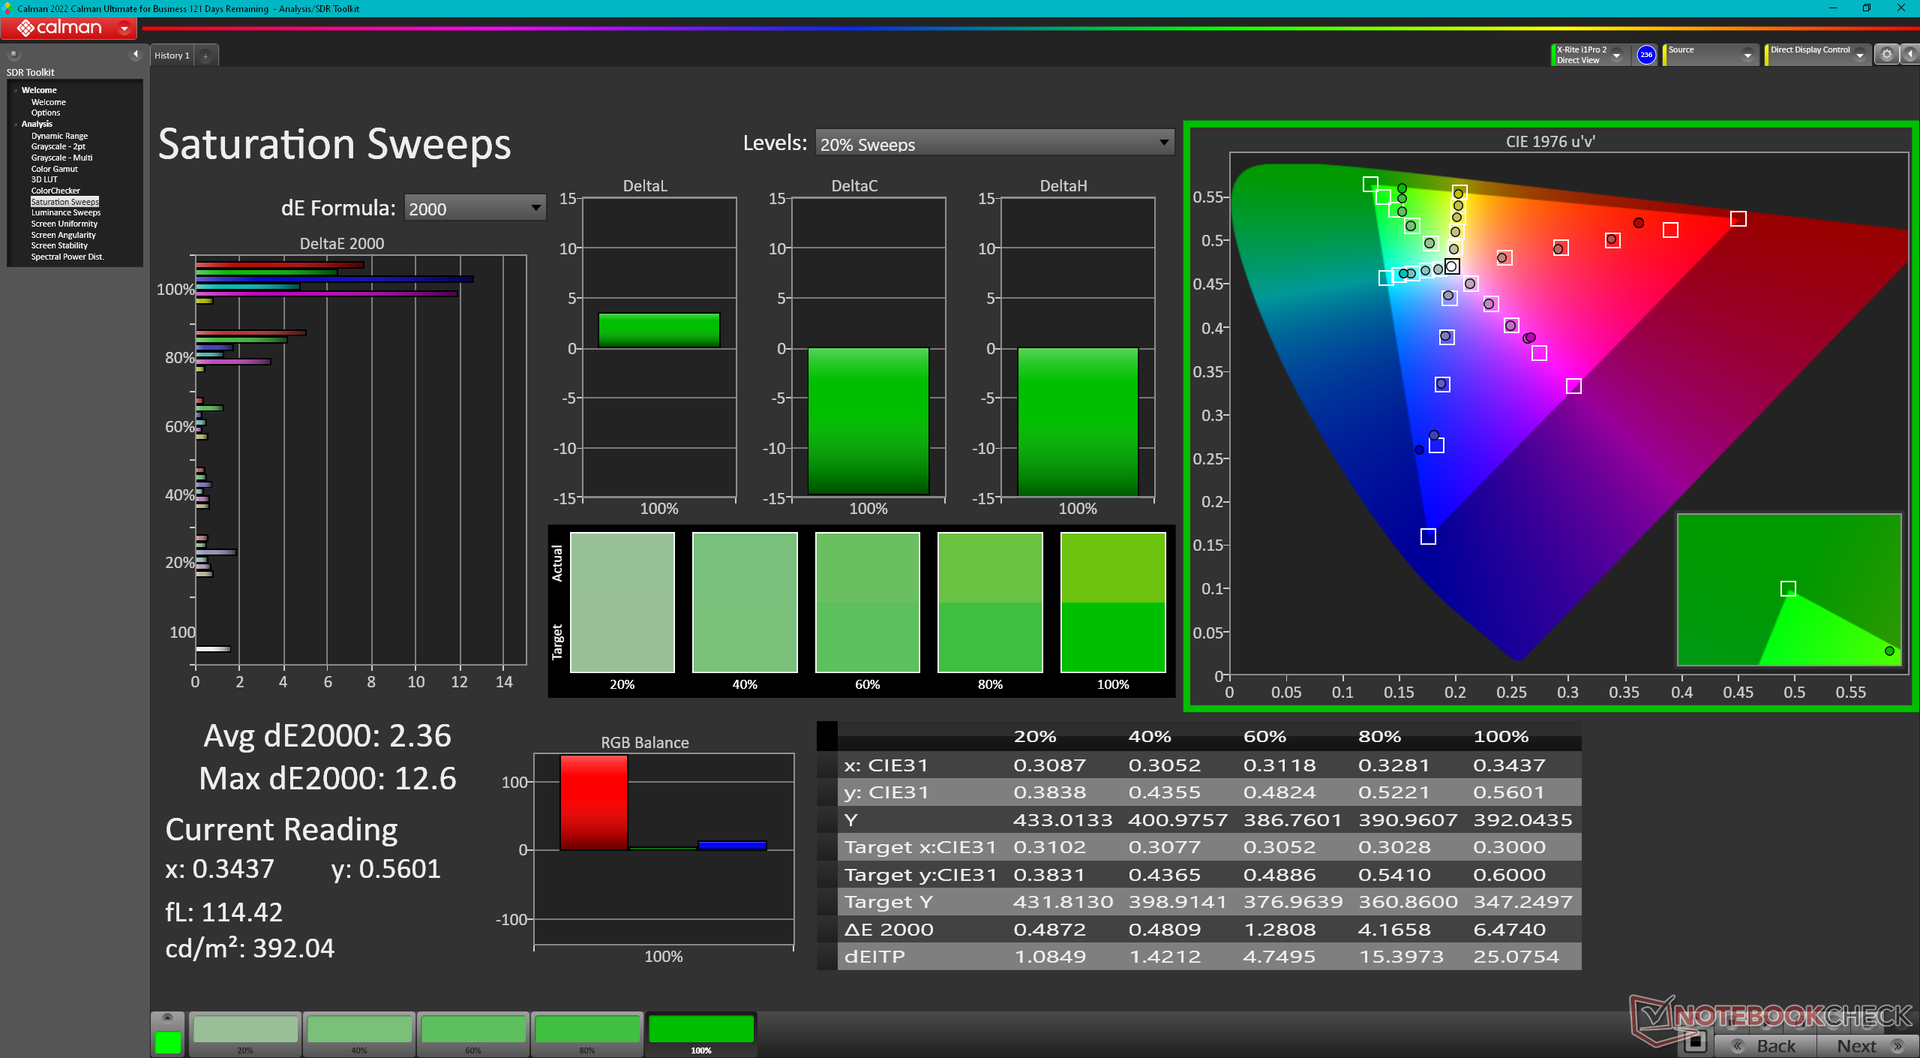
Our S410 G5 ships with a panel from TCL CSOT (SNE001BS1-1) whereas the S410 G4 would ship with a panel from AU Optronics. The TCL panel offers faster black-white and gray-gray response times to reduce ghosting which was a noticeable issue on the S410 G4. Otherwise, all other characteristics remain almost the same including the 1000-nit brightness, decent 1000:1 contrast ratio, and limited <60% sRGB colors.

| |||||||||||||||||||||||||
Brightness Distribution: 86 %
Center on Battery: 958.4 cd/m²
Contrast: 998:1 (Black: 0.96 cd/m²)
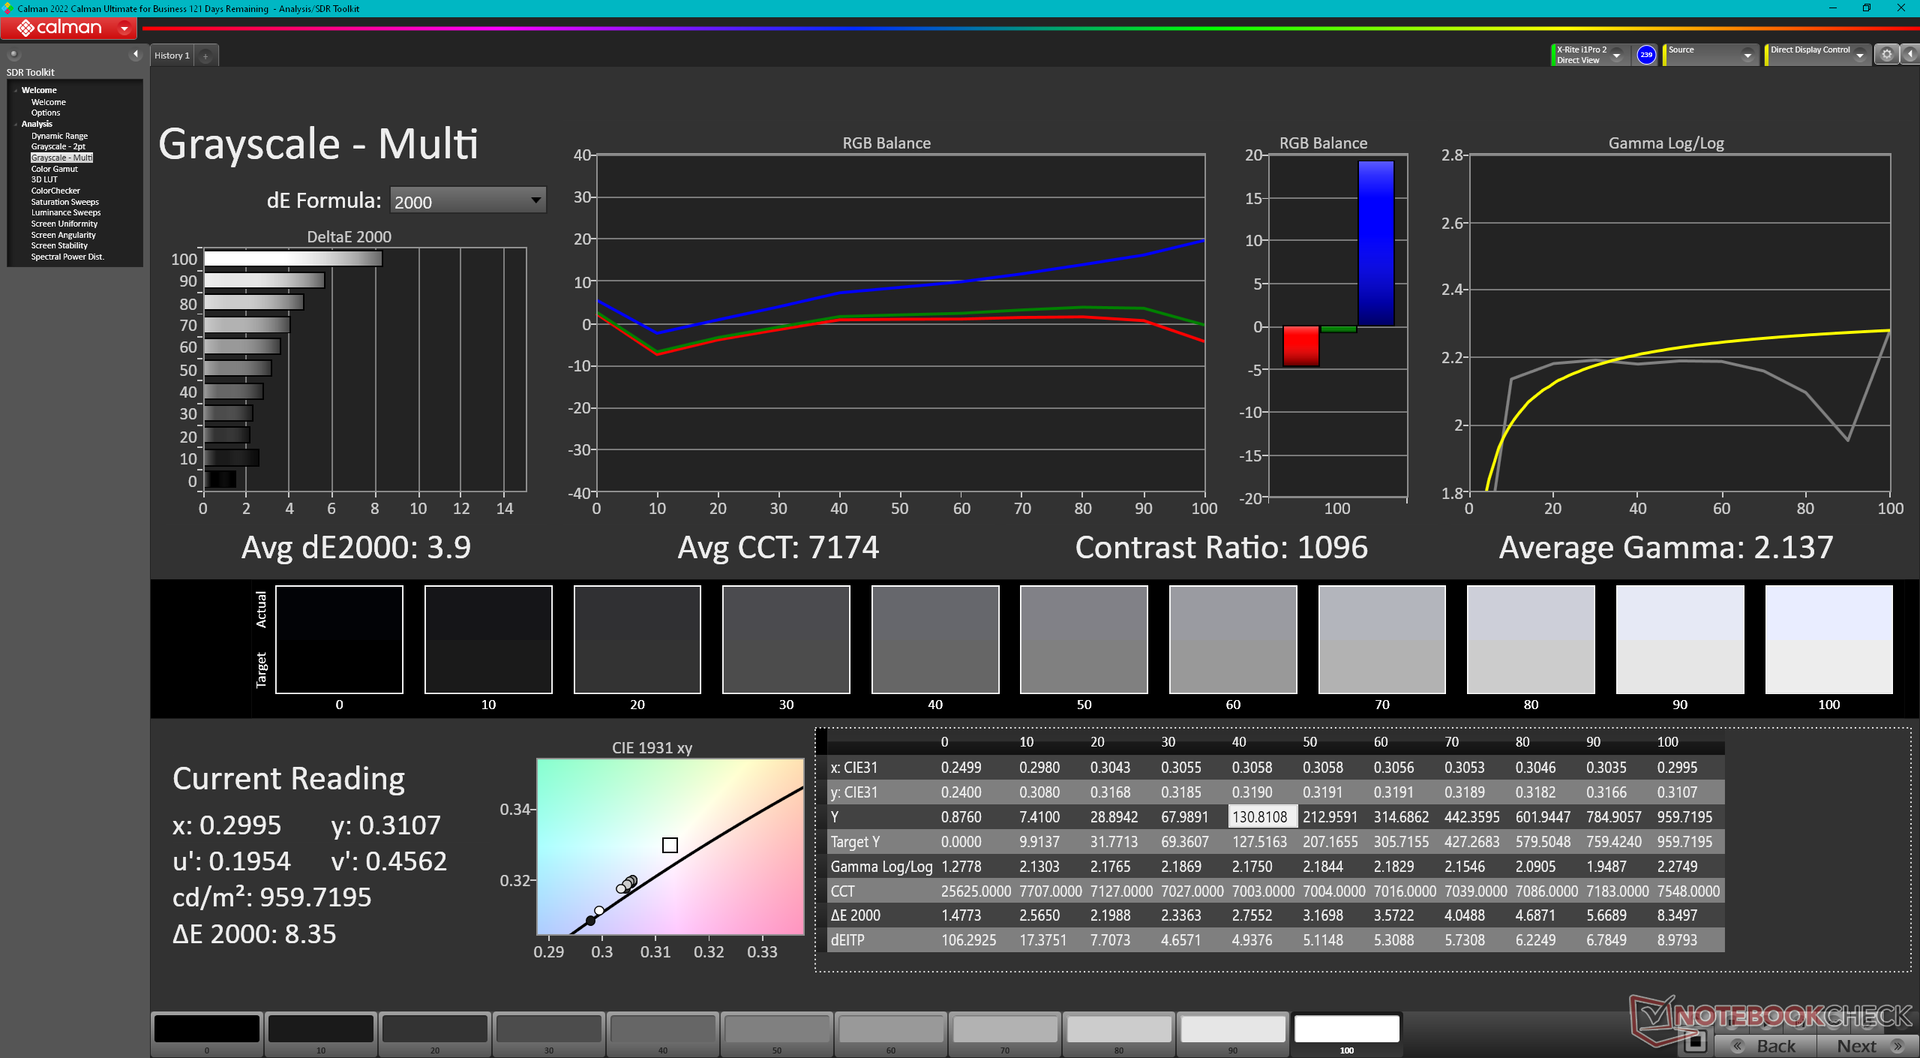
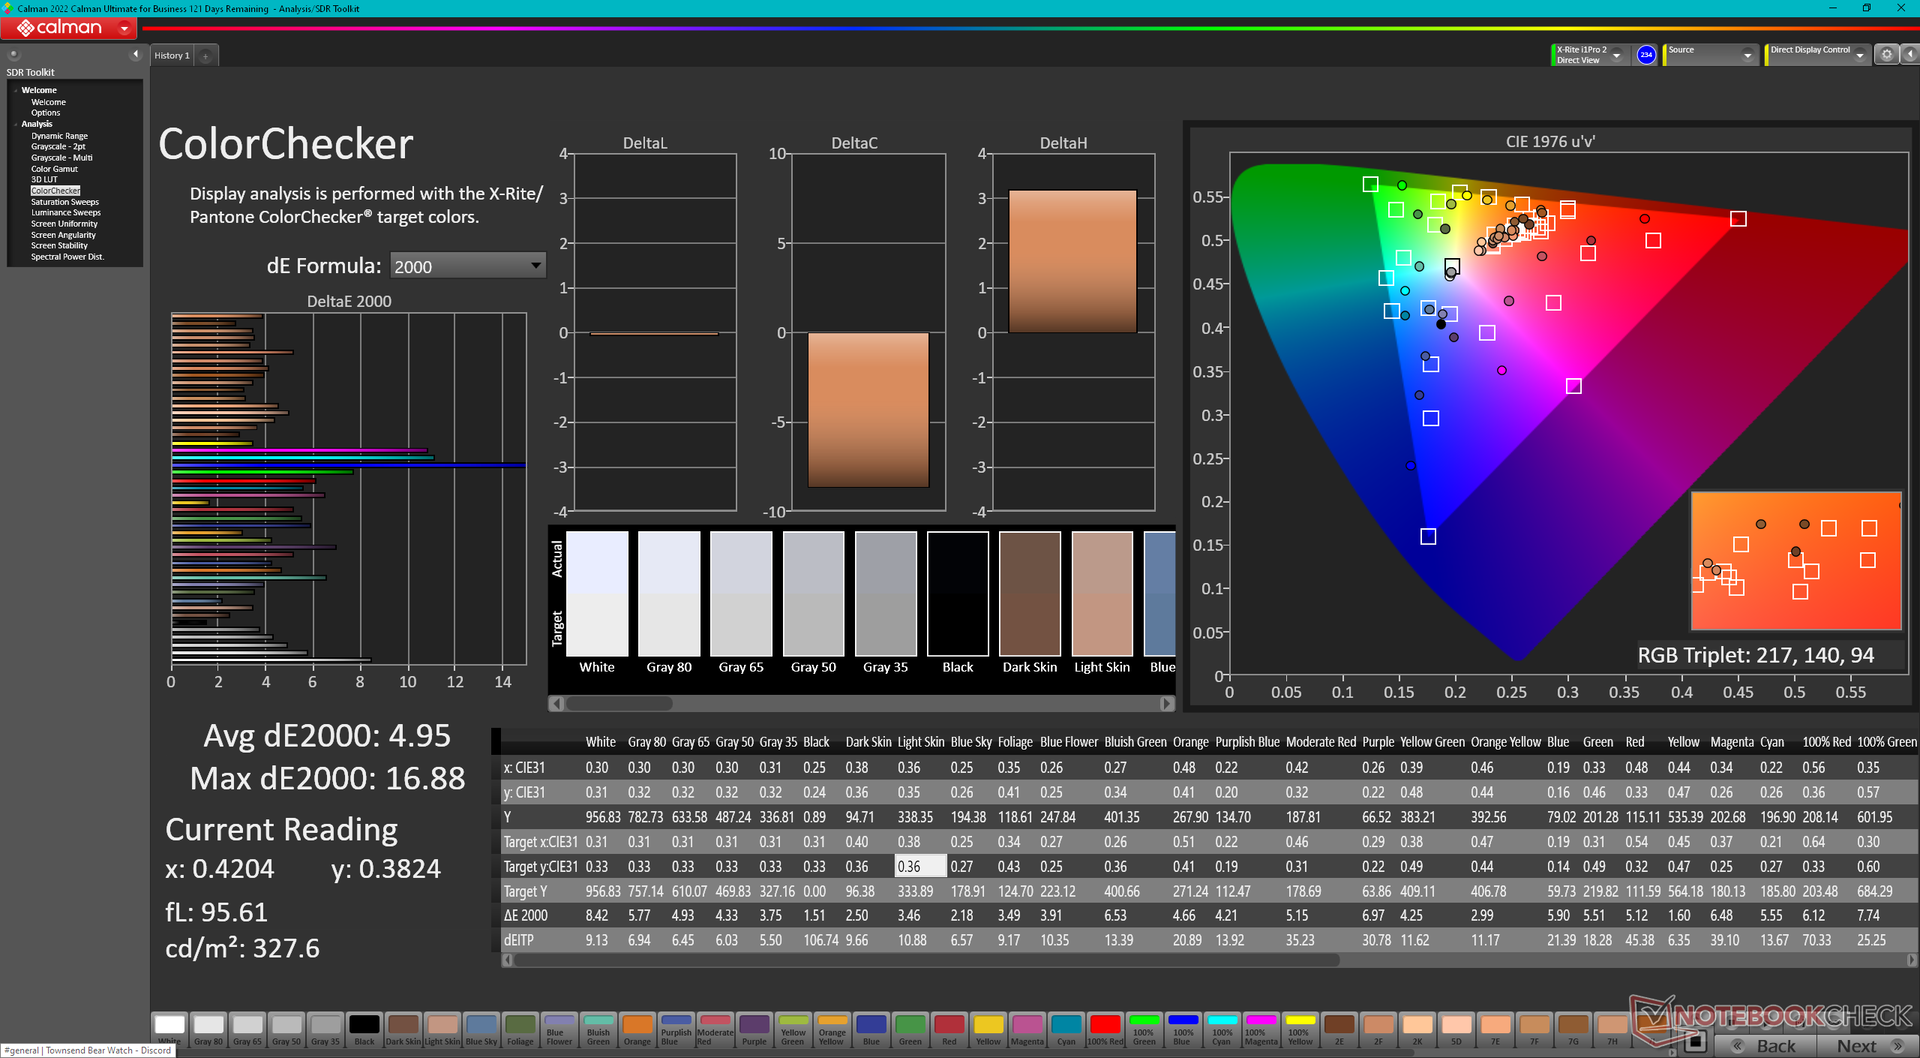
ΔE ColorChecker Calman: 4.95 | ∀{0.5-29.43 Ø4.72}
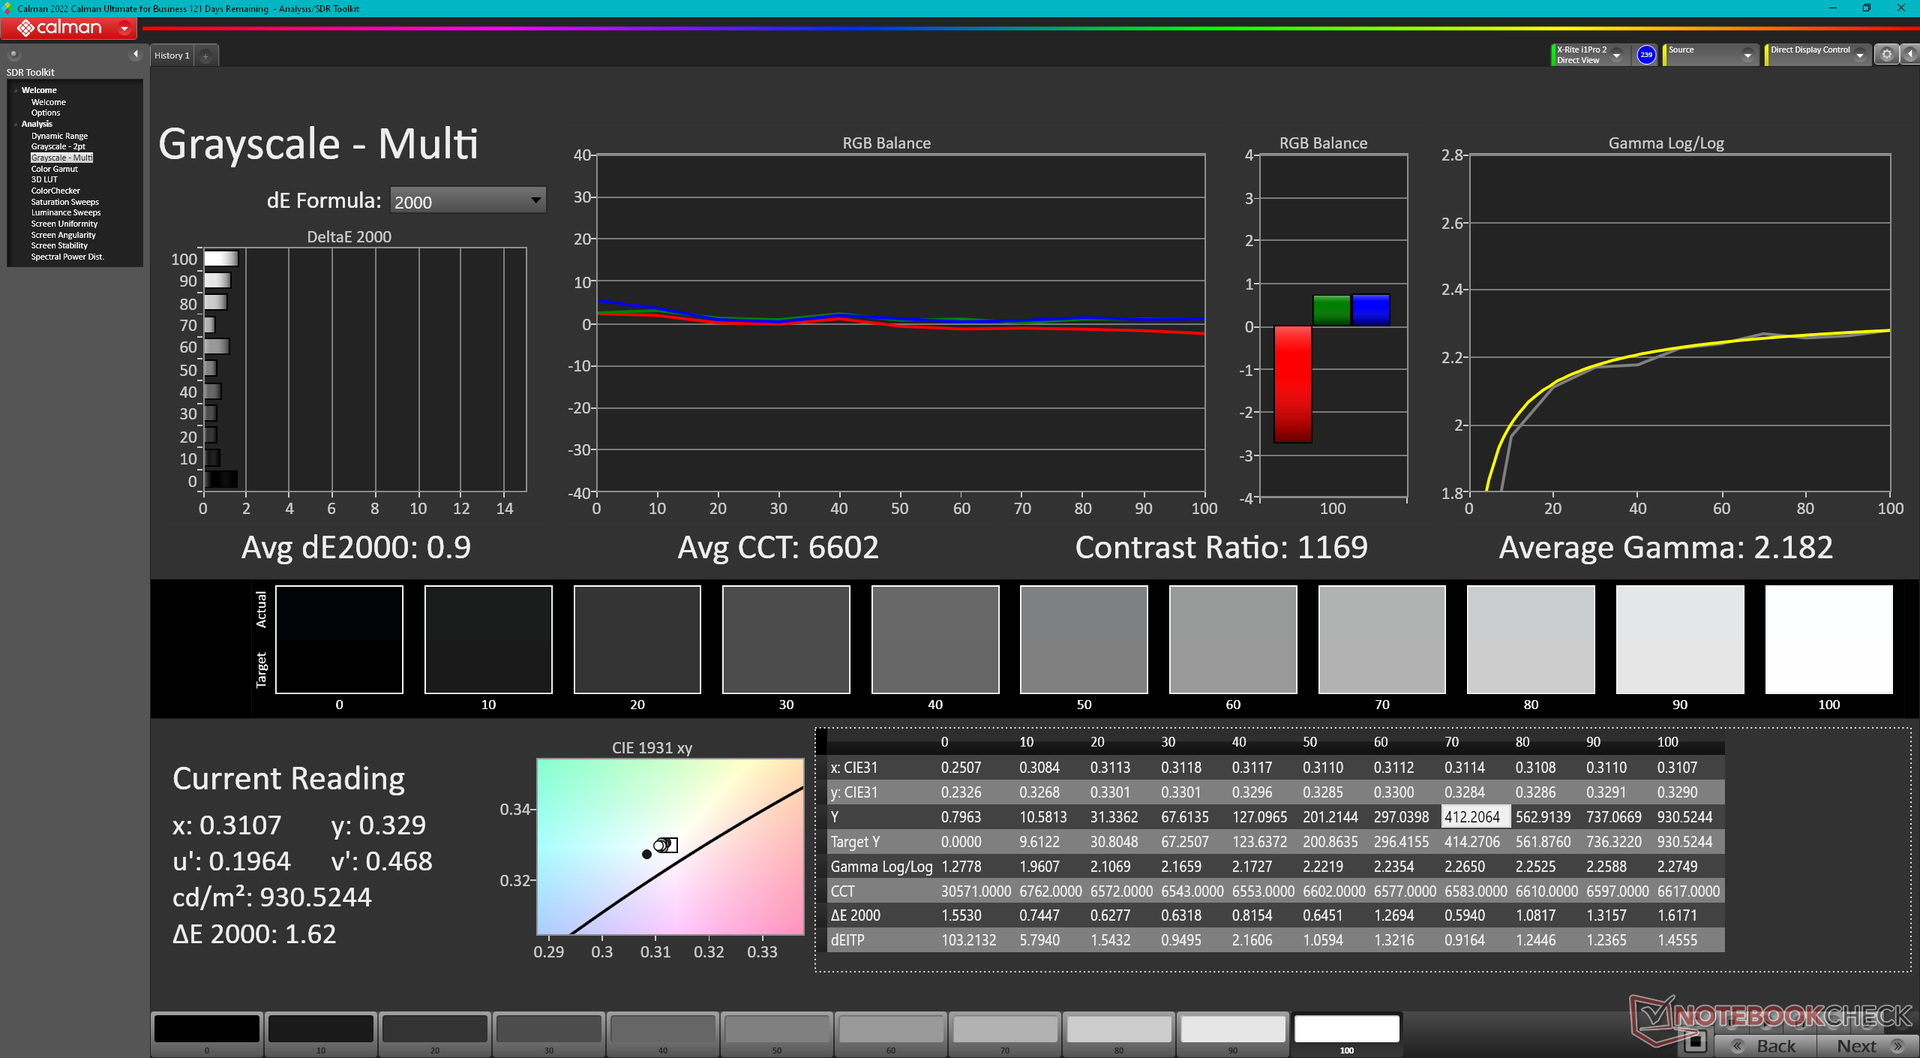
calibrated: 1.96
ΔE Greyscale Calman: 3.9 | ∀{0.09-98 Ø4.97}
39.8% AdobeRGB 1998 (Argyll 3D)
57.9% sRGB (Argyll 3D)
38.5% Display P3 (Argyll 3D)
Gamma: 2.14
CCT: 7174 K
| Getac S410 G5 CSOT T9 SNE001BS1-1, IPS, 1920x1080, 14" | Getac S410 Gen 4 AU Optronics AUO413D, IPS, 1920x1080, 14" | Durabook S14I KD140N0730A01, TN, 1920x1080, 14" | Dell Latitude 14 5420-D2G5W AUO5491 / B140HAN, IPS, 1920x1080, 14" | Dell Latitude 7330 Rugged Extreme Sharp LQ133M1, IPS, 1920x1080, 13.3" | Panasonic Toughbook 40 InfoVision M140NWF5 R3, IPS, 1920x1080, 14" | |
|---|---|---|---|---|---|---|
| Display | -1% | 13% | -7% | 72% | -7% | |
| Display P3 Coverage (%) | 38.5 | 38.3 -1% | 43.55 13% | 36 -6% | 67.1 74% | 35.8 -7% |
| sRGB Coverage (%) | 57.9 | 57.2 -1% | 65.4 13% | 54 -7% | 98.2 70% | 53.8 -7% |
| AdobeRGB 1998 Coverage (%) | 39.8 | 39.5 -1% | 45 13% | 37 -7% | 69 73% | 37 -7% |
| Response Times | -45% | 16% | -41% | -143% | -61% | |
| Response Time Grey 50% / Grey 80% * (ms) | 29 ? | 35.2 ? -21% | 30.4 ? -5% | 41 ? -41% | 74.4 ? -157% | 50.4 ? -74% |
| Response Time Black / White * (ms) | 18.6 ? | 31.2 ? -68% | 11.8 ? 37% | 26 ? -40% | 42.4 ? -128% | 27.6 ? -48% |
| PWM Frequency (Hz) | 876 ? | 870 ? | 304.9 ? | 694.4 ? | ||
| Screen | -22% | -73% | -10% | 43% | 13% | |
| Brightness middle (cd/m²) | 958.4 | 956.9 0% | 1180.7 23% | 290 -70% | 1414.1 48% | 1284.3 34% |
| Brightness (cd/m²) | 978 | 984 1% | 1102 13% | 282 -71% | 1282 31% | 1289 32% |
| Brightness Distribution (%) | 86 | 84 -2% | 89 3% | 81 -6% | 84 -2% | 82 -5% |
| Black Level * (cd/m²) | 0.96 | 0.81 16% | 1.91 -99% | 0.26 73% | 0.83 14% | 0.89 7% |
| Contrast (:1) | 998 | 1181 18% | 618 -38% | 1115 12% | 1704 71% | 1443 45% |
| Colorchecker dE 2000 * | 4.95 | 6.6 -33% | 13.45 -172% | 4.65 6% | 1.99 60% | 4.67 6% |
| Colorchecker dE 2000 max. * | 16.88 | 22.94 -36% | 22.52 -33% | 7.5 56% | 3.75 78% | 19.85 -18% |
| Colorchecker dE 2000 calibrated * | 1.96 | 4.05 -107% | 3.19 -63% | 3.98 -103% | 0.72 63% | 2.21 -13% |
| Greyscale dE 2000 * | 3.9 | 6 -54% | 15.4 -295% | 3.22 17% | 2.8 28% | 2.7 31% |
| Gamma | 2.14 103% | 2.19 100% | 1.97 112% | 2.54 87% | 2.06 107% | 1.97 112% |
| CCT | 7174 91% | 7276 89% | 21134 31% | 6169 105% | 6775 96% | 6222 104% |
| Color Space (Percent of AdobeRGB 1998) (%) | 41.6 | |||||
| Color Space (Percent of sRGB) (%) | 65.5 | |||||
| Total Average (Program / Settings) | -23% /
-21% | -15% /
-42% | -19% /
-13% | -9% /
23% | -18% /
-2% |
* ... smaller is better
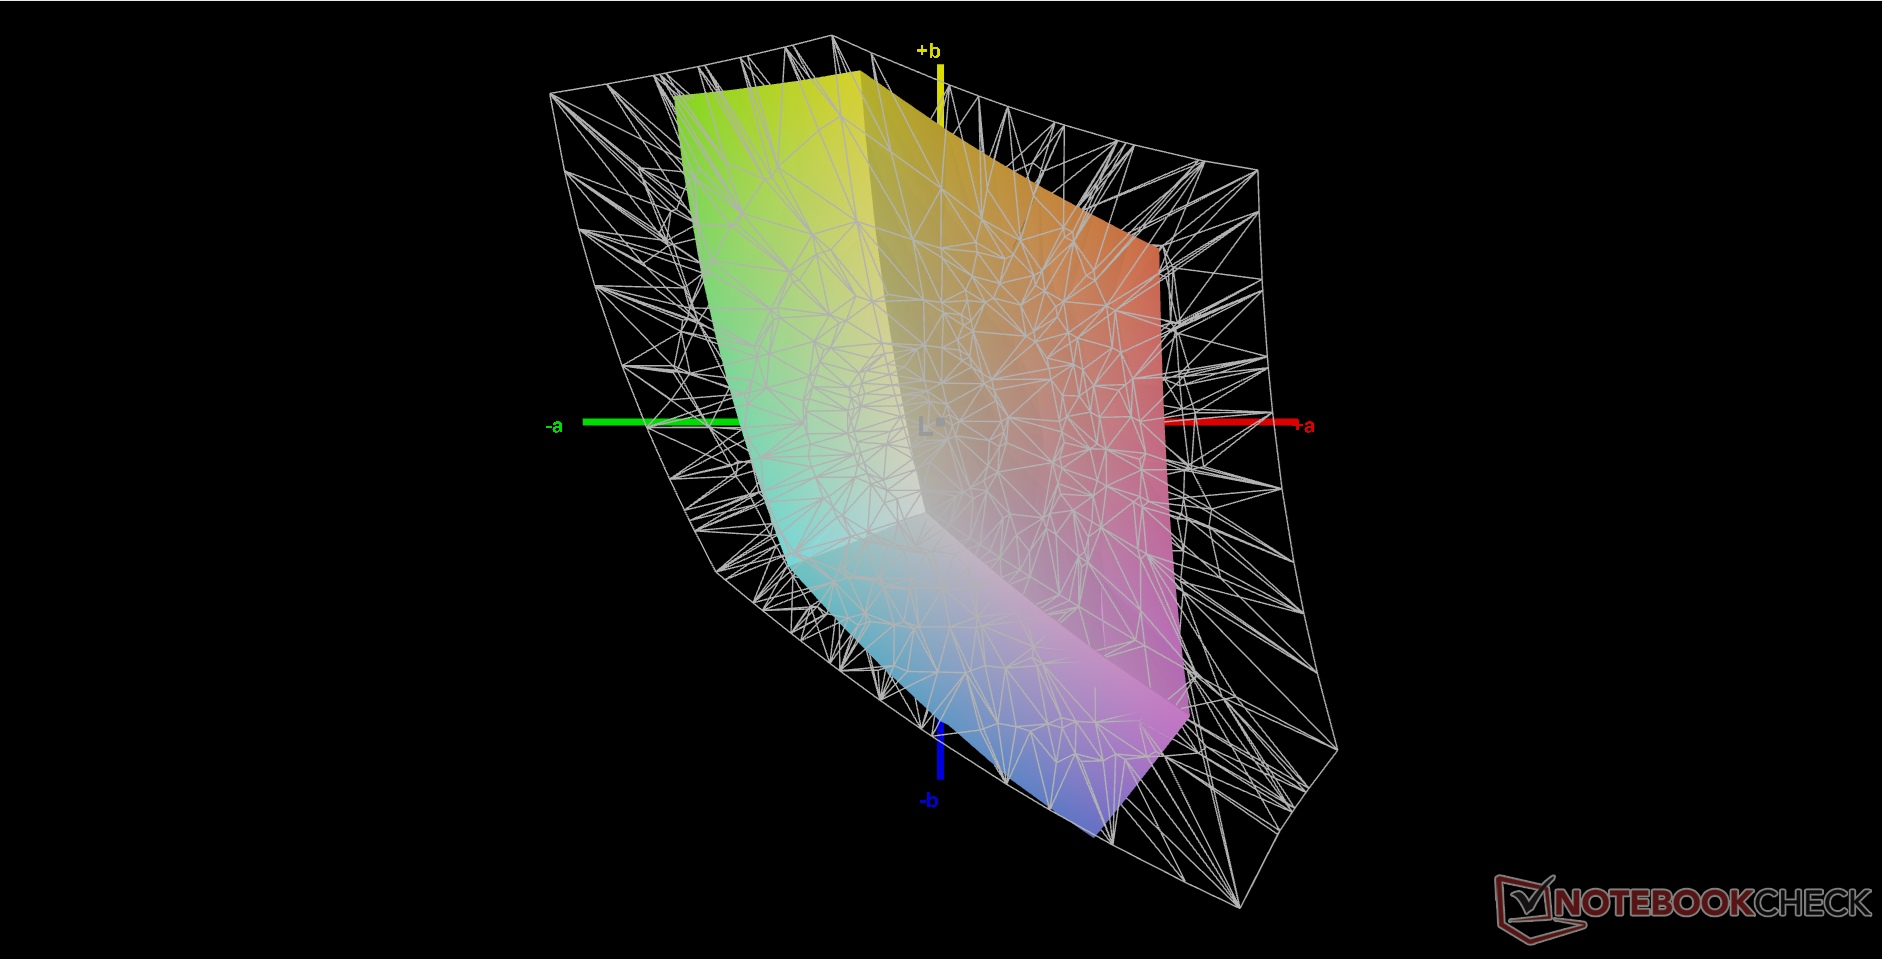
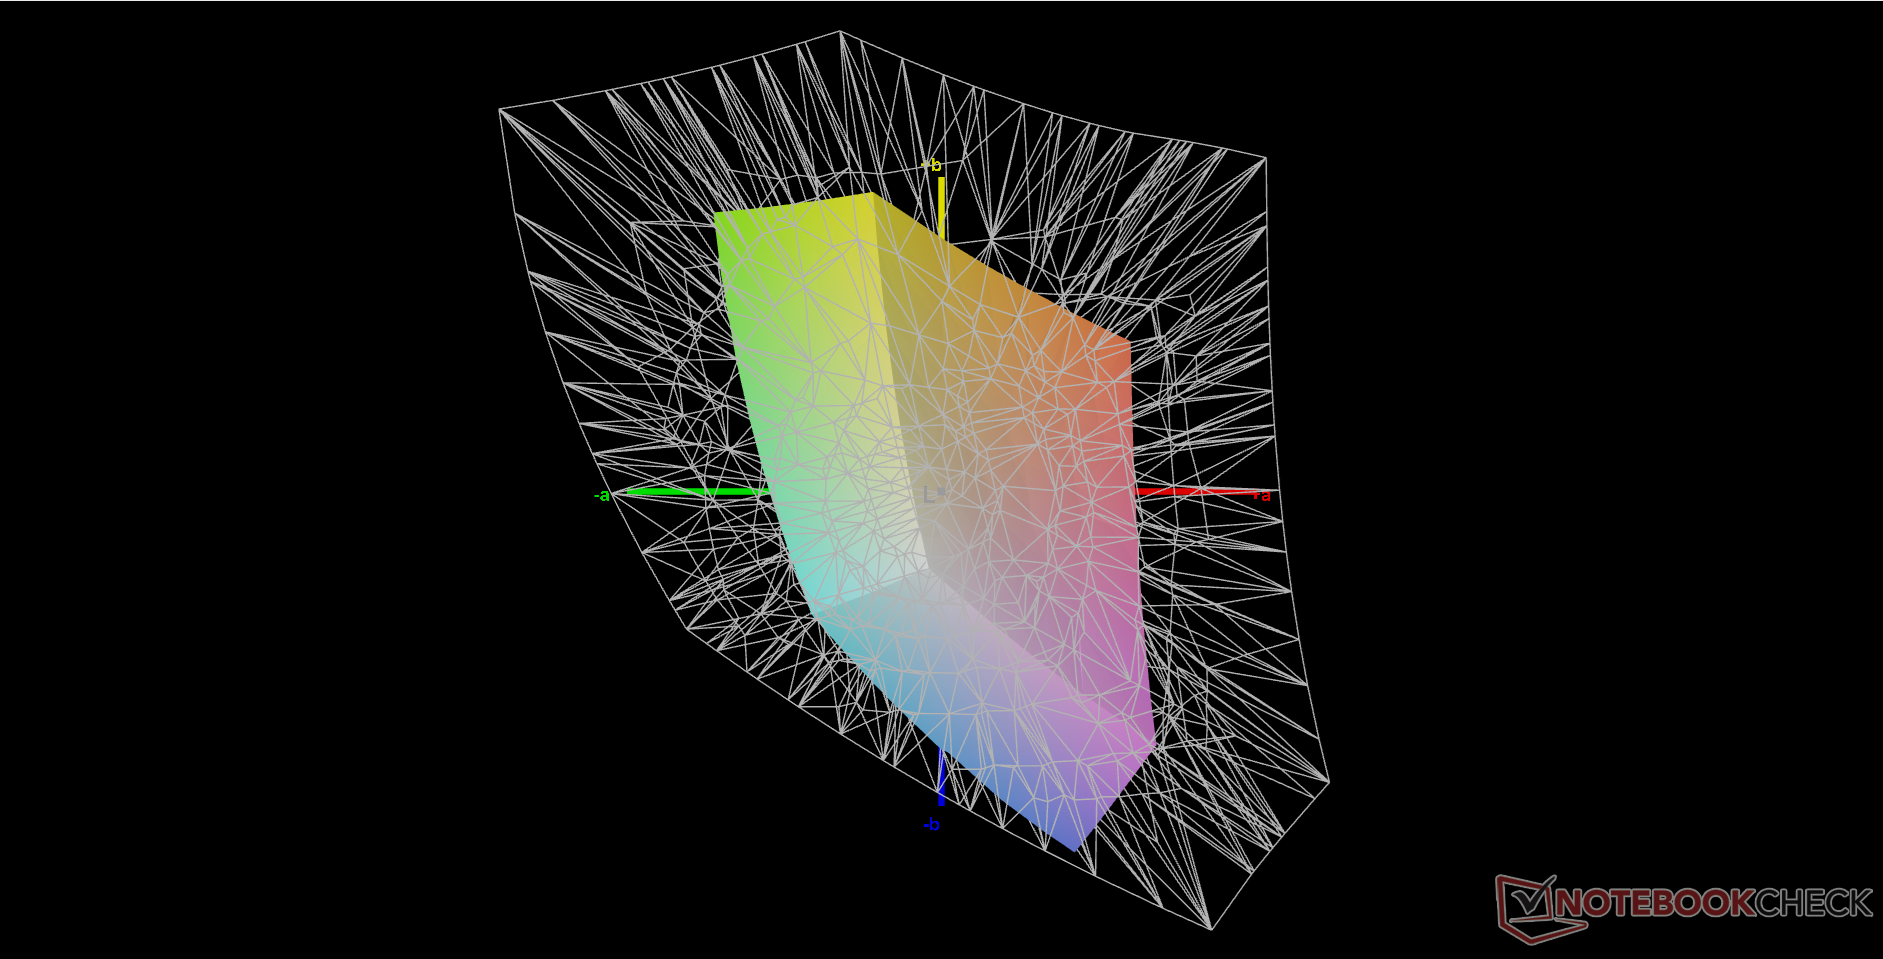
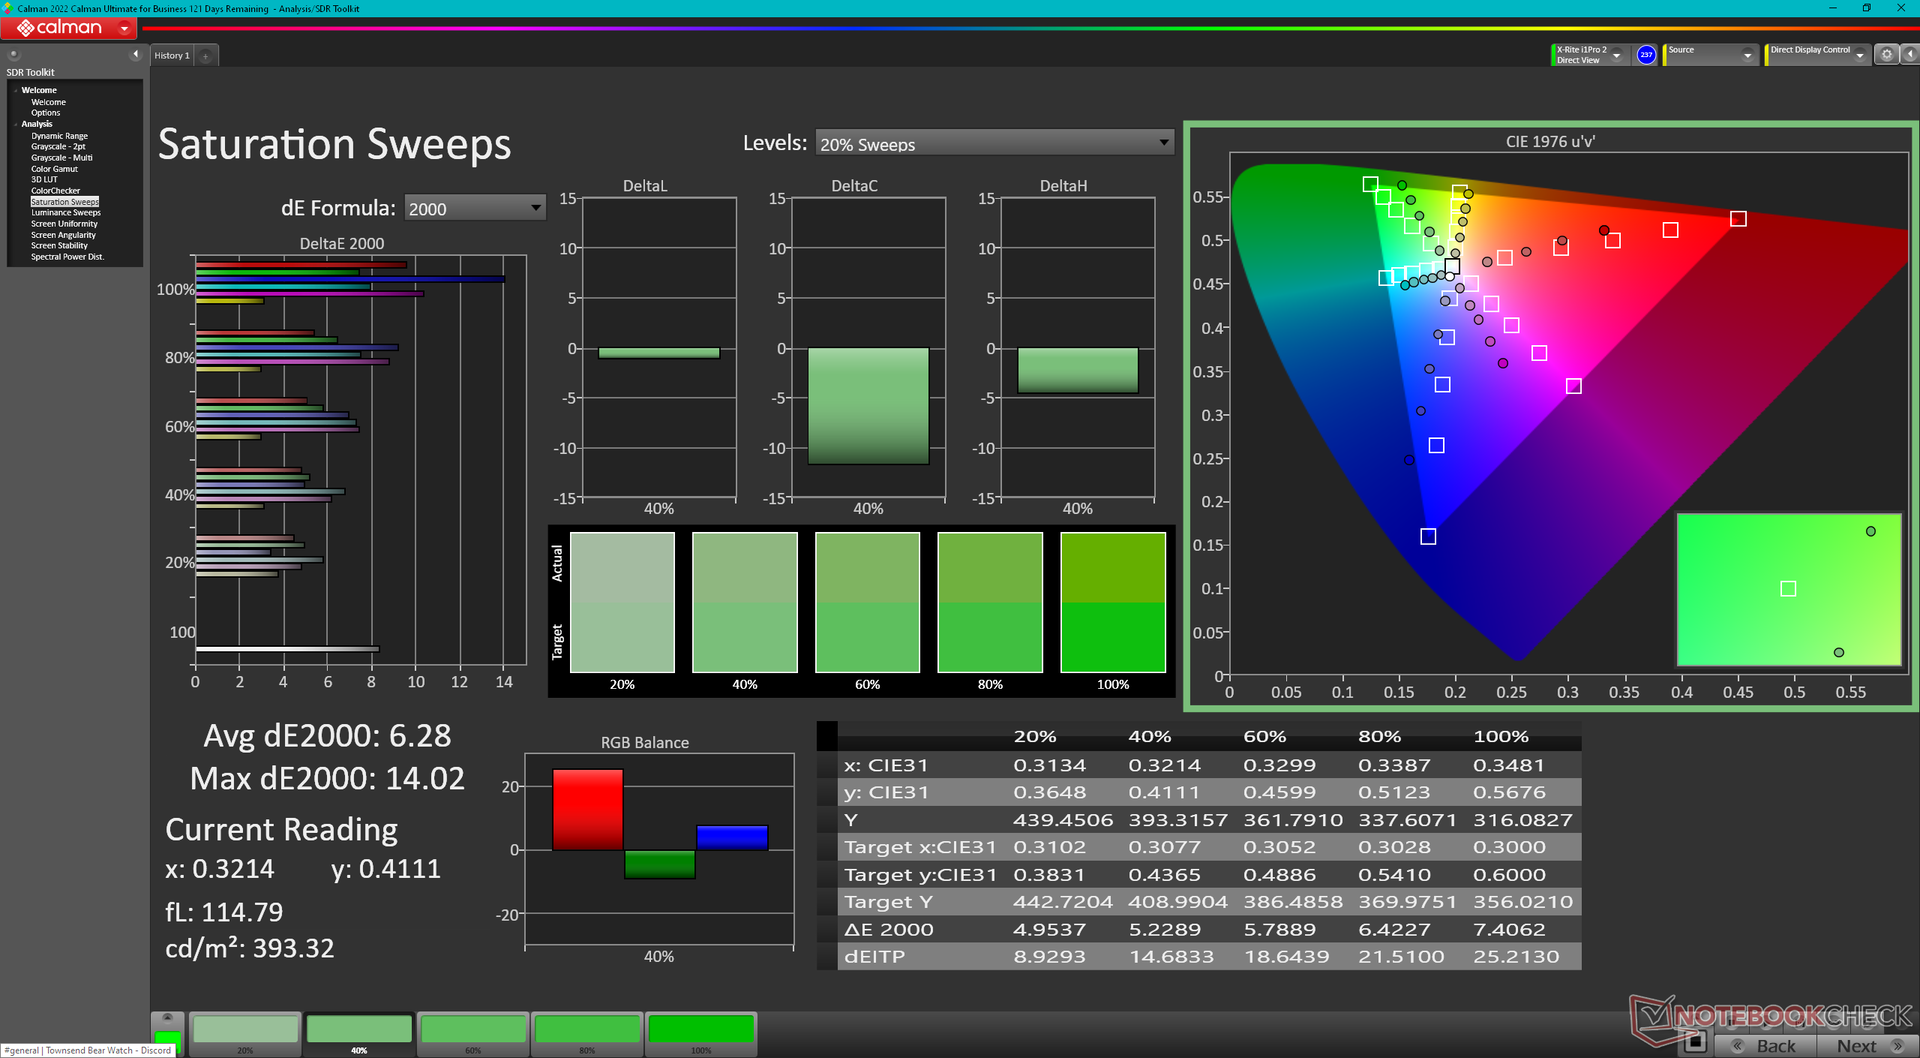
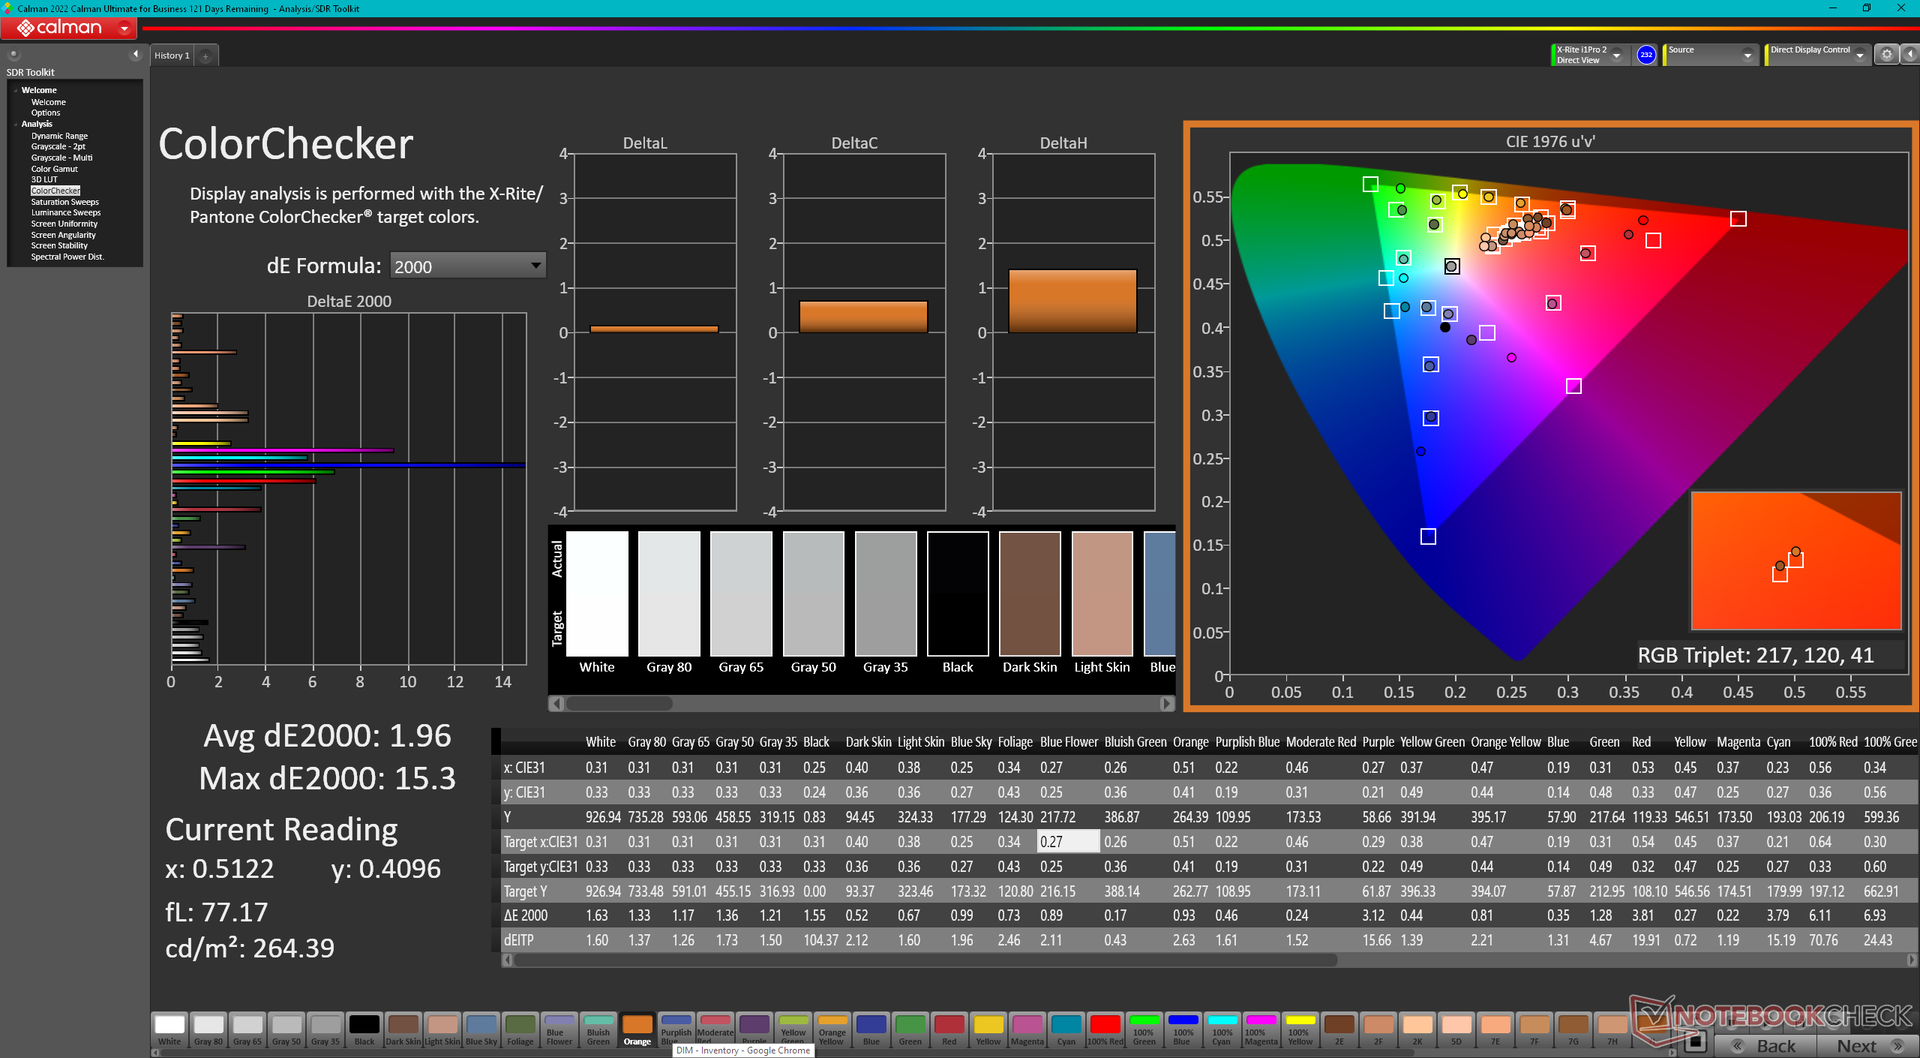
The display comes poorly calibrated with average deltaE values greater than 4 and an overly cool color temperature. A proper calibration with our X-Rite colorimeter addresses these concerns, but colors still become more inaccurate at higher saturation levels no matter what due to the limited color space mentioned above. We recommend applying our calibrated ICM profile to get the most out of the display.
Display Response Times
| ↔ Response Time Black to White | ||
|---|---|---|
| 18.6 ms ... rise ↗ and fall ↘ combined | ↗ 9.4 ms rise | 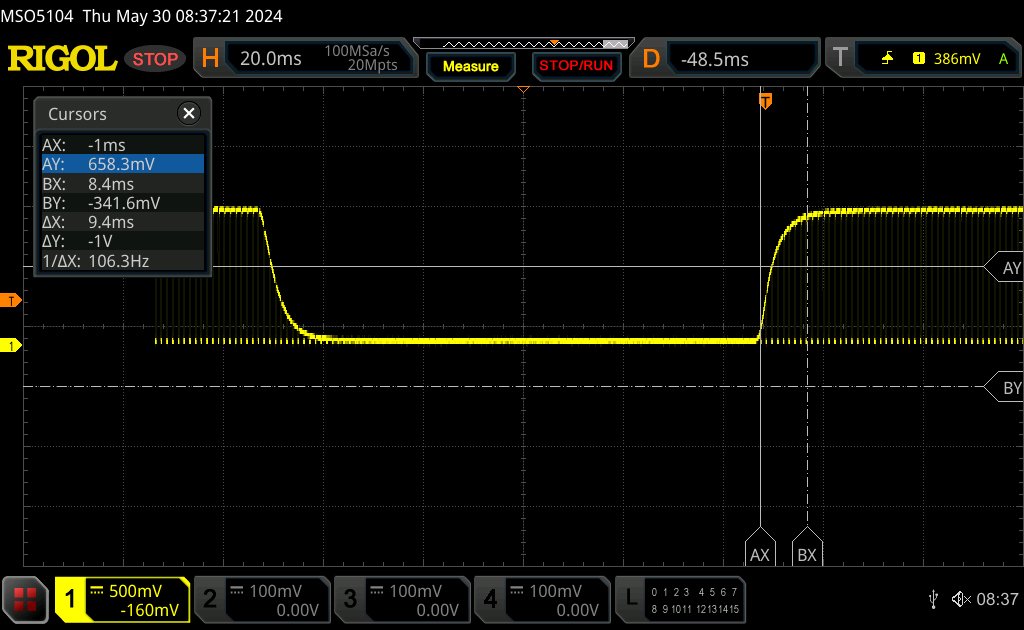 |
| ↘ 9.2 ms fall | ||
| The screen shows good response rates in our tests, but may be too slow for competitive gamers. In comparison, all tested devices range from 0.1 (minimum) to 240 (maximum) ms. » 42 % of all devices are better. This means that the measured response time is similar to the average of all tested devices (19.8 ms). | ||
| ↔ Response Time 50% Grey to 80% Grey | ||
| 29 ms ... rise ↗ and fall ↘ combined | ↗ 14.6 ms rise | 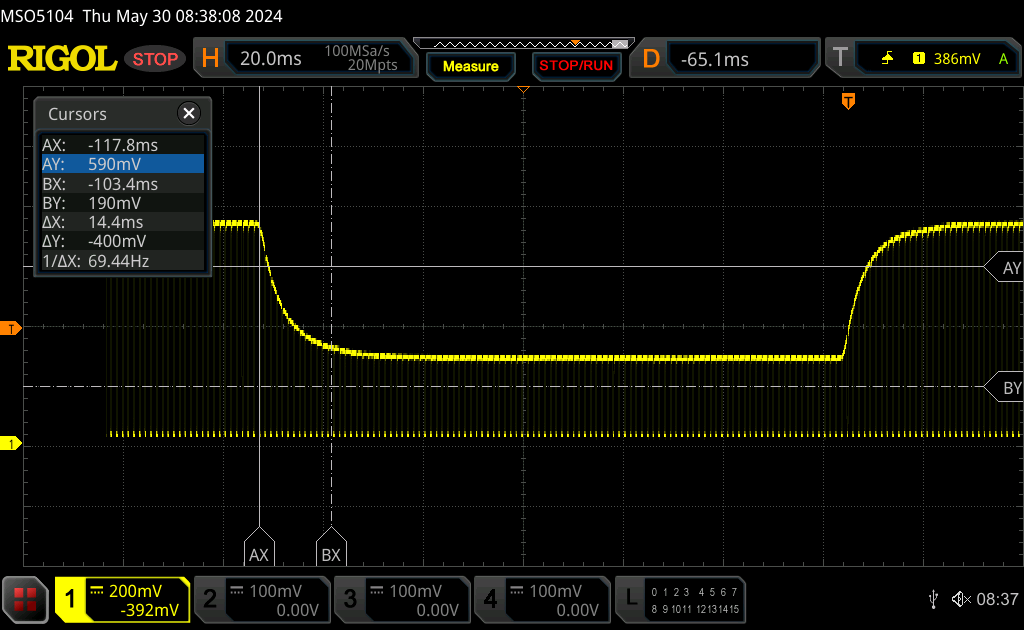 |
| ↘ 14.4 ms fall | ||
| The screen shows relatively slow response rates in our tests and may be too slow for gamers. In comparison, all tested devices range from 0.165 (minimum) to 636 (maximum) ms. » 39 % of all devices are better. This means that the measured response time is similar to the average of all tested devices (31 ms). | ||
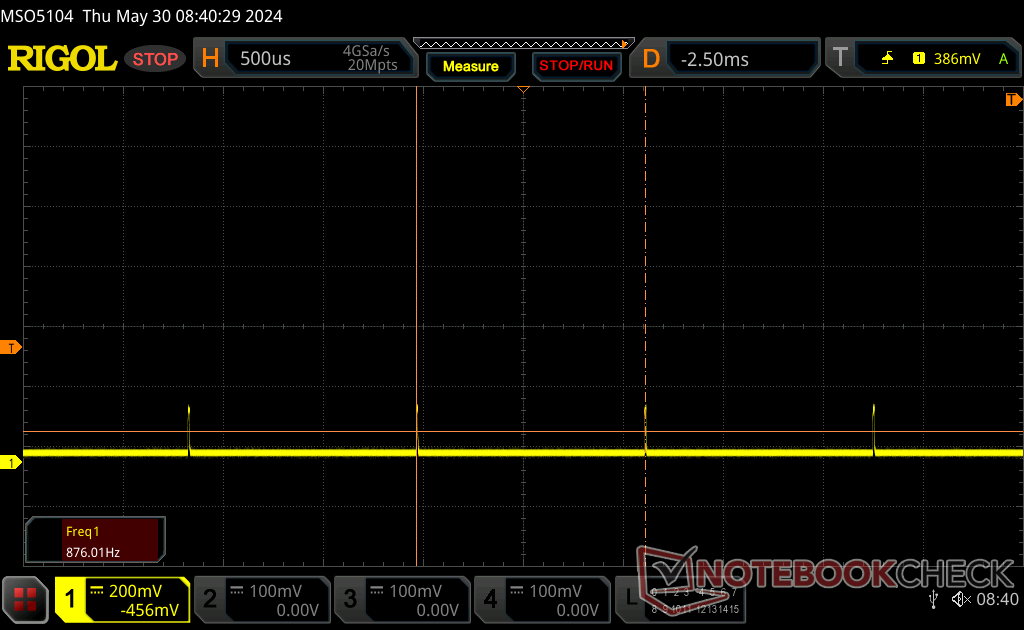
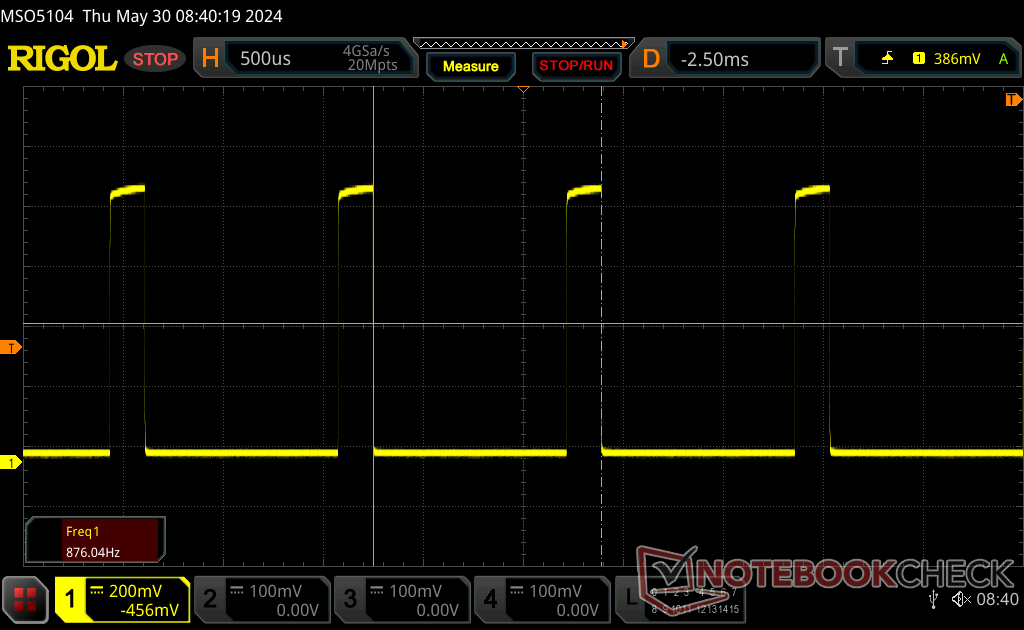
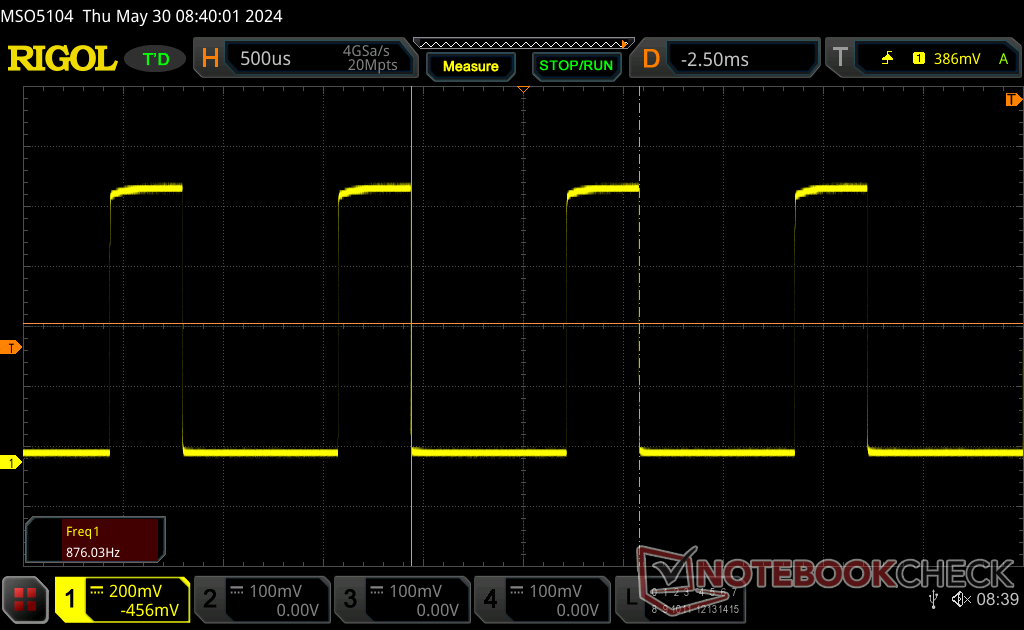
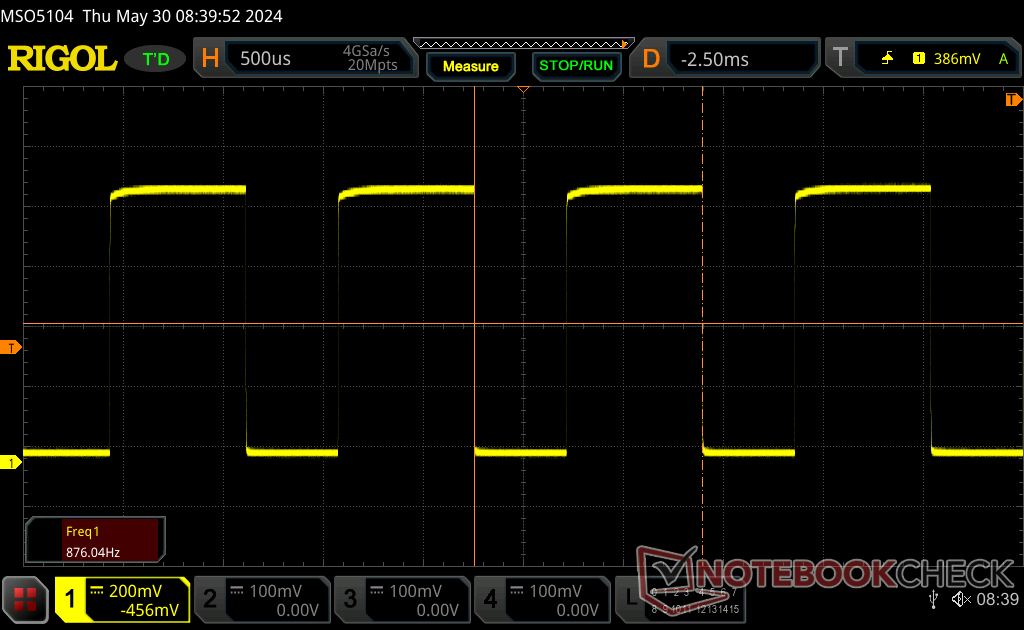
Screen Flickering / PWM (Pulse-Width Modulation)
| Screen flickering / PWM detected | 876 Hz | ≤ 100 % brightness setting | 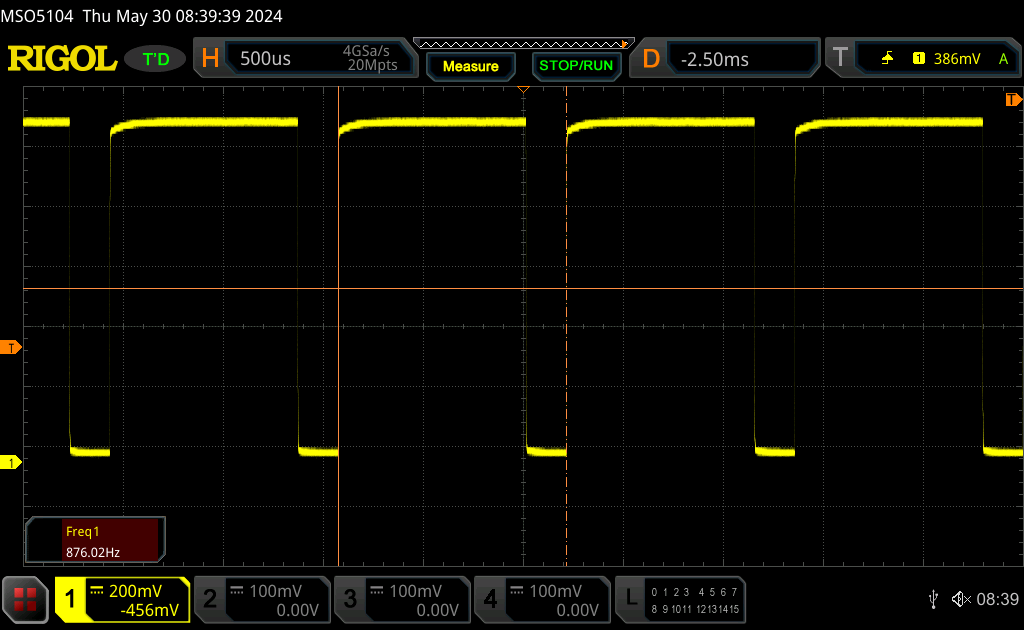 |
The display backlight flickers at 876 Hz (worst case, e.g., utilizing PWM) Flickering detected at a brightness setting of 100 % and below. There should be no flickering or PWM above this brightness setting. The frequency of 876 Hz is quite high, so most users sensitive to PWM should not notice any flickering. In comparison: 52 % of all tested devices do not use PWM to dim the display. If PWM was detected, an average of 7747 (minimum: 5 - maximum: 343500) Hz was measured. | |||
Pulse-width modulation or flickering is present on all brightness levels at a frequency of 876 Hz. Users who are sensitive to flickering may want to avoid using the screen for long periods or at least reduce the brightness level.
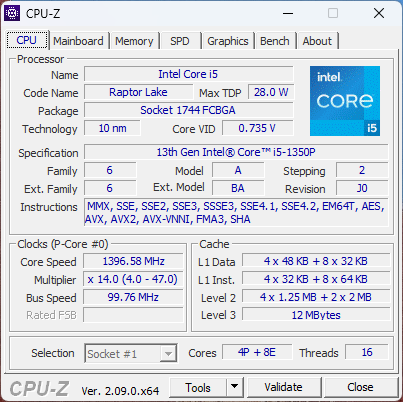
Performance — Raptor Lake-P Upgrade
Testing Conditions
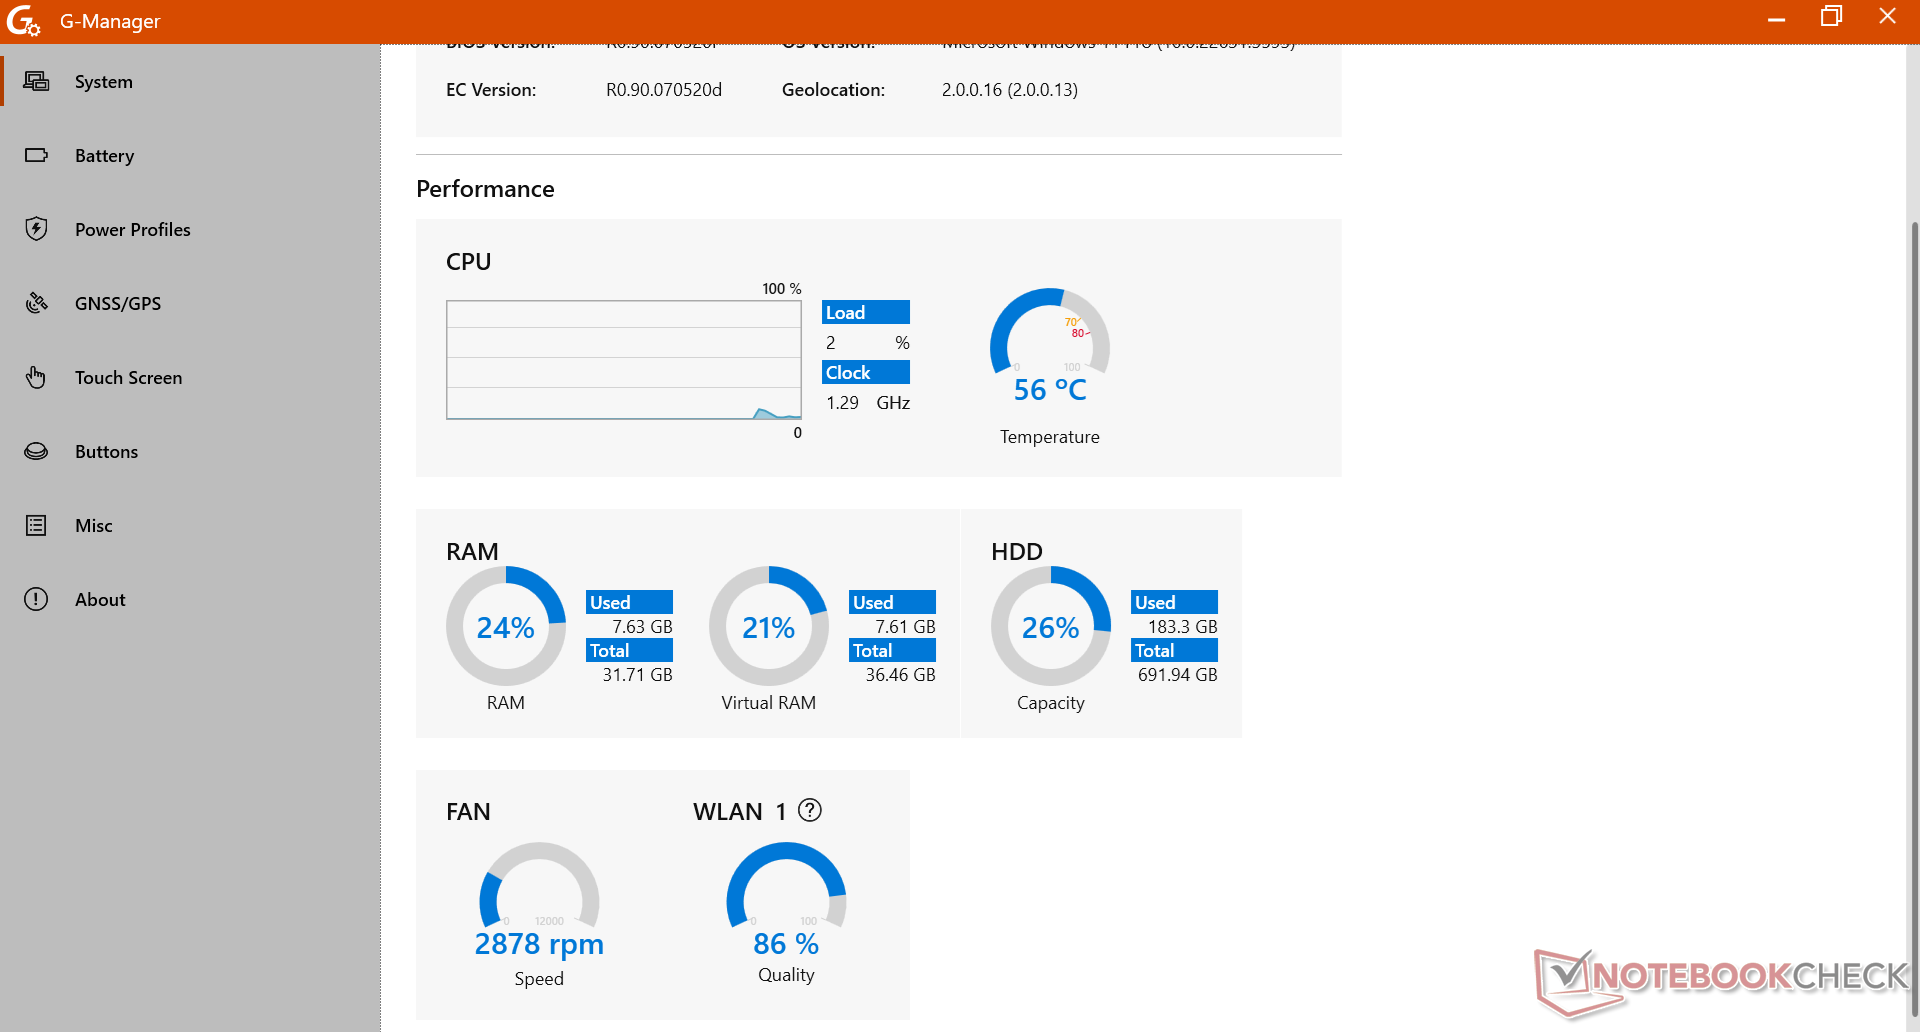
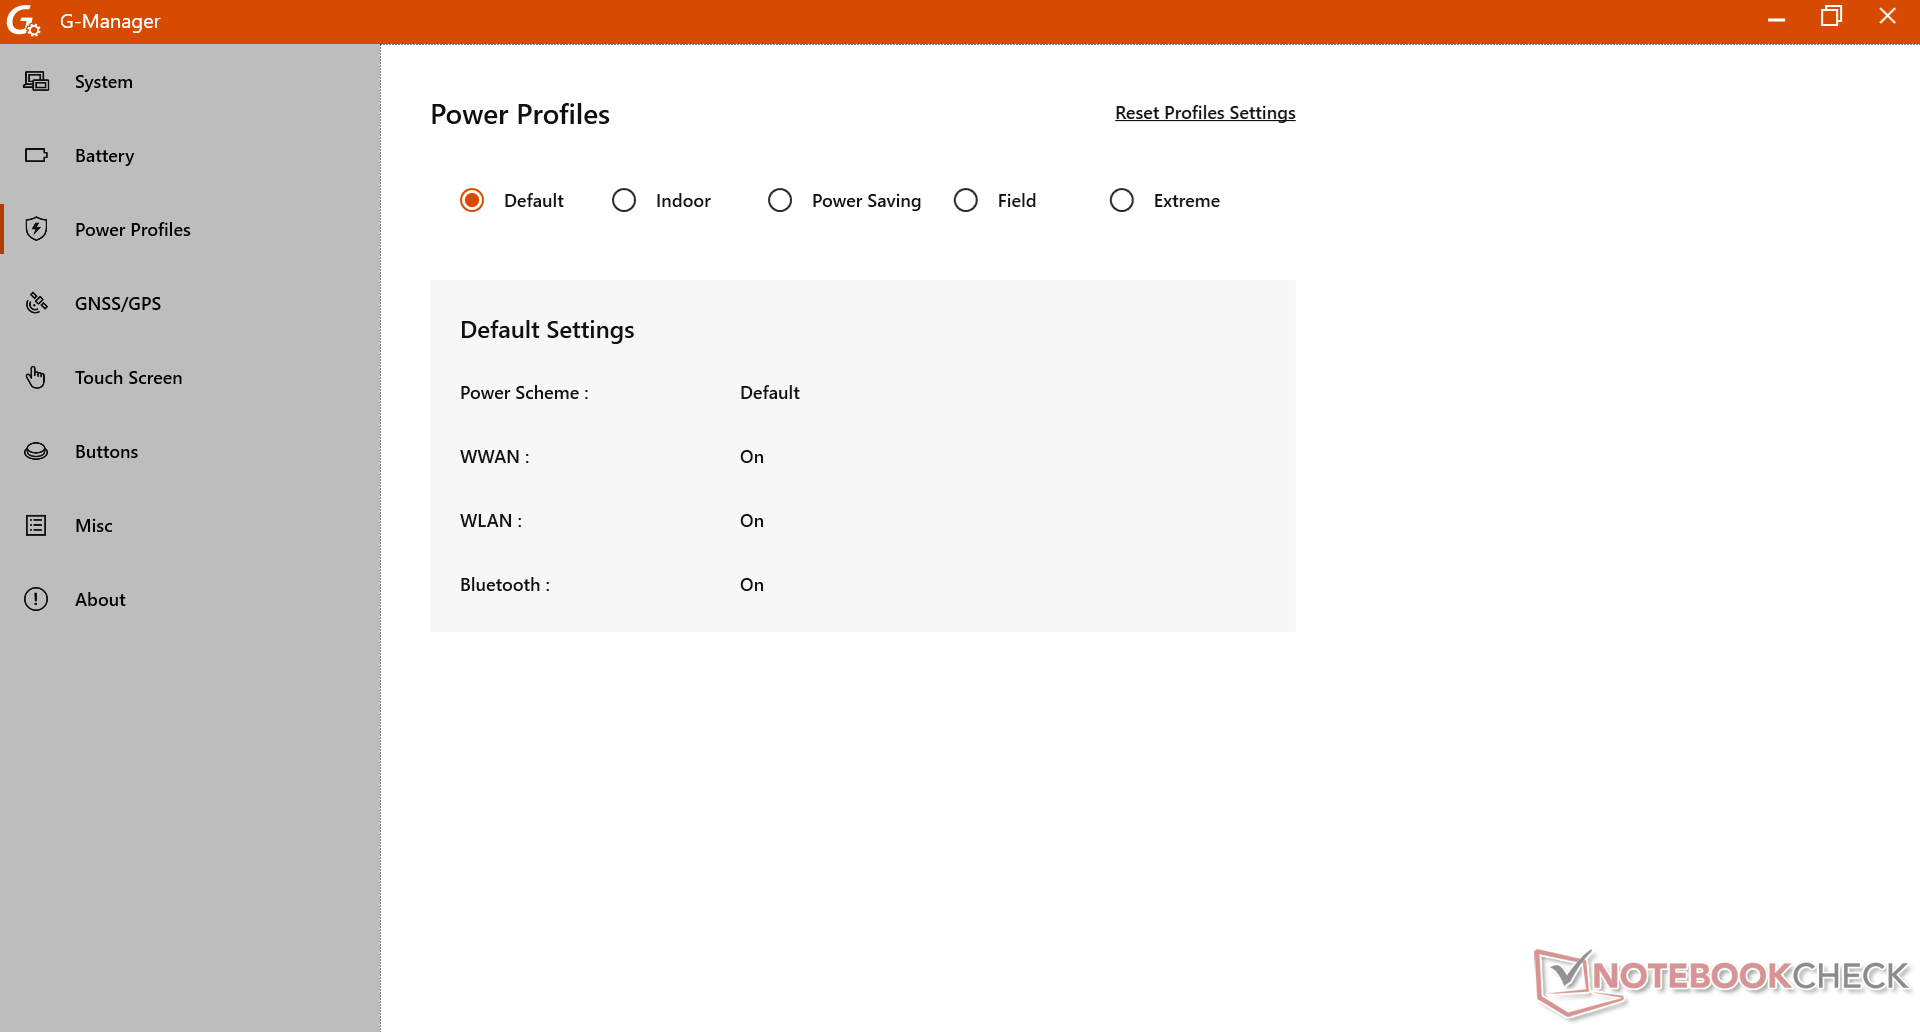
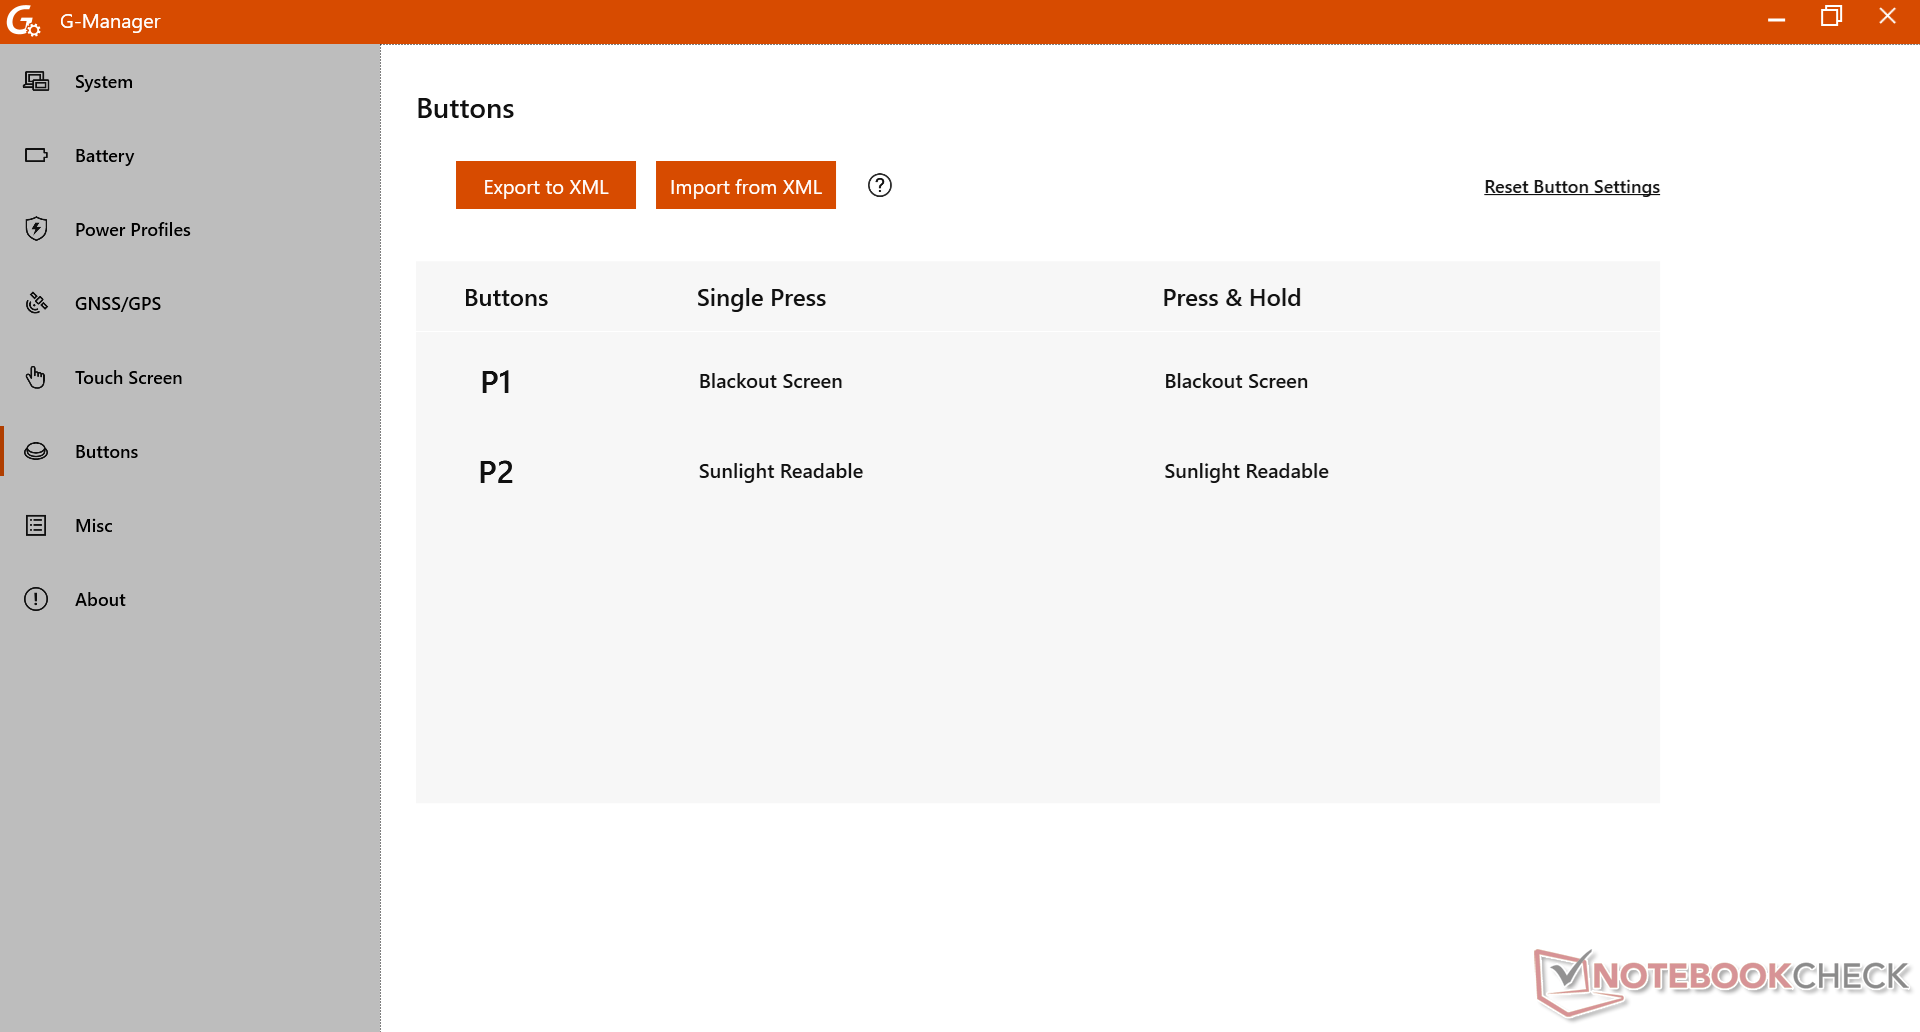
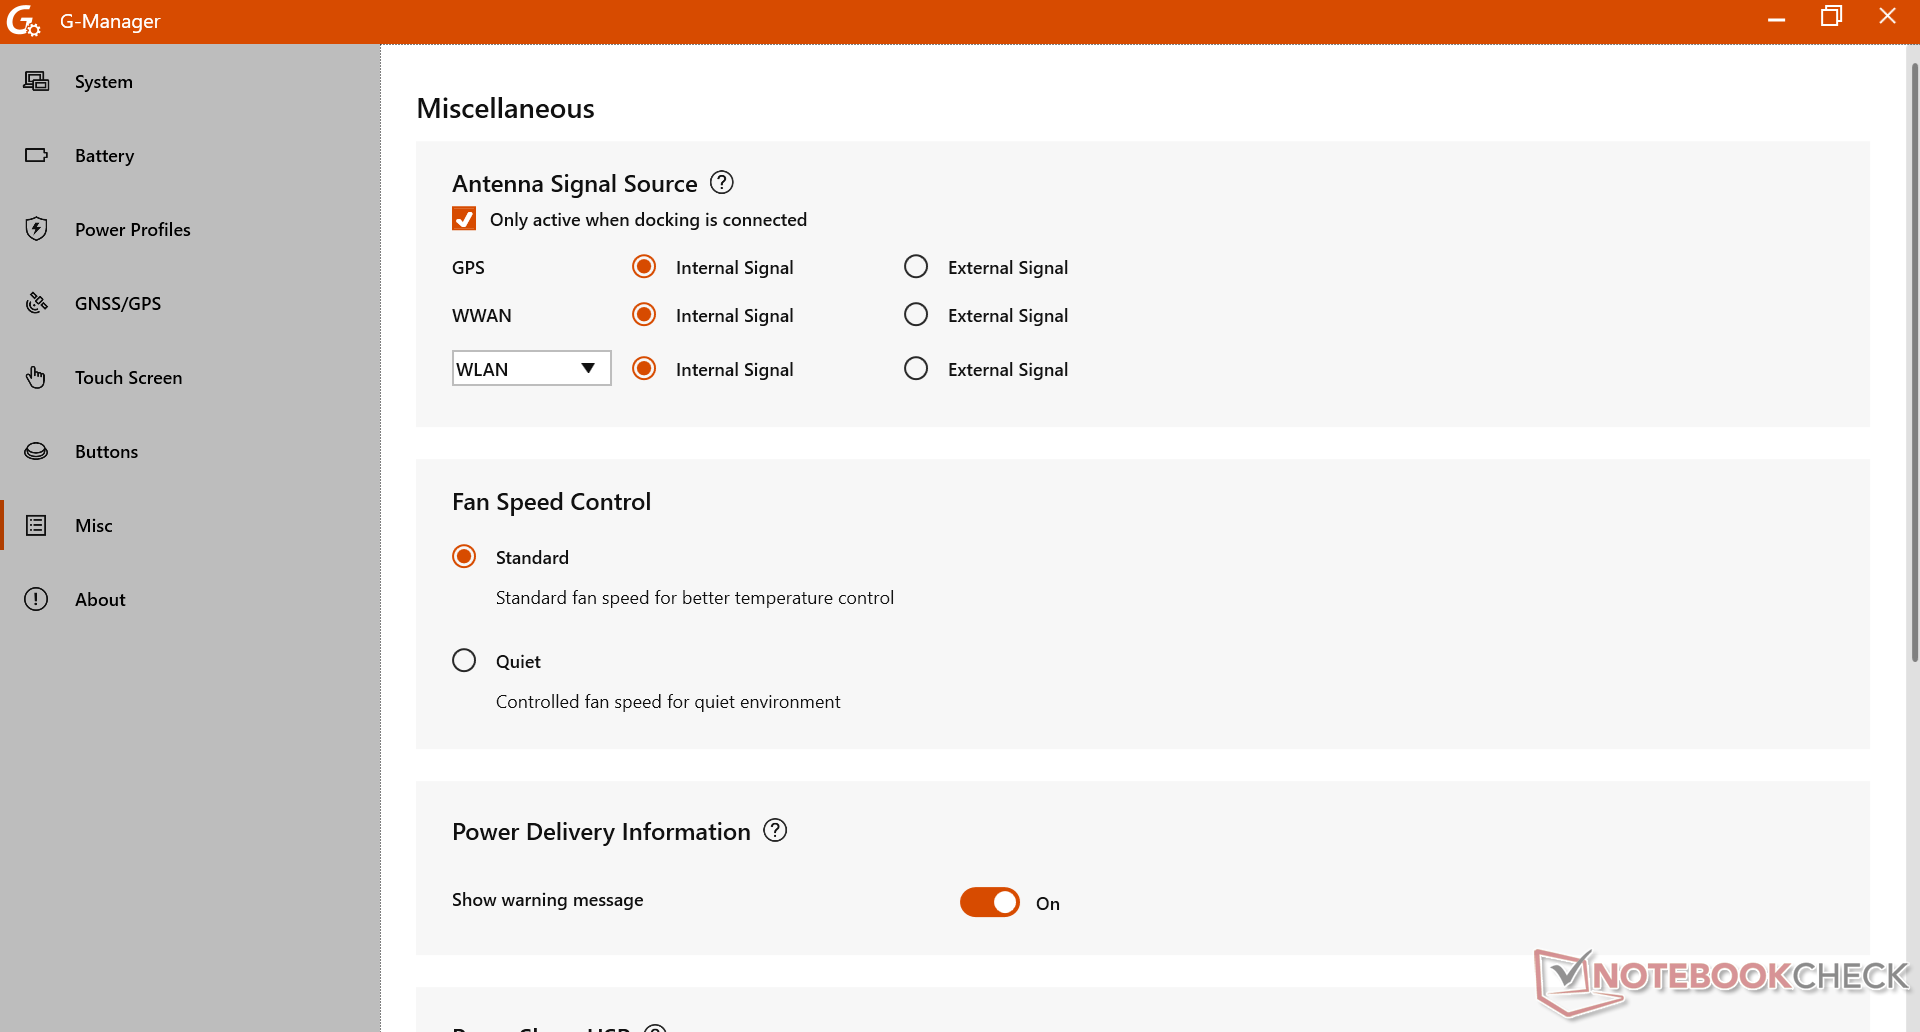
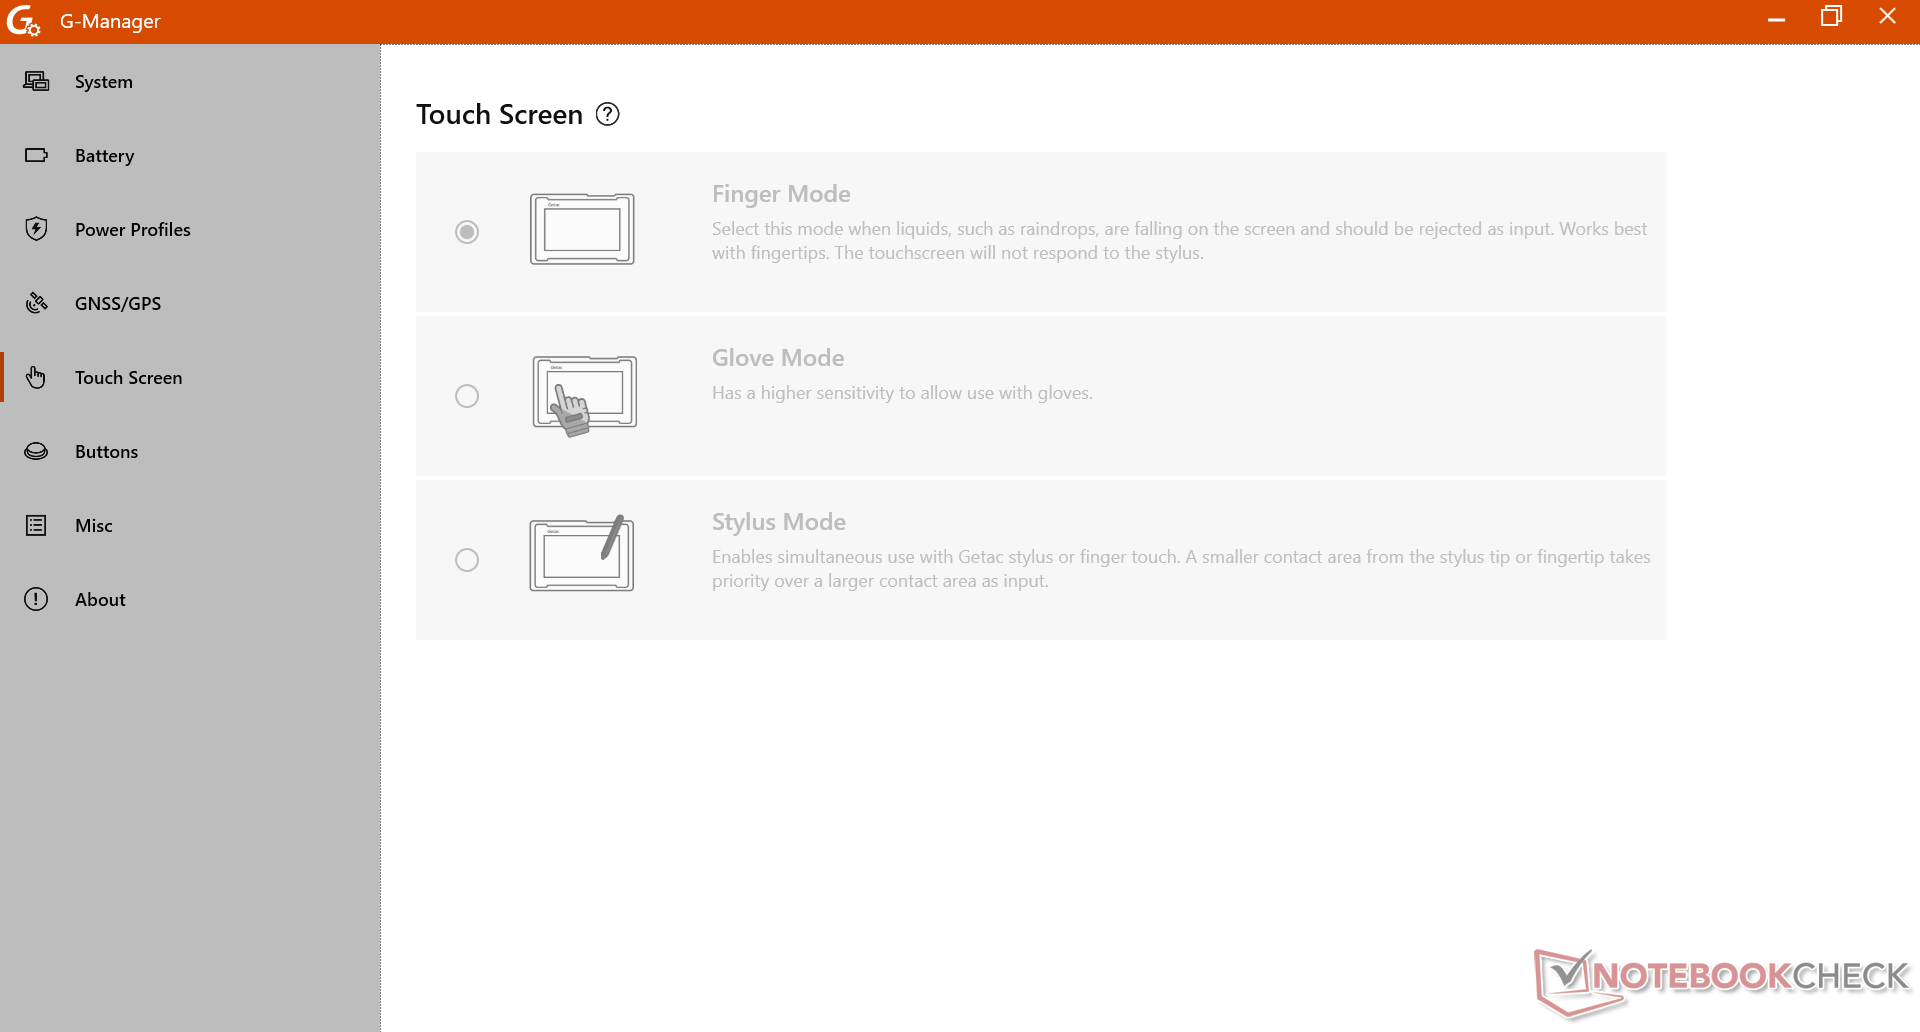
We set Windows to Performance mode and G-Manager to Extreme performance mode prior to running the benchmarks below. Users are encouraged to become familiar with G-Manager as it is the hub for adjusting several unique features of the S410 including the integrated GPS/GNSS, customizable buttons, and touchscreen sensitivity.
Processor
The performance jump from the Core i7-1185G7 in the older S410 G4 to our newer Core i5-1350P is significant as the Raptor Lake-P CPU can be over 2x faster than Tiger Lake-U when it comes to multi-threaded workloads. Turbo Boost is limited, however, as demonstrated by our CineBench R15 xT loop test graph below. Despite this, the system is still much faster than before even after accounting for the steep throttling.
Cinebench R15 Multi Loop
Cinebench R23: Multi Core | Single Core
Cinebench R20: CPU (Multi Core) | CPU (Single Core)
Cinebench R15: CPU Multi 64Bit | CPU Single 64Bit
Blender: v2.79 BMW27 CPU
7-Zip 18.03: 7z b 4 | 7z b 4 -mmt1
Geekbench 6.7: Multi-Core | Single-Core
Geekbench 5.5: Multi-Core | Single-Core
HWBOT x265 Benchmark v2.2: 4k Preset
LibreOffice : 20 Documents To PDF
R Benchmark 2.5: Overall mean
| CPU Performance rating | |
| Getac S410 G5 | |
| Average Intel Core i5-1350P | |
| Dell Latitude 7330 Rugged Extreme -2! | |
| Panasonic Toughbook FZ-55 MK2 -4! | |
| Getac S410 Gen 4 -2! | |
| Dell Latitude 14 5420-D2G5W -2! | |
| Panasonic Toughbook 40 -2! | |
| Durabook S14I -2! | |
| Panasonic Toughbook FZ-55 -14! | |
| Getac B360 -3! | |
| Getac S410 -14! | |
| Cinebench R23 / Multi Core | |
| Getac S410 G5 | |
| Average Intel Core i5-1350P (n=1) | |
| Dell Latitude 7330 Rugged Extreme | |
| Dell Latitude 14 5420-D2G5W | |
| Panasonic Toughbook FZ-55 MK2 | |
| Getac S410 Gen 4 | |
| Panasonic Toughbook 40 | |
| Getac B360 | |
| Durabook S14I | |
| Cinebench R23 / Single Core | |
| Getac S410 G5 | |
| Average Intel Core i5-1350P (n=1) | |
| Dell Latitude 7330 Rugged Extreme | |
| Panasonic Toughbook FZ-55 MK2 | |
| Getac S410 Gen 4 | |
| Panasonic Toughbook 40 | |
| Durabook S14I | |
| Dell Latitude 14 5420-D2G5W | |
| Getac B360 | |
| Cinebench R20 / CPU (Multi Core) | |
| Getac S410 G5 | |
| Average Intel Core i5-1350P (n=1) | |
| Dell Latitude 14 5420-D2G5W | |
| Dell Latitude 7330 Rugged Extreme | |
| Panasonic Toughbook FZ-55 MK2 | |
| Getac S410 Gen 4 | |
| Panasonic Toughbook 40 | |
| Getac B360 | |
| Durabook S14I | |
| Cinebench R20 / CPU (Single Core) | |
| Getac S410 G5 | |
| Average Intel Core i5-1350P (n=1) | |
| Dell Latitude 7330 Rugged Extreme | |
| Panasonic Toughbook FZ-55 MK2 | |
| Getac S410 Gen 4 | |
| Durabook S14I | |
| Panasonic Toughbook 40 | |
| Dell Latitude 14 5420-D2G5W | |
| Getac B360 | |
| Cinebench R15 / CPU Multi 64Bit | |
| Getac S410 G5 | |
| Average Intel Core i5-1350P (n=1) | |
| Dell Latitude 14 5420-D2G5W | |
| Dell Latitude 7330 Rugged Extreme | |
| Panasonic Toughbook FZ-55 MK2 | |
| Getac S410 Gen 4 | |
| Panasonic Toughbook 40 | |
| Getac B360 | |
| Durabook S14I | |
| Panasonic Toughbook FZ-55 | |
| Getac S410 | |
| Cinebench R15 / CPU Single 64Bit | |
| Getac S410 G5 | |
| Average Intel Core i5-1350P (n=1) | |
| Dell Latitude 7330 Rugged Extreme | |
| Panasonic Toughbook FZ-55 MK2 | |
| Getac S410 Gen 4 | |
| Durabook S14I | |
| Panasonic Toughbook 40 | |
| Dell Latitude 14 5420-D2G5W | |
| Getac B360 | |
| Panasonic Toughbook FZ-55 | |
| Getac S410 | |
| Blender / v2.79 BMW27 CPU | |
| Durabook S14I | |
| Getac B360 | |
| Panasonic Toughbook 40 | |
| Getac S410 Gen 4 | |
| Panasonic Toughbook FZ-55 MK2 | |
| Dell Latitude 7330 Rugged Extreme | |
| Dell Latitude 14 5420-D2G5W | |
| Getac S410 G5 | |
| Average Intel Core i5-1350P (n=1) | |
| 7-Zip 18.03 / 7z b 4 | |
| Getac S410 G5 | |
| Average Intel Core i5-1350P (n=1) | |
| Dell Latitude 7330 Rugged Extreme | |
| Panasonic Toughbook FZ-55 MK2 | |
| Dell Latitude 14 5420-D2G5W | |
| Getac S410 Gen 4 | |
| Getac B360 | |
| Panasonic Toughbook 40 | |
| Durabook S14I | |
| 7-Zip 18.03 / 7z b 4 -mmt1 | |
| Dell Latitude 7330 Rugged Extreme | |
| Panasonic Toughbook FZ-55 MK2 | |
| Durabook S14I | |
| Getac S410 G5 | |
| Average Intel Core i5-1350P (n=1) | |
| Panasonic Toughbook 40 | |
| Getac S410 Gen 4 | |
| Dell Latitude 14 5420-D2G5W | |
| Getac B360 | |
| Geekbench 6.7 / Multi-Core | |
| Getac S410 G5 | |
| Average Intel Core i5-1350P (n=1) | |
| Geekbench 6.7 / Single-Core | |
| Getac S410 G5 | |
| Average Intel Core i5-1350P (n=1) | |
| Geekbench 5.5 / Multi-Core | |
| Getac S410 G5 | |
| Average Intel Core i5-1350P (n=1) | |
| Dell Latitude 7330 Rugged Extreme | |
| Getac S410 Gen 4 | |
| Panasonic Toughbook 40 | |
| Getac B360 | |
| Durabook S14I | |
| Dell Latitude 14 5420-D2G5W | |
| Geekbench 5.5 / Single-Core | |
| Getac S410 G5 | |
| Average Intel Core i5-1350P (n=1) | |
| Dell Latitude 7330 Rugged Extreme | |
| Durabook S14I | |
| Getac S410 Gen 4 | |
| Panasonic Toughbook 40 | |
| Getac B360 | |
| Dell Latitude 14 5420-D2G5W | |
| HWBOT x265 Benchmark v2.2 / 4k Preset | |
| Getac S410 G5 | |
| Average Intel Core i5-1350P (n=1) | |
| Dell Latitude 7330 Rugged Extreme | |
| Panasonic Toughbook FZ-55 MK2 | |
| Getac S410 Gen 4 | |
| Dell Latitude 14 5420-D2G5W | |
| Panasonic Toughbook 40 | |
| Getac B360 | |
| Durabook S14I | |
| LibreOffice / 20 Documents To PDF | |
| Dell Latitude 14 5420-D2G5W | |
| Panasonic Toughbook 40 | |
| Getac S410 Gen 4 | |
| Dell Latitude 7330 Rugged Extreme | |
| Panasonic Toughbook FZ-55 MK2 | |
| Durabook S14I | |
| Getac S410 G5 | |
| Average Intel Core i5-1350P (n=1) | |
| R Benchmark 2.5 / Overall mean | |
| Getac B360 | |
| Dell Latitude 14 5420-D2G5W | |
| Panasonic Toughbook 40 | |
| Getac S410 Gen 4 | |
| Durabook S14I | |
| Panasonic Toughbook FZ-55 MK2 | |
| Dell Latitude 7330 Rugged Extreme | |
| Getac S410 G5 | |
| Average Intel Core i5-1350P (n=1) | |
* ... smaller is better
AIDA64: FP32 Ray-Trace | FPU Julia | CPU SHA3 | CPU Queen | FPU SinJulia | FPU Mandel | CPU AES | CPU ZLib | FP64 Ray-Trace | CPU PhotoWorxx
| Performance rating | |
| Getac S410 G5 | |
| Average Intel Core i5-1350P | |
| Dell Latitude 7330 Rugged Extreme | |
| Dell Latitude 14 5420-D2G5W | |
| Getac S410 Gen 4 | |
| Panasonic Toughbook 40 | |
| Durabook S14I | |
| AIDA64 / FP32 Ray-Trace | |
| Getac S410 G5 | |
| Average Intel Core i5-1350P (n=1) | |
| Dell Latitude 14 5420-D2G5W | |
| Dell Latitude 7330 Rugged Extreme | |
| Getac S410 Gen 4 | |
| Panasonic Toughbook 40 | |
| Durabook S14I | |
| AIDA64 / FPU Julia | |
| Getac S410 G5 | |
| Average Intel Core i5-1350P (n=1) | |
| Dell Latitude 7330 Rugged Extreme | |
| Dell Latitude 14 5420-D2G5W | |
| Getac S410 Gen 4 | |
| Panasonic Toughbook 40 | |
| Durabook S14I | |
| AIDA64 / CPU SHA3 | |
| Dell Latitude 7330 Rugged Extreme | |
| Dell Latitude 14 5420-D2G5W | |
| Getac S410 G5 | |
| Average Intel Core i5-1350P (n=1) | |
| Getac S410 Gen 4 | |
| Panasonic Toughbook 40 | |
| Durabook S14I | |
| AIDA64 / CPU Queen | |
| Getac S410 G5 | |
| Average Intel Core i5-1350P (n=1) | |
| Dell Latitude 7330 Rugged Extreme | |
| Durabook S14I | |
| Getac S410 Gen 4 | |
| Dell Latitude 14 5420-D2G5W | |
| Panasonic Toughbook 40 | |
| AIDA64 / FPU SinJulia | |
| Getac S410 G5 | |
| Average Intel Core i5-1350P (n=1) | |
| Dell Latitude 7330 Rugged Extreme | |
| Dell Latitude 14 5420-D2G5W | |
| Getac S410 Gen 4 | |
| Panasonic Toughbook 40 | |
| Durabook S14I | |
| AIDA64 / FPU Mandel | |
| Getac S410 G5 | |
| Average Intel Core i5-1350P (n=1) | |
| Dell Latitude 7330 Rugged Extreme | |
| Dell Latitude 14 5420-D2G5W | |
| Getac S410 Gen 4 | |
| Panasonic Toughbook 40 | |
| Durabook S14I | |
| AIDA64 / CPU AES | |
| Dell Latitude 7330 Rugged Extreme | |
| Dell Latitude 14 5420-D2G5W | |
| Durabook S14I | |
| Getac S410 G5 | |
| Average Intel Core i5-1350P (n=1) | |
| Getac S410 Gen 4 | |
| Panasonic Toughbook 40 | |
| AIDA64 / CPU ZLib | |
| Getac S410 G5 | |
| Average Intel Core i5-1350P (n=1) | |
| Dell Latitude 7330 Rugged Extreme | |
| Dell Latitude 14 5420-D2G5W | |
| Panasonic Toughbook 40 | |
| Getac S410 Gen 4 | |
| Durabook S14I | |
| AIDA64 / FP64 Ray-Trace | |
| Getac S410 G5 | |
| Average Intel Core i5-1350P (n=1) | |
| Dell Latitude 7330 Rugged Extreme | |
| Dell Latitude 14 5420-D2G5W | |
| Getac S410 Gen 4 | |
| Panasonic Toughbook 40 | |
| Durabook S14I | |
| AIDA64 / CPU PhotoWorxx | |
| Dell Latitude 7330 Rugged Extreme | |
| Getac S410 G5 | |
| Average Intel Core i5-1350P (n=1) | |
| Getac S410 Gen 4 | |
| Panasonic Toughbook 40 | |
| Durabook S14I | |
| Dell Latitude 14 5420-D2G5W | |
System Performance
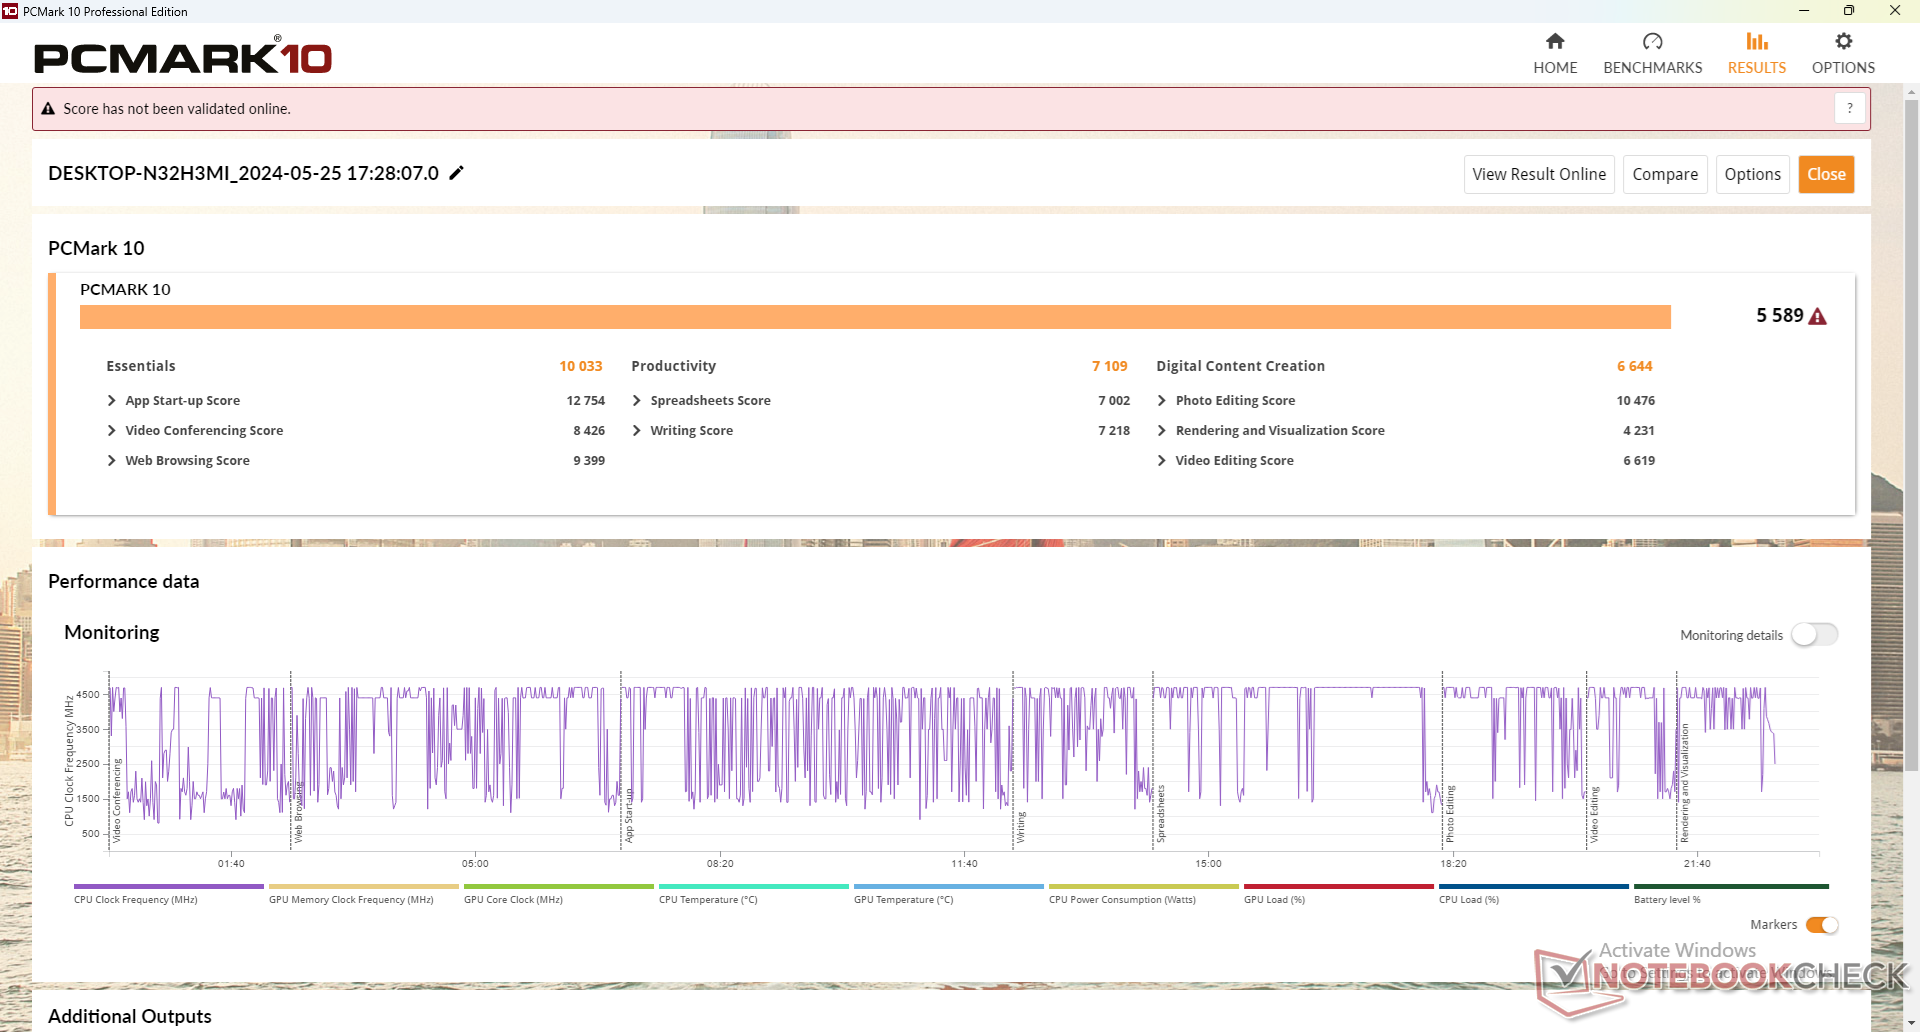
PCMark results are consistently higher than last year's model to reflect the faster overall performance with the newer processor.
CrossMark: Overall | Productivity | Creativity | Responsiveness
WebXPRT 3: Overall
WebXPRT 4: Overall
Mozilla Kraken 1.1: Total
| PCMark 10 / Score | |
| Getac S410 G5 | |
| Average Intel Core i5-1350P, Intel Iris Xe Graphics G7 80EUs (n=1) | |
| Dell Latitude 7330 Rugged Extreme | |
| Panasonic Toughbook 40 | |
| Durabook S14I | |
| Getac S410 Gen 4 | |
| Dell Latitude 14 5420-D2G5W | |
| PCMark 10 / Essentials | |
| Dell Latitude 7330 Rugged Extreme | |
| Durabook S14I | |
| Getac S410 G5 | |
| Average Intel Core i5-1350P, Intel Iris Xe Graphics G7 80EUs (n=1) | |
| Getac S410 Gen 4 | |
| Panasonic Toughbook 40 | |
| Dell Latitude 14 5420-D2G5W | |
| PCMark 10 / Productivity | |
| Getac S410 G5 | |
| Average Intel Core i5-1350P, Intel Iris Xe Graphics G7 80EUs (n=1) | |
| Durabook S14I | |
| Dell Latitude 7330 Rugged Extreme | |
| Panasonic Toughbook 40 | |
| Dell Latitude 14 5420-D2G5W | |
| Getac S410 Gen 4 | |
| PCMark 10 / Digital Content Creation | |
| Getac S410 G5 | |
| Average Intel Core i5-1350P, Intel Iris Xe Graphics G7 80EUs (n=1) | |
| Dell Latitude 7330 Rugged Extreme | |
| Panasonic Toughbook 40 | |
| Getac S410 Gen 4 | |
| Dell Latitude 14 5420-D2G5W | |
| Durabook S14I | |
| CrossMark / Overall | |
| Getac S410 G5 | |
| Average Intel Core i5-1350P, Intel Iris Xe Graphics G7 80EUs (n=1) | |
| Panasonic Toughbook 40 | |
| Getac S410 Gen 4 | |
| Dell Latitude 14 5420-D2G5W | |
| CrossMark / Productivity | |
| Getac S410 G5 | |
| Average Intel Core i5-1350P, Intel Iris Xe Graphics G7 80EUs (n=1) | |
| Panasonic Toughbook 40 | |
| Getac S410 Gen 4 | |
| Dell Latitude 14 5420-D2G5W | |
| CrossMark / Creativity | |
| Getac S410 G5 | |
| Average Intel Core i5-1350P, Intel Iris Xe Graphics G7 80EUs (n=1) | |
| Panasonic Toughbook 40 | |
| Getac S410 Gen 4 | |
| Dell Latitude 14 5420-D2G5W | |
| CrossMark / Responsiveness | |
| Getac S410 G5 | |
| Average Intel Core i5-1350P, Intel Iris Xe Graphics G7 80EUs (n=1) | |
| Panasonic Toughbook 40 | |
| Dell Latitude 14 5420-D2G5W | |
| Getac S410 Gen 4 | |
| WebXPRT 3 / Overall | |
| Getac S410 G5 | |
| Average Intel Core i5-1350P, Intel Iris Xe Graphics G7 80EUs (n=1) | |
| Dell Latitude 7330 Rugged Extreme | |
| Durabook S14I | |
| Getac S410 Gen 4 | |
| Panasonic Toughbook 40 | |
| Dell Latitude 14 5420-D2G5W | |
| WebXPRT 4 / Overall | |
| Getac S410 G5 | |
| Average Intel Core i5-1350P, Intel Iris Xe Graphics G7 80EUs (n=1) | |
| Mozilla Kraken 1.1 / Total | |
| Dell Latitude 14 5420-D2G5W | |
| Dell Latitude 7330 Rugged Extreme | |
| Panasonic Toughbook 40 | |
| Durabook S14I | |
| Getac S410 G5 | |
| Average Intel Core i5-1350P, Intel Iris Xe Graphics G7 80EUs (n=1) | |
* ... smaller is better
| PCMark 10 Score | 5589 points | |
Help | ||
| AIDA64 / Memory Copy | |
| Dell Latitude 7330 Rugged Extreme | |
| Getac S410 G5 | |
| Average Intel Core i5-1350P (n=1) | |
| Getac S410 Gen 4 | |
| Panasonic Toughbook 40 | |
| Durabook S14I | |
| Dell Latitude 14 5420-D2G5W | |
| AIDA64 / Memory Read | |
| Dell Latitude 7330 Rugged Extreme | |
| Getac S410 G5 | |
| Average Intel Core i5-1350P (n=1) | |
| Getac S410 Gen 4 | |
| Panasonic Toughbook 40 | |
| Durabook S14I | |
| Dell Latitude 14 5420-D2G5W | |
| AIDA64 / Memory Write | |
| Dell Latitude 7330 Rugged Extreme | |
| Getac S410 G5 | |
| Average Intel Core i5-1350P (n=1) | |
| Getac S410 Gen 4 | |
| Panasonic Toughbook 40 | |
| Durabook S14I | |
| Dell Latitude 14 5420-D2G5W | |
| AIDA64 / Memory Latency | |
| Getac S410 G5 | |
| Average Intel Core i5-1350P (n=1) | |
| Panasonic Toughbook 40 | |
| Dell Latitude 7330 Rugged Extreme | |
| Getac S410 Gen 4 | |
| Durabook S14I | |
| Dell Latitude 14 5420-D2G5W | |
* ... smaller is better
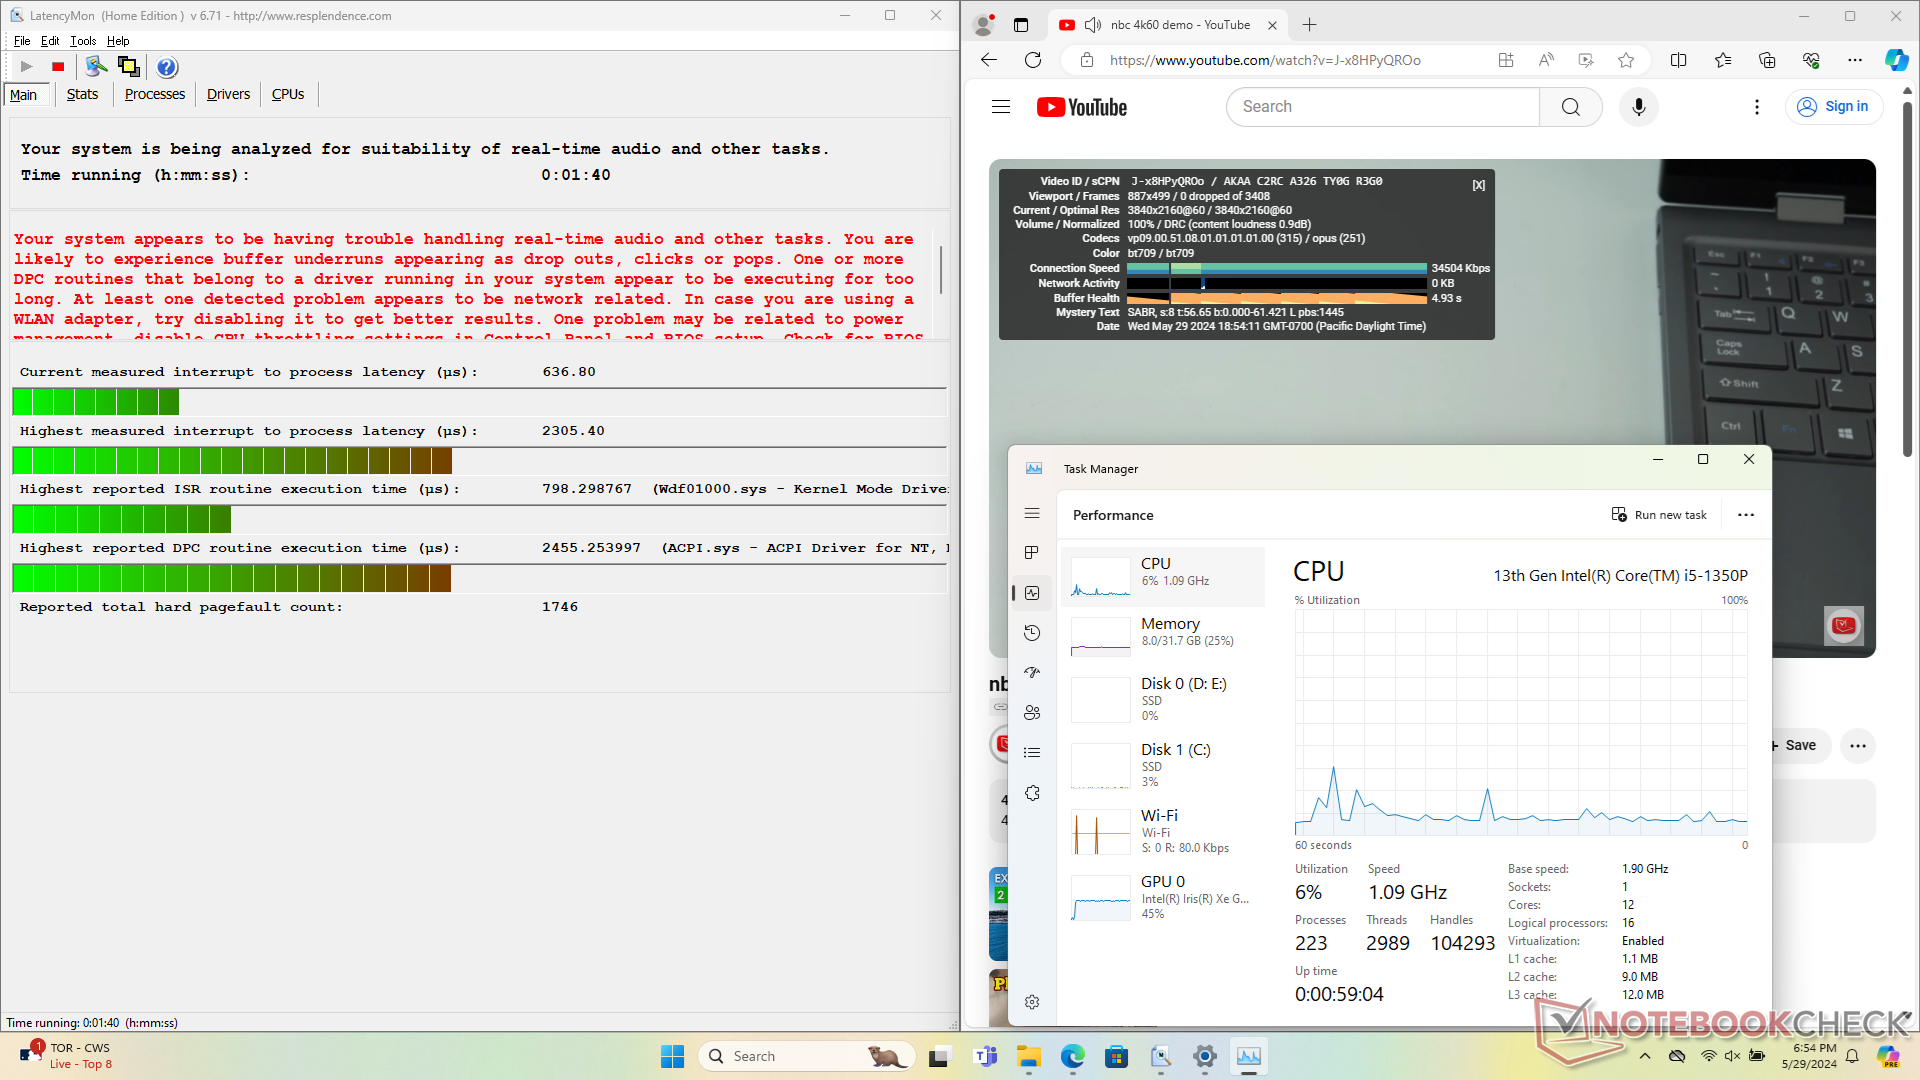
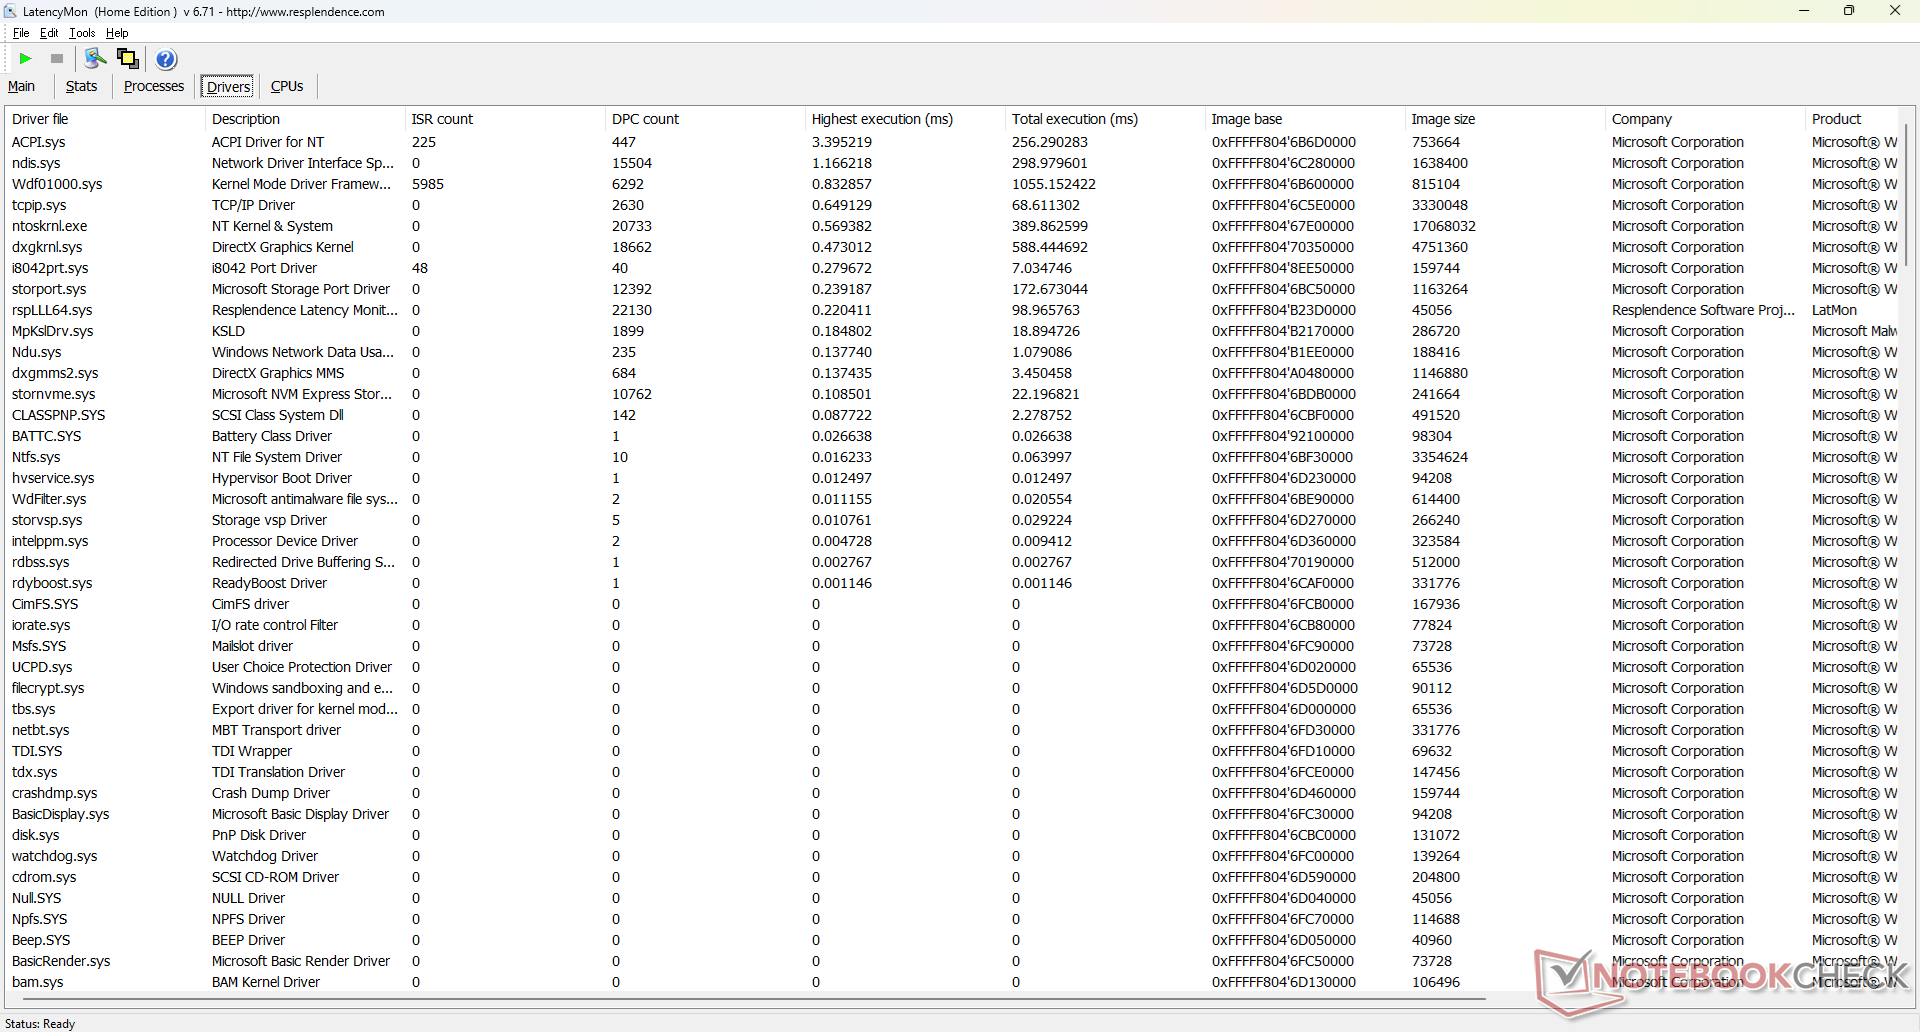
DPC Latency
There are slight DPC issues when opening multiple browser tabs of our homepage. 4K video playback at 60 FPS is otherwise perfect with no skipped frames recorded.
| DPC Latencies / LatencyMon - interrupt to process latency (max), Web, Youtube, Prime95 | |
| Dell Latitude 14 5420-D2G5W | |
| Getac S410 G5 | |
| Durabook S14I | |
| Getac S410 Gen 4 | |
| Panasonic Toughbook 40 | |
| Dell Latitude 7330 Rugged Extreme | |
* ... smaller is better
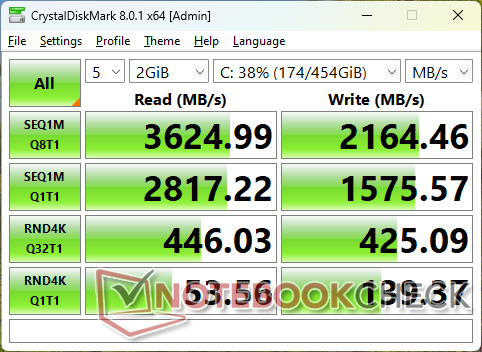
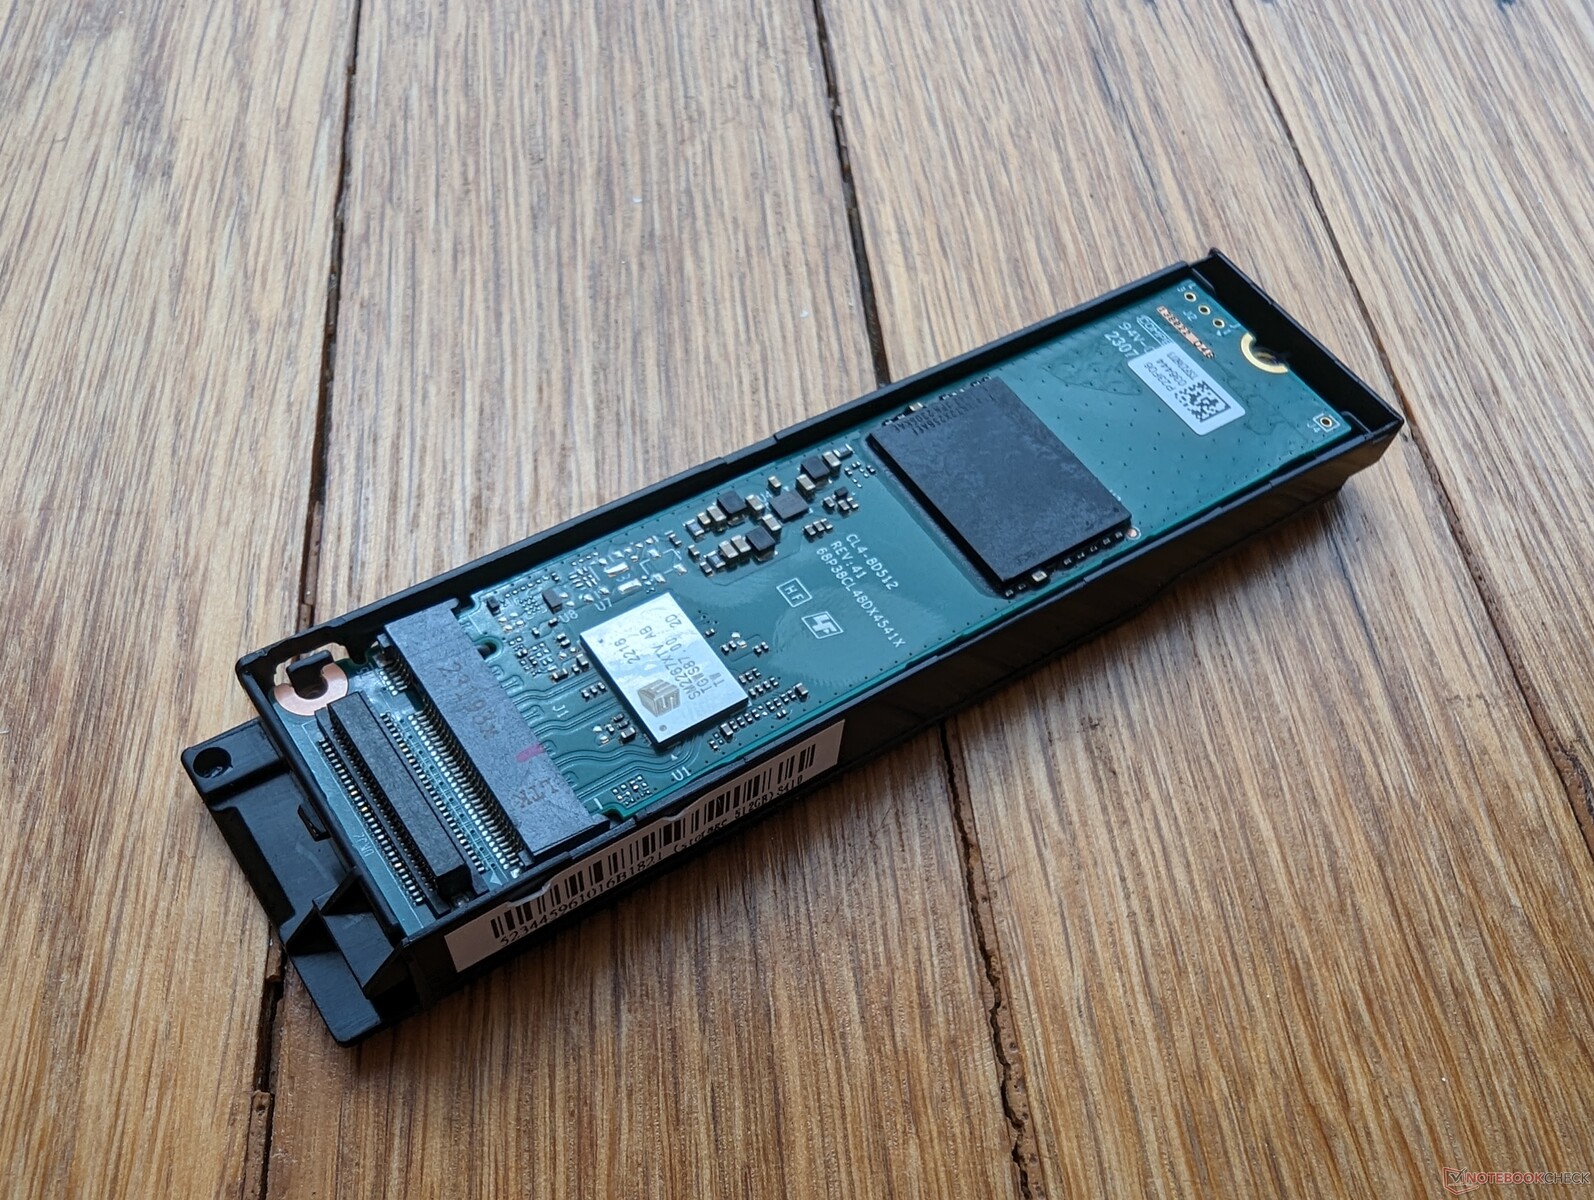
Storage Devices
Our test unit ships with the SSSTC CL4-8D512 whereas the older S410 G4 would ship with the SSSTC CA5-8D256. The newer drive is a bit faster on all fronts, but it still suffers from slightly longer access times than most other drives.


| Drive Performance rating - Percent | |
| Dell Latitude 7330 Rugged Extreme | |
| Getac S410 G5 | |
| Durabook S14I | |
| Panasonic Toughbook 40 | |
| Dell Latitude 14 5420-D2G5W | |
| Getac S410 Gen 4 | |
* ... smaller is better
Disk Throttling: DiskSpd Read Loop, Queue Depth 8
GPU Performance — Iris Xe Yet Again
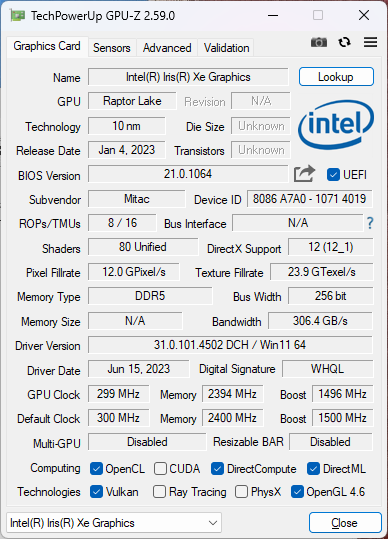
Tiger Lake-U and Raptor Lake-P share the same underlying Iris Xe architecture and so any performance boosts between the S410 G4 and S410 G5 are minimal. The Iris Xe Graphics G7 80 EUs in our unit is only about 10 percent faster than the Iris Xe Graphics G7 96 EUs in last year's model. This minor advantage won't be noticeable for the vast majority of applications.
| Power Profile | Graphics Score | Physics Score | Combined Score |
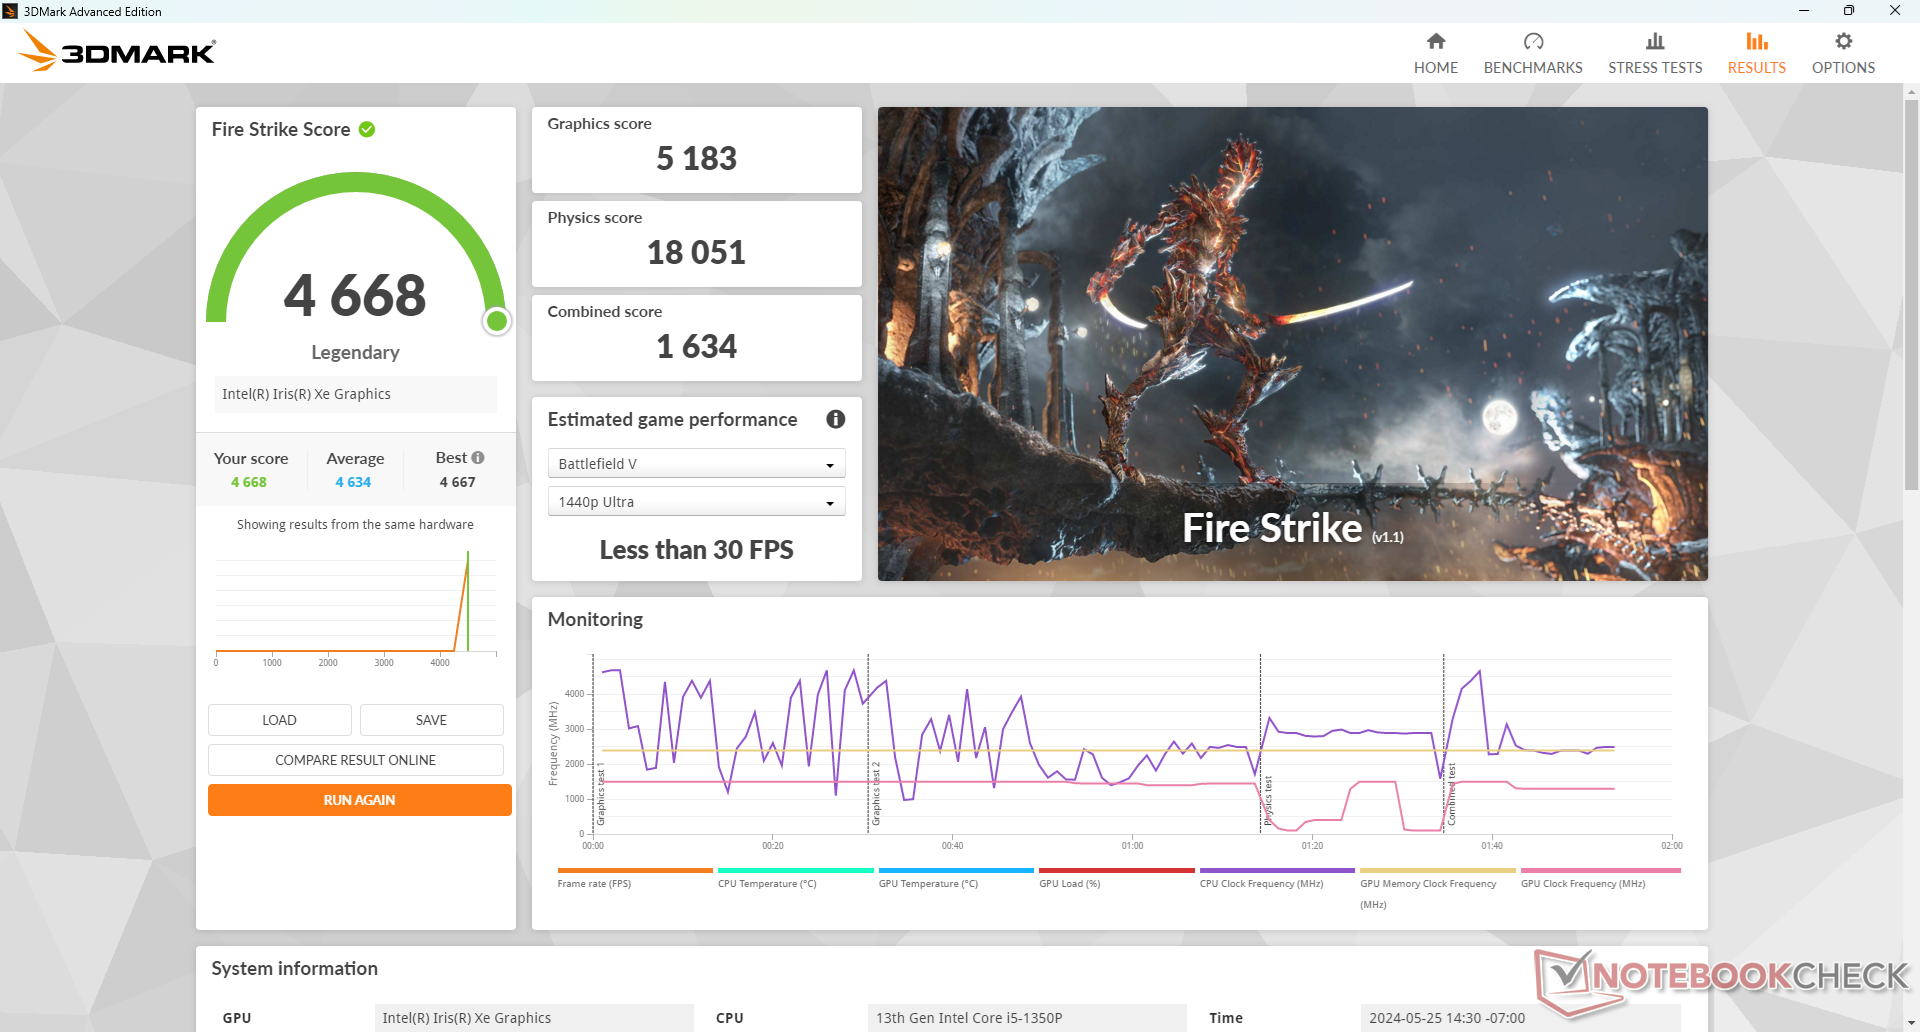
| Extreme Profile | 5183 | 18051 | 1634 |
| Default Profile | 5169 (-0%) | 17729 (-2%) | 1648 (-0%) |
| Battery Power | 5186 (-0%) | 11113 (-38%) | 1725 (-0%) |
Running on Extreme performance mode does not result in faster performance than the regular Default performance mode as shown by our Fire Strike results table above. However, CPU performance is heavily reduced if running on battery power which can be disappointing if out in the field.
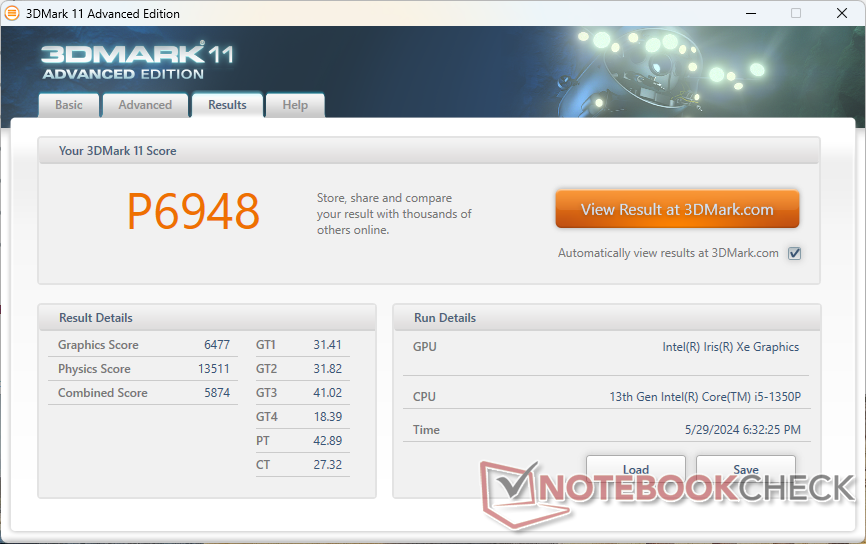
| 3DMark 11 Performance | 6948 points | |
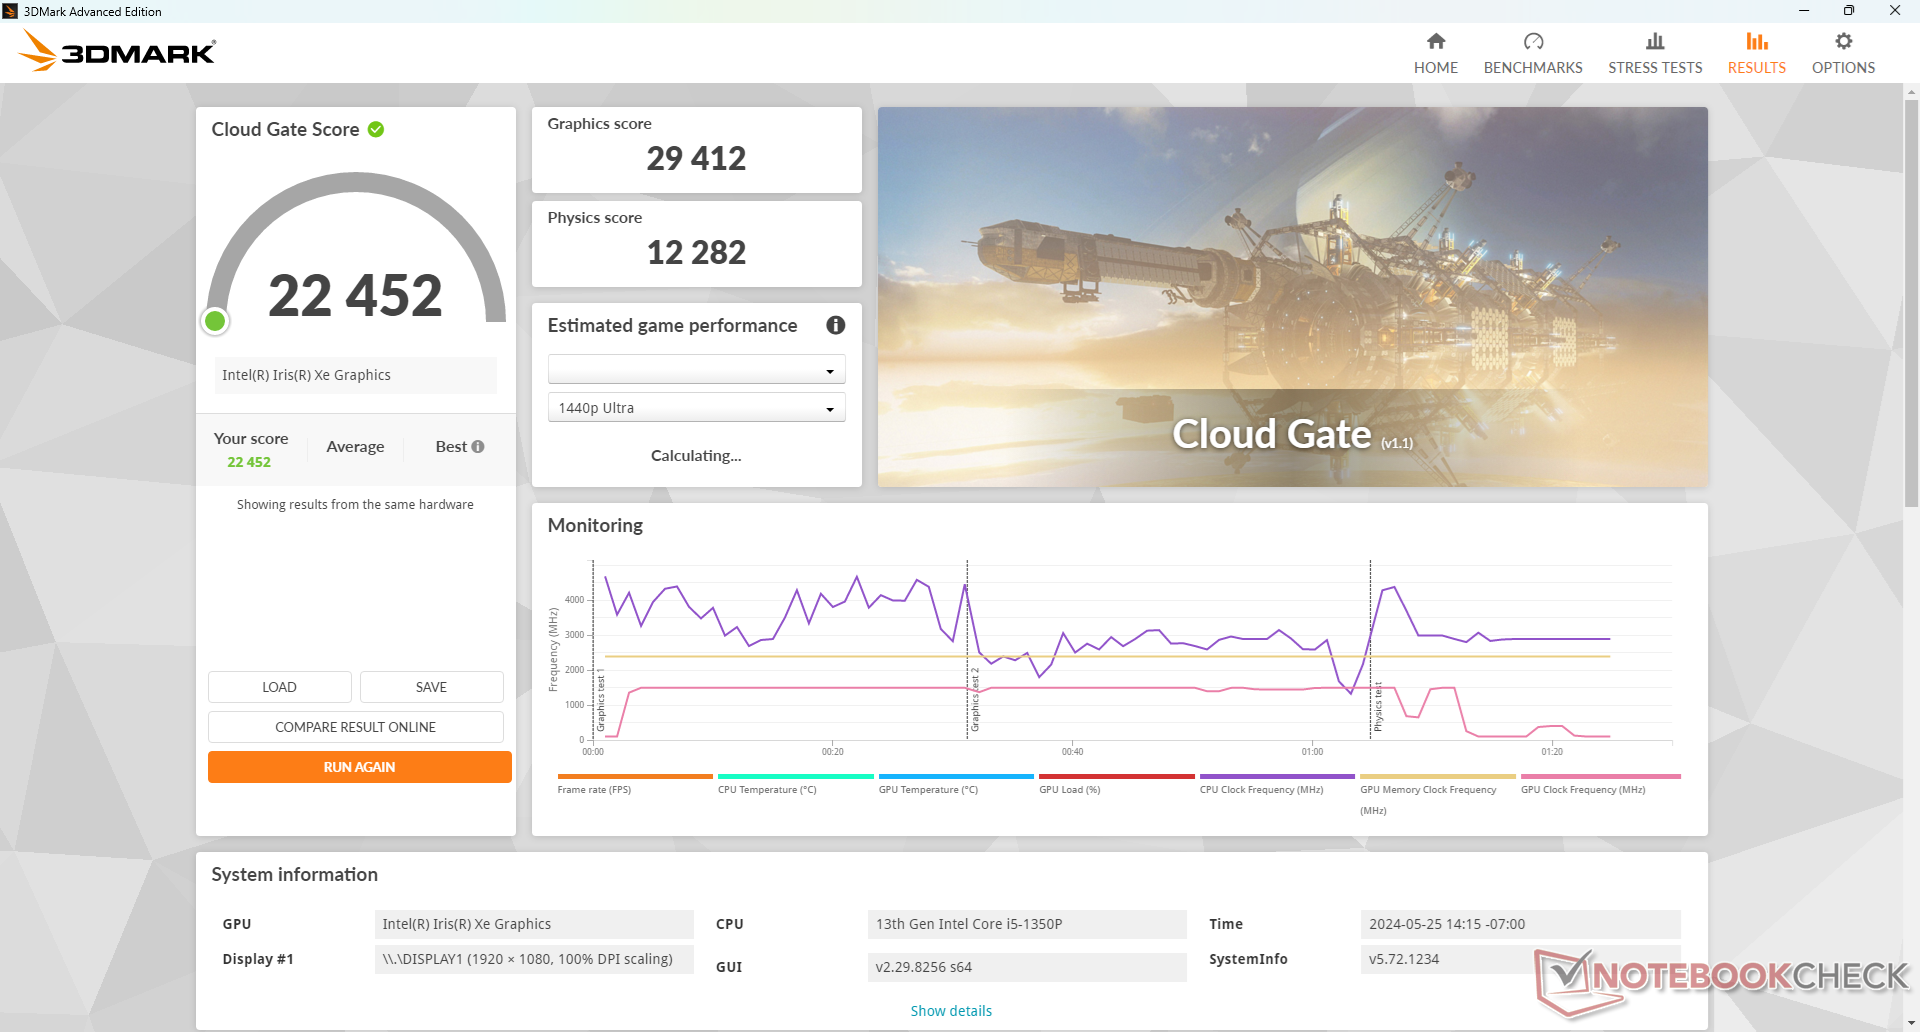
| 3DMark Cloud Gate Standard Score | 22452 points | |
| 3DMark Fire Strike Score | 4668 points | |
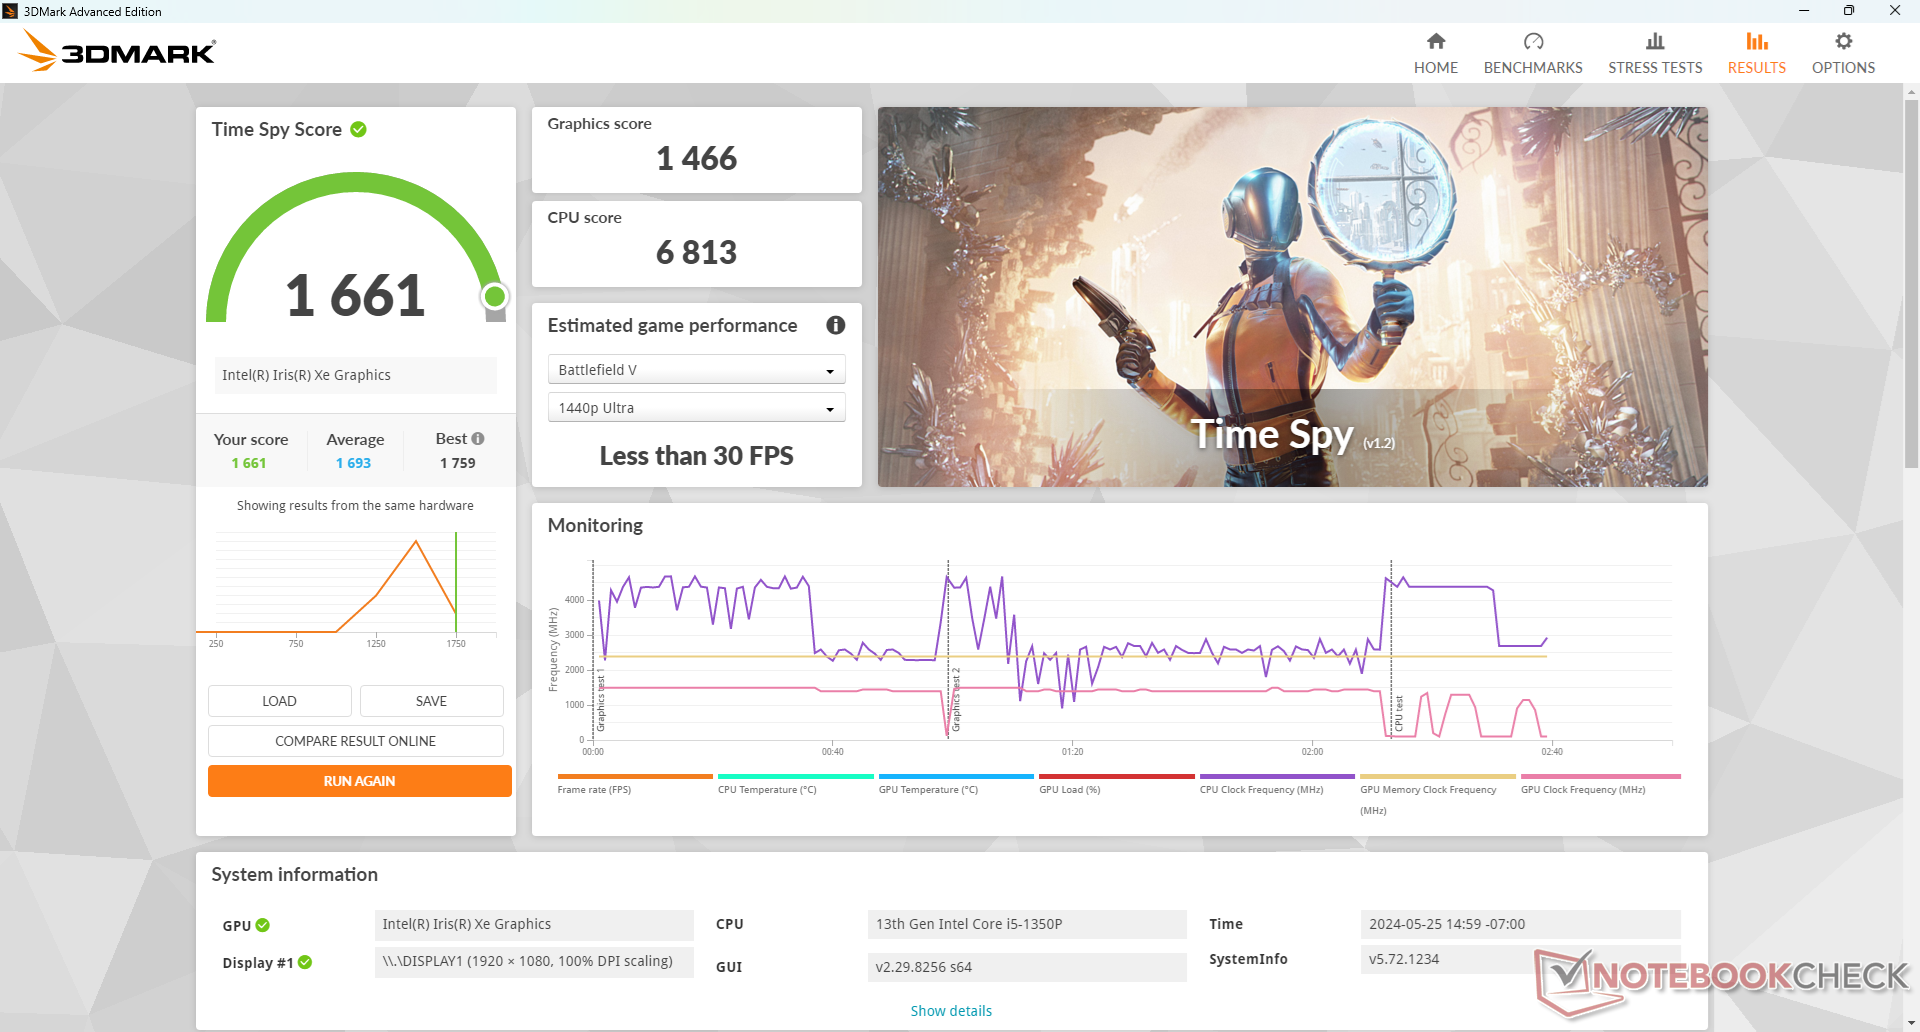
| 3DMark Time Spy Score | 1661 points | |
Help | ||
| Blender - v3.3 Classroom CPU | |
| Getac S410 G5 | |
* ... smaller is better
| Performance rating - Percent | |
| Getac S410 G5 | |
| Dell Latitude 7330 Rugged Extreme -2! | |
| Getac S410 Gen 4 | |
| Panasonic Toughbook 40 -2! | |
| Durabook S14I -3! | |
| Dell Latitude 14 5420-D2G5W -3! | |
| The Witcher 3 - 1920x1080 Ultra Graphics & Postprocessing (HBAO+) | |
| Getac S410 G5 | |
| Dell Latitude 7330 Rugged Extreme | |
| Panasonic Toughbook 40 | |
| Getac S410 Gen 4 | |
| Dell Latitude 14 5420-D2G5W | |
| GTA V - 1920x1080 Highest AA:4xMSAA + FX AF:16x | |
| Getac S410 G5 | |
| Getac S410 Gen 4 | |
| Final Fantasy XV Benchmark - 1920x1080 High Quality | |
| Dell Latitude 7330 Rugged Extreme | |
| Getac S410 G5 | |
| Panasonic Toughbook 40 | |
| Getac S410 Gen 4 | |
| Durabook S14I | |
| Dell Latitude 14 5420-D2G5W | |
| Strange Brigade - 1920x1080 ultra AA:ultra AF:16 | |
| Getac S410 G5 | |
| Getac S410 Gen 4 | |
| Dota 2 Reborn - 1920x1080 ultra (3/3) best looking | |
| Dell Latitude 7330 Rugged Extreme | |
| Panasonic Toughbook 40 | |
| Getac S410 G5 | |
| Getac S410 Gen 4 | |
| Durabook S14I | |
| X-Plane 11.11 - 1920x1080 high (fps_test=3) | |
| Getac S410 G5 | |
| Getac S410 Gen 4 | |
| Durabook S14I | |
| Panasonic Toughbook 40 | |
| Dell Latitude 14 5420-D2G5W | |
| Dell Latitude 7330 Rugged Extreme | |
| GTA V | |
| 1024x768 Lowest Settings possible | |
| Getac S410 G5 | |
| Average Intel Iris Xe Graphics G7 80EUs (36.5 - 144.6, n=84) | |
| Getac S410 Gen 4 | |
| Dell Latitude 14 5420-D2G5W | |
| 1920x1080 Lowest Settings possible | |
| Getac S410 G5 | |
| Average Intel Iris Xe Graphics G7 80EUs (21.5 - 98.1, n=68) | |
| Getac S410 Gen 4 | |
| 1366x768 Normal/Off AF:4x | |
| Getac S410 G5 | |
| Average Intel Iris Xe Graphics G7 80EUs (28.9 - 133.8, n=87) | |
| Getac S410 Gen 4 | |
| Dell Latitude 14 5420-D2G5W | |
| 1920x1080 Normal/Off AF:4x | |
| Getac S410 G5 | |
| Average Intel Iris Xe Graphics G7 80EUs (18.8 - 97.2, n=68) | |
| Getac S410 Gen 4 | |
| 1920x1080 High/On (Advanced Graphics Off) AA:2xMSAA + FX AF:8x | |
| Getac S410 G5 | |
| Getac S410 Gen 4 | |
| Average Intel Iris Xe Graphics G7 80EUs (7.81 - 32, n=86) | |
| Dell Latitude 14 5420-D2G5W | |
| 1920x1080 Highest AA:4xMSAA + FX AF:16x | |
| Getac S410 G5 | |
| Getac S410 Gen 4 | |
| Average Intel Iris Xe Graphics G7 80EUs (3.07 - 11.6, n=74) | |
| Strange Brigade | |
| 1280x720 lowest AF:1 | |
| Getac S410 G5 | |
| Getac S410 Gen 4 | |
| Average Intel Iris Xe Graphics G7 80EUs (22.7 - 98.7, n=84) | |
| Dell Latitude 14 5420-D2G5W | |
| 1920x1080 medium AA:medium AF:4 | |
| Getac S410 G5 | |
| Getac S410 Gen 4 | |
| Average Intel Iris Xe Graphics G7 80EUs (6 - 48.8, n=86) | |
| Dell Latitude 14 5420-D2G5W | |
| 1920x1080 high AA:high AF:8 | |
| Getac S410 G5 | |
| Getac S410 Gen 4 | |
| Average Intel Iris Xe Graphics G7 80EUs (11.4 - 34, n=83) | |
| Dell Latitude 14 5420-D2G5W | |
| 1920x1080 ultra AA:ultra AF:16 | |
| Getac S410 G5 | |
| Getac S410 Gen 4 | |
| Average Intel Iris Xe Graphics G7 80EUs (13.6 - 27, n=60) | |
Frame rates when idling on Witcher 3 are steady save for an instance 40 minutes into the test where they dropped to just 10 FPS to suggest interrupting background activity. This is disappointing to see from an industrial or rugged system where stability is of utmost importance and any background applications should not take priority.
Witcher 3 FPS Chart
| low | med. | high | ultra | |
|---|---|---|---|---|
| GTA V (2015) | 101.8 | 94.6 | 22.5 | 9.58 |
| The Witcher 3 (2015) | 79.9 | 56.3 | 31.5 | 28 |
| Dota 2 Reborn (2015) | 94.8 | 71.3 | 55.8 | 49.5 |
| Final Fantasy XV Benchmark (2018) | 40.4 | 22 | 15.8 | |
| X-Plane 11.11 (2018) | 47.6 | 36.1 | 32.7 | |
| Strange Brigade (2018) | 86.2 | 38.9 | 31 | 25.1 |
Emissions
System Noise — High-Pitched Fan
Fan noise behavior is largely the same as before with a similar floor and ceiling. Most disappointing is that the relatively high-pitched fan noise remains which makes the fan more noticeable than it needs to be during use.
Noise level
| Idle |
| 23.4 / 25.9 / 26 dB(A) |
| Load |
| 38.7 / 42.1 dB(A) |
 | ||
30 dB silent 40 dB(A) audible 50 dB(A) loud |
||
min: | ||
| Getac S410 G5 Iris Xe G7 80EUs, i5-1350P, SSSTC CL4-8D512 | Getac S410 Gen 4 Iris Xe G7 96EUs, i7-1185G7, SSSTC CA5-8D256 | Durabook S14I Iris Xe G7 96EUs, i7-1165G7, UDinfo M2P M2P80DE512GBAEP | Dell Latitude 14 5420-D2G5W Iris Xe G7 80EUs, i5-1135G7, WDC PC SN530 SDBPTPZ-256G | Dell Latitude 7330 Rugged Extreme Iris Xe G7 96EUs, i7-1185G7 | Panasonic Toughbook 40 Iris Xe G7 96EUs, i7-1185G7, Samsung PM991 MZVLQ1T0HALB | |
|---|---|---|---|---|---|---|
| Noise | -2% | -4% | -4% | 13% | 1% | |
| off / environment * (dB) | 23.4 | 23.3 -0% | 25.2 -8% | 25 -7% | 22.9 2% | 22.8 3% |
| Idle Minimum * (dB) | 23.4 | 23.5 -0% | 25.2 -8% | 25 -7% | 23.1 1% | 26 -11% |
| Idle Average * (dB) | 25.9 | 23.5 9% | 25.2 3% | 25 3% | 23.1 11% | 26 -0% |
| Idle Maximum * (dB) | 26 | 28 -8% | 34.5 -33% | 25 4% | 23.1 11% | 26 -0% |
| Load Average * (dB) | 38.7 | 42.8 -11% | 34.5 11% | 36.5 6% | 28 28% | 37.6 3% |
| Witcher 3 ultra * (dB) | 42.1 | 42.3 -0% | 31.2 26% | 37.8 10% | ||
| Load Maximum * (dB) | 42.1 | 42.6 -1% | 36.2 14% | 52.4 -24% | 36.2 14% | 40.3 4% |
* ... smaller is better
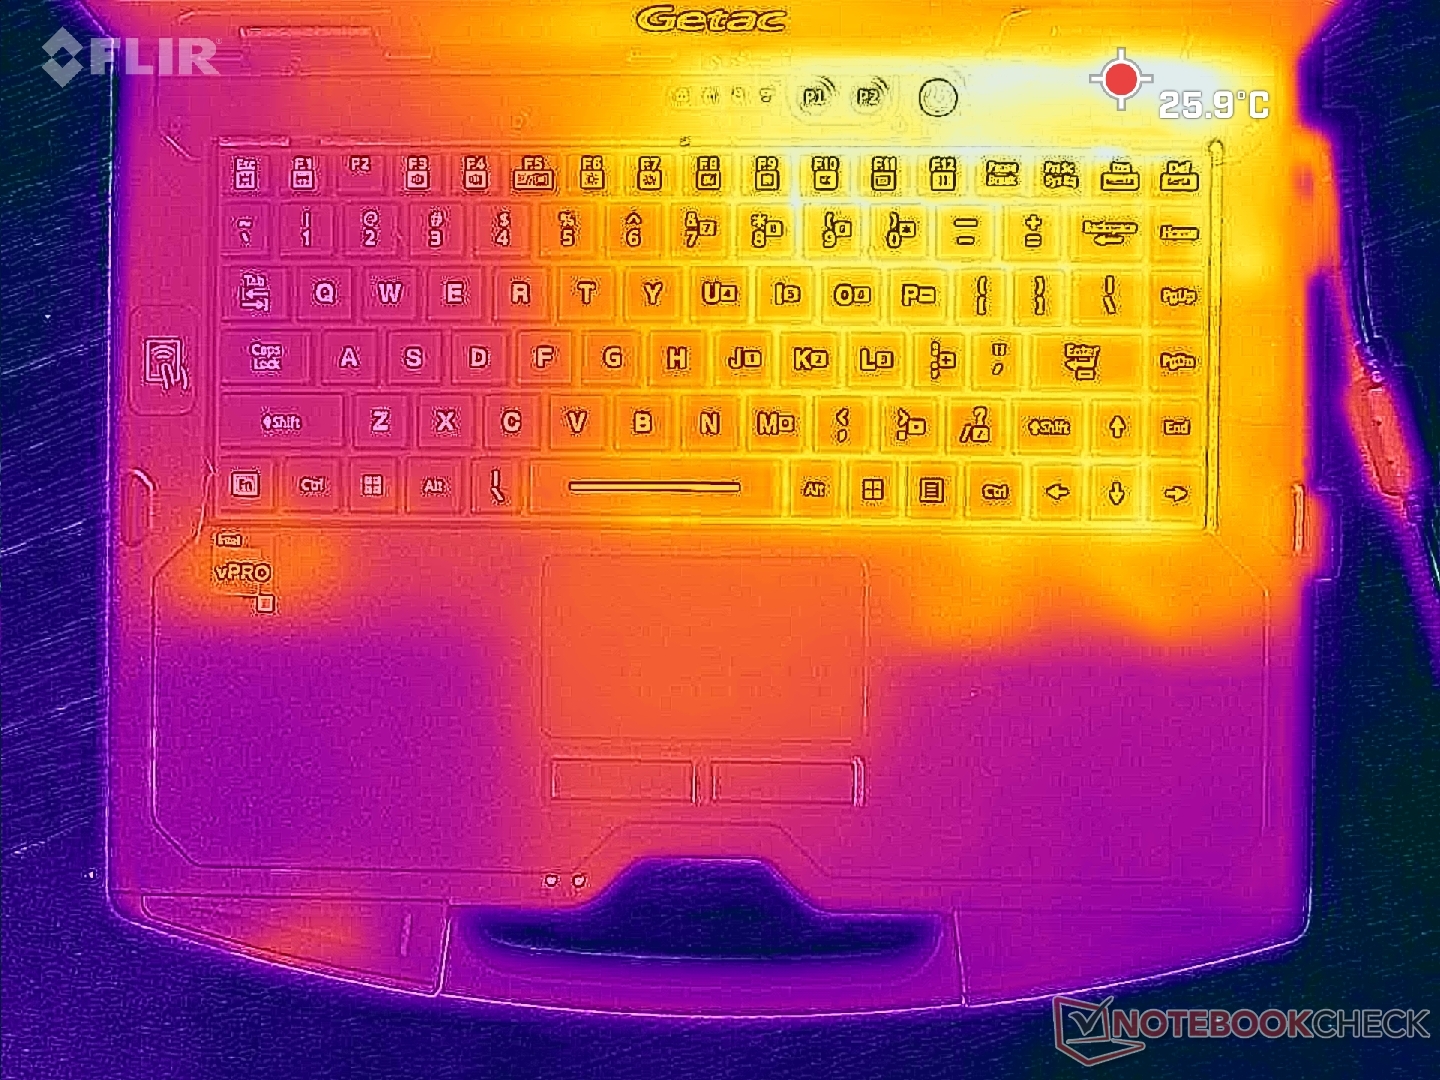
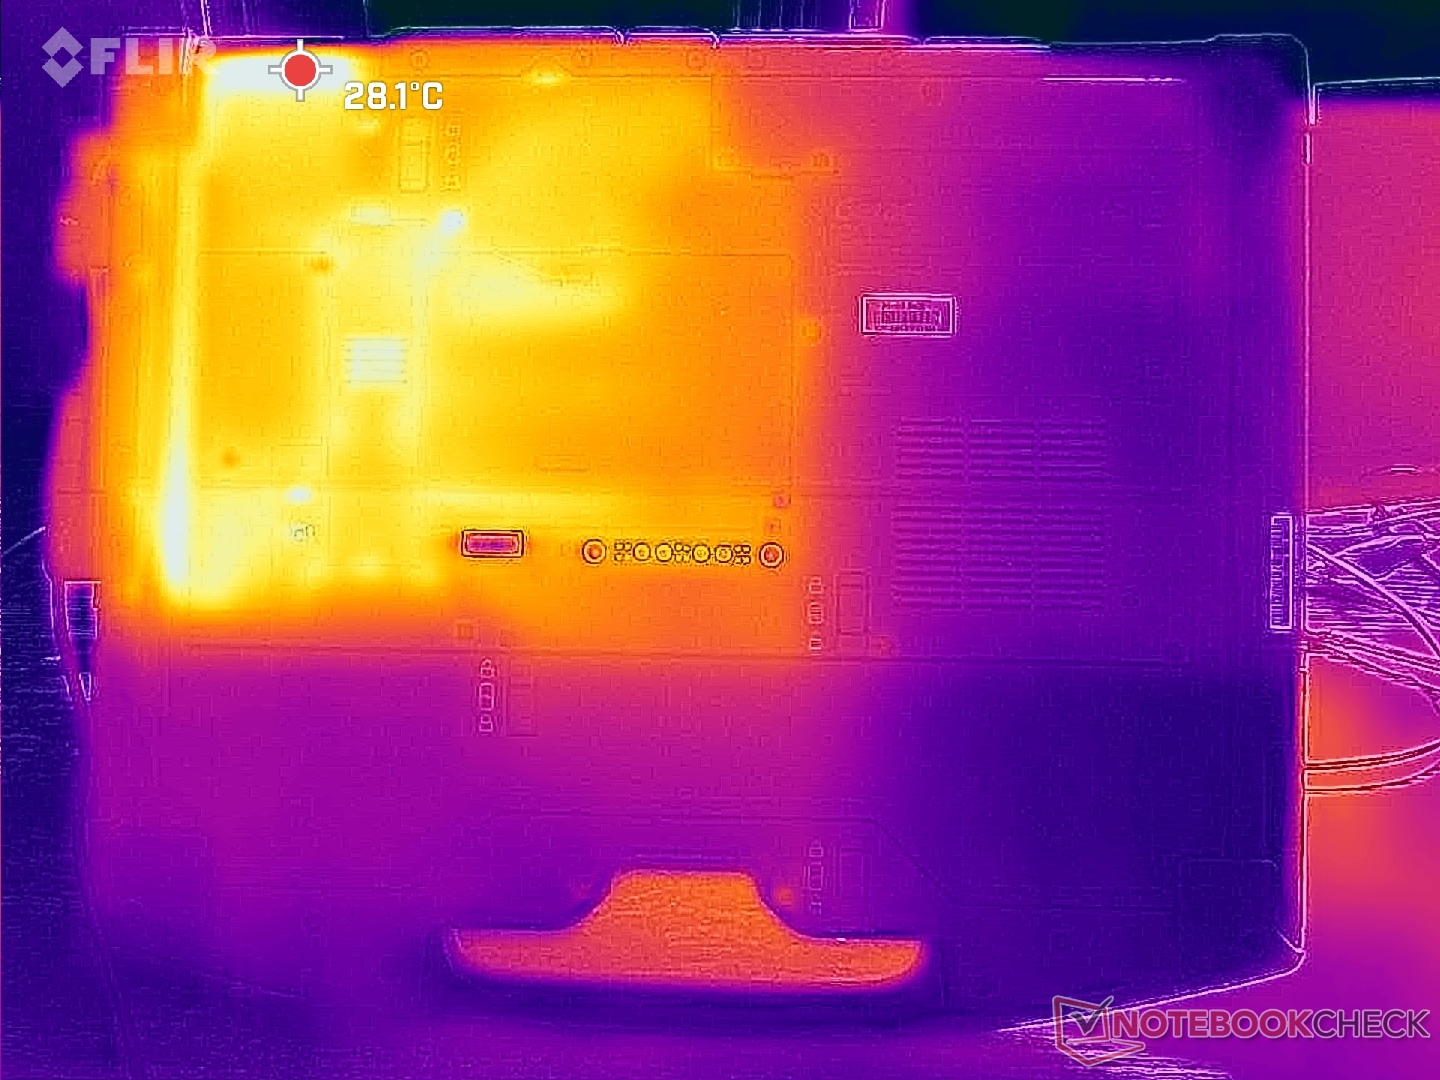
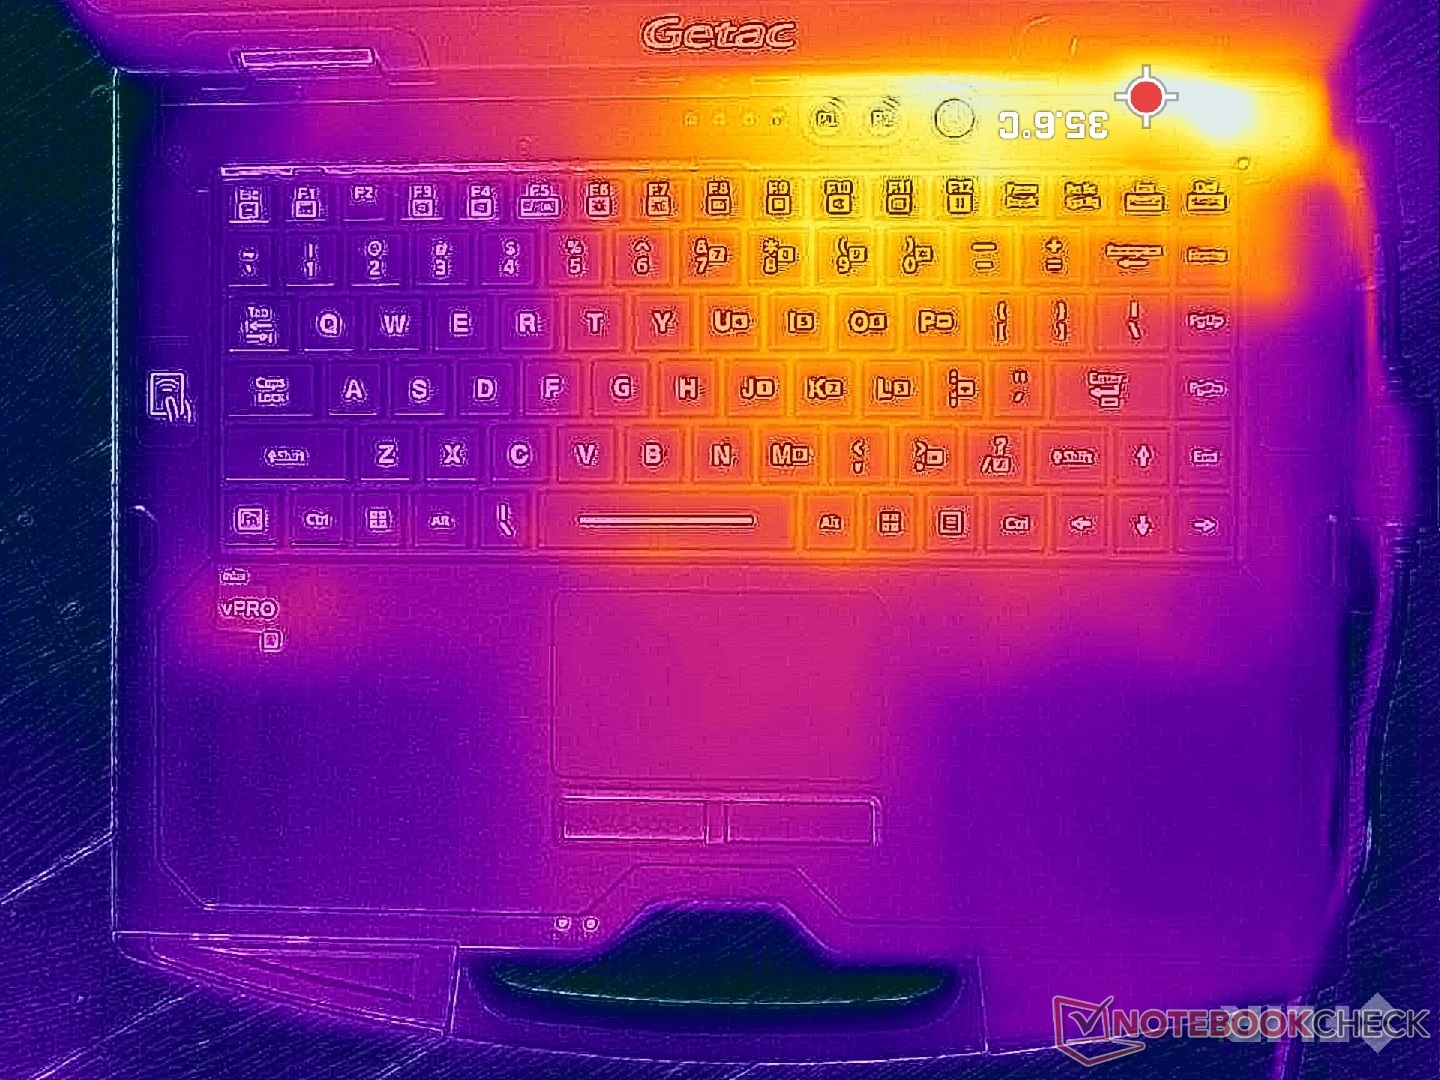
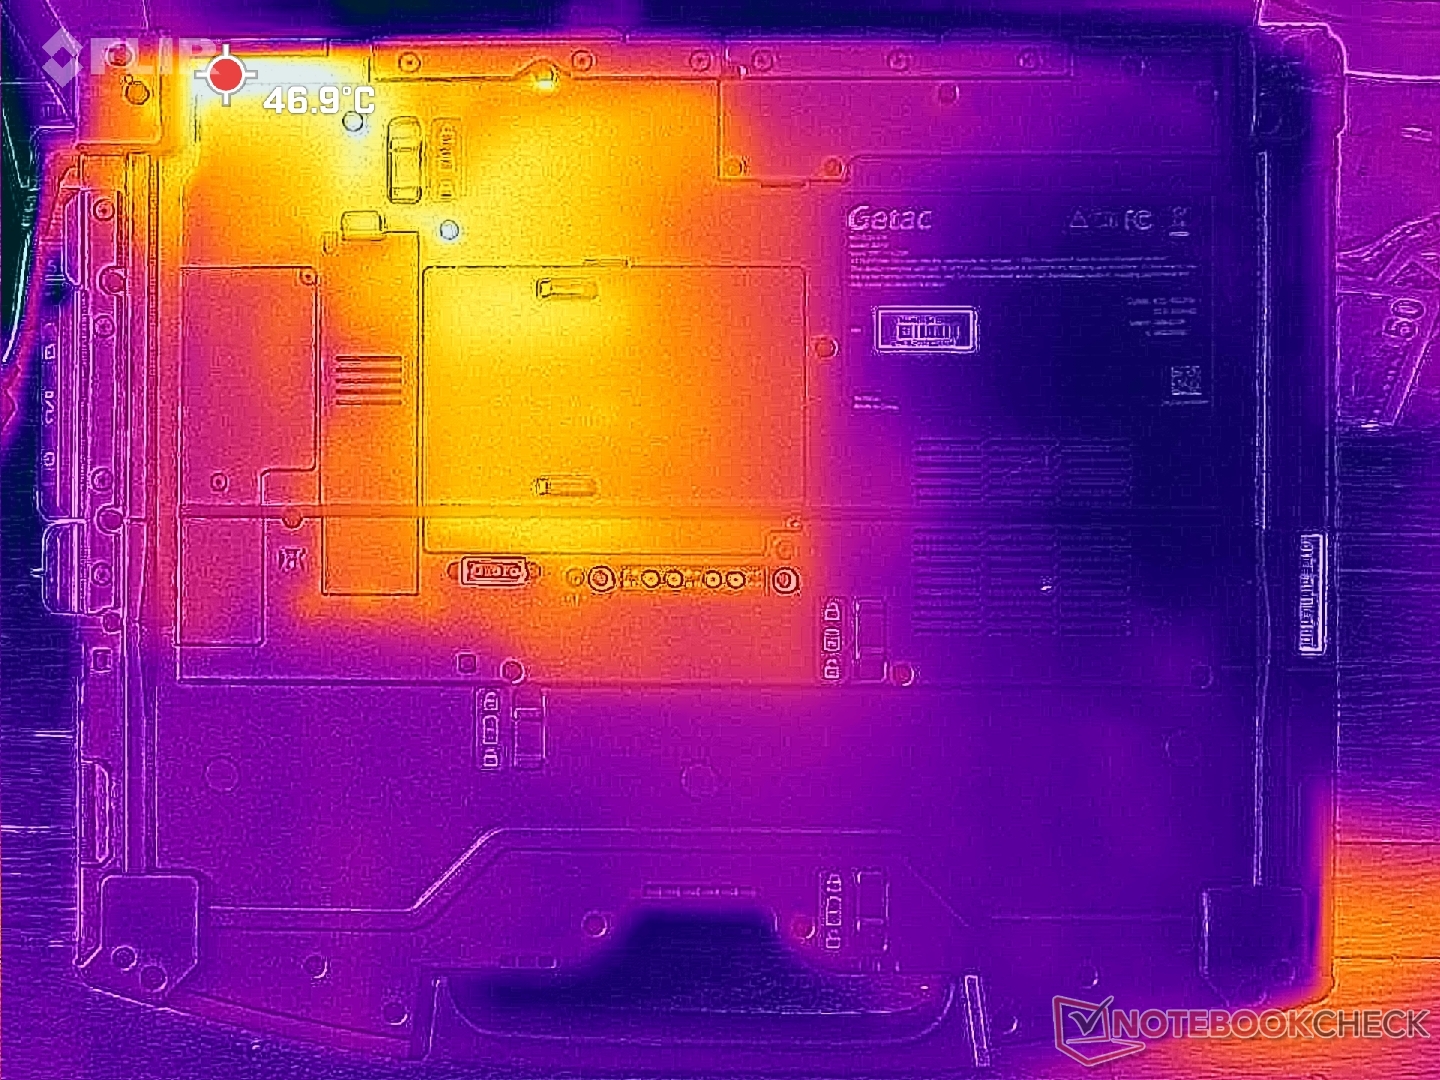
Temperature
Surface temperatures are warmer on the right half of the chassis than the left. Hot spots can reach over 36 C and 47 C on the C and D covers of the laptop, respectively, but these areas are concentrated toward the rear where fingers or skin are unlikely to touch.
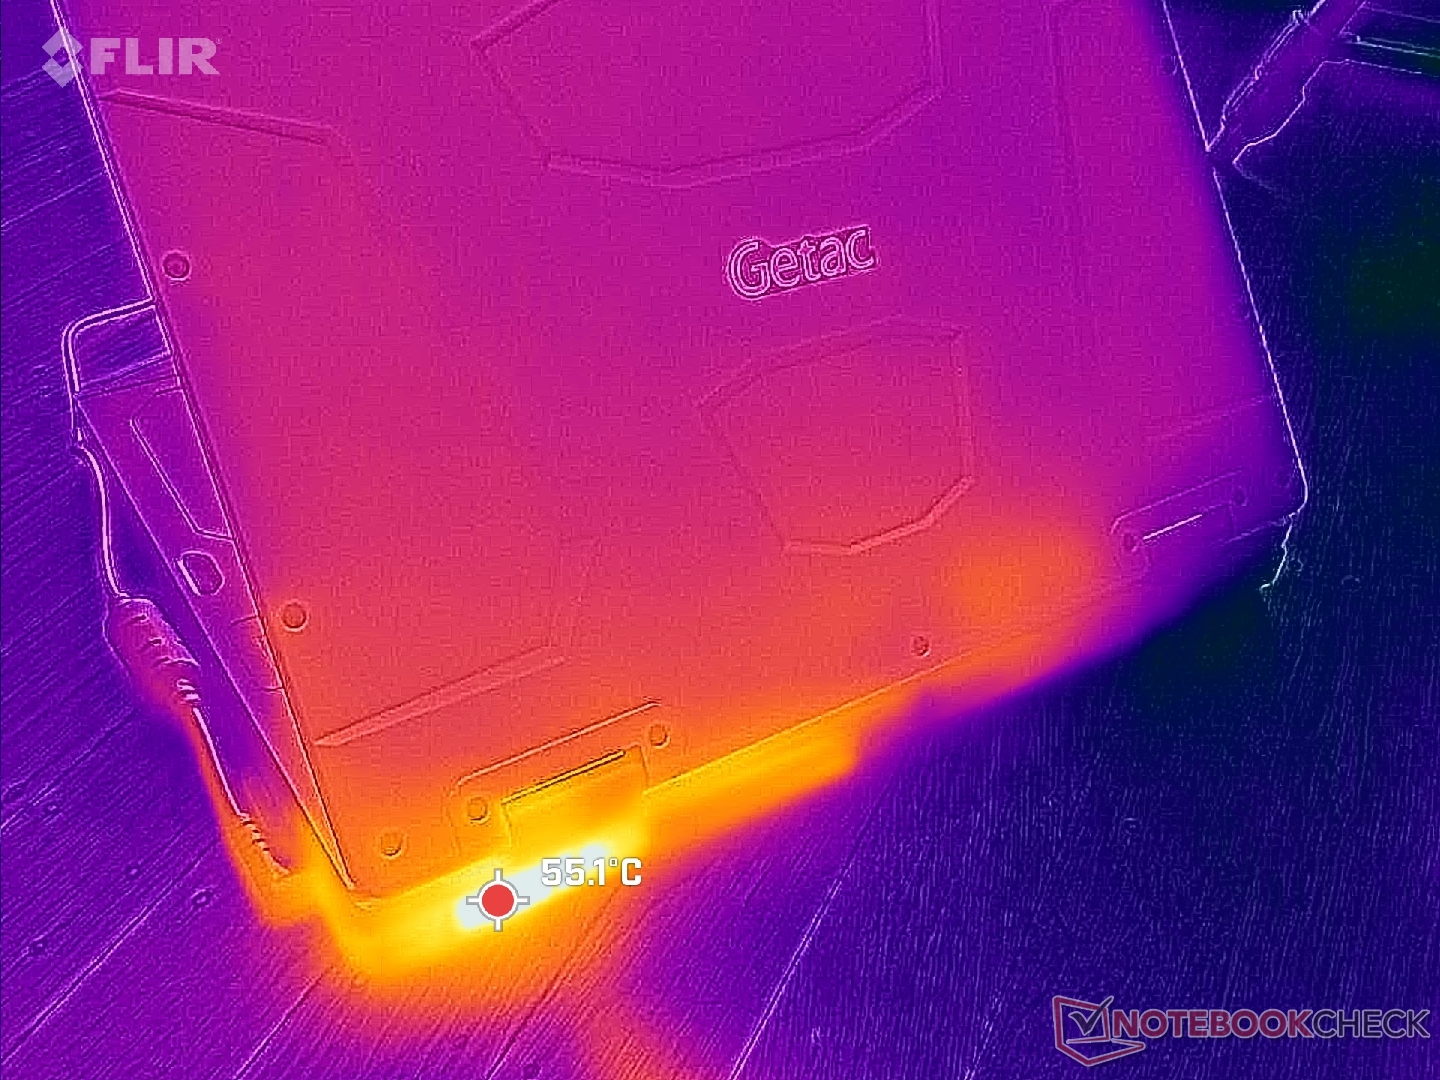
(+) The maximum temperature on the upper side is 37 °C / 99 F, compared to the average of 34.3 °C / 94 F, ranging from 21.2 to 62.5 °C for the class Office.
(±) The bottom heats up to a maximum of 42.2 °C / 108 F, compared to the average of 36.8 °C / 98 F
(+) In idle usage, the average temperature for the upper side is 25.6 °C / 78 F, compared to the device average of 29.5 °C / 85 F.
(+) The palmrests and touchpad are cooler than skin temperature with a maximum of 26.8 °C / 80.2 F and are therefore cool to the touch.
(±) The average temperature of the palmrest area of similar devices was 27.5 °C / 81.5 F (+0.7 °C / 1.3 F).
| Getac S410 G5 Intel Core i5-1350P, Intel Iris Xe Graphics G7 80EUs | Getac S410 Gen 4 Intel Core i7-1185G7, Intel Iris Xe Graphics G7 96EUs | Durabook S14I Intel Core i7-1165G7, Intel Iris Xe Graphics G7 96EUs | Dell Latitude 14 5420-D2G5W Intel Core i5-1135G7, Intel Iris Xe Graphics G7 80EUs | Dell Latitude 7330 Rugged Extreme Intel Core i7-1185G7, Intel Iris Xe Graphics G7 96EUs | Panasonic Toughbook 40 Intel Core i7-1185G7, Intel Iris Xe Graphics G7 96EUs | |
|---|---|---|---|---|---|---|
| Heat | -7% | -1% | 2% | 14% | 5% | |
| Maximum Upper Side * (°C) | 37 | 36 3% | 36.4 2% | 41.7 -13% | 34.6 6% | 35.6 4% |
| Maximum Bottom * (°C) | 42.2 | 46.8 -11% | 38.6 9% | 35.6 16% | 36.6 13% | 40 5% |
| Idle Upper Side * (°C) | 28.8 | 30 -4% | 32.6 -13% | 29.9 -4% | 24.8 14% | 28.6 1% |
| Idle Bottom * (°C) | 33 | 38.2 -16% | 33.8 -2% | 29.7 10% | 25.2 24% | 29.4 11% |
* ... smaller is better
Stress Test
Core temperature under load is slightly cooler by a few degrees C than on last year's S410 G4. When running Prime95 stress, the CPU would boost to 3.1 GHz, 53 W, and 97 C until dropping to 1.9 GHz, 88 C, and 29 W after a minute into the test due to limited Turbo Boost sustainability. Core temperature would also be similar when running Witcher 3 whereas the CPU in the S410 G4 would stabilize well above 90 C.
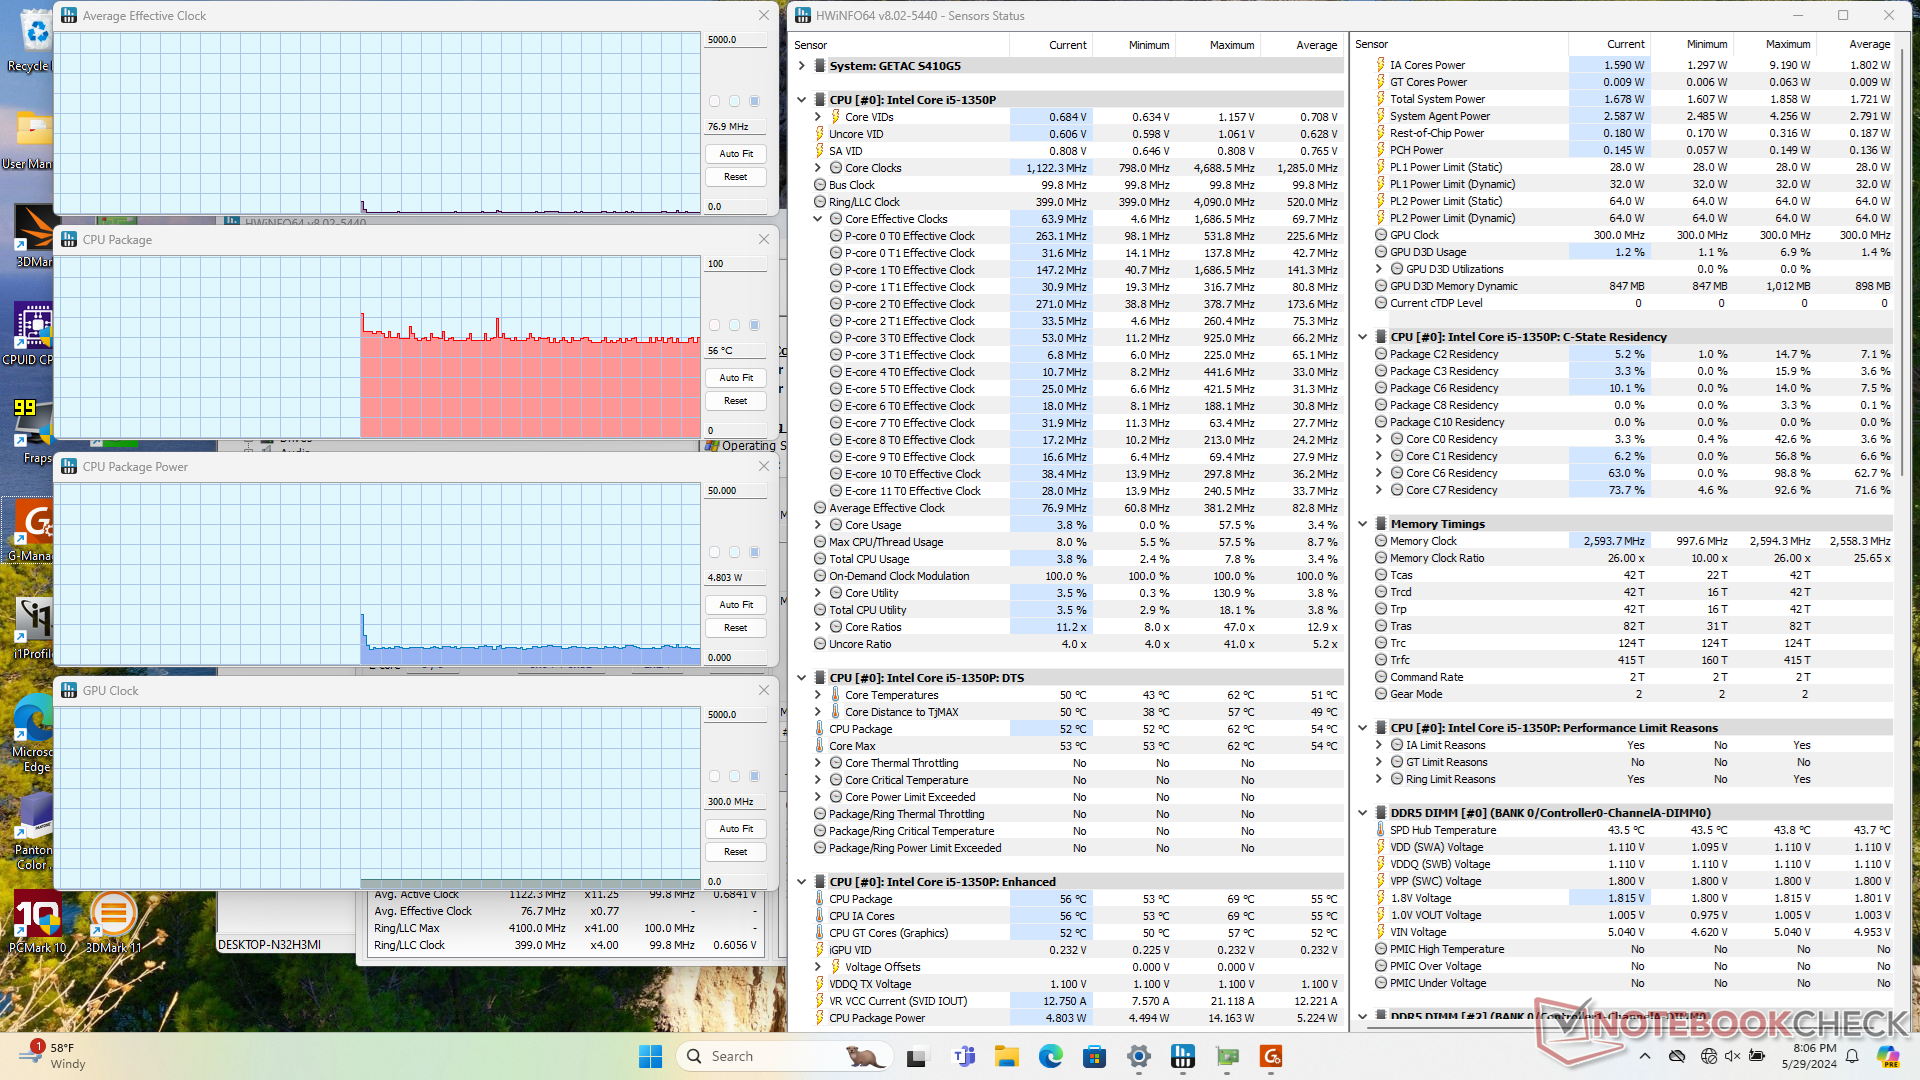
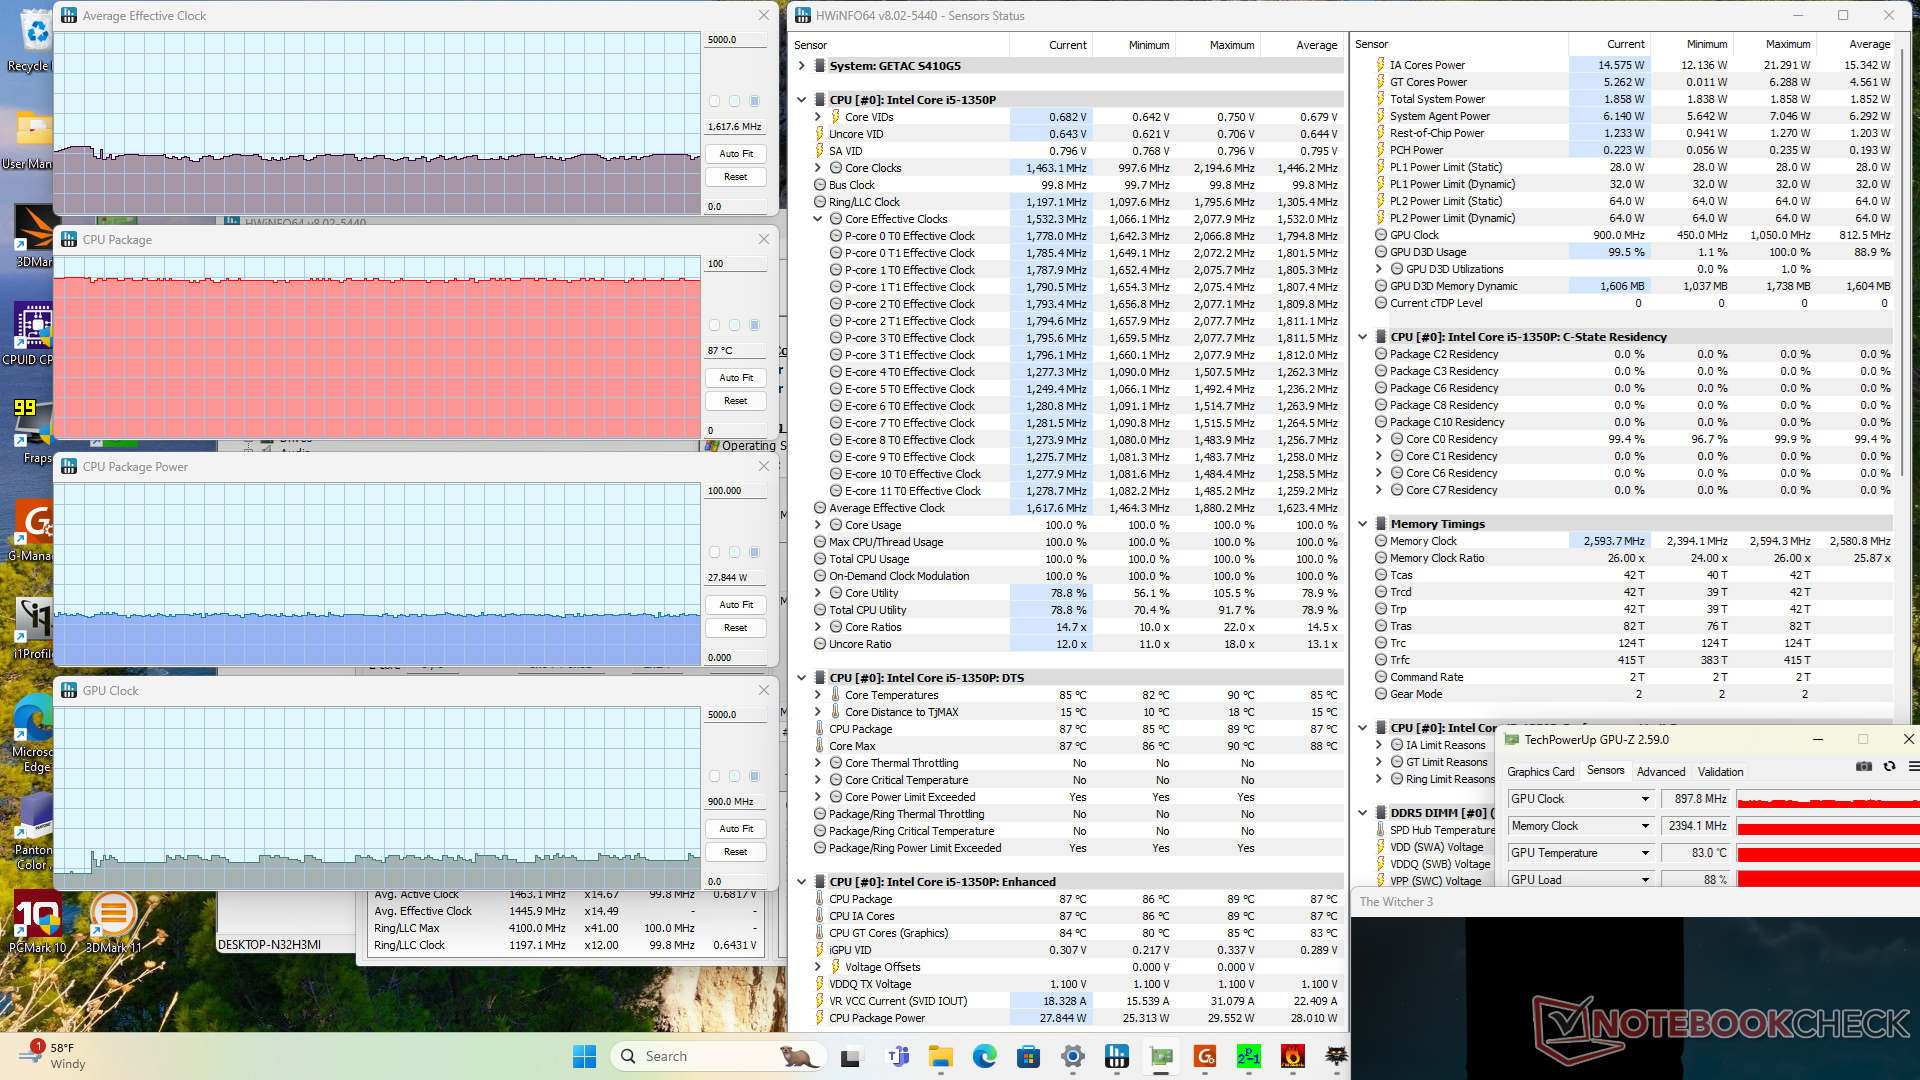
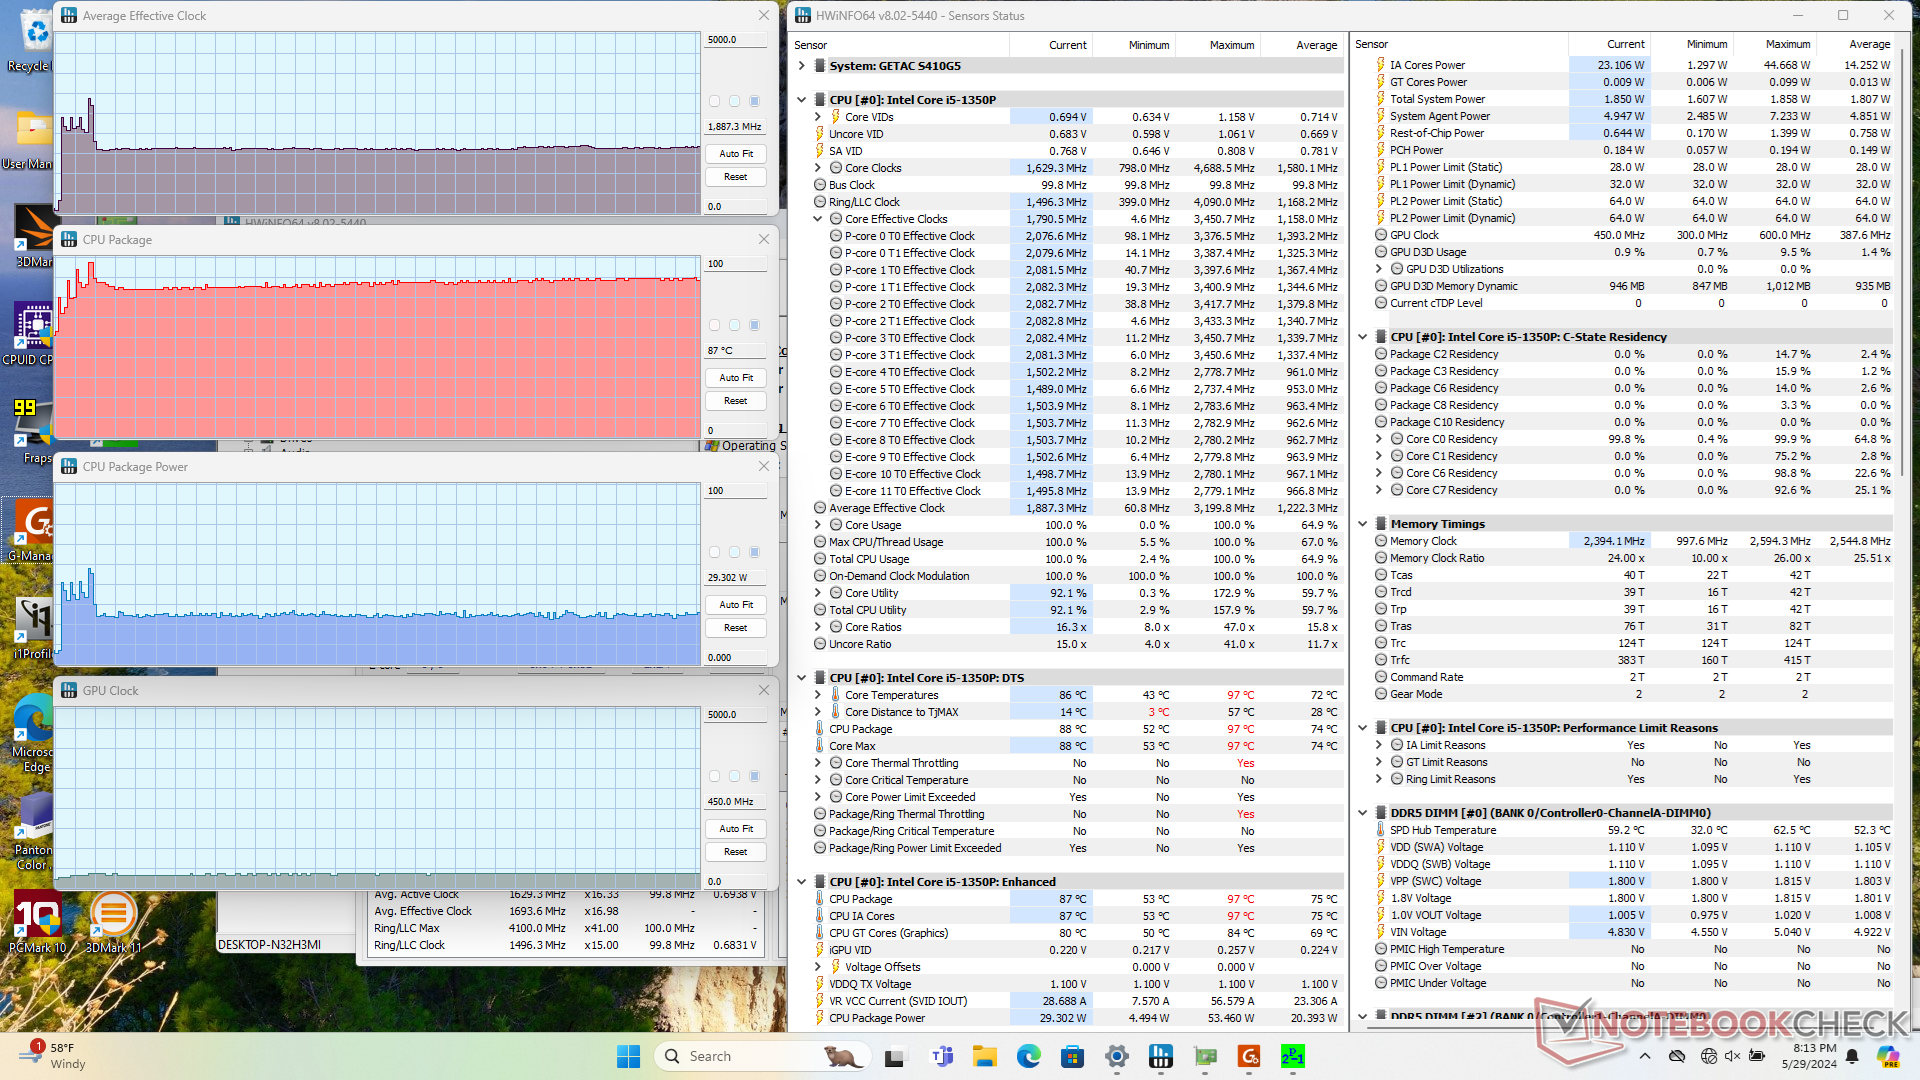
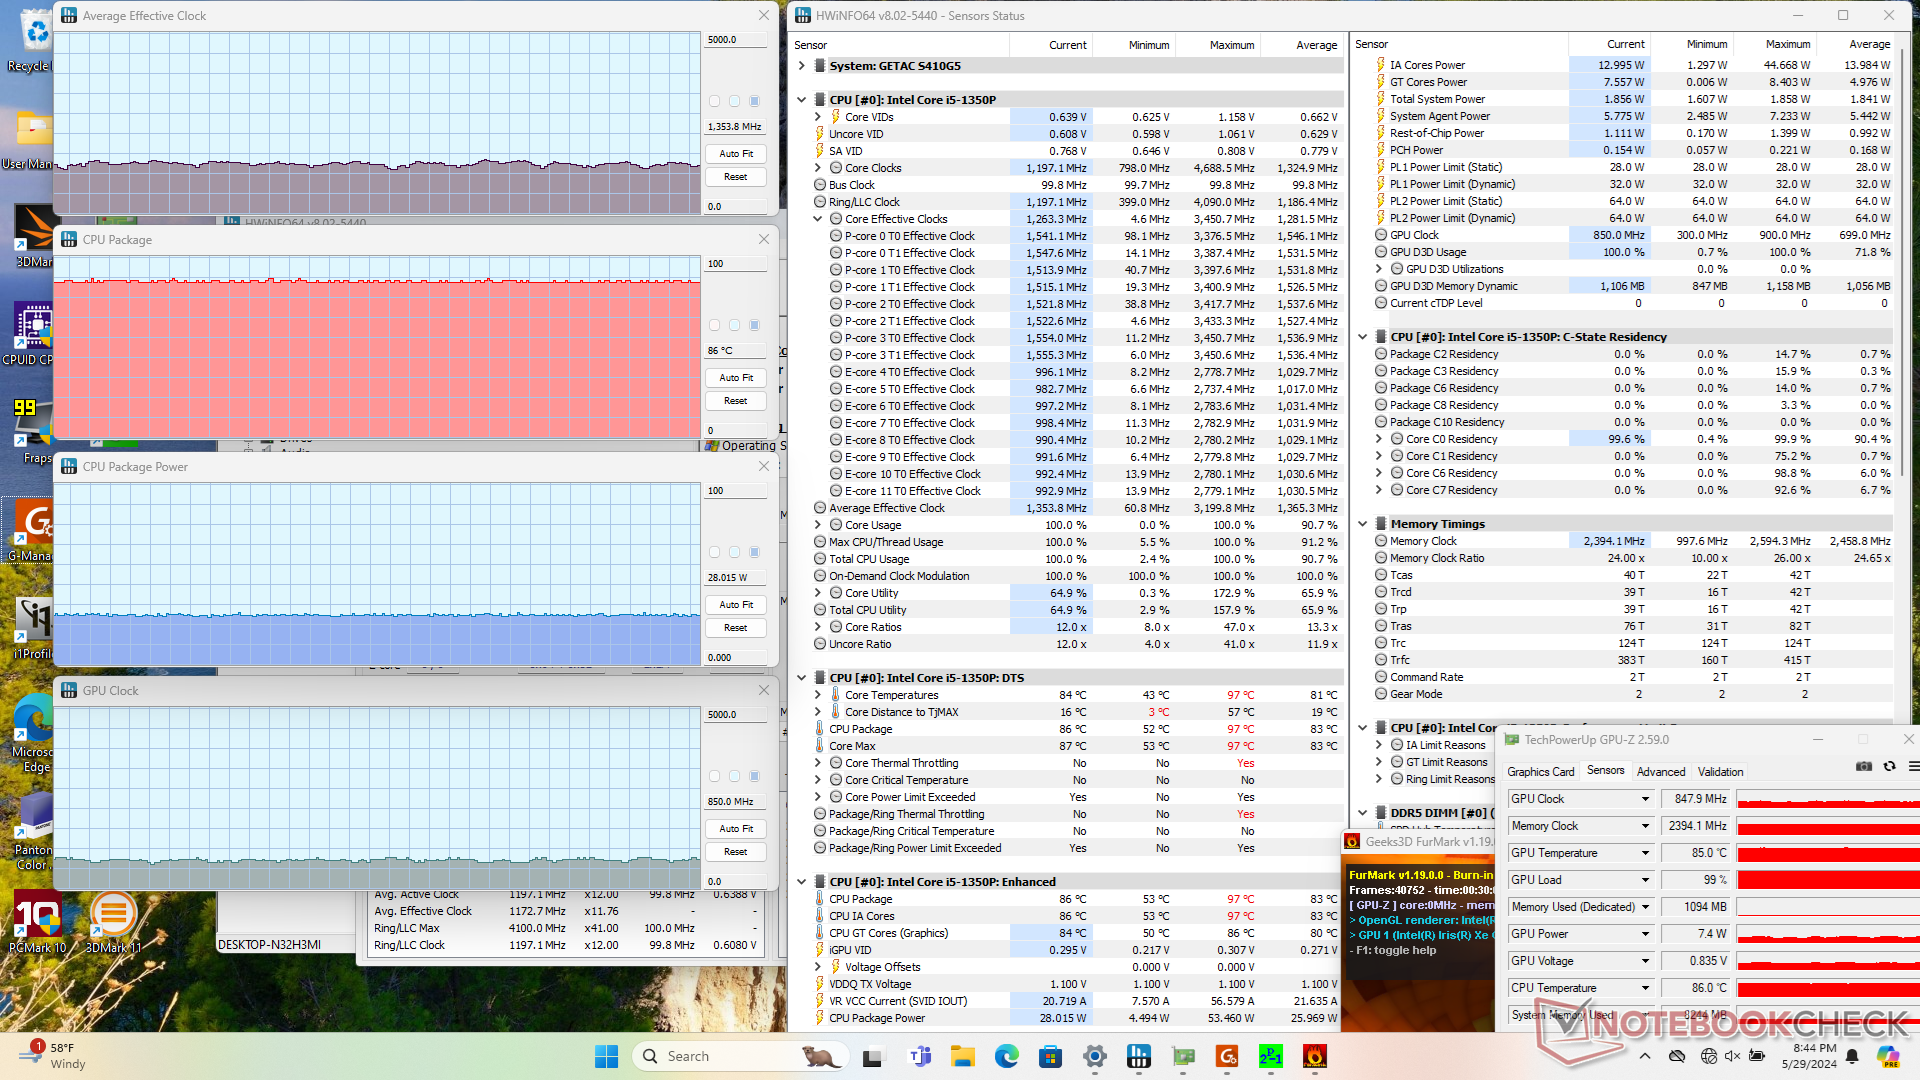
| Average CPU Clock (GHz) | GPU Clock (MHz) | Average CPU Temperature (°C) | |
| System Idle | -- | -- | 56 |
| Prime95 Stress | 1.9 | -- | 88 |
| Prime95 + FurMark Stress | 1.2 - 1.5 | 850 | 86 |
| Witcher 3 Stress | 1.6 | 900 | 87 |
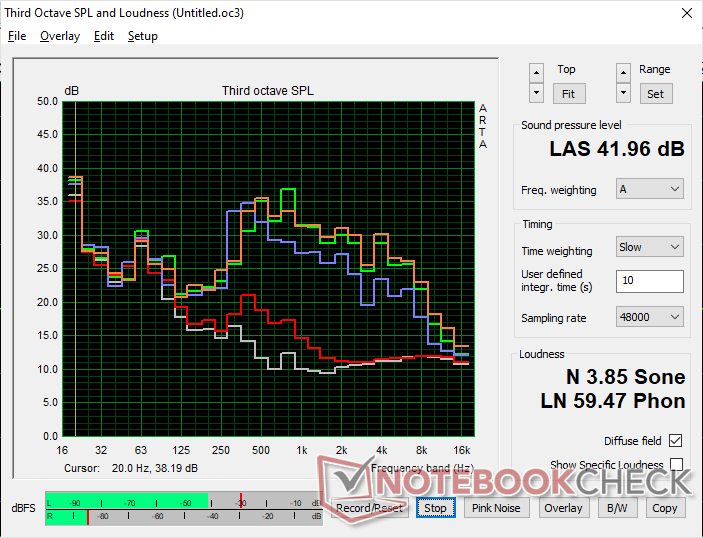
Speakers
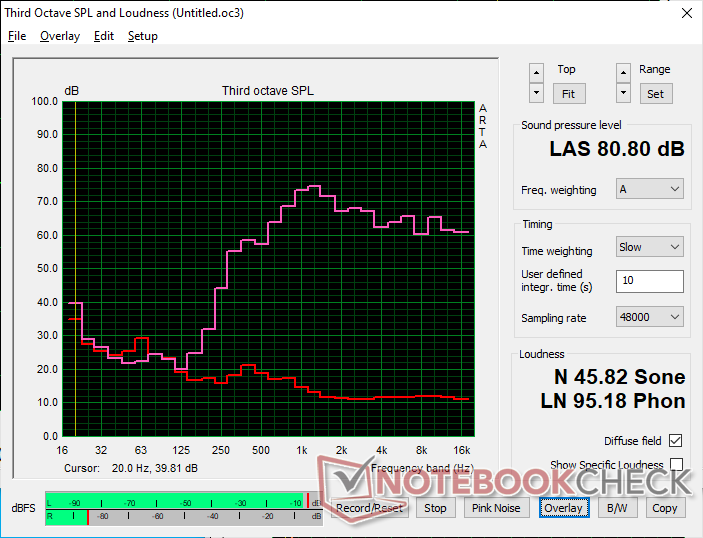
Getac S410 G5 audio analysis
(±) | speaker loudness is average but good (80.8 dB)
Bass 100 - 315 Hz
(-) | nearly no bass - on average 29.2% lower than median
(±) | linearity of bass is average (13.4% delta to prev. frequency)
Mids 400 - 2000 Hz
(±) | higher mids - on average 6.7% higher than median
(±) | linearity of mids is average (7.5% delta to prev. frequency)
Highs 2 - 16 kHz
(+) | balanced highs - only 2.9% away from median
(+) | highs are linear (6% delta to prev. frequency)
Overall 100 - 16.000 Hz
(±) | linearity of overall sound is average (23.3% difference to median)
Compared to same class
» 66% of all tested devices in this class were better, 7% similar, 27% worse
» The best had a delta of 7%, average was 21%, worst was 53%
Compared to all devices tested
» 70% of all tested devices were better, 5% similar, 25% worse
» The best had a delta of 4%, average was 23%, worst was 134%
Apple MacBook Pro 16 2021 M1 Pro audio analysis
(+) | speakers can play relatively loud (84.7 dB)
Bass 100 - 315 Hz
(+) | good bass - only 3.8% away from median
(+) | bass is linear (5.2% delta to prev. frequency)
Mids 400 - 2000 Hz
(+) | balanced mids - only 1.3% away from median
(+) | mids are linear (2.1% delta to prev. frequency)
Highs 2 - 16 kHz
(+) | balanced highs - only 1.9% away from median
(+) | highs are linear (2.7% delta to prev. frequency)
Overall 100 - 16.000 Hz
(+) | overall sound is linear (4.6% difference to median)
Compared to same class
» 0% of all tested devices in this class were better, 0% similar, 100% worse
» The best had a delta of 5%, average was 17%, worst was 45%
Compared to all devices tested
» 0% of all tested devices were better, 0% similar, 100% worse
» The best had a delta of 4%, average was 23%, worst was 134%
Energy Management
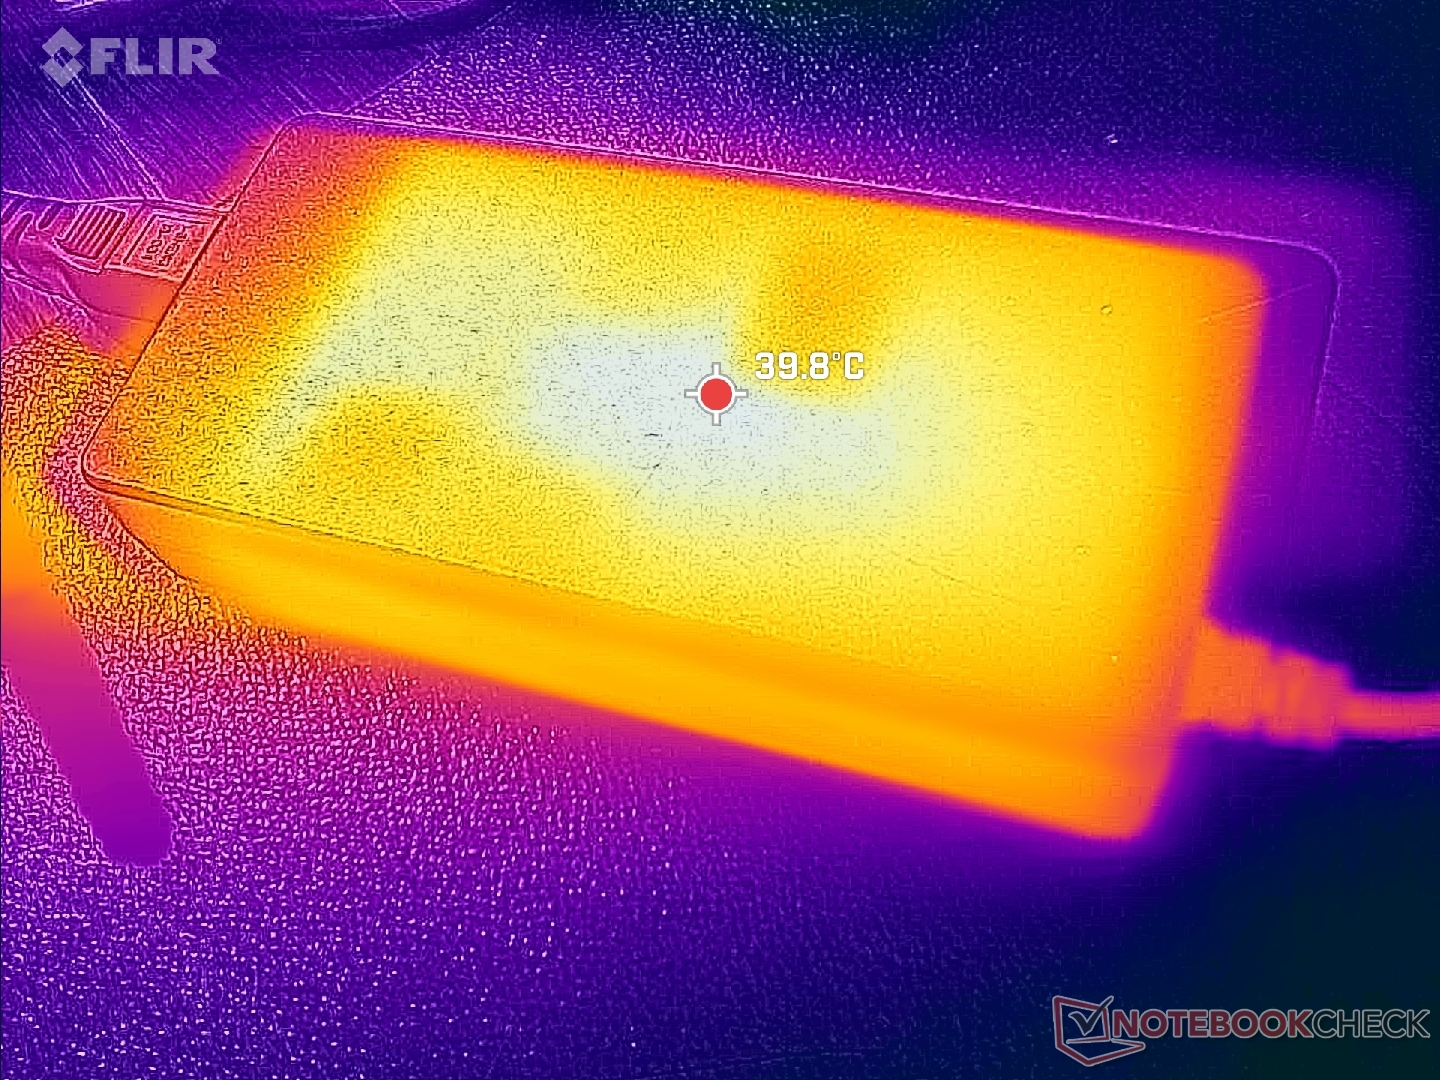
Power Consumption
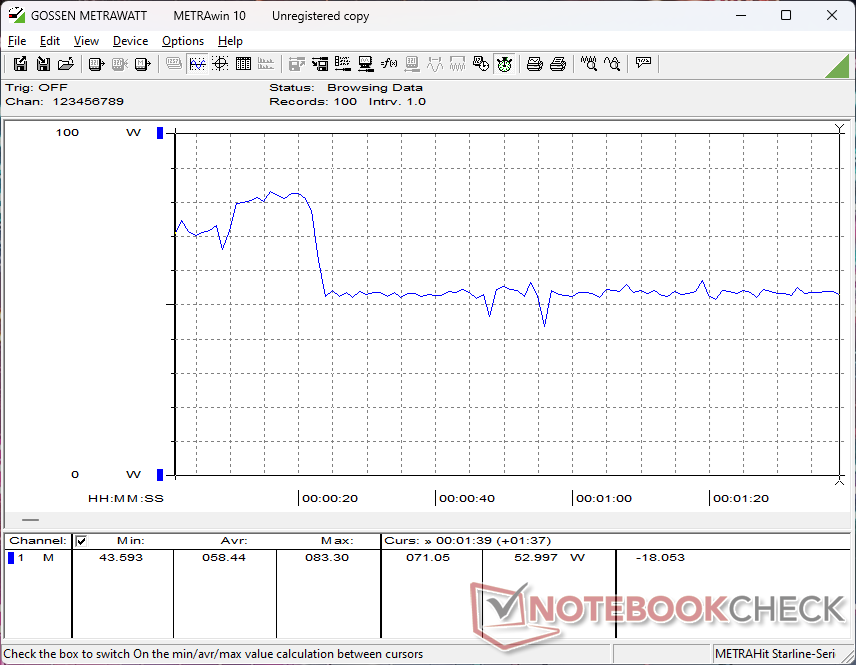
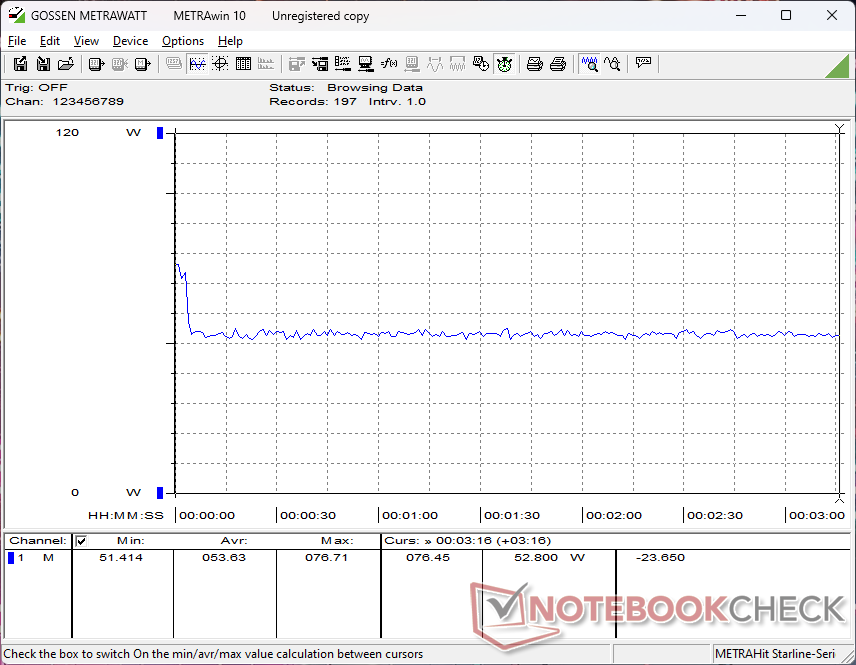
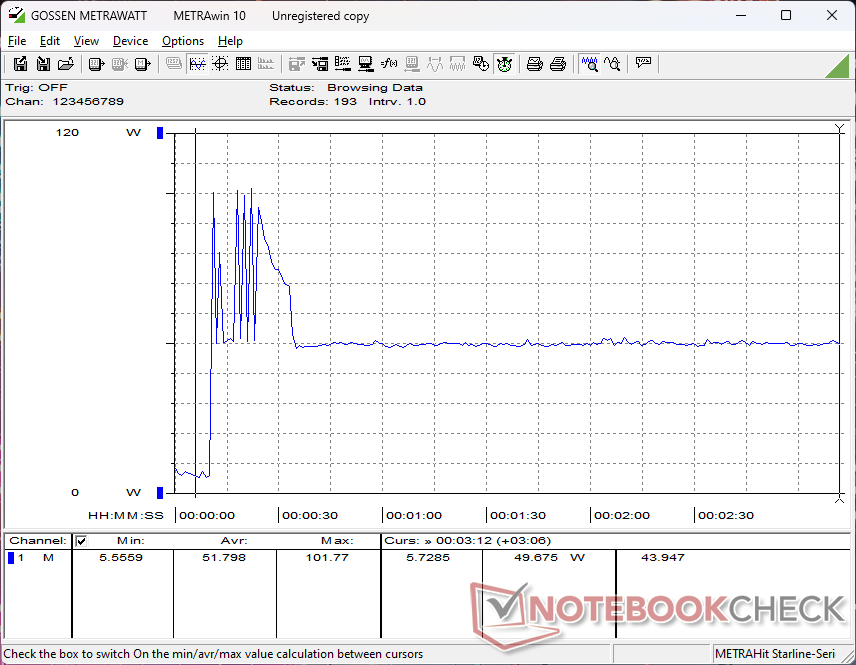
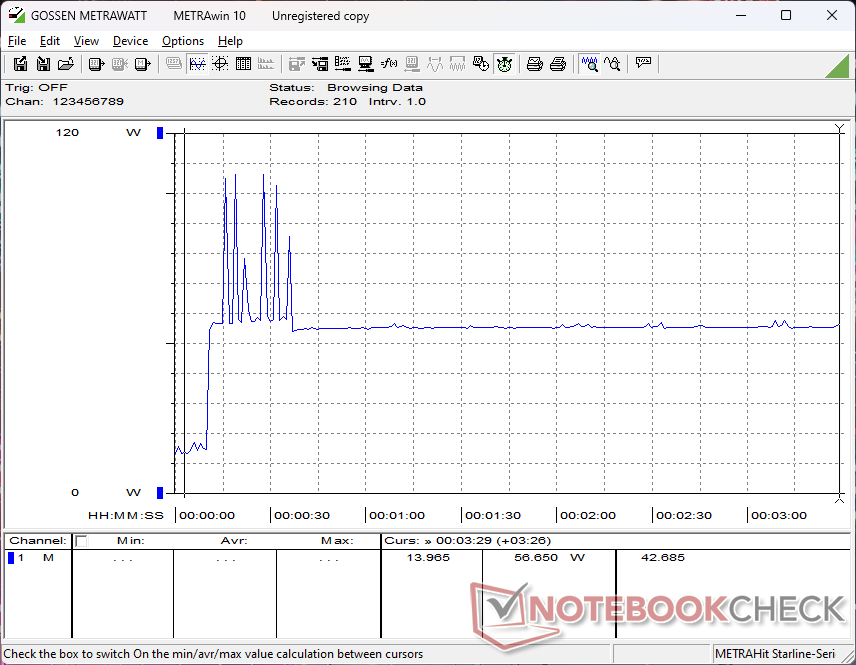
Power consumption is comparable to the S410 G4 but with one notable exception related to the CPU. The new Core i5-1350P is significantly faster than the Core i7-1185G7 as mentioned above, but this comes at the price of higher power consumption especially when Turbo Boost is active. For example, consumption can be as high as 102 W during the first few seconds of Prime95 stress when Turbo Boost is fastest compared to just 73 W on the S410 G4. Even so, performance-per-watt is still superior with the newer CPU before and after any throttling.
The model ships with the same 90 W AC adapter as before.
| Off / Standby | |
| Idle | |
| Load |
|
Key:
min: | |
| Getac S410 G5 i5-1350P, Iris Xe G7 80EUs, SSSTC CL4-8D512, IPS, 1920x1080, 14" | Getac S410 Gen 4 i7-1185G7, Iris Xe G7 96EUs, SSSTC CA5-8D256, IPS, 1920x1080, 14" | Durabook S14I i7-1165G7, Iris Xe G7 96EUs, UDinfo M2P M2P80DE512GBAEP, TN, 1920x1080, 14" | Dell Latitude 14 5420-D2G5W i5-1135G7, Iris Xe G7 80EUs, WDC PC SN530 SDBPTPZ-256G, IPS, 1920x1080, 14" | Dell Latitude 7330 Rugged Extreme i7-1185G7, Iris Xe G7 96EUs, , IPS, 1920x1080, 13.3" | Panasonic Toughbook 40 i7-1185G7, Iris Xe G7 96EUs, Samsung PM991 MZVLQ1T0HALB, IPS, 1920x1080, 14" | |
|---|---|---|---|---|---|---|
| Power Consumption | 10% | 11% | 44% | 23% | 18% | |
| Idle Minimum * (Watt) | 7.9 | 8.3 -5% | 6.8 14% | 3.4 57% | 4.1 48% | 4.9 38% |
| Idle Average * (Watt) | 14.4 | 10.5 27% | 16.4 -14% | 7.1 51% | 11.7 19% | 12.3 15% |
| Idle Maximum * (Watt) | 15.2 | 14.9 2% | 16.9 -11% | 8.4 45% | 11.8 22% | 14 8% |
| Load Average * (Watt) | 58.4 | 48.6 17% | 39.2 33% | 35.3 40% | 48.5 17% | 54 8% |
| Witcher 3 ultra * (Watt) | 53.7 | 50.9 5% | 35.4 34% | 44.3 18% | 46.3 14% | |
| Load Maximum * (Watt) | 106.5 | 90.1 15% | 73.1 31% | 67 37% | 91 15% | 83.6 22% |
* ... smaller is better
Power Consumption Witcher 3 / Stresstest
Power Consumption external Monitor
Battery Life
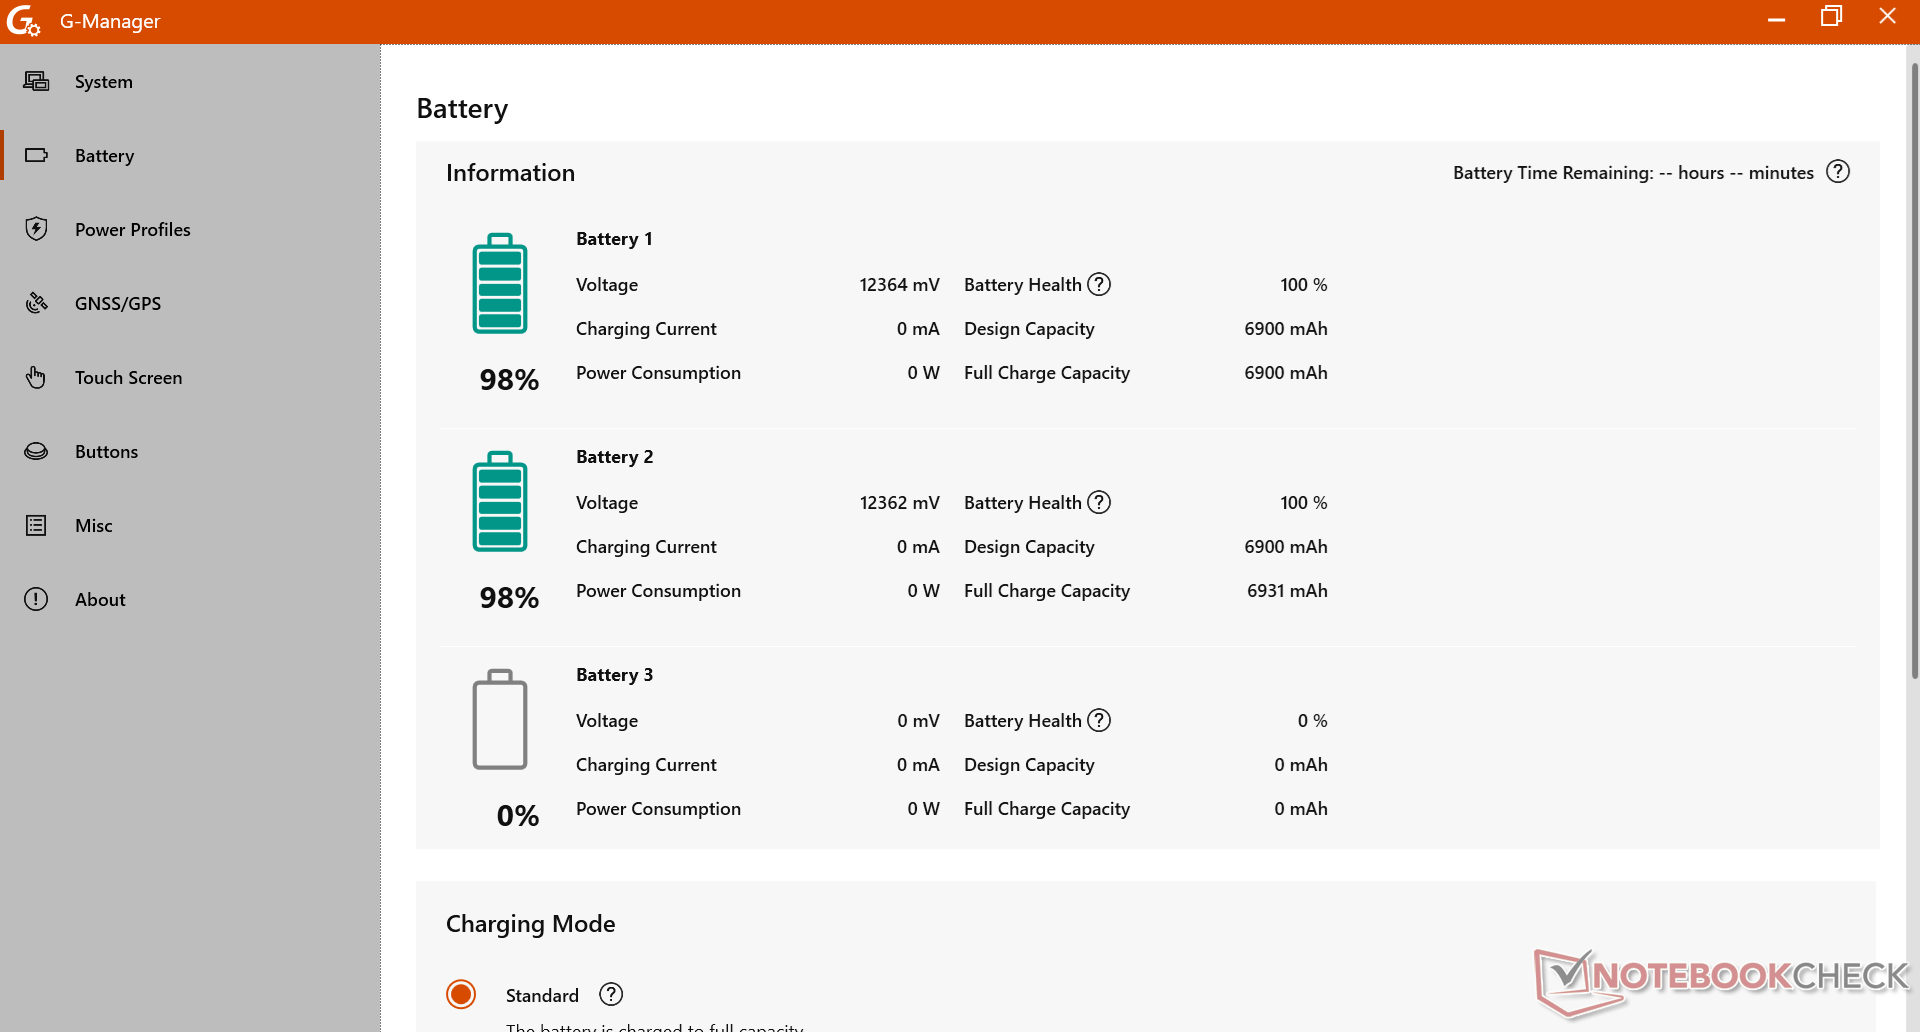
Our S410 G5 test unit does not include an internal battery unlike on our S410 G4 unit and so it instead relies on two removable 75 Wh batteries for a total capacity of 150 Wh. WLAN runtime is still nonetheless much shorter than on last year's model (17.5 hours vs. 28.5 hours) even after accounting for the smaller total capacity. The battery life discrepancy can be largely attributed to the more demanding Raptor Lake-P CPU as mentioned in the Power Consumption section above.
| Getac S410 G5 i5-1350P, Iris Xe G7 80EUs, 150 Wh | Getac S410 Gen 4 i7-1185G7, Iris Xe G7 96EUs, 194 Wh | Durabook S14I i7-1165G7, Iris Xe G7 96EUs, 50 Wh | Dell Latitude 14 5420-D2G5W i5-1135G7, Iris Xe G7 80EUs, 63 Wh | Dell Latitude 7330 Rugged Extreme i7-1185G7, Iris Xe G7 96EUs, 107 Wh | Panasonic Toughbook 40 i7-1185G7, Iris Xe G7 96EUs, 136 Wh | |
|---|---|---|---|---|---|---|
| Battery runtime | 63% | -69% | -27% | 3% | 9% | |
| WiFi v1.3 (h) | 17.5 | 28.6 63% | 5.5 -69% | 12.8 -27% | 18 3% | 19 9% |
| Reader / Idle (h) | 22.9 | |||||
| Load (h) | 2.4 |
Pros
Cons
Verdict

The S410 G5 maintains compatibility with previous generation models which is important for industrial and government applications. The reduced display ghosting and boost in CPU performance are definitely highlights of the latest model and the main reasons for purchasing the S410 G5 over the older S410 G4. Battery life takes a hit from the faster CPU, but it's still very long especially since the system can support multiple battery packs. Meanwhile, the higher resolution webcam and proper Wi-Fi 6E support are nice extras.
The rugged Getac S410 G5 is faster than before by significant margins due to the new 13th gen CPU. However, some internal and external features are in need of updates to improve the user experience.
We would love to see some annoying aspects of the design be addressed for future releases. A larger fan, for example, would help to reduce fan noise. The speakers could be louder and the port covers could be easier to open. The keyboard keys are also not very reliable as it's possible to strike a key without registering an input. These drawbacks have been persistent on the S410 series and they are becoming more difficult to ignore after each year.
Price and Availability
Quotes are available upon request from the official Getac website.
Getac S410 G5
- 06/05/2024 v7 (old)
Allen Ngo
Transparency
The selection of devices to be reviewed is made by our editorial team. The test sample was provided to the author as a loan by the manufacturer or retailer for the purpose of this review. The lender had no influence on this review, nor did the manufacturer receive a copy of this review before publication. There was no obligation to publish this review. As an independent media company, Notebookcheck is not subjected to the authority of manufacturers, retailers or publishers.
This is how Notebookcheck is testing
Every year, Notebookcheck independently reviews hundreds of laptops and smartphones using standardized procedures to ensure that all results are comparable. We have continuously developed our test methods for around 20 years and set industry standards in the process. In our test labs, high-quality measuring equipment is utilized by experienced technicians and editors. These tests involve a multi-stage validation process. Our complex rating system is based on hundreds of well-founded measurements and benchmarks, which maintains objectivity. Further information on our test methods can be found here.
Price comparison
