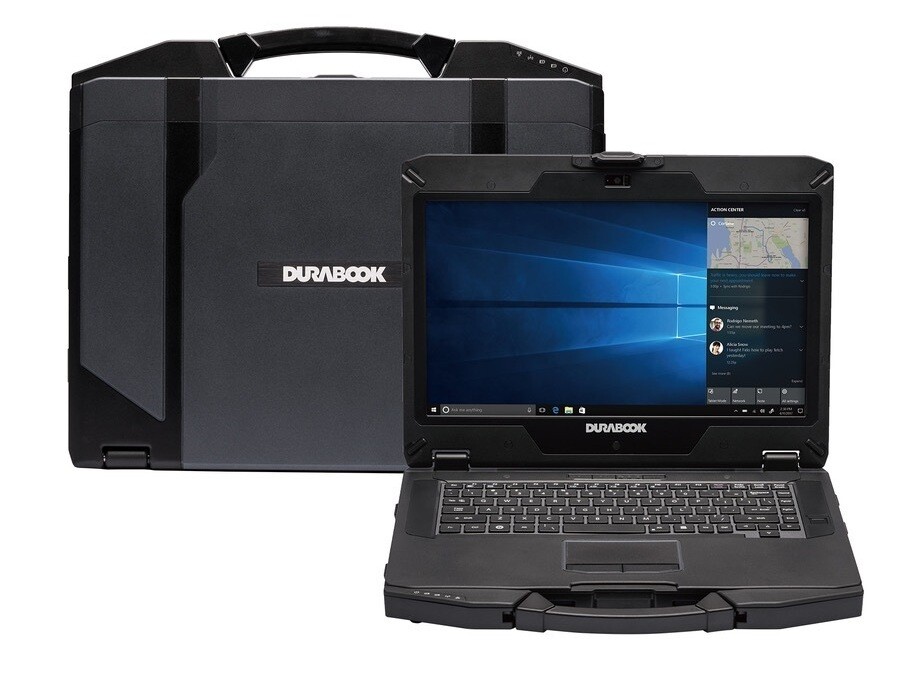
Durabook S14I Rugged Laptop Review: Durable 11th Gen Tiger Lake
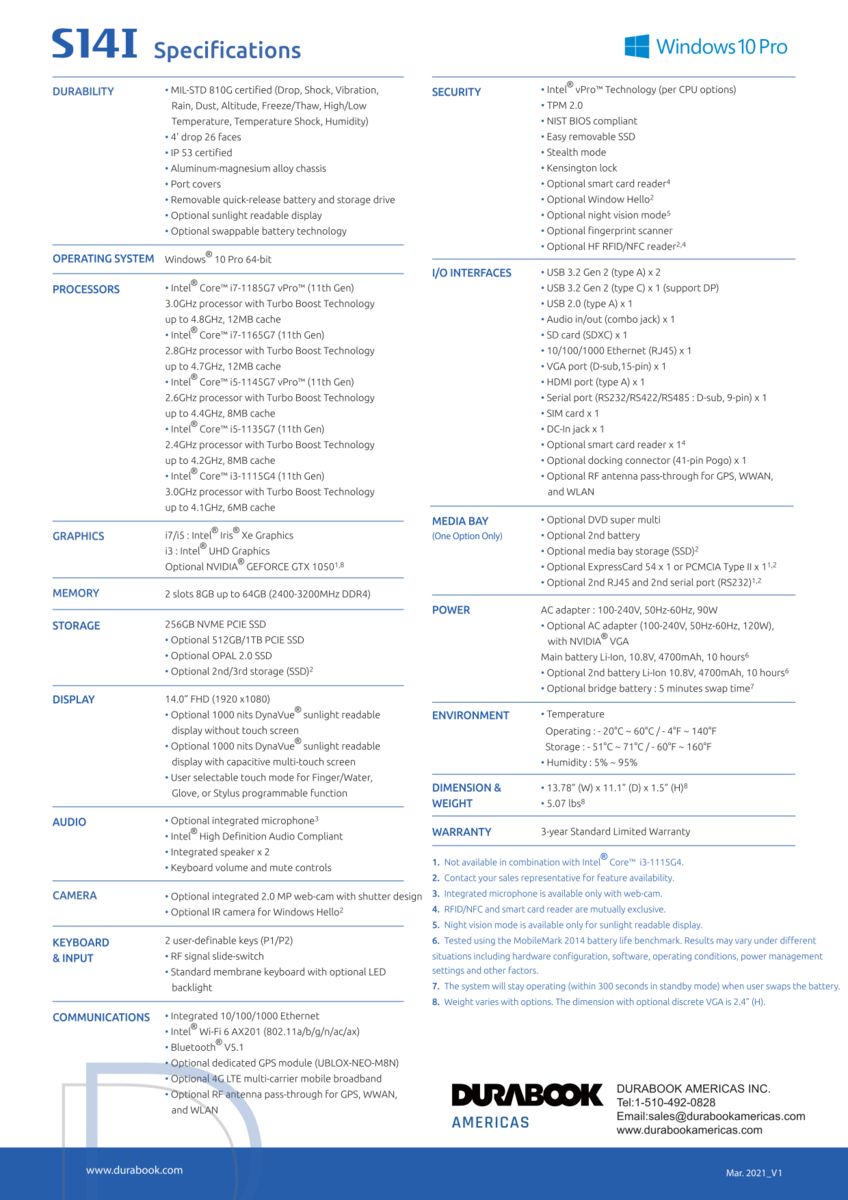
Announced in March, the Durabook S14I is notable for being one of the first rugged laptops to ship with 11th gen Intel Tiger Lake-U options and other features commonly found on consumer Ultrabooks like Wi-Fi 6, NVMe SSD support, and optional vPro. There are plenty of configurations available as detailed by the official specifications sheet below.
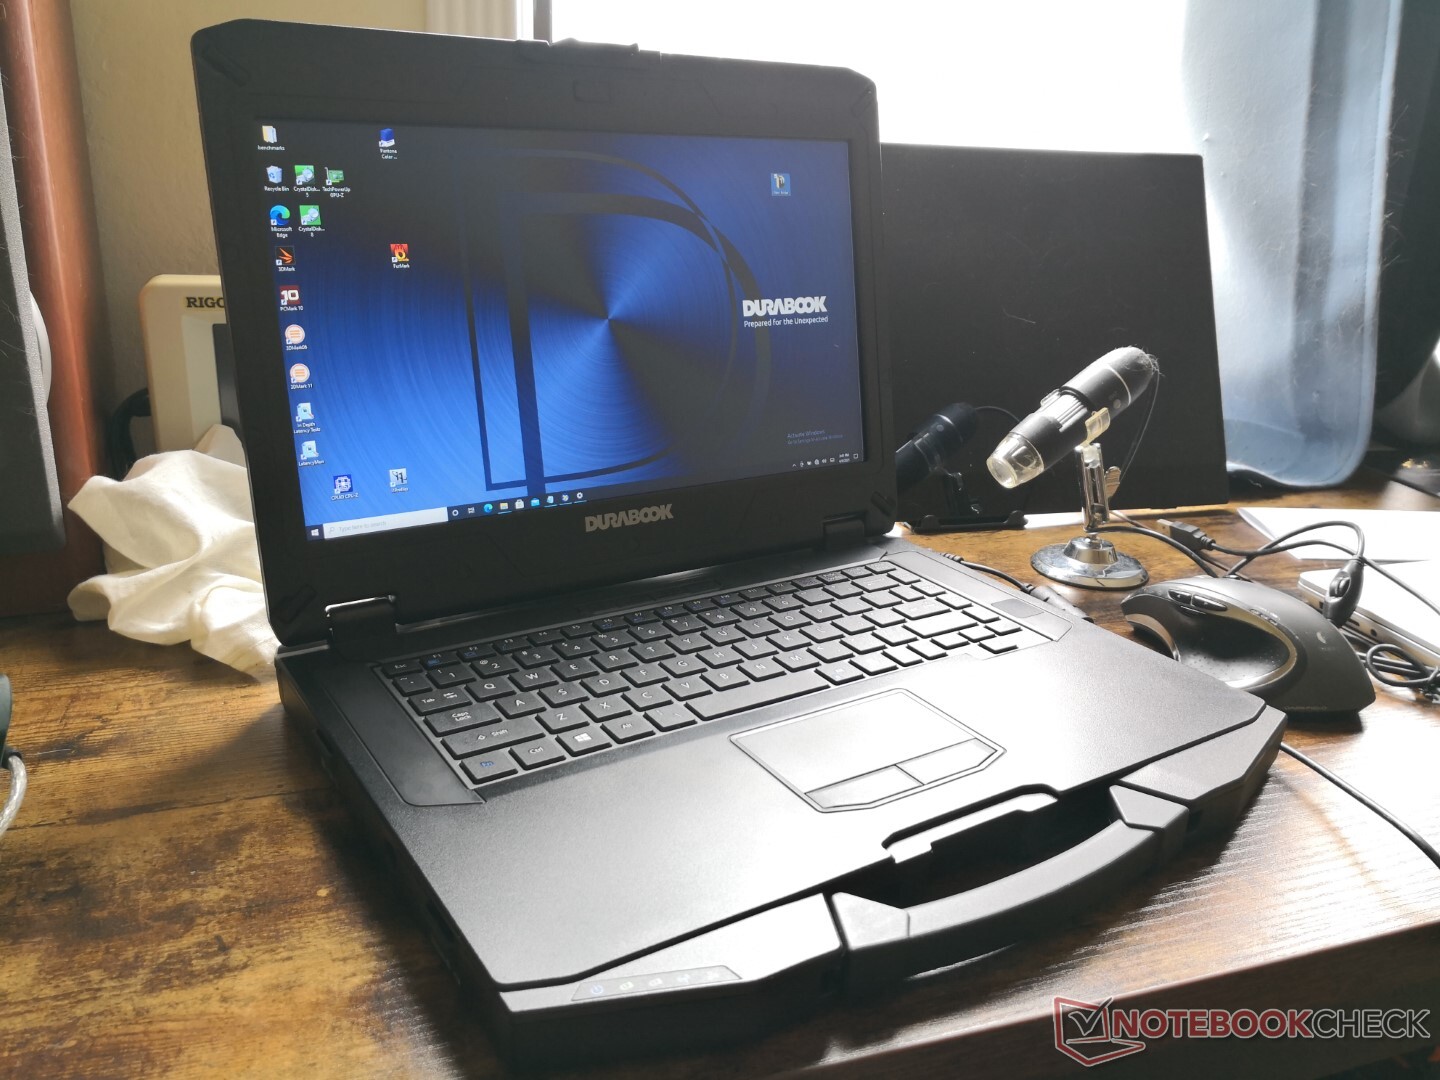
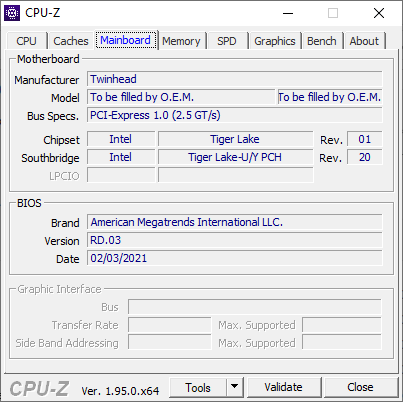
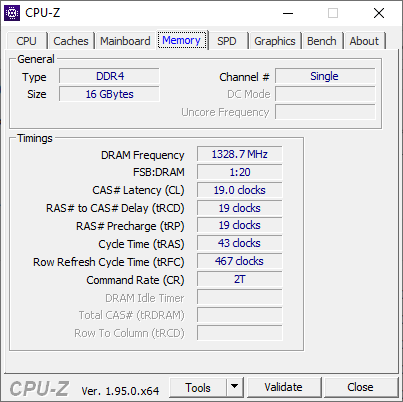
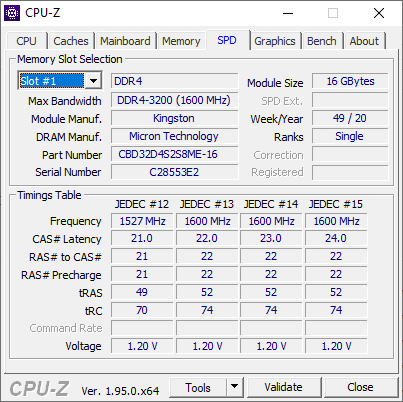
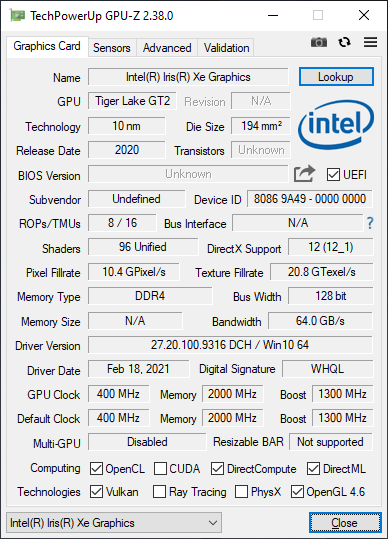
Our test unit today is an upper mid-range SKU with the Core i7-1165G7 CPU, 16 GB of single-channel RAM, 512 GB NVMe SSD, and 1000-nit 1080p TN display. Competitors include other 14-inch rugged laptops like the Dell Latitude 14 Rugged, Getac S410, or the Panasonic Toughbook.
More Durabook reviews:
potential competitors in comparison
Rating | Date | Model | Weight | Height | Size | Resolution | Price |
|---|---|---|---|---|---|---|---|
v (old) | 04 / 2021 | Durabook S14I i7-1165G7, Iris Xe G7 96EUs | 3 kg | 38.1 mm | 14.00" | 1920x1080 | |
| 78.3 % v7 (old) | 04 / 2020 | Durabook S15ABG2 i5-8265U, UHD Graphics 620 | 2.6 kg | 30 mm | 15.60" | 1920x1080 | |
| 80.9 % v7 (old) | 09 / 2019 | Panasonic Toughbook FZ-55 i5-8365U, UHD Graphics 620 | 2.2 kg | 33 mm | 14.00" | 1920x1080 | |
| 84.3 % v6 (old) | 03 / 2019 | Dell Latitude 7424 Rugged Extreme i7-8650U, Radeon RX 540 | 3.5 kg | 59.3 mm | 14.00" | 1920x1080 | |
| 81.9 % v6 (old) | 10 / 2018 | Getac S410 i5-8550U, UHD Graphics 620 | 3.2 kg | 34.9 mm | 14.00" | 1366x768 | |
| 80.4 % v6 (old) | 10 / 2018 | Panasonic Toughbook CF-54G2999VM i5-7300U, HD Graphics 620 | 1.9 kg | 30.5 mm | 14.00" | 1366x768 |
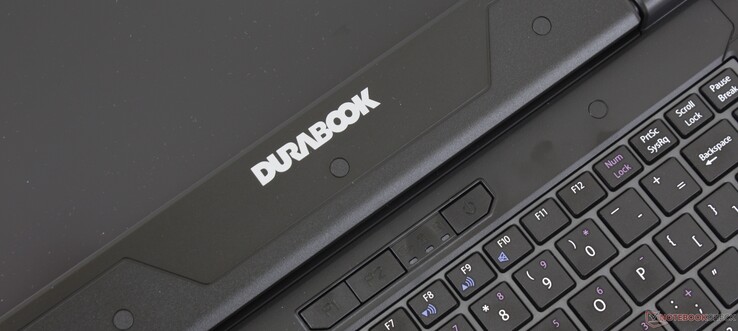
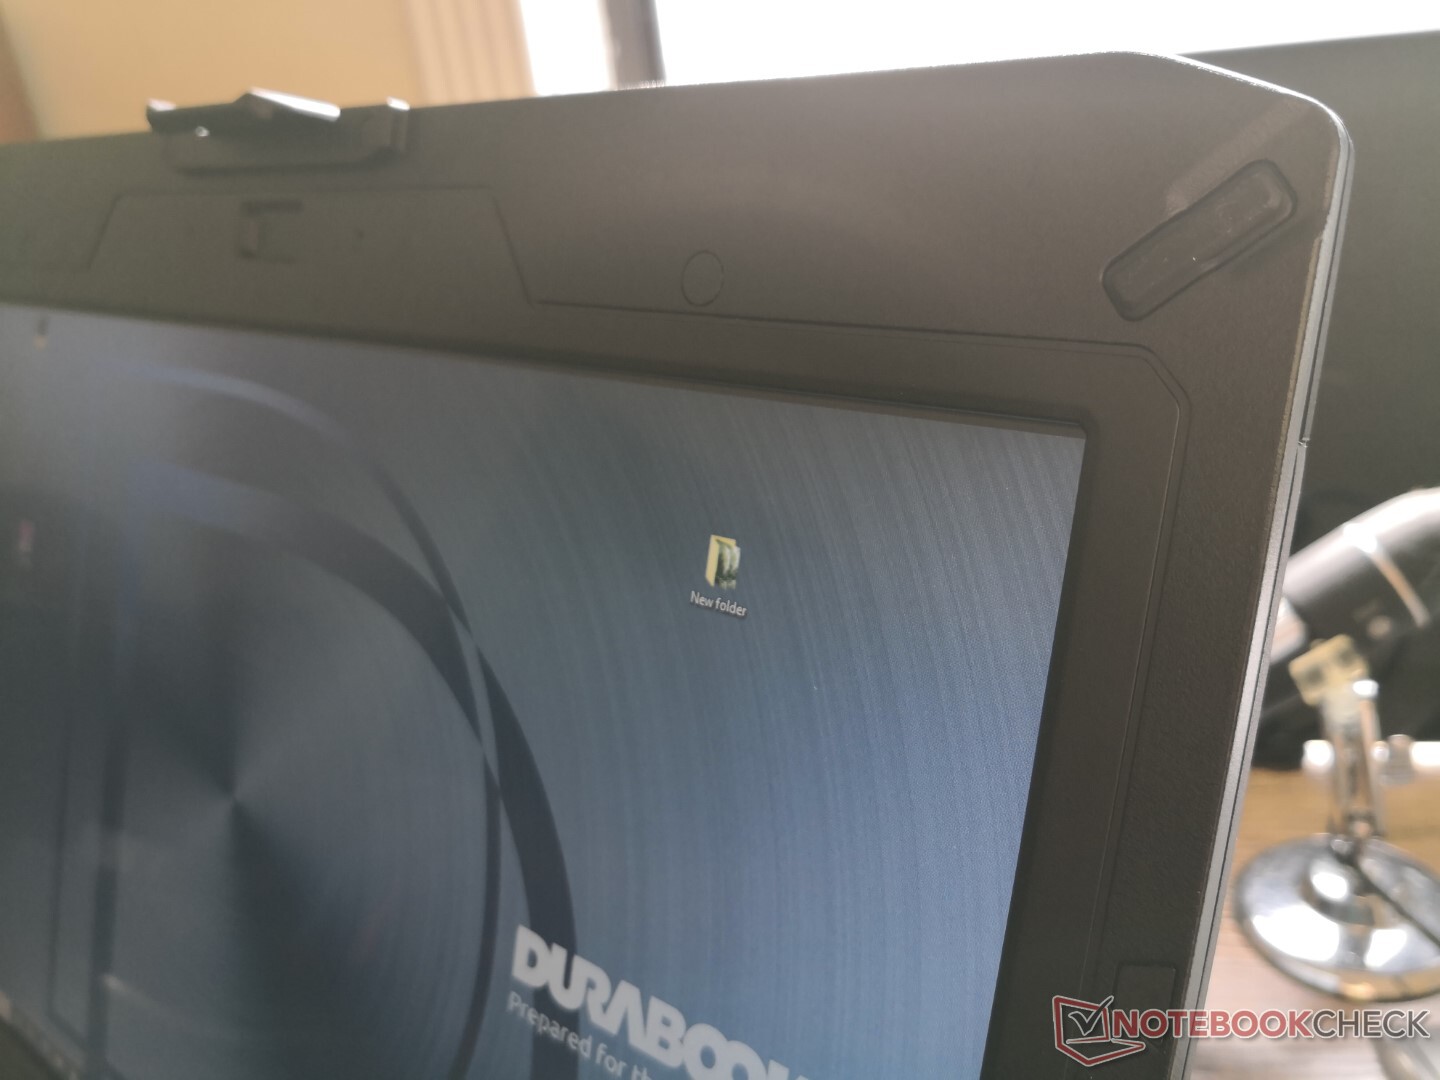
Case
The S14I is heavy even for a rugged laptop. The 15.6-inch Durabook S15A, for example, is 400 grams lighter despite the fact that our S14I is a smaller screen size. Its high weight increases stability, modularity, and sense of longevity should any upgrades or servicing be necessary down the line.
Connectivity
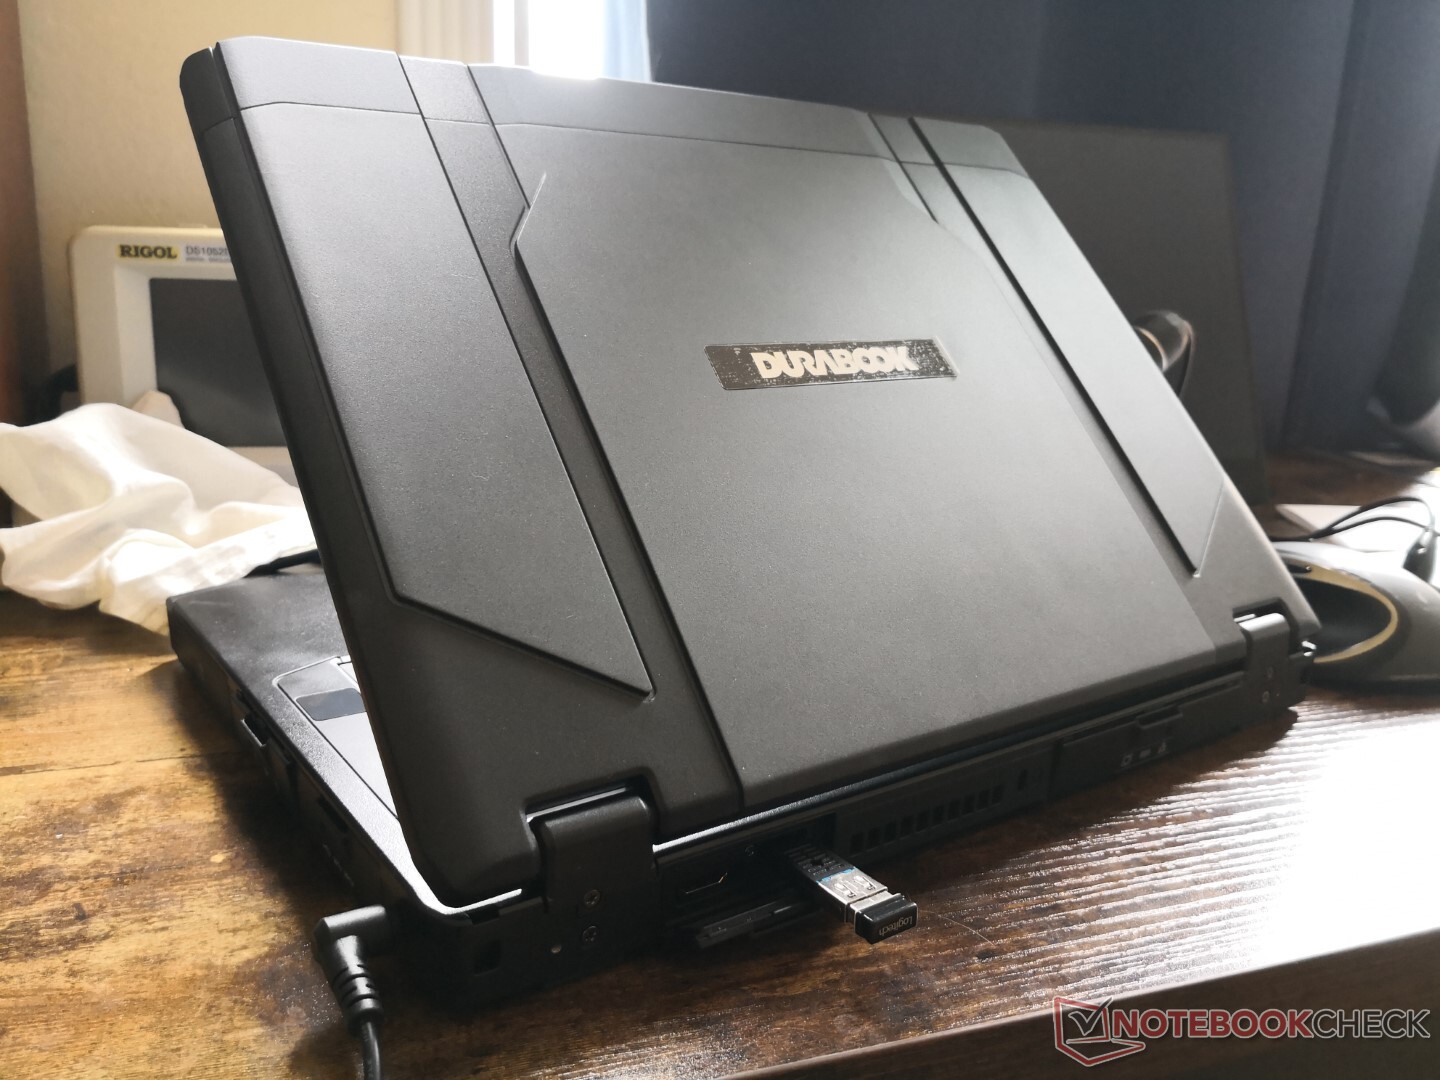
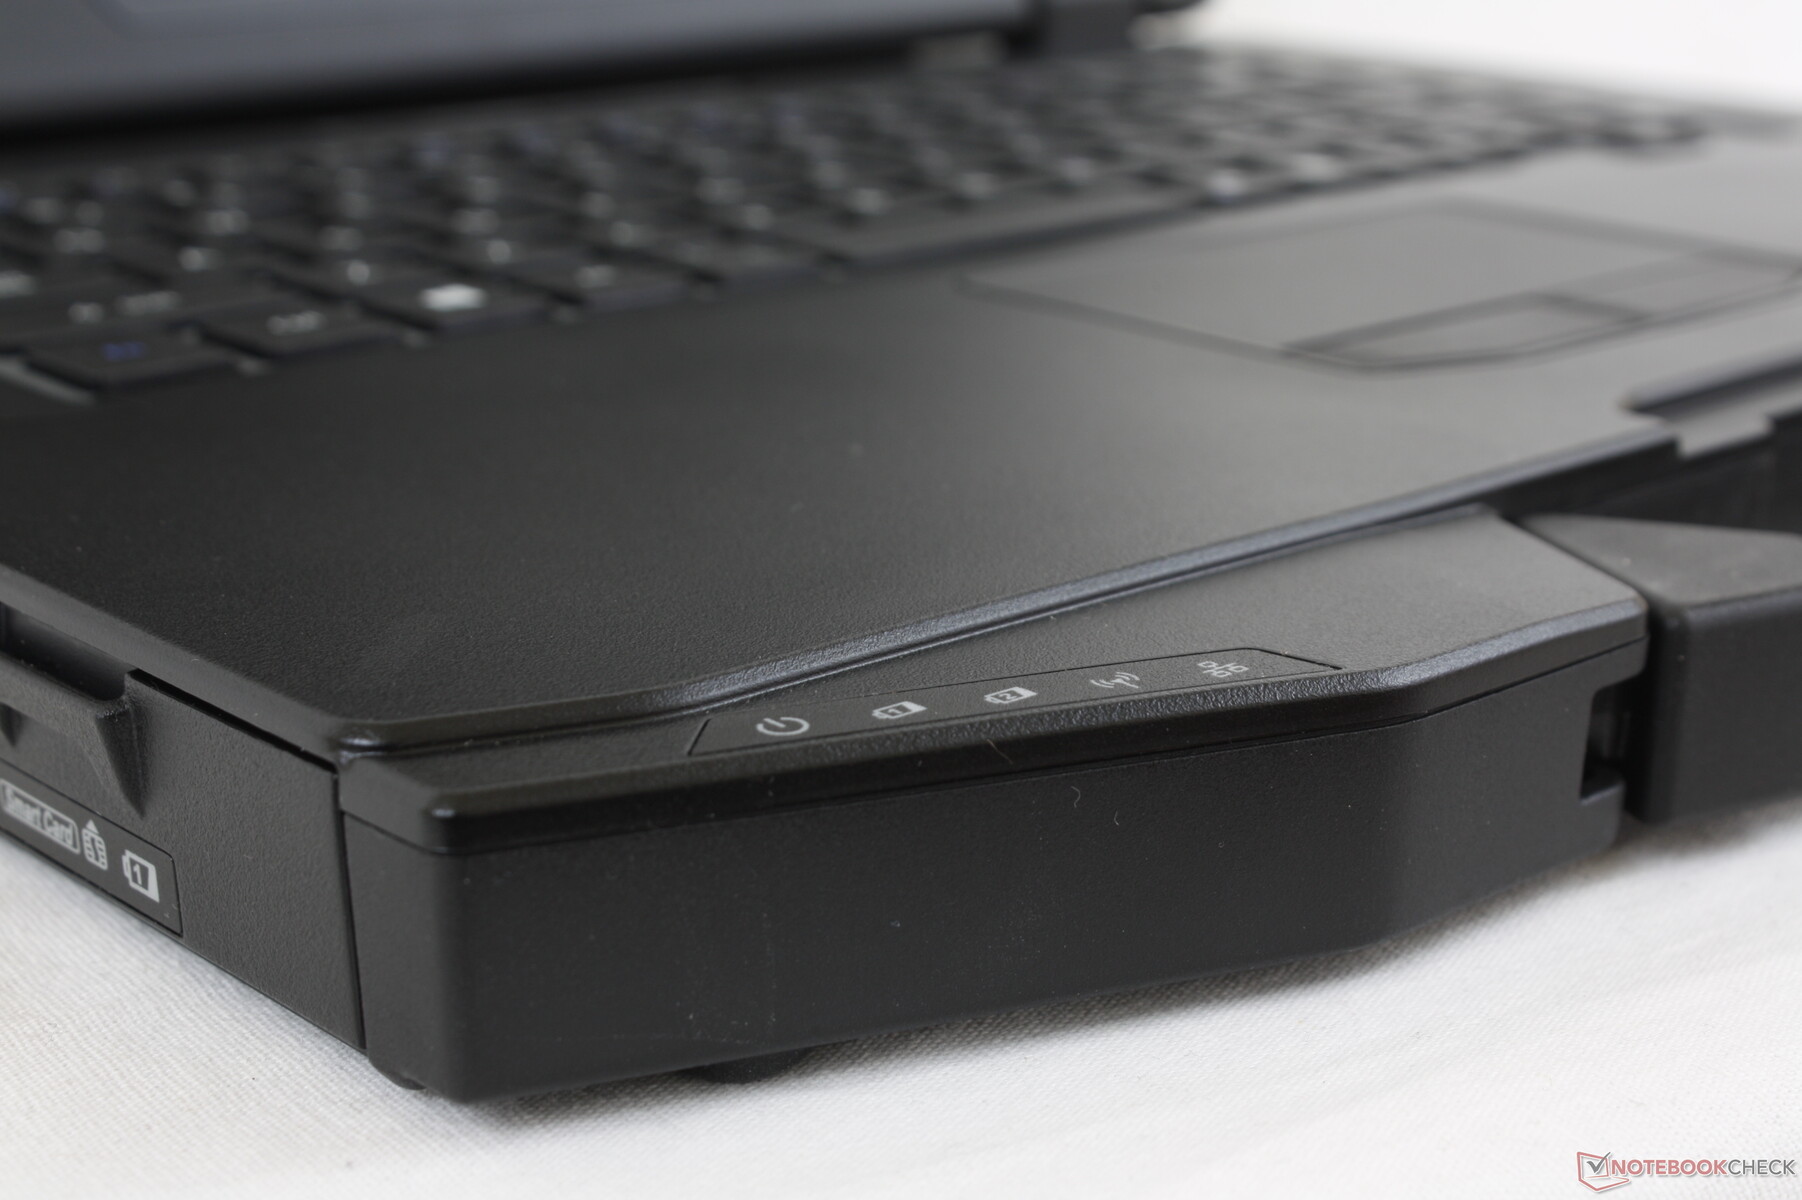
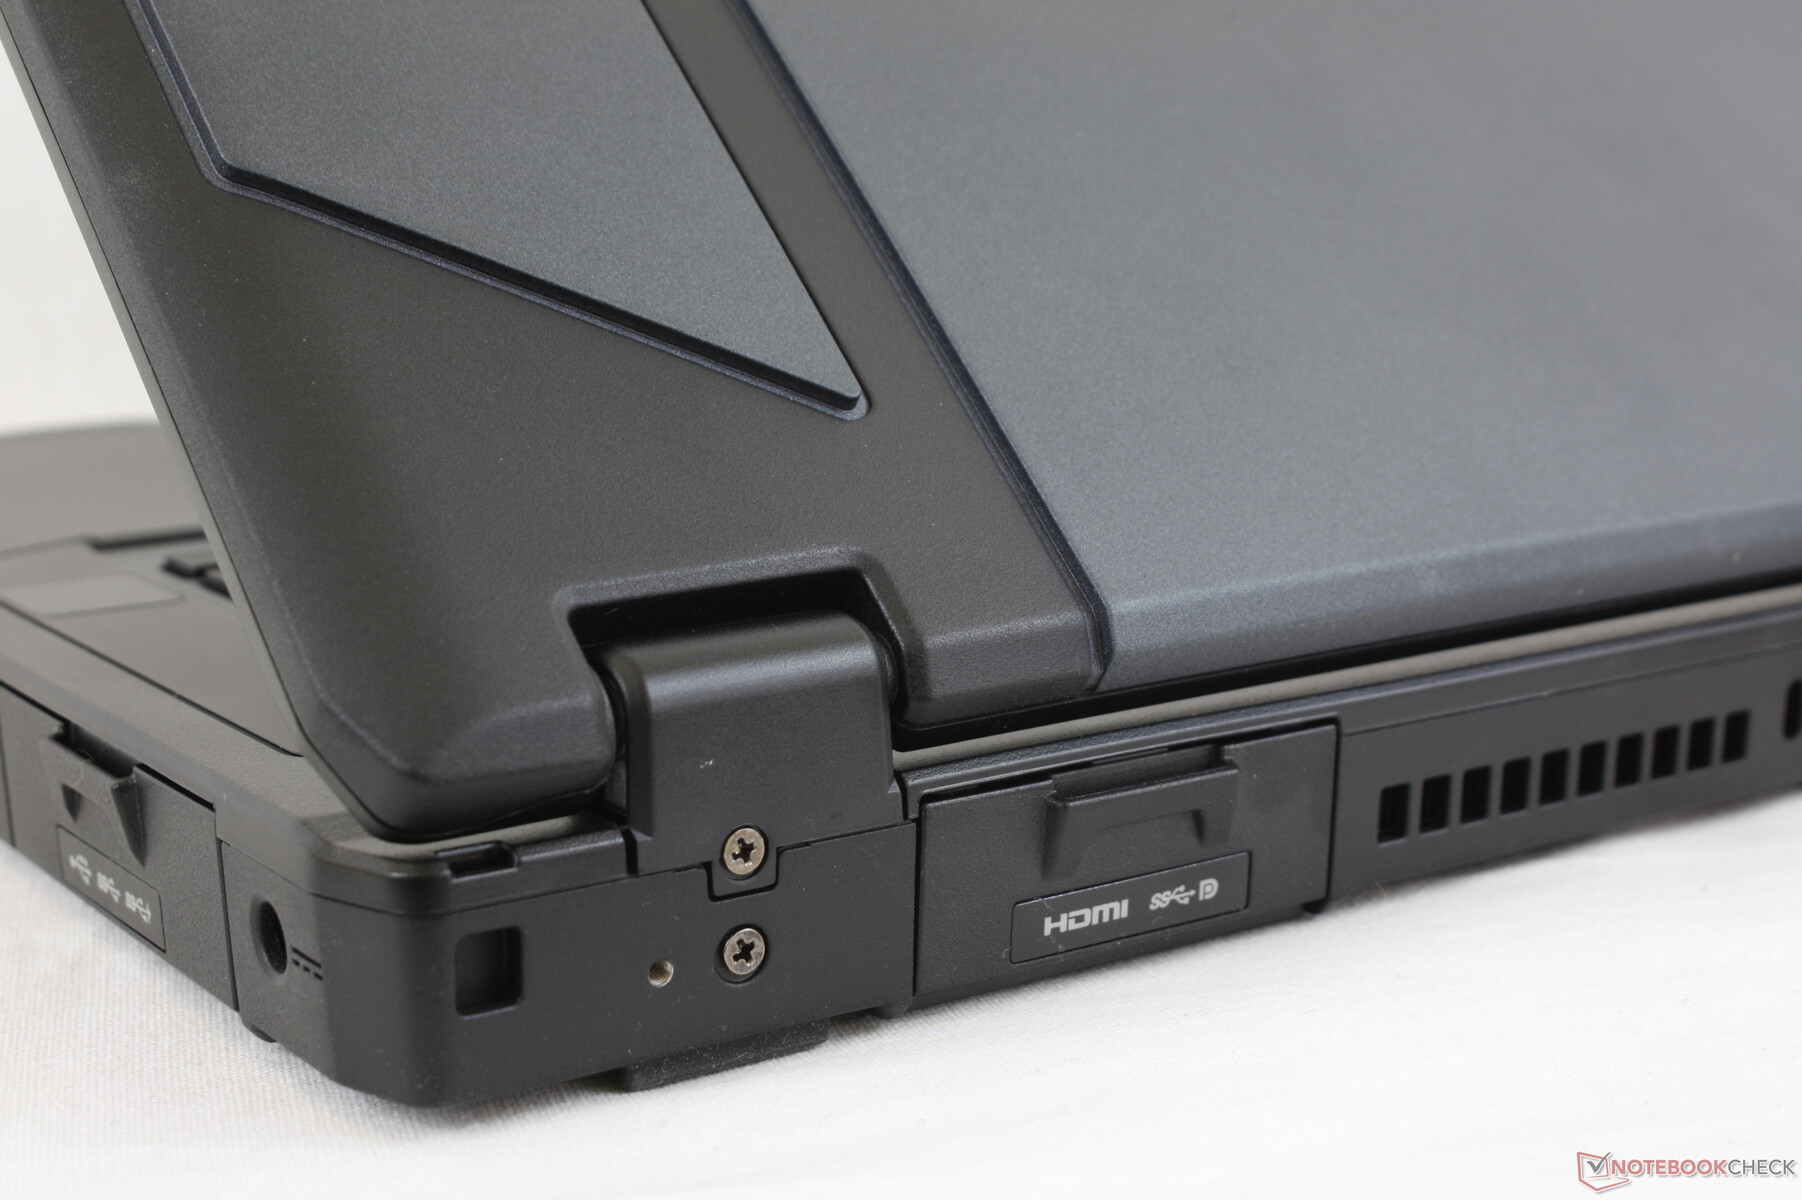
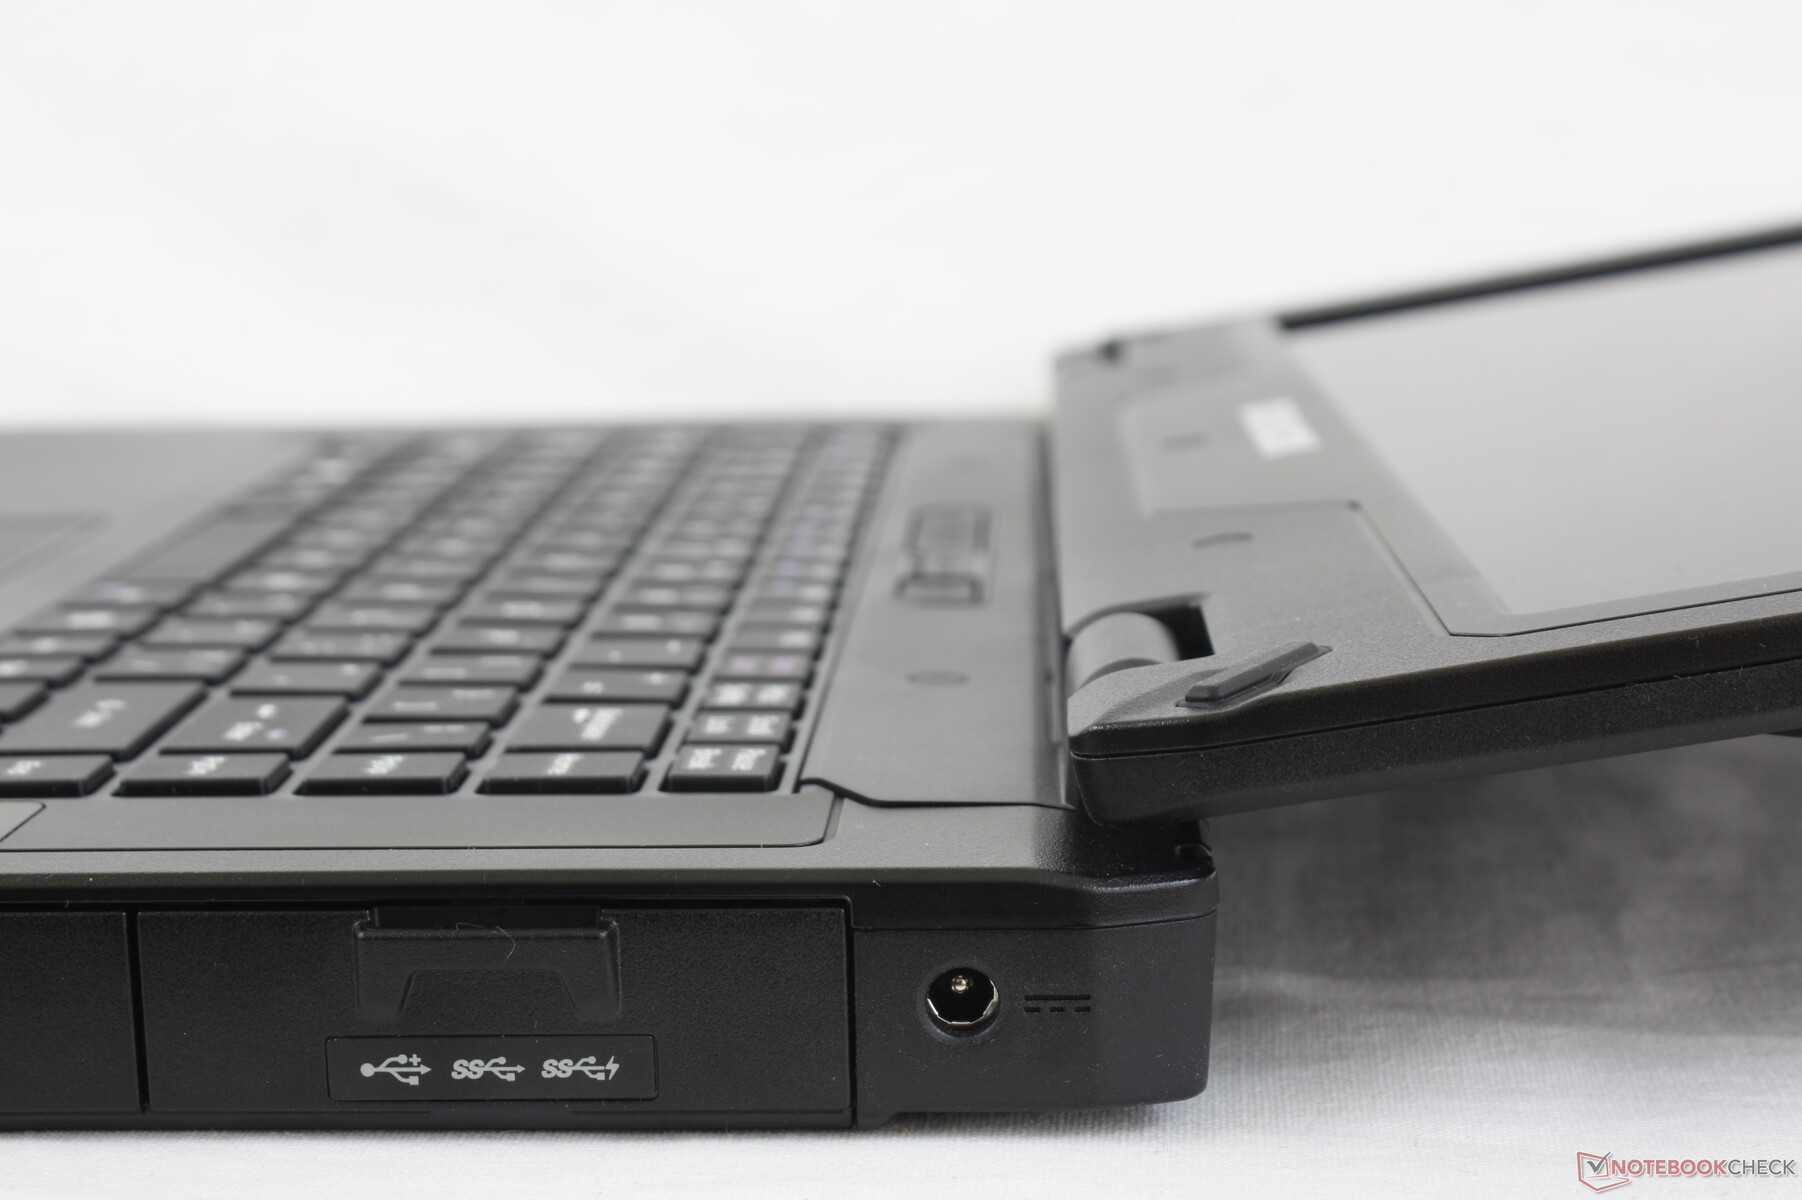
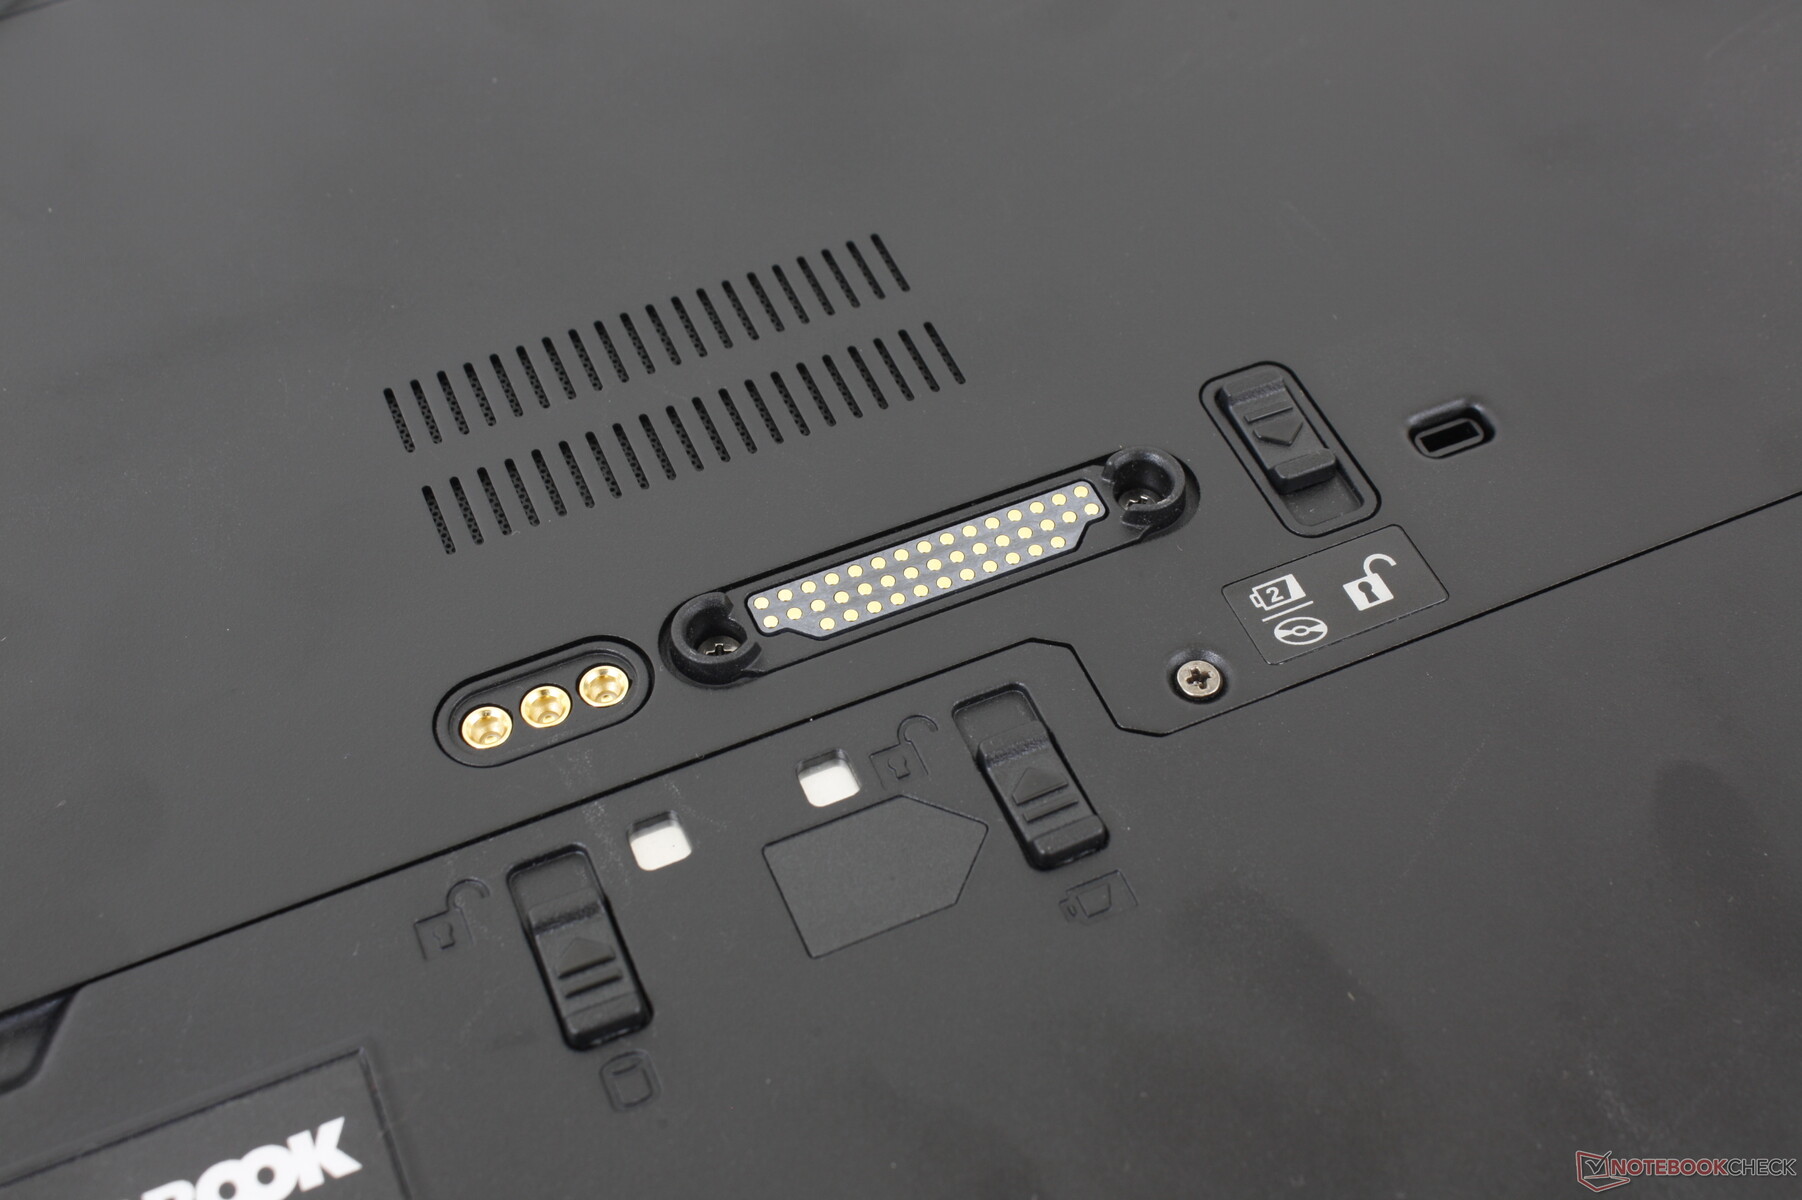
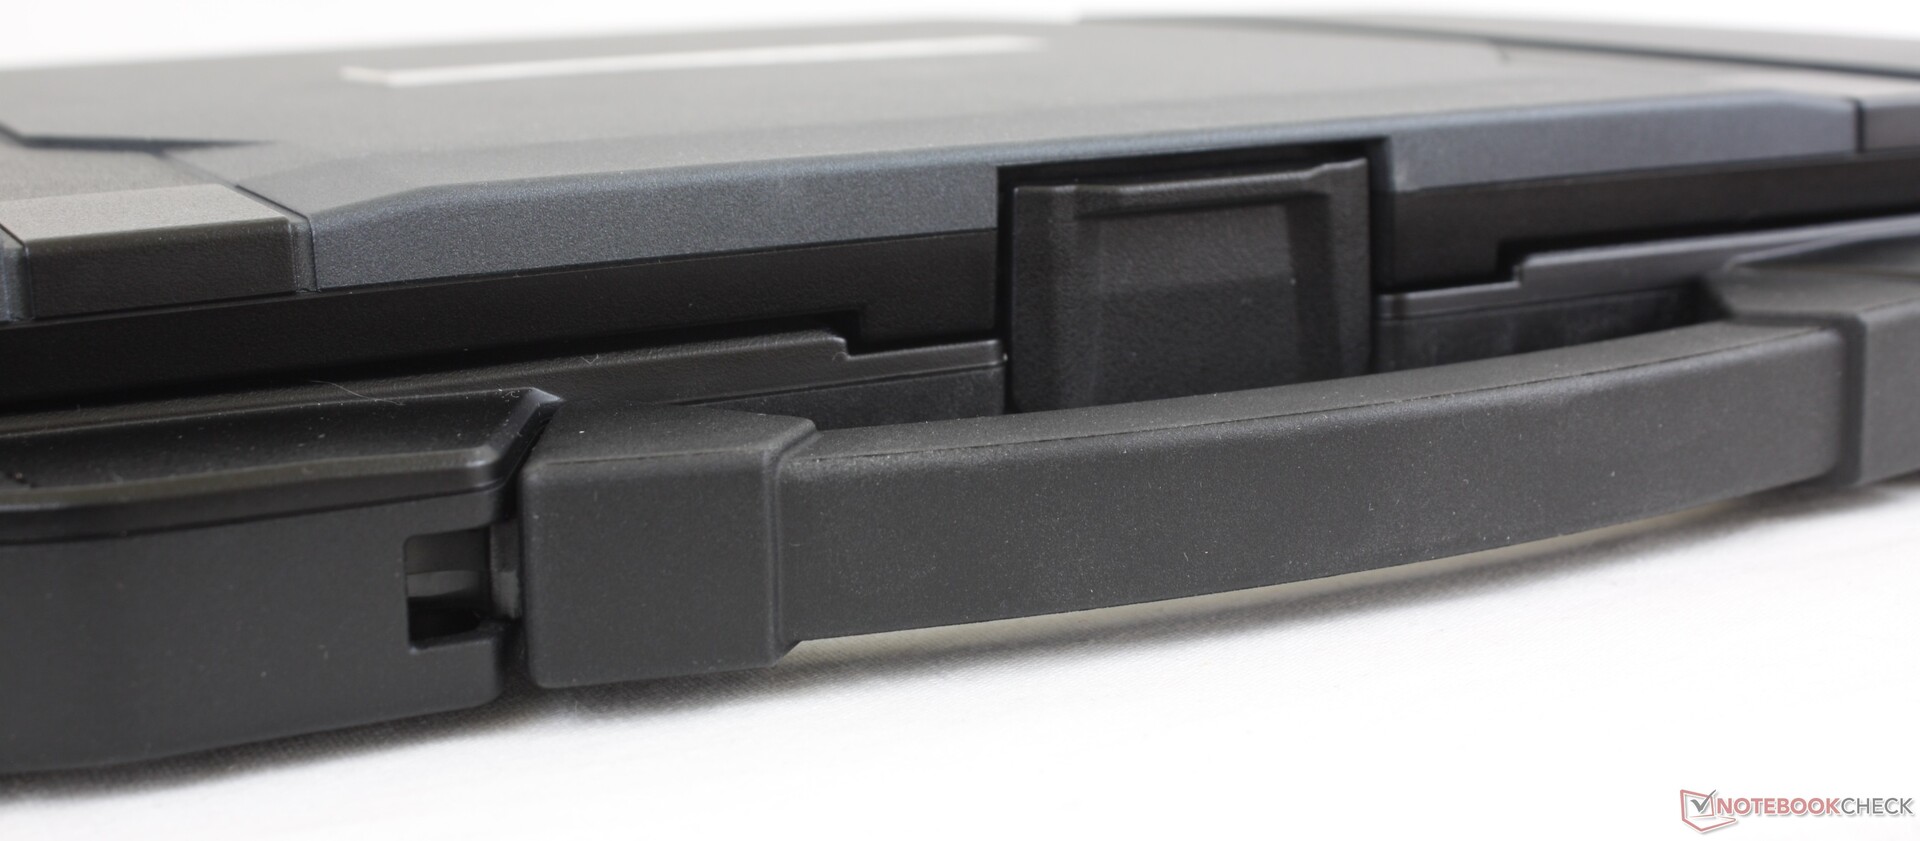
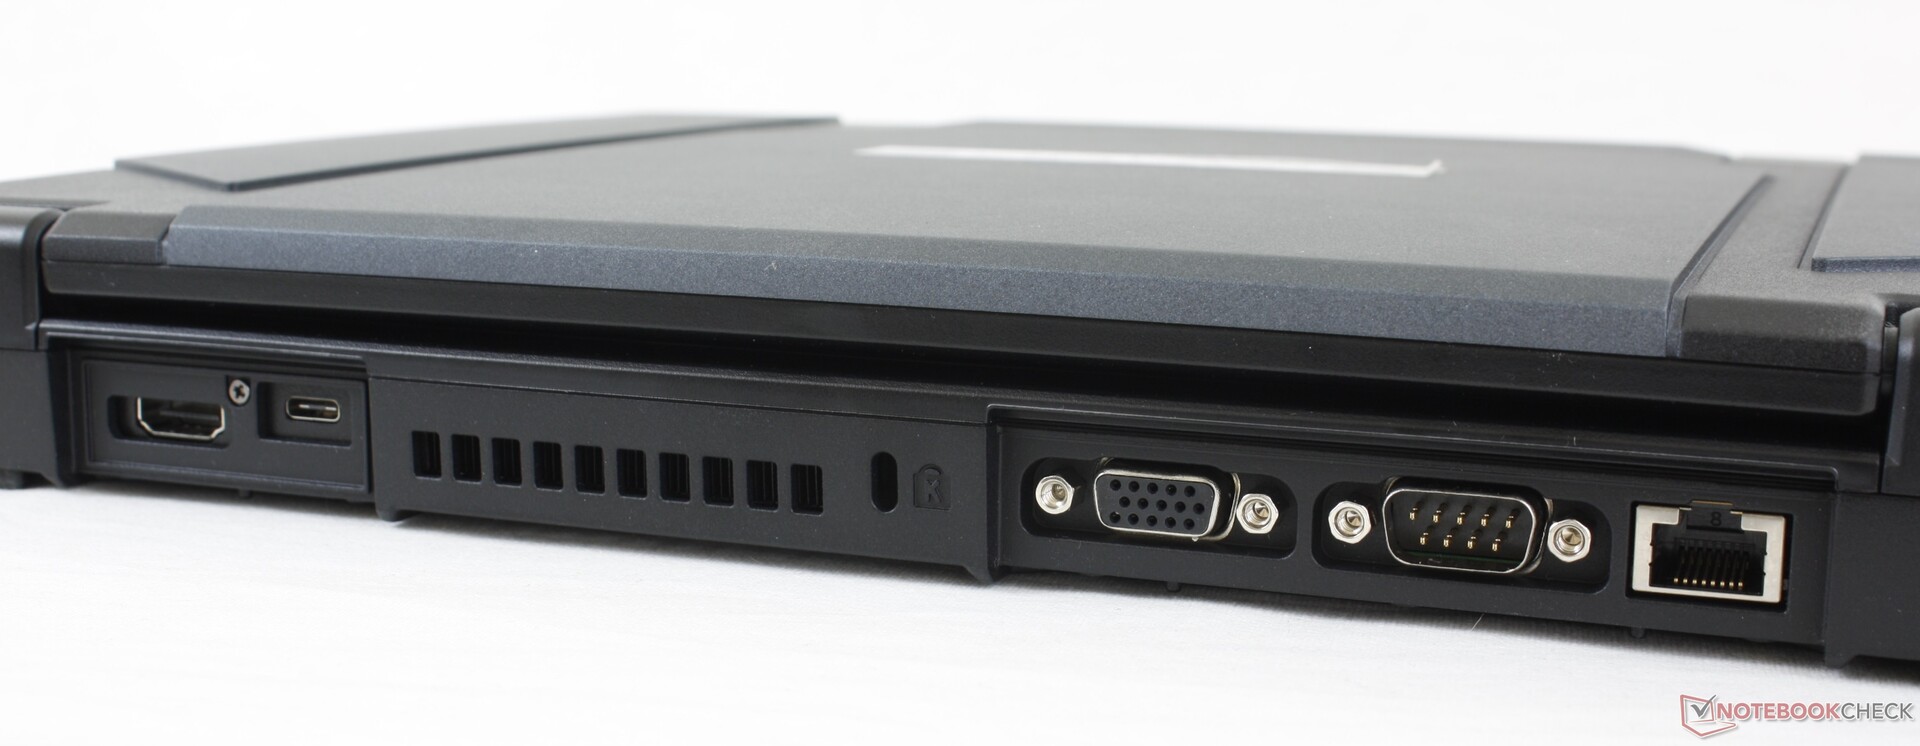
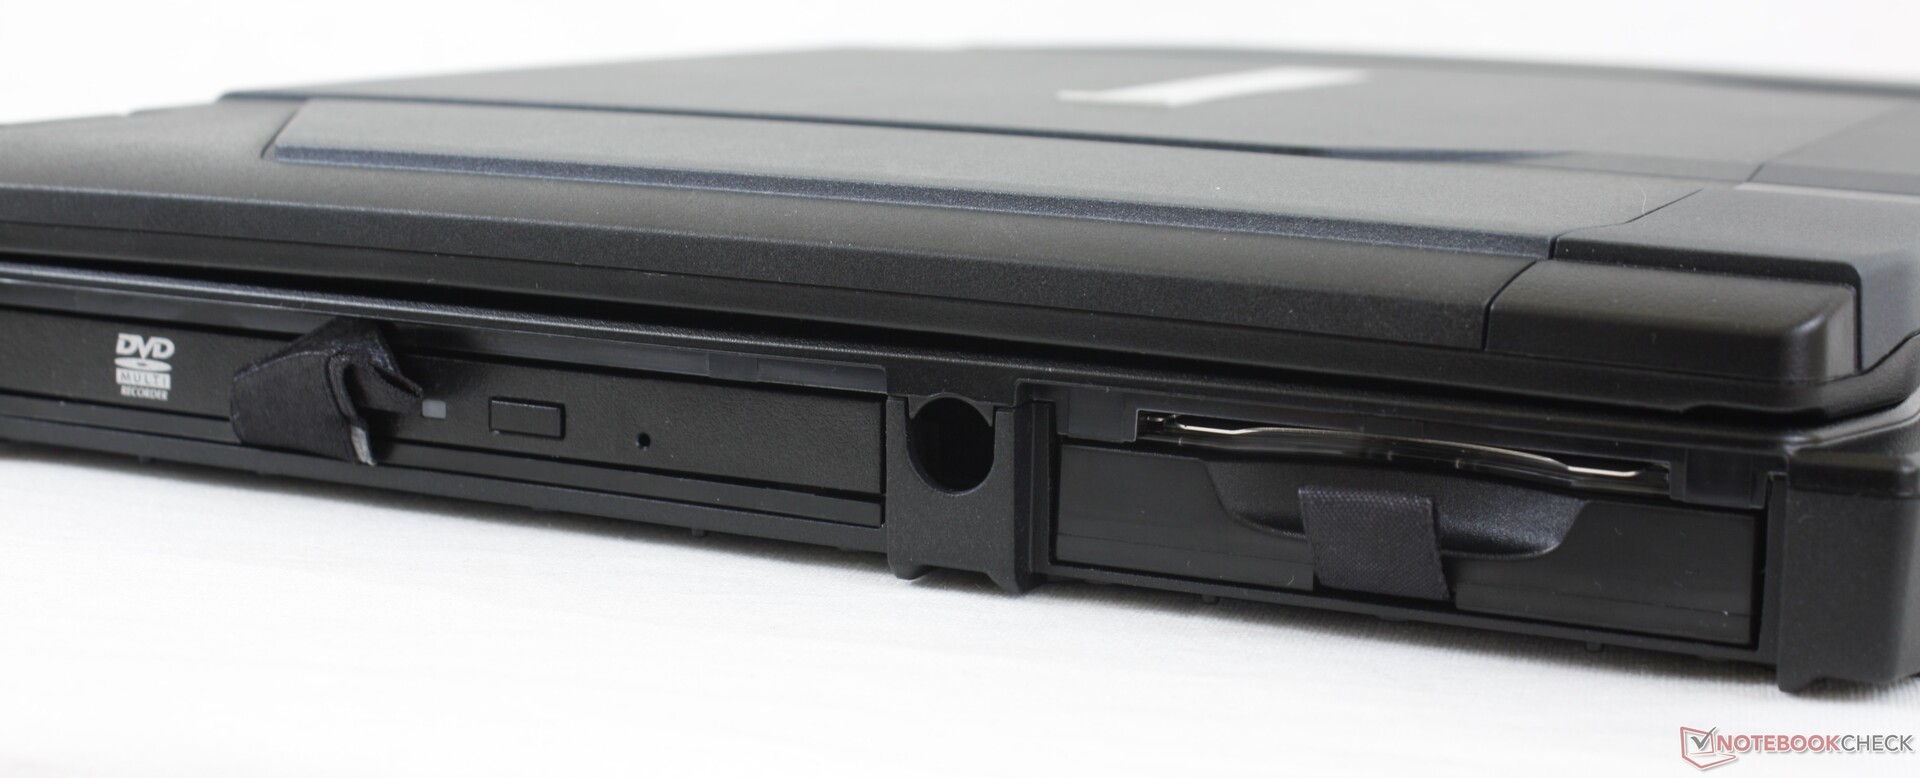
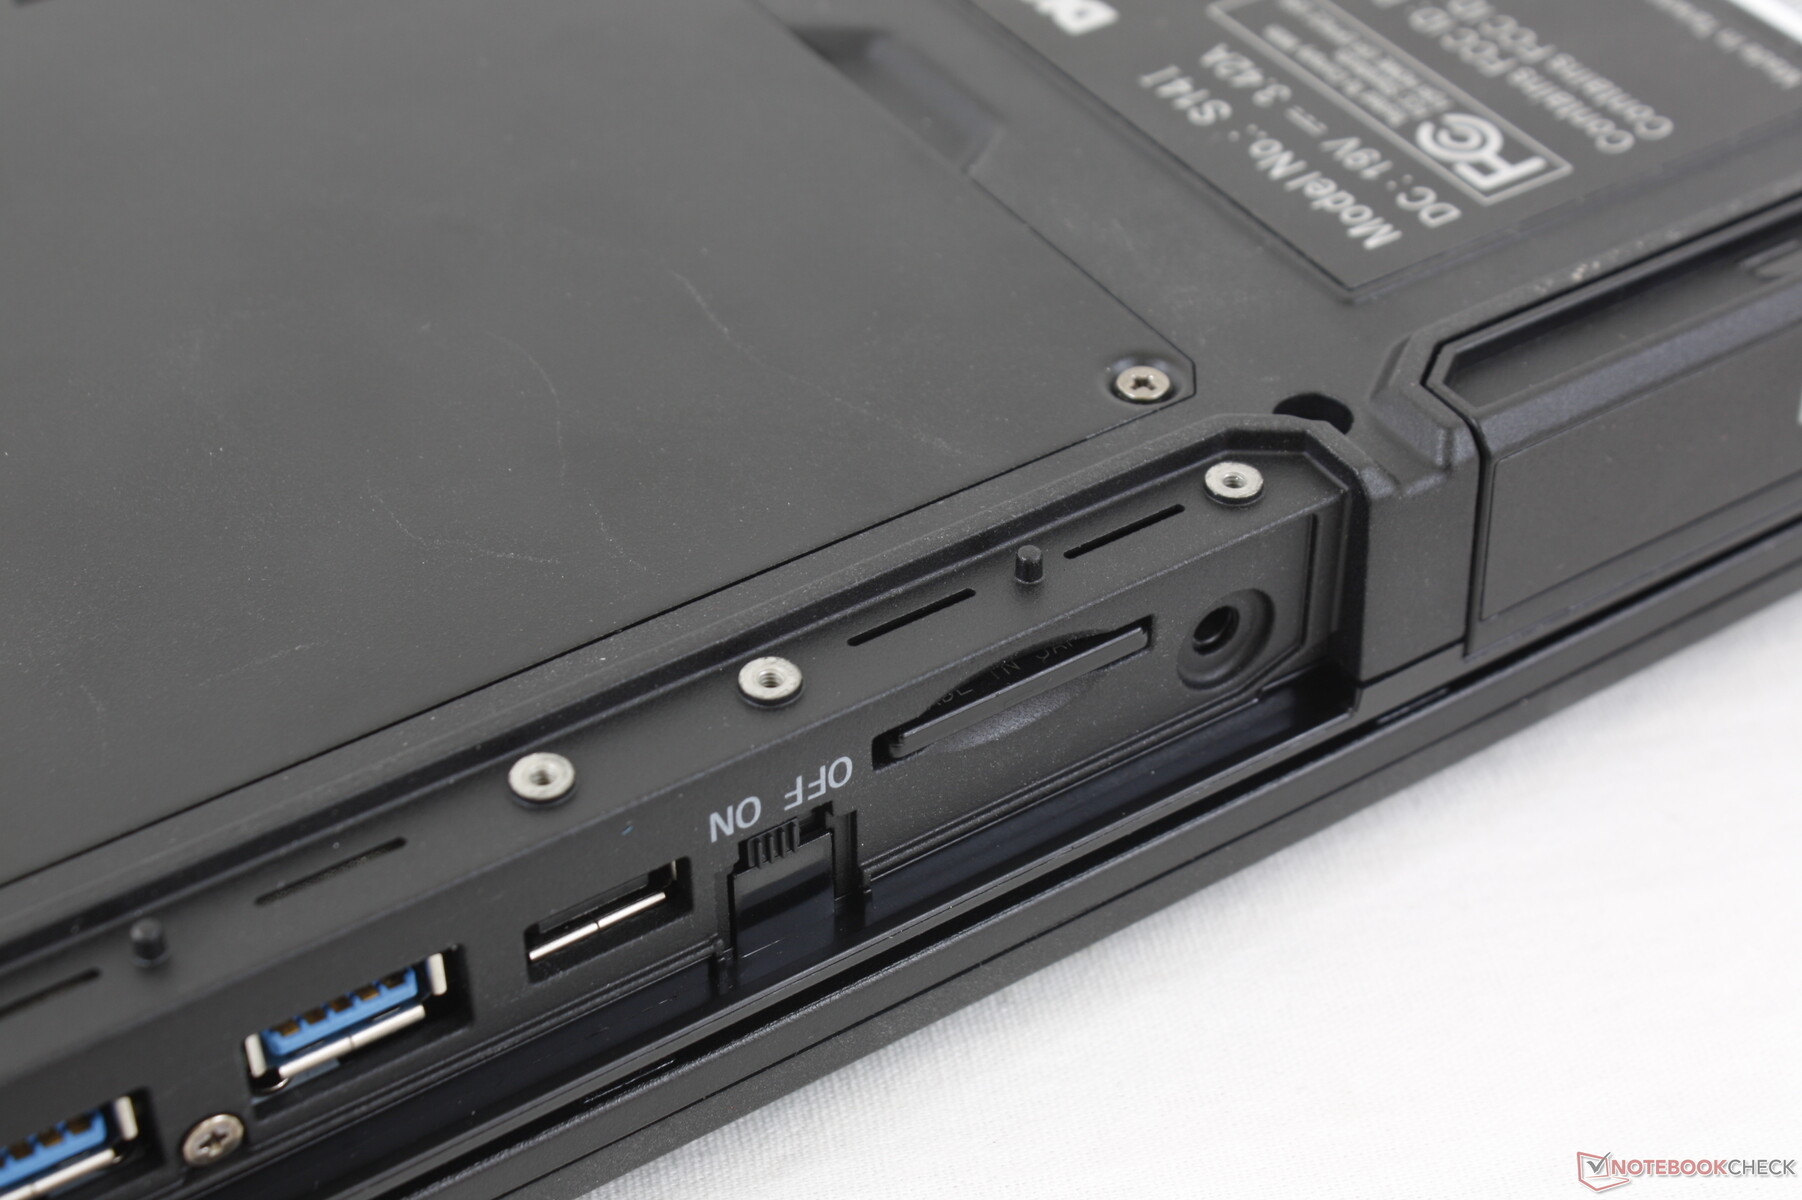
Port options are plentiful, but the flaps covering them can be annoying to open. Thunderbolt is not supported here.
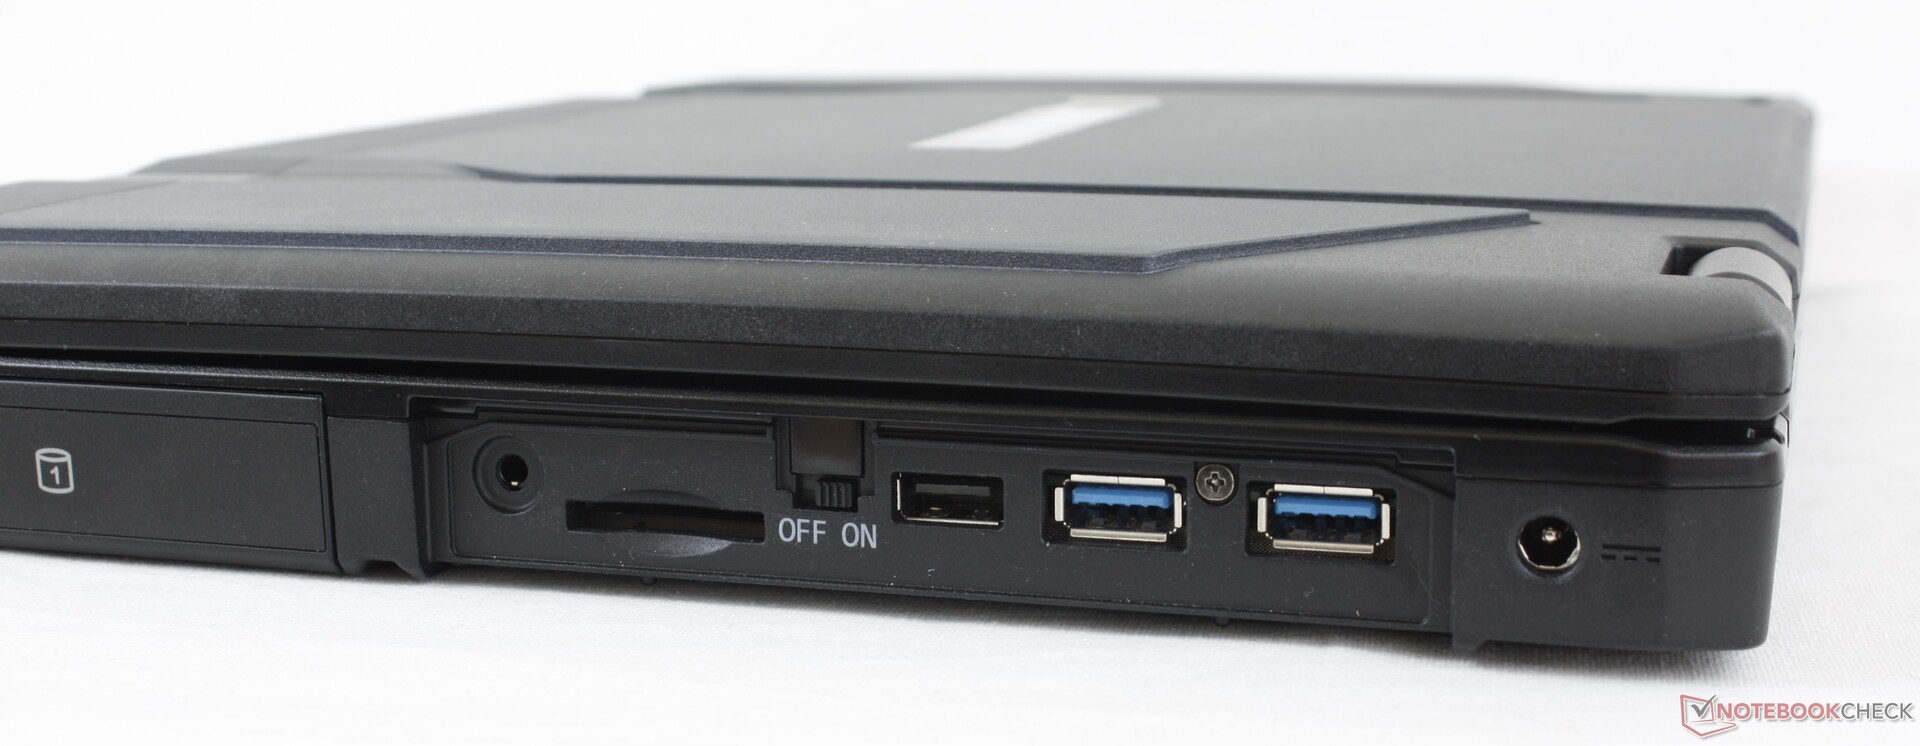
SD Card Reader
The integrated card reader is slower than expected. Transferring 1 GB of pictures from our UHS-II test card to desktop takes over 50 seconds.
| SD Card Reader | |
| average JPG Copy Test (av. of 3 runs) | |
| Dell Latitude 7424 Rugged Extreme (Toshiba Exceria Pro SDXC 64 GB UHS-II) | |
| Panasonic Toughbook CF-54G2999VM (Toshiba Exceria Pro SDXC 64 GB UHS-II) | |
| Getac S410 (Toshiba Exceria Pro SDXC 64 GB UHS-II) | |
| Panasonic Toughbook FZ-55 (Toshiba Exceria Pro M501 64 GB UHS-II) | |
| Durabook S15ABG2 (Toshiba Exceria Pro SDXC 64 GB UHS-II) | |
| Durabook S14I (Angelbird 128GB AV Pro UHS-II) | |
| maximum AS SSD Seq Read Test (1GB) | |
| Dell Latitude 7424 Rugged Extreme (Toshiba Exceria Pro SDXC 64 GB UHS-II) | |
| Panasonic Toughbook CF-54G2999VM (Toshiba Exceria Pro SDXC 64 GB UHS-II) | |
| Getac S410 (Toshiba Exceria Pro SDXC 64 GB UHS-II) | |
| Panasonic Toughbook FZ-55 (Toshiba Exceria Pro M501 64 GB UHS-II) | |
| Durabook S15ABG2 (Toshiba Exceria Pro SDXC 64 GB UHS-II) | |
| Durabook S14I (Angelbird 128GB AV Pro UHS-II) | |
Communication
The Intel AX201 comes standard for Wi-Fi 6 and Bluetooth 5.1 connectivity. We experienced no connection issues when paired with our Netgear RAX200 router.
Webcam


Maintenance
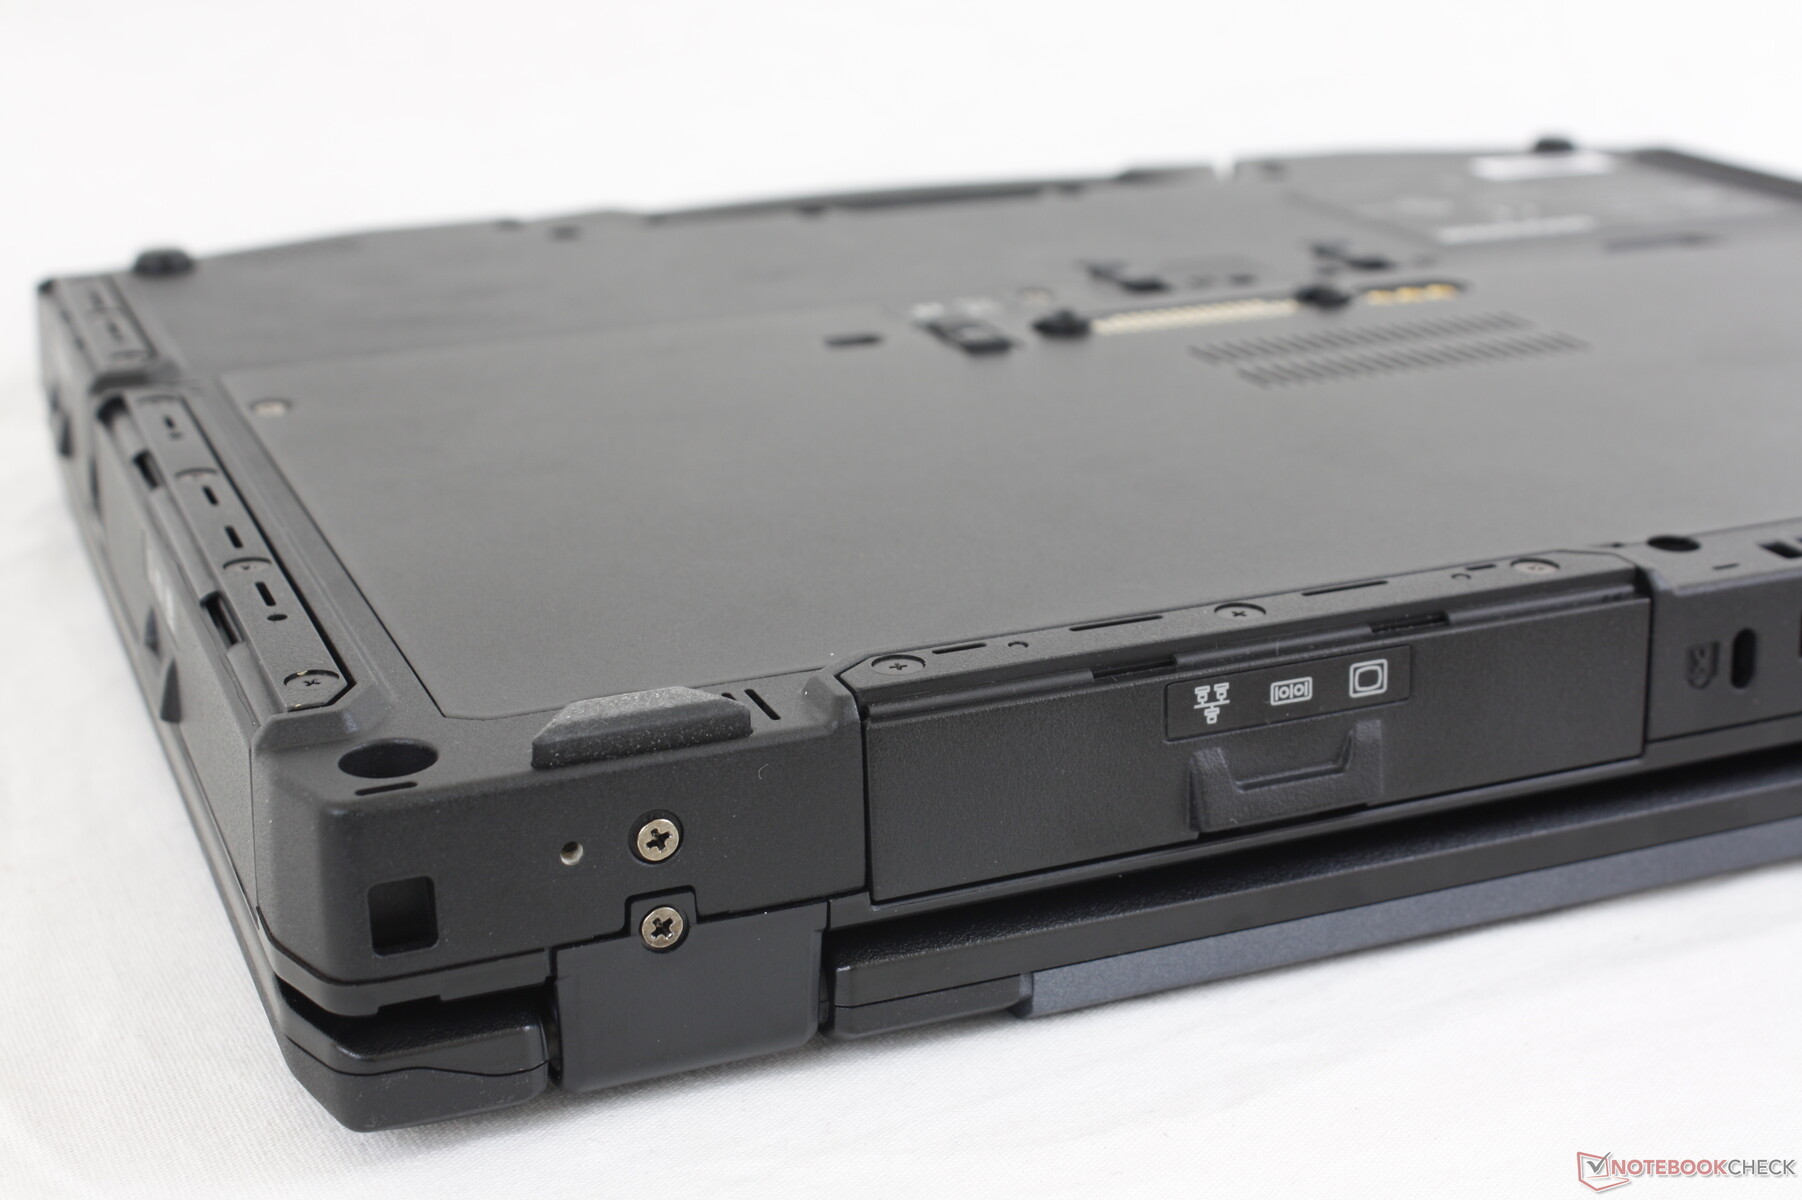
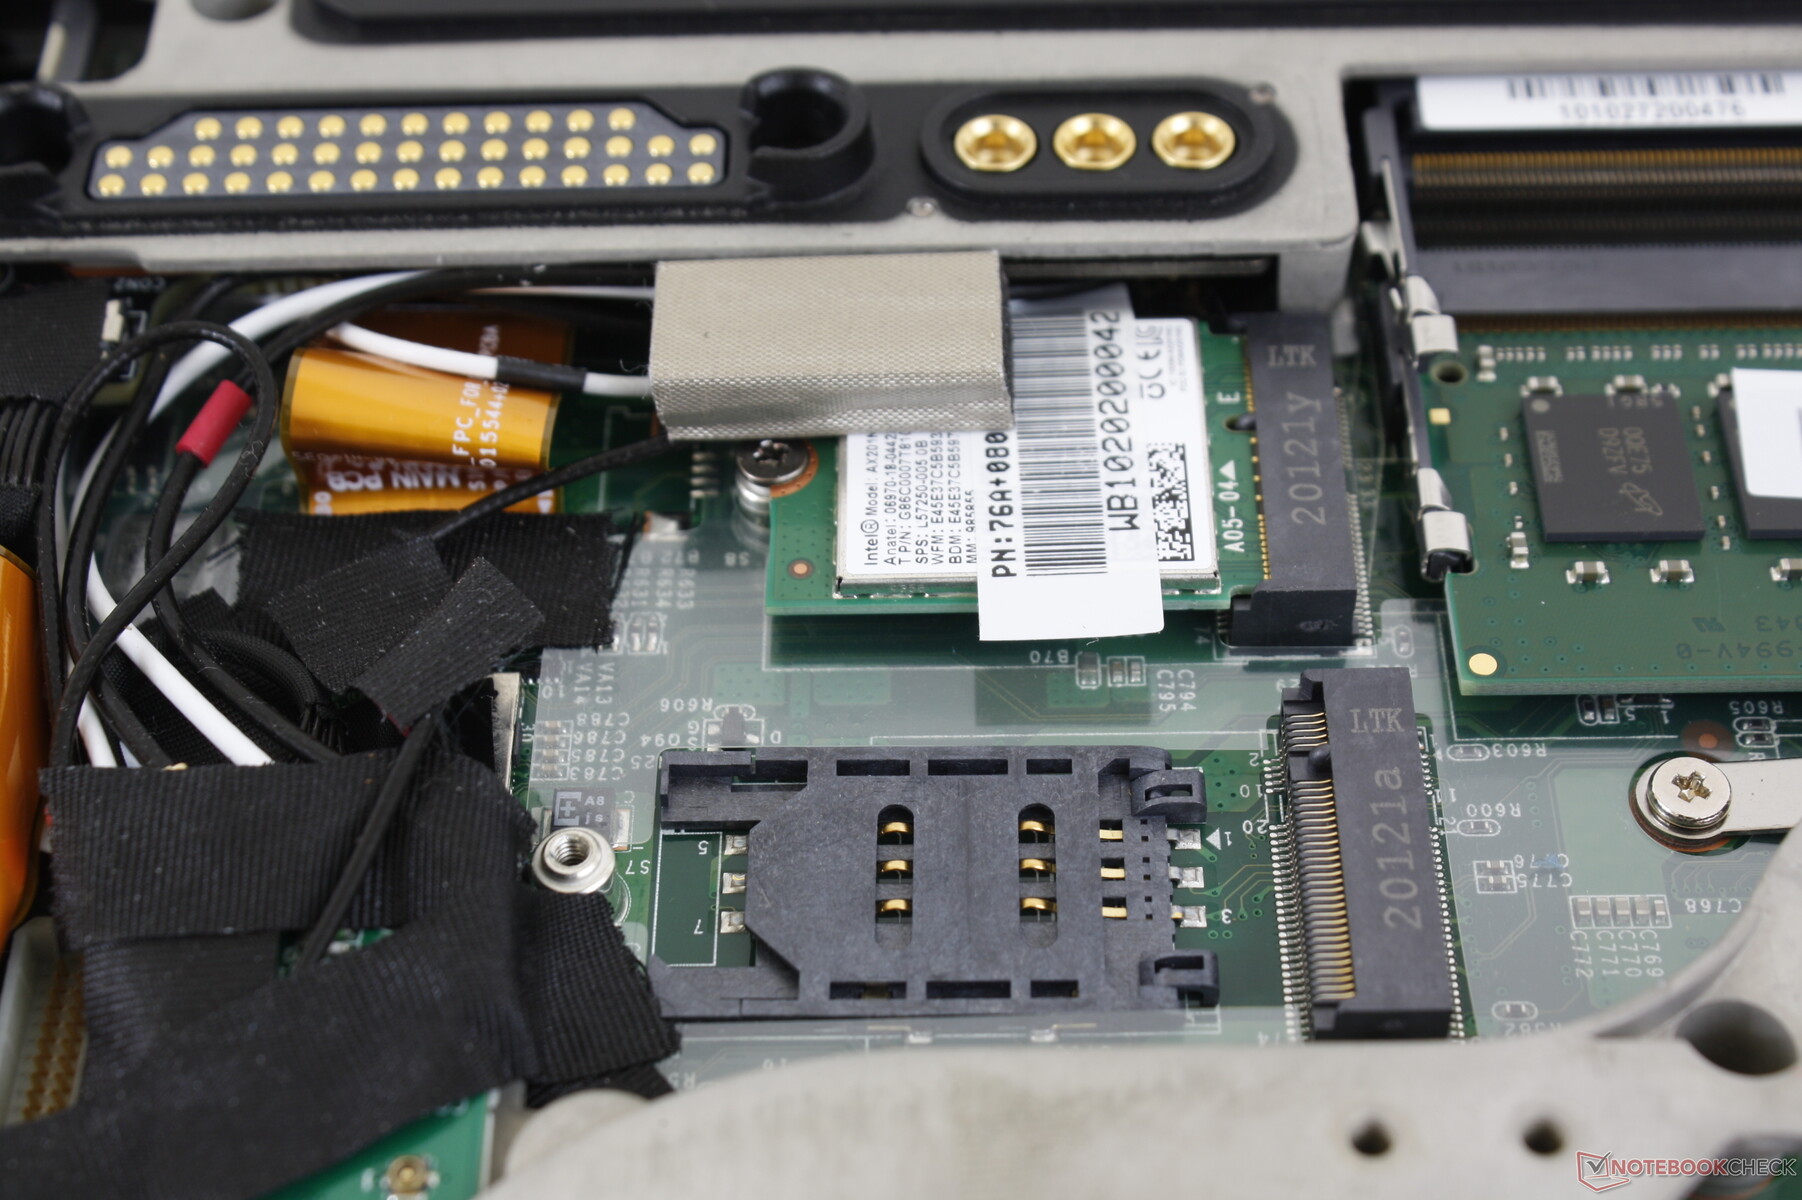
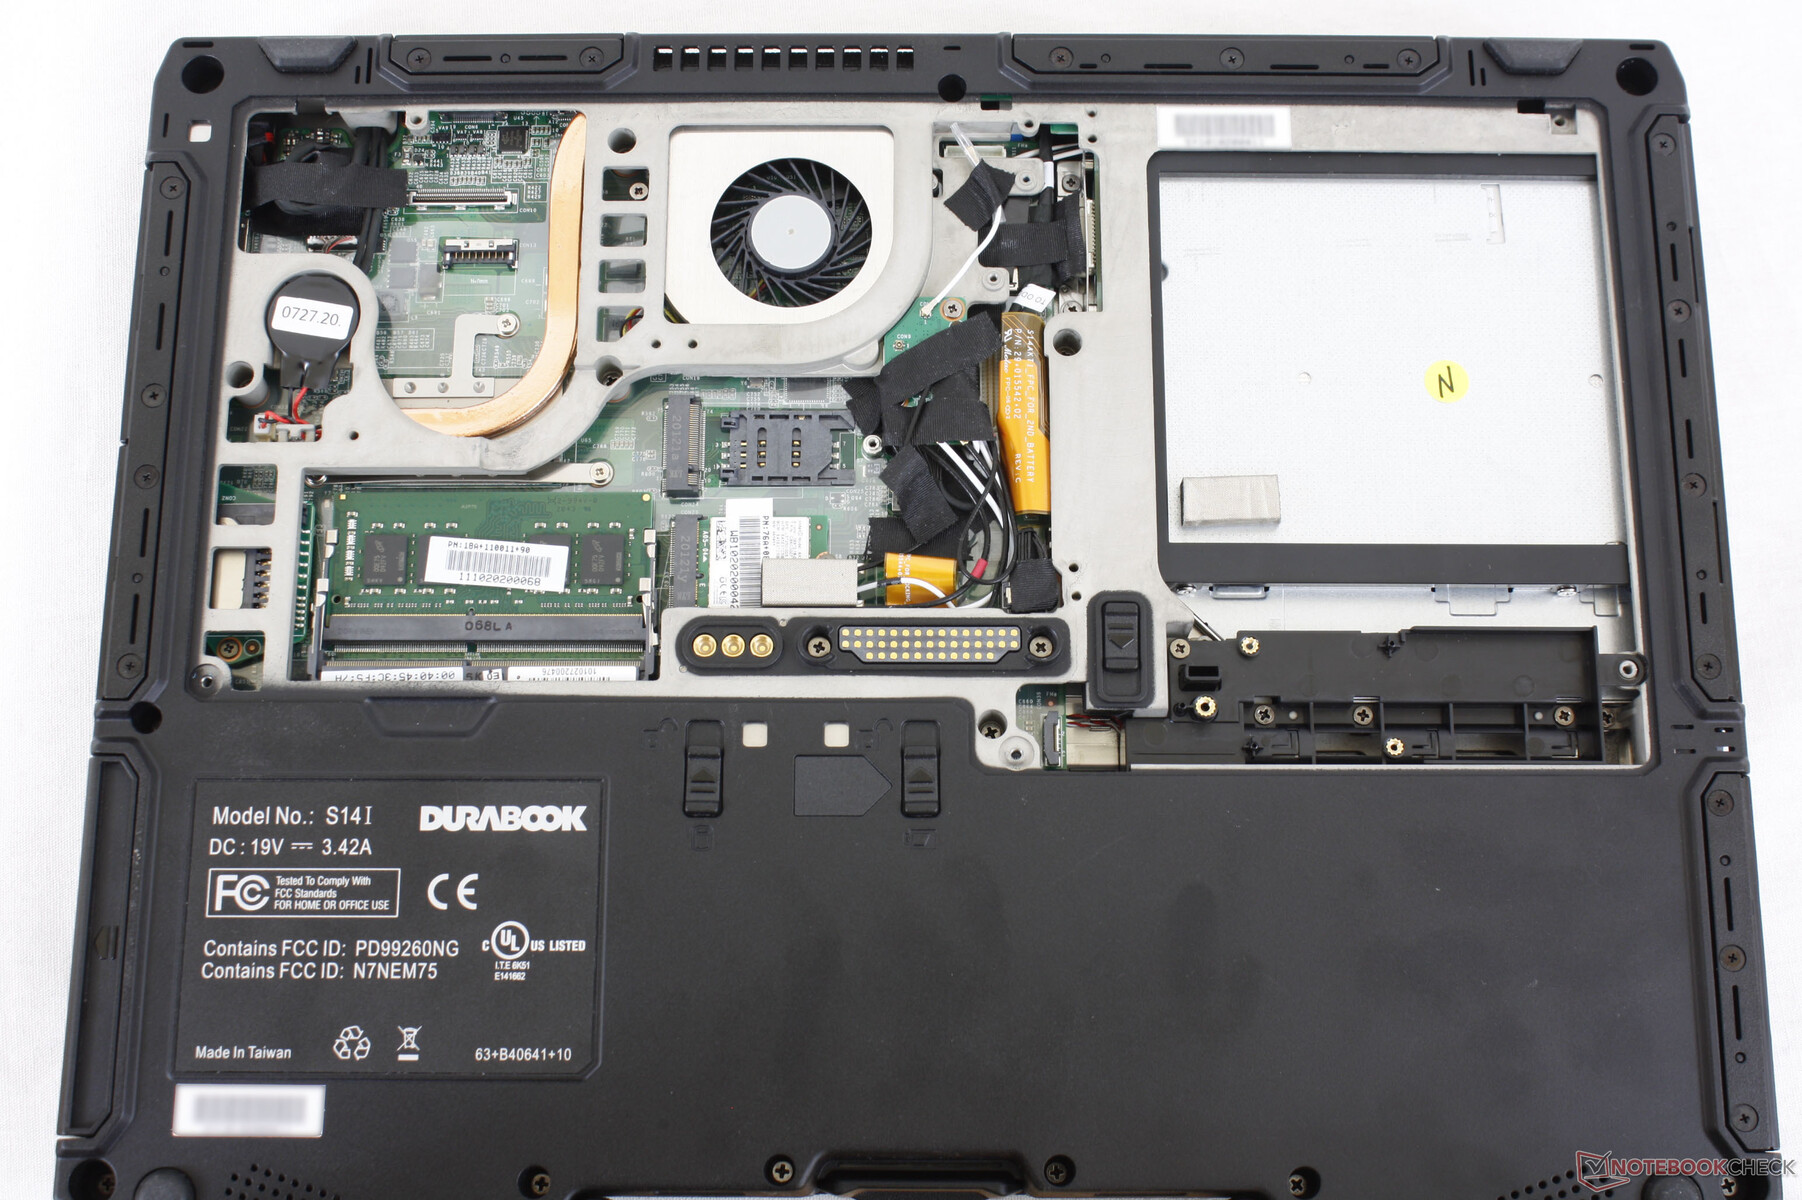
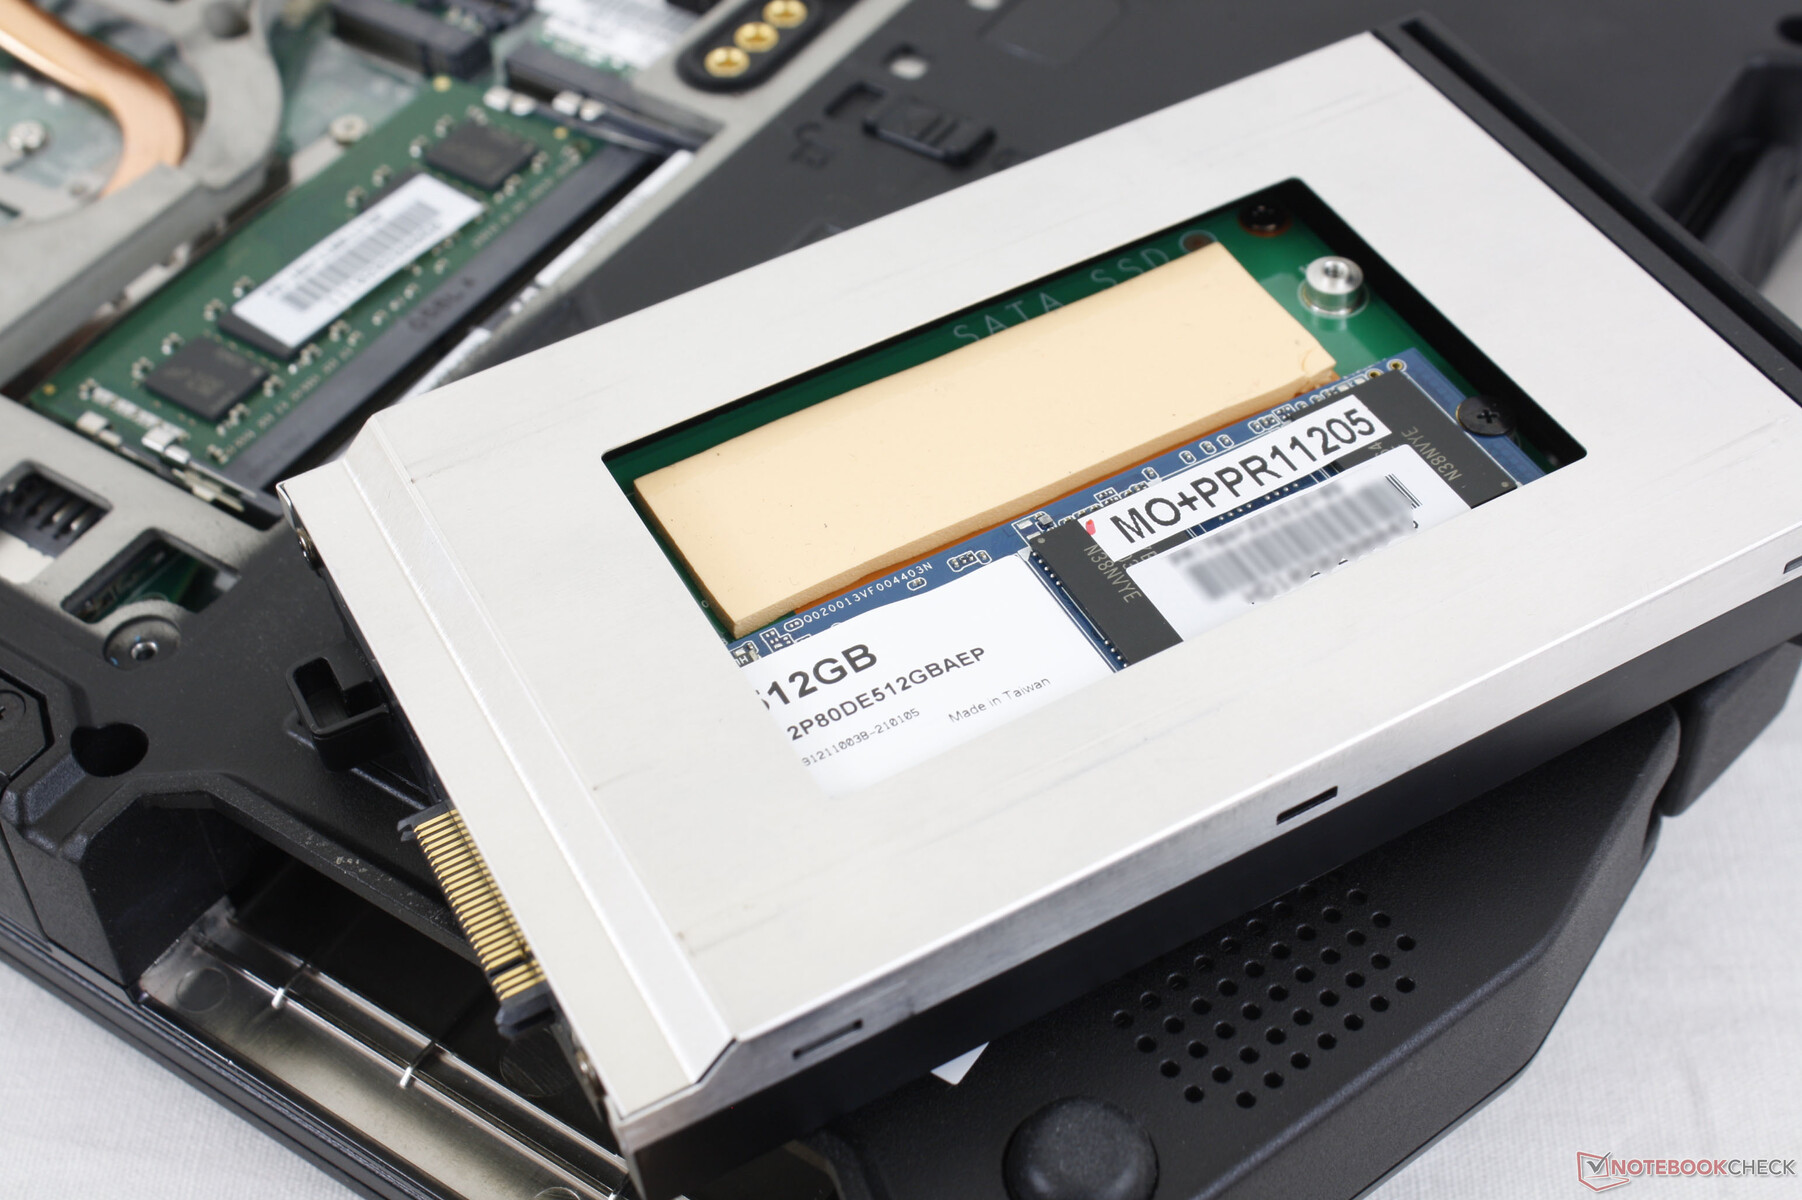
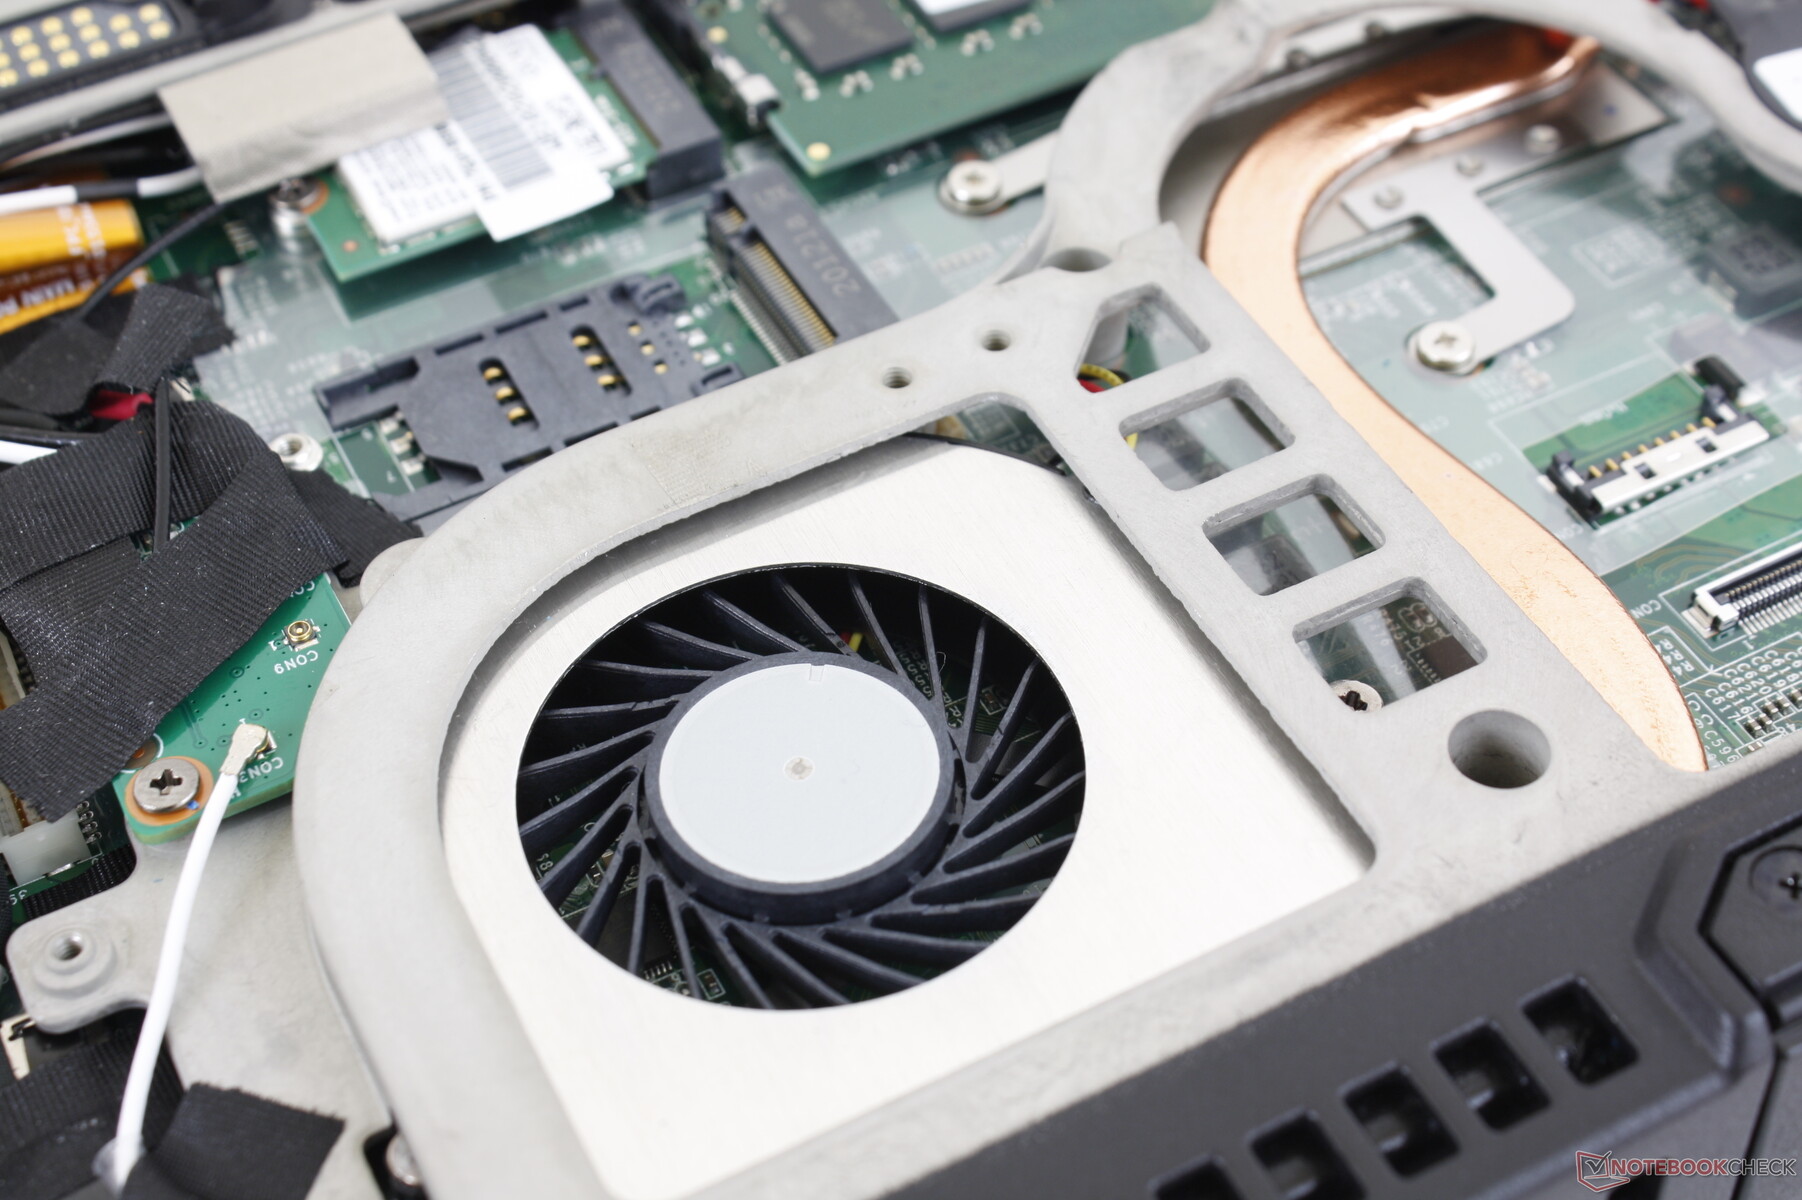
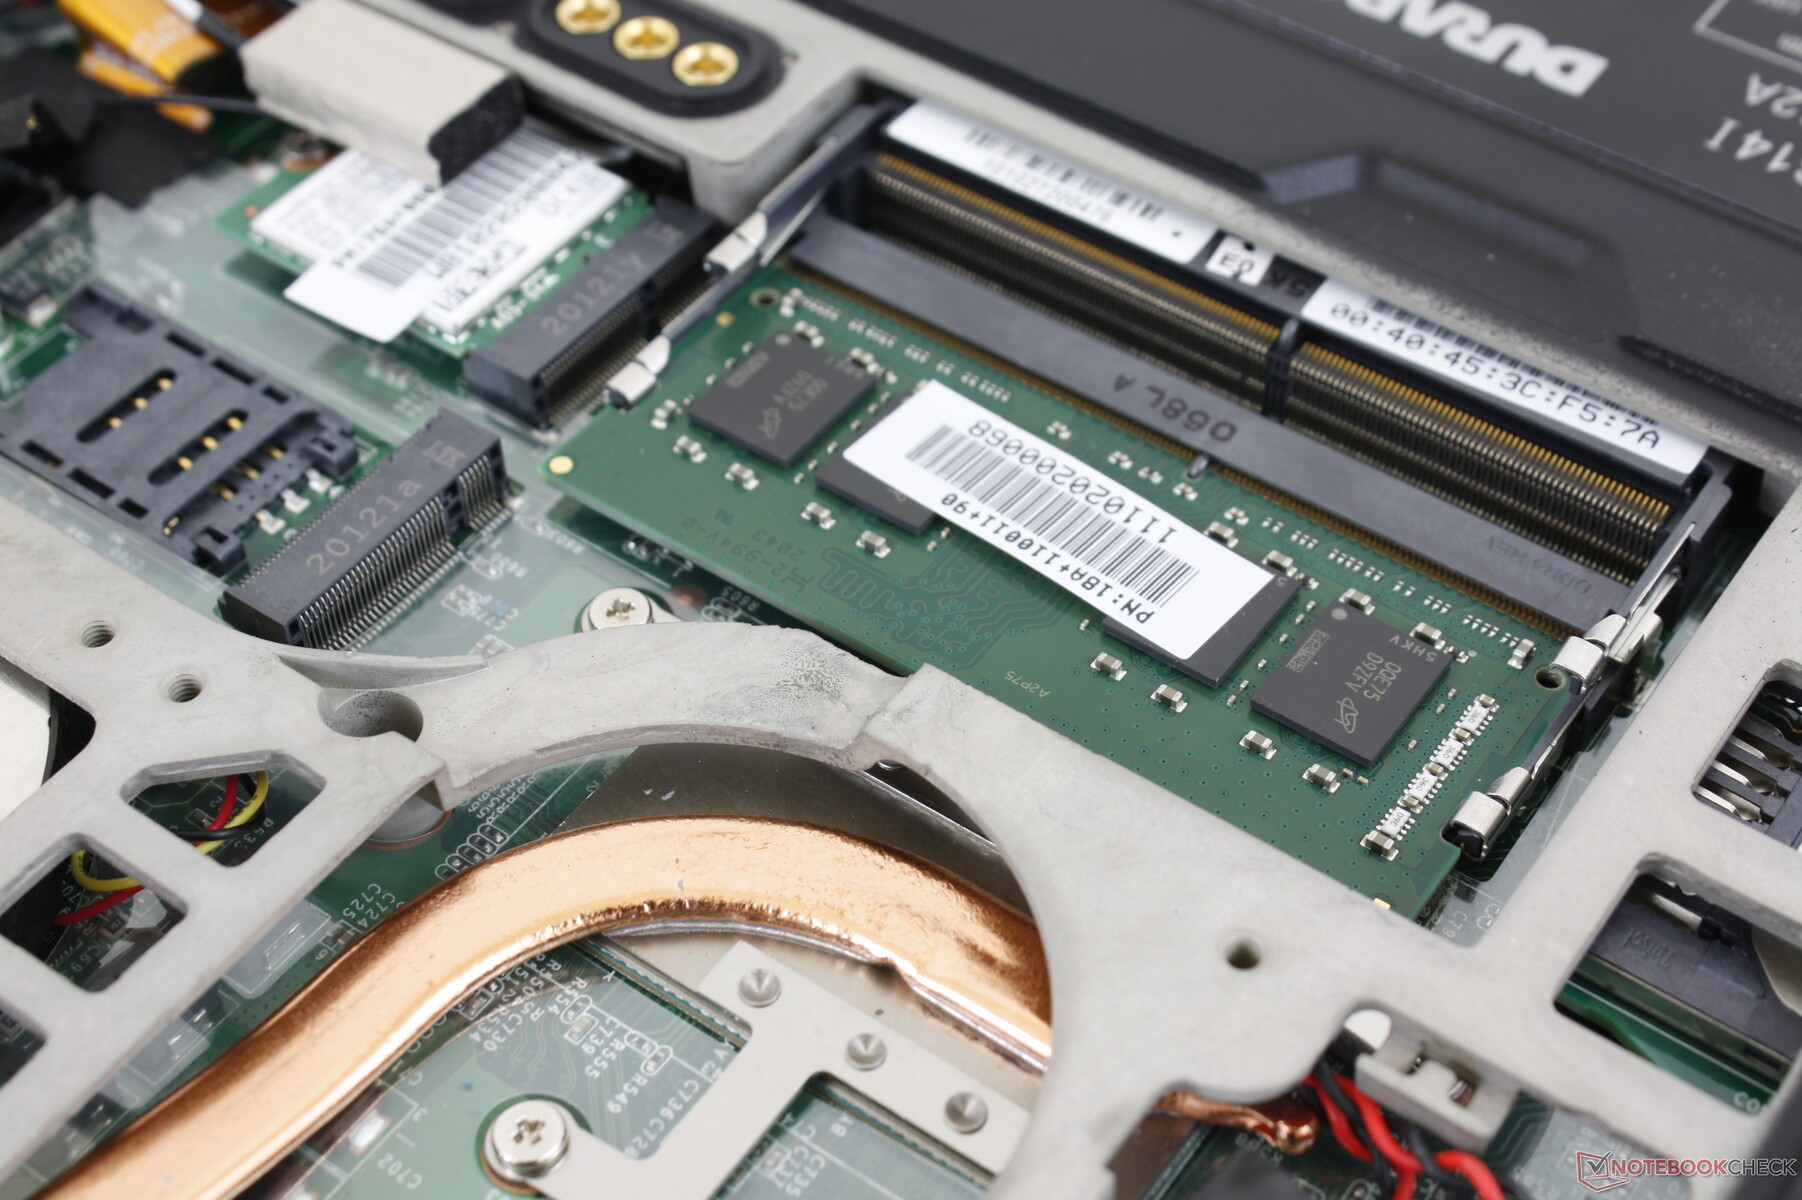
The bottom panel is secured by just three Philips screws for easy servicing. Users have direct access to two RAM slots and both the removable WLAN and WAN modules. The storage bay, battery, and DVD drive can all be quickly removed without needing to first remove the bottom panel.
Accessories and Warranty
The box includes a cleaning cloth, passive stylus pen, and additional screws for installing a WAN or M.2 SSD. A three-year limited manufacturer applies.
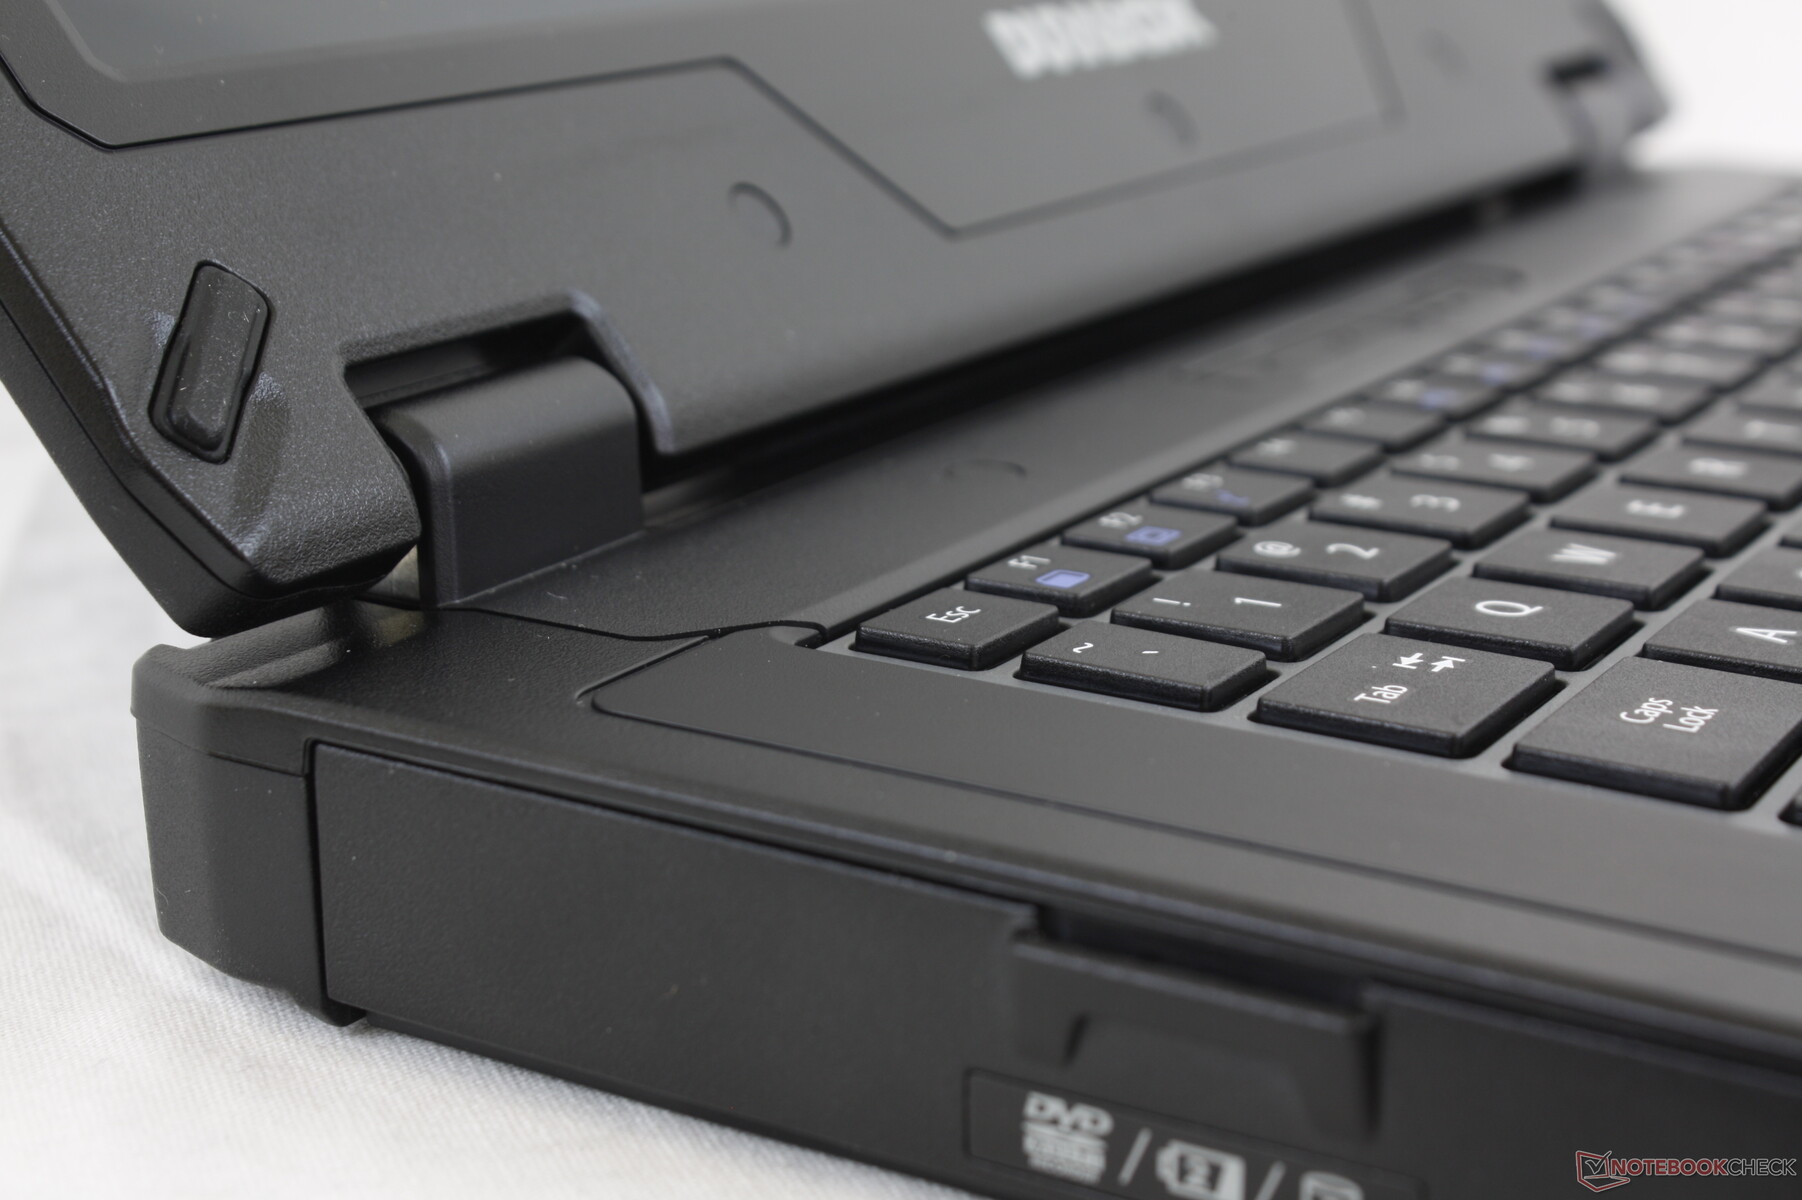
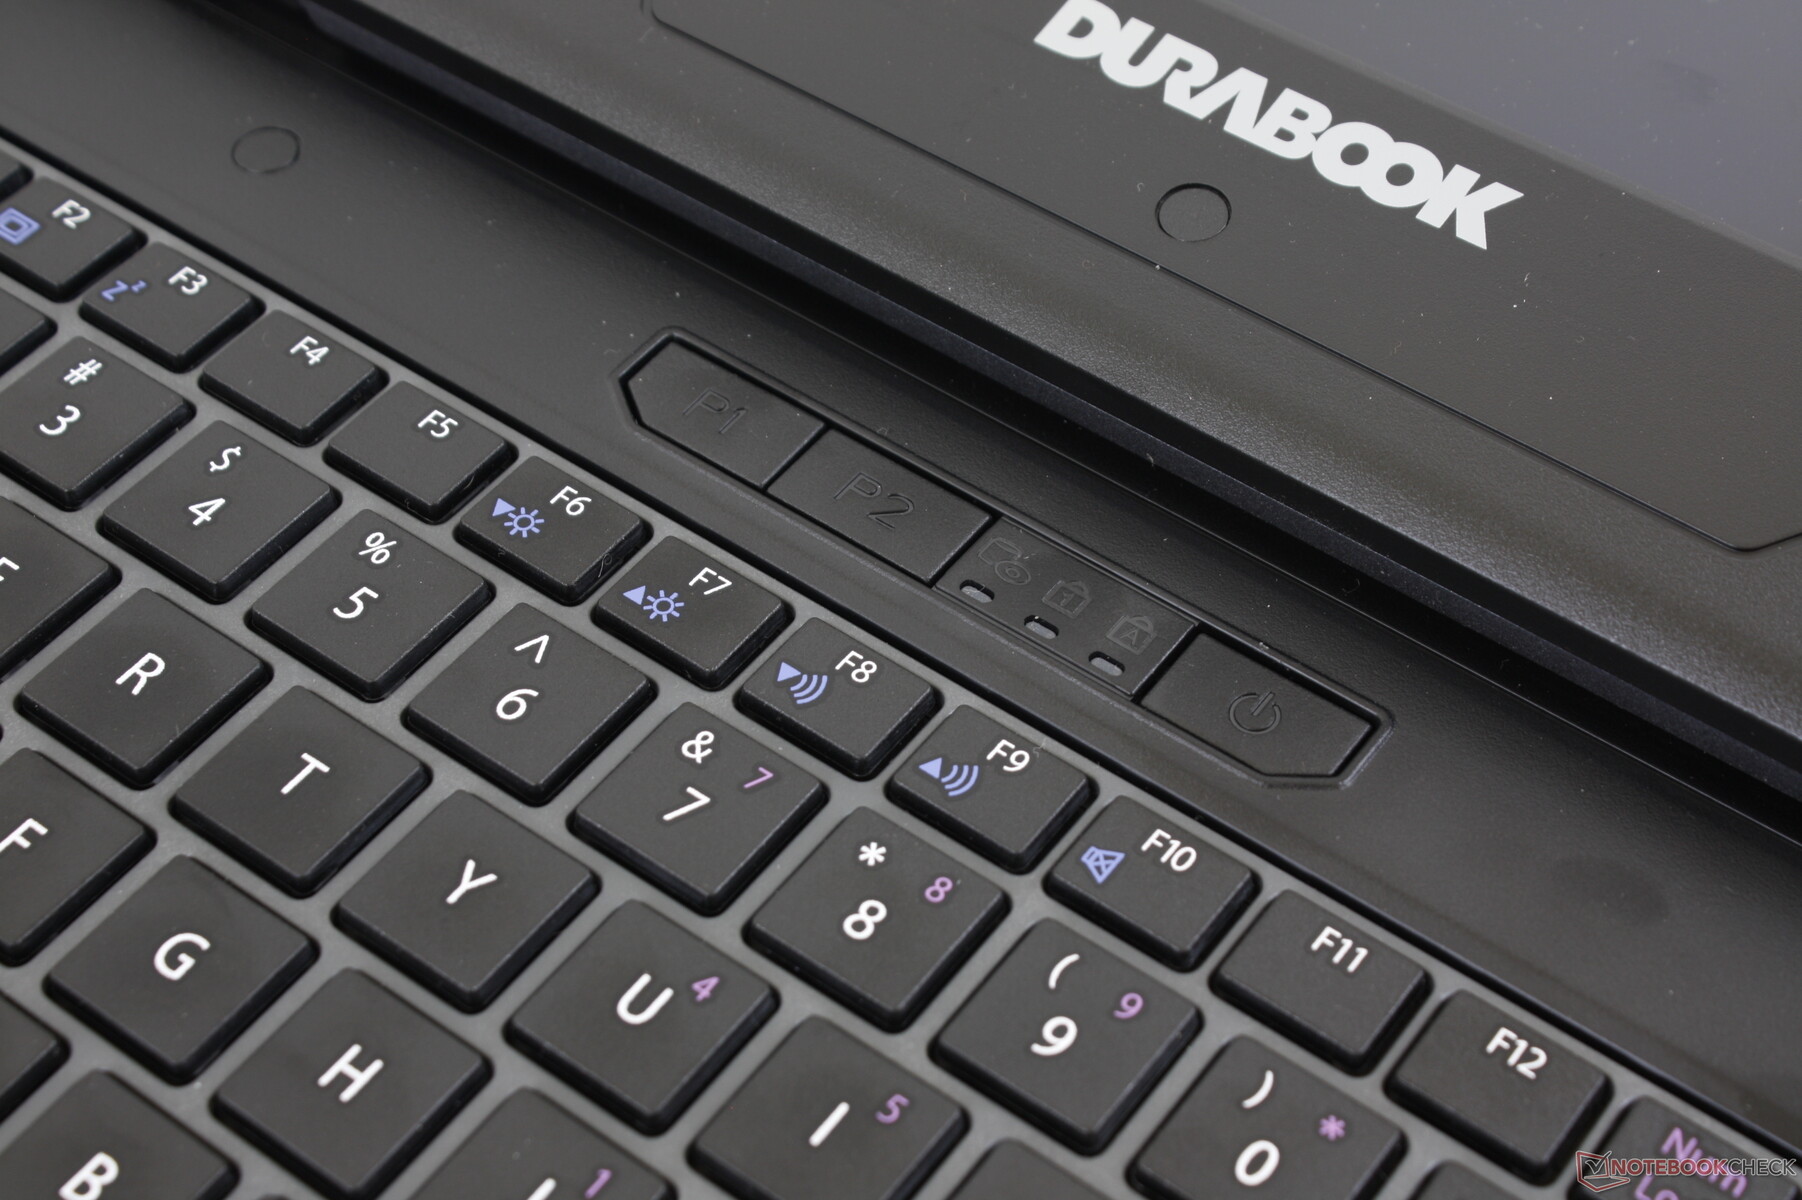
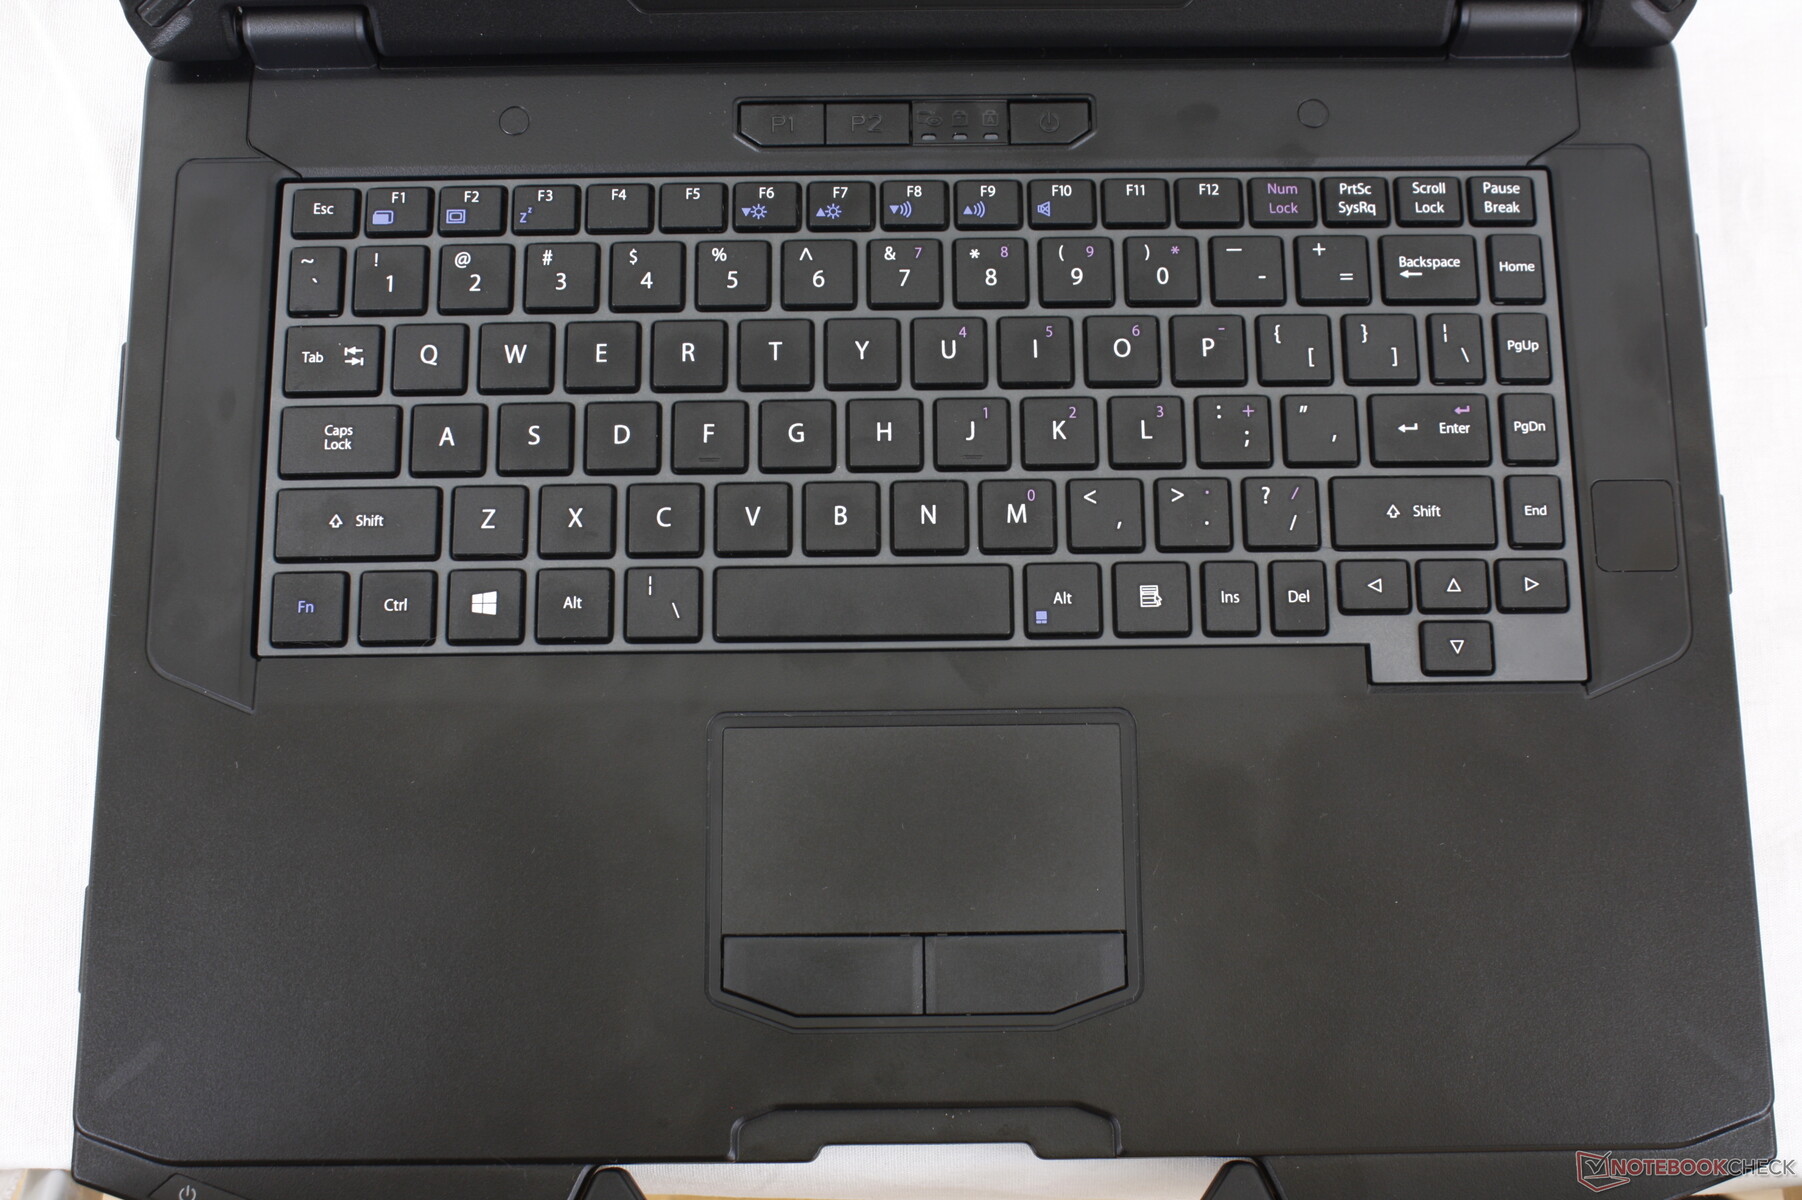
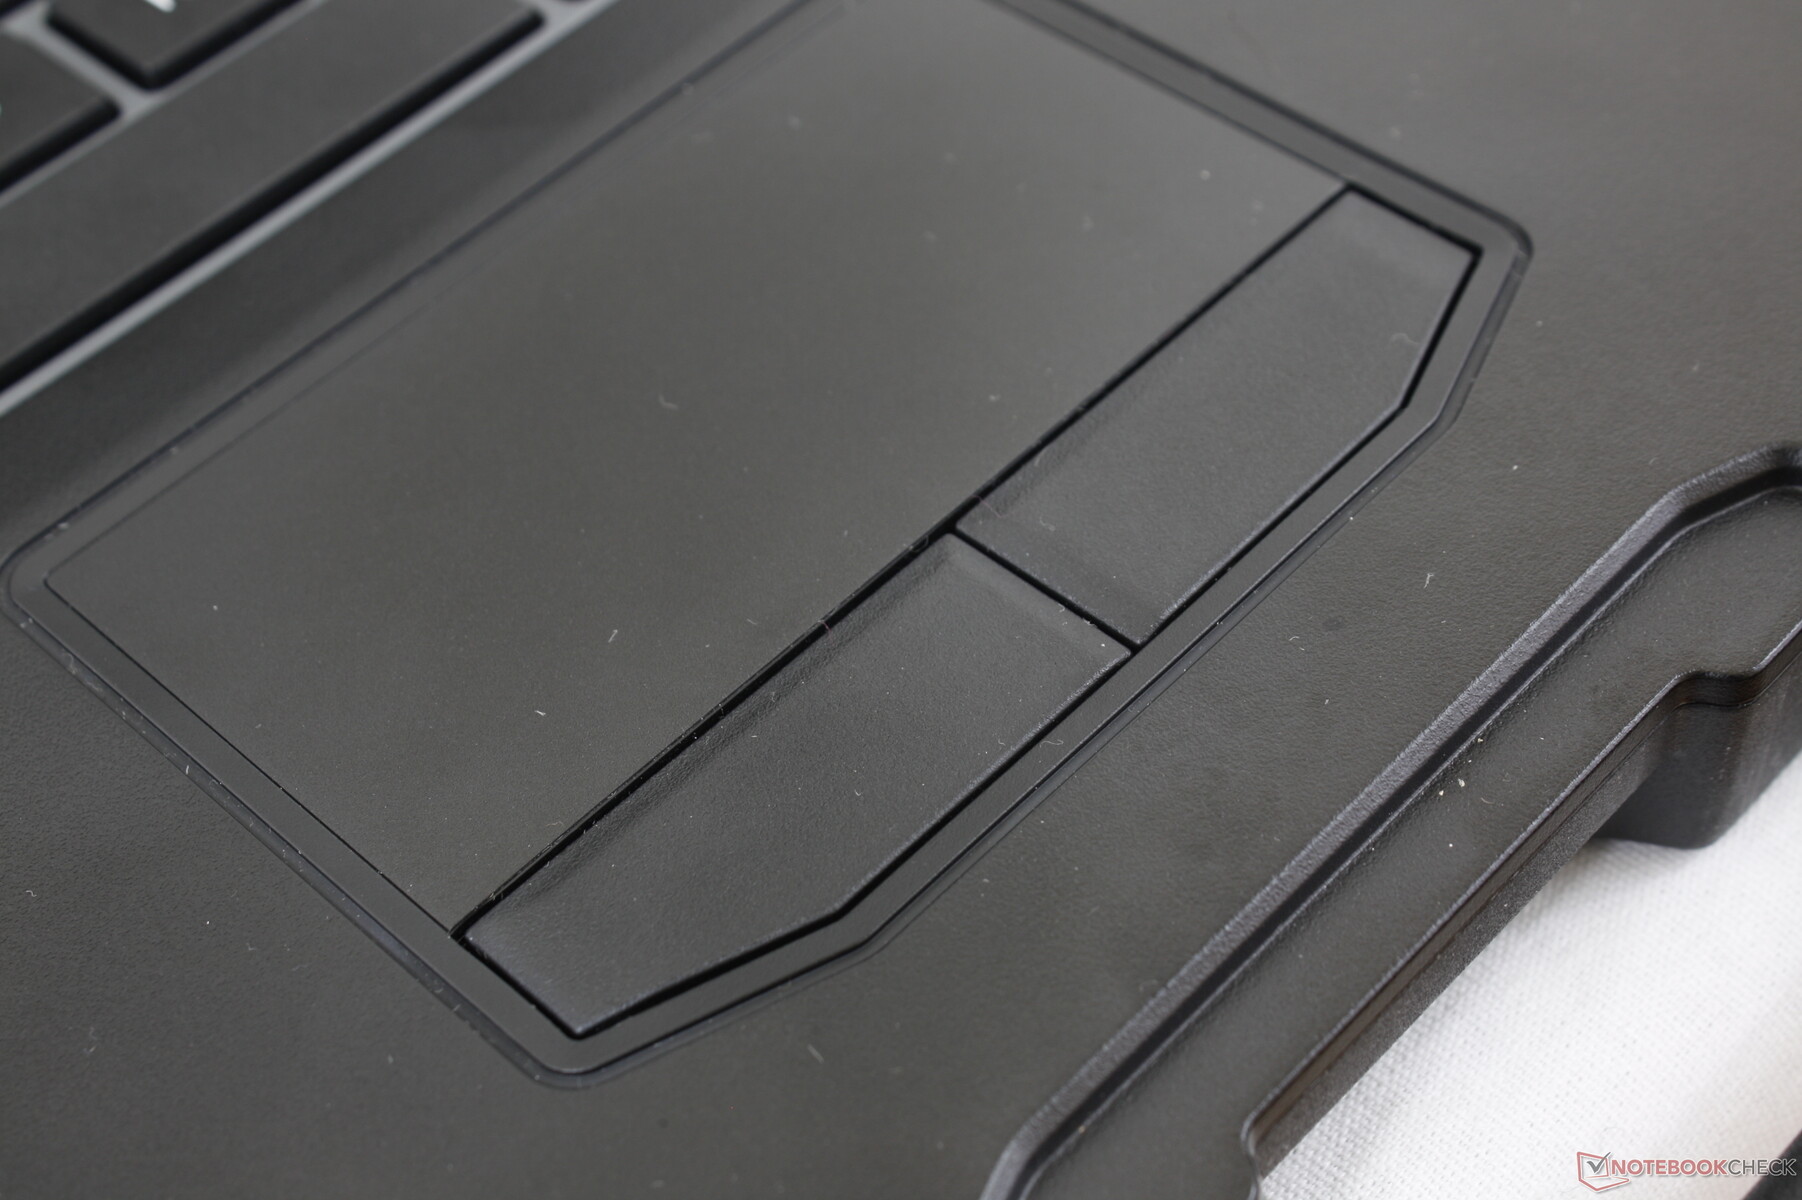
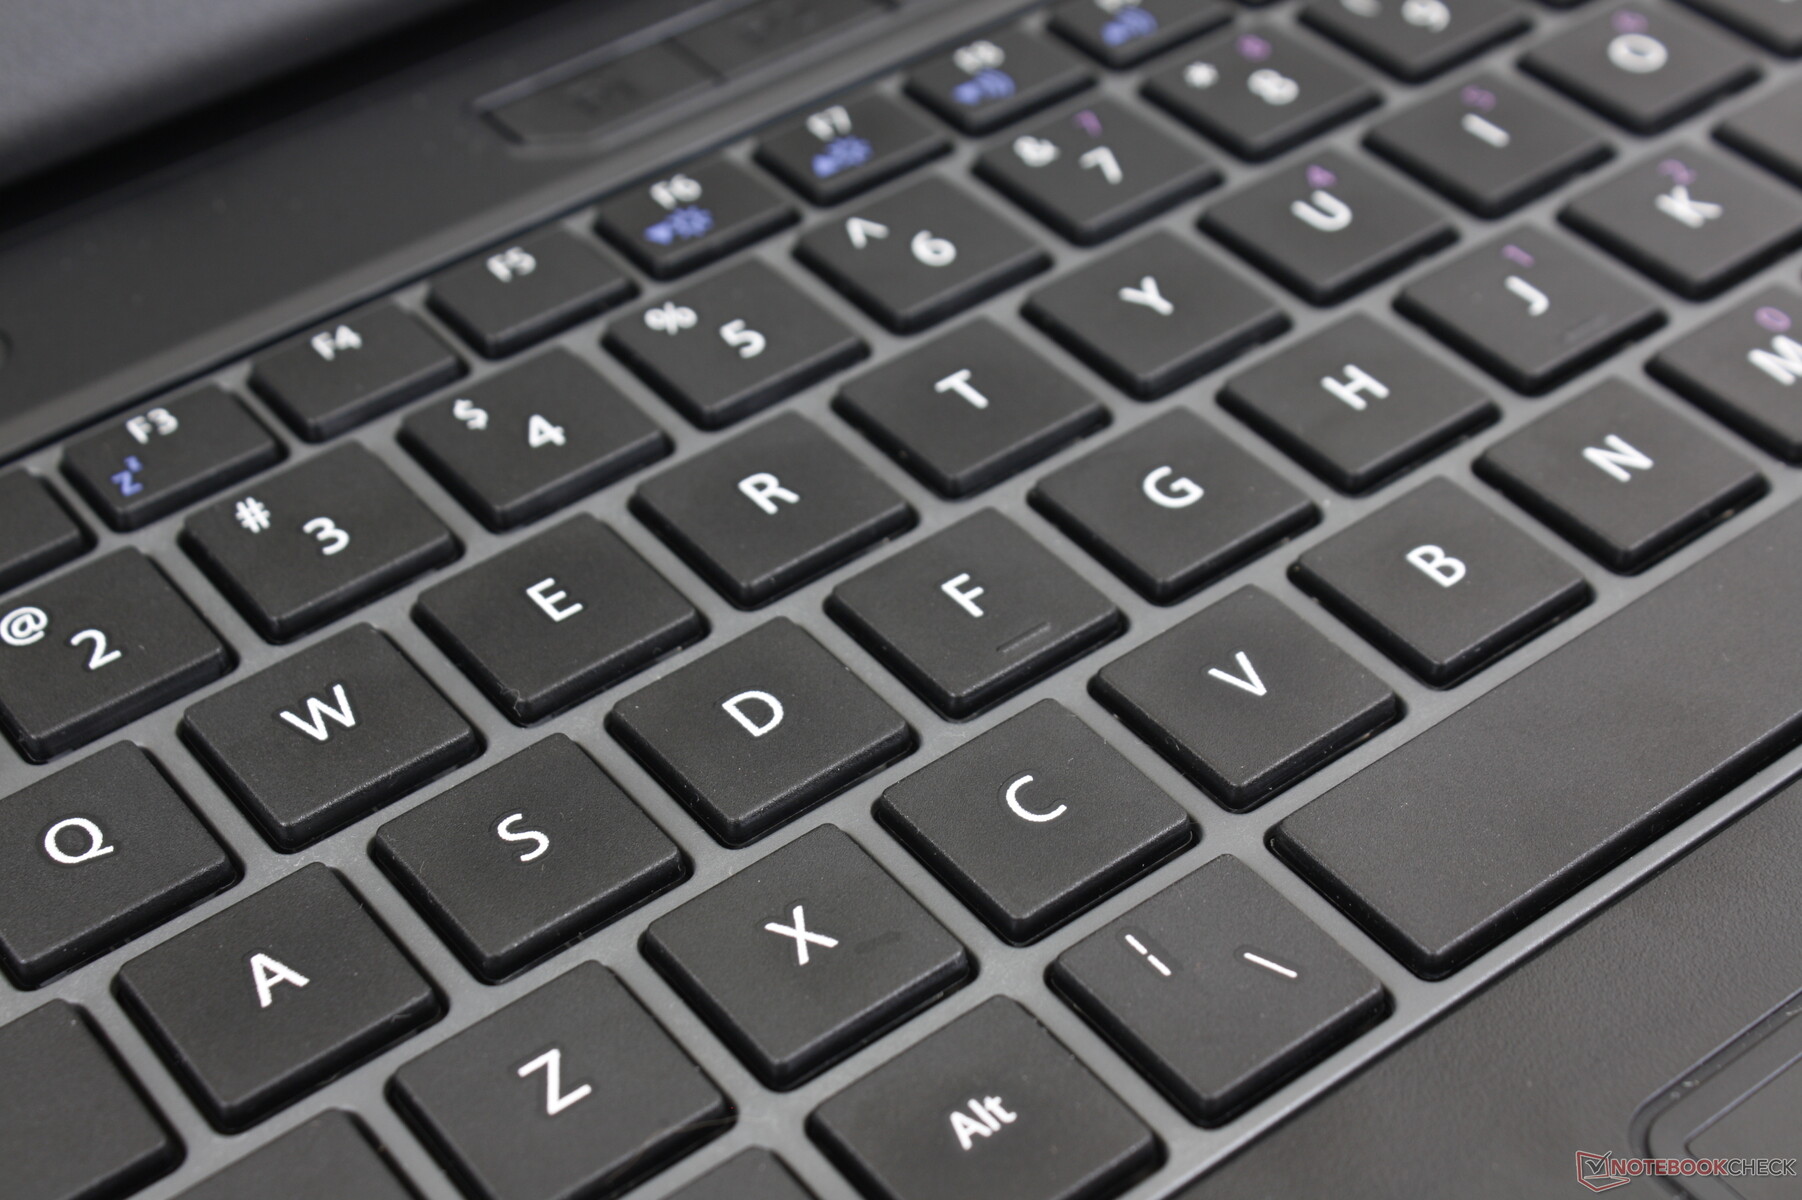
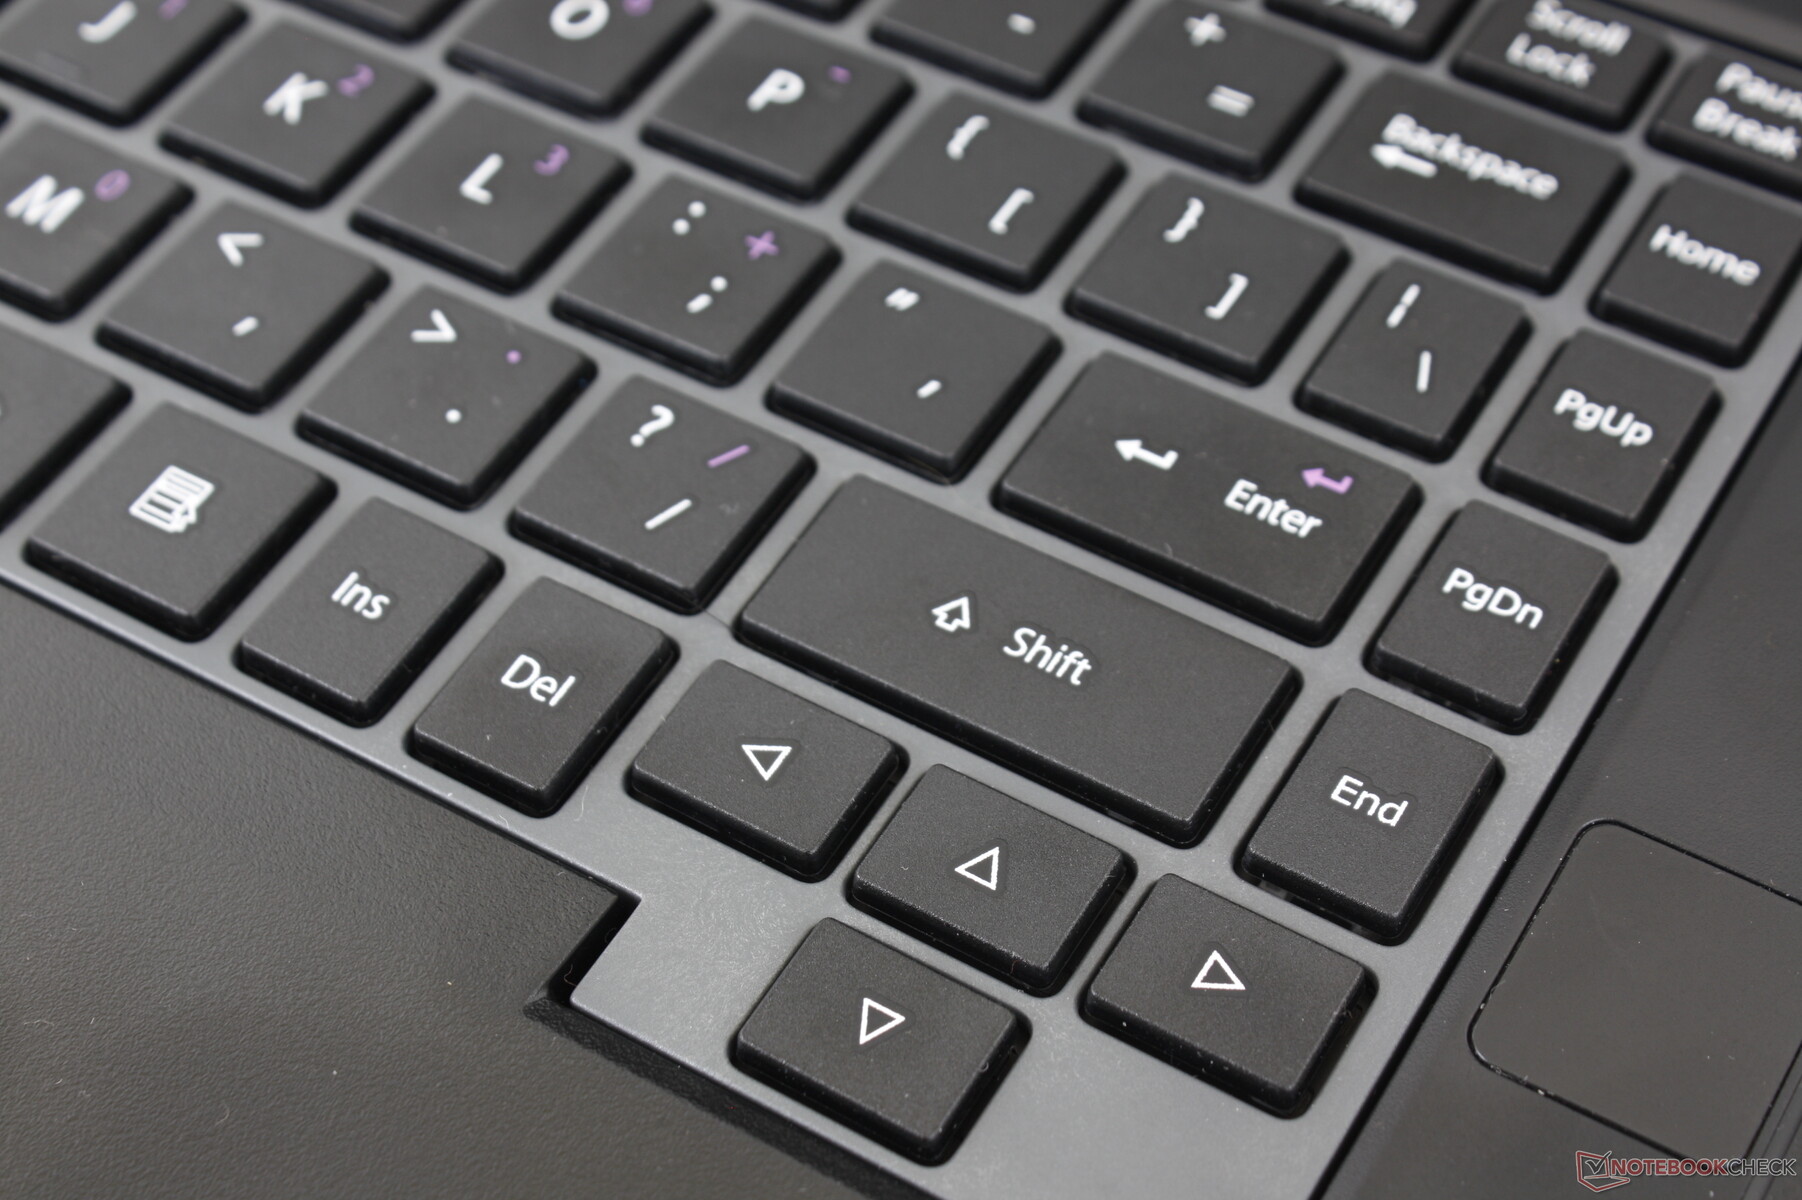
Input Devices
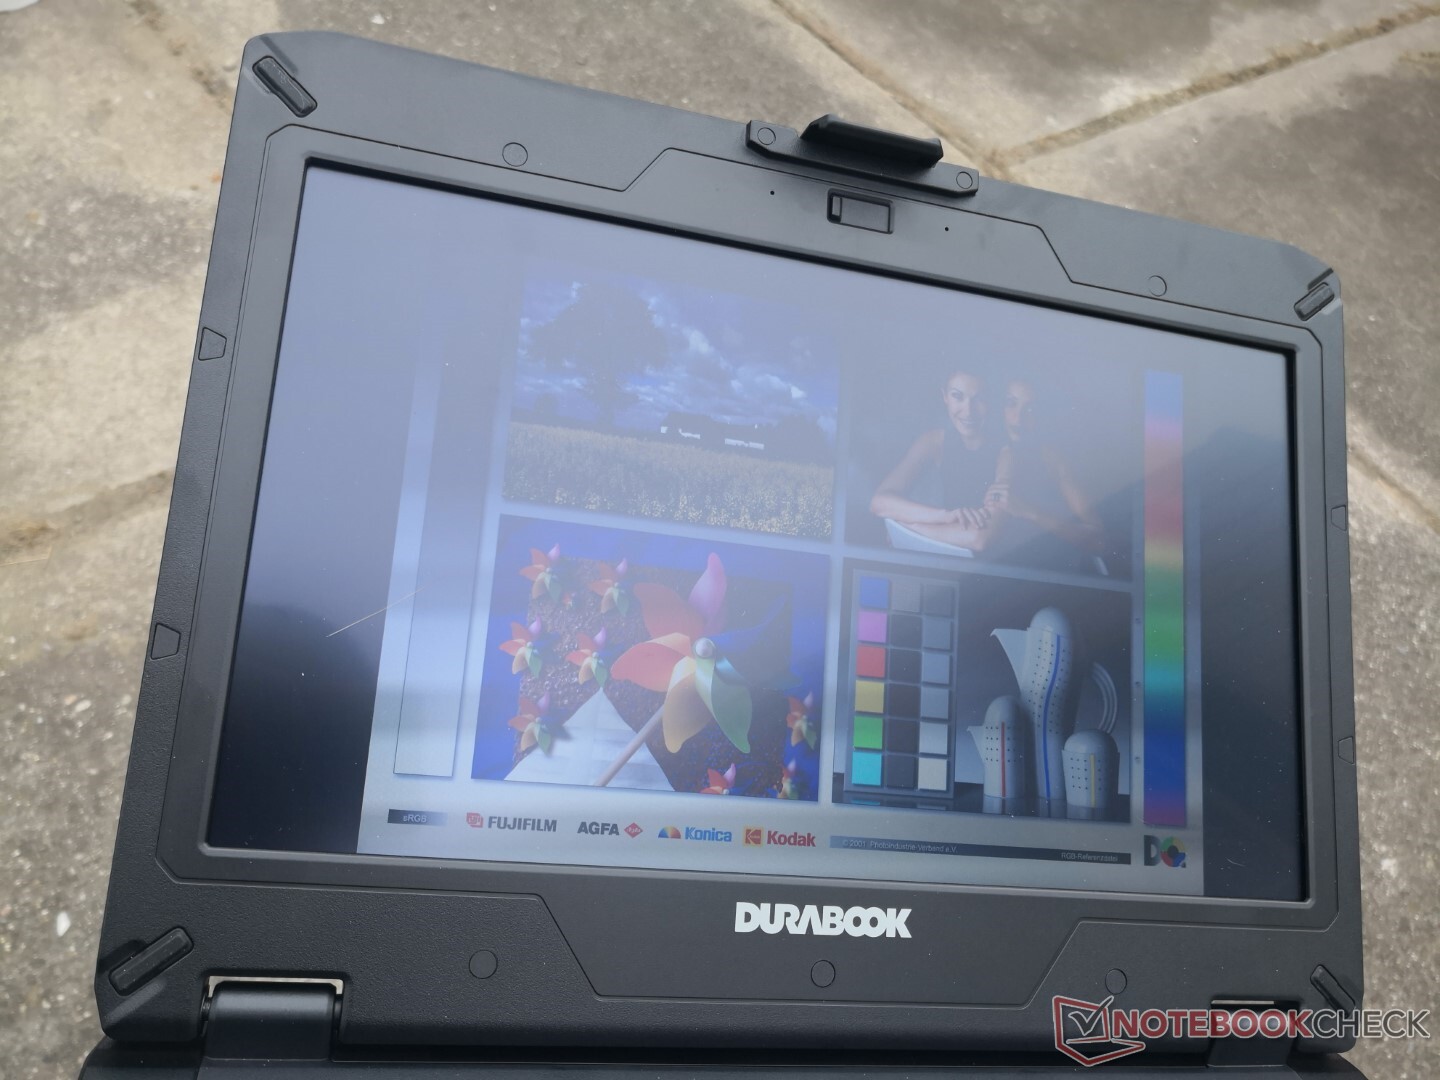
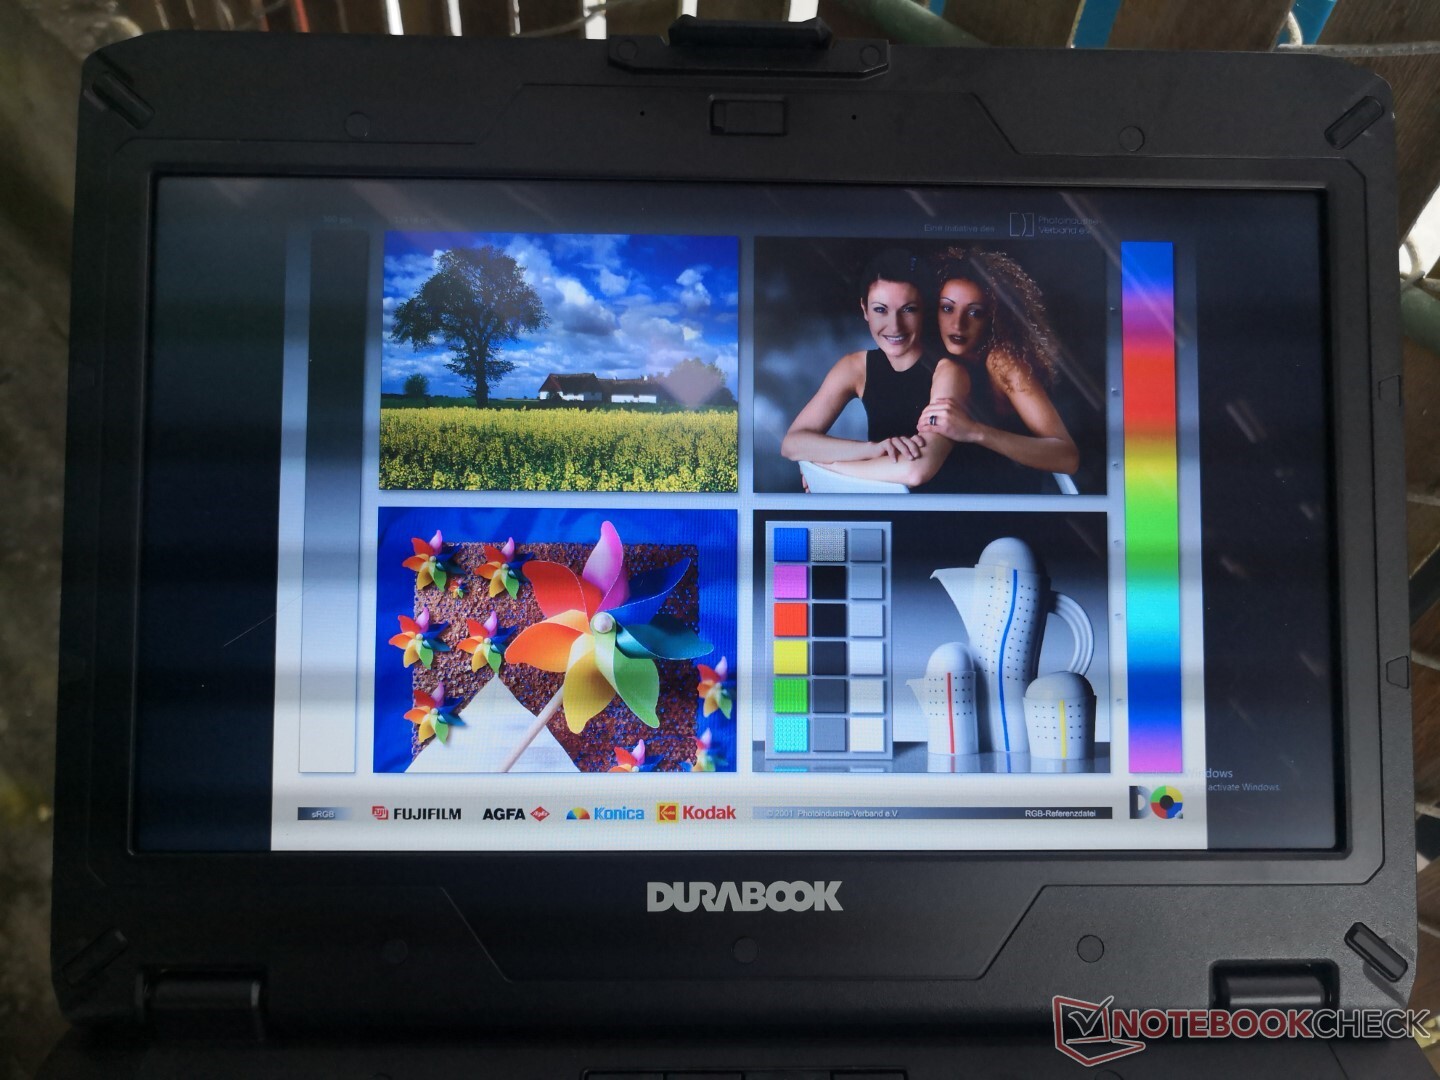
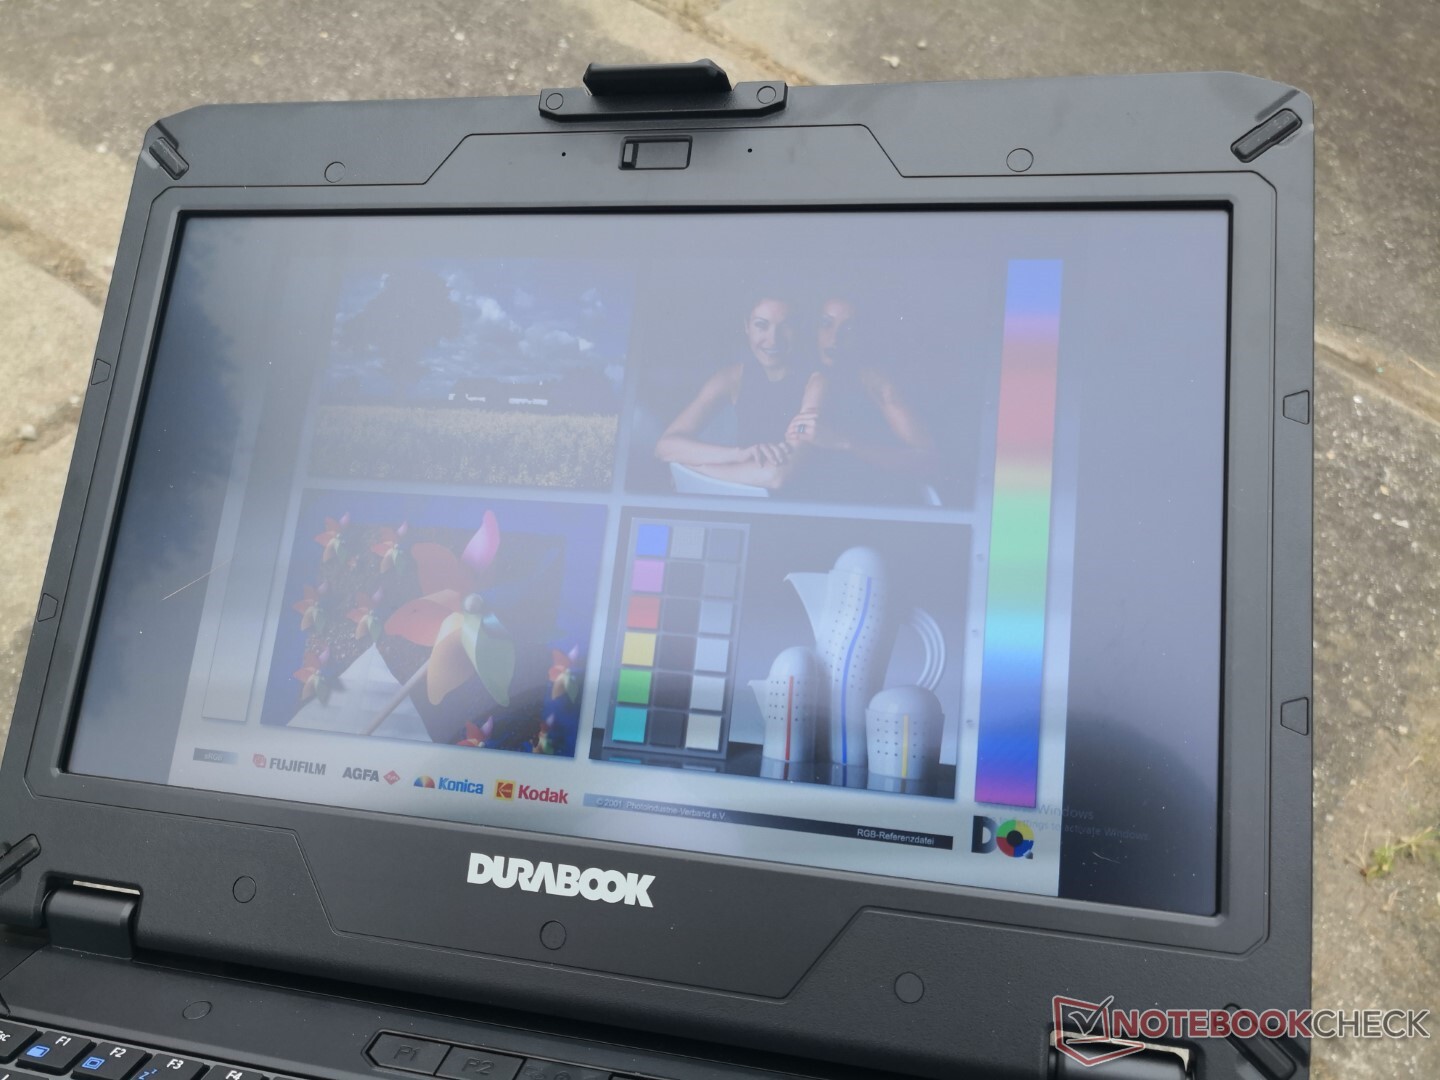
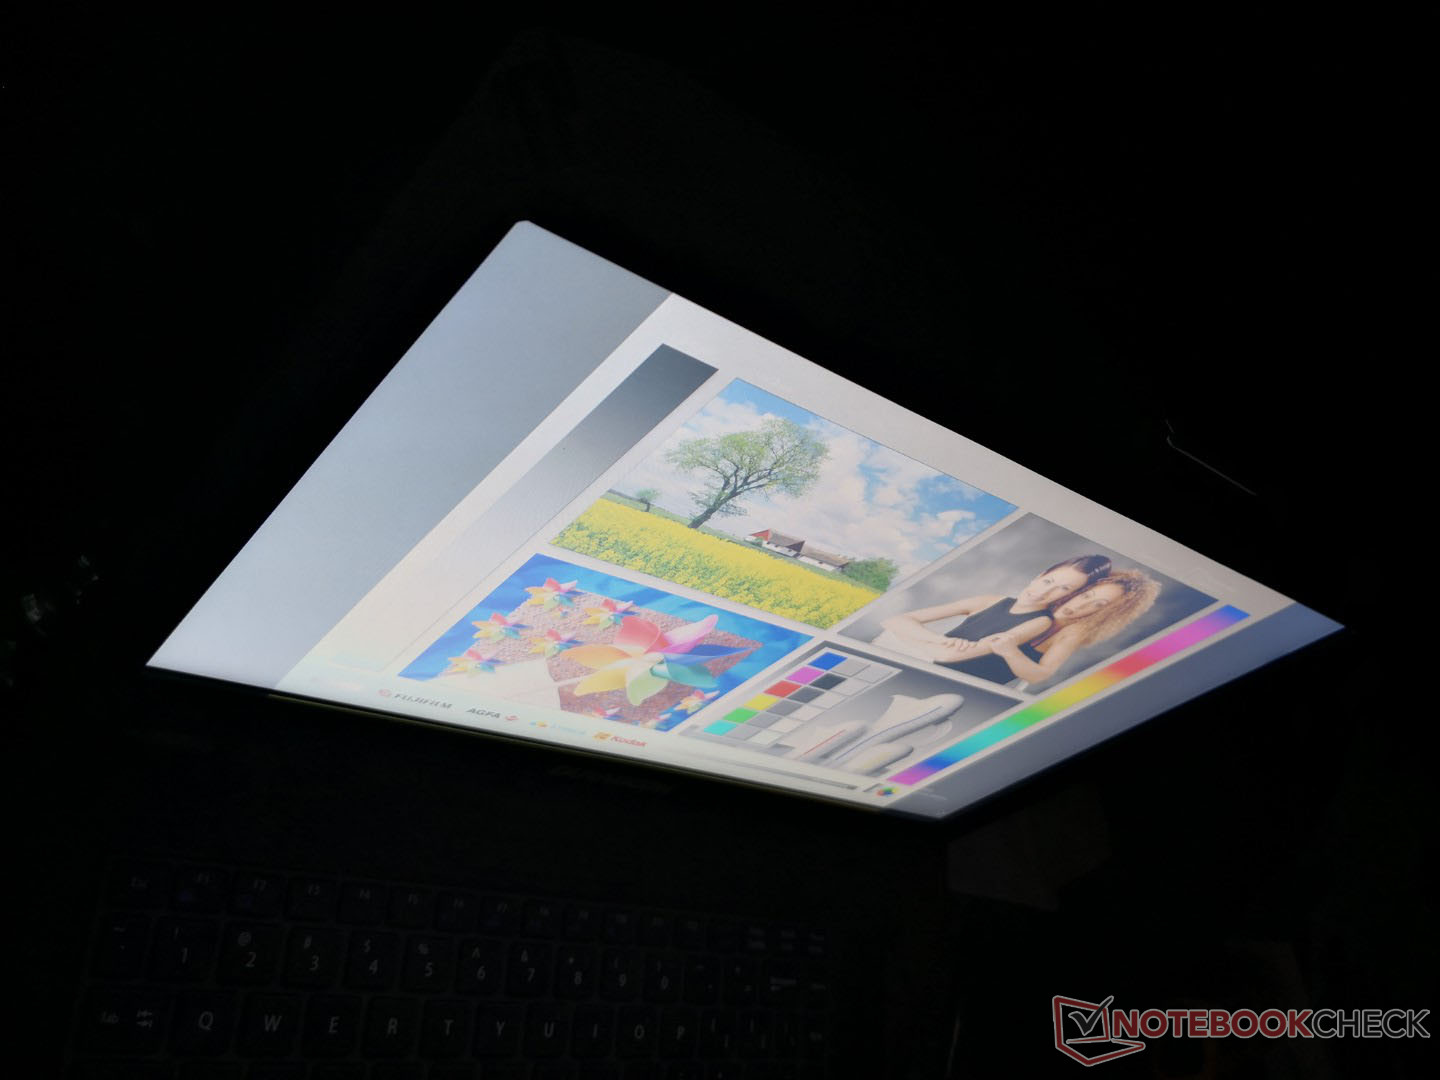
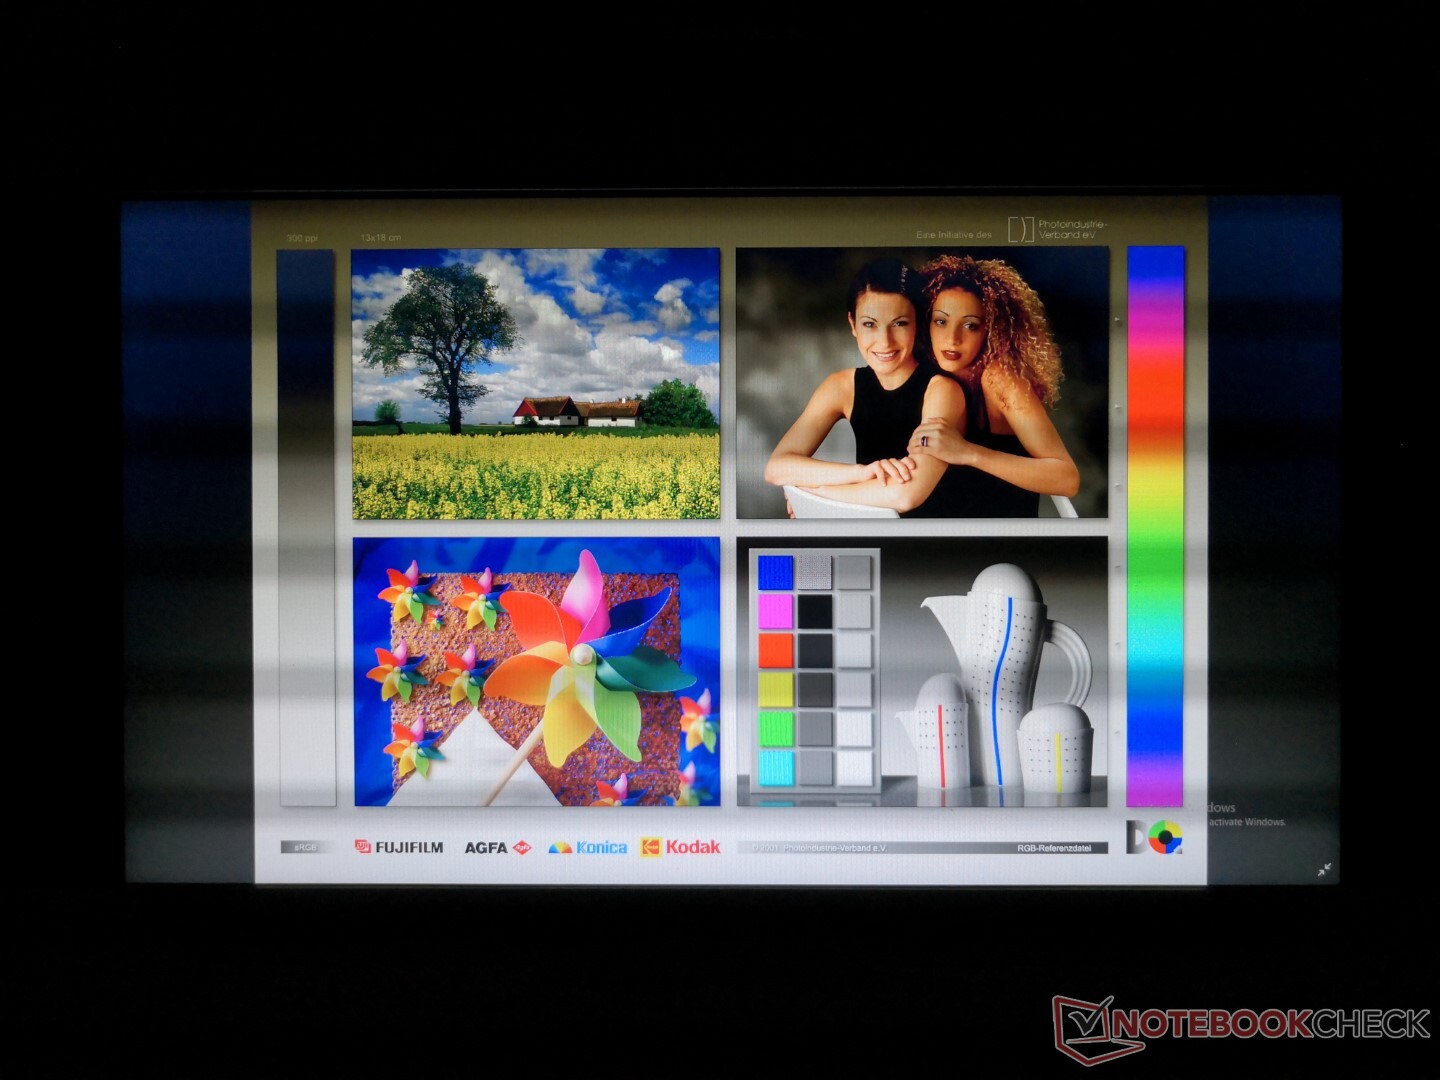
Display
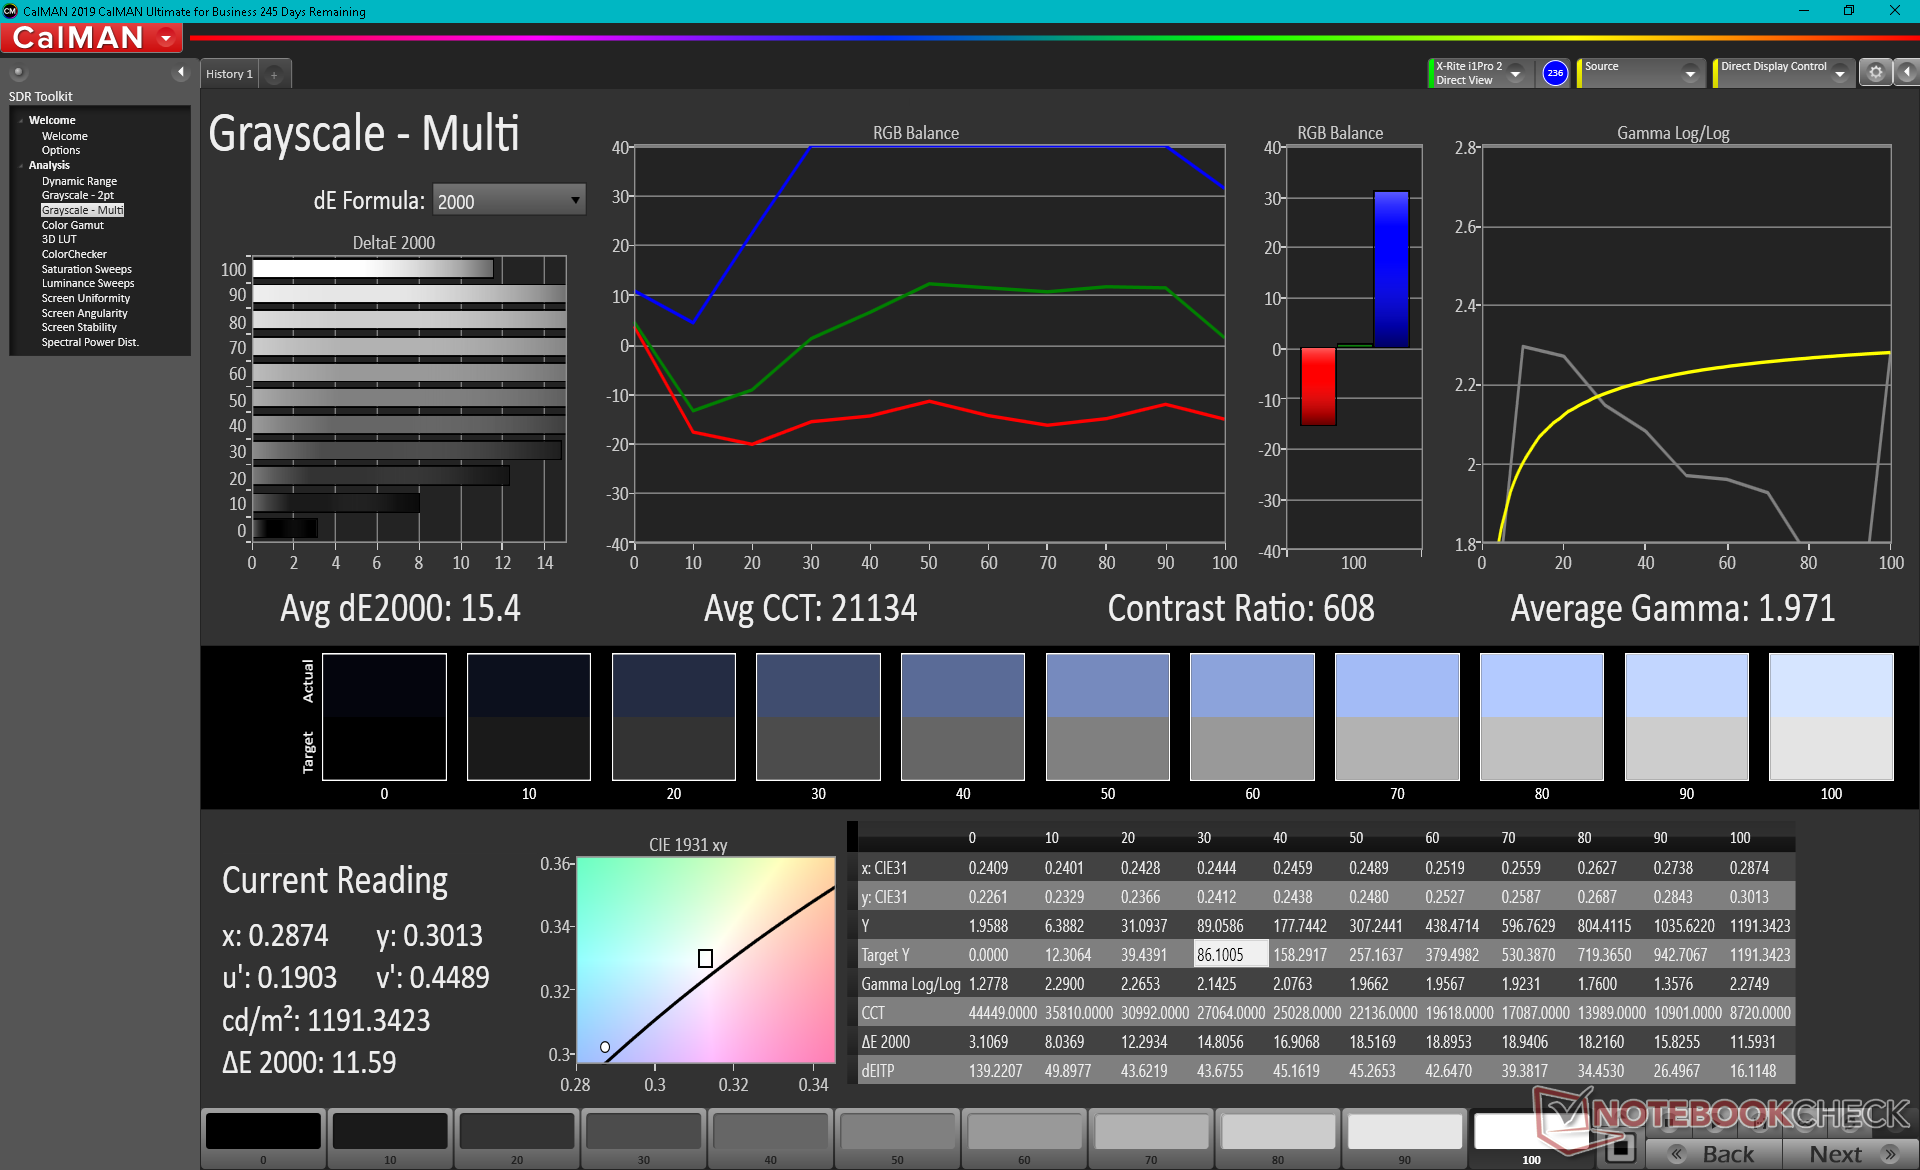
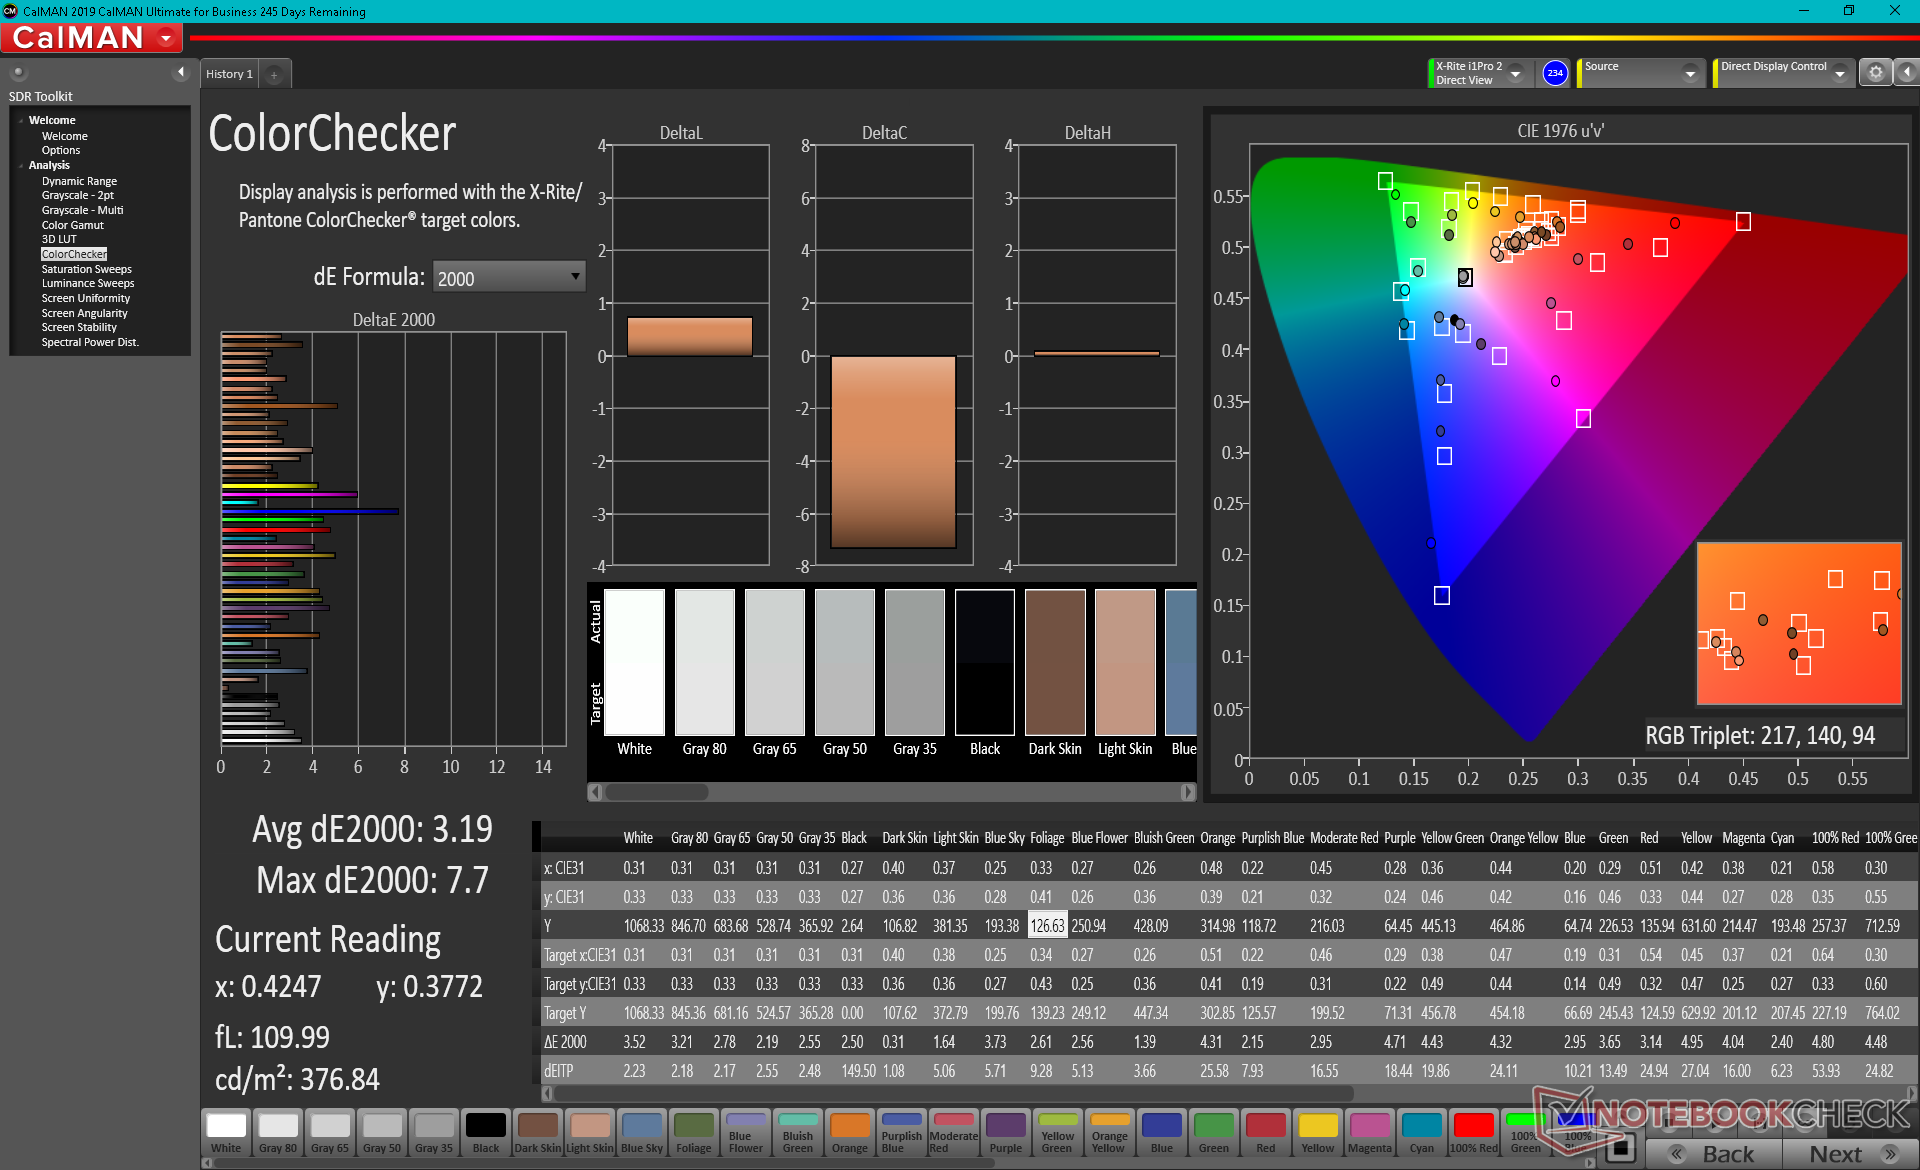
The best aspect of the display is its very bright backlight of over 1000 nits to be more than two times brighter than popular consumer laptops like the Dell XPS or MacBook Pro. If you intend to use this laptop outdoors frequently, then the extra brightness will certainly help. Contrast and colors are otherwise average at best which is to be expected for a rugged system where durability takes precedence over color accuracy.
Unfortunately, PWM is present on all brightness levels including maximum. Users who are sensitive to screen flickering may want to avoid using the S14I for long periods. Our findings are for the 1000-nit panel only and so we cannot comment on the other display options available.
| |||||||||||||||||||||||||
Brightness Distribution: 89 %
Center on Battery: 1180.7 cd/m²
Contrast: 618:1 (Black: 1.91 cd/m²)
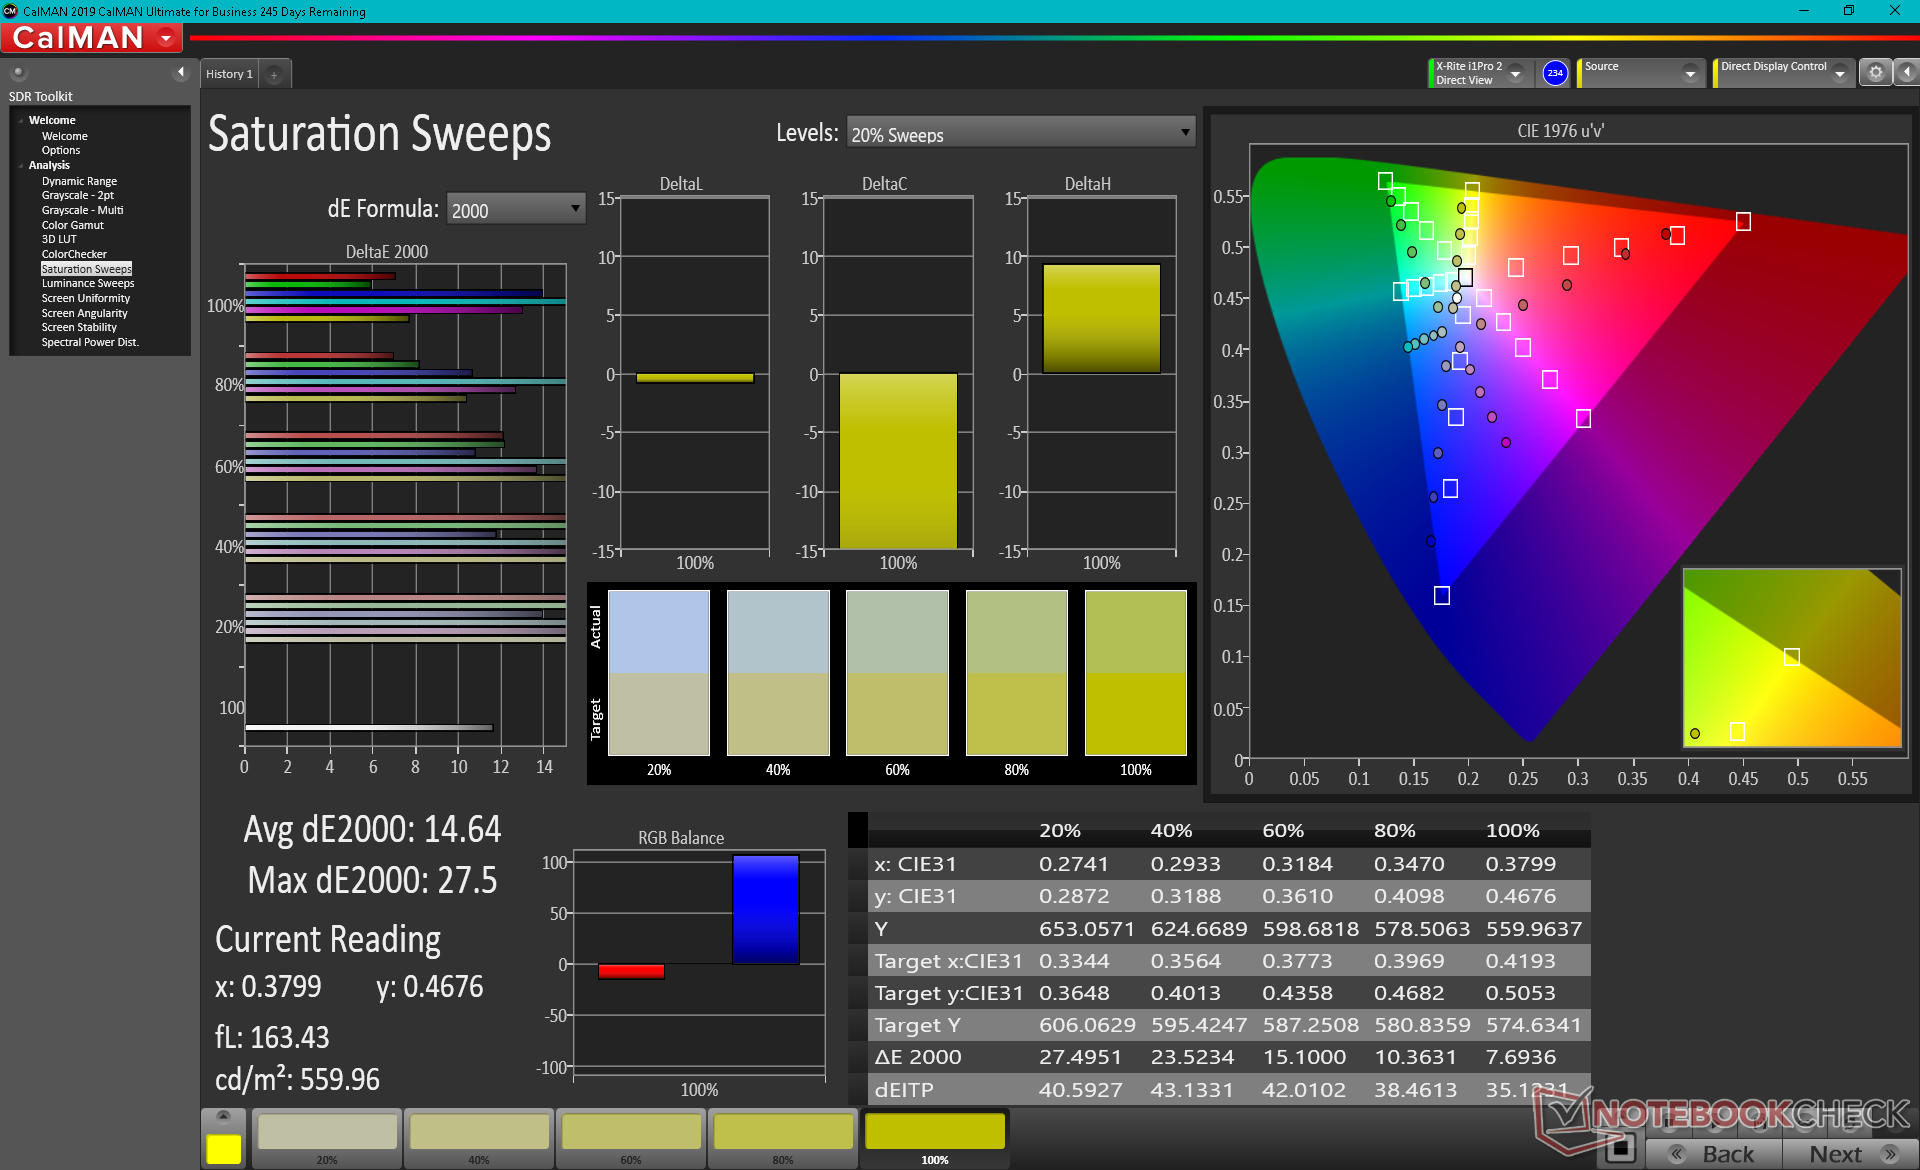
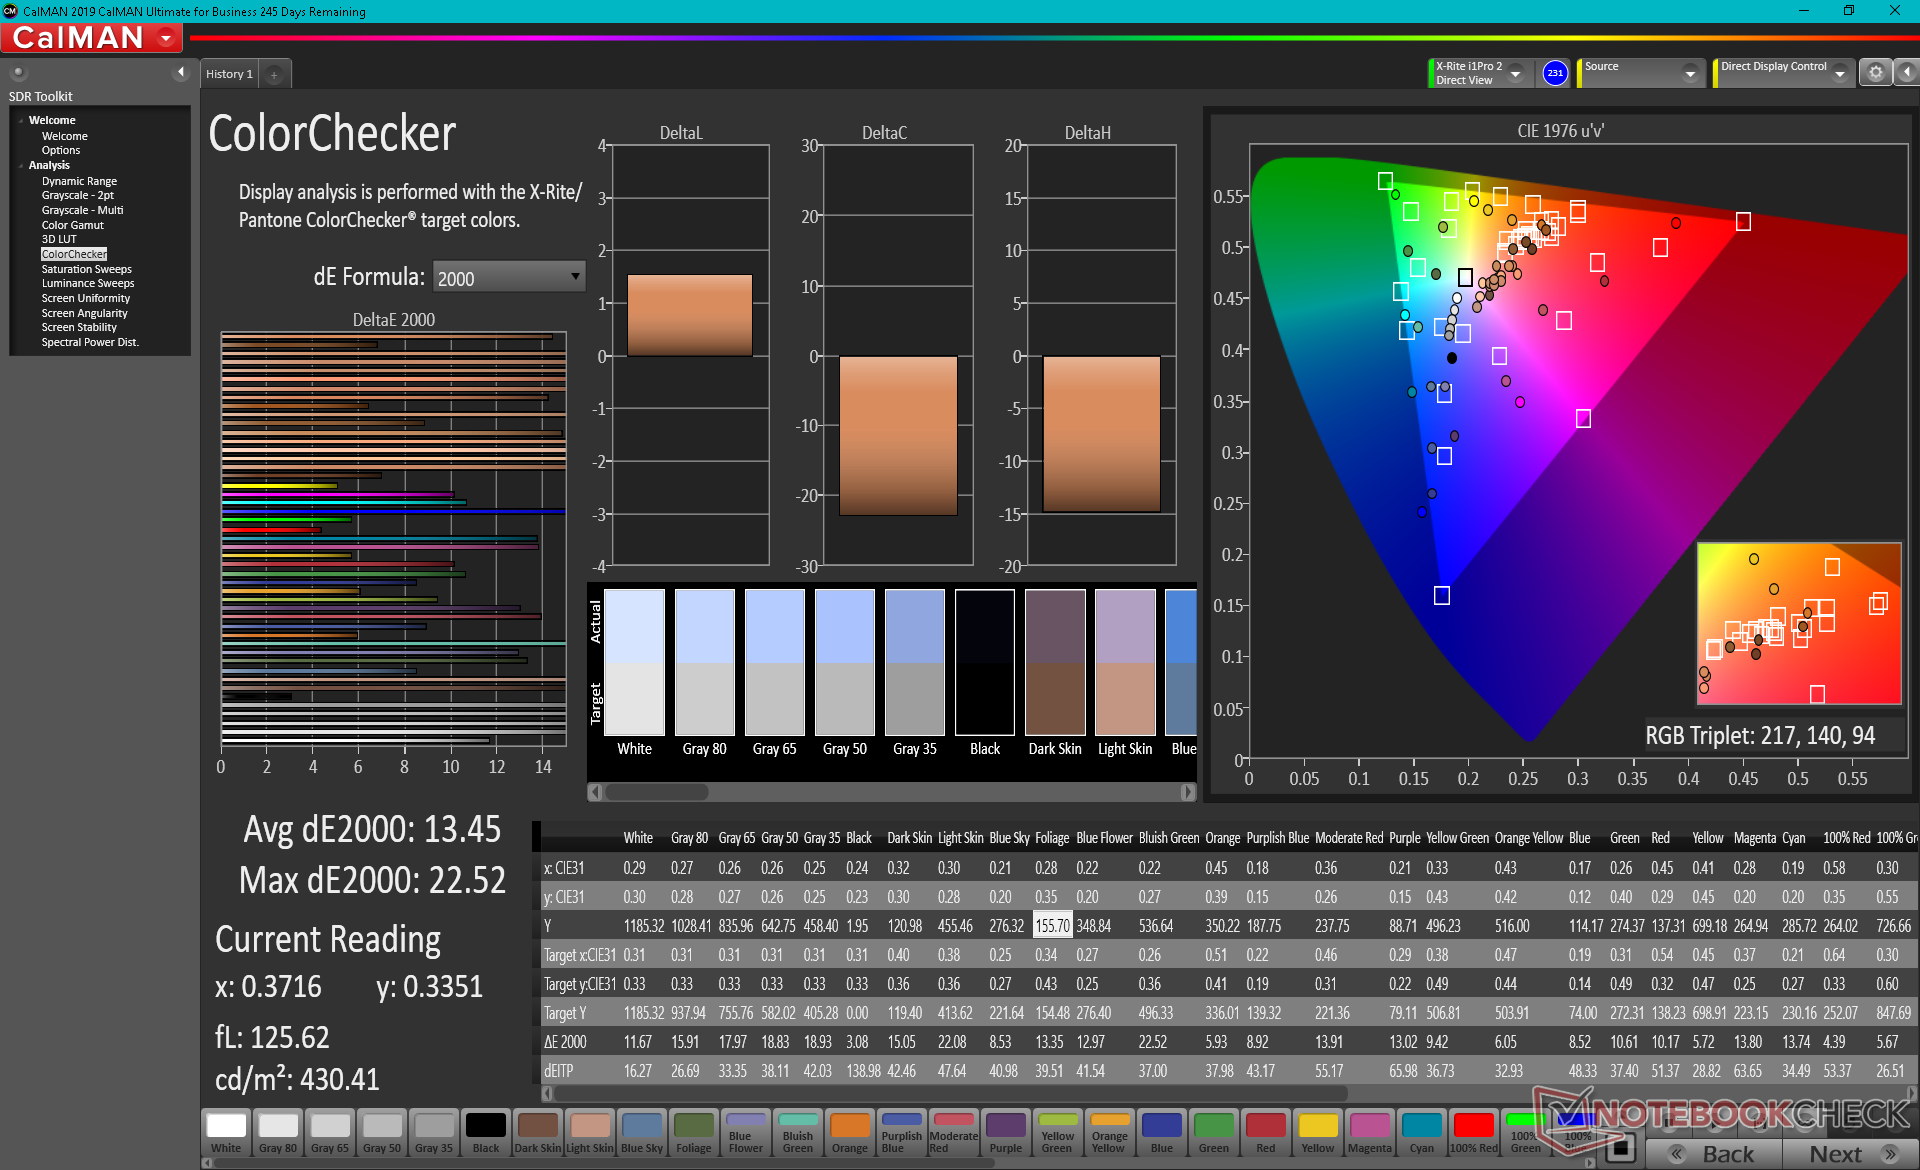
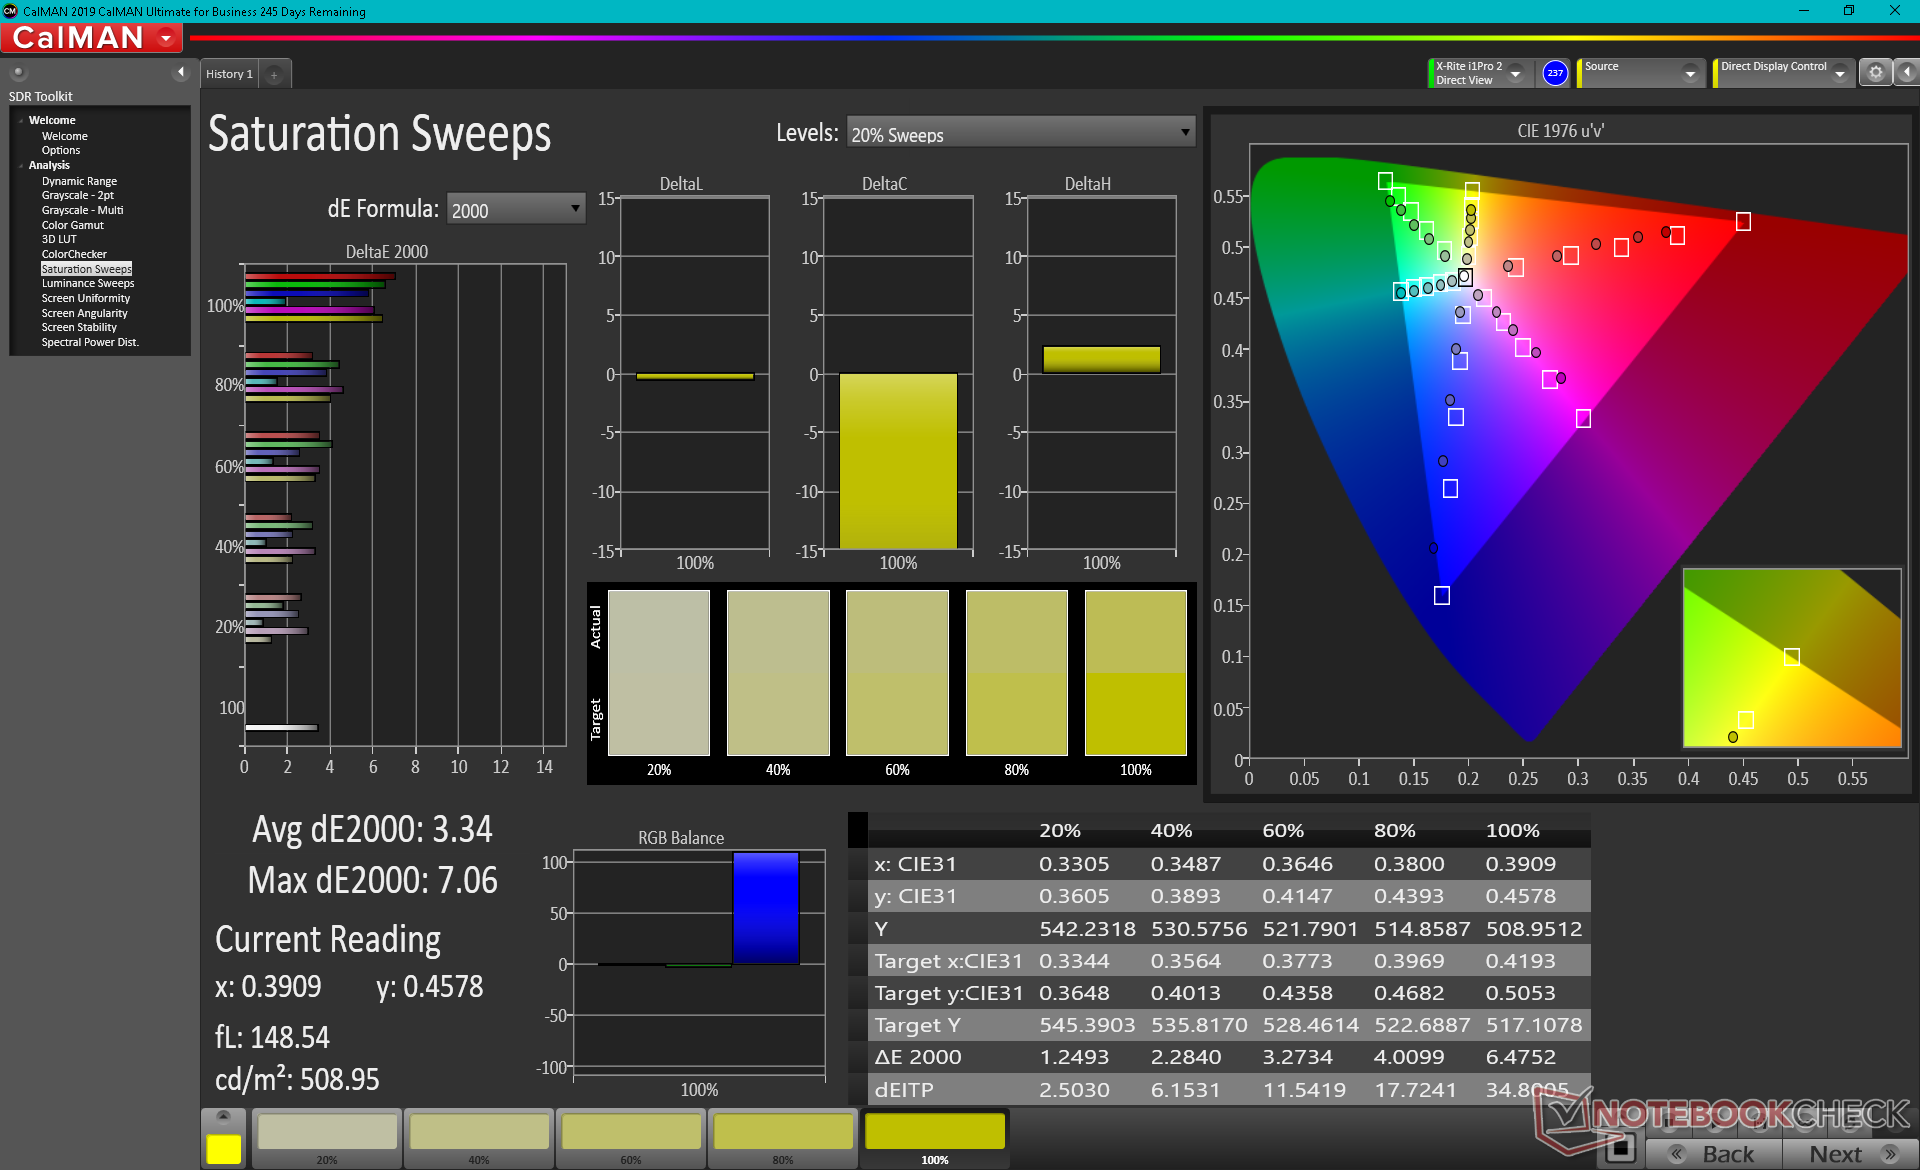
ΔE ColorChecker Calman: 13.45 | ∀{0.5-29.43 Ø4.71}
calibrated: 3.19
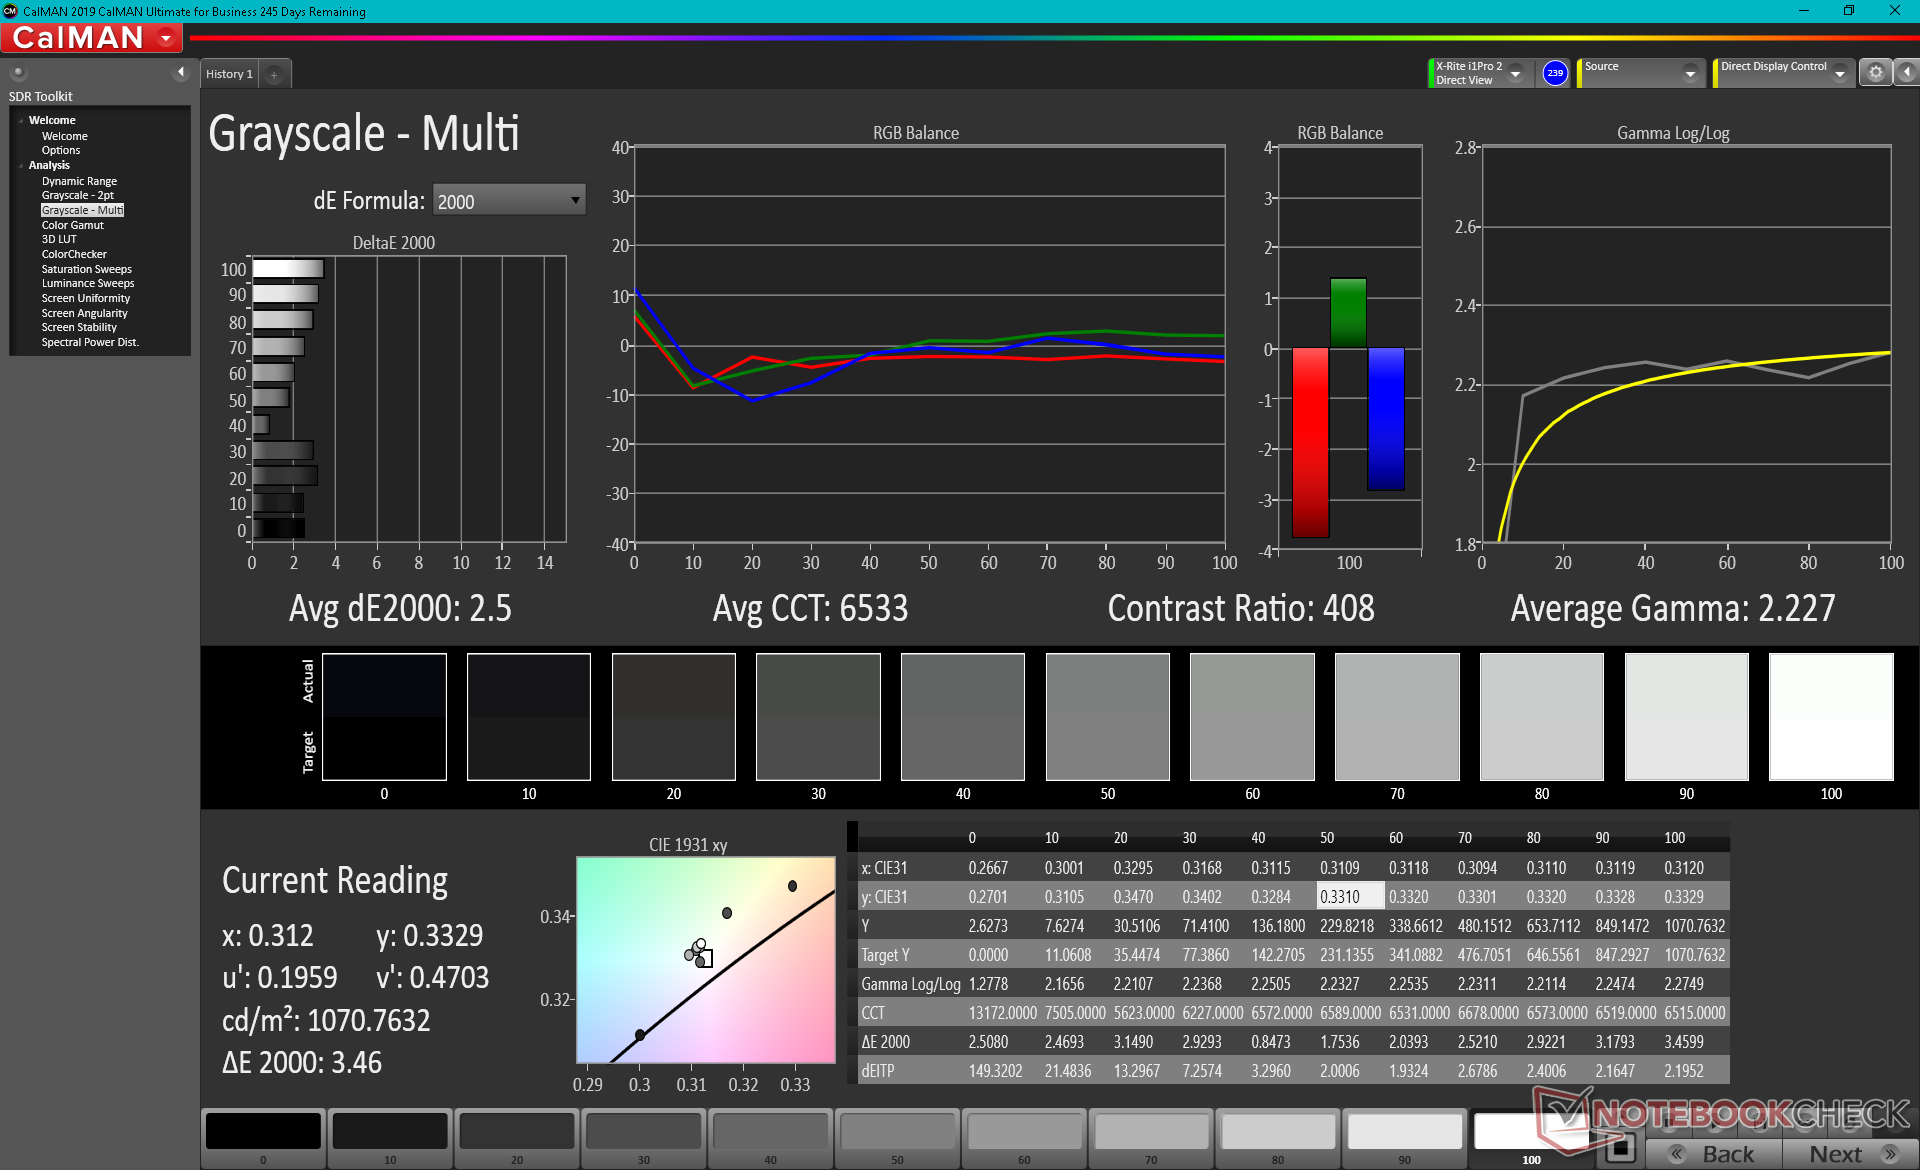
ΔE Greyscale Calman: 15.4 | ∀{0.09-98 Ø4.96}
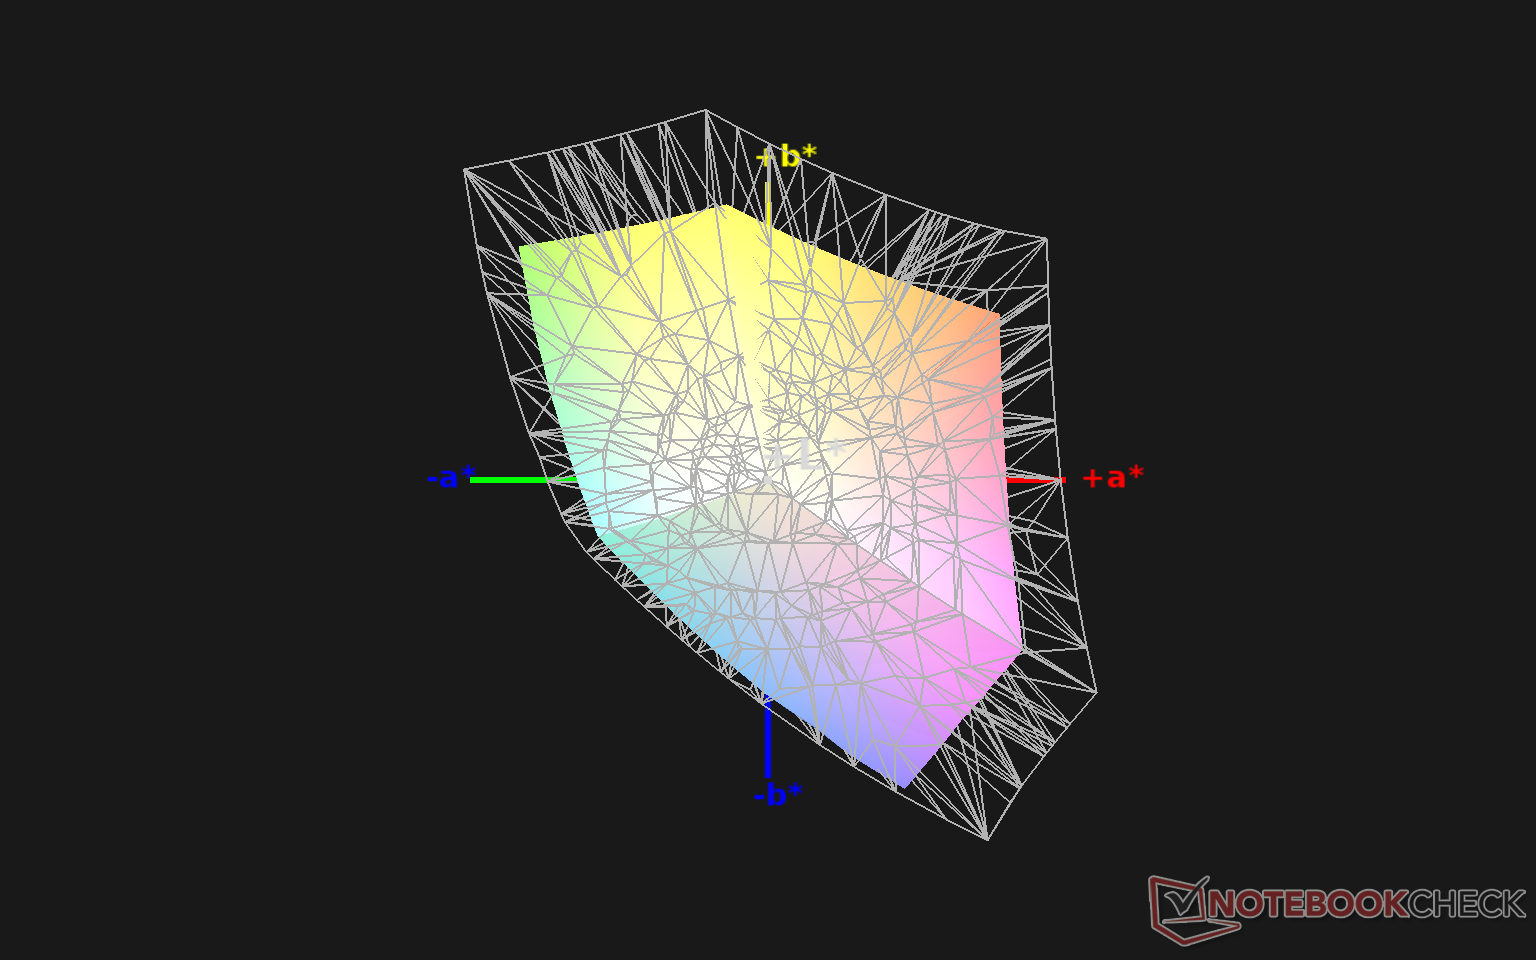
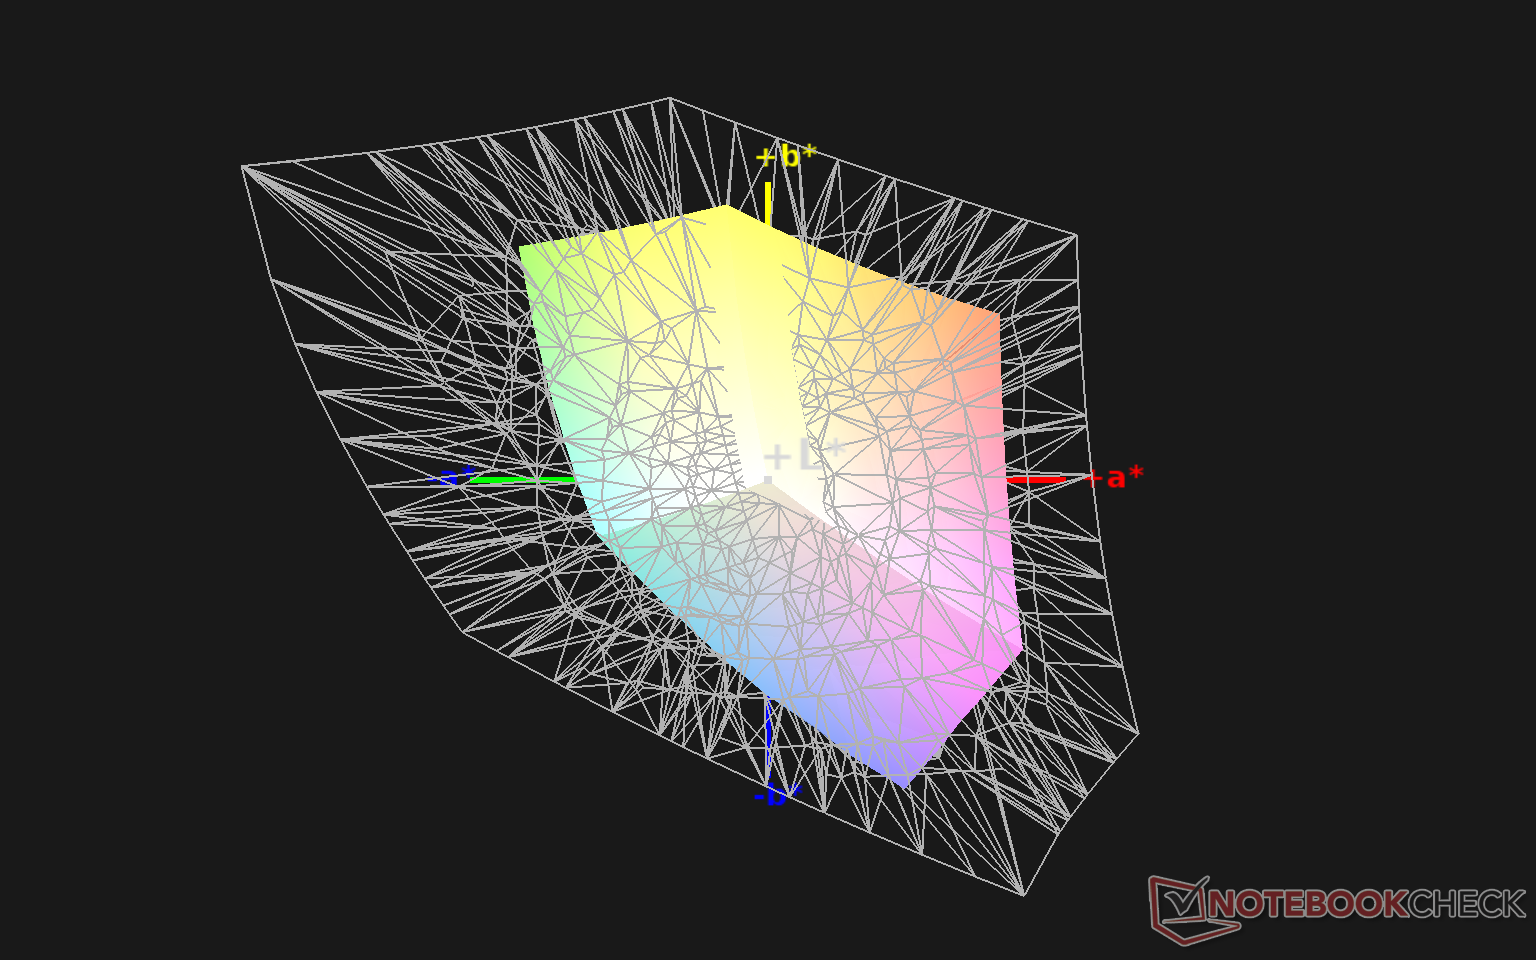
65.5% sRGB (Argyll 1.6.3 3D)
41.6% AdobeRGB 1998 (Argyll 1.6.3 3D)
45% AdobeRGB 1998 (Argyll 3D)
65.4% sRGB (Argyll 3D)
43.55% Display P3 (Argyll 3D)
Gamma: 1.97
CCT: 21134 K
| Durabook S14I KD140N0730A01, TN, 14", 1920x1080 | Durabook S15ABG2 Chi Mei N156HGE-EA2, TN LED, 15.6", 1920x1080 | Panasonic Toughbook FZ-55 InfoVision M140NWF5 R3, IPS, 14", 1920x1080 | Dell Latitude 7424 Rugged Extreme AU Optronics AUO523D, IPS, 14", 1920x1080 | Getac S410 CMN N140BGE-E33, TN PED, 14", 1366x768 | Panasonic Toughbook CF-54G2999VM B140XTN, AUO2E3C, TN LED, 14", 1366x768 | |
|---|---|---|---|---|---|---|
| Display | 18% | -13% | 49% | -7% | -14% | |
| Display P3 Coverage (%) | 43.55 | 51.4 18% | 38.09 -13% | 65.3 50% | 40.46 -7% | 37.36 -14% |
| sRGB Coverage (%) | 65.4 | 77.1 18% | 57 -13% | 96.9 48% | 60.9 -7% | 56.1 -14% |
| AdobeRGB 1998 Coverage (%) | 45 | 52.9 18% | 39.38 -12% | 67.3 50% | 41.8 -7% | 38.62 -14% |
| Response Times | -23% | -95% | -173% | -28% | -44% | |
| Response Time Grey 50% / Grey 80% * (ms) | 30.4 ? | 24.4 ? 20% | 42 ? -38% | 62.8 ? -107% | 41.2 ? -36% | 43.2 ? -42% |
| Response Time Black / White * (ms) | 11.8 ? | 19.6 ? -66% | 29.6 ? -151% | 40 ? -239% | 14 ? -19% | 17.2 ? -46% |
| PWM Frequency (Hz) | 304.9 ? | 301.2 ? | 694 ? | 763 | 877 ? | |
| Screen | -4% | 23% | 45% | -16% | -22% | |
| Brightness middle (cd/m²) | 1180.7 | 284.8 -76% | 1037 -12% | 844 -29% | 265.1 -78% | 174.5 -85% |
| Brightness (cd/m²) | 1102 | 267 -76% | 1015 -8% | 793 -28% | 246 -78% | 164 -85% |
| Brightness Distribution (%) | 89 | 86 -3% | 76 -15% | 88 -1% | 81 -9% | 71 -20% |
| Black Level * (cd/m²) | 1.91 | 0.7 63% | 0.6 69% | 0.54 72% | 0.58 70% | 0.6 69% |
| Contrast (:1) | 618 | 407 -34% | 1728 180% | 1563 153% | 457 -26% | 291 -53% |
| Colorchecker dE 2000 * | 13.45 | 11.48 15% | 5.71 58% | 4.8 64% | 14.24 -6% | 12.05 10% |
| Colorchecker dE 2000 max. * | 22.52 | 19.71 12% | 26.27 -17% | 11.88 47% | 26.66 -18% | 27.5 -22% |
| Colorchecker dE 2000 calibrated * | 3.19 | 3.06 4% | 4.52 -42% | 1.15 64% | 3.94 -24% | 4.34 -36% |
| Greyscale dE 2000 * | 15.4 | 13.2 14% | 5.5 64% | 7.6 51% | 14.2 8% | 14.8 4% |
| Gamma | 1.97 112% | 2.09 105% | 2.04 108% | 2.334 94% | 2.03 108% | 1.4 157% |
| CCT | 21134 31% | 14566 45% | 5783 112% | 6546 99% | 17152 38% | 14529 45% |
| Color Space (Percent of AdobeRGB 1998) (%) | 41.6 | 48.8 17% | 36.4 -13% | 62 49% | 38.7 -7% | 35.7 -14% |
| Color Space (Percent of sRGB) (%) | 65.5 | 76.8 17% | 57 -13% | 97 48% | 61 -7% | 56.2 -14% |
| Total Average (Program / Settings) | -3% /
-2% | -28% /
2% | -26% /
18% | -17% /
-16% | -27% /
-24% |
* ... smaller is better
Color space covers just 65 percent and 42 percent of the AdobeRGB and sRGB standards, respectively, which is common for rugged laptops.
An X-Rite colorimeter analysis shows a very unbalanced display out of the box with an overly cool color temperature. Grayscale and colors improve dramatically once properly calibrated as shown by our screenshots below with average grayscale DeltaE values jumping from 15.4 to just 2.5. We recommend applying our ICC profile above to get the most out of the display.
Display Response Times
| ↔ Response Time Black to White | ||
|---|---|---|
| 11.8 ms ... rise ↗ and fall ↘ combined | ↗ 8.2 ms rise | 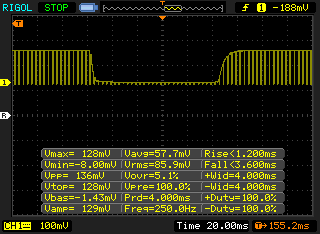 |
| ↘ 3.6 ms fall | ||
| The screen shows good response rates in our tests, but may be too slow for competitive gamers. In comparison, all tested devices range from 0.1 (minimum) to 240 (maximum) ms. » 32 % of all devices are better. This means that the measured response time is better than the average of all tested devices (19.8 ms). | ||
| ↔ Response Time 50% Grey to 80% Grey | ||
| 30.4 ms ... rise ↗ and fall ↘ combined | ↗ 16.8 ms rise | 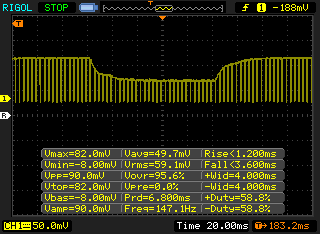 |
| ↘ 13.6 ms fall | ||
| The screen shows slow response rates in our tests and will be unsatisfactory for gamers. In comparison, all tested devices range from 0.165 (minimum) to 636 (maximum) ms. » 41 % of all devices are better. This means that the measured response time is similar to the average of all tested devices (31 ms). | ||
Screen Flickering / PWM (Pulse-Width Modulation)
| Screen flickering / PWM detected | 304.9 Hz | ≤ 100 % brightness setting | 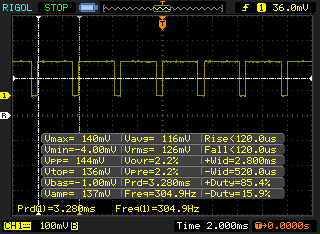 |
The display backlight flickers at 304.9 Hz (worst case, e.g., utilizing PWM) Flickering detected at a brightness setting of 100 % and below. There should be no flickering or PWM above this brightness setting. The frequency of 304.9 Hz is relatively high, so most users sensitive to PWM should not notice any flickering. However, there are reports that some users are still sensitive to PWM at 500 Hz and above, so be aware. In comparison: 52 % of all tested devices do not use PWM to dim the display. If PWM was detected, an average of 7754 (minimum: 5 - maximum: 343500) Hz was measured. | |||
Outdoor visibility is good especially when under shade because of how bright the display is. However, the limited gamut and low contrast ratio of the display result in washed out colors on a bright day with lots of ambient lighting.
Performance
CPU options range from the Core i3-1115G4 up to the Core i7-1185G7 with vPro supported only on the Core i5-1145G7 and Core i7-1185G7. All of these processors belong to Intel's newest 11th gen Tiger Lake-U series that power the latest consumer Ultrabooks. The discrete GeForce GTX 1050 GPU is optional for users who want more power than the integrated Iris Xe.
Our unit was set to High Performance mode prior to running any performance benchmarks below.
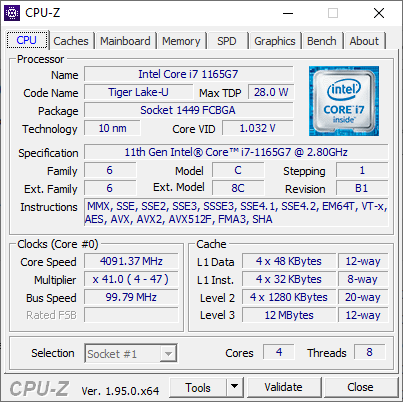
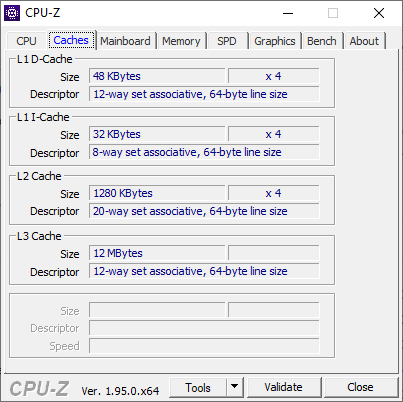
Processor
Multi-thread CPU performance is disappointing at roughly 30 percent slower than the average Core i7-1165G7 in our database. Results are therefore quite close to the older Core i5-8265U or Core i7-1065G7. The limited Turbo Boost sustainability of the S14I is responsible for the underperforming CPU as detailed in our Stress Test section below.
Cinebench R15: CPU Multi 64Bit | CPU Single 64Bit
Blender: v2.79 BMW27 CPU
7-Zip 18.03: 7z b 4 -mmt1 | 7z b 4
Geekbench 5.5: Single-Core | Multi-Core
HWBOT x265 Benchmark v2.2: 4k Preset
LibreOffice : 20 Documents To PDF
R Benchmark 2.5: Overall mean
| Geekbench 5.5 / Single-Core | |
| Average Intel Core i7-1165G7 (1302 - 1595, n=77) | |
| Lenovo Yoga 9 14 ITL 4K | |
| Durabook S14I | |
| Lenovo ThinkBook 14 G2 ITL 20VD008WGE | |
| Acer Spin 3 SP314-54N-56S5 | |
| Lenovo Yoga Slim 7 14ARE05 82A20008GE | |
| Lenovo ThinkPad L14-20U50003GE | |
| Acer Swift 3 SF314-42-R27B | |
| Geekbench 5.5 / Multi-Core | |
| Lenovo Yoga Slim 7 14ARE05 82A20008GE | |
| Lenovo Yoga 9 14 ITL 4K | |
| Average Intel Core i7-1165G7 (3078 - 5926, n=77) | |
| Lenovo ThinkBook 14 G2 ITL 20VD008WGE | |
| Lenovo ThinkPad L14-20U50003GE | |
| Durabook S14I | |
| Acer Spin 3 SP314-54N-56S5 | |
| Acer Swift 3 SF314-42-R27B | |
| HWBOT x265 Benchmark v2.2 / 4k Preset | |
| Lenovo Yoga Slim 7 14ARE05 82A20008GE | |
| Lenovo ThinkPad L14-20U50003GE | |
| Lenovo ThinkBook 14 G2 ITL 20VD008WGE | |
| Average Intel Core i7-1165G7 (1.39 - 8.47, n=80) | |
| Lenovo Yoga 9 14 ITL 4K | |
| Lenovo ThinkPad P43s-20RH001FGE | |
| Durabook S14I | |
| Acer Spin 3 SP314-54N-56S5 | |
| Acer Swift 3 SF314-42-R27B | |
| Lenovo ThinkPad T490-20N2004EGE | |
| LibreOffice / 20 Documents To PDF | |
| Lenovo Yoga Slim 7 14ARE05 82A20008GE | |
| Acer Swift 3 SF314-42-R27B | |
| Lenovo ThinkPad L14-20U50003GE | |
| Acer Spin 3 SP314-54N-56S5 | |
| Lenovo ThinkBook 14 G2 ITL 20VD008WGE | |
| Lenovo Yoga 9 14 ITL 4K | |
| Average Intel Core i7-1165G7 (21.5 - 88.1, n=78) | |
| Durabook S14I | |
| R Benchmark 2.5 / Overall mean | |
| Acer Spin 3 SP314-54N-56S5 | |
| Acer Swift 3 SF314-42-R27B | |
| Lenovo ThinkPad L14-20U50003GE | |
| Lenovo ThinkBook 14 G2 ITL 20VD008WGE | |
| Lenovo Yoga Slim 7 14ARE05 82A20008GE | |
| Durabook S14I | |
| Average Intel Core i7-1165G7 (0.552 - 1.002, n=80) | |
| Lenovo Yoga 9 14 ITL 4K | |
* ... smaller is better
System Performance
PCMark 10 benchmarks are consistently ahead of the Durabook S15 equipped with the older Whiskey Lake-U CPU to be in line with other Tiger Lake-U laptops despite the below-average CPU and GPU performance we recorded.
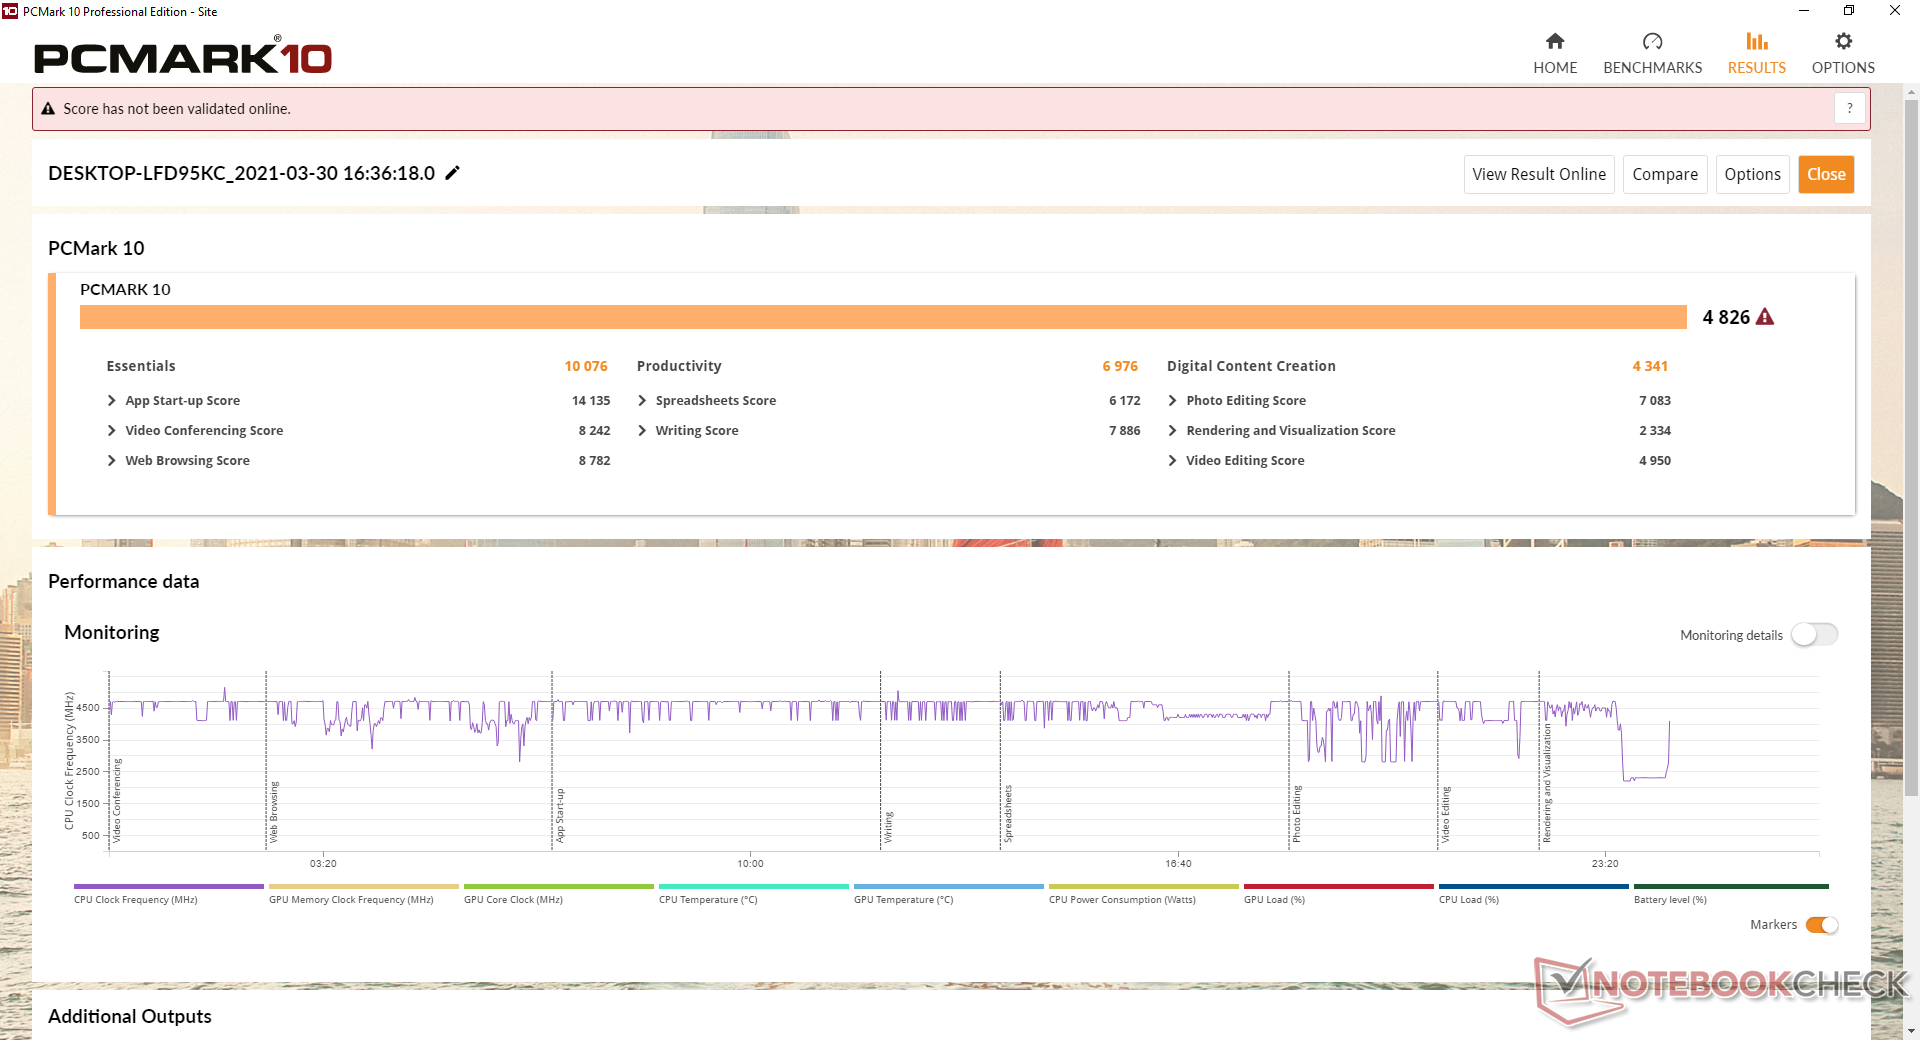
| PCMark 10 Score | 4826 points | |
Help | ||
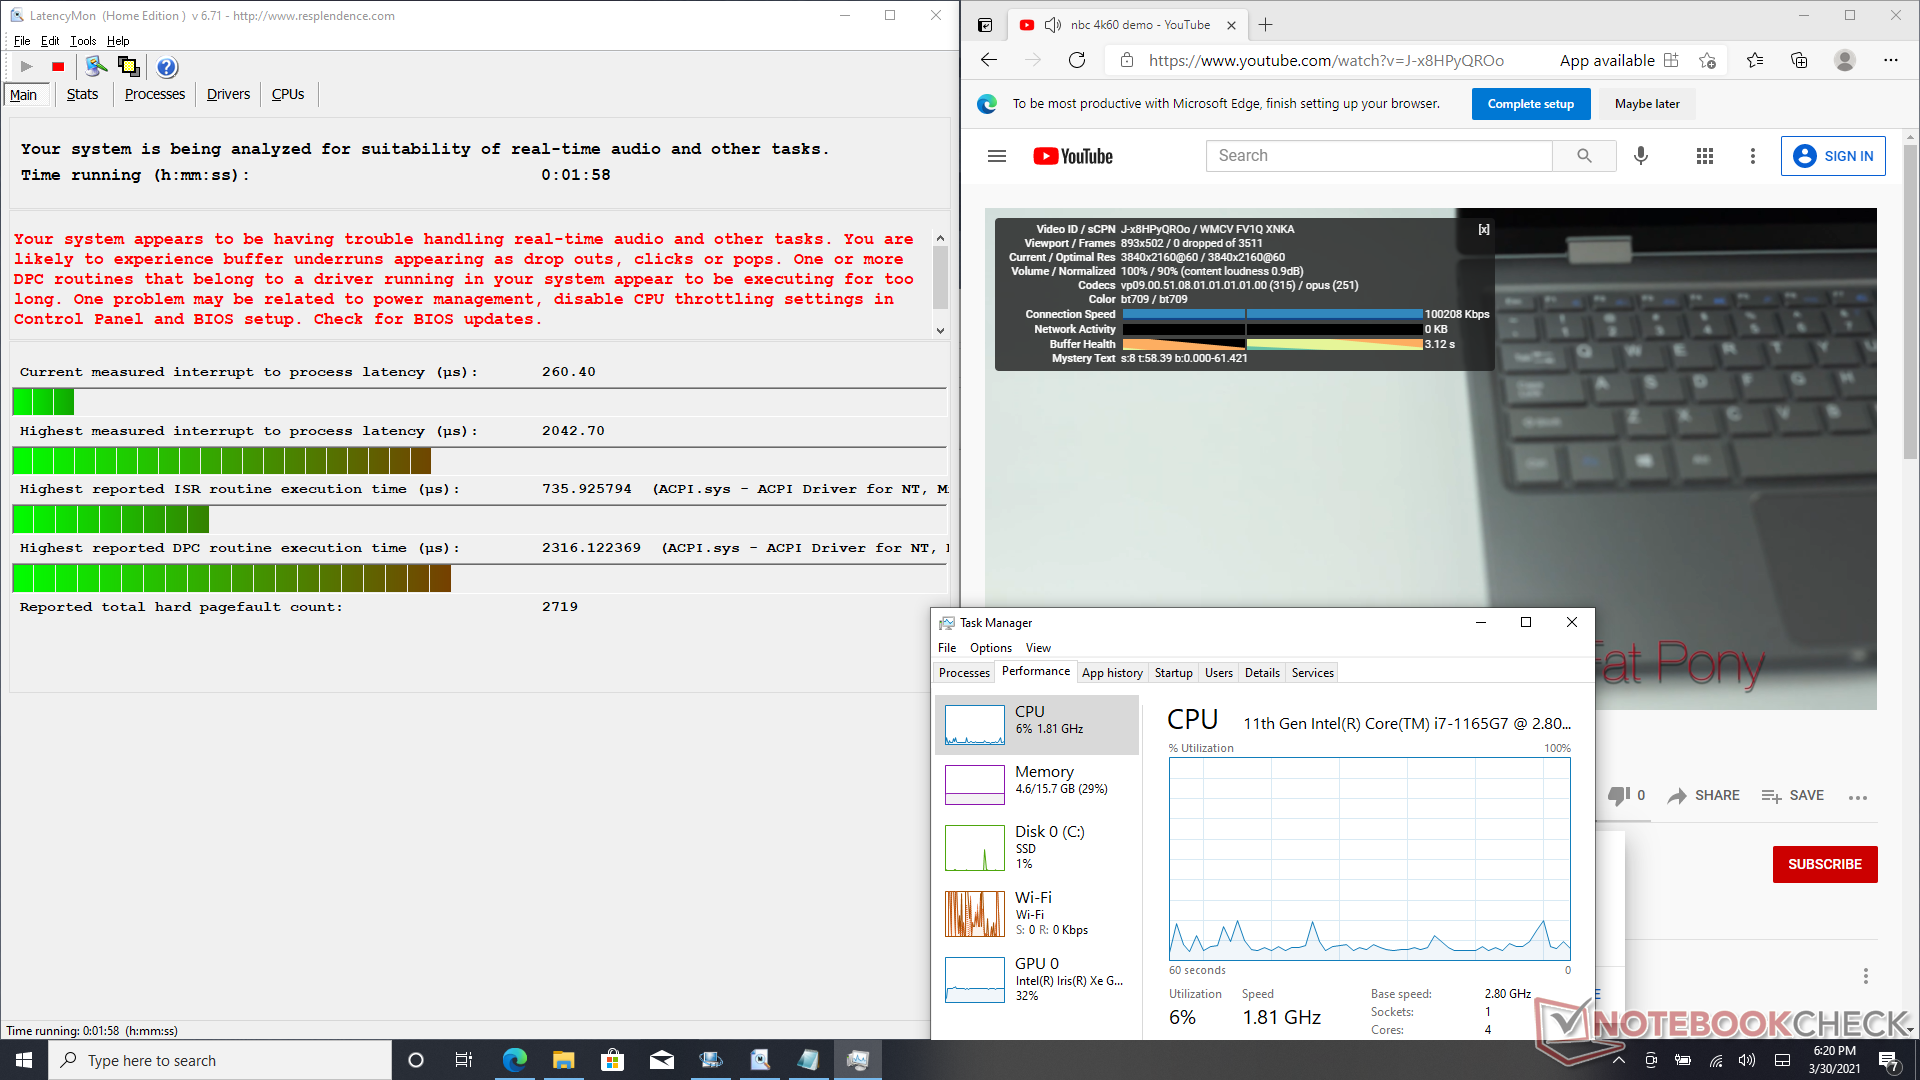
DPC Latency
LatencyMon shows DPC latency issues when opening multiple browser tabs on our homepage. 4K UHD video playback at 60 FPS is otherwise flawless with minimal CPU utilization and no dropped frames as one would expect.
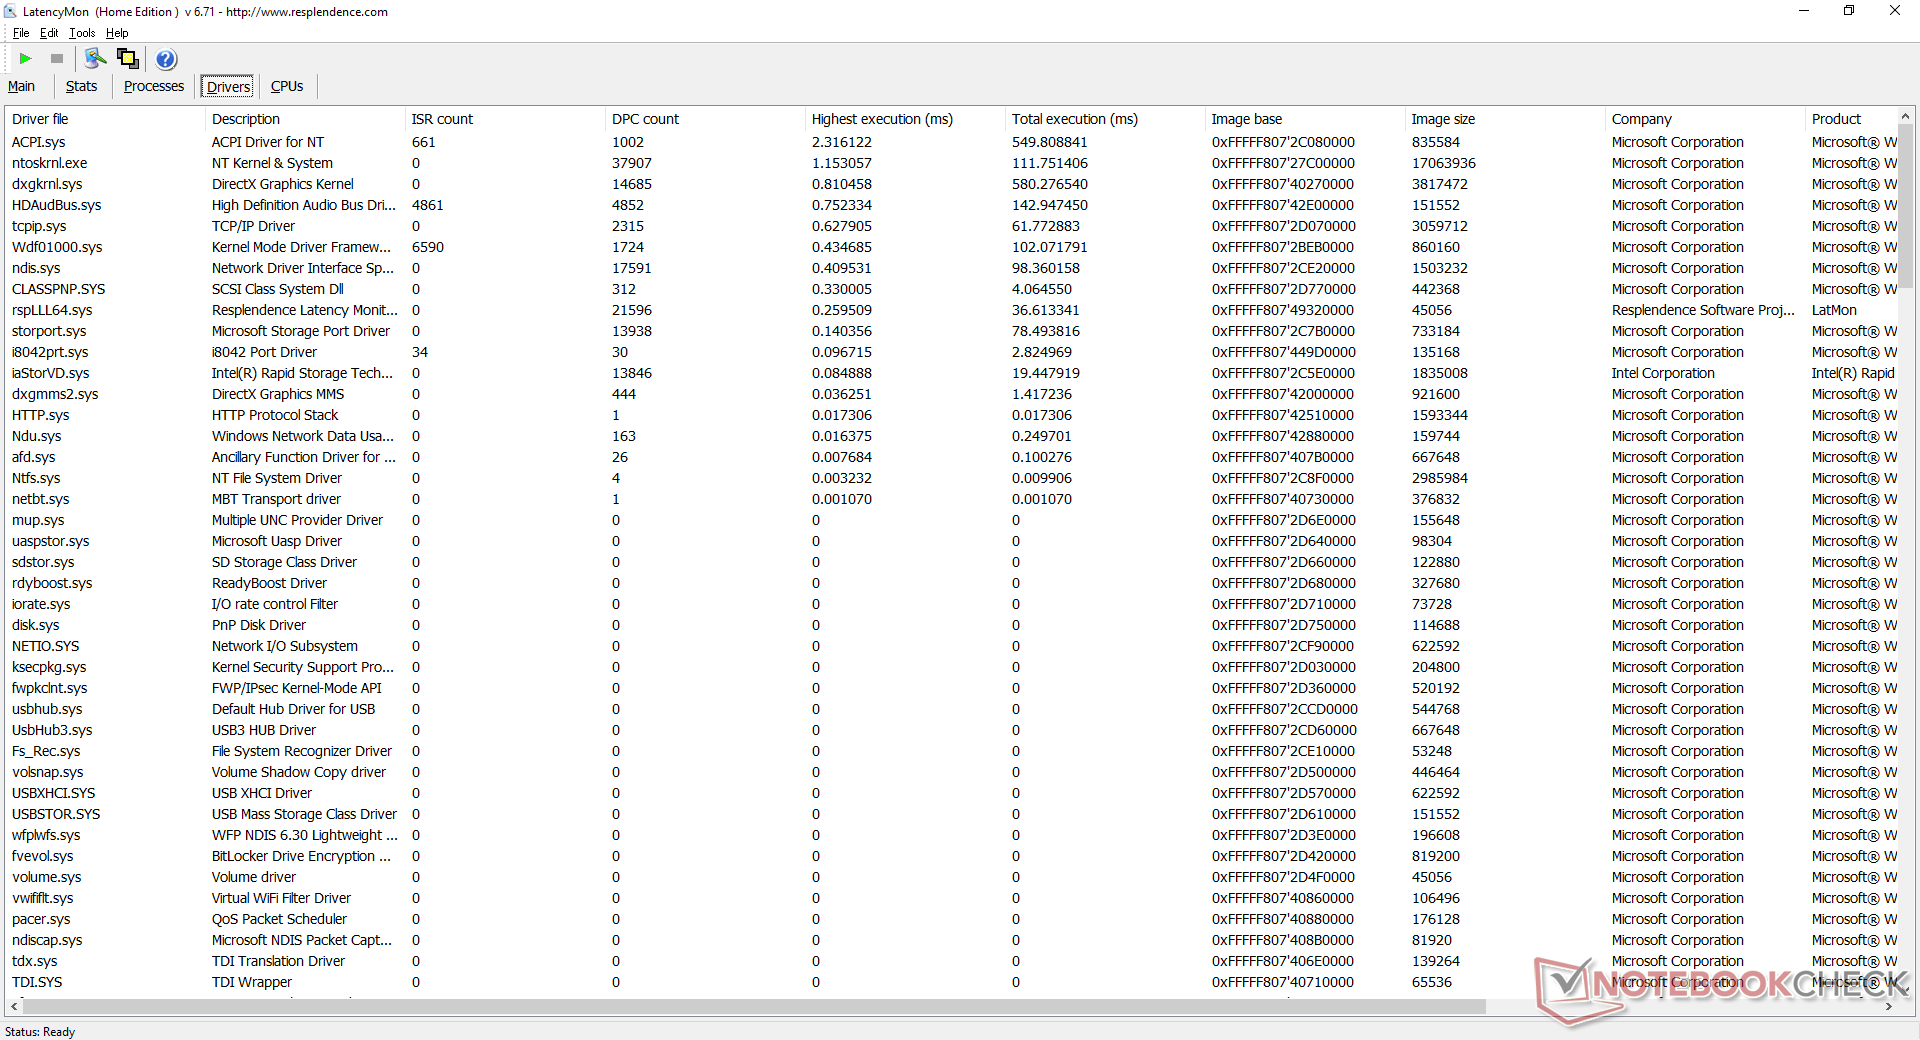
| DPC Latencies / LatencyMon - interrupt to process latency (max), Web, Youtube, Prime95 | |
| Durabook S14I | |
| Durabook S15ABG2 | |
* ... smaller is better
Storage Devices
UDinfo drives appear mostly commonly on Durabook laptops. Performance is excellent with the ability to maintain maximum transfer rates of about 2000 MB/s.
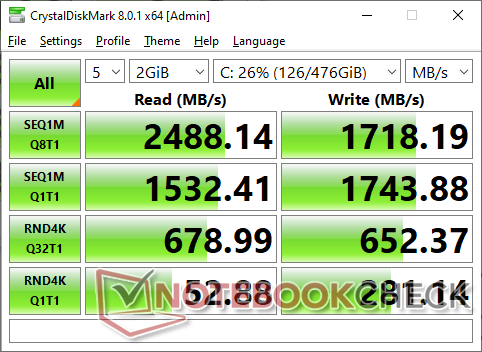
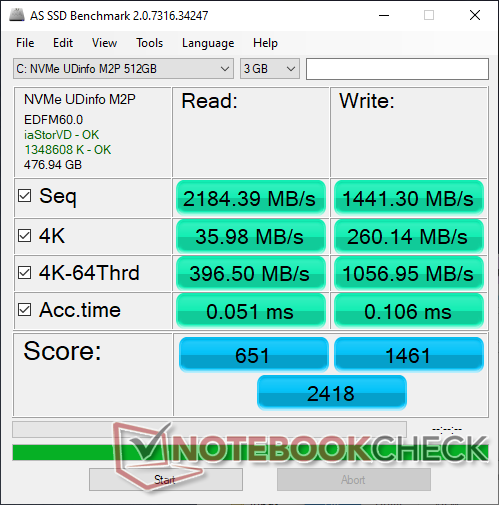
| Durabook S14I UDinfo M2P M2P80DE512GBAEP | Durabook S15ABG2 UDinfo HF3-25UB HF325UB256GBA2P | Panasonic Toughbook FZ-55 Samsung SSD PM871b MZNLN256HAJQ | Dell Latitude 7424 Rugged Extreme SK Hynix PC401 512GB M.2 (HFS512GD9TNG) | Getac S410 CUKUSA 1 TB SATA SSD Q0526A | |
|---|---|---|---|---|---|
| AS SSD | -79% | -49% | -2% | -22% | |
| Seq Read (MB/s) | 2184 | 424.7 -81% | 437.7 -80% | 2096 -4% | 484.2 -78% |
| Seq Write (MB/s) | 1441 | 290.4 -80% | 387.3 -73% | 1016 -29% | 396.1 -73% |
| 4K Read (MB/s) | 35.98 | 35.07 -3% | 26.18 -27% | 39.91 11% | 34.9 -3% |
| 4K Write (MB/s) | 260.1 | 46.69 -82% | 60.3 -77% | 97.9 -62% | 74.1 -72% |
| 4K-64 Read (MB/s) | 396.5 | 291.8 -26% | 369.8 -7% | 636 60% | 382.3 -4% |
| 4K-64 Write (MB/s) | 1057 | 297.8 -72% | 313.7 -70% | 604 -43% | 329 -69% |
| Access Time Read * (ms) | 0.051 | 0.192 -276% | 0.089 -75% | 0.044 14% | 0.058 -14% |
| Access Time Write * (ms) | 0.106 | 0.189 -78% | 0.058 45% | 0.051 52% | 0.045 58% |
| Score Read (Points) | 651 | 369 -43% | 440 -32% | 886 36% | 466 -28% |
| Score Write (Points) | 1461 | 374 -74% | 413 -72% | 804 -45% | 443 -70% |
| Score Total (Points) | 2418 | 938 -61% | 1083 -55% | 2099 -13% | 1154 -52% |
| Copy ISO MB/s (MB/s) | 1538 | 371.3 -76% | 553 -64% | 2151 40% | |
| Copy Program MB/s (MB/s) | 570 | 151.3 -73% | 204.7 -64% | 422.8 -26% | |
| Copy Game MB/s (MB/s) | 566 | 134.7 -76% | 385.9 -32% | 1045 85% | |
| CrystalDiskMark 5.2 / 6 | -71% | -68% | -24% | -67% | |
| Write 4K (MB/s) | 260.4 | 63.5 -76% | 55.4 -79% | 114.4 -56% | 74 -72% |
| Read 4K (MB/s) | 53 | 26.67 -50% | 31.11 -41% | 43.86 -17% | 31.85 -40% |
| Write Seq (MB/s) | 1665 | 258.8 -84% | 460.9 -72% | 1281 -23% | 460.6 -72% |
| Read Seq (MB/s) | 1541 | 392.4 -75% | 481.9 -69% | 1918 24% | 514 -67% |
| Write 4K Q32T1 (MB/s) | 638 | 249.4 -61% | 234.6 -63% | 422.5 -34% | 211.4 -67% |
| Read 4K Q32T1 (MB/s) | 683 | 259.2 -62% | 181.7 -73% | 260.6 -62% | 203.5 -70% |
| Write Seq Q32T1 (MB/s) | 1656 | 311.9 -81% | 528 -68% | 1282 -23% | 523 -68% |
| Read Seq Q32T1 (MB/s) | 2490 | 459 -82% | 548 -78% | 2515 1% | 554 -78% |
| Total Average (Program / Settings) | -75% /
-76% | -59% /
-56% | -13% /
-11% | -45% /
-38% |
* ... smaller is better

Disk Throttling: DiskSpd Read Loop, Queue Depth 8
GPU Performance
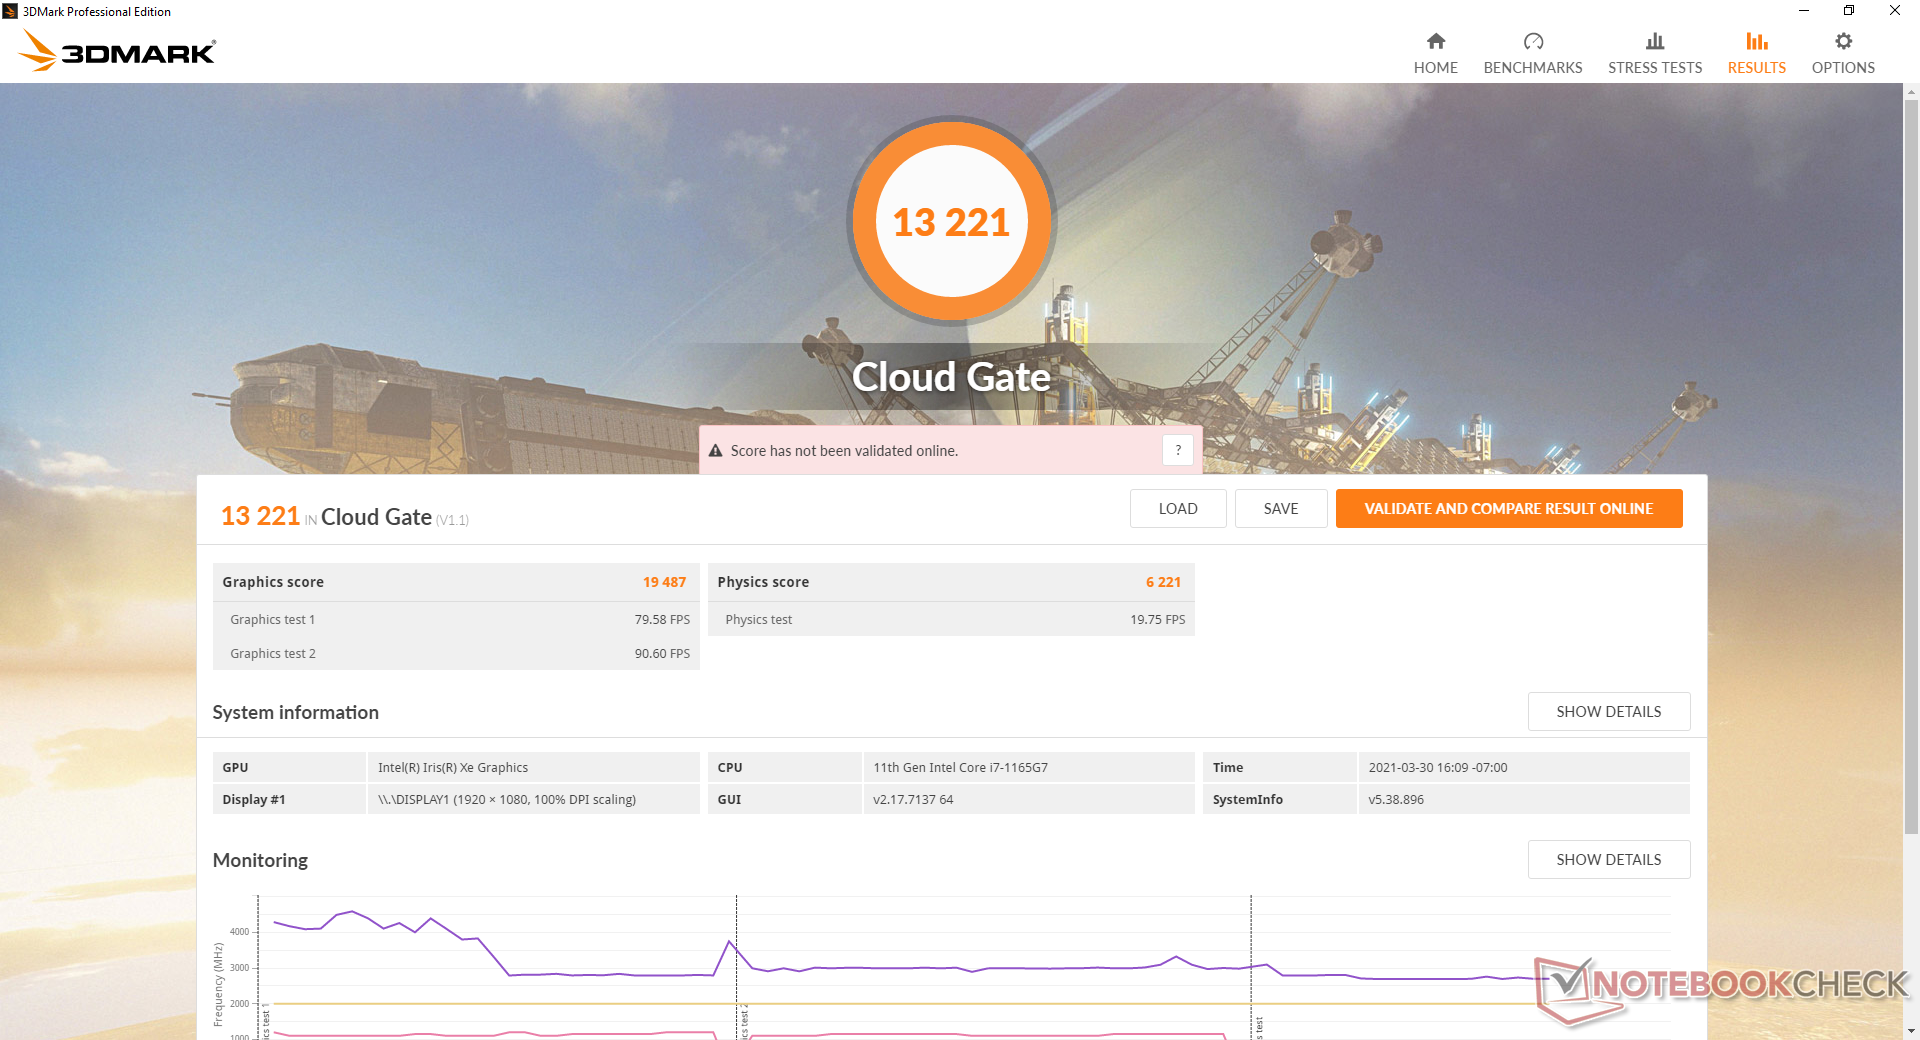
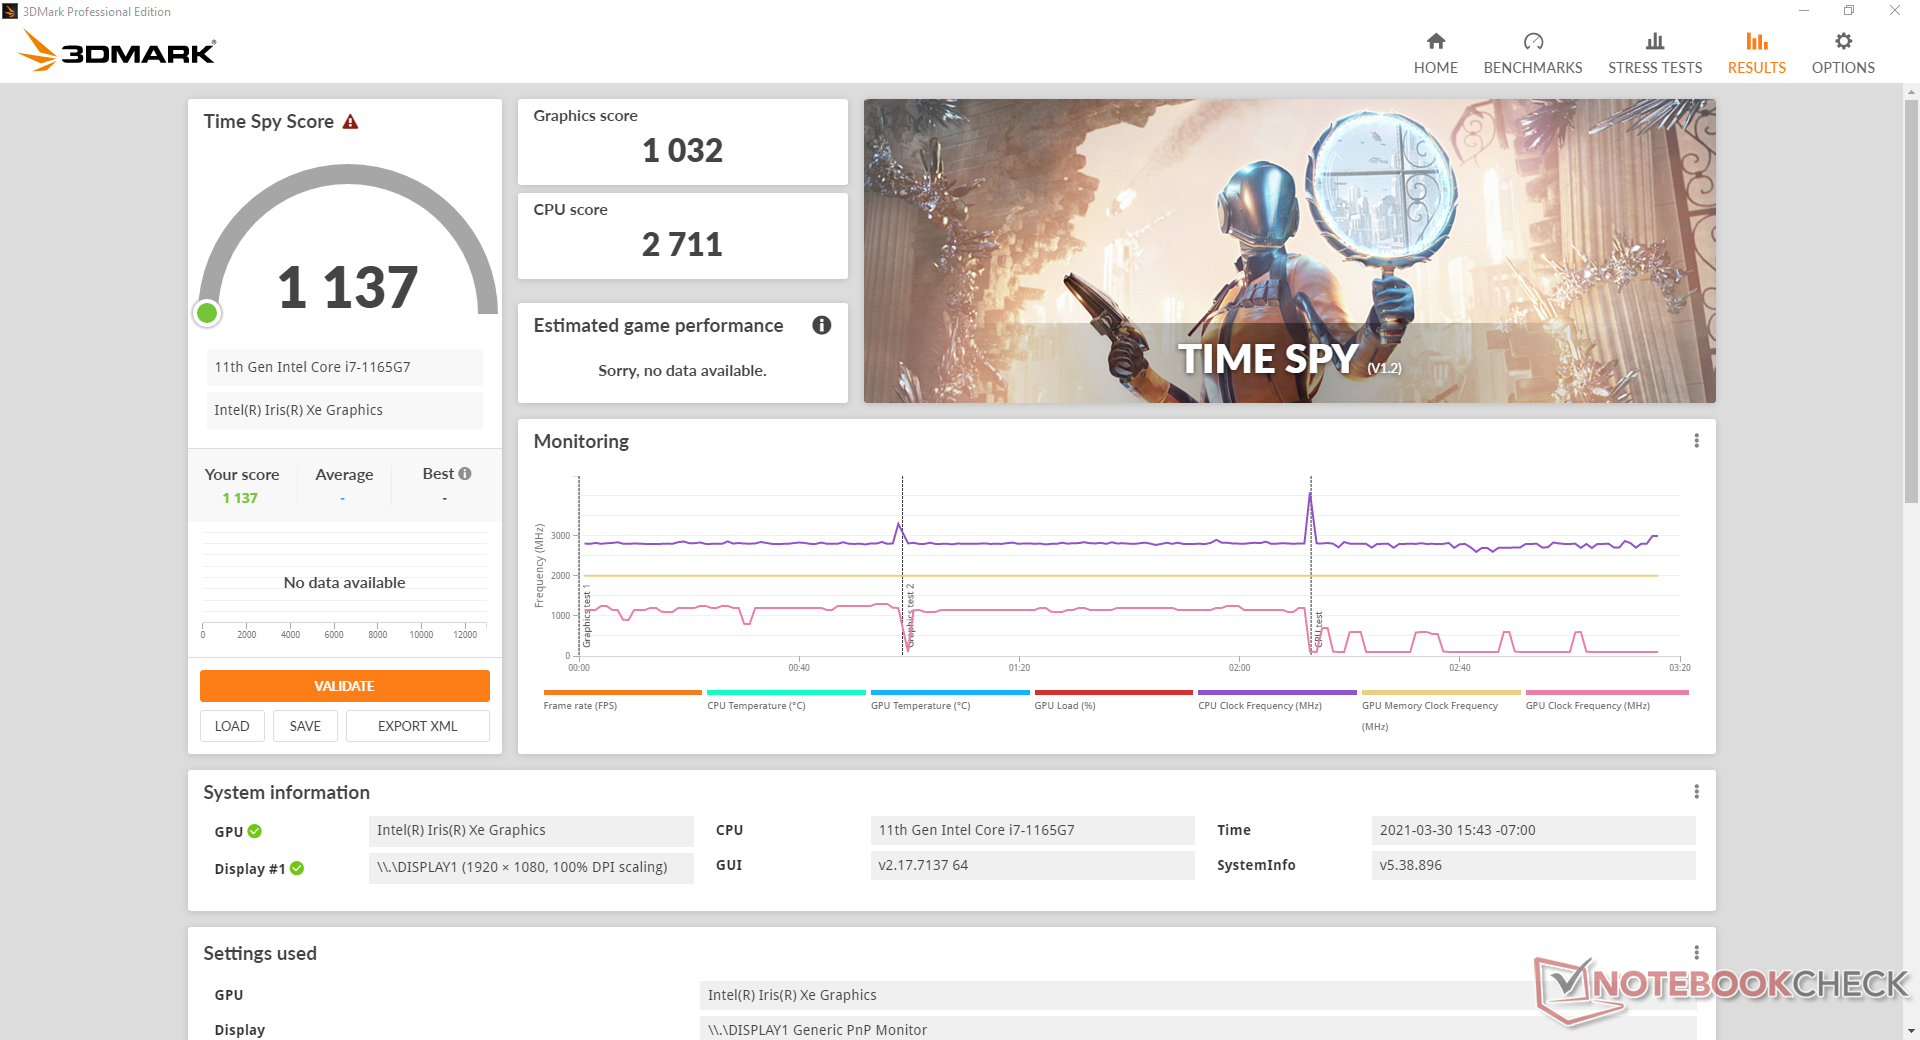
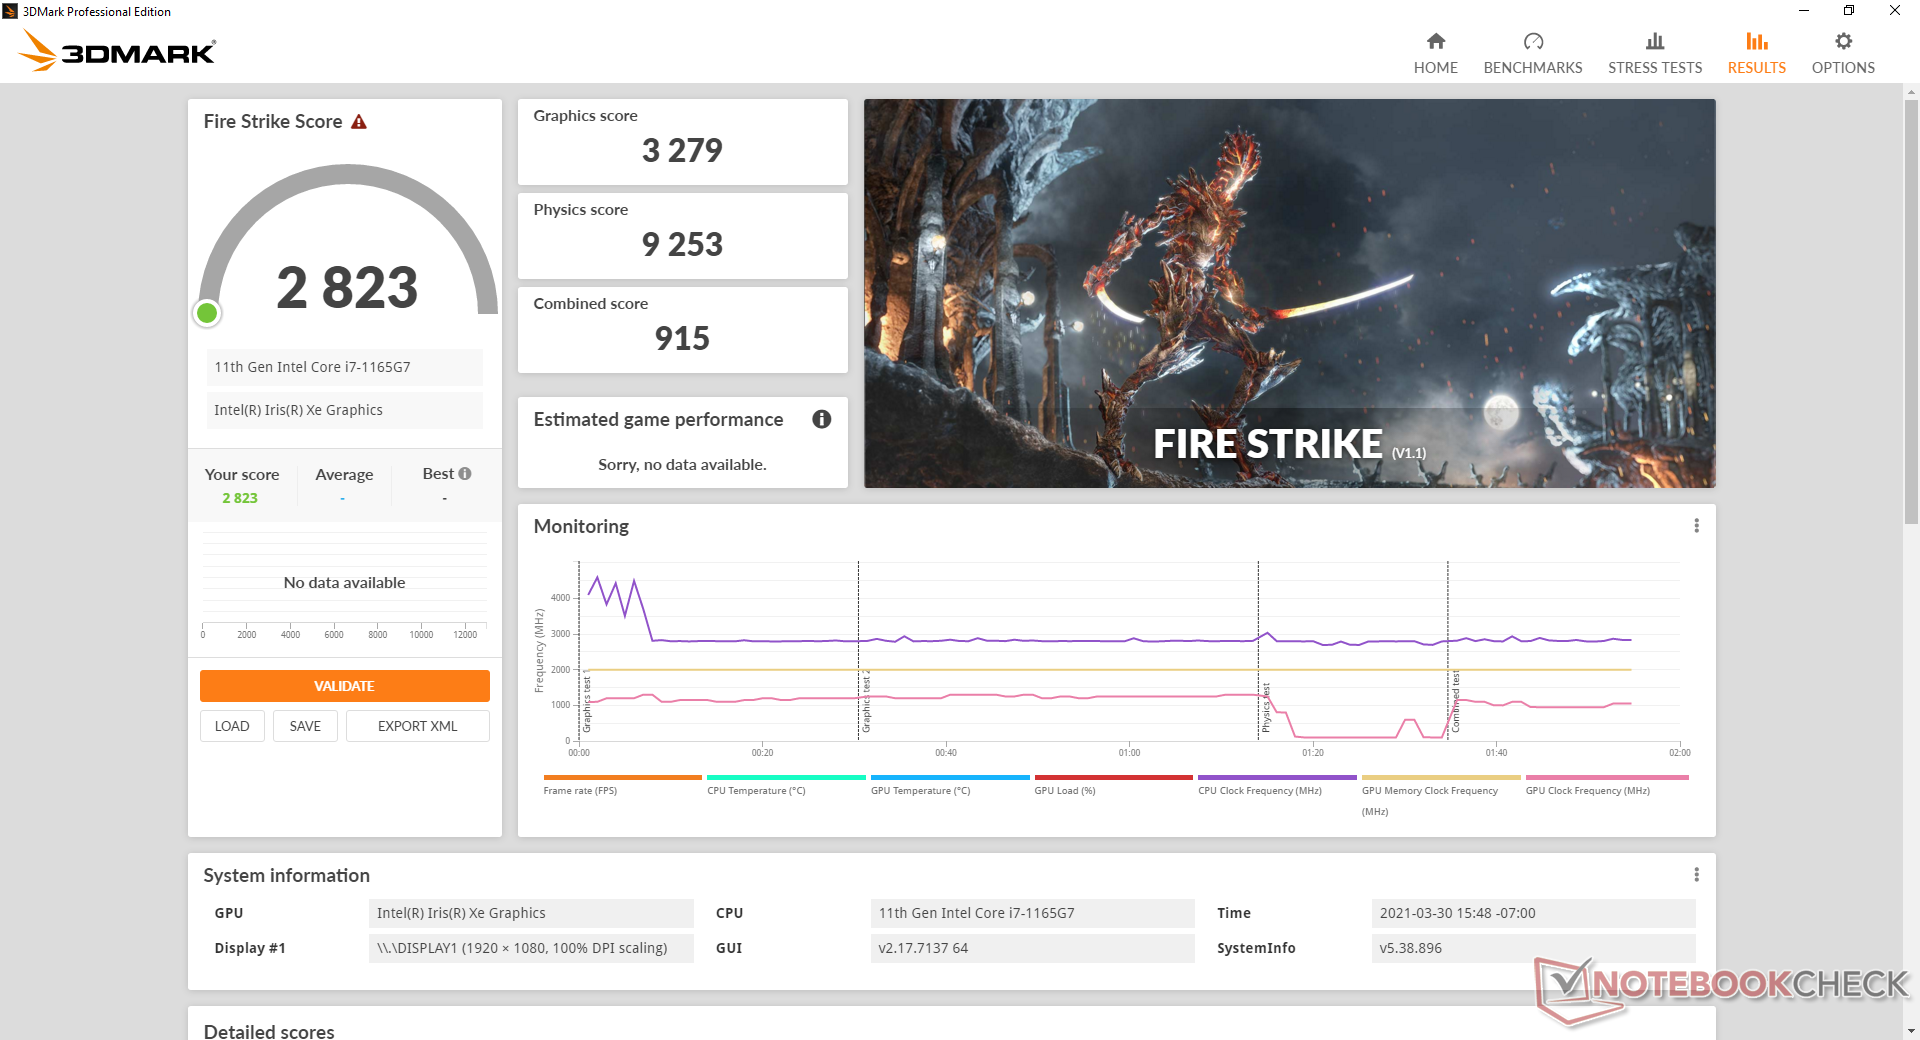
Graphics performance is underwhelming. 3DMark results are about 30 to 35 percent lower than the average laptop in our database equipped with the same Iris Xe GPU to be one of the slowest Iris Xe laptops yet. It's still a significant upgrade from the UHD Graphics series that most rugged laptops are stuck with, but it's disappointing nonetheless because we know that the GPU here is capable of much more. Scores would have likely been higher had our unit come with dual-channel RAM instead of single-channel RAM.
Upgrading to the optional GeForce GTX 1050 should net users an 80 percent boost in raw graphics power.
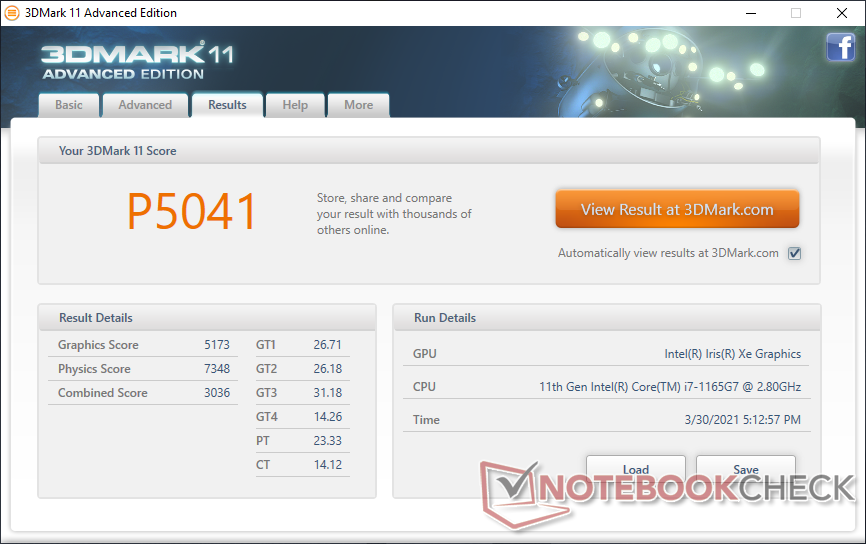
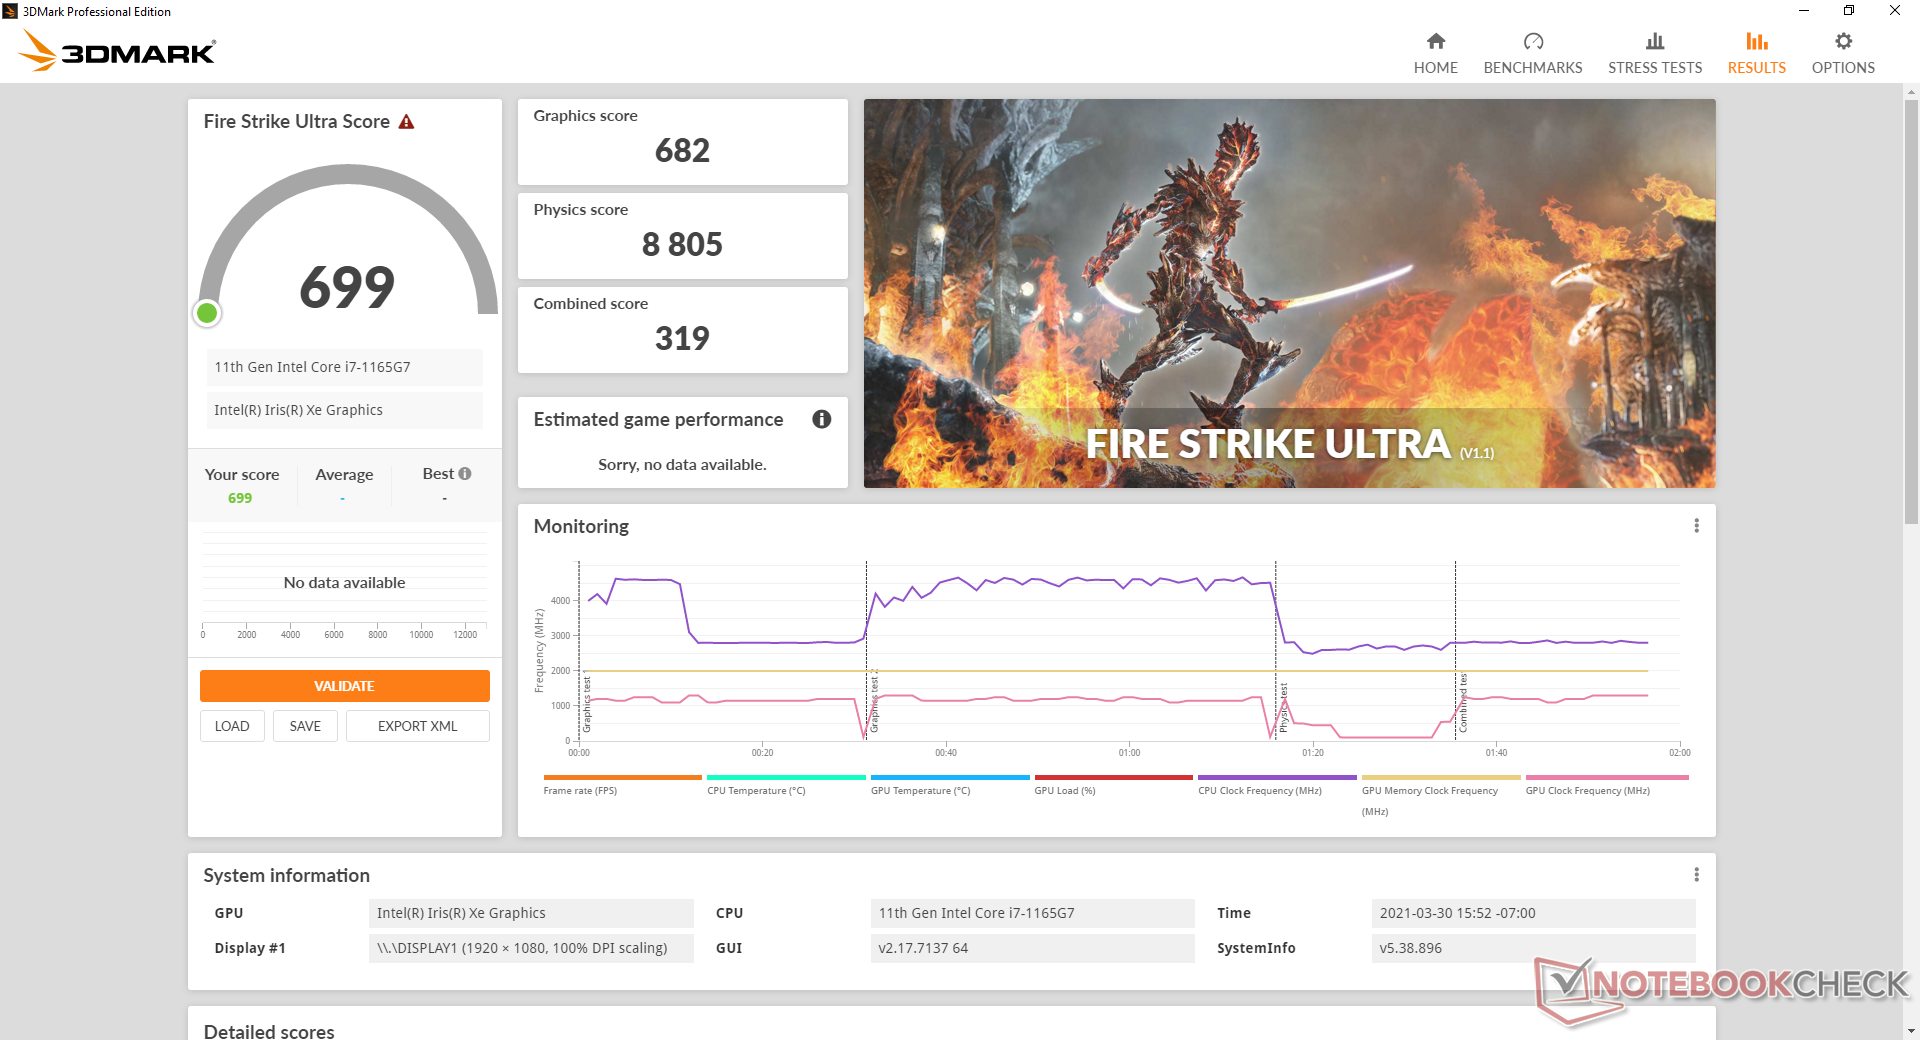
| 3DMark 11 Performance | 5041 points | |
| 3DMark Cloud Gate Standard Score | 13221 points | |
| 3DMark Fire Strike Score | 2823 points | |
| 3DMark Time Spy Score | 1137 points | |
Help | ||
| low | med. | high | ultra | |
|---|---|---|---|---|
| Dota 2 Reborn (2015) | 75.4 | 60 | 36.8 | 32.8 |
| Final Fantasy XV Benchmark (2018) | 23.8 | 13.4 | 9.86 | |
| X-Plane 11.11 (2018) | 37.4 | 28.8 | 26.2 |
Emissions
System Noise
Though fan noise is generally low, its behavior could have been better because it pulses more frequently than we would like. The fan would periodically jump between silent (25.2 dB(A)) and 34.5 dB(A) during low to low-medium loads. Setting the system to Power Saver mode may help reduce the pulsing.
| Durabook S14I Iris Xe G7 96EUs, i7-1165G7, UDinfo M2P M2P80DE512GBAEP | Durabook S15ABG2 UHD Graphics 620, i5-8265U, UDinfo HF3-25UB HF325UB256GBA2P | Panasonic Toughbook FZ-55 UHD Graphics 620, i5-8365U, Samsung SSD PM871b MZNLN256HAJQ | Dell Latitude 7424 Rugged Extreme Radeon RX 540, i7-8650U, SK Hynix PC401 512GB M.2 (HFS512GD9TNG) | Getac S410 UHD Graphics 620, i5-8550U, CUKUSA 1 TB SATA SSD Q0526A | Panasonic Toughbook CF-54G2999VM HD Graphics 620, i5-7300U, Seagate BarraCuda Compute 1TB ST1000LM048 | |
|---|---|---|---|---|---|---|
| Noise | -7% | -5% | -4% | -0% | -4% | |
| off / environment * (dB) | 25.2 | 29.3 -16% | 29 -15% | 28.6 -13% | 28.4 -13% | 28.3 -12% |
| Idle Minimum * (dB) | 25.2 | 29.3 -16% | 29 -15% | 28.6 -13% | 28.4 -13% | 28.8 -14% |
| Idle Average * (dB) | 25.2 | 29.3 -16% | 29.6 -17% | 28.6 -13% | 28.4 -13% | 28.8 -14% |
| Idle Maximum * (dB) | 34.5 | 29.3 15% | 30.5 12% | 28.6 17% | 28.4 18% | 29.1 16% |
| Load Average * (dB) | 34.5 | 35.5 -3% | 30.3 12% | 32.9 5% | 30.3 12% | 31.3 9% |
| Load Maximum * (dB) | 36.2 | 38 -5% | 39 -8% | 39 -8% | 33.3 8% | 40 -10% |
* ... smaller is better
Noise level
| Idle |
| 25.2 / 25.2 / 34.5 dB(A) |
| Load |
| 34.5 / 36.2 dB(A) |
 | ||
30 dB silent 40 dB(A) audible 50 dB(A) loud |
||
min: | ||
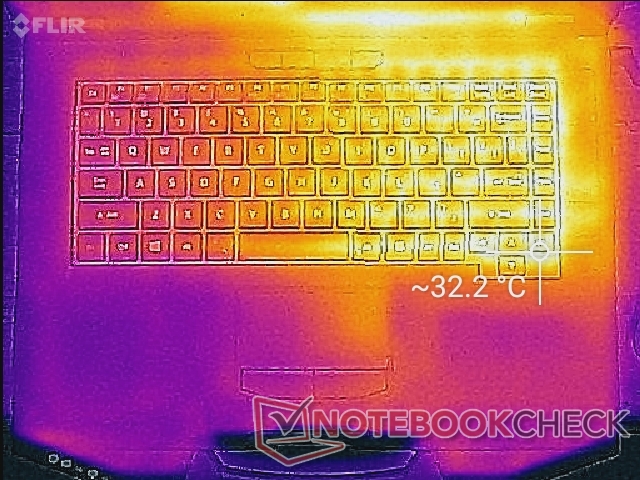
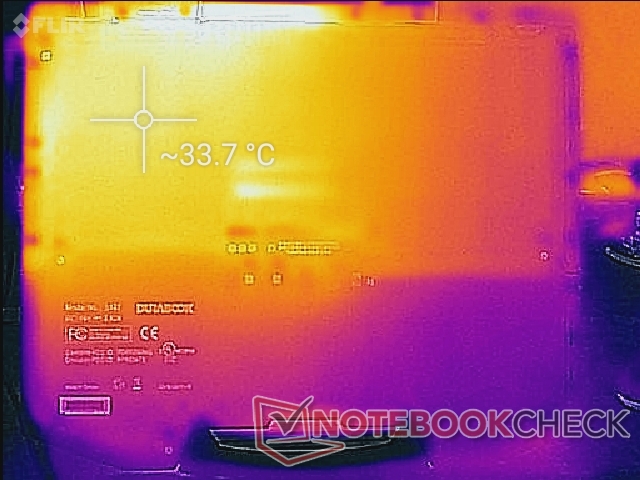
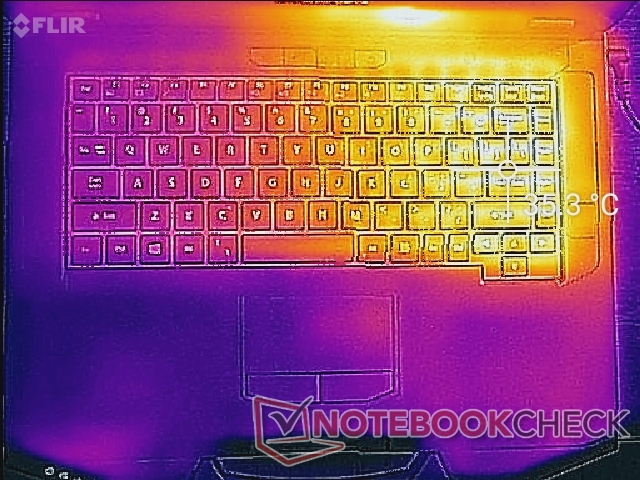
Temperature
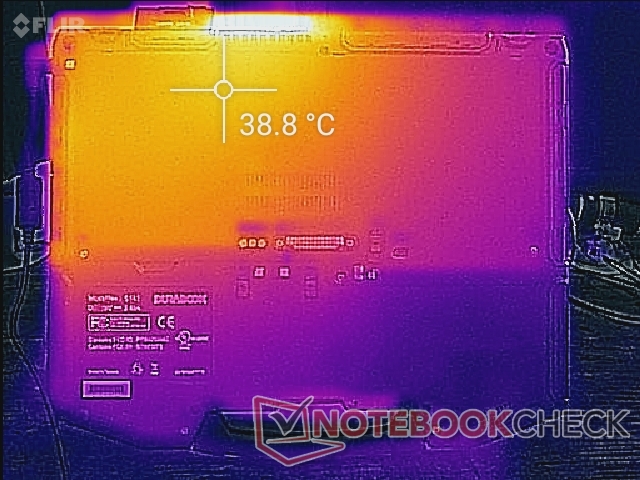
Surface temperatures are not an issue since the chassis is much thicker than most laptops with the same CPU. Hot spots can range from just 35 C to 38 C. The right half of the system will always be warmer than the left half because of how the cooling solution is positioned inside.
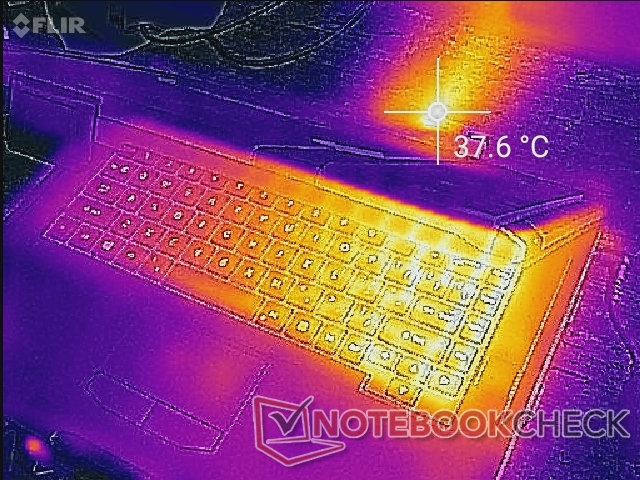
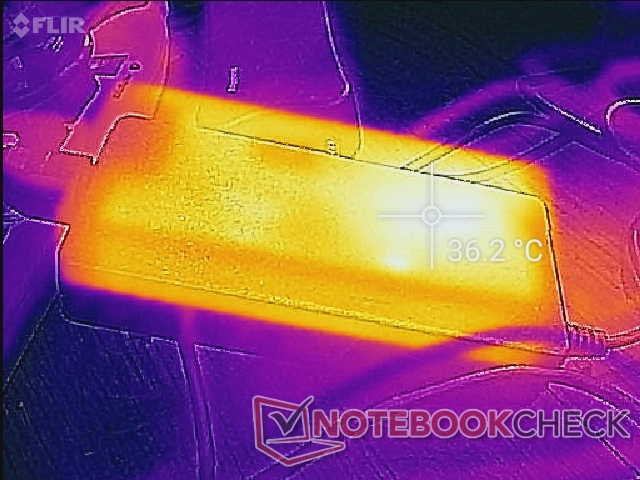
(+) The maximum temperature on the upper side is 36.4 °C / 98 F, compared to the average of 34.3 °C / 94 F, ranging from 21.2 to 62.5 °C for the class Office.
(+) The bottom heats up to a maximum of 38.6 °C / 101 F, compared to the average of 36.8 °C / 98 F
(+) In idle usage, the average temperature for the upper side is 30.1 °C / 86 F, compared to the device average of 29.5 °C / 85 F.
(+) The palmrests and touchpad are cooler than skin temperature with a maximum of 29.6 °C / 85.3 F and are therefore cool to the touch.
(-) The average temperature of the palmrest area of similar devices was 27.5 °C / 81.5 F (-2.1 °C / -3.8 F).
Stress Test
The relatively poor CPU performance can be observed when running Prime95. Clock rates would spike to 3.9 GHz for only the first few seconds until hitting a core temperature of 82 C. Thereafter, clock rates would drop and stabilize in the 1.8 to 1.9 GHz range in order to maintain a cooler core temperature of 63 C. Typical consumer laptops with the same Core i7-1165G7 CPU like the Dell XPS 13 or Razer Book 13 are able to sustain higher clock rates for faster processor performance.
Running on battery power will limit graphics performance. A 3DMark 11 test on batteries would return Physics and Graphics scores of 7529 and 3245 points, respectively, compared to 7348 and 5173 points when on mains.
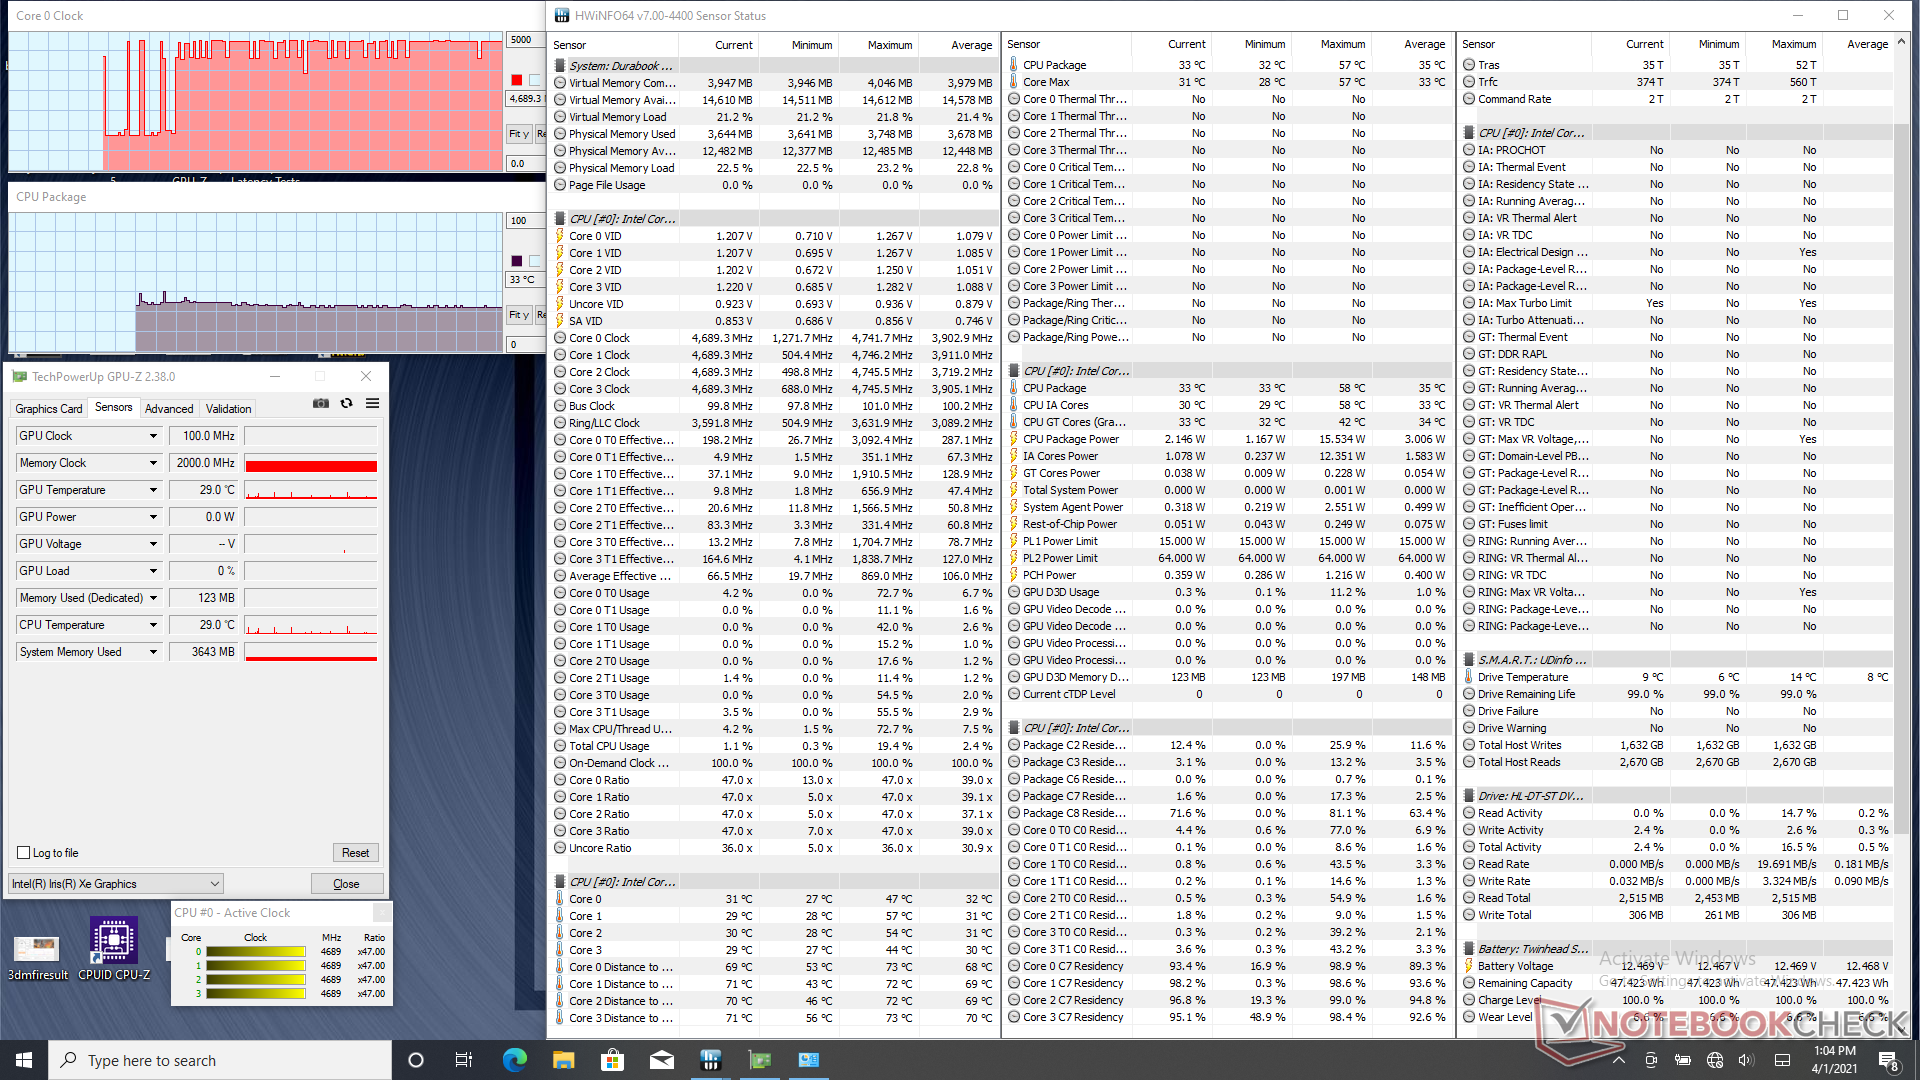
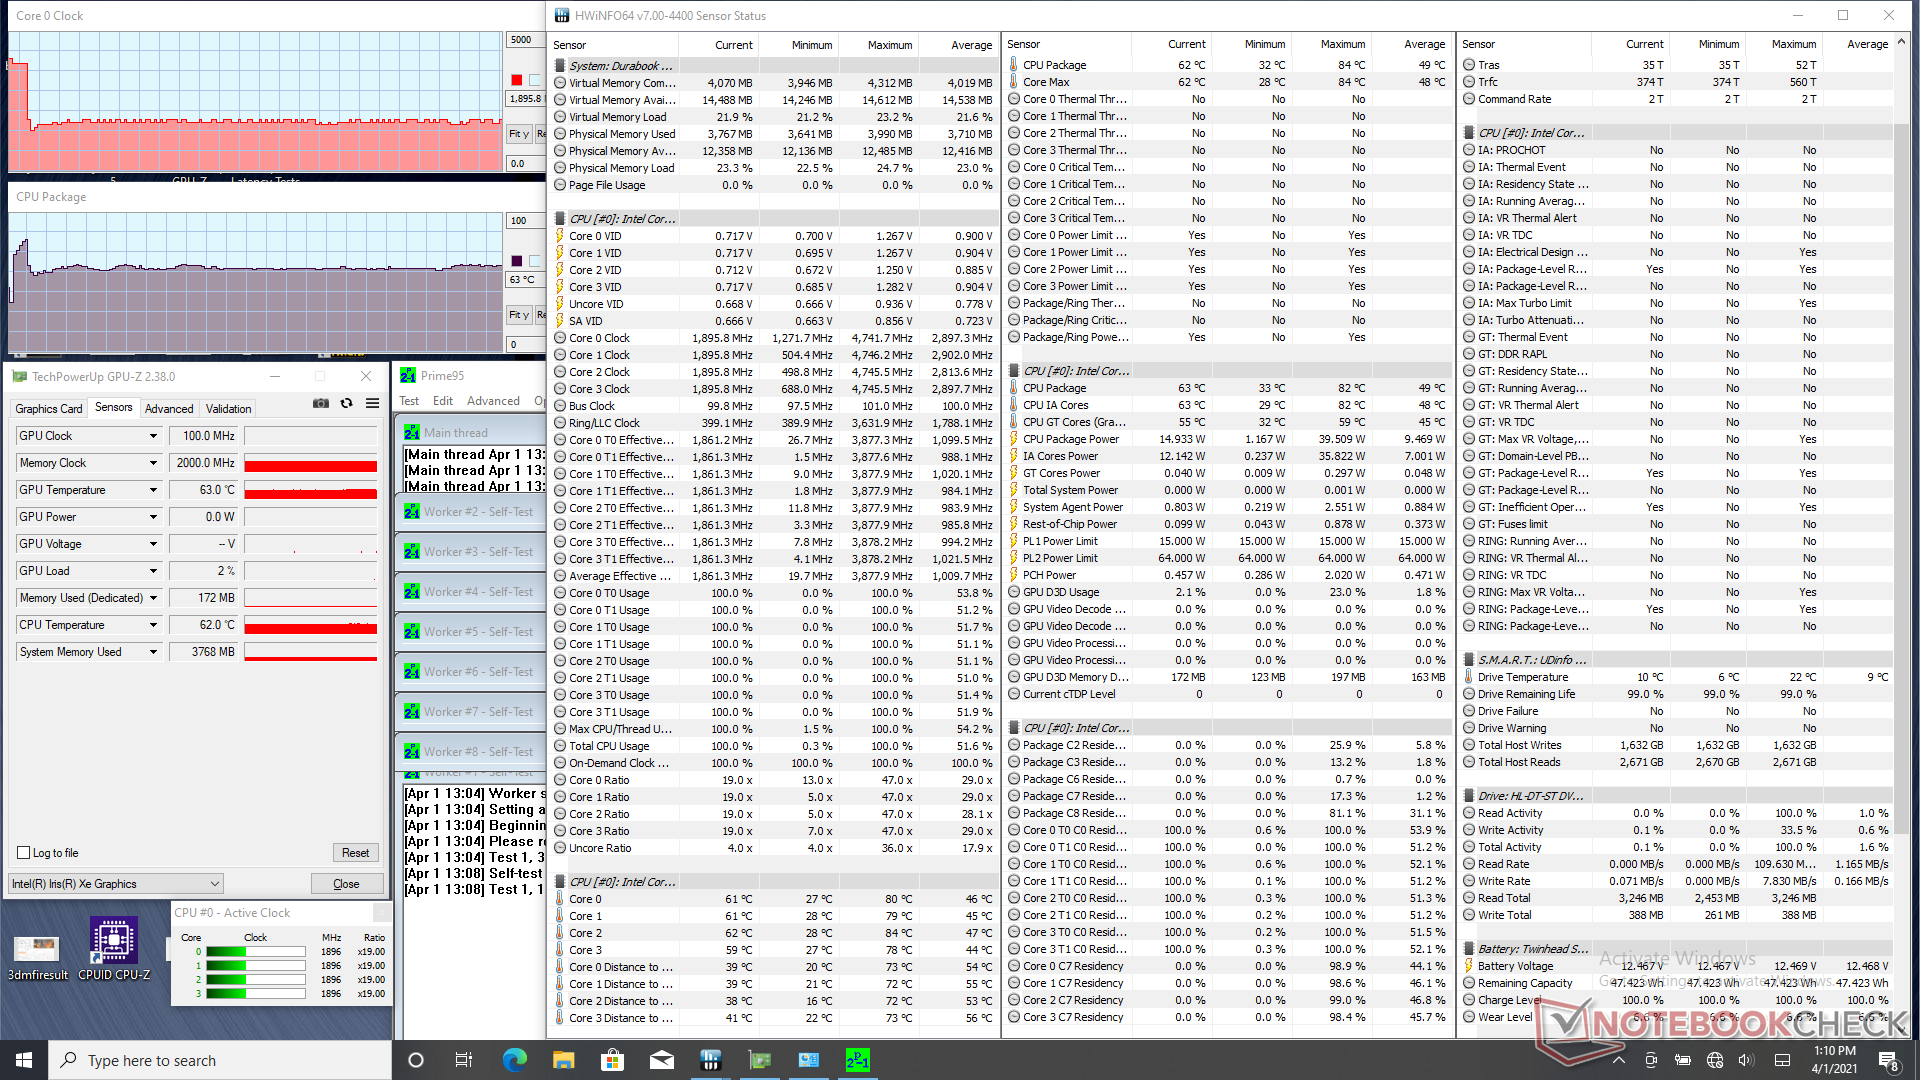
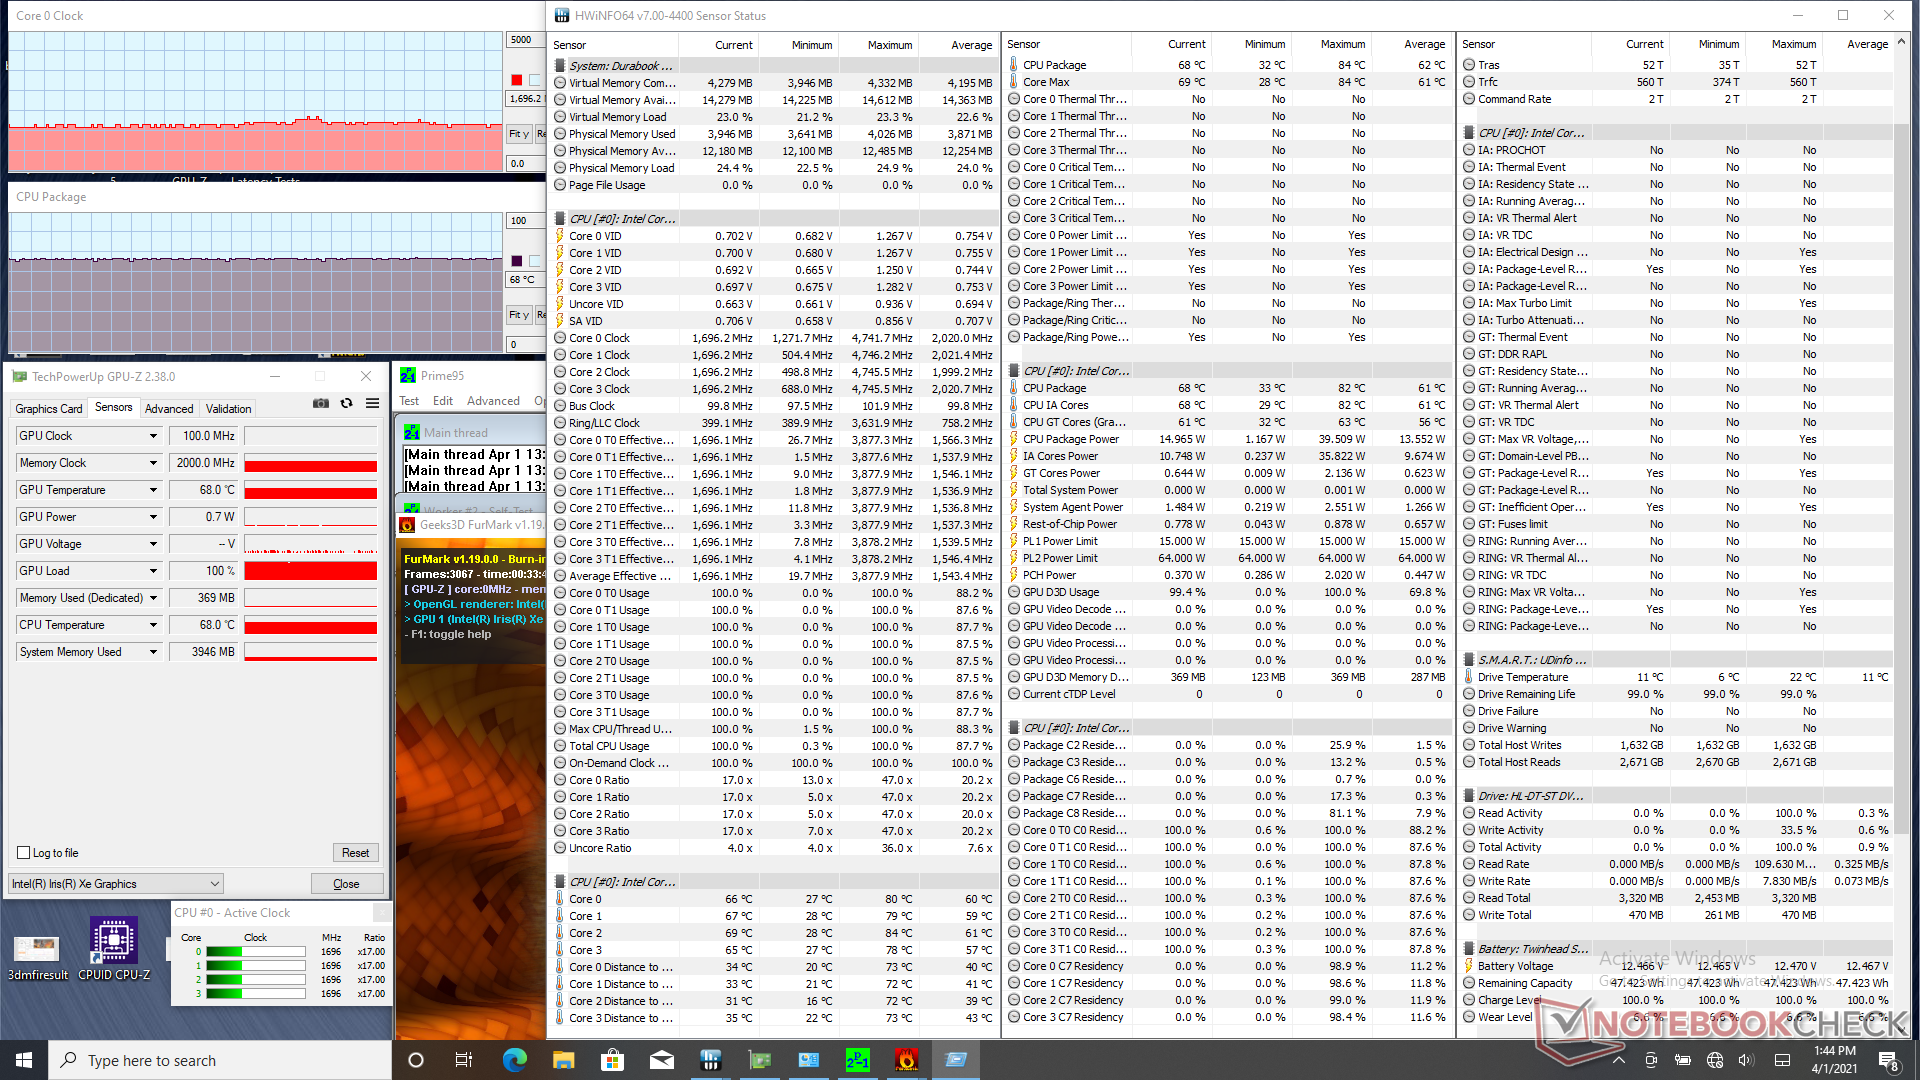
| CPU Clock (GHz) | GPU Clock (MHz) | Average CPU Temperature (°C) | |
| System Idle | -- | -- | 33 |
| Prime95 Stress | 1.8 - 1.9 | -- | 63 |
| Prime95 + FurMark Stress | 1.5 - 1.7 | -- | 68 |
Speakers

Durabook S14I audio analysis
(+) | speakers can play relatively loud (82.9 dB)
Bass 100 - 315 Hz
(-) | nearly no bass - on average 37.9% lower than median
(±) | linearity of bass is average (12% delta to prev. frequency)
Mids 400 - 2000 Hz
(±) | reduced mids - on average 11.4% lower than median
(±) | linearity of mids is average (11.8% delta to prev. frequency)
Highs 2 - 16 kHz
(±) | higher highs - on average 6.2% higher than median
(+) | highs are linear (6.2% delta to prev. frequency)
Overall 100 - 16.000 Hz
(-) | overall sound is not linear (31.3% difference to median)
Compared to same class
» 93% of all tested devices in this class were better, 2% similar, 5% worse
» The best had a delta of 7%, average was 21%, worst was 53%
Compared to all devices tested
» 90% of all tested devices were better, 2% similar, 8% worse
» The best had a delta of 4%, average was 23%, worst was 134%
Apple MacBook 12 (Early 2016) 1.1 GHz audio analysis
(+) | speakers can play relatively loud (83.6 dB)
Bass 100 - 315 Hz
(±) | reduced bass - on average 11.3% lower than median
(±) | linearity of bass is average (14.2% delta to prev. frequency)
Mids 400 - 2000 Hz
(+) | balanced mids - only 2.4% away from median
(+) | mids are linear (5.5% delta to prev. frequency)
Highs 2 - 16 kHz
(+) | balanced highs - only 2% away from median
(+) | highs are linear (4.5% delta to prev. frequency)
Overall 100 - 16.000 Hz
(+) | overall sound is linear (10.2% difference to median)
Compared to same class
» 7% of all tested devices in this class were better, 2% similar, 90% worse
» The best had a delta of 5%, average was 18%, worst was 53%
Compared to all devices tested
» 5% of all tested devices were better, 1% similar, 94% worse
» The best had a delta of 4%, average was 23%, worst was 134%
Energy Management
Power Consumption
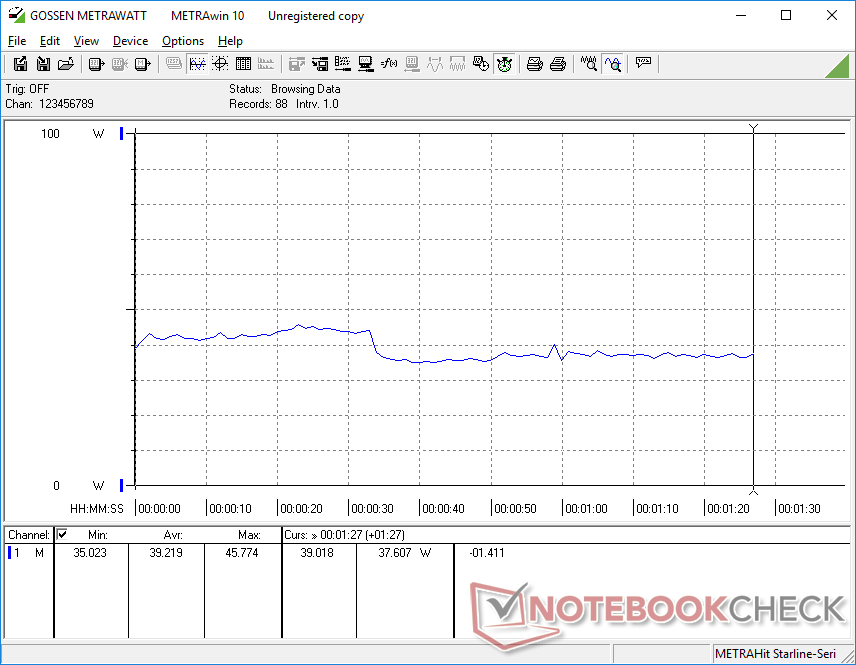
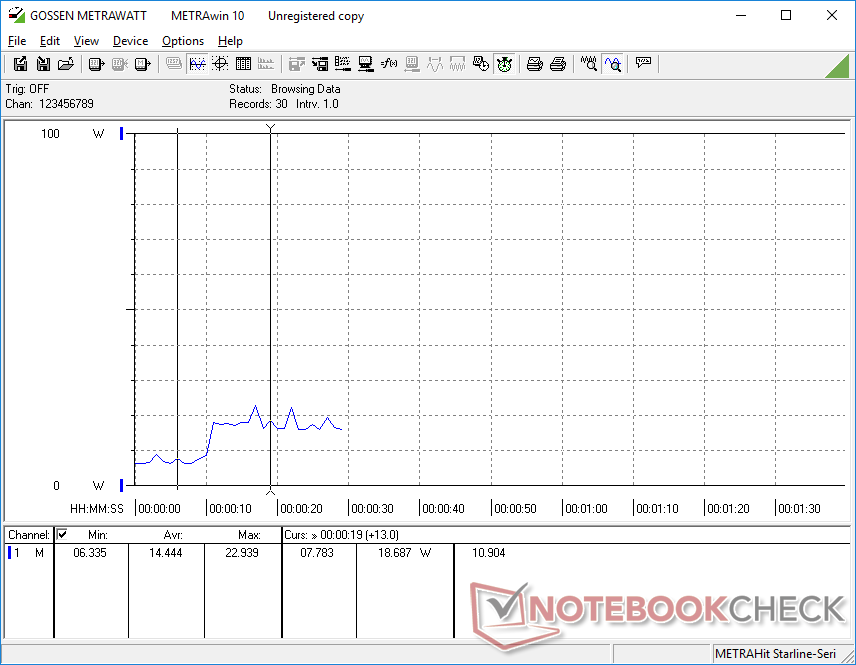
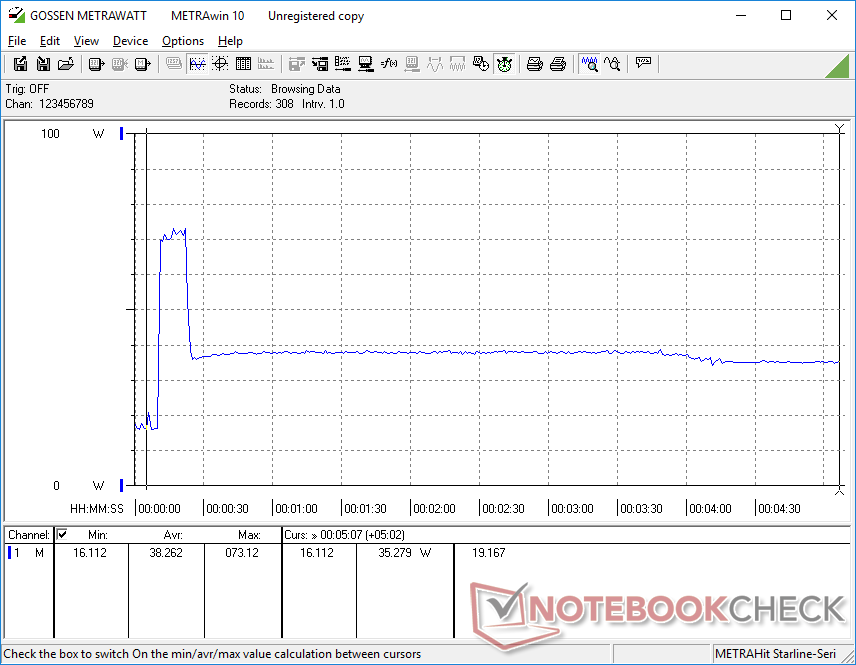
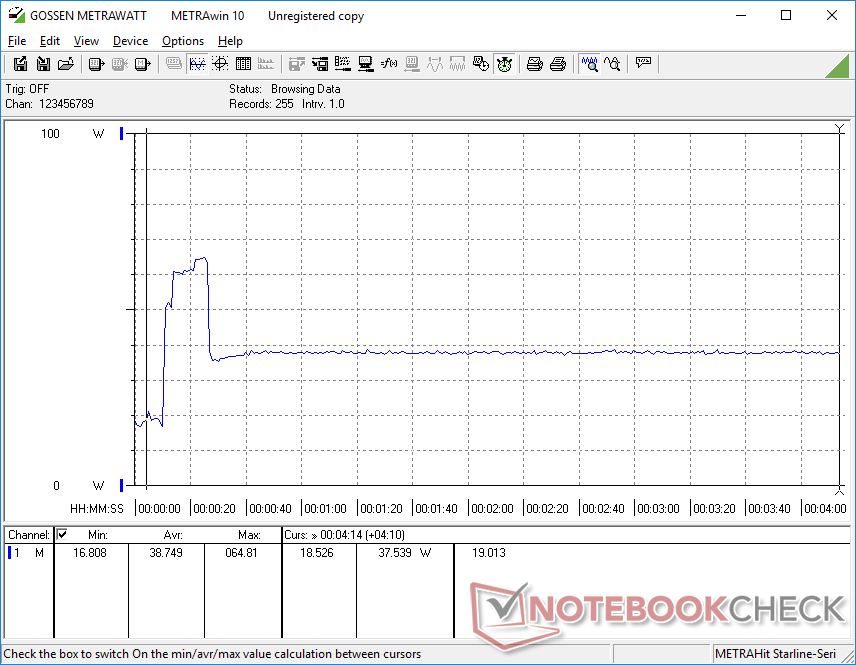
Idling on desktop consumes between 6 W and 17 W to be more than most other Core U-series-powered Ultrabooks due to the extra-bright display on the Durabook. Higher loads like 3DMark will demand about 39 W.
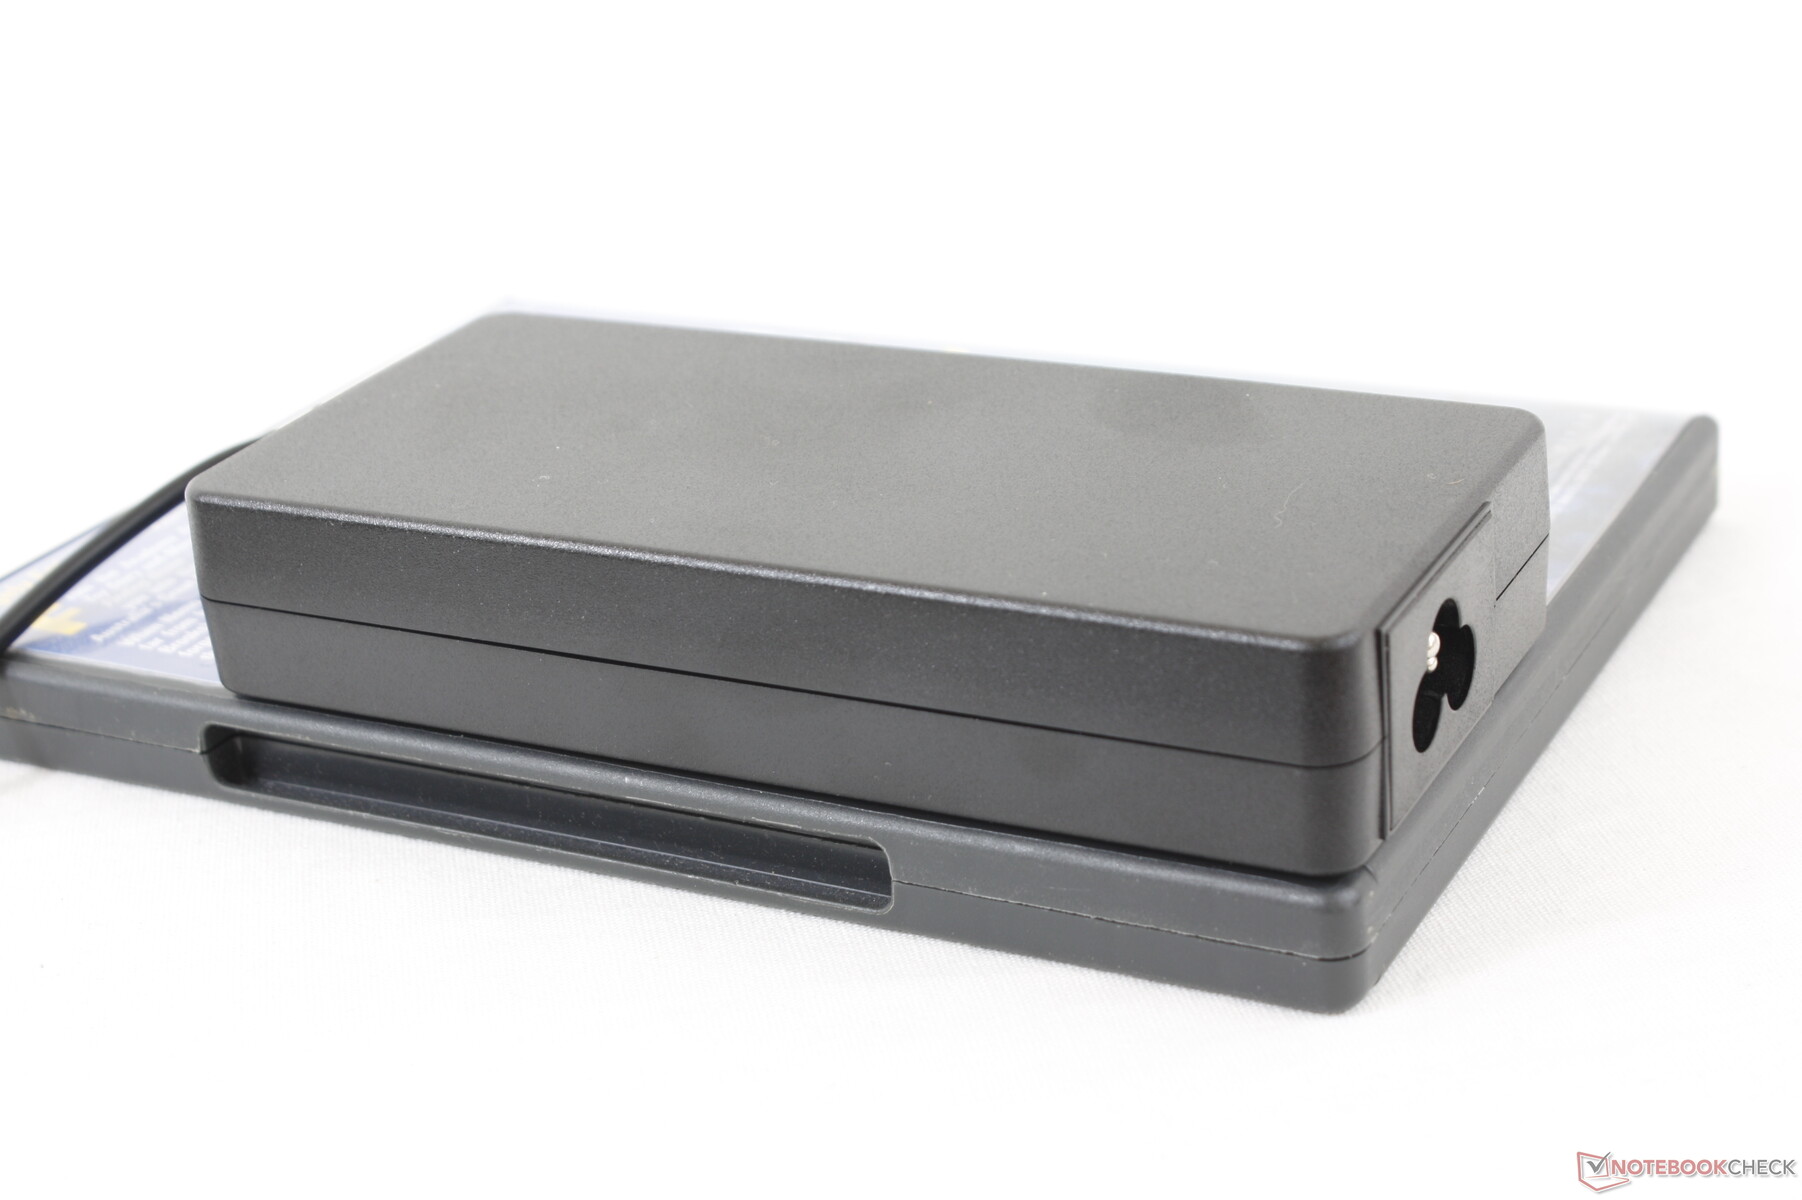
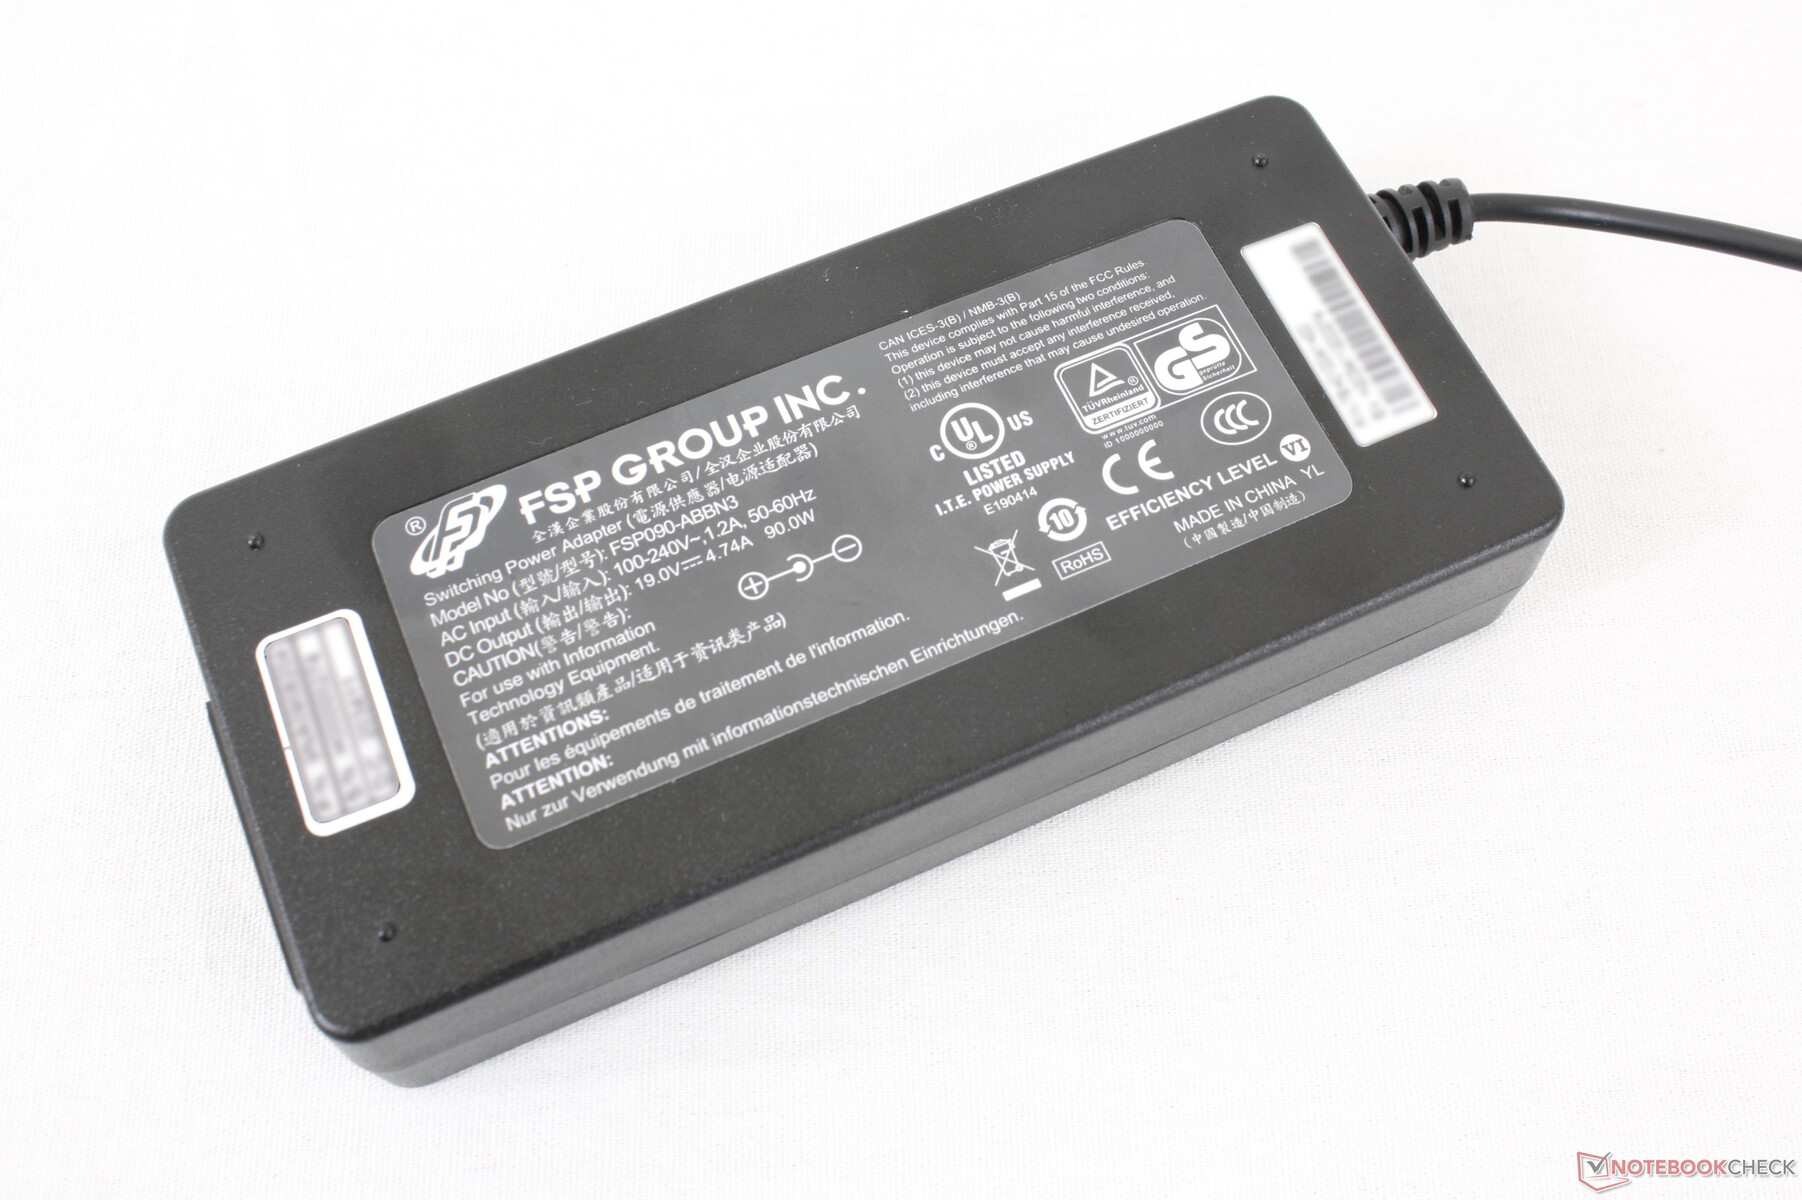
We're able to record a maximum consumption of 73.1 W from the small-medium (~14 x 6.5 x 2.5 cm) 90 W AC adapter when running Prime95. This maximum is very short lived as shown by our graphs below even when on High Performance mode.
| Off / Standby | |
| Idle | |
| Load |
|
Key:
min: | |
| Durabook S14I i7-1165G7, Iris Xe G7 96EUs, UDinfo M2P M2P80DE512GBAEP, TN, 1920x1080, 14" | Durabook S15ABG2 i5-8265U, UHD Graphics 620, UDinfo HF3-25UB HF325UB256GBA2P, TN LED, 1920x1080, 15.6" | Panasonic Toughbook FZ-55 i5-8365U, UHD Graphics 620, Samsung SSD PM871b MZNLN256HAJQ, IPS, 1920x1080, 14" | Dell Latitude 7424 Rugged Extreme i7-8650U, Radeon RX 540, SK Hynix PC401 512GB M.2 (HFS512GD9TNG), IPS, 1920x1080, 14" | Getac S410 i5-8550U, UHD Graphics 620, CUKUSA 1 TB SATA SSD Q0526A, TN PED, 1366x768, 14" | Panasonic Toughbook CF-54G2999VM i5-7300U, HD Graphics 620, Seagate BarraCuda Compute 1TB ST1000LM048, TN LED, 1366x768, 14" | |
|---|---|---|---|---|---|---|
| Power Consumption | 33% | 25% | -19% | 38% | 43% | |
| Idle Minimum * (Watt) | 6.8 | 3.5 49% | 3.7 46% | 6.5 4% | 5.6 18% | 4.4 35% |
| Idle Average * (Watt) | 16.4 | 7.9 52% | 9.6 41% | 15.1 8% | 7.9 52% | 6.3 62% |
| Idle Maximum * (Watt) | 16.9 | 9 47% | 10.4 38% | 16.1 5% | 8.4 50% | 6.5 62% |
| Load Average * (Watt) | 39.2 | 39.8 -2% | 40 -2% | 70.5 -80% | 32.8 16% | 36.3 7% |
| Load Maximum * (Watt) | 73.1 | 59.8 18% | 71.9 2% | 95.2 -30% | 34.3 53% | 38.3 48% |
| Witcher 3 ultra * (Watt) | 68.1 |
* ... smaller is better
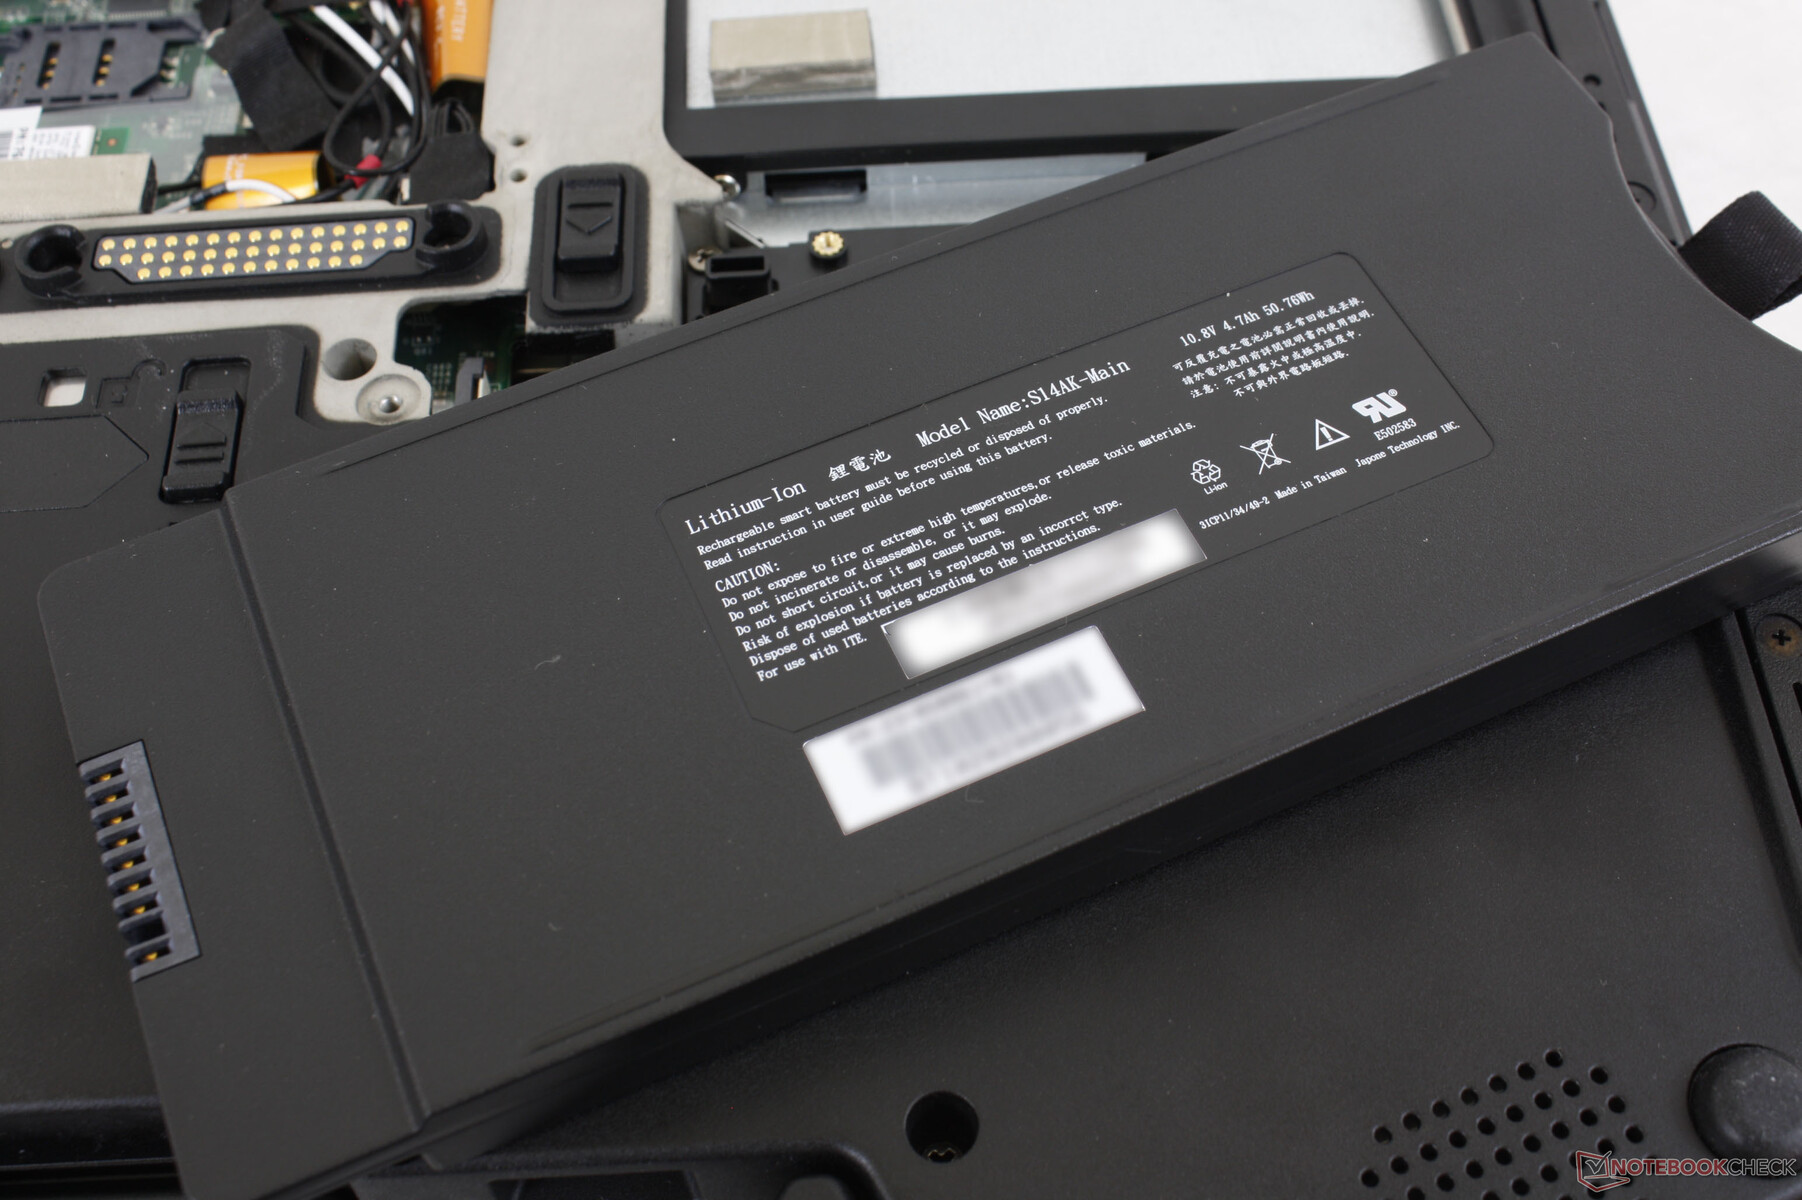
Battery Life
Expect around 5.5 hours of real-world WLAN use at 150 nits brightness from the main 50 Wh battery. Secondary battery options are available to extend runtimes.
Charging the main battery from empty to full capacity takes about 1.5 hours with the included proprietary AC adapter. Users can also recharge the laptop via USB-C.
| Durabook S14I i7-1165G7, Iris Xe G7 96EUs, 50 Wh | Durabook S15ABG2 i5-8265U, UHD Graphics 620, 56 Wh | Panasonic Toughbook FZ-55 i5-8365U, UHD Graphics 620, 71 Wh | Dell Latitude 7424 Rugged Extreme i7-8650U, Radeon RX 540, 102 Wh | Getac S410 i5-8550U, UHD Graphics 620, 46.6 Wh | Panasonic Toughbook CF-54G2999VM i5-7300U, HD Graphics 620, 33 Wh | |
|---|---|---|---|---|---|---|
| Battery runtime | 25% | 235% | 113% | -5% | 7% | |
| WiFi v1.3 (h) | 5.5 | 6.9 25% | 18.4 235% | 11.7 113% | 5.2 -5% | 5.9 7% |
| Load (h) | 2.7 |
Pros
Cons
Verdict
Rugged laptops are usually behind the latest Ultrabooks in performance and features, but the Durabook S14I brings its family up to speed with luxuries like Wi-Fi 6, USB-C, NVMe, and the high performance-per-watt of Intel Tiger Lake. If you know you can exploit these features, then the S14I should be a solid buy over other 14-inch rugged models.
A feature-heavy PC that isn't afraid to be heavier for stronger impressions.
There are a handful of changes we'd like to see on future revisions. For one, PWM should be eliminated to reduce eyesore for those who may be sensitive to flickering. The touchpad is too small and finicky and the port coverings don't pop open very easily. The SD card reader is slow and an IPS display would go a long way to improving image quality and upping contrast when outdoors.
Price and availability
Prices vary considerably depending on configuration. Durabook offers quotes on request via the official S14I product page.
Price comparison
