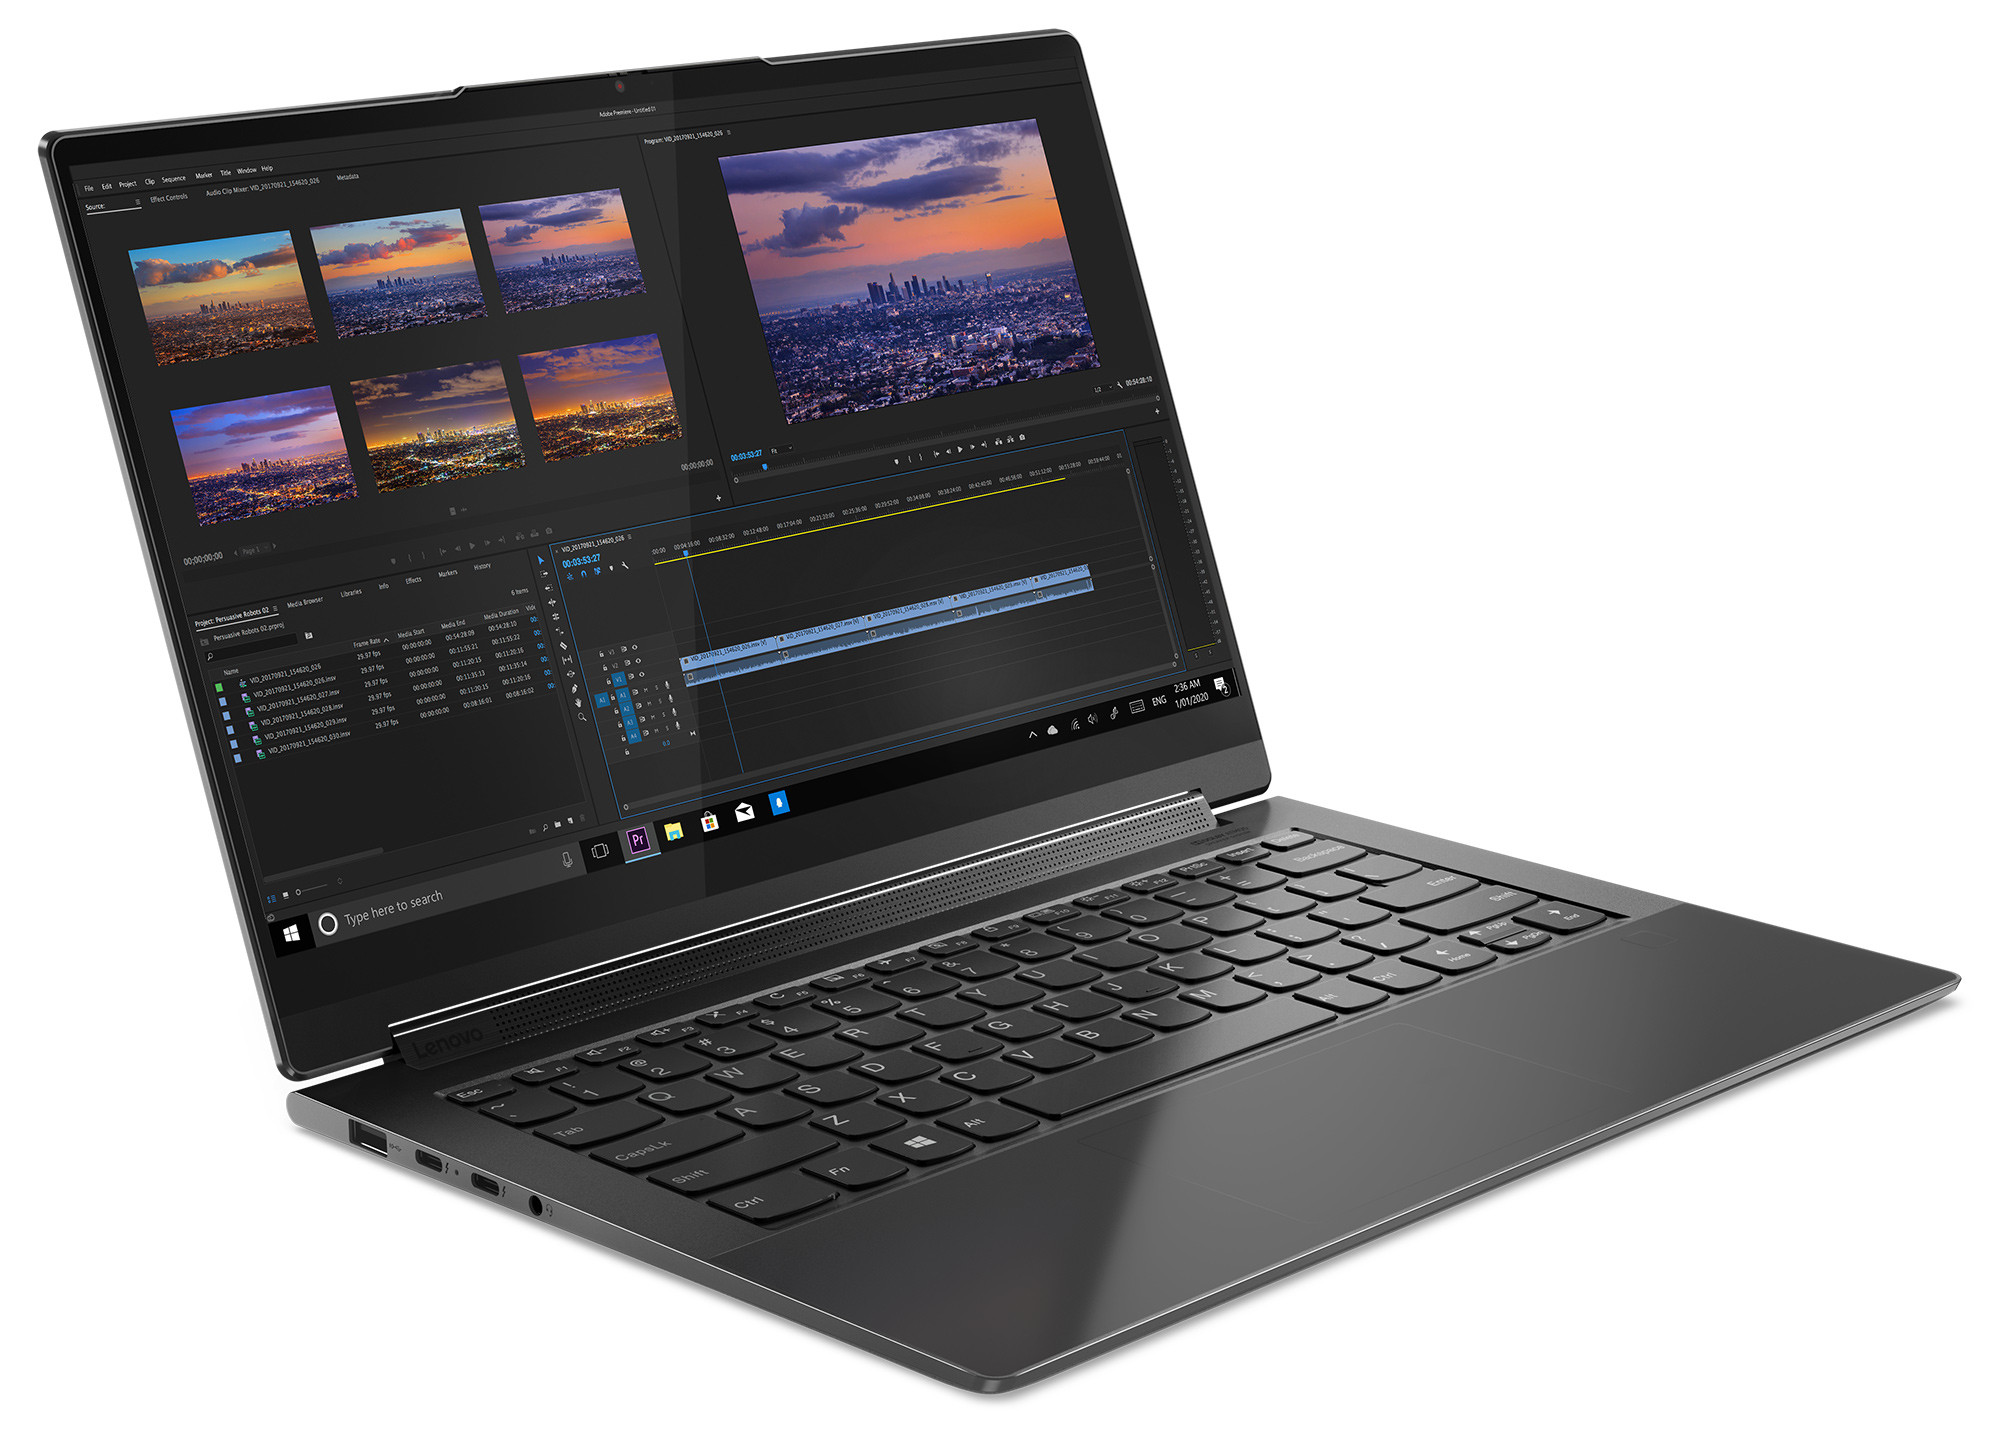
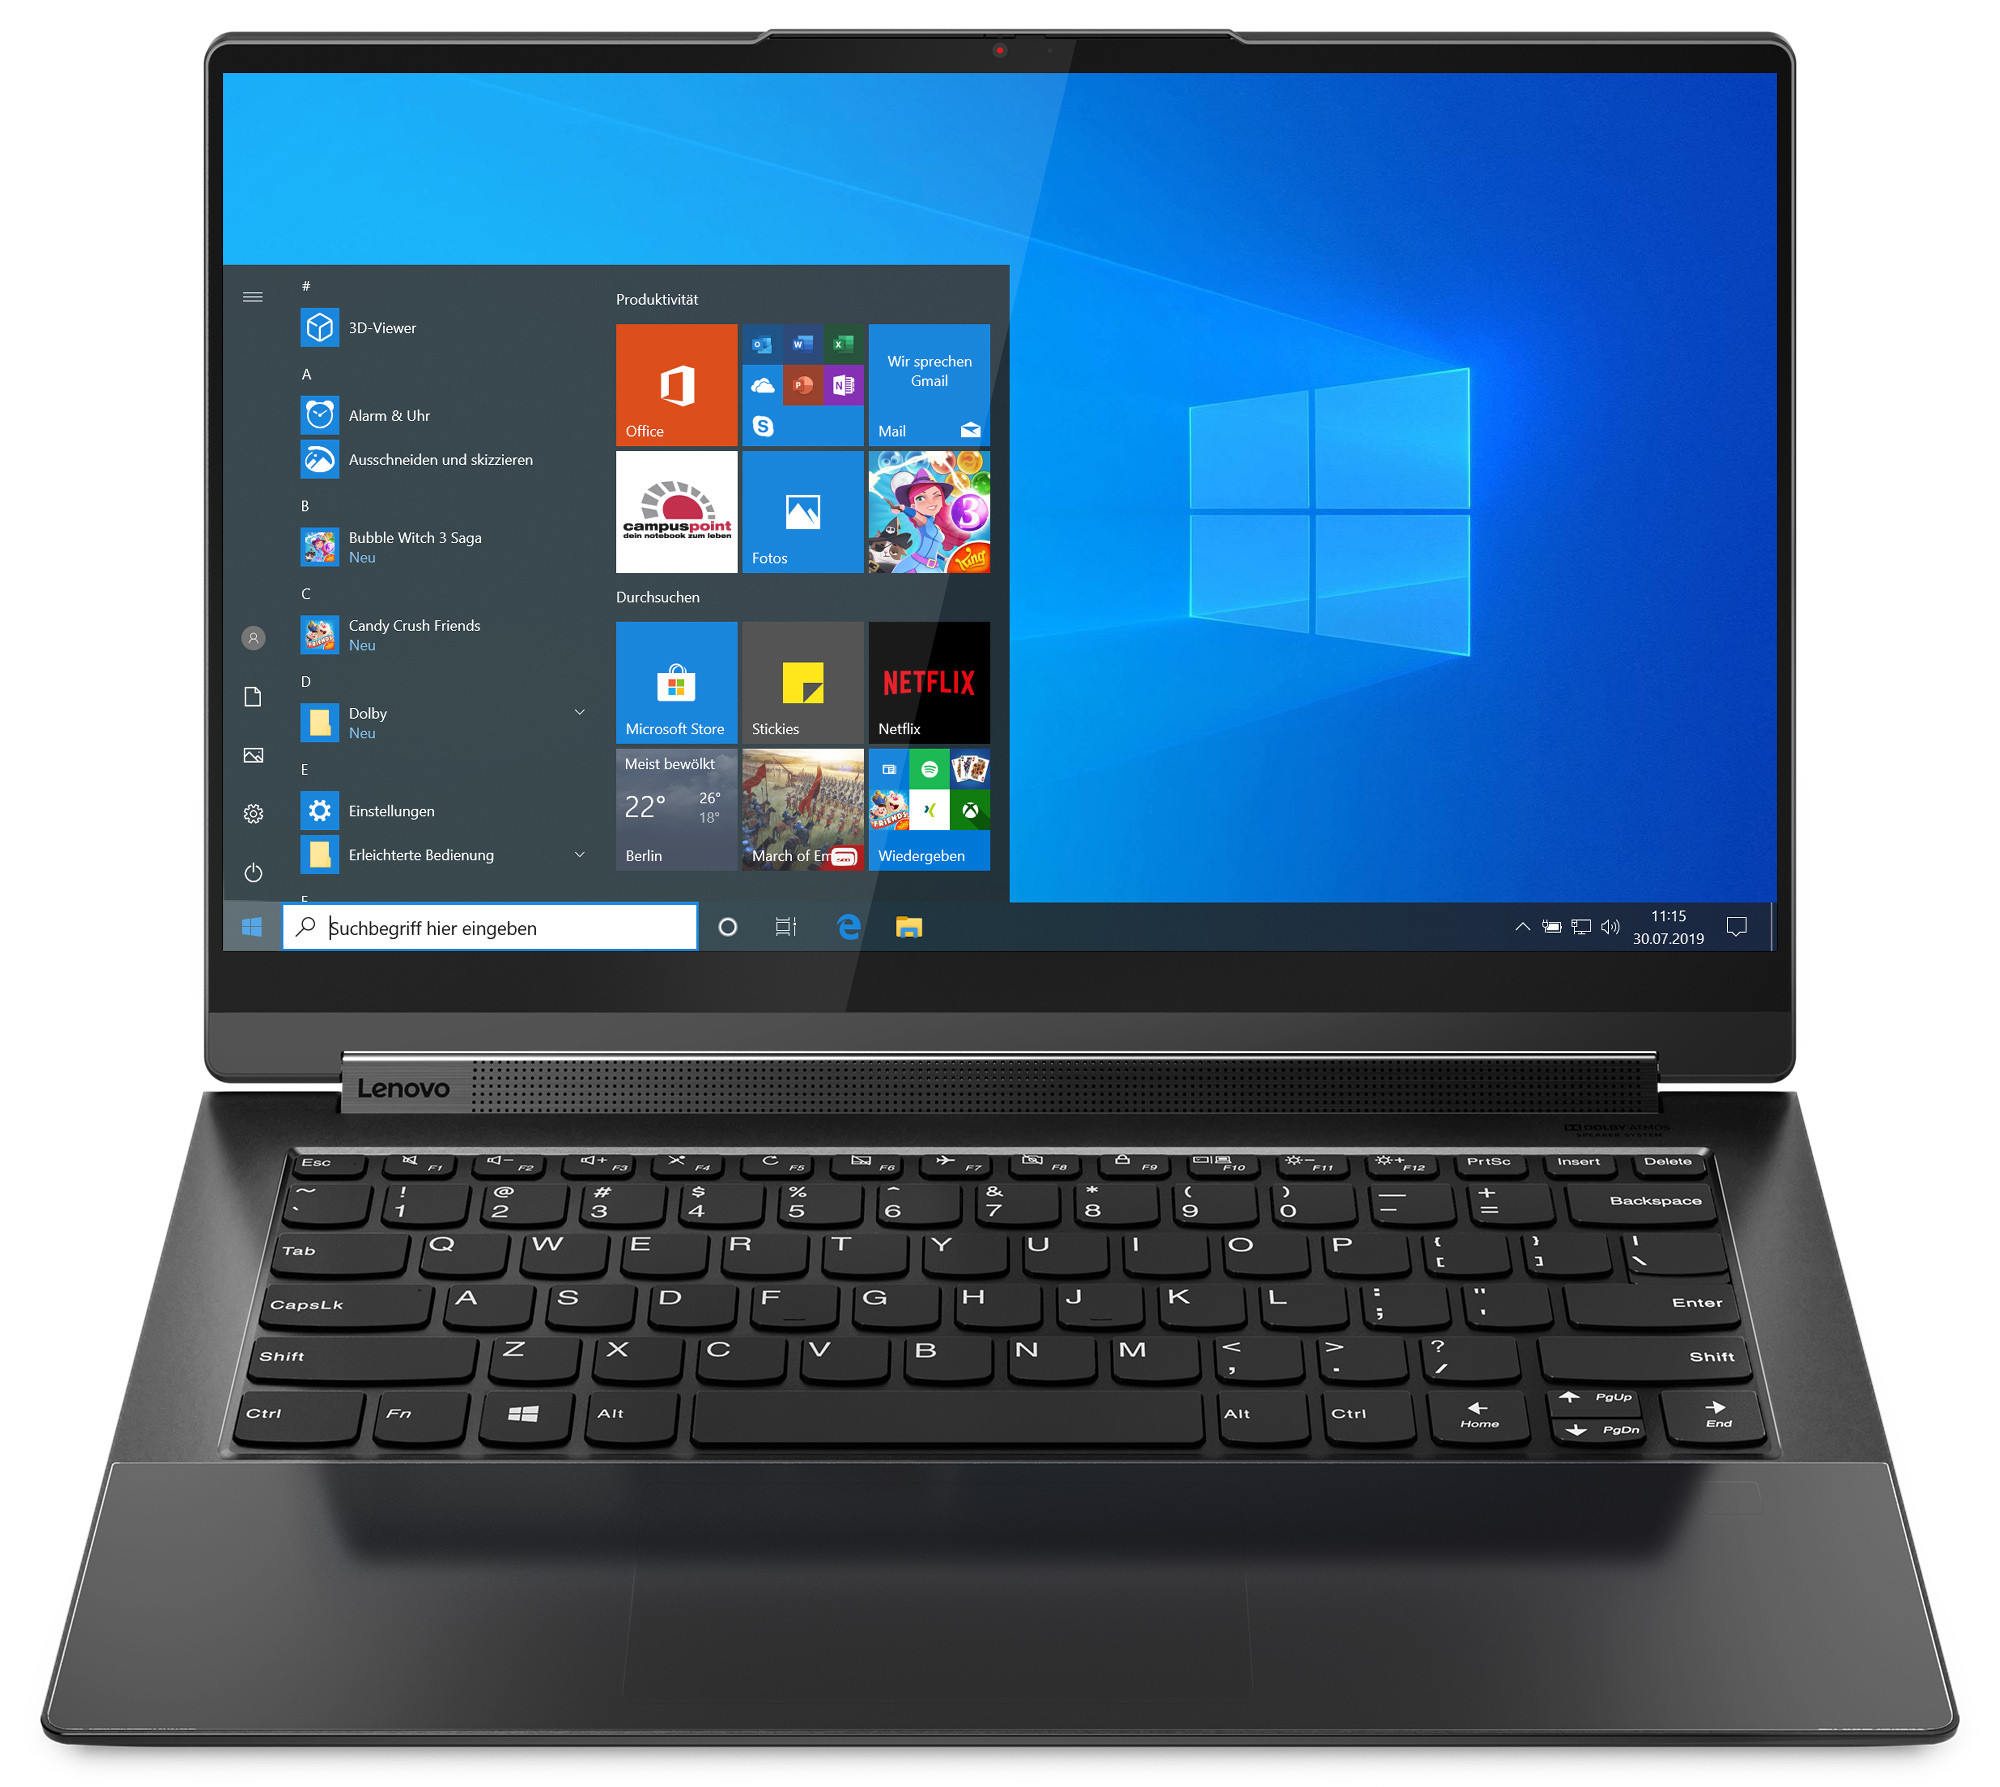
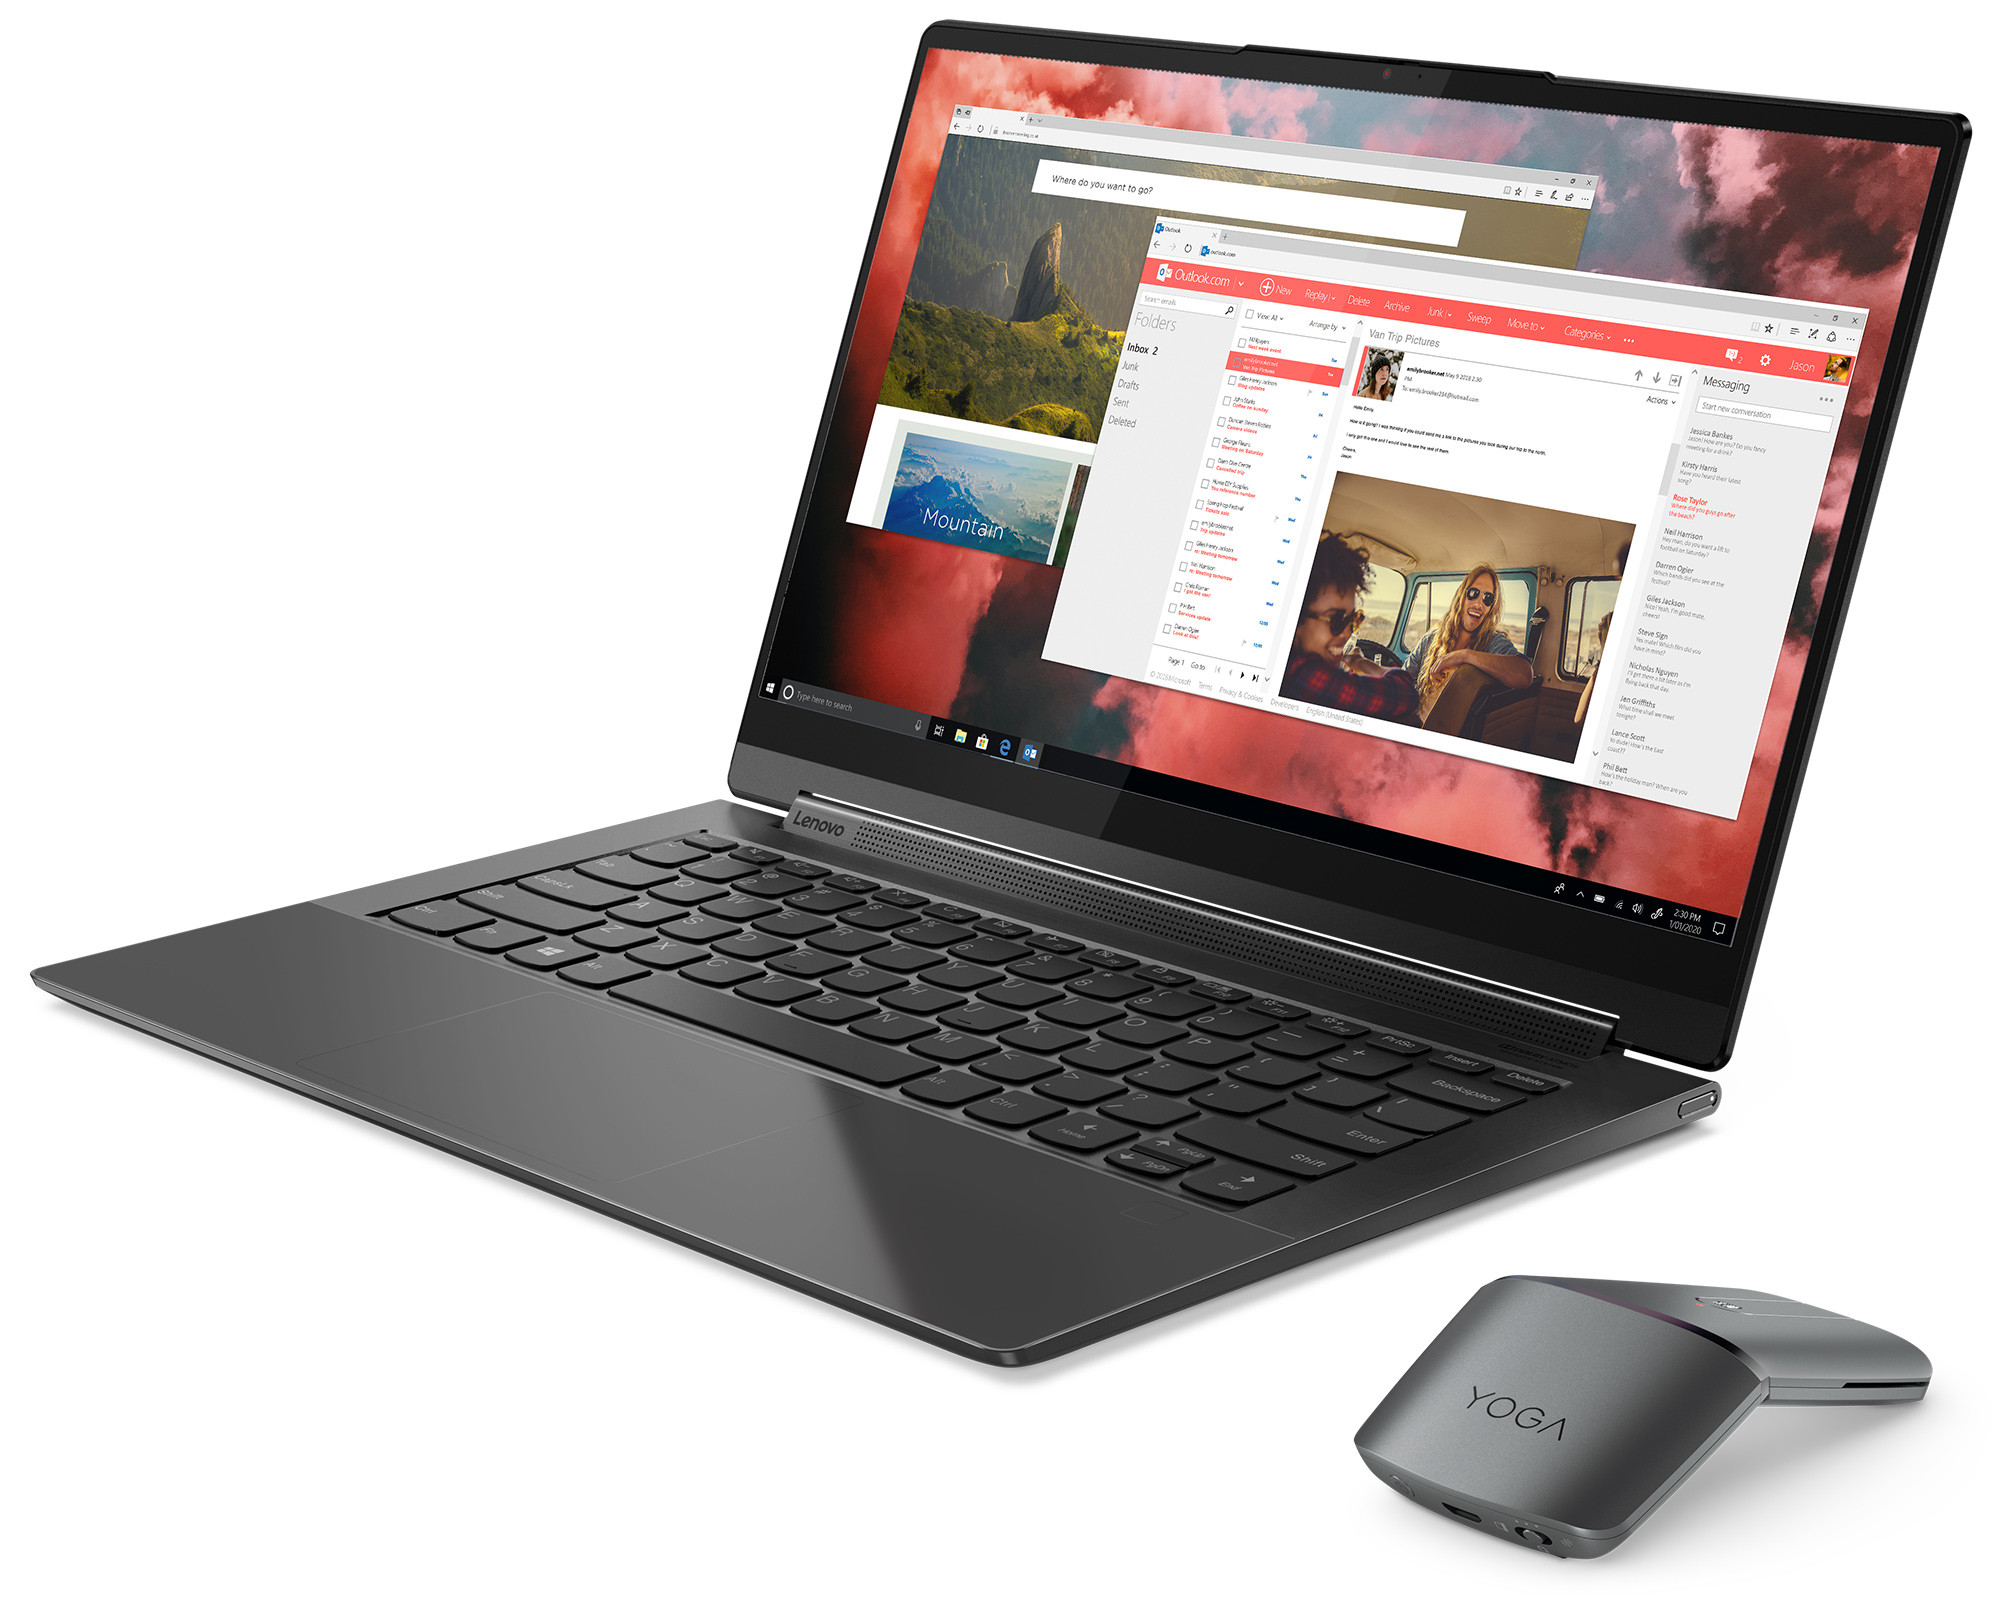
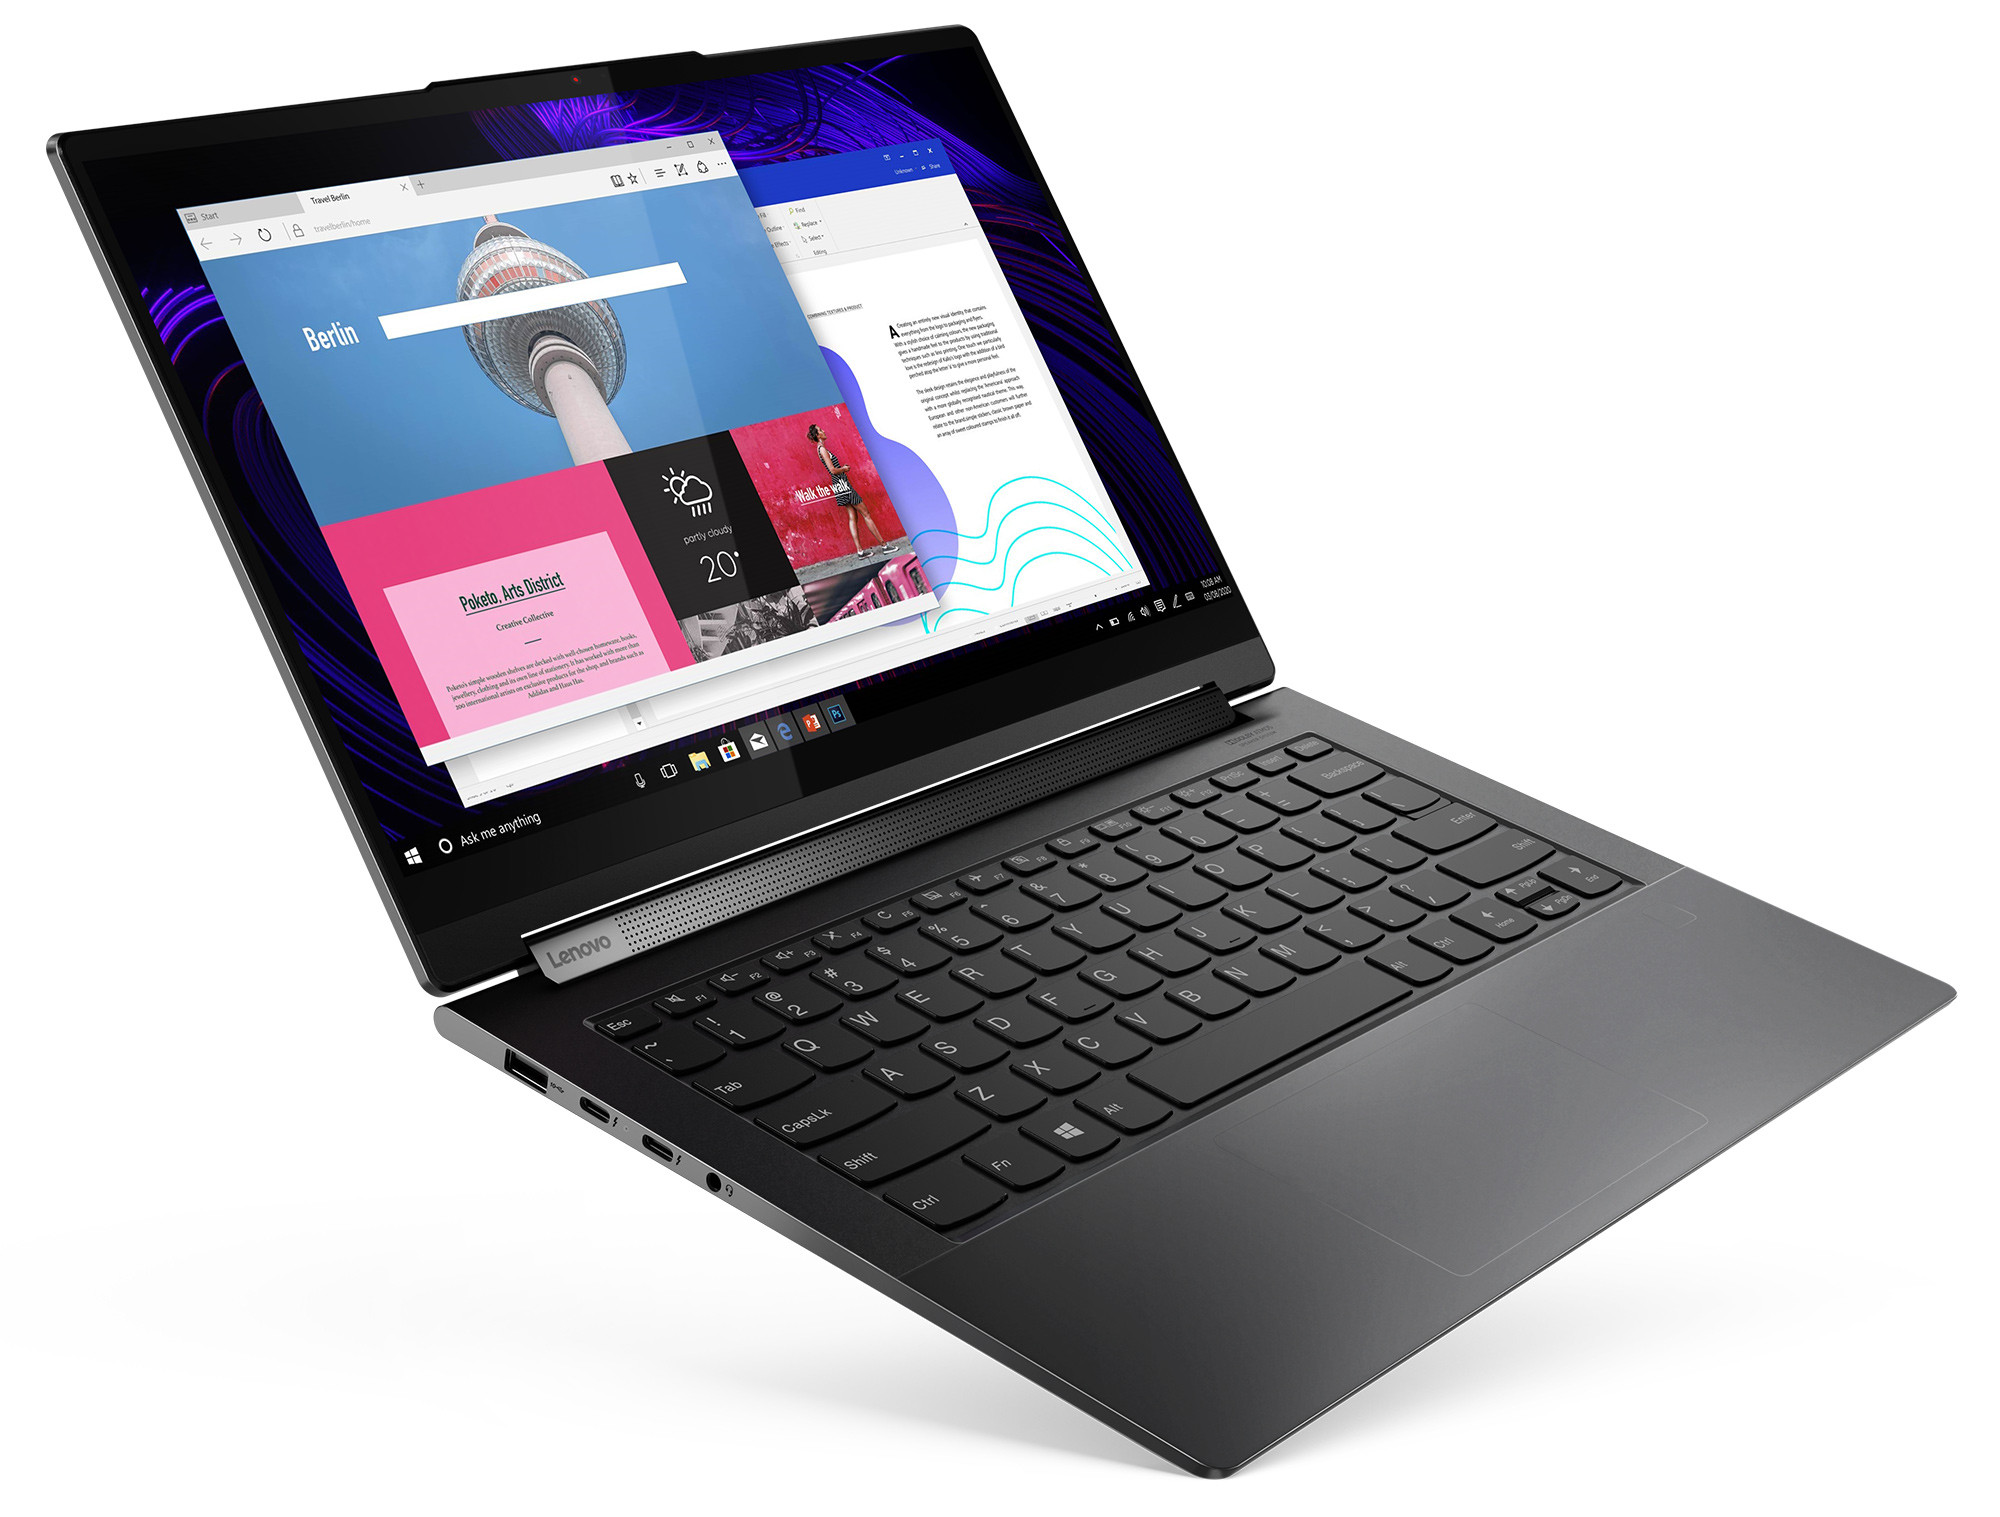
Lenovo Yoga 9i 14 4K laptop review: High-performance 14-inch 2-in-1 now also with 4K touchscreen and Intel Core i7-1185G7
We've already reviewed the entry-level configuration with a Core i5 processor, 8 GB of RAM, and a 1080p display. Now we have the top model with a Core i7 Tiger Lake processor, a 4K touchscreen, and 16 GB of RAM in our hands. Naturally, we'll compare both configurations and look at the gain in benefits.
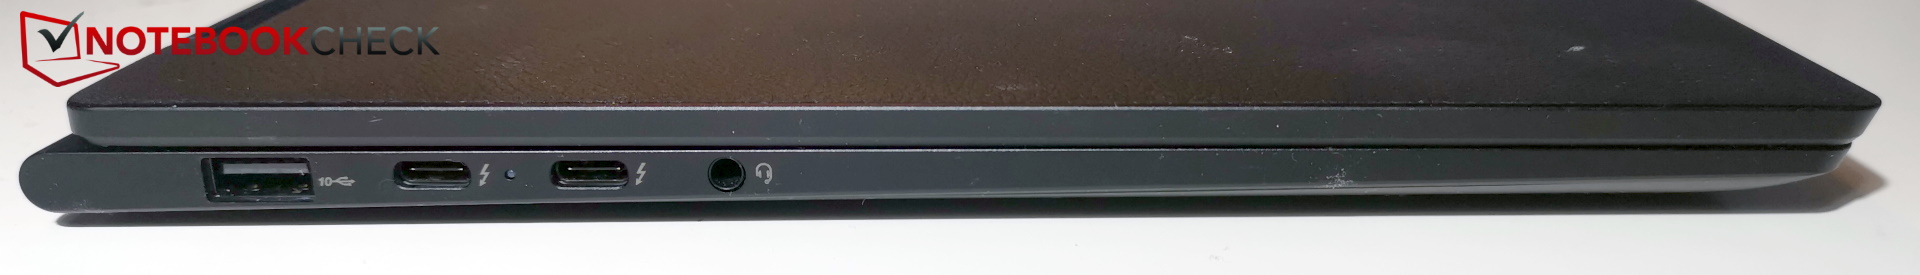
Since everything has remained the same externally, we will skip the sections that cover the case, connectivity, and input devices, unless there are significant differences, of course. You can find the details on these sections in the first review of the Lenovo Yoga 9i 14.
Possible contenders in comparison
Rating | Date | Model | Weight | Height | Size | Resolution | Price |
|---|---|---|---|---|---|---|---|
| 86.9 % v7 (old) | 02 / 2021 | Lenovo Yoga 9 14 ITL 4K i7-1185G7, Iris Xe G7 96EUs | 1.5 kg | 16.5 mm | 14.00" | 3840x2160 | |
| 87.1 % v7 (old) | 12 / 2020 | Lenovo Yoga 9i 14ITL5 i5-1135G7, Iris Xe G7 80EUs | 1.4 kg | 15.7 mm | 14.00" | 1920x1080 | |
| 84.3 % v7 (old) | 03 / 2020 | Lenovo Yoga C740-14IML i5-10210U, UHD Graphics 620 | 1.4 kg | 16.9 mm | 14.00" | 1920x1080 | |
| 80.7 % v7 (old) | 08 / 2020 | Asus VivoBook Flip 14 TM420IA R7 4700U, Vega 7 | 1.6 kg | 18.2 mm | 14.00" | 1920x1080 | |
| 88.4 % v7 (old) | 12 / 2019 | HP Spectre x360 13-aw0013dx i7-1065G7, Iris Plus Graphics G7 (Ice Lake 64 EU) | 1.2 kg | 16.9 mm | 13.30" | 1920x1080 | |
| 86.3 % v7 (old) | 10 / 2019 | Dell XPS 13 7390 2-in-1 Core i7 i7-1065G7, Iris Plus Graphics G7 (Ice Lake 64 EU) | 1.3 kg | 13 mm | 13.40" | 1920x1200 |
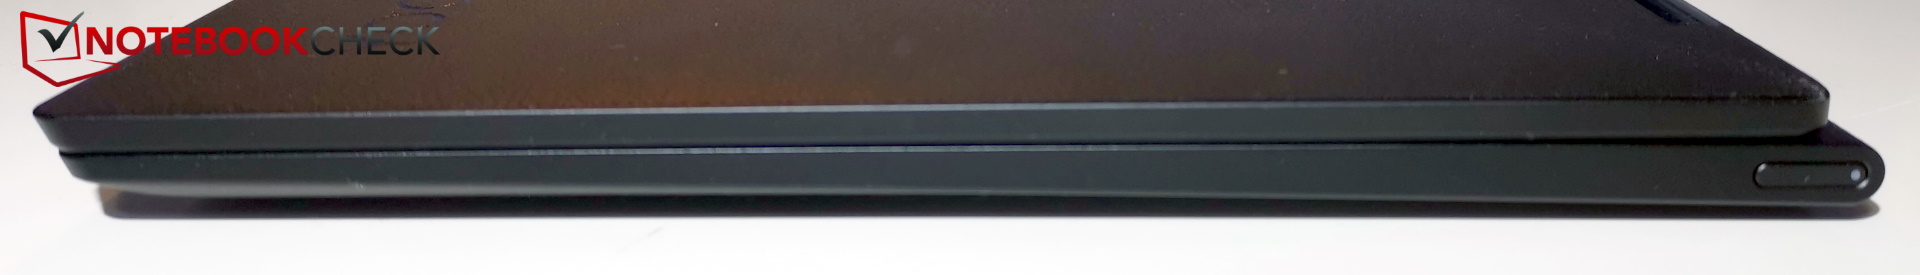
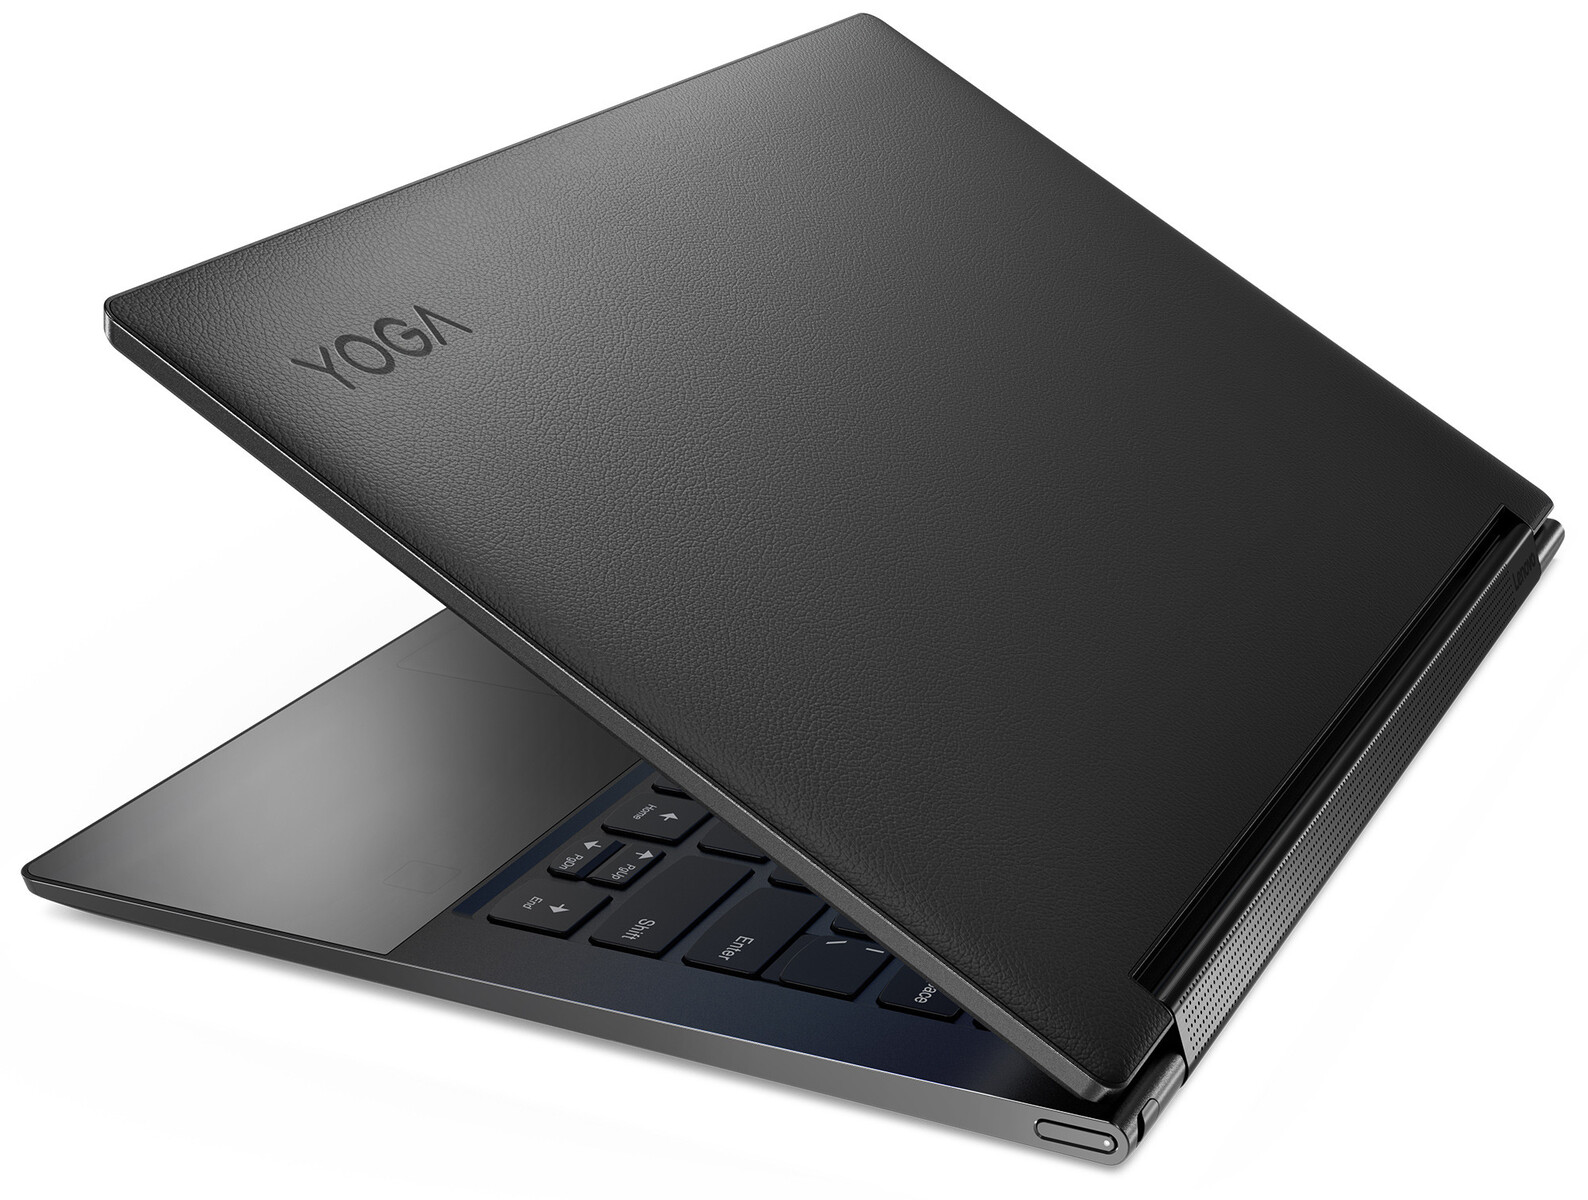
Case - Leather on the lid
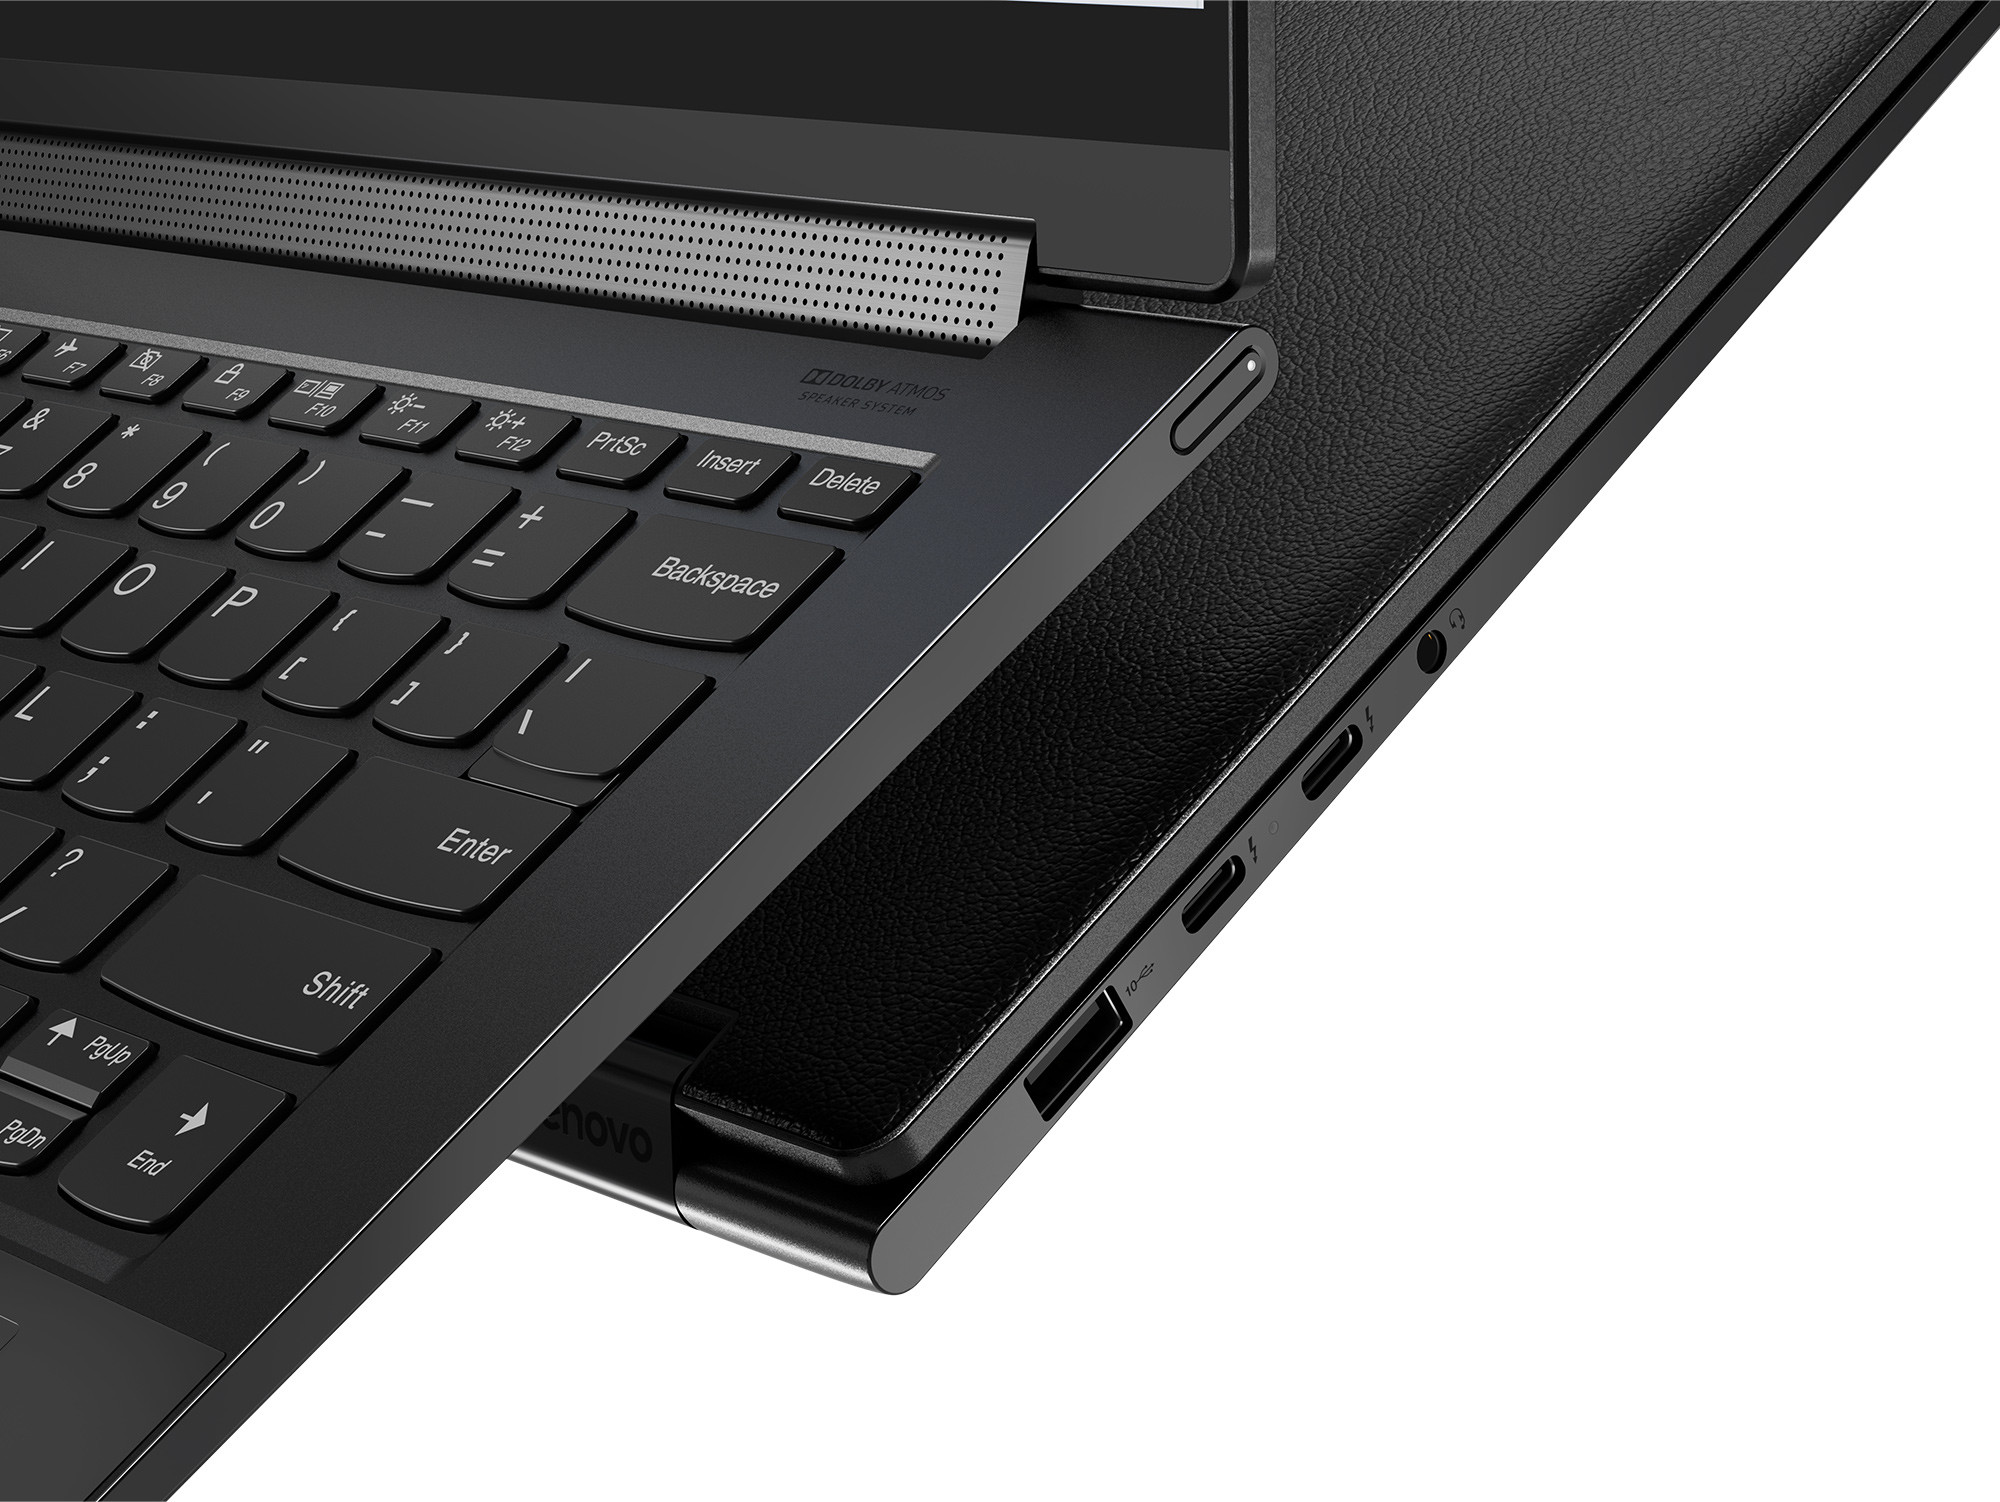
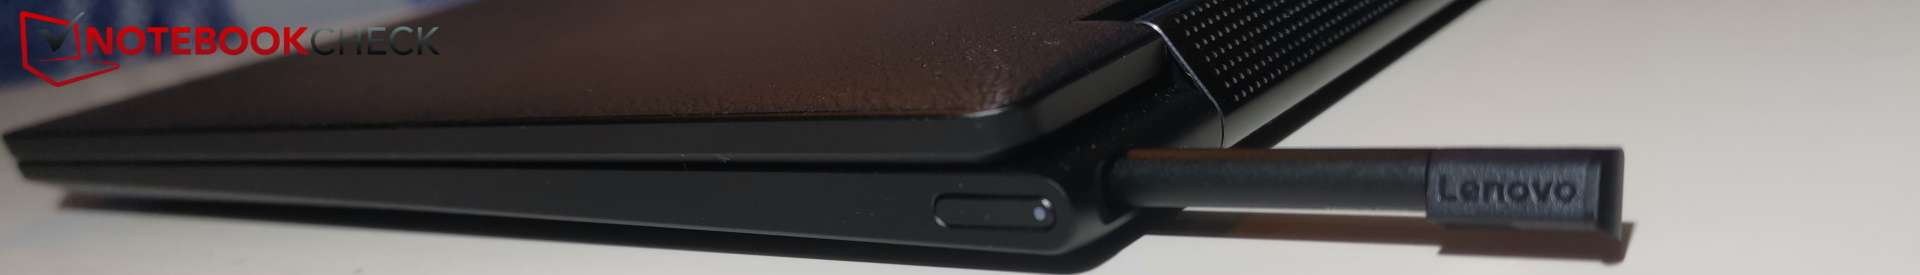
Our new test model has been provided with the optional leather cover for the display lid. The dark animal skin comes from "responsible sources" and looks really good.


Connectivity
Communication
Webcam


Accessories
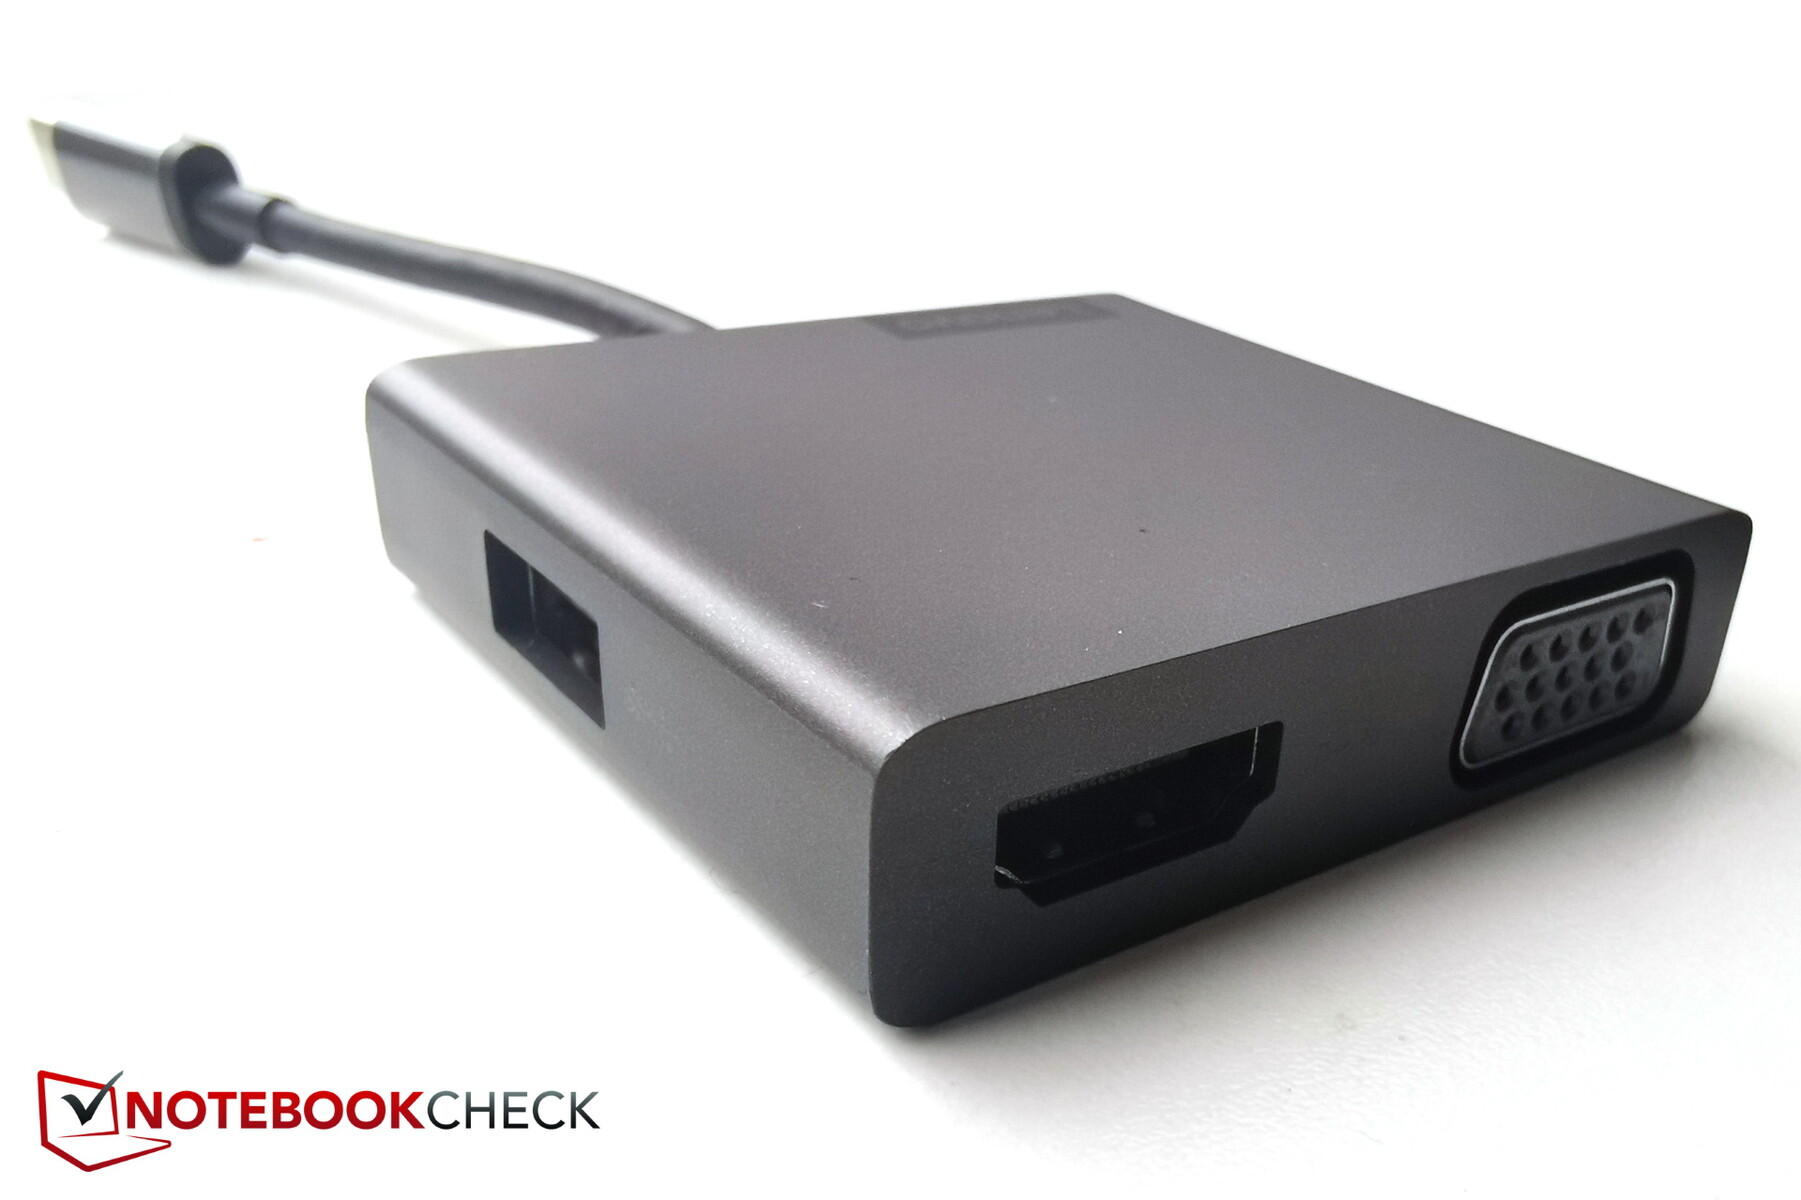
More recently, a small 3-in-1 USB-C hub with HDMI, VGA, and USB-A ports is also included.
Input devices - Yoga 9i 14 with click problems
Touchpad
While the pad had already performed rather moderately in the original test, the current ClickPad is a middling disaster, at least its buttons are. It was the rule rather than the exception for the click buttons to jam and, therefore, not trigger or trigger too late when they finally became unstuck.
It was almost worse to experience long-pressed clicks being constantly "released" when attempting to perform drag-and-drop actions; dragging and dropping items is hardly possible in this way. This might be an isolated error in our test unit, but buyers should absolutely check the touchpad before buying; it could be a weak point of the still quite expensive high-end device.
The fact that the touchpad is not separated from the rest of the palm rest in terms of feel is also suboptimal; you can't feel any boundaries, which is unsettling.
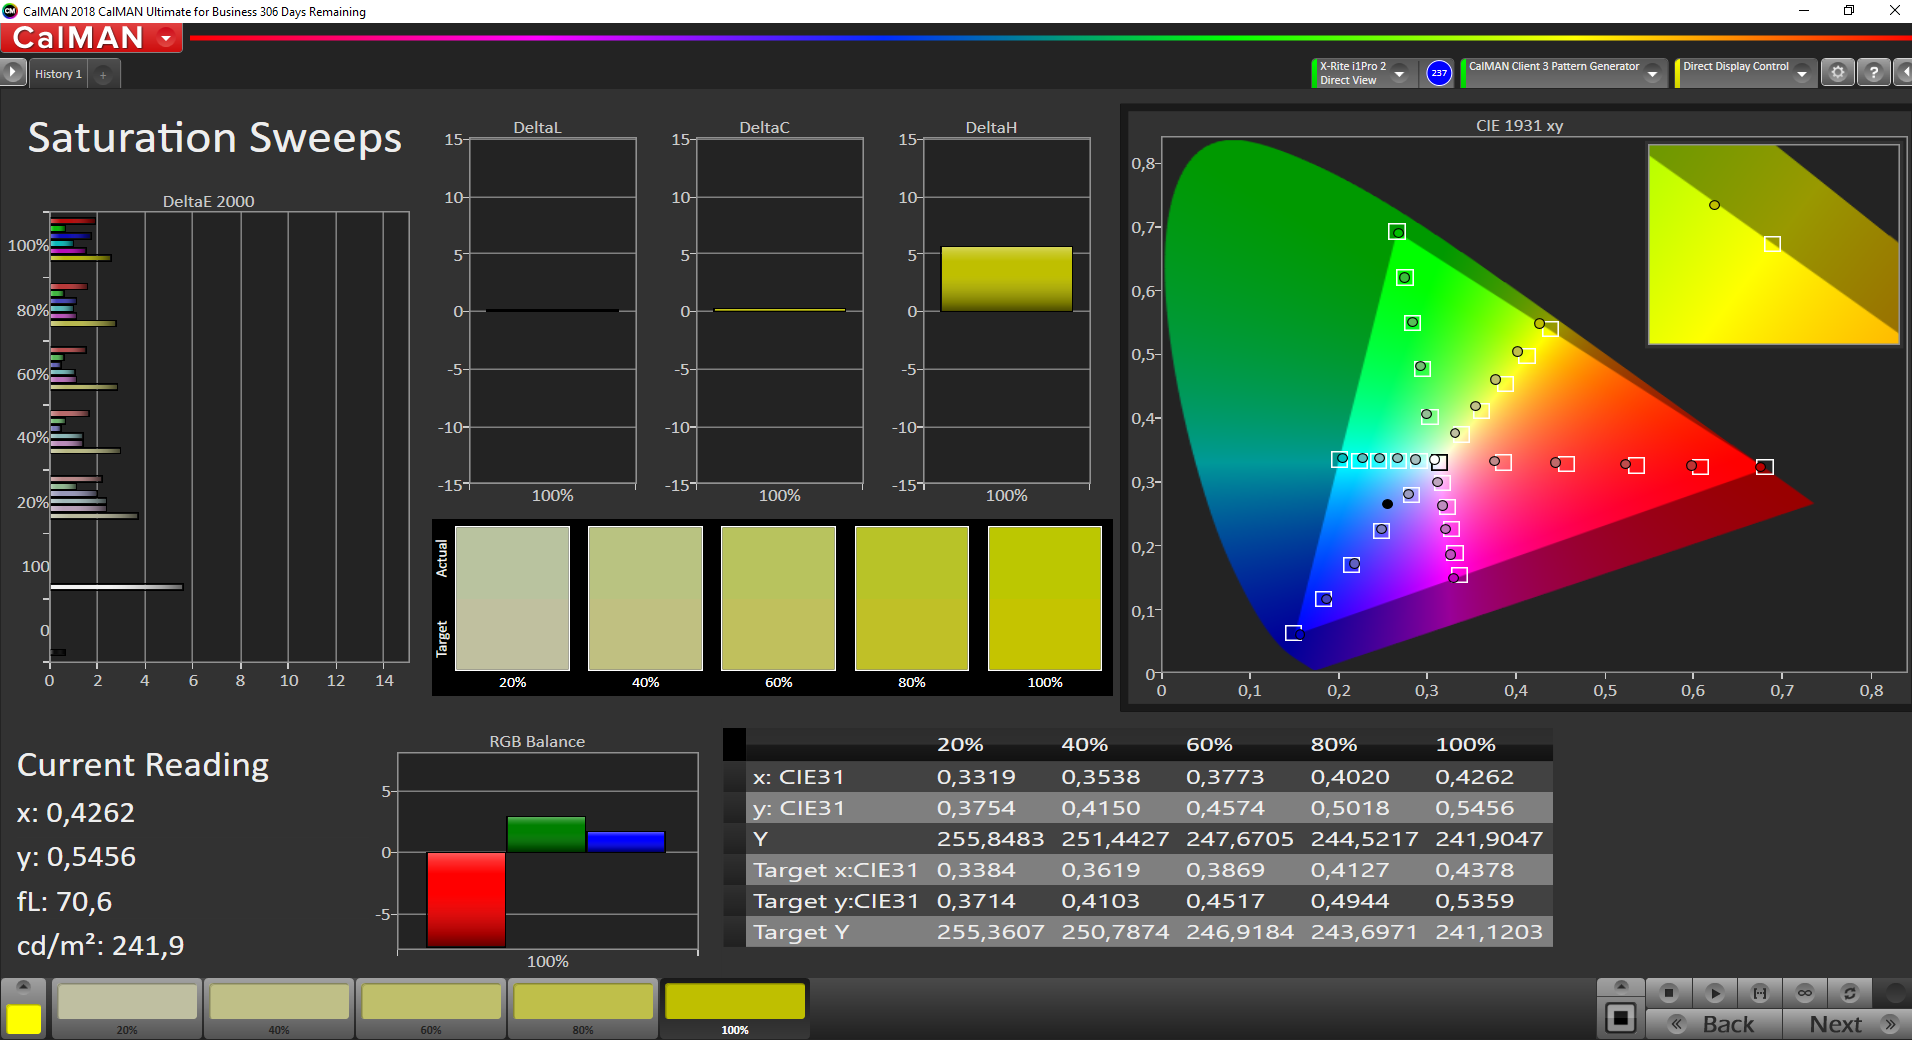
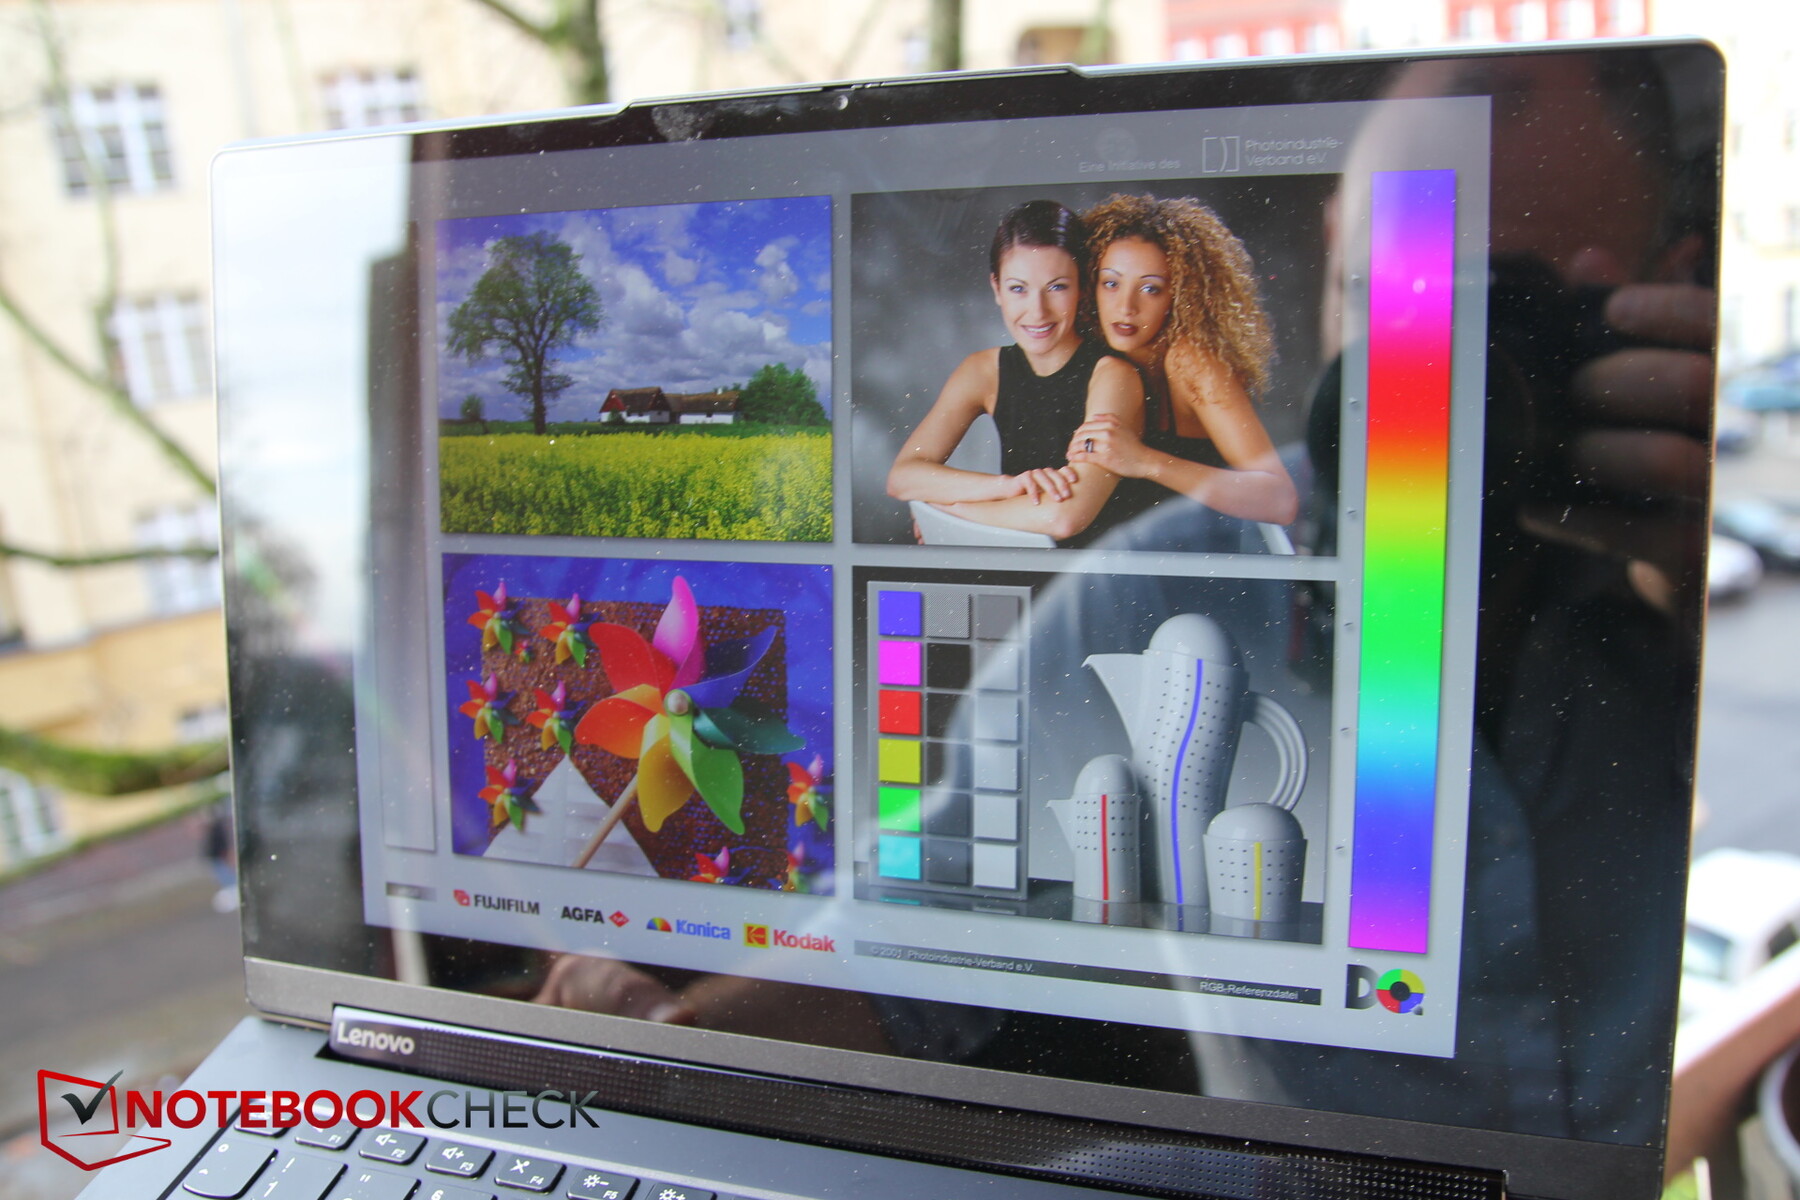
Display - Lenovo panel with 4K and HDR

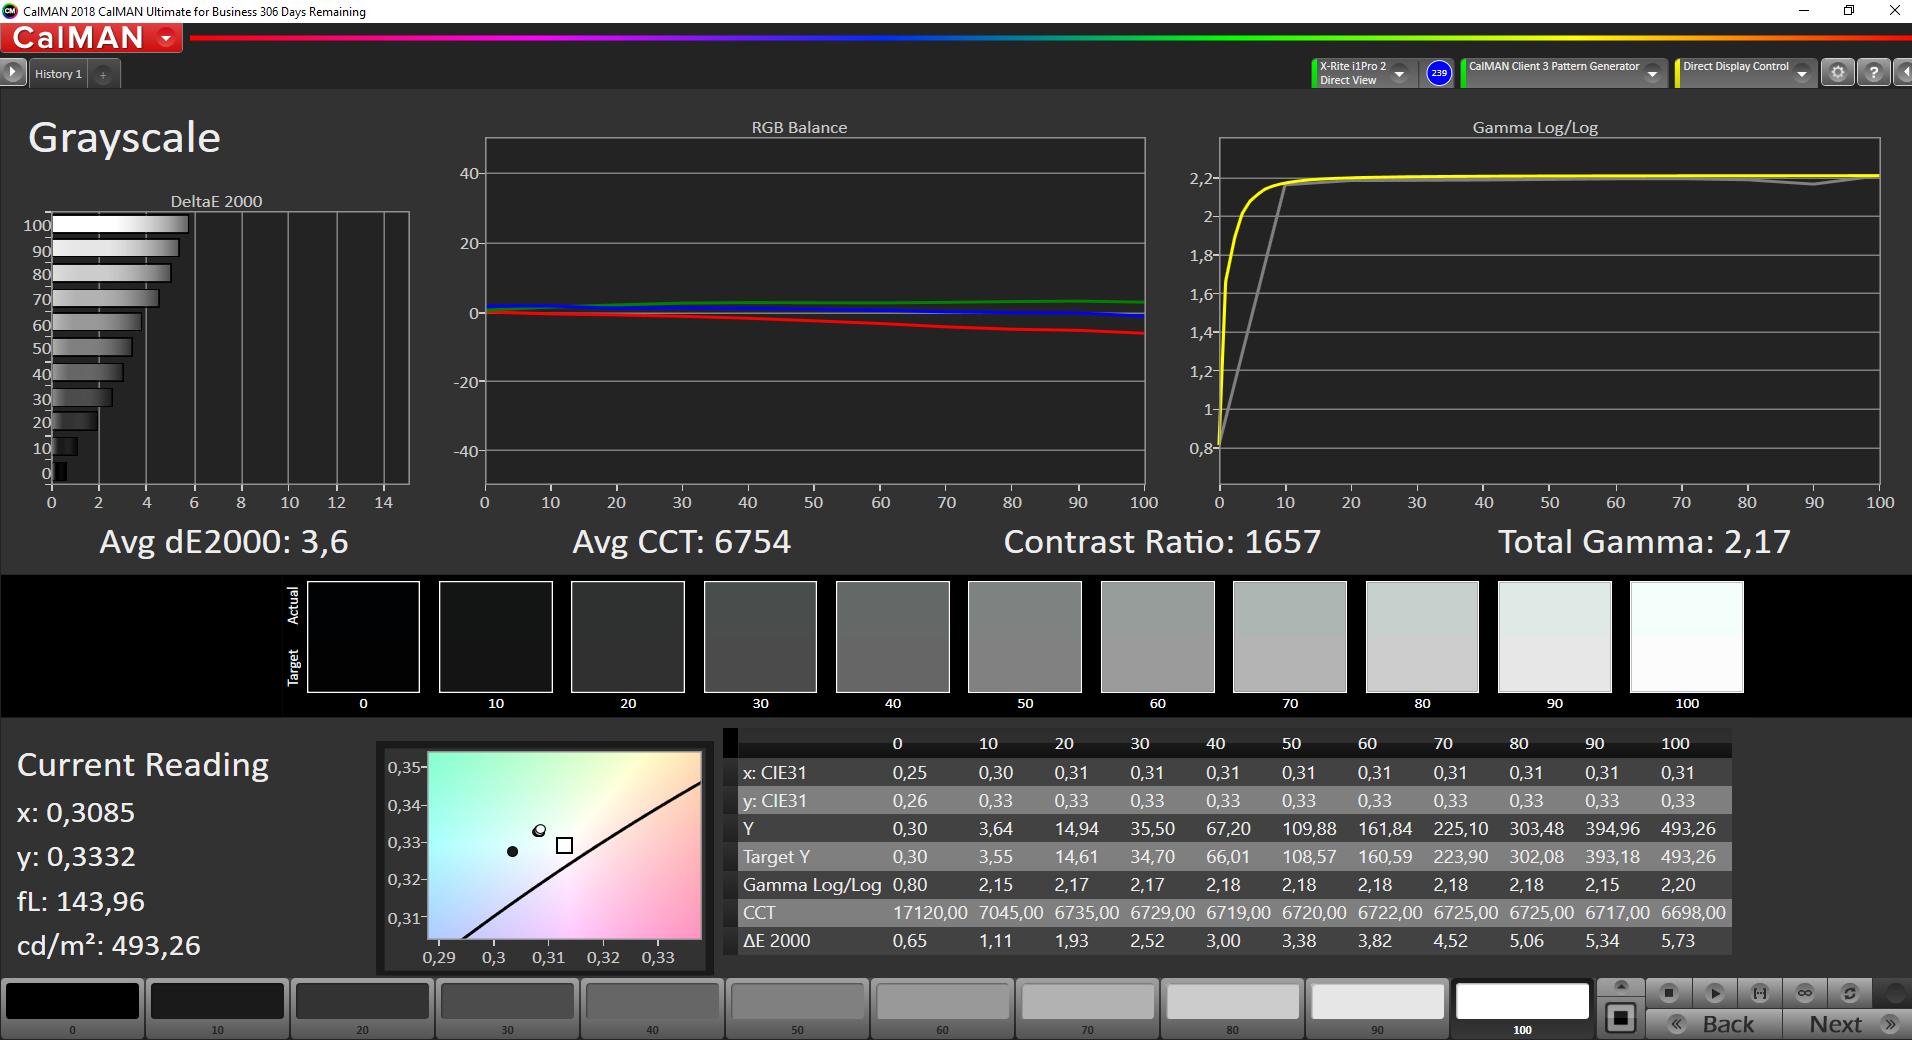
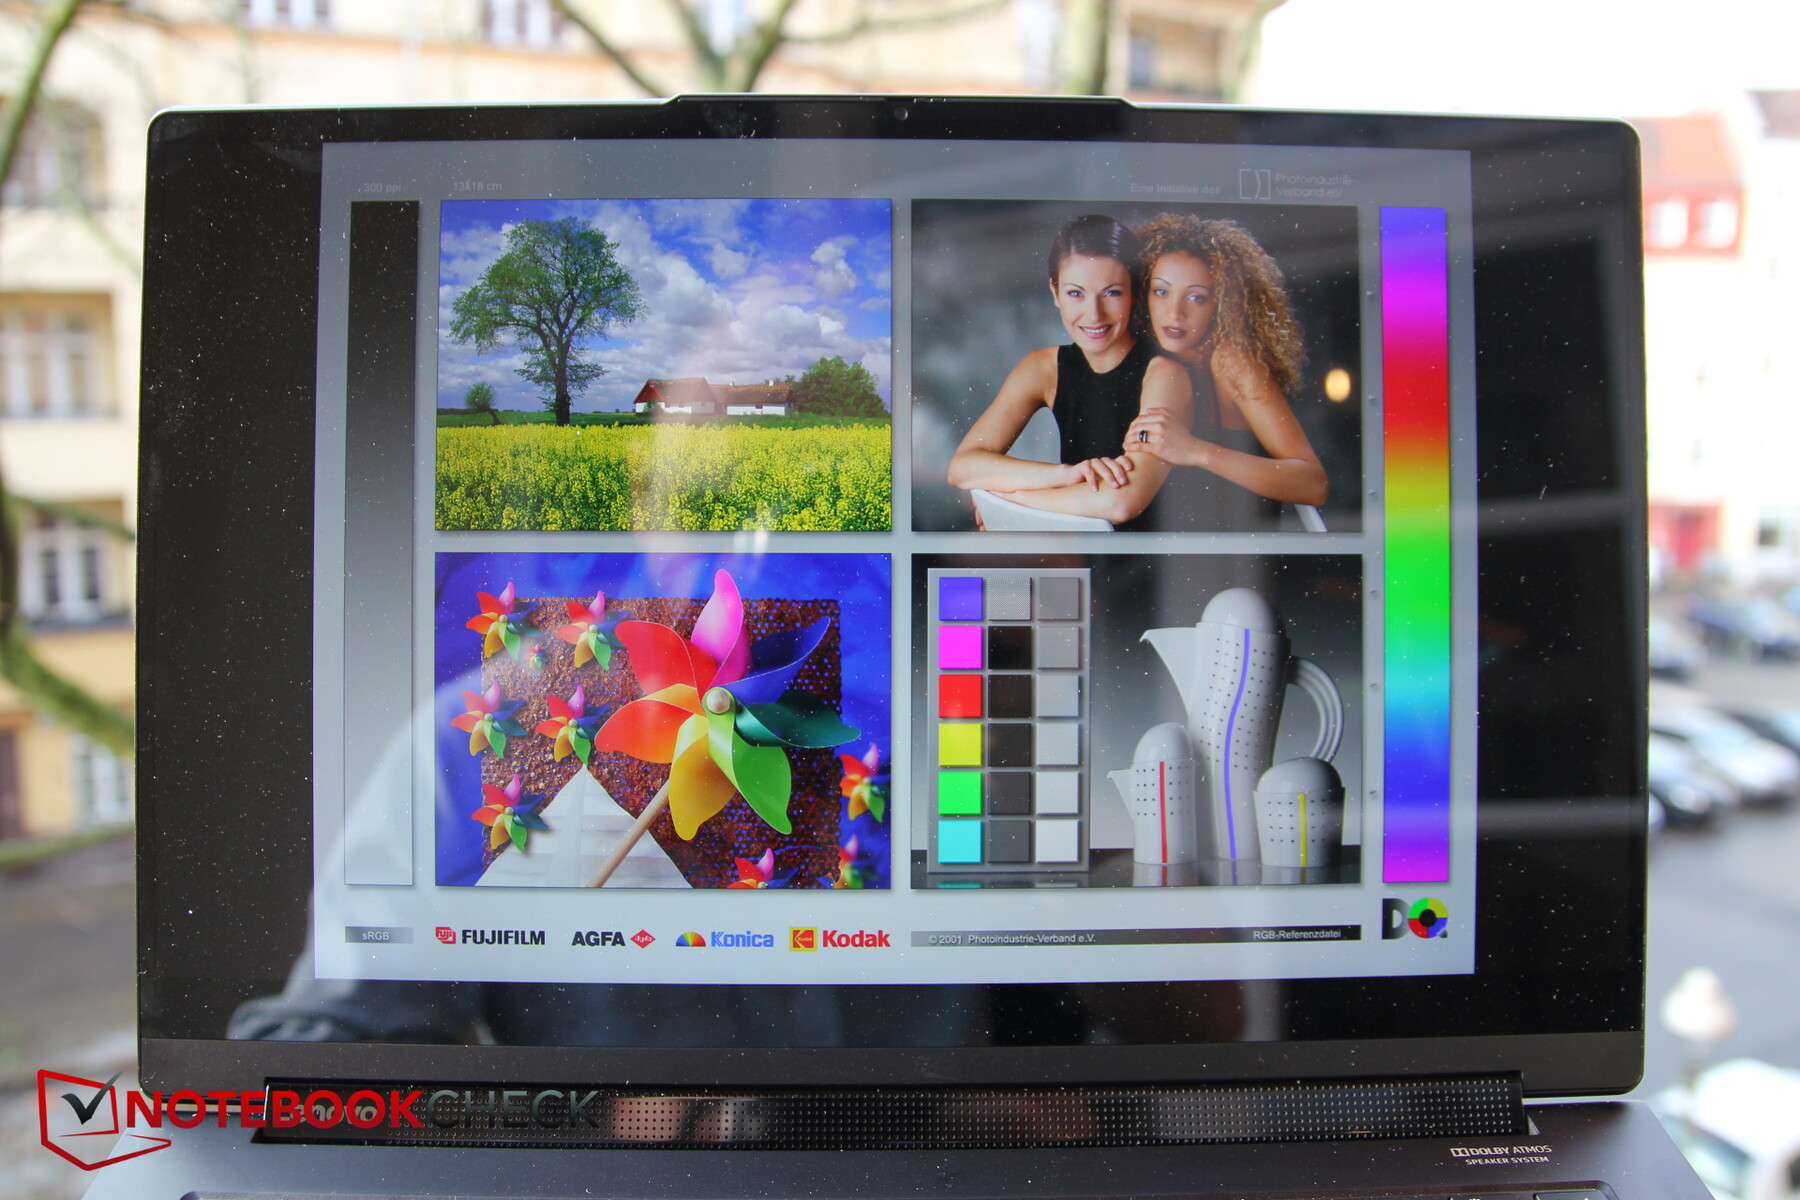
Instead of a 1080p one, a 4K UHD IPS touchscreen is now installed. The panel is supposed to have a brightness of up to 500 nits and is HDR 400 VESA certified.
We actually measure a maximum brightness of 493 nits; the display reaches an average of 453 nits with an acceptable brightness distribution of 85%.
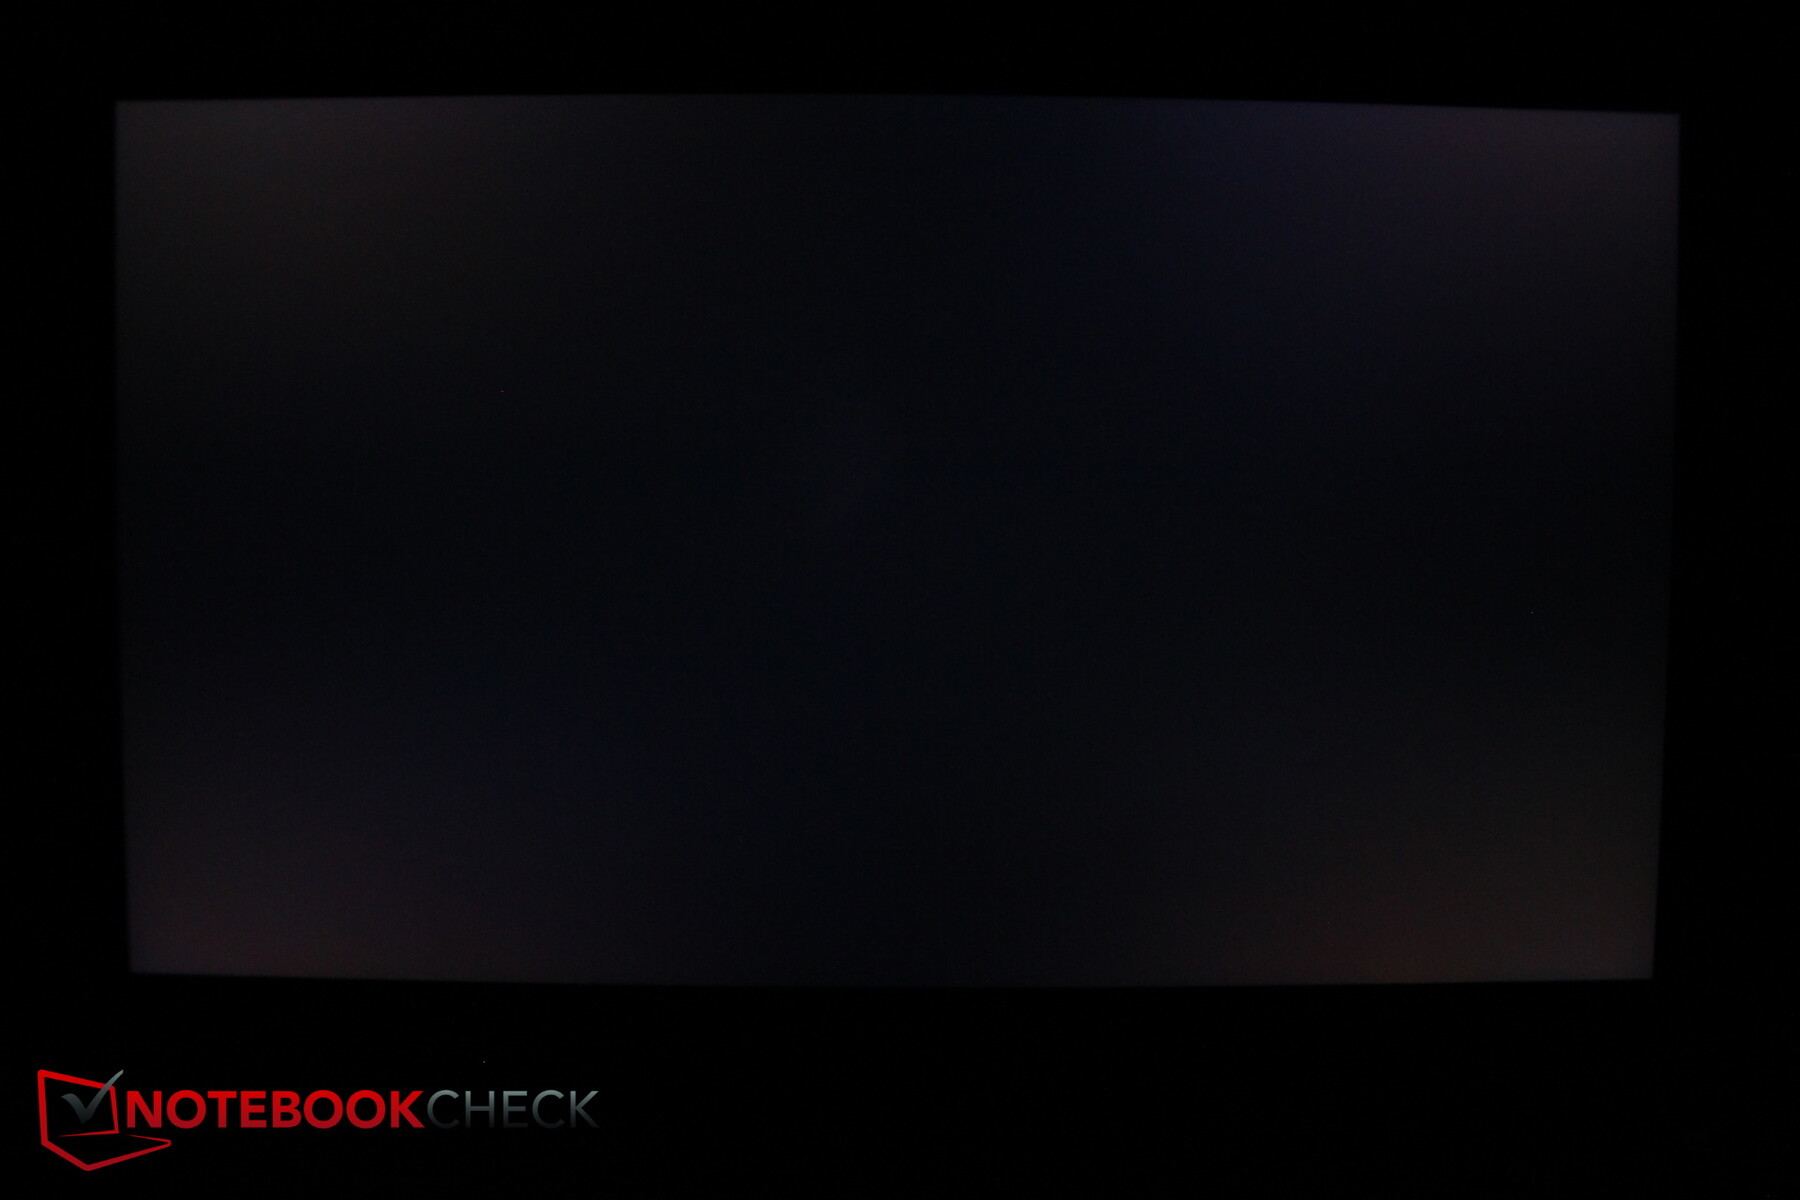
Screen bleeding isn't a problem with this model.
| |||||||||||||||||||||||||
Brightness Distribution: 85 %
Center on Battery: 494 cd/m²
Contrast: 1643:1 (Black: 0.3 cd/m²)
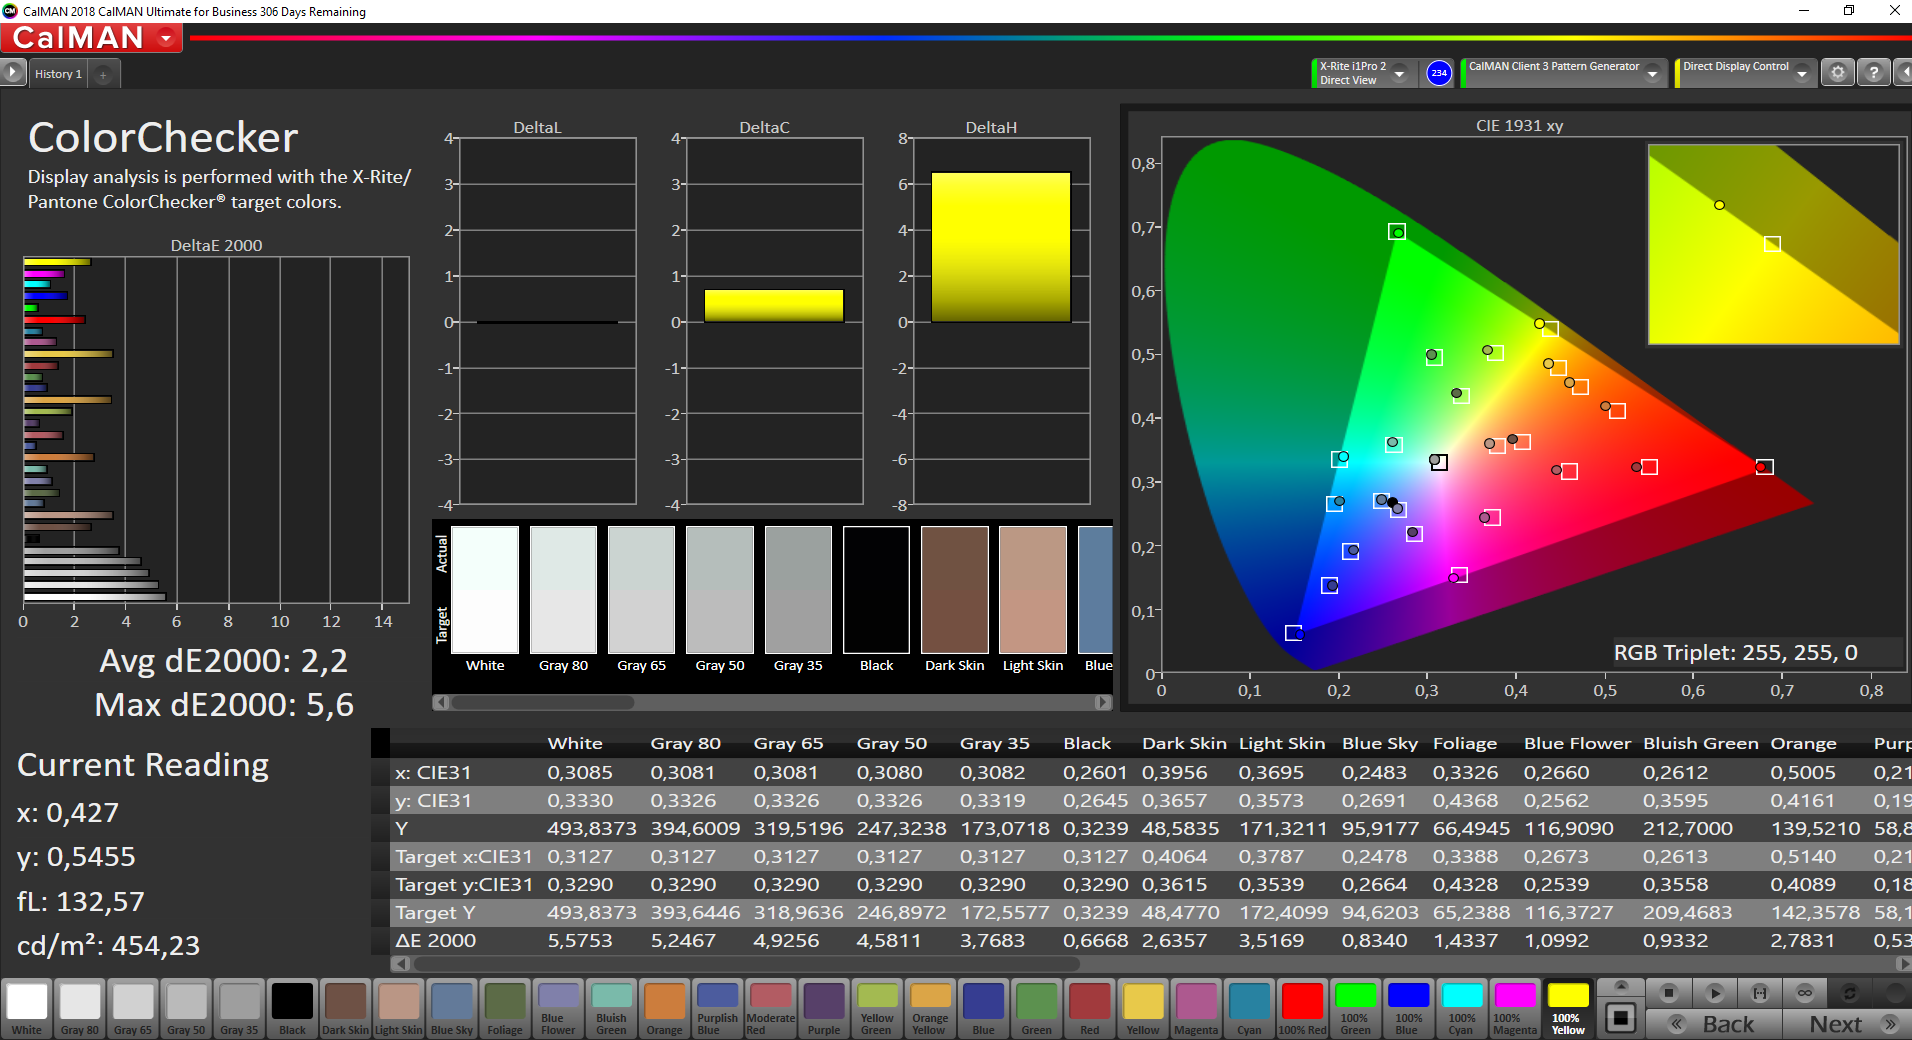
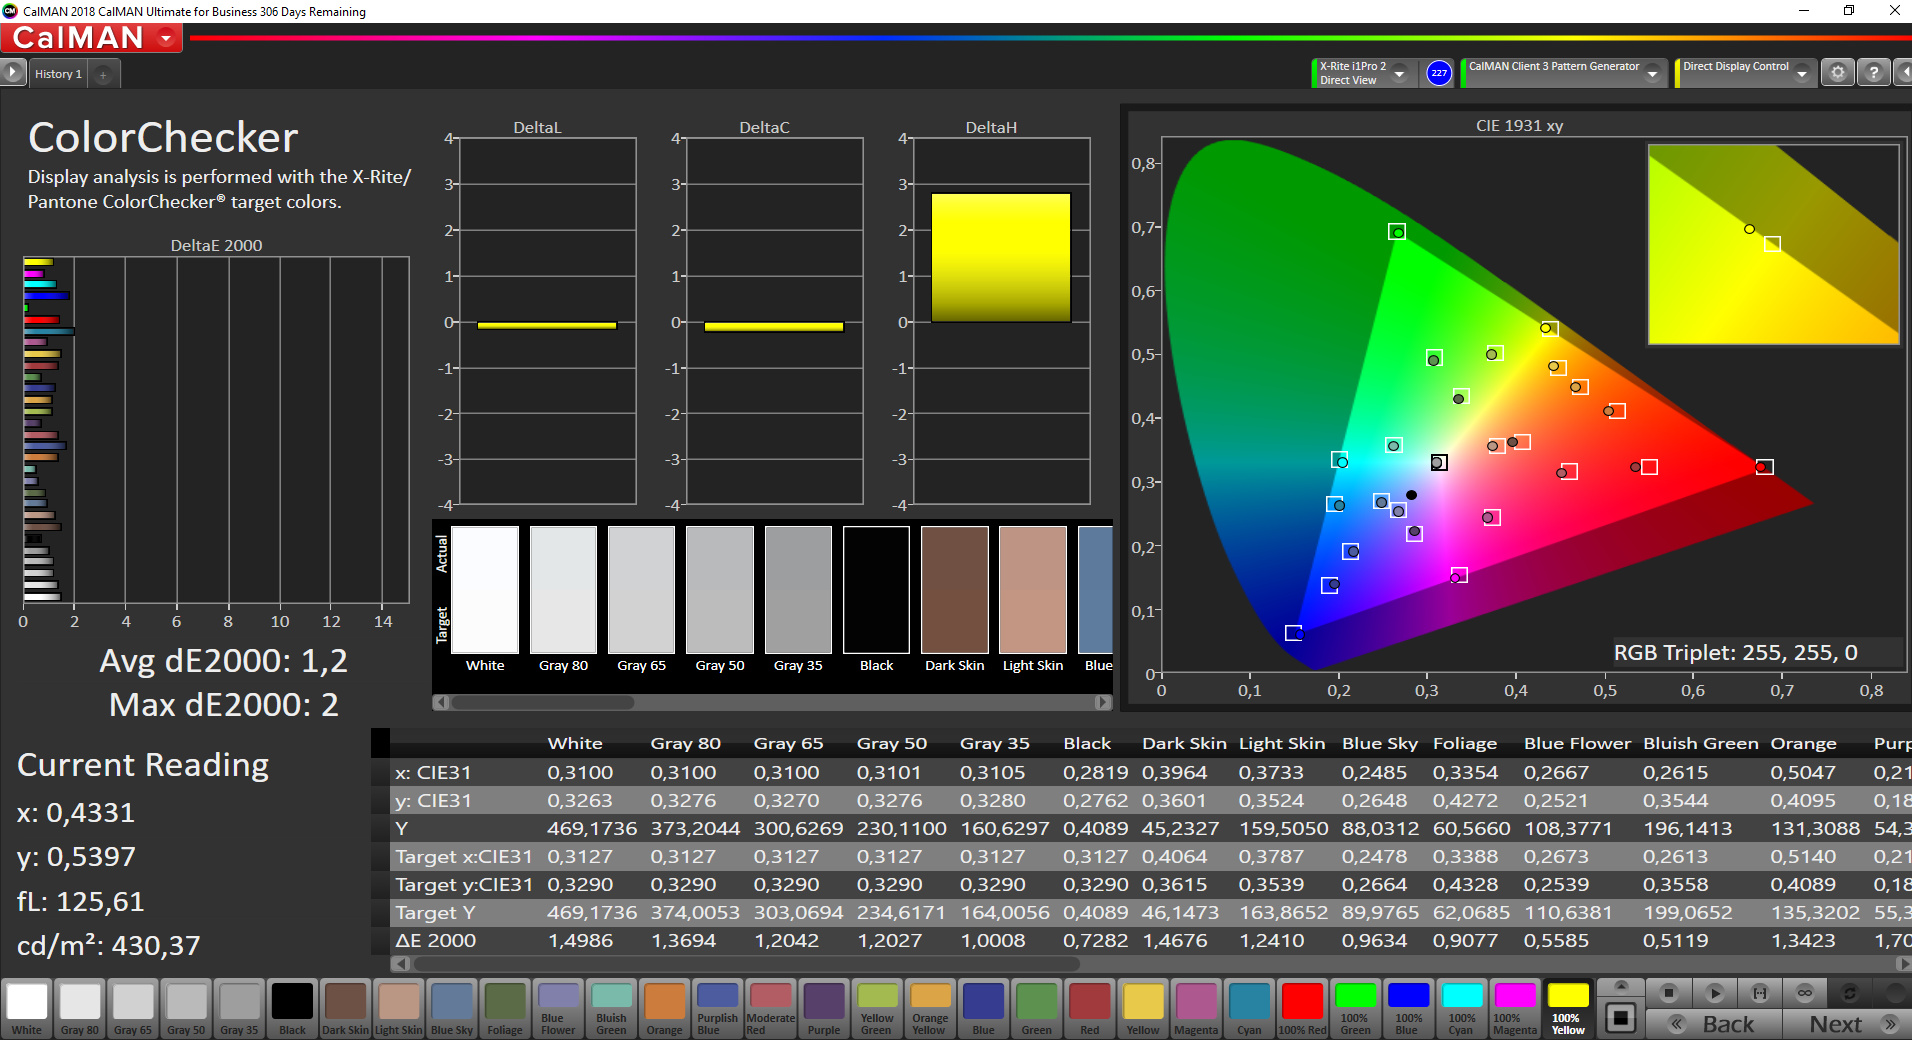
ΔE ColorChecker Calman: 2.2 | ∀{0.5-29.43 Ø4.71}
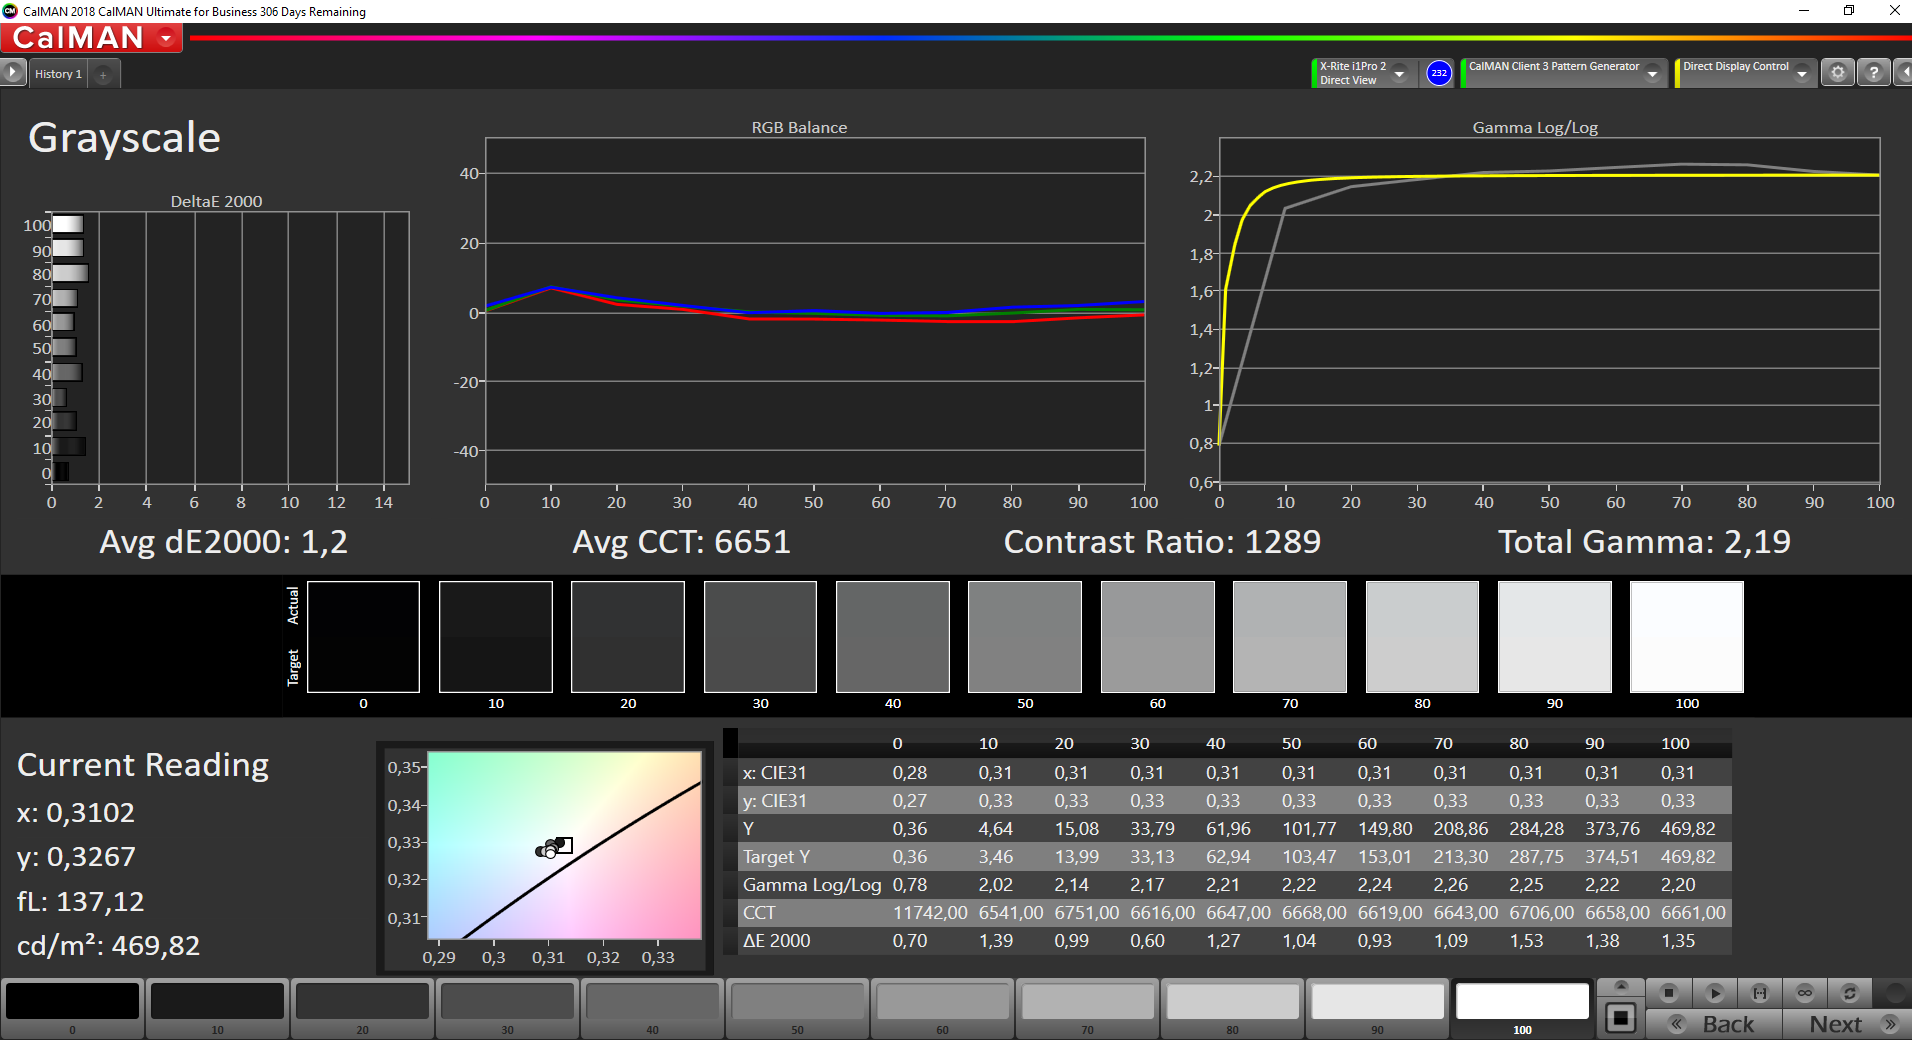
calibrated: 1.2
ΔE Greyscale Calman: 3.6 | ∀{0.09-98 Ø4.96}
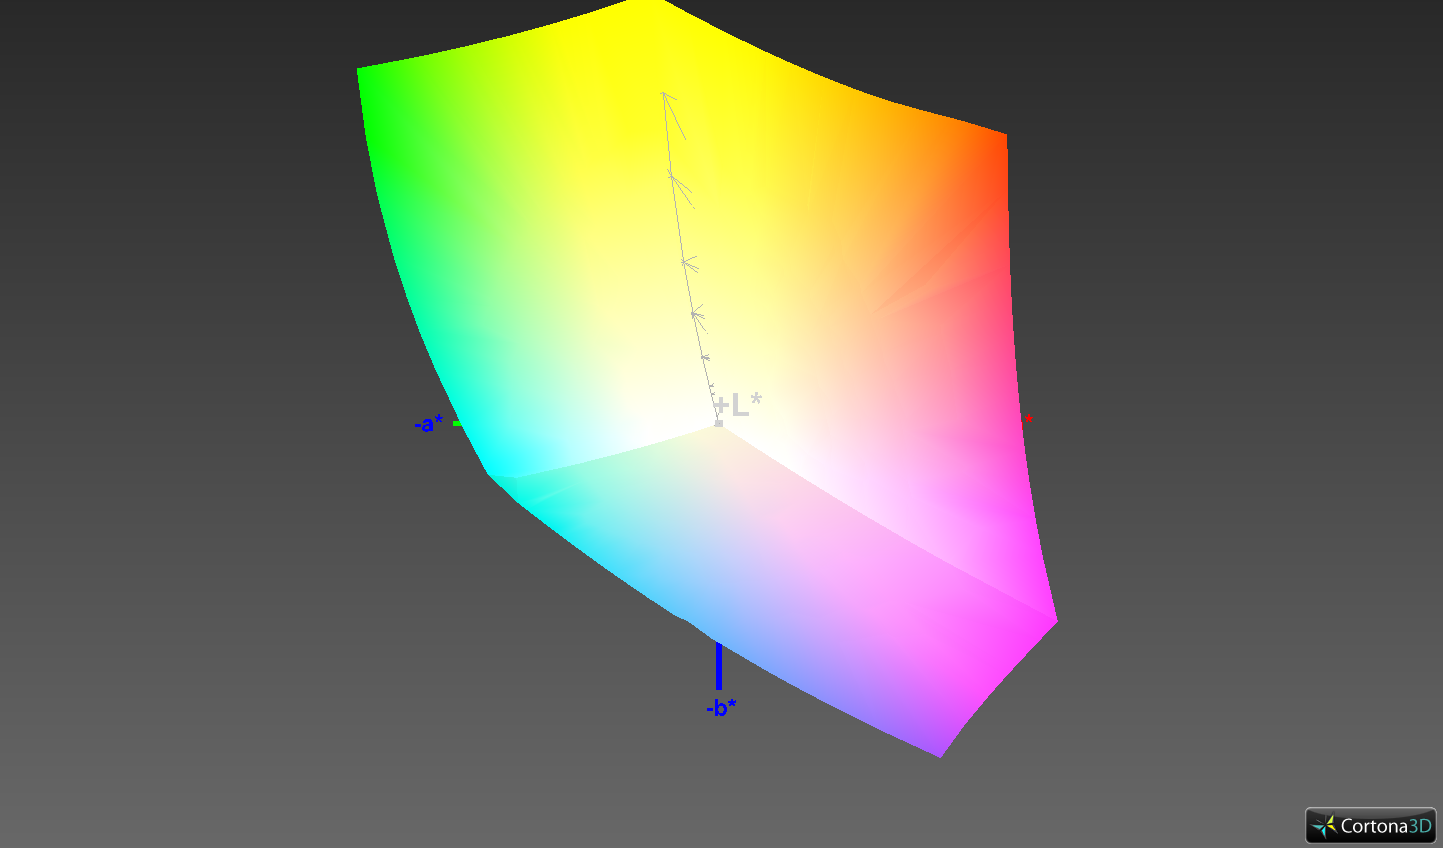
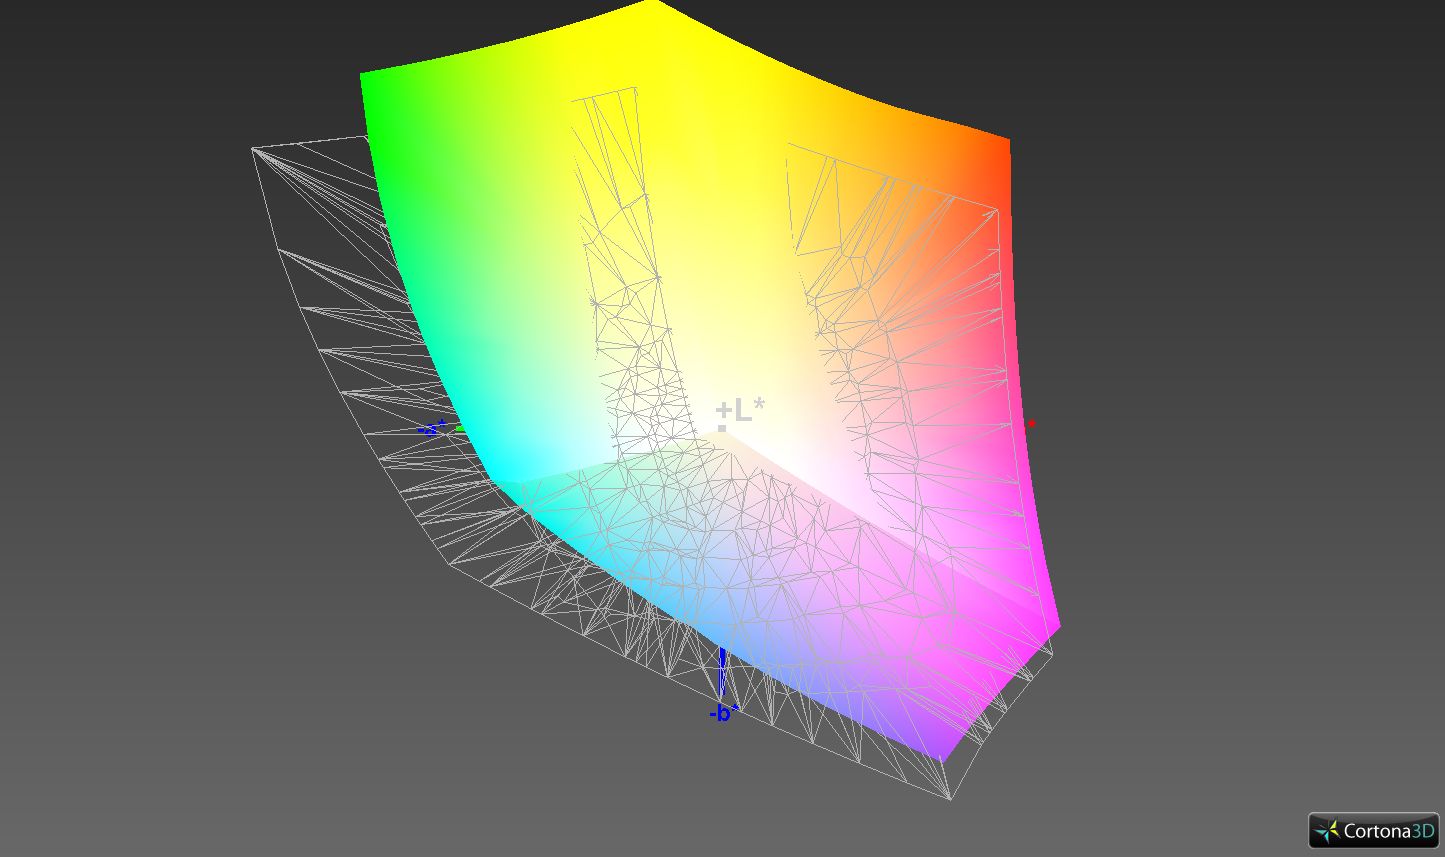
99.3% sRGB (Argyll 1.6.3 3D)
75.2% AdobeRGB 1998 (Argyll 1.6.3 3D)
84% AdobeRGB 1998 (Argyll 3D)
99.3% sRGB (Argyll 3D)
94.4% Display P3 (Argyll 3D)
Gamma: 2.17
CCT: 6754 K
| Lenovo Yoga 9 14 ITL 4K Lenovo CSOT3 MNE001EA1-2, IPS, 3840x2160, 14" | Lenovo Yoga 9i 14ITL5 LG Display LP140WF9-SPE2, IPS, 1920x1080, 14" | Lenovo Yoga C740-14IML CMN N140HCE-ET2, IPS, 1920x1080, 14" | Asus VivoBook Flip 14 TM420IA BOE NV140FHM-N49, IPS, 1920x1080, 14" | HP Spectre x360 13-aw0013dx AU Optronics AUO5E2D, IPS, 1920x1080, 13.3" | Dell XPS 13 7390 2-in-1 Core i7 Sharp LQ134N1, IPS, 1920x1200, 13.4" | |
|---|---|---|---|---|---|---|
| Display | -20% | -15% | -49% | -14% | -14% | |
| Display P3 Coverage (%) | 94.4 | 64.2 -32% | 67.9 -28% | 40.47 -57% | 69.6 -26% | 69.9 -26% |
| sRGB Coverage (%) | 99.3 | 94.2 -5% | 98.3 -1% | 60 -40% | 98.9 0% | 99.2 0% |
| AdobeRGB 1998 Coverage (%) | 84 | 65 -23% | 70.1 -17% | 41.81 -50% | 71.5 -15% | 71.5 -15% |
| Response Times | -54% | -39% | -23% | -67% | -32% | |
| Response Time Grey 50% / Grey 80% * (ms) | 45.6 ? | 55.2 ? -21% | 35.6 ? 22% | 36.4 ? 20% | 60.8 ? -33% | 47.6 ? -4% |
| Response Time Black / White * (ms) | 18.4 ? | 34.4 ? -87% | 36.8 ? -100% | 30.4 ? -65% | 36.8 ? -100% | 29.2 ? -59% |
| PWM Frequency (Hz) | 27030 ? | 2500 ? | ||||
| Screen | -17% | -26% | -81% | -26% | 2% | |
| Brightness middle (cd/m²) | 493 | 365 -26% | 329.9 -33% | 272.5 -45% | 447.4 -9% | 549.8 12% |
| Brightness (cd/m²) | 453 | 346 -24% | 315 -30% | 260 -43% | 420 -7% | 520 15% |
| Brightness Distribution (%) | 85 | 82 -4% | 90 6% | 88 4% | 85 0% | 86 1% |
| Black Level * (cd/m²) | 0.3 | 0.23 23% | 0.29 3% | 0.42 -40% | 0.31 -3% | 0.39 -30% |
| Contrast (:1) | 1643 | 1587 -3% | 1138 -31% | 649 -60% | 1443 -12% | 1410 -14% |
| Colorchecker dE 2000 * | 2.2 | 3.65 -66% | 3.68 -67% | 4.65 -111% | 4.23 -92% | 2.12 4% |
| Colorchecker dE 2000 max. * | 5.6 | 6.69 -19% | 8.64 -54% | 17.78 -218% | 9.34 -67% | 3.66 35% |
| Colorchecker dE 2000 calibrated * | 1.2 | 1.61 -34% | 1.03 14% | 4.34 -262% | 1.32 -10% | 1.37 -14% |
| Greyscale dE 2000 * | 3.6 | 4 -11% | 6.4 -78% | 4.4 -22% | 6.1 -69% | 2.6 28% |
| Gamma | 2.17 101% | 2.33 94% | 2.17 101% | 2.2 100% | 2.11 104% | 2.3 96% |
| CCT | 6754 96% | 6873 95% | 6195 105% | 6984 93% | 6136 106% | 6884 94% |
| Color Space (Percent of AdobeRGB 1998) (%) | 75.2 | 60.1 -20% | 63.6 -15% | 38.4 -49% | 64.8 -14% | 65.4 -13% |
| Color Space (Percent of sRGB) (%) | 99.3 | 93.9 -5% | 98.4 -1% | 59.8 -40% | 98.9 0% | 99.7 0% |
| Total Average (Program / Settings) | -30% /
-22% | -27% /
-26% | -51% /
-67% | -36% /
-29% | -15% /
-5% |
* ... smaller is better
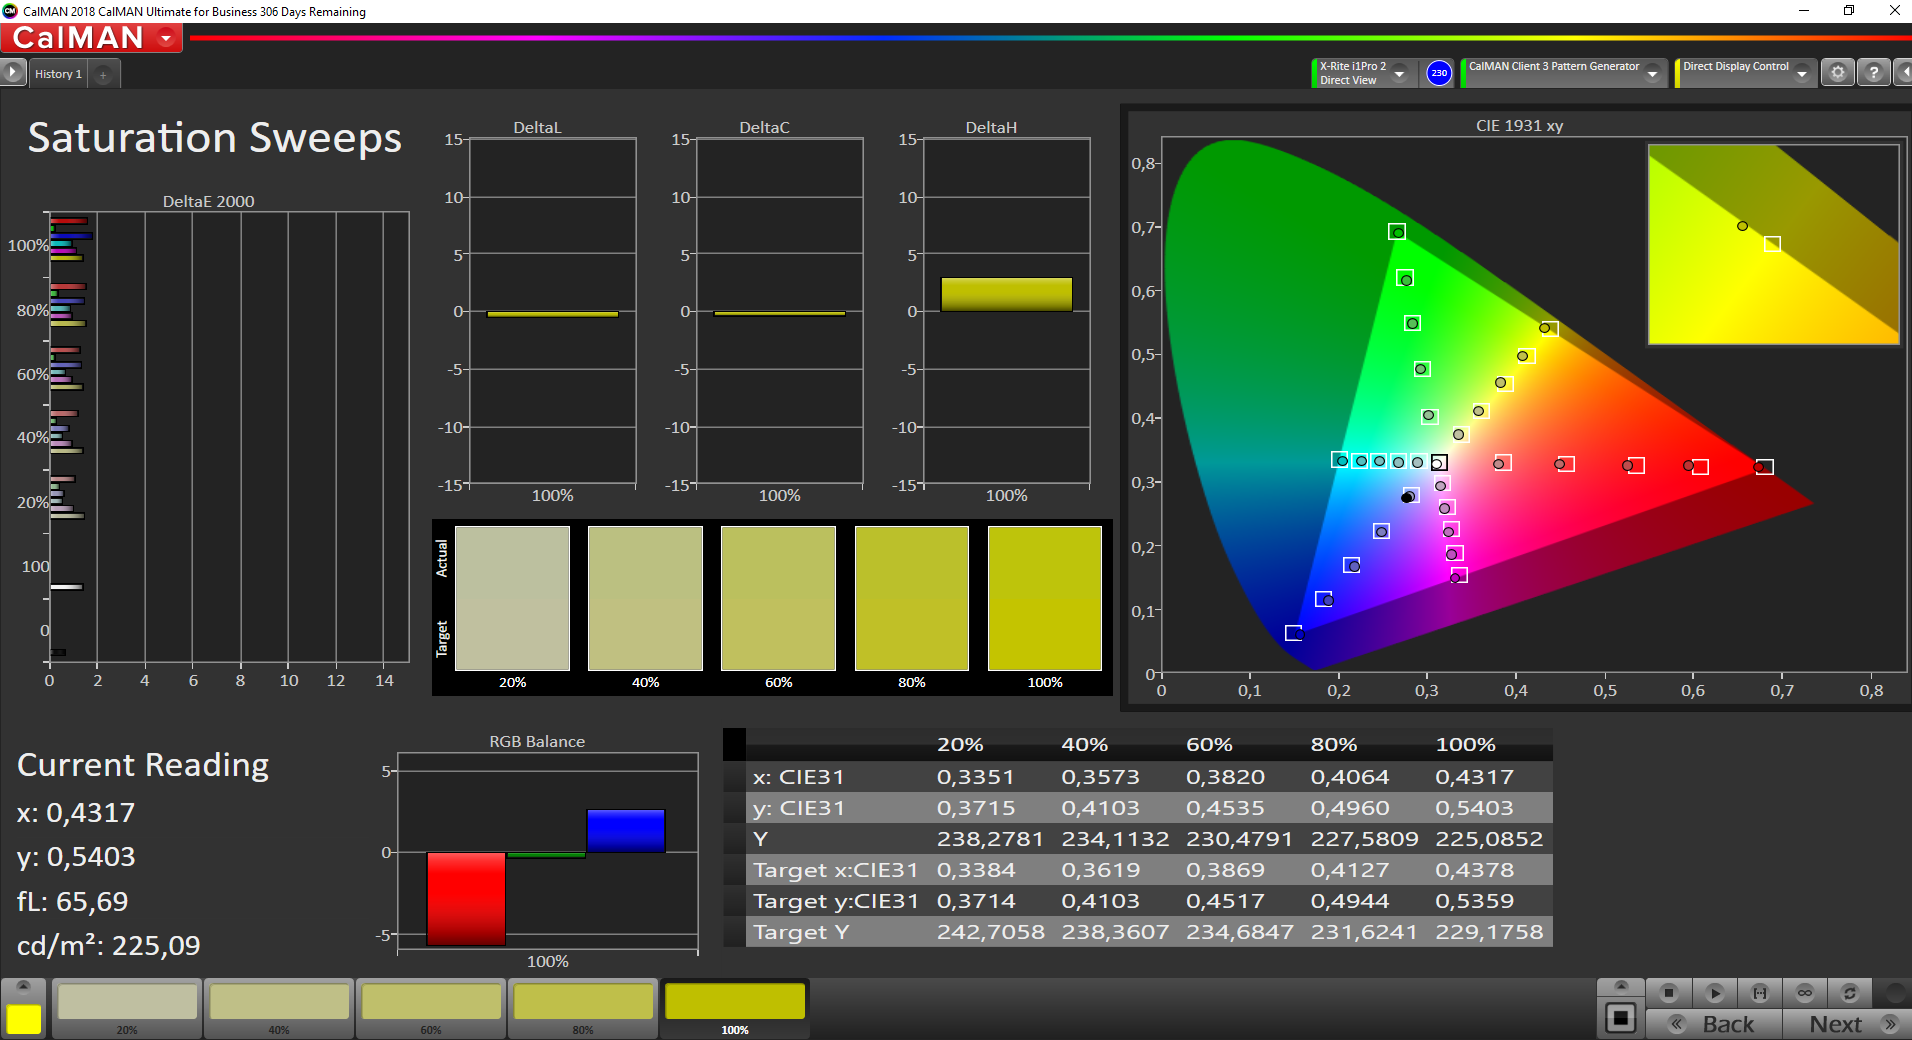
The black level and contrast are at a good level, but the 4K model is already better calibrated out of the box, so color deviations are even smaller.
Response times are slightly better than on the 1080p model but still too slow for gamers. PWM is not used.
The sRGB color space is almost completely covered now, while AdobeRGB is still at 75%, and DCI-P3 reaches a coverage of up to 90% according to Lenovo.
Outdoor use is possible due to good brightness and contrast values, despite the glossy surface not being entirely optimal for this.
Display Response Times
| ↔ Response Time Black to White | ||
|---|---|---|
| 18.4 ms ... rise ↗ and fall ↘ combined | ↗ 5.2 ms rise | 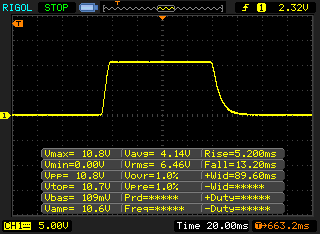 |
| ↘ 13.2 ms fall | ||
| The screen shows good response rates in our tests, but may be too slow for competitive gamers. In comparison, all tested devices range from 0.1 (minimum) to 240 (maximum) ms. » 41 % of all devices are better. This means that the measured response time is similar to the average of all tested devices (19.8 ms). | ||
| ↔ Response Time 50% Grey to 80% Grey | ||
| 45.6 ms ... rise ↗ and fall ↘ combined | ↗ 21.2 ms rise | 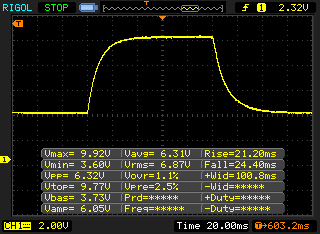 |
| ↘ 24.4 ms fall | ||
| The screen shows slow response rates in our tests and will be unsatisfactory for gamers. In comparison, all tested devices range from 0.165 (minimum) to 636 (maximum) ms. » 78 % of all devices are better. This means that the measured response time is worse than the average of all tested devices (31 ms). | ||
Screen Flickering / PWM (Pulse-Width Modulation)
| Screen flickering / PWM not detected | 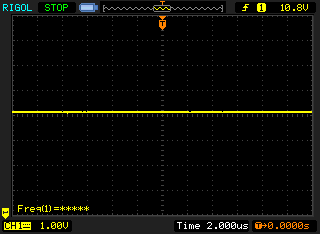 | ||
In comparison: 52 % of all tested devices do not use PWM to dim the display. If PWM was detected, an average of 7757 (minimum: 5 - maximum: 343500) Hz was measured. | |||

Performance - Top graphics, poor long-term CPU performance

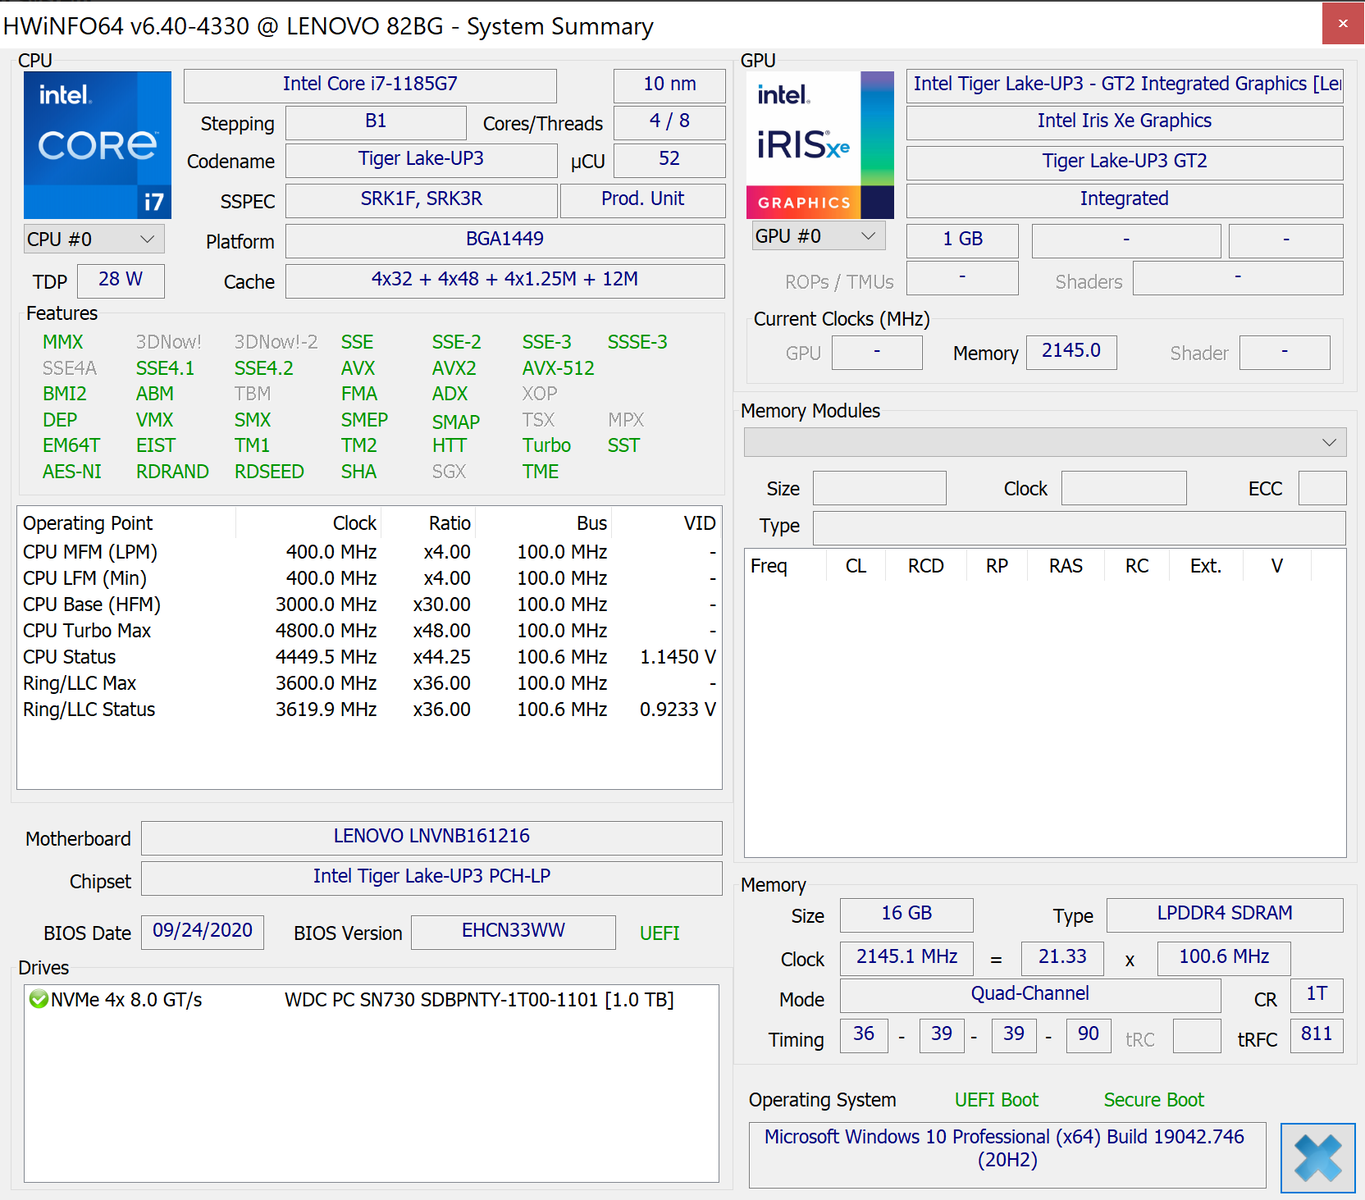
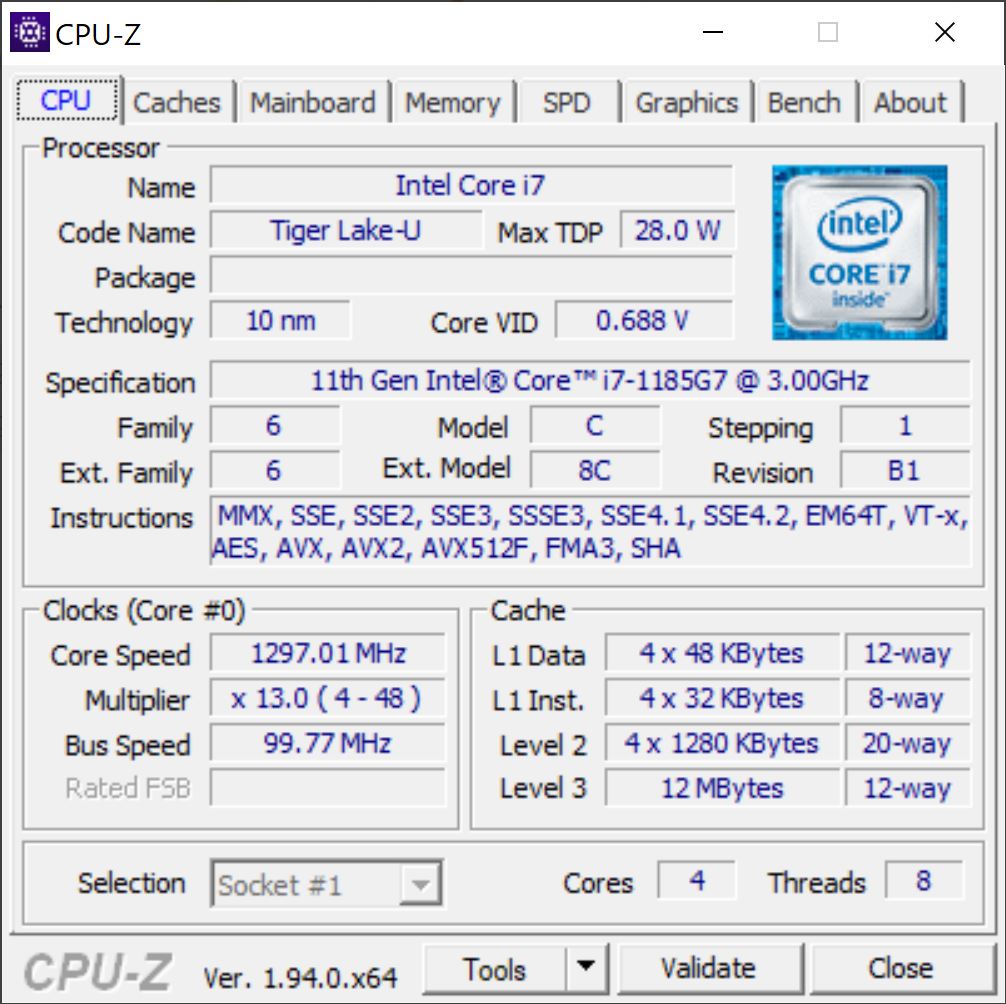
Instead of an Intel Core i5-1135G7, Lenovo now uses an Intel Core i7-1185G7. RAM has been doubled to 16 GB, and the SSD now holds 1 TB of data.
We ran all benchmarks using the Maximum Performance mode in Lenovo's Vantage software in order to achieve the best possible results.
Processor
The Intel Core i7-1185G7 is the fastest Tiger Lake G7 CPU for laptops. Its four cores clock between 3 GHz and 4.8 GHz. Additionally, the not-uncontroversial Intel vPro (Wikipedia, news) is supported. It should be well-equipped for all the tasks that the convertible has to do.
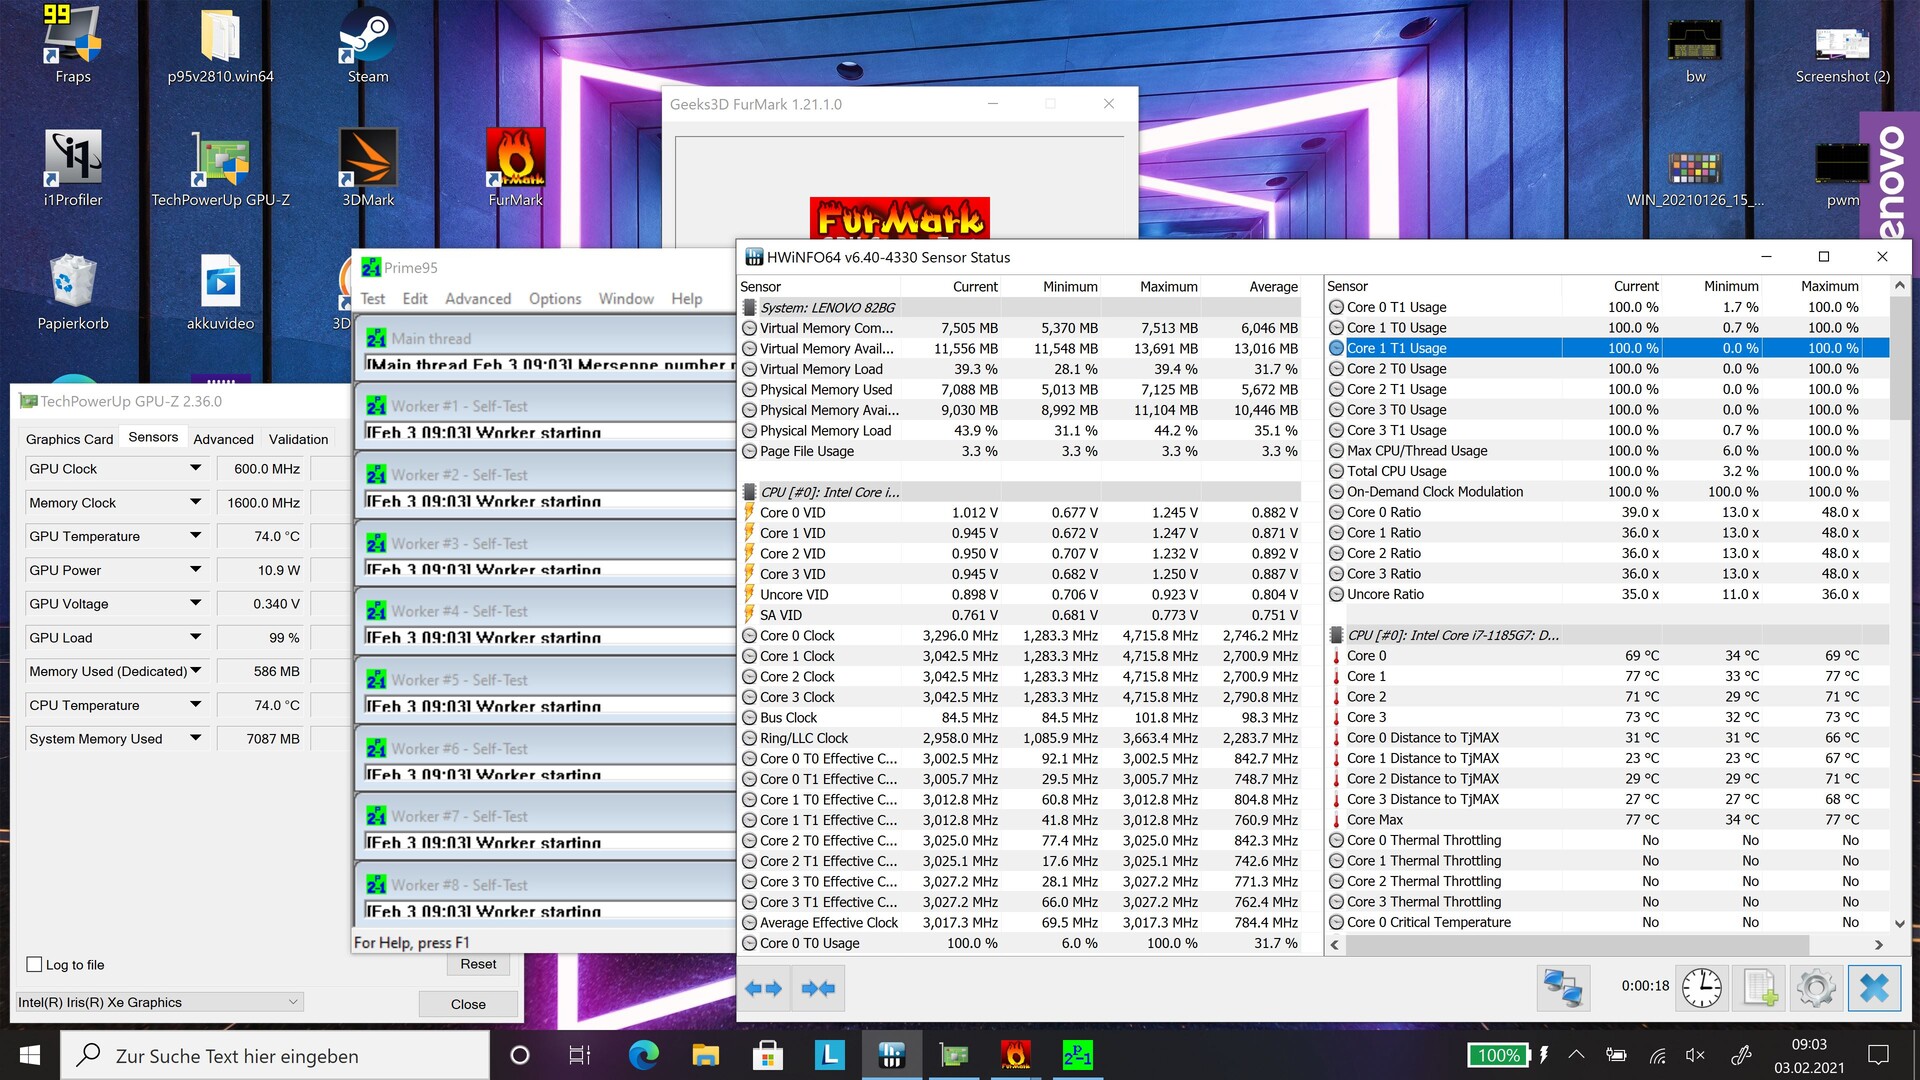
In the Cinebench R15 loop, the long-term performance of the nominally stronger processor is disappointing in any case. However, the short-term output is significantly higher than that of the Intel Core i5-1135G7, so there's a performance gain in short tasks. But the long-term performance is even lower than that of the lower-end model! The CPU performance is nowhere near the one of the Ryzen 7 4700U in the Asus VivoBook Flip and neither is the output power.
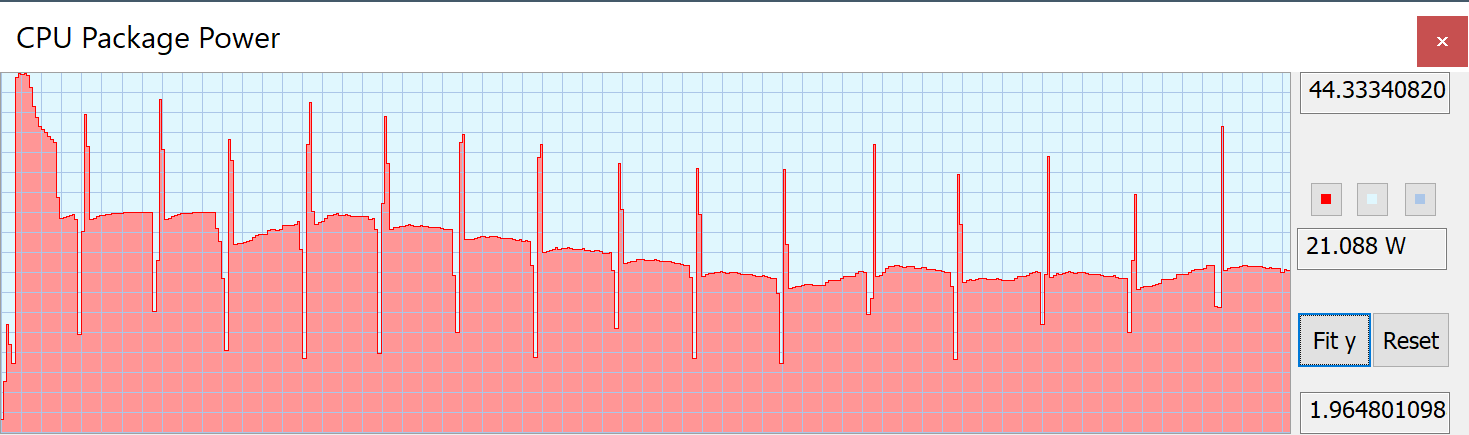
In the first loop, the TDP briefly reaches 44 watts. After that, it drops to 25 to 27 watts. When a new loop is started, the TDP only reaches 35 to 40 watts. After only one second, the value drops to 25 watts again, and even to 20 watts in the subsequent loops.
On battery power, we measure a performance drop of only about 5% in Cinebench R15.
Cinebench R15: CPU Single 64Bit | CPU Multi 64Bit
Blender: v2.79 BMW27 CPU
7-Zip 18.03: 7z b 4 -mmt1 | 7z b 4
Geekbench 5.5: Single-Core | Multi-Core
HWBOT x265 Benchmark v2.2: 4k Preset
LibreOffice : 20 Documents To PDF
R Benchmark 2.5: Overall mean
| Cinebench R20 / CPU (Single Core) | |
| Average of class Convertible (273 - 834, n=48, last 2 years) | |
| Average Intel Core i7-1185G7 (489 - 593, n=28) | |
| Lenovo Yoga 9 14 ITL 4K | |
| Lenovo Yoga 9i 14ITL5 | |
| Dell XPS 13 7390 2-in-1 Core i7 | |
| Asus VivoBook Flip 14 TM420IA | |
| Lenovo Yoga C740-14IML | |
| HP Spectre x360 13-aw0013dx | |
| Cinebench R20 / CPU (Multi Core) | |
| Average of class Convertible (595 - 12102, n=48, last 2 years) | |
| Asus VivoBook Flip 14 TM420IA | |
| Average Intel Core i7-1185G7 (1425 - 2493, n=28) | |
| Lenovo Yoga 9i 14ITL5 | |
| Dell XPS 13 7390 2-in-1 Core i7 | |
| Lenovo Yoga 9 14 ITL 4K | |
| HP Spectre x360 13-aw0013dx | |
| Lenovo Yoga C740-14IML | |
| Cinebench R15 / CPU Single 64Bit | |
| Average of class Convertible (149.8 - 317, n=47, last 2 years) | |
| Average Intel Core i7-1185G7 (168 - 230, n=27) | |
| Lenovo Yoga 9 14 ITL 4K | |
| Lenovo Yoga 9i 14ITL5 | |
| Asus VivoBook Flip 14 TM420IA | |
| HP Spectre x360 13-aw0013dx | |
| Dell XPS 13 7390 2-in-1 Core i7 | |
| Lenovo Yoga C740-14IML | |
| Cinebench R15 / CPU Multi 64Bit | |
| Average of class Convertible (478 - 4940, n=47, last 2 years) | |
| Asus VivoBook Flip 14 TM420IA | |
| Lenovo Yoga 9 14 ITL 4K | |
| Average Intel Core i7-1185G7 (617 - 1066, n=32) | |
| Dell XPS 13 7390 2-in-1 Core i7 | |
| Lenovo Yoga 9i 14ITL5 | |
| Lenovo Yoga C740-14IML | |
| HP Spectre x360 13-aw0013dx | |
| Blender / v2.79 BMW27 CPU | |
| Dell XPS 13 7390 2-in-1 Core i7 | |
| Lenovo Yoga 9 14 ITL 4K | |
| Lenovo Yoga 9i 14ITL5 | |
| Average Intel Core i7-1185G7 (478 - 745, n=28) | |
| Asus VivoBook Flip 14 TM420IA | |
| Average of class Convertible (105 - 1051, n=47, last 2 years) | |
| 7-Zip 18.03 / 7z b 4 -mmt1 | |
| Average of class Convertible (3672 - 6655, n=47, last 2 years) | |
| Average Intel Core i7-1185G7 (3678 - 5507, n=27) | |
| Lenovo Yoga 9 14 ITL 4K | |
| Lenovo Yoga 9i 14ITL5 | |
| Dell XPS 13 7390 2-in-1 Core i7 | |
| Asus VivoBook Flip 14 TM420IA | |
| 7-Zip 18.03 / 7z b 4 | |
| Average of class Convertible (12977 - 121368, n=47, last 2 years) | |
| Asus VivoBook Flip 14 TM420IA | |
| Average Intel Core i7-1185G7 (18812 - 27693, n=27) | |
| Dell XPS 13 7390 2-in-1 Core i7 | |
| Lenovo Yoga 9i 14ITL5 | |
| Lenovo Yoga 9 14 ITL 4K | |
| Geekbench 5.5 / Single-Core | |
| Average of class Convertible (806 - 2275, n=48, last 2 years) | |
| Average Intel Core i7-1185G7 (1398 - 1626, n=21) | |
| Lenovo Yoga 9 14 ITL 4K | |
| Lenovo Yoga 9i 14ITL5 | |
| Asus VivoBook Flip 14 TM420IA | |
| Geekbench 5.5 / Multi-Core | |
| Average of class Convertible (1608 - 22023, n=48, last 2 years) | |
| Lenovo Yoga 9 14 ITL 4K | |
| Average Intel Core i7-1185G7 (4620 - 5944, n=21) | |
| Asus VivoBook Flip 14 TM420IA | |
| Lenovo Yoga 9i 14ITL5 | |
| HWBOT x265 Benchmark v2.2 / 4k Preset | |
| Average of class Convertible (3.43 - 36.2, n=47, last 2 years) | |
| Asus VivoBook Flip 14 TM420IA | |
| Average Intel Core i7-1185G7 (5.02 - 8.13, n=27) | |
| Lenovo Yoga 9i 14ITL5 | |
| Dell XPS 13 7390 2-in-1 Core i7 | |
| Lenovo Yoga 9 14 ITL 4K | |
| LibreOffice / 20 Documents To PDF | |
| Asus VivoBook Flip 14 TM420IA | |
| Average of class Convertible (42.5 - 84.3, n=47, last 2 years) | |
| Lenovo Yoga 9 14 ITL 4K | |
| Average Intel Core i7-1185G7 (41.3 - 61.7, n=26) | |
| Lenovo Yoga 9i 14ITL5 | |
| R Benchmark 2.5 / Overall mean | |
| Lenovo Yoga 9i 14ITL5 | |
| Asus VivoBook Flip 14 TM420IA | |
| Lenovo Yoga 9 14 ITL 4K | |
| Average Intel Core i7-1185G7 (0.55 - 0.615, n=27) | |
| Average of class Convertible (0.3915 - 0.84, n=47, last 2 years) | |
* ... smaller is better
System performance
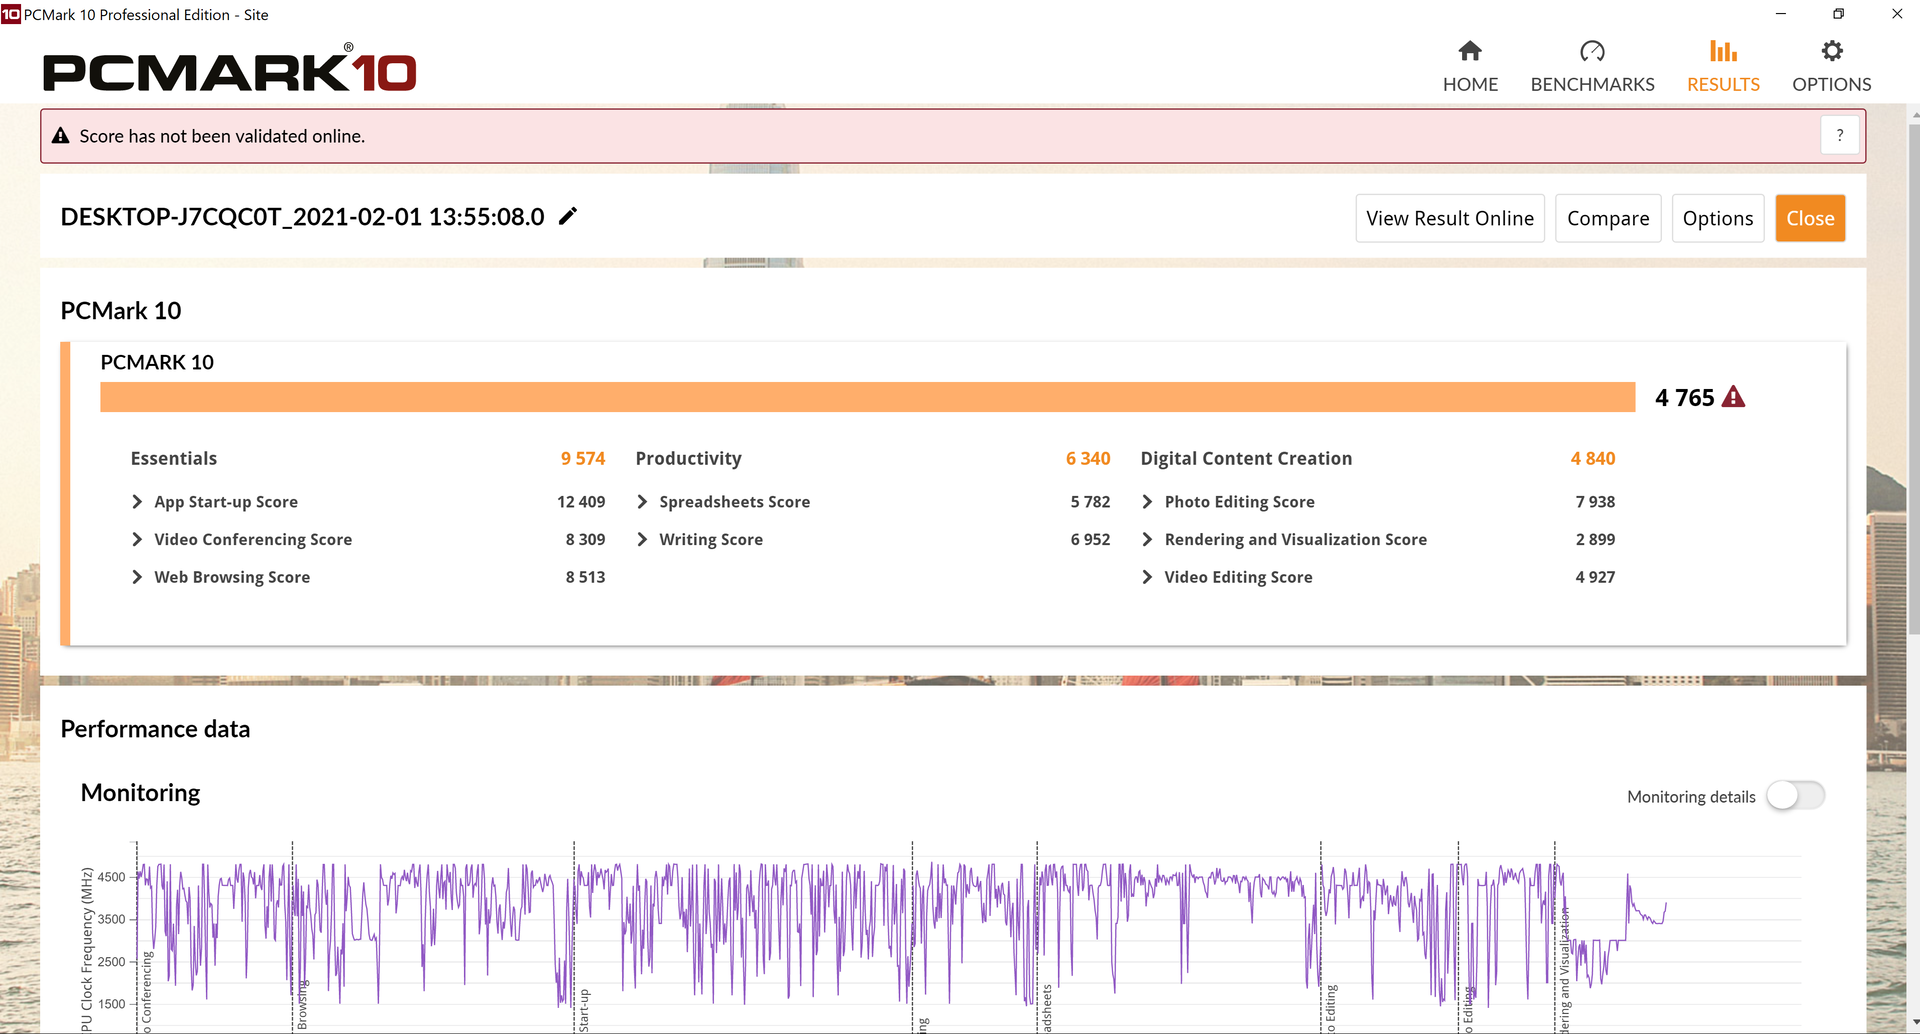
In PCMark, the Yoga 9i performs about 3% to 5% below an average Intel Core i7-1185G7. The differences between the rivals are otherwise rather small. Everyday work is mostly smooth.
| PCMark 10 Score | 4765 points | |
Help | ||
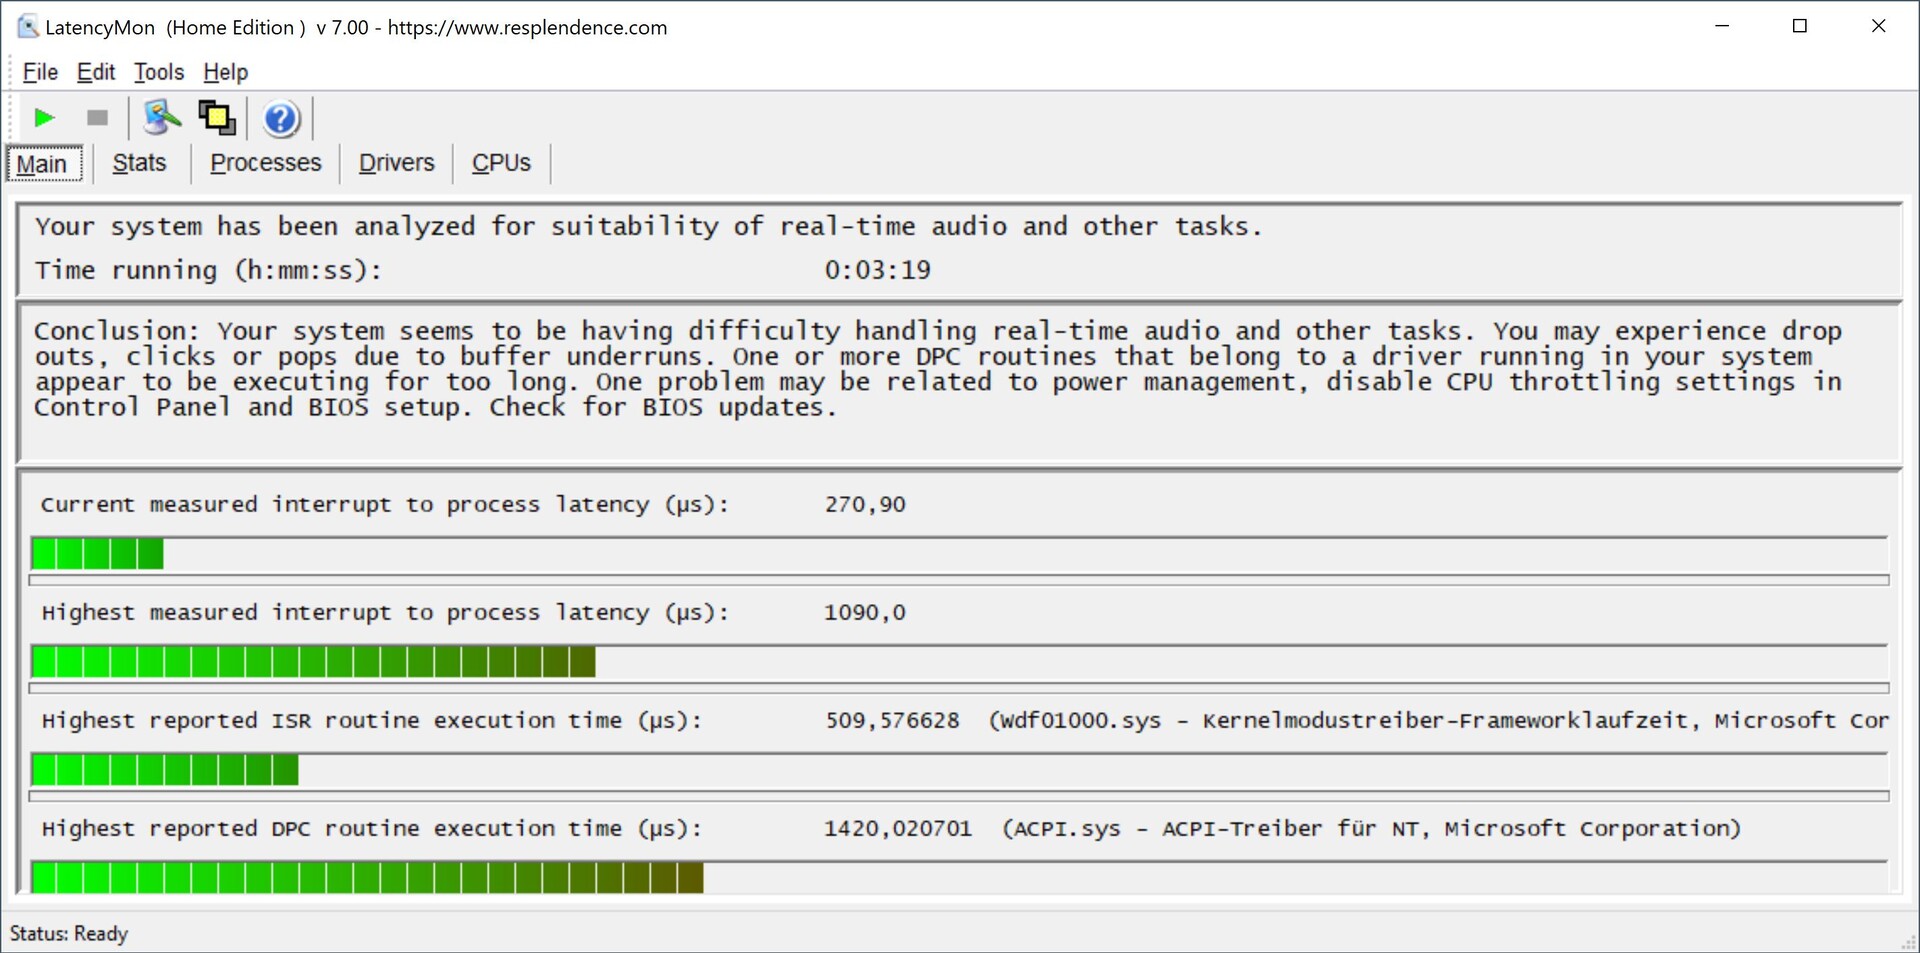
DPC latencies
There are latencies when opening multiple browser tabs. YouTube playback of our 4K/60 fps test video caused eight dropped frames.
Problems are caused by the ACPI Driver for NT, a network driver, and the Kernel-Mode Driver Framework, among others.

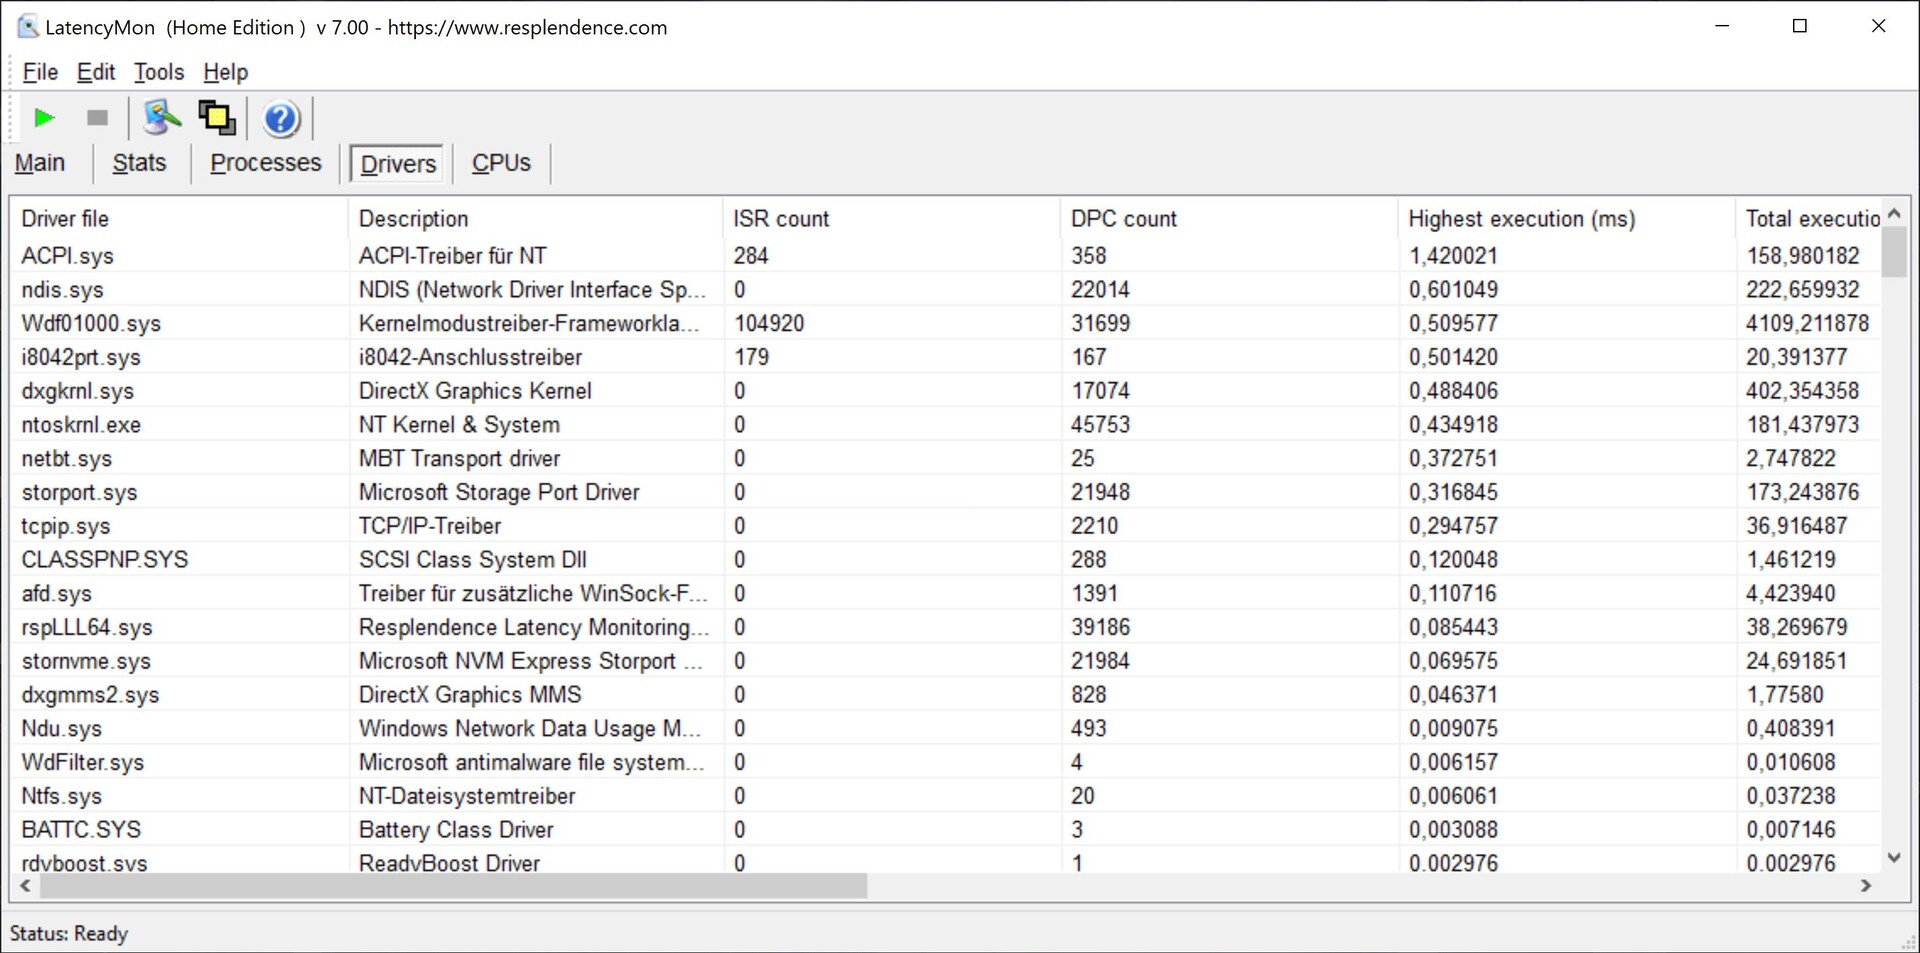
| DPC Latencies / LatencyMon - interrupt to process latency (max), Web, Youtube, Prime95 | |
| Lenovo Yoga 9i 14ITL5 | |
| Lenovo Yoga 9 14 ITL 4K | |
| Asus VivoBook Flip 14 TM420IA | |
* ... smaller is better
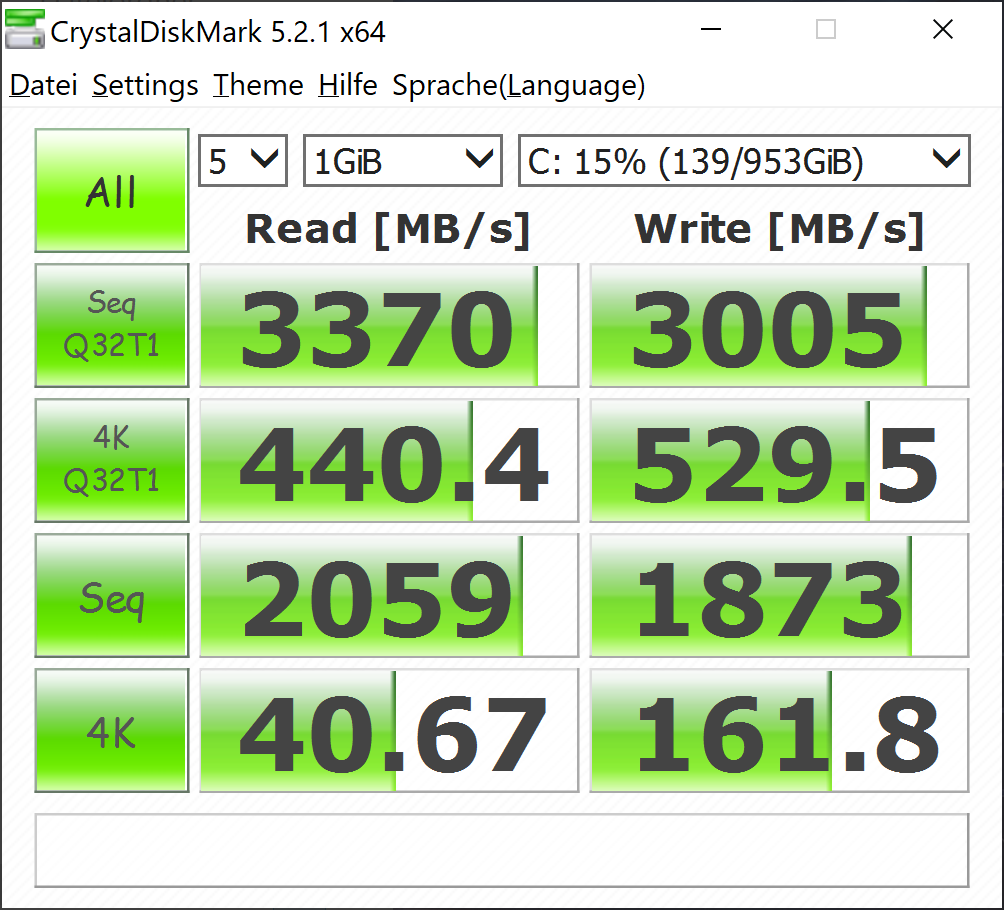
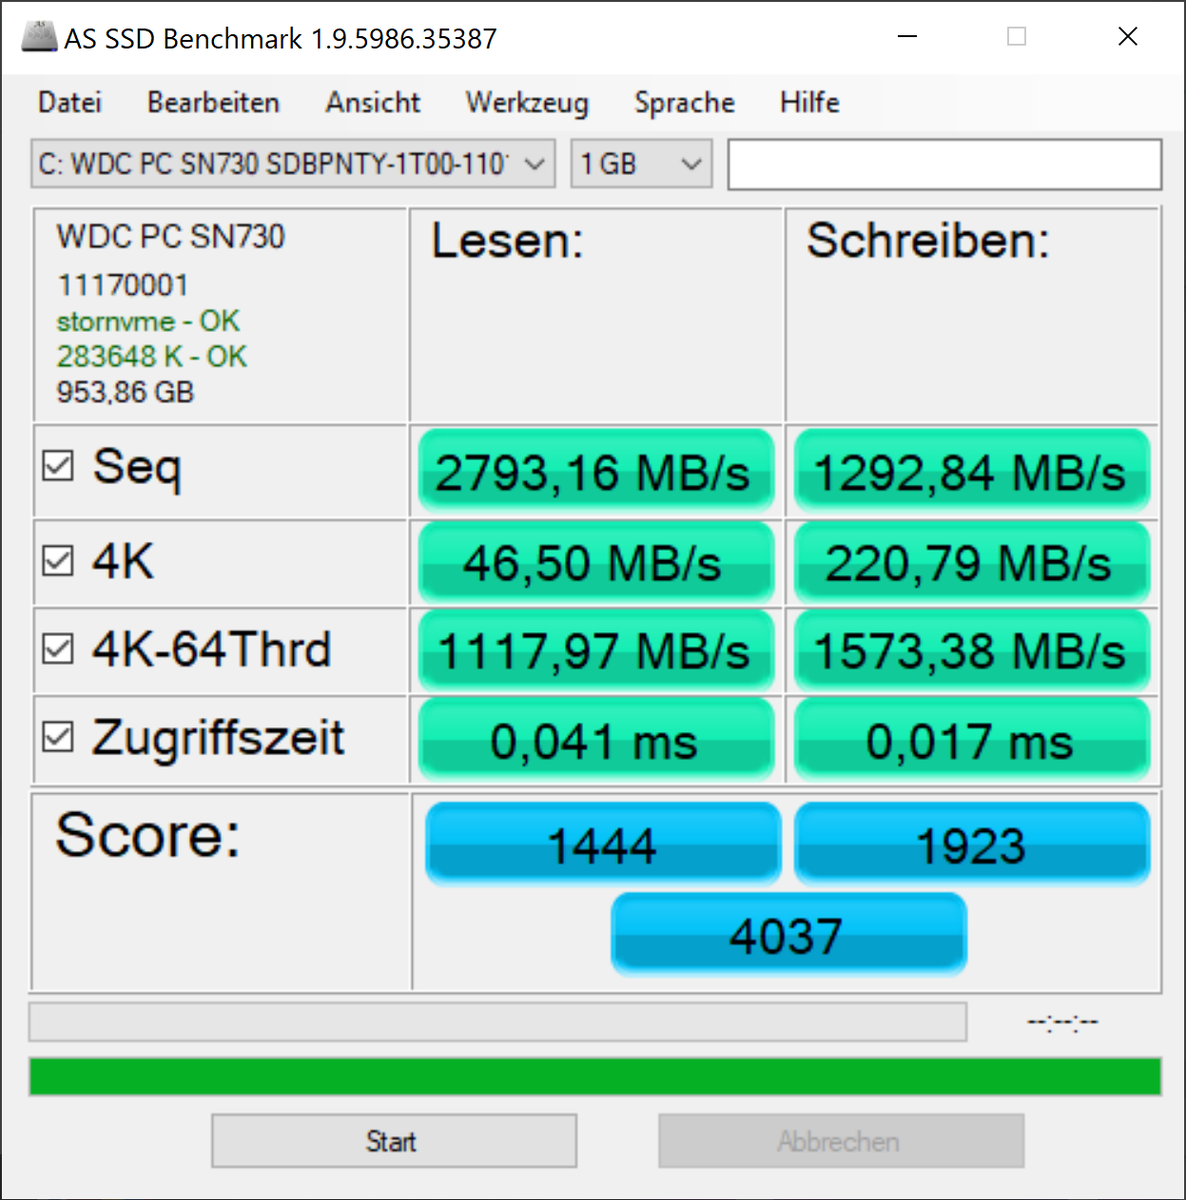
Storage
Lenovo installs a 1 TB NVMe SSD from Western Digital. The PCIe 3.0 model ranks 15th in our SSD/HDD ranking, so it's fast. Our measurements confirm this; it even outperforms the Samsung PM981a SSD found in the lower-end Yoga 9i.
| Lenovo Yoga 9 14 ITL 4K WDC PC SN730 SDBPNTY-1T00 | Lenovo Yoga 9i 14ITL5 Samsung SSD PM981a MZVLB256HBHQ | Lenovo Yoga C740-14IML Samsung SSD PM981a MZVLB256HBHQ | Asus VivoBook Flip 14 TM420IA Samsung PM991 MZVLQ512HALU | HP Spectre x360 13-aw0013dx Intel Optane Memory H10 with Solid State Storage 32GB + 512GB HBRPEKNX0202A(L/H) | Dell XPS 13 7390 2-in-1 Core i7 Toshiba BG4 KBG40ZPZ512G | Average WDC PC SN730 SDBPNTY-1T00 | |
|---|---|---|---|---|---|---|---|
| CrystalDiskMark 5.2 / 6 | -8% | -10% | -24% | -8% | -20% | 1% | |
| Write 4K (MB/s) | 161.8 | 139.6 -14% | 125.6 -22% | 121.2 -25% | 112.6 -30% | 106.7 -34% | 139.9 ? -14% |
| Read 4K (MB/s) | 40.67 | 37.3 -8% | 43.46 7% | 49.91 23% | 131 222% | 49.94 23% | 44.5 ? 9% |
| Write Seq (MB/s) | 1873 | 1827 -2% | 2011 7% | 1090 -42% | 458.9 -75% | 1223 -35% | 2346 ? 25% |
| Read Seq (MB/s) | 2059 | 2253 9% | 2046 -1% | 1533 -26% | 1355 -34% | 1801 -13% | 2102 ? 2% |
| Write 4K Q32T1 (MB/s) | 530 | 467.9 -12% | 375.8 -29% | 393.3 -26% | 341.3 -36% | 325.3 -39% | 442 ? -17% |
| Read 4K Q32T1 (MB/s) | 440.4 | 366.7 -17% | 338.1 -23% | 406 -8% | 320.6 -27% | 551 25% | 460 ? 4% |
| Write Seq Q32T1 (MB/s) | 3005 | 2349 -22% | 2346 -22% | 1225 -59% | 1219 -59% | 1224 -59% | 3049 ? 1% |
| Read Seq Q32T1 (MB/s) | 3370 | 3540 5% | 3562 6% | 2277 -32% | 2462 -27% | 2350 -30% | 3285 ? -3% |
| AS SSD | -43% | -50% | -65% | -95% | -286% | -16% | |
| Seq Read (MB/s) | 2793 | 2177 -22% | 1719 -38% | 1397 -50% | 1039 -63% | 1801 -36% | 2606 ? -7% |
| Seq Write (MB/s) | 1292 | 813 -37% | 1211 -6% | 783 -39% | 310.1 -76% | 1125 -13% | 1935 ? 50% |
| 4K Read (MB/s) | 46.5 | 53.2 14% | 53.1 14% | 48.08 3% | 76 63% | 39.7 -15% | 42.9 ? -8% |
| 4K Write (MB/s) | 220.8 | 180 -18% | 131.4 -40% | 134.6 -39% | 118 -47% | 67 -70% | 129.1 ? -42% |
| 4K-64 Read (MB/s) | 1118 | 531 -53% | 508 -55% | 835 -25% | 371.8 -67% | 1253 12% | 1361 ? 22% |
| 4K-64 Write (MB/s) | 1573 | 398.5 -75% | 883 -44% | 734 -53% | 469.5 -70% | 209 -87% | 1920 ? 22% |
| Access Time Read * (ms) | 0.041 | 0.052 -27% | 0.05 -22% | 0.081 -98% | 0.067 -63% | 0.069 -68% | 0.0689 ? -68% |
| Access Time Write * (ms) | 0.017 | 0.058 -241% | 0.085 -400% | 0.084 -394% | 0.138 -712% | 0.625 -3576% | 0.06215 ? -266% |
| Score Read (Points) | 1444 | 802 -44% | 733 -49% | 1022 -29% | 552 -62% | 1472 2% | 1664 ? 15% |
| Score Write (Points) | 1923 | 660 -66% | 1135 -41% | 947 -51% | 618 -68% | 388 -80% | 2242 ? 17% |
| Score Total (Points) | 4037 | 1822 -55% | 2235 -45% | 2474 -39% | 1448 -64% | 2583 -36% | 4726 ? 17% |
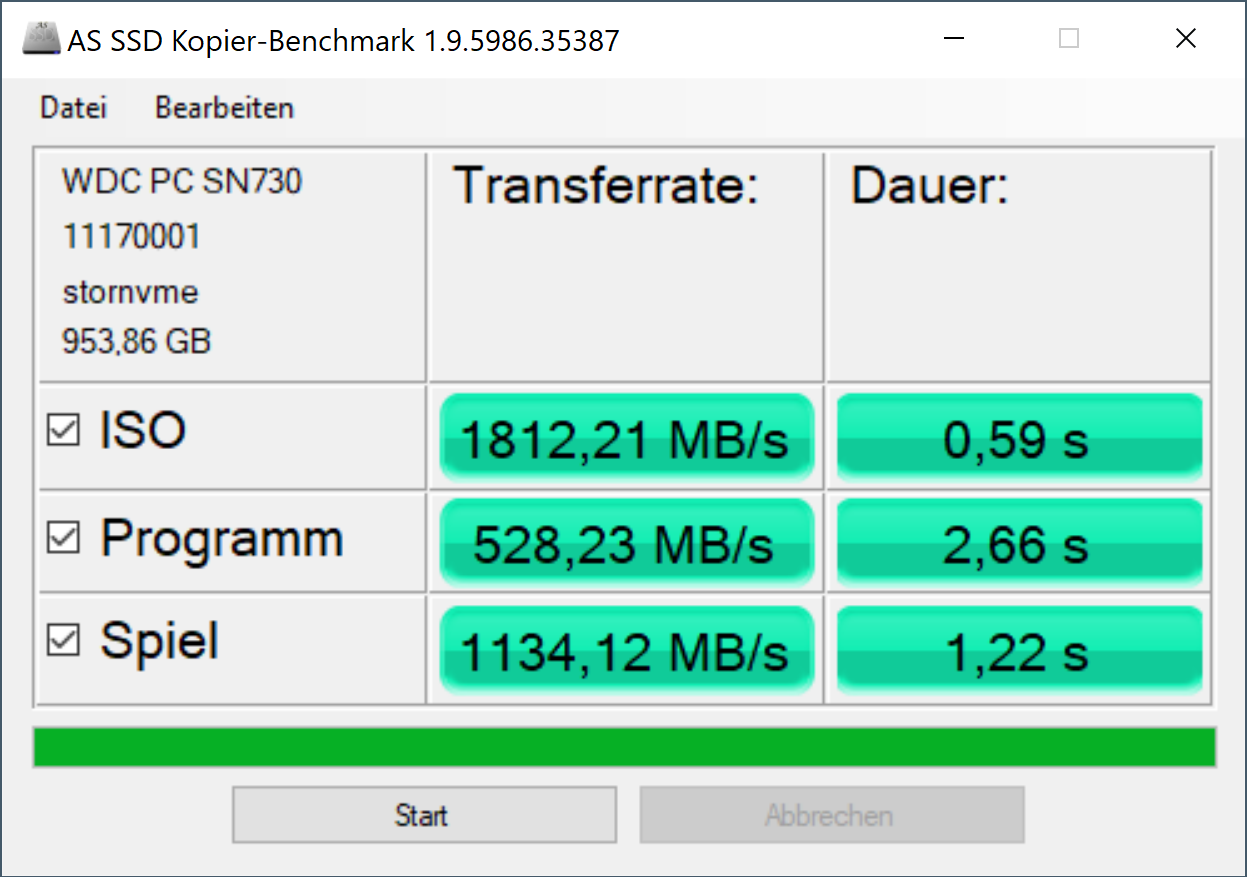
| Copy ISO MB/s (MB/s) | 1812 | 1962 8% | 1636 -10% | 1212 -33% | 764 -58% | 1293 -29% | 2041 ? 13% |
| Copy Program MB/s (MB/s) | 528 | 522 -1% | 698 32% | 374.3 -29% | 465.8 -12% | 560 6% | 552 ? 5% |
| Copy Game MB/s (MB/s) | 1134 | 1258 11% | 1246 10% | 829 -27% | 764 -33% | 927 -18% | 1183 ? 4% |
| Total Average (Program / Settings) | -26% /
-30% | -30% /
-35% | -45% /
-50% | -52% /
-64% | -153% /
-190% | -8% /
-10% |
* ... smaller is better

Continuous load read: DiskSpd Read Loop, Queue Depth 8
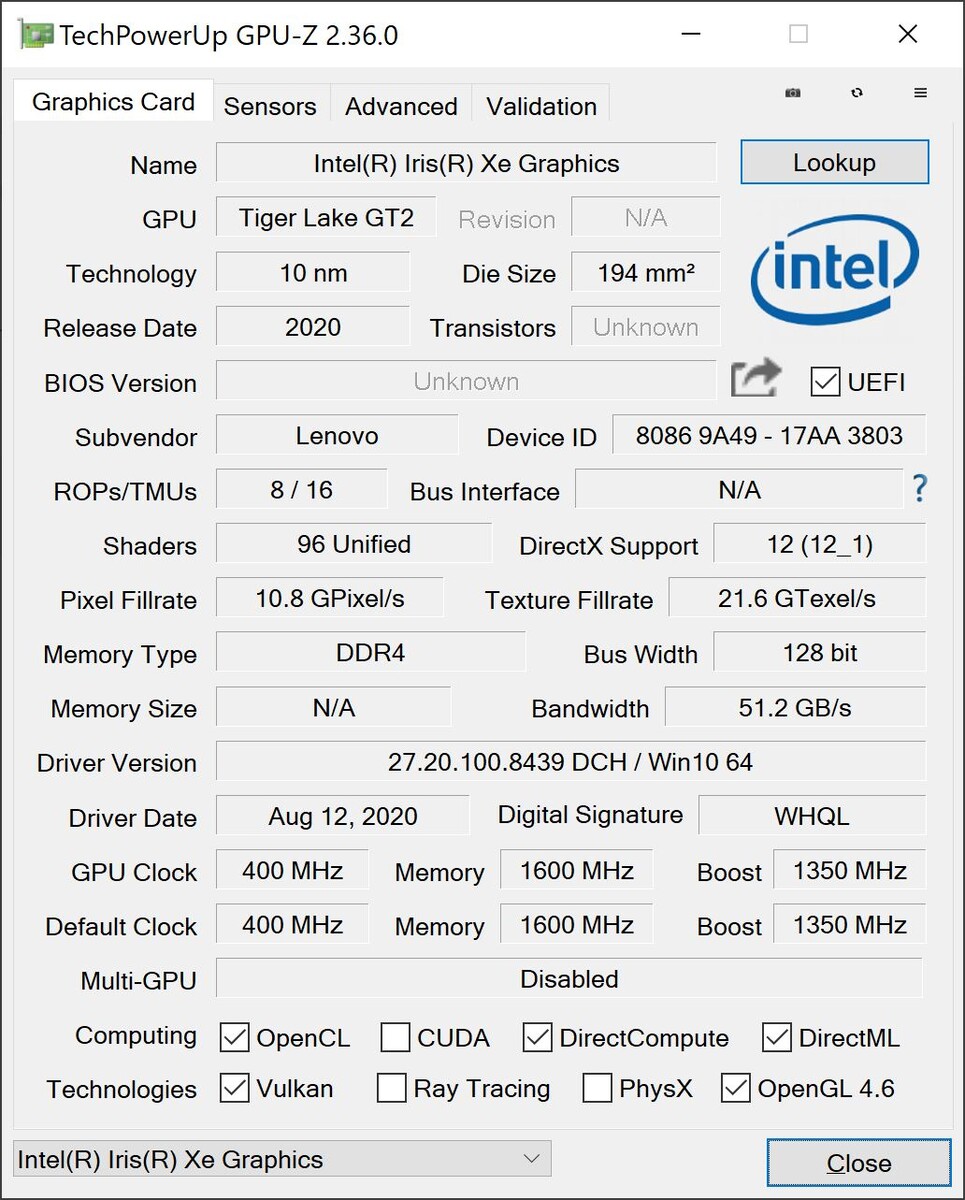
Graphics card
The Intel Iris Xe Graphics G7 iGPU now has 96 instead of 80 EUs and potentially slightly higher clock rates. You can definitely play games with this iGPU but rather at medium resolutions and details. Other graphics tasks like photo or video-editing are handled well by the graphics unit.
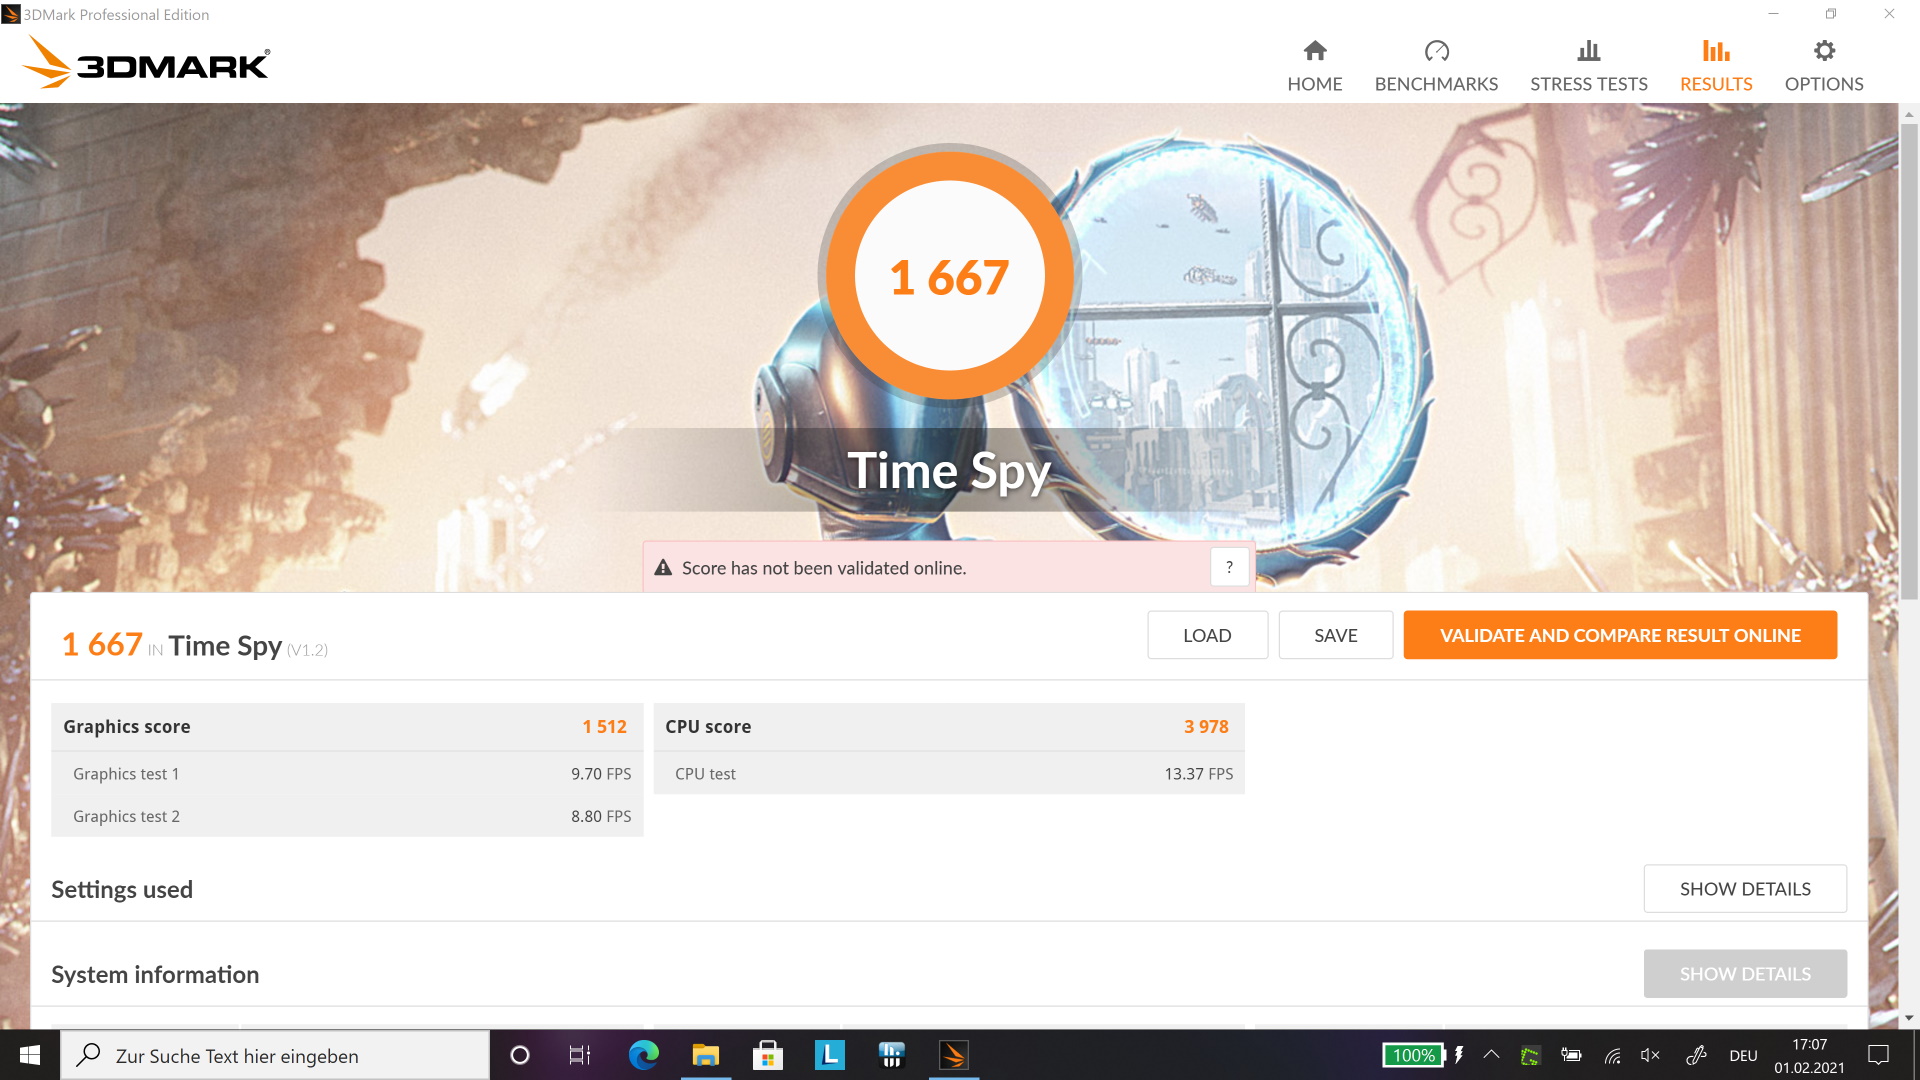
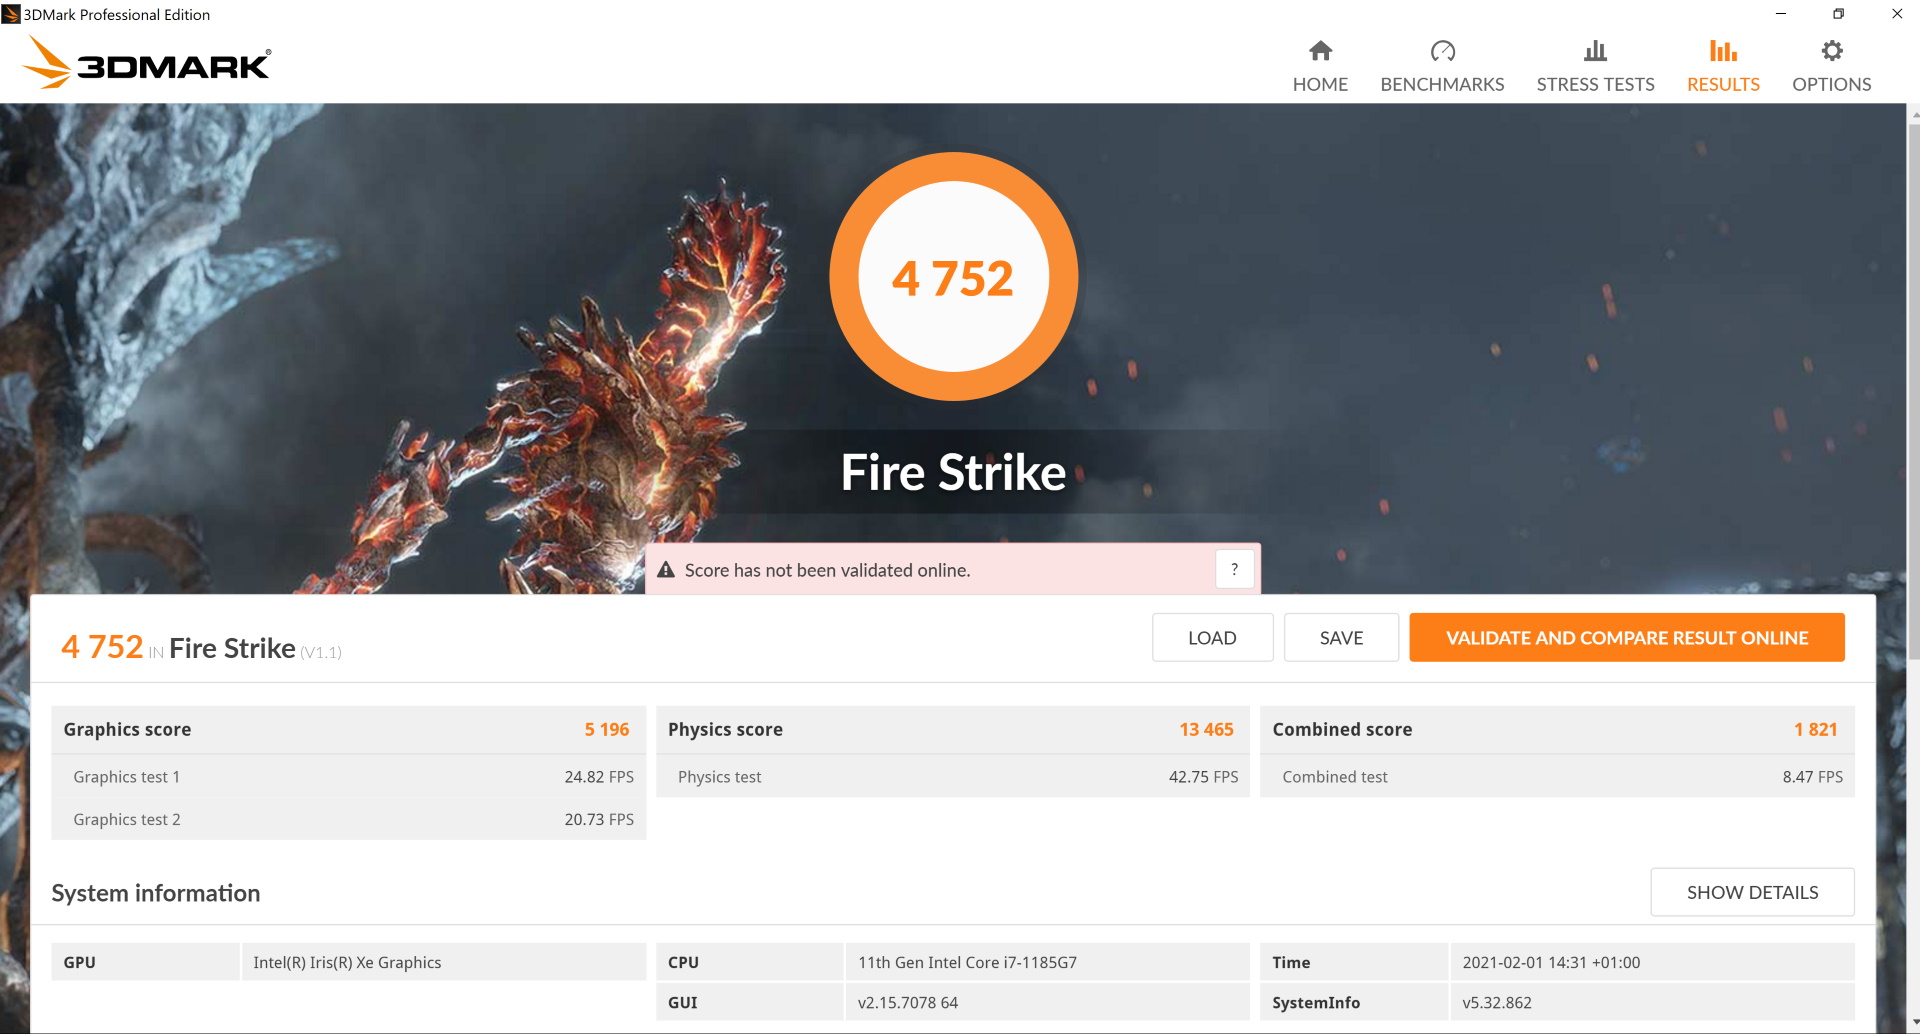
In the 3DMark tests, the card places itself ahead of the competition and is about 5% faster than the average model. It's about 10% to 12% superior compared with its sibling configuration. The AMD RX Vega 7 in the Ryzen 7 4700U is about 30% to 40% behind.
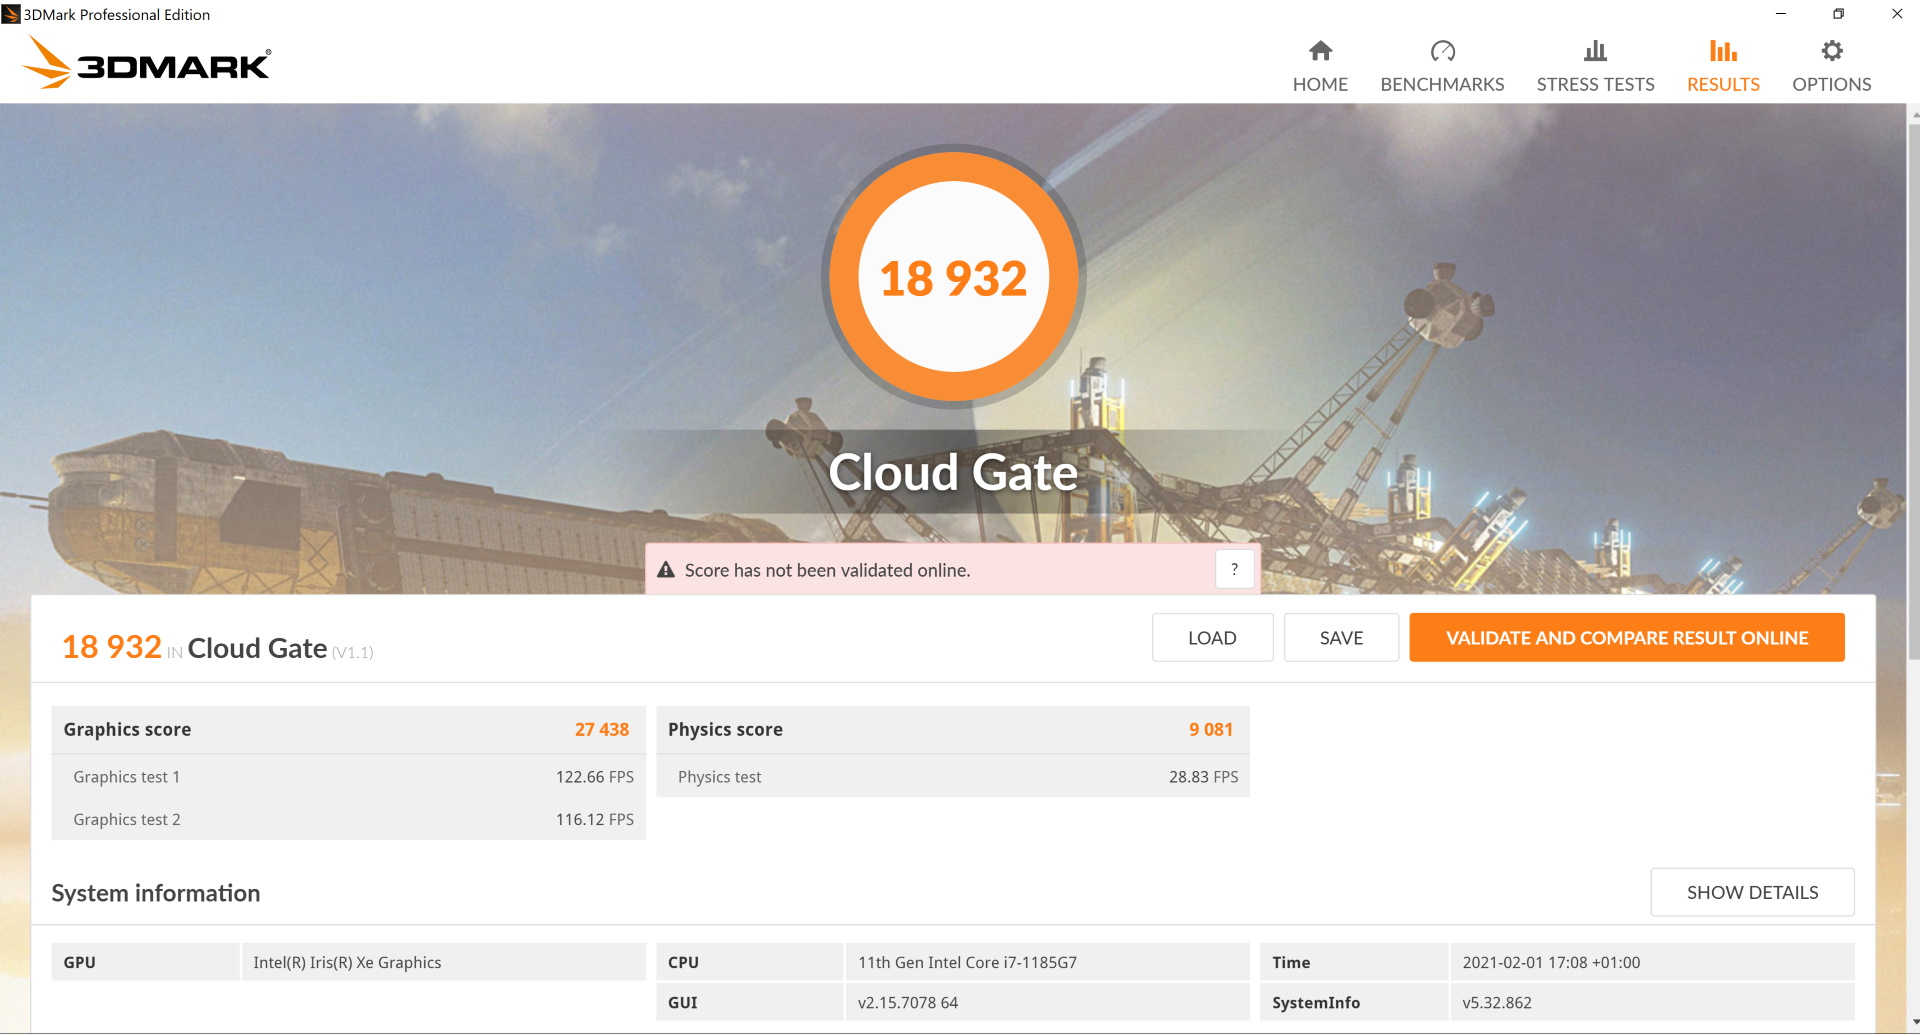
According to the 3DMark 11 results, hardly any 3D performance is lost on battery power.
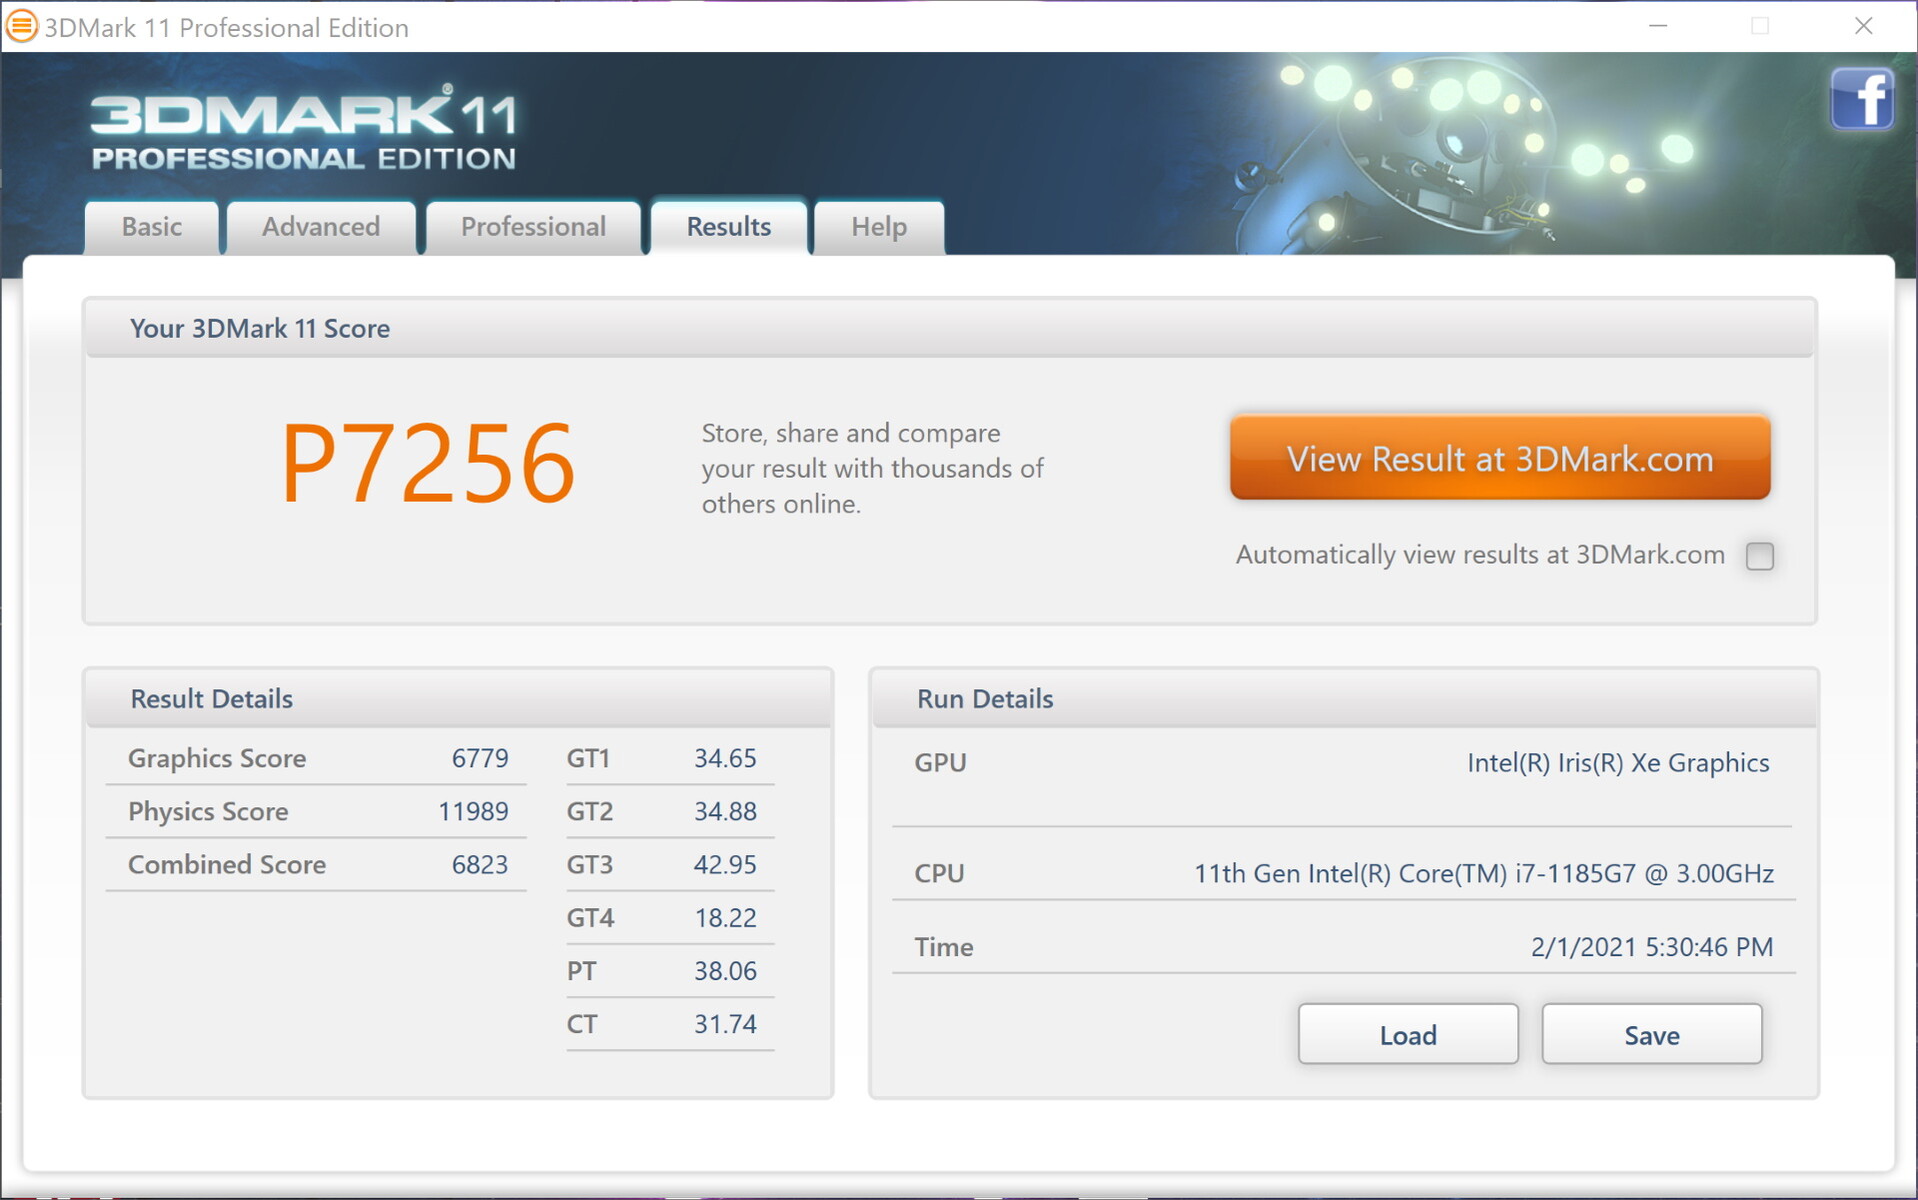

| 3DMark 11 Performance | 7256 points | |
| 3DMark Cloud Gate Standard Score | 18932 points | |
| 3DMark Fire Strike Score | 4752 points | |
| 3DMark Time Spy Score | 1667 points | |
Help | ||
Gaming performance
The Witcher 3 sometimes even runs in Full HD but only with low details. Otherwise, performance is rather sufficient for medium resolutions and details. Compared with the competition, the Yoga 9i takes the top position again. The average Iris Xe G7 is outperformed by 10% at least (The Witcher 3), the sibling configuration is 5% to 10% behind, and the competition with last-gen iGPUs is even further behind. The differences seen in The Witcher 3 are slightly higher than in the 3DMark tests and other titles.
| Rise of the Tomb Raider | |
| 1024x768 Lowest Preset | |
| Lenovo Yoga 9 14 ITL 4K | |
| Average Intel Iris Xe Graphics G7 96EUs (46 - 85.5, n=5) | |
| Dell XPS 13 7390 2-in-1 Core i7 | |
| 1366x768 Medium Preset AF:2x | |
| Average Intel Iris Xe Graphics G7 96EUs (35.1 - 49, n=5) | |
| Lenovo Yoga 9 14 ITL 4K | |
| Dell XPS 13 7390 2-in-1 Core i7 | |
| 1920x1080 High Preset AA:FX AF:4x | |
| Lenovo Yoga 9 14 ITL 4K | |
| Average Intel Iris Xe Graphics G7 96EUs (19.9 - 28.2, n=5) | |
| Dell XPS 13 7390 2-in-1 Core i7 | |
| 1920x1080 Very High Preset AA:FX AF:16x | |
| Lenovo Yoga 9 14 ITL 4K | |
| Average Intel Iris Xe Graphics G7 96EUs (16.4 - 22.7, n=5) | |
| Dell XPS 13 7390 2-in-1 Core i7 | |
| Shadow of the Tomb Raider | |
| 1280x720 Lowest Preset | |
| Average of class Convertible (24 - 180, n=2, last 2 years) | |
| Lenovo Yoga 9 14 ITL 4K | |
| Average Intel Iris Xe Graphics G7 96EUs (29 - 68.7, n=26) | |
| Dell XPS 13 7390 2-in-1 Core i7 | |
| HP Spectre x360 13-aw0013dx | |
| Lenovo Yoga C740-14IML | |
| 1920x1080 Lowest Preset | |
| Average Intel Iris Xe Graphics G7 96EUs (23.9 - 50.2, n=13) | |
| Lenovo Yoga 9 14 ITL 4K | |
| 1920x1080 Medium Preset | |
| Average of class Convertible (n=1last 2 years) | |
| Average Intel Iris Xe Graphics G7 96EUs (11 - 35.6, n=26) | |
| Lenovo Yoga 9 14 ITL 4K | |
| 1920x1080 High Preset AA:SM | |
| Average of class Convertible (n=1last 2 years) | |
| Average Intel Iris Xe Graphics G7 96EUs (12 - 30.3, n=19) | |
| Lenovo Yoga 9 14 ITL 4K | |
Gaming performance is relatively stable and only drops minimally over a period of more than an hour (from 15 fps to 13-14 fps). The Y9i 4K passes the Fire Strike stress test with 99%.
| low | med. | high | ultra | 4K | |
|---|---|---|---|---|---|
| The Witcher 3 (2015) | 98 | 60.3 | 30.3 | 15.8 | |
| Dota 2 Reborn (2015) | 76.8 | 53.5 | 41.2 | 40.1 | 20.1 |
| Rise of the Tomb Raider (2016) | 85.5 | 43 | 25 | 20.4 | 8.3 |
| X-Plane 11.11 (2018) | 54.3 | 41.1 | 35 | 18.6 | |
| Shadow of the Tomb Raider (2018) | 52 | 21 | 20 |
Emissions - Depending on the cooling mode
Noise emissions
The fan volume also depends on the selected cooling mode (Vantage software). In Maximum Performance mode, the fans can rev up to 39.7 dB(A) under stress; in the Intelligent Mode, they reach 35.7 dB(A), and in Battery Saving mode, only a maximum of 29.5 dB(A) is reached.
Therefore, it's worth it to adjust the cooling mode depending on the task. Those who only surf the Internet or type will be able to do so more quietly in Battery Saving mode. Otherwise, our Yoga 9i gets a bit louder than the competition under average load conditions (Maximum Performance mode), but it stays a bit quieter in extreme stress. Only the HP Spectre x360 13 has advantages across all load conditions.
Noise level
| Idle |
| 24.9 / 28.3 / 29.5 dB(A) |
| Load |
| 39.7 / 39.7 dB(A) |
 | ||
30 dB silent 40 dB(A) audible 50 dB(A) loud |
||
min: | ||
| Lenovo Yoga 9 14 ITL 4K Iris Xe G7 96EUs, i7-1185G7, WDC PC SN730 SDBPNTY-1T00 | Lenovo Yoga 9i 14ITL5 Iris Xe G7 80EUs, i5-1135G7, Samsung SSD PM981a MZVLB256HBHQ | Lenovo Yoga C740-14IML UHD Graphics 620, i5-10210U, Samsung SSD PM981a MZVLB256HBHQ | Asus VivoBook Flip 14 TM420IA Vega 7, R7 4700U, Samsung PM991 MZVLQ512HALU | HP Spectre x360 13-aw0013dx Iris Plus Graphics G7 (Ice Lake 64 EU), i7-1065G7, Intel Optane Memory H10 with Solid State Storage 32GB + 512GB HBRPEKNX0202A(L/H) | Dell XPS 13 7390 2-in-1 Core i7 Iris Plus Graphics G7 (Ice Lake 64 EU), i7-1065G7, Toshiba BG4 KBG40ZPZ512G | |
|---|---|---|---|---|---|---|
| Noise | 0% | -3% | -0% | 3% | -3% | |
| off / environment * (dB) | 24.9 | 26.3 -6% | 29 -16% | 27.1 -9% | 28.5 -14% | 28.1 -13% |
| Idle Minimum * (dB) | 24.9 | 26.3 -6% | 29 -16% | 27.1 -9% | 28.5 -14% | 28.1 -13% |
| Idle Average * (dB) | 28.3 | 26.3 7% | 29 -2% | 27.1 4% | 28.5 -1% | 28.1 1% |
| Idle Maximum * (dB) | 29.5 | 26.3 11% | 29.7 -1% | 27.1 8% | 28.5 3% | 28.1 5% |
| Load Average * (dB) | 39.7 | 34.1 14% | 32.6 18% | 35 12% | 28.5 28% | 31.7 20% |
| Witcher 3 ultra * (dB) | 39.7 | 43.4 -9% | 41.3 -4% | 35.3 11% | 43.4 -9% | |
| Load Maximum * (dB) | 39.7 | 43.3 -9% | 39 2% | 41.3 -4% | 35.3 11% | 43.4 -9% |
* ... smaller is better
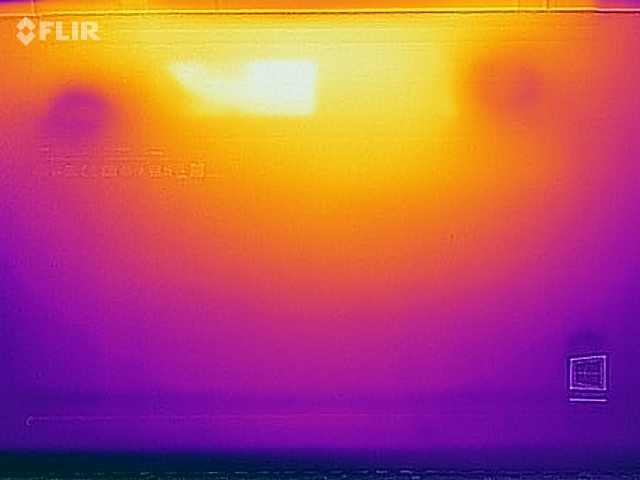
Temperature
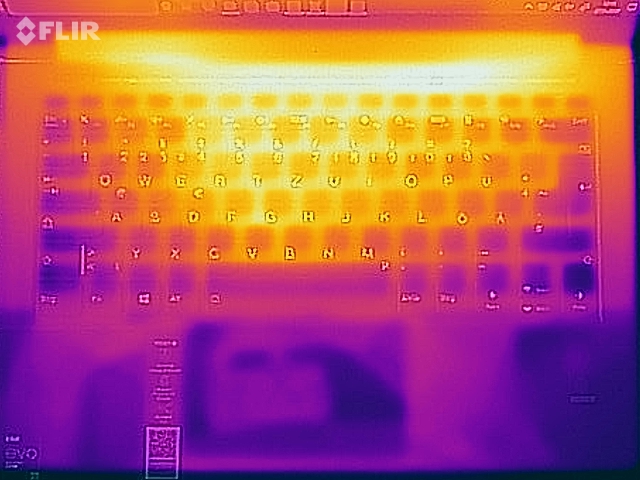
Everything remains pleasantly cool in idle usage. Under heavy load, the bottom reaches a maximum of 48.6 °C (~119 °F). It stays a bit cooler on the top, especially in the area of the palm rests.
The 1080p Yoga 9i gets even a bit hotter, and the HP Spectre has the best rates of all contenders here as well.
(±) The maximum temperature on the upper side is 42 °C / 108 F, compared to the average of 35.4 °C / 96 F, ranging from 19.6 to 60 °C for the class Convertible.
(-) The bottom heats up to a maximum of 48.6 °C / 119 F, compared to the average of 36.9 °C / 98 F
(+) In idle usage, the average temperature for the upper side is 24.3 °C / 76 F, compared to the device average of 30.3 °C / 87 F.
(+) The palmrests and touchpad are cooler than skin temperature with a maximum of 28.8 °C / 83.8 F and are therefore cool to the touch.
(±) The average temperature of the palmrest area of similar devices was 28 °C / 82.4 F (-0.8 °C / -1.4 F).
| Lenovo Yoga 9 14 ITL 4K Iris Xe G7 96EUs, i7-1185G7, WDC PC SN730 SDBPNTY-1T00 | Lenovo Yoga 9i 14ITL5 Iris Xe G7 80EUs, i5-1135G7, Samsung SSD PM981a MZVLB256HBHQ | Lenovo Yoga C740-14IML UHD Graphics 620, i5-10210U, Samsung SSD PM981a MZVLB256HBHQ | Asus VivoBook Flip 14 TM420IA Vega 7, R7 4700U, Samsung PM991 MZVLQ512HALU | HP Spectre x360 13-aw0013dx Iris Plus Graphics G7 (Ice Lake 64 EU), i7-1065G7, Intel Optane Memory H10 with Solid State Storage 32GB + 512GB HBRPEKNX0202A(L/H) | Dell XPS 13 7390 2-in-1 Core i7 Iris Plus Graphics G7 (Ice Lake 64 EU), i7-1065G7, Toshiba BG4 KBG40ZPZ512G | |
|---|---|---|---|---|---|---|
| Heat | -6% | -0% | -15% | 3% | -18% | |
| Maximum Upper Side * (°C) | 42 | 43.4 -3% | 38.6 8% | 44.6 -6% | 37.2 11% | 51.4 -22% |
| Maximum Bottom * (°C) | 48.6 | 49.6 -2% | 42.6 12% | 46 5% | 42.2 13% | 46.4 5% |
| Idle Upper Side * (°C) | 25.3 | 26.4 -4% | 26.8 -6% | 33.2 -31% | 25.8 -2% | 32 -26% |
| Idle Bottom * (°C) | 25.5 | 29.4 -15% | 29.2 -15% | 33 -29% | 28 -10% | 32.8 -29% |
* ... smaller is better
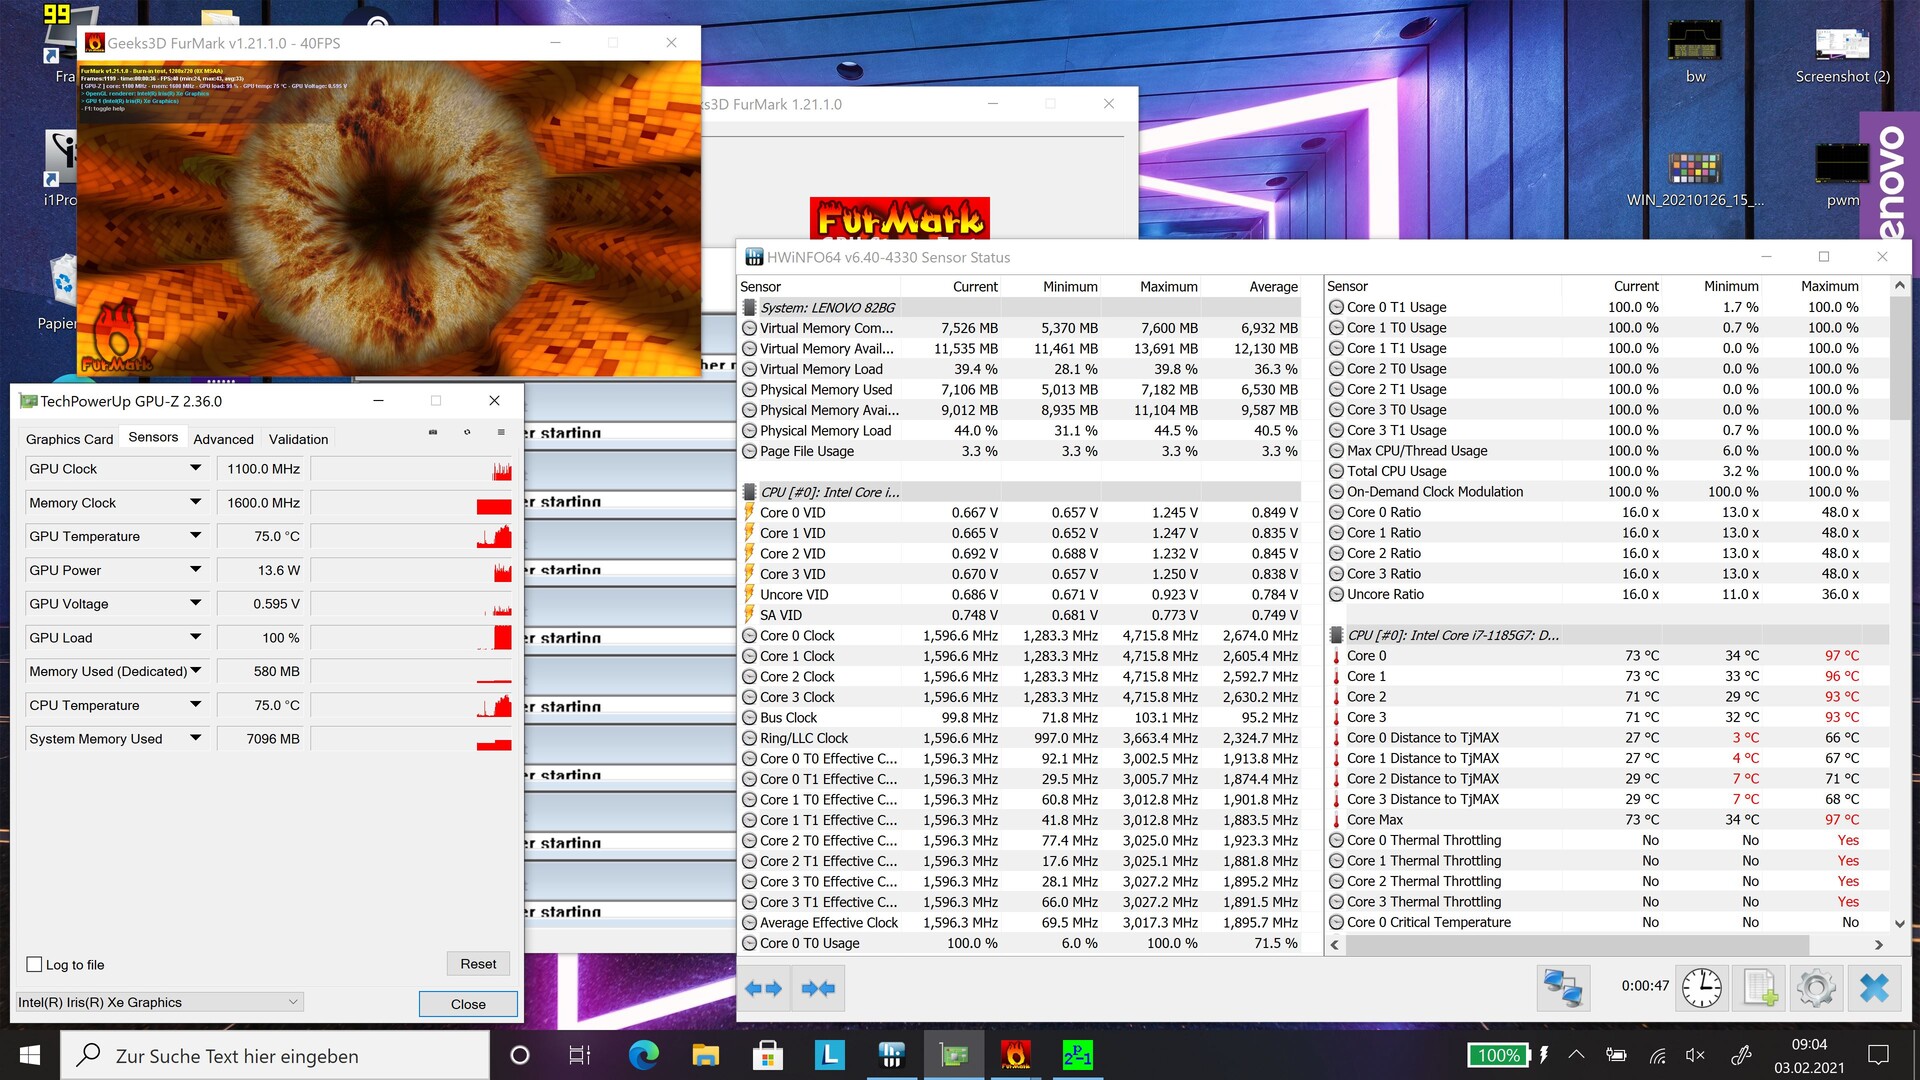
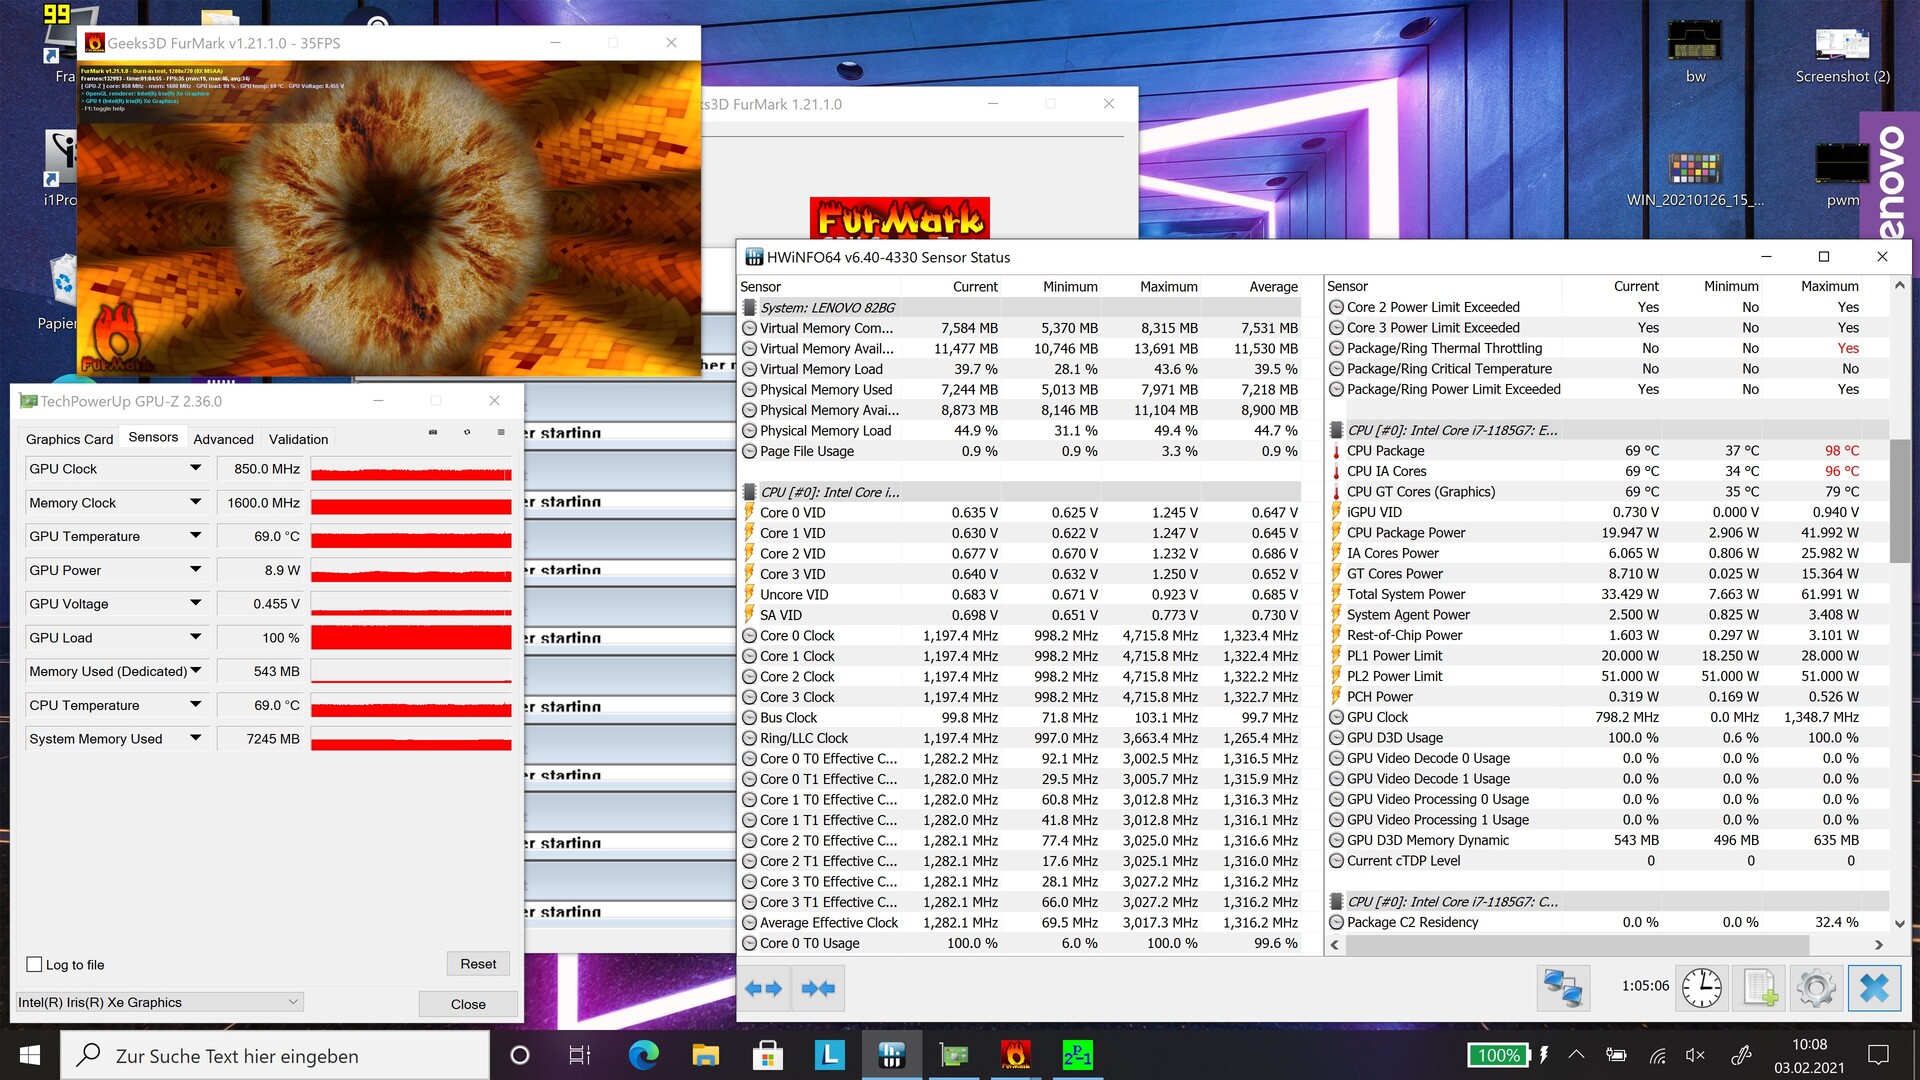
The Yoga 9i begins our stress test at around 3 GHz (base clock) for a very short time only. The clock rates drop after a few seconds and then fluctuate between 1.6 and 1.8 GHz for the first few minutes, and later between 1.2 and 1.5 GHz.
A new run of 3DMark 11 directly after the end of the stress reveals a performance loss of a moderate 5%.
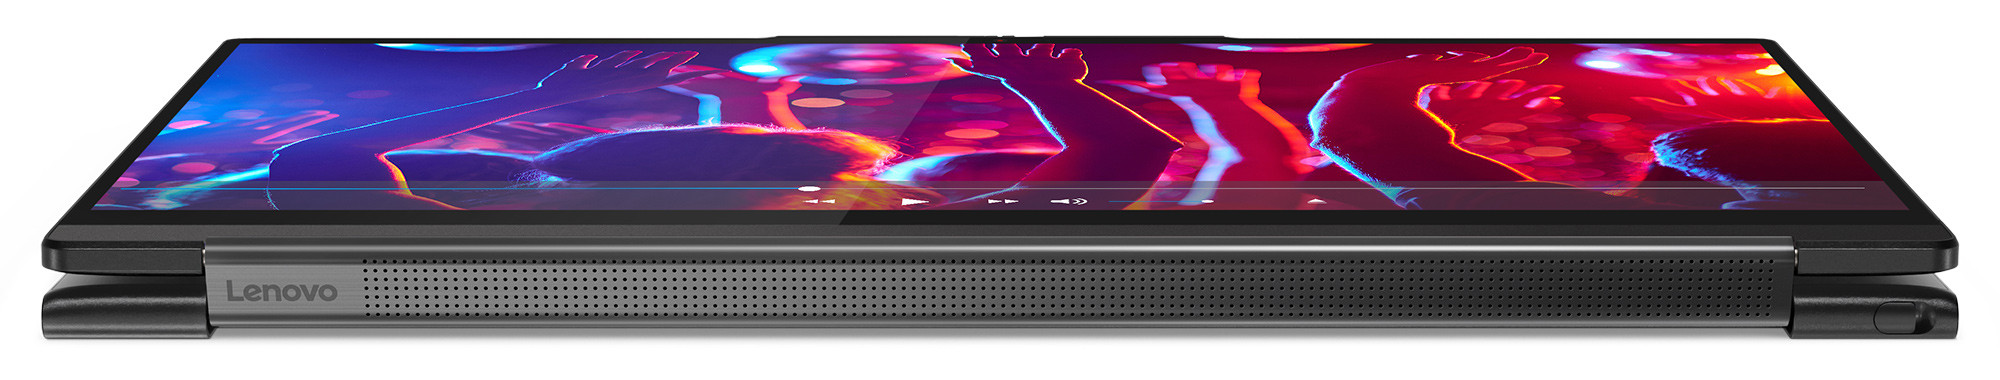
Speakers
The "soundbar" (two stereo speakers) built into the hinge is superior to conventional solutions in combination with the two subwoofers, especially in view of the small form factor, and is welcome to be imitated. The basses are a bit lowered, but they are still clearly noticeable for laptop speakers, and the speakers also get quite loud. The combined audio jack is available for connecting external devices.
Lenovo Yoga 9 14 ITL 4K audio analysis
(+) | speakers can play relatively loud (85.6 dB)
Bass 100 - 315 Hz
(±) | reduced bass - on average 9.2% lower than median
(±) | linearity of bass is average (9.4% delta to prev. frequency)
Mids 400 - 2000 Hz
(±) | higher mids - on average 5.4% higher than median
(+) | mids are linear (4.3% delta to prev. frequency)
Highs 2 - 16 kHz
(+) | balanced highs - only 2.5% away from median
(+) | highs are linear (3.7% delta to prev. frequency)
Overall 100 - 16.000 Hz
(+) | overall sound is linear (10.1% difference to median)
Compared to same class
» 6% of all tested devices in this class were better, 2% similar, 92% worse
» The best had a delta of 6%, average was 20%, worst was 57%
Compared to all devices tested
» 5% of all tested devices were better, 2% similar, 94% worse
» The best had a delta of 4%, average was 23%, worst was 134%
Apple MacBook 12 (Early 2016) 1.1 GHz audio analysis
(+) | speakers can play relatively loud (83.6 dB)
Bass 100 - 315 Hz
(±) | reduced bass - on average 11.3% lower than median
(±) | linearity of bass is average (14.2% delta to prev. frequency)
Mids 400 - 2000 Hz
(+) | balanced mids - only 2.4% away from median
(+) | mids are linear (5.5% delta to prev. frequency)
Highs 2 - 16 kHz
(+) | balanced highs - only 2% away from median
(+) | highs are linear (4.5% delta to prev. frequency)
Overall 100 - 16.000 Hz
(+) | overall sound is linear (10.2% difference to median)
Compared to same class
» 7% of all tested devices in this class were better, 2% similar, 90% worse
» The best had a delta of 5%, average was 18%, worst was 53%
Compared to all devices tested
» 5% of all tested devices were better, 1% similar, 94% worse
» The best had a delta of 4%, average was 23%, worst was 134%
Energy management - Decent battery life
Energy consumption
The Yoga 9i isn't very energy-efficient in Maximum Performance mode. It consumes a maximum of 11 watts in idle usage without the keyboard backlight, and about 1 watt is added for each lighting level. Competitors use about 7 watts in contrast. However, consumption is also reduced in the Intelligent performance mode.
Under stress, consumption can briefly soar to 60 watts, but it soon settles at 42.4 watts.
The 65-watt power adapter should be able to cope well in all stress situations.
| Off / Standby | |
| Idle | |
| Load |
|
Key:
min: | |
| Lenovo Yoga 9 14 ITL 4K i7-1185G7, Iris Xe G7 96EUs, WDC PC SN730 SDBPNTY-1T00, IPS, 3840x2160, 14" | Lenovo Yoga 9i 14ITL5 i5-1135G7, Iris Xe G7 80EUs, Samsung SSD PM981a MZVLB256HBHQ, IPS, 1920x1080, 14" | Lenovo Yoga C740-14IML i5-10210U, UHD Graphics 620, Samsung SSD PM981a MZVLB256HBHQ, IPS, 1920x1080, 14" | Asus VivoBook Flip 14 TM420IA R7 4700U, Vega 7, Samsung PM991 MZVLQ512HALU, IPS, 1920x1080, 14" | HP Spectre x360 13-aw0013dx i7-1065G7, Iris Plus Graphics G7 (Ice Lake 64 EU), Intel Optane Memory H10 with Solid State Storage 32GB + 512GB HBRPEKNX0202A(L/H), IPS, 1920x1080, 13.3" | Dell XPS 13 7390 2-in-1 Core i7 i7-1065G7, Iris Plus Graphics G7 (Ice Lake 64 EU), Toshiba BG4 KBG40ZPZ512G, IPS, 1920x1200, 13.4" | Average Intel Iris Xe Graphics G7 96EUs | Average of class Convertible | |
|---|---|---|---|---|---|---|---|---|
| Power Consumption | 18% | 25% | 25% | 26% | 25% | -4% | 10% | |
| Idle Minimum * (Watt) | 4.2 | 3.3 21% | 3 29% | 4 5% | 3.9 7% | 2.6 38% | 5.51 ? -31% | 4.2 ? -0% |
| Idle Average * (Watt) | 10 | 6.7 33% | 3.9 61% | 6.4 36% | 6.3 37% | 5.3 47% | 8.66 ? 13% | 6.89 ? 31% |
| Idle Maximum * (Watt) | 13.2 | 6.9 48% | 7.3 45% | 7 47% | 6.8 48% | 7 47% | 10.9 ? 17% | 8.63 ? 35% |
| Load Average * (Watt) | 42.4 | 41.4 2% | 42.5 -0% | 34.6 18% | 32.6 23% | 43.1 -2% | 45.6 ? -8% | 44.1 ? -4% |
| Witcher 3 ultra * (Watt) | 43 | 39.3 9% | 35 19% | 25.6 40% | 43.1 -0% | |||
| Load Maximum * (Watt) | 60.5 | 64.7 -7% | 65.5 -8% | 45.1 25% | 59 2% | 49 19% | 67.8 ? -12% | 66.5 ? -10% |
* ... smaller is better
Battery life
The Yoga 9i's 60 Wh battery allows almost 10 hours of video playback. Surfing the web over WLAN is possible for between less than 6 hours (100% brightness) and almost 9 hours (150 nits) depending on the brightness of the 4K panel. Under full load, the laptop shuts down after about 1:45 hours. The values are similar to the 1080p variant despite the 4K resolution. However, battery life can still be optimized with other Vantage performance modes (e.g. Intelligent mode, Battery Saving mode). The HP Spectre also lasts much longer at times using the same 60 Wh, but it also has a lower performance than the Yoga 9i.
| Lenovo Yoga 9 14 ITL 4K i7-1185G7, Iris Xe G7 96EUs, 60 Wh | Lenovo Yoga 9i 14ITL5 i5-1135G7, Iris Xe G7 80EUs, 60 Wh | Lenovo Yoga C740-14IML i5-10210U, UHD Graphics 620, 51 Wh | Asus VivoBook Flip 14 TM420IA R7 4700U, Vega 7, 42 Wh | HP Spectre x360 13-aw0013dx i7-1065G7, Iris Plus Graphics G7 (Ice Lake 64 EU), 60 Wh | Dell XPS 13 7390 2-in-1 Core i7 i7-1065G7, Iris Plus Graphics G7 (Ice Lake 64 EU), 51 Wh | Average of class Convertible | |
|---|---|---|---|---|---|---|---|
| Battery runtime | 6% | 2% | -10% | 35% | 1% | 29% | |
| H.264 (h) | 9.9 | 15 ? 52% | |||||
| WiFi v1.3 (h) | 8.9 | 9.9 11% | 9.2 3% | 8 -10% | 9.9 11% | 9 1% | 12 ? 35% |
| Load (h) | 1.7 | 1.7 0% | 1.7 0% | 2.7 59% | 1.713 ? 1% | ||
| Reader / Idle (h) | 37.7 | 18.6 | 37.1 | 26.7 ? |
Pros
Cons
Verdict - Top 4K screen, so-so CPU

The new 4K touchscreen in the Yoga 9i 14 makes quite an impression and shines with good rates and an HDR 400 certification. The new processor increases both the graphics and short-term performance, but long-term performance is even lower than with the cheaper model.
However, considering that you currently pay almost as much for the 1080p variant, the 4K display is definitely worth the current premium of only 50 Euros (~$61) (Campuspoint)!
The condition of the ClickPad in our test model is somewhat worrying. We can only hope that this only affects our test unit; it wasn't a point of criticism in the 1080p version.
The Yoga 9i 14 does even better with 4K and HDR, and graphics performance could also be increased a bit. The CPU long-term performance is slightly worse than in the "smaller" model, and unfortunately, the poor ClickPad is unworthy of a high-end device.
Price and availability
You can find several configurations for the Yoga 9i 14 on Lenovo's website; prices start at $999.99 for the 1080p version and go up to $1,849.99 for the 4K version. Moreover, Best Buy has the 4K version with 16 GB of RAM and 512 GB of SSD storage for $1,699.99.
Lenovo Yoga 9 14 ITL 4K
- 02/08/2021 v7 (old)
Christian Hintze
Price comparison

