Lenovo Yoga 9i 14 Convertible Review: The Yoga C940 Twin
The Yoga 9i 14 is Lenovo's latest subnotebook convertible to succeed last year's Yoga C940 14. It is the manufacturer's highest-end 2-in-1 model for consumers in contrast to the mid-range Yoga 7i or low-end IdeaPad Flex series.
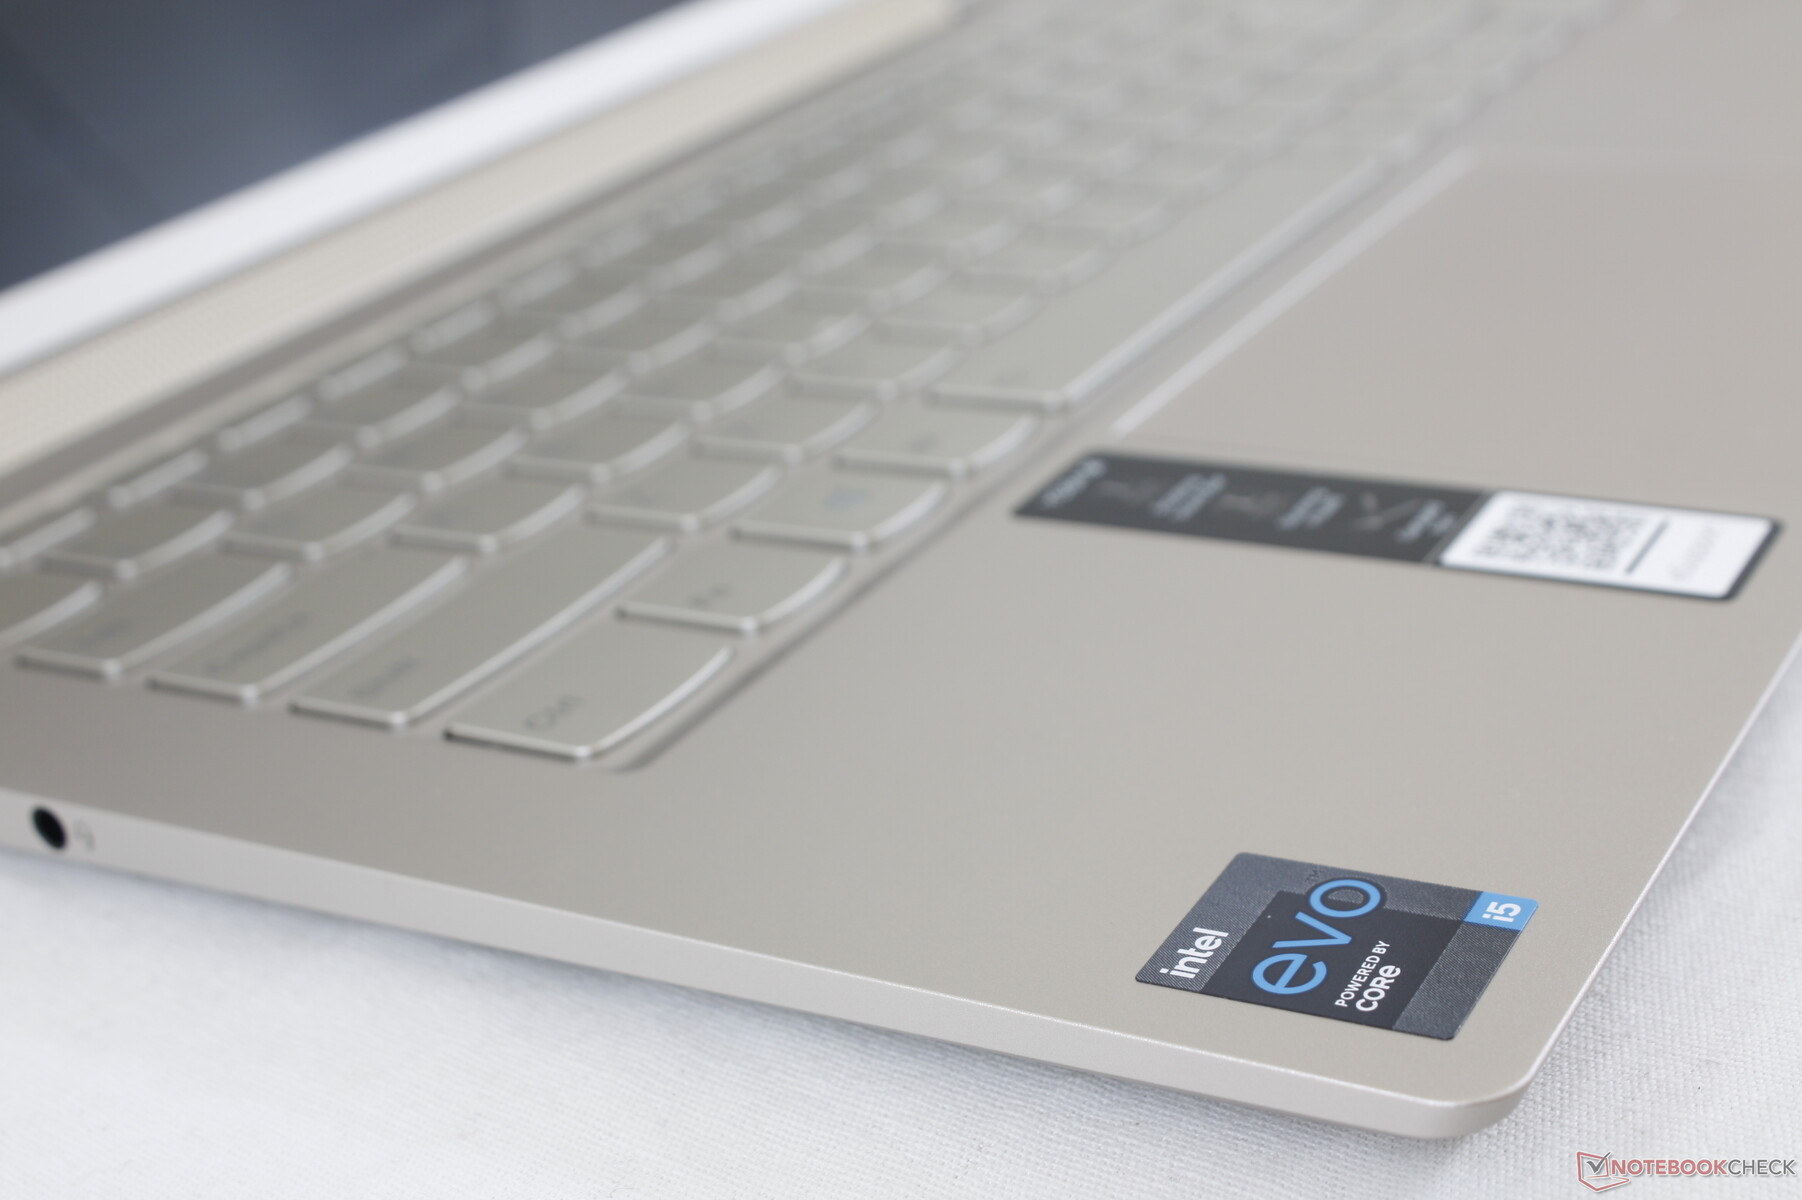
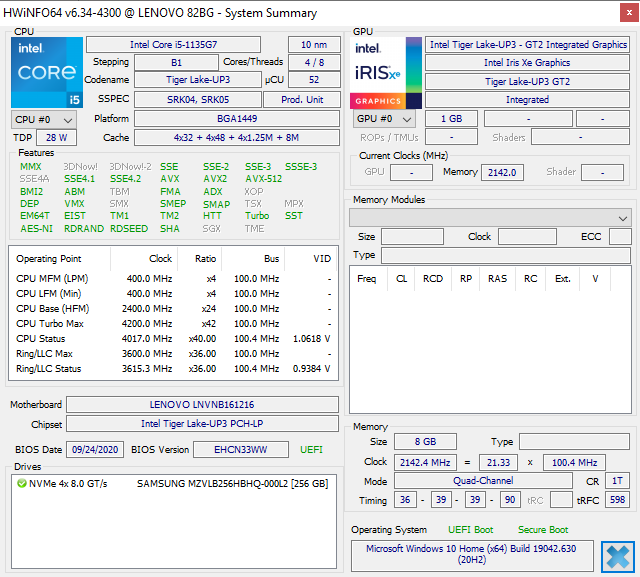
Current configurations range from the Core i5-1135G7 CPU, 8 GB of LPDDR4X soldered RAM, and 256 GB PCIe SSD for $1100 USD up to the Core i7-1085G7 CPU, 16 GB of RAM, and 1 TB PCIe SSD for $1750 USD. All options come with the same 14-inch 1080p touchscreen, integrated Iris Xe GPU, and active stylus pen. Our test unit here is the entry-level configuration.
Competitors to the Yoga 9i 14 include other high-end convertible subnotebooks like the Asus ZenBook Flip 14, , LG Gram 14 2-in-1, Dell XPS 13 2-in-1, or the HP Spectre x360 13. A larger 15.6-inch version of this same chassis design is also available called the Yoga 9i 15. We recommend checking out our review on last year's Yoga C940 14 since many of our existing comments apply here for the Yoga 9i 14.
More Lenovo reviews:
potential competitors in comparison
Rating | Date | Model | Weight | Height | Size | Resolution | Price |
|---|---|---|---|---|---|---|---|
| 87.1 % v7 (old) | 12 / 2020 | Lenovo Yoga 9i 14ITL5 i5-1135G7, Iris Xe G7 80EUs | 1.4 kg | 15.7 mm | 14.00" | 1920x1080 | |
| 80.7 % v7 (old) | 08 / 2020 | Asus VivoBook Flip 14 TM420IA R7 4700U, Vega 7 | 1.6 kg | 18.2 mm | 14.00" | 1920x1080 | |
| 81.2 % v7 (old) | 04 / 2020 | LG Gram 14T90N i7-10510U, UHD Graphics 620 | 1.2 kg | 18 mm | 14.00" | 1920x1080 | |
| 84.3 % v7 (old) | 03 / 2020 | Lenovo Yoga C740-14IML i5-10210U, UHD Graphics 620 | 1.4 kg | 16.9 mm | 14.00" | 1920x1080 | |
| 88.4 % v7 (old) | 12 / 2019 | HP Spectre x360 13-aw0013dx i7-1065G7, Iris Plus Graphics G7 (Ice Lake 64 EU) | 1.2 kg | 16.9 mm | 13.30" | 1920x1080 | |
| 86.3 % v7 (old) | 10 / 2019 | Dell XPS 13 7390 2-in-1 Core i7 i7-1065G7, Iris Plus Graphics G7 (Ice Lake 64 EU) | 1.3 kg | 13 mm | 13.40" | 1920x1200 |
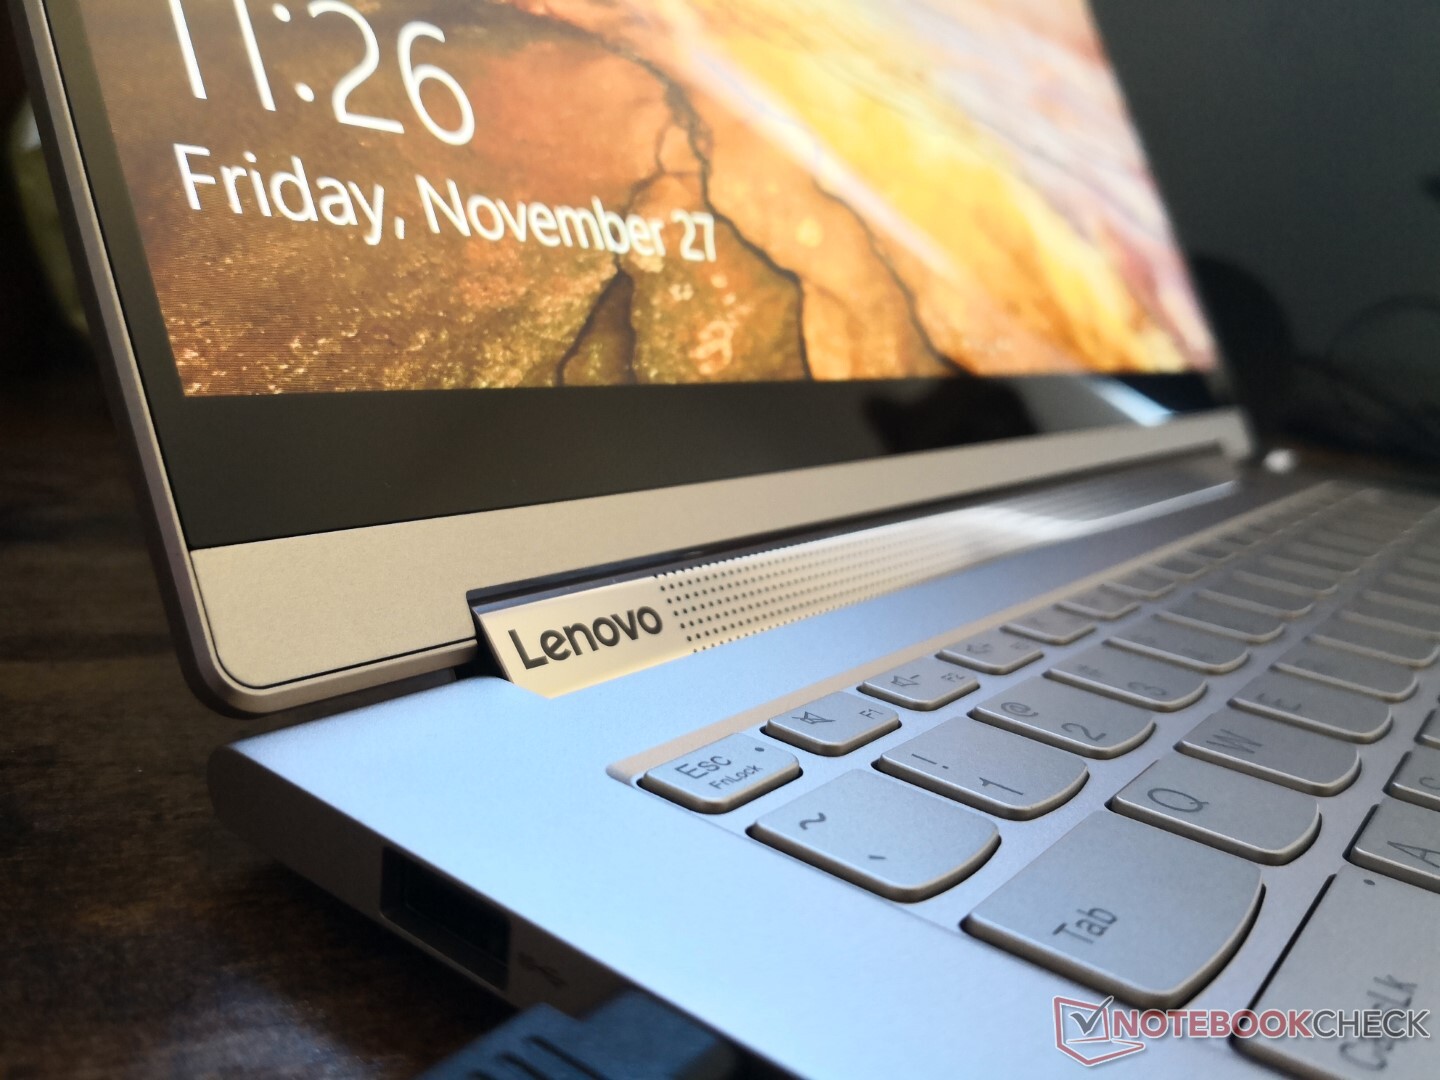
Case
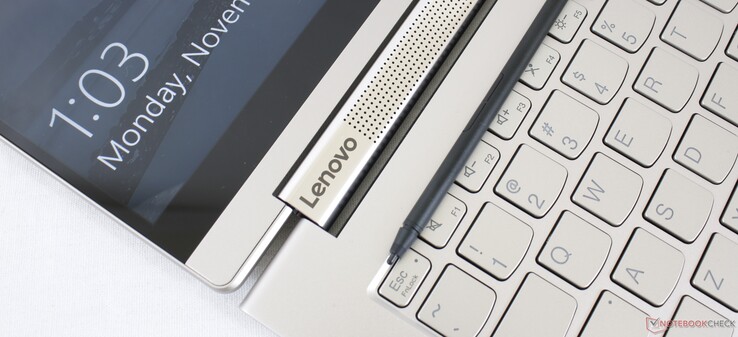
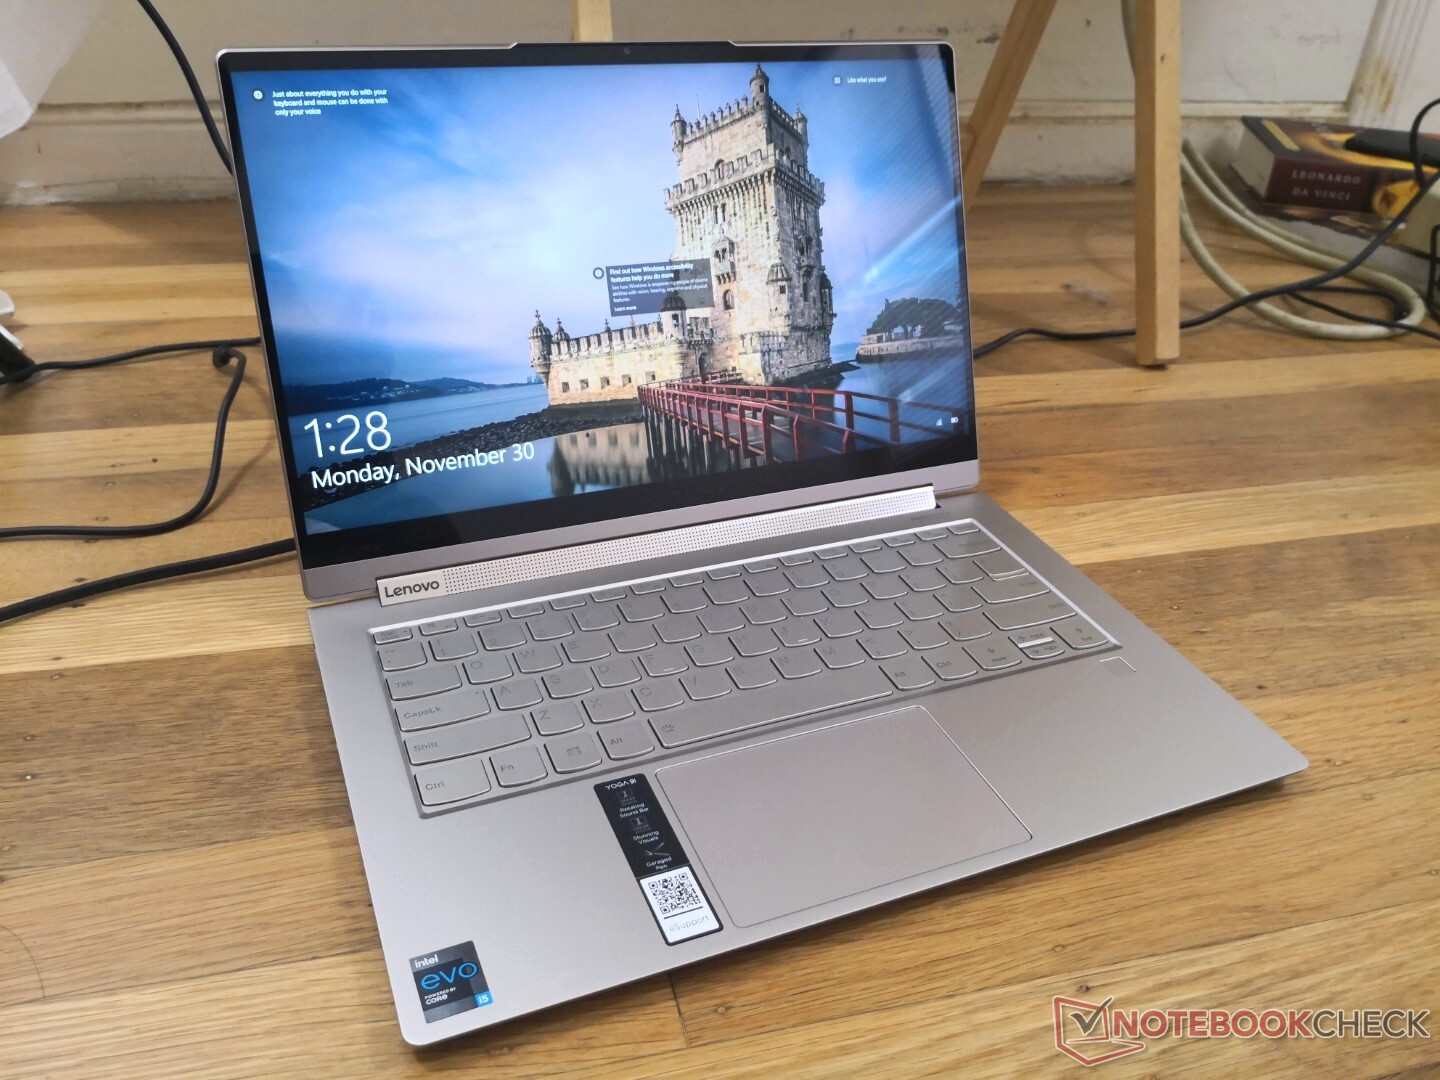
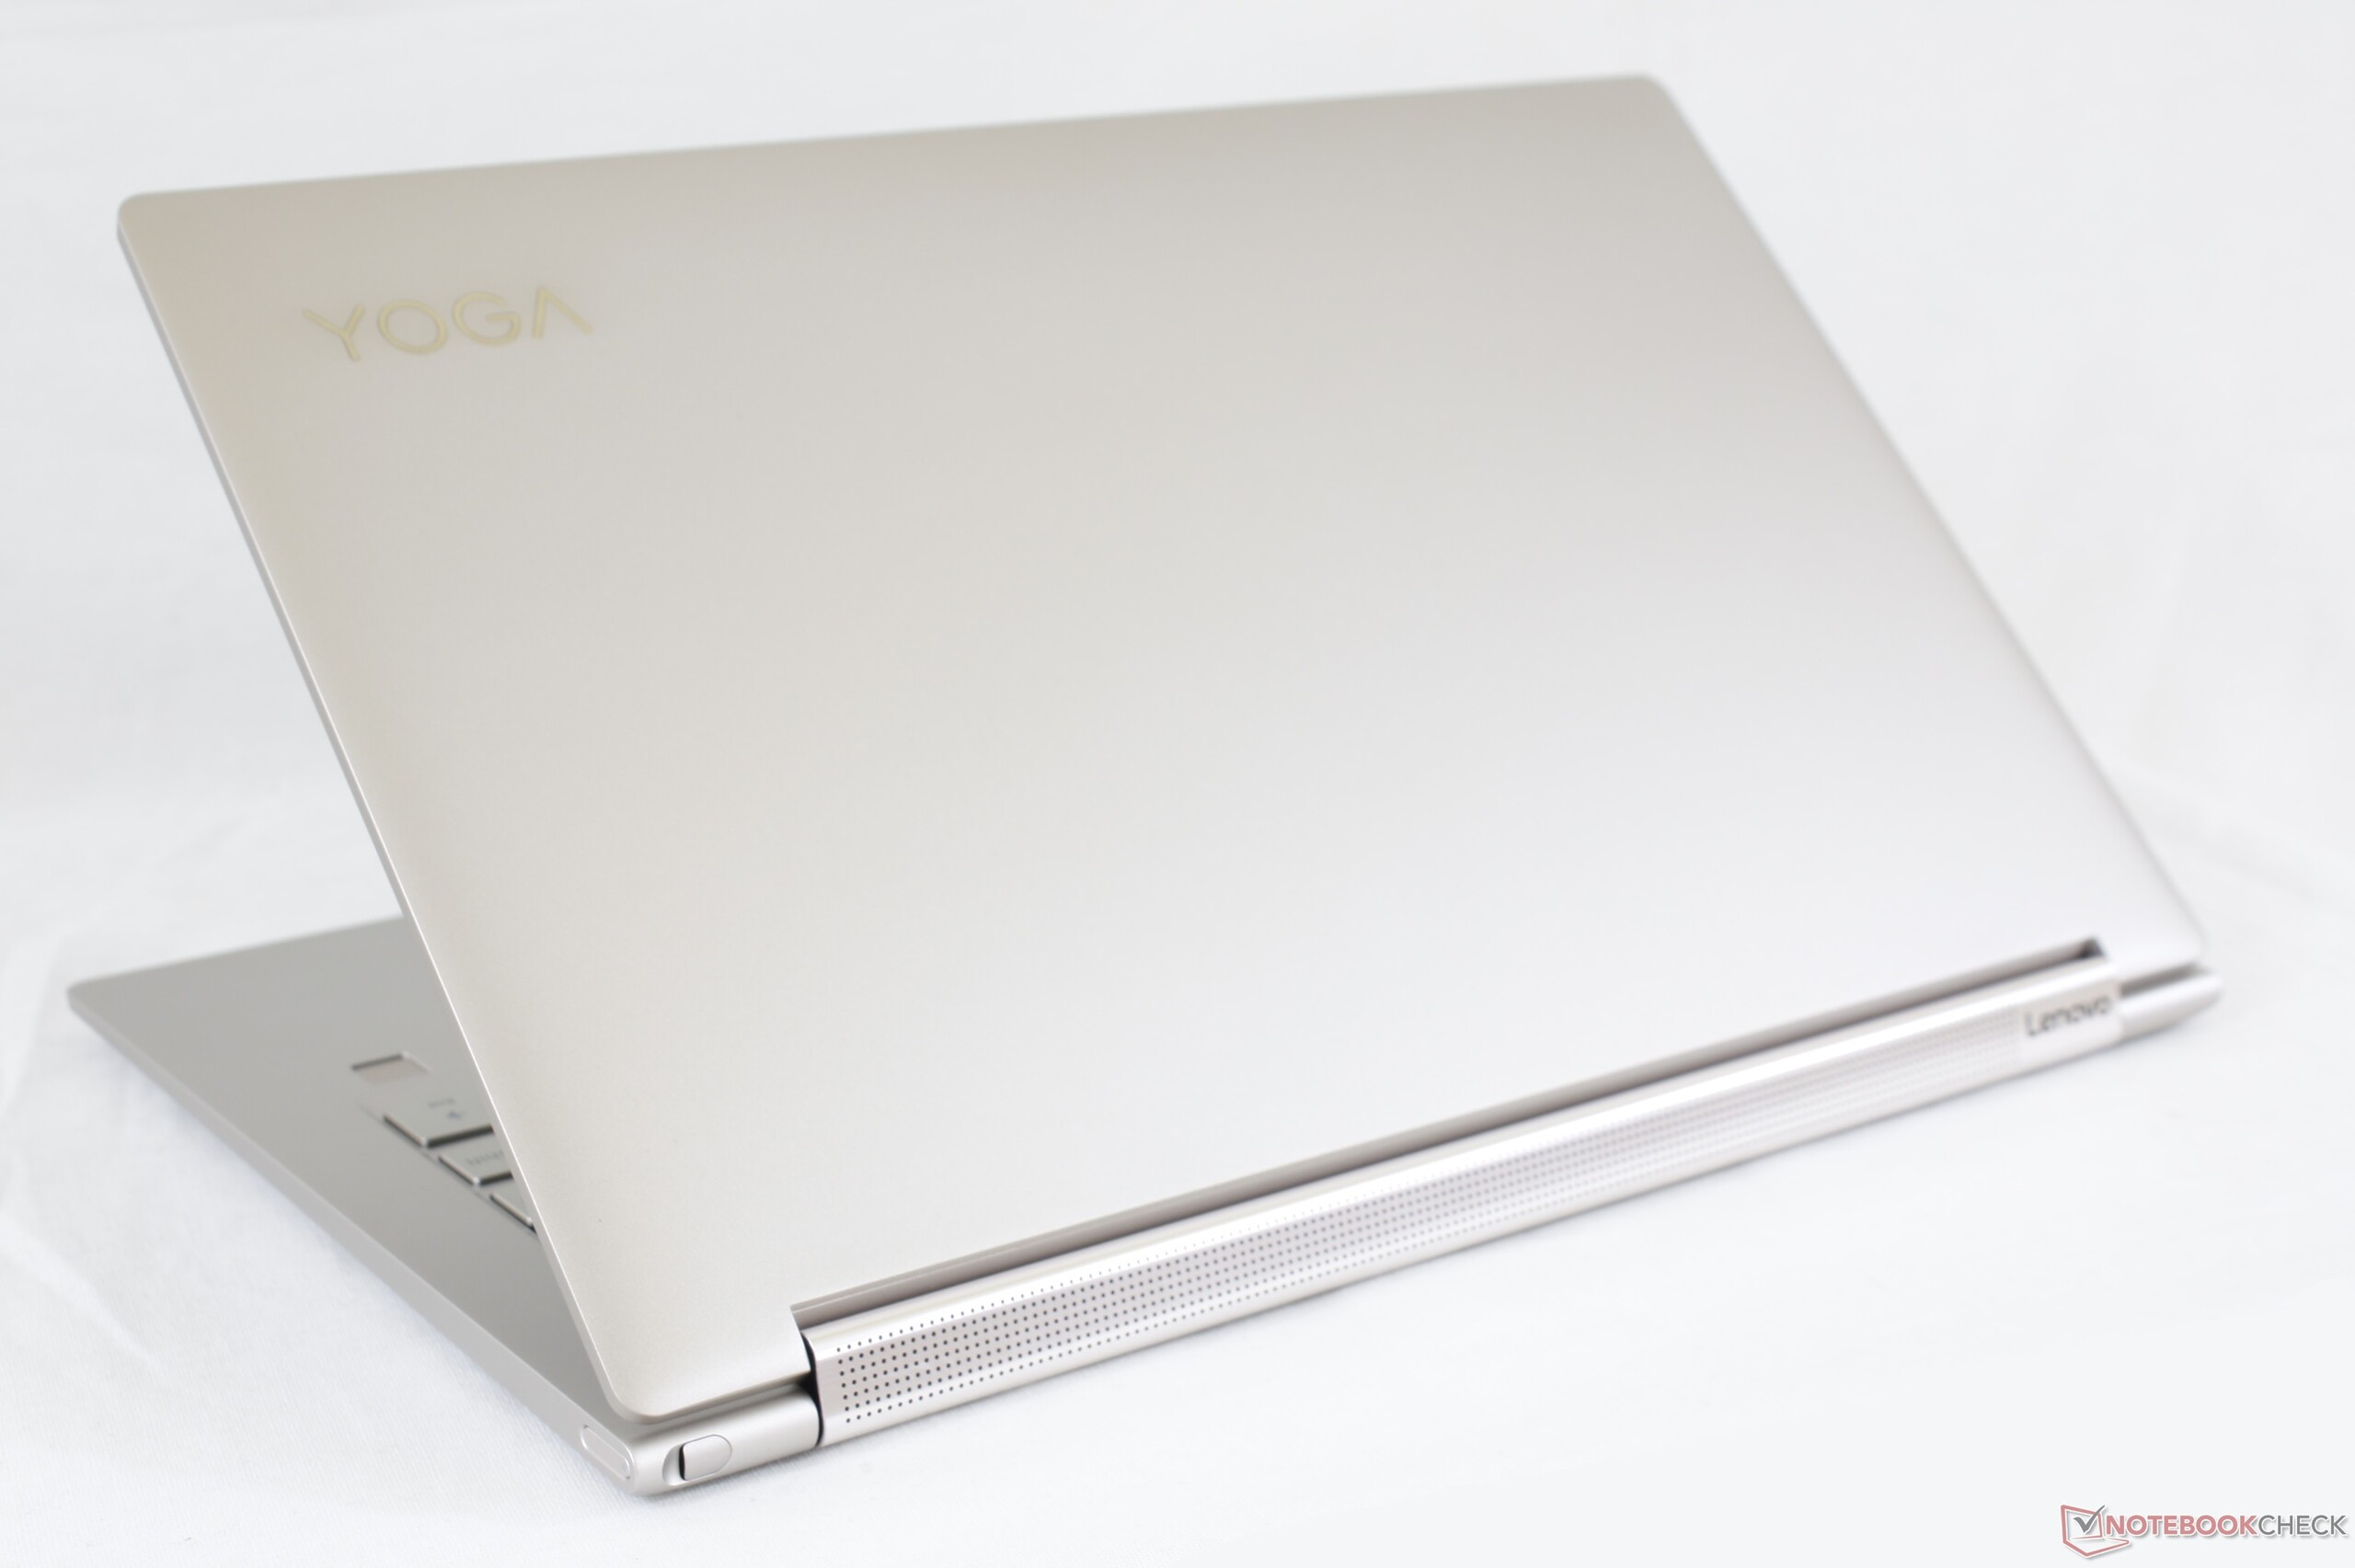
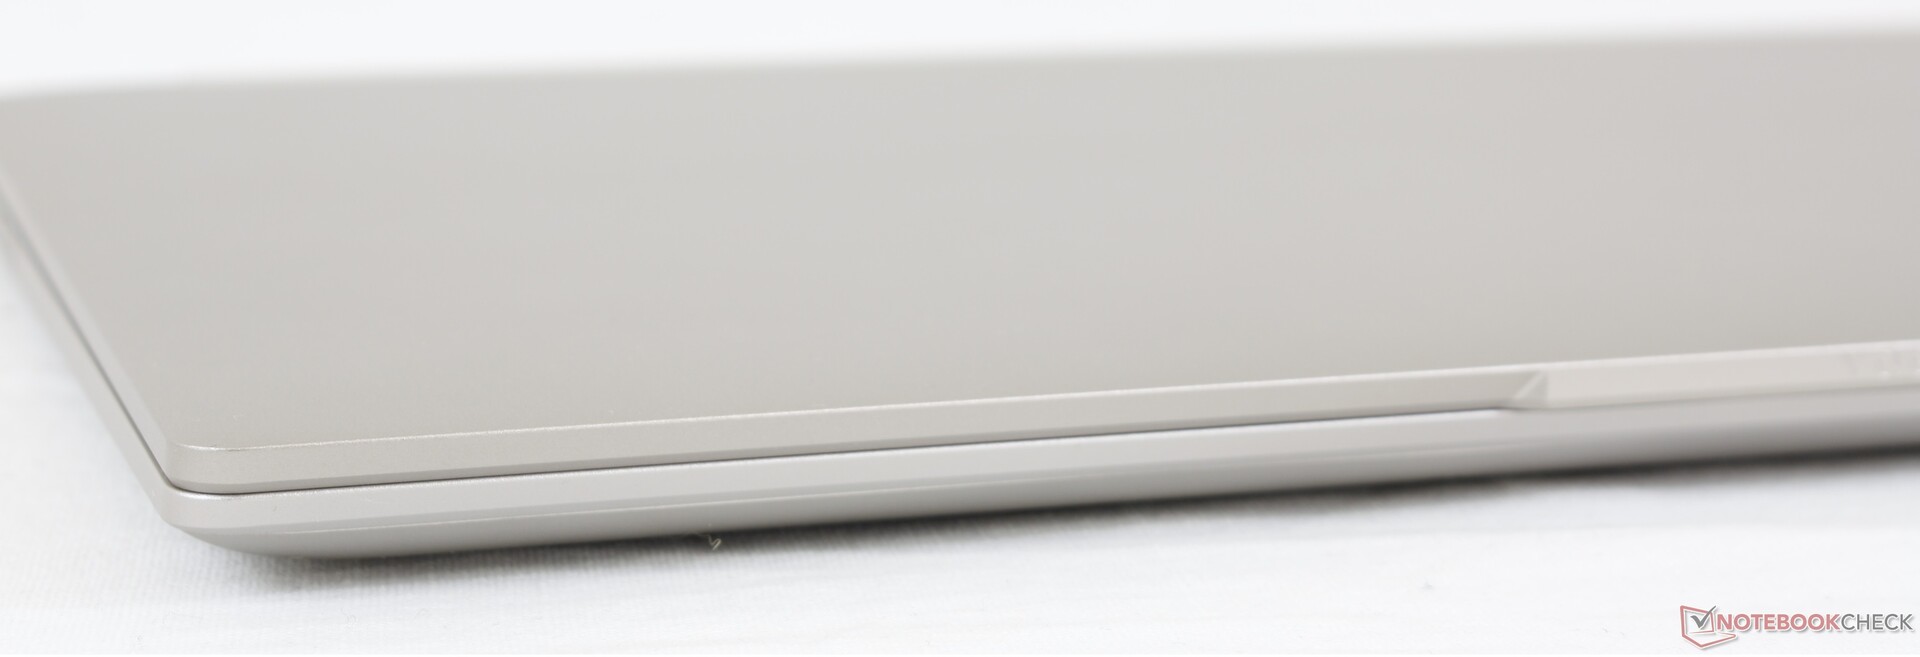
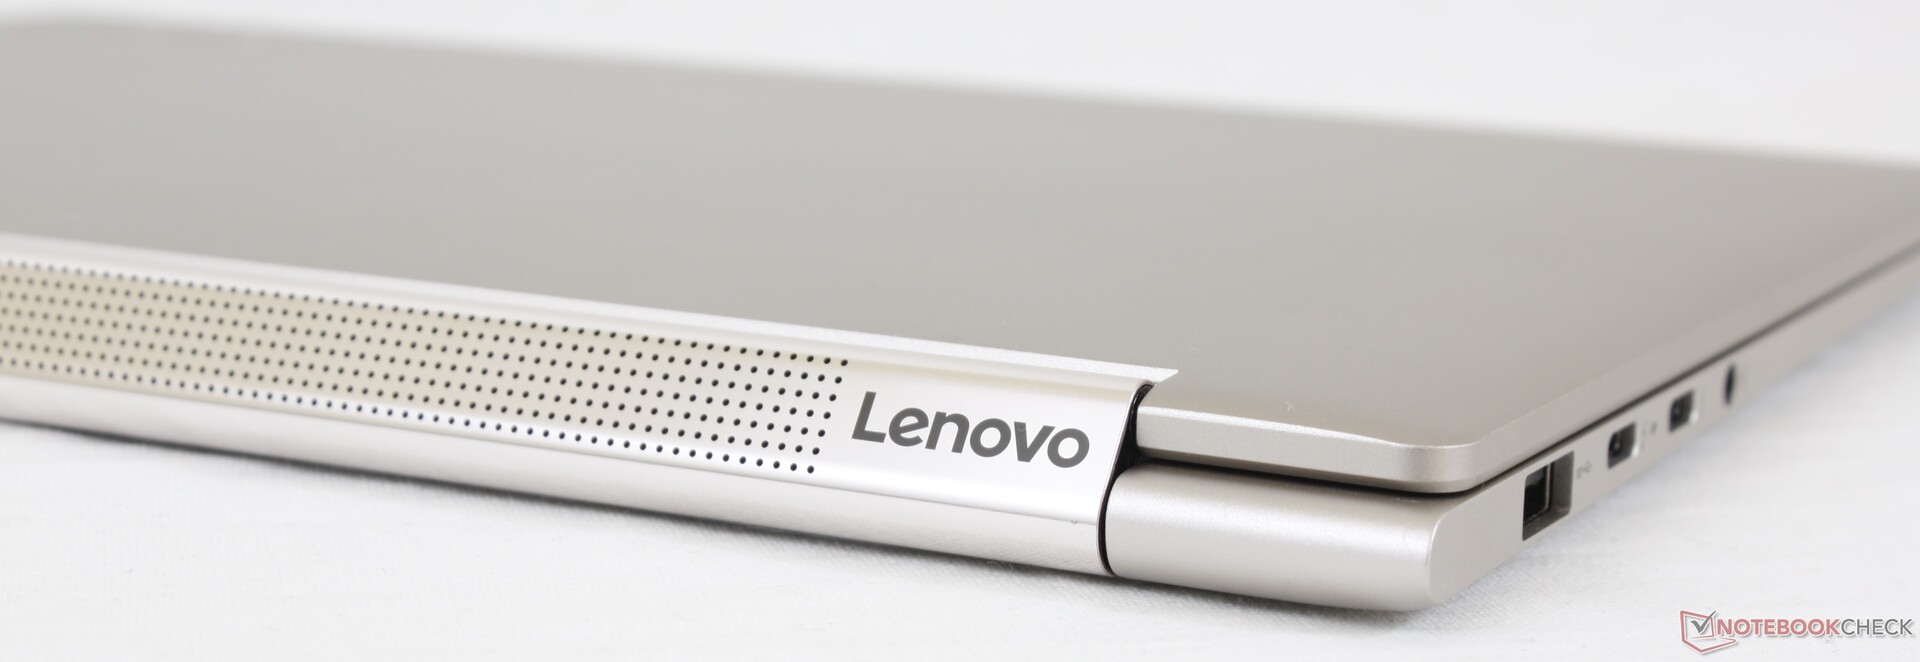
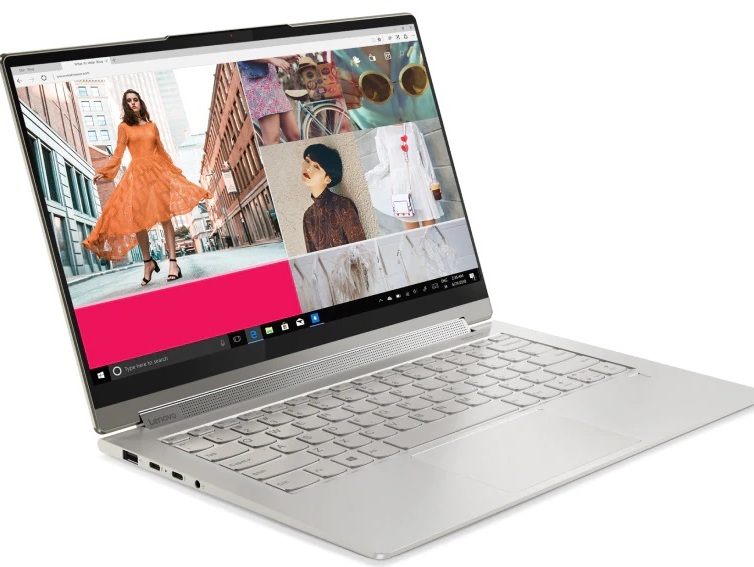
Lenovo uses similar metal materials for all of its Yoga laptops for a similar look, texture, and level of rigidity across the family. If you've handled a Yoga C740, C940, Yoga 7i or Yoga Slim 7 before, then the Yoga i9 will hold no surprises. The base and lid flex only marginally for strong first impressions much like on the XPS 13 2-in-1. Nonetheless, we still find the HP Spectre x360 13 to be stronger and less prone to bumps and creaks.
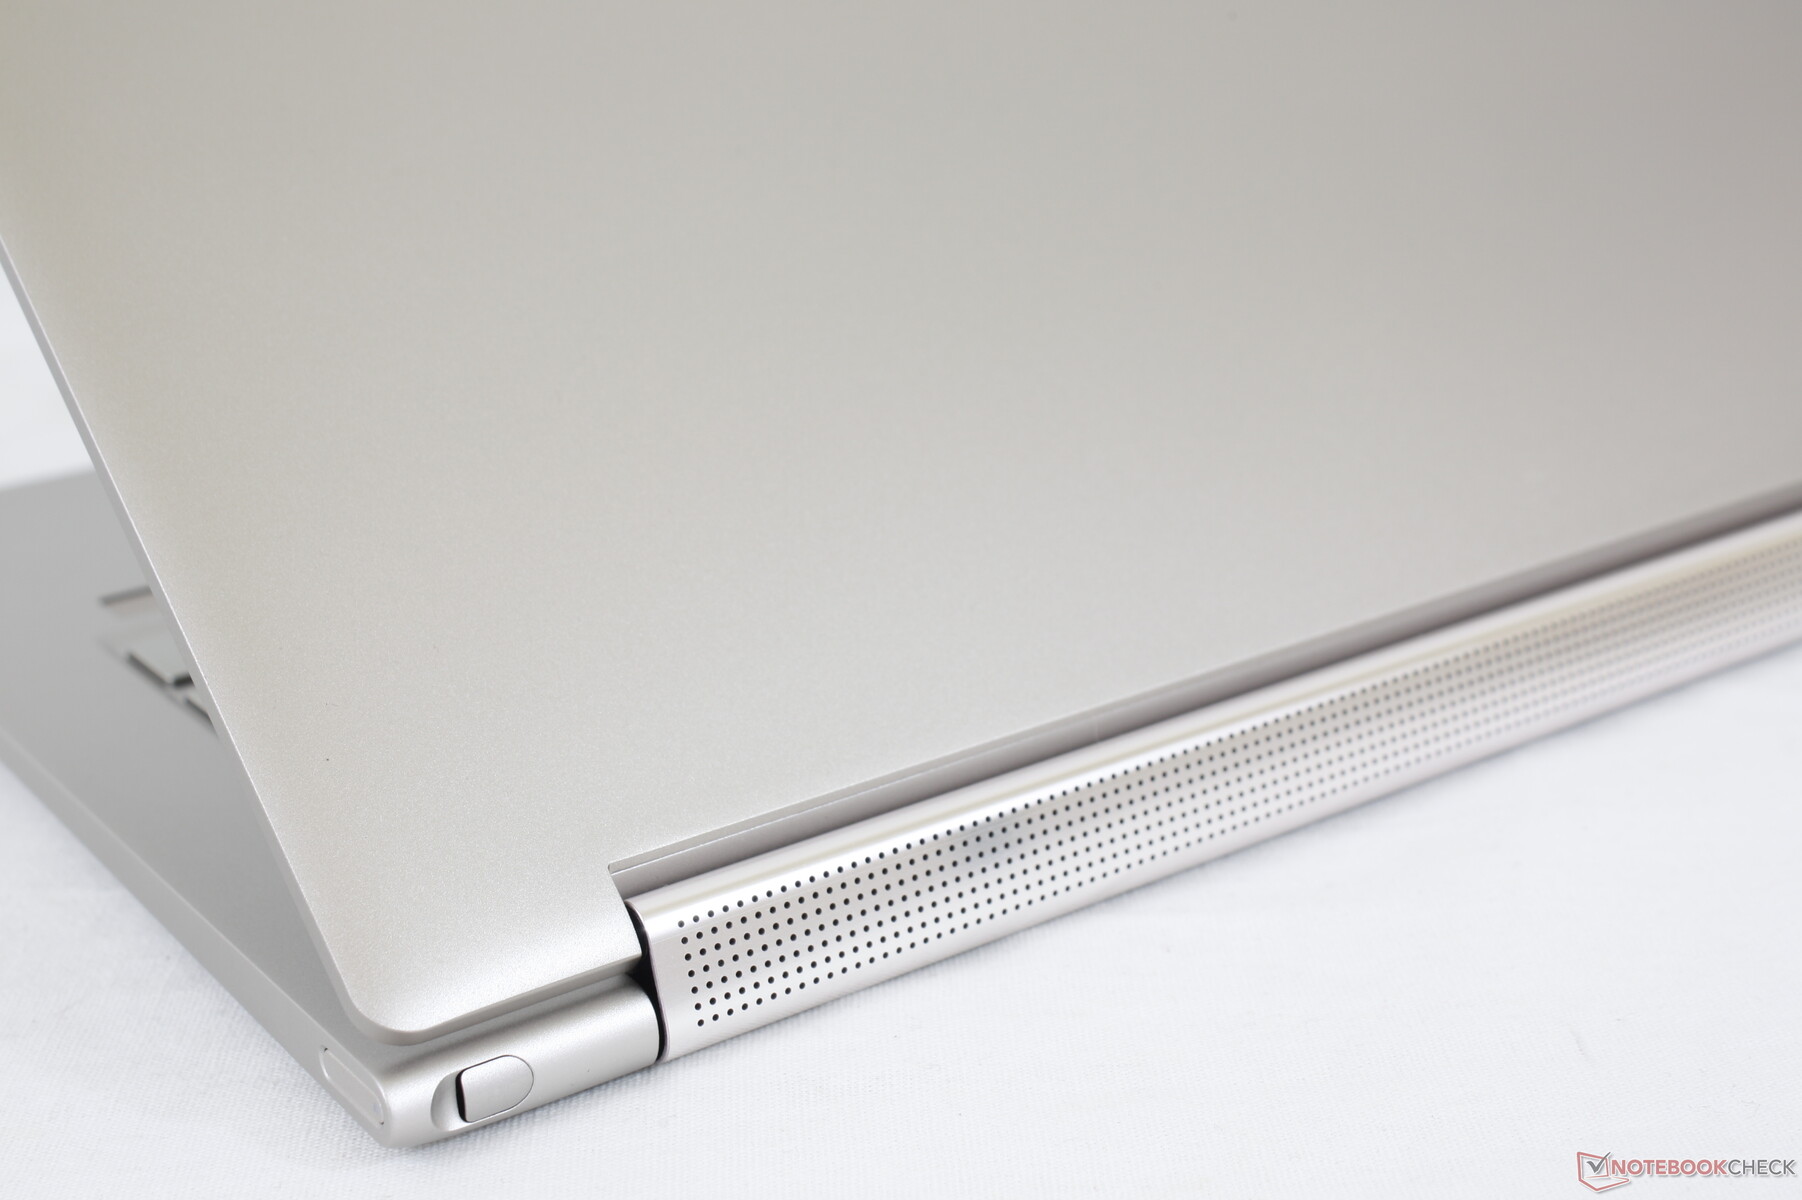
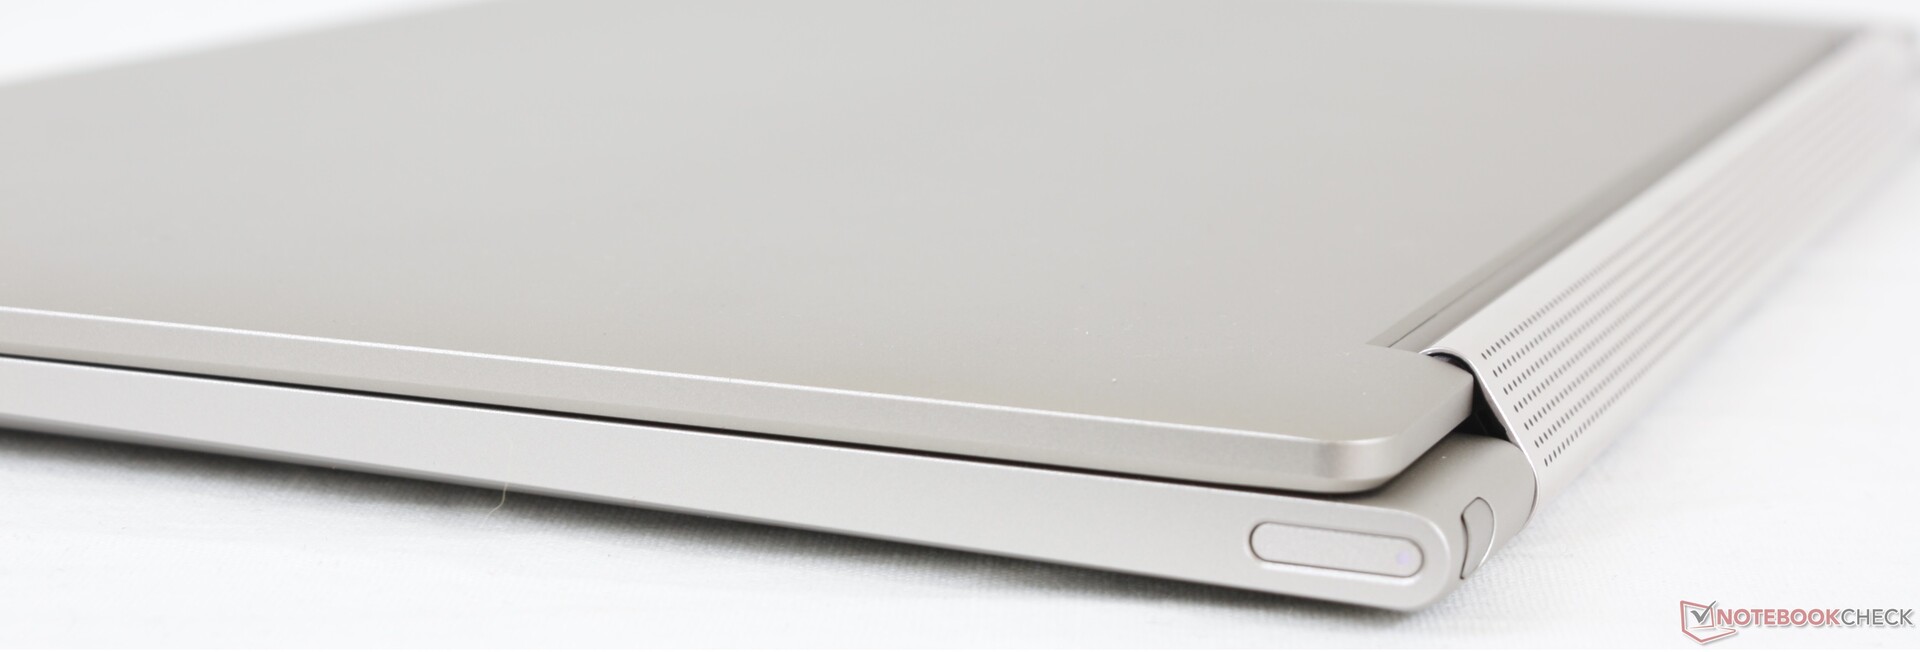
Chassis size and weight are essentially the same as last year's Yoga C940 14. The Yoga 9i is rounder along the rear edges and corners, but these minor aesthetic changes are skin deep.
Connectivity
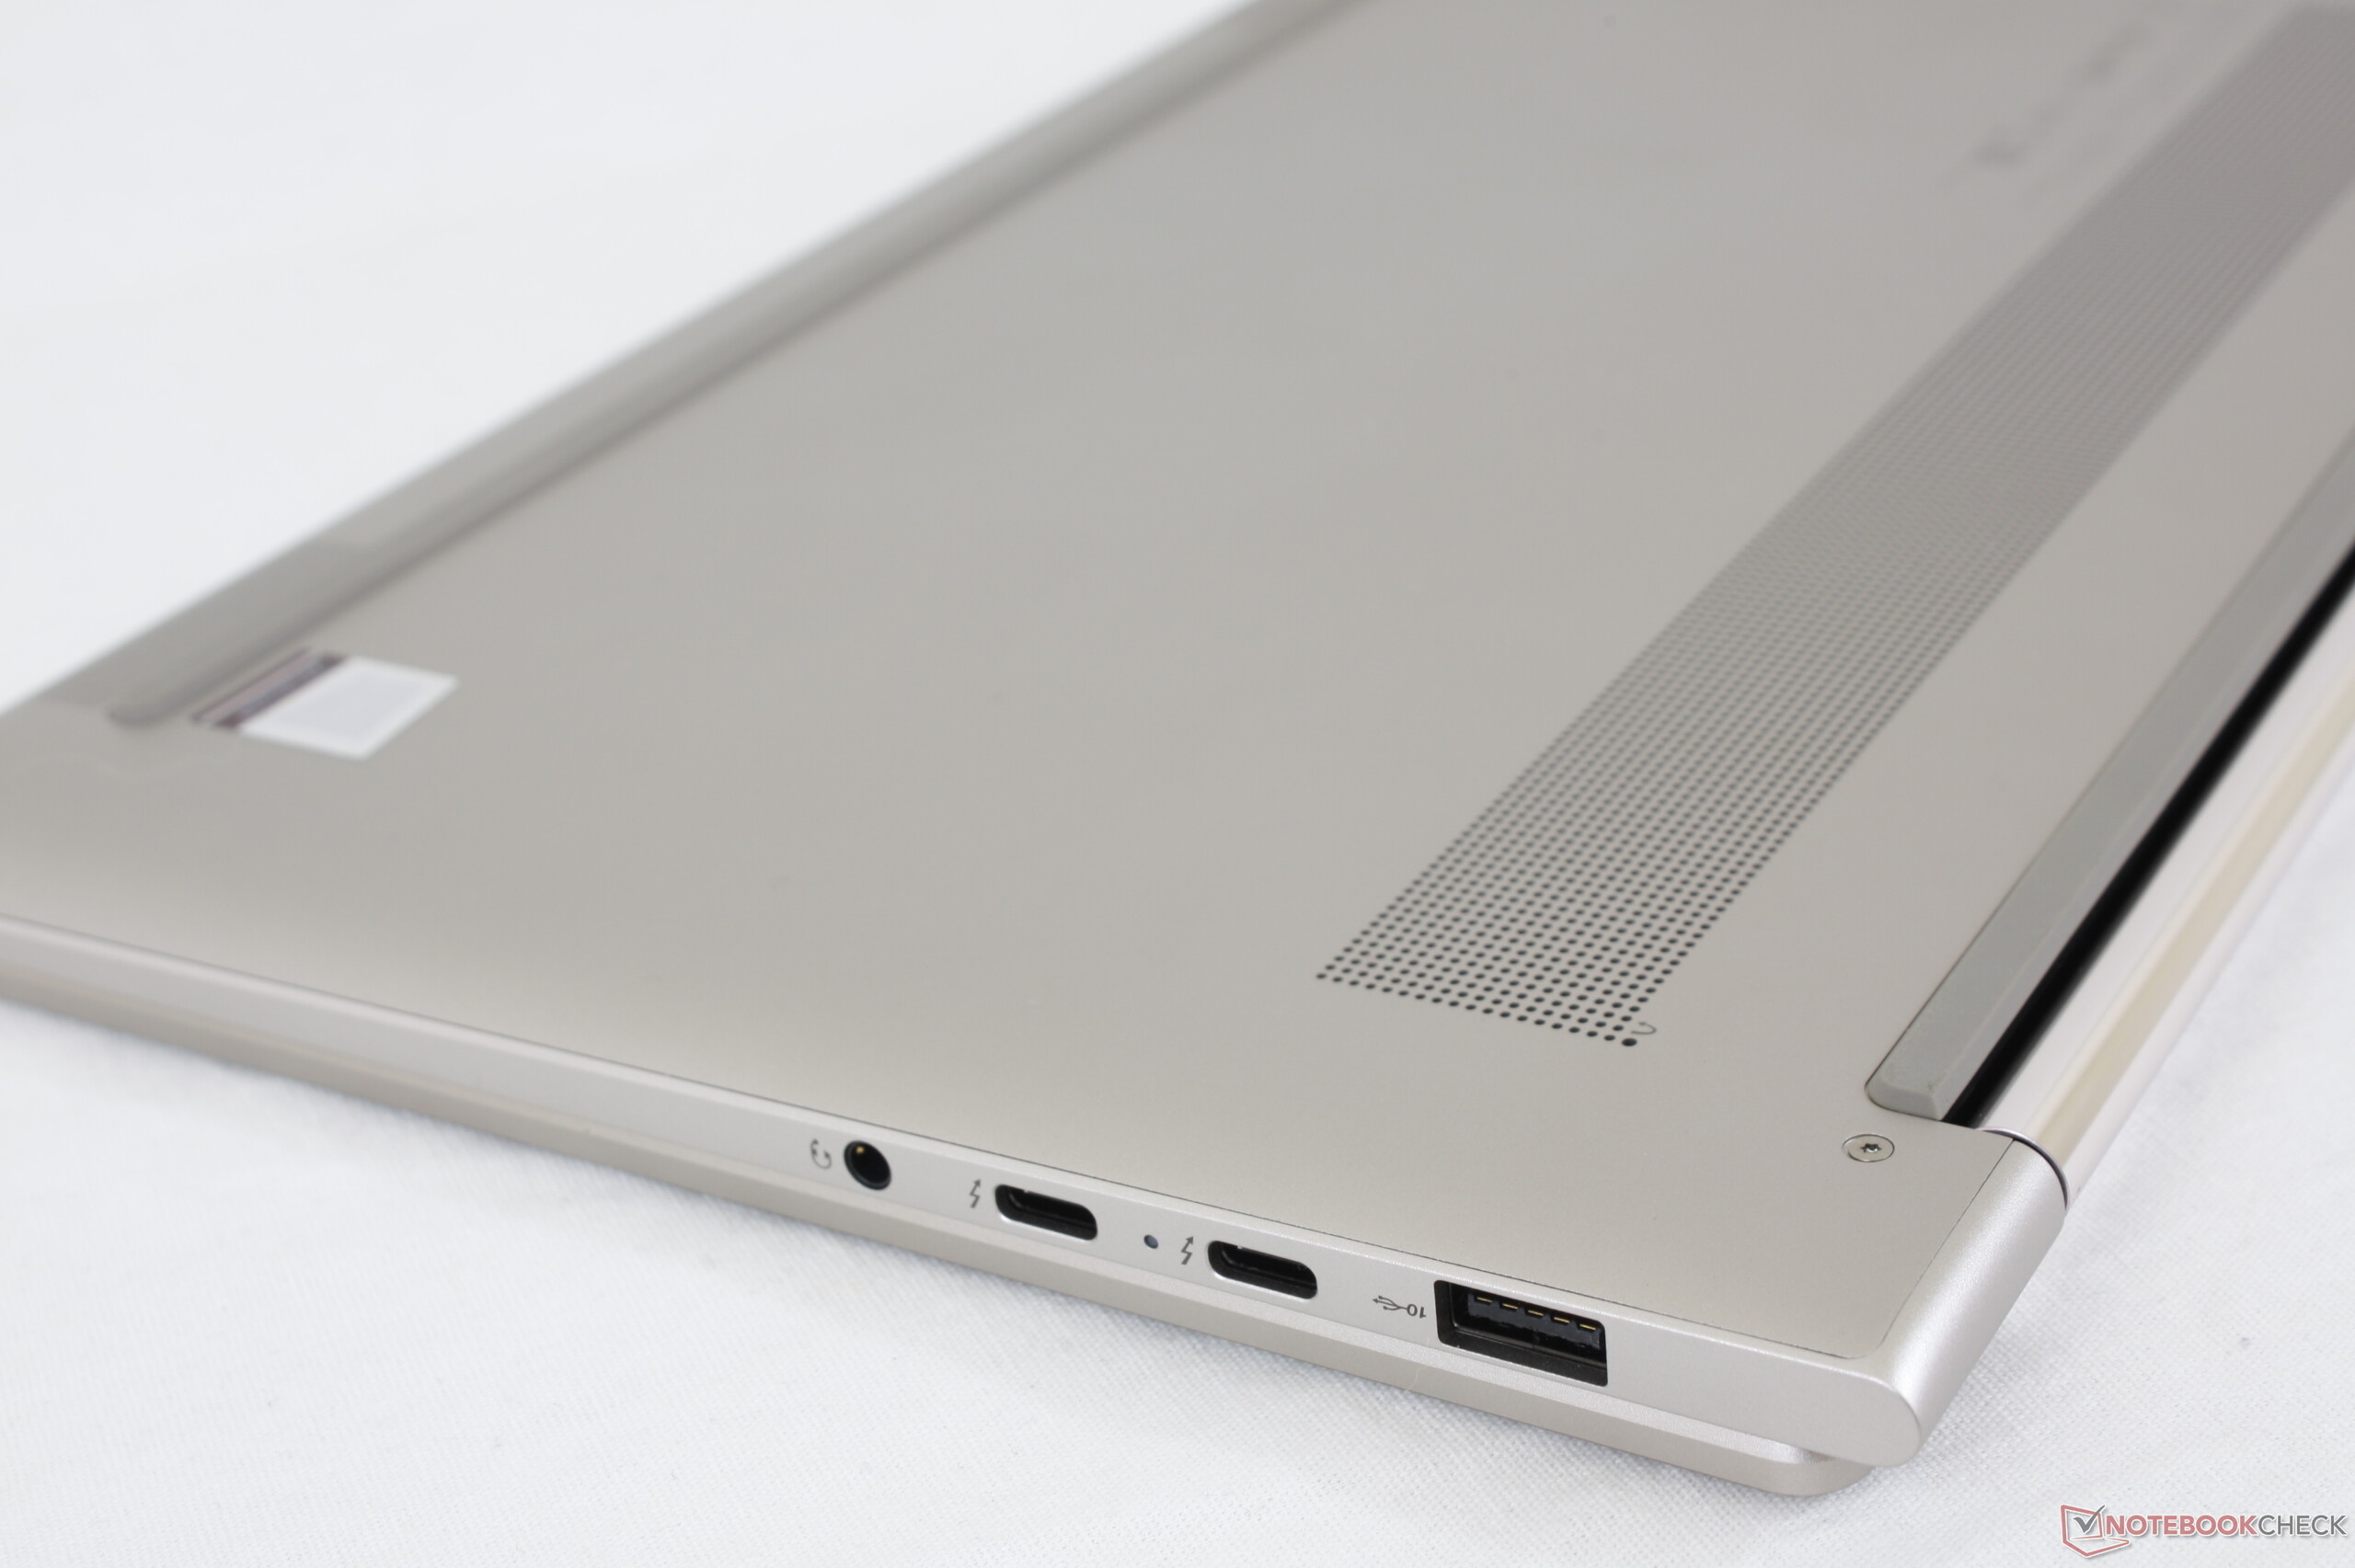
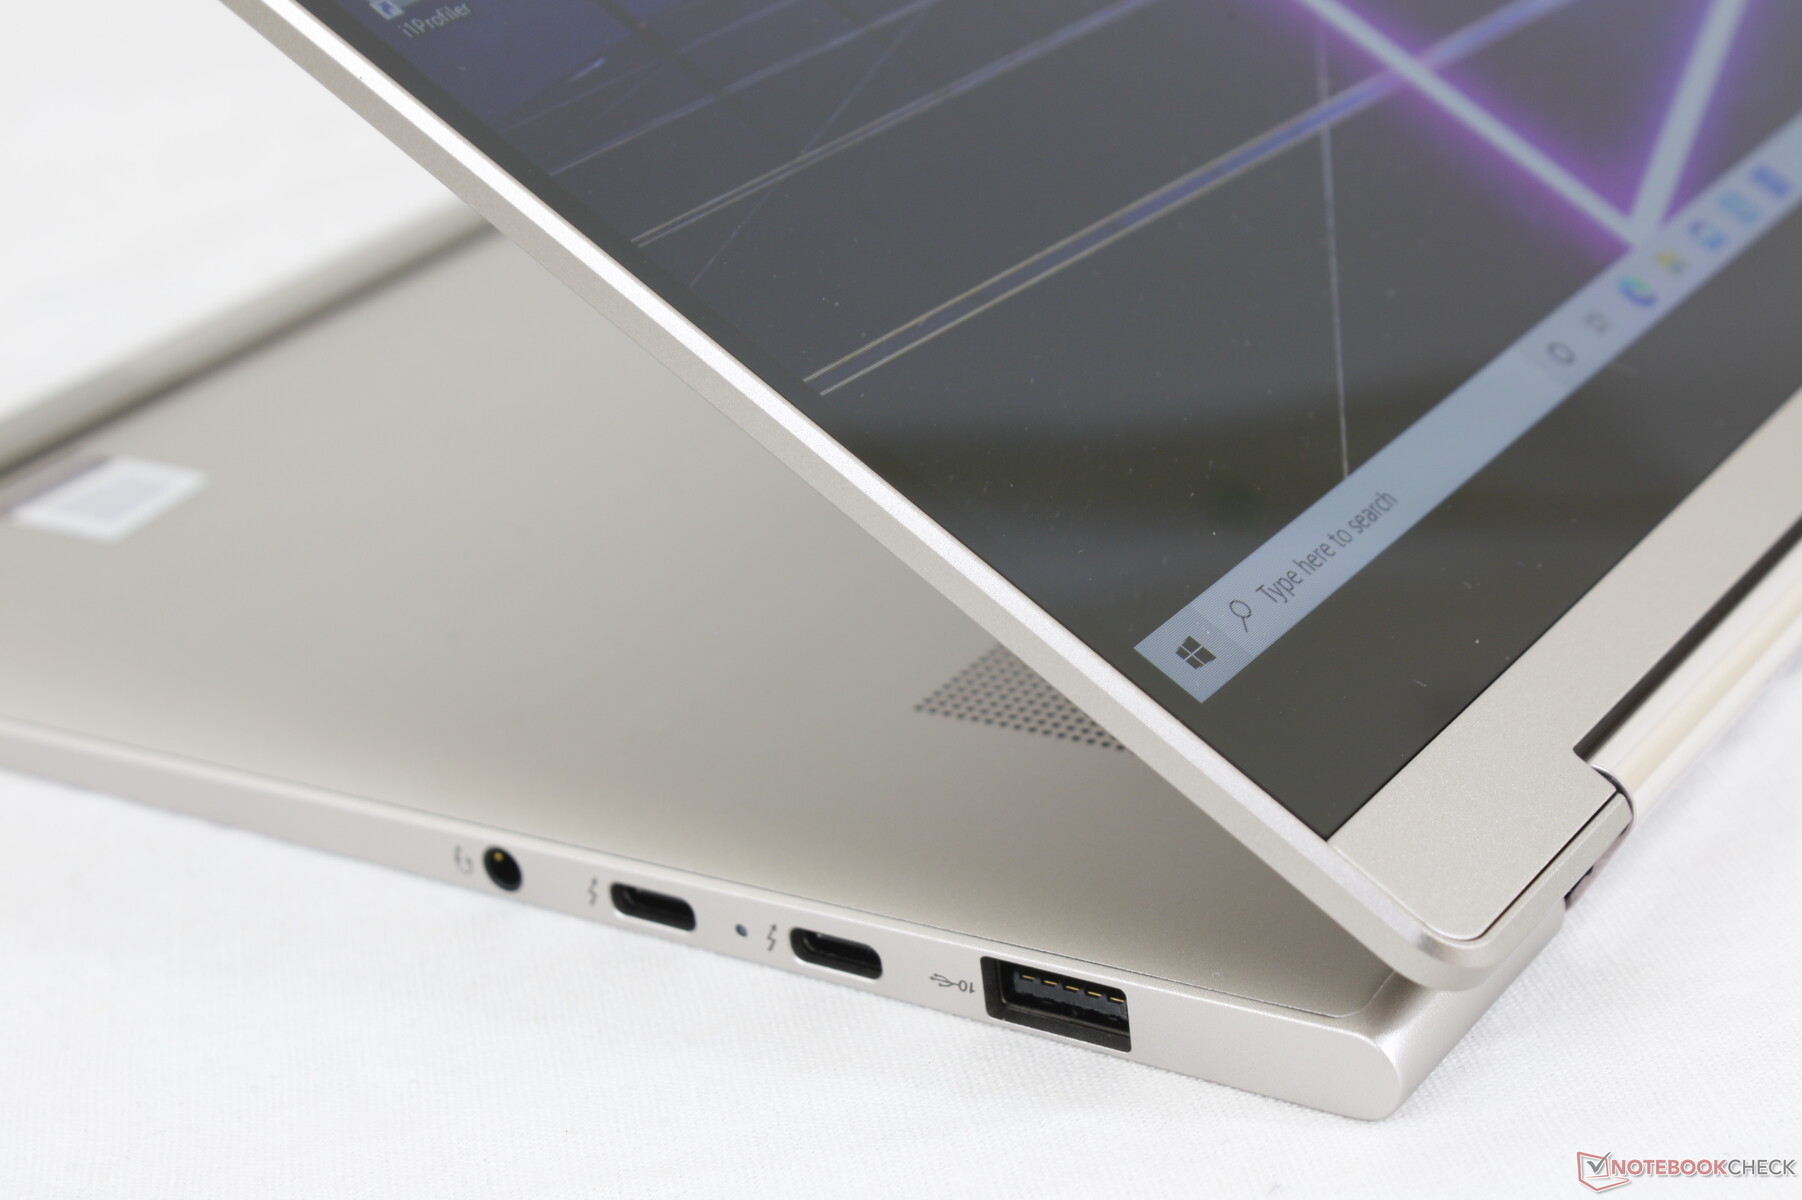
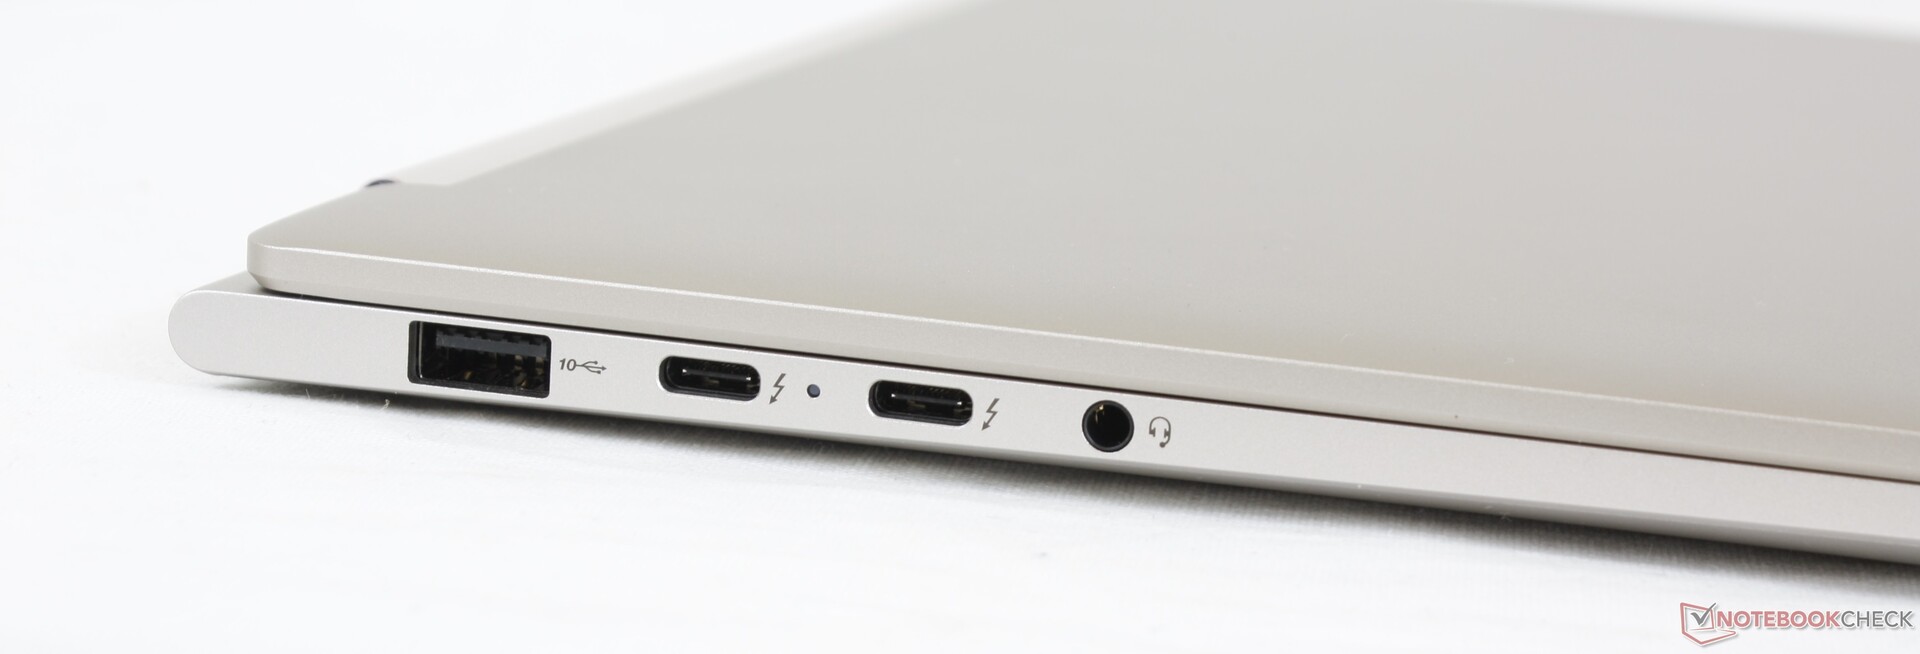
Port options are similar to the older Yoga C940 14 including the positioning of all ports along the left edge. There are no HDMI ports unlike on the Yoga Slim 7 meaning users will have to rely on Thunderbolt adapters to get the job done.
Communication
The Intel AX201 comes standard for Wi-Fi 6 and Bluetooth 5.1 connectivity. We experienced no connectivity issues during our time with the unit.
Webcam


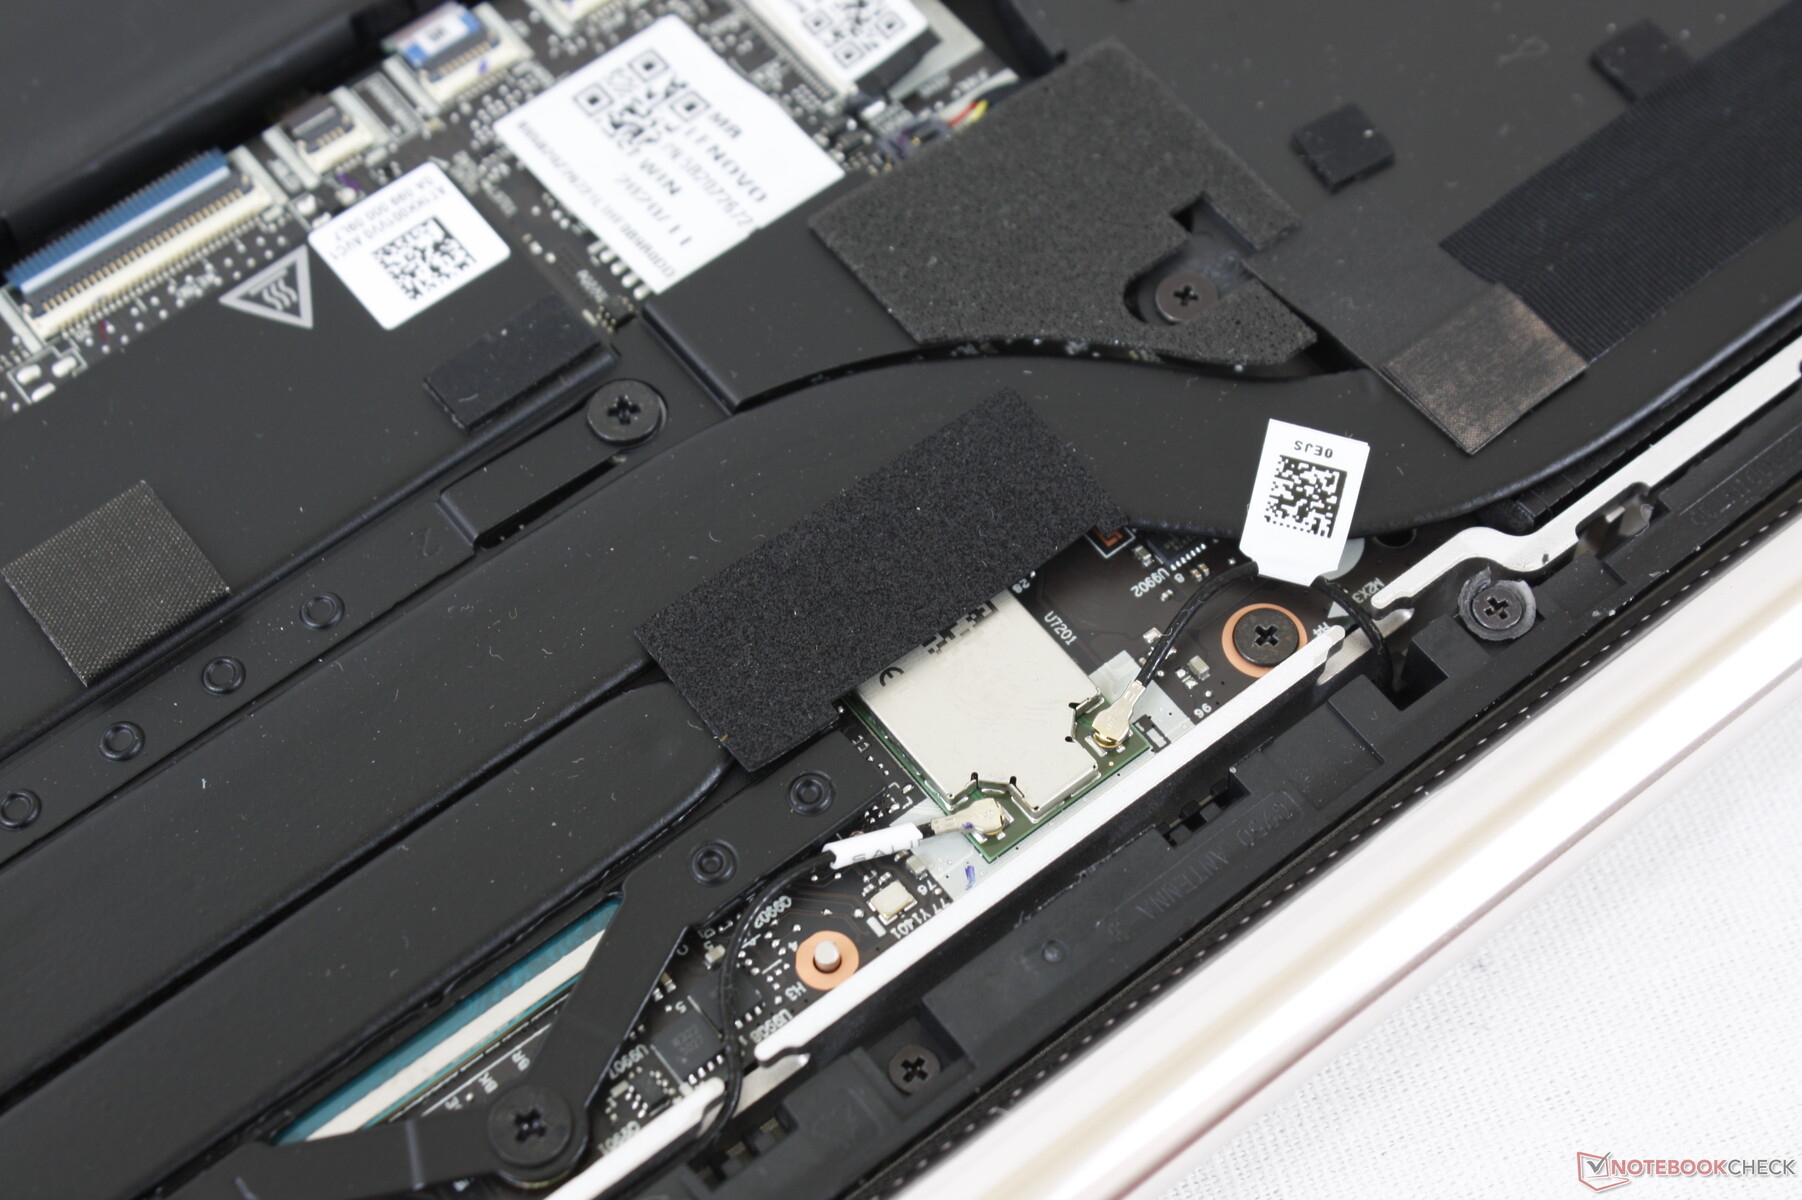
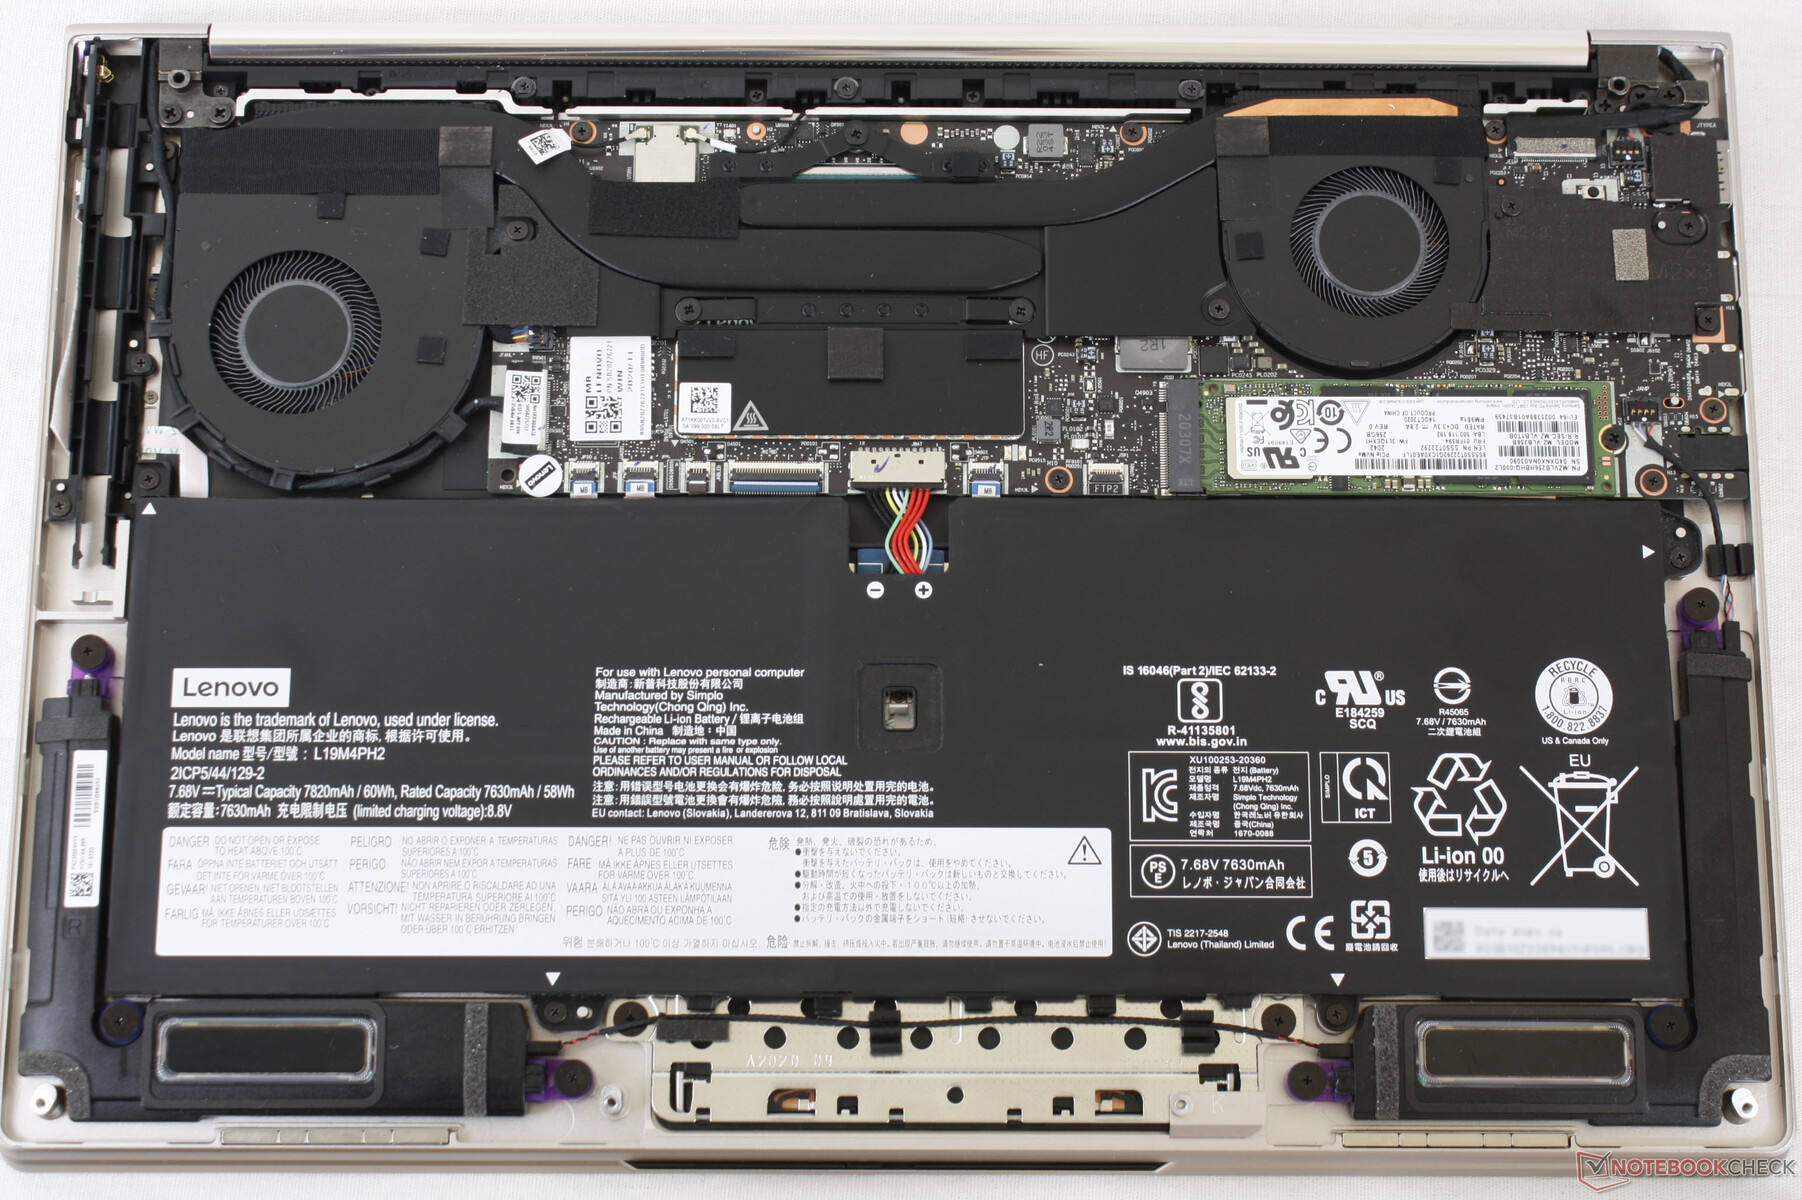
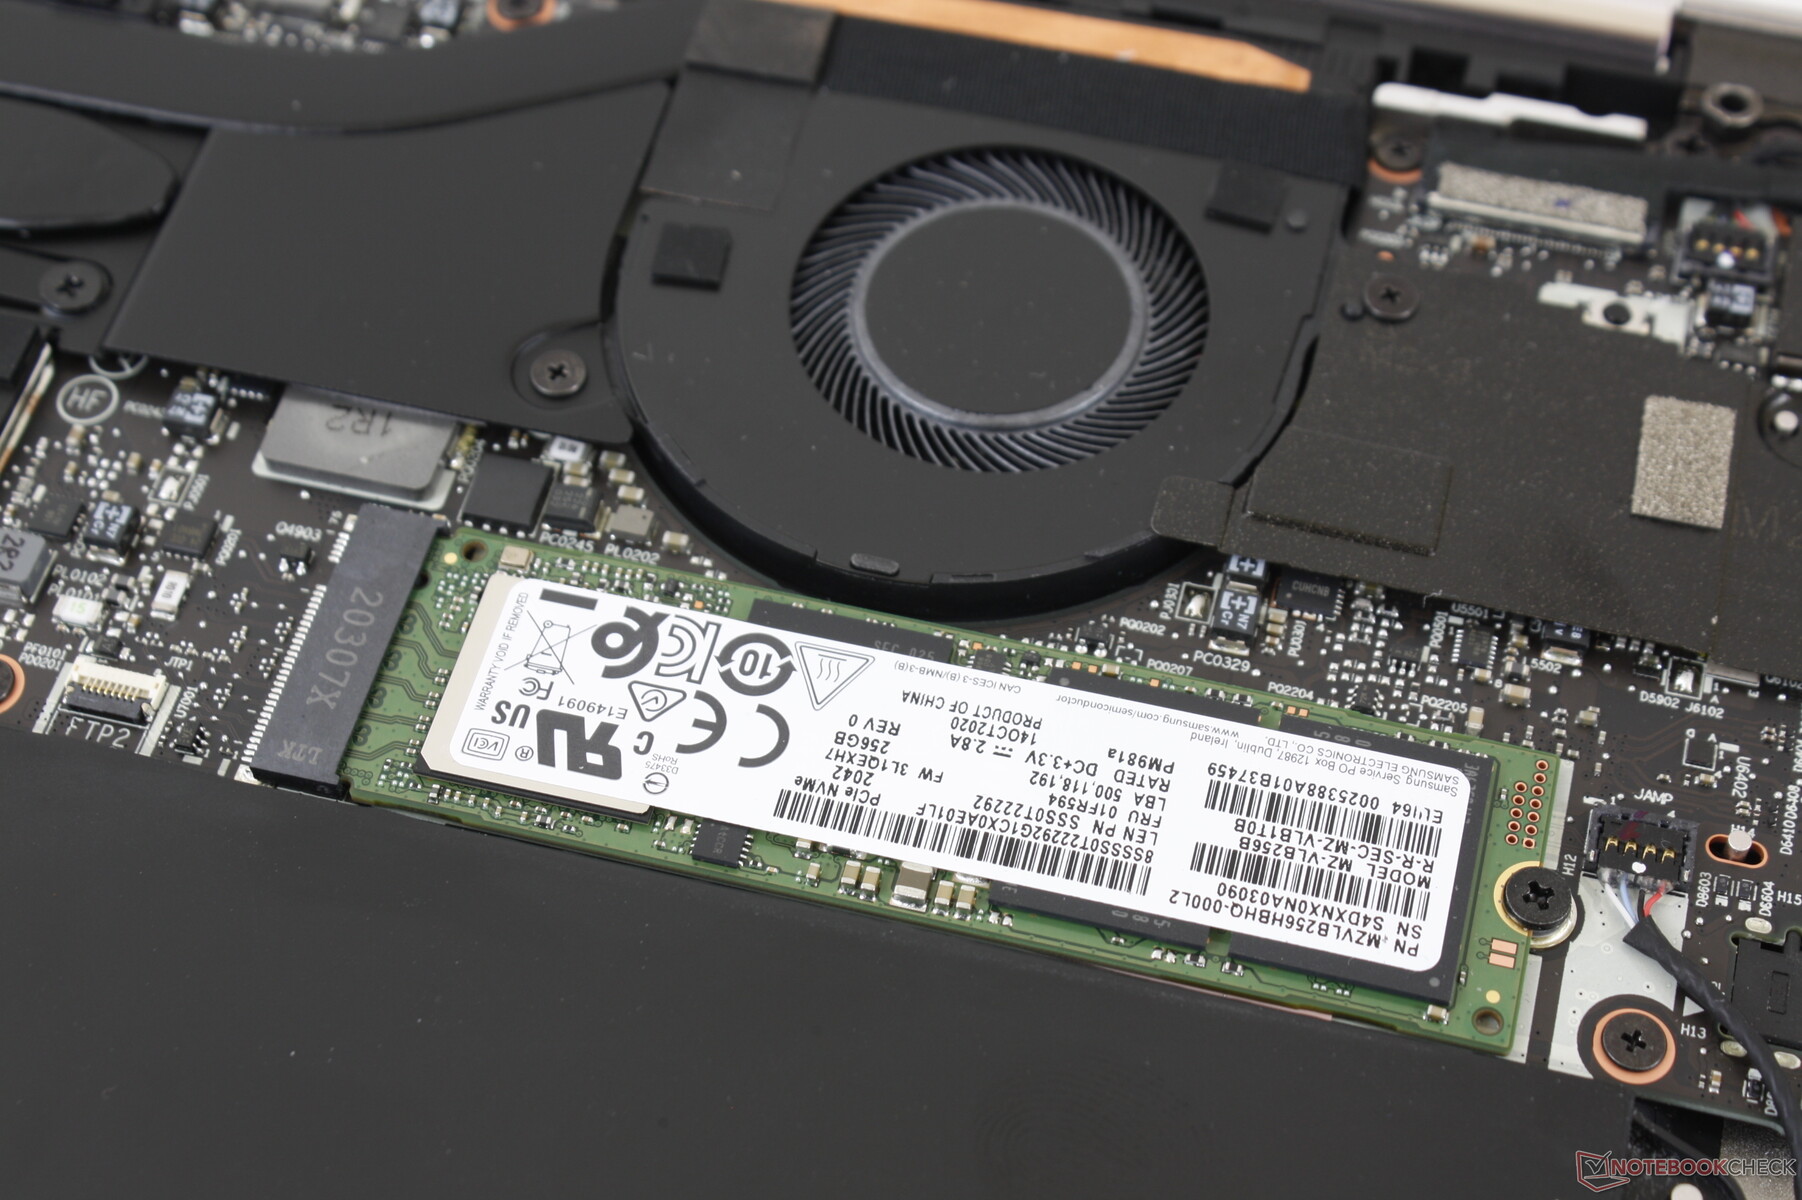
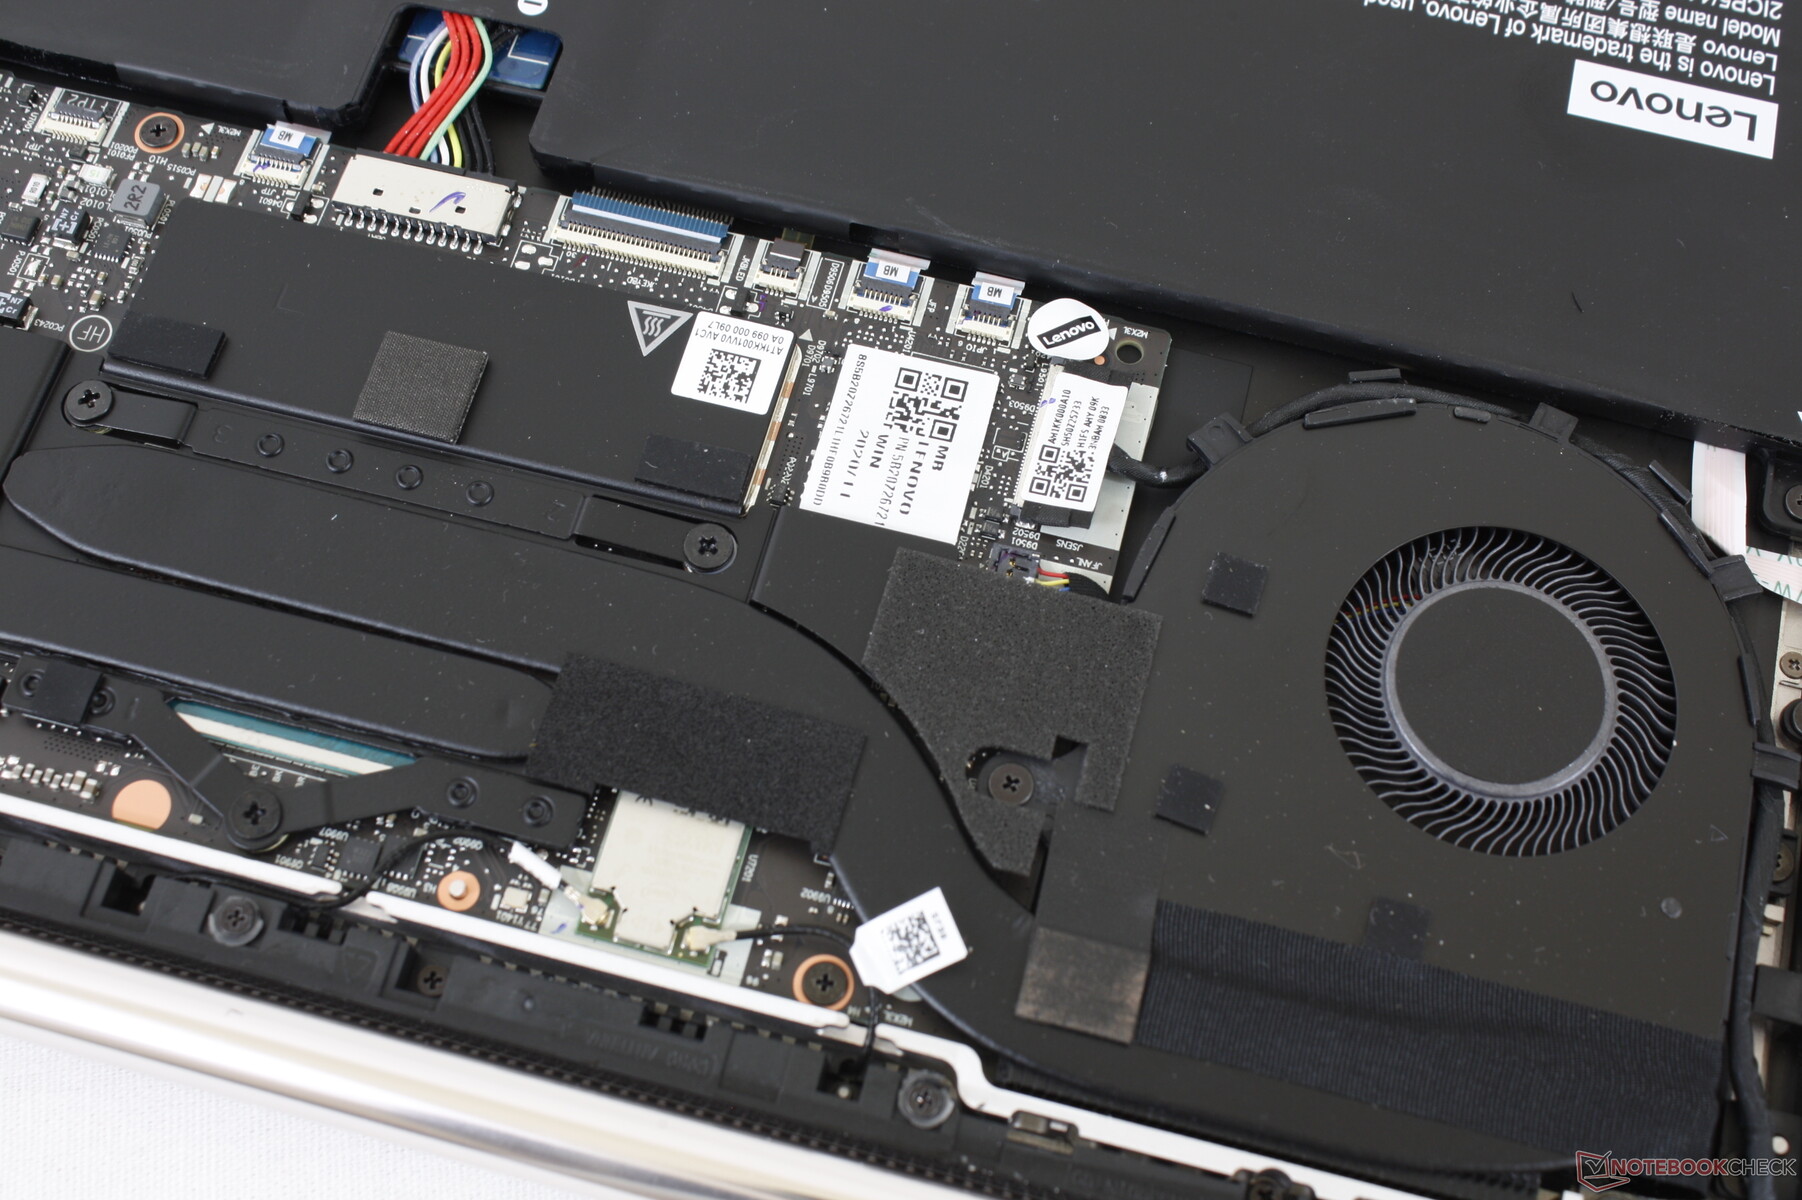
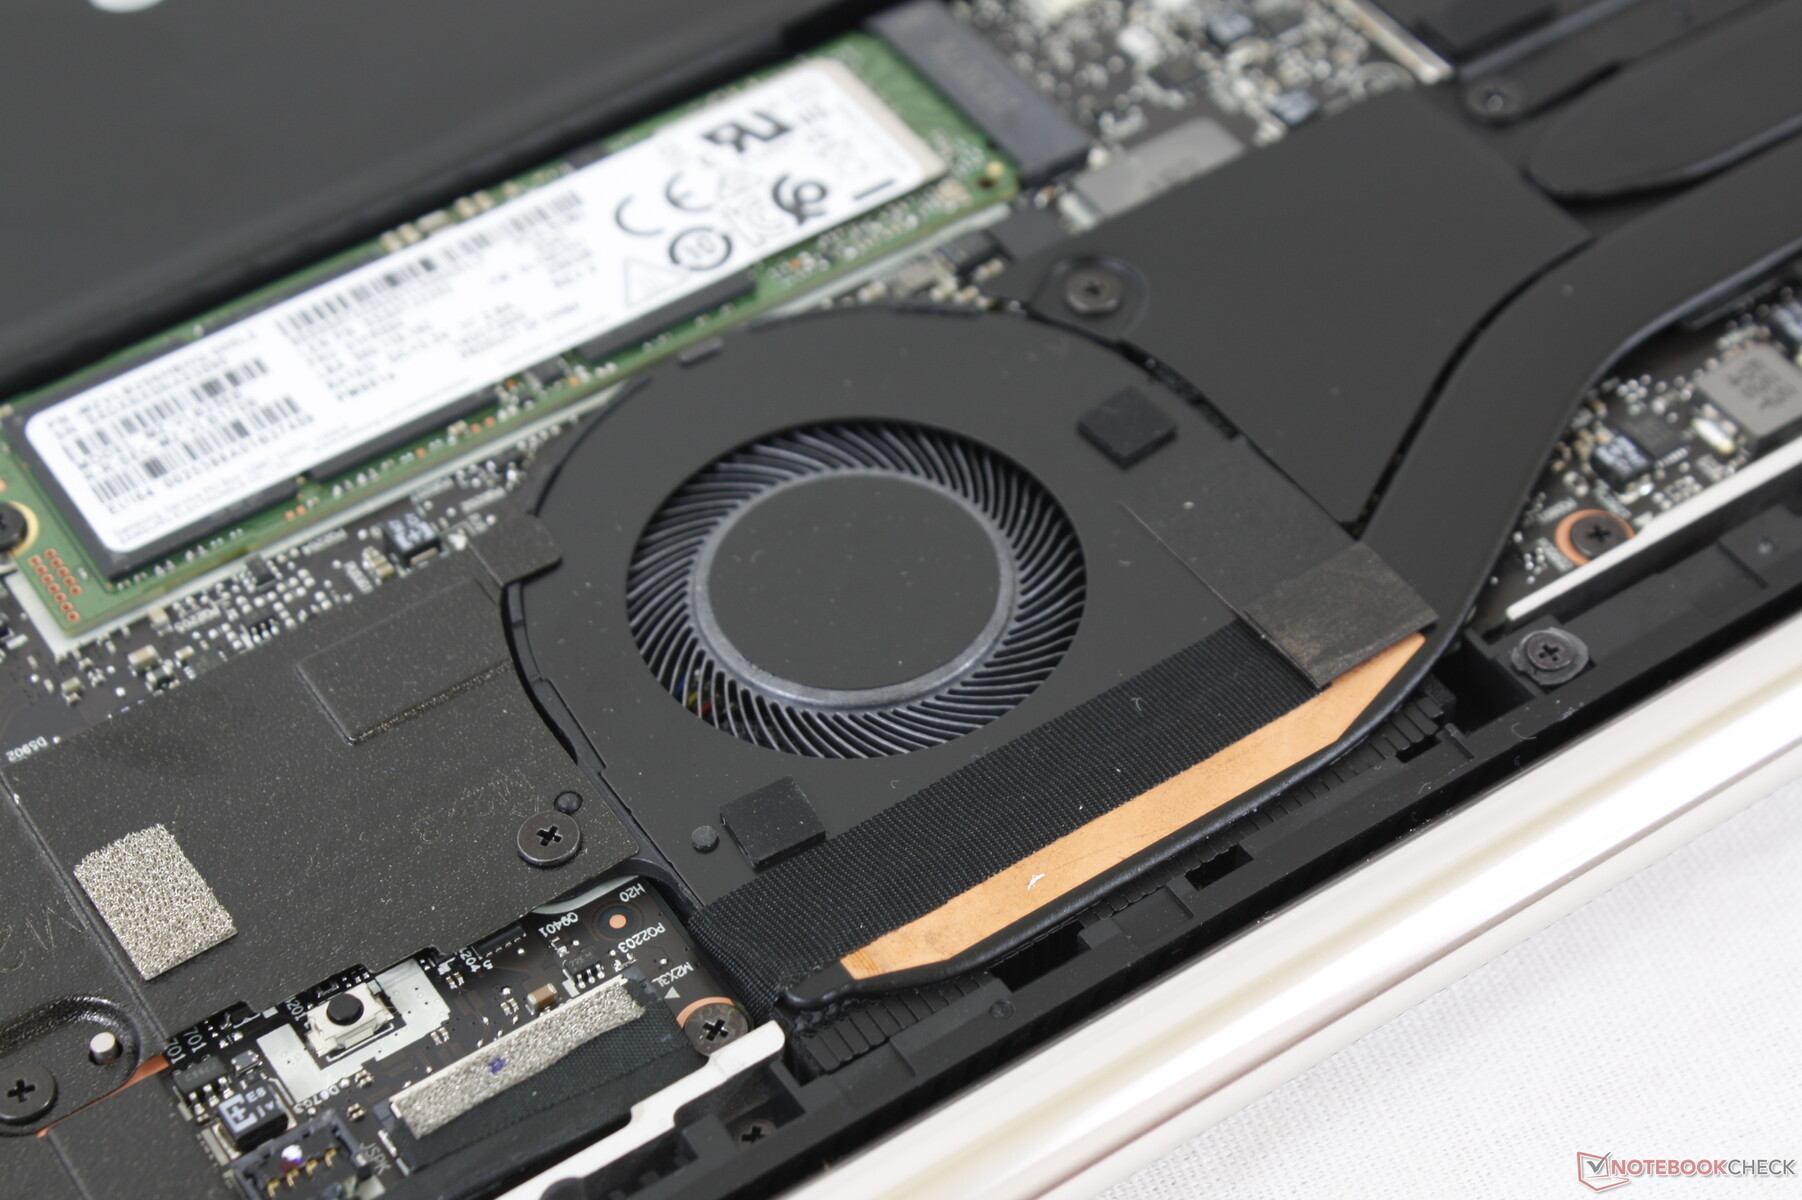
Maintenance
The bottom panel can be removed fairly easily with a T5 Torx wrench. However, there isn't much to upgrade beyond the M.2 2280 SSD.
Accessories and Warranty
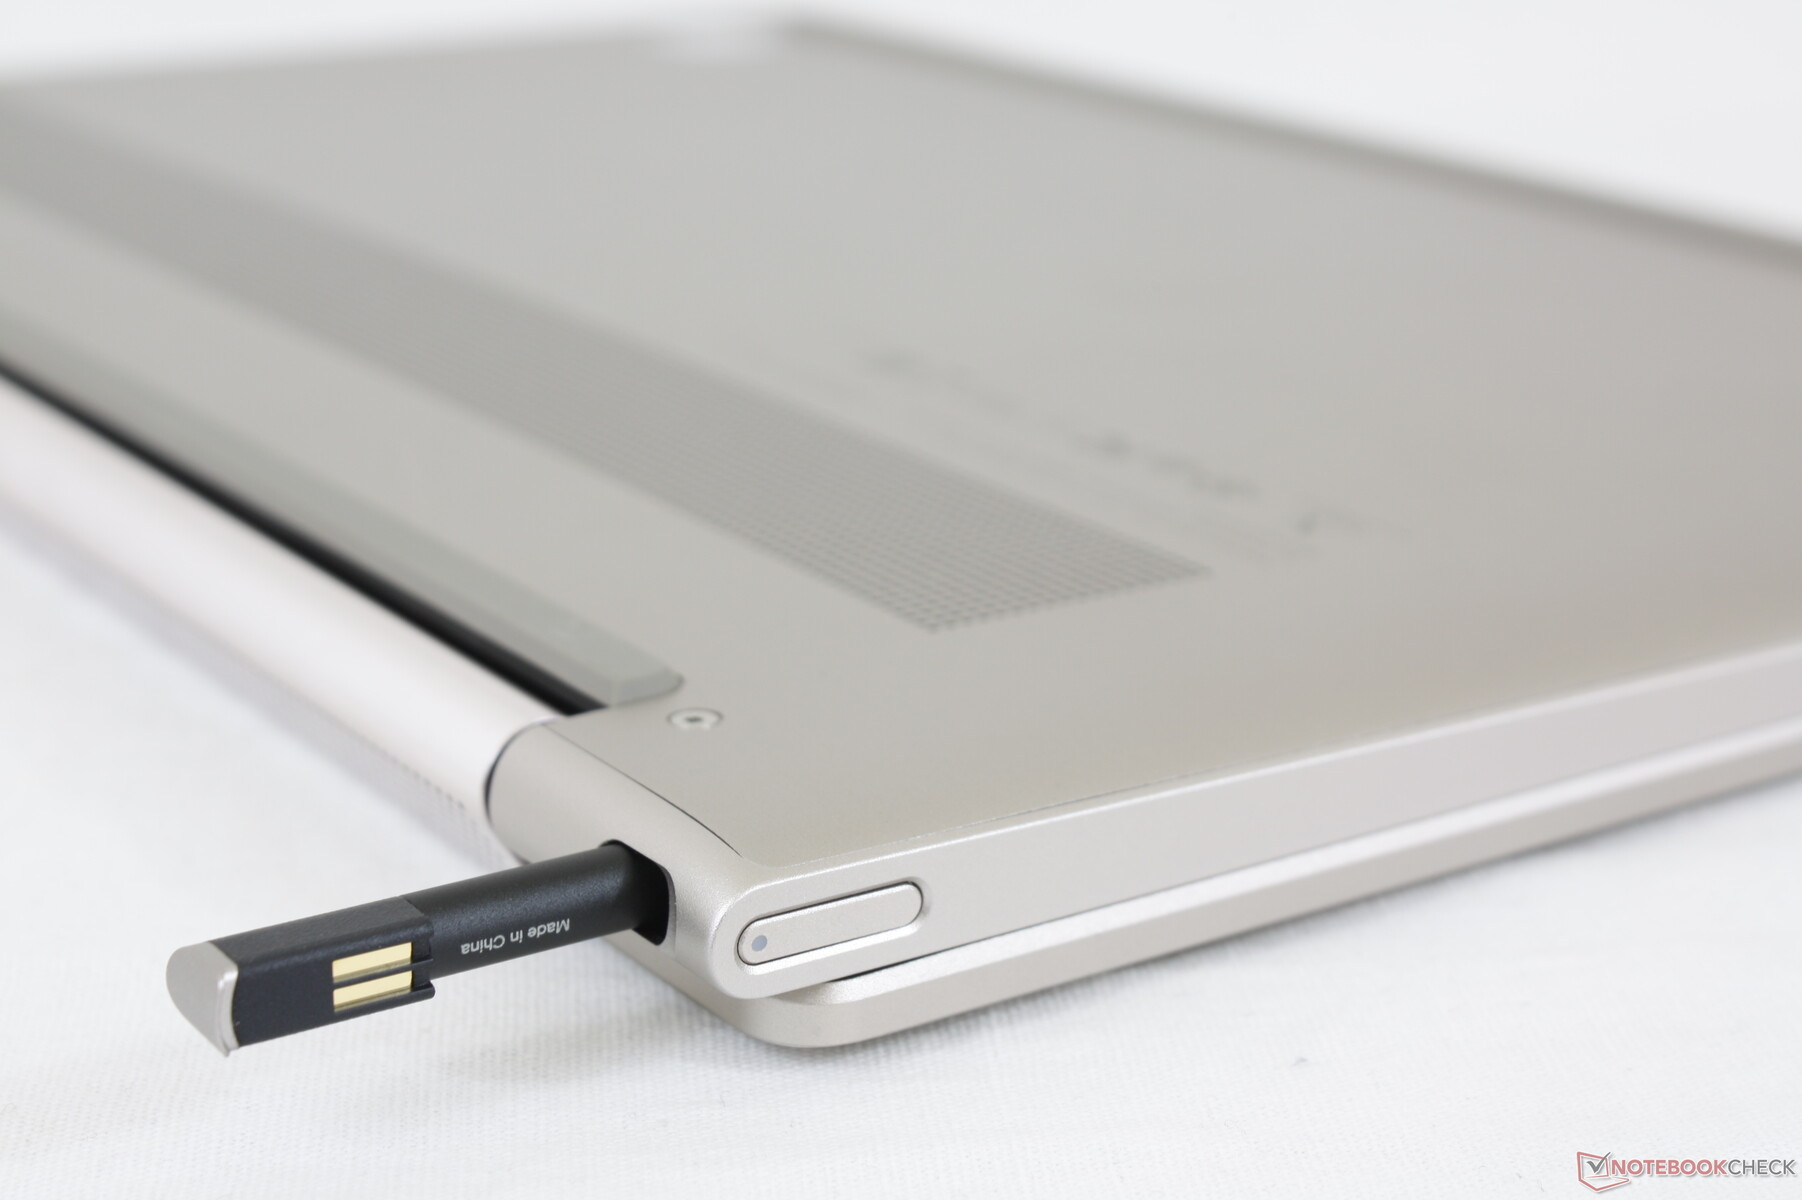
There are no extras in the box save for the active stylus pen in the laptop itself. The standard one-year limited warranty applies.
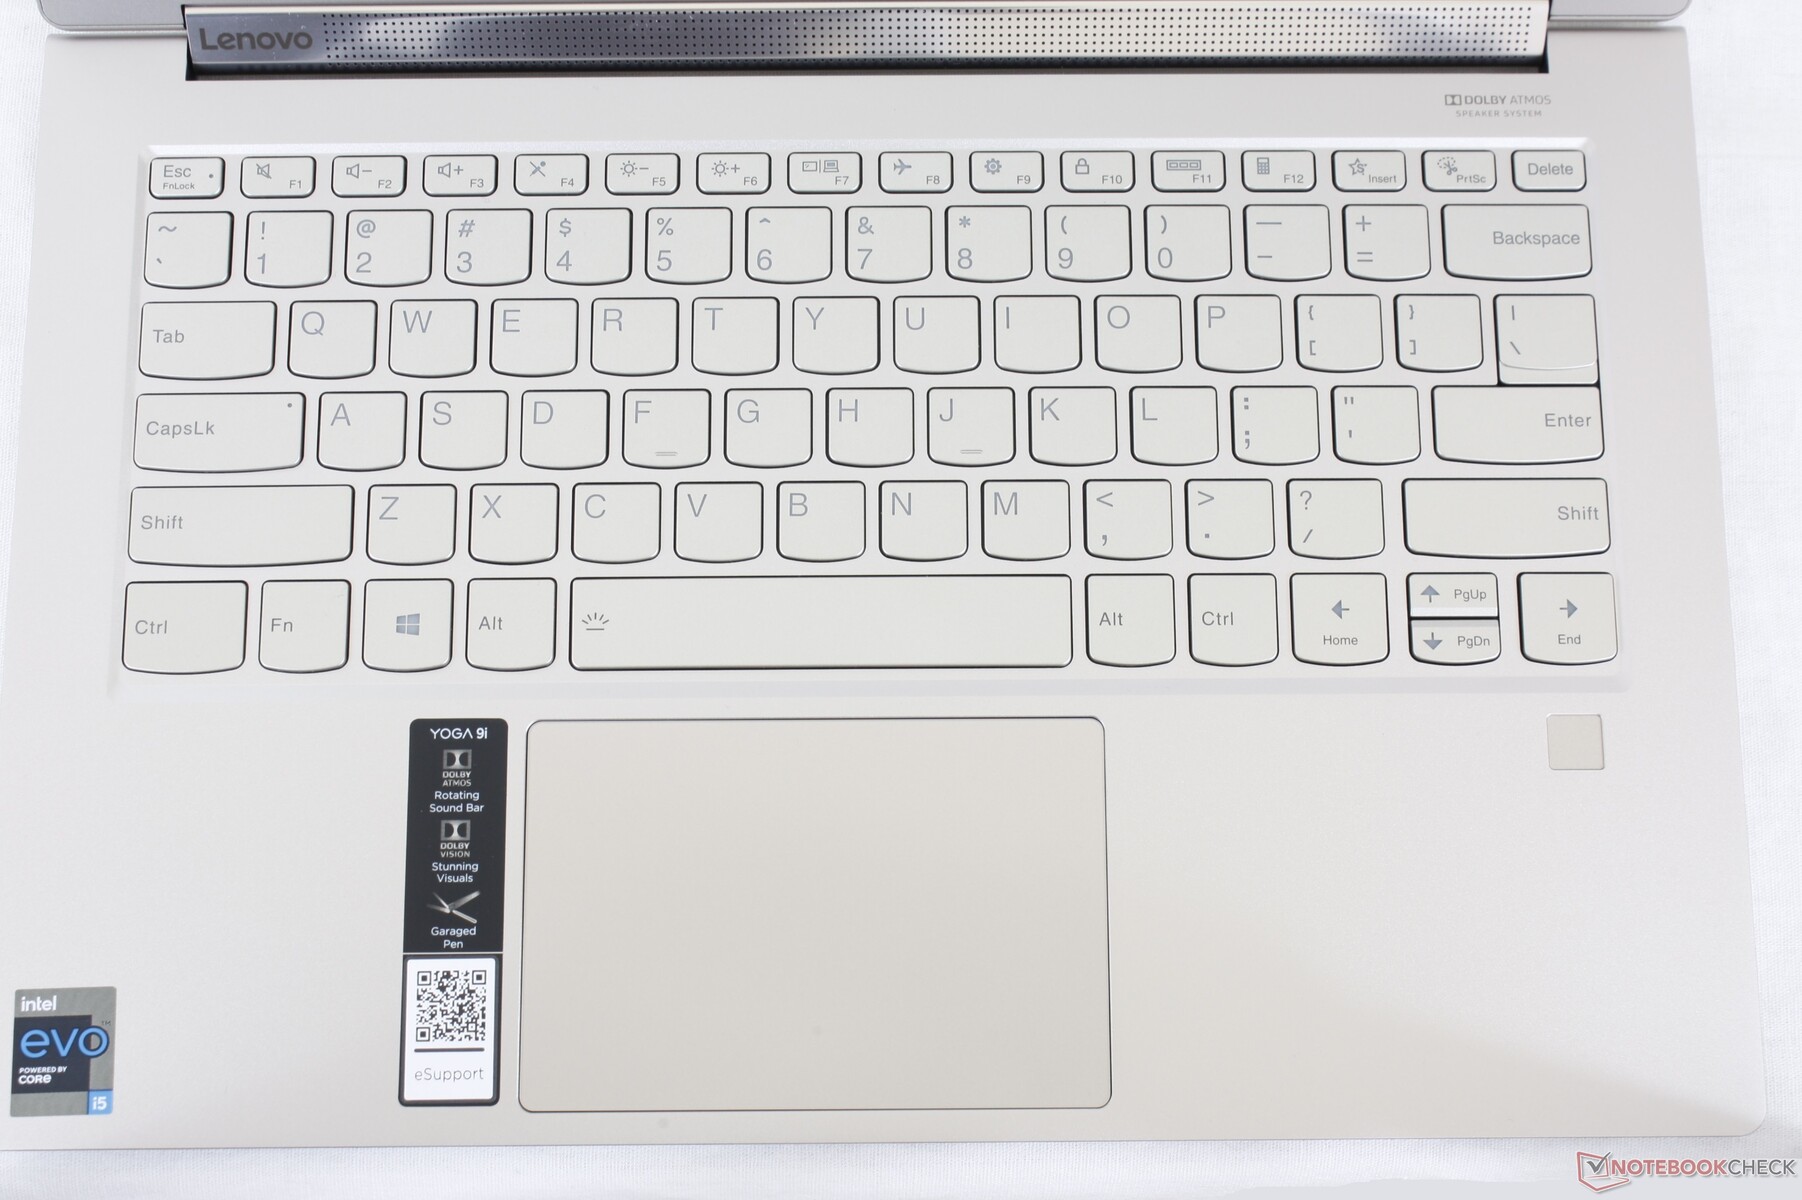
Input Devices
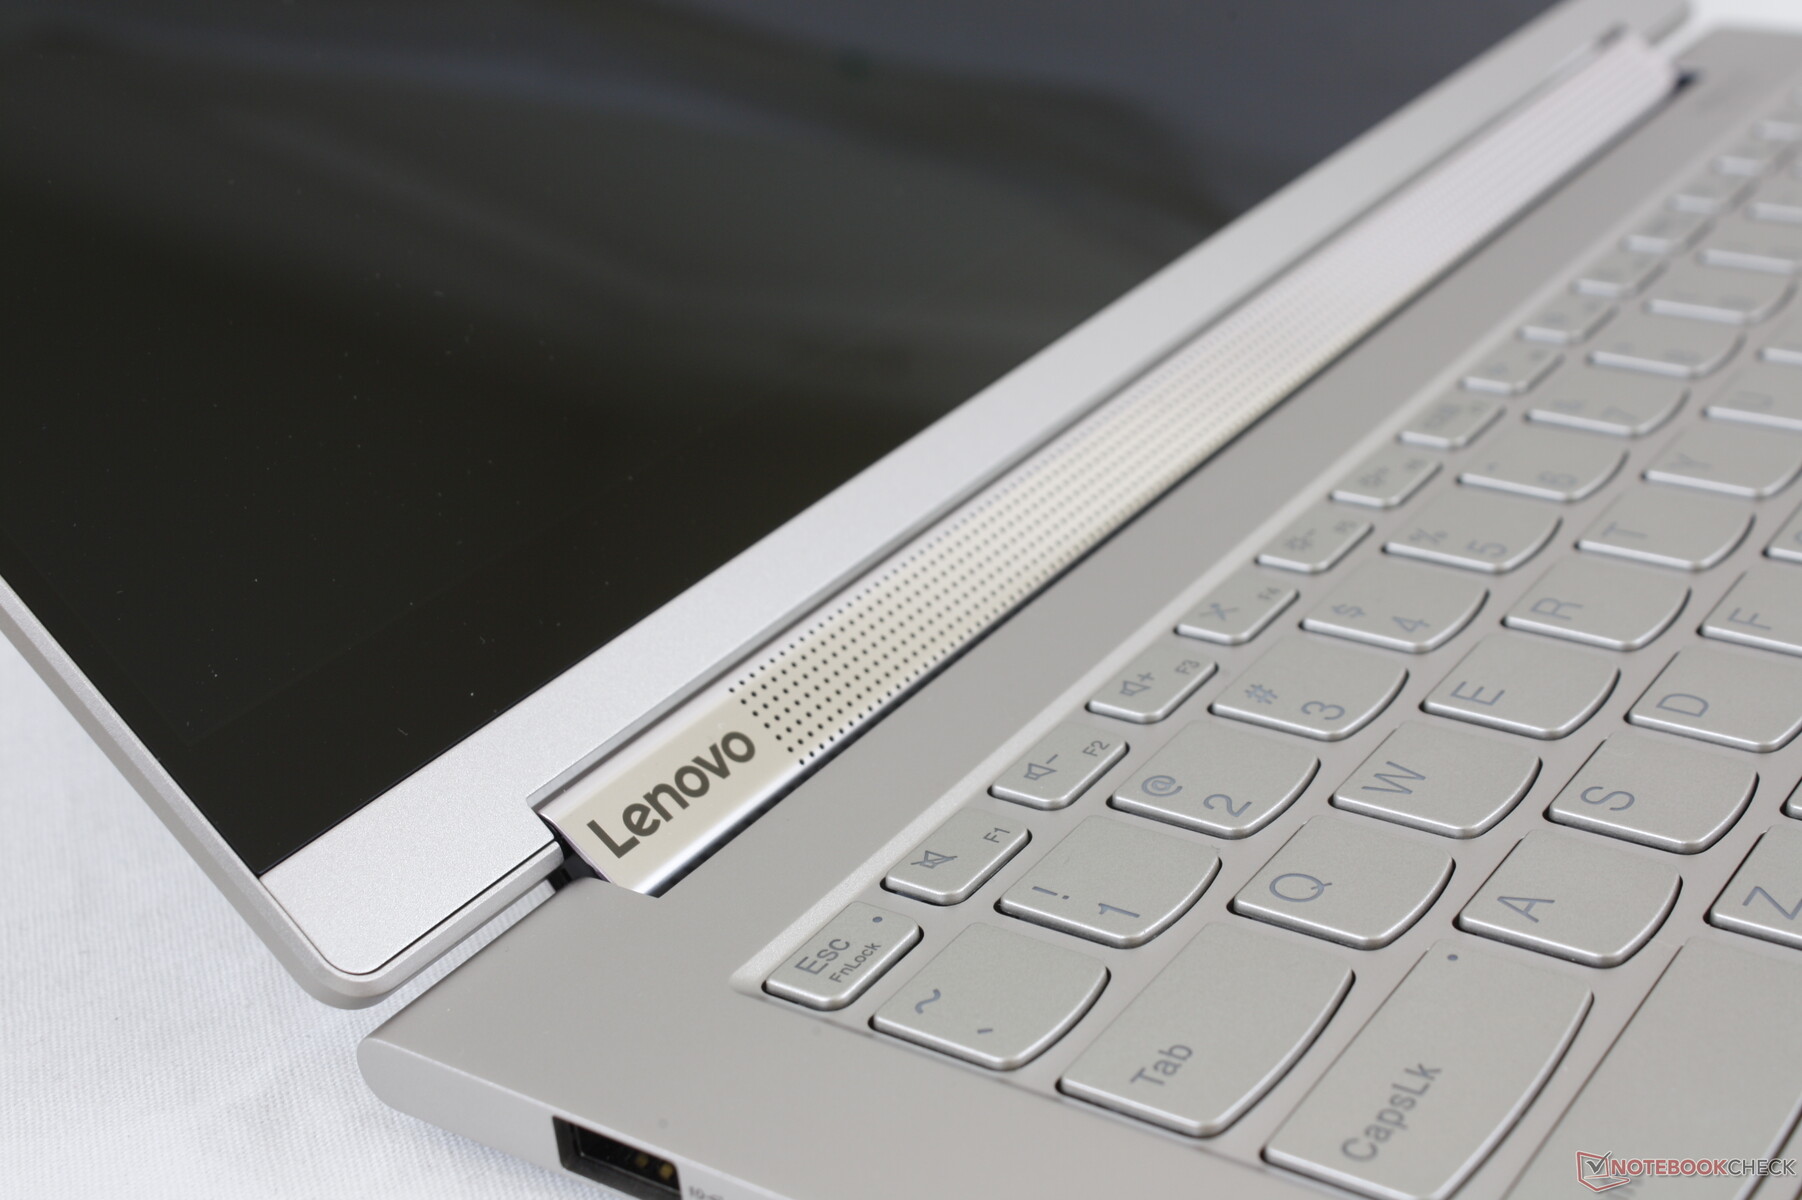
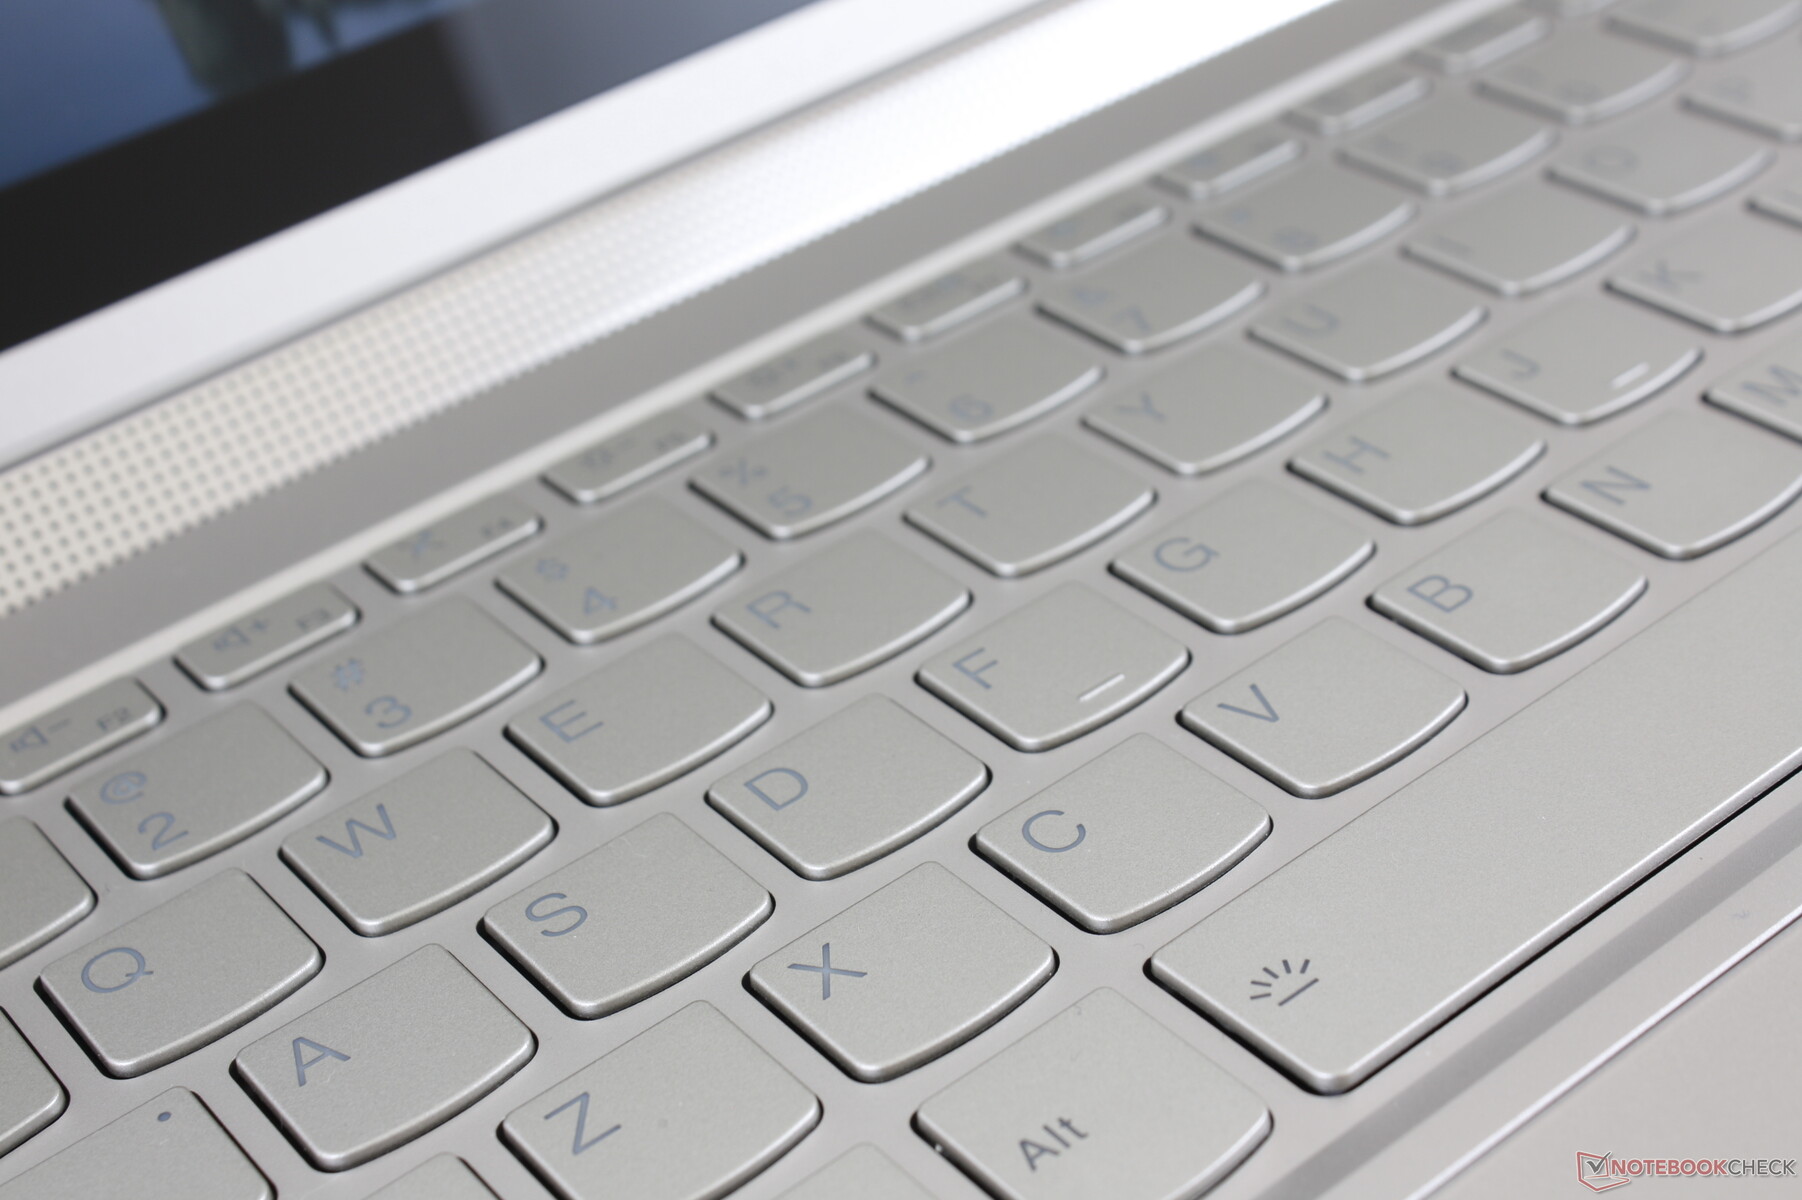
Keyboard
The typing experience is essentially the same as most IdeaPad laptops which is unfortunate because the keys are shallower, spongier, and weaker than on the competing HP Spectre. Lenovo hasn't improved upon the keys at all between generations. We would much prefer a typing experience closer to the renowned ThinkPad series instead of a cheap IdeaPad 3 14 retailing for less than half the price. Clatter is relatively quiet as a result of the weak key feedback.
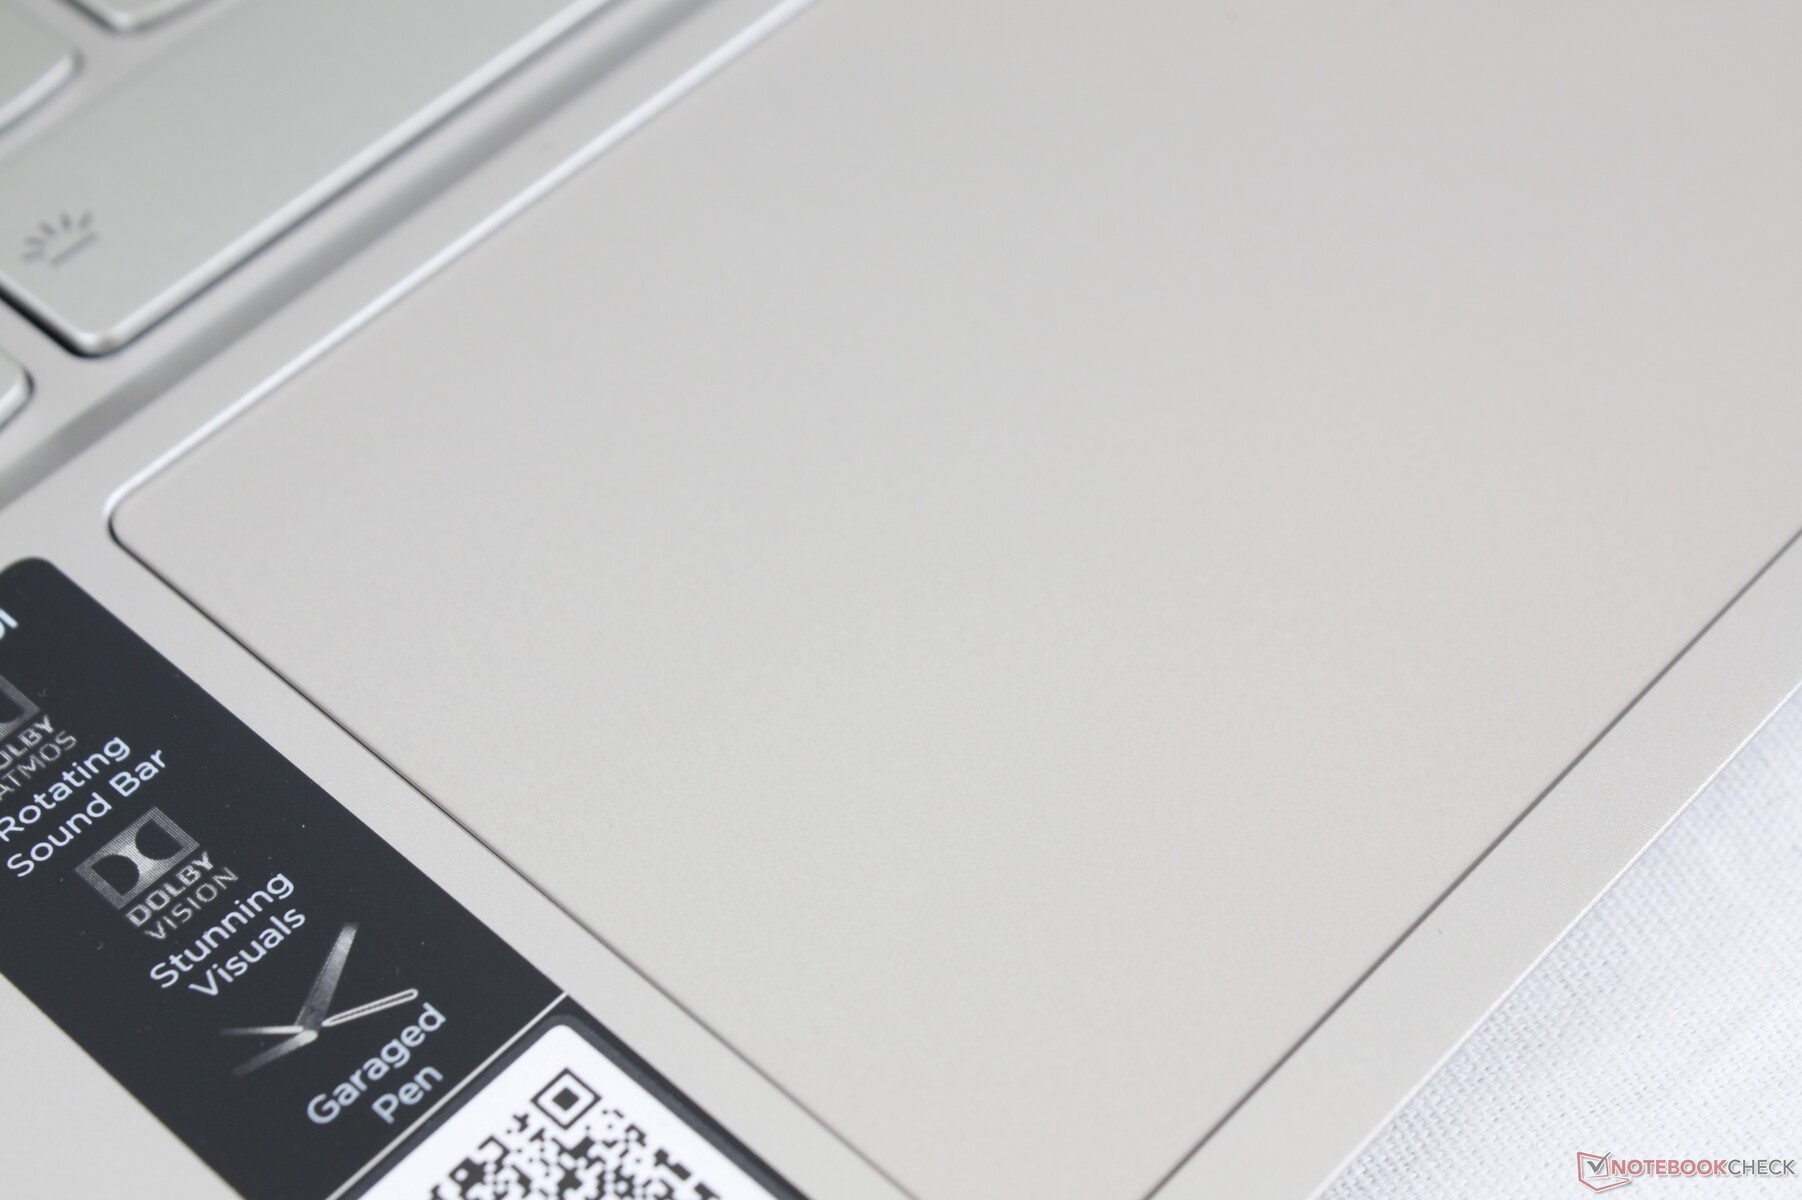
Touchpad
Clickpad size and surface area remain identical to the one on the Yoga C740 14 or C940 14 (10.5 x 7 cm). While the smooth glide is great for low or high speed cursor control, we still don't enjoy the shallow travel or spongy feedback of the integrated clicks.

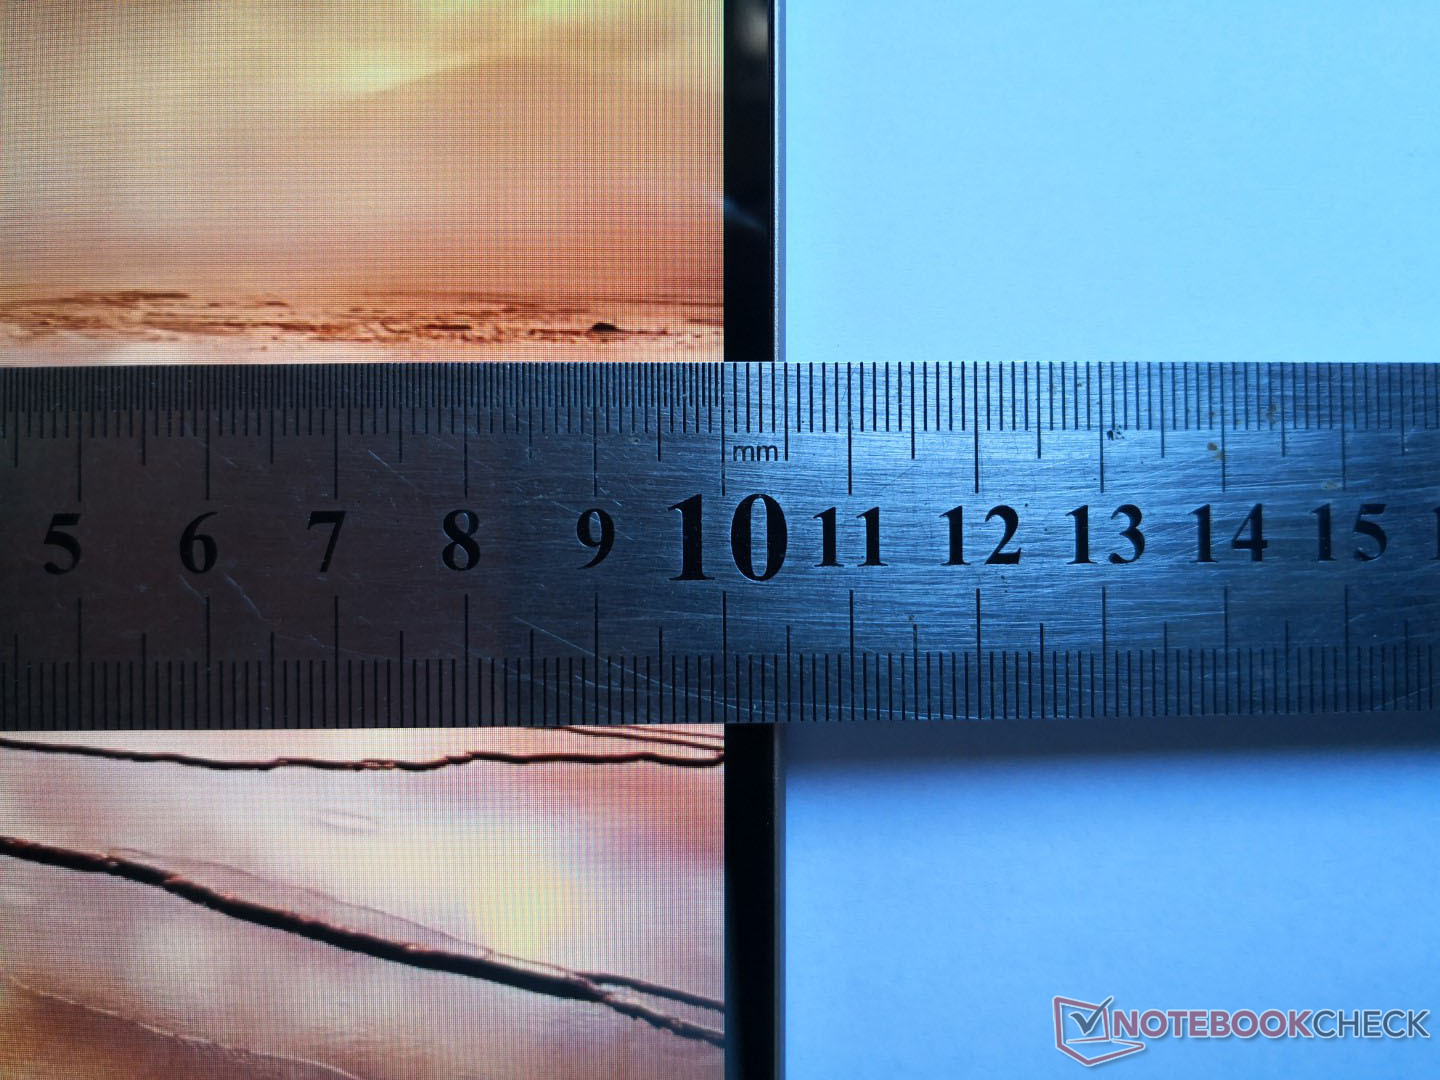
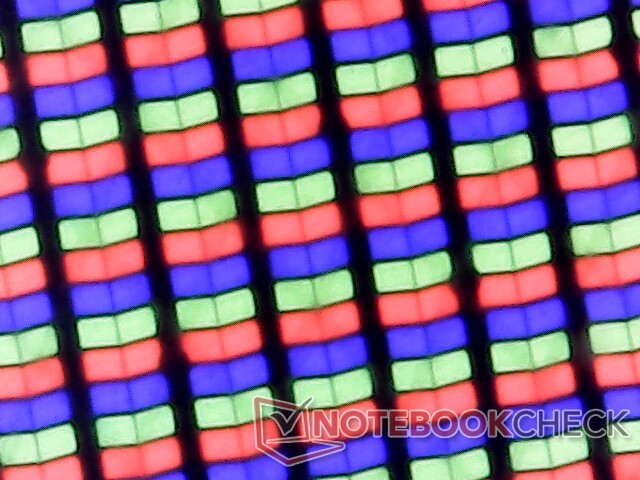
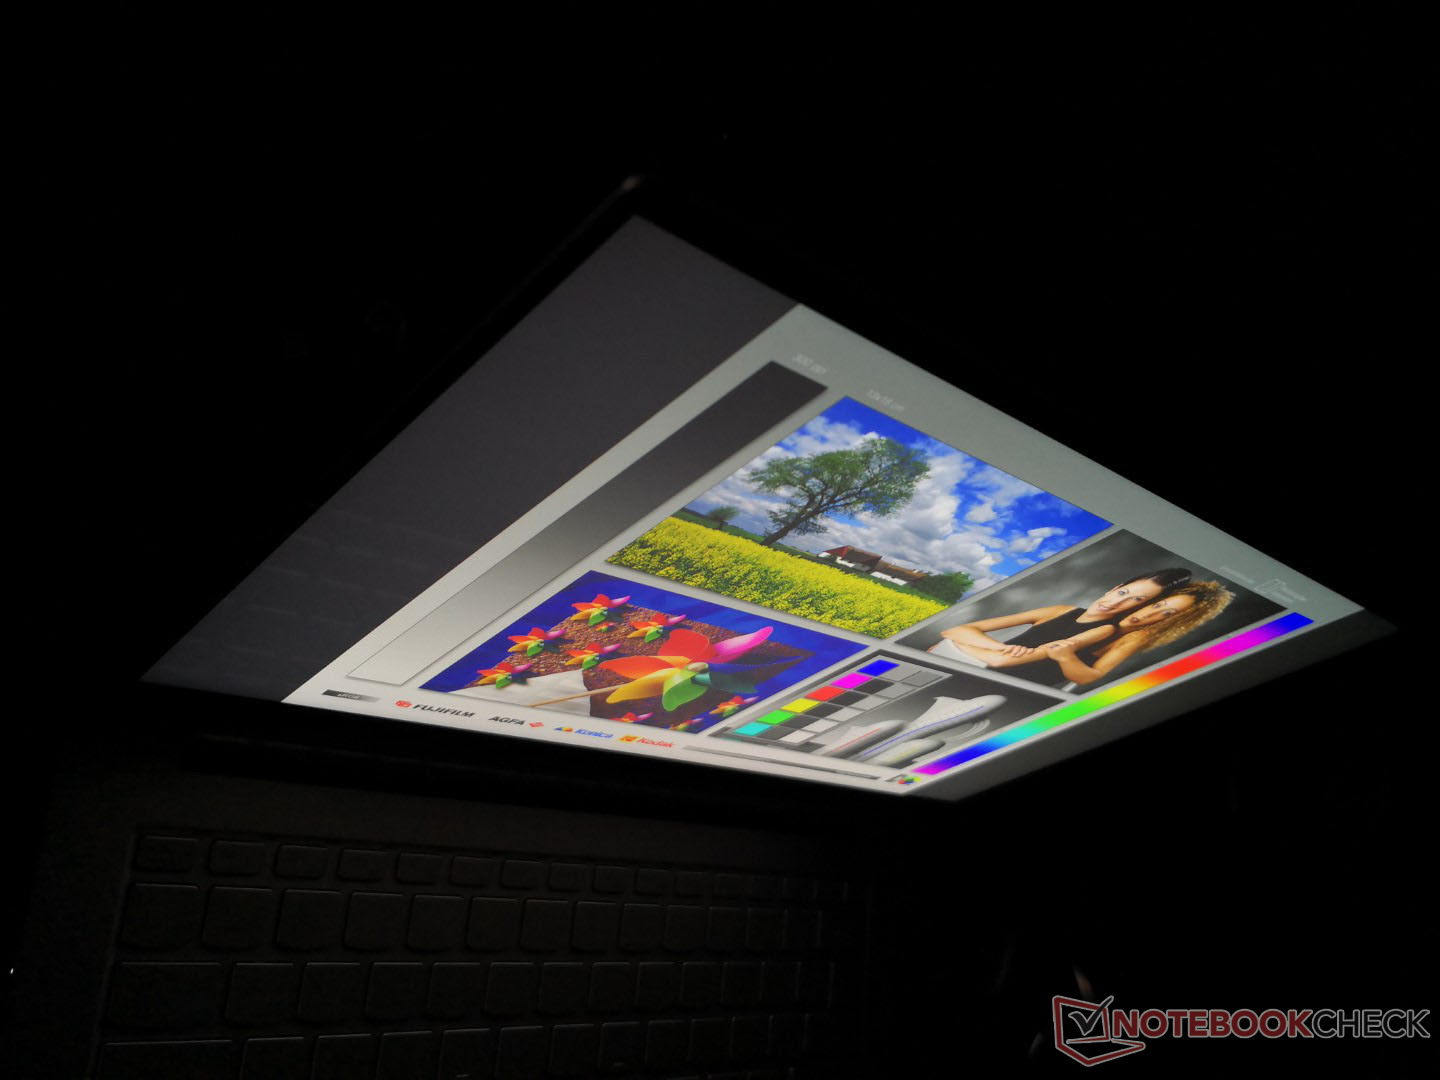
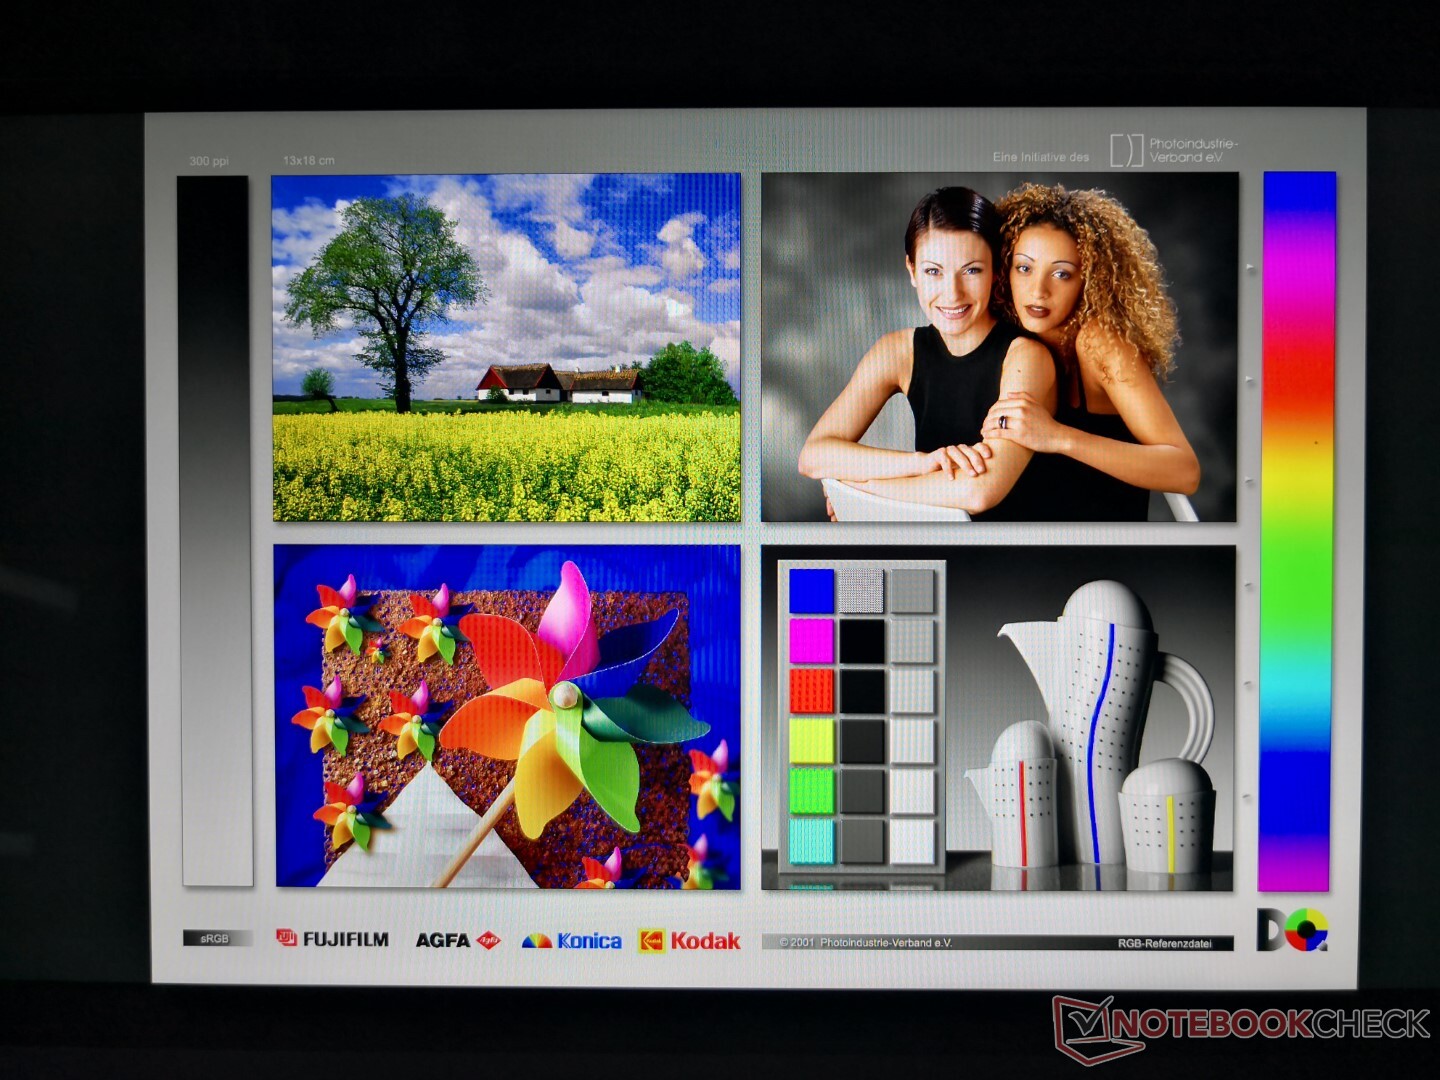
Display
Lenovo has equipped the Yoga 9i 14 with the same high quality LG Philips LP140WF9-SPE2 IPS panel as found on last year's Yoga C940 14. Thus, the Yoga 9i offers almost the same visual experience as on the Yoga C940 14. Display brightness remains average for a high-end convertible as competing models like the XPS 13, HP Spectre x360 13 or Samsung Notebook 9 Pen all have brighter displays for better outdoor visibility.
Black-white and gray-gray response times are slow for noticeable ghosting, but this is a common disadvantage on most Ultrabooks and subnotebooks. This shouldn't be an issue for most applications outside of fast-paced games like Rocket League or Overwatch where ghosting can be distracting.
| |||||||||||||||||||||||||
Brightness Distribution: 82 %
Center on Battery: 365 cd/m²
Contrast: 1587:1 (Black: 0.23 cd/m²)
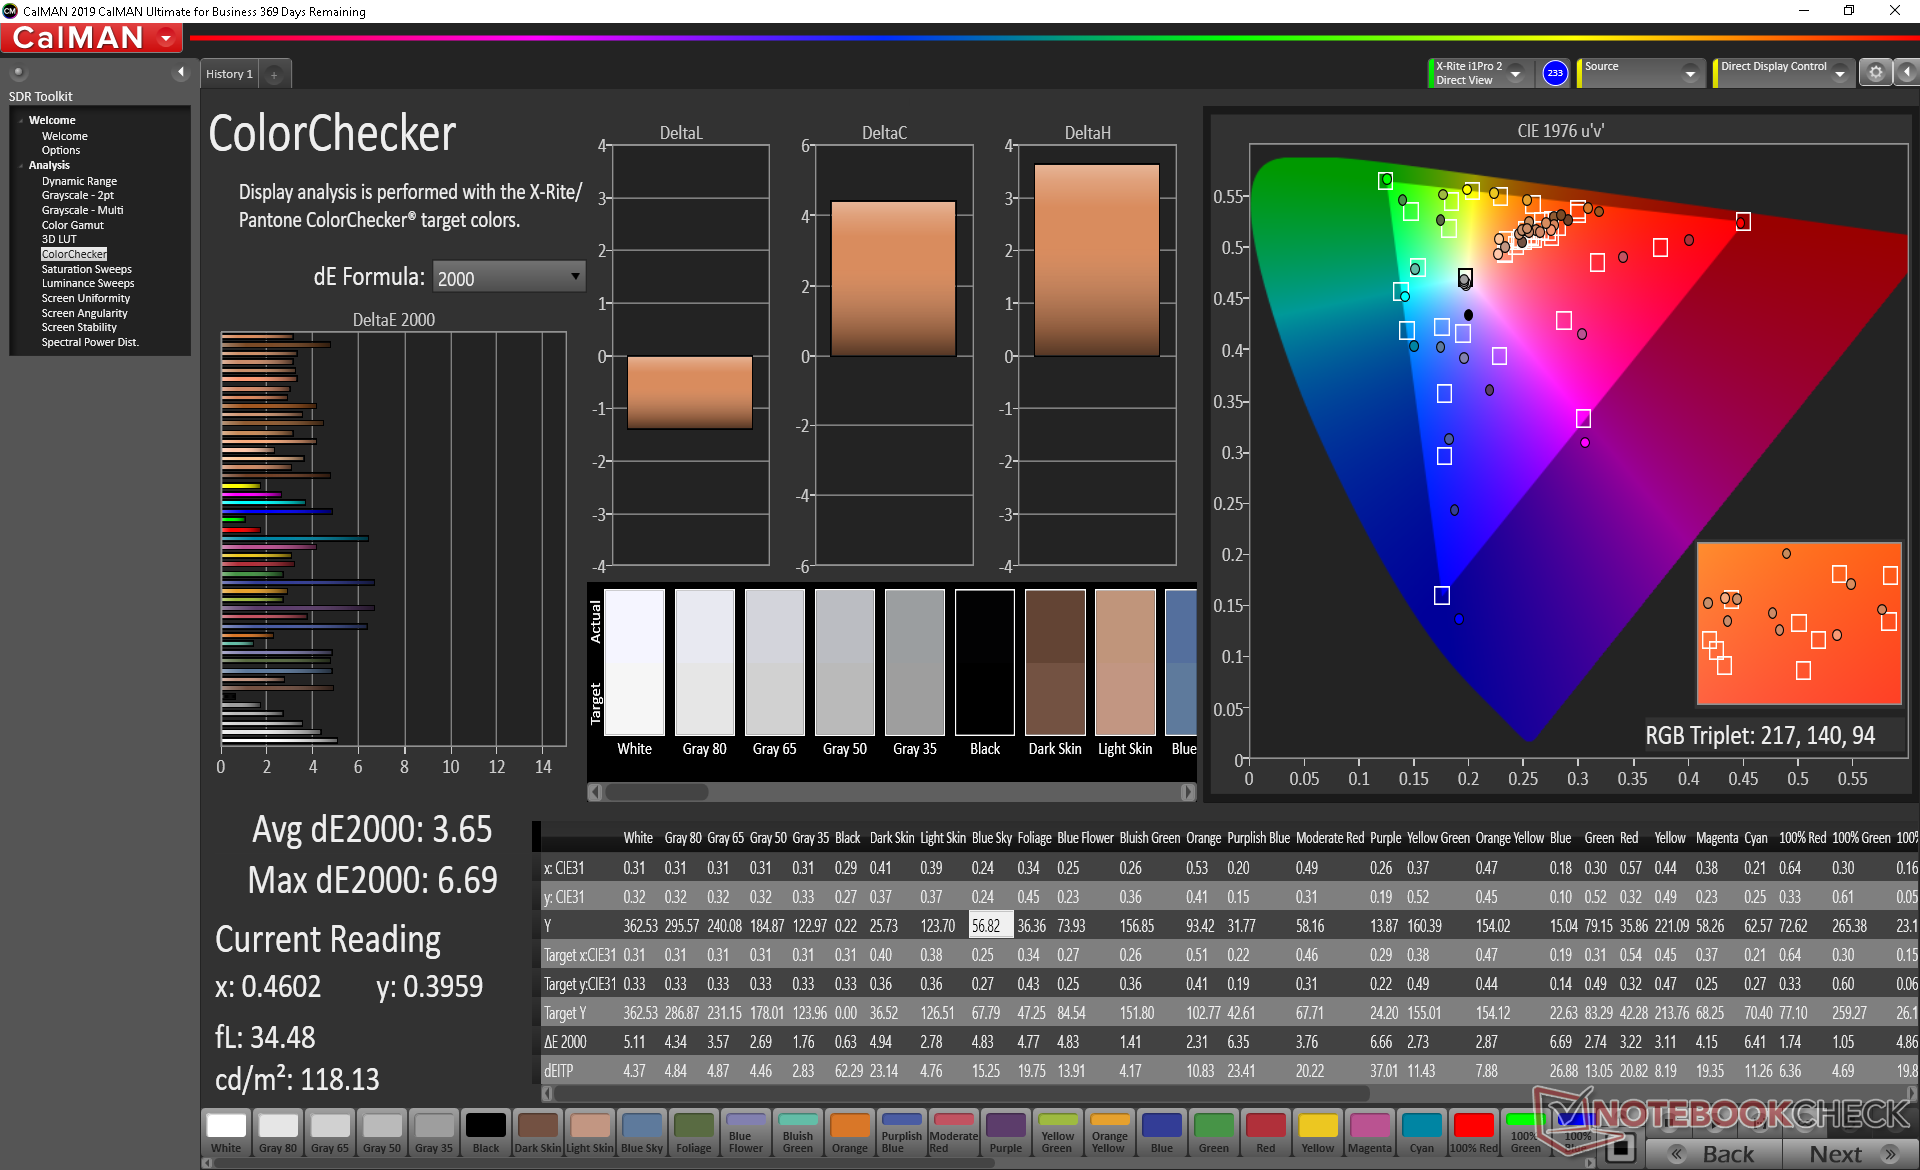
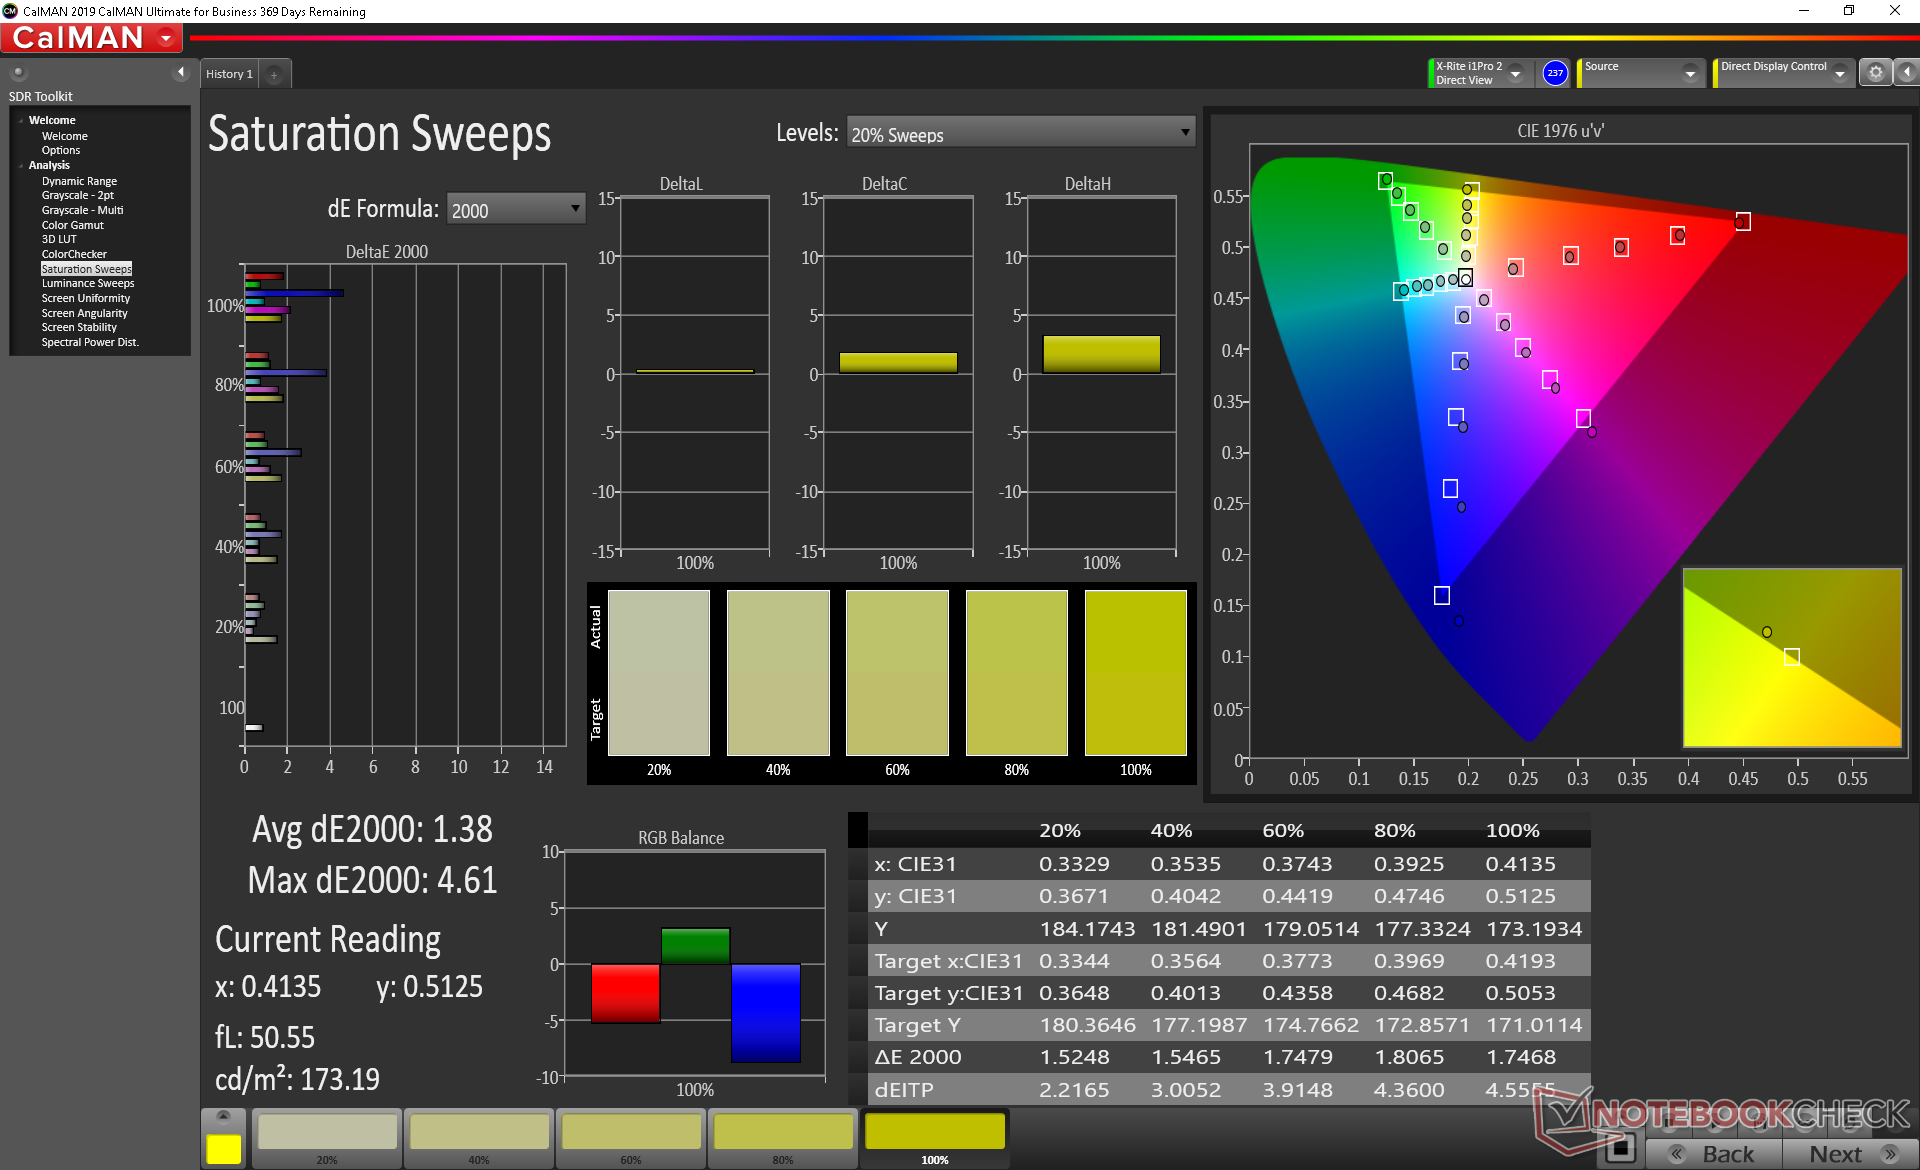
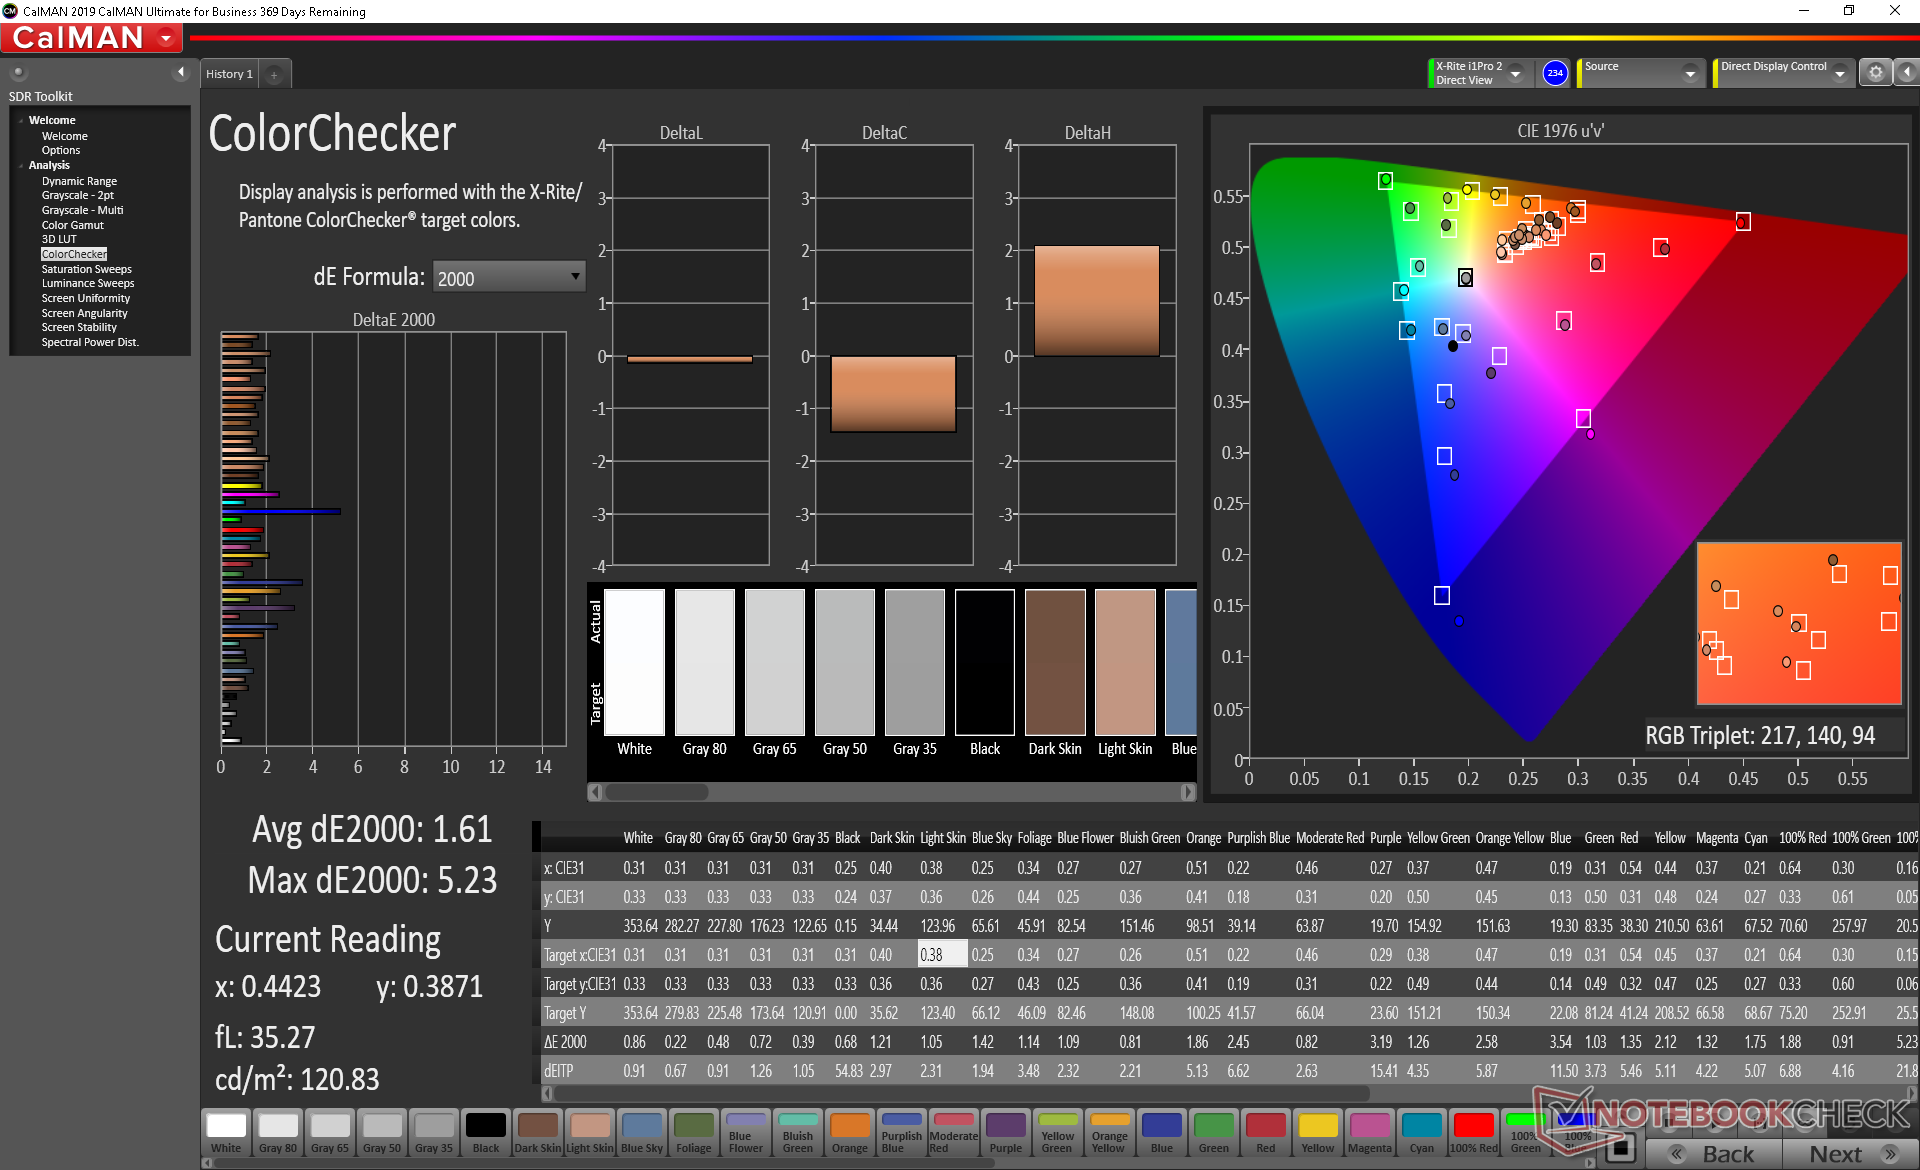
ΔE ColorChecker Calman: 3.65 | ∀{0.5-29.43 Ø4.73}
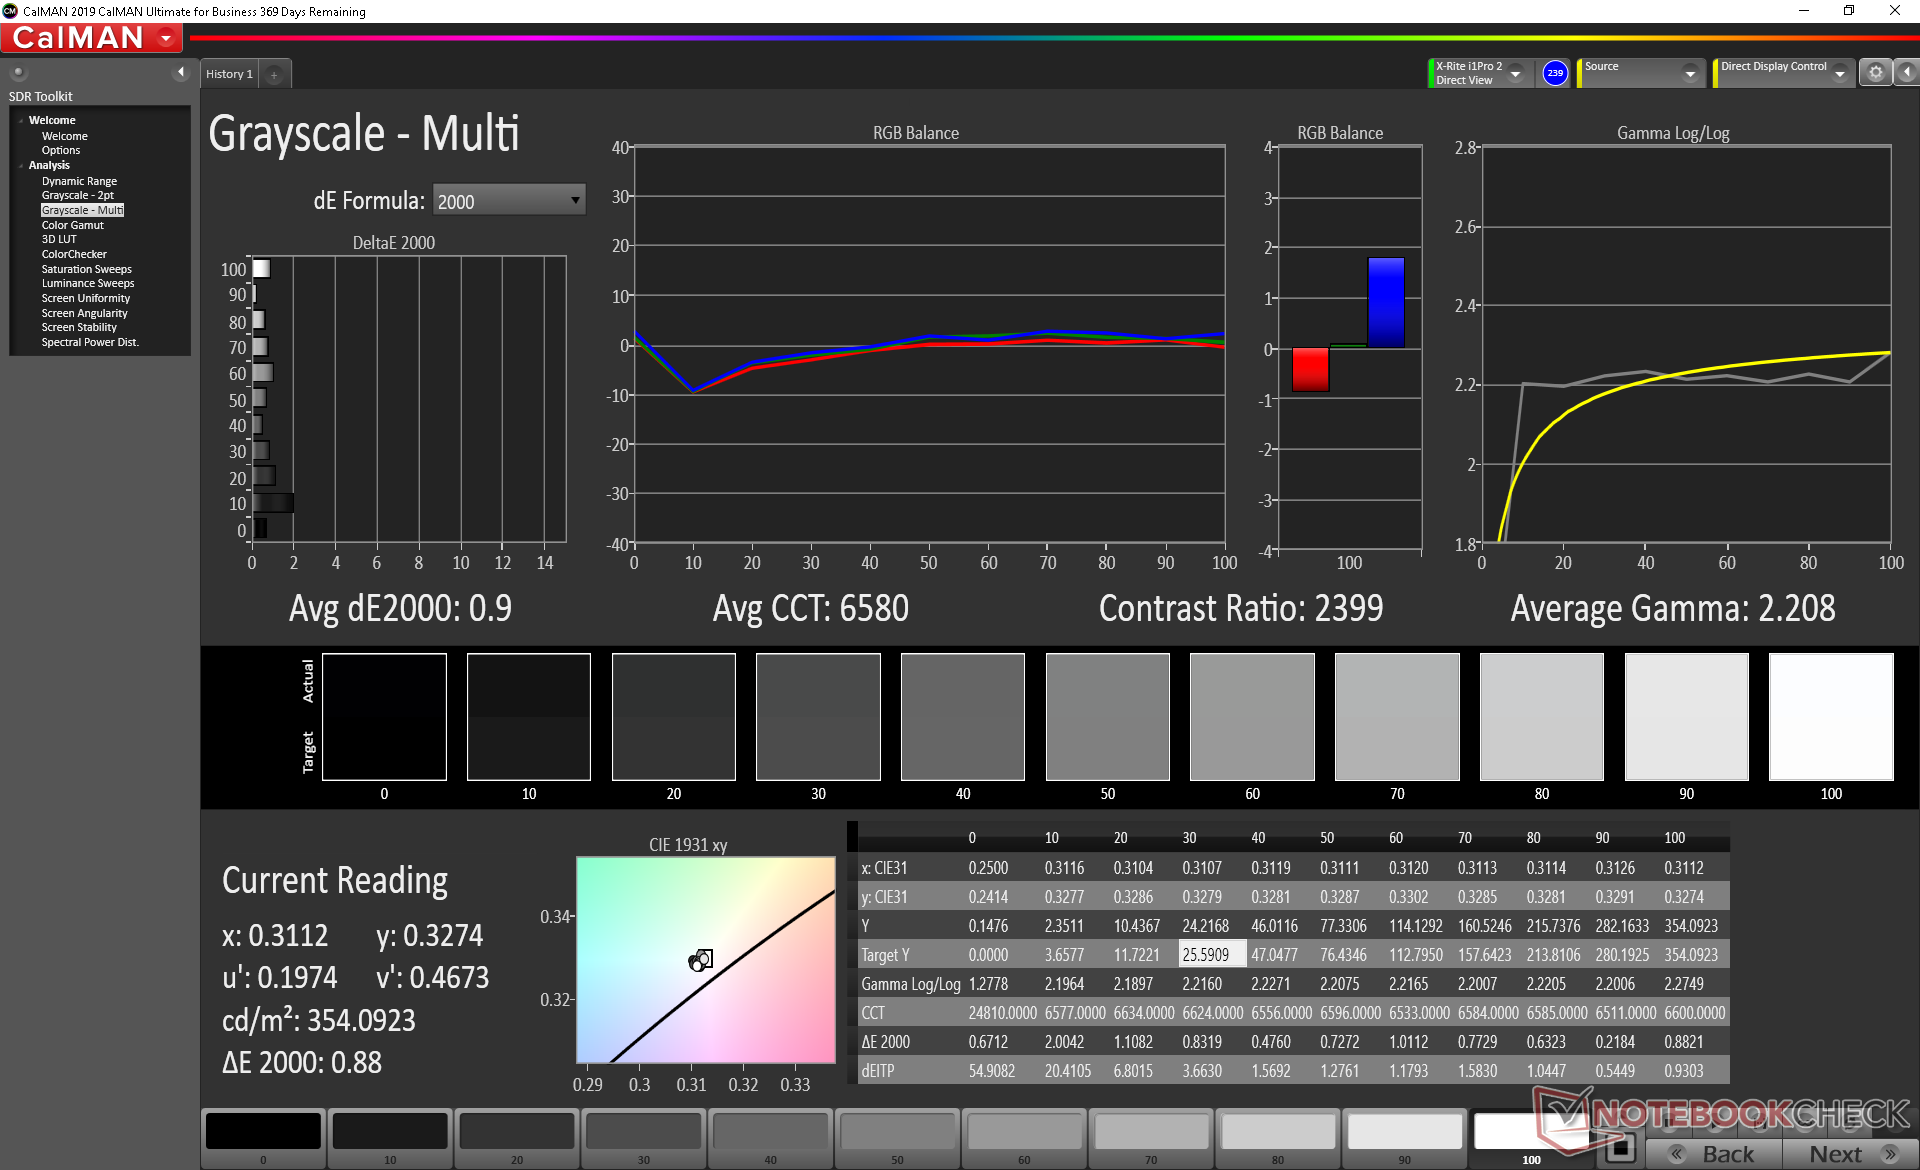
calibrated: 1.61
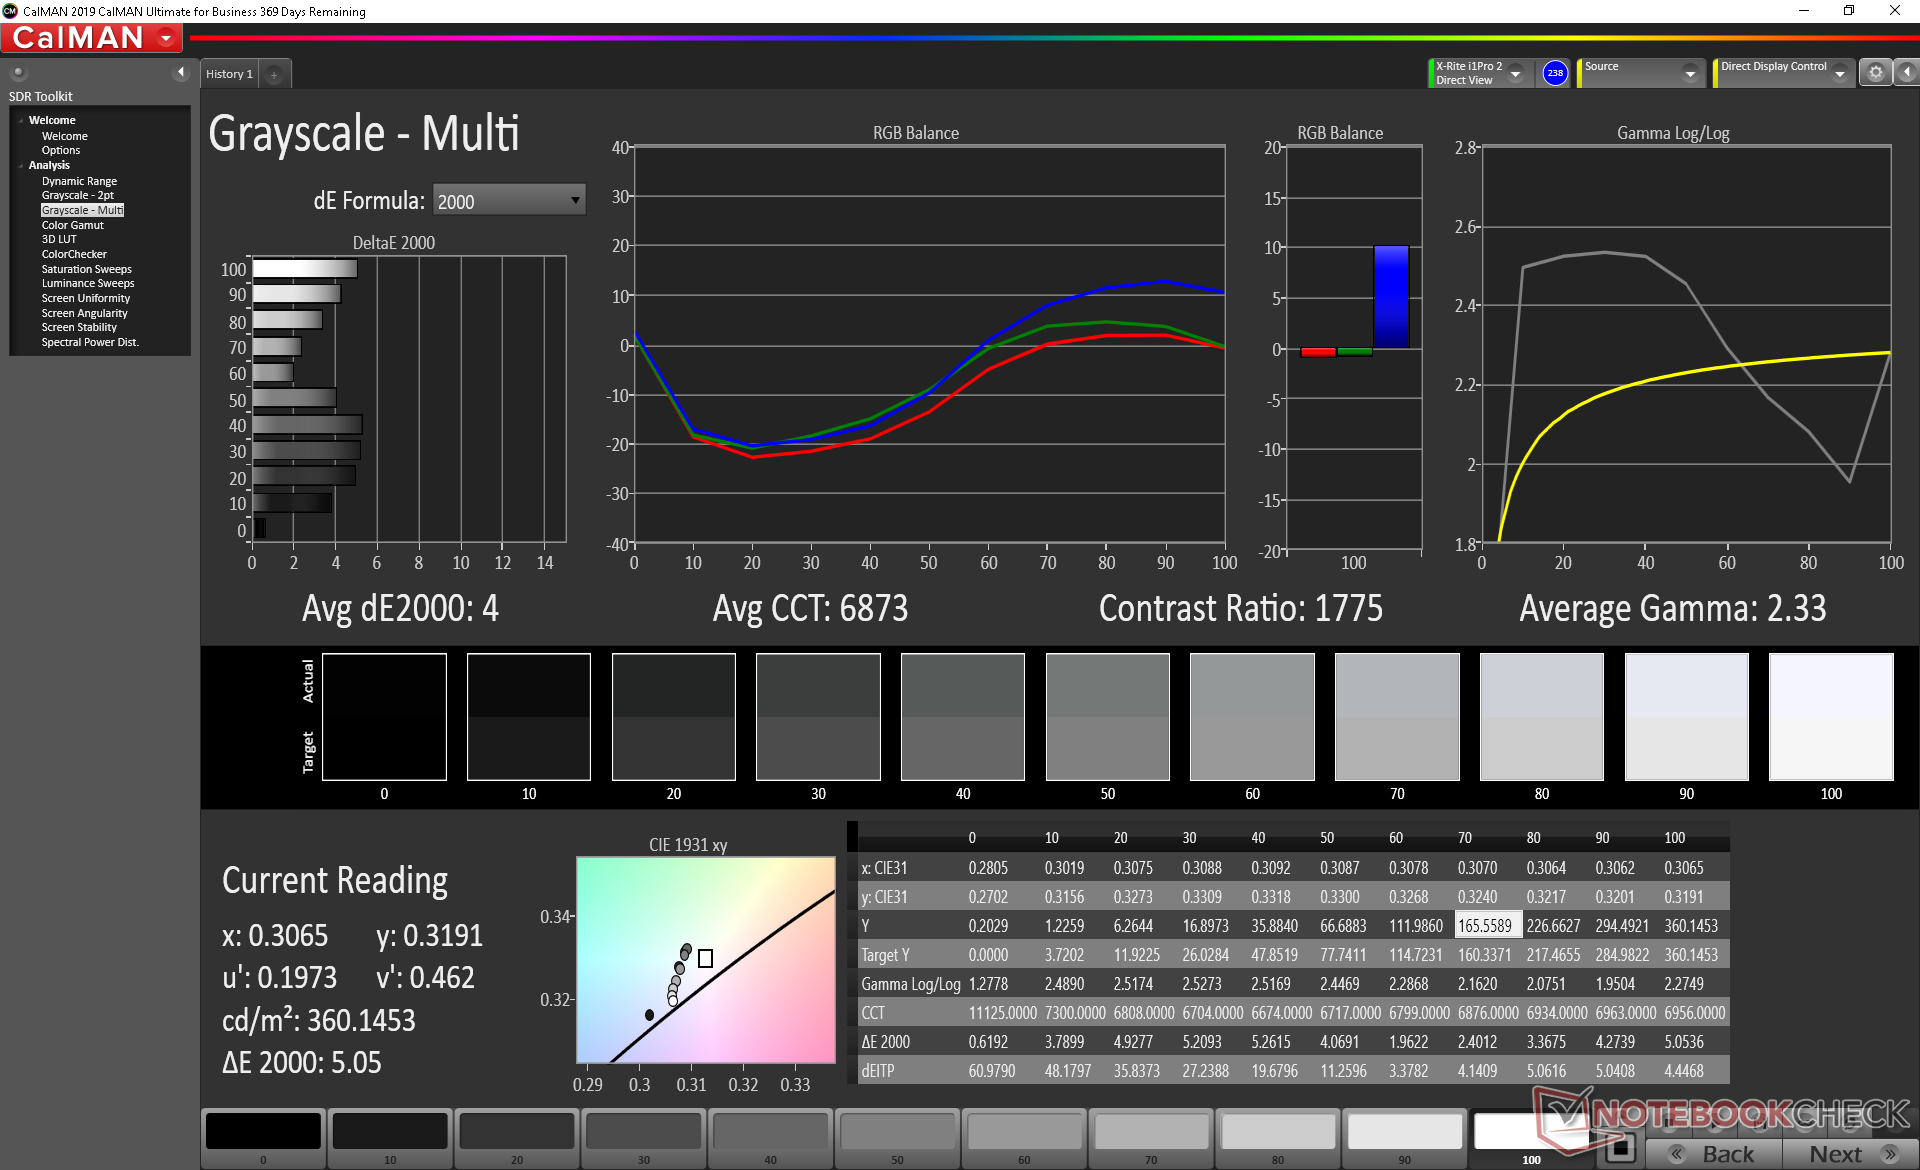
ΔE Greyscale Calman: 4 | ∀{0.09-98 Ø4.97}
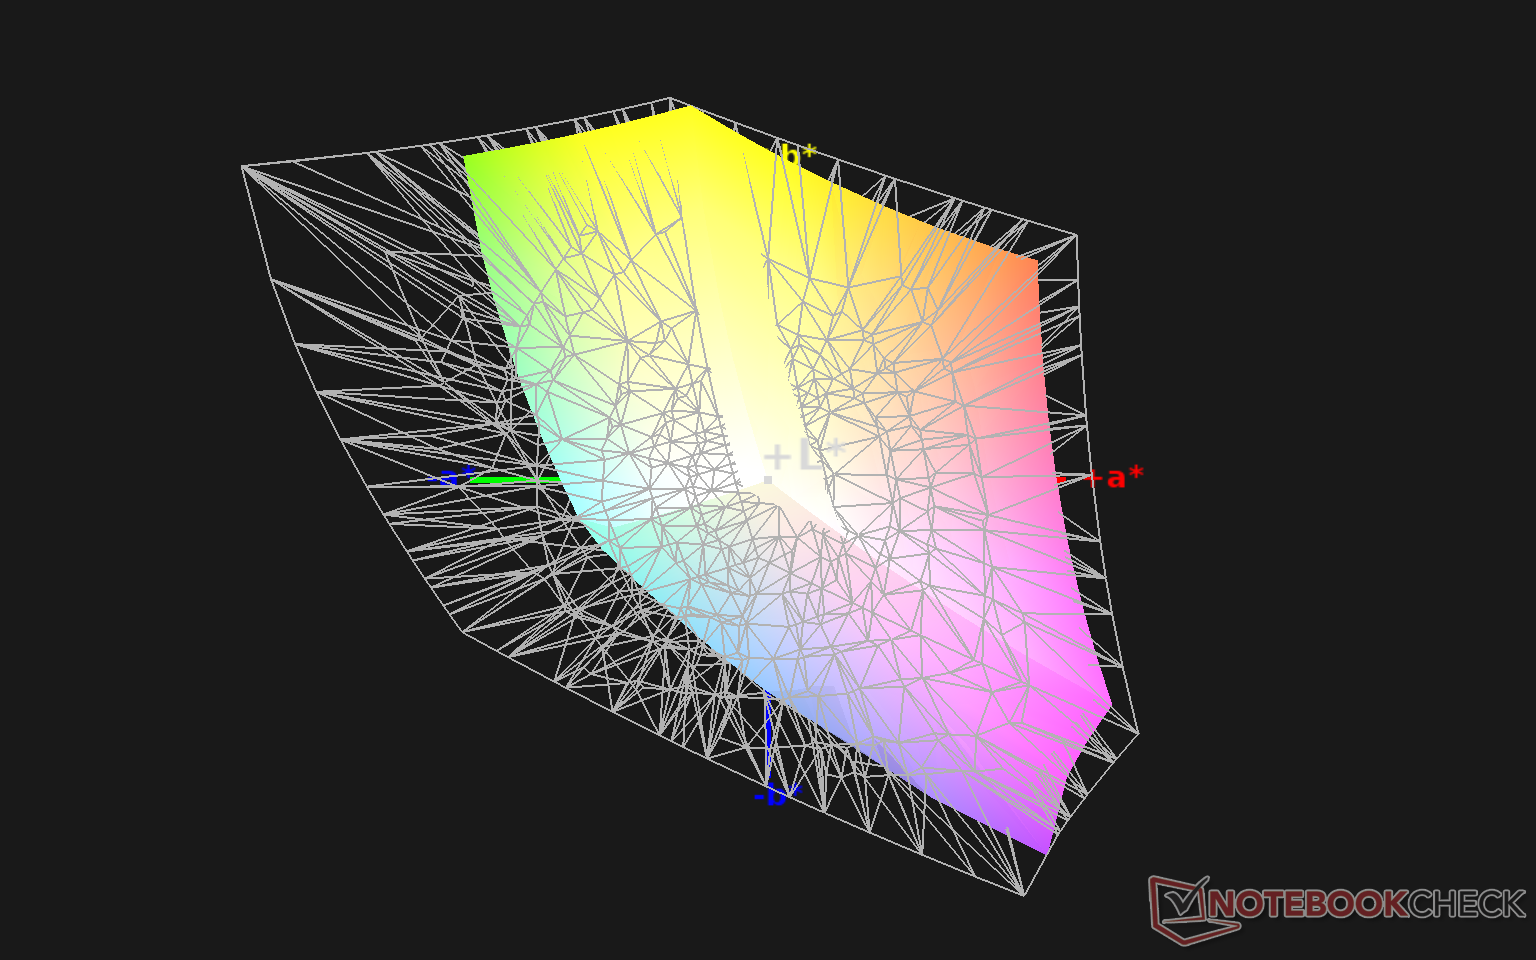
93.9% sRGB (Argyll 1.6.3 3D)
60.1% AdobeRGB 1998 (Argyll 1.6.3 3D)
65% AdobeRGB 1998 (Argyll 3D)
94.2% sRGB (Argyll 3D)
64.2% Display P3 (Argyll 3D)
Gamma: 2.33
CCT: 6873 K
| Lenovo Yoga 9i 14ITL5 LG Display LP140WF9-SPE2, IPS, 14", 1920x1080 | Asus VivoBook Flip 14 TM420IA BOE NV140FHM-N49, IPS, 14", 1920x1080 | LG Gram 14T90N LG Philips LP140WFA-SPY1, IPS, 14", 1920x1080 | Lenovo Yoga C740-14IML CMN N140HCE-ET2, IPS, 14", 1920x1080 | HP Spectre x360 13-aw0013dx AU Optronics AUO5E2D, IPS, 13.3", 1920x1080 | Dell XPS 13 7390 2-in-1 Core i7 Sharp LQ134N1, IPS, 13.4", 1920x1200 | |
|---|---|---|---|---|---|---|
| Display | -36% | 2% | 6% | 8% | 8% | |
| Display P3 Coverage (%) | 64.2 | 40.47 -37% | 65 1% | 67.9 6% | 69.6 8% | 69.9 9% |
| sRGB Coverage (%) | 94.2 | 60 -36% | 95.7 2% | 98.3 4% | 98.9 5% | 99.2 5% |
| AdobeRGB 1998 Coverage (%) | 65 | 41.81 -36% | 66.7 3% | 70.1 8% | 71.5 10% | 71.5 10% |
| Response Times | 23% | 4% | 15% | -9% | 15% | |
| Response Time Grey 50% / Grey 80% * (ms) | 55.2 ? | 36.4 ? 34% | 54 ? 2% | 35.6 ? 36% | 60.8 ? -10% | 47.6 ? 14% |
| Response Time Black / White * (ms) | 34.4 ? | 30.4 ? 12% | 32.8 ? 5% | 36.8 ? -7% | 36.8 ? -7% | 29.2 ? 15% |
| PWM Frequency (Hz) | 27030 ? | 2500 ? | ||||
| Screen | -57% | -2% | -10% | -7% | 16% | |
| Brightness middle (cd/m²) | 365 | 272.5 -25% | 322.2 -12% | 329.9 -10% | 447.4 23% | 549.8 51% |
| Brightness (cd/m²) | 346 | 260 -25% | 301 -13% | 315 -9% | 420 21% | 520 50% |
| Brightness Distribution (%) | 82 | 88 7% | 86 5% | 90 10% | 85 4% | 86 5% |
| Black Level * (cd/m²) | 0.23 | 0.42 -83% | 0.25 -9% | 0.29 -26% | 0.31 -35% | 0.39 -70% |
| Contrast (:1) | 1587 | 649 -59% | 1289 -19% | 1138 -28% | 1443 -9% | 1410 -11% |
| Colorchecker dE 2000 * | 3.65 | 4.65 -27% | 3.62 1% | 3.68 -1% | 4.23 -16% | 2.12 42% |
| Colorchecker dE 2000 max. * | 6.69 | 17.78 -166% | 6.9 -3% | 8.64 -29% | 9.34 -40% | 3.66 45% |
| Colorchecker dE 2000 calibrated * | 1.61 | 4.34 -170% | 1.22 24% | 1.03 36% | 1.32 18% | 1.37 15% |
| Greyscale dE 2000 * | 4 | 4.4 -10% | 3.9 2% | 6.4 -60% | 6.1 -53% | 2.6 35% |
| Gamma | 2.33 94% | 2.2 100% | 2.43 91% | 2.17 101% | 2.11 104% | 2.3 96% |
| CCT | 6873 95% | 6984 93% | 6344 102% | 6195 105% | 6136 106% | 6884 94% |
| Color Space (Percent of AdobeRGB 1998) (%) | 60.1 | 38.4 -36% | 61.3 2% | 63.6 6% | 64.8 8% | 65.4 9% |
| Color Space (Percent of sRGB) (%) | 93.9 | 59.8 -36% | 95.6 2% | 98.4 5% | 98.9 5% | 99.7 6% |
| Total Average (Program / Settings) | -23% /
-43% | 1% /
-0% | 4% /
-4% | -3% /
-4% | 13% /
14% |
* ... smaller is better
Color space covers 60 percent of AdobeRGB and essentially all of sRGB to be comparable to most other high-end Ultrabooks. Less expensive budget alternatives like the Asus VivoBook Flip tend to have much narrower color spaces and noticeably shallower colors as a result.
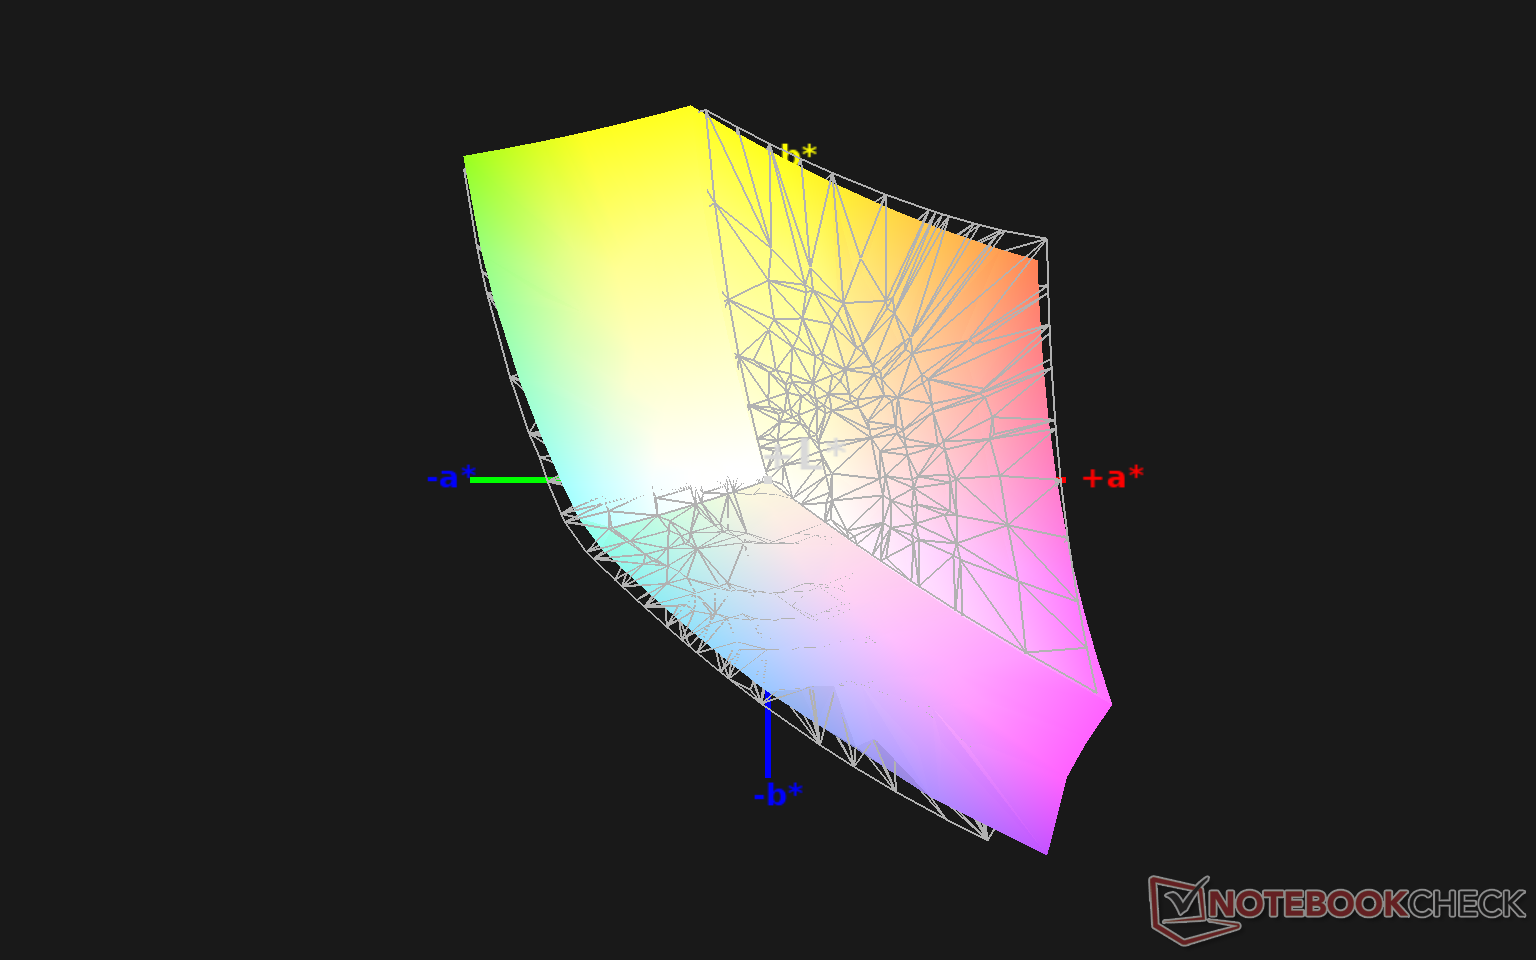
RGB balance, gamma, and color temperature are all way off and could use some adjustment out of the box. Calibrating the panel ourselves addresses all these concerns for a much more accurate display as shown by our results below. We recommend applying our calibrated ICM profile above or calibrating the display yourself to maximize the viewing experience especially since the panel encompasses almost all of sRGB.

Display Response Times
| ↔ Response Time Black to White | ||
|---|---|---|
| 34.4 ms ... rise ↗ and fall ↘ combined | ↗ 18.8 ms rise | 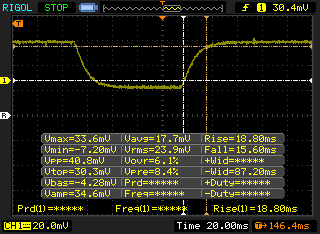 |
| ↘ 15.6 ms fall | ||
| The screen shows slow response rates in our tests and will be unsatisfactory for gamers. In comparison, all tested devices range from 0.1 (minimum) to 240 (maximum) ms. » 92 % of all devices are better. This means that the measured response time is worse than the average of all tested devices (19.9 ms). | ||
| ↔ Response Time 50% Grey to 80% Grey | ||
| 55.2 ms ... rise ↗ and fall ↘ combined | ↗ 26.8 ms rise | 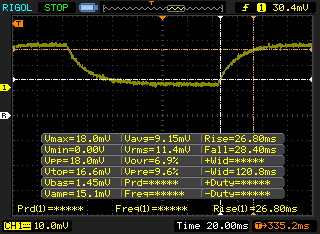 |
| ↘ 28.4 ms fall | ||
| The screen shows slow response rates in our tests and will be unsatisfactory for gamers. In comparison, all tested devices range from 0.165 (minimum) to 636 (maximum) ms. » 92 % of all devices are better. This means that the measured response time is worse than the average of all tested devices (31.1 ms). | ||
Screen Flickering / PWM (Pulse-Width Modulation)
| Screen flickering / PWM not detected | 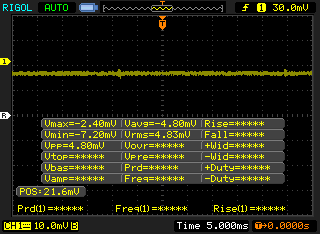 | ||
In comparison: 52 % of all tested devices do not use PWM to dim the display. If PWM was detected, an average of 7797 (minimum: 5 - maximum: 343500) Hz was measured. | |||
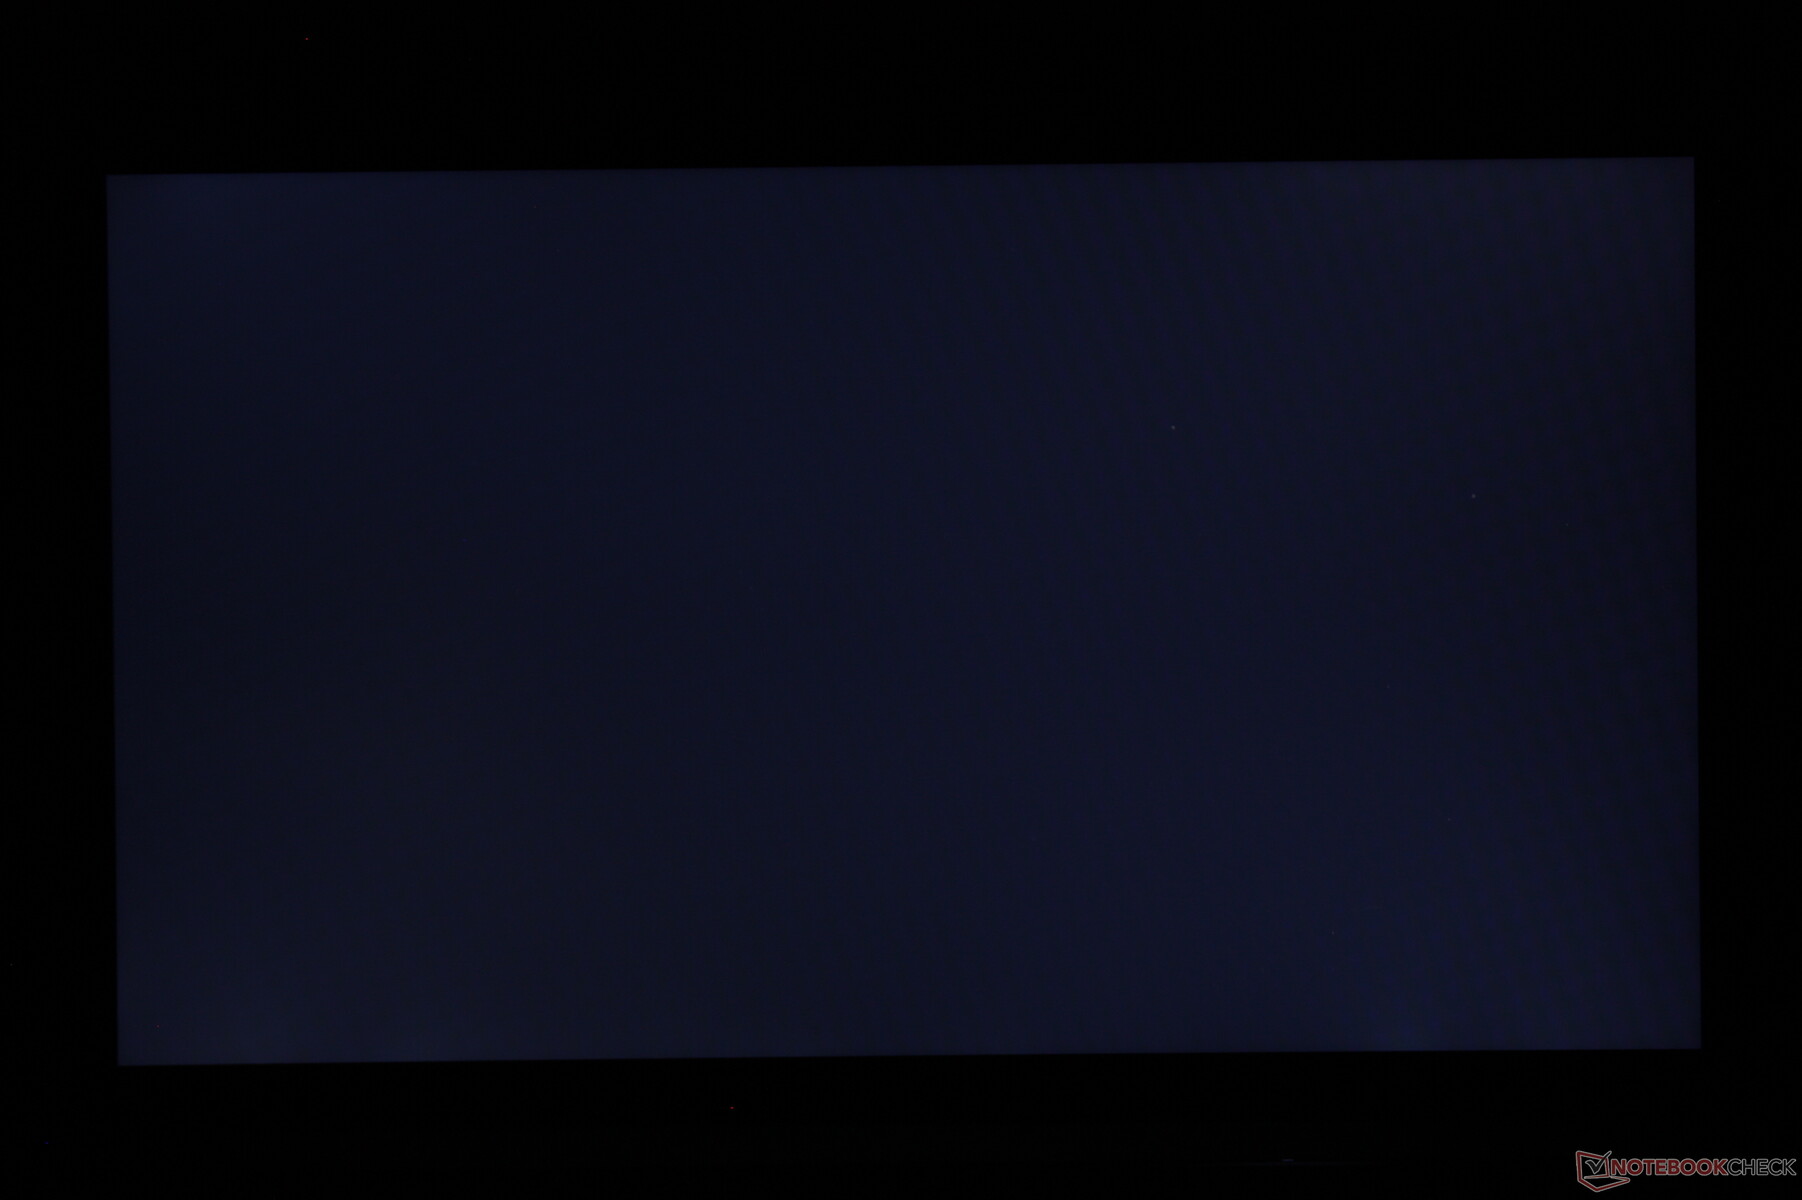
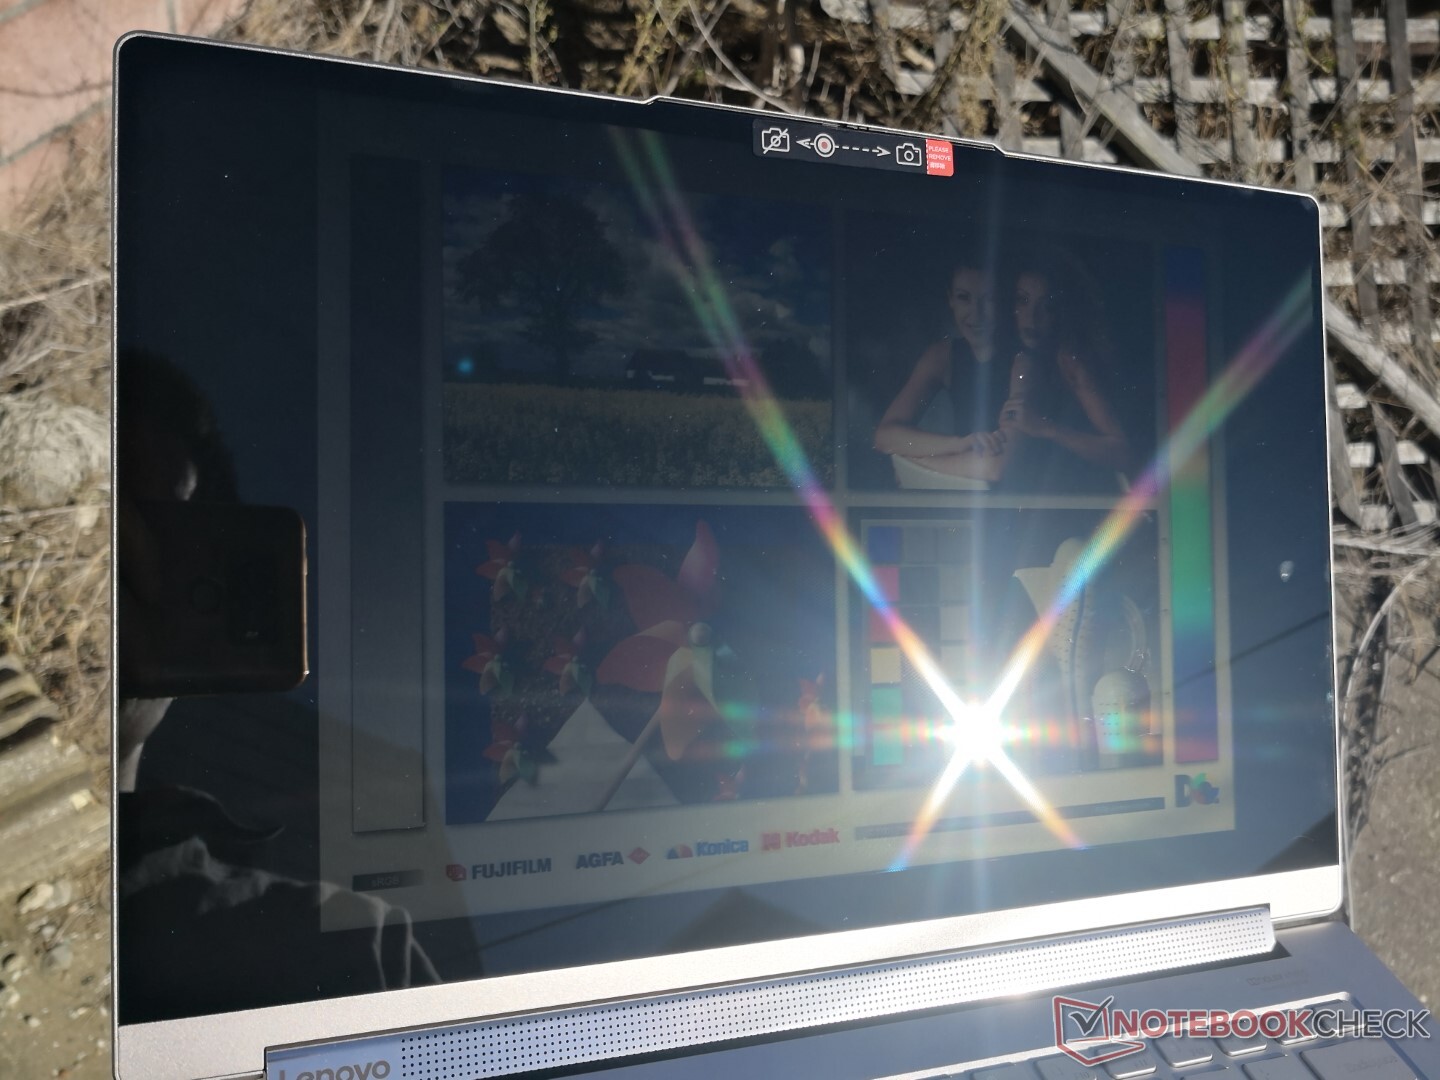
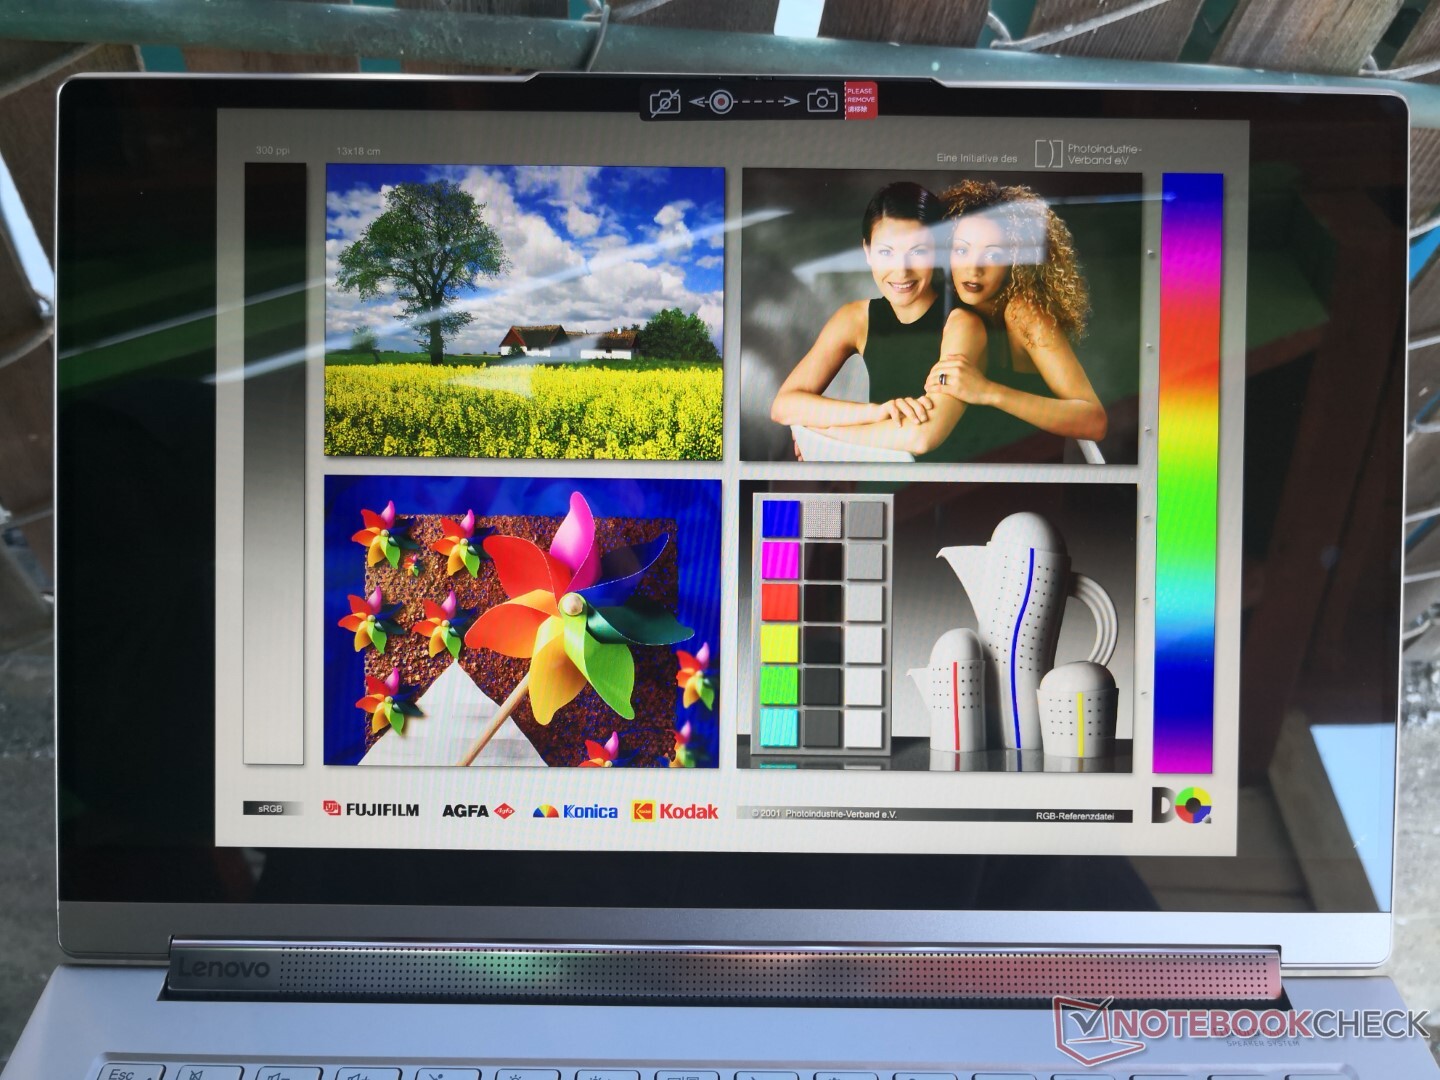
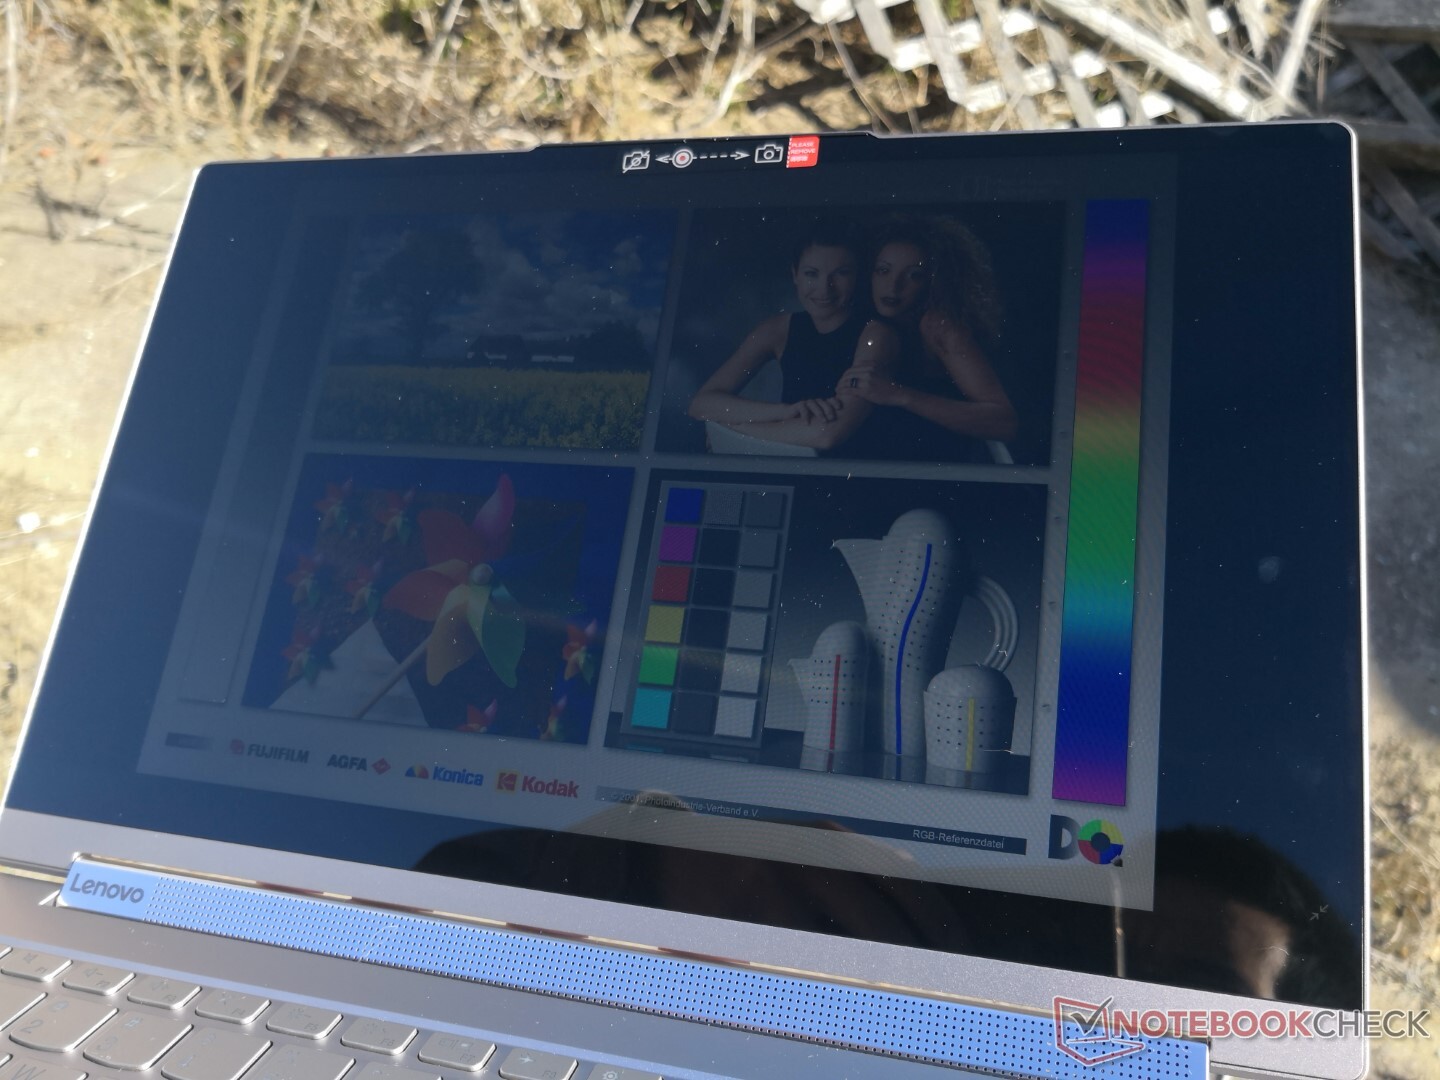
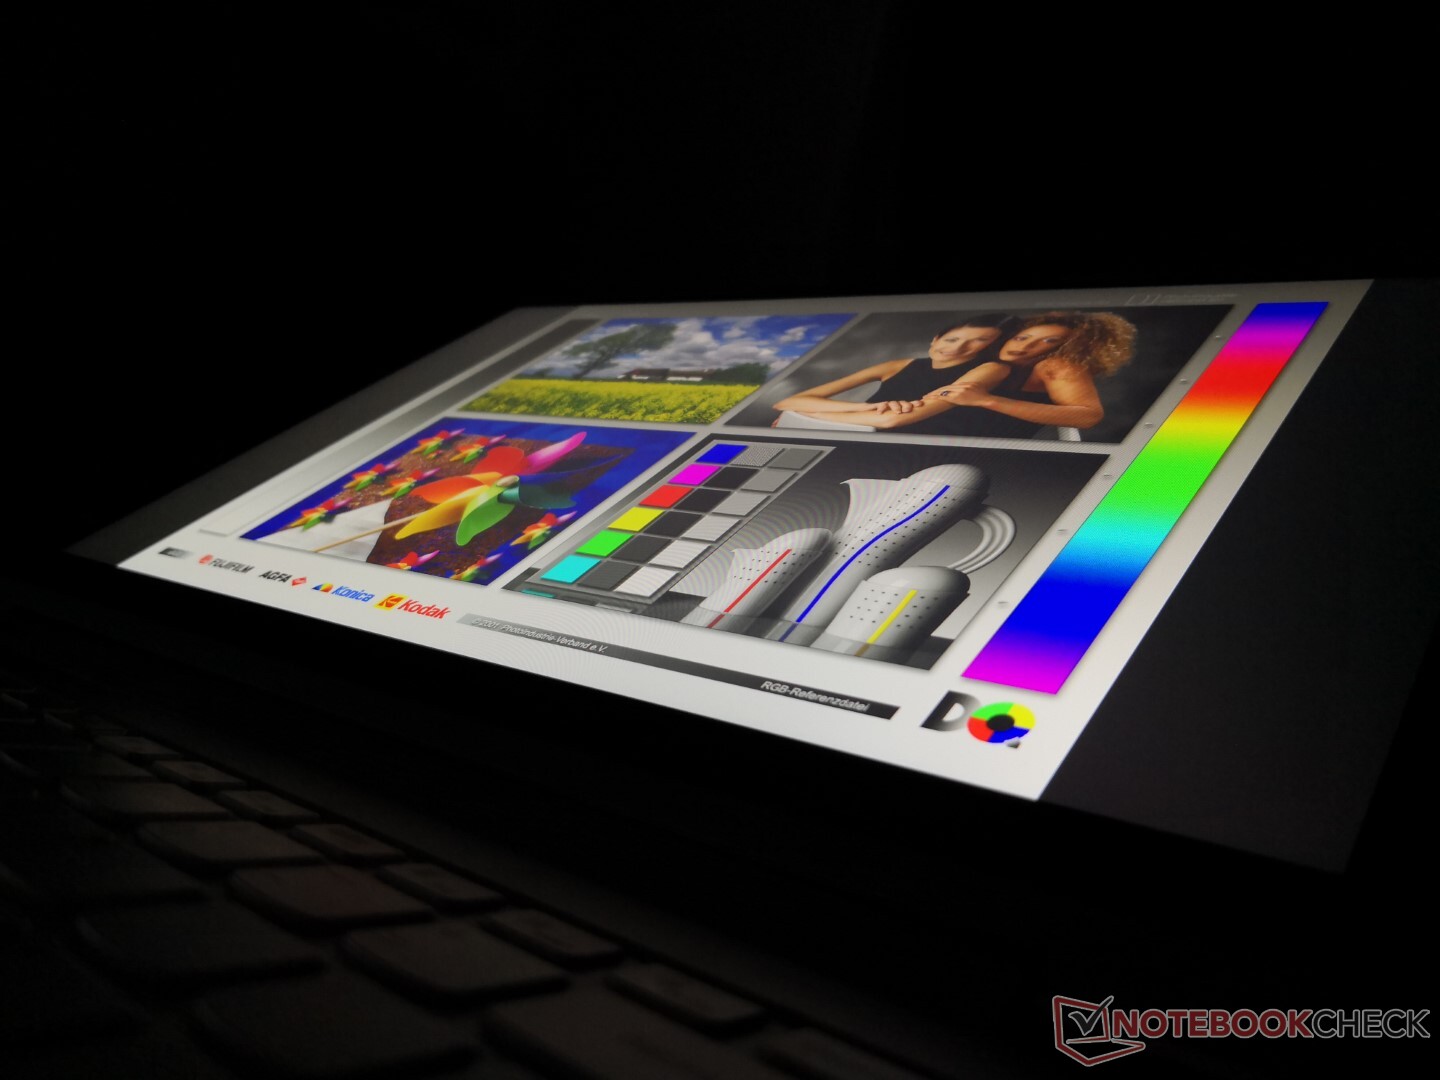
Outdoor visibility could be better as the glare-heavy display could have benefited from a brighter backlight. If you plan on using the convertible outdoors frequently, then the brighter XPS 13 2-in-1, Samsung 2-in-1, or HP EliteBook x360 series would be better options.
Performance
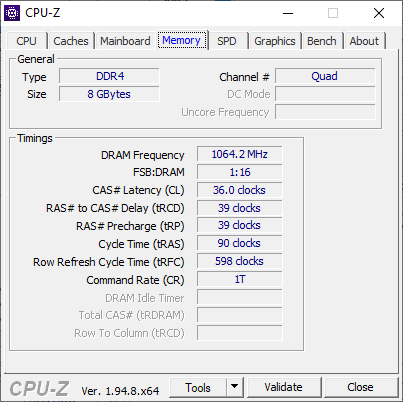
Interestingly, only the Core i5-1135G7 or Core i7-1185G7 CPUs are available while the common Core i7-1165G7 is nowhere in sight. Both discrete GPU and AMD Ryzen options are not available, either. Upgrading from 8 GB of LPDDR4X-4266 RAM to 16 GB costs only $50 USD which we highly recommend since the memory modules are soldered.
Our test unit was set to Extreme Performance mode via the Lenovo Vantage software prior to running any performance benchmarks below. We recommend owners become familiar with Vantage since system updates and other Lenovo-specific settings are found here.
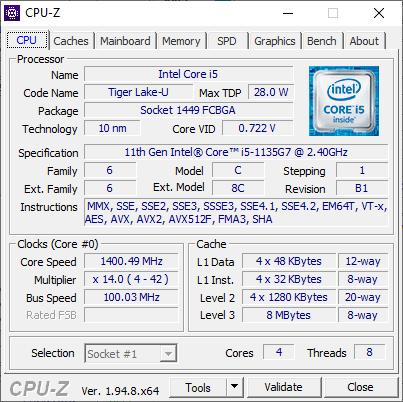
Processor
Raw multi-thread performance is slightly slower than on the competing Ryzen 5 4500U while the opposite is true for single-threaded workloads. Nonetheless, the Core i5-1135G7 is still a noticeable uptick in performance over the last generation Core i5-1035G7 by about 25 percent. We're hopeful that all upcoming laptops with the same Core i5-1135G7 CPU will show consistent performance results between them like what we're seeing thus far. The Asus ZenBook 14 UX425EA with the supposedly faster Core i7-1165G7 can actually run slower due to poorer Turbo Boost sustainability.
See our dedicated page on the Core i5-1135G7 for more technical information and benchmarks.
Cinebench R15: CPU Multi 64Bit | CPU Single 64Bit
Blender: v2.79 BMW27 CPU
7-Zip 18.03: 7z b 4 -mmt1 | 7z b 4
Geekbench 5.5: Single-Core | Multi-Core
HWBOT x265 Benchmark v2.2: 4k Preset
LibreOffice : 20 Documents To PDF
R Benchmark 2.5: Overall mean
| Geekbench 5.5 / Single-Core | |
| Asus ZenBook 14 UX425EA | |
| Lenovo Yoga 9i 14ITL5 | |
| Average Intel Core i5-1135G7 (1147 - 1428, n=58) | |
| Lenovo Yoga Slim 7-14IIL05 | |
| Asus ZenBook 14 UX434FL-DB77 | |
| Lenovo Yoga Slim 7-14ARE | |
| Lenovo Yoga Slim 7-14ARE | |
| Lenovo Yoga Slim 7 14ARE05 82A20008GE | |
| Lenovo ThinkPad E14 Gen2-20T7S00W00 | |
| LibreOffice / 20 Documents To PDF | |
| Asus ZenBook 14 UX434FL-DB77 | |
| Lenovo Yoga Slim 7 14ARE05 82A20008GE | |
| Lenovo ThinkPad E14 Gen2-20T7S00W00 | |
| Lenovo Yoga Slim 7-14ARE | |
| Lenovo Yoga Slim 7-14IIL05 | |
| Average Intel Core i5-1135G7 (44.2 - 62.9, n=60) | |
| Lenovo Yoga 9i 14ITL5 | |
| Asus ZenBook 14 UX425EA | |
| R Benchmark 2.5 / Overall mean | |
| Asus ZenBook 14 UX434FL-DB77 | |
| Lenovo Yoga Slim 7-14IIL05 | |
| Average Intel Core i5-1135G7 (0.619 - 0.727, n=59) | |
| Lenovo ThinkPad E14 Gen2-20T7S00W00 | |
| Lenovo Yoga 9i 14ITL5 | |
| Lenovo Yoga Slim 7 14ARE05 82A20008GE | |
| Lenovo Yoga Slim 7-14ARE | |
| Asus ZenBook 14 UX425EA | |
* ... smaller is better
System Performance
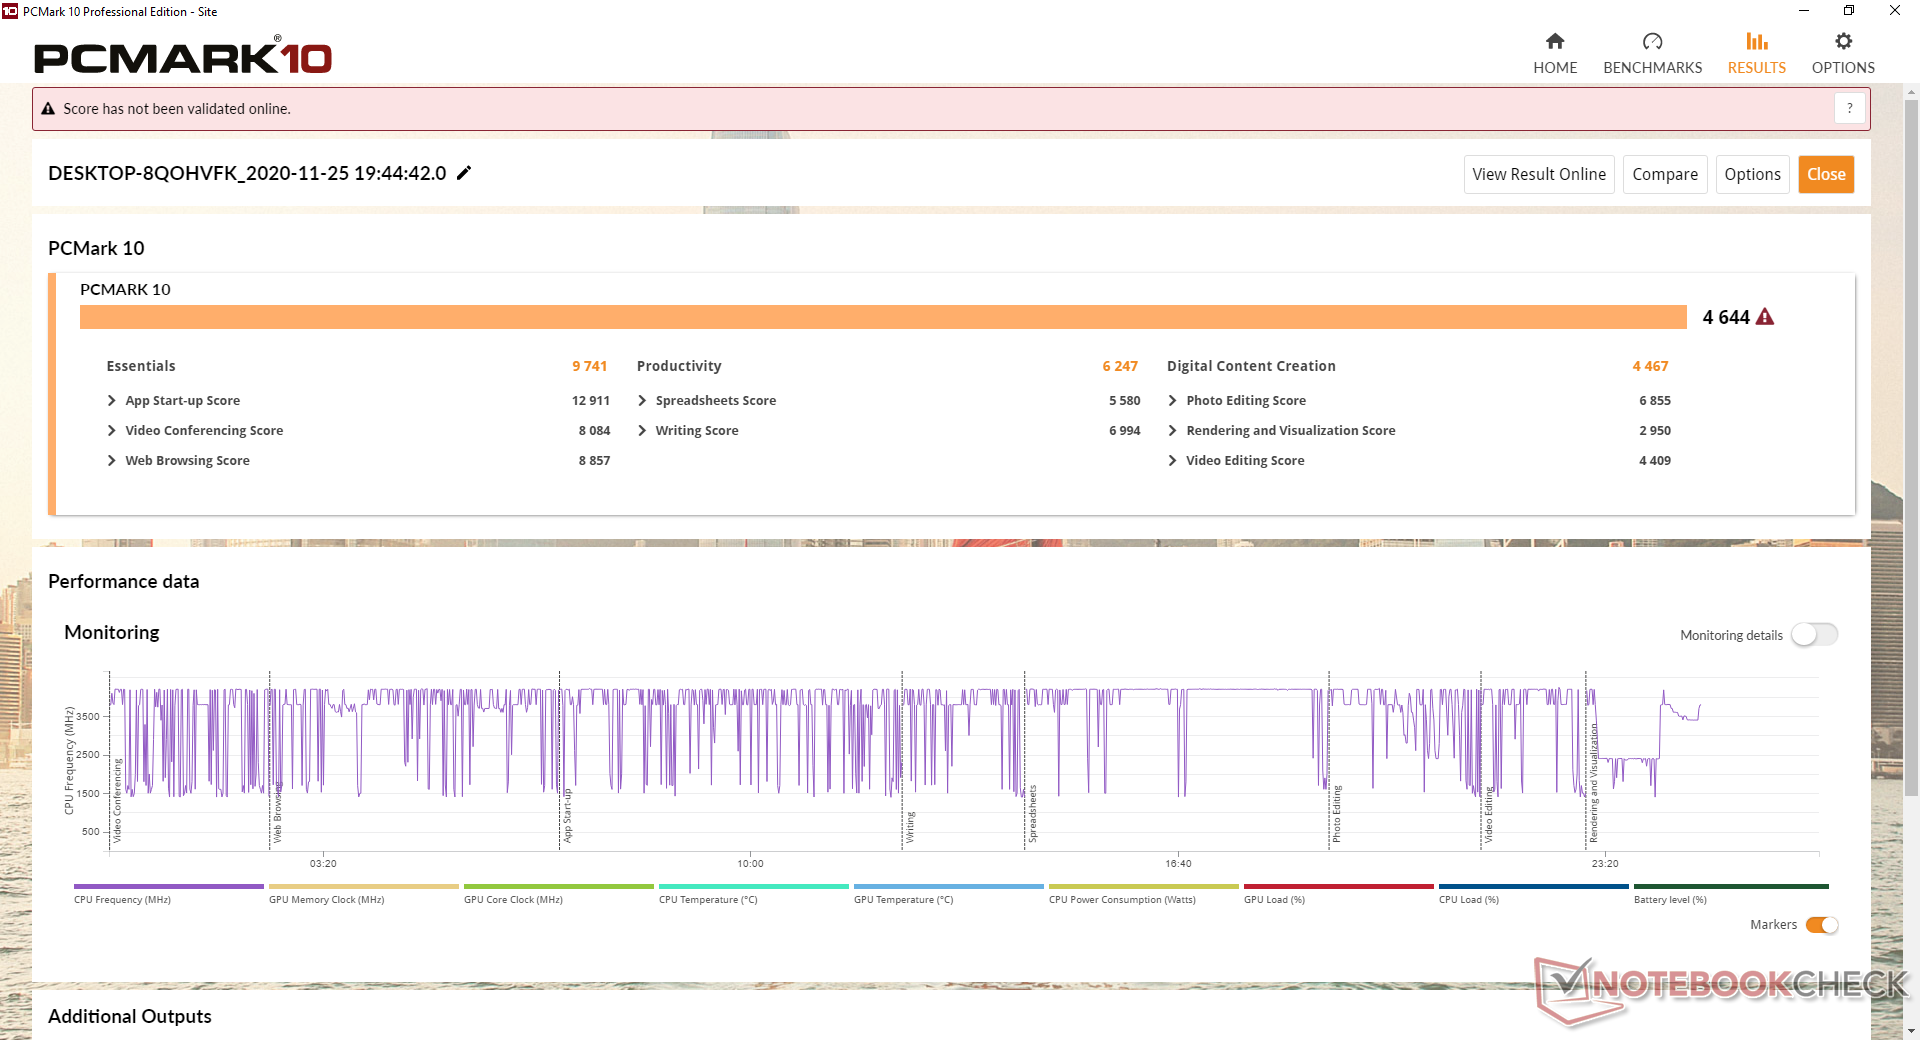
PCMark results are comparable to most other high-end Ultrabooks even across multiple generations. The biggest gains will be in Digital Content Creation where graphics power plays a bigger part.
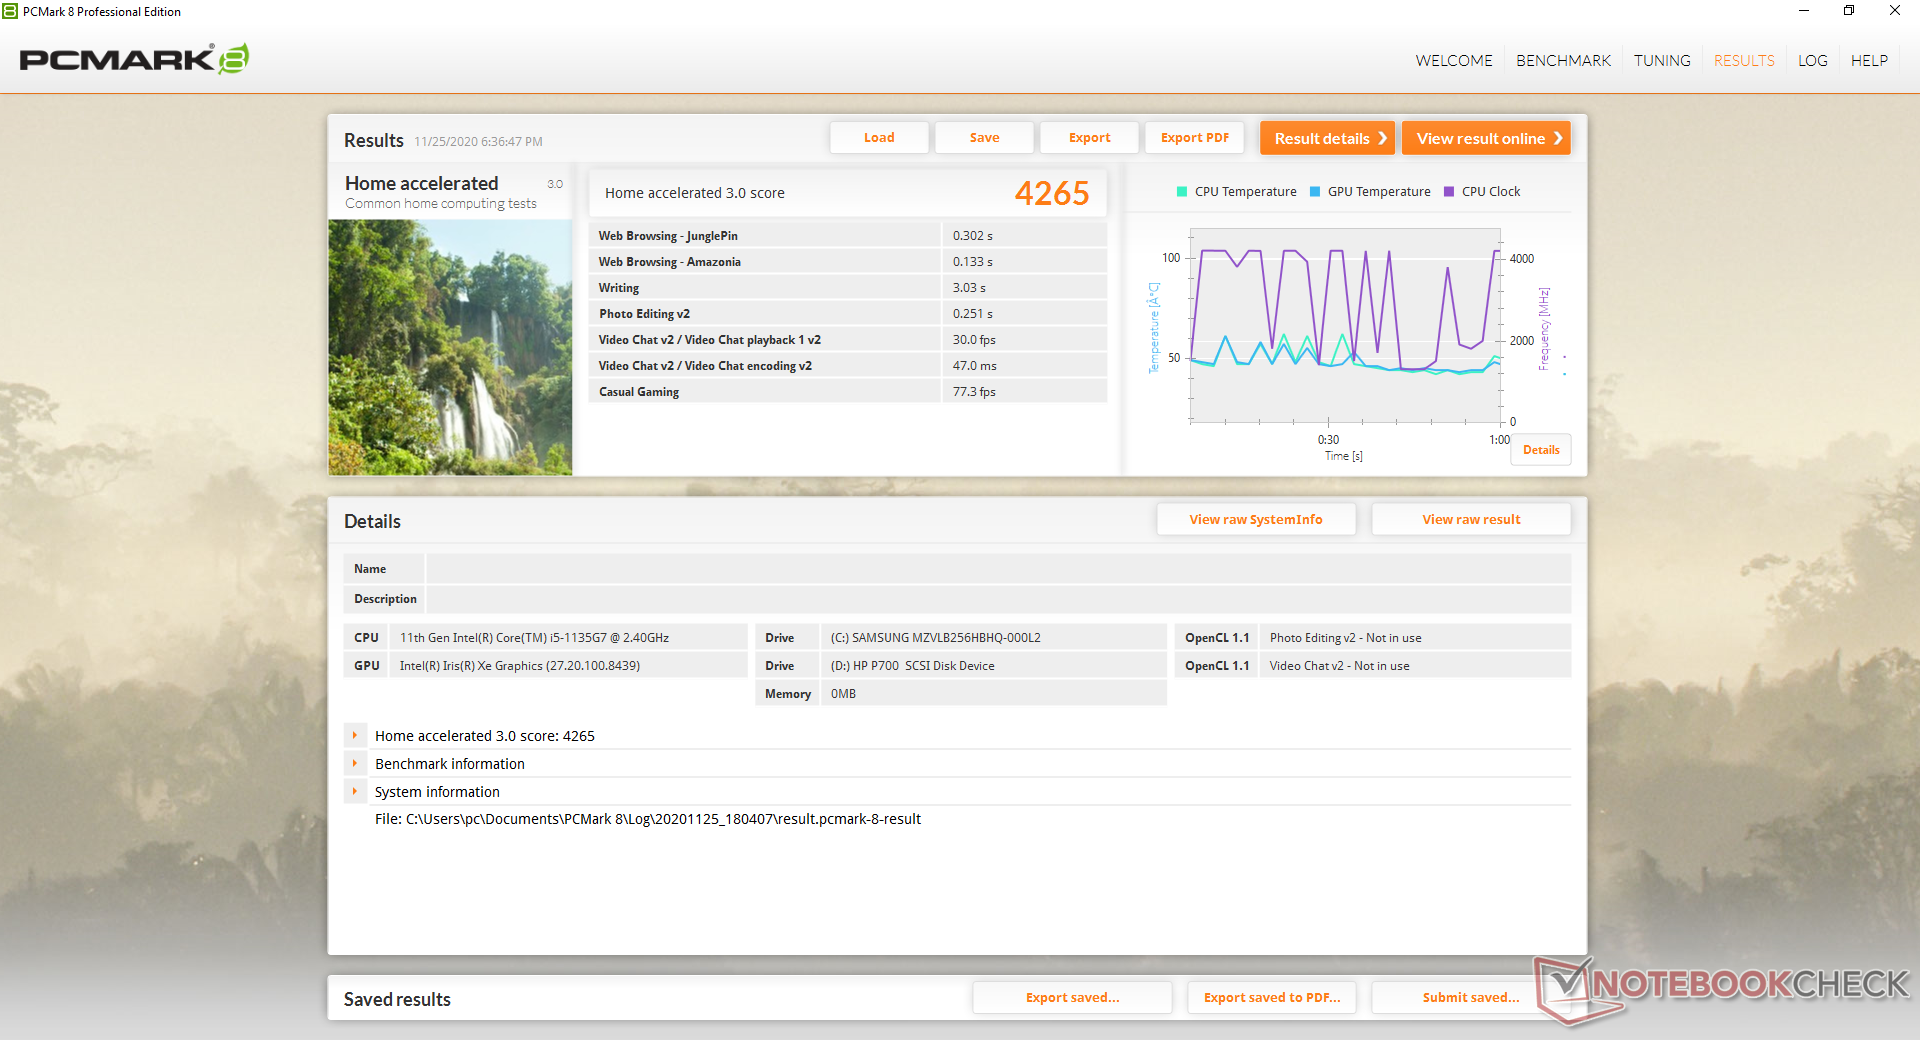
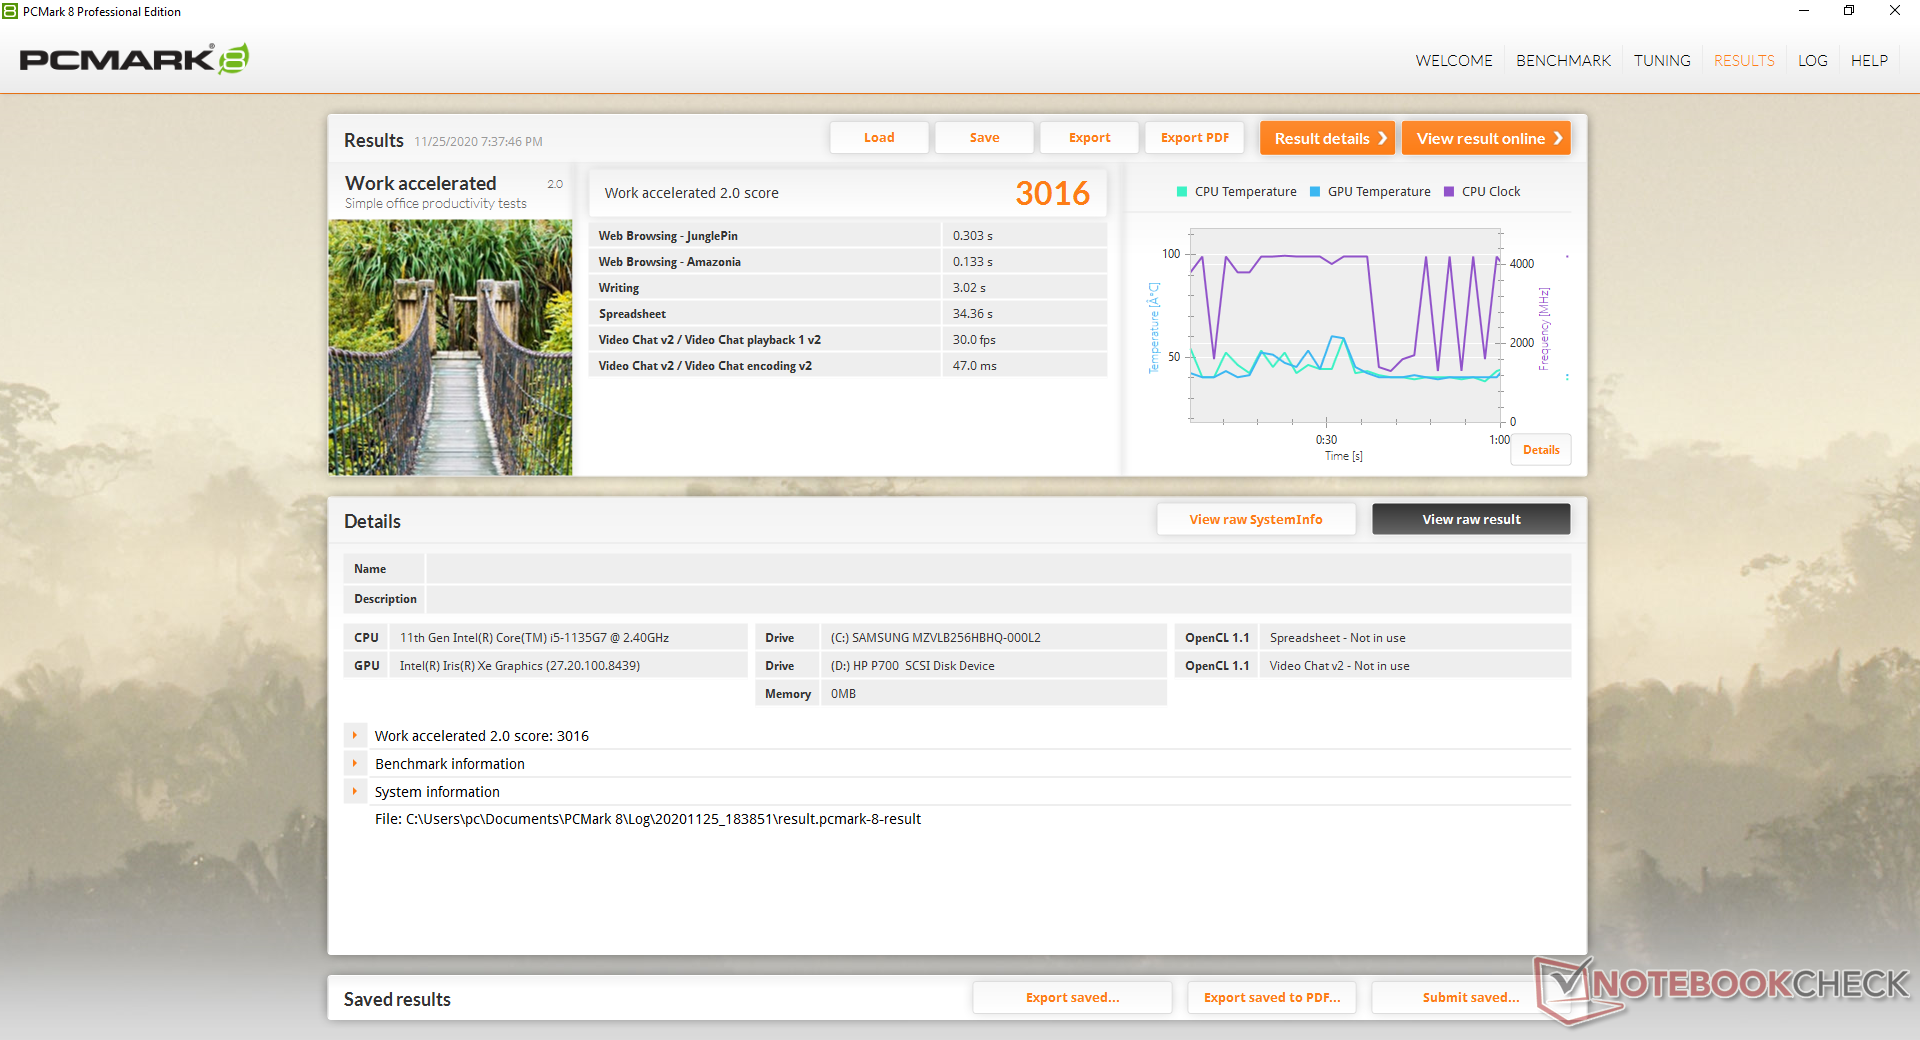
| PCMark 8 Home Score Accelerated v2 | 4265 points | |
| PCMark 8 Work Score Accelerated v2 | 3016 points | |
| PCMark 10 Score | 4644 points | |
Help | ||
DPC Latency
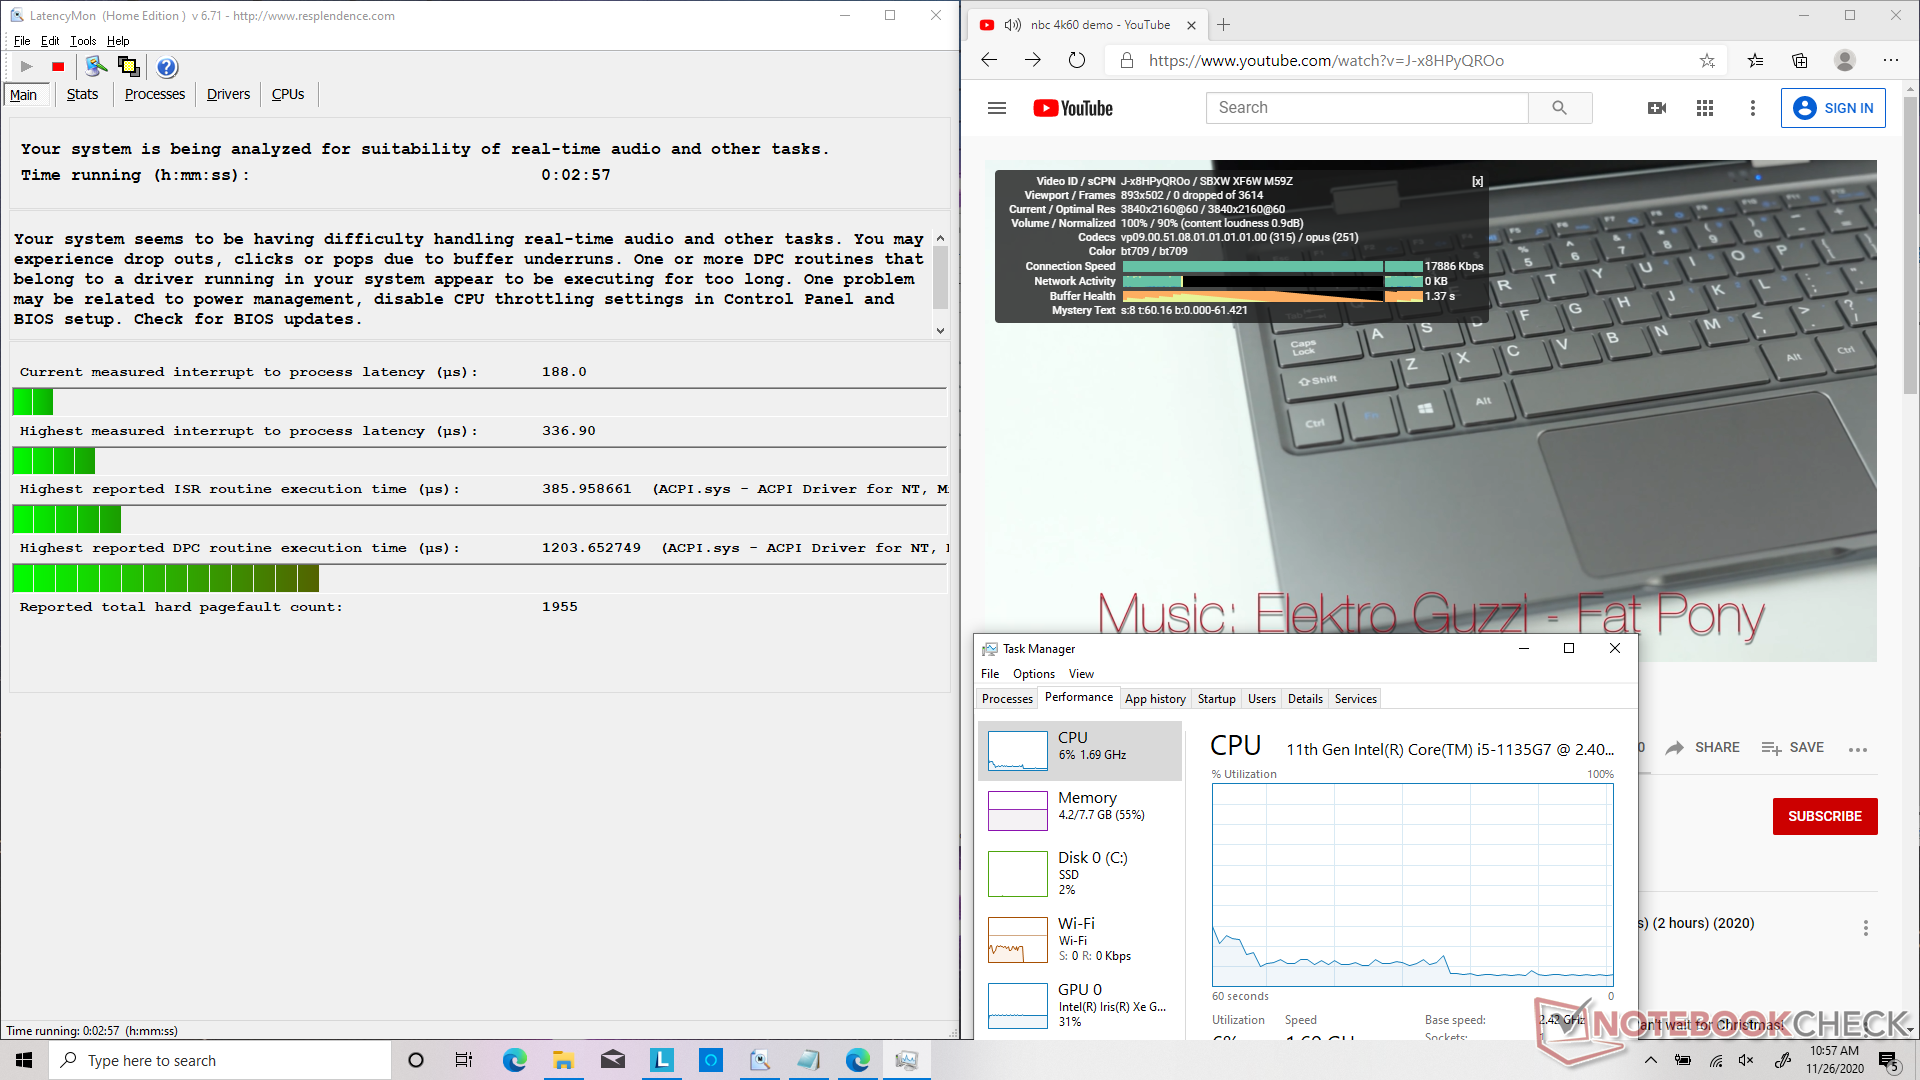
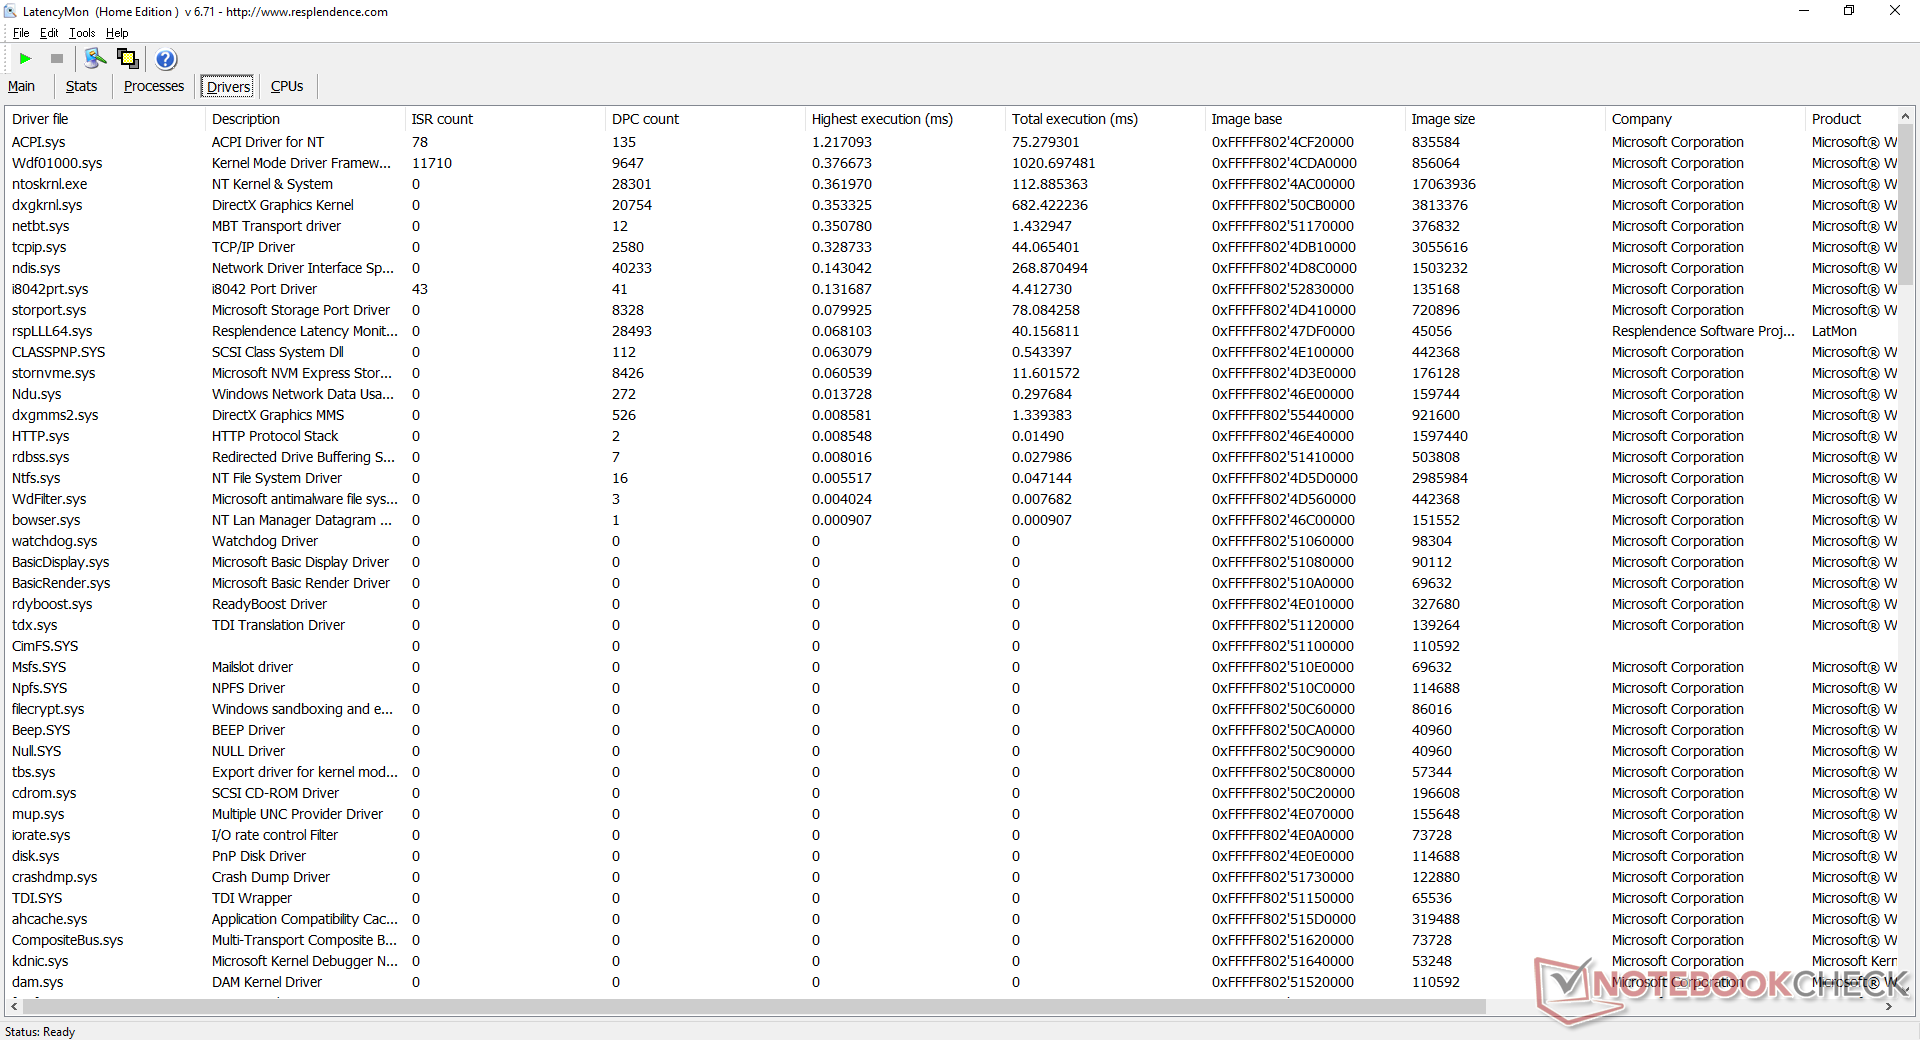
| DPC Latencies / LatencyMon - interrupt to process latency (max), Web, Youtube, Prime95 | |
| LG Gram 14T90N | |
| Lenovo Yoga 9i 14ITL5 | |
| Asus VivoBook Flip 14 TM420IA | |
* ... smaller is better
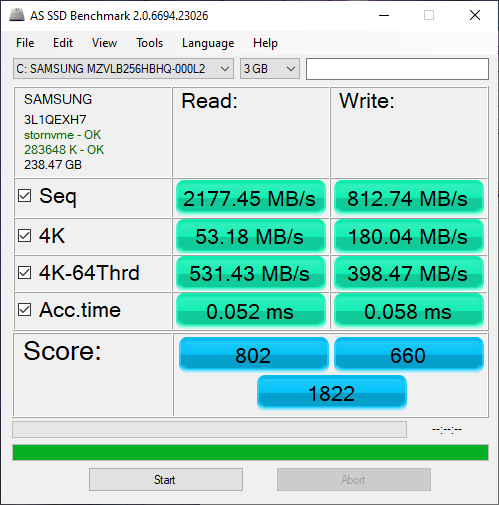
Storage Devices
| Lenovo Yoga 9i 14ITL5 Samsung SSD PM981a MZVLB256HBHQ | Asus VivoBook Flip 14 TM420IA Samsung PM991 MZVLQ512HALU | LG Gram 14T90N Samsung SSD PM981a MZVLB512HBJQ | Lenovo Yoga C740-14IML Samsung SSD PM981a MZVLB256HBHQ | HP Spectre x360 13-aw0013dx Intel Optane Memory H10 with Solid State Storage 32GB + 512GB HBRPEKNX0202A(L/H) | Dell XPS 13 7390 2-in-1 Core i7 Toshiba BG4 KBG40ZPZ512G | |
|---|---|---|---|---|---|---|
| AS SSD | -2% | 72% | 13% | -32% | -68% | |
| Seq Read (MB/s) | 2177 | 1397 -36% | 1829 -16% | 1719 -21% | 1039 -52% | 1801 -17% |
| Seq Write (MB/s) | 813 | 783 -4% | 2048 152% | 1211 49% | 310.1 -62% | 1125 38% |
| 4K Read (MB/s) | 53.2 | 48.08 -10% | 54.2 2% | 53.1 0% | 76 43% | 39.7 -25% |
| 4K Write (MB/s) | 180 | 134.6 -25% | 120.5 -33% | 131.4 -27% | 118 -34% | 67 -63% |
| 4K-64 Read (MB/s) | 531 | 835 57% | 1512 185% | 508 -4% | 371.8 -30% | 1253 136% |
| 4K-64 Write (MB/s) | 398.5 | 734 84% | 1573 295% | 883 122% | 469.5 18% | 209 -48% |
| Access Time Read * (ms) | 0.052 | 0.081 -56% | 0.046 12% | 0.05 4% | 0.067 -29% | 0.069 -33% |
| Access Time Write * (ms) | 0.058 | 0.084 -45% | 0.091 -57% | 0.085 -47% | 0.138 -138% | 0.625 -978% |
| Score Read (Points) | 802 | 1022 27% | 1749 118% | 733 -9% | 552 -31% | 1472 84% |
| Score Write (Points) | 660 | 947 43% | 1899 188% | 1135 72% | 618 -6% | 388 -41% |
| Score Total (Points) | 1822 | 2474 36% | 4560 150% | 2235 23% | 1448 -21% | 2583 42% |
| Copy ISO MB/s (MB/s) | 1962 | 1212 -38% | 1891 -4% | 1636 -17% | 764 -61% | 1293 -34% |
| Copy Program MB/s (MB/s) | 522 | 374.3 -28% | 569 9% | 698 34% | 465.8 -11% | 560 7% |
| Copy Game MB/s (MB/s) | 1258 | 829 -34% | 1425 13% | 1246 -1% | 764 -39% | 927 -26% |
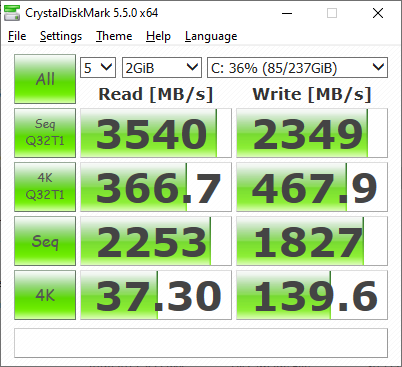
| CrystalDiskMark 5.2 / 6 | -18% | 14% | -2% | -0% | -13% | |
| Write 4K (MB/s) | 139.6 | 121.2 -13% | 181.4 30% | 125.6 -10% | 112.6 -19% | 106.7 -24% |
| Read 4K (MB/s) | 37.3 | 49.91 34% | 52.5 41% | 43.46 17% | 131 251% | 49.94 34% |
| Write Seq (MB/s) | 1827 | 1090 -40% | 1592 -13% | 2011 10% | 458.9 -75% | 1223 -33% |
| Read Seq (MB/s) | 2253 | 1533 -32% | 1617 -28% | 2046 -9% | 1355 -40% | 1801 -20% |
| Write 4K Q32T1 (MB/s) | 467.9 | 393.3 -16% | 556 19% | 375.8 -20% | 341.3 -27% | 325.3 -30% |
| Read 4K Q32T1 (MB/s) | 366.7 | 406 11% | 539 47% | 338.1 -8% | 320.6 -13% | 551 50% |
| Write Seq Q32T1 (MB/s) | 2349 | 1225 -48% | 2955 26% | 2346 0% | 1219 -48% | 1224 -48% |
| Read Seq Q32T1 (MB/s) | 3540 | 2277 -36% | 3270 -8% | 3562 1% | 2462 -30% | 2350 -34% |
| Total Average (Program / Settings) | -10% /
-8% | 43% /
51% | 6% /
7% | -16% /
-21% | -41% /
-48% |
* ... smaller is better

Disk Throttling: DiskSpd Read Loop, Queue Depth 8
GPU Performance
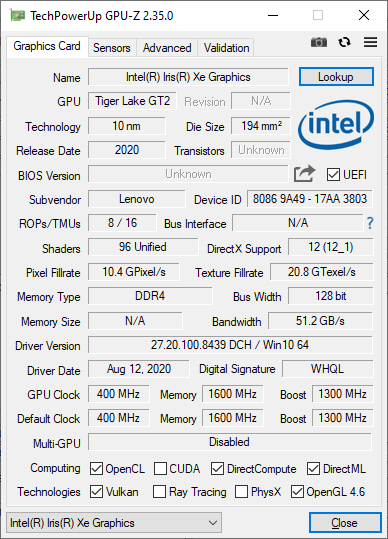
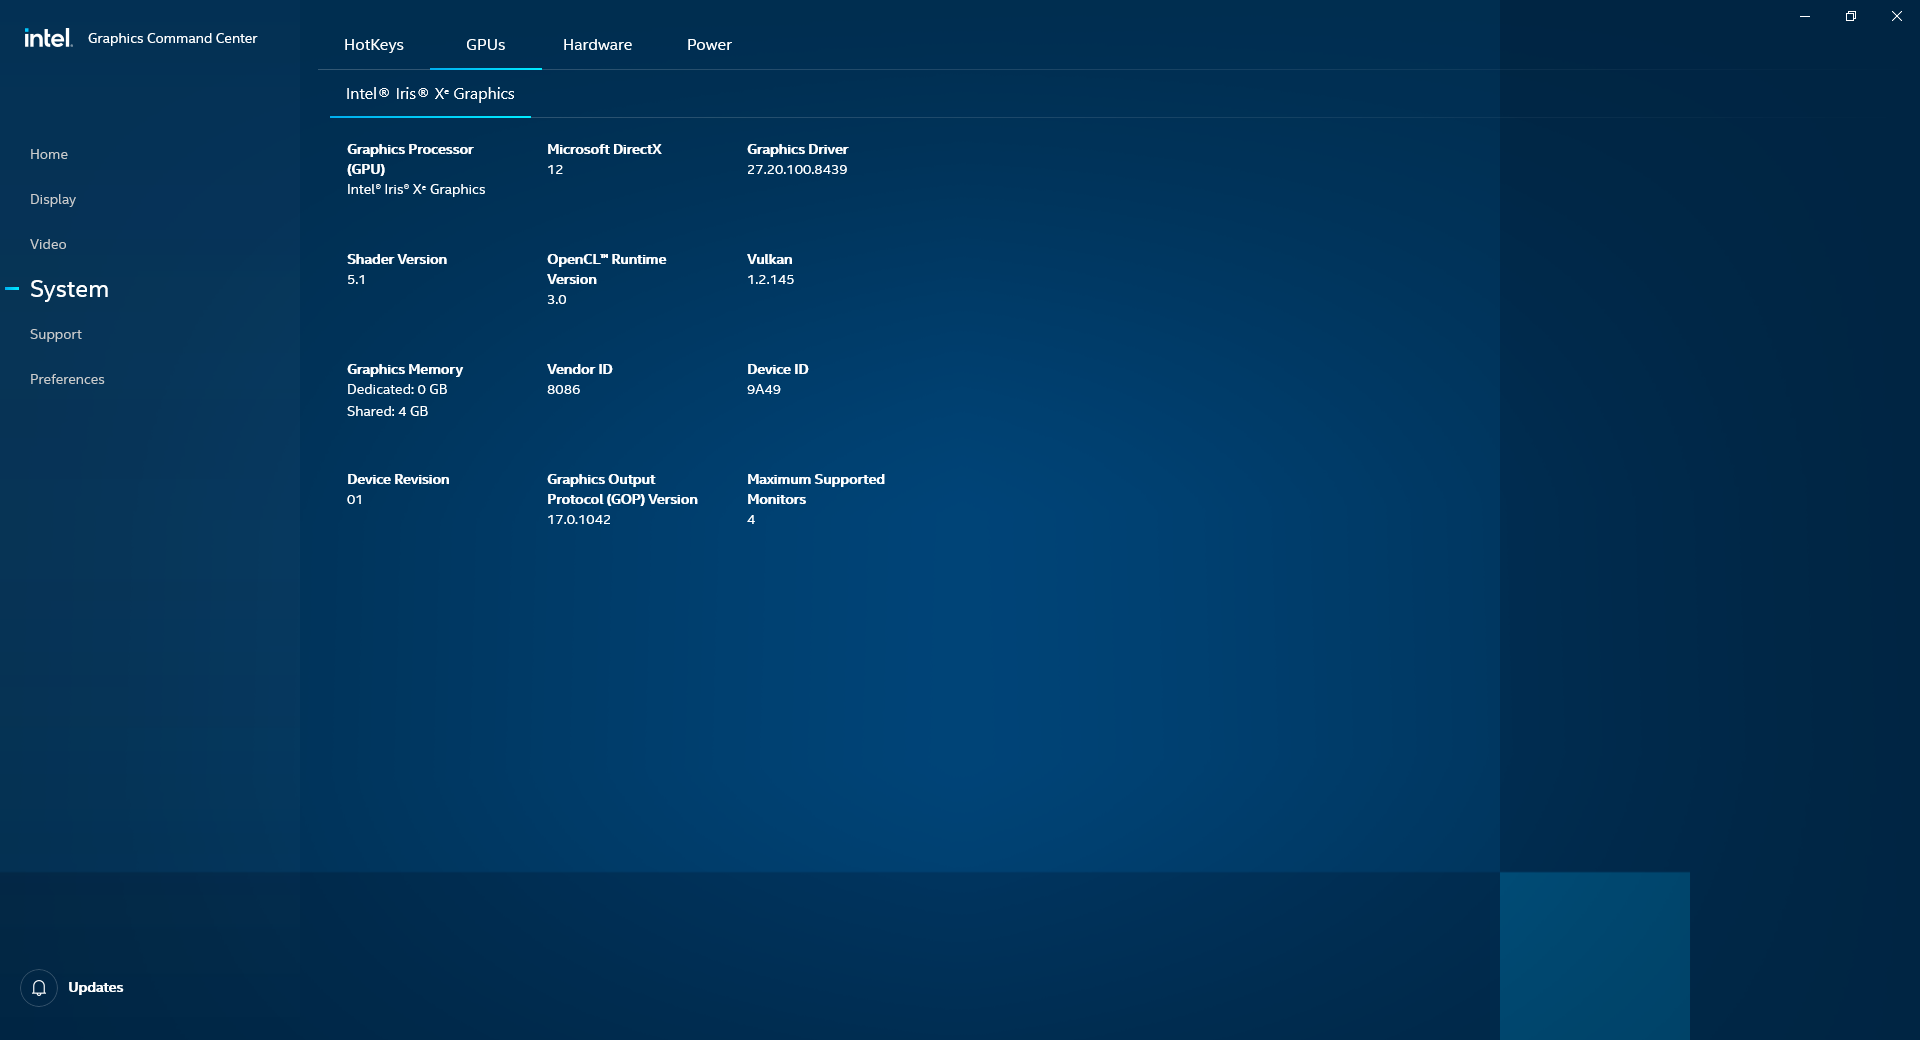
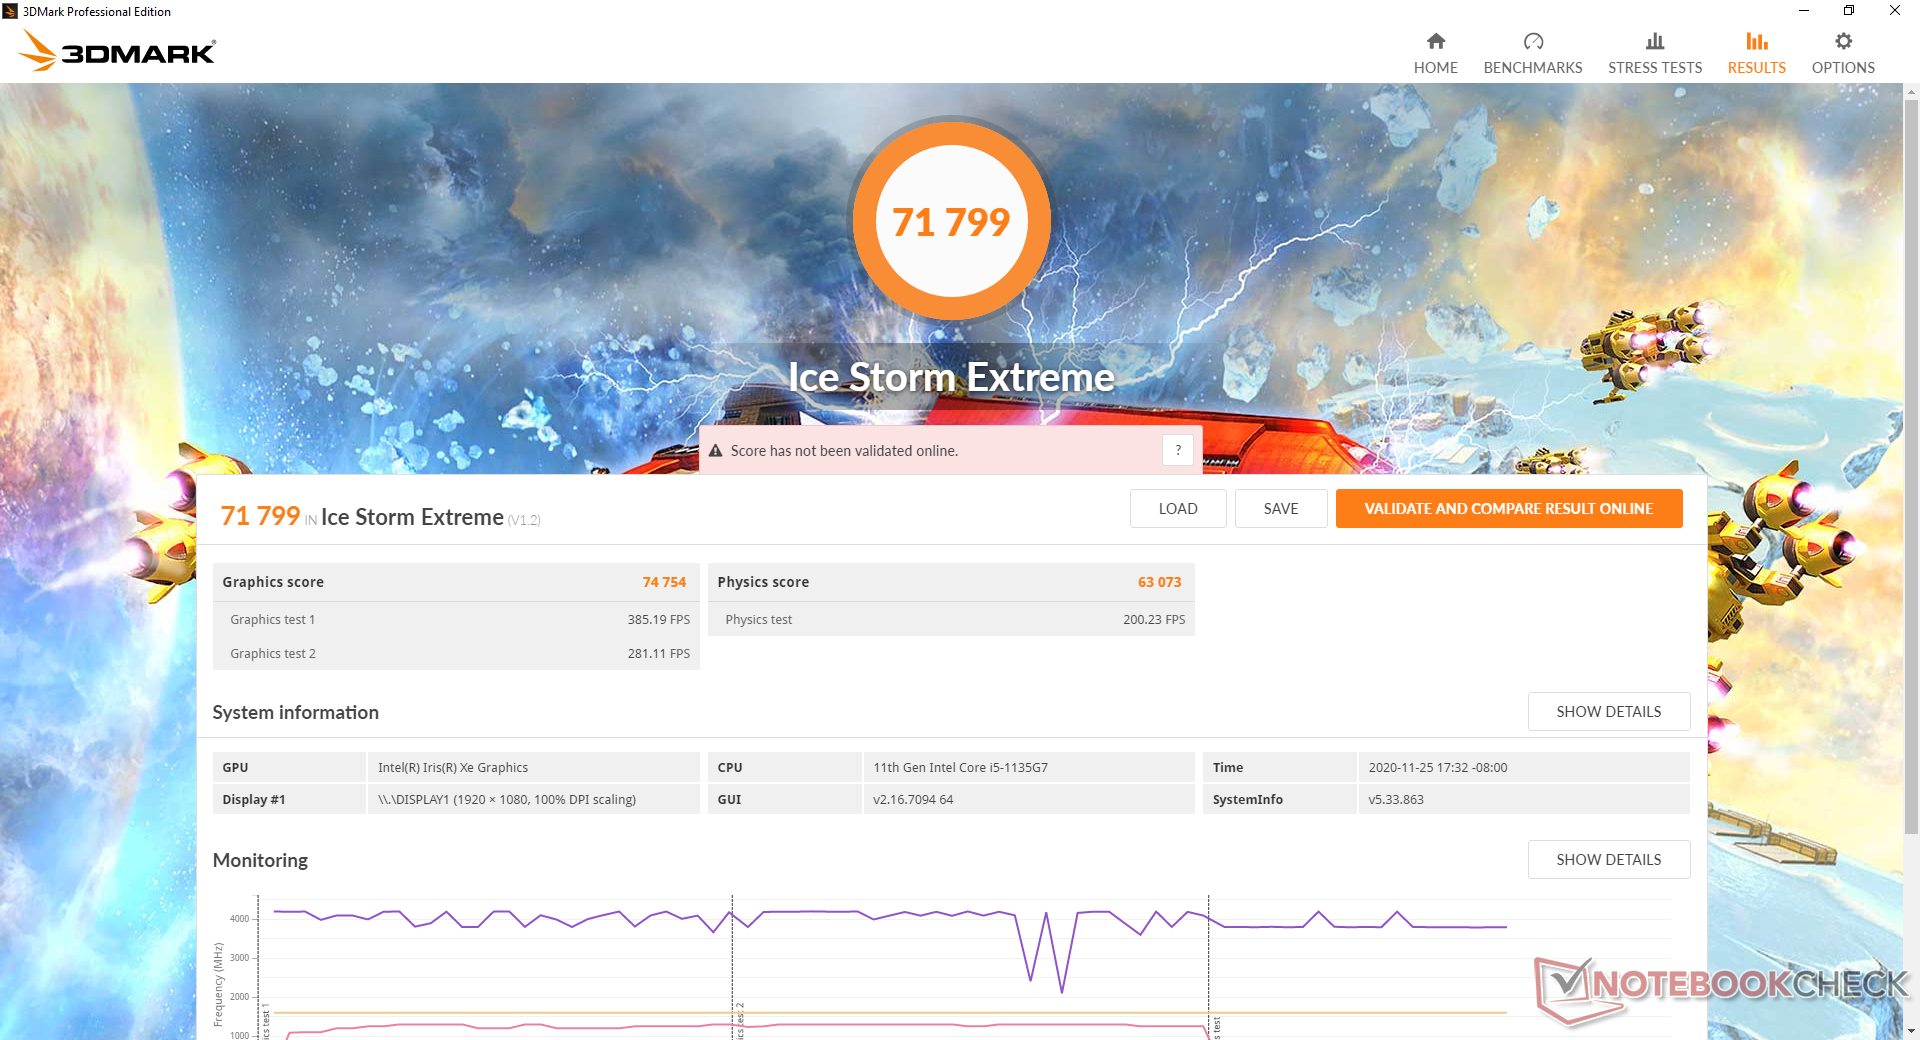
Iris Xe has been pulling excellent 3DMark numbers since inception. Results are ahead of the Radeon RX Vega 7 and Vega 8 by about 10 and 25 percent, respectively, to be neck-to-neck with the GeForce MX350. It's a noticeable improvement over the last generation Iris Plus G7 and an even bigger improvement over the ancient UHD Graphics 620.
Unfortunately, real-world gaming performance remains all over the place due to Intel's immature drivers. Most games will run significantly slower on the Iris Xe when compared to the GeForce MX250 or MX350 despite what 3DMark is claiming. We expect this to steadily change over time when newer drivers become available.
See our dedicated page on the Iris Xe for more technical information and benchmark comparisons. Interestingly, graphics performance here on our Yoga 9i 14 is much better than what we observed on the Yoga 7i 14 even though both are using the same Core i7-1135G7 CPU and Iris Xe GPU.
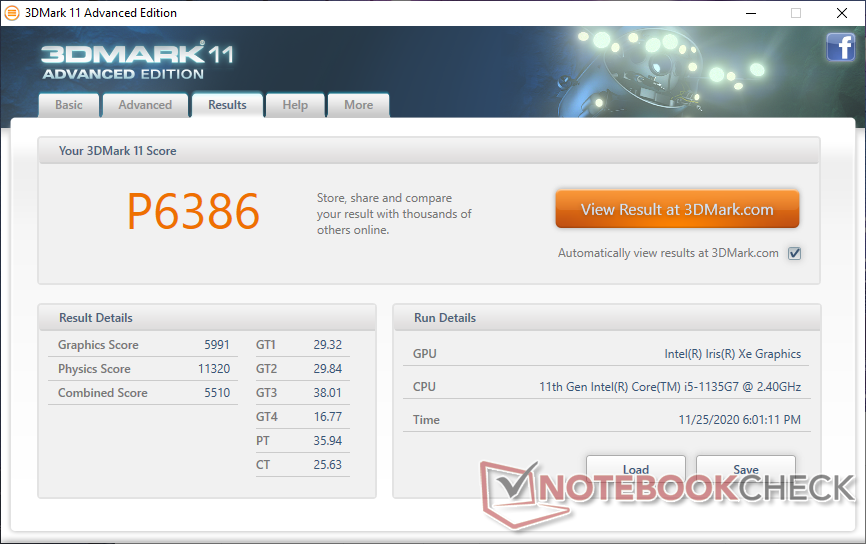
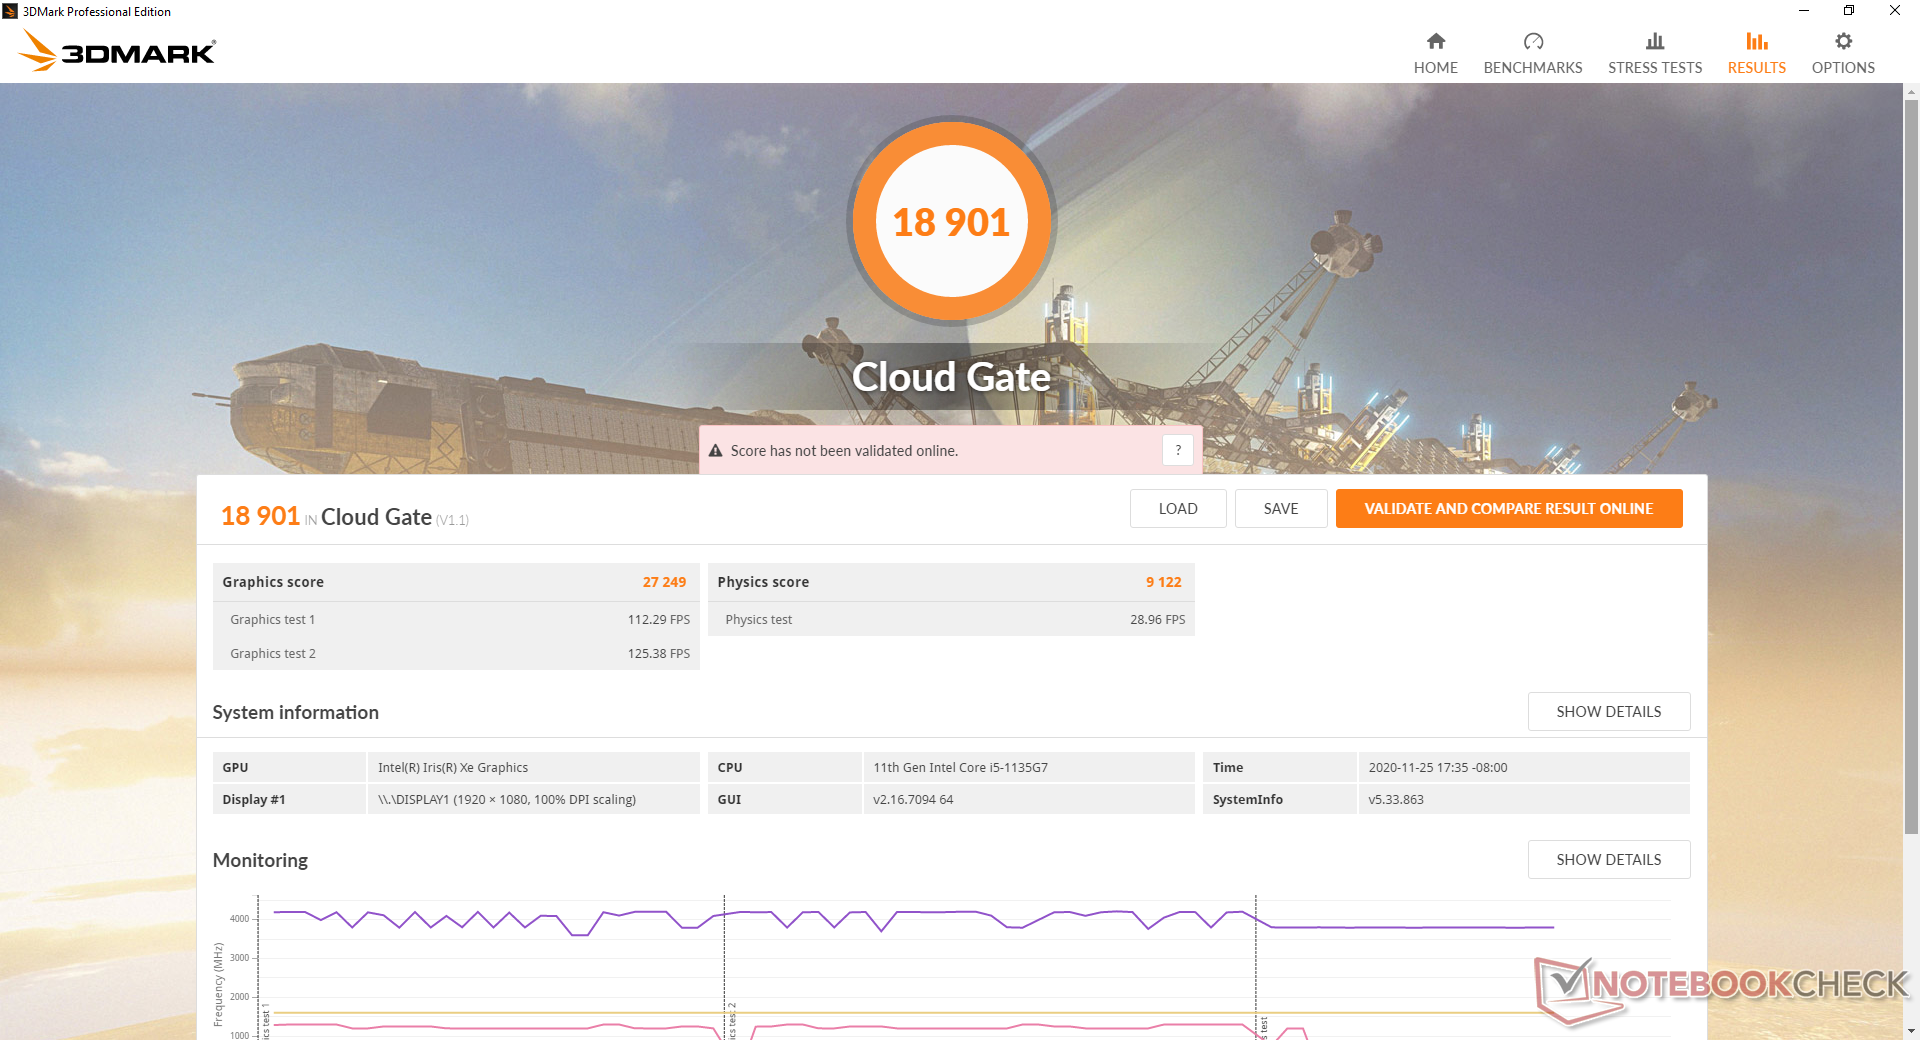
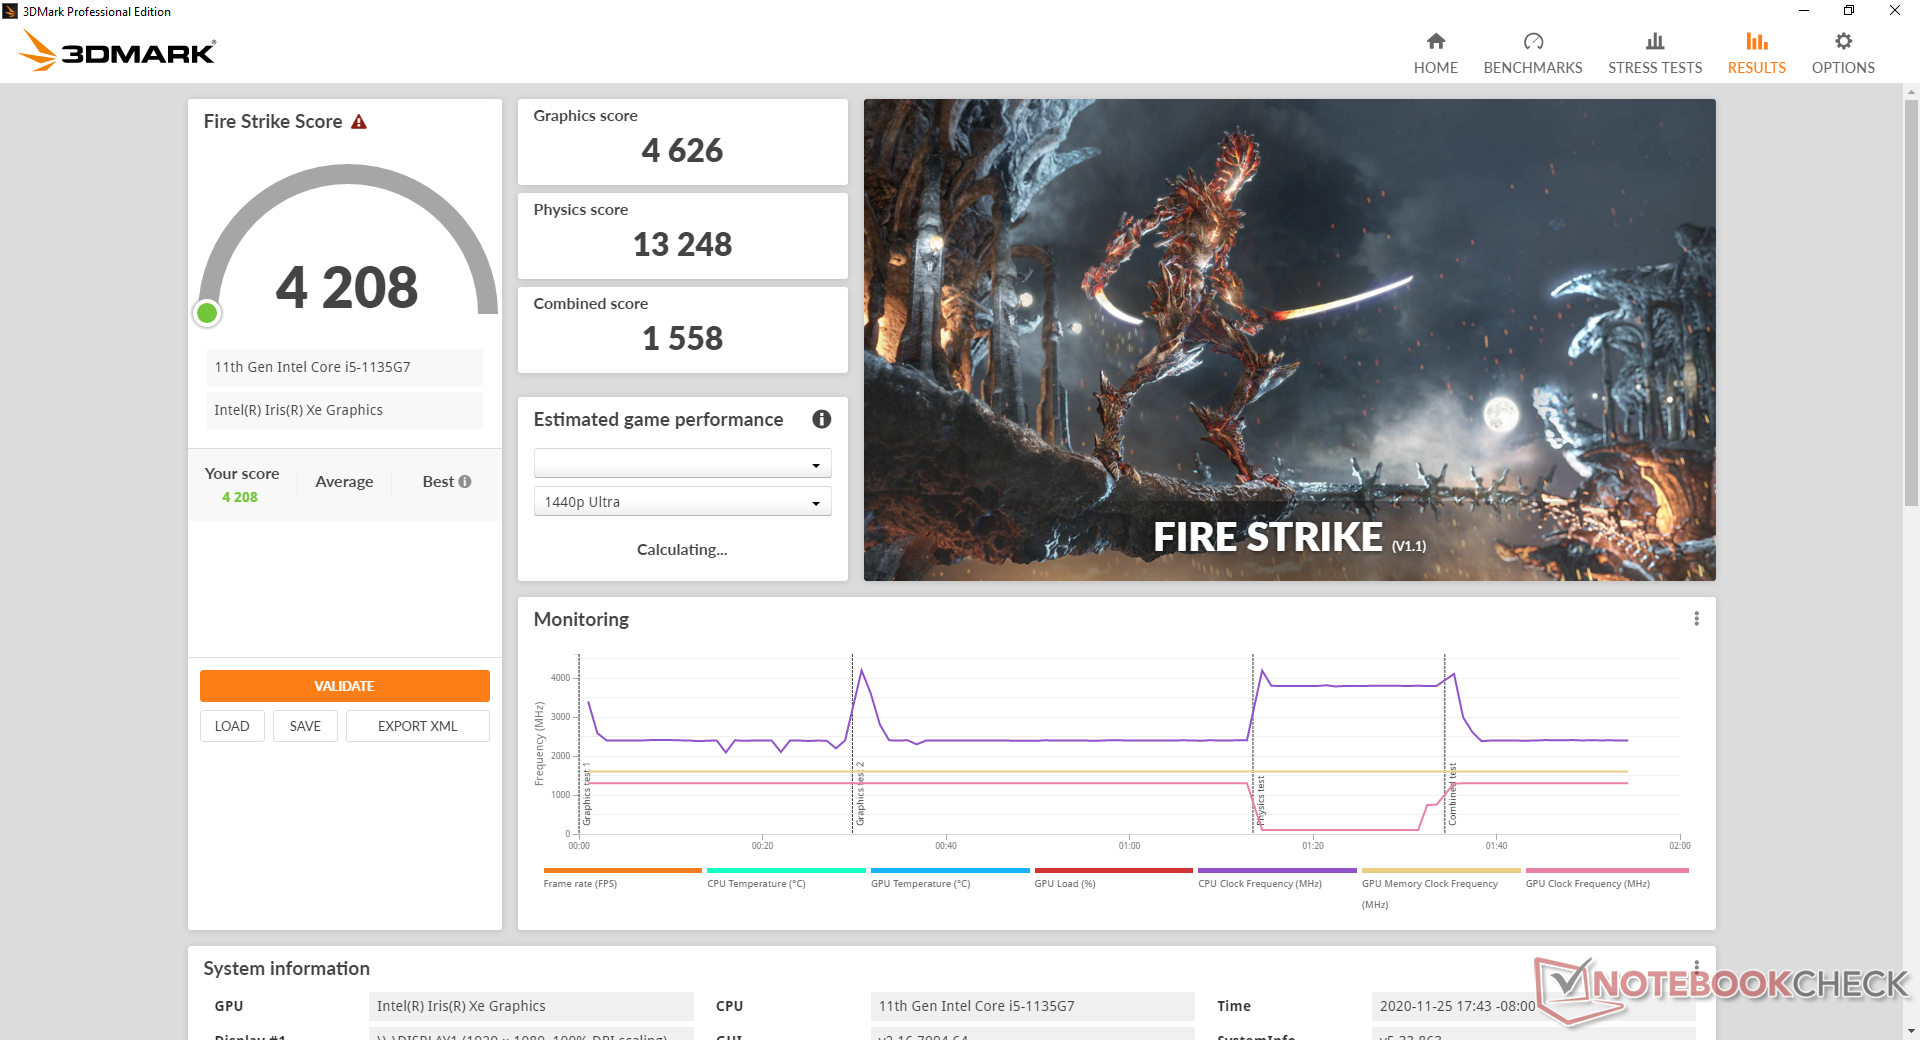
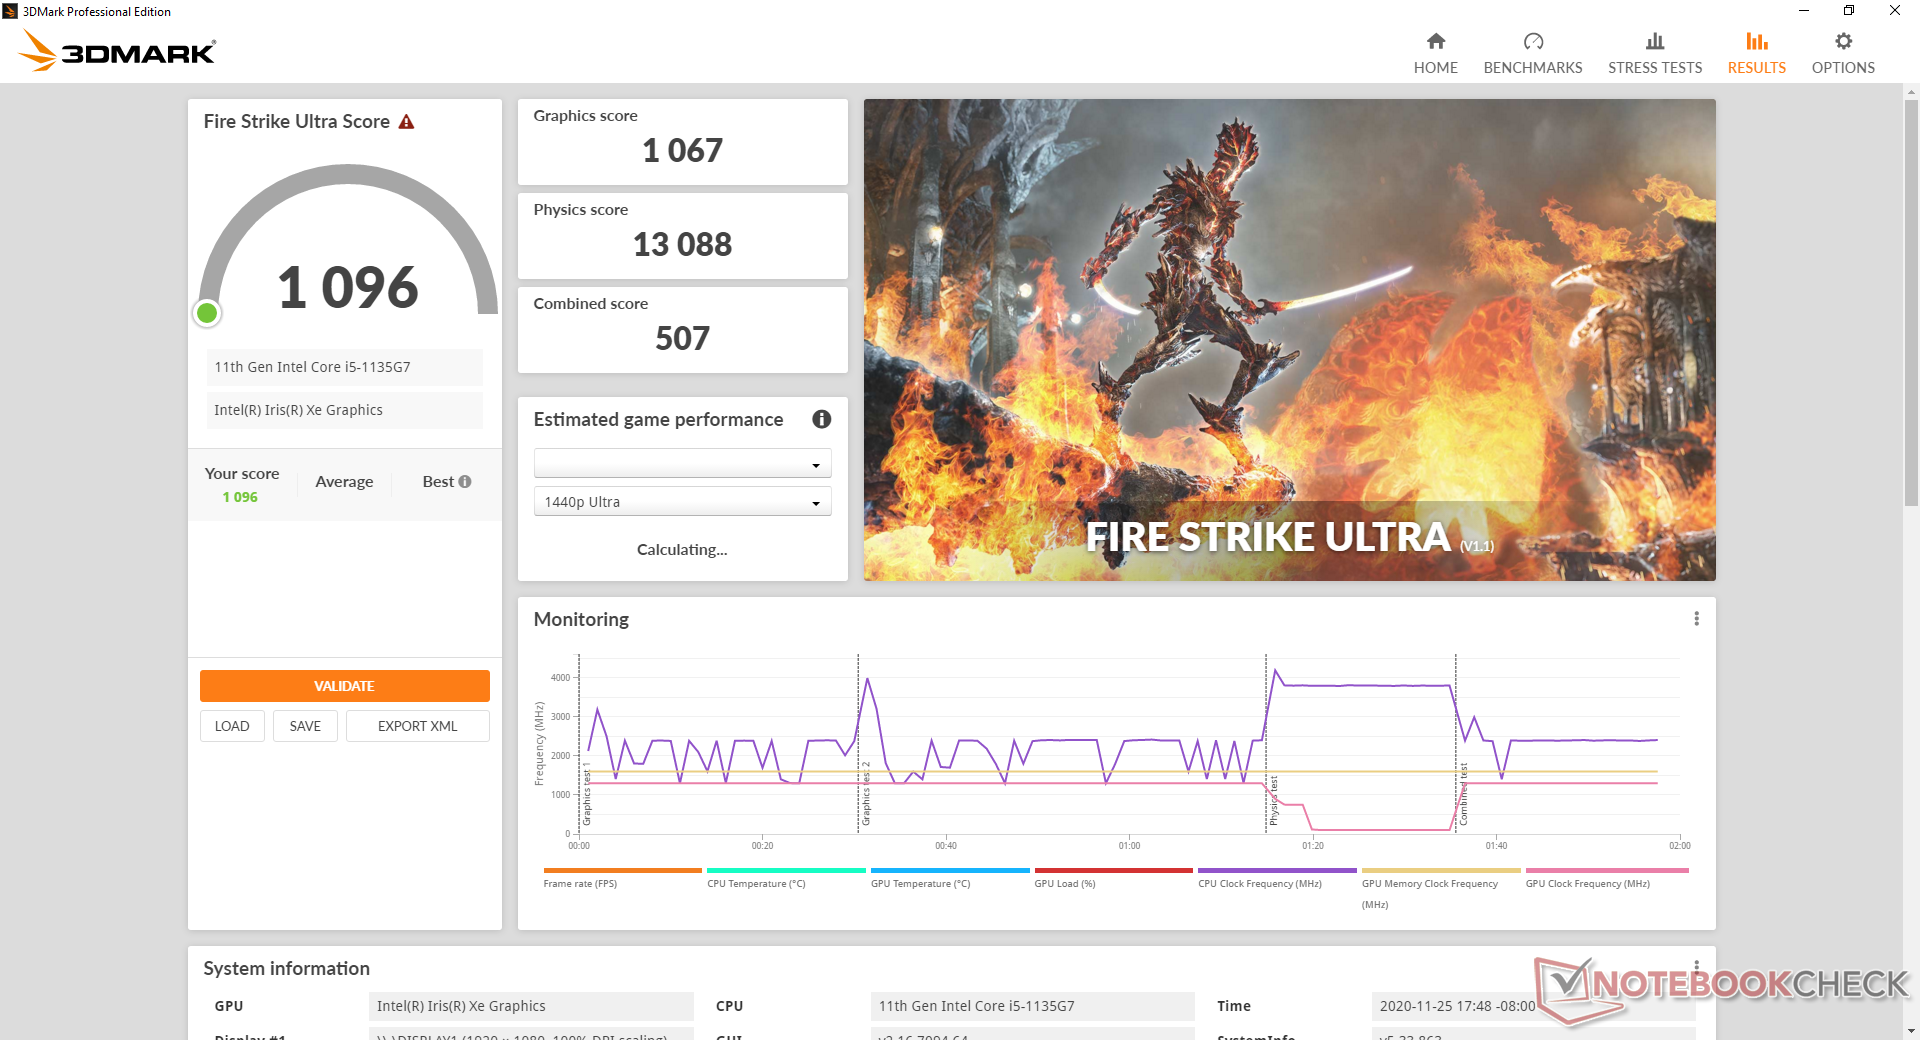
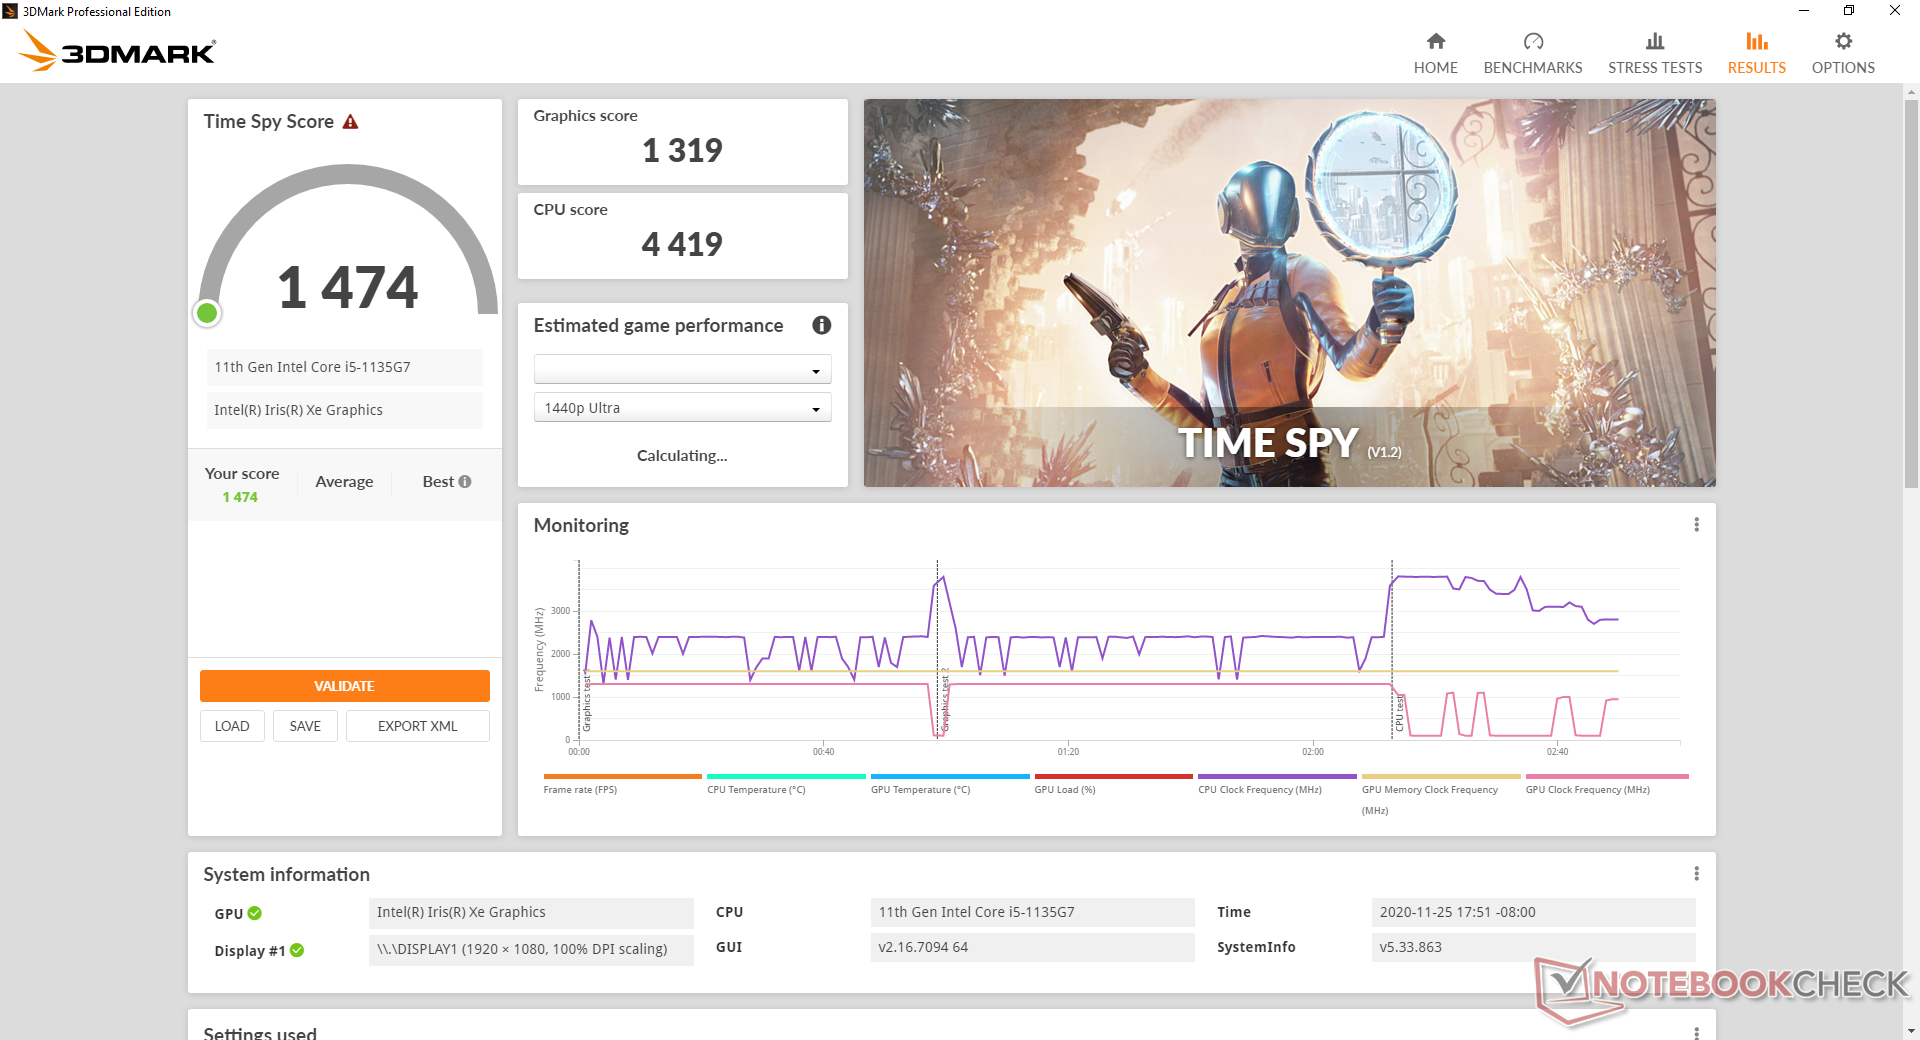
| 3DMark 11 Performance | 6386 points | |
| 3DMark Cloud Gate Standard Score | 18901 points | |
| 3DMark Fire Strike Score | 4208 points | |
| 3DMark Time Spy Score | 1474 points | |
Help | ||
| low | med. | high | ultra | |
|---|---|---|---|---|
| GTA V (2015) | 87.9 | 77 | 25.3 | 10.5 |
| The Witcher 3 (2015) | 92.2 | 53 | 31.6 | 14 |
| Dota 2 Reborn (2015) | 80.9 | 61.7 | 42.9 | 40.7 |
| Final Fantasy XV Benchmark (2018) | 36.5 | 19.9 | 13.9 | |
| X-Plane 11.11 (2018) | 57 | 40.5 | 35.5 |
Emissions
System Noise
Fan noise is quiet when under low loads like browsing or video streaming at up to about 29.7 dB(A) against a silent background of 26.3 dB(A). When under heavier loads like gaming, however, fan noise becomes louder at just over 43 dB(A) to be louder than what we recorded on the older Comet Lake-U-powered Yoga C740 14 and most other convertibles. Overall fan noise is generally not audible unless if the system is running software updates or other stressful applications.
| Lenovo Yoga 9i 14ITL5 Iris Xe G7 80EUs, i5-1135G7, Samsung SSD PM981a MZVLB256HBHQ | Asus VivoBook Flip 14 TM420IA Vega 7, R7 4700U, Samsung PM991 MZVLQ512HALU | LG Gram 14T90N UHD Graphics 620, i7-10510U, Samsung SSD PM981a MZVLB512HBJQ | Lenovo Yoga C740-14IML UHD Graphics 620, i5-10210U, Samsung SSD PM981a MZVLB256HBHQ | HP Spectre x360 13-aw0013dx Iris Plus Graphics G7 (Ice Lake 64 EU), i7-1065G7, Intel Optane Memory H10 with Solid State Storage 32GB + 512GB HBRPEKNX0202A(L/H) | Dell XPS 13 7390 2-in-1 Core i7 Iris Plus Graphics G7 (Ice Lake 64 EU), i7-1065G7, Toshiba BG4 KBG40ZPZ512G | |
|---|---|---|---|---|---|---|
| Noise | -1% | -7% | -5% | 3% | -3% | |
| off / environment * (dB) | 26.3 | 27.1 -3% | 29 -10% | 29 -10% | 28.5 -8% | 28.1 -7% |
| Idle Minimum * (dB) | 26.3 | 27.1 -3% | 30 -14% | 29 -10% | 28.5 -8% | 28.1 -7% |
| Idle Average * (dB) | 26.3 | 27.1 -3% | 30 -14% | 29 -10% | 28.5 -8% | 28.1 -7% |
| Idle Maximum * (dB) | 26.3 | 27.1 -3% | 30 -14% | 29.7 -13% | 28.5 -8% | 28.1 -7% |
| Load Average * (dB) | 34.1 | 35 -3% | 35.2 -3% | 32.6 4% | 28.5 16% | 31.7 7% |
| Witcher 3 ultra * (dB) | 43.4 | 41.3 5% | 35.3 19% | 43.4 -0% | ||
| Load Maximum * (dB) | 43.3 | 41.3 5% | 37 15% | 39 10% | 35.3 18% | 43.4 -0% |
* ... smaller is better
Noise level
| Idle |
| 26.3 / 26.3 / 26.3 dB(A) |
| Load |
| 34.1 / 43.3 dB(A) |
 | ||
30 dB silent 40 dB(A) audible 50 dB(A) loud |
||
min: | ||
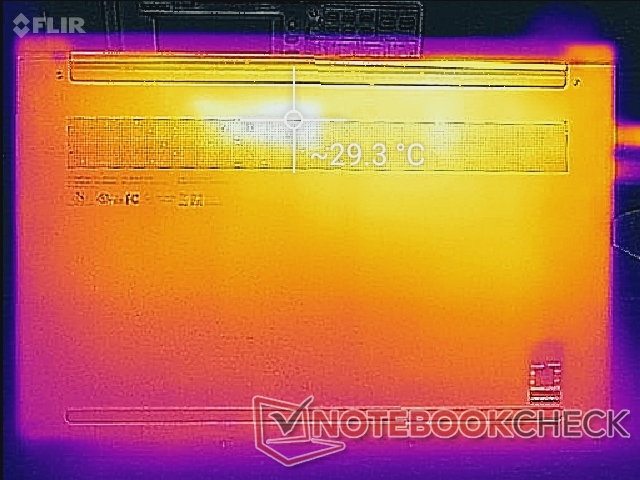
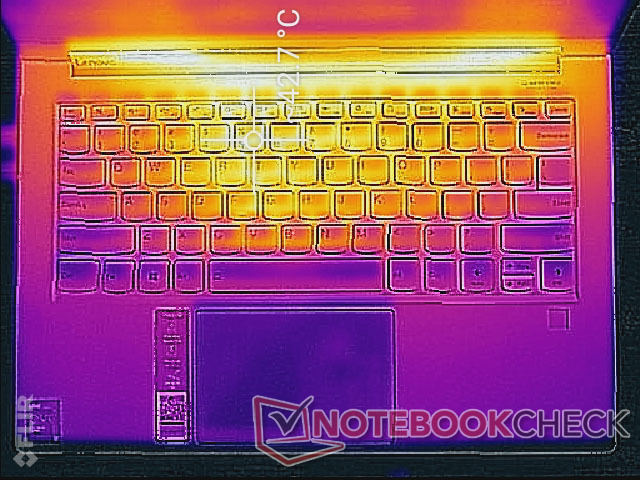
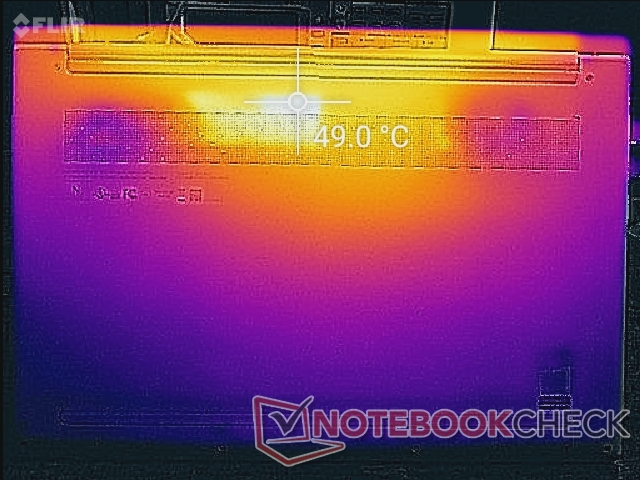
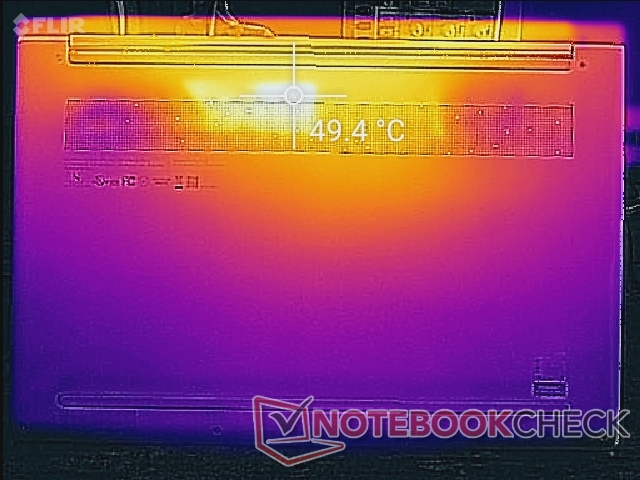
Temperature
Surface temperature development is largely symmetrical with hot spots reaching 43 C to 50 C near the rear quadrants of the laptop. Though the palm rests and frontal areas remain cool, we would have preferred a cooler bottom. The Yoga Slim 7 would run even warmer under the same conditions.
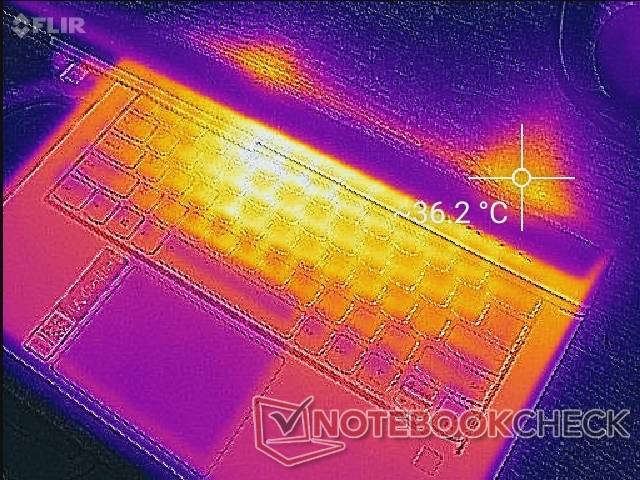
(±) The maximum temperature on the upper side is 43.4 °C / 110 F, compared to the average of 35.4 °C / 96 F, ranging from 19.6 to 60 °C for the class Convertible.
(-) The bottom heats up to a maximum of 49.6 °C / 121 F, compared to the average of 36.9 °C / 98 F
(+) In idle usage, the average temperature for the upper side is 24.6 °C / 76 F, compared to the device average of 30.3 °C / 87 F.
(±) Playing The Witcher 3, the average temperature for the upper side is 32.6 °C / 91 F, compared to the device average of 30.3 °C / 87 F.
(+) The palmrests and touchpad are cooler than skin temperature with a maximum of 29 °C / 84.2 F and are therefore cool to the touch.
(±) The average temperature of the palmrest area of similar devices was 28 °C / 82.4 F (-1 °C / -1.8 F).


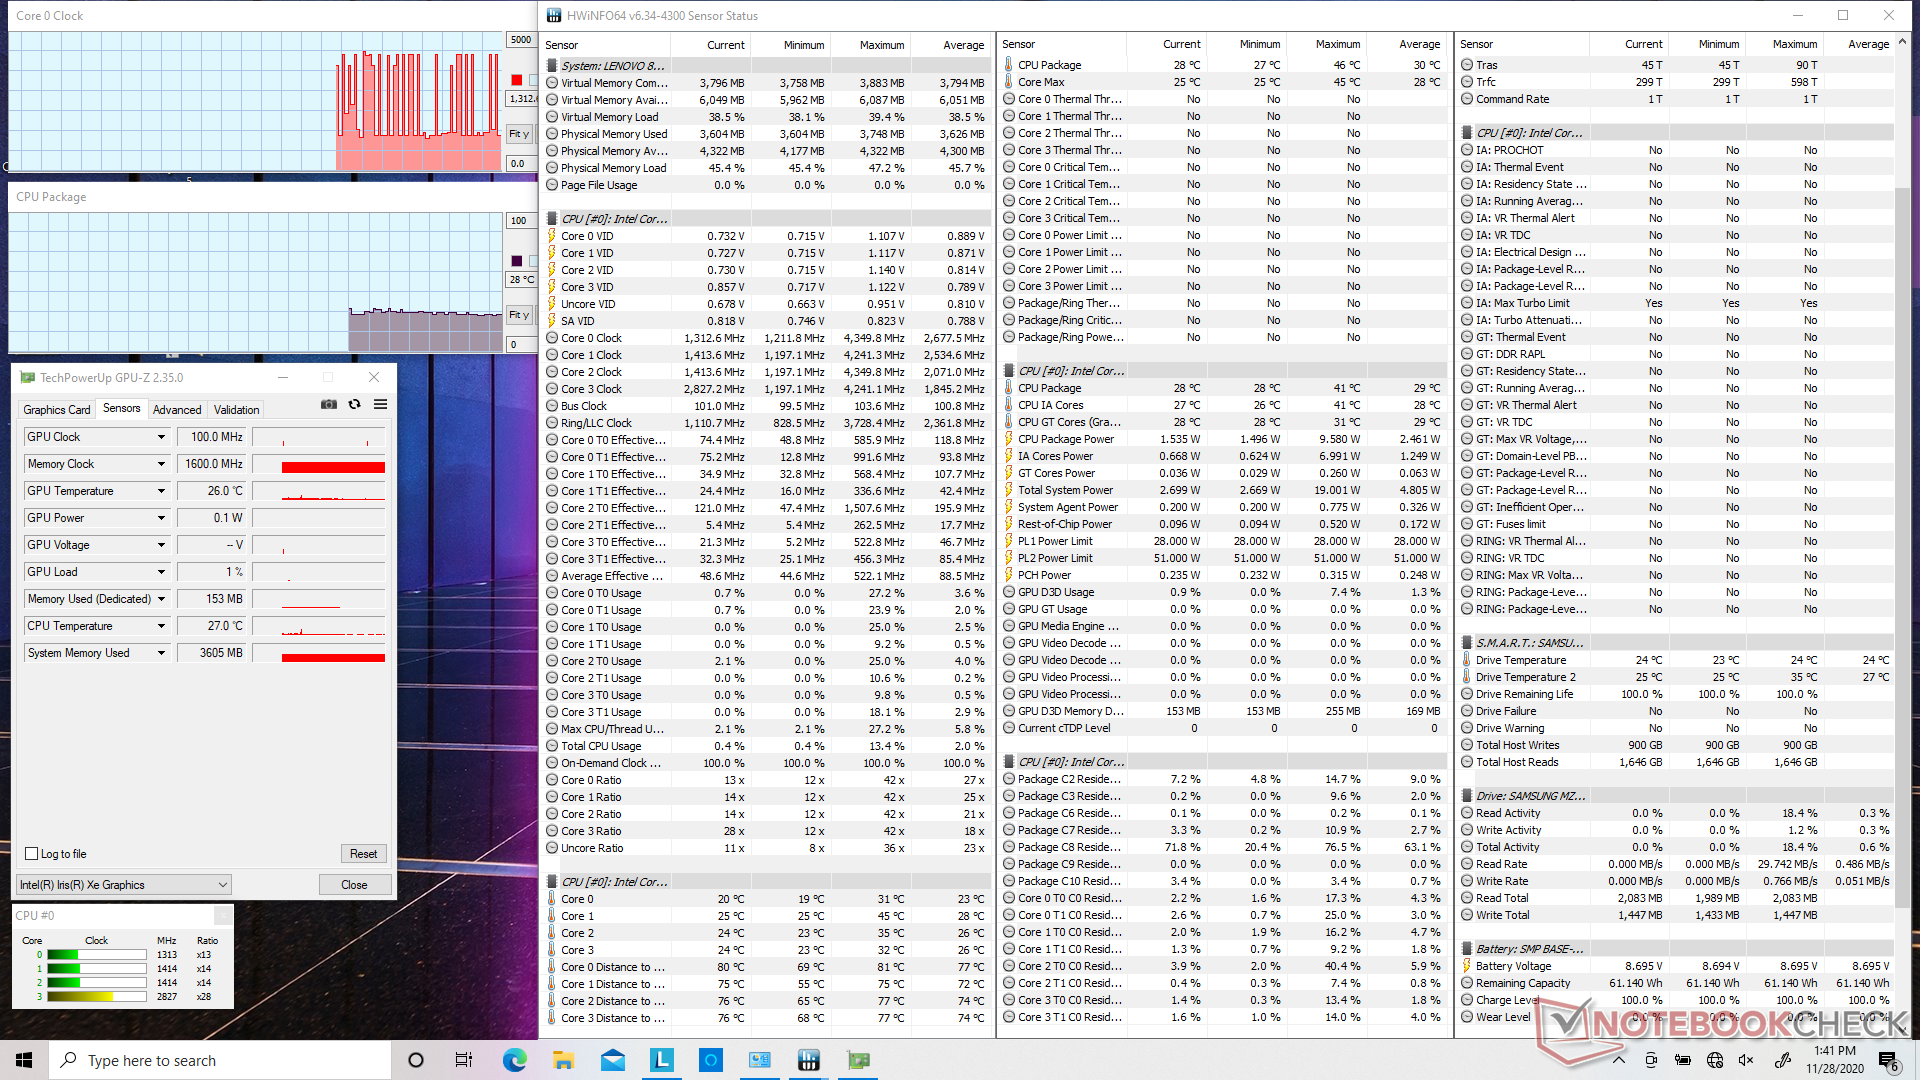
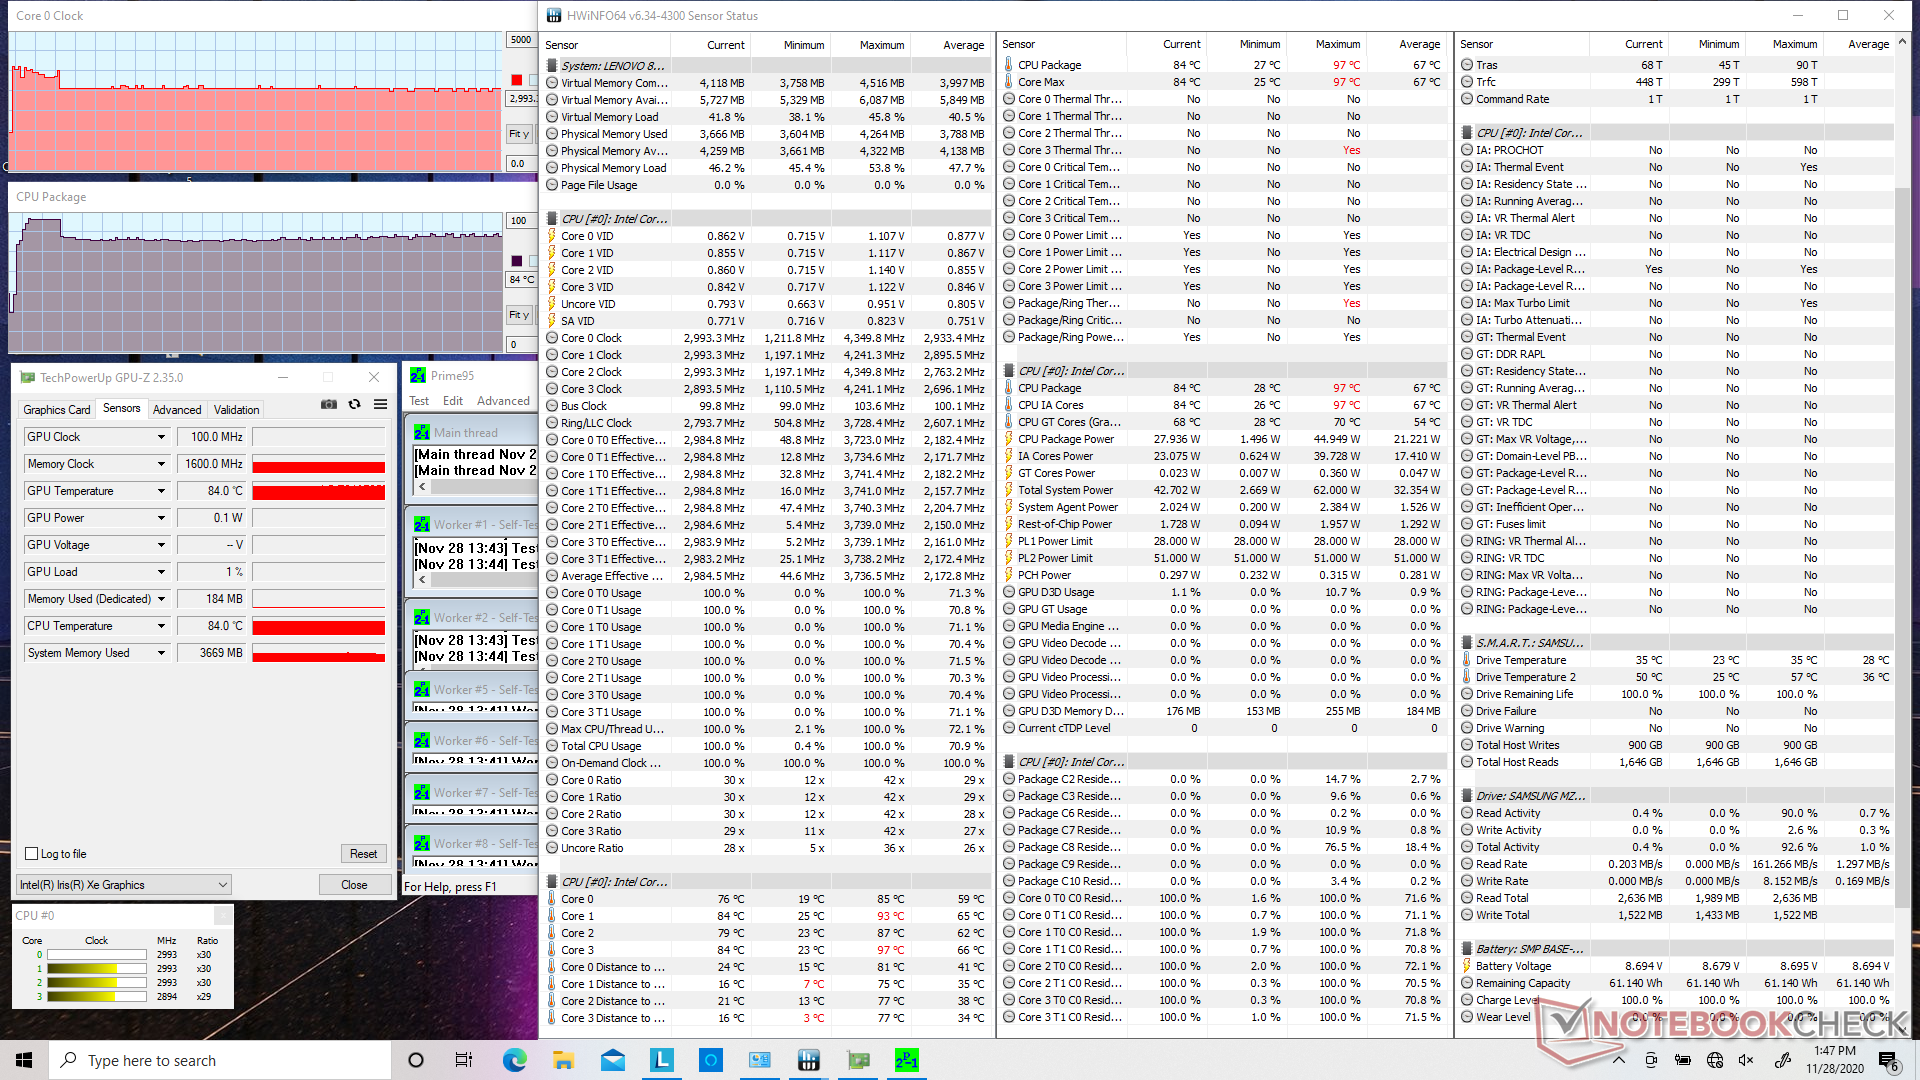
Stress Test
Running Prime95 would cause the CPU to boost to 3.8 GHz and 96 C for about 30 seconds before eventually falling and stabilizing at 3 GHz and 83 C. In comparison, the Yoga 7i would stabilize at the same clock rate but slightly warmer 88 C when under the same Prime95 conditions.
Running on battery power limits performance slightly. A 3DMark 11 test on batteries would return Physics and Graphics scores of 10636 and 5734 points, respectively, compared to 11320 and 5991 points when on mains.
| CPU Clock (GHz) | GPU Clock (MHz) | Average CPU Temperature (°C) | |
| System Idle | -- | -- | 28 |
| Prime95 Stress | 3.0 | -- | 83 |
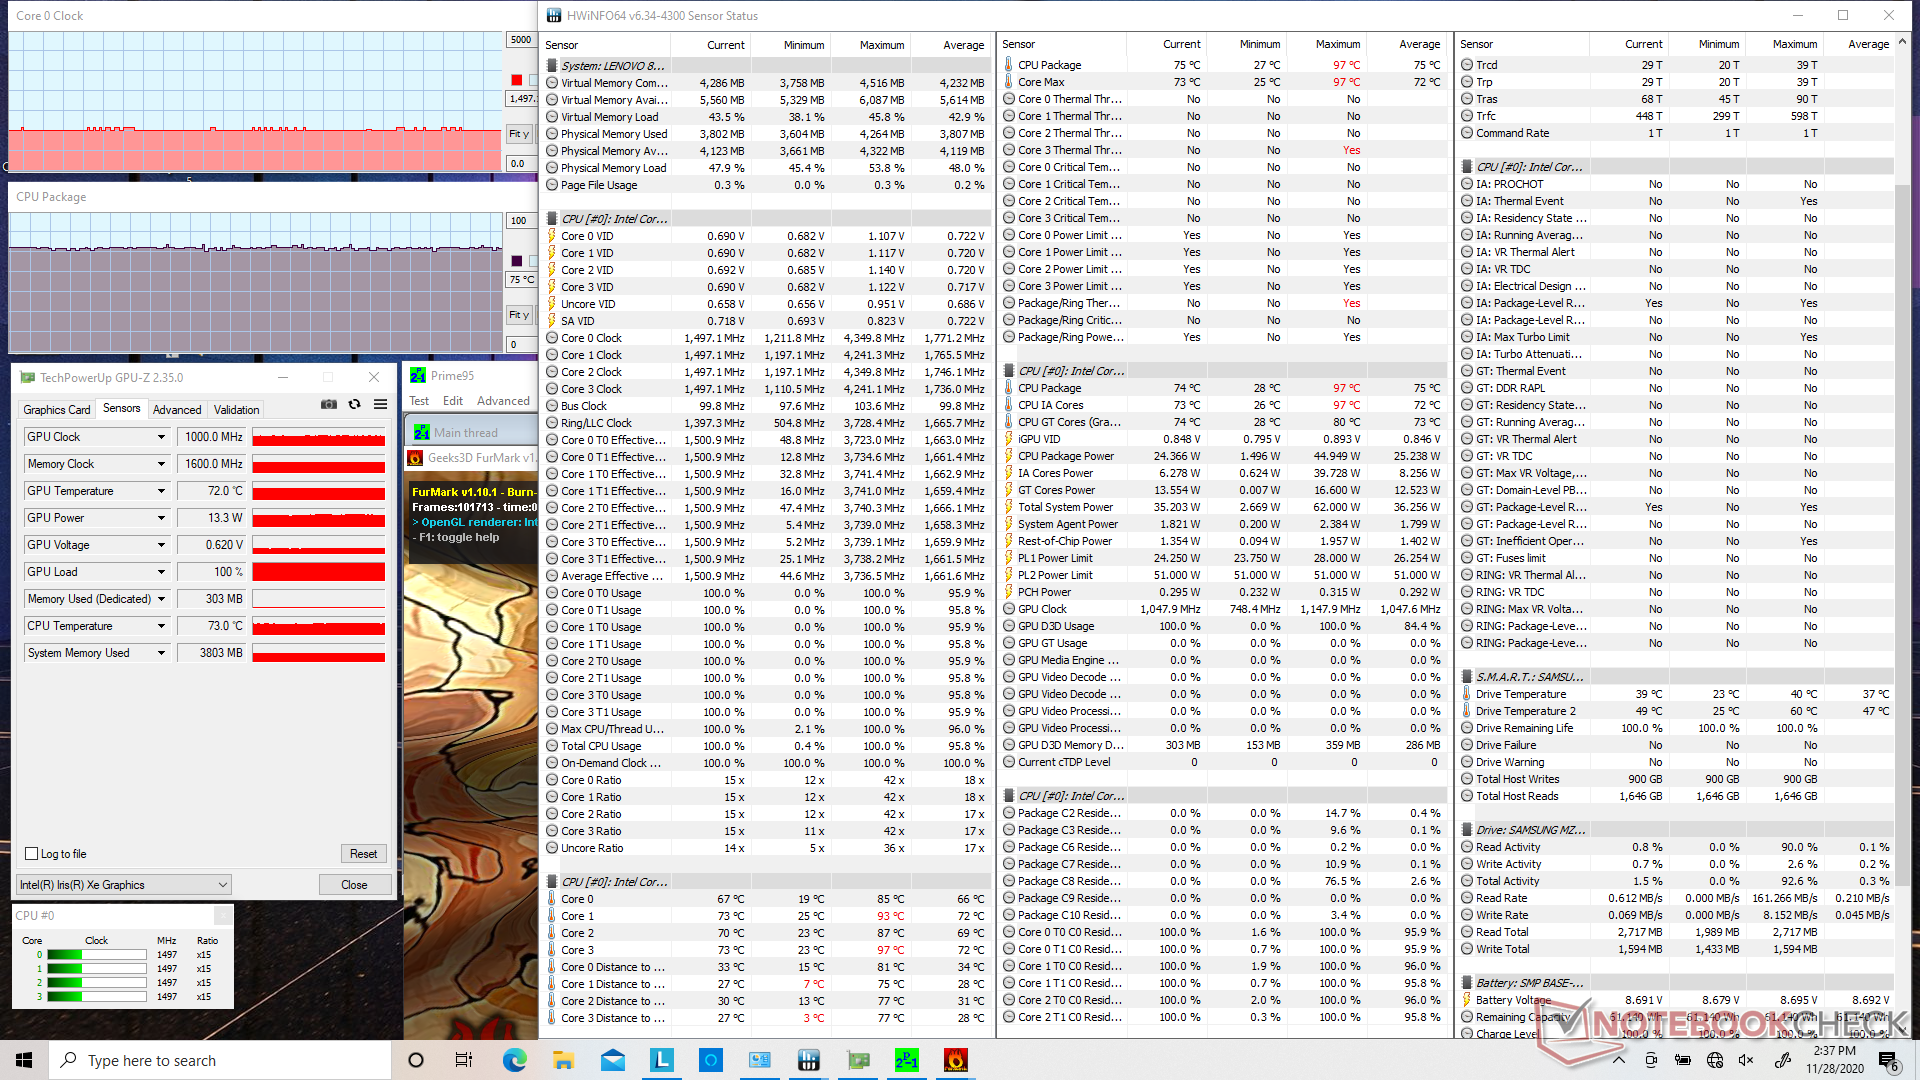
| Prime95 + FurMark Stress | 1.5 | 1000 | 75 |
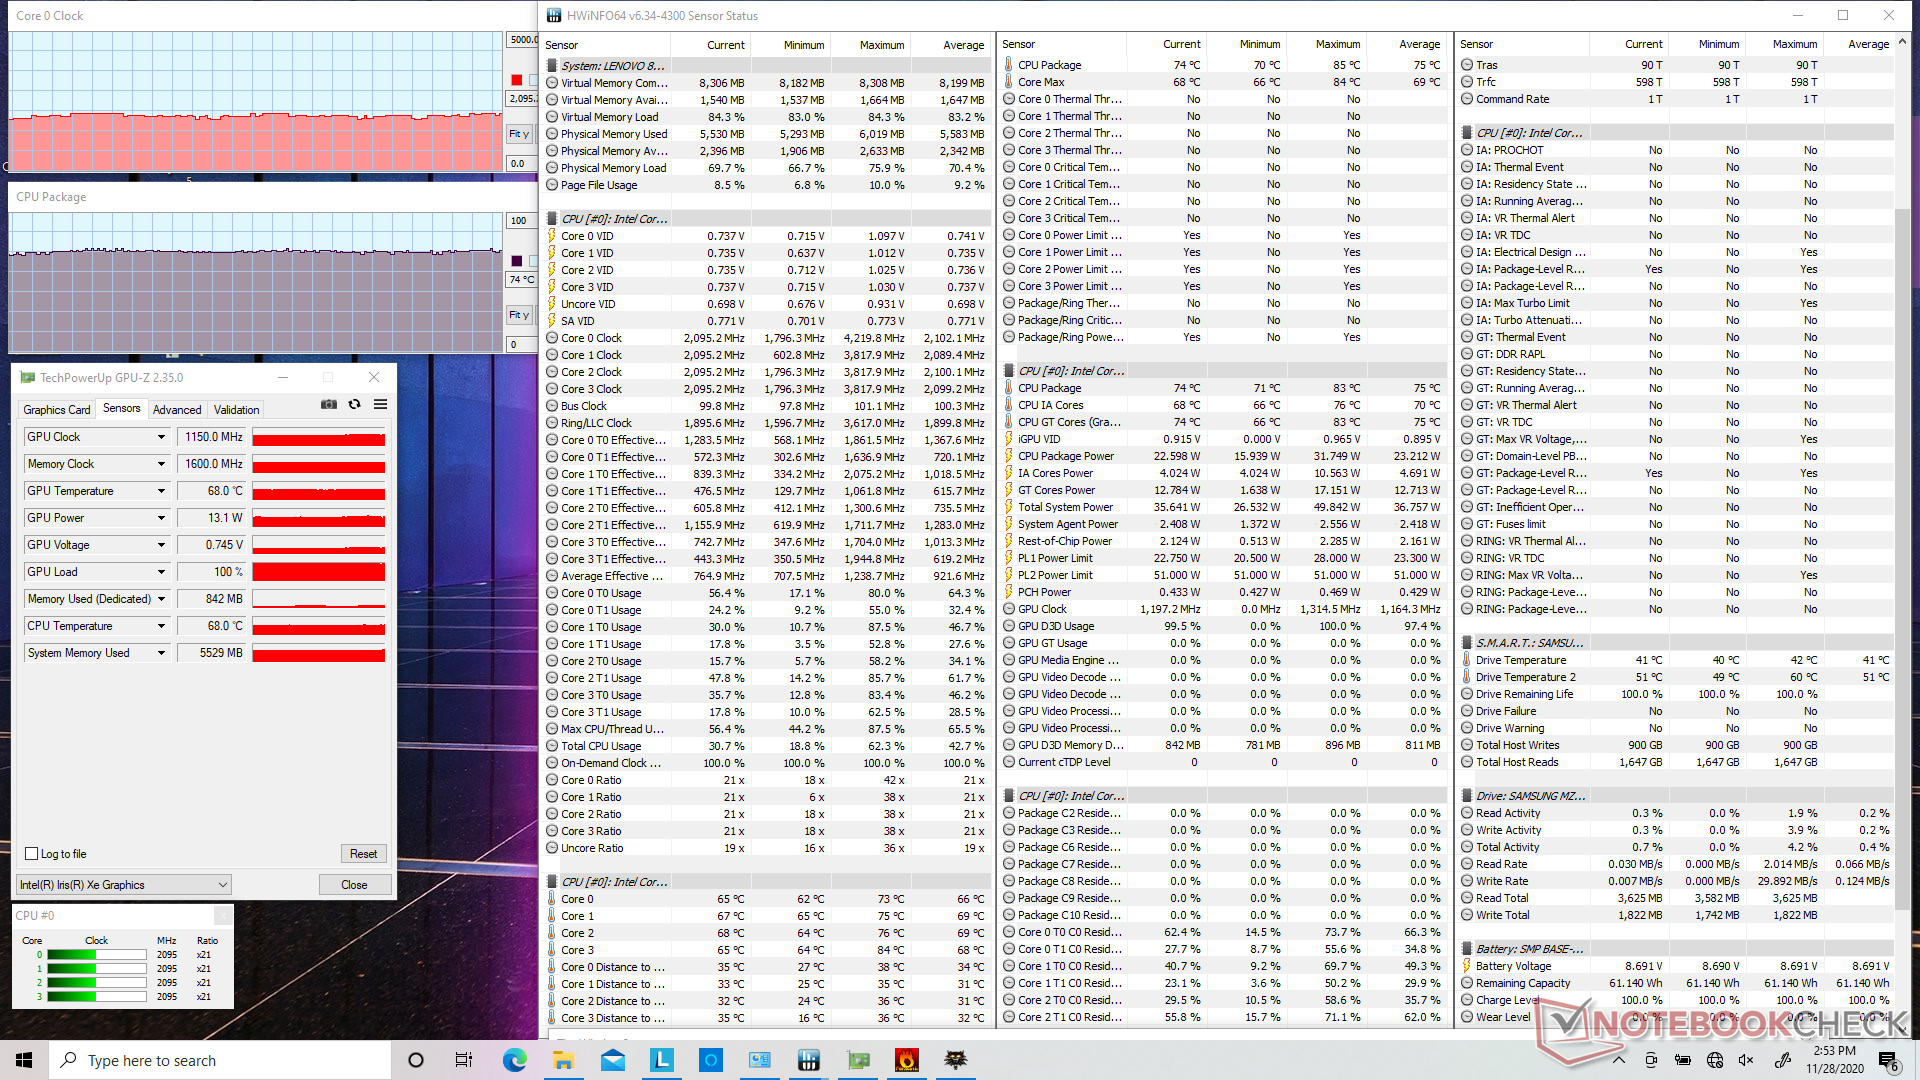
| Witcher 3 Stress | 2.0 - 2.1 | 1150 | 74 |
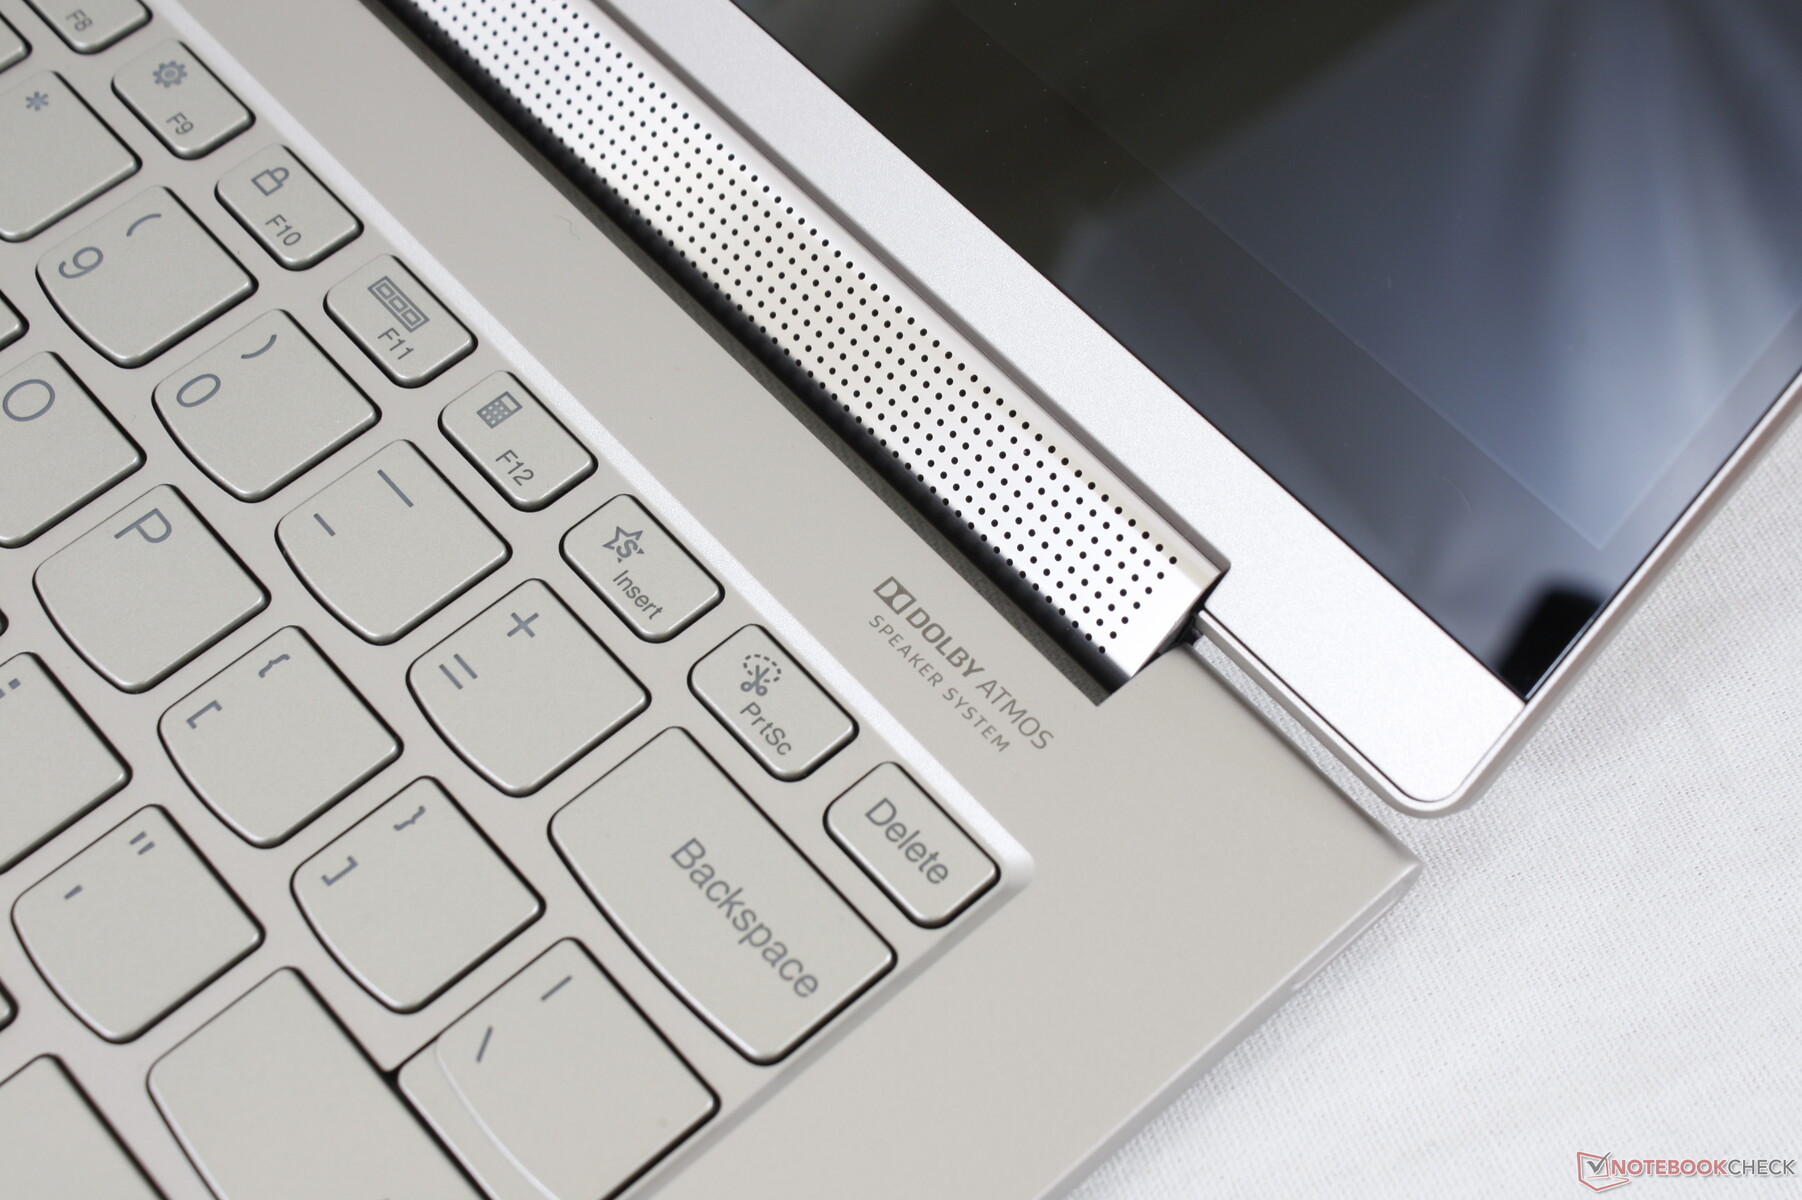
Speakers


Lenovo Yoga 9i 14ITL5 audio analysis
(+) | speakers can play relatively loud (88.8 dB)
Bass 100 - 315 Hz
(±) | reduced bass - on average 9.4% lower than median
(±) | linearity of bass is average (8.7% delta to prev. frequency)
Mids 400 - 2000 Hz
(+) | balanced mids - only 3.7% away from median
(+) | mids are linear (3.6% delta to prev. frequency)
Highs 2 - 16 kHz
(+) | balanced highs - only 3% away from median
(+) | highs are linear (4% delta to prev. frequency)
Overall 100 - 16.000 Hz
(+) | overall sound is linear (9.5% difference to median)
Compared to same class
» 5% of all tested devices in this class were better, 1% similar, 94% worse
» The best had a delta of 6%, average was 20%, worst was 57%
Compared to all devices tested
» 4% of all tested devices were better, 1% similar, 95% worse
» The best had a delta of 4%, average was 24%, worst was 134%
Apple MacBook 12 (Early 2016) 1.1 GHz audio analysis
(+) | speakers can play relatively loud (83.6 dB)
Bass 100 - 315 Hz
(±) | reduced bass - on average 11.3% lower than median
(±) | linearity of bass is average (14.2% delta to prev. frequency)
Mids 400 - 2000 Hz
(+) | balanced mids - only 2.4% away from median
(+) | mids are linear (5.5% delta to prev. frequency)
Highs 2 - 16 kHz
(+) | balanced highs - only 2% away from median
(+) | highs are linear (4.5% delta to prev. frequency)
Overall 100 - 16.000 Hz
(+) | overall sound is linear (10.2% difference to median)
Compared to same class
» 7% of all tested devices in this class were better, 2% similar, 91% worse
» The best had a delta of 5%, average was 18%, worst was 53%
Compared to all devices tested
» 5% of all tested devices were better, 1% similar, 94% worse
» The best had a delta of 4%, average was 24%, worst was 134%
Energy Management
Power Consumption
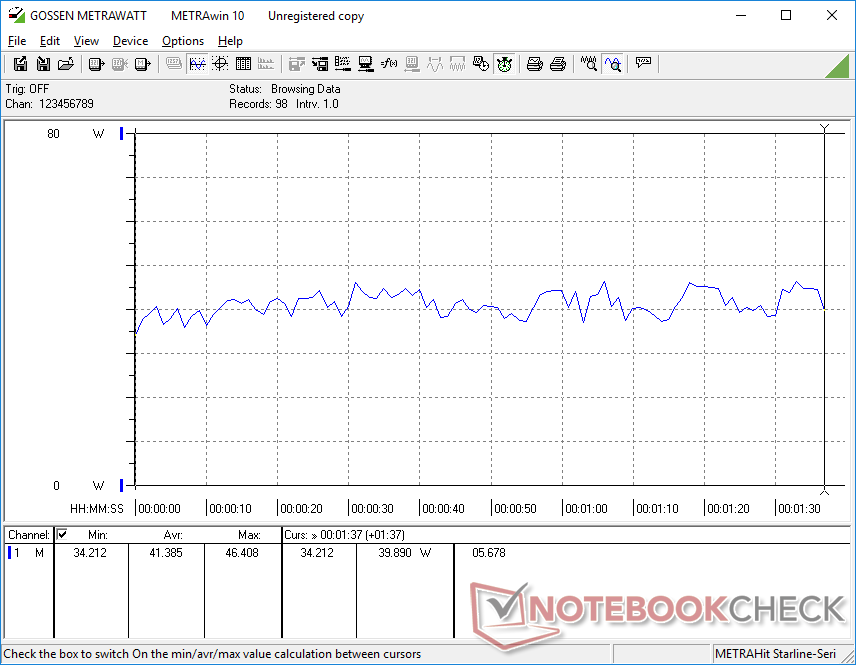
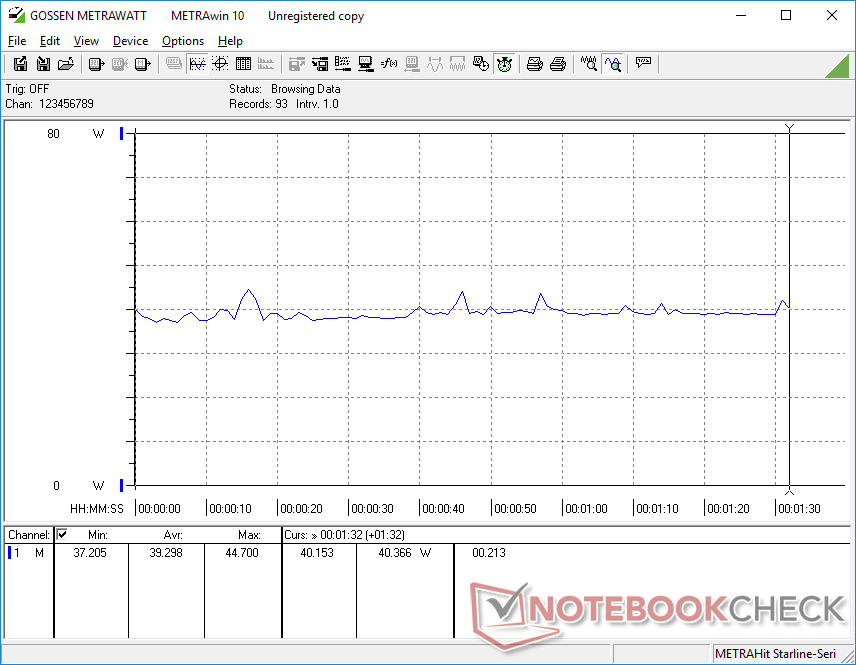
Idling on desktop draws between 3 W and 7 W depending on the brightness level and power profile setting. Running games would consume between 39 W and 42 W to be comparable to the Lenovo Yoga C740 14 powered by the much weaker Core i5-10210U. The graphical performance-per-watt increase between 10th gen Comet Lake-U and 11th gen Tiger Lake is tremendous as a result.
The Yoga Slim 7 14 with discrete GeForce MX350 graphics would consume about 40 percent more power when gaming which makes our Iris Xe-powered Yoga 9i the more efficient system. Nonetheless, the GeForce MX350 remains the better choice for gaming due to its performance consistency between games.
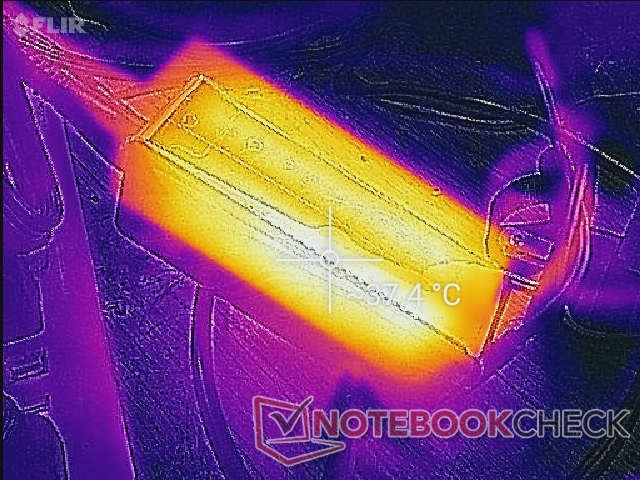
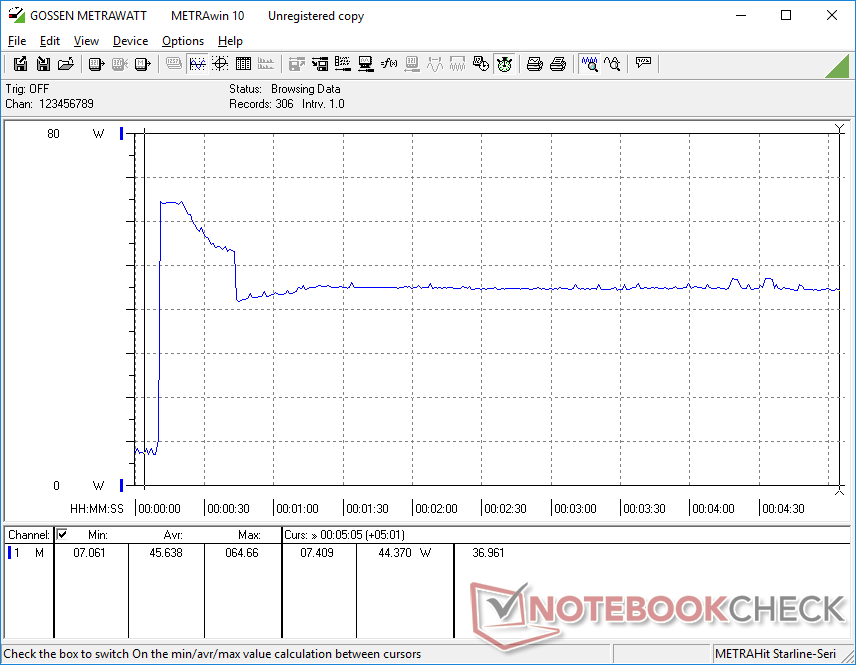
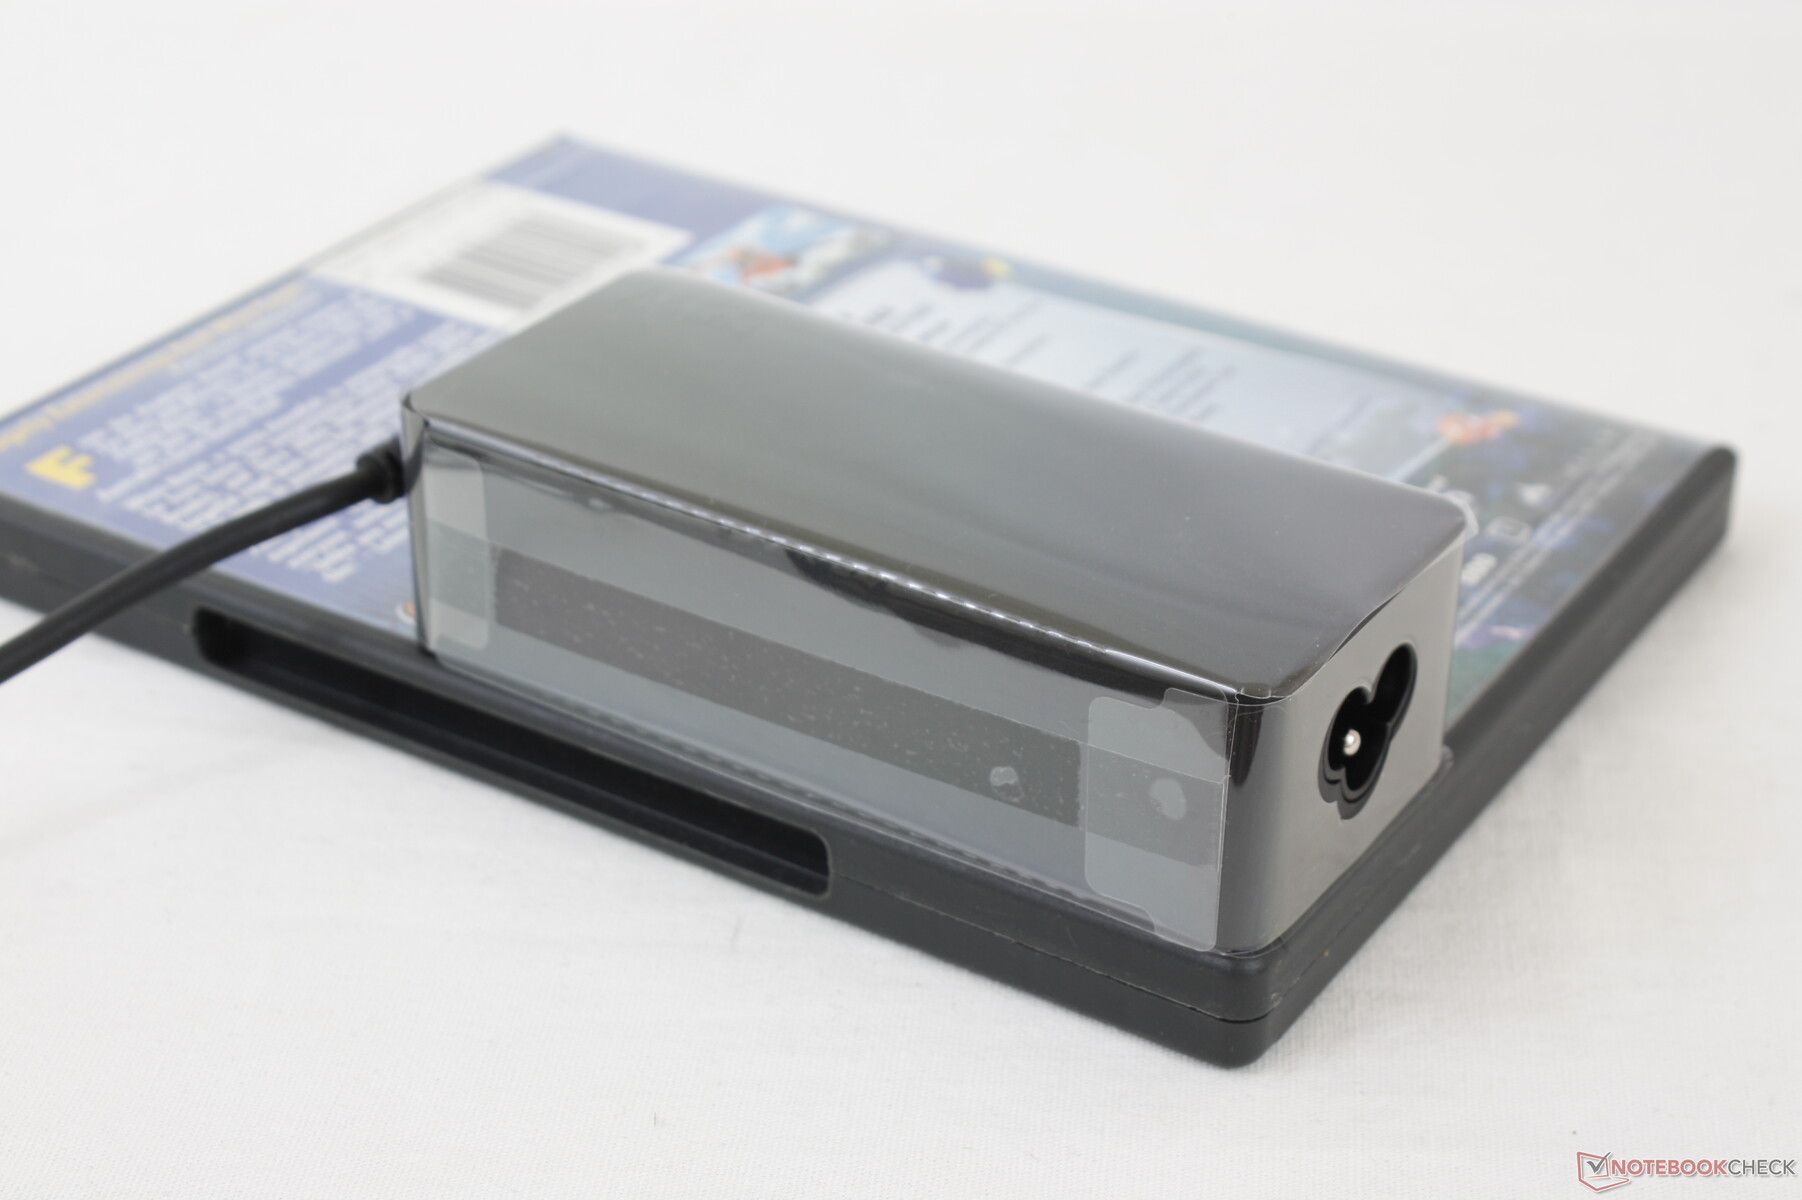
We're able to record a maximum consumption of 64.7 W from the small (~11 x 4.8 x 3 cm) 65 W AC adapter when running Prime95. This rate is temporary as shown by our graphs below.

| Off / Standby | |
| Idle | |
| Load |
|
Key:
min: | |
| Lenovo Yoga 9i 14ITL5 i5-1135G7, Iris Xe G7 80EUs, Samsung SSD PM981a MZVLB256HBHQ, IPS, 1920x1080, 14" | Asus VivoBook Flip 14 TM420IA R7 4700U, Vega 7, Samsung PM991 MZVLQ512HALU, IPS, 1920x1080, 14" | LG Gram 14T90N i7-10510U, UHD Graphics 620, Samsung SSD PM981a MZVLB512HBJQ, IPS, 1920x1080, 14" | Lenovo Yoga C740-14IML i5-10210U, UHD Graphics 620, Samsung SSD PM981a MZVLB256HBHQ, IPS, 1920x1080, 14" | Dell XPS 13 7390 2-in-1 Core i7 i7-1065G7, Iris Plus Graphics G7 (Ice Lake 64 EU), Toshiba BG4 KBG40ZPZ512G, IPS, 1920x1200, 13.4" | Lenovo Yoga Slim 7-14IIL05 i7-1065G7, GeForce MX350, WDC PC SN730 SDBPNTY-512G, , 1920x1080, 14" | |
|---|---|---|---|---|---|---|
| Power Consumption | 7% | 16% | 8% | 9% | -20% | |
| Idle Minimum * (Watt) | 3.3 | 4 -21% | 2.9 12% | 3 9% | 2.6 21% | 3.7 -12% |
| Idle Average * (Watt) | 6.7 | 6.4 4% | 5.8 13% | 3.9 42% | 5.3 21% | 5.7 15% |
| Idle Maximum * (Watt) | 6.9 | 7 -1% | 6.2 10% | 7.3 -6% | 7 -1% | 8.2 -19% |
| Load Average * (Watt) | 41.4 | 34.6 16% | 32.9 21% | 42.5 -3% | 43.1 -4% | 57.1 -38% |
| Witcher 3 ultra * (Watt) | 39.3 | 35 11% | 43.1 -10% | 54 -37% | ||
| Load Maximum * (Watt) | 64.7 | 45.1 30% | 48.5 25% | 65.5 -1% | 49 24% | 82.8 -28% |
* ... smaller is better
Battery Life
Runtimes are almost exactly the same as what we recorded on the Yoga 7 14 and Yoga Slim 7 at about 10 hours of real-world WLAN use. Battery capacity is the same as on the 13.3-inch HP Spectre x360 13 but smaller than on the 14-inch LG Gram 14 convertible.
Charging from empty to full takes about 1.5 hours.
| Lenovo Yoga 9i 14ITL5 i5-1135G7, Iris Xe G7 80EUs, 60 Wh | Asus VivoBook Flip 14 TM420IA R7 4700U, Vega 7, 42 Wh | LG Gram 14T90N i7-10510U, UHD Graphics 620, 72 Wh | Lenovo Yoga C740-14IML i5-10210U, UHD Graphics 620, 51 Wh | HP Spectre x360 13-aw0013dx i7-1065G7, Iris Plus Graphics G7 (Ice Lake 64 EU), 60 Wh | Dell XPS 13 7390 2-in-1 Core i7 i7-1065G7, Iris Plus Graphics G7 (Ice Lake 64 EU), 51 Wh | |
|---|---|---|---|---|---|---|
| Battery runtime | -19% | 22% | -19% | 19% | -9% | |
| Reader / Idle (h) | 37.7 | 32.8 -13% | 18.6 -51% | 37.1 -2% | ||
| WiFi v1.3 (h) | 9.9 | 8 -19% | 12.5 26% | 9.2 -7% | 9.9 0% | 9 -9% |
| Load (h) | 1.7 | 2.6 53% | 1.7 0% | 2.7 59% |
Pros
Cons
Verdict
Lenovo could have probably named the Yoga 9i the Yoga C941 instead because it is just a minor update to the Yoga C940. Everything from keyboard feedback to the clickpad, ports, and even LG IPS touchscreen are identical between the two models. The slight changes to the chassis feel entirely superficial as dimensions and weight remain essentially the same as well. In spite of what the big model name change implies, the actual gen-to-gen hardware improvements are ever-so-marginal.
The notable changes are mostly internal including the upgrade from 10th gen Intel to 11th gen Intel for faster CPU performance and even faster GPU performance that should all come in handy for graphics editing and the occasional gaming. If such applications don't apply to you, then the cheaper and already excellent Yoga C940 14 will provide the same convertible experience. For future revisions, we would love to see improvements to the keyboard, clickpad, display brightness, and pen thickness to fully justify the name change. Such attributes have remained stagnant across too many generations of Yoga models to ignore for any longer.
The Yoga 9i 14 is an impressive performance upgrade over the Yoga C940 14. It's too bad that the keyboard, clickpad or display didn't get the same attention.
Lenovo Yoga 9i 14ITL5
- 12/01/2020 v7 (old)
Allen Ngo
Price comparison
