Lenovo IdeaPad Flex 14API Review: Ryzen 5 raises the bar

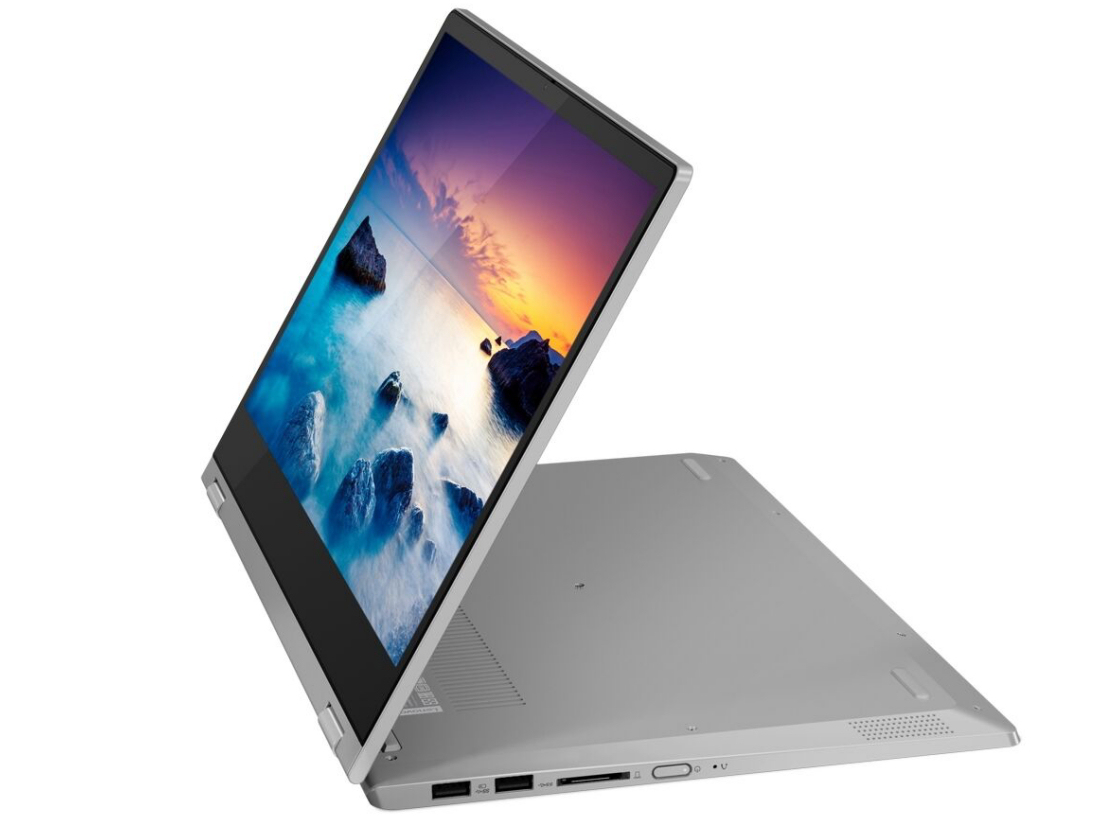
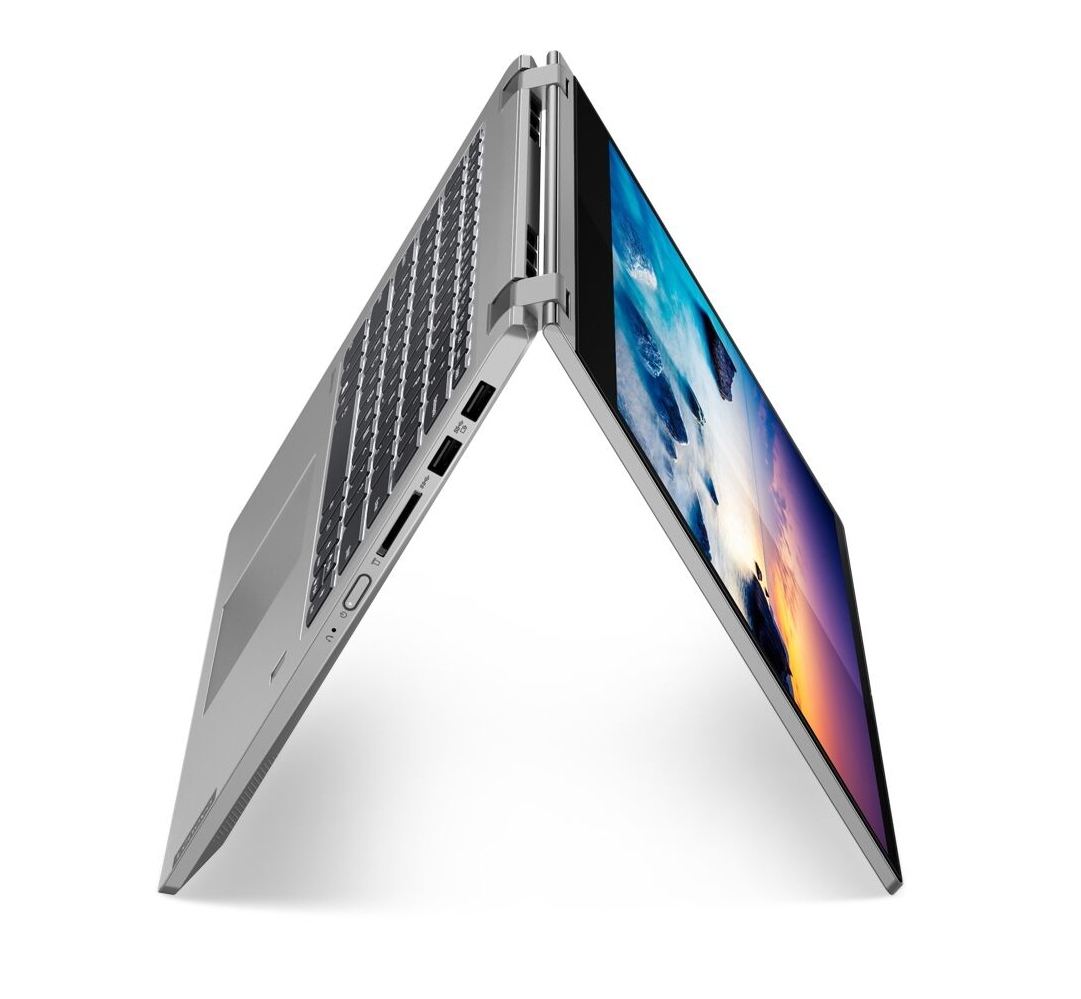
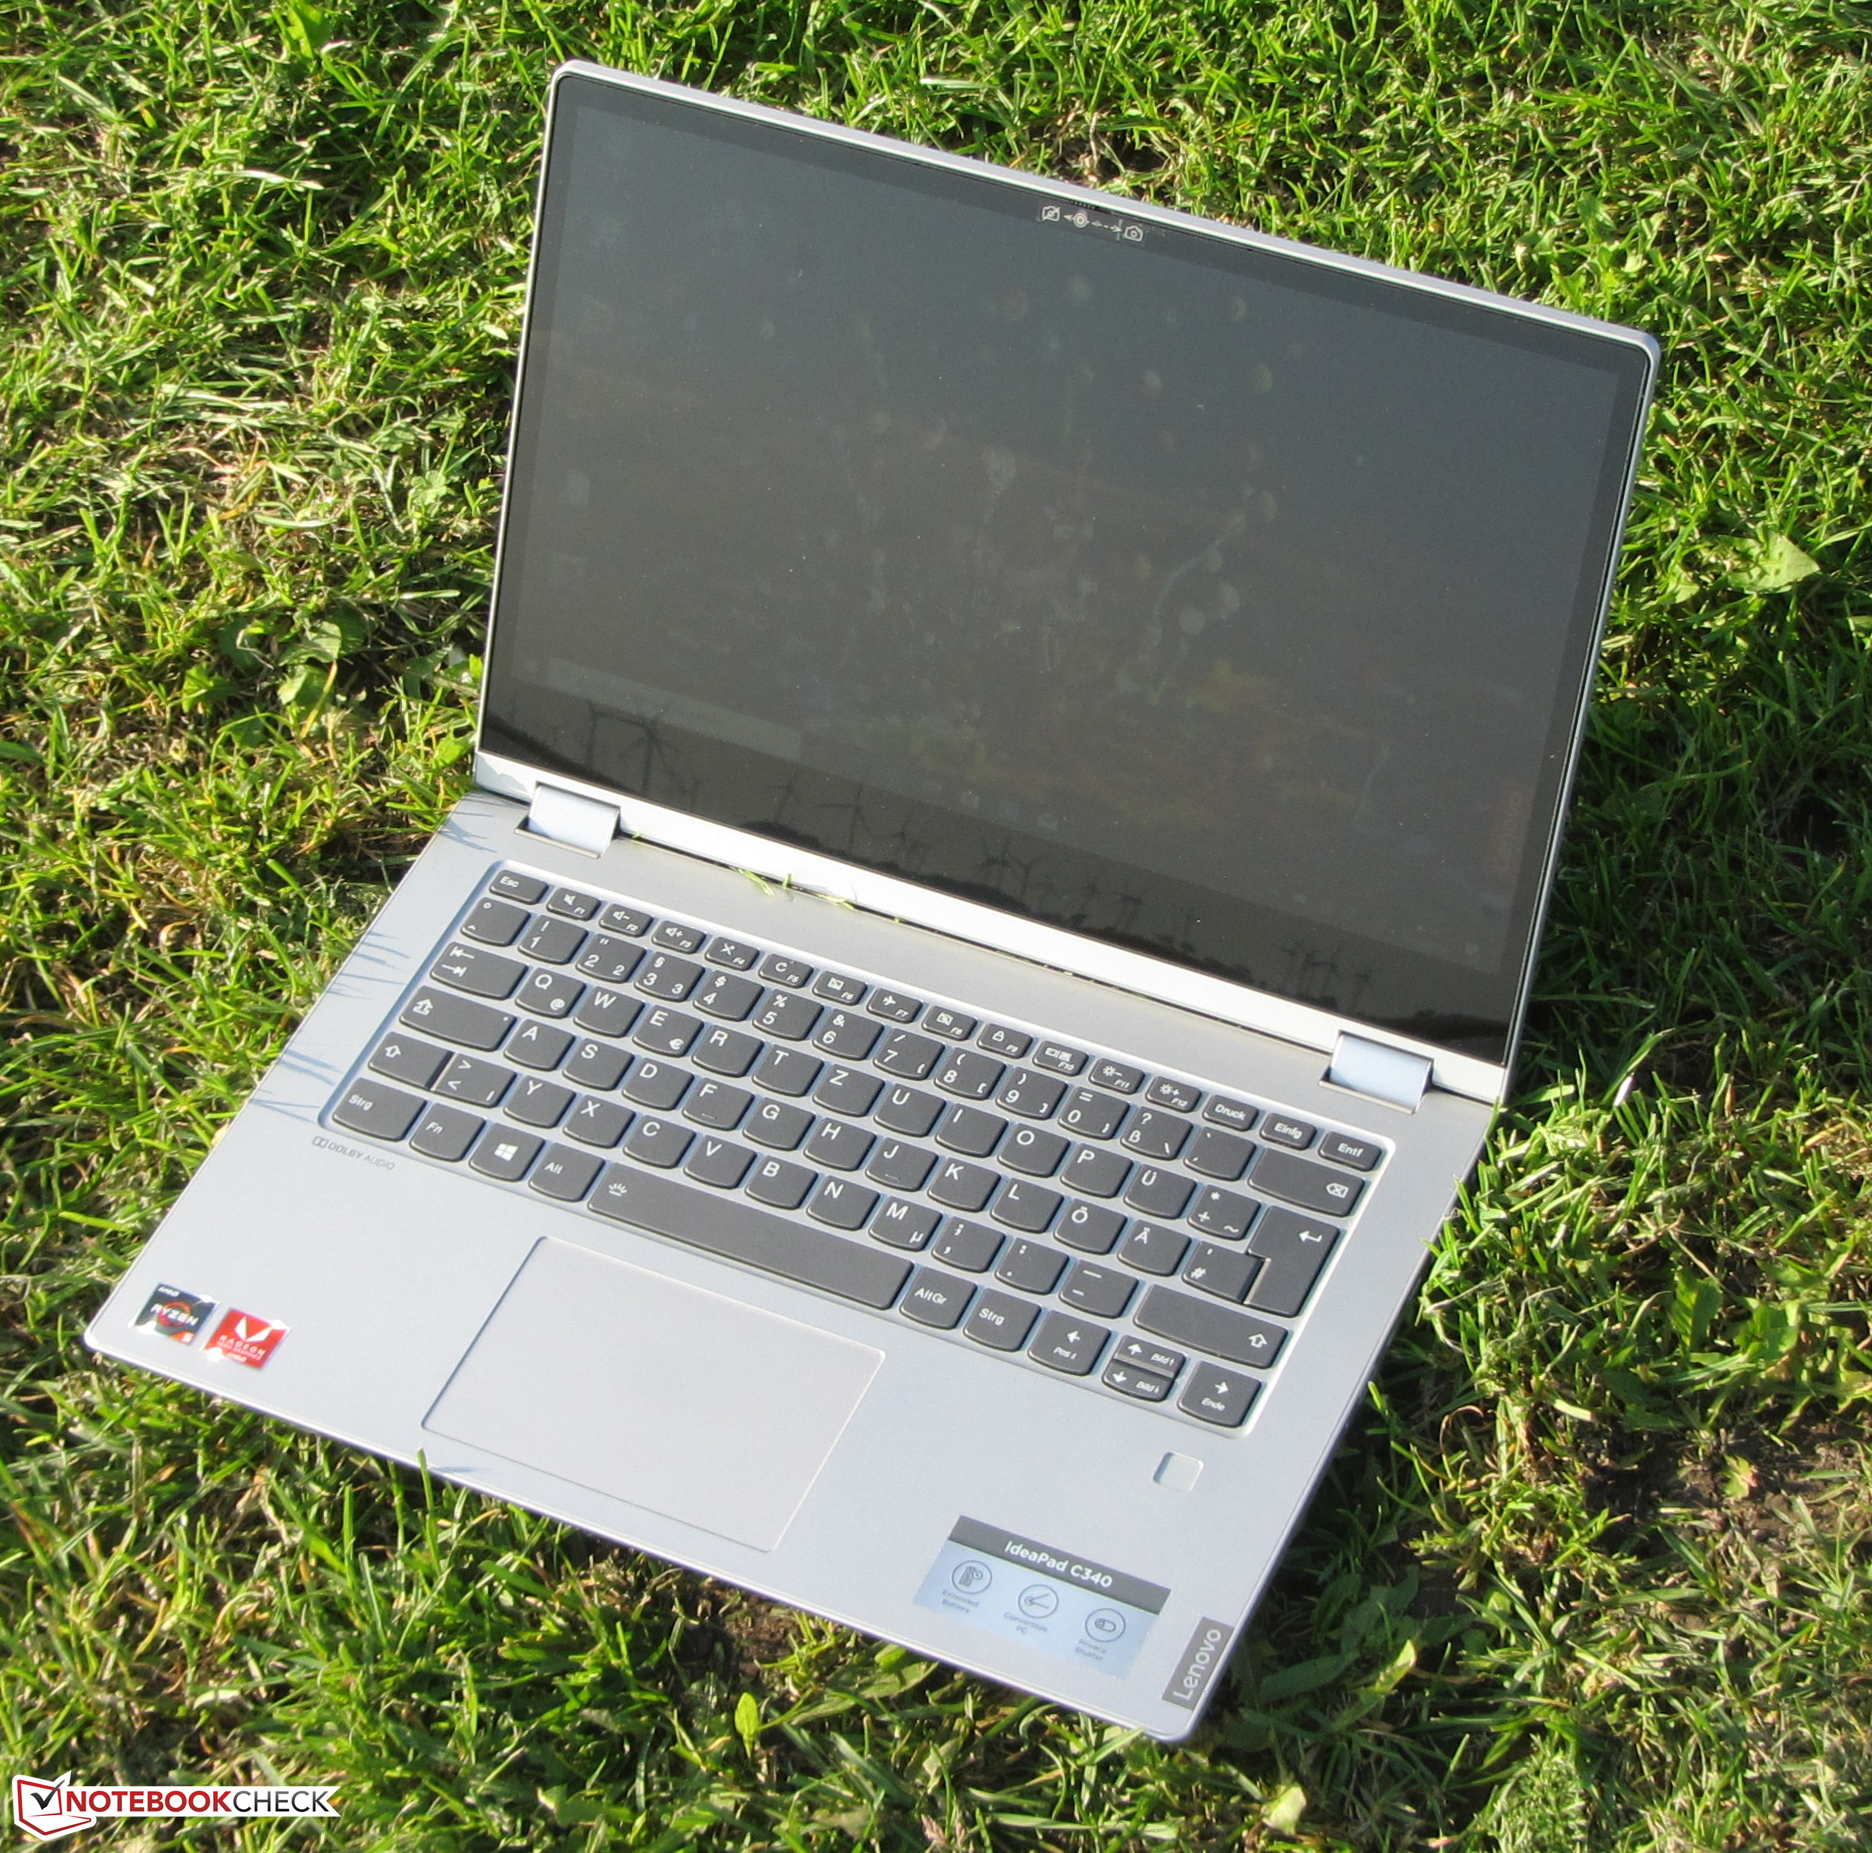
The Lenovo IdeaPad Flex 14API is a slim and compact 14-inch convertible powered by an AMD Ryzen 5 3500U APU. Except for the processor, it is identical to the Flex 14IWL. The latter is powered by an Intel CPU instead. Its main competitors are the Asus VivoBook Flip 14 TP412UA, the HP Pavilion x360 14, and the Acer Spin 3 SP314-51.
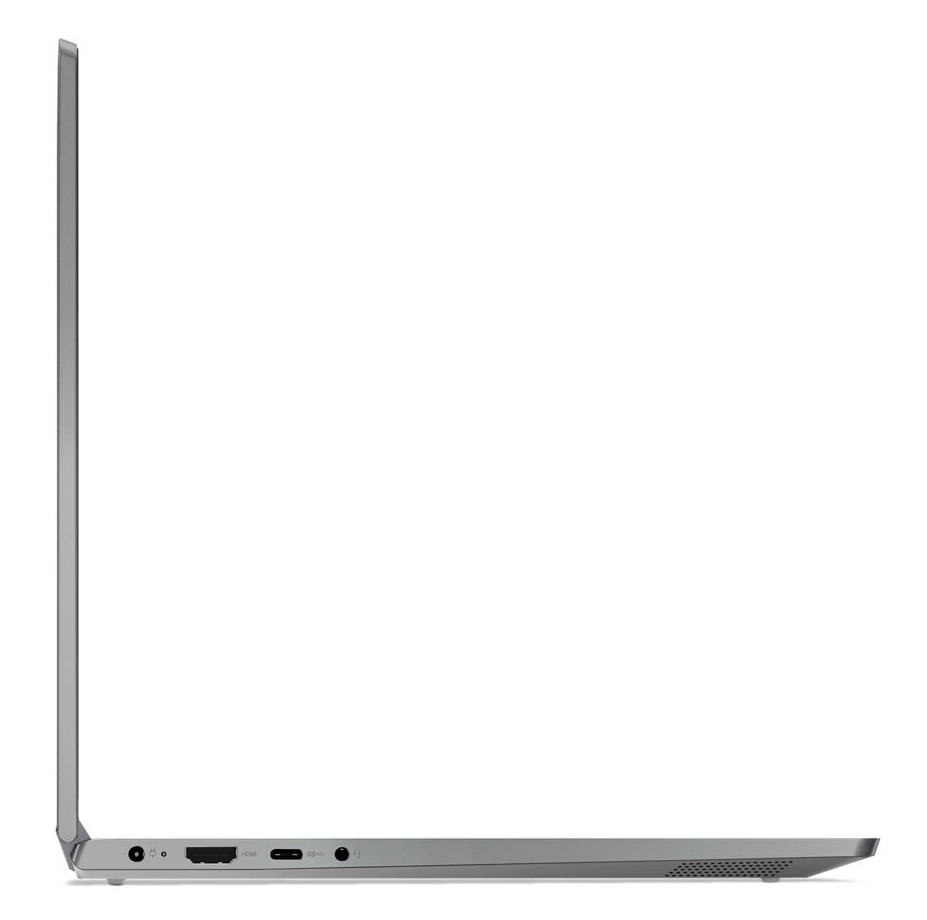
Given the similarities between the Flex 14API and the Flex 14IWL we are not going to cover case, connectivity, input devices, and speakers in this review. Should you be interested in these aspects we would like to refer you to our Flex 14 review.
Rating | Date | Model | Weight | Height | Size | Resolution | Price |
|---|---|---|---|---|---|---|---|
| 80.6 % v7 (old) | 10 / 2019 | Lenovo Ideapad C340-14API 81N6004UGE R5 3500U, Vega 8 | 1.7 kg | 17.9 mm | 14.00" | 1920x1080 | |
| 83.2 % v6 (old) | 07 / 2019 | Lenovo Flex 14IWL i5-8265U, UHD Graphics 620 | 1.7 kg | 17.8 mm | 14.00" | 1920x1080 | |
| 82.6 % v6 (old) | 09 / 2018 | Asus VivoBook Flip 14 TP412UA-DB51T i5-8250U, UHD Graphics 620 | 1.5 kg | 17.6 mm | 14.00" | 1920x1080 | |
| 79.9 % v6 (old) | 01 / 2019 | HP Pavilion x360 14-cd0002ng i3-8130U, UHD Graphics 620 | 1.6 kg | 20 mm | 14.00" | 1920x1080 | |
| 80.8 % v6 (old) | 04 / 2018 | Acer Spin 3 SP314-51-548L i5-8250U, UHD Graphics 620 | 1.7 kg | 20.8 mm | 14.00" | 1920x1080 | |
| 84.1 % v6 (old) | 06 / 2019 | Lenovo Yoga 530-14ARR-81H9000VGE R7 2700U, Vega 10 | 1.7 kg | 17.6 mm | 14.00" | 1920x1080 |

| SD Card Reader | |
| average JPG Copy Test (av. of 3 runs) | |
| Lenovo Flex 14IWL (Toshiba Exceria Pro SDXC 64 GB UHS-II) | |
| Lenovo Ideapad C340-14API 81N6004UGE (Toshiba Exceria Pro SDXC 64 GB UHS-II) | |
| HP Pavilion x360 14-cd0002ng (Toshiba Exceria Pro SDXC 64 GB UHS-II) | |
| Average of class Convertible (28.1 - 197, n=23, last 2 years) | |
| Asus VivoBook Flip 14 TP412UA-DB51T (Toshiba Exceria Pro SDXC 64 GB UHS-II) | |
| Asus VivoBook Flip 14 TP412UA-EC969T (Toshiba Exceria Pro SDXC 64 GB UHS-II) | |
| Acer Spin 3 SP314-51-548L (Toshiba Exceria Pro SDXC 64 GB UHS-II) | |
| maximum AS SSD Seq Read Test (1GB) | |
| Average of class Convertible (28.9 - 254, n=22, last 2 years) | |
| Lenovo Ideapad C340-14API 81N6004UGE (Toshiba Exceria Pro SDXC 64 GB UHS-II) | |
| Lenovo Flex 14IWL (Toshiba Exceria Pro SDXC 64 GB UHS-II) | |
| HP Pavilion x360 14-cd0002ng (Toshiba Exceria Pro SDXC 64 GB UHS-II) | |
| Asus VivoBook Flip 14 TP412UA-EC969T (Toshiba Exceria Pro SDXC 64 GB UHS-II) | |
| Asus VivoBook Flip 14 TP412UA-DB51T (Toshiba Exceria Pro SDXC 64 GB UHS-II) | |
| Acer Spin 3 SP314-51-548L (Toshiba Exceria Pro SDXC 64 GB UHS-II) | |
Display
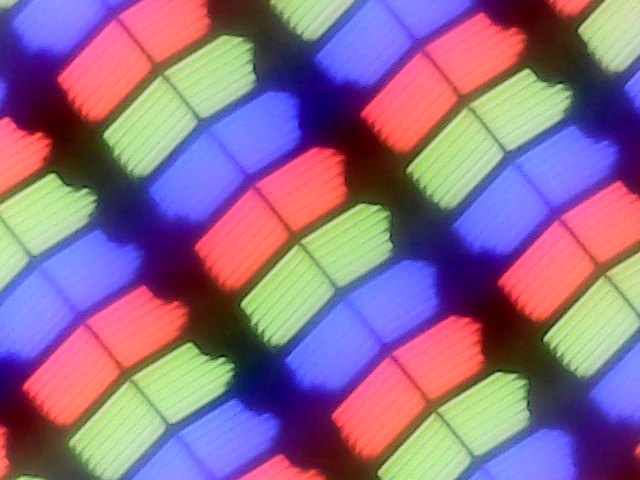
The Flex 14’s 14-inch touchscreen runs at a native resolution of 1920x1080 pixels. At just 273.1 nits and 713:1, respectively, its maximum brightness and contrast ratio are comparatively poor. We expect a display to have at least 300 nits as well as a contrast ratio of 1,000:1 in order to be considered a good display. That said not a single one of the Flex 14’s competitors in our test group managed to achieve that.
Unfortunately, we found PWM at a very low frequency of just 208 Hz at brightness levels of 90% and below. This low frequency could cause headaches and sore eyes in more sensitive users.
| |||||||||||||||||||||||||
Brightness Distribution: 87 %
Center on Battery: 285 cd/m²
Contrast: 713:1 (Black: 0.4 cd/m²)
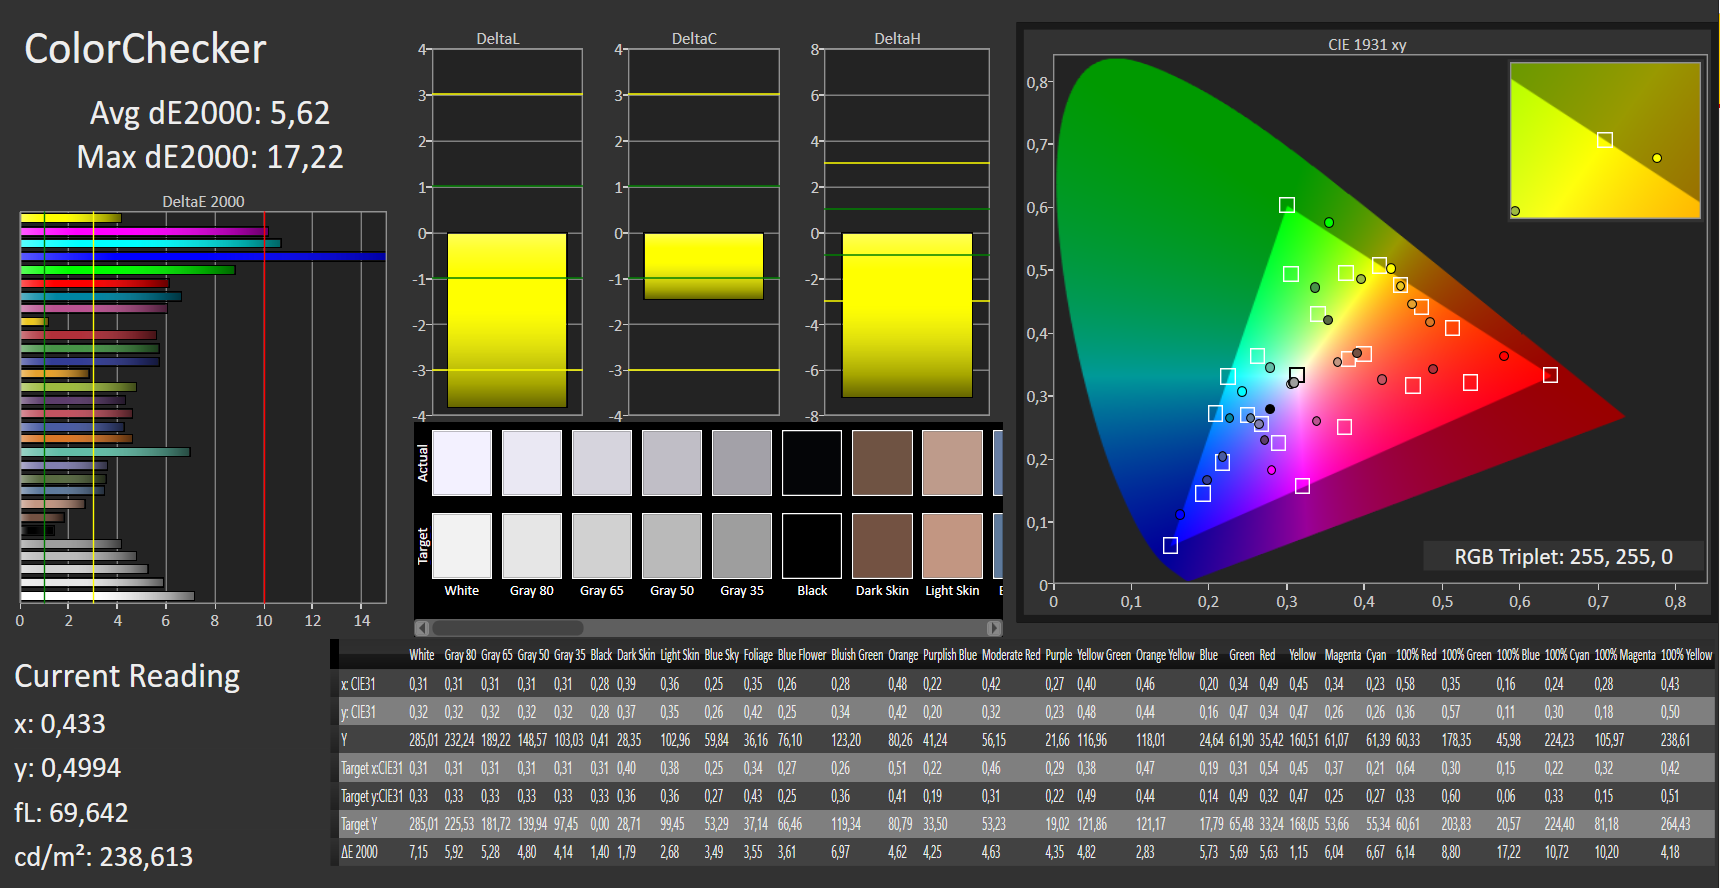
ΔE ColorChecker Calman: 5.62 | ∀{0.5-29.43 Ø4.73}
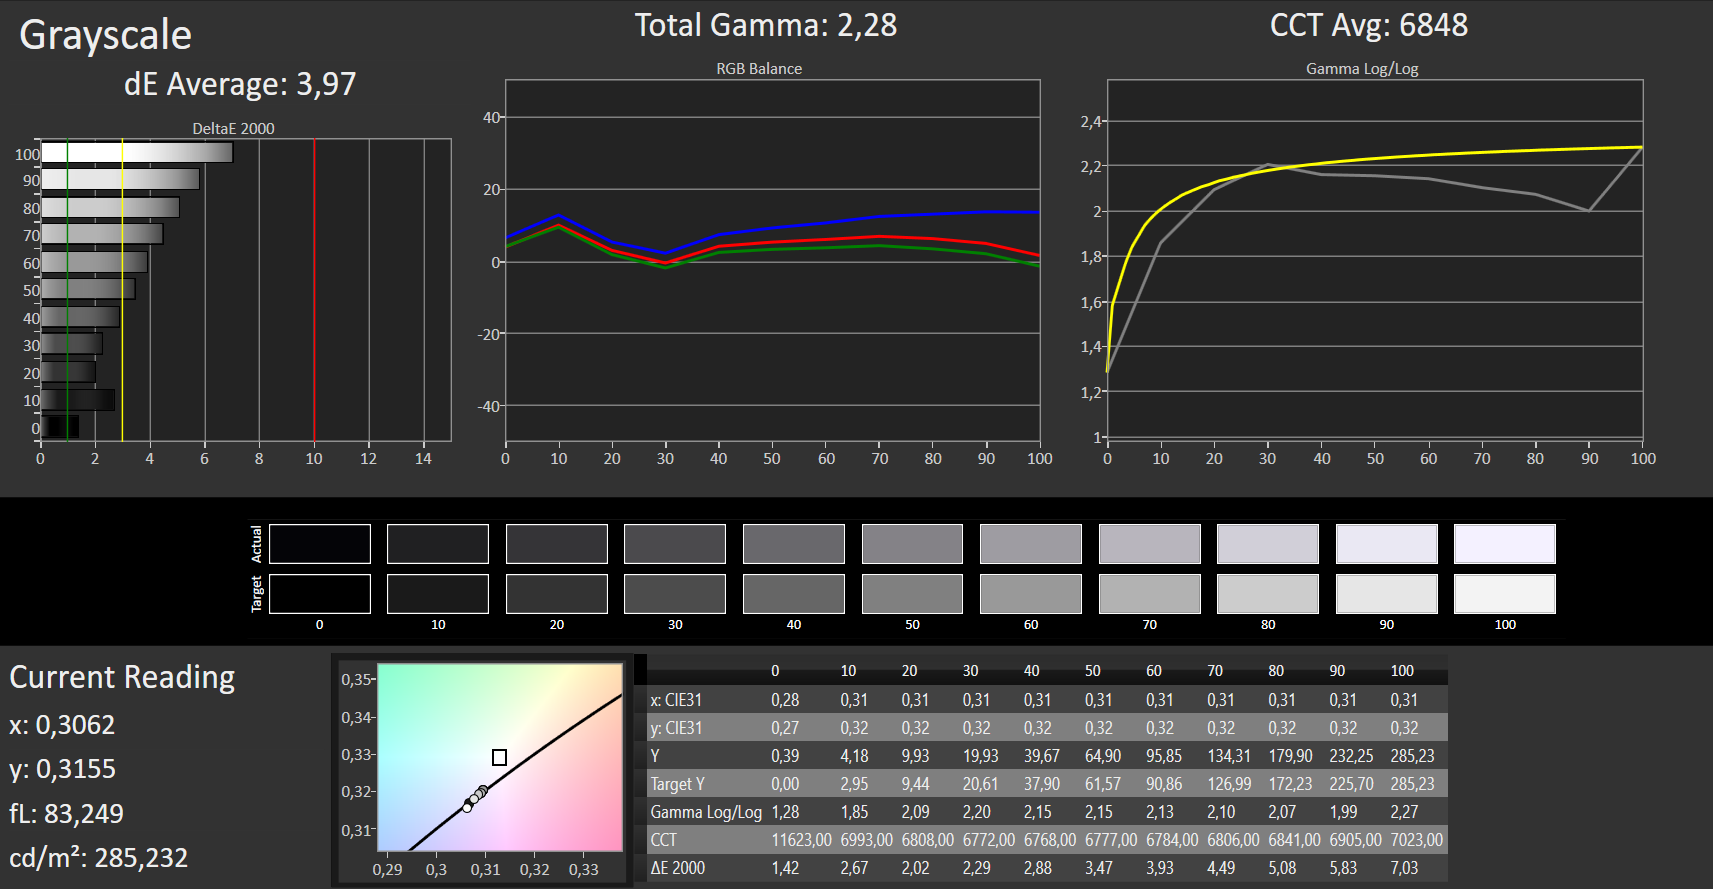
ΔE Greyscale Calman: 3.97 | ∀{0.09-98 Ø4.97}
58% sRGB (Argyll 1.6.3 3D)
38% AdobeRGB 1998 (Argyll 1.6.3 3D)
40.94% AdobeRGB 1998 (Argyll 3D)
58.6% sRGB (Argyll 3D)
39.63% Display P3 (Argyll 3D)
Gamma: 2.28
CCT: 6848 K
| Lenovo Ideapad C340-14API 81N6004UGE IPS, 1920x1080, 14" | Lenovo Flex 14IWL IPS, 1920x1080, 14" | Asus VivoBook Flip 14 TP412UA-EC969T IPS, 1920x1080, 14" | Asus VivoBook Flip 14 TP412UA-DB51T IPS, 1920x1080, 14" | HP Pavilion x360 14-cd0002ng IPS, 1920x1080, 14" | Acer Spin 3 SP314-51-548L IPS, 1920x1080, 14" | |
|---|---|---|---|---|---|---|
| Display | 1% | 1% | -0% | 4% | 0% | |
| Display P3 Coverage (%) | 39.63 | 40 1% | 39.56 0% | 39.42 -1% | 41.32 4% | 39.68 0% |
| sRGB Coverage (%) | 58.6 | 59 1% | 59.5 2% | 59.2 1% | 61.8 5% | 58.9 1% |
| AdobeRGB 1998 Coverage (%) | 40.94 | 41.32 1% | 40.88 0% | 40.73 -1% | 42.74 4% | 41 0% |
| Response Times | 14% | 10% | 8% | 2% | -5% | |
| Response Time Grey 50% / Grey 80% * (ms) | 43 ? | 30.4 ? 29% | 40 ? 7% | 38 ? 12% | 44 ? -2% | 43 ? -0% |
| Response Time Black / White * (ms) | 32 ? | 32.8 ? -2% | 28 ? 12% | 30.8 ? 4% | 30 ? 6% | 35 ? -9% |
| PWM Frequency (Hz) | 208 ? | 352.1 ? | 2439 ? | 1000 | ||
| Screen | -2% | 18% | 9% | 12% | 22% | |
| Brightness middle (cd/m²) | 285 | 284.2 0% | 251 -12% | 255.5 -10% | 225 -21% | 220 -23% |
| Brightness (cd/m²) | 273 | 271 -1% | 242 -11% | 242 -11% | 195 -29% | 221 -19% |
| Brightness Distribution (%) | 87 | 89 2% | 87 0% | 87 0% | 72 -17% | 78 -10% |
| Black Level * (cd/m²) | 0.4 | 0.49 -22% | 0.25 37% | 0.29 28% | 0.14 65% | 0.18 55% |
| Contrast (:1) | 713 | 580 -19% | 1004 41% | 881 24% | 1607 125% | 1222 71% |
| Colorchecker dE 2000 * | 5.62 | 4.59 18% | 4.03 28% | 4.18 26% | 5.44 3% | 3.98 29% |
| Colorchecker dE 2000 max. * | 17.22 | 18.03 -5% | 7.33 57% | 19.15 -11% | 20.38 -18% | 7.69 55% |
| Greyscale dE 2000 * | 3.97 | 3.9 2% | 2.55 36% | 2.2 45% | 3.98 -0% | 1.68 58% |
| Gamma | 2.28 96% | 2.123 104% | 2.48 89% | 2.05 107% | 2.32 95% | 2.37 93% |
| CCT | 6848 95% | 6679 97% | 6831 95% | 6599 98% | 6163 105% | 6382 102% |
| Color Space (Percent of AdobeRGB 1998) (%) | 38 | 38 0% | 38 0% | 37.5 -1% | 39 3% | 38 0% |
| Color Space (Percent of sRGB) (%) | 58 | 59 2% | 59 2% | 59.1 2% | 62 7% | 58 0% |
| Colorchecker dE 2000 calibrated * | 4.57 | 4.46 | 3.8 | 4 | ||
| Total Average (Program / Settings) | 4% /
0% | 10% /
13% | 6% /
7% | 6% /
9% | 6% /
14% |
* ... smaller is better
Display Response Times
| ↔ Response Time Black to White | ||
|---|---|---|
| 32 ms ... rise ↗ and fall ↘ combined | ↗ 18 ms rise | 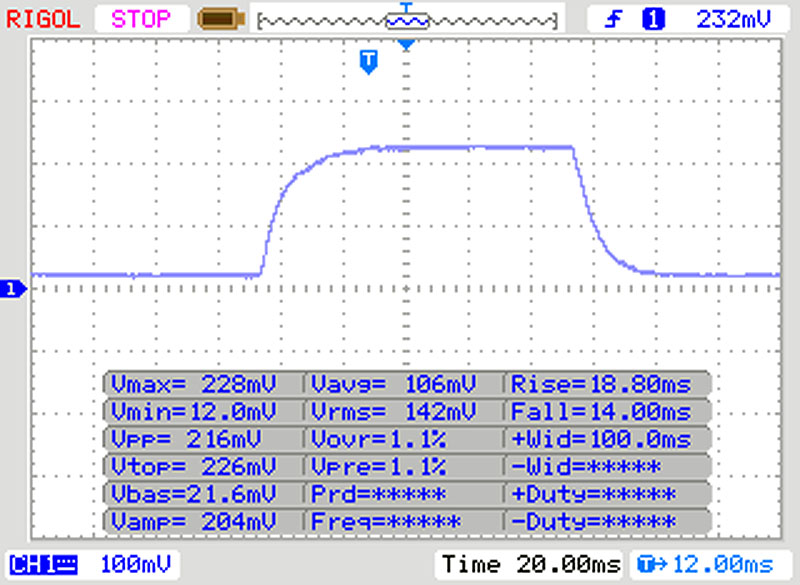 |
| ↘ 14 ms fall | ||
| The screen shows slow response rates in our tests and will be unsatisfactory for gamers. In comparison, all tested devices range from 0.1 (minimum) to 240 (maximum) ms. » 86 % of all devices are better. This means that the measured response time is worse than the average of all tested devices (19.9 ms). | ||
| ↔ Response Time 50% Grey to 80% Grey | ||
| 43 ms ... rise ↗ and fall ↘ combined | ↗ 23 ms rise | 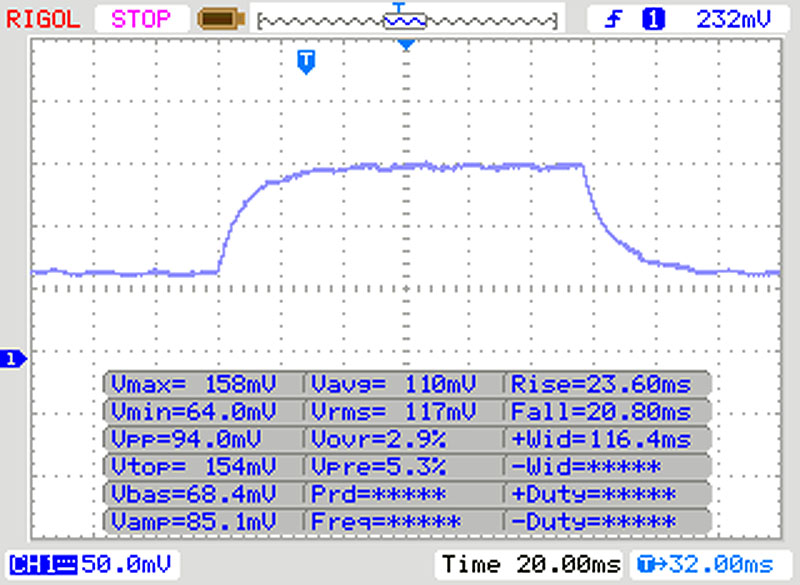 |
| ↘ 20 ms fall | ||
| The screen shows slow response rates in our tests and will be unsatisfactory for gamers. In comparison, all tested devices range from 0.165 (minimum) to 636 (maximum) ms. » 71 % of all devices are better. This means that the measured response time is worse than the average of all tested devices (31.1 ms). | ||
Screen Flickering / PWM (Pulse-Width Modulation)
| Screen flickering / PWM detected | 208 Hz | ≤ 90 % brightness setting | 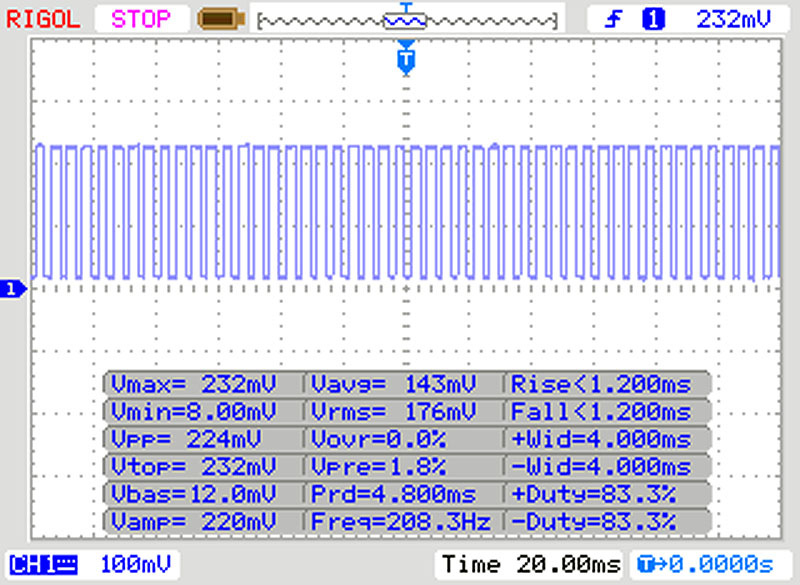 |
The display backlight flickers at 208 Hz (worst case, e.g., utilizing PWM) Flickering detected at a brightness setting of 90 % and below. There should be no flickering or PWM above this brightness setting. The frequency of 208 Hz is relatively low, so sensitive users will likely notice flickering and experience eyestrain at the stated brightness setting and below. In comparison: 52 % of all tested devices do not use PWM to dim the display. If PWM was detected, an average of 7801 (minimum: 5 - maximum: 343500) Hz was measured. | |||
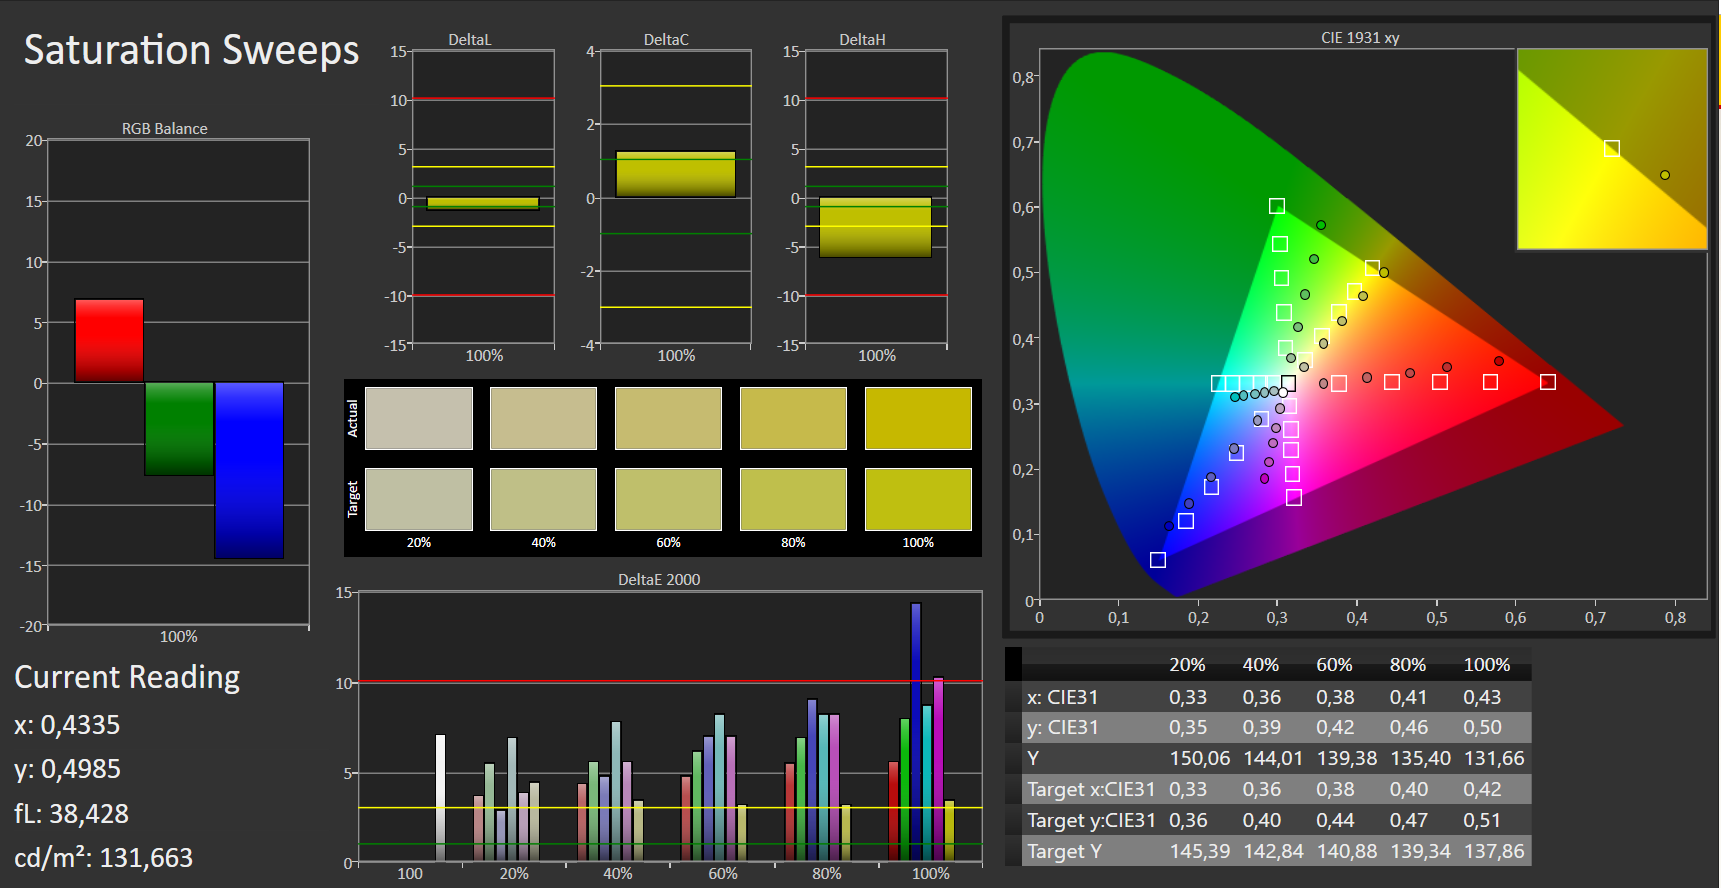
Color accuracy was decent out of the box. Nevertheless, at 5.62 the display’s Delta E deviation for colors was higher than the ideal value of less than 3. At least we found no blue tint. At no more than 38% and 58%, respectively, neither the AdobeRGB nor the sRGB color space are fully covered.
We were able to improve color accuracy slightly through calibration, and as always, the resulting ICC profile can be found for download in the box above. Keep in mind to check whether your display matches ours (manufacturer and model number). Otherwise you might end up decreasing instead of increasing color accuracy. Many OEMs source their displays from various manufacturers even within a single series.
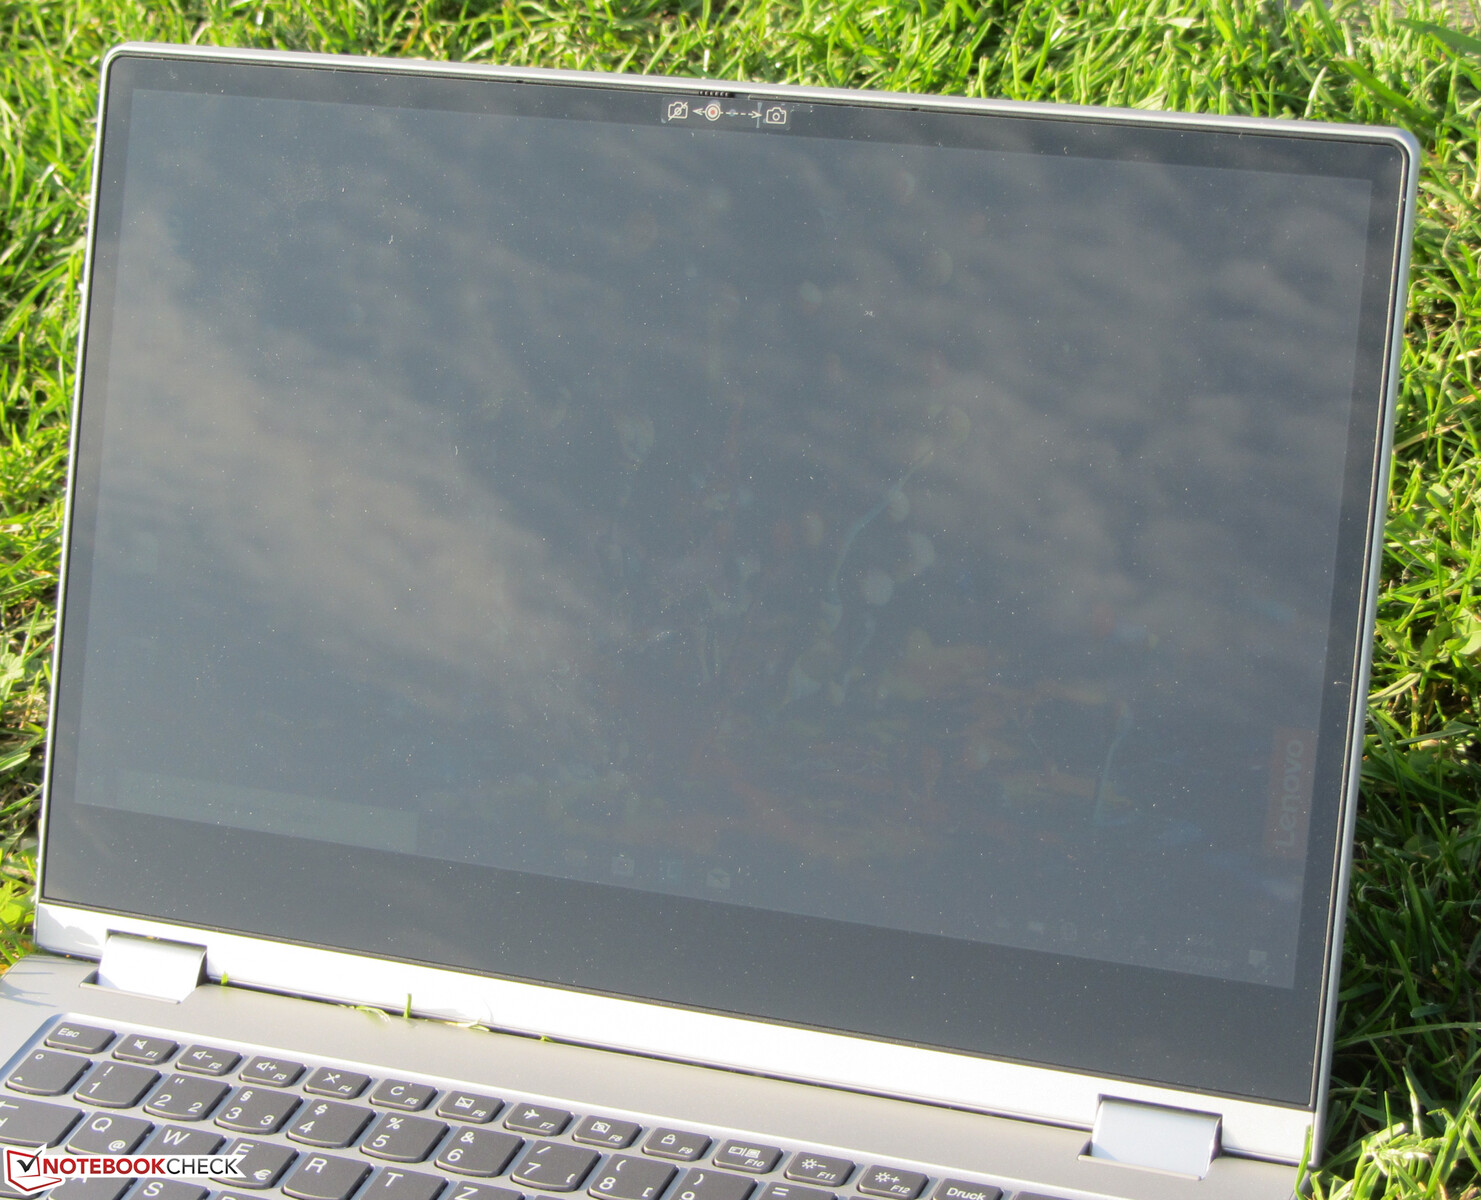
The Flex 14 is equipped with an IPS panel with wide viewing angles. Accordingly, it can be read from all sides regardless of angle. Outdoors, the display was barely usable at all due to the fatal combination of its reflective coating, its poor maximum brightness, and its low contrast ratio.
Performance
Lenovo’s IdeaPad Flex 14API is a 14-inch convertible with more than enough oomph for all office and internet applications and workloads. Our review unit sold for around 650 Euros (~$714). Various SKUs are available, and prices start at around $450.
Processor
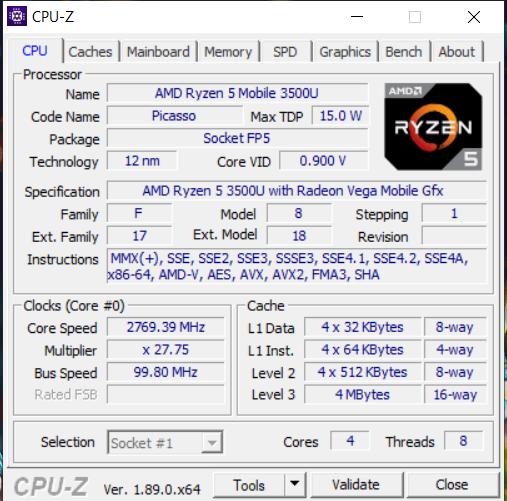
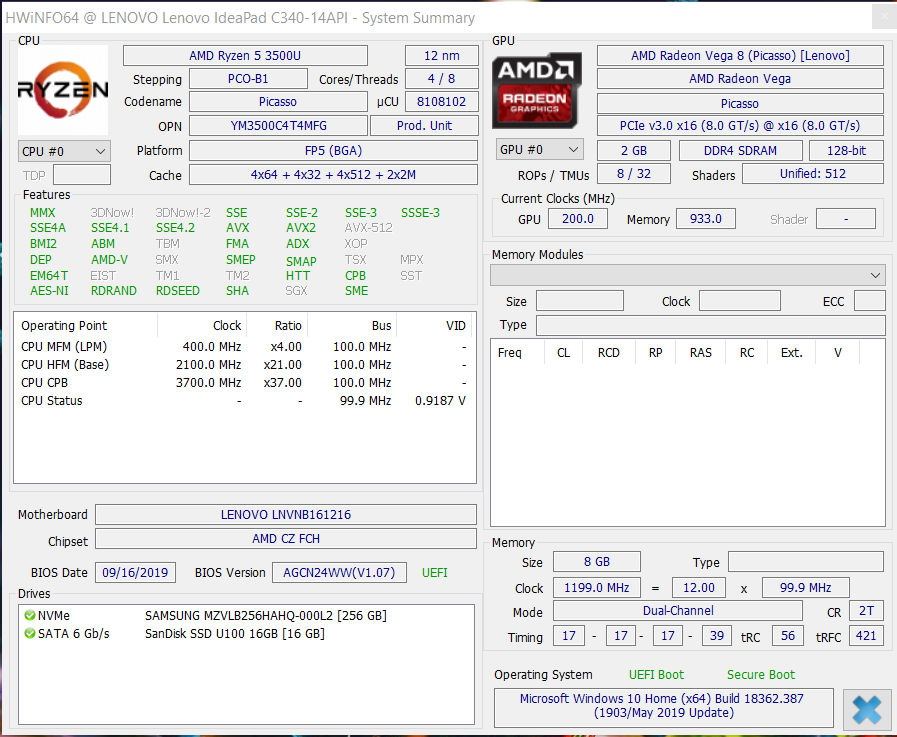
The Flex 14 is equipped with a Ryzen 5 3500U (Picasso) APU. At its core sits a quad-core CPU running at 2.1 GHz, with a turbo boost of up to 3.7 GHz, and support for simultaneous multi-threading (SMT) with two threads per core.
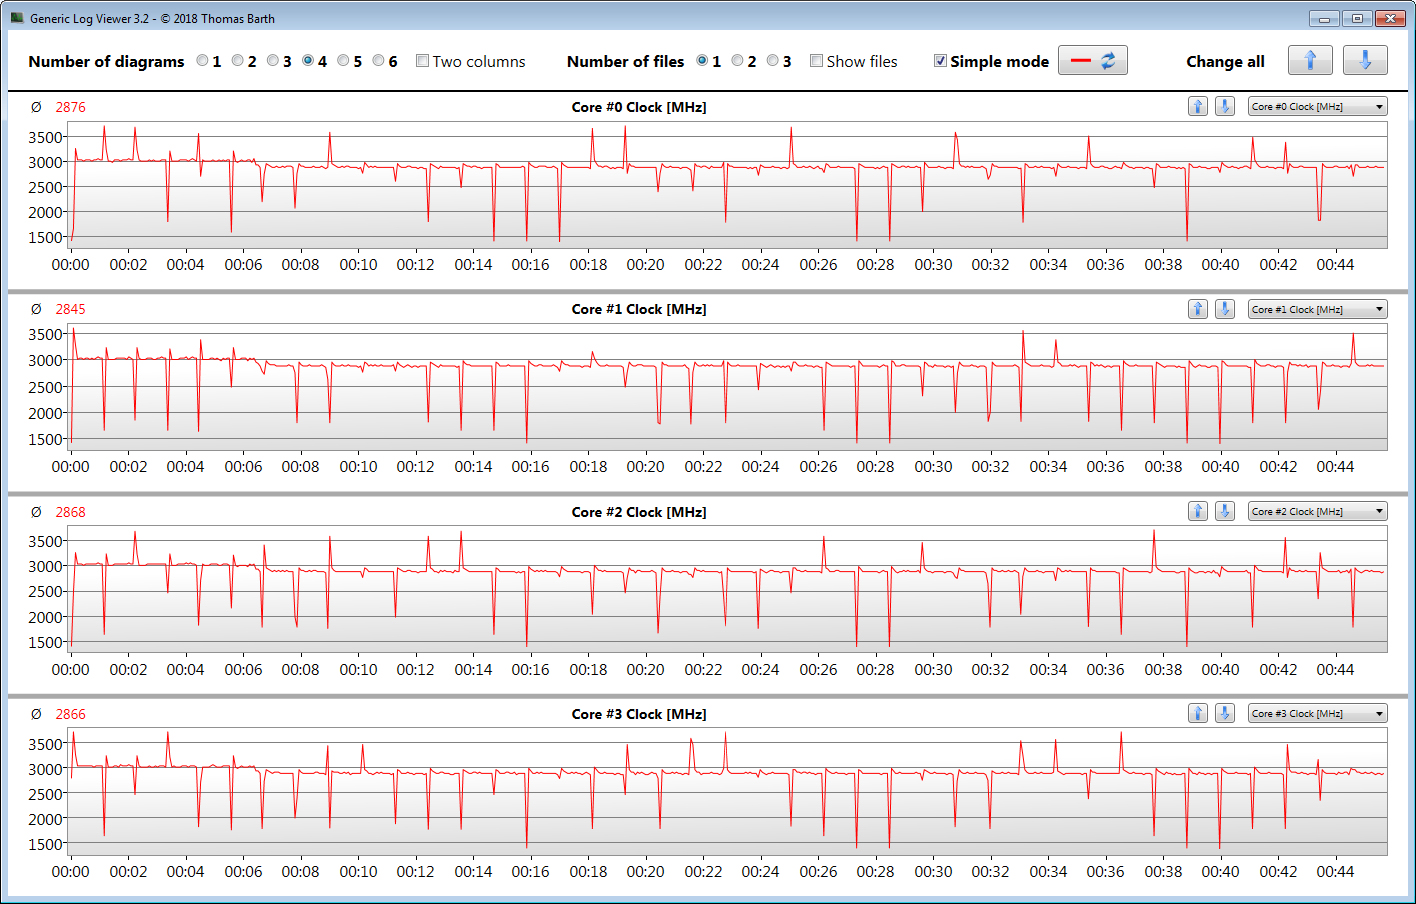
In our Cinebench R15 multithread test the cores ran at up to 3.3 GHz for a short time but eventually dropped to 3 GHz for the remainder of the test. In the single-thread test the single CPU core ran at between 1.5 and 3.7 GHz. On battery, the CPU started out at 2.4 GHz in the multithread test but quickly increased its clock speed to 3.1-3.2 GHz. In the single-thread test it ran at between 1.4 and 2.4 GHz.
We run the Cinebench R15 multithread test in a 30-minute loop in order to determine whether or not turbo boost is applied liberally during long periods of high sustained load. The scores drop between the first and the seventh iteration but remain constant afterwards. Turbo boost is applied, albeit not at its full potential.
| Mozilla Kraken 1.1 - Total | |
| HP Pavilion x360 14-cd0002ng (42.17134.10 EDGE HTML 17.17134) | |
| Asus VivoBook Flip 14 TP412UA-EC969T (Edge 44) | |
| Lenovo Ideapad C340-14API 81N6004UGE (Edge 44) | |
| Average AMD Ryzen 5 3500U (1101 - 1693, n=14) | |
| Acer Spin 3 SP314-51-548L (Edge 41) | |
| Average of class Convertible (386 - 1089, n=52, last 2 years) | |
| Octane V2 - Total Score | |
| Average of class Convertible (50984 - 123023, n=13, last 2 years) | |
| Acer Spin 3 SP314-51-548L (Edge 41) | |
| Lenovo Ideapad C340-14API 81N6004UGE (Edge 44) | |
| Average AMD Ryzen 5 3500U (19083 - 32938, n=11) | |
| Asus VivoBook Flip 14 TP412UA-EC969T (Edge 44) | |
| HP Pavilion x360 14-cd0002ng (42.17134.10 EDGE HTML 17.17134) | |
| JetStream 1.1 - 1.1 Total | |
| Acer Spin 3 SP314-51-548L (Edge 41) | |
| Asus VivoBook Flip 14 TP412UA-DB51T (Edge 42.17134.1.0) | |
| Lenovo Ideapad C340-14API 81N6004UGE (Edge 44) | |
| HP Pavilion x360 14-cd0002ng (42.17134.10 EDGE HTML 17.17134) | |
| Average AMD Ryzen 5 3500U (106.9 - 208, n=13) | |
* ... smaller is better
System Performance
The system felt very fast and snappy thanks to its combination of Ryzen APU, NVMe SSD, and dual-channel RAM. We did not encounter any issues during our review period. The notebook is more than fast enough for office and internet applications, and it scored very well in our PCMark benchmarks.
| PCMark 8 Home Score Accelerated v2 | 3538 points | |
| PCMark 8 Creative Score Accelerated v2 | 3549 points | |
| PCMark 8 Work Score Accelerated v2 | 4613 points | |
| PCMark 10 Score | 3972 points | |
Help | ||
Storage Devices
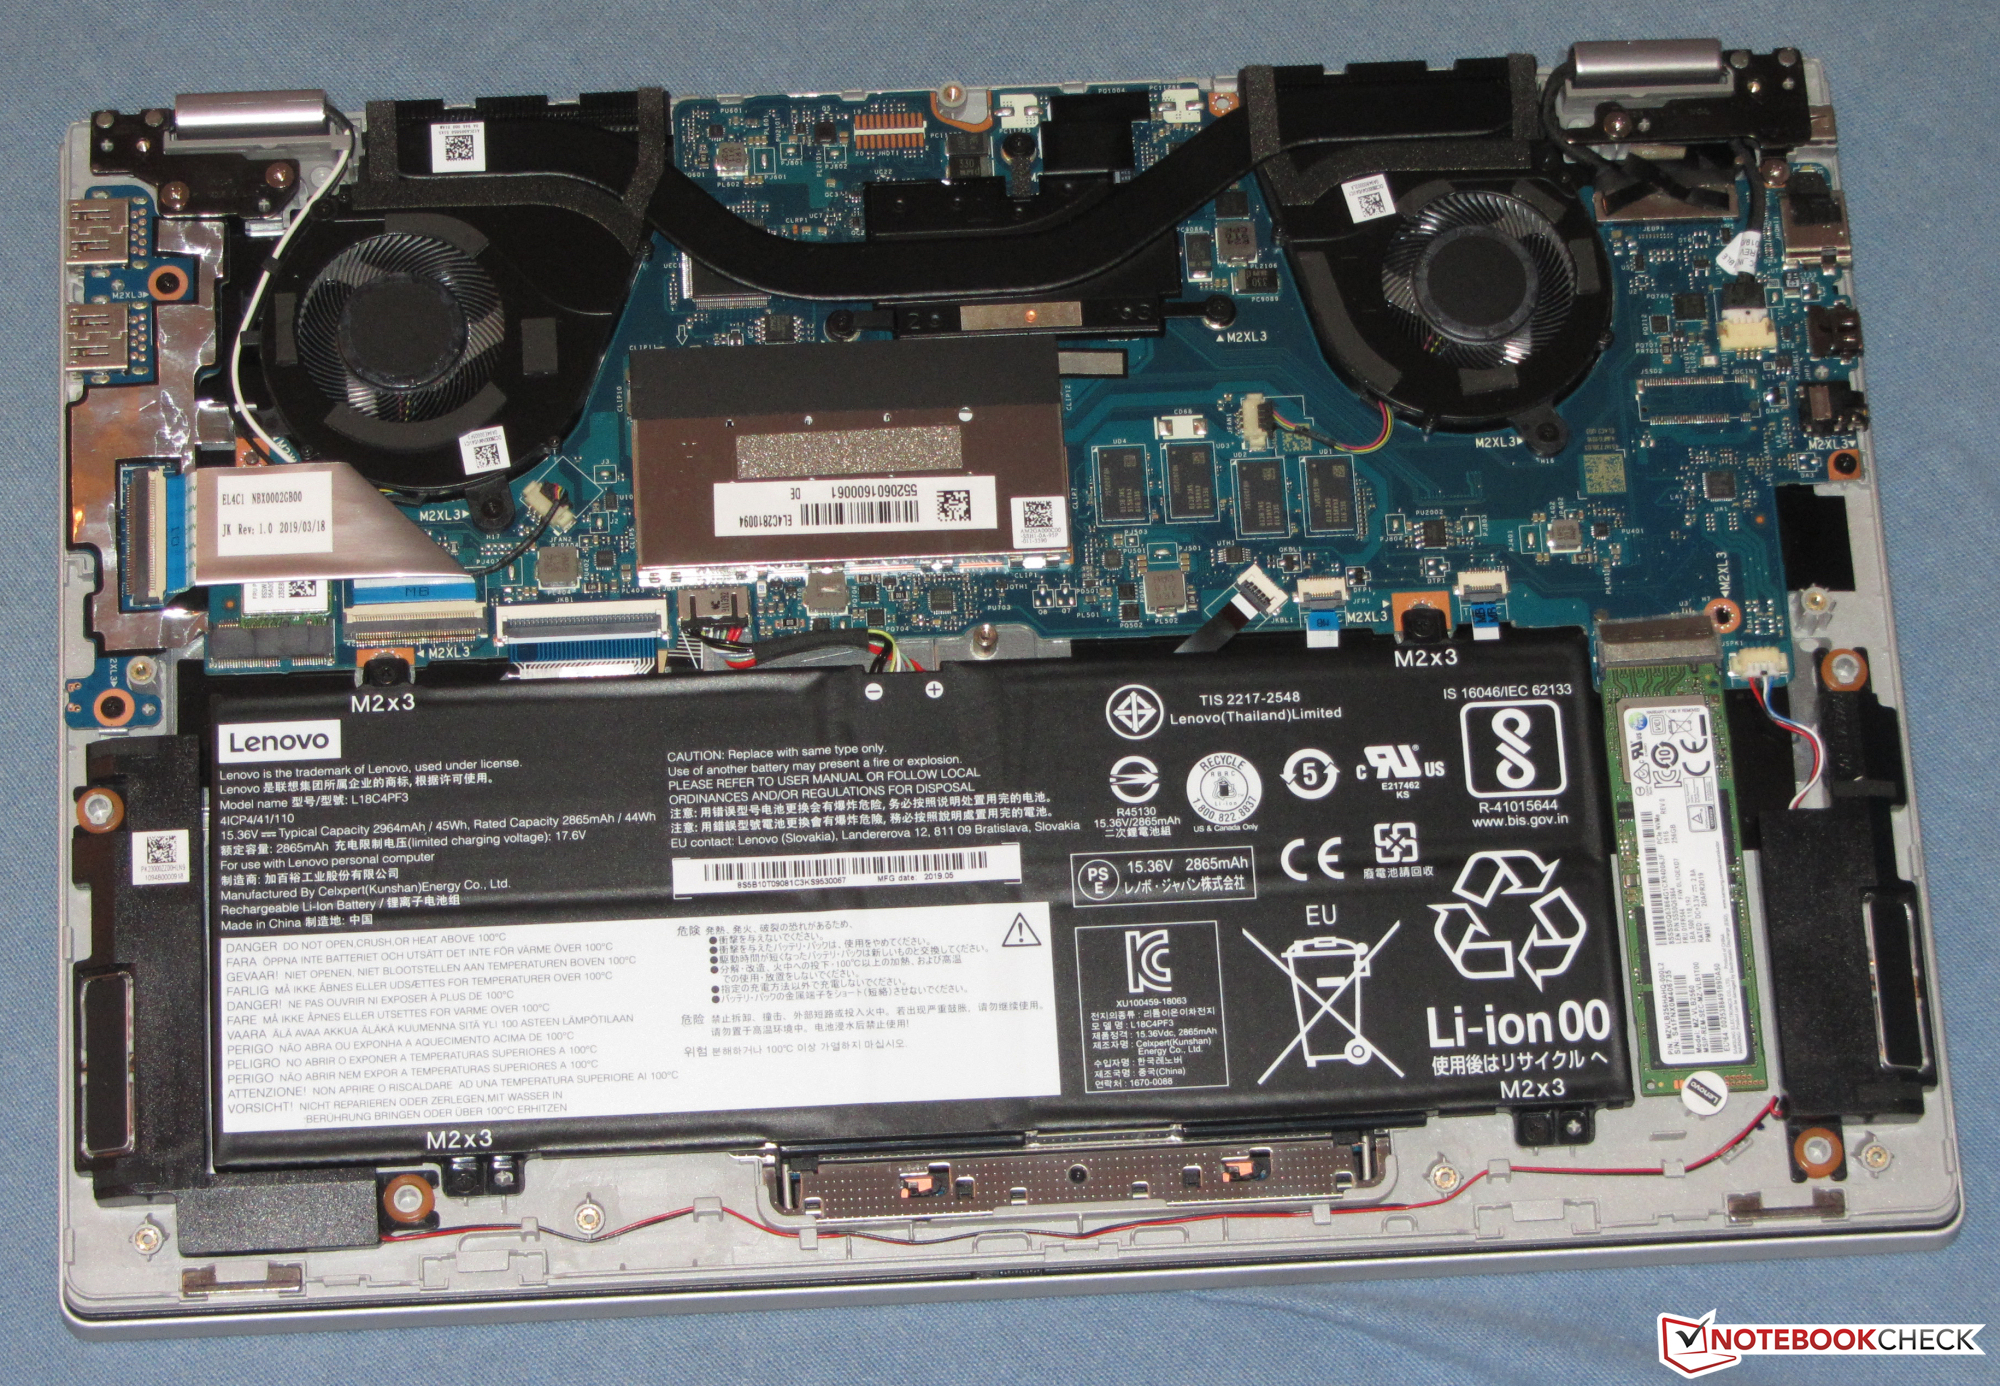
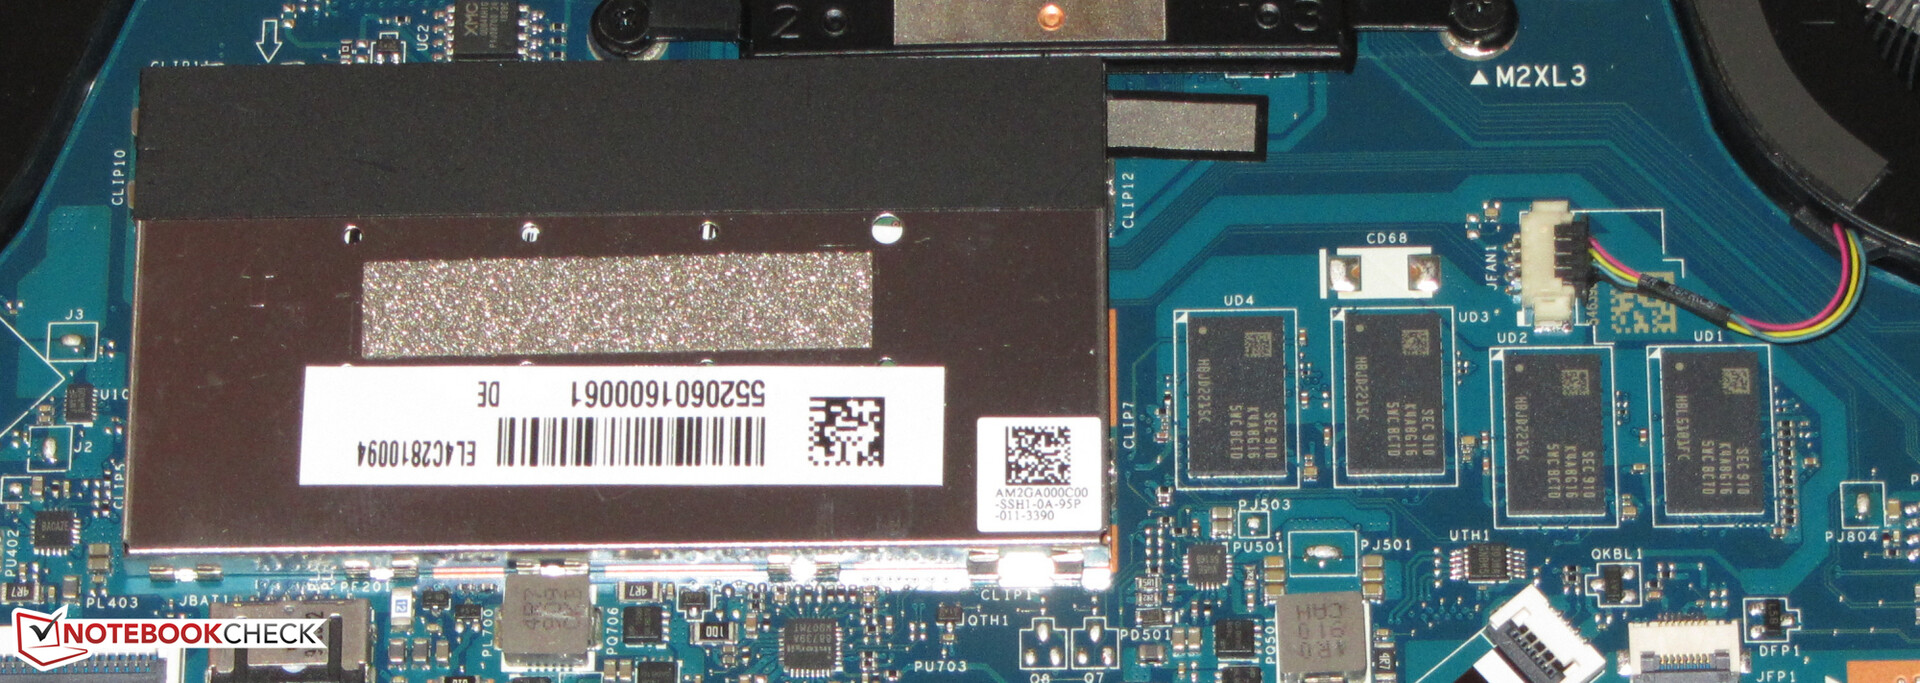
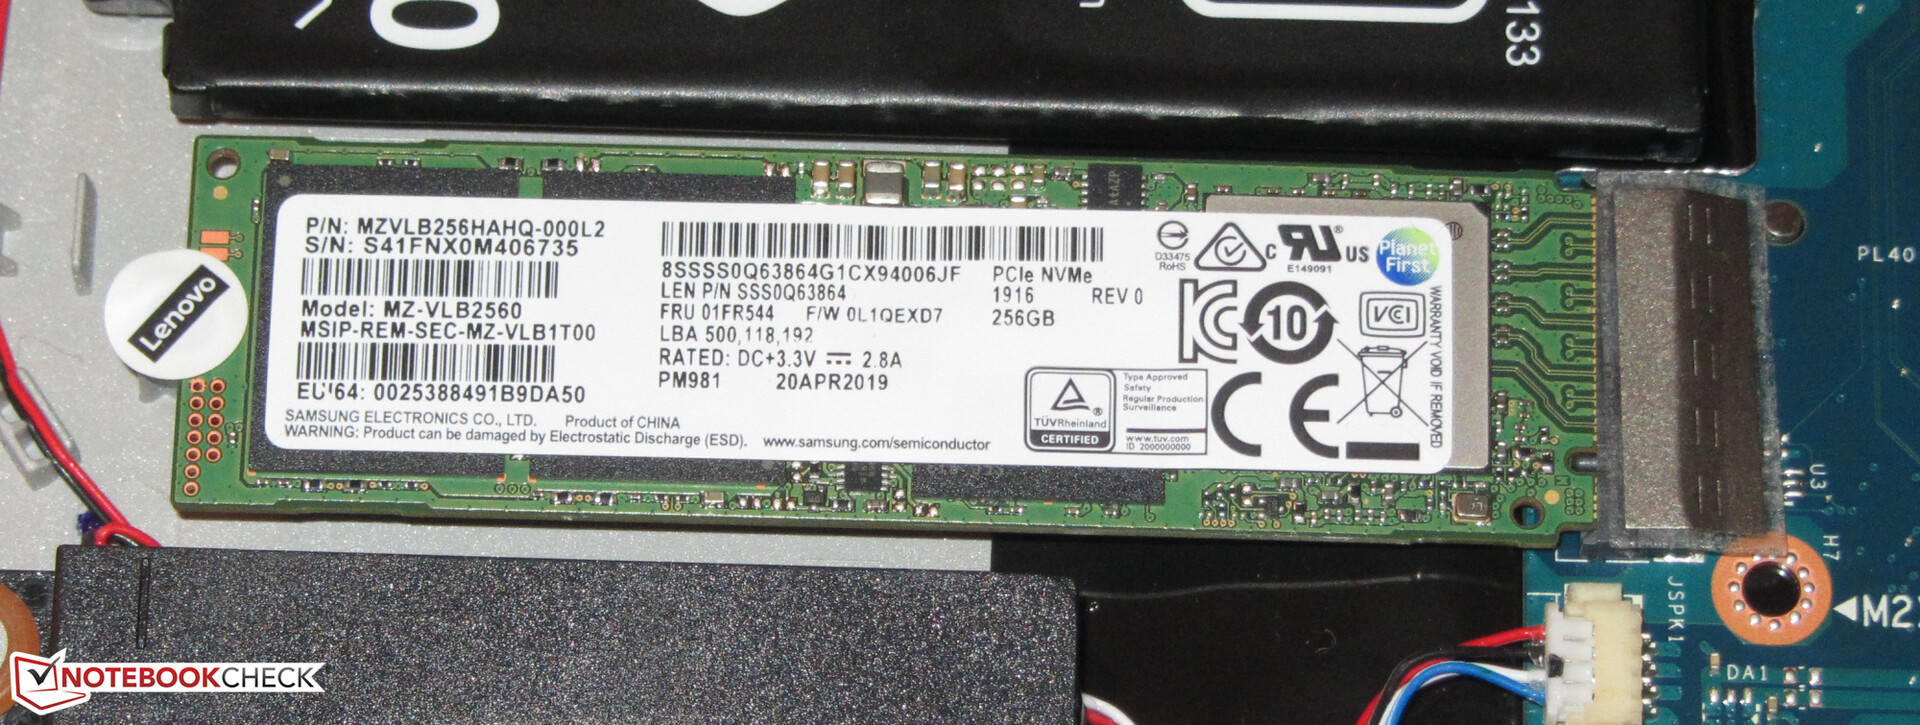
Our review unit was equipped with a fast 256 GB M.2-2280 NVMe SSD made by Samsung. Around 214 GB was user accessible after first boot; the rest is used up by the recovery partition and the Windows operating system. The SSD was very fast overall. Since they are connected to the much faster PCI Express bus NVMe SSDs tend to be much faster than SATA III SSDs, which are limited to just 600 MB/s.

| Lenovo Ideapad C340-14API 81N6004UGE Samsung SSD PM981 MZVLB256HAHQ | Lenovo Flex 14IWL Samsung SSD PM981 MZVLB256HAHQ | Asus VivoBook Flip 14 TP412UA-EC969T SanDisk SD9SN8W256G1002 | Asus VivoBook Flip 14 TP412UA-DB51T Micron 1100 MTFDDAV256TBN | Acer Spin 3 SP314-51-548L Micron 1100 MTFDDAV256TBN | Average Samsung SSD PM981 MZVLB256HAHQ | Average of class Convertible | |
|---|---|---|---|---|---|---|---|
| CrystalDiskMark 5.2 / 6 | 15% | -57% | -56% | -50% | 45% | 76% | |
| Write 4K (MB/s) | 132.9 | 136.5 3% | 44.92 -66% | 66.5 -50% | 90.7 -32% | 116.1 ? -13% | 144.3 ? 9% |
| Read 4K (MB/s) | 42.75 | 45.74 7% | 25.32 -41% | 24.65 -42% | 27.58 -35% | 189.5 ? 343% | 67.3 ? 57% |
| Write Seq (MB/s) | 1447 | 466.2 -68% | 413.2 -71% | 396.1 -73% | 1409 ? -3% | 2614 ? 81% | |
| Read Seq (MB/s) | 2134 | 415.6 -81% | 465.2 -78% | 486.8 -77% | 1624 ? -24% | 2957 ? 39% | |
| Write 4K Q32T1 (MB/s) | 252 | 380.5 51% | 237.4 -6% | 227 -10% | 253.4 1% | 360 ? 43% | 454 ? 80% |
| Read 4K Q32T1 (MB/s) | 334.2 | 437.5 31% | 172.2 -48% | 188.4 -44% | 246.4 -26% | 396 ? 18% | 583 ? 74% |
| Write Seq Q32T1 (MB/s) | 1447 | 1502 4% | 532 -63% | 439.9 -70% | 436 -70% | 1492 ? 3% | 4362 ? 201% |
| Read Seq Q32T1 (MB/s) | 3522 | 3357 -5% | 563 -84% | 533 -85% | 524 -85% | 3313 ? -6% | 5787 ? 64% |
GPU Performance
The other half of the Ryzen 5 APU is a Radeon RX Vega 8 GPU with support for DirectX 12 and clock speeds of up to 1,200 MHz. 3DMark results were at a level expected of this particular GPU, which benefits immensely from dual-channel RAM configurations.
| 3DMark 11 Performance | 3950 points | |
| 3DMark Ice Storm Standard Score | 62308 points | |
| 3DMark Cloud Gate Standard Score | 13484 points | |
| 3DMark Fire Strike Score | 2287 points | |
| 3DMark Time Spy Score | 714 points | |
Help | ||
Gaming Performance
The APU is powerful enough to run many of the games from our database smoothly, especially those that are a bit older or not as demanding as the latest and greatest AAA titles, such as for example Dota 2 Reborn, Diablo 3, Sims 4, Starcraft 2, Team Fortress 2, or League of Legends. Many games will run smoothly at HD resolution (1366x768) in medium details, and some will even allow higher settings and resolutions.
| low | med. | high | ultra | |
|---|---|---|---|---|
| BioShock Infinite (2013) | 116.2 | 71.4 | 60.2 | 21 |
| Control (2019) | 26 | 9.1 | 6.4 | |
| Borderlands 3 (2019) | 34.9 | 14.2 | 9 | 7.1 |
| FIFA 20 (2019) | 103.7 | 58.5 | 49.8 | 41.1 |
Emissions and Energy Management
System Noise
Overall, the IdeaPad remained comparatively quiet. Both fans are off when idle, and the laptop is completely silent as a result. Even once they start spinning, the fans are barely noticeable. However, they spin up quite quickly under load, and we measured a sound pressure level of 37.2 dB(A) during our stress test.
Noise level
| Idle |
| 30.2 / 31 / 31 dB(A) |
| Load |
| 37.3 / 37.2 dB(A) |
 | ||
30 dB silent 40 dB(A) audible 50 dB(A) loud |
||
min: | ||
Temperature
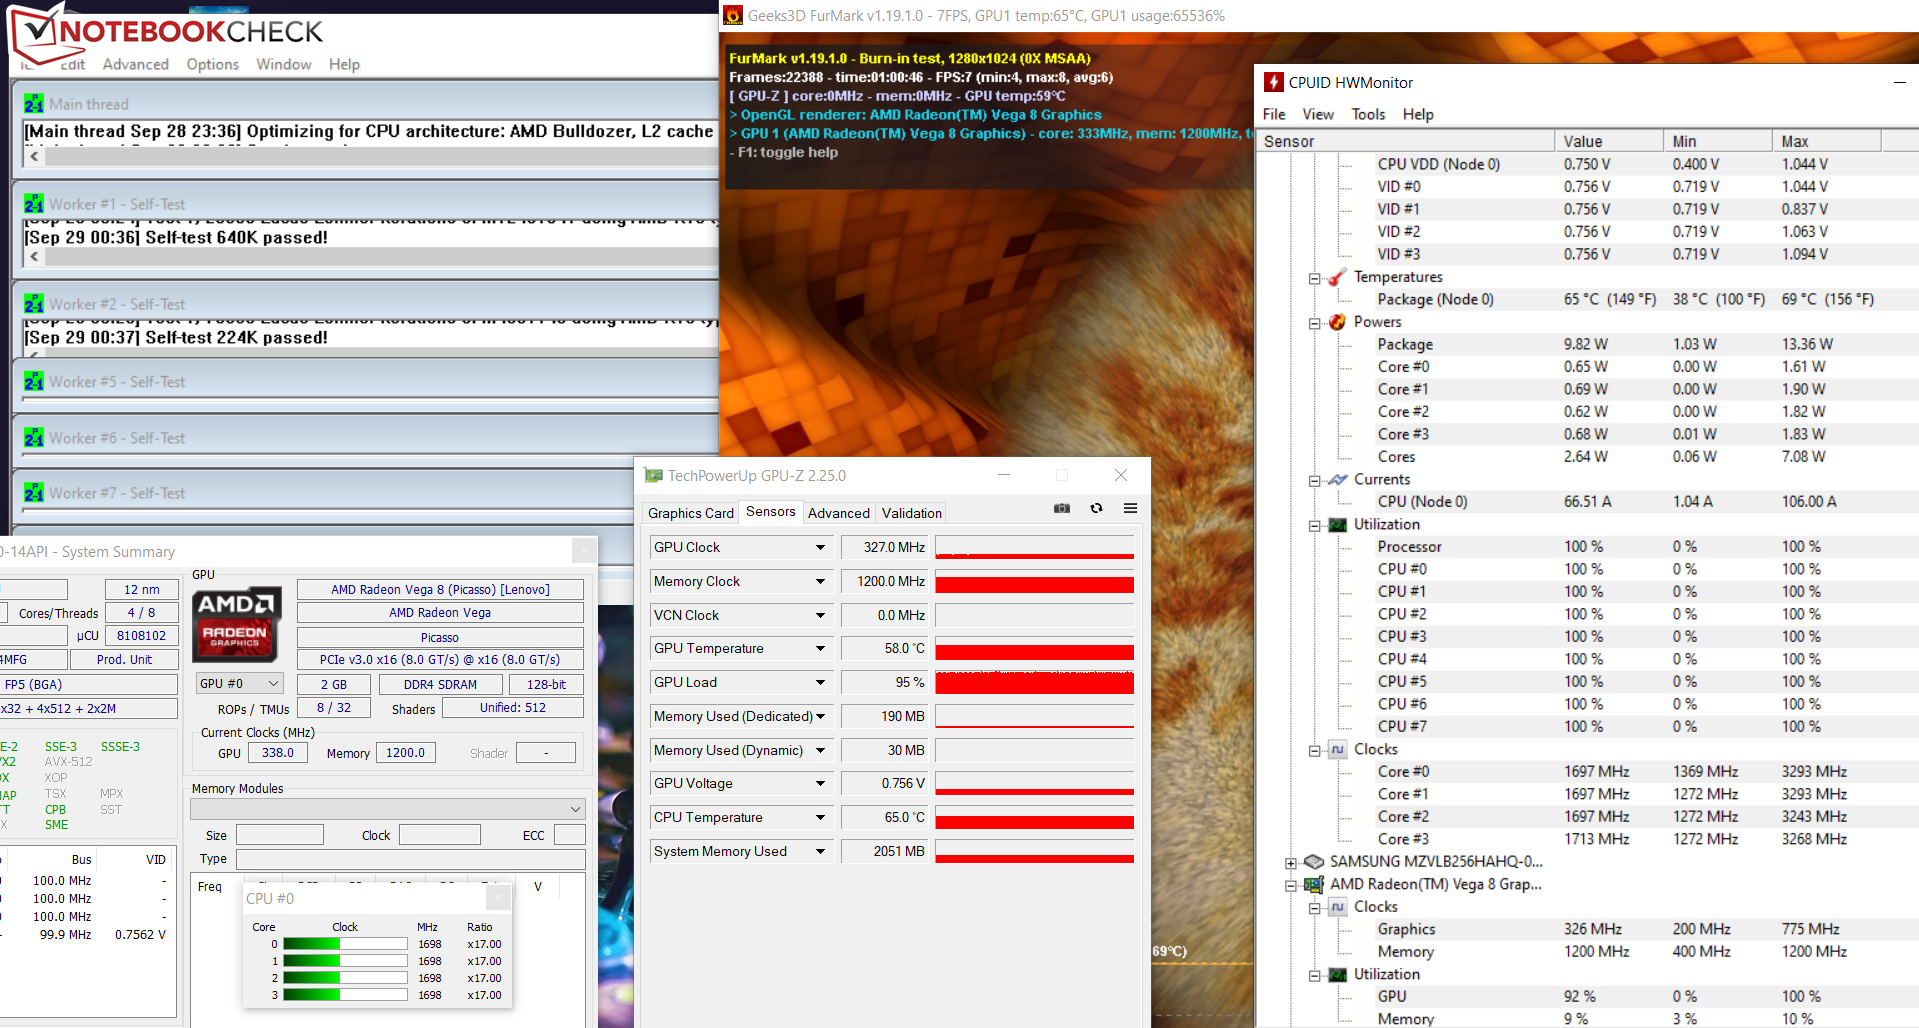
Early on during the test the CPU ran at up to 2.3-2.4 GHz, which was quickly reduced to just 1.7 GHz. The GPU ran at 300 to 400 MHz. Oddly enough, at a constant 2.3-2.4 GHz for the CPU and 600 to 800 MHz for the GPU, clock speeds were actually higher on battery than they were on mains. Keep in mind that our stress test is an extreme load scenario that rarely ever occurs during everyday use. We use this test in order to determine whether or not a notebook is stable at maximum load.
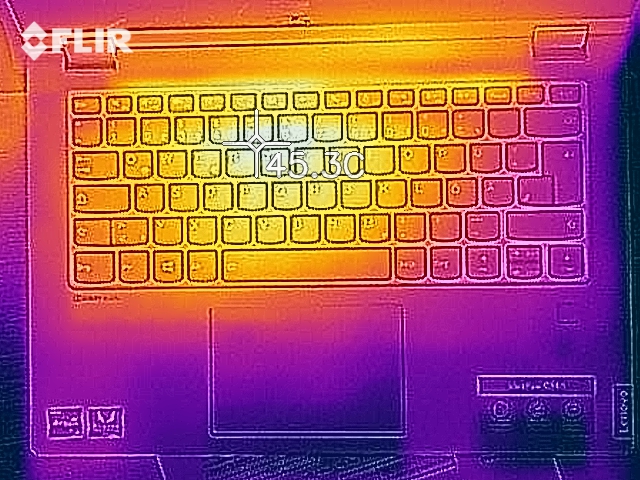
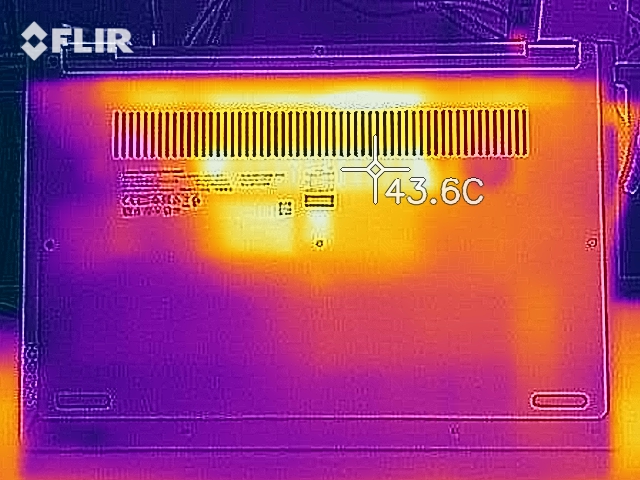
The Flex 14 stayed fairly cool overall. The maximum temperature determined during our stress test was slightly over 40 °C at the bottom of the device. It remained much cooler during normal use.
(+) The maximum temperature on the upper side is 38 °C / 100 F, compared to the average of 35.4 °C / 96 F, ranging from 19.6 to 60 °C for the class Convertible.
(±) The bottom heats up to a maximum of 40.4 °C / 105 F, compared to the average of 36.9 °C / 98 F
(+) In idle usage, the average temperature for the upper side is 26.4 °C / 80 F, compared to the device average of 30.3 °C / 87 F.
(+) The palmrests and touchpad are cooler than skin temperature with a maximum of 25.7 °C / 78.3 F and are therefore cool to the touch.
(+) The average temperature of the palmrest area of similar devices was 28 °C / 82.4 F (+2.3 °C / 4.1 F).
Speaker
Lenovo Ideapad C340-14API 81N6004UGE audio analysis
(-) | not very loud speakers (68.3 dB)
Bass 100 - 315 Hz
(±) | reduced bass - on average 10.4% lower than median
(±) | linearity of bass is average (14.9% delta to prev. frequency)
Mids 400 - 2000 Hz
(±) | higher mids - on average 6.9% higher than median
(+) | mids are linear (6% delta to prev. frequency)
Highs 2 - 16 kHz
(+) | balanced highs - only 2% away from median
(±) | linearity of highs is average (8% delta to prev. frequency)
Overall 100 - 16.000 Hz
(±) | linearity of overall sound is average (17.9% difference to median)
Compared to same class
» 37% of all tested devices in this class were better, 7% similar, 56% worse
» The best had a delta of 6%, average was 20%, worst was 57%
Compared to all devices tested
» 37% of all tested devices were better, 8% similar, 55% worse
» The best had a delta of 4%, average was 24%, worst was 134%
Asus VivoBook Flip 14 TP412UA-DB51T audio analysis
(±) | speaker loudness is average but good (77 dB)
Bass 100 - 315 Hz
(-) | nearly no bass - on average 18.2% lower than median
(±) | linearity of bass is average (12.3% delta to prev. frequency)
Mids 400 - 2000 Hz
(+) | balanced mids - only 3.2% away from median
(+) | mids are linear (6.4% delta to prev. frequency)
Highs 2 - 16 kHz
(+) | balanced highs - only 4.6% away from median
(+) | highs are linear (5.6% delta to prev. frequency)
Overall 100 - 16.000 Hz
(±) | linearity of overall sound is average (18.4% difference to median)
Compared to same class
» 41% of all tested devices in this class were better, 7% similar, 53% worse
» The best had a delta of 6%, average was 20%, worst was 57%
Compared to all devices tested
» 41% of all tested devices were better, 8% similar, 52% worse
» The best had a delta of 4%, average was 24%, worst was 134%
Power Consumption
We did not notice any power consumption abnormalities during our tests. Maximum power consumption when idle was measured at 9.7 W and peaked at 49 W when running our stress test (Prime95 and FurMark simultaneously for at least one hour) but decreased shortly thereafter. The power supply is rated at 65 W.
| Off / Standby | |
| Idle | |
| Load |
|
Key:
min: | |
Battery Life
Our real-life Wi-Fi test simulates a load scenario typical for browsing the web. The power profile is set to Balanced, all power-saving features are disabled, and the display brightness is set to 150 nits. With these settings, the IdeaPad Flex 14 lasted for 7:28 hours.
Pros
Cons
Verdict
Lenovo’s IdeaPad Flex 14API is equipped with a powerful Ryzen 5 3500U APU. In Cinebench R15 the CPU was significantly faster than the Core i5-8265U quad-core CPU that the otherwise identical Lenovo Flex 14IWL is equipped with. The integrated GPU was much faster than Intel's counterpart as well, and it even allowed for some limited gaming.
Lenovo’s IdeaPad Flex 14API is a well-rounded convertible for home users. Unfortunately, it has a few drawbacks.
The system felt very fast thanks to the NVMe SSD, which can be replaced and upgraded after removing the bottom panel. The keyboard was usable and equipped with a backlight. Battery life was decent, albeit noticeably shorter than on the Flex 14’s Intel-equipped sibling.
The IPS touchscreen offered great viewing angles and a somewhat decent color accuracy. However, it lacked in brightness, contrast ratio, and color-space coverage. In addition to finger input, the touchscreen also supports the optional Lenovo Active Pen 2 stylus, which can be purchased for around $50.
Lenovo Ideapad C340-14API 81N6004UGE
- 10/07/2019 v7 (old)
Sascha Mölck
Price comparison

