Asus ZenBook 14 UX425E Review: 11th Gen Core i7 "Tiger Lake" Debut
The Tiger Lake-powered ZenBook 14 UX425E series is set to succeed last year's ZenBook 14 UX425J series when it launches this October. The new 11th gen Intel processors are notable for their integrated Iris Xe graphics that have been designed to better compete against both the mobile AMD Ryzen Vega RX series and the Nvidia GeForce MX series. In other words, thin-and-light laptops equipped with Tiger Lake like our ZenBook 14 should be even better at video editing and running games without needing to rely on discrete GPUs.
Aside from the updated CPU, new QHD display option, and faster RAM, the UX425E chassis remains visually identical to the UX425J. Our test unit comes configured with the Core i7-1165G7 CPU, 16 GB of RAM, and 400-nit FHD display. Competitors in this space include other upper mid-range 13-inch or 14-inch Ultrabooks like the Huawei MateBook X Pro, Dell XPS 13 9300, LG Gram 14, MSI Modern 14, and the Lenovo Yoga Slim 7.
Though Asus has not yet revealed the price of our Core i7 Tiger Lake test unit, we suspect it to launch for around $1000 to $1200 USD to be similar to the Ice Lake-powered UX425J.
More Asus reviews:
- Asus Strix G17 G712
- Asus VivoBook 15
- Asus Zephyrus G15 GA502
- Asus ROG Phone 3
- Asus TUF A15
Rating | Date | Model | Weight | Height | Size | Resolution | Price |
|---|---|---|---|---|---|---|---|
| 84.2 % v7 (old) | 09 / 2020 | Asus ZenBook 14 UX425EA i7-1165G7, Iris Xe G7 96EUs | 1.2 kg | 13.9 mm | 14.00" | 1920x1080 | |
| 82.4 % v7 (old) | 09 / 2020 | Asus ZenBook 14 UX434FL-DB77 i7-8565U, GeForce MX250 | 1.3 kg | 16.9 mm | 14.00" | 1920x1080 | |
| 85 % v7 (old) | 05 / 2020 | Asus ZenBook Flip 14 UX463FA-AI039T i5-10210U, UHD Graphics 620 | 1.4 kg | 18 mm | 14.00" | 1920x1080 | |
| 81.2 % v7 (old) | 04 / 2020 | LG Gram 14T90N i7-10510U, UHD Graphics 620 | 1.2 kg | 18 mm | 14.00" | 1920x1080 | |
| 85.3 % v7 (old) | 08 / 2020 | Lenovo Yoga Slim 7-14ARE R7 4800U, Vega 8 | 1.4 kg | 14.9 mm | 14.00" | 1920x1080 | |
| 88.9 % v7 (old) | 03 / 2020 | Dell XPS 13 9300 Core i7-1065G7 i7-1065G7, Iris Plus Graphics G7 (Ice Lake 64 EU) | 1.2 kg | 14.8 mm | 13.40" | 1920x1200 |
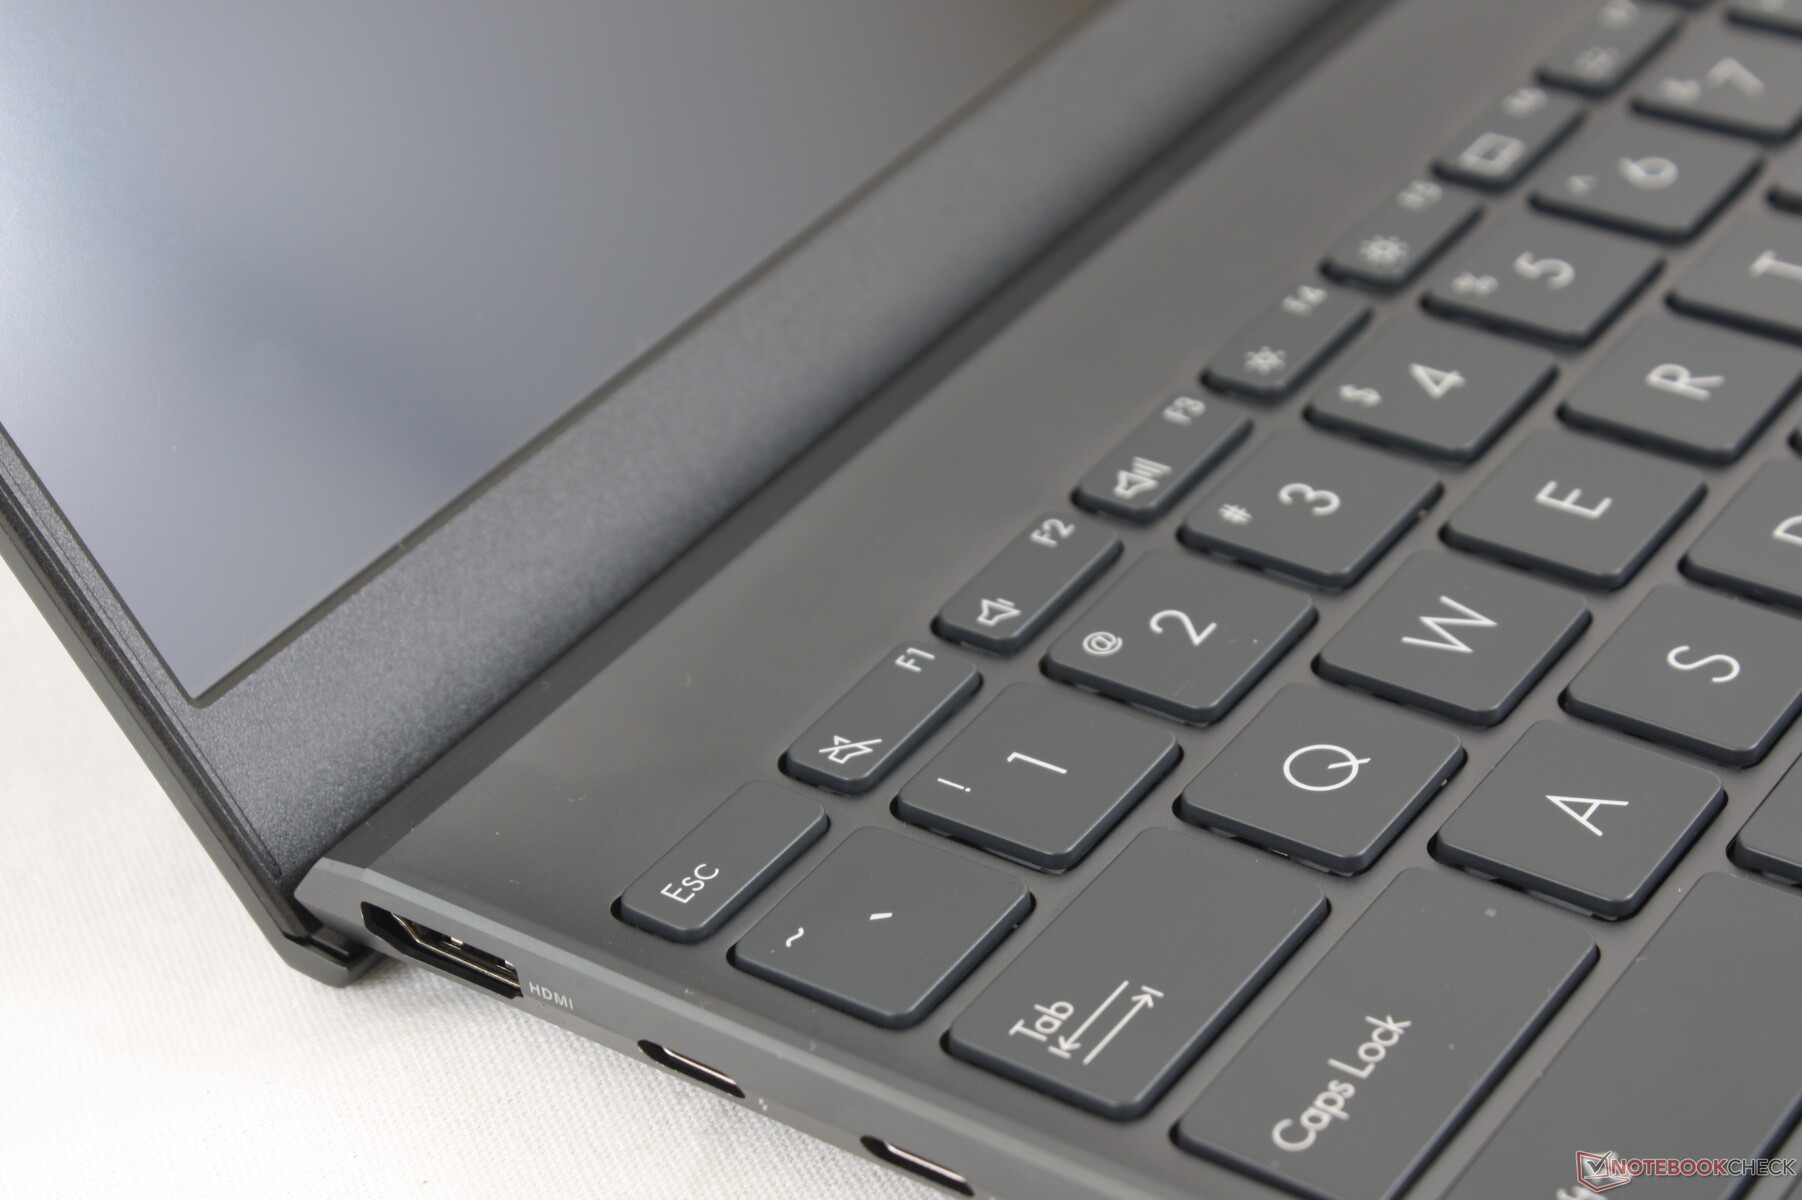
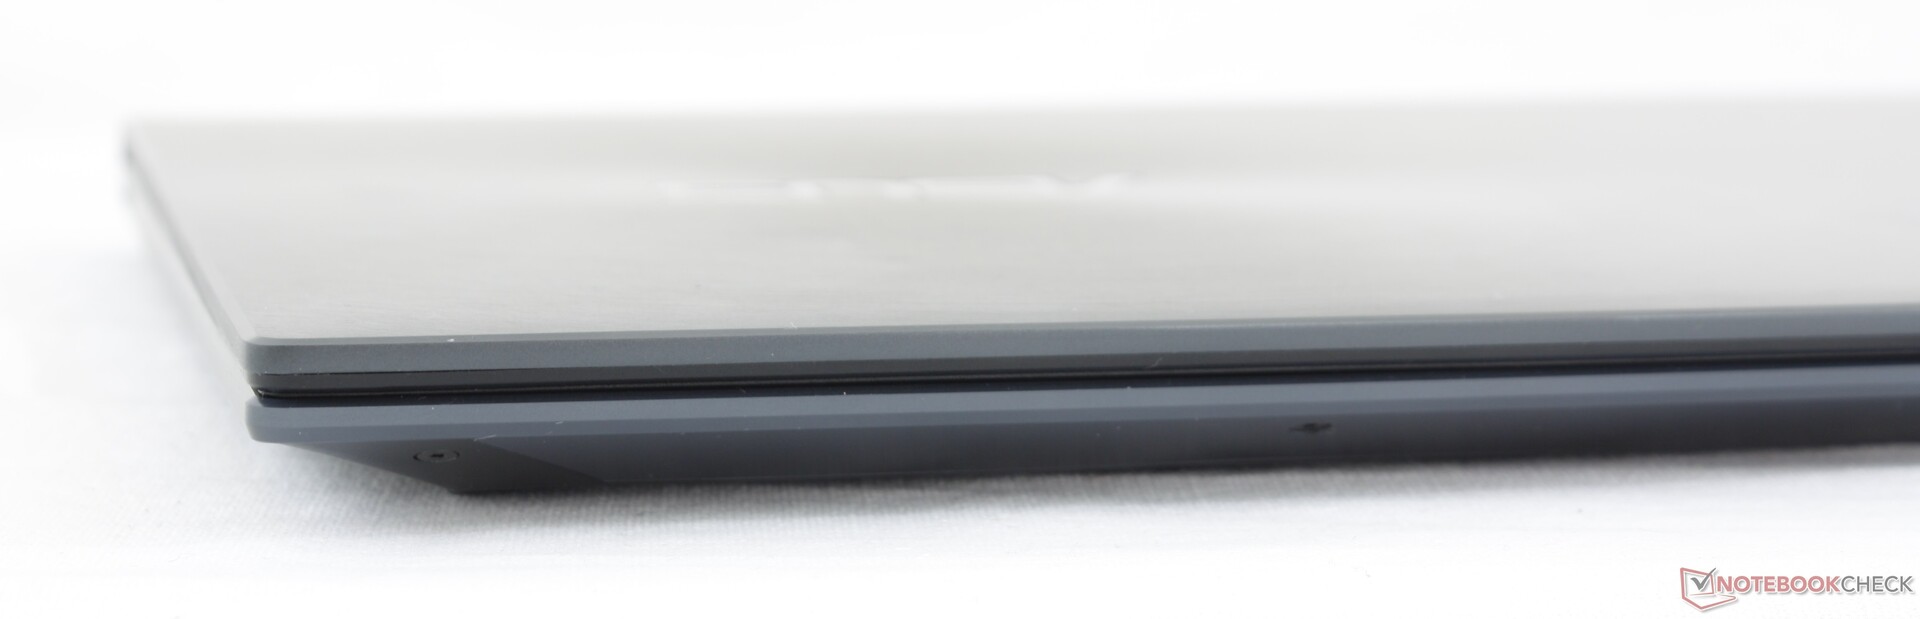
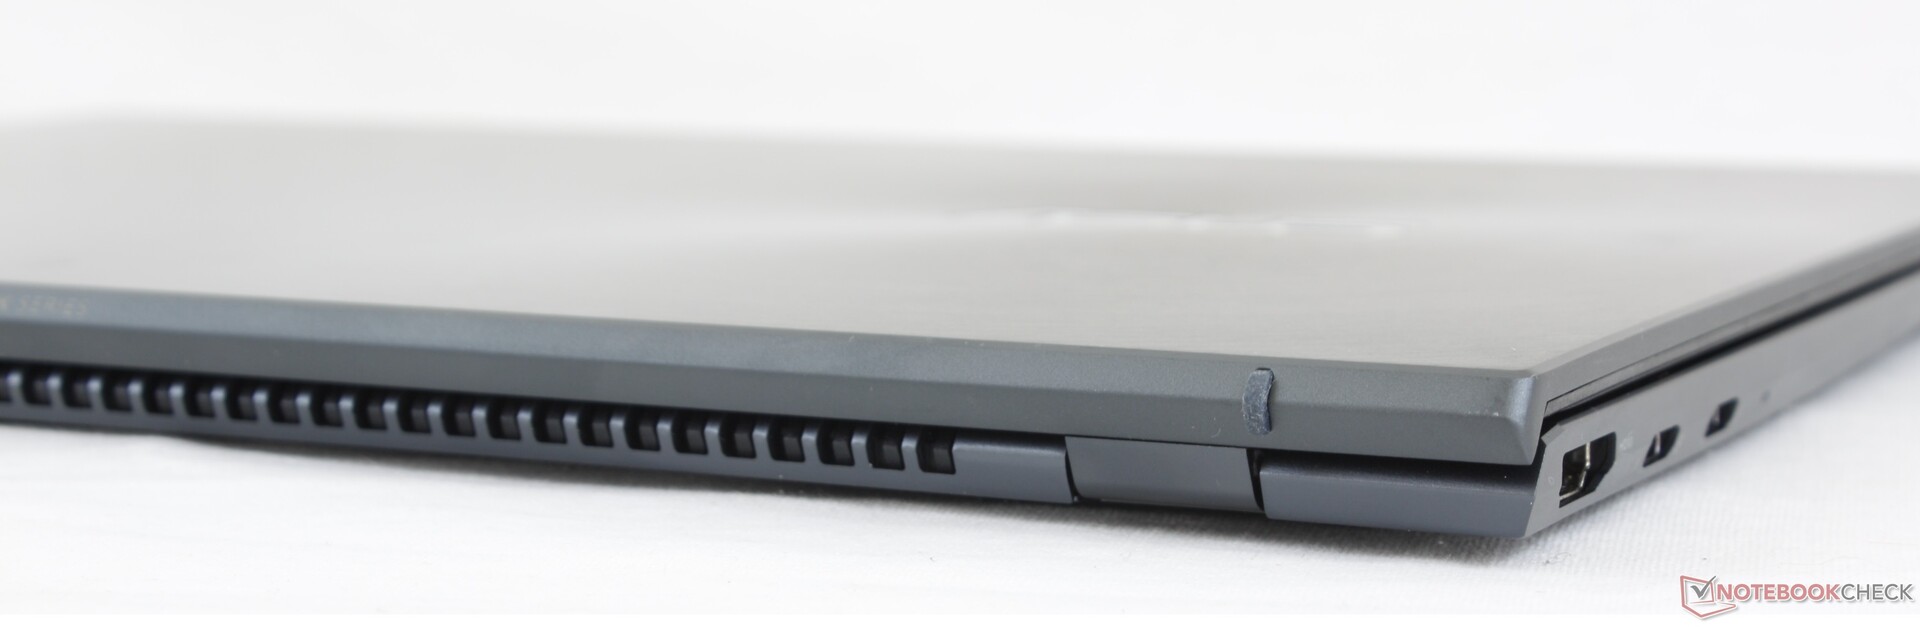
Case
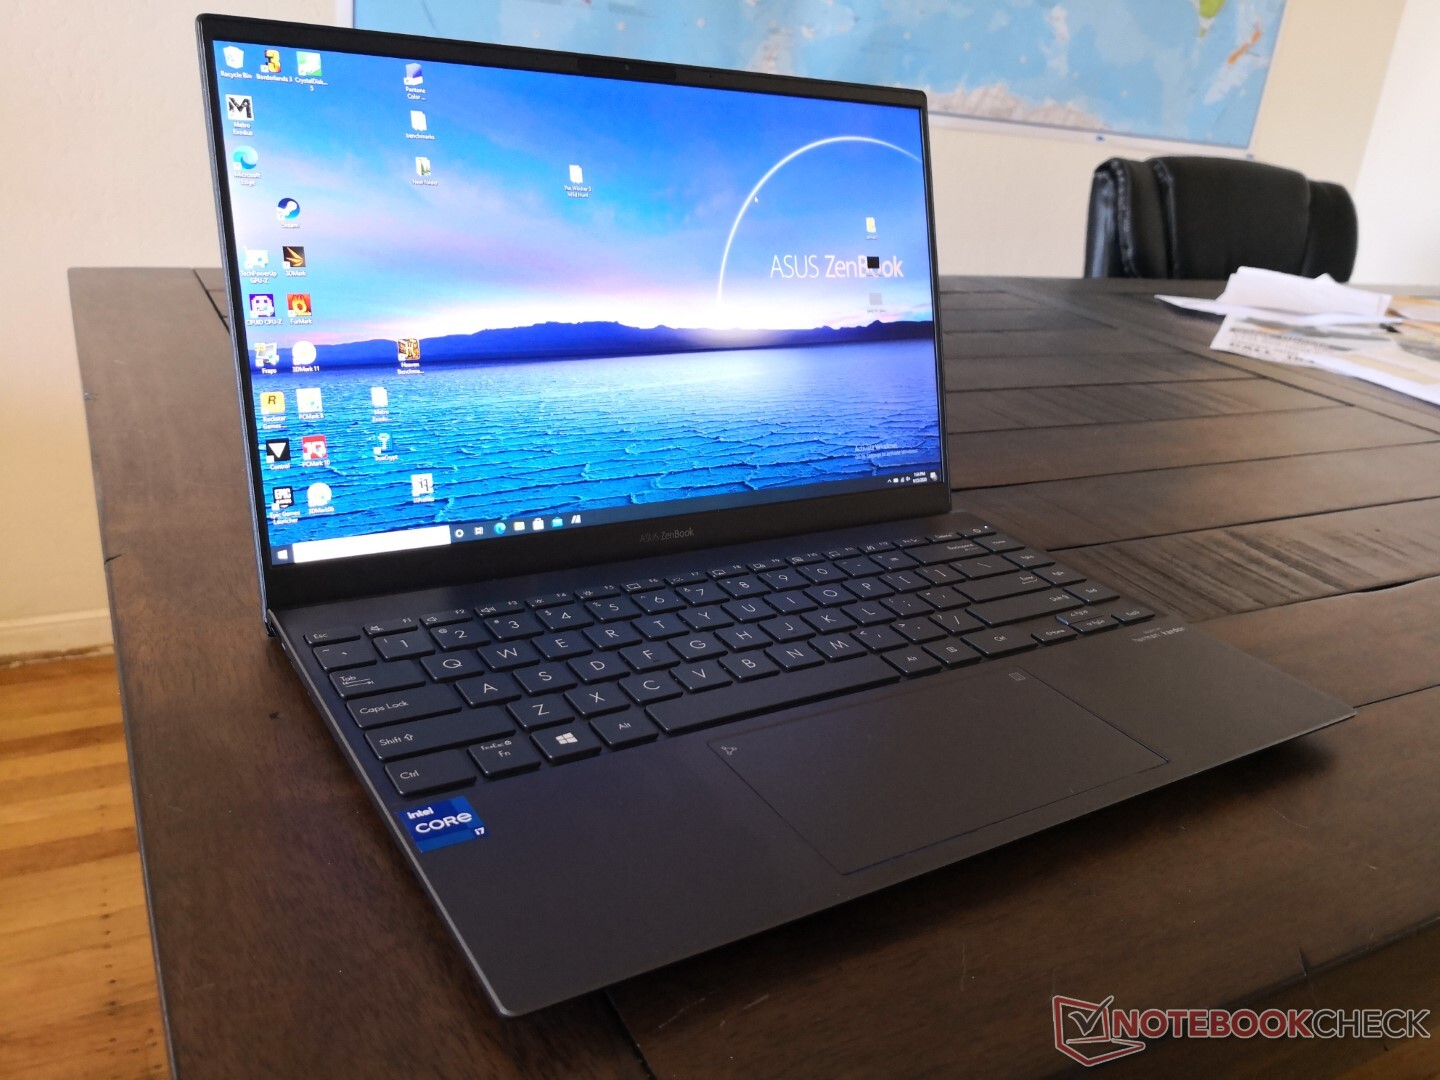
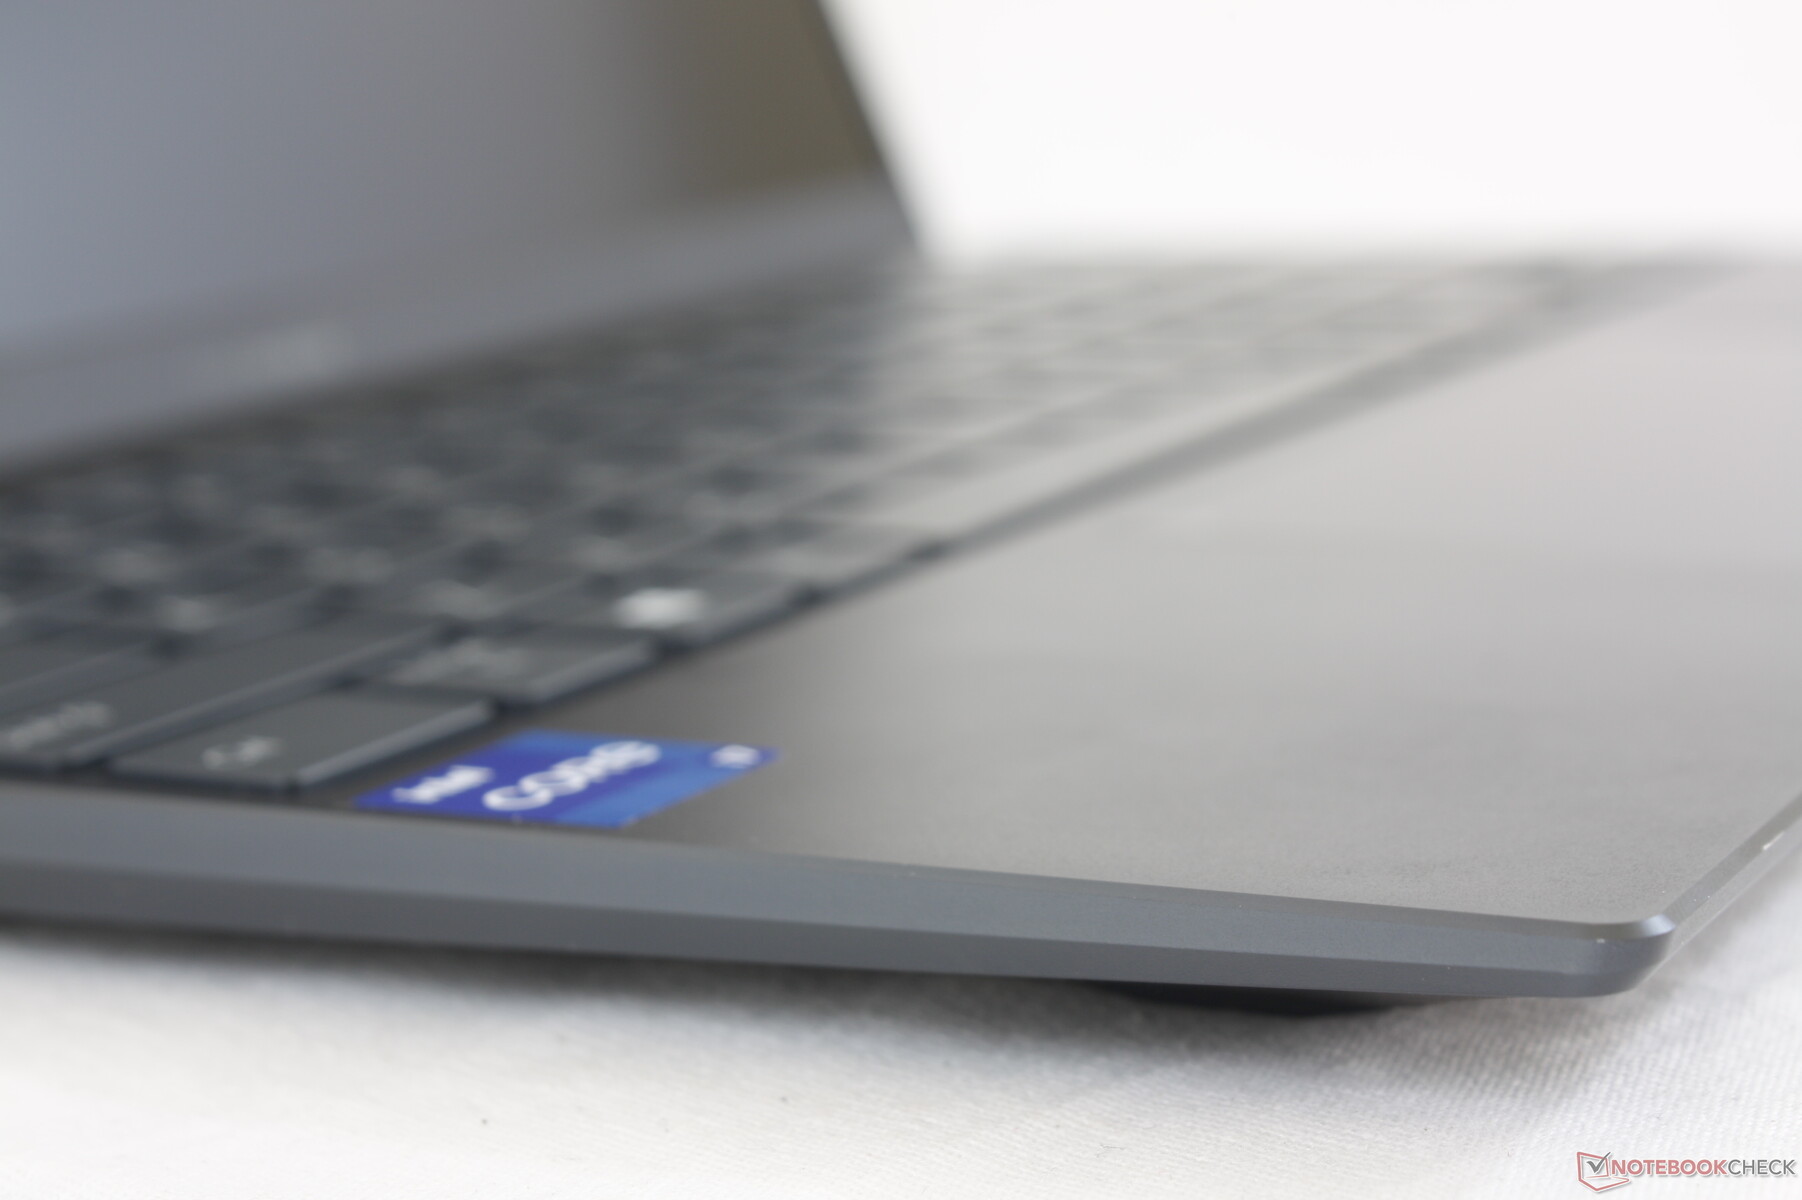
Visually, Asus has dropped the gold trim along the top row of the keyboard in favor of a more unibody look. Corners are sharper and surfaces are flatter to contribute to the thinner design.
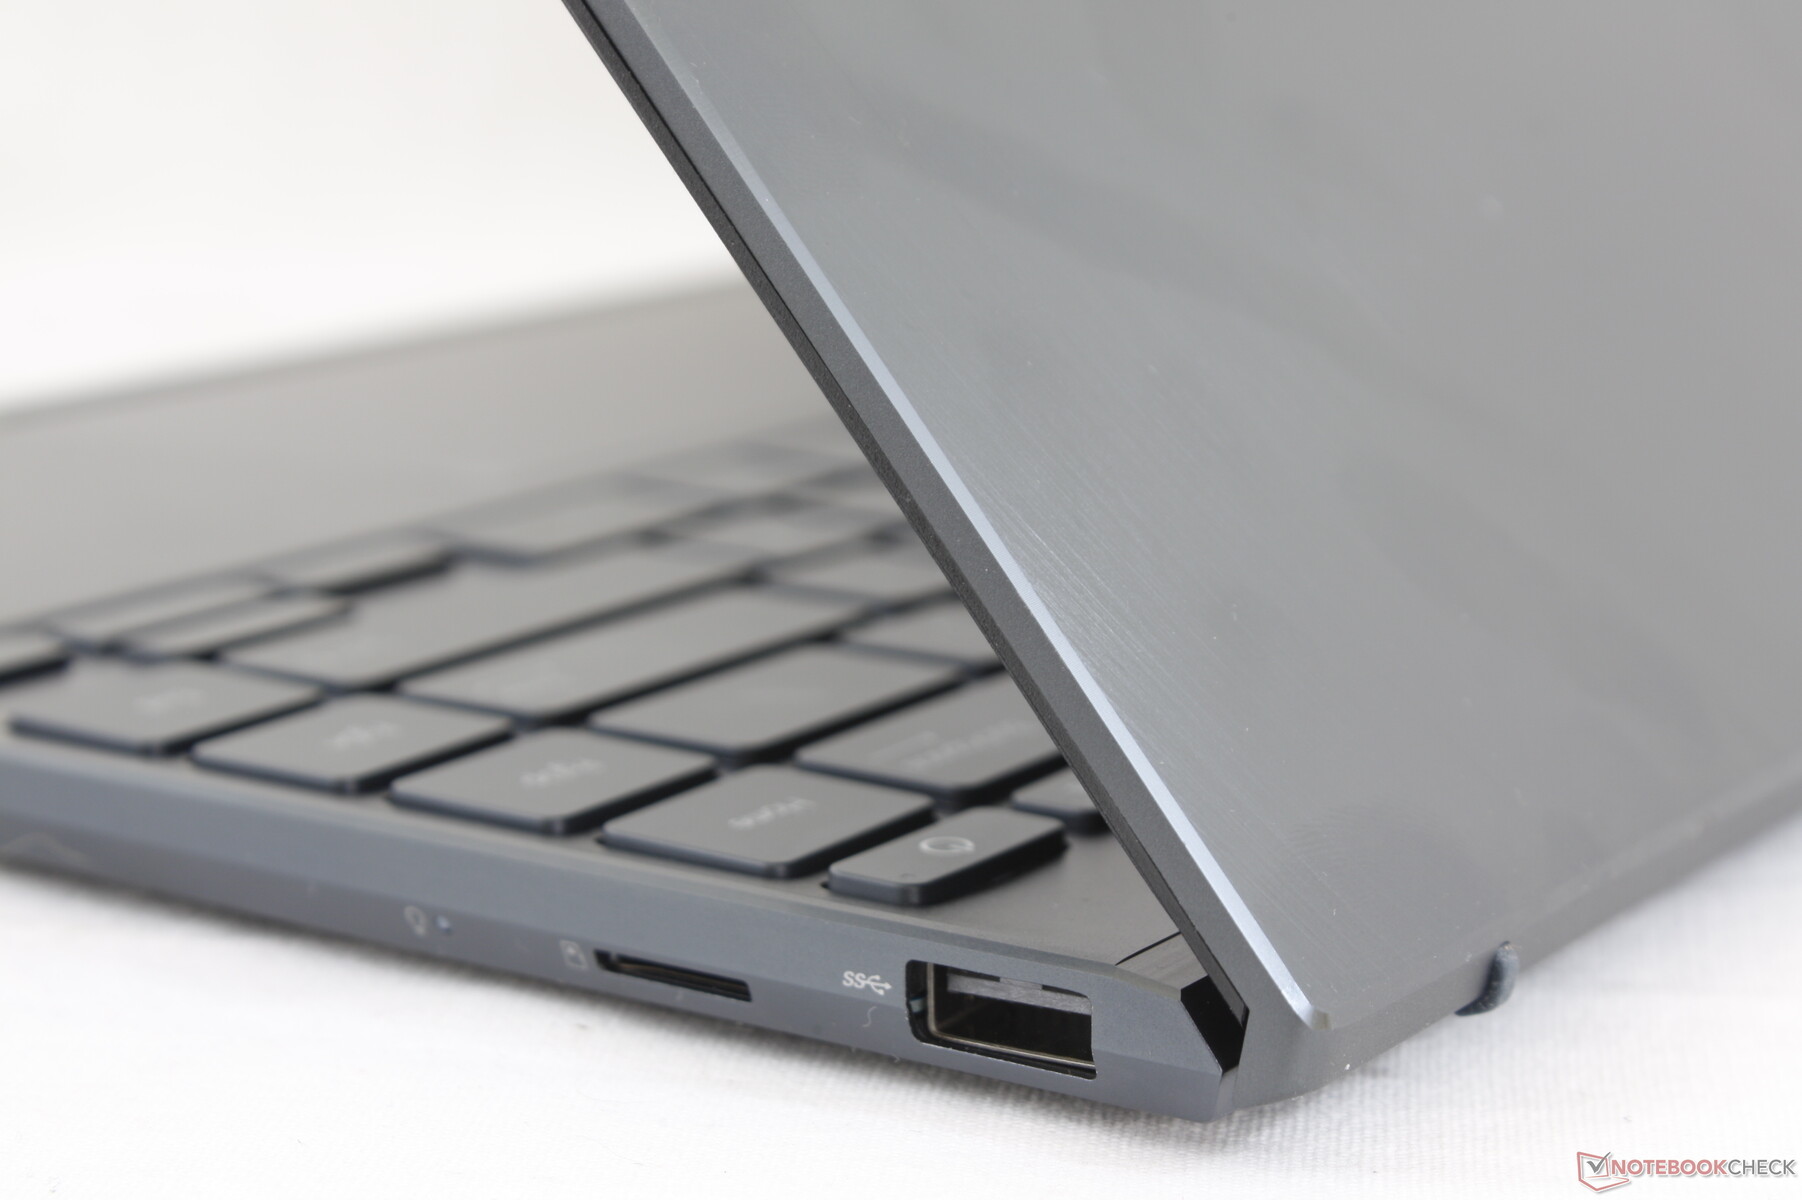
Chassis rigidity is a step down from other ZenBooks and popular high-end Ultrabooks like the HP Spectre, Dell XPS, Razer Blade Stealth, or Lenovo Yoga Slim 7. The metal skeleton, while very light, is thin and more susceptible to warping than we would like. Attempting to twist the base from its corners would result in more creaking and warping than on the UX434, for example. The lid is even worse especially since it carries no edge-to-edge Gorilla Glass reinforcement.
The hinges could have been firmer as well since it tends to teeter a bit when adjusting angles or typing. Hinge rigidity becomes weaker at wider angles which makes the laptop difficult to pick up or transport without the display falling backwards. We don't have a lot of confidence on the longevity of these hinges over the lifespan of the laptop.
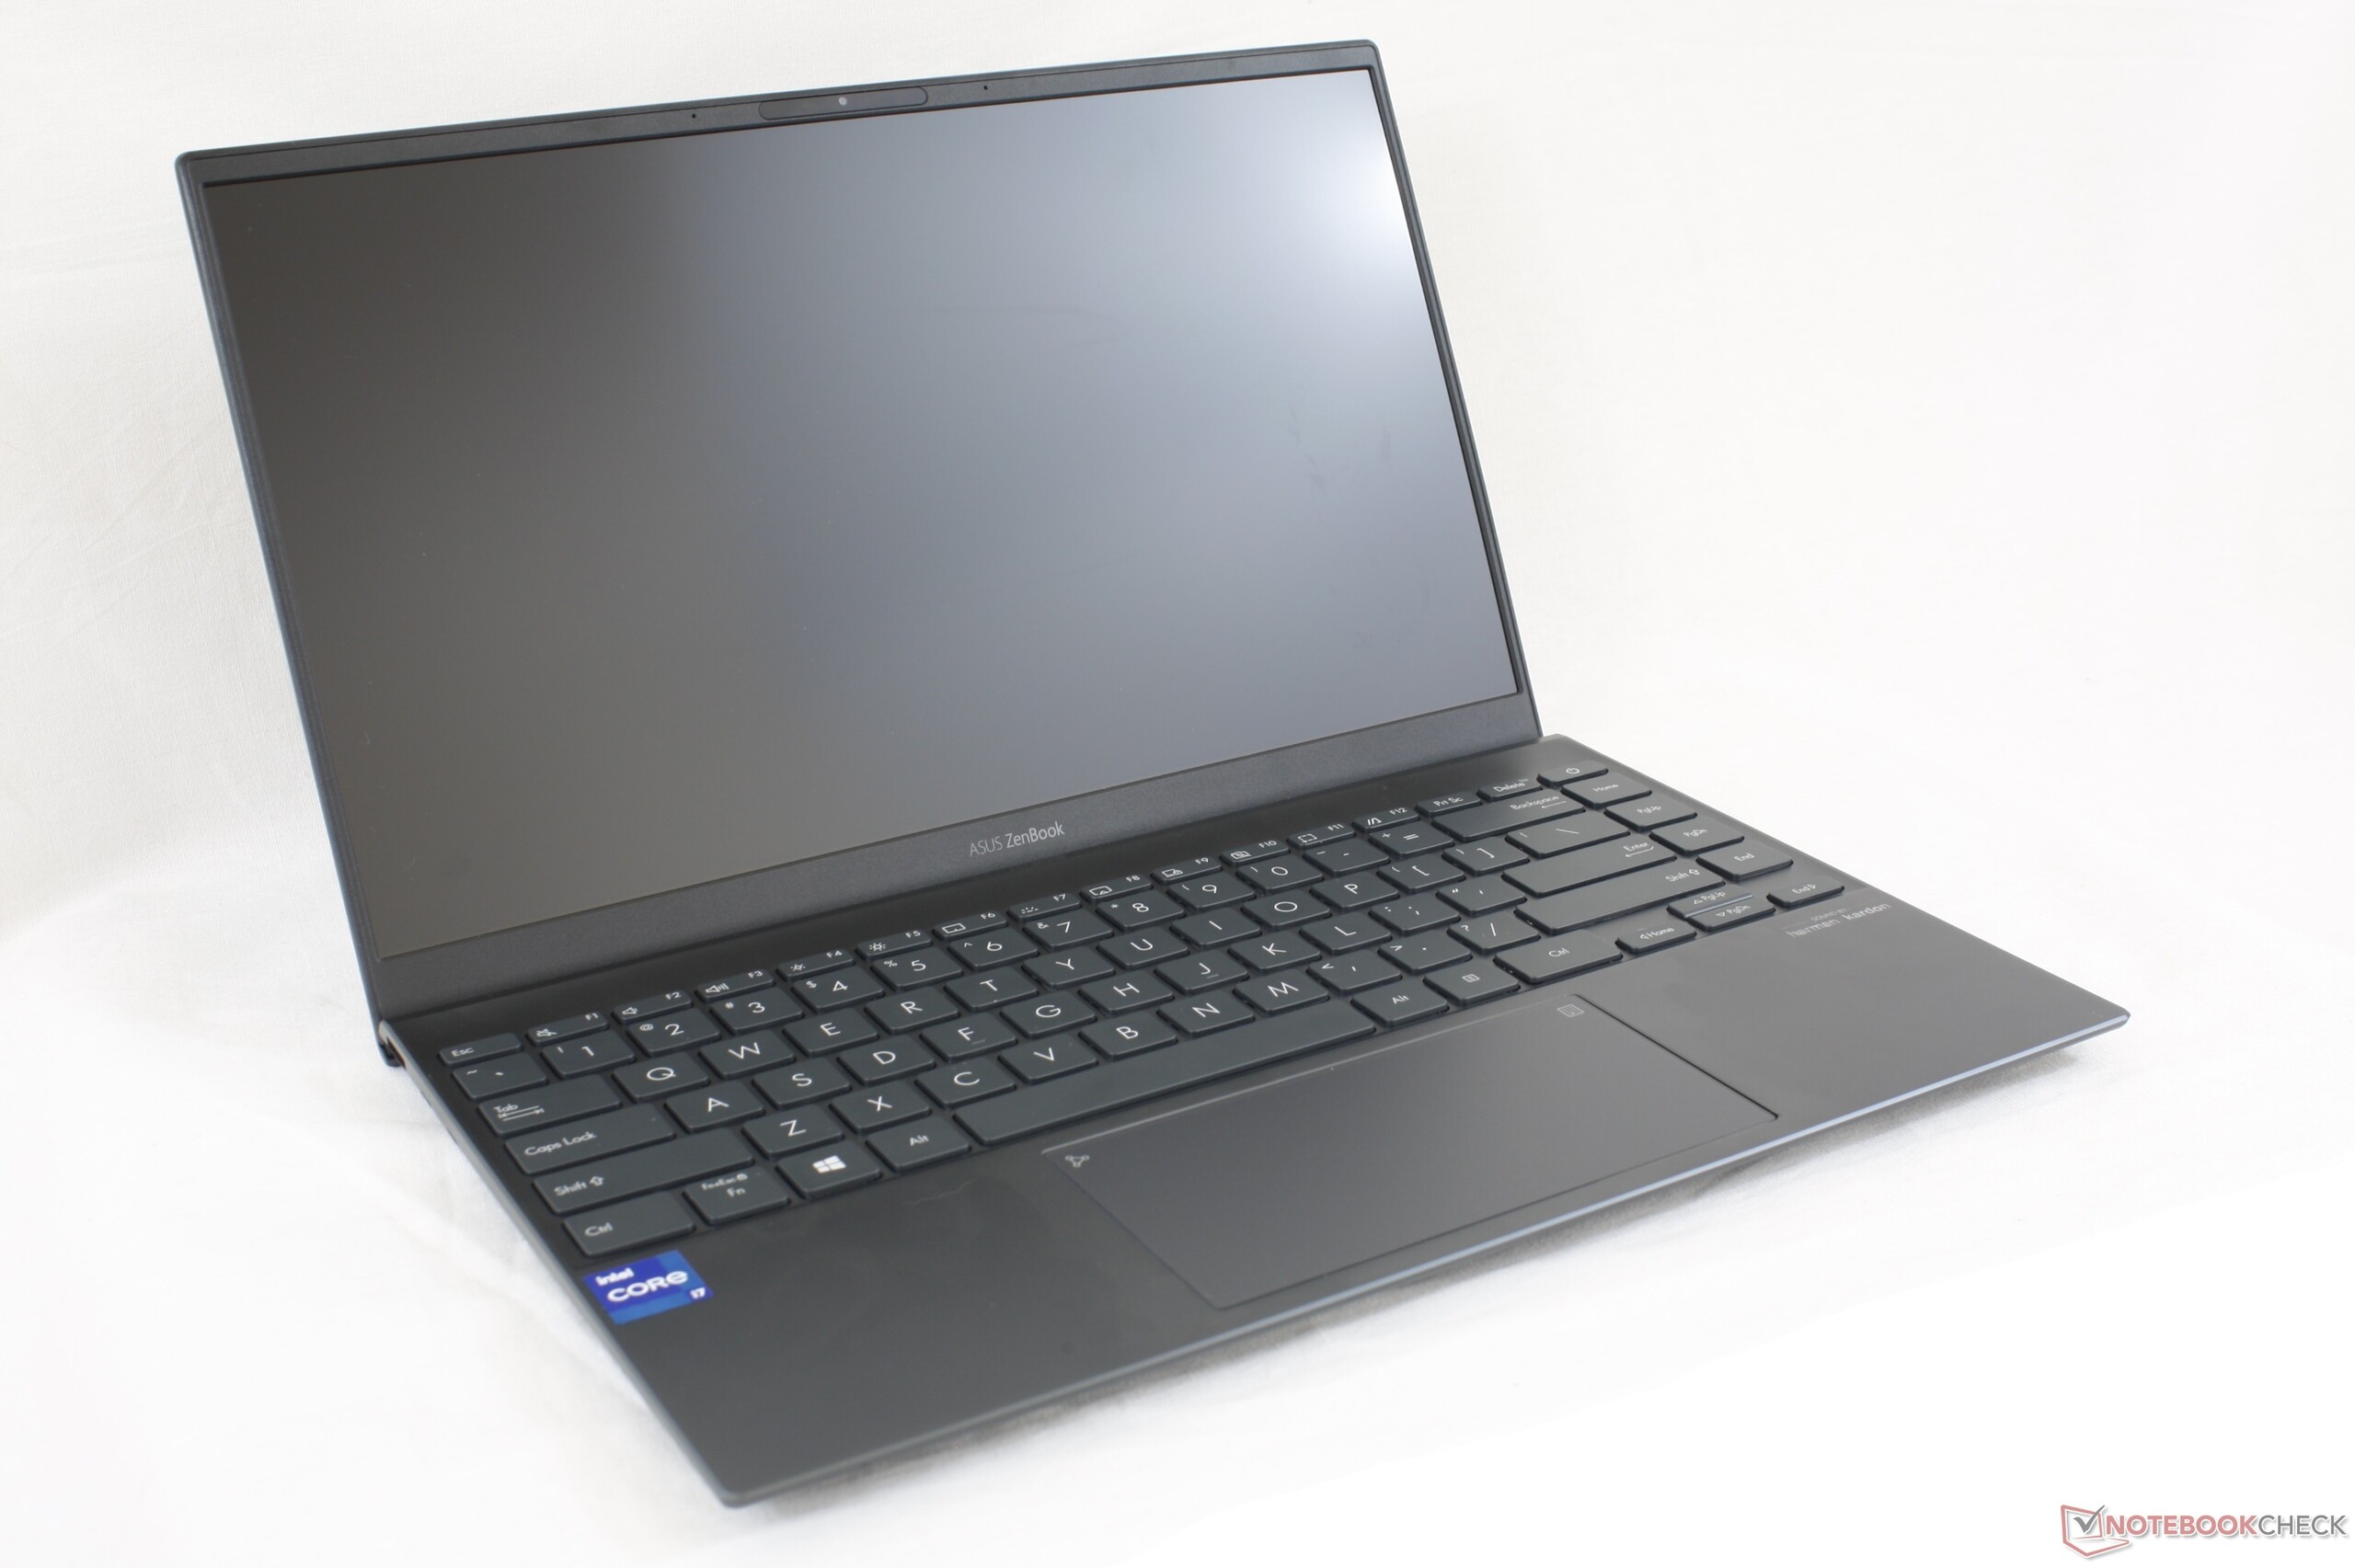
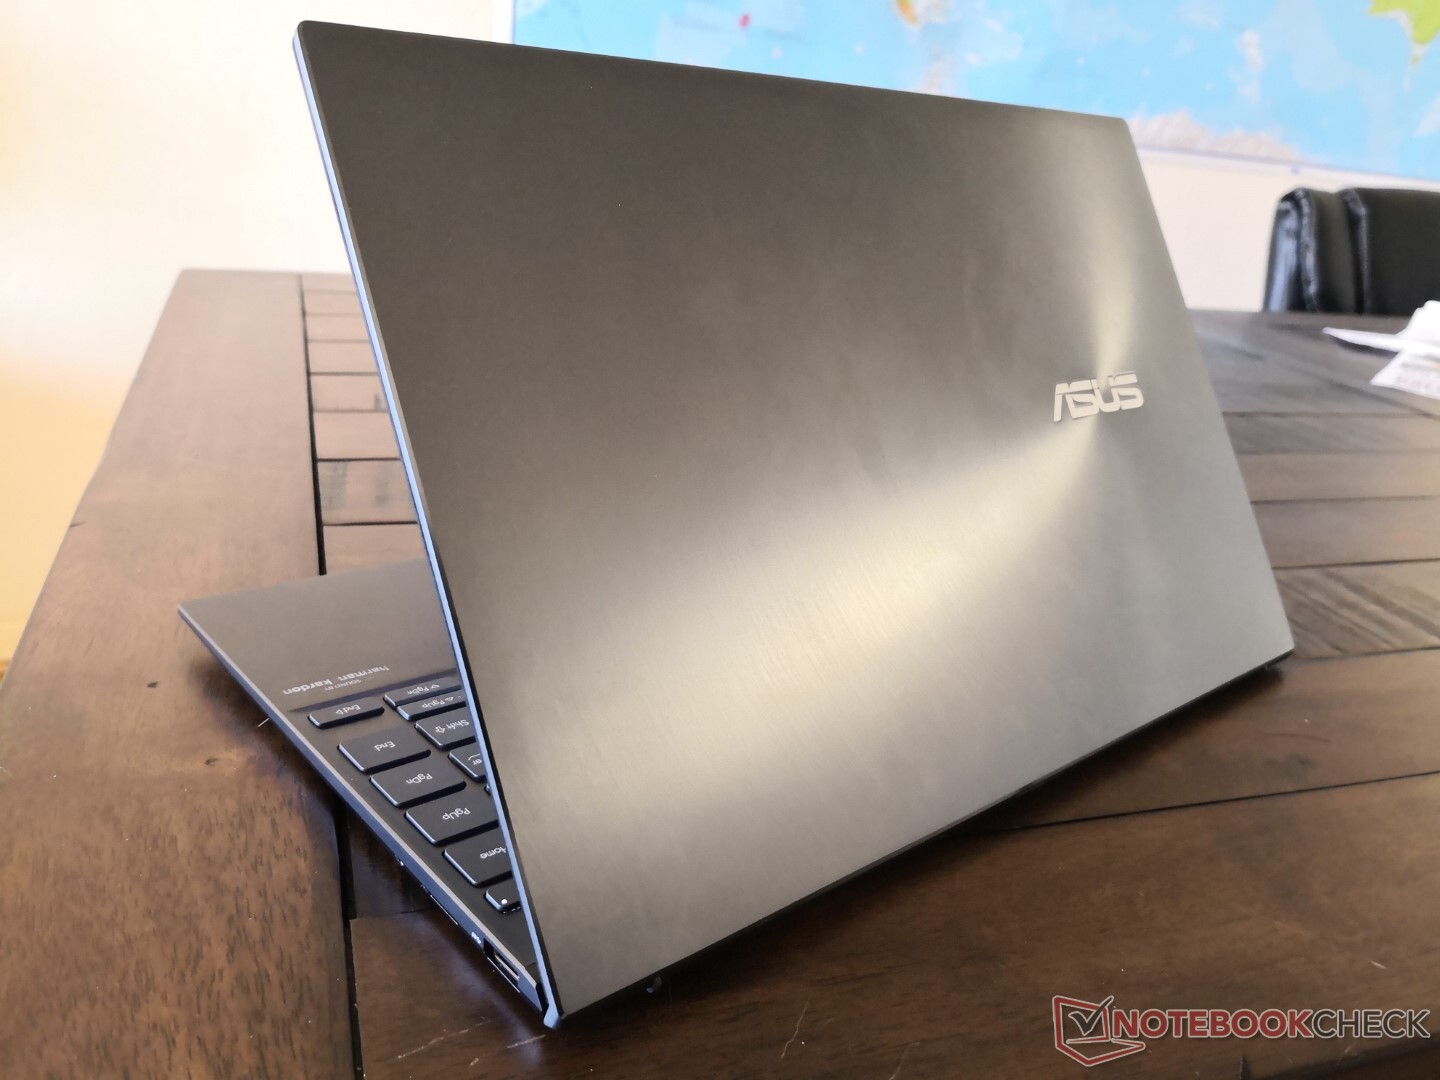
The chassis is slightly thinner and noticeably lighter than the UX434 series. However, the new design has a larger footprint due to the thicker bottom display bezel. Overall size is very similar to the Lenovo Yoga Slim 7 while being as light as the LG Gram 14 which partly explains its more frail chassis.
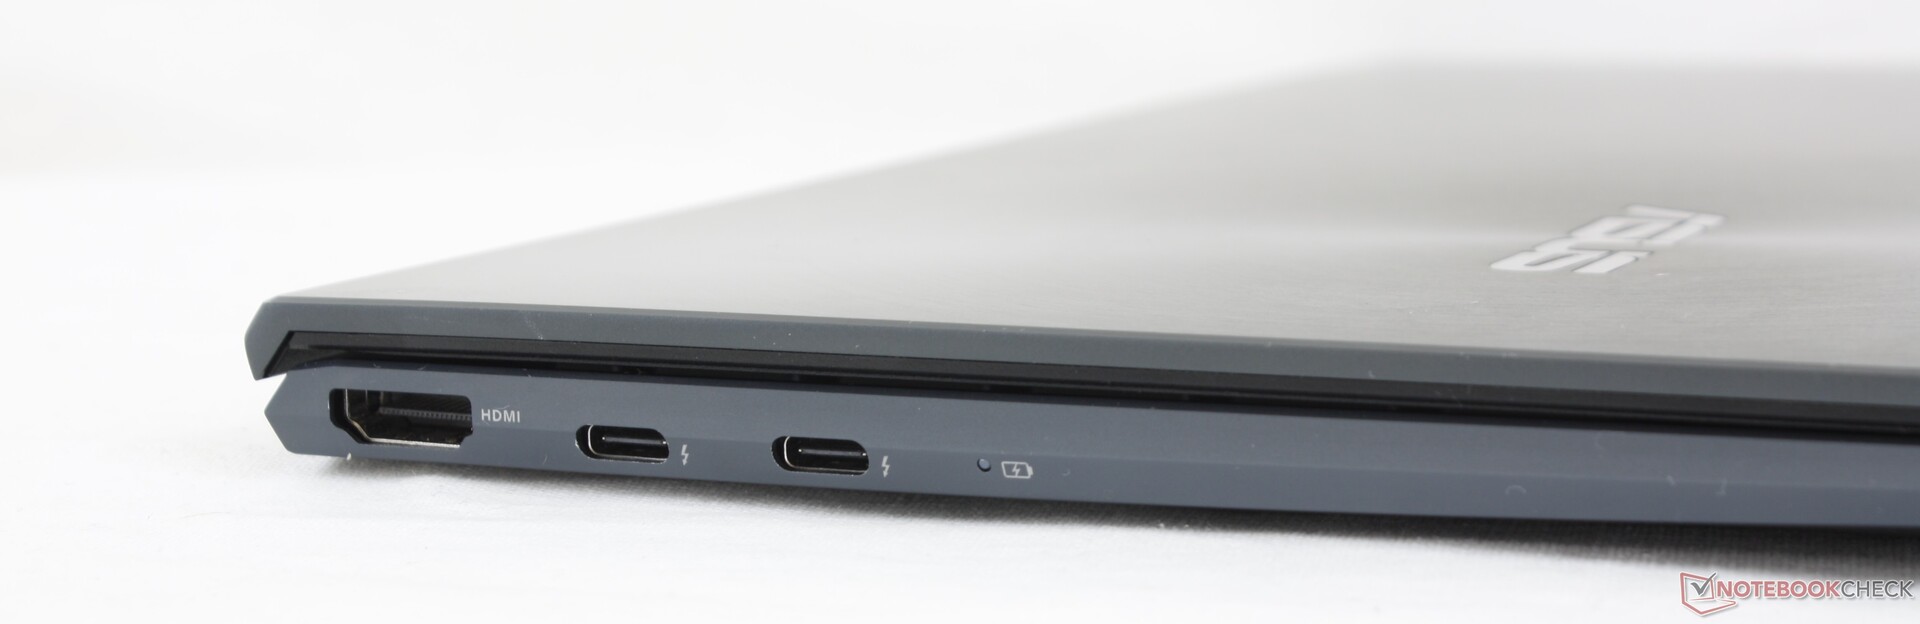
Connectivity
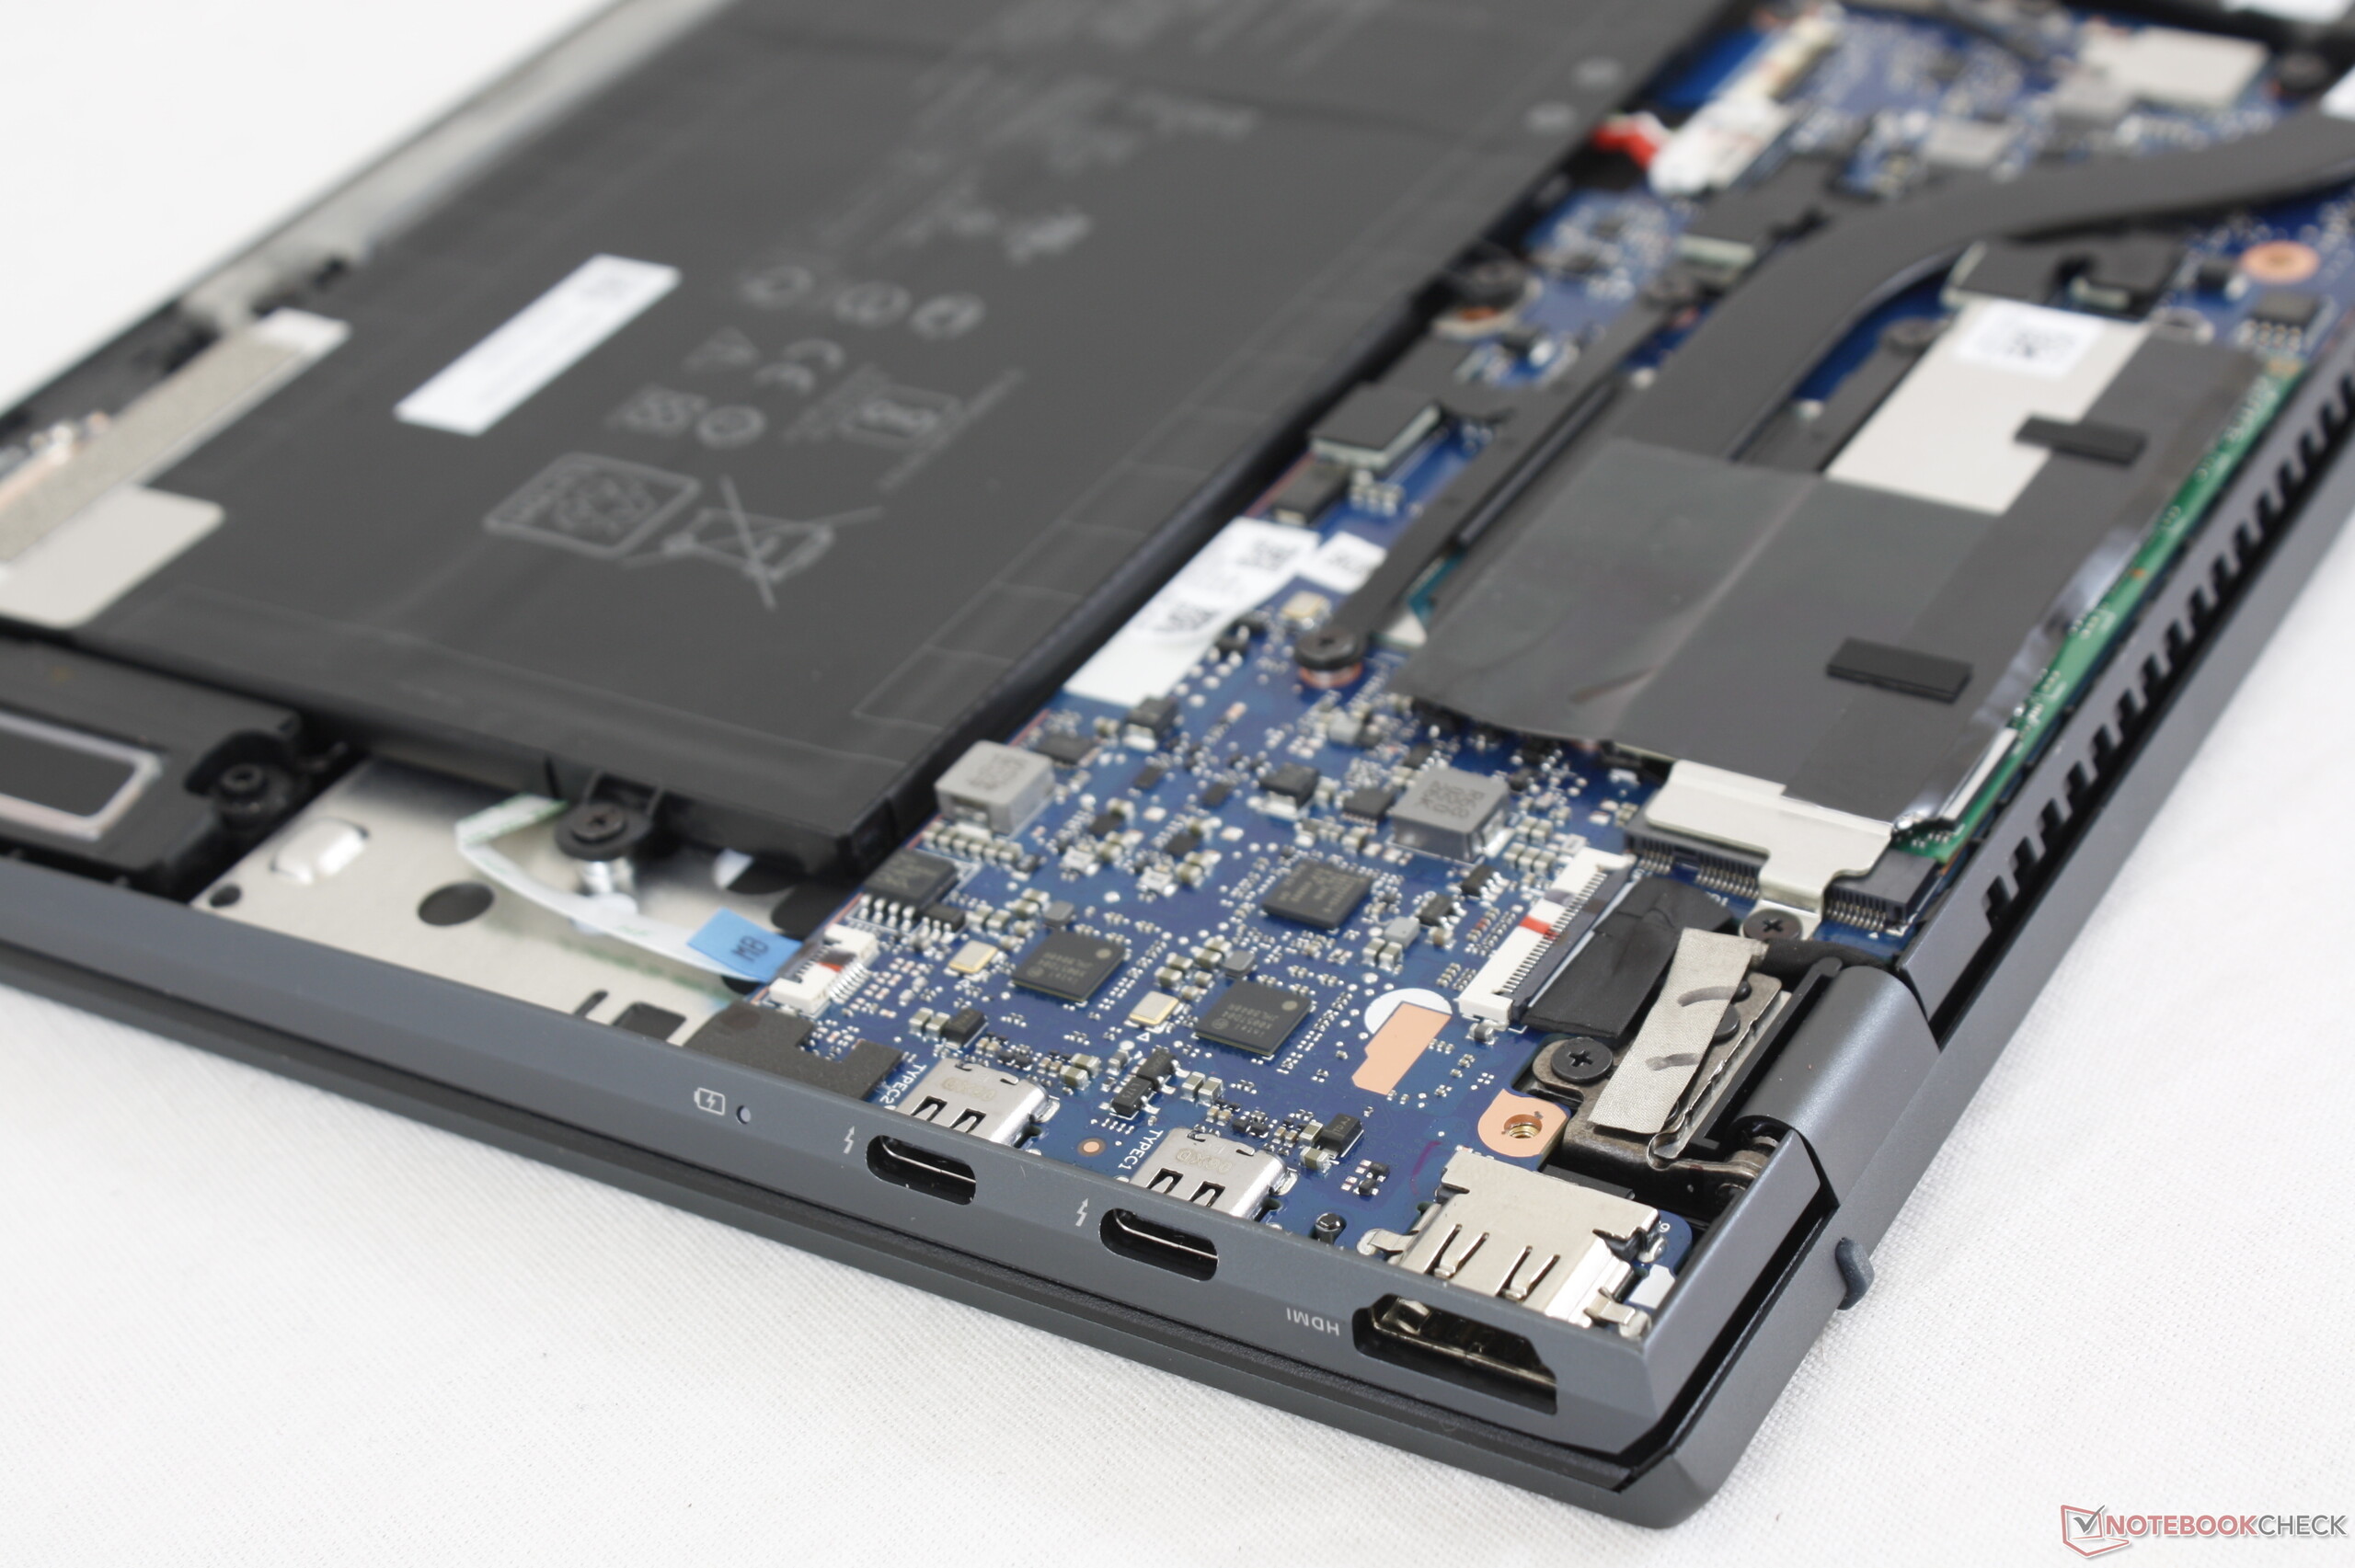
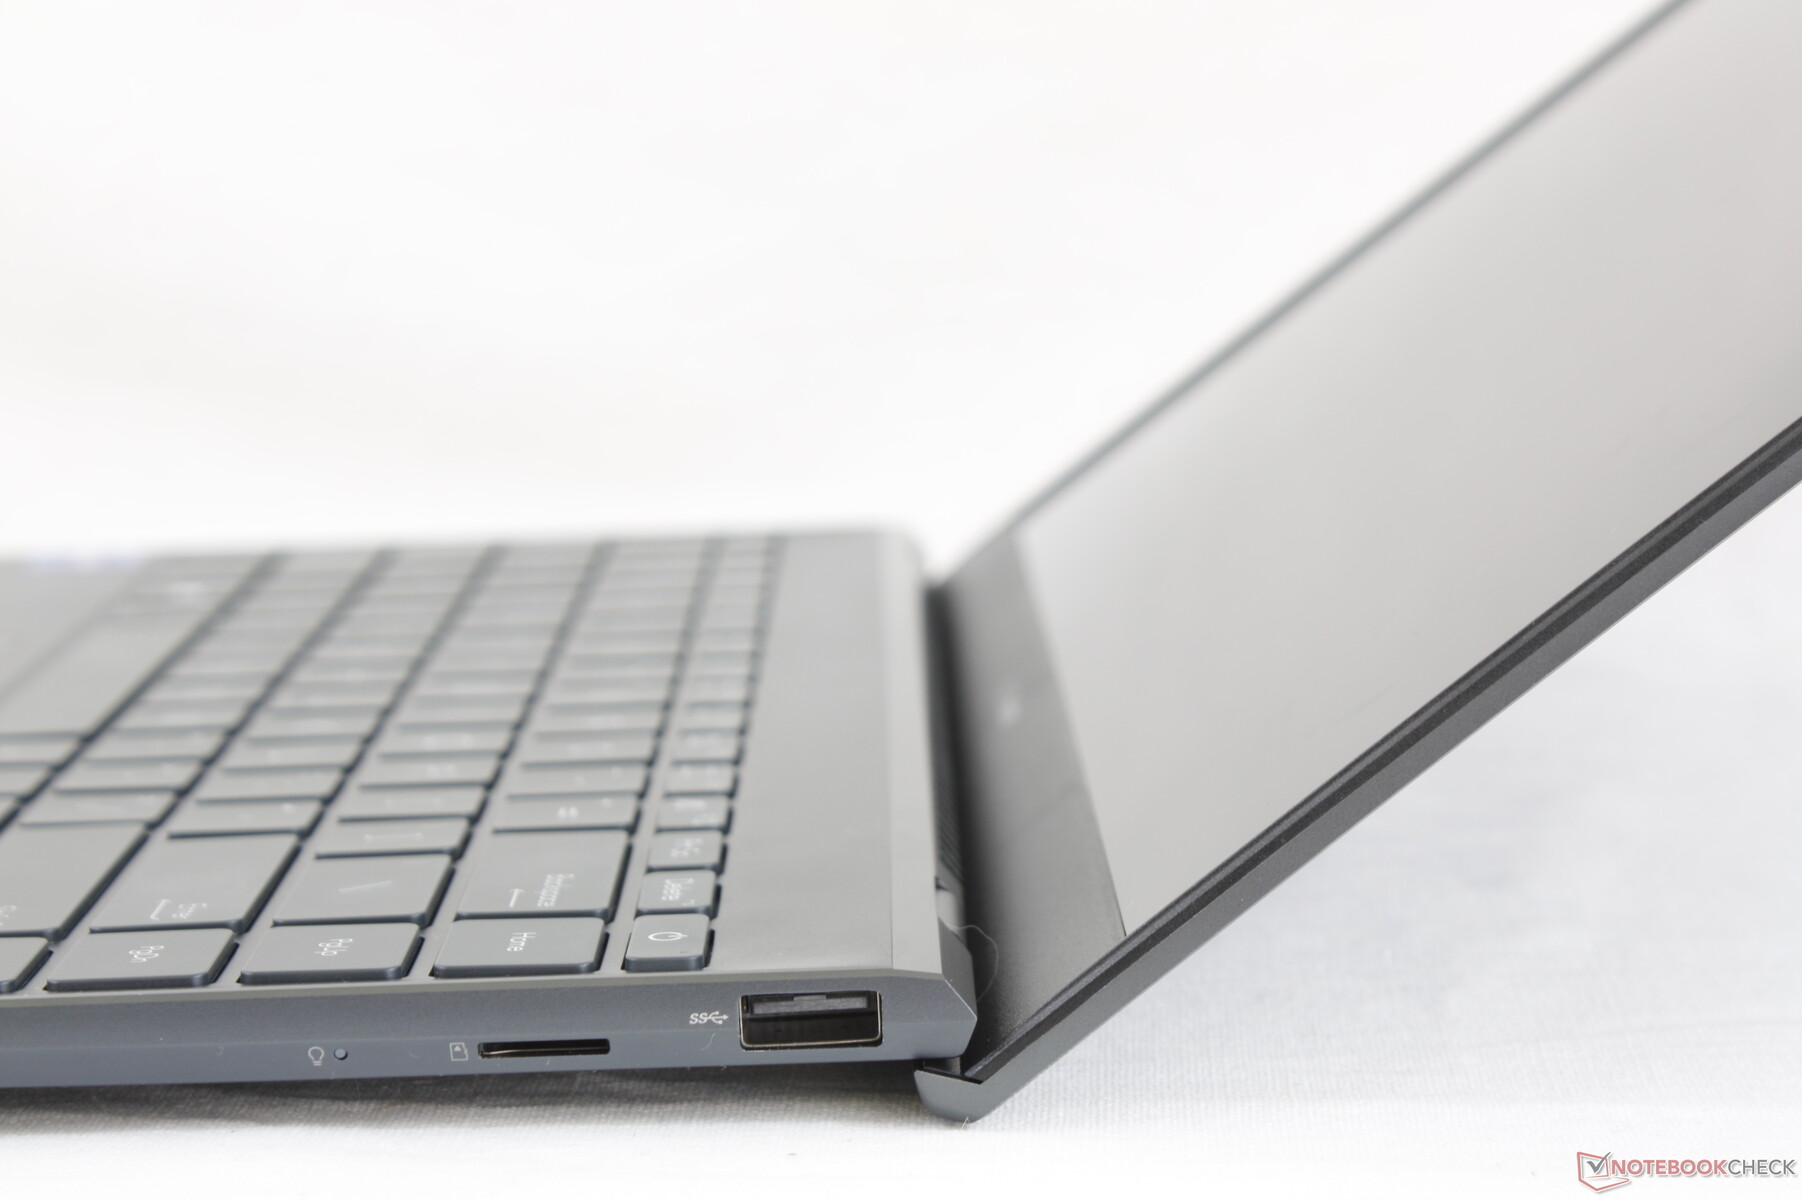
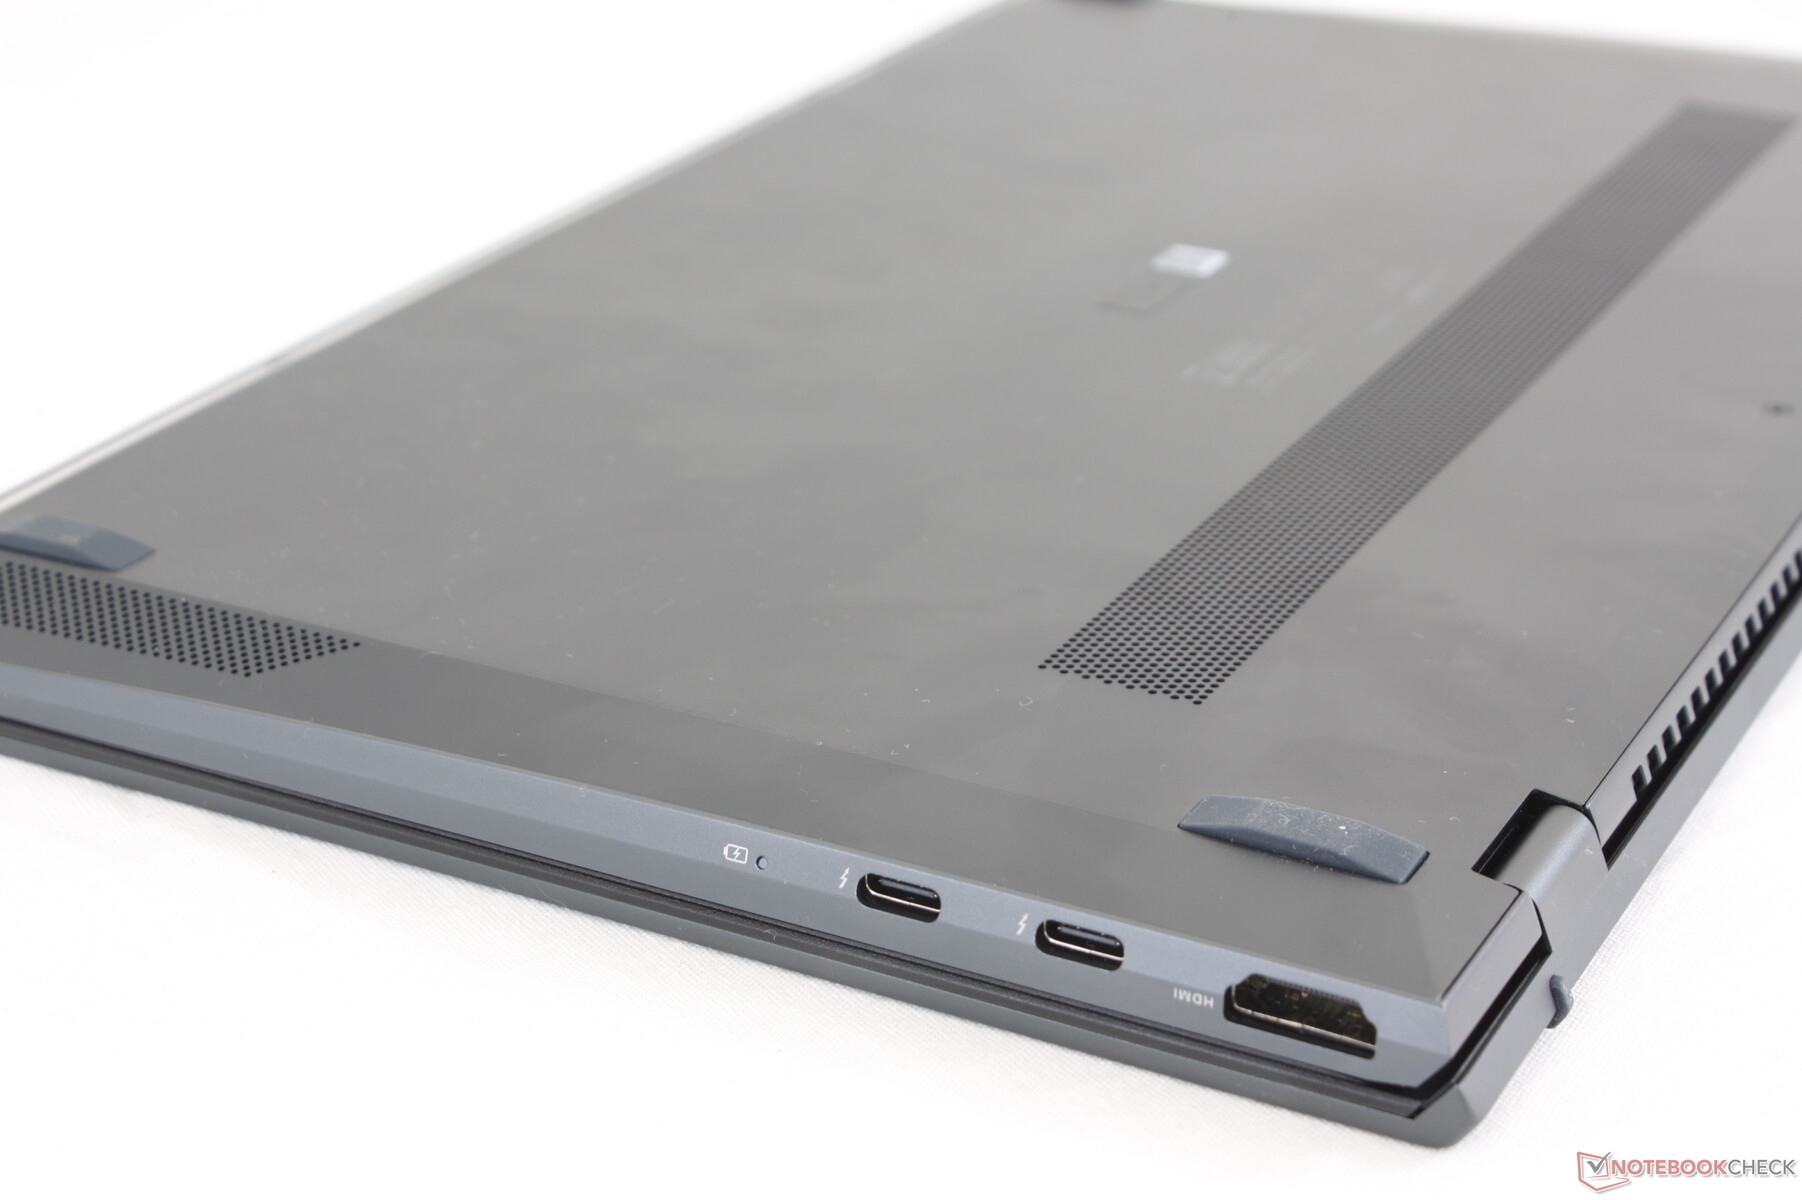
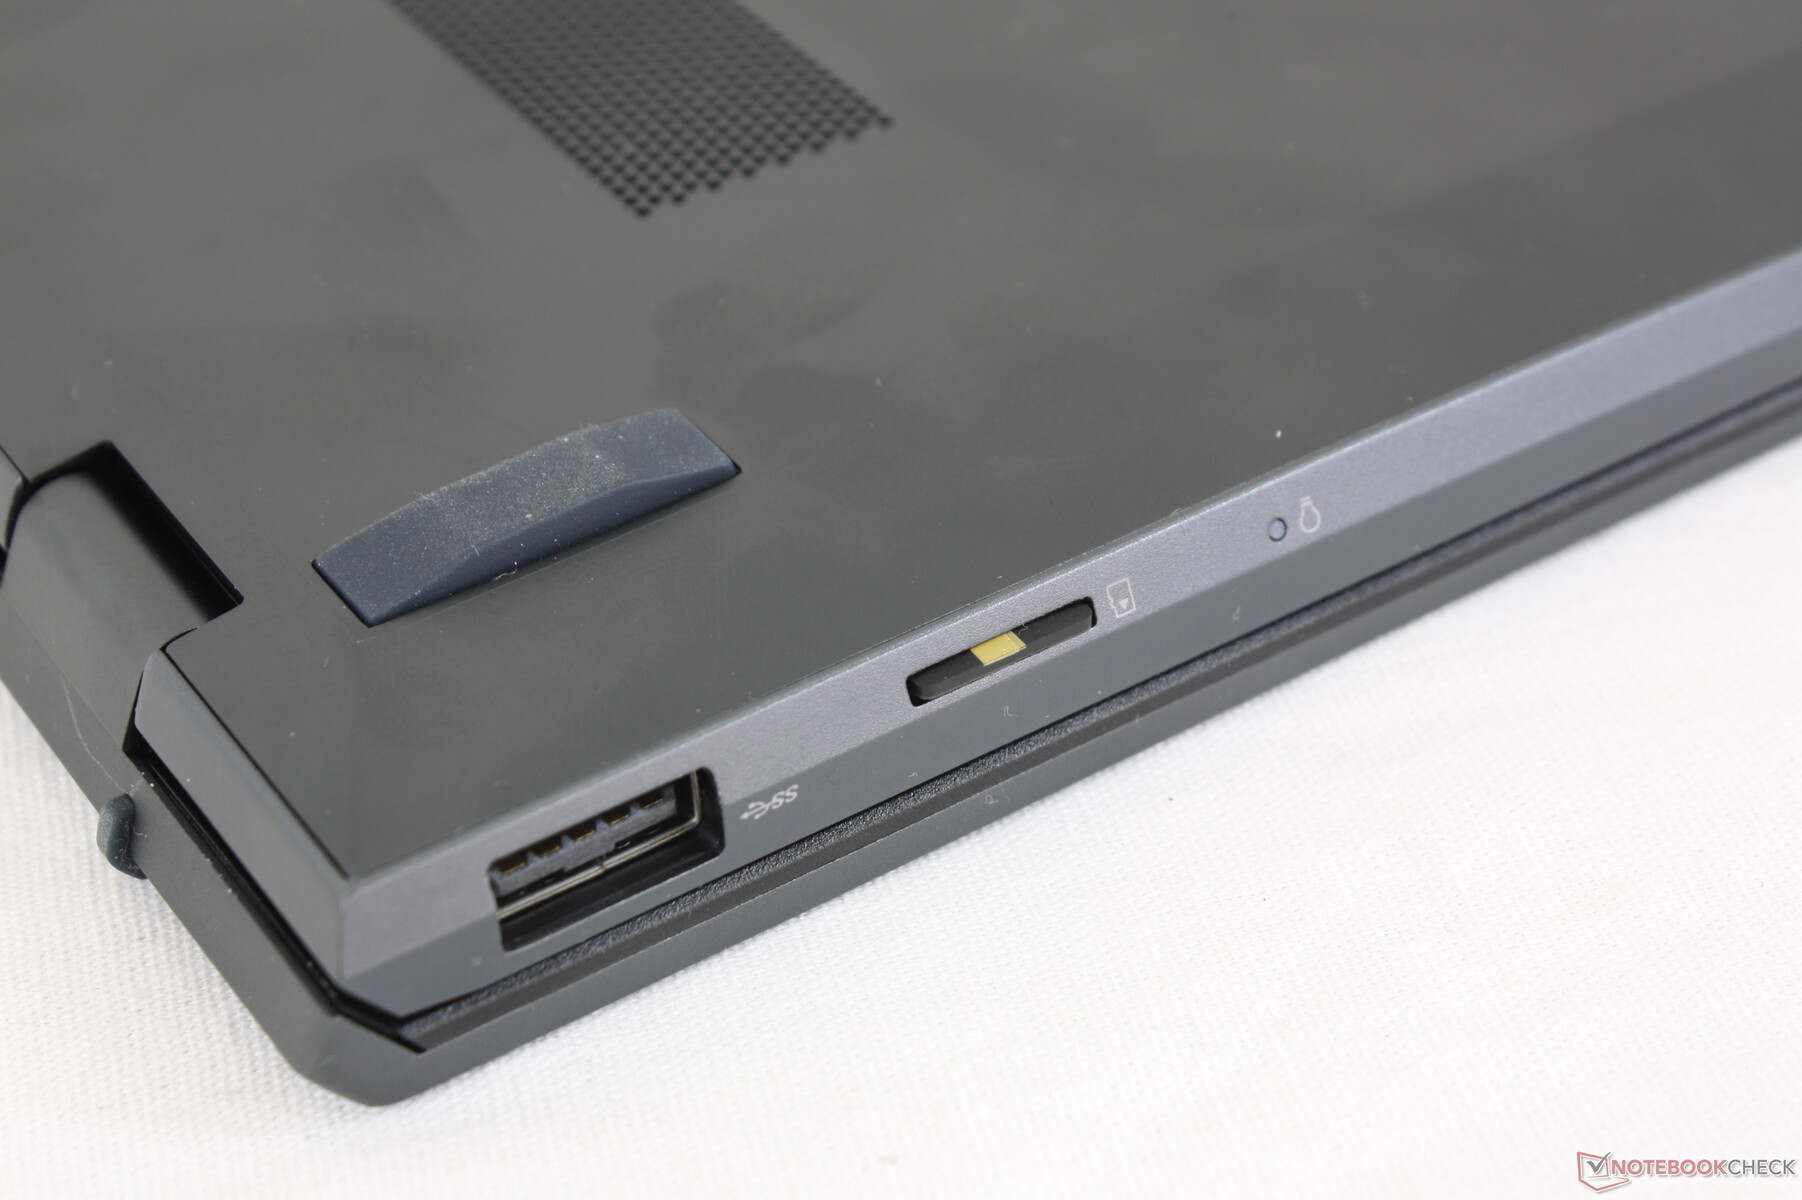
The most noteworthy additions are the two 40 Gbps Thunderbolt 4 ports along the left edge which also double as charging ports. Keep in mind that there is no integrated 3.5 mm audio port unlike on almost every other laptop out there.
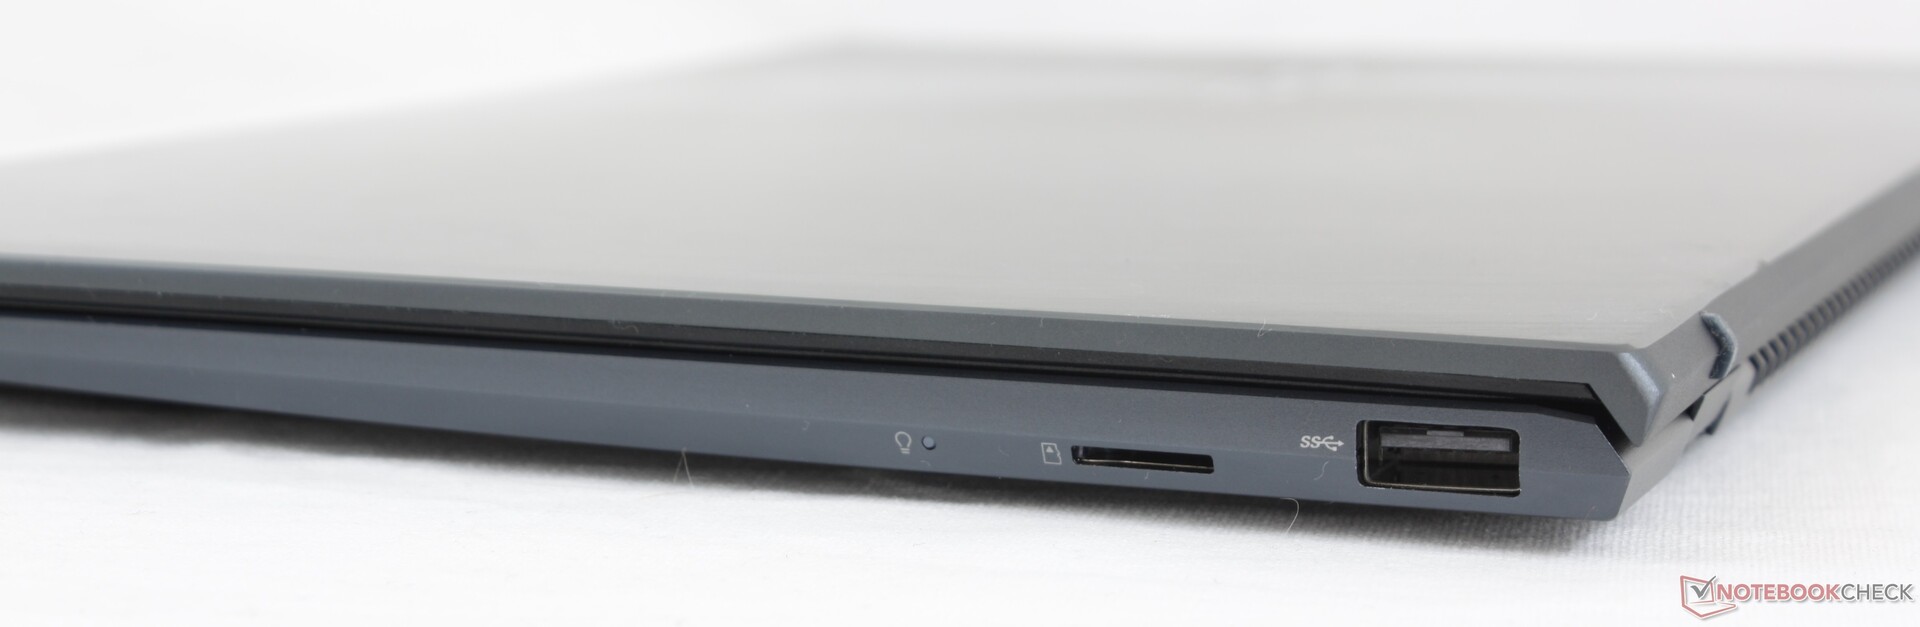
SD Card Reader
The spring-loaded MicroSD card reader is almost three times faster than the card reader on the older ZenBook 14 UX434. Moving 1 GB of files takes about 13 seconds compared to ~40 seconds on the aforementioned ZenBook.
| SD Card Reader | |
| average JPG Copy Test (av. of 3 runs) | |
| Dell XPS 13 9300 Core i7-1065G7 (Toshiba Exceria Pro M501 64 GB UHS-II) | |
| Asus ZenBook 14 UX425EA (Toshiba Exceria Pro M501 64 GB UHS-II) | |
| LG Gram 14T90N (Toshiba Exceria Pro M501 64 GB UHS-II) | |
| Lenovo Yoga Slim 7-14ARE (Toshiba Exceria Pro M501 64 GB UHS-II) | |
| Asus ZenBook Flip 14 UX463FA-AI039T (Toshiba Exceria Pro M501 microSDXC 64GB) | |
| Asus ZenBook 14 UX434FL-DB77 (Toshiba Exceria Pro M501 64 GB UHS-II) | |
| maximum AS SSD Seq Read Test (1GB) | |
| Dell XPS 13 9300 Core i7-1065G7 (Toshiba Exceria Pro M501 64 GB UHS-II) | |
| Asus ZenBook 14 UX425EA (Toshiba Exceria Pro M501 64 GB UHS-II) | |
| LG Gram 14T90N (Toshiba Exceria Pro M501 64 GB UHS-II) | |
| Lenovo Yoga Slim 7-14ARE (Toshiba Exceria Pro M501 64 GB UHS-II) | |
| Asus ZenBook 14 UX434FL-DB77 (Toshiba Exceria Pro M501 64 GB UHS-II) | |
| Asus ZenBook Flip 14 UX463FA-AI039T (Toshiba Exceria Pro M501 microSDXC 64GB) | |
Communication
The Intel AX201 comes standard with Wi-Fi 6 and Bluetooth 5.1 connectivity. We experienced no issues when paired to our Netgear RAX200 router, but transmit rates are much slower than we would have liked.
Webcam


Maintenance
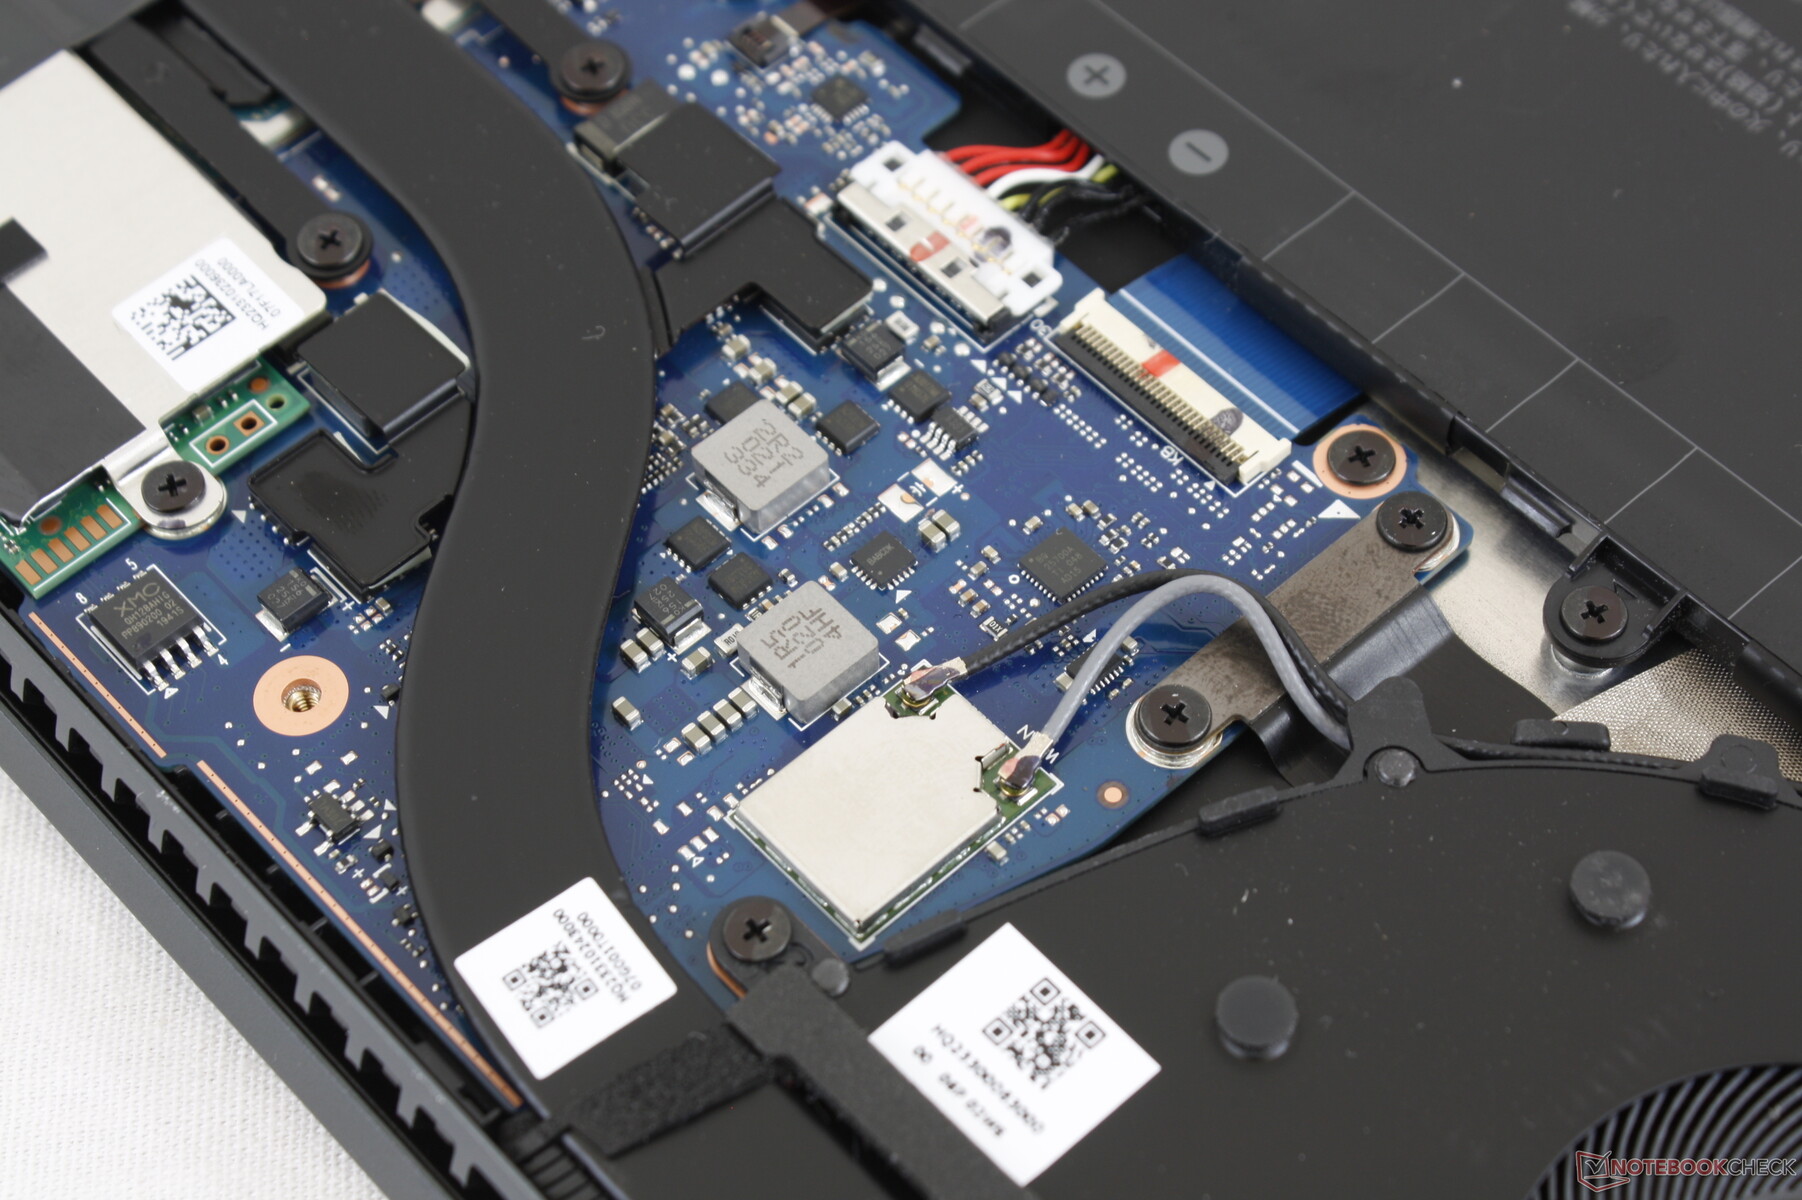
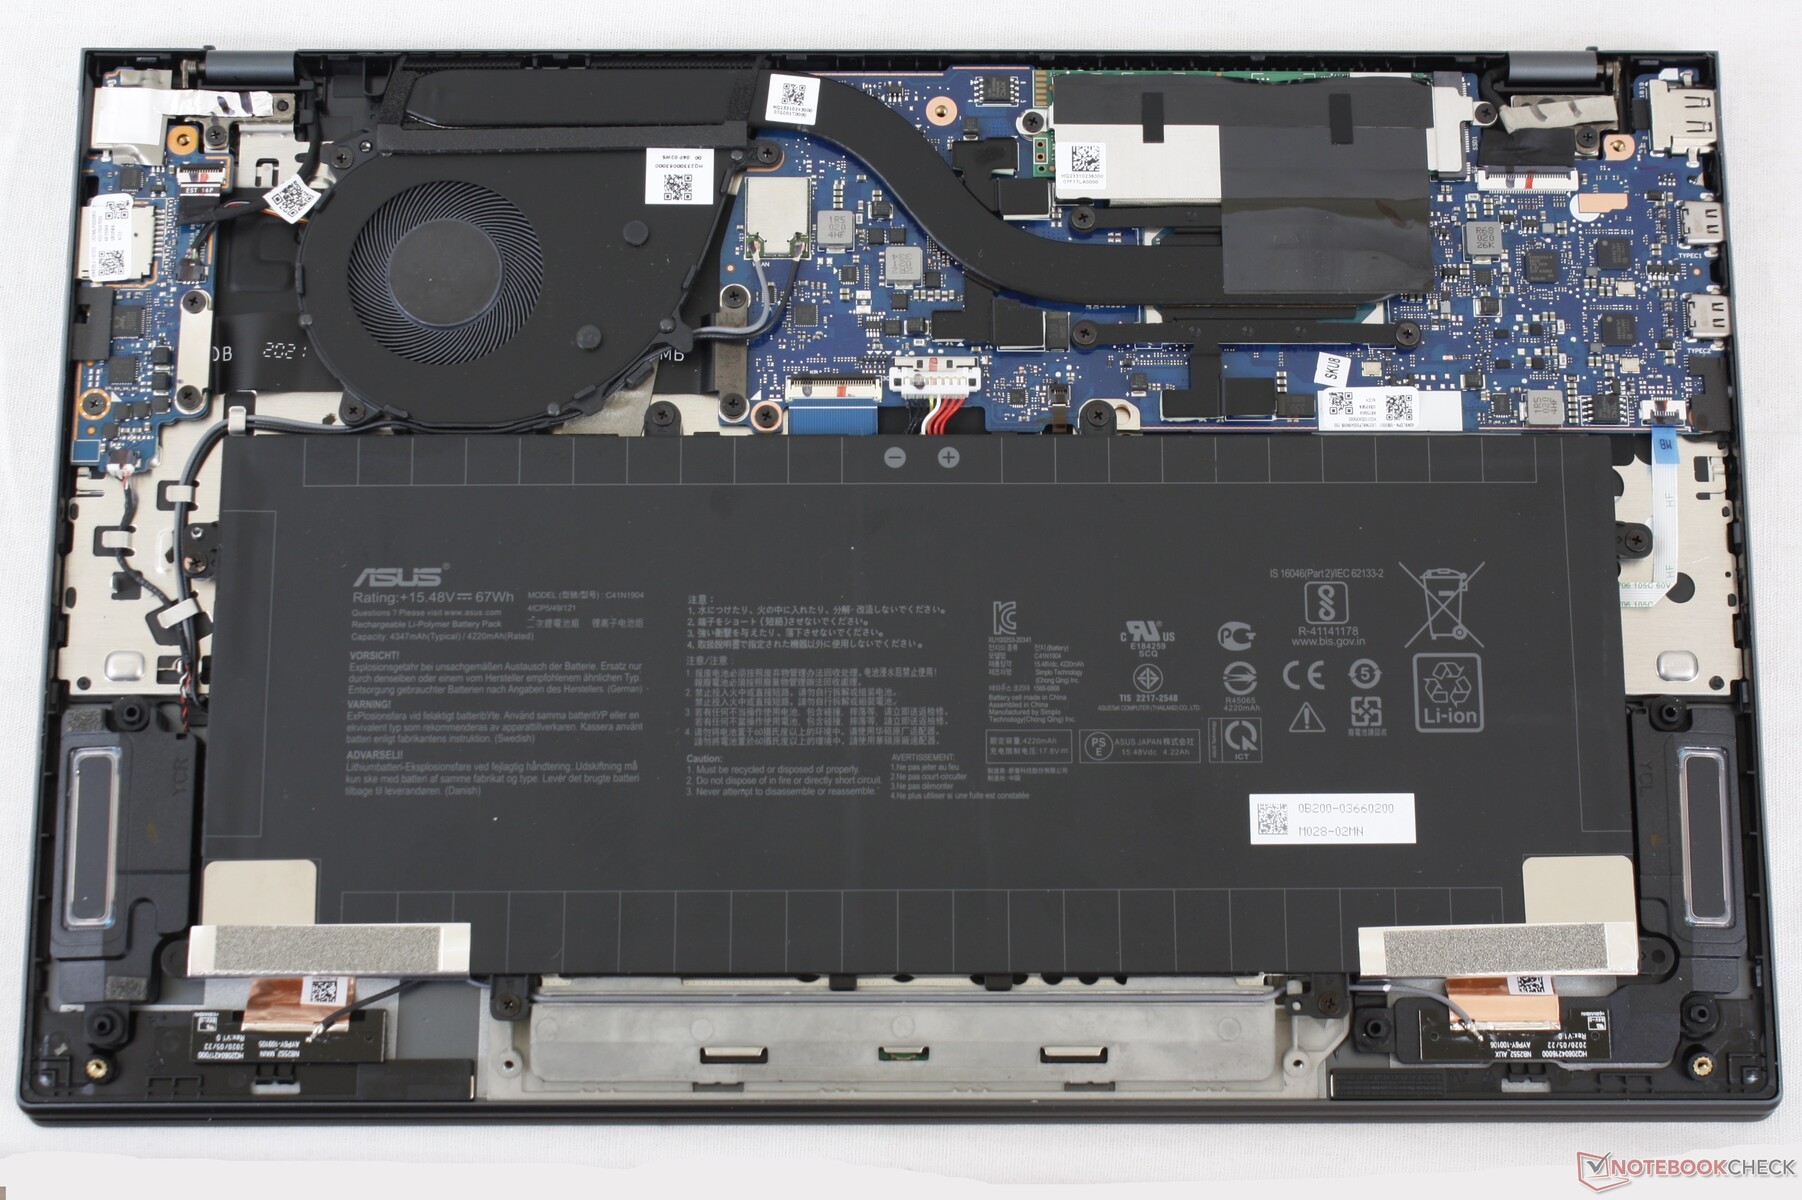
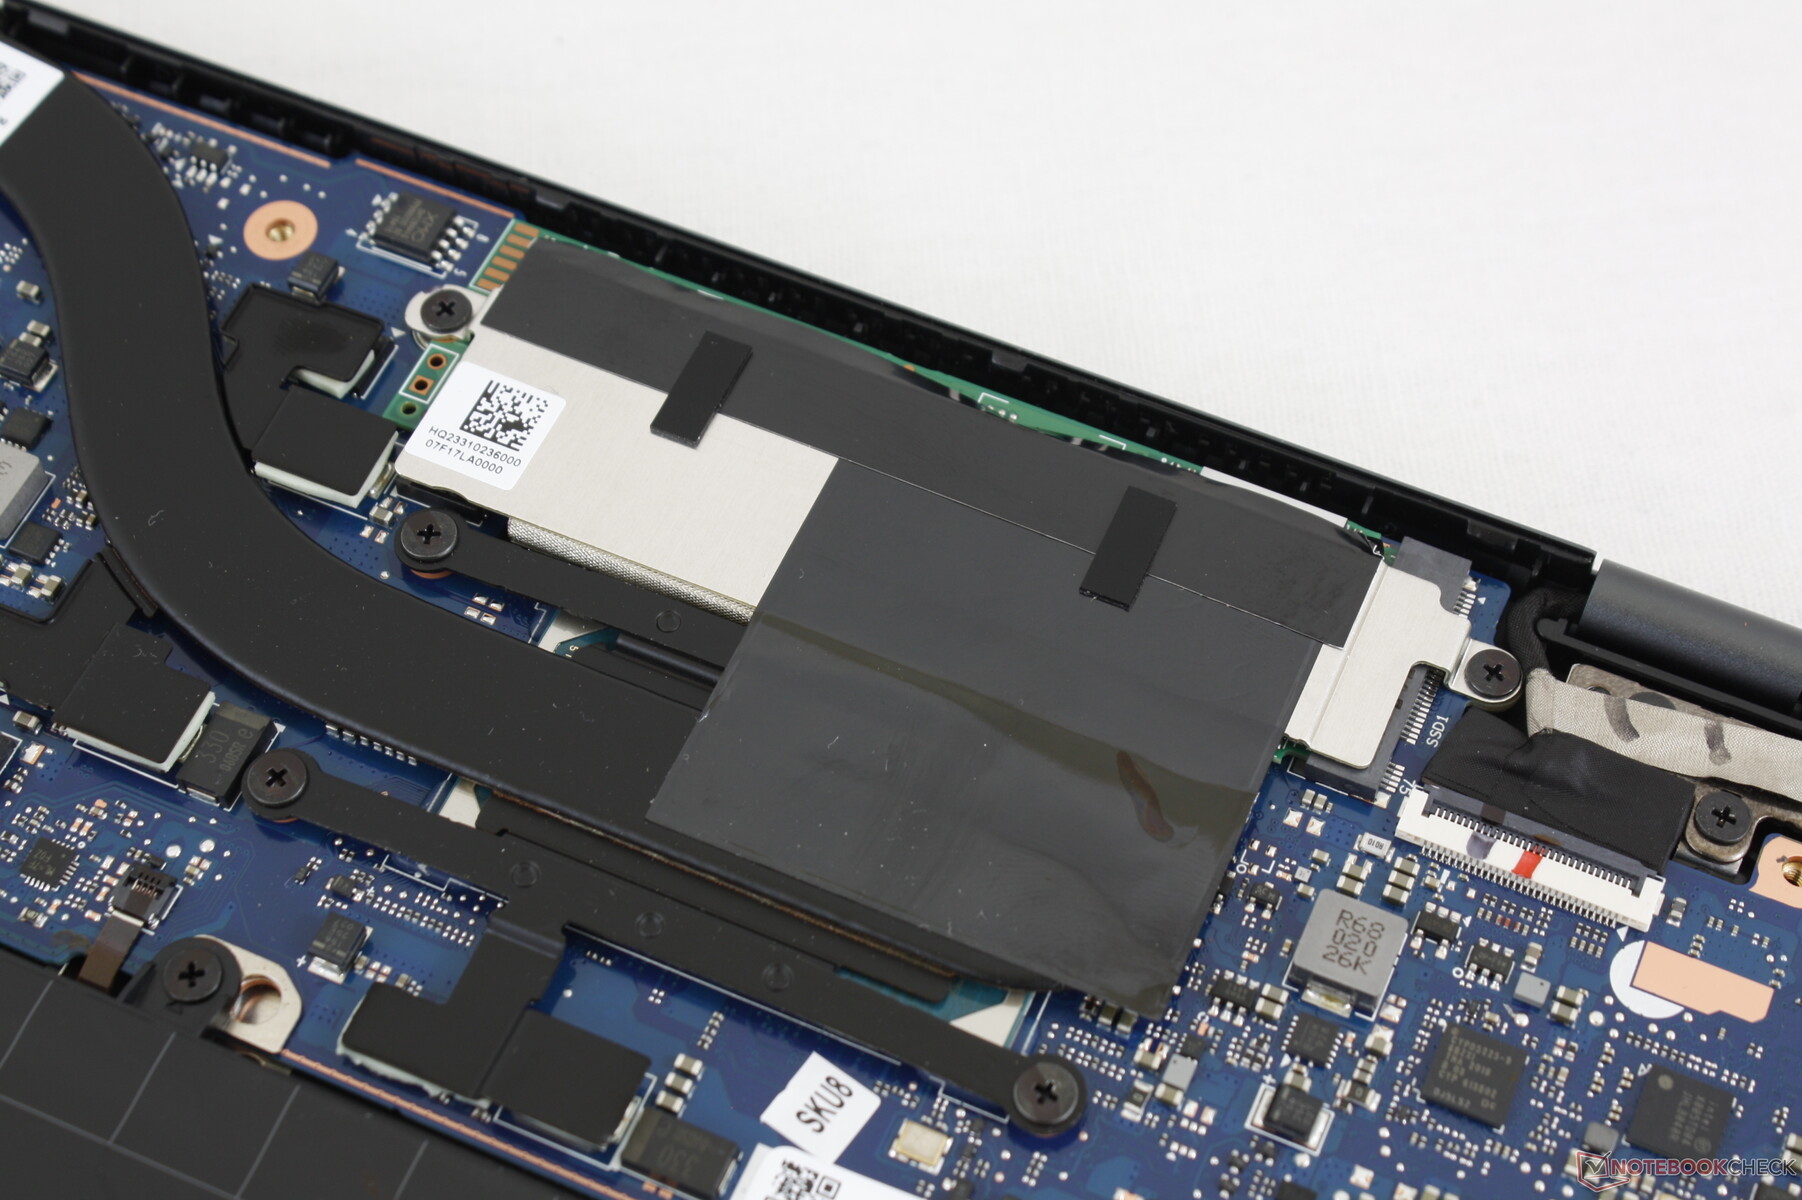
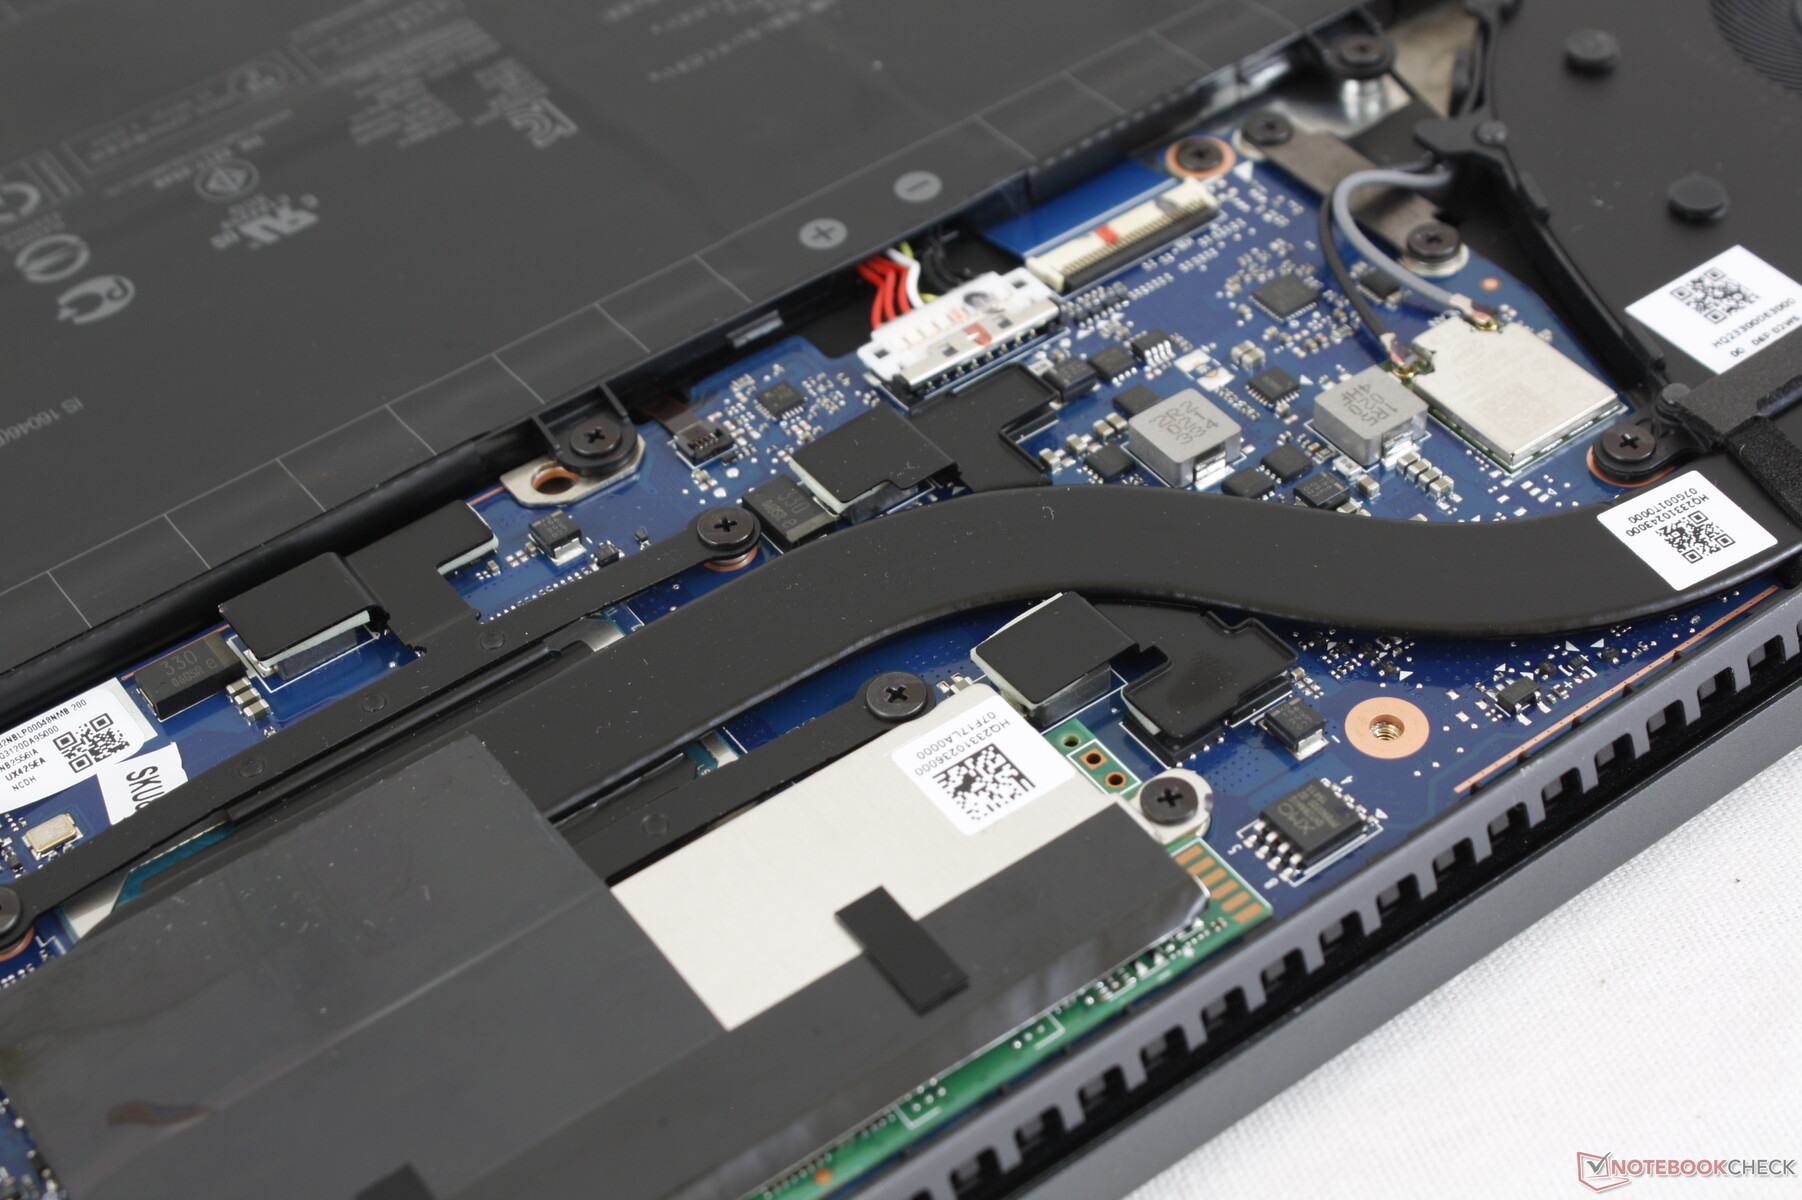
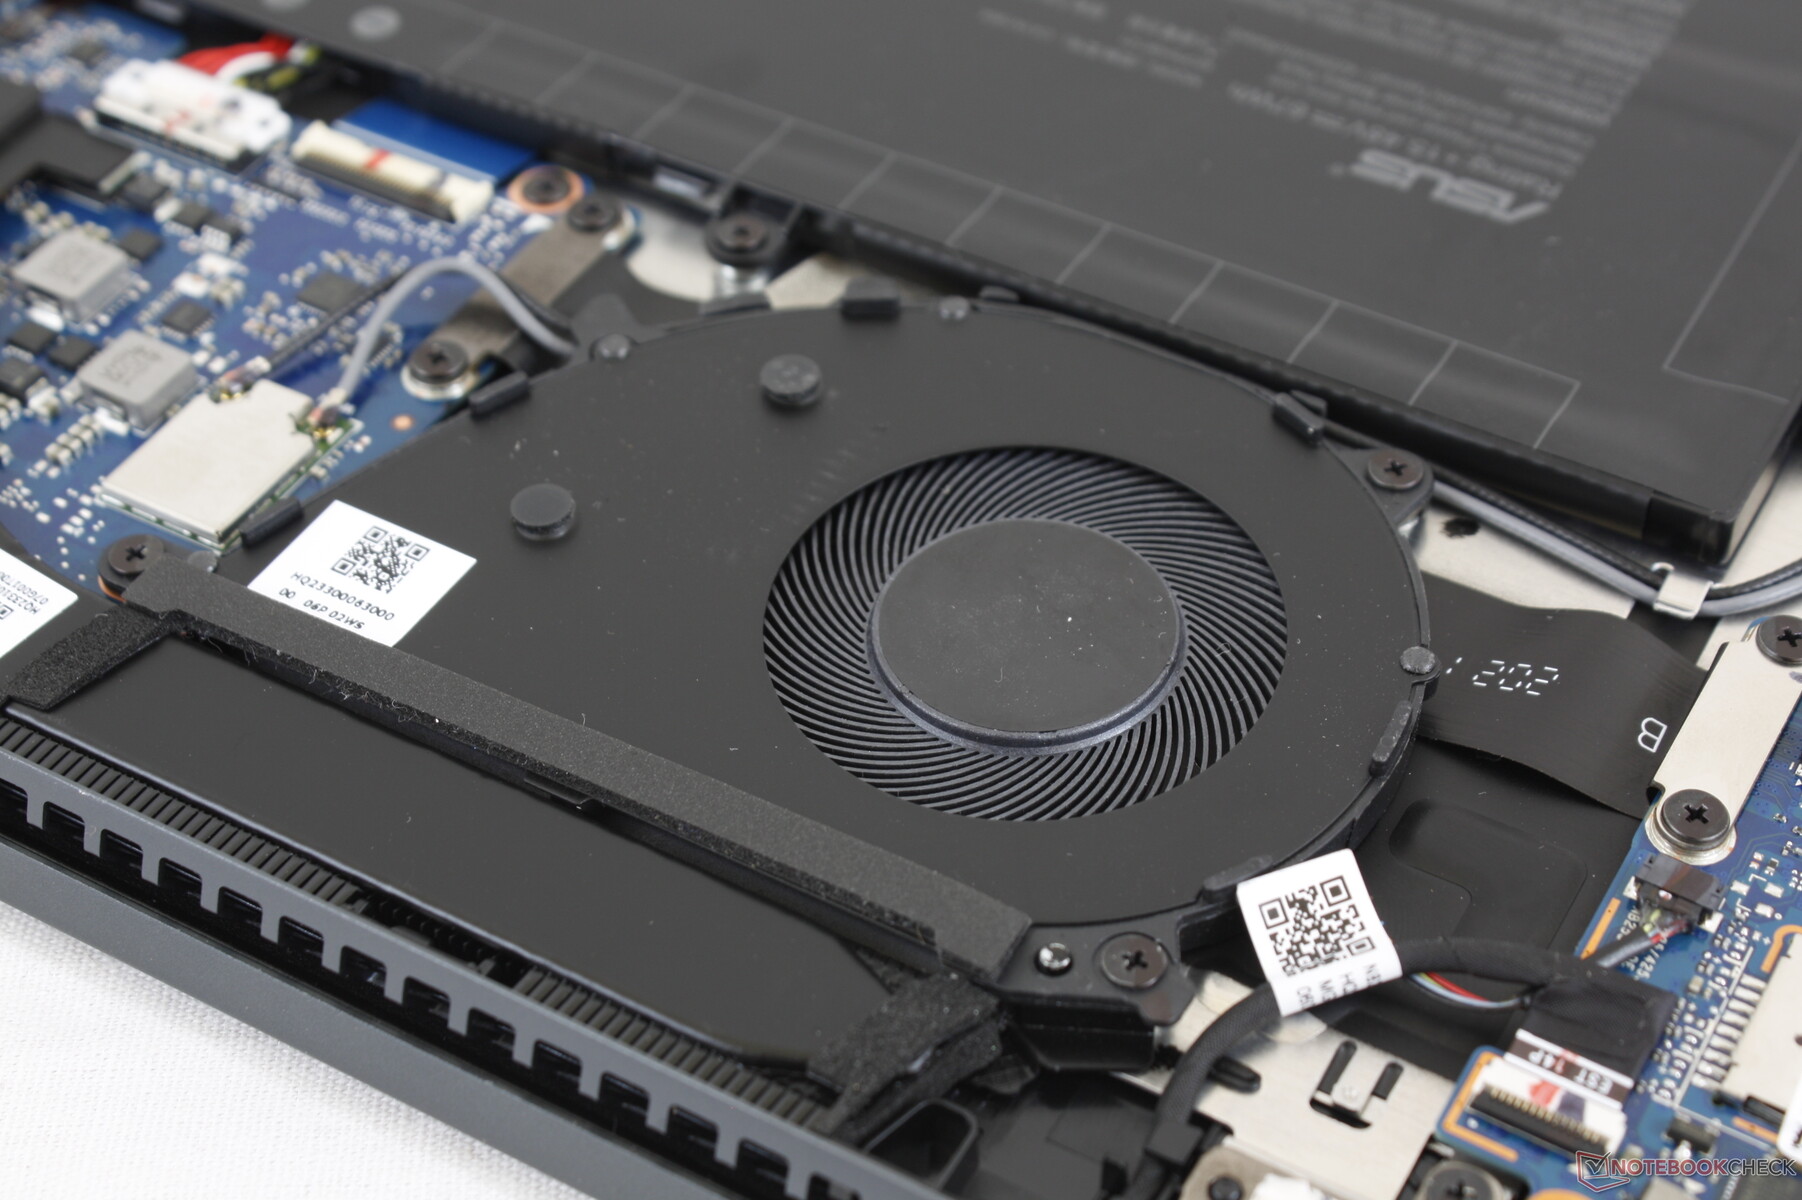
The bottom panel requires a T5 Torx wrench to remove. Keep in mind that two additional screws are hidden underneath the rear rubber footing. There isn't much to upgrade once inside as both RAM and WLAN are soldered.
Accessories and Warranty
Asus includes a USB-C to 3.5 mm audio jack adapter, USB-A to RJ-45 adapter, and a carrying sleeve in each retail the box. The former will be especially useful for those who don't have Bluetooth earphones and it can be used for USB-C smartphones, too. The standard one-year limited manufacturer warranty applies.
Input Devices
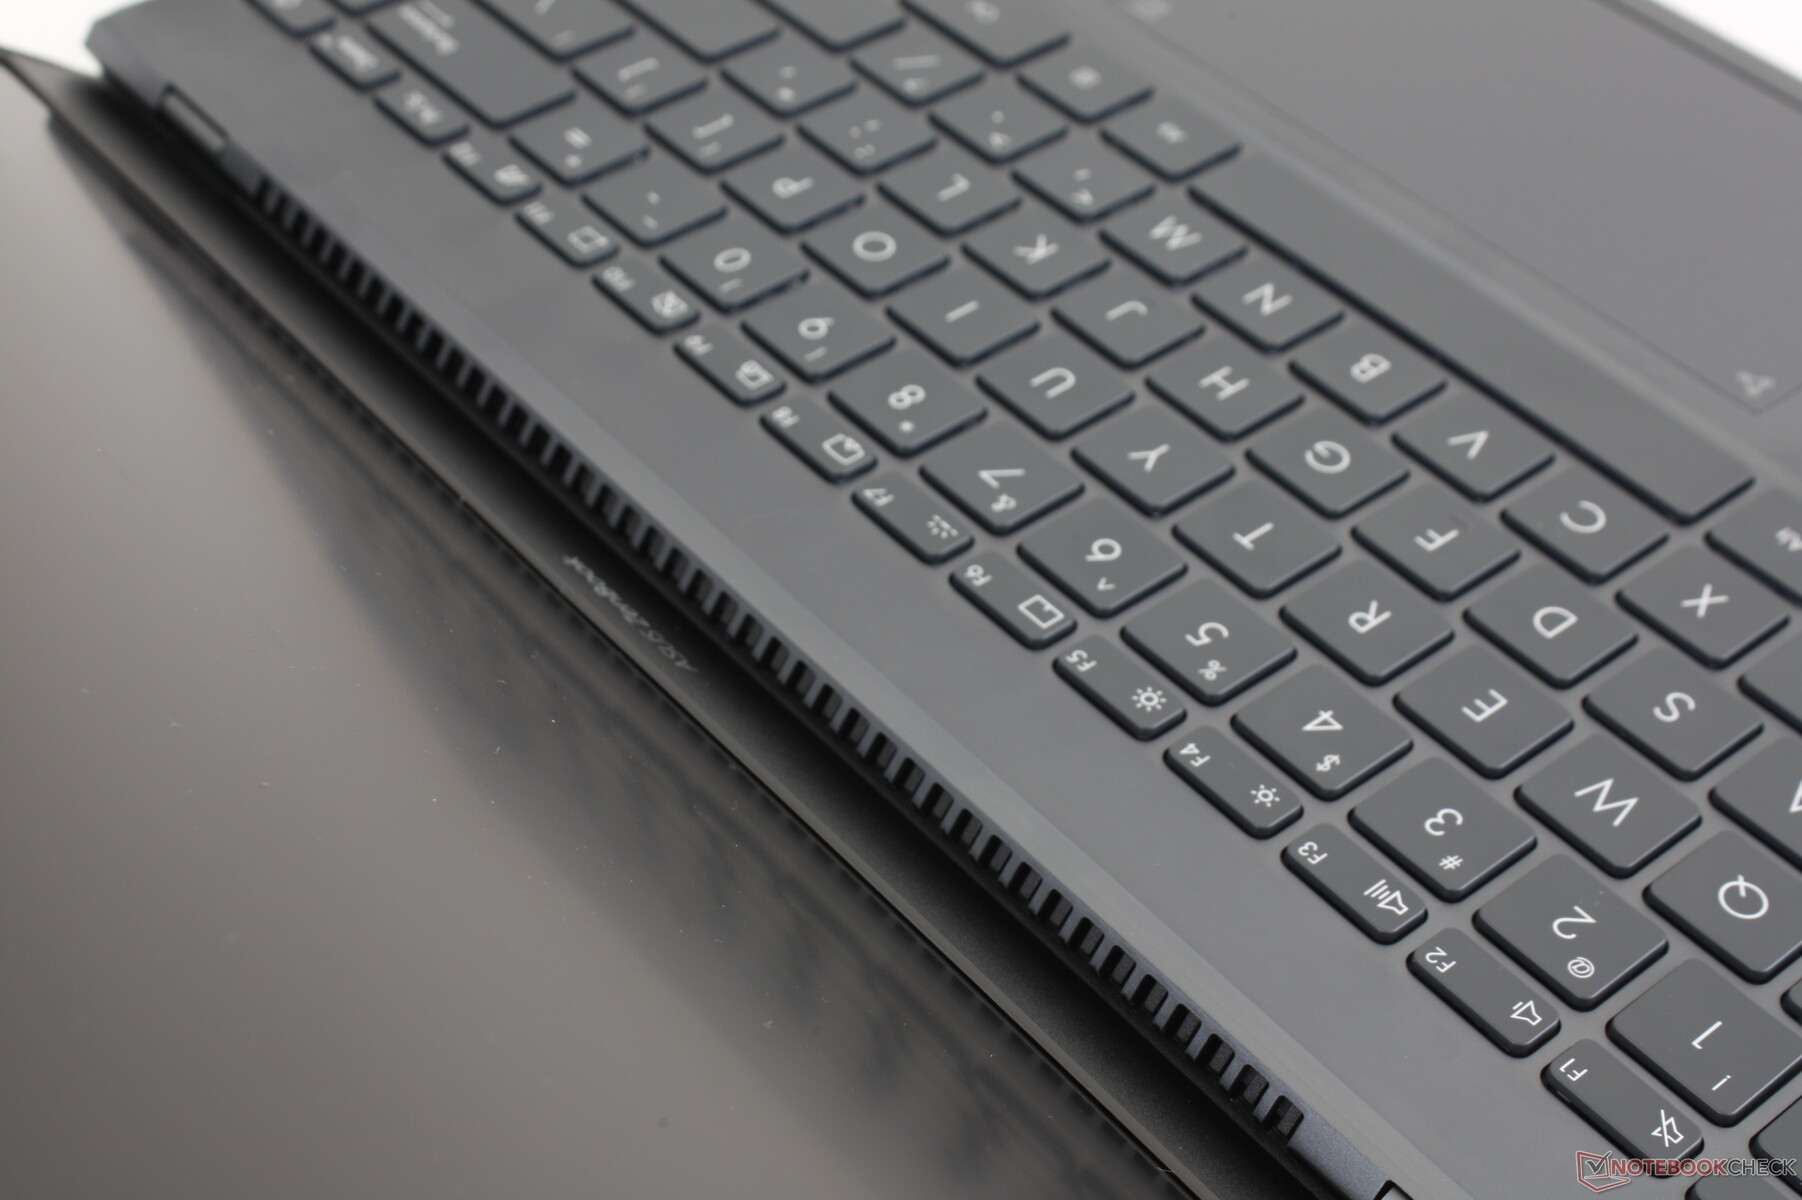
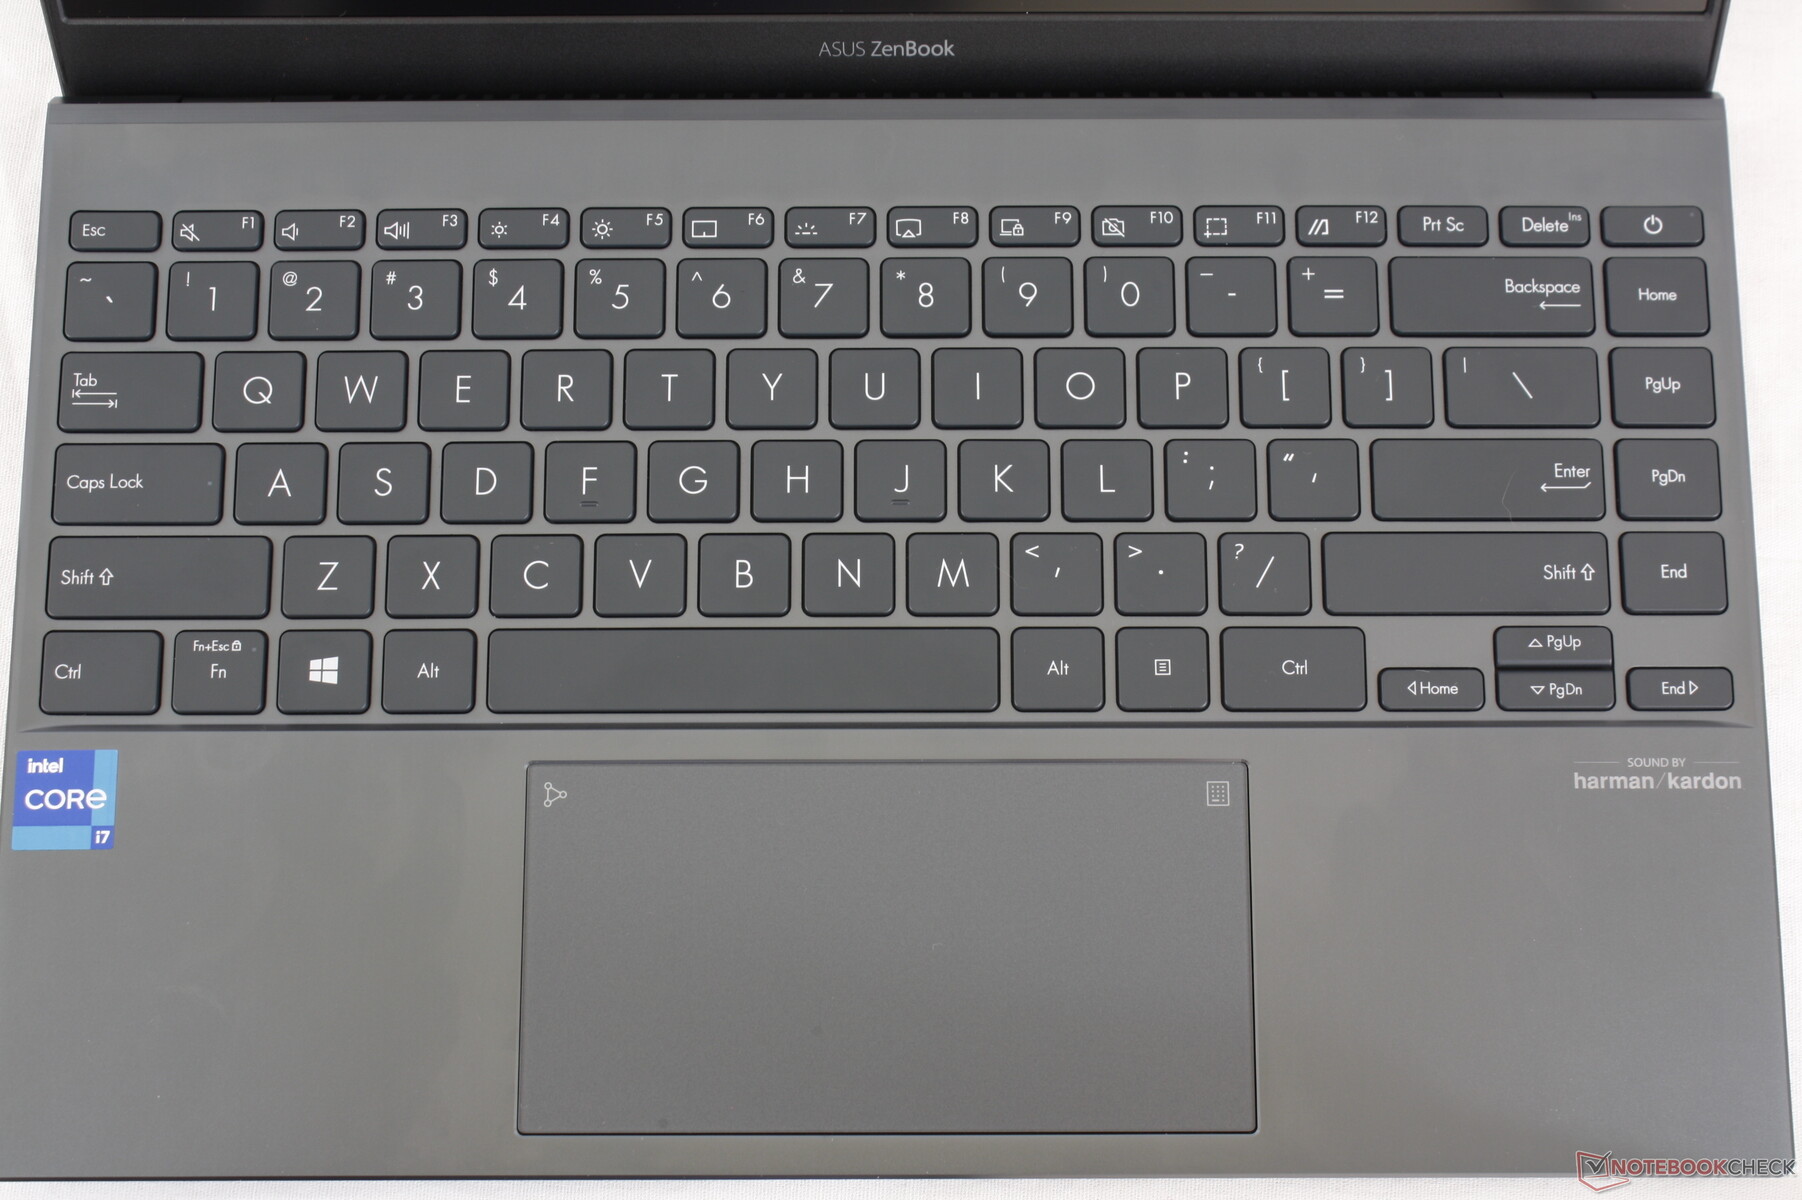
Keyboard
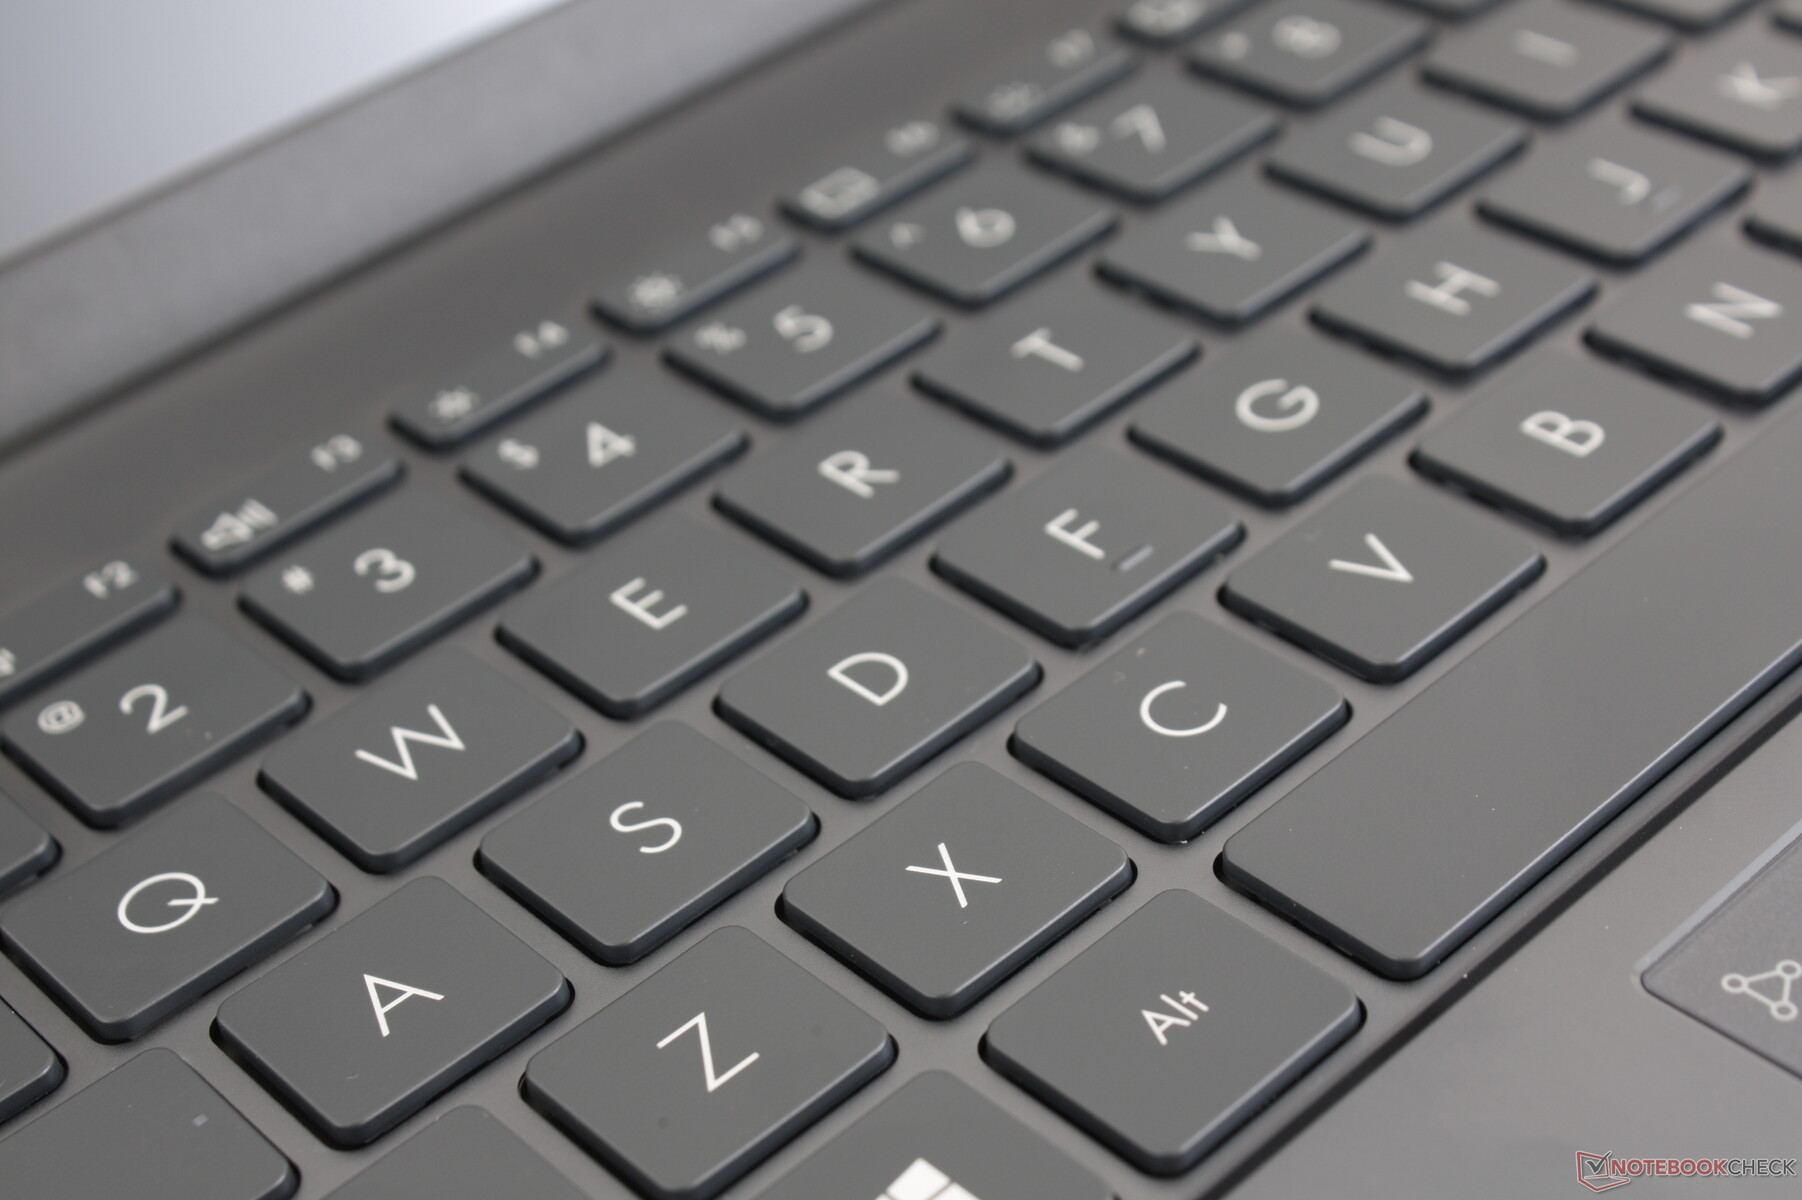
Key clatter is louder on our Asus when compared to the Yoga Slim 7 especially for the Space and Enter keys. Key feedback is otherwise satisfactory with shallow travel as one would expect from a thin-and-light chassis. Business laptops like the HP EliteBook or Lenovo ThinkPad T series have firmer keys with stronger feedback.
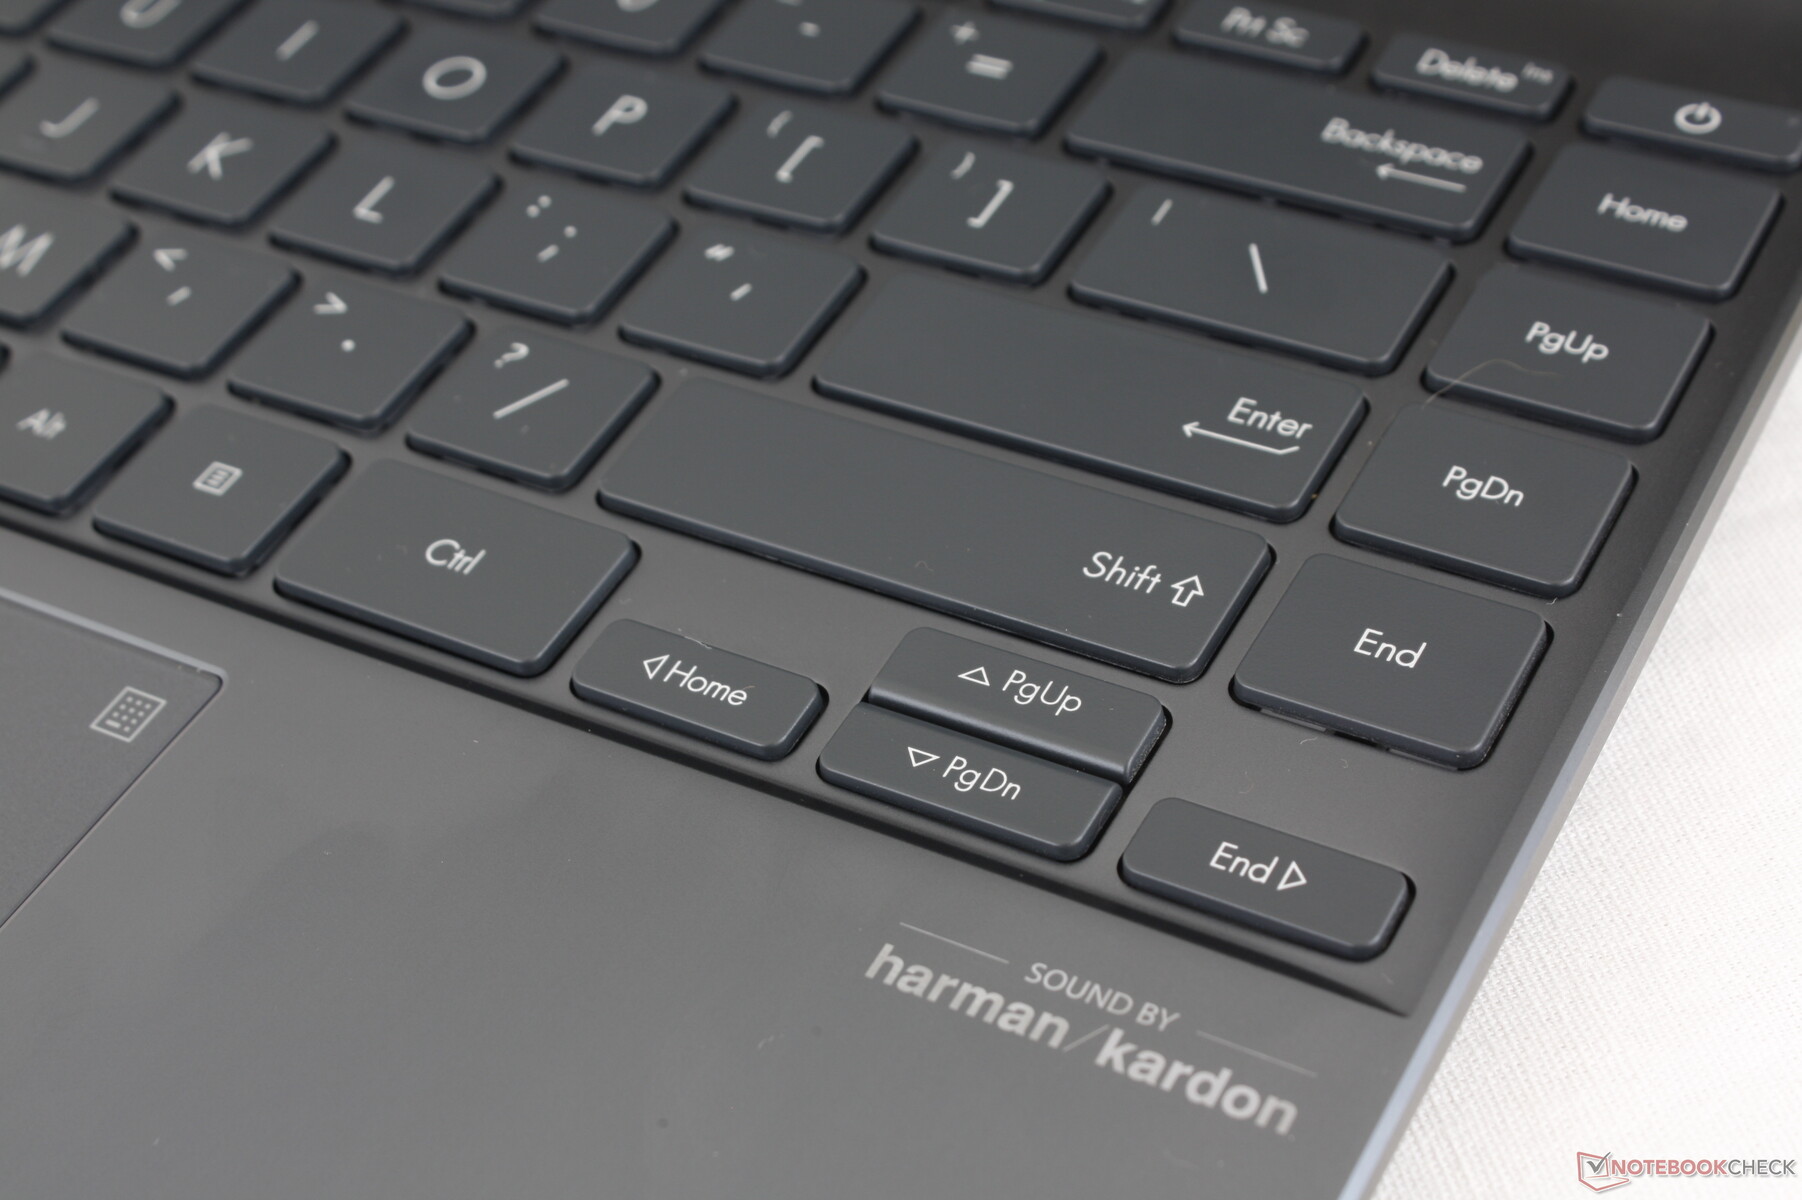
We particularly like the large column of Home, PgUp, PgDn, and End keys along the right edge of the keyboard. Such keys typically get the short end of the stick on most other laptops where they are smaller and less comfortable to use.
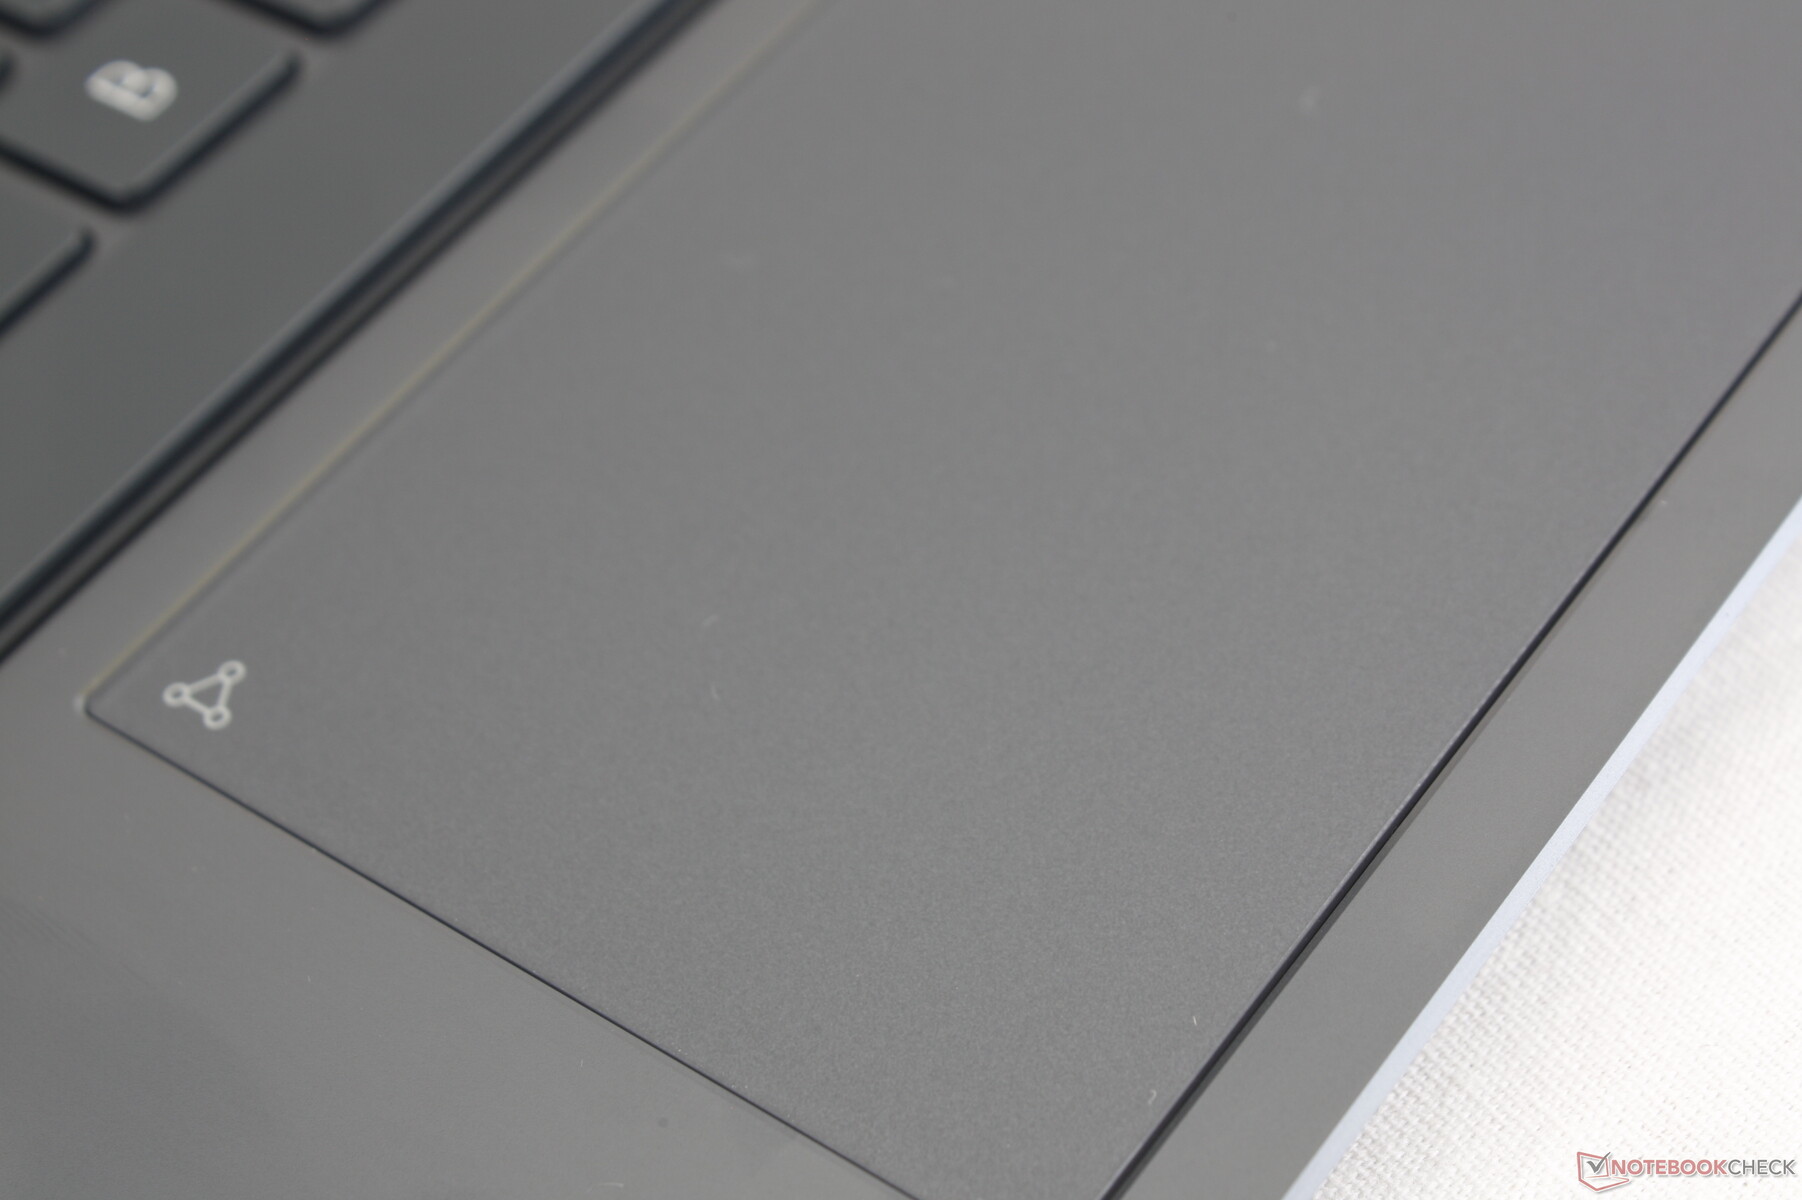
Touchpad
The Precision clickpad is large at 13.0 x 6.6 cm compared to "only" 10.5 x 6.2 cm on the Yoga Slim 7. Its glass surface is completely smooth and responsive with only a bit of sticking when gliding at slower speeds. However, the integrated mouse clicks are both shallow in travel and weak in feedback which make accurate drag-and-drop actions difficult.
Display
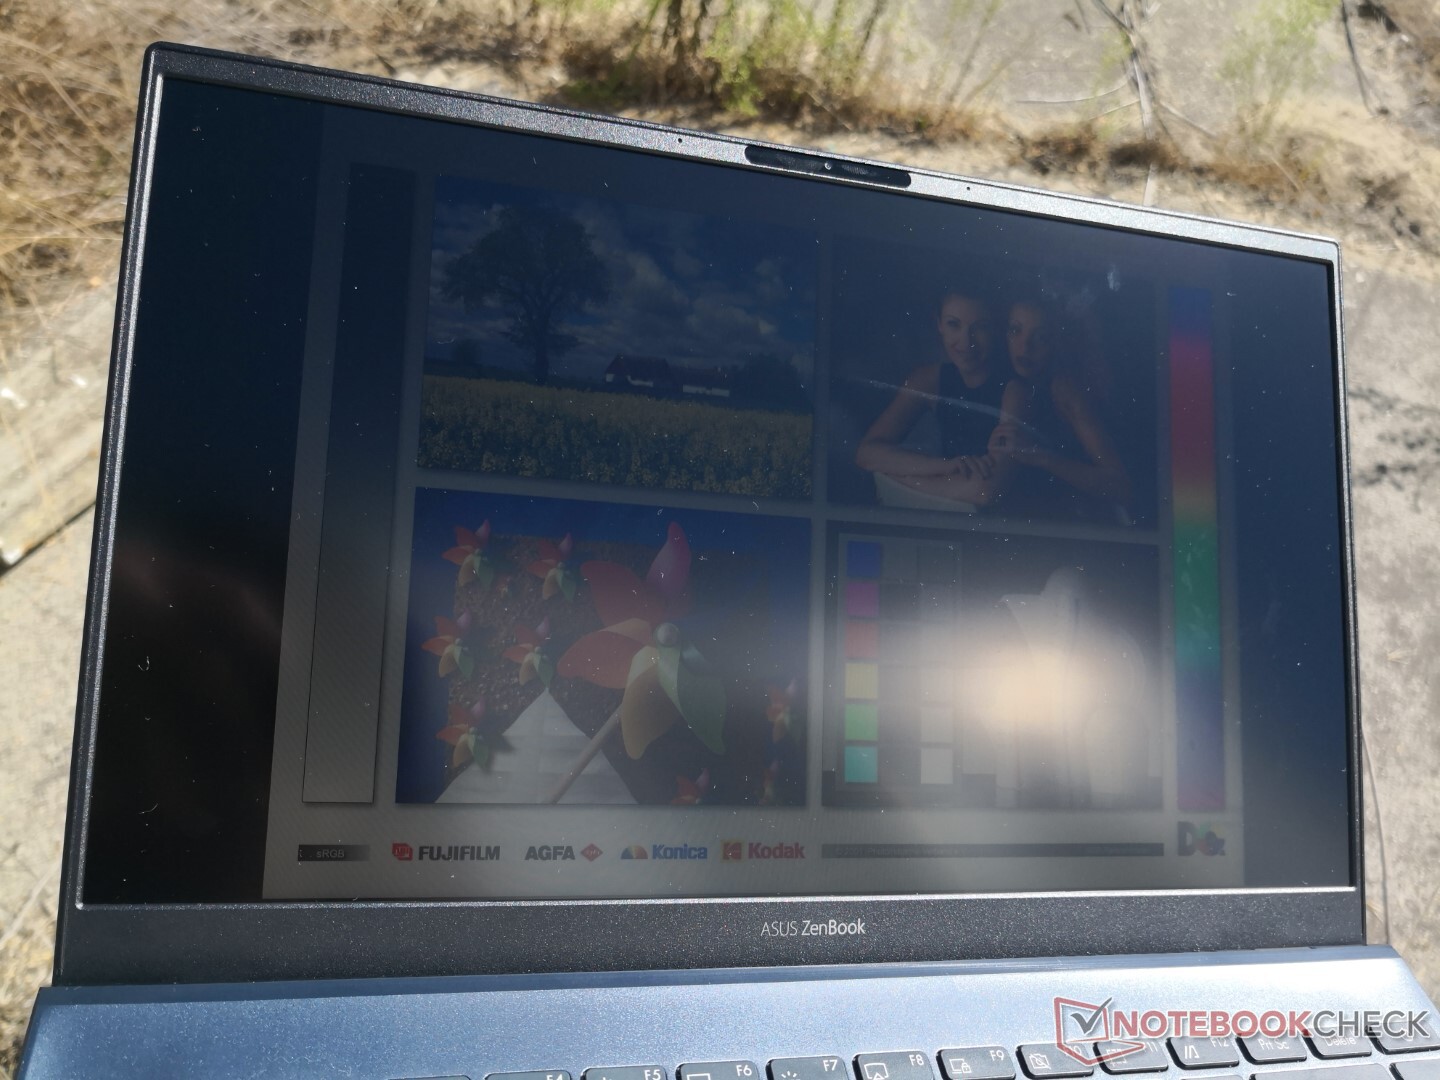
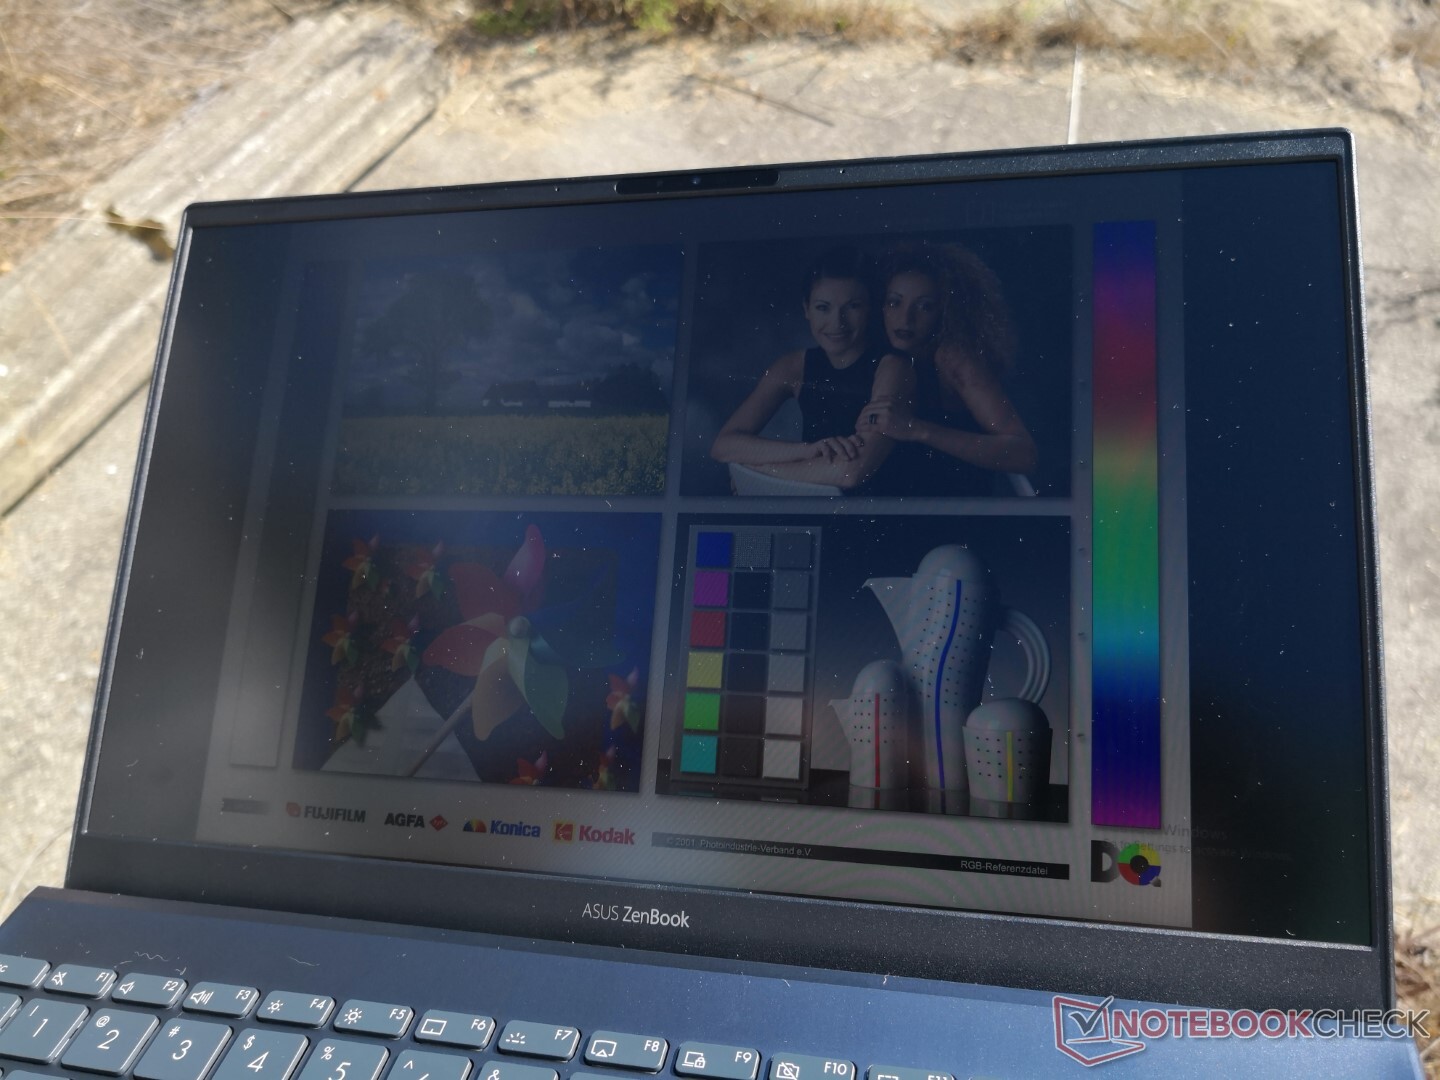
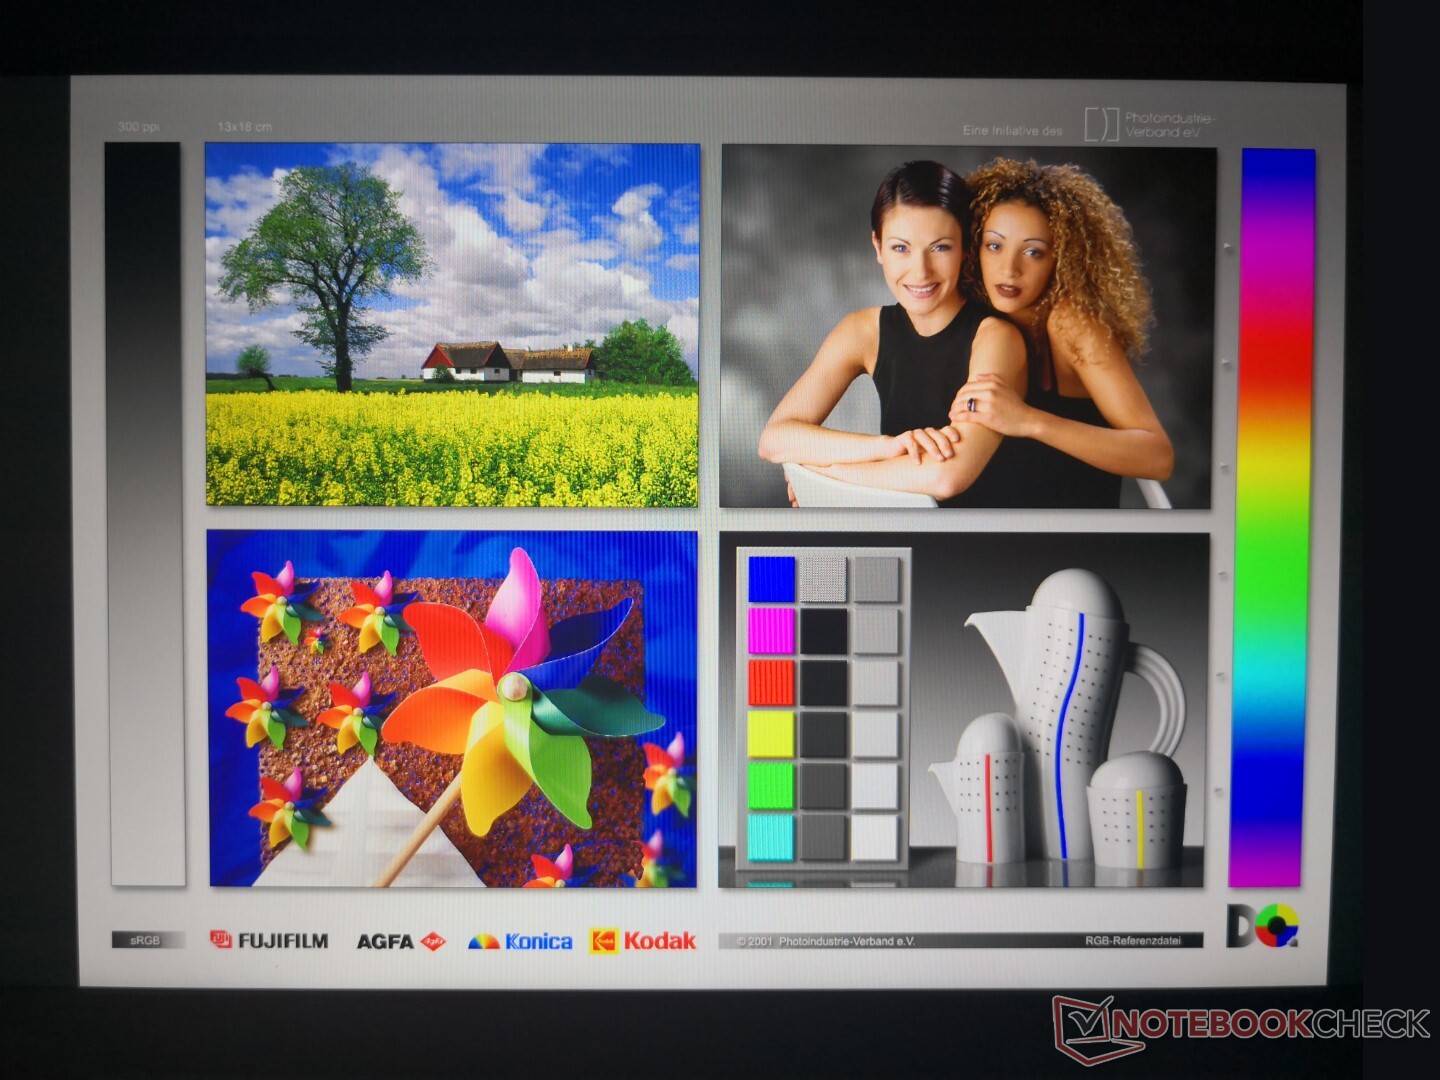
The Asus system comes with the same 1080p AU Optronics B140HAN06.8 IPS panel as found on the Lenovo Yoga Slim 7 but with two major differences. Firstly, the latter is glossy whereas our Asus is matte meaning texts and images are slightly grainier here. Secondly, the AMD-powered Lenovo supports FreeSync to limit screen tearing when gaming while our Asus has no such adaptive sync options. Visual quality is otherwise similar between the two laptops with similar brightness levels, contrast ratios, gamuts, and response times.
Asus offers 300-nit and 400-nit 1080p panel options. We recommend the latter for better visibility when outdoors.
| |||||||||||||||||||||||||
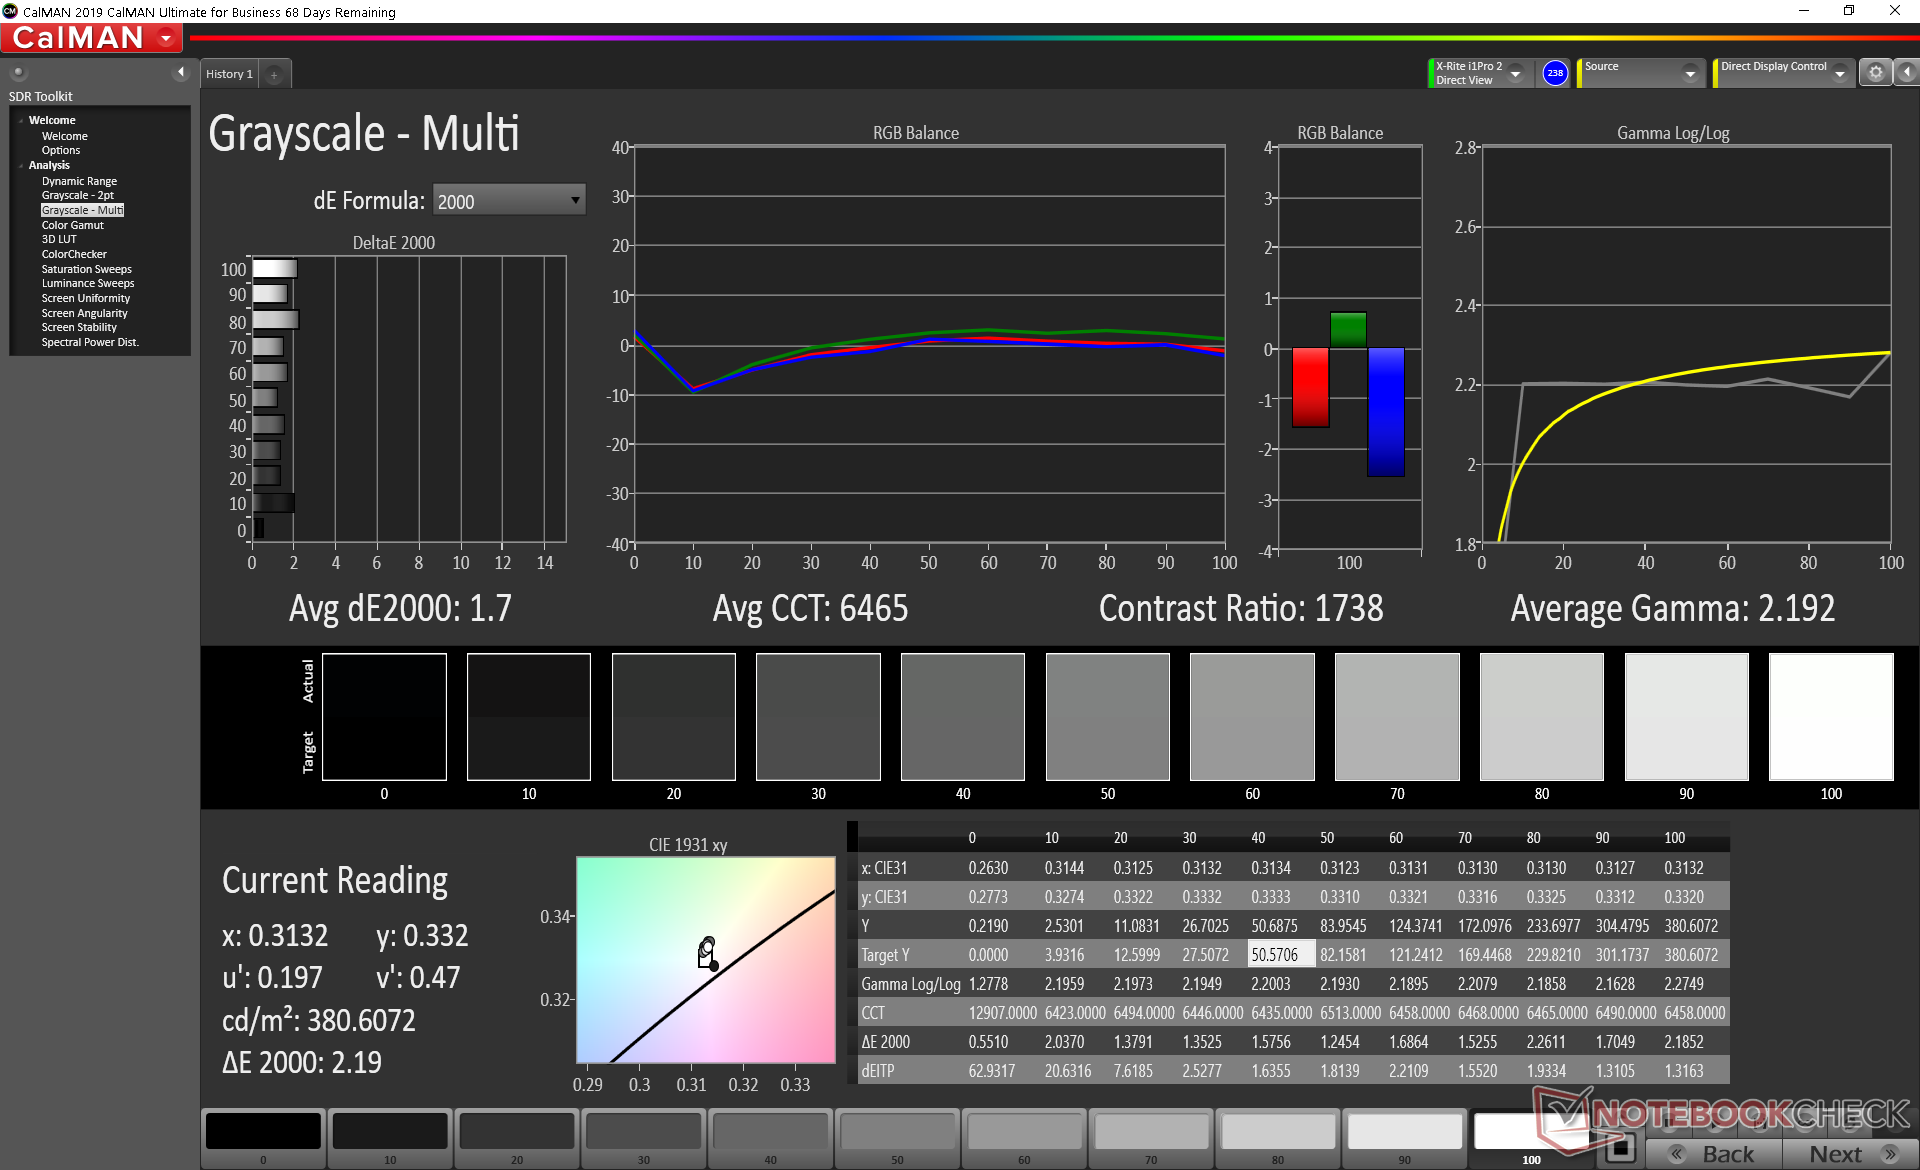
Brightness Distribution: 91 %
Center on Battery: 375.1 cd/m²
Contrast: 1103:1 (Black: 0.34 cd/m²)
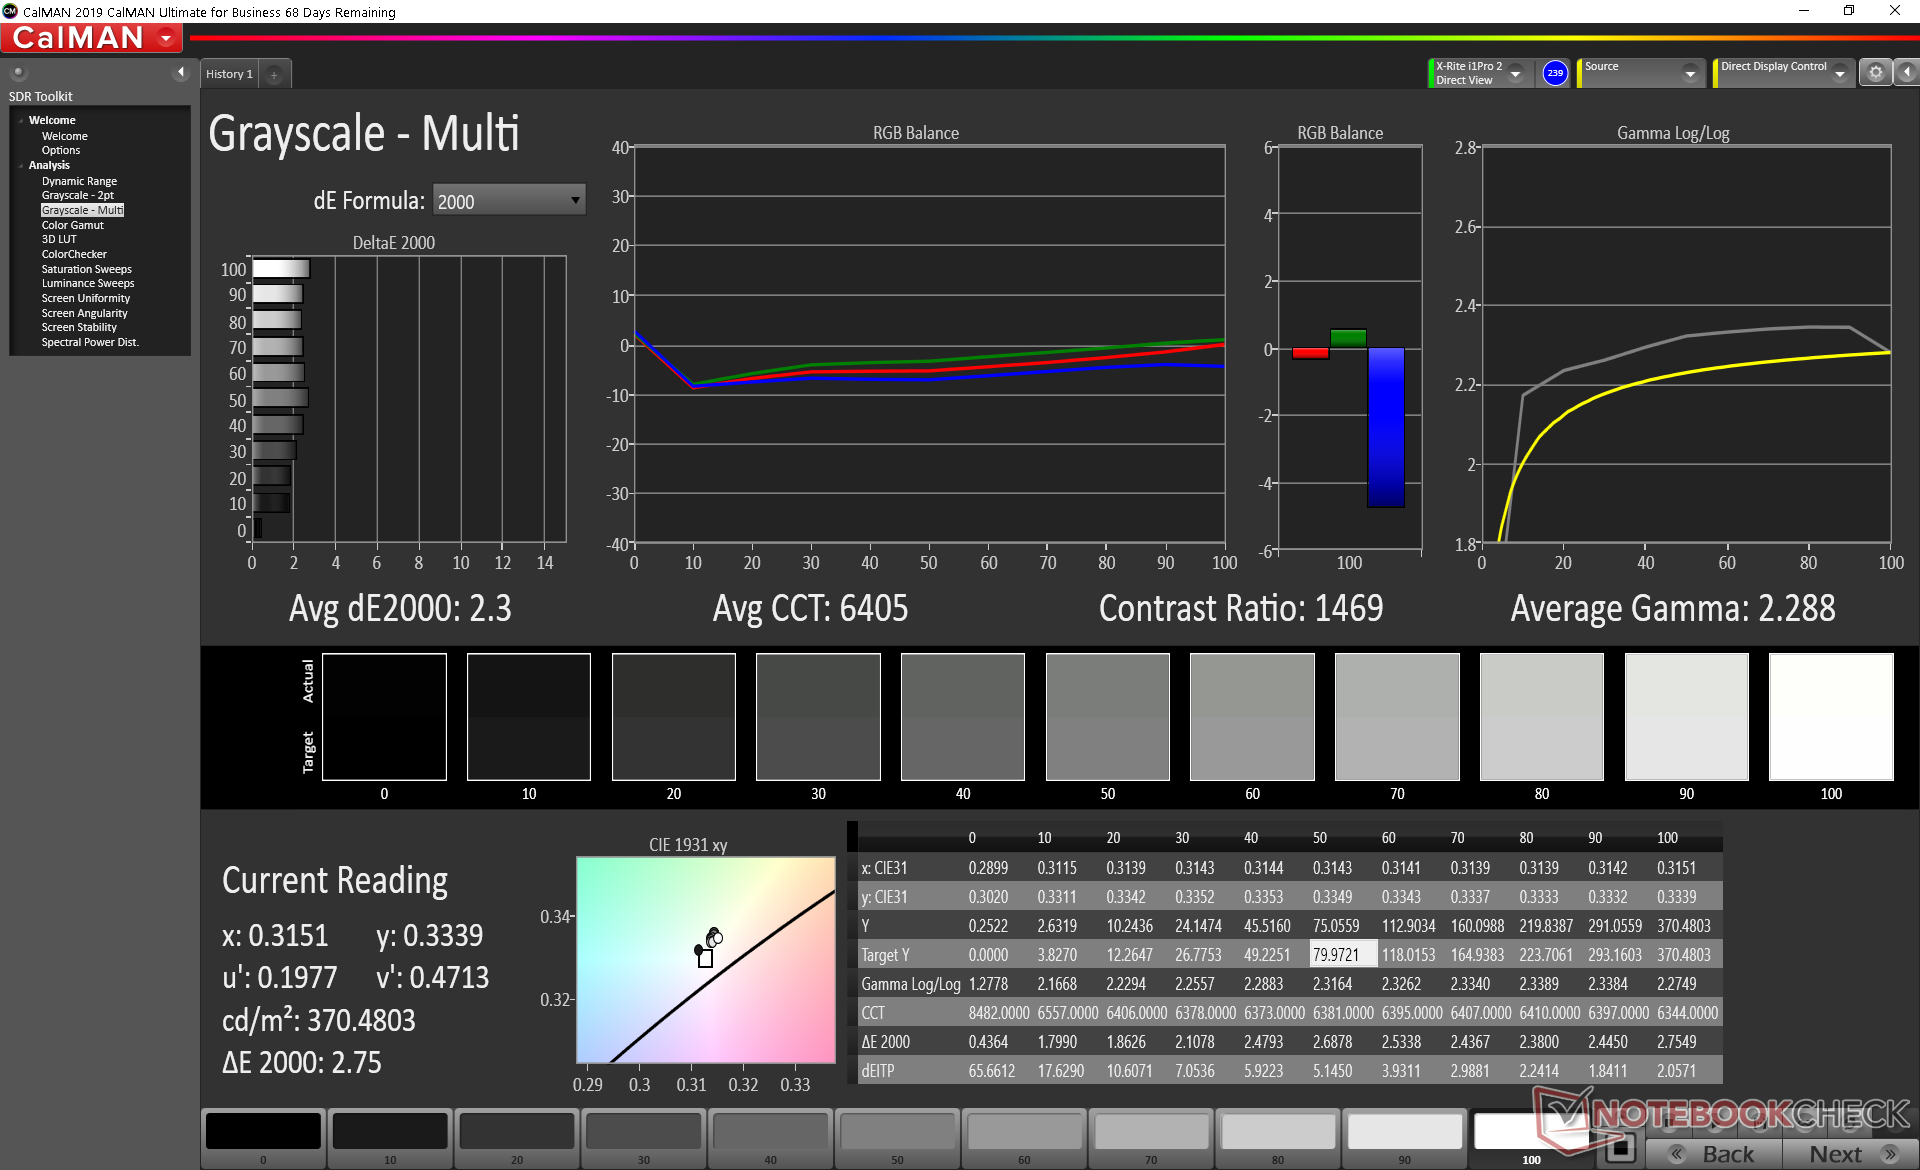
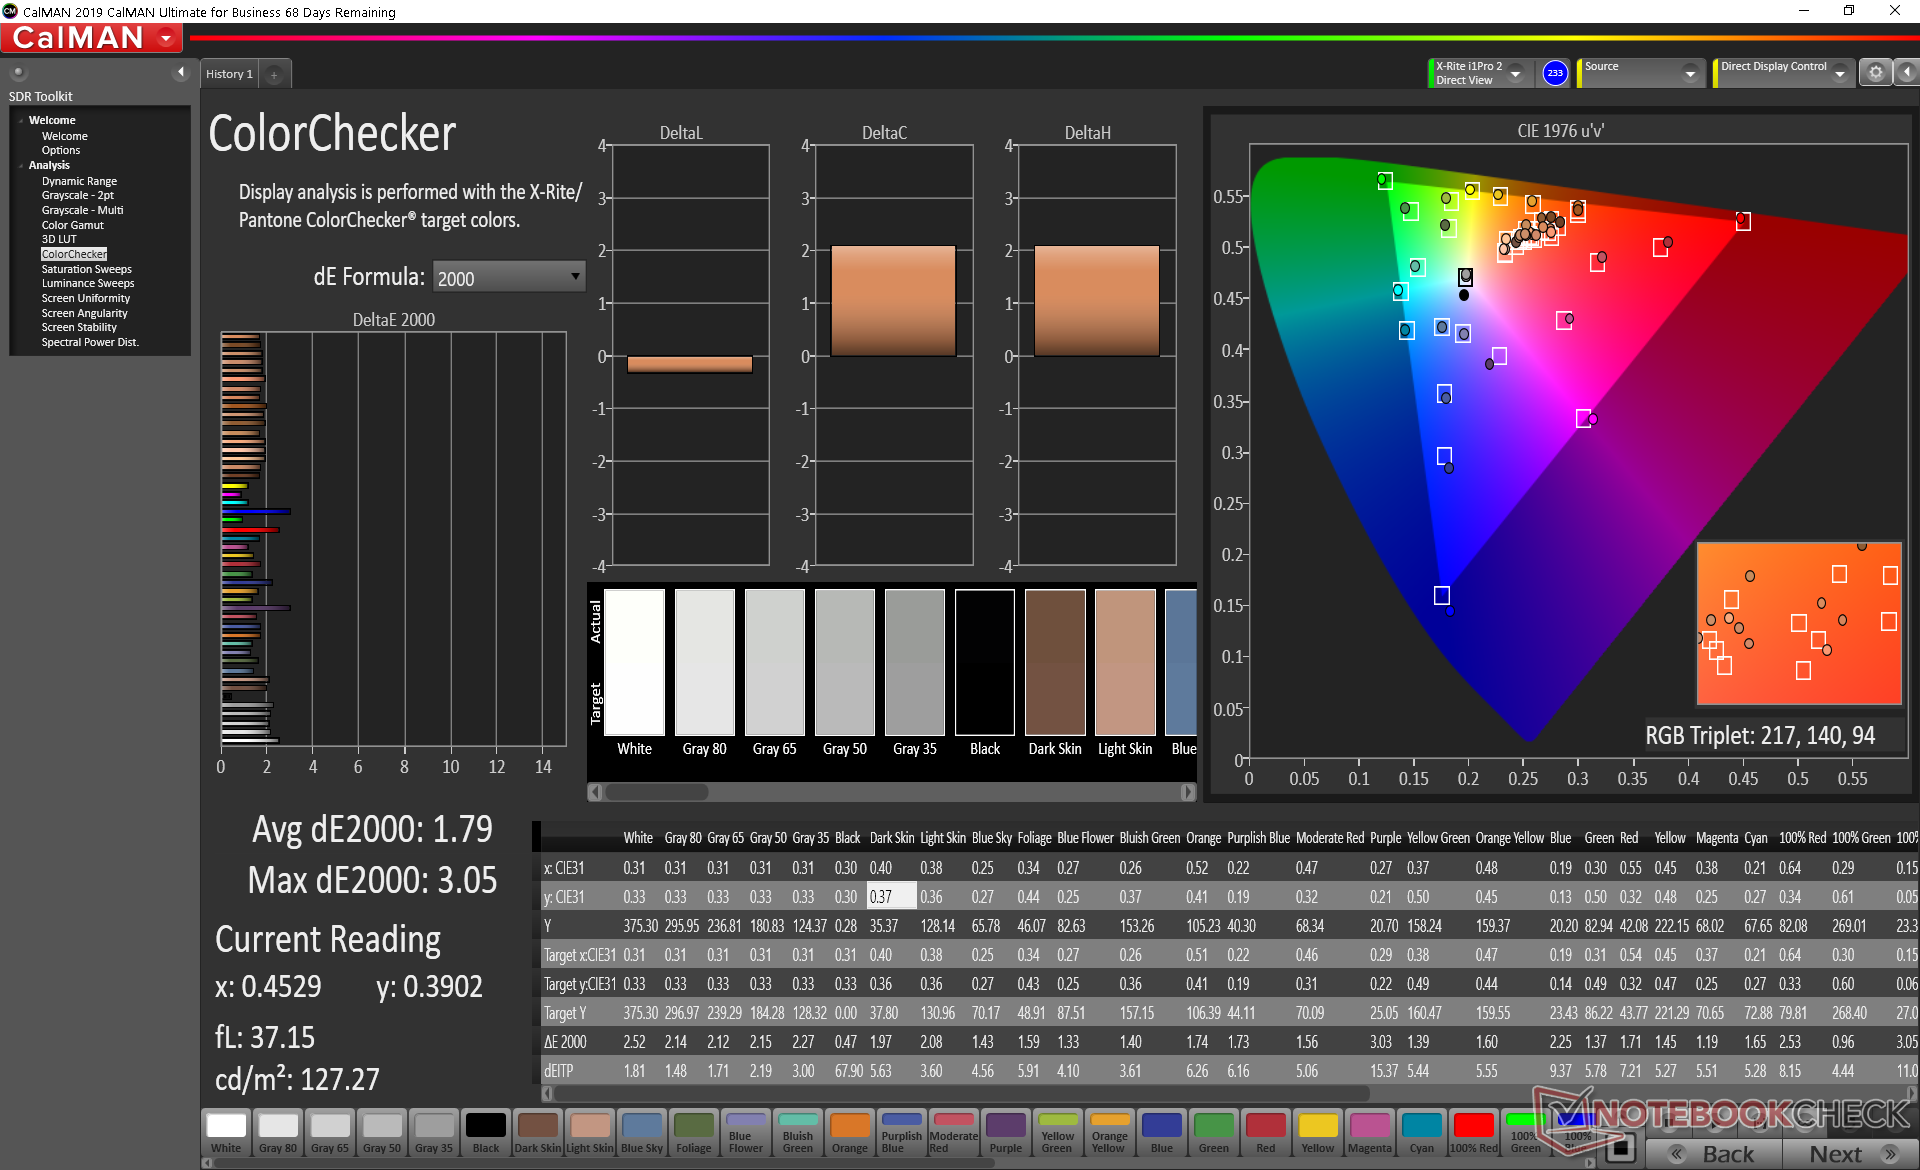
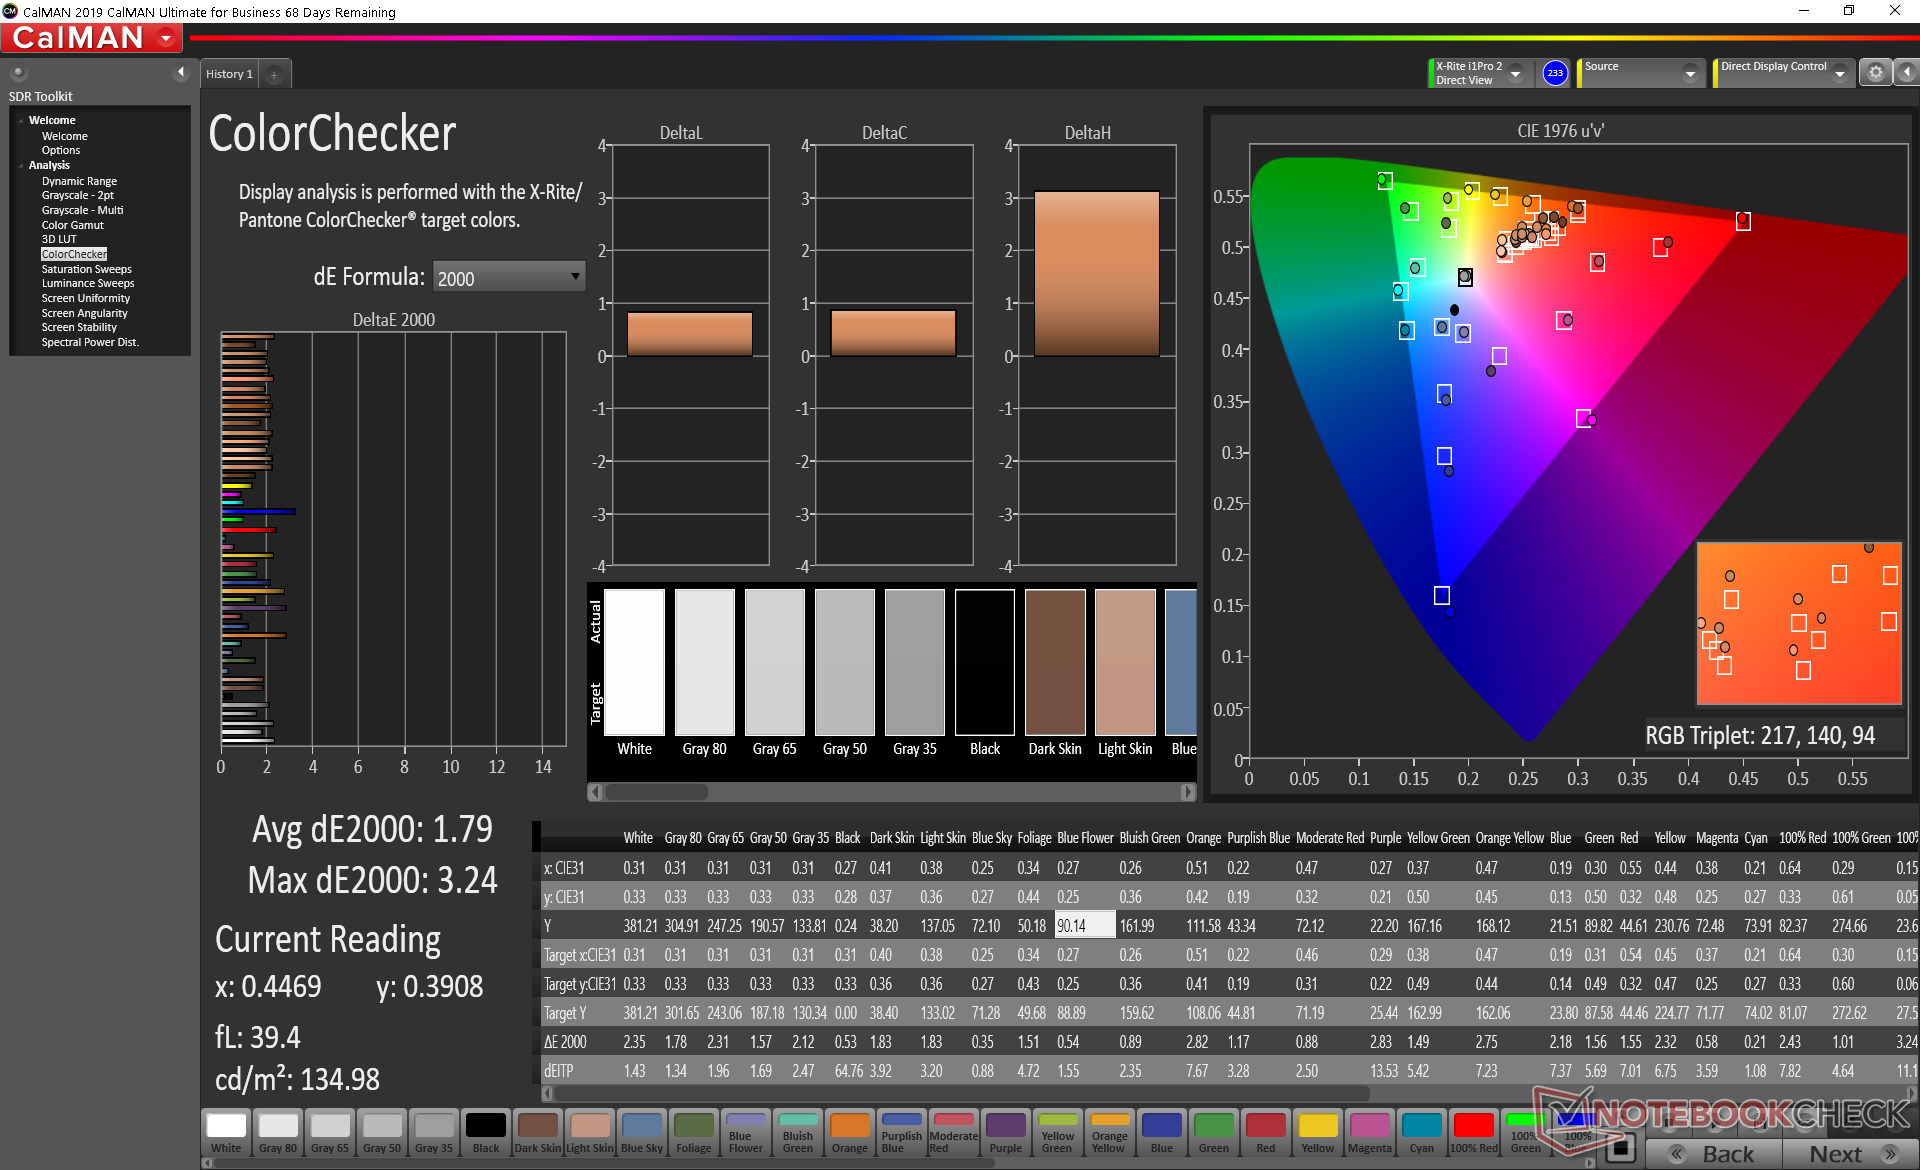
ΔE ColorChecker Calman: 1.79 | ∀{0.5-29.43 Ø4.72}
calibrated: 1.79
ΔE Greyscale Calman: 2.3 | ∀{0.09-98 Ø4.97}
98.8% sRGB (Argyll 1.6.3 3D)
63.9% AdobeRGB 1998 (Argyll 1.6.3 3D)
69.8% AdobeRGB 1998 (Argyll 3D)
98.3% sRGB (Argyll 3D)
68.6% Display P3 (Argyll 3D)
Gamma: 2.29
CCT: 6405 K
| Asus ZenBook 14 UX425EA AU Optronics B140HAN06.8, IPS, 14", 1920x1080 | Asus ZenBook 14 UX434FL-DB77 AU Optronics B140HAN03.2, IPS, 14", 1920x1080 | Asus ZenBook Flip 14 UX463FA-AI039T AU AUO323D, IPS, 14", 1920x1080 | LG Gram 14T90N LG Philips LP140WFA-SPY1, IPS, 14", 1920x1080 | Lenovo Yoga Slim 7-14ARE AU Optronics B140HAN06.8, IPS, 14", 1920x1080 | Dell XPS 13 9300 Core i7-1065G7 Sharp LQ134N1, IPS, 13.4", 1920x1200 | |
|---|---|---|---|---|---|---|
| Display | -6% | -12% | -4% | 3% | -2% | |
| Display P3 Coverage (%) | 68.6 | 64 -7% | 60.1 -12% | 65 -5% | 71.7 5% | 66.3 -3% |
| sRGB Coverage (%) | 98.3 | 92 -6% | 85.5 -13% | 95.7 -3% | 99.3 1% | 97.3 -1% |
| AdobeRGB 1998 Coverage (%) | 69.8 | 65.3 -6% | 61.1 -12% | 66.7 -4% | 72.9 4% | 68.5 -2% |
| Response Times | 8% | 11% | -17% | -2% | -14% | |
| Response Time Grey 50% / Grey 80% * (ms) | 49.6 ? | 37.6 ? 24% | 36 ? 27% | 54 ? -9% | 45.6 ? 8% | 50 ? -1% |
| Response Time Black / White * (ms) | 26.4 ? | 28.8 ? -9% | 28 ? -6% | 32.8 ? -24% | 29.6 ? -12% | 33.2 ? -26% |
| PWM Frequency (Hz) | 2500 ? | |||||
| Screen | -58% | -40% | -24% | -26% | -19% | |
| Brightness middle (cd/m²) | 375.1 | 355.8 -5% | 280 -25% | 322.2 -14% | 399.6 7% | 607.6 62% |
| Brightness (cd/m²) | 371 | 341 -8% | 286 -23% | 301 -19% | 385 4% | 595 60% |
| Brightness Distribution (%) | 91 | 88 -3% | 78 -14% | 86 -5% | 89 -2% | 96 5% |
| Black Level * (cd/m²) | 0.34 | 0.38 -12% | 0.208 39% | 0.25 26% | 0.37 -9% | 0.4 -18% |
| Contrast (:1) | 1103 | 936 -15% | 1346 22% | 1289 17% | 1080 -2% | 1519 38% |
| Colorchecker dE 2000 * | 1.79 | 4.47 -150% | 3.97 -122% | 3.62 -102% | 3.2 -79% | 3.23 -80% |
| Colorchecker dE 2000 max. * | 3.05 | 9.12 -199% | 8.29 -172% | 6.9 -126% | 6.44 -111% | 8.67 -184% |
| Colorchecker dE 2000 calibrated * | 1.79 | 2.89 -61% | 3.42 -91% | 1.22 32% | 1.73 3% | 1.01 44% |
| Greyscale dE 2000 * | 2.3 | 6.2 -170% | 2.83 -23% | 3.9 -70% | 4.7 -104% | 5.5 -139% |
| Gamma | 2.29 96% | 2.27 97% | 2.34 94% | 2.43 91% | 2.21 100% | 2.12 104% |
| CCT | 6405 101% | 8072 81% | 6556 99% | 6344 102% | 7184 90% | 6413 101% |
| Color Space (Percent of AdobeRGB 1998) (%) | 63.9 | 59.3 -7% | 56 -12% | 61.3 -4% | 66.3 4% | 63 -1% |
| Color Space (Percent of sRGB) (%) | 98.8 | 91.6 -7% | 85 -14% | 95.6 -3% | 99.5 1% | 97.5 -1% |
| Total Average (Program / Settings) | -19% /
-40% | -14% /
-28% | -15% /
-20% | -8% /
-18% | -12% /
-15% |
* ... smaller is better
Color space is wide at nearly 100 percent of sRGB and 64 percent of AdobeRGB to be similar to most high-end subnotebooks. If deeper colors are required, larger 15.6-inch Ultrabooks like Asus' own ZenBook Pro series tend to offer >95 percent AdobeRGB or OLED options.
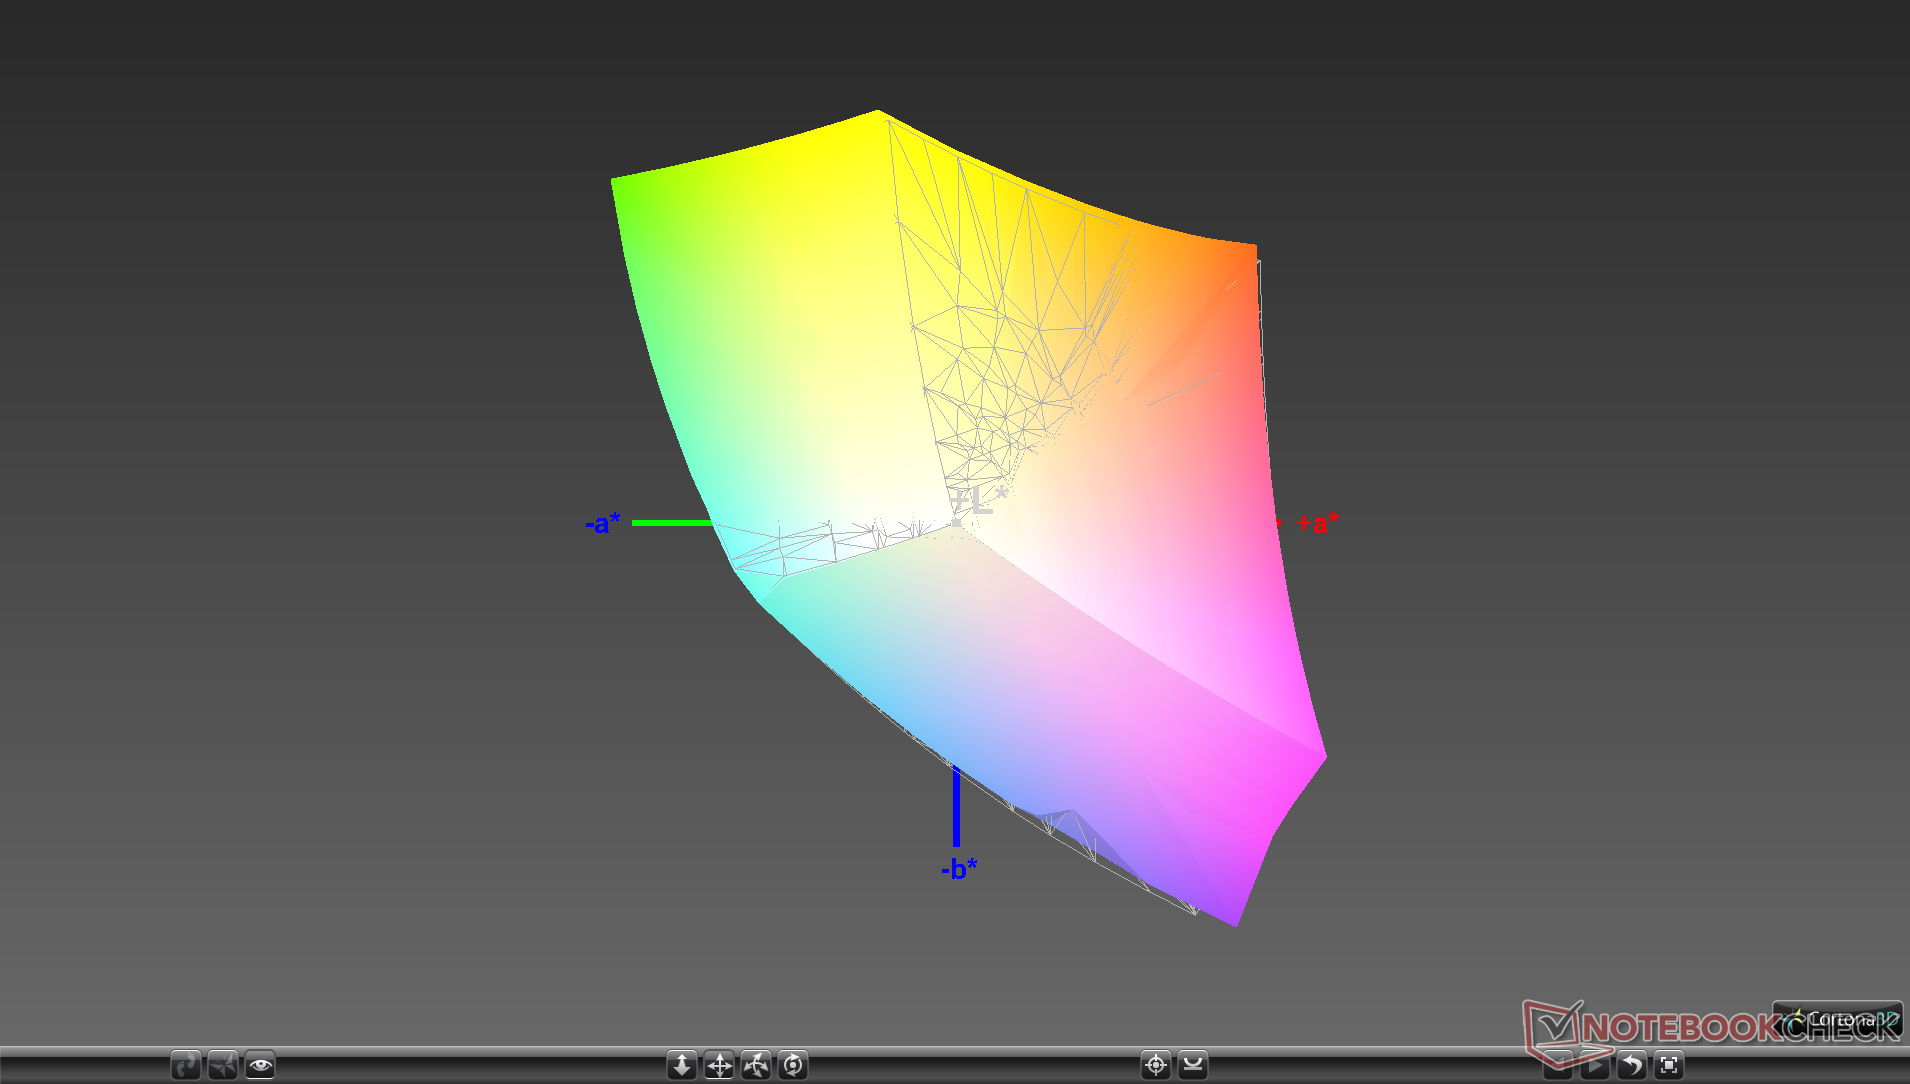
X-Rite colorimeter measurements show a well-calibrated display out of the box with excellent average grayscale DeltaE and color values of only 2.3 and 1.79, respectively. Calibrating the panel ourselves would result in just marginal changes meaning an end-user calibration will not be necessary.

Display Response Times
| ↔ Response Time Black to White | ||
|---|---|---|
| 26.4 ms ... rise ↗ and fall ↘ combined | ↗ 13.2 ms rise | 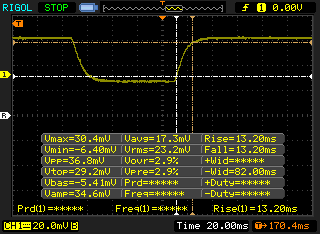 |
| ↘ 13.2 ms fall | ||
| The screen shows relatively slow response rates in our tests and may be too slow for gamers. In comparison, all tested devices range from 0.1 (minimum) to 240 (maximum) ms. » 66 % of all devices are better. This means that the measured response time is worse than the average of all tested devices (19.8 ms). | ||
| ↔ Response Time 50% Grey to 80% Grey | ||
| 49.6 ms ... rise ↗ and fall ↘ combined | ↗ 27.6 ms rise | 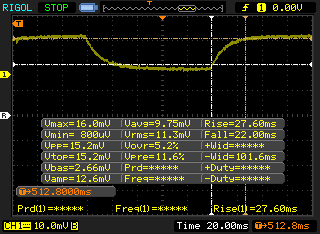 |
| ↘ 22 ms fall | ||
| The screen shows slow response rates in our tests and will be unsatisfactory for gamers. In comparison, all tested devices range from 0.165 (minimum) to 636 (maximum) ms. » 86 % of all devices are better. This means that the measured response time is worse than the average of all tested devices (31 ms). | ||
Screen Flickering / PWM (Pulse-Width Modulation)
| Screen flickering / PWM not detected | 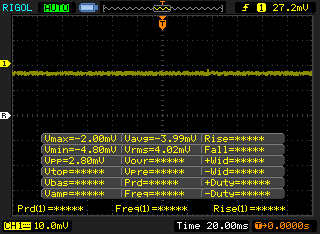 | ||
In comparison: 52 % of all tested devices do not use PWM to dim the display. If PWM was detected, an average of 7747 (minimum: 5 - maximum: 343500) Hz was measured. | |||
Outdoor visibility is acceptable if standing under shade. Otherwise, ambient lighting from the sky will overwhelm and wash out the matte screen. The good news is that maximum brightness will not automatically drop if running on battery power meaning the display will be just as bright on battery power as it can be on AC power.
Performance
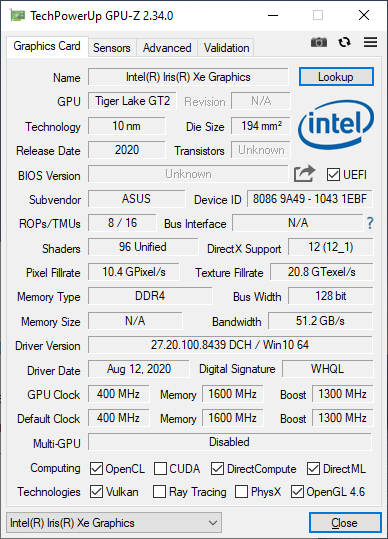
The 11th gen Core i7-1165G7 succeeds last year's 10th gen Core i7-1065G7. The gen-to-gen processor performance uptick is relatively minor, but jumping from the integrated Iris Plus G7 to the new Iris Xe G7 is significant as our benchmarks below will show. Asus will offer lesser Core i5-1135G7 and i3-1115G4 options in the near future with no word yet on any AMD variants.
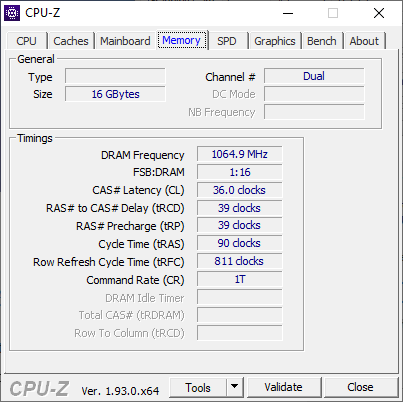
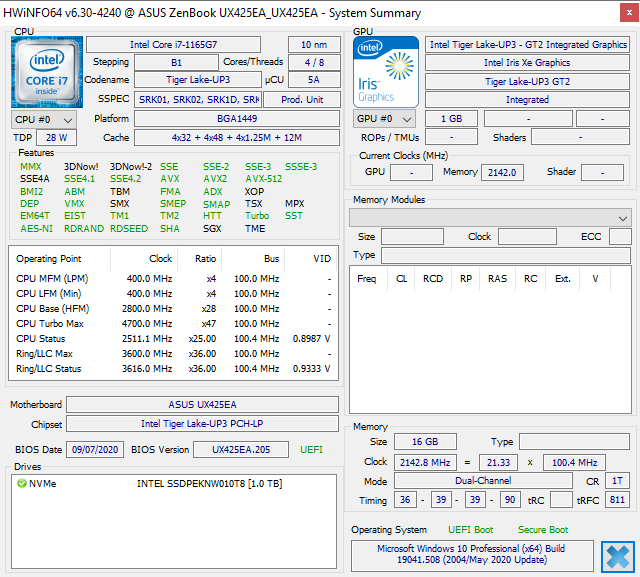
LPDDR4 RAM is even faster now at up to 4266 MHz compared to 3200 MHz on the older UX425J series which will help when running games.
It seems unlikely that GeForce MX options will ever be an option on this particular model based on its motherboard design. Such an option would have been redundant anyway because the integrated Iris Xe G7 offers a similar level of performance. We set our unit to High Performance mode prior to running any performance benchmarks for the best possible scores.
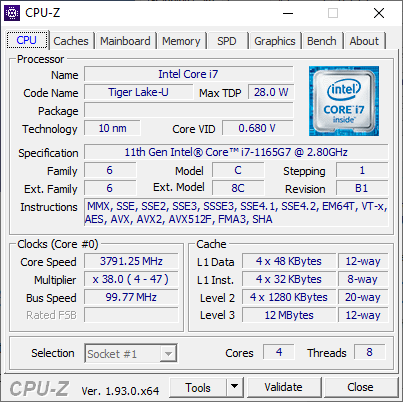
Processor
Raw multi-thread performance is about 20 to 30 percent slower than the Ryzen 5 4500U according to CineBench benchmarks. In fact, it's barely any faster than the older Core i7-1065G7 that our i7-1165G7 is supposed to replace.
Performance sustainability is not that great as well. When running CineBench R15 xT in a loop, the high initial score of 863 points would drop by as much as 25 percent over time. The Core i7-1065G7 in the Dell XPS 13 7390 2-in-1 would behave almost identically. Clock rates are explored further in our Stress Test section below.
See our dedicated page on the Core i7-1165G7 for more technical information and benchmark comparisons.
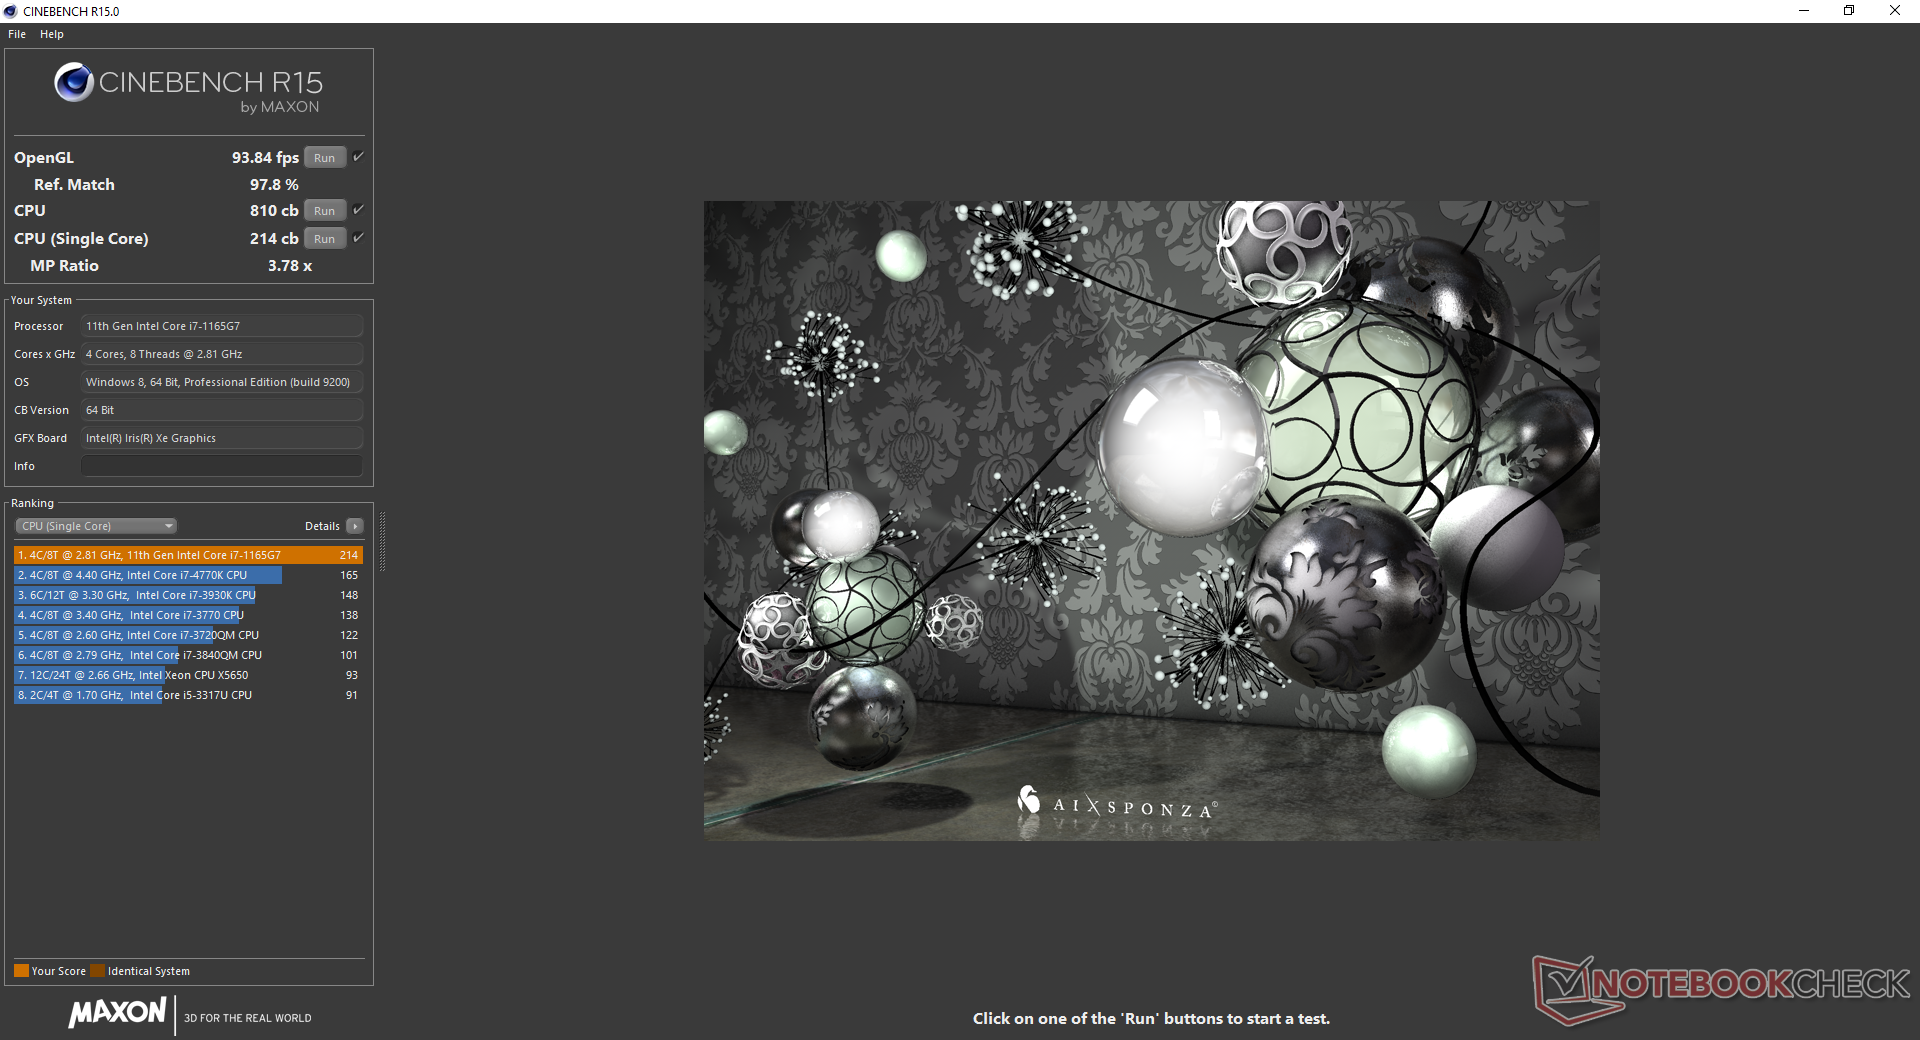
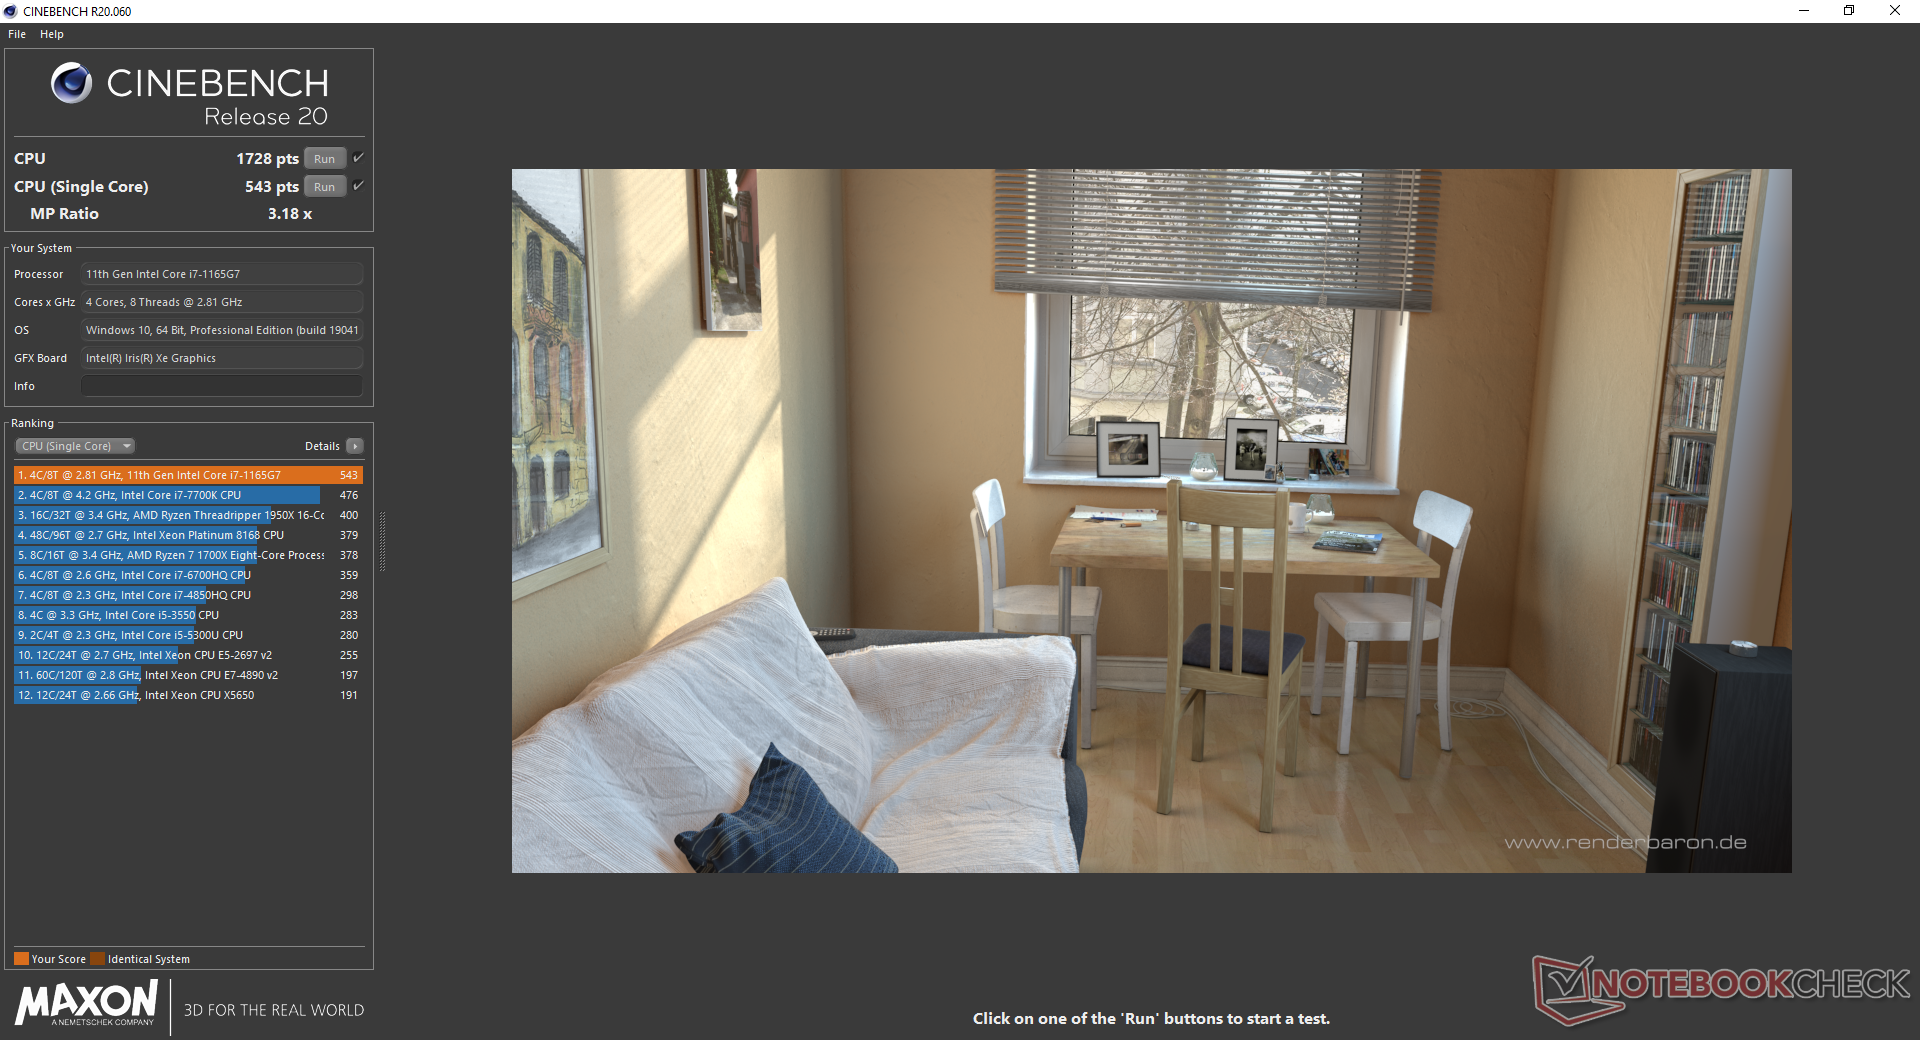
Cinebench R15: CPU Multi 64Bit | CPU Single 64Bit
Blender: v2.79 BMW27 CPU
7-Zip 18.03: 7z b 4 -mmt1 | 7z b 4
Geekbench 5.5: Single-Core | Multi-Core
HWBOT x265 Benchmark v2.2: 4k Preset
LibreOffice : 20 Documents To PDF
R Benchmark 2.5: Overall mean
| HWBOT x265 Benchmark v2.2 / 4k Preset | |
| Lenovo Yoga Slim 7-14ARE | |
| Acer Swift 3 SF314-42-R4XJ | |
| Lenovo IdeaPad 5 14ARE05 | |
| Lenovo IdeaPad 5 15IIL05 | |
| Average Intel Core i7-1165G7 (1.39 - 8.47, n=80) | |
| Dell XPS 13 7390 Core i7-10710U | |
| Lenovo Yoga Slim 7-14IIL05 | |
| Asus ZenBook 14 UX425EA | |
| Asus ZenBook Duo UX481FL | |
| Asus ZenBook 14 UX434FL-DB77 | |
| Asus VivoBook 14 X403FA | |
| LibreOffice / 20 Documents To PDF | |
| Asus ZenBook Duo UX481FL | |
| Asus ZenBook 14 UX434FL-DB77 | |
| Acer Swift 3 SF314-42-R4XJ | |
| Lenovo IdeaPad 5 14ARE05 | |
| Lenovo Yoga Slim 7-14ARE | |
| Lenovo Yoga Slim 7-14IIL05 | |
| Lenovo IdeaPad 5 15IIL05 | |
| Average Intel Core i7-1165G7 (21.5 - 88.1, n=78) | |
| Asus ZenBook 14 UX425EA | |
| R Benchmark 2.5 / Overall mean | |
| Asus ZenBook 14 UX434FL-DB77 | |
| Asus ZenBook Duo UX481FL | |
| Lenovo IdeaPad 5 15IIL05 | |
| Lenovo Yoga Slim 7-14IIL05 | |
| Lenovo IdeaPad 5 14ARE05 | |
| Acer Swift 3 SF314-42-R4XJ | |
| Lenovo Yoga Slim 7-14ARE | |
| Average Intel Core i7-1165G7 (0.552 - 1.002, n=80) | |
| Asus ZenBook 14 UX425EA | |
* ... smaller is better
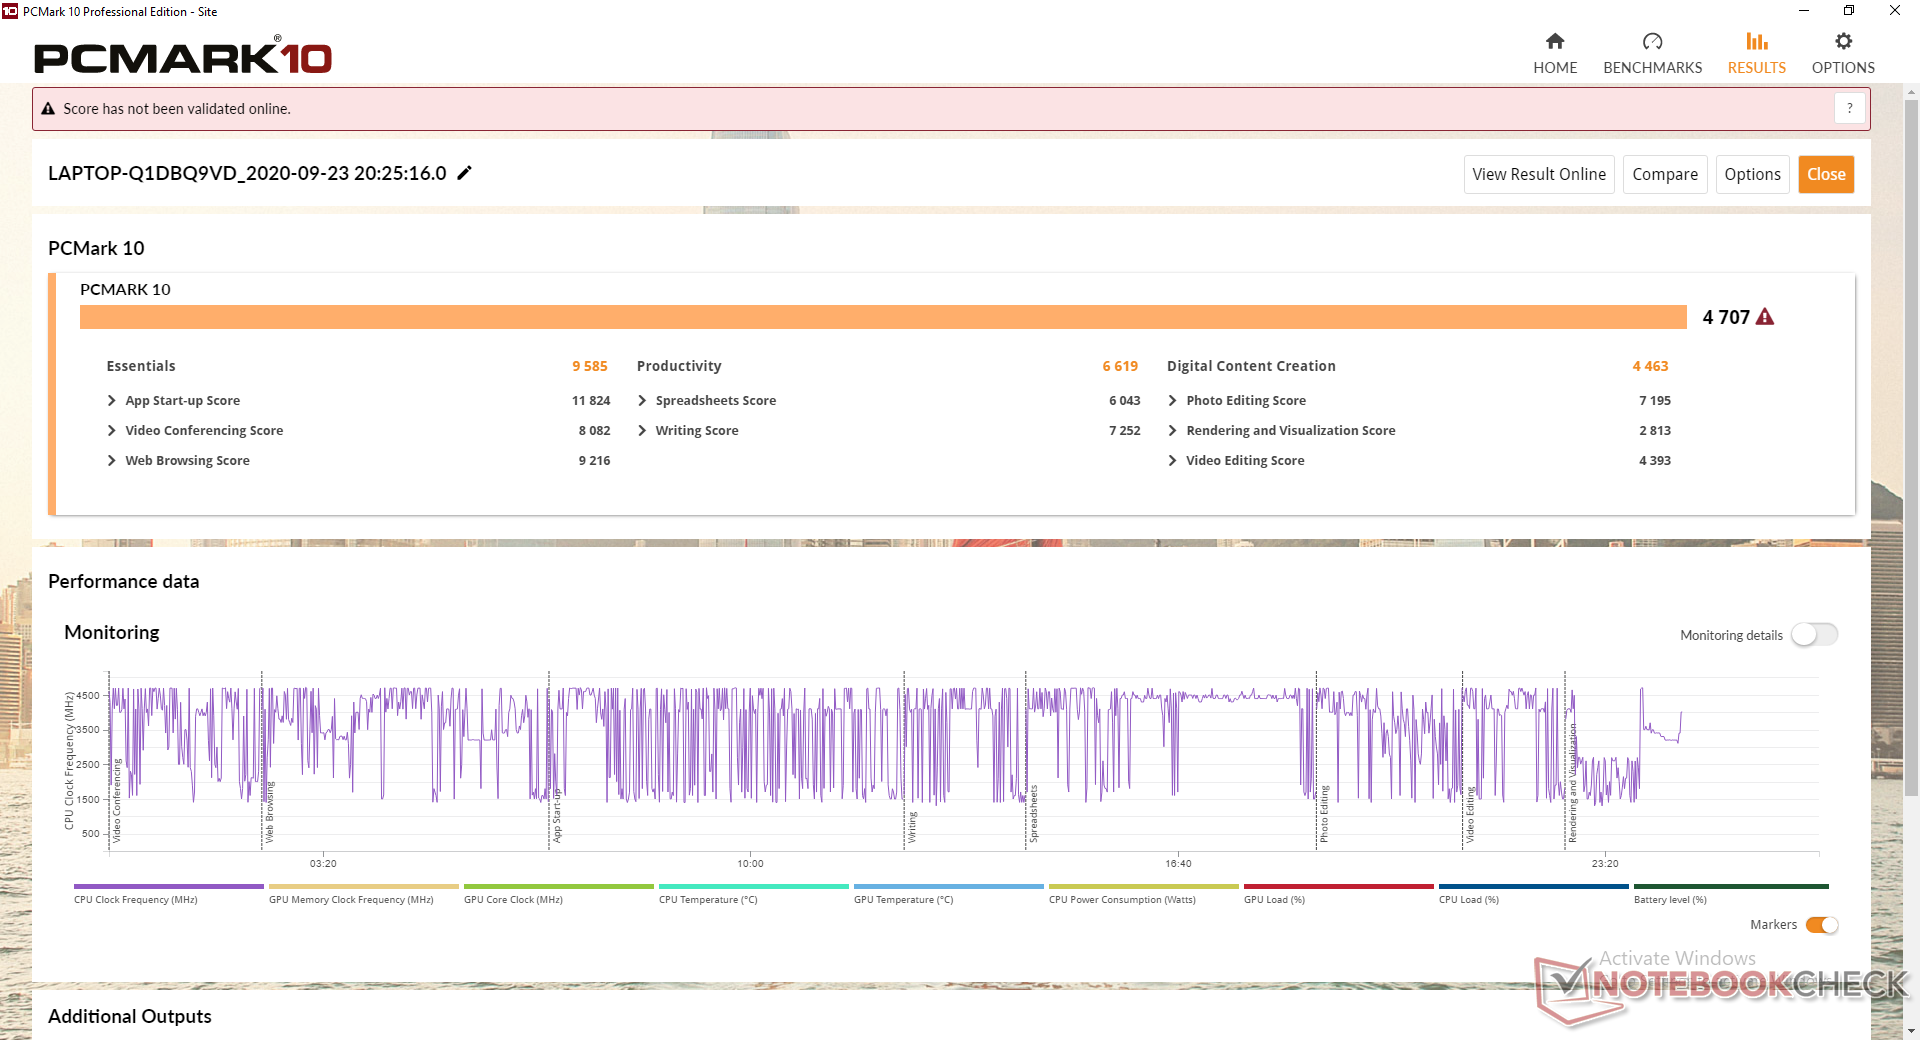
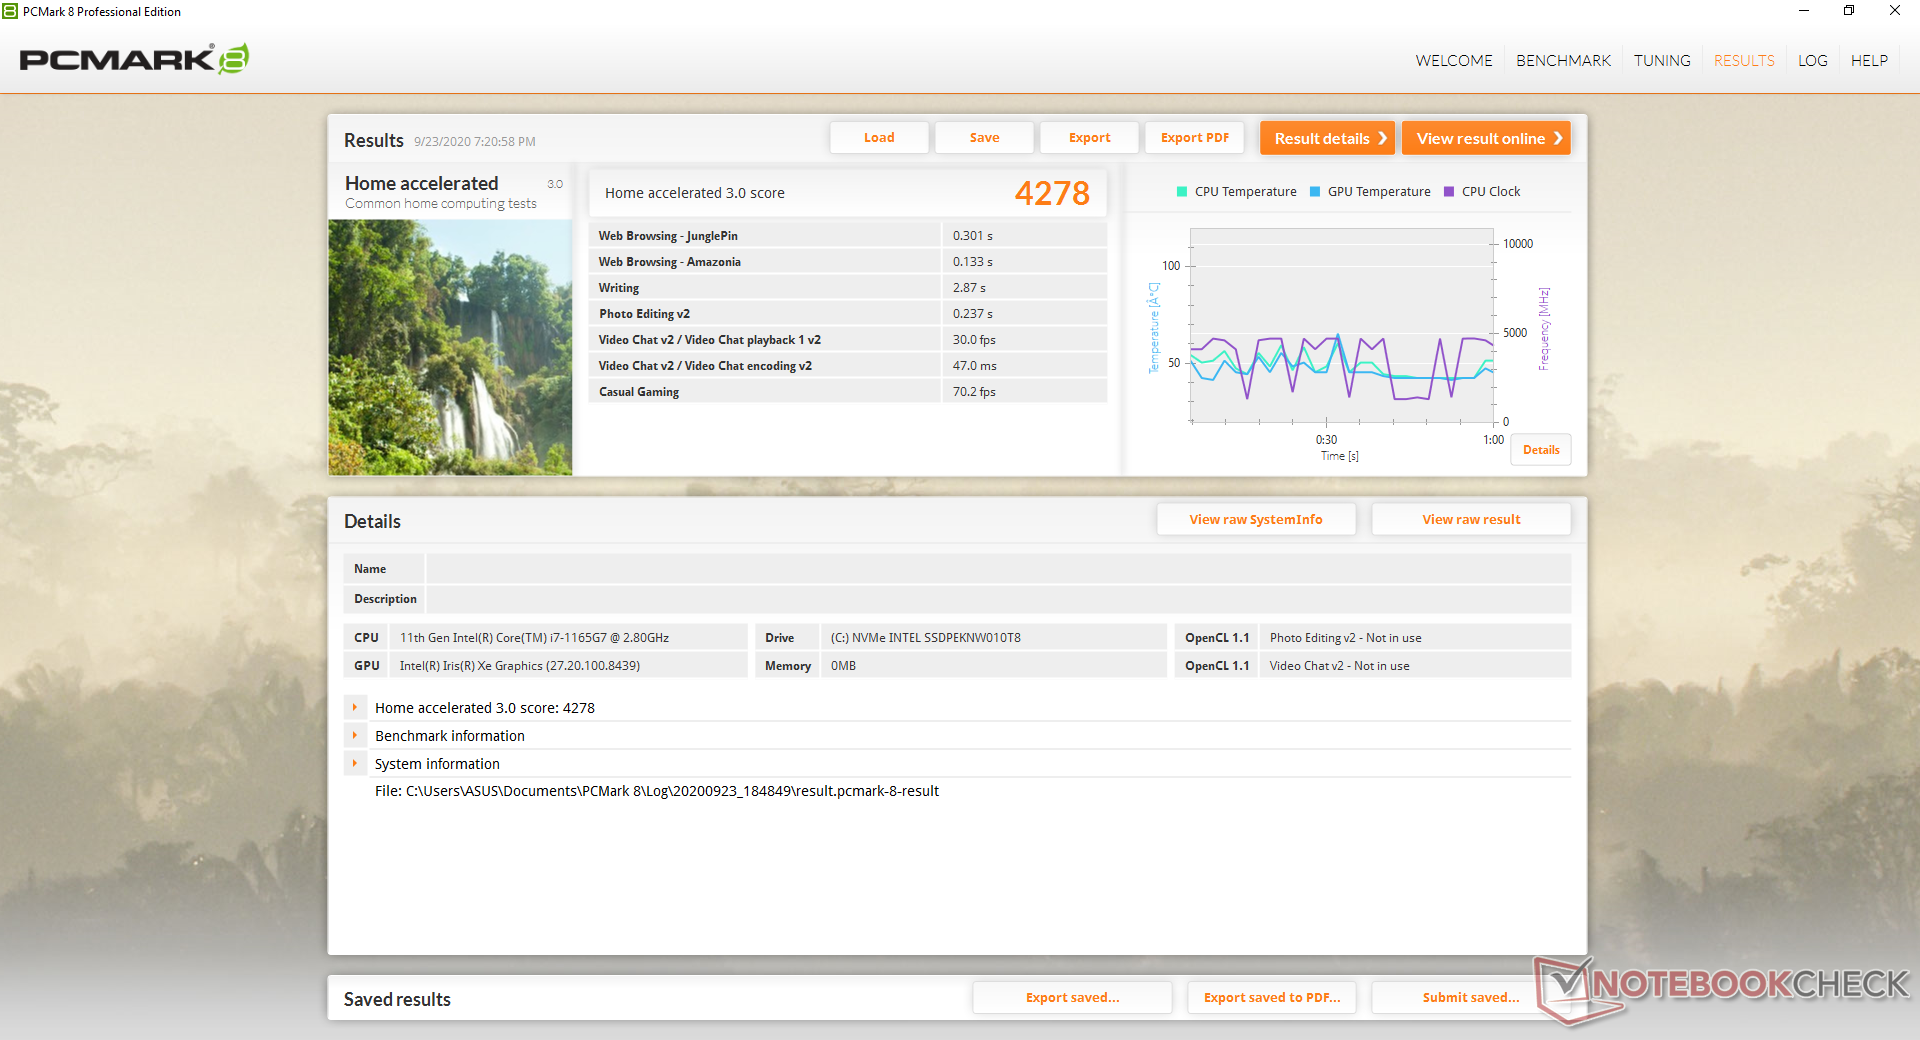
System Performance
PCMark benchmarks are consistently below the Yoga Slim 7 despite the small GPU gains that the Core i7-1165G7 has over the Ryzen 7 4800U. The slower multi-thread performance of the Intel CPU (quad-core vs. octa-core) and the slower NVMe SSD are likely responsible for the lower scores.
We experienced no software or hardware issues during our time with the test unit. The occasional Asus and McAfee pop ups, however, can be annoying.
| PCMark 8 | |
| Home Score Accelerated v2 | |
| Lenovo Yoga Slim 7-14ARE | |
| Asus ZenBook 14 UX425EA | |
| Dell XPS 13 9300 Core i7-1065G7 | |
| LG Gram 14T90N | |
| Asus ZenBook 14 UX434FL-DB77 | |
| Work Score Accelerated v2 | |
| Lenovo Yoga Slim 7-14ARE | |
| LG Gram 14T90N | |
| Dell XPS 13 9300 Core i7-1065G7 | |
| Asus ZenBook 14 UX434FL-DB77 | |
| Asus ZenBook 14 UX425EA | |
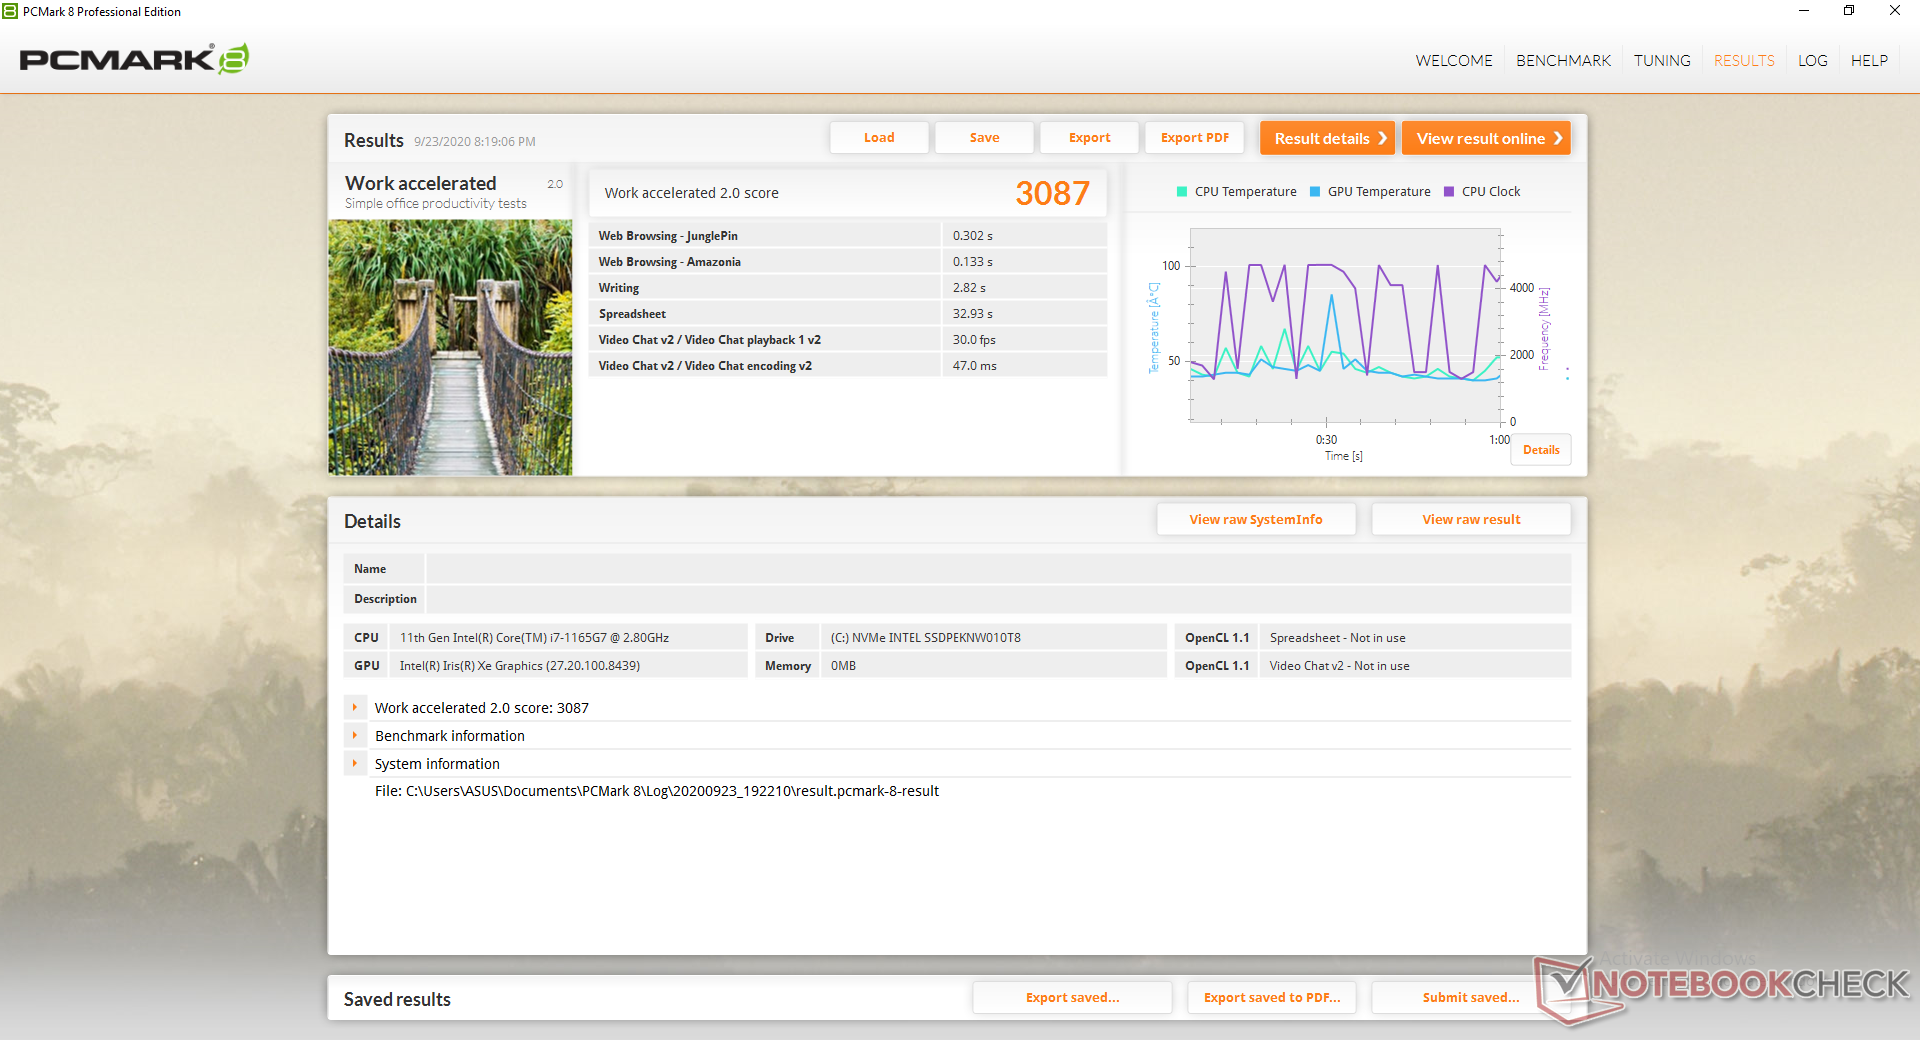
| PCMark 8 Home Score Accelerated v2 | 4278 points | |
| PCMark 8 Work Score Accelerated v2 | 3087 points | |
| PCMark 10 Score | 4704 points | |
Help | ||
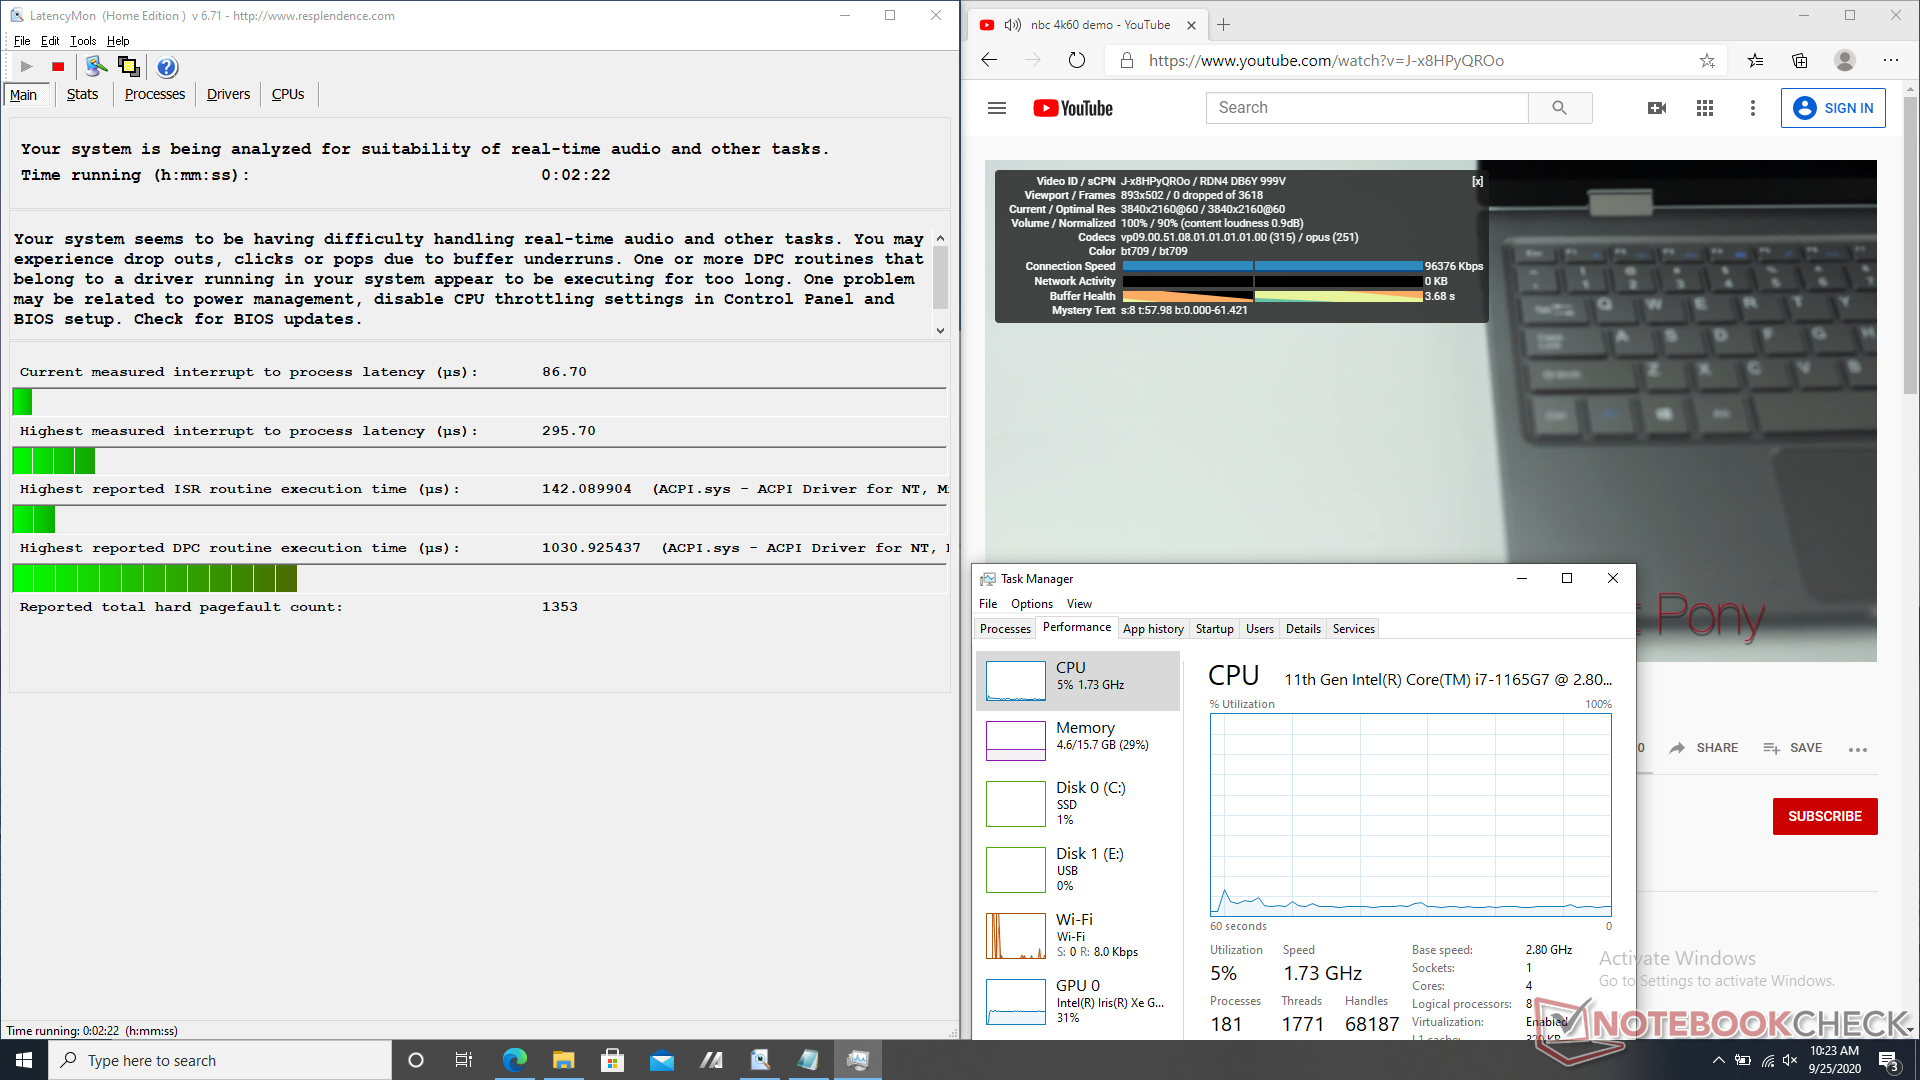
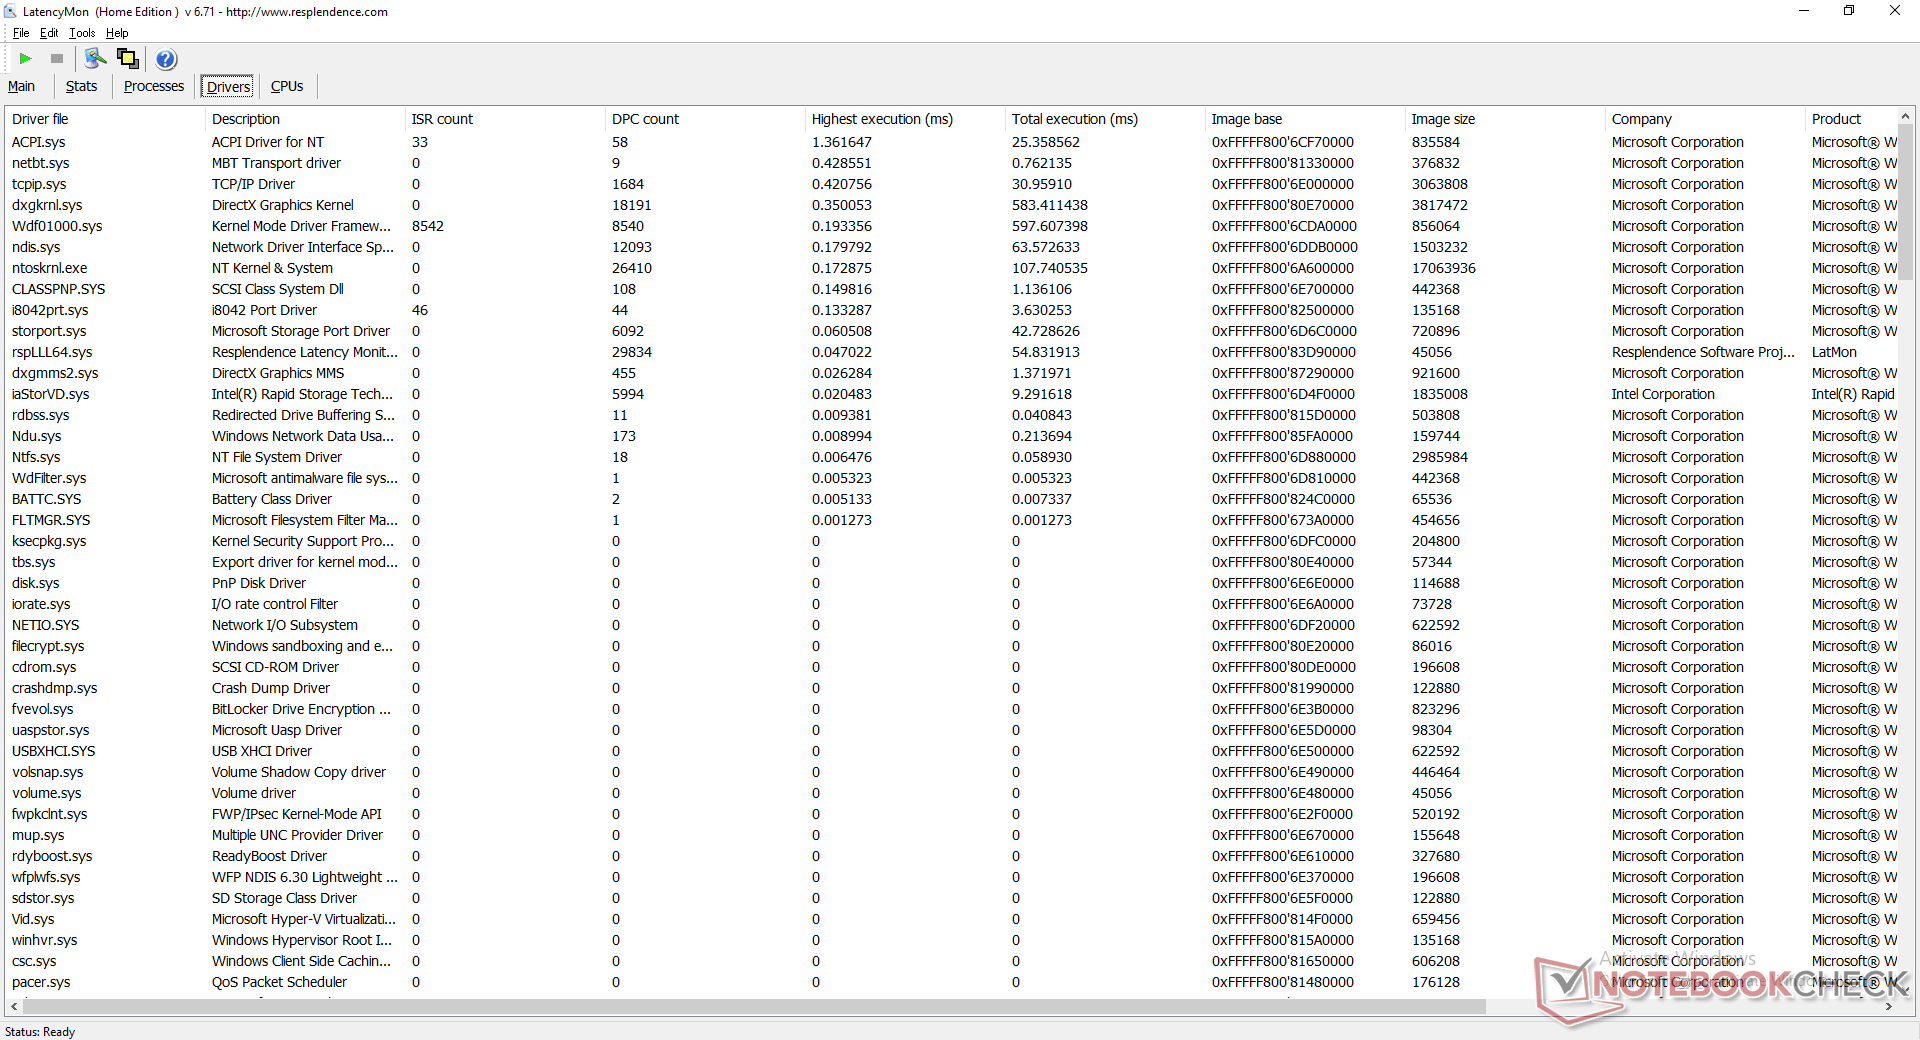
DPC Latency
LatencyMon shows only minor DPC latency issues when opening multiple tabs on our homepage. 4K playback at 60 FPS is otherwise smooth with no dropped frames during our minute-long YouTube test. GPU utilization would sit at 31 percent compared to over 50 percent on the older UHD Graphics 620.
| DPC Latencies / LatencyMon - interrupt to process latency (max), Web, Youtube, Prime95 | |
| Dell XPS 13 9300 Core i7-1065G7 | |
| Lenovo Yoga Slim 7-14ARE | |
| Asus ZenBook 14 UX434FL-DB77 | |
| LG Gram 14T90N | |
| Asus ZenBook 14 UX425EA | |
| Asus ZenBook Flip 14 UX463FA-AI039T | |
* ... smaller is better
Storage Devices
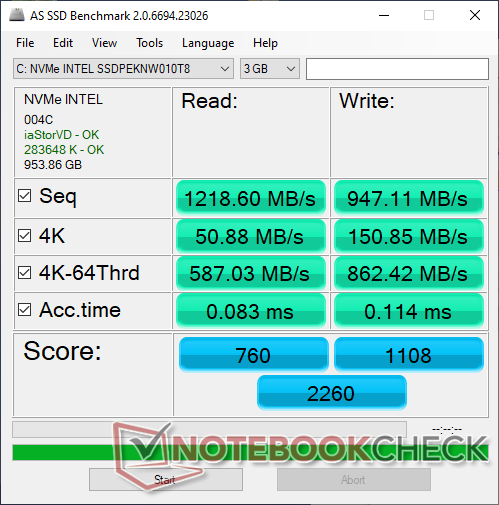
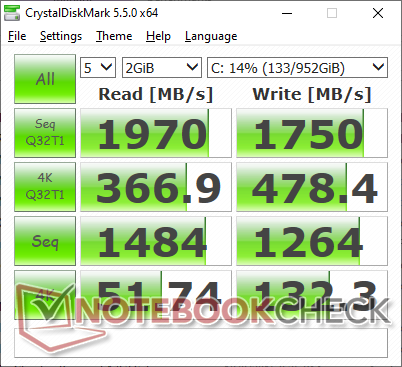
There is only one internal storage bay due to the size of the chassis. Asus has equipped its ZenBook 14 UX425EA with the same 1 TB Intel SSD 660p as found on the recent ZenBook Duo UX481FL for a similar level of performance between them. Transfer rates are more than sufficient for a 14-inch subnotebook even though they are slower than the more expensive Samsung PM981 series.
See our table of HDDs and SSDs for more benchmark comparisons.
| Asus ZenBook 14 UX425EA Intel SSD 660p 1TB SSDPEKNW010T8 | LG Gram 17 17Z90N-V.AA77G Samsung PM981a MZVLB1T0HBLR | Acer Spin 5 SP513-54N-79EY Samsung PM991 MZVLQ1T0HALB | Asus ZenBook Duo UX481FL Intel SSD 660p 1TB SSDPEKNW010T8 | Lenovo Yoga C940-14IIL 81Q9 Samsung PM981a MZVLB1T0HBLR | |
|---|---|---|---|---|---|
| AS SSD | 46% | 21% | 3% | 40% | |
| Seq Read (MB/s) | 1219 | 2722 123% | 2071 70% | 1237 1% | 2213 82% |
| Seq Write (MB/s) | 947 | 2649 180% | 1462 54% | 1069 13% | 1401 48% |
| 4K Read (MB/s) | 50.9 | 52.2 3% | 49.82 -2% | 52.1 2% | 55.2 8% |
| 4K Write (MB/s) | 150.9 | 132.4 -12% | 140.7 -7% | 134.7 -11% | 130.3 -14% |
| 4K-64 Read (MB/s) | 587 | 886 51% | 869 48% | 585 0% | 878 50% |
| 4K-64 Write (MB/s) | 862 | 1074 25% | 729 -15% | 854 -1% | 1478 71% |
| Access Time Read * (ms) | 0.083 | 0.041 51% | 0.069 17% | 0.05 40% | 0.036 57% |
| Access Time Write * (ms) | 0.114 | 0.03 74% | 0.028 75% | 0.117 -3% | 0.086 25% |
| Score Read (Points) | 760 | 1211 59% | 1126 48% | 761 0% | 1154 52% |
| Score Write (Points) | 1108 | 1471 33% | 1016 -8% | 1095 -1% | 1748 58% |
| Score Total (Points) | 2260 | 3309 46% | 2700 19% | 2255 0% | 3467 53% |
| Copy ISO MB/s (MB/s) | 1518 | 2096 38% | 1574 4% | 1714 13% | 2161 42% |
| Copy Program MB/s (MB/s) | 549 | 395.6 -28% | 553 1% | 511 -7% | 572 4% |
| Copy Game MB/s (MB/s) | 1164 | 1096 -6% | 993 -15% | 1187 2% | 1433 23% |
| CrystalDiskMark 5.2 / 6 | 36% | 13% | 5% | 32% | |
| Write 4K (MB/s) | 132.3 | 162.8 23% | 168.4 27% | 140.7 6% | 128.6 -3% |
| Read 4K (MB/s) | 51.7 | 51 -1% | 55 6% | 55.6 8% | 45.25 -12% |
| Write Seq (MB/s) | 1264 | 2078 64% | 1415 12% | 1949 54% | |
| Read Seq (MB/s) | 1484 | 1991 34% | 1516 2% | 2359 59% | |
| Write 4K Q32T1 (MB/s) | 478.4 | 440.1 -8% | 476.1 0% | 474.5 -1% | 445 -7% |
| Read 4K Q32T1 (MB/s) | 366.9 | 450.1 23% | 506 38% | 403.4 10% | 404.5 10% |
| Write Seq Q32T1 (MB/s) | 1750 | 2998 71% | 1492 -15% | 1796 3% | 3019 73% |
| Read Seq Q32T1 (MB/s) | 1970 | 3562 81% | 2357 20% | 1913 -3% | 3564 81% |
| Write 4K Q8T8 (MB/s) | 930 | ||||
| Read 4K Q8T8 (MB/s) | 963 | ||||
| Total Average (Program / Settings) | 41% /
42% | 17% /
18% | 4% /
4% | 36% /
37% |
* ... smaller is better

Disk Throttling: DiskSpd Read Loop, Queue Depth 8
GPU Performance
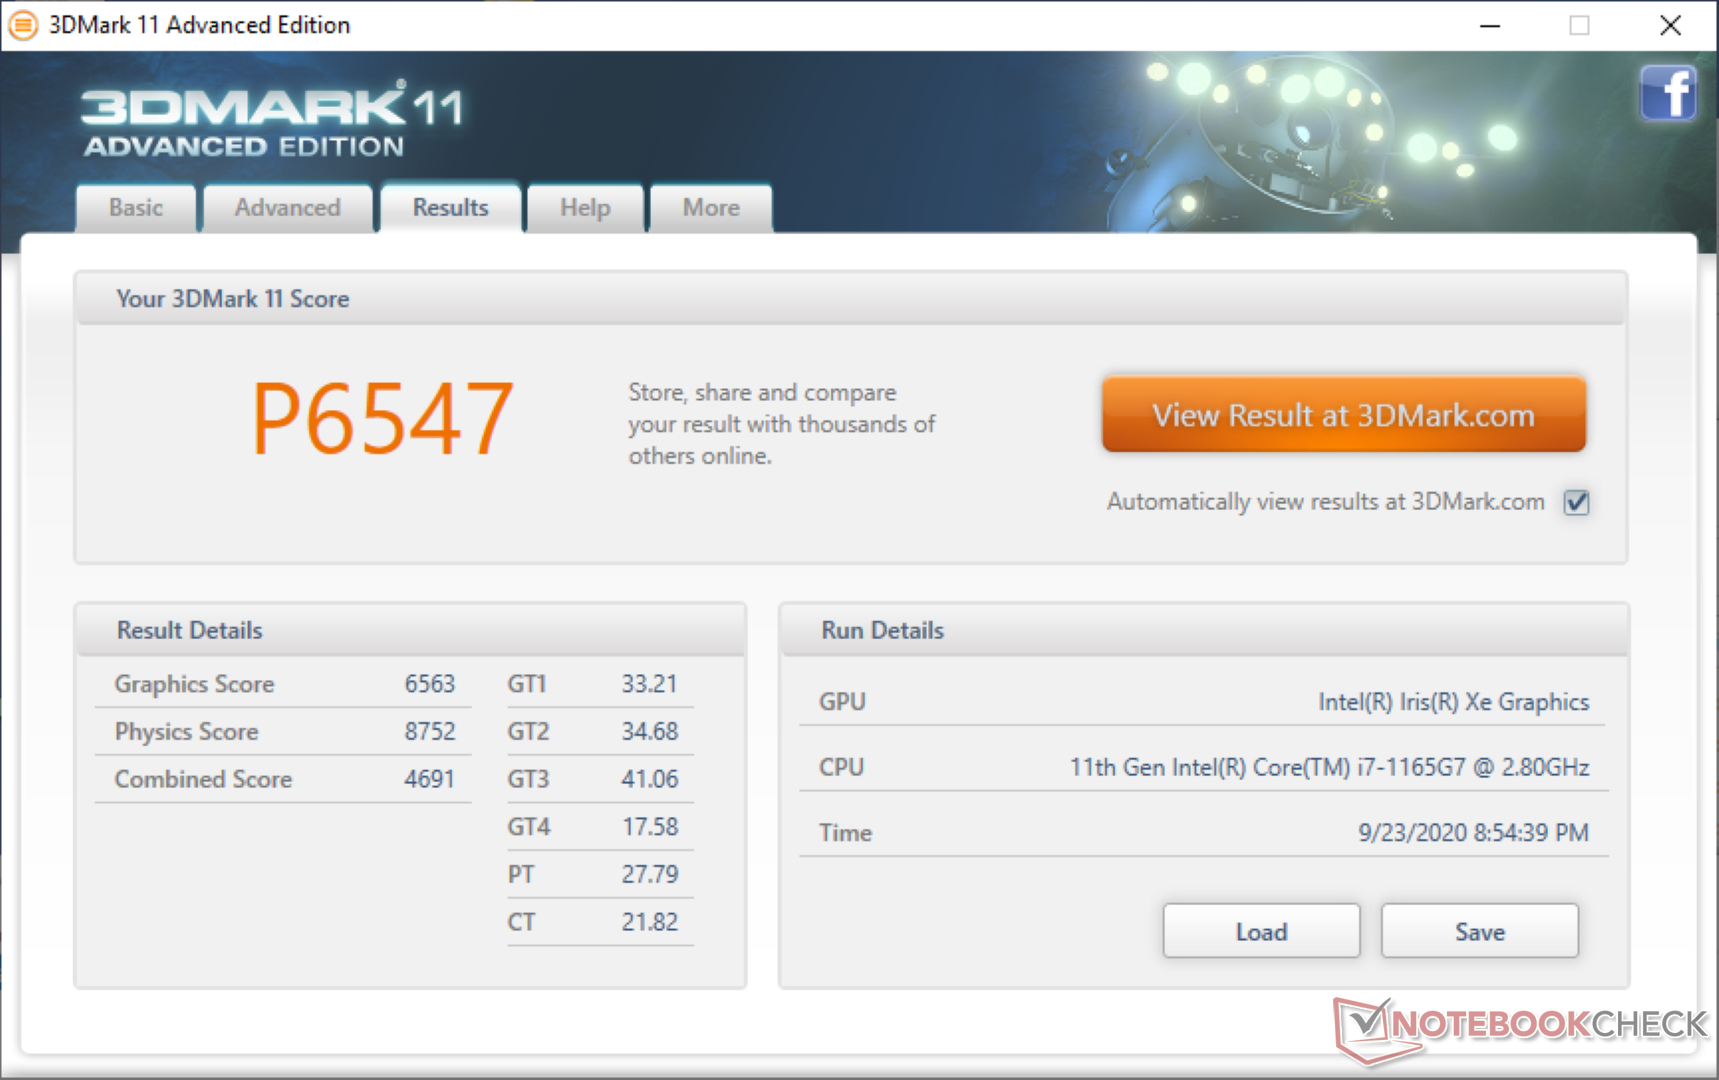
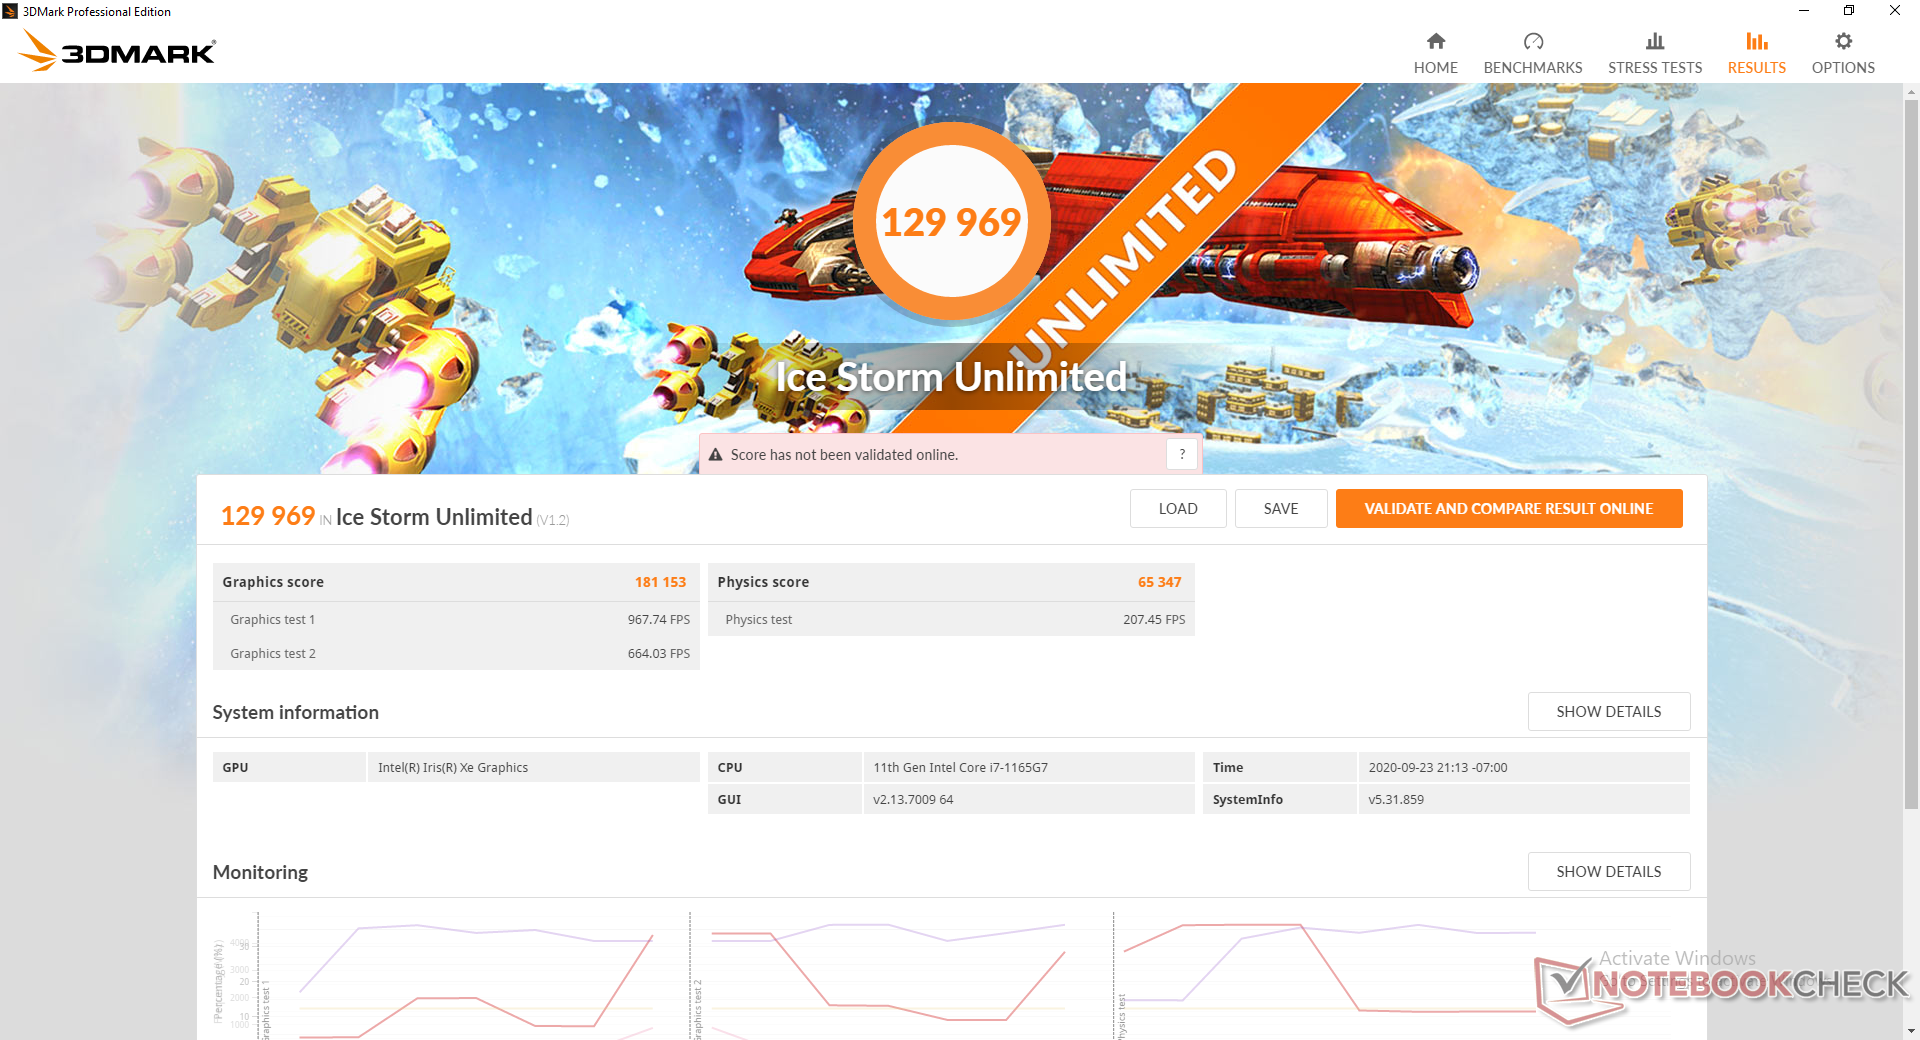
3DMark benchmarks show the Iris Xe G7 to be slightly ahead of both the GeForce MX350 and Renoir Radeon RX Vega 8 or almost 2x faster than the Iris Plus G7 on last generation Core i7 Ice Lake CPUs. The raw graphics power is certainly impressive given that this is only an integrated GPU, but 3DMark results aren't necessarily a 1:1 representation of actual gaming performance especially when if used to compared GPUs from different brands.
| 3DMark 06 Standard Score | 20836 points | |
| 3DMark Vantage P Result | 20704 points | |
| 3DMark 11 Performance | 6547 points | |
| 3DMark Ice Storm Standard Score | 83826 points | |
| 3DMark Cloud Gate Standard Score | 16127 points | |
| 3DMark Fire Strike Score | 4471 points | |
| 3DMark Time Spy Score | 1541 points | |
Help | ||
Gaming Performance
Performance in real-world games is much more complicated than what 3DMark would have you believe. Frame rates when running Witcher 3, DOTA 2, or GTA V are all noticeably slower than the AMD-powered Yoga Slim 7 despite what our 3DMark results above suggest. Frame rates fluctuate wildly in most games which is where an adaptive sync display could have really come in handy. Though performance is measurably better than the Iris Plus G7, we still recommend running most games at 1080p on the lowest settings with vsync enabled. If a locked 30 FPS can't be reached in this way, then dial back the resolution.
It's worth noting that we experienced compatibility issues with some titles. Doom Eternal and Division 2, for example, both exhibited texture issues on all settings. Meanwhile, Shadow of the Tomb Raider and Hunt Showdown would crash when certain settings are enabled and Apex Legends would be stuck at single-digit frame rates for seemingly no reason for the first five minutes of gameplay. Horizon Zero Dawn wouldn't even launch at all. This is where GeForce MX shines because its graphics drivers have always been much more reliable and consistent than anything from Intel or AMD.
See our dedicated page on the Iris Xe G7 for more technical information and benchmark comparisons.
| low | med. | high | ultra | |
|---|---|---|---|---|
| GTA V (2015) | 81.7 | 66.6 | 18.7 | 7.95 |
| The Witcher 3 (2015) | 74.4 | 41 | 25.4 | 11.9 |
| Dota 2 Reborn (2015) | 76.9 | 67.4 | 46.4 | 42.3 |
| Final Fantasy XV Benchmark (2018) | 35.4 | 20.8 | 15.8 | |
| X-Plane 11.11 (2018) | 50.1 | 35.4 | 32.6 | |
| Strange Brigade (2018) | 77.5 | 35.2 | 28.3 | 23.1 |
| Shadow of the Tomb Raider (2018) | 41 | 18 | 15 | |
| Assassin´s Creed Odyssey (2018) | 25 | 19 | 16 | |
| Apex Legends (2019) | 70.6 | 30.8 | 24.8 | 22.3 |
| Far Cry New Dawn (2019) | 38 | 23 | 20 | 19 |
| Metro Exodus (2019) | 28.2 | 15 | 11.6 | 9.5 |
| Dirt Rally 2.0 (2019) | 113.6 | 43.8 | 29.9 | 20.1 |
| The Division 2 (2019) | 30 | 17 | 12 | 8 |
| Anno 1800 (2019) | 50.8 | 19.9 | 12.1 | 7.1 |
| Total War: Three Kingdoms (2019) | 76.2 | 26.2 | 16.2 | 11 |
| Control (2019) | 42.9 | 14.1 | 9.8 | |
| Borderlands 3 (2019) | 39.3 | 19.7 | 13 | 9.7 |
| GRID 2019 (2019) | 67.5 | 36.9 | 26.9 | 25.8 |
| Star Wars Jedi Fallen Order (2019) | 11.8 | 10.2 | 10.3 | |
| Hunt Showdown (2020) | 38 | |||
| Doom Eternal (2020) | 42.1 | 21.4 | 19.9 | 18.6 |
| Gears Tactics (2020) | 97 | 39.3 | 21.2 | 16.2 |
| F1 2020 (2020) | 70 | 40 | 29 | 18 |
| Death Stranding (2020) | 37 | 22.6 | 21.8 | 21.3 |
Emissions
System Noise
The system is silent when idling on desktop, but don't expect that to last very long. The fan will stabilize at around 31 dB(A) when browsing or video streaming whereas the Lenovo Yoga Slim 7 can remain quieter for longer. While we're not saying the UX425 is noisy, the fan is audible when working in quieter environments and its high pitch certainly doesn't help.
Running higher loads like 3DMark 06 or games will induce a fan noise between 35 dB(A) to 41 dB(A) which is a common range on many Ultrabooks.
| Asus ZenBook 14 UX425EA Iris Xe G7 96EUs, i7-1165G7, Intel SSD 660p 1TB SSDPEKNW010T8 | Asus ZenBook 14 UX434FL-DB77 GeForce MX250, i7-8565U, WDC PC SN520 SDAPNUW-512G | Asus ZenBook Flip 14 UX463FA-AI039T UHD Graphics 620, i5-10210U, Kingston RBUSNS8154P3512GJ1 | LG Gram 14T90N UHD Graphics 620, i7-10510U, Samsung SSD PM981a MZVLB512HBJQ | Lenovo Yoga Slim 7-14ARE Vega 8, R7 4800U, Samsung SSD PM981a MZVLB512HBJQ | Dell XPS 13 9300 Core i7-1065G7 Iris Plus Graphics G7 (Ice Lake 64 EU), i7-1065G7, Intel SSDPEMKF512G8 NVMe SSD | |
|---|---|---|---|---|---|---|
| Noise | 3% | 7% | 3% | 11% | 5% | |
| off / environment * (dB) | 29.8 | 26.2 12% | 30.1 -1% | 29 3% | 26.3 12% | 28.3 5% |
| Idle Minimum * (dB) | 29.9 | 26.2 12% | 30.1 -1% | 30 -0% | 26.5 11% | 28.3 5% |
| Idle Average * (dB) | 31 | 27.2 12% | 30.1 3% | 30 3% | 26.5 15% | 28.3 9% |
| Idle Maximum * (dB) | 31 | 27.2 12% | 30.1 3% | 30 3% | 26.5 15% | 28.3 9% |
| Load Average * (dB) | 35.6 | 41.5 -17% | 30.1 15% | 35.2 1% | 31.8 11% | 32.5 9% |
| Witcher 3 ultra * (dB) | 37.4 | 39.7 -6% | 35.9 4% | 39.3 -5% | ||
| Load Maximum * (dB) | 40.8 | 41.1 -1% | 32.02 22% | 37 9% | 35.9 12% | 39.3 4% |
* ... smaller is better
Noise level
| Idle |
| 29.9 / 31 / 31 dB(A) |
| Load |
| 35.6 / 40.8 dB(A) |
 | ||
30 dB silent 40 dB(A) audible 50 dB(A) loud |
||
min: | ||
Temperature
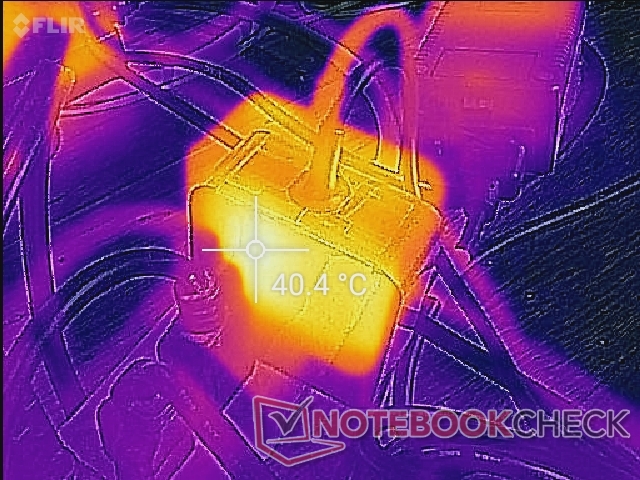
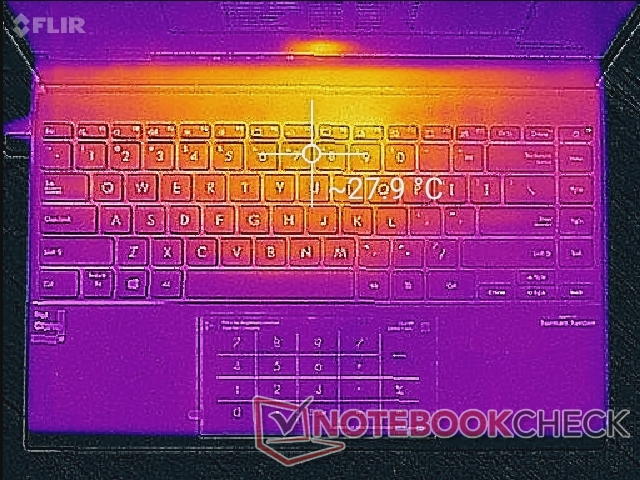
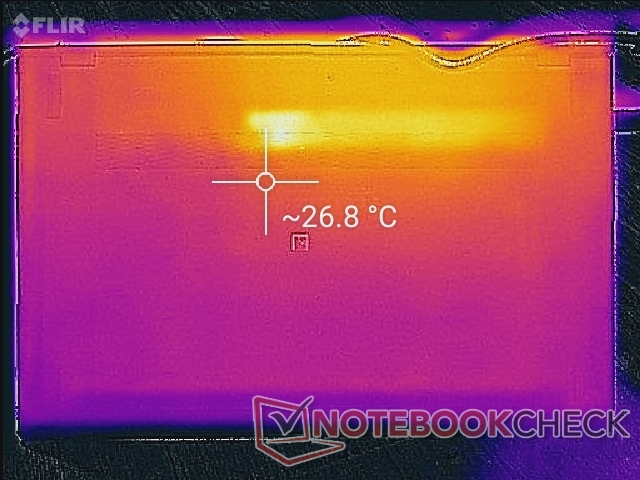
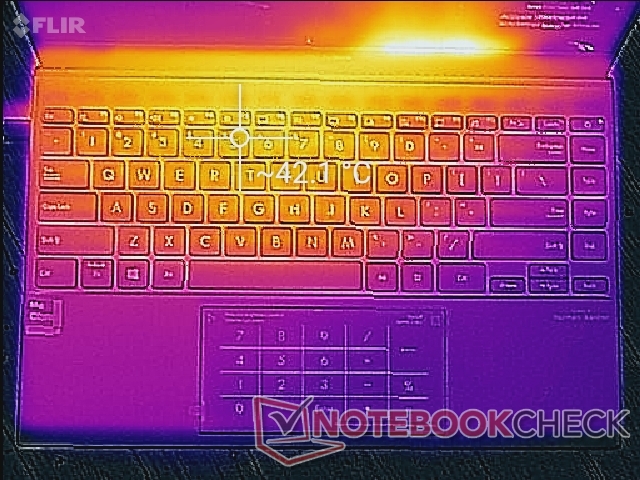
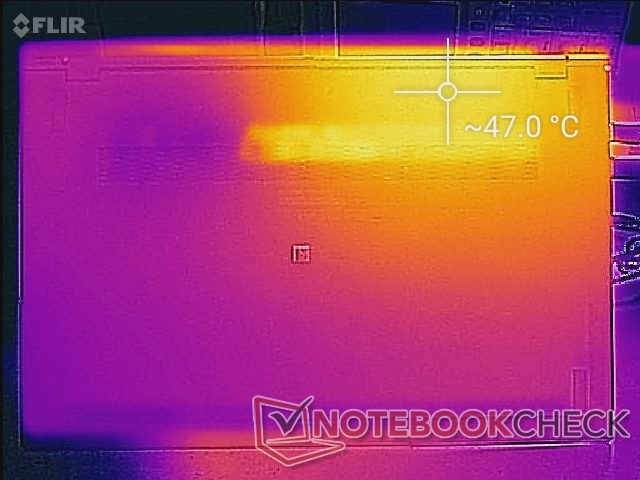
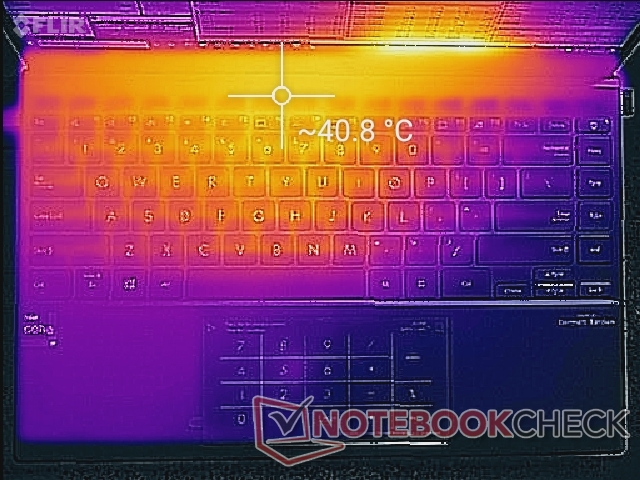
Surface temperatures are warmest toward the back of the system where the processor are heat pipe are located. Hot spots here can reach over 42 C compared to 47 C on the XPS 13 9300. The palm rests and sides of the keyboard remain relatively cool no matter the load as shown by the temperature maps below. Your hands don't typically rest on the back of the laptop and so surface temperature is not normally an issue. However, you may want a flat desk if gaming or running higher loads.
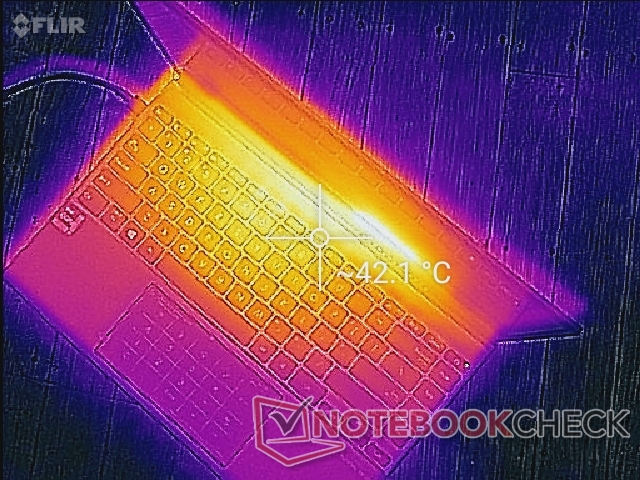
(±) The maximum temperature on the upper side is 41 °C / 106 F, compared to the average of 36.8 °C / 98 F, ranging from 21 to 71 °C for the class Multimedia.
(±) The bottom heats up to a maximum of 44.4 °C / 112 F, compared to the average of 39.1 °C / 102 F
(+) In idle usage, the average temperature for the upper side is 26 °C / 79 F, compared to the device average of 31.3 °C / 88 F.
(-) Playing The Witcher 3, the average temperature for the upper side is 38.9 °C / 102 F, compared to the device average of 31.3 °C / 88 F.
(±) The palmrests and touchpad can get very hot to the touch with a maximum of 37.2 °C / 99 F.
(-) The average temperature of the palmrest area of similar devices was 28.7 °C / 83.7 F (-8.5 °C / -15.3 F).

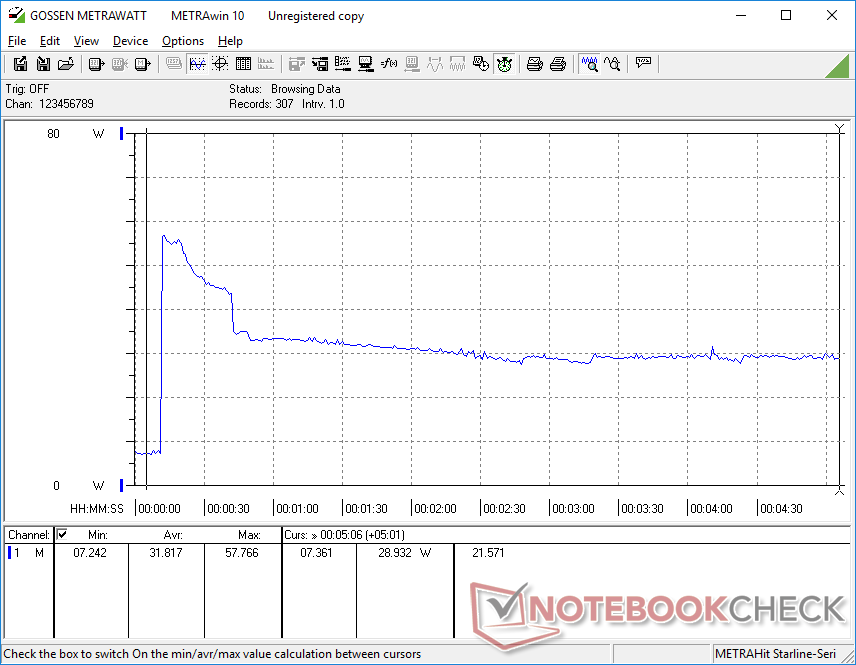
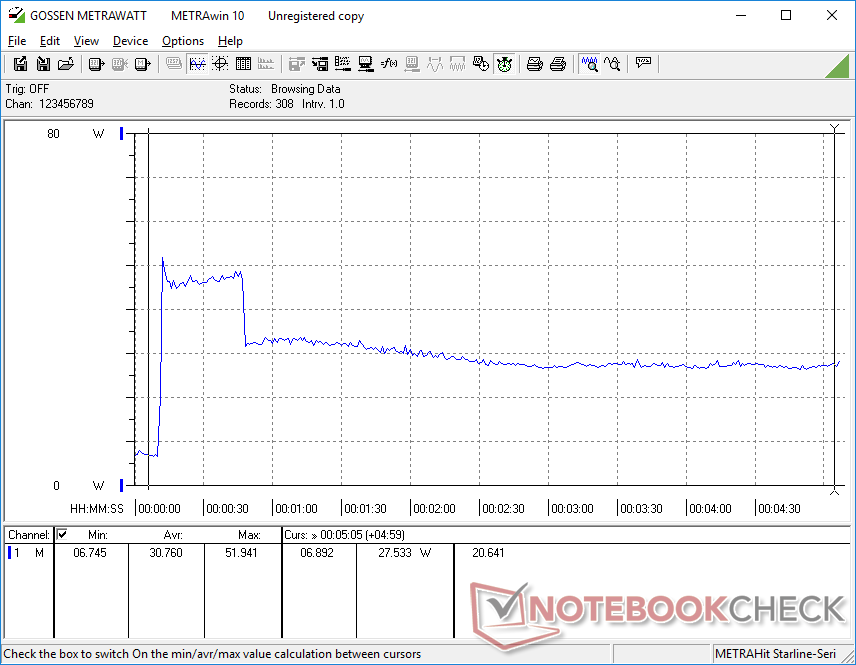
Stress Test
When running Prime95 to stress the CPU, clock rates would boost to 3.7 GHz for just the first few seconds until hitting a core temperature of 95 C. Clock rates would then steadily drop until stabilizing at 2.5 GHz for a more reasonable core temperature of 68 C. "Perfect" Turbo Boost sustainability is not possible here which is common on most laptops powered by ULV U-series CPUs. Even so, we would have preferred longer-lasting sustained clocks that performance users can appreciate. Core temperature plateaus at 68 C compared to 97 C on the Ice Lake-powered XPS 13 9300.
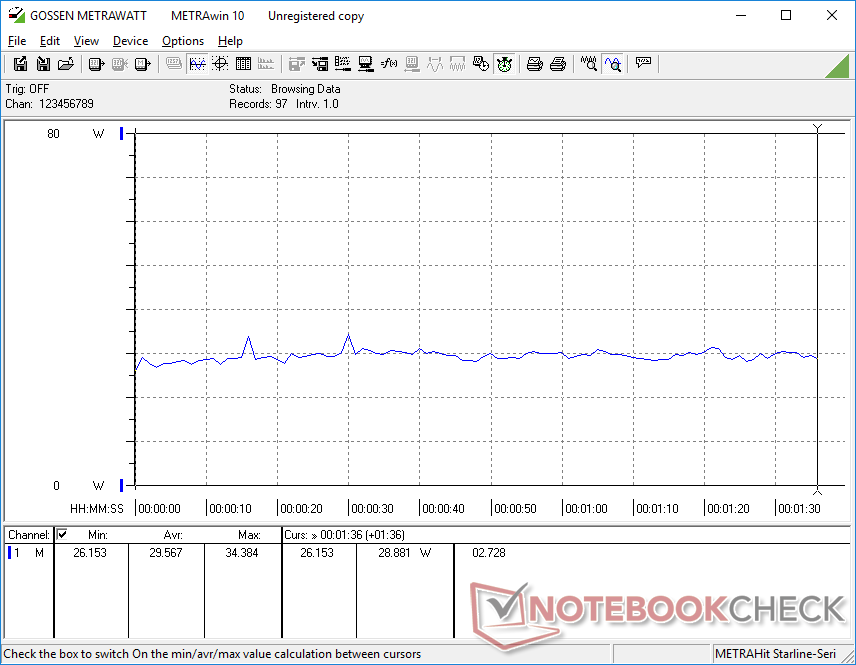
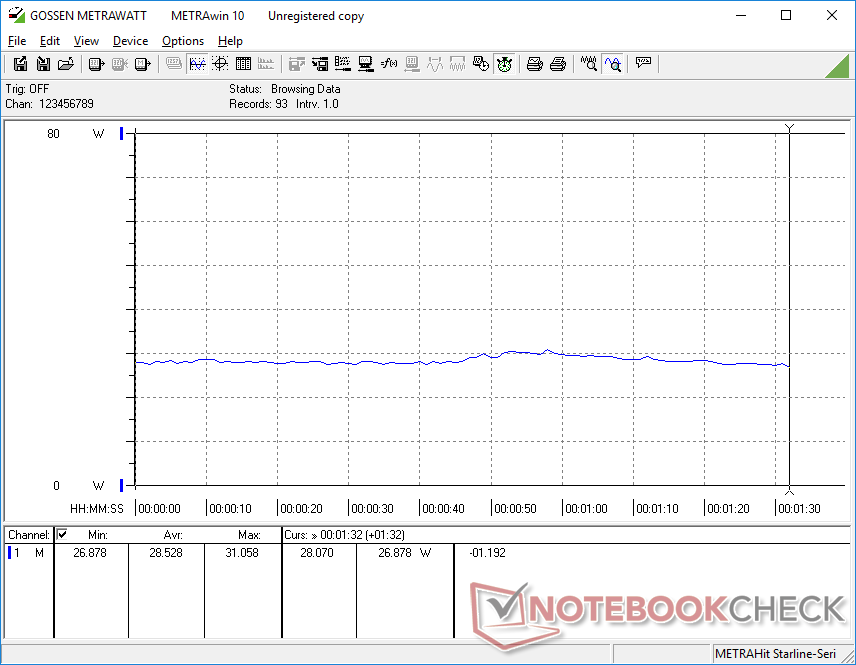
Running Witcher 3 is more representative of sustained real-world stress. Core temperature would stabilize at only 63 C compared to 86 C on the AMD-powered Yoga Slim 7.
Running on battery will limit performance. A 3DMark 11 test on batteries would return Physics and Graphics scores of 7251 and 5846 points, respectively, compared to 8752 and 6563 points when on mains.
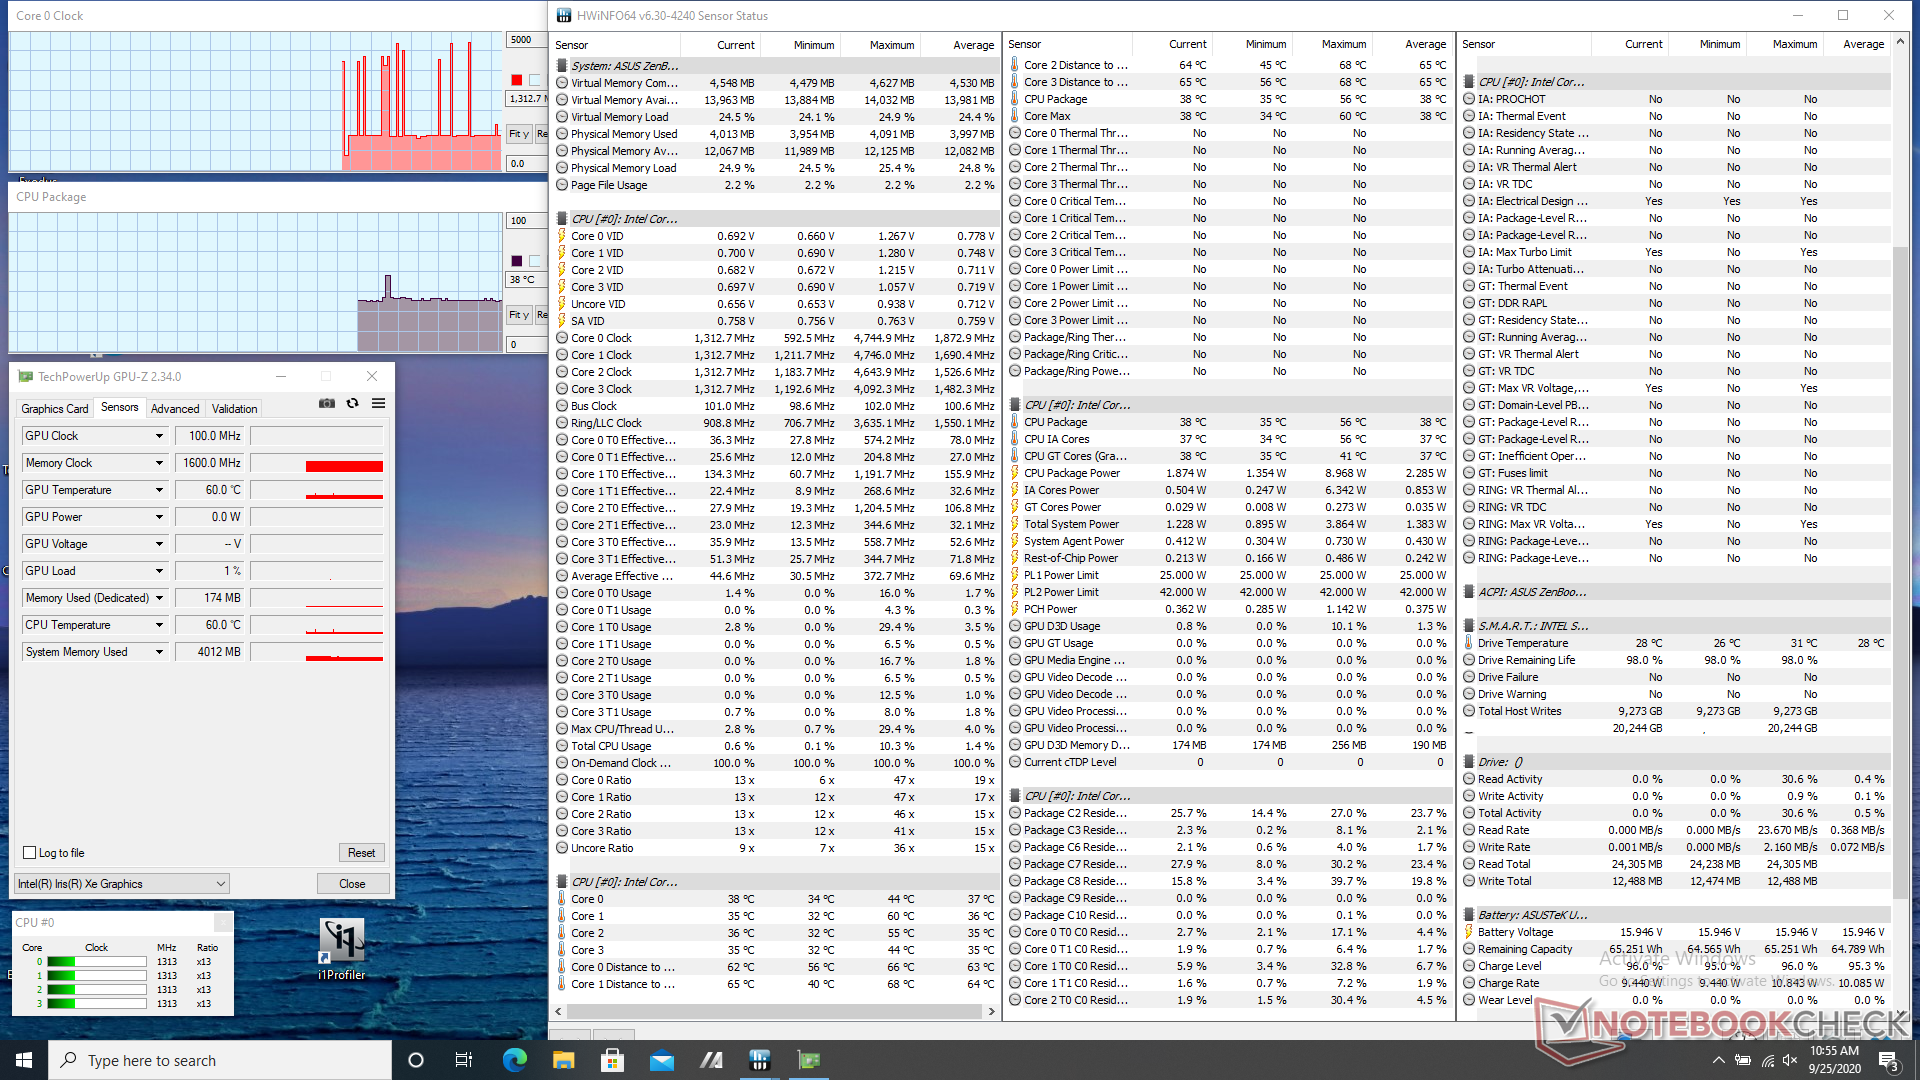
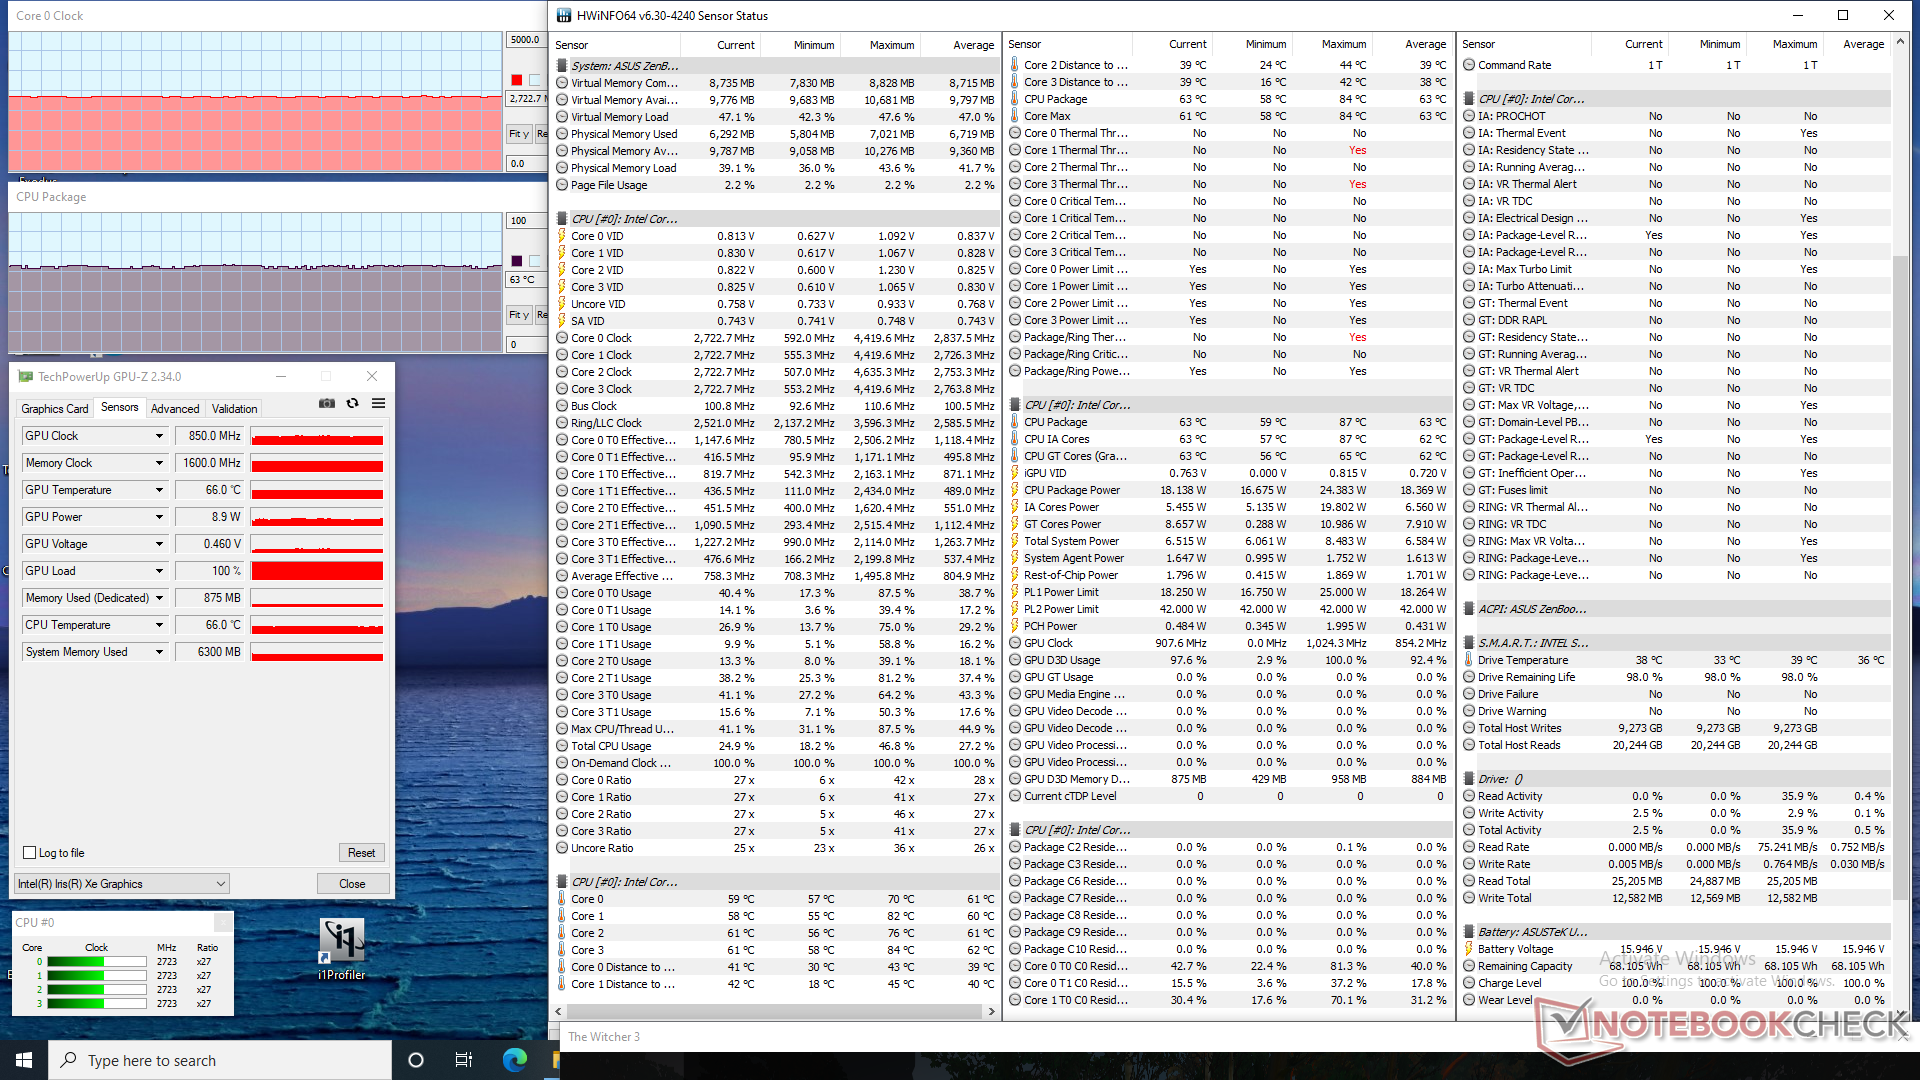
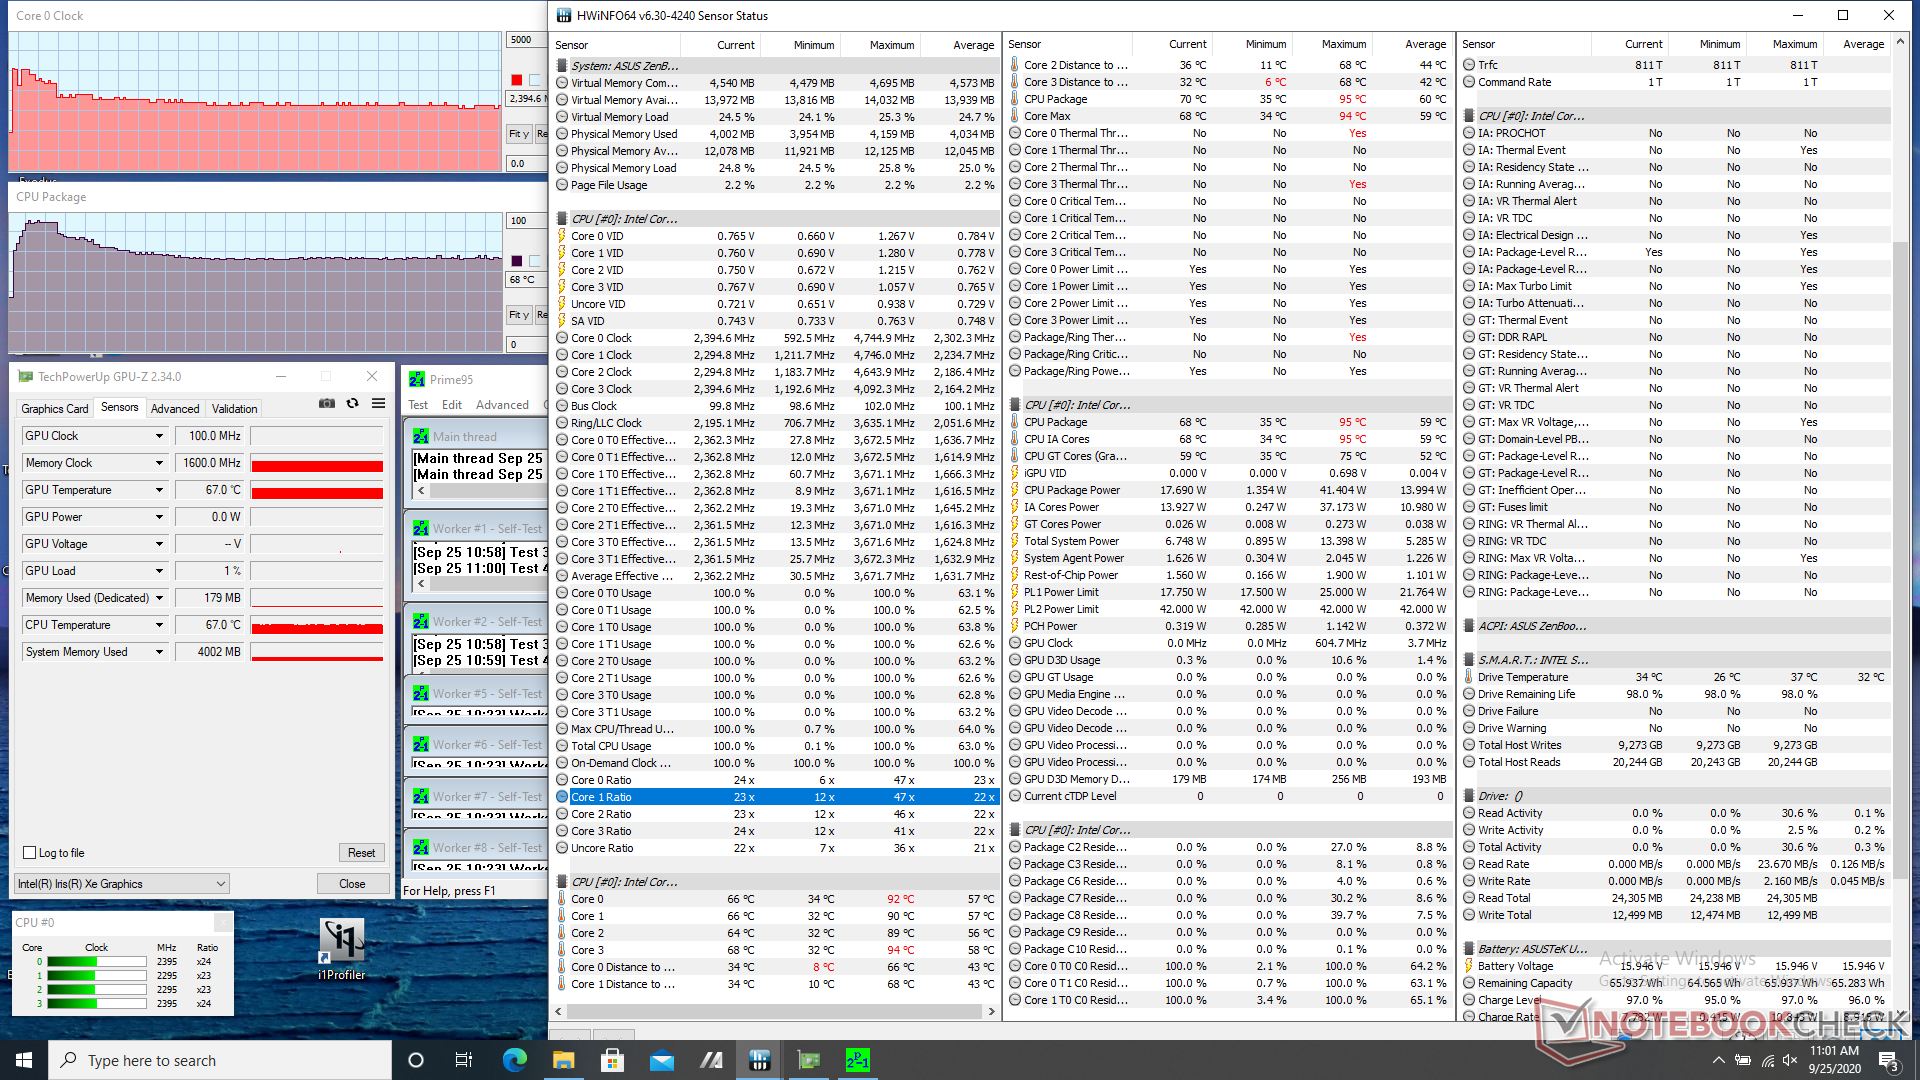
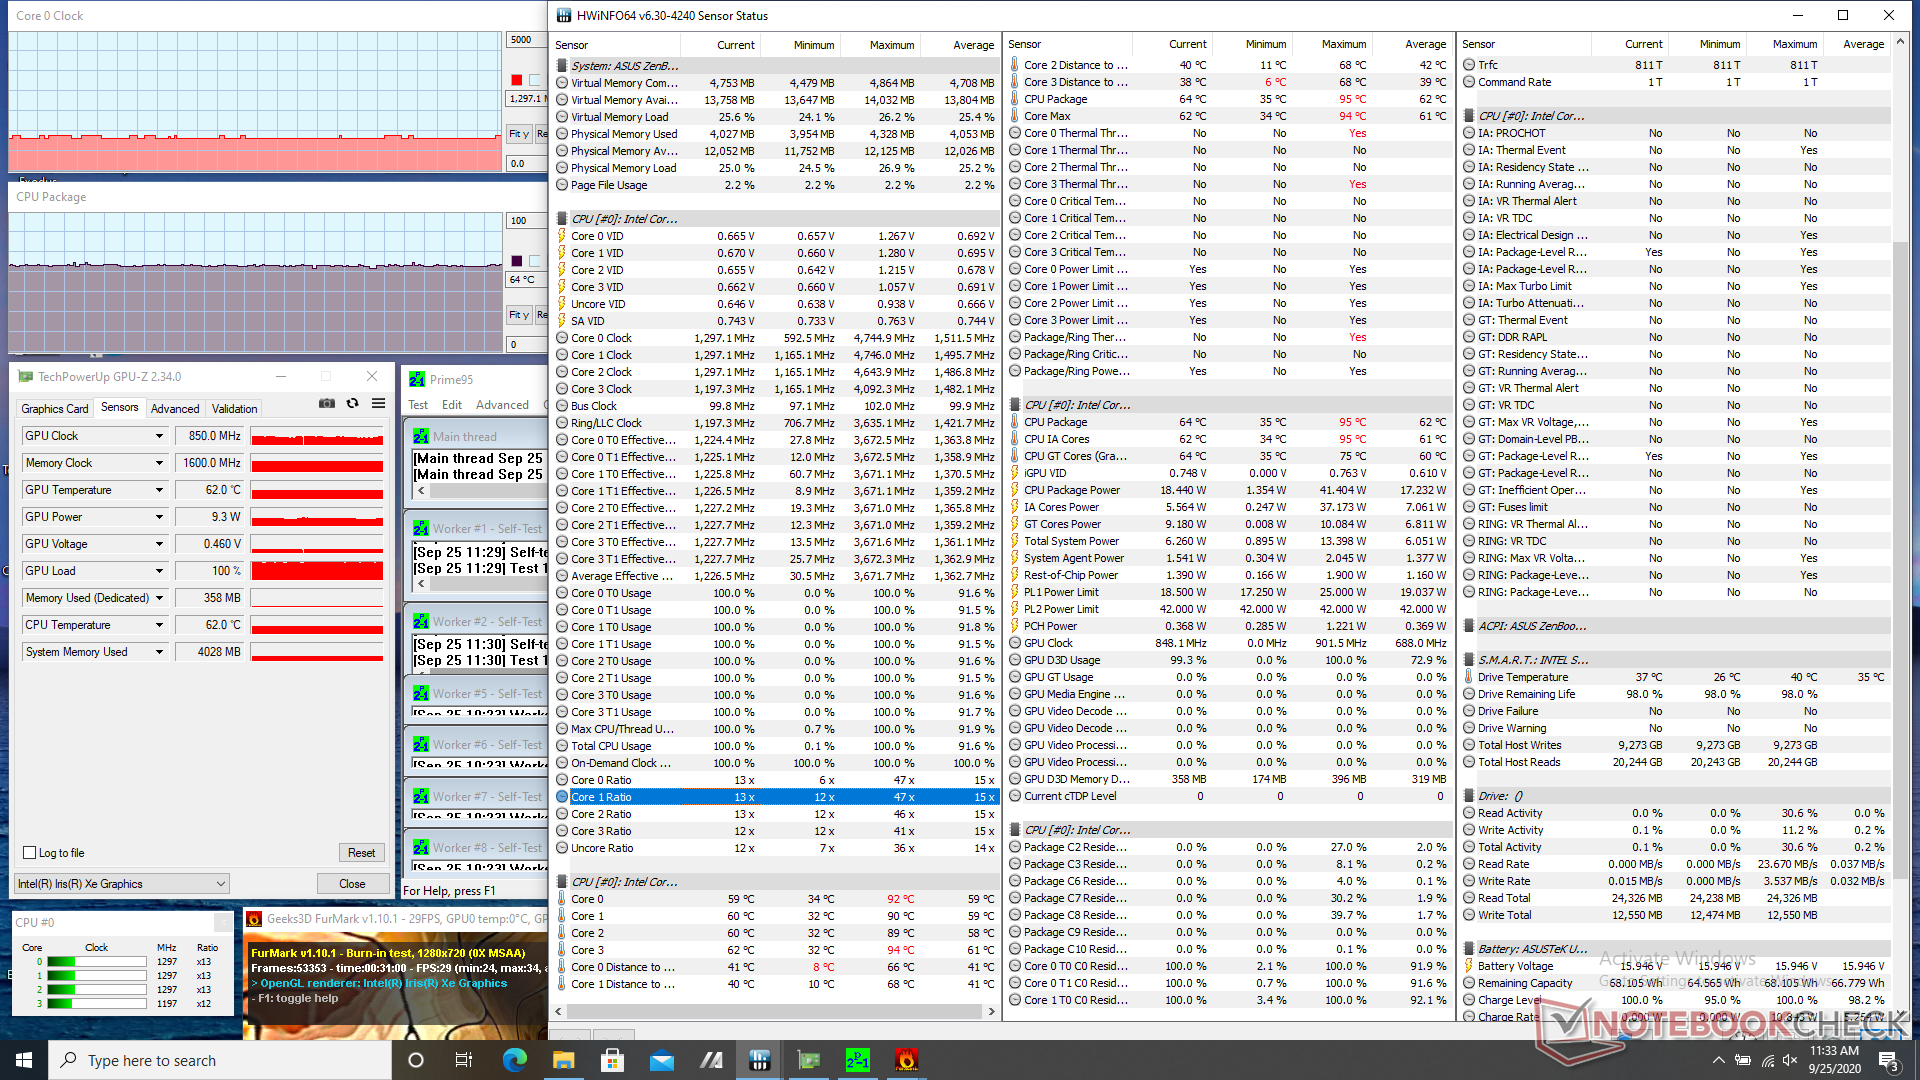
| CPU Clock (GHz) | GPU Clock (MHz) | Average CPU Temperature (°C) | |
| System Idle | -- | -- | 38 |
| Prime95 Stress | 2.3 - 2.4 | -- | 68 |
| Prime95 + FurMark Stress | 1.2 - 1.3 | ~850 | 64 |
| Witcher 3 Stress | 2.7 | 850 | 63 |
Speakers


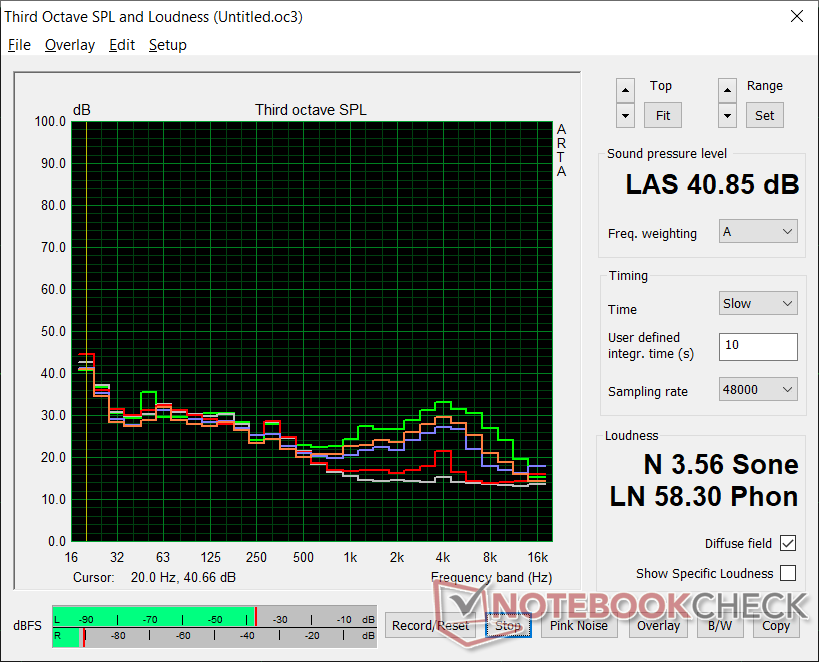
Asus ZenBook 14 UX425EA audio analysis
(+) | speakers can play relatively loud (87.5 dB)
Bass 100 - 315 Hz
(-) | nearly no bass - on average 18.5% lower than median
(±) | linearity of bass is average (12.1% delta to prev. frequency)
Mids 400 - 2000 Hz
(±) | higher mids - on average 6.9% higher than median
(+) | mids are linear (4.5% delta to prev. frequency)
Highs 2 - 16 kHz
(+) | balanced highs - only 4.1% away from median
(±) | linearity of highs is average (7.3% delta to prev. frequency)
Overall 100 - 16.000 Hz
(±) | linearity of overall sound is average (17.3% difference to median)
Compared to same class
» 49% of all tested devices in this class were better, 7% similar, 44% worse
» The best had a delta of 5%, average was 17%, worst was 45%
Compared to all devices tested
» 32% of all tested devices were better, 8% similar, 59% worse
» The best had a delta of 4%, average was 23%, worst was 134%
Apple MacBook 12 (Early 2016) 1.1 GHz audio analysis
(+) | speakers can play relatively loud (83.6 dB)
Bass 100 - 315 Hz
(±) | reduced bass - on average 11.3% lower than median
(±) | linearity of bass is average (14.2% delta to prev. frequency)
Mids 400 - 2000 Hz
(+) | balanced mids - only 2.4% away from median
(+) | mids are linear (5.5% delta to prev. frequency)
Highs 2 - 16 kHz
(+) | balanced highs - only 2% away from median
(+) | highs are linear (4.5% delta to prev. frequency)
Overall 100 - 16.000 Hz
(+) | overall sound is linear (10.2% difference to median)
Compared to same class
» 7% of all tested devices in this class were better, 2% similar, 90% worse
» The best had a delta of 5%, average was 18%, worst was 53%
Compared to all devices tested
» 5% of all tested devices were better, 1% similar, 94% worse
» The best had a delta of 4%, average was 23%, worst was 134%
Energy Management
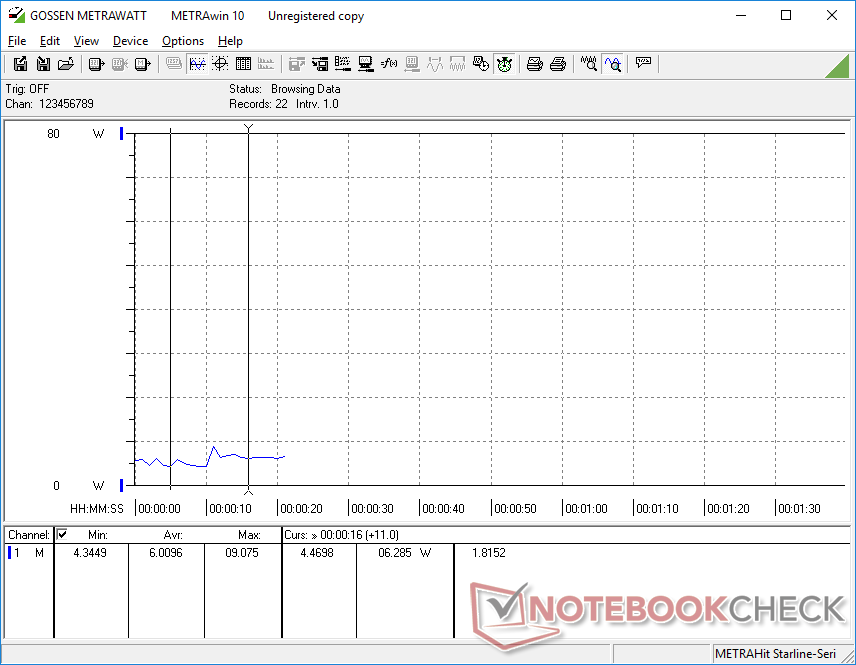
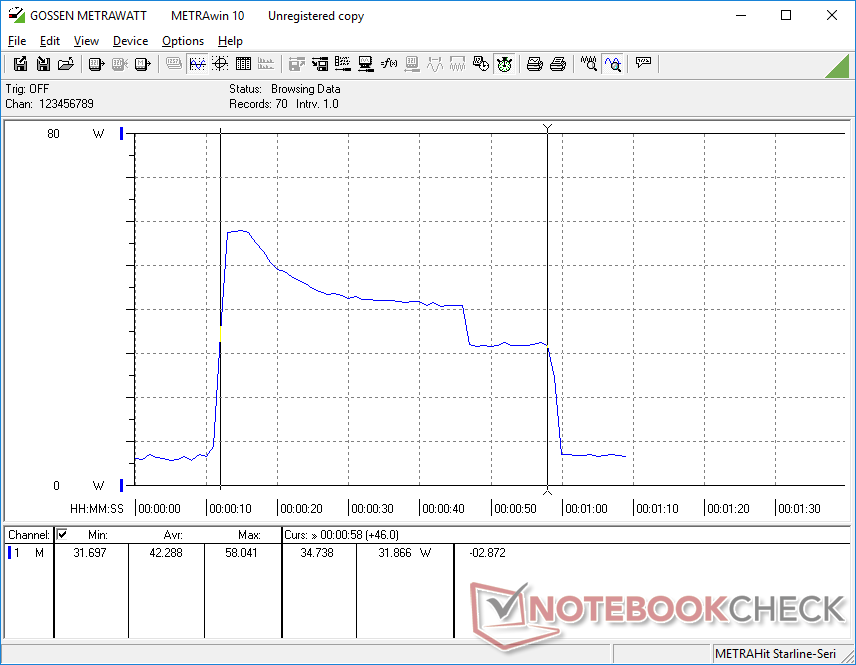
Power Consumption
Idling on desktop draws between 4 W and 7 W much like what we observed on the Yoga Slim 7. However, power consumption begins to diverge between the two laptops when running higher loads. 3DMark 06, for example, would consume just 30 W on average on our Asus compared to 48 W on the Lenovo. The Asus system appears to be more power efficient or at least more aware of its consumption rate when running heavier loads. Maximum consumption is otherwise similar between the two laptops at up to 58 W when under 100 percent CPU and GPU utilization.
| Off / Standby | |
| Idle | |
| Load |
|
Key:
min: | |
| Asus ZenBook 14 UX425EA i7-1165G7, Iris Xe G7 96EUs, Intel SSD 660p 1TB SSDPEKNW010T8, IPS, 1920x1080, 14" | Asus ZenBook 14 UX434FL-DB77 i7-8565U, GeForce MX250, WDC PC SN520 SDAPNUW-512G, IPS, 1920x1080, 14" | Asus ZenBook Flip 14 UX463FA-AI039T i5-10210U, UHD Graphics 620, Kingston RBUSNS8154P3512GJ1, IPS, 1920x1080, 14" | LG Gram 14T90N i7-10510U, UHD Graphics 620, Samsung SSD PM981a MZVLB512HBJQ, IPS, 1920x1080, 14" | Lenovo Yoga Slim 7-14ARE R7 4800U, Vega 8, Samsung SSD PM981a MZVLB512HBJQ, IPS, 1920x1080, 14" | Dell XPS 13 9300 Core i7-1065G7 i7-1065G7, Iris Plus Graphics G7 (Ice Lake 64 EU), Intel SSDPEMKF512G8 NVMe SSD, IPS, 1920x1200, 13.4" | |
|---|---|---|---|---|---|---|
| Power Consumption | -6% | -8% | 15% | -19% | -3% | |
| Idle Minimum * (Watt) | 4.8 | 2.9 40% | 3.6 25% | 2.9 40% | 4 17% | 4.2 12% |
| Idle Average * (Watt) | 6.5 | 6.2 5% | 7.5 -15% | 5.8 11% | 6.3 3% | 6.9 -6% |
| Idle Maximum * (Watt) | 7.7 | 7 9% | 9.4 -22% | 6.2 19% | 7.7 -0% | 7.5 3% |
| Load Average * (Watt) | 29.6 | 47.1 -59% | 42 -42% | 32.9 -11% | 48.3 -63% | 33.3 -12% |
| Witcher 3 ultra * (Watt) | 28.6 | 34.7 -21% | 49 -71% | 37.1 -30% | ||
| Load Maximum * (Watt) | 57.8 | 62.8 -9% | 51 12% | 48.5 16% | 57.6 -0% | 48.4 16% |
* ... smaller is better
Battery Life
Runtimes are very long at over 13 hours of real-world WLAN usage when on the Balanced power profile. Results are similar to the LG Gram 14 but with a much more powerful Tiger Lake CPU and a slightly smaller battery capacity.
Charging from empty to full capacity takes less than 1.5 hours.
| Asus ZenBook 14 UX425EA i7-1165G7, Iris Xe G7 96EUs, 67 Wh | Asus ZenBook 14 UX434FL-DB77 i7-8565U, GeForce MX250, 50 Wh | Asus ZenBook Flip 14 UX463FA-AI039T i5-10210U, UHD Graphics 620, 50 Wh | LG Gram 14T90N i7-10510U, UHD Graphics 620, 72 Wh | Lenovo Yoga Slim 7-14ARE R7 4800U, Vega 8, 61 Wh | Dell XPS 13 9300 Core i7-1065G7 i7-1065G7, Iris Plus Graphics G7 (Ice Lake 64 EU), 52 Wh | |
|---|---|---|---|---|---|---|
| Battery runtime | -30% | -41% | 1% | -25% | -3% | |
| Reader / Idle (h) | 25.9 | 16.1 -38% | 32.8 27% | 27.1 5% | ||
| WiFi v1.3 (h) | 13.1 | 7.3 -44% | 7.7 -41% | 12.5 -5% | 10.3 -21% | 12.7 -3% |
| Load (h) | 3.2 | 2.9 -9% | 2.6 -19% | 1.3 -59% |
Pros
Cons
Verdict
The strongest advantage of the ZenBook 14 UX425EA is its high performance-per-weight. It is as light as the LG Gram 14 but with significantly faster performance and a brighter display to boot. We heralded the 2018 Razer Blade Stealth as having impressive performance for the size at the time, but the UX425EA can run games just as fast or even slightly faster while weighing less and drawing much less power in the process.
The low weight comes at the cost of chassis rigidity as alternatives like the Dell XPS, HP Spectre, Blade Stealth, Huawei MateBook X Pro, or Lenovo Yoga Slim 7 all feel stronger and better built. Raw CPU performance isn't any faster than many existing Ice Lake Core i7 options and GPU performance remains unsteady for many demanding titles..
Intel has succeeded in creating an 11th gen Core i7 U-series CPU that's better than its 10th gen predecessor. Exactly how much better, however, depends on the workload.
If you enjoy the occasional game of Rocket League or DOTA 2 while on the go, then this super-light Tiger Lake-powered Ultrabook can come in handy. Otherwise, your browsing, emailing, battery life, and video streaming experience will be essentially identical to any older 10th gen Ice Lake laptop you can find.
Asus ZenBook 14 UX425EA
- 09/29/2020 v7 (old)
Allen Ngo
Price comparison
