Asus ZenBook 14 UX434FL Laptop Review: ScreenPad Is Here To Stay
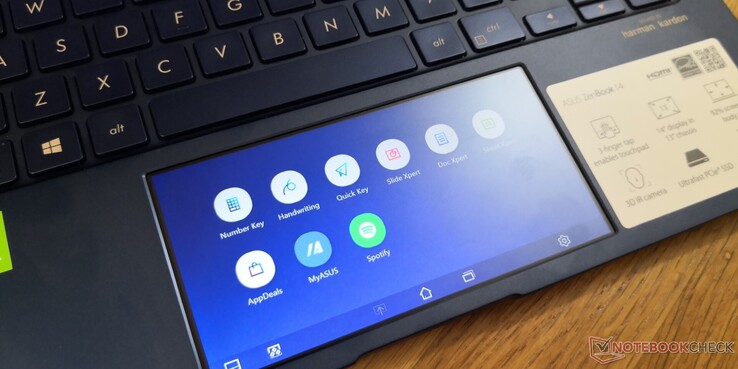
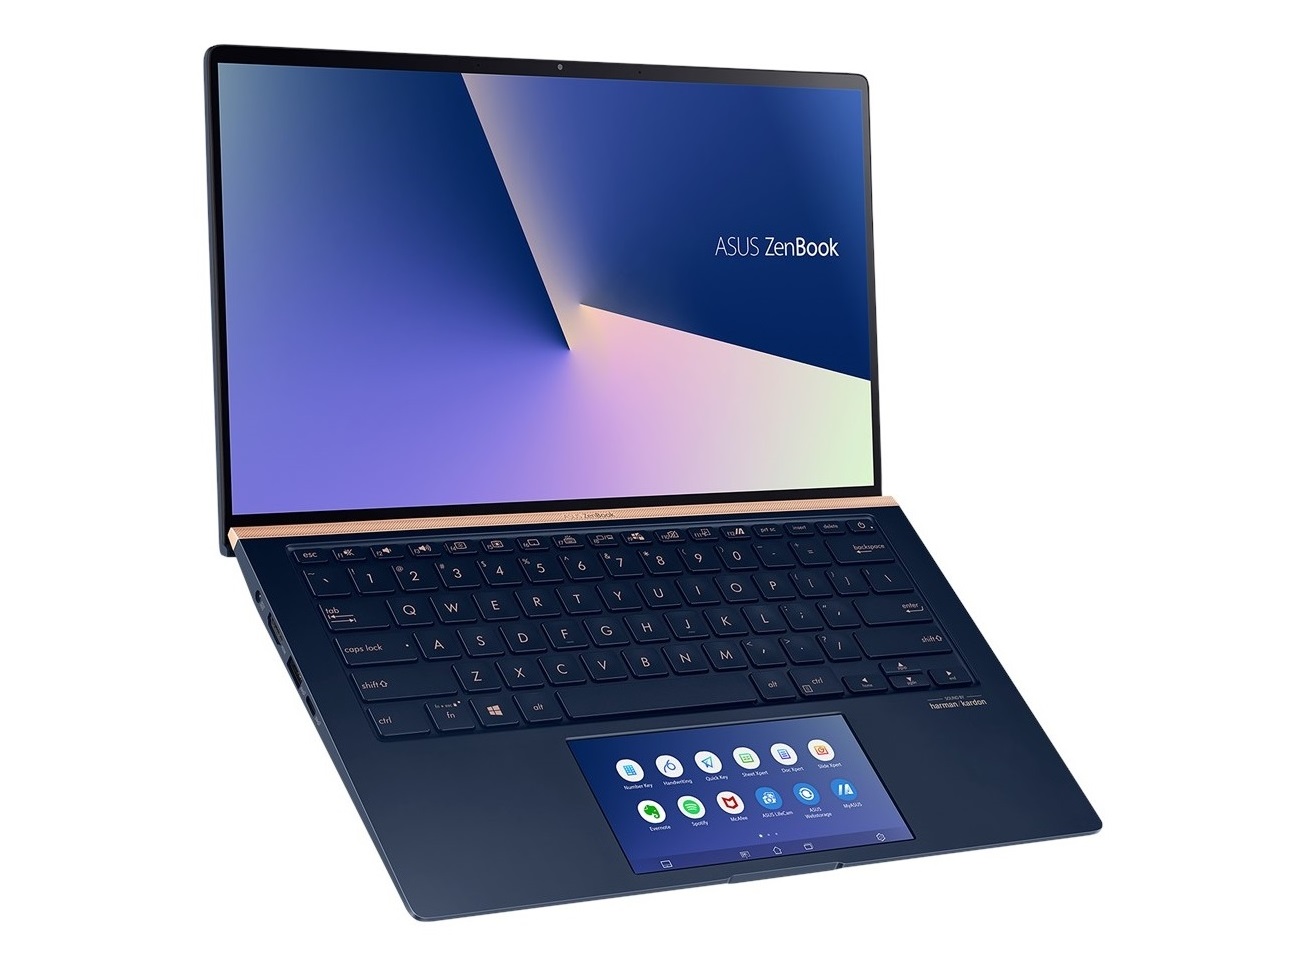
The Asus ZenBook 14 UX434 is an update to the older ZenBook 14 UX433 series with newer GPU options (GeForce MX250 vs. MX150) and the all-important integrated ScreenPad 2.0. As explained here, the ScreenPad is a clickpad-turned-touchscreen that essentially mimics an external display to aid in multi-tasking. The simple concept of having two screens on your laptop at all times is alluring for both productivity and multimedia reasons.
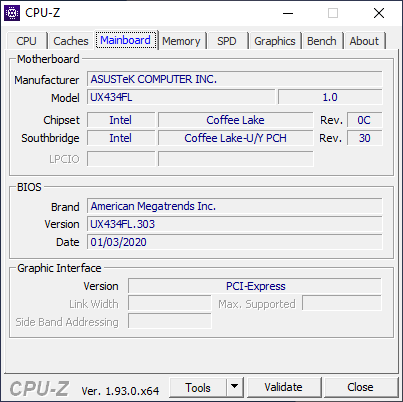
Aside from the ScreenPad and GeForce MX250 GPU, the ZenBook 14 UX434 is visually identical to the ZenBook 14 UX433. We recommend checking out our review on the UX433 series as many of our existing comments apply here on the UX434. The system competes directly with other upper mid-range 14-inch Ultrabooks like the Lenovo IdeaPad 5, LG Gram 14, Lenovo Yoga Slim 7, or the MSI Modern 14.
More Asus reviews:
Rating | Date | Model | Weight | Height | Size | Resolution | Price |
|---|---|---|---|---|---|---|---|
| 82.4 % v7 (old) | 09 / 2020 | Asus ZenBook 14 UX434FL-DB77 i7-8565U, GeForce MX250 | 1.3 kg | 16.9 mm | 14.00" | 1920x1080 | |
| 86 % v7 (old) | 07 / 2020 | Lenovo IdeaPad 5 14ARE05 R5 4500U, Vega 6 | 1.4 kg | 16.9 mm | 14.00" | 1920x1080 | |
| 80.7 % v7 (old) | 07 / 2020 | Asus VivoBook S14 S433FL i7-10510U, GeForce MX250 | 1.4 kg | 16 mm | 14.00" | 1920x1080 | |
| 85.3 % v7 (old) | 05 / 2020 | LG Gram 14Z90N i7-1065G7, Iris Plus Graphics G7 (Ice Lake 64 EU) | 994 g | 18 mm | 14.00" | 1920x1080 | |
| 85.3 % v7 (old) | 08 / 2020 | Lenovo Yoga Slim 7-14ARE R7 4800U, Vega 8 | 1.4 kg | 14.9 mm | 14.00" | 1920x1080 | |
| 80.9 % v7 (old) | 01 / 2020 | MSI Modern 14 A10RB-459US i5-10210U, GeForce MX250 | 1.2 kg | 16 mm | 14.00" | 1920x1080 |
Case
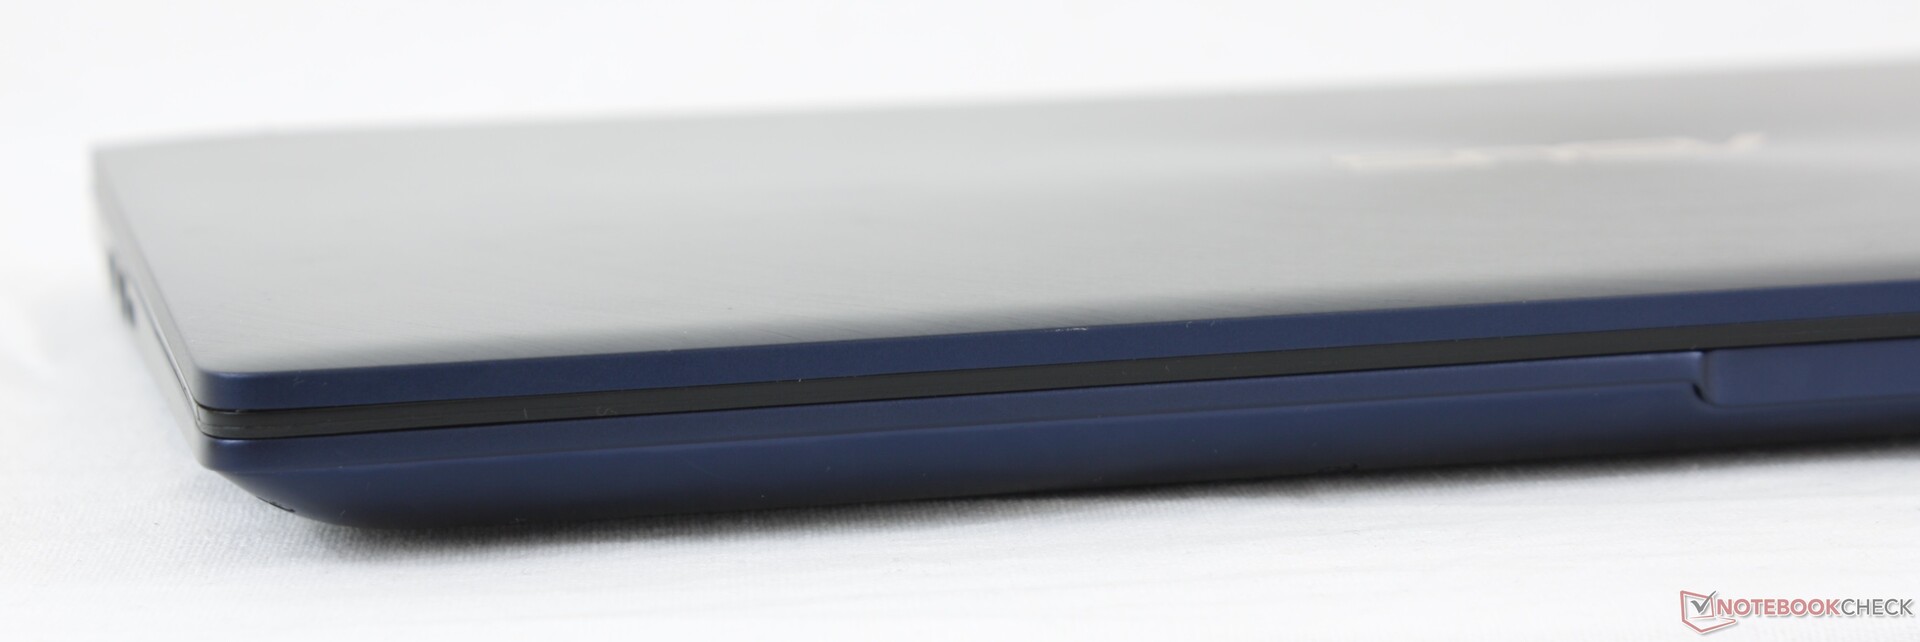
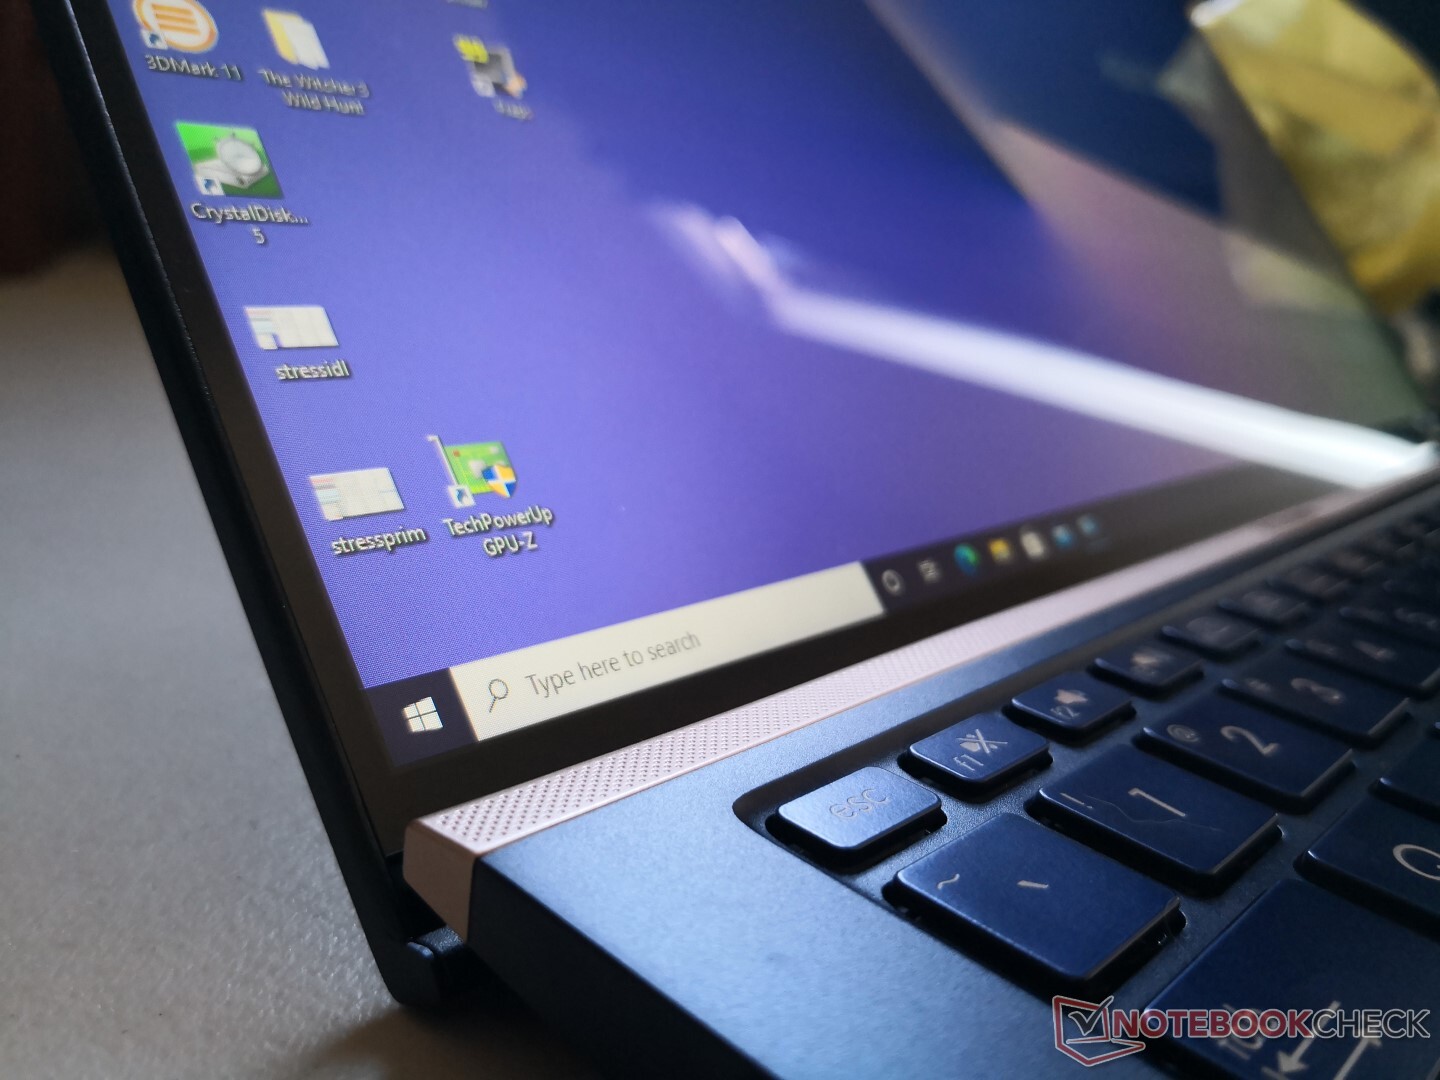
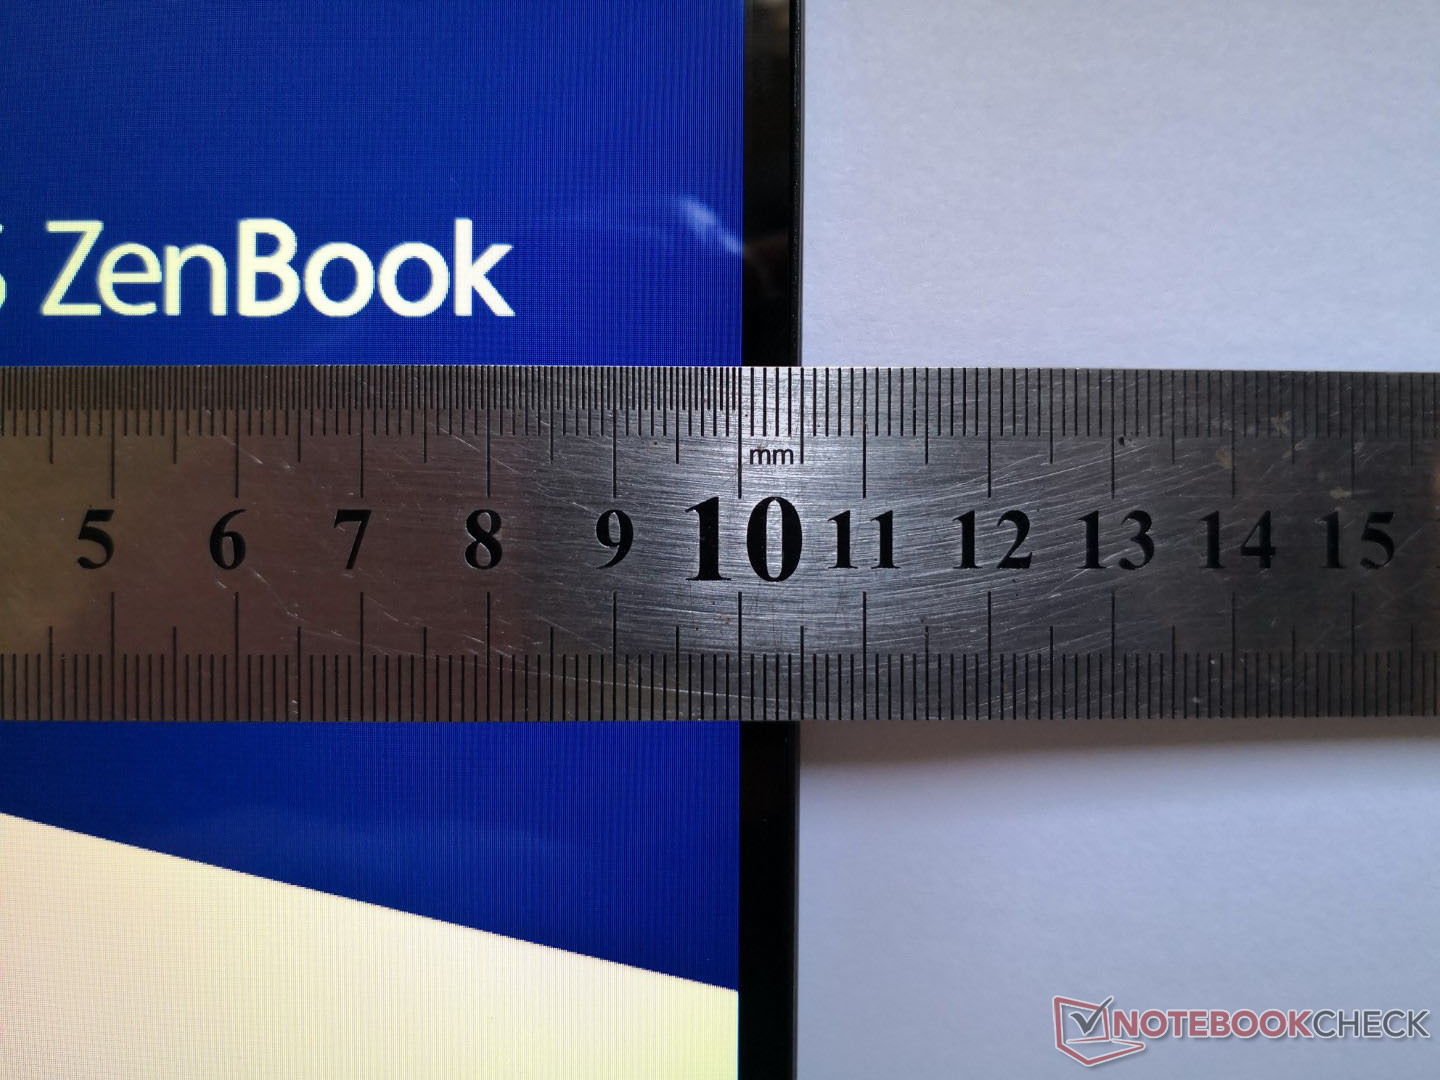
The chassis makes no compromises for the integrated ScreenPad as it is the same as the ScreenPad-less UX433. The design is 13 percent smaller in footprint than the older UX430 chassis due to the narrower bezels. The ErgoLift hinges, however, could be stiffer.
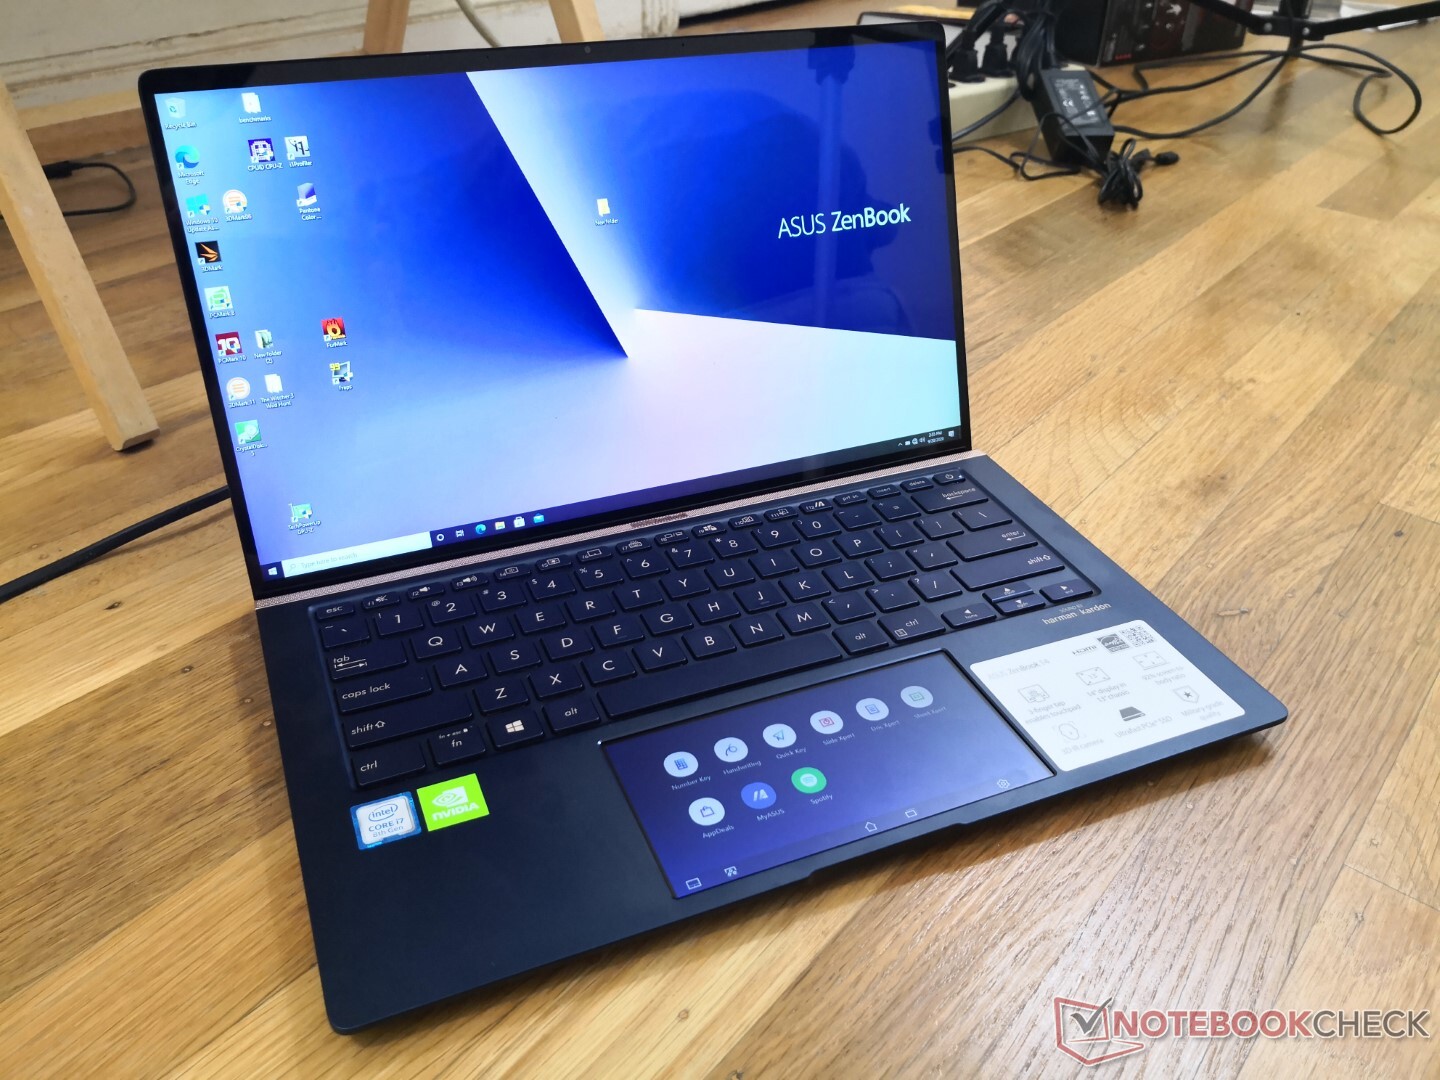
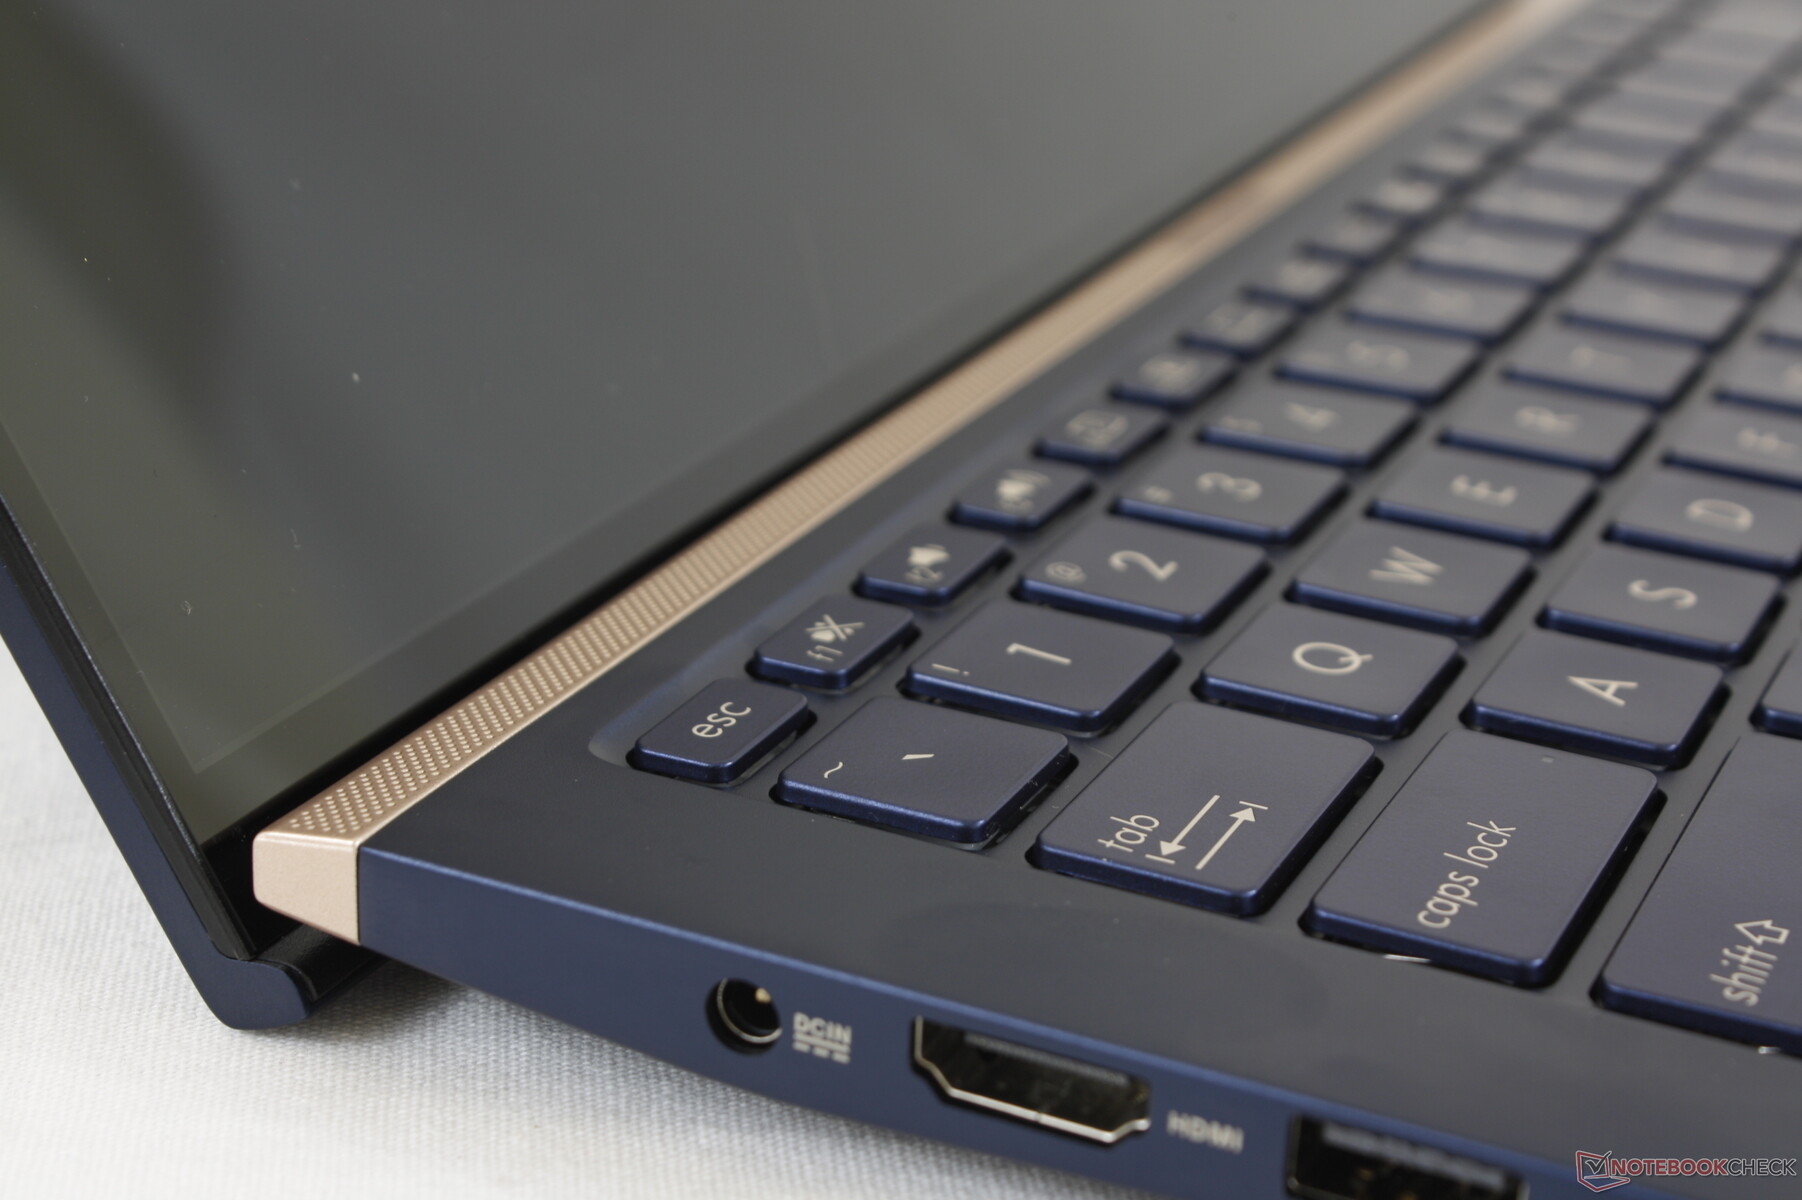
The very narrow display bezels on all for sides (instead of just the left and right like on most other laptops) help the ZenBook 14 be smaller in footprint than many competitors. Weight and thickness are otherwise comparable despite the integrated ScreenPad functionality.
Connectivity
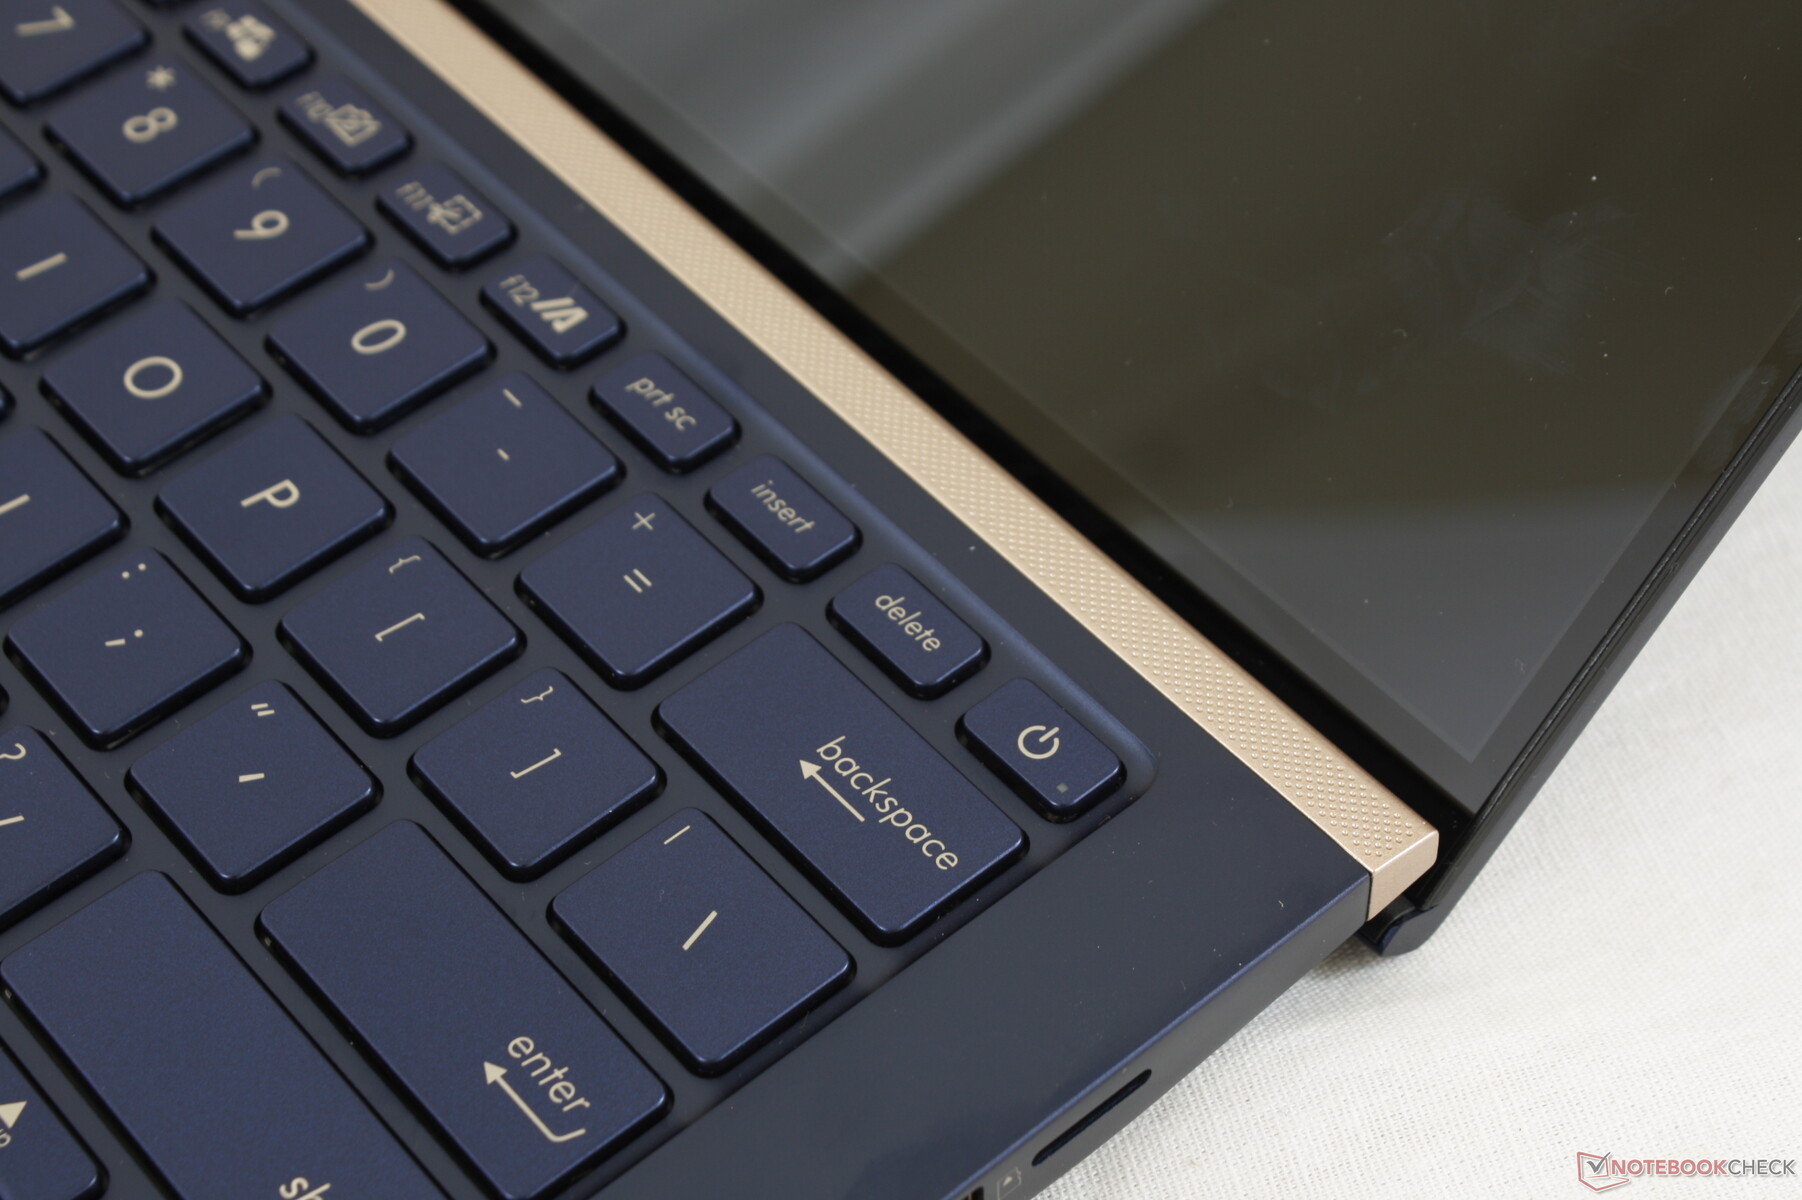
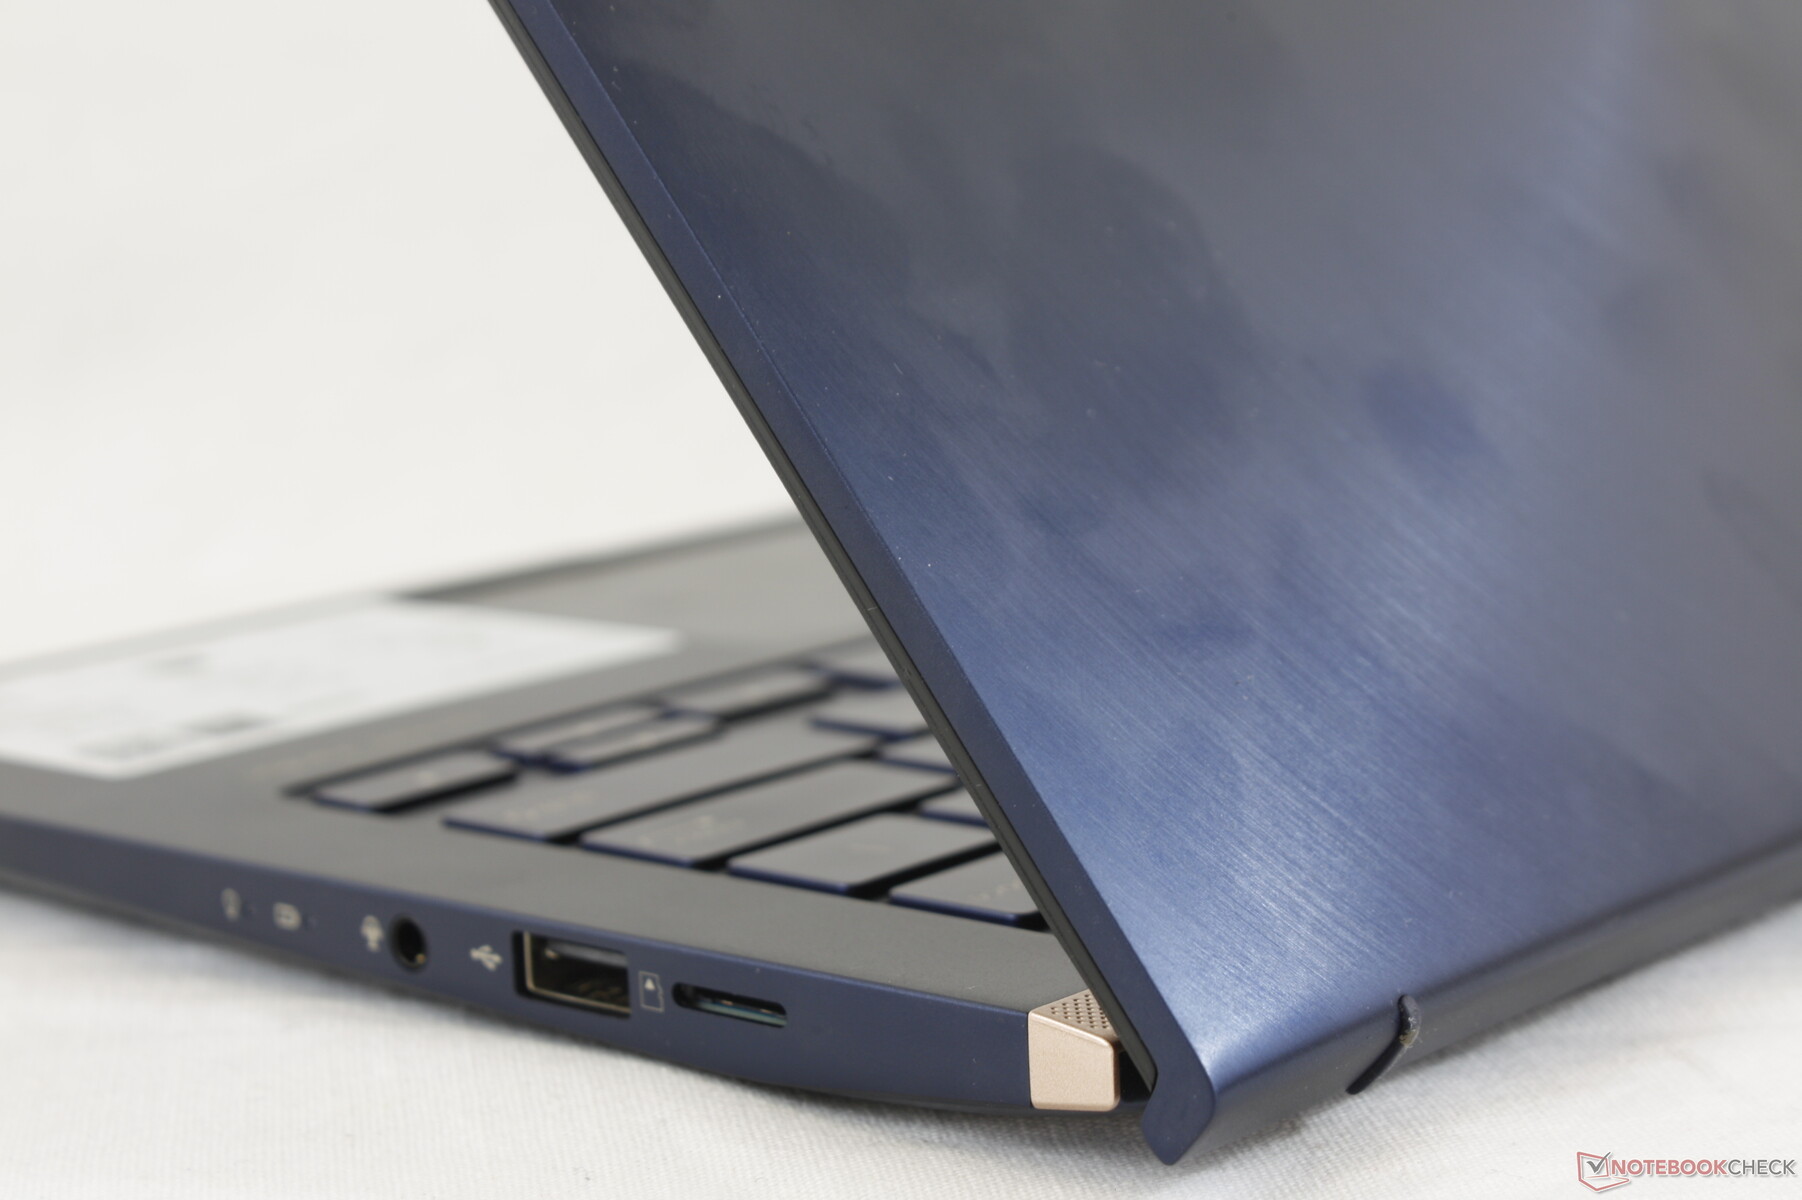
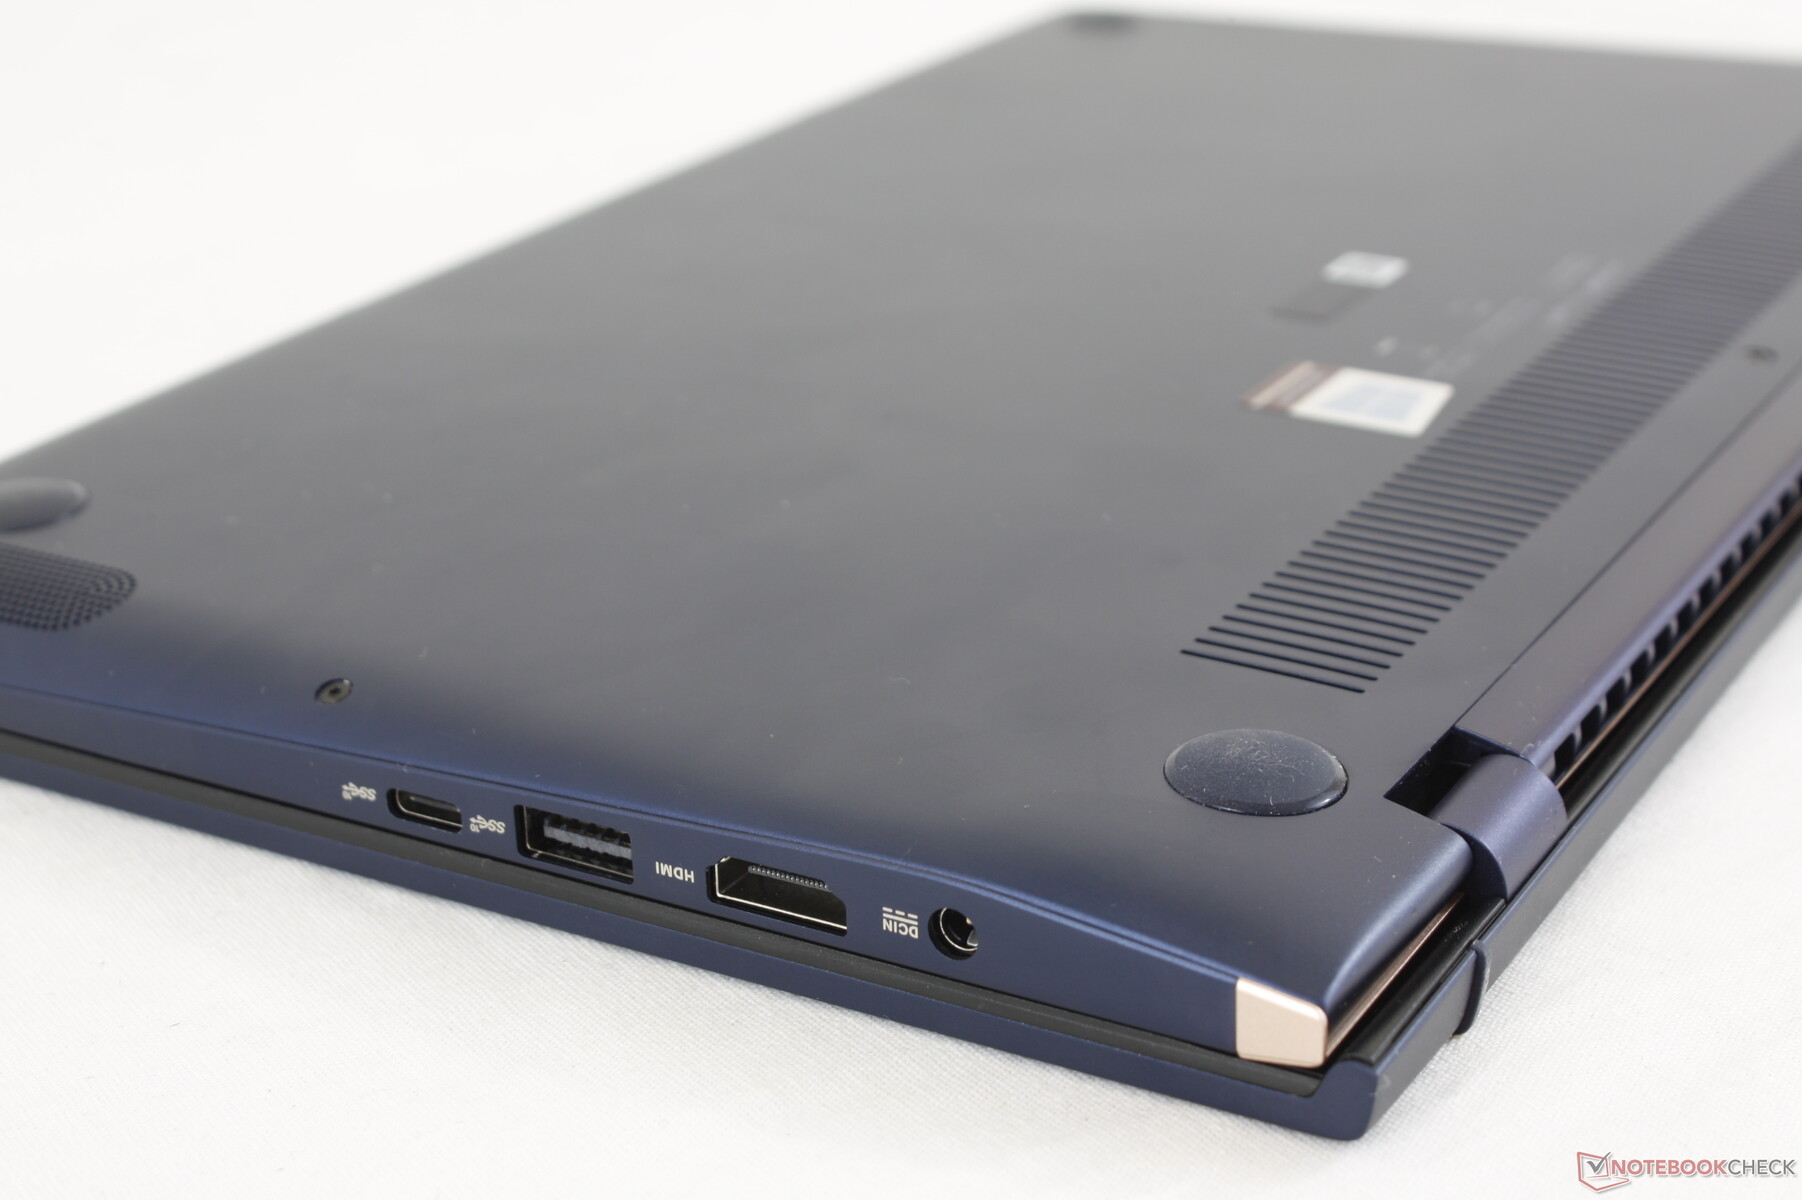
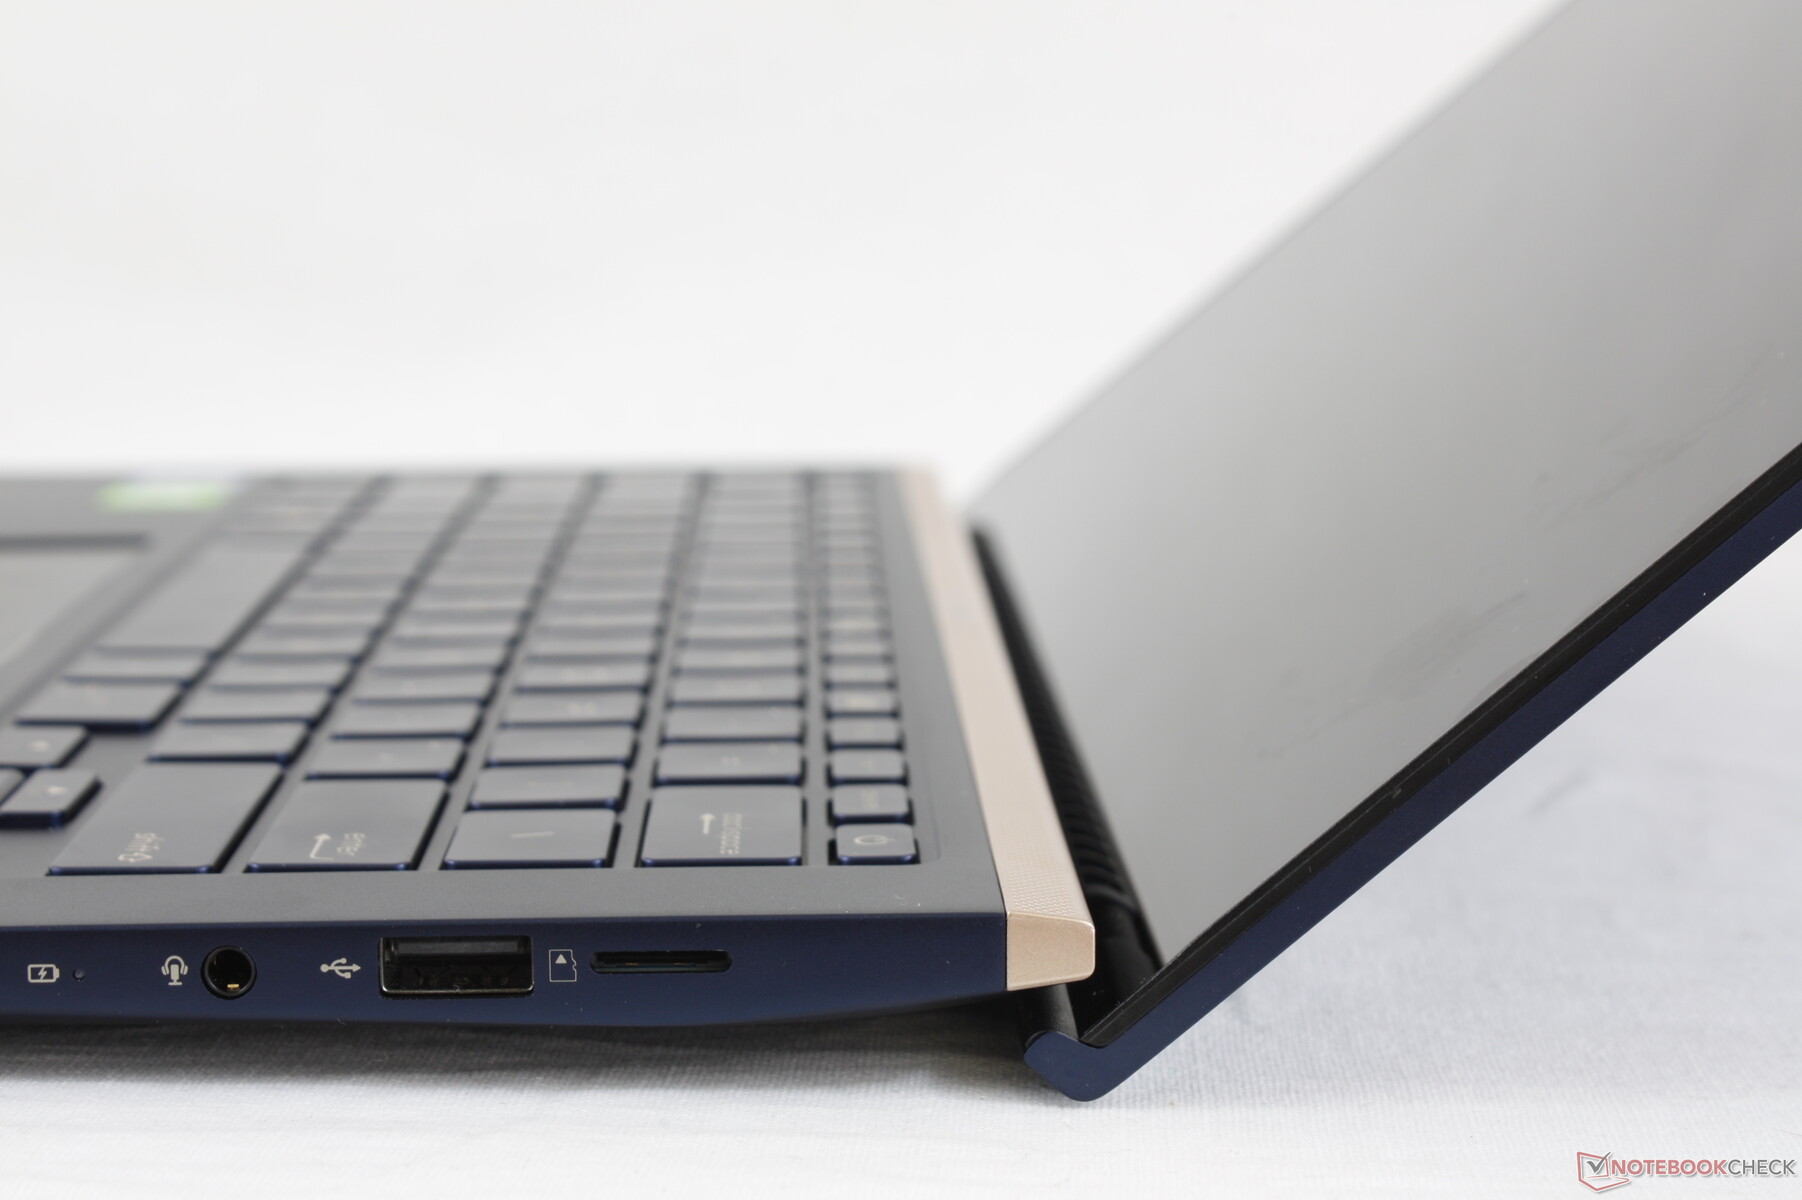
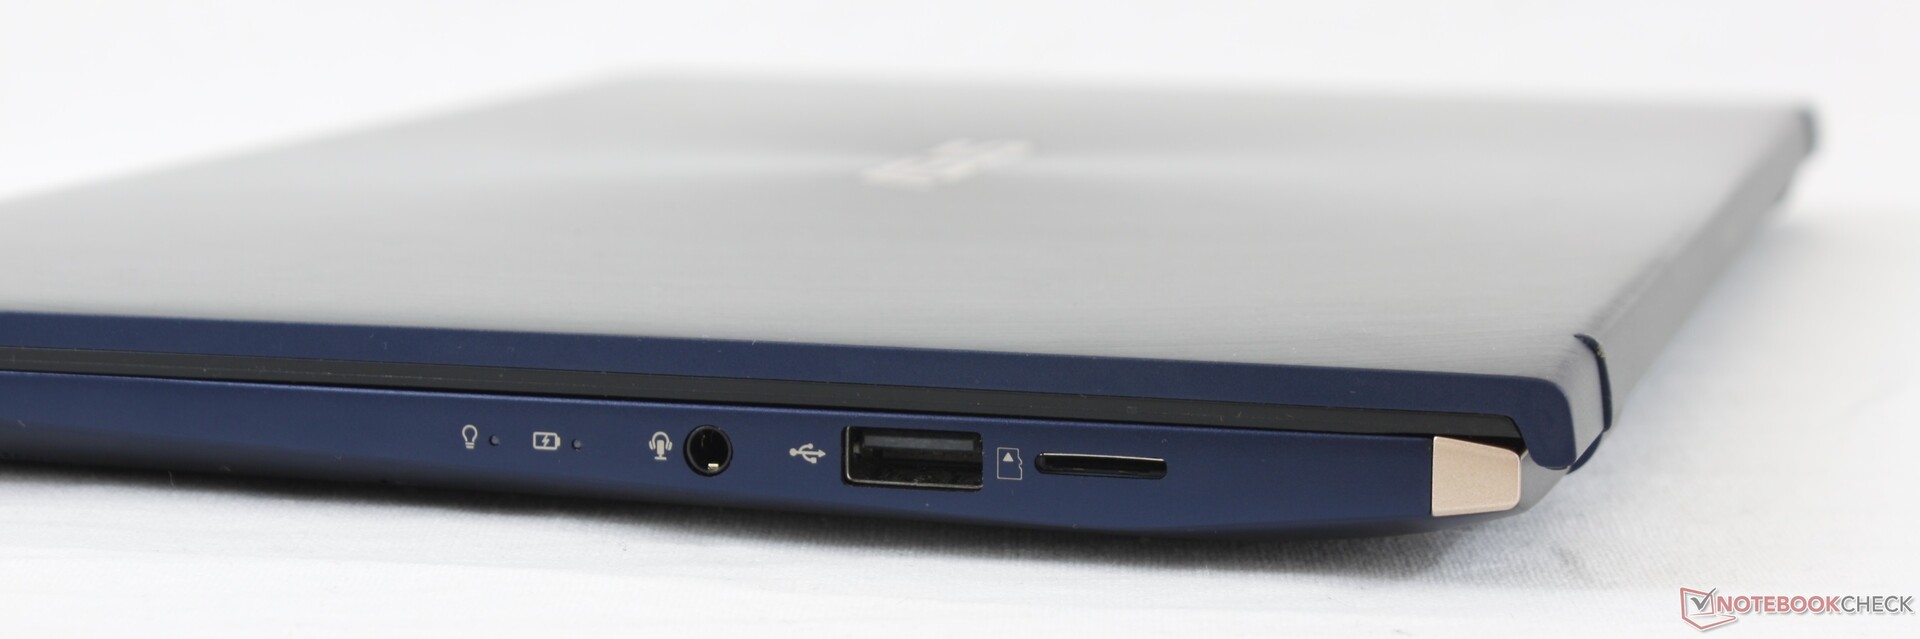
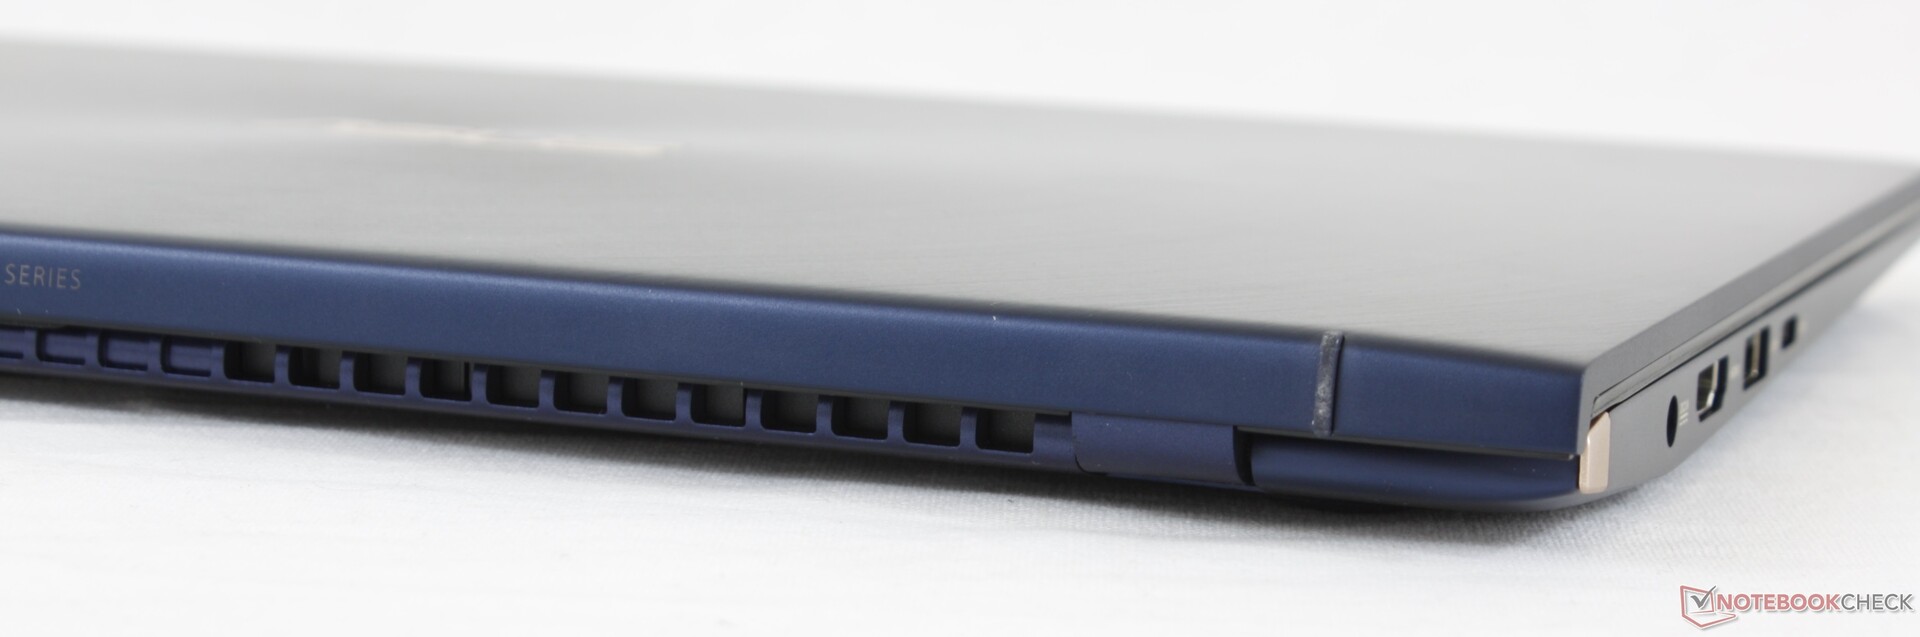
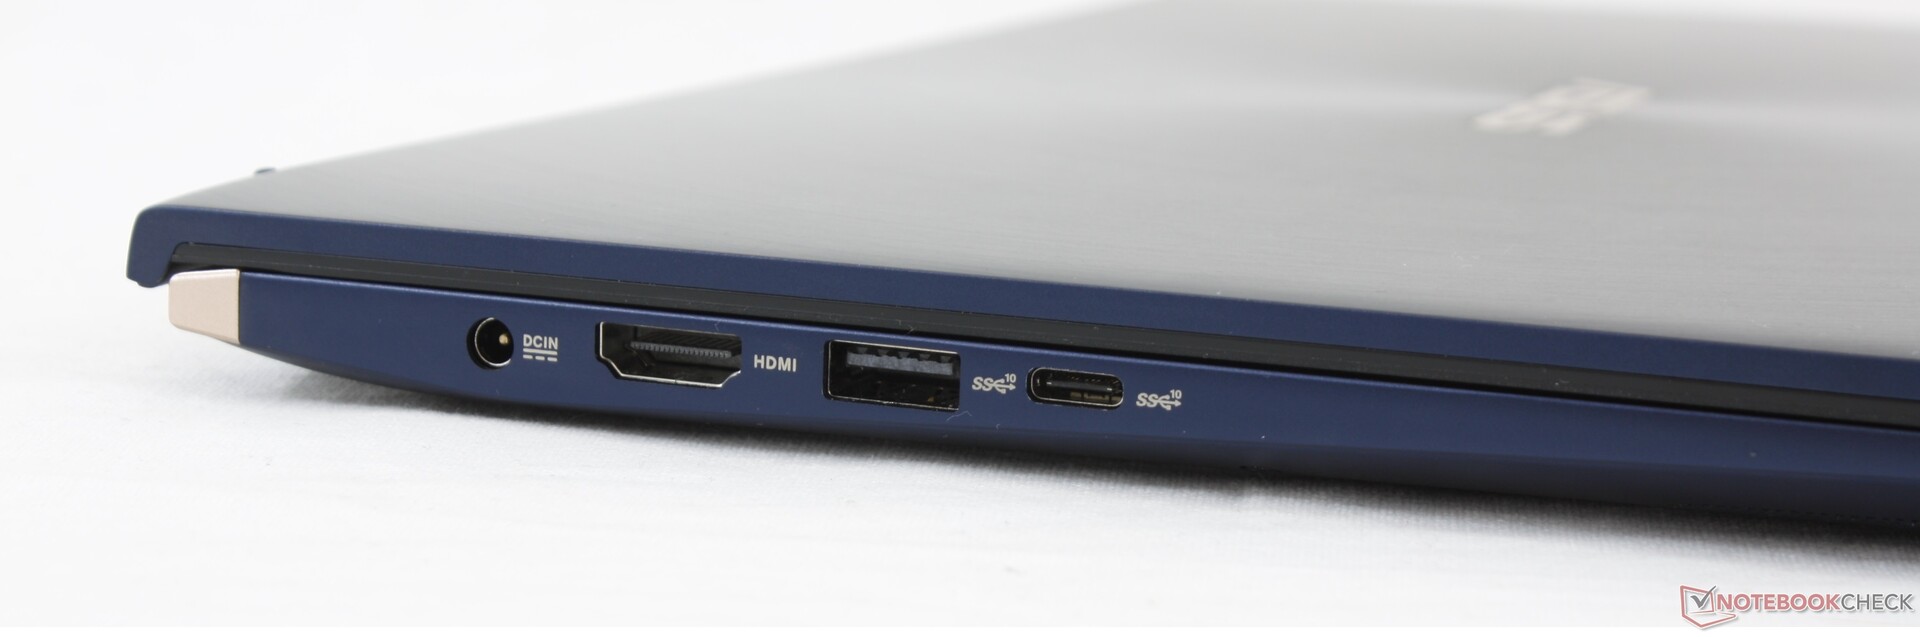
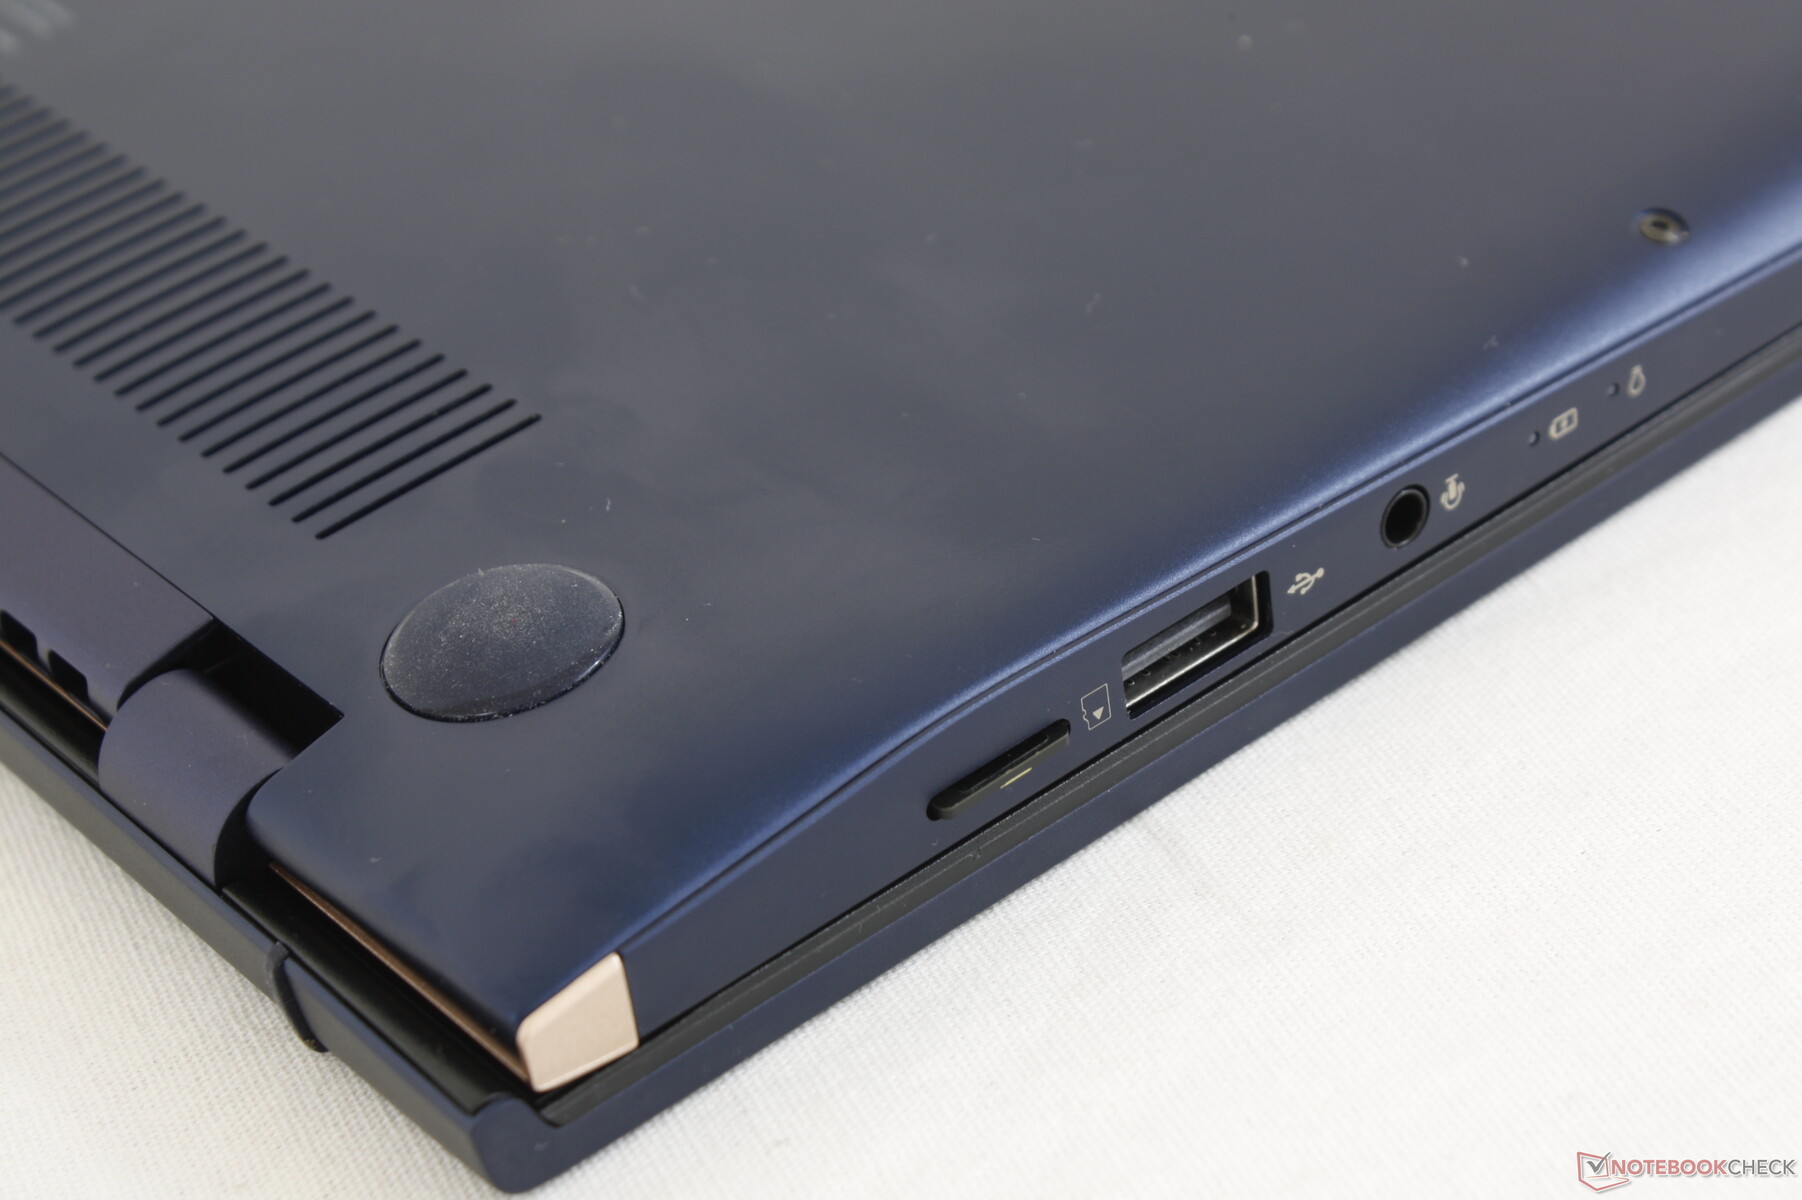
The UX434 integrates the same ports as found on the UX433. Keep in mind that the USB-C port does not support Thunderbolt 3 or even DisplayPort. Port positioning along the left edge is also tight and so thicker cables may block access to adjacent ports.
SD Card Reader
Transfer rates with the integrated spring-loaded MicroSD card reader is slow at just under 30 MB/s. Moving 1 GB of pictures from our UHS-II test card to desktop takes about 45 seconds compared to under 7 seconds on the Dell XPS 13.
| SD Card Reader | |
| average JPG Copy Test (av. of 3 runs) | |
| LG Gram 14Z90N (Toshiba Exceria Pro M501 64 GB UHS-II) | |
| Lenovo IdeaPad 5 14ARE05 (Toshiba Exceria Pro SDXC 64 GB UHS-II) | |
| Lenovo Yoga Slim 7-14ARE (Toshiba Exceria Pro M501 64 GB UHS-II) | |
| MSI Modern 14 A10RB-459US (Toshiba Exceria Pro SDXC 64 GB UHS-II) | |
| Asus VivoBook S14 S433FL (Toshiba Exceria Pro M501 microSDXC 64GB) | |
| Asus ZenBook 14 UX434FL-DB77 (Toshiba Exceria Pro M501 64 GB UHS-II) | |
| maximum AS SSD Seq Read Test (1GB) | |
| LG Gram 14Z90N (Toshiba Exceria Pro M501 64 GB UHS-II) | |
| Lenovo IdeaPad 5 14ARE05 (Toshiba Exceria Pro SDXC 64 GB UHS-II) | |
| Lenovo Yoga Slim 7-14ARE (Toshiba Exceria Pro M501 64 GB UHS-II) | |
| Asus ZenBook 14 UX434FL-DB77 (Toshiba Exceria Pro M501 64 GB UHS-II) | |
| MSI Modern 14 A10RB-459US (Toshiba Exceria Pro SDXC 64 GB UHS-II) | |
| Asus VivoBook S14 S433FL (Toshiba Exceria Pro M501 microSDXC 64GB) | |
Communication
The Intel AX201 comes standard for Wi-Fi 6 and Bluetooth 5.1 compatibility. We experienced no issues when connected to our Netgear RAX200 test router, but average transmit speeds are oddly half of what we were expecting.
Webcam


Maintenance
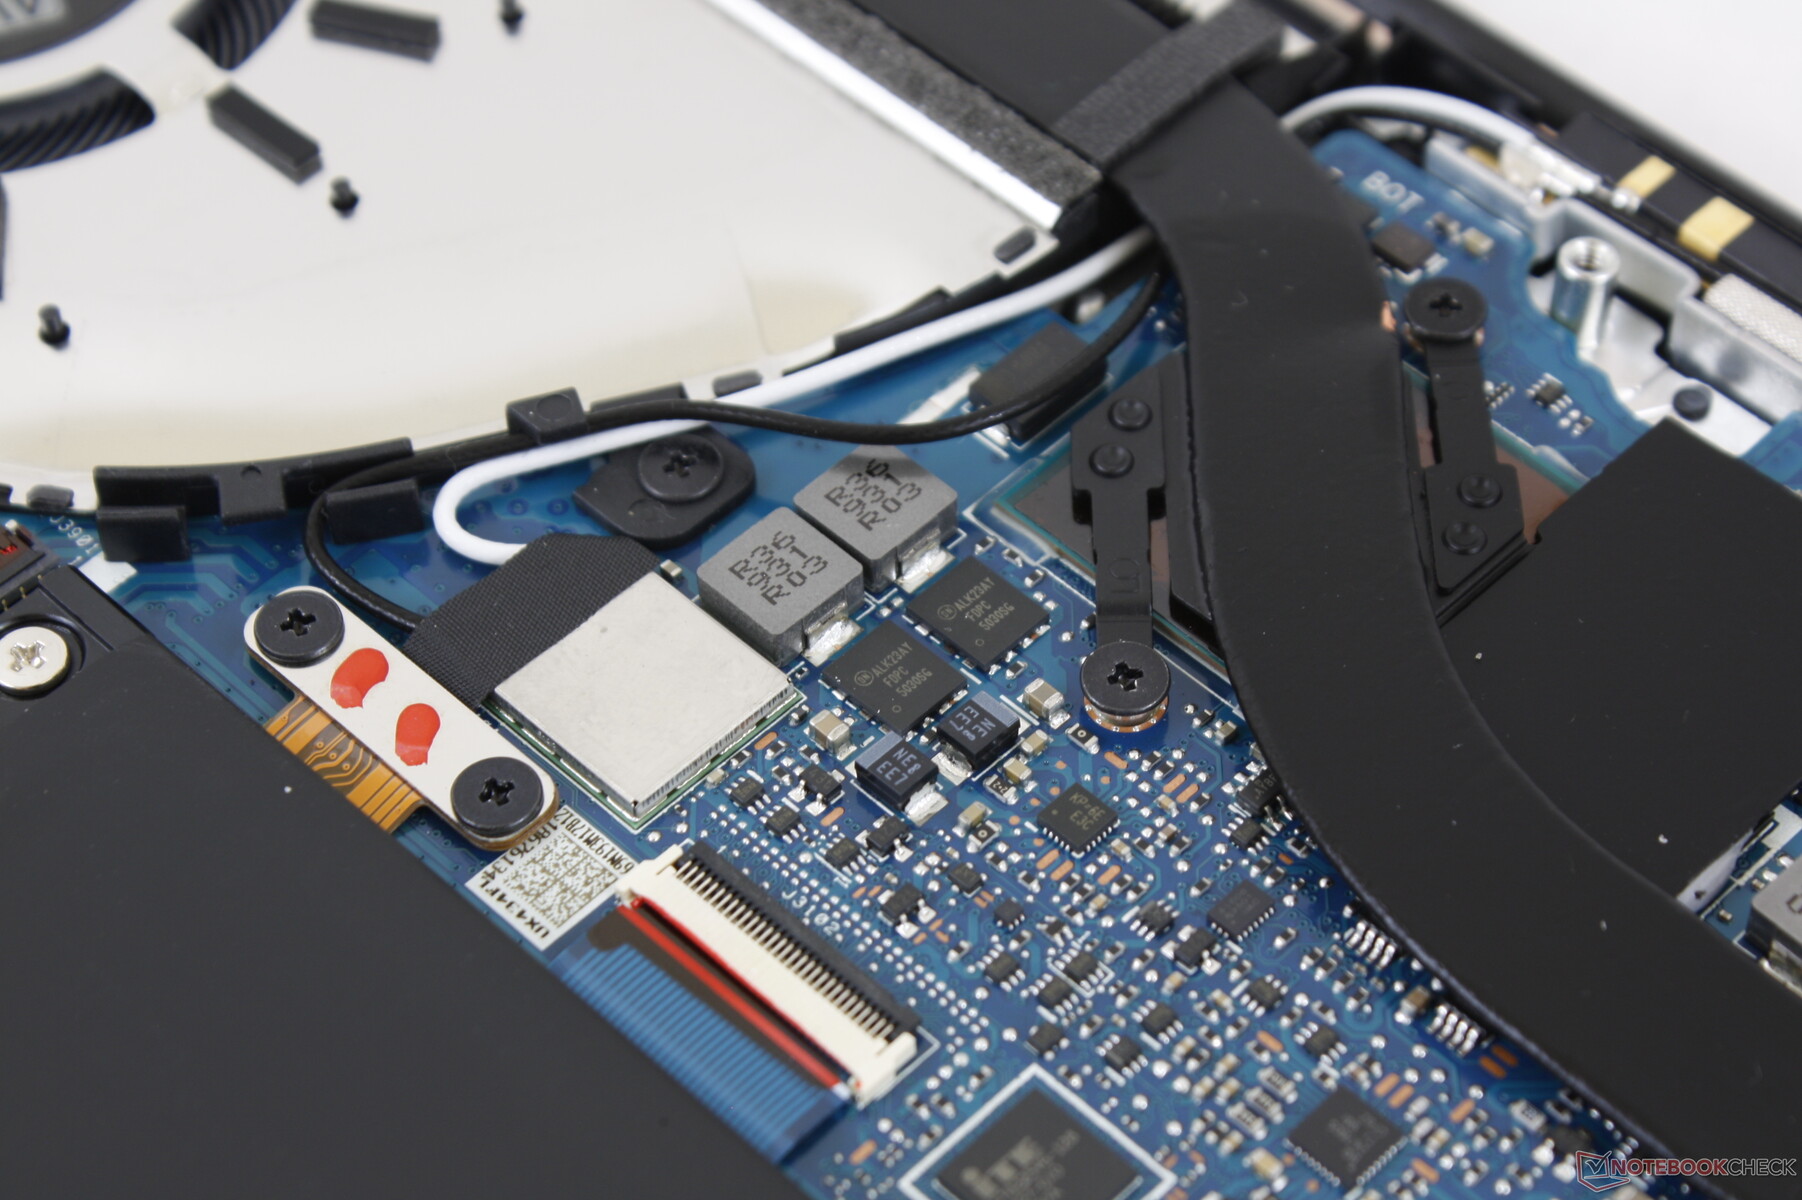
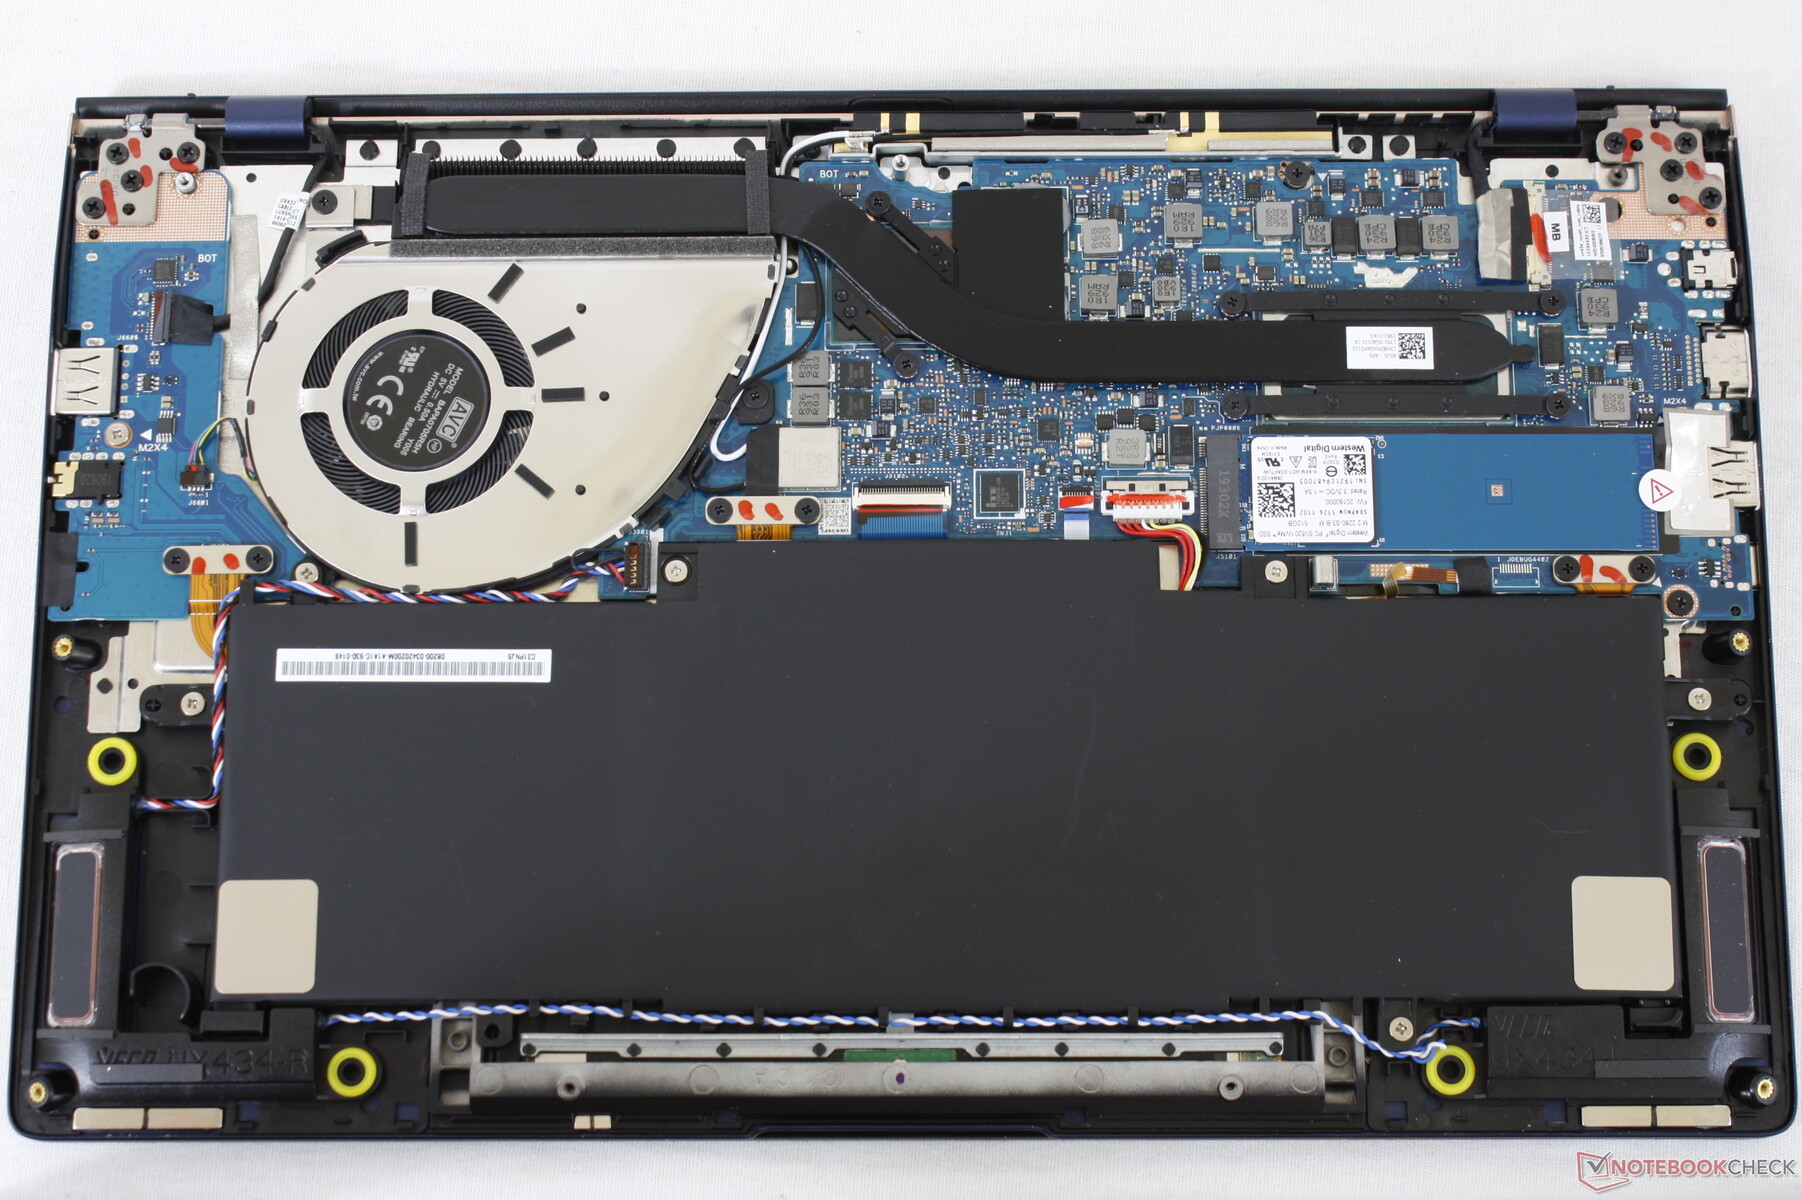
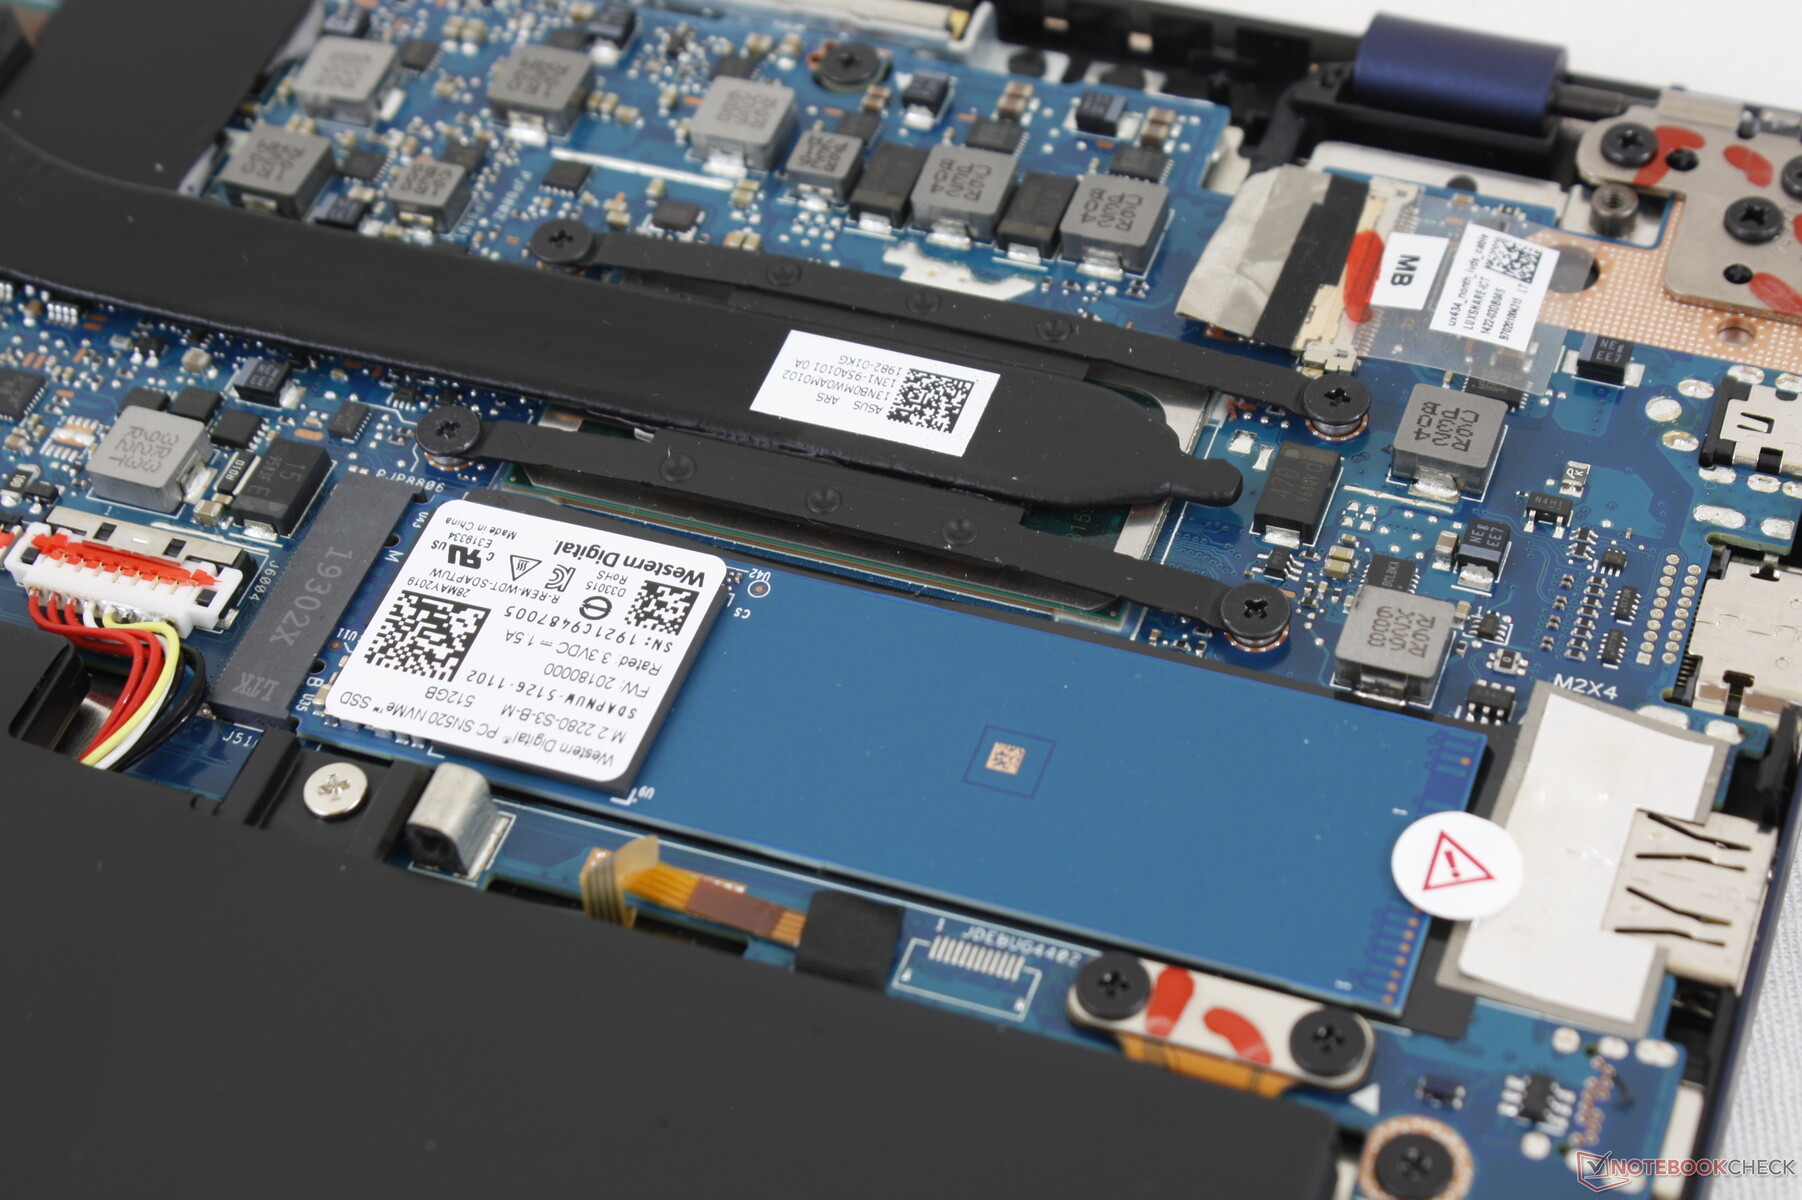
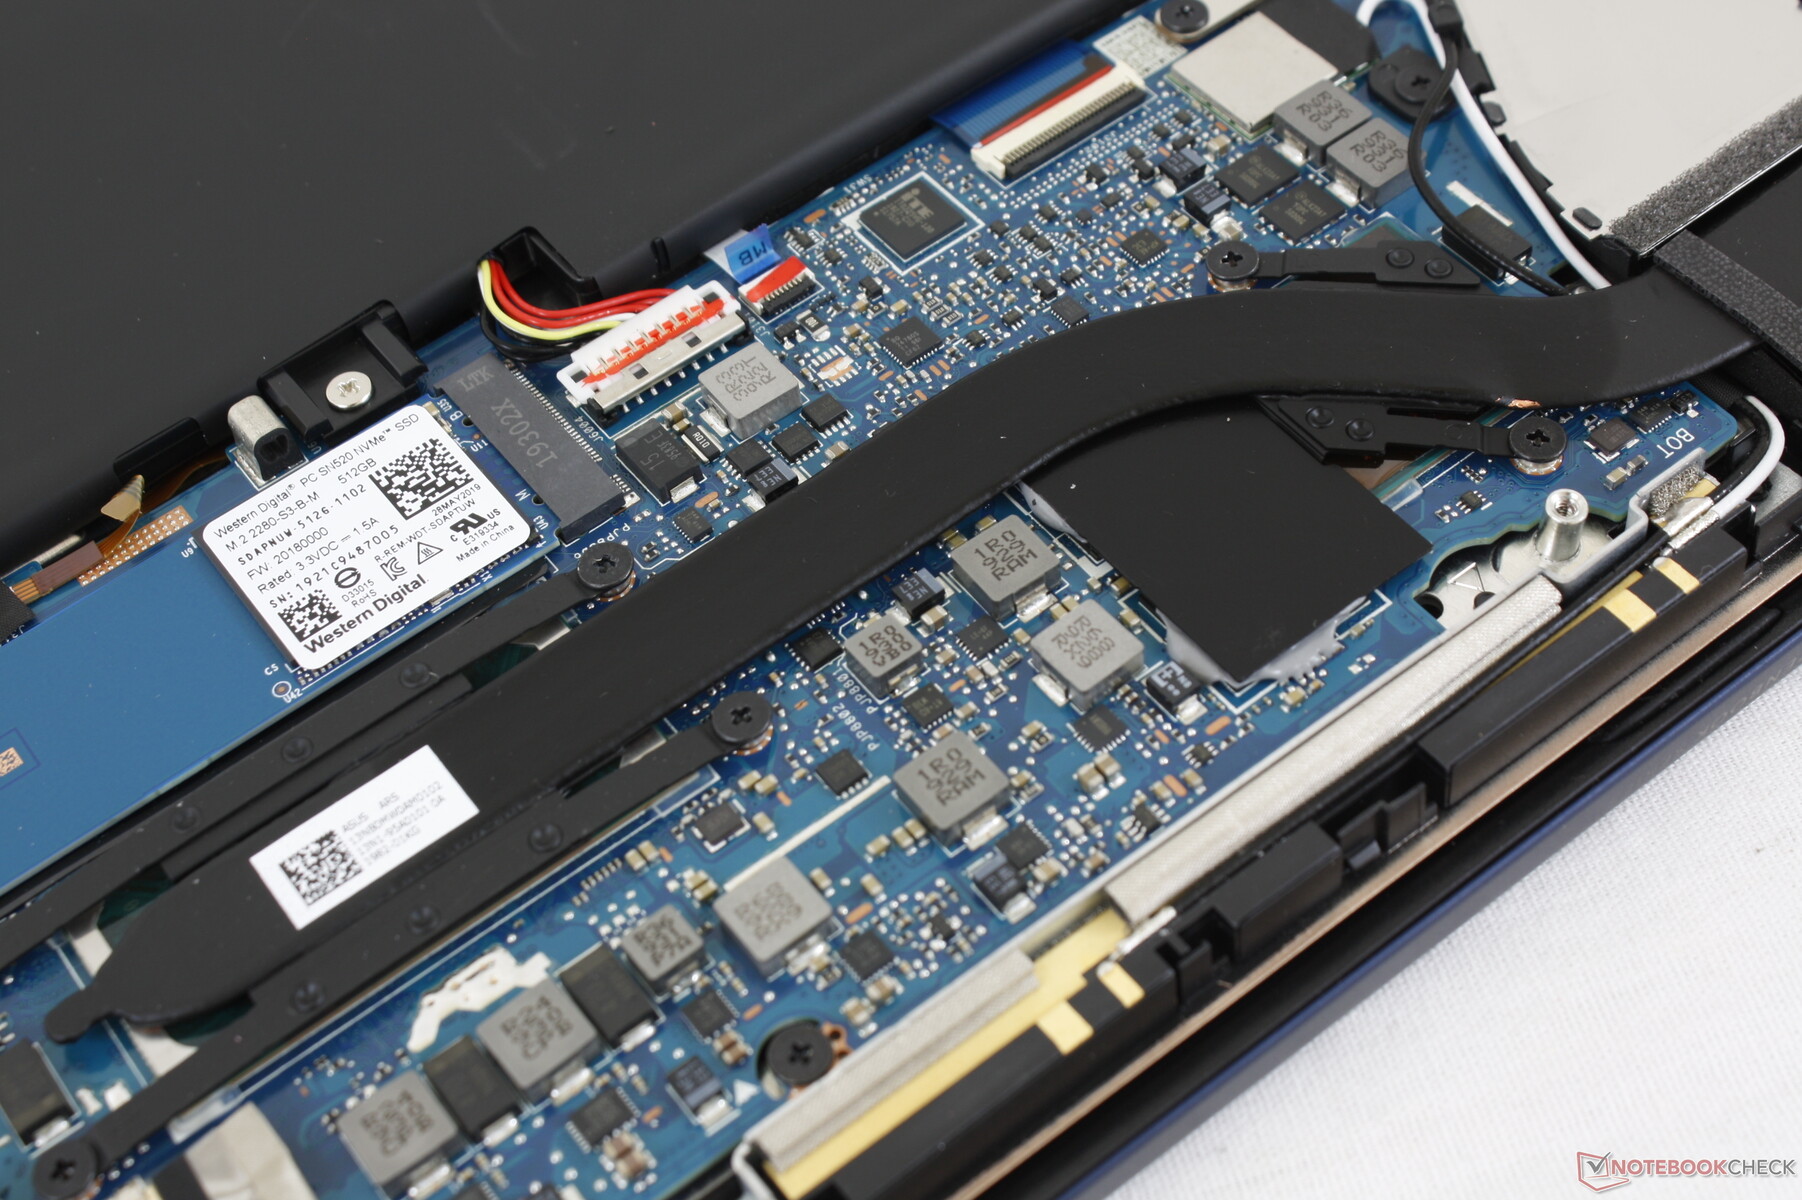
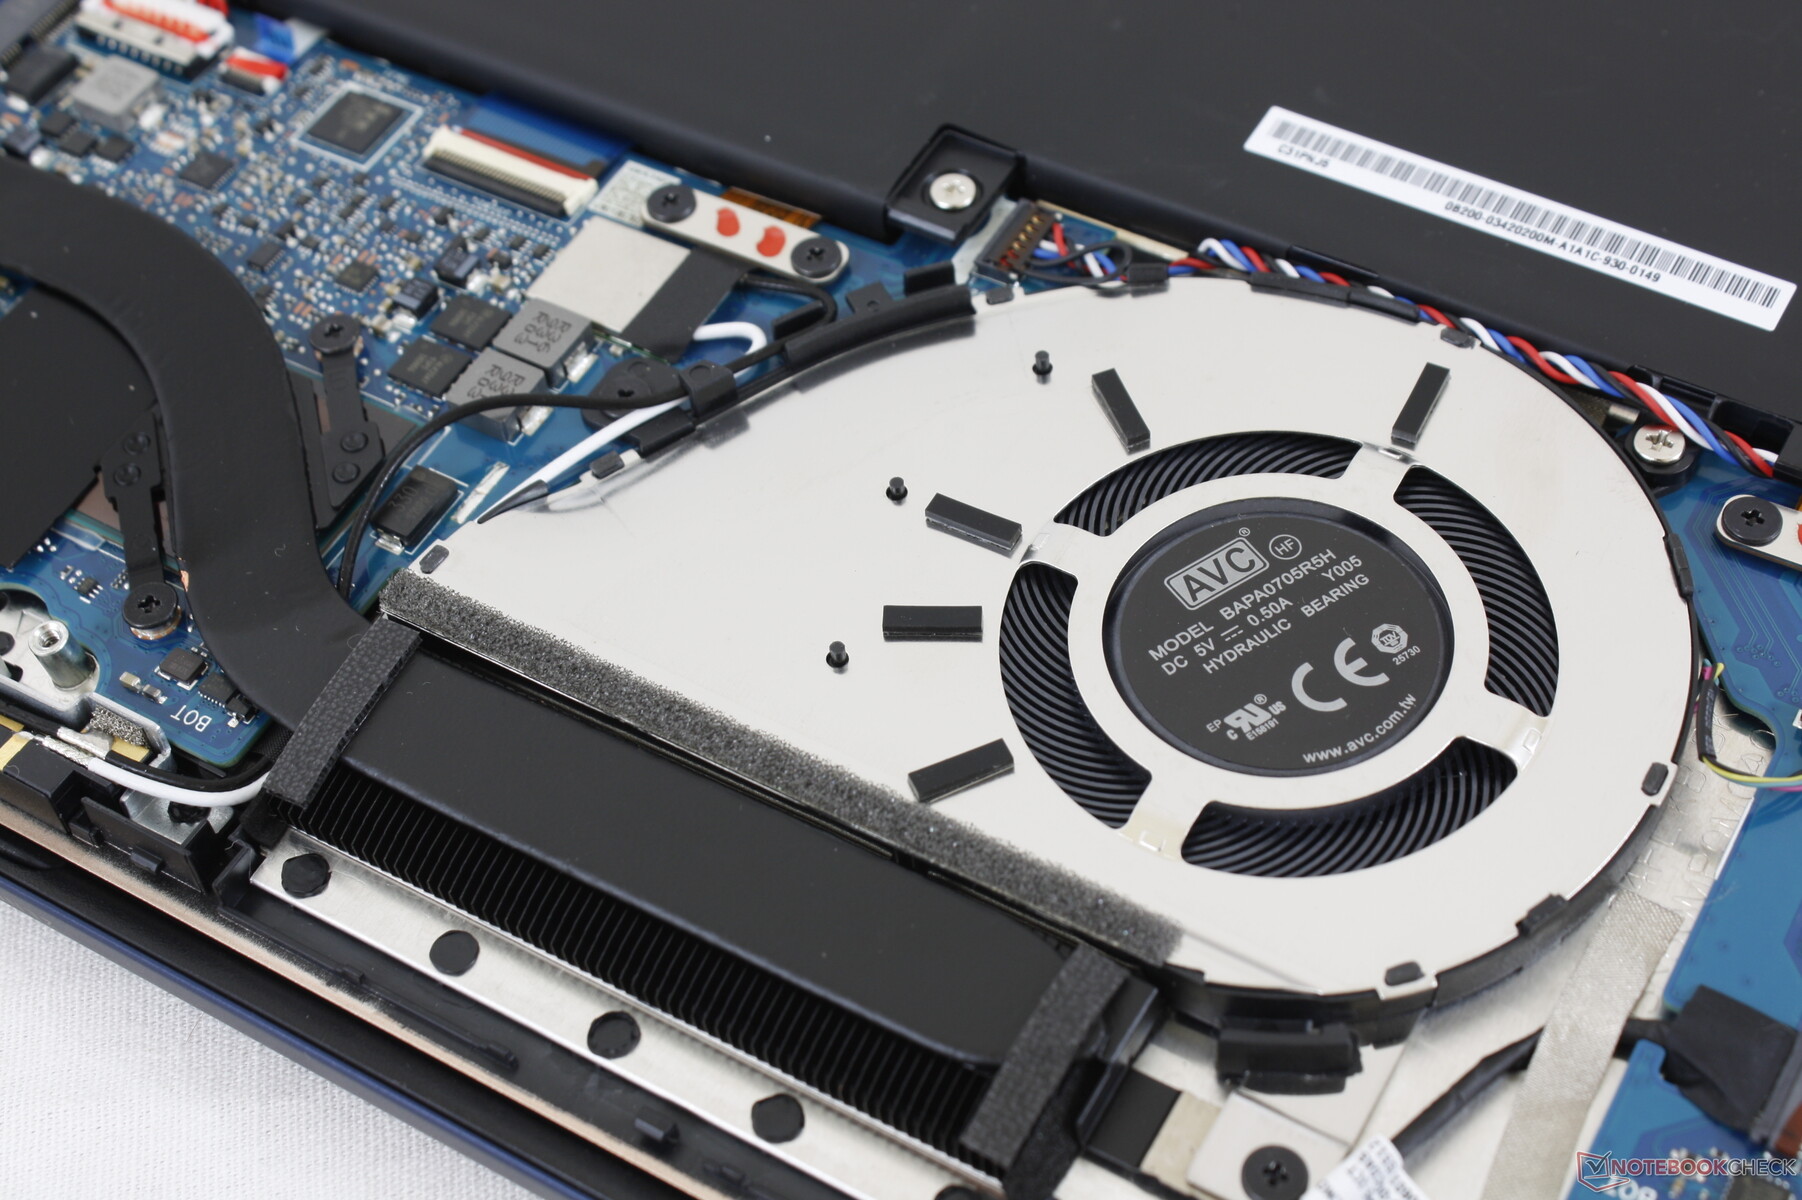
The bottom panel is annoying to remove since you will need two types of screwdrivers plus a spatula to remove the rubber feet covering the hidden screws. There is not much to upgrade once inside other than the M.2 2280 SSD because both RAM and WLAN are soldered.
Accessories and Warranty
Asus throws in a USB-A to RJ-45 adapter in addition to the usual AC adapter and paperwork. The standard one-year limited manufacturer warranty applies.
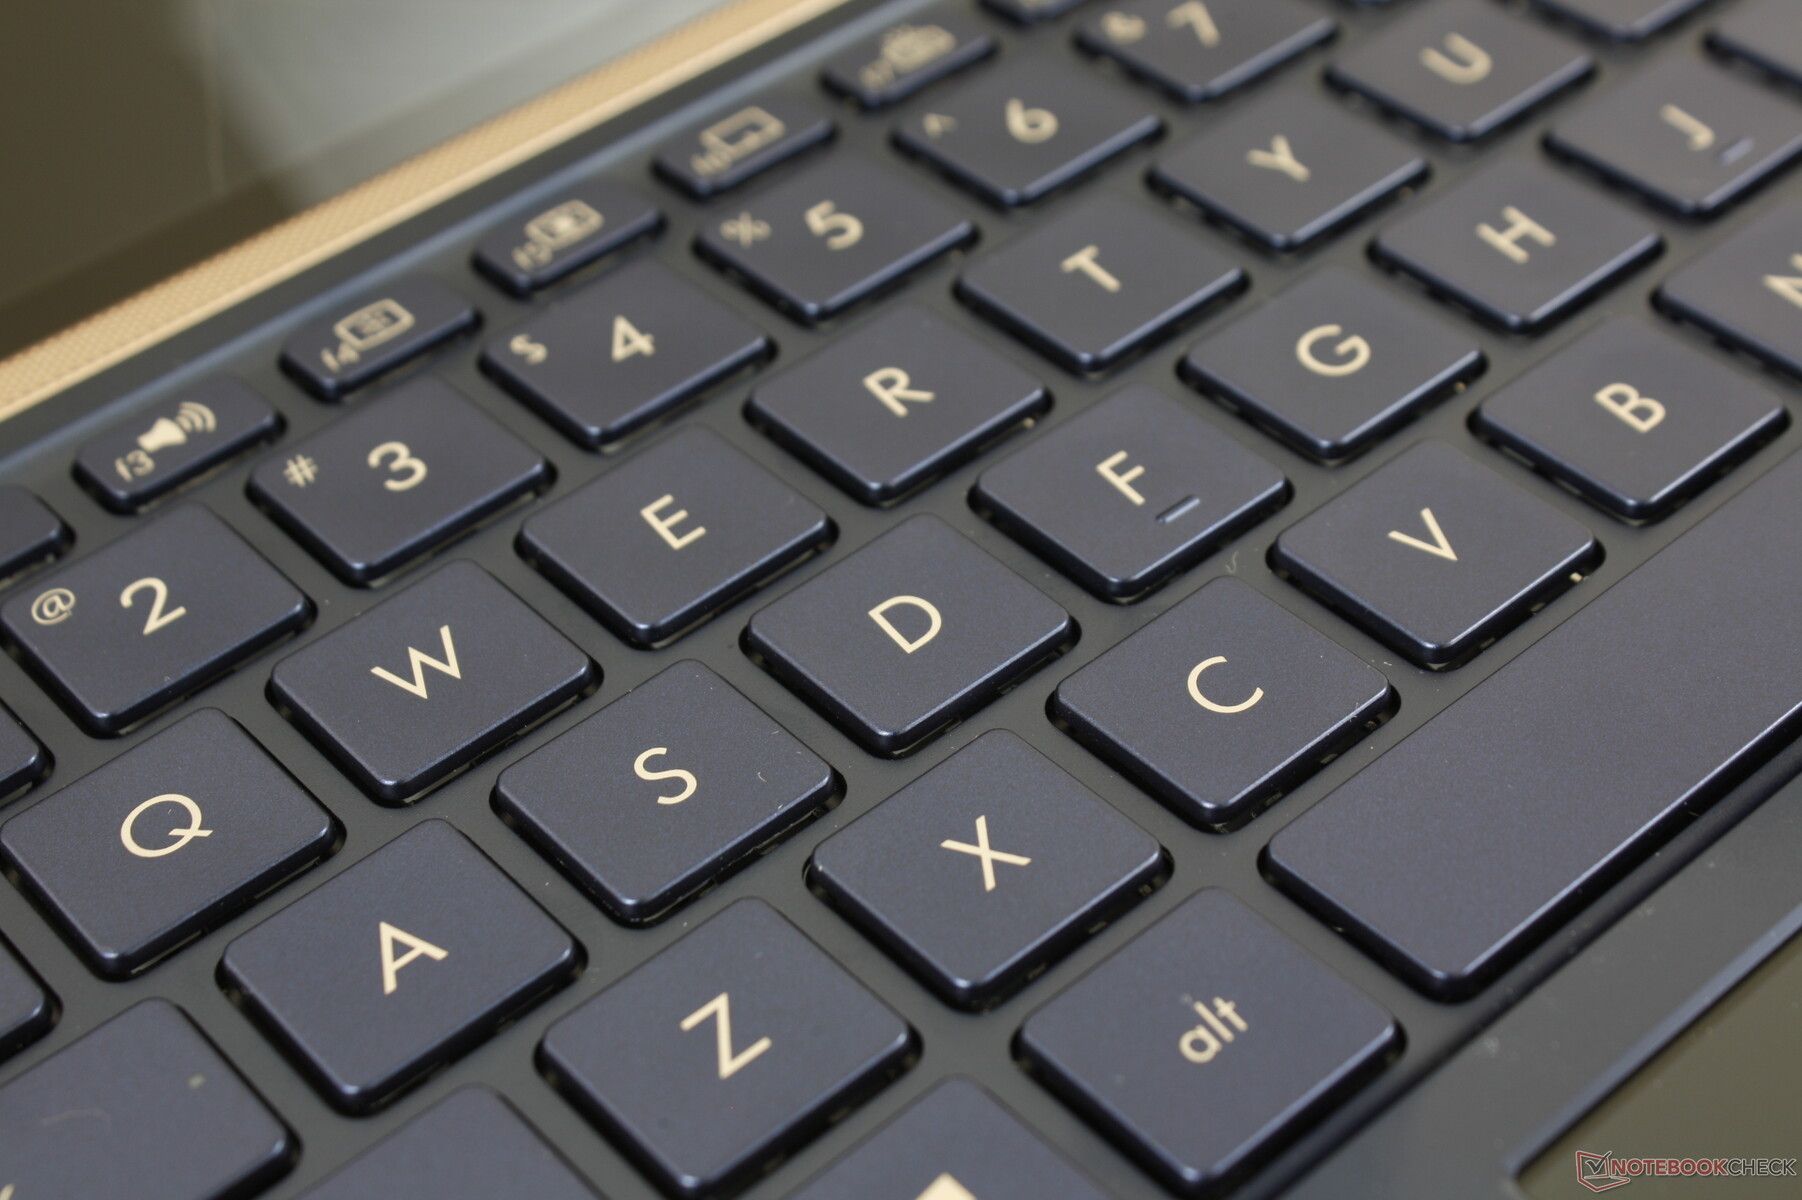
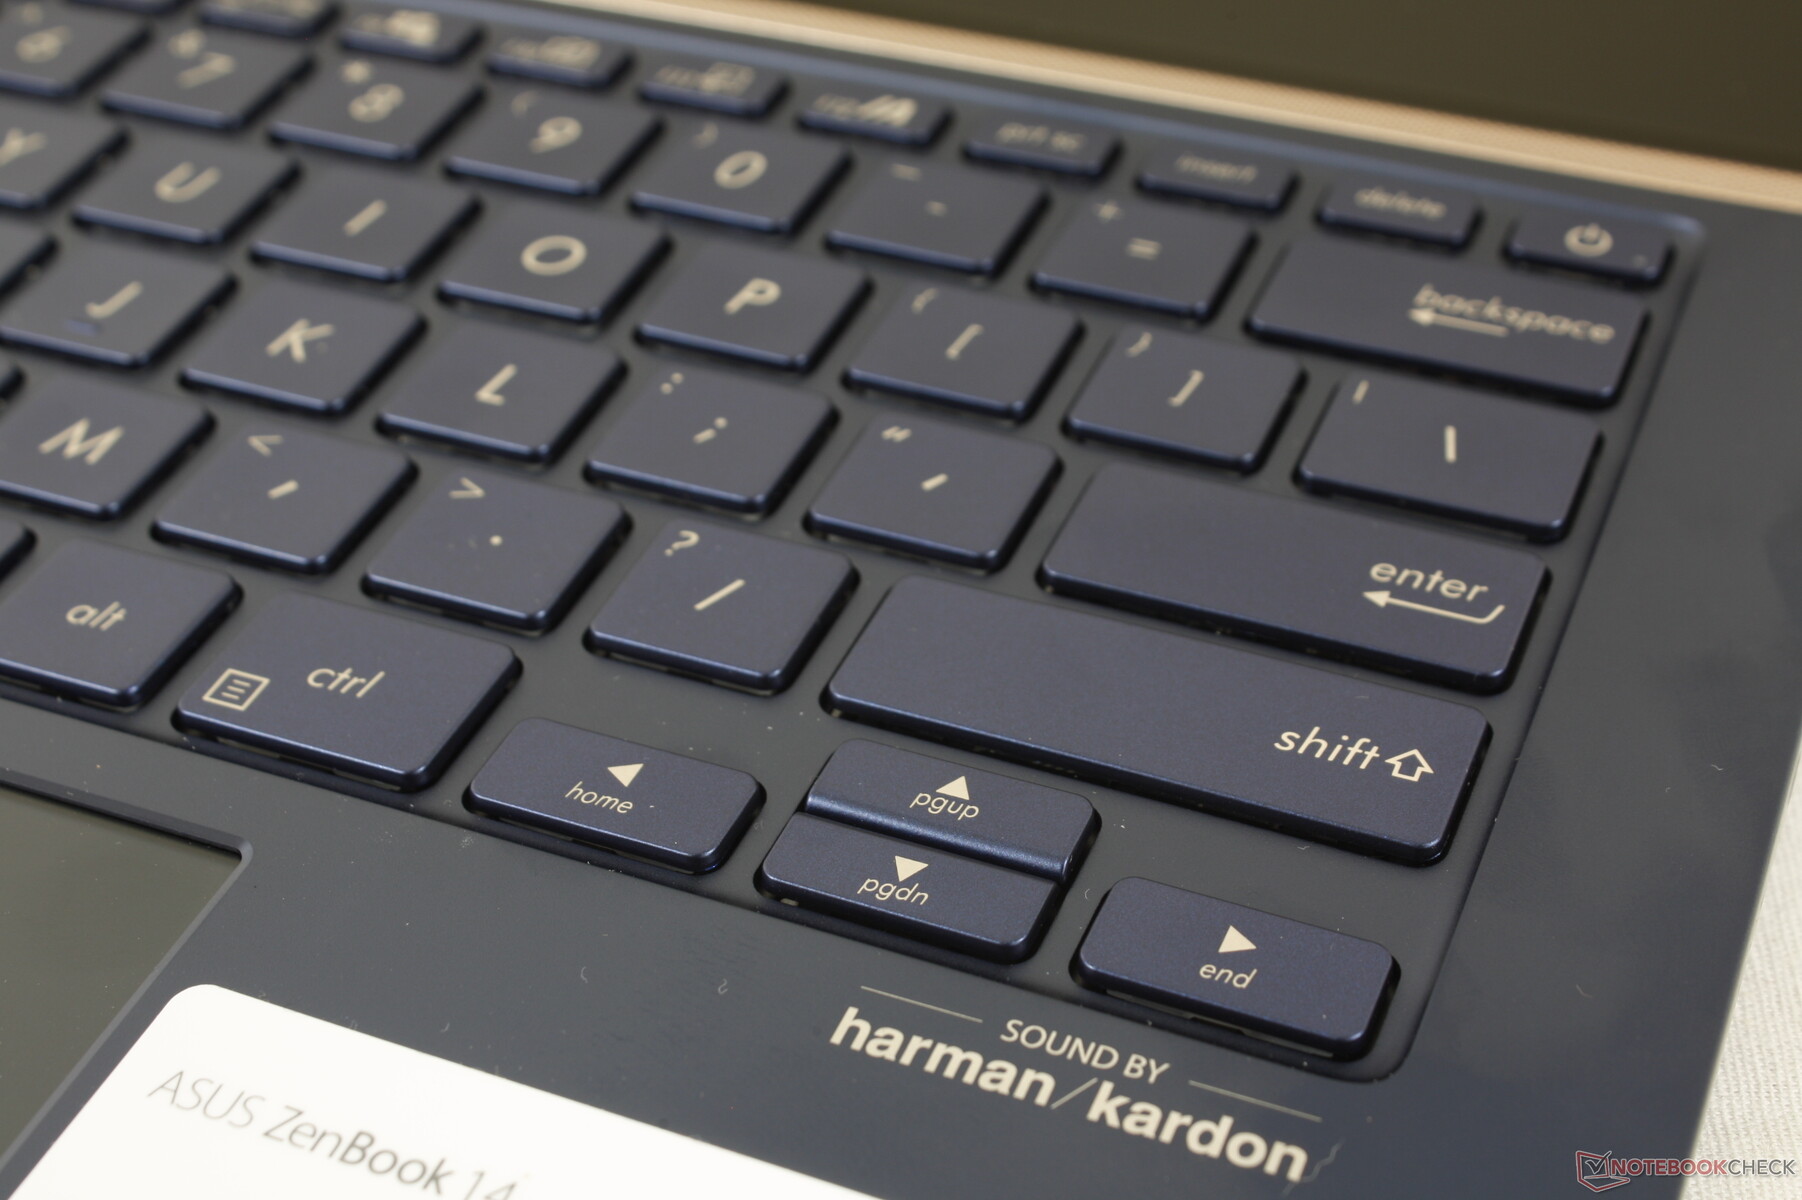
Input Devices
Touchpad
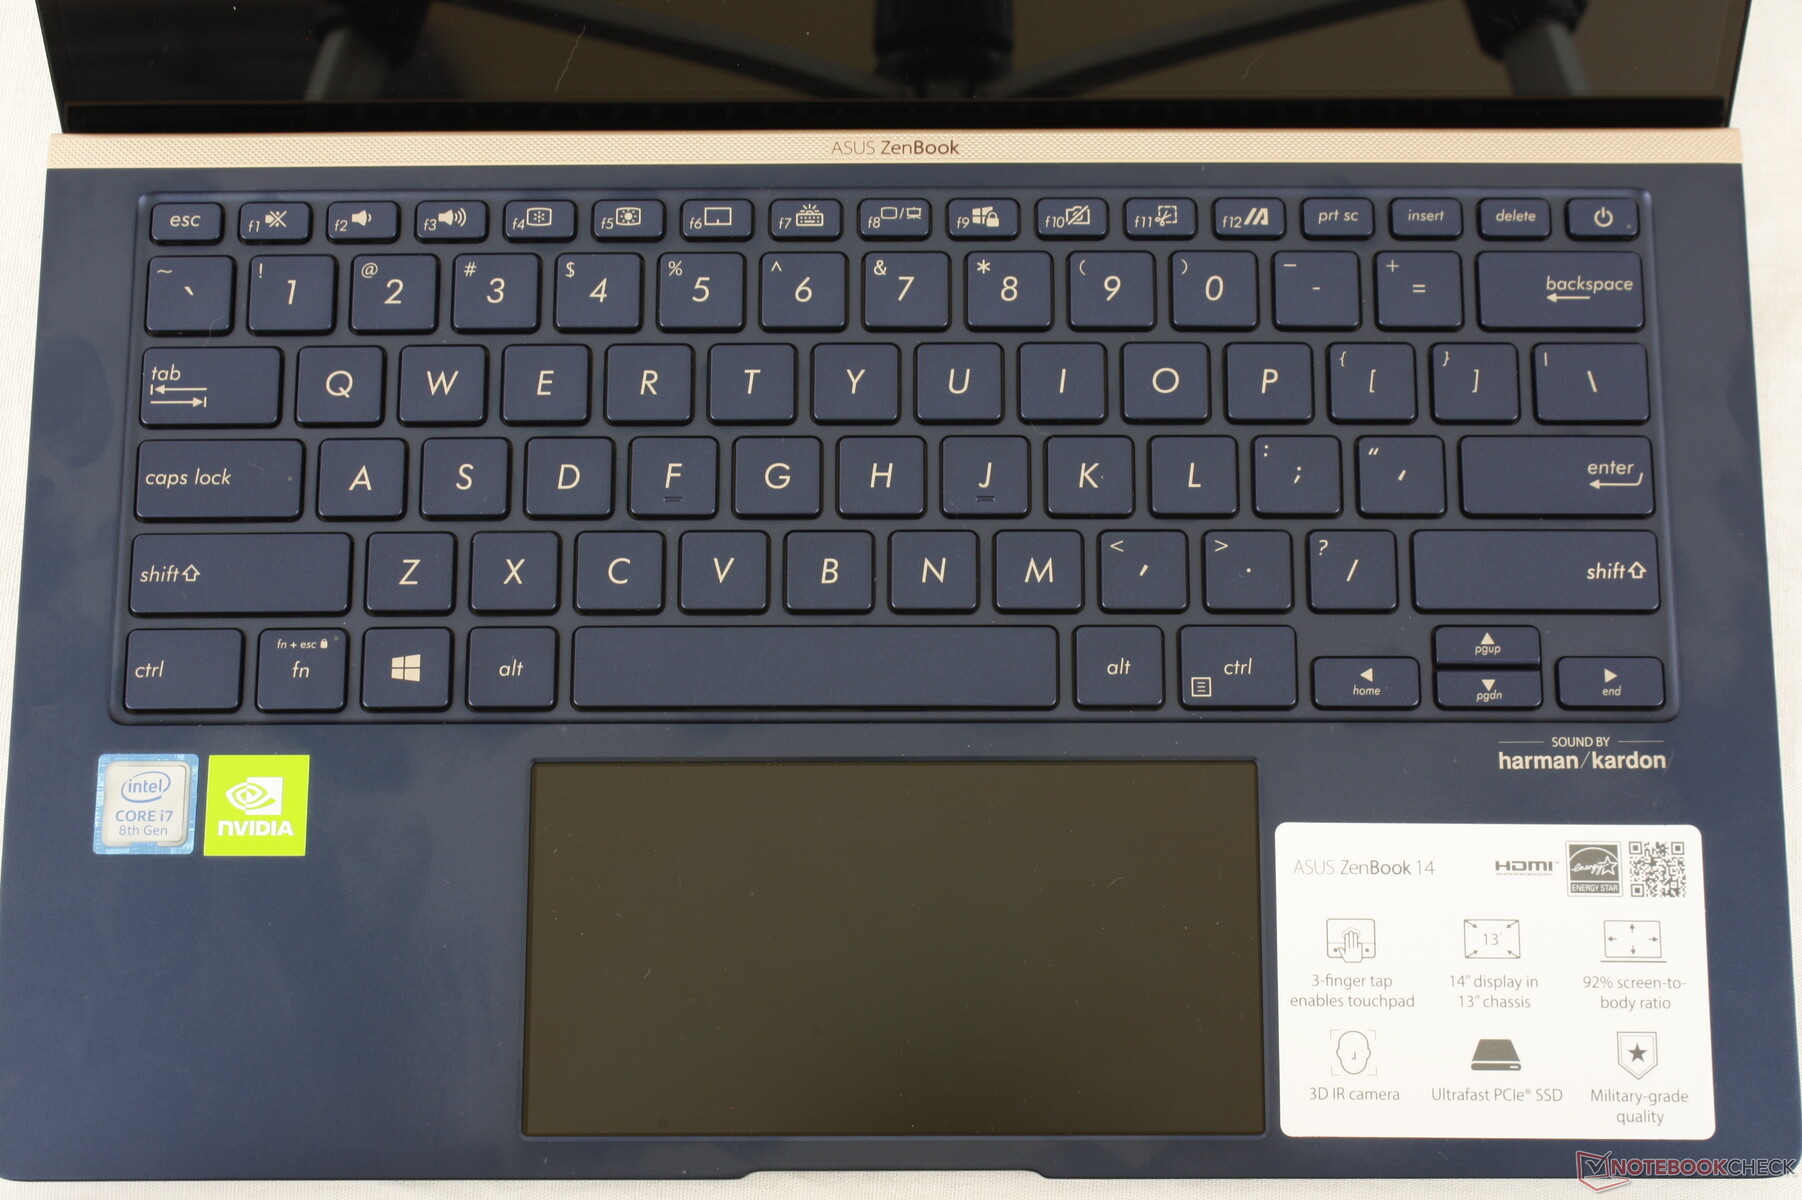
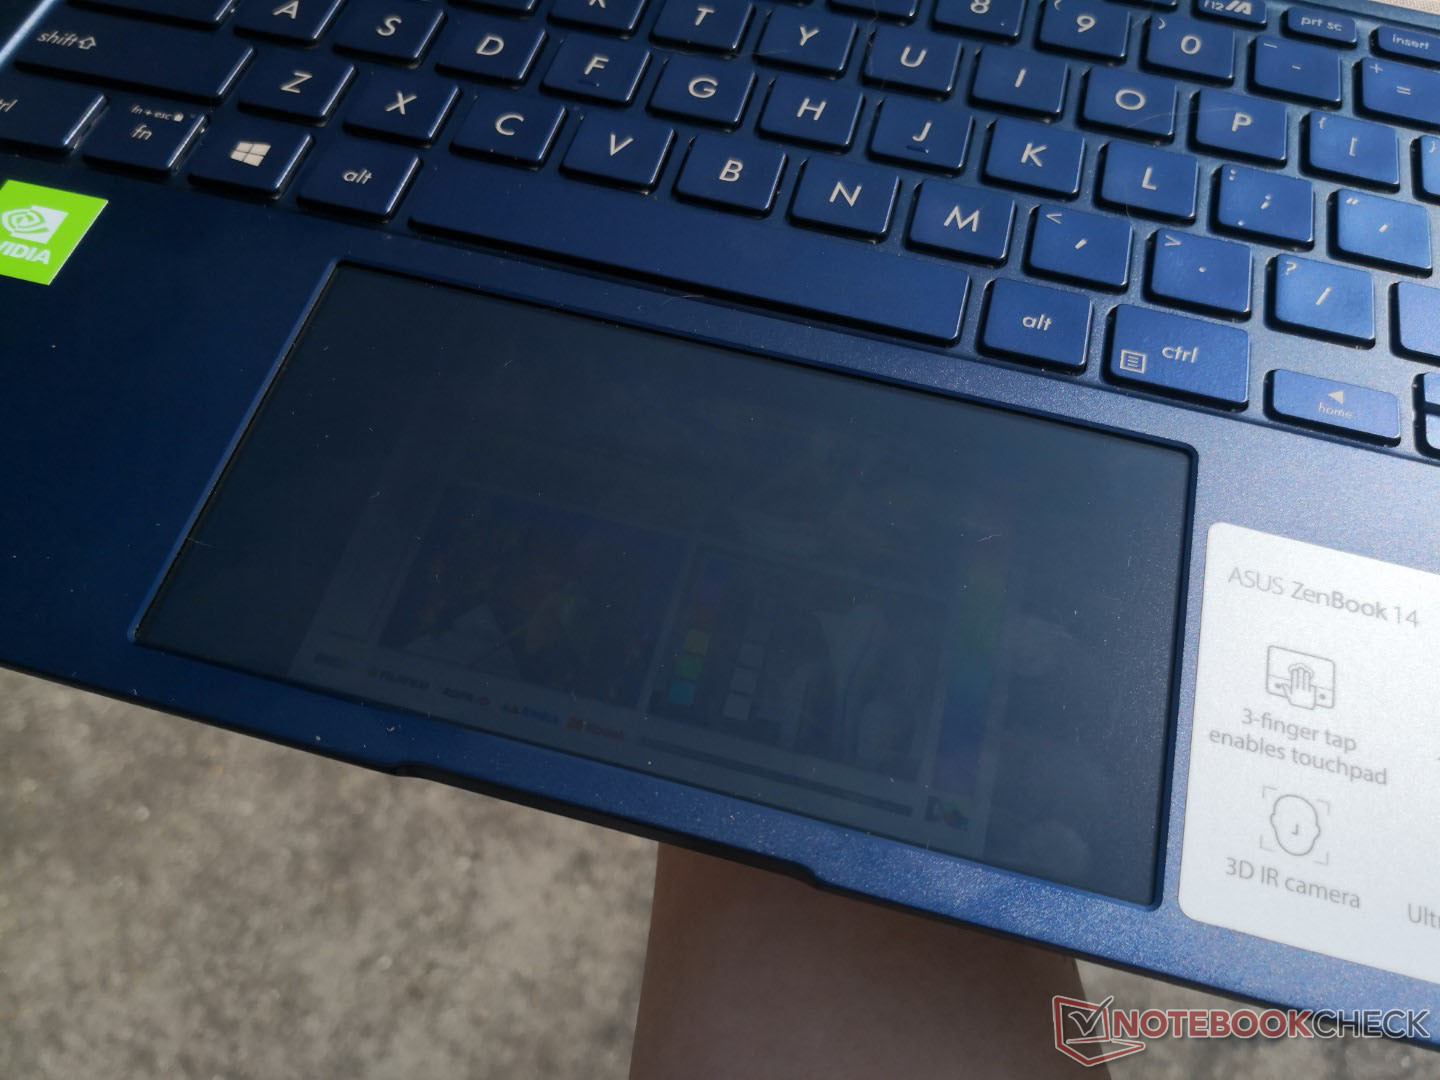
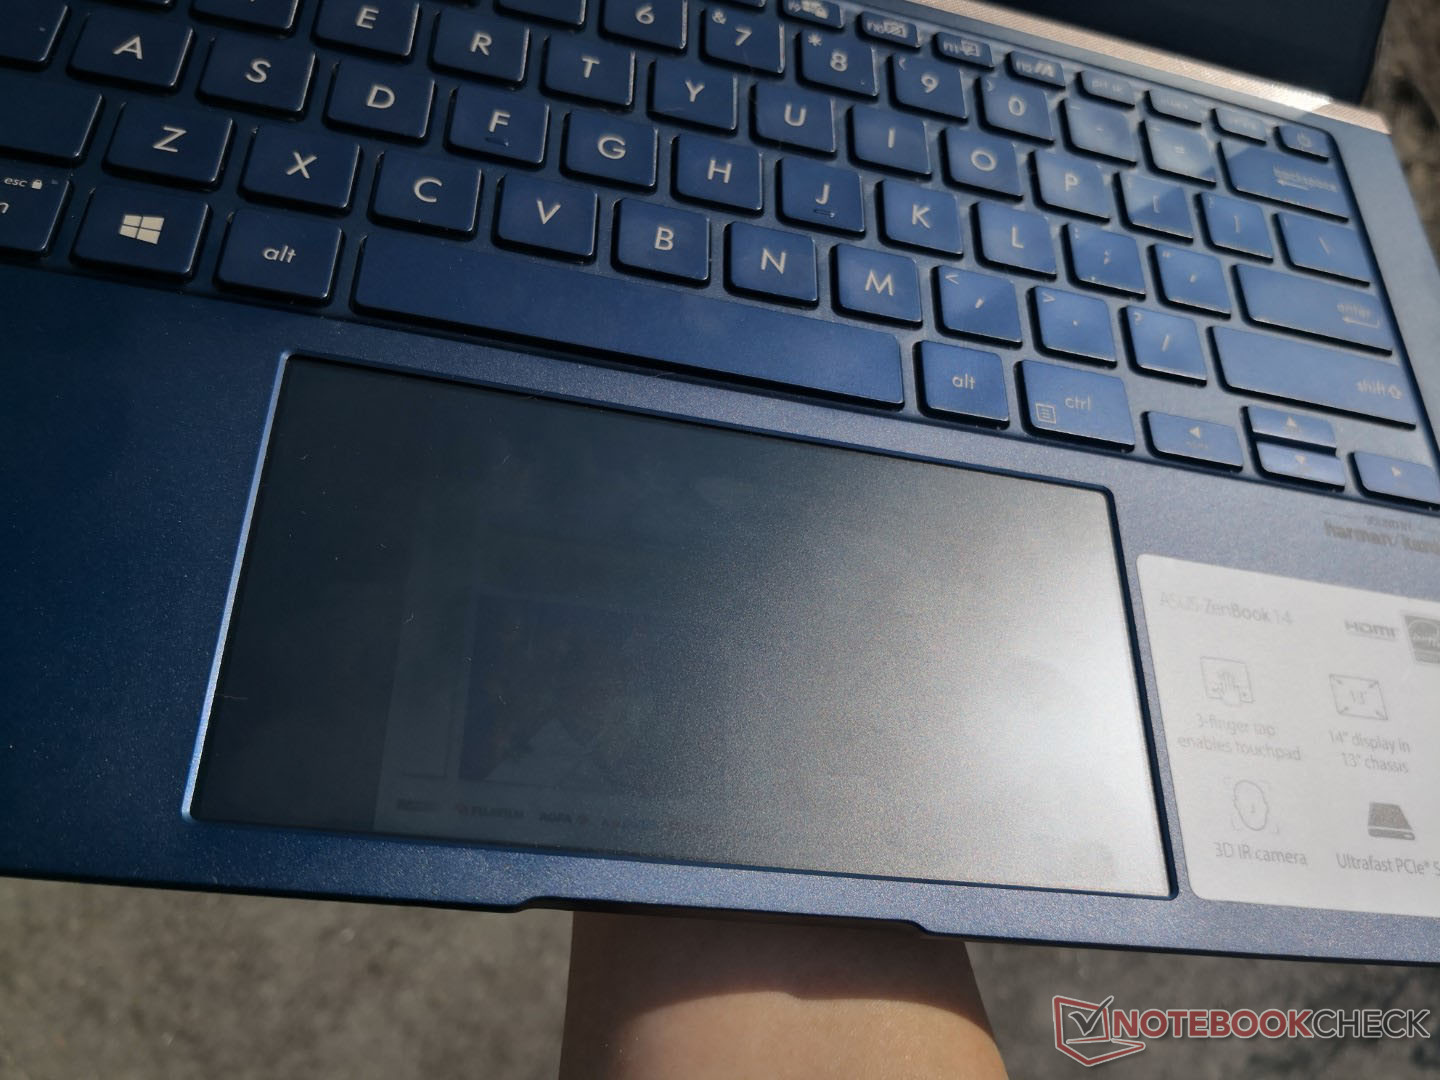
As a regular clickpad, the multi-touch ScreenPad surface is smooth with excellent gliding properties and only minimal sticking even when moving at slow speeds. It feels like a traditional clickpad instead of a tablet touchscreen since the overlay is matte and not glossy. The integrated mouse buttons, however, are unfortunately shallow and with weak feedback.
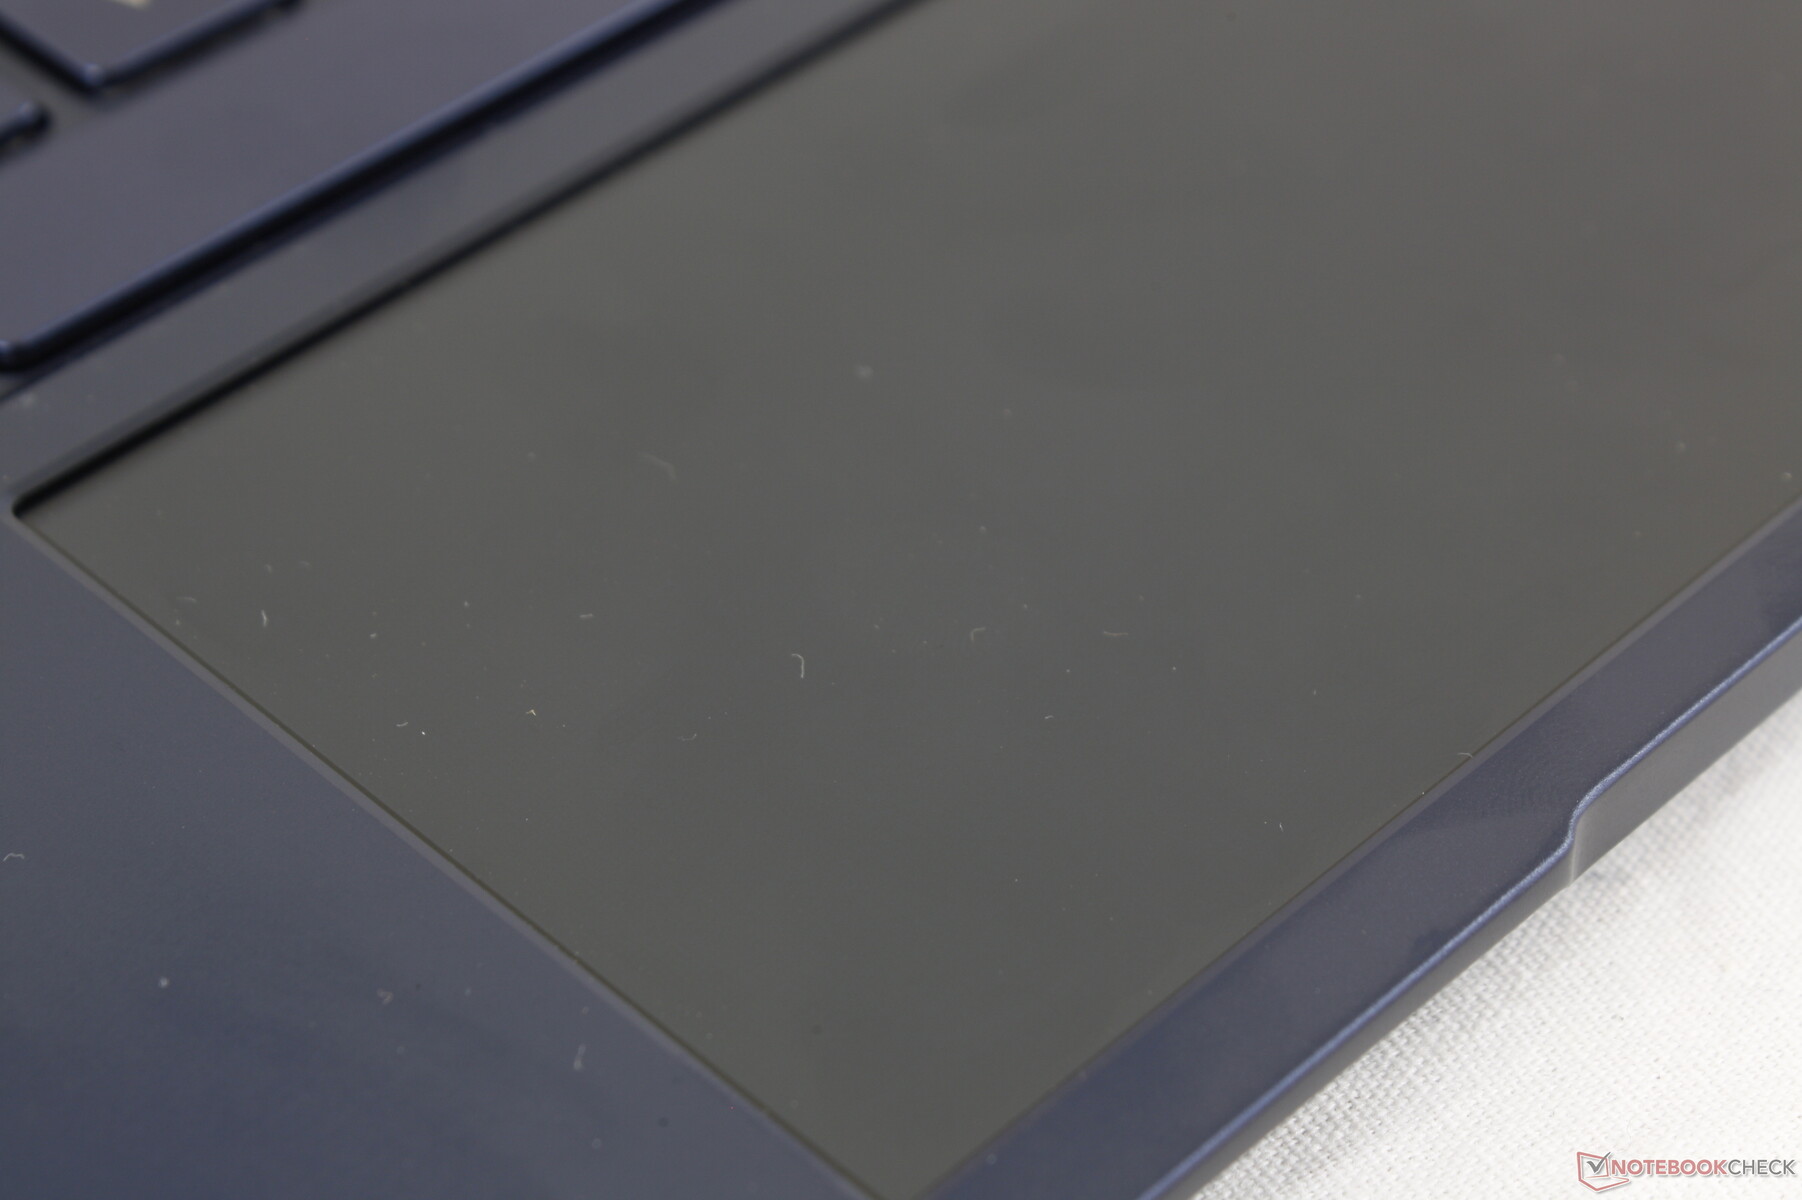
ScreenPad
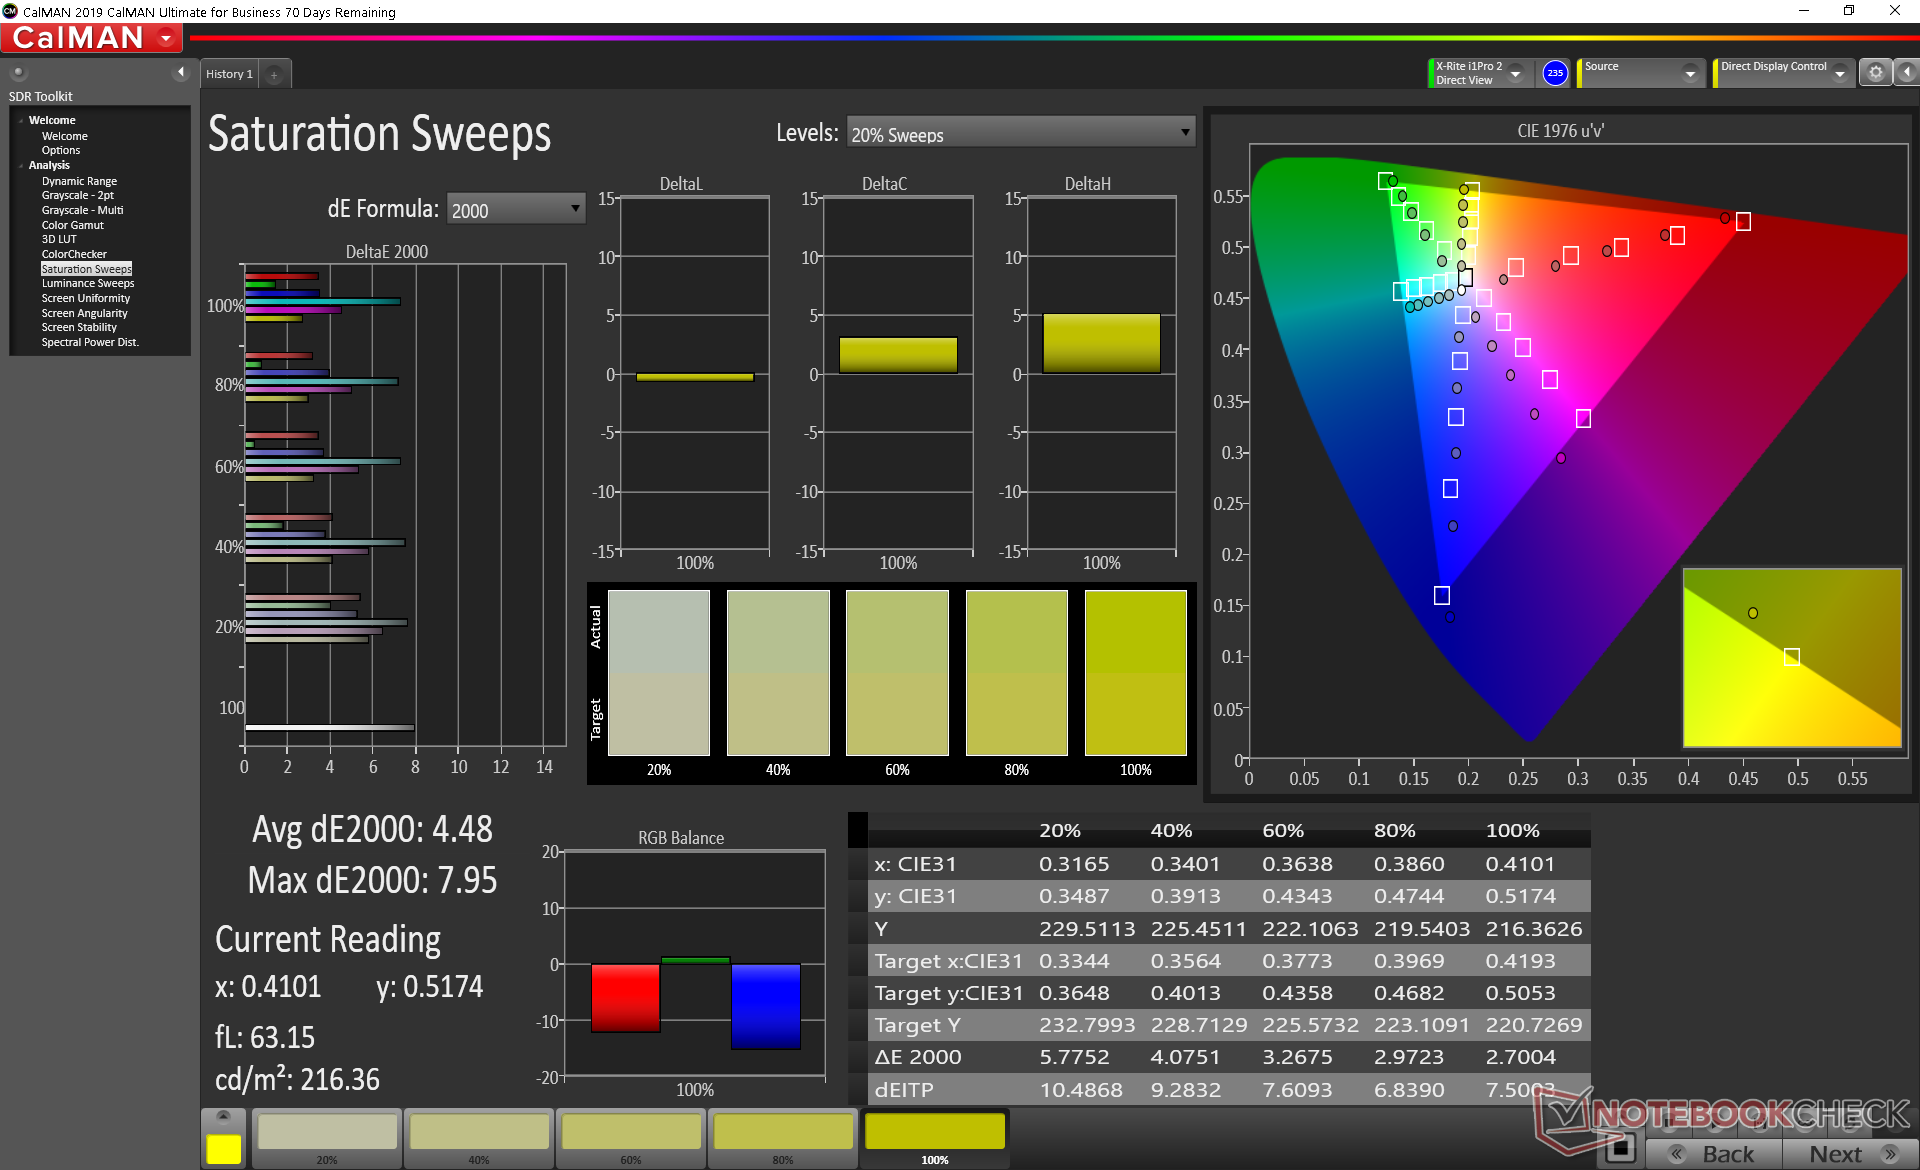
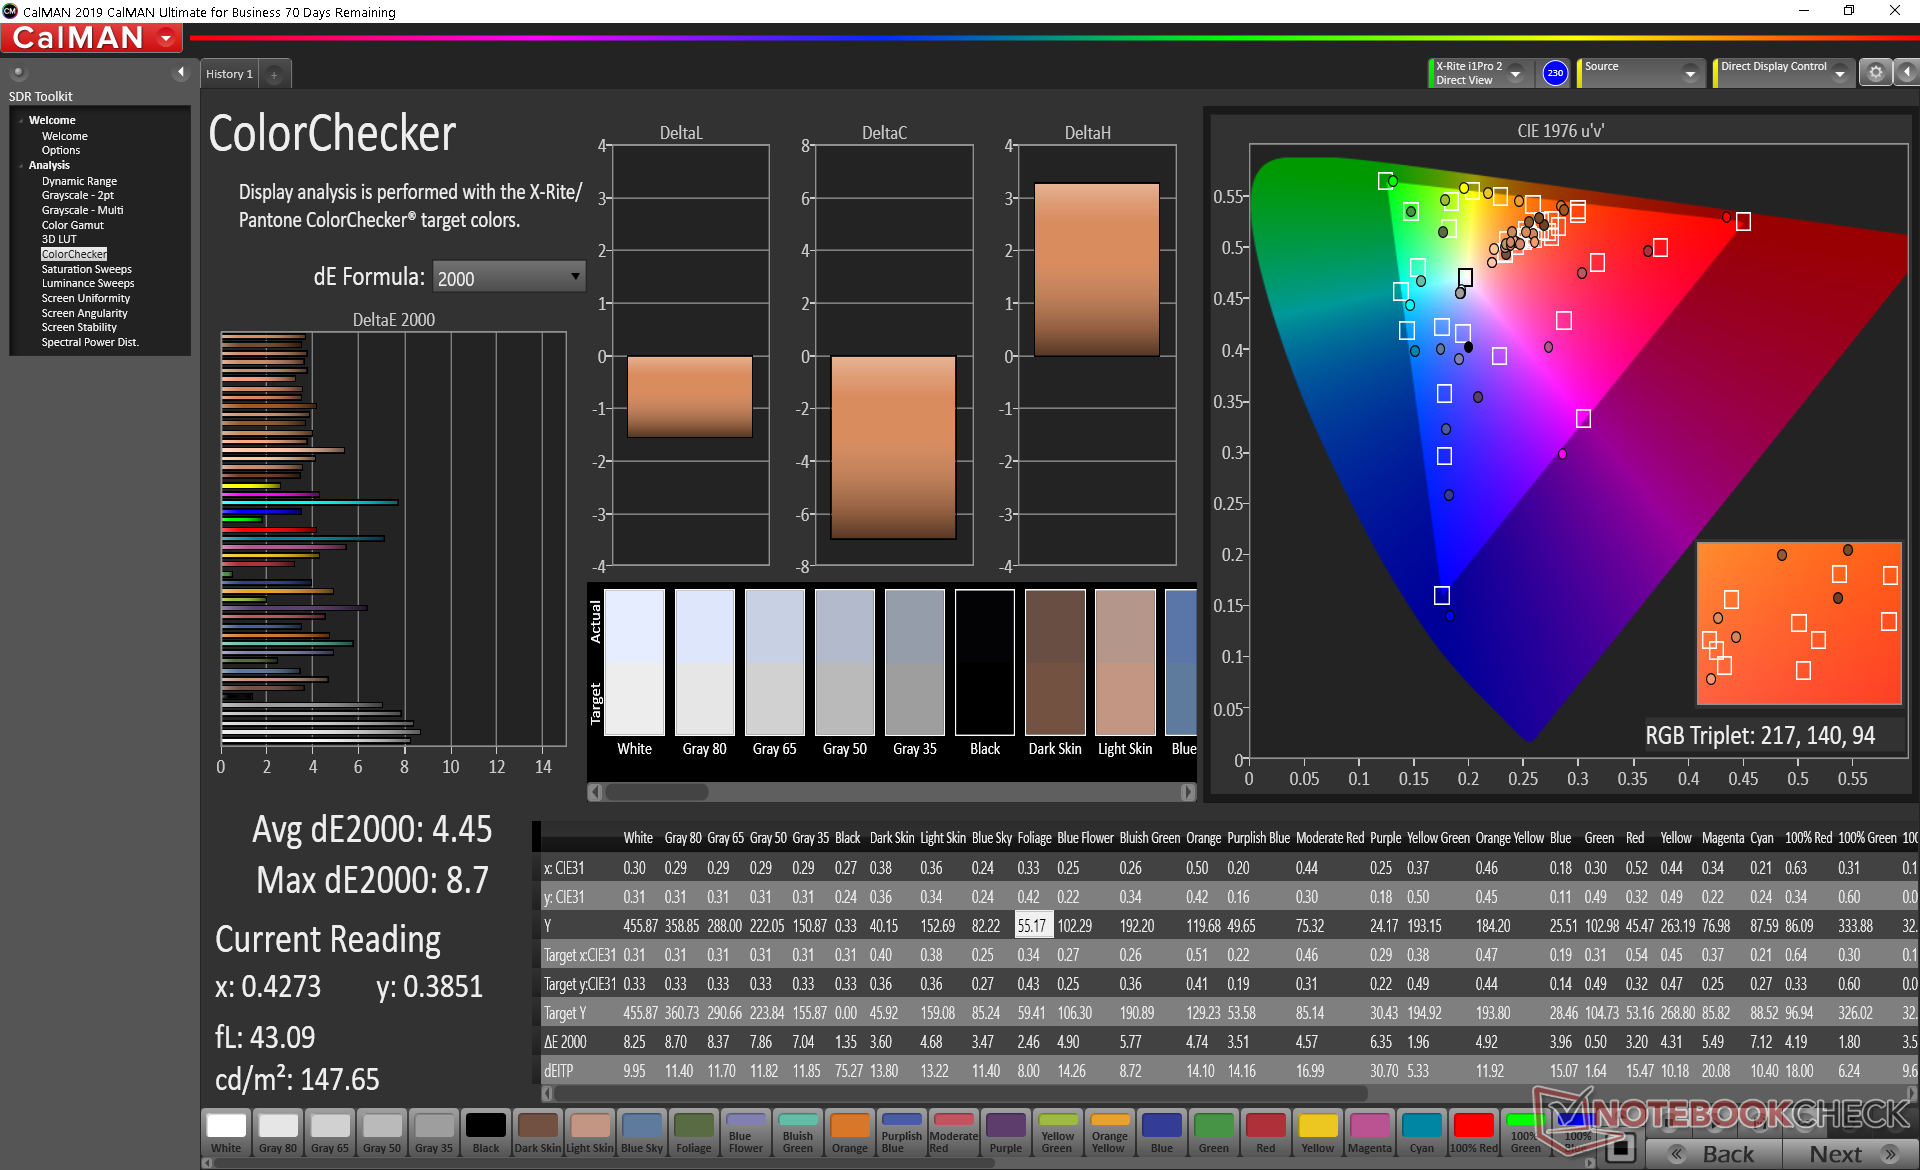
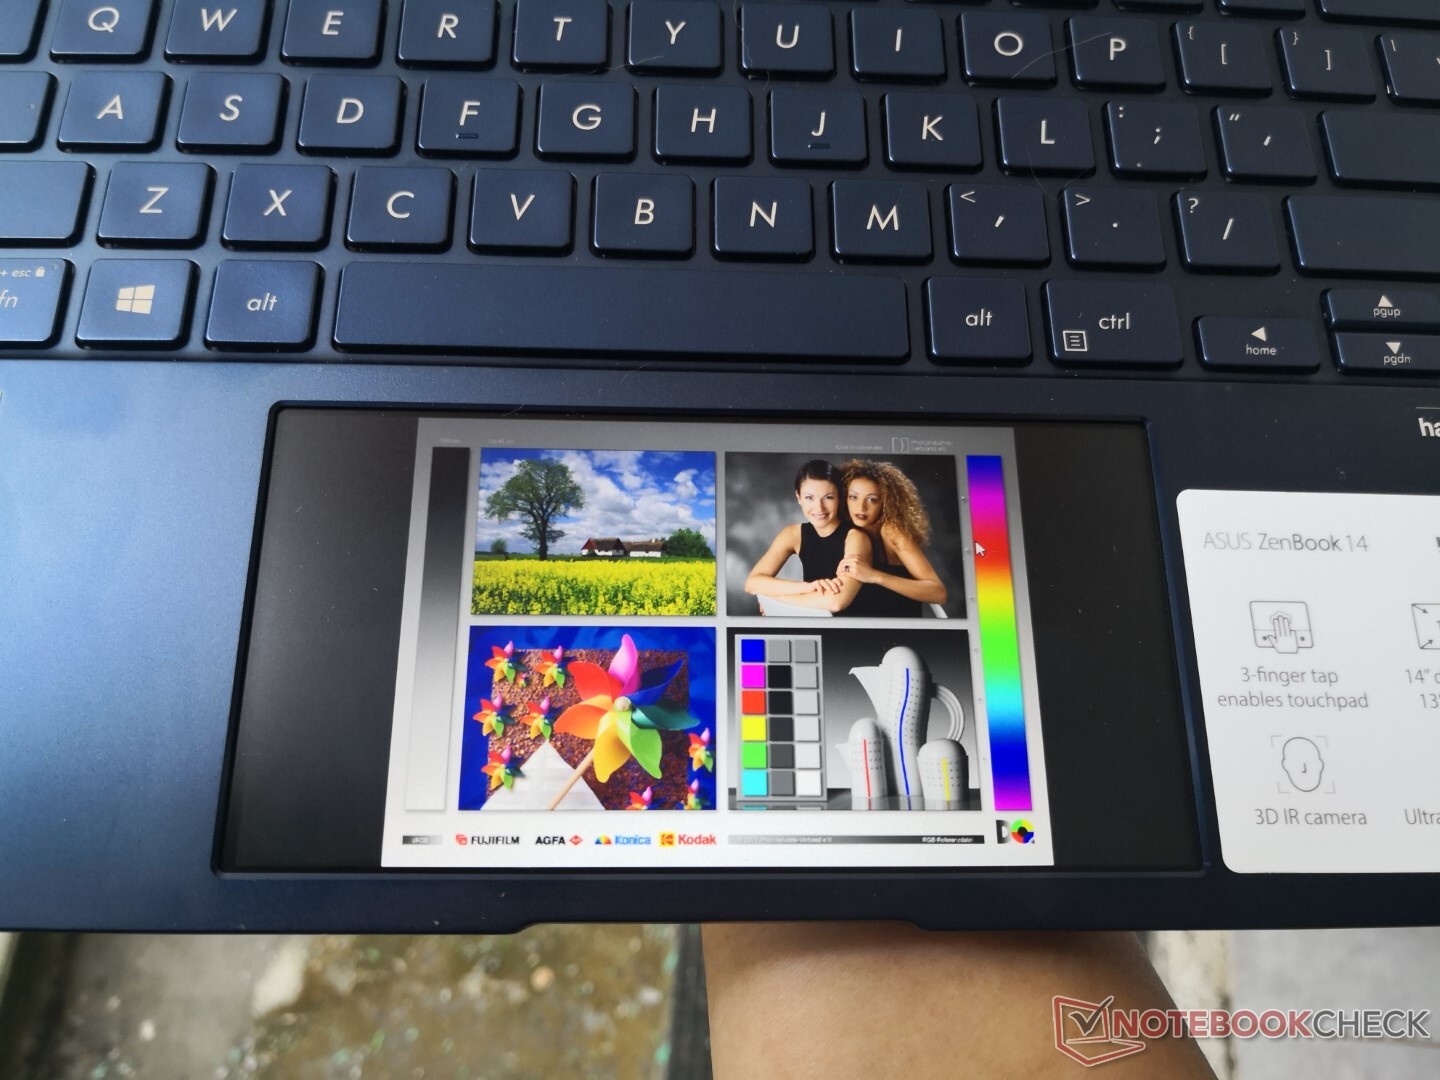
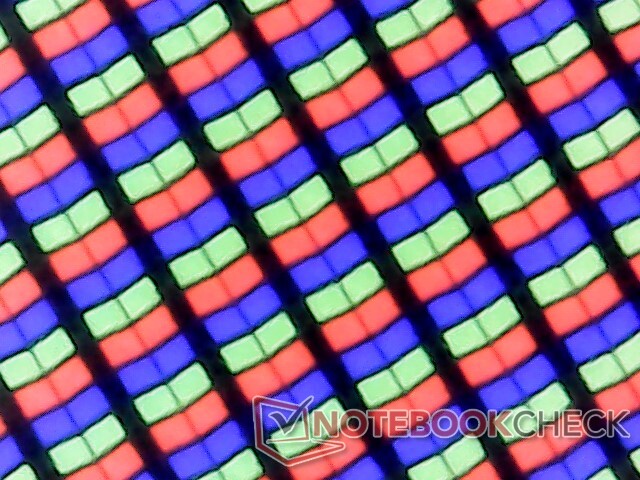
On paper, the 5.65-inch IPS touchscreen and its 2160 x 1080 native resolution, high contrast ratio, and ~90 percent color coverage sound as good as any popular Android smartphone. In practice, however, the screen will be grainier than anticipated due to the matte overlay. Reducing the resolution will hide some of the graininess, but there's no doubt that this matte overlay impacts visual quality by a noticeable degree.
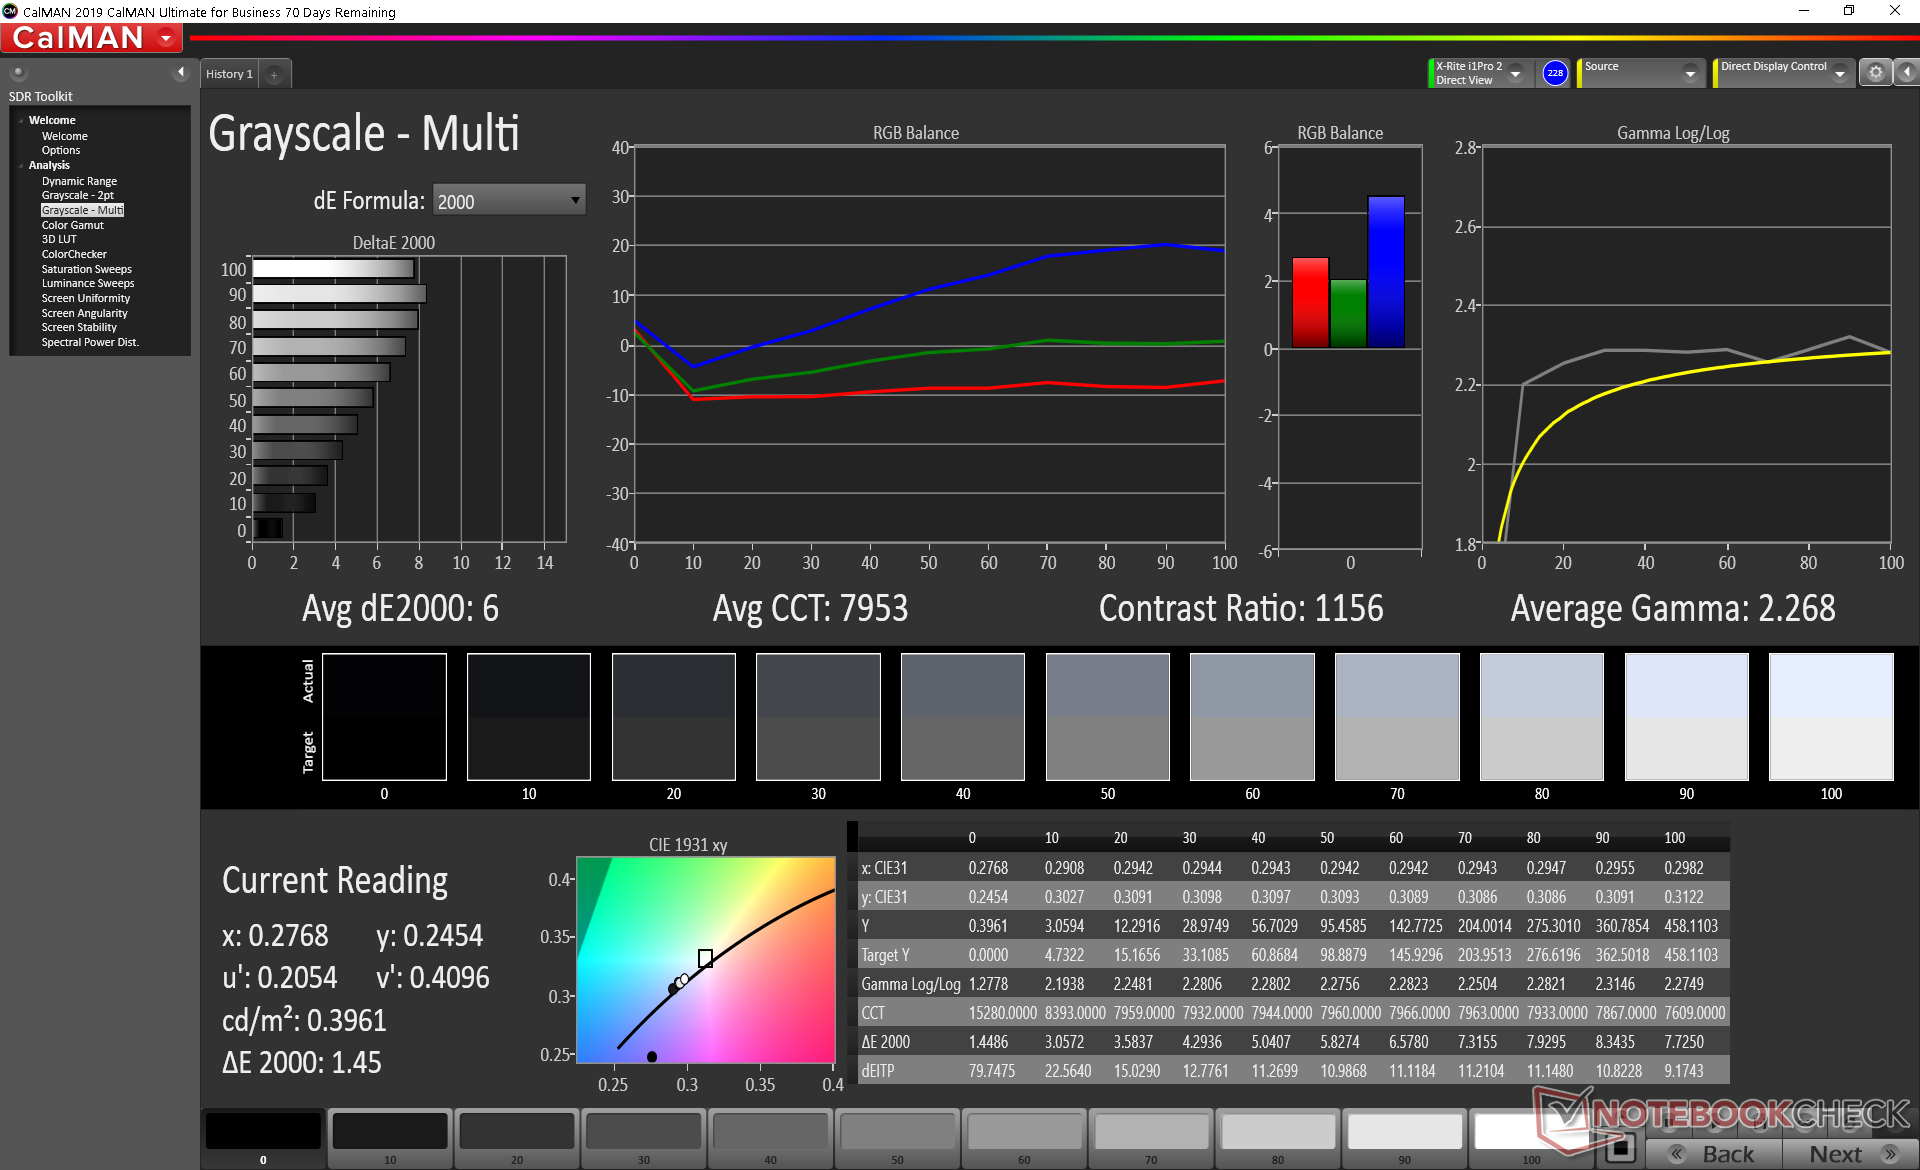
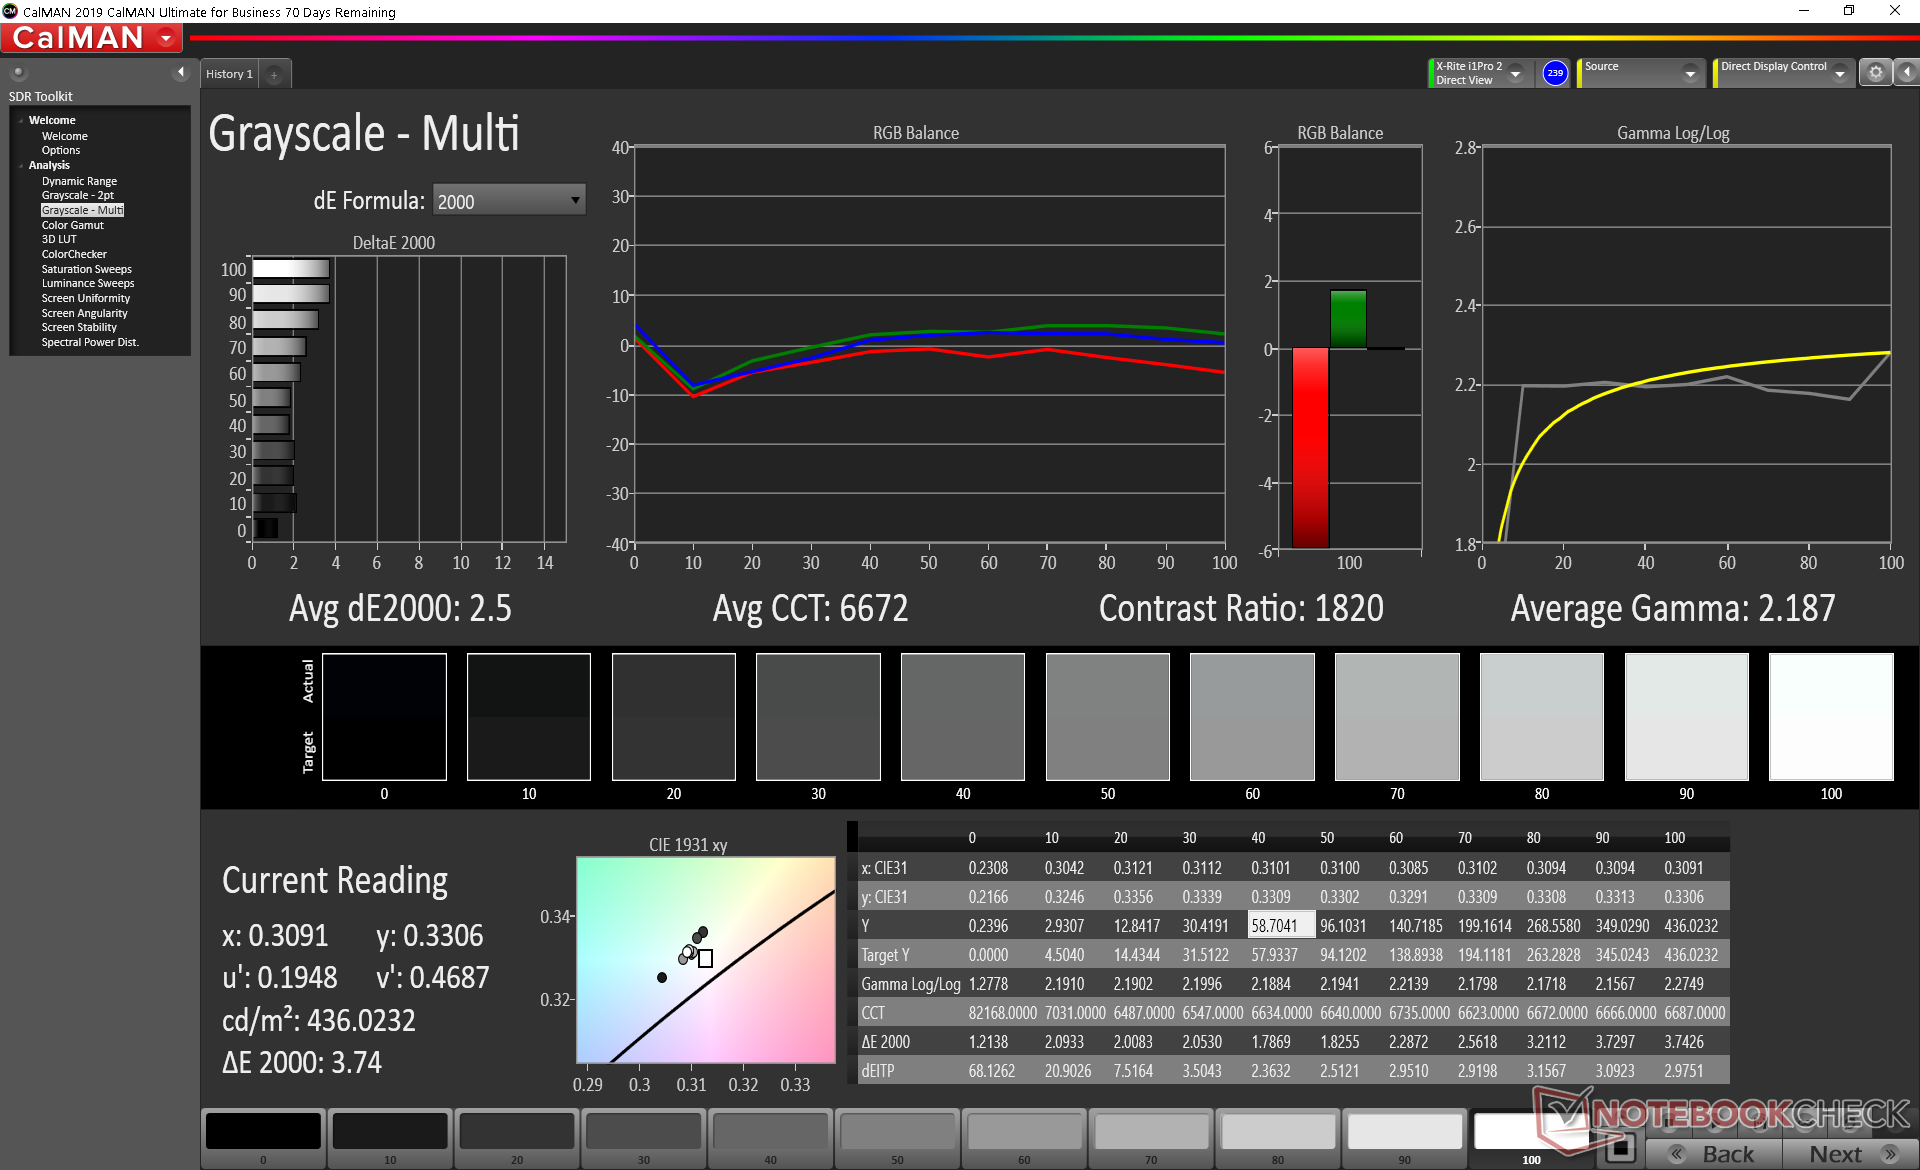
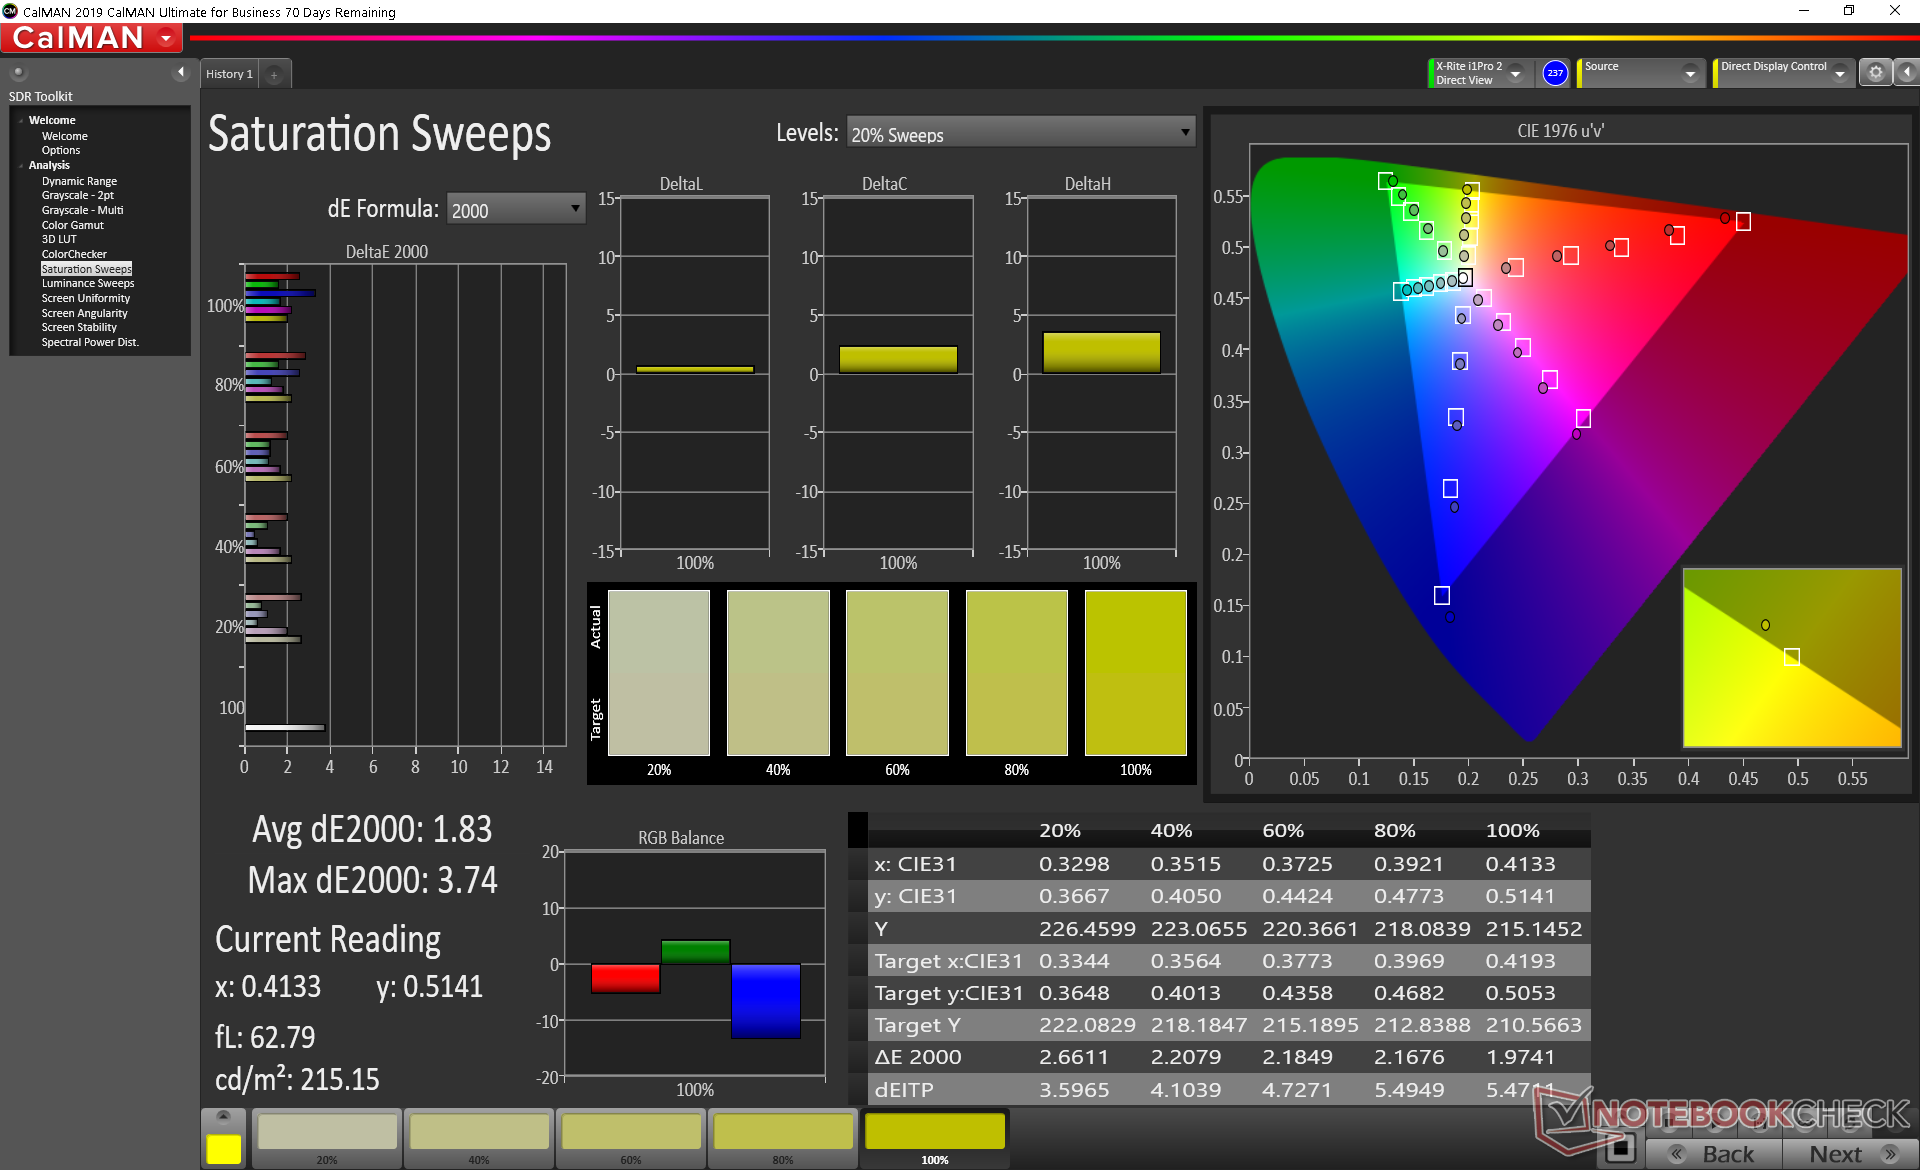
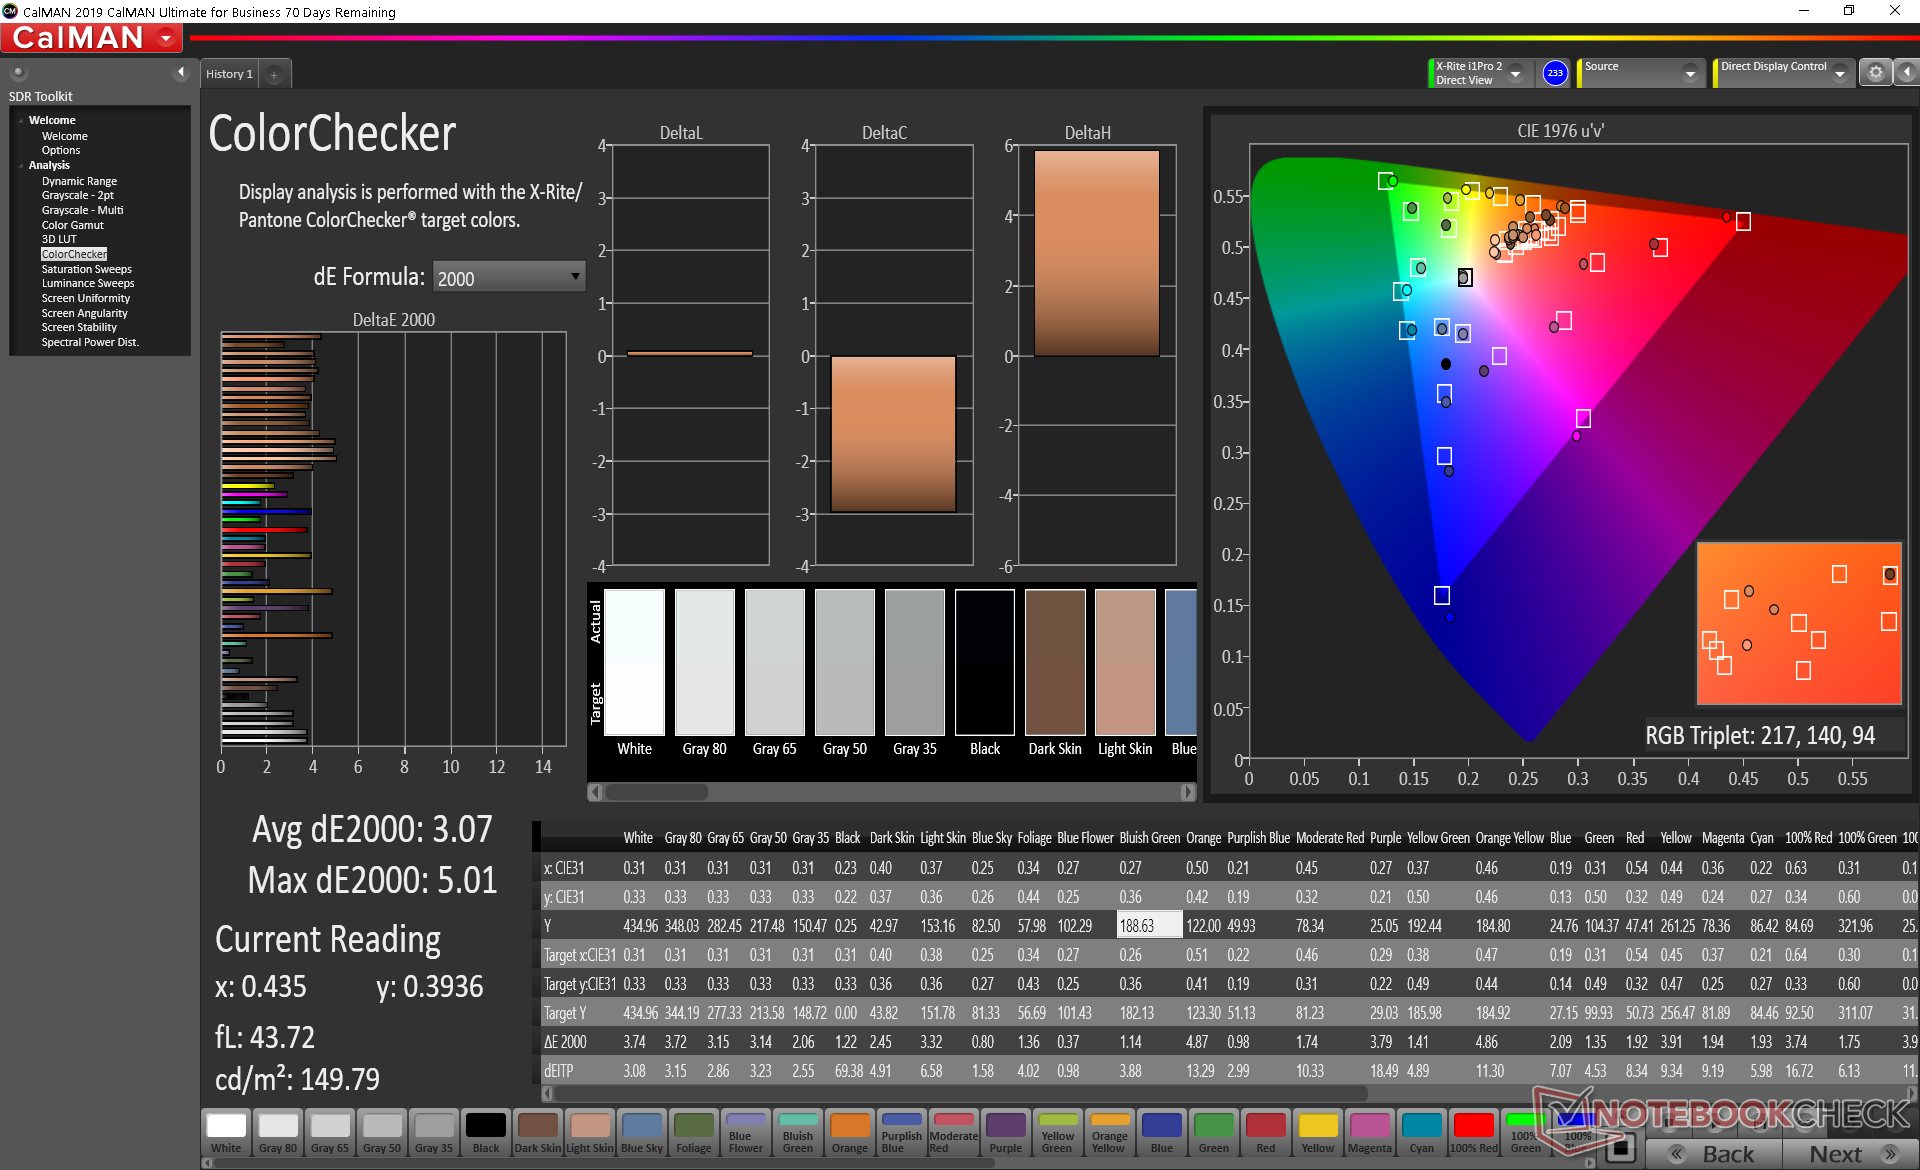
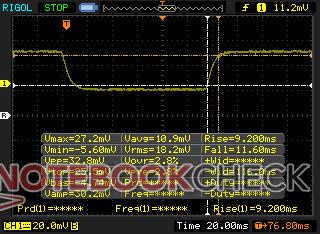
Analyzing the ScreenPad with an X-Rite colorimeter reveals a backlight that's even brighter than the main display which is good because the user will almost always be looking at the ScreenPad from a wider angle than the main display. Colors are not that well calibrated and grayscale is overly cool, but it is possible to calibrate the ScreenPad to address these shortcomings. Colors and grayscale would improve noticeably after calibrating the display ourselves as shown by our screenshots below.
ScreenPad 2.0 is a significant step forward when compared to the original ScreenPad on the old ZenBook Pro 15 UX580 in terms of picture quality and usability. It's still not quite as crisp as we would like, but the differences are noticeable. An external mouse is still recommended or else precision inputs on the small display will be difficult.
HWiNFO reveals Toshiba to the original manufacturer of the ScreenPad with the panel name ScreenXpert.
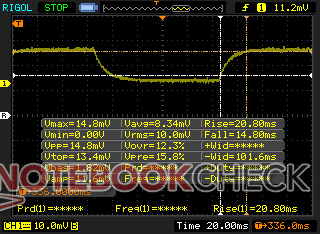
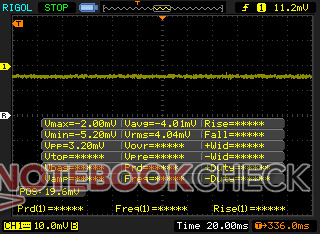
| Black-White Response Times | Gray-Gray Response Times | PWM | Maximum/Minimum Brightness | CCT | Black Level | Contrast Ratio | ColorChecker DeltaE Average | ColorChecker DeltaE Maximum | ColorChecker DeltaE Average After Calbration | Grayscale DeltaE Average | Gamma | sRGB Coverage | AdobeRGB Coverage |
|---|---|---|---|---|---|---|---|---|---|---|---|---|---|
| 9.2 ms rise, 11.6 mm fall | 20.8 ms rise, 14.8 ms fall | None | 454.3 nits, 19.6 nits | 7953 | 0.38 | 851:1 | 4.45 | 8.7 | 3.07 | 6.0 | 2.27 | 88.7% | 57% |

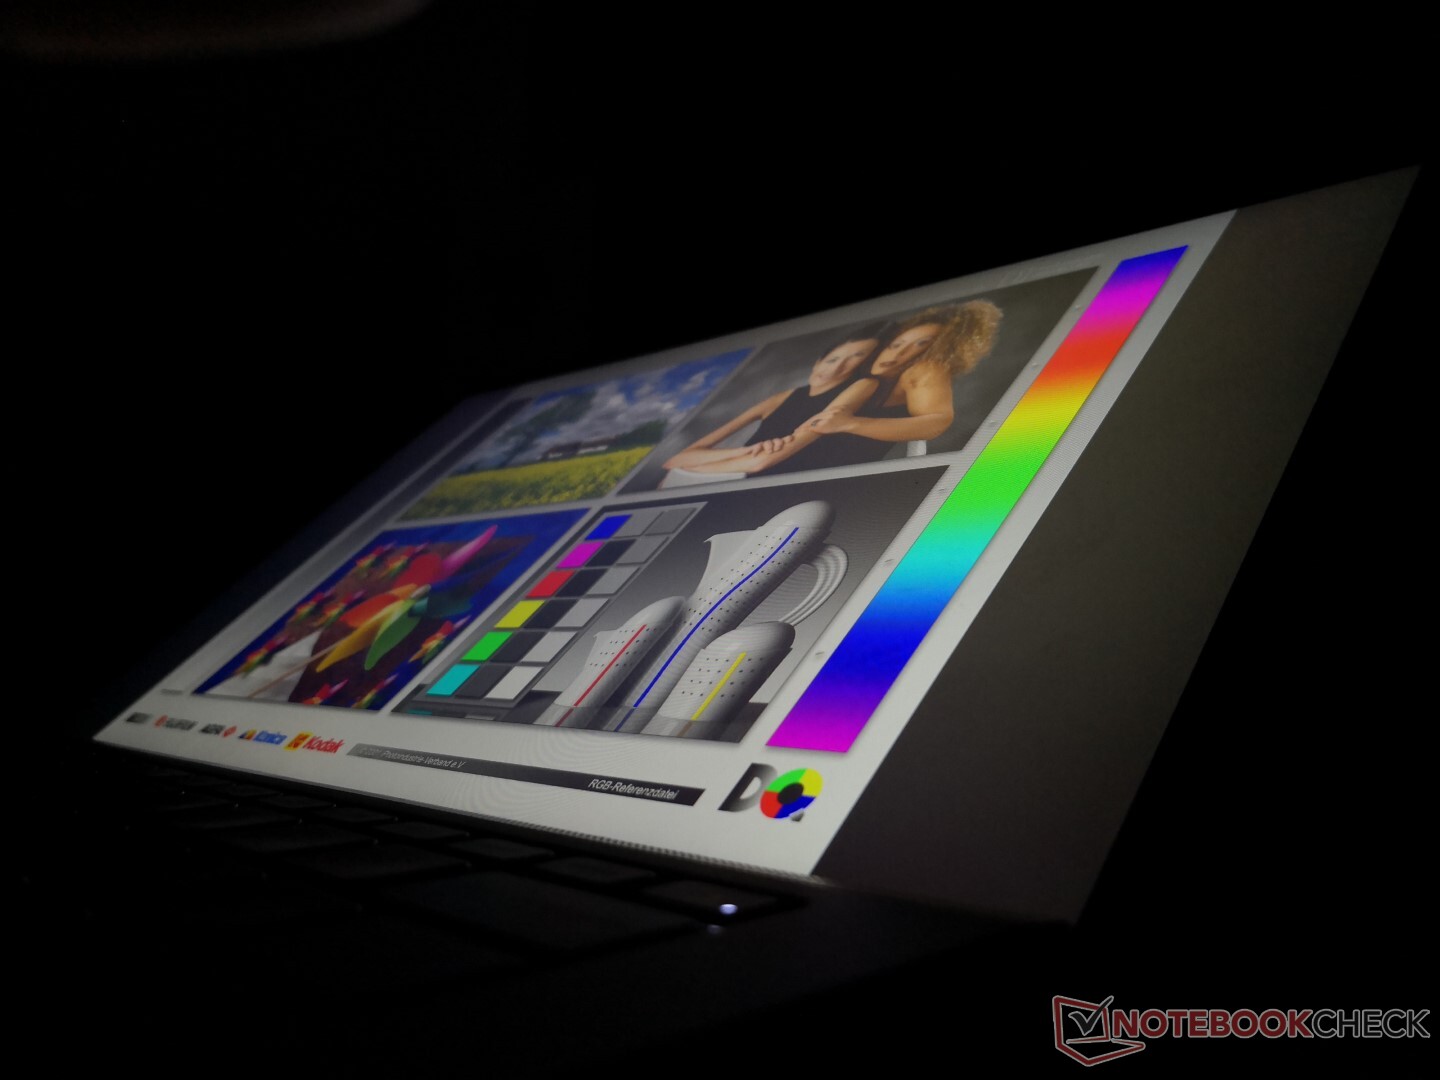
Display
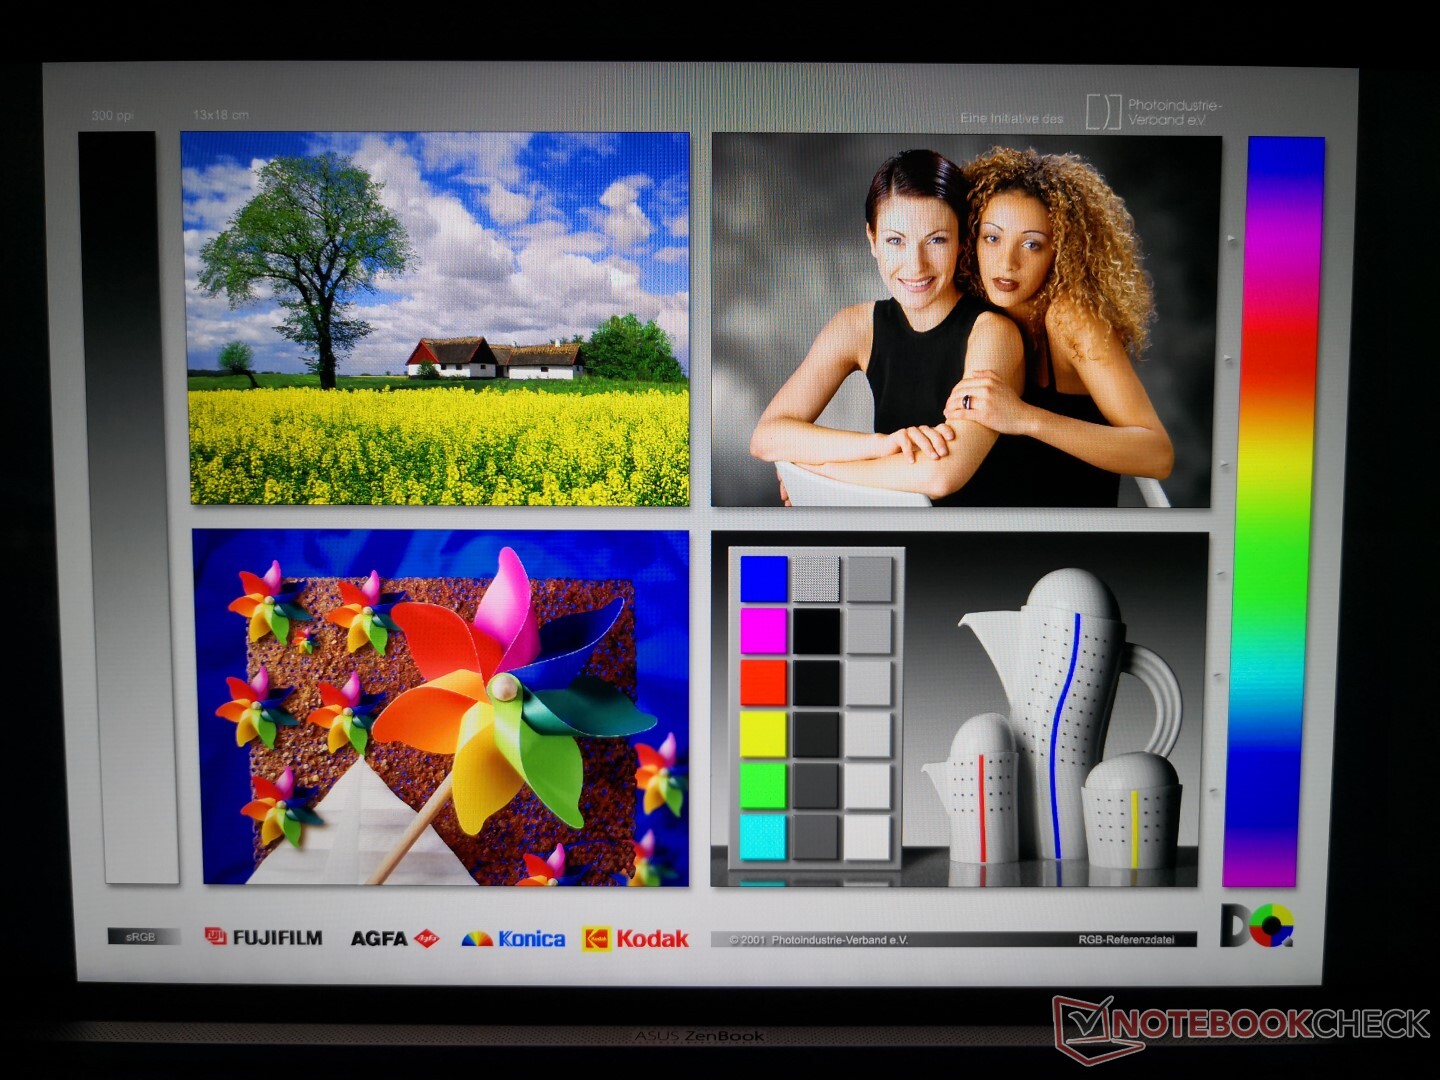
The UX434 uses the same AU Optronics B140HAN03.2 IPS panel as found on the 2018 UX433 series meaning there are no changes to the display. This is great since the B140HAN03.2 is already a high quality display with good contrast ratio and color reproduction, but it's also disappointing at the same time because there are no new display options to choose from.
The Acer Spin 7 SP714 uses the same AU Optronics B140HAN03.2 panel as our Asus.
| |||||||||||||||||||||||||
Brightness Distribution: 88 %
Center on Battery: 355.8 cd/m²
Contrast: 936:1 (Black: 0.38 cd/m²)
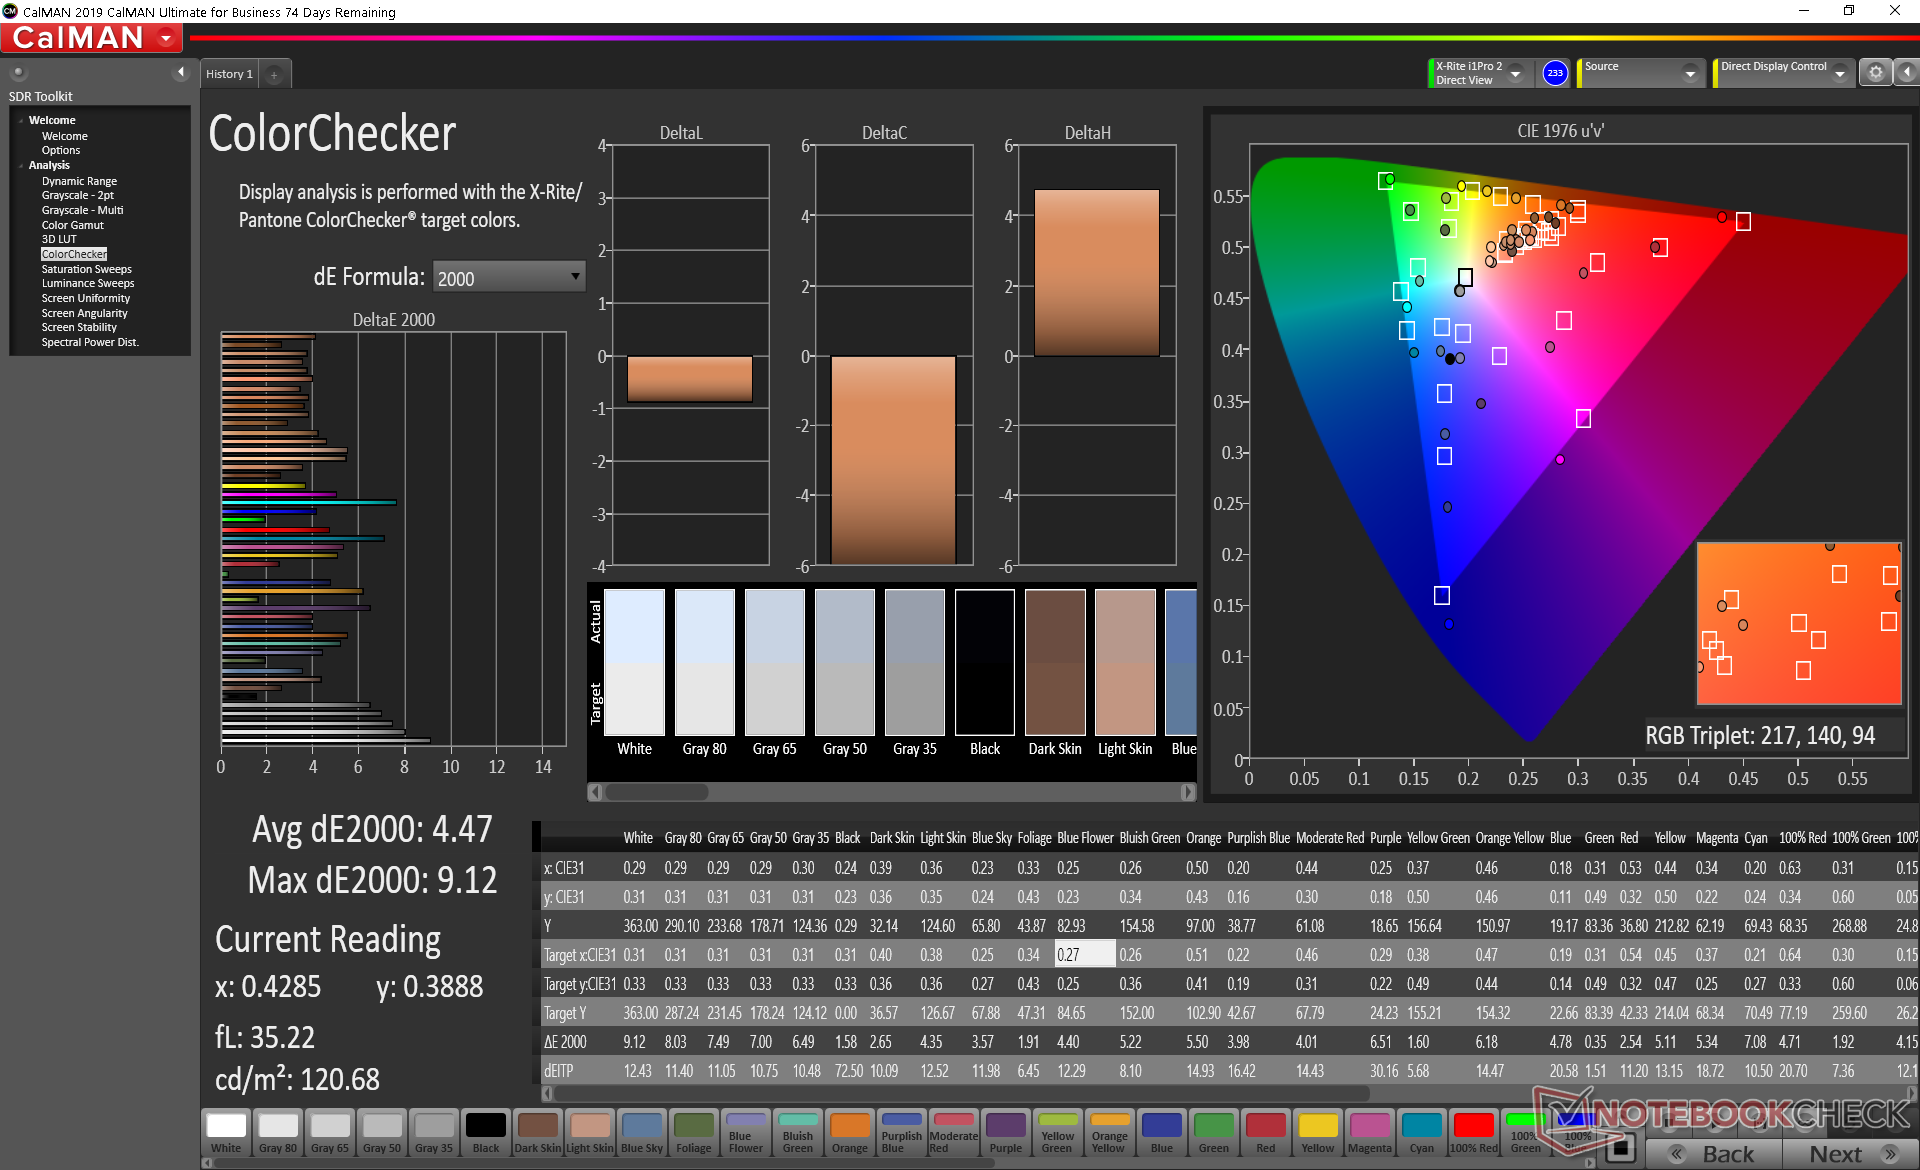
ΔE ColorChecker Calman: 4.47 | ∀{0.5-29.43 Ø4.72}
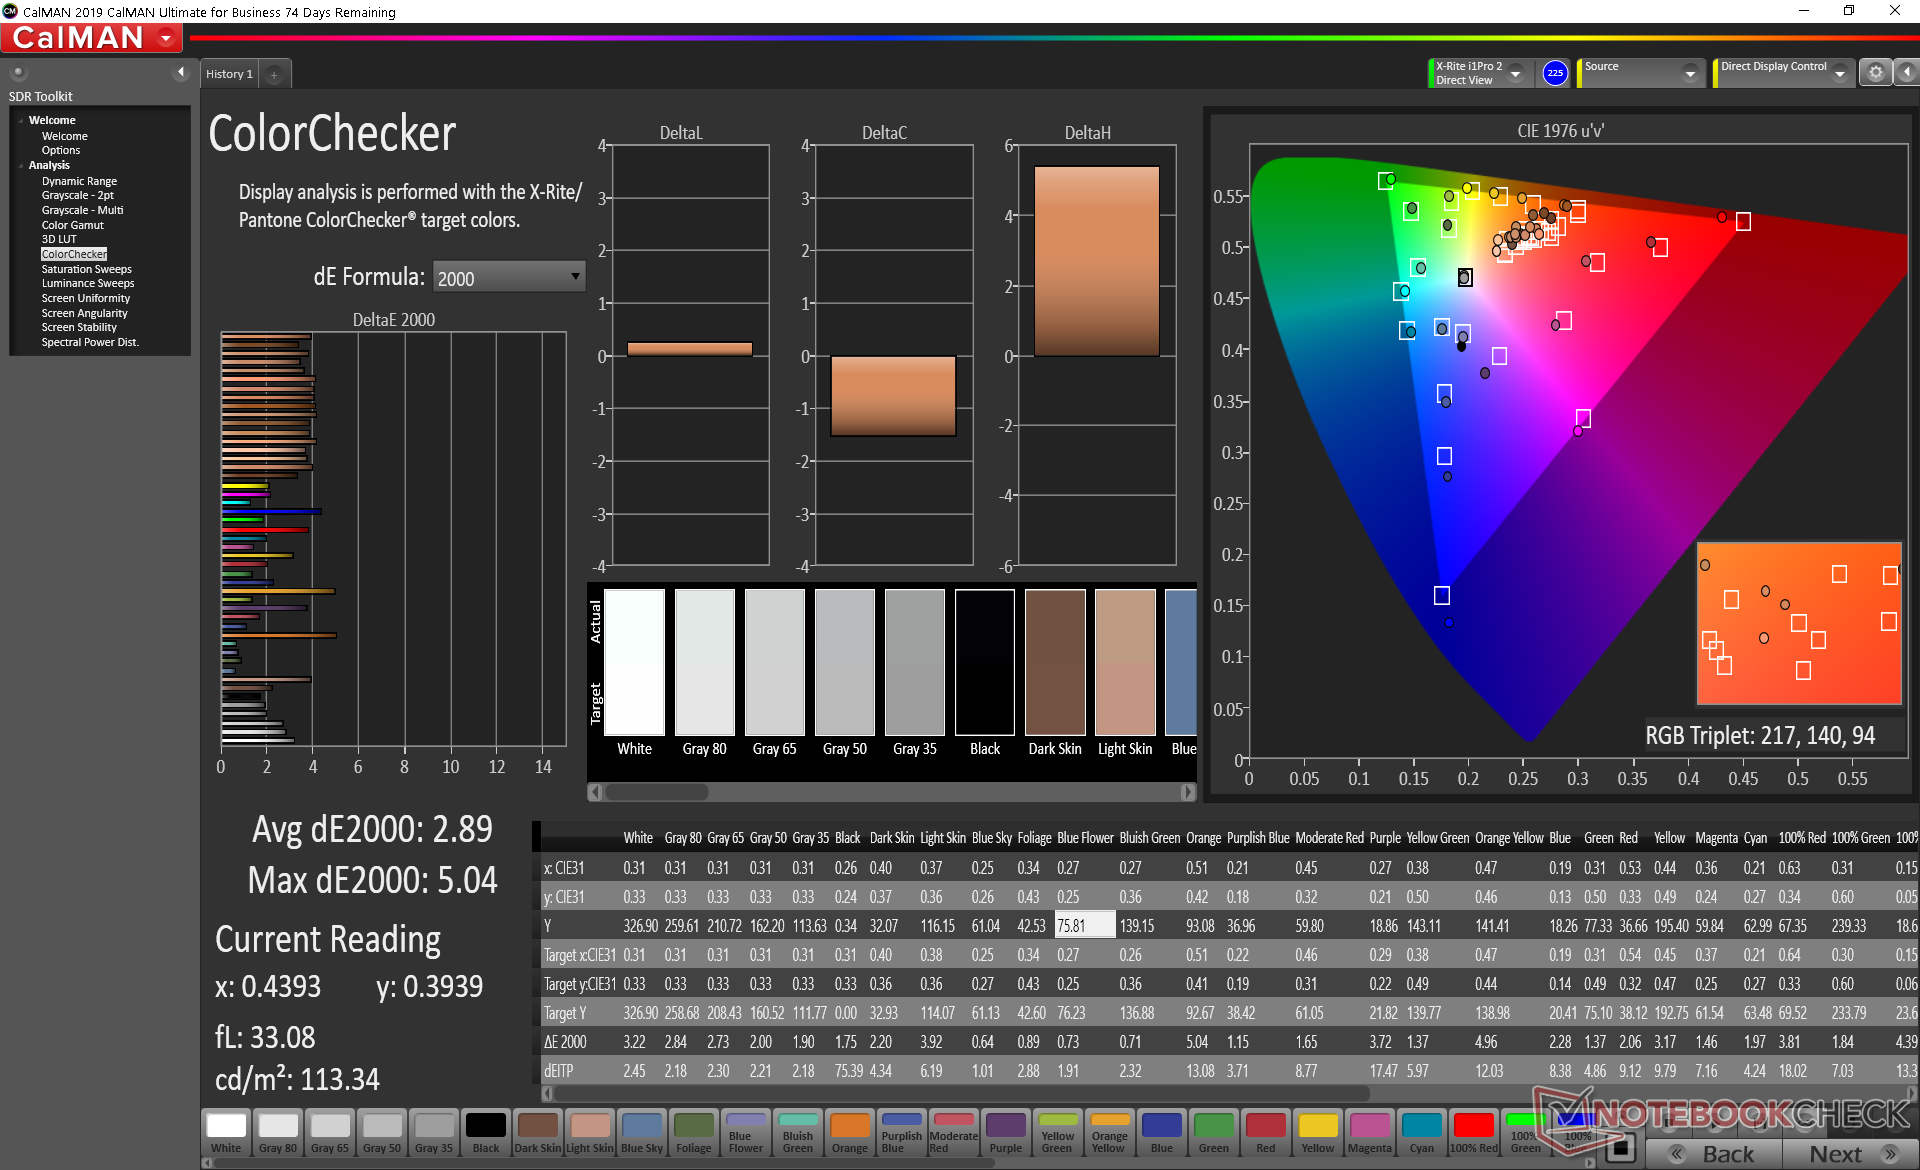
calibrated: 2.89
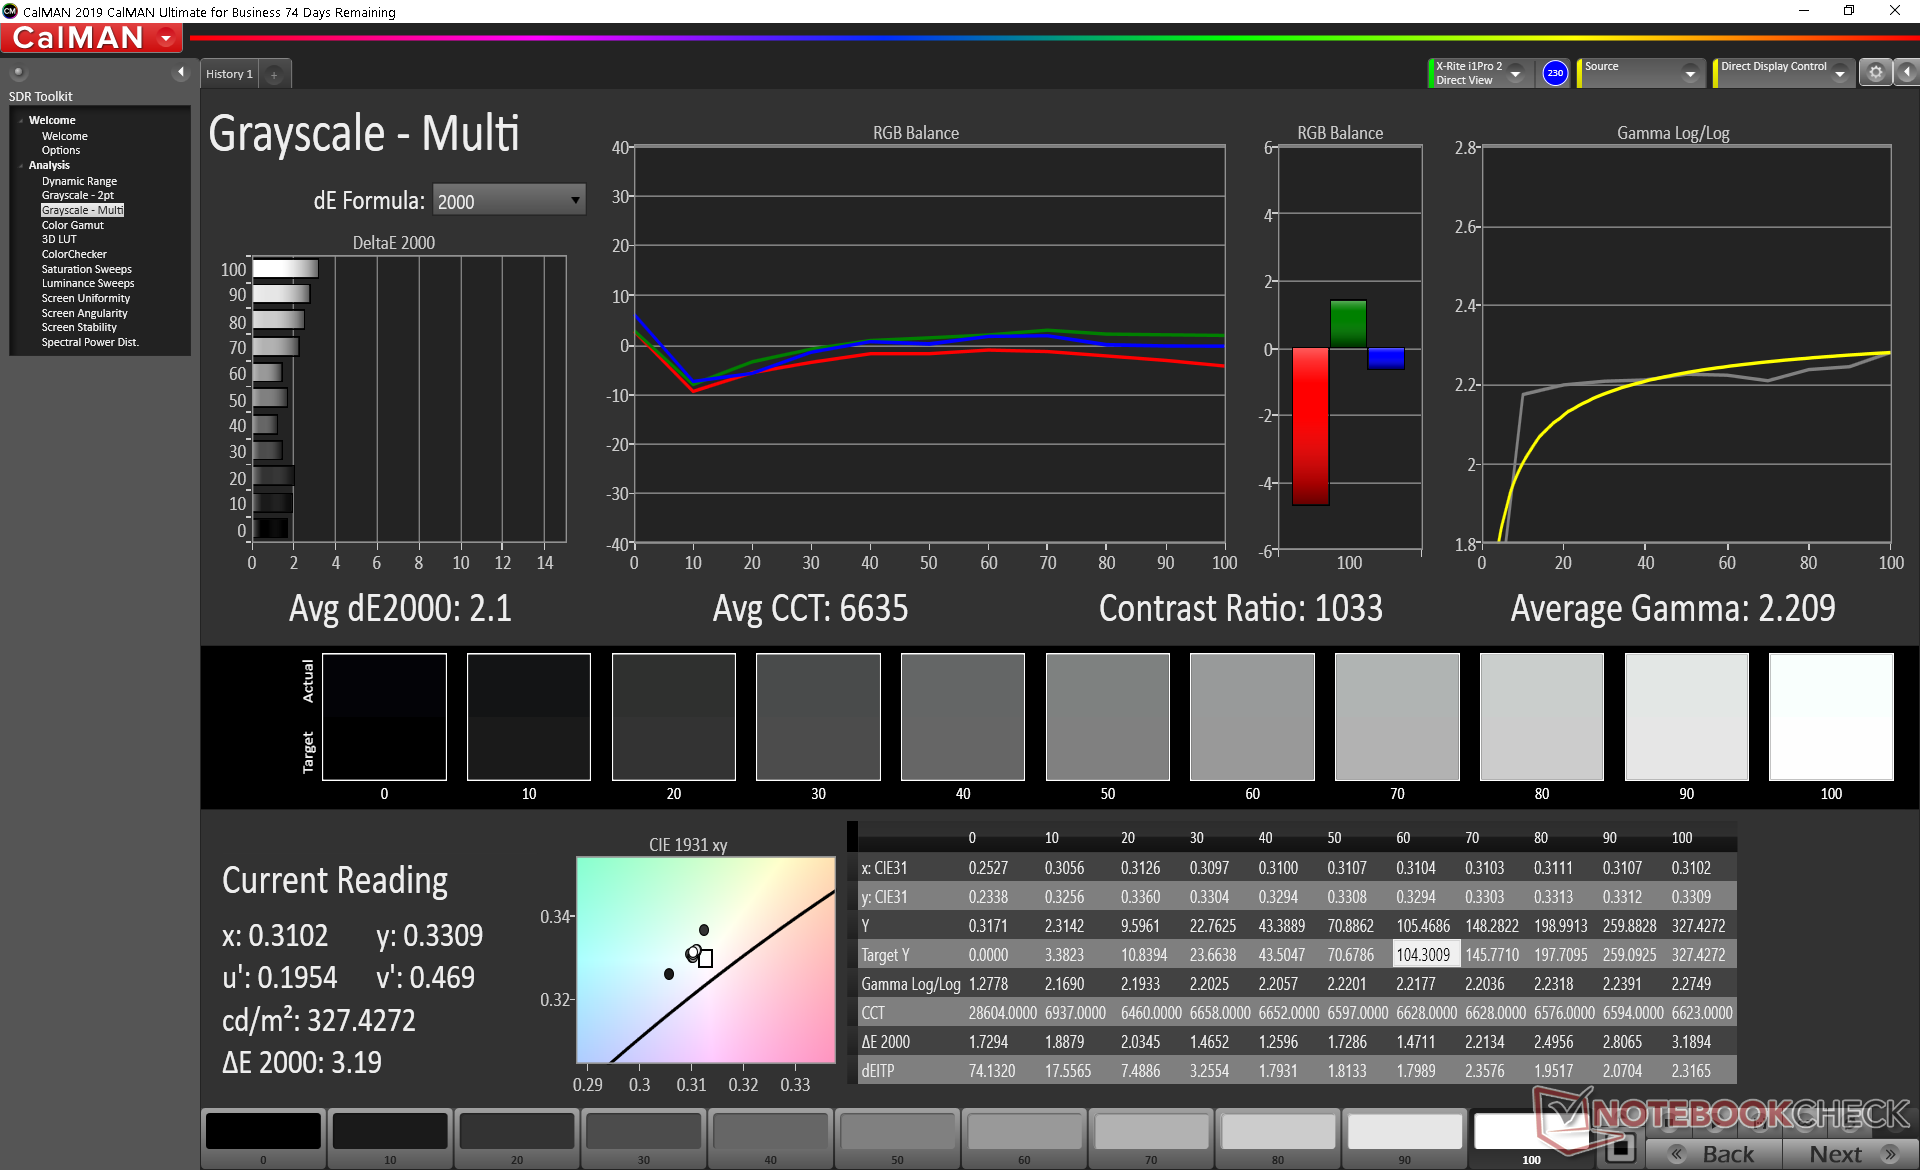
ΔE Greyscale Calman: 6.2 | ∀{0.09-98 Ø4.97}
91.6% sRGB (Argyll 1.6.3 3D)
59.3% AdobeRGB 1998 (Argyll 1.6.3 3D)
65.3% AdobeRGB 1998 (Argyll 3D)
92% sRGB (Argyll 3D)
64% Display P3 (Argyll 3D)
Gamma: 2.27
CCT: 8072 K
| Asus ZenBook 14 UX434FL-DB77 AU Optronics B140HAN03.2, IPS, 14", 1920x1080 | Lenovo IdeaPad 5 14ARE05 AU Optronics B140HAN04.E, IPS, 14", 1920x1080 | Asus VivoBook S14 S433FL Chi Mei CMN14D4, IPS, 14", 1920x1080 | LG Gram 14Z90N LG Philips LP140WF7-SPG1, IPS, 14", 1920x1080 | Lenovo Yoga Slim 7-14ARE AU Optronics B140HAN06.8, IPS, 14", 1920x1080 | MSI Modern 14 A10RB-459US Chi Mei N140HCE-EN2, IPS, 14", 1920x1080 | |
|---|---|---|---|---|---|---|
| Display | -41% | -34% | 2% | 11% | 1% | |
| Display P3 Coverage (%) | 64 | 37.23 -42% | 41.55 -35% | 65 2% | 71.7 12% | 64.2 0% |
| sRGB Coverage (%) | 92 | 55.9 -39% | 62 -33% | 95.5 4% | 99.3 8% | 94.8 3% |
| AdobeRGB 1998 Coverage (%) | 65.3 | 38.46 -41% | 42.99 -34% | 66.1 1% | 72.9 12% | 65.4 0% |
| Response Times | -3% | 14% | -4% | -12% | -14% | |
| Response Time Grey 50% / Grey 80% * (ms) | 37.6 ? | 41 ? -9% | 34 ? 10% | 40.4 ? -7% | 45.6 ? -21% | 39.2 ? -4% |
| Response Time Black / White * (ms) | 28.8 ? | 28 ? 3% | 24 ? 17% | 28.8 ? -0% | 29.6 ? -3% | 35.6 ? -24% |
| PWM Frequency (Hz) | 250 ? | 25000 ? | ||||
| Screen | -11% | -20% | 19% | 17% | 29% | |
| Brightness middle (cd/m²) | 355.8 | 360 1% | 220 -38% | 316.8 -11% | 399.6 12% | 324.1 -9% |
| Brightness (cd/m²) | 341 | 317 -7% | 204 -40% | 298 -13% | 385 13% | 301 -12% |
| Brightness Distribution (%) | 88 | 82 -7% | 68 -23% | 89 1% | 89 1% | 87 -1% |
| Black Level * (cd/m²) | 0.38 | 0.41 -8% | 0.155 59% | 0.33 13% | 0.37 3% | 0.22 42% |
| Contrast (:1) | 936 | 878 -6% | 1419 52% | 960 3% | 1080 15% | 1473 57% |
| Colorchecker dE 2000 * | 4.47 | 4.75 -6% | 5.23 -17% | 1.74 61% | 3.2 28% | 1.63 64% |
| Colorchecker dE 2000 max. * | 9.12 | 7.4 19% | 21.51 -136% | 5.41 41% | 6.44 29% | 4.25 53% |
| Colorchecker dE 2000 calibrated * | 2.89 | 4.86 -68% | 4.4 -52% | 1.37 53% | 1.73 40% | 1.42 51% |
| Greyscale dE 2000 * | 6.2 | 3.75 40% | 3.77 39% | 2.7 56% | 4.7 24% | 2.2 65% |
| Gamma | 2.27 97% | 2.32 95% | 2.35 94% | 2.23 99% | 2.21 100% | 2.26 97% |
| CCT | 8072 81% | 6543 99% | 6666 98% | 6655 98% | 7184 90% | 6887 94% |
| Color Space (Percent of AdobeRGB 1998) (%) | 59.3 | 36 -39% | 40 -33% | 61.3 3% | 66.3 12% | 60.2 2% |
| Color Space (Percent of sRGB) (%) | 91.6 | 56 -39% | 62 -32% | 95.4 4% | 99.5 9% | 95 4% |
| Total Average (Program / Settings) | -18% /
-16% | -13% /
-19% | 6% /
13% | 5% /
12% | 5% /
18% |
* ... smaller is better
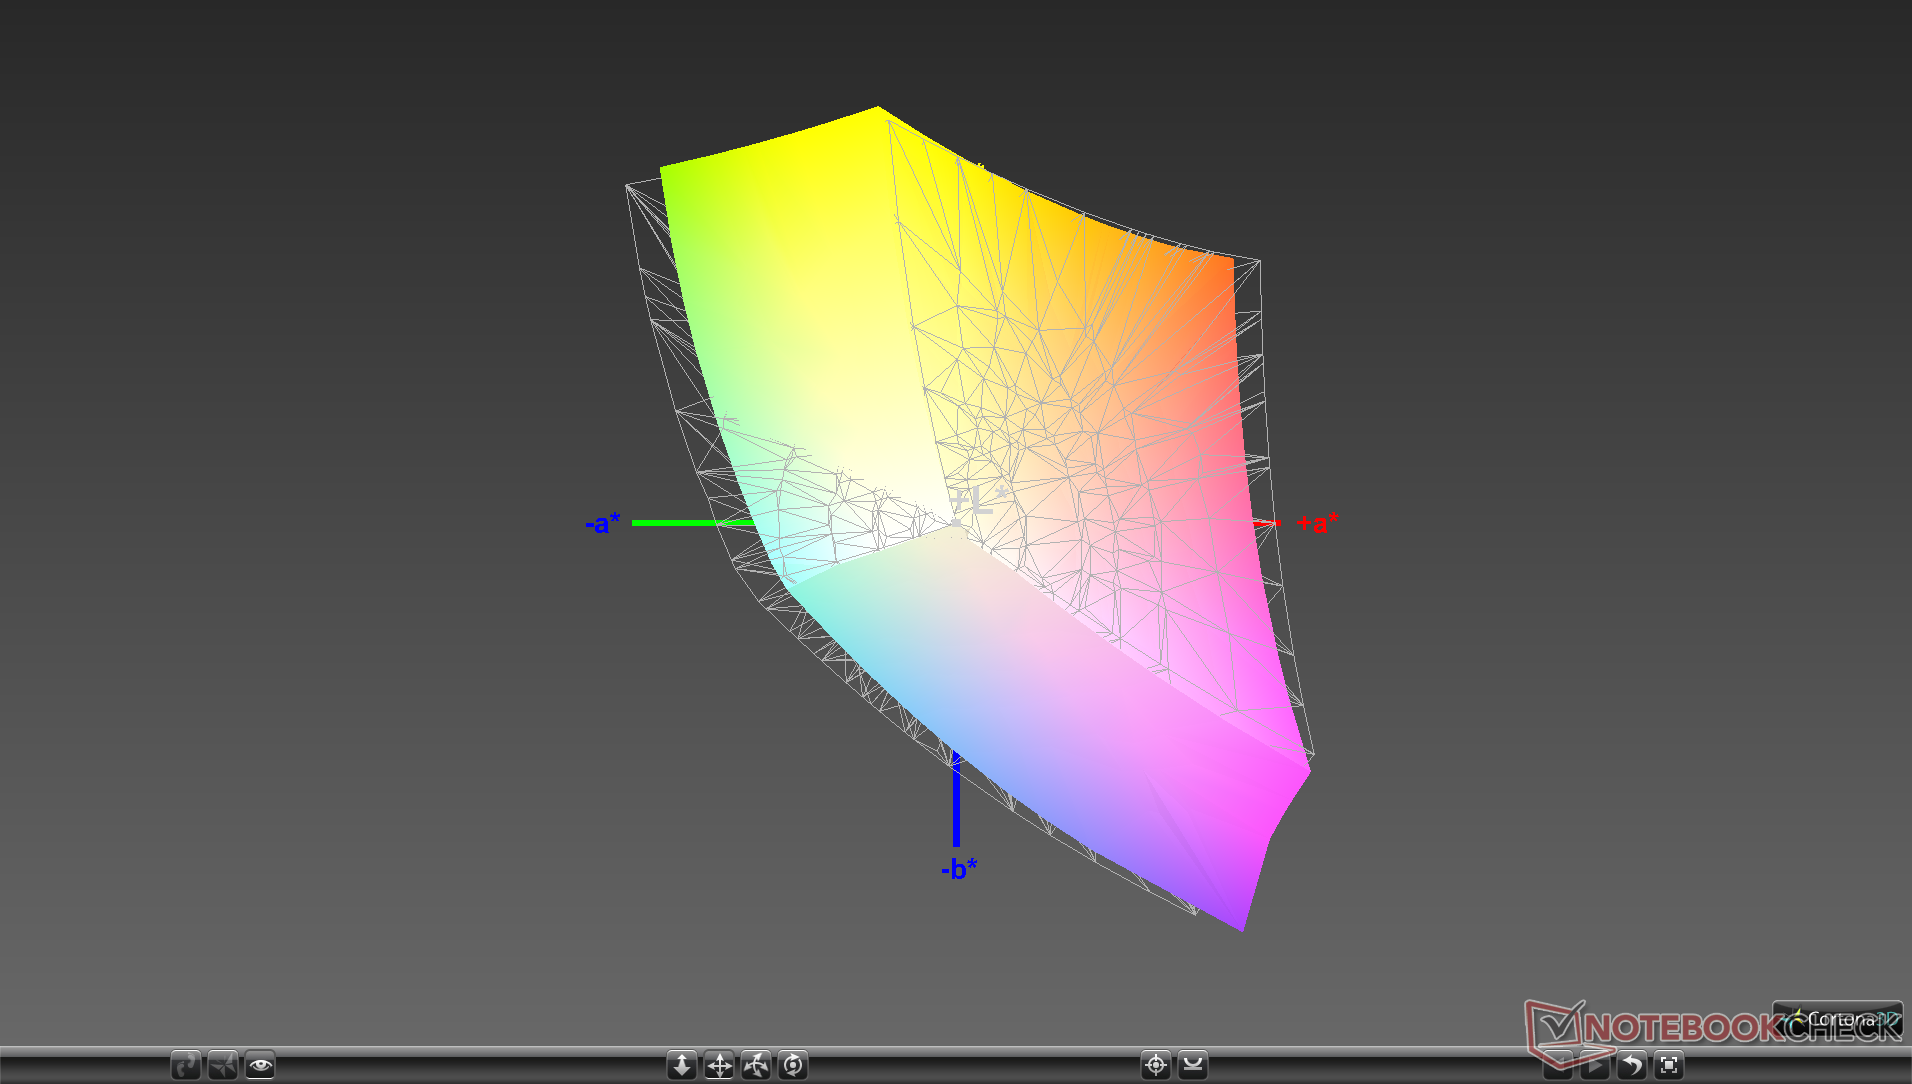
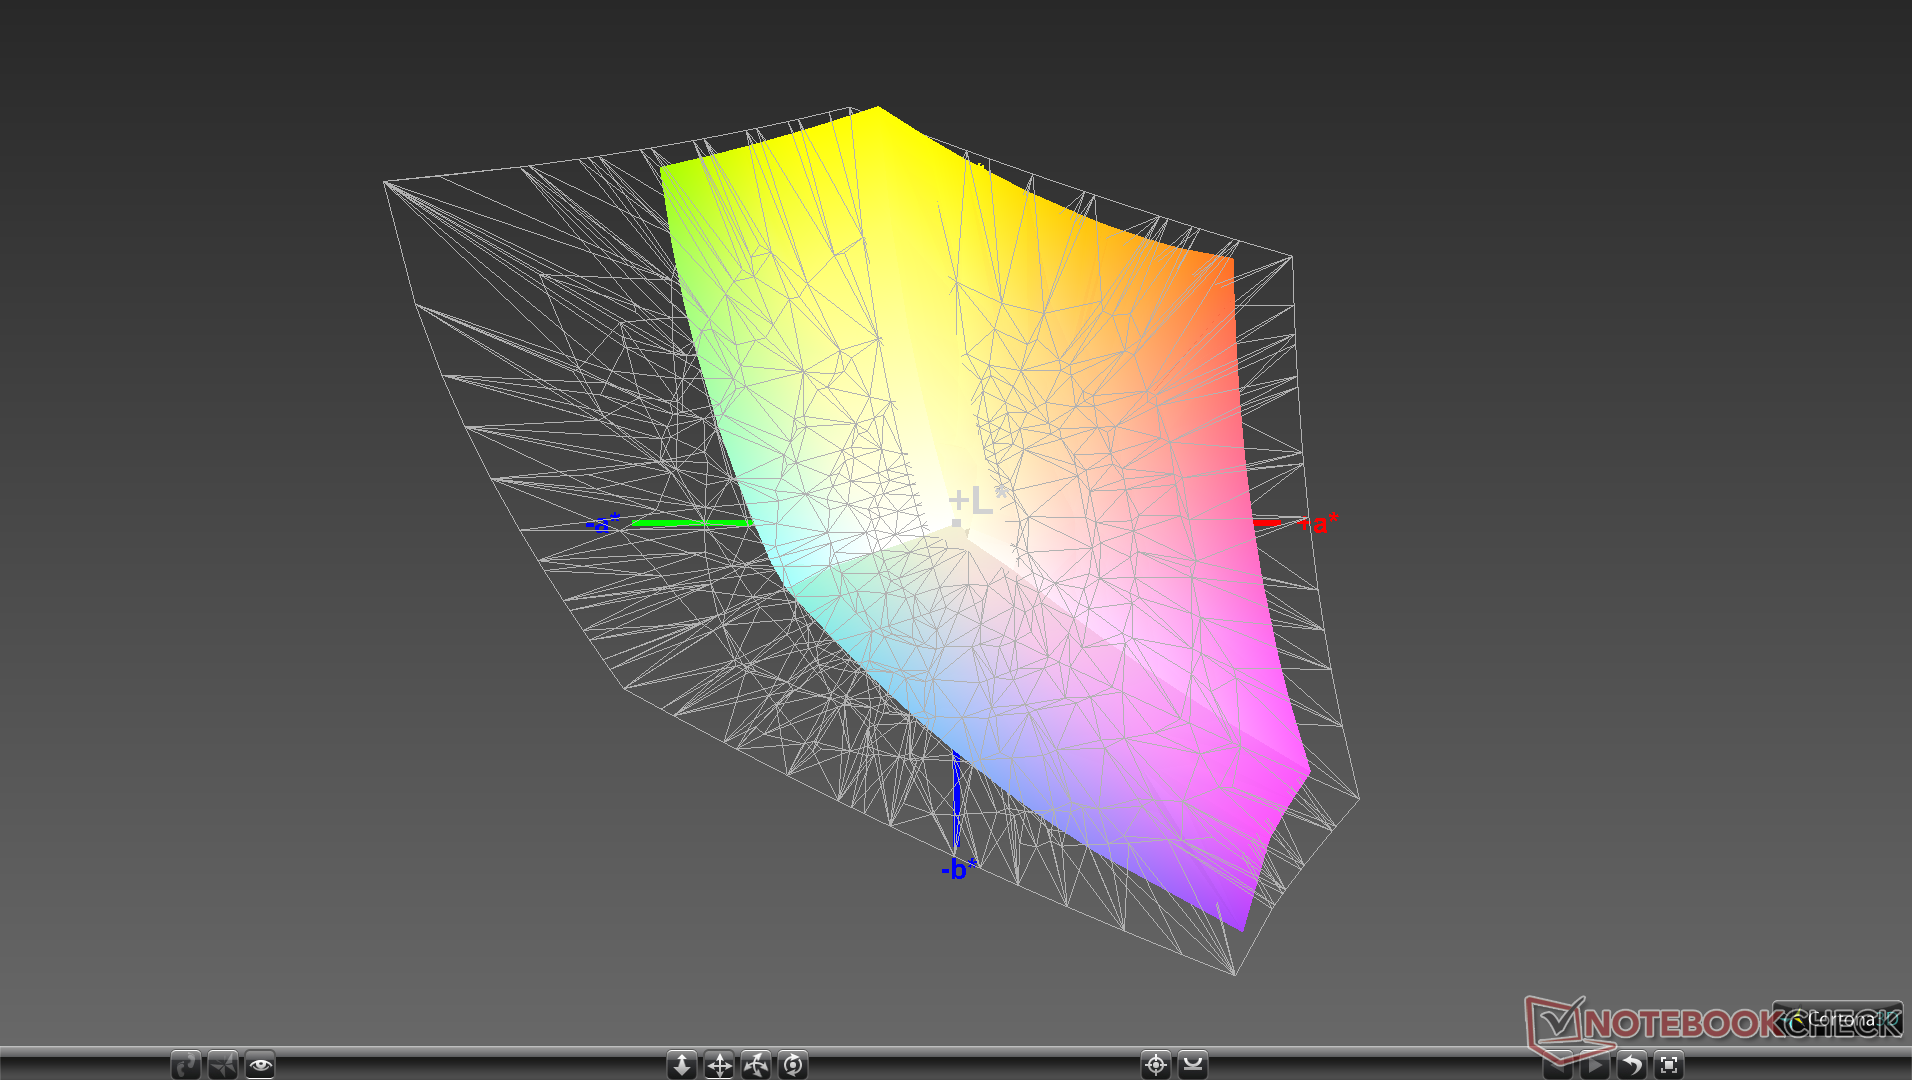
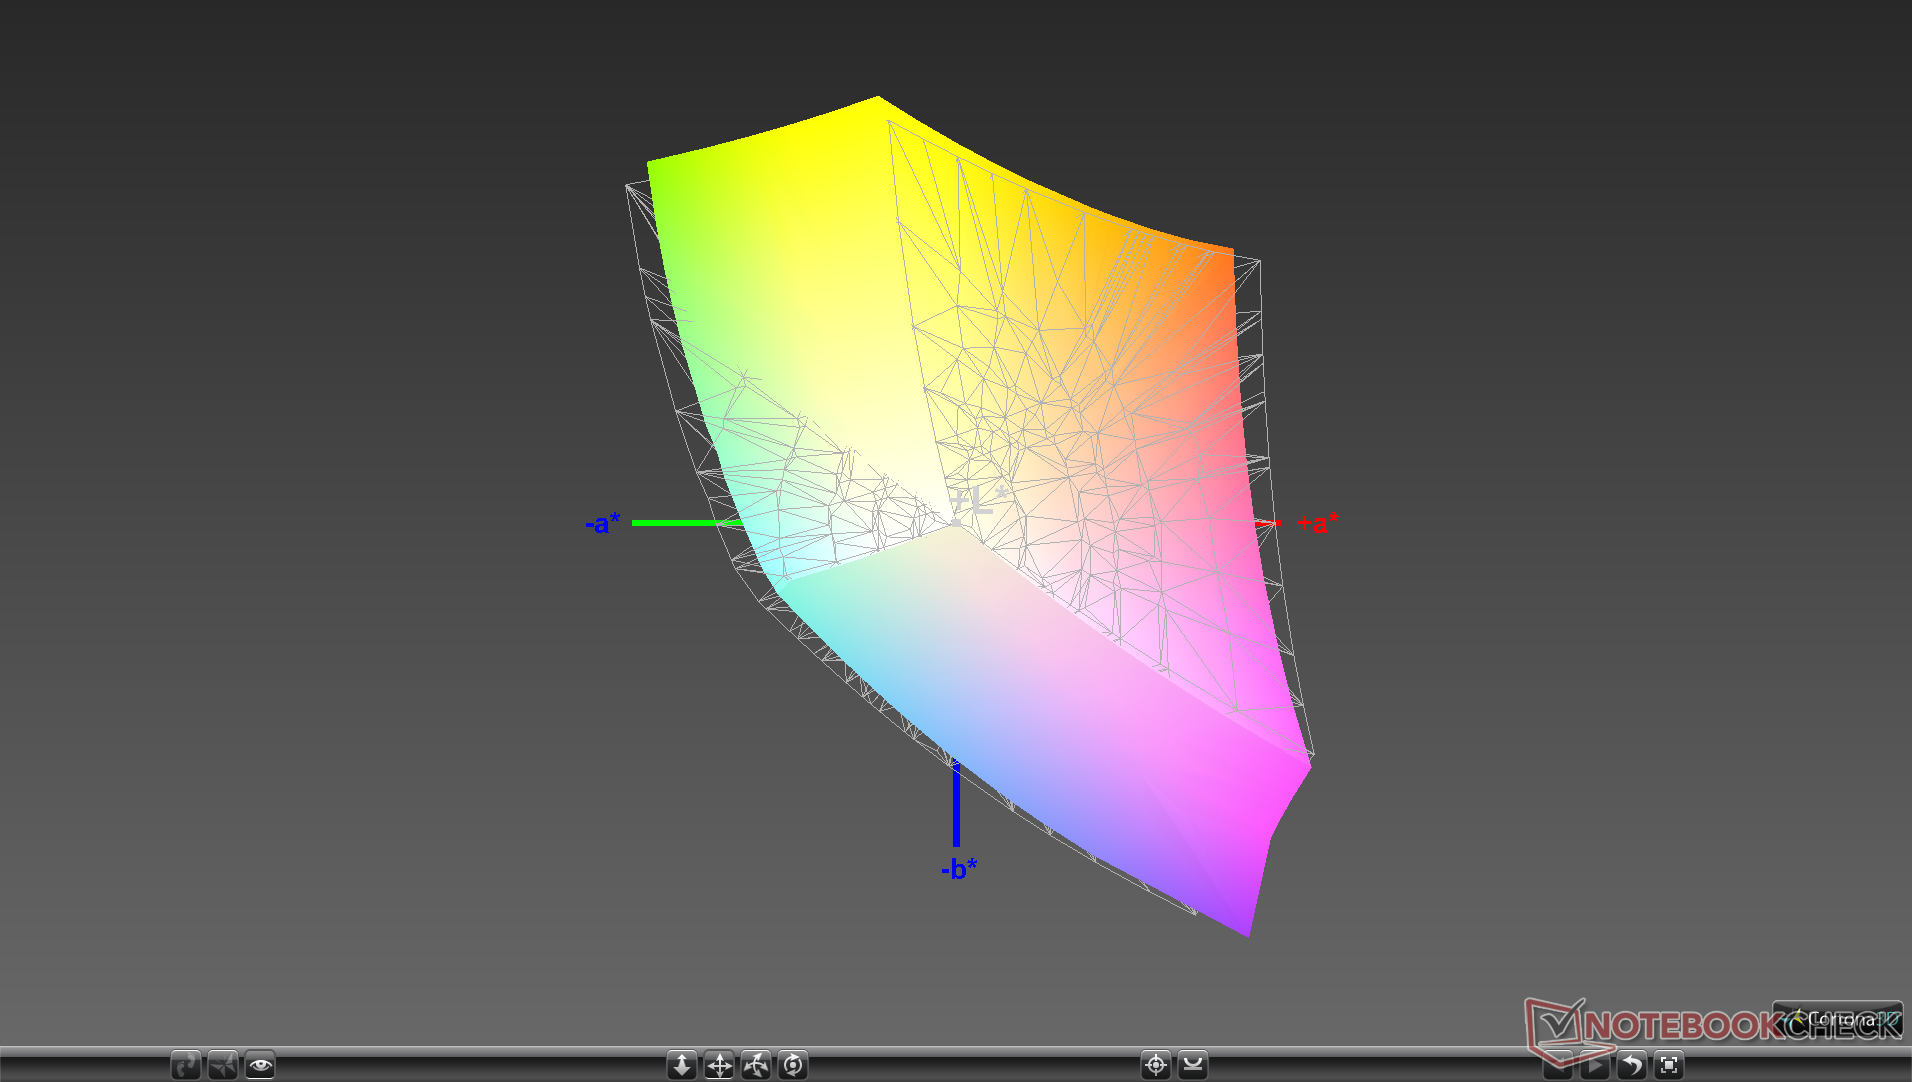
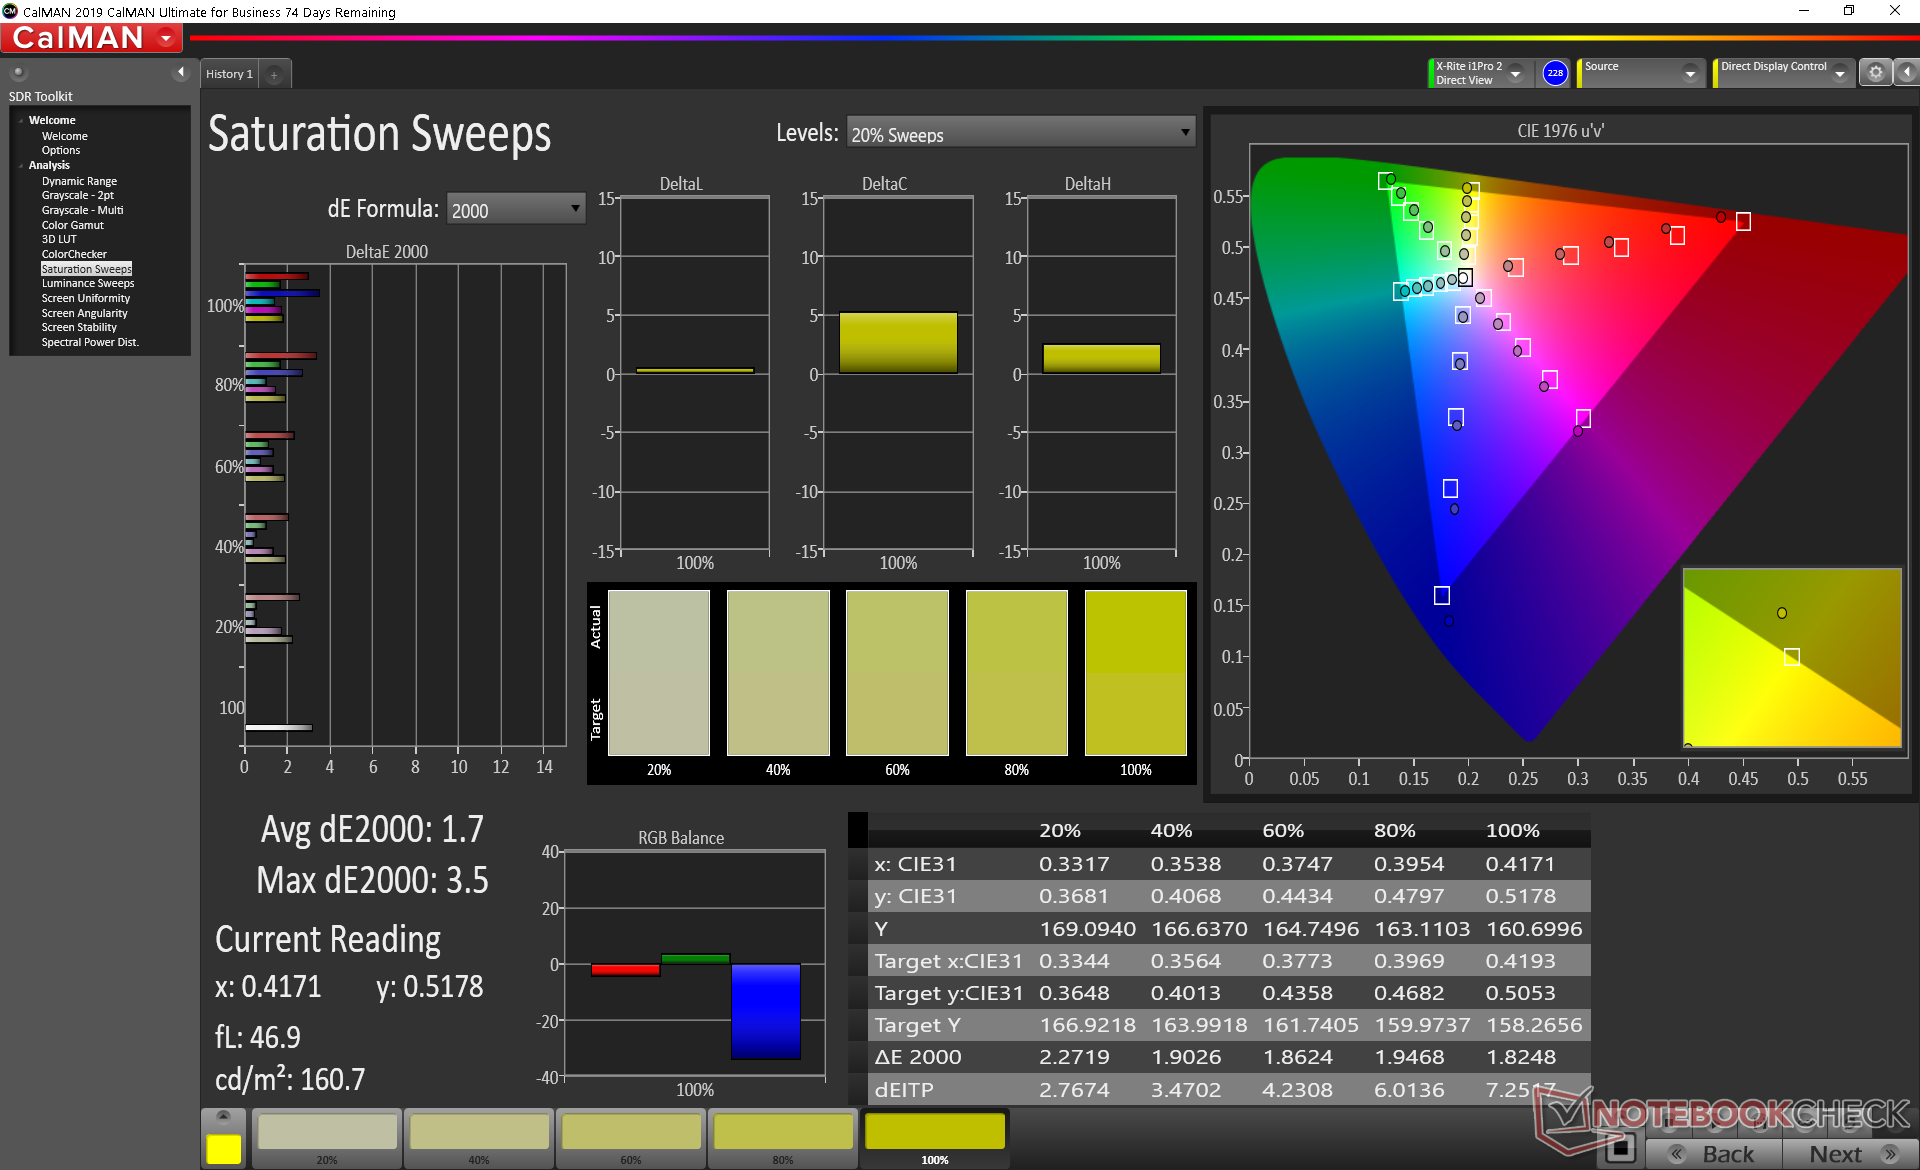
Color space is comparable to most other mid-range to high-end Ultrabooks at over 90 percent sRGB or approximately 60 percent of AdobeRGB.

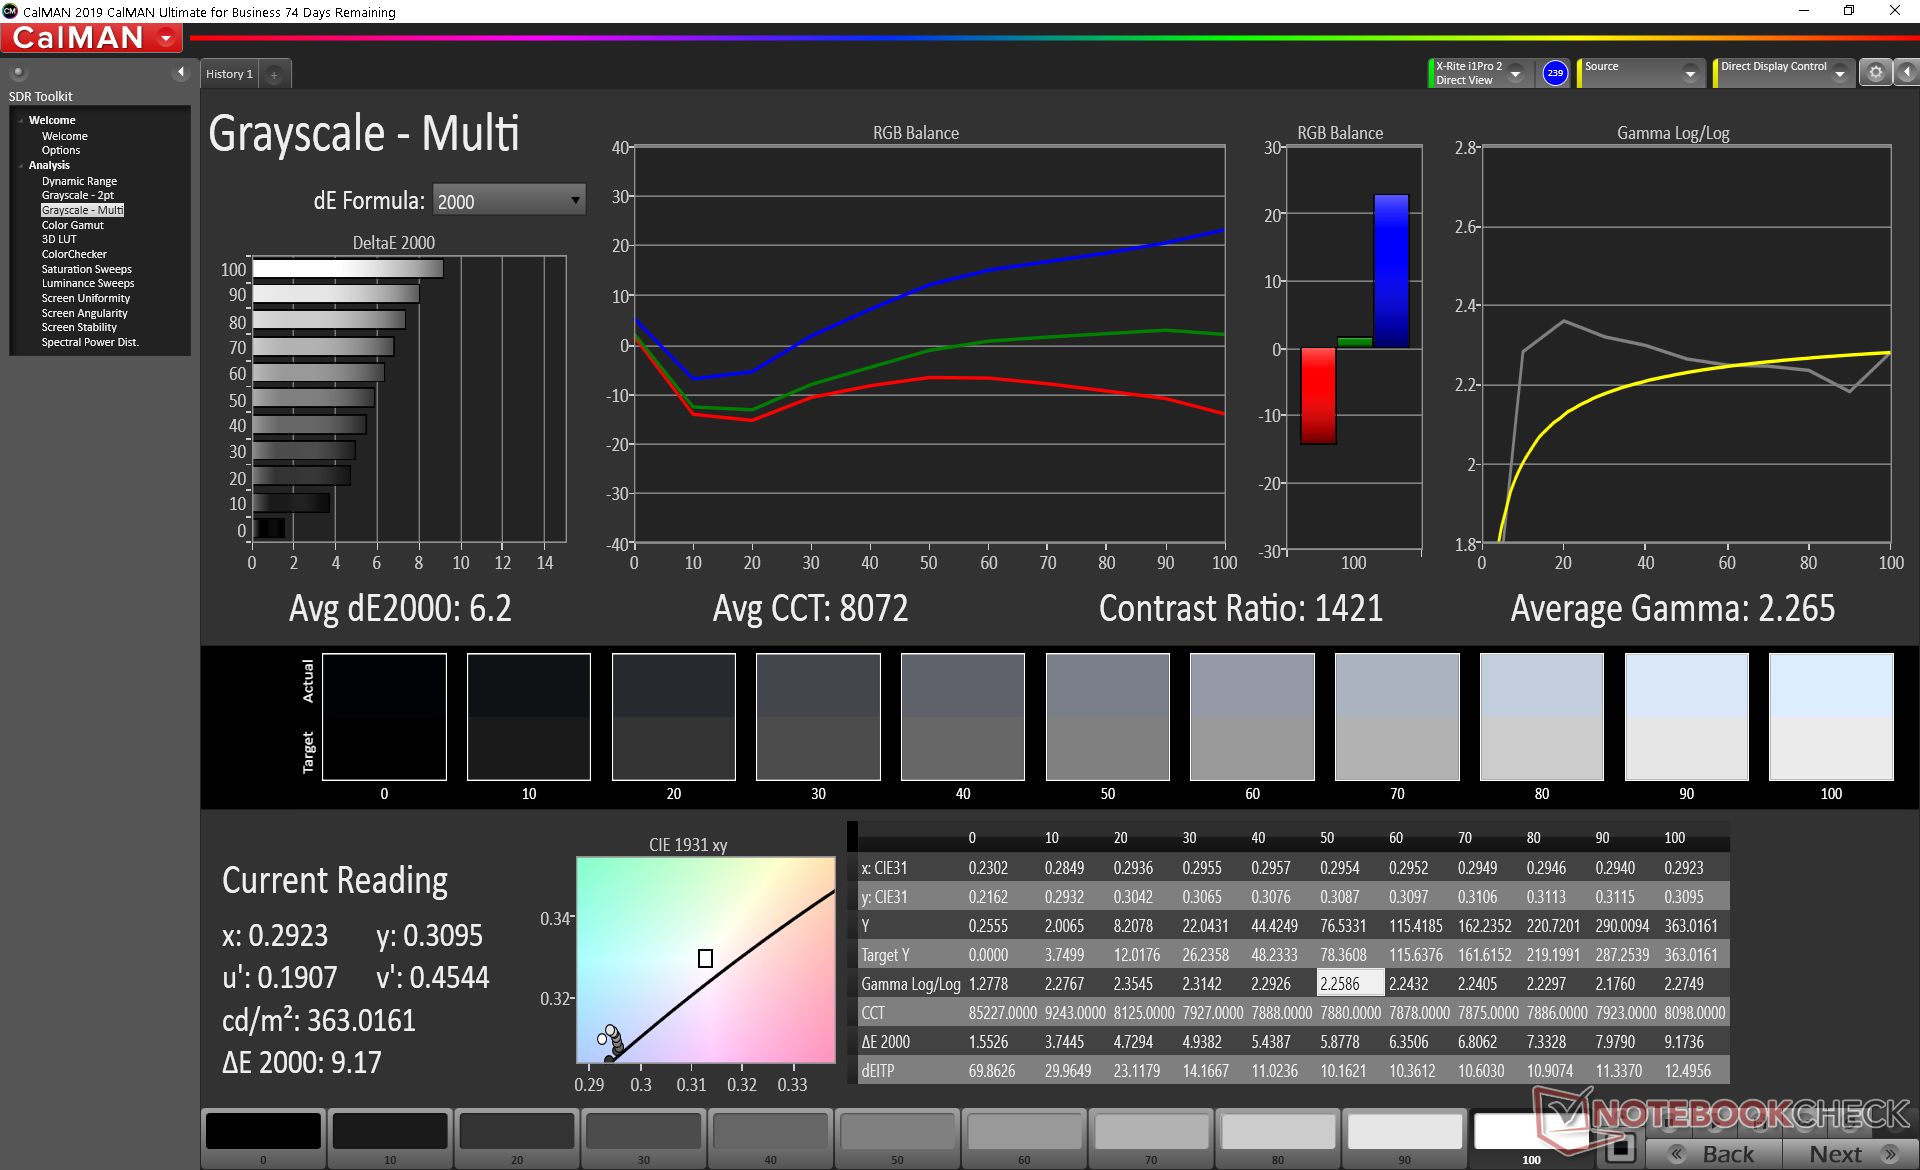
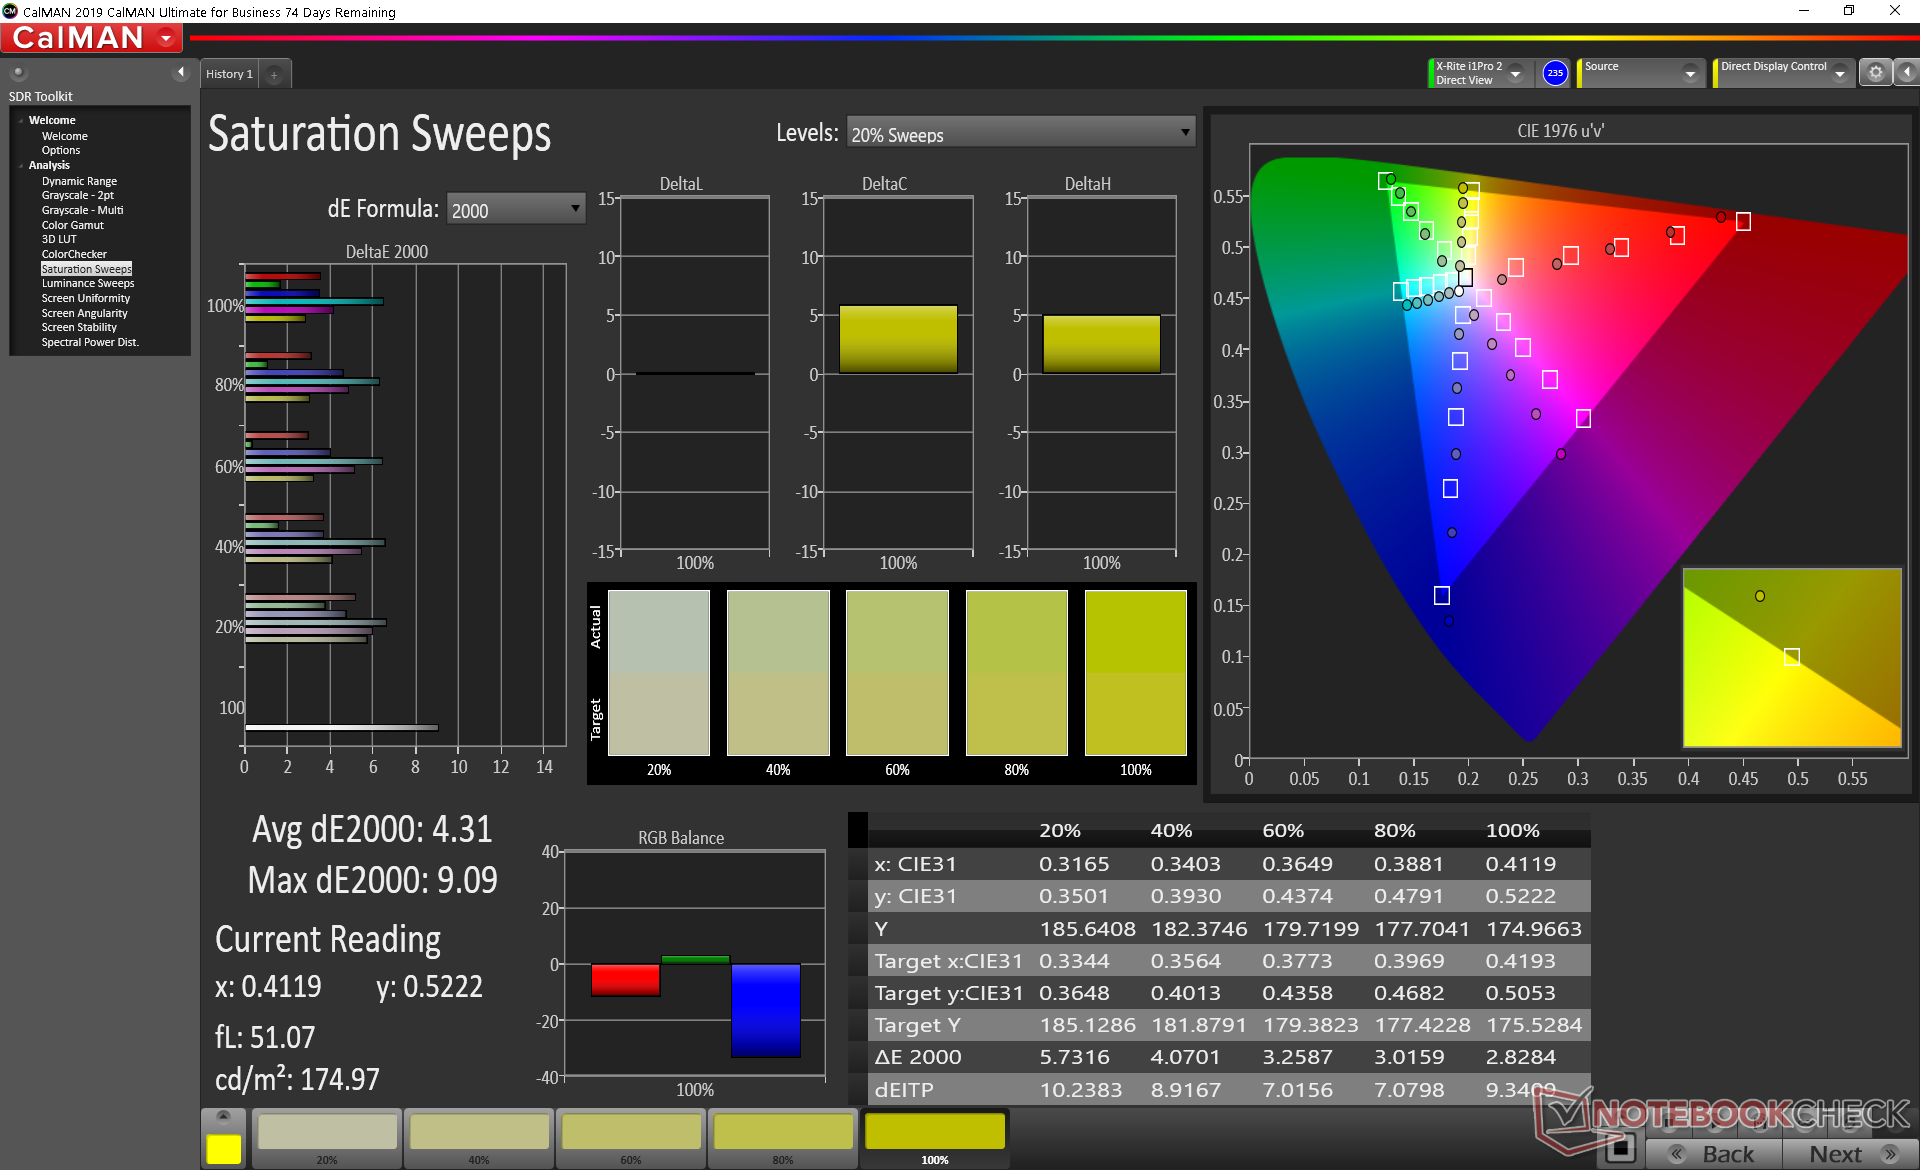
The display is poorly calibrated out of the box with its overly cool color temperature. After calibrating the panel ourselves, grayscale and colors would improve noticeably from average DeltaE values of 6.2 and 4.47 to just 2.1 and 2.89, respectively. We recommend calibrating the display to get the most out of its wide sRGB coverage.
Display Response Times
| ↔ Response Time Black to White | ||
|---|---|---|
| 28.8 ms ... rise ↗ and fall ↘ combined | ↗ 18 ms rise | 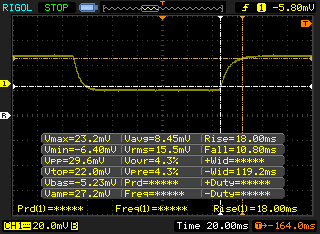 |
| ↘ 10.8 ms fall | ||
| The screen shows relatively slow response rates in our tests and may be too slow for gamers. In comparison, all tested devices range from 0.1 (minimum) to 240 (maximum) ms. » 76 % of all devices are better. This means that the measured response time is worse than the average of all tested devices (19.8 ms). | ||
| ↔ Response Time 50% Grey to 80% Grey | ||
| 37.6 ms ... rise ↗ and fall ↘ combined | ↗ 19.6 ms rise | 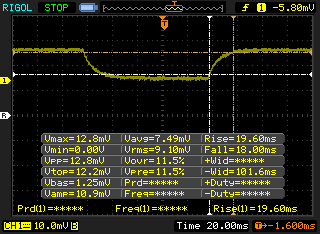 |
| ↘ 18 ms fall | ||
| The screen shows slow response rates in our tests and will be unsatisfactory for gamers. In comparison, all tested devices range from 0.165 (minimum) to 636 (maximum) ms. » 55 % of all devices are better. This means that the measured response time is worse than the average of all tested devices (31 ms). | ||
Screen Flickering / PWM (Pulse-Width Modulation)
| Screen flickering / PWM not detected | 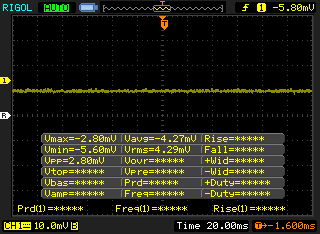 | ||
In comparison: 52 % of all tested devices do not use PWM to dim the display. If PWM was detected, an average of 7753 (minimum: 5 - maximum: 343500) Hz was measured. | |||
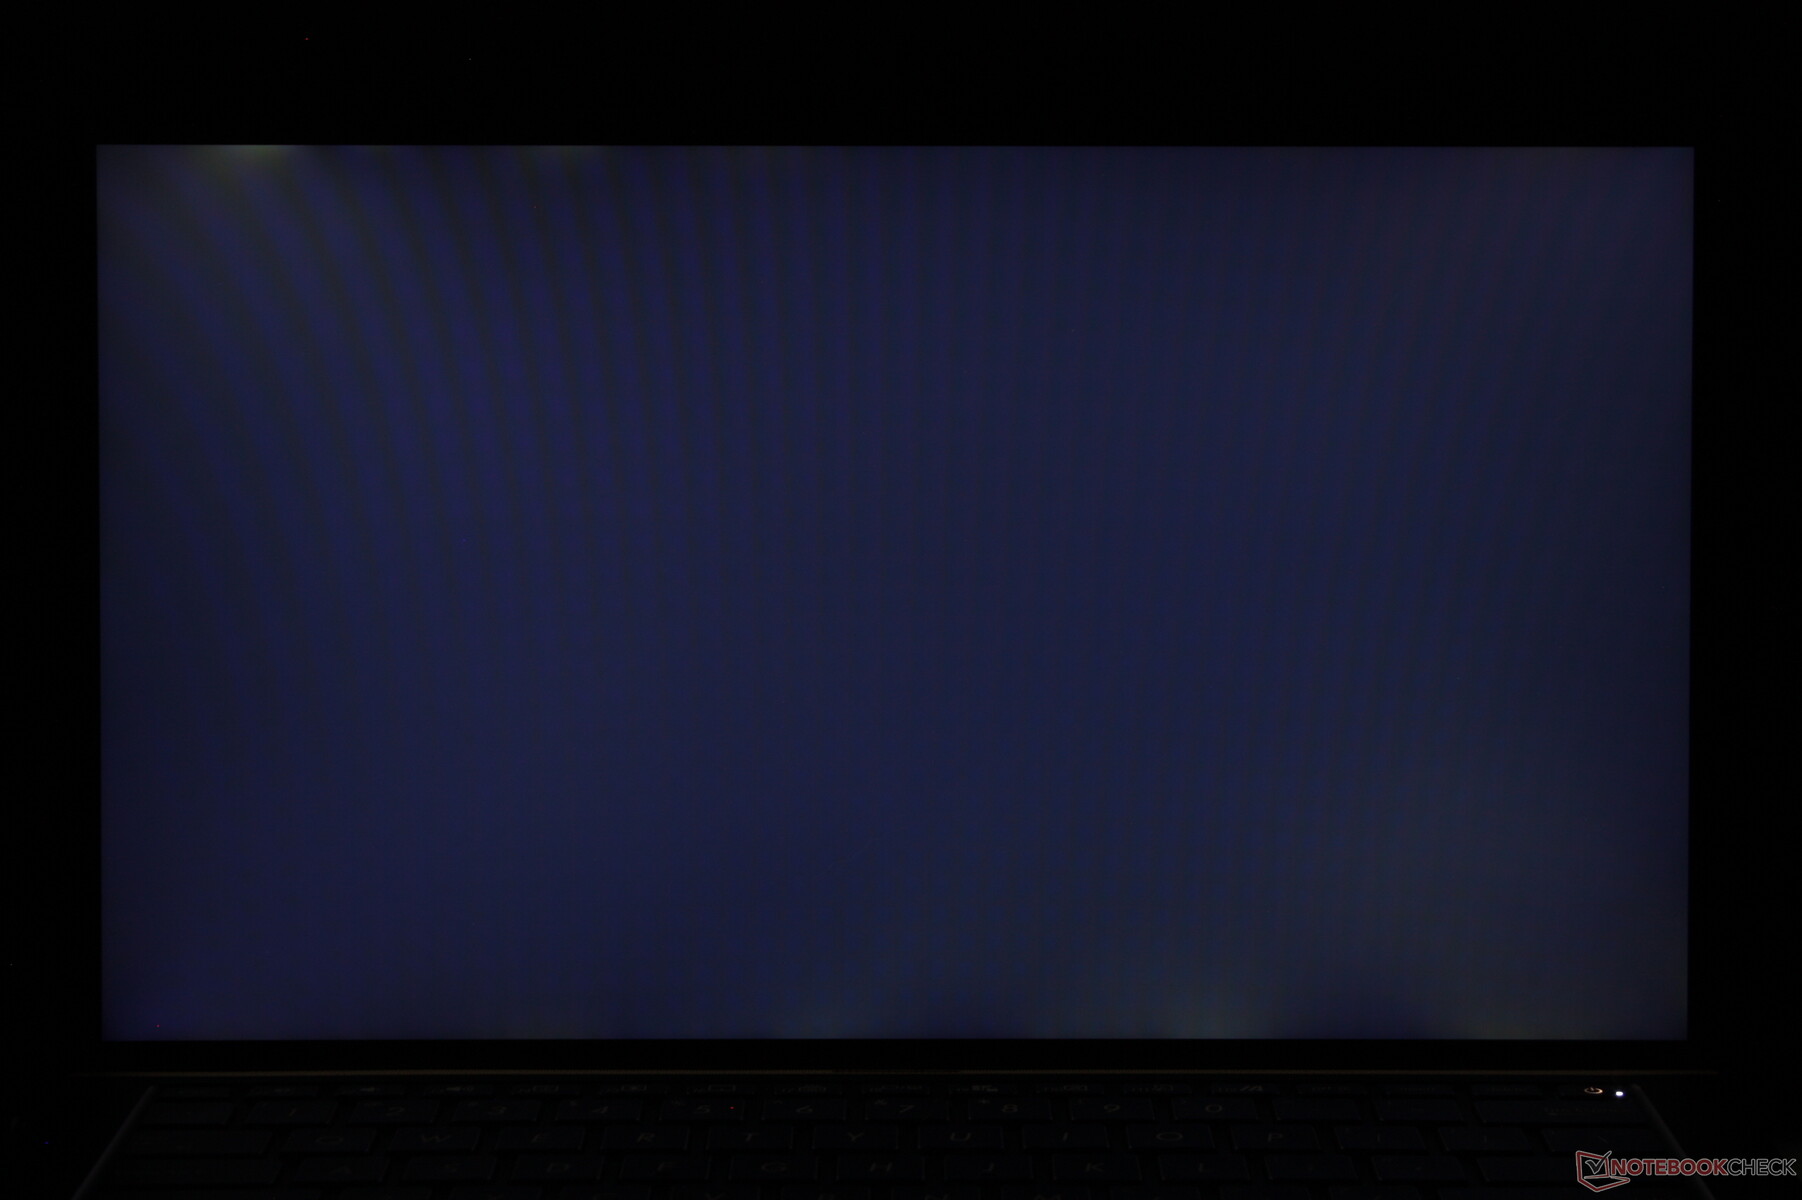
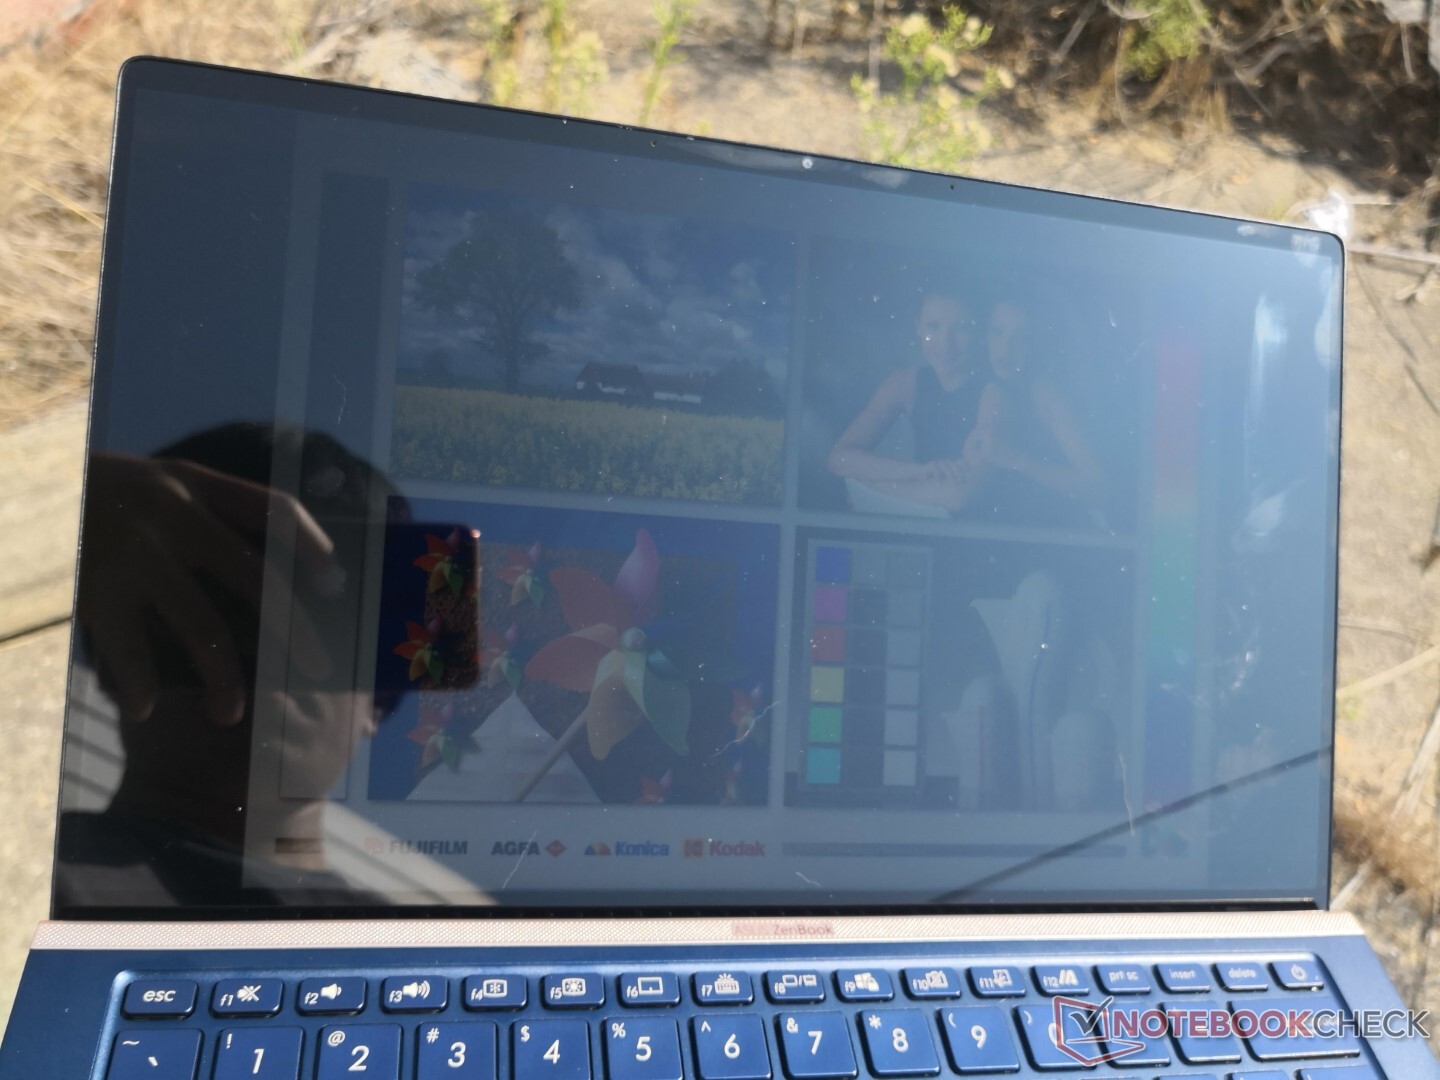
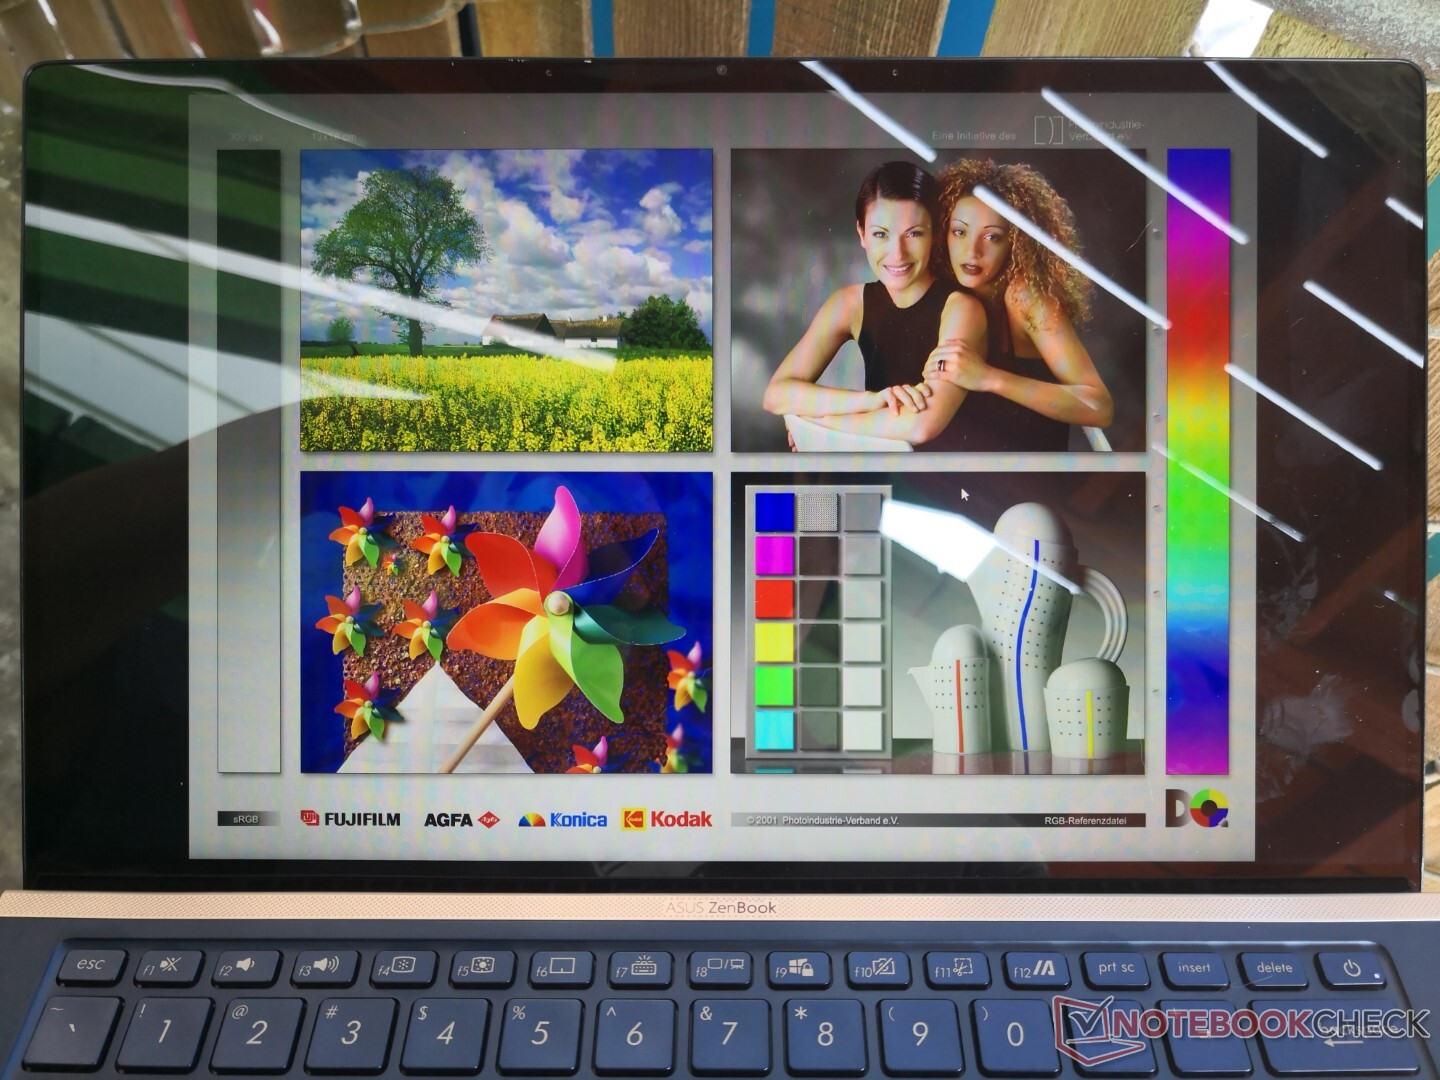
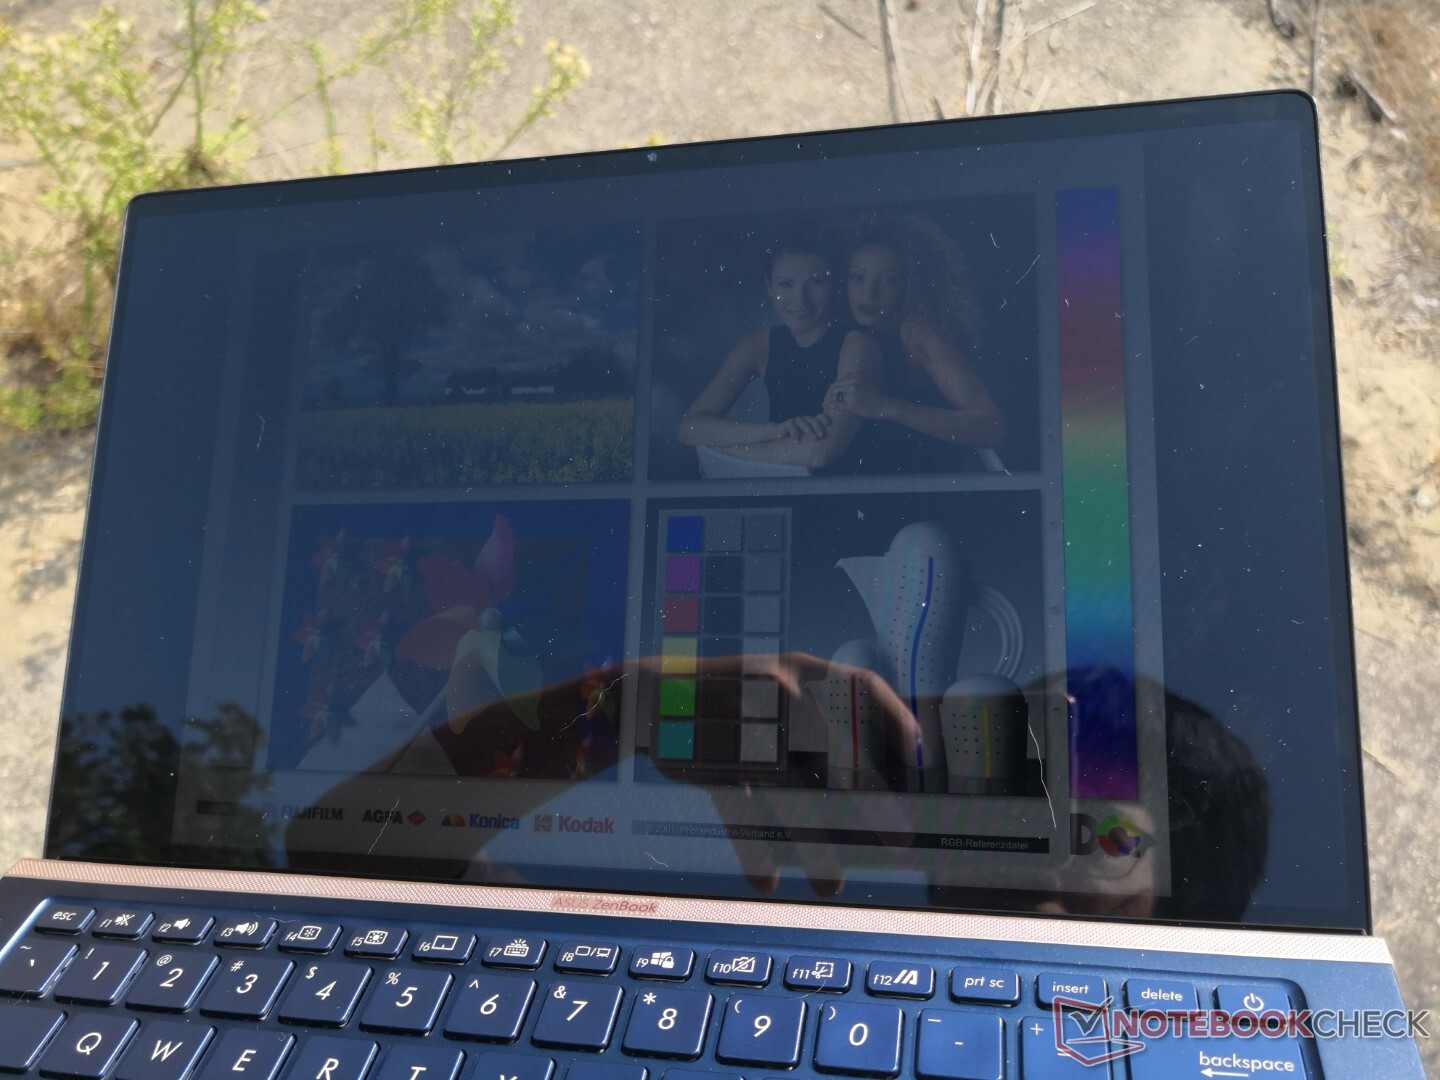
Outdoor visibility is average for the category and glare is ever present due to the glossy overlay. The MacBook Pro, HP EliteBook, and Dell XPS series have much brighter panels if outdoor visibility is a concern.
Performance
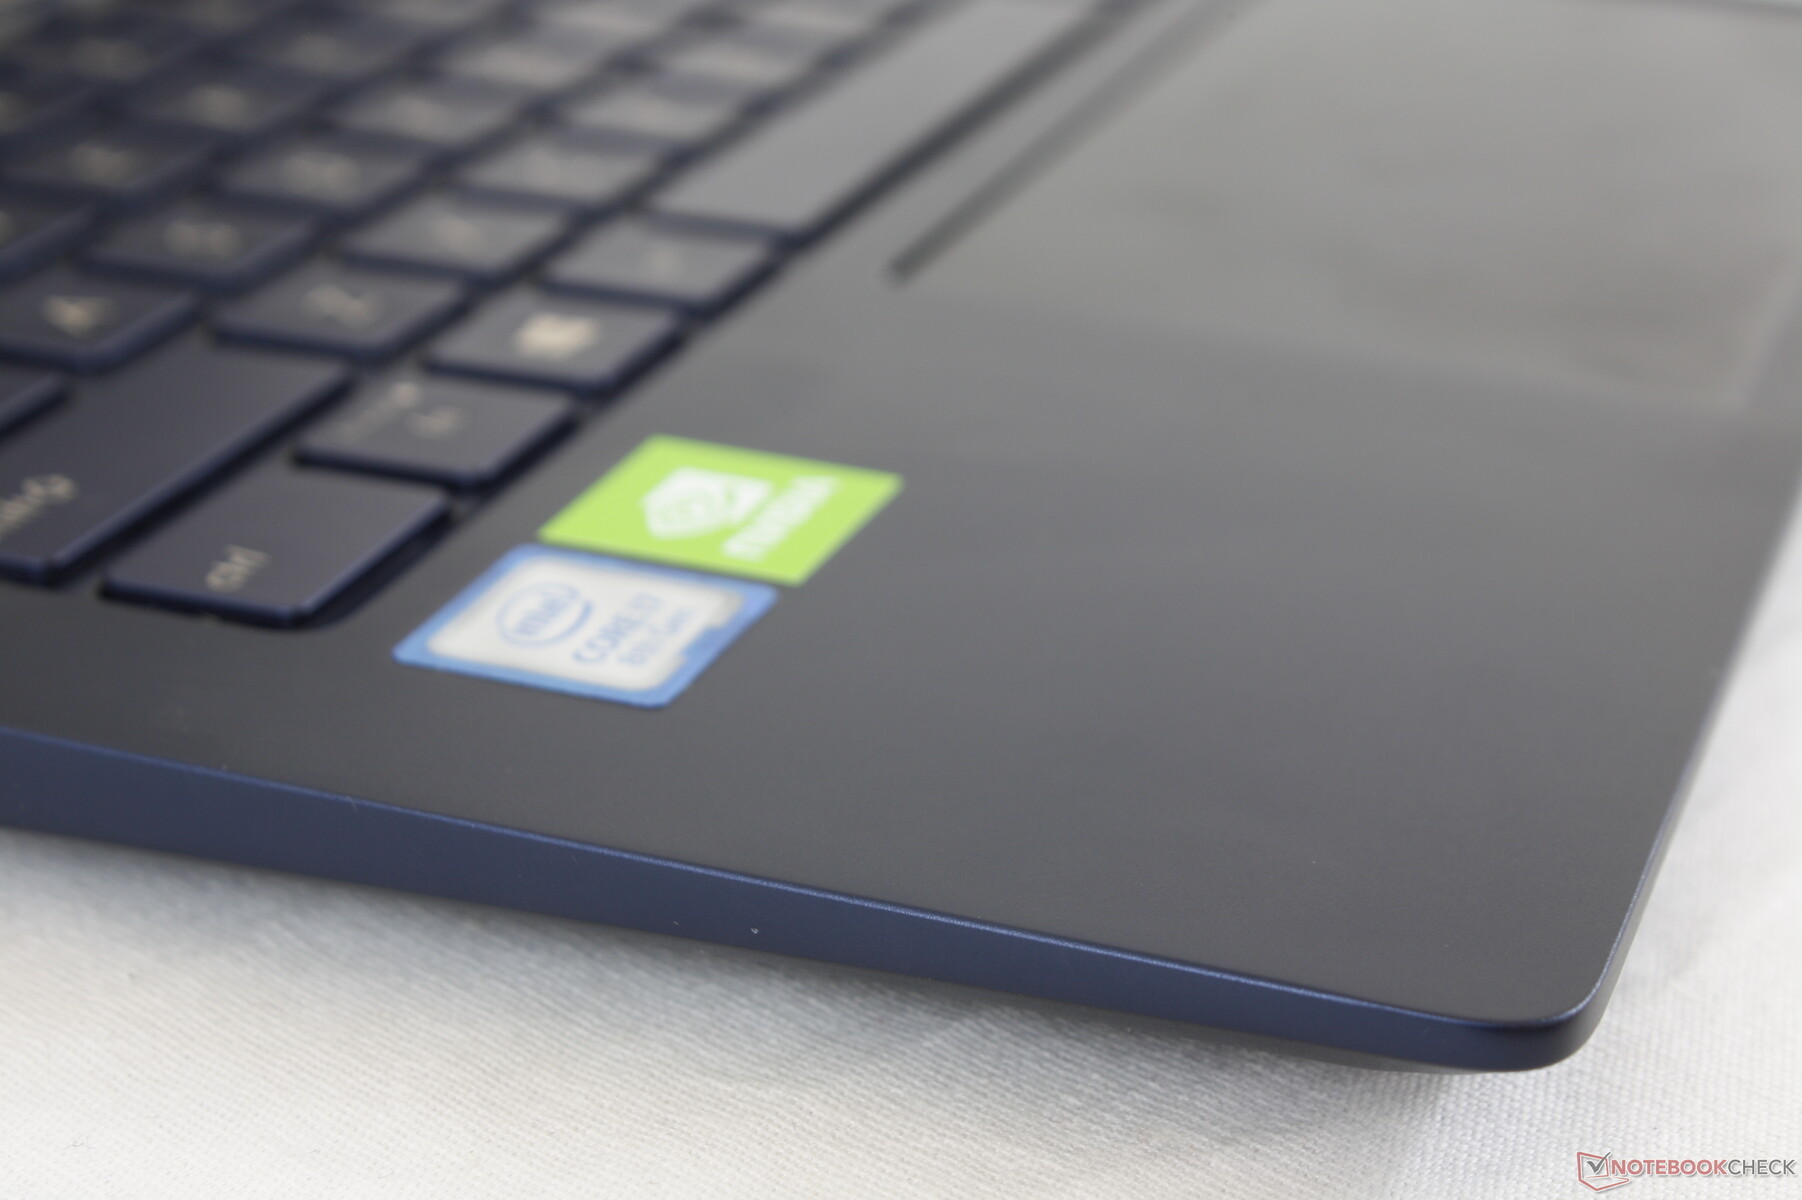
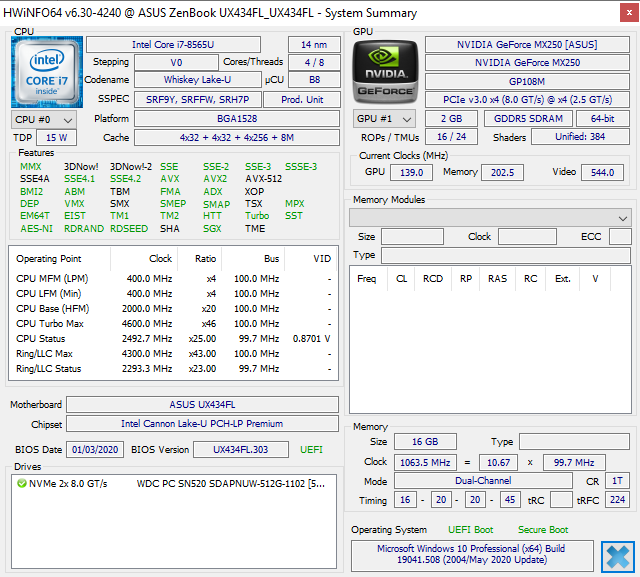
Though Asus offers 8th gen Core i5-8265U and Core i7-8565U options on this particular model, the newer refresh models includes 10th gen Core i5-10210U and Core i7-10510U options instead. Even so, the year-over-year performance gap between 8th gen Whiskey Lake-U and 10th gen Comet Lake-U is minuscule and so users wouldn't be missing out on much by going with the 8th gen series.
Nvidia Optimus comes standard for automatic graphics switching. Unlike the VivoBook S14 and its 25 W GeForce MX250, however, this ZenBook uses the much slower 10 W version with reduced clock rates across the board. AMD versions of the ZenBook 14 are also available albeit none come equipped with the ScreenPad feature as of this writing.
All benchmarks below were performed on High Performance mode for the best possible scores. We elected to enable the ScreenPad as well since this is a defining feature of the ZenBook 14 UX434 series.
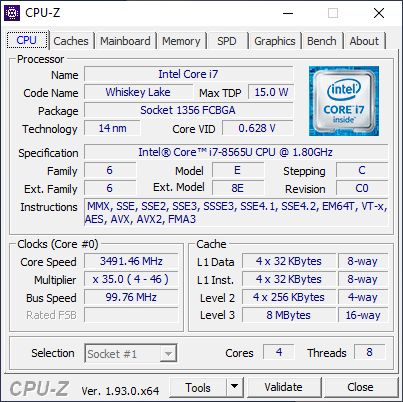
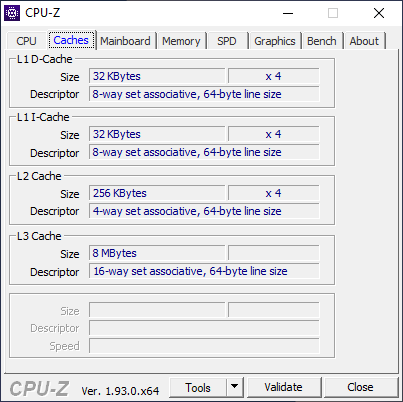
Processor
CPU performance is good at about 10 to 15 percent faster than the average laptop in our database equipped with the same Core i7-8565U. It's within just a few percentage points of the newer Core i5-10210U or Core i7-10510U even though these latter processors are newer and often more expensive. Turbo Boost sustainability, however, is only average as performance can dip by as much as 20 percent when subjected to prolonged stress as shown by our CineBench R15 xT loop test results below.
See our dedicated page on the Core i7-8565U for more technical information and benchmark comparisons.
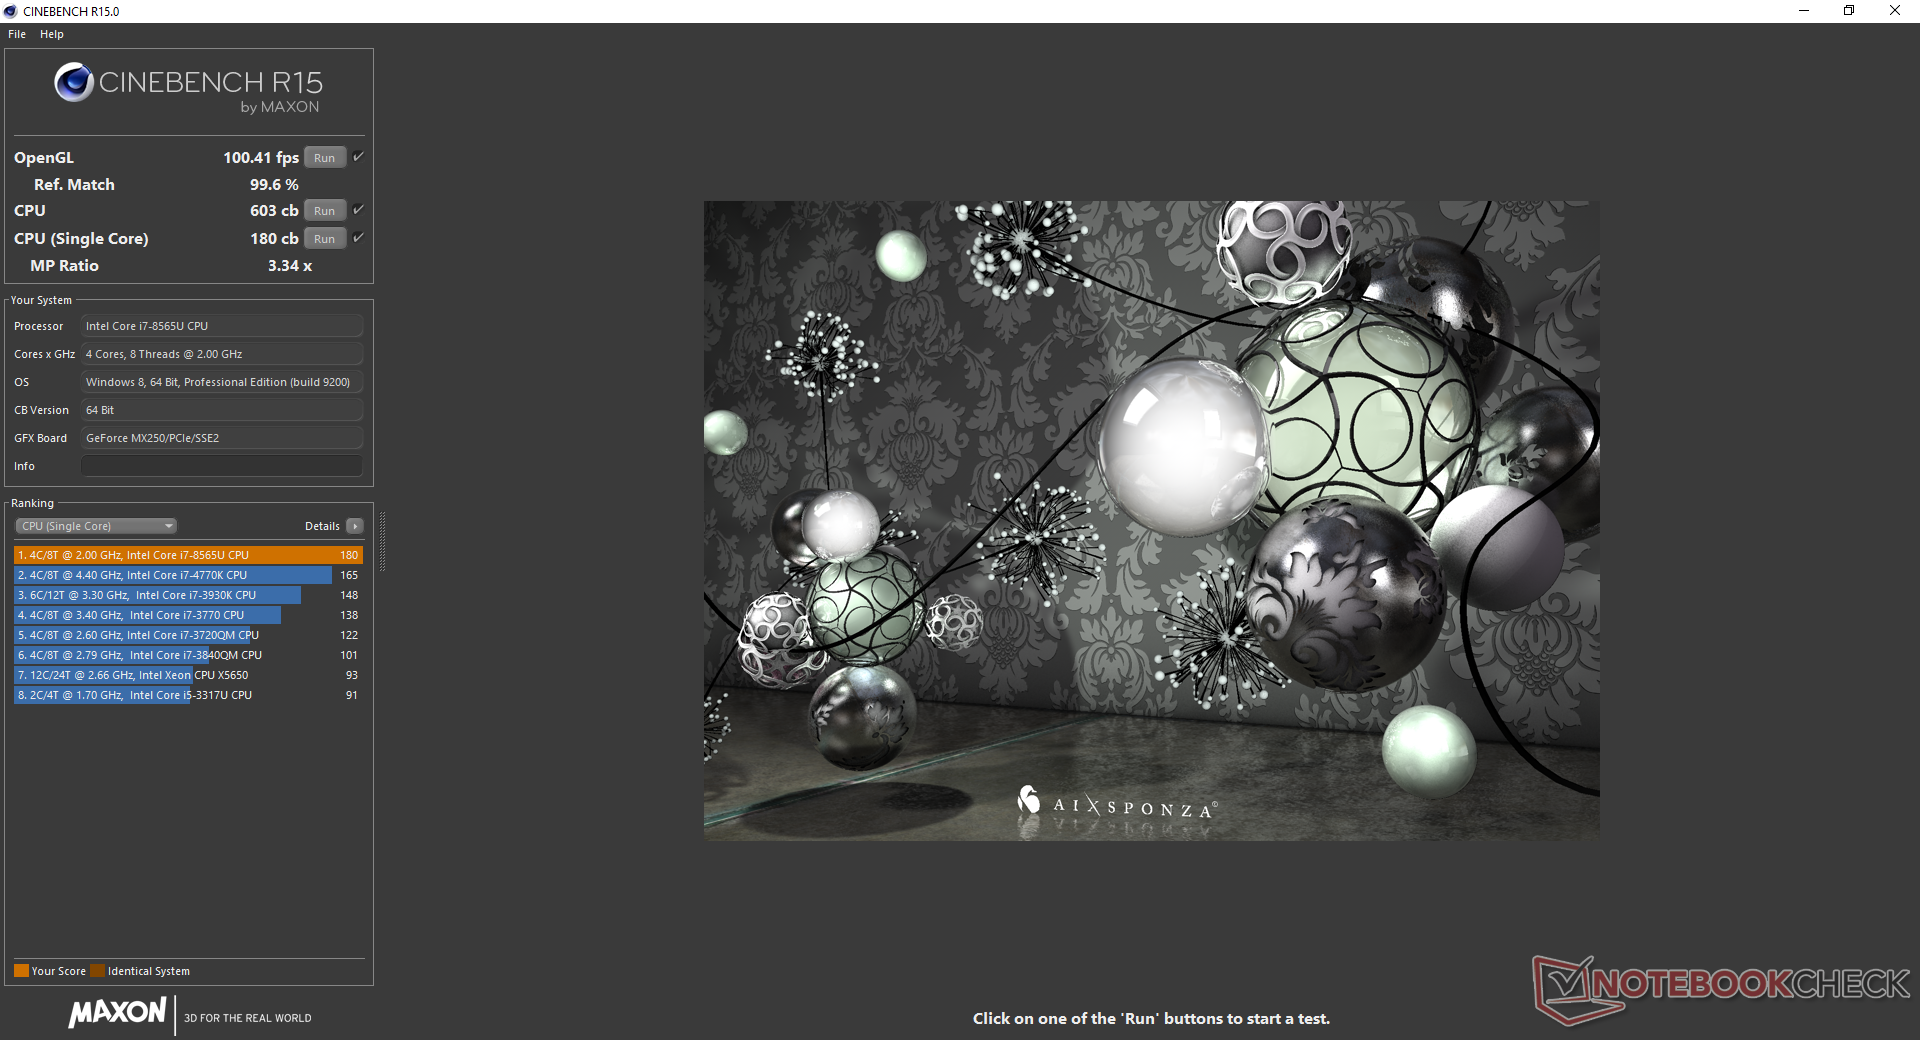
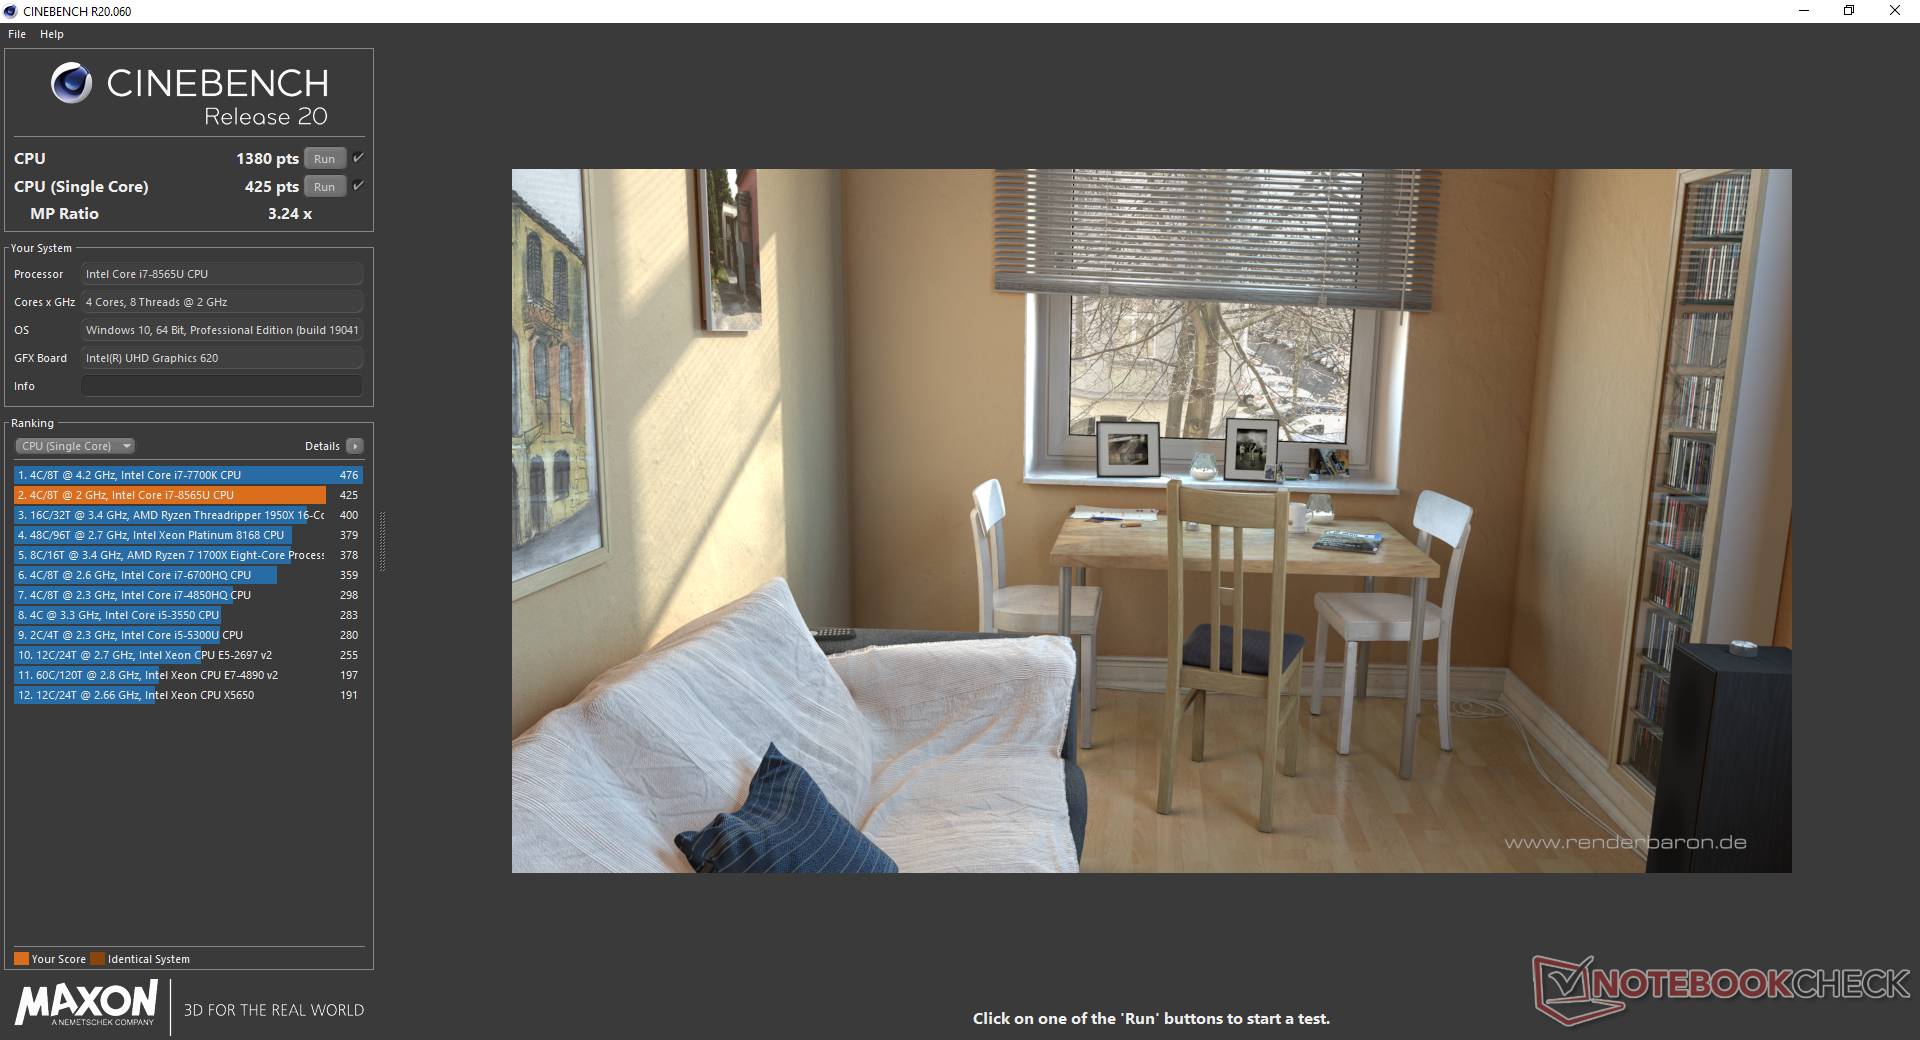
Cinebench R15: CPU Multi 64Bit | CPU Single 64Bit
Blender: v2.79 BMW27 CPU
7-Zip 18.03: 7z b 4 -mmt1 | 7z b 4
Geekbench 5.5: Single-Core | Multi-Core
HWBOT x265 Benchmark v2.2: 4k Preset
LibreOffice : 20 Documents To PDF
R Benchmark 2.5: Overall mean
| LibreOffice / 20 Documents To PDF | |
| HP Envy x360 15-ee0257ng | |
| Asus ZenBook 14 UX434FL-DB77 | |
| Average Intel Core i7-8565U (n=1) | |
| Acer Swift 3 SF314-42-R27B | |
| LG Gram 14Z90N | |
| Lenovo IdeaPad 5 14ARE05 | |
| Lenovo Yoga Slim 7-14ARE | |
| Asus VivoBook S14 S433FL | |
| Lenovo ThinkPad T14s-20T00044GE | |
| Asus ZenBook 13 UX325JA | |
Cinebench R15: CPU Multi 64Bit | CPU Single 64Bit
Blender: v2.79 BMW27 CPU
7-Zip 18.03: 7z b 4 -mmt1 | 7z b 4
Geekbench 5.5: Single-Core | Multi-Core
HWBOT x265 Benchmark v2.2: 4k Preset
LibreOffice : 20 Documents To PDF
R Benchmark 2.5: Overall mean
* ... smaller is better
System Performance
PCMark benchmarks are where we expect them to be relative to other laptops with the same CPU and GPU. We experienced no software or hardware issues during our time with the unit, though there is a small learning curve before the ScreenPad becomes second nature.
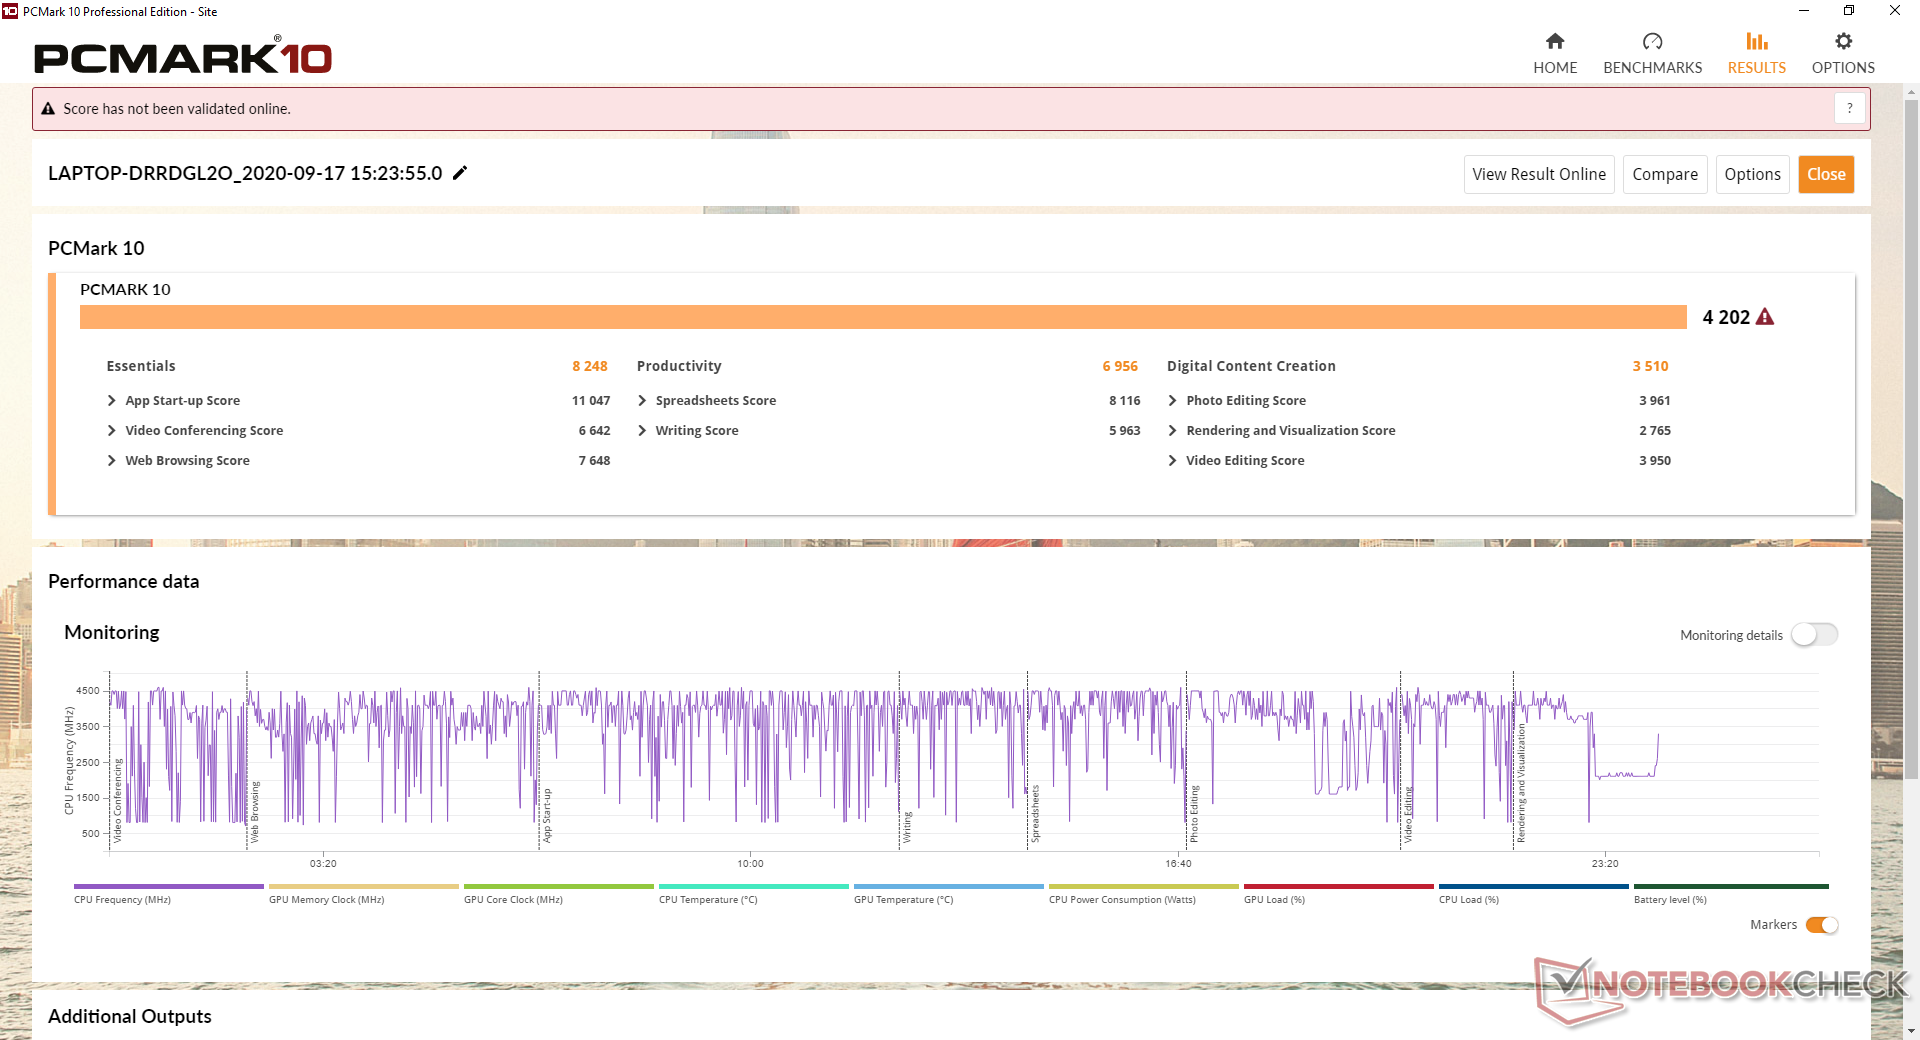
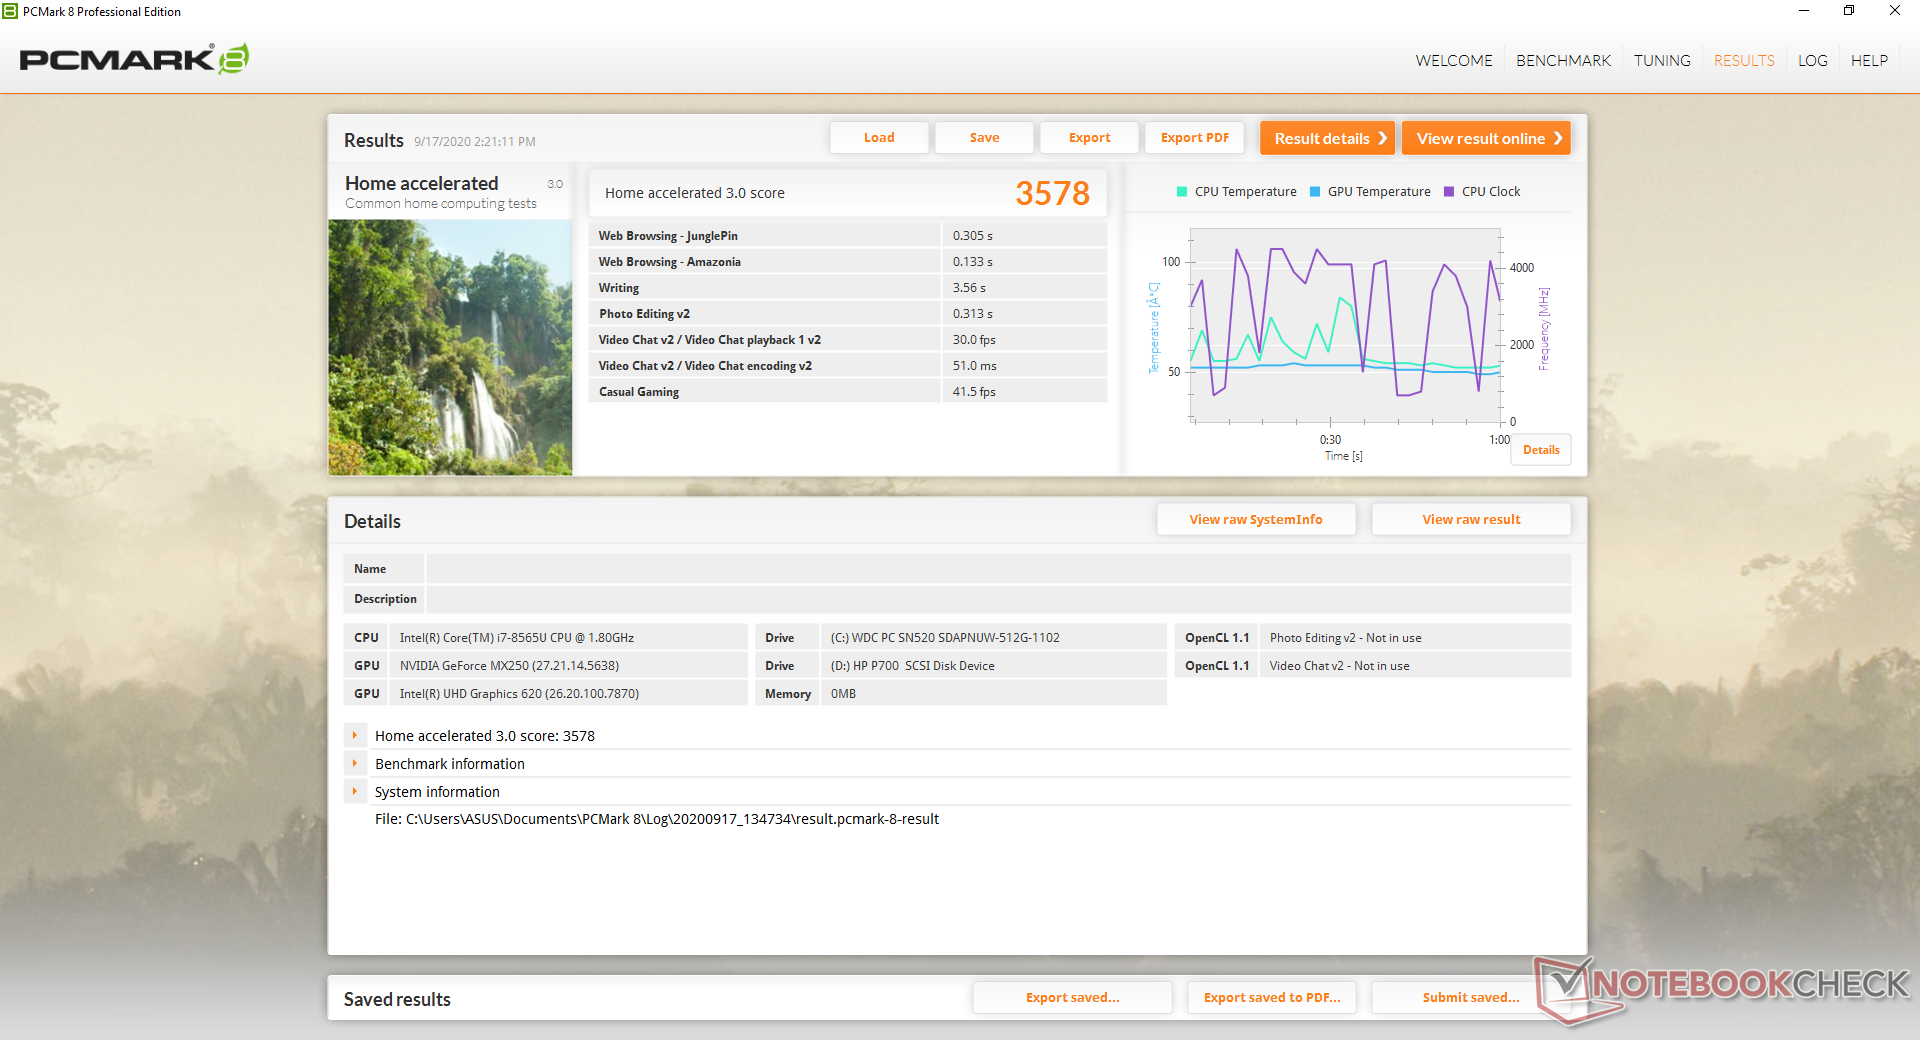
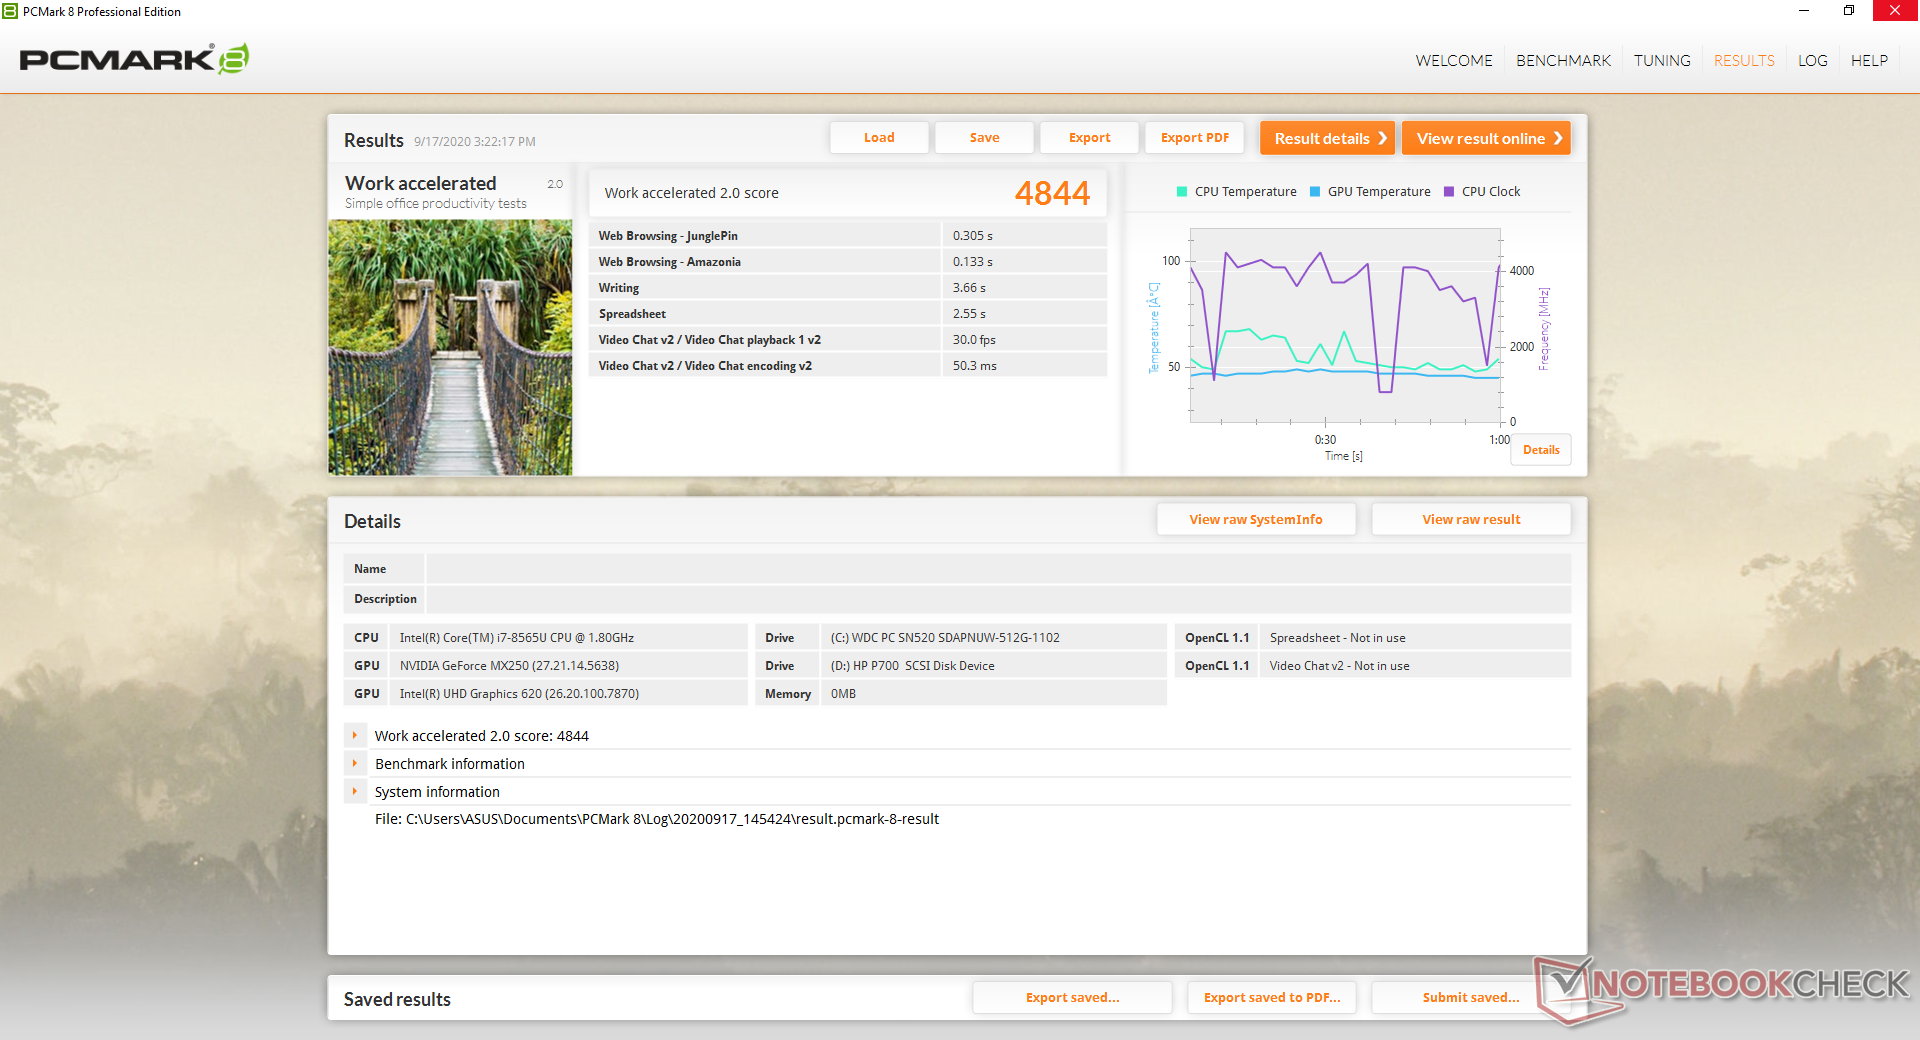
| PCMark 8 Home Score Accelerated v2 | 3578 points | |
| PCMark 8 Work Score Accelerated v2 | 4844 points | |
| PCMark 10 Score | 4202 points | |
Help | ||
DPC Latency
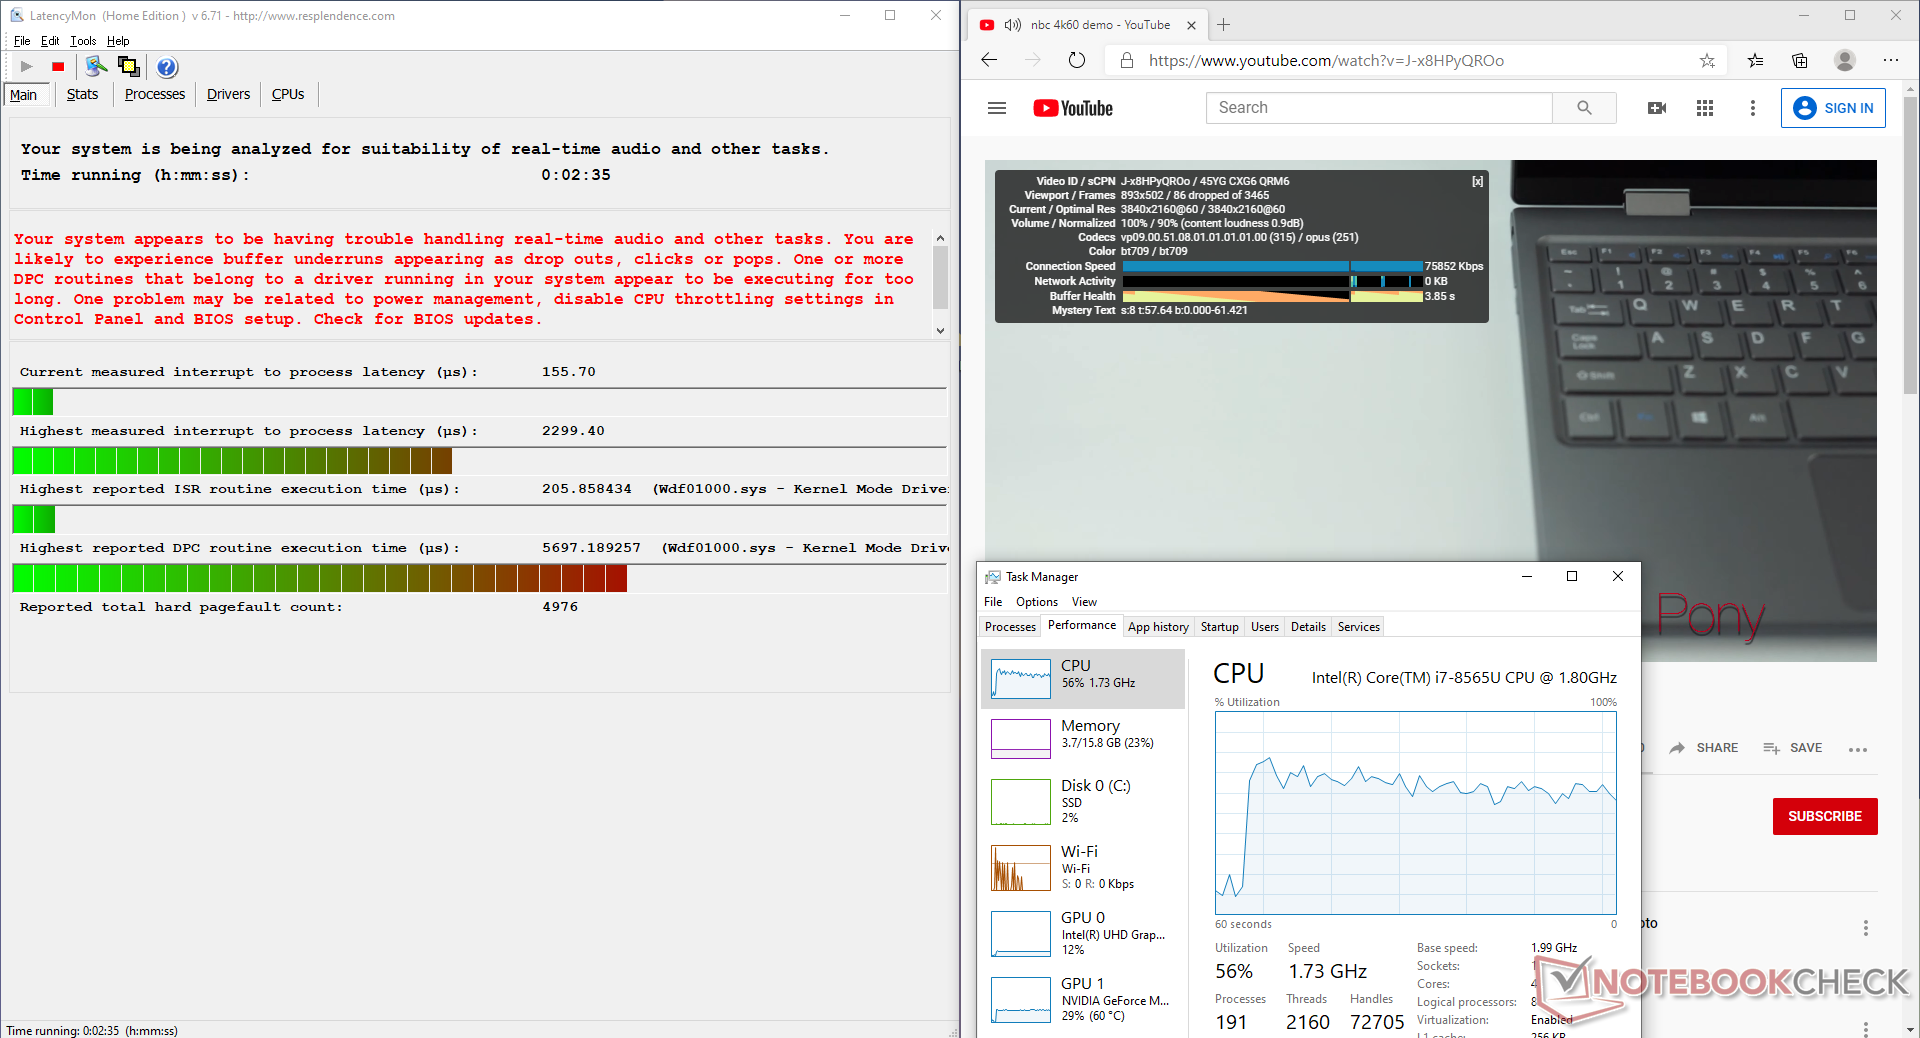
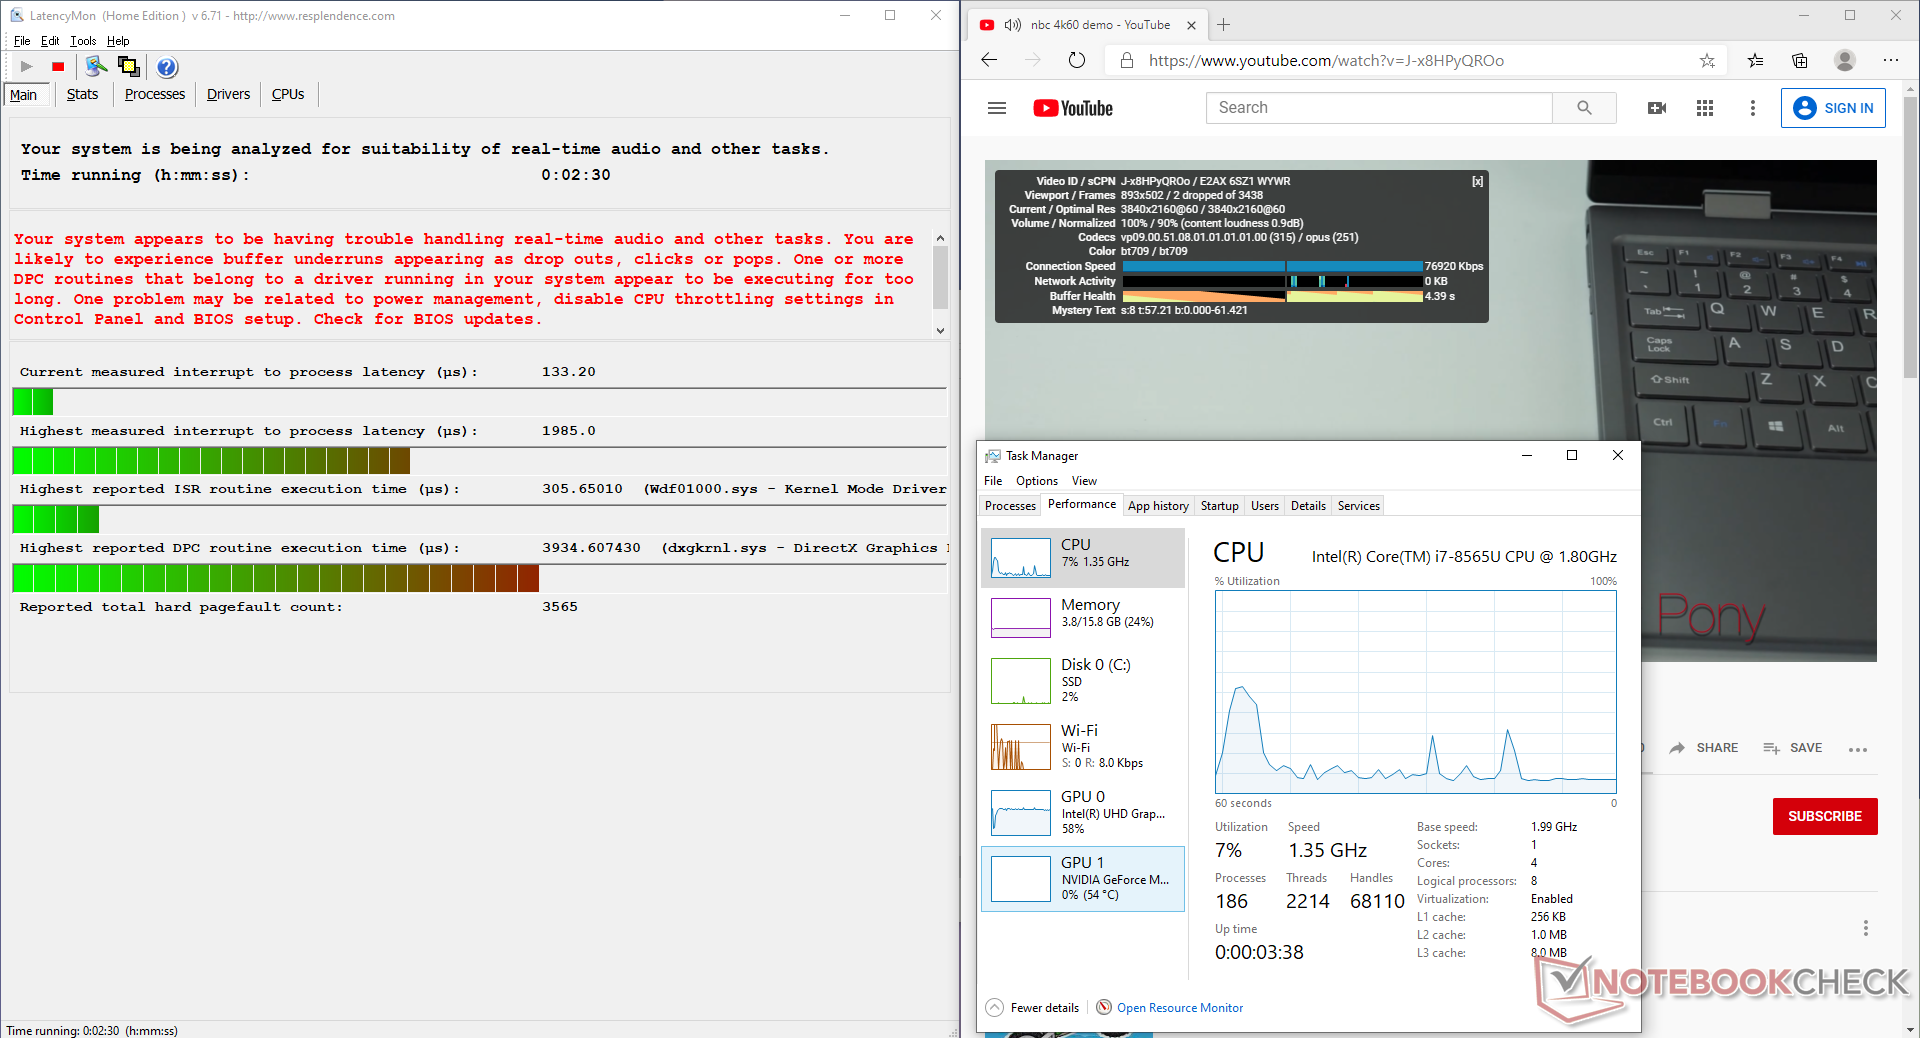
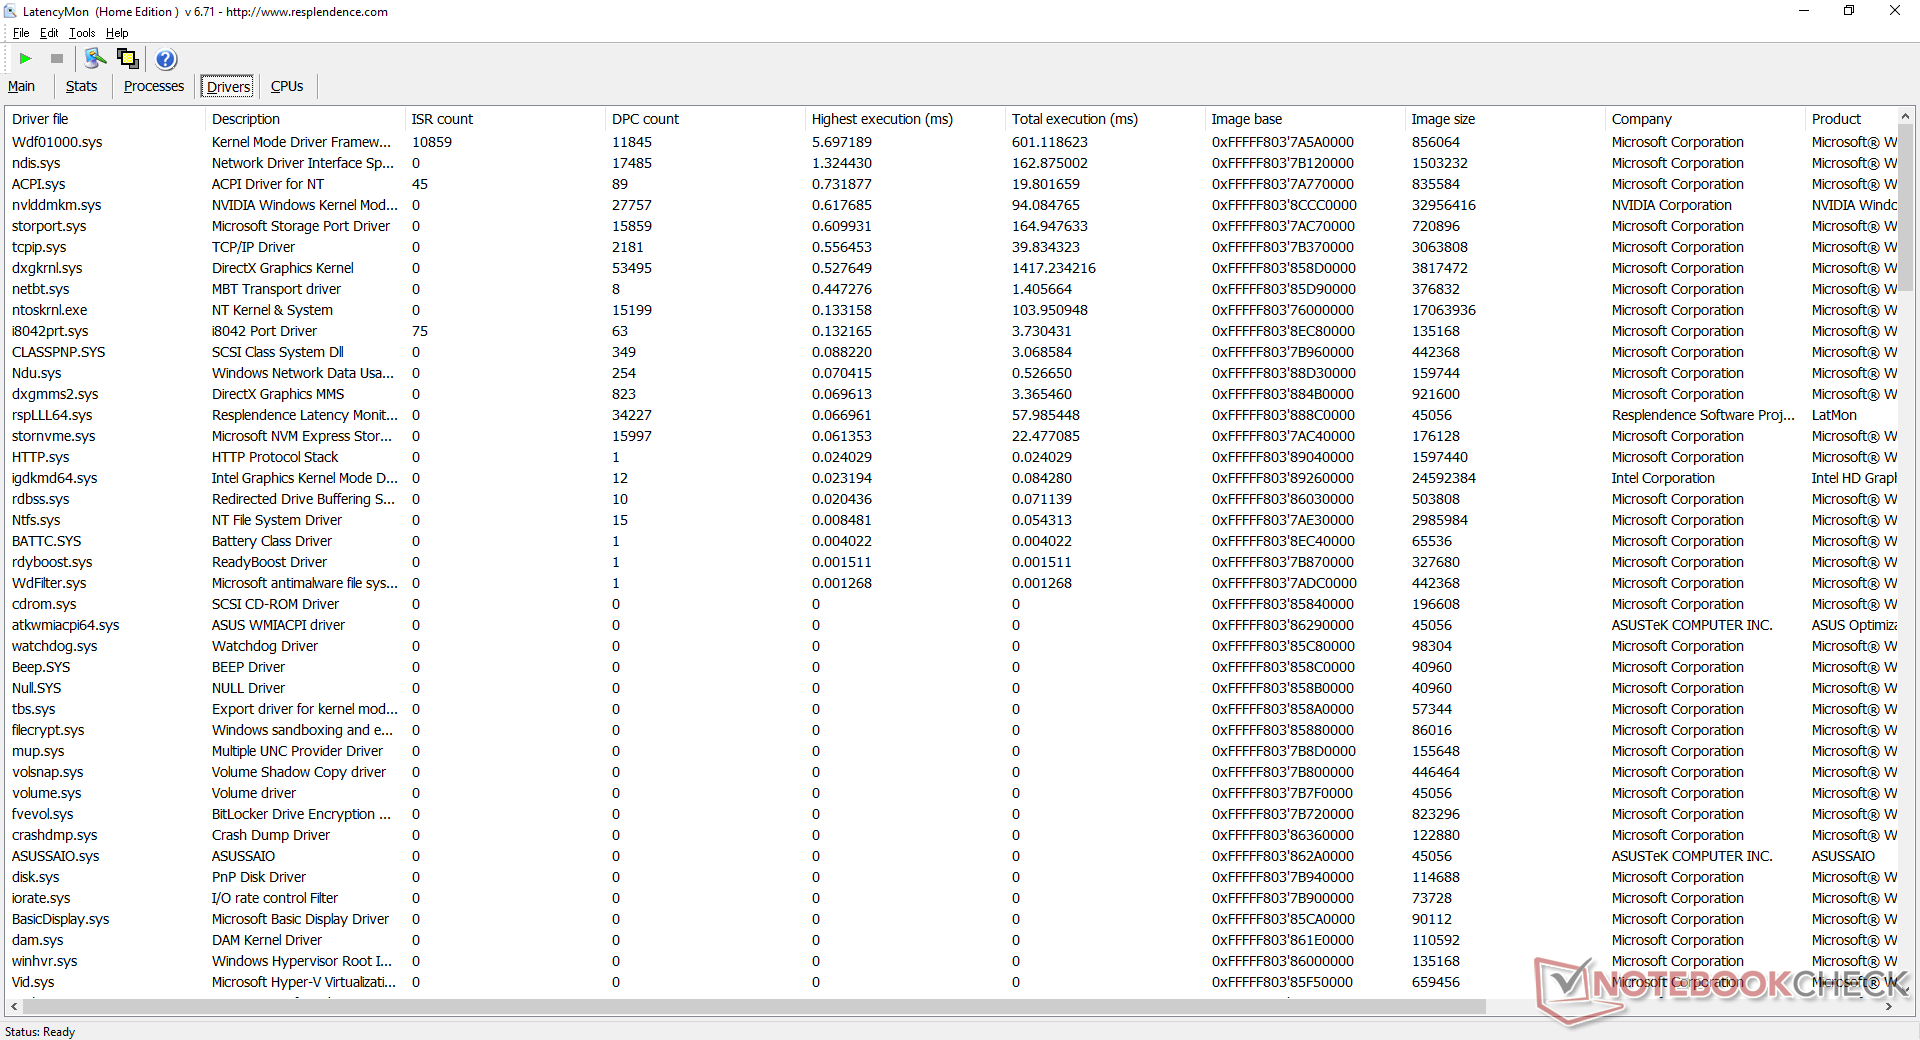
LatencyMon shows DPC latency issues when opening multiple browser tabs on our homepage. Additionally, 4K UHD playback at 60 FPS is not smooth with 86 dropped frames and an unusually high CPU load of ~56 percent during our minute-long YouTube video test when the discrete GPU is active. Deactivating the discrete GPU fixes the playback problem although the DPC latency issues remain.
| DPC Latencies / LatencyMon - interrupt to process latency (max), Web, Youtube, Prime95 | |
| LG Gram 14Z90N | |
| Asus ZenBook 13 UX325JA | |
| Lenovo Yoga Slim 7-14ARE | |
| Lenovo ThinkPad T14s-20T00044GE | |
| Asus ZenBook 14 UX434FL-DB77 | |
| Acer Swift 3 SF314-42-R27B | |
| Asus VivoBook S14 S433FL | |
| HP Envy x360 15-ee0257ng | |
| Lenovo IdeaPad 5 14ARE05 | |
* ... smaller is better
Storage Devices
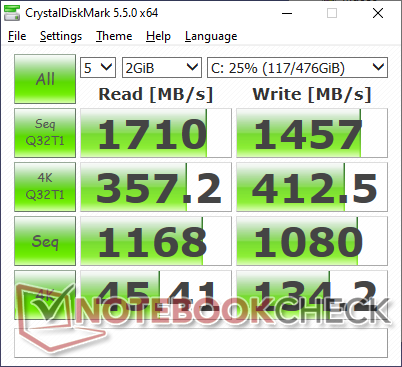
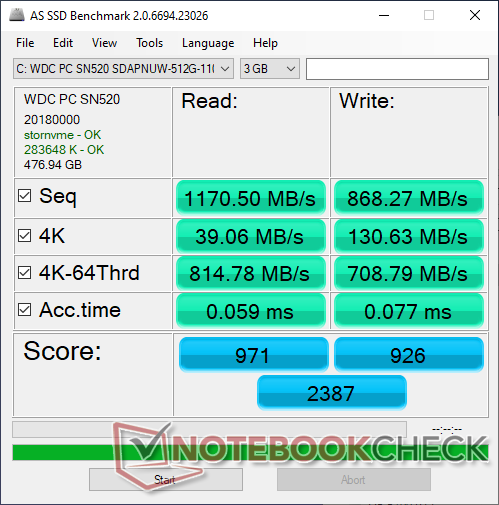
The WD SN520 is an entry-level M.2 PCIe x2 NVMe SSD in contrast to the pricier PCIe x4 SN720 series. Theoretical sequential read and write rates top at 1700 MB/s and 1400 MB/s, respectively, which we're able to reach with CrystalDiskMark and DiskSpd. Though performance is more than sufficient considering the U-series CPU and GeForce MX GPU setup, higher-end Ultrabooks ship with the much faster Samsung PM981 series SSDs instead.
See our table of HDDs and SSDs for more benchmark comparisons.
| Asus ZenBook 14 UX434FL-DB77 WDC PC SN520 SDAPNUW-512G | Lenovo IdeaPad 5 14ARE05 Samsung PM991 MZALQ512HALU | Asus VivoBook S14 S433FL Intel Optane Memory H10 with Solid State Storage 32GB + 512GB HBRPEKNX0202A(L/H) | LG Gram 14Z90N Samsung SSD PM981 MZVLB256HAHQ | Lenovo Yoga Slim 7-14ARE Samsung SSD PM981a MZVLB512HBJQ | MSI Modern 14 A10RB-459US Kingston RBUSNS8154P3512GJ | |
|---|---|---|---|---|---|---|
| AS SSD | 11% | -21% | 33% | 71% | -14% | |
| Seq Read (MB/s) | 1171 | 1970 68% | 957 -18% | 1744 49% | 1658 42% | 1061 -9% |
| Seq Write (MB/s) | 868 | 1268 46% | 353.1 -59% | 1450 67% | 2464 184% | 953 10% |
| 4K Read (MB/s) | 39.06 | 47.13 21% | 62.4 60% | 57.4 47% | 59.5 52% | 35.59 -9% |
| 4K Write (MB/s) | 130.6 | 121.6 -7% | 122.8 -6% | 140.9 8% | 128.6 -2% | 87 -33% |
| 4K-64 Read (MB/s) | 815 | 855 5% | 386.2 -53% | 907 11% | 1576 93% | 769 -6% |
| 4K-64 Write (MB/s) | 709 | 859 21% | 605 -15% | 1372 94% | 1986 180% | 733 3% |
| Access Time Read * (ms) | 0.059 | 0.065 -10% | 0.107 -81% | 0.059 -0% | 0.049 17% | 0.084 -42% |
| Access Time Write * (ms) | 0.077 | 0.032 58% | 0.046 40% | 0.081 -5% | 0.087 -13% | 0.136 -77% |
| Score Read (Points) | 971 | 1100 13% | 544 -44% | 1138 17% | 1802 86% | 911 -6% |
| Score Write (Points) | 926 | 1108 20% | 763 -18% | 1658 79% | 2361 155% | 916 -1% |
| Score Total (Points) | 2387 | 2745 15% | 1581 -34% | 3380 42% | 5133 115% | 2294 -4% |
| Copy ISO MB/s (MB/s) | 1287 | 982 -24% | 1520 18% | 1588 23% | 956 -26% | |
| Copy Program MB/s (MB/s) | 417 | 276.2 -34% | 539 29% | 550 32% | 496.5 19% | |
| Copy Game MB/s (MB/s) | 1017 | 681 -33% | 1070 5% | 1329 31% | 872 -14% | |
| CrystalDiskMark 5.2 / 6 | 10% | 27% | 42% | 72% | -9% | |
| Write 4K (MB/s) | 134.2 | 102.8 -23% | 124.9 -7% | 183.6 37% | 146.1 9% | 107.7 -20% |
| Read 4K (MB/s) | 45.41 | 45.48 0% | 147.9 226% | 48.51 7% | 47.18 4% | 39.73 -13% |
| Write Seq (MB/s) | 1080 | 1255 16% | 753 -30% | 1520 41% | 2896 168% | 926 -14% |
| Read Seq (MB/s) | 1168 | 1434 23% | 1223 5% | 1914 64% | 2754 136% | 1014 -13% |
| Write 4K Q32T1 (MB/s) | 412.5 | 441 7% | 369.2 -10% | 529 28% | 425.8 3% | 343.6 -17% |
| Read 4K Q32T1 (MB/s) | 357.2 | 474.1 33% | 358.1 0% | 560 57% | 514 44% | 499.1 40% |
| Write Seq Q32T1 (MB/s) | 1457 | 1456 0% | 1057 -27% | 1540 6% | 2989 105% | 1033 -29% |
| Read Seq Q32T1 (MB/s) | 1710 | 2085 22% | 2738 60% | 3408 99% | 3568 109% | 1604 -6% |
| Total Average (Program / Settings) | 11% /
11% | 3% /
-1% | 38% /
36% | 72% /
72% | -12% /
-12% |
* ... smaller is better

Disk Throttling: DiskSpd Read Loop, Queue Depth 8
GPU Performance
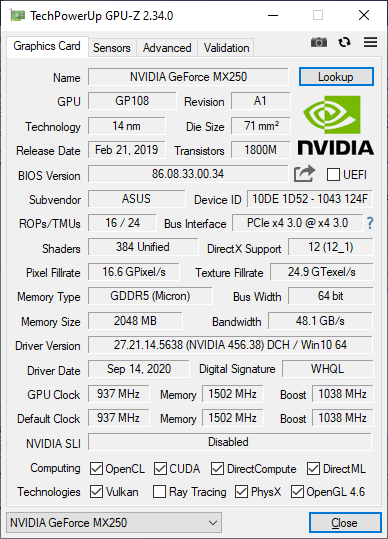
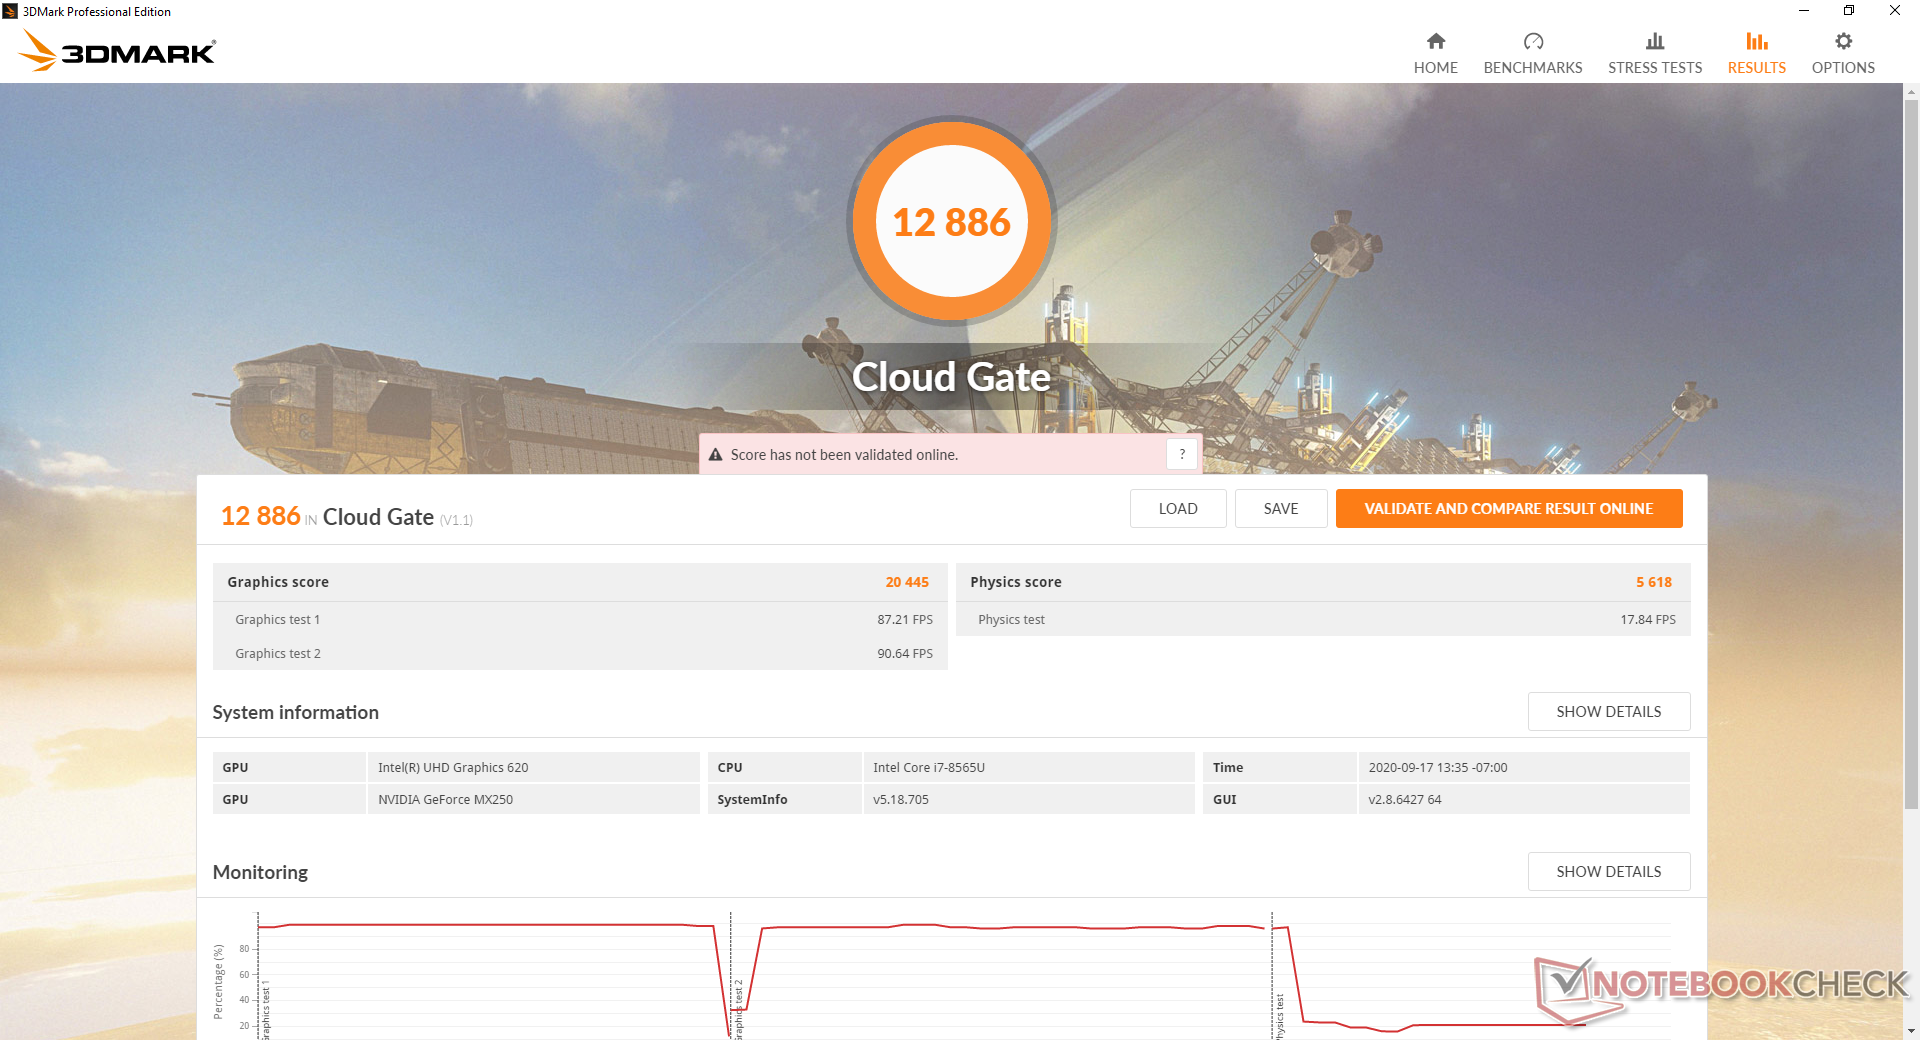
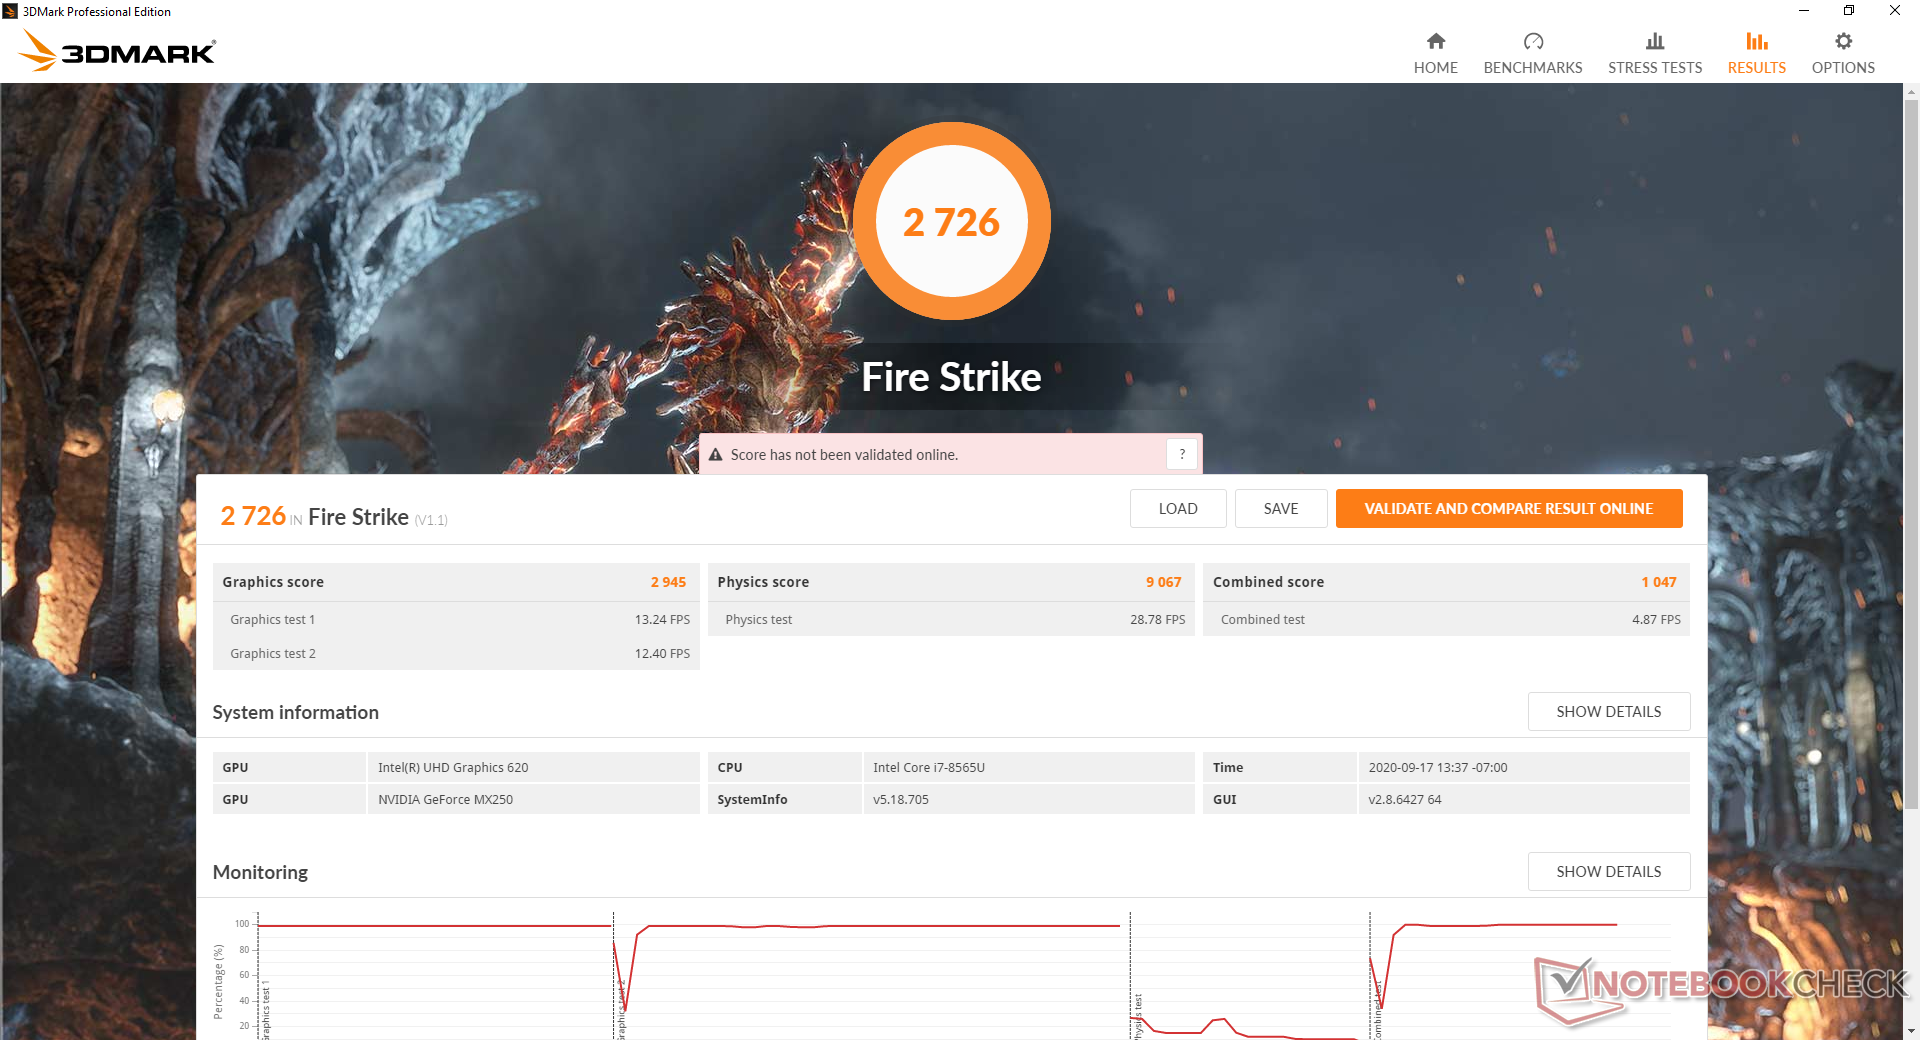
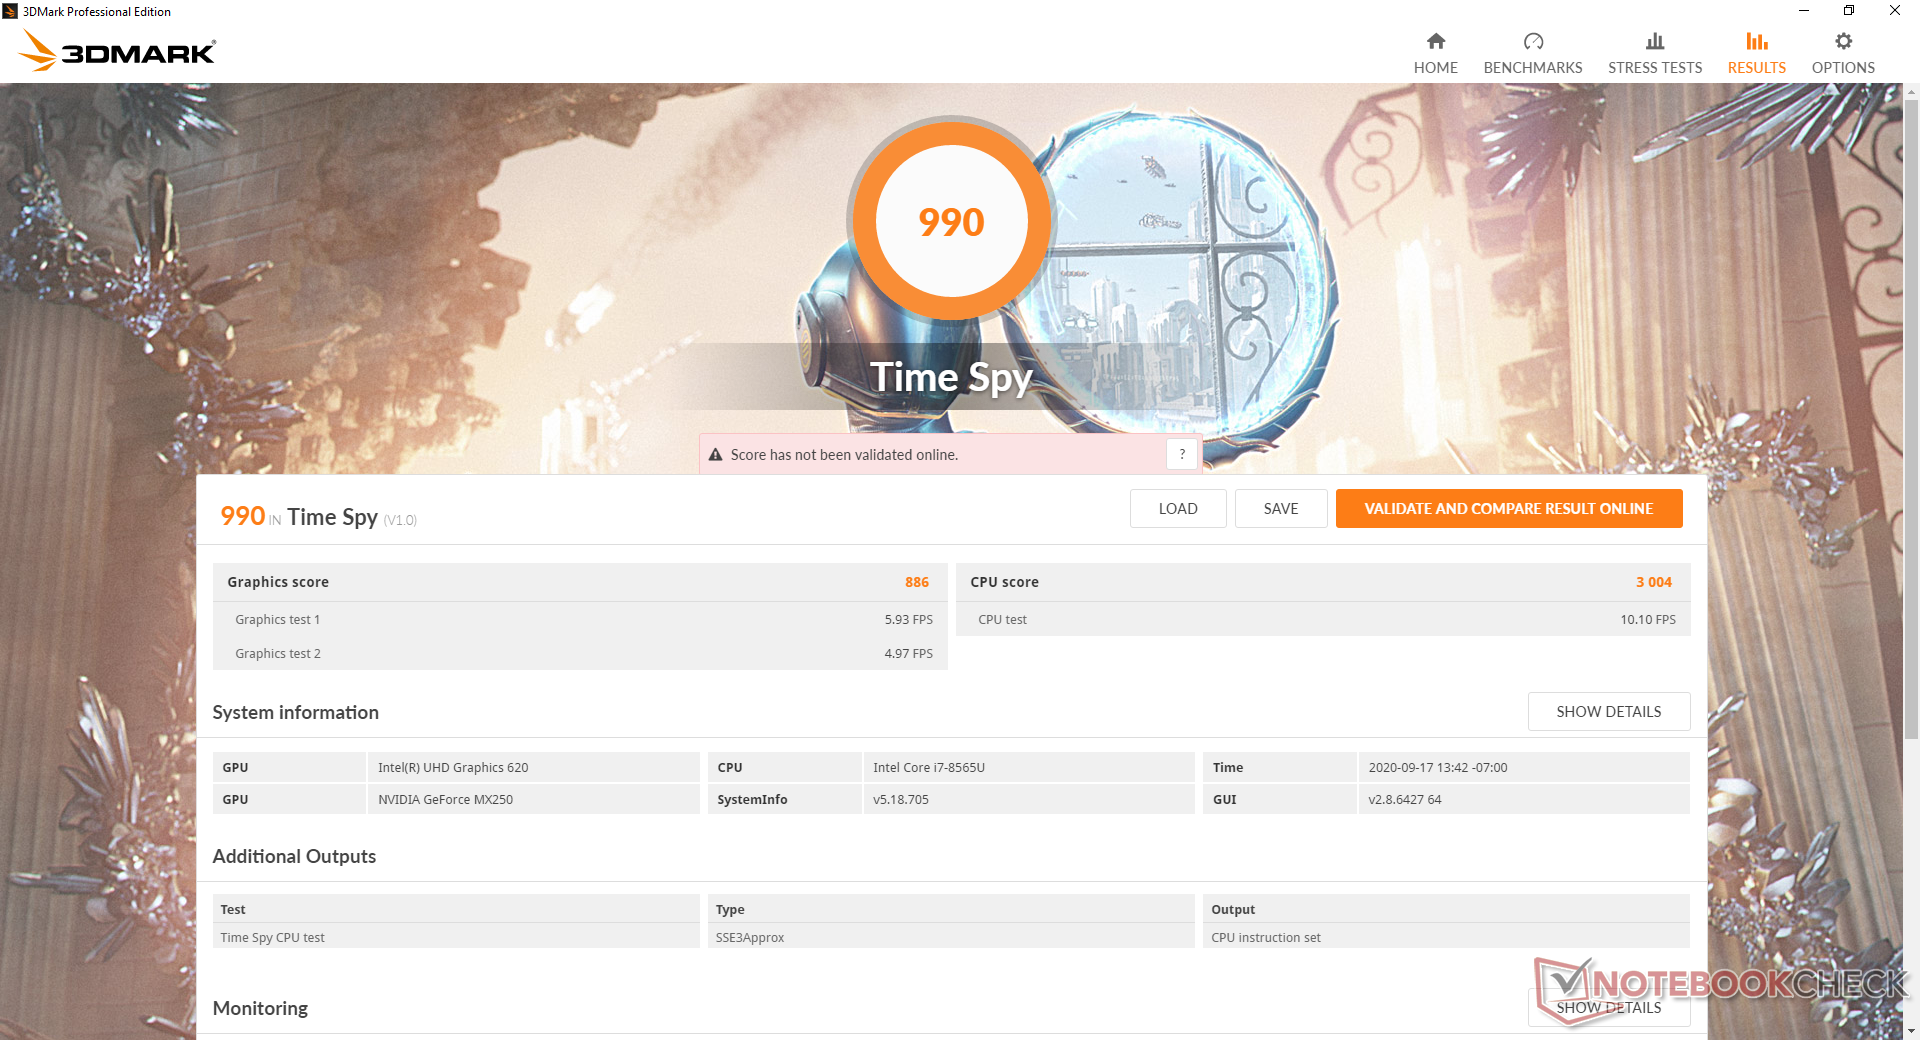
Of the 25 different laptops in our database with the GeForce MX250, the one in this Asus is the slowest. 3DMark benchmarks reveal the GPU to be about 17 percent slower than the average MX250 which means it's slower than most older MX150 laptops. Even Asus' cheaper Asus VivoBook S14 S433FL is about to offer 30 percent faster graphics performance than our ZenBook with the same nominal MX250 GPU.
The disappointing graphics performance can be attributed to the 10 W TDP GPU whereas most other MX250 laptops are using the faster 25 W version. Boost clock rates top out at only 1038 MHz here compared to 1582 MHz on the MateBook 14.
See our dedicated page on the GeForce MX250 for more technical information and benchmark comparisons.
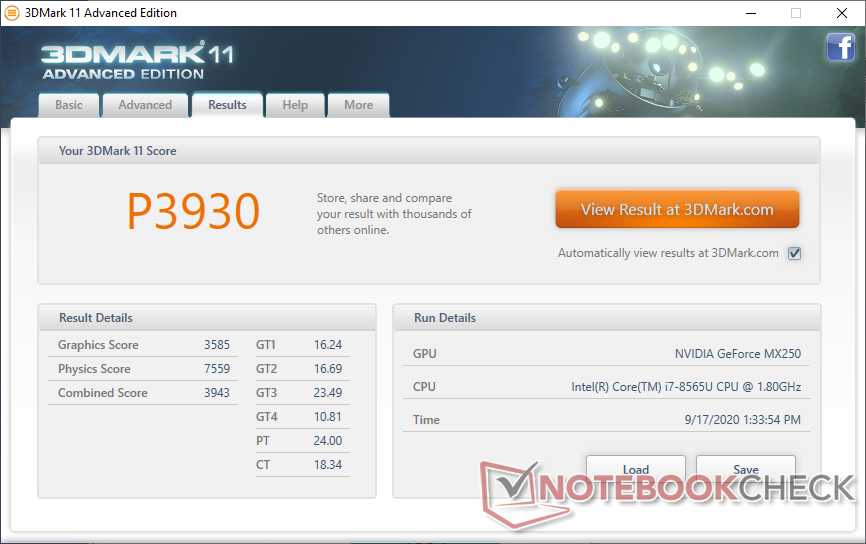
| 3DMark 11 Performance | 3930 points | |
| 3DMark Cloud Gate Standard Score | 12886 points | |
| 3DMark Fire Strike Score | 2726 points | |
| 3DMark Time Spy Score | 990 points | |
Help | ||
| low | med. | high | ultra | |
|---|---|---|---|---|
| GTA V (2015) | 109 | 95.4 | 35.9 | 16.1 |
| The Witcher 3 (2015) | 59.5 | 33 | 19.4 | 10.3 |
| Dota 2 Reborn (2015) | 113 | 88.6 | 61.3 | 54.1 |
| Final Fantasy XV Benchmark (2018) | 33.7 | 16.4 | 11 | |
| X-Plane 11.11 (2018) | 49.2 | 41.1 | 37.5 | |
| Strange Brigade (2018) | 71.3 | 26.7 | 19.9 | 15.7 |
Emissions
System Noise
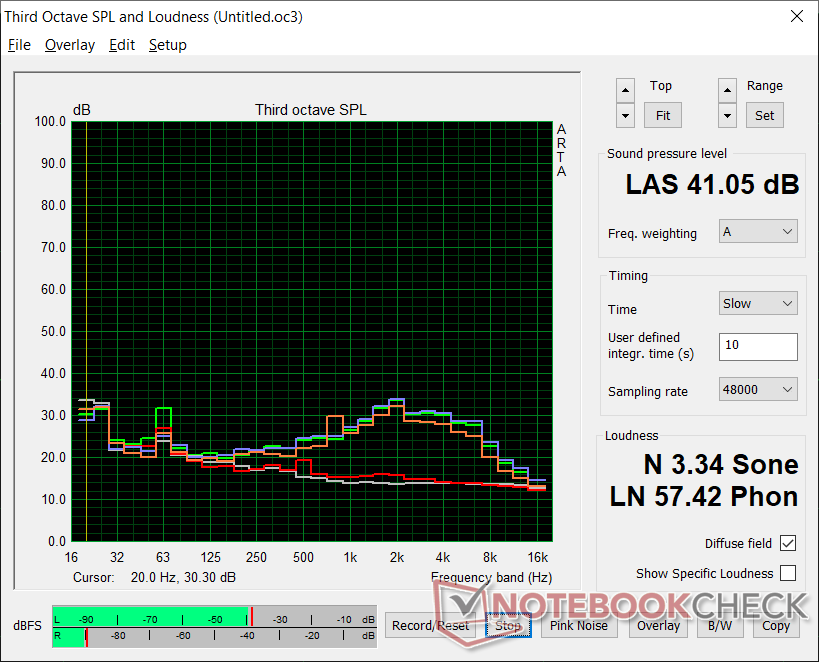
The single internal fan will idle when sitting on desktop, but it will quickly pick up in speed when running tasks like browsers or videos. Fan noise, for example, would slowly build up to its maximum of 41.5 dB(A) in less than 90 seconds when running 3DMark 06 to be louder than many other 14-inch Ultrabooks. The good news is that any RPM changes are steady and gradual and never too sudden.
We can notice no electronic noise or coil whine on our test unit.
| Asus ZenBook 14 UX434FL-DB77 GeForce MX250, i7-8565U, WDC PC SN520 SDAPNUW-512G | Lenovo IdeaPad 5 14ARE05 Vega 6, R5 4500U, Samsung PM991 MZALQ512HALU | Asus VivoBook S14 S433FL GeForce MX250, i7-10510U, Intel Optane Memory H10 with Solid State Storage 32GB + 512GB HBRPEKNX0202A(L/H) | LG Gram 14Z90N Iris Plus Graphics G7 (Ice Lake 64 EU), i7-1065G7, Samsung SSD PM981 MZVLB256HAHQ | Lenovo Yoga Slim 7-14ARE Vega 8, R7 4800U, Samsung SSD PM981a MZVLB512HBJQ | MSI Modern 14 A10RB-459US GeForce MX250, i5-10210U, Kingston RBUSNS8154P3512GJ | |
|---|---|---|---|---|---|---|
| Noise | -12% | -11% | 4% | 7% | -2% | |
| off / environment * (dB) | 26.2 | 30.7 -17% | 30.7 -17% | 28.6 -9% | 26.3 -0% | 28.7 -10% |
| Idle Minimum * (dB) | 26.2 | 30.7 -17% | 31 -18% | 28.6 -9% | 26.5 -1% | 29.5 -13% |
| Idle Average * (dB) | 27.2 | 30.7 -13% | 31 -14% | 29.2 -7% | 26.5 3% | 29.5 -8% |
| Idle Maximum * (dB) | 27.2 | 30.7 -13% | 31.3 -15% | 29.2 -7% | 26.5 3% | 29.5 -8% |
| Load Average * (dB) | 41.5 | 41.3 -0% | 43.4 -5% | 29.2 30% | 31.8 23% | 33.4 20% |
| Witcher 3 ultra * (dB) | 39.7 | 42.8 -8% | 35.9 10% | 37.9 5% | ||
| Load Maximum * (dB) | 41.1 | 41.5 -1% | 29.5 28% | 35.9 13% | 40.5 1% |
* ... smaller is better
Noise level
| Idle |
| 26.2 / 27.2 / 27.2 dB(A) |
| Load |
| 41.5 / 41.1 dB(A) |
 | ||
30 dB silent 40 dB(A) audible 50 dB(A) loud |
||
min: | ||
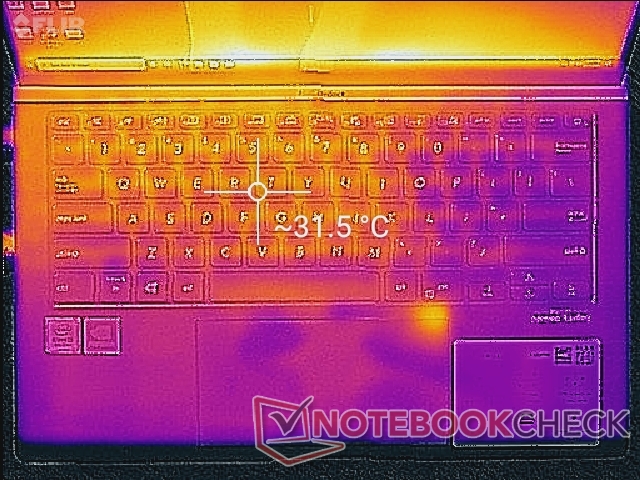
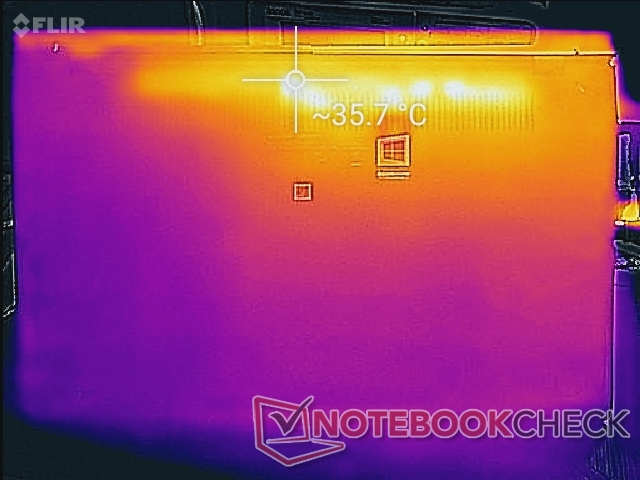
Temperature
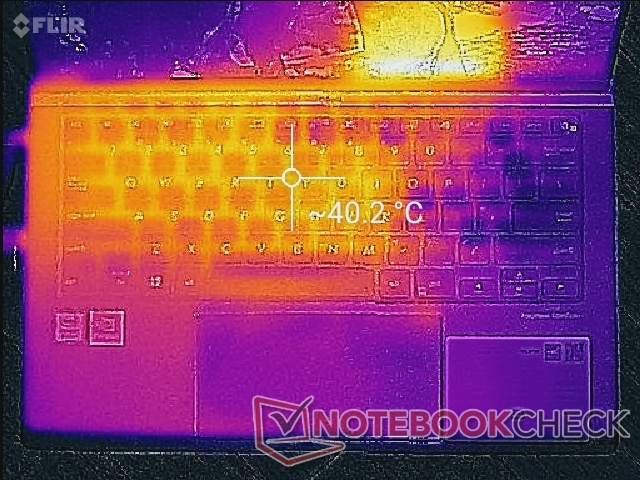
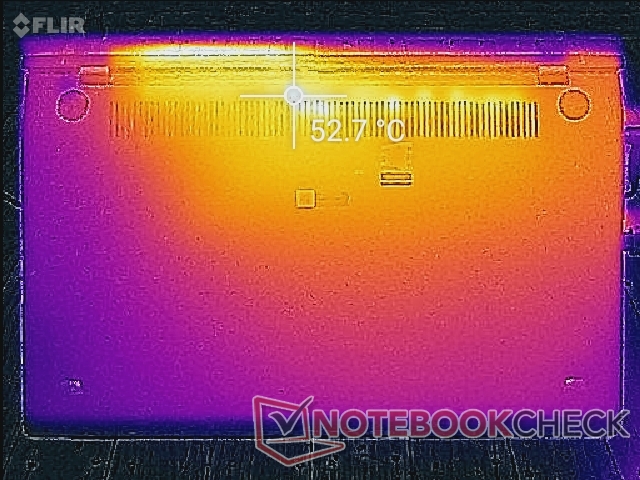
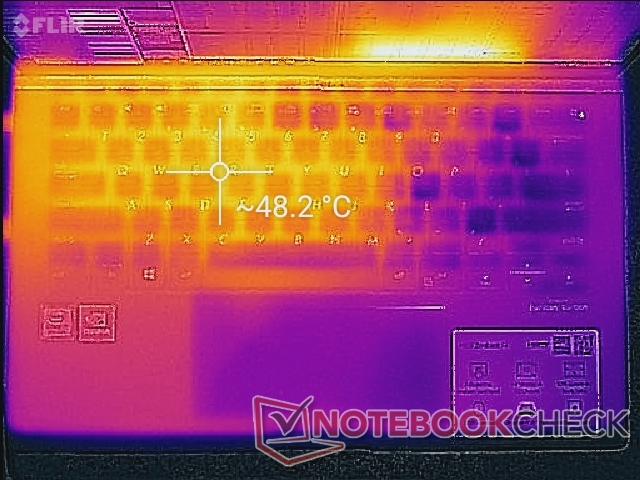
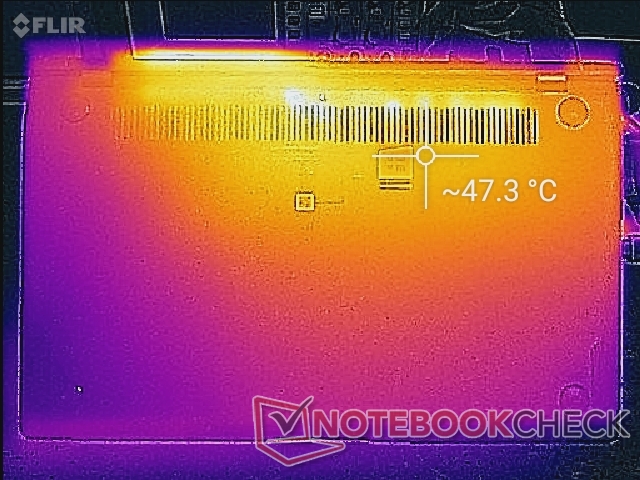
Surface temperatures are cooler toward the front while the back can be as warm as 36 C simply by idling on desktop. Hot spots on the keyboard center and bottom can be as warm as 48 C to 53 C as shown by the temperature maps below to be similar to what we observed on the Lenovo Yoga Slim 7. You're going to want a desk if you plan on running games or other high loads on this machine.
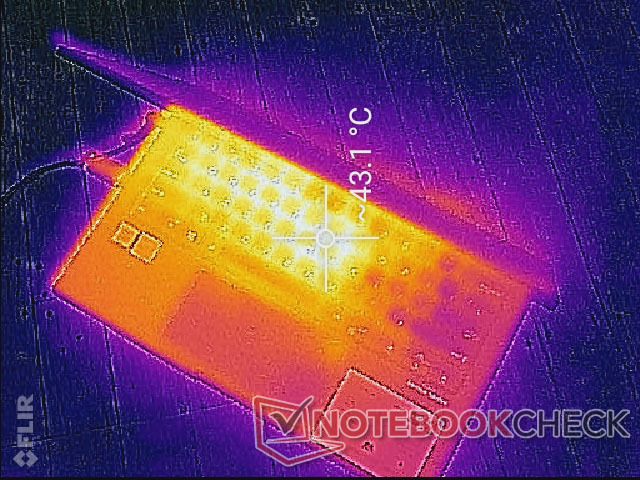
(-) The maximum temperature on the upper side is 47.4 °C / 117 F, compared to the average of 35.9 °C / 97 F, ranging from 21.4 to 59 °C for the class Subnotebook.
(-) The bottom heats up to a maximum of 54.2 °C / 130 F, compared to the average of 39.2 °C / 103 F
(+) In idle usage, the average temperature for the upper side is 30.6 °C / 87 F, compared to the device average of 30.8 °C / 87 F.
(±) Playing The Witcher 3, the average temperature for the upper side is 33.9 °C / 93 F, compared to the device average of 30.8 °C / 87 F.
(±) The palmrests and touchpad can get very hot to the touch with a maximum of 39.4 °C / 102.9 F.
(-) The average temperature of the palmrest area of similar devices was 28.2 °C / 82.8 F (-11.2 °C / -20.1 F).
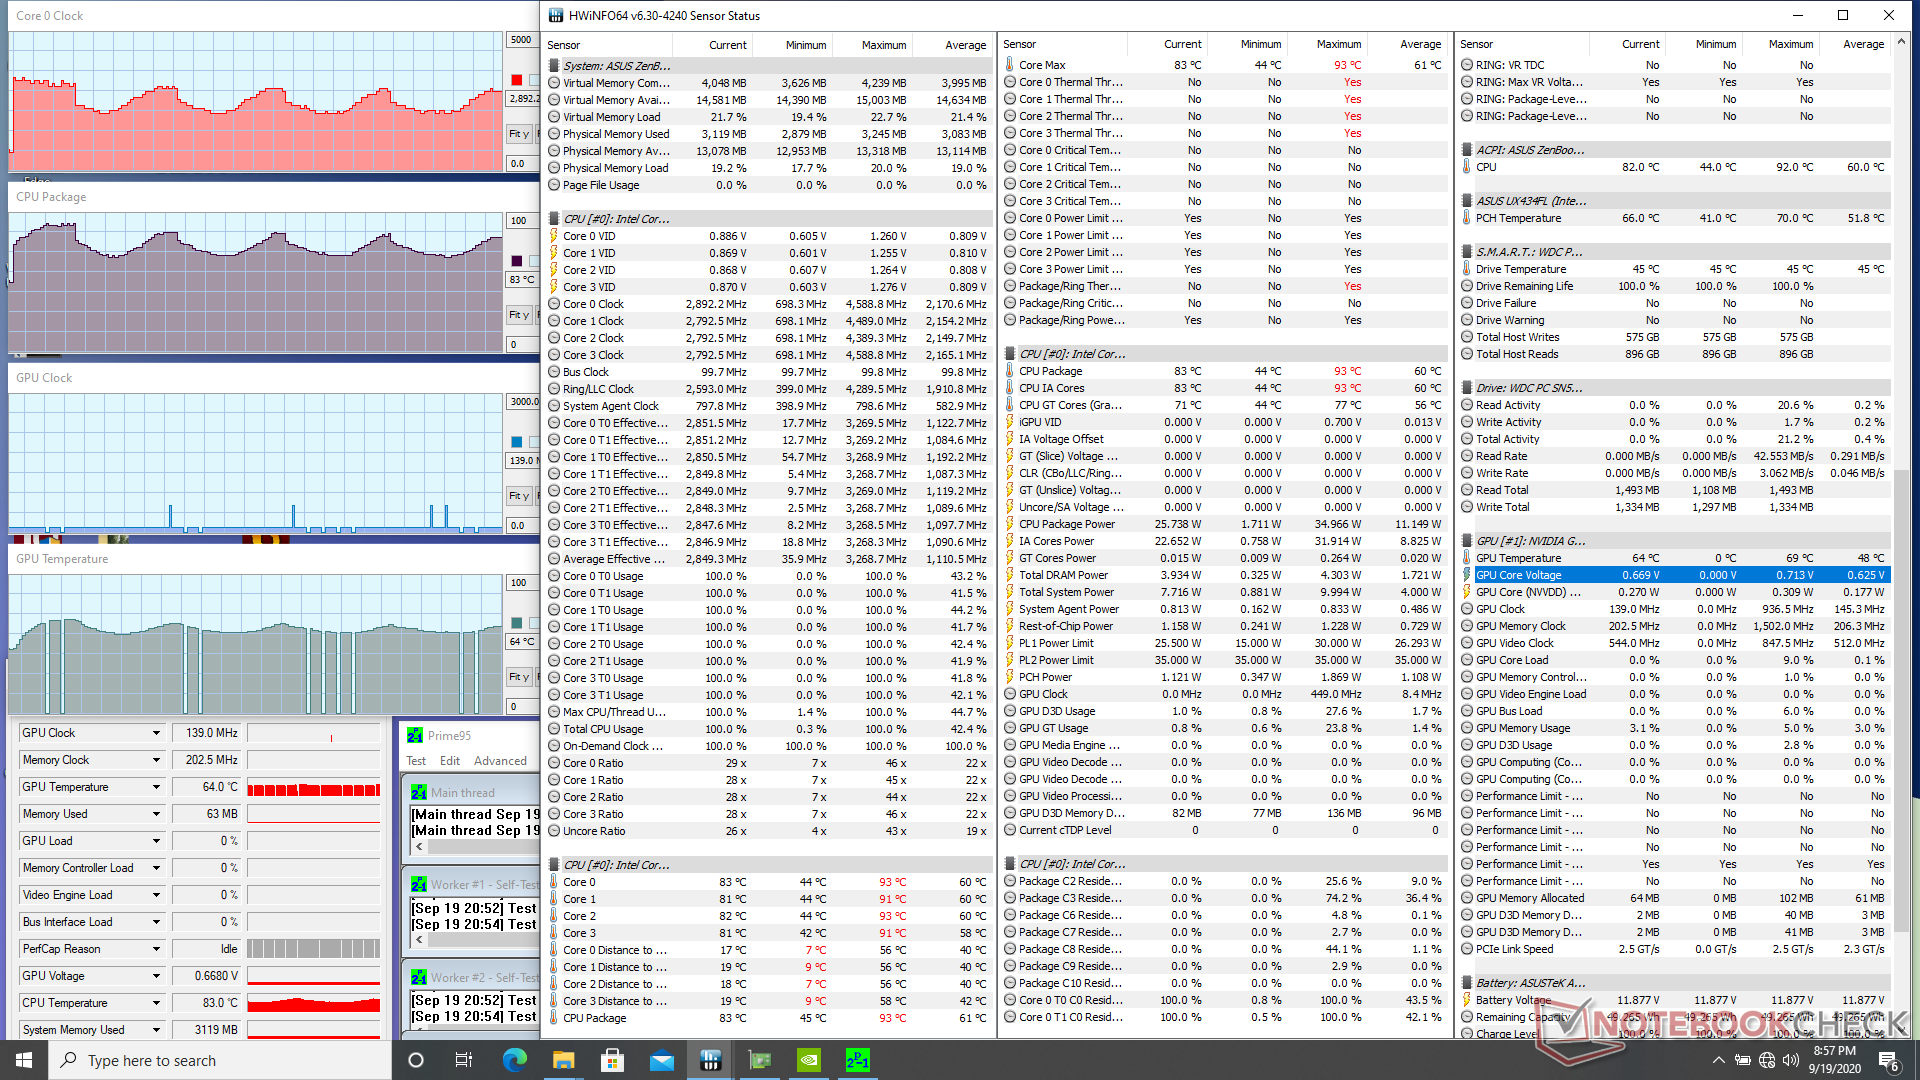
Stress Test
When running Prime95 to stress the CPU, clock rates would boost to 3.3 to 3.4 GHz for about 30 to 40 seconds at a core temperature of 93 C. Thereafter, clock rates would drop and cycle between 2.1 GHz and 3 GHz and 69 C and 87 C, respectively, to keep temperatures at more comfortable levels. This cycling behavior is uncommon, but it can also be observed on the Dell XPS series.
When running Witcher 3 to represent more real-world stressful conditions, the CPU and GPU would stabilize at 75 C and 76 C, respectively, compared to just 58 C and 59 C on the faster Razer Blade Stealth.
Running on battery power will not impact performance. A 3DMark 11 test on batteries would return very similar Physics and Graphics scores as the same test on mains.
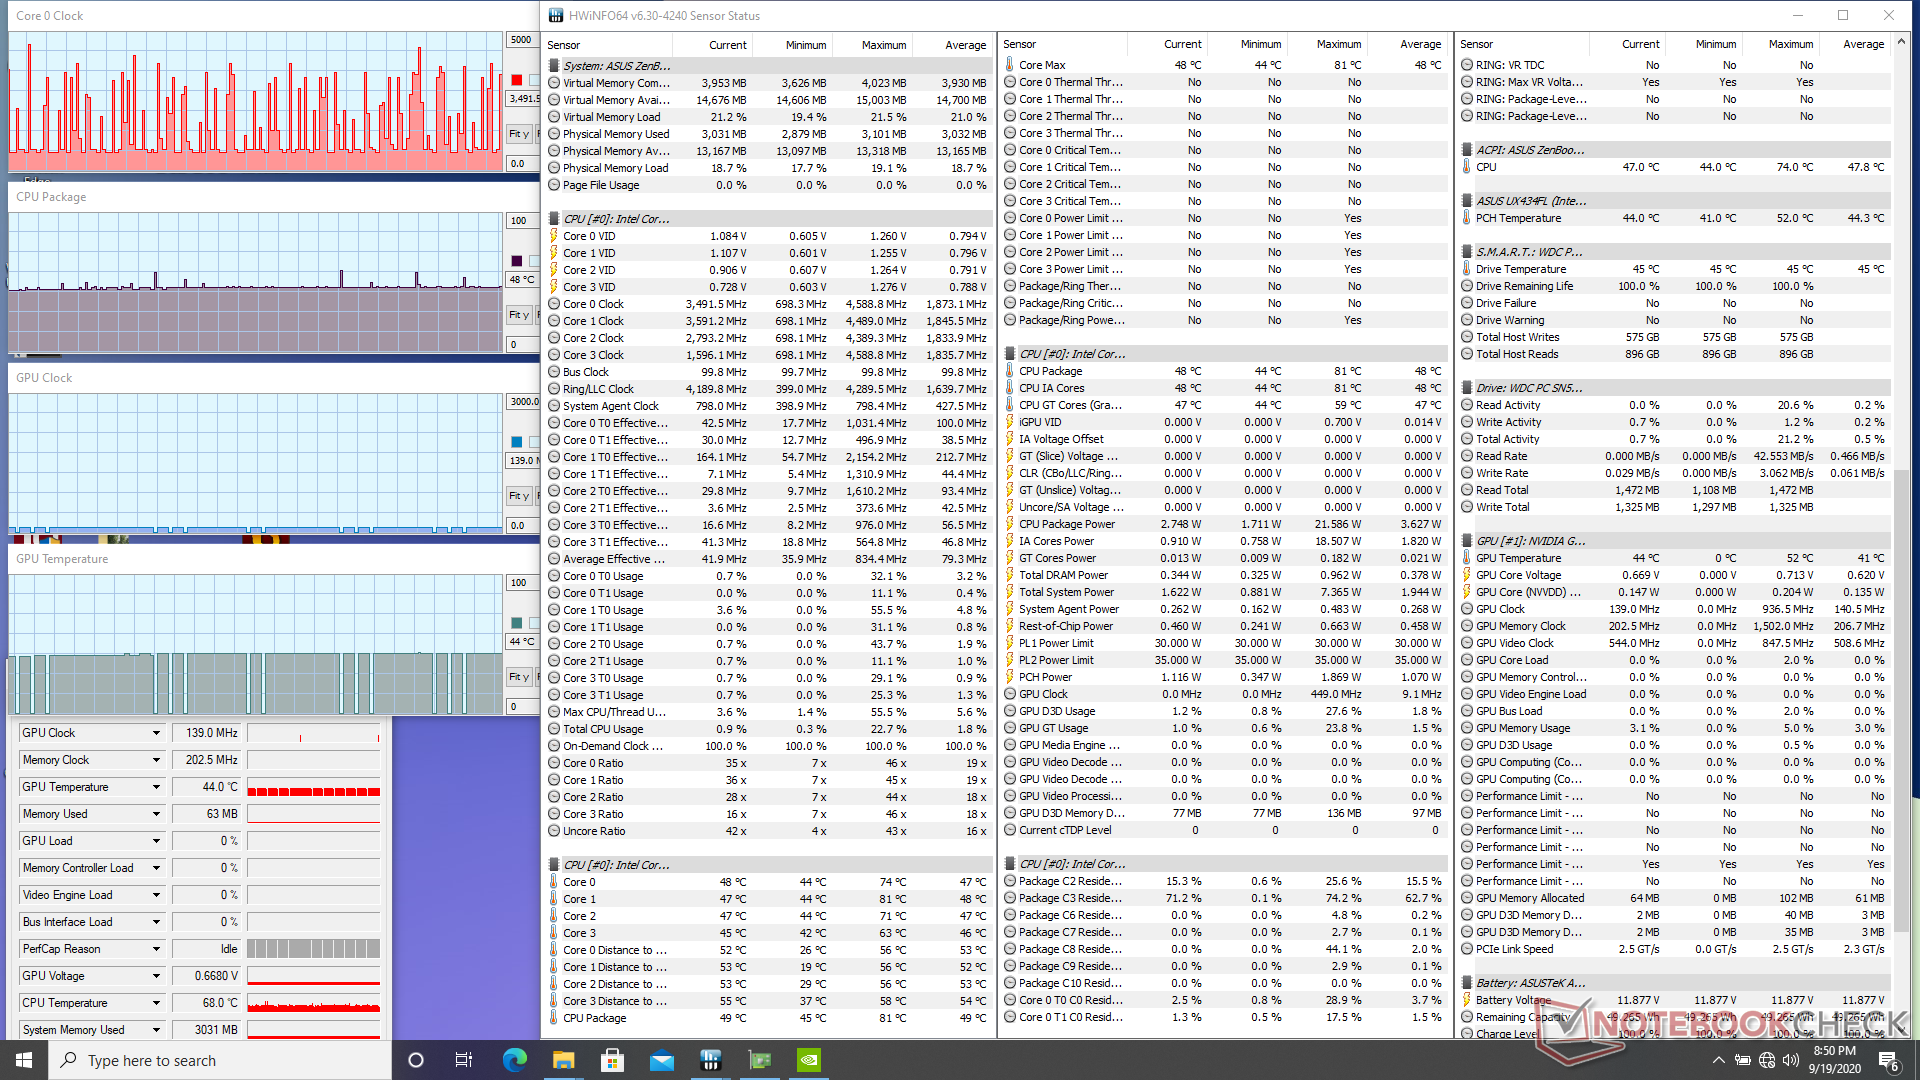
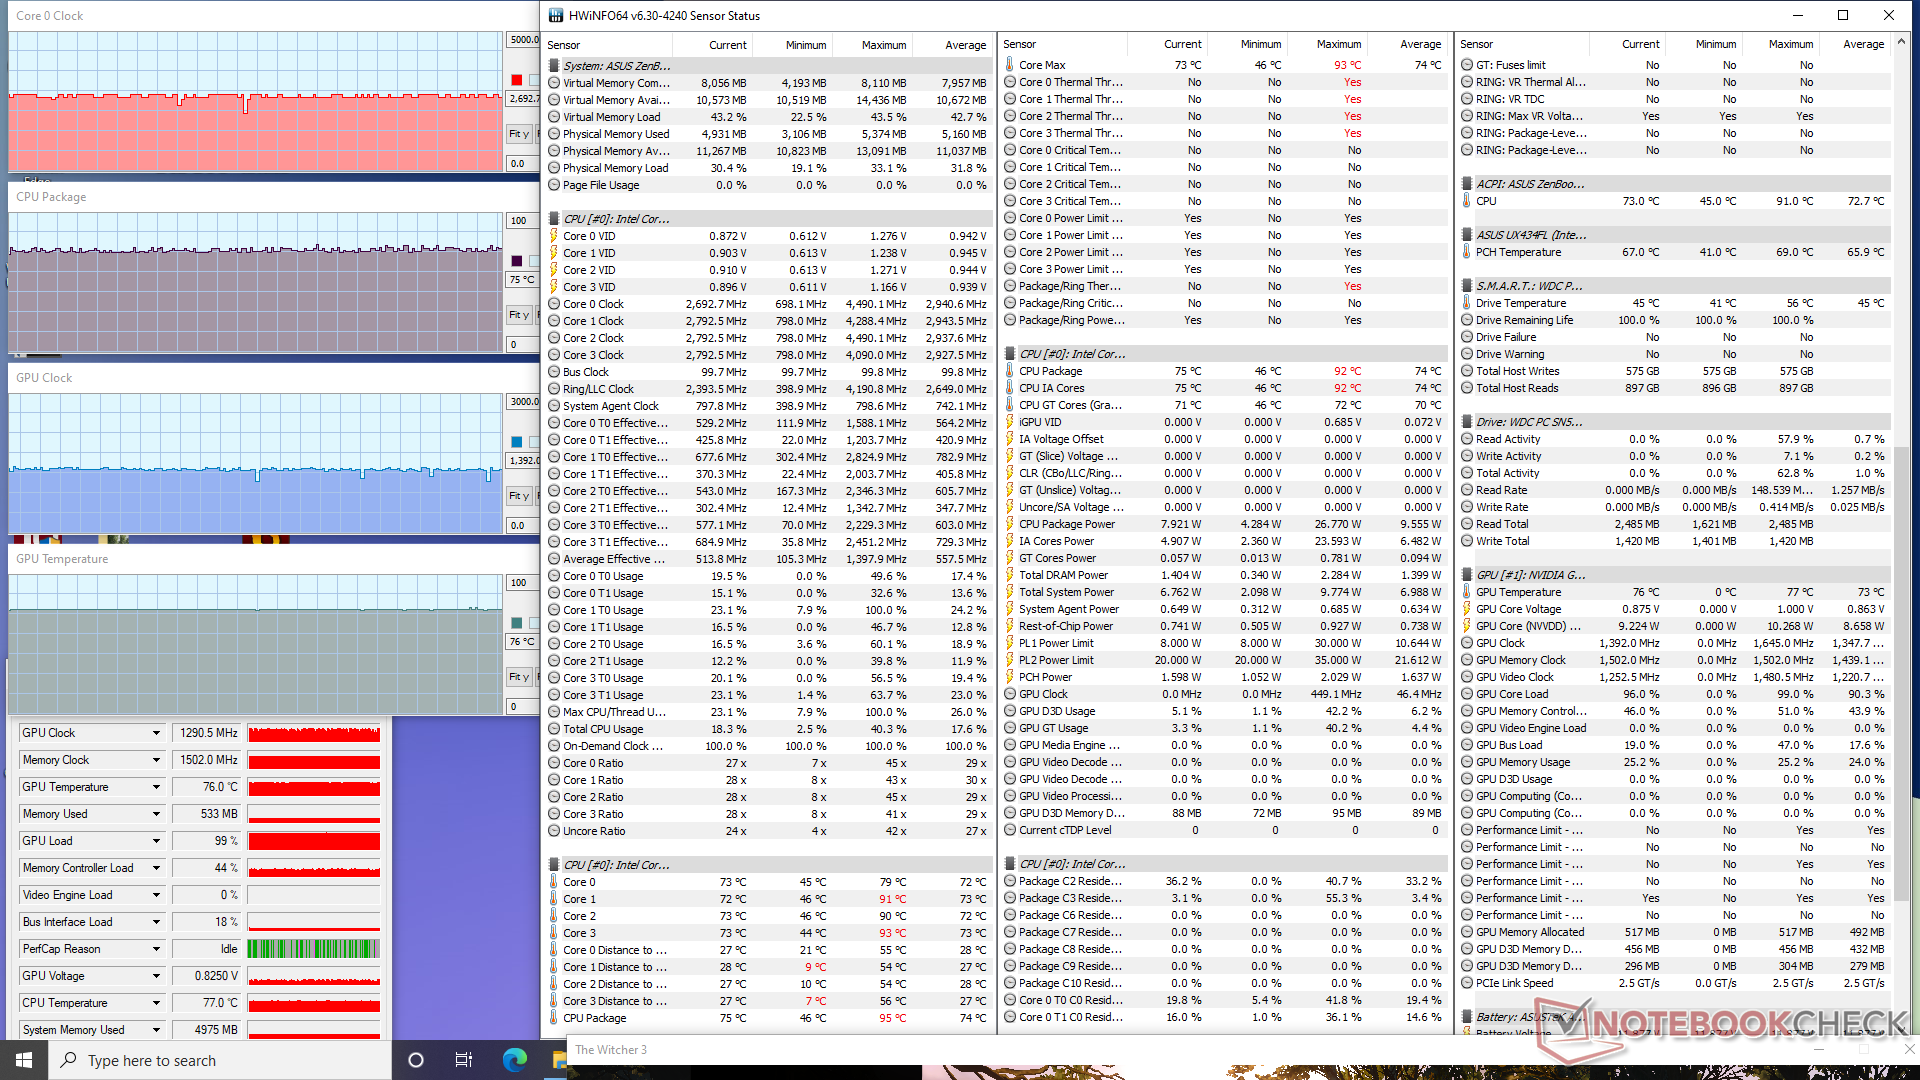
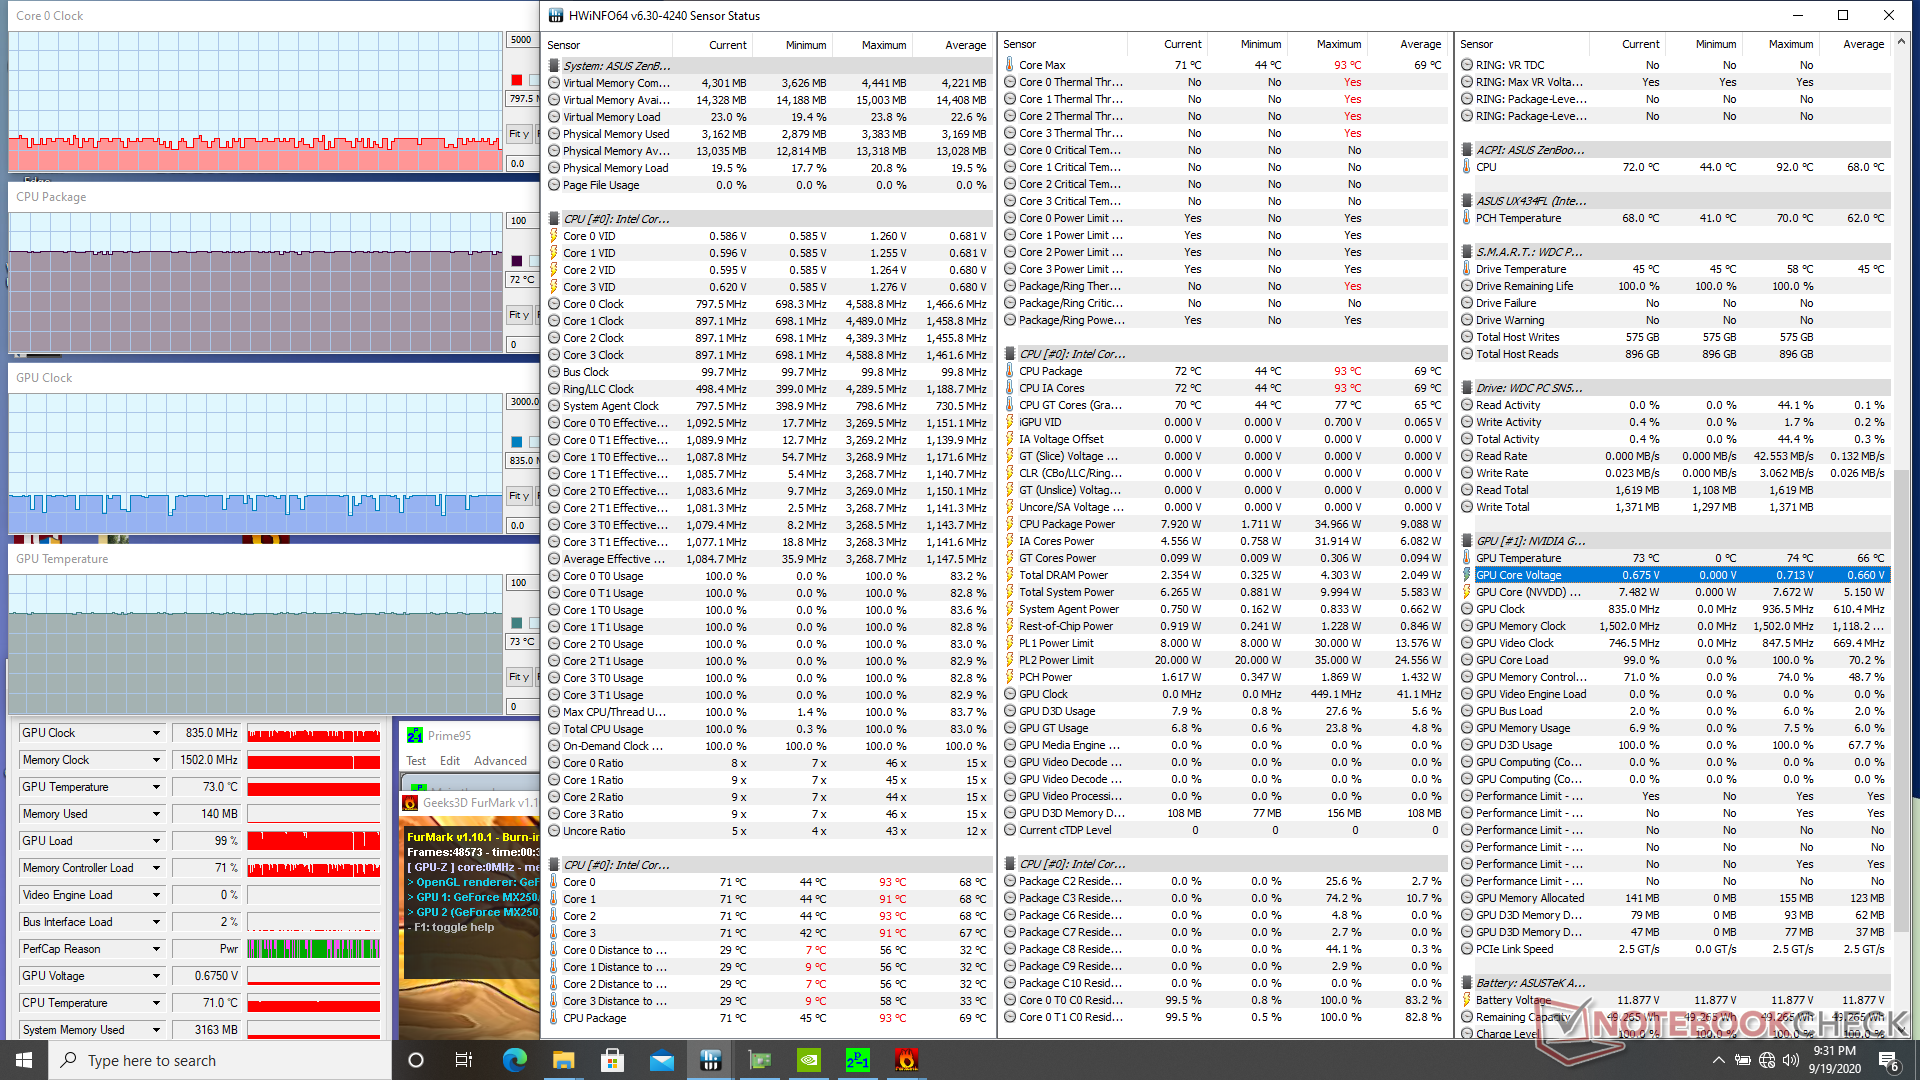
| CPU Clock (GHz) | GPU Clock (MHz) | Average CPU Temperature (°C) | Average GPU Temperature (°C) | |
| System Idle | -- | -- | 48 | 44 |
| Prime95 Stress | 2.1 - 3.0 | -- | 69 - 87 | 57 - 64 |
| Prime95 + FurMark Stress | 0.9 - 1.2 | 400 - 835 | 72 | 73 |
| Witcher 3 Stress | 2.7 - 2.8 | ~1290 | 75 | 76 |
Speakers


Asus ZenBook 14 UX434FL-DB77 audio analysis
(±) | speaker loudness is average but good (75.6 dB)
Bass 100 - 315 Hz
(±) | reduced bass - on average 12% lower than median
(±) | linearity of bass is average (14% delta to prev. frequency)
Mids 400 - 2000 Hz
(+) | balanced mids - only 4.3% away from median
(+) | mids are linear (6.2% delta to prev. frequency)
Highs 2 - 16 kHz
(+) | balanced highs - only 1.9% away from median
(+) | highs are linear (6.5% delta to prev. frequency)
Overall 100 - 16.000 Hz
(+) | overall sound is linear (14.6% difference to median)
Compared to same class
» 29% of all tested devices in this class were better, 6% similar, 65% worse
» The best had a delta of 5%, average was 18%, worst was 53%
Compared to all devices tested
» 19% of all tested devices were better, 4% similar, 77% worse
» The best had a delta of 4%, average was 23%, worst was 134%
Apple MacBook 12 (Early 2016) 1.1 GHz audio analysis
(+) | speakers can play relatively loud (83.6 dB)
Bass 100 - 315 Hz
(±) | reduced bass - on average 11.3% lower than median
(±) | linearity of bass is average (14.2% delta to prev. frequency)
Mids 400 - 2000 Hz
(+) | balanced mids - only 2.4% away from median
(+) | mids are linear (5.5% delta to prev. frequency)
Highs 2 - 16 kHz
(+) | balanced highs - only 2% away from median
(+) | highs are linear (4.5% delta to prev. frequency)
Overall 100 - 16.000 Hz
(+) | overall sound is linear (10.2% difference to median)
Compared to same class
» 7% of all tested devices in this class were better, 2% similar, 91% worse
» The best had a delta of 5%, average was 18%, worst was 53%
Compared to all devices tested
» 5% of all tested devices were better, 1% similar, 94% worse
» The best had a delta of 4%, average was 23%, worst was 134%
Energy Management
Power Consumption
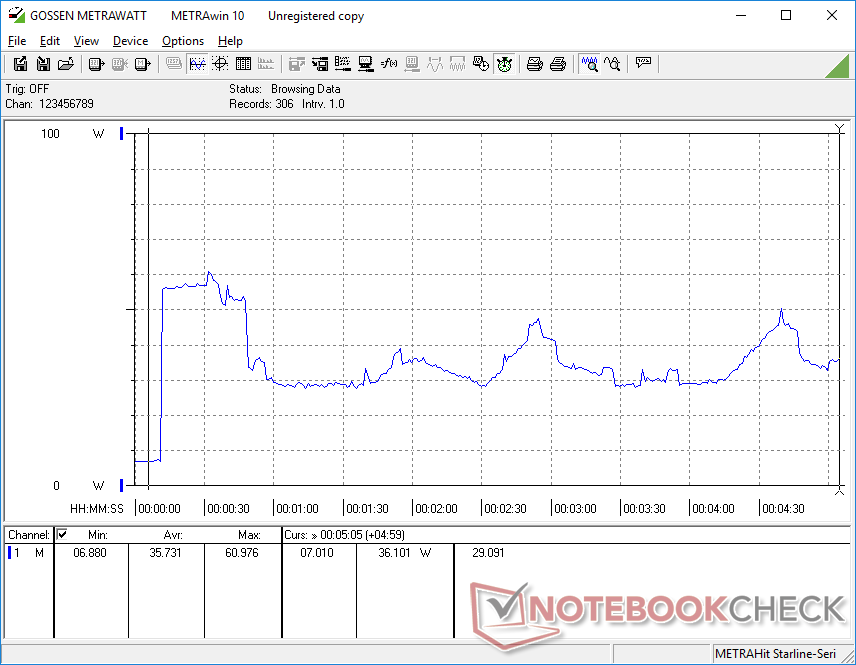
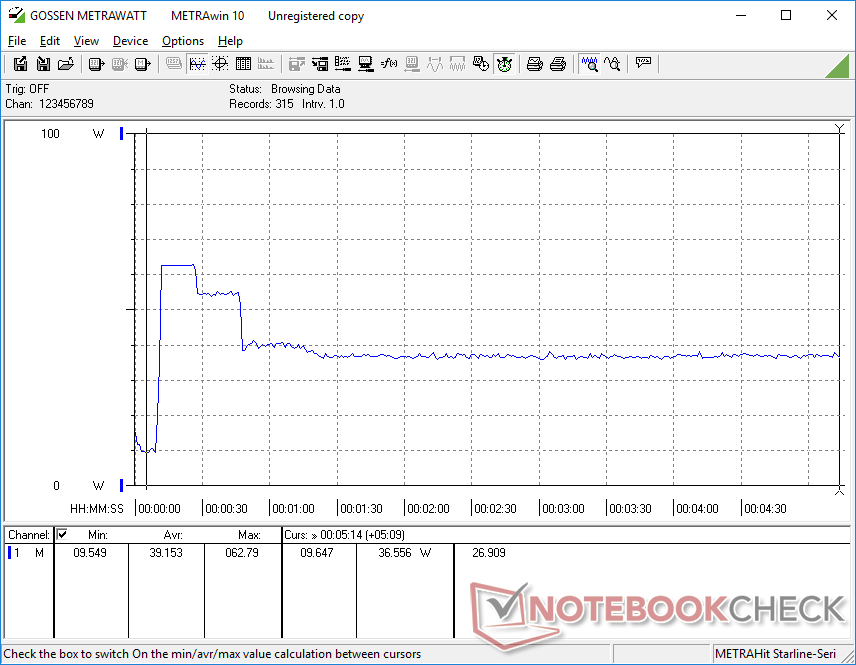
Idling on desktop demands between 3 W and 7 W depending on display brightness and the current power profile. Activating the ScreenPad and setting it to maximum brightness will draw an additional 2.6 W.
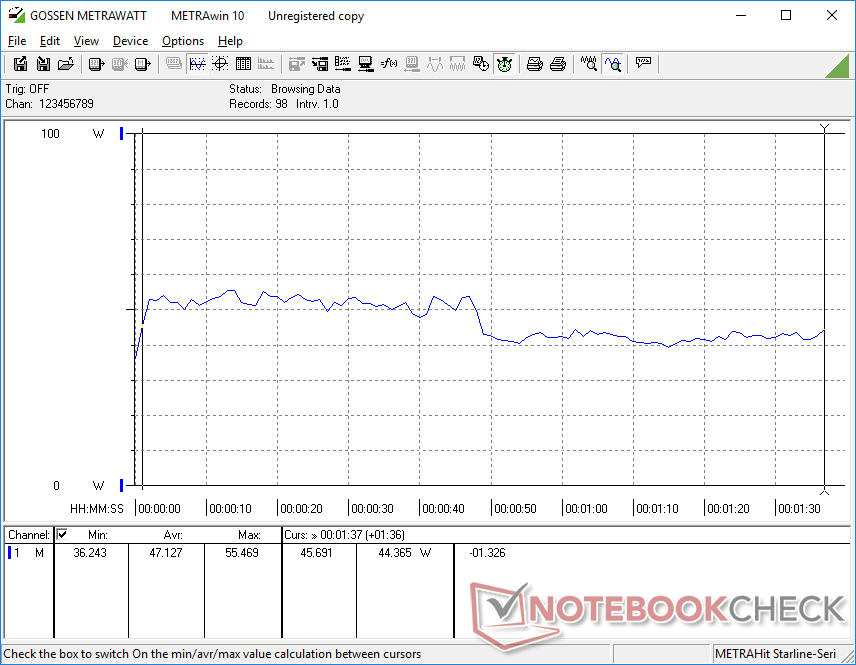
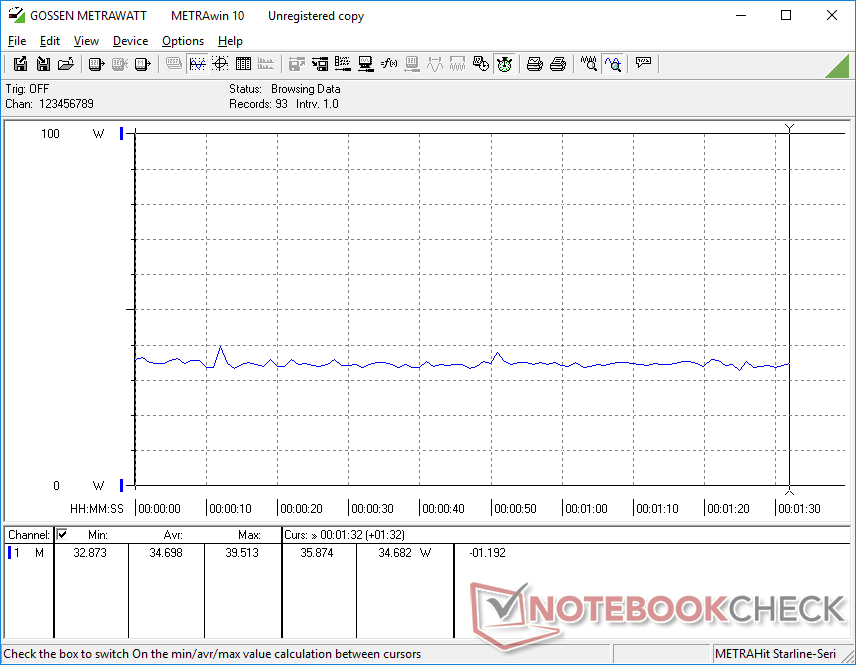
Gaming will demand between 34 W and 47 W depending on frame rate and GPU stress. Overall consumption is less than both the Asus VivoBook S14 and MSI Modern 14 due largely to the lower-power 10 W GeForce MX250 in our Asus.
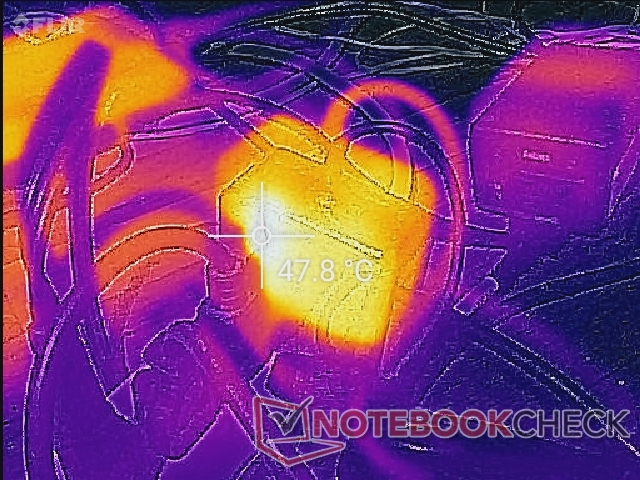
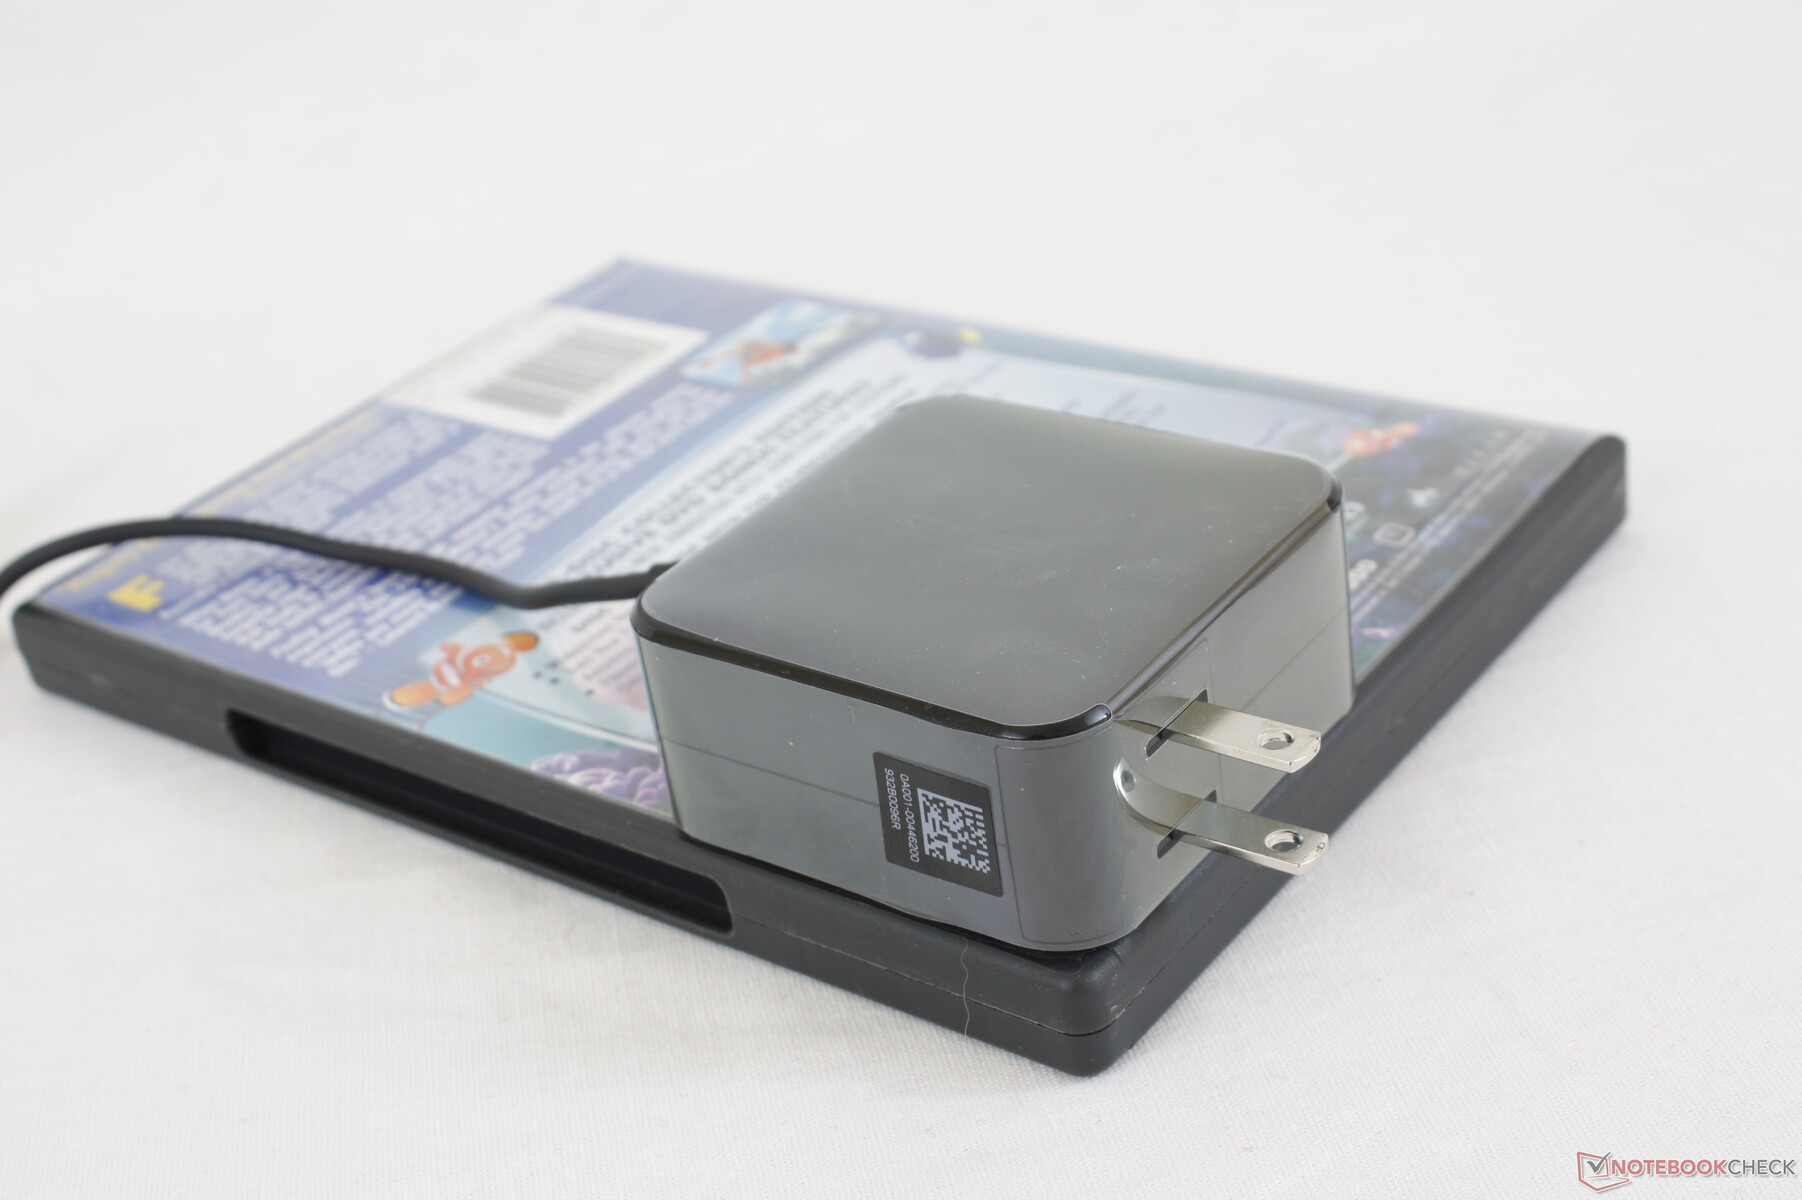
We're able to record a temporary maximum consumption of 62.8 W from the small (~6.3 x 6.3 x 3 cm) 65 W AC adapter when running Prime95 and FurMark loads.
| Off / Standby | |
| Idle | |
| Load |
|
Key:
min: | |
| Asus ZenBook 14 UX434FL-DB77 i7-8565U, GeForce MX250, WDC PC SN520 SDAPNUW-512G, IPS, 1920x1080, 14" | Lenovo IdeaPad 5 14ARE05 R5 4500U, Vega 6, Samsung PM991 MZALQ512HALU, IPS, 1920x1080, 14" | Asus VivoBook S14 S433FL i7-10510U, GeForce MX250, Intel Optane Memory H10 with Solid State Storage 32GB + 512GB HBRPEKNX0202A(L/H), IPS, 1920x1080, 14" | LG Gram 14Z90N i7-1065G7, Iris Plus Graphics G7 (Ice Lake 64 EU), Samsung SSD PM981 MZVLB256HAHQ, IPS, 1920x1080, 14" | Lenovo Yoga Slim 7-14ARE R7 4800U, Vega 8, Samsung SSD PM981a MZVLB512HBJQ, IPS, 1920x1080, 14" | MSI Modern 14 A10RB-459US i5-10210U, GeForce MX250, Kingston RBUSNS8154P3512GJ, IPS, 1920x1080, 14" | |
|---|---|---|---|---|---|---|
| Power Consumption | -22% | -6% | 14% | -14% | -23% | |
| Idle Minimum * (Watt) | 2.9 | 4.4 -52% | 2.4 17% | 2.6 10% | 4 -38% | 4.2 -45% |
| Idle Average * (Watt) | 6.2 | 7.6 -23% | 4.2 32% | 5.9 5% | 6.3 -2% | 5.9 5% |
| Idle Maximum * (Watt) | 7 | 9.9 -41% | 7.8 -11% | 8 -14% | 7.7 -10% | 7.2 -3% |
| Load Average * (Watt) | 47.1 | 46 2% | 57 -21% | 29.8 37% | 48.3 -3% | 63.4 -35% |
| Witcher 3 ultra * (Watt) | 34.7 | 52 -50% | 30.9 11% | 49 -41% | 53.5 -54% | |
| Load Maximum * (Watt) | 62.8 | 59 6% | 64 -2% | 39.5 37% | 57.6 8% | 67.4 -7% |
* ... smaller is better
Battery Life
Runtime is respectable at almost 7.5 hours of real-world WLAN use with the ScreenPad active. This is about an hour or two shorter than many other 14-inch subnotebooks including Asus' own VivoBook S14 which is the price ot pay for having a built-in secondary touchscreen.
Charging from empty to full capacity is fast at less than 90 minutes. The system cannot be recharged via USB-C.
| Asus ZenBook 14 UX434FL-DB77 i7-8565U, GeForce MX250, 50 Wh | Lenovo IdeaPad 5 14ARE05 R5 4500U, Vega 6, 56.5 Wh | Asus VivoBook S14 S433FL i7-10510U, GeForce MX250, 50 Wh | LG Gram 14Z90N i7-1065G7, Iris Plus Graphics G7 (Ice Lake 64 EU), 72 Wh | Lenovo Yoga Slim 7-14ARE R7 4800U, Vega 8, 61 Wh | MSI Modern 14 A10RB-459US i5-10210U, GeForce MX250, 50 Wh | |
|---|---|---|---|---|---|---|
| Battery runtime | 36% | 18% | 99% | 18% | -6% | |
| Reader / Idle (h) | 16.1 | 45.6 183% | 27.1 68% | 16.4 2% | ||
| WiFi v1.3 (h) | 7.3 | 9.9 36% | 8.6 18% | 14 92% | 10.3 41% | 8.6 18% |
| Load (h) | 2.9 | 3.5 21% | 1.3 -55% | 1.8 -38% |
Pros
Cons
Verdict
As configured, our ZenBook 14 UX434FL currently retails for about $1400 to $1500 USD to be more expensive than other upper mid-range systems like the Lenovo Yoga Slim 7. Much of the price premium goes towards the unique ScreenPad as you're not going to find support for Thunderbolt 3, USB-C charging, DisplayPort, webcam shutter, or a fingerprint reader here. The slower 10 W GeForce MX250 GPU is also a bummer for casual gamers.
If you frequently find yourself in situations where a second monitor isn't possible, then the ScreenPad would be the next best solution. It can be invaluable for travelers and especially on flights where table space is limited. But for office or home users, it may be wiser to consider pairing the less expensive ScreenPad-less ZenBook 14 UX433 with an external monitor instead.
The ScreenPad is useful in situations where an external monitor is out of reach. ScreenPad 2.0 addresses many of the shortcomings of ScreenPad 1.0 for a smoother user experience and a slightly less grainy display. If you don't expect to use the feature all that much, then other subnotebooks are available with the same or better performance for less money.
Asus ZenBook 14 UX434FL-DB77
- 09/21/2020 v7 (old)
Allen Ngo
Price comparison
