Notebookcheck Logo

Intel Core i7-1185G7 in Review - First Tiger Lake Benchmarks

Tiger Lake vs. Renoir Intel gave us the opportunity to check the new high-end CPU for slim notebooks. Intel's new Tiger Lake chip uses a new and more powerful integrated graphics card, so the gap to AMD can be closed. We have a closer look at a development laptop from Intel and test the capabilities of the new chip in numerous benchmarks and with different TDP configurations.
Intel Core i7-1185G7 in review

Test System

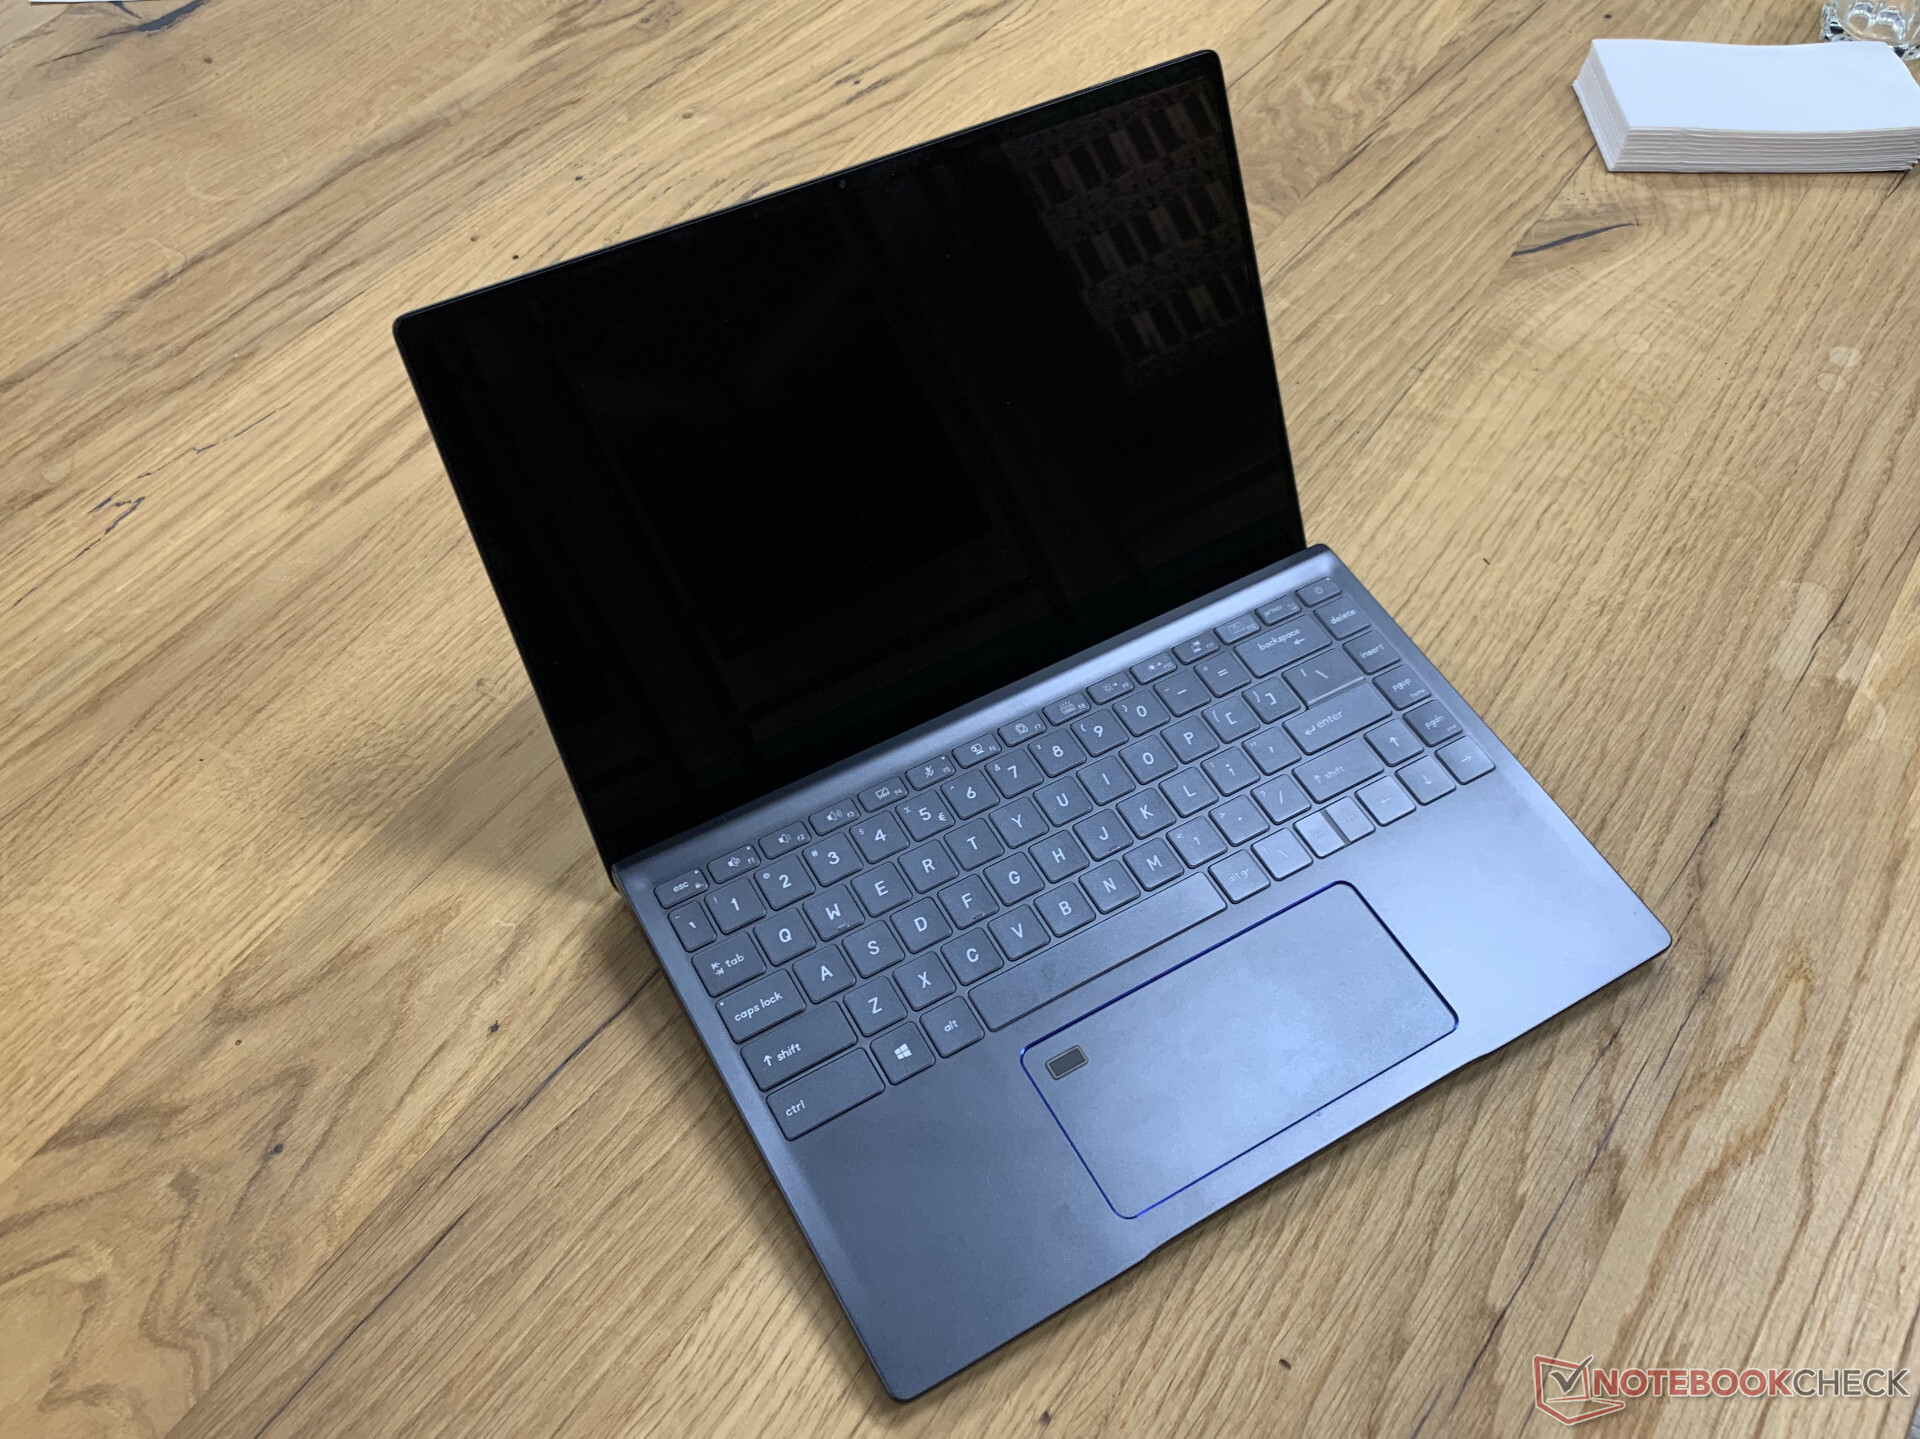
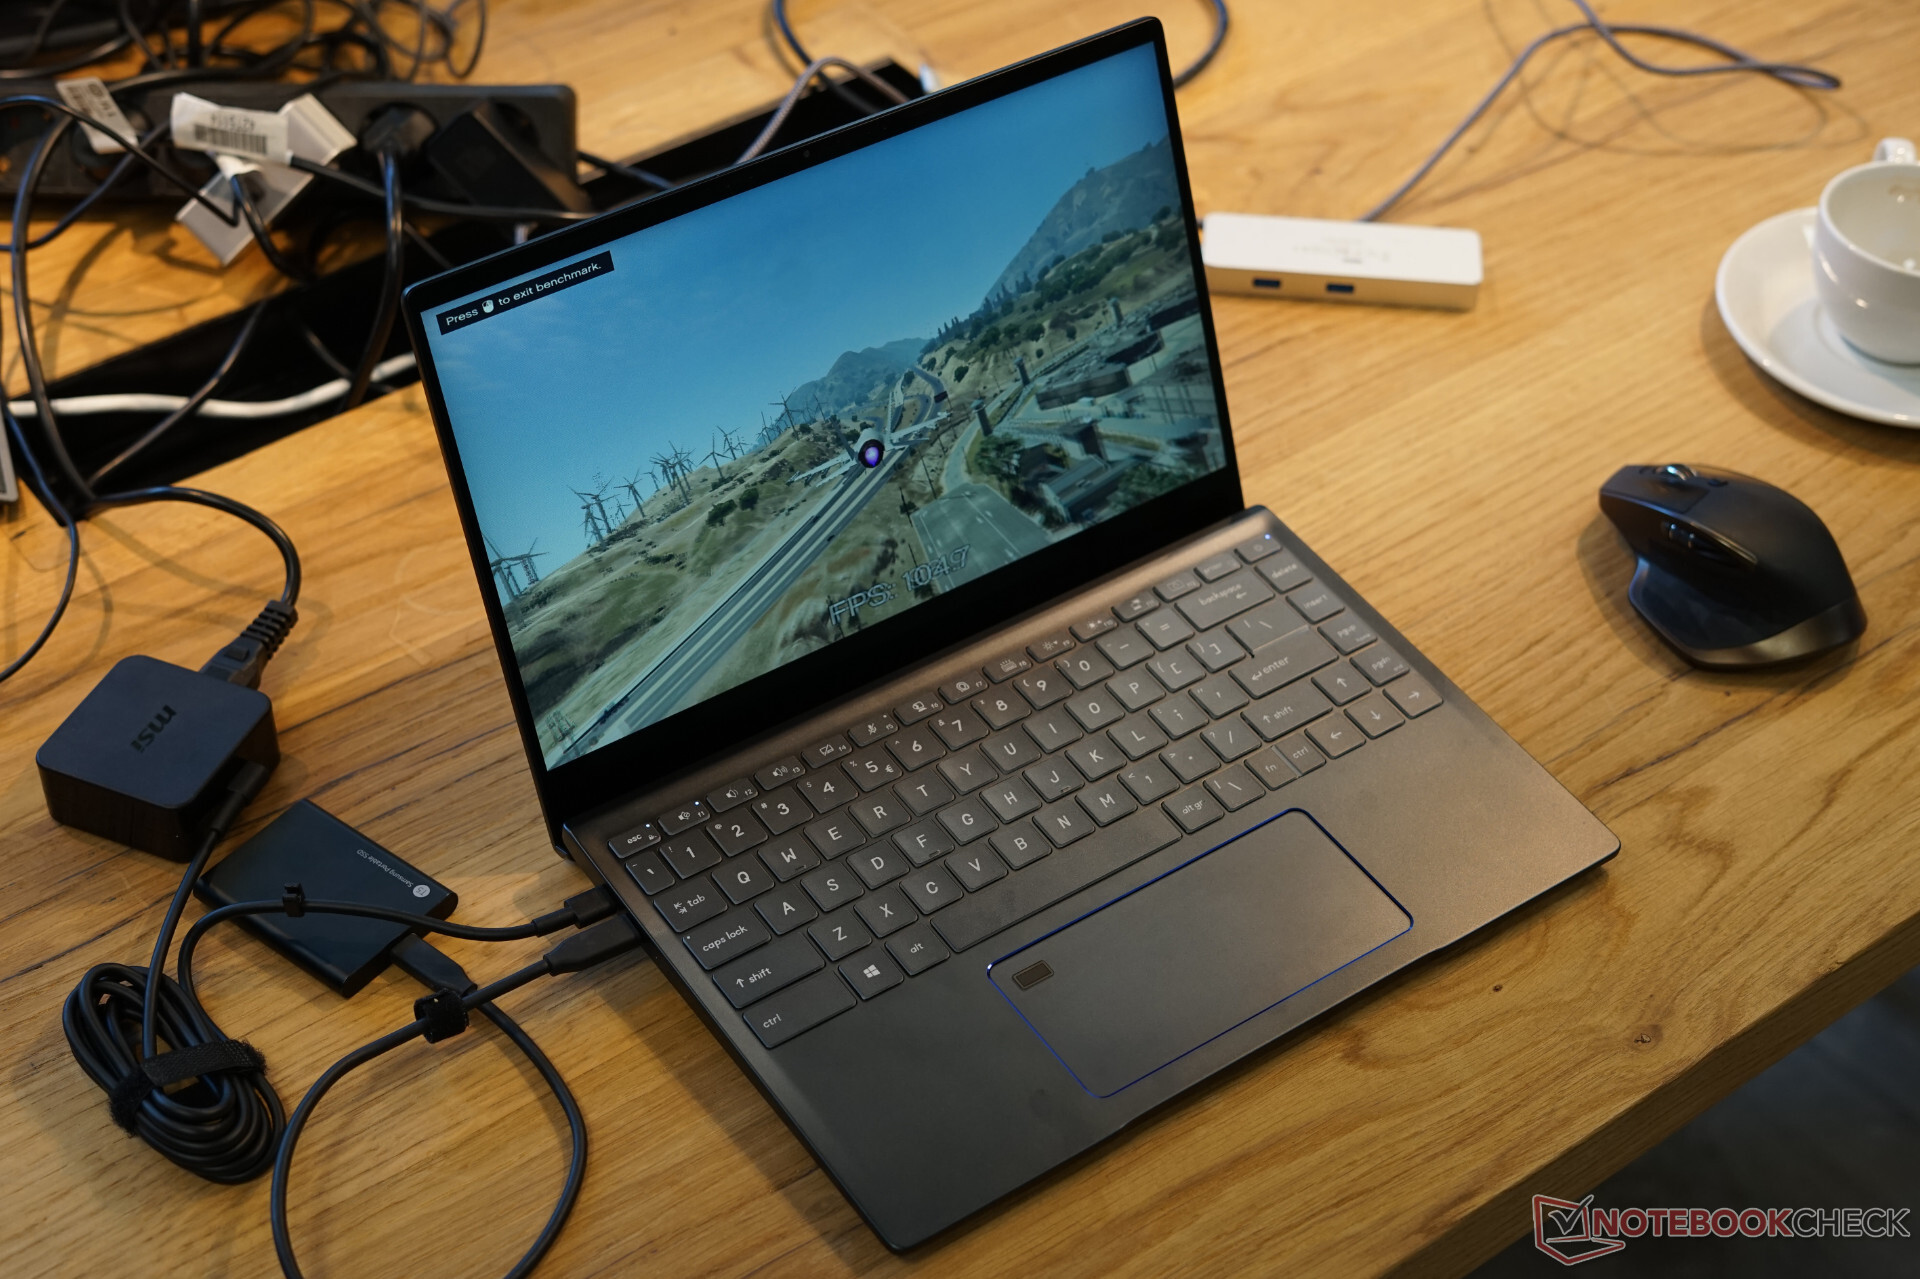
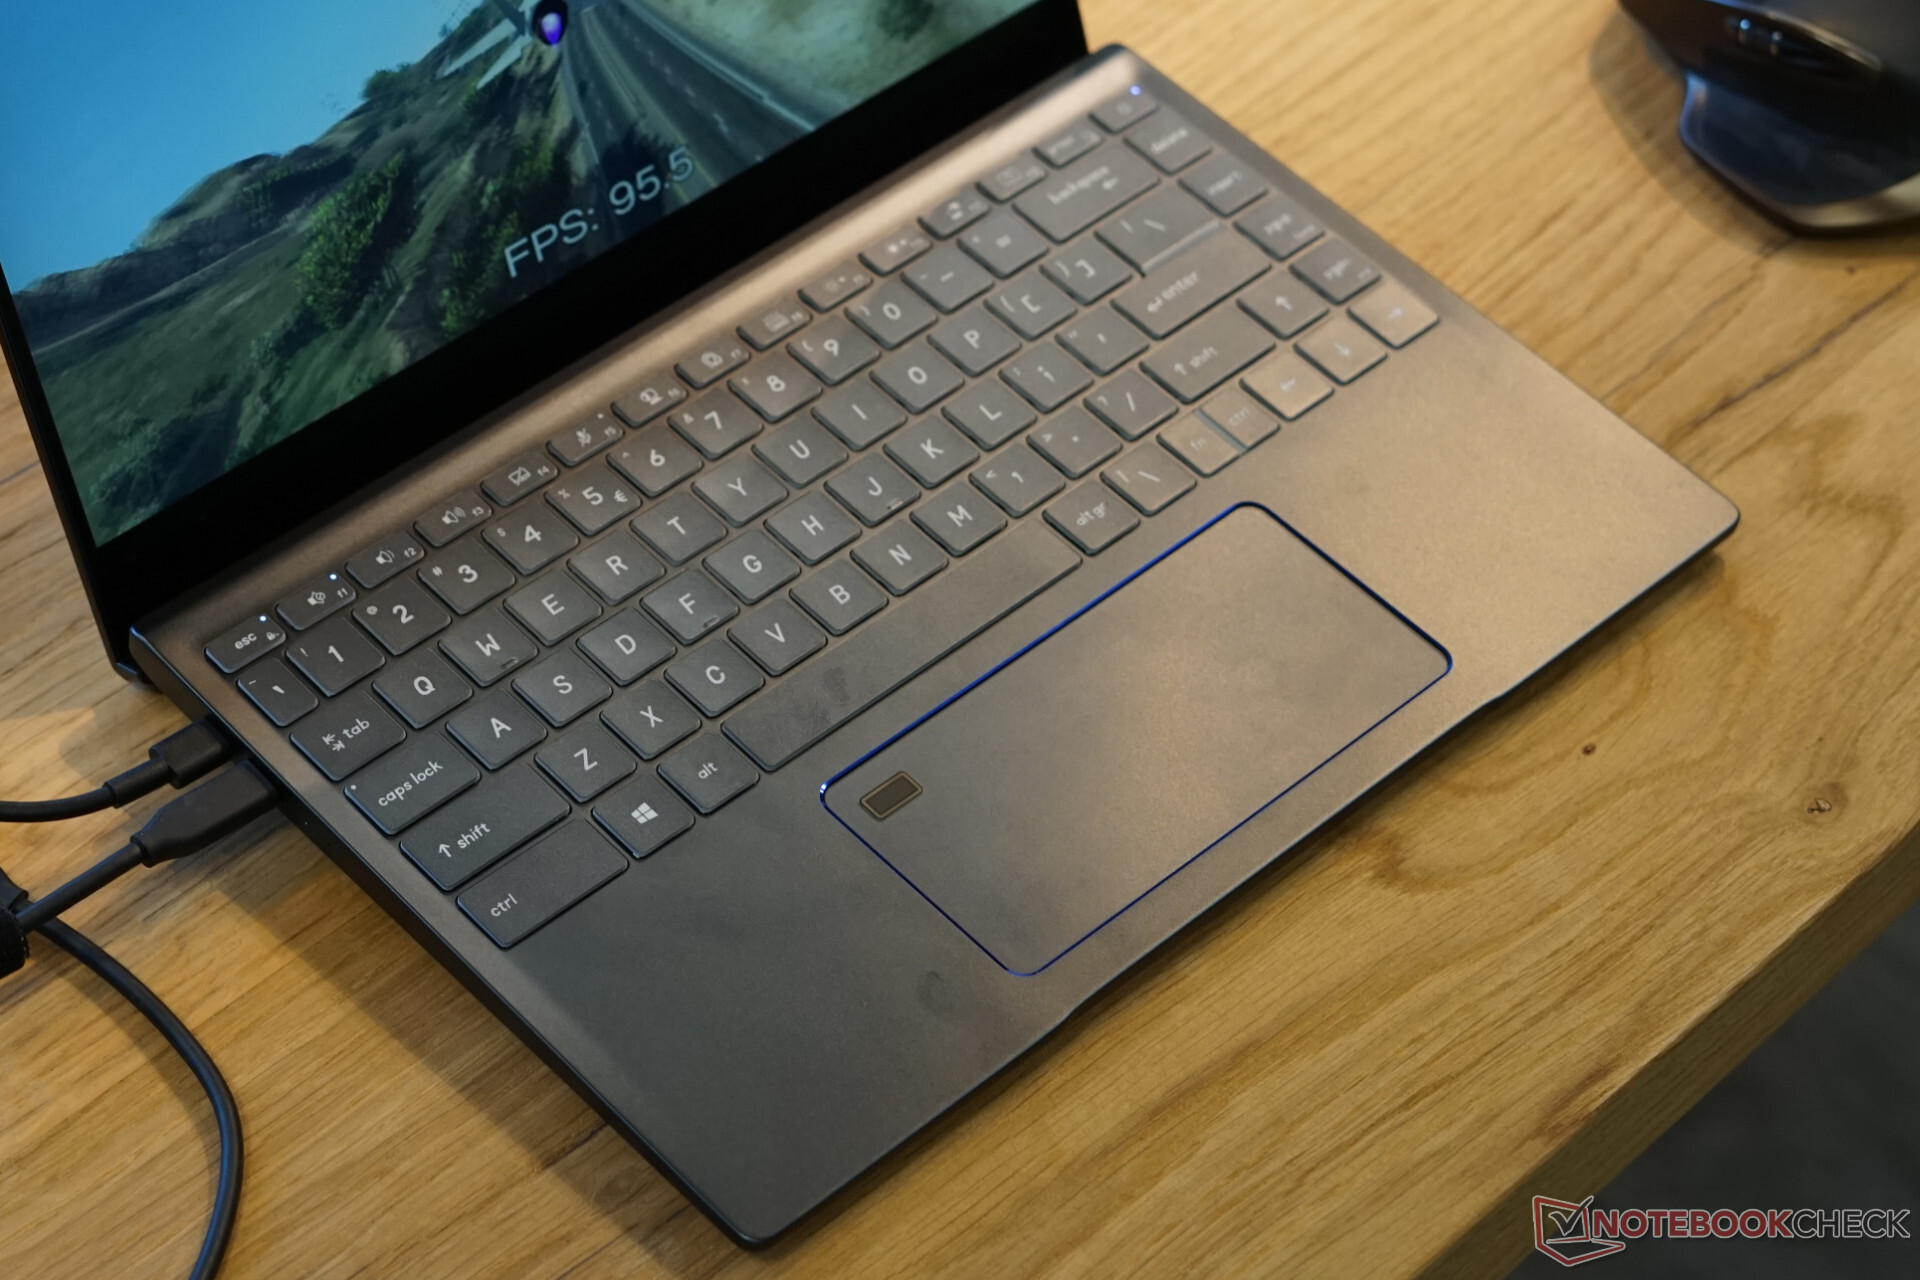
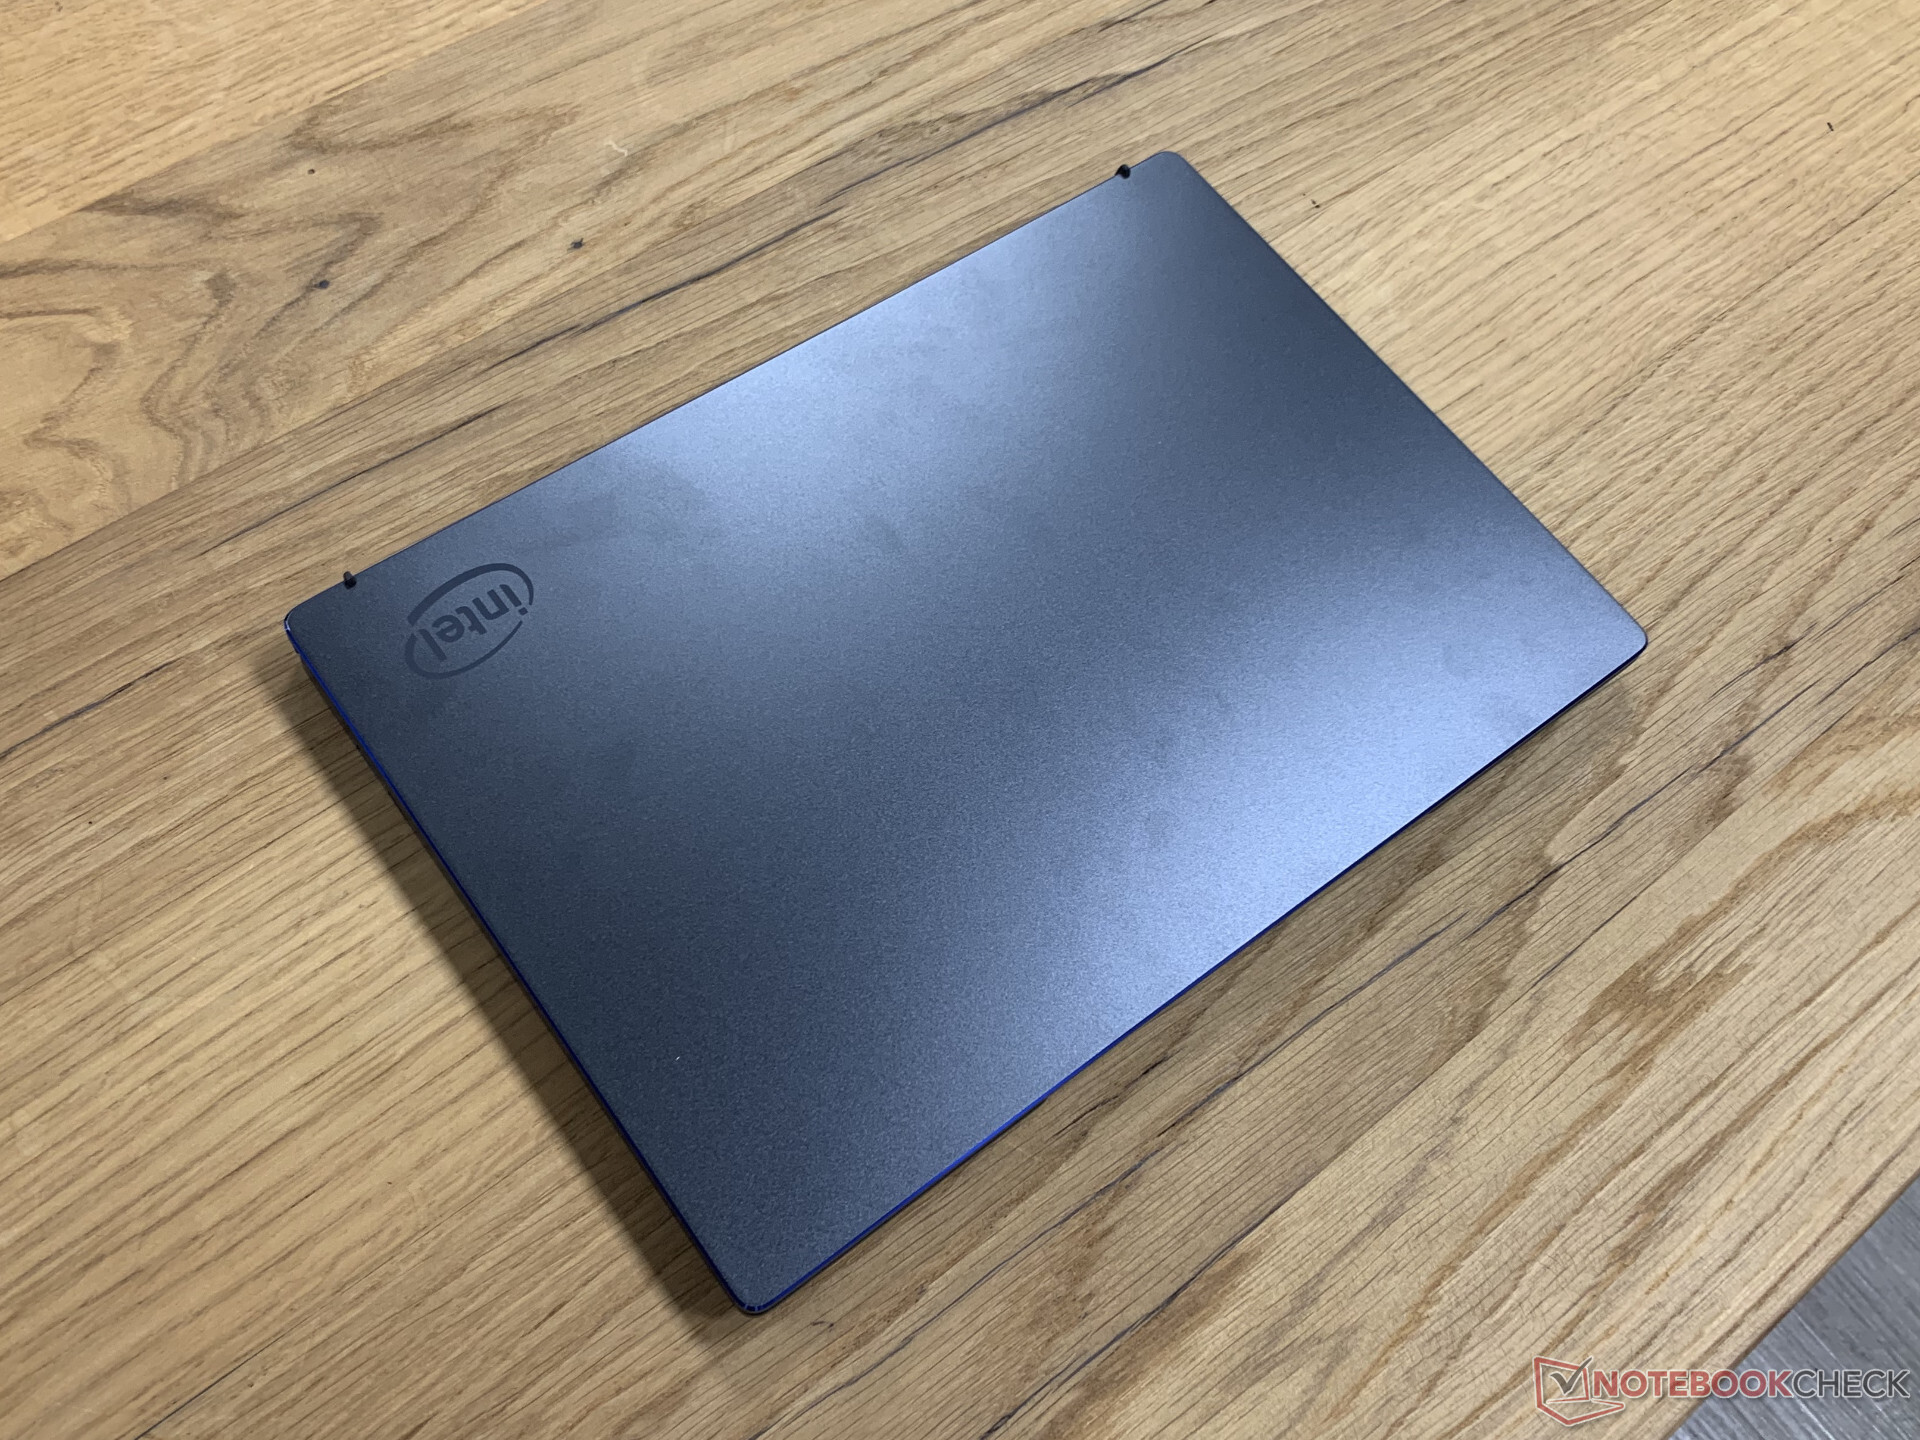
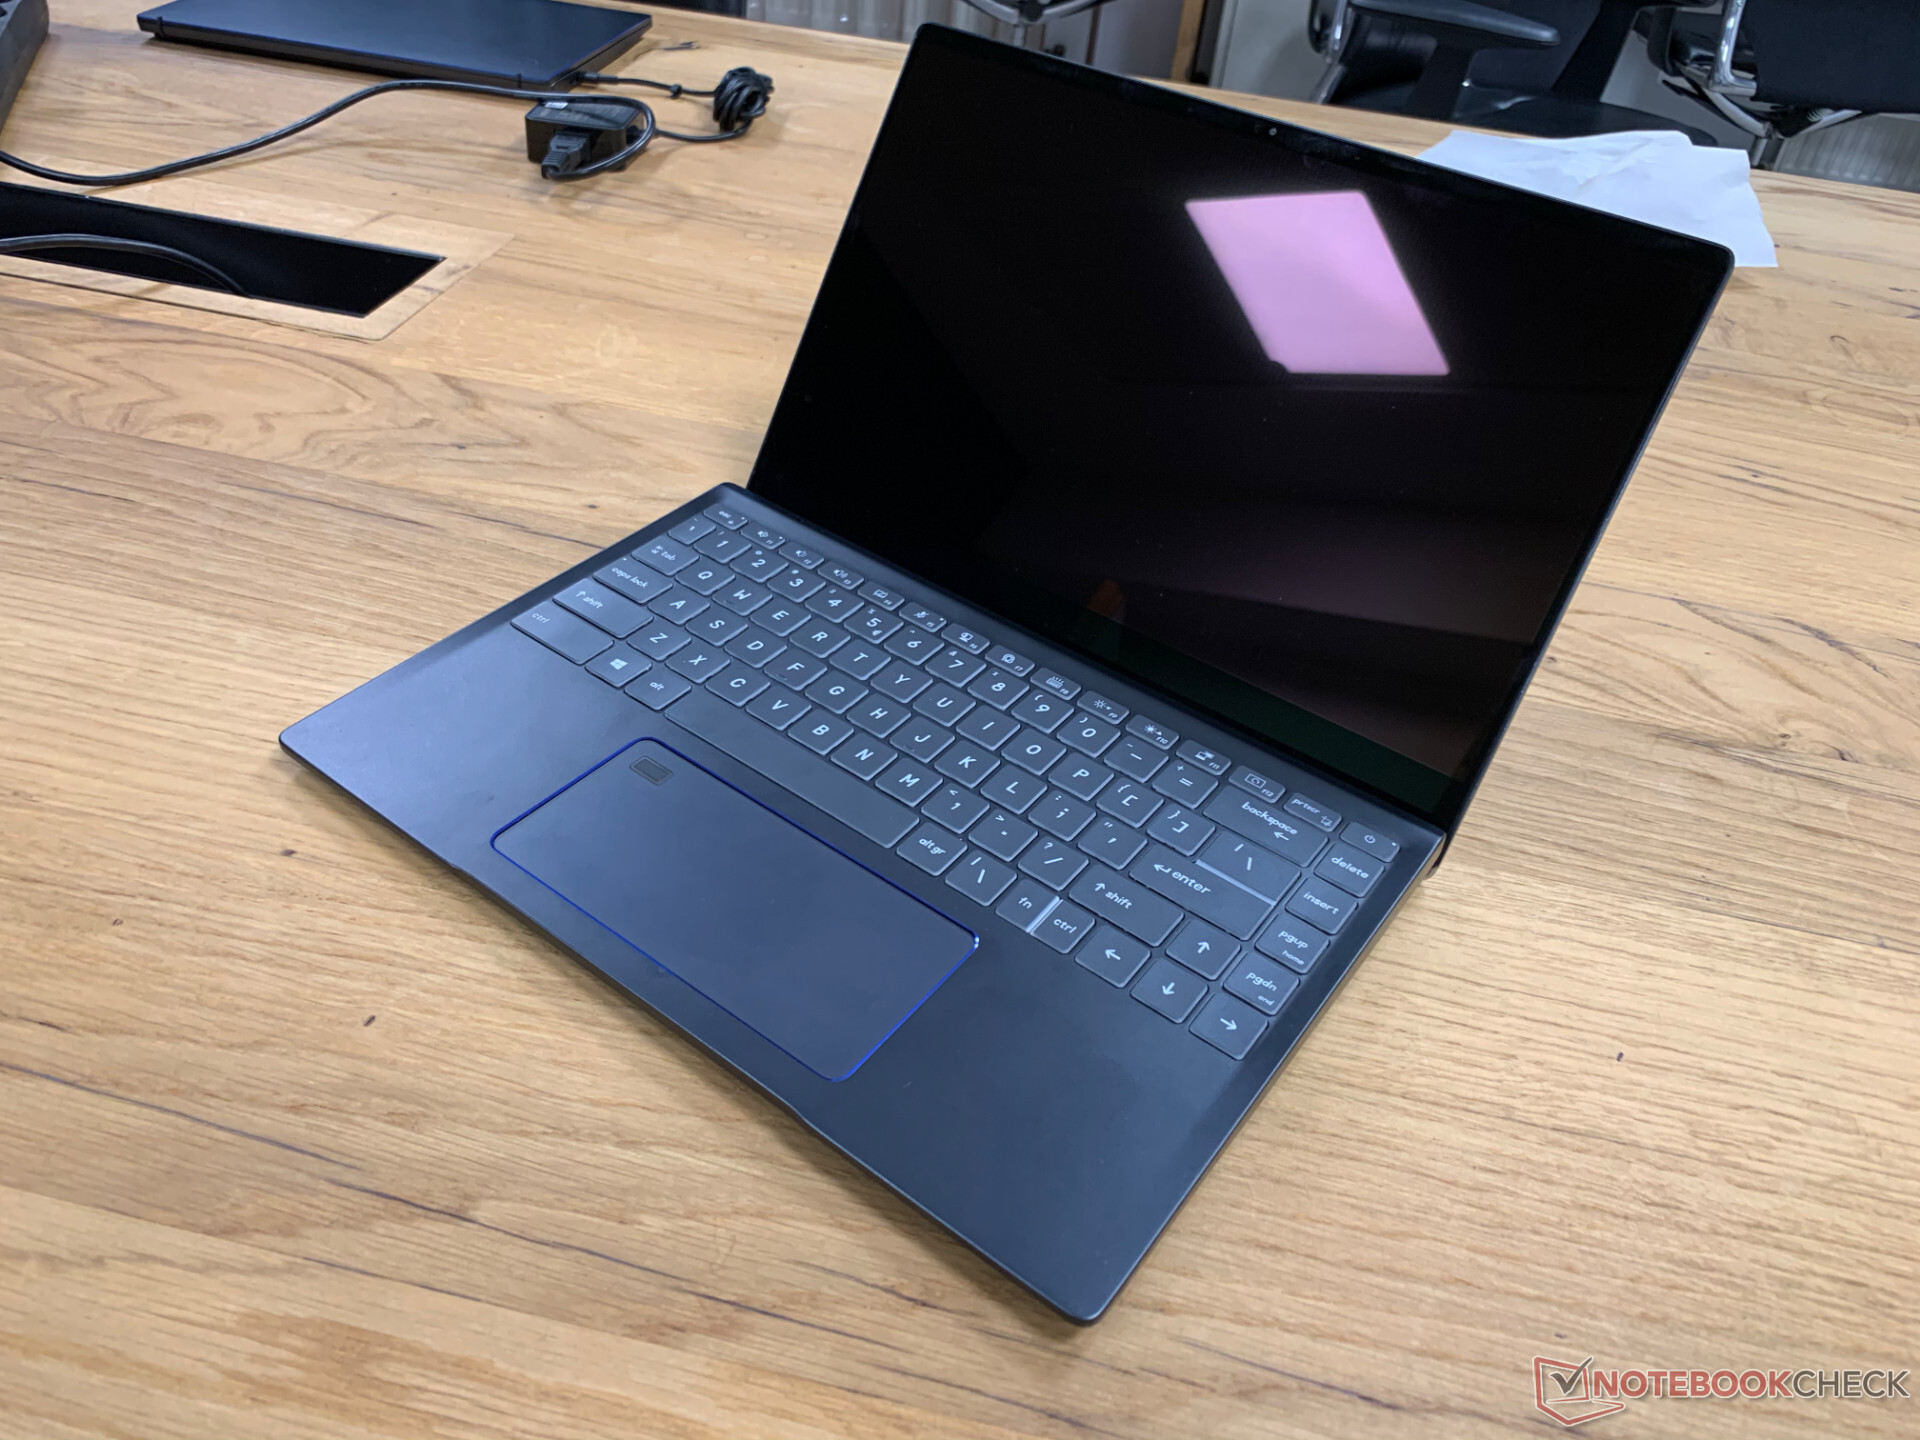
We tested an "Intel Reference Design System", which was build for Intel. It is based on the MSI Prestige 14 (in review with Comet Lake) barebone notebook, which will not be available for retail. It is a comparatively slim 14-inch laptop, which is slightly raised when you open the lid and sucks in air from the bottom. The fan noise was moderate during our benchmark tests. The aluminum chassis did get pretty warm, but it was not too bad. We are unfortunately not allowed to post any pictures of the internals.

We could select three different performance levels for our benchmarks:

  1. Better Battery: 15 Watt PL1 (sustained load, HWInfo: 14.8 W during Blender) and 54W PL2 (28s peak load, HWInfo 54.5W during Blender)
  2. Better Performance: 28 Watt PL1 (sustained load, HWInfo: 27.9 W duirng Blender) and 54W PL2 (28s peak load, HWInfo: 54 W during Blender)
  3. Best Performance: 28 Watt or 36 Watt with Dynamic Tuning (sustained load, HWInfo 35.3W during Blender) and 54 W PL2 (HWInfo 54.7 W duirng Blender)

Intel recommended the mode "Better Performance", because it will probably be the most representative for production units. We therefore performed the majority of our tests with 28W and only checked individual tests with 15W and 36W (Dynamic Tuning). Dynamic Tuning maintains the 36W PL1 as long as the internal temperatures and the "skin" temperatures are not getting too high, otherwise it will drop down to 28W.

Intel Reference Design Laptop 28W
Processor
Intel Core i7-1185G7 4 x 3 - 4.8 GHz, 28 W PL2 / Short Burst, 56 W PL1 / Sustained, Tiger Lake-UP3
Graphics adapter
Memory
16 GB 
, LDDR4X-4266 Dual Channel
Display
14.00 inch 16:9, 1920 x 1080 pixel 157 PPI, glossy: yes, 60 Hz
Storage
Connections
2 Thunderbolt
Networking
Intel Wi-Fi 6 AX201 (a/b/g/h/n = Wi-Fi 4/ac = Wi-Fi 5/ax = Wi-Fi 6/)
Operating System
Microsoft Windows 10 Pro 64 Bit
Price
0 Euro
Note: The manufacturer may use components from different suppliers including display panels, drives or memory sticks with similar specifications.


CPU Performance - Ice Lake with Turbo

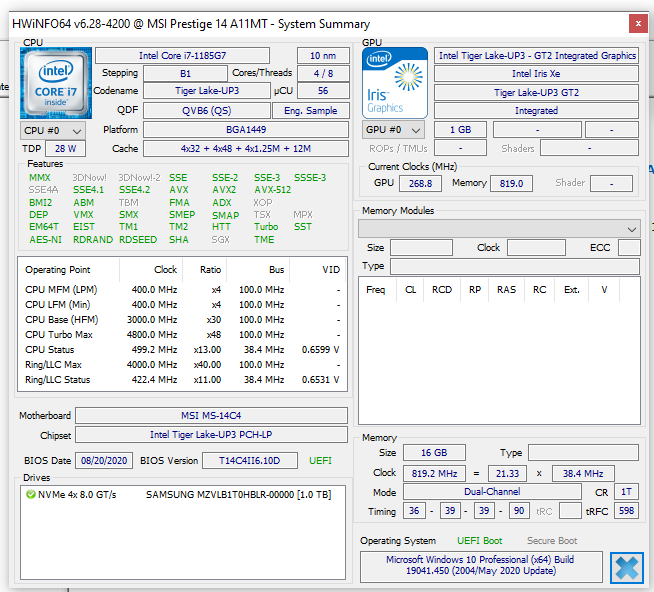
The tested Core i7-1185G7 is the high-end model for the launch of the Tiger Lake U generation and offers four processor cores (Willow Cove micro architecture), which can run at up to 4.8 GHz. This means the peak clock is much higher compared to Ice Lake and should result in higher single-core performance. Compared to AMD's current top models, Intel still uses four cores and prefers to use the chip die for a more powerful graphics unit as well as (partially) integrated Wi-Fi as well as Thunderbolt 4.

If we only look at the processor performance, there is an impressive advantage over the old Core i7-1065G7 (like in the Dell XPS 13 9300, for example). Compared to the fast AMD Renoir processors, the test system is sitting between the two 8-core chips Ryzen 7 4700U and 4800U - impressive. The high single-core performance really makes the difference here. The i7-1185G7 can beat all the rivals in the Cinebench Single-Core tests. Even a desktop Core i9-10900K or Ryzen 7 3800XT are slightly slower. If you look at the multi-core benchmarks, like the time consuming Blender test, AMD's 8-core chips still have a big advantage. However, Intel can close the gap to the Ryzen 5 4500U 6-core CPU, which once again shows the performance potential of the four Tiger Lake cores.

Compared to Intel's own Comet lake-U and H-series chips, Tiger Lake once again performs very well. The U-series is clearly beaten - despite 6 cores (which hardly pay off due to the low TDP envelope). The H-series with 8 cores still wins the multi-core tests, but the smaller quad-core chips like the Core i5-10300H are beaten.

Performance Rating - Percent
Average Intel Core i9-10980HK
 
84.4 pt
Average Intel Core i7-10875H
 
78.9 pt
Lenovo Yoga Slim 7-14ARE
AMD Ryzen 7 4800U
74.7 pt
Intel Reference Design Laptop 35W Dynamic Tuning -4!
Intel Core i7-1185G7
72.9 pt
Average Intel Core i7-10750H
 
69 pt
Intel Reference Design Laptop 28W
Intel Core i7-1185G7
62.7 pt
Average AMD Ryzen 7 4700U
 
61.9 pt
Average Intel Core i7-1165G7
 
58.2 pt
Xiaomi RedmiBook 16 R5
AMD Ryzen 5 4500U
56.8 pt
Average Intel Core i5-10300H
 
54.1 pt
Average AMD Ryzen 5 4500U
 
53.9 pt
Intel Reference Design Laptop 15W
Intel Core i7-1185G7
52.7 pt
Average Intel Core i7-10710U
 
52.7 pt
Dell XPS 13 9300 4K UHD
Intel Core i7-1065G7
48.4 pt
Average Intel Core i7-10810U
 
48.4 pt
Average Intel Core i7-1065G7
 
41.9 pt
Average AMD Ryzen 3 4300U
 
40.6 pt
Cinebench R20
CPU (Multi Core)
Average Intel Core i9-10980HK
  (3526 - 4487, n=13)
3933 Points +78%
Average Intel Core i7-10875H
  (1986 - 4176, n=32)
3455 Points +56%
Lenovo Yoga Slim 7-14ARE
AMD Ryzen 7 4800U
3213 Points +45%
Average Intel Core i7-10750H
  (1749 - 3325, n=43)
2848 Points +29%
Average AMD Ryzen 7 4700U
  (2401 - 3095, n=9)
2698 Points +22%
Xiaomi RedmiBook 16 R5
AMD Ryzen 5 4500U
2440 Points +10%
Intel Reference Design Laptop 35W Dynamic Tuning
Intel Core i7-1185G7
2402 Points +8%
Average AMD Ryzen 5 4500U
  (1843 - 2530, n=13)
2236 Points +1%
Intel Reference Design Laptop 28W
Intel Core i7-1185G7
2214 Points
Average Intel Core i5-10300H
  (1397 - 2240, n=15)
2046 Points -8%
Average Intel Core i7-10710U
  (1181 - 2598, n=5)
2012 Points -9%
Average Intel Core i7-1165G7
  (1060 - 2657, n=81)
1967 Points -11%
Average Intel Core i7-10810U
  (1498 - 2344, n=5)
1778 Points -20%
Intel Reference Design Laptop 15W
Intel Core i7-1185G7
1560 Points -30%
Average AMD Ryzen 3 4300U
  (1432 - 1609, n=3)
1537 Points -31%
Average Intel Core i7-1065G7
  (1081 - 2024, n=31)
1510 Points -32%
Dell XPS 13 9300 4K UHD
Intel Core i7-1065G7
1396 Points -37%
CPU (Single Core)
Intel Reference Design Laptop 35W Dynamic Tuning
Intel Core i7-1185G7
593 Points +2%
Intel Reference Design Laptop 28W
Intel Core i7-1185G7
580 Points
Intel Reference Design Laptop 15W
Intel Core i7-1185G7
553 Points -5%
Average Intel Core i7-1165G7
  (442 - 589, n=81)
552 Points -5%
Average Intel Core i9-10980HK
  (465 - 507, n=13)
488 Points -16%
Average Intel Core i7-10875H
  (430 - 524, n=32)
486 Points -16%
Lenovo Yoga Slim 7-14ARE
AMD Ryzen 7 4800U
474 Points -18%
Average Intel Core i7-10750H
  (431 - 504, n=43)
473 Points -18%
Average AMD Ryzen 7 4700U
  (448 - 478, n=9)
467 Points -19%
Average Intel Core i7-10710U
  (429 - 480, n=4)
457 Points -21%
Dell XPS 13 9300 4K UHD
Intel Core i7-1065G7
453 Points -22%
Xiaomi RedmiBook 16 R5
AMD Ryzen 5 4500U
451 Points -22%
Average AMD Ryzen 5 4500U
  (424 - 453, n=12)
446 Points -23%
Average Intel Core i5-10300H
  (312 - 470, n=15)
443 Points -24%
Average Intel Core i7-1065G7
  (358 - 474, n=31)
438 Points -24%
Average Intel Core i7-10810U
  (396 - 447, n=5)
425 Points -27%
Average AMD Ryzen 3 4300U
  (412 - 427, n=3)
420 Points -28%
Blender - v2.79 BMW27 CPU
Average AMD Ryzen 3 4300U
  (868 - 907, n=2)
888 Seconds * -63%
Average Intel Core i7-1065G7
  (675 - 1650, n=23)
882 Seconds * -62%
Intel Reference Design Laptop 15W
Intel Core i7-1185G7
745 Seconds * -37%
Average Intel Core i7-10810U
  (571 - 875, n=5)
689 Seconds * -26%
Dell XPS 13 9300 4K UHD
Intel Core i7-1065G7
681 Seconds * -25%
Average Intel Core i7-10710U
  (468 - 892, n=4)
649 Seconds * -19%
Average Intel Core i7-1165G7
  (468 - 1138, n=80)
618 Seconds * -13%
Average AMD Ryzen 5 4500U
  (533 - 748, n=11)
603 Seconds * -11%
Intel Reference Design Laptop 28W
Intel Core i7-1185G7
545 Seconds *
Xiaomi RedmiBook 16 R5
AMD Ryzen 5 4500U
533 Seconds * +2%
Average Intel Core i5-10300H
  (479 - 555, n=14)
515 Seconds * +6%
Intel Reference Design Laptop 35W Dynamic Tuning
Intel Core i7-1185G7
513 Seconds * +6%
Average AMD Ryzen 7 4700U
  (407 - 537, n=8)
480 Seconds * +12%
Average Intel Core i7-10750H
  (322 - 587, n=43)
389 Seconds * +29%
Average Intel Core i7-10875H
  (259 - 535, n=30)
327 Seconds * +40%
Lenovo Yoga Slim 7-14ARE
AMD Ryzen 7 4800U
322 Seconds * +41%
Average Intel Core i9-10980HK
  (239 - 299, n=13)
277 Seconds * +49%
Cinebench R15
CPU Single 64Bit
Intel Reference Design Laptop 35W Dynamic Tuning
Intel Core i7-1185G7
230 Points +3%
Intel Reference Design Laptop 28W
Intel Core i7-1185G7
224 Points
Intel Reference Design Laptop 15W
Intel Core i7-1185G7
216 Points -4%
Average Intel Core i7-1165G7
  (115 - 230, n=78)
212 Points -5%
Average Intel Core i9-10980HK
  (198 - 219, n=15)
207 Points -8%
Average Intel Core i7-10875H
  (190 - 220, n=37)
204 Points -9%
Average Intel Core i7-10750H
  (184 - 213, n=45)
196.7 Points -12%
Lenovo Yoga Slim 7-14ARE
AMD Ryzen 7 4800U
182 Points -19%
Dell XPS 13 9300 4K UHD
Intel Core i7-1065G7
182 Points -19%
Average AMD Ryzen 7 4700U
  (176 - 185, n=11)
180.3 Points -20%
Xiaomi RedmiBook 16 R5
AMD Ryzen 5 4500U
176 Points -21%
Average Intel Core i7-10810U
  (161 - 183, n=5)
175.6 Points -22%
Average Intel Core i7-10710U
  (138 - 194, n=8)
174.9 Points -22%
Average Intel Core i7-1065G7
  (141 - 190, n=35)
174.2 Points -22%
Average Intel Core i5-10300H
  (108 - 194, n=17)
174 Points -22%
Average AMD Ryzen 5 4500U
  (156 - 177, n=13)
172.8 Points -23%
Average AMD Ryzen 3 4300U
  (162.8 - 165, n=2)
163.9 Points -27%
CPU Multi 64Bit
Average Intel Core i9-10980HK
  (1606 - 1862, n=15)
1739 Points +80%
Lenovo Yoga Slim 7-14ARE
AMD Ryzen 7 4800U
1639 (1505.17min - 1639.01max) Points +70%
Average Intel Core i7-10875H
  (1003 - 1833, n=38)
1554 Points +61%
Average Intel Core i7-10750H
  (804 - 1418, n=50)
1263 Points +31%
Average AMD Ryzen 7 4700U
  (801 - 1253, n=12)
1091 Points +13%
Intel Reference Design Laptop 35W Dynamic Tuning
Intel Core i7-1185G7
1066 Points +10%
Xiaomi RedmiBook 16 R5
AMD Ryzen 5 4500U
966 (866.27min - 966.32max) Points 0%
Intel Reference Design Laptop 28W
Intel Core i7-1185G7
966 Points
Intel Reference Design Laptop 28W
Intel Core i7-1185G7
866 (754.55min - 866.1max) Points -10%
Average Intel Core i7-10710U
  (513 - 1113, n=8)
957 Points -1%
Average AMD Ryzen 5 4500U
  (715 - 1007, n=18)
896 Points -7%
Average Intel Core i7-1165G7
  (553 - 1027, n=86)
846 Points -12%
Average Intel Core i5-10300H
  (536 - 921, n=17)
825 Points -15%
Average Intel Core i7-10810U
  (623 - 1064, n=4)
799 Points -17%
Dell XPS 13 9300 4K UHD
Intel Core i7-1065G7
760 (489.25min - 610.17max) Points -21%
Intel Reference Design Laptop 15W
Intel Core i7-1185G7
702 Points -27%
Intel Reference Design Laptop 15W
Intel Core i7-1185G7
628 (619.66min - 627.69max) Points -35%
Average Intel Core i7-1065G7
  (288 - 836, n=36)
648 Points -33%
Average AMD Ryzen 3 4300U
  (545 - 580, n=2)
563 Points -42%
7-Zip 18.03
7z b 4 -mmt1
Average Intel Core i9-10980HK
  (5081 - 5542, n=13)
5386 MIPS 0%
Intel Reference Design Laptop 28W
Intel Core i7-1185G7
5368 MIPS
Average Intel Core i7-10875H
  (5071 - 5780, n=31)
5360 MIPS 0%
Average Intel Core i7-1165G7
  (4478 - 5507, n=80)
5182 MIPS -3%
Intel Reference Design Laptop 15W
Intel Core i7-1185G7
5153 MIPS -4%
Average Intel Core i7-10750H
  (4504 - 5470, n=43)
5114 MIPS -5%
Average Intel Core i5-10300H
  (2945 - 4956, n=14)
4704 MIPS -12%
Average Intel Core i7-10710U
  (4425 - 4727, n=4)
4609 MIPS -14%
Average Intel Core i7-10810U
  (4398 - 4794, n=5)
4561 MIPS -15%
Dell XPS 13 9300 4K UHD
Intel Core i7-1065G7
4438 MIPS -17%
Lenovo Yoga Slim 7-14ARE
AMD Ryzen 7 4800U
4436 MIPS -17%
Average AMD Ryzen 7 4700U
  (4208 - 4470, n=8)
4361 MIPS -19%
Xiaomi RedmiBook 16 R5
AMD Ryzen 5 4500U
4321 MIPS -20%
Average AMD Ryzen 5 4500U
  (4235 - 4338, n=11)
4290 MIPS -20%
Average Intel Core i7-1065G7
  (3289 - 4589, n=24)
4284 MIPS -20%
Average AMD Ryzen 3 4300U
  (4014 - 4113, n=2)
4064 MIPS -24%
7z b 4
Average Intel Core i9-10980HK
  (43786 - 49275, n=13)
47126 MIPS +88%
Lenovo Yoga Slim 7-14ARE
AMD Ryzen 7 4800U
44804 MIPS +79%
Average Intel Core i7-10875H
  (29844 - 49562, n=31)
43117 MIPS +72%
Average Intel Core i7-10750H
  (26040 - 37345, n=43)
33946 MIPS +35%
Average AMD Ryzen 7 4700U
  (26652 - 33890, n=8)
30273 MIPS +21%
Xiaomi RedmiBook 16 R5
AMD Ryzen 5 4500U
25891 MIPS +3%
Intel Reference Design Laptop 28W
Intel Core i7-1185G7
25086 MIPS
Average AMD Ryzen 5 4500U
  (22466 - 25891, n=11)
24384 MIPS -3%
Average Intel Core i7-10710U
  (16713 - 29948, n=4)
23912 MIPS -5%
Average Intel Core i5-10300H
  (15146 - 24841, n=14)
23295 MIPS -7%
Average Intel Core i7-1165G7
  (15347 - 27405, n=80)
22935 MIPS -9%
Average Intel Core i7-10810U
  (16072 - 25244, n=5)
21290 MIPS -15%
Dell XPS 13 9300 4K UHD
Intel Core i7-1065G7
21139 MIPS -16%
Intel Reference Design Laptop 15W
Intel Core i7-1185G7
18936 MIPS -25%
Average Intel Core i7-1065G7
  (10406 - 22898, n=24)
17024 MIPS -32%
Average AMD Ryzen 3 4300U
  (15043 - 16605, n=2)
15824 MIPS -37%
HWBOT x265 Benchmark v2.2 - 4k Preset
Average Intel Core i9-10980HK
  (12 - 14.6, n=13)
13 fps +101%
Average Intel Core i7-10875H
  (7.27 - 14.1, n=27)
11.7 fps +81%
Lenovo Yoga Slim 7-14ARE
AMD Ryzen 7 4800U
10.77 fps +67%
Average Intel Core i7-10750H
  (5.54 - 11.6, n=43)
9.61 fps +49%
Average AMD Ryzen 7 4700U
  (6.79 - 10.1, n=8)
8.44 fps +31%
Xiaomi RedmiBook 16 R5
AMD Ryzen 5 4500U
7.16 fps +11%
Average Intel Core i5-10300H
  (6.13 - 7.78, n=14)
7.1 fps +10%
Average AMD Ryzen 5 4500U
  (5.86 - 7.33, n=10)
6.8 fps +5%
Intel Reference Design Laptop 28W
Intel Core i7-1185G7
6.46 fps
Average Intel Core i7-1165G7
  (1.39 - 8.47, n=80)
6.3 fps -2%
Dell XPS 13 9300 4K UHD
Intel Core i7-1065G7
6.08 fps -6%
Average Intel Core i7-10710U
  (4.2 - 7.95, n=4)
5.94 fps -8%
Average Intel Core i7-10810U
  (3.81 - 6.45, n=5)
5.31 fps -18%
Intel Reference Design Laptop 15W
Intel Core i7-1185G7
5.02 fps -22%
Average AMD Ryzen 3 4300U
  (4.37 - 5.36, n=2)
4.87 fps -25%
Average Intel Core i7-1065G7
  (2.2 - 6.38, n=22)
4.58 fps -29%
R Benchmark 2.5 - Overall mean
Average Intel Core i7-1065G7
  (0.661 - 0.798, n=18)
0.708 sec * -24%
Dell XPS 13 9300 4K UHD
Intel Core i7-1065G7
0.682 sec * -19%
Average Intel Core i7-10810U
  (0.651 - 0.717, n=5)
0.682 sec * -19%
Average Intel Core i5-10300H
  (0.625 - 1.088, n=14)
0.68 sec * -19%
Average AMD Ryzen 3 4300U
  (0.652 - 0.686, n=2)
0.669 sec * -17%
Average Intel Core i7-10710U
  (0.649 - 0.674, n=2)
0.662 sec * -16%
Average AMD Ryzen 5 4500U
  (0.614 - 0.654, n=10)
0.636 sec * -11%
Xiaomi RedmiBook 16 R5
AMD Ryzen 5 4500U
0.634 sec * -11%
Average AMD Ryzen 7 4700U
  (0.598 - 0.651, n=8)
0.618 sec * -8%
Lenovo Yoga Slim 7-14ARE
AMD Ryzen 7 4800U
0.613 sec * -7%
Average Intel Core i7-10750H
  (0.578 - 0.708, n=42)
0.611 sec * -7%
Average Intel Core i7-1165G7
  (0.552 - 1.002, n=80)
0.594 sec * -4%
Average Intel Core i7-10875H
  (0.546 - 0.662, n=29)
0.582 sec * -2%
Intel Reference Design Laptop 15W
Intel Core i7-1185G7
0.579 sec * -1%
Average Intel Core i9-10980HK
  (0.561 - 0.596, n=13)
0.576 sec * -1%
Intel Reference Design Laptop 28W
Intel Core i7-1185G7
0.571 sec *

* ... smaller is better

The sustained performance is stable on Intel's reference laptop, and we can neither see the usual drop after the initial benchmark runs in the 28W or 15W mode.

0501001502002503003504004505005506006507007508008509009501000105011001150120012501300135014001450150015501600Tooltip
Intel Reference Design Laptop 28W Intel Core i7-1185G7, Intel Core i7-1185G7: Ø853 (754.55-866.1)
Lenovo Yoga Slim 7-14ARE AMD Ryzen 7 4800U, AMD Ryzen 7 4800U: Ø1522 (1505.17-1639.01)
Dell XPS 13 9300 4K UHD Intel Core i7-1065G7, Intel Core i7-1065G7: Ø573 (480.43-760.86)
Intel Reference Design Laptop 15W Intel Core i7-1185G7, Intel Core i7-1185G7: Ø625 (619.66-627.69)

As we have already reported during the launch, Tiger Lake does not use fixed TDP limits anymore, but manufacturers can choose between 15 and 28W (depending on the cooling solution). Including Dynamic Tuning, the CPU can even consume up to 36W for longer periods. Our benchmarks clearly show that these TDP settings have a massive effect on the performance. The single-core performance is not affected that much, because the 15W limit is already sufficient for high clocks, but the CPU performance will drop by 27 % or 31 %, respectively, compared to the maximum setting. This means there will still be significant performance differences from notebook to notebook. You cannot just look at the model designation like i7-1185G7 for the performance you will get.

Cinebench R20
CPU (Multi Core)
Average Intel Core i9-10980HK
  (3526 - 4487, n=13)
3933 Points +78%
Average Intel Core i7-10875H
  (1986 - 4176, n=32)
3455 Points +56%
Lenovo Yoga Slim 7-14ARE
AMD Ryzen 7 4800U, AMD Radeon RX Vega 8 (Ryzen 4000/5000)
3213 Points +45%
Average AMD Ryzen 7 4800U
  (2943 - 3306, n=4)
3178 Points +44%
Average AMD Ryzen 7 4700U
  (2401 - 3095, n=9)
2698 Points +22%
Average AMD Ryzen 5 4600U
  (2544 - 2796, n=3)
2628 Points +19%
Xiaomi RedmiBook 16 R5
AMD Ryzen 5 4500U, AMD Radeon RX Vega 6 (Ryzen 4000/5000)
2440 Points +10%
Intel Reference Design Laptop 35W Dynamic Tuning
Intel Core i7-1185G7, Intel Iris Xe Graphics G7 96EUs
2402 Points +8%
Average AMD Ryzen 5 4500U
  (1843 - 2530, n=13)
2236 Points +1%
Intel Reference Design Laptop 28W
Intel Core i7-1185G7, Intel Iris Xe Graphics G7 96EUs
2214 Points
Average Intel Core i5-10300H
  (1397 - 2240, n=15)
2046 Points -8%
Average Intel Core i7-1165G7
  (1060 - 2657, n=81)
1967 Points -11%
Intel Reference Design Laptop 15W
Intel Core i7-1185G7, Intel Iris Xe Graphics G7 96EUs
1560 Points -30%
Average AMD Ryzen 3 4300U
  (1432 - 1609, n=3)
1537 Points -31%
CPU (Single Core)
Intel Reference Design Laptop 35W Dynamic Tuning
Intel Core i7-1185G7, Intel Iris Xe Graphics G7 96EUs
593 Points +2%
Intel Reference Design Laptop 28W
Intel Core i7-1185G7, Intel Iris Xe Graphics G7 96EUs
580 Points
Intel Reference Design Laptop 15W
Intel Core i7-1185G7, Intel Iris Xe Graphics G7 96EUs
553 Points -5%
Average Intel Core i7-1165G7
  (442 - 589, n=81)
552 Points -5%
Average Intel Core i9-10980HK
  (465 - 507, n=13)
488 Points -16%
Average Intel Core i7-10875H
  (430 - 524, n=32)
486 Points -16%
Average AMD Ryzen 7 4800U
  (474 - 488, n=4)
481 Points -17%
Lenovo Yoga Slim 7-14ARE
AMD Ryzen 7 4800U, AMD Radeon RX Vega 8 (Ryzen 4000/5000)
474 Points -18%
Average AMD Ryzen 7 4700U
  (448 - 478, n=9)
467 Points -19%
Xiaomi RedmiBook 16 R5
AMD Ryzen 5 4500U, AMD Radeon RX Vega 6 (Ryzen 4000/5000)
451 Points -22%
Average AMD Ryzen 5 4600U
  (447 - 453, n=3)
449 Points -23%
Average AMD Ryzen 5 4500U
  (424 - 453, n=12)
446 Points -23%
Average Intel Core i5-10300H
  (312 - 470, n=15)
443 Points -24%
Average AMD Ryzen 3 4300U
  (412 - 427, n=3)
420 Points -28%
Blender - v2.79 BMW27 CPU
Average AMD Ryzen 3 4300U
  (868 - 907, n=2)
888 Seconds * -63%
Intel Reference Design Laptop 15W
Intel Core i7-1185G7, Intel Iris Xe Graphics G7 96EUs
745 Seconds * -37%
Average Intel Core i7-1165G7
  (468 - 1138, n=80)
618 Seconds * -13%
Average AMD Ryzen 5 4500U
  (533 - 748, n=11)
603 Seconds * -11%
Intel Reference Design Laptop 28W
Intel Core i7-1185G7, Intel Iris Xe Graphics G7 96EUs
545 Seconds *
Xiaomi RedmiBook 16 R5
AMD Ryzen 5 4500U, AMD Radeon RX Vega 6 (Ryzen 4000/5000)
533 Seconds * +2%
Average Intel Core i5-10300H
  (479 - 555, n=14)
515 Seconds * +6%
Intel Reference Design Laptop 35W Dynamic Tuning
Intel Core i7-1185G7, Intel Iris Xe Graphics G7 96EUs
513 Seconds * +6%
Average AMD Ryzen 7 4700U
  (407 - 537, n=8)
480 Seconds * +12%
Average AMD Ryzen 5 4600U
 
402 Seconds * +26%
Average AMD Ryzen 7 4800U
  (322 - 374, n=3)
345 Seconds * +37%
Average Intel Core i7-10875H
  (259 - 535, n=30)
327 Seconds * +40%
Lenovo Yoga Slim 7-14ARE
AMD Ryzen 7 4800U, AMD Radeon RX Vega 8 (Ryzen 4000/5000)
322 Seconds * +41%
Average Intel Core i9-10980HK
  (239 - 299, n=13)
277 Seconds * +49%

* ... smaller is better

Application Performance - PCMark 10

We still use the regular PCMark 10 for the application performance, which includes free software like LibreOffice, GIMP, Firefox, and Chromium. Thanks to the fast 1TB PM981a SSD from Samsung, the MSI barebone with Tiger Lake shows a great performance. The system only drops back a bit in the Content Creation part, but the other two sub tests produce even higher scores compared to fast gaming notebooks with 8-core CML-H CPUs (i9-10980HK). The overall score is lower on the i7-1185G7 system, but it is alightly ahead of the Lenovo Yoga Slim 7 with Ryzen 7 4800U CPU. The result is an indicator how well Tiger Lake based systems should (or could, respectively) handle office and productive tasks.

PCMark 10 / Score
Average Intel Core i9-10980HK
  (5277 - 6988, n=12)
6288 Points +13%
Average Intel Core i7-10875H
  (4884 - 6739, n=24)
5970 Points +7%
Intel Reference Design Laptop 28W
Intel Core i7-1185G7, Intel Iris Xe Graphics G7 96EUs, Samsung PM981a MZVLB1T0HBLR
5561 Points
Lenovo Yoga Slim 7-14ARE
AMD Ryzen 7 4800U, AMD Radeon RX Vega 8 (Ryzen 4000/5000), Samsung SSD PM981a MZVLB512HBJQ
5383 Points -3%
Average AMD Ryzen 7 4800U
  (5233 - 5383, n=3)
5291 Points -5%
Average Intel Core i7-1165G7
  (4531 - 5931, n=72)
5070 Points -9%
Average AMD Ryzen 7 4700U
  (4527 - 5307, n=8)
4898 Points -12%
Xiaomi RedmiBook 16 R5
AMD Ryzen 5 4500U, AMD Radeon RX Vega 6 (Ryzen 4000/5000), Samsung PM881 MZNLH512HALU-0000/07
4784 Points -14%
Average AMD Ryzen 5 4600U
 
4772 Points -14%
Average Intel Core i5-10300H
  (4077 - 5301, n=13)
4748 Points -15%
Average AMD Ryzen 5 4500U
  (4393 - 5024, n=12)
4683 Points -16%
Dell XPS 13 9300 4K UHD
Intel Core i7-1065G7, Intel Iris Plus Graphics G7 (Ice Lake 64 EU), Intel SSDPEMKF512G8 NVMe SSD
4451 Points -20%
Average AMD Ryzen 3 4300U
 
4322 Points -22%
PCMark 10 / Essentials
Intel Reference Design Laptop 28W
Intel Core i7-1185G7, Intel Iris Xe Graphics G7 96EUs, Samsung PM981a MZVLB1T0HBLR
10484 Points
Average Intel Core i9-10980HK
  (9312 - 10829, n=12)
9798 Points -7%
Average Intel Core i7-1165G7
  (8026 - 11505, n=72)
9763 Points -7%
Lenovo Yoga Slim 7-14ARE
AMD Ryzen 7 4800U, AMD Radeon RX Vega 8 (Ryzen 4000/5000), Samsung SSD PM981a MZVLB512HBJQ
9637 Points -8%
Average Intel Core i7-10875H
  (7547 - 10458, n=24)
9567 Points -9%
Average AMD Ryzen 7 4800U
  (9188 - 9637, n=3)
9403 Points -10%
Average AMD Ryzen 5 4600U
 
9352 Points -11%
Dell XPS 13 9300 4K UHD
Intel Core i7-1065G7, Intel Iris Plus Graphics G7 (Ice Lake 64 EU), Intel SSDPEMKF512G8 NVMe SSD
9096 Points -13%
Average AMD Ryzen 7 4700U
  (8303 - 9559, n=8)
9009 Points -14%
Xiaomi RedmiBook 16 R5
AMD Ryzen 5 4500U, AMD Radeon RX Vega 6 (Ryzen 4000/5000), Samsung PM881 MZNLH512HALU-0000/07
8905 Points -15%
Average Intel Core i5-10300H
  (7148 - 9874, n=13)
8714 Points -17%
Average AMD Ryzen 5 4500U
  (8204 - 9124, n=11)
8669 Points -17%
Average AMD Ryzen 3 4300U
 
8600 Points -18%
PCMark 10 / Productivity
Intel Reference Design Laptop 28W
Intel Core i7-1185G7, Intel Iris Xe Graphics G7 96EUs, Samsung PM981a MZVLB1T0HBLR
8770 Points
Average Intel Core i9-10980HK
  (7641 - 9337, n=12)
8502 Points -3%
Average Intel Core i7-10875H
  (7534 - 9070, n=24)
8179 Points -7%
Average AMD Ryzen 7 4800U
  (7631 - 8091, n=3)
7879 Points -10%
Lenovo Yoga Slim 7-14ARE
AMD Ryzen 7 4800U, AMD Radeon RX Vega 8 (Ryzen 4000/5000), Samsung SSD PM981a MZVLB512HBJQ
7631 Points -13%
Average Intel Core i5-10300H
  (6732 - 8058, n=13)
7374 Points -16%
Average Intel Core i7-1165G7
  (5570 - 9317, n=72)
7252 Points -17%
Average AMD Ryzen 7 4700U
  (5348 - 7945, n=8)
7201 Points -18%
Xiaomi RedmiBook 16 R5
AMD Ryzen 5 4500U, AMD Radeon RX Vega 6 (Ryzen 4000/5000), Samsung PM881 MZNLH512HALU-0000/07
7096 Points -19%
Average AMD Ryzen 5 4500U
  (6400 - 7752, n=11)
6987 Points -20%
Dell XPS 13 9300 4K UHD
Intel Core i7-1065G7, Intel Iris Plus Graphics G7 (Ice Lake 64 EU), Intel SSDPEMKF512G8 NVMe SSD
6912 Points -21%
Average AMD Ryzen 3 4300U
 
6489 Points -26%
Average AMD Ryzen 5 4600U
 
6230 Points -29%
PCMark 10 / Digital Content Creation
Average Intel Core i9-10980HK
  (5177 - 10217, n=12)
8238 Points +62%
Average Intel Core i7-10875H
  (4563 - 9448, n=24)
7517 Points +48%
Lenovo Yoga Slim 7-14ARE
AMD Ryzen 7 4800U, AMD Radeon RX Vega 8 (Ryzen 4000/5000), Samsung SSD PM981a MZVLB512HBJQ
5758 Points +13%
Average AMD Ryzen 7 4800U
  (5123 - 5758, n=3)
5434 Points +7%
Intel Reference Design Laptop 28W
Intel Core i7-1185G7, Intel Iris Xe Graphics G7 96EUs, Samsung PM981a MZVLB1T0HBLR
5075 Points
Average AMD Ryzen 5 4600U
 
5062 Points 0%
Average Intel Core i7-1165G7
  (4083 - 6957, n=72)
5045 Points -1%
Average AMD Ryzen 7 4700U
  (4459 - 5495, n=8)
4947 Points -3%
Xiaomi RedmiBook 16 R5
AMD Ryzen 5 4500U, AMD Radeon RX Vega 6 (Ryzen 4000/5000), Samsung PM881 MZNLH512HALU-0000/07
4704 Points -7%
Average Intel Core i5-10300H
  (2928 - 6003, n=13)
4621 Points -9%
Average AMD Ryzen 5 4500U
  (4189 - 4808, n=11)
4517 Points -11%
Average AMD Ryzen 3 4300U
 
3926 Points -23%
Dell XPS 13 9300 4K UHD
Intel Core i7-1065G7, Intel Iris Plus Graphics G7 (Ice Lake 64 EU), Intel SSDPEMKF512G8 NVMe SSD
3807 Points -25%

GPU Performance - Xe Architecture promises a lot of performance

High performance of the Iris Xe in 3DMark tests

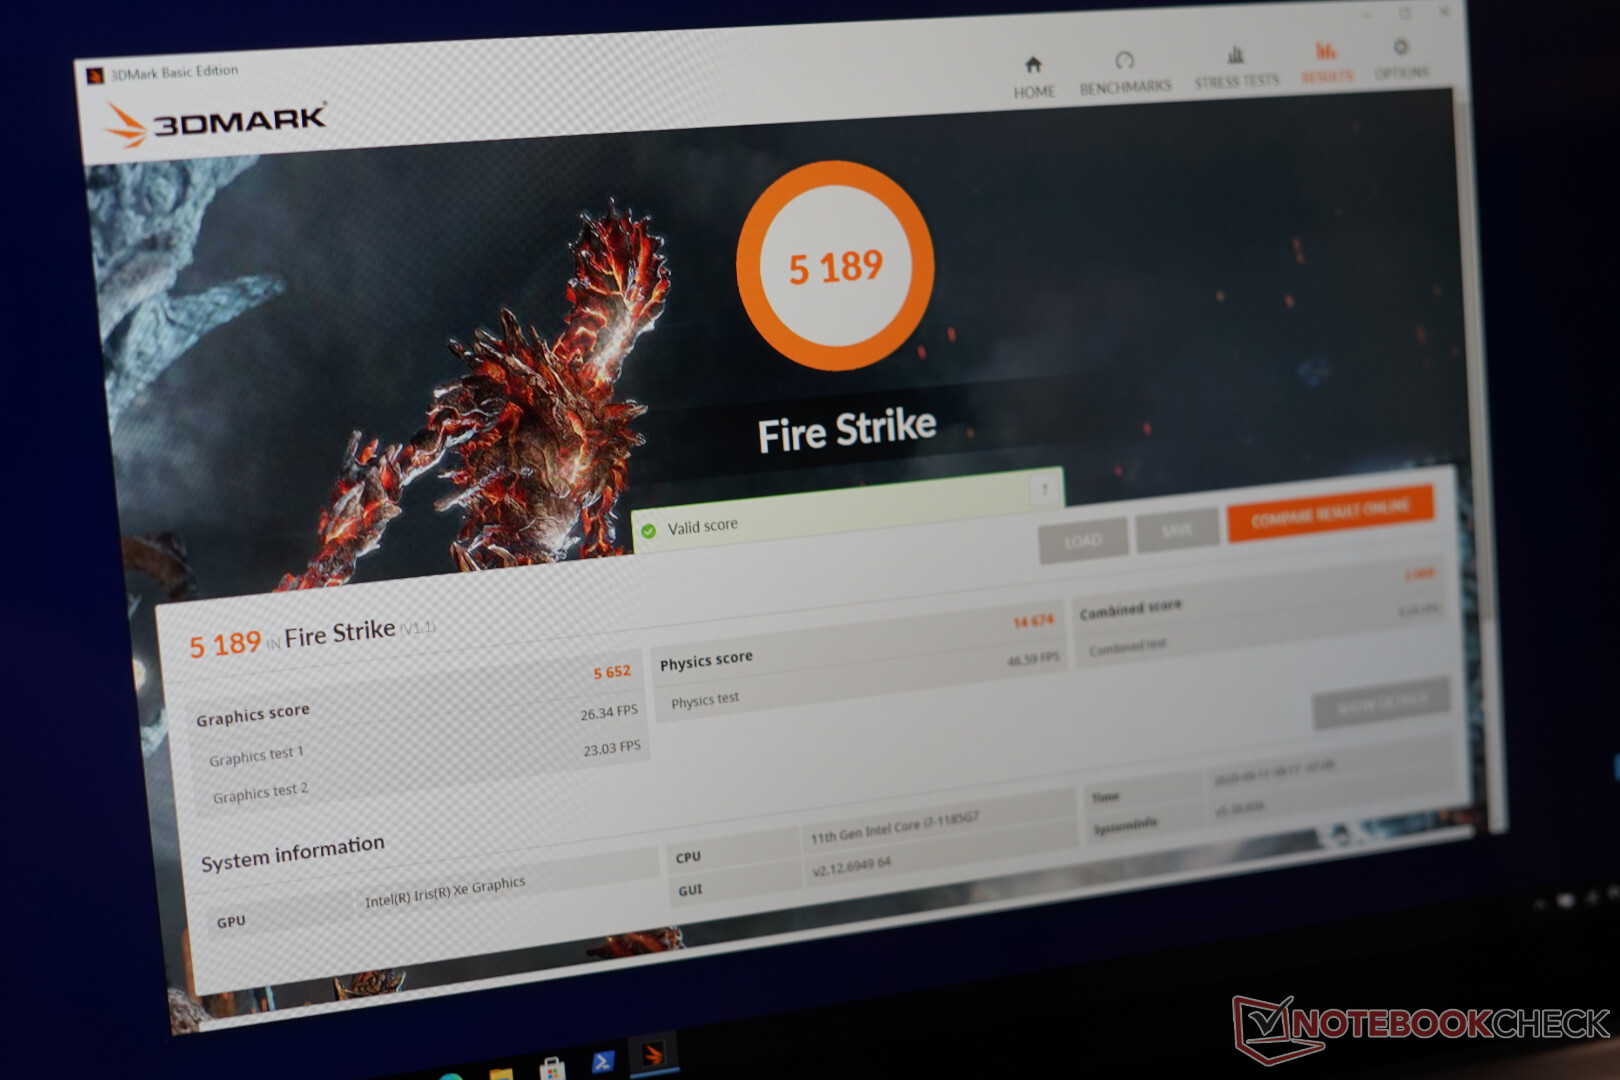
The Tiger Lake processors are the first chips with the new Xe graphics generation. Intel only calls it "Intel Iris Xe Graphics" on our Core i7-1185G7, and it is supported by 16 GB LPDDR4x-4266 RAM in a dual-channel configuration. However, the iGPU does not have its own graphics memory (except for caches). Intel advertises a big performance advantage over the Ice Lake Generation, so it is a big improvement after a long time of familiar iGPUs.

The new Xe GPU performs extremely well in the synthetic graphics benchmarks. It is on par with a dedicated AMD Radeon Pro 560X in the Apple MacBook Pro 15 and the fastest Ryzen iGPUs (like the RX Vega 8 in the Ryzen 4000) are clearly beaten. Mobile graphics cards from Nvidia like the GeForce MX350 are also much slower and the score is more comparable to the new MX450. 

The compute performance of the GPU in V-Ray is not that impressive, but still on par with the older GeForce MX250/MX330. The AMD GPUs are more powerful in this test.

3DMark
2560x1440 Time Spy Graphics
Average NVIDIA GeForce MX450
  (1086 - 2300, n=16)
1796 Points +11%
Average NVIDIA GeForce GTX 1050 Mobile
  (1416 - 2130, n=11)
1672 Points +3%
Intel Reference Design Laptop 28W
Intel Iris Xe Graphics G7 96EUs, Intel Core i7-1185G7
1618 Points
Average NVIDIA GeForce GTX 1050 Max-Q
  (1596 - 1634, n=2)
1615 Points 0%
Apple MacBook Pro 15 2018 (2.6 GHz, 560X)
AMD Radeon Pro 560X, Intel Core i7-8850H
1614 Points 0%
Intel Reference Design Laptop 35W Dynamic Tuning
Intel Iris Xe Graphics G7 96EUs, Intel Core i7-1185G7
1614 Points 0%
Average NVIDIA GeForce MX350
  (1123 - 1595, n=12)
1322 Points -18%
Lenovo Yoga Slim 7-14ARE
AMD Radeon RX Vega 8 (Ryzen 4000/5000), AMD Ryzen 7 4800U
1173 Points -28%
Average AMD Radeon RX Vega 8 (Ryzen 4000/5000)
  (540 - 1557, n=53)
1156 Points -29%
Average NVIDIA GeForce MX250
  (881 - 1169, n=22)
1070 Points -34%
Average AMD Radeon RX Vega 7
  (496 - 1249, n=57)
991 Points -39%
Average AMD Radeon RX Vega 9
 
872 Points -46%
Average AMD Radeon RX Vega 6 (Ryzen 4000/5000)
  (650 - 996, n=22)
821 Points -49%
Xiaomi RedmiBook 16 R5
AMD Radeon RX Vega 6 (Ryzen 4000/5000), AMD Ryzen 5 4500U
783 Points -52%
Average Intel Iris Plus Graphics G7 (Ice Lake 64 EU)
  (526 - 851, n=23)
744 Points -54%
1920x1080 Fire Strike Graphics
Average NVIDIA GeForce GTX 1050 Mobile
  (4935 - 6651, n=43)
6022 Points +7%
Apple MacBook Pro 15 2018 (2.6 GHz, 560X)
AMD Radeon Pro 560X, Intel Core i7-8850H
5699 Points +1%
Average NVIDIA GeForce GTX 1050 Max-Q
  (5616 - 5792, n=4)
5677 Points 0%
Intel Reference Design Laptop 28W
Intel Iris Xe Graphics G7 96EUs, Intel Core i7-1185G7
5652 Points
Average NVIDIA GeForce MX450
  (4336 - 5753, n=17)
4869 Points -14%
Average NVIDIA GeForce MX350
  (3999 - 4656, n=14)
4390 Points -22%
Lenovo Yoga Slim 7-14ARE
AMD Radeon RX Vega 8 (Ryzen 4000/5000), AMD Ryzen 7 4800U
3938 Points -30%
Average AMD Radeon RX Vega 8 (Ryzen 4000/5000)
  (1694 - 5041, n=53)
3677 Points -35%
Average NVIDIA GeForce MX250
  (2939 - 3885, n=29)
3531 Points -38%
Average AMD Radeon RX Vega 7
  (1772 - 4037, n=62)
3189 Points -44%
Average AMD Radeon RX Vega 9
 
2789 Points -51%
Average AMD Radeon RX Vega 6 (Ryzen 4000/5000)
  (2122 - 3239, n=23)
2673 Points -53%
Xiaomi RedmiBook 16 R5
AMD Radeon RX Vega 6 (Ryzen 4000/5000), AMD Ryzen 5 4500U
2656 Points -53%
Average Intel Iris Plus Graphics G7 (Ice Lake 64 EU)
  (1418 - 3156, n=27)
2594 Points -54%
Basemark GPU 1.2 - 1920x1080 Vulkan Medium Offscreen
Average NVIDIA GeForce MX450
 
235 fps +16%
Intel Reference Design Laptop 28W
Intel Iris Xe Graphics G7 96EUs, Intel Core i7-1185G7
202 (105min, 155P1 - 432max) fps
Apple MacBook Pro 15 2018 (2.6 GHz, 560X)
AMD Radeon Pro 560X, Intel Core i7-8850H
182 (113min, 133P1 - 370max) fps -10%
Apple MacBook Pro 15 2018 (2.6 GHz, 560X)
AMD Radeon Pro 560X, Intel Core i7-8850H
177.5 (107min - 390max) fps -12%
Intel Reference Design Laptop 15W
Intel Iris Xe Graphics G7 96EUs, Intel Core i7-1185G7
172 (89.2min, 133P1 - 403max) fps -15%
Average AMD Radeon RX Vega 8 (Ryzen 4000/5000)
  (76.9 - 289, n=8)
156.3 fps -23%
Average AMD Radeon RX Vega 7
  (104.6 - 289, n=10)
134.4 fps -33%
Average Intel Iris Plus Graphics G7 (Ice Lake 64 EU)
 
102 fps -50%
Average AMD Radeon RX Vega 6 (Ryzen 4000/5000)
  (82.6 - 104.6, n=2)
93.6 fps -54%
Xiaomi RedmiBook 16 R5
AMD Radeon RX Vega 6 (Ryzen 4000/5000), AMD Ryzen 5 4500U
82.6 (47.9min, 62.3P1 - 176max) fps -59%
Cinebench R15 - OpenGL 64Bit
Average NVIDIA GeForce MX450
  (84.6 - 150, n=19)
127 fps +19%
Average NVIDIA GeForce MX350
  (97.5 - 140, n=11)
116.7 fps +9%
Average AMD Radeon RX Vega 8 (Ryzen 4000/5000)
  (37.4 - 1714, n=54)
111.6 fps +4%
Intel Reference Design Laptop 28W
Intel Iris Xe Graphics G7 96EUs, Intel Core i7-1185G7
107 fps
Average NVIDIA GeForce GTX 1050 Max-Q
  (64.5 - 119.9, n=4)
100.9 fps -6%
Apple MacBook Pro 15 2018 (2.6 GHz, 560X)
AMD Radeon Pro 560X, Intel Core i7-8850H
98.4 fps -8%
Average NVIDIA GeForce GTX 1050 Mobile
  (0.99 - 122.9, n=41)
97.3 fps -9%
Average NVIDIA GeForce MX250
  (48.5 - 114.8, n=30)
96.8 fps -10%
Intel Reference Design Laptop 15W
Intel Iris Xe Graphics G7 96EUs, Intel Core i7-1185G7
88.3 fps -17%
Lenovo Yoga Slim 7-14ARE
AMD Radeon RX Vega 8 (Ryzen 4000/5000), AMD Ryzen 7 4800U
75.4 fps -30%
Lenovo Yoga Slim 7-14ARE
AMD Radeon RX Vega 8 (Ryzen 4000/5000), AMD Ryzen 7 4800U
73.1 fps -32%
Lenovo Yoga Slim 7-14ARE
AMD Radeon RX Vega 8 (Ryzen 4000/5000), AMD Ryzen 7 4800U
72.7 fps -32%
Average AMD Radeon RX Vega 7
  (37.3 - 123.2, n=59)
73.3 fps -31%
Average Intel Iris Plus Graphics G7 (Ice Lake 64 EU)
  (38.4 - 74.5, n=30)
62.8 fps -41%
Average AMD Radeon RX Vega 6 (Ryzen 4000/5000)
  (47.5 - 91.3, n=23)
59.6 fps -44%
Xiaomi RedmiBook 16 R5
AMD Radeon RX Vega 6 (Ryzen 4000/5000), AMD Ryzen 5 4500U
59.4 fps -44%
Average AMD Radeon RX Vega 9
 
55 fps -49%
V-Ray Benchmark Next 4.10 - GPU
Average NVIDIA GeForce GTX 1050 Mobile
 
61 mpaths +85%
Average AMD Radeon RX Vega 8 (Ryzen 4000/5000)
  (31 - 83, n=47)
59.9 mpaths +82%
Lenovo Yoga Slim 7-14ARE
AMD Radeon RX Vega 8 (Ryzen 4000/5000), AMD Ryzen 7 4800U
47 mpaths +42%
Average AMD Radeon RX Vega 7
  (14 - 70, n=47)
46.2 mpaths +40%
Average AMD Radeon RX Vega 6 (Ryzen 4000/5000)
  (30 - 52, n=15)
39.4 mpaths +19%
Intel Reference Design Laptop 35W Dynamic Tuning
Intel Iris Xe Graphics G7 96EUs, Intel Core i7-1185G7
37 mpaths +12%
Average NVIDIA GeForce MX350
  (33 - 41, n=10)
35.9 mpaths +9%
Average NVIDIA GeForce MX450
  (28 - 40, n=17)
34.6 mpaths +5%
Xiaomi RedmiBook 16 R5
AMD Radeon RX Vega 6 (Ryzen 4000/5000), AMD Ryzen 5 4500U
33 mpaths 0%
Intel Reference Design Laptop 28W
Intel Iris Xe Graphics G7 96EUs, Intel Core i7-1185G7
33 mpaths
Intel Reference Design Laptop 28W
Intel Iris Xe Graphics G7 96EUs, Intel Core i7-1185G7
29 mpaths -12%
Average NVIDIA GeForce MX250
  (24 - 34, n=5)
29.6 mpaths -10%
Intel Reference Design Laptop 15W
Intel Iris Xe Graphics G7 96EUs, Intel Core i7-1185G7
25 mpaths -24%
Average Intel Iris Plus Graphics G7 (Ice Lake 64 EU)
  (17 - 28, n=5)
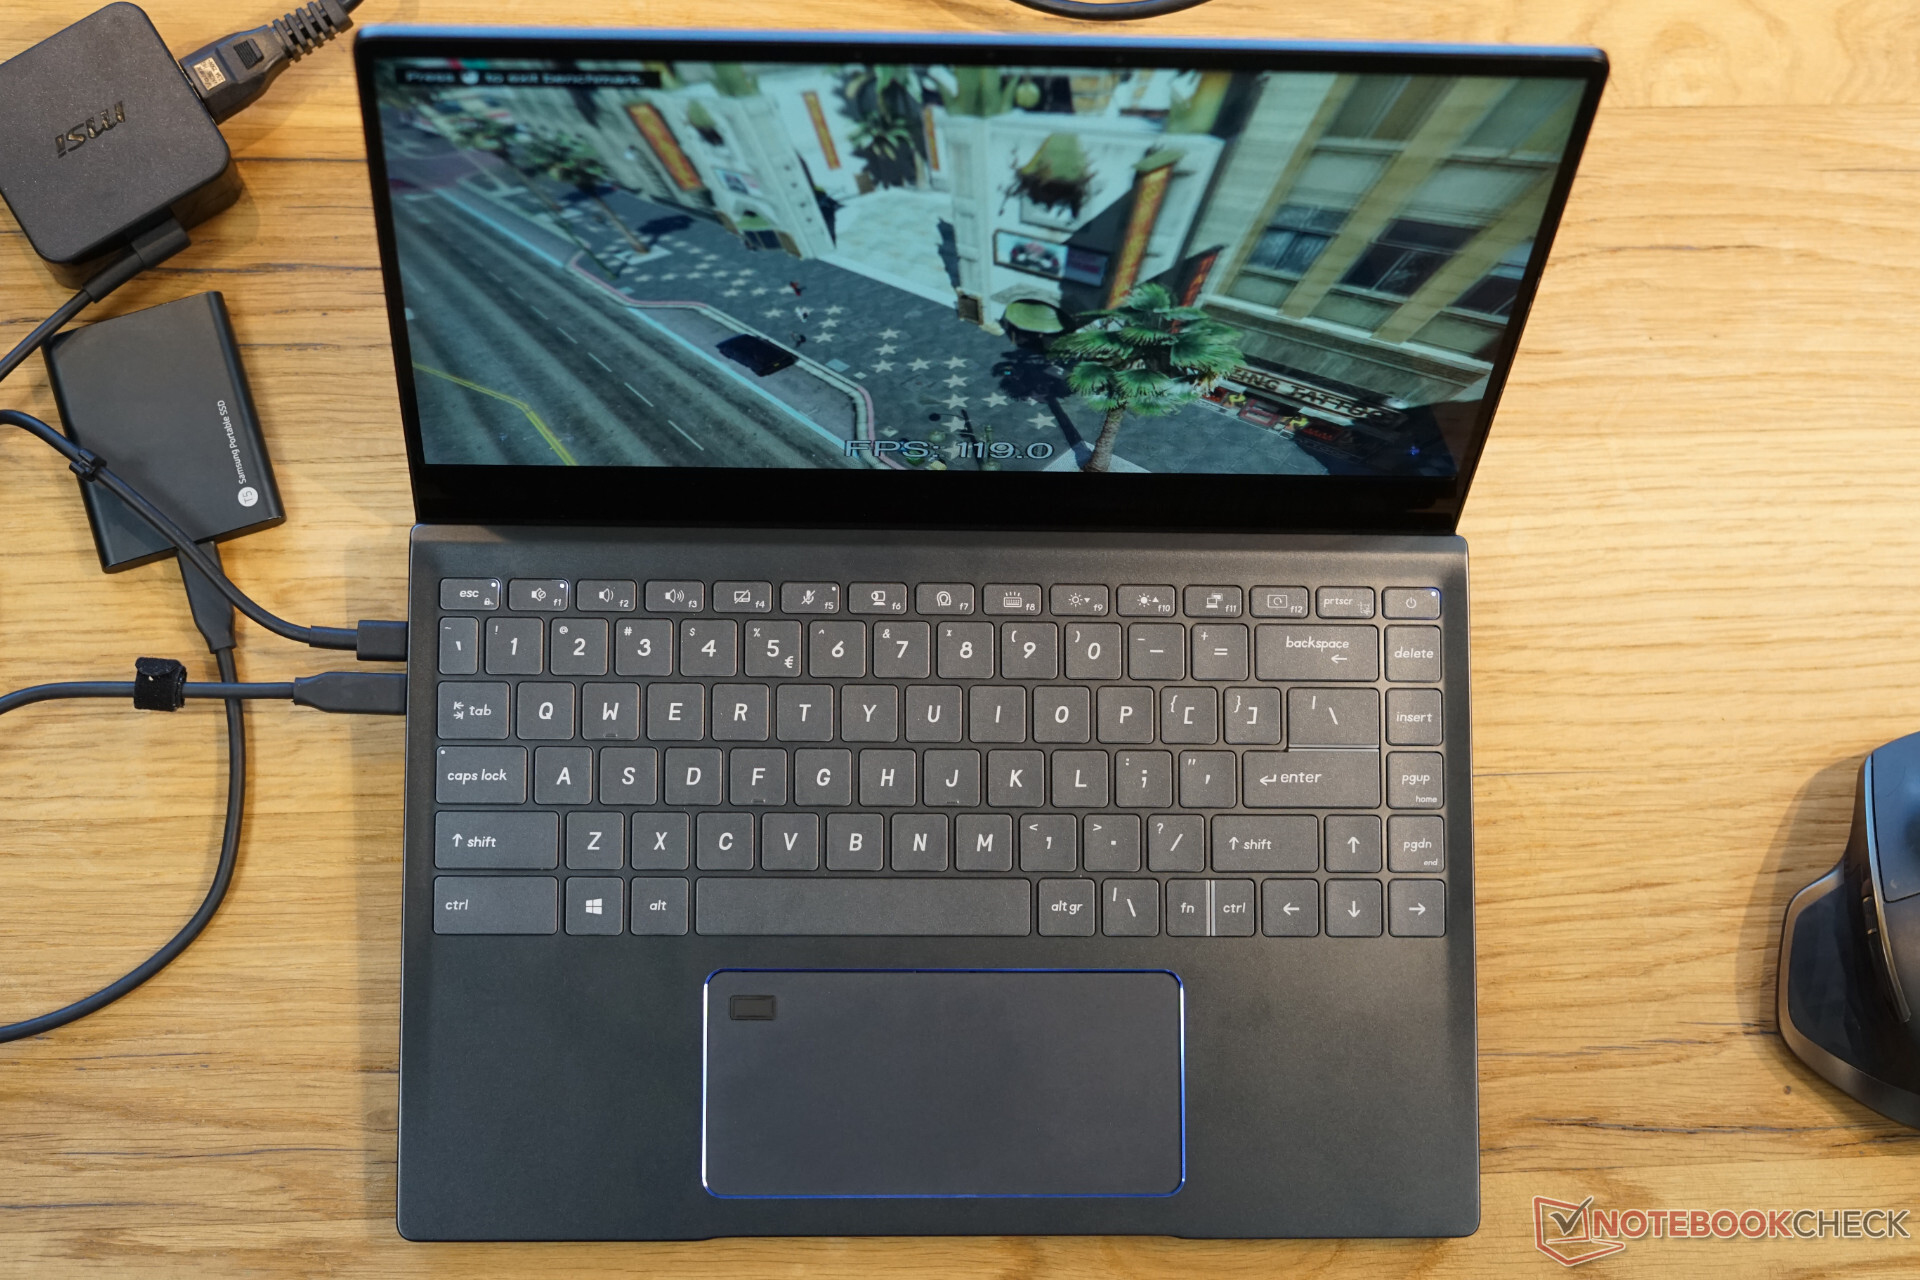
21.2 mpaths -36%

Gaming Performance

Graphics errors should be eliminated on retail units

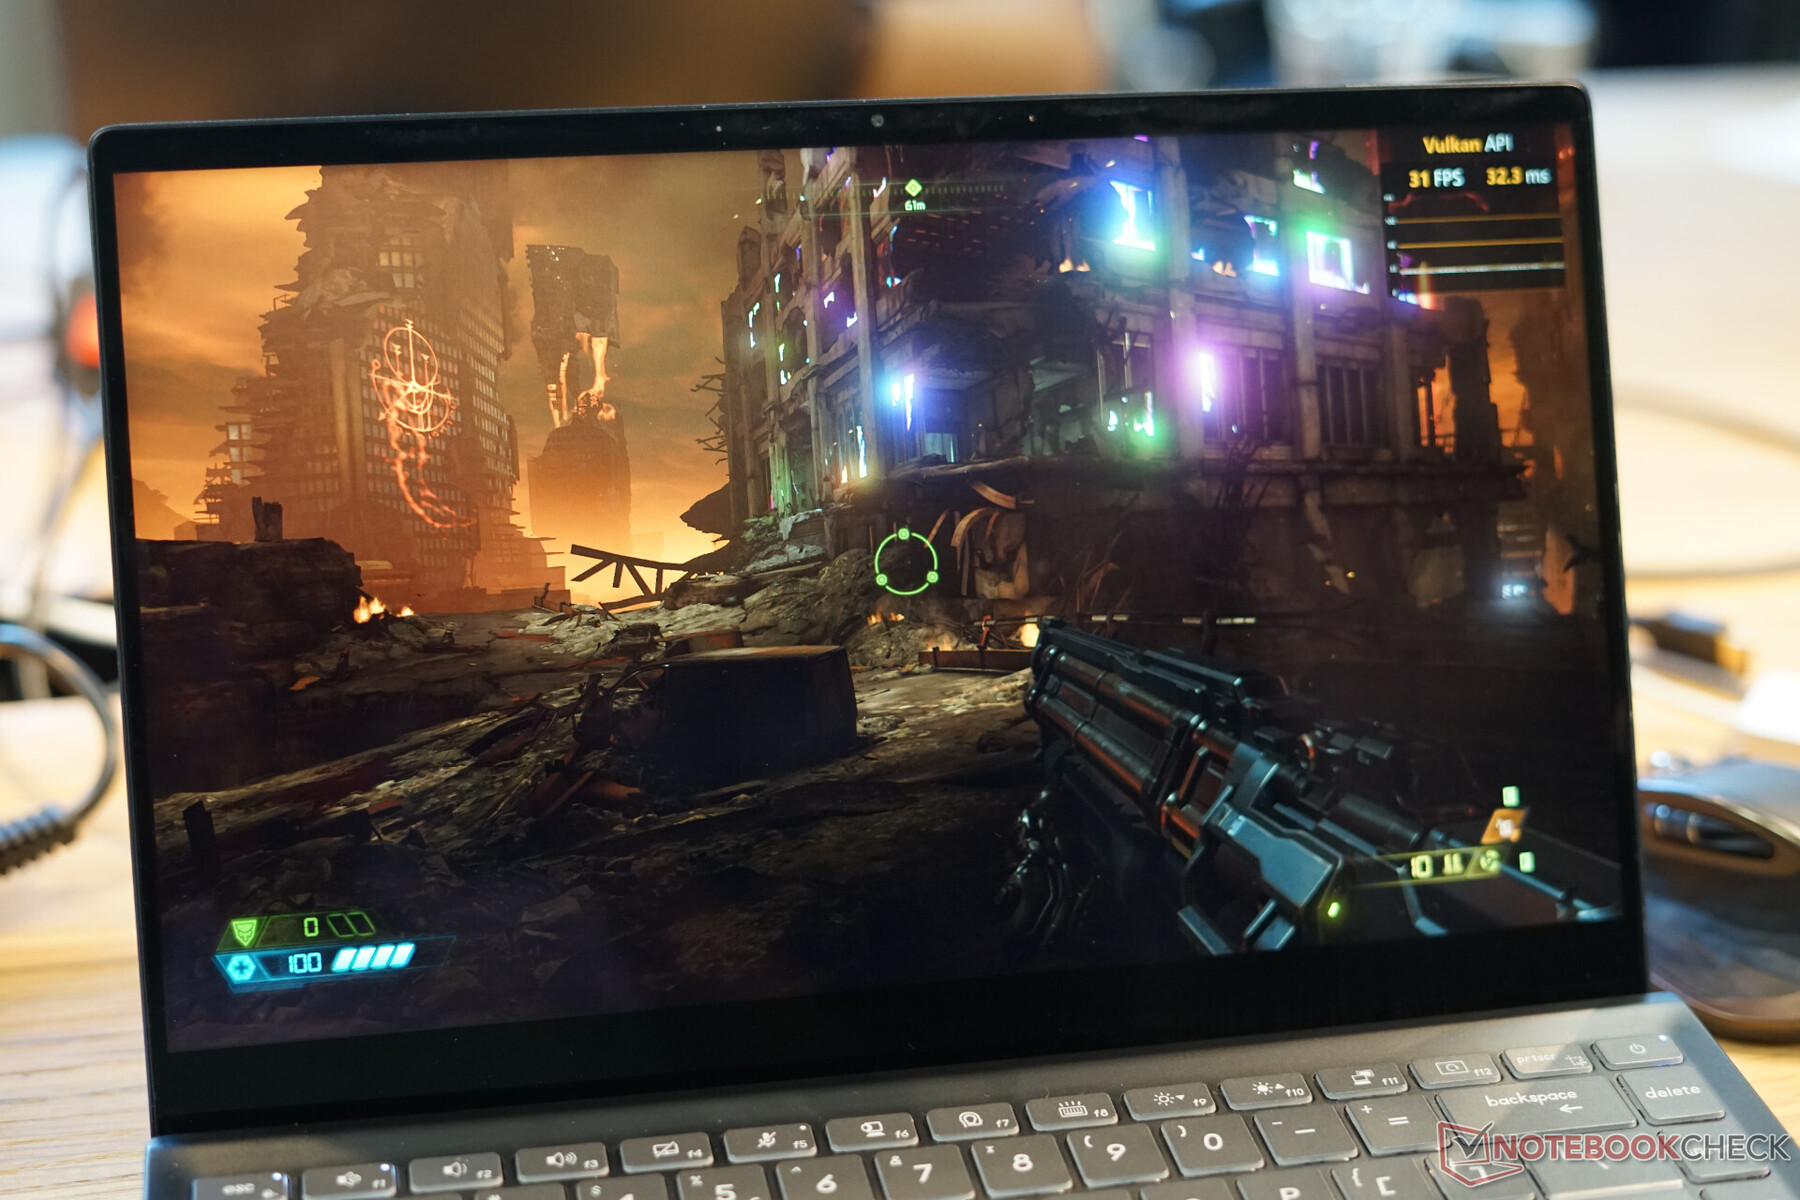
Thanks to the much higher GPU performance, the iGPU is also much better suited for games compared to previous iGPUs. We tested a couple of titles and even Doom Eternal ran smoothly with good frame rates, but we did not record the result due to a graphics error caused by the beta drivers.

The demanding title "The Witcher 3" shows the performance of the iGPU very well. It is almost on par with the GeForce GTX 1050 Max-Q and playable at 1080p and high settings at 35 FPS. The GeForce MX350 is much slower, but the situation changes in GTA 5, where the MX350 can manage a clear lead. The AMD Vega 7 in the Acer Swift 3 SF314 is clearly beaten both times.

Our test of an older version of DOTA 2 also places the Xe behind the MX350 and on par with the Vega 7, while the Vega 8 in the Slim 7 is even a bit faster.

Real-world gaming tests once again show that the performance depends on drivers, optimizations, and graphics memory. You cannot always say that dedicated GPUa like a MX350 with fast GDDR5 VRAM are always beaten, but you can see the performance potential of the Iris Xe and that it makes entry-level dGPUs unnecessary.

The Witcher 3 - 1920x1080 High Graphics & Postprocessing (Nvidia HairWorks Off)
Average NVIDIA GeForce GTX 1050 Mobile
  (29.1 - 43, n=29)
38 fps +6%
Average NVIDIA GeForce GTX 1050 Max-Q
  (34 - 41, n=3)
36.5 fps +2%
Intel Reference Design Laptop 28W
Intel Iris Xe Graphics G7 96EUs, Intel Core i7-1185G7
35.9 (31min - 41max) fps
Average NVIDIA GeForce MX450
  (21 - 46, n=16)
34.8 fps -3%
Average NVIDIA GeForce MX350
  (20.6 - 29.9, n=13)
26.3 fps -27%
Lenovo Yoga Slim 7-14ARE
AMD Radeon RX Vega 8 (Ryzen 4000/5000), AMD Ryzen 7 4800U
23.1 fps -36%
Average AMD Radeon RX Vega 8 (Ryzen 4000/5000)
  (8.7 - 26.8, n=45)
20.6 fps -43%
Average NVIDIA GeForce MX250
  (16.3 - 23.1, n=27)
20.1 fps -44%
Average AMD Radeon RX Vega 7
  (8.96 - 26.2, n=49)
18.1 fps -50%
Average Intel Iris Plus Graphics G7 (Ice Lake 64 EU)
  (10.9 - 20.1, n=18)
17 fps -53%
Xiaomi RedmiBook 16 R5
AMD Radeon RX Vega 6 (Ryzen 4000/5000), AMD Ryzen 5 4500U
15.7 (13min - 18max) fps -56%
Average AMD Radeon RX Vega 6 (Ryzen 4000/5000)
  (10.7 - 19.4, n=20)
15 fps -58%
Average AMD Radeon RX Vega 9
 
13.3 fps -63%
GTA V - 1920x1080 High/On (Advanced Graphics Off) AA:2xMSAA + FX AF:8x
Average NVIDIA GeForce GTX 1050 Mobile
 
65.9 fps +119%
Average NVIDIA GeForce GTX 1050 Max-Q
  (61.8 - 62.1, n=2)
62 fps +106%
Average NVIDIA GeForce MX450
  (30.6 - 68.3, n=11)
54.1 fps +80%
Average NVIDIA GeForce MX350
  (45.8 - 49.5, n=3)
47.4 fps +57%
Average NVIDIA GeForce MX250
  (35.9 - 41.5, n=4)
38.4 fps +28%
Intel Reference Design Laptop 28W
Intel Iris Xe Graphics G7 96EUs, Intel Core i7-1185G7
30.1 (7.4min, 20P1 - 122max) fps
Lenovo Yoga Slim 7-14ARE
AMD Radeon RX Vega 8 (Ryzen 4000/5000), AMD Ryzen 7 4800U
29.8 (3.22min, 21.3P1 - 83.4max) fps -1%
Average AMD Radeon RX Vega 8 (Ryzen 4000/5000)
  (13.8 - 40.6, n=44)
26.1 fps -13%
Average AMD Radeon RX Vega 7
  (11.3 - 32.2, n=36)
22.7 fps -25%
Average AMD Radeon RX Vega 6 (Ryzen 4000/5000)
  (20.1 - 24.6, n=6)
21.5 fps -29%
Xiaomi RedmiBook 16 R5
AMD Radeon RX Vega 6 (Ryzen 4000/5000), AMD Ryzen 5 4500U
20.5 (2.05min, 14.5P1 - 33.2max) fps -32%
Average Intel Iris Plus Graphics G7 (Ice Lake 64 EU)
  (12.7 - 13.3, n=2)
13 fps -57%
Dota 2 Reborn - 1920x1080 ultra (3/3) best looking
Average NVIDIA GeForce GTX 1050 Mobile
  (94.9 - 117, n=4)
106 fps +115%
Average NVIDIA GeForce GTX 1050 Max-Q
 
104.1 fps +111%
Average NVIDIA GeForce MX450
  (34.9 - 104.6, n=20)
79.9 fps +62%
Average NVIDIA GeForce MX350
  (52.3 - 80.6, n=14)
72.5 fps +47%
Average NVIDIA GeForce MX250
  (7.8 - 67.5, n=21)
53.6 fps +9%
Lenovo Yoga Slim 7-14ARE
AMD Radeon RX Vega 8 (Ryzen 4000/5000), AMD Ryzen 7 4800U
52.5 (47.3min) fps +6%
Intel Reference Design Laptop 28W
Intel Iris Xe Graphics G7 96EUs, Intel Core i7-1185G7
49.4 (33.1min) fps
Average AMD Radeon RX Vega 8 (Ryzen 4000/5000)
  (23.3 - 72, n=56)
48.7 fps -1%
Average AMD Radeon RX Vega 7
  (23.3 - 58.2, n=58)
41.9 fps -15%
Average AMD Radeon RX Vega 6 (Ryzen 4000/5000)
  (30.4 - 66.1, n=21)
40 fps -19%
Xiaomi RedmiBook 16 R5
AMD Radeon RX Vega 6 (Ryzen 4000/5000), AMD Ryzen 5 4500U
39.8 (36.6min) fps -19%
Intel Reference Design Laptop 15W
Intel Iris Xe Graphics G7 96EUs, Intel Core i7-1185G7
38 (25.9min) fps -23%
Average Intel Iris Plus Graphics G7 (Ice Lake 64 EU)
  (16.4 - 35.7, n=18)
26.9 fps -46%
X-Plane 11.11 - 1920x1080 high (fps_test=3)
Average NVIDIA GeForce GTX 1050 Max-Q
 
65.1 fps +56%
Average NVIDIA GeForce GTX 1050 Mobile
  (44.6 - 66.7, n=2)
55.7 fps +34%
Average NVIDIA GeForce MX450
  (35.4 - 71.4, n=20)
54.9 fps +32%
Average NVIDIA GeForce MX350
  (30.2 - 63.7, n=14)
48 fps +15%
Intel Reference Design Laptop 28W
Intel Iris Xe Graphics G7 96EUs, Intel Core i7-1185G7
41.7 fps
Average NVIDIA GeForce MX250
  (9.8 - 52.6, n=17)
39.4 fps -6%
Intel Reference Design Laptop 15W
Intel Iris Xe Graphics G7 96EUs, Intel Core i7-1185G7
33.1 fps -21%
Average AMD Radeon RX Vega 8 (Ryzen 4000/5000)
  (19.1 - 43.1, n=56)
30.6 fps -27%
Lenovo Yoga Slim 7-14ARE
AMD Radeon RX Vega 8 (Ryzen 4000/5000), AMD Ryzen 7 4800U
30.5 fps -27%
Average AMD Radeon RX Vega 7
  (17.4 - 35.7, n=56)
27.2 fps -35%
Xiaomi RedmiBook 16 R5
AMD Radeon RX Vega 6 (Ryzen 4000/5000), AMD Ryzen 5 4500U
26.2 fps -37%
Average AMD Radeon RX Vega 6 (Ryzen 4000/5000)
  (22.6 - 29.9, n=20)
25.8 fps -38%
Average Intel Iris Plus Graphics G7 (Ice Lake 64 EU)
  (10.8 - 19.7, n=18)
15 fps -64%

Verdict

Our initial benchmarks with a reference system from Intel with the new high-end Tiger Lake-U chip, the Core i7-1185G7, are very promising and the chip leaves an excellent impression. Intel shows what a well-configured version with sufficient cooling is capable of. The performance is very impressive for a quad-core CPU and both Intel's as well as AMD's 6-core chips are beaten. The fast Ryzen 7 4800U with 8 cores is still ahead in many multi-core tests for this TDP segment, but the real highlight is the excellent single-core performance thank to high clocks. The efficient mobile processor can even beat high-end desktop models like the i9-10900K. This also results in excellent results in application benchmarks, which is shown by PCMark 10.

The integrated Iris Xe GPU is another highlight. Intel manages to beat dedicated entry-level GPUs like the GeForce MX330 or 350 in synthetic tests, but we have to wait and see how the real-world gaming performance will be. Our initial tests are promising in this respect.

The performance of Tiger Lake is still decent at 15 Watts, so we also hope that there will be fast 6W models. However, the model designation alone does not show the performance, but it really depends on the TDP configuration and the cooling performance.

Read all 17 comments / answer
static version load dynamic
Loading comments
Comment on this article
Please share our article, every link counts!
> Expert Reviews and News on Laptops, Smartphones and Tech Innovations > Reviews > Intel Core i7-1185G7 in Review - First Tiger Lake Benchmarks
Klaus Hinum, 2020-09-17 (Update: 2020-09-17)