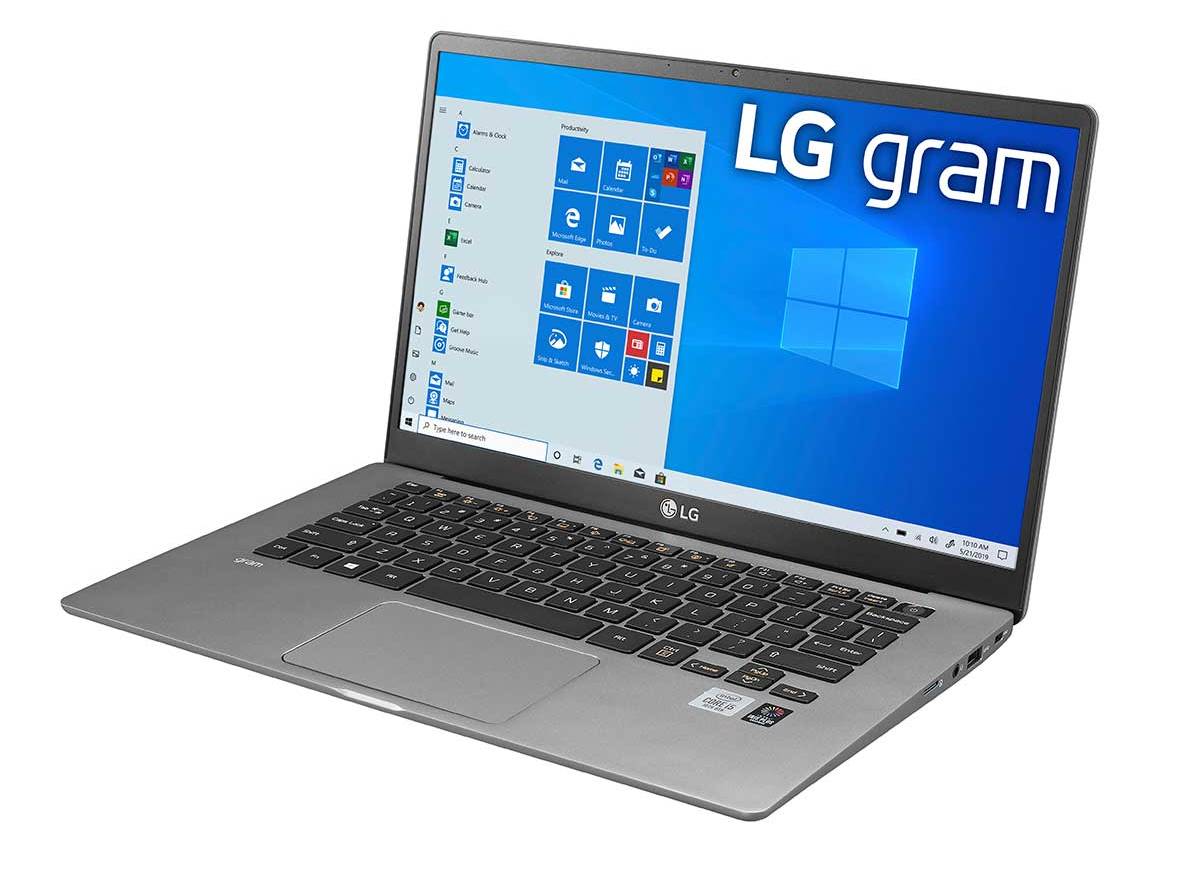
LG Gram 14Z90N Laptop Review: Lightweight at the Cost of Performance
Announced late last year, the 2020 LG Gram 14Z90N directly succeeds the 2019 Gram 14Z980 by refreshing the chassis design while updating the processor options. The Gram family prioritizes weight above all else and so it consists of some of the lightest Ultrabooks you can find from the 13.3-inch Gram 13Z980 all the way up to 17.3-inch Gram 17Z990. Thus, you'd be hard-pressed to find another Core U-class 14-inch Ultrabook as light as our Gram 14Z90N.
LG has only a few configurable options for the Gram 14Z90N as all SKUs come with a glossy FHD display and a Core i7-1065G7 Ice Lake-U CPU at the time of writing. RAM and SSD capacities may be different depending on the retailer. The 14-inch system competes directly with other Ultrabooks and subnotebooks like the Lenovo IdeaPad S940, Microsoft Surface Laptop 3 13.5, Asus ZenBook 14, or the smaller Dell XPS 13 and HP Spectre 13.
More LG reviews:
- LG Gram 14T90N (Convertible version of the Gram 14Z90N)
- LG Gram 17Z990
- LG Gram 14Z980
- LG Gram 15Z980
- LG K50s
- LG G8X ThinQ
Rating | Date | Model | Weight | Height | Size | Resolution | Price |
|---|---|---|---|---|---|---|---|
| 85.3 % v7 (old) | 05 / 2020 | LG Gram 14Z90N i7-1065G7, Iris Plus Graphics G7 (Ice Lake 64 EU) | 994 g | 18 mm | 14.00" | 1920x1080 | |
| 81.2 % v7 (old) | 04 / 2020 | LG Gram 14T90N i7-10510U, UHD Graphics 620 | 1.2 kg | 18 mm | 14.00" | 1920x1080 | |
| 88.9 % v7 (old) | 03 / 2020 | Dell XPS 13 9300 Core i7-1065G7 i7-1065G7, Iris Plus Graphics G7 (Ice Lake 64 EU) | 1.2 kg | 14.8 mm | 13.40" | 1920x1200 | |
| 85 % v6 (old) | 06 / 2019 | Lenovo IdeaPad S940-14IWL i7-8565U, UHD Graphics 620 | 1.2 kg | 12 mm | 14.00" | 3840x2160 | |
| 81.2 % v7 (old) | 02 / 2020 | Asus ZenBook 14 UM431DA-AM020T R7 3700U, Vega 10 | 1.4 kg | 16 mm | 14.00" | 1920x1080 | |
| 82 % v7 (old) | 03 / 2020 | Lenovo ThinkBook 14-IML-20RV006TGE i5-10210U, UHD Graphics 620 | 1.6 kg | 17.9 mm | 14.00" | 1920x1080 |
Case
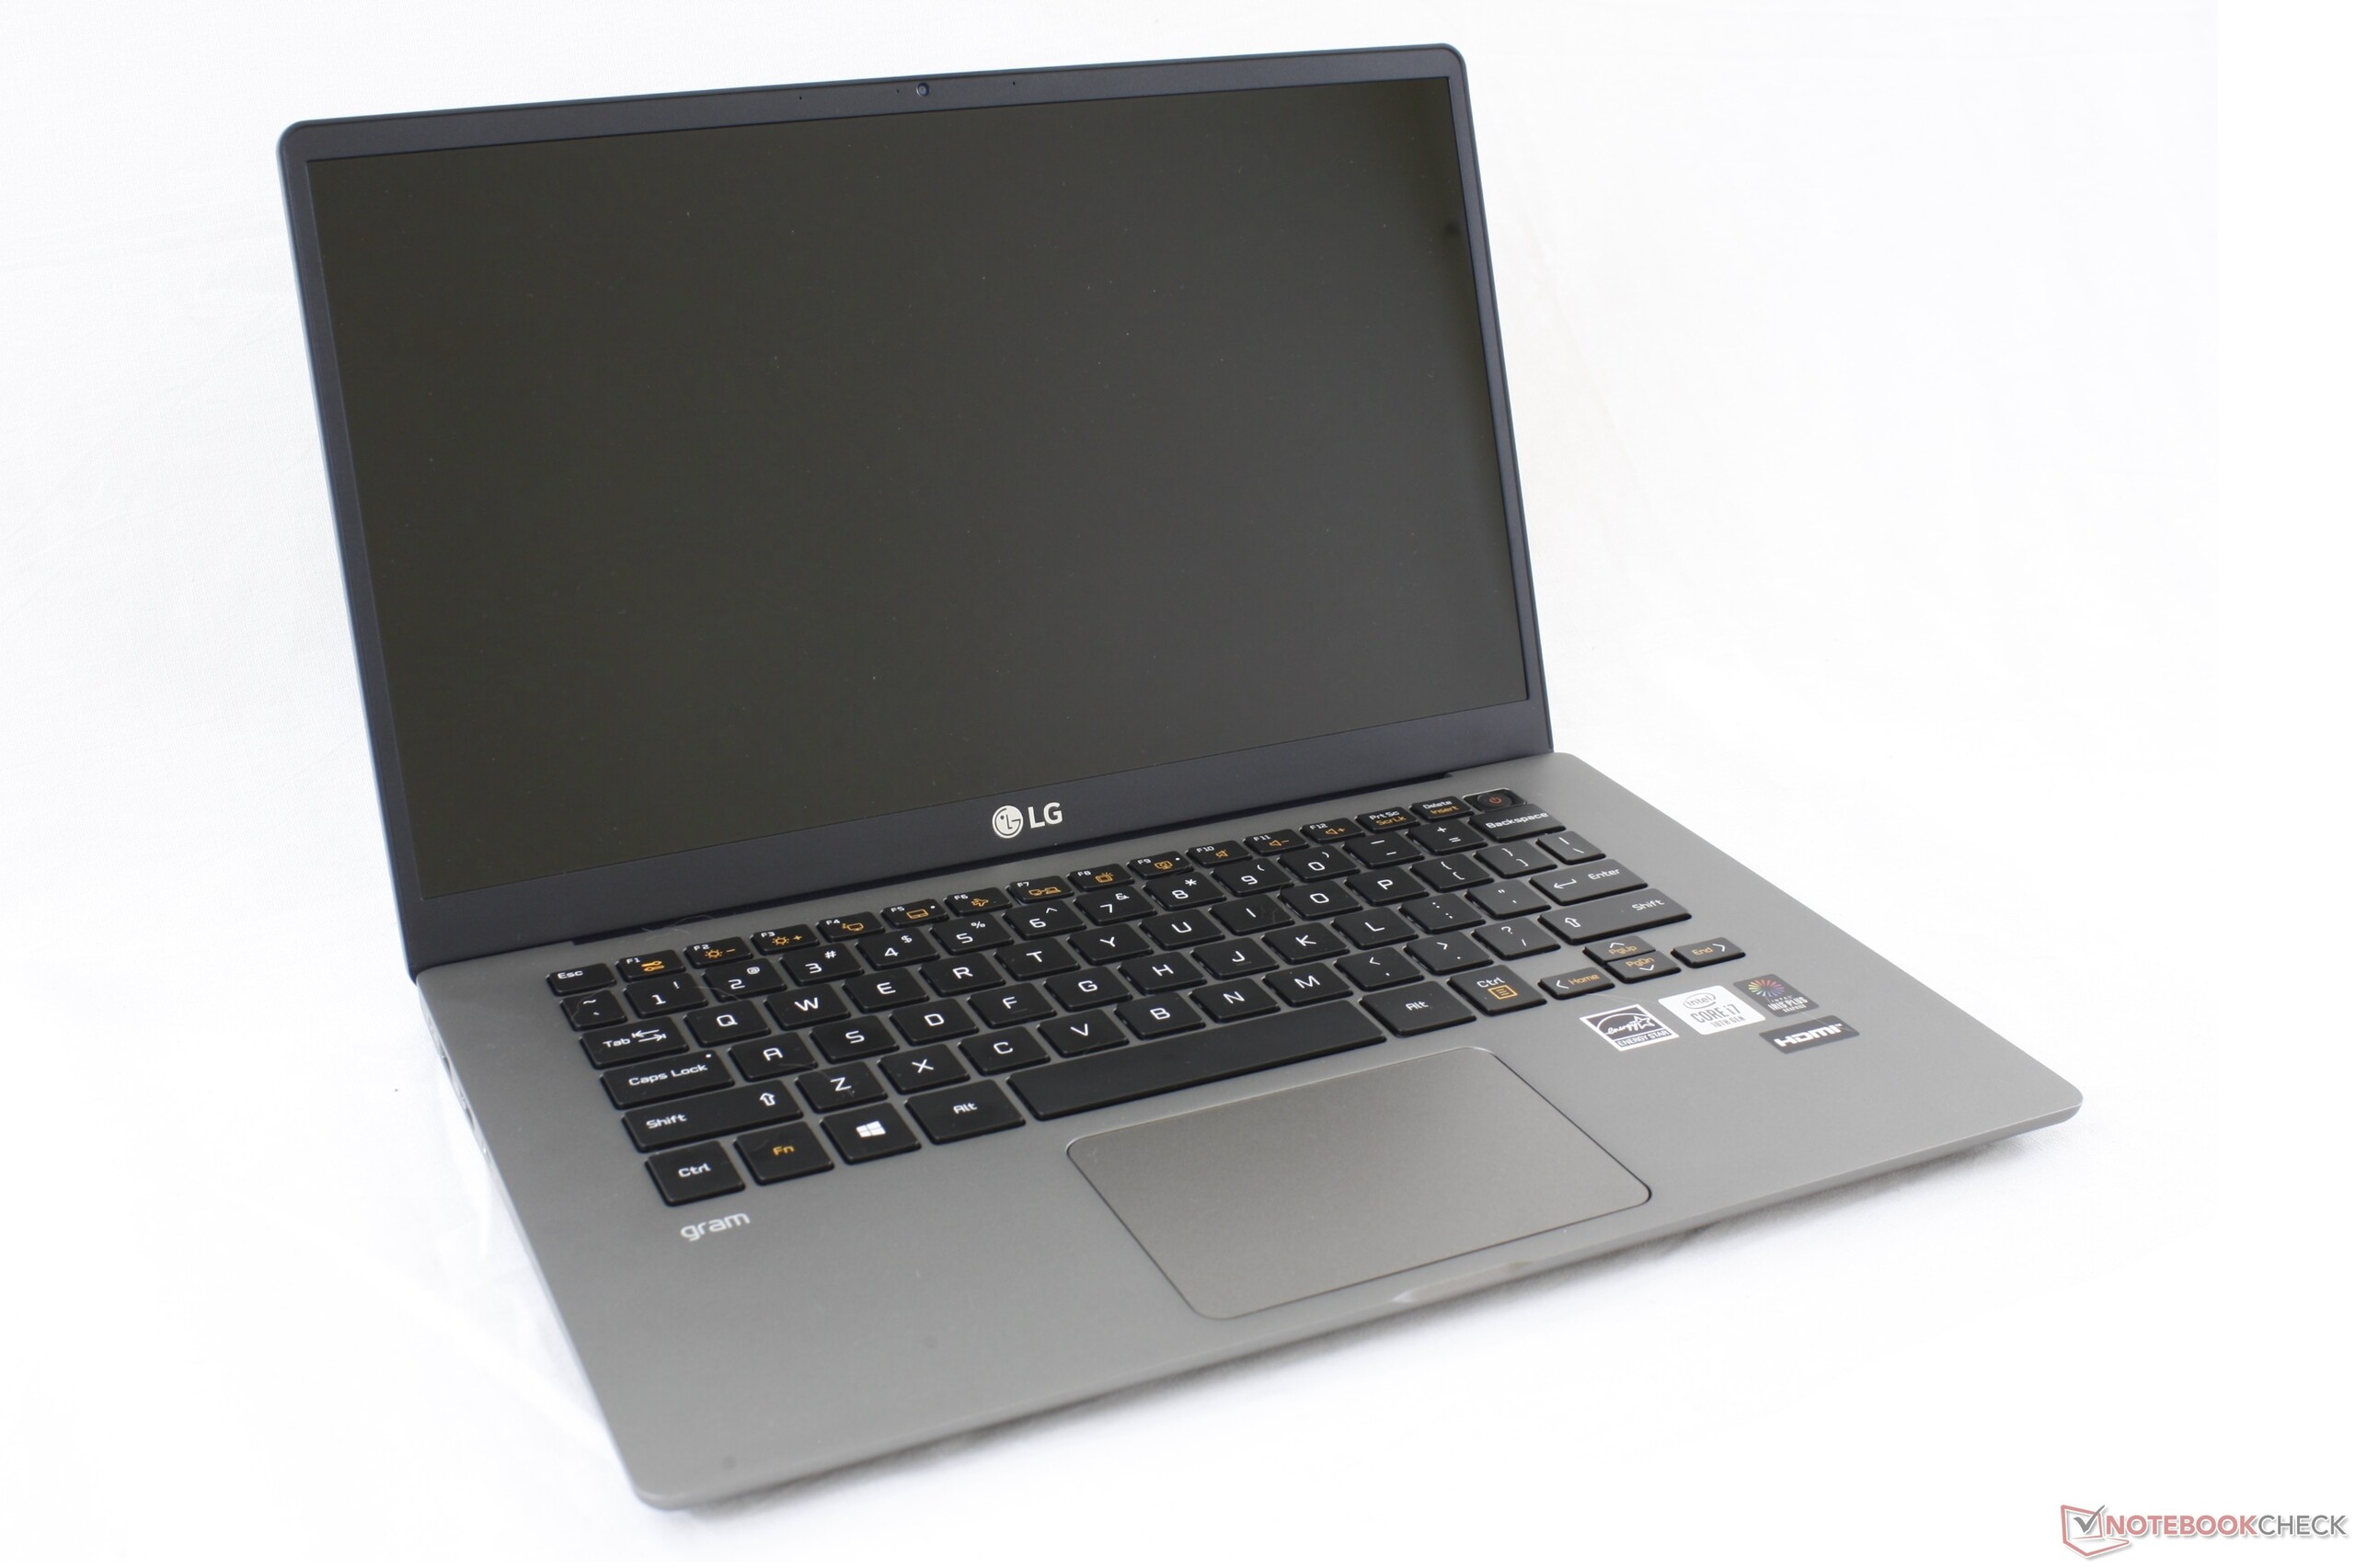
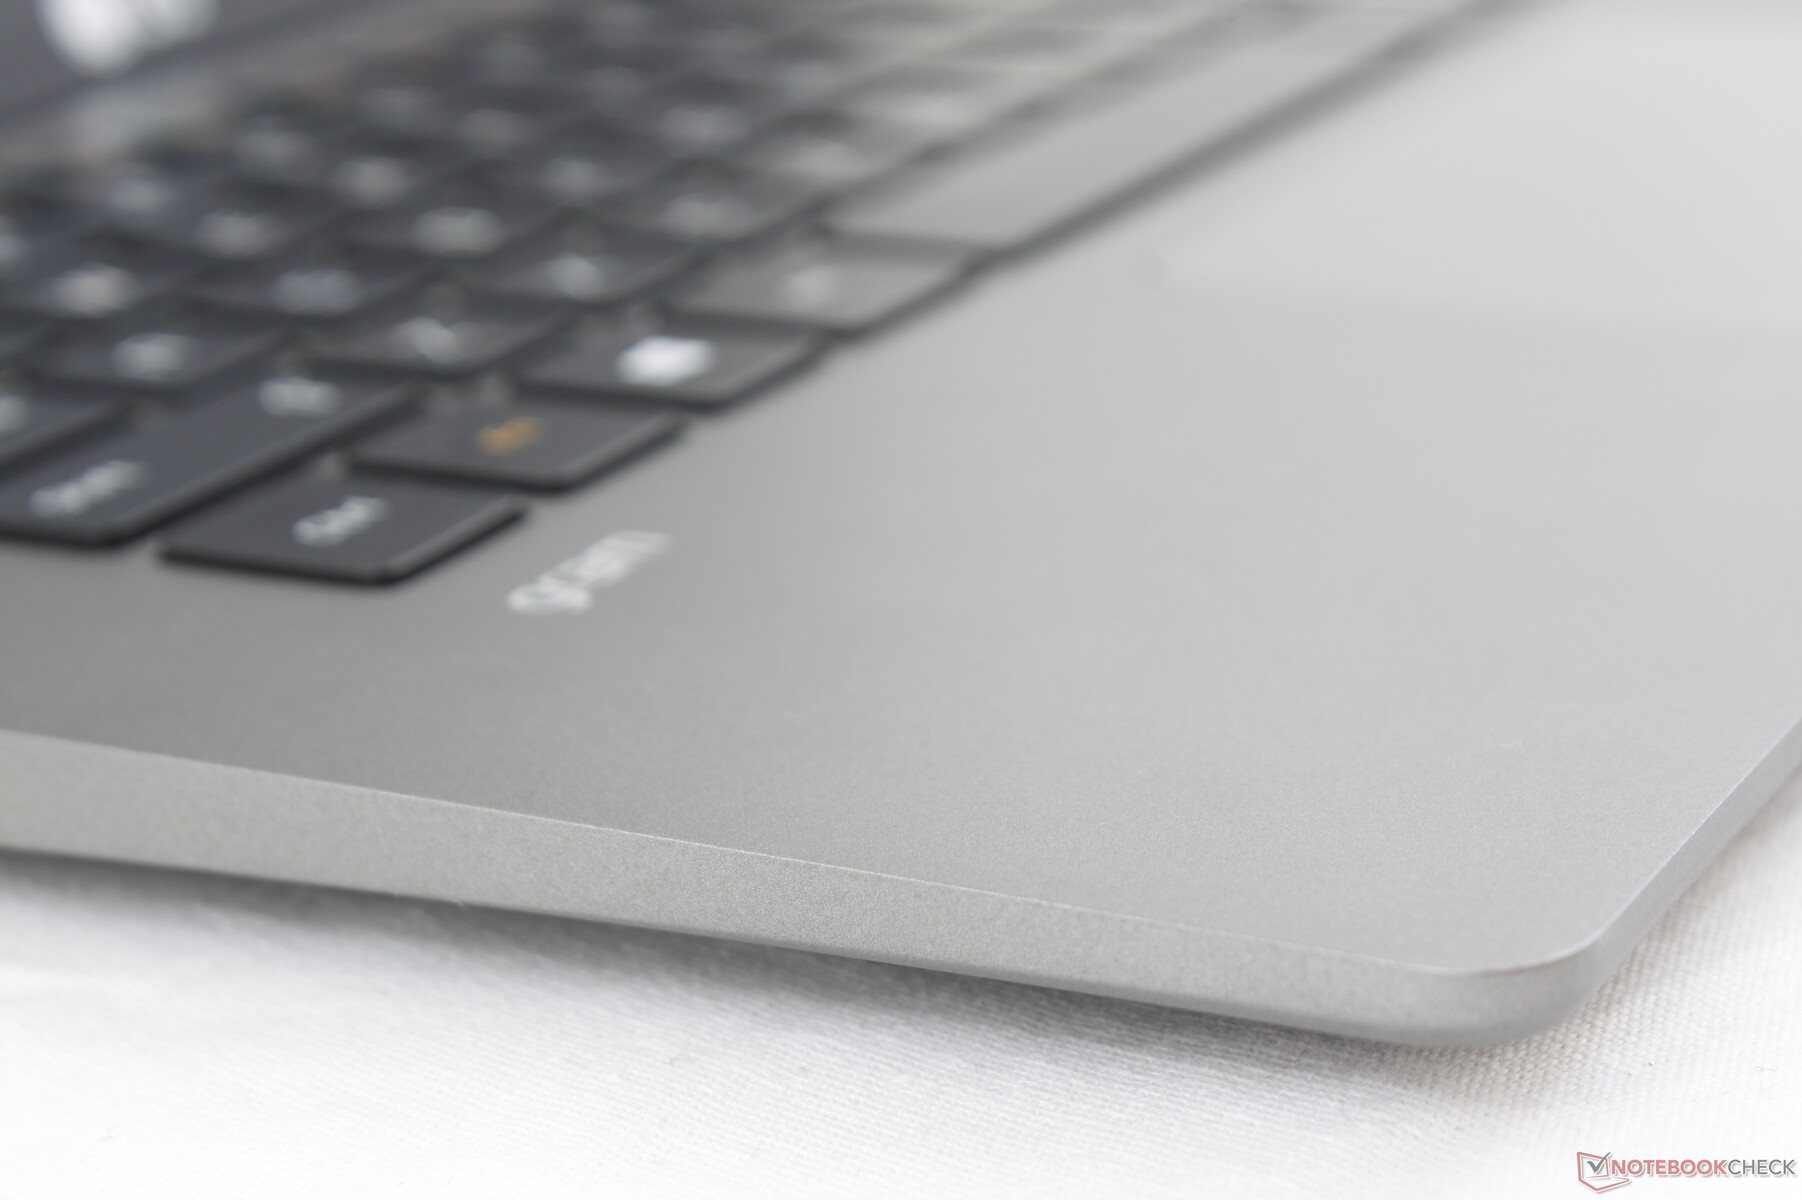
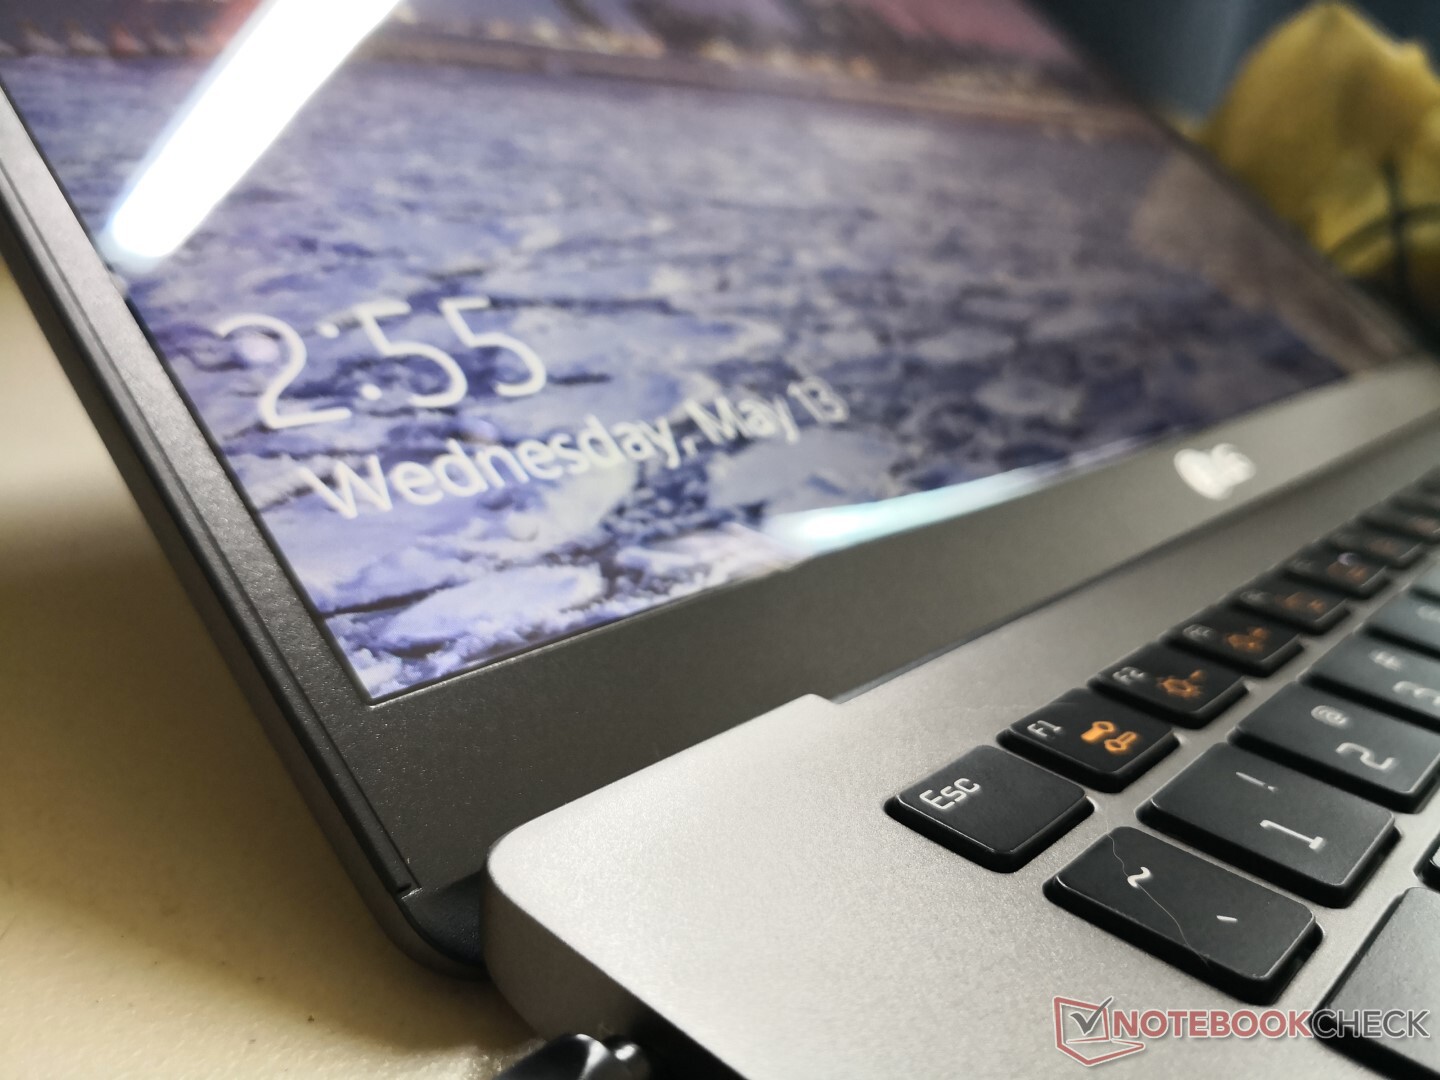
The Gram 14Z90N uses similar lightweight metal chassis materials as the outgoing Gram 14Z980 for almost the same look and feel. The matte texture is very different from your typical magnesium-aluminum Ultrabook or carbon fiber ThinkPad as surfaces are slightly roughened on the Gram to hide fingerprints much better than you'd expect.
The biggest change from the Gram 14Z980 is to the hinges as LG has switched over to a bar hinge. One of our complaints about last year's Gram 14Z980 was its weak hinges, but it appears that LG has addressed this directly; the hinges feel stiffer this time around for stronger first impressions especially when the display is opened to wider angles.
Chassis rigidity remains a disadvantage of the Gram series. Since the Gram 14Z90N is so light, it's more susceptible to warping and creaking and this is especially true of the display. This isn't to say that the chassis is weak or poorly built, but it definitely doesn't feel as sound or unyielding as say the Dell XPS 13, HP Spectre 13, Asus ZenBook S13, or the Razer Blade Stealth.
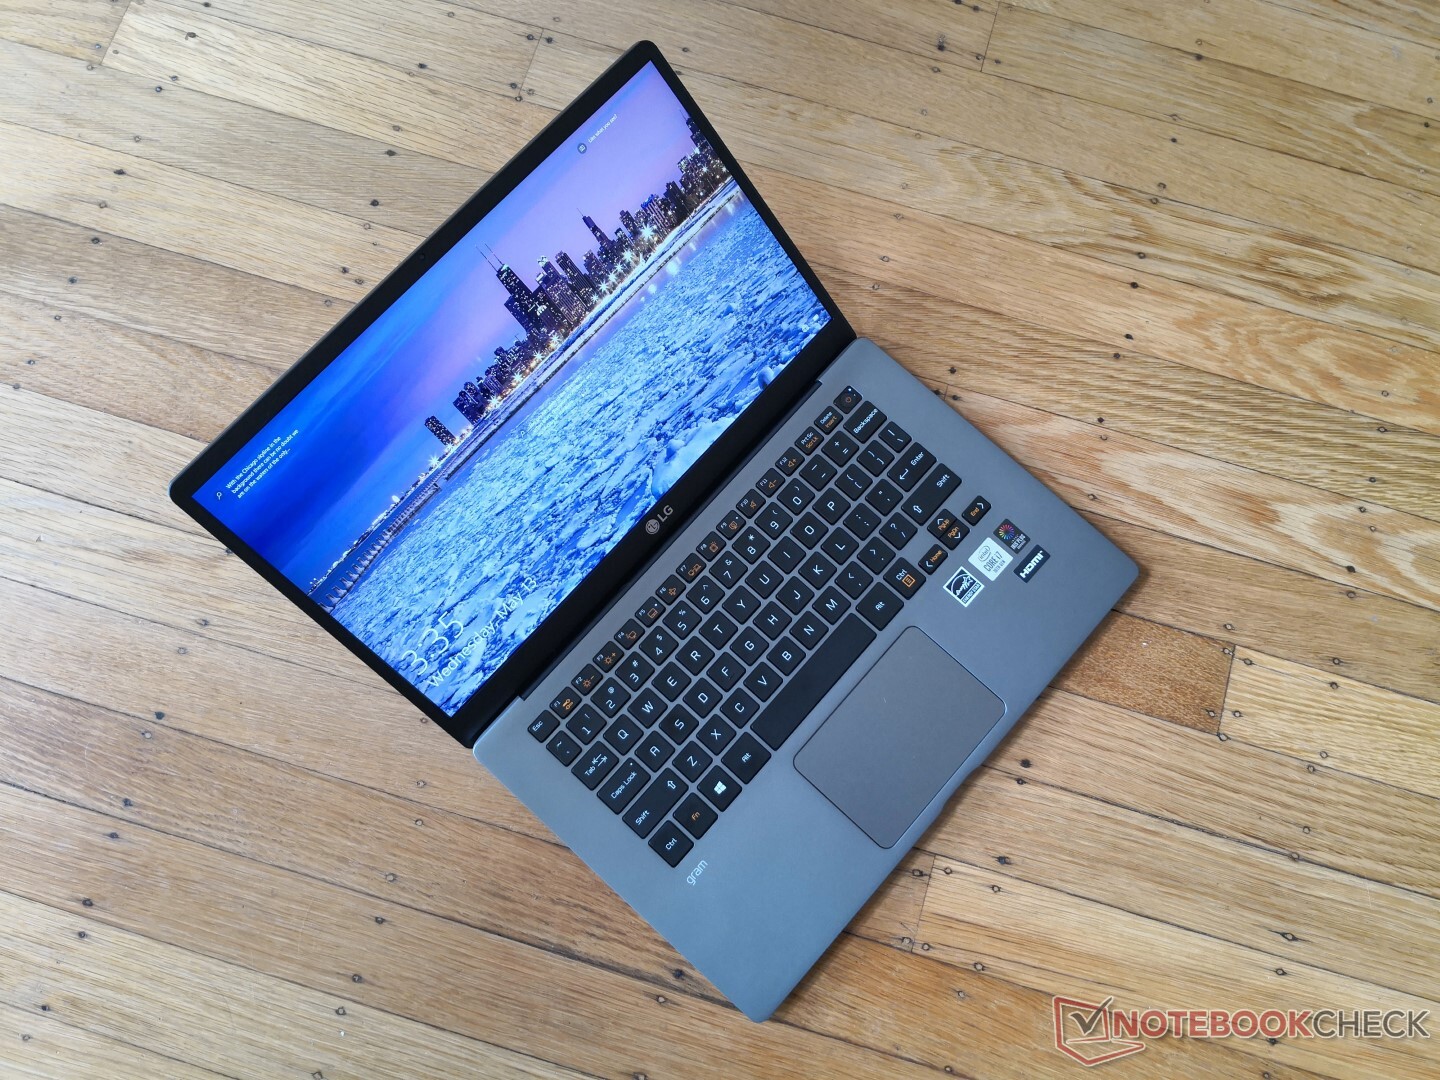
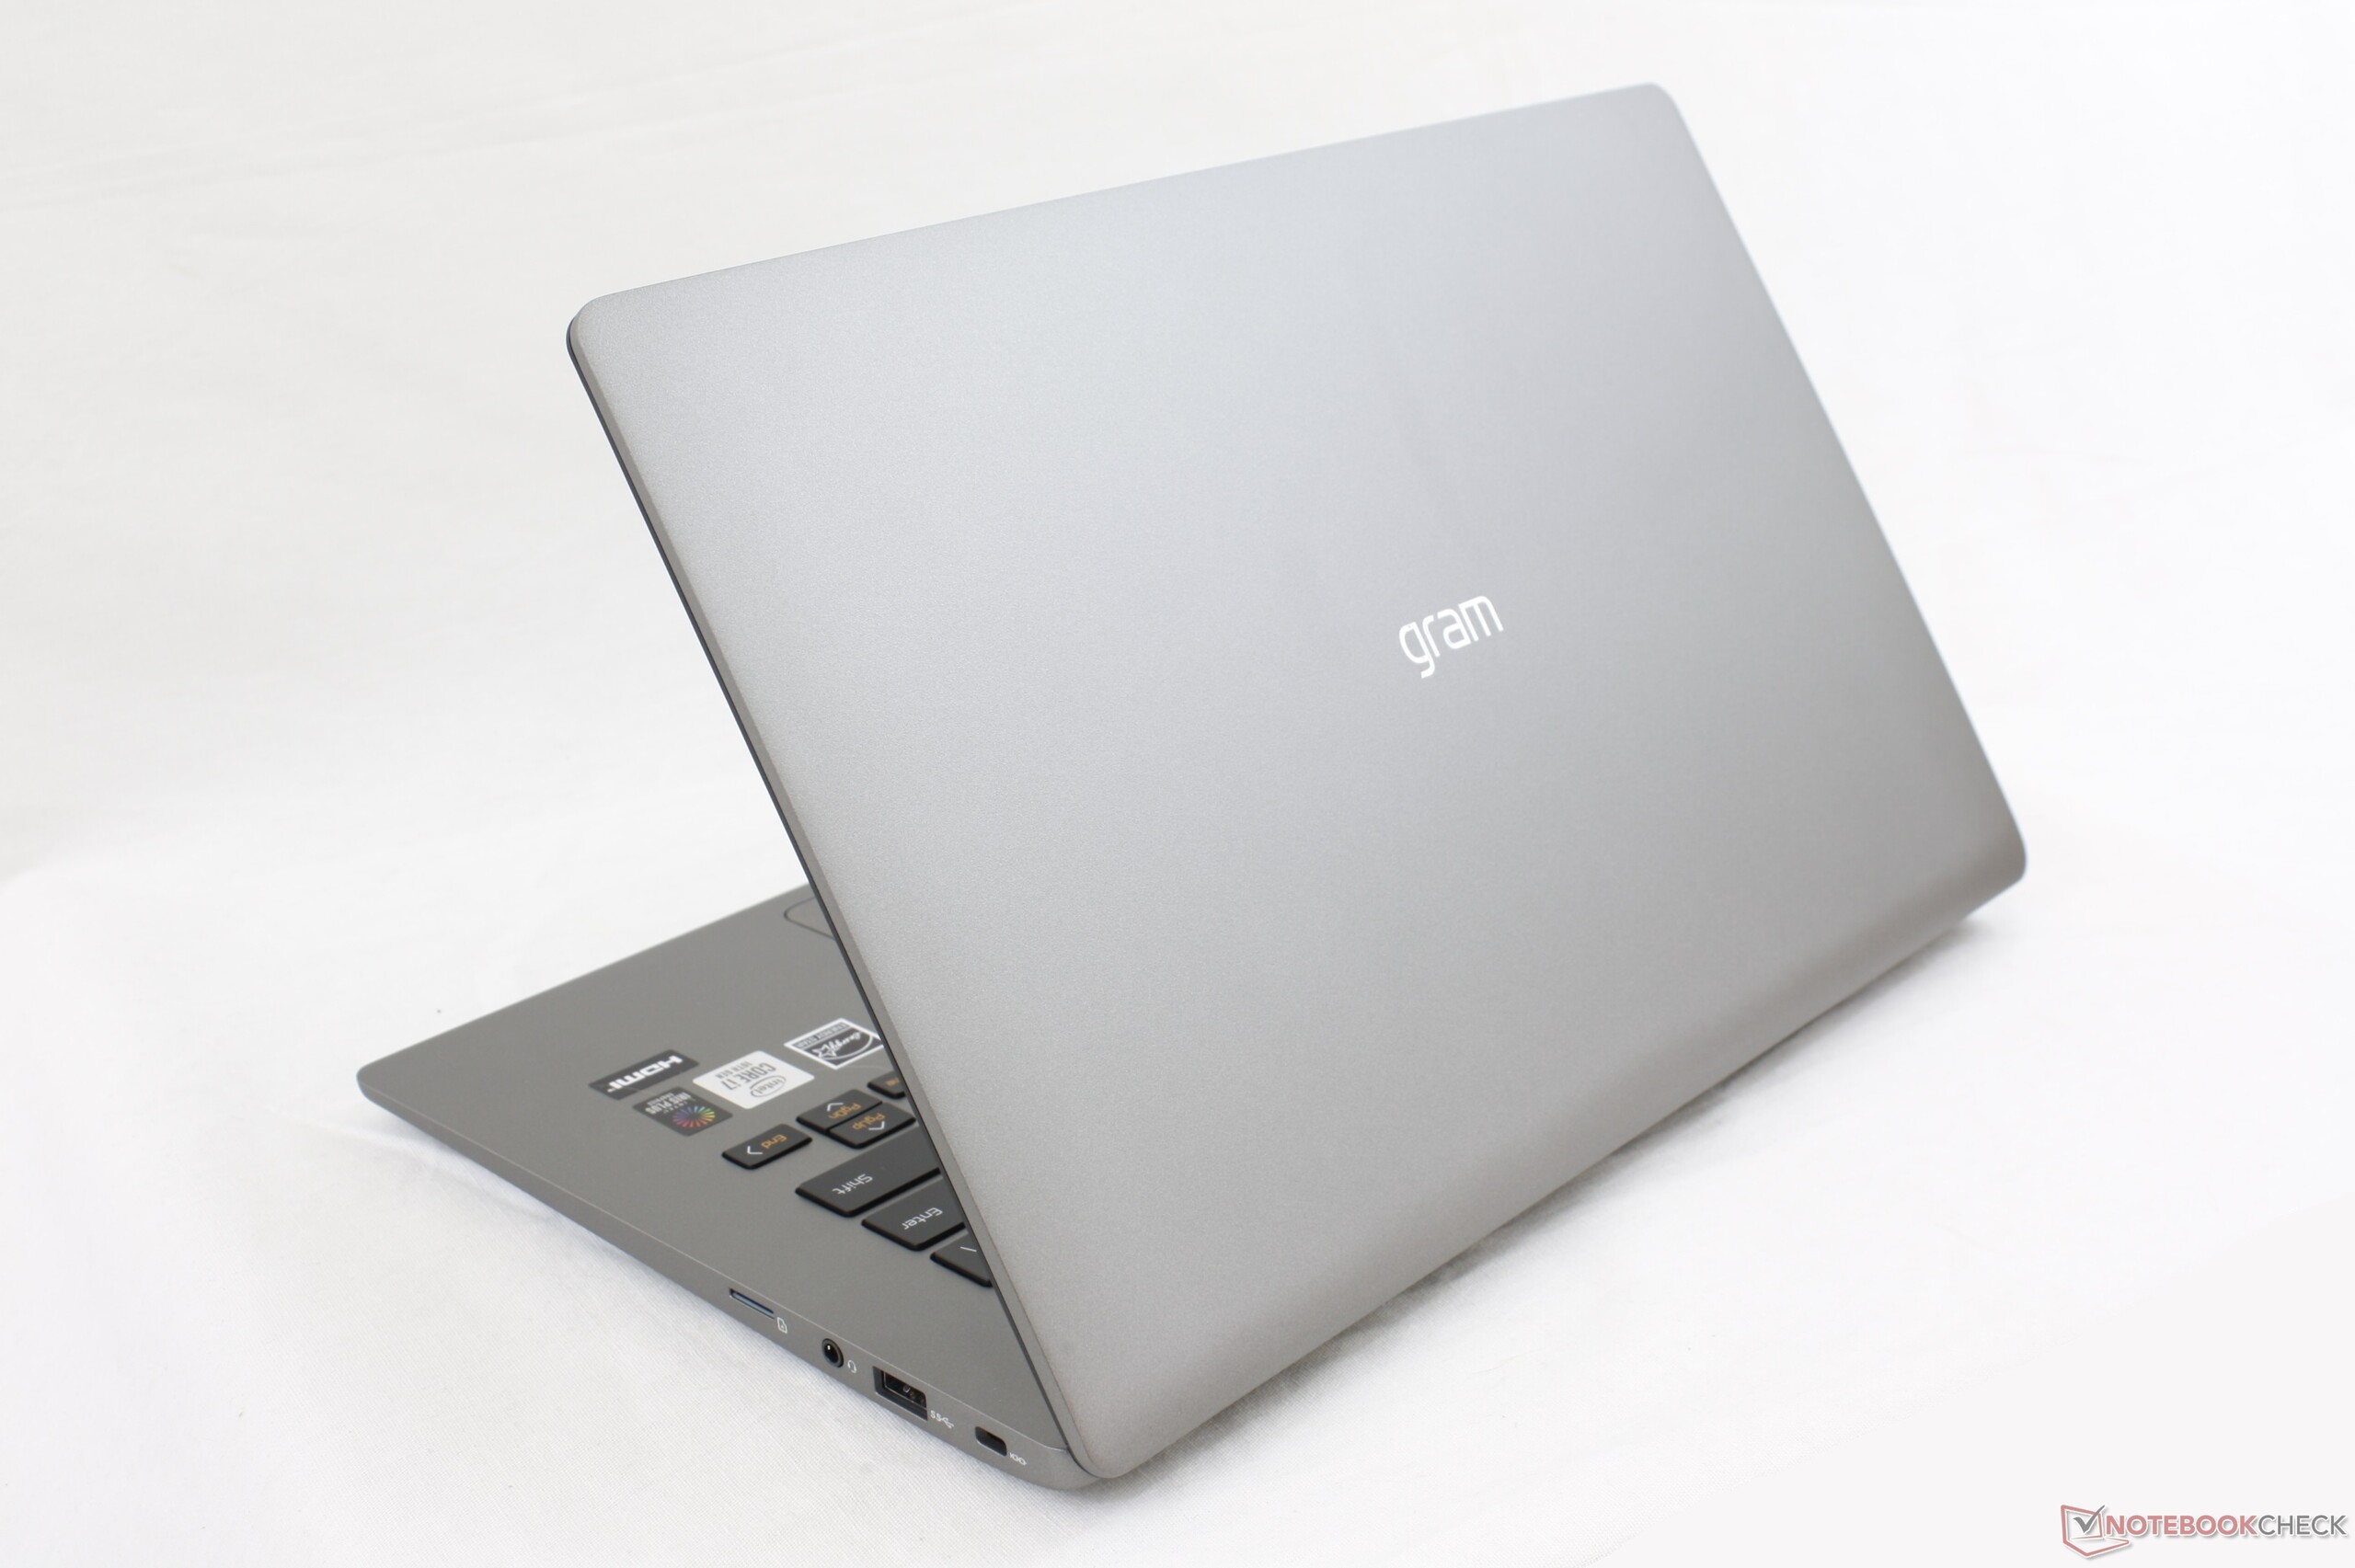
True to its name, the defining feature of the Gram 14Z90N is its weight of just under 1 kg to be several hundred grams lighter than most other Ultrabooks. Even the latest Dell XPS 13 weighs noticeably more despite it offering a smaller 13.3-inch screen. LG has made the system slightly thinner than last year's Gram 14Z980 without changing the footprint of the system.

Connectivity
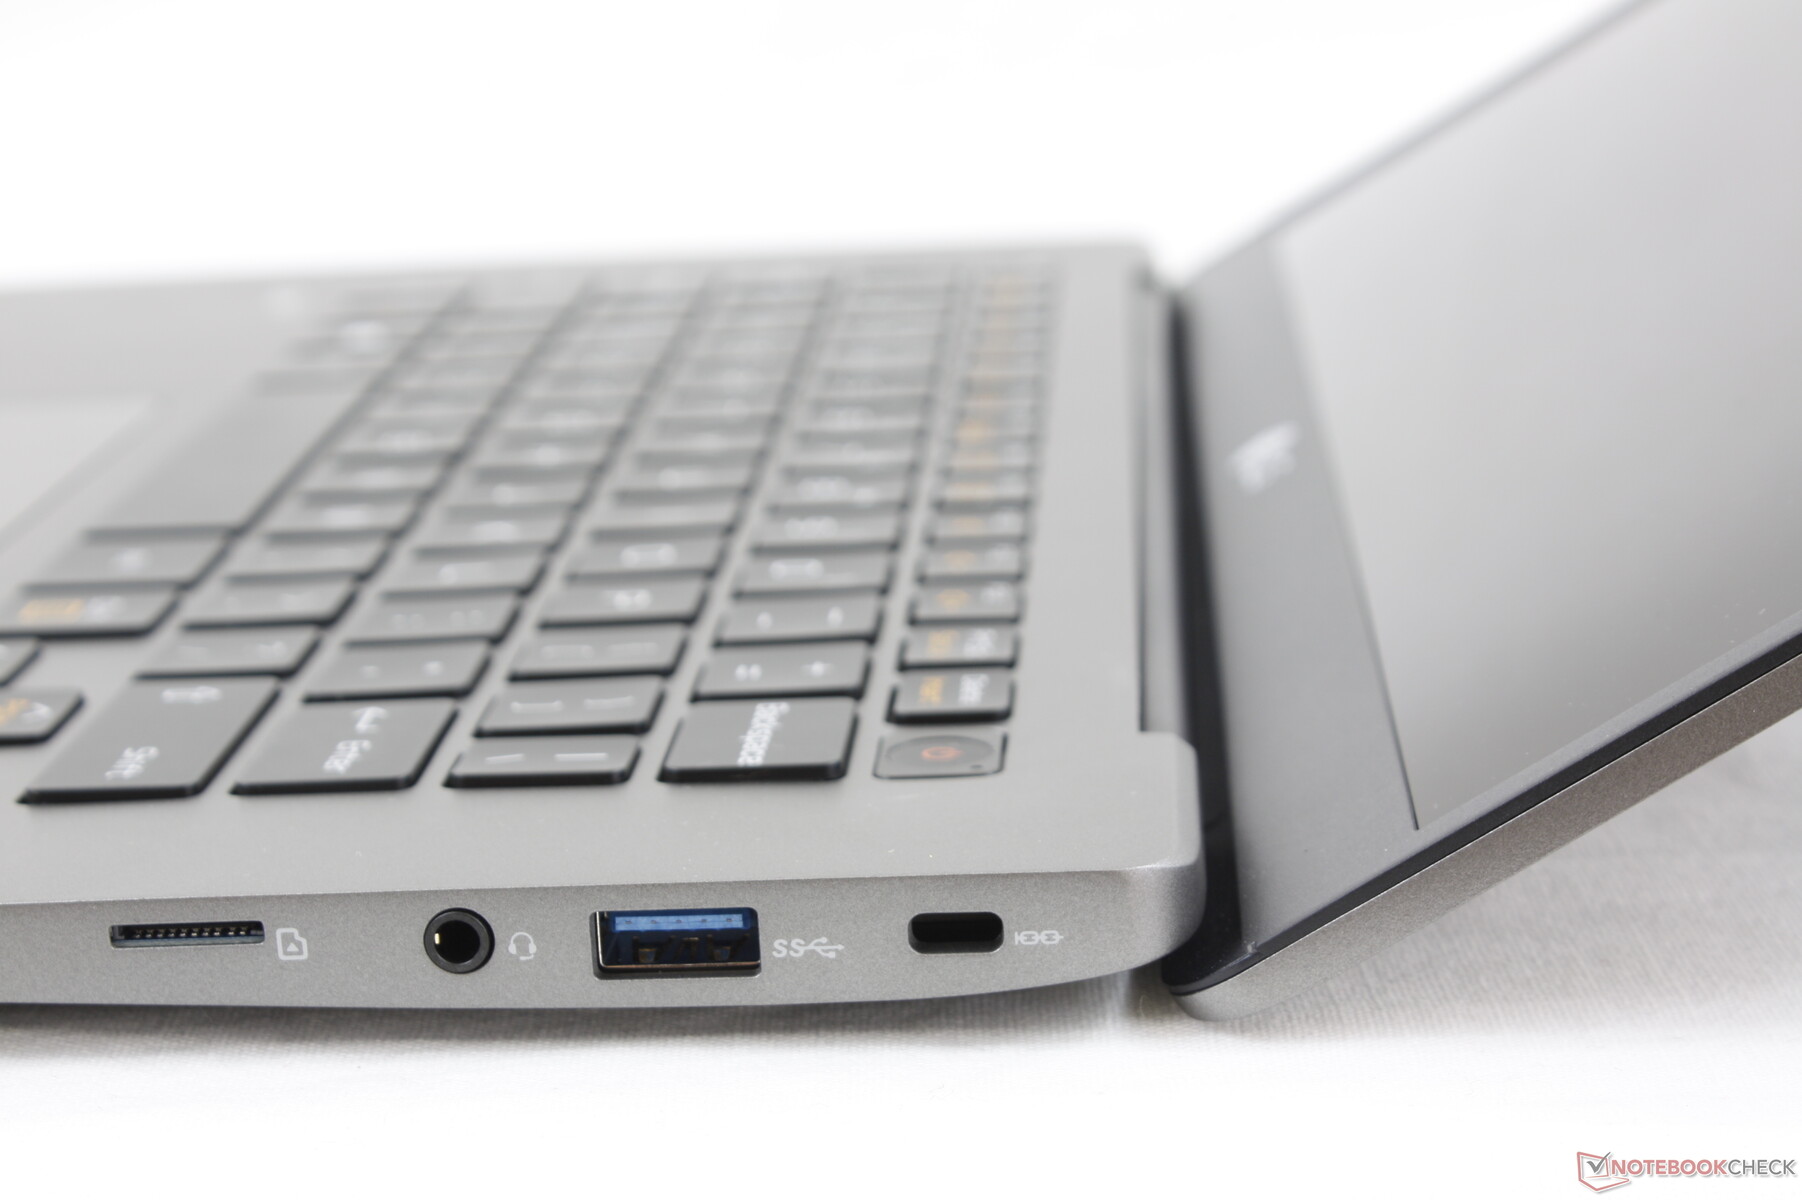
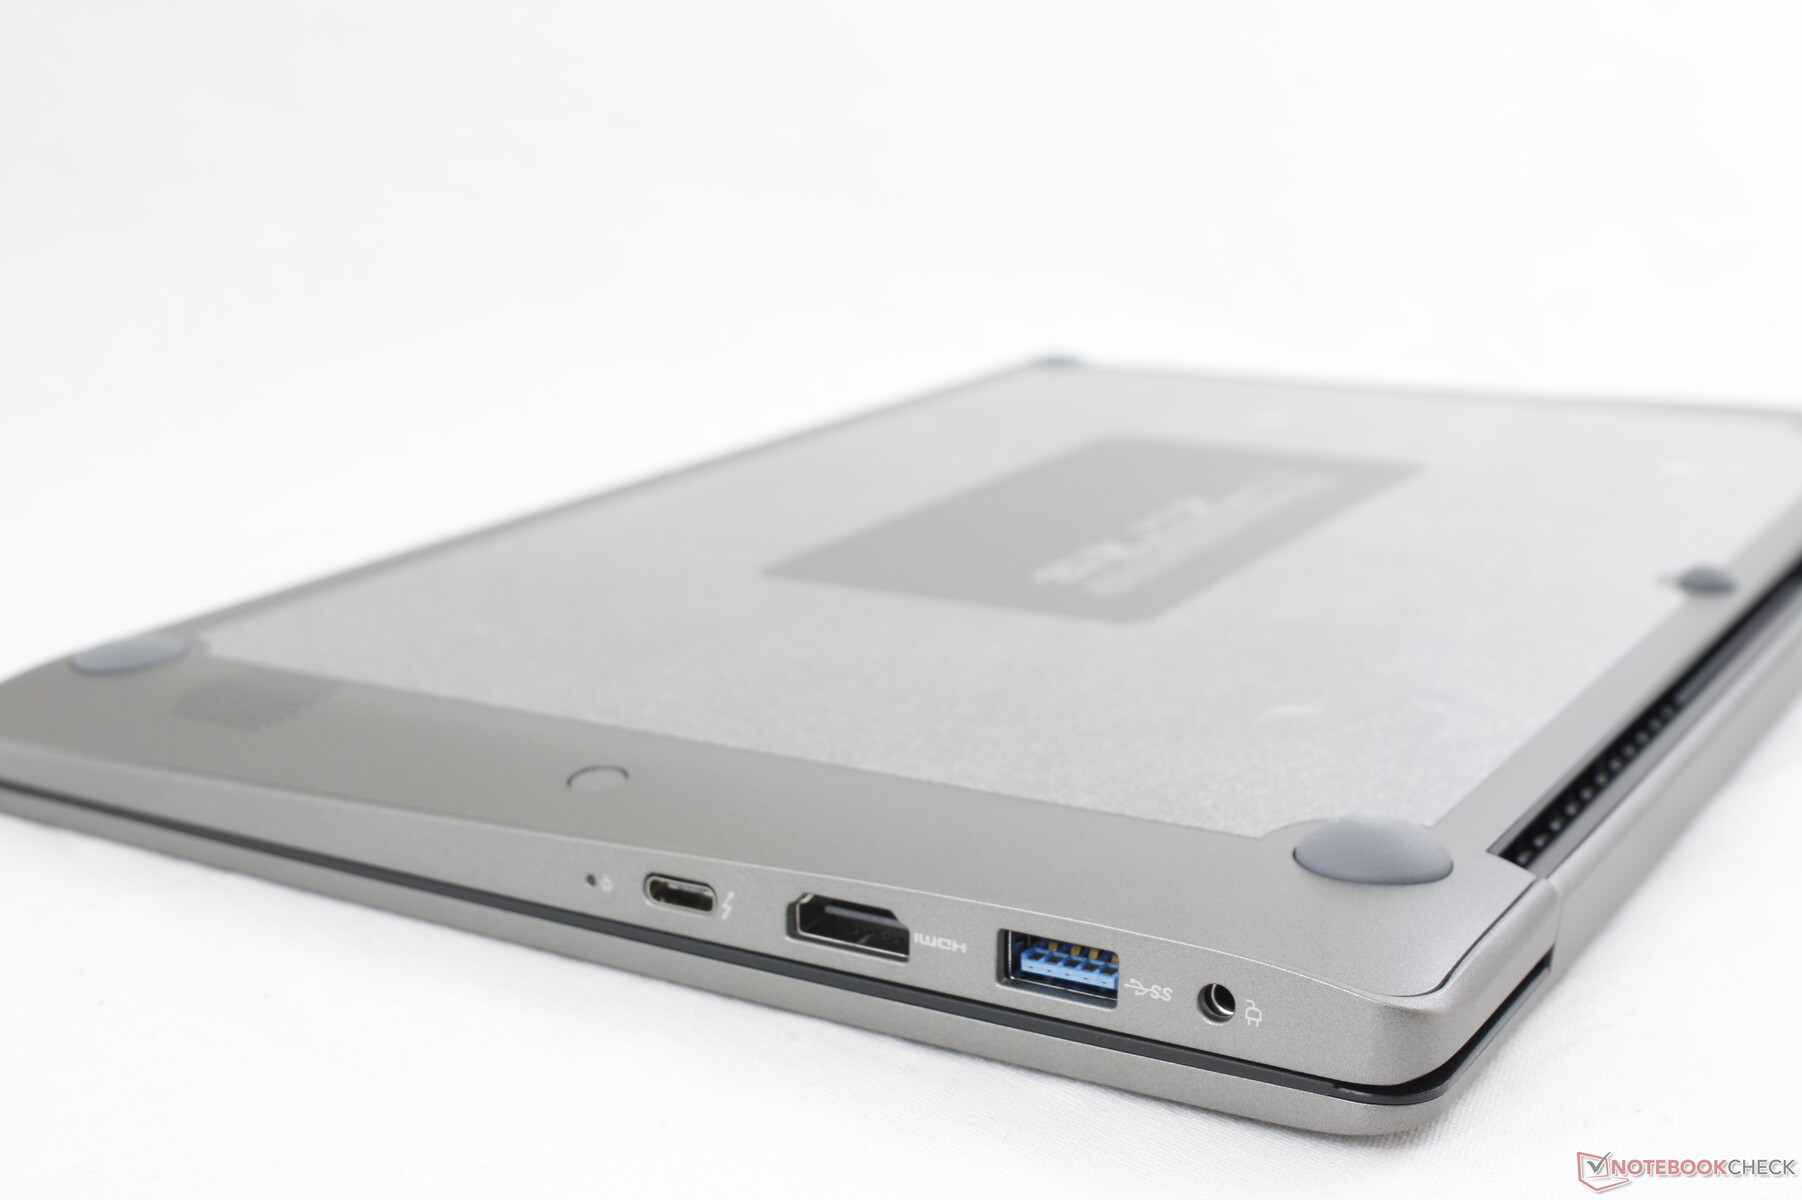
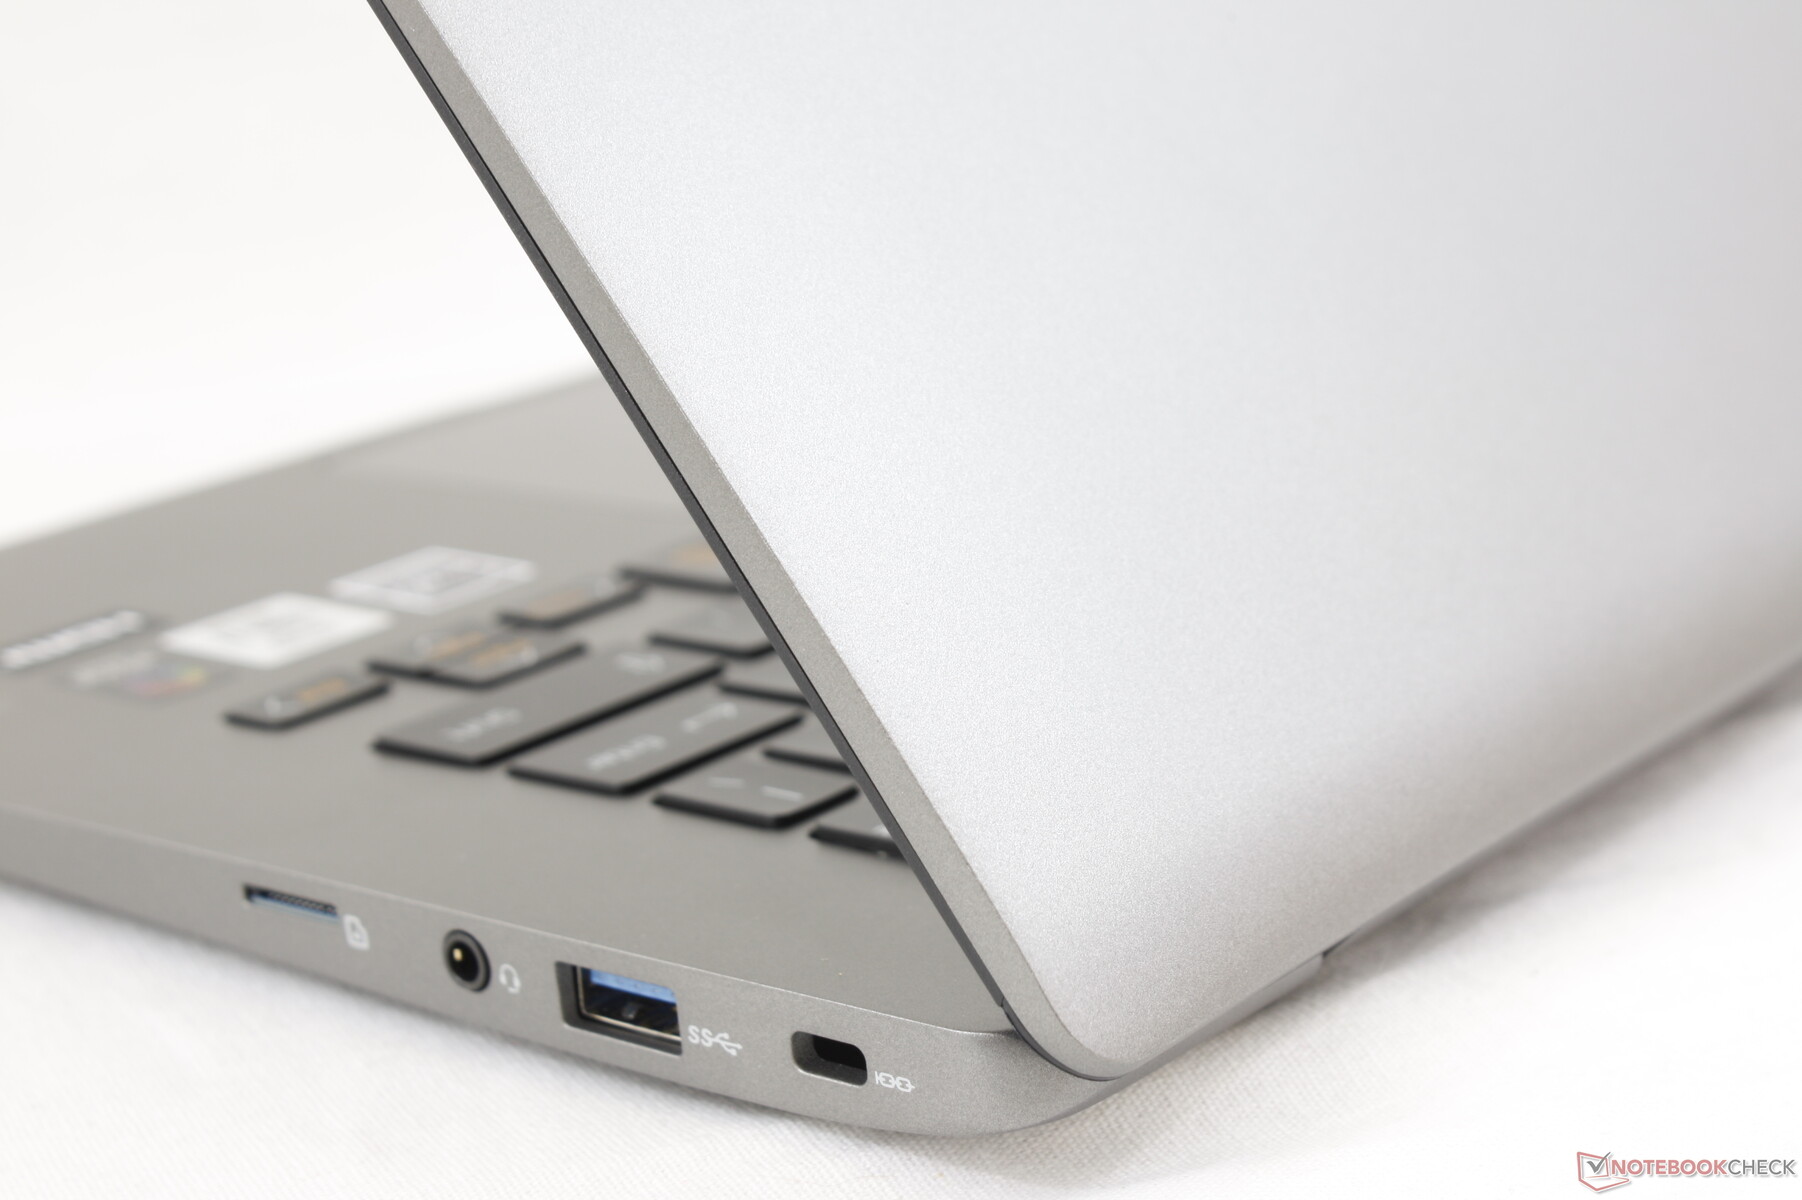
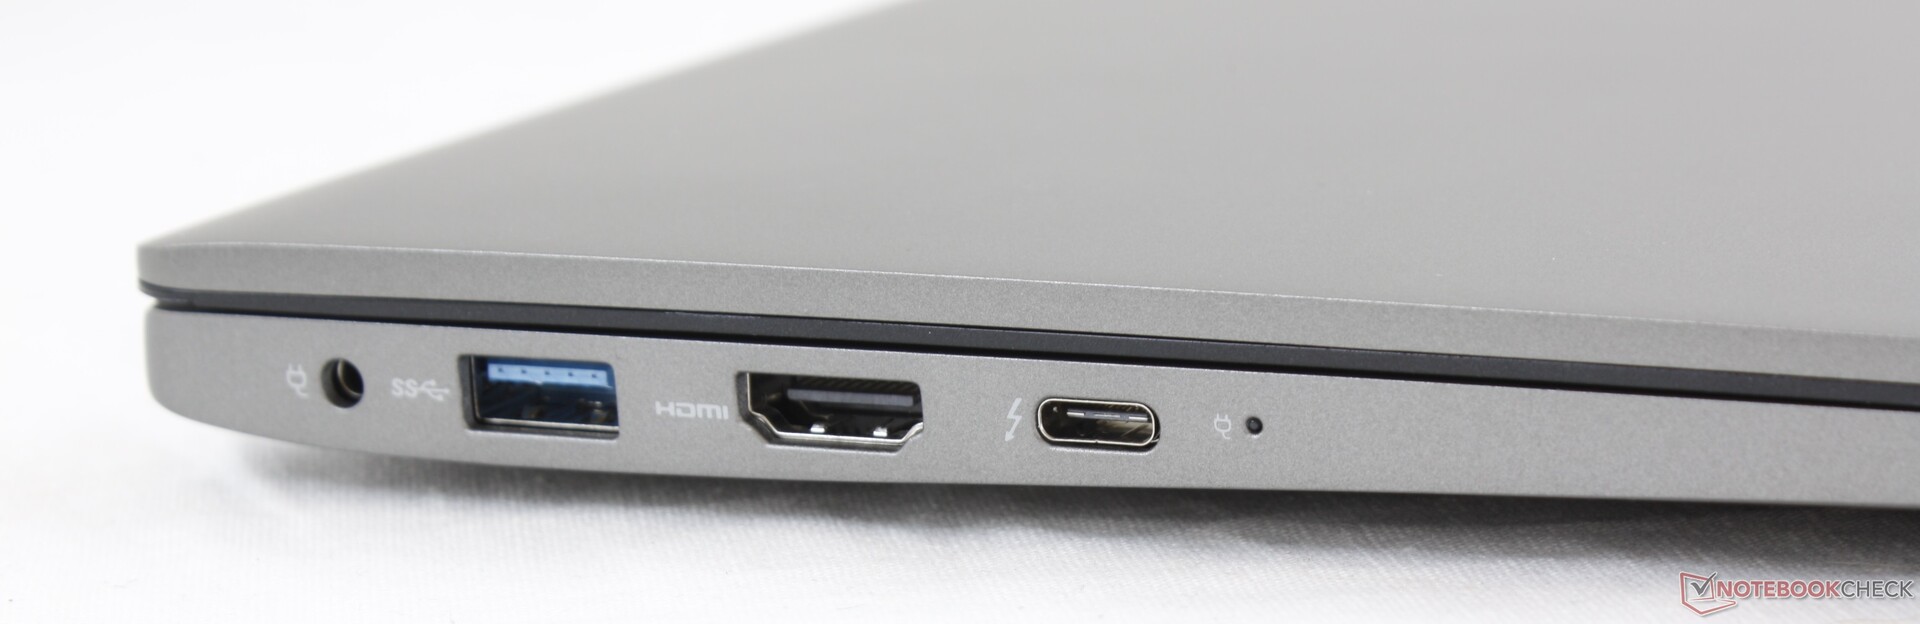
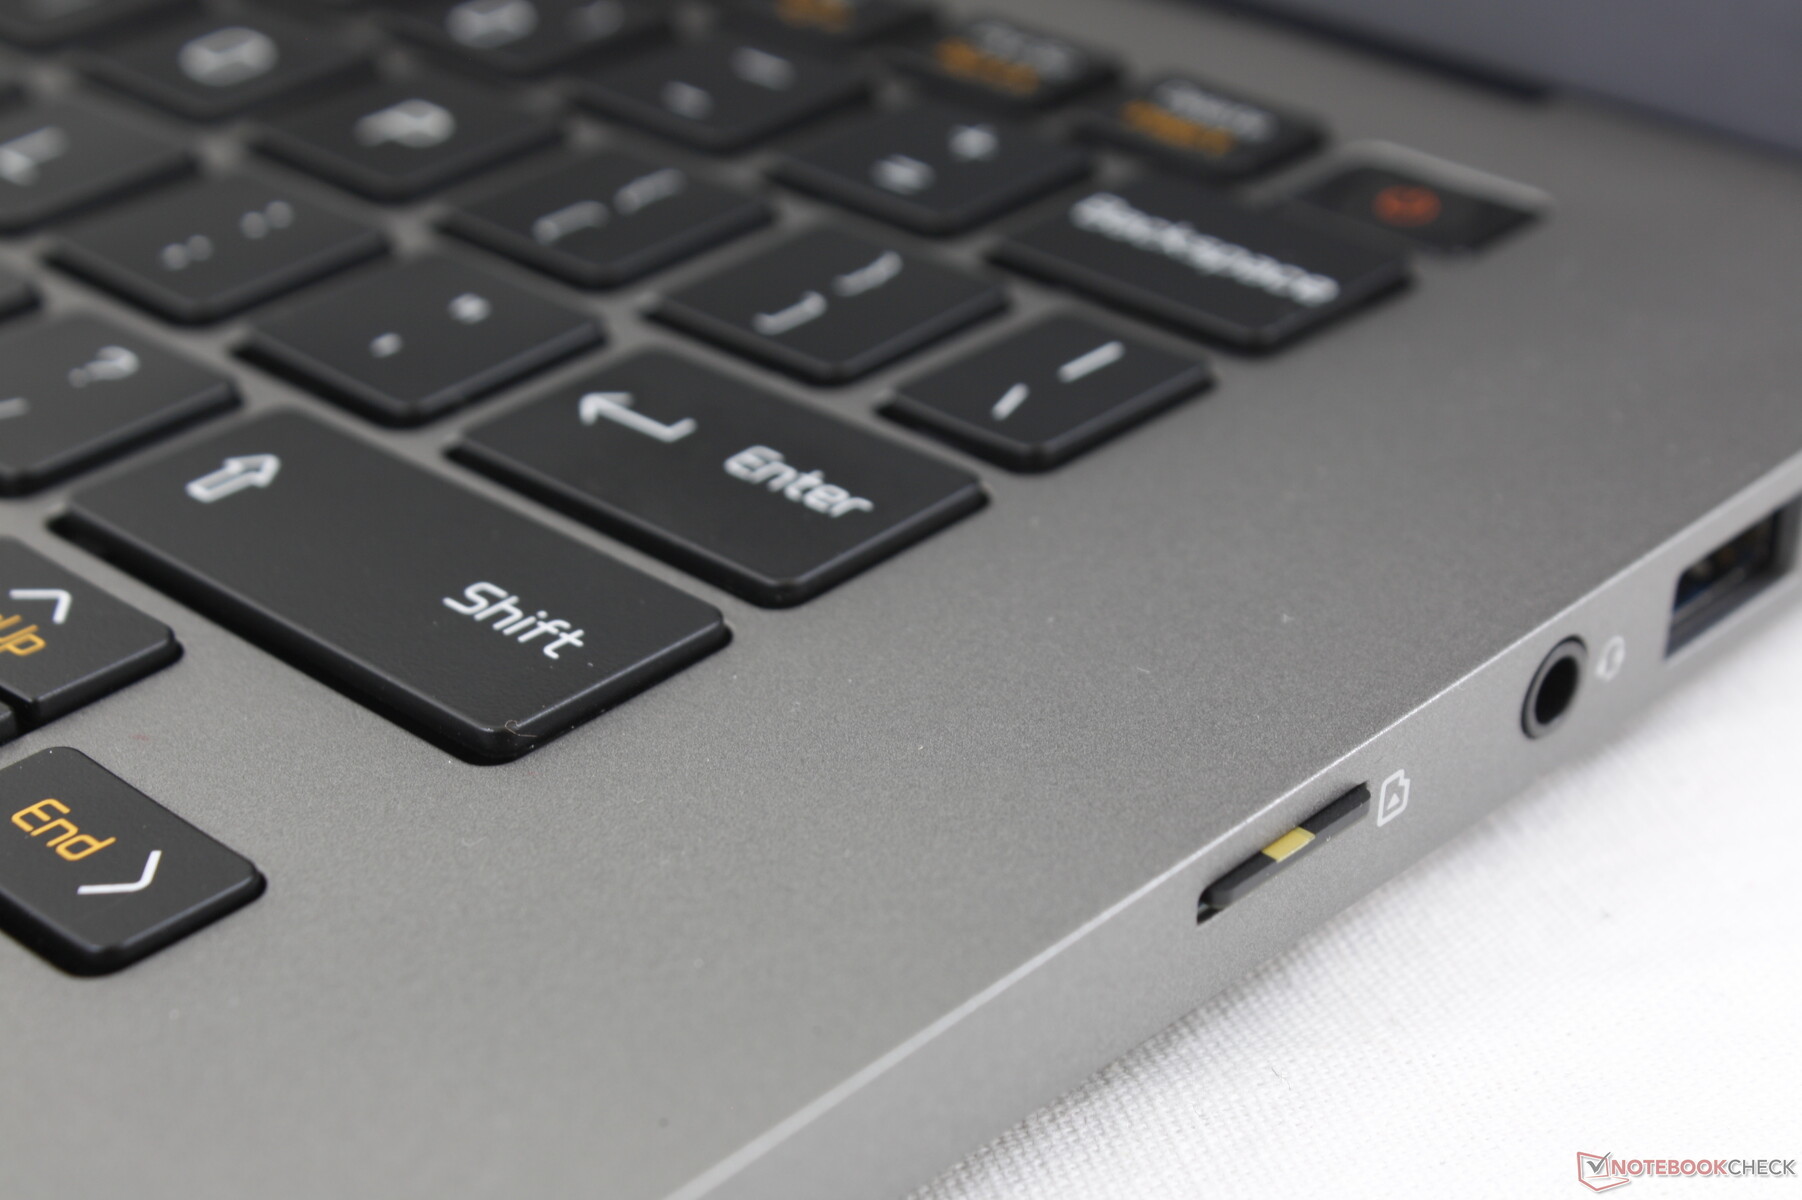
Port options are nearly identical to the last generation Gram 14Z980 but with some key differences. Firstly, the two USB Type-A ports are now 3.1 instead of 3.0. Secondly, the single USB Type-C port now supports Thunderbolt 3 for a wider variety of compatible monitors and docking stations. And lastly, port positioning has changed slightly. It's great seeing so many options here especially since most other Ultrabooks have been leaning towards USB Type-C with nothing else.

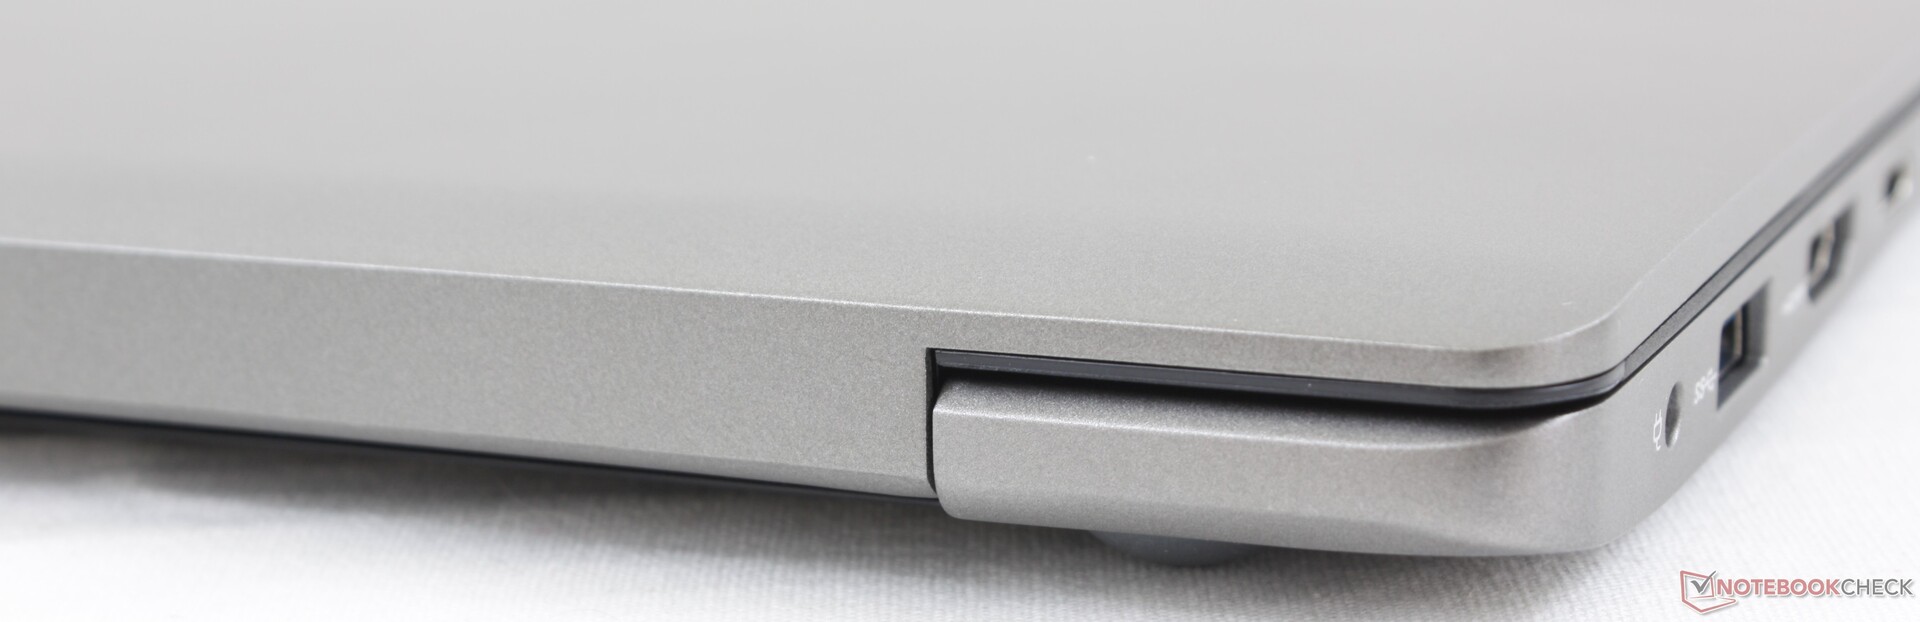
SD Card Reader
LG hasn't touched or upgraded the spring-loaded MicroSD reader at all. Moving 1 GB worth if images from our UHS-II card to desktop still takes about 13 seconds compared to almost half that on the XPS 13 card reader.
| SD Card Reader | |
| average JPG Copy Test (av. of 3 runs) | |
| Dell XPS 13 9300 Core i7-1065G7 (Toshiba Exceria Pro M501 64 GB UHS-II) | |
| LG Gram 14Z90N (Toshiba Exceria Pro M501 64 GB UHS-II) | |
| LG Gram 14T90N (Toshiba Exceria Pro M501 64 GB UHS-II) | |
| LG Gram 14Z980-U.AAW5U1 (Toshiba Exceria Pro M501 microSDXC 64GB) | |
| Asus ZenBook 14 UM431DA-AM020T (Toshiba Exceria Pro SDXC 64 GB UHS-II) | |
| maximum AS SSD Seq Read Test (1GB) | |
| Dell XPS 13 9300 Core i7-1065G7 (Toshiba Exceria Pro M501 64 GB UHS-II) | |
| LG Gram 14Z90N (Toshiba Exceria Pro M501 64 GB UHS-II) | |
| LG Gram 14Z980-U.AAW5U1 (Toshiba Exceria Pro M501 microSDXC 64GB) | |
| LG Gram 14T90N (Toshiba Exceria Pro M501 64 GB UHS-II) | |
| Asus ZenBook 14 UM431DA-AM020T (Toshiba Exceria Pro SDXC 64 GB UHS-II) | |
Communication
A non-removable Intel AX201 comes standard for Wi-Fi 6 compatibility as opposed to the slower Intel 8265 on the older Gram 14Z980. We experienced no issues when connected to our Netgear RAX200 test router.
Webcam

, i7-1065G7, Samsung SSD PM981 MZVLB256HAHQ")
, i7-1065G7, Samsung SSD PM981 MZVLB256HAHQ")
Maintenance
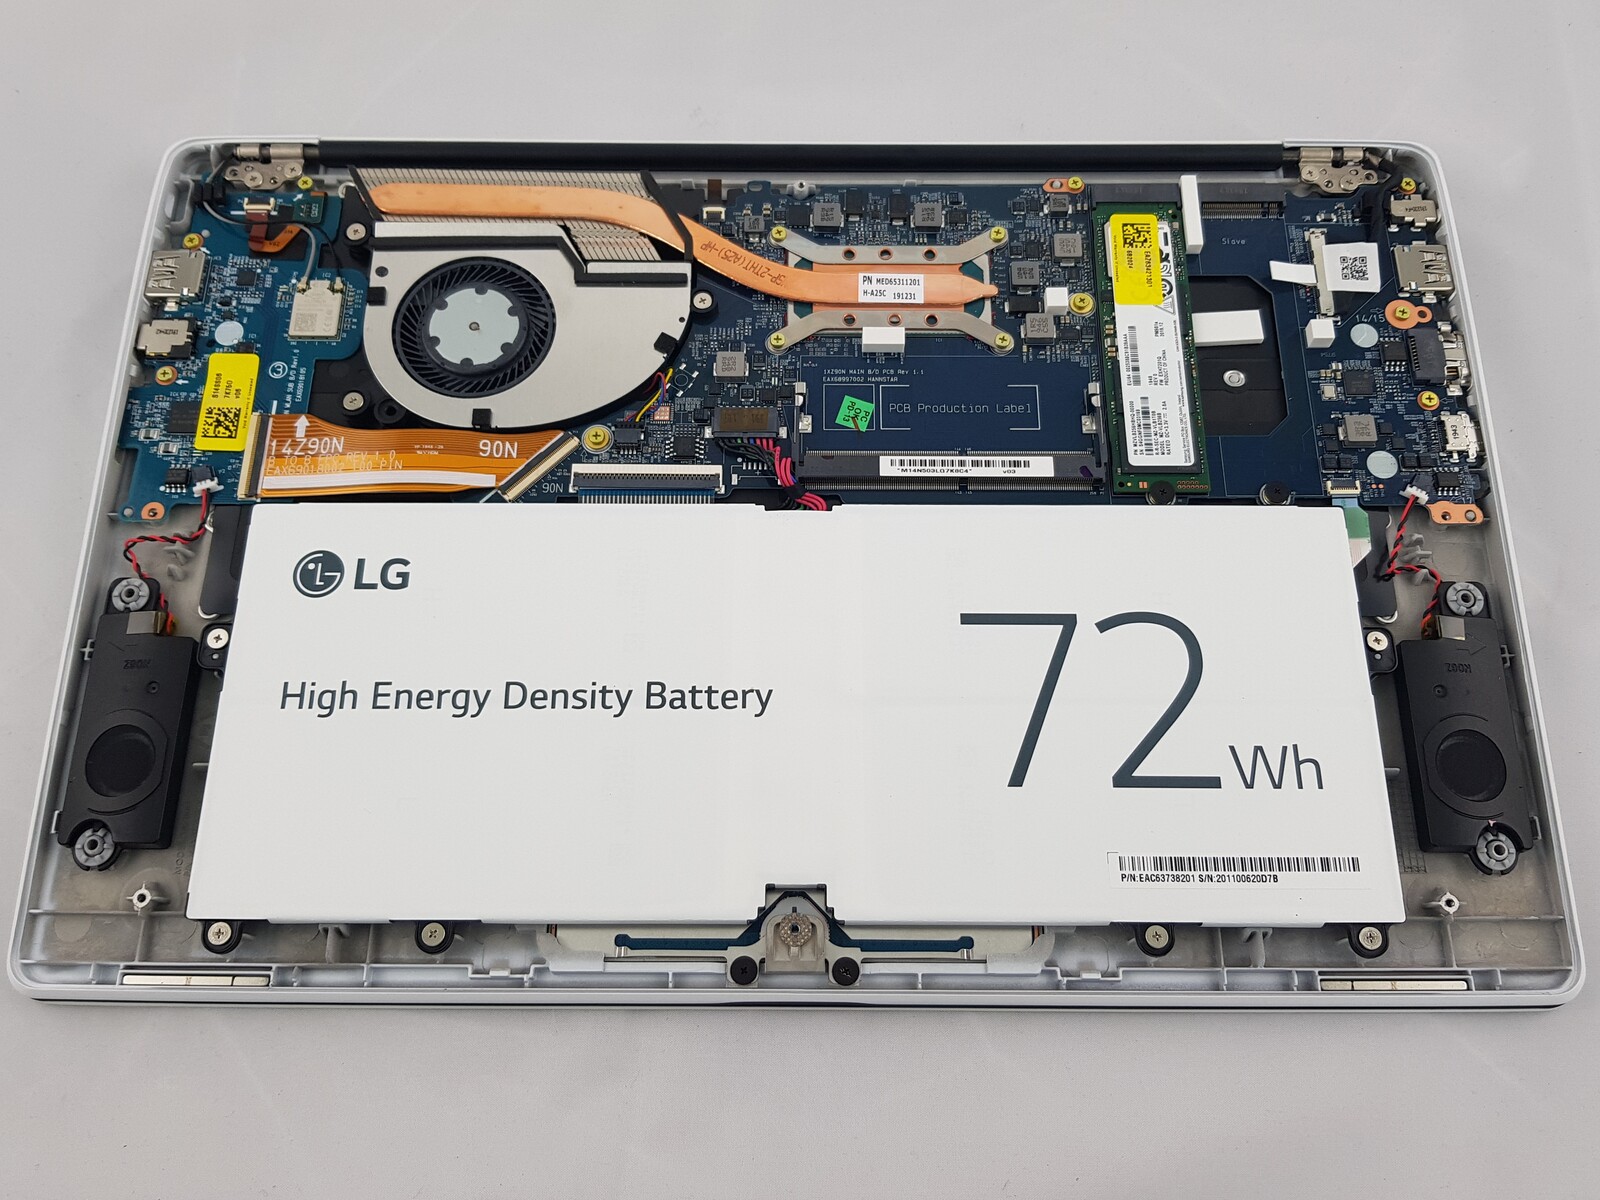
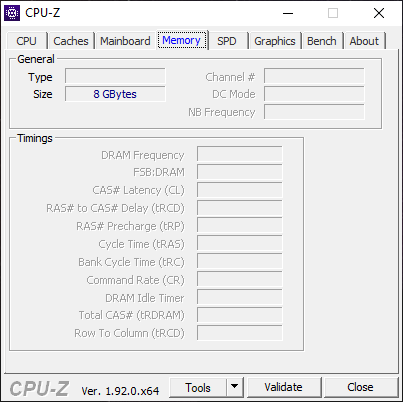
Much like on previous Gram systems, the bottom panel of the Gram 14Z90N is difficult to remove even with the proper tools. All screws are hidden underneath covers and the tight rubber footing to make end-user upgrades a pain. According to a disassembly guide here, however, users will have the same upgrade options as on the Gram 14T90N convertible since both systems share similar components. Note that 8 GB of single-channel RAM comes soldered with the ability to support up to 24 GB via an open SODIMM slot.
Accessories and Warranty
LG throws in a handy USB to RJ-45 adapter in the retail box. The usual one-year limited manufacturer warranty applies.
Input Devices
Keyboard
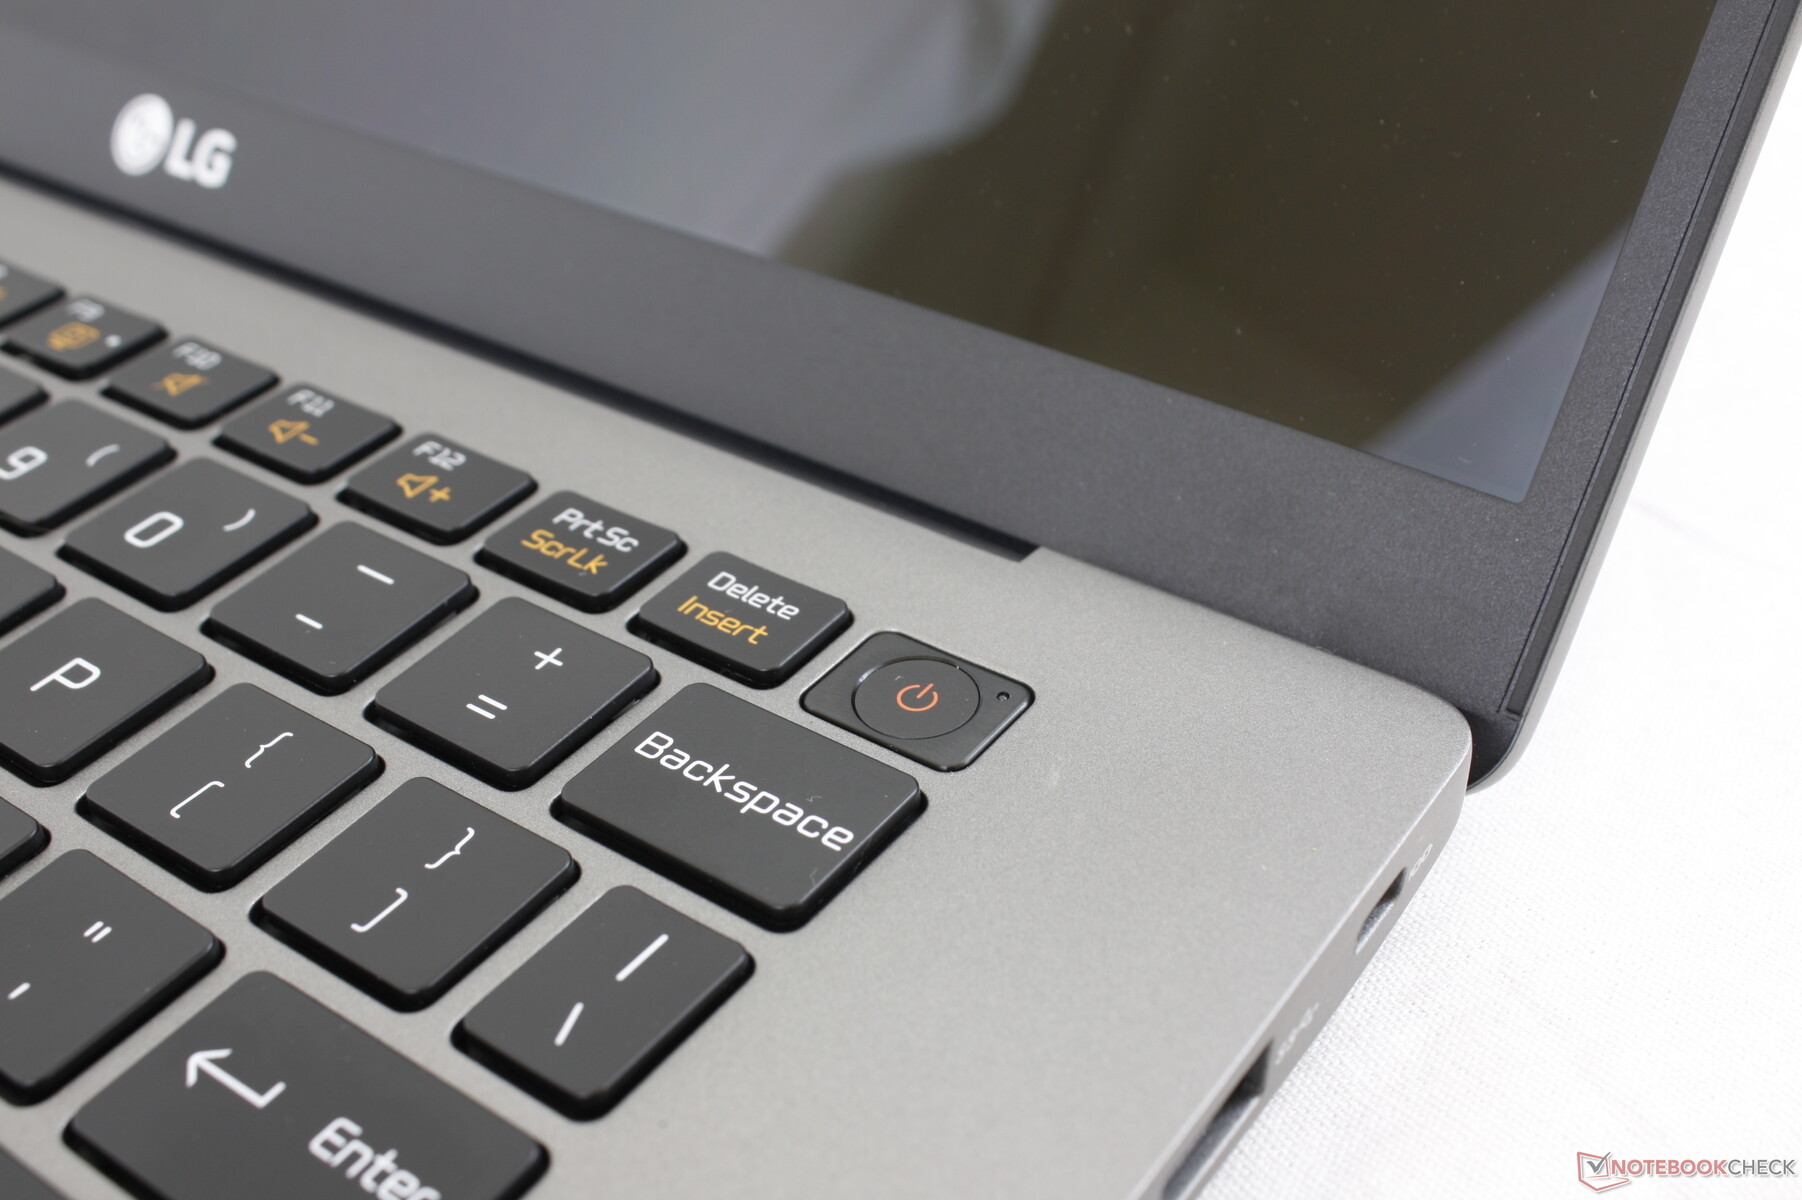
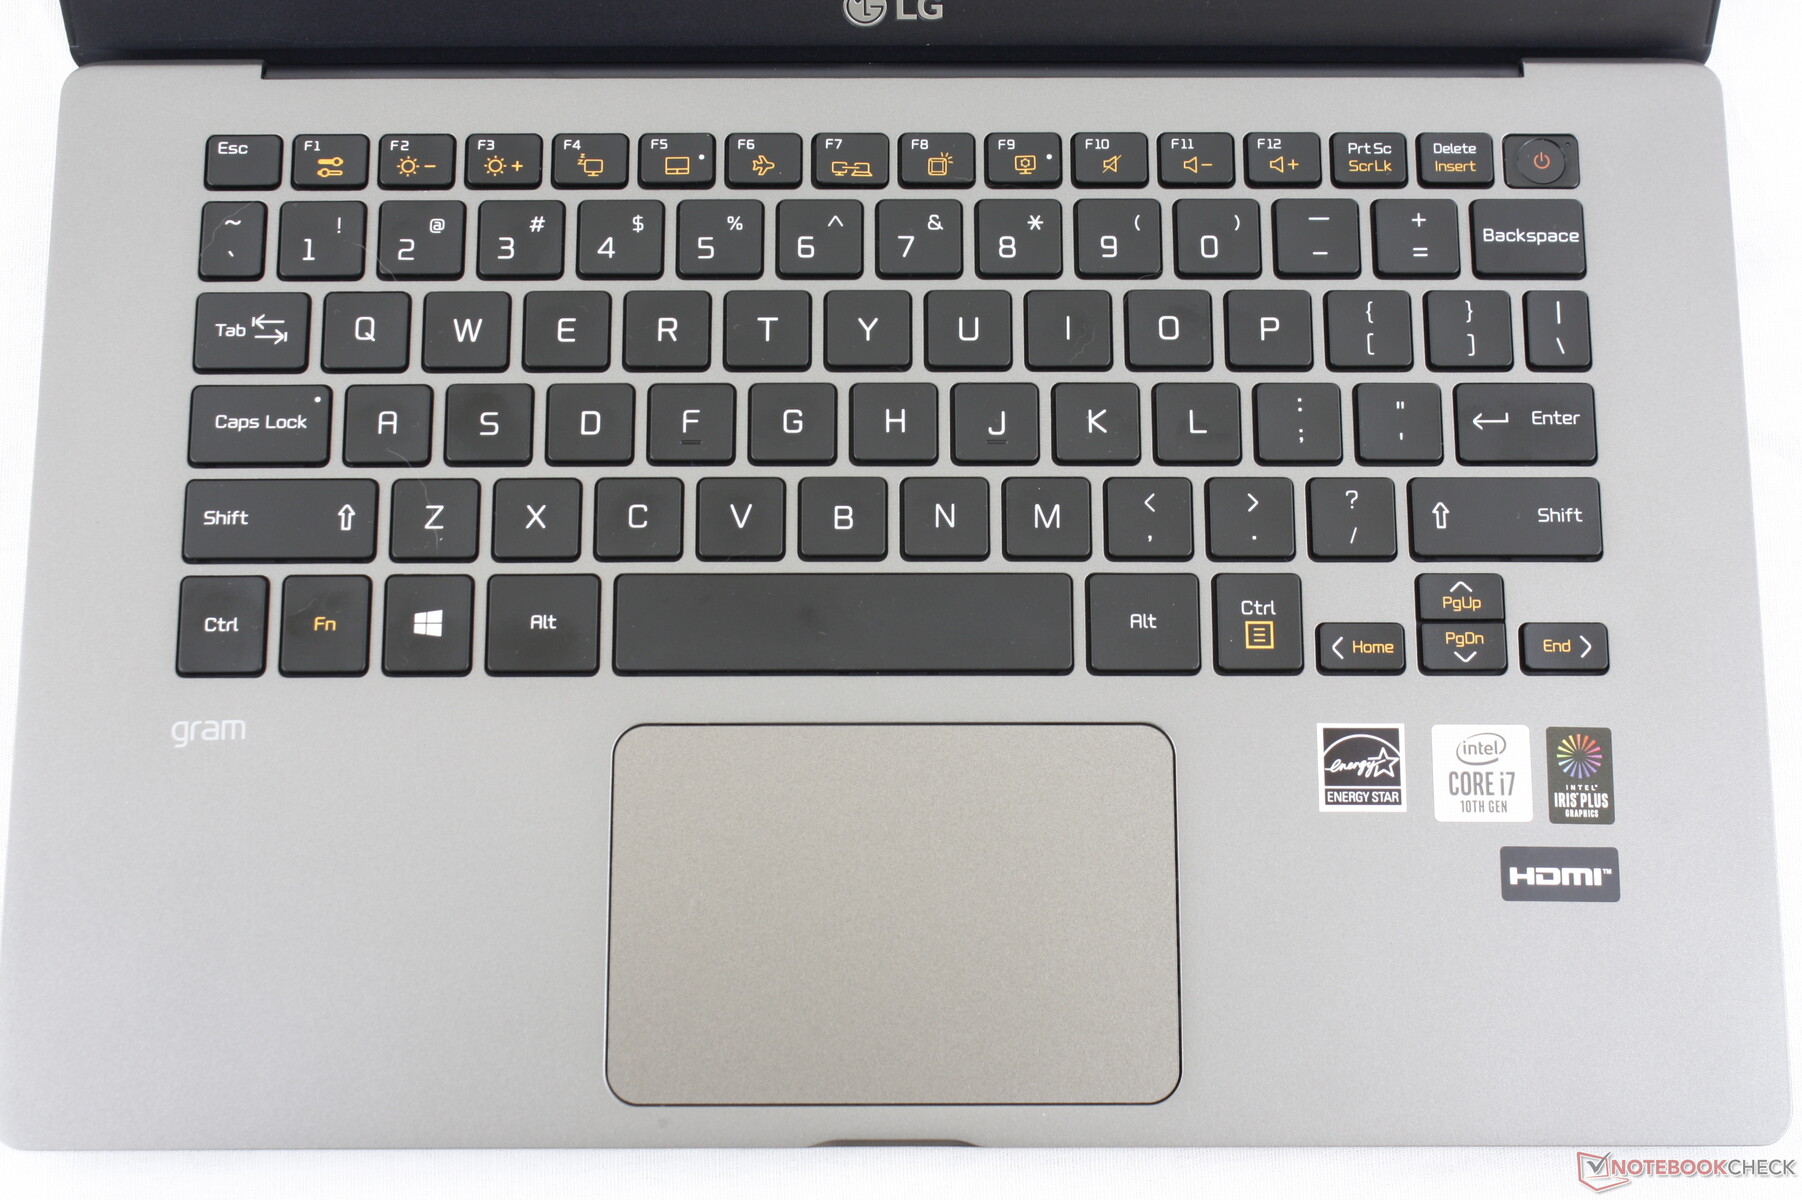
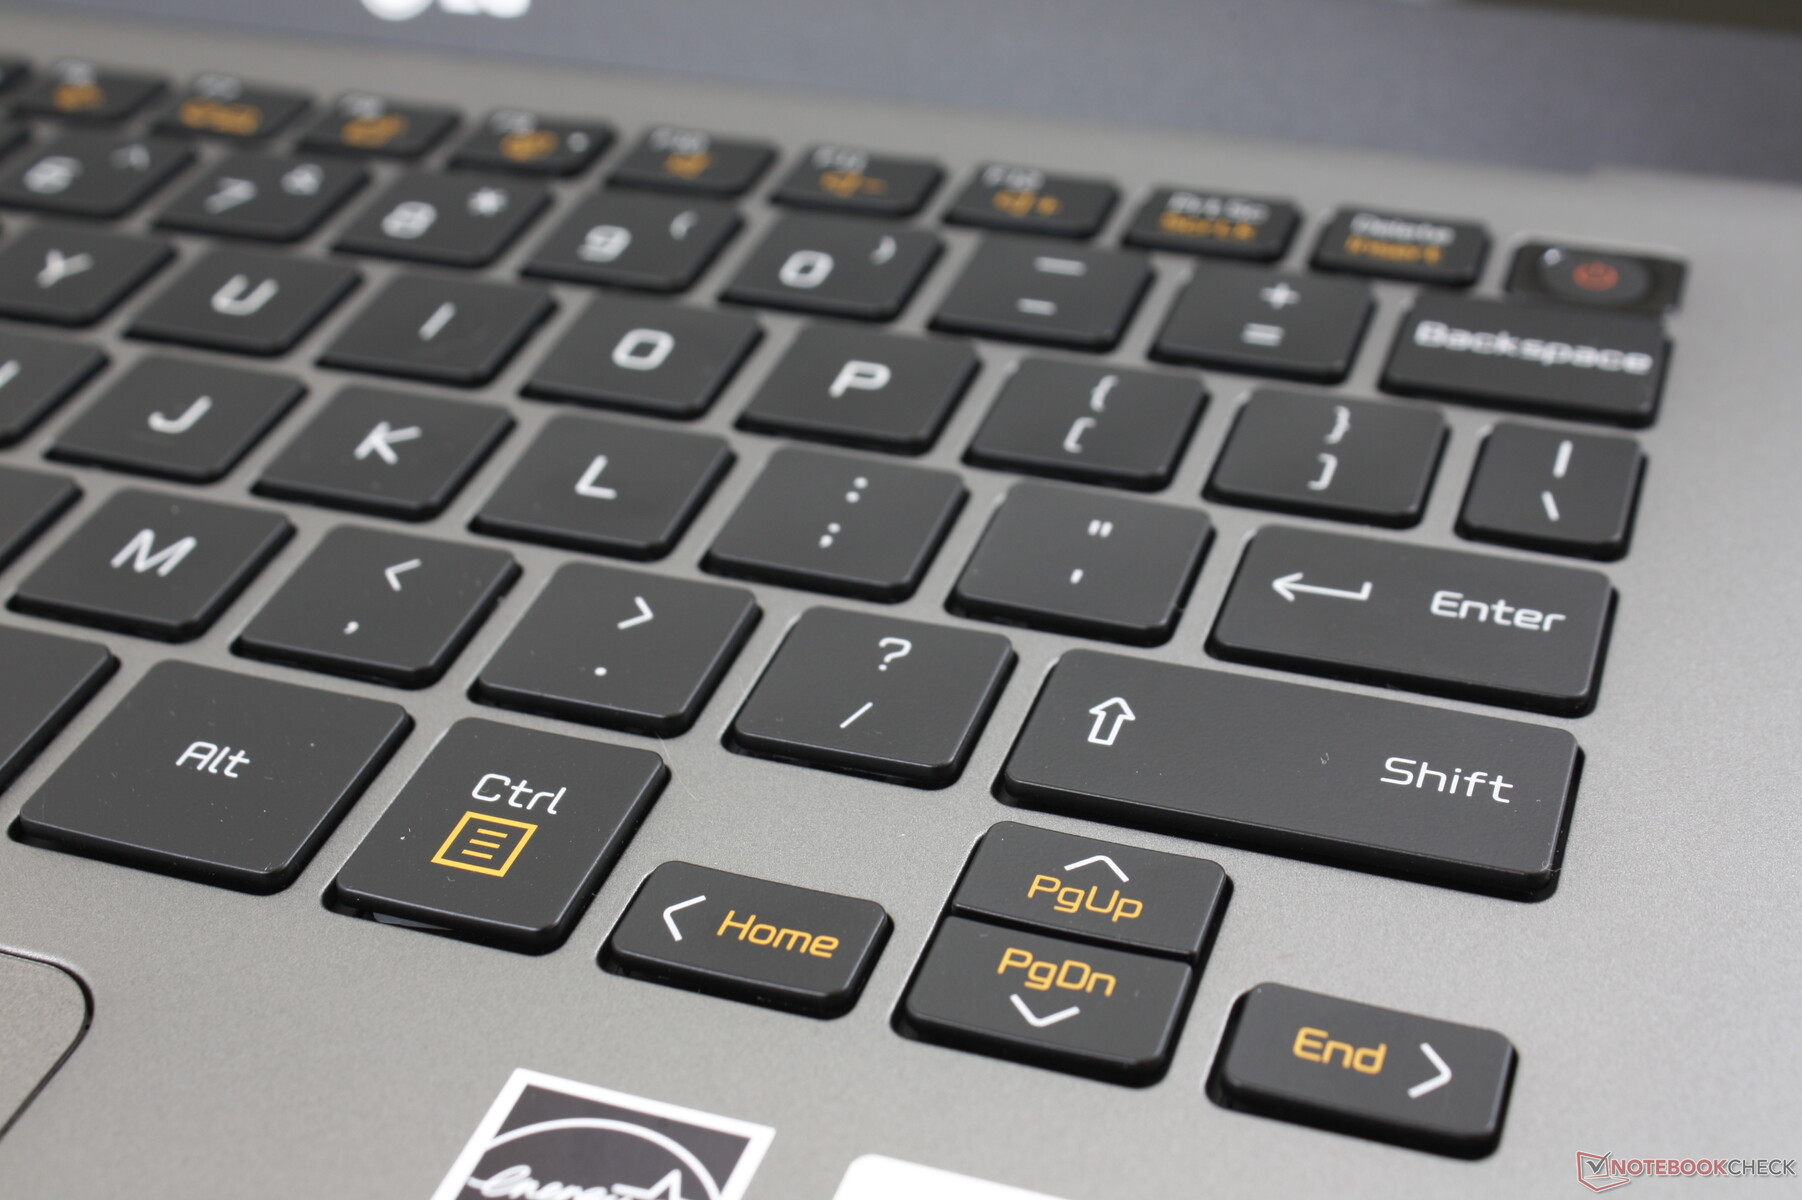
LG hasn't changed the keyboard layout or key sizes at all when compared to the Gram 14Z980. Key feedback, however, feels firmer and more satisfying here than on the Gram 14Z90N. Clatter is subsequently louder, but that's a fair trade-off especially since the Gram series caters well to on-the-go typists. All letters and symbols are lit when the white backlight is activated.
The small Arrow keys continue to be one of the worst aspects of the keyboard as they're far too spongy and uncomfortable to use.
Touchpad
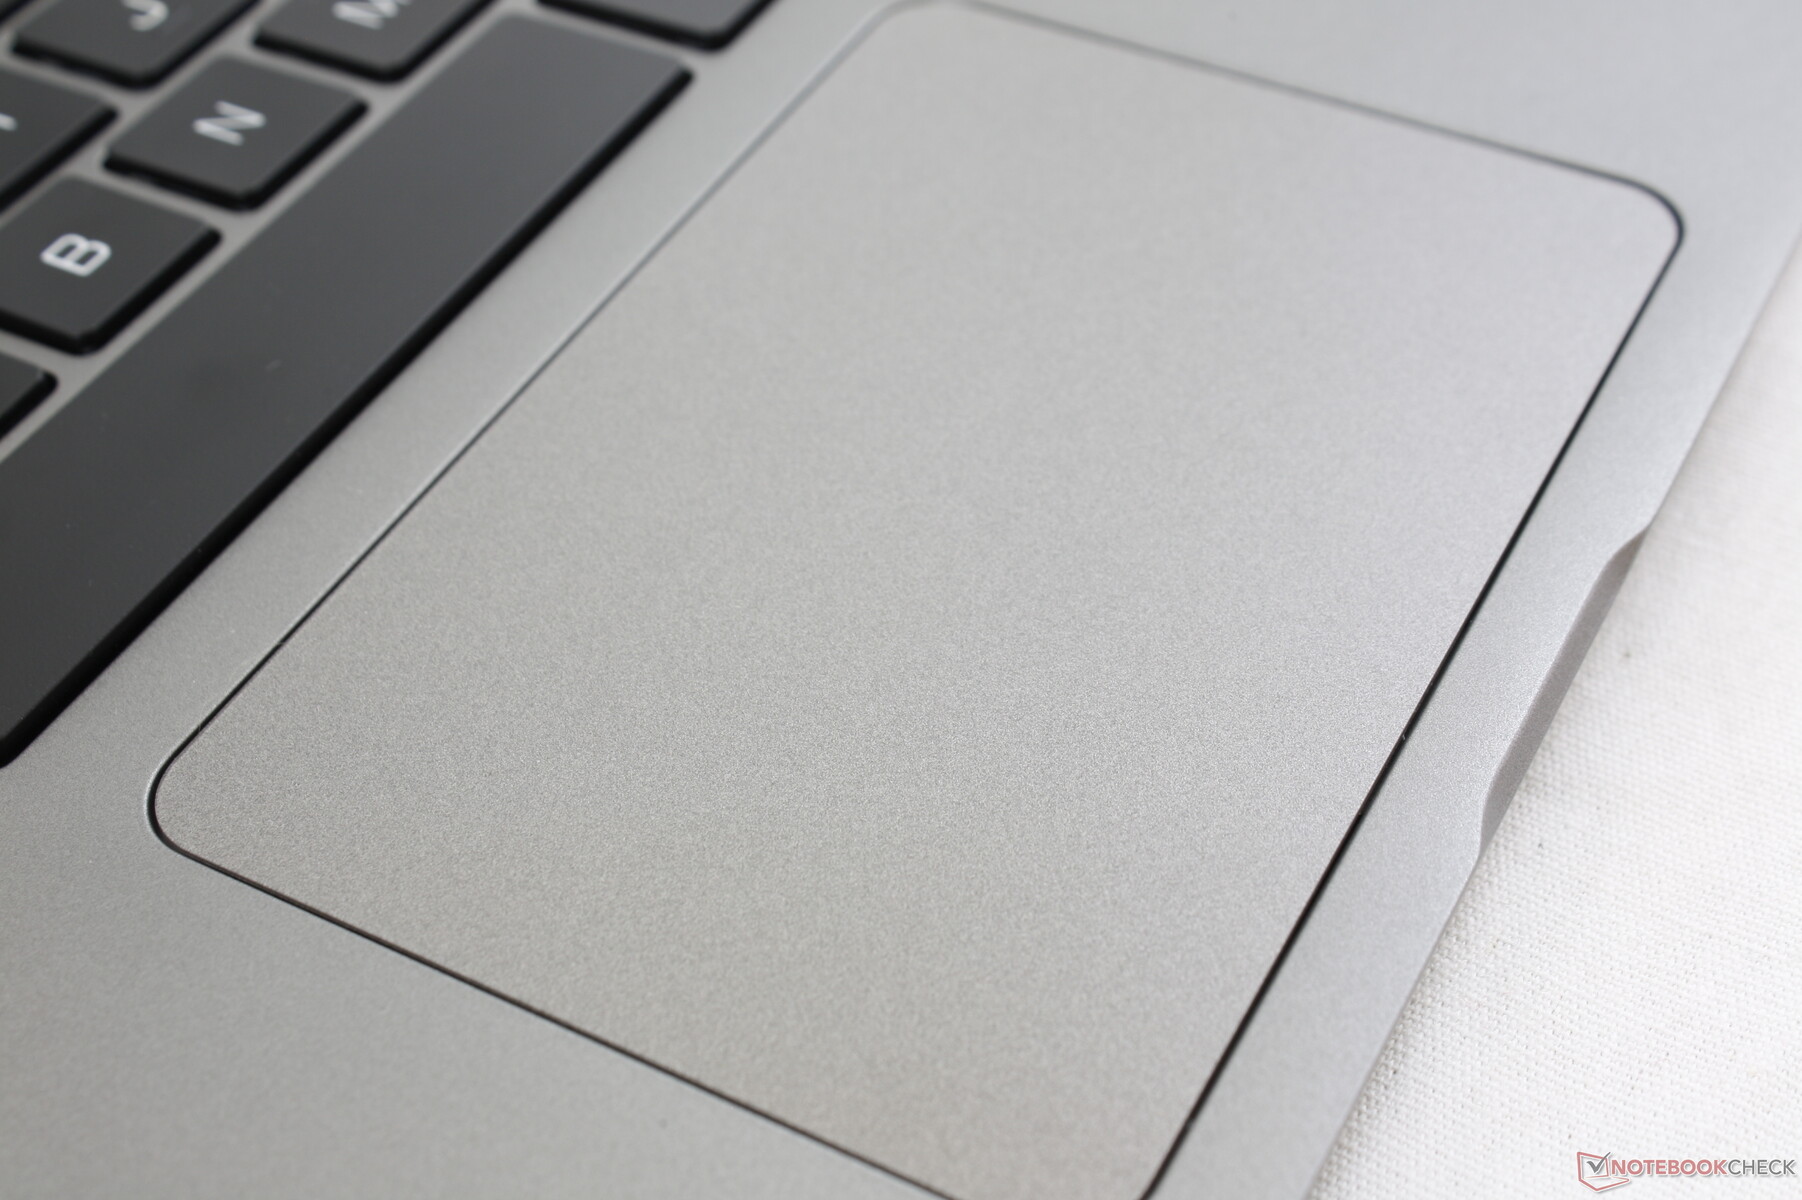
The clickpad remains identical in size to the one on its predecessor (10.5 x 7 cm). Unlike most other clickpads, however, the surface here is completely smooth and not roughened at all. The finger tends to stick and jump when gliding at slow to slow-medium speeds as a result.
Meanwhile, the integrated click keys have an audible click when pressed even though feedback is on the soft side. It's a decent clickpad after growing accustomed to its plasticky surface and somewhat spongy key feedback.

Display
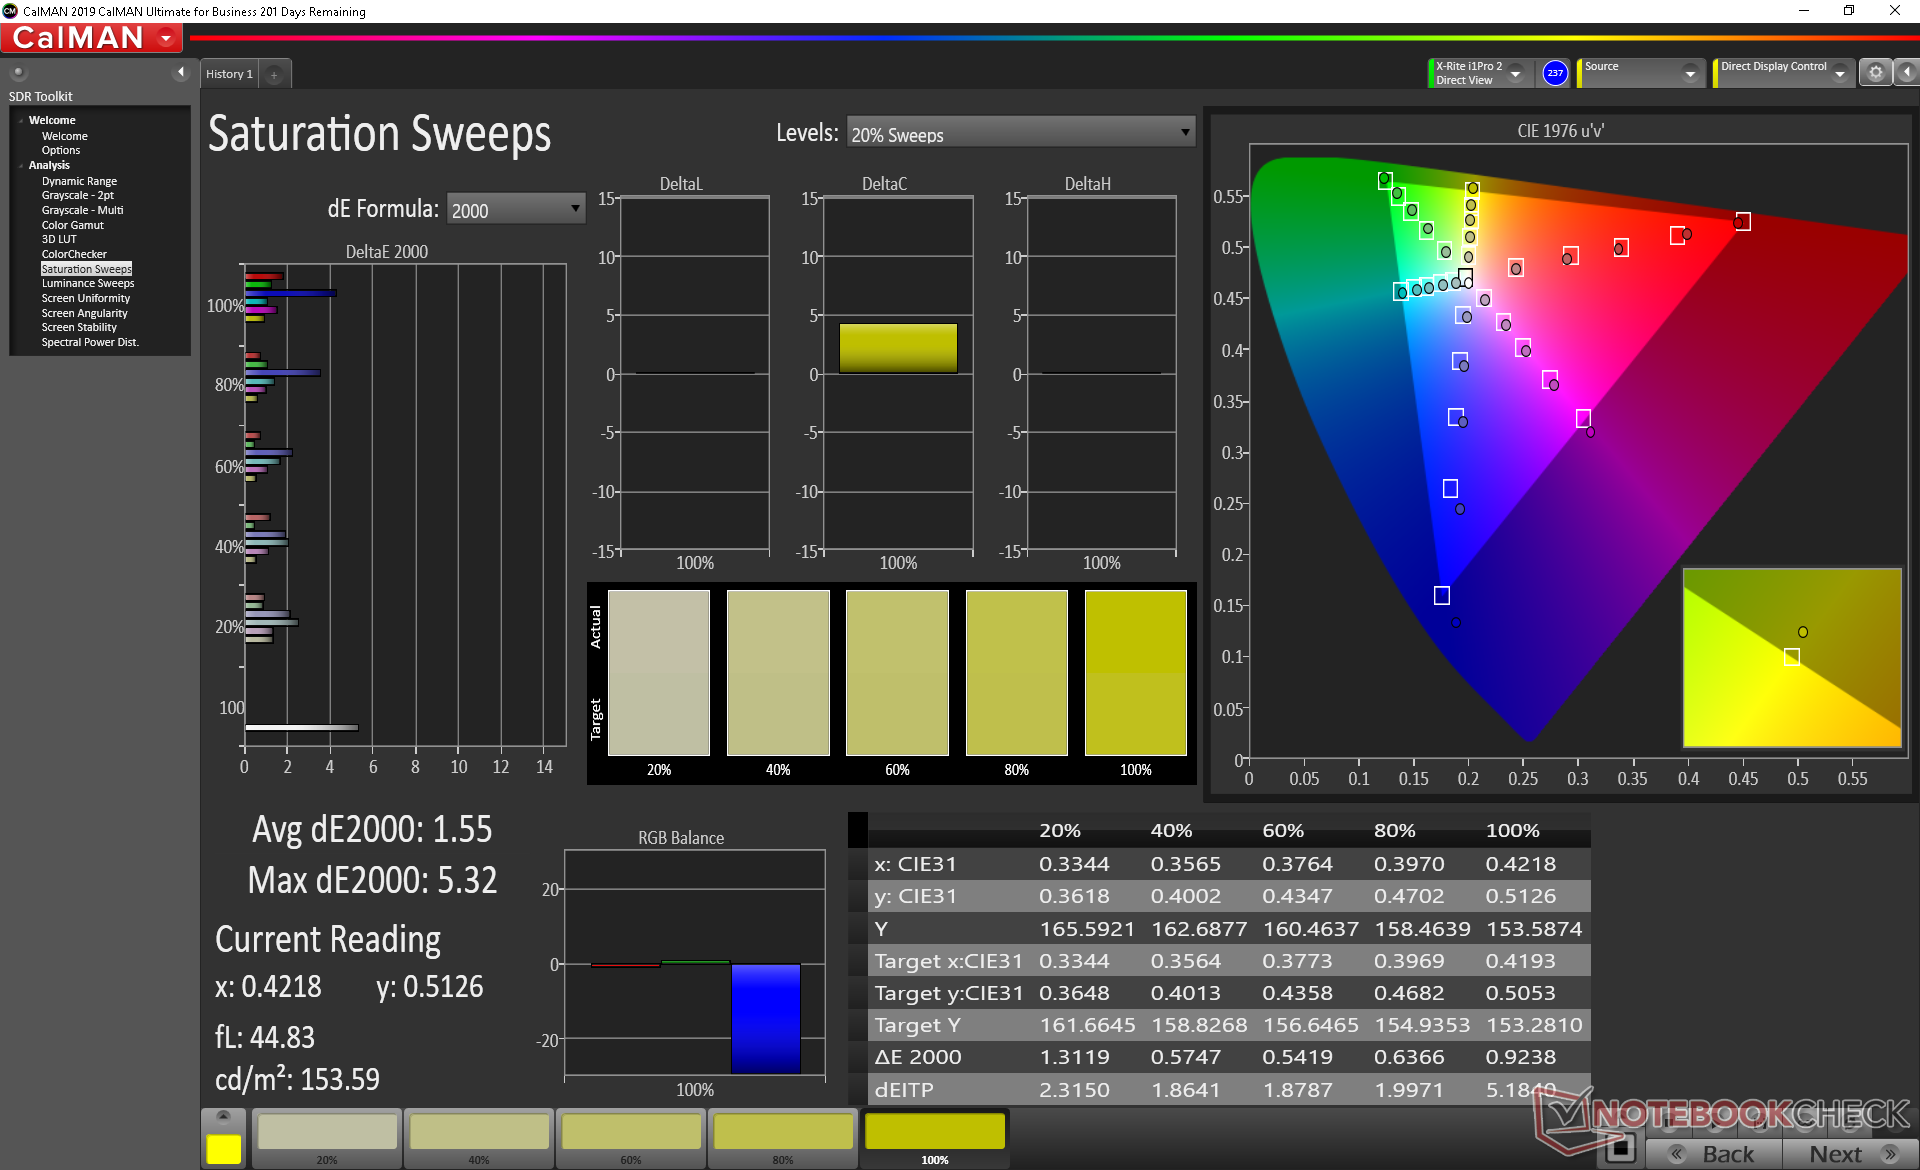
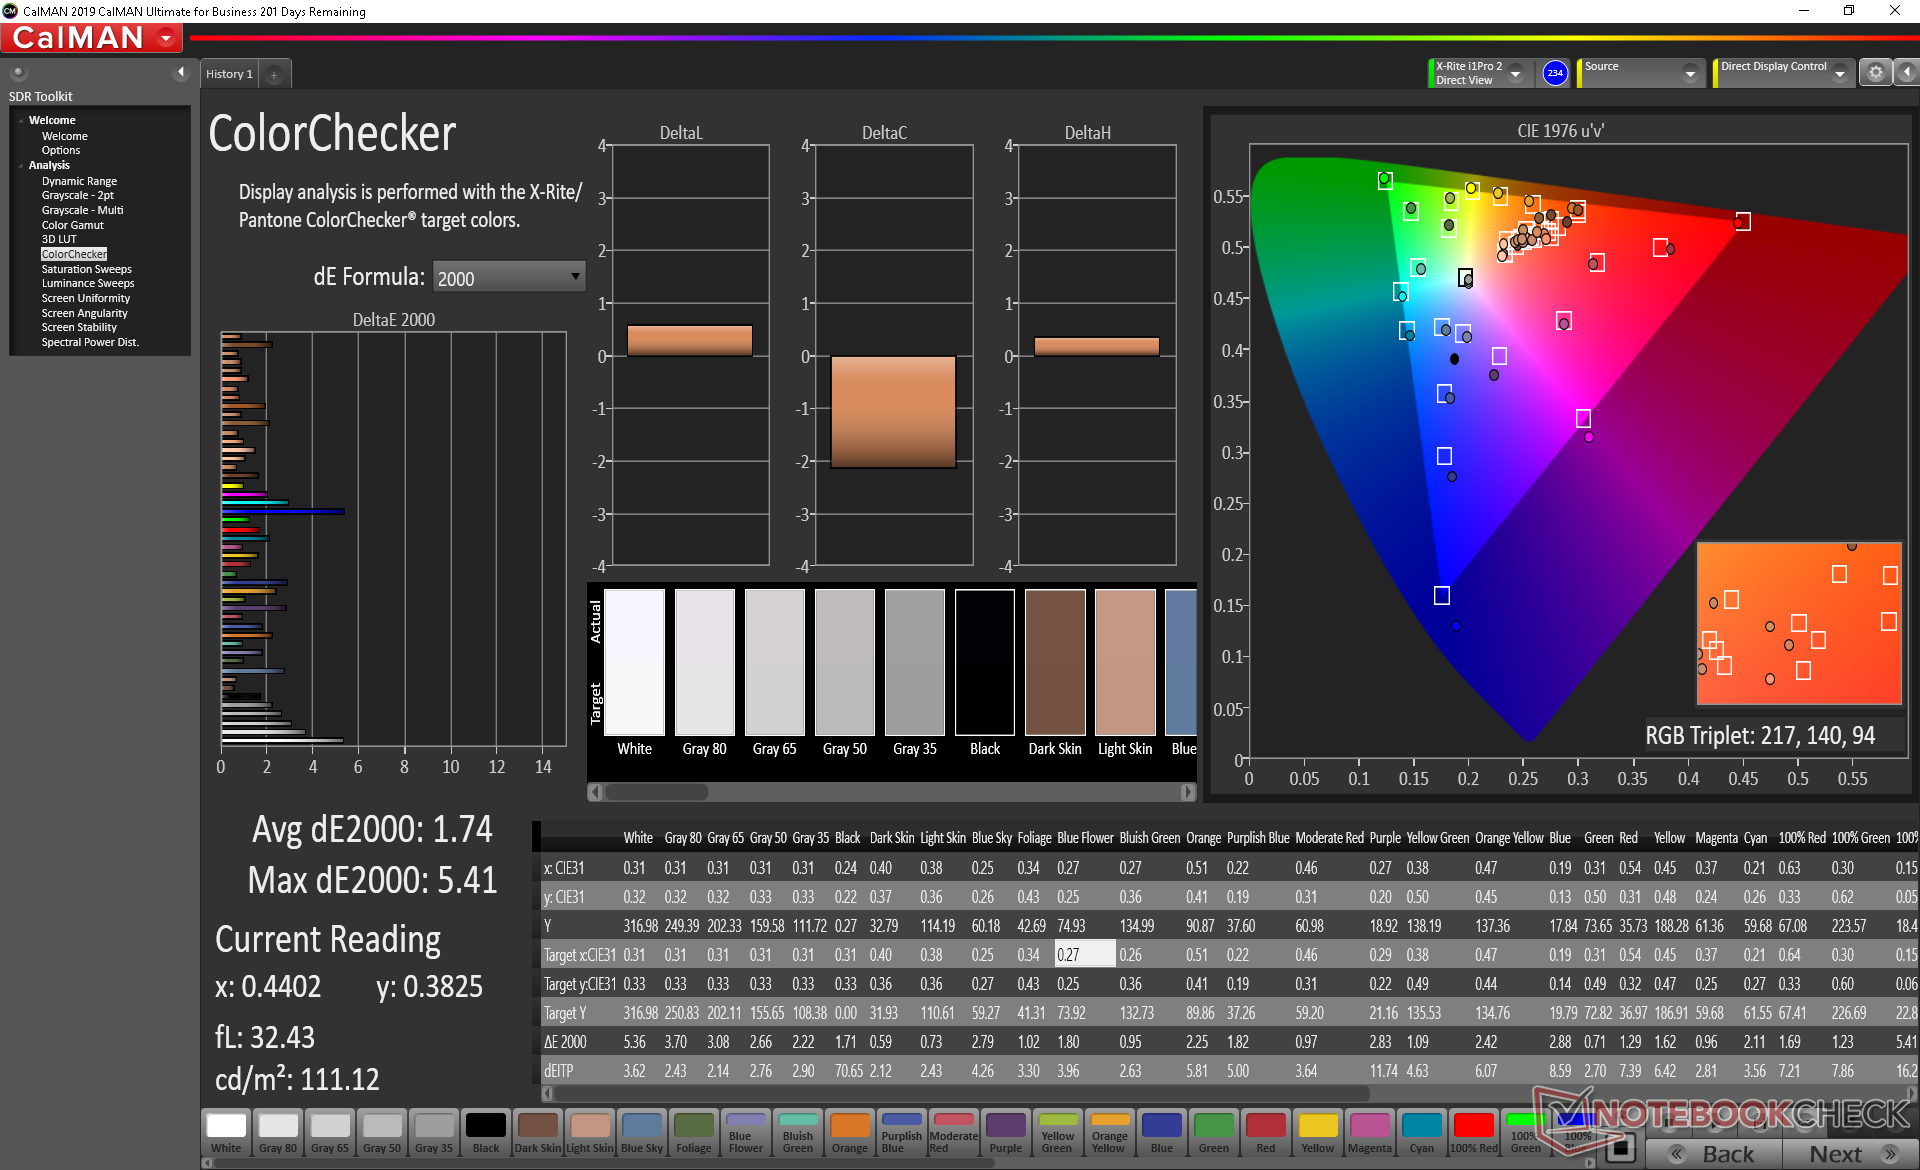
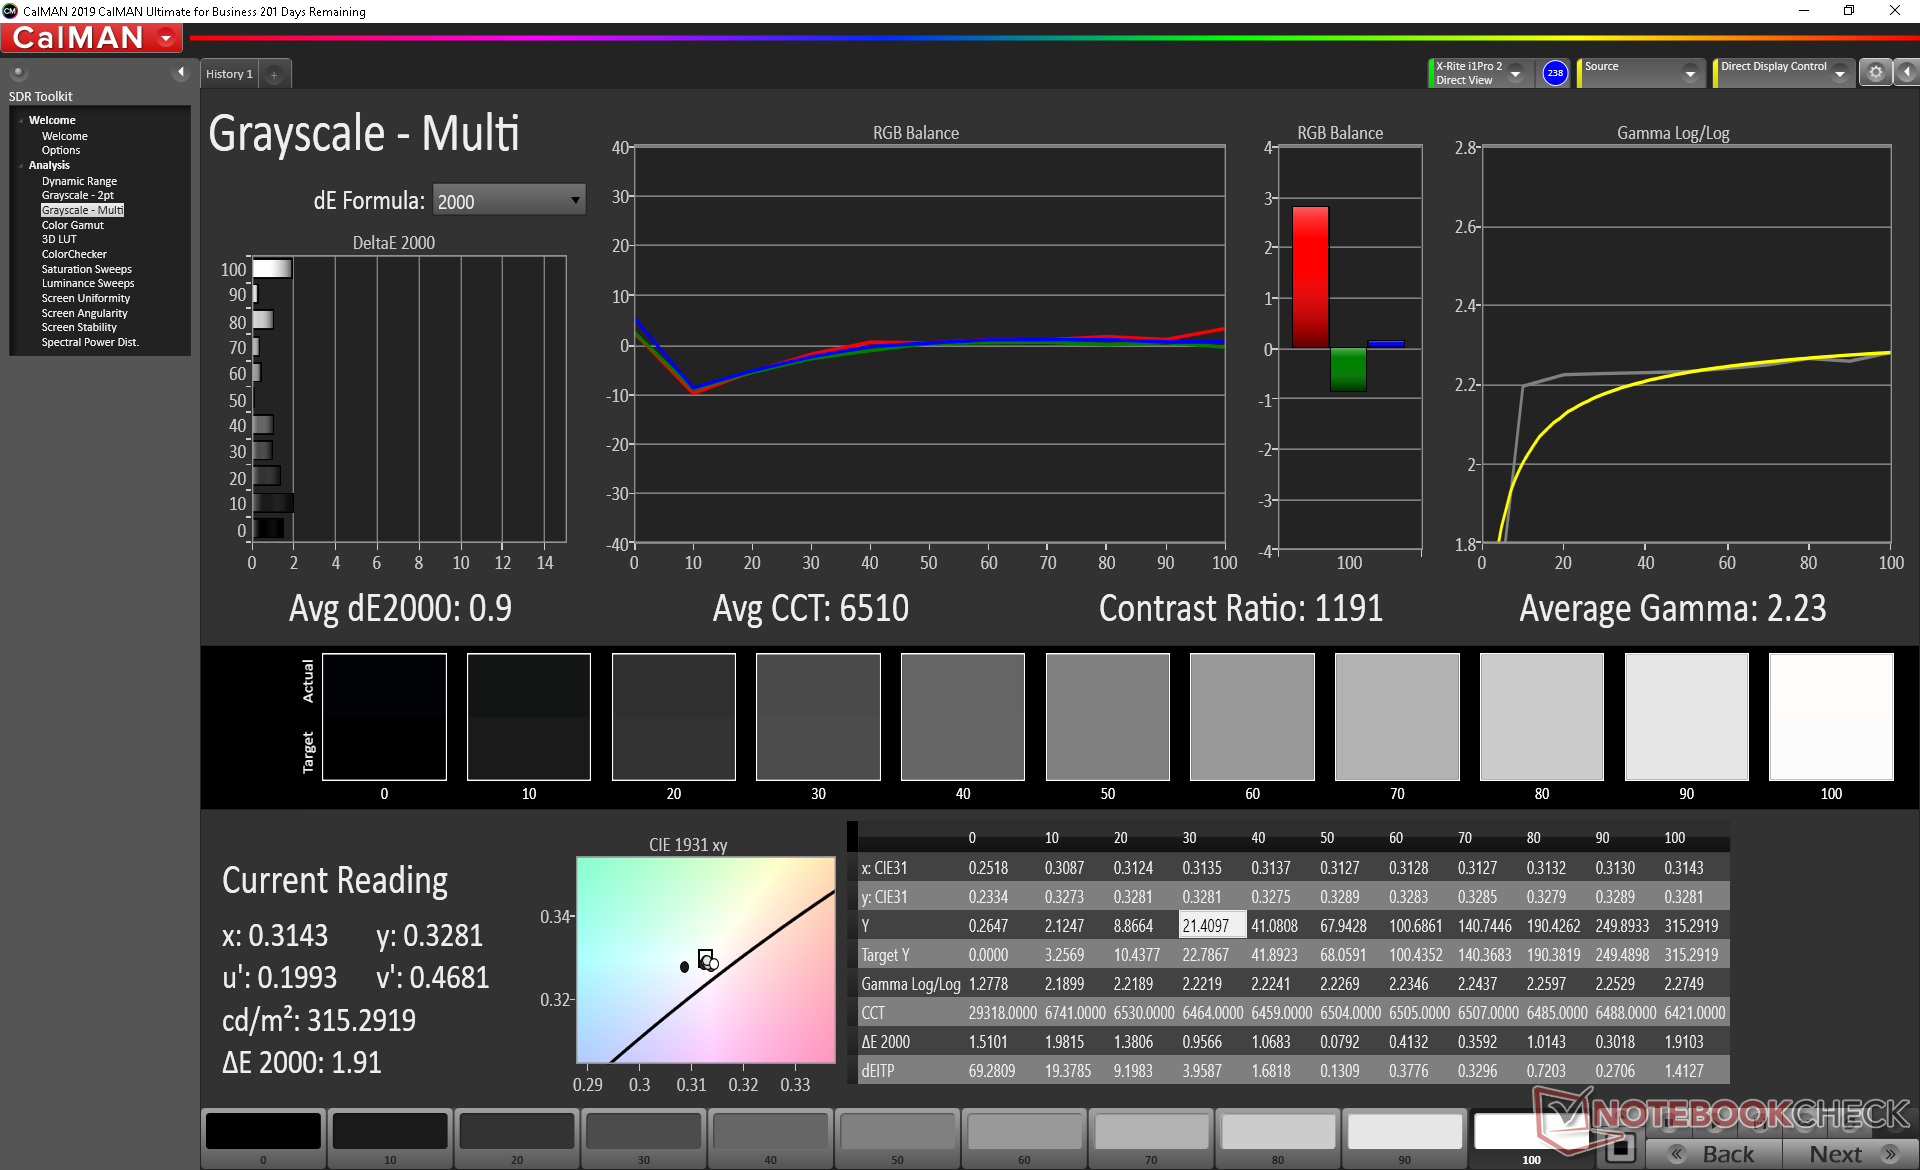
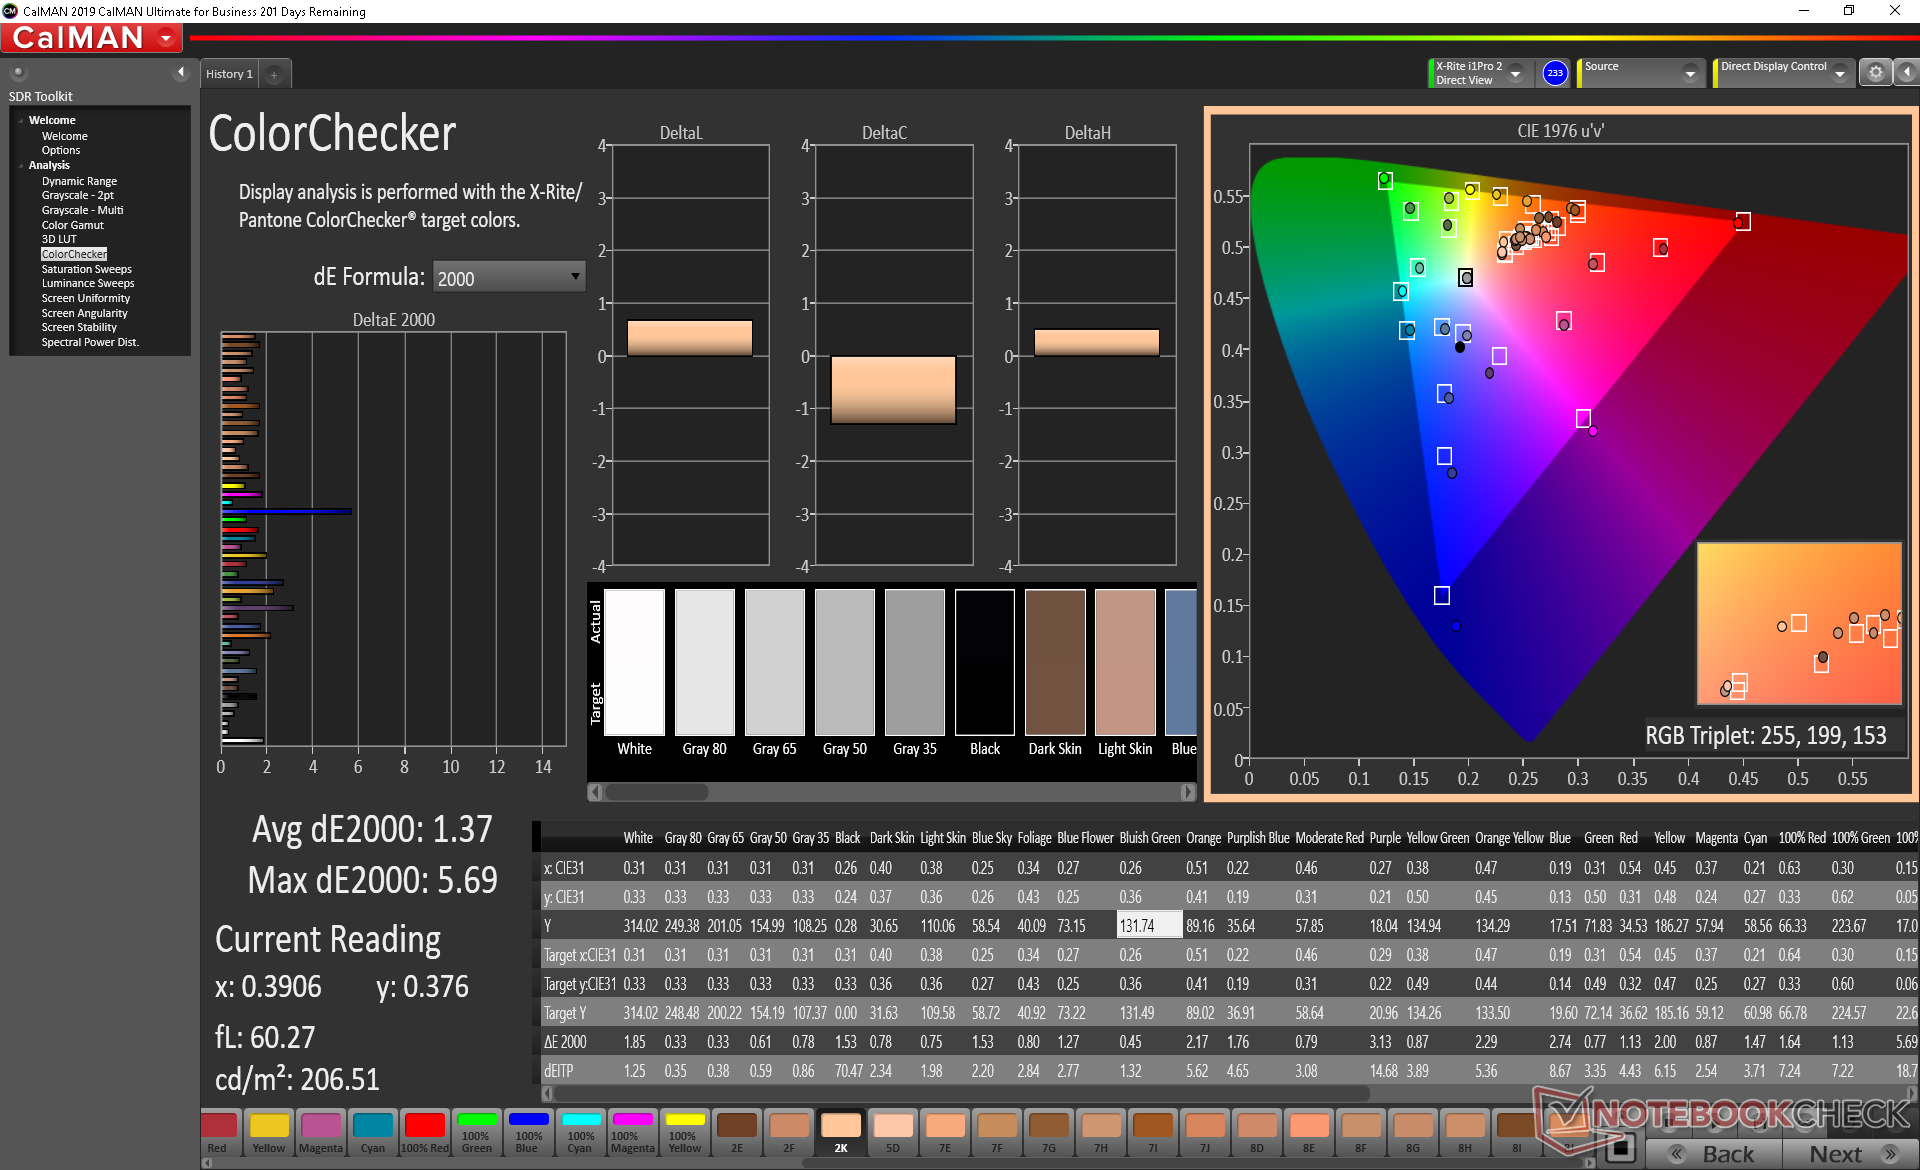
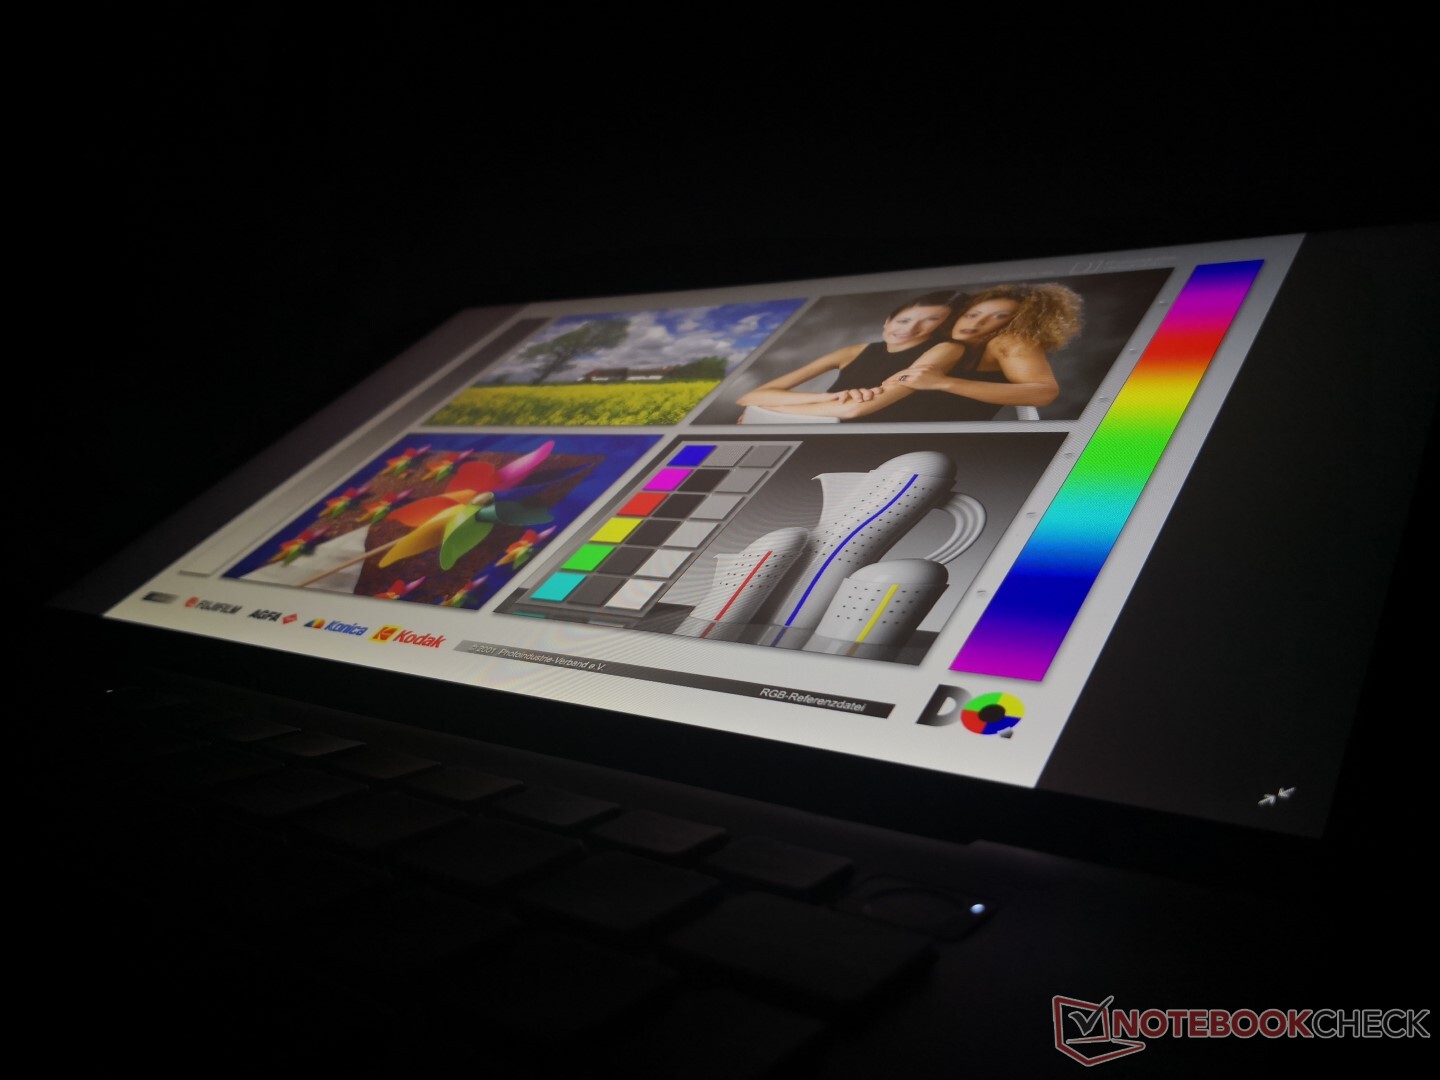
Unlike most other laptop manufacturers who have to source their panels from elsewhere, LG has the advantage of using their own in-house panels. Our Gram 14Z90N uses the same LP140WF7-SPG1 IPS panel as found on last year's Gram 14Z980 and so both models share very similar display characteristics including contrast ratio, response times, gamut, and brightness. This time, however, the panel appears to be better calibrated out of the box than before as shown by the table below.
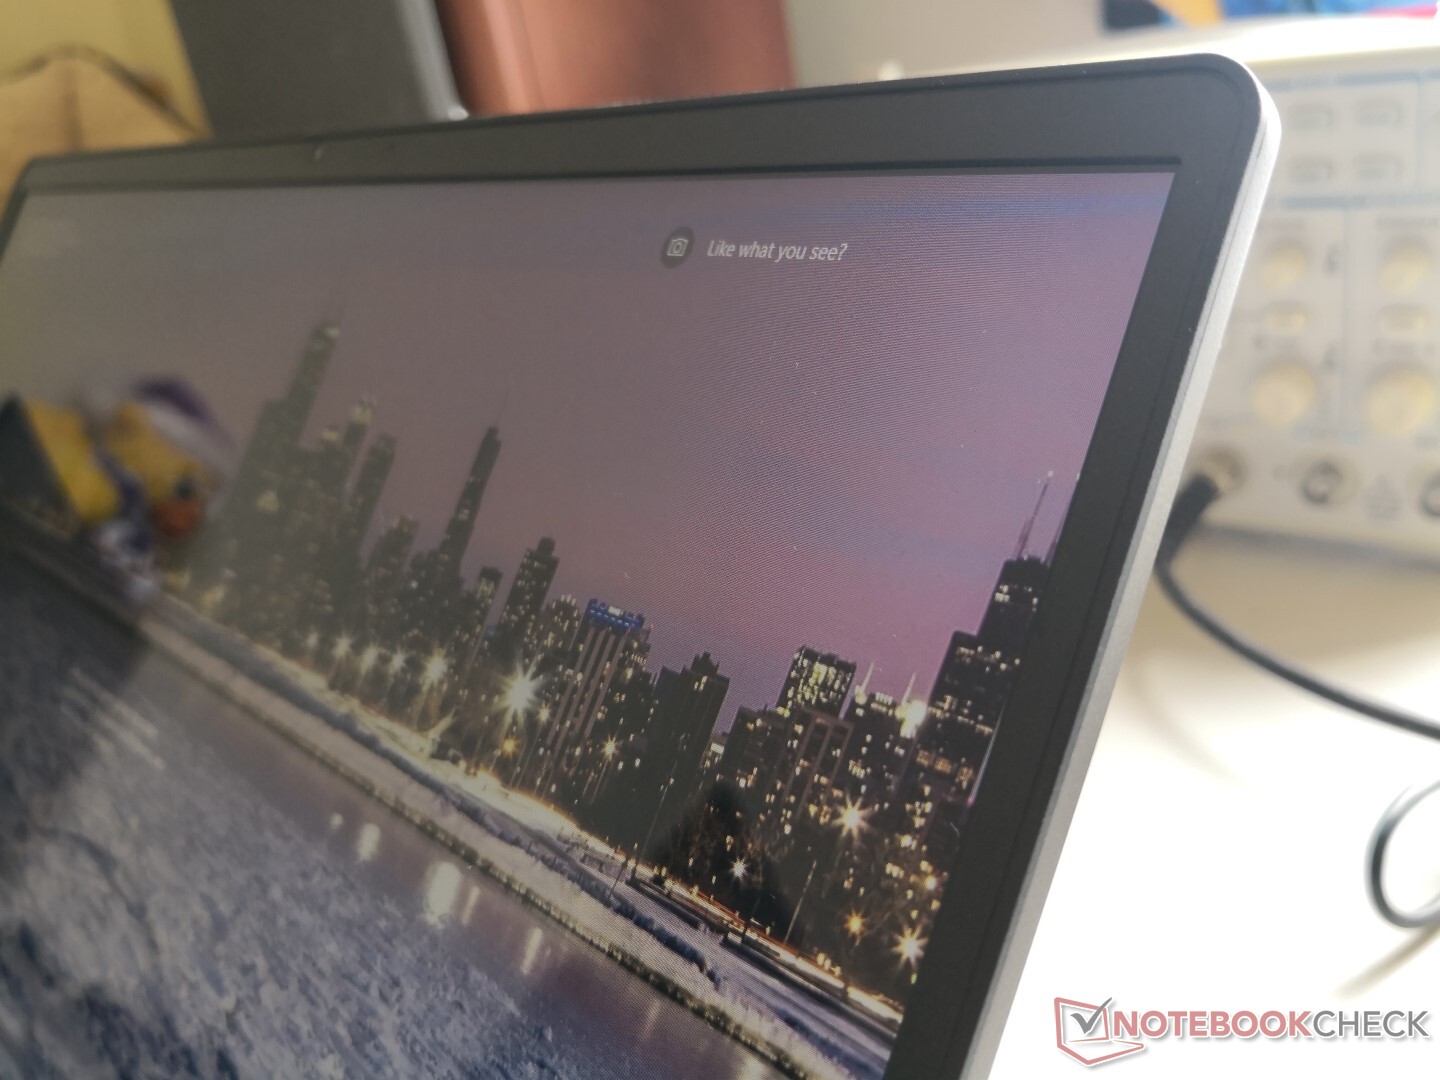
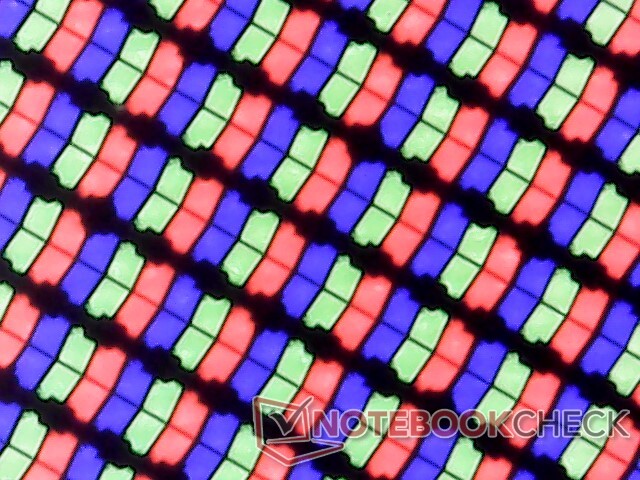
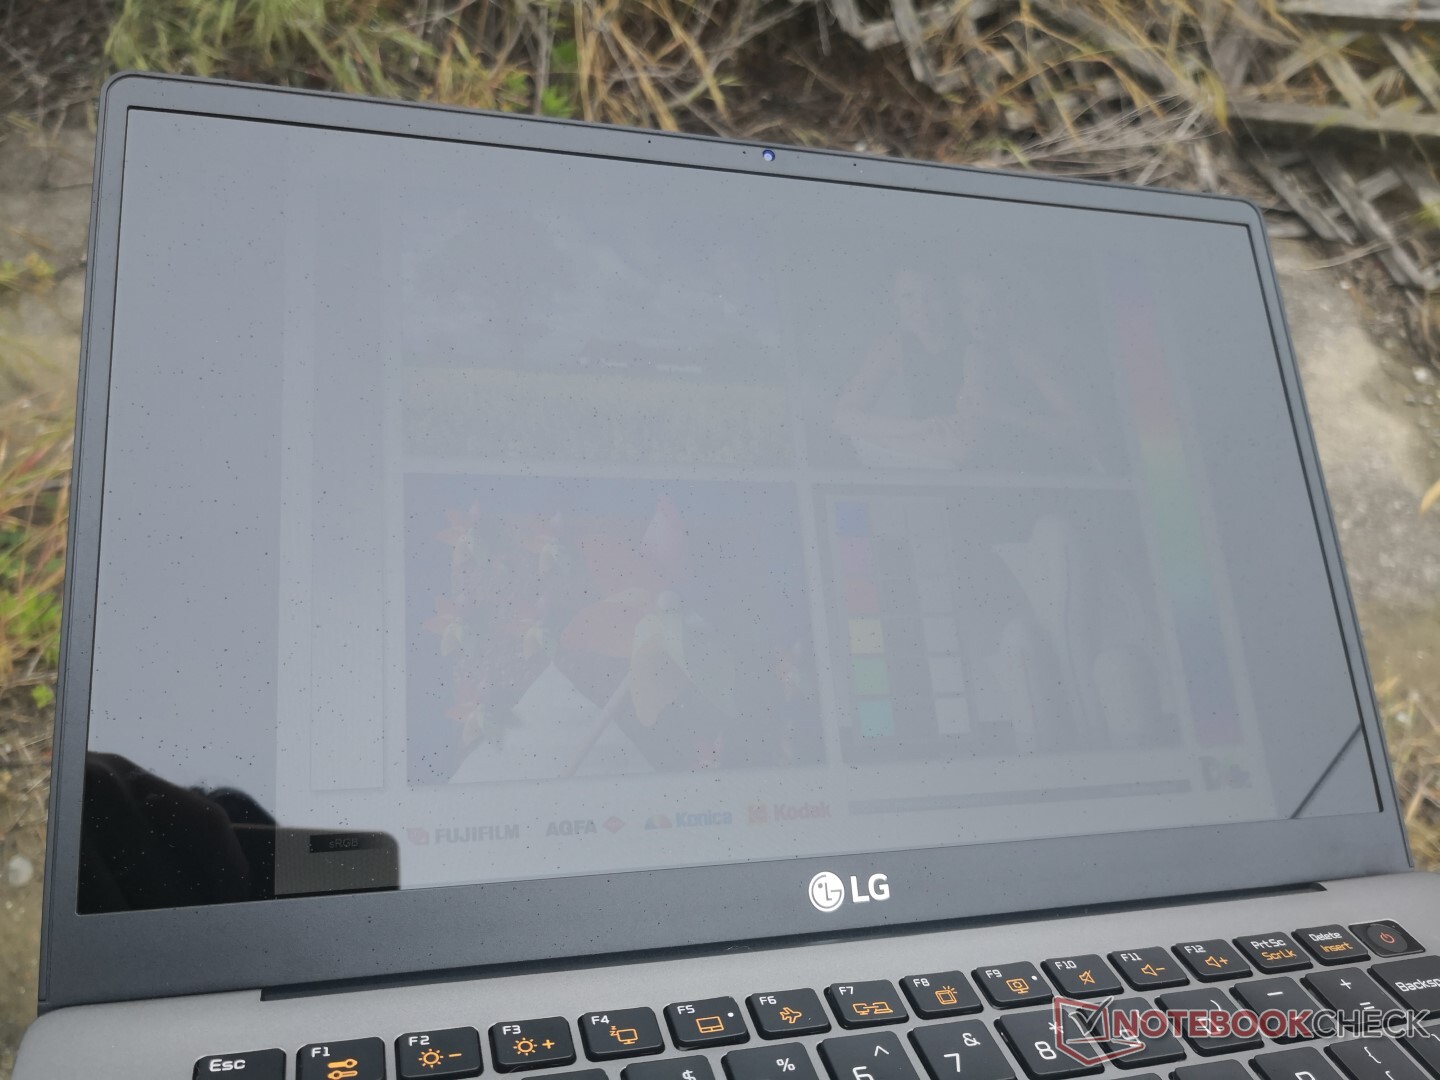
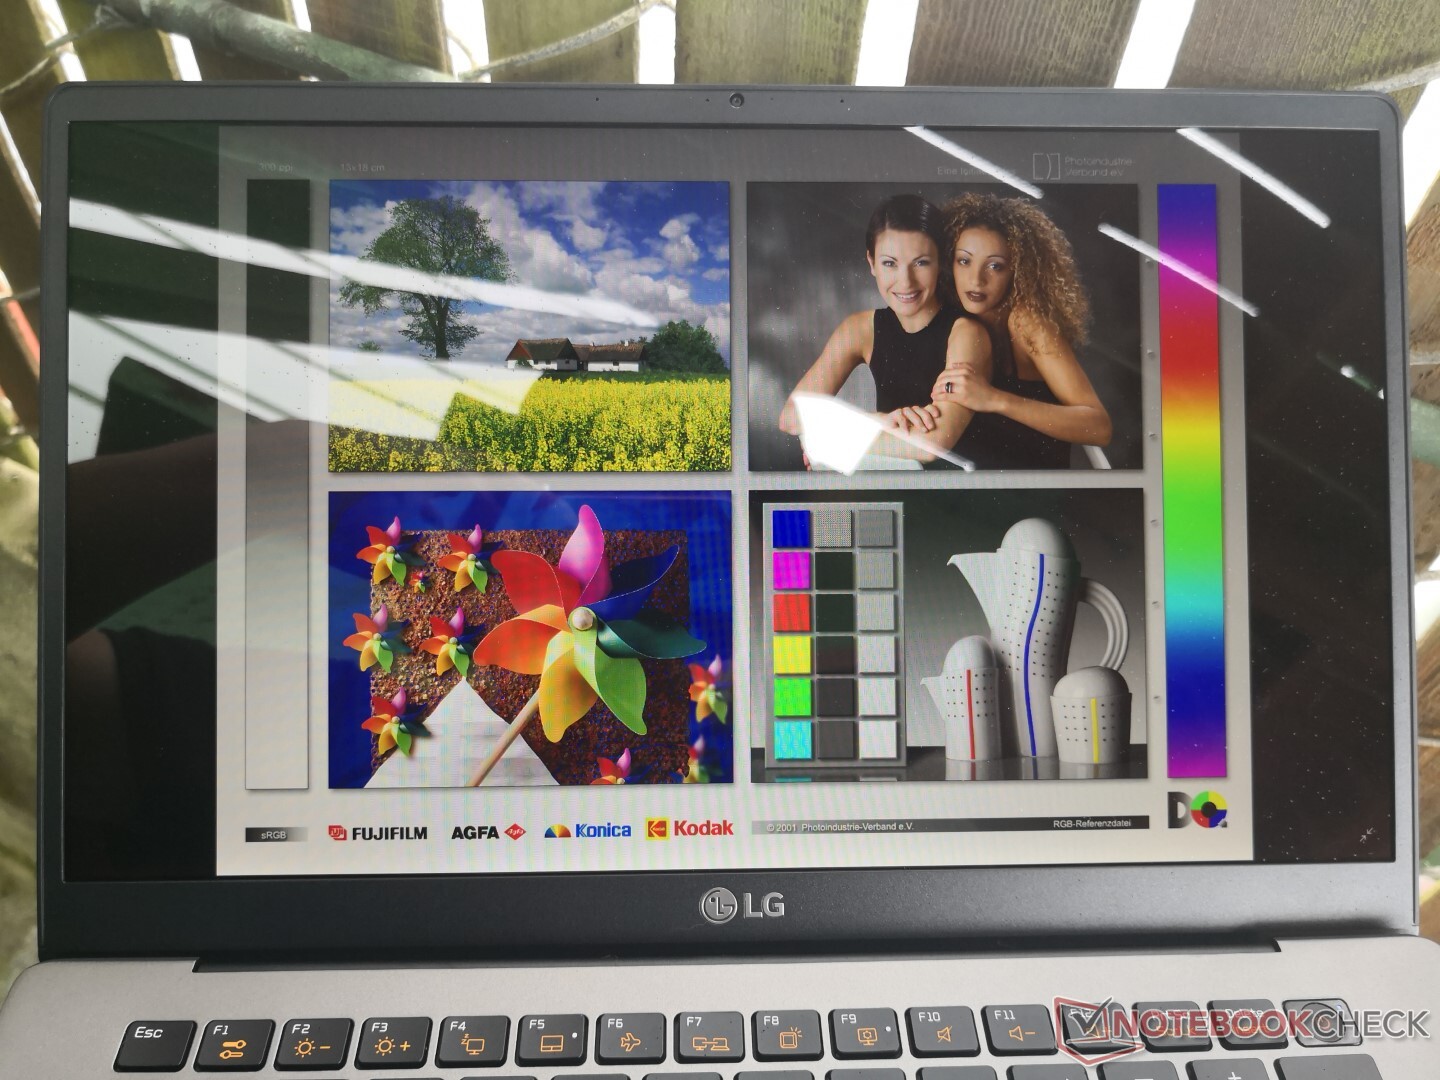
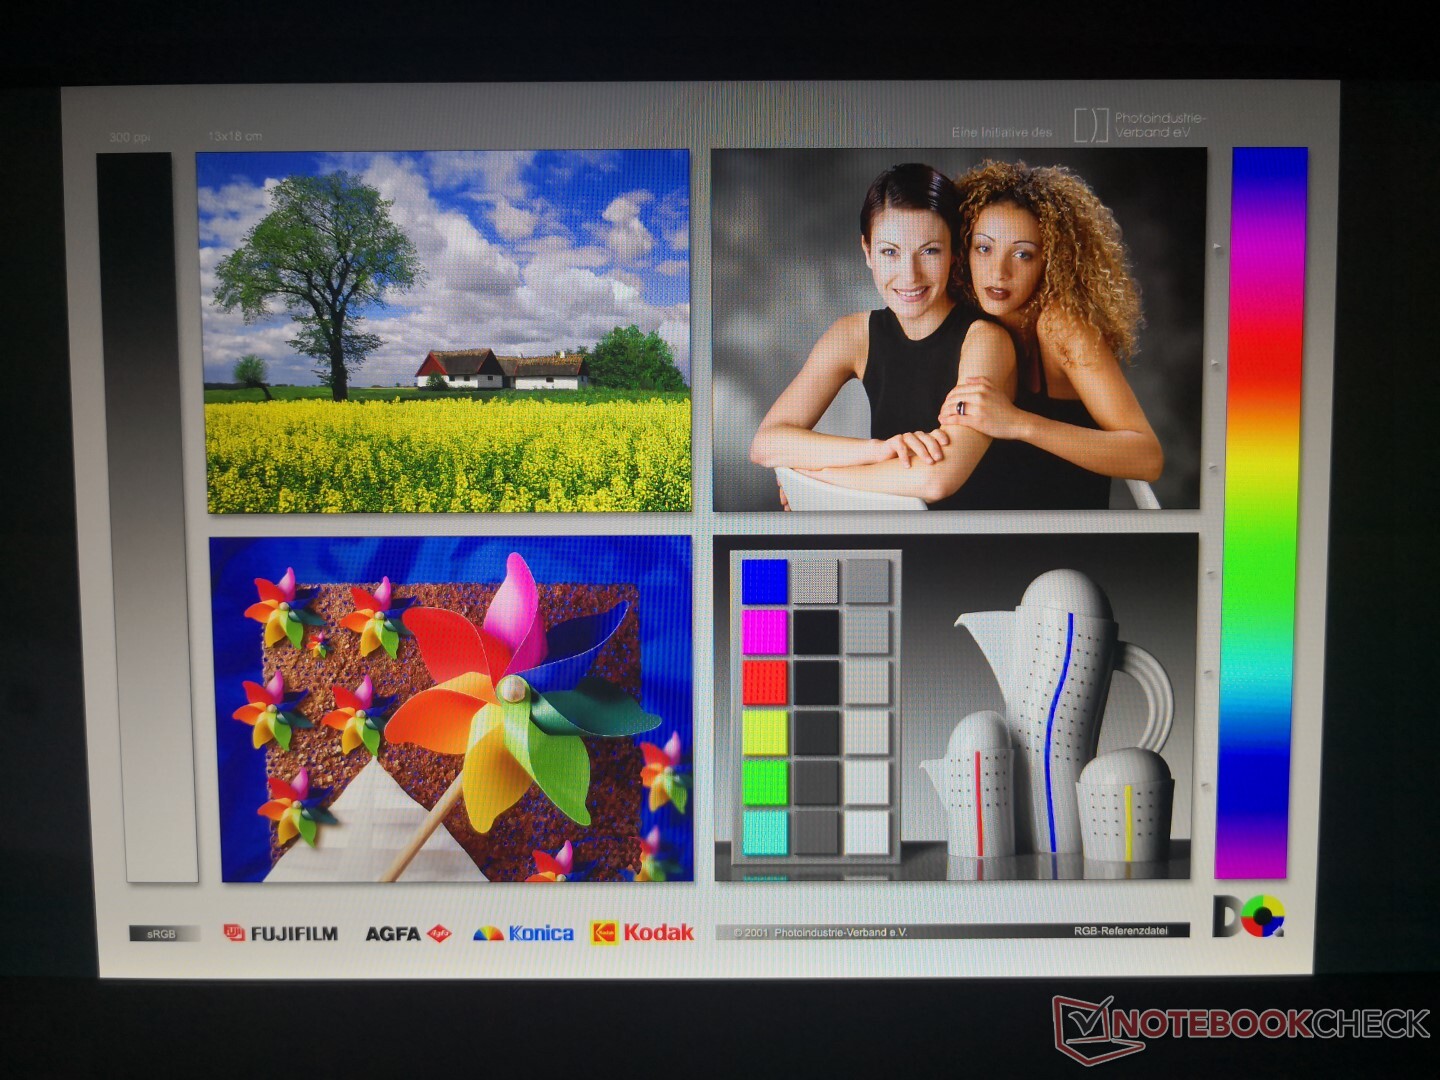
All SKUs come with glossy displays for sharper texts and images. Though "only" 1080p, the screen could almost pass as a 4K display because of how sharp onscreen content looks.
| |||||||||||||||||||||||||
Brightness Distribution: 89 %
Center on Battery: 316.8 cd/m²
Contrast: 960:1 (Black: 0.33 cd/m²)
ΔE ColorChecker Calman: 1.74 | ∀{0.5-29.43 Ø4.73}
calibrated: 1.37
ΔE Greyscale Calman: 2.7 | ∀{0.09-98 Ø4.97}
95.4% sRGB (Argyll 1.6.3 3D)
61.3% AdobeRGB 1998 (Argyll 1.6.3 3D)
66.1% AdobeRGB 1998 (Argyll 3D)
95.5% sRGB (Argyll 3D)
65% Display P3 (Argyll 3D)
Gamma: 2.23
CCT: 6655 K
| LG Gram 14Z90N LG Philips LP140WF7-SPG1, IPS, 14", 1920x1080 | LG Gram 14T90N LG Philips LP140WFA-SPY1, IPS, 14", 1920x1080 | LG Gram 14Z980-U.AAW5U1 LG Philips LP140WF7-SPG1, IPS, 14", 1920x1080 | Dell XPS 13 9300 Core i7-1065G7 Sharp LQ134N1, IPS, 13.4", 1920x1200 | Lenovo IdeaPad S940-14IWL B140ZAN01.3, IPS, 14", 3840x2160 | Asus ZenBook 14 UM431DA-AM020T CEC PA LM140LF-3L03, IPS, 14", 1920x1080 | |
|---|---|---|---|---|---|---|
| Display | 0% | -0% | 3% | 21% | 1% | |
| Display P3 Coverage (%) | 65 | 65 0% | 64.7 0% | 66.3 2% | 87.5 35% | 66.7 3% |
| sRGB Coverage (%) | 95.5 | 95.7 0% | 94.3 -1% | 97.3 2% | 99.7 4% | 92.3 -3% |
| AdobeRGB 1998 Coverage (%) | 66.1 | 66.7 1% | 66 0% | 68.5 4% | 81.1 23% | 67.5 2% |
| Response Times | -24% | 3% | -20% | -27% | 11% | |
| Response Time Grey 50% / Grey 80% * (ms) | 40.4 ? | 54 ? -34% | 36.8 ? 9% | 50 ? -24% | 57.2 ? -42% | 36 ? 11% |
| Response Time Black / White * (ms) | 28.8 ? | 32.8 ? -14% | 30 ? -4% | 33.2 ? -15% | 32 ? -11% | 26 ? 10% |
| PWM Frequency (Hz) | 2500 ? | 44 ? | ||||
| Screen | -10% | -26% | 2% | -26% | -72% | |
| Brightness middle (cd/m²) | 316.8 | 322.2 2% | 333.8 5% | 607.6 92% | 594.5 88% | 253 -20% |
| Brightness (cd/m²) | 298 | 301 1% | 307 3% | 595 100% | 536 80% | 245 -18% |
| Brightness Distribution (%) | 89 | 86 -3% | 83 -7% | 96 8% | 83 -7% | 78 -12% |
| Black Level * (cd/m²) | 0.33 | 0.25 24% | 0.4 -21% | 0.4 -21% | 0.43 -30% | 0.225 32% |
| Contrast (:1) | 960 | 1289 34% | 835 -13% | 1519 58% | 1383 44% | 1124 17% |
| Colorchecker dE 2000 * | 1.74 | 3.62 -108% | 3.54 -103% | 3.23 -86% | 4.87 -180% | 8.89 -411% |
| Colorchecker dE 2000 max. * | 5.41 | 6.9 -28% | 5.8 -7% | 8.67 -60% | 7.9 -46% | 4.56 16% |
| Colorchecker dE 2000 calibrated * | 1.37 | 1.22 11% | 2.36 -72% | 1.01 26% | 2.83 -107% | 4.9 -258% |
| Greyscale dE 2000 * | 2.7 | 3.9 -44% | 4.7 -74% | 5.5 -104% | 6.7 -148% | 6.33 -134% |
| Gamma | 2.23 99% | 2.43 91% | 2.14 103% | 2.12 104% | 2.091 105% | 2.52 87% |
| CCT | 6655 98% | 6344 102% | 6261 104% | 6413 101% | 6891 94% | 6745 96% |
| Color Space (Percent of AdobeRGB 1998) (%) | 61.3 | 61.3 0% | 61.2 0% | 63 3% | 72 17% | 60 -2% |
| Color Space (Percent of sRGB) (%) | 95.4 | 95.6 0% | 94.7 -1% | 97.5 2% | 100 5% | 91 -5% |
| Total Average (Program / Settings) | -11% /
-10% | -8% /
-18% | -5% /
-1% | -11% /
-17% | -20% /
-48% |
* ... smaller is better
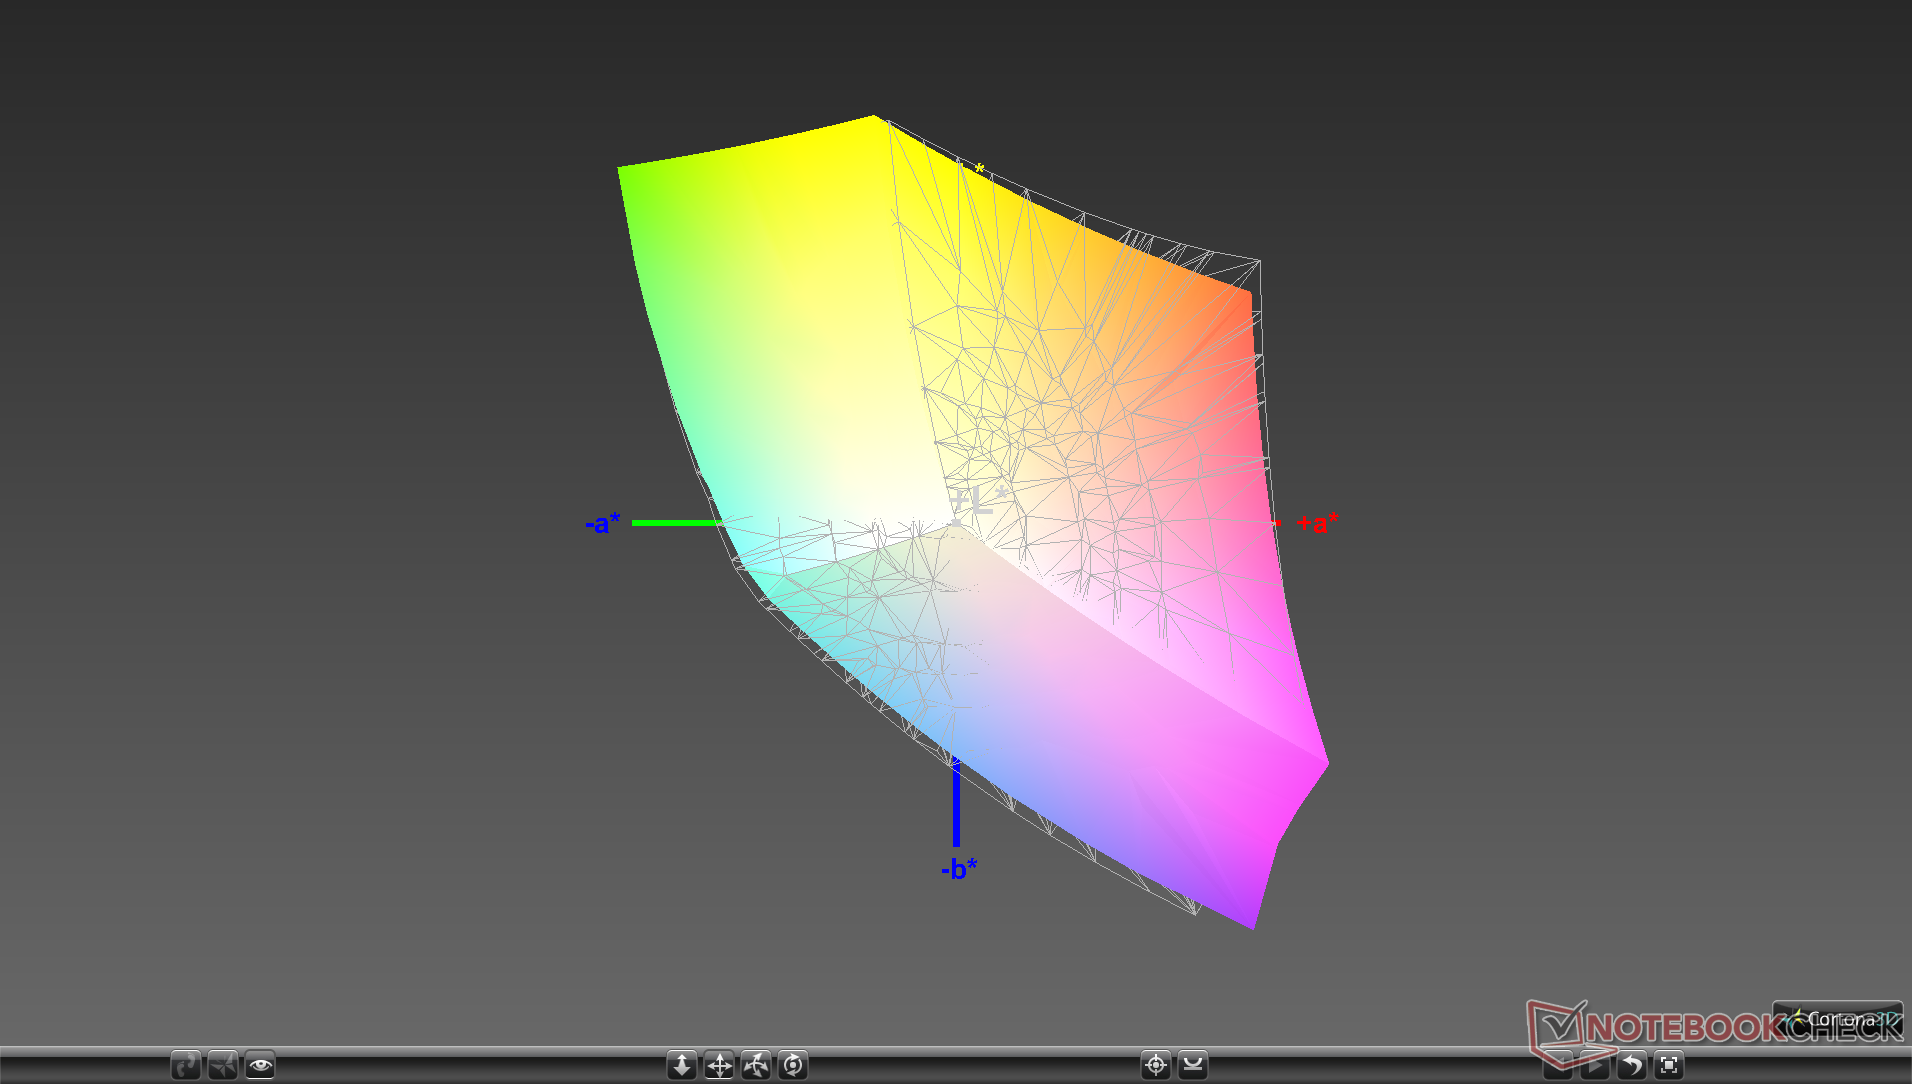
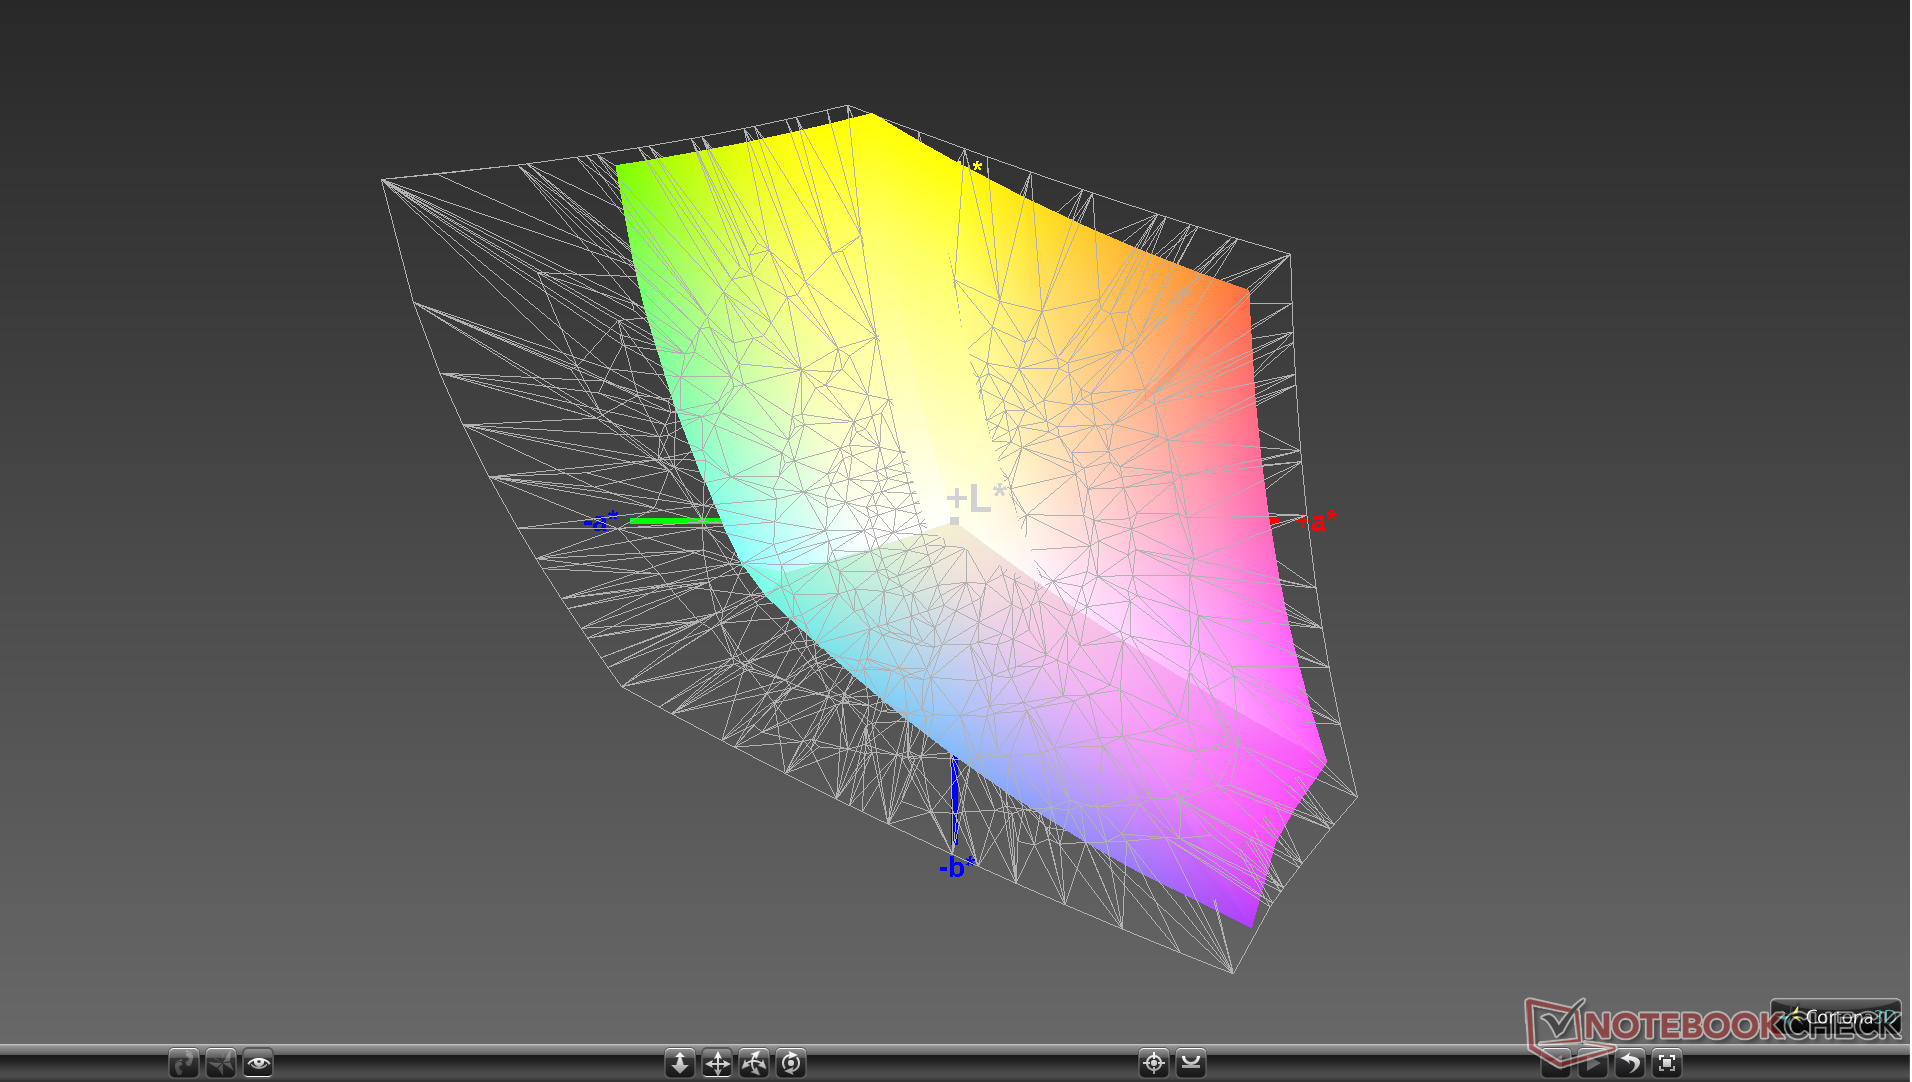
Color space is the same as last year's model at approximately 95 percent and 61 percent of sRGB and AdobeRGB, respectively, which is comparable to most high-end subnotebooks currently available. In fact, no Gram laptop we've tested thus far offer anything greater. Users will have to look at 15.6-inch laptops from other OEMs like the Asus ZenBook Pro 15 or Dell XPS 15 for wider coverage of AdobeRGB.
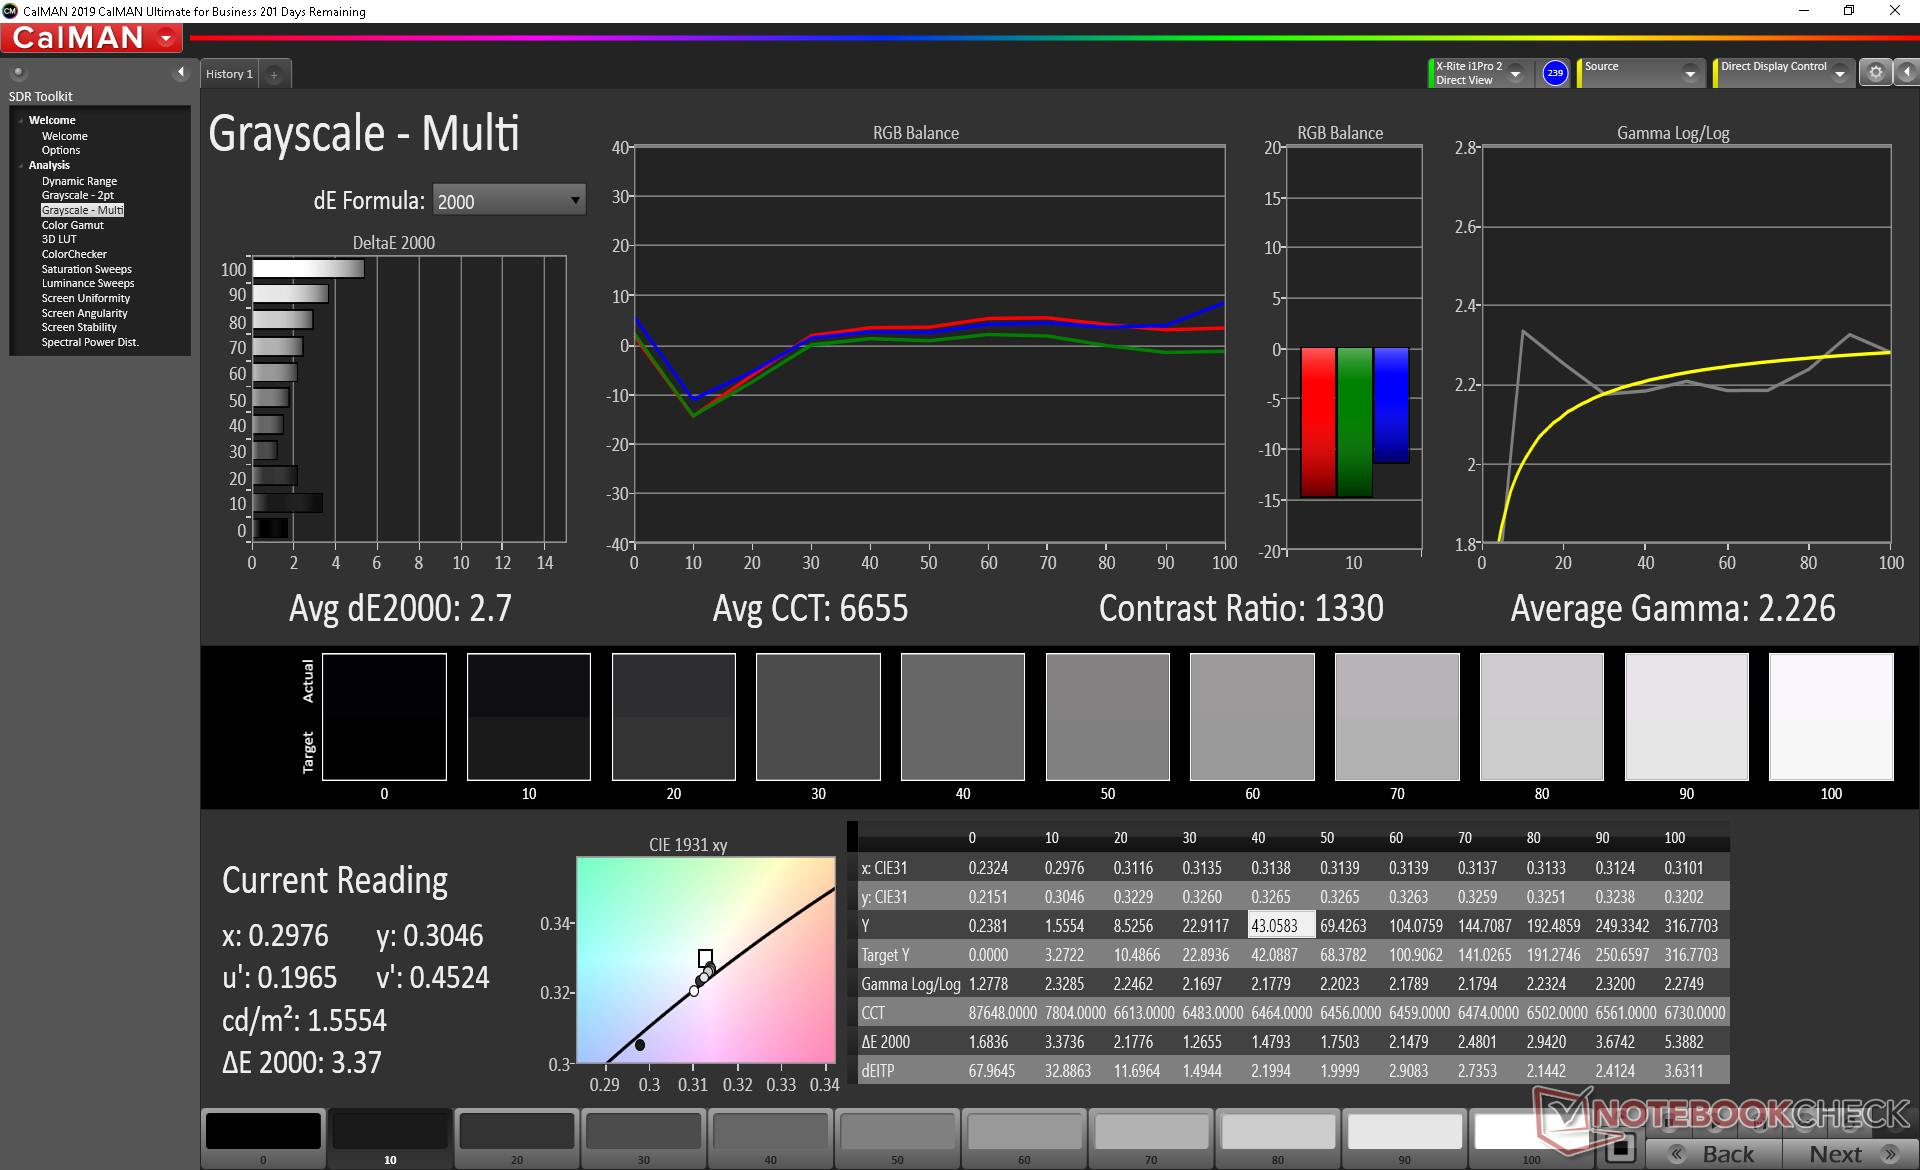
Gram laptops are generally well calibrated and the Gram 14Z90N is no exception. Measurements with our X-Rite colorimeter show excellent grayscale and colors with average DeltaE values of just 2.7 and 1.74, respectively. Calibrating the panel even further ourselves would improve both just marginally. If we are to nitpick, the color blue appears to be less accurate than the other tested colors.

Display Response Times
| ↔ Response Time Black to White | ||
|---|---|---|
| 28.8 ms ... rise ↗ and fall ↘ combined | ↗ 18 ms rise | 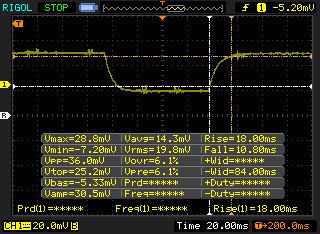 |
| ↘ 10.8 ms fall | ||
| The screen shows relatively slow response rates in our tests and may be too slow for gamers. In comparison, all tested devices range from 0.1 (minimum) to 240 (maximum) ms. » 76 % of all devices are better. This means that the measured response time is worse than the average of all tested devices (19.9 ms). | ||
| ↔ Response Time 50% Grey to 80% Grey | ||
| 40.4 ms ... rise ↗ and fall ↘ combined | ↗ 20.8 ms rise | 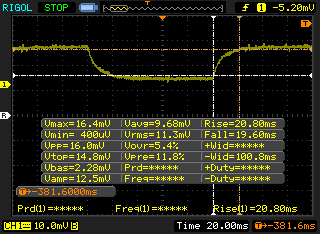 |
| ↘ 19.6 ms fall | ||
| The screen shows slow response rates in our tests and will be unsatisfactory for gamers. In comparison, all tested devices range from 0.165 (minimum) to 636 (maximum) ms. » 63 % of all devices are better. This means that the measured response time is worse than the average of all tested devices (31.1 ms). | ||
Screen Flickering / PWM (Pulse-Width Modulation)
| Screen flickering / PWM not detected | 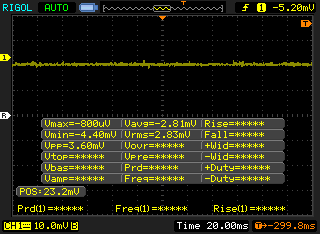 | ||
In comparison: 52 % of all tested devices do not use PWM to dim the display. If PWM was detected, an average of 7794 (minimum: 5 - maximum: 343500) Hz was measured. | |||
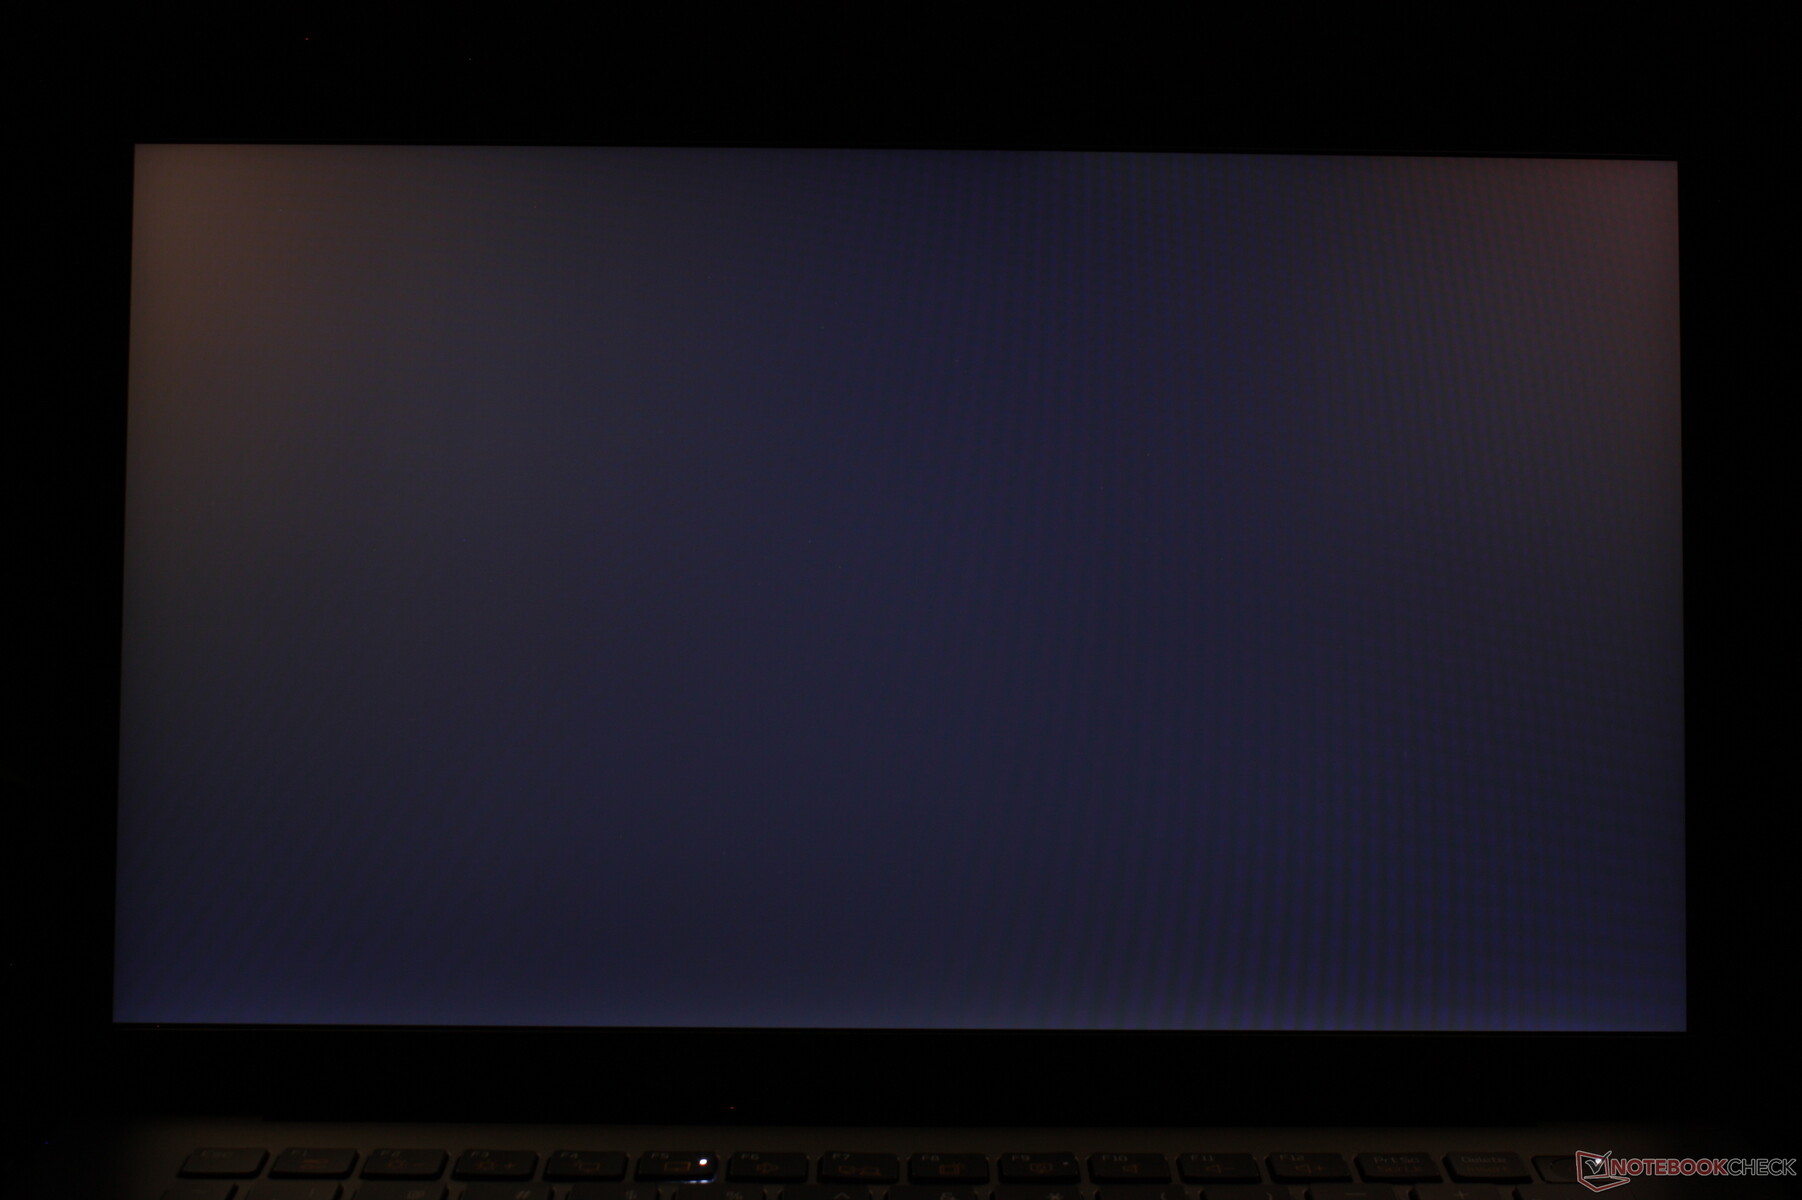
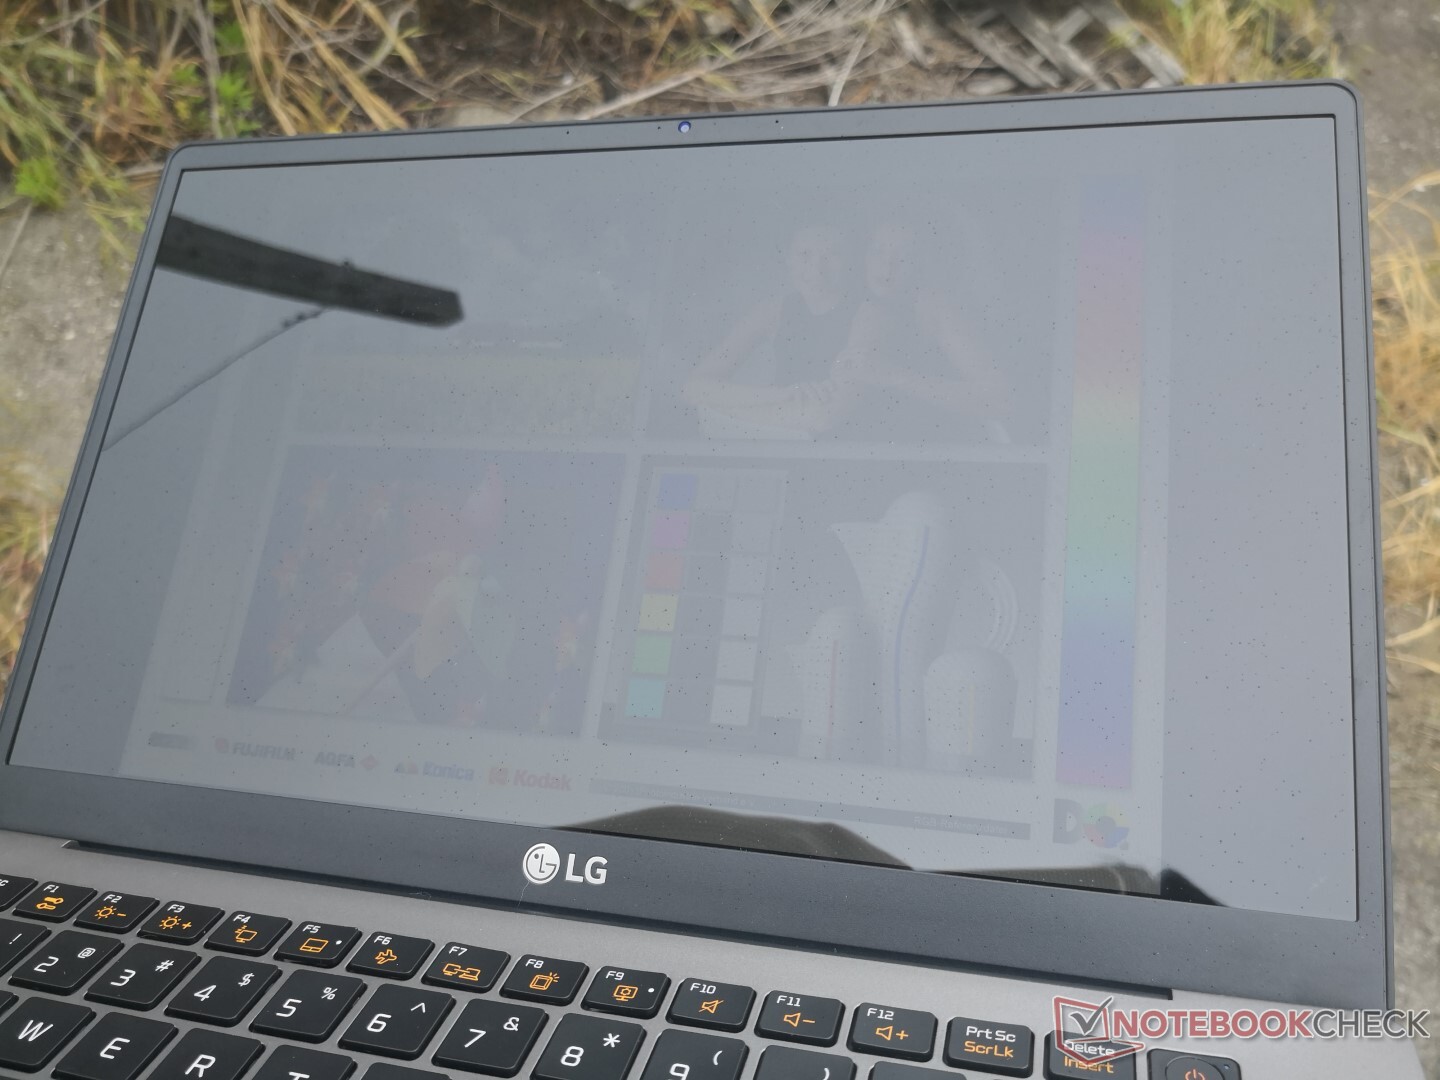
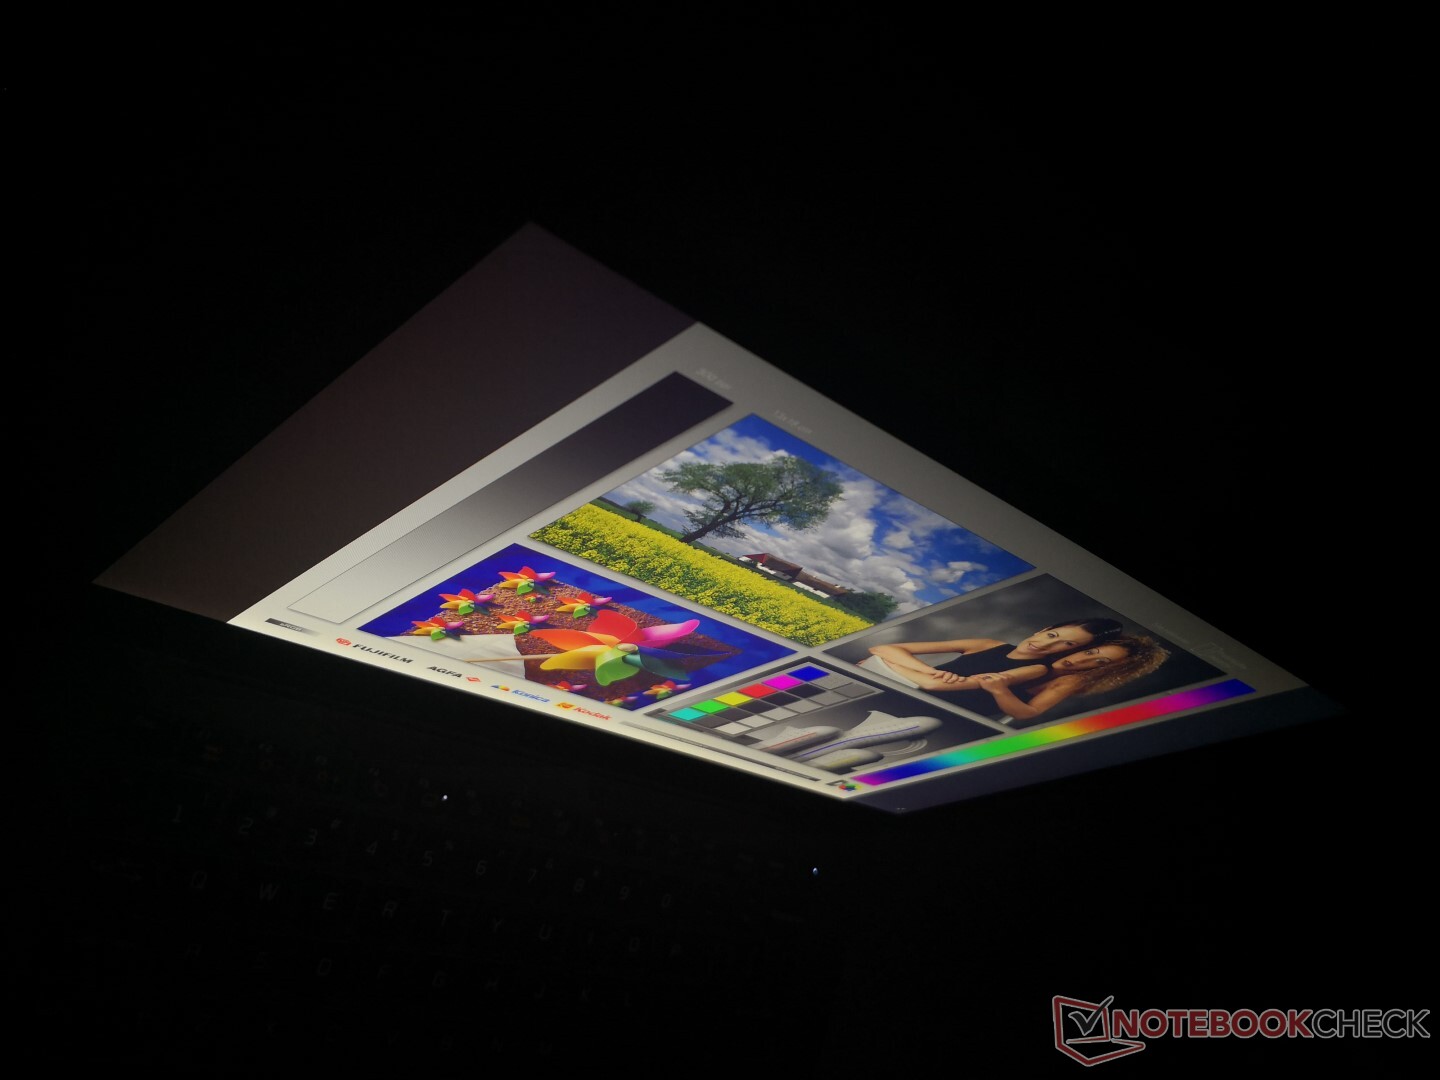
Display brightness hasn't changed from the last generation model which is a shame because the panel is almost half as bright as some subnotebooks like the MacBook Pro 13, XPS 13, or the Lenovo IdeaPad S940. The mandatory glossy display further exacerbates the need for a brighter backlight to improve outdoor visibility and reduce glare. Viewing angles are otherwise excellent with only minimal shifts in colors and contrast.
Performance
Much like every other Gram laptop thus far, the Gram 14 comes with an Intel U-class CPU and no dedicated GeForce option in order to keep weight as low as possible. It would have been nice to see AMD Ryzen U options especially since these LG laptops are very pricey to begin with.
Processor
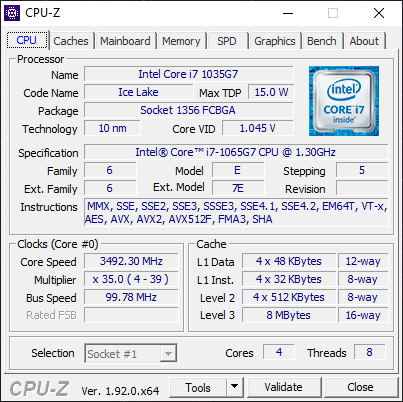
CPU performance is disappointing at approximately 18 to 31 percent slower than the average Core i7-1065G7 in our database. In fact, results are so disappointing that even the much older 8th gen Core i5-8250U is able to offer comparable CPU performance to our 10th gen Core i7 part. The weak performance is explored further in our Stress Test section below.
Running CineBench R15 Multi-Thread in a loop shows a performance drop of about 10 percent overtime from an already low initial score of 495 points.
See our dedicated page on the Core i7-1065G7 for more technical information and benchmark comparisons.
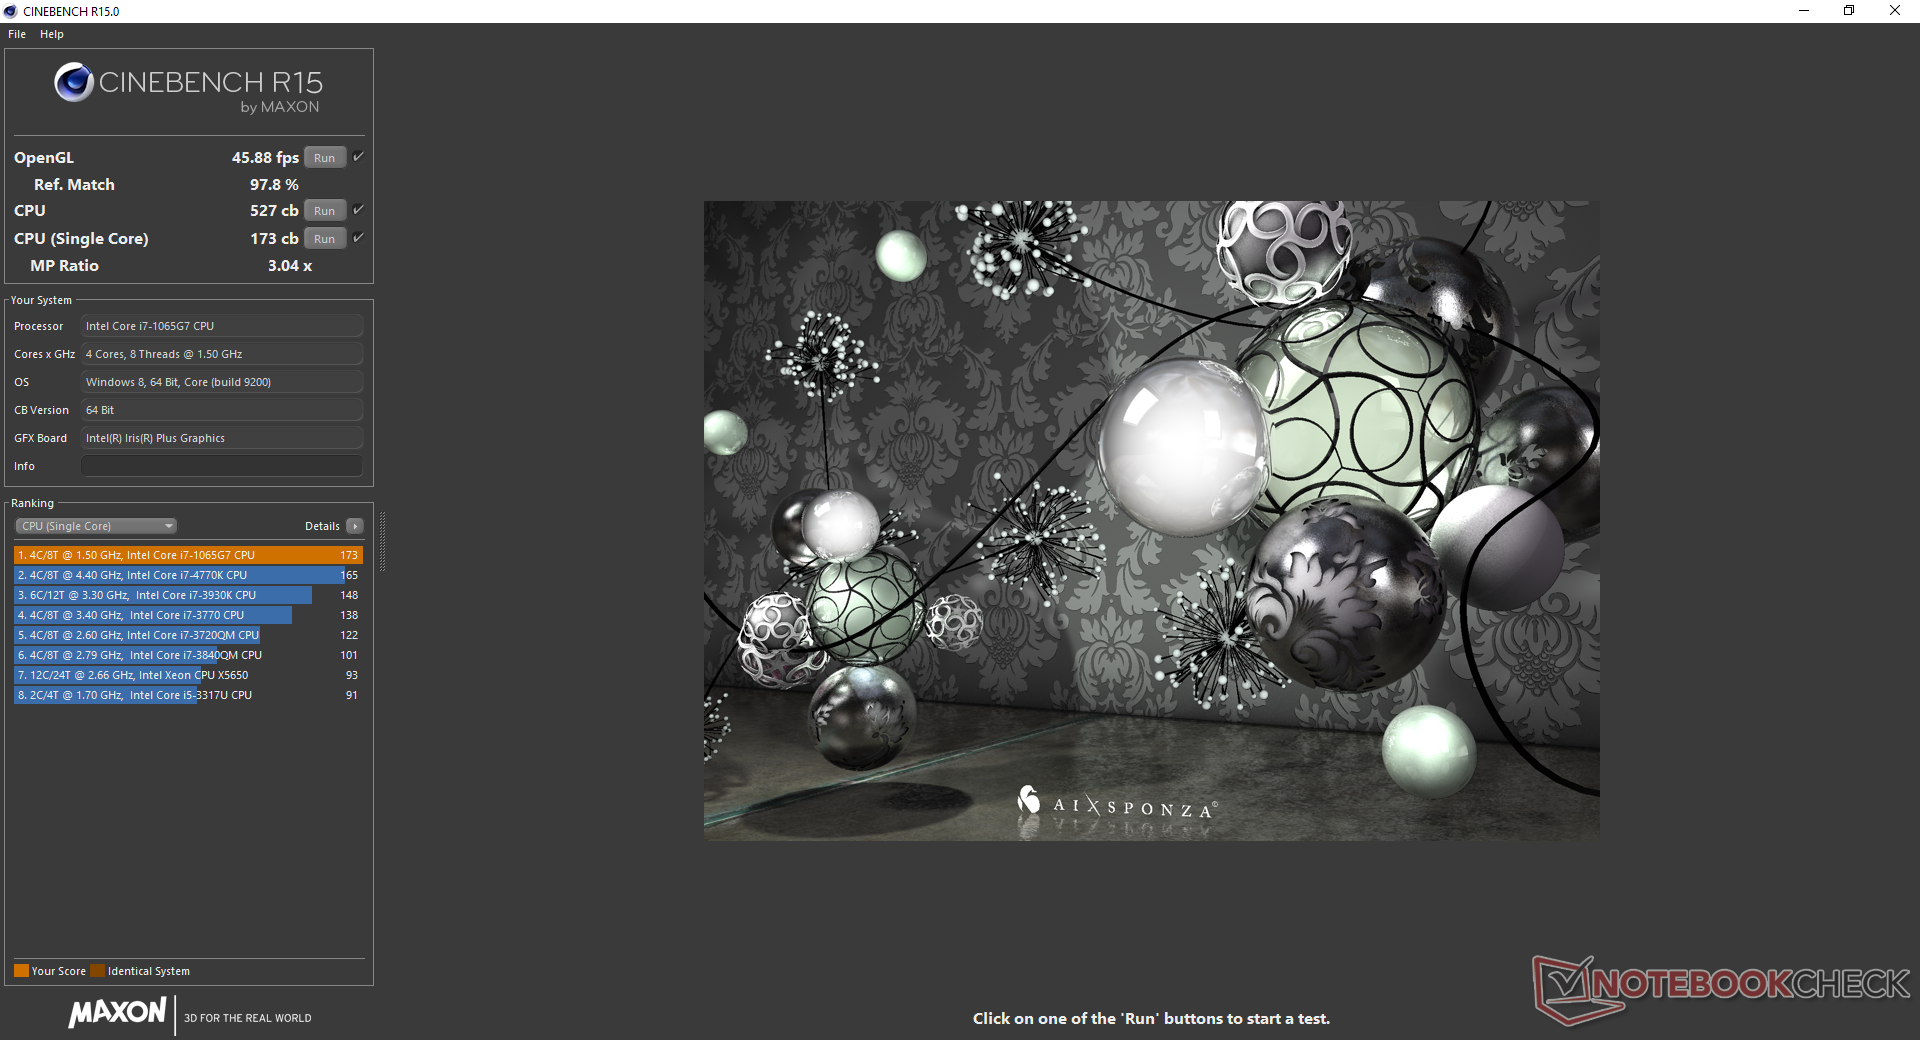
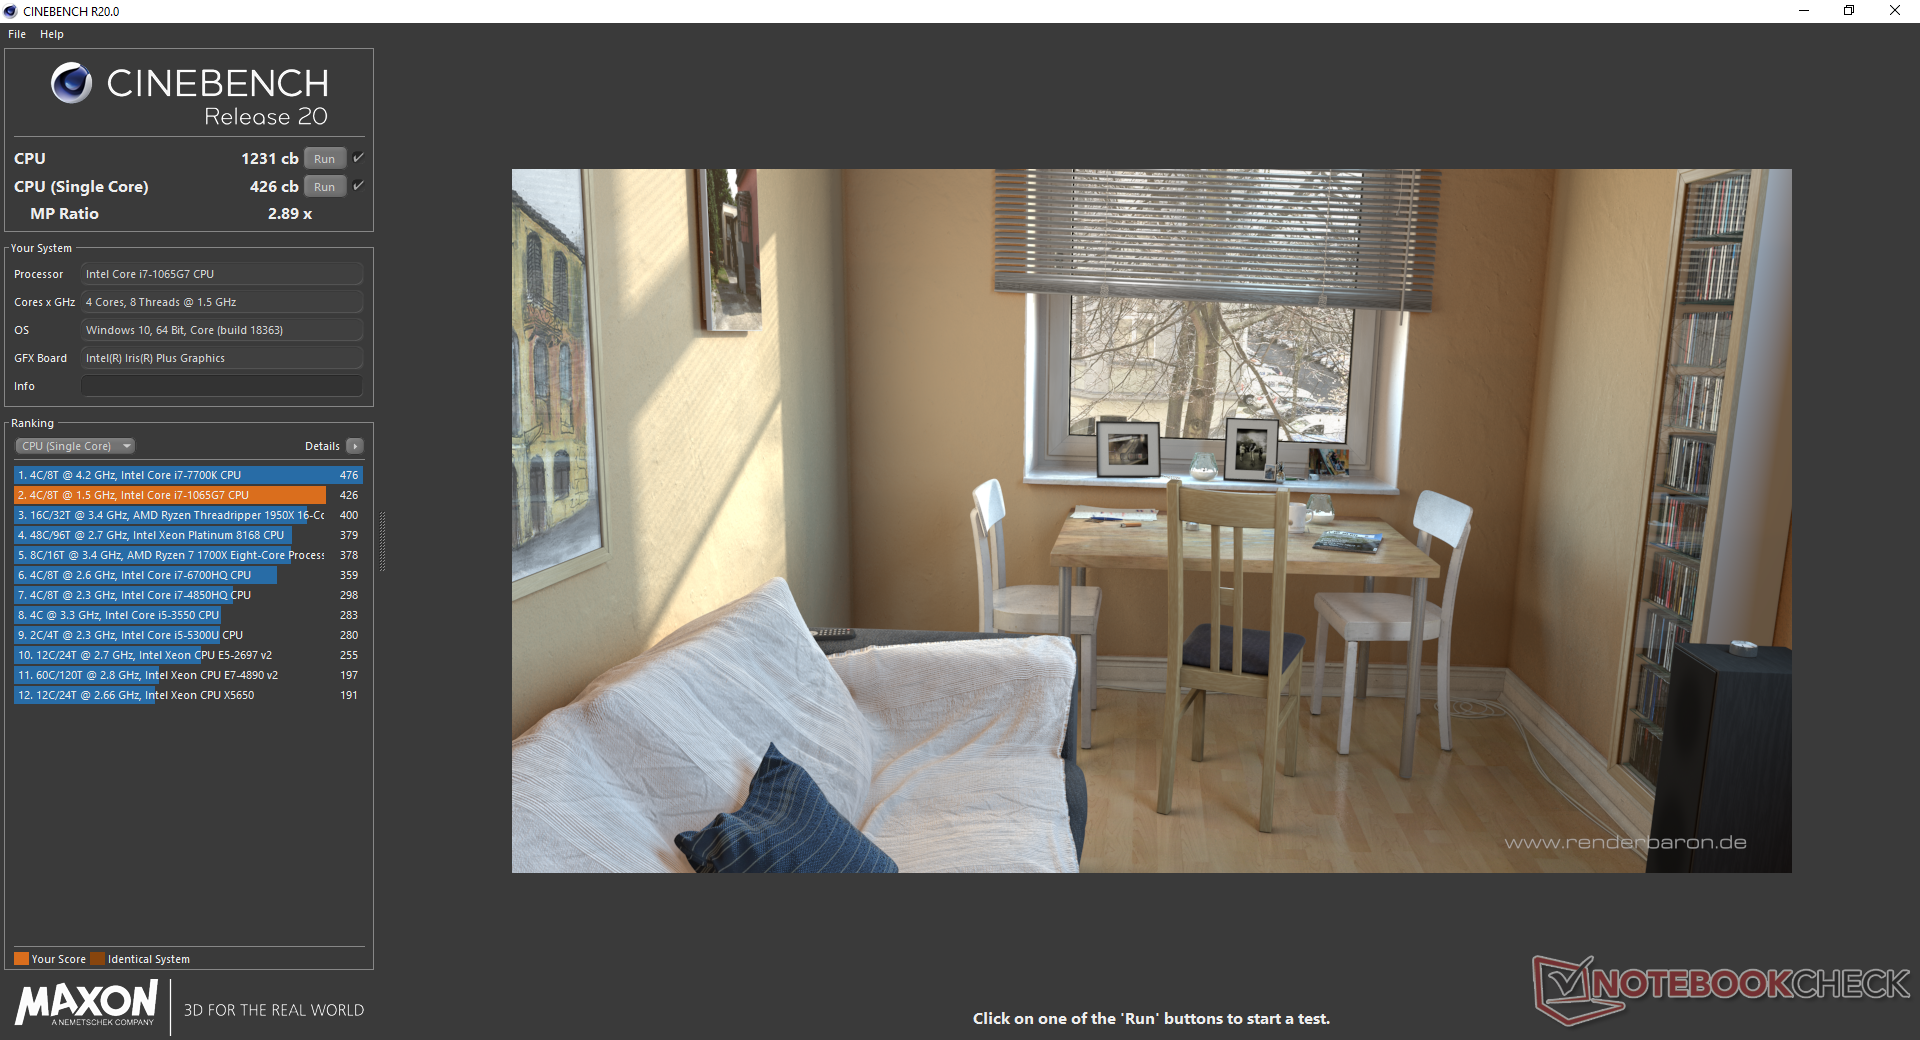
Cinebench R15: CPU Multi 64Bit | CPU Single 64Bit
Blender: v2.79 BMW27 CPU
7-Zip 18.03: 7z b 4 -mmt1 | 7z b 4
Geekbench 5.5: Single-Core | Multi-Core
HWBOT x265 Benchmark v2.2: 4k Preset
LibreOffice : 20 Documents To PDF
R Benchmark 2.5: Overall mean
| Cinebench R20 / CPU (Single Core) | |
| Dell XPS 13 9300 Core i7-1065G7 | |
| Asus ZenBook 15 UX534FT-DB77 | |
| Average Intel Core i7-1065G7 (358 - 474, n=31) | |
| Dell XPS 13 9300 i5 FHD | |
| Asus VivoBook 14 X403FA | |
| LG Gram 14T90N | |
| Lenovo IdeaPad S540-14API | |
| LG Gram 14Z90N | |
| Dell Latitude 13 3390 | |
| Huawei MateBook D 14-53010TVS | |
| Huawei MateBook D 14-53010TVS | |
| Blender / v2.79 BMW27 CPU | |
| LG Gram 14Z90N | |
| LG Gram 14T90N | |
| Dell Latitude 13 3390 | |
| MSI Modern 14 A10RB | |
| Average Intel Core i7-1065G7 (675 - 1650, n=23) | |
| Asus VivoBook 14 X403FA | |
| Dell XPS 13 9300 i5 FHD | |
| Lenovo IdeaPad S540-14API | |
| Huawei MateBook D 14-53010TVS | |
| Huawei MateBook D 14-53010TVS | |
| 7-Zip 18.03 / 7z b 4 -mmt1 | |
| MSI Modern 14 A10RB | |
| LG Gram 14T90N | |
| Average Intel Core i7-1065G7 (3289 - 4589, n=24) | |
| LG Gram 14Z90N | |
| Dell XPS 13 9300 i5 FHD | |
| Asus VivoBook 14 X403FA | |
| Dell Latitude 13 3390 | |
| Lenovo IdeaPad S540-14API | |
| Huawei MateBook D 14-53010TVS | |
| Huawei MateBook D 14-53010TVS | |
| Geekbench 5.5 / Single-Core | |
| Average Intel Core i7-1065G7 (948 - 1348, n=18) | |
| LG Gram 14T90N | |
| Dell XPS 13 9300 i5 FHD | |
| LG Gram 14Z90N | |
| Huawei MateBook D 14-53010TVS | |
| Huawei MateBook D 14-53010TVS | |
| Geekbench 5.5 / Multi-Core | |
| Dell XPS 13 9300 i5 FHD | |
| Average Intel Core i7-1065G7 (2464 - 4855, n=18) | |
| LG Gram 14T90N | |
| Huawei MateBook D 14-53010TVS | |
| Huawei MateBook D 14-53010TVS | |
| LG Gram 14Z90N | |
| HWBOT x265 Benchmark v2.2 / 4k Preset | |
| Asus VivoBook 14 X403FA | |
| Average Intel Core i7-1065G7 (2.2 - 6.38, n=22) | |
| Dell XPS 13 9300 i5 FHD | |
| MSI Modern 14 A10RB | |
| Huawei MateBook D 14-53010TVS | |
| Huawei MateBook D 14-53010TVS | |
| Lenovo IdeaPad S540-14API | |
| Dell Latitude 13 3390 | |
| LG Gram 14T90N | |
| LG Gram 14Z90N | |
| LibreOffice / 20 Documents To PDF | |
| LG Gram 14Z90N | |
| LG Gram 14T90N | |
| Average Intel Core i7-1065G7 (46.9 - 85.3, n=19) | |
| R Benchmark 2.5 / Overall mean | |
| LG Gram 14Z90N | |
| Huawei MateBook D 14-53010TVS | |
| Huawei MateBook D 14-53010TVS | |
| Dell XPS 13 9300 i5 FHD | |
| Average Intel Core i7-1065G7 (0.661 - 0.798, n=18) | |
| LG Gram 14T90N | |
* ... smaller is better
System Performance
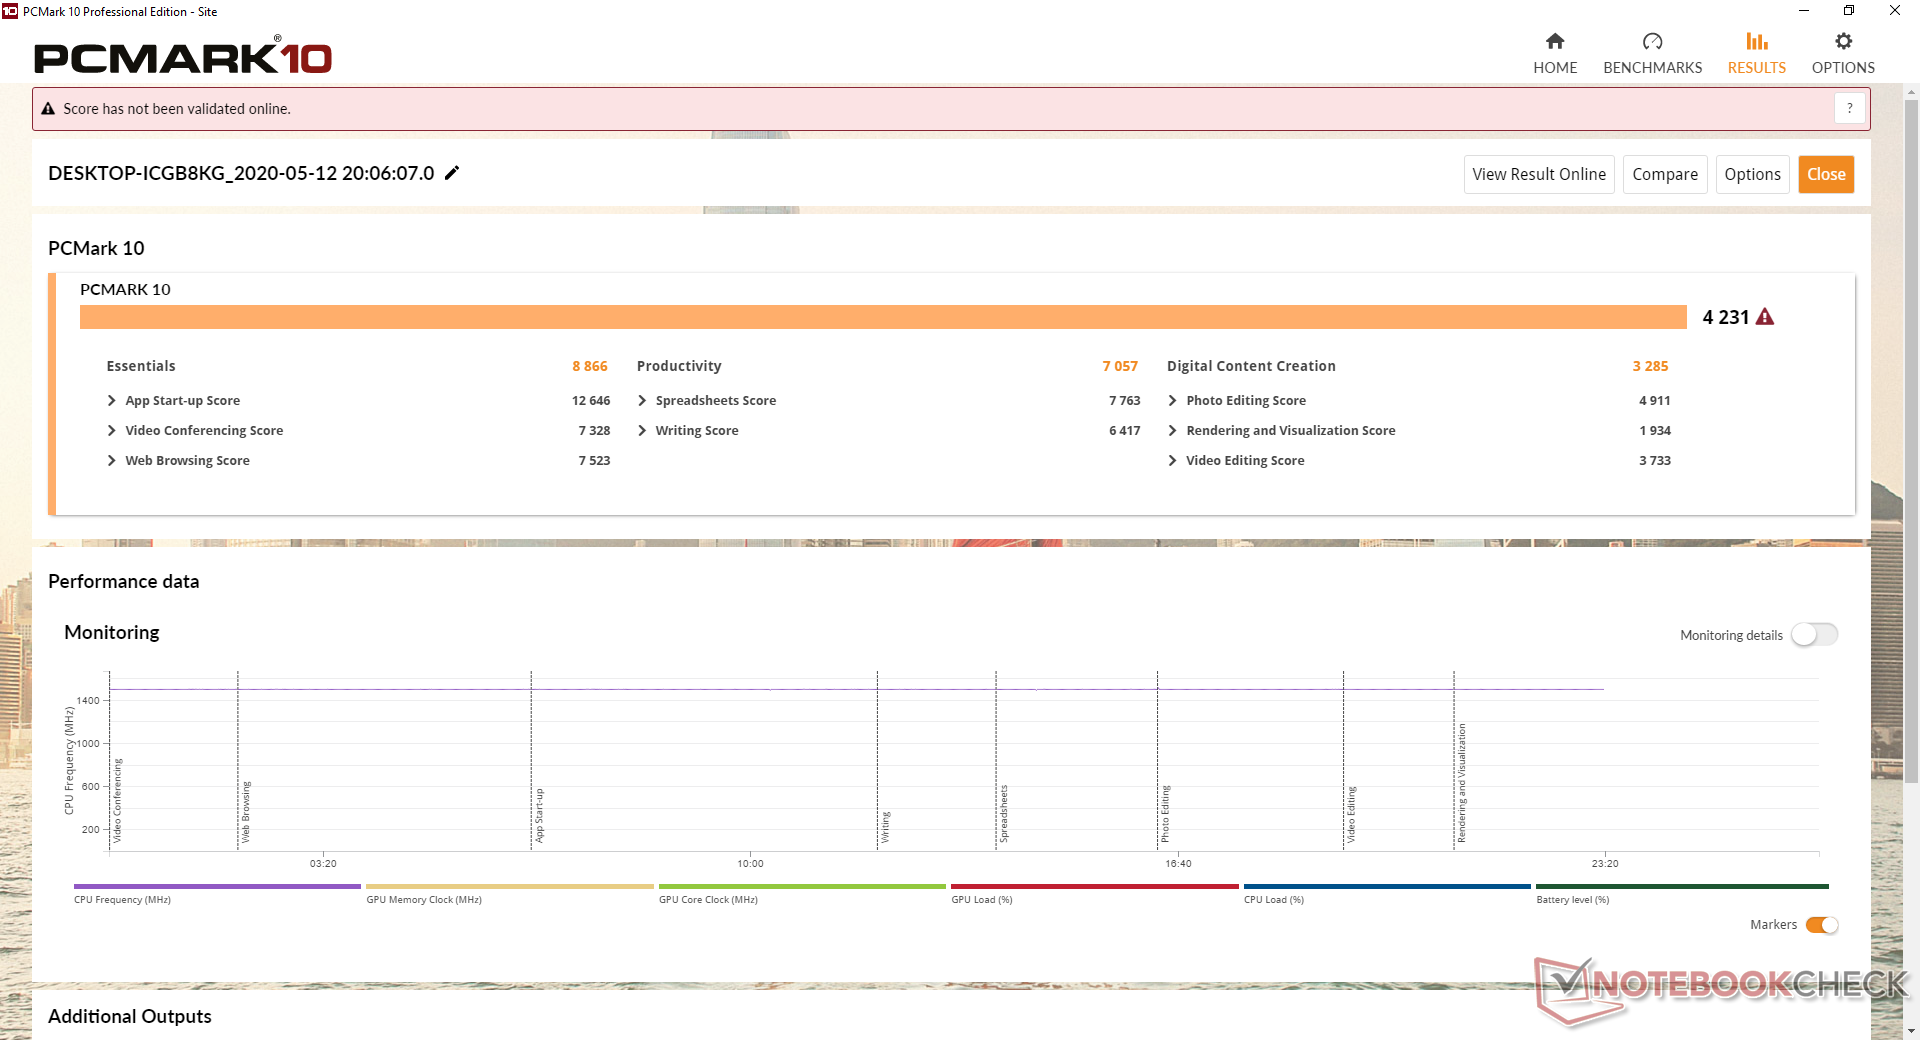
PCMark 10 scores are consistently below the average Core i7-1065G7 laptop in our database by a few percentage points likely due to the system's combination of slow processor performance and single-channel RAM. Results are still ever-so-slight better than the LG Gram 14T90N with the Comet Lake-U CPU since the Iris Plus G7 GPU is much faster than the UHD Graphics 620.
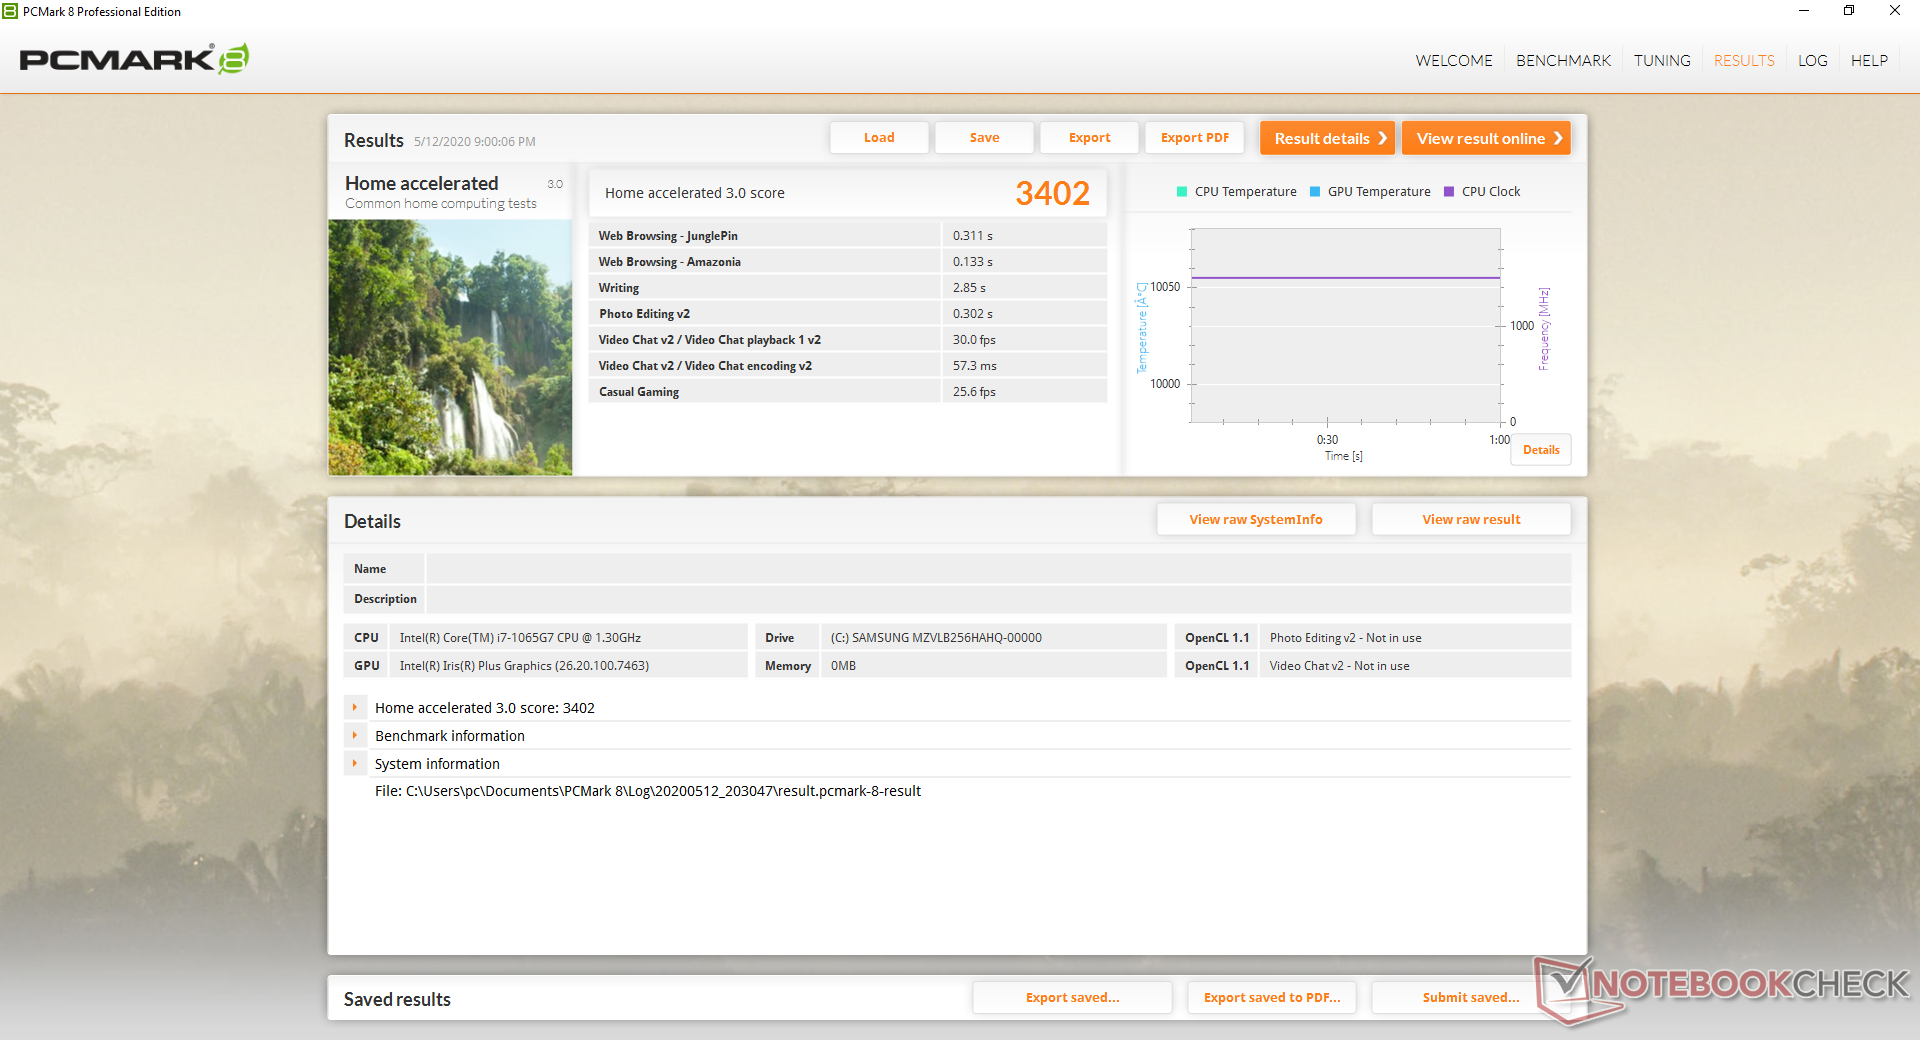
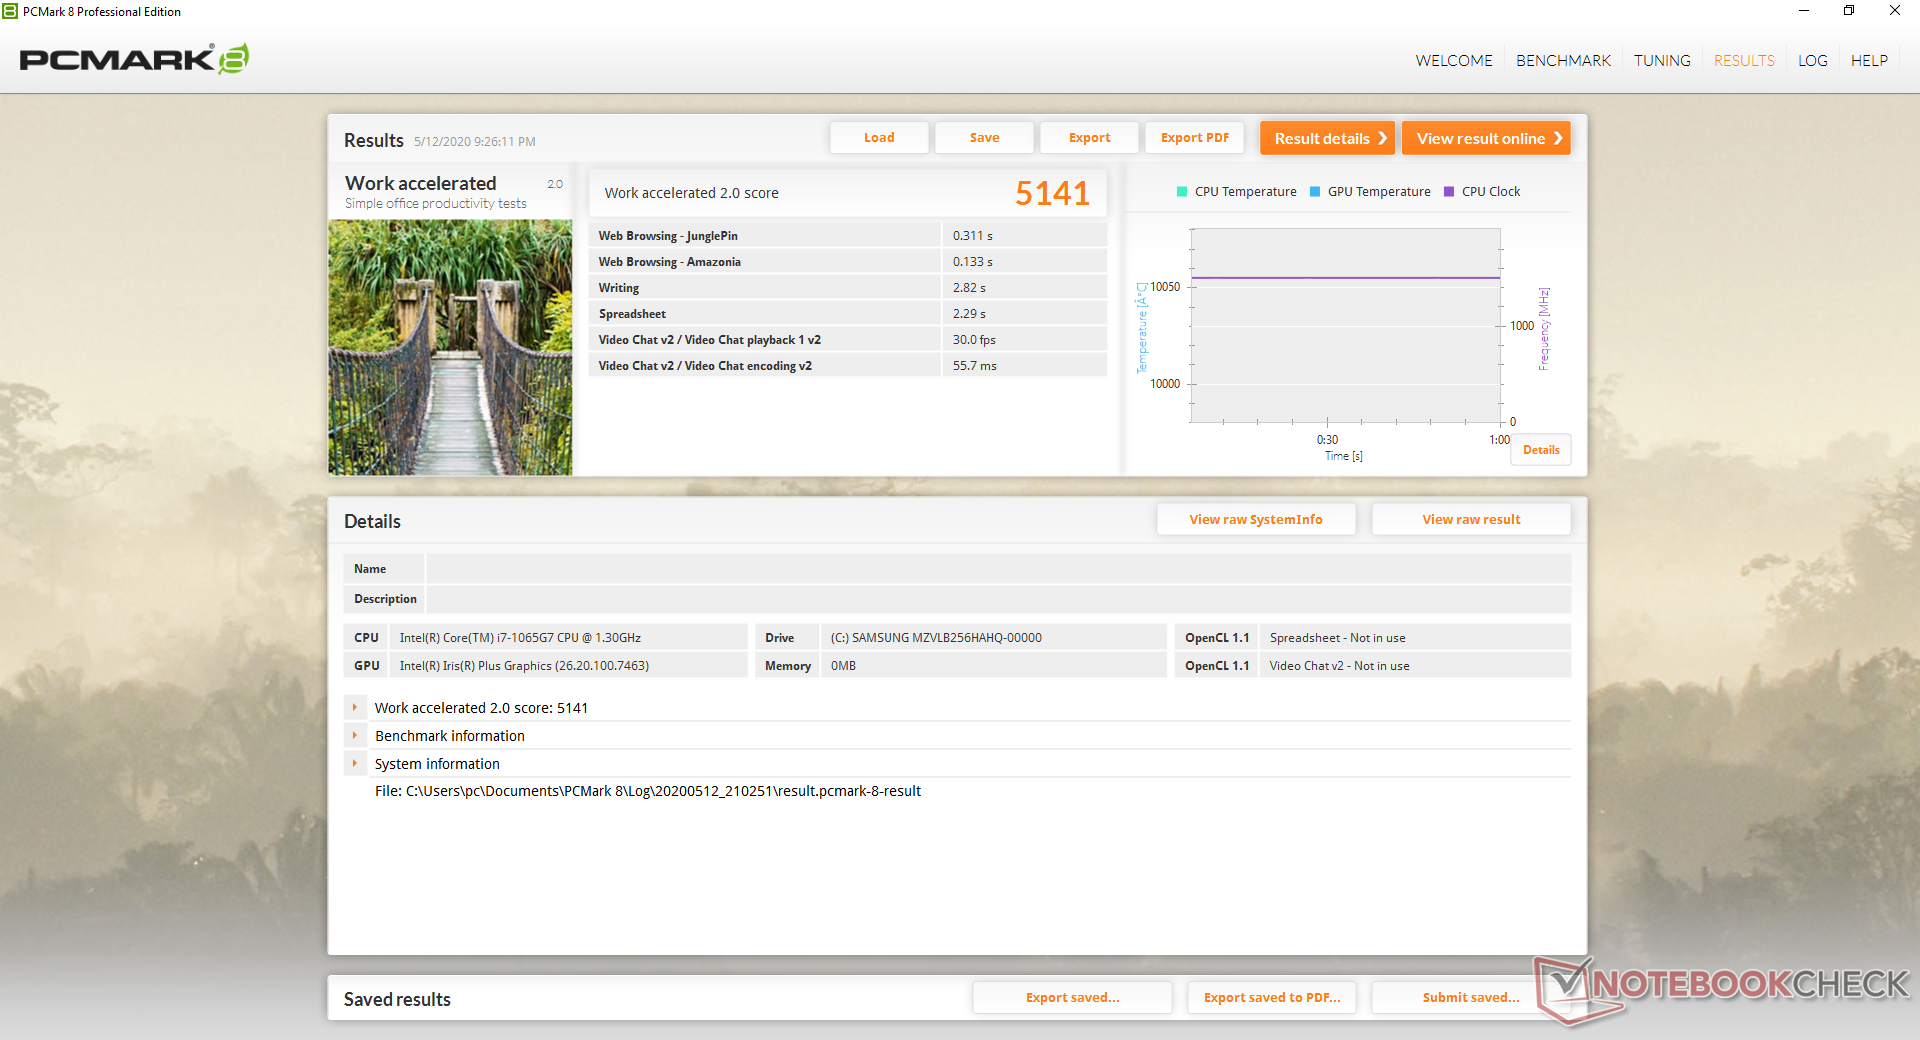
| PCMark 8 Home Score Accelerated v2 | 3402 points | |
| PCMark 8 Work Score Accelerated v2 | 5141 points | |
| PCMark 10 Score | 4231 points | |
Help | ||
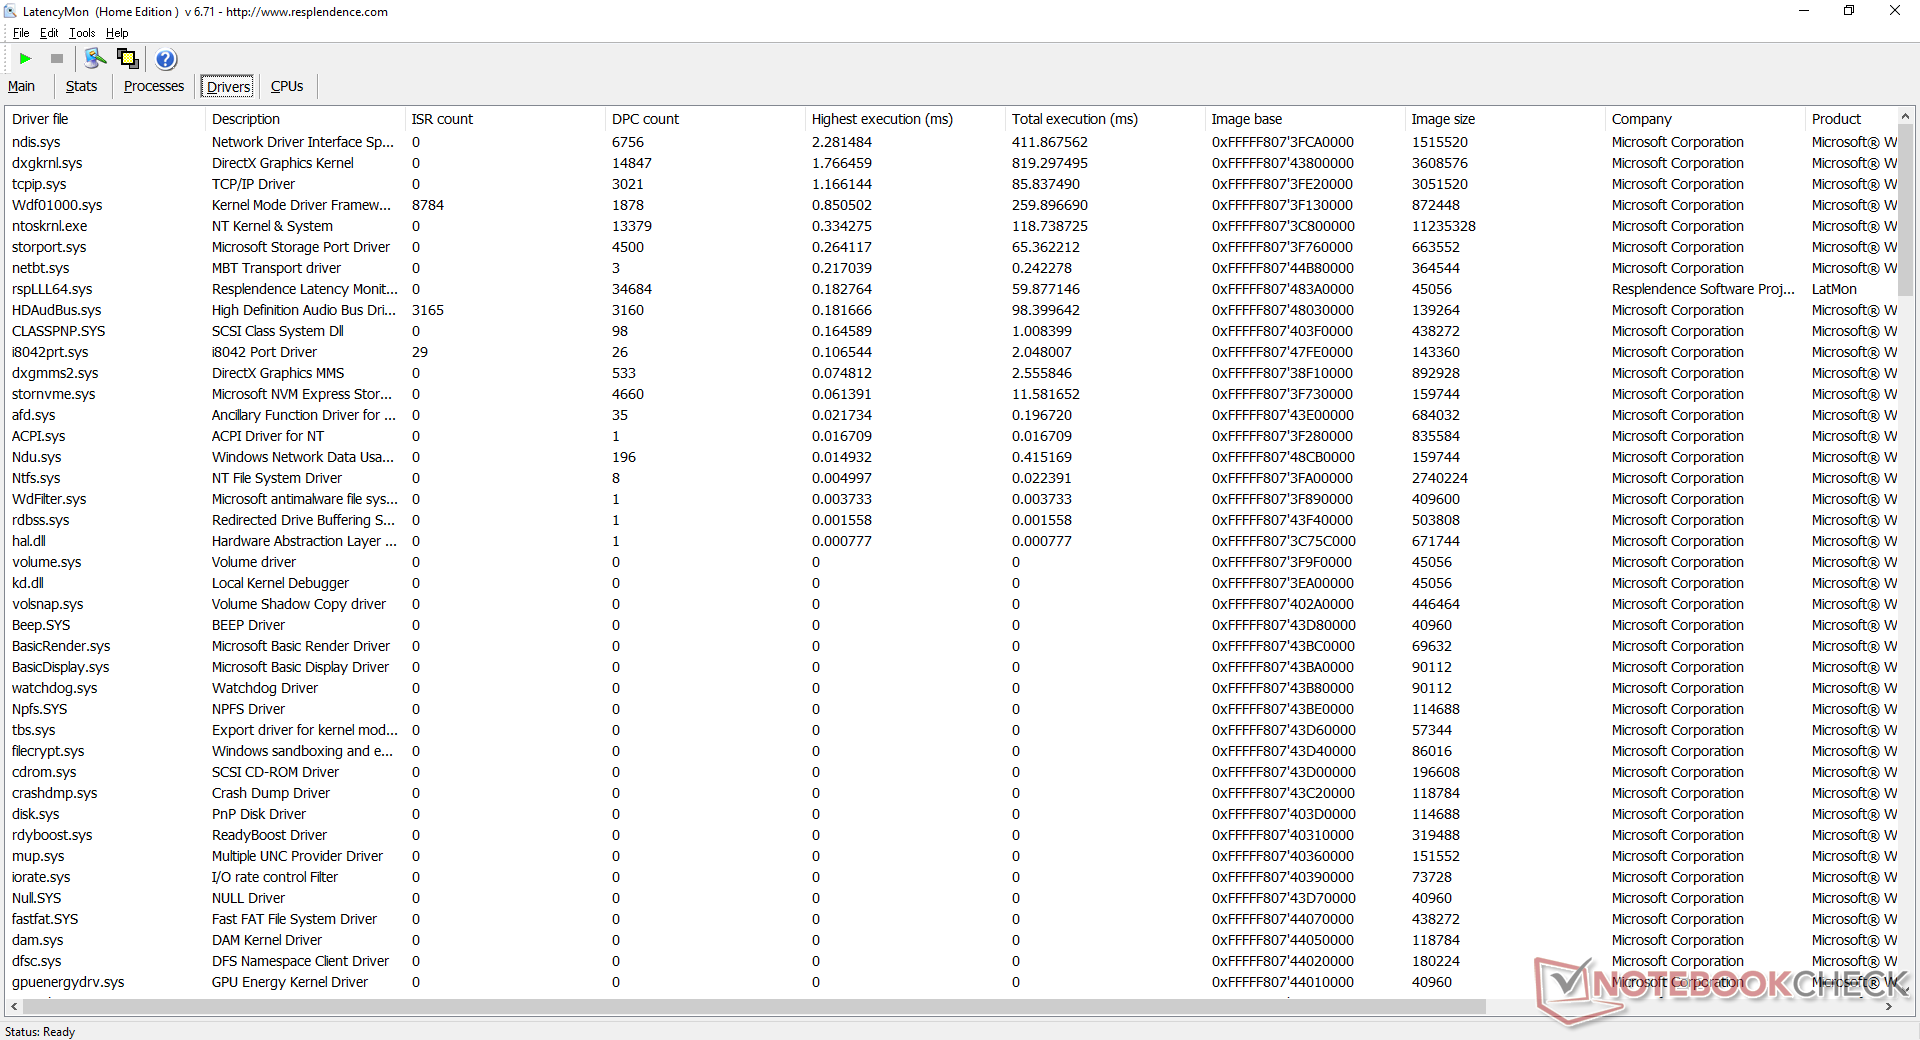
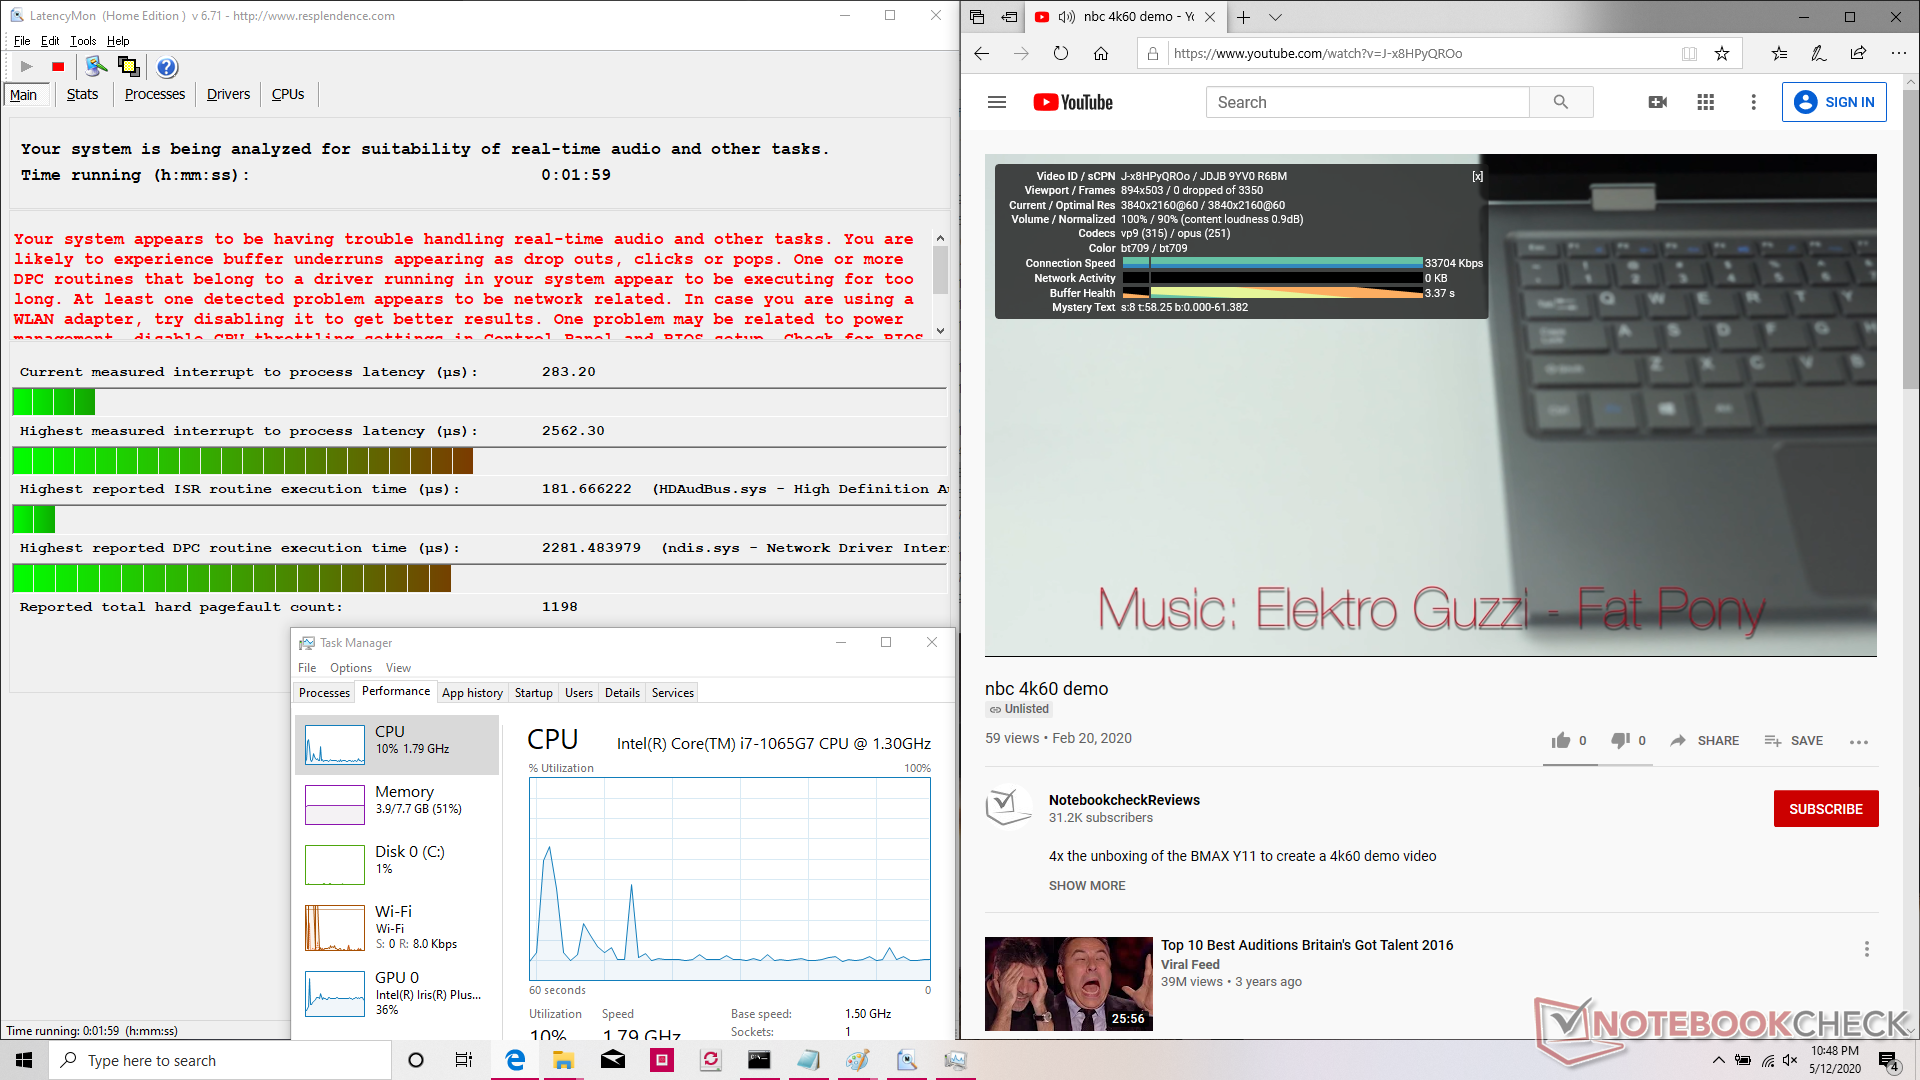
DPC Latency
LatencyMon shows DPC latency issues when opening five browser tabs on Notebookcheck.net. 4K UHD playback on our YouTube test video is otherwise smooth with no dropped frames.
| DPC Latencies / LatencyMon - interrupt to process latency (max), Web, Youtube, Prime95 | |
| LG Gram 14Z90N | |
* ... smaller is better
Storage Devices
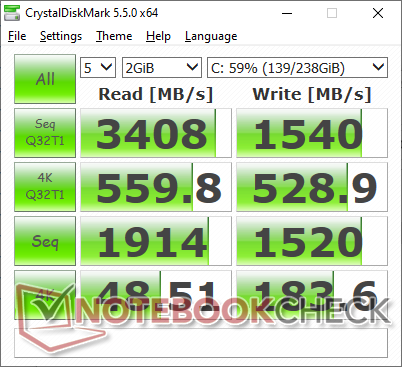
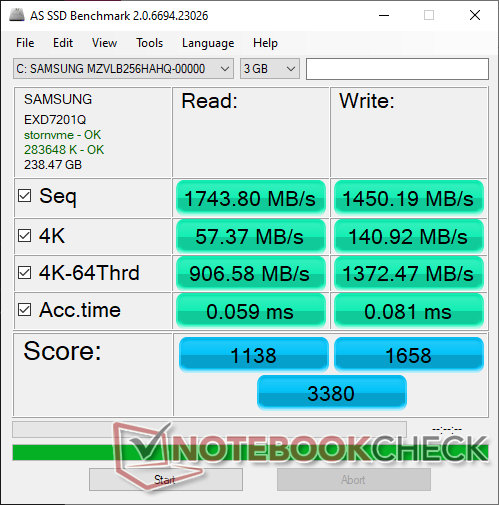
Our system comes equipped with a 256 GB Samsung PM981 MZVLB256HAHQ NVMe SSD with the option to install a second M.2 drive. Unfortunately, we cannot confirm if the second slot supports NVMe or if it's SATA only. Higher capacities are available from LG up to 512 GB.
Running DiskSpd Read in a loop 50 times shows increasing performance over time likely due to automatic caching. Thus, users won't need to worry about reaching any thermal limitations of the SSD in real-world day-to-day loads.
More SSD and HDD benchmarks can be found on our table here.
| LG Gram 14Z90N Samsung SSD PM981 MZVLB256HAHQ | LG Gram 14T90N Samsung SSD PM981a MZVLB512HBJQ | LG Gram 14Z980-U.AAW5U1 SK Hynix SC313 HFS256G39TNF | Dell XPS 13 9300 Core i7-1065G7 Intel SSDPEMKF512G8 NVMe SSD | Lenovo IdeaPad S940-14IWL Samsung SSD PM981 MZVLB512HAJQ | |
|---|---|---|---|---|---|
| AS SSD | 20% | -56% | -25% | 19% | |
| Seq Read (MB/s) | 1744 | 1829 5% | 476.1 -73% | 1956 12% | 2625 51% |
| Seq Write (MB/s) | 1450 | 2048 41% | 487.4 -66% | 1227 -15% | 1360 -6% |
| 4K Read (MB/s) | 57.4 | 54.2 -6% | 30.57 -47% | 63 10% | 47.71 -17% |
| 4K Write (MB/s) | 140.9 | 120.5 -14% | 66.1 -53% | 156.6 11% | 115.5 -18% |
| 4K-64 Read (MB/s) | 907 | 1512 67% | 352.9 -61% | 475.6 -48% | 1492 64% |
| 4K-64 Write (MB/s) | 1372 | 1573 15% | 263.1 -81% | 539 -61% | 1154 -16% |
| Access Time Read * (ms) | 0.059 | 0.046 22% | 0.092 -56% | 0.042 29% | 0.045 24% |
| Access Time Write * (ms) | 0.081 | 0.091 -12% | 0.055 32% | 0.105 -30% | 0.032 60% |
| Score Read (Points) | 1138 | 1749 54% | 431 -62% | 734 -36% | 1802 58% |
| Score Write (Points) | 1658 | 1899 15% | 378 -77% | 818 -51% | 1406 -15% |
| Score Total (Points) | 3380 | 4560 35% | 1040 -69% | 1915 -43% | 4069 20% |
| Copy ISO MB/s (MB/s) | 1520 | 1891 24% | 514 -66% | 1022 -33% | |
| Copy Program MB/s (MB/s) | 539 | 569 6% | 259.3 -52% | 302.8 -44% | |
| Copy Game MB/s (MB/s) | 1070 | 1425 33% | 521 -51% | 491.4 -54% | |
| CrystalDiskMark 5.2 / 6 | 11% | -67% | 0% | -8% | |
| Write 4K (MB/s) | 183.6 | 181.4 -1% | 74.7 -59% | 186.8 2% | 105.3 -43% |
| Read 4K (MB/s) | 48.51 | 52.5 8% | 14.89 -69% | 71.4 47% | 40.9 -16% |
| Write Seq (MB/s) | 1520 | 1592 5% | 502 -67% | 1203 -21% | 1914 26% |
| Read Seq (MB/s) | 1914 | 1617 -16% | 498.6 -74% | 2600 36% | 2224 16% |
| Write 4K Q32T1 (MB/s) | 529 | 556 5% | 214.3 -59% | 514 -3% | 419.3 -21% |
| Read 4K Q32T1 (MB/s) | 560 | 539 -4% | 225.5 -60% | 570 2% | 288.1 -49% |
| Write Seq Q32T1 (MB/s) | 1540 | 2955 92% | 505 -67% | 786 -49% | 1954 27% |
| Read Seq Q32T1 (MB/s) | 3408 | 3270 -4% | 560 -84% | 2947 -14% | 3382 -1% |
| Total Average (Program / Settings) | 16% /
17% | -62% /
-60% | -13% /
-16% | 6% /
8% |
* ... smaller is better

Disk Throttling: DiskSpd Read Loop, Queue Depth 8
GPU Performance
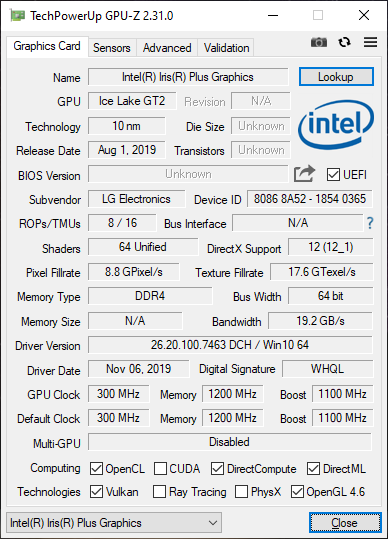
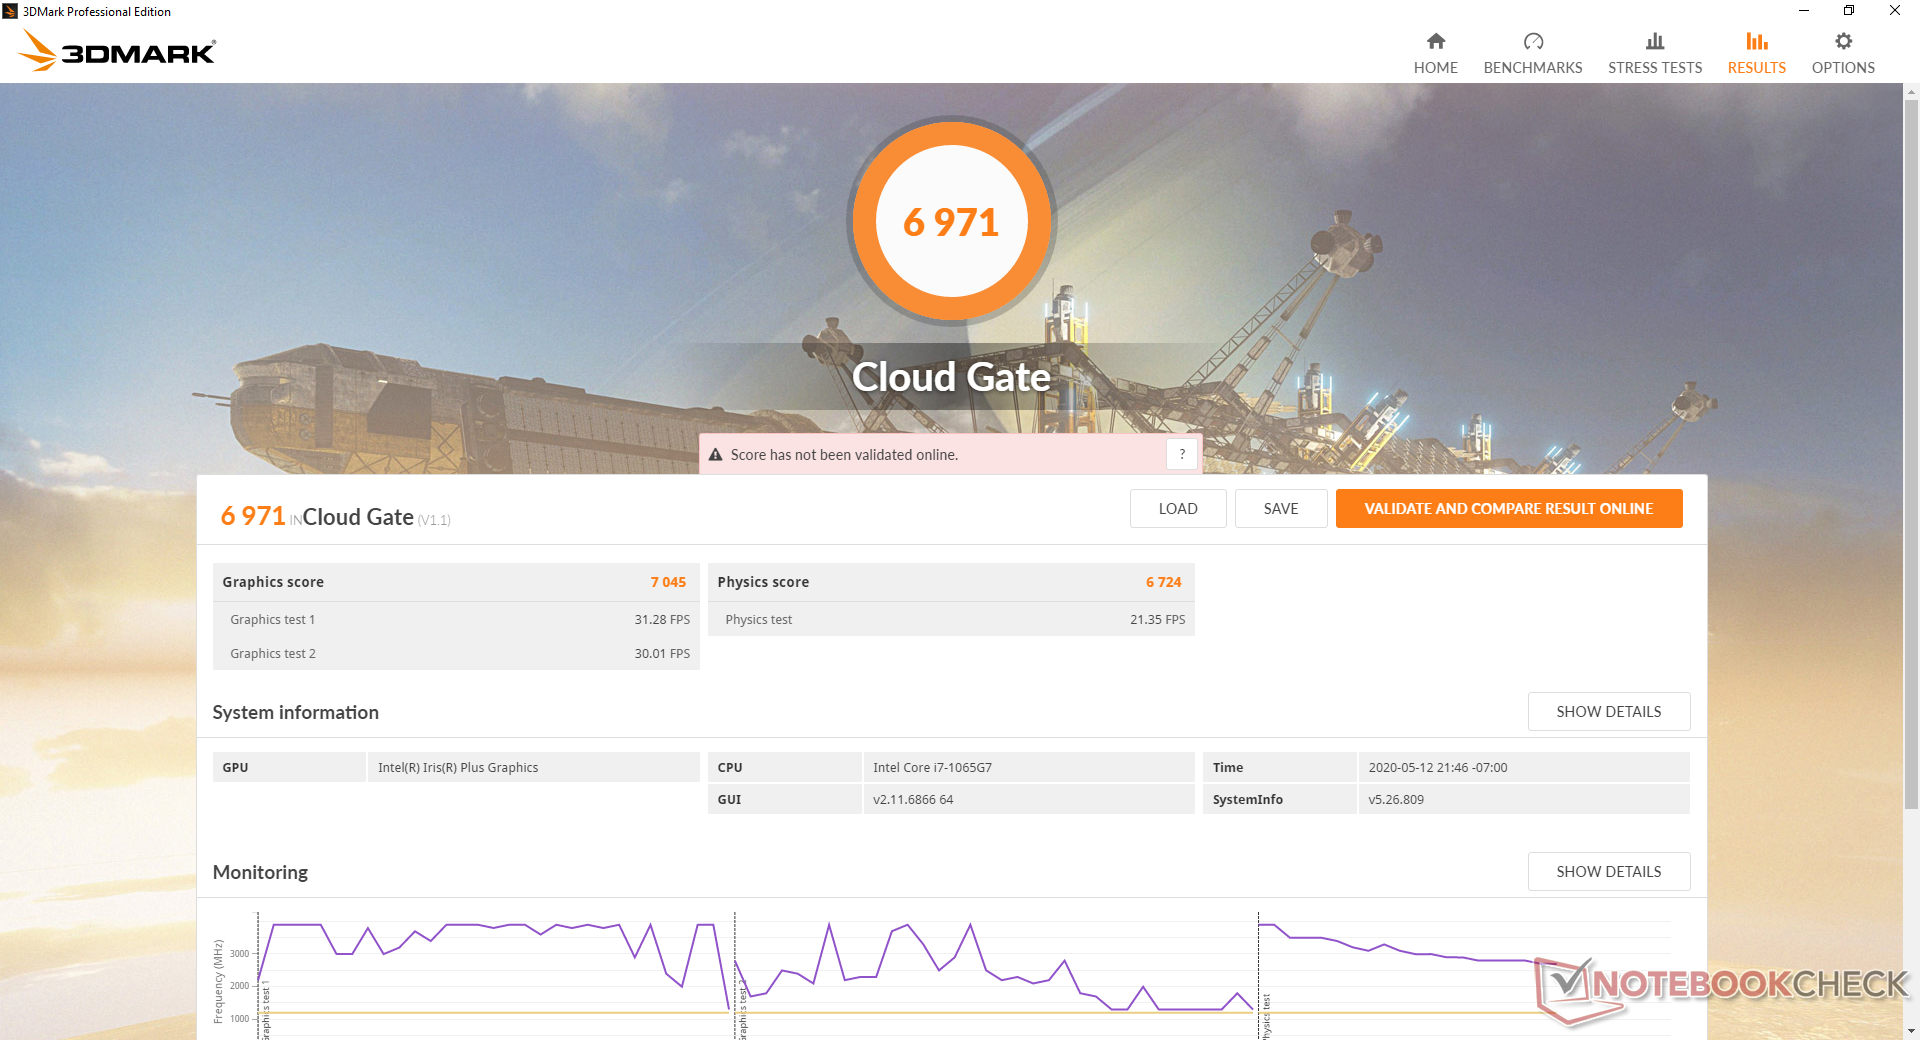
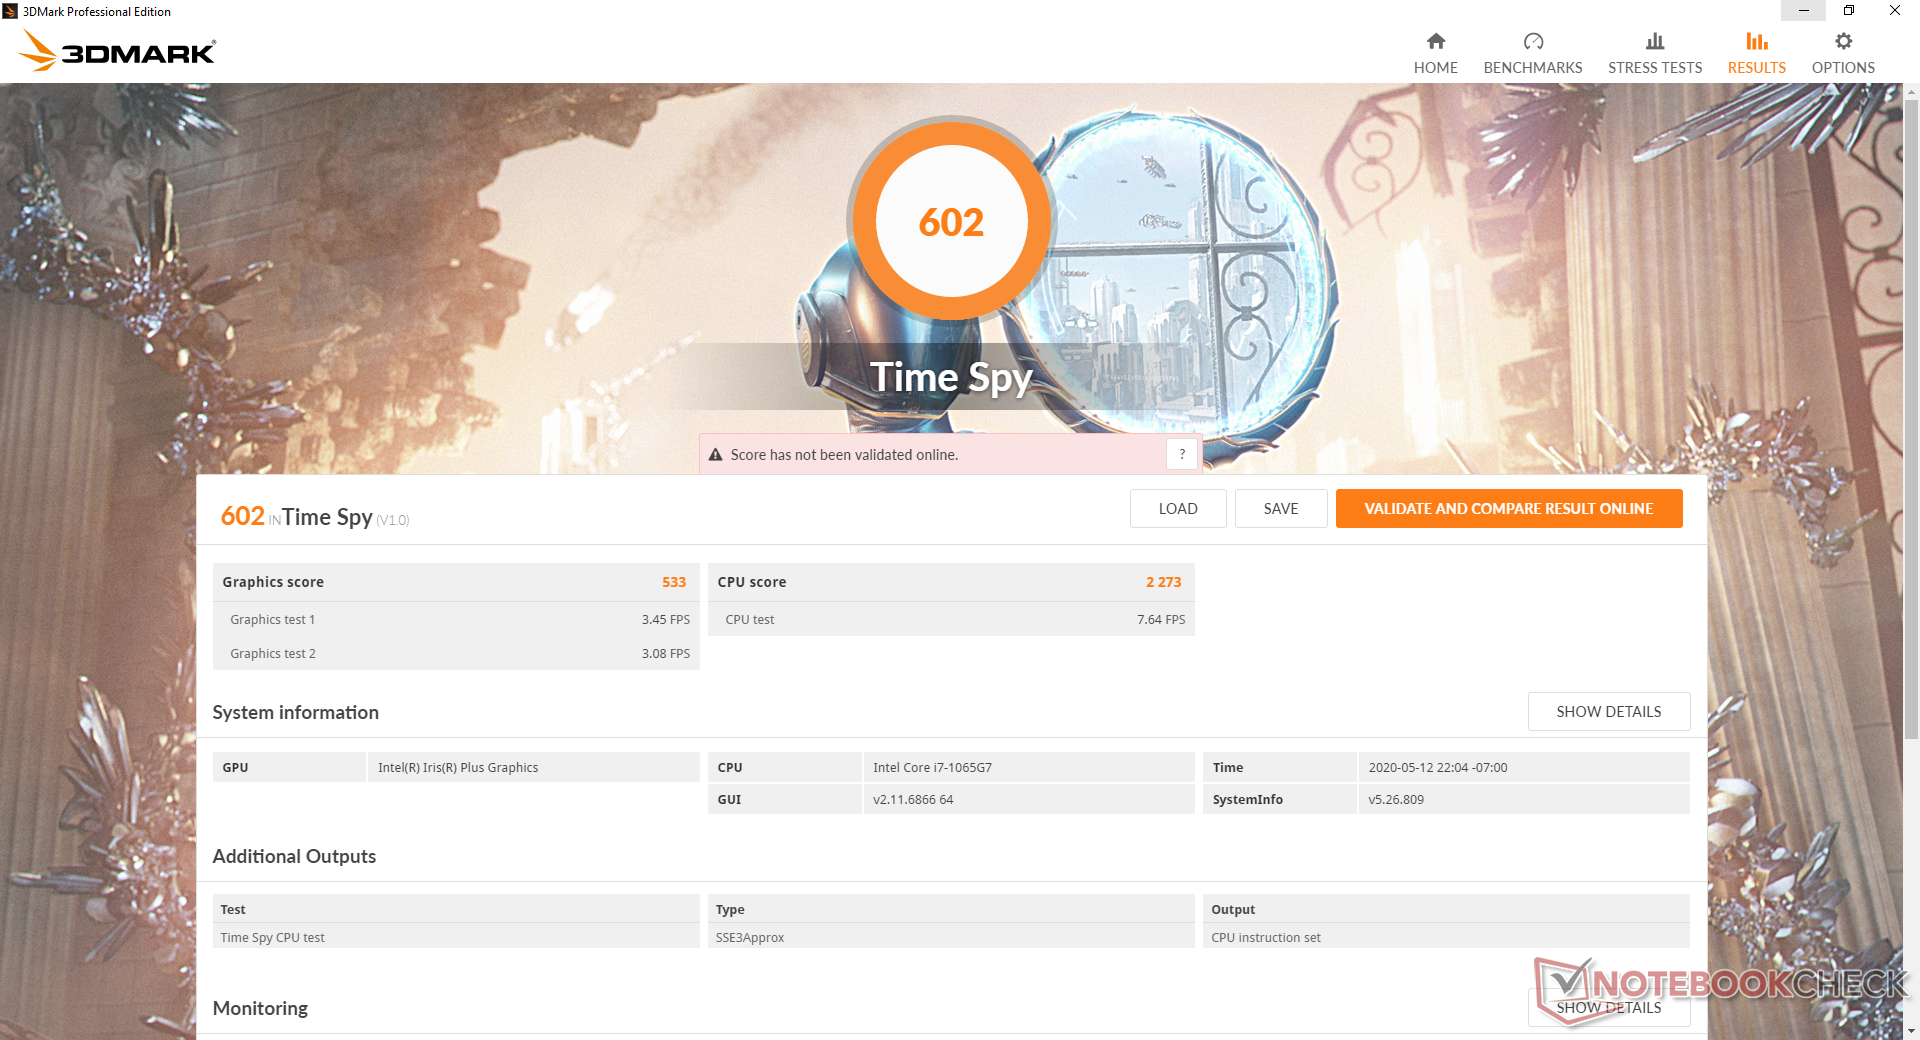
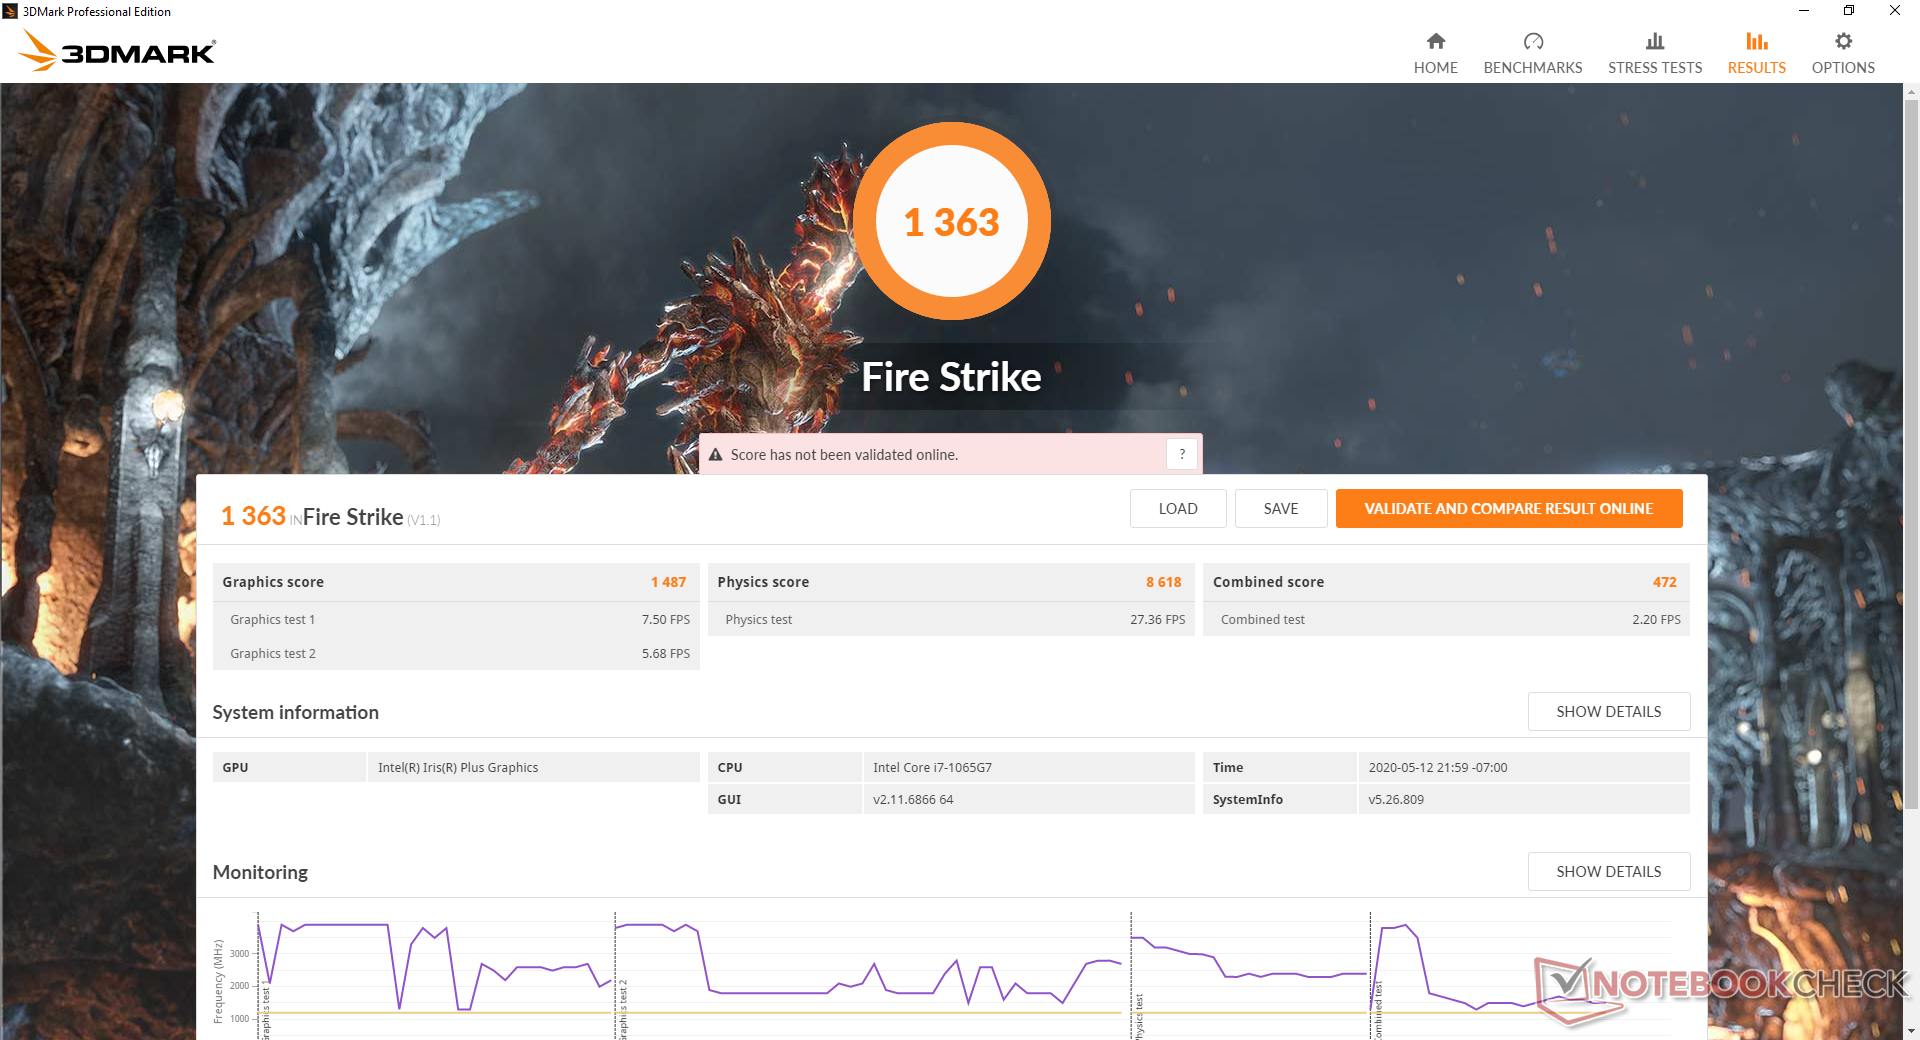
Much like the disappointing CPU performance, the integrated Iris Plus G7 GPU also performs well below average. 3DMark scores are approximately 28 to 50 percent slower than the average Iris Plus G7 in our database. Even so, raw performance is still much better than the generations old UHD Graphics 620 as found on all other LG Gram laptops thus far. 3D gaming isn't recommended unless if you are satisfied with the lowest settings and resolutions possible.
See our dedicated page on the Iris Plus G7 for more technical information and benchmark comparisons.
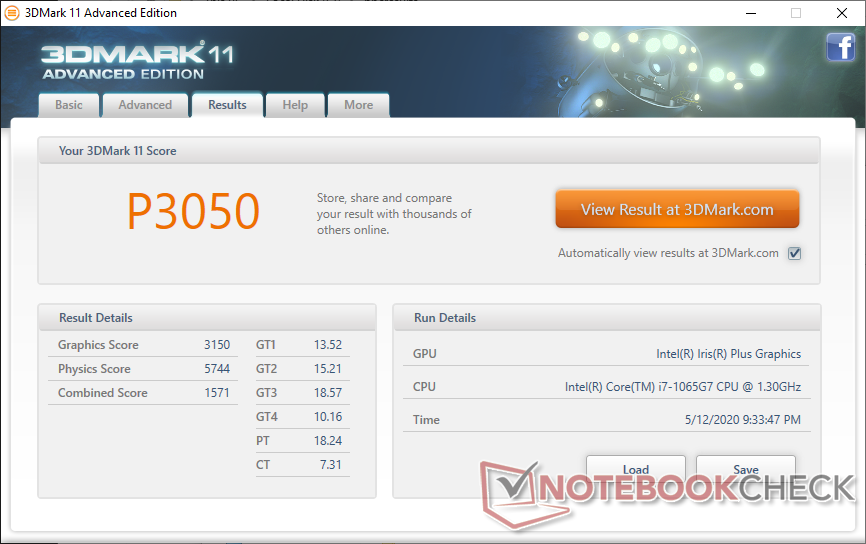
| 3DMark 11 Performance | 3050 points | |
| 3DMark Cloud Gate Standard Score | 6971 points | |
| 3DMark Fire Strike Score | 1363 points | |
| 3DMark Time Spy Score | 602 points | |
Help | ||
| low | med. | high | ultra | |
|---|---|---|---|---|
| The Witcher 3 (2015) | 32.5 | |||
| Dota 2 Reborn (2015) | 56.3 | 32.6 | 19 | 17.7 |
| X-Plane 11.11 (2018) | 22.8 | 11.7 | 11.9 |
Emissions
System Noise
At just 29.5 dB(A) maximum against a silent background of 28.6 dB(A), the Gram 14Z90N is one of the quietest laptops we've tested with a U-class Core i7 CPU. The system is essentially inaudible in typical office or home environments unless if you place an ear on the keyboard keys. Fan noise would not go up any higher even when running Prime95 to stress the CPU at the highest power profile setting. In comparison, Asus ZenBook 14 with the Ryzen 7 3700U would reach 39 dB(A) when stressed. The very low fan noise of the LG is likely tied to the below-average processor performance noted above.
Our system exhibits no electronic noise or coil whine.
| LG Gram 14Z90N Iris Plus Graphics G7 (Ice Lake 64 EU), i7-1065G7, Samsung SSD PM981 MZVLB256HAHQ | LG Gram 14T90N UHD Graphics 620, i7-10510U, Samsung SSD PM981a MZVLB512HBJQ | LG Gram 14Z980-U.AAW5U1 UHD Graphics 620, i5-8250U, SK Hynix SC313 HFS256G39TNF | Dell XPS 13 9300 Core i7-1065G7 Iris Plus Graphics G7 (Ice Lake 64 EU), i7-1065G7, Intel SSDPEMKF512G8 NVMe SSD | Lenovo IdeaPad S940-14IWL UHD Graphics 620, i7-8565U, Samsung SSD PM981 MZVLB512HAJQ | Asus ZenBook 14 UM431DA-AM020T Vega 10, R7 3700U, SK hynix BC501 HFM512GDHTNG-8310A | |
|---|---|---|---|---|---|---|
| Noise | -10% | -5% | -6% | -6% | -9% | |
| off / environment * (dB) | 28.6 | 29 -1% | 28.2 1% | 28.3 1% | 28.3 1% | 29.8 -4% |
| Idle Minimum * (dB) | 28.6 | 30 -5% | 28.4 1% | 28.3 1% | 28.3 1% | 28 2% |
| Idle Average * (dB) | 29.2 | 30 -3% | 28.4 3% | 28.3 3% | 28.3 3% | 28 4% |
| Idle Maximum * (dB) | 29.2 | 30 -3% | 28.4 3% | 28.3 3% | 31.3 -7% | 28 4% |
| Load Average * (dB) | 29.2 | 35.2 -21% | 35.7 -22% | 32.5 -11% | 34.3 -17% | 36.8 -26% |
| Load Maximum * (dB) | 29.5 | 37 -25% | 34.2 -16% | 39.3 -33% | 34.3 -16% | 39 -32% |
| Witcher 3 ultra * (dB) | 39.3 |
* ... smaller is better
Noise level
| Idle |
| 28.6 / 29.2 / 29.2 dB(A) |
| Load |
| 29.2 / 29.5 dB(A) |
 | ||
30 dB silent 40 dB(A) audible 50 dB(A) loud |
||
min: | ||
Temperature
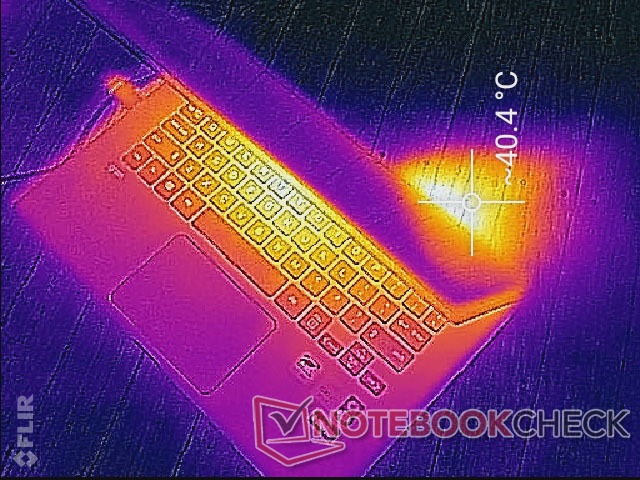
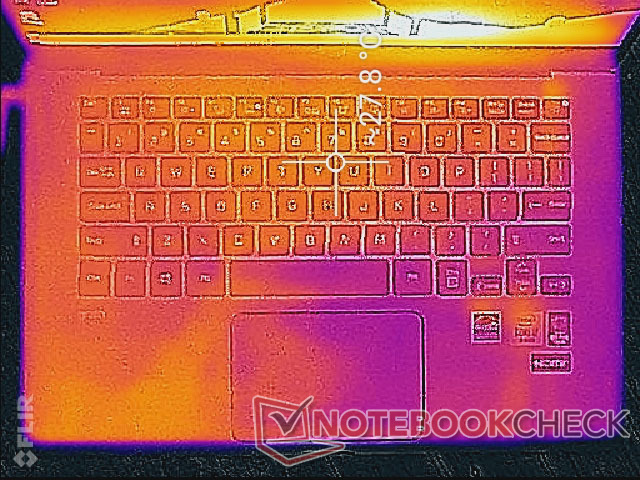
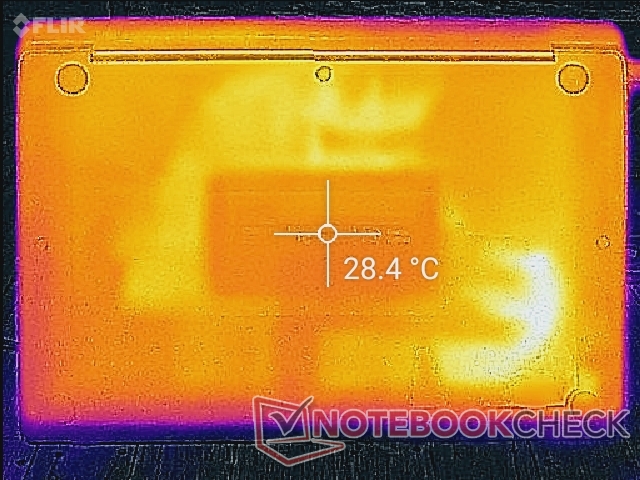
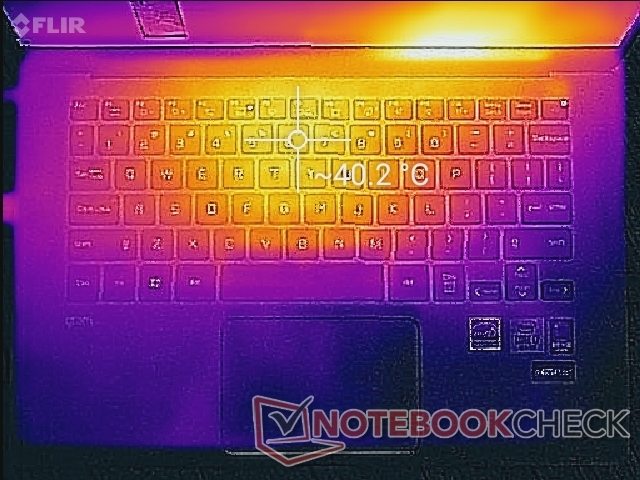
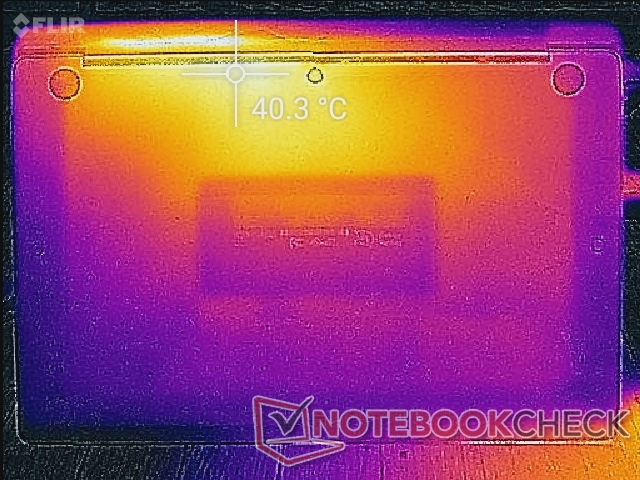
Surface temperatures are flat on both sides of the laptop when idling. When under extreme processing loads, hot spots can become as warm as 40 C which is still cooler than on most other subnotebooks like the Huawei MateBook D 14 or Lenovo IdeaPad S940 where surfaces can reach up to 45 C when under similar conditions. The palm rests, clickpad, and most of the keyboard remain relatively cool for comfortable use no matter the onscreen load.
(±) The maximum temperature on the upper side is 41 °C / 106 F, compared to the average of 35.9 °C / 97 F, ranging from 21.4 to 59 °C for the class Subnotebook.
(±) The bottom heats up to a maximum of 40.2 °C / 104 F, compared to the average of 39.2 °C / 103 F
(+) In idle usage, the average temperature for the upper side is 27.4 °C / 81 F, compared to the device average of 30.8 °C / 87 F.
(+) The palmrests and touchpad are cooler than skin temperature with a maximum of 27.8 °C / 82 F and are therefore cool to the touch.
(±) The average temperature of the palmrest area of similar devices was 28.2 °C / 82.8 F (+0.4 °C / 0.8 F).
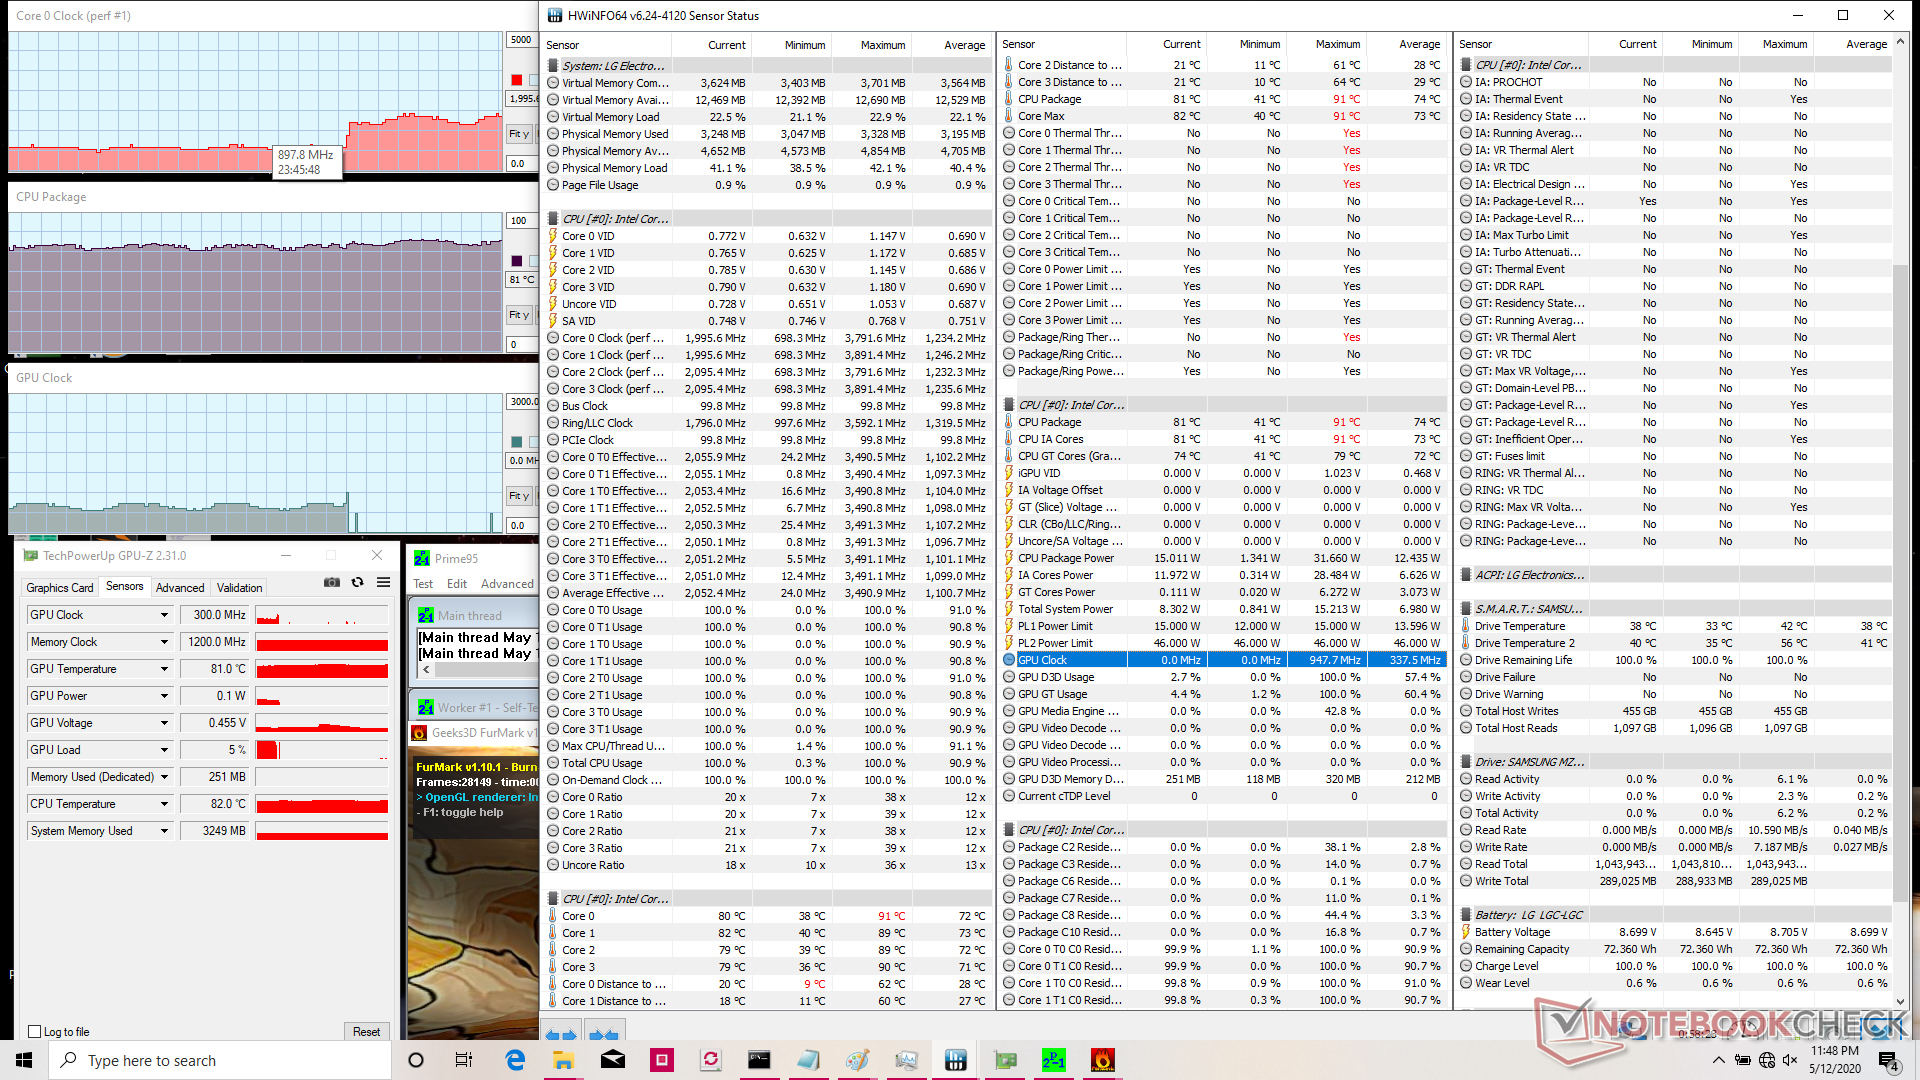
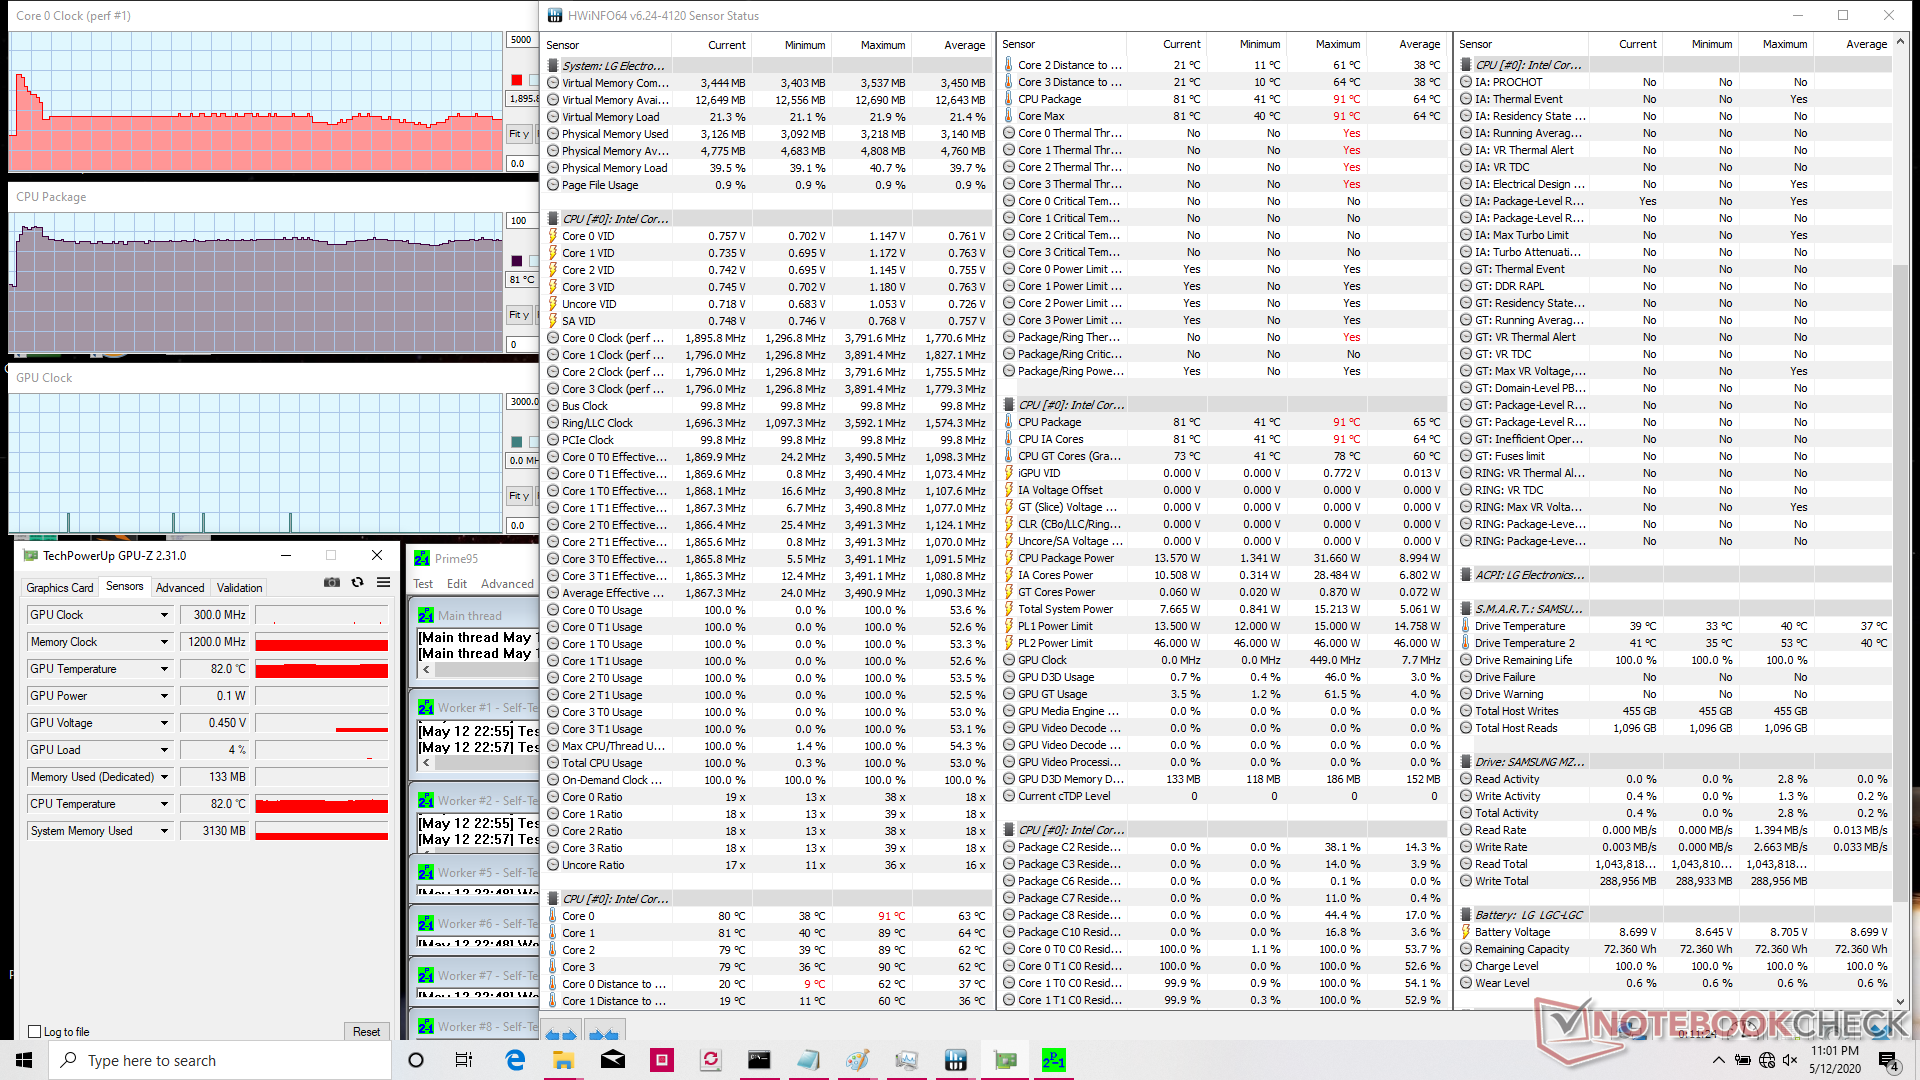
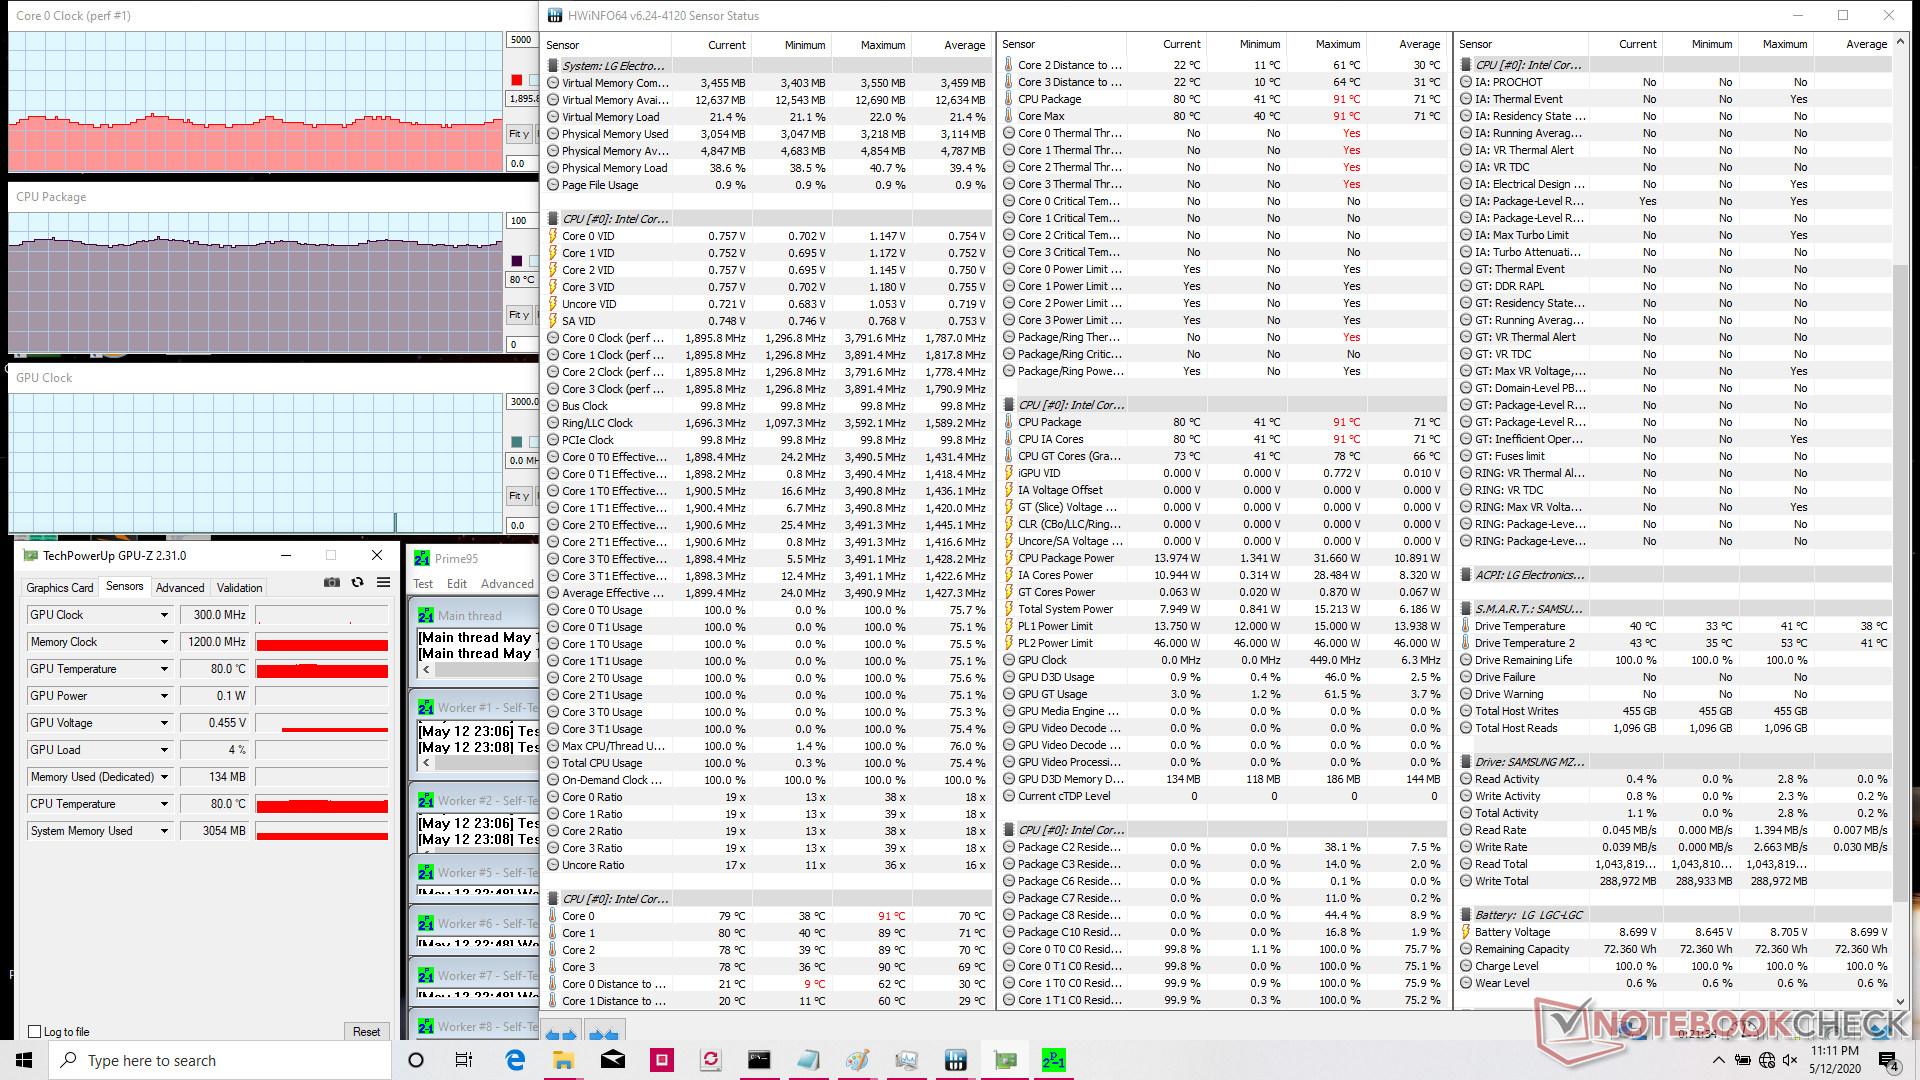
Stress Test
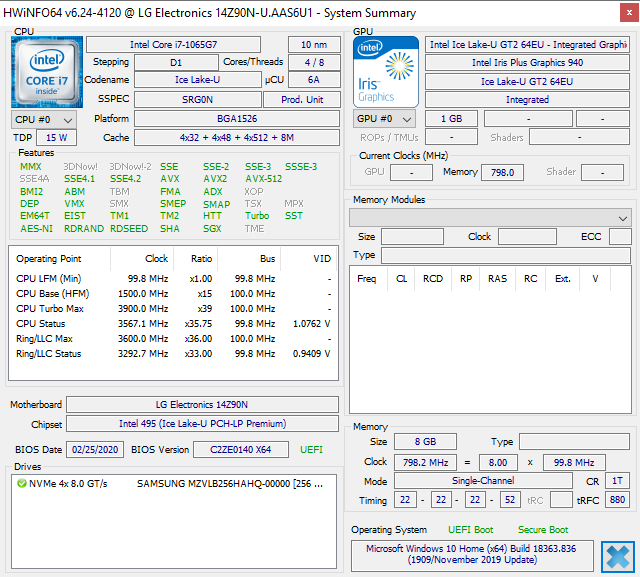
We stress the laptop with synthetic loads to identify for any potential throttling or stability issues. When running Prime95, the CPU would boost up to 3.5 GHz for just the first couple of seconds before hitting a core temperature of 90 C. Clock rates would then quickly fall and stabilize at 2 GHz for the next two minutes. Eventually, however, both clock rates and temperature would cycle between 1.6 GHz to 2.0 GHz and 78 C to 82 C, respectively. When considering that the base clock rate of the Core i7-1065G7 is 1.3 GHz, the Gram 14 is only able to sustain a Turbo Boost of +300 to +700 MHz. In comparison, the same CPU in the XPS 13 9300 would cycle between a much higher range of 1.8 GHz to 3.3 GHz for significantly faster processor performance on average.
Running on battery power will limit performance even when set to the High Performance power profile. A 3DMark 11 test on batteries would return Physics and Graphics scores of 4672 and 2675 points, respectively, compared to 5744 and 3150 points when on mains.
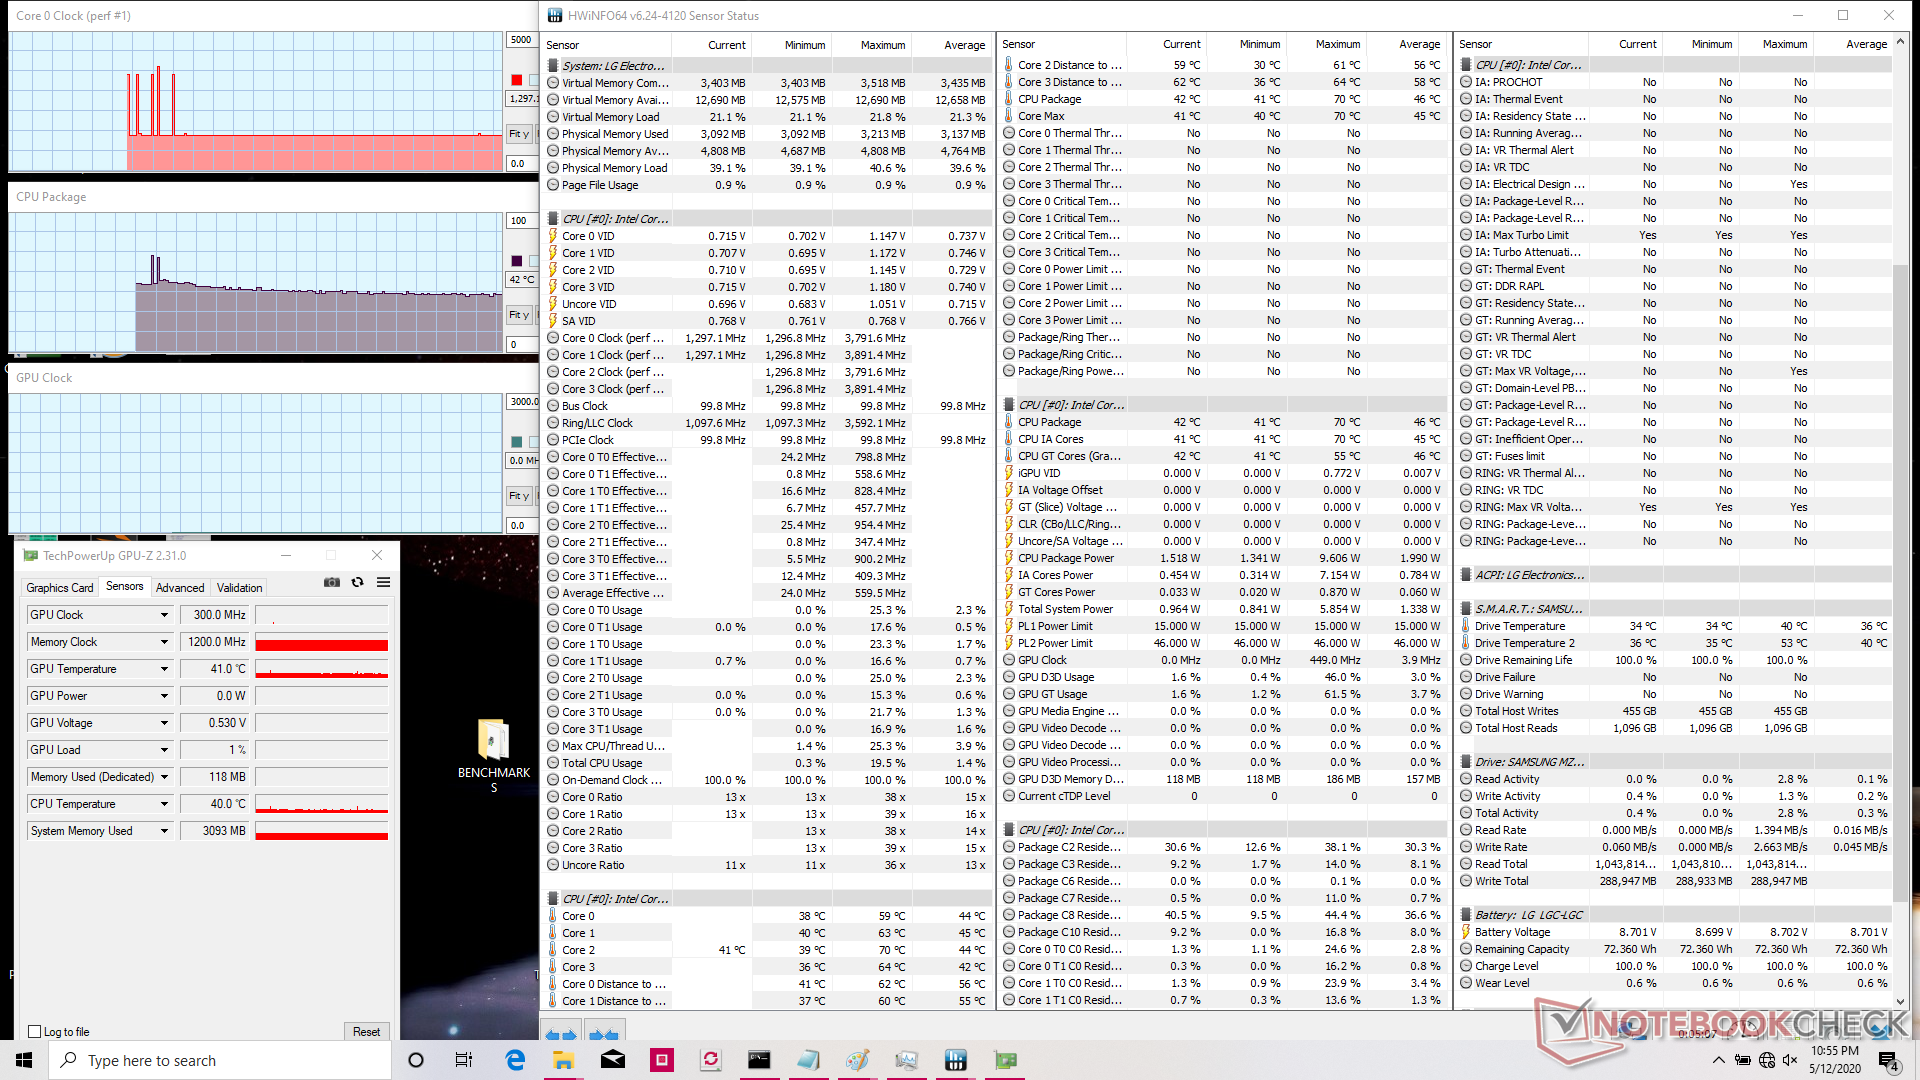
| CPU Clock (GHz) | GPU Clock (MHz) | Average CPU Temperature (°C) | |
| System Idle | -- | -- | 42 |
| Prime95 Stress | 1.6 - 2.0 | -- | 78 - 82 |
| Prime95 + FurMark Stress | 1.6 - 2.0 | 430 - 450 | 78 - 82 |
Speakers

The dual 1.5 W speakers are better than expected for such a lightweight system. Not only are they loud, but bass reproduction is also decent for the category. Higher volume settings will vibrate the palm rests just slightly but there will otherwise be no static or heavy imbalances.
LG Gram 14Z90N audio analysis
(+) | speakers can play relatively loud (83.8 dB)
Bass 100 - 315 Hz
(-) | nearly no bass - on average 19.3% lower than median
(±) | linearity of bass is average (11.7% delta to prev. frequency)
Mids 400 - 2000 Hz
(+) | balanced mids - only 4.5% away from median
(+) | mids are linear (5.6% delta to prev. frequency)
Highs 2 - 16 kHz
(+) | balanced highs - only 1.6% away from median
(+) | highs are linear (5.9% delta to prev. frequency)
Overall 100 - 16.000 Hz
(±) | linearity of overall sound is average (16.9% difference to median)
Compared to same class
» 43% of all tested devices in this class were better, 7% similar, 49% worse
» The best had a delta of 5%, average was 18%, worst was 53%
Compared to all devices tested
» 30% of all tested devices were better, 8% similar, 62% worse
» The best had a delta of 4%, average was 24%, worst was 134%
Apple MacBook 12 (Early 2016) 1.1 GHz audio analysis
(+) | speakers can play relatively loud (83.6 dB)
Bass 100 - 315 Hz
(±) | reduced bass - on average 11.3% lower than median
(±) | linearity of bass is average (14.2% delta to prev. frequency)
Mids 400 - 2000 Hz
(+) | balanced mids - only 2.4% away from median
(+) | mids are linear (5.5% delta to prev. frequency)
Highs 2 - 16 kHz
(+) | balanced highs - only 2% away from median
(+) | highs are linear (4.5% delta to prev. frequency)
Overall 100 - 16.000 Hz
(+) | overall sound is linear (10.2% difference to median)
Compared to same class
» 7% of all tested devices in this class were better, 2% similar, 91% worse
» The best had a delta of 5%, average was 18%, worst was 53%
Compared to all devices tested
» 5% of all tested devices were better, 1% similar, 94% worse
» The best had a delta of 4%, average was 24%, worst was 134%
Energy Management
Power Consumption
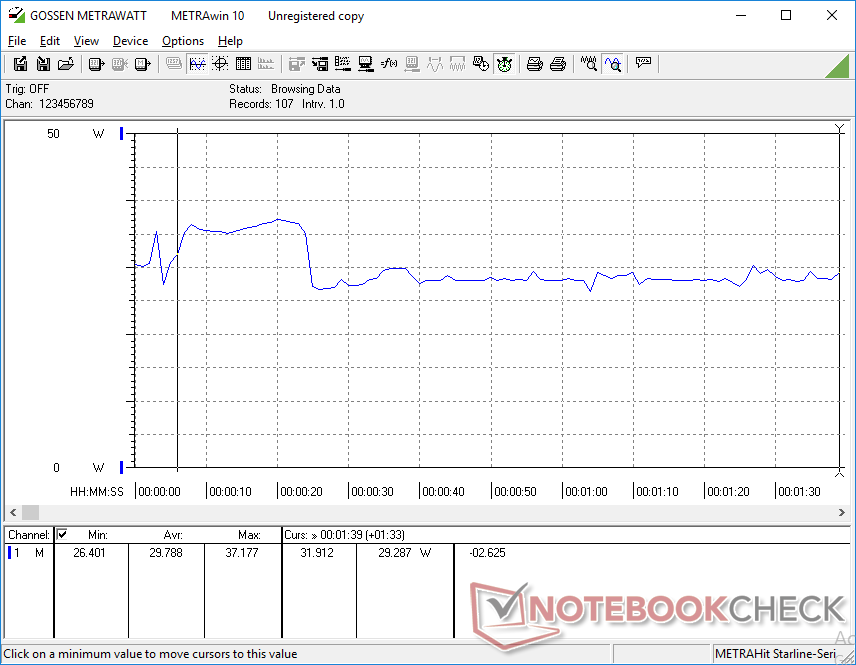
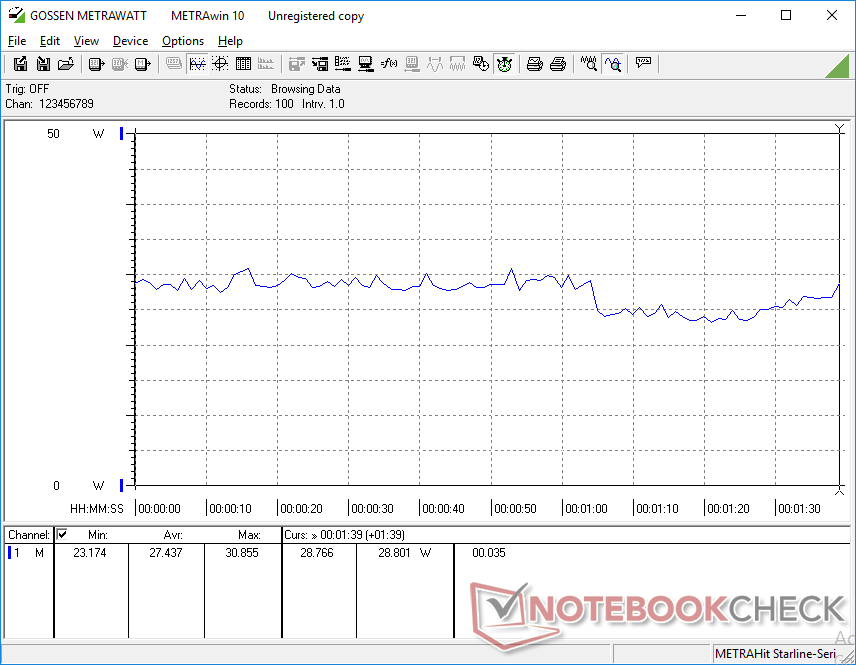
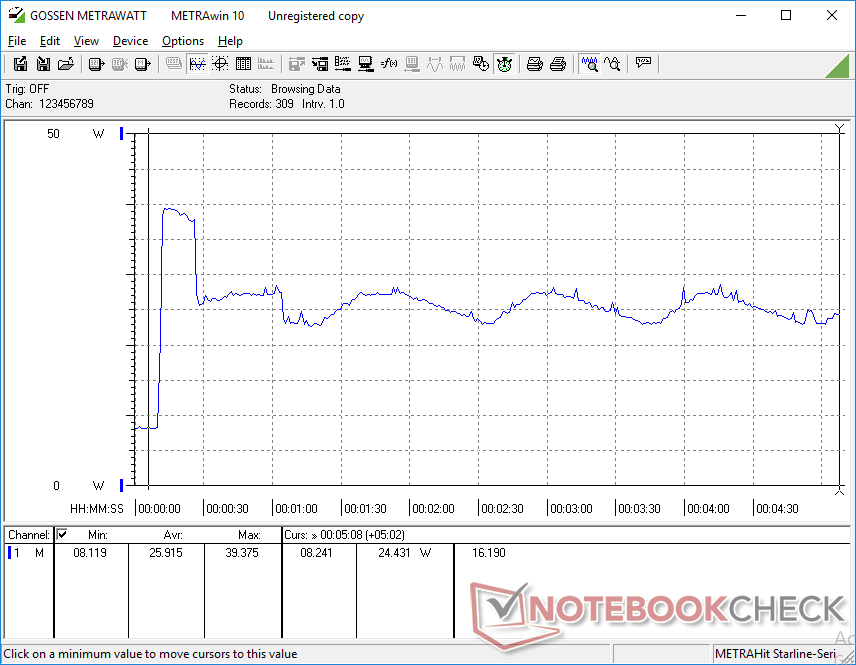
Power consumption is generally lower than other subnotebooks with the same Ice Lake CPU which is in line with the slower-than-average performance recorded above. When running the first benchmark scene of 3DMark 06, for example, consumption is only about 30 W compared to 33 W to 34 W on the Dell XPS 13 or HP Spectre x360 13, respectively, even though these alternatives have smaller 13.3-inch screens.
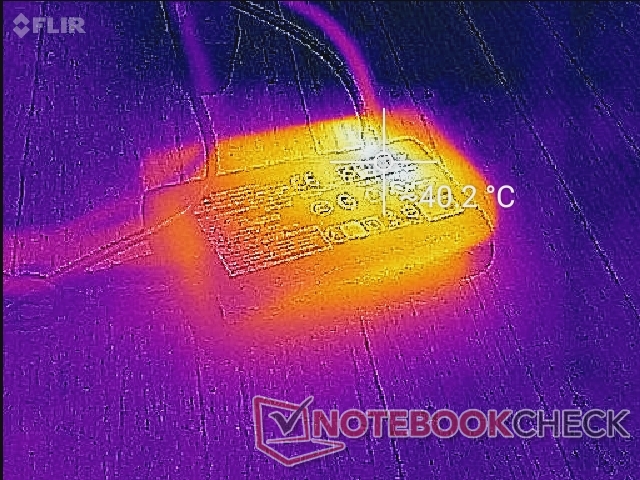
We're able to record a temporary maximum of 39.5 W from the small (~9.7 x 6 x 2.7 cm) 48 W AC adapter when running Prime95 and/or FurMark to show the very limited Turbo Boost potential of the system. Power consumption eventually cycles between 25 W and 30 W much like how the clock rates would cycle as noted in our Stress Test section above.

| Off / Standby | |
| Idle | |
| Load |
|
Key:
min: | |
| LG Gram 14Z90N i7-1065G7, Iris Plus Graphics G7 (Ice Lake 64 EU), Samsung SSD PM981 MZVLB256HAHQ, IPS, 1920x1080, 14" | LG Gram 14T90N i7-10510U, UHD Graphics 620, Samsung SSD PM981a MZVLB512HBJQ, IPS, 1920x1080, 14" | Dell XPS 13 9300 Core i7-1065G7 i7-1065G7, Iris Plus Graphics G7 (Ice Lake 64 EU), Intel SSDPEMKF512G8 NVMe SSD, IPS, 1920x1200, 13.4" | Lenovo IdeaPad S940-14IWL i7-8565U, UHD Graphics 620, Samsung SSD PM981 MZVLB512HAJQ, IPS, 3840x2160, 14" | Asus ZenBook 14 UM431DA-AM020T R7 3700U, Vega 10, SK hynix BC501 HFM512GDHTNG-8310A, IPS, 1920x1080, 14" | Huawei Matebook X Pro i5 i5-8250U, GeForce MX150, Samsung PM961 MZVLW256HEHP, IPS, 3000x2000, 13.9" | |
|---|---|---|---|---|---|---|
| Power Consumption | -4% | -21% | -60% | -27% | -49% | |
| Idle Minimum * (Watt) | 2.6 | 2.9 -12% | 4.2 -62% | 5.2 -100% | 3.6 -38% | 3.5 -35% |
| Idle Average * (Watt) | 5.9 | 5.8 2% | 6.9 -17% | 10.2 -73% | 7.2 -22% | 8.9 -51% |
| Idle Maximum * (Watt) | 8 | 6.2 22% | 7.5 6% | 11.9 -49% | 10.8 -35% | 12.3 -54% |
| Load Average * (Watt) | 29.8 | 32.9 -10% | 33.3 -12% | 42.1 -41% | 38 -28% | 54.2 -82% |
| Witcher 3 ultra * (Watt) | 30.9 | 37.1 -20% | 42.4 -37% | |||
| Load Maximum * (Watt) | 39.5 | 48.5 -23% | 48.4 -23% | 53.6 -36% | 45.2 -14% | 52.1 -32% |
* ... smaller is better
Battery Life
LG likes to equip their Gram laptops with large 72 Wh batteries despite their small and lightweight designs. In comparison, the Lenovo IdeaPad S940 and Asus ZenBook 14 each come with only 52 WH and 47 Wh batteries, respectively. Runtimes are therefore impressively long for any Ultrabook at 14 hours of real-world WLAN use.
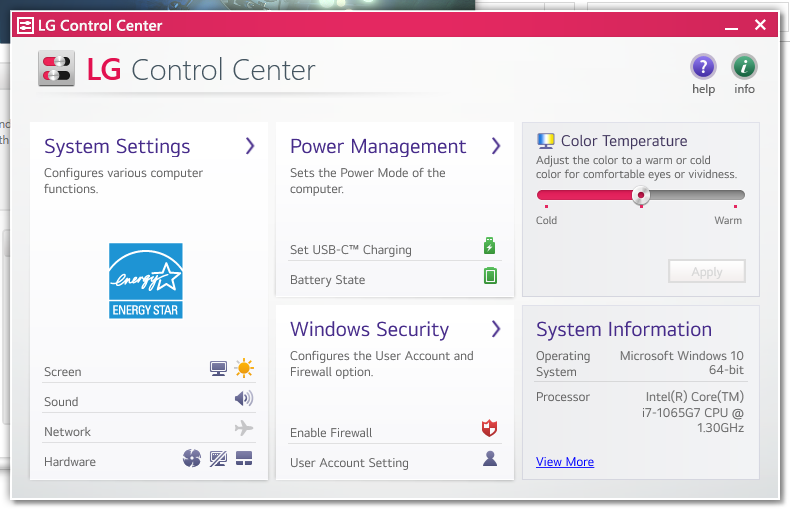
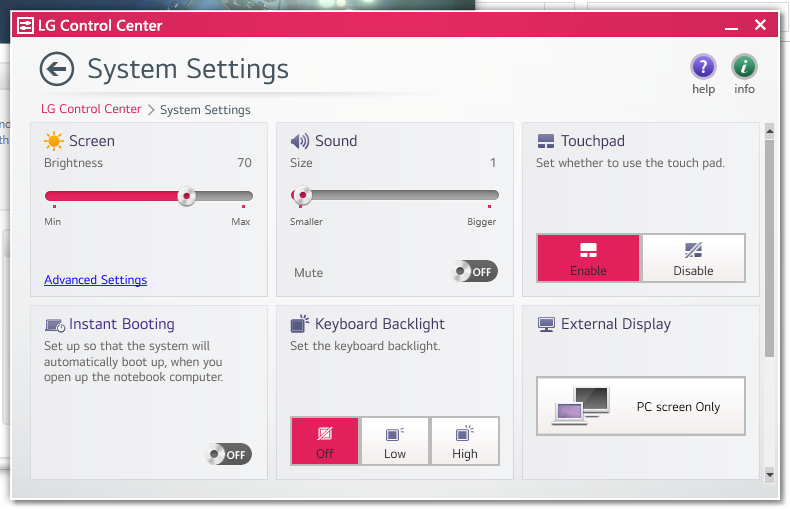
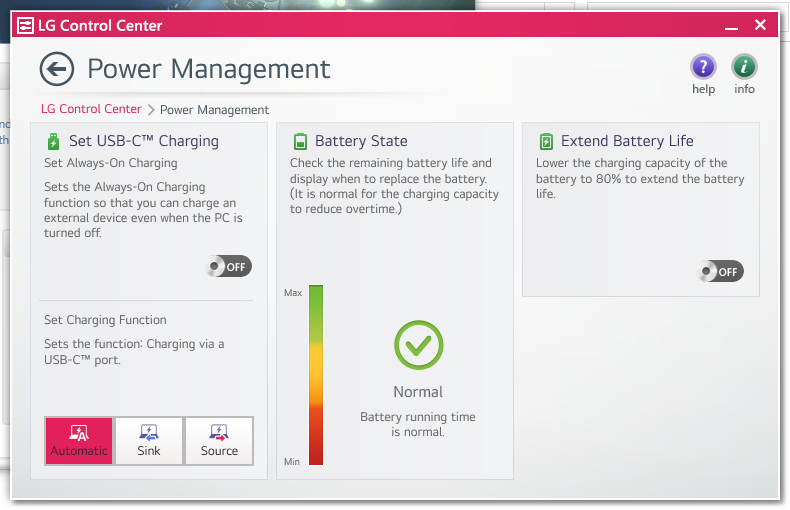
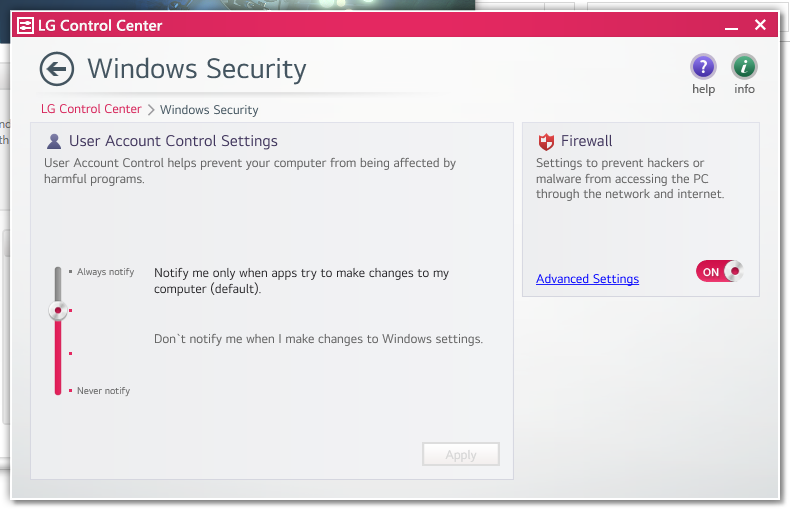
Charging, however, is very slow. A full charge from empty to full capacity takes about 3 hours compared to half that on most other Ultrabooks. Charging via USB Type-C is possible so long as the feature is enabled through the LG Control Center software.
| LG Gram 14Z90N i7-1065G7, Iris Plus Graphics G7 (Ice Lake 64 EU), 72 Wh | LG Gram 14T90N i7-10510U, UHD Graphics 620, 72 Wh | LG Gram 14Z980-U.AAW5U1 i5-8250U, UHD Graphics 620, 72 Wh | Dell XPS 13 9300 Core i7-1065G7 i7-1065G7, Iris Plus Graphics G7 (Ice Lake 64 EU), 52 Wh | Lenovo IdeaPad S940-14IWL i7-8565U, UHD Graphics 620, 52 Wh | Asus ZenBook 14 UM431DA-AM020T R7 3700U, Vega 10, 47 Wh | |
|---|---|---|---|---|---|---|
| Battery runtime | -22% | -18% | -9% | -66% | -51% | |
| Reader / Idle (h) | 45.6 | 32.8 -28% | 37.3 -18% | 8.4 -82% | 17.8 -61% | |
| WiFi v1.3 (h) | 14 | 12.5 -11% | 12 -14% | 12.7 -9% | 5 -64% | 6.7 -52% |
| Load (h) | 3.5 | 2.6 -26% | 2.7 -23% | 1.7 -51% | 2.1 -40% |
Pros
Cons
Verdict
The LG Gram 14Z90N addresses just a few of shortcomings on last year's Gram 14Z980 while ignoring the rest. The welcomed changes include Thunderbolt 3 support, a stronger hinge design, and seemingly stronger key feedback.
Unfortunately, key drawbacks remain such as the dismal processor performance, average display brightness, and the difficult serviceability. Users who may have been looking forward to owning a Core i7 Ice Lake-U CPU will only find a shell of what the processor is capable of when compared to machines with the exact same CPU like the Dell XPS 13 9300. We suspect that the manufacturer had to tone down the performance of the Core i7 in order to meet the low weight goals and limited cooling potential. It's also disappointing that LG didn't take the time to up the brightness of the backlight because as lightweight and portable as the system may be, it's not that great in outdoor conditions where glare becomes prevalent.
The core advantages of the Gram have thankfully transferred over to make the overall package still appealing. The super lightweight, wide port options, quiet fan, crisp and well-calibrated display, and extra-long battery life are all representative of the high ~$1500 USD asking price. If you're looking for more CPU and GPU oomph, however, alternatives from Dell, HP, Lenovo, or Asus would be your better bet.
Great for light to light-medium office tasks especially when on-the-go. The LG Gram 14 is quite versatile considering the light weight, but just don't overload it with demanding applications as CPU performance is well below average for a U-class Core i7.
LG Gram 14Z90N
- 05/16/2020 v7 (old)
Allen Ngo
Price comparison
