LG Gram 16 (2021) in review: 1,200 grams, excellent battery life, 16:10 display

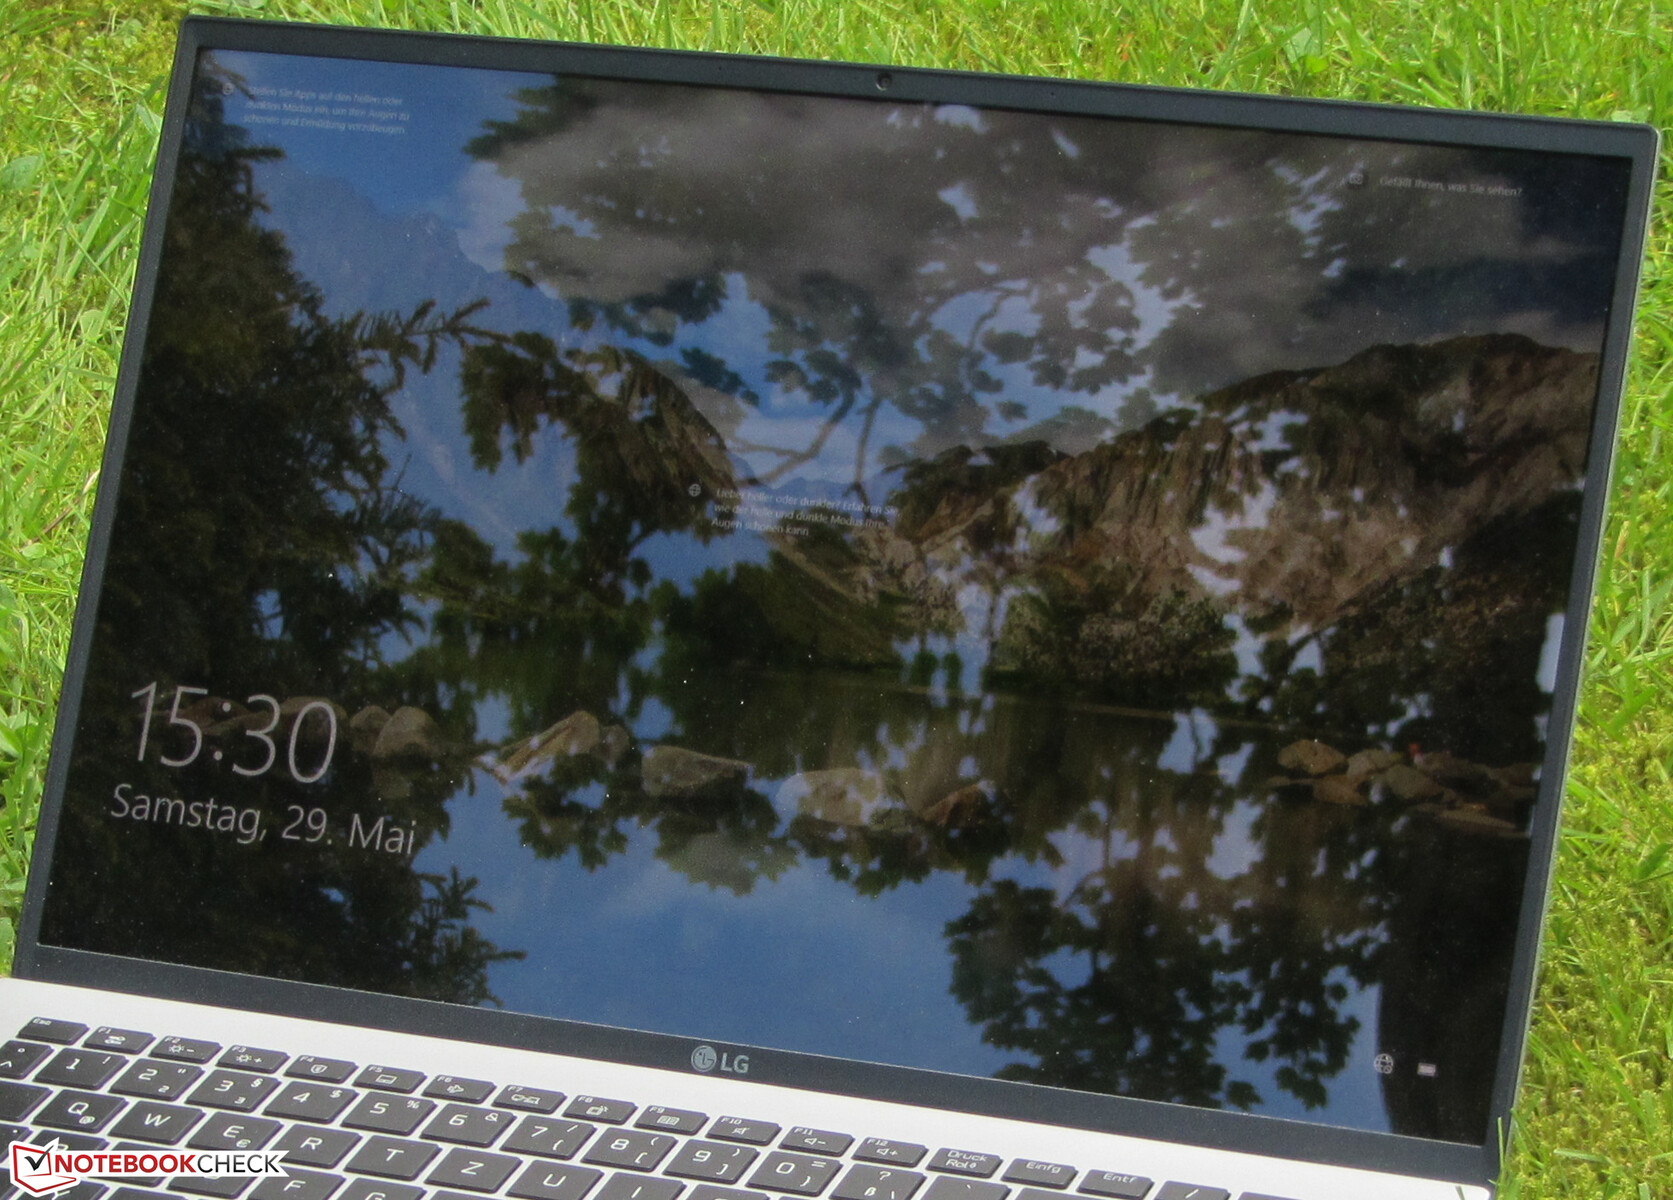
With the Gram 16, LG delivers a slim, mobile office laptop, and with its weight of just under 1.2 kg, it also belongs to the lightweight category. In addition to the low weight, the 16-inch display in the 16:10 format is another one of the laptop's highlights.
Our database doesn't hold any direct contenders. Comparable laptops are usually cheaper and/or weigh more. The extended competition includes devices like the Samsung Galaxy Book Ion Aura Silver, the Huawei MateBook D 16, the Acer Aspire 5 A515-56, the Asus VivoBook S15 S533EQ, and the Schenker Vision 15.
Possible contenders in comparison
Rating | Date | Model | Weight | Height | Size | Resolution | Price |
|---|---|---|---|---|---|---|---|
| 86.3 % v7 (old) | 06 / 2021 | LG Gram 16 (2021) i7-1165G7, Iris Xe G7 96EUs | 1.2 kg | 16.8 mm | 16.00" | 2560x1600 | |
| 81.7 % v7 (old) | 10 / 2020 | Samsung Galaxy Book Ion Aura Silver i7-10510U, GeForce MX250 | 1.3 kg | 15 mm | 15.60" | 1920x1080 | |
| 86 % v7 (old) | 04 / 2021 | Huawei MateBook D 16-53011VFJ R5 4600H, Vega 6 | 1.7 kg | 18.4 mm | 16.10" | 1920x1080 | |
| 81.4 % v7 (old) | 02 / 2021 | Acer Aspire 5 A515-56-511A i5-1135G7, Iris Xe G7 80EUs | 1.9 kg | 18 mm | 15.60" | 1920x1080 | |
| 83.4 % v7 (old) | 12 / 2020 | Asus VivoBook S15 S533EQ-BQ002T i7-1165G7, GeForce MX350 | 1.8 kg | 16.1 mm | 15.60" | 1920x1080 | |
| 87.7 % v7 (old) | 12 / 2020 | Schenker Vision 15 i7-1165G7, Iris Xe G7 96EUs | 1.7 kg | 15 mm | 15.60" | 1920x1080 |
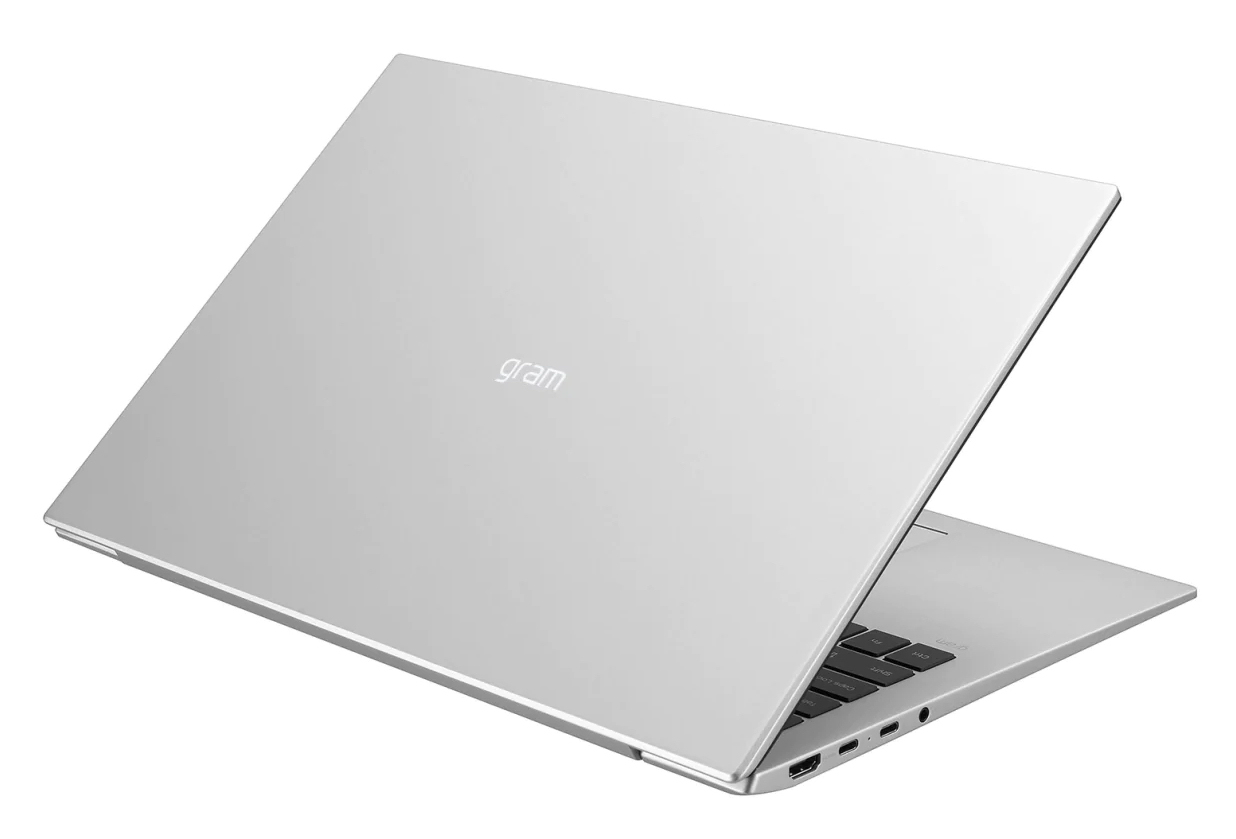
Case - LG opts for a magnesium chassis
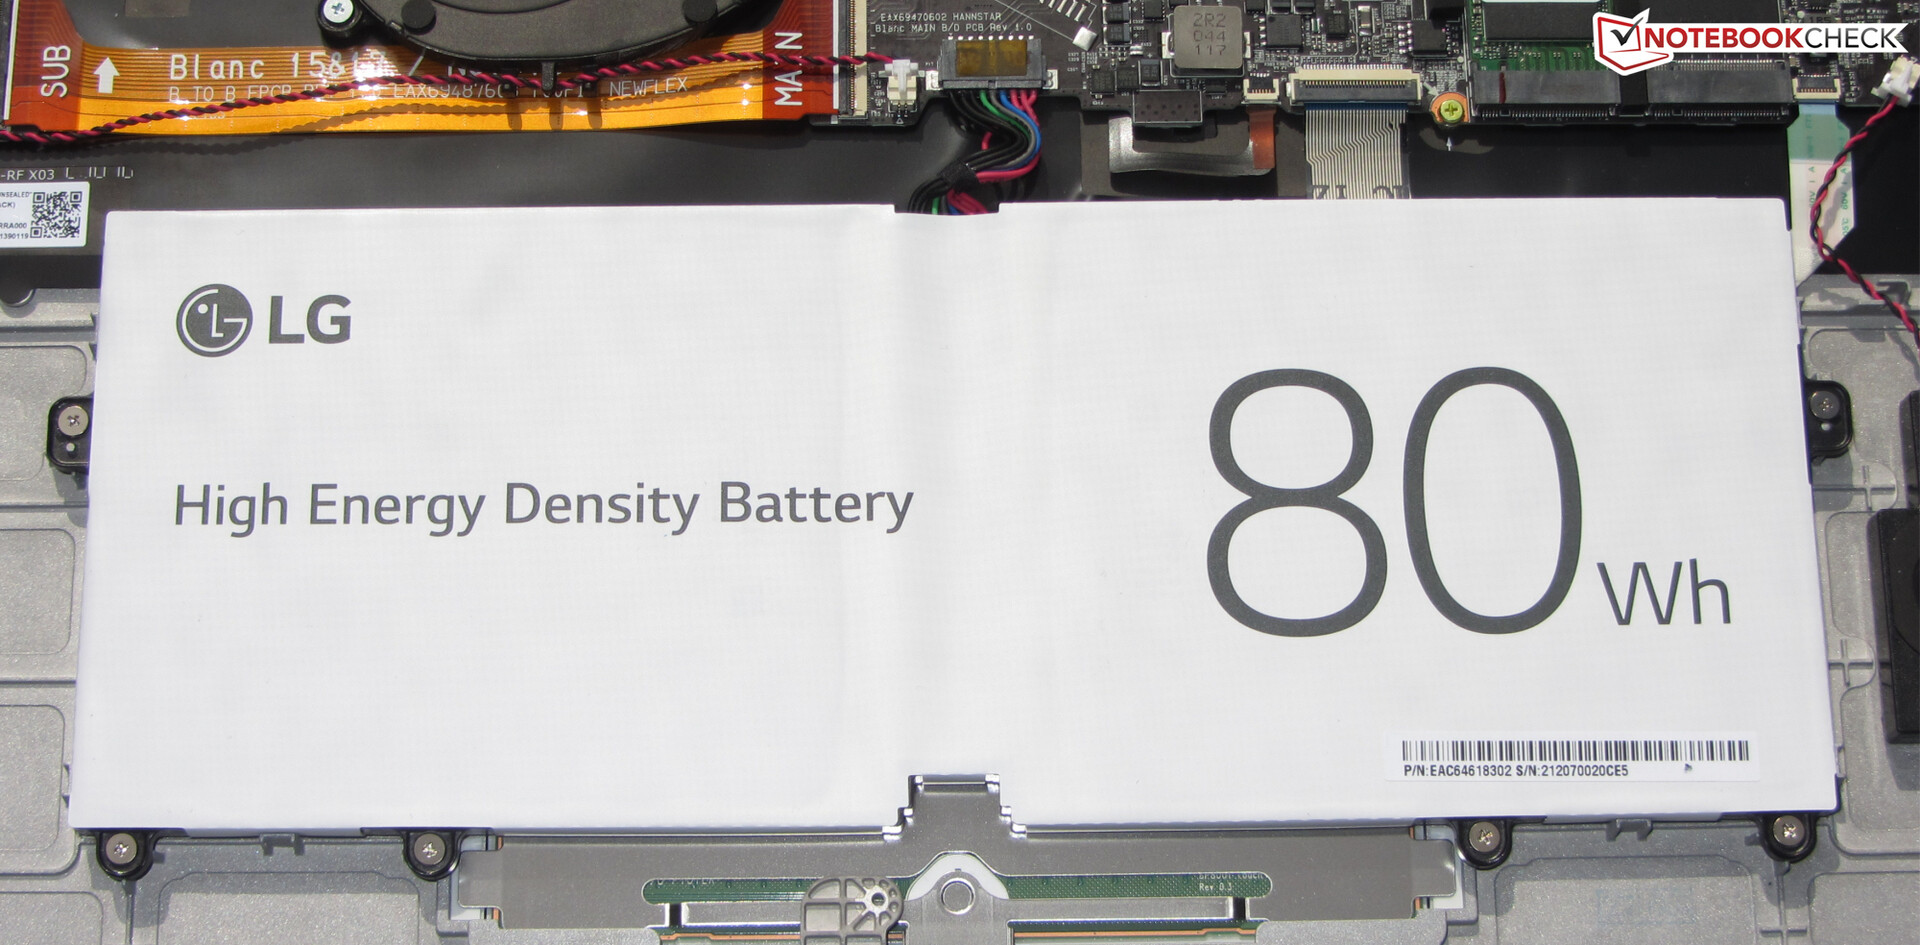
The silver-gray case of the Gram 16 is completely made of a magnesium alloy. LG goes for smooth, matte surfaces that are less susceptible to fingerprints. The sleek and elegant laptop doesn't feature any eye-catching design features. Moreover, the battery is firmly built into the device, and there is no maintenance hatch.
The laptop doesn't exhibit any manufacturing flaws. The gap dimensions are correct, and no material protrusions can be found. The lightweight and sophisticated construction has its price: The base unit and - to an even greater extent - the lid can be twisted. In addition, the back of the lid wobbles noticeably when pressure is applied. The hinges hold the screen firmly in position, but they allow it to rock back and forth. The maximum aperture angle is about 140 degrees, and a one-handed opening of the lid is possible.
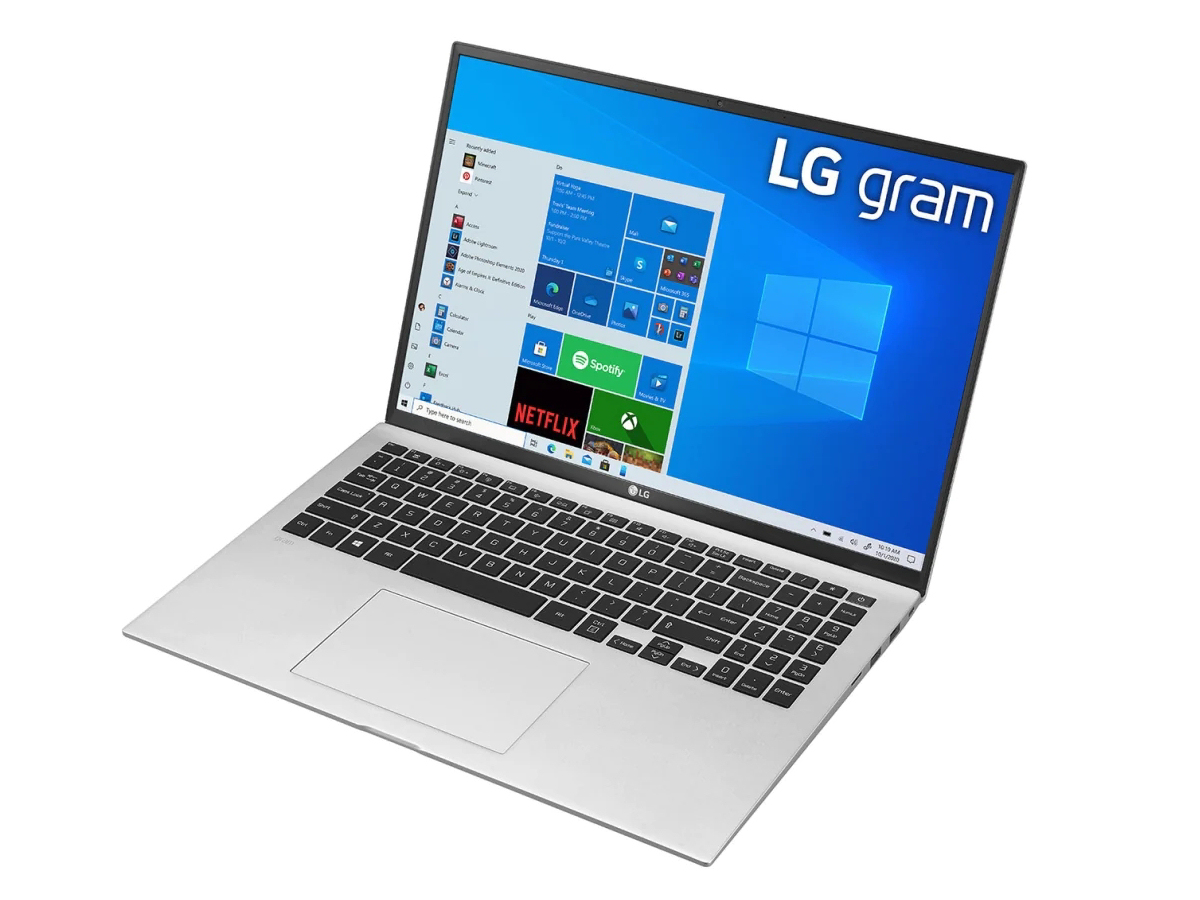
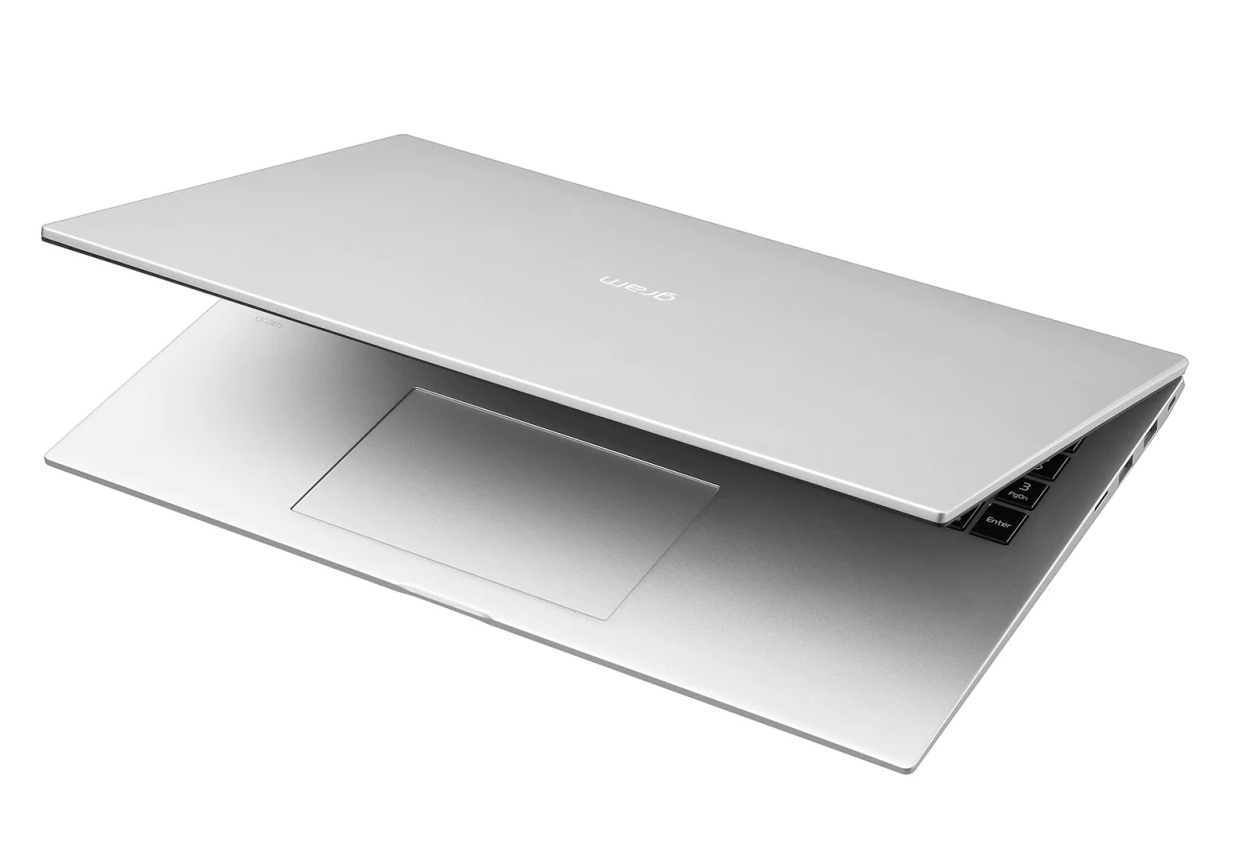
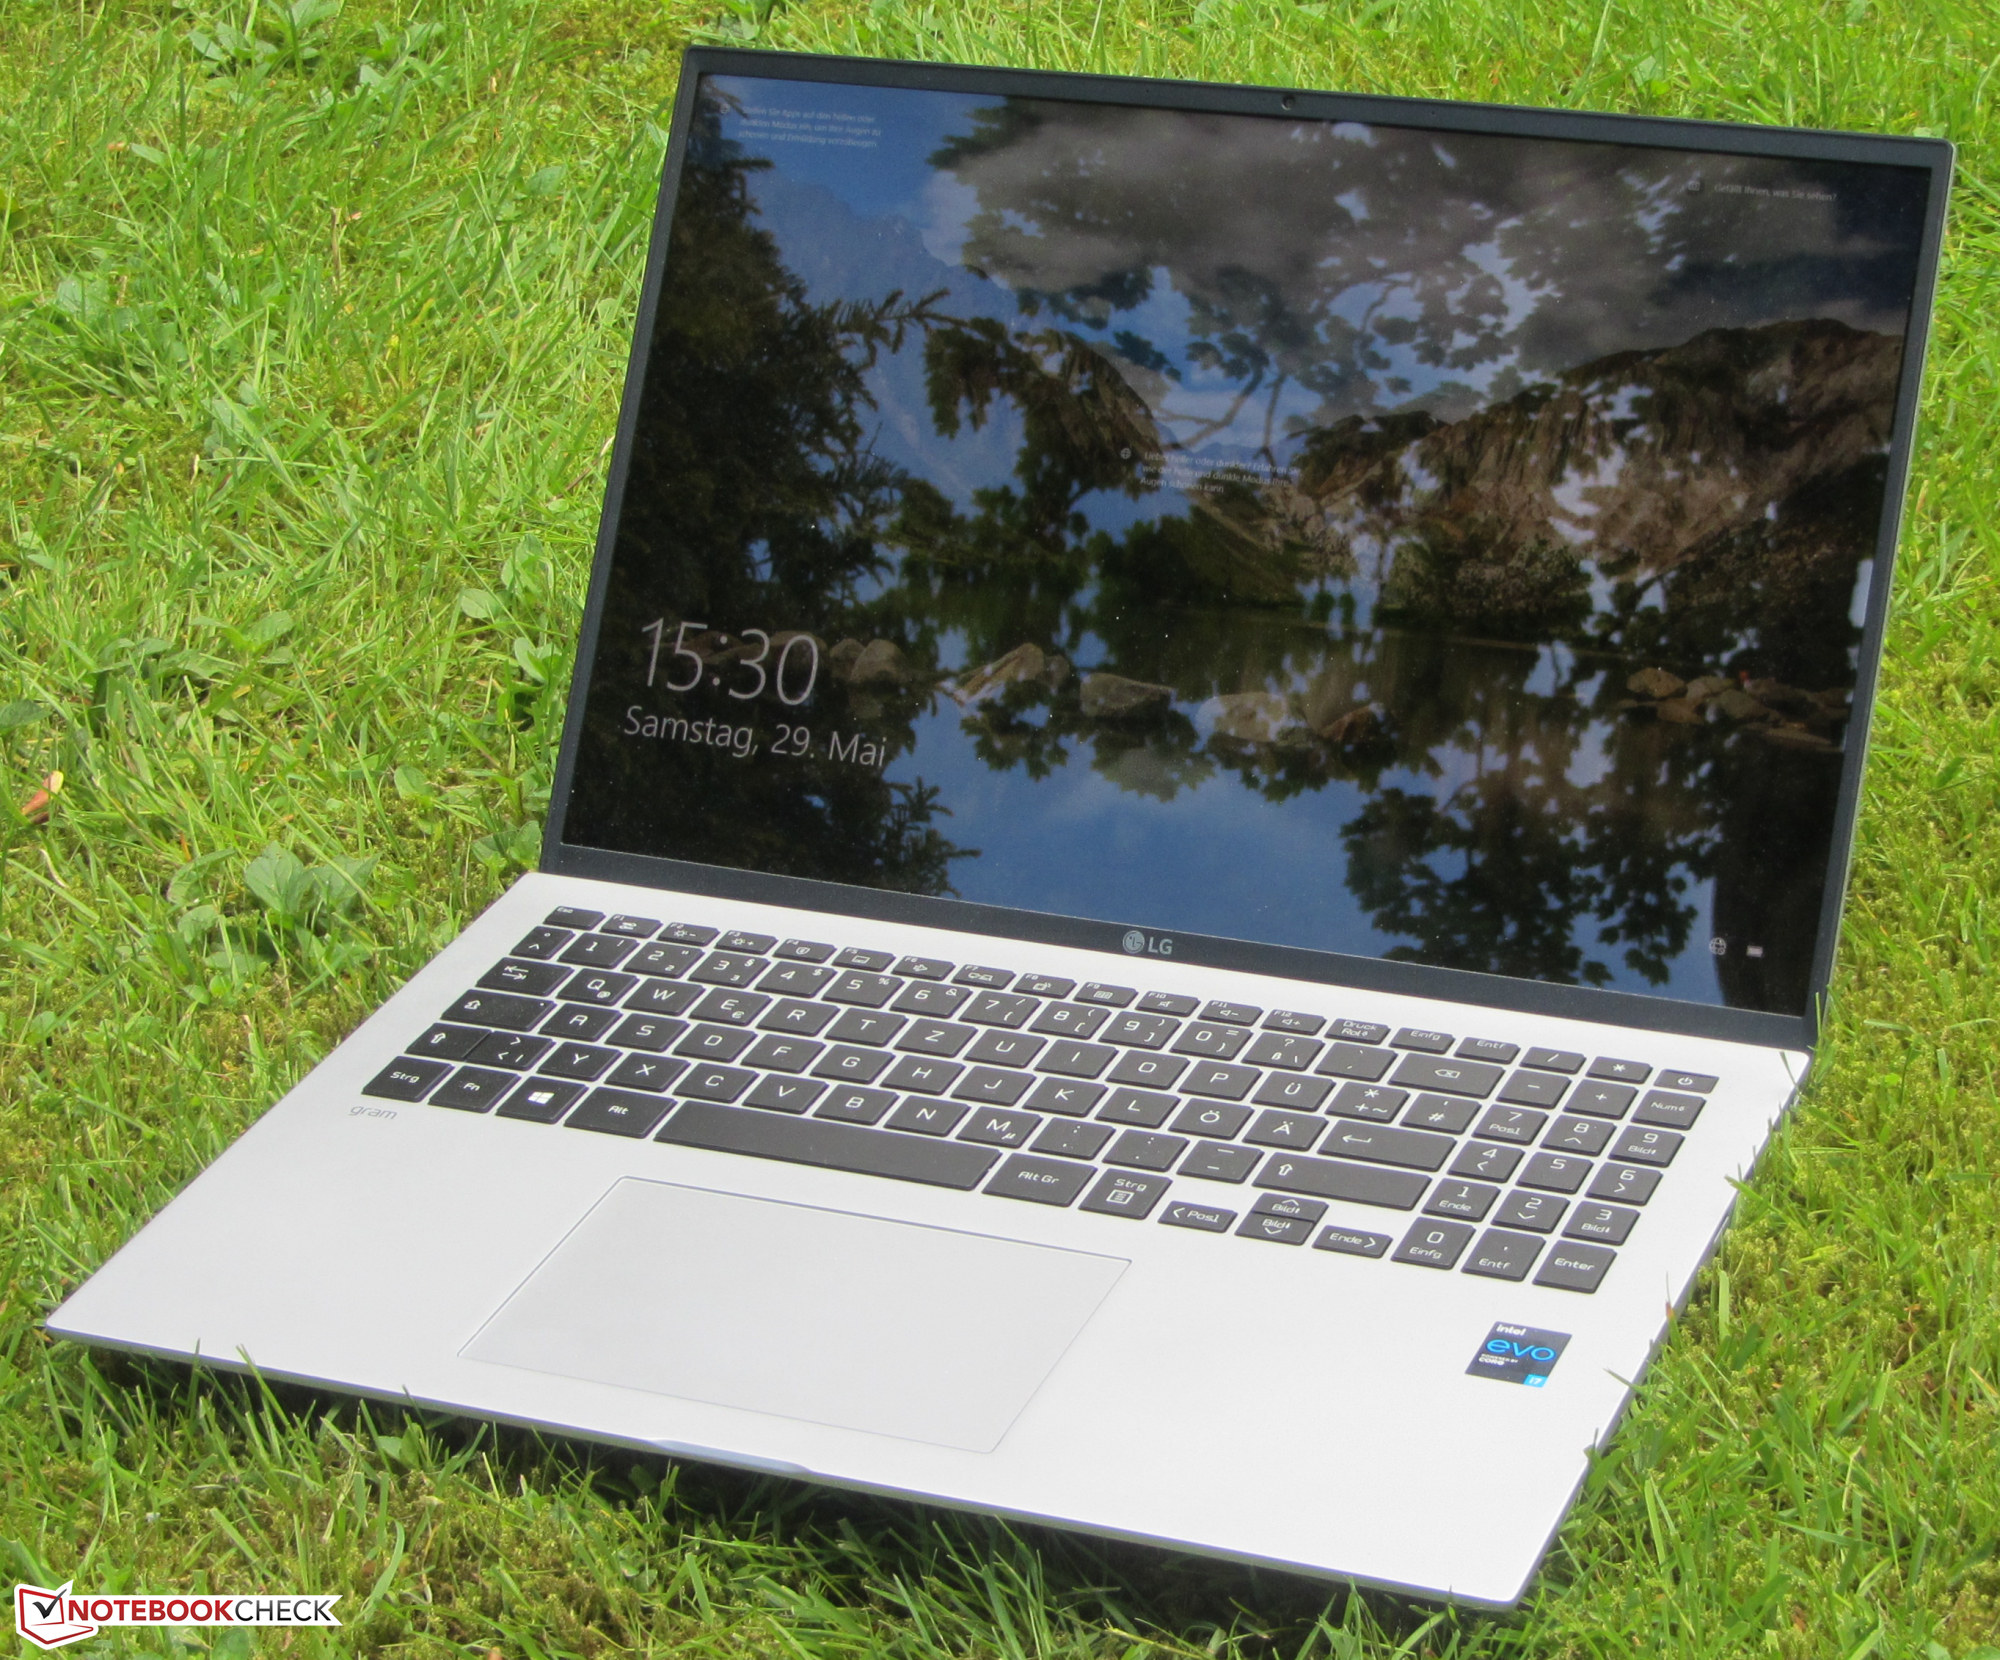
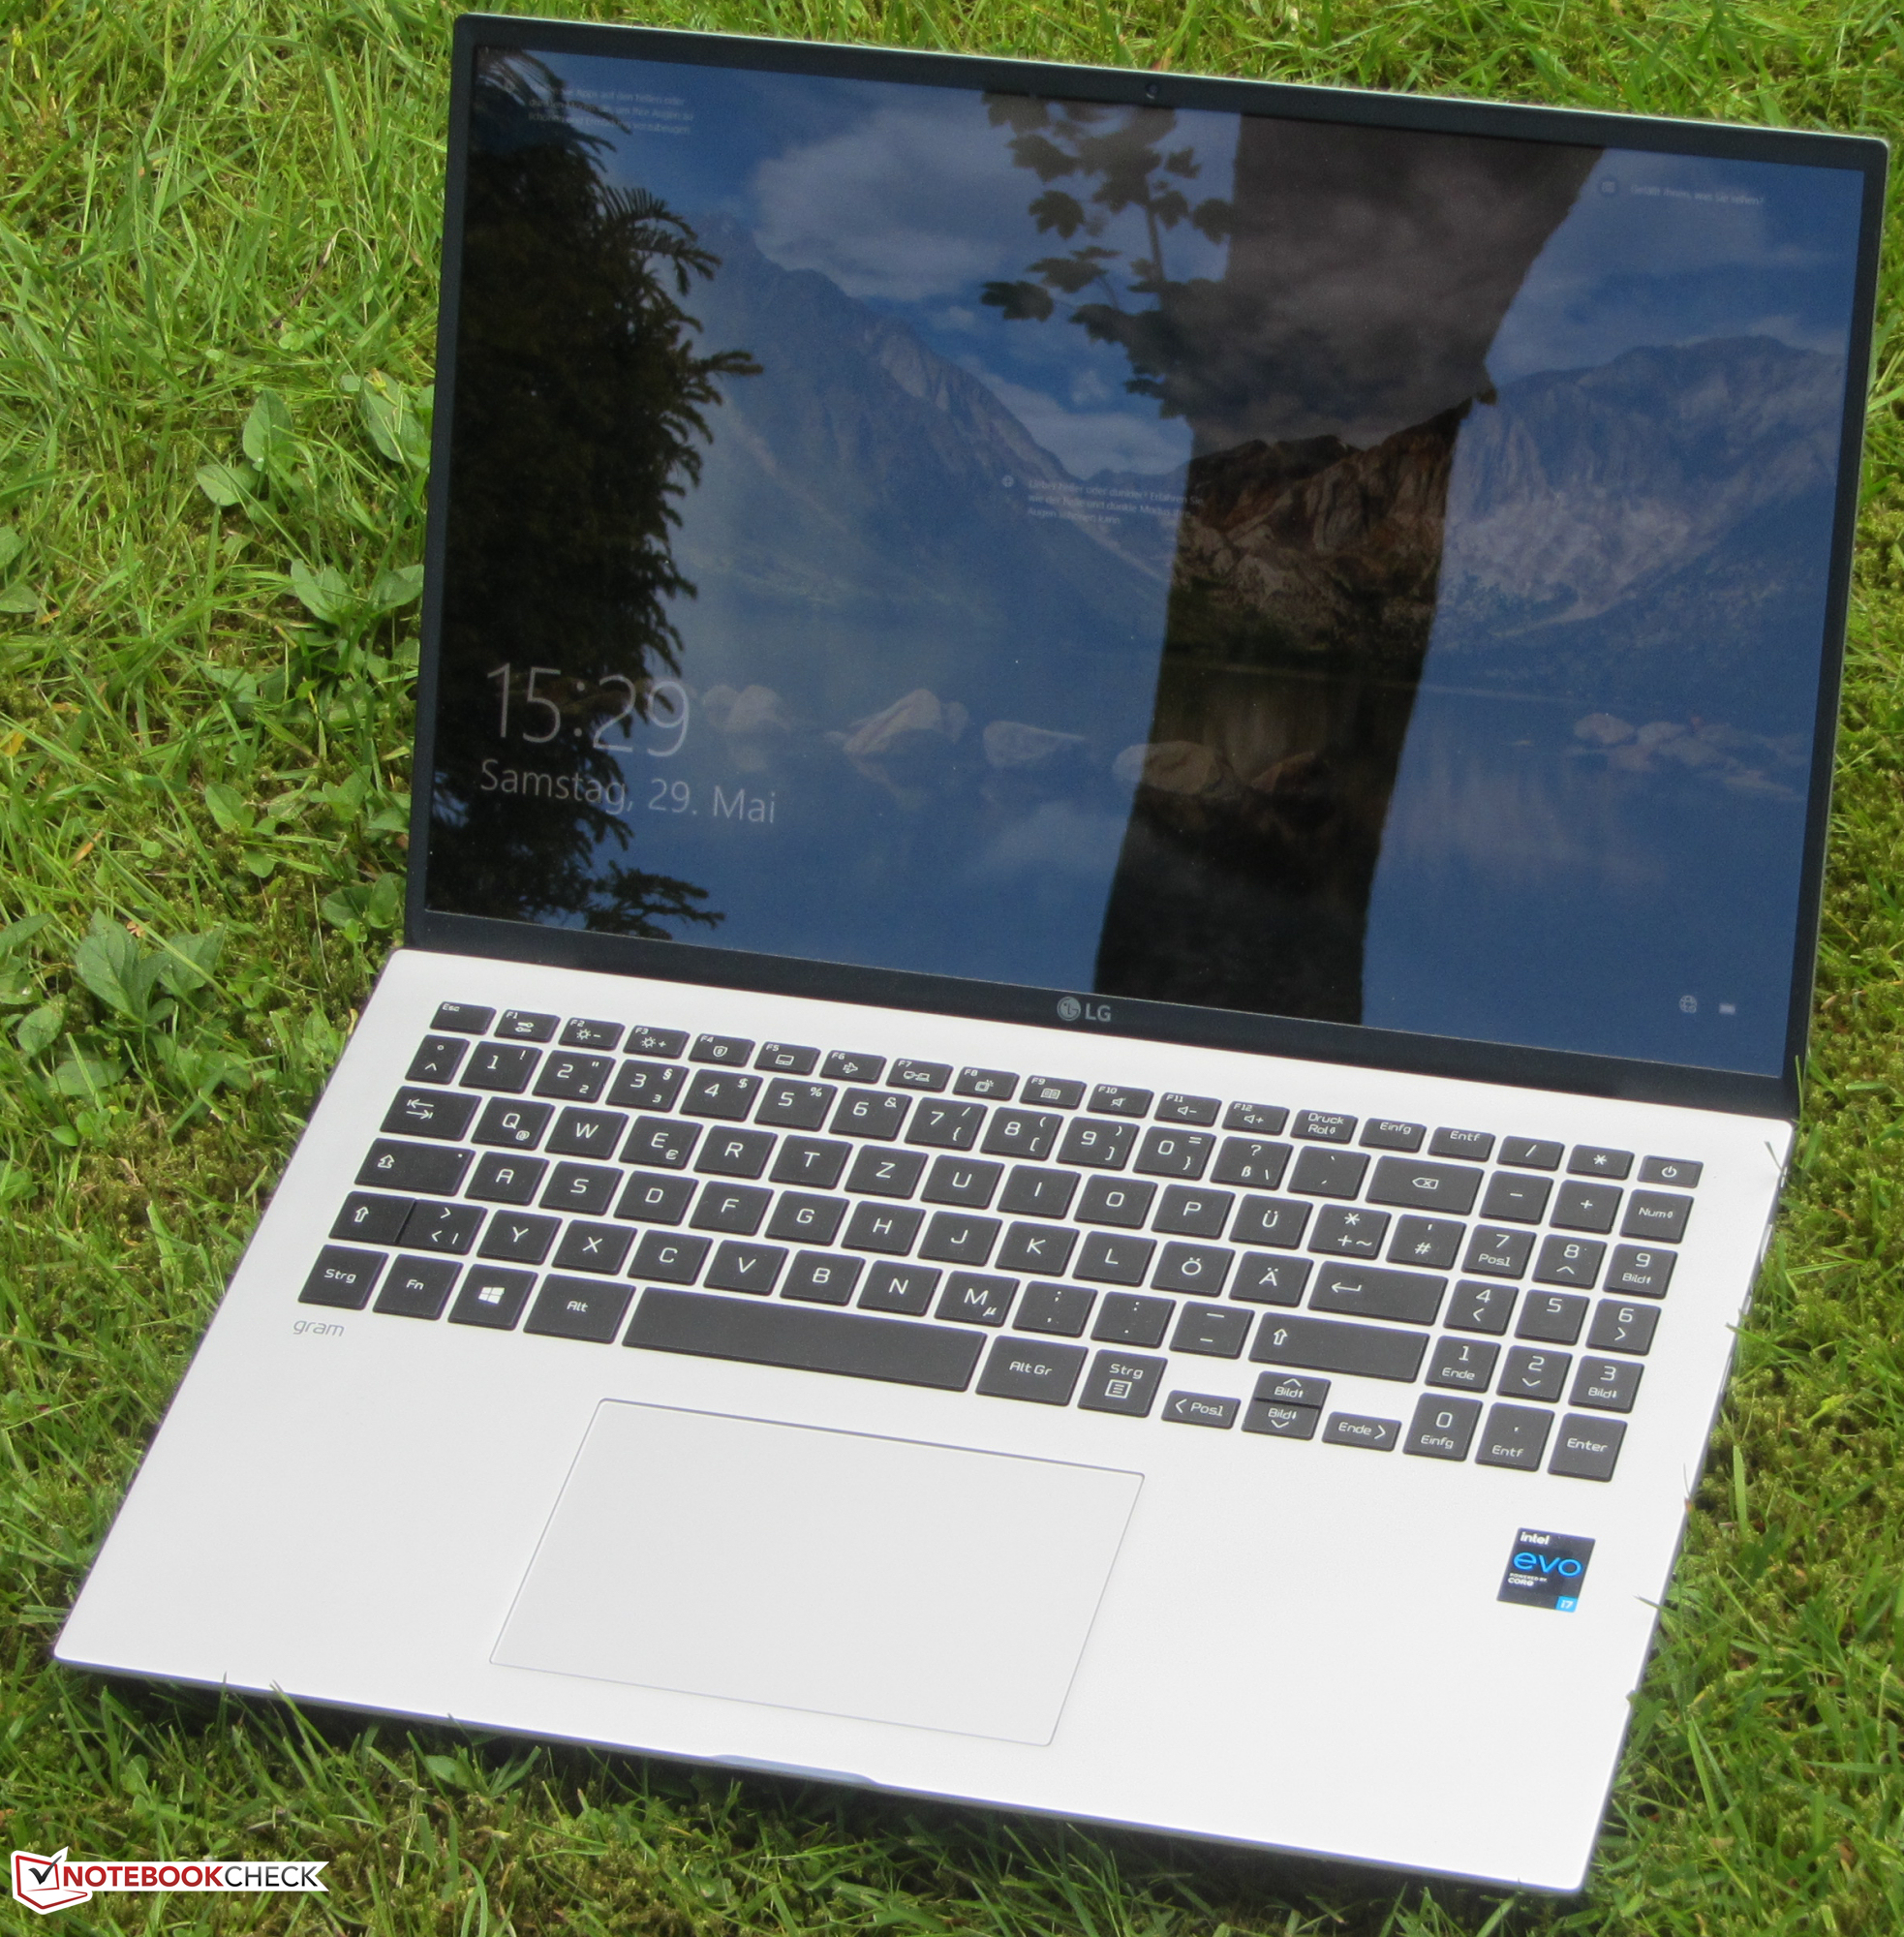
The Gram weighs just under 1,200 grams and is consequently the lightest device in our comparison field. Only the Samsung Galaxy Book Ion Aura Silver has a similar weight. Despite its 16-inch display in the 16:10 format, the device is hardly any bigger than 15.6-inch laptops with 16:9 displays.
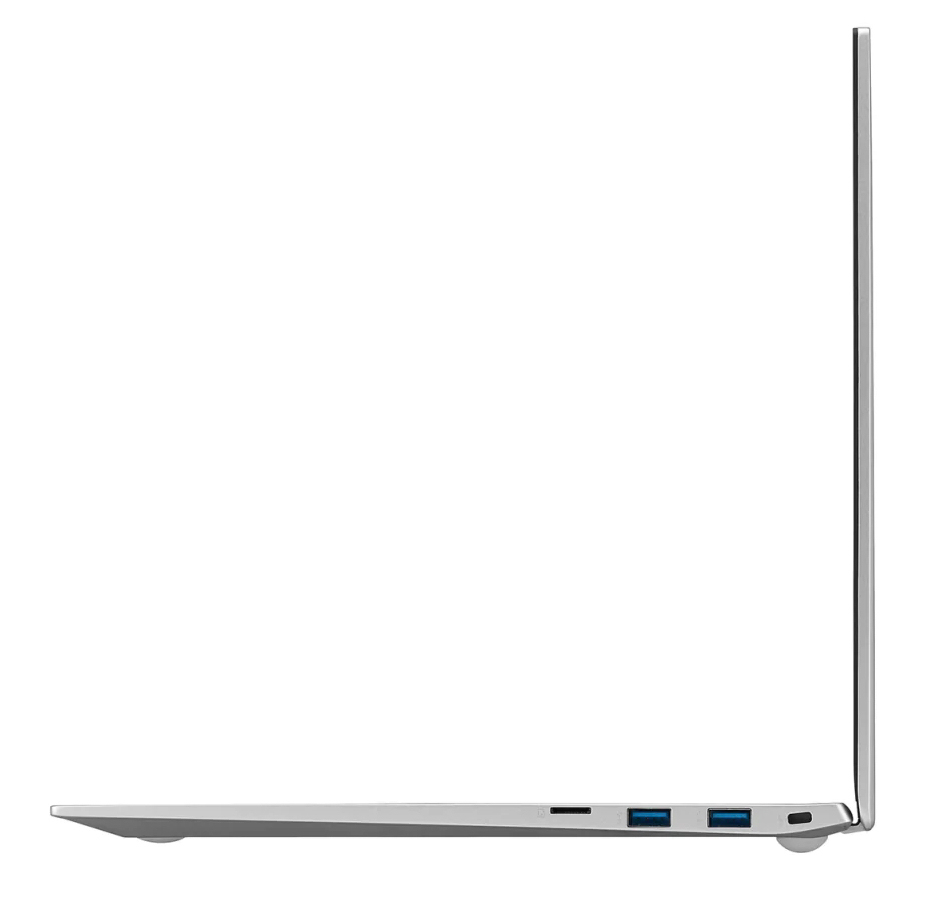
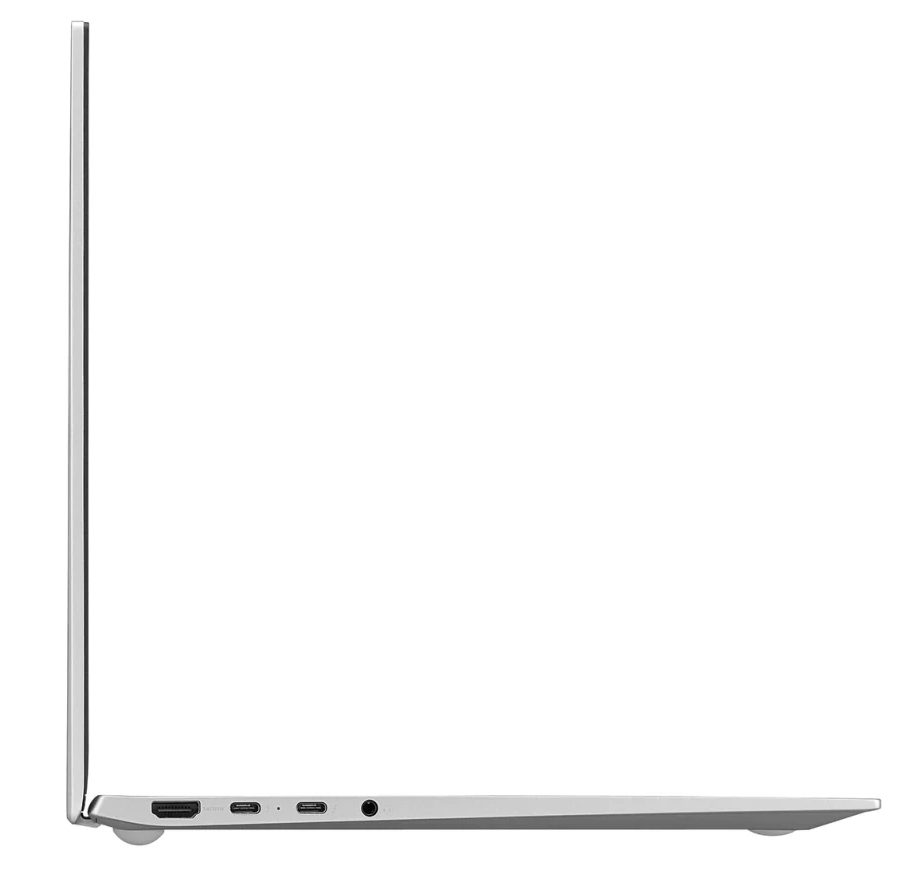
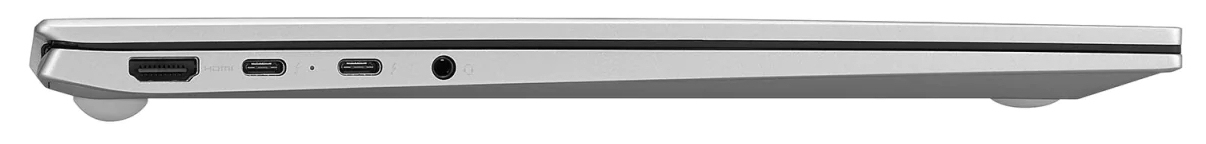
Connectivity - Gram 16 with Thunderbolt 4
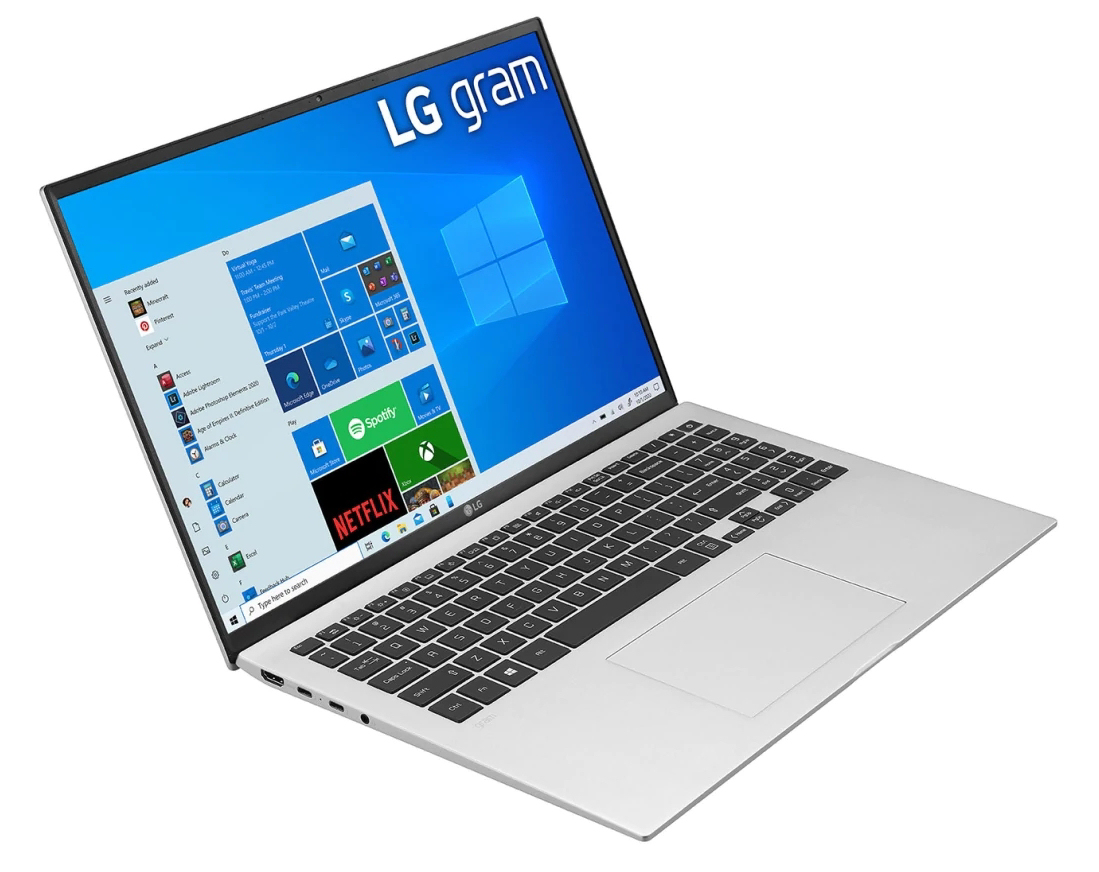
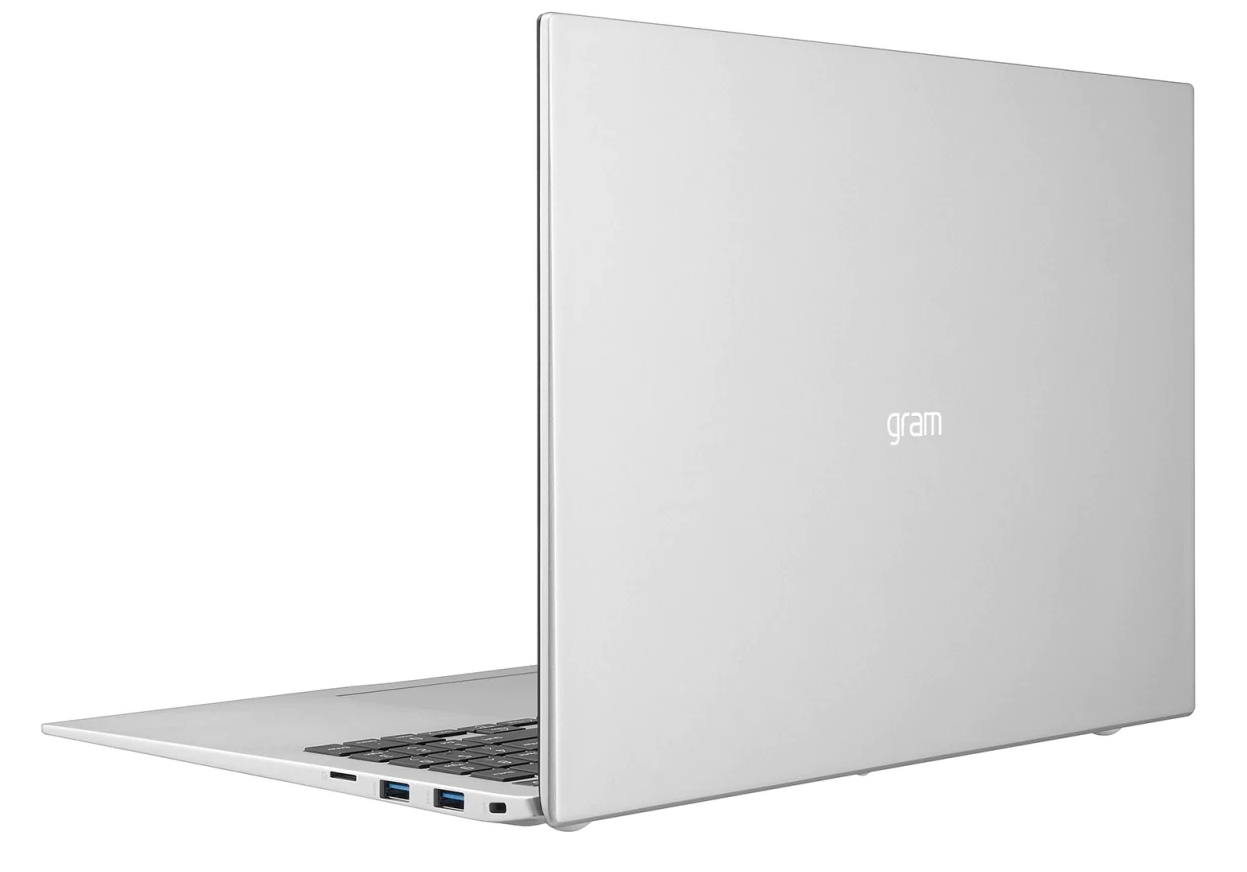
LG has equipped the 16-inch device with two USB-A ports (USB 3.2 Gen 1) and two USB-C ports (Thunderbolt 4/USB 4). The latter are used for power supply (Power Delivery) and/or as video outputs (DisplayPort via USB-C). As a result, the laptop offers three video outputs together with the HDMI output.
The ports are located in the rear areas of the right and left sides. The space next to the palm rest remains free of cables. However, the placement of the ports leaves room for criticism: It would've been better to put one USB-C port and one USB-A port on each side of the laptop. This would allow the power adapter to be plugged in on both sides - which is definitely an advantage when it comes to mobile devices.
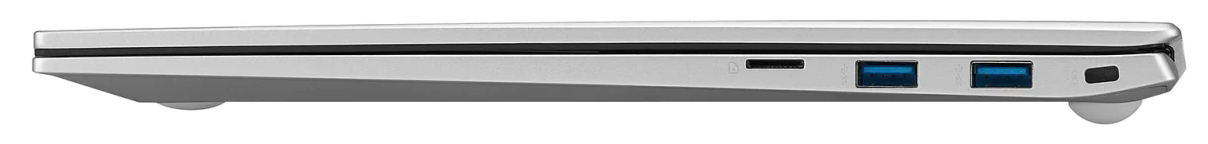
SD card reader
The MicroSD memory card reader (reference card: 64 GB Toshiba Exceria Pro M501 microSDXC) is among the fastest representatives of its kind with maximum transfer rates of 78.6 MB/s (transferring 250 jpg image files of around 5 MB each) and 90.5 MB/s (copying large data blocks).
| SD Card Reader | |
| average JPG Copy Test (av. of 3 runs) | |
| Samsung Galaxy Book Ion Aura Silver (Toshiba Exceria Pro M501 microSDXC 64GB) | |
| LG Gram 16 (2021) (Toshiba Exceria Pro M501 microSDXC 64GB) | |
| Average of class Office (22.4 - 198.5, n=22, last 2 years) | |
| Asus VivoBook S15 S533EQ-BQ002T (Toshiba Exceria Pro M501 microSDXC 64GB) | |
| maximum AS SSD Seq Read Test (1GB) | |
| LG Gram 16 (2021) (Toshiba Exceria Pro M501 microSDXC 64GB) | |
| Samsung Galaxy Book Ion Aura Silver (Toshiba Exceria Pro M501 microSDXC 64GB) | |
| Average of class Office (27.4 - 249, n=20, last 2 years) | |
| Asus VivoBook S15 S533EQ-BQ002T (Toshiba Exceria Pro M501 microSDXC 64GB) | |
Communication
The WLAN chip (Intel AX201) supports the 802.11a/b/g/n/ac/ax standards and offers Bluetooth 5 functionality. The data rates determined under optimal conditions (no other WLAN devices nearby, short distance between laptop and server PC) clearly lag behind the chip's potential. We believe this is due to a driver problem.
Webcam
The webcam (0.9 MP) generates images with a maximum resolution of 1280x720 pixels. There are issues with color accuracy. With a color deviation of almost 13, the target (Delta E less than 3) is very clearly missed.


 Iris Xe G7 96EUs, i7-1165G7, SK Hynix PC601 1TB HFS001TD9TNG")
 Iris Xe G7 96EUs, i7-1165G7, SK Hynix PC601 1TB HFS001TD9TNG")
Accessories
Besides the usual documents (warranty information, quick-start guide), the laptop comes with a transparent rubber cover to protect the keyboard.
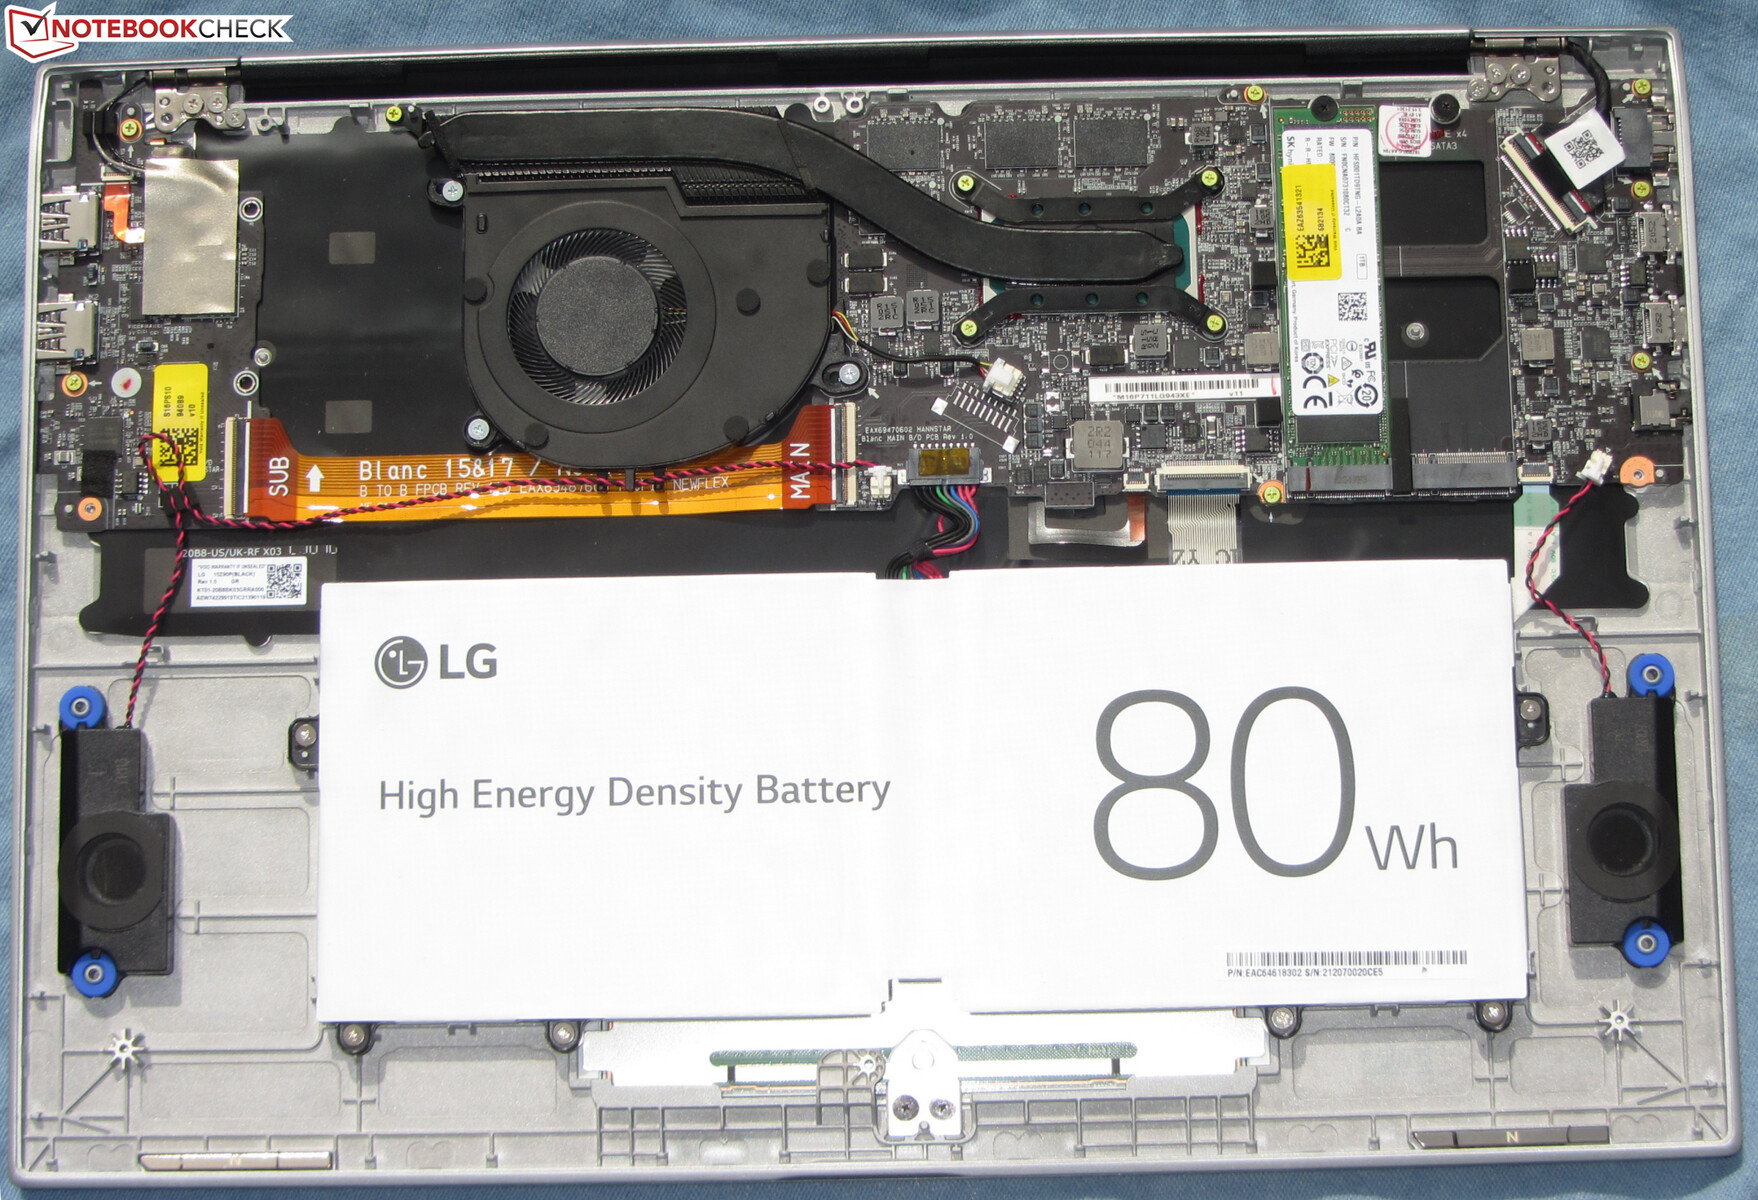
Maintenance
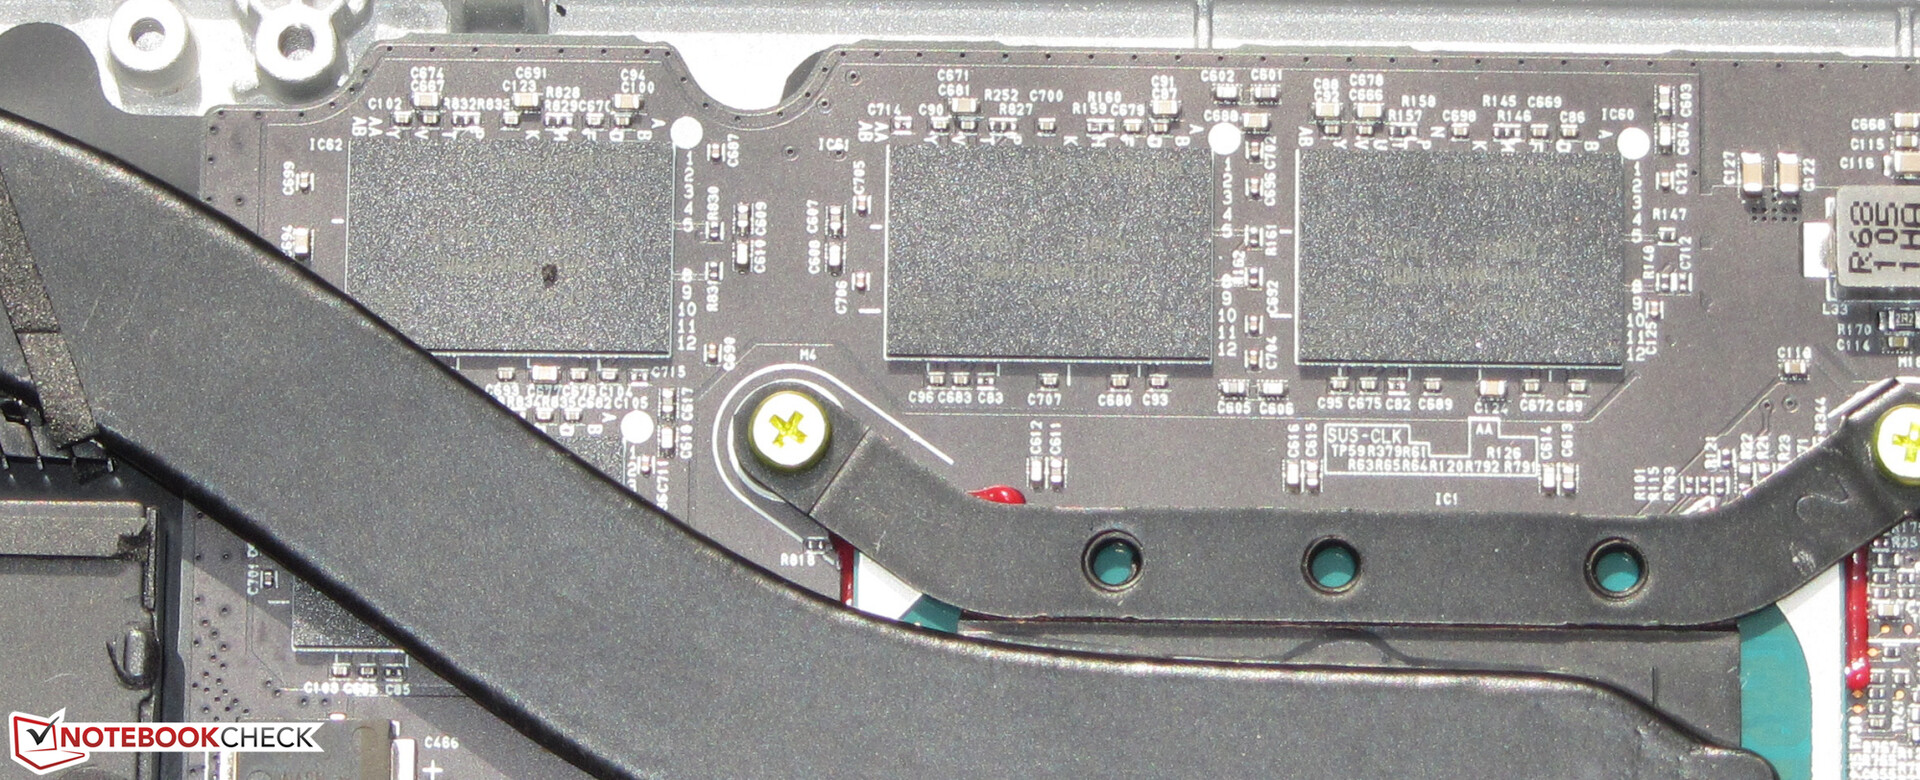
There's no maintenance hatch, so that the interior is accessible after removing the bottom cover. A screw is hidden under each of the five rubber feet (glued), and three further screws are covered by small plates (glued). The latter were able to be removed with a small flathead screwdriver and the rubber feet with a plastic spatula.
After removing the screws, it's time to carefully (!) detach the bottom cover. The delicate base plate can be easily twisted. The left and right sides as well as the front can be loosened with a flat spatula. The back is secured with additional clamps that can be released by gently moving them around.
Warranty
LG grants the 16-incher a two-year warranty. Extending the warranty to three years costs about 50 Euros (~$61).
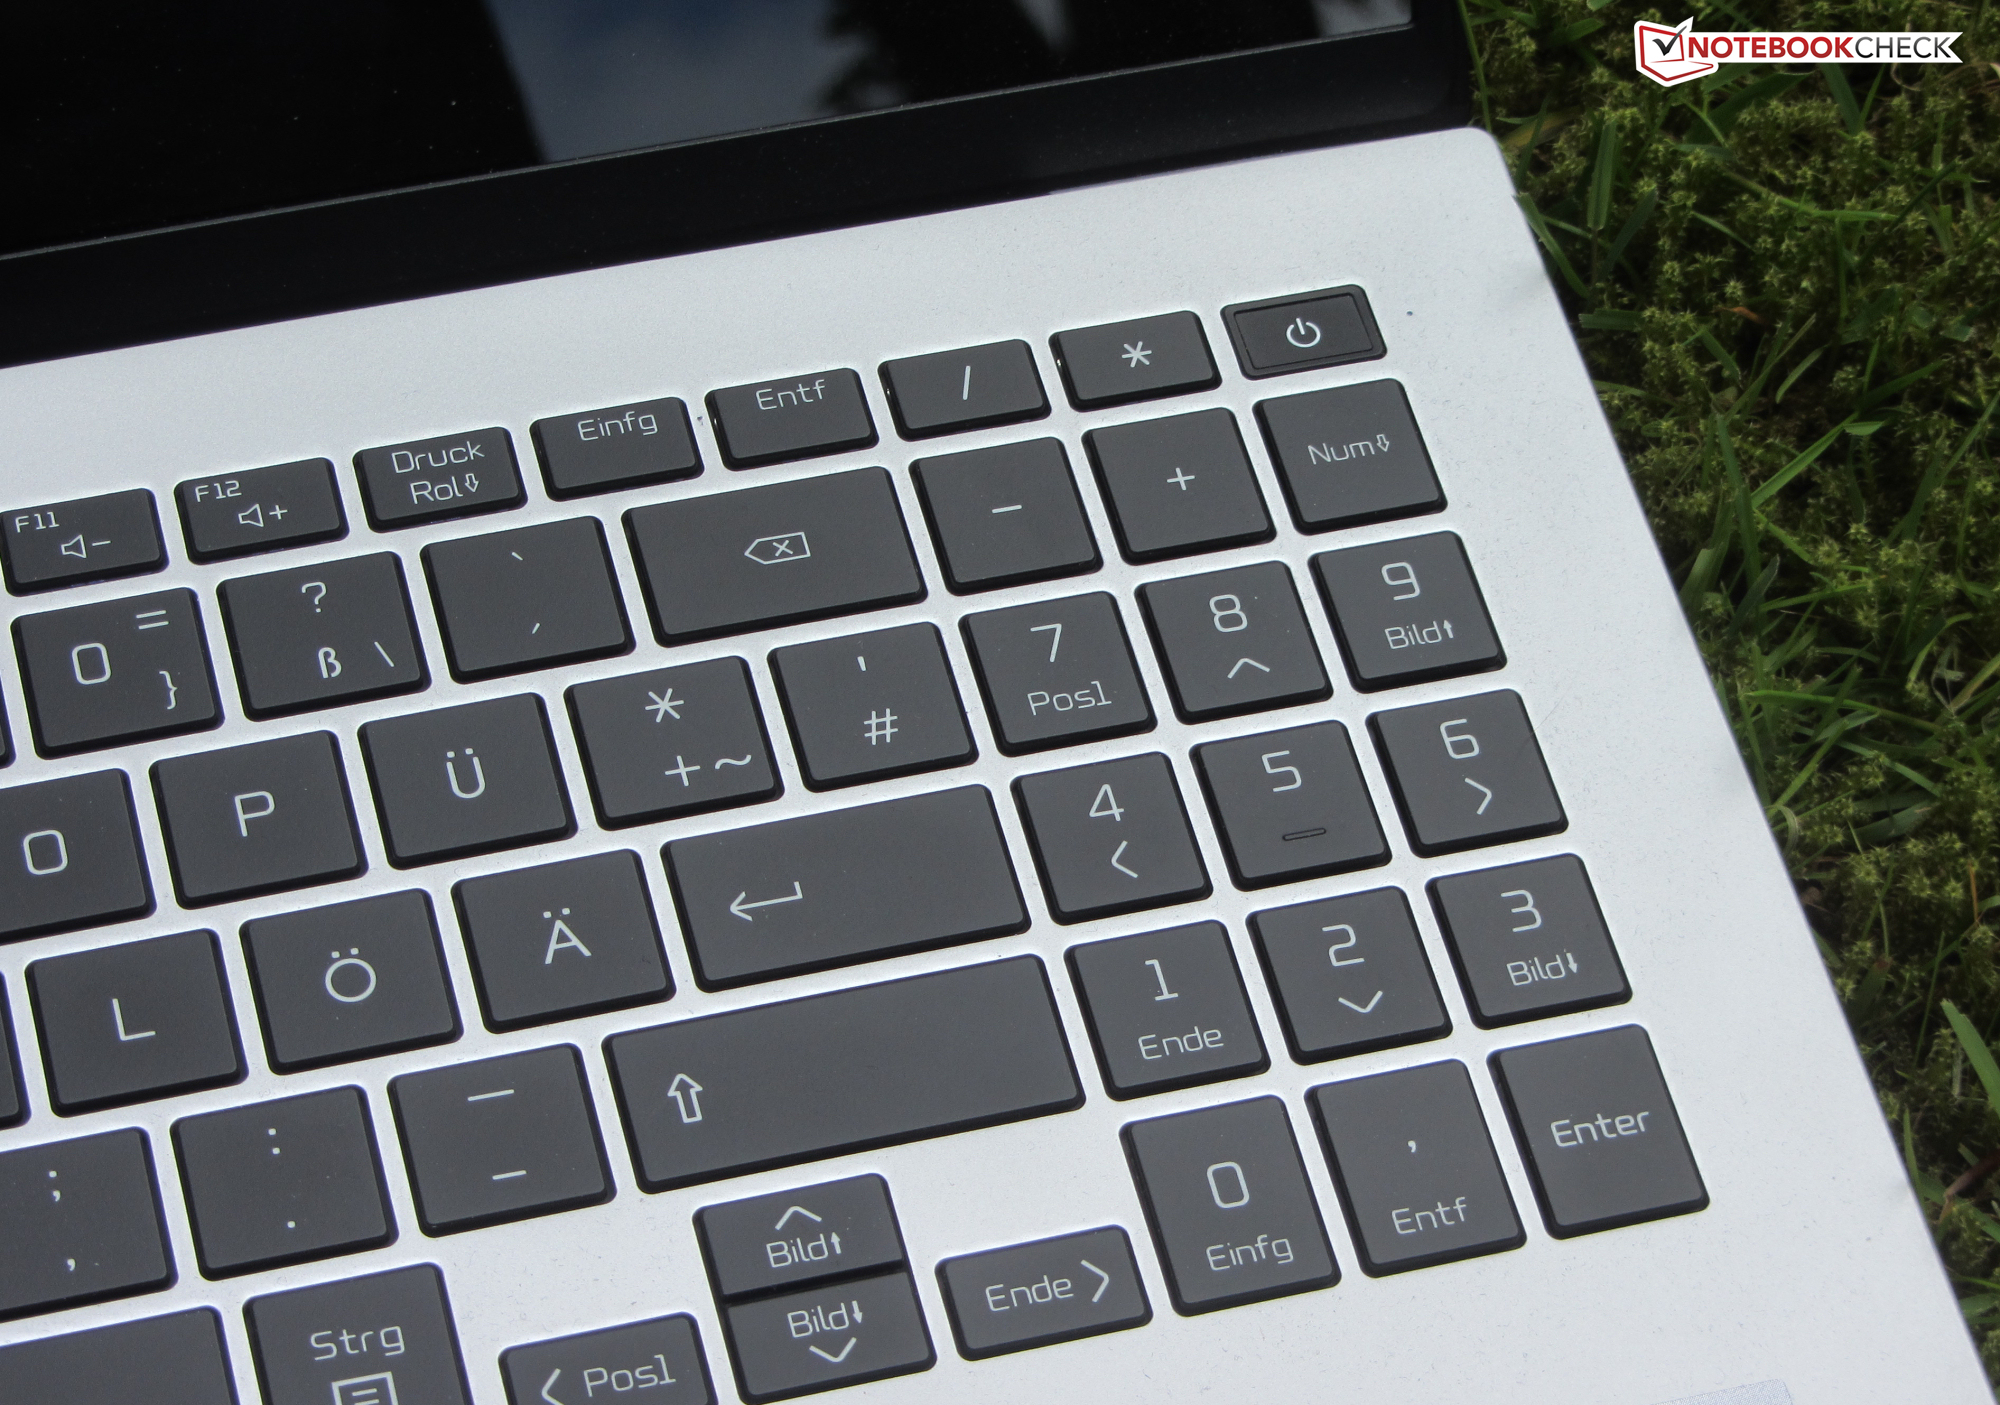
Input devices - The LG laptop provides keyboard backlighting
Keyboard
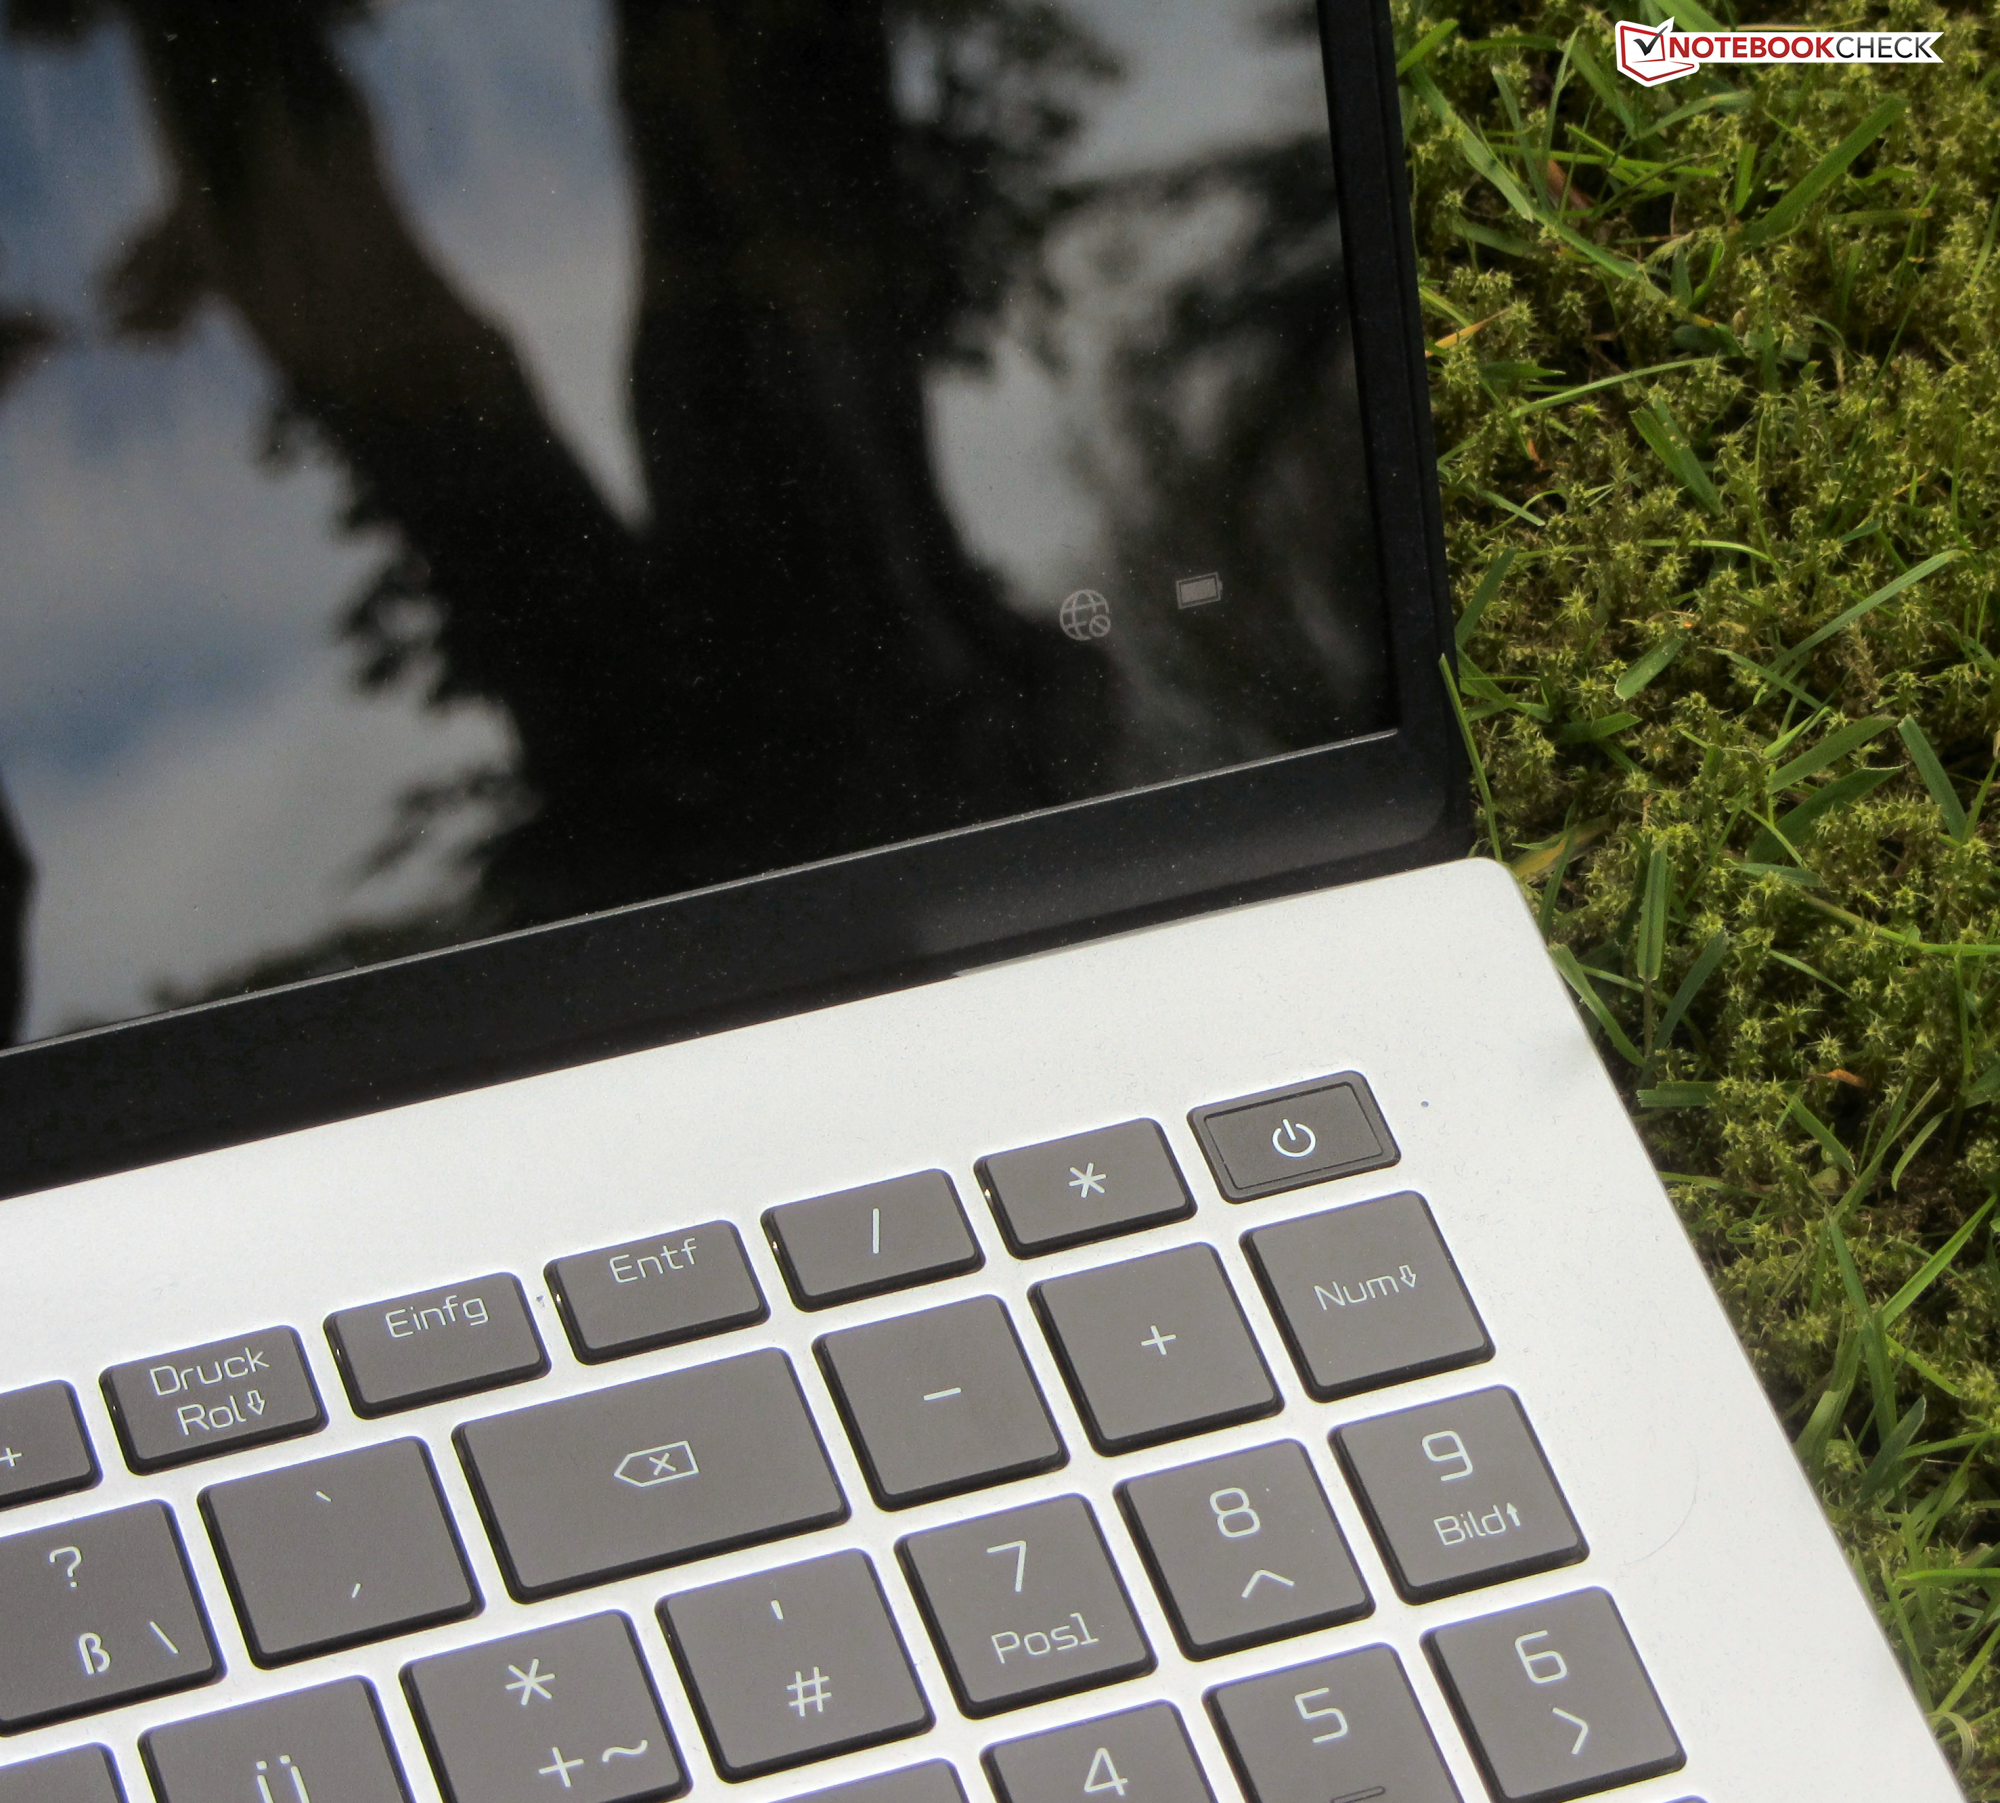
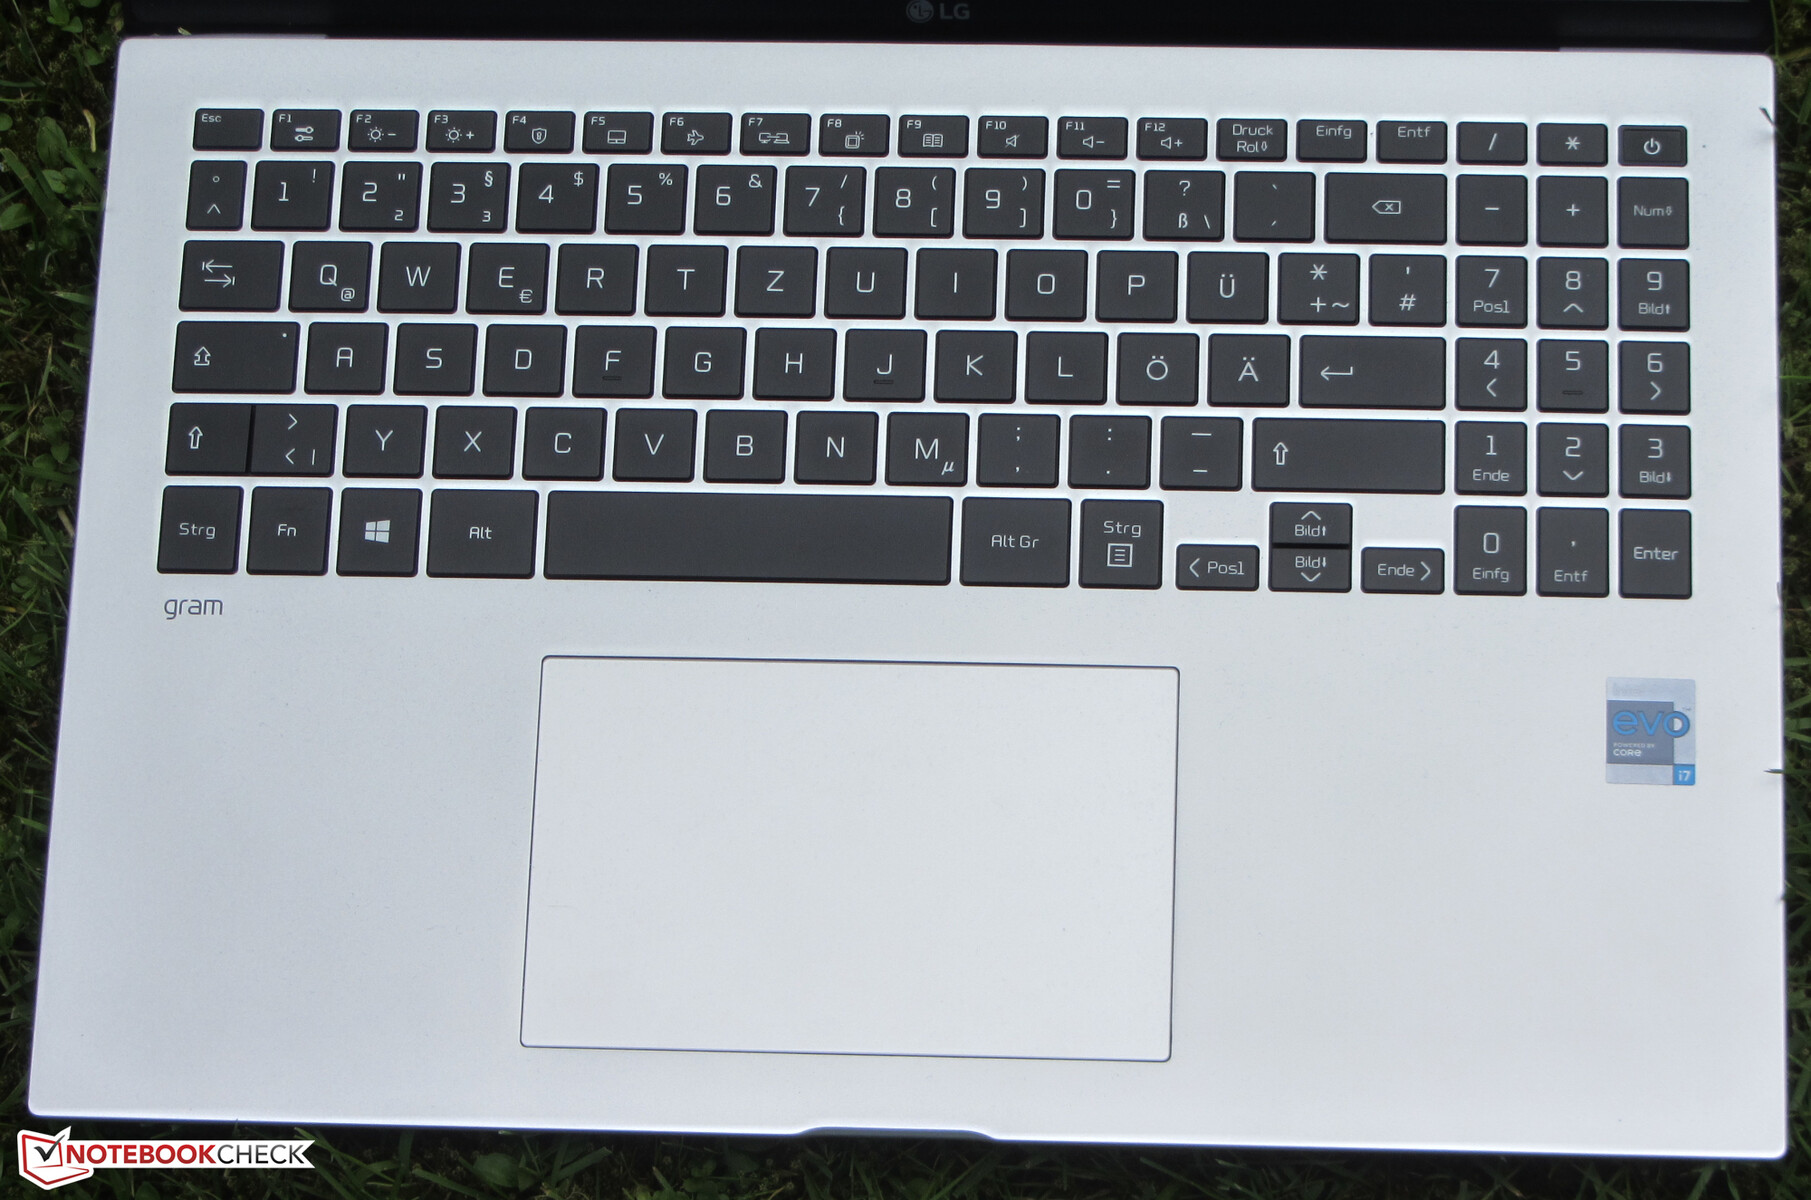
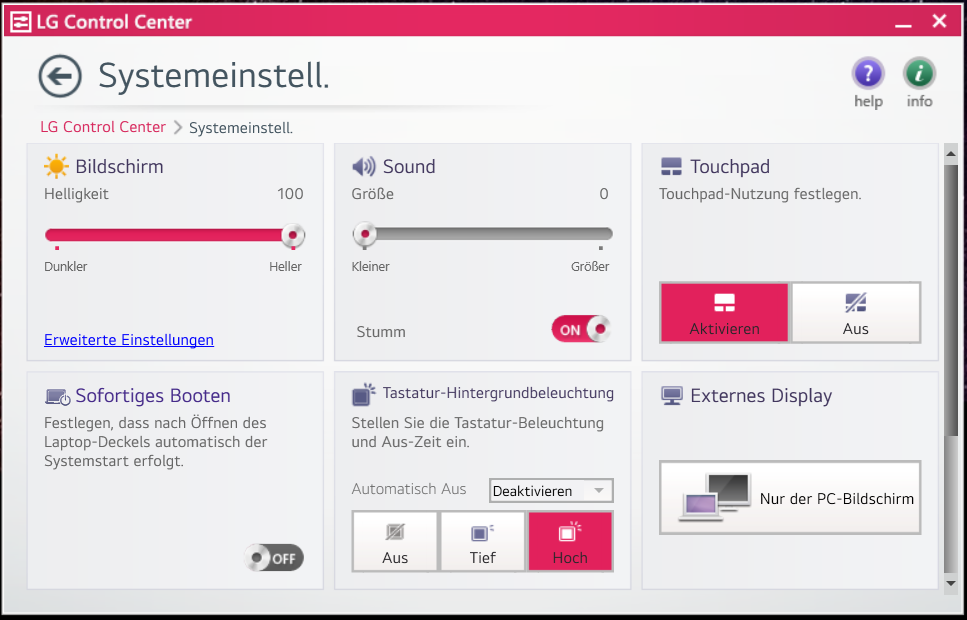
The flat, smooth keys of the backlit chiclet keyboard have a short travel and a very clear pressure point. We like the crisp resistance of the keys - a significant progress compared to the 2020 Gram models can be seen in this respect. Moreover, the keyboard bounces slightly during typing. The keyboard backlight (two brightness levels) is controlled using a function key. All in all, LG delivers a keyboard that is suitable for everyday use here.
Touchpad
The smooth surface of the multitouch-capable ClickPad (about 13.2 x 8.2 cm) makes it easy for fingers to glide on it. The pad also responds to inputs in the corners. It has a short travel and a clear pressure point.
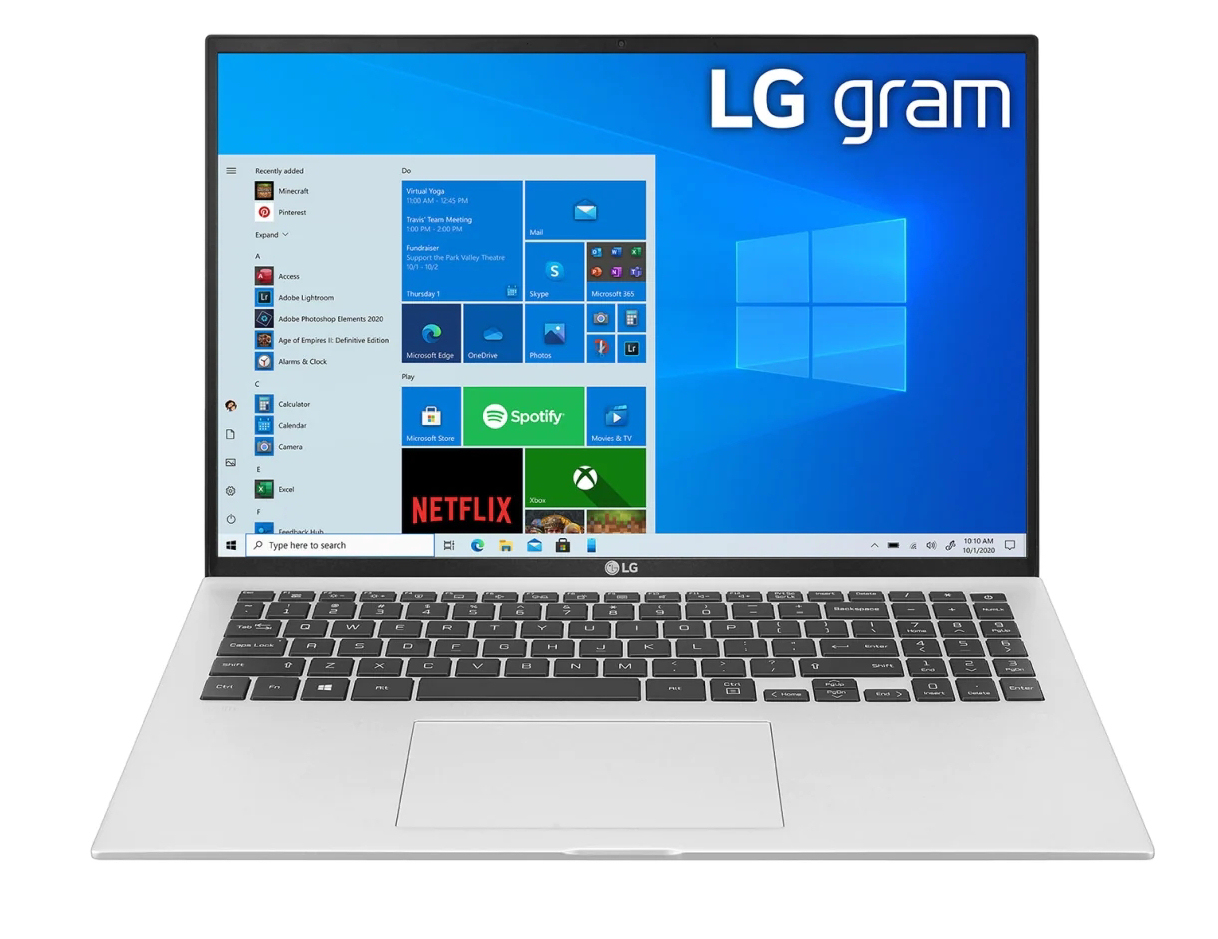
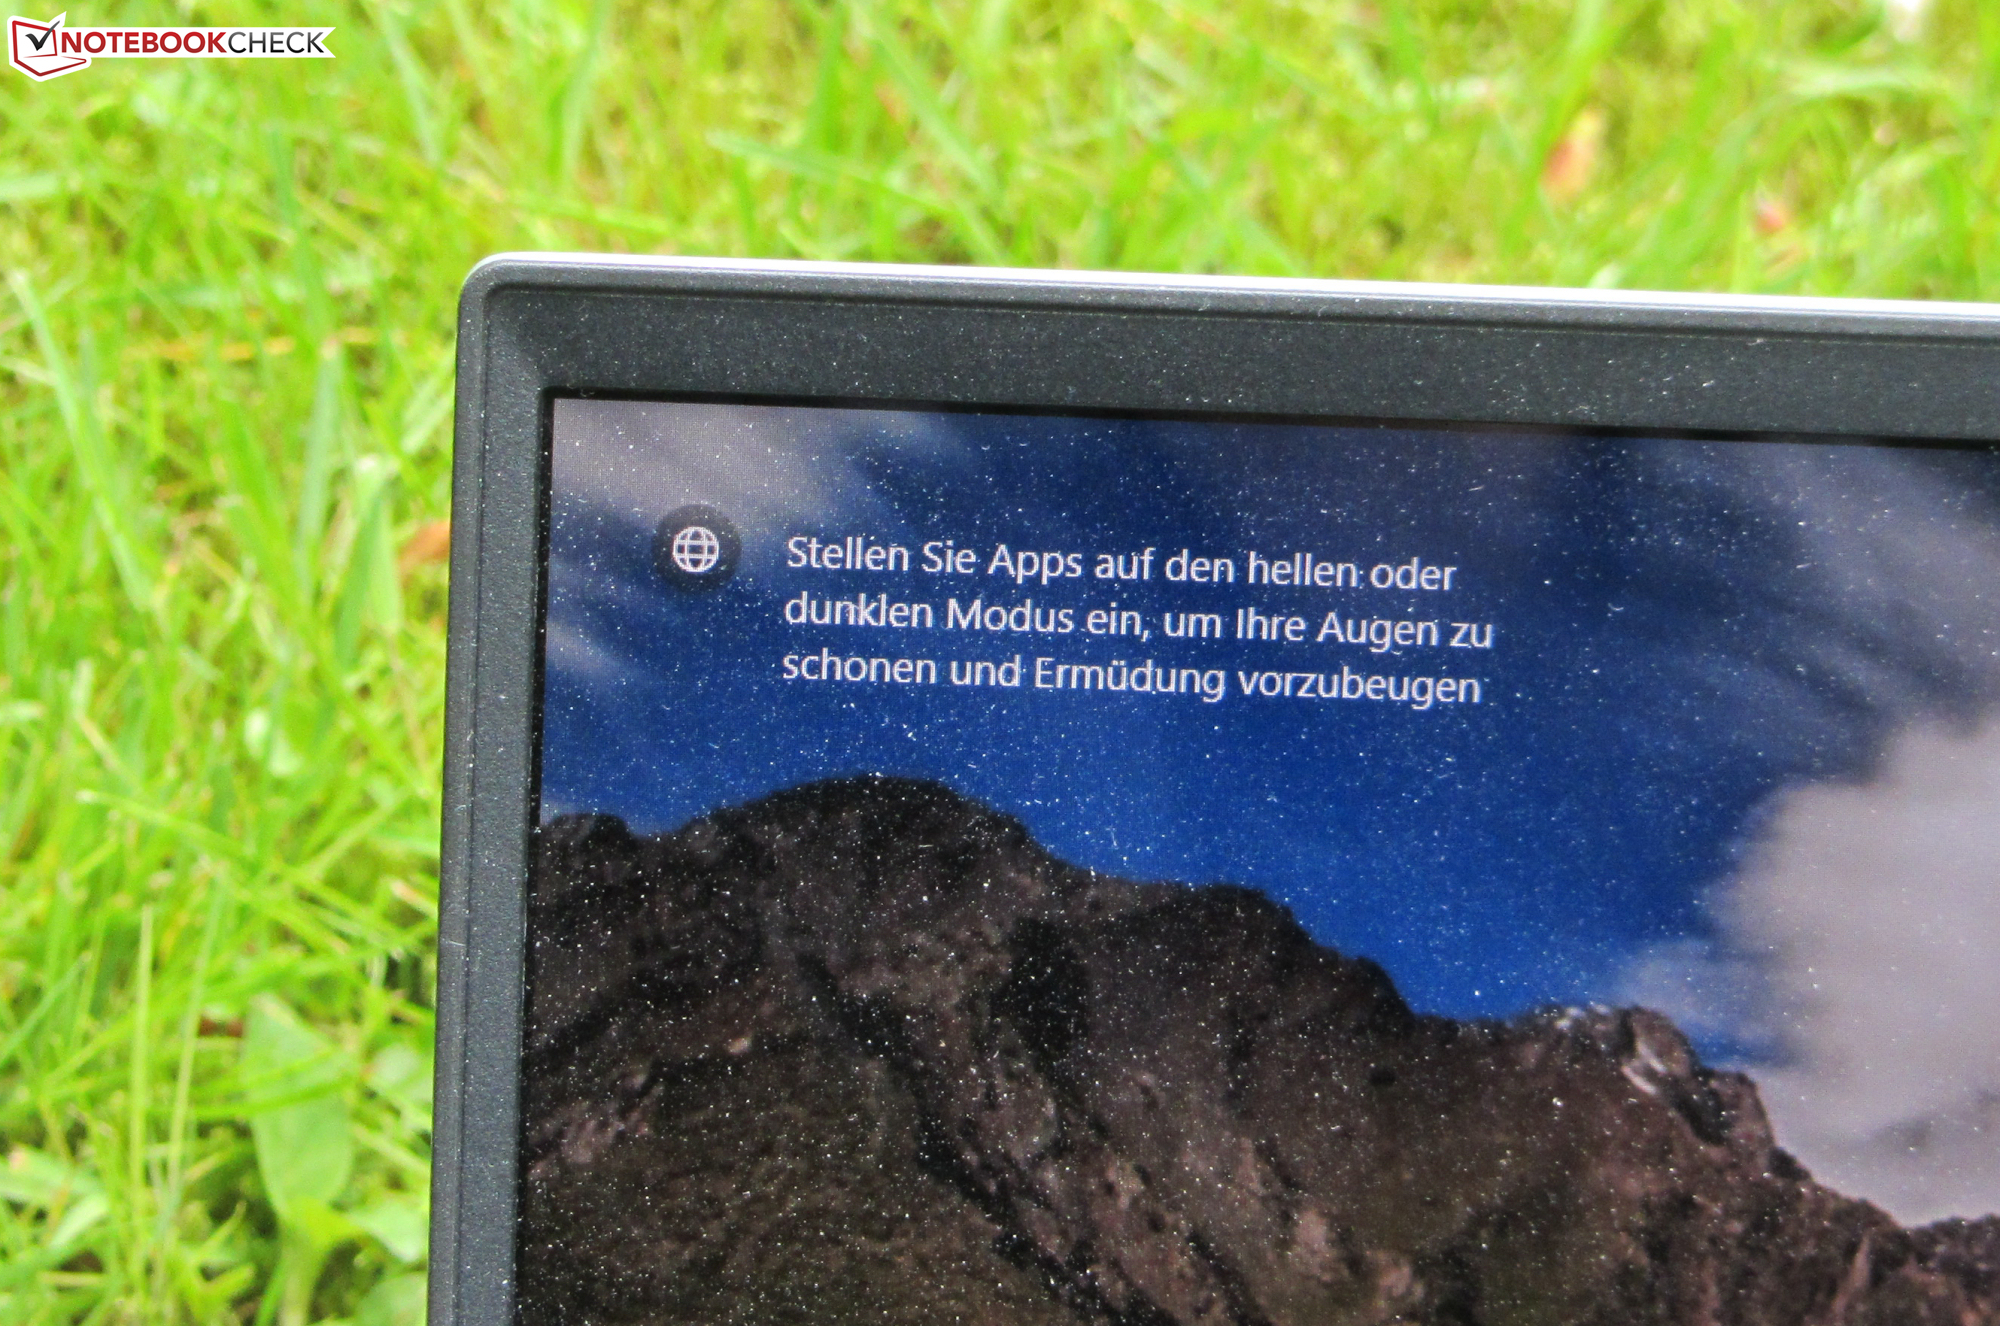
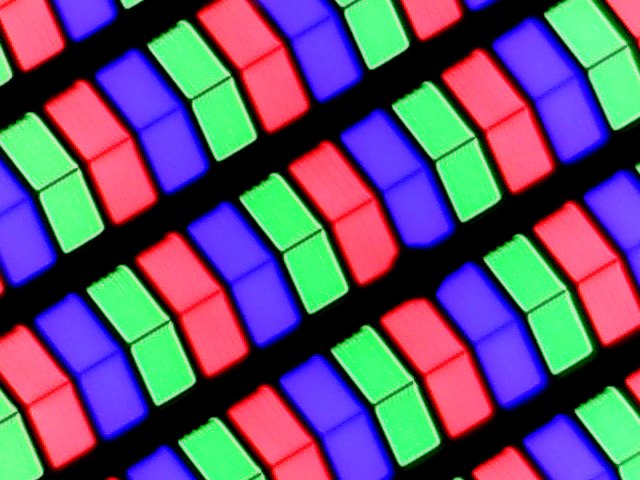
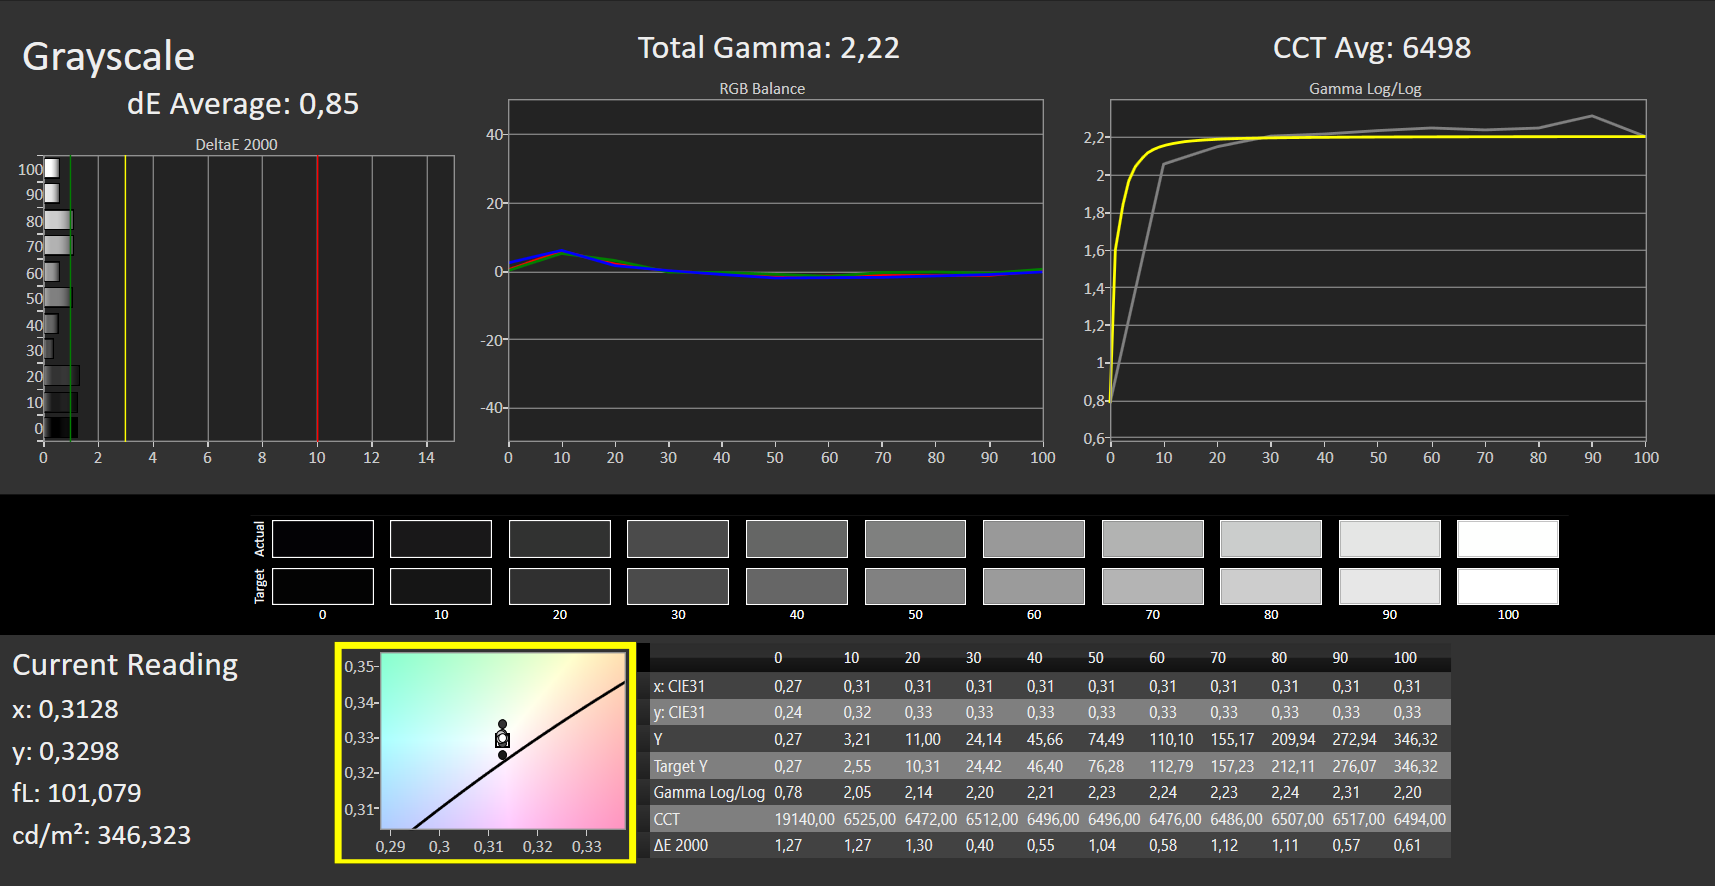
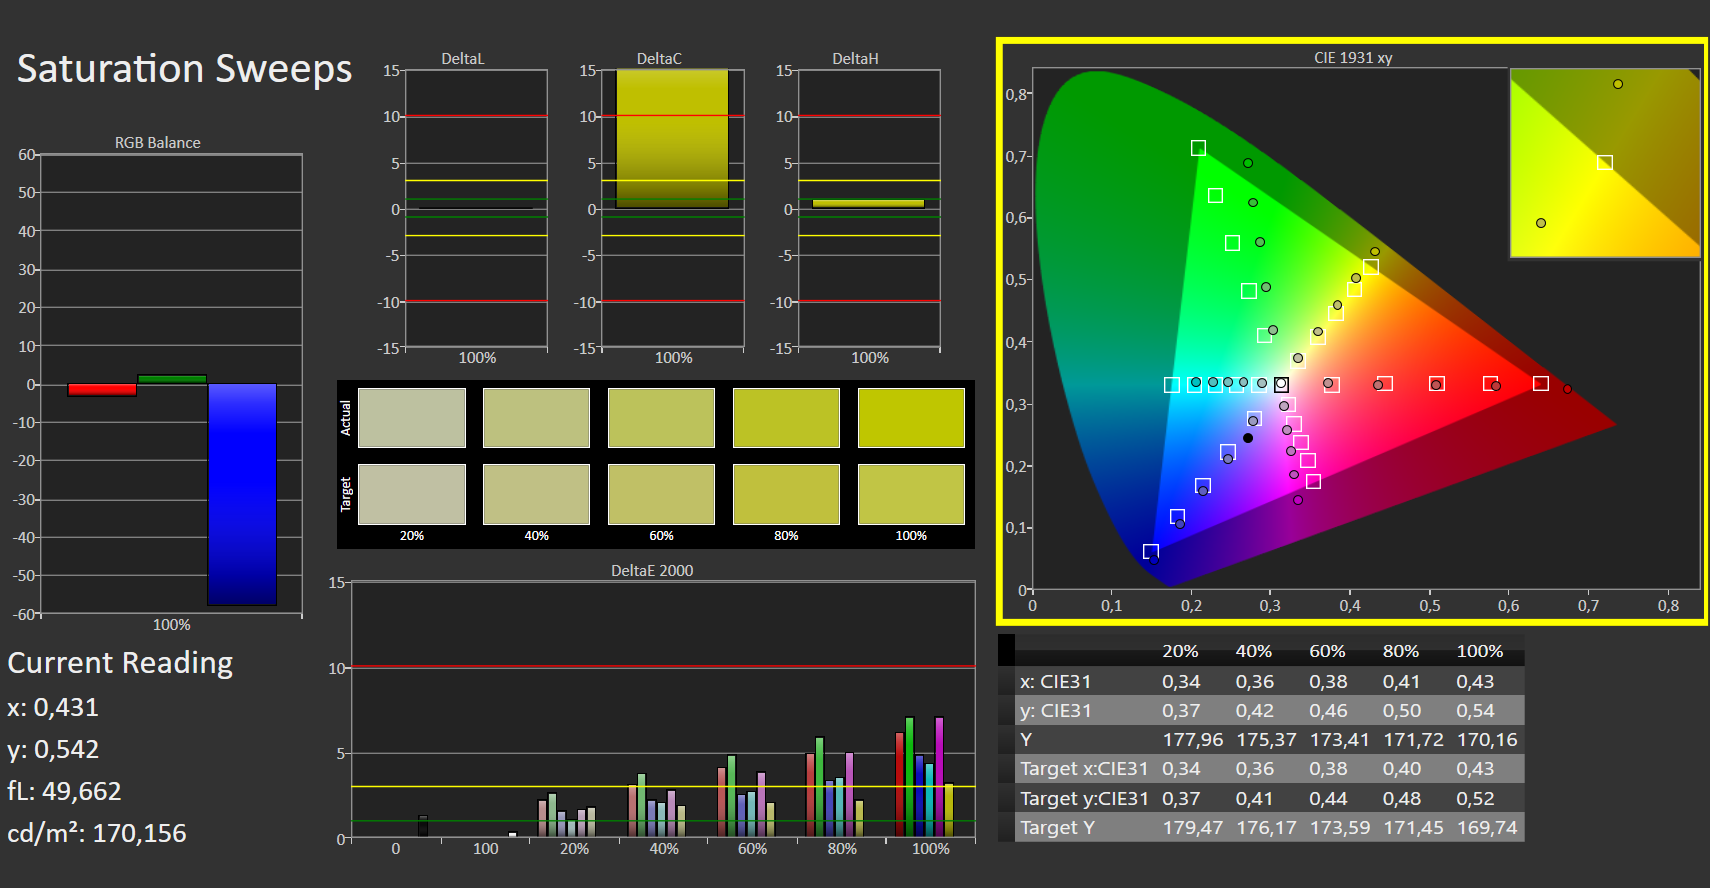
Display - IPS panel in the 16:10 format
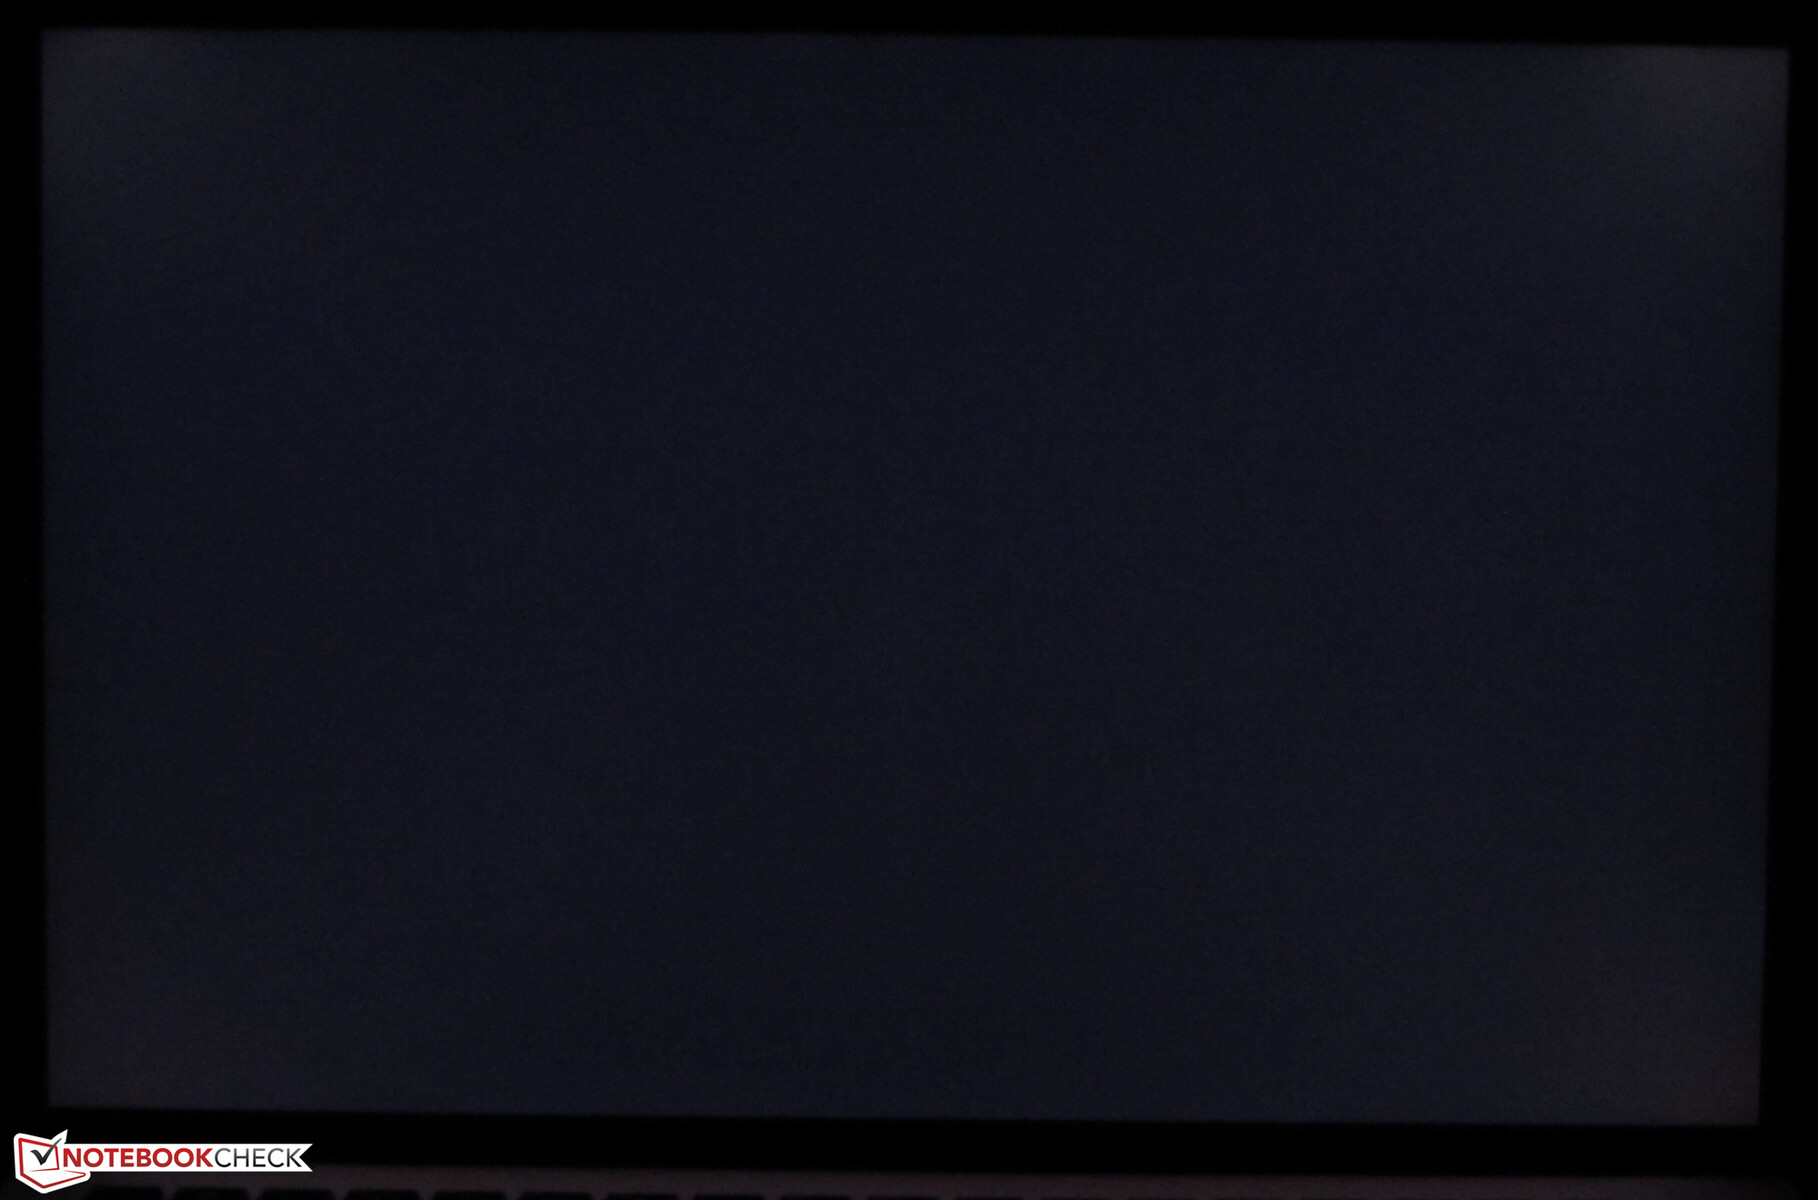
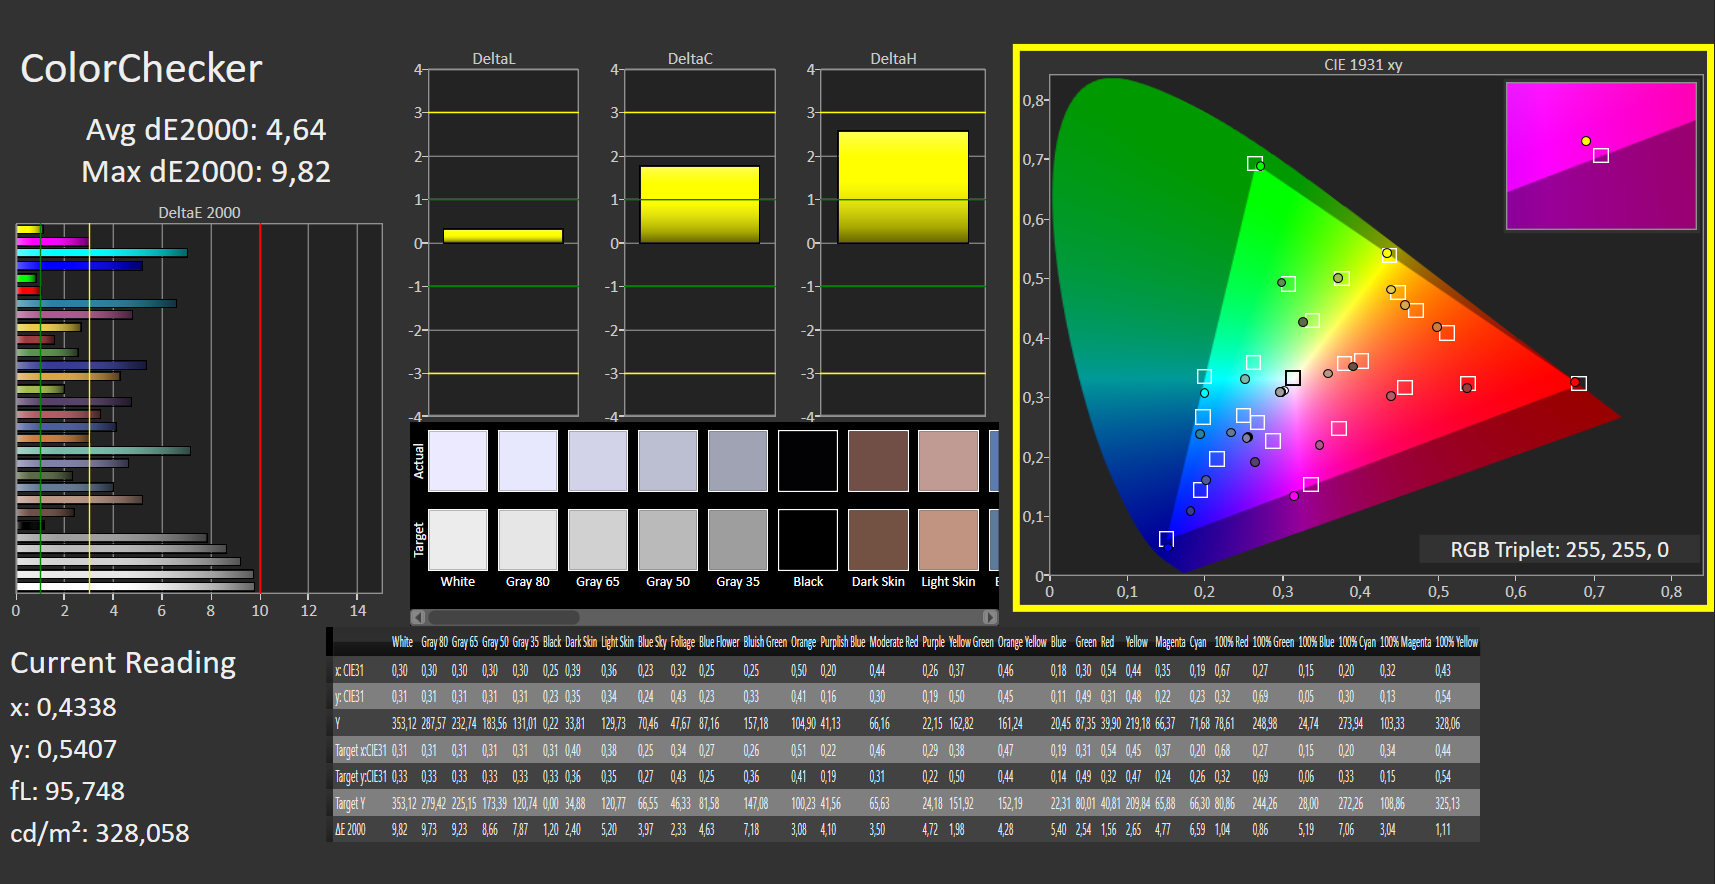
The brightness (309.2 cd/m²) and contrast (1,505:1) of the glossy 16-inch display (2560x1600 pixels) meet their respective targets - when plugged in. The maximum brightness decreases a bit on battery power. Good: The display doesn't show PWM flickering.
| |||||||||||||||||||||||||
Brightness Distribution: 88 %
Center on Battery: 284 cd/m²
Contrast: 1505:1 (Black: 0.22 cd/m²)
ΔE ColorChecker Calman: 4.64 | ∀{0.5-29.43 Ø4.73}
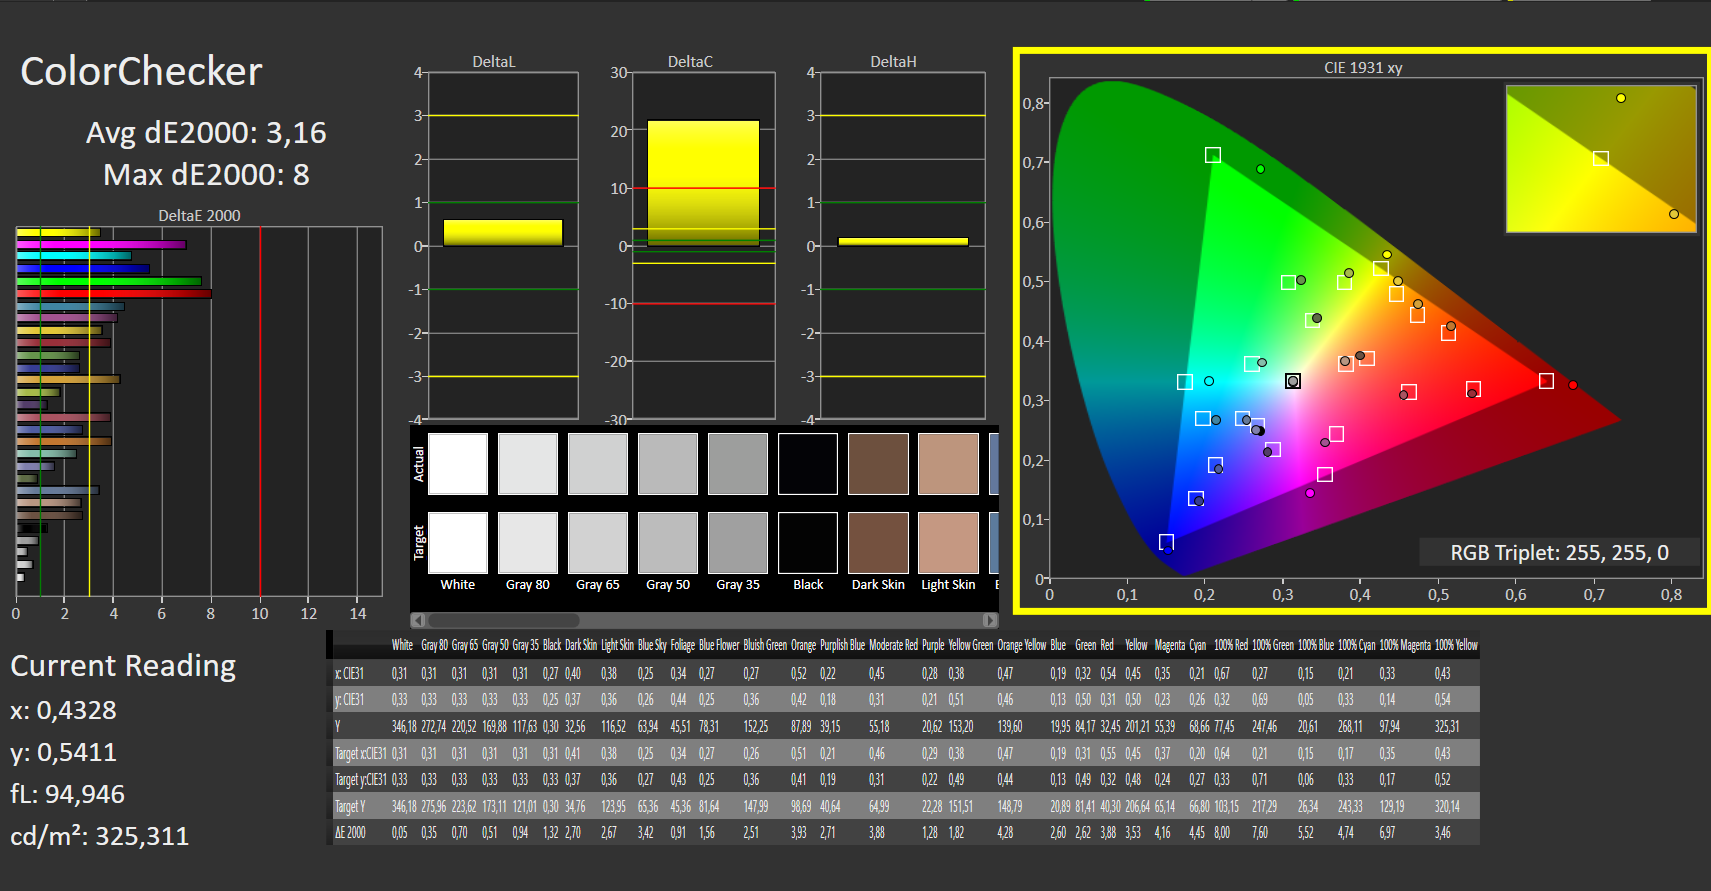
calibrated: 3.16
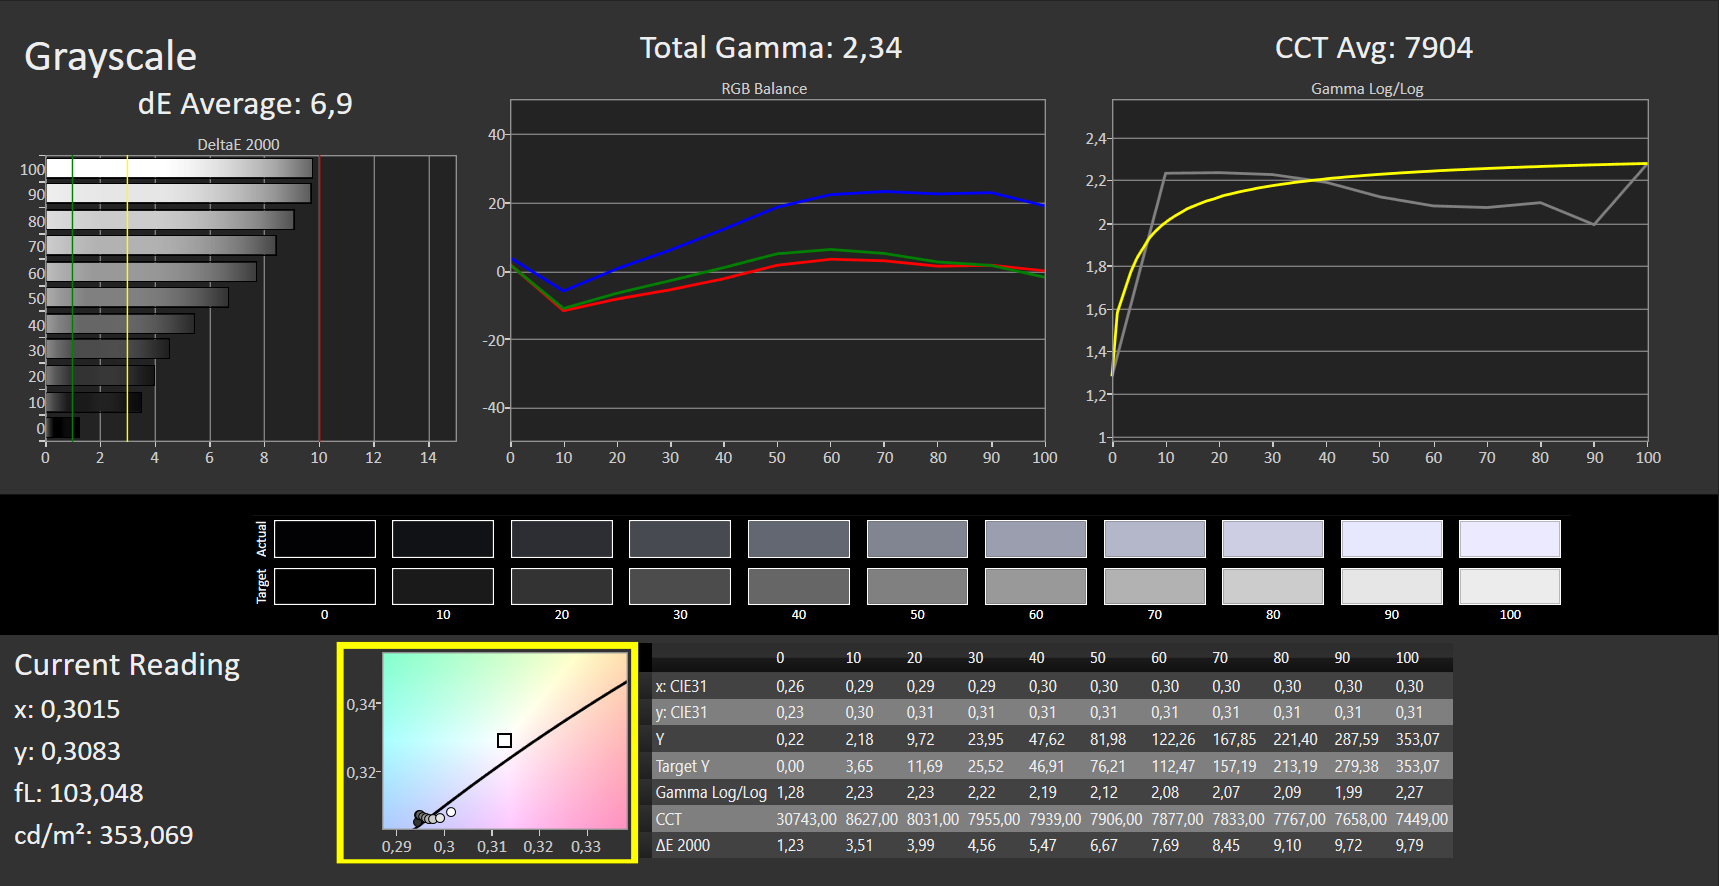
ΔE Greyscale Calman: 6.9 | ∀{0.09-98 Ø4.97}
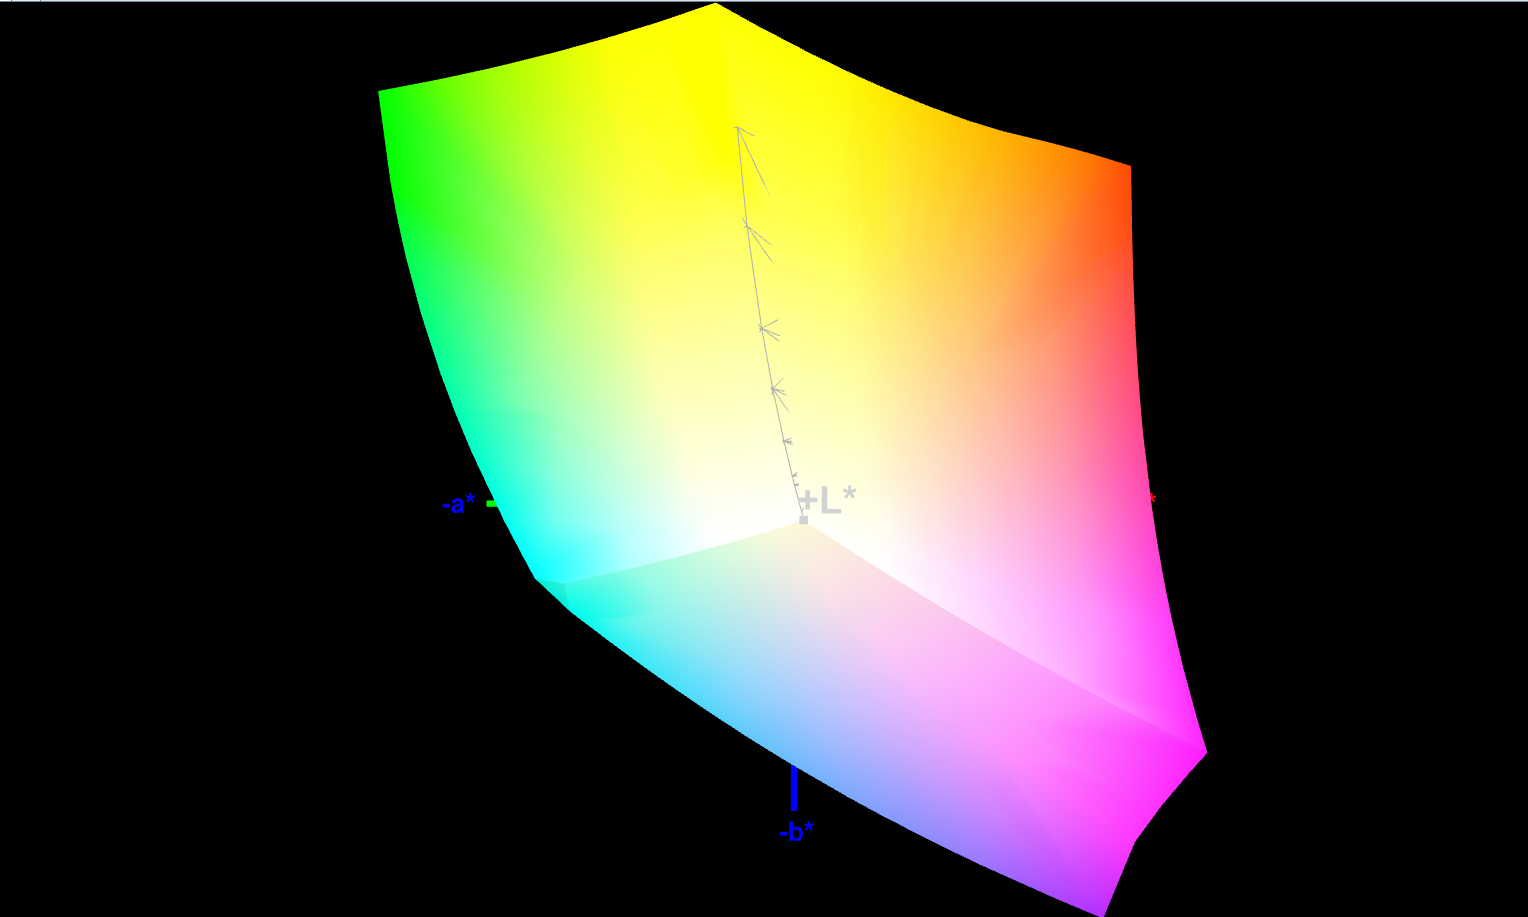
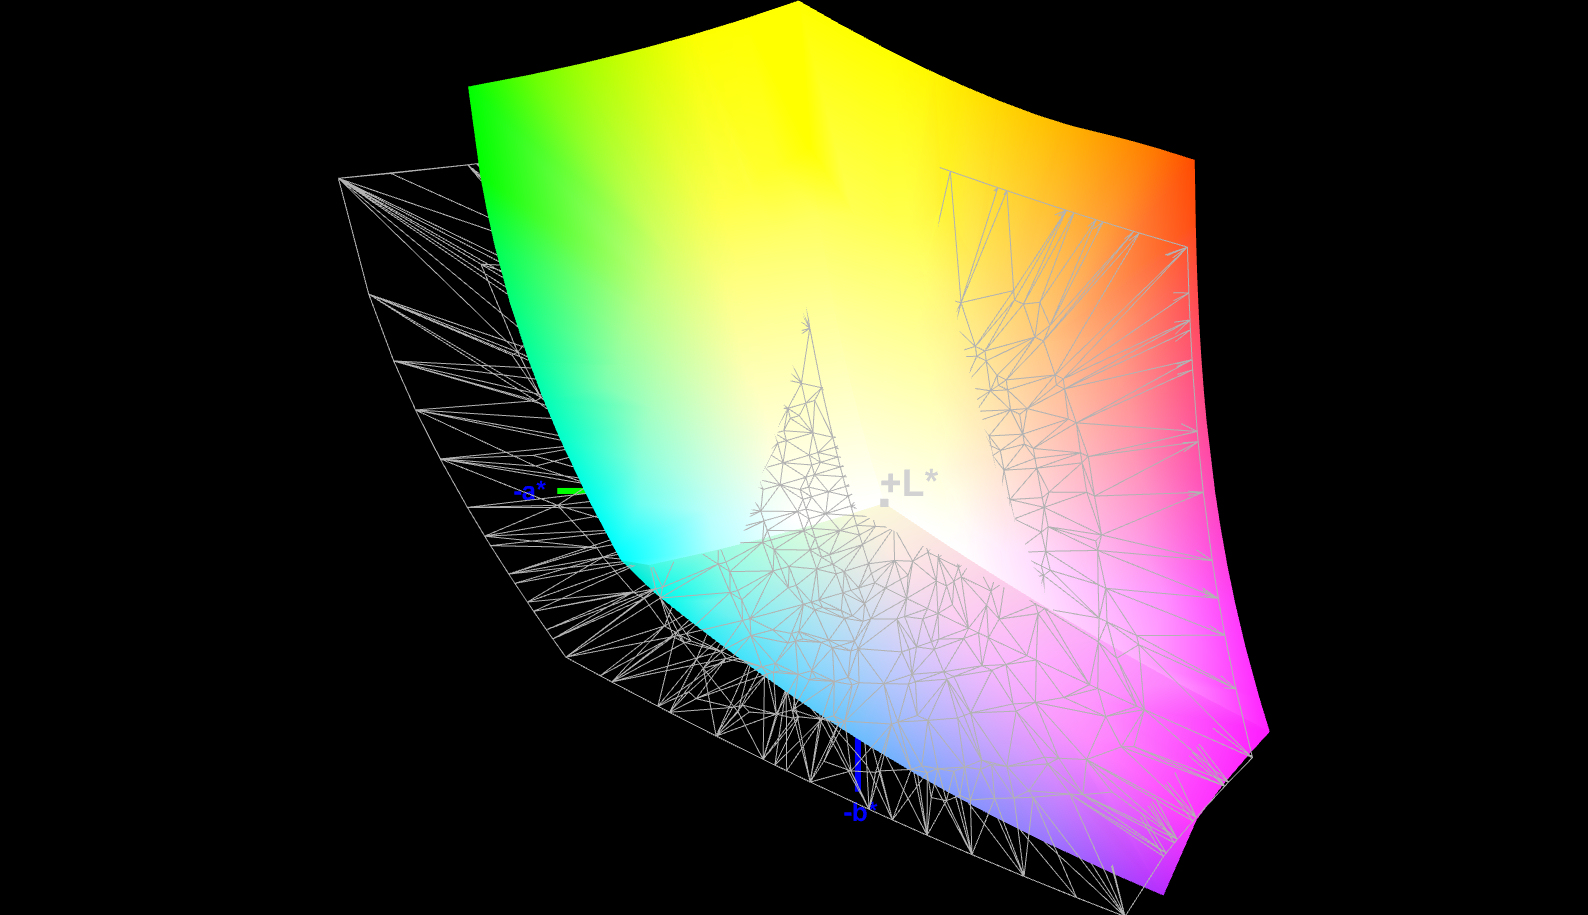
100% sRGB (Argyll 1.6.3 3D)
75.1% AdobeRGB 1998 (Argyll 1.6.3 3D)
83.8% AdobeRGB 1998 (Argyll 3D)
99.8% sRGB (Argyll 3D)
95.8% Display P3 (Argyll 3D)
Gamma: 2.34
CCT: 7904 K
| LG Gram 16 (2021) LG Philips LP160WQ1-SPA1, IPS, 2560x1600, 16" | Samsung Galaxy Book Ion Aura Silver BOE0889, QLED, 1920x1080, 15.6" | Huawei MateBook D 16-53011VFJ N161HCA-EA3, IPS, 1920x1080, 16.1" | Acer Aspire 5 A515-56-511A LG Philips LGD065A, IPS, 1920x1080, 15.6" | Asus VivoBook S15 S533EQ-BQ002T Panda LM156LF-5L04, IPS, 1920x1080, 15.6" | Schenker Vision 15 BOE08F5, IPS, 1920x1080, 15.6" | |
|---|---|---|---|---|---|---|
| Display | 2% | -16% | -52% | -51% | -17% | |
| Display P3 Coverage (%) | 95.8 | 99.1 3% | 66.8 -30% | 38.32 -60% | 39.01 -59% | 69.3 -28% |
| sRGB Coverage (%) | 99.8 | 99.9 0% | 99 -1% | 57.5 -42% | 58.5 -41% | 94 -6% |
| AdobeRGB 1998 Coverage (%) | 83.8 | 87.3 4% | 69 -18% | 39.6 -53% | 40.33 -52% | 70.8 -16% |
| Response Times | -28% | 17% | -12% | -11% | -66% | |
| Response Time Grey 50% / Grey 80% * (ms) | 44 ? | 49 ? -11% | 25 ? 43% | 37 ? 16% | 38 ? 14% | 60 ? -36% |
| Response Time Black / White * (ms) | 20 ? | 29 ? -45% | 22 ? -10% | 28 ? -40% | 27 ? -35% | 39 ? -95% |
| PWM Frequency (Hz) | 2500 ? | |||||
| Screen | 21% | 17% | -13% | -32% | 17% | |
| Brightness middle (cd/m²) | 331 | 467 41% | 352 6% | 285 -14% | 287 -13% | 478 44% |
| Brightness (cd/m²) | 309 | 437 41% | 330 7% | 255 -17% | 261 -16% | 462 50% |
| Brightness Distribution (%) | 88 | 91 3% | 89 1% | 84 -5% | 84 -5% | 94 7% |
| Black Level * (cd/m²) | 0.22 | 0.27 -23% | 0.28 -27% | 0.325 -48% | 0.51 -132% | 0.27 -23% |
| Contrast (:1) | 1505 | 1730 15% | 1257 -16% | 877 -42% | 563 -63% | 1770 18% |
| Colorchecker dE 2000 * | 4.64 | 3.39 27% | 1.35 71% | 4.23 9% | 4.72 -2% | 3.2 31% |
| Colorchecker dE 2000 max. * | 9.82 | 6.27 36% | 2.58 74% | 7.94 19% | 17.94 -83% | 8.4 14% |
| Colorchecker dE 2000 calibrated * | 3.16 | 3.75 -19% | 3.74 -18% | 2 37% | ||
| Greyscale dE 2000 * | 6.9 | 2.17 69% | 2.02 71% | 2.51 64% | 2.2 68% | 4.5 35% |
| Gamma | 2.34 94% | 2.45 90% | 2.49 88% | 2.57 86% | 2.51 88% | 2.16 102% |
| CCT | 7904 82% | 6488 100% | 6445 101% | 6626 98% | 6758 96% | 6788 96% |
| Color Space (Percent of AdobeRGB 1998) (%) | 75.1 | 78 4% | 63 -16% | 36 -52% | 37 -51% | 63.1 -16% |
| Color Space (Percent of sRGB) (%) | 100 | 100 0% | 99 -1% | 57 -43% | 58 -42% | 93.6 -6% |
| Total Average (Program / Settings) | -2% /
11% | 6% /
10% | -26% /
-20% | -31% /
-33% | -22% /
1% |
* ... smaller is better
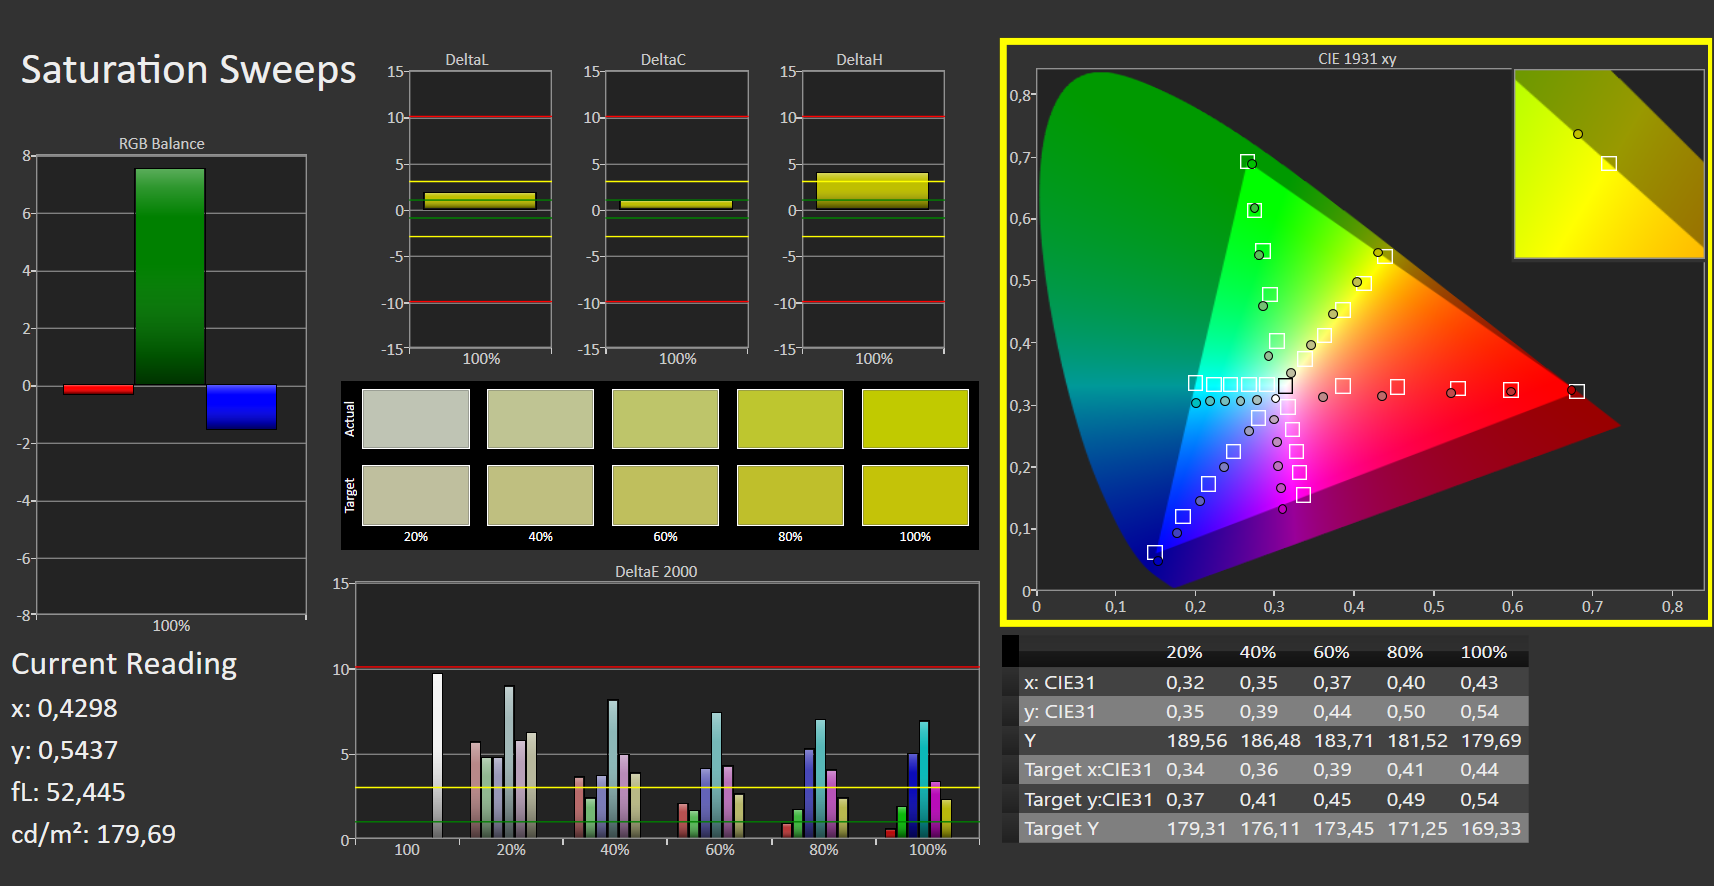
The display shows a decent color reproduction out of the box, but it fails to meet the target with a color deviation of about 4.6 (Delta E less than 3). Nevertheless, the display doesn't suffer from a blue tint, and slight improvements can be achieved with a calibration. The color deviation drops to just under 3.2, and the grayscale levels are displayed in a more balanced way. The sRGB color space is covered by 100%, the AdobeRGB color space by 75%.
Display Response Times
| ↔ Response Time Black to White | ||
|---|---|---|
| 20 ms ... rise ↗ and fall ↘ combined | ↗ 8 ms rise |  |
| ↘ 12 ms fall | ||
| The screen shows good response rates in our tests, but may be too slow for competitive gamers. In comparison, all tested devices range from 0.1 (minimum) to 240 (maximum) ms. » 44 % of all devices are better. This means that the measured response time is similar to the average of all tested devices (19.9 ms). | ||
| ↔ Response Time 50% Grey to 80% Grey | ||
| 44 ms ... rise ↗ and fall ↘ combined | ↗ 19 ms rise |  |
| ↘ 25 ms fall | ||
| The screen shows slow response rates in our tests and will be unsatisfactory for gamers. In comparison, all tested devices range from 0.165 (minimum) to 636 (maximum) ms. » 73 % of all devices are better. This means that the measured response time is worse than the average of all tested devices (31.1 ms). | ||
Screen Flickering / PWM (Pulse-Width Modulation)
| Screen flickering / PWM not detected |  | ||
In comparison: 52 % of all tested devices do not use PWM to dim the display. If PWM was detected, an average of 7798 (minimum: 5 - maximum: 343500) Hz was measured. | |||
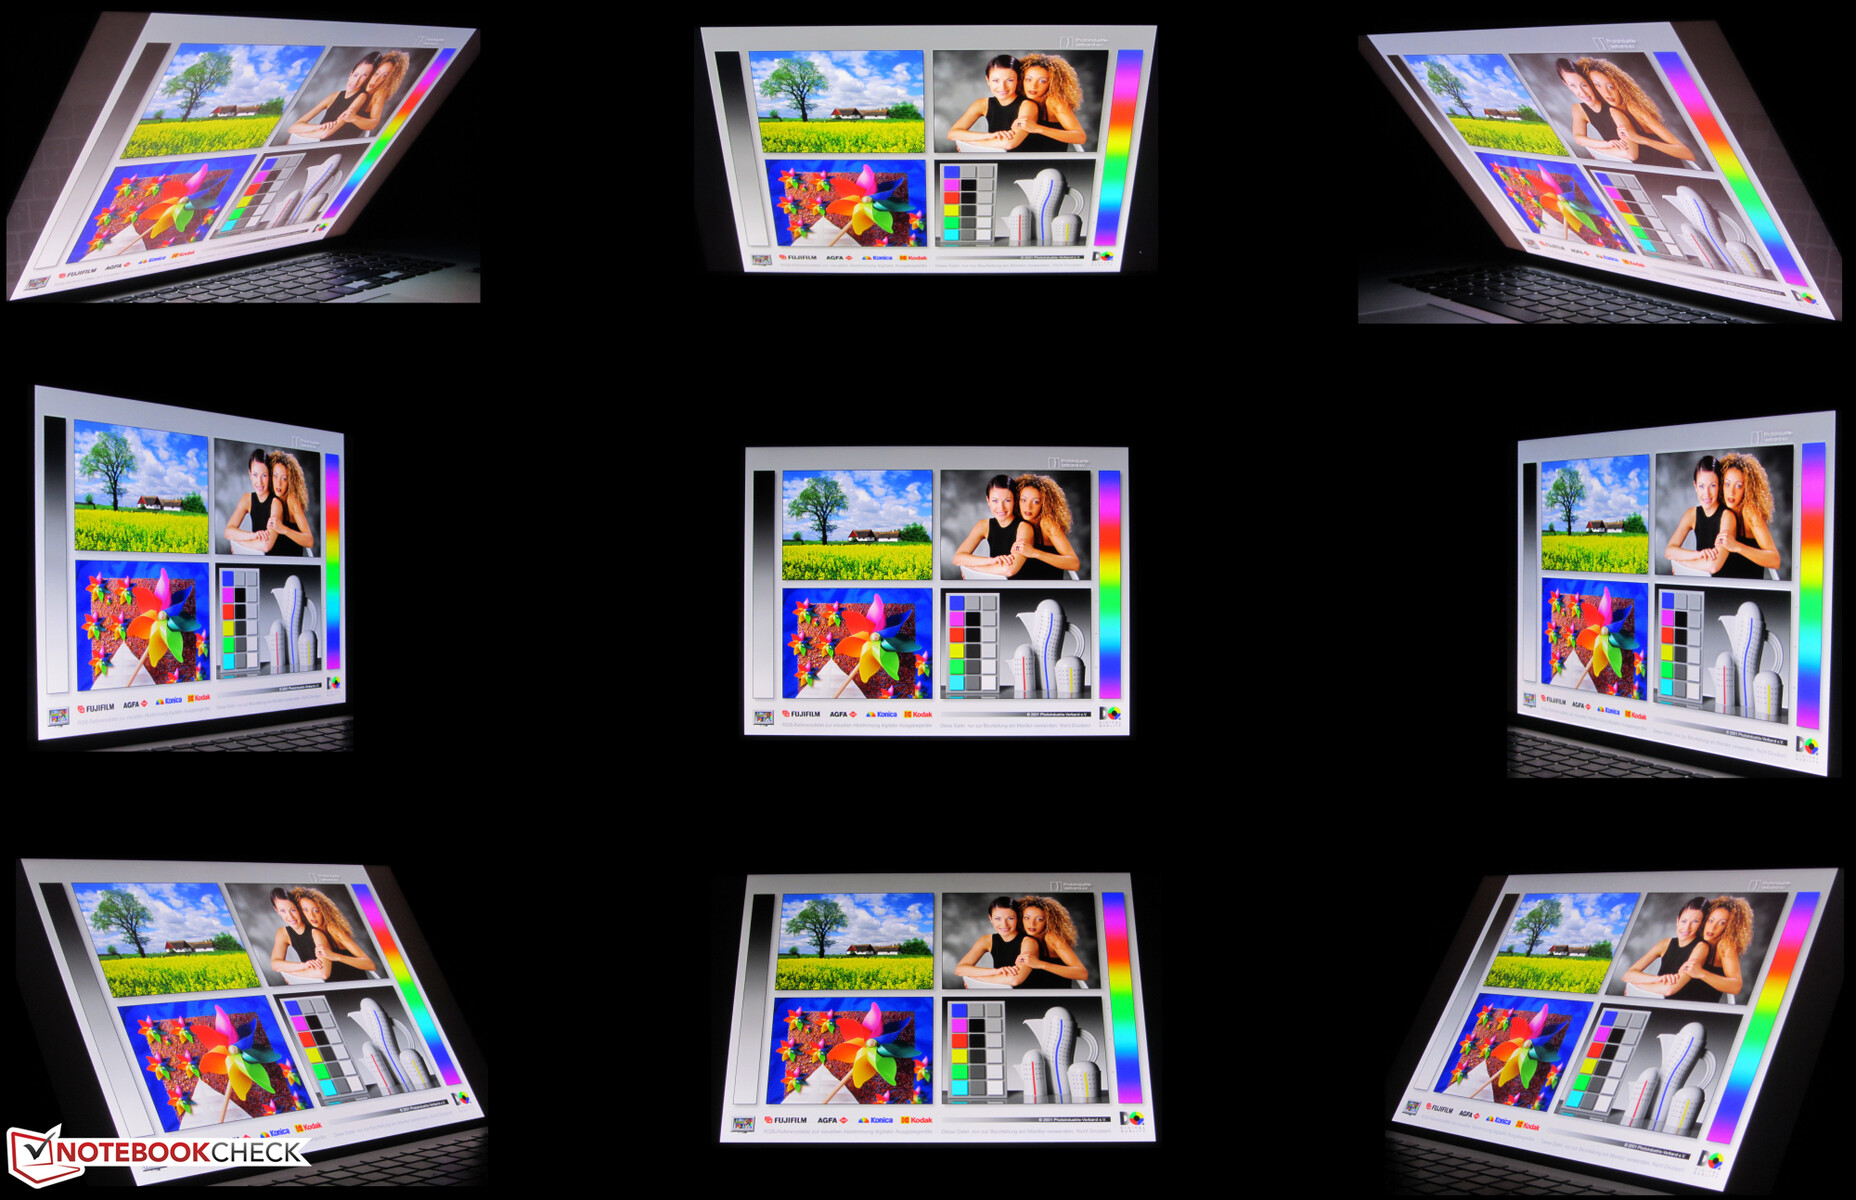
The viewing-angle stable IPS panel can be read from any position. However, reading the screen outdoors is hardly possible. The glossy display surface usually prevents this.
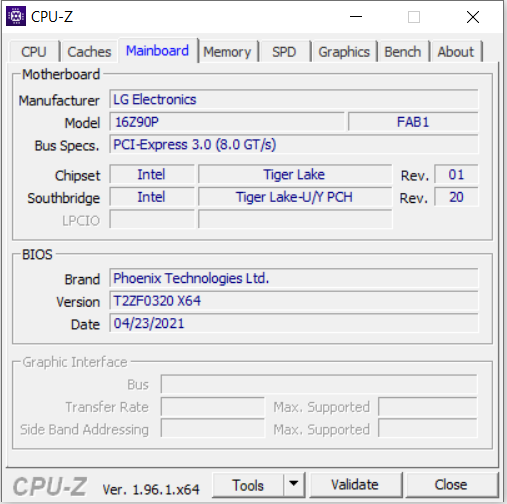
Performance - Tiger Lake on board
With the Gram 16, LG has a mobile 16-inch device in its lineup that offers more than enough computing power for office and Internet applications.
Test conditions
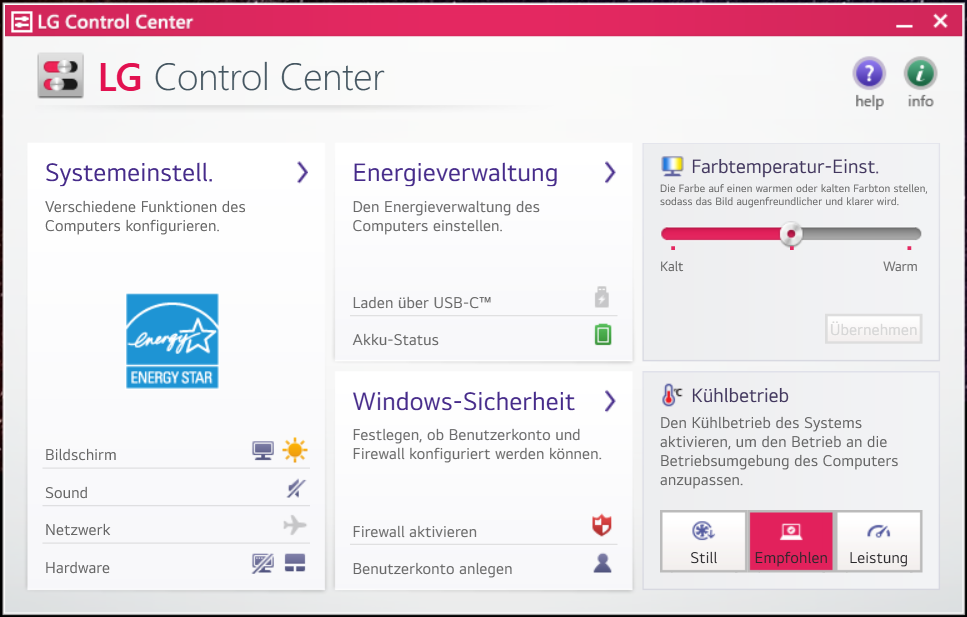
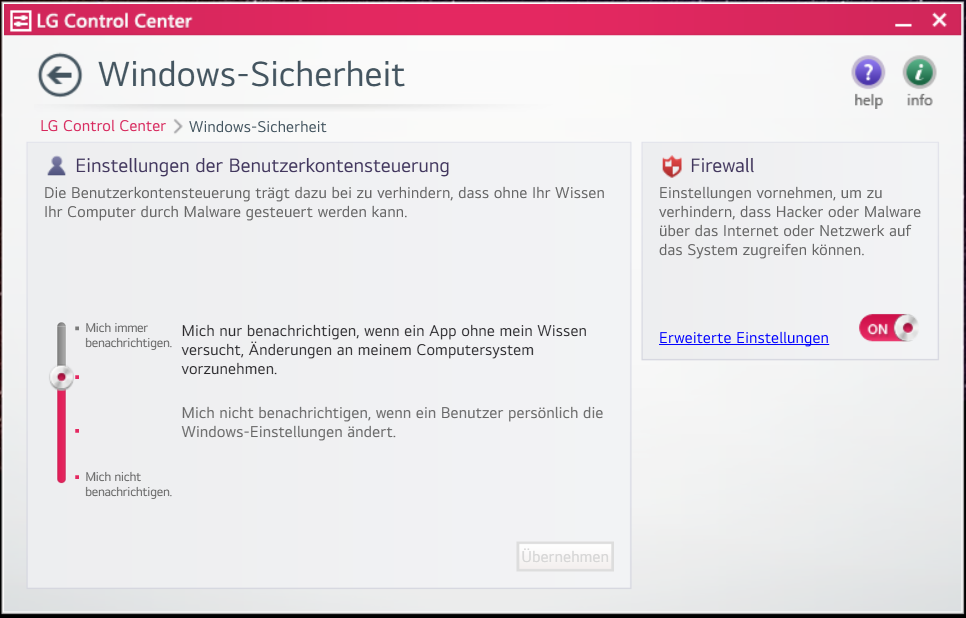
The preinstalled LG Control Center allows choosing between three operating modes ("Silent", "Recommended", and "Performance") that have an impact on performance as well as on heat and noise development. We used the "Recommended" mode (PL1: 25 watts, PL2: 60 watts). We also ran some benchmarks with the "Performance" mode active (PL1: 28 watts, PL2: 60 watts). The "Recommended" mode is automatically activated after each computer reboot.
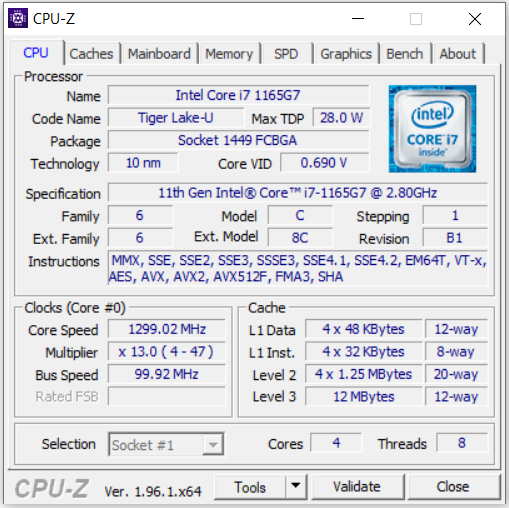
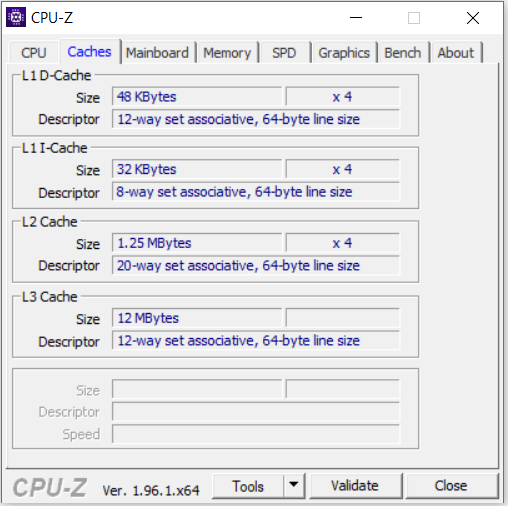
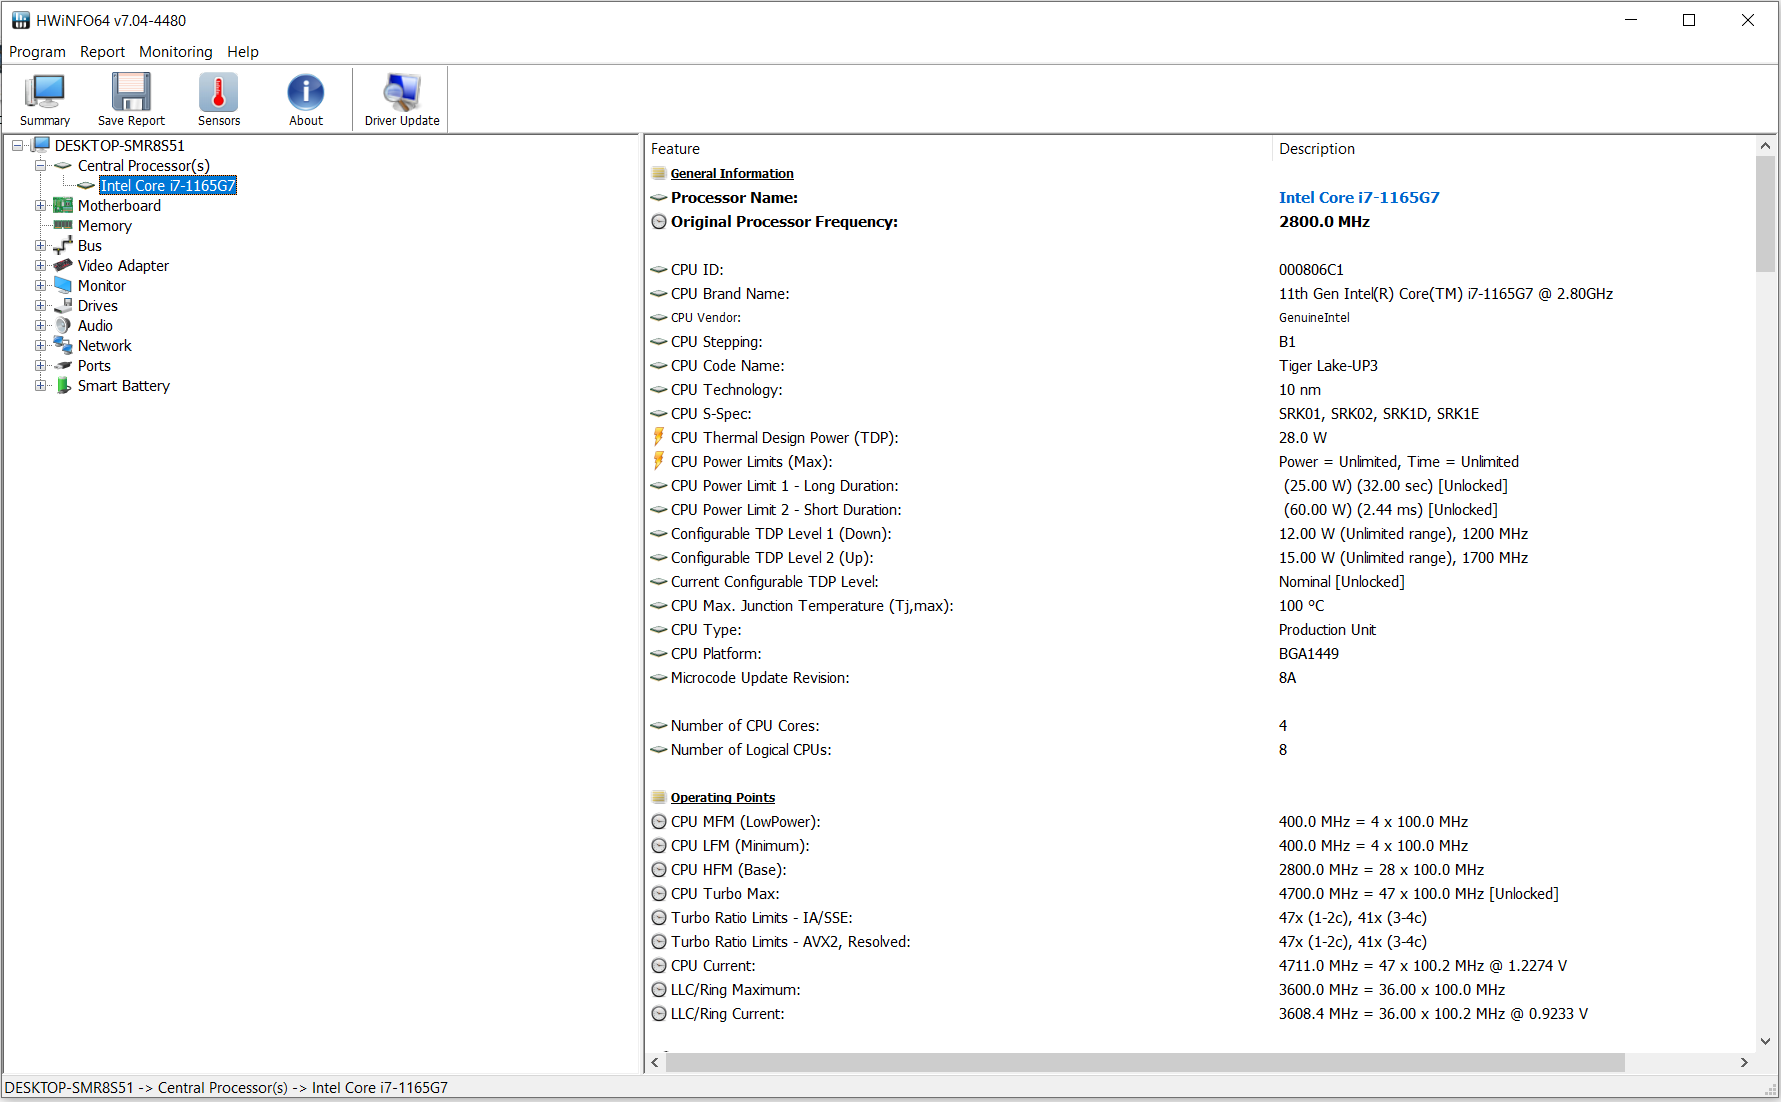
Processor
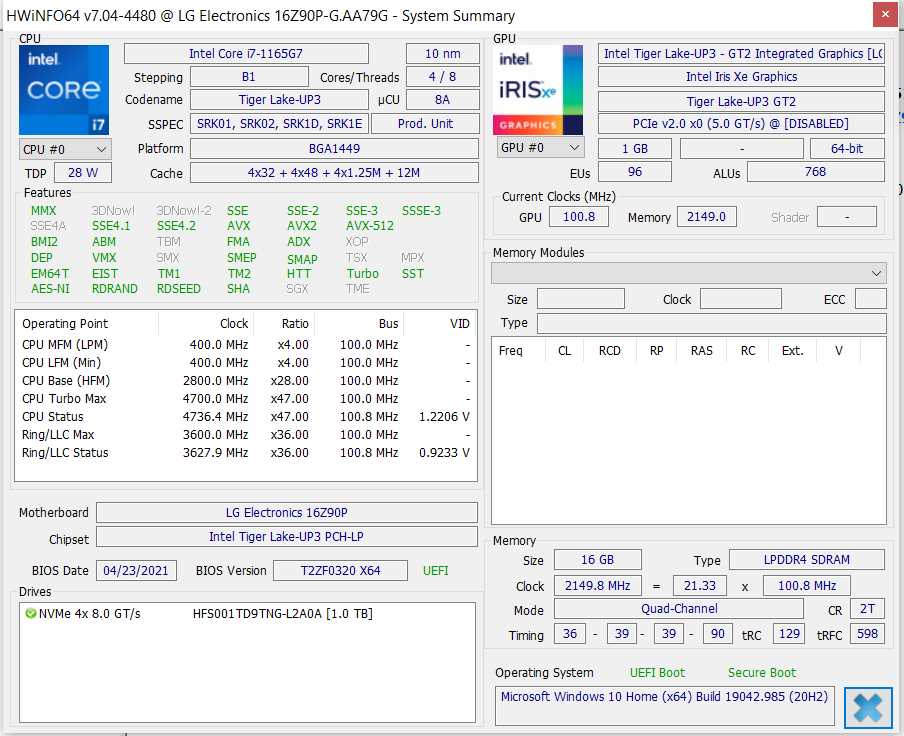
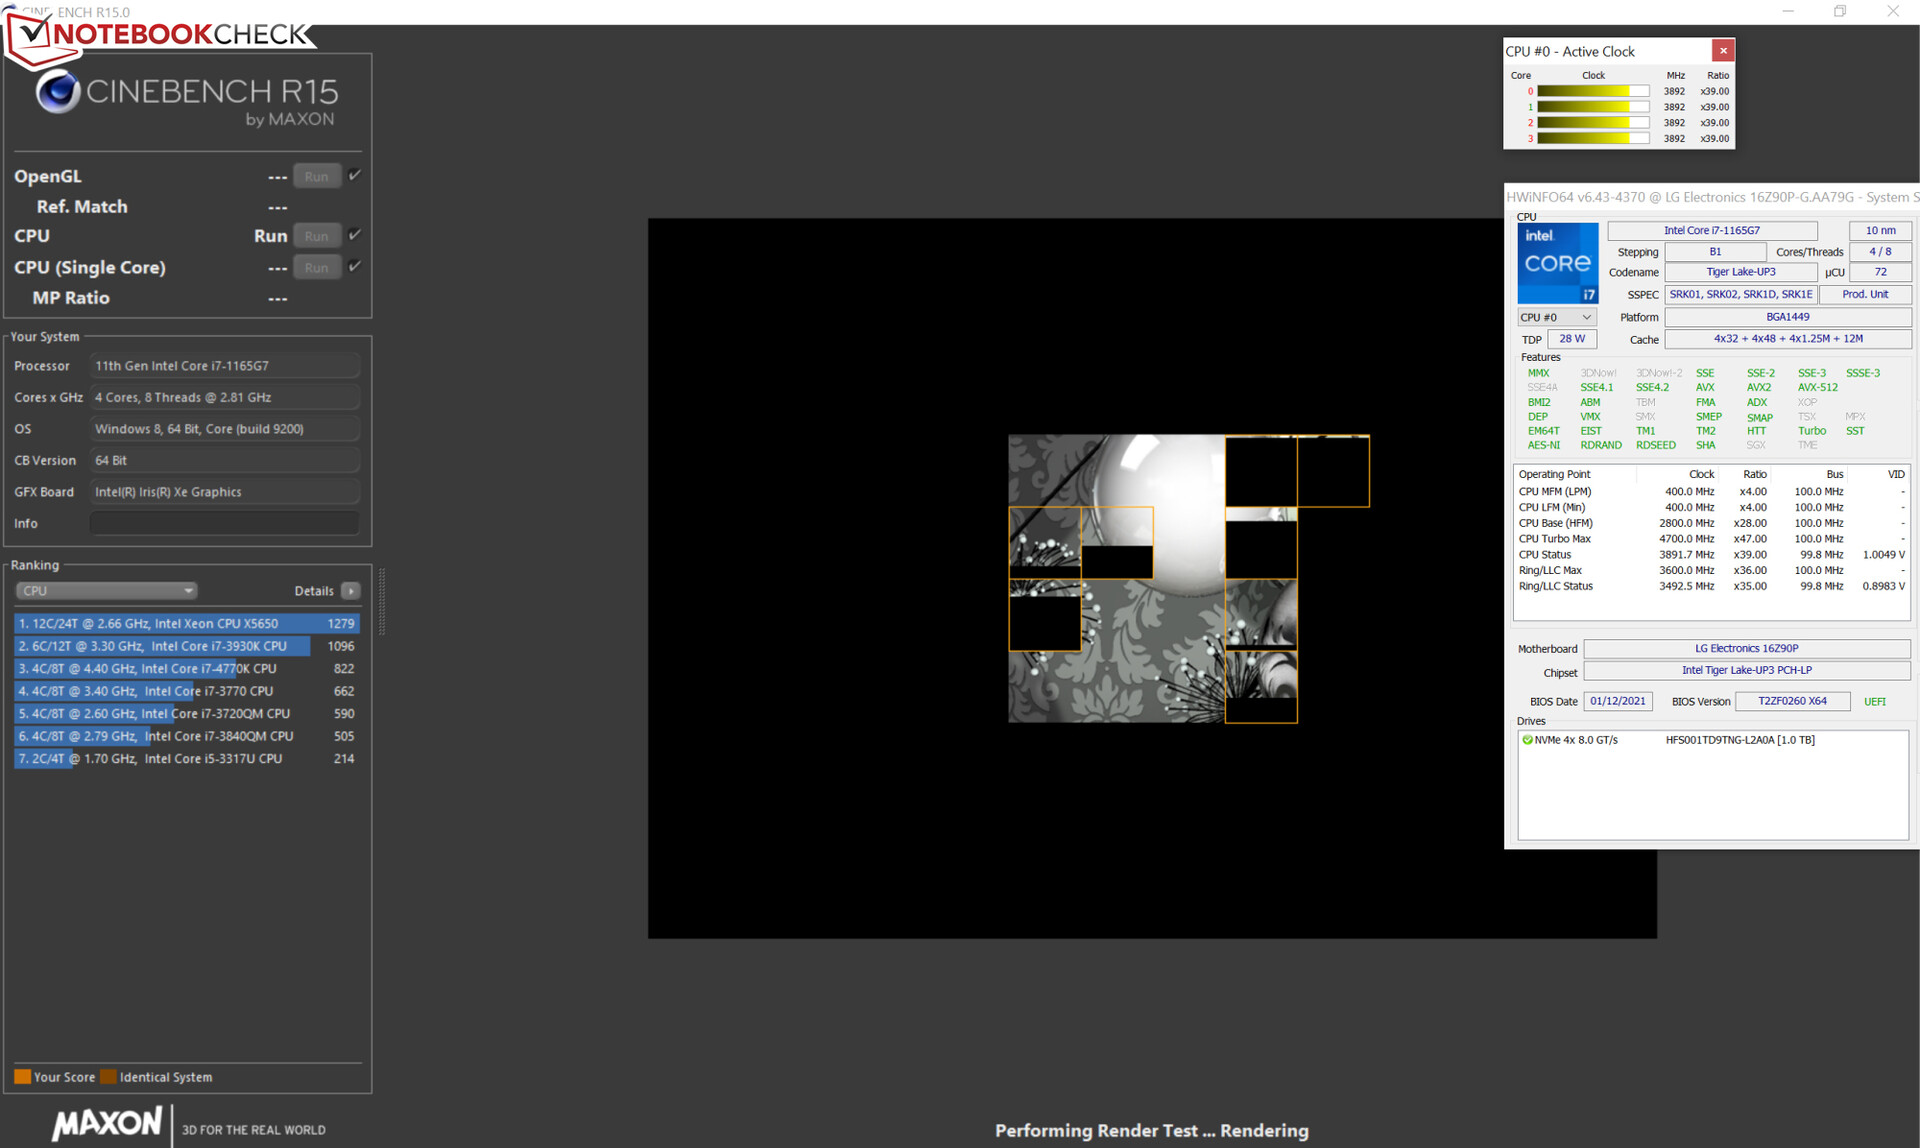
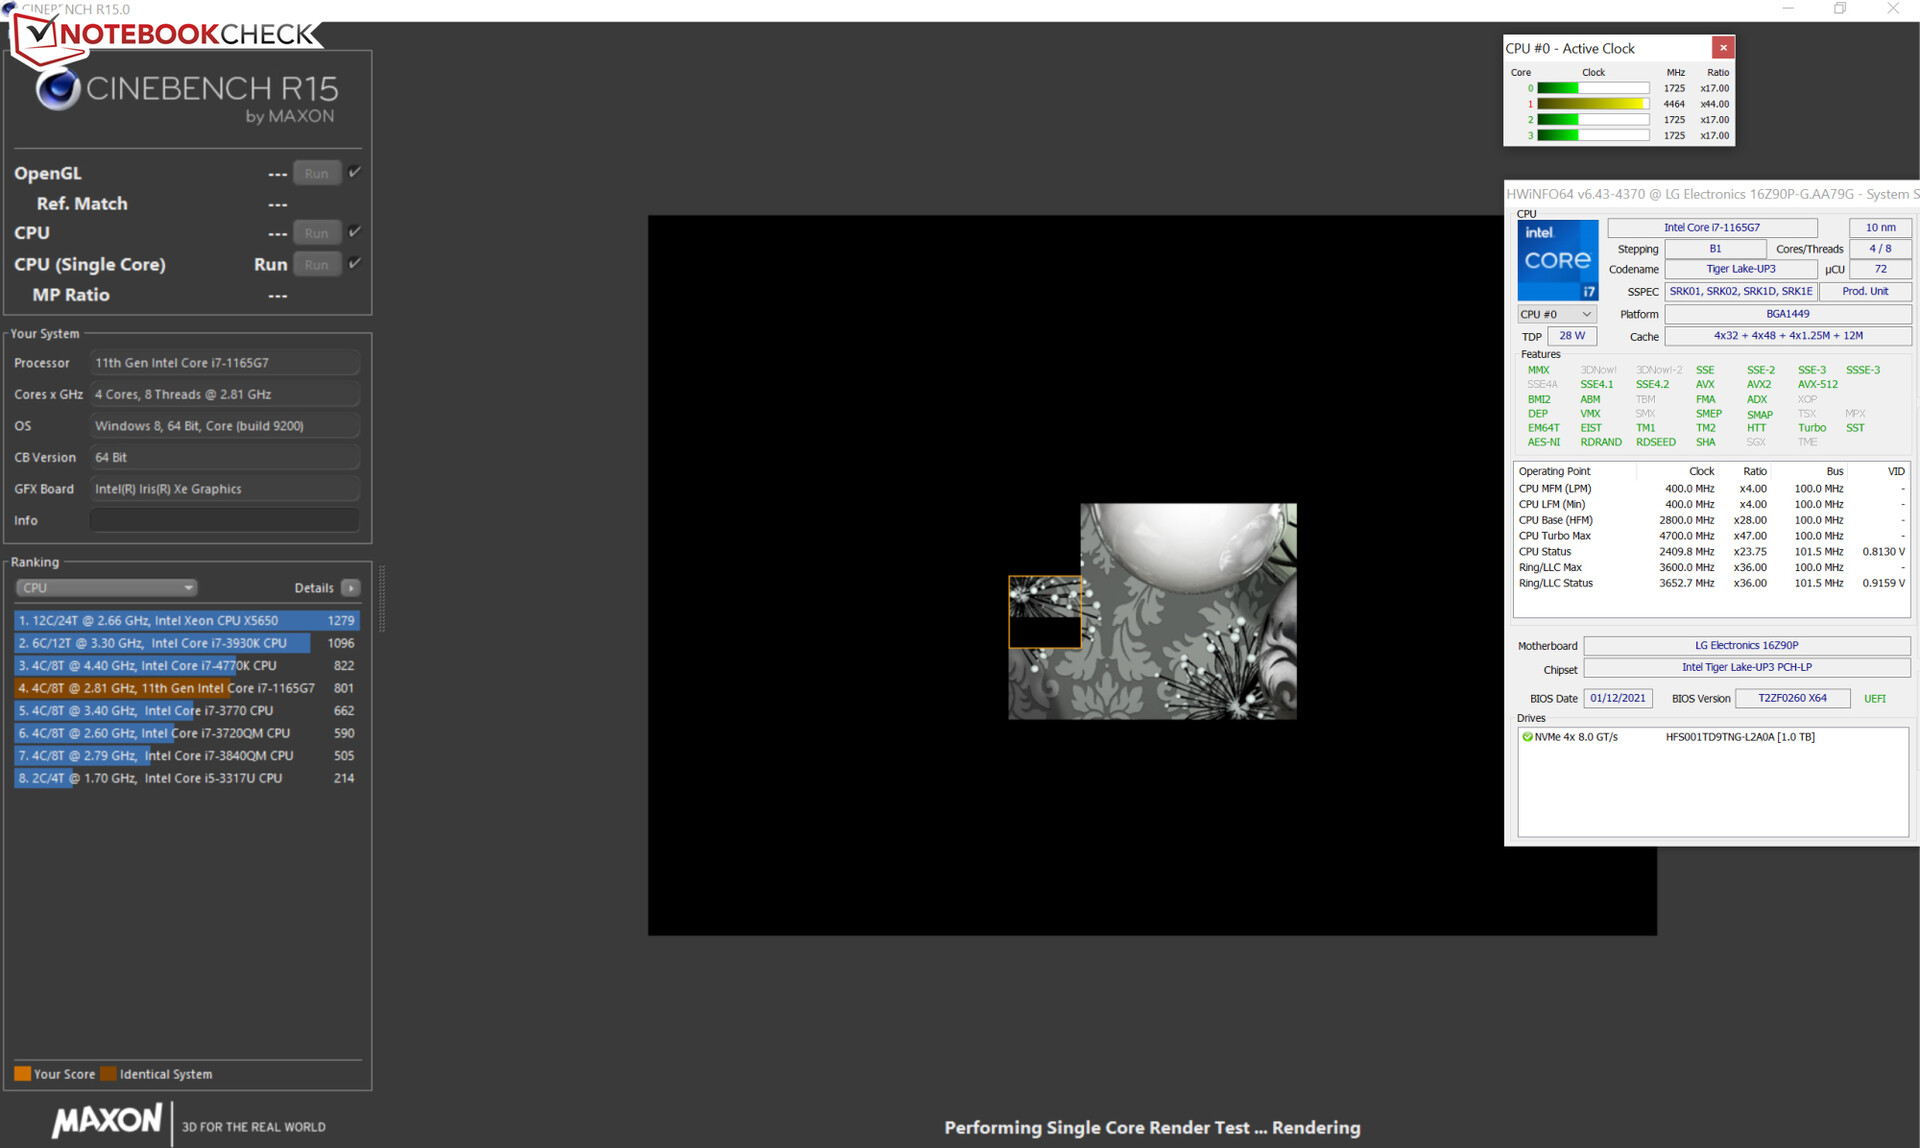
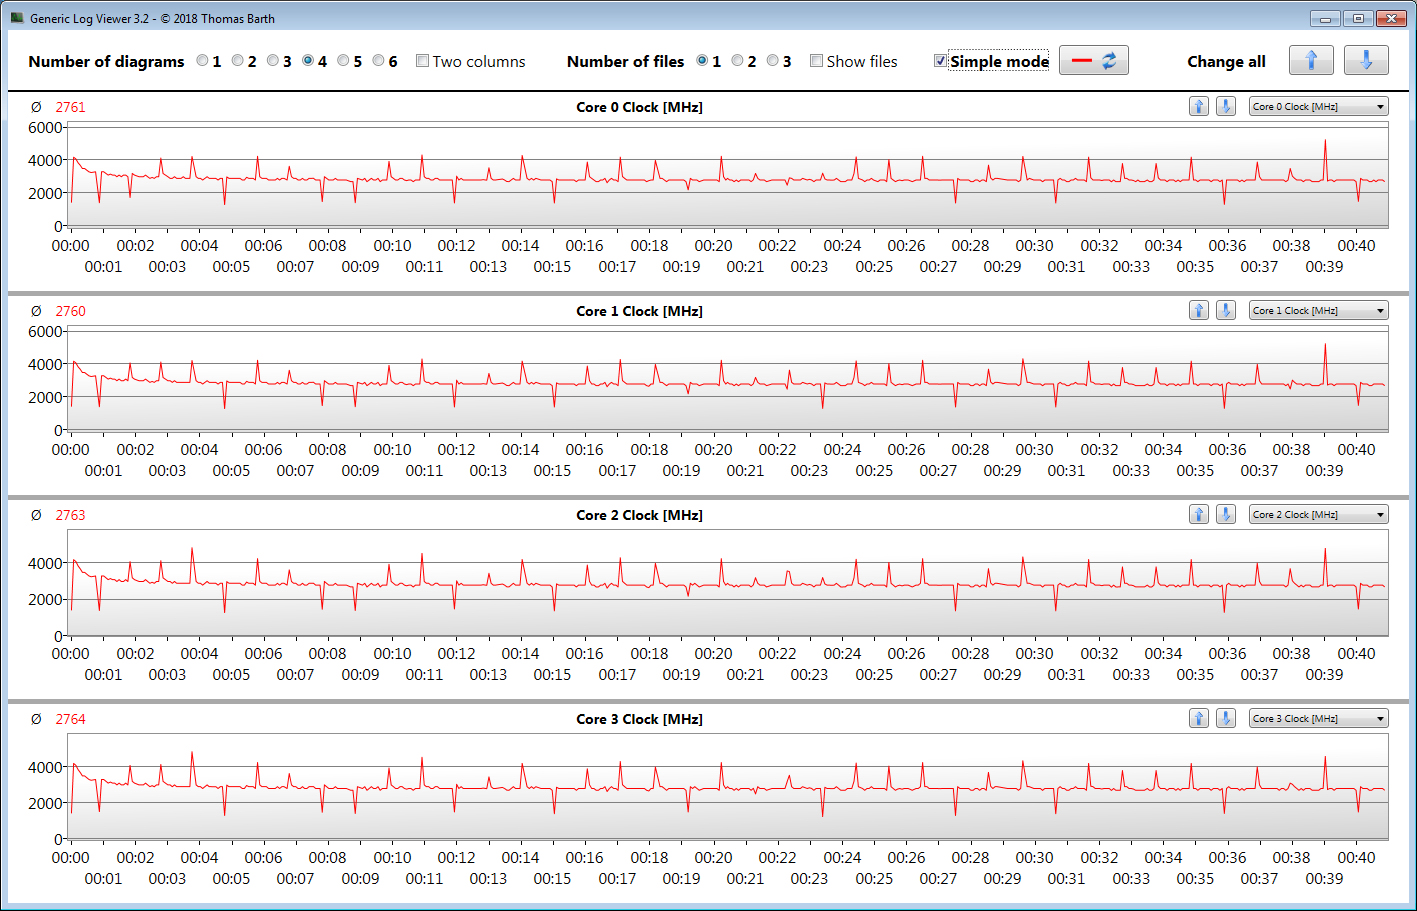
The Core-i7-1165G7 quad-core processor (Tiger Lake) operates at a base clock speed of 2.8 GHz. An increase to 4.1 GHz (all four cores) and 4.7 GHz (one core) is possible via Turbo. Hyper-Threading (two threads per core) is supported as well.
The multithread test of the Cinebench R15 benchmark is briefly processed at 4.1 GHz. The clock rate then drops to between 2.9 and 3 GHz. Meanwhile, the single-thread tests are run at 1.7 to 4.7 GHz. The clock rates are significantly lower on battery power.
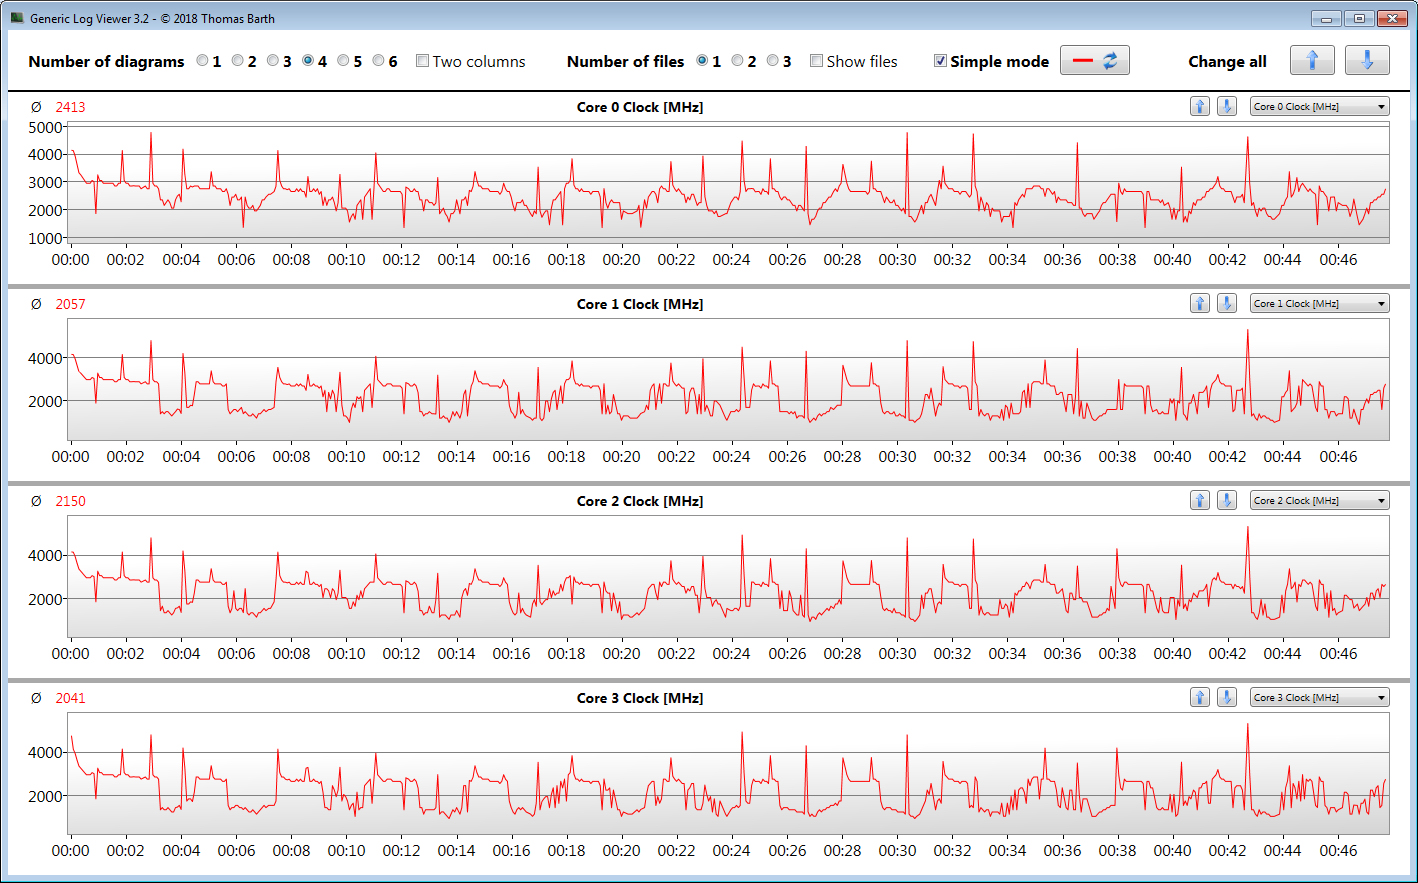
We verify if the CPU Turbo is also consistently used when plugged in by running the Cinebench R15 benchmark's multithread test in a continuous loop for at least 30 minutes.
High clock rates can only be maintained within the first minute. The clock speed then drops to a lower level. The "Performance" mode allows clock rates to increase a bit and ensures smoother performance development.
| Cinebench R23 | |
| Single Core | |
| Average of class Office (708 - 2130, n=73, last 2 years) | |
| Asus VivoBook S15 S533EQ-BQ002T | |
| Average Intel Core i7-1165G7 (1110 - 1539, n=59) | |
| LG Gram 16 (2021) (Leistung) | |
| LG Gram 16 (2021) | |
| Schenker Vision 15 | |
| Huawei MateBook D 16-53011VFJ | |
| Multi Core | |
| Average of class Office (1673 - 22808, n=73, last 2 years) | |
| Huawei MateBook D 16-53011VFJ | |
| Asus VivoBook S15 S533EQ-BQ002T | |
| Average Intel Core i7-1165G7 (2525 - 6862, n=64) | |
| LG Gram 16 (2021) (Leistung) | |
| Schenker Vision 15 | |
| LG Gram 16 (2021) | |
| HWBOT x265 Benchmark v2.2 - 4k Preset | |
| Average of class Office (2.21 - 26, n=73, last 2 years) | |
| Huawei MateBook D 16-53011VFJ | |
| Schenker Vision 15 | |
| LG Gram 16 (2021) (Leistung) | |
| Average Intel Core i7-1165G7 (1.39 - 8.47, n=80) | |
| Asus VivoBook S15 S533EQ-BQ002T | |
| LG Gram 16 (2021) | |
| Samsung Galaxy Book Ion Aura Silver | |
| Acer Aspire 5 A515-56-511A | |
| LibreOffice - 20 Documents To PDF | |
| Samsung Galaxy Book Ion Aura Silver | |
| Huawei MateBook D 16-53011VFJ | |
| Average of class Office (41.5 - 102.3, n=73, last 2 years) | |
| Acer Aspire 5 A515-56-511A | |
| Average Intel Core i7-1165G7 (21.5 - 88.1, n=78) | |
| LG Gram 16 (2021) | |
| Schenker Vision 15 | |
| Asus VivoBook S15 S533EQ-BQ002T | |
| LG Gram 16 (2021) (Leistung) | |
| R Benchmark 2.5 - Overall mean | |
| Samsung Galaxy Book Ion Aura Silver | |
| Acer Aspire 5 A515-56-511A | |
| LG Gram 16 (2021) | |
| Huawei MateBook D 16-53011VFJ | |
| Average Intel Core i7-1165G7 (0.552 - 1.002, n=80) | |
| Schenker Vision 15 | |
| Asus VivoBook S15 S533EQ-BQ002T | |
| LG Gram 16 (2021) (Leistung) | |
| Average of class Office (0.4098 - 0.888, n=73, last 2 years) | |
* ... smaller is better
System performance
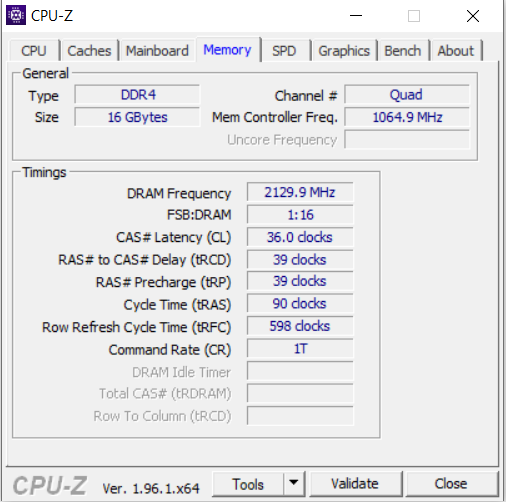
The fast and smooth system offers more than enough performance for office and Internet applications. However, the laptop wasn't designed for sustained high load. Furthermore, the PCMark results are good. RAM (16 GB, LPDDR4X 4266, on-board) runs in dual-channel mode, and it's not possible to expand it.
| PCMark 8 Home Score Accelerated v2 | 4189 points | |
| PCMark 8 Creative Score Accelerated v2 | 4823 points | |
| PCMark 8 Work Score Accelerated v2 | 2431 points | |
| PCMark 10 Score | 4917 points | |
Help | ||
DPC latencies
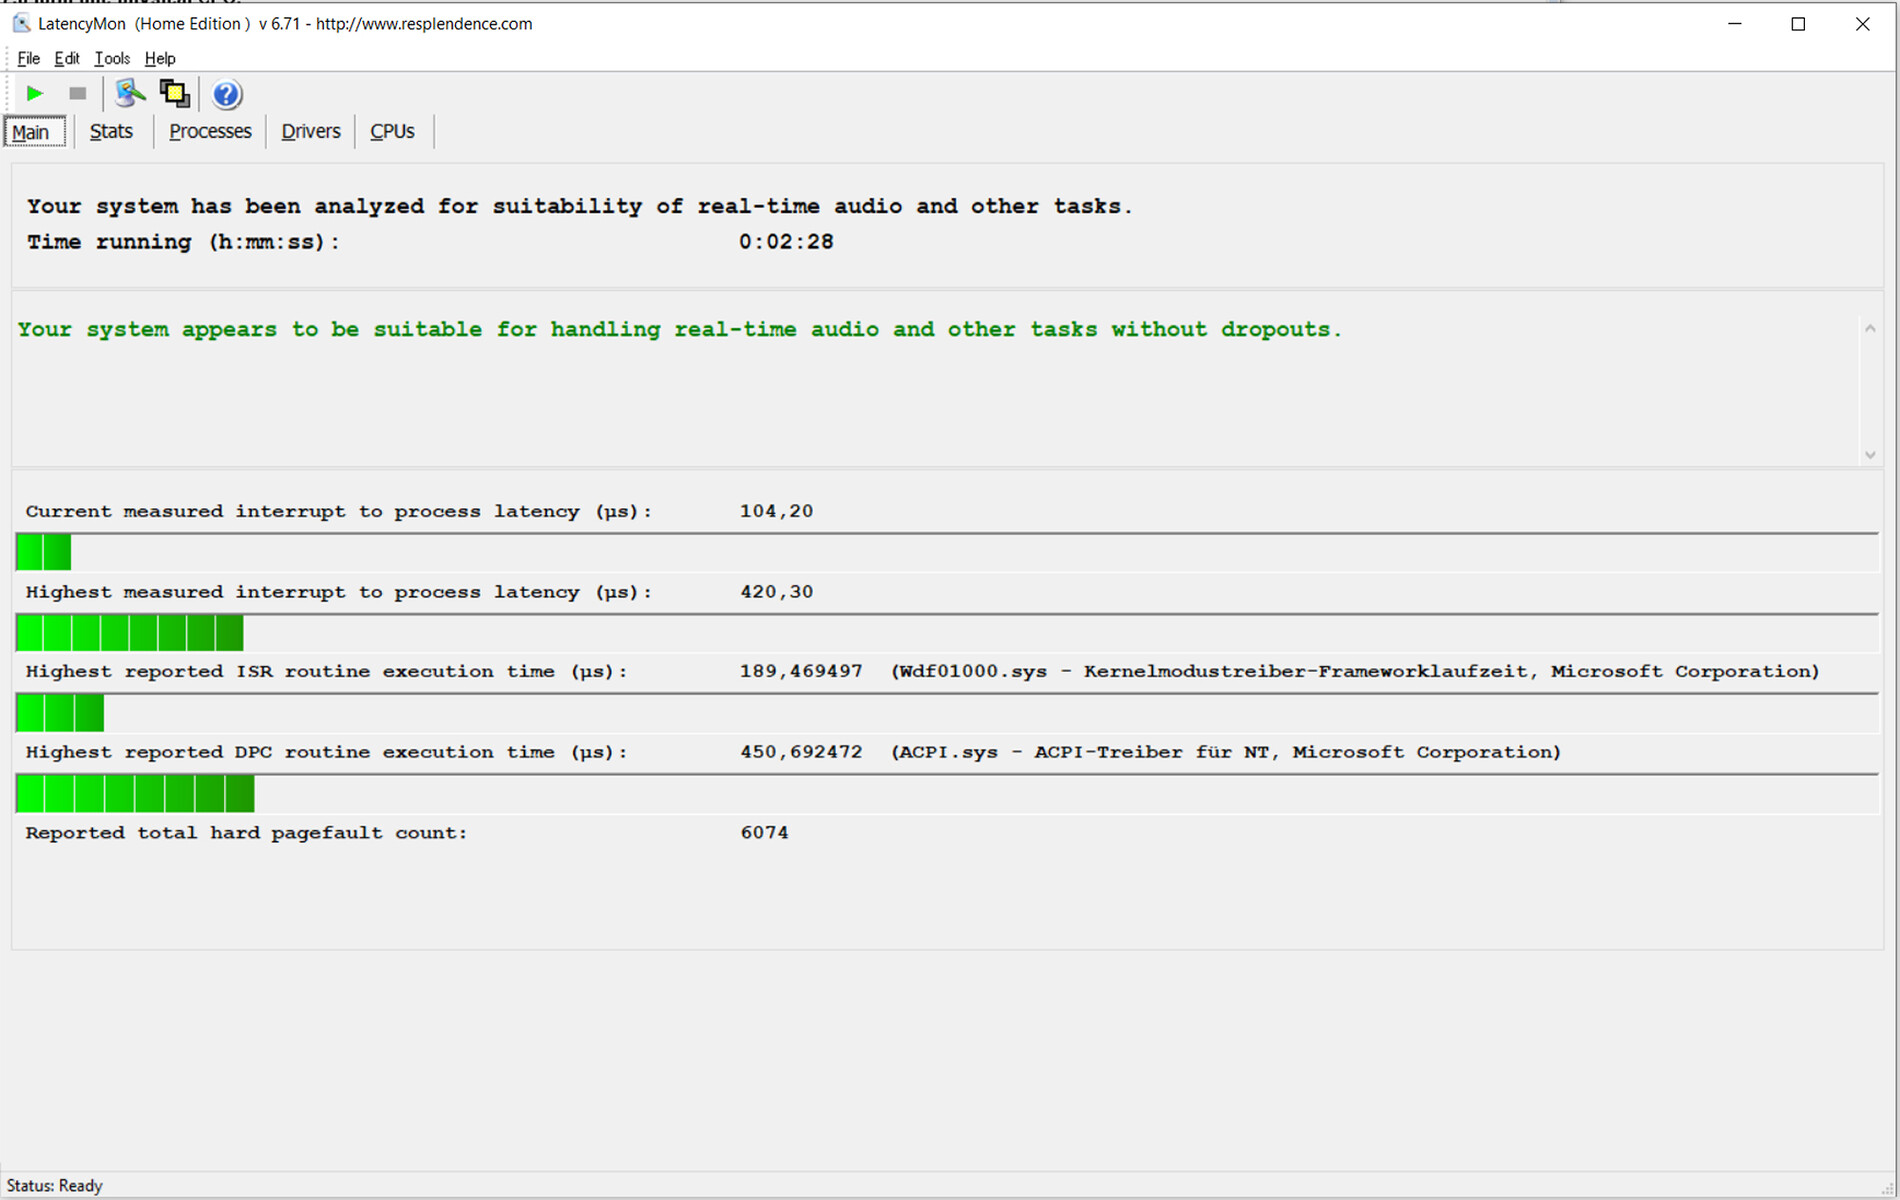
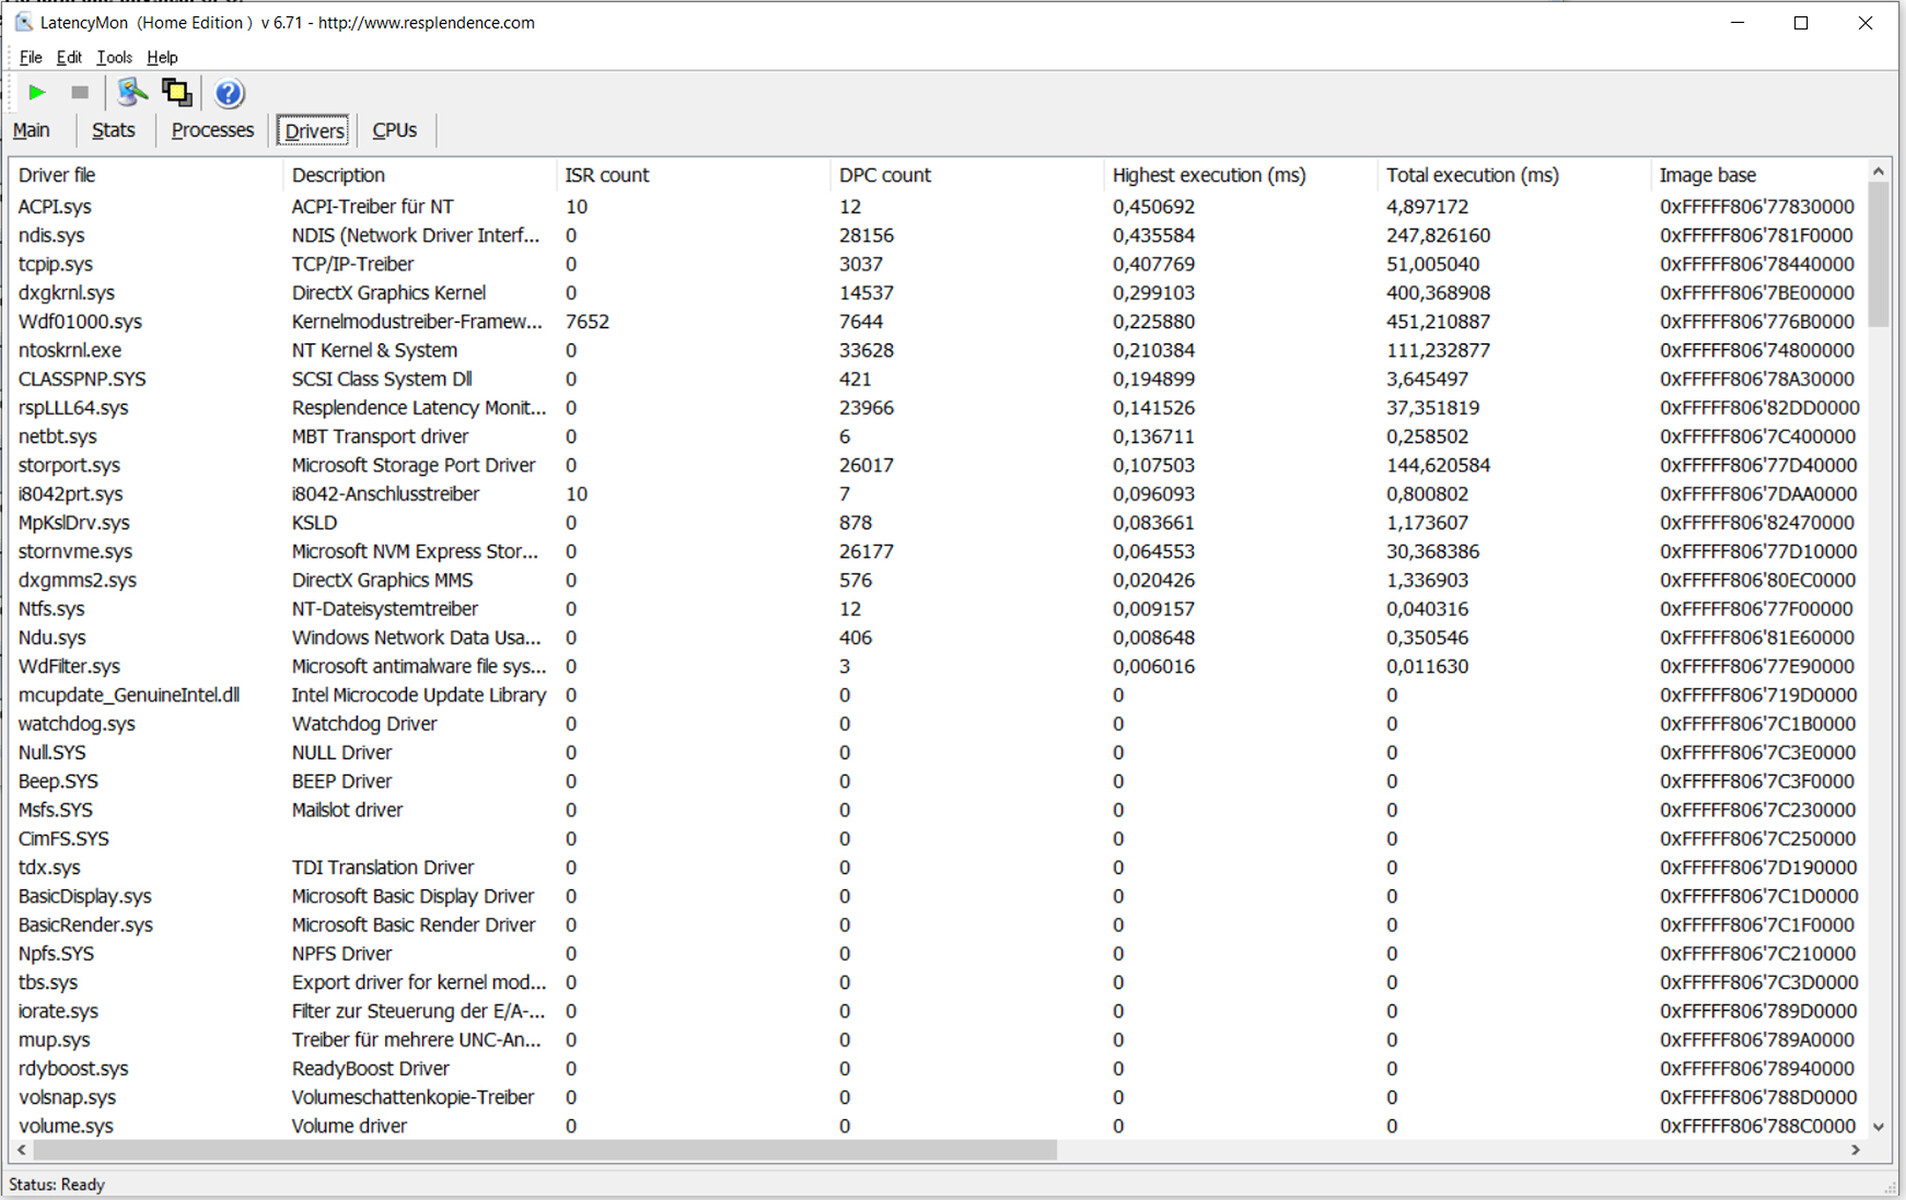
In our standardized latency monitor test (web browsing, 4K video playback, high-load Prime95), we didn't observe any irregularities with the DPC latencies. The system seems to be suitable for real-time video and audio editing.
| DPC Latencies / LatencyMon - interrupt to process latency (max), Web, Youtube, Prime95 | |
| Schenker Vision 15 | |
| Samsung Galaxy Book Ion Aura Silver | |
| Acer Aspire 5 A515-56-511A | |
| Huawei MateBook D 16-53011VFJ | |
| Asus VivoBook S15 S533EQ-BQ002T | |
| LG Gram 16 (2021) | |
* ... smaller is better
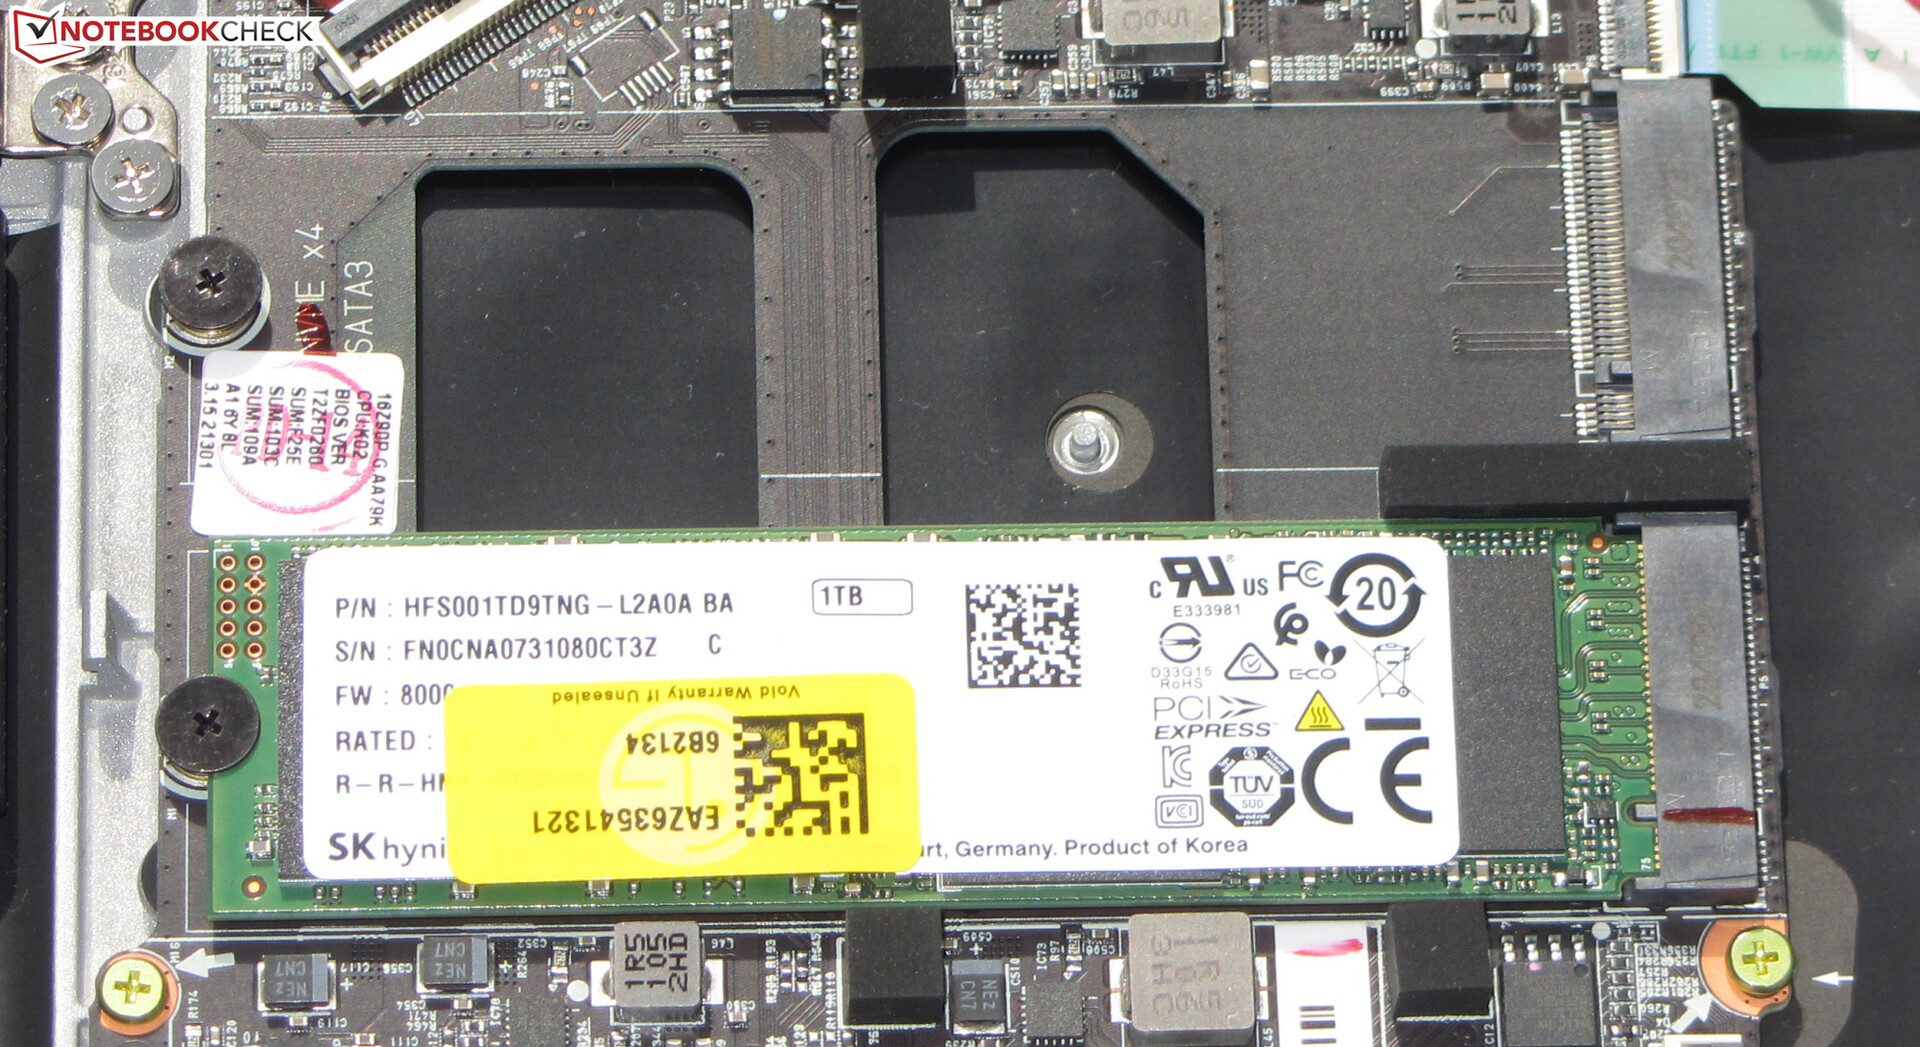
Storage
LG installs an NVMe SSD (M.2 2280) from SK Hynix that has a storage capacity of 1 TB. Its transfer rates are good. Moreover, the laptop still has room for a second NVMe SSD.

| LG Gram 16 (2021) SK Hynix PC601 1TB HFS001TD9TNG | Samsung Galaxy Book Ion Aura Silver WDC PC SN730 SDBQNTY-512GB | Huawei MateBook D 16-53011VFJ Samsung SSD PM981a MZVLB512HBJQ | Acer Aspire 5 A515-56-511A Micron 2210 MTFDHBA1T0QFD | Asus VivoBook S15 S533EQ-BQ002T Intel SSD 660p 1TB SSDPEKNW010T8 | Schenker Vision 15 Samsung SSD 980 Pro 1TB MZ-V8P1T0BW | Average SK Hynix PC601 1TB HFS001TD9TNG | |
|---|---|---|---|---|---|---|---|
| CrystalDiskMark 5.2 / 6 | -2% | 2% | -18% | -14% | 63% | 1% | |
| Write 4K (MB/s) | 204.2 | 196.3 -4% | 147 -28% | 86.8 -57% | 214.4 5% | 238.1 17% | 202 ? -1% |
| Read 4K (MB/s) | 47.14 | 54.2 15% | 65.5 39% | 66.4 41% | 58.5 24% | 79.2 68% | 51.5 ? 9% |
| Write Seq (MB/s) | 2521 | 2194 -13% | 2680 6% | 1851 -27% | 1678 -33% | 4139 64% | 2481 ? -2% |
| Read Seq (MB/s) | 1748 | 2508 43% | 2556 46% | 1707 -2% | 1648 -6% | 4133 136% | 1844 ? 5% |
| Write 4K Q32T1 (MB/s) | 669 | 423.8 -37% | 413.4 -38% | 542 -19% | 644 -4% | 697 4% | 650 ? -3% |
| Read 4K Q32T1 (MB/s) | 760 | 547 -28% | 500 -34% | 589 -22% | 600 -21% | 758 0% | 732 ? -4% |
| Write Seq Q32T1 (MB/s) | 2513 | 2705 8% | 2978 19% | 1960 -22% | 1760 -30% | 5187 106% | 2540 ? 1% |
| Read Seq Q32T1 (MB/s) | 3452 | 3405 -1% | 3567 3% | 2227 -35% | 1853 -46% | 7117 106% | 3452 ? 0% |
| AS SSD | -40% | -16% | -25% | -44% | 41% | -1% | |
| Seq Read (MB/s) | 2808 | 2901 3% | 2829 1% | 2023 -28% | 1754 -38% | 5427 93% | 2892 ? 3% |
| Seq Write (MB/s) | 2345 | 2289 -2% | 2423 3% | 1781 -24% | 1567 -33% | 3886 66% | 1803 ? -23% |
| 4K Read (MB/s) | 50.2 | 46.57 -7% | 42.06 -16% | 61.9 23% | 53 6% | 72.9 45% | 50.1 ? 0% |
| 4K Write (MB/s) | 138.6 | 137.1 -1% | 126.1 -9% | 128.7 -7% | 167.9 21% | 219.3 58% | 153.5 ? 11% |
| 4K-64 Read (MB/s) | 1584 | 772 -51% | 1481 -7% | 904 -43% | 586 -63% | 2209 39% | 1562 ? -1% |
| 4K-64 Write (MB/s) | 1687 | 1245 -26% | 2009 19% | 976 -42% | 858 -49% | 2265 34% | 1602 ? -5% |
| Access Time Read * (ms) | 0.035 | 0.142 -306% | 0.079 -126% | 0.097 -177% | 0.033 6% | 0.0355 ? -1% | |
| Access Time Write * (ms) | 0.028 | 0.028 -0% | 0.029 -4% | 0.031 -11% | 0.038 -36% | 0.02 29% | 0.027 ? 4% |
| Score Read (Points) | 1915 | 1108 -42% | 1806 -6% | 1168 -39% | 815 -57% | 2825 48% | 1901 ? -1% |
| Score Write (Points) | 2060 | 1611 -22% | 2377 15% | 1283 -38% | 1182 -43% | 2873 39% | 1936 ? -6% |
| Score Total (Points) | 4934 | 3266 -34% | 5087 3% | 3053 -38% | 2421 -51% | 7069 43% | 4757 ? -4% |
| Copy ISO MB/s (MB/s) | 1852 | 1597 -14% | 1358 -27% | 1477 -20% | 2775 50% | 1681 ? -9% | |
| Copy Program MB/s (MB/s) | 704 | 494.8 -30% | 407.1 -42% | 495.3 -30% | 662 -6% | 827 ? 17% | |
| Copy Game MB/s (MB/s) | 1329 | 879 -34% | 918 -31% | 719 -46% | 1655 25% | 1400 ? 5% | |
| Total Average (Program / Settings) | -21% /
-27% | -7% /
-10% | -22% /
-22% | -29% /
-33% | 52% /
49% | 0% /
-0% |
* ... smaller is better
Continuous load read: DiskSpd Read Loop, Queue Depth 8
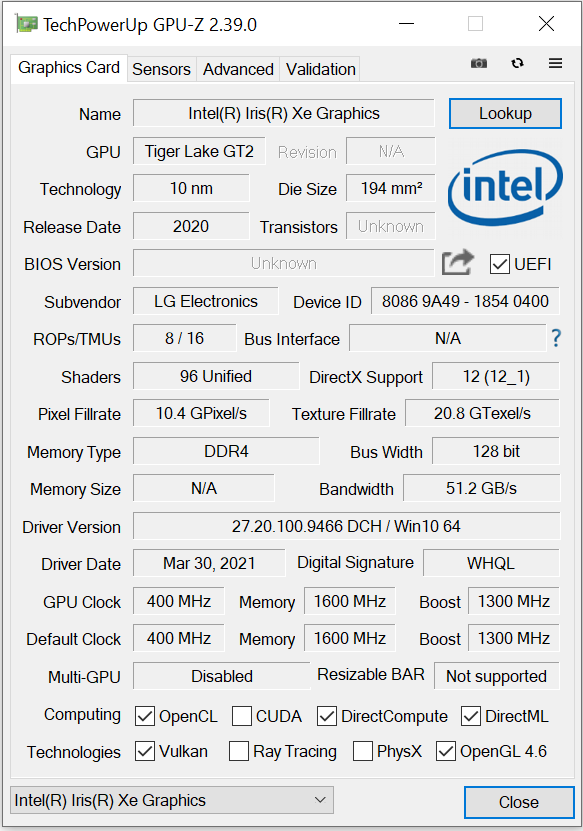
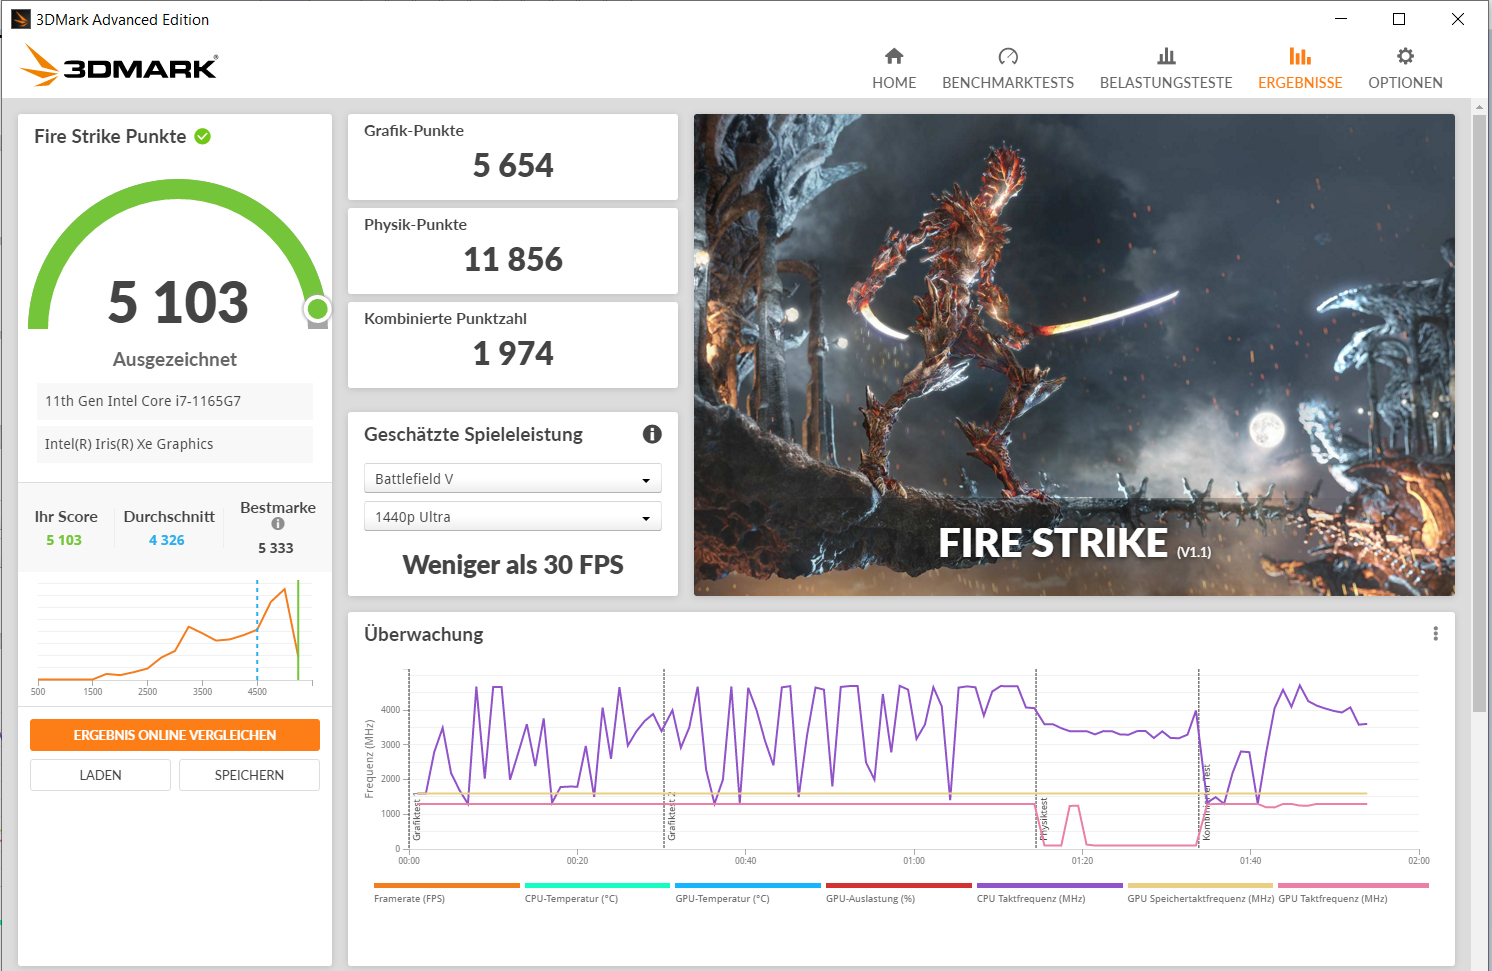
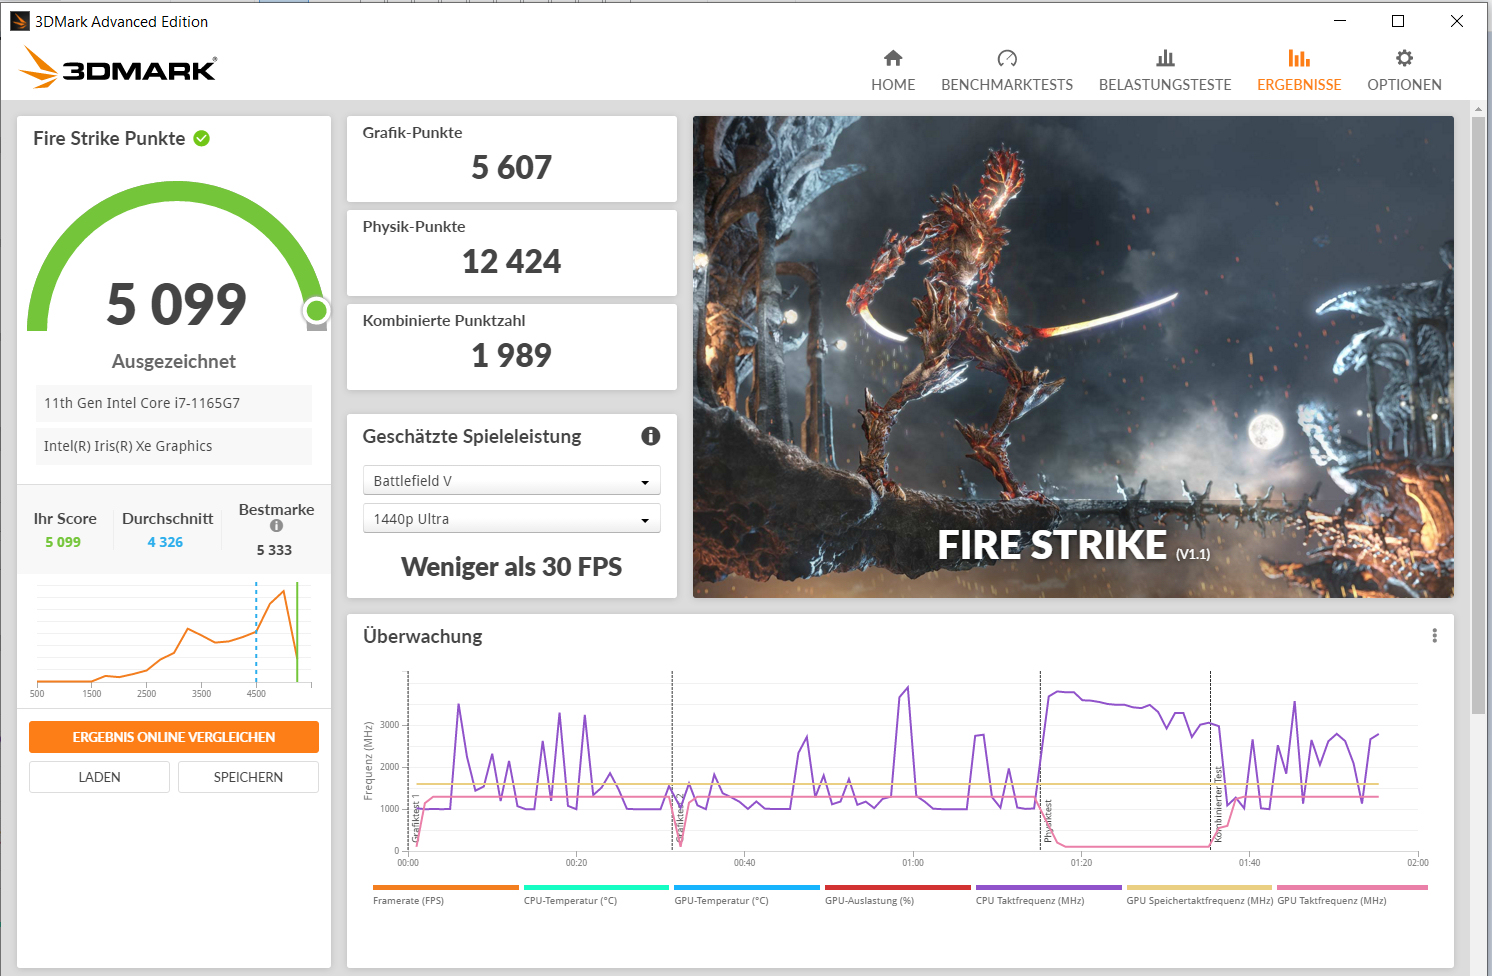
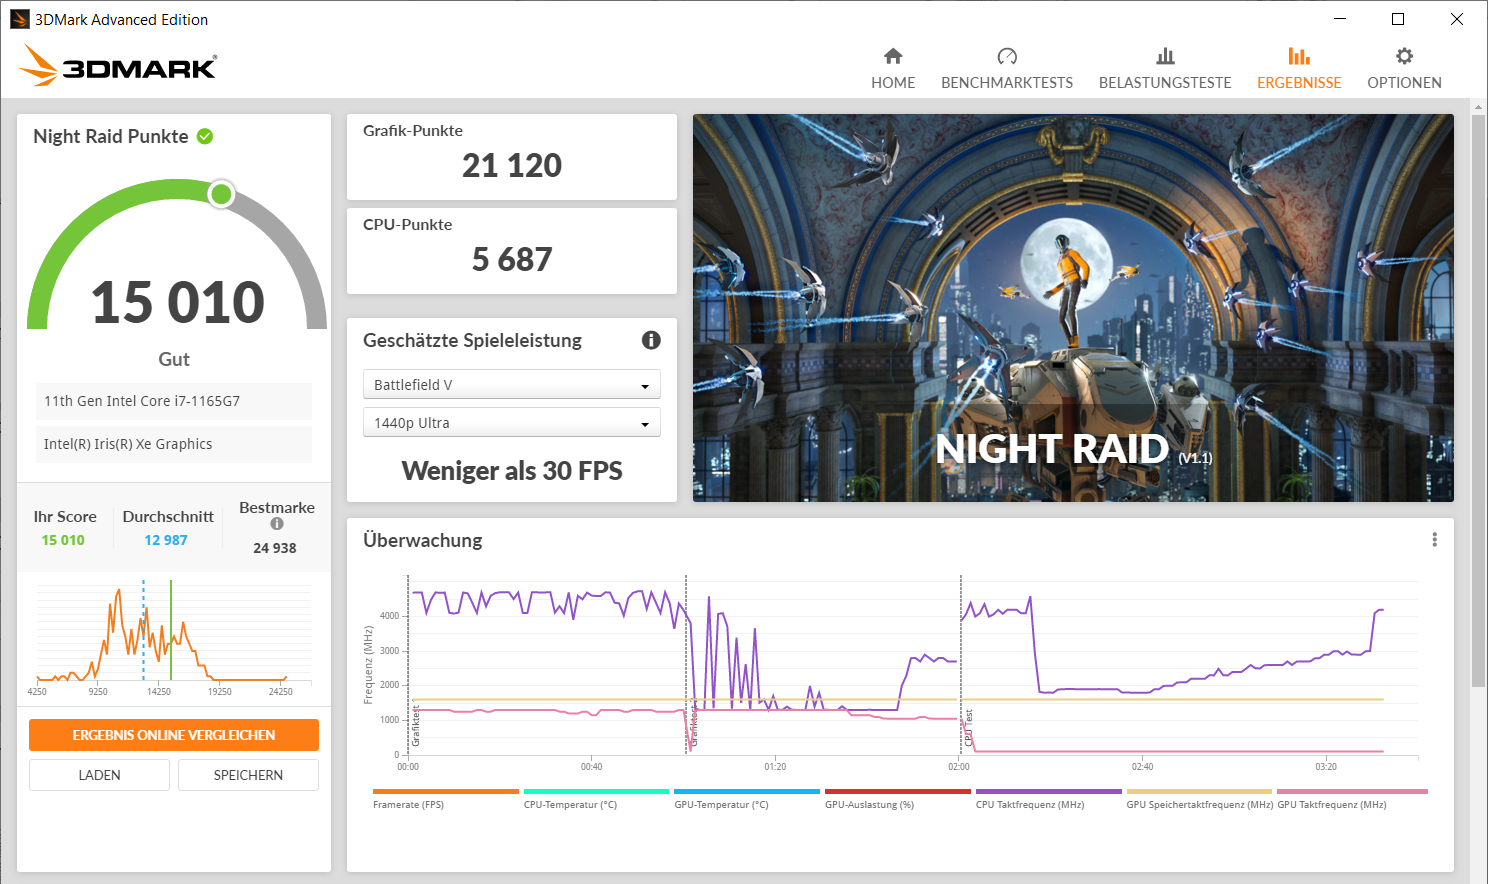
Graphics card
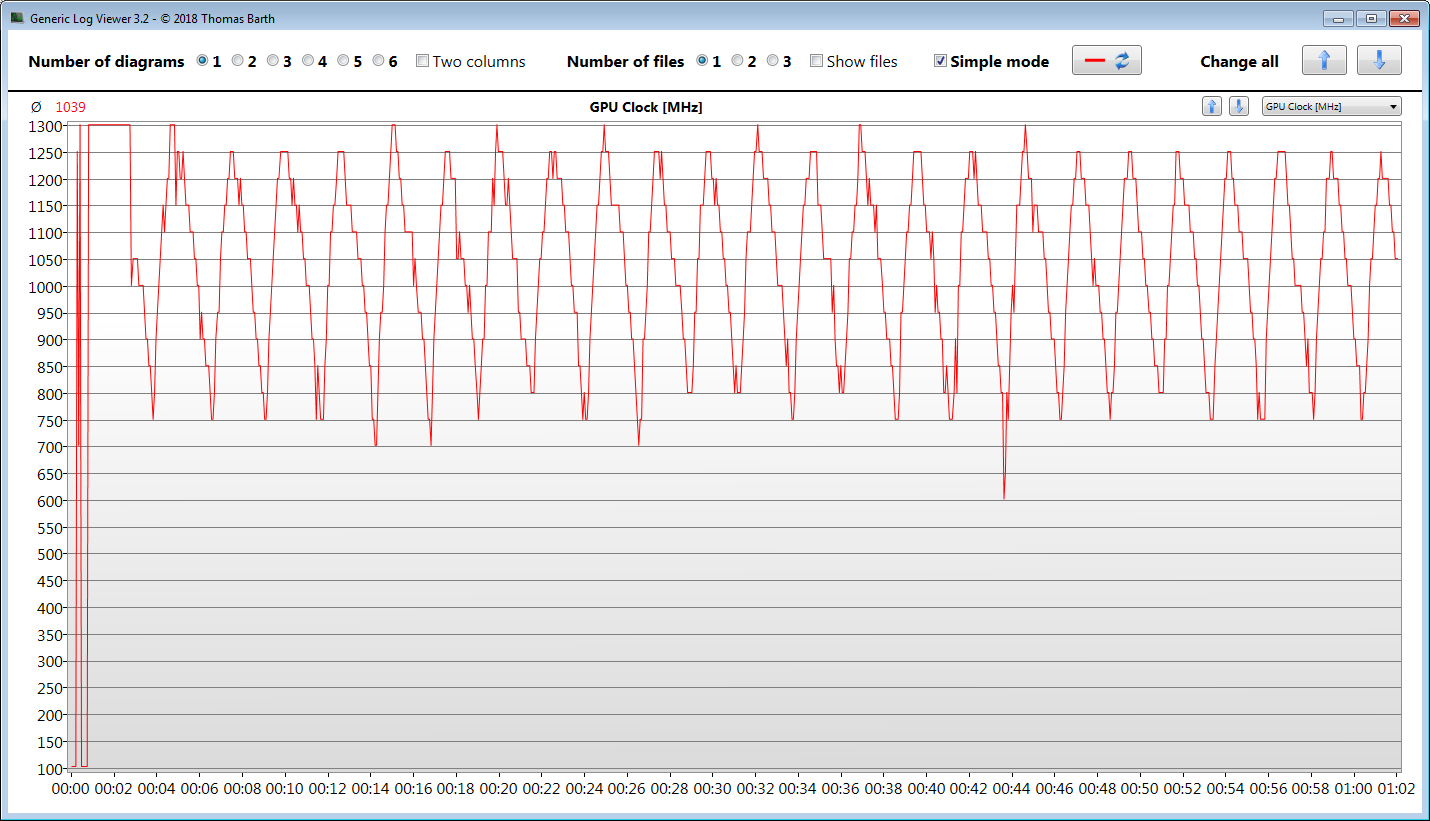
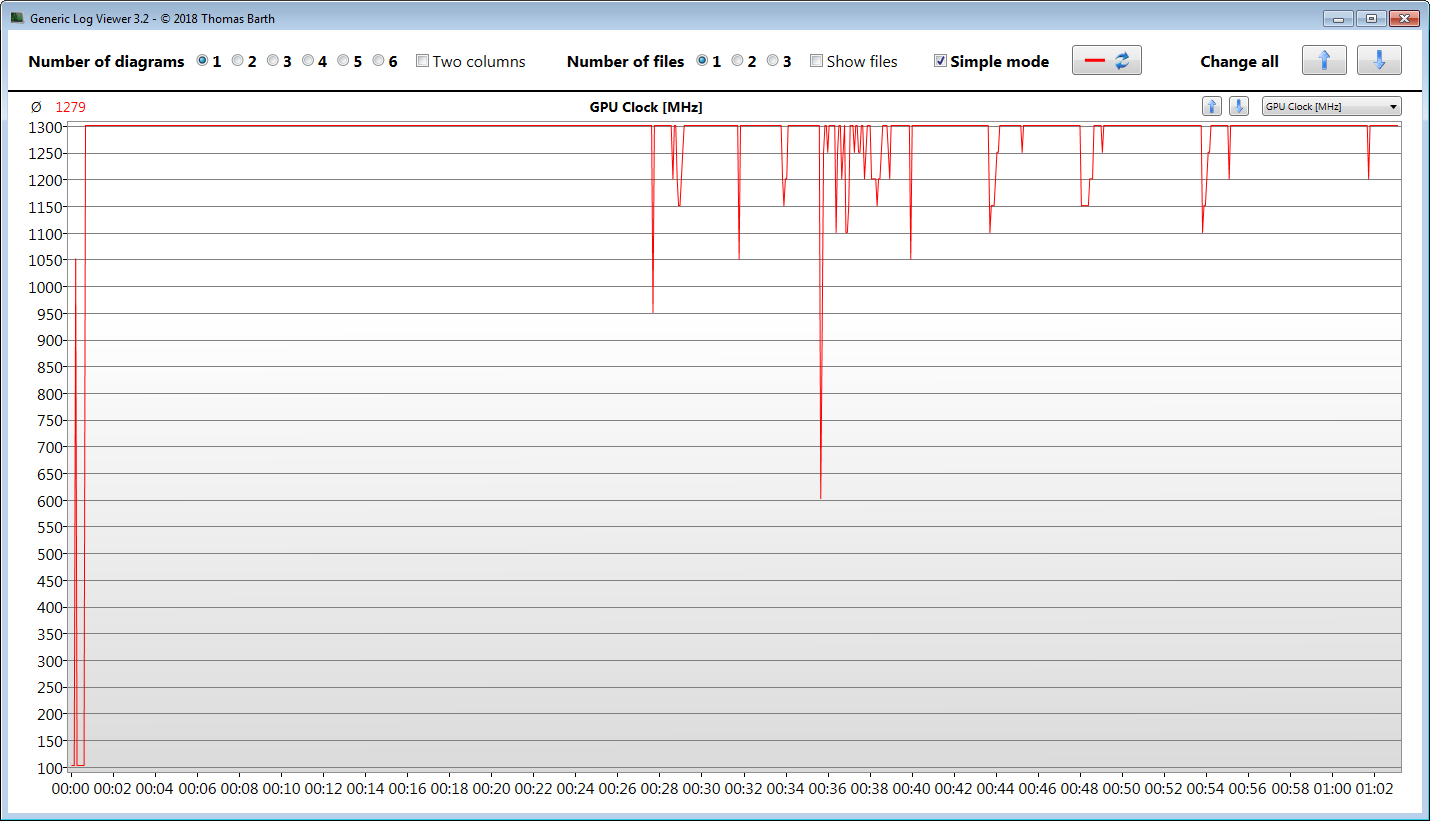
Intel's Iris Xe Graphics G7 96EUs GPU supports DirectX 12 and reaches an operating clock speed of up to 1,300 MHz. The 3DMark results are at a normal level for this GPU. However, "Performance" mode doesn't cause an immediate increase in graphics performance. Only under prolonged load does it have an impact by ensuring a constant and high level of performance. Our The Witcher 3 test illustrates this well.

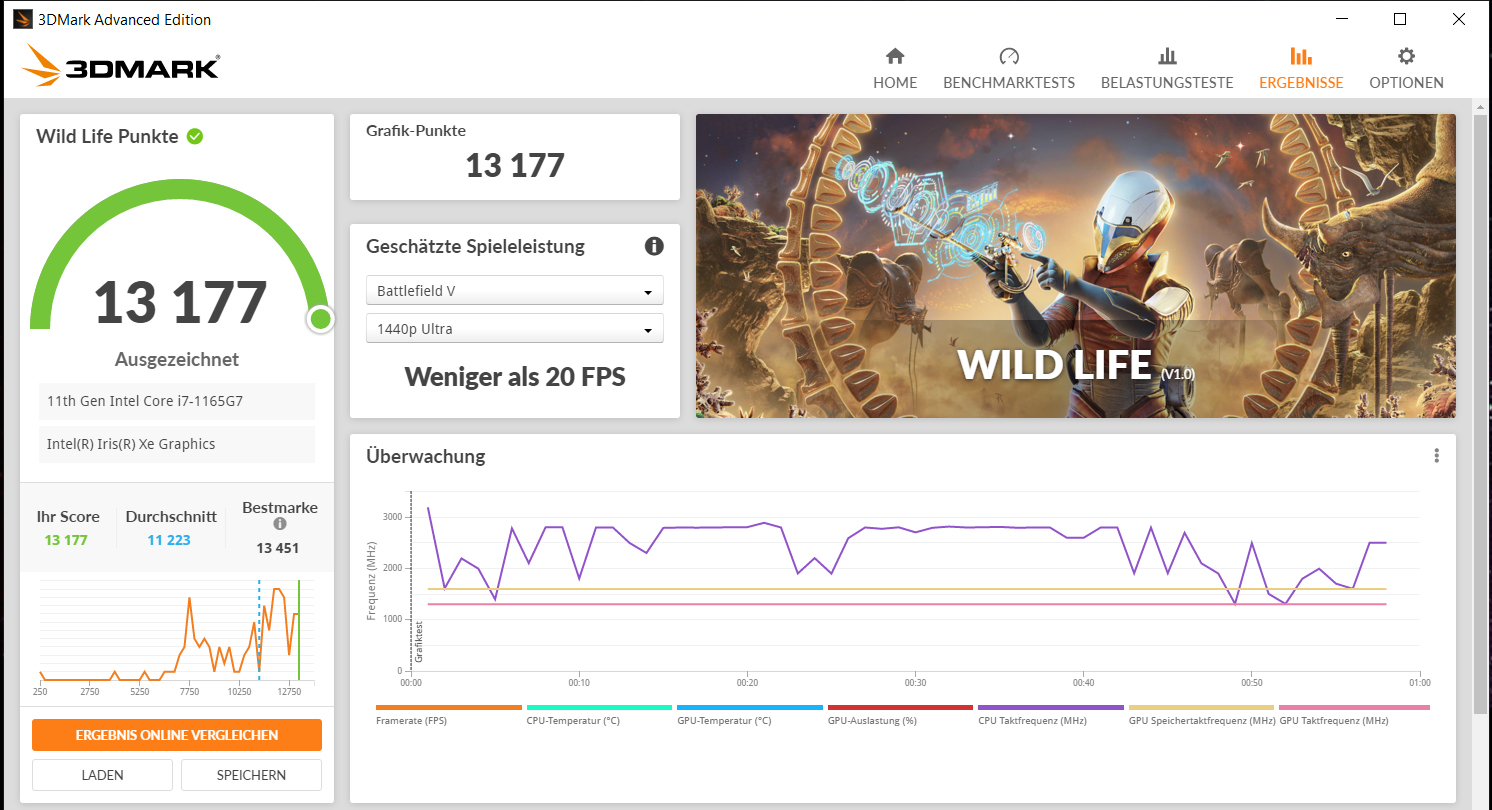
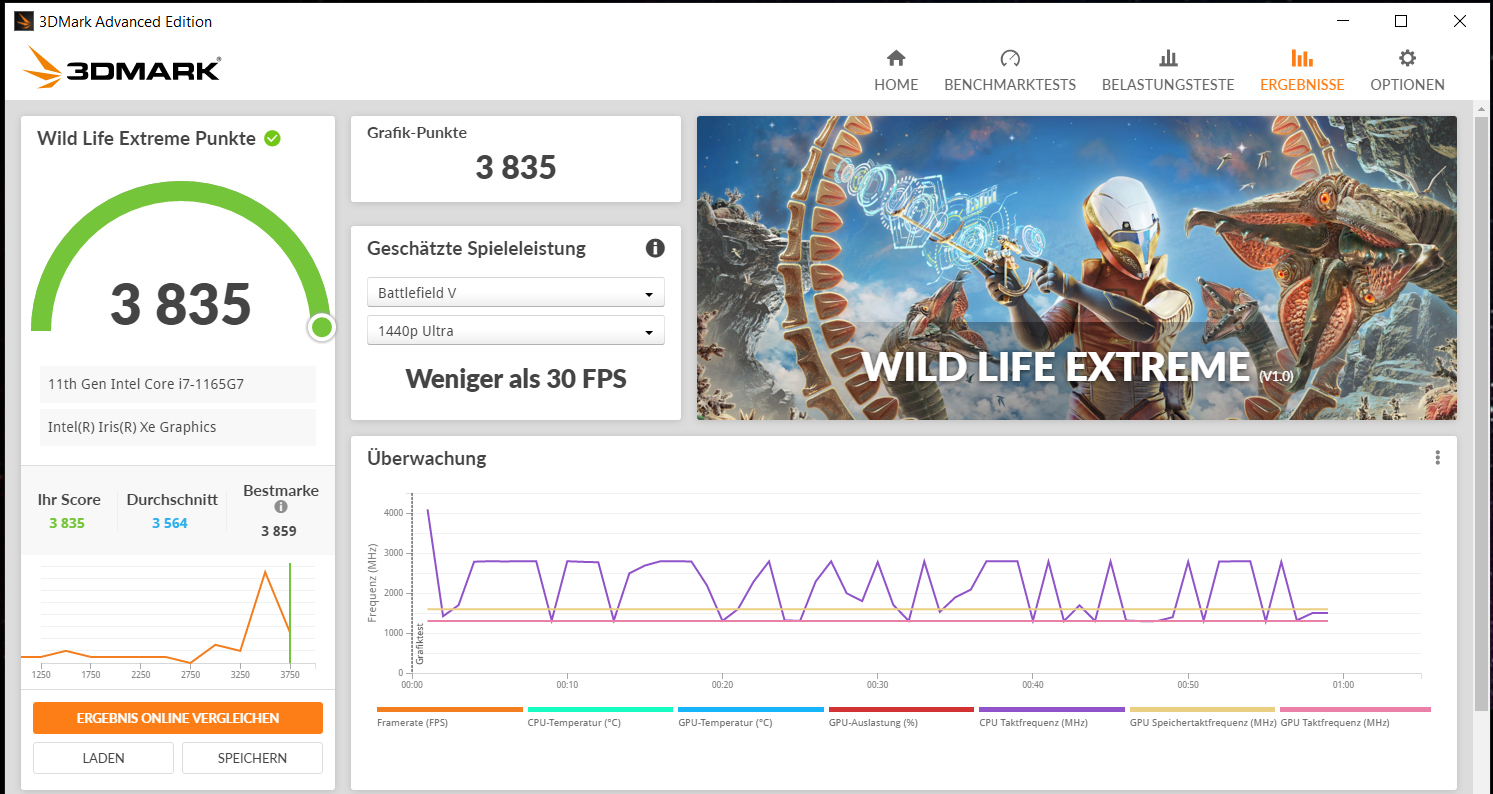
| 3DMark 11 Performance | 5901 points | |
| 3DMark Cloud Gate Standard Score | 15457 points | |
| 3DMark Fire Strike Score | 5103 points | |
| 3DMark Time Spy Score | 1794 points | |
Help | ||
| 3DMark | |
| 1280x720 Cloud Gate Standard Graphics | |
| Average of class Office (11640 - 118515, n=37, last 2 years) | |
| LG Gram 16 (2021) (Leistung) | |
| LG Gram 16 (2021) | |
| Average Intel Iris Xe Graphics G7 96EUs (13162 - 39880, n=187) | |
| Asus VivoBook S15 S533EQ-BQ002T | |
| Huawei MateBook D 16-53011VFJ | |
| Acer Aspire 5 A515-56-511A | |
| Samsung Galaxy Book Ion Aura Silver | |
| 1920x1080 Fire Strike Graphics | |
| Average of class Office (736 - 21871, n=72, last 2 years) | |
| Schenker Vision 15 | |
| LG Gram 16 (2021) (Leistung) | |
| LG Gram 16 (2021) | |
| Average Intel Iris Xe Graphics G7 96EUs (2286 - 6624, n=222) | |
| Asus VivoBook S15 S533EQ-BQ002T | |
| Samsung Galaxy Book Ion Aura Silver | |
| Acer Aspire 5 A515-56-511A | |
| Huawei MateBook D 16-53011VFJ | |
| 2560x1440 Time Spy Graphics | |
| Average of class Office (493 - 6679, n=67, last 2 years) | |
| LG Gram 16 (2021) | |
| LG Gram 16 (2021) (Leistung) | |
| Schenker Vision 15 | |
| Average Intel Iris Xe Graphics G7 96EUs (707 - 1890, n=218) | |
| Asus VivoBook S15 S533EQ-BQ002T | |
| Acer Aspire 5 A515-56-511A | |
| Samsung Galaxy Book Ion Aura Silver | |
| Huawei MateBook D 16-53011VFJ | |
Gaming performance
The Gram 16 is certainly not a gaming laptop. Nevertheless, the built-in hardware can render many games smoothly - at low resolutions and low quality settings. More is possible with titles that have moderate hardware requirements.
It's recommended to use "Performance" mode. On one hand, CPU-heavy titles benefit from this mode, on the other hand, it lets the GPU work at a high level and constant clock speed, which ensures stable frame rates. Our The Witcher 3 test shows the difference between the "Recommended" and "Performance" modes.
| The Witcher 3 - 1024x768 Low Graphics & Postprocessing | |
| Schenker Vision 15 | |
| LG Gram 16 (2021) (Leistung) | |
| LG Gram 16 (2021) | |
| Average Intel Iris Xe Graphics G7 96EUs (28.9 - 117.2, n=188) | |
| Asus VivoBook S15 S533EQ-BQ002T | |
| Average of class Office (32.2 - 103.7, n=4, last 2 years) | |
| Samsung Galaxy Book Ion Aura Silver | |
| Huawei MateBook D 16-53011VFJ | |
| Dota 2 Reborn - 1366x768 med (1/3) | |
| Asus VivoBook S15 S533EQ-BQ002T | |
| Samsung Galaxy Book Ion Aura Silver | |
| LG Gram 16 (2021) (Leistung) | |
| Huawei MateBook D 16-53011VFJ | |
| Average of class Office (31.2 - 152, n=73, last 2 years) | |
| Schenker Vision 15 | |
| Average Intel Iris Xe Graphics G7 96EUs (31.6 - 108.5, n=221) | |
| LG Gram 16 (2021) | |
| Acer Aspire 5 A515-56-511A | |
| X-Plane 11.11 - 1280x720 low (fps_test=1) | |
| Asus VivoBook S15 S533EQ-BQ002T | |
| Samsung Galaxy Book Ion Aura Silver | |
| LG Gram 16 (2021) (Leistung) | |
| Average of class Office (20.7 - 105.6, n=69, last 2 years) | |
| Schenker Vision 15 | |
| Acer Aspire 5 A515-56-511A | |
| Huawei MateBook D 16-53011VFJ | |
| LG Gram 16 (2021) | |
| Average Intel Iris Xe Graphics G7 96EUs (13.4 - 88.4, n=213) | |
| Final Fantasy XV Benchmark - 1280x720 Lite Quality | |
| Average of class Office (16.5 - 171.2, n=70, last 2 years) | |
| Average Intel Iris Xe Graphics G7 96EUs (14.9 - 56.5, n=189) | |
| LG Gram 16 (2021) (1.3) | |
| Acer Aspire 5 A515-56-511A | |
| GTA V - 1366x768 Normal/Off AF:4x | |
| Average of class Office (51.9 - 174.4, n=64, last 2 years) | |
| Samsung Galaxy Book Ion Aura Silver | |
| LG Gram 16 (2021) (Leistung) | |
| LG Gram 16 (2021) | |
| Average Intel Iris Xe Graphics G7 96EUs (24.1 - 152.7, n=169) | |
| Strange Brigade - 1280x720 lowest AF:1 | |
| Average of class Office (19.4 - 388, n=51, last 2 years) | |
| LG Gram 16 (2021) (1.47.22.14 D3D12, Leistung) | |
| LG Gram 16 (2021) (1.47.22.14 D3D12) | |
| Average Intel Iris Xe Graphics G7 96EUs (48.5 - 115.1, n=172) | |
In order to verify whether the frame rates remain largely constant over a prolonged period of time, we let the game The Witcher 3 run for about 60 minutes at Full HD resolution and maximum quality settings. The character is not moved.
| low | med. | high | ultra | QHD | |
|---|---|---|---|---|---|
| GTA V (2015) | 94.8 | 84.8 | 32.7 | 12 | 7.37 |
| The Witcher 3 (2015) | 84.4 | 47.7 | 16.7 | 15.6 | |
| Dota 2 Reborn (2015) | 84.5 | 63.2 | 47.1 | 36.6 | |
| Final Fantasy XV Benchmark (2018) | 37.4 | 22.8 | 18.8 | 21.8 | |
| X-Plane 11.11 (2018) | 42.6 | 32.2 | 28.5 | ||
| Far Cry 5 (2018) | 55 | 25 | 18 | 22 | 11 |
| Strange Brigade (2018) | 94.5 | 41.2 | 30.6 | 26.5 | 19.3 |
| Shadow of the Tomb Raider (2018) | 40 | 18 | 16 | 13 | 11 |
Emissions - The LG laptop always runs quietly
Noise emissions
LG tuned the laptop to be as quiet as possible. The fan is often inactive and silent during idle usage and under low load. Moreover, it barely revs up under full load. The maximum sound pressure level is 31.1 dB(A) (stress test). The operating noise can be reduced a bit more by using the "Silent" mode. This is at the expense of performance, though.
Noise level
| Idle |
| 26 / 26 / 26 dB(A) |
| Load |
| 30.8 / 31.1 dB(A) |
 | ||
30 dB silent 40 dB(A) audible 50 dB(A) loud |
||
min: | ||
| LG Gram 16 (2021) i7-1165G7, Iris Xe G7 96EUs | Samsung Galaxy Book Ion Aura Silver i7-10510U, GeForce MX250 | Huawei MateBook D 16-53011VFJ R5 4600H, Vega 6 | Acer Aspire 5 A515-56-511A i5-1135G7, Iris Xe G7 80EUs | Asus VivoBook S15 S533EQ-BQ002T i7-1165G7, GeForce MX350 | Schenker Vision 15 i7-1165G7, Iris Xe G7 96EUs | Average Intel Iris Xe Graphics G7 96EUs | Average of class Office | |
|---|---|---|---|---|---|---|---|---|
| Noise | -6% | -6% | -2% | -8% | -21% | -7% | -4% | |
| off / environment * (dB) | 26 | 24.9 4% | 25.5 2% | 24.5 6% | 25 4% | 29.8 -15% | 24.9 ? 4% | 24.2 ? 7% |
| Idle Minimum * (dB) | 26 | 24.9 4% | 25.5 2% | 24.5 6% | 25 4% | 29.8 -15% | 25.4 ? 2% | 24.4 ? 6% |
| Idle Average * (dB) | 26 | 24.9 4% | 25.5 2% | 24.5 6% | 25 4% | 29.8 -15% | 25.6 ? 2% | 24.7 ? 5% |
| Idle Maximum * (dB) | 26 | 24.9 4% | 25.5 2% | 26.4 -2% | 25 4% | 31.1 -20% | 26.8 ? -3% | 25.5 ? 2% |
| Load Average * (dB) | 30.8 | 39 -27% | 33 -7% | 32 -4% | 39.5 -28% | 40.5 -31% | 35.6 ? -16% | 33.7 ? -9% |
| Load Maximum * (dB) | 31.1 | 39.2 -26% | 42.1 -35% | 39 -25% | 41.6 -34% | 40.5 -30% | 40.8 ? -31% | 40.9 ? -32% |
| Witcher 3 ultra * (dB) | 38.9 | 39.3 | 40.5 |
* ... smaller is better
Temperature
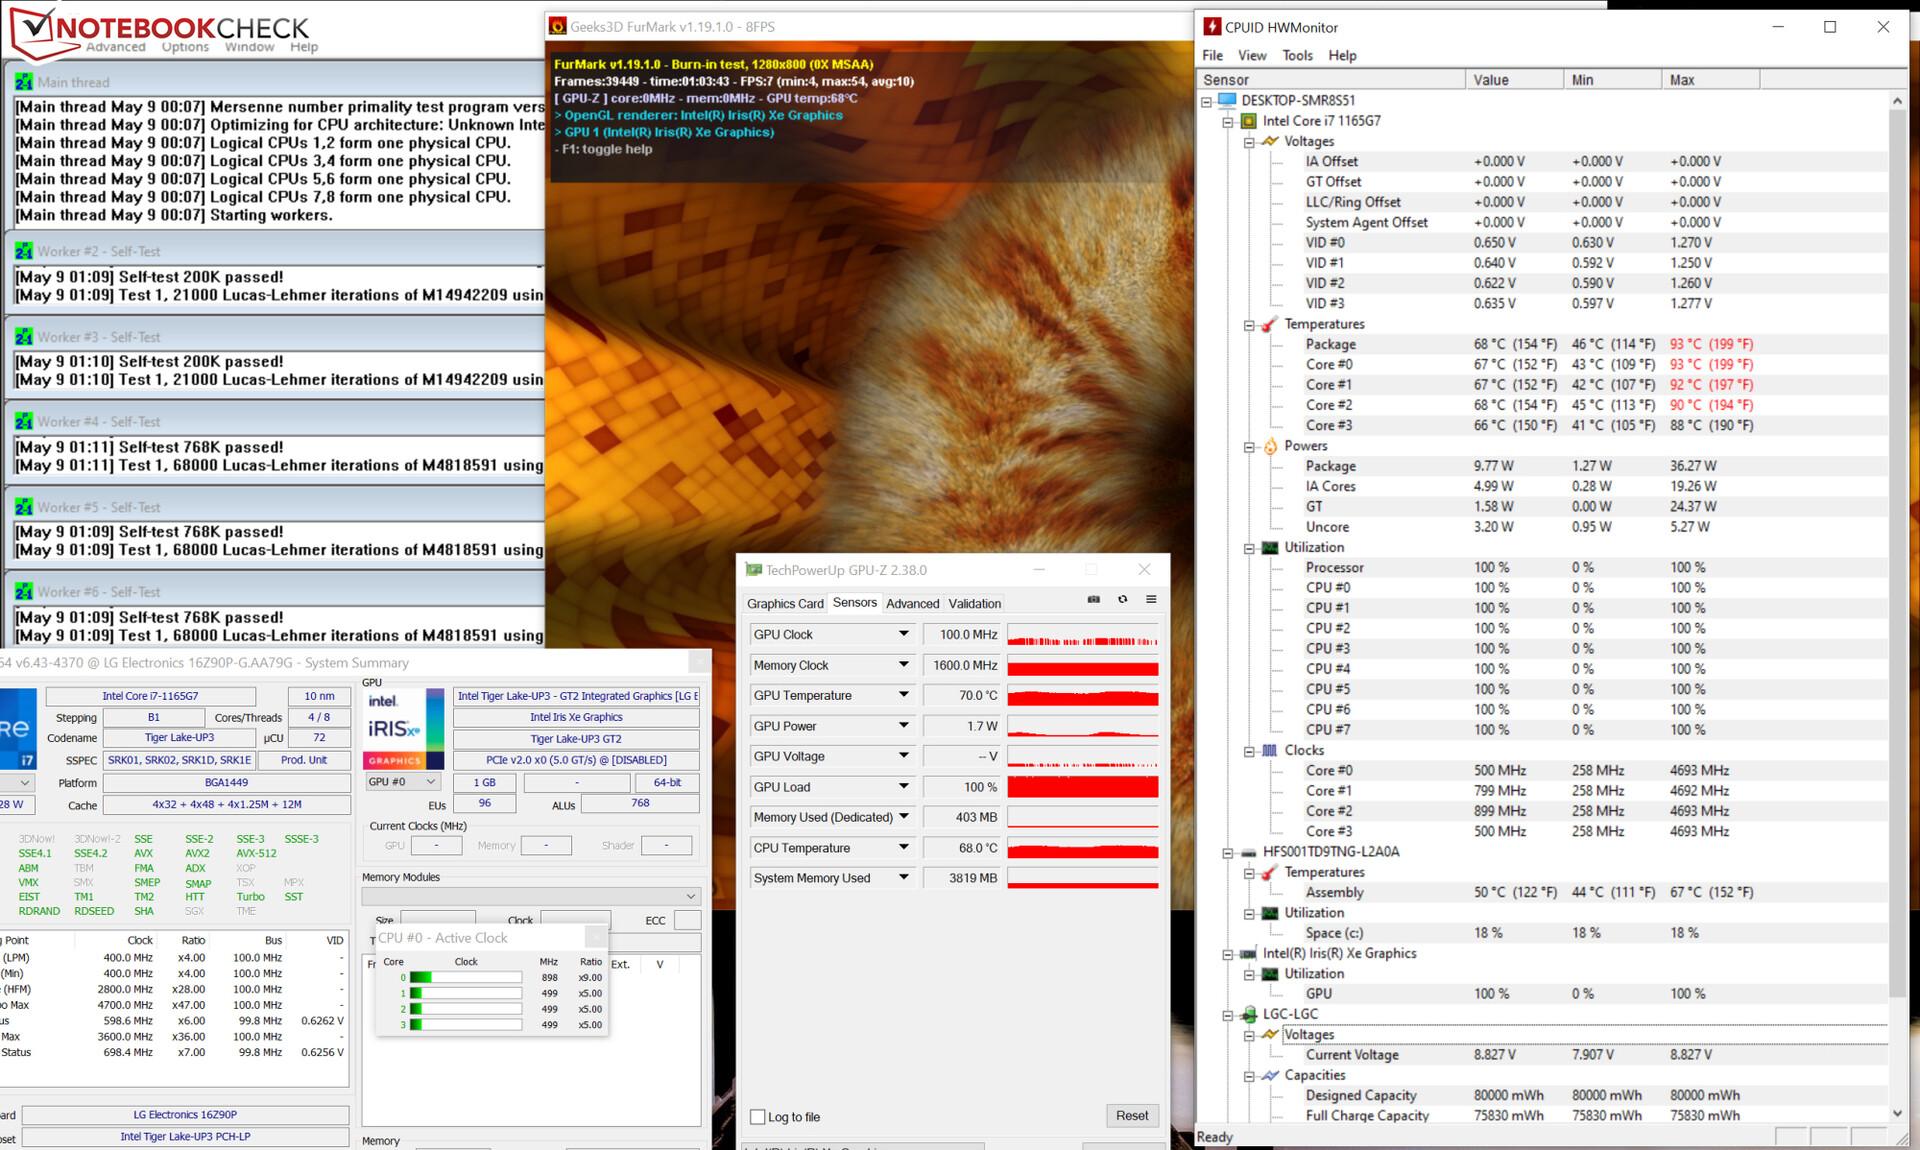
The CPU and GPU initially process our stress test (Prime95 and FurMark run for at least an hour) at 1 to 2.8 GHz and 800 to 1,300 MHz, respectively. In the further course of the test, the clock rates drop significantly to between 500 and 900 MHz (CPU) and 100 MHz (GPU). The stress test represents an extreme scenario, and we use it to verify that the system remains stable even under full load.
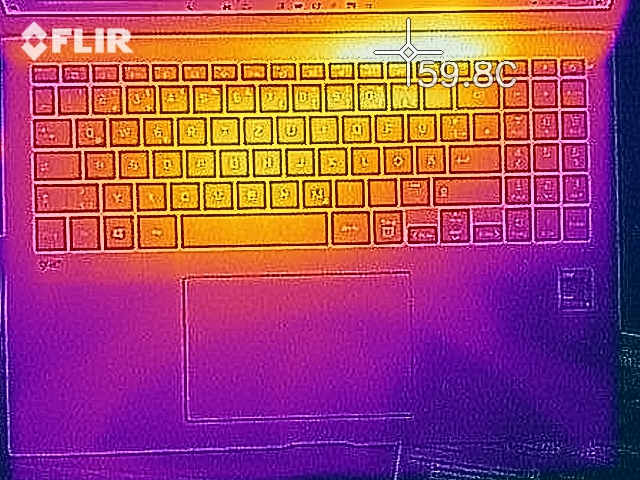
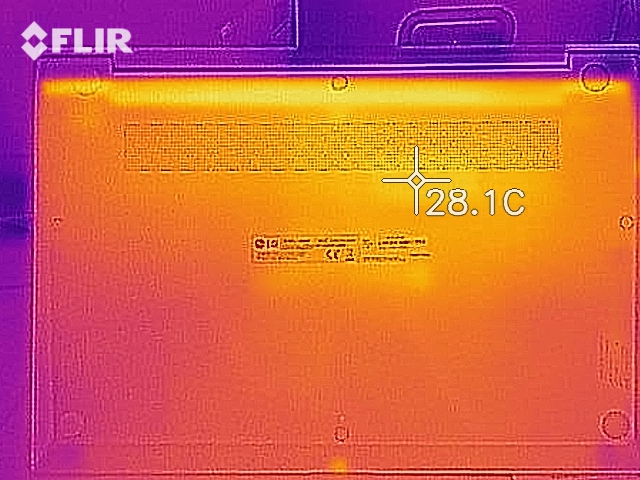
The laptop doesn't heat up excessively at any time. During the stress test, temperatures in the mid 40 °C (~104 °F) range are reached at three measuring points. The rates are within the green range in everyday use.
(-) The maximum temperature on the upper side is 46.9 °C / 116 F, compared to the average of 34.3 °C / 94 F, ranging from 21.2 to 62.5 °C for the class Office.
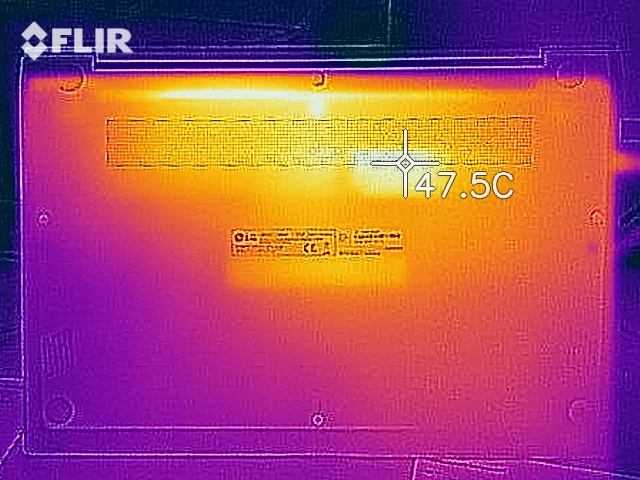
(-) The bottom heats up to a maximum of 45.1 °C / 113 F, compared to the average of 36.8 °C / 98 F
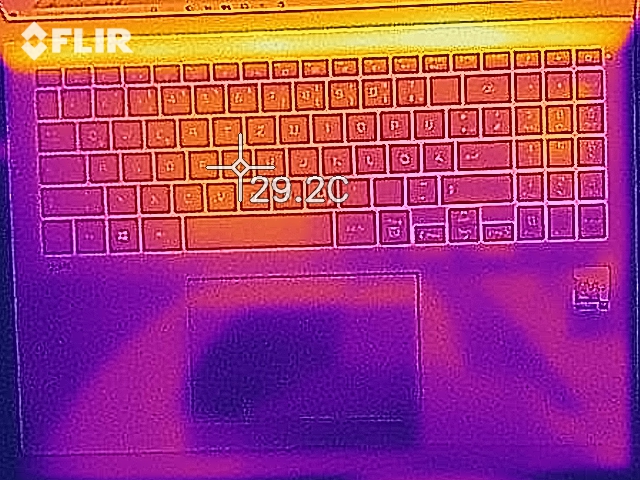
(+) In idle usage, the average temperature for the upper side is 23.3 °C / 74 F, compared to the device average of 29.5 °C / 85 F.
(+) The palmrests and touchpad are cooler than skin temperature with a maximum of 25.9 °C / 78.6 F and are therefore cool to the touch.
(±) The average temperature of the palmrest area of similar devices was 27.5 °C / 81.5 F (+1.6 °C / 2.9 F).
| LG Gram 16 (2021) i7-1165G7, Iris Xe G7 96EUs | Samsung Galaxy Book Ion Aura Silver i7-10510U, GeForce MX250 | Huawei MateBook D 16-53011VFJ R5 4600H, Vega 6 | Acer Aspire 5 A515-56-511A i5-1135G7, Iris Xe G7 80EUs | Asus VivoBook S15 S533EQ-BQ002T i7-1165G7, GeForce MX350 | Schenker Vision 15 i7-1165G7, Iris Xe G7 96EUs | Average Intel Iris Xe Graphics G7 96EUs | Average of class Office | |
|---|---|---|---|---|---|---|---|---|
| Heat | -5% | -1% | 14% | 6% | 3% | -4% | -1% | |
| Maximum Upper Side * (°C) | 46.9 | 50.1 -7% | 42.6 9% | 33.6 28% | 38.1 19% | 42.4 10% | 41.4 ? 12% | 40.5 ? 14% |
| Maximum Bottom * (°C) | 45.1 | 50.2 -11% | 41.7 8% | 30.1 33% | 41.3 8% | 46.8 -4% | 44.5 ? 1% | 42.8 ? 5% |
| Idle Upper Side * (°C) | 26.4 | 24.8 6% | 27.8 -5% | 25.5 3% | 24.5 7% | 24.6 7% | 28.3 ? -7% | 27.2 ? -3% |
| Idle Bottom * (°C) | 24.1 | 25.5 -6% | 27.6 -15% | 26.1 -8% | 26.8 -11% | 24.4 -1% | 29.2 ? -21% | 28.4 ? -18% |
* ... smaller is better
Speakers
The stereo speakers produce a decent sound that lacks bass. Headphones or external speakers are recommended for a better audio experience.
LG Gram 16 (2021) audio analysis
(±) | speaker loudness is average but good (76.1 dB)
Bass 100 - 315 Hz
(-) | nearly no bass - on average 18.8% lower than median
(±) | linearity of bass is average (12.2% delta to prev. frequency)
Mids 400 - 2000 Hz
(+) | balanced mids - only 2.2% away from median
(+) | mids are linear (5.4% delta to prev. frequency)
Highs 2 - 16 kHz
(+) | balanced highs - only 2.5% away from median
(+) | highs are linear (3.7% delta to prev. frequency)
Overall 100 - 16.000 Hz
(+) | overall sound is linear (14.7% difference to median)
Compared to same class
» 12% of all tested devices in this class were better, 4% similar, 84% worse
» The best had a delta of 7%, average was 21%, worst was 53%
Compared to all devices tested
» 19% of all tested devices were better, 4% similar, 77% worse
» The best had a delta of 4%, average was 24%, worst was 134%
Energy management - LG laptop offers outstanding battery life
Energy consumption
Power consumption is at a normal level for the hardware installed here. We register a maximum power consumption of 11.3 watts in idle usage. The stress test (Prime95 and FurMark run for at least an hour) increases the demand up to 43.5 watts - but only briefly. The following graph shows how power consumption drops after a short time during the stress test due to the CPU and GPU being significantly throttled. The USB-C power adapter's rated output is 65 watts.
| Off / Standby | |
| Idle | |
| Load |
|
Key:
min: | |
| LG Gram 16 (2021) i7-1165G7, Iris Xe G7 96EUs | Samsung Galaxy Book Ion Aura Silver i7-10510U, GeForce MX250 | Huawei MateBook D 16-53011VFJ R5 4600H, Vega 6 | Acer Aspire 5 A515-56-511A i5-1135G7, Iris Xe G7 80EUs | Asus VivoBook S15 S533EQ-BQ002T i7-1165G7, GeForce MX350 | Schenker Vision 15 i7-1165G7, Iris Xe G7 96EUs | Average Intel Iris Xe Graphics G7 96EUs | Average of class Office | |
|---|---|---|---|---|---|---|---|---|
| Power Consumption | -8% | -16% | 10% | -9% | -0% | -25% | -8% | |
| Idle Minimum * (Watt) | 3.8 | 2.9 24% | 5.2 -37% | 3.3 13% | 3 21% | 3.5 8% | 5.51 ? -45% | 4.4 ? -16% |
| Idle Average * (Watt) | 9 | 7 22% | 8.2 9% | 8.4 7% | 6.4 29% | 6.3 30% | 8.66 ? 4% | 7.32 ? 19% |
| Idle Maximum * (Watt) | 11.3 | 9.9 12% | 9.4 17% | 8.9 21% | 7.9 30% | 6.8 40% | 10.9 ? 4% | 8.56 ? 24% |
| Load Average * (Watt) | 35.2 | 53 -51% | 40 -14% | 30.1 14% | 59 -68% | 43.2 -23% | 45.6 ? -30% | 42.5 ? -21% |
| Load Maximum * (Watt) | 43.5 | 64 -47% | 67 -54% | 45.4 -4% | 68 -56% | 67.7 -56% | 67.8 ? -56% | 64.1 ? -47% |
| Witcher 3 ultra * (Watt) | 39.3 | 40.5 | 48 | 52 |
* ... smaller is better
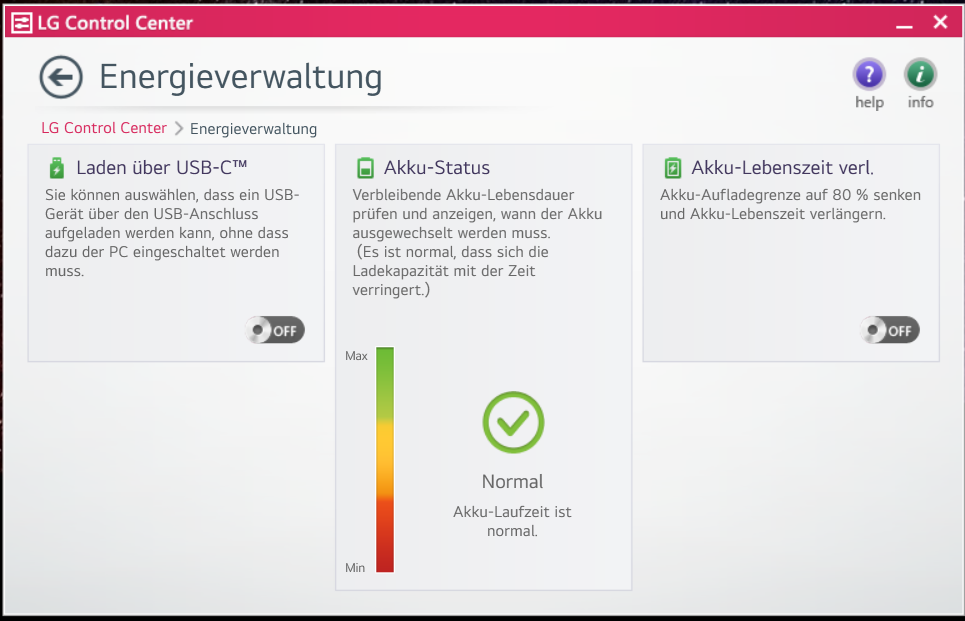
Battery life
The Gram 16 achieves runtimes of 15:43 hours and 20:04 hours in our Wi-Fi test (accessing websites with a script) and video test (short film Big Buck Bunny (H.264 encoding, Full HD) running in a loop), respectively. The power-saving features are disabled and the display brightness is set to about 150 cd/m². For the video test, the wireless module is also disabled.
| LG Gram 16 (2021) i7-1165G7, Iris Xe G7 96EUs, 80 Wh | Samsung Galaxy Book Ion Aura Silver i7-10510U, GeForce MX250, 70 Wh | Huawei MateBook D 16-53011VFJ R5 4600H, Vega 6, 56 Wh | Acer Aspire 5 A515-56-511A i5-1135G7, Iris Xe G7 80EUs, 48.85 Wh | Asus VivoBook S15 S533EQ-BQ002T i7-1165G7, GeForce MX350, 50 Wh | Schenker Vision 15 i7-1165G7, Iris Xe G7 96EUs, 73 Wh | Average of class Office | |
|---|---|---|---|---|---|---|---|
| Battery runtime | -49% | -59% | -55% | -46% | -27% | -30% | |
| Reader / Idle (h) | 28.6 | 16.1 -44% | 11.8 -59% | 23.7 ? -17% | |||
| H.264 (h) | 20.1 | 10.8 -46% | 8.5 -58% | 18.7 -7% | 15 ? -25% | ||
| WiFi v1.3 (h) | 15.7 | 6.9 -56% | 9 -43% | 6.9 -56% | 8.4 -46% | 15.2 -3% | 12.9 ? -18% |
| Load (h) | 4.3 | 2.2 -49% | 1.1 -74% | 2 -53% | 1.3 -70% | 1.807 ? -58% | |
| Witcher 3 ultra (h) | 1 |
Pros
Cons
Verdict
The focus of the LG Gram laptops is portability, and the Gram 16 doesn't disappoint in this respect. The sleek, slim laptop weighs just under 1,200 grams. An 80 Wh battery ensures real-world runtimes of about 15 to 20 hours (display brightness set to about 150 cd/m²). One battery charge is sufficient for a Wi-Fi runtime of about 9 hours at full display brightness.
LG delivers a quiet and mobile work device with the Gram 16 (2021).
The laptop is supplied with energy via a USB-C power adapter (65 watts) that can be plugged into both Thunderbolt 4 ports (Power Delivery, DisplayPort). The latter also offer the option of connecting a docking solution or an external GPU to the laptop.
The laptop wasn't designed for prolonged high performance. The Core i7-1165G7 processor responds to short load peaks with a lot of computing power, but it has to throttle its speed when it comes to prolonged periods of load. Positive consequence: The fan doesn't have to do much work, and the laptop always ranges from quiet to silent.
The 16:10 display (2560x1600 pixels, IPS) scores points with good contrast, stable viewing angles, decent color reproduction, and good color-space coverage. The display's brightness value meets the target - but only when plugged in. This is because the maximum brightness drops a bit on battery power. Finally, it's a shame that LG decided to use a display with a reflective surface, since this is unacceptable for a device that has been designed for mobility.
Price and availability
At the time of writing, you can find the LG Gram 16 2021 on Amazon for around $1,699 (Core i7-1165G7, 16 GB of RAM, 1 TB SSD, WQXGA display). Alternatively, it's also available in this same configuration and price from Best Buy.
LG Gram 16 (2021)
- 06/03/2021 v7 (old)
Sascha Mölck
Price comparison

