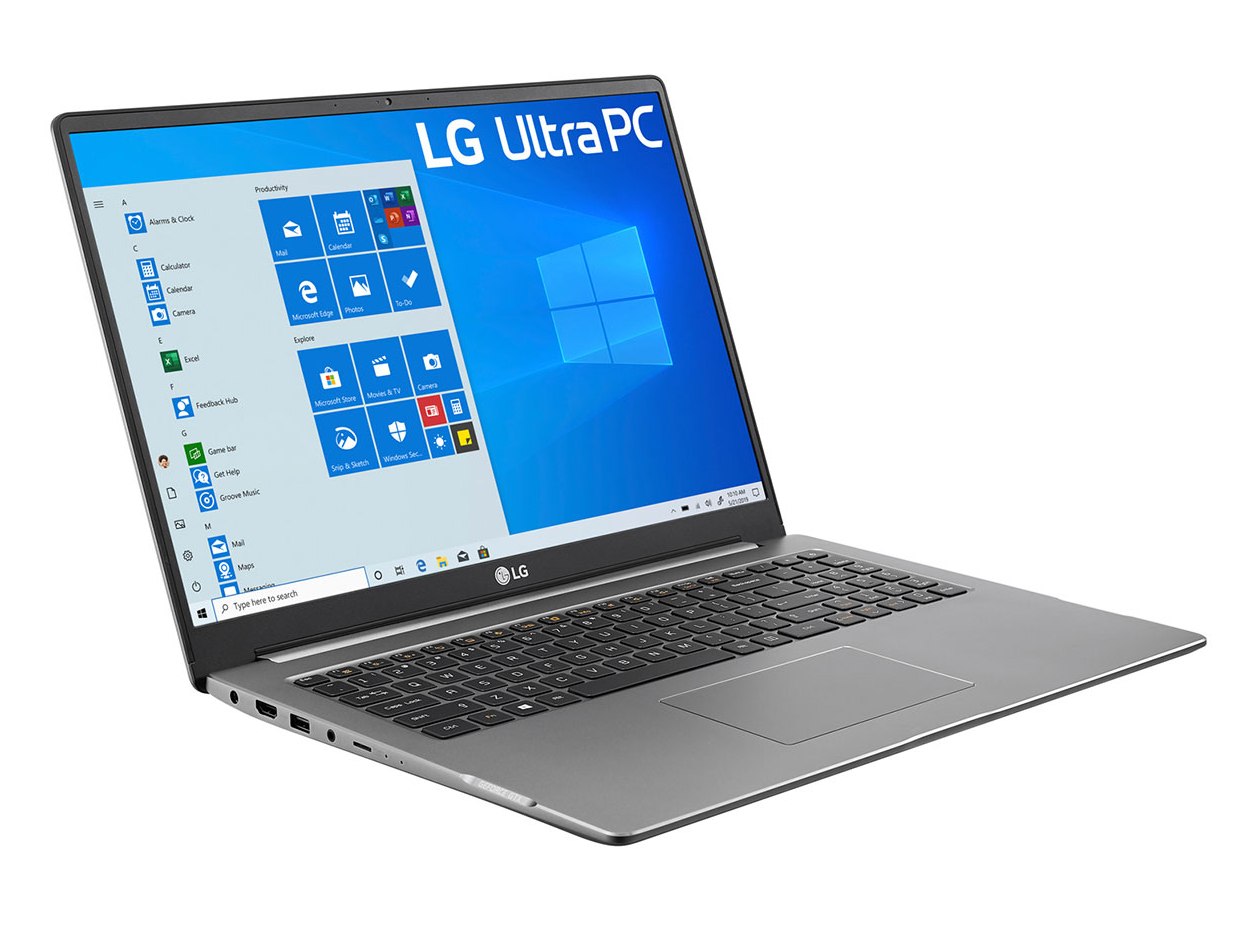
Like a Dell XPS 17, But Worse: LG Ultra 17 Laptop Review
LG laptops typically maximize portability at the cost of performance. The Gram series, for example, is home to some of the lightest Ultrabooks you can find with Core U-series options, but processor performance would be significantly slower than most other laptops equipped with the same CPU.
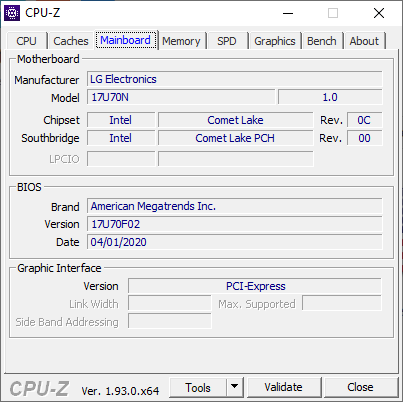
The Ultra 17 can be viewed as a Gram 17 laptop but with faster dedicated GeForce GTX 1650 graphics. Its chassis is larger, heavier, and different than a Gram, but there are many similarities nonetheless. In fact, this is one of the few (if not only) 17.0-inch 16:10 laptops to pair a U-series Core i5-10210U or Core i7-10510U CPU with a full-power GTX 1650. Our Core i5 test unit can be found online for approximately $1400 USD retail.
Competitors in this space include other 17-inch multimedia systems like the Dell XPS 17, HP Envy 17, Gigabyte Aorus 17, or the Asus VivoBook 17.
More LG reviews:
Rating | Date | Model | Weight | Height | Size | Resolution | Price |
|---|---|---|---|---|---|---|---|
| 82.8 % v7 (old) | 09 / 2020 | LG Ultra 17U70N i5-10210U, GeForce GTX 1650 Mobile | 2 kg | 20.4 mm | 17.00" | 2560x1600 | |
| 87.9 % v7 (old) | 07 / 2020 | Dell XPS 17 9700 Core i7 RTX 2060 Max-Q i7-10875H, GeForce RTX 2060 Max-Q | 2.5 kg | 19.5 mm | 17.00" | 3840x2400 | |
| 85.2 % v7 (old) | 08 / 2020 | LG Gram 17 17Z90N-V.AA77G i7-1065G7, Iris Plus Graphics G7 (Ice Lake 64 EU) | 1.4 kg | 17.4 mm | 17.00" | 2560x1600 | |
| 84.3 % v7 (old) | 08 / 2020 | Eluktronics RP-17 R7 4800H, GeForce RTX 2060 Mobile | 2.6 kg | 30 mm | 17.30" | 1920x1080 | |
| 80.9 % v7 (old) | 07 / 2020 | MSI Bravo 17 A4DDR R7 4800H, Radeon RX 5500M | 2.2 kg | 23 mm | 17.30" | 1920x1080 | |
| 80.9 % v7 (old) | 06 / 2020 | HP Envy 17t-cg000 i7-1065G7, GeForce MX330 | 2.7 kg | 19.3 mm | 17.30" | 3840x2160 |
Case
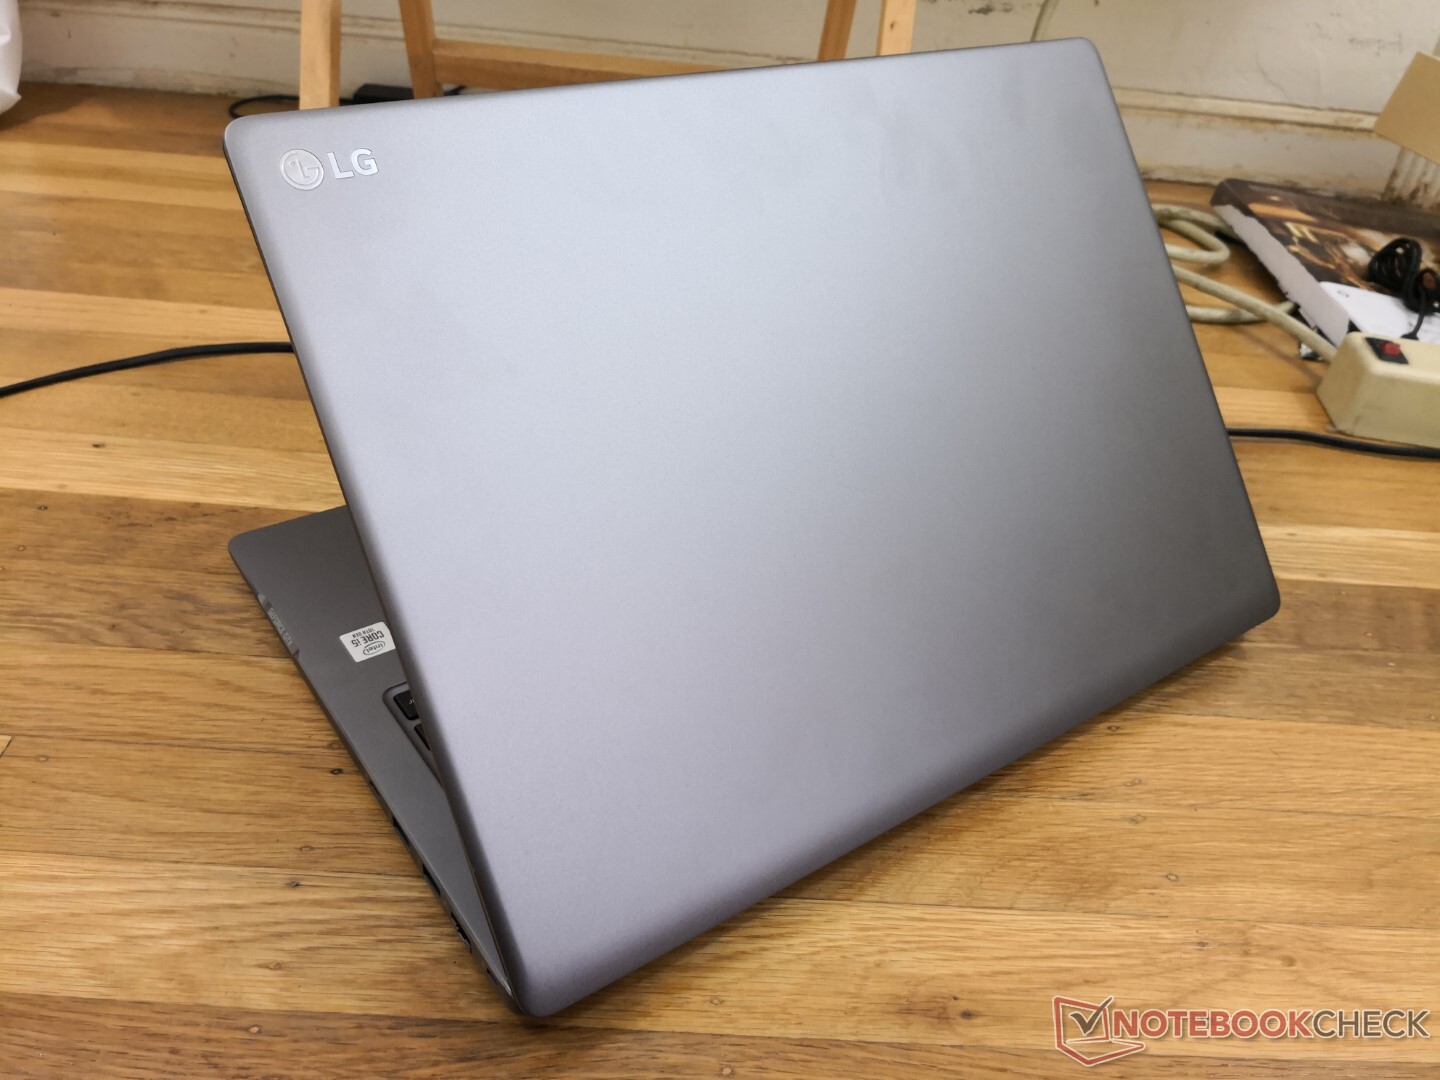
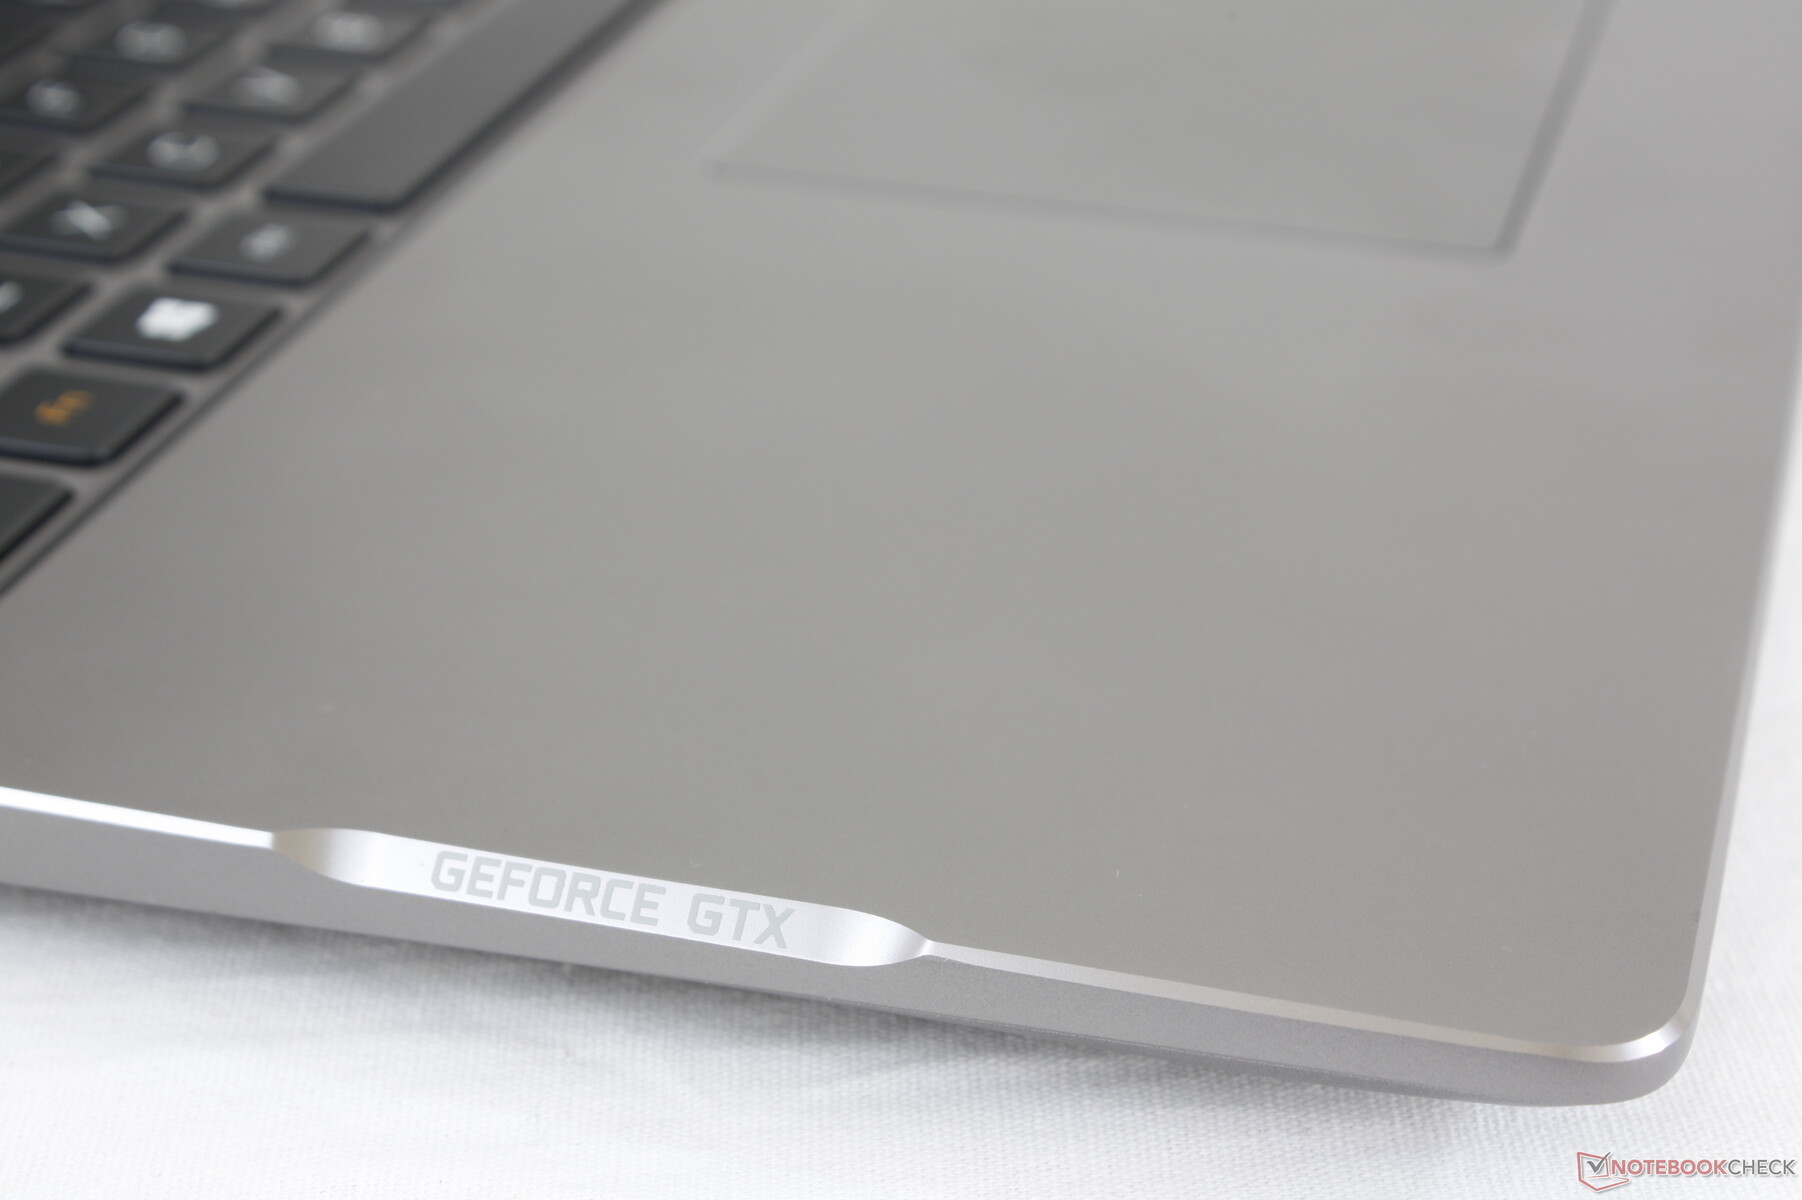
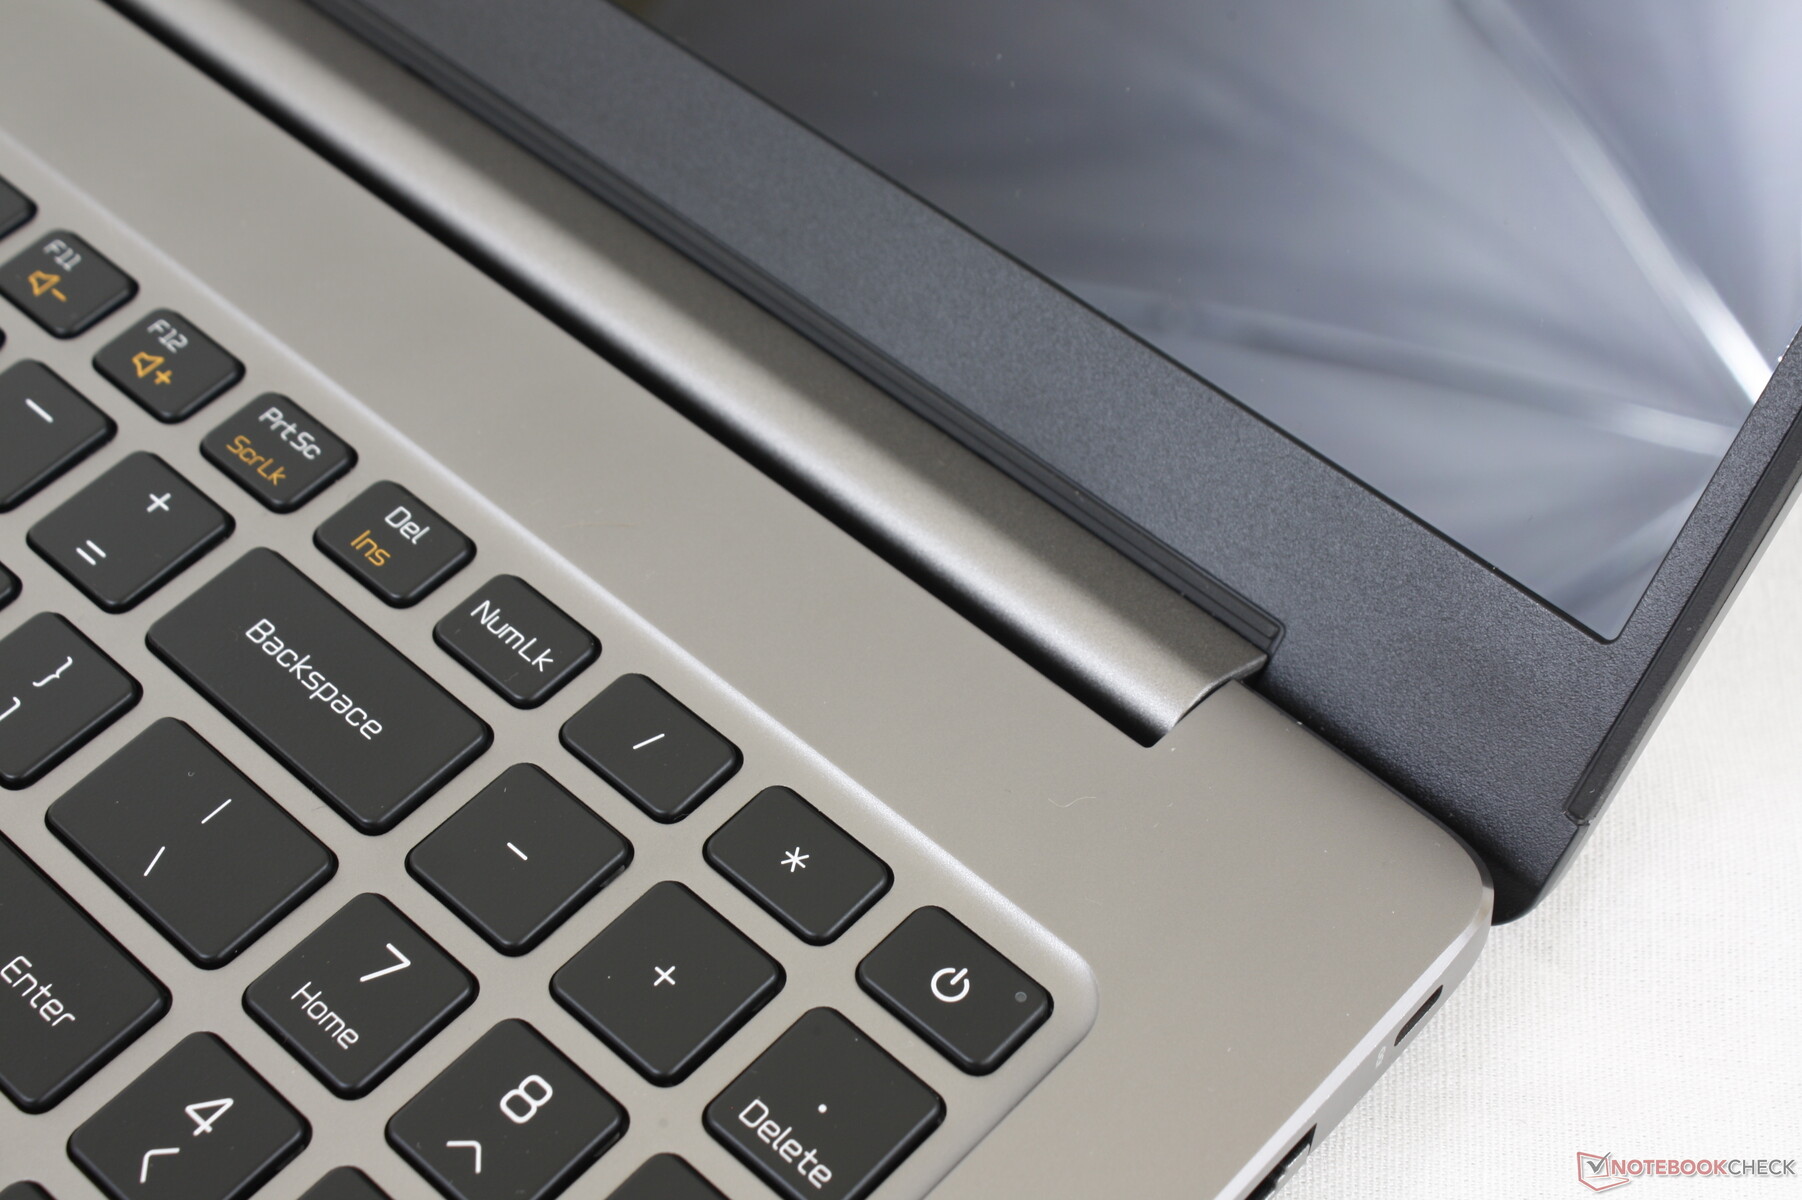
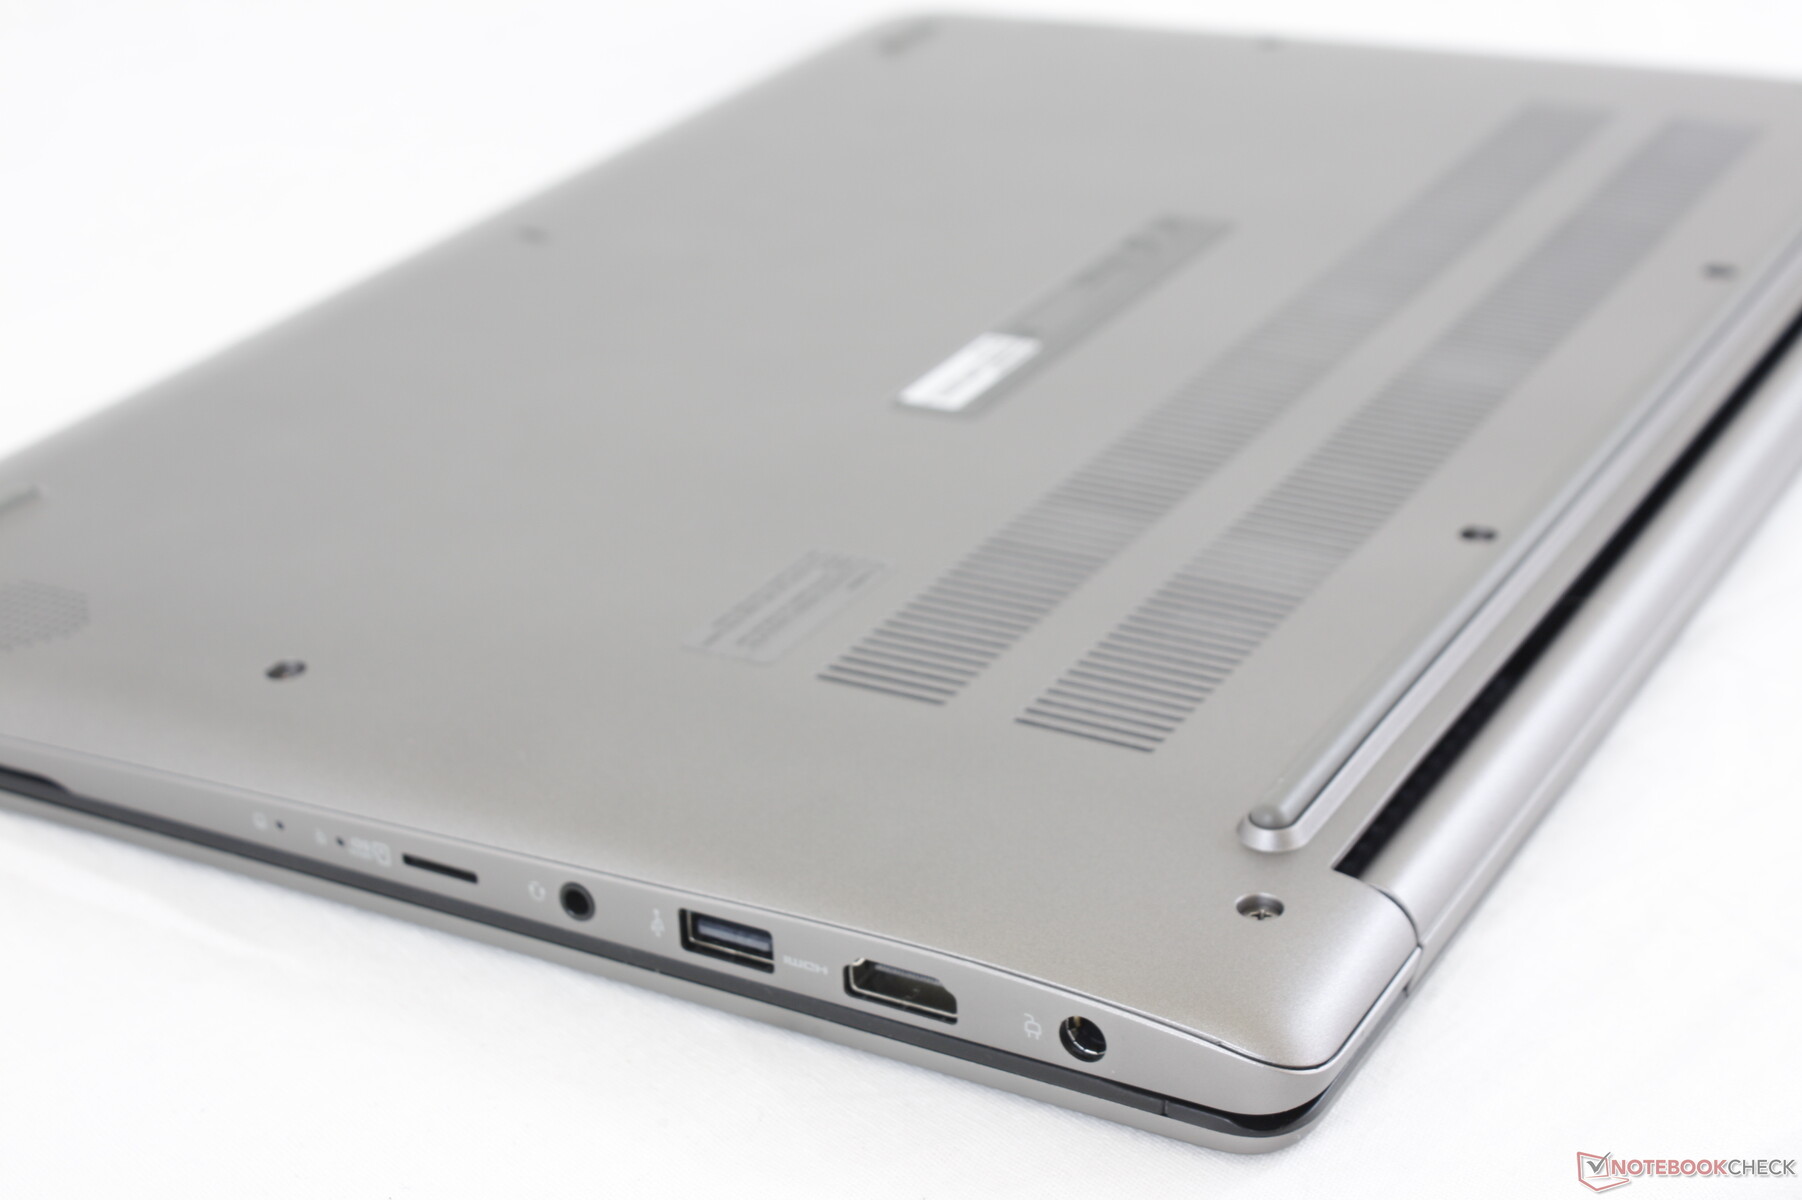
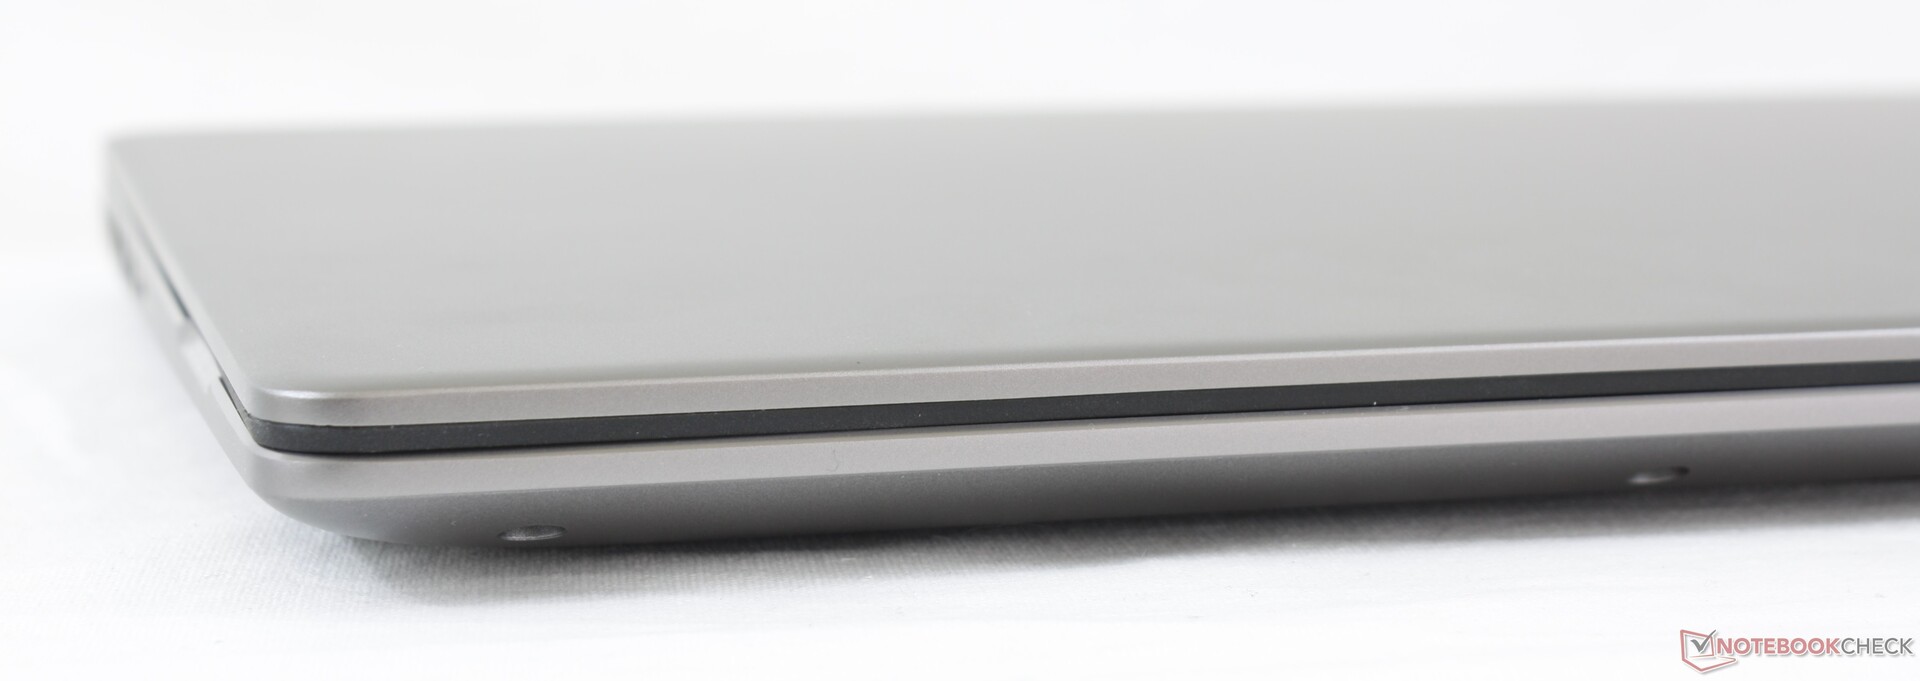
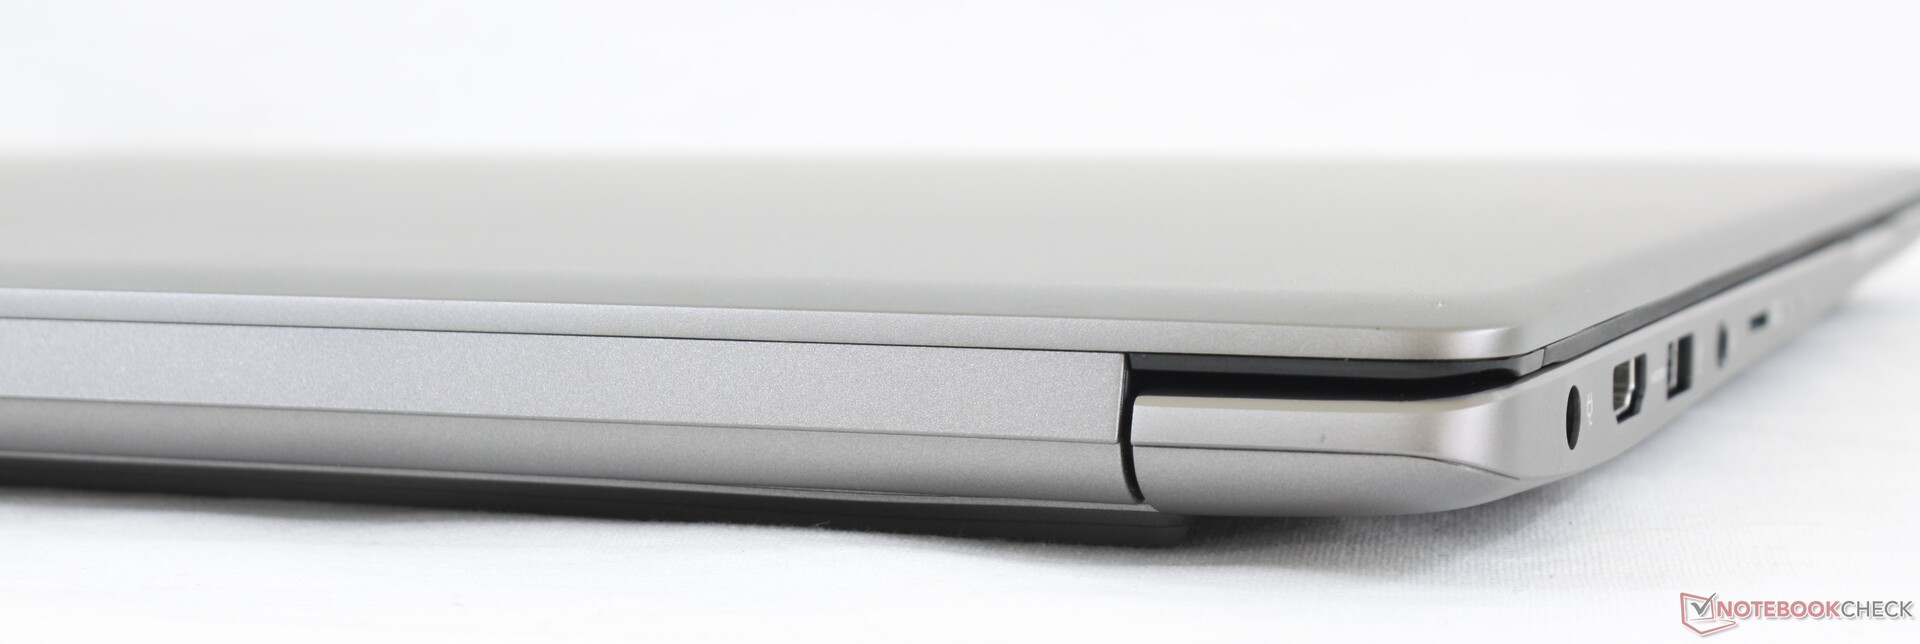
It may not have "Gram" in its name, but the Ultra 17 still shares the same lightweight gray aluminum materials as all of its siblings. On one hand, this is great because the slightly roughened matte surfaces detract fingerprints better than the aluminum materials used for the Razer Blade or HP Spectre. On the other hand, this also means that the Ultra 17 suffers from many of the same drawbacks as the Gram series including the flimsy lid and muted visual design. The base is at least more rigid than on the Gram 17 due to the increased thickness and there is thankfully only minimal creaking despite the flexible lid.
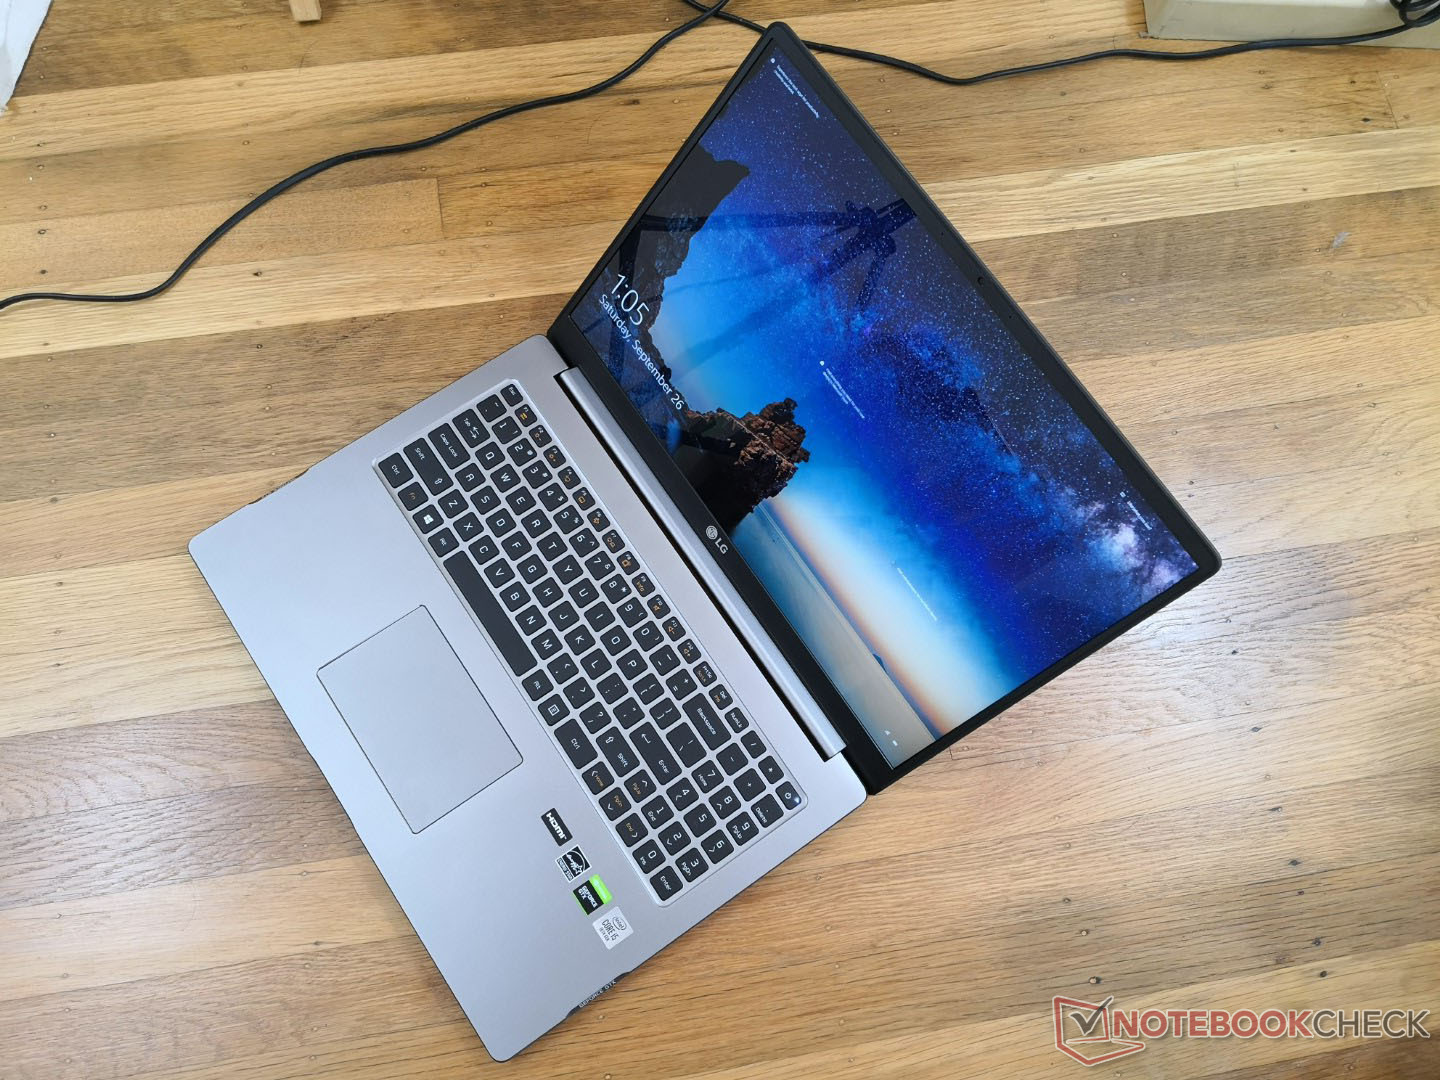
At almost 2 kg, the Ultra 17 is significantly heavier than the 1.4 kg Gram 17. The longer length and thicker profile also explain why this is an "Ultra 17" and not just another Gram laptop. Even so, this is one of the lightest 17-inch laptops you can find with the GTX 1650 GPU especially when considering that the XPS 17 is a full 500 grams heavier.
Connectivity
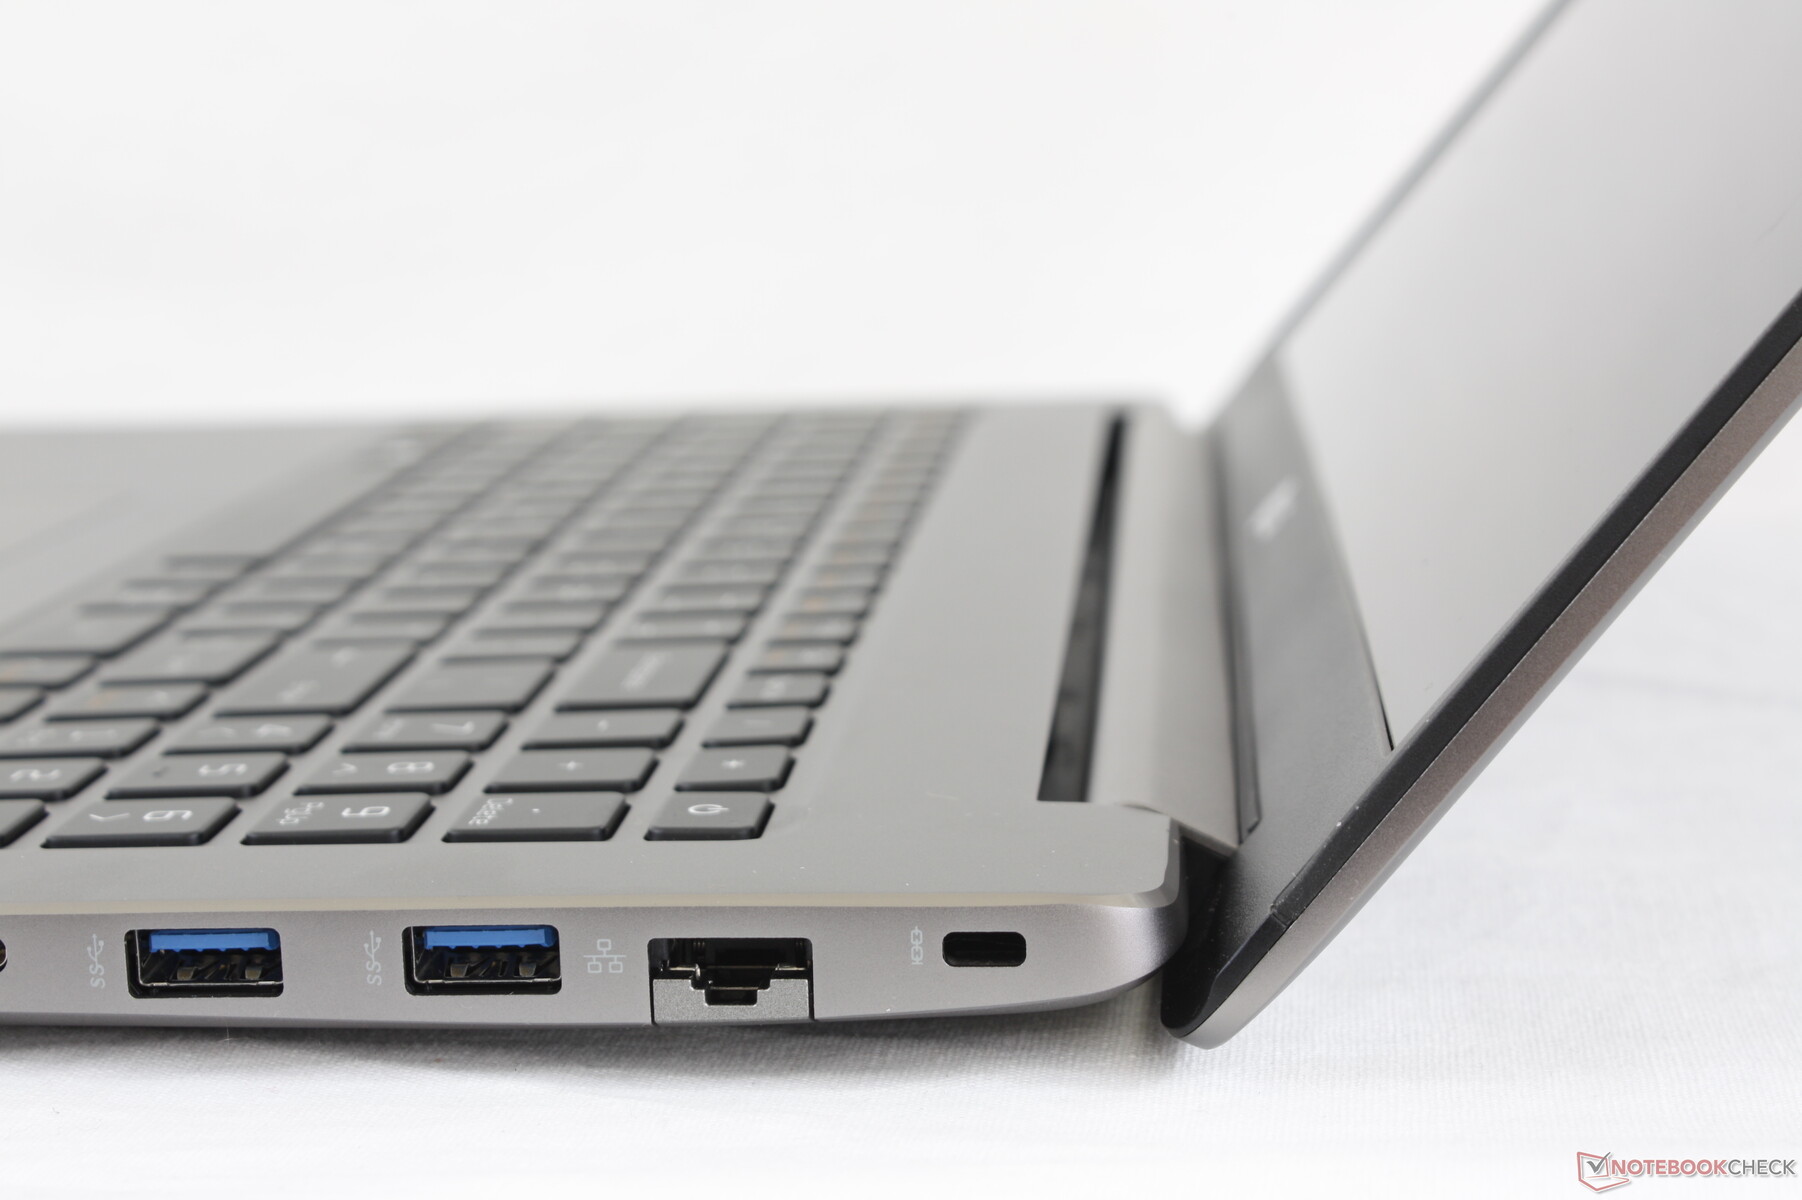
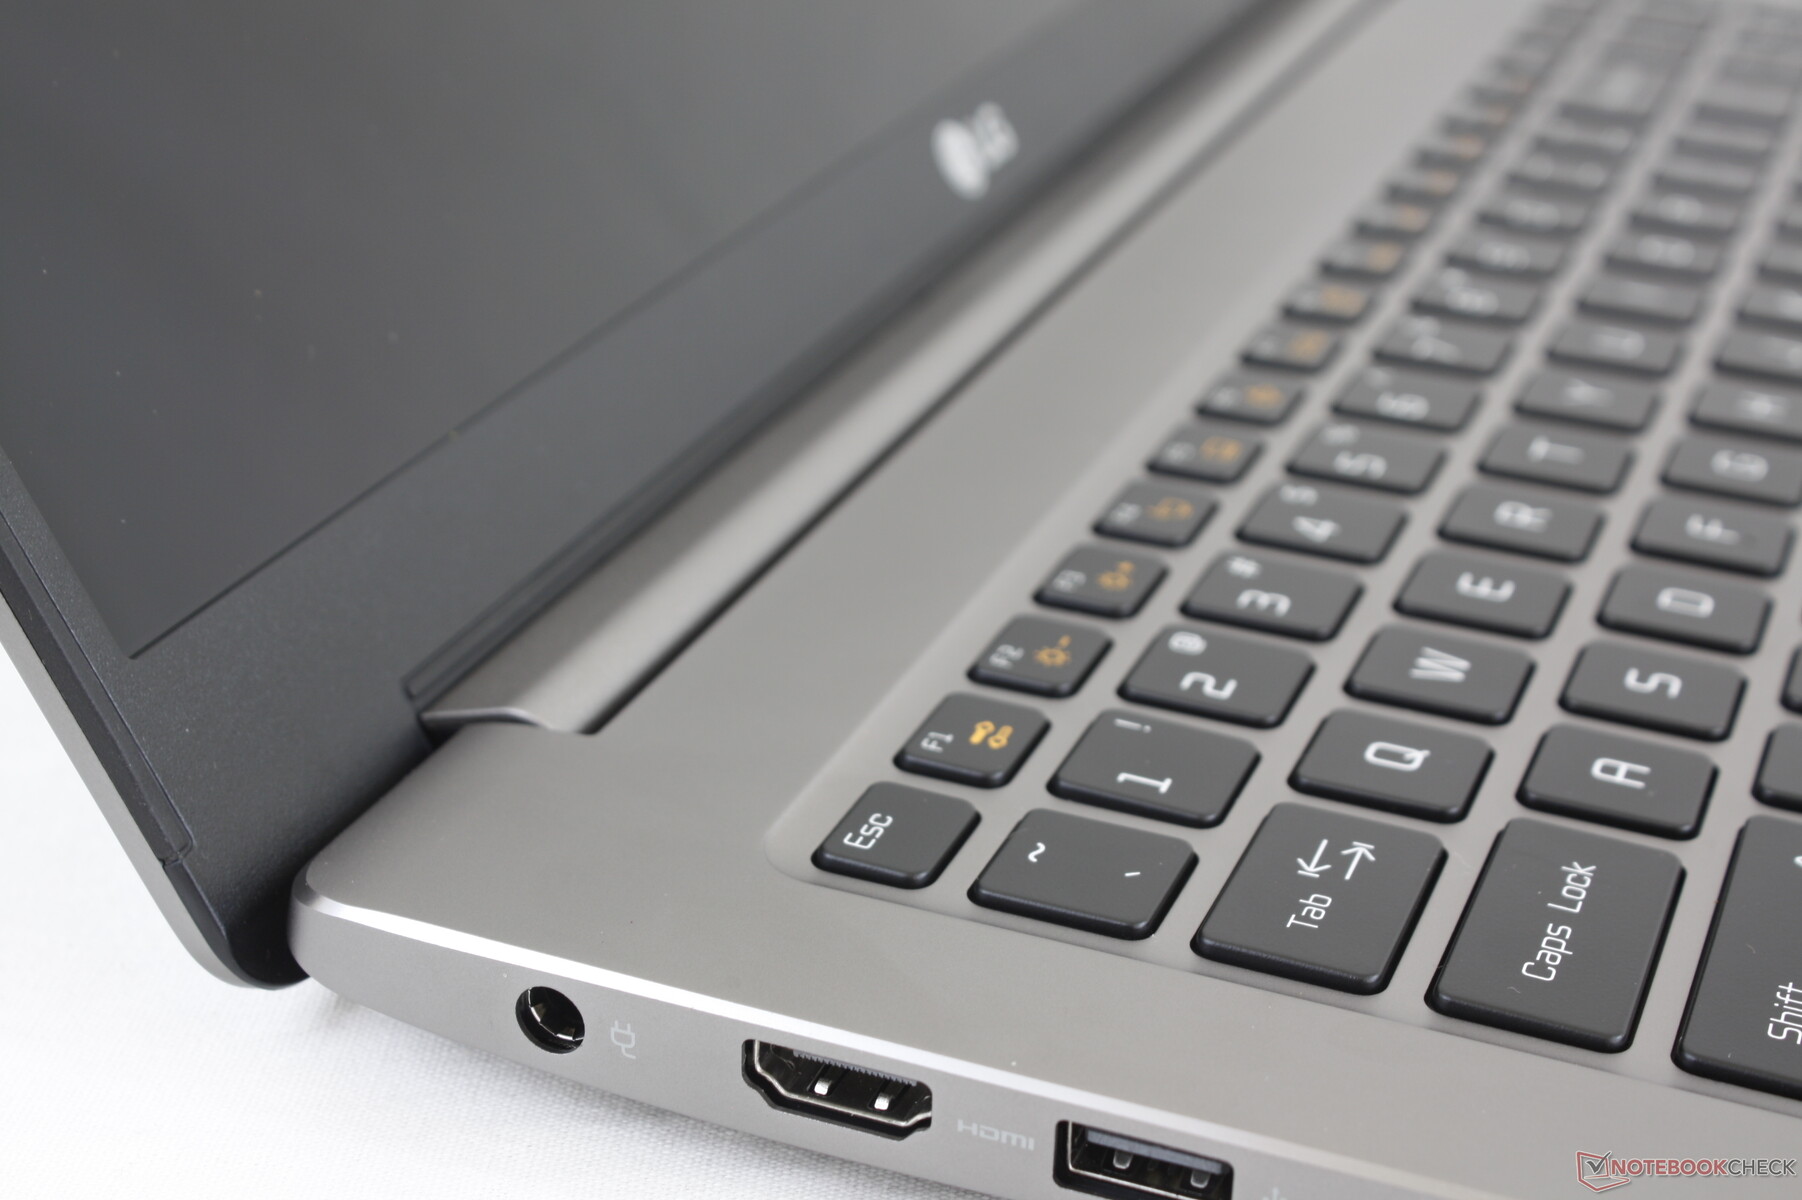
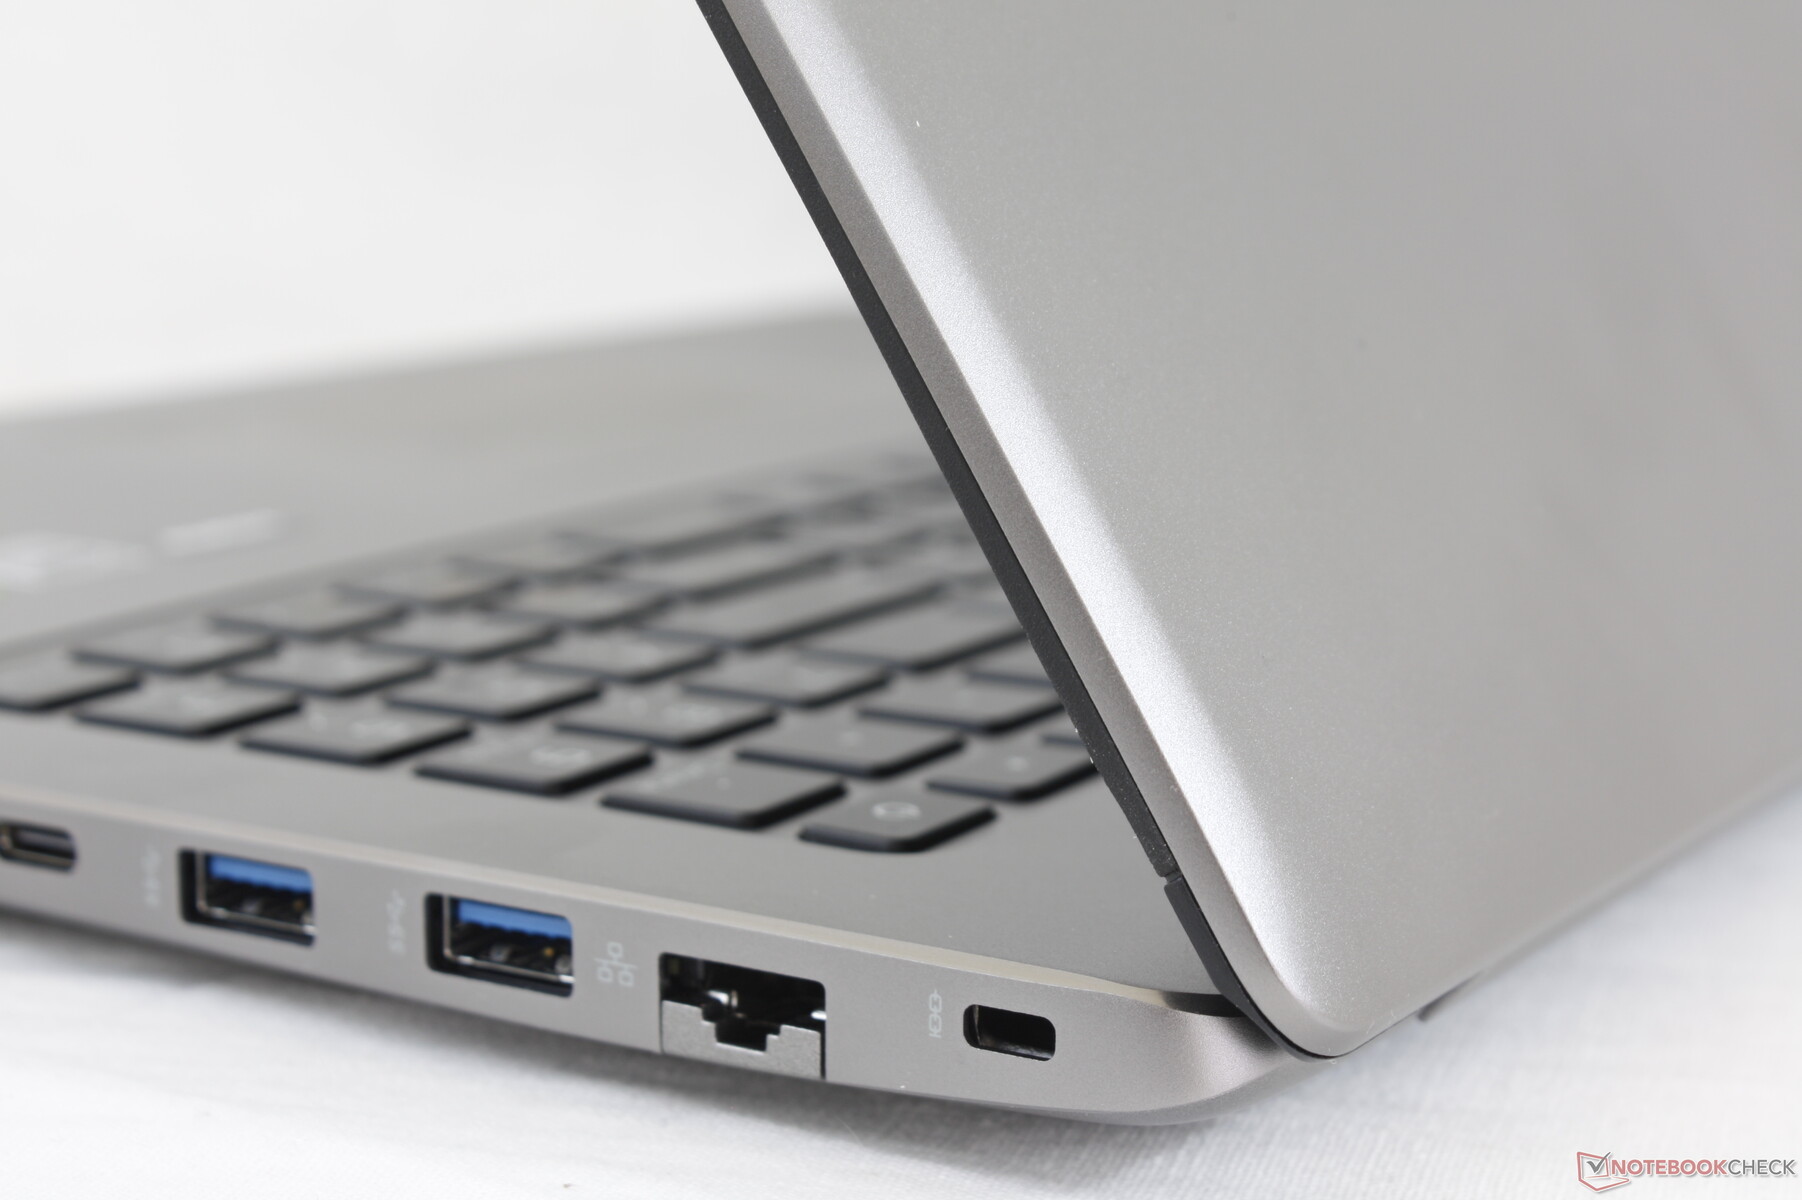
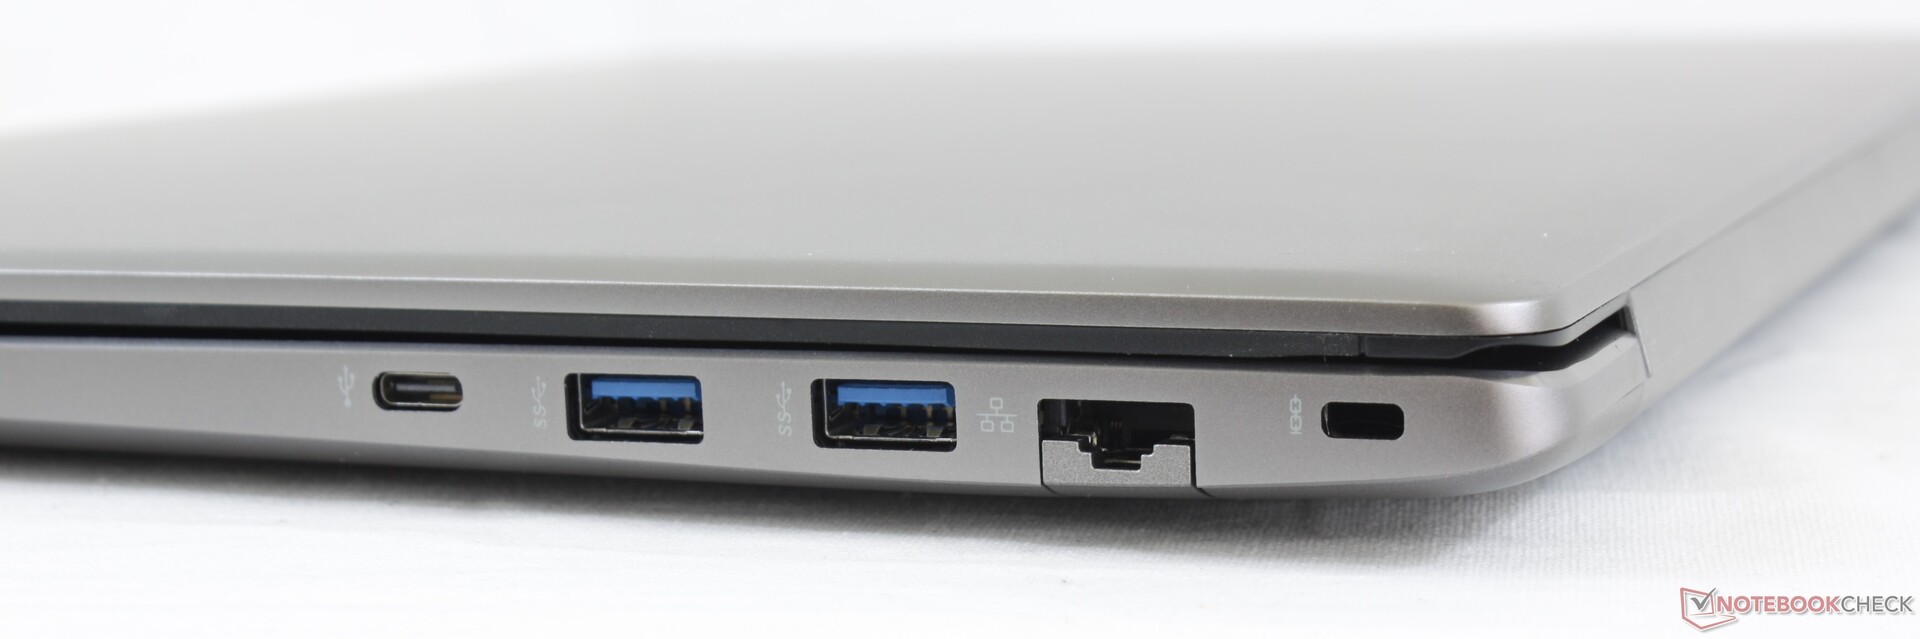
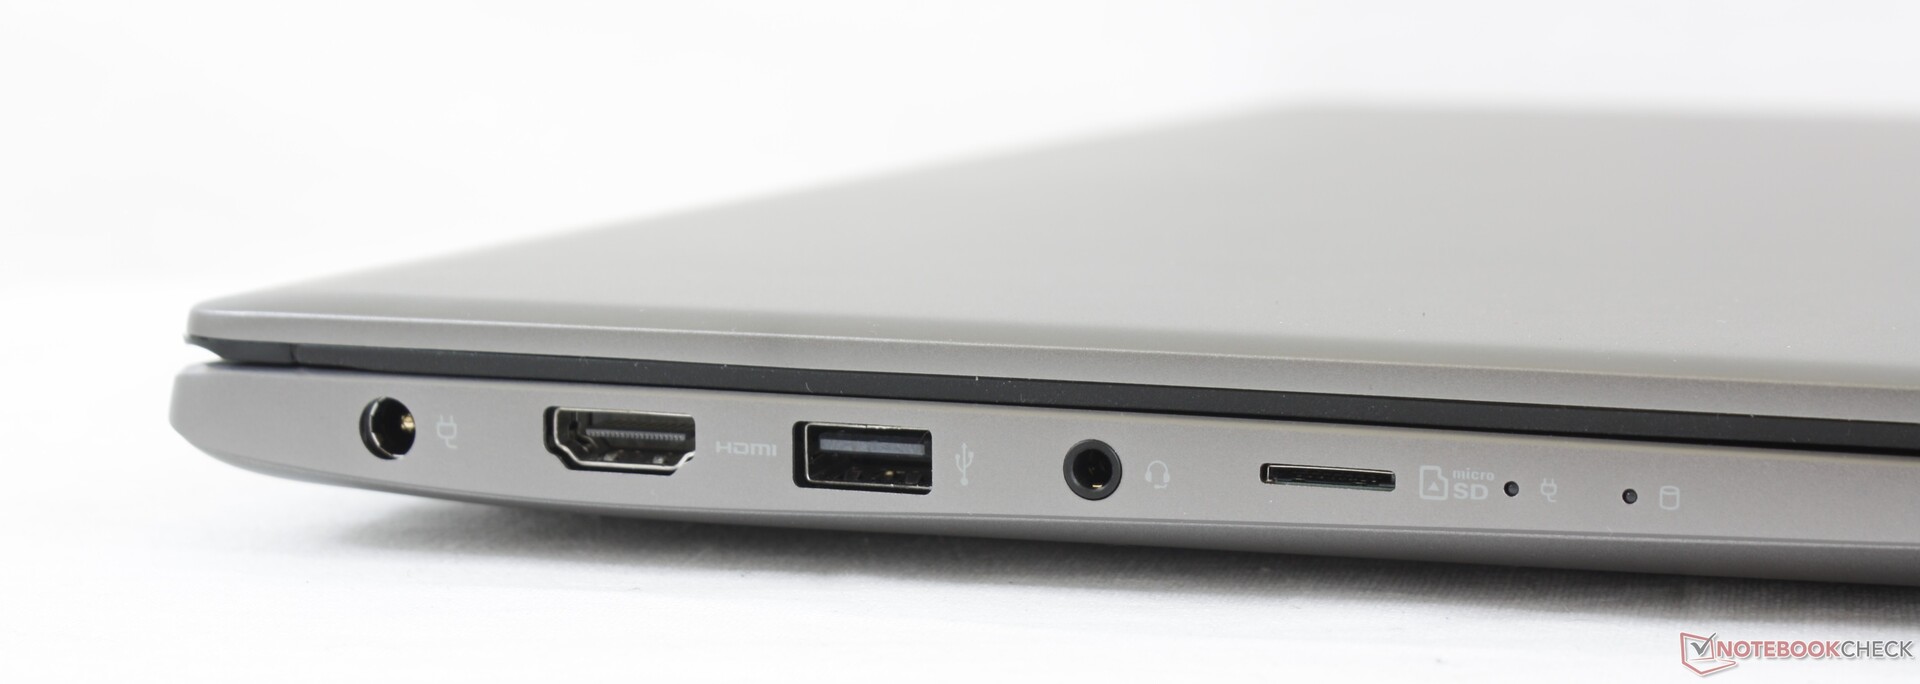
Port options are similar to the Gram 17 but with two major differences. Firstly, the Ultra 17 integrates an RJ-45 port likely because of its slightly thicker profile. Secondly, it unfortunately does not support Thunderbolt 3 despite the hefty price tag. This is likely because the Gram 17 is running on Ice Lake while the Ultra 17 is using Comet Lake-U.
SD Card Reader
Transfer rates from the integrated MicroSD reader are the same as on the Gram 17. Moving 1 GB of pictures from our UHS-II test card to desktop takes about 14 seconds compared to under half that on the XPS 17.
| SD Card Reader | |
| average JPG Copy Test (av. of 3 runs) | |
| Dell XPS 17 9700 Core i7 RTX 2060 Max-Q (Toshiba Exceria Pro SDXC 64 GB UHS-II) | |
| LG Gram 17 17Z90N-V.AA77G (Toshiba Exceria Pro M501 microSDXC 64GB) | |
| LG Ultra 17U70N (Toshiba Exceria Pro M501 microSDXC 64GB) | |
| HP Envy 17t-cg000 (Toshiba Exceria Pro SDXC 64 GB UHS-II) | |
| Eluktronics RP-17 (Toshiba Exceria Pro SDXC 64 GB UHS-II) | |
| maximum AS SSD Seq Read Test (1GB) | |
| Dell XPS 17 9700 Core i7 RTX 2060 Max-Q (Toshiba Exceria Pro SDXC 64 GB UHS-II) | |
| LG Gram 17 17Z90N-V.AA77G (Toshiba Exceria Pro M501 microSDXC 64GB) | |
| LG Ultra 17U70N (Toshiba Exceria Pro M501 microSDXC 64GB) | |
| HP Envy 17t-cg000 (Toshiba Exceria Pro SDXC 64 GB UHS-II) | |
| Eluktronics RP-17 (Toshiba Exceria Pro SDXC 64 GB UHS-II) | |
Communication
The Intel AX201 comes standard for Wi-Fi 6 and Bluetooth 5.1 connectivity. We experienced no issues when paired to our Netgear RAX200 test router.
Webcam


Maintenance
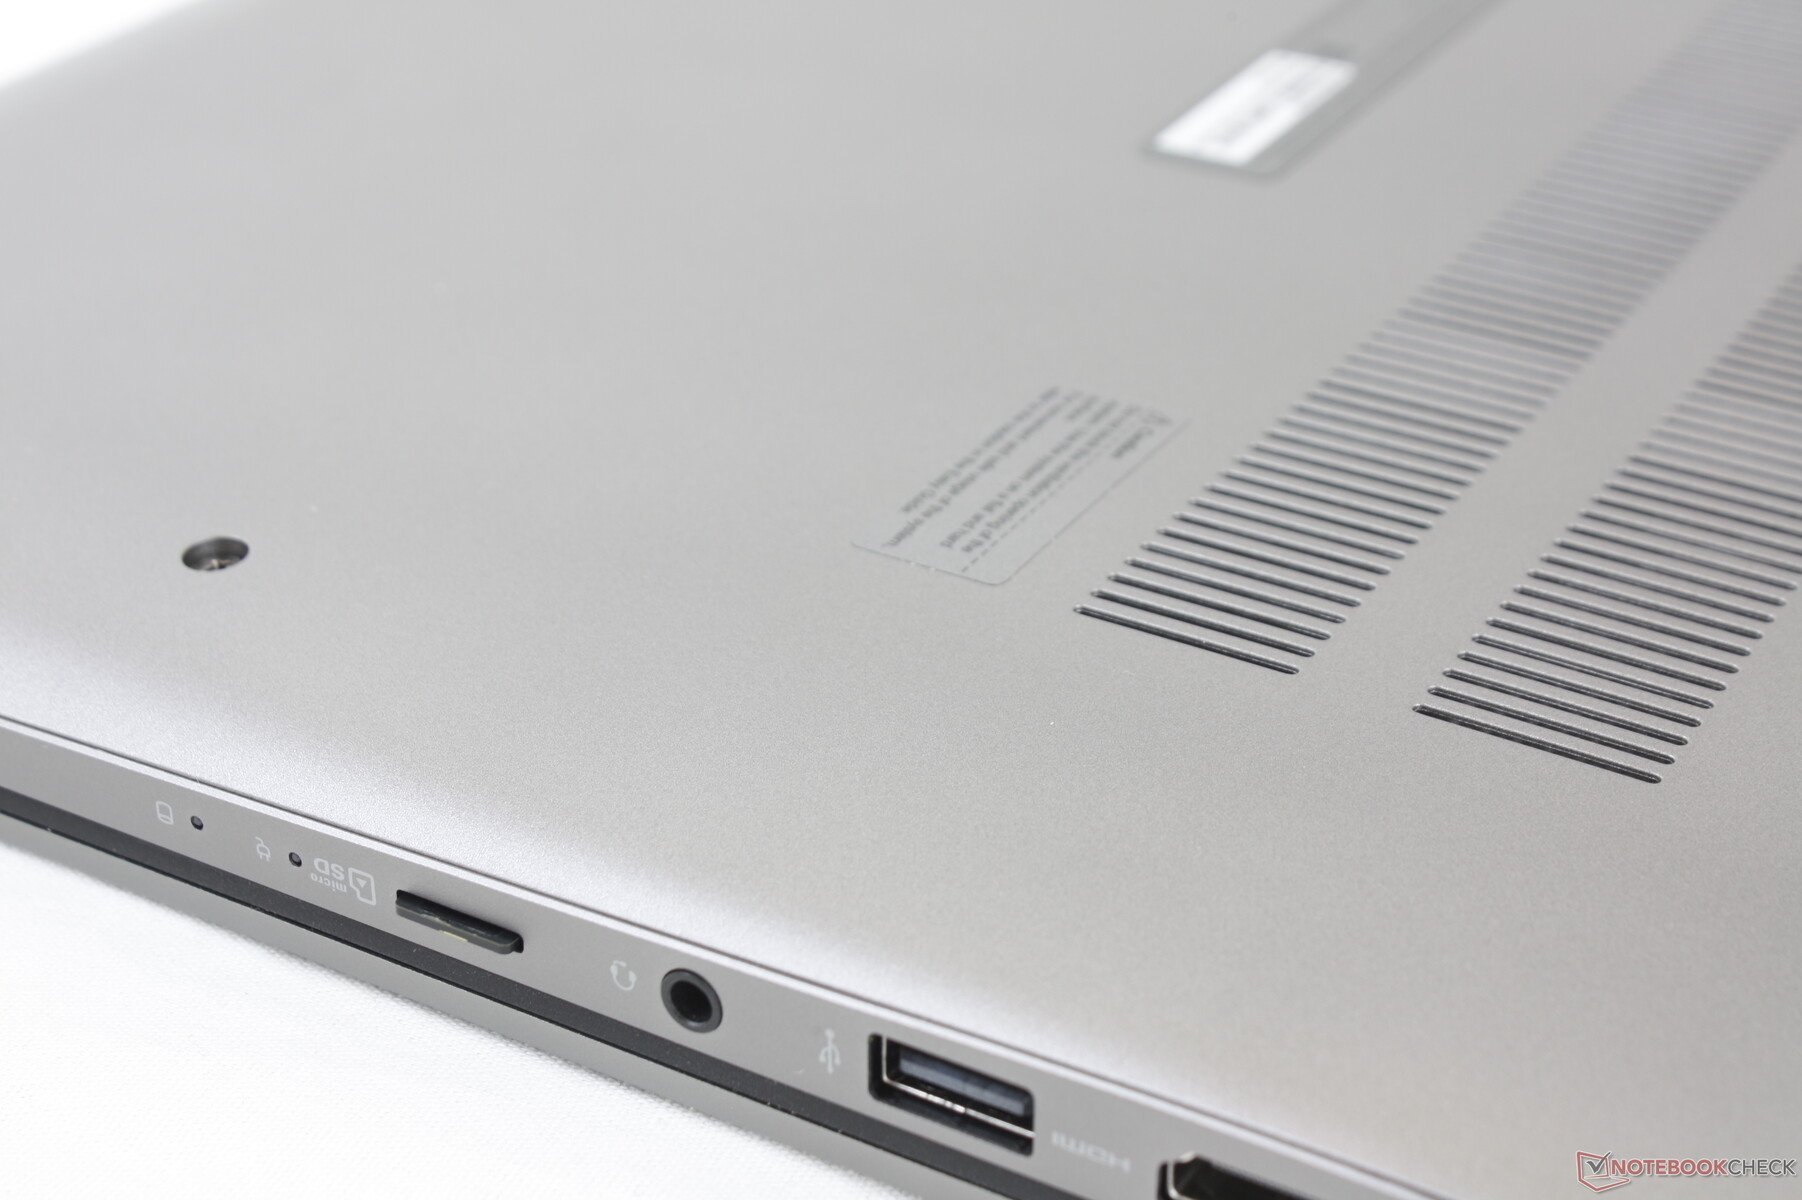
The bottom panel is secured by ten screws plus one on the very center under an anti-tamper sticker. We elected to honor the warranty, but it's still disappointing nonetheless for users who just want to upgrade RAM or storage. RAM is upgradeable and not soldered, but we cannot identify if there are any internal secondary storage options.
Accessories and Warranty
There are no extras in the box other than the AC adapter and paperwork. The standard one-year limited manufacturer warranty applies.
Input Devices
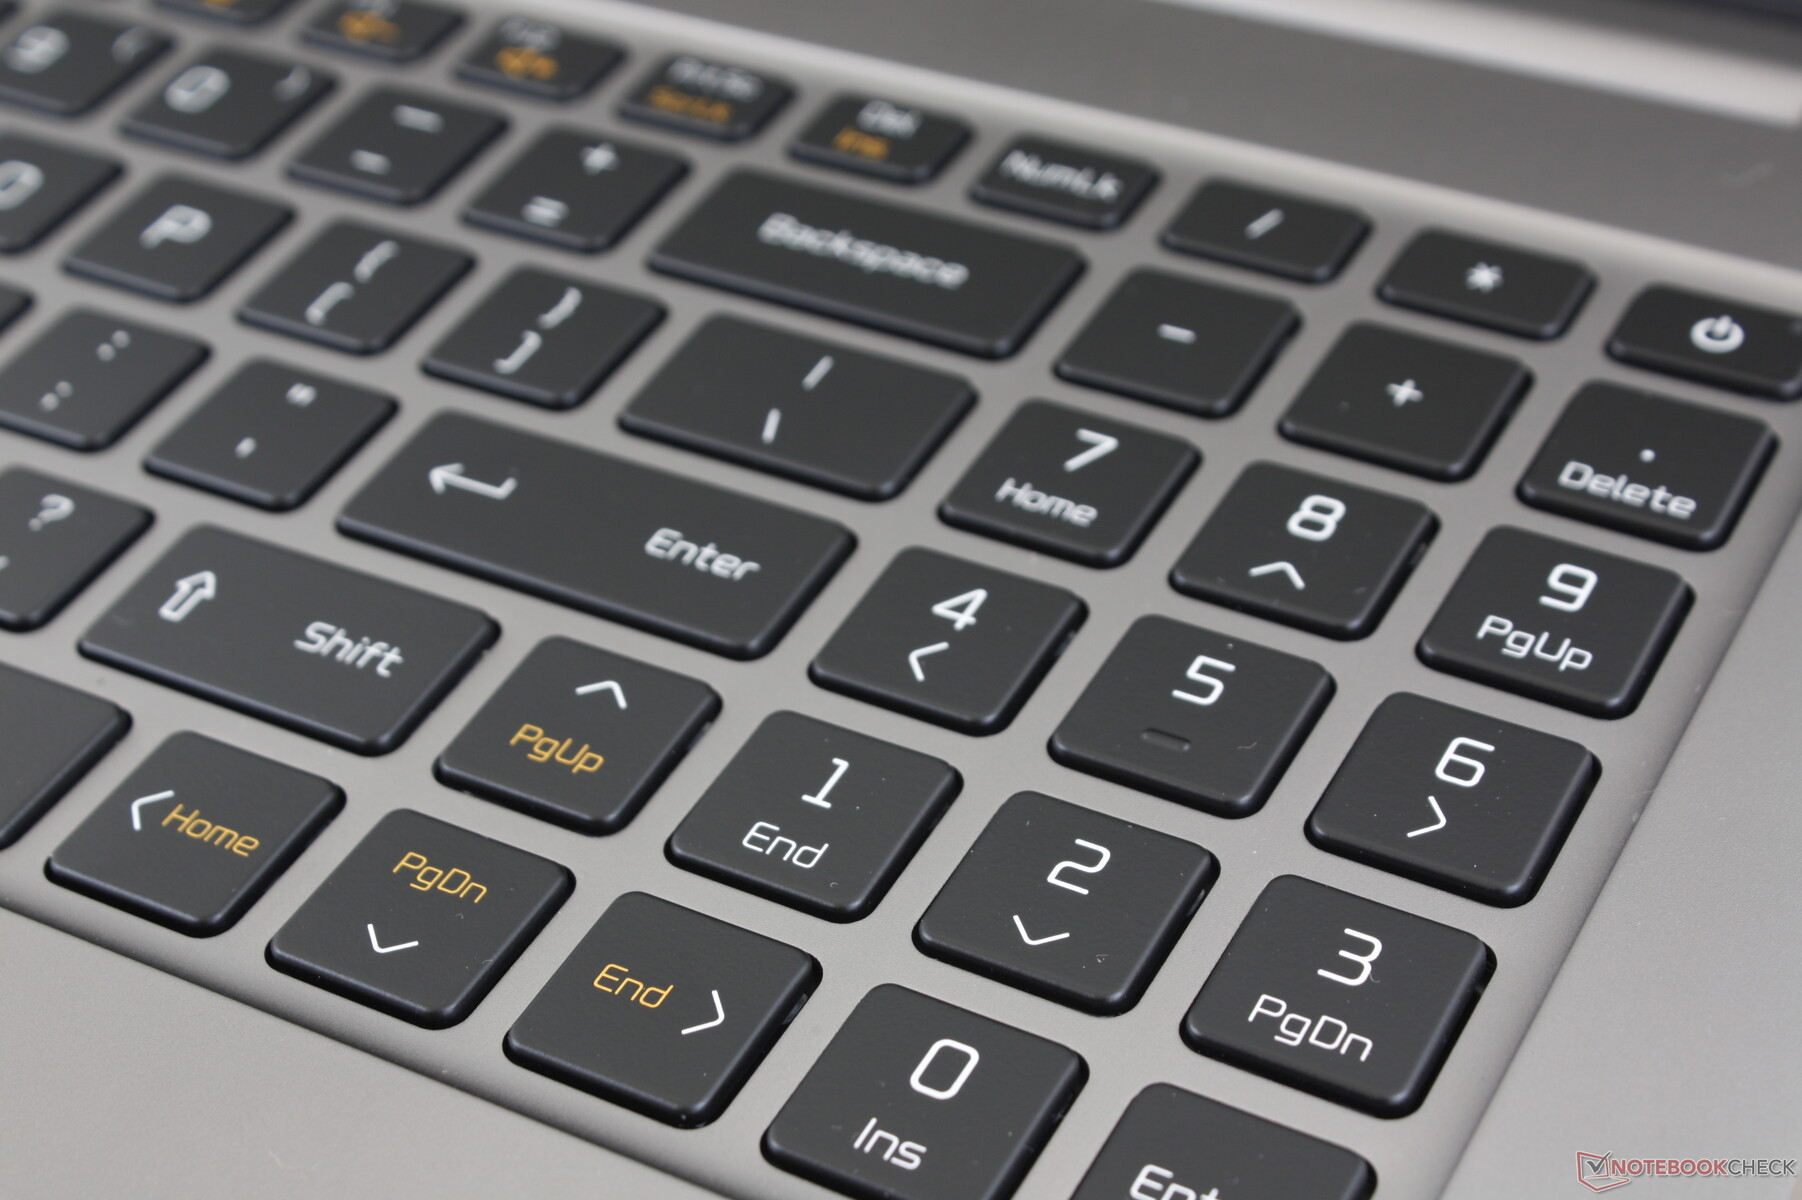
Keyboard
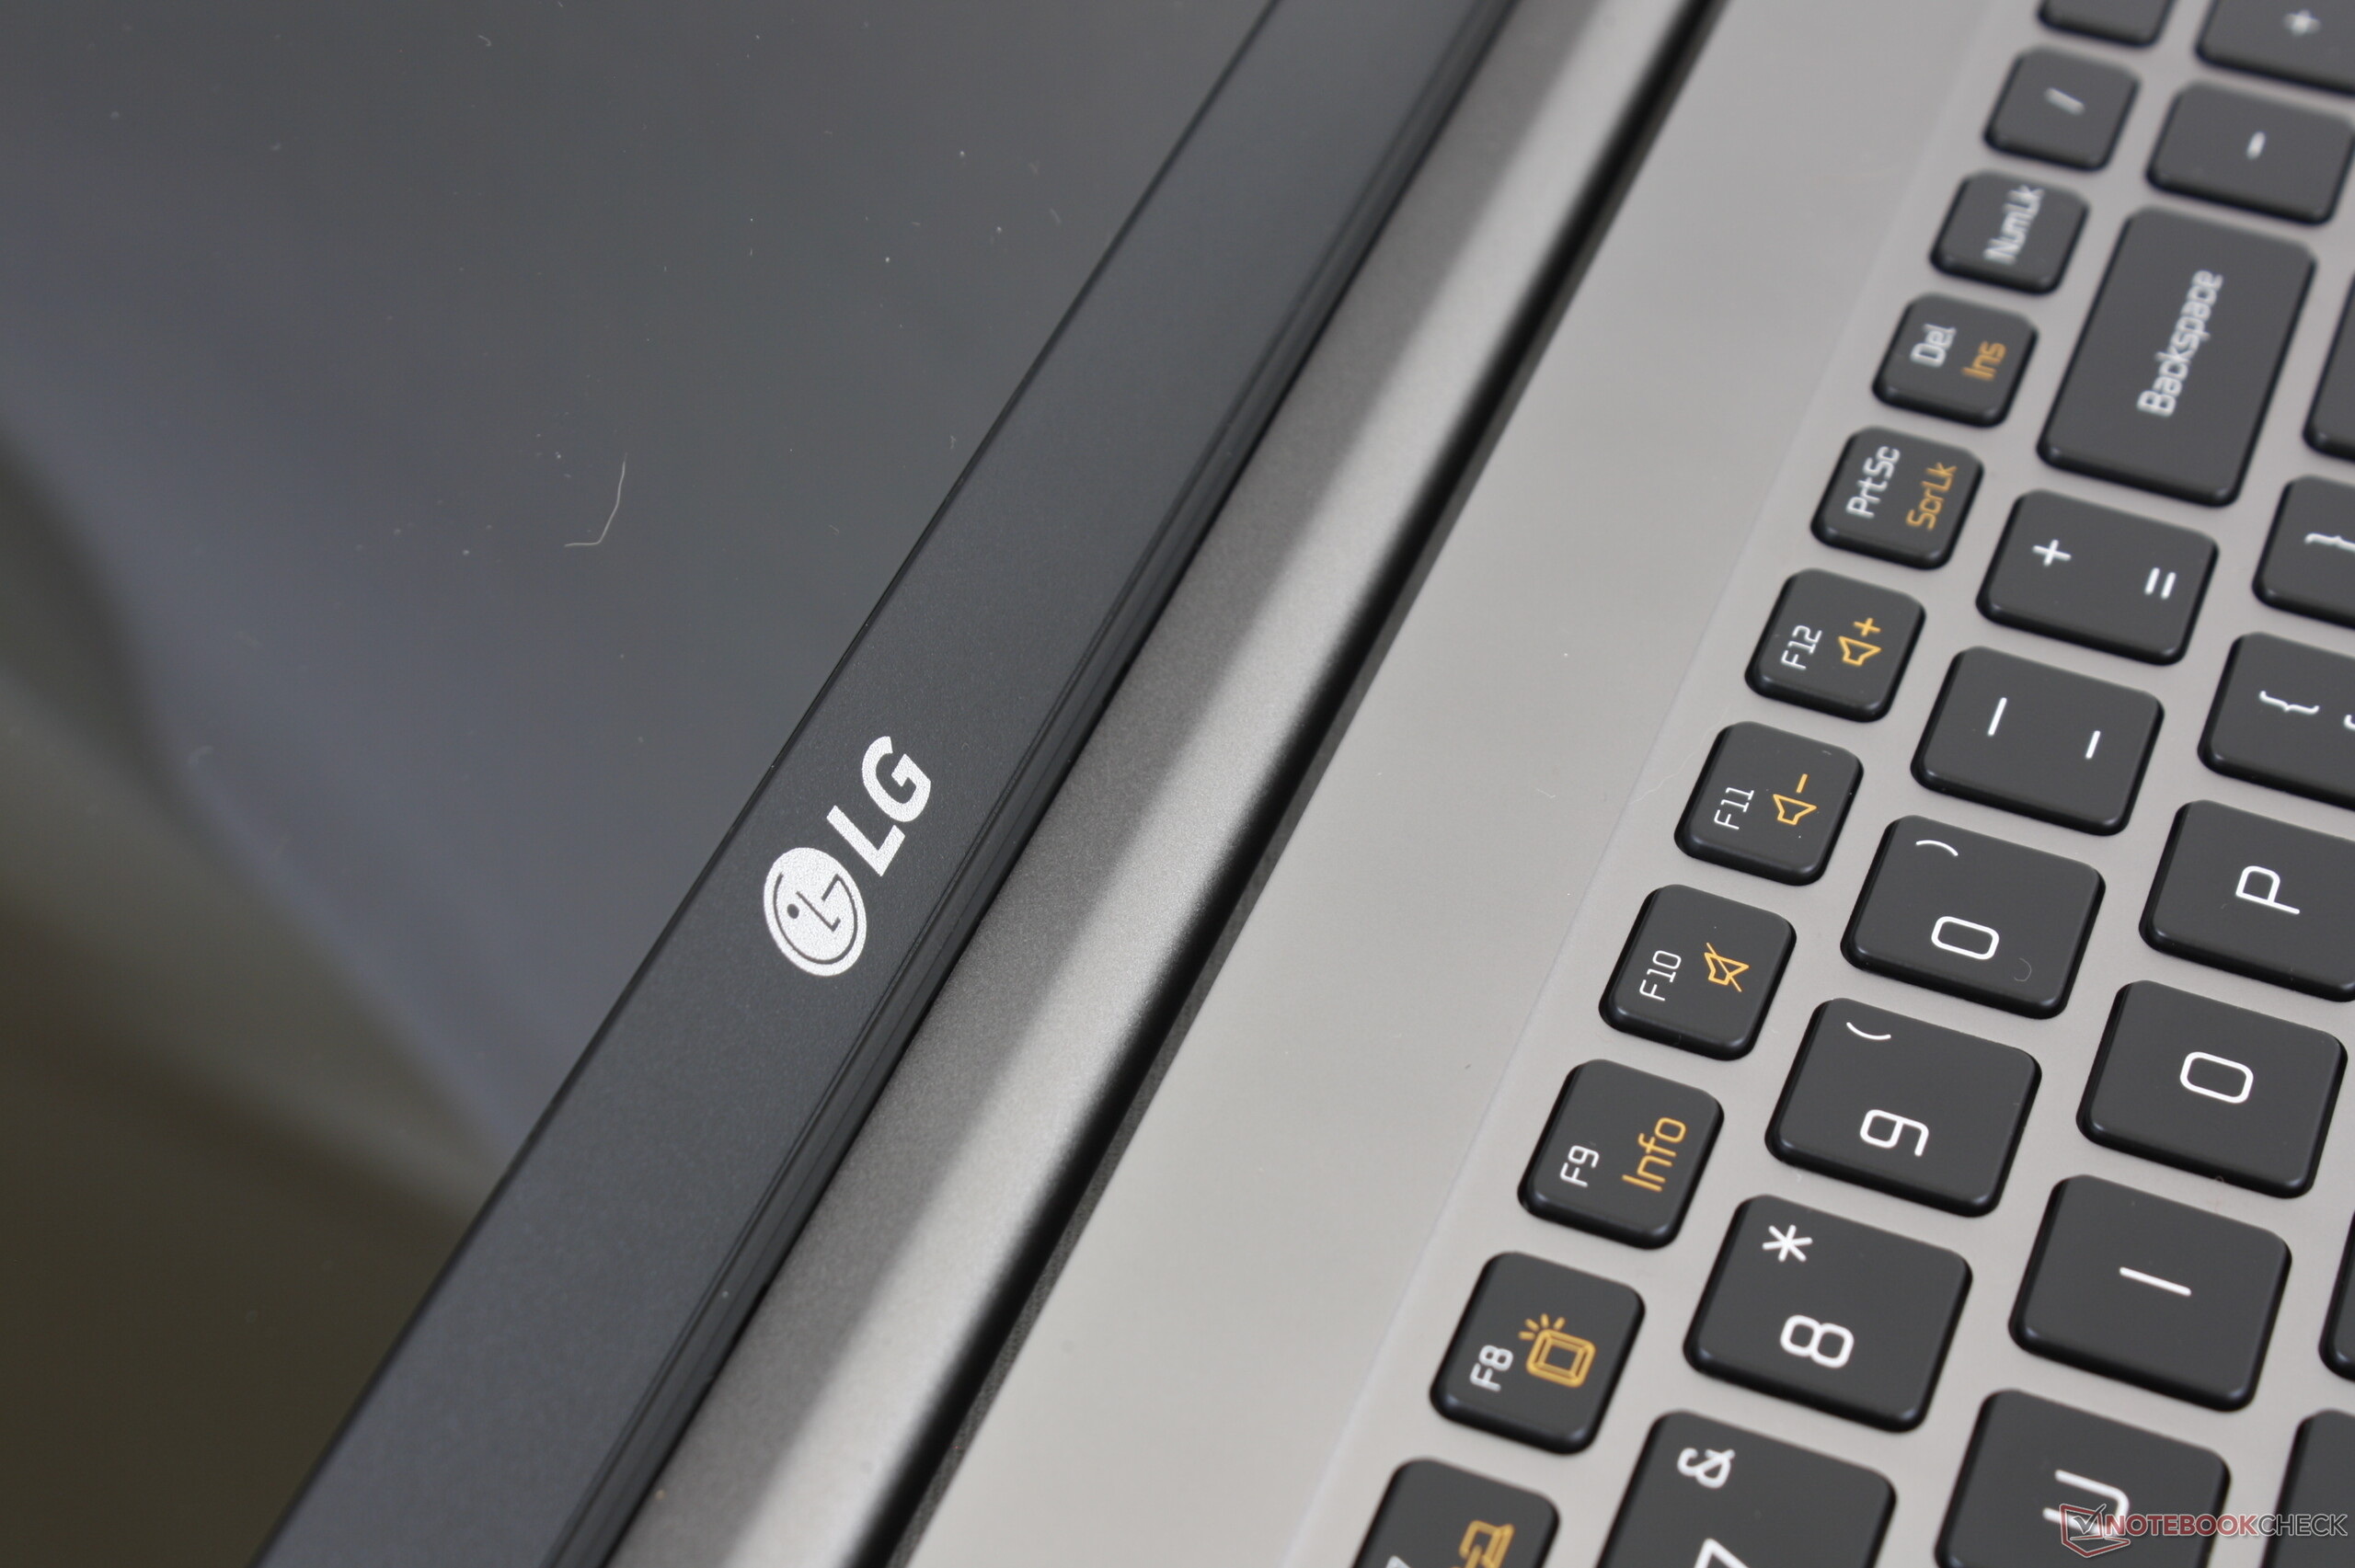
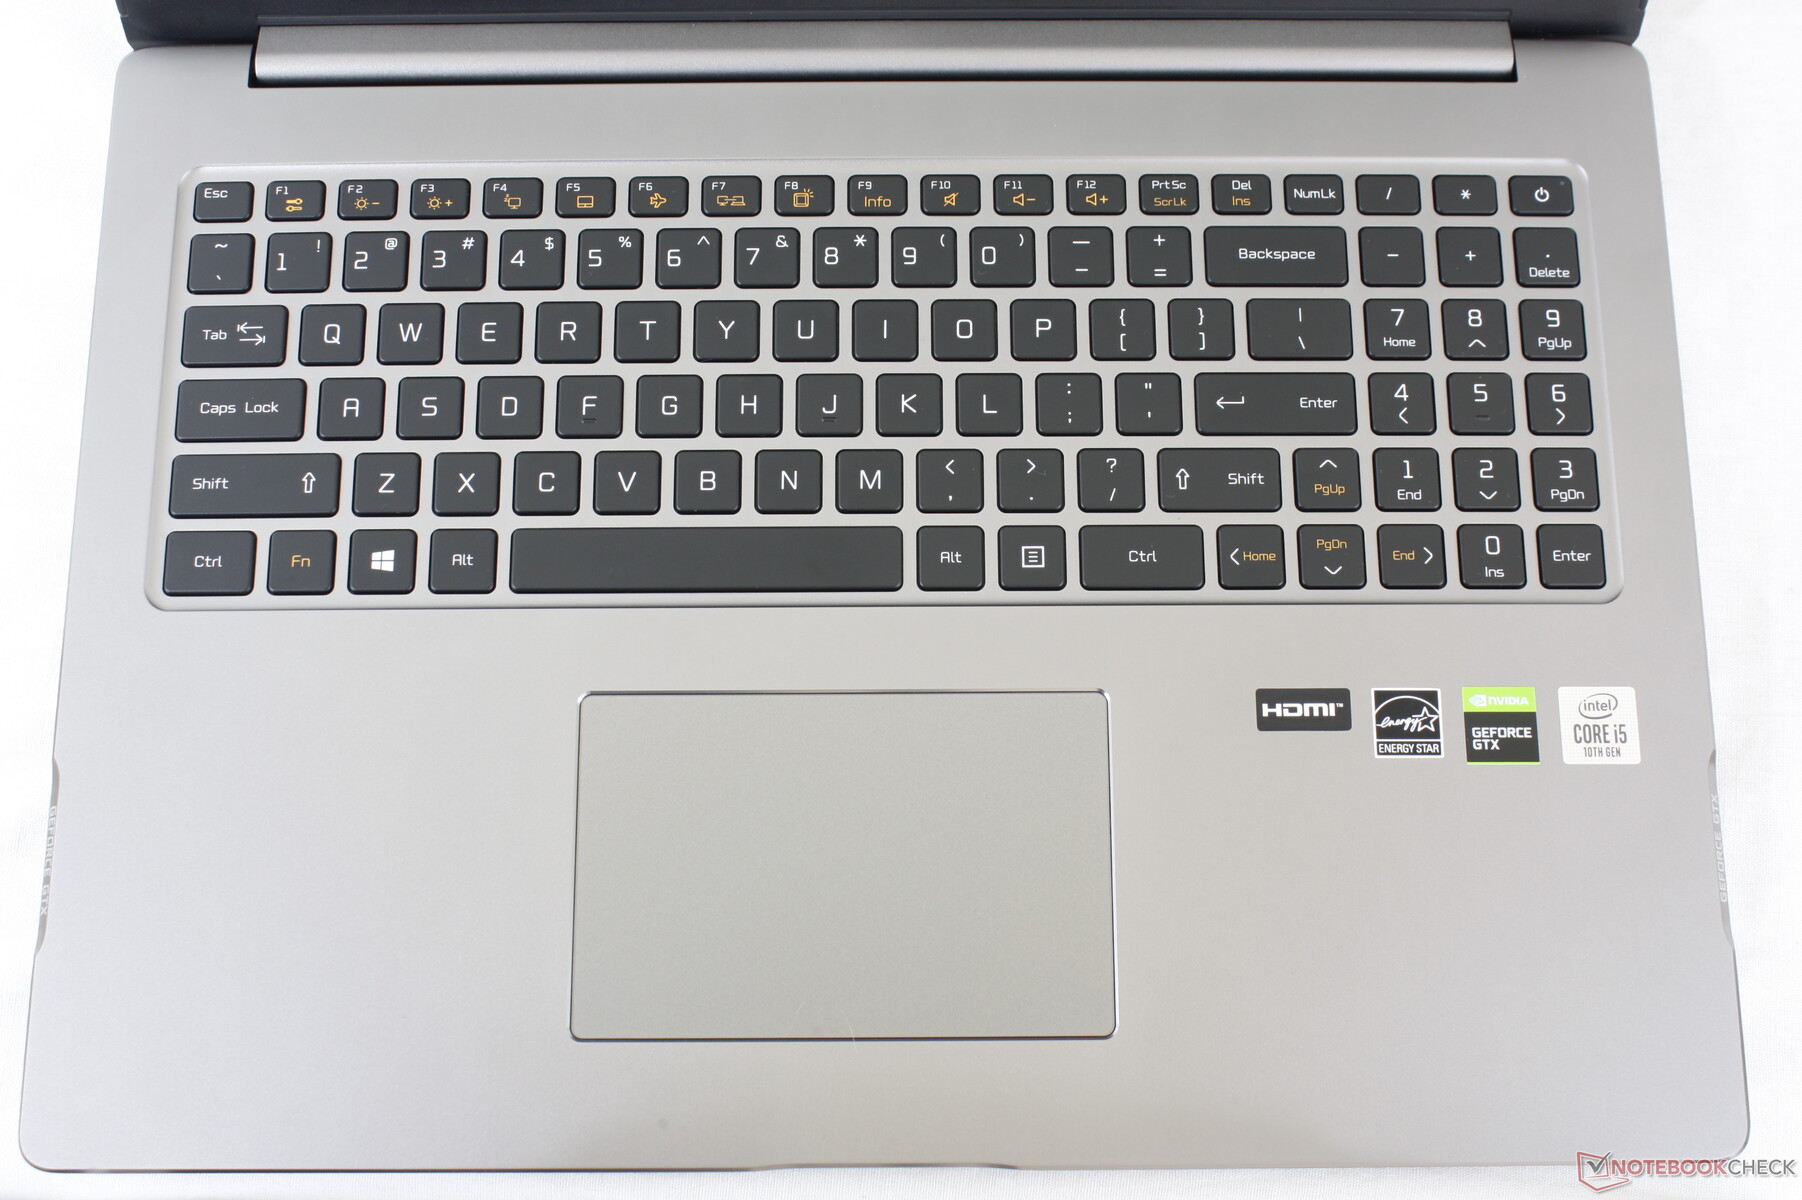
Keyboard layout is different from the Gram 17. The key caps themselves are slightly smaller and rounder while the Arrow keys are now full-size. For a 17-inch form factor, however, we find key travel to be too shallow and the resulting feedback too weak. Deeper keys would have gone a long way here to improving the typing experience.
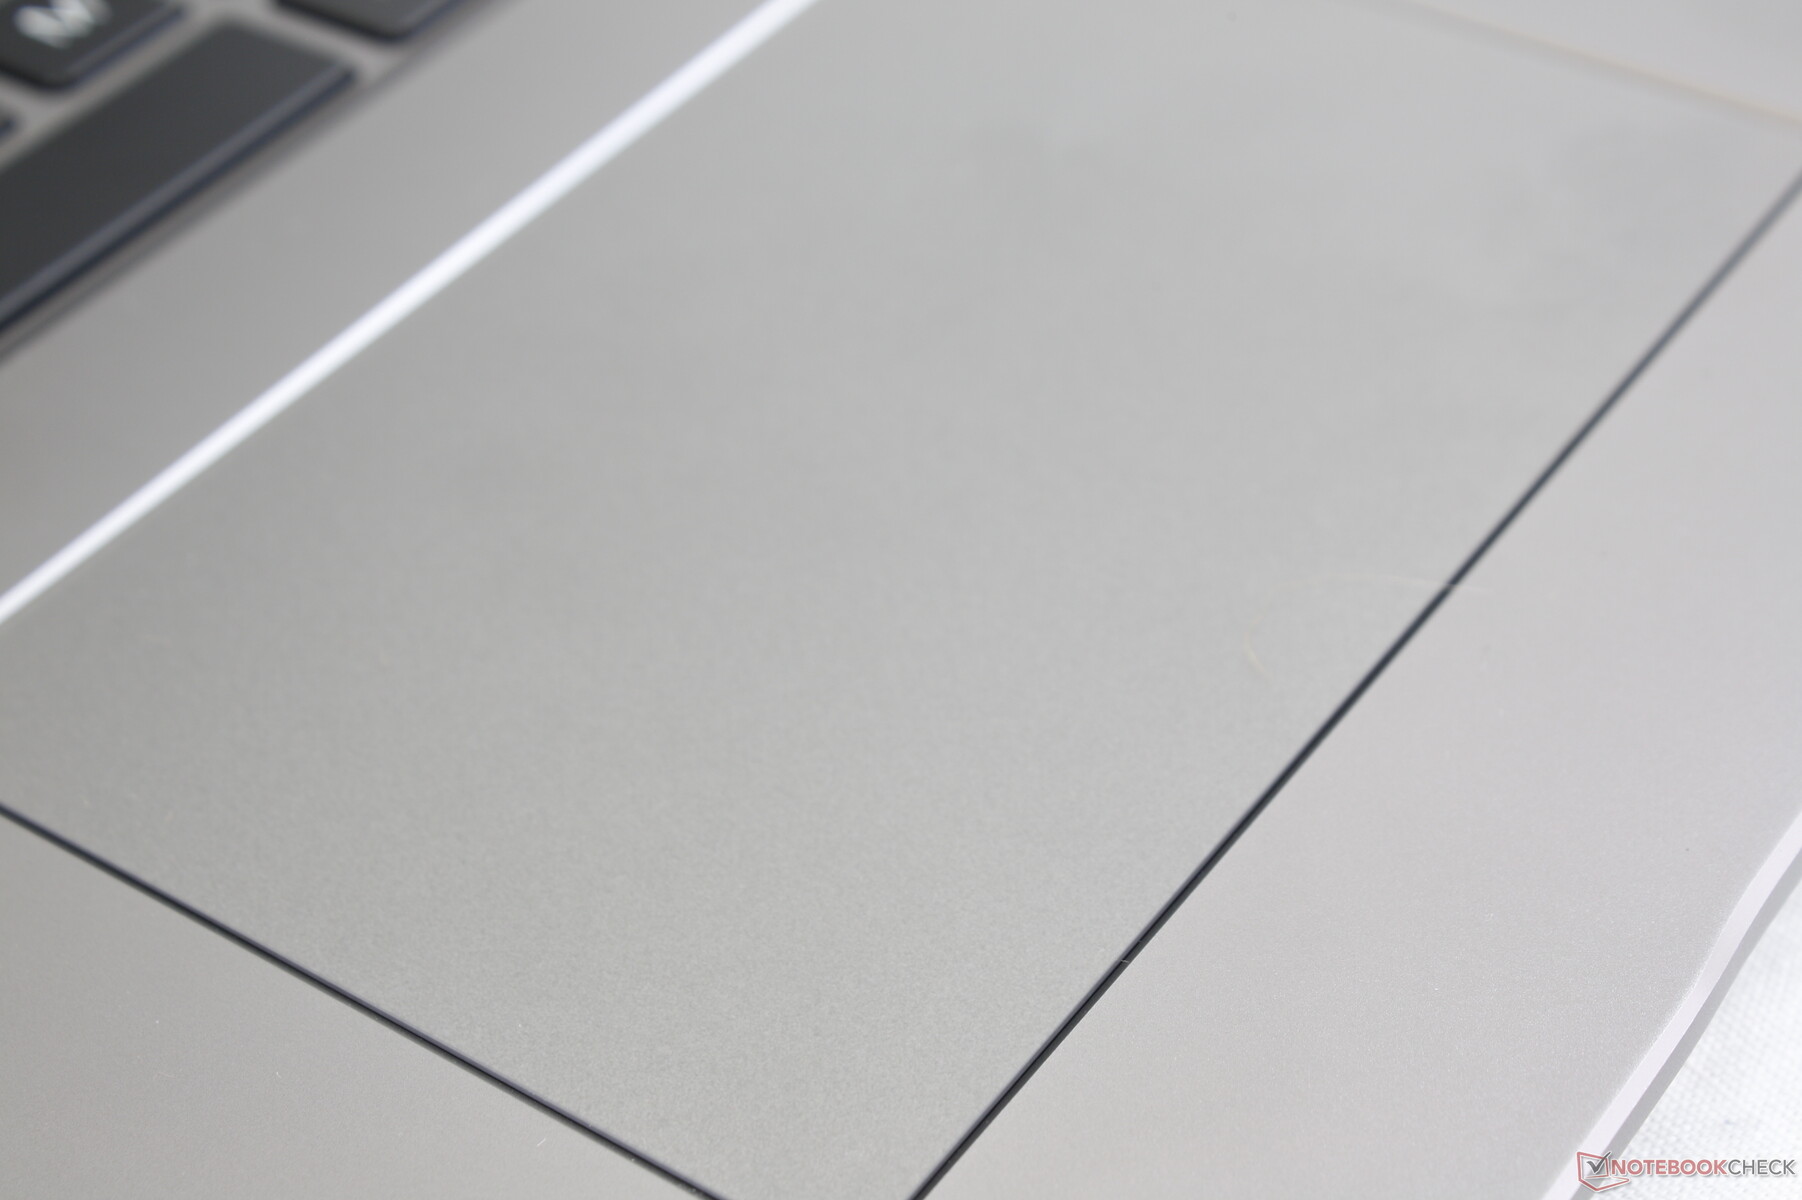
Touchpad
The Precision clickpad is much smaller than the one on the Dell XPS 17 (12 x 7.9 cm vs. 15.1 x 9 cm). Its surface is smoother than on most other clickpads with just a bit of sticking only when gliding at very slow speeds. Cursor control works well enough, but the integrated mouse buttons are spongy and difficult to depress for a poor experience especially when dragging and dropping. For such a large form factor, it's too bad that LG decided to not include dedicated mouse buttons.

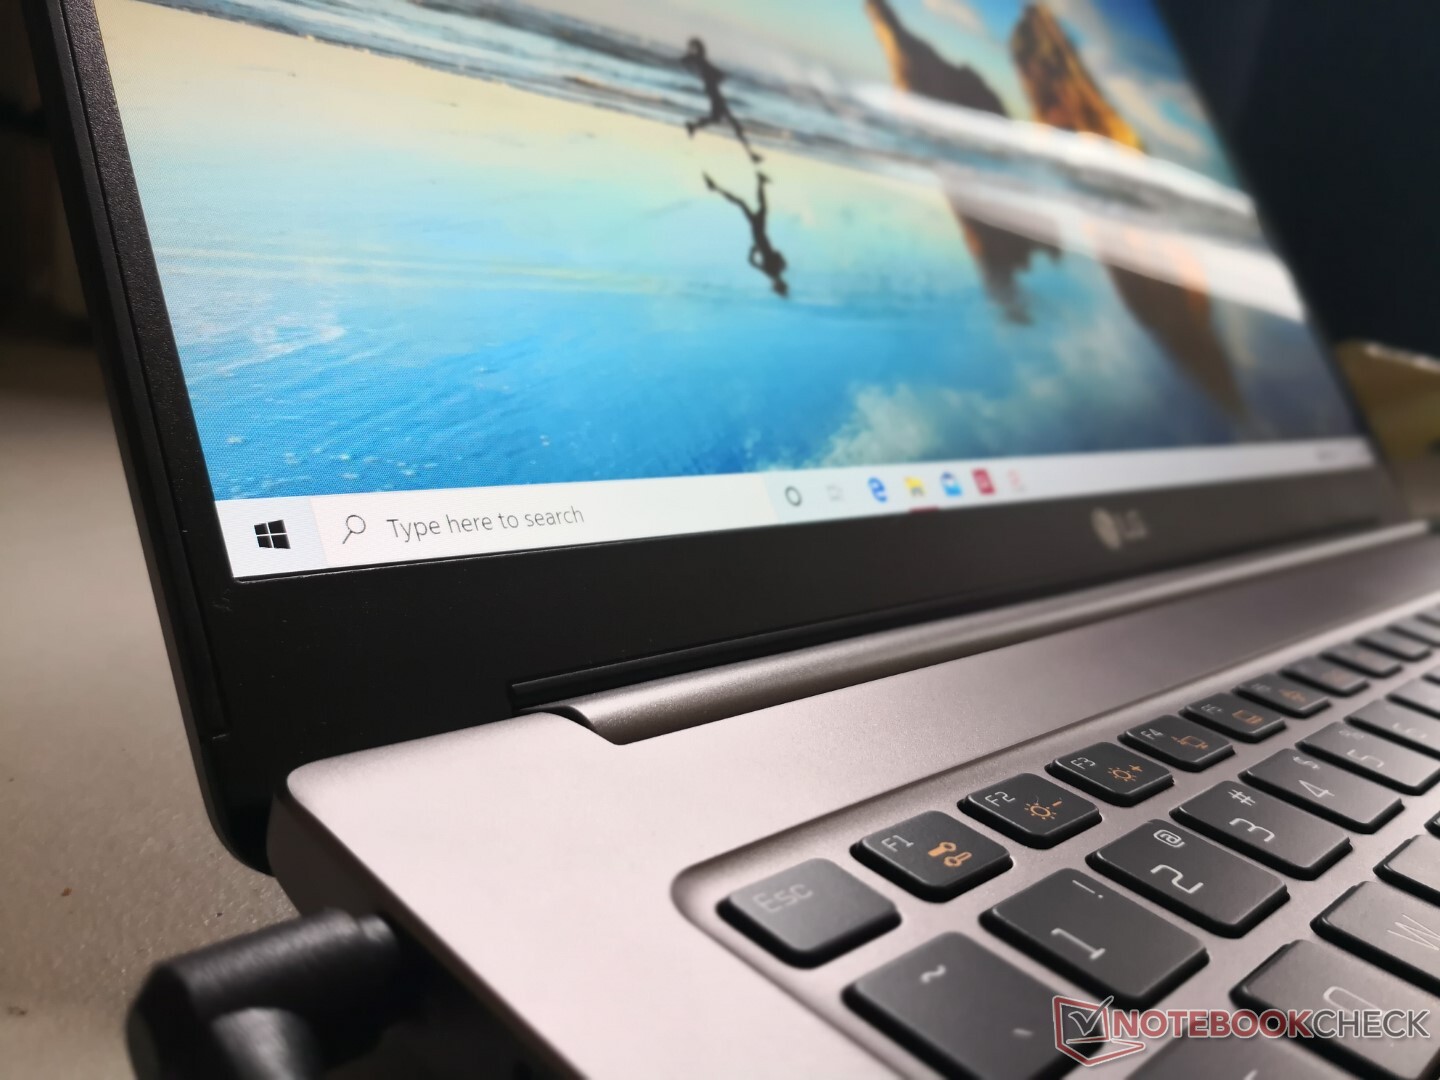
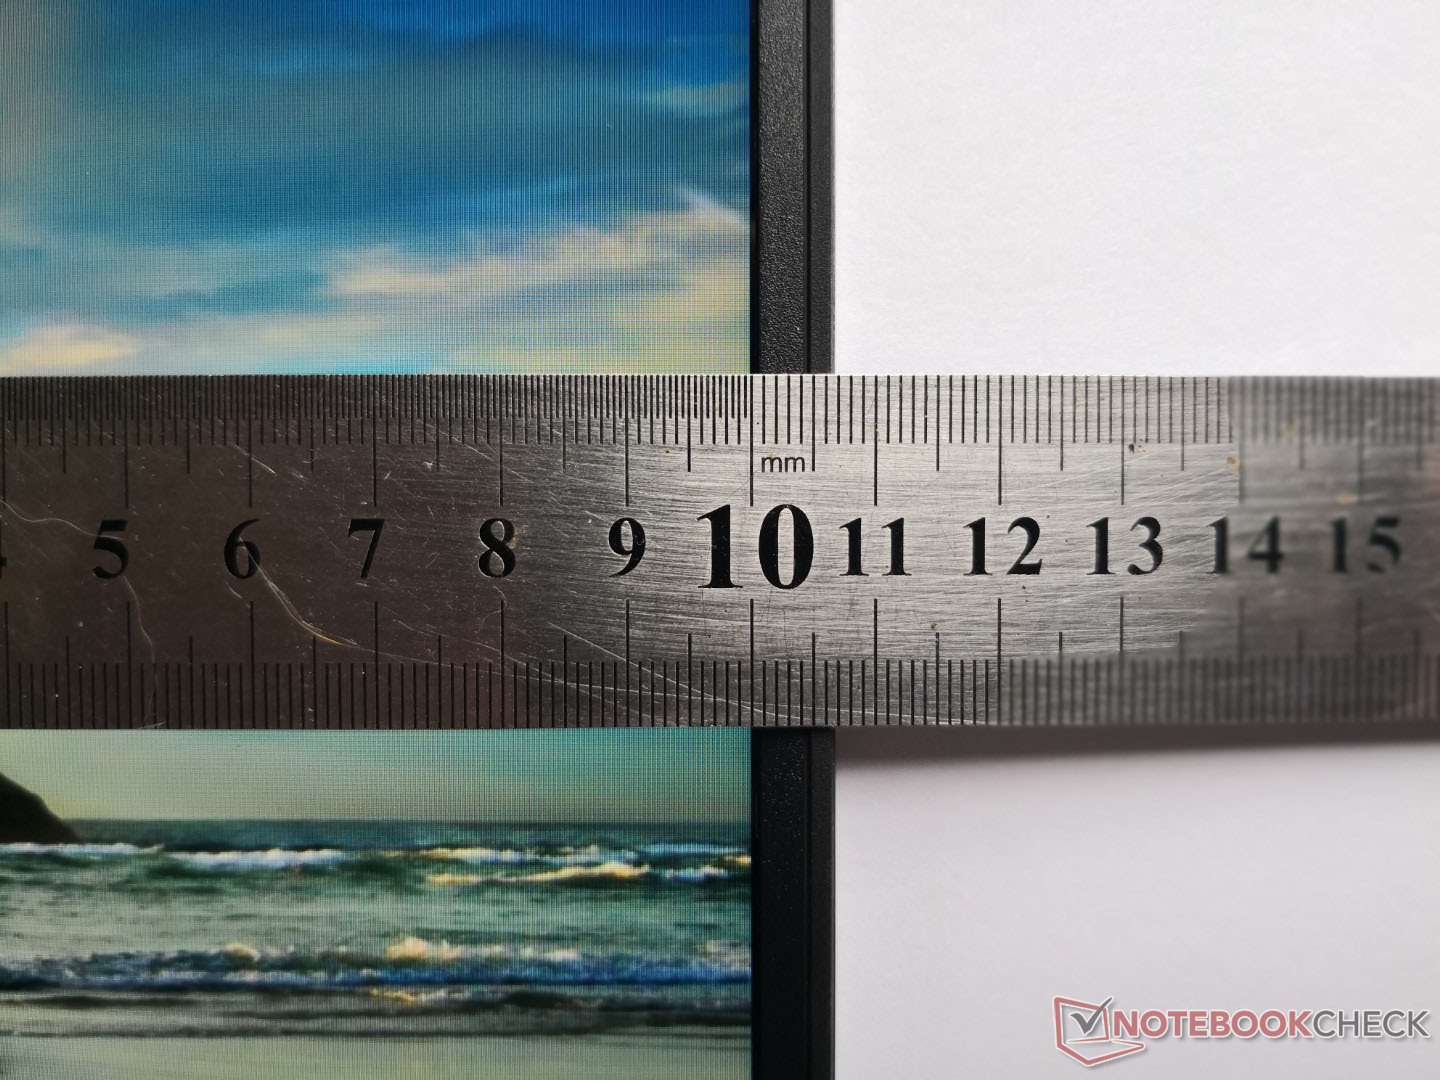
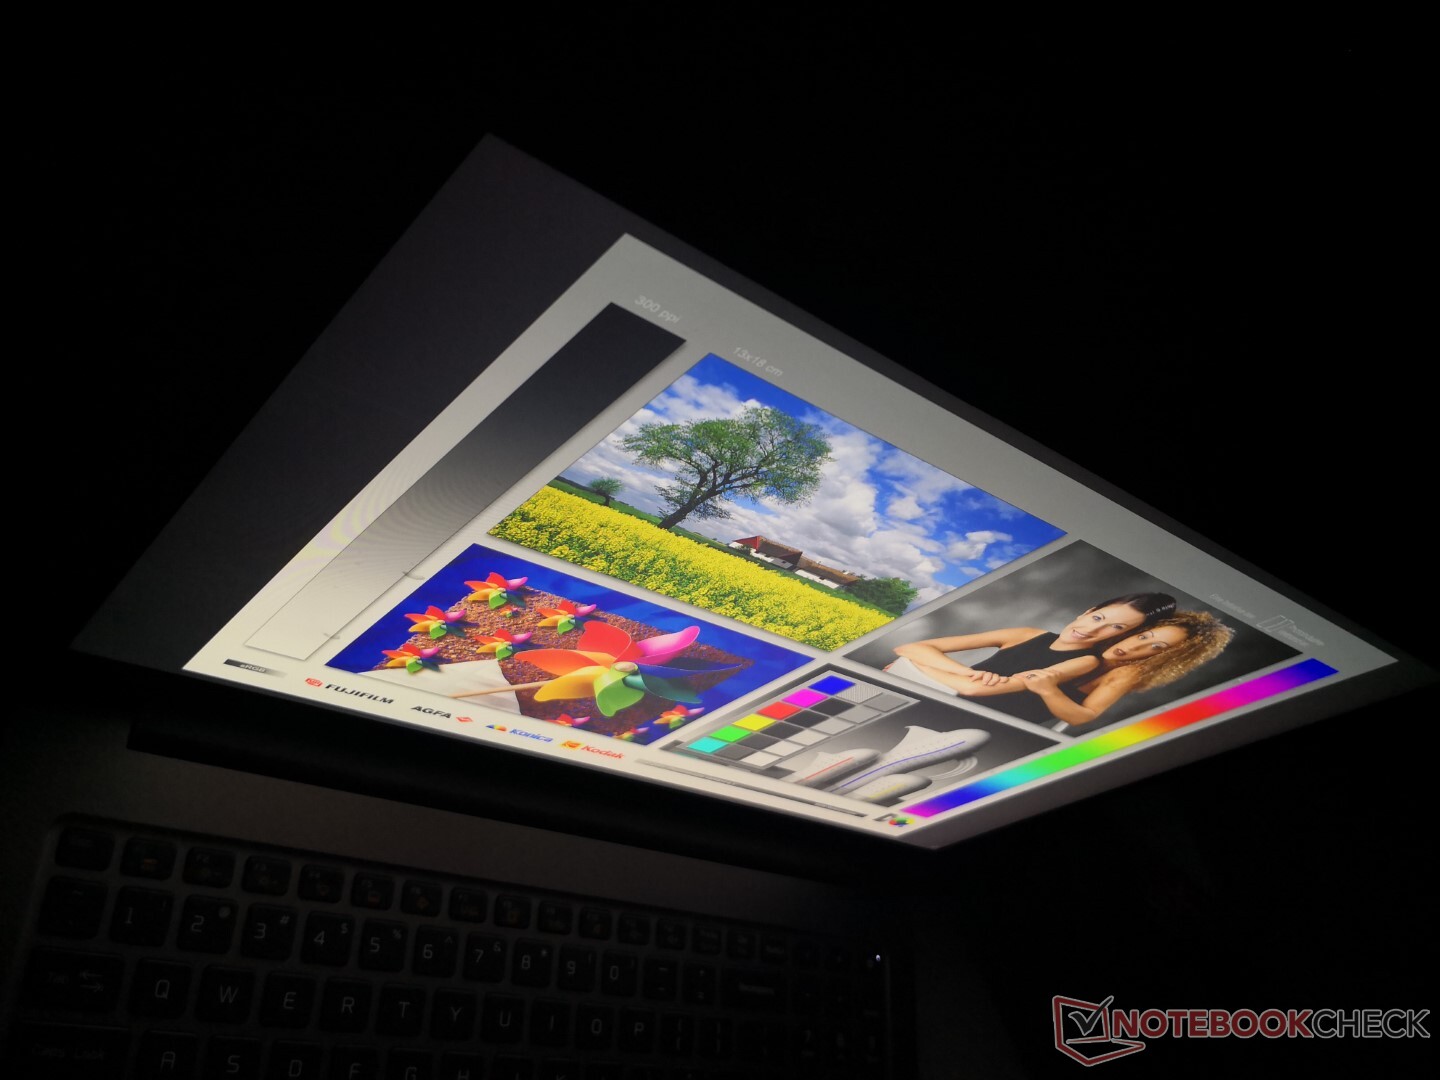
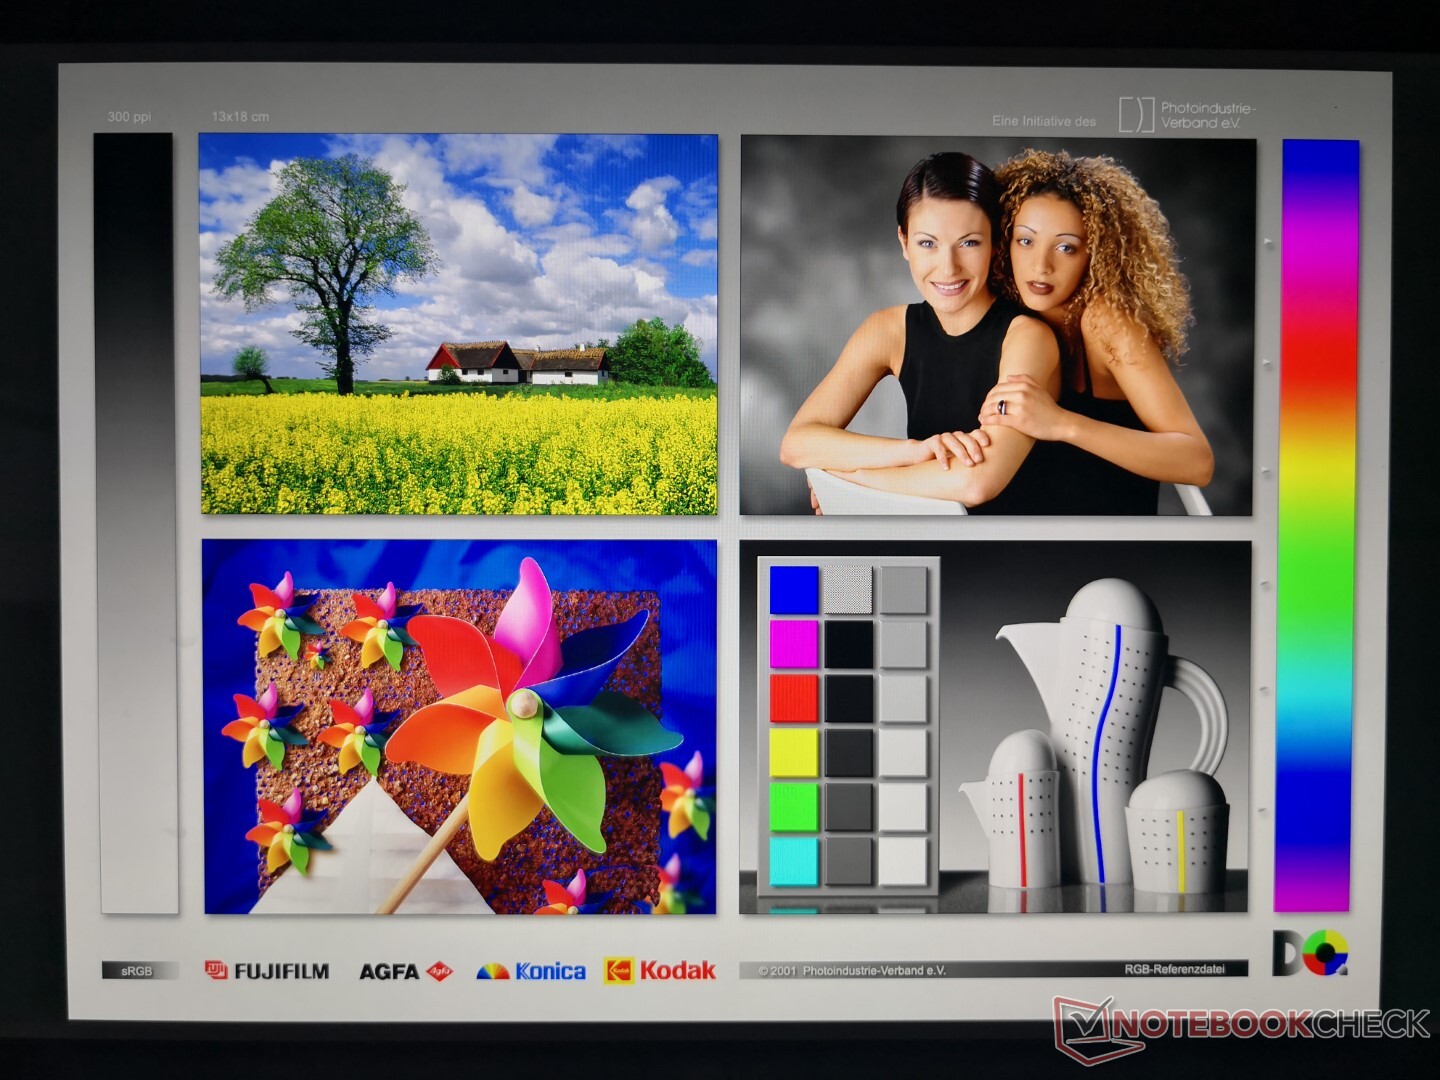
Display
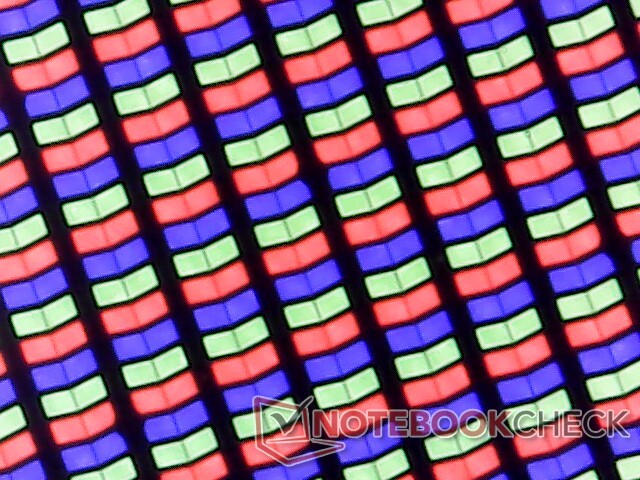
As most of us probably expected, the Ultra 17 uses the same LG LP170WQ1-SPA1 IPS panel as found on the Gram 17 for a similar visual experience between the two systems. Display quality is excellent even though it's a step or two down in brightness and colors from the even better Sharp panel on the XPS 17. LG has always had great laptop panels, but the drawback here is that the Ultra 17 comes only in glossy.
If you intend on running games, keep in mind that black-white response times are average for noticeable ghosting when playing fast-moving titles like Rocket League or Overwatch. Slower-paced games like DOTA 2 aren't as distracting in this regard.
| |||||||||||||||||||||||||
Brightness Distribution: 88 %
Center on Battery: 354 cd/m²
Contrast: 1731:1 (Black: 0.24 cd/m²)
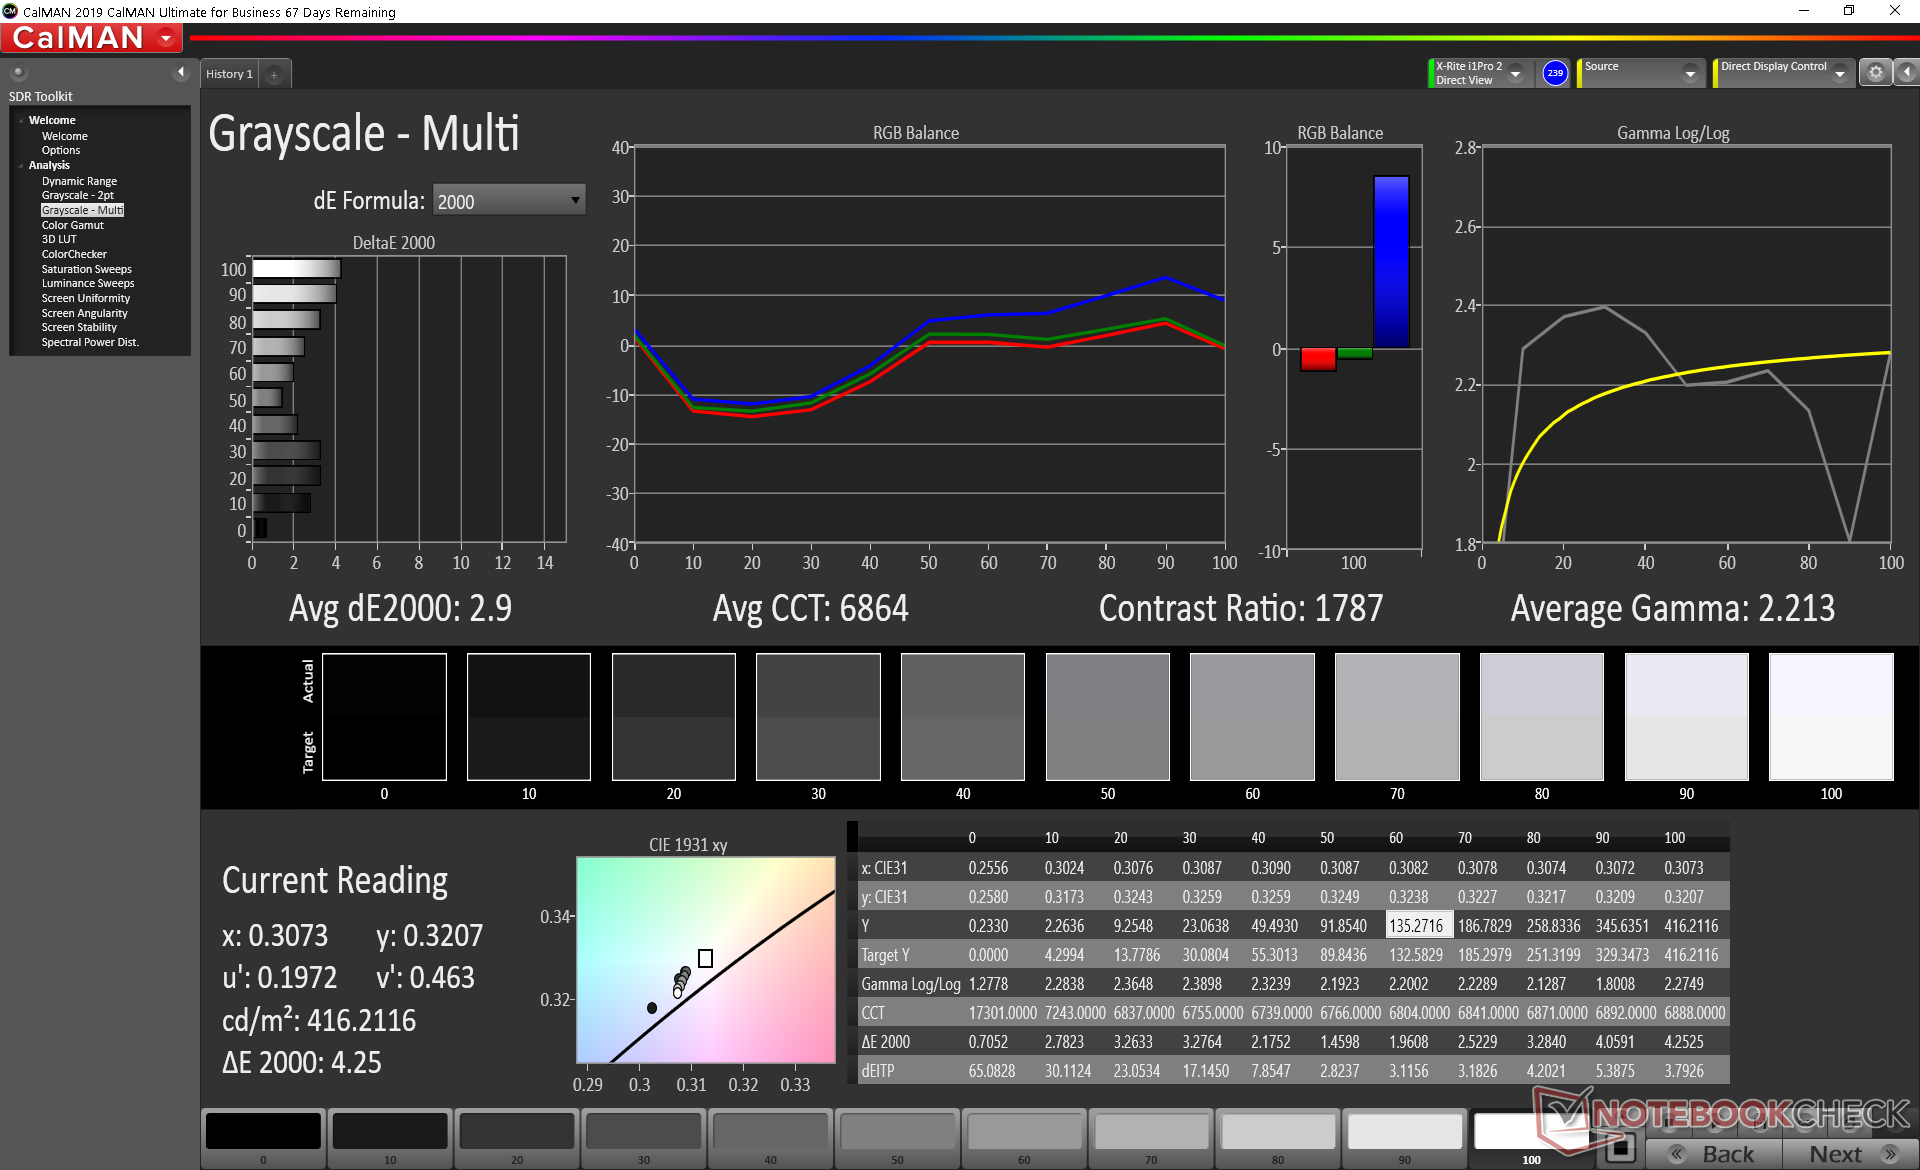
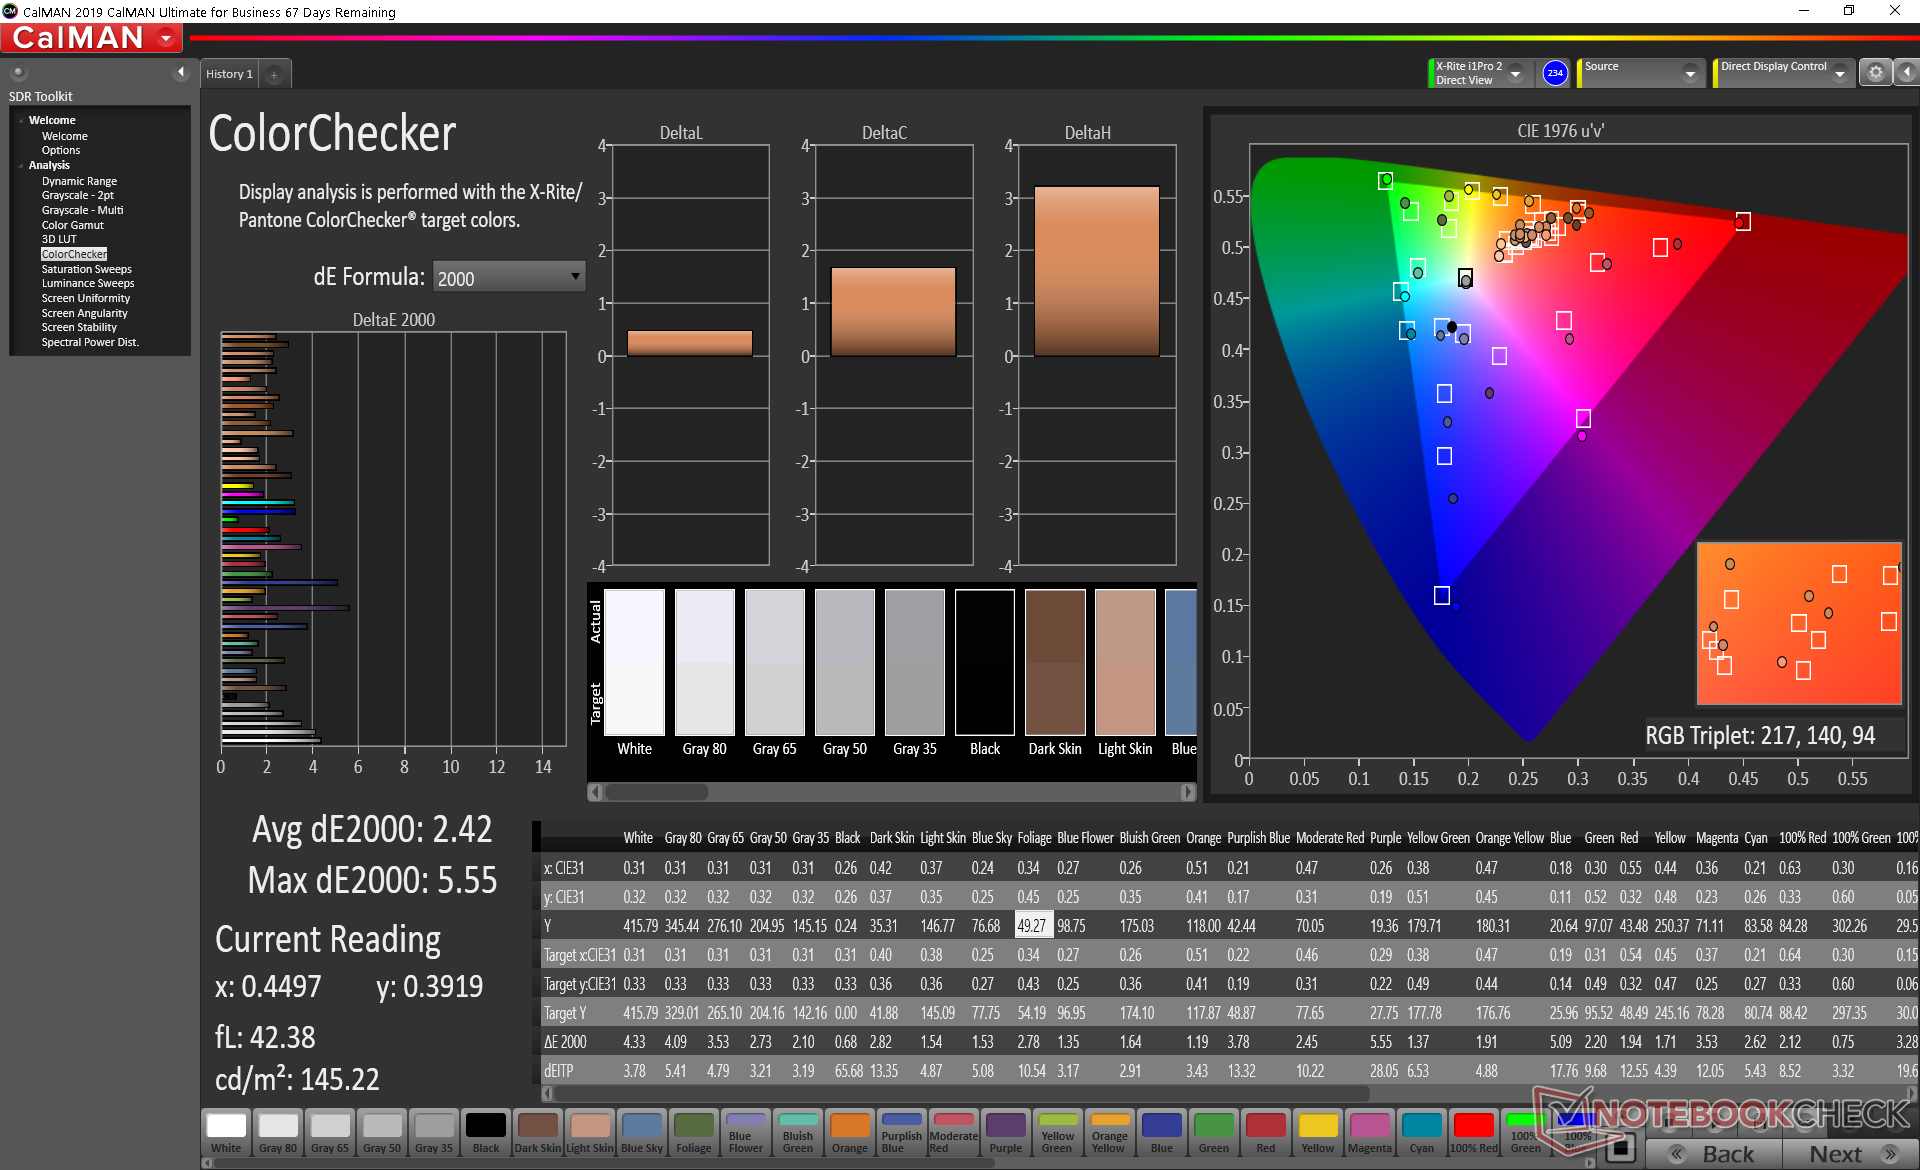
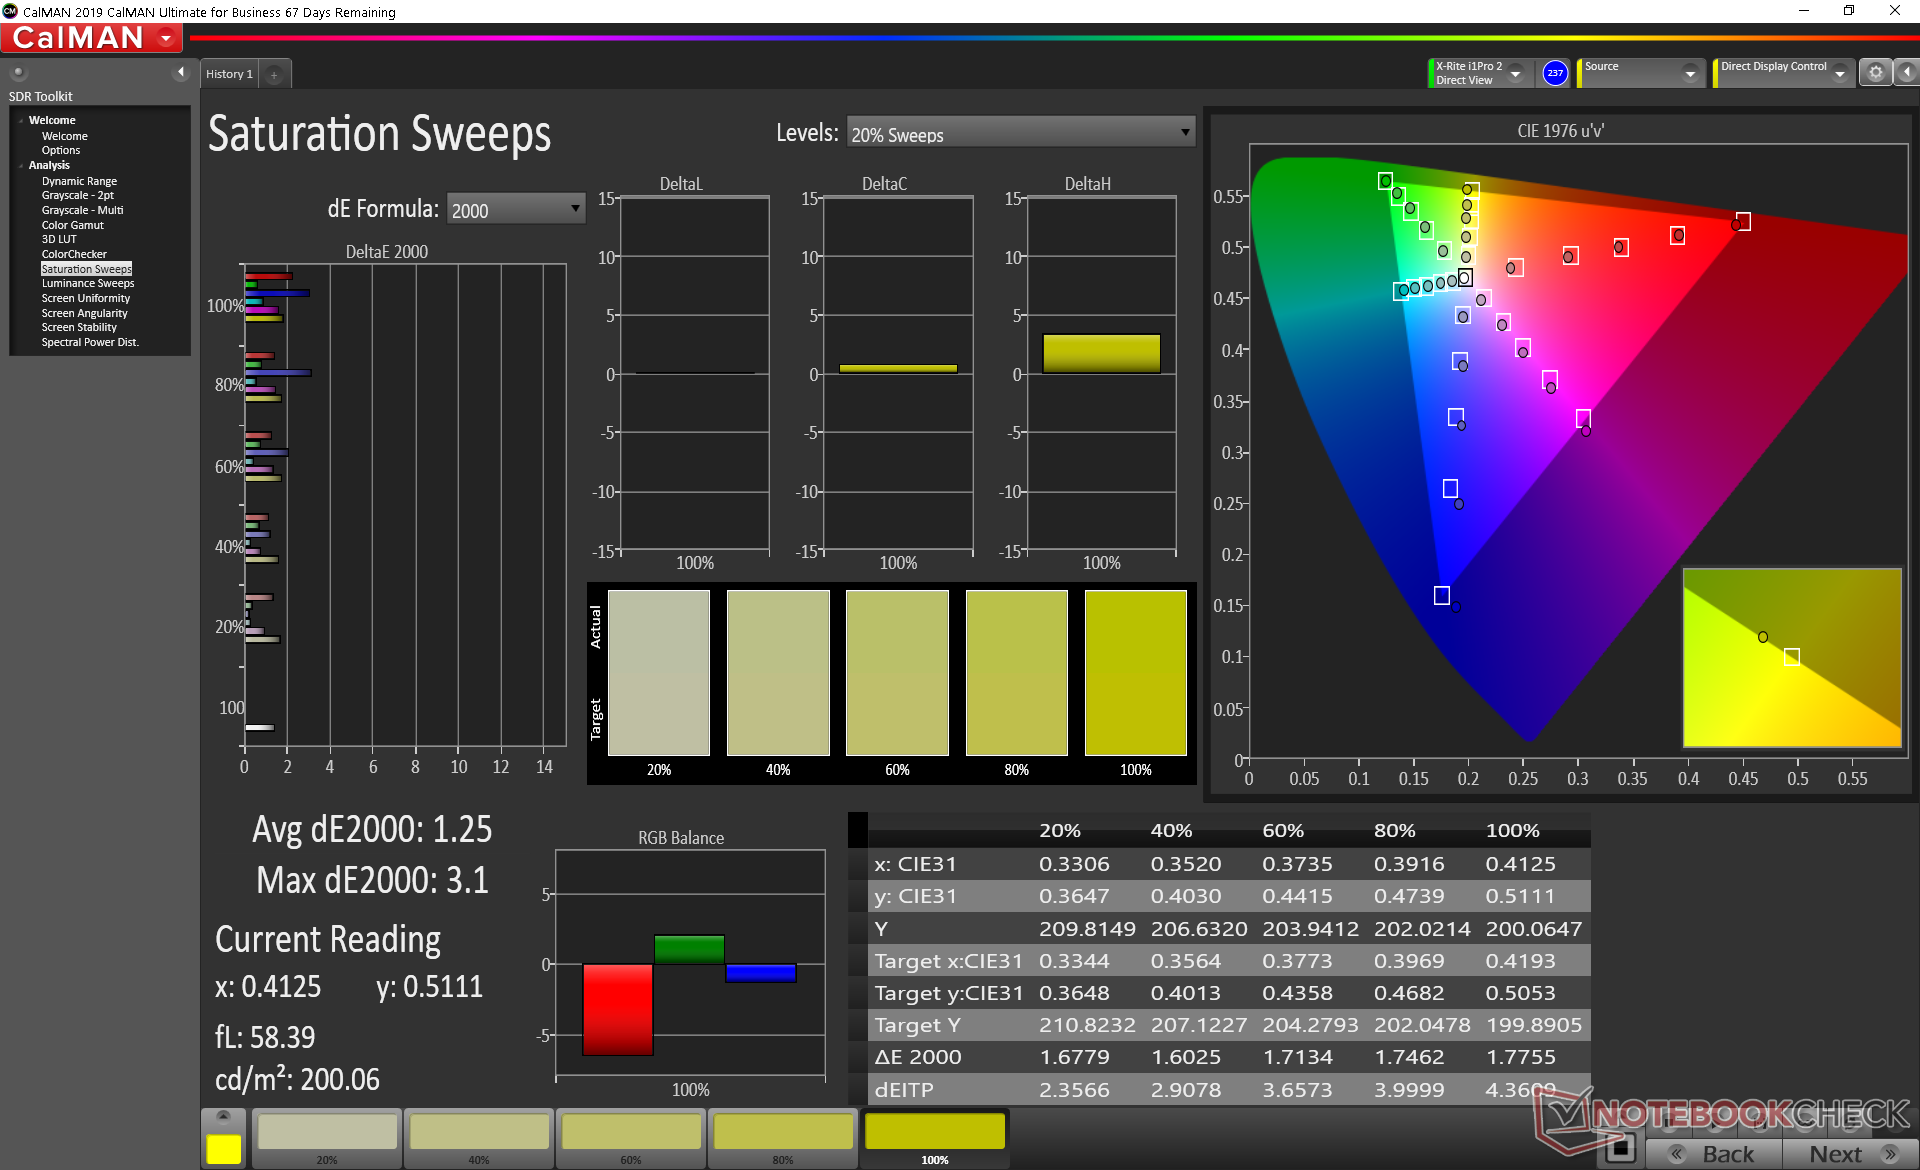
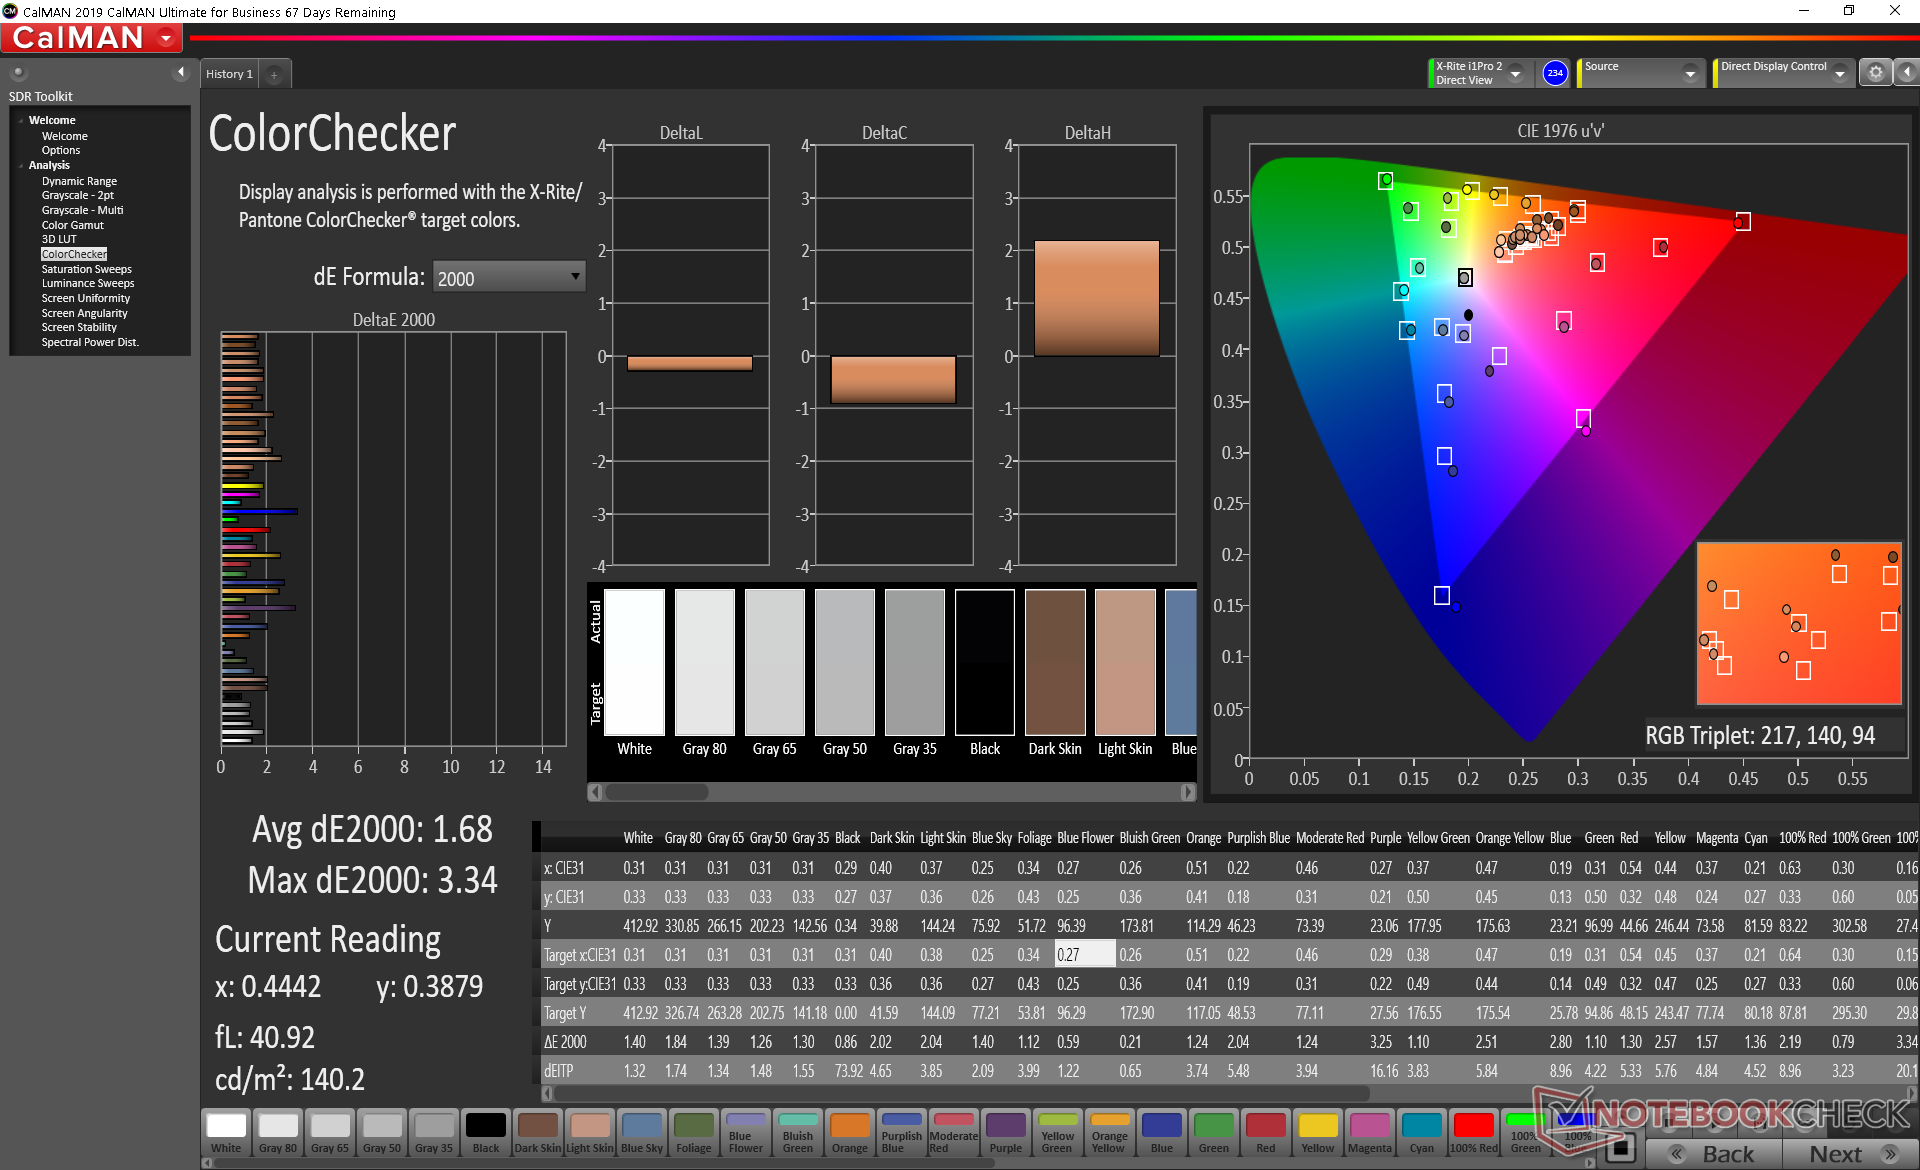
ΔE ColorChecker Calman: 2.42 | ∀{0.5-29.43 Ø4.73}
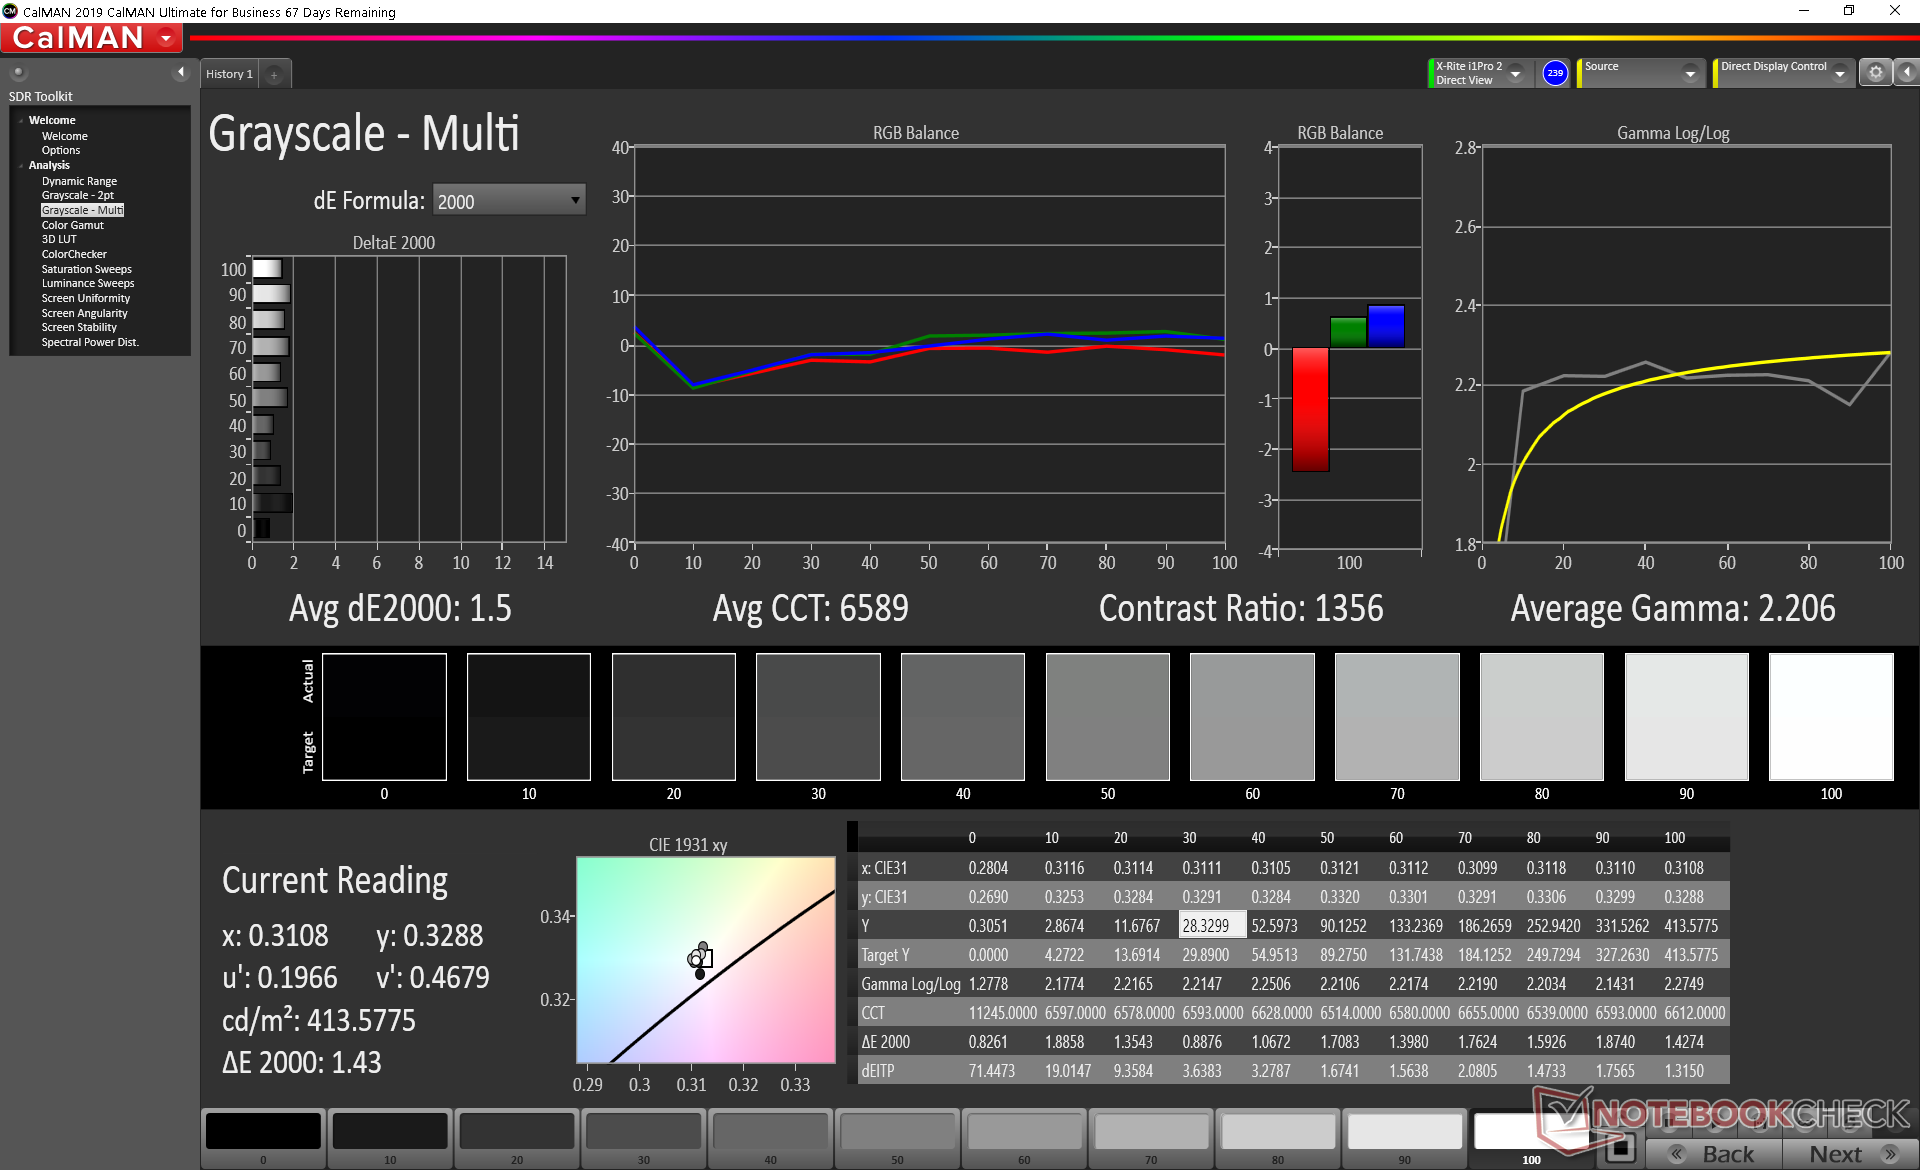
calibrated: 1.68
ΔE Greyscale Calman: 2.9 | ∀{0.09-98 Ø4.97}
94.2% sRGB (Argyll 1.6.3 3D)
60.2% AdobeRGB 1998 (Argyll 1.6.3 3D)
65.2% AdobeRGB 1998 (Argyll 3D)
94.5% sRGB (Argyll 3D)
64.2% Display P3 (Argyll 3D)
Gamma: 2.21
CCT: 6864 K
| LG Ultra 17U70N LG LP170WQ1-SPA1, IPS, 17", 2560x1600 | Dell XPS 17 9700 Core i7 RTX 2060 Max-Q Sharp LQ170R1, IPS, 17", 3840x2400 | LG Gram 17 17Z90N-V.AA77G LG Display LP170WQ1-SPA1, IPS, 17", 2560x1600 | Eluktronics RP-17 BOE NV173FHM-N44, IPS, 17.3", 1920x1080 | MSI Bravo 17 A4DDR AU Optronics B173HAN04.7 (AUO479D), IPS, 17.3", 1920x1080 | HP Envy 17t-cg000 AU Optronics AUO168E, IPS, 17.3", 3840x2160 | |
|---|---|---|---|---|---|---|
| Display | 33% | -2% | -0% | -36% | 31% | |
| Display P3 Coverage (%) | 64.2 | 90.5 41% | 62.9 -2% | 64.7 1% | 40.54 -37% | 86.2 34% |
| sRGB Coverage (%) | 94.5 | 100 6% | 92.7 -2% | 92 -3% | 60.1 -36% | 100 6% |
| AdobeRGB 1998 Coverage (%) | 65.2 | 99.8 53% | 63.6 -2% | 65.8 1% | 41.88 -36% | 99.8 53% |
| Response Times | -19% | 4% | 52% | -1% | -7% | |
| Response Time Grey 50% / Grey 80% * (ms) | 41.2 ? | 51.2 ? -24% | 43 ? -4% | 22.4 ? 46% | 40 ? 3% | 45.2 ? -10% |
| Response Time Black / White * (ms) | 28.4 ? | 32 ? -13% | 25 ? 12% | 12 ? 58% | 29.6 ? -4% | 29.6 ? -4% |
| PWM Frequency (Hz) | 943 | |||||
| Screen | -11% | -41% | -28% | -33% | -48% | |
| Brightness middle (cd/m²) | 415.4 | 539.4 30% | 393 -5% | 311.5 -25% | 264 -36% | 383.4 -8% |
| Brightness (cd/m²) | 385 | 494 28% | 354 -8% | 301 -22% | 244 -37% | 382 -1% |
| Brightness Distribution (%) | 88 | 84 -5% | 84 -5% | 91 3% | 88 0% | 86 -2% |
| Black Level * (cd/m²) | 0.24 | 0.32 -33% | 0.365 -52% | 0.31 -29% | 0.23 4% | 0.34 -42% |
| Contrast (:1) | 1731 | 1686 -3% | 1077 -38% | 1005 -42% | 1148 -34% | 1128 -35% |
| Colorchecker dE 2000 * | 2.42 | 4.12 -70% | 4.83 -100% | 4.13 -71% | 3.85 -59% | 6.24 -158% |
| Colorchecker dE 2000 max. * | 5.55 | 7.65 -38% | 11.6 -109% | 7.32 -32% | 9.13 -65% | 10.18 -83% |
| Colorchecker dE 2000 calibrated * | 1.68 | 3.91 -133% | 1.22 27% | 2.93 -74% | 3.4 -102% | 3.7 -120% |
| Greyscale dE 2000 * | 2.9 | 1.5 48% | 7.37 -154% | 3.3 -14% | 1.95 33% | 6.6 -128% |
| Gamma | 2.21 100% | 2.15 102% | 2.36 93% | 2.17 101% | 2.52 87% | 2.272 97% |
| CCT | 6864 95% | 6438 101% | 6668 97% | 7157 91% | 6371 102% | 5973 109% |
| Color Space (Percent of AdobeRGB 1998) (%) | 60.2 | 90.4 50% | 59 -2% | 59.5 -1% | 42 -30% | 88 46% |
| Color Space (Percent of sRGB) (%) | 94.2 | 100 6% | 93 -1% | 91.6 -3% | 60 -36% | 100 6% |
| Total Average (Program / Settings) | 1% /
-4% | -13% /
-28% | 8% /
-13% | -23% /
-30% | -8% /
-28% |
* ... smaller is better
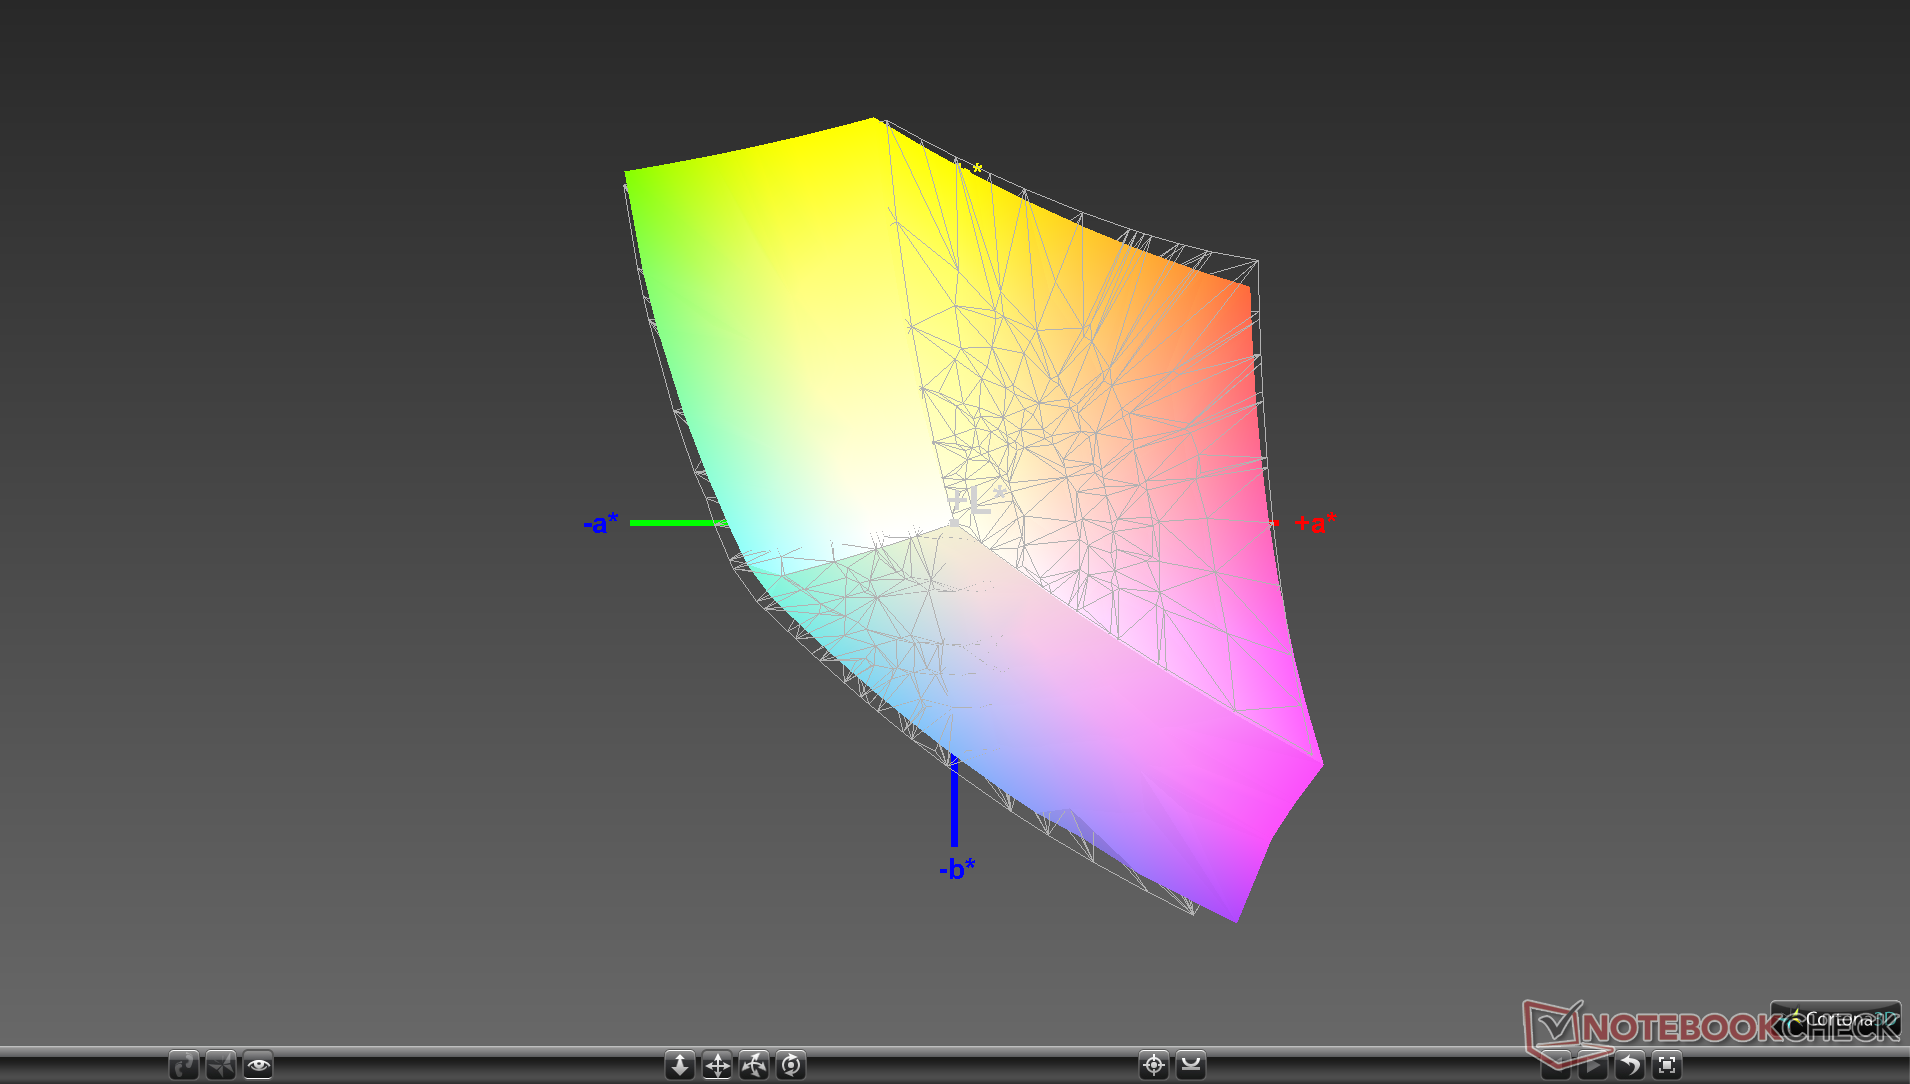
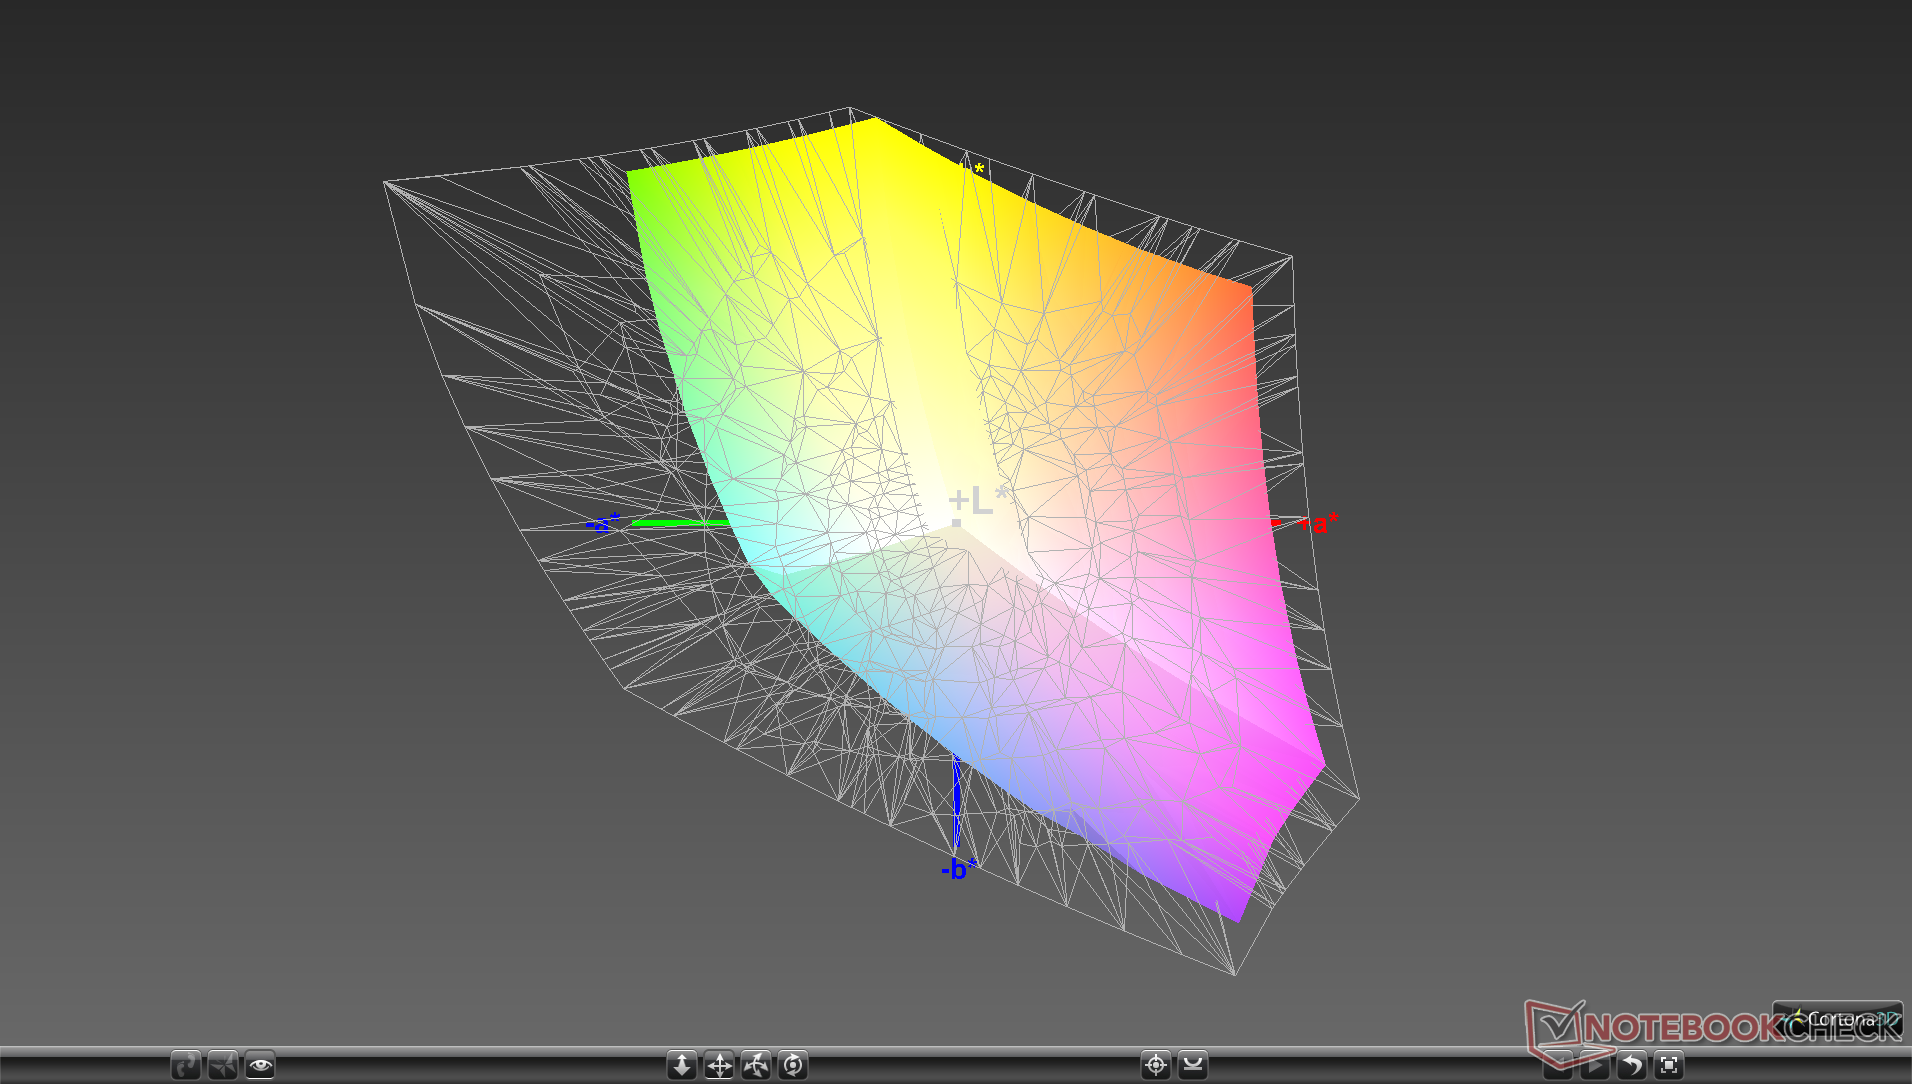
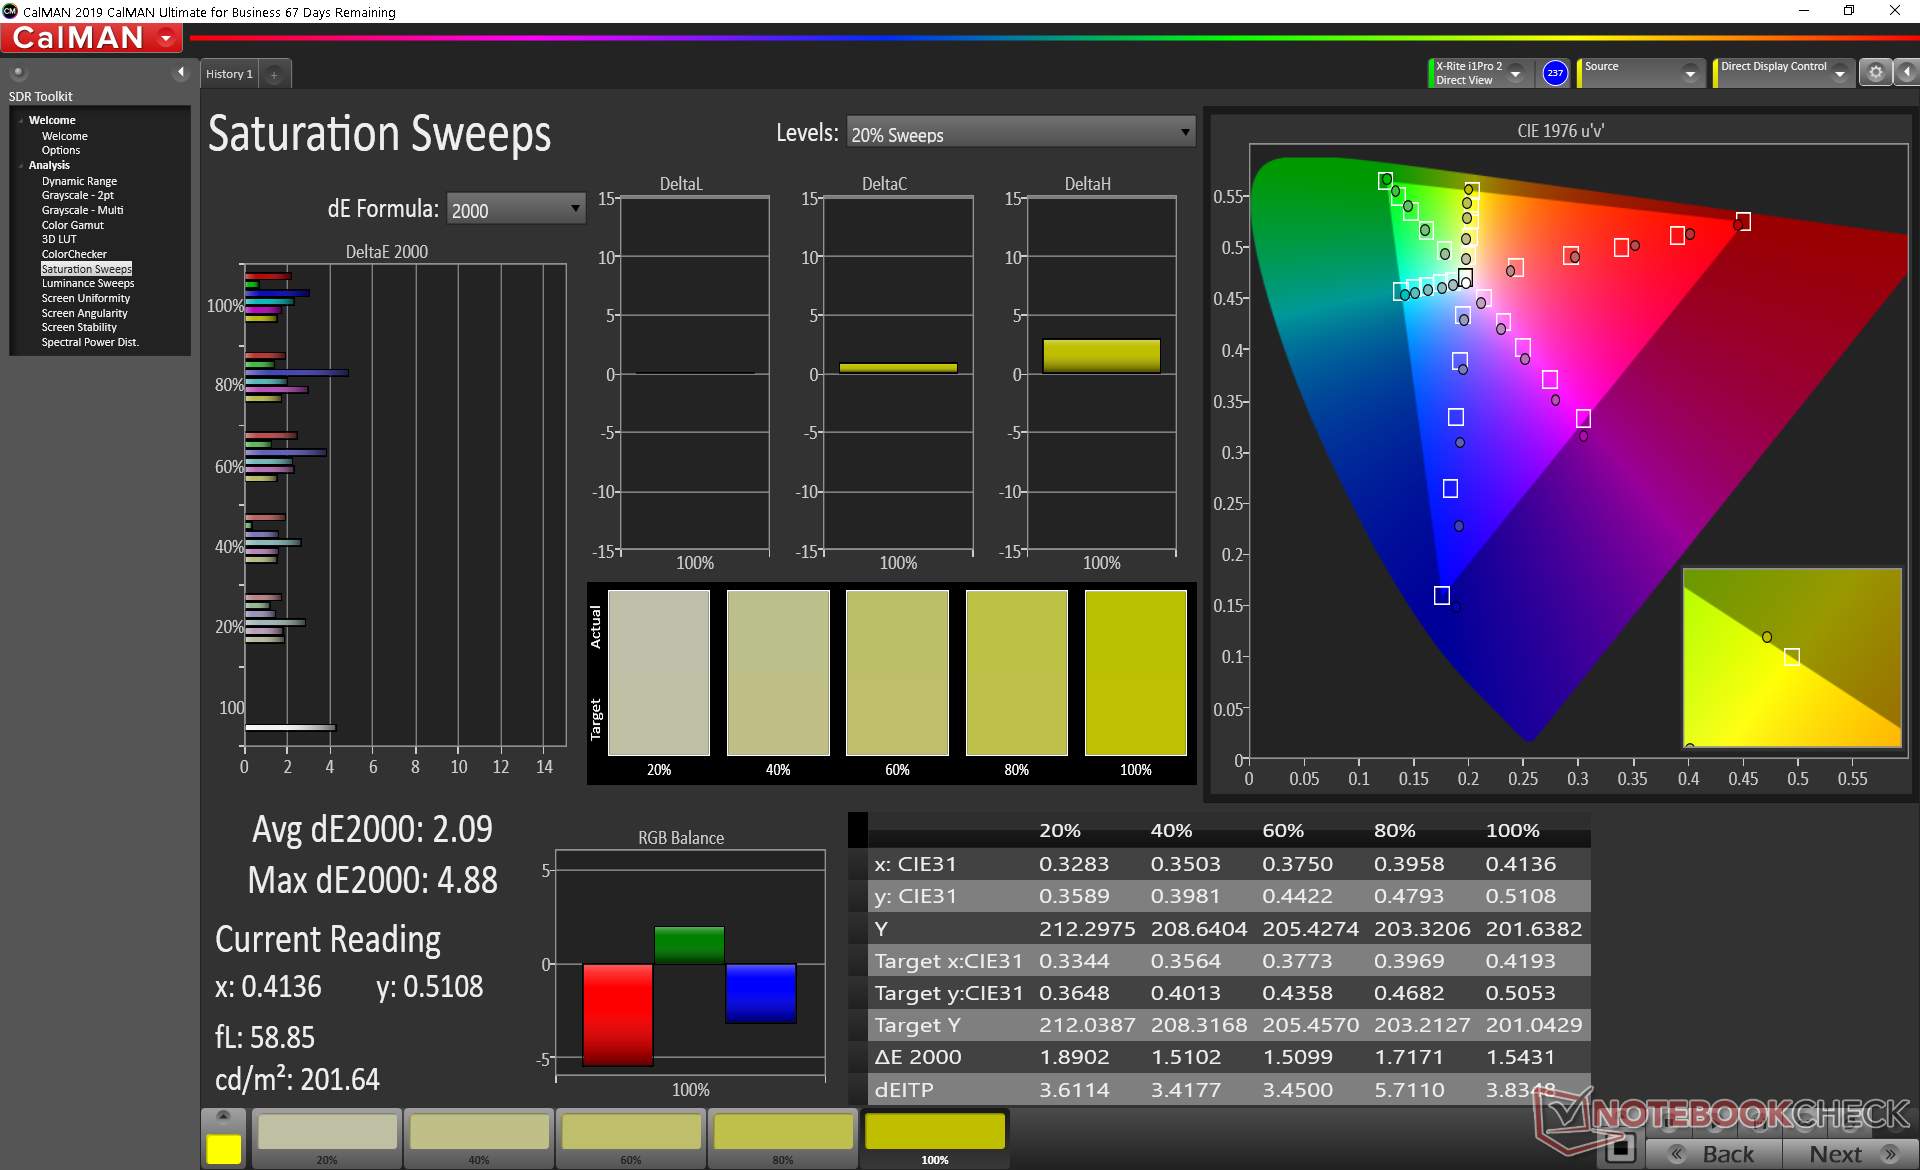
Color space covers approximately 95 percent of sRGB or 60 percent of AdobeRGB to be similar to most Ultrabooks. The Dell XPS 17 which offers >90 percent AdobeRGB options for even deeper colors that digital artists can appreciate.
X-Rite colorimeter measurements reveal the display to be better calibrated than the Gram 17 even though both are using the same 17-inch IPS panels. Average grayscale and ColorChecker deltaE values sit at just 2.9 and 2.42, respectively, with color temperature being slightly too cool. Calibrating the panel further ourselves addresses these concerns.
Display Response Times
| ↔ Response Time Black to White | ||
|---|---|---|
| 28.4 ms ... rise ↗ and fall ↘ combined | ↗ 16.4 ms rise | 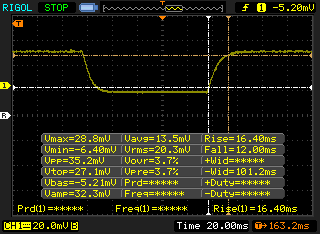 |
| ↘ 12 ms fall | ||
| The screen shows relatively slow response rates in our tests and may be too slow for gamers. In comparison, all tested devices range from 0.1 (minimum) to 240 (maximum) ms. » 75 % of all devices are better. This means that the measured response time is worse than the average of all tested devices (19.9 ms). | ||
| ↔ Response Time 50% Grey to 80% Grey | ||
| 41.2 ms ... rise ↗ and fall ↘ combined | ↗ 22.4 ms rise | 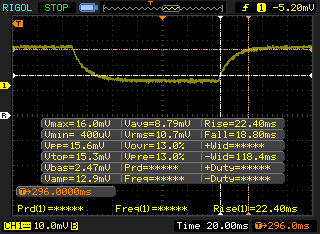 |
| ↘ 18.8 ms fall | ||
| The screen shows slow response rates in our tests and will be unsatisfactory for gamers. In comparison, all tested devices range from 0.165 (minimum) to 636 (maximum) ms. » 66 % of all devices are better. This means that the measured response time is worse than the average of all tested devices (31.1 ms). | ||
Screen Flickering / PWM (Pulse-Width Modulation)
| Screen flickering / PWM not detected | 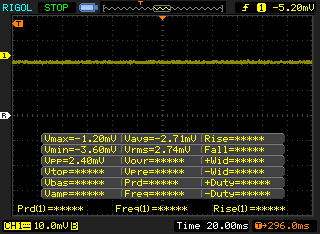 | ||
In comparison: 52 % of all tested devices do not use PWM to dim the display. If PWM was detected, an average of 7794 (minimum: 5 - maximum: 343500) Hz was measured. | |||
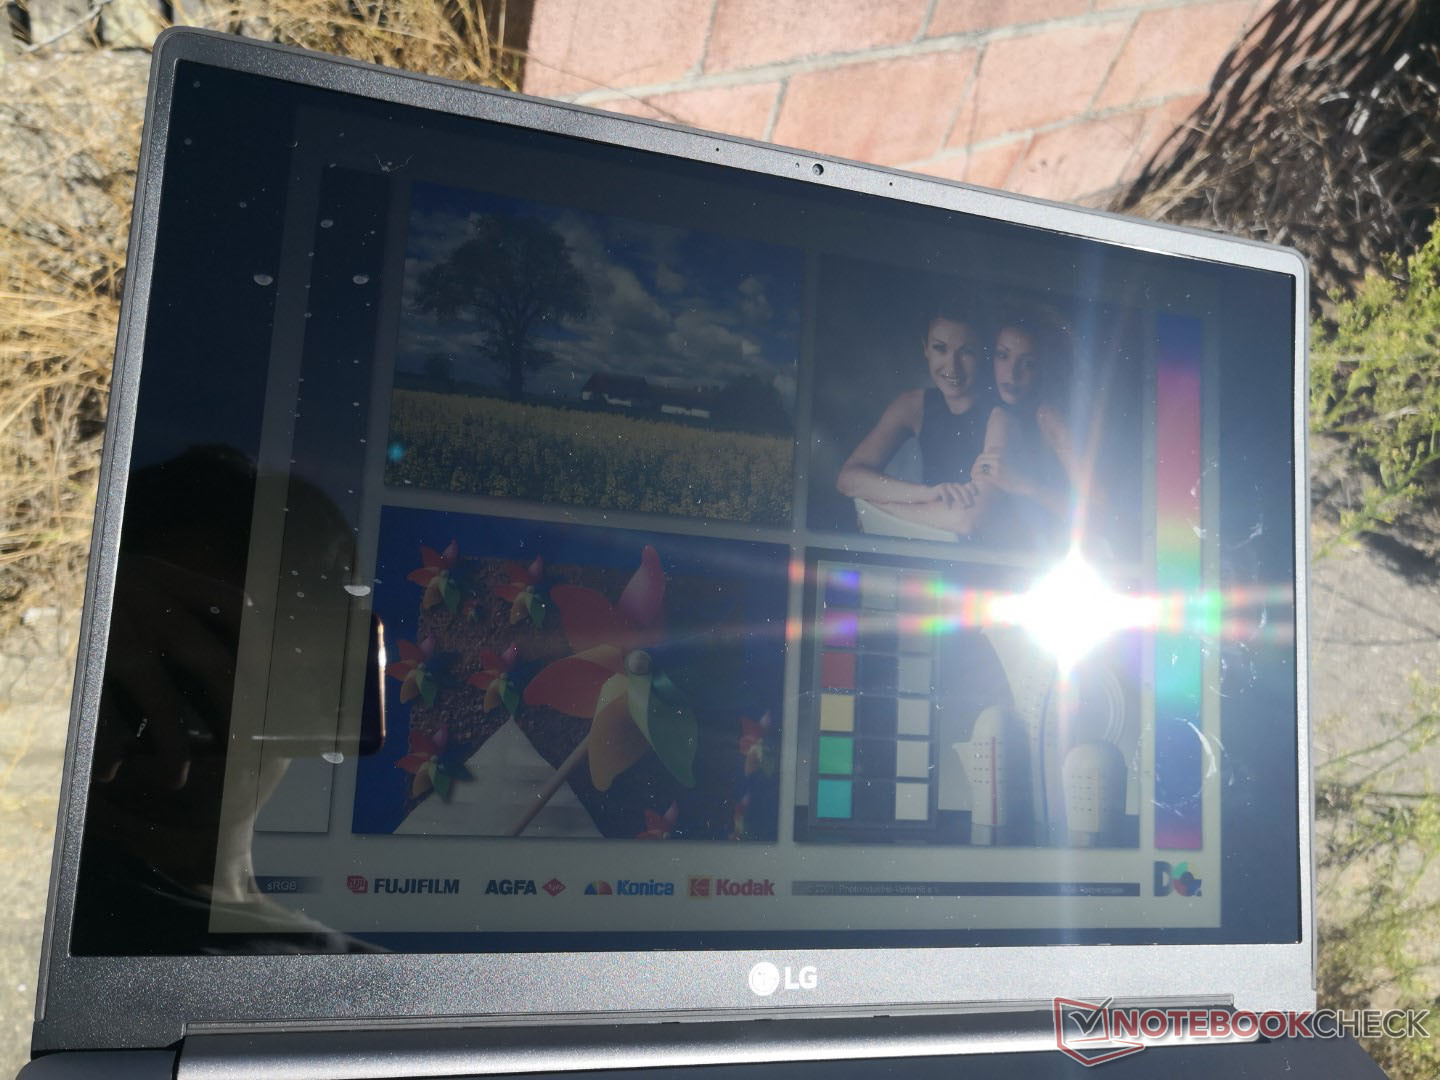
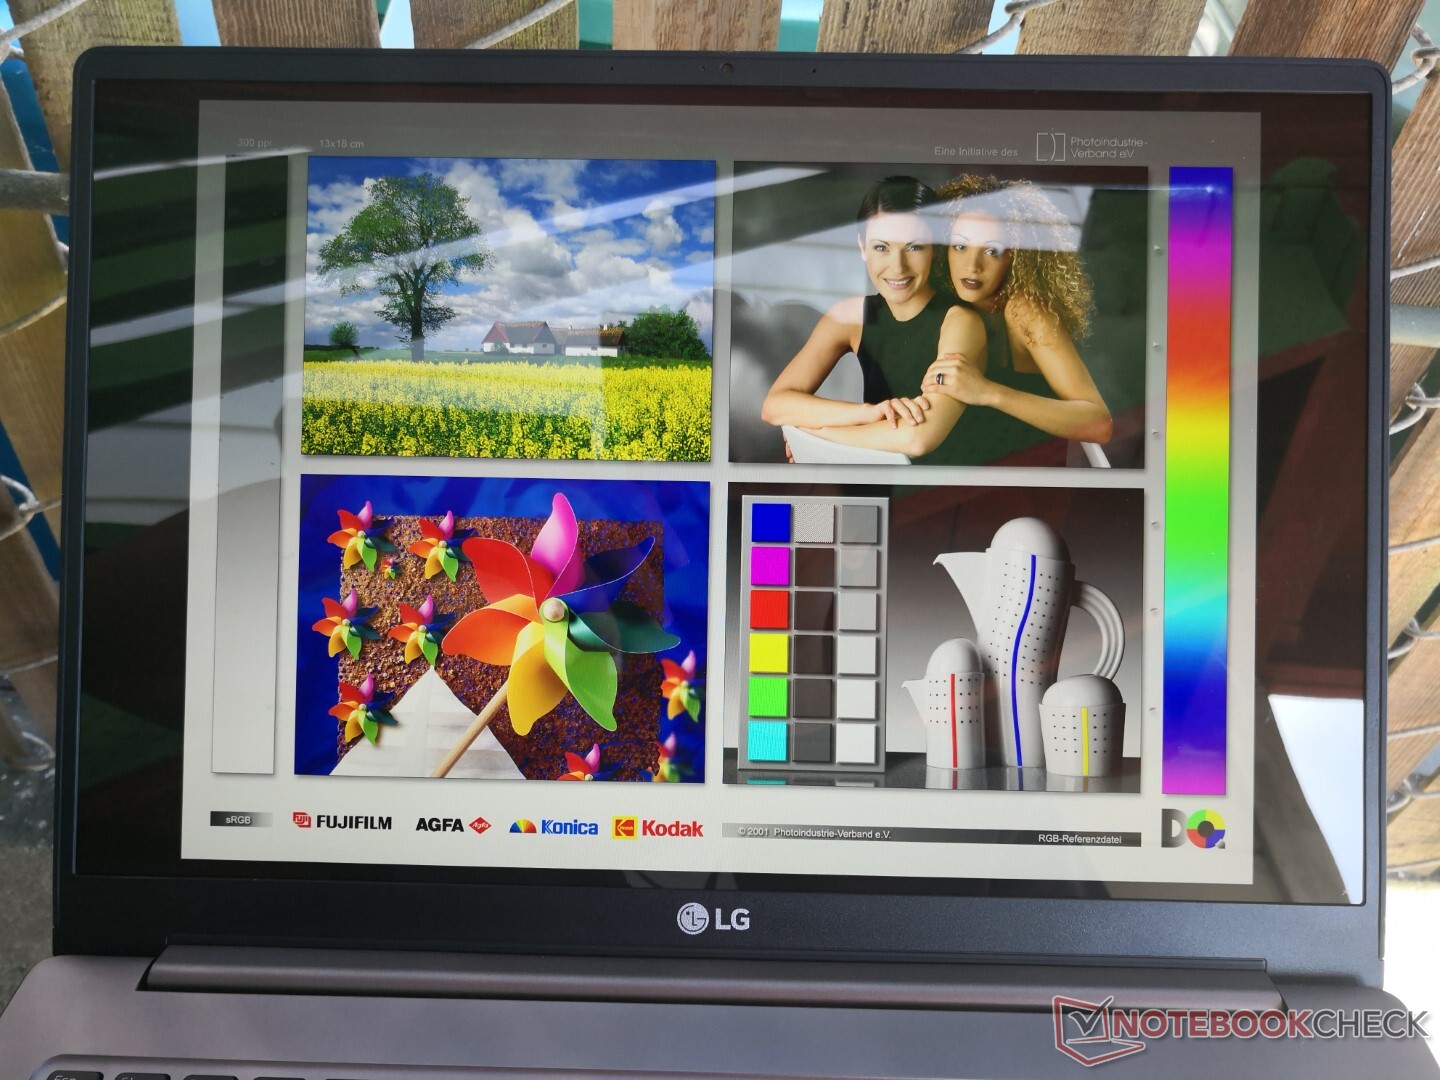
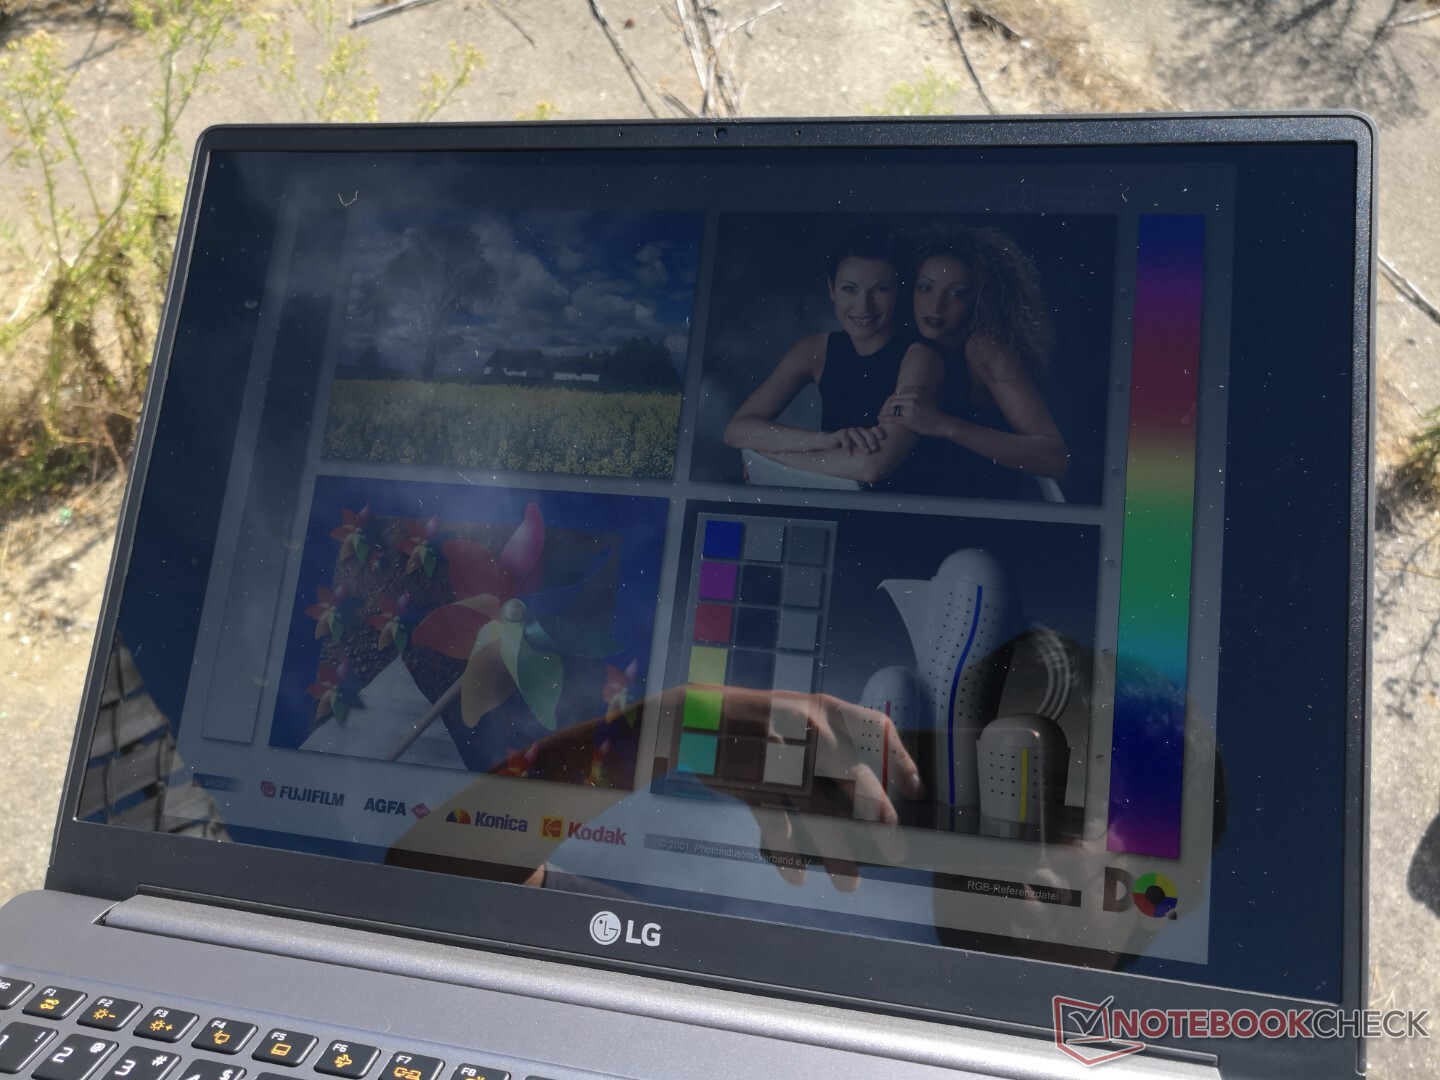
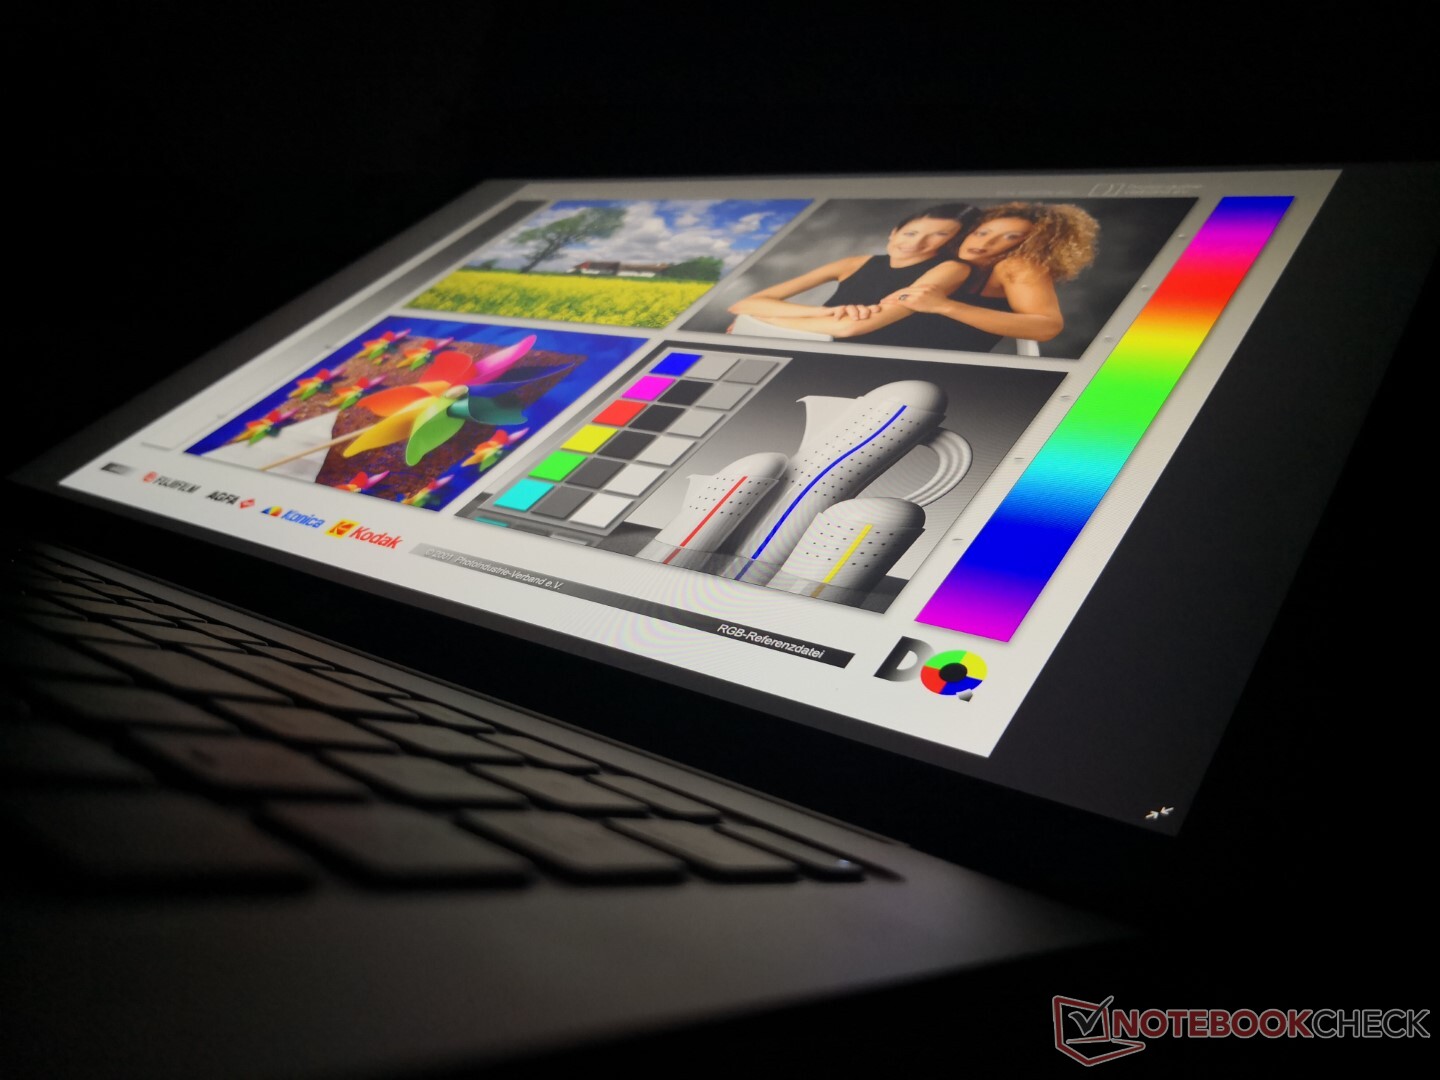
The display is just as bright as the Envy 17 but still dimmer than the XPS 17. Glare will almost always be present to some degree because of the glossy panel.
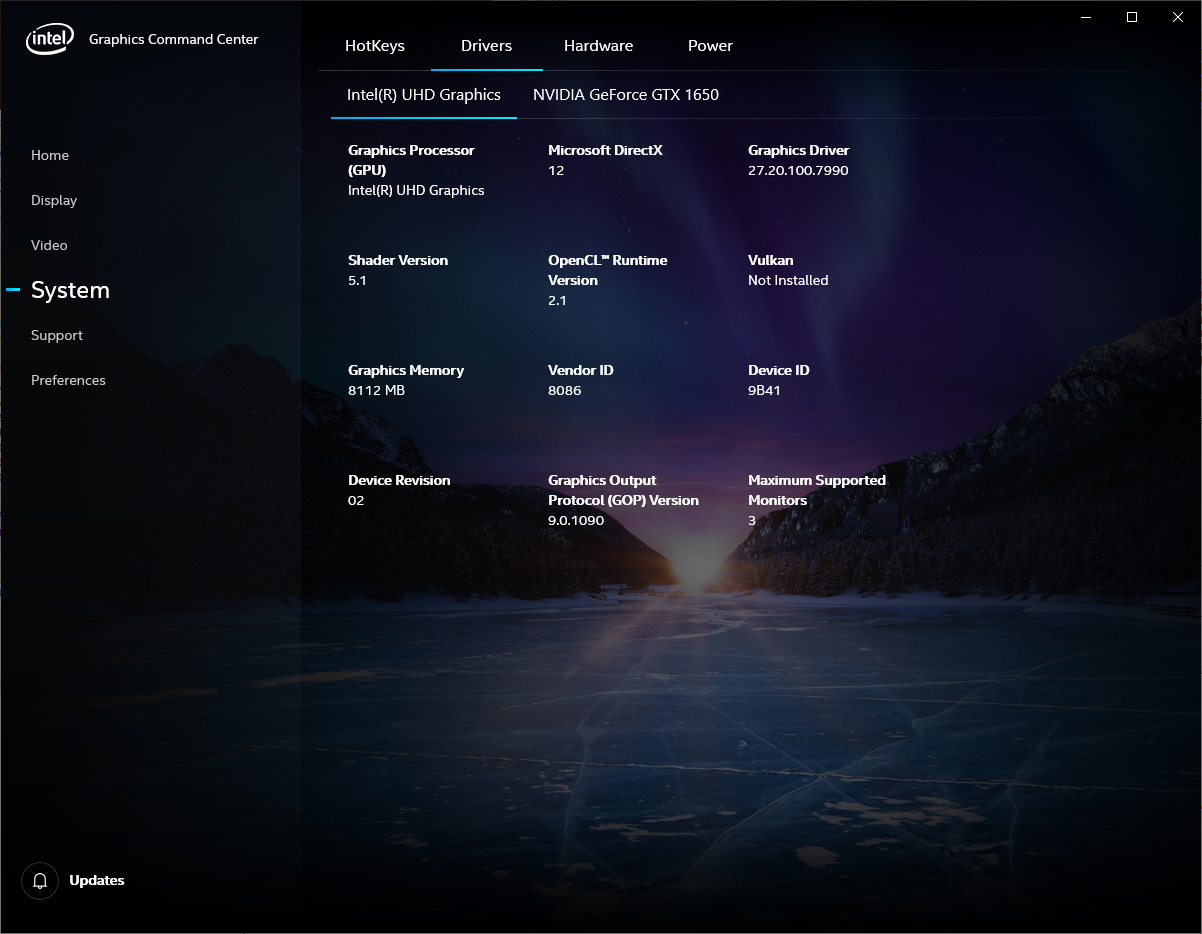
Maximum brightness automatically drops from 415 nits when on mains to 354 nits when on battery power. Changing settings on Intel Command Center or Nvidia Control Panel would have no effect.
Performance
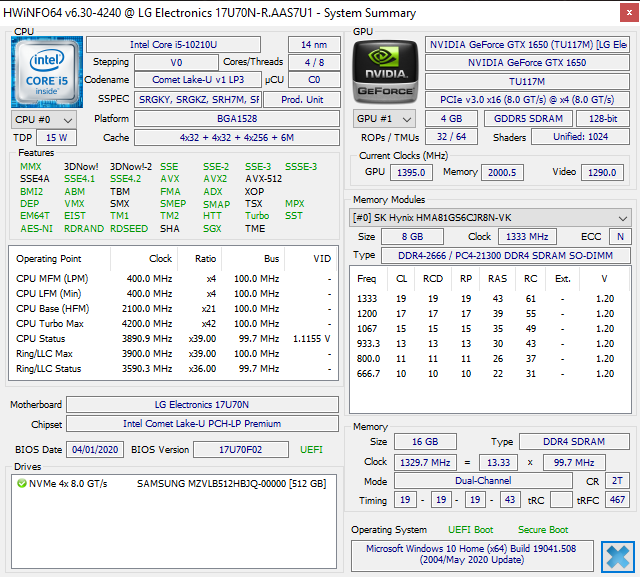
Unlike most other GeForce GTX-powered laptops, the Ultra 17 pairs a Core U-series CPU with a GeForce GTX GPU. Users can choose between the 10th gen Core i5-10210U or Core i7-10510U to run alongside the full-power (non-Max-Q) GTX 1650. Optimus is included for automatic graphics switching.
We had set the system to High Performance mode prior to running any performance tests below for the highest possible scores.
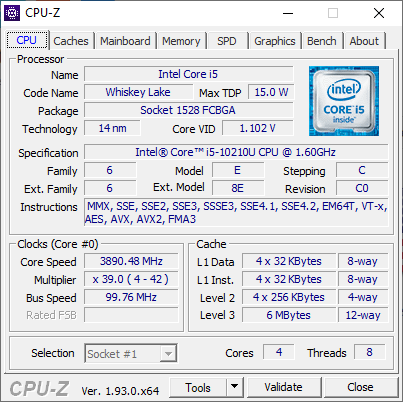
Processor
Raw CPU performance is disappointing much like what we observed on the Gram series. The Core i5-10210U in our Ultra 17 is 15 to 25 percent slower in multi-threaded workloads than the average laptop in our database equipped with the exact same processor. Poor Turbo Boost performance is to blame here which we will go into more detail in our Stress Test section below. We can't speak for the Core i7-10510U configuration, but it will likely perform below average as well based on our experience with other laptops from LG.
See our dedicated page on the Core i5-10210U for more technical information and benchmark comparisons.
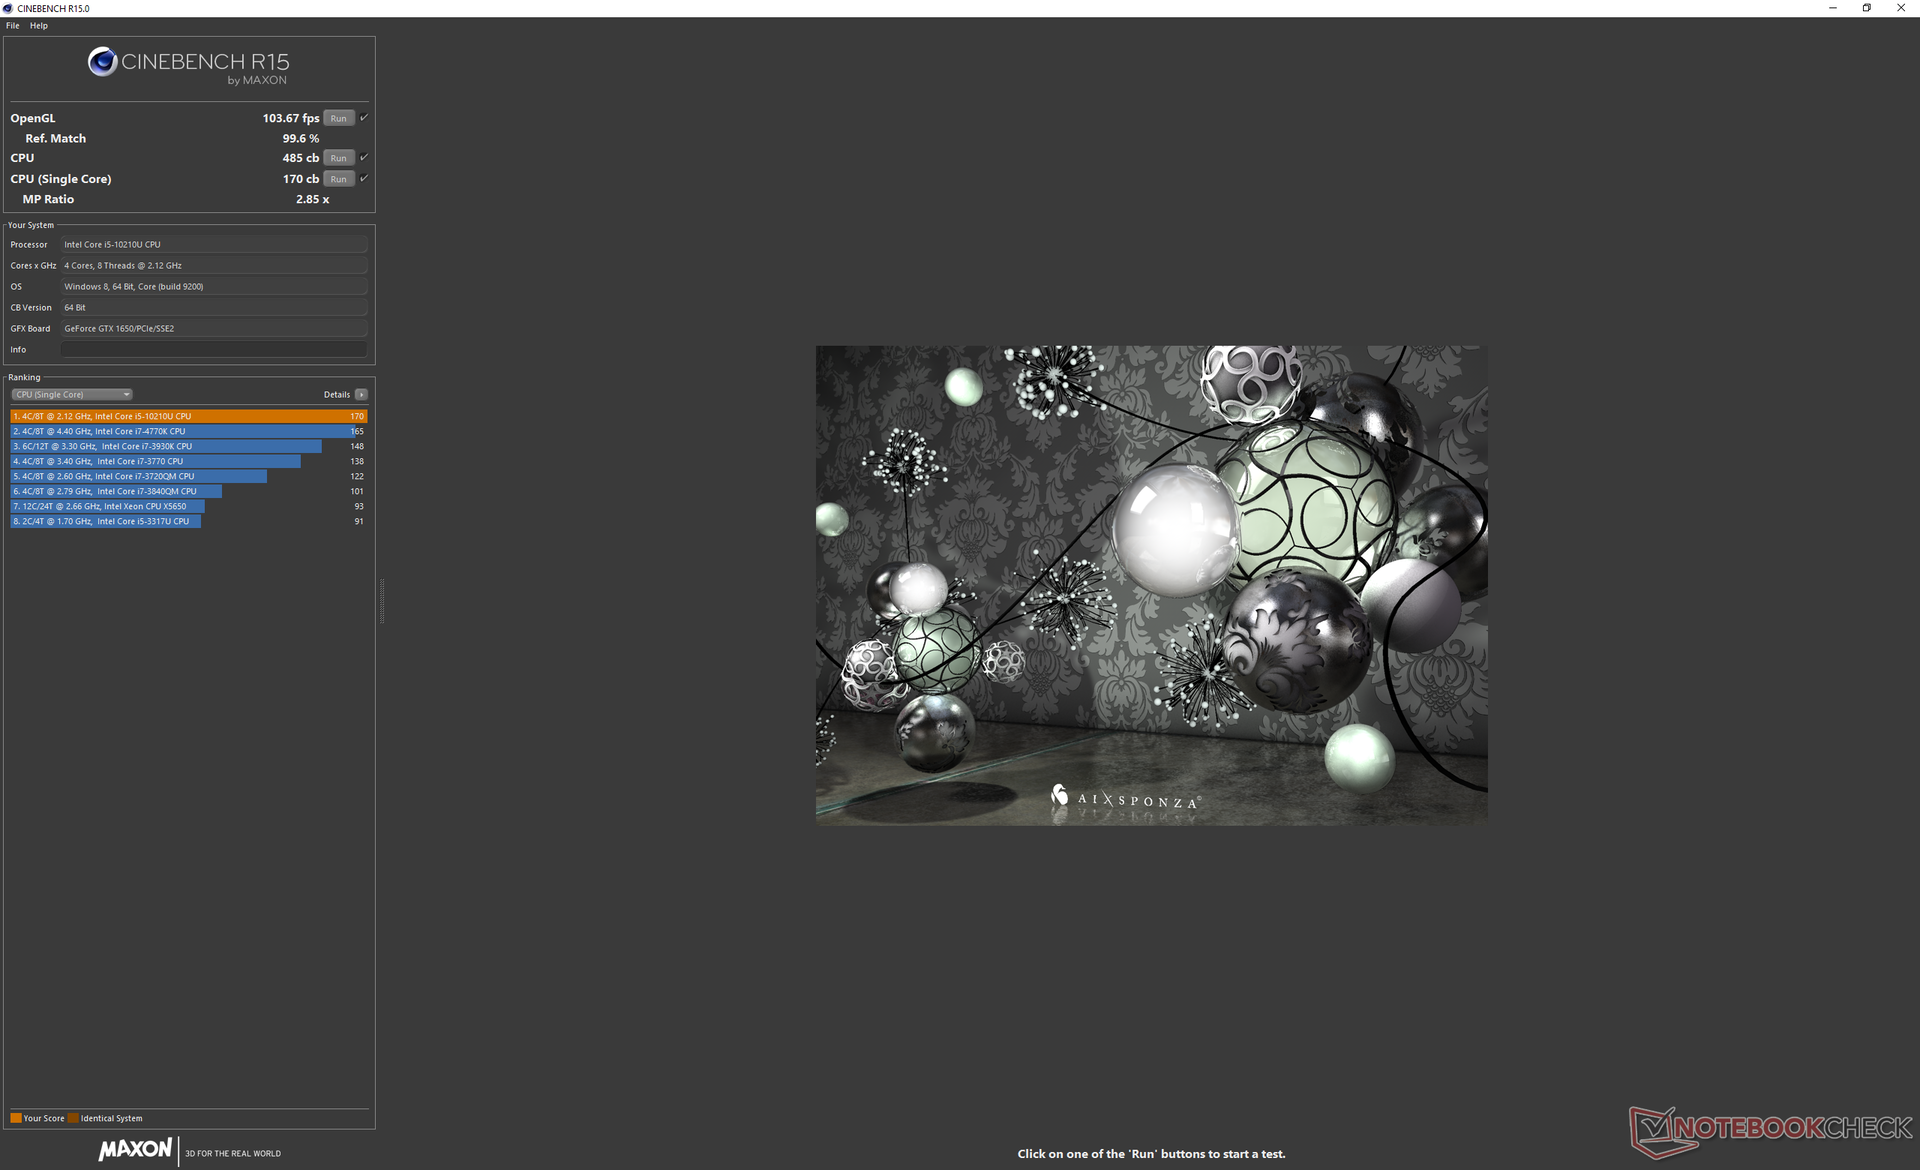
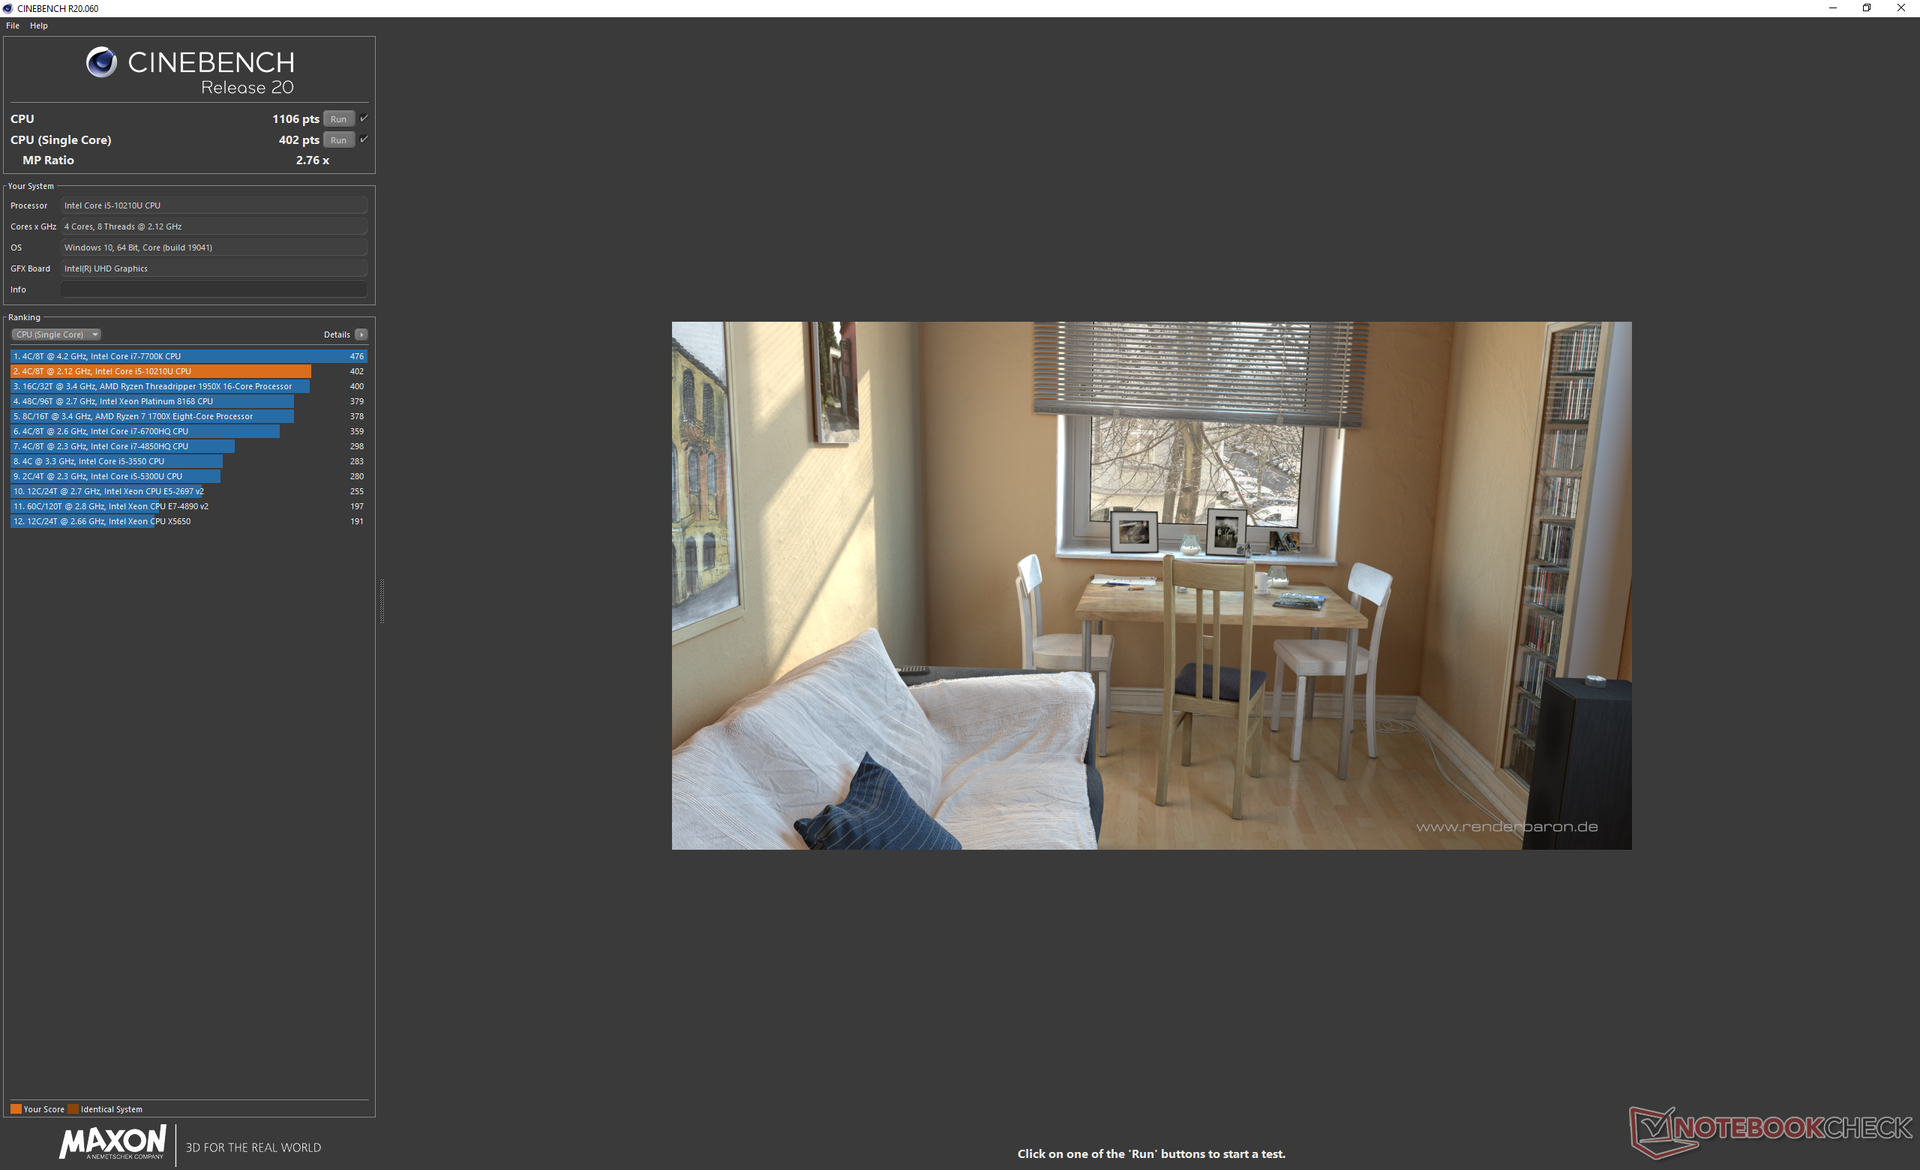
Cinebench R15: CPU Multi 64Bit | CPU Single 64Bit
Blender: v2.79 BMW27 CPU
7-Zip 18.03: 7z b 4 -mmt1 | 7z b 4
Geekbench 5.5: Single-Core | Multi-Core
HWBOT x265 Benchmark v2.2: 4k Preset
LibreOffice : 20 Documents To PDF
R Benchmark 2.5: Overall mean
| Cinebench R20 / CPU (Multi Core) | |
| Dell XPS 13 7390 Core i7-10710U | |
| Dell XPS 13 7390 2-in-1 Core i7 | |
| Lenovo IdeaPad 5 15IIL05 | |
| Asus ZenBook 15 UX534FT-DB77 | |
| Lenovo Ideapad C340-15IWL-81N5004QGE | |
| Average Intel Core i5-10210U (722 - 1820, n=30) | |
| Acer Aspire 3 A317-51G-72MD | |
| LG Ultra 17U70N | |
| LG Gram 17 17Z90N-V.AA77G | |
| Cinebench R20 / CPU (Single Core) | |
| Dell XPS 13 7390 2-in-1 Core i7 | |
| Dell XPS 13 7390 Core i7-10710U | |
| Asus ZenBook 15 UX534FT-DB77 | |
| Lenovo IdeaPad 5 15IIL05 | |
| Acer Aspire 3 A317-51G-72MD | |
| LG Gram 17 17Z90N-V.AA77G | |
| Average Intel Core i5-10210U (322 - 428, n=30) | |
| Lenovo Ideapad C340-15IWL-81N5004QGE | |
| LG Ultra 17U70N | |
| Cinebench R15 / CPU Multi 64Bit | |
| Dell XPS 13 7390 Core i7-10710U | |
| Dell XPS 13 7390 2-in-1 Core i7 | |
| Lenovo IdeaPad 5 15IIL05 | |
| Lenovo Ideapad C340-15IWL-81N5004QGE | |
| Asus ZenBook 15 UX534FT-DB77 | |
| Average Intel Core i5-10210U (320 - 790, n=35) | |
| LG Gram 17 17Z90N-V.AA77G | |
| Acer Aspire 3 A317-51G-72MD | |
| LG Ultra 17U70N | |
| Cinebench R15 / CPU Single 64Bit | |
| Asus ZenBook 15 UX534FT-DB77 | |
| Dell XPS 13 7390 Core i7-10710U | |
| Dell XPS 13 7390 2-in-1 Core i7 | |
| Lenovo IdeaPad 5 15IIL05 | |
| Acer Aspire 3 A317-51G-72MD | |
| Average Intel Core i5-10210U (134 - 174, n=35) | |
| LG Ultra 17U70N | |
| LG Gram 17 17Z90N-V.AA77G | |
| Lenovo Ideapad C340-15IWL-81N5004QGE | |
| Blender / v2.79 BMW27 CPU | |
| LG Gram 17 17Z90N-V.AA77G | |
| LG Ultra 17U70N | |
| Acer Aspire 3 A317-51G-72MD | |
| Average Intel Core i5-10210U (585 - 1339, n=24) | |
| Dell XPS 13 7390 2-in-1 Core i7 | |
| Lenovo IdeaPad 5 15IIL05 | |
| Dell XPS 13 7390 Core i7-10710U | |
| 7-Zip 18.03 / 7z b 4 -mmt1 | |
| Acer Aspire 3 A317-51G-72MD | |
| Dell XPS 13 7390 2-in-1 Core i7 | |
| Dell XPS 13 7390 Core i7-10710U | |
| Lenovo IdeaPad 5 15IIL05 | |
| Average Intel Core i5-10210U (3504 - 4467, n=24) | |
| LG Gram 17 17Z90N-V.AA77G | |
| LG Ultra 17U70N | |
| 7-Zip 18.03 / 7z b 4 | |
| Dell XPS 13 7390 Core i7-10710U | |
| Dell XPS 13 7390 2-in-1 Core i7 | |
| Lenovo IdeaPad 5 15IIL05 | |
| Average Intel Core i5-10210U (10920 - 21679, n=24) | |
| Acer Aspire 3 A317-51G-72MD | |
| LG Ultra 17U70N | |
| LG Gram 17 17Z90N-V.AA77G | |
| Geekbench 5.5 / Single-Core | |
| LG Gram 17 17Z90N-V.AA77G | |
| Lenovo IdeaPad 5 15IIL05 | |
| Acer Aspire 3 A317-51G-72MD | |
| Average Intel Core i5-10210U (949 - 1133, n=27) | |
| LG Ultra 17U70N | |
| Geekbench 5.5 / Multi-Core | |
| Lenovo IdeaPad 5 15IIL05 | |
| LG Gram 17 17Z90N-V.AA77G | |
| LG Ultra 17U70N | |
| Average Intel Core i5-10210U (2079 - 4256, n=27) | |
| Acer Aspire 3 A317-51G-72MD | |
| HWBOT x265 Benchmark v2.2 / 4k Preset | |
| Lenovo IdeaPad 5 15IIL05 | |
| Dell XPS 13 7390 2-in-1 Core i7 | |
| Dell XPS 13 7390 Core i7-10710U | |
| Average Intel Core i5-10210U (2.36 - 6.28, n=24) | |
| Acer Aspire 3 A317-51G-72MD | |
| LG Ultra 17U70N | |
| LG Gram 17 17Z90N-V.AA77G | |
| LibreOffice / 20 Documents To PDF | |
| Average Intel Core i5-10210U (49.6 - 80.3, n=18) | |
| Acer Aspire 3 A317-51G-72MD | |
| LG Gram 17 17Z90N-V.AA77G | |
| Lenovo IdeaPad 5 15IIL05 | |
| LG Ultra 17U70N | |
| R Benchmark 2.5 / Overall mean | |
| LG Gram 17 17Z90N-V.AA77G | |
| Average Intel Core i5-10210U (0.658 - 0.901, n=24) | |
| Lenovo IdeaPad 5 15IIL05 | |
| LG Ultra 17U70N | |
| Acer Aspire 3 A317-51G-72MD | |
* ... smaller is better
System Performance
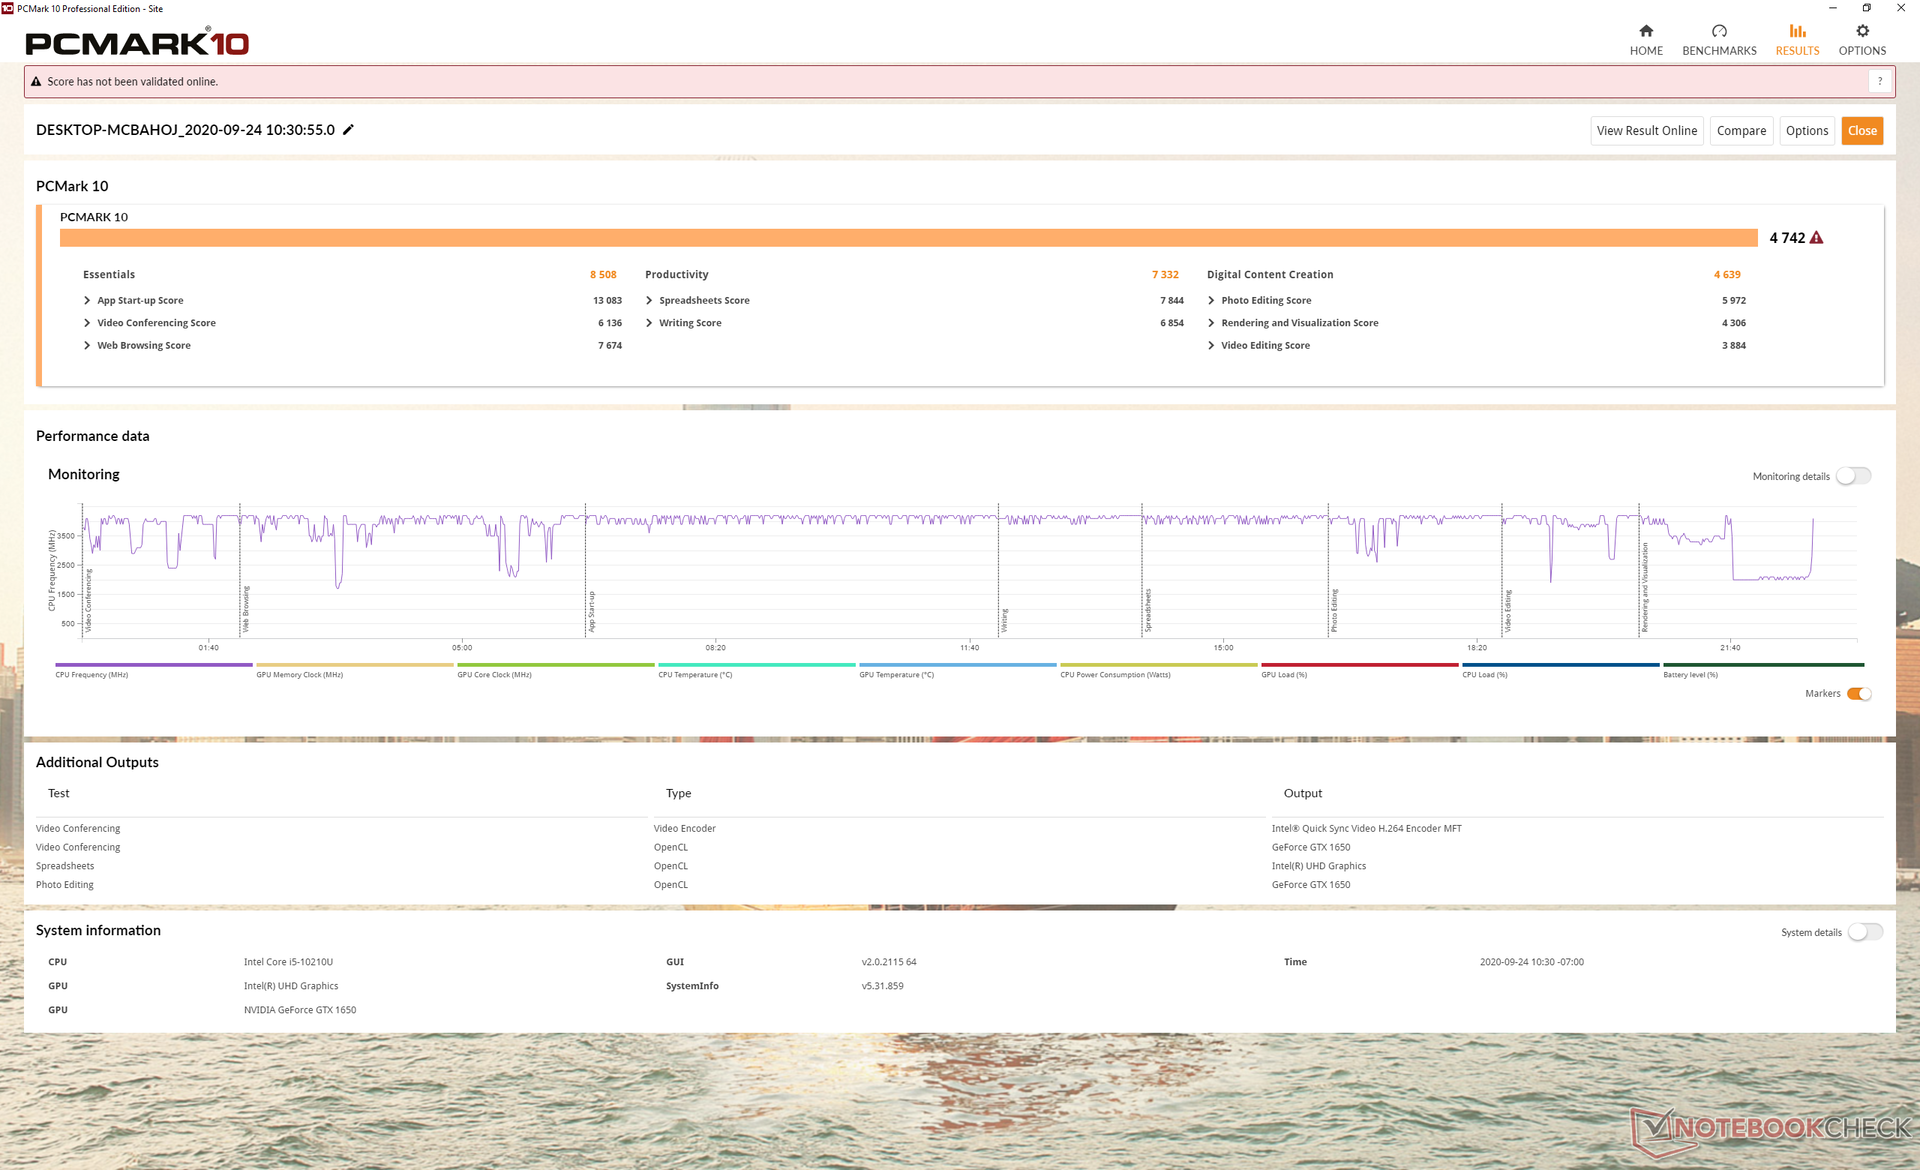
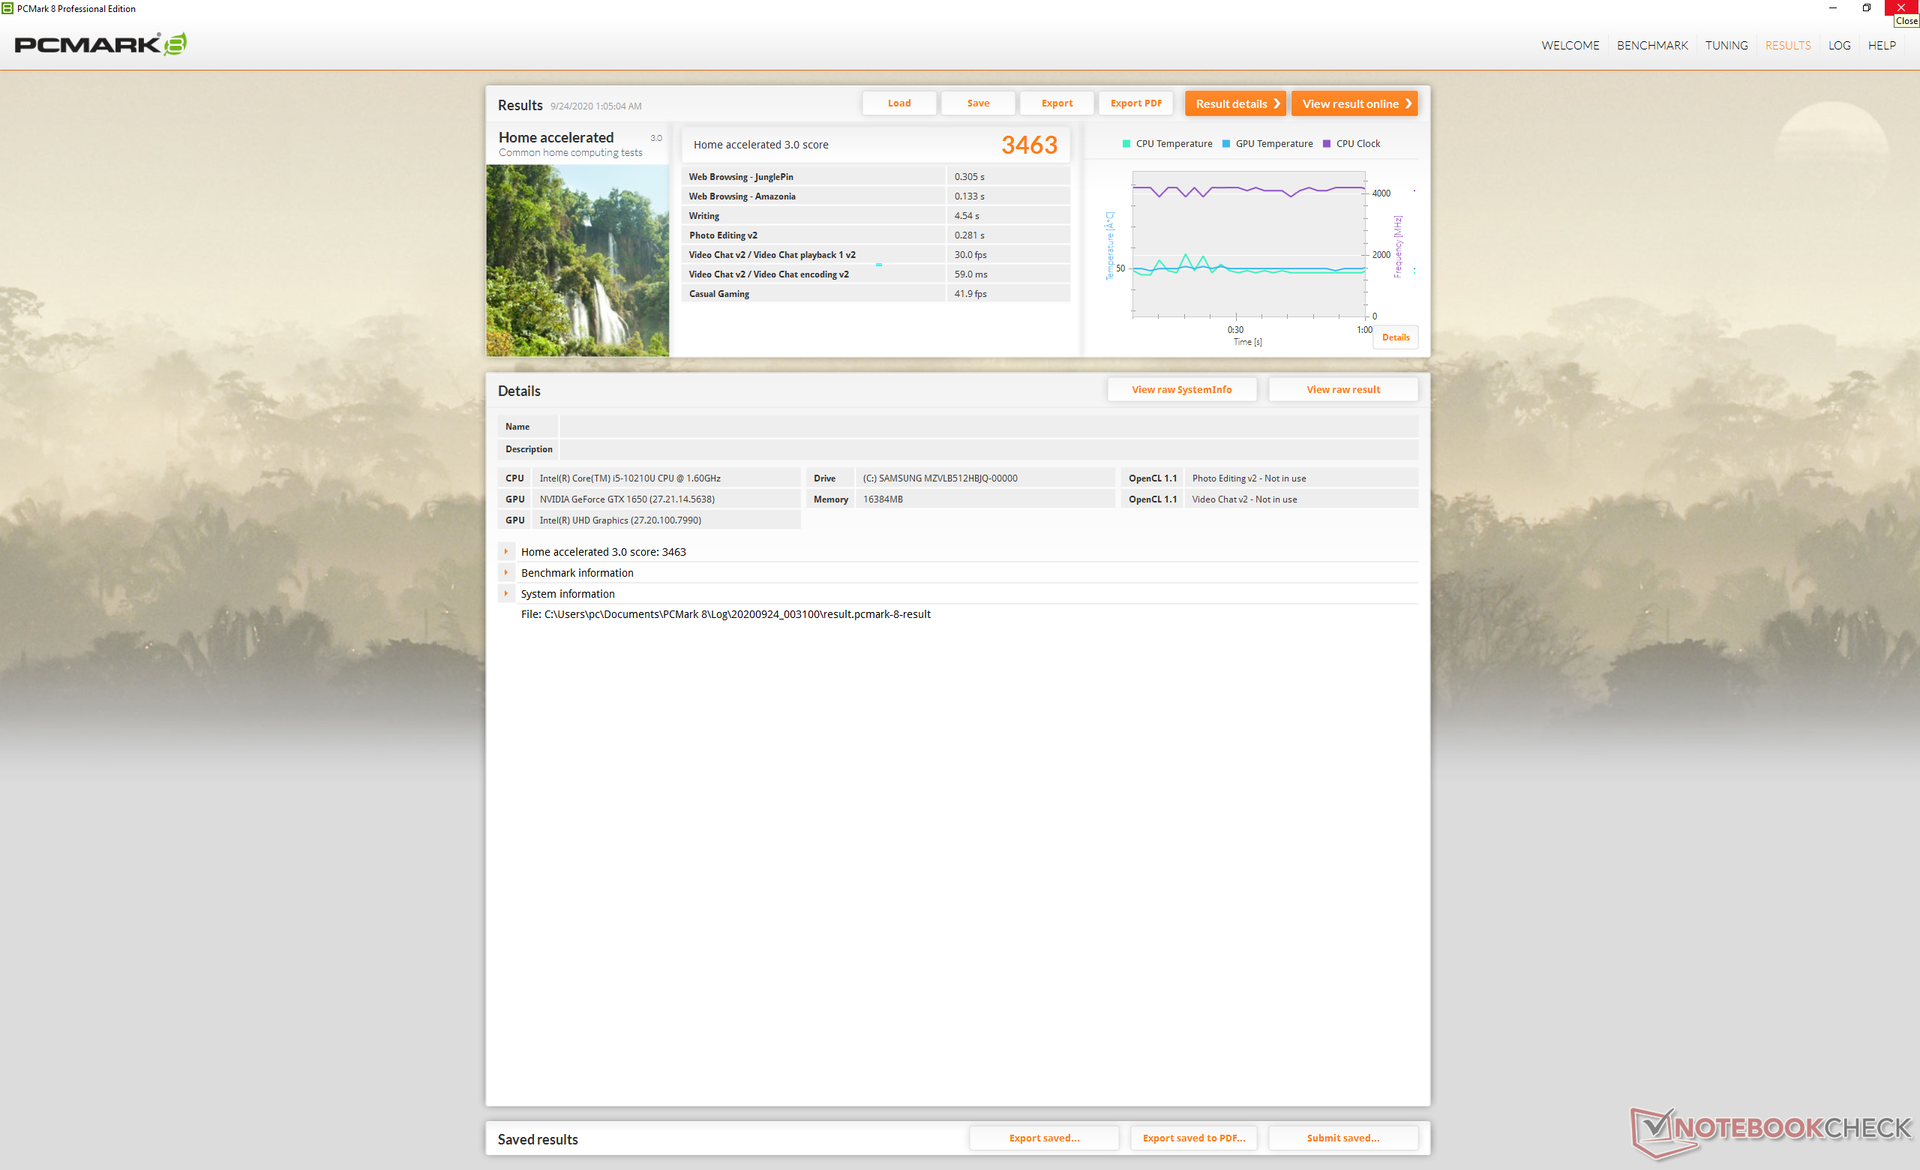
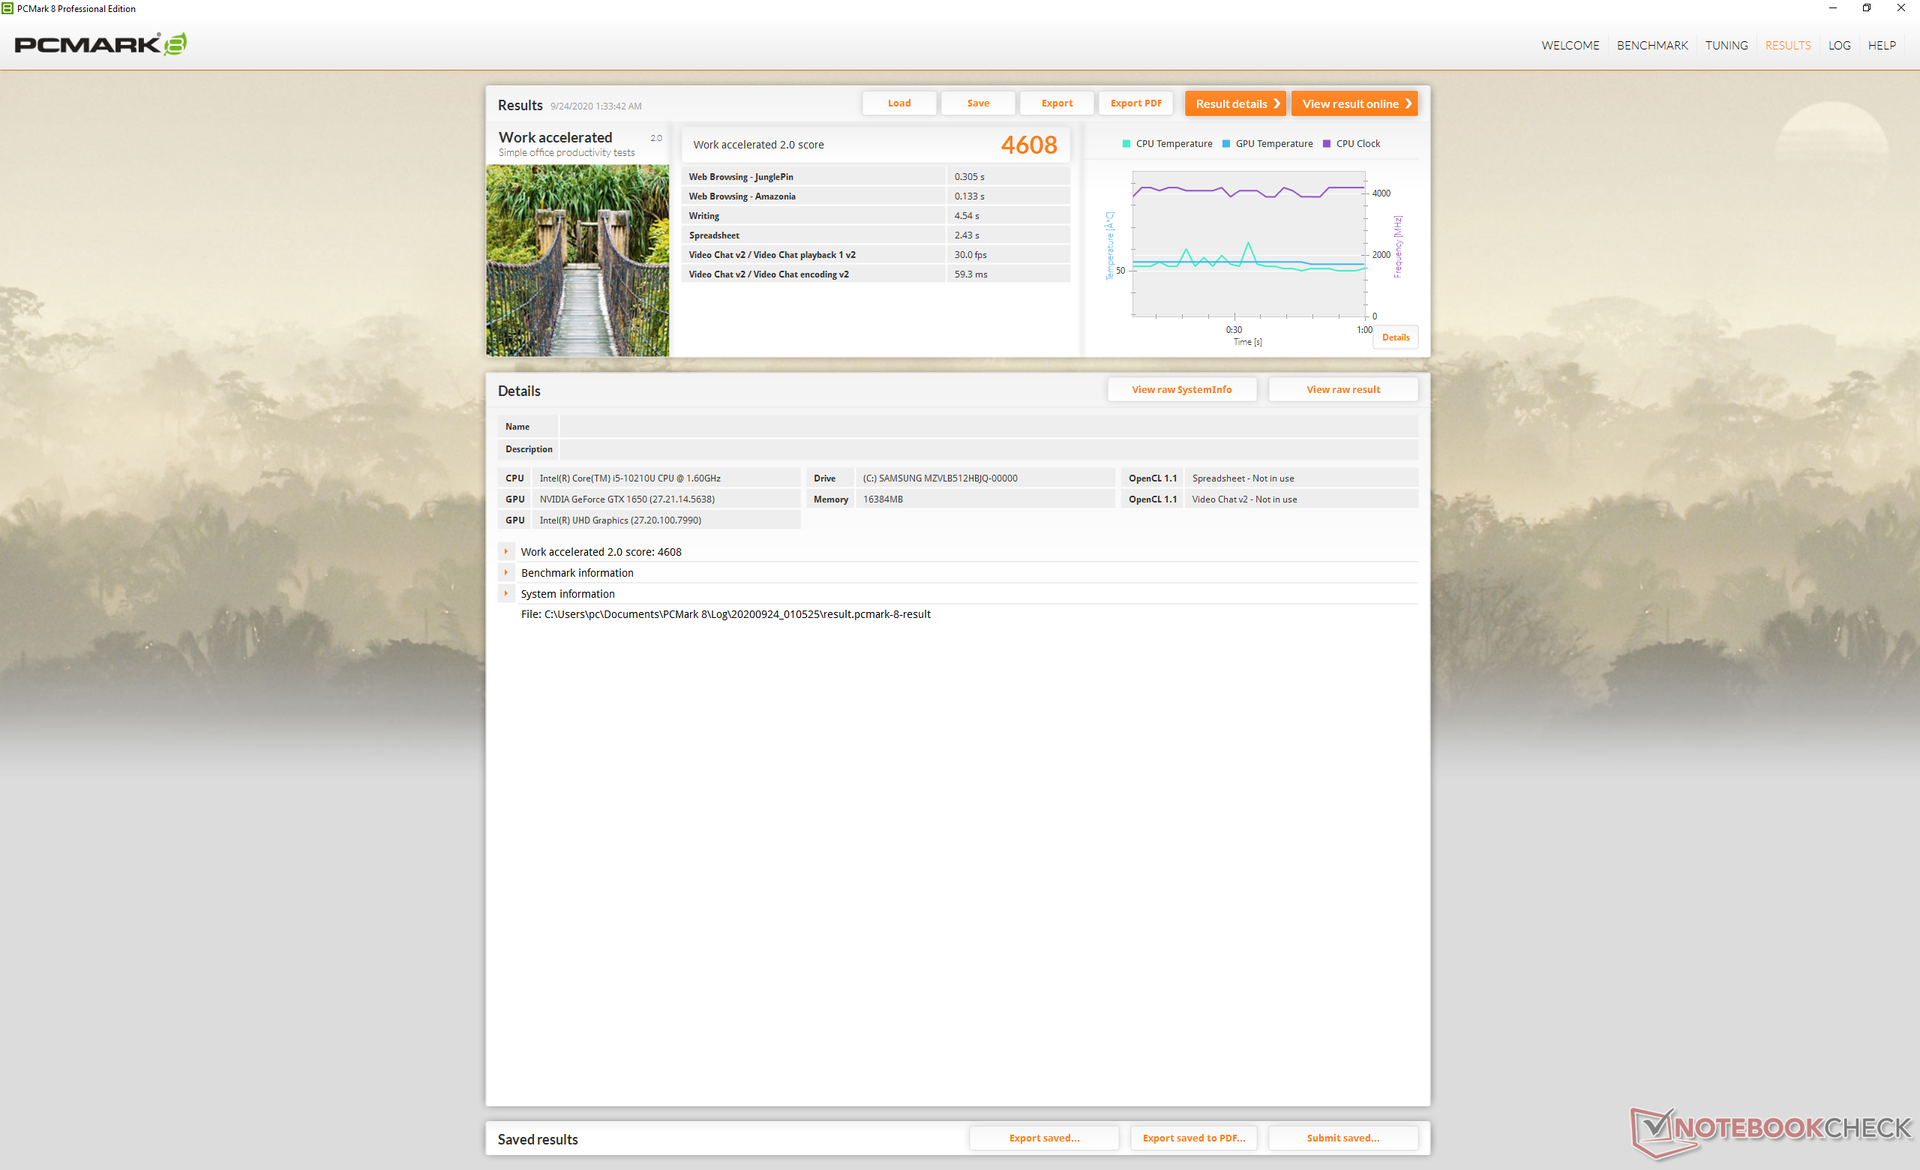
PCMark benchmarks are not all that different from the Gram 17 except in Content Creation due to the much faster GTX 1650 GPU. We experienced no software or hardware issues during our time with the test unit.
| PCMark 8 | |
| Home Score Accelerated v2 | |
| Eluktronics RP-17 | |
| HP Envy 17t-cg000 | |
| Dell XPS 17 9700 Core i7 RTX 2060 Max-Q | |
| LG Ultra 17U70N | |
| LG Gram 17 17Z90N-V.AA77G | |
| Work Score Accelerated v2 | |
| Eluktronics RP-17 | |
| HP Envy 17t-cg000 | |
| LG Gram 17 17Z90N-V.AA77G | |
| LG Ultra 17U70N | |
| Dell XPS 17 9700 Core i7 RTX 2060 Max-Q | |
| PCMark 8 Home Score Accelerated v2 | 3463 points | |
| PCMark 8 Work Score Accelerated v2 | 4608 points | |
| PCMark 10 Score | 4742 points | |
Help | ||
DPC Latency
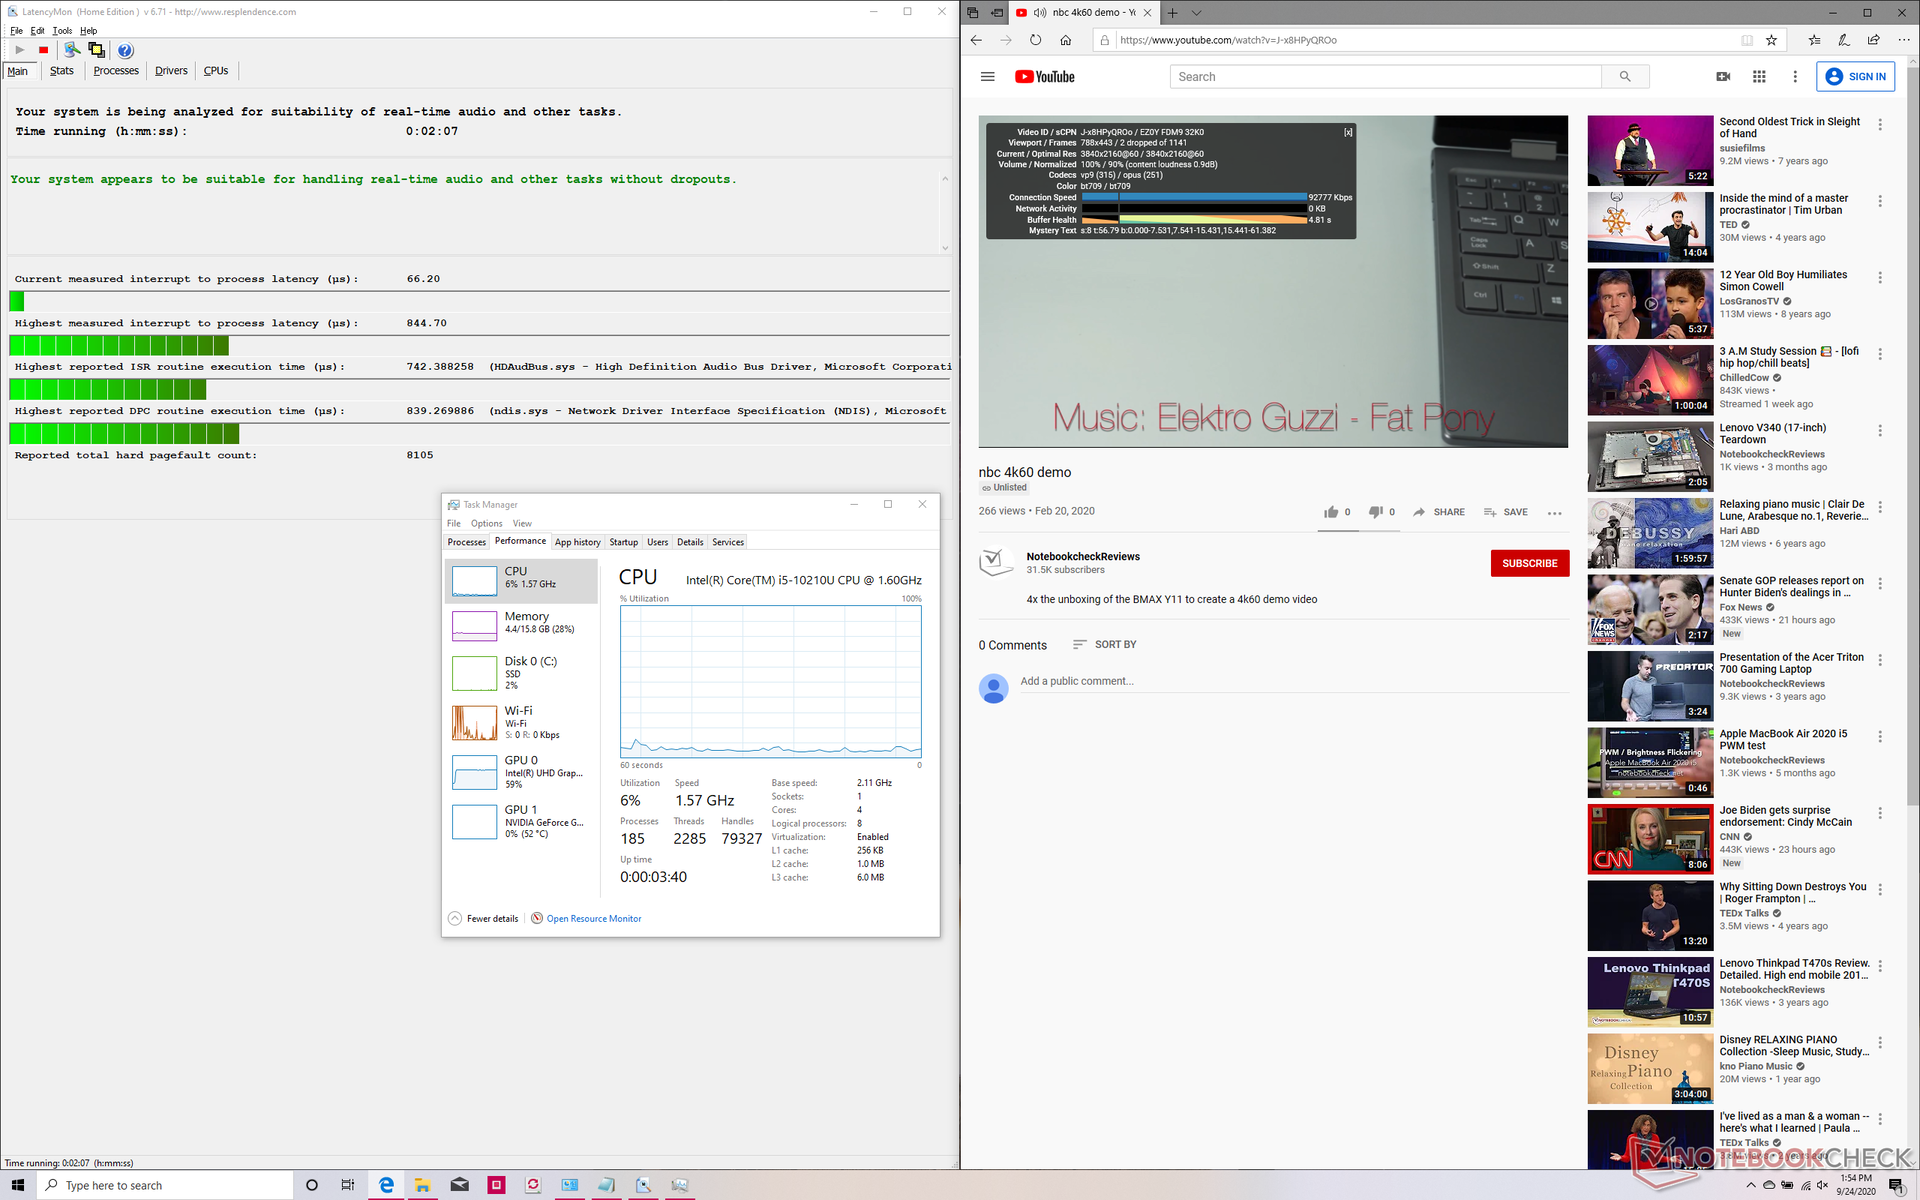
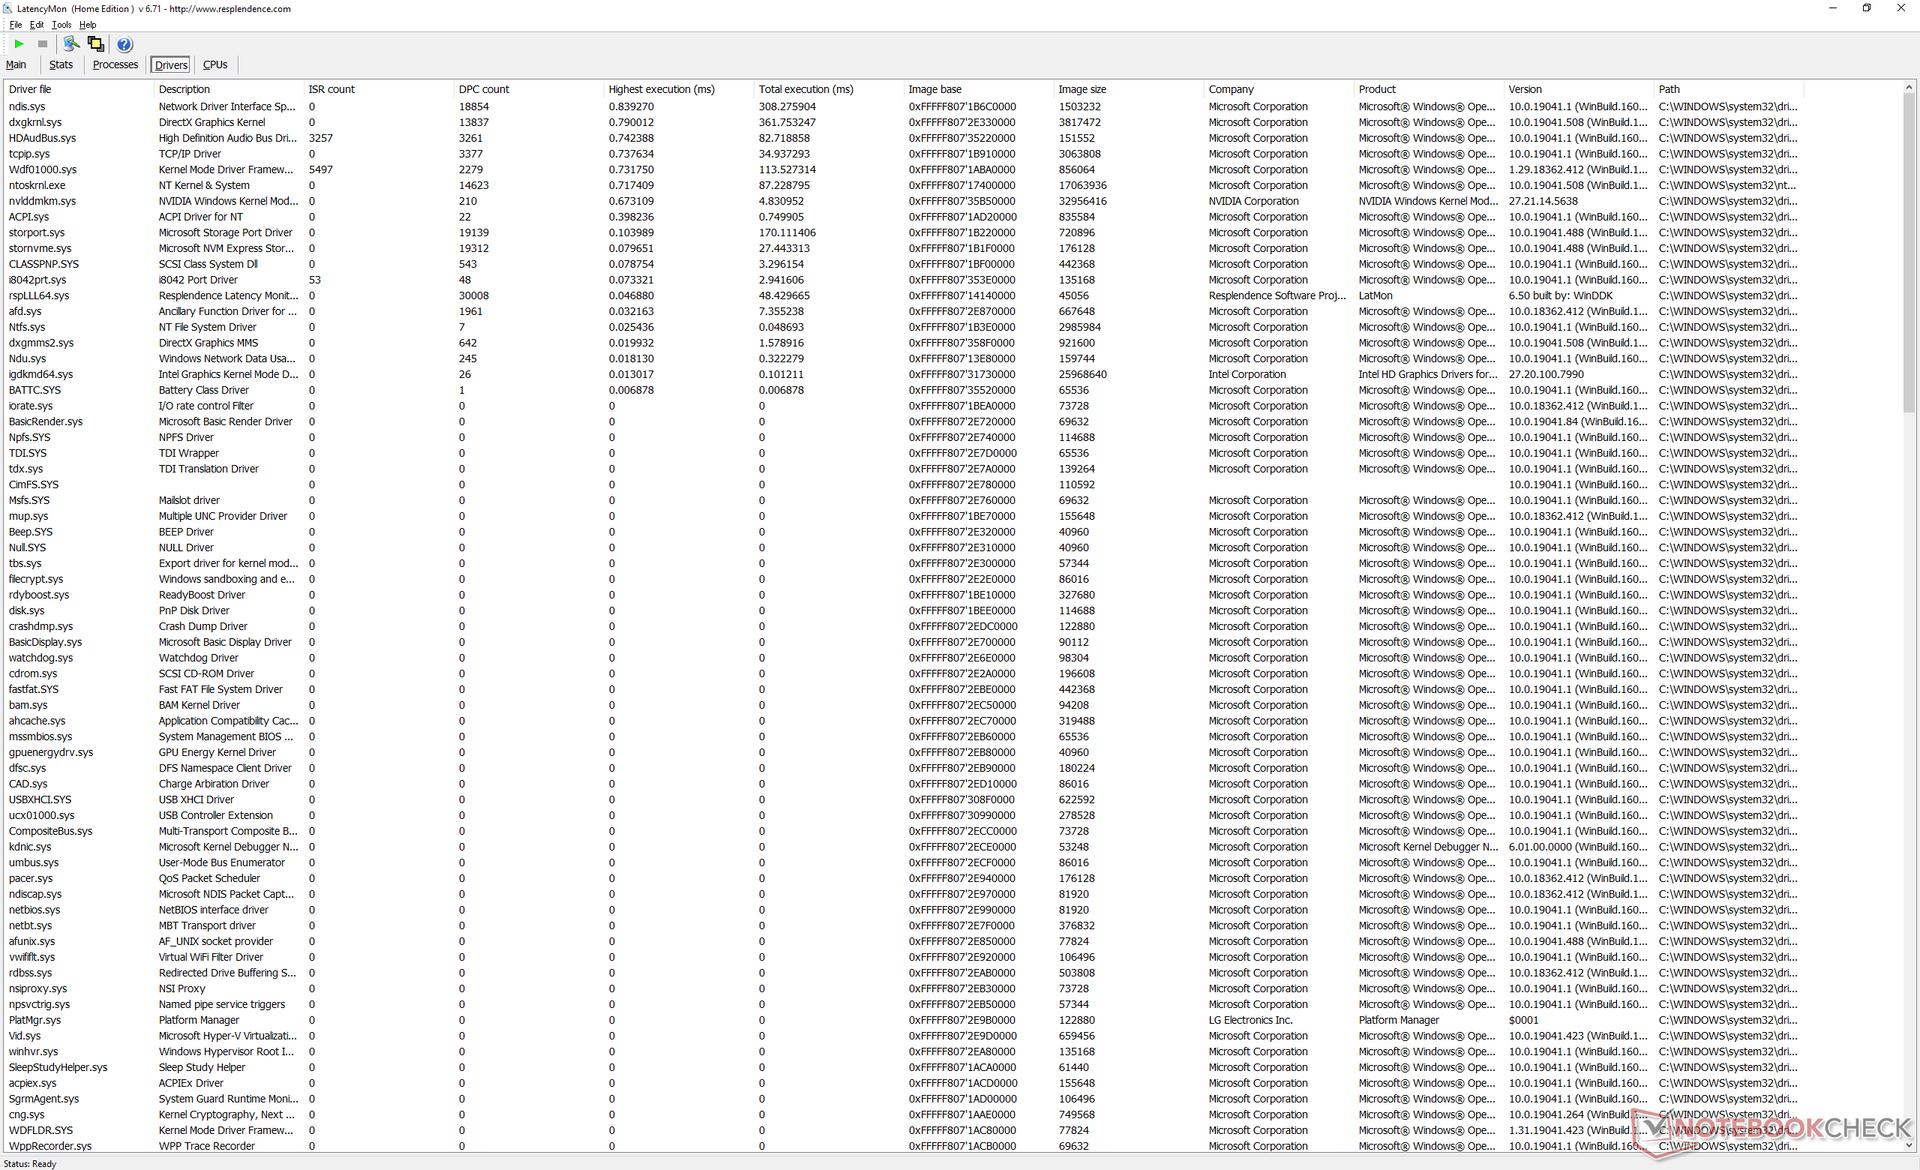
LatencyMon shows no major DPC latency issues when opening multiple tabs on our homepage. 4K UHD video playback at 60 FPS is also smooth albeit with two dropped frames during our minute-long YouTube test.
| DPC Latencies / LatencyMon - interrupt to process latency (max), Web, Youtube, Prime95 | |
| HP Envy 17t-cg000 | |
| Eluktronics RP-17 | |
| MSI Bravo 17 A4DDR | |
| LG Ultra 17U70N | |
| Dell XPS 17 9700 Core i7 RTX 2060 Max-Q | |
| LG Gram 17 17Z90N-V.AA77G | |
* ... smaller is better
Storage Devices
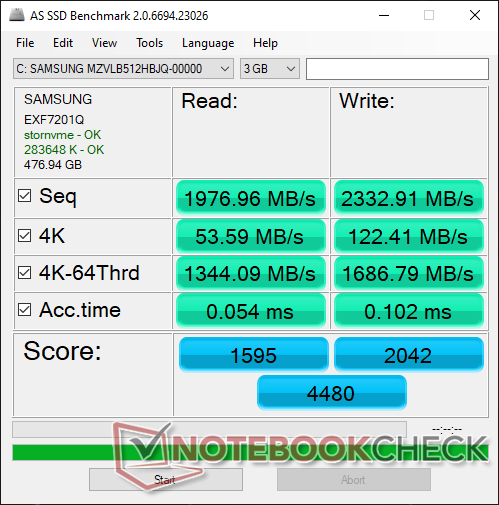
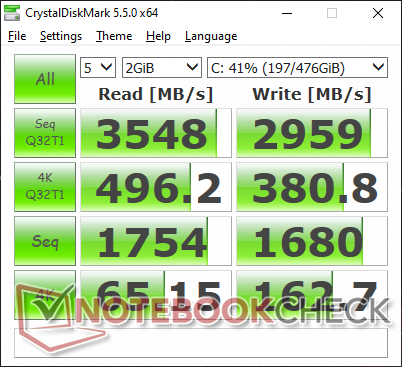
LG laptops come with either Samsung or SK Hynix SSDs. In our case, the system shipped with the Samsung PM981a to offer some of the fastest read and write rates of any consumer NVMe drive. Strangely, it takes a while for the SSD to reach its full potential on the Ultra 17 as shown by our DiskSpd loop test below.
| LG Ultra 17U70N Samsung SSD PM981a MZVLB512HBJQ | Dell XPS 17 9700 Core i7 RTX 2060 Max-Q Micron 2200S 1TB MTFDHBA1T0TCK | LG Gram 17 17Z90N-V.AA77G Samsung PM981a MZVLB1T0HBLR | MSI Bravo 17 A4DDR Toshiba KBG30ZMV512G | HP Envy 17t-cg000 WDC PC SN520 SDAPNUW-512G | |
|---|---|---|---|---|---|
| AS SSD | -69% | -2% | -47% | -17% | |
| Seq Read (MB/s) | 1977 | 1141 -42% | 2722 38% | 1420 -28% | 1161 -41% |
| Seq Write (MB/s) | 2333 | 994 -57% | 2649 14% | 922 -60% | 809 -65% |
| 4K Read (MB/s) | 53.6 | 31.98 -40% | 52.2 -3% | 48.51 -9% | 40.63 -24% |
| 4K Write (MB/s) | 122.4 | 61 -50% | 132.4 8% | 116.8 -5% | 138.6 13% |
| 4K-64 Read (MB/s) | 1344 | 790 -41% | 886 -34% | 928 -31% | 857 -36% |
| 4K-64 Write (MB/s) | 1687 | 845 -50% | 1074 -36% | 345.4 -80% | 1041 -38% |
| Access Time Read * (ms) | 0.054 | 0.063 -17% | 0.041 24% | 0.089 -65% | 0.067 -24% |
| Access Time Write * (ms) | 0.102 | 0.679 -566% | 0.03 71% | 0.189 -85% | 0.026 75% |
| Score Read (Points) | 1595 | 966 -39% | 1211 -24% | 1119 -30% | 1013 -36% |
| Score Write (Points) | 2042 | 1005 -51% | 1471 -28% | 554 -73% | 1260 -38% |
| Score Total (Points) | 4480 | 2448 -45% | 3309 -26% | 2232 -50% | 2783 -38% |
| Copy ISO MB/s (MB/s) | 1998 | 1732 -13% | 2096 5% | 1350 -32% | |
| Copy Program MB/s (MB/s) | 514 | 717 39% | 395.6 -23% | 766 49% | |
| Copy Game MB/s (MB/s) | 1295 | 1343 4% | 1096 -15% | 1190 -8% | |
| CrystalDiskMark 5.2 / 6 | -28% | 3% | -37% | -28% | |
| Write 4K (MB/s) | 162.7 | 64.1 -61% | 162.8 0% | 94.6 -42% | 124.2 -24% |
| Read 4K (MB/s) | 65.2 | 39.93 -39% | 51 -22% | 47.12 -28% | 46.11 -29% |
| Write Seq (MB/s) | 1680 | 1191 -29% | 2078 24% | 850 -49% | |
| Read Seq (MB/s) | 1754 | 1418 -19% | 1991 14% | 1157 -34% | |
| Write 4K Q32T1 (MB/s) | 380.8 | 450.3 18% | 440.1 16% | 277.7 -27% | 447 17% |
| Read 4K Q32T1 (MB/s) | 496.2 | 365 -26% | 450.1 -9% | 546 10% | 350.1 -29% |
| Write Seq Q32T1 (MB/s) | 2959 | 1563 -47% | 2998 1% | 908 -69% | 1463 -51% |
| Read Seq Q32T1 (MB/s) | 3548 | 2683 -24% | 3562 0% | 1632 -54% | 1751 -51% |
| Write 4K Q8T8 (MB/s) | 445.5 | ||||
| Read 4K Q8T8 (MB/s) | 926 | ||||
| Total Average (Program / Settings) | -49% /
-54% | 1% /
-0% | -42% /
-43% | -23% /
-21% |
* ... smaller is better

Disk Throttling: DiskSpd Read Loop, Queue Depth 8
GPU Performance
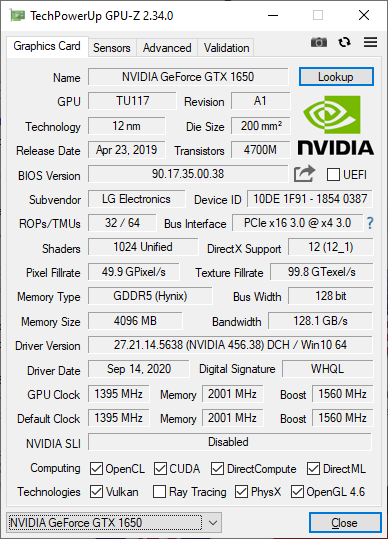
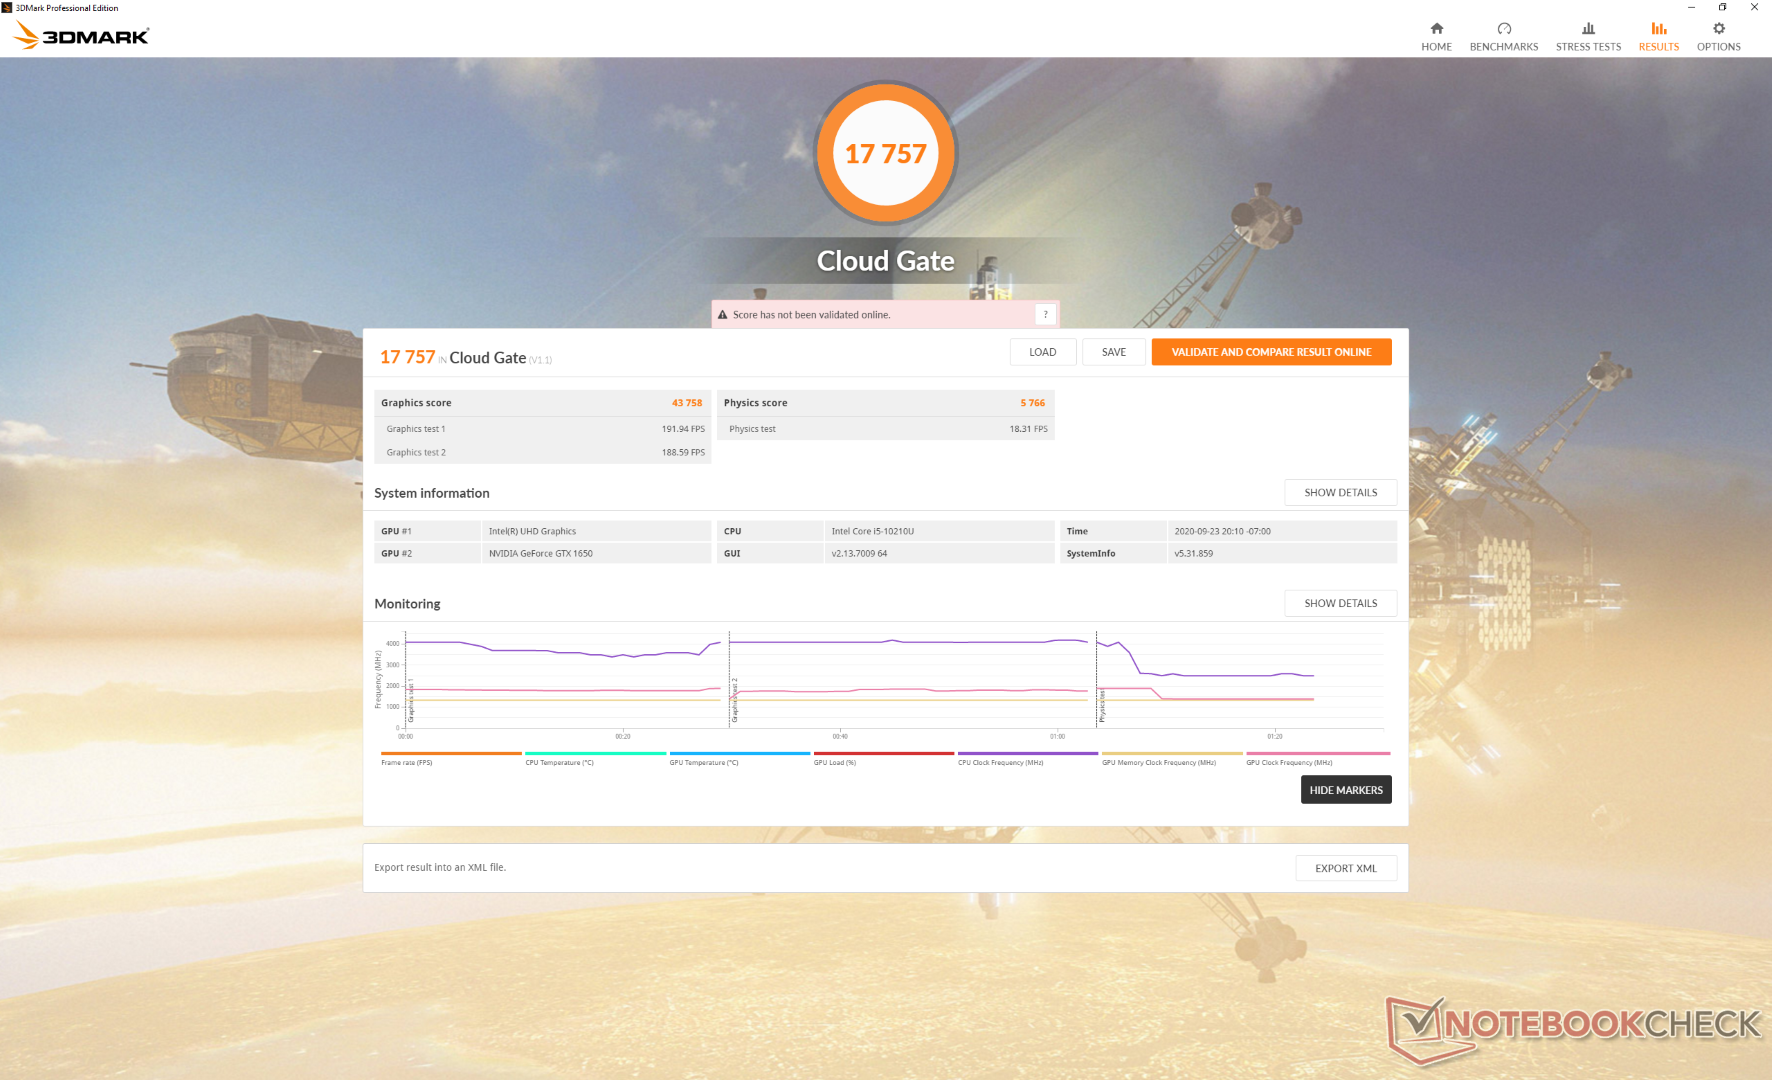
3DMark results are where we expect them to be relative to other laptops with the same GTX 1650 GPU. Results are consistently slower than the average by a few percentage points due to the U-series CPU, however, since most other laptops with GTX GPUs are typically paired with H-series CPUs instead. Gaming performance is otherwise not all that much slower or even the same as many budget Core H-series laptops since most games are GPU bound.
See our dedicated page on the mobile GeForce GTX 1650 for more technical information and benchmark comparisons.
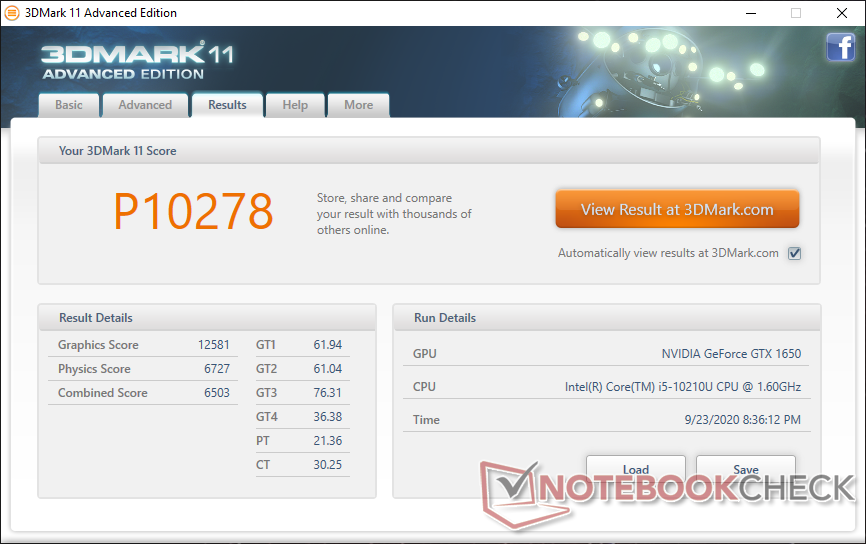
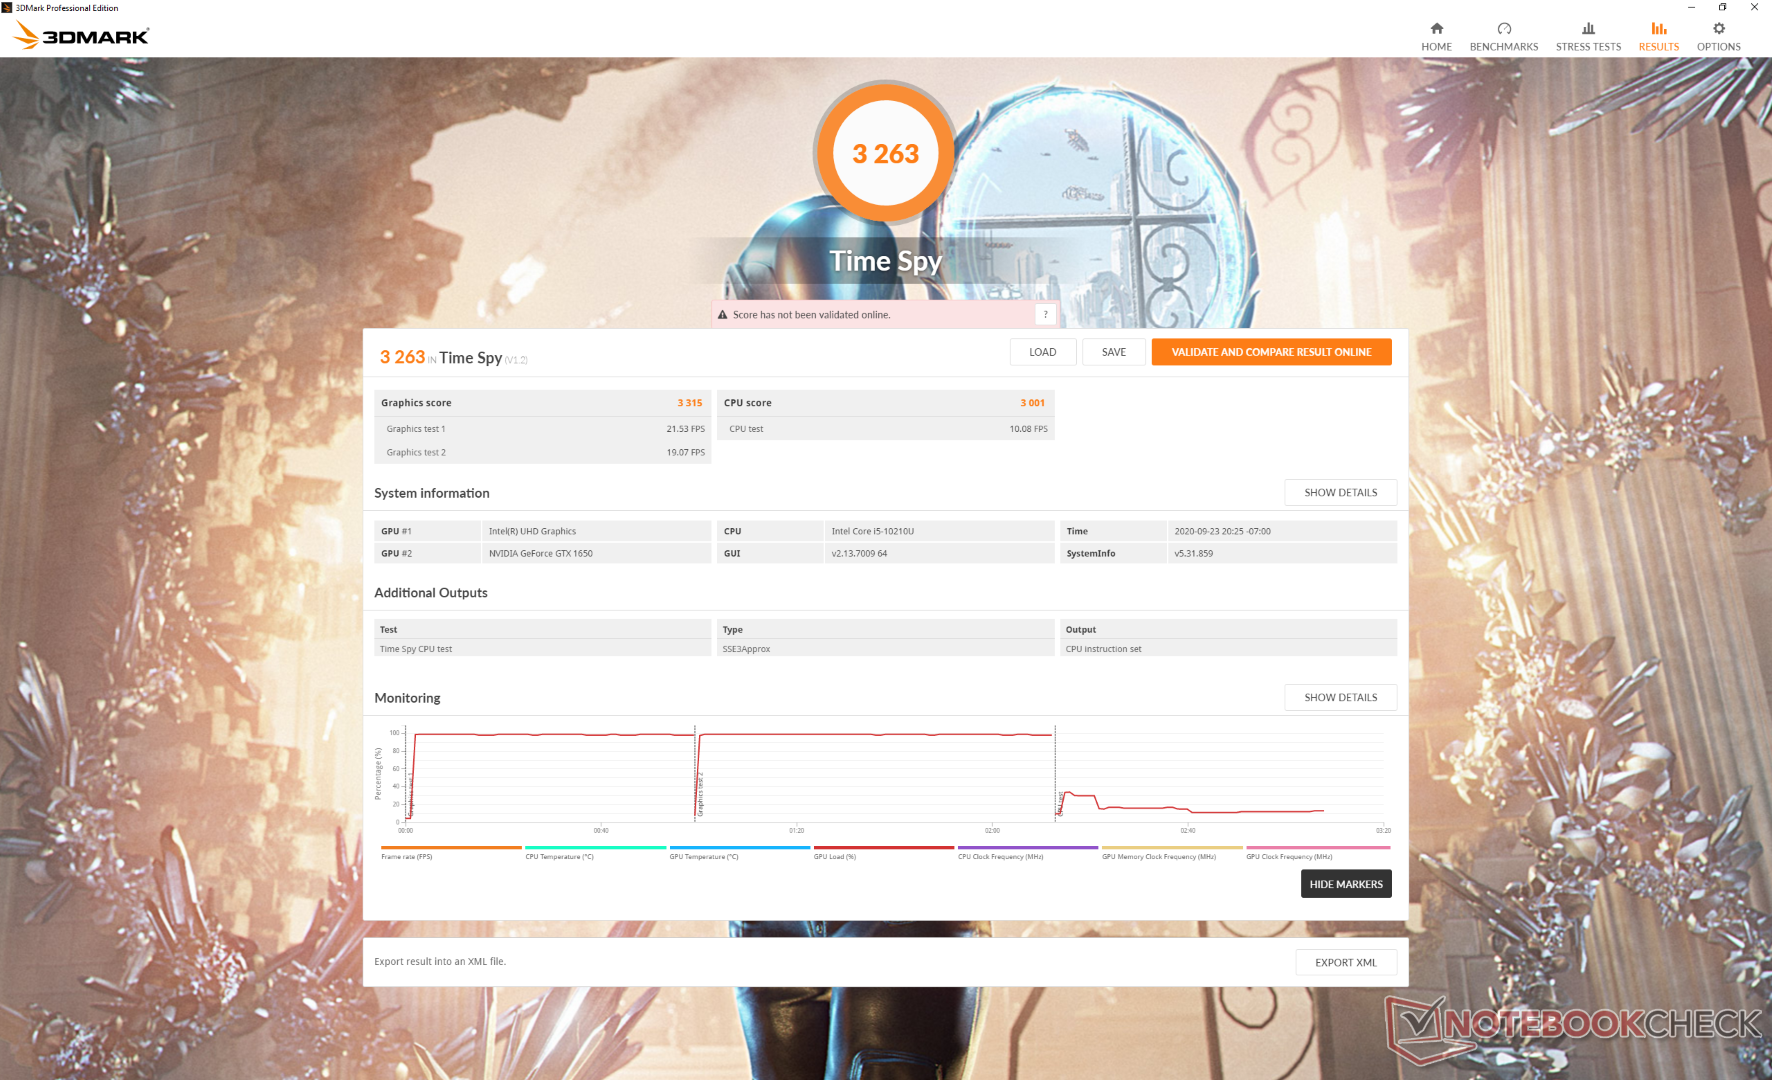
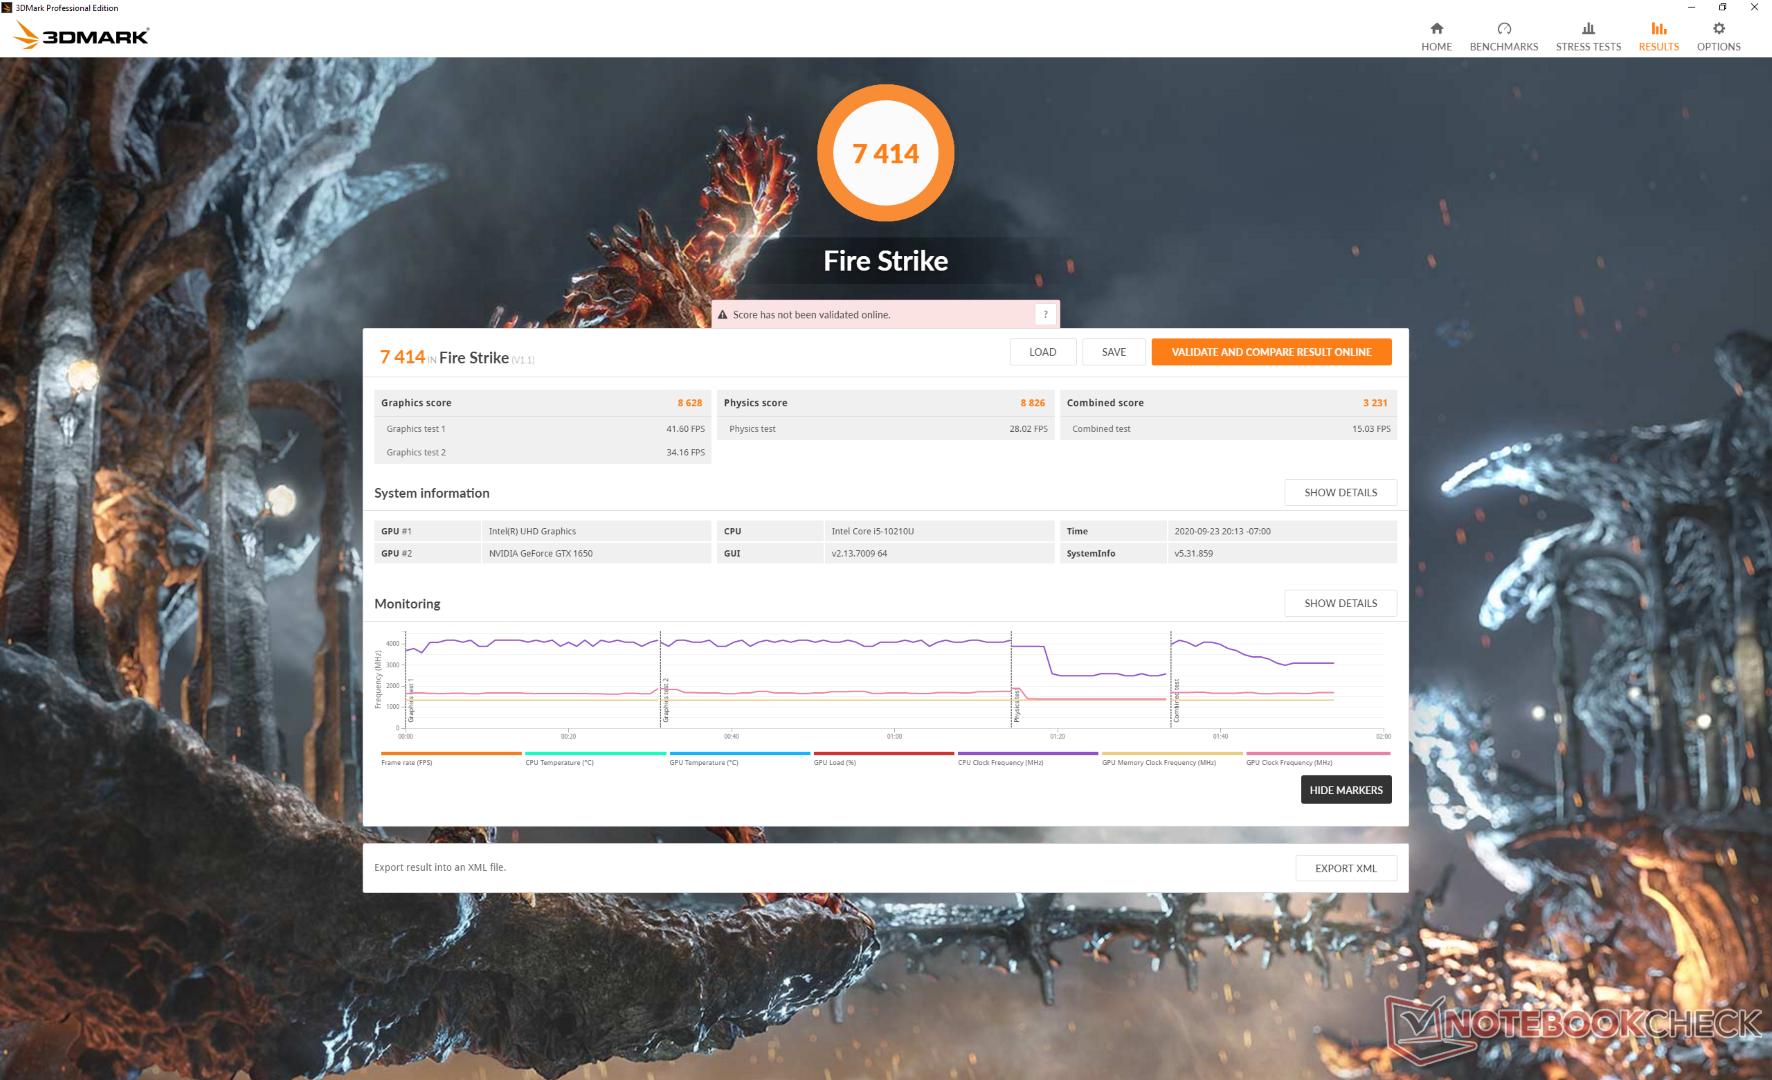
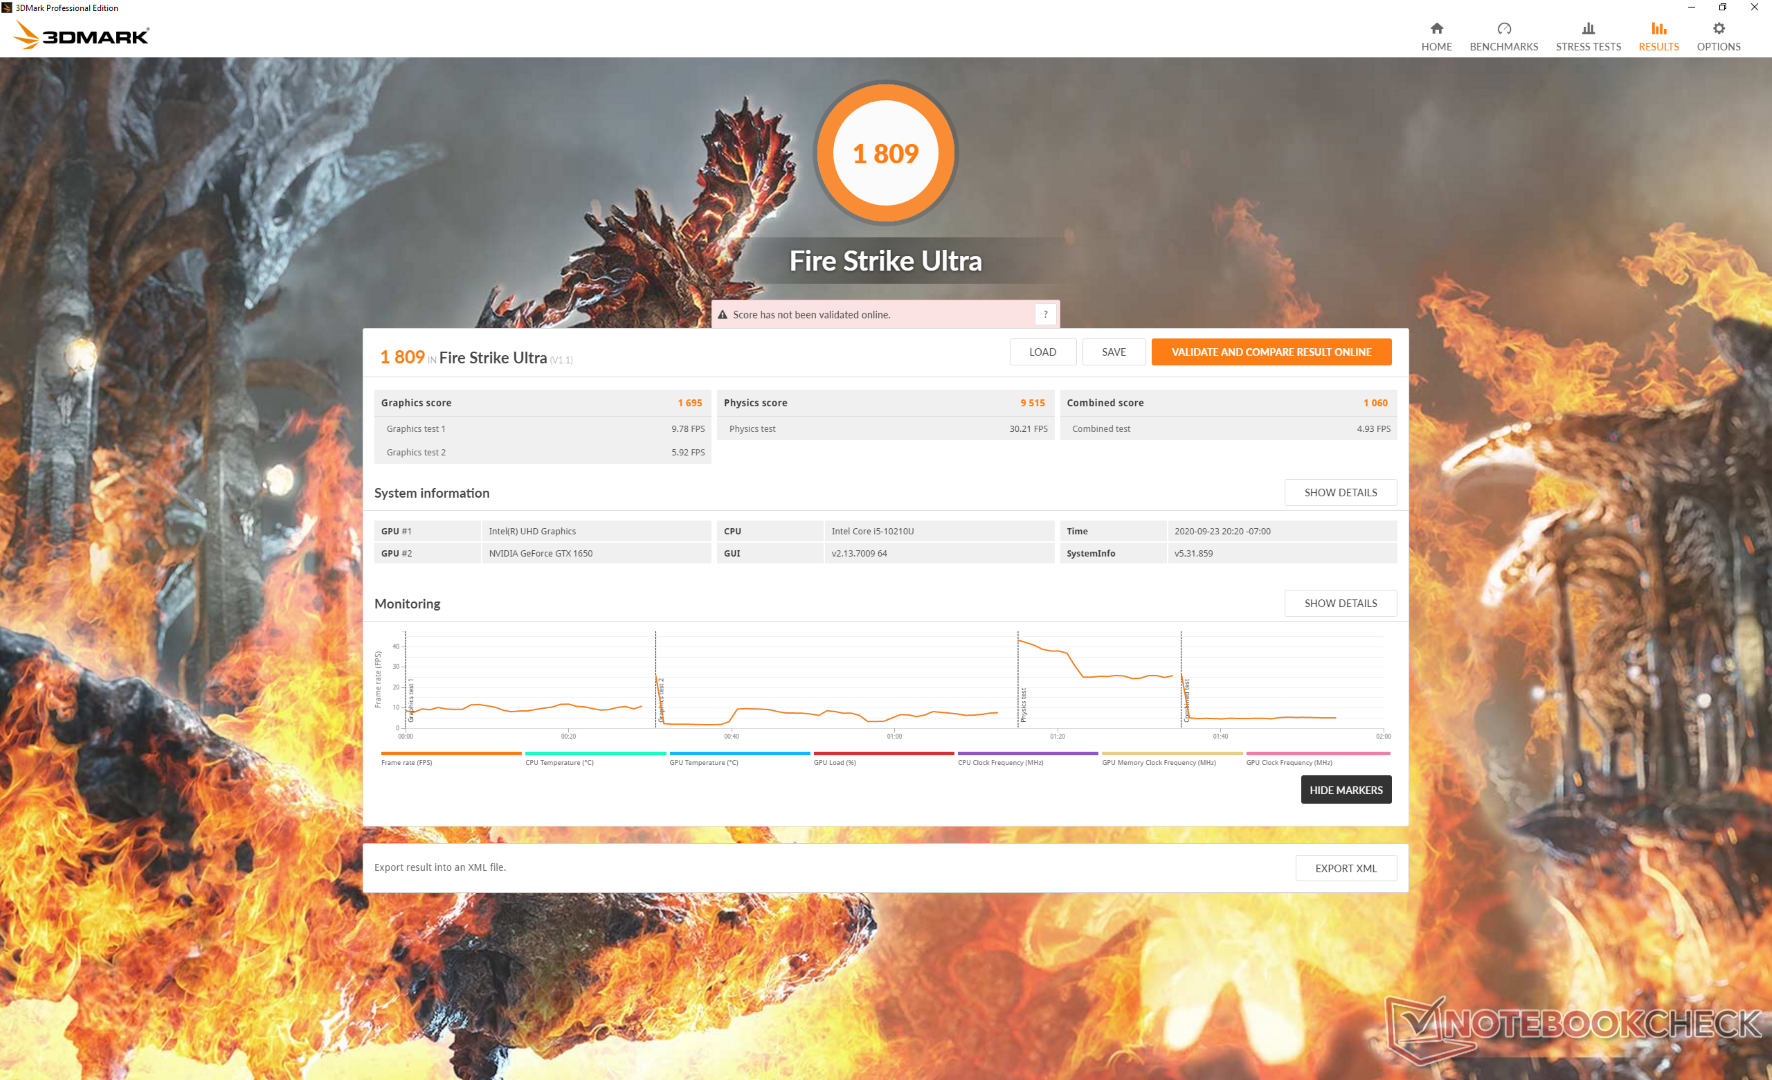
| 3DMark 11 Performance | 10278 points | |
| 3DMark Cloud Gate Standard Score | 17757 points | |
| 3DMark Fire Strike Score | 7414 points | |
| 3DMark Time Spy Score | 3263 points | |
Help | ||
| Final Fantasy XV Benchmark | |
| 1920x1080 Standard Quality | |
| Gigabyte Aero 17 HDR XB | |
| MSI RTX 2060 Gaming Z 6G | |
| Eluktronics RP-17 | |
| Asus ROG Zephyrus G15 GA502IU-ES76 | |
| Dell G7 15-7588 | |
| LG Ultra 17U70N | |
| Average NVIDIA GeForce GTX 1650 Mobile (47.7 - 52.4, n=5) | |
| Apple MacBook Pro 16 2019 i9 5500M | |
| Lenovo IdeaPad 330-15ICH | |
| 1920x1080 High Quality | |
| Gigabyte Aero 17 HDR XB | |
| MSI RTX 2060 Gaming Z 6G | |
| Eluktronics RP-17 | |
| Asus ROG Zephyrus G15 GA502IU-ES76 | |
| Dell G7 15-7588 | |
| LG Ultra 17U70N | |
| Average NVIDIA GeForce GTX 1650 Mobile (31.8 - 37.6, n=6) | |
| Lenovo IdeaPad 330-15ICH | |
| Apple MacBook Pro 16 2019 i9 5500M | |
| low | med. | high | ultra | |
|---|---|---|---|---|
| The Witcher 3 (2015) | 163 | 95.4 | 57 | 33.1 |
| Dota 2 Reborn (2015) | 112 | 97.6 | 92.9 | 88.2 |
| Final Fantasy XV Benchmark (2018) | 82.3 | 50.2 | 35.9 | |
| X-Plane 11.11 (2018) | 59.3 | 54.4 | 49.3 |
Emissions
System Noise
The fan is mostly silent when the iGPU is active with a range between 27 to 31 dB(A) when browsing the web or emailing. If the dGPU is active, this can jump to as high as 35 dB(A) and so we recommend exploiting Optimus to keep fan noise to a minimum and reduce pulsing.
Running Witcher 3 will induce a steady fan noise of 45 dB(A) to be close to many gaming laptops. The XPS 17 is louder still, but it is also much more powerful. We can notice no electronic noise or coil whine on our unit.
| LG Ultra 17U70N GeForce GTX 1650 Mobile, i5-10210U, Samsung SSD PM981a MZVLB512HBJQ | Dell XPS 17 9700 Core i7 RTX 2060 Max-Q GeForce RTX 2060 Max-Q, i7-10875H, Micron 2200S 1TB MTFDHBA1T0TCK | LG Gram 17 17Z90N-V.AA77G Iris Plus Graphics G7 (Ice Lake 64 EU), i7-1065G7, Samsung PM981a MZVLB1T0HBLR | Eluktronics RP-17 GeForce RTX 2060 Mobile, R7 4800H, Phison PS5013 PRO-X-1TB-G2R NVMe SSD | MSI Bravo 17 A4DDR Radeon RX 5500M, R7 4800H, Toshiba KBG30ZMV512G | HP Envy 17t-cg000 GeForce MX330, i7-1065G7, WDC PC SN520 SDAPNUW-512G | |
|---|---|---|---|---|---|---|
| Noise | -3% | 13% | 0% | -11% | 0% | |
| off / environment * (dB) | 27 | 28 -4% | 26 4% | 26.2 3% | 30 -11% | 28.2 -4% |
| Idle Minimum * (dB) | 27.3 | 28 -3% | 26 5% | 26.2 4% | 33 -21% | 28.2 -3% |
| Idle Average * (dB) | 27.3 | 28 -3% | 26.8 2% | 26.2 4% | 34 -25% | 28.2 -3% |
| Idle Maximum * (dB) | 31.7 | 28 12% | 27.5 13% | 30 5% | 35 -10% | 29.5 7% |
| Load Average * (dB) | 43.6 | 43.2 1% | 32.2 26% | 38.5 12% | 39 11% | 43.9 -1% |
| Witcher 3 ultra * (dB) | 45.3 | 49 -8% | 47.2 -4% | 48 -6% | 43.9 3% | |
| Load Maximum * (dB) | 44.7 | 50.5 -13% | 32.7 27% | 54.6 -22% | 52 -16% | 43.9 2% |
* ... smaller is better
Noise level
| Idle |
| 27.3 / 27.3 / 31.7 dB(A) |
| Load |
| 43.6 / 44.7 dB(A) |
 | ||
30 dB silent 40 dB(A) audible 50 dB(A) loud |
||
min: | ||
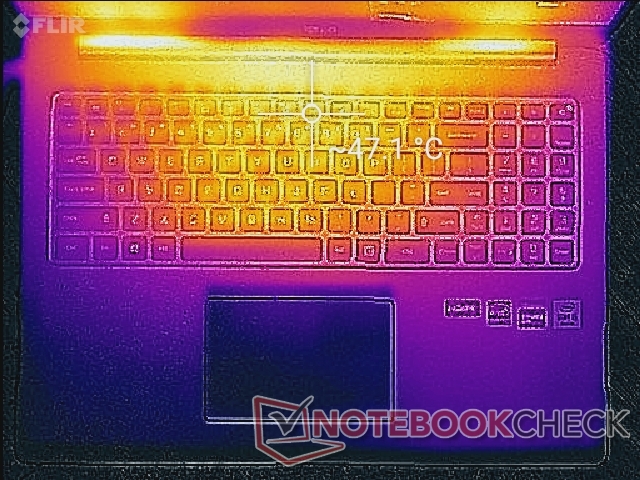
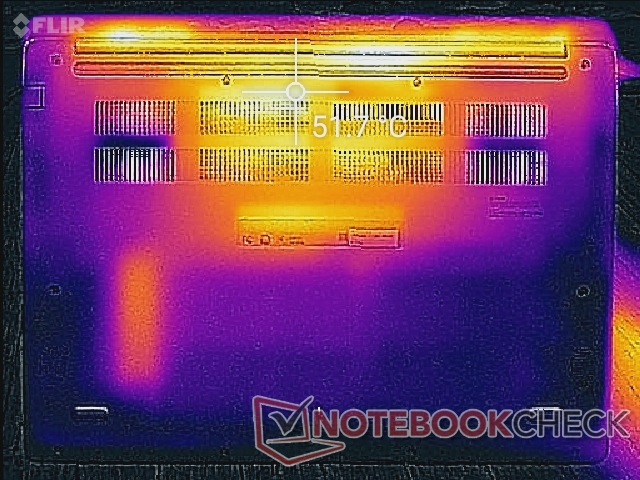
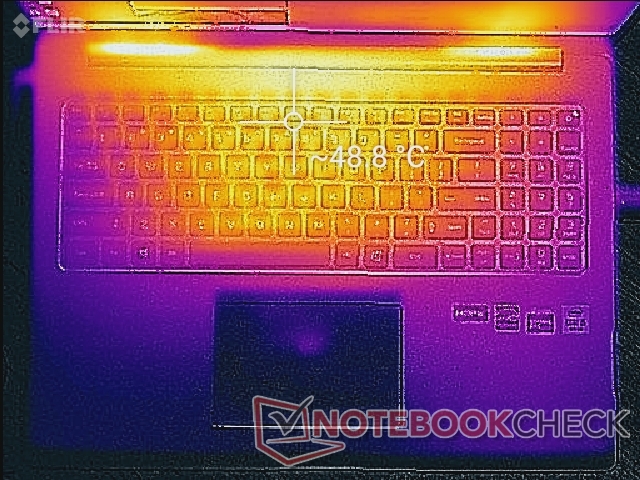
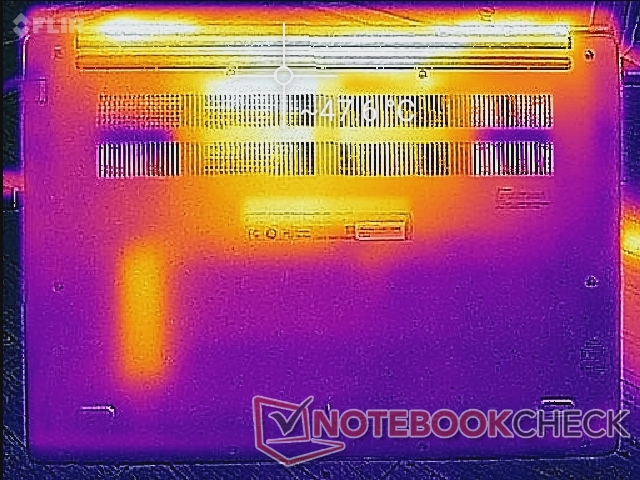
Temperature
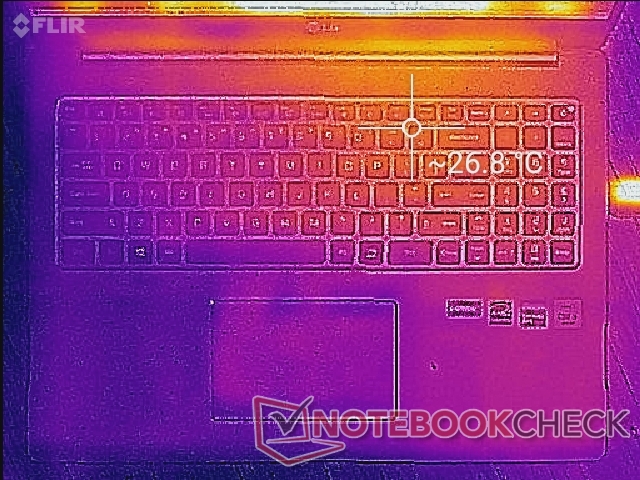
Surface temperatures are flat when idling on desktop but they will warm up quickly to over 47 C when running games. The Gram 17 exhibited similar temperature ranges despite the Ultra 17 being the much faster system. Hot spots are toward the center of the keyboard and away from the front quadrants.
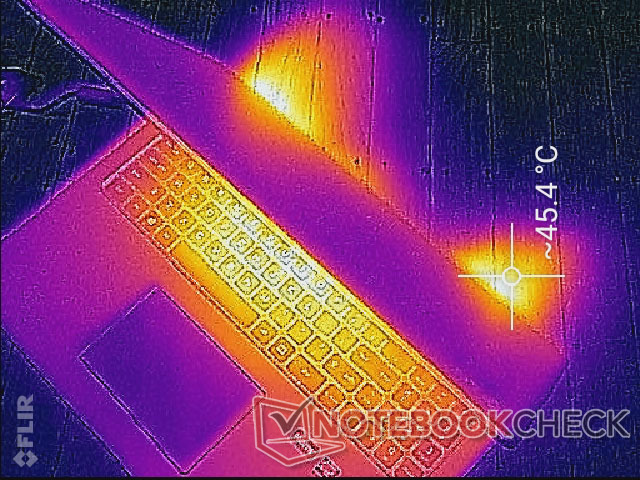
(-) The maximum temperature on the upper side is 49.4 °C / 121 F, compared to the average of 36.8 °C / 98 F, ranging from 21 to 71 °C for the class Multimedia.
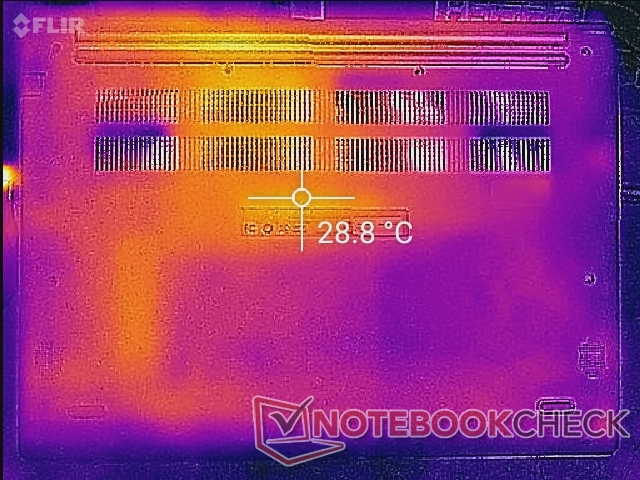
(-) The bottom heats up to a maximum of 49.4 °C / 121 F, compared to the average of 39.1 °C / 102 F
(+) In idle usage, the average temperature for the upper side is 25.9 °C / 79 F, compared to the device average of 31.3 °C / 88 F.
(±) Playing The Witcher 3, the average temperature for the upper side is 35.8 °C / 96 F, compared to the device average of 31.3 °C / 88 F.
(+) The palmrests and touchpad are cooler than skin temperature with a maximum of 30.2 °C / 86.4 F and are therefore cool to the touch.
(±) The average temperature of the palmrest area of similar devices was 28.7 °C / 83.7 F (-1.5 °C / -2.7 F).
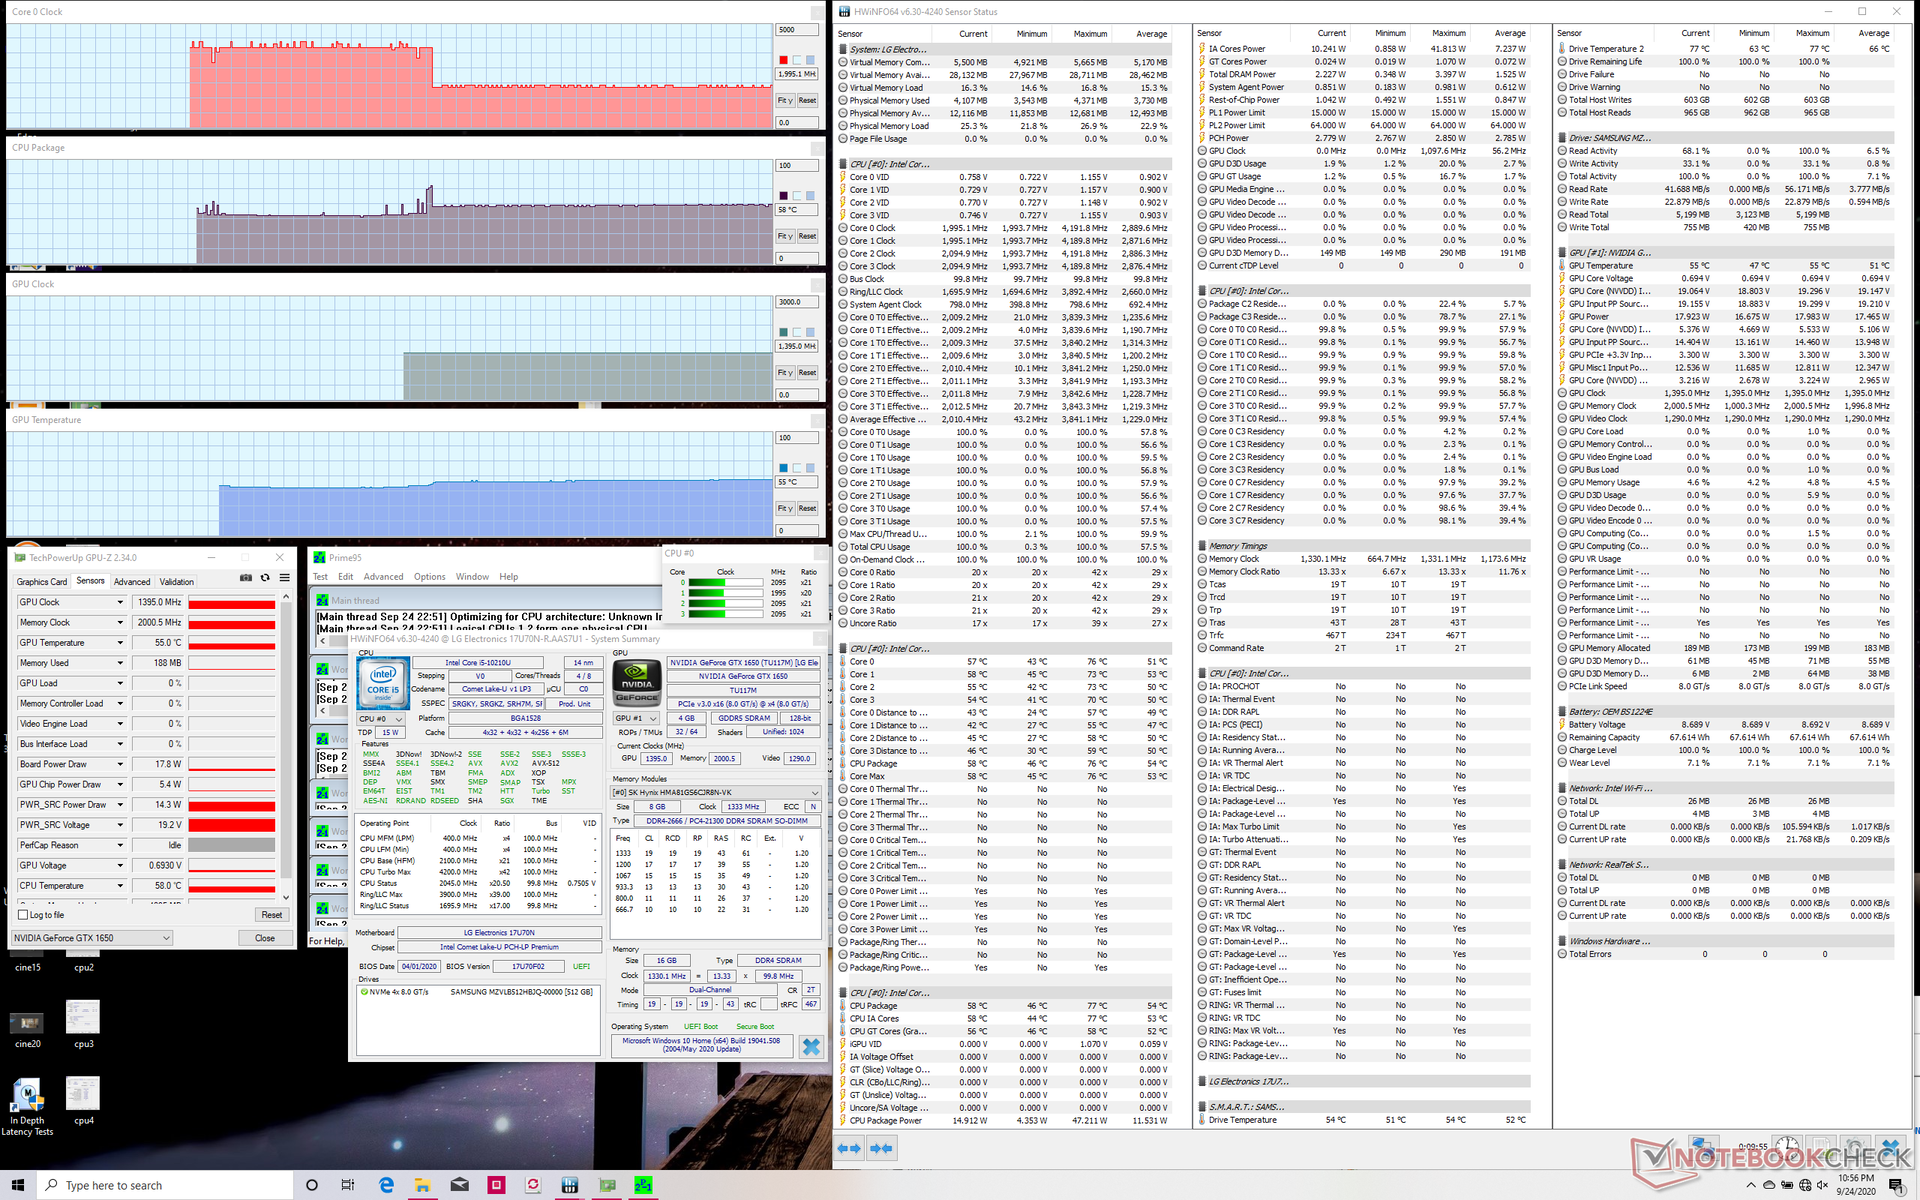
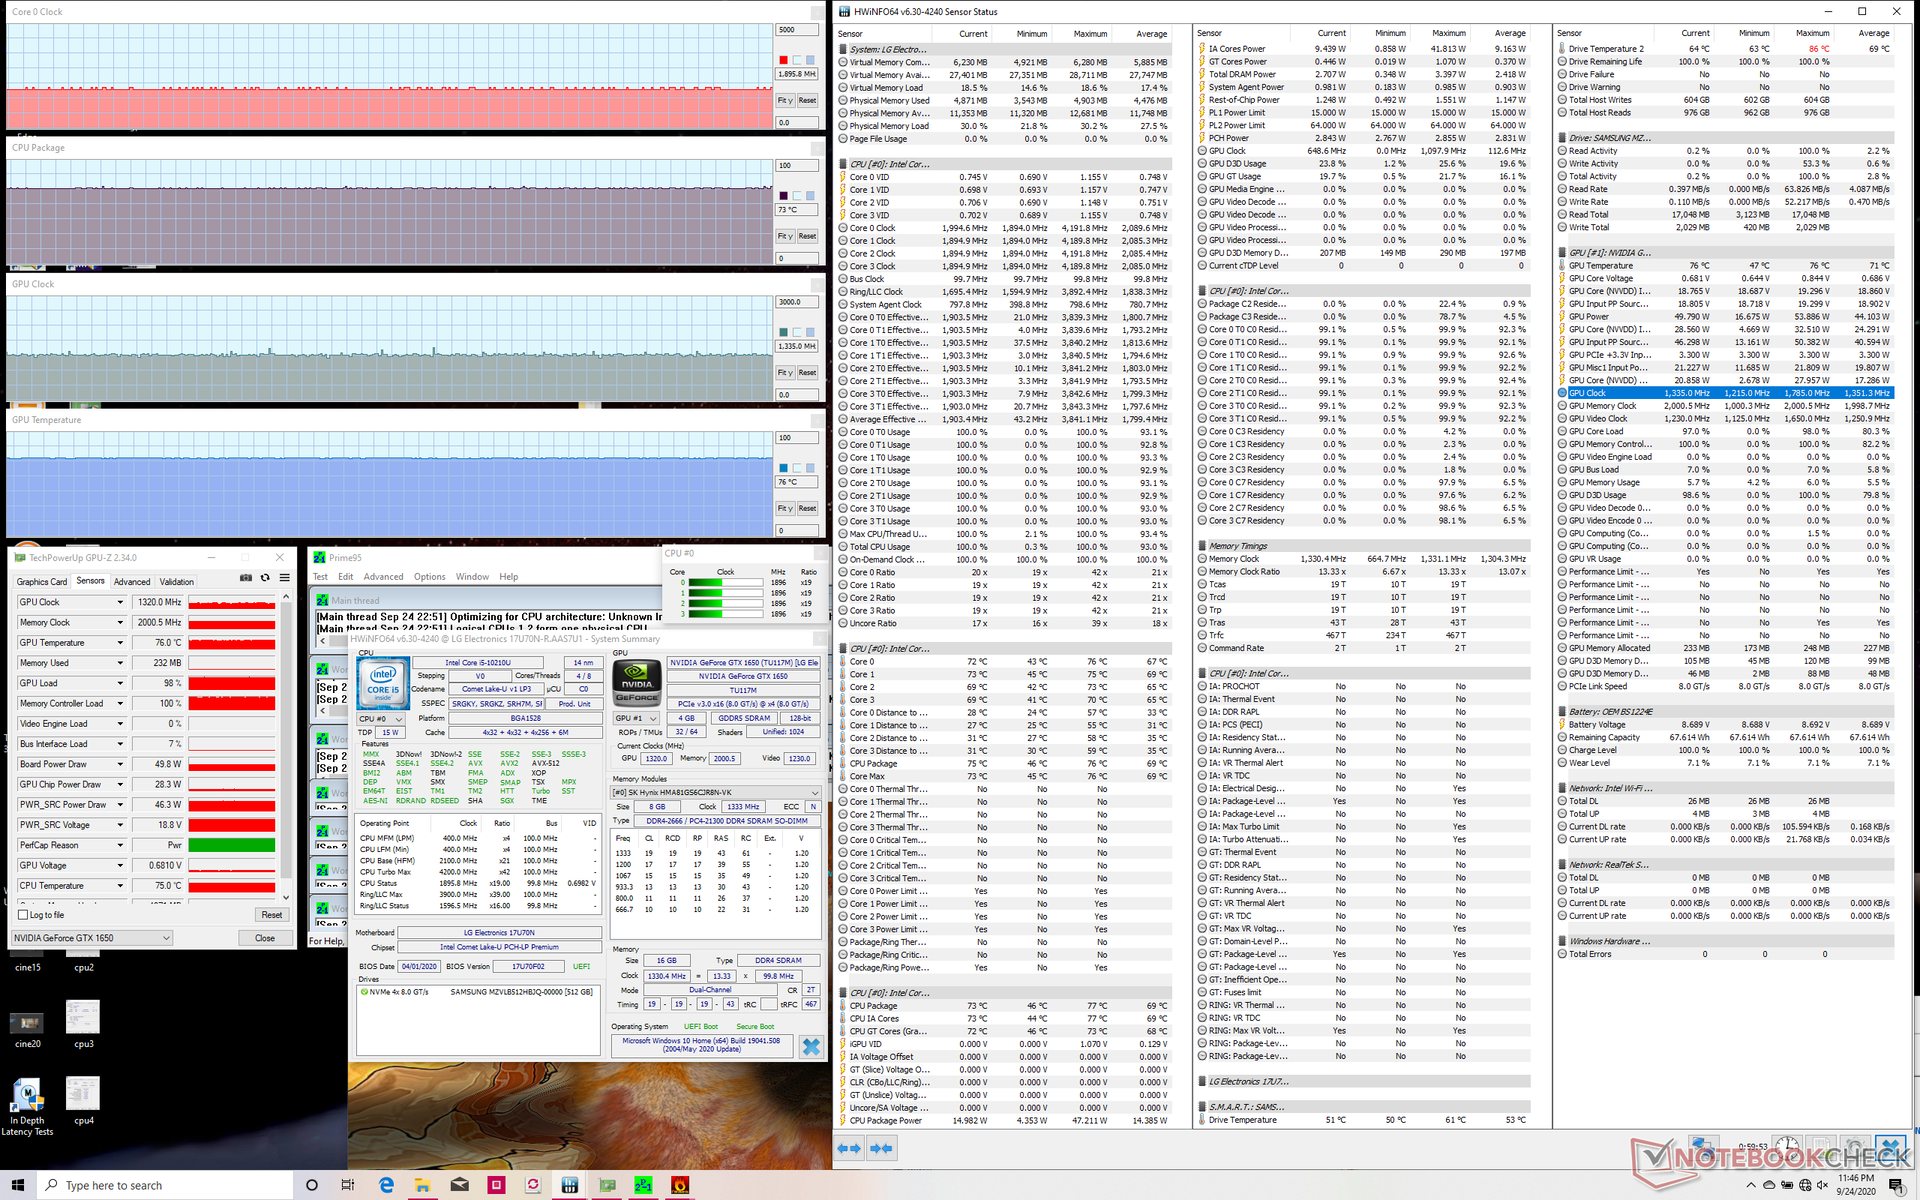
Stress Test
When running Prime95 to stress the CPU, clock rates would boost to 3.9 GHz for just the first few seconds until hitting a core temperature of 76 C. Thereafter, clock rates drop and stabilize at just 2.0 GHz. When considering that the base clock rate of the i5-10210U is 1.6 GHz, the 400 MHz sustainable Turbo Boost is not great especially for such a large form factor chassis.
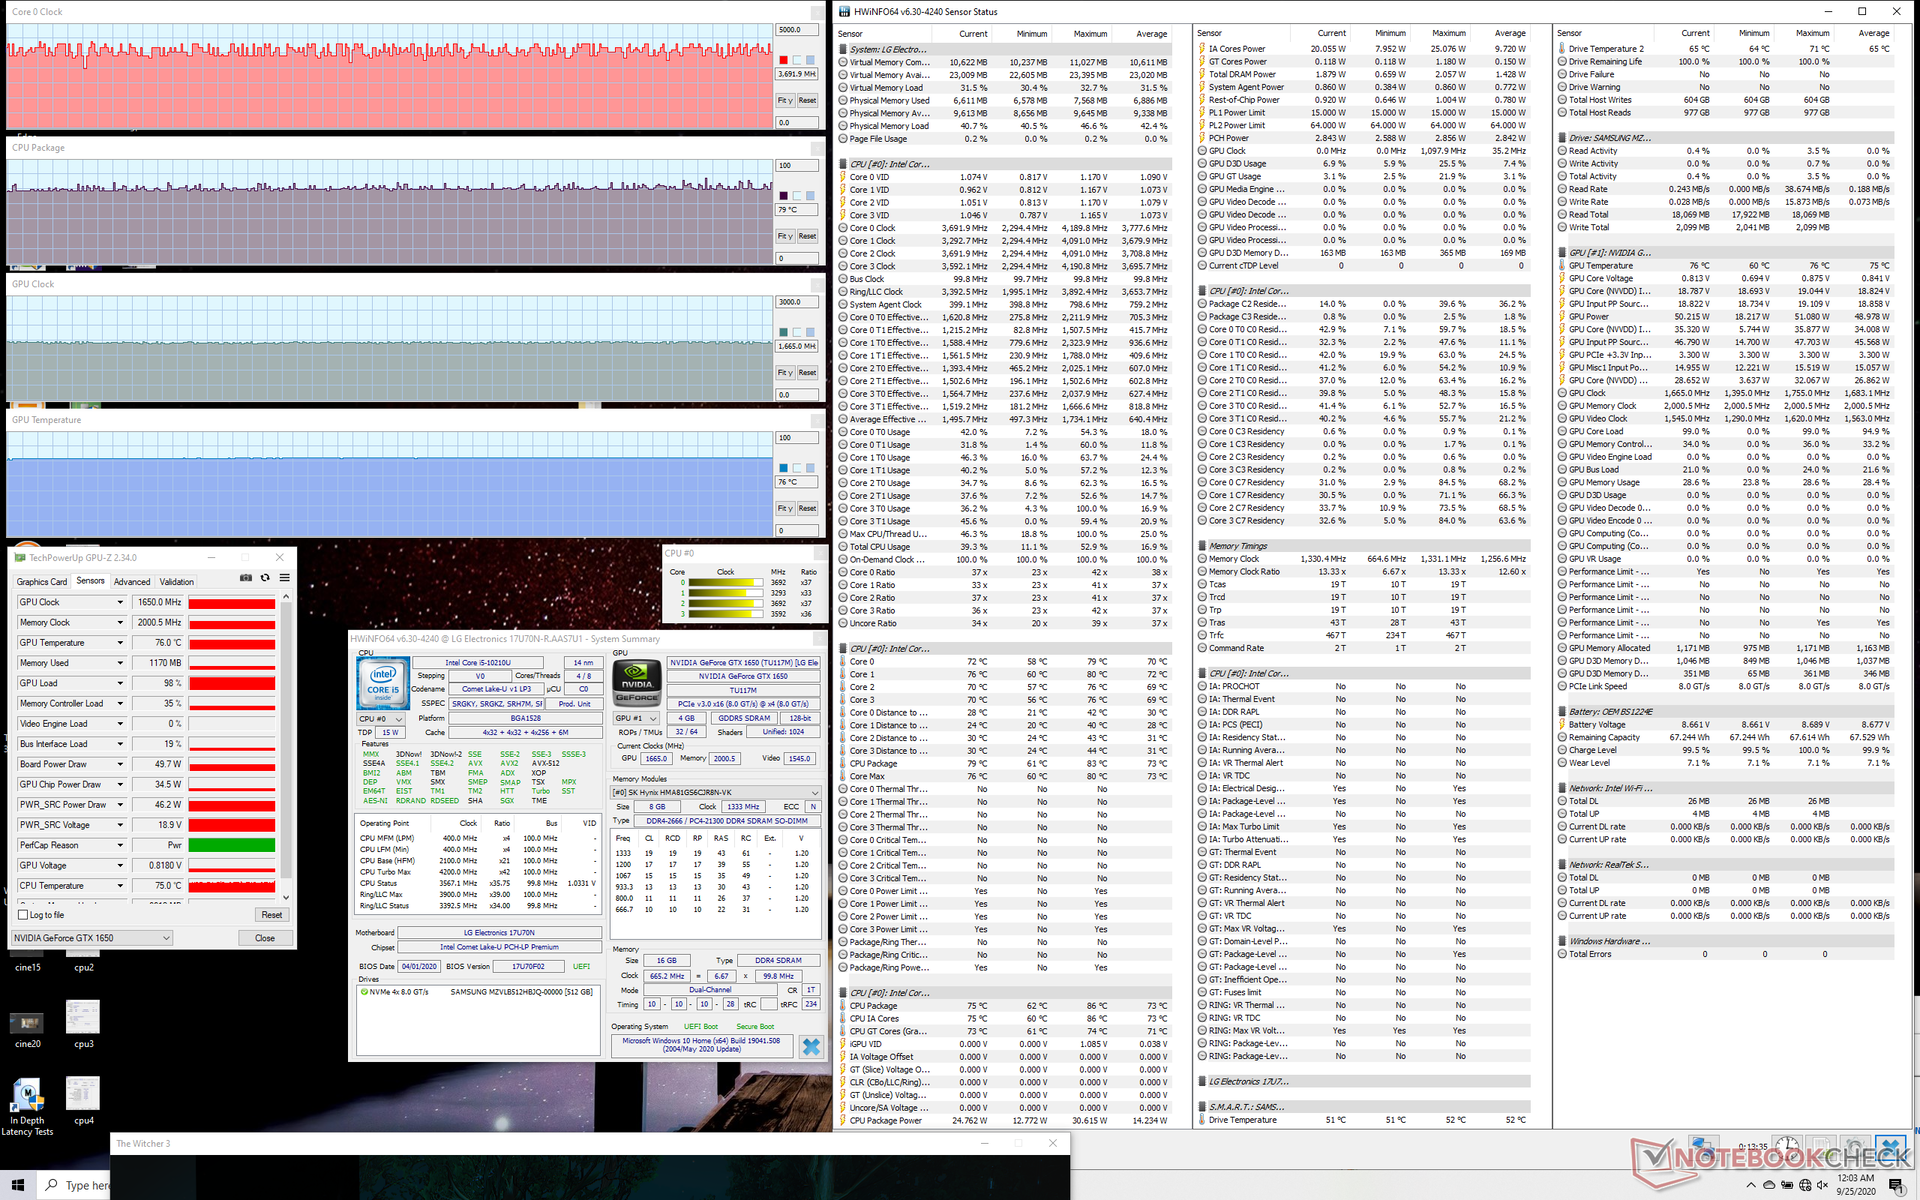
Running Witcher 3 causes the CPU and GPU to stabilize at 79 C and 76 C, respectively, compared to 61 C and 60 C on the 15.6-inch Asus ROG Strix G15 G512LI with the Core i7-10750H and GTX 1650 Ti GPU.
Running on batteries will limit GPU performance. A 3DMark 11 test on battery power would return Physics and Graphics scores of 6931 and 10397 points respectively, compared to 6727 and 12581 points when on mains.
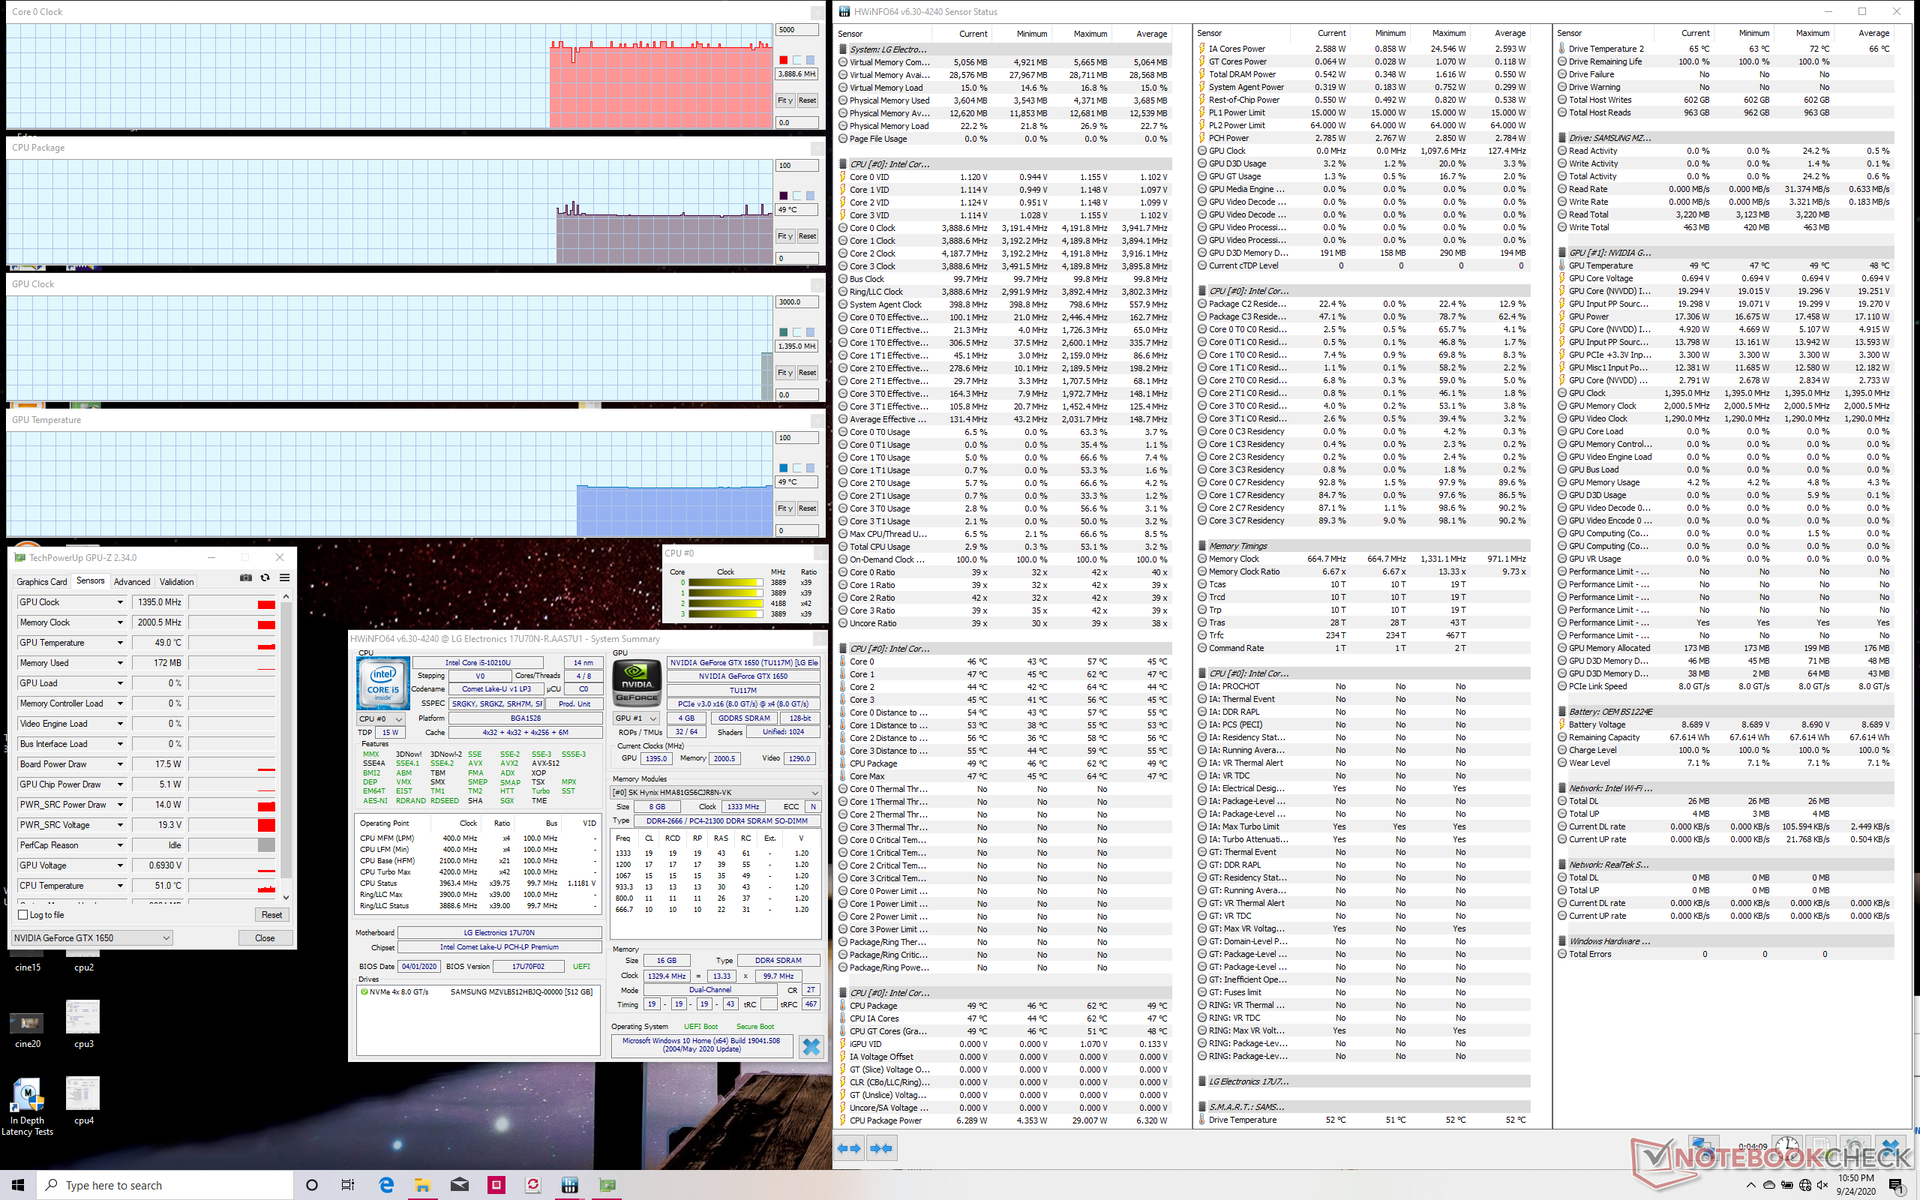
| CPU Clock (GHz) | GPU Clock (MHz) | Average CPU Temperature (°C) | Average GPU Temperature (°C) | |
| System Idle | -- | -- | 49 | 49 |
| Prime95 Stress | 2.0 - 2.1 | -- | 58 | 55 |
| Prime95 + FurMark Stress | 2.0 - 2.1 | 1320 | 73 | 76 |
| Witcher 3 Stress | ~3.7 | 1650 | 79 | 76 |
Speakers


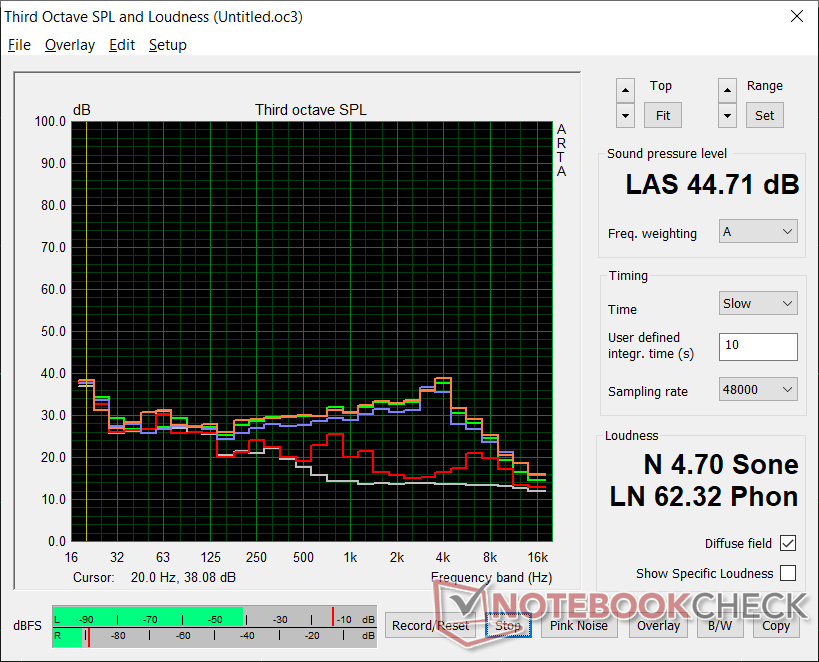
LG Ultra 17U70N audio analysis
(±) | speaker loudness is average but good (79.1 dB)
Bass 100 - 315 Hz
(-) | nearly no bass - on average 17.2% lower than median
(-) | bass is not linear (15.3% delta to prev. frequency)
Mids 400 - 2000 Hz
(+) | balanced mids - only 4.2% away from median
(±) | linearity of mids is average (9.5% delta to prev. frequency)
Highs 2 - 16 kHz
(+) | balanced highs - only 2.8% away from median
(+) | highs are linear (5.7% delta to prev. frequency)
Overall 100 - 16.000 Hz
(±) | linearity of overall sound is average (18.4% difference to median)
Compared to same class
» 57% of all tested devices in this class were better, 7% similar, 36% worse
» The best had a delta of 5%, average was 17%, worst was 45%
Compared to all devices tested
» 41% of all tested devices were better, 8% similar, 52% worse
» The best had a delta of 4%, average was 24%, worst was 134%
Apple MacBook 12 (Early 2016) 1.1 GHz audio analysis
(+) | speakers can play relatively loud (83.6 dB)
Bass 100 - 315 Hz
(±) | reduced bass - on average 11.3% lower than median
(±) | linearity of bass is average (14.2% delta to prev. frequency)
Mids 400 - 2000 Hz
(+) | balanced mids - only 2.4% away from median
(+) | mids are linear (5.5% delta to prev. frequency)
Highs 2 - 16 kHz
(+) | balanced highs - only 2% away from median
(+) | highs are linear (4.5% delta to prev. frequency)
Overall 100 - 16.000 Hz
(+) | overall sound is linear (10.2% difference to median)
Compared to same class
» 7% of all tested devices in this class were better, 2% similar, 91% worse
» The best had a delta of 5%, average was 18%, worst was 53%
Compared to all devices tested
» 5% of all tested devices were better, 1% similar, 94% worse
» The best had a delta of 4%, average was 24%, worst was 134%
Energy Management
Power Consumption
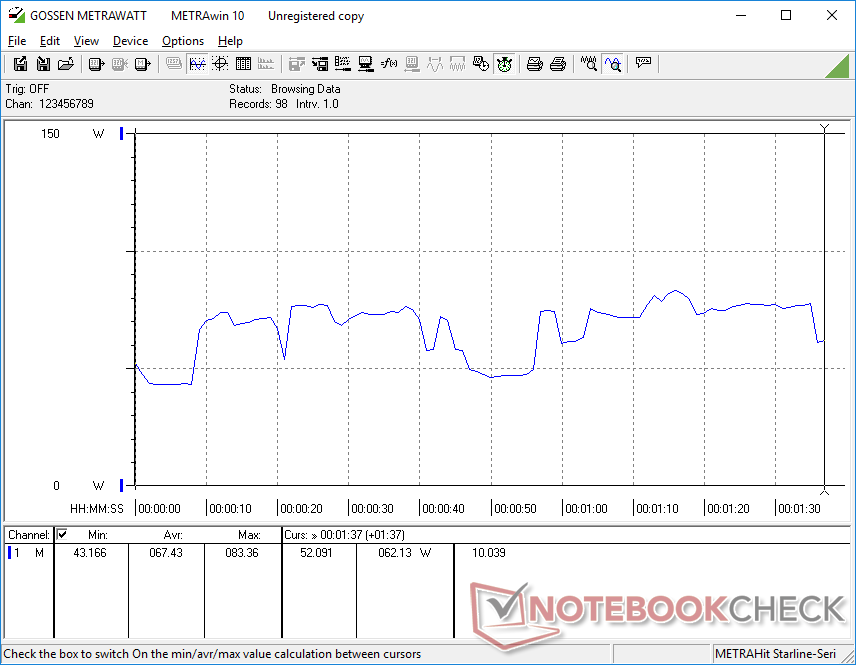
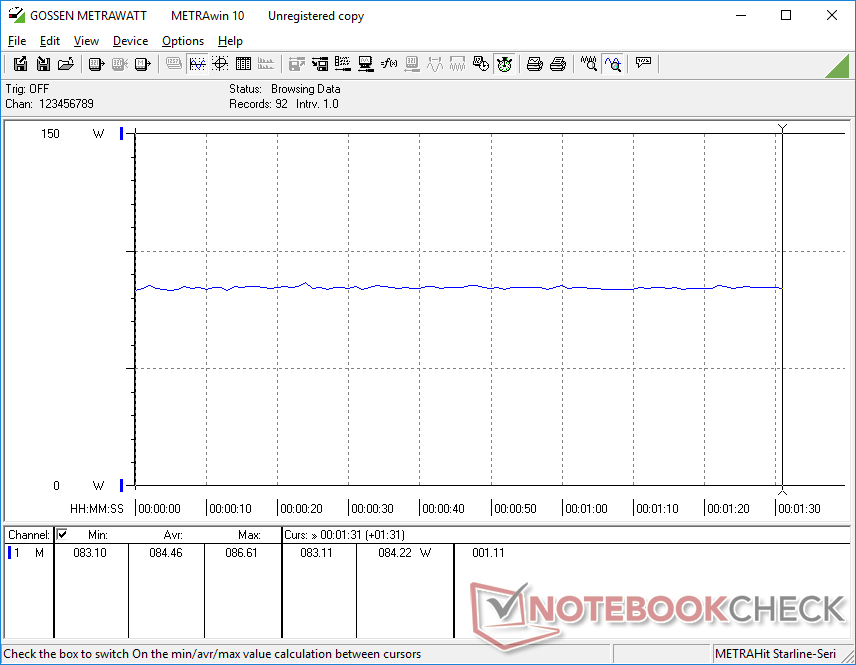
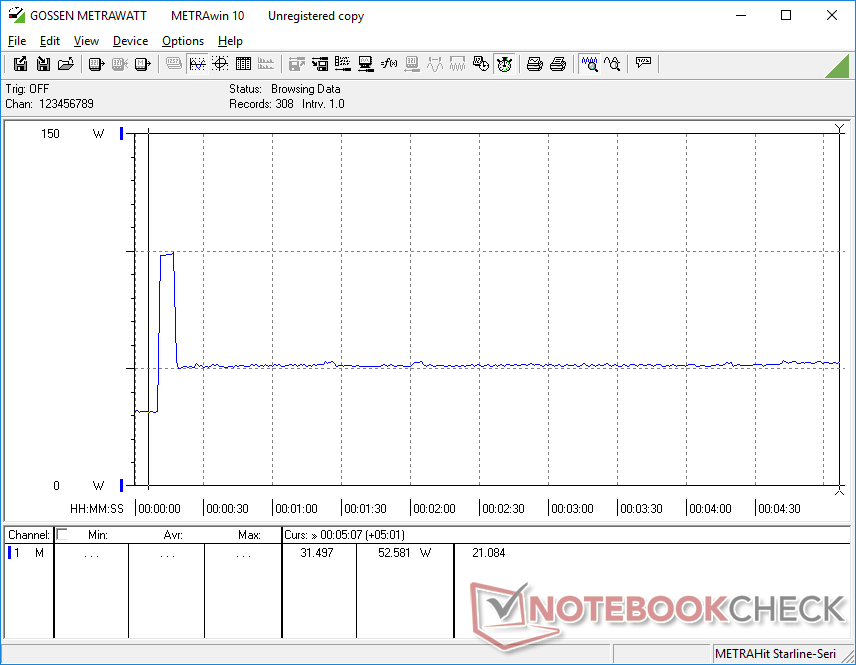
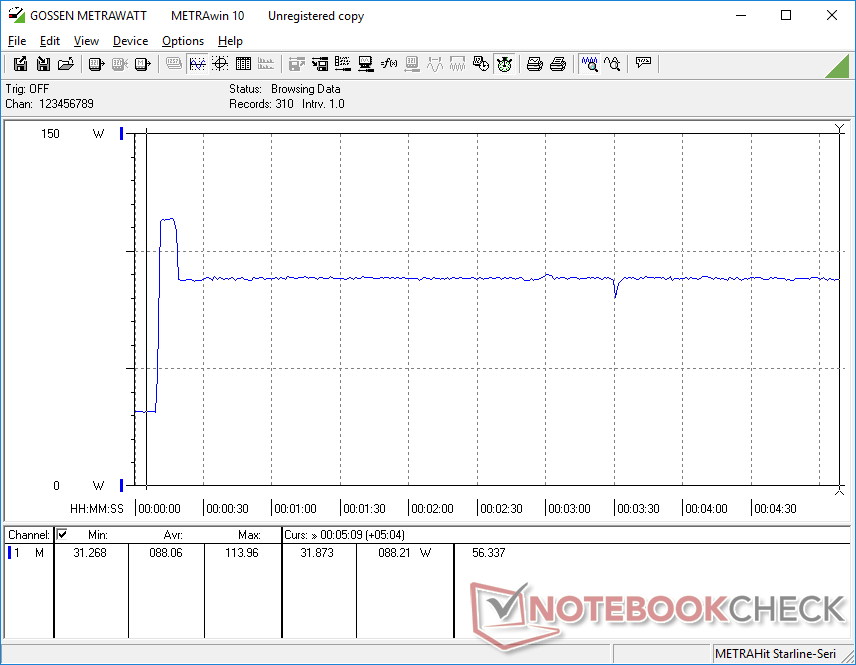
The laptop draws between 3 W and 9 W depending on the power profile and brightness setting. If the discrete GPU is active, this jumps up to almost 31 W and so we recommend running the system on the integrated GPU if the extra graphics horsepower is not needed.
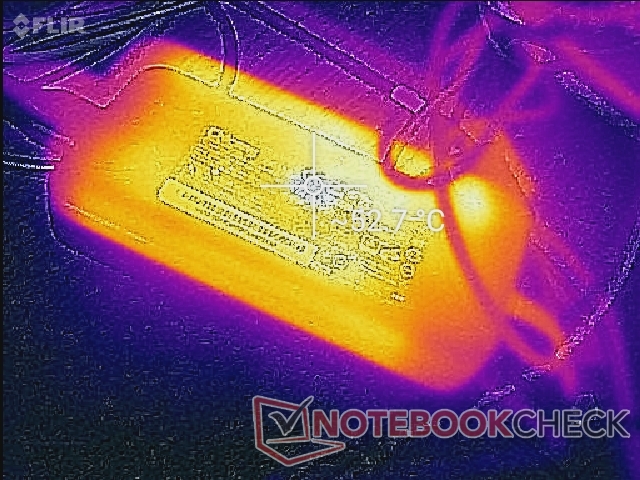
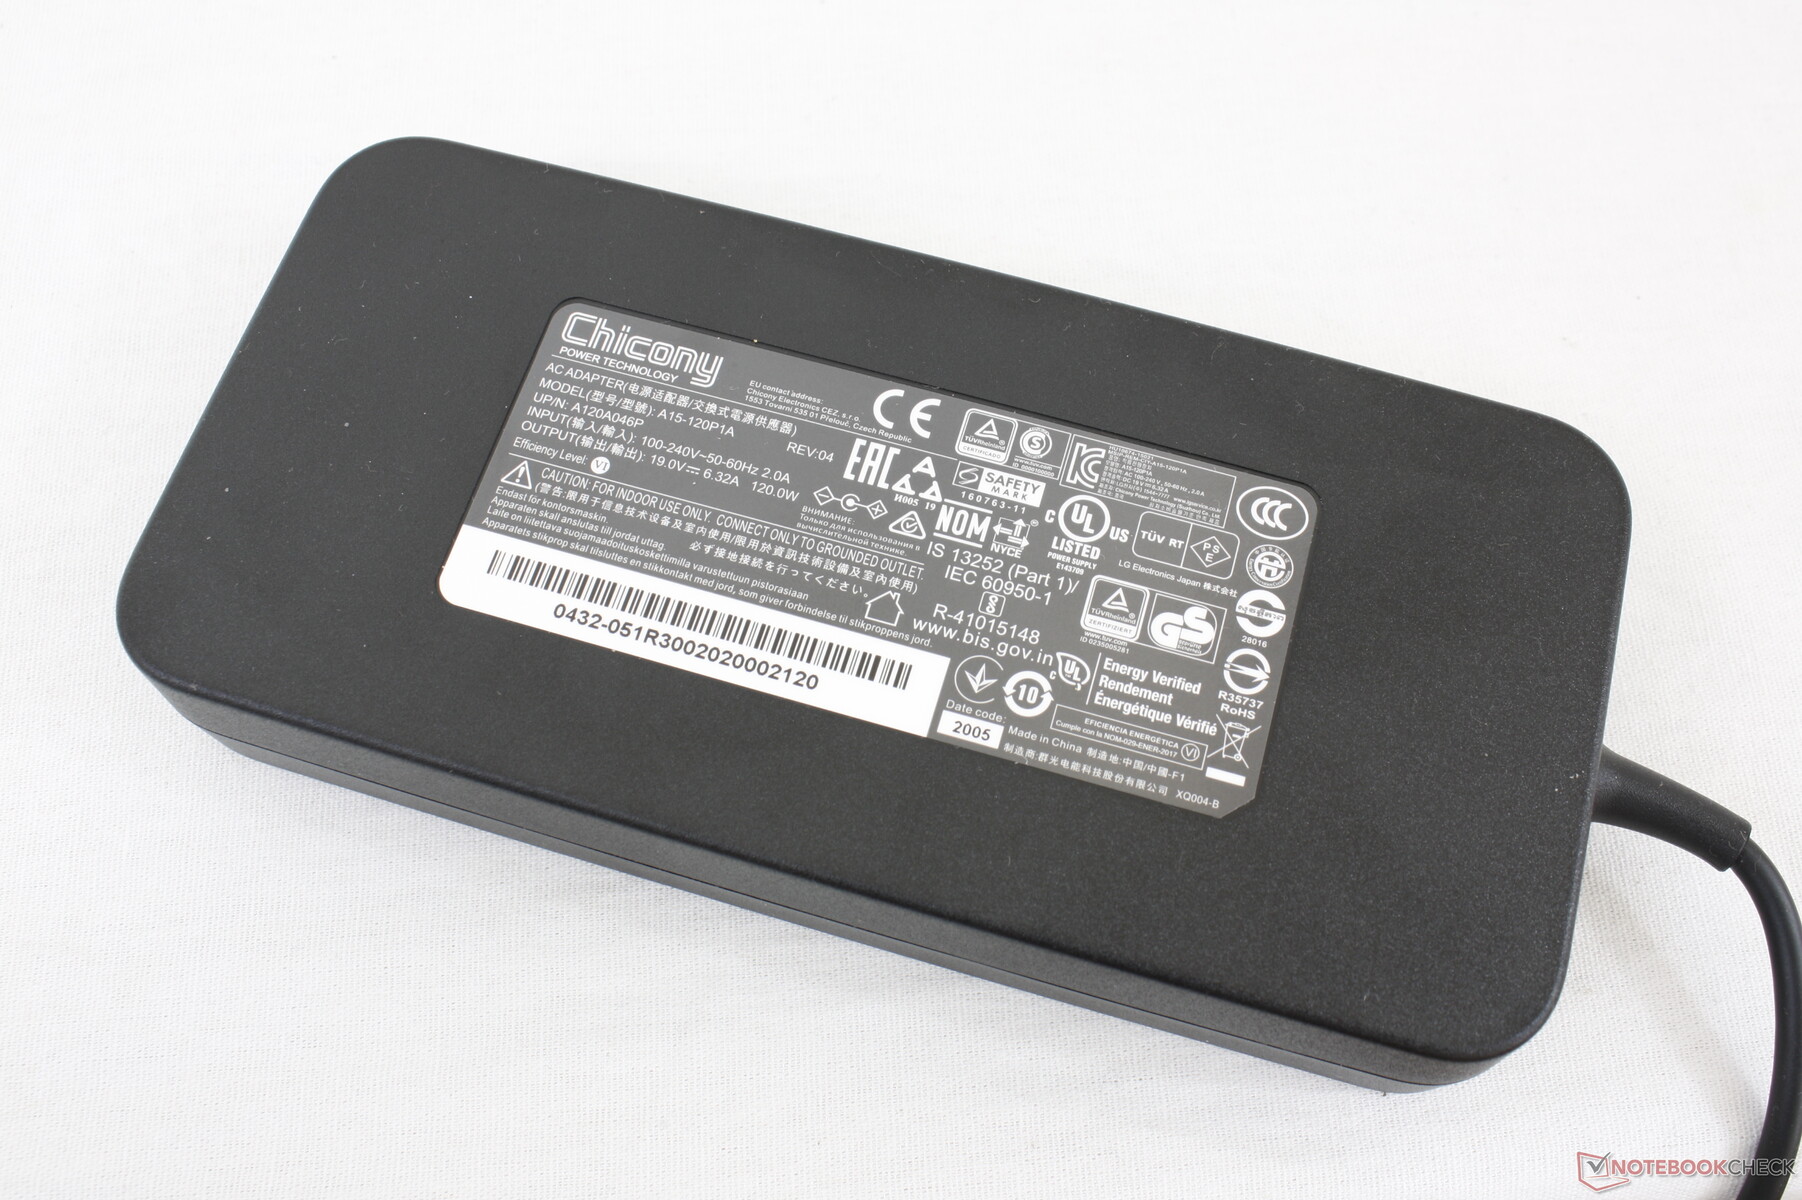
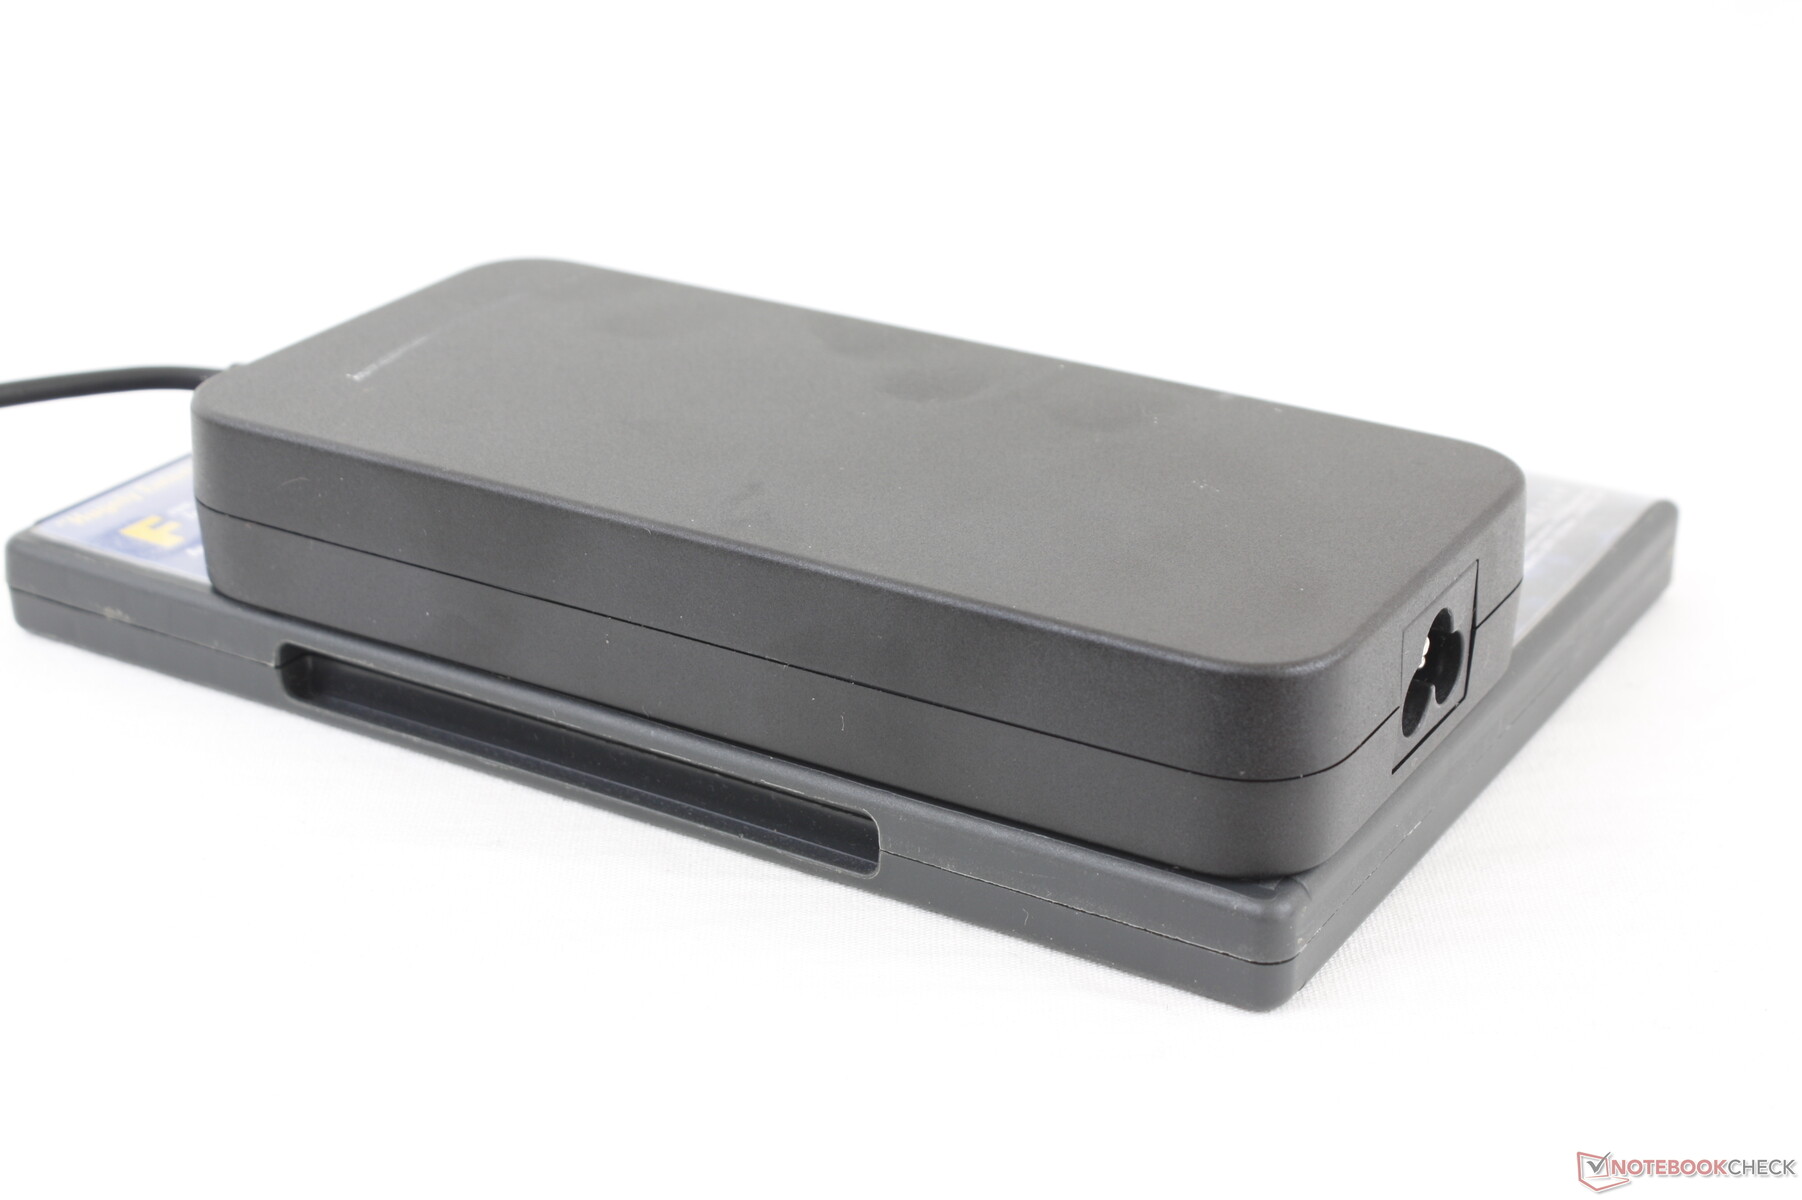
Gaming will of course demand more power than the Gram 17 by about 25 W to 40 W more. We're able to record a maximum draw of 114 W from the medium-sized (~16 x 7.5 x 2.5 cm) 120 W AC adapter when running extreme loads. This maximum is very short-lived due to thermal limitations as shown by the graphs below.
| Off / Standby | |
| Idle | |
| Load |
|
Key:
min: | |
| LG Ultra 17U70N i5-10210U, GeForce GTX 1650 Mobile, Samsung SSD PM981a MZVLB512HBJQ, IPS, 2560x1600, 17" | LG Gram 17 17Z90N-V.AA77G i7-1065G7, Iris Plus Graphics G7 (Ice Lake 64 EU), Samsung PM981a MZVLB1T0HBLR, IPS, 2560x1600, 17" | Eluktronics RP-17 R7 4800H, GeForce RTX 2060 Mobile, Phison PS5013 PRO-X-1TB-G2R NVMe SSD, IPS, 1920x1080, 17.3" | MSI Bravo 17 A4DDR R7 4800H, Radeon RX 5500M, Toshiba KBG30ZMV512G, IPS, 1920x1080, 17.3" | HP Envy 17t-cg000 i7-1065G7, GeForce MX330, WDC PC SN520 SDAPNUW-512G, IPS, 3840x2160, 17.3" | |
|---|---|---|---|---|---|
| Power Consumption | 38% | -145% | -40% | -4% | |
| Idle Minimum * (Watt) | 3.7 | 3.2 14% | 20.2 -446% | 9 -143% | 6.1 -65% |
| Idle Average * (Watt) | 8.8 | 8.4 5% | 24.5 -178% | 10 -14% | 13 -48% |
| Idle Maximum * (Watt) | 30.6 | 11.7 62% | 28.7 6% | 13 58% | 13.5 56% |
| Load Average * (Watt) | 67.4 | 39.6 41% | 110.4 -64% | 69 -2% | 72.7 -8% |
| Witcher 3 ultra * (Watt) | 84.5 | 166.3 -97% | 128 -51% | 62.2 26% | |
| Load Maximum * (Watt) | 114 | 34 70% | 217.4 -91% | 214 -88% | 97.1 15% |
* ... smaller is better
Battery Life
Battery capacity is slightly smaller on the Ultra 17 than on the Gram 17 (72 Wh vs. 80 Wh). Runtimes, however, are nonetheless very close when on the Balanced profile. We're able to measure a total runtime of over 13.5 hours when browsing the web with the integrated GPU active.
Charging from empty to full capacity takes 2 hours. The system cannot be recharged via USB-C.
| LG Ultra 17U70N i5-10210U, GeForce GTX 1650 Mobile, 72 Wh | Dell XPS 17 9700 Core i7 RTX 2060 Max-Q i7-10875H, GeForce RTX 2060 Max-Q, 97 Wh | LG Gram 17 17Z90N-V.AA77G i7-1065G7, Iris Plus Graphics G7 (Ice Lake 64 EU), 80 Wh | Eluktronics RP-17 R7 4800H, GeForce RTX 2060 Mobile, 62 Wh | MSI Bravo 17 A4DDR R7 4800H, Radeon RX 5500M, 51 Wh | HP Envy 17t-cg000 i7-1065G7, GeForce MX330, 55 Wh | |
|---|---|---|---|---|---|---|
| Battery runtime | 7% | 55% | -42% | -44% | -32% | |
| Reader / Idle (h) | 24.8 | 23.8 -4% | 24 -3% | 7.7 -69% | 15.4 -38% | |
| WiFi v1.3 (h) | 13.7 | 9.7 -29% | 11.4 -17% | 4.4 -68% | 5.2 -62% | 4.6 -66% |
| Load (h) | 1.3 | 2 54% | 3.7 185% | 1.1 -15% | 1.3 0% | 1.4 8% |
Pros
Cons
Verdict
Key features of the LG Ultra 17 seem to be at odds with one another. The 16:10 aspect ratio is great, but multimedia users may prefer 16:9. On the flip side, content creators might appreciate the taller aspect ratio, but the slow processor performance can make editing and encoding take longer than expected and the lack of AdobeRGB coverage can be a deal breaker. And finally, casual gamers will like the full-power GeForce GTX 1650 GPU, but the noticeable ghosting and U-series CPU might leave a sour taste in the mouth. The laptop doesn't excel at any particular category which makes it a strange office/multimedia hybrid laptop with both good graphics and slow processor performance.
The one notable advantage of the Ultra 17 is its relatively light weight for a 17-inch laptop with GTX graphics. Otherwise, you'd be better off with the XPS 17 if you don't intend to travel much with the Ultra 17.
Part content creator, part gamer, part multimedia machine. The LG Ultra 17 is useful if you travel a lot and need a powerful GPU with a large 17-inch sRGB display.
LG Ultra 17U70N
- 09/30/2020 v7 (old)
Allen Ngo
Price comparison
