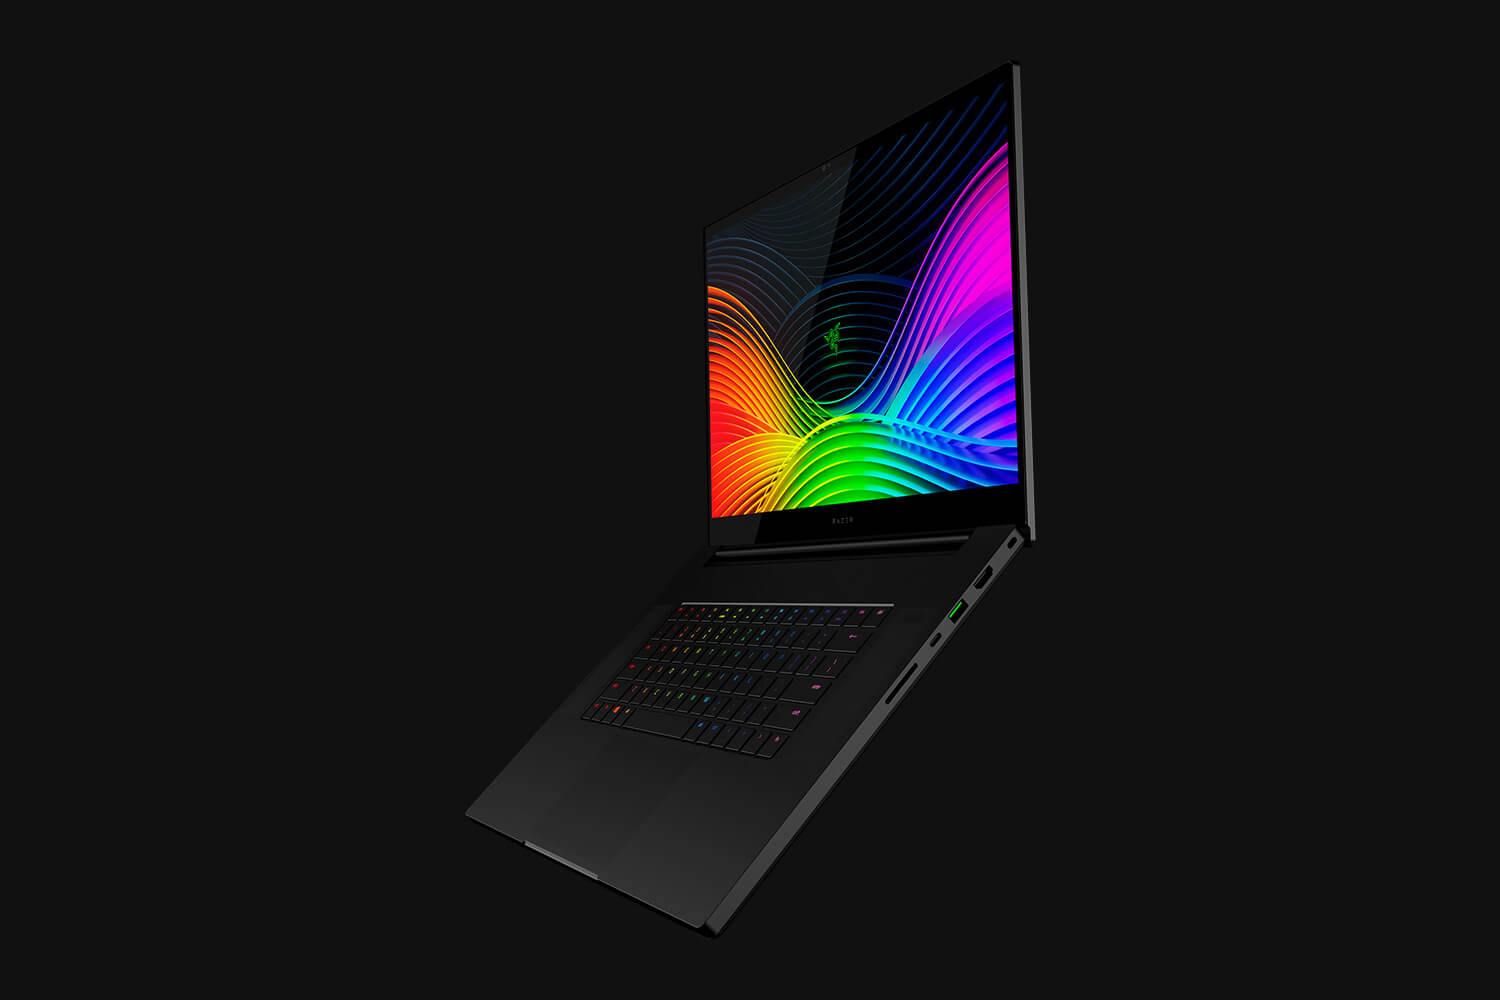
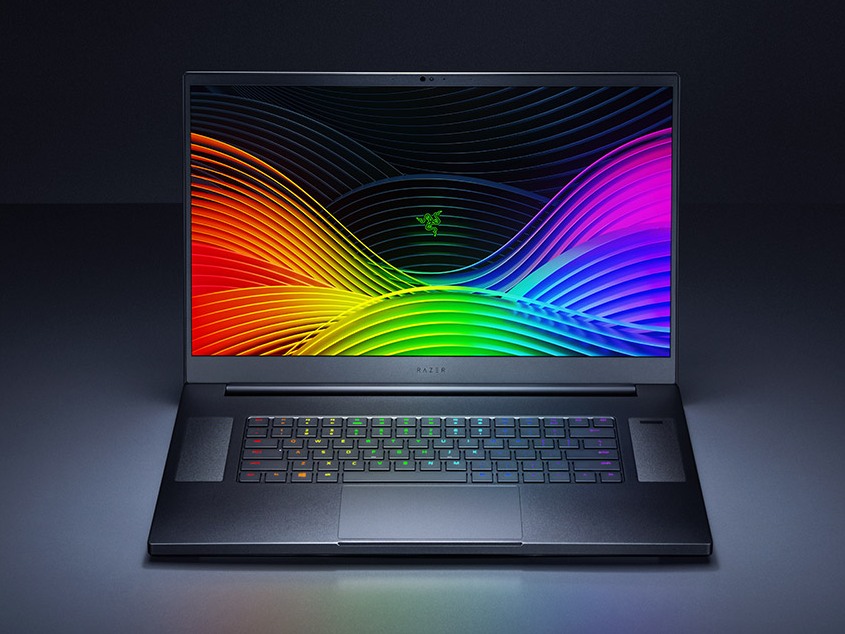
Razer Blade Pro 17 4K UHD 120 Hz Laptop Review: Finally, a 17-inch 4K Display With Almost No Ghosting
Razer added one more SKU to its Blade Pro 17 lineup in September with a never-before-seen 17.3-inch 120 Hz 4K display option capable of fast response times. Previously, all 17.3-inch 4K UHD displays were limited to 60 Hz and much slower response times for more noticeable ghosting.
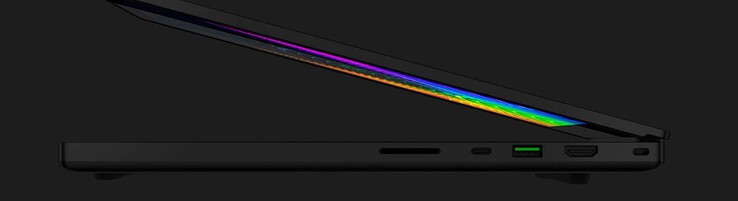
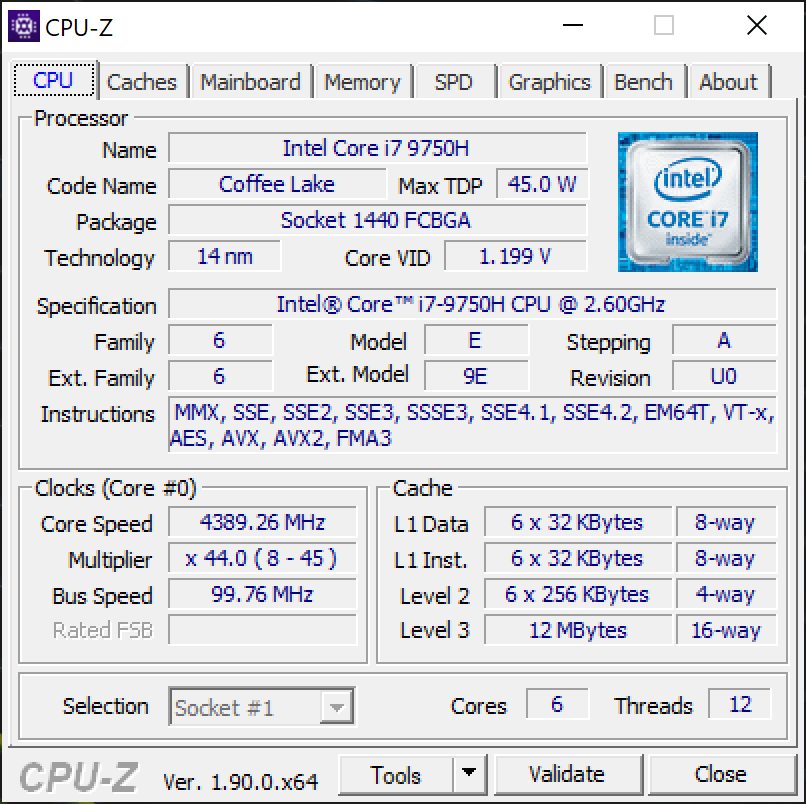
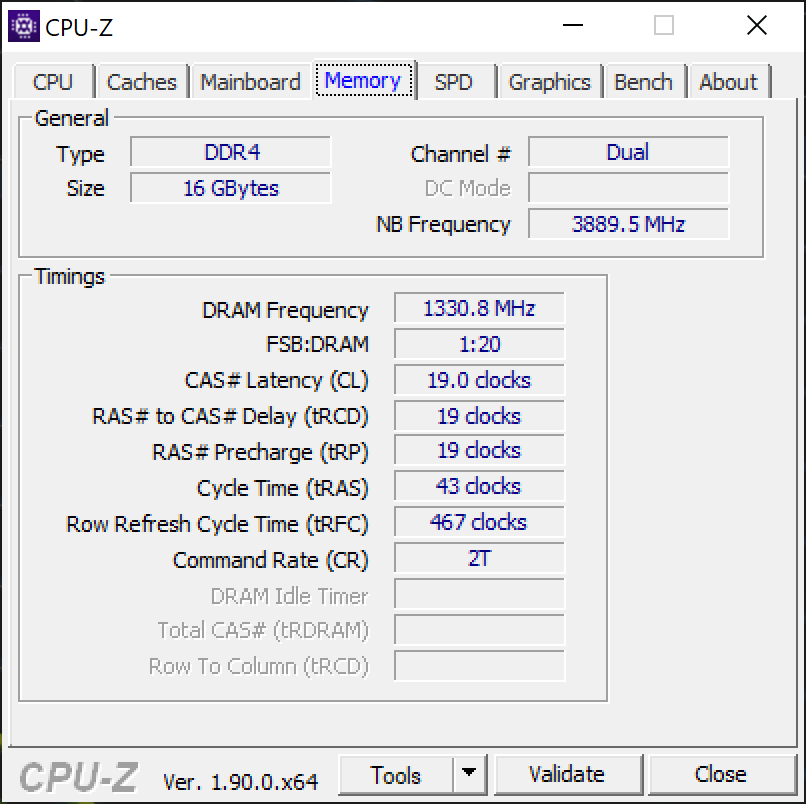
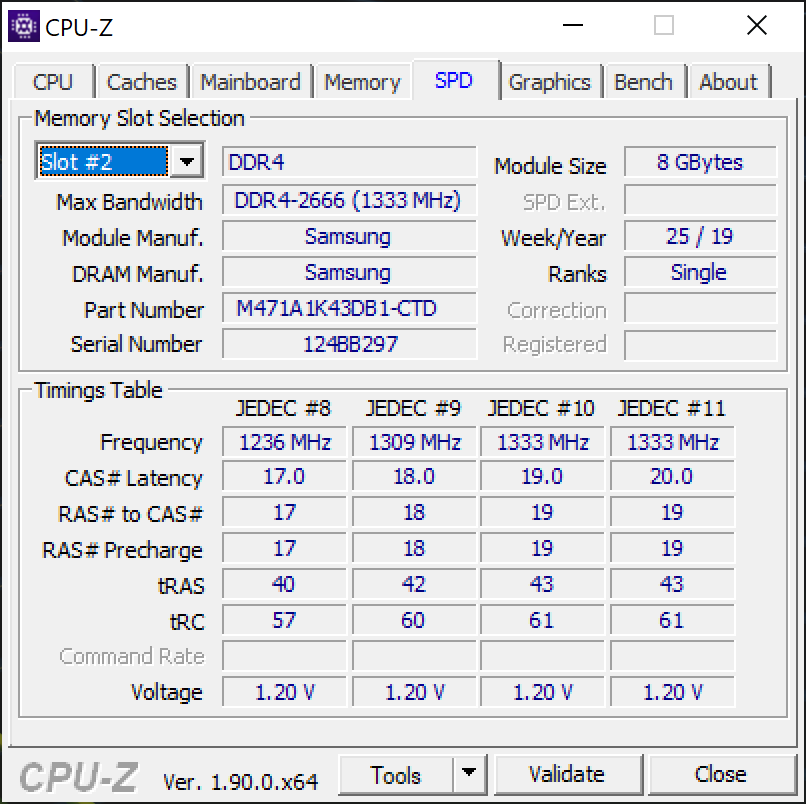
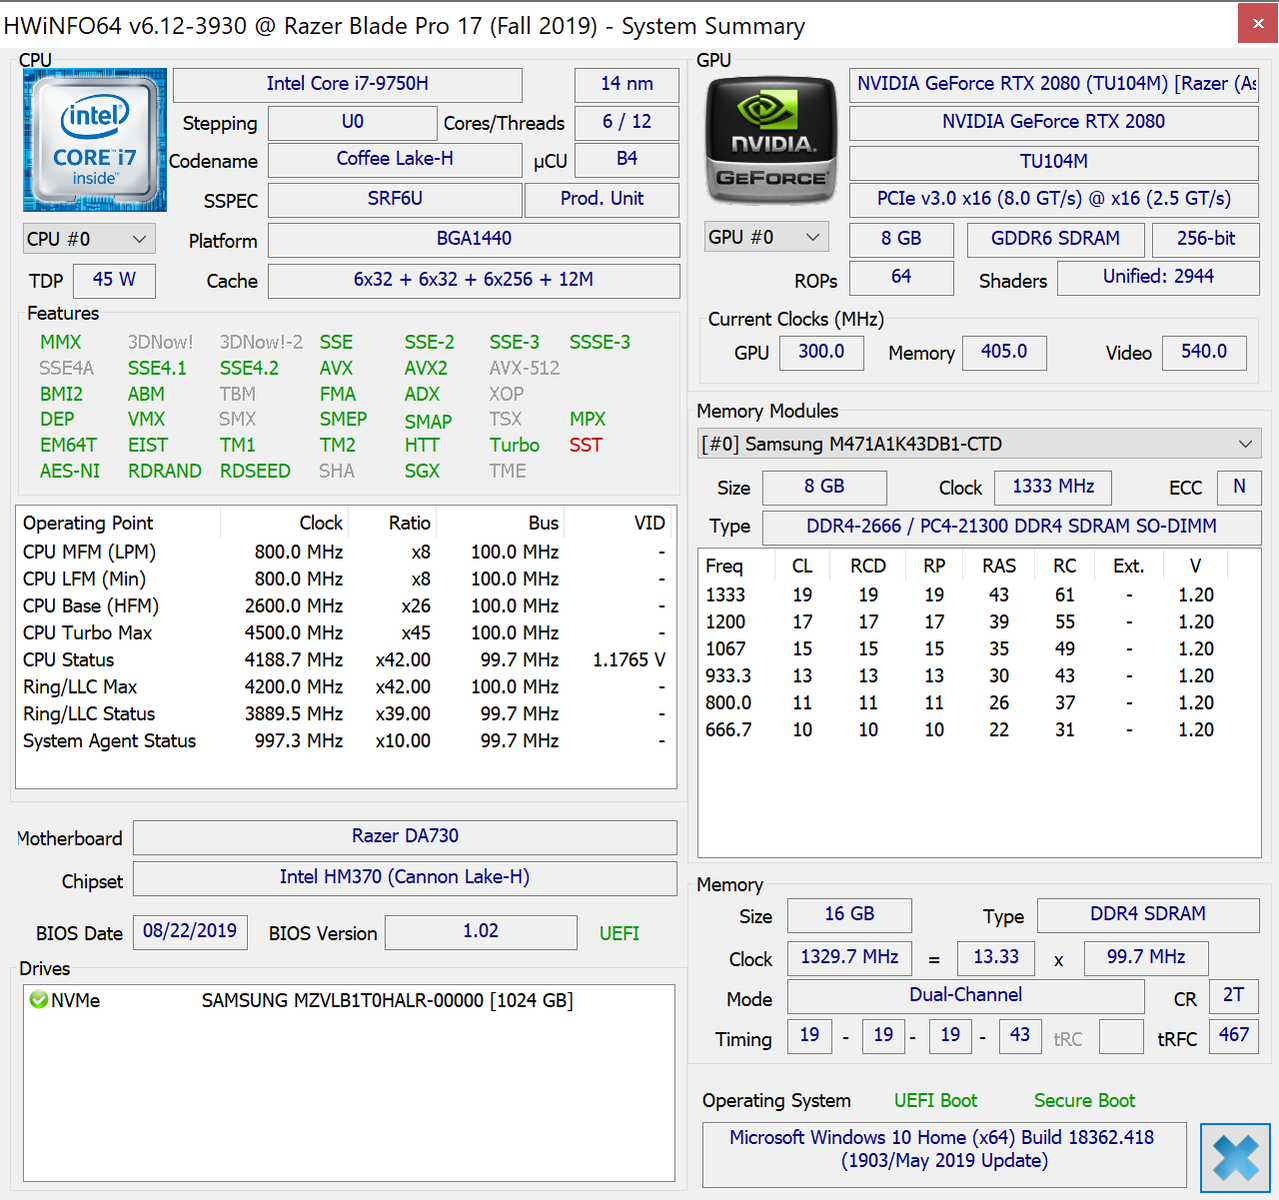
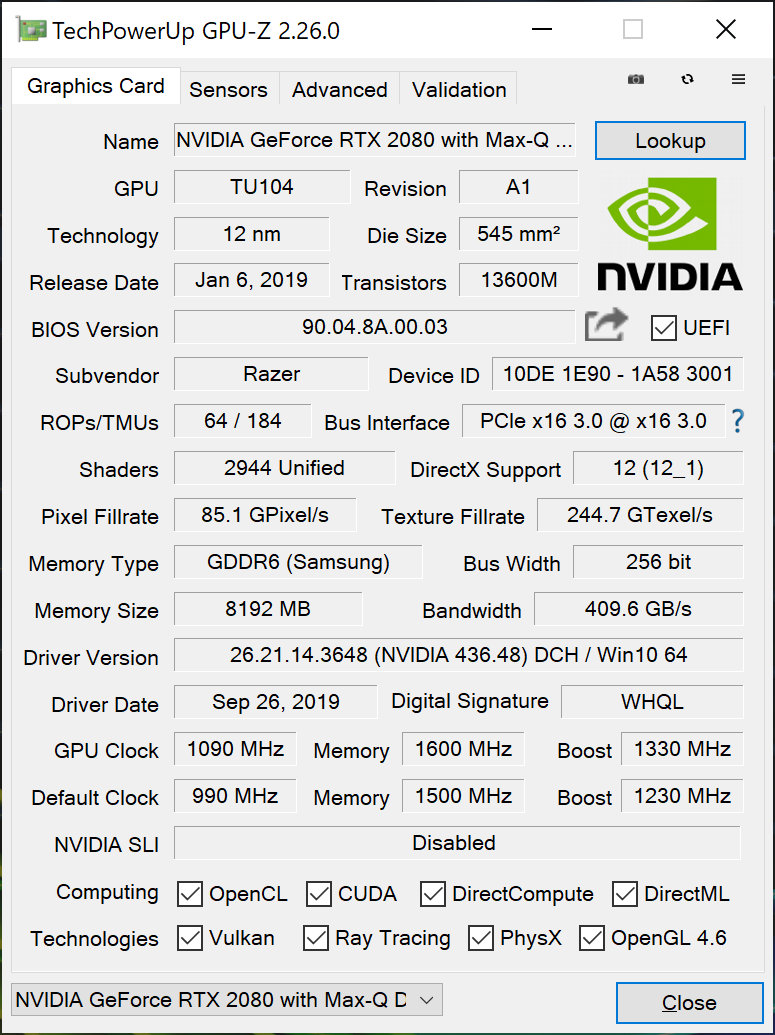
Currently, only the highest-end Blade Pro 17 configuration comes with the new 120 Hz glossy panel for a starting price of $3700 USD. Our review here will focus on the display and how it compares to other 17.3-inch and 15.6-inch panels in the market. See our existing review on the Razer Blade Pro 17 to learn more about the chassis since the Blade Pro 17 4K 120 Hz SKU shares the same Core i7-9750H CPU, GeForce RTX 2080 Max-Q GPU, 16 GB of DDR4-2666 RAM, and other physical features.
More Razer Blade reviews:
Rating | Date | Model | Weight | Height | Size | Resolution | Price |
|---|---|---|---|---|---|---|---|
| 86.7 % v7 (old) | 10 / 2019 | Razer Blade Pro 17 4K UHD 120 Hz i7-9750H, GeForce RTX 2080 Max-Q | 2.8 kg | 19.9 mm | 17.30" | 3840x2160 | |
| 82.9 % v7 (old) | 06 / 2019 | MSI GS75 Stealth 9SG i7-9750H, GeForce RTX 2080 Max-Q | 2.3 kg | 18.9 mm | 17.30" | 1920x1080 | |
| 85.6 % v6 (old) | 02 / 2019 | Asus Zephyrus S GX701GX i7-8750H, GeForce RTX 2080 Max-Q | 2.6 kg | 19 mm | 17.30" | 1920x1080 | |
| 83.2 % v7 (old) | 10 / 2019 | Lenovo Legion Y740-17IRH i7-9750H, GeForce RTX 2060 Mobile | 3 kg | 23 mm | 17.30" | 1920x1080 | |
| 86.1 % v7 (old) | 09 / 2019 | Gigabyte Aero 17 XA RP77 i9-9980HK, GeForce RTX 2070 Max-Q | 2.5 kg | 21.4 mm | 17.30" | 3840x2160 |
Case
SD Card Reader
| SD Card Reader | |
| average JPG Copy Test (av. of 3 runs) | |
| Gigabyte Aero 17 XA RP77 (Toshiba Exceria Pro SDXC 64 GB UHS-II) | |
| Eurocom Nightsky RX15 (Toshiba Exceria Pro SDXC 64 GB UHS-II) | |
| Razer Blade Pro 17 4K UHD 120 Hz (Toshiba Exceria Pro SDXC 64 GB UHS-II) | |
| Razer Blade Pro 2017 (Toshiba Exceria Pro SDXC 64 GB UHS-II) | |
| HP Pavilion Gaming 15-ec0017ng (Toshiba Exceria Pro SDXC 64 GB UHS-II) | |
| maximum AS SSD Seq Read Test (1GB) | |
| Gigabyte Aero 17 XA RP77 (Toshiba Exceria Pro SDXC 64 GB UHS-II) | |
| Eurocom Nightsky RX15 (Toshiba Exceria Pro SDXC 64 GB UHS-II) | |
| Razer Blade Pro 17 4K UHD 120 Hz (Toshiba Exceria Pro SDXC 64 GB UHS-II) | |
| Razer Blade Pro 2017 (Toshiba Exceria Pro SDXC 64 GB UHS-II) | |
| HP Pavilion Gaming 15-ec0017ng (Toshiba Exceria Pro SDXC 64 GB UHS-II) | |
Communication
Display
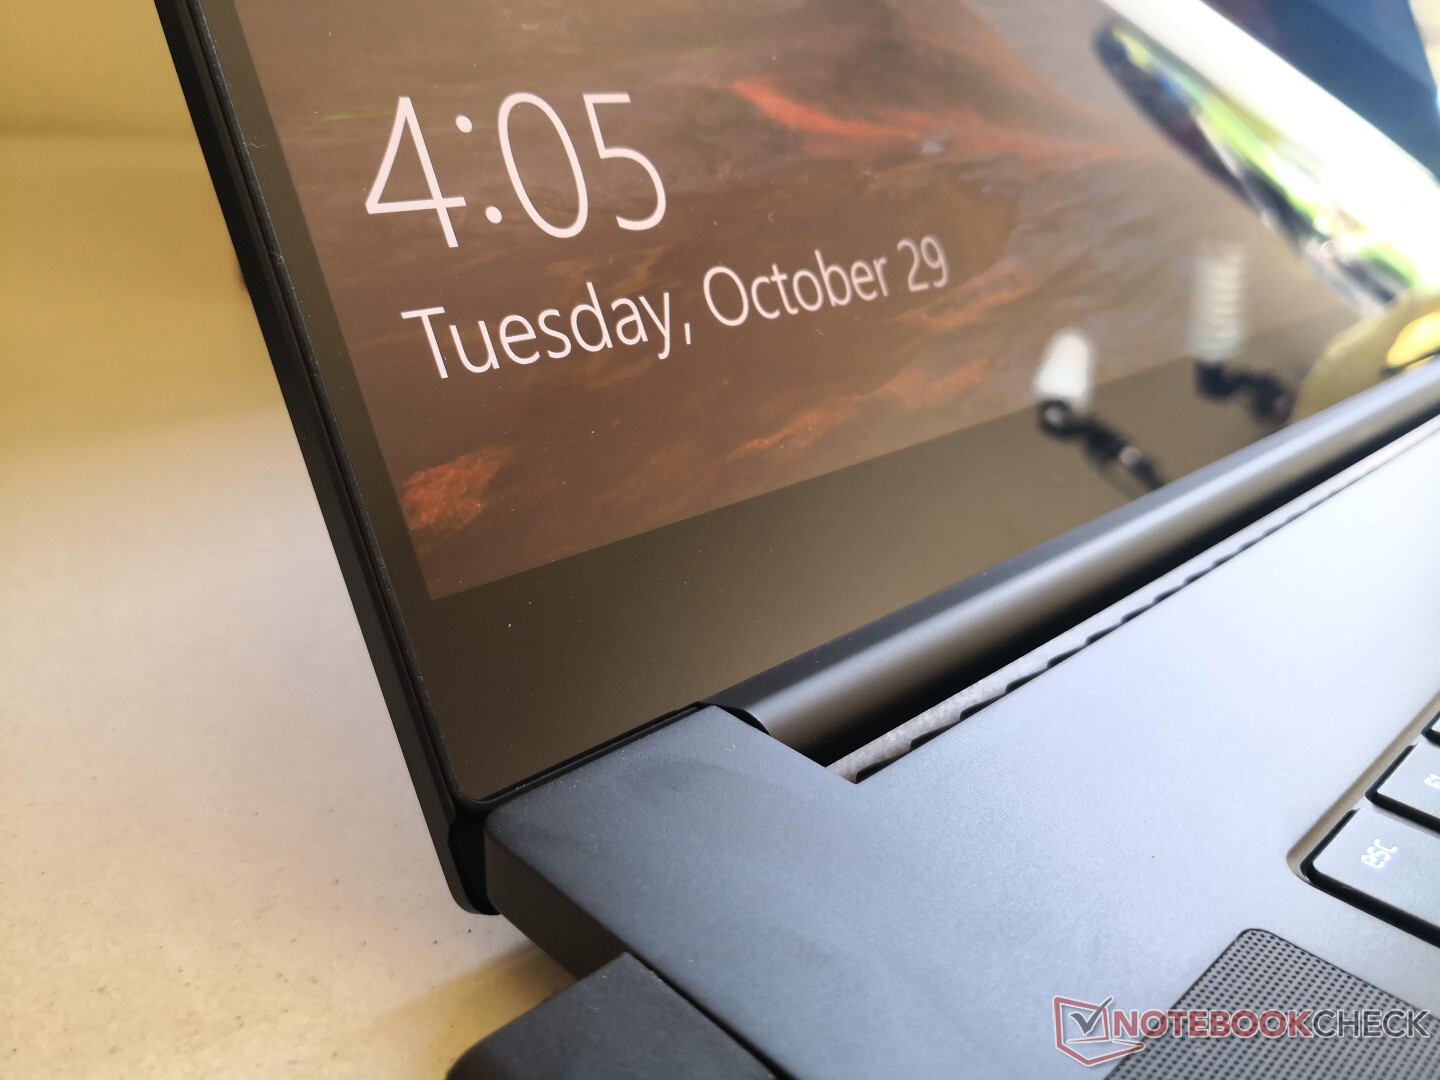
As detailed here, the Razer Blade Pro 17 is the first laptop to ship with the AU Optronics B173ZAN03.3 IPS panel. This is notable because the panel is capable of a native refresh rate of 120 Hz with fast response times - features never-before-seen on any 17.3-inch 4K laptop display.
Razer had initially advertised a brightness of 400 nits, but our own measurements refute their claim as we're able to measure a maximum of only 347 nits on the center of the screen when at the maximum brightness setting. While it's still about 50 nits brighter than on the Blade Pro 17 FHD SKU, the difference is not very noticeable.
What *is* noticeable, however, is the fast refresh rate of 120 Hz. Previously, users who had wanted a laptop with both fast refresh rates and fast black-white response times would have had to settle with a native 1080p resolution display because there were no 4K 120 Hz panels available in this screen size. The new AU Optronics B173ZAN03.3 panel addresses these shortcomings and the results are stunning. Even more impressive is that both contrast and colors remain excellent to be nearly identical to the 2017 Blade Pro Sharp IGZO display. Ghosting has been dramatically reduced when compared to other 17.3-inch 4K displays like the ones on the Gigabyte Aero 17 or EVGA SC17.

| |||||||||||||||||||||||||
Brightness Distribution: 91 %
Center on Battery: 346.7 cd/m²
Contrast: 1284:1 (Black: 0.27 cd/m²)
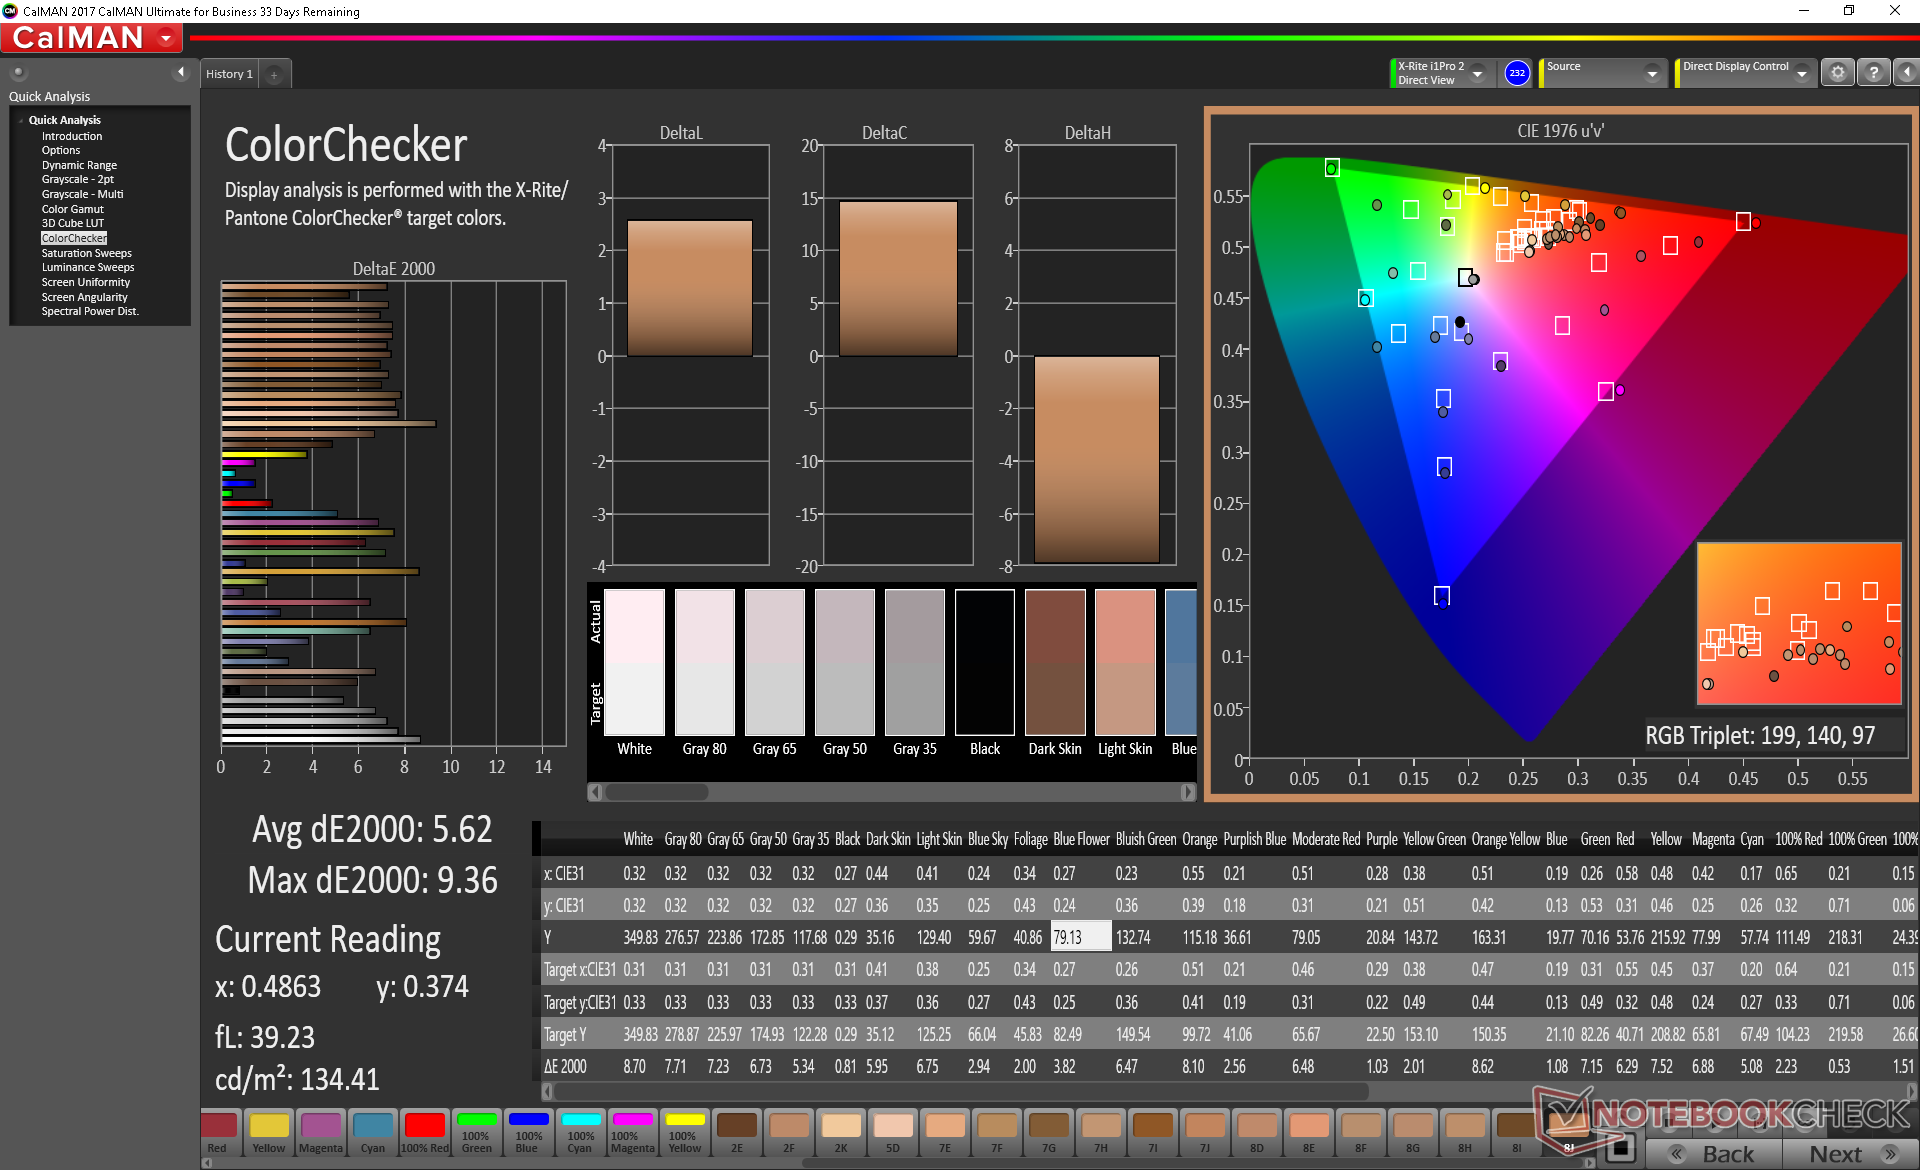
ΔE ColorChecker Calman: 5.62 | ∀{0.5-29.43 Ø4.71}
calibrated: 3.81
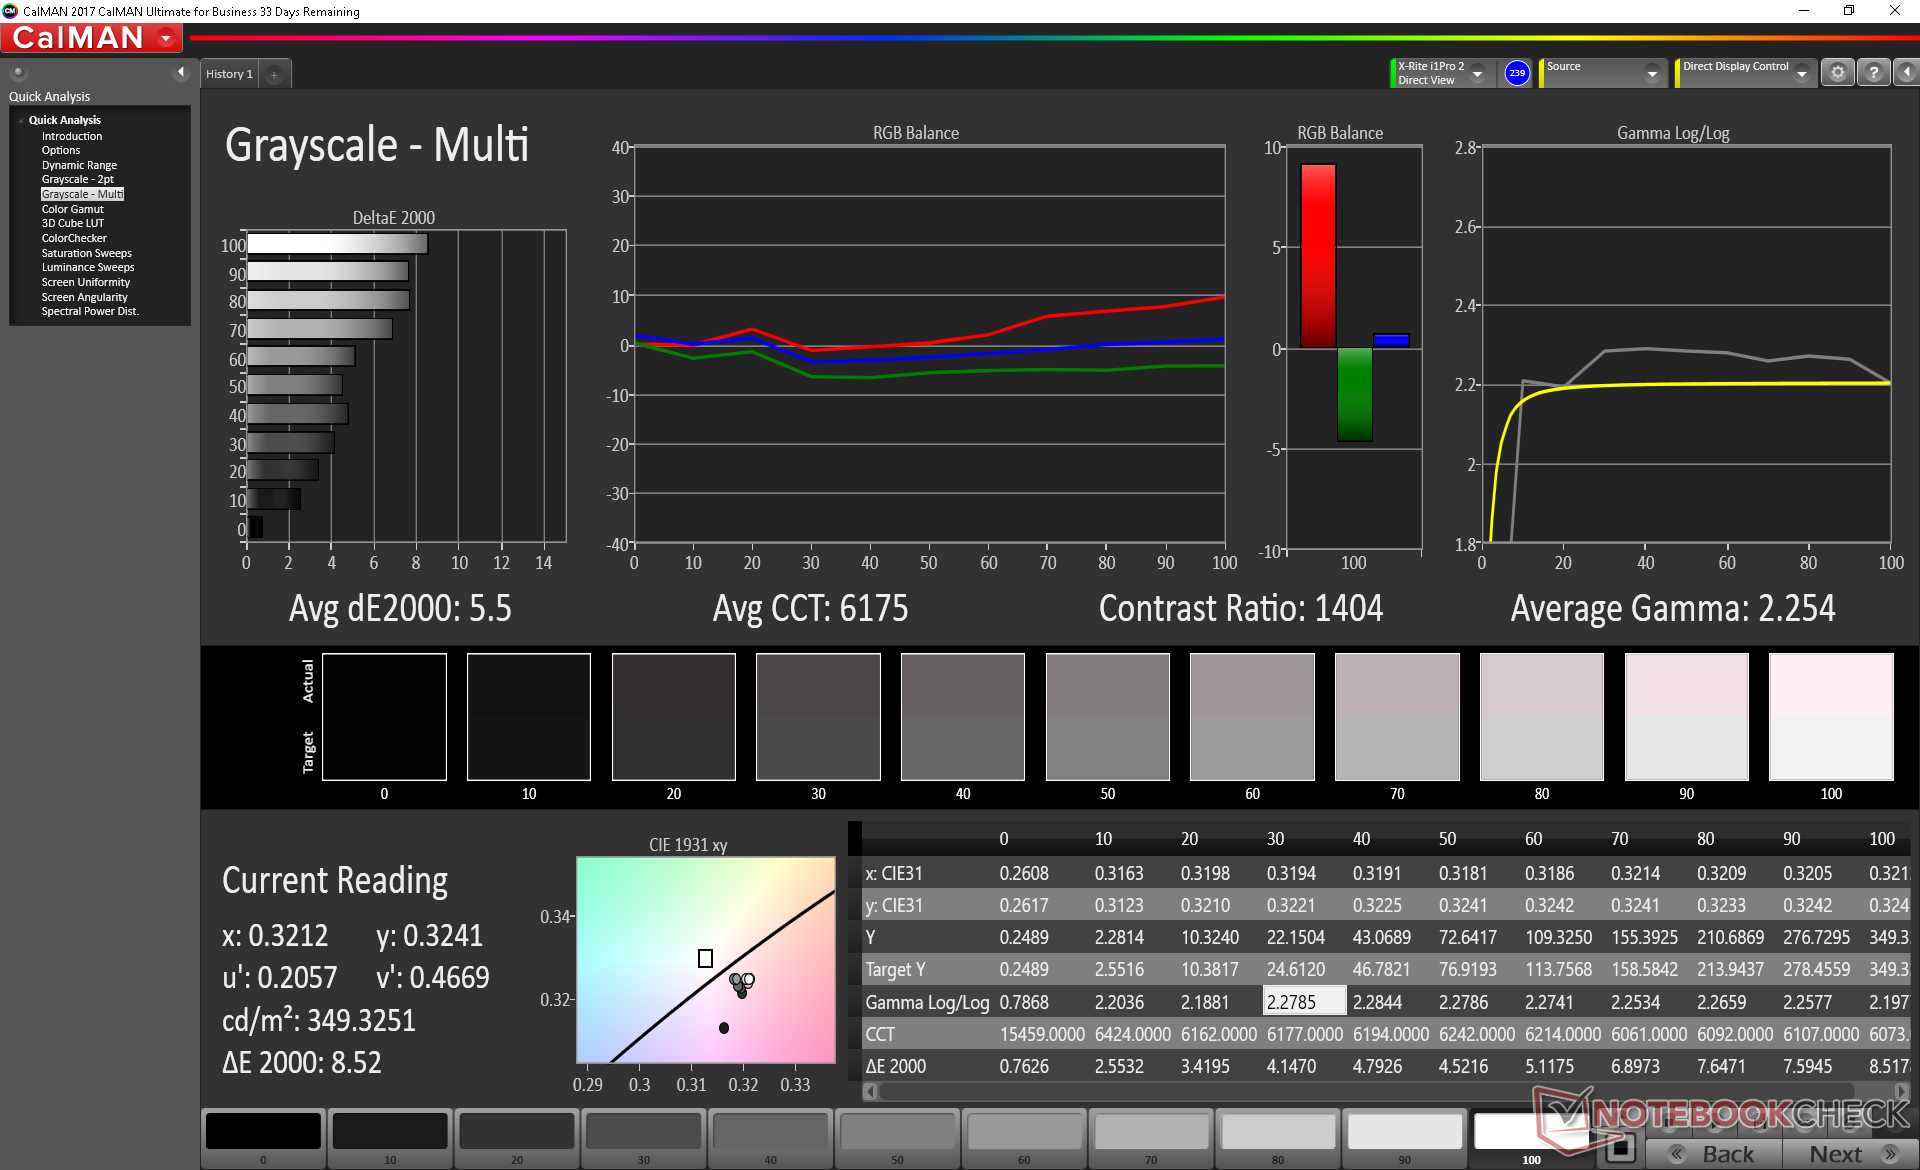
ΔE Greyscale Calman: 5.5 | ∀{0.09-98 Ø4.96}
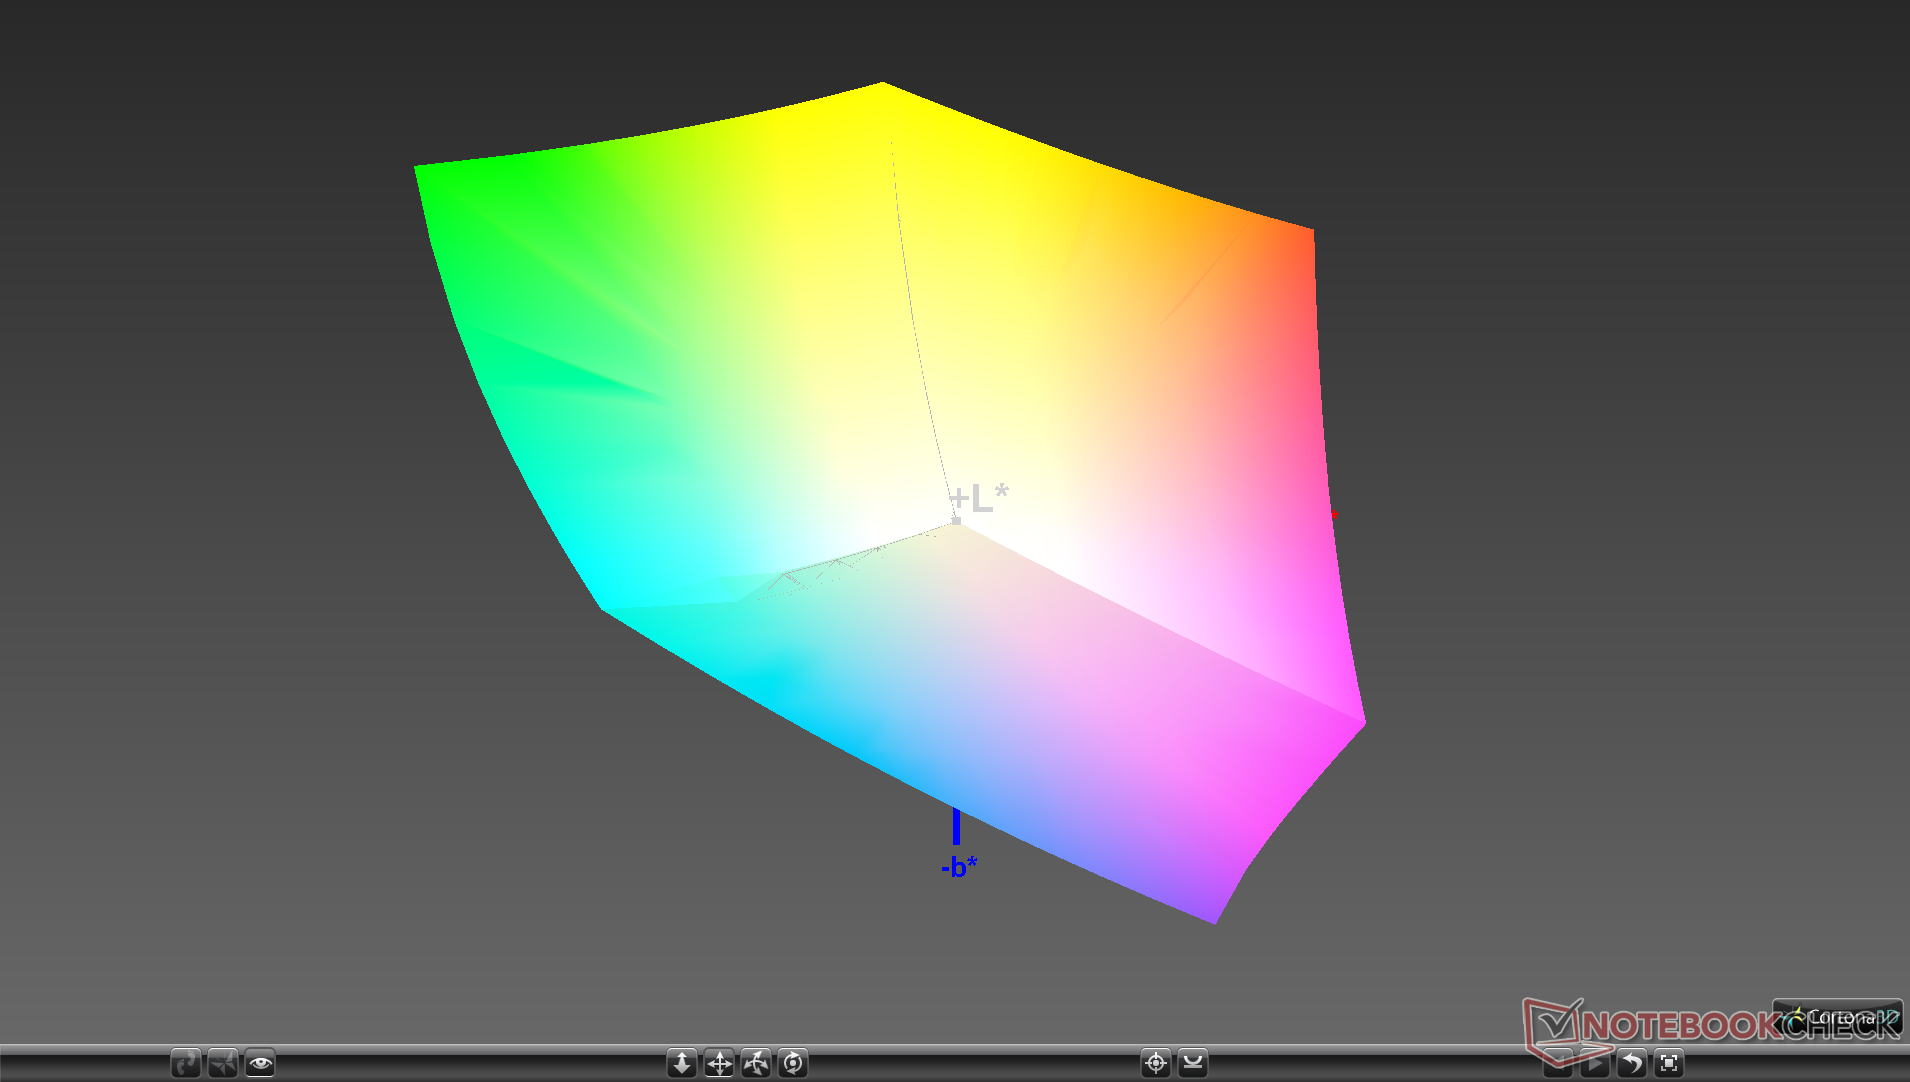
100% sRGB (Argyll 1.6.3 3D)
87.2% AdobeRGB 1998 (Argyll 1.6.3 3D)
98.6% AdobeRGB 1998 (Argyll 3D)
99.9% sRGB (Argyll 3D)
84.8% Display P3 (Argyll 3D)
Gamma: 2.25
CCT: 6175 K
| Razer Blade Pro 17 4K UHD 120 Hz AU Optronics B173ZAN03.3, IPS, 17.3", 3840x2160 | Razer Blade Pro 17 RTX 2080 Max-Q AU Optronics B173HAN04.0, IPS, 17.3", 1920x1080 | Razer Blade Pro 2017 Sharp LQ173D1JW33 (SHP145A), IGZO, 17.3", 3840x2160 | Gigabyte Aero 17 XA RP77 AU Optronics B173ZAN03.2, IPS, 17.3", 3840x2160 | Dell XPS 15 7590 9980HK GTX 1650 Samsung 156WR04, SDCA029, OLED, 15.6", 3840x2160 | MSI P65 Creator 9SF-657 AU Optronics AUO41EB, IPS, 15.6", 3840x2160 | |
|---|---|---|---|---|---|---|
| Display | -26% | 2% | 1% | -1% | 0% | |
| Display P3 Coverage (%) | 84.8 | 60.6 -29% | 88.9 5% | 86.8 2% | 88.1 4% | 84.4 0% |
| sRGB Coverage (%) | 99.9 | 89 -11% | 100 0% | 100 0% | 99.6 0% | 100 0% |
| AdobeRGB 1998 Coverage (%) | 98.6 | 62.1 -37% | 99.7 1% | 99.5 1% | 91.8 -7% | 98.5 0% |
| Response Times | 32% | -285% | -196% | 81% | -217% | |
| Response Time Grey 50% / Grey 80% * (ms) | 15.2 ? | 6.8 ? 55% | 60.8 ? -300% | 45.6 ? -200% | 2.3 ? 85% | 51 ? -236% |
| Response Time Black / White * (ms) | 10.4 ? | 9.6 ? 8% | 38.4 ? -269% | 30.4 ? -192% | 2.4 ? 77% | 31 ? -198% |
| PWM Frequency (Hz) | 204.9 ? | 59.5 ? | ||||
| Screen | 6% | -6% | 25% | 7% | -1% | |
| Brightness middle (cd/m²) | 346.7 | 299.3 -14% | 230 -34% | 667.3 92% | 421.2 21% | 445 28% |
| Brightness (cd/m²) | 332 | 294 -11% | 207 -38% | 633 91% | 417 26% | 462 39% |
| Brightness Distribution (%) | 91 | 94 3% | 83 -9% | 90 -1% | 94 3% | 83 -9% |
| Black Level * (cd/m²) | 0.27 | 0.29 -7% | 0.2 26% | 0.46 -70% | 0.5 -85% | |
| Contrast (:1) | 1284 | 1032 -20% | 1150 -10% | 1451 13% | 890 -31% | |
| Colorchecker dE 2000 * | 5.62 | 2.55 55% | 5.62 -0% | 3.53 37% | 6.06 -8% | 4.75 15% |
| Colorchecker dE 2000 max. * | 9.36 | 4.73 49% | 10.24 -9% | 6.88 26% | 11.89 -27% | 7.79 17% |
| Colorchecker dE 2000 calibrated * | 3.81 | 2.9 24% | 3.79 1% | |||
| Greyscale dE 2000 * | 5.5 | 3.5 36% | 4.54 17% | 0.9 84% | 2.8 49% | 4.49 18% |
| Gamma | 2.25 98% | 2.28 96% | 2.36 93% | 2.17 101% | 2.15 102% | 2.49 88% |
| CCT | 6175 105% | 7101 92% | 6625 98% | 6533 99% | 6235 104% | 7374 88% |
| Color Space (Percent of AdobeRGB 1998) (%) | 87.2 | 57 -35% | 88 1% | 87.1 0% | 81 -7% | 87 0% |
| Color Space (Percent of sRGB) (%) | 100 | 88.7 -11% | 100 0% | 100 0% | 99.6 0% | 100 0% |
| Total Average (Program / Settings) | 4% /
3% | -96% /
-41% | -57% /
-7% | 29% /
17% | -73% /
-29% |
* ... smaller is better
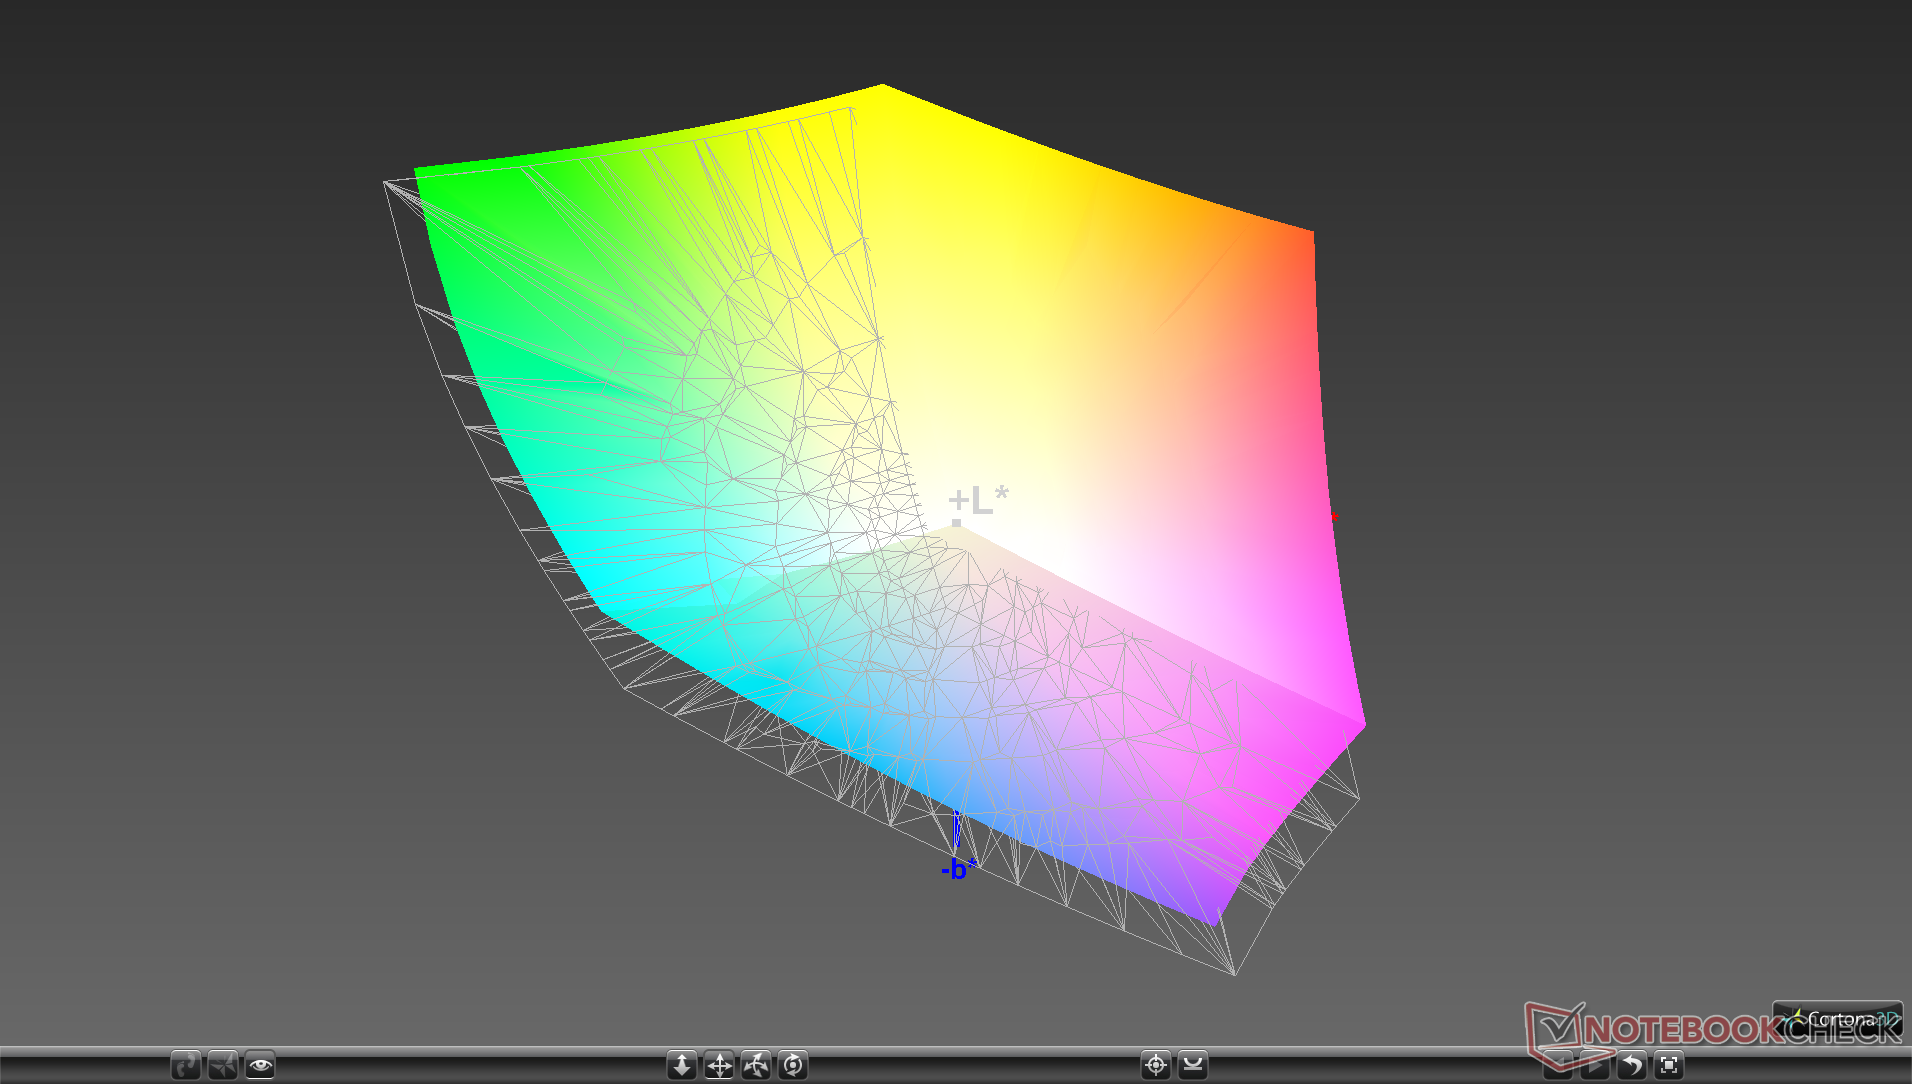
Razer promises full AdobeRGB coverage and our own measurements reflect this claim.
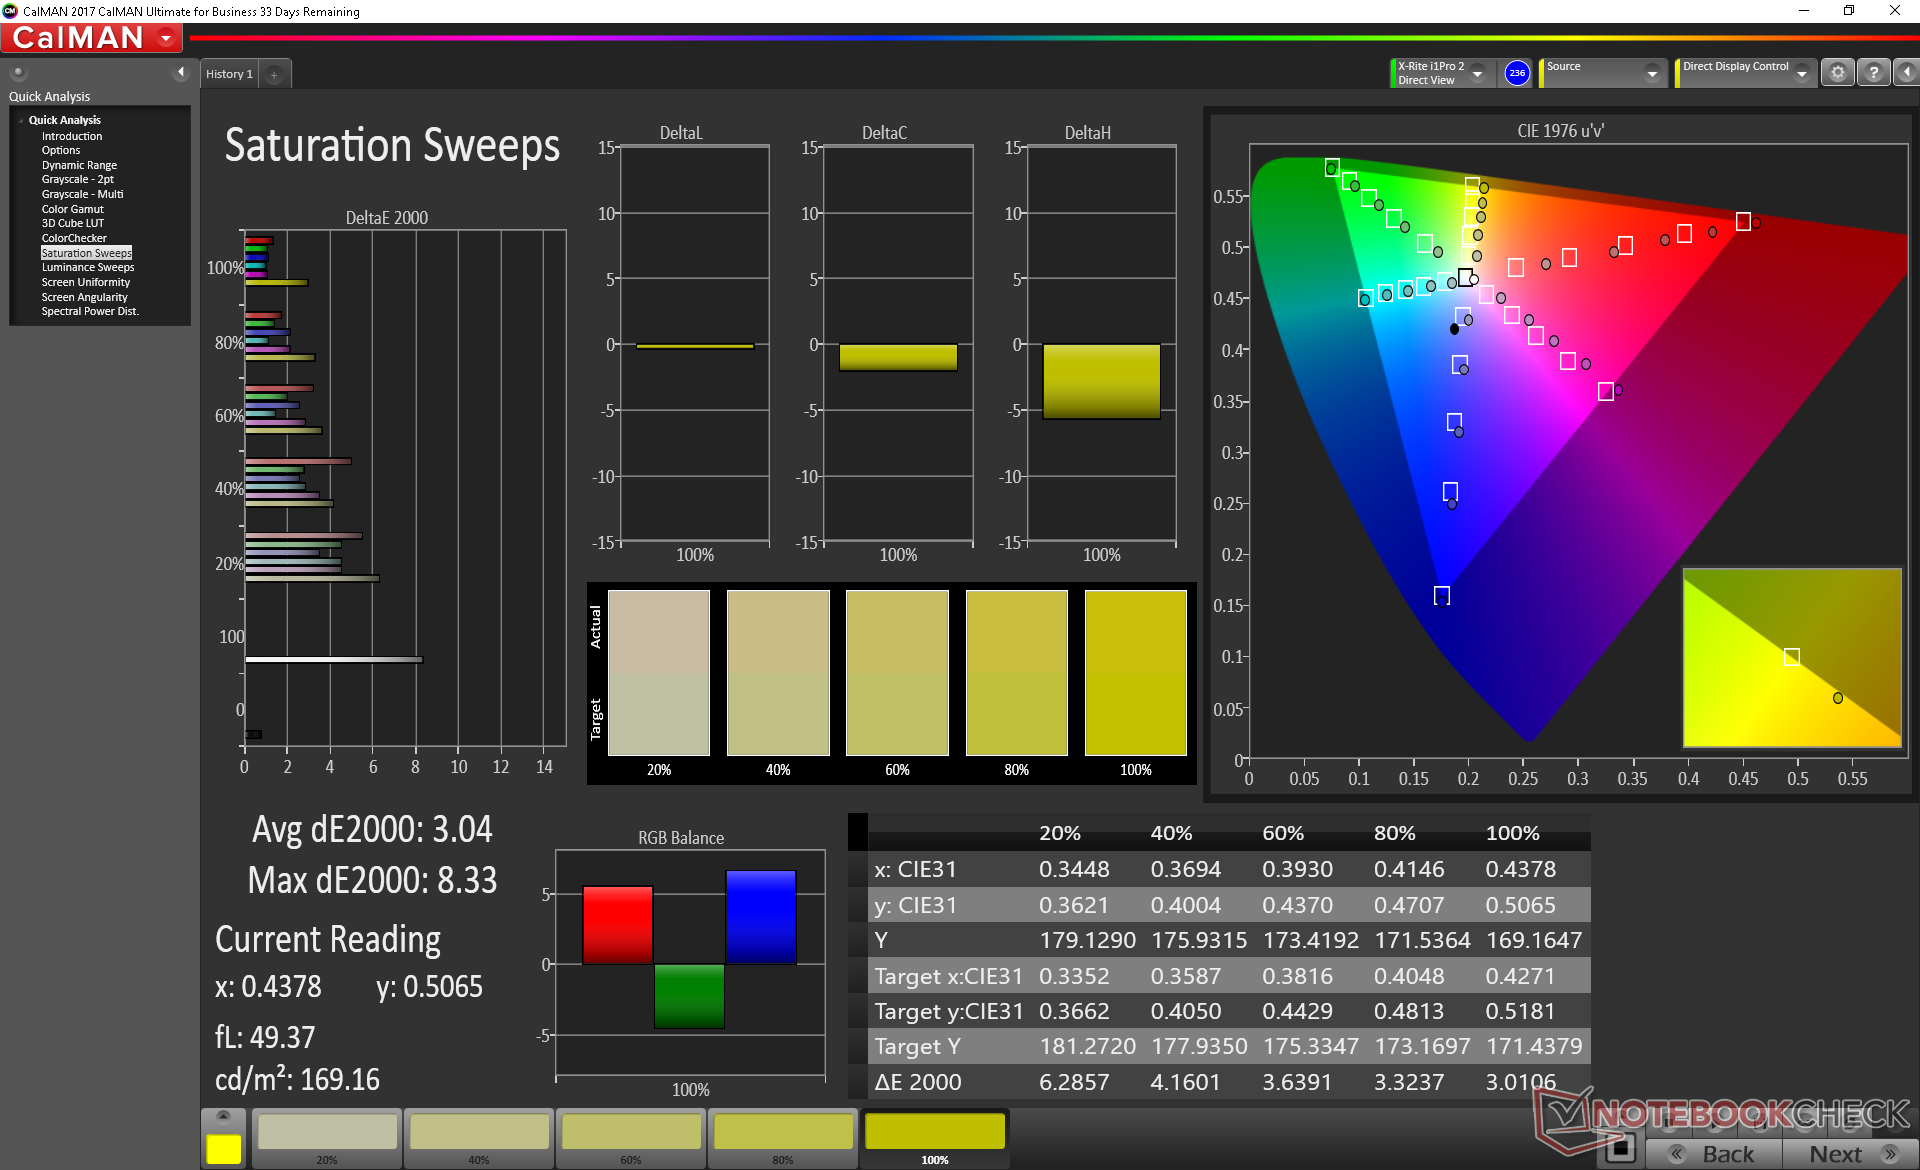
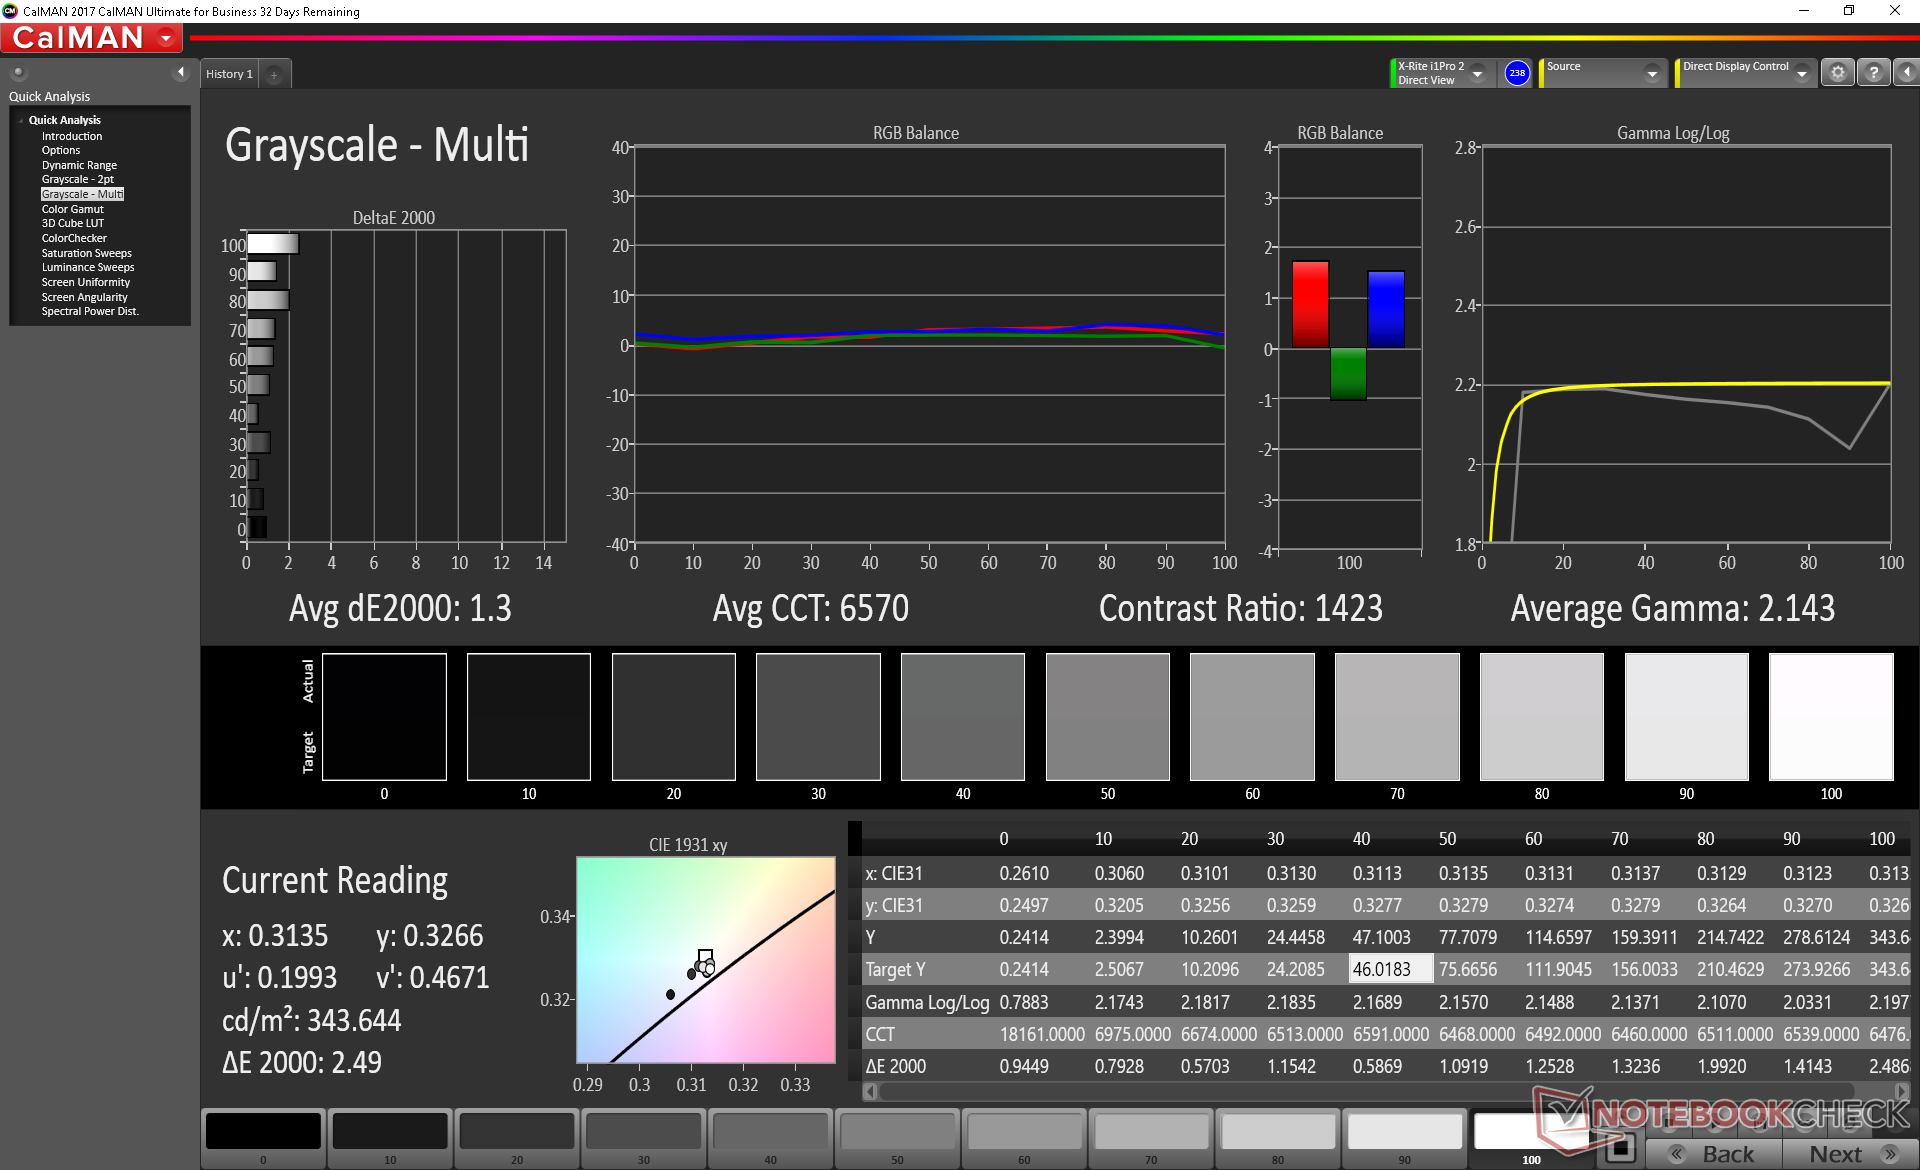
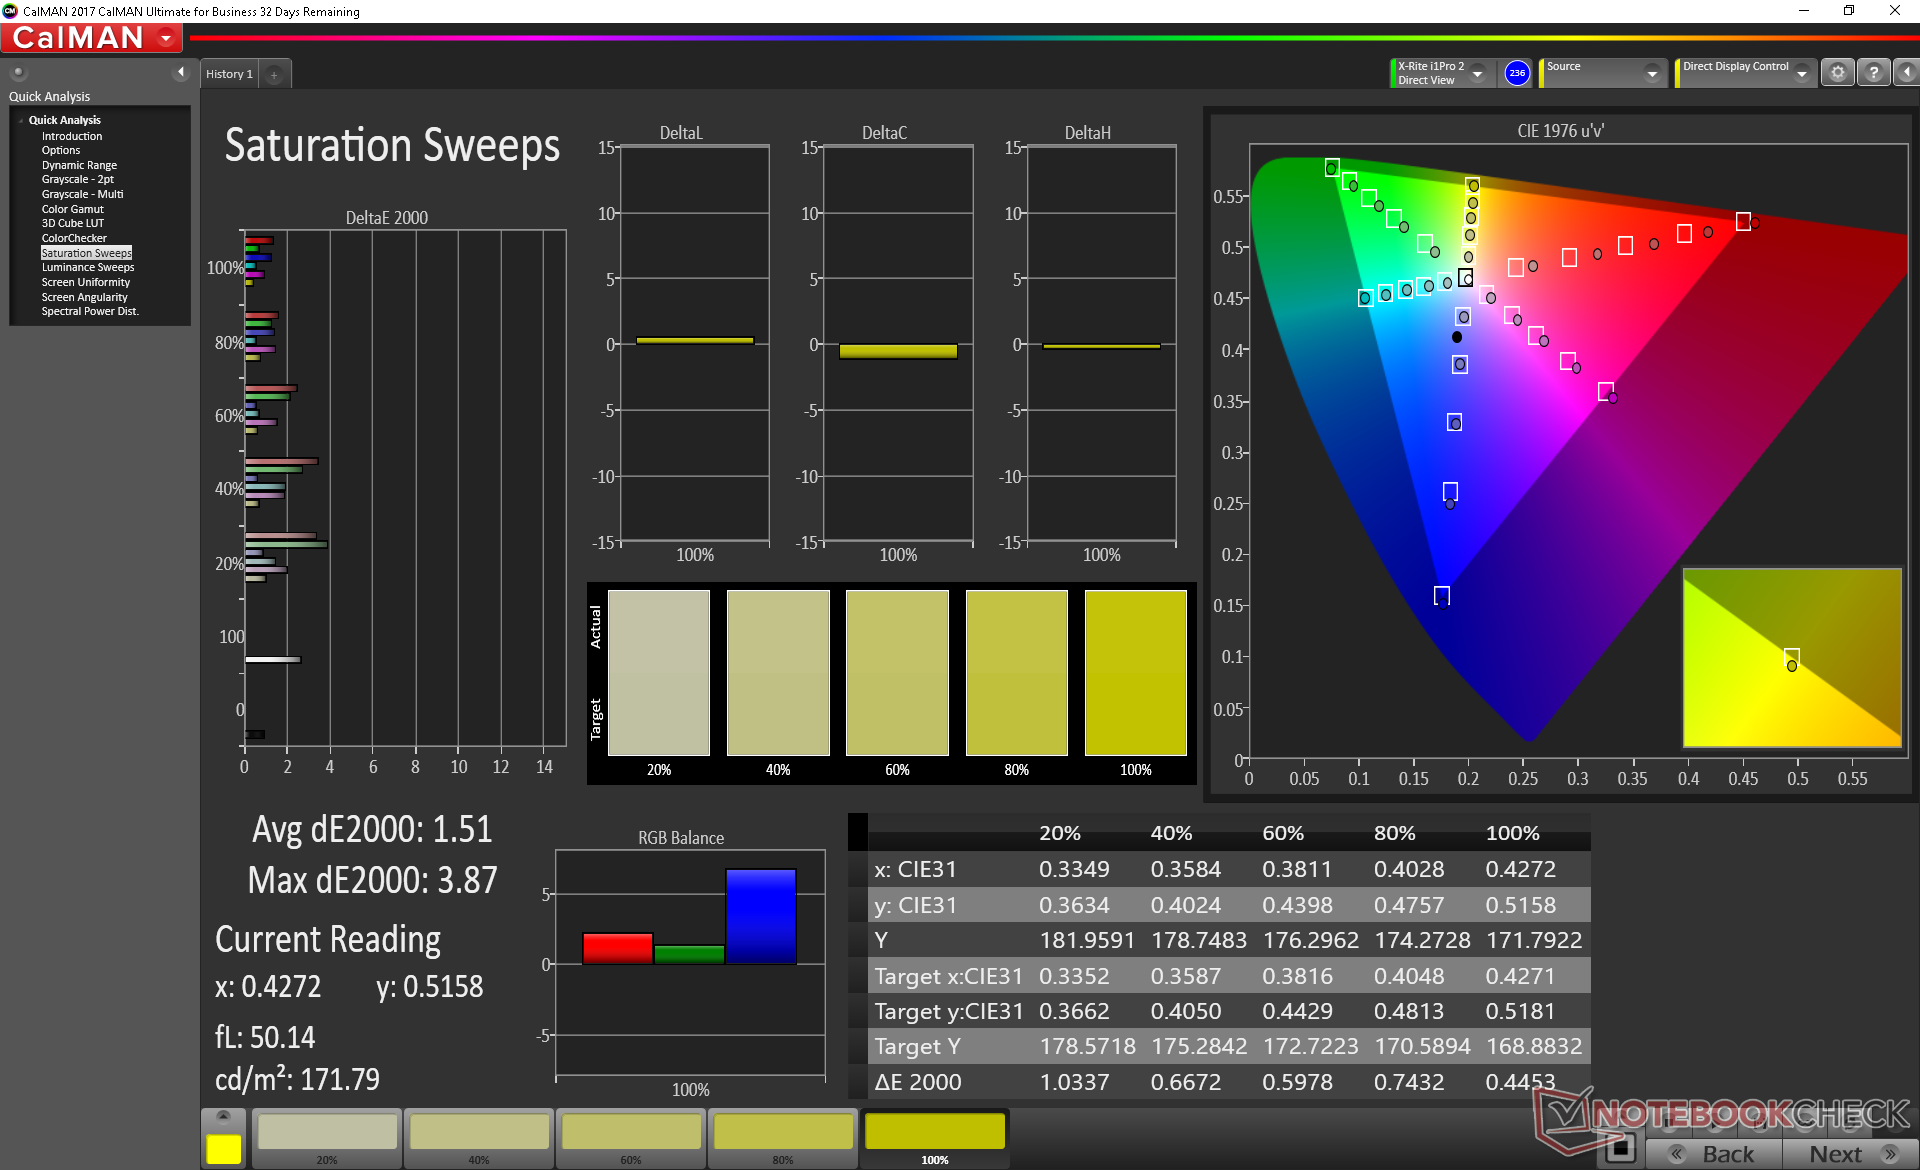
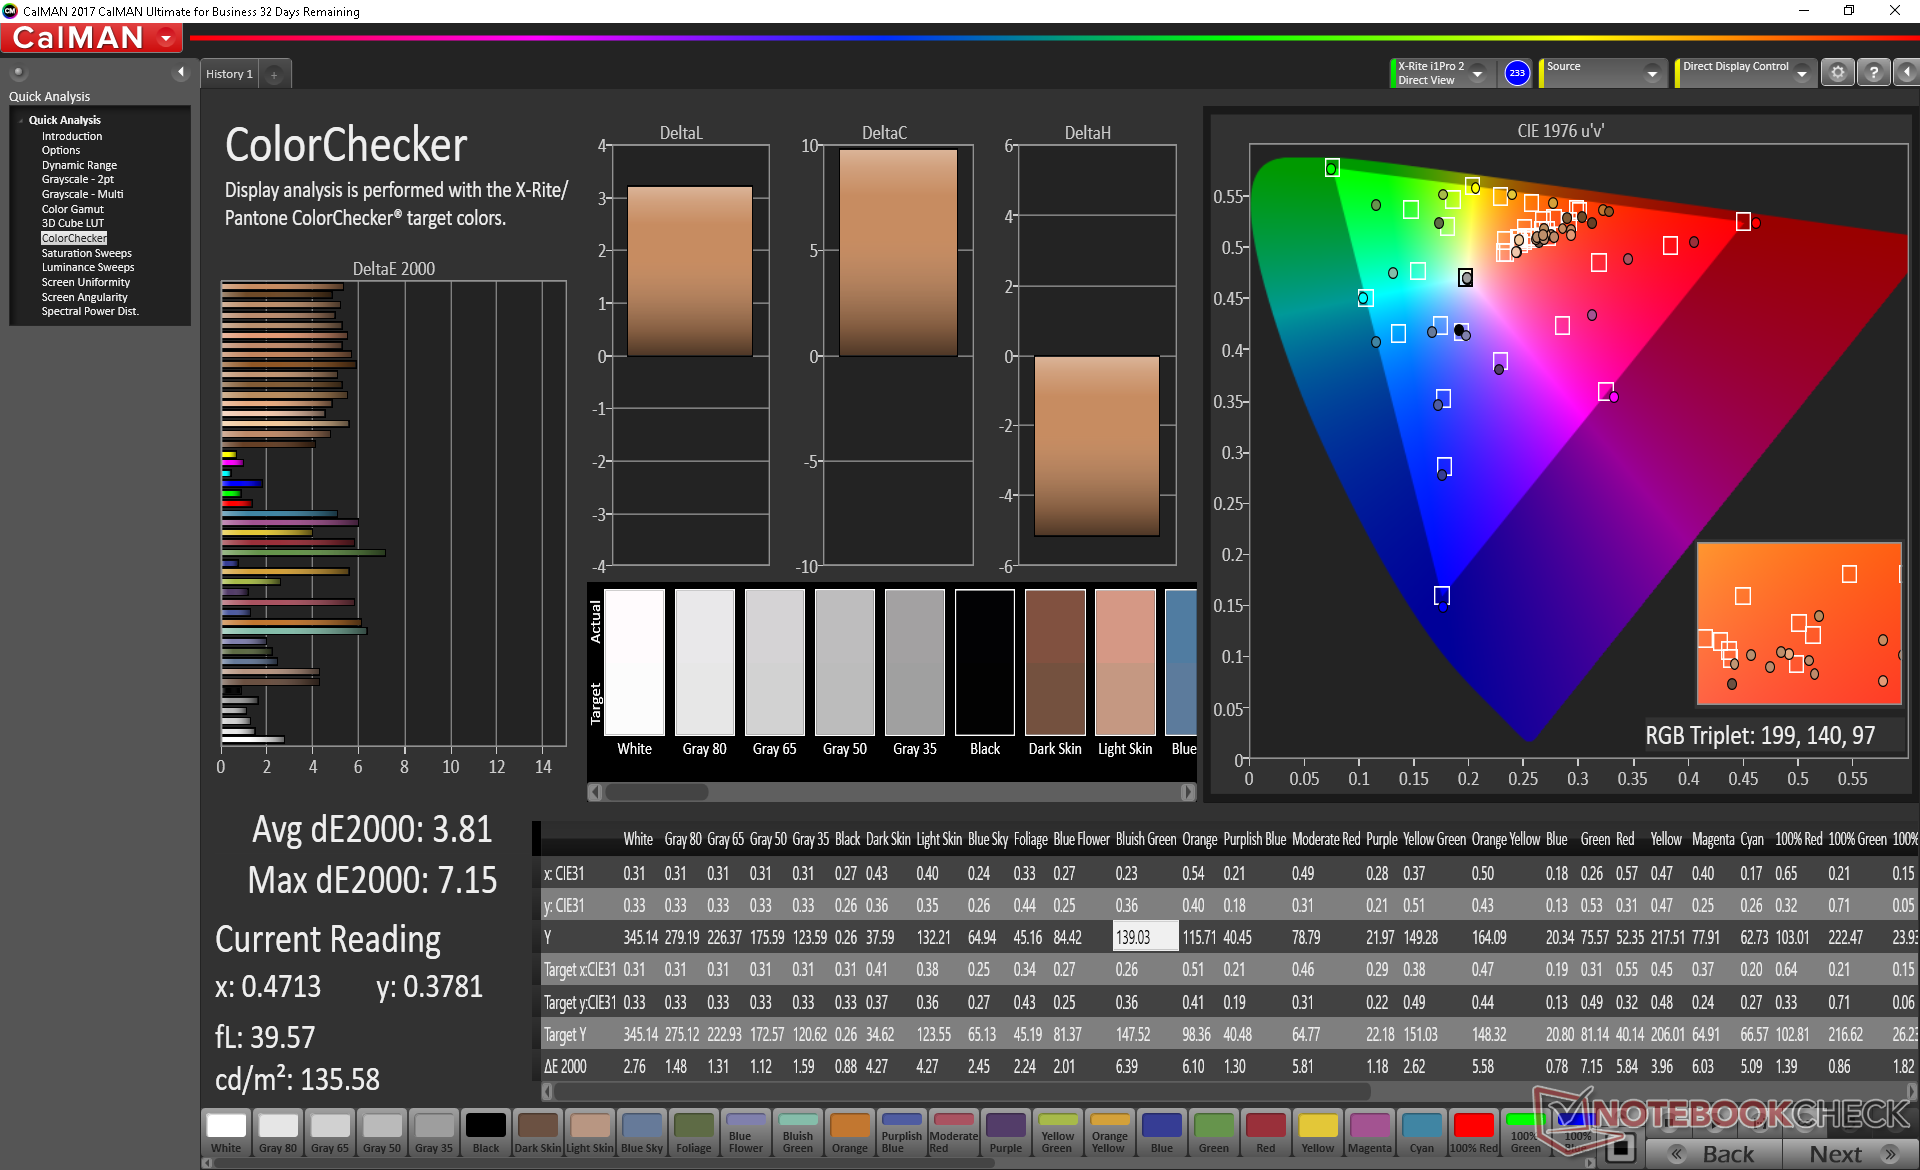
As great as the display may be upon first glance, it's not particularly well-calibrated out of the box. Color temperature is warmer than it should be and grayscale suffers as a result. Once we had calibrated the panel ourselves, average grayscale DeltaE improves noticeably from 5.5 to 1.3 with better RGB balance and color reproduction at lower saturation levels as shown by the CalMAN screenshots below.
Display Response Times
| ↔ Response Time Black to White | ||
|---|---|---|
| 10.4 ms ... rise ↗ and fall ↘ combined | ↗ 5.2 ms rise | 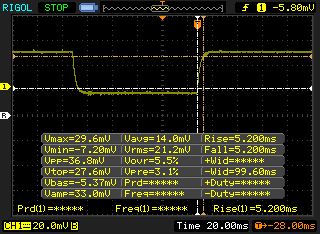 |
| ↘ 5.2 ms fall | ||
| The screen shows good response rates in our tests, but may be too slow for competitive gamers. In comparison, all tested devices range from 0.1 (minimum) to 240 (maximum) ms. » 28 % of all devices are better. This means that the measured response time is better than the average of all tested devices (19.8 ms). | ||
| ↔ Response Time 50% Grey to 80% Grey | ||
| 15.2 ms ... rise ↗ and fall ↘ combined | ↗ 8.4 ms rise | 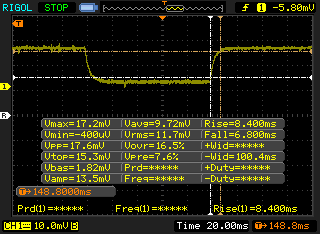 |
| ↘ 6.8 ms fall | ||
| The screen shows good response rates in our tests, but may be too slow for competitive gamers. In comparison, all tested devices range from 0.165 (minimum) to 636 (maximum) ms. » 29 % of all devices are better. This means that the measured response time is better than the average of all tested devices (31 ms). | ||
Screen Flickering / PWM (Pulse-Width Modulation)
| Screen flickering / PWM not detected | 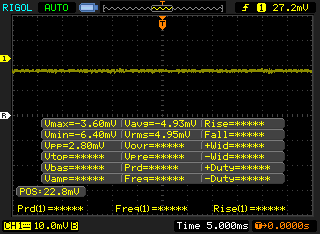 | ||
In comparison: 52 % of all tested devices do not use PWM to dim the display. If PWM was detected, an average of 7747 (minimum: 5 - maximum: 343500) Hz was measured. | |||
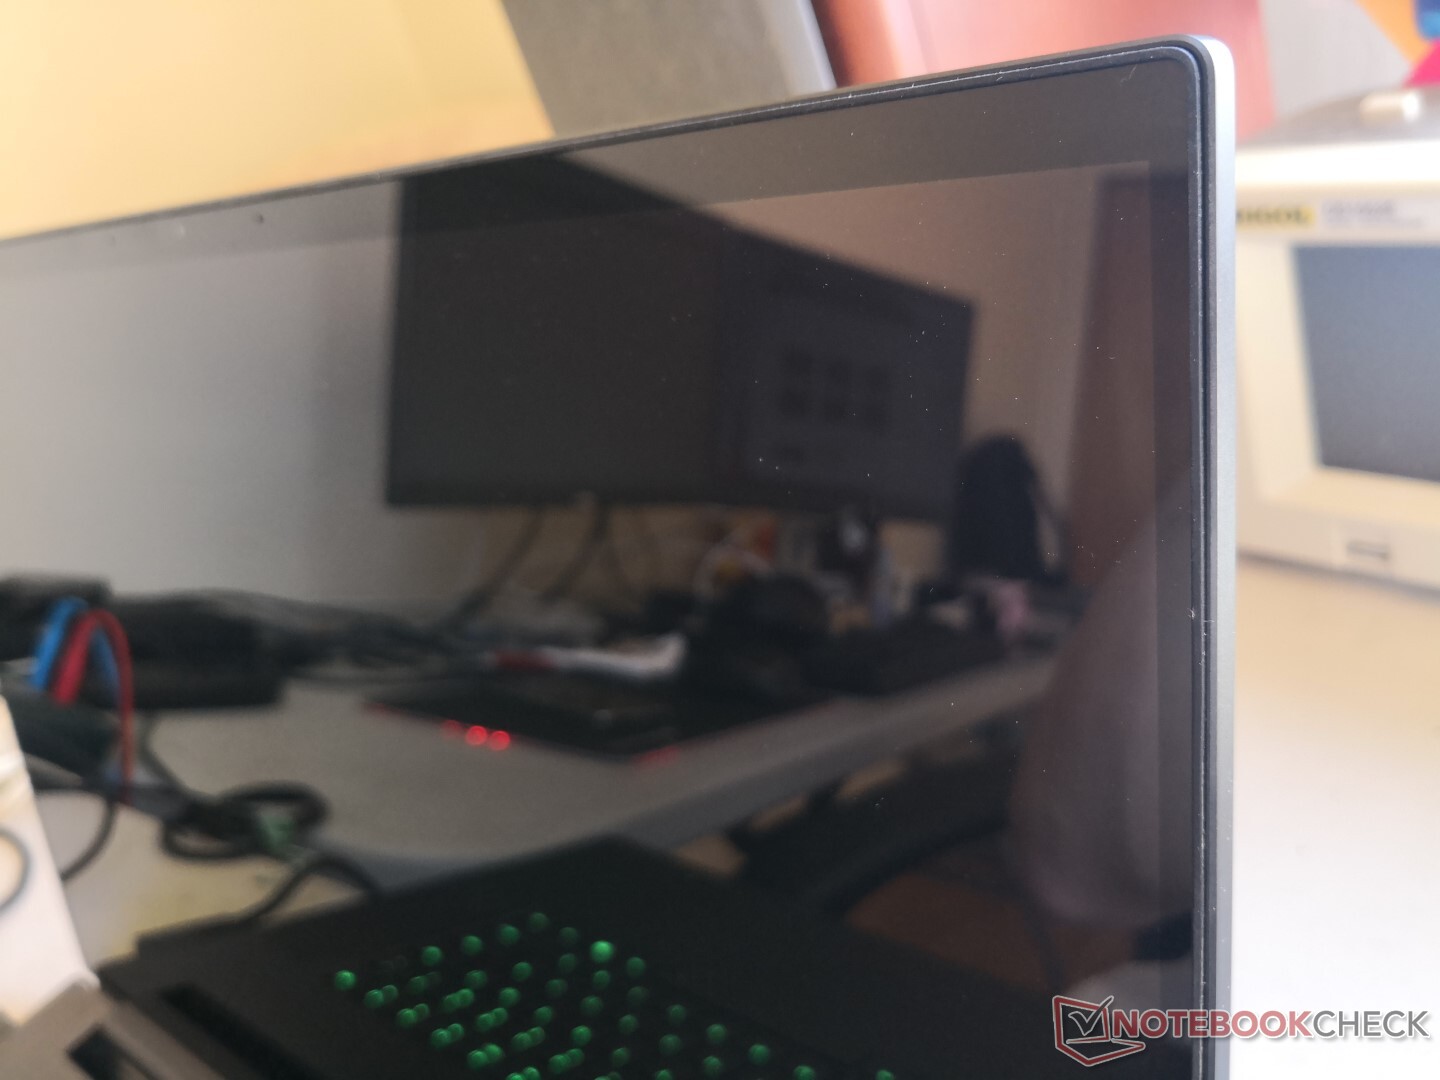
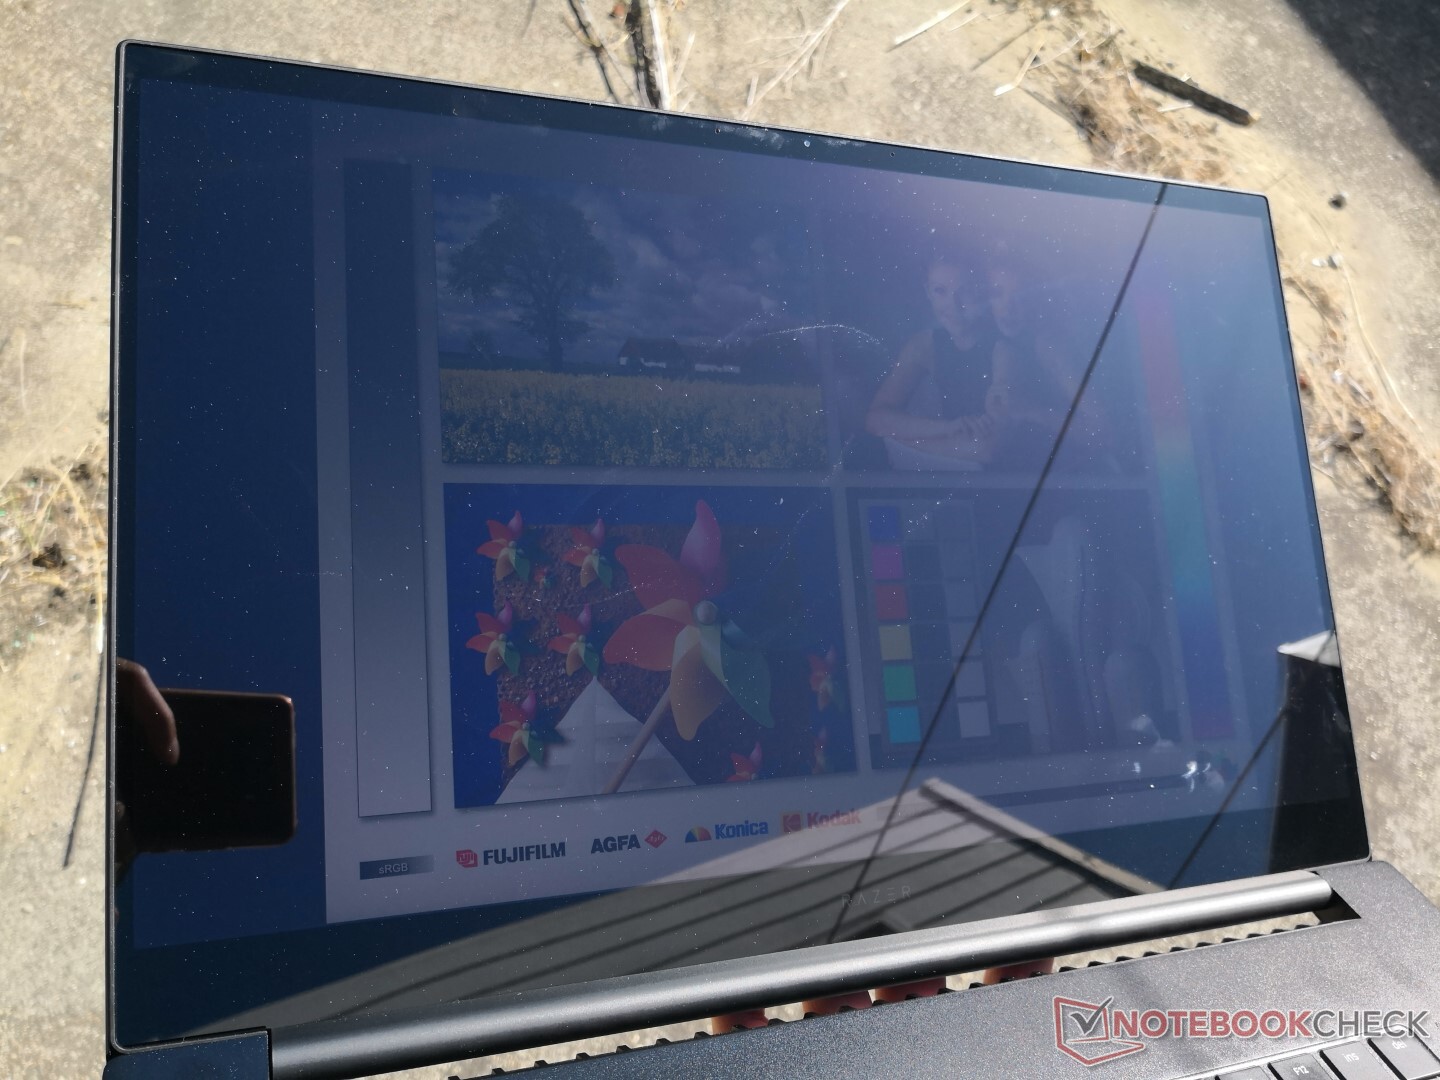
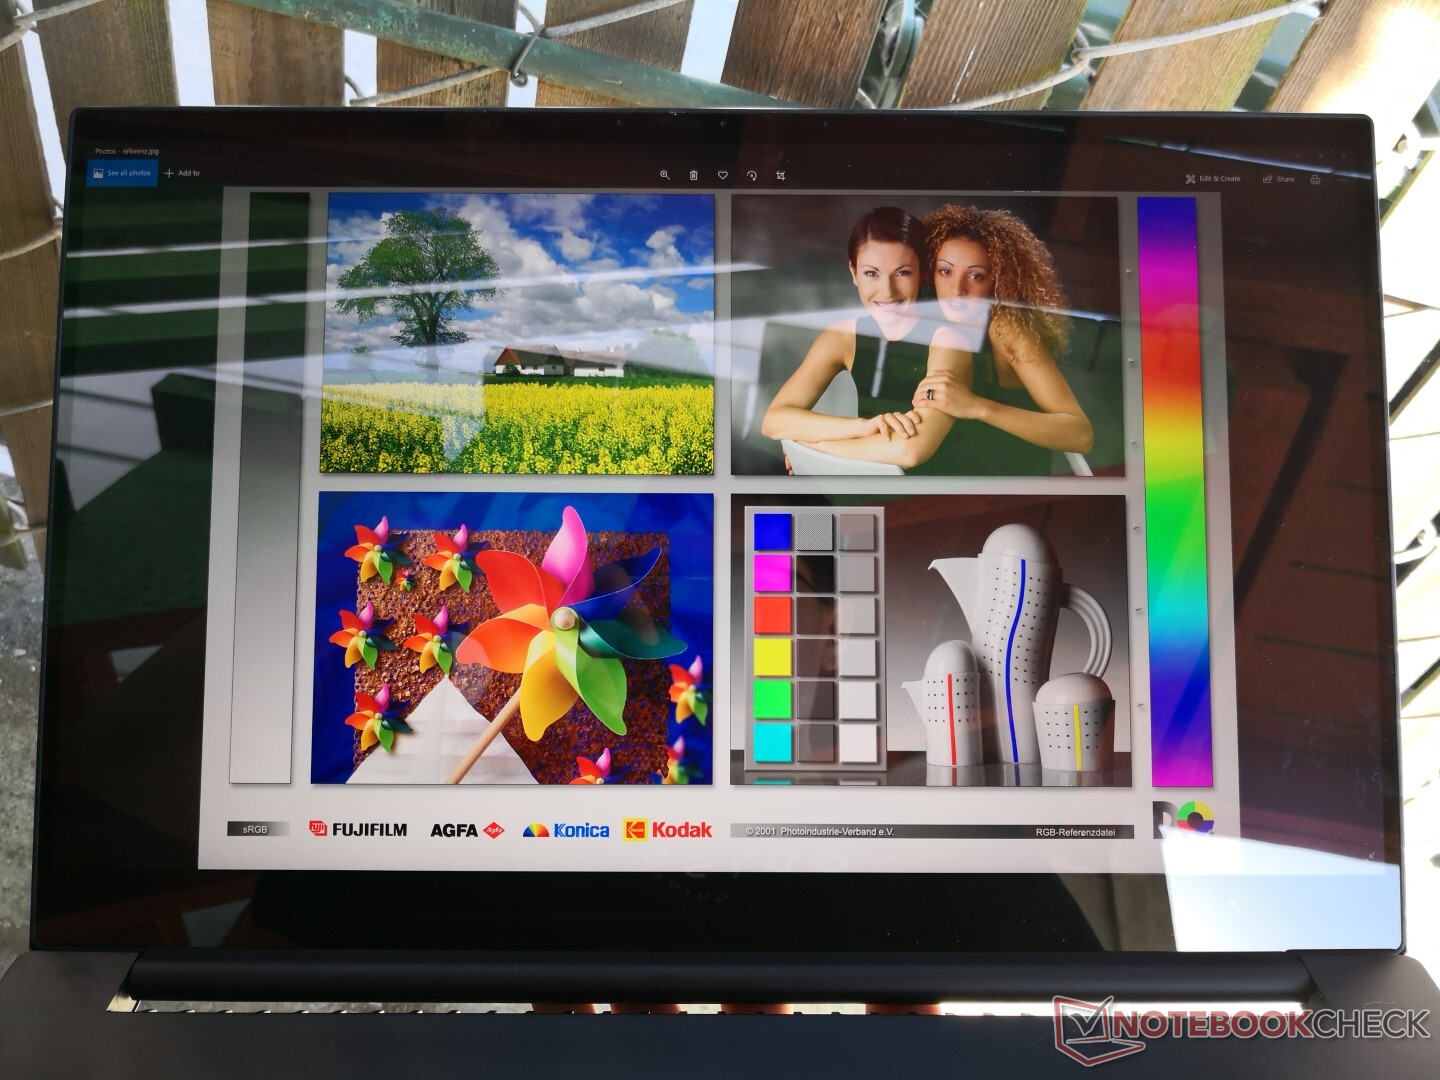
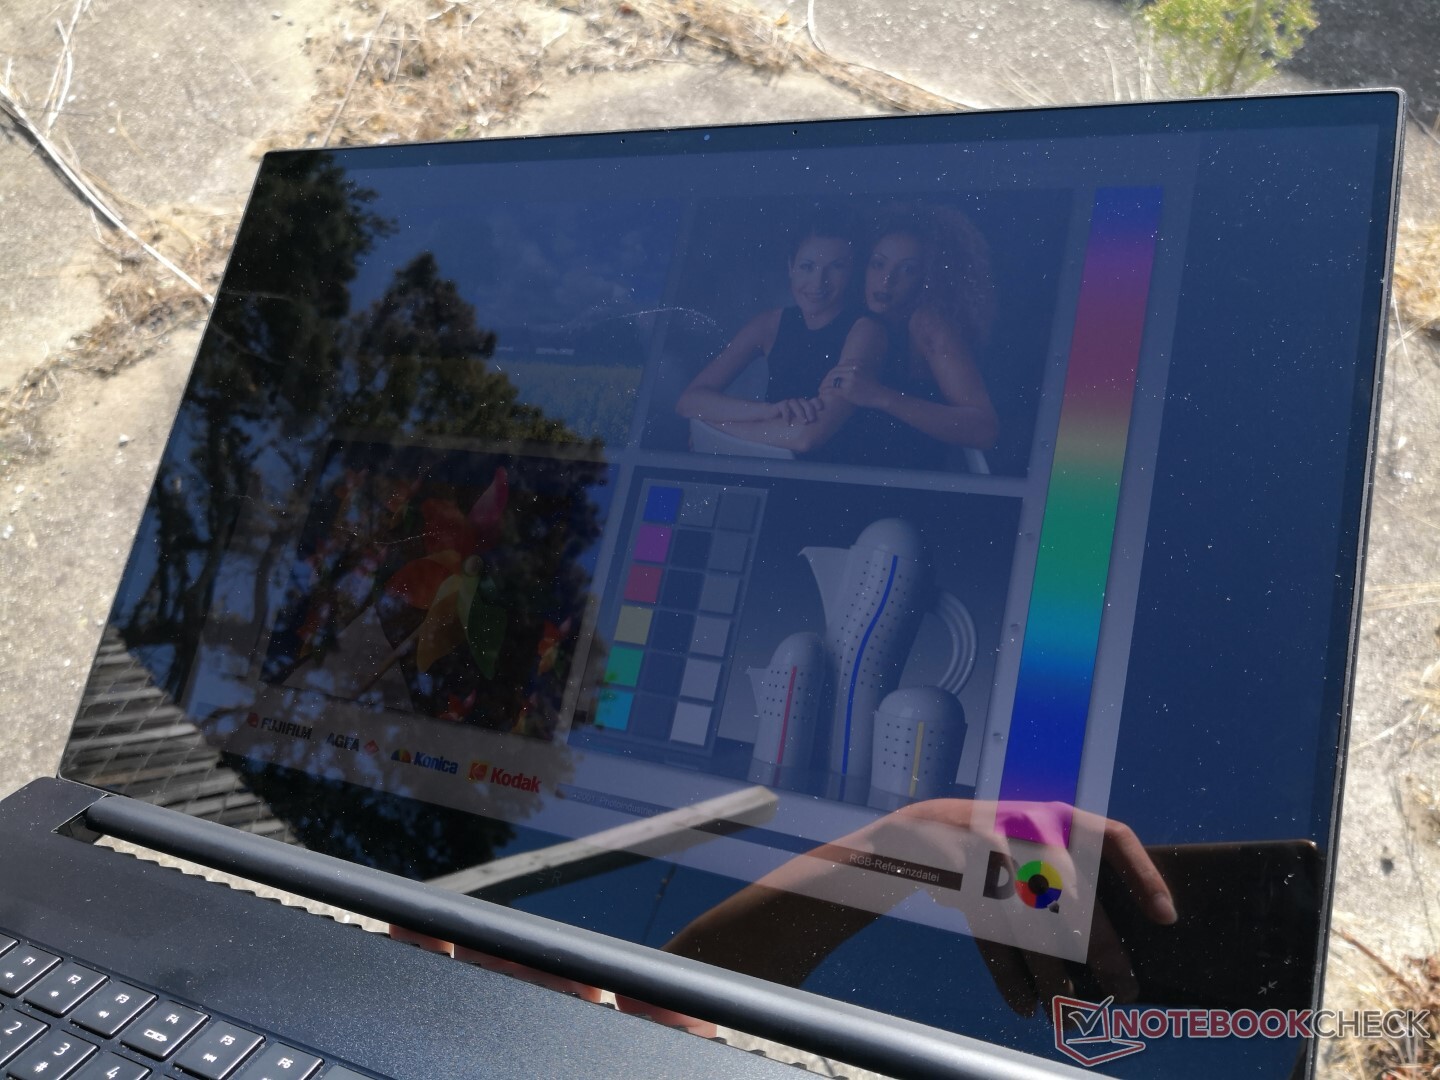
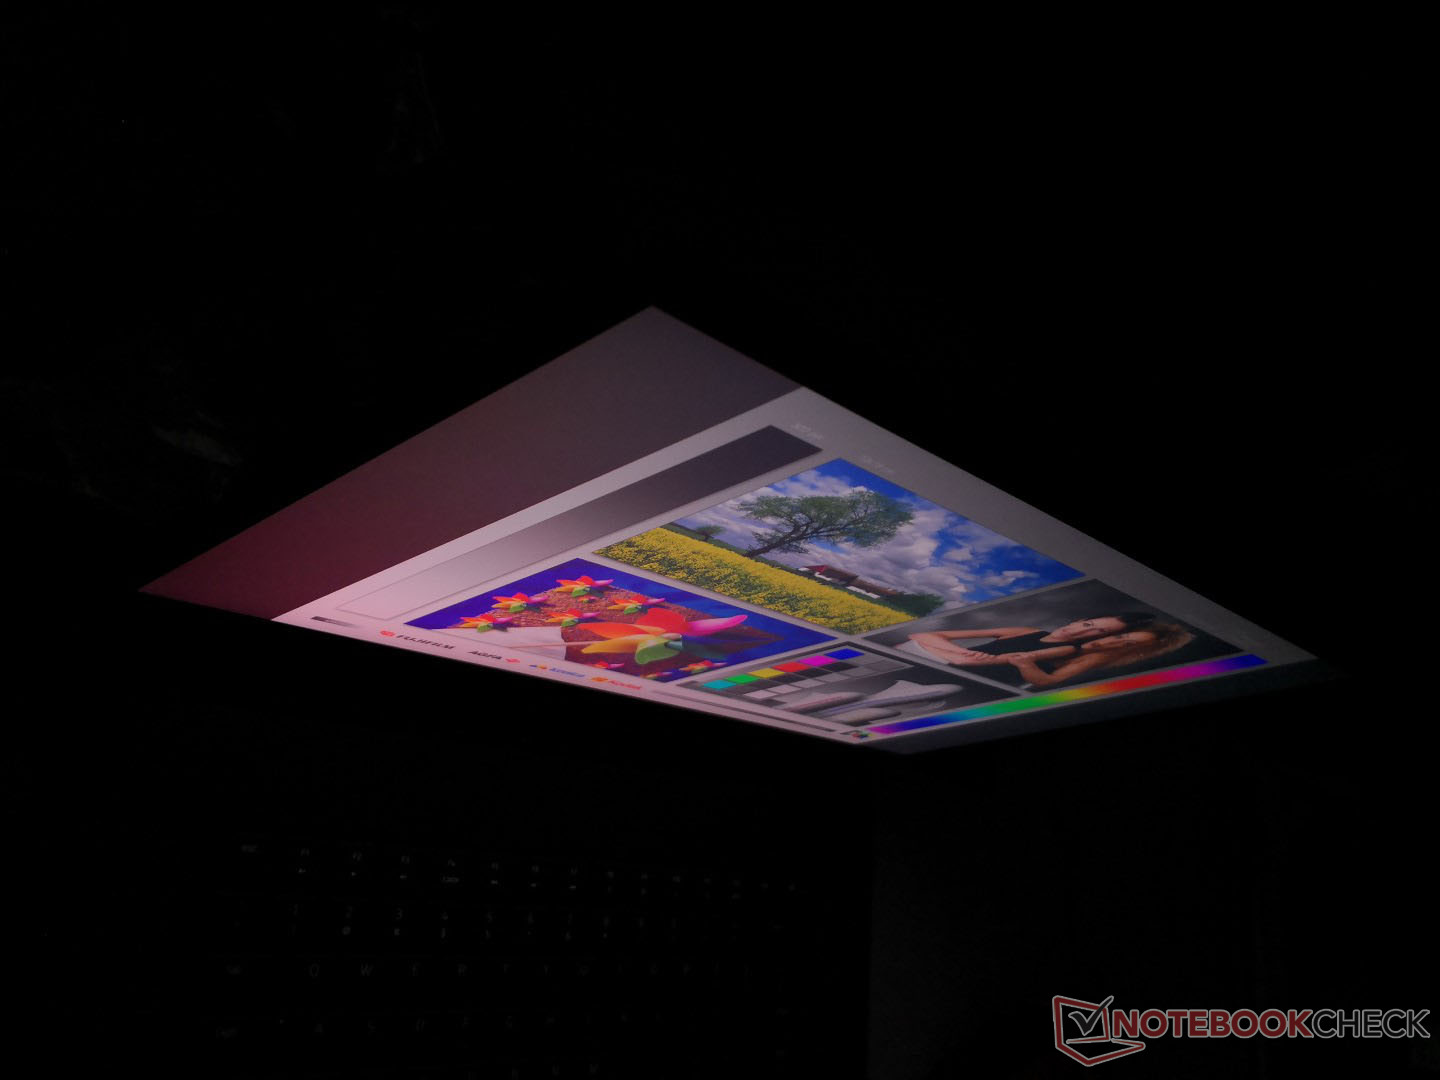
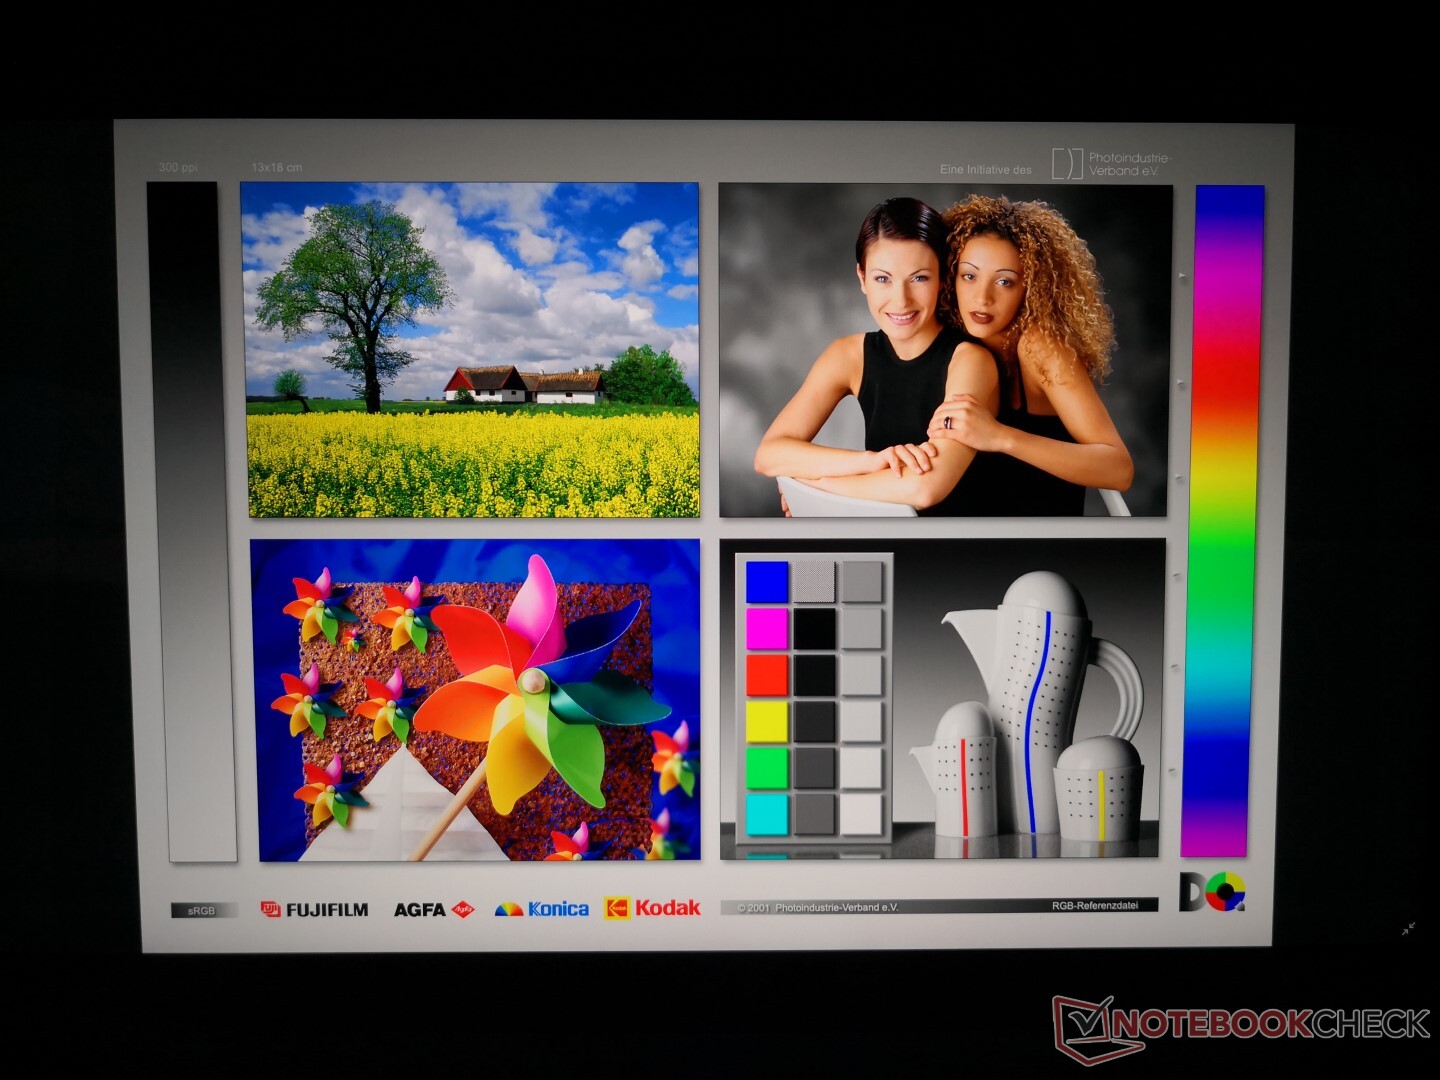
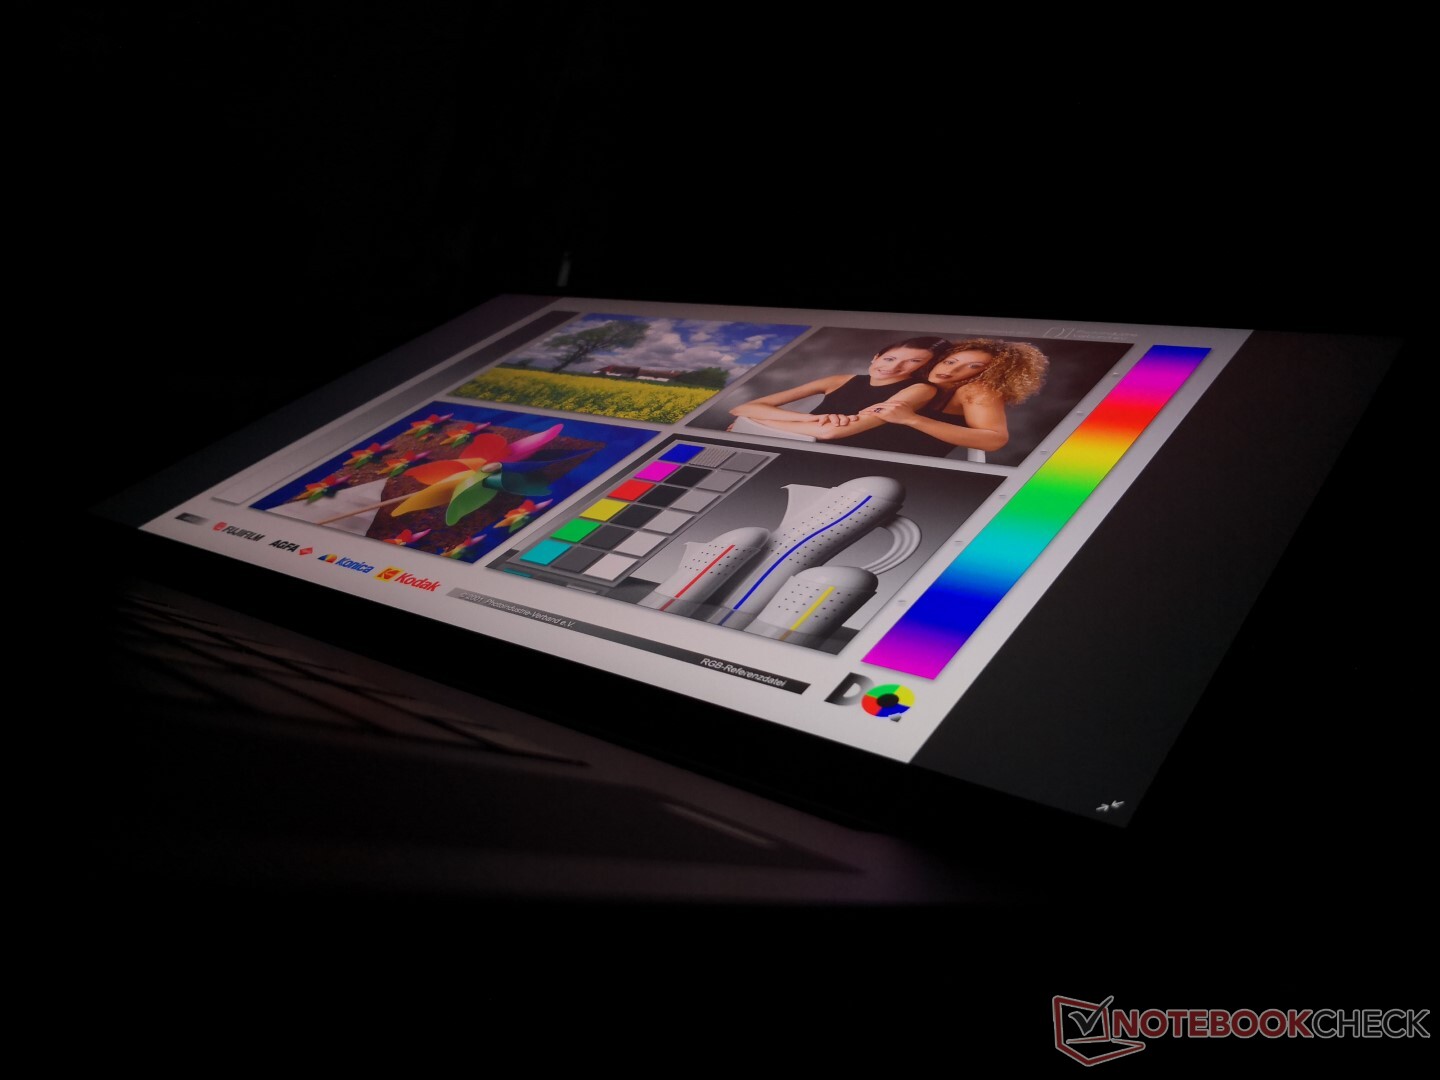
Viewing angles are excellent just as one would expect from any IPS display. Viewing too far off angle, however, can result in a red hue. Outdoor visibility feels even more limited than the cheaper matte Blade Pro 17 FHD SKU because of the super-glossy overlay on this Blade Pro 17 4K SKU.
Performance

Processor
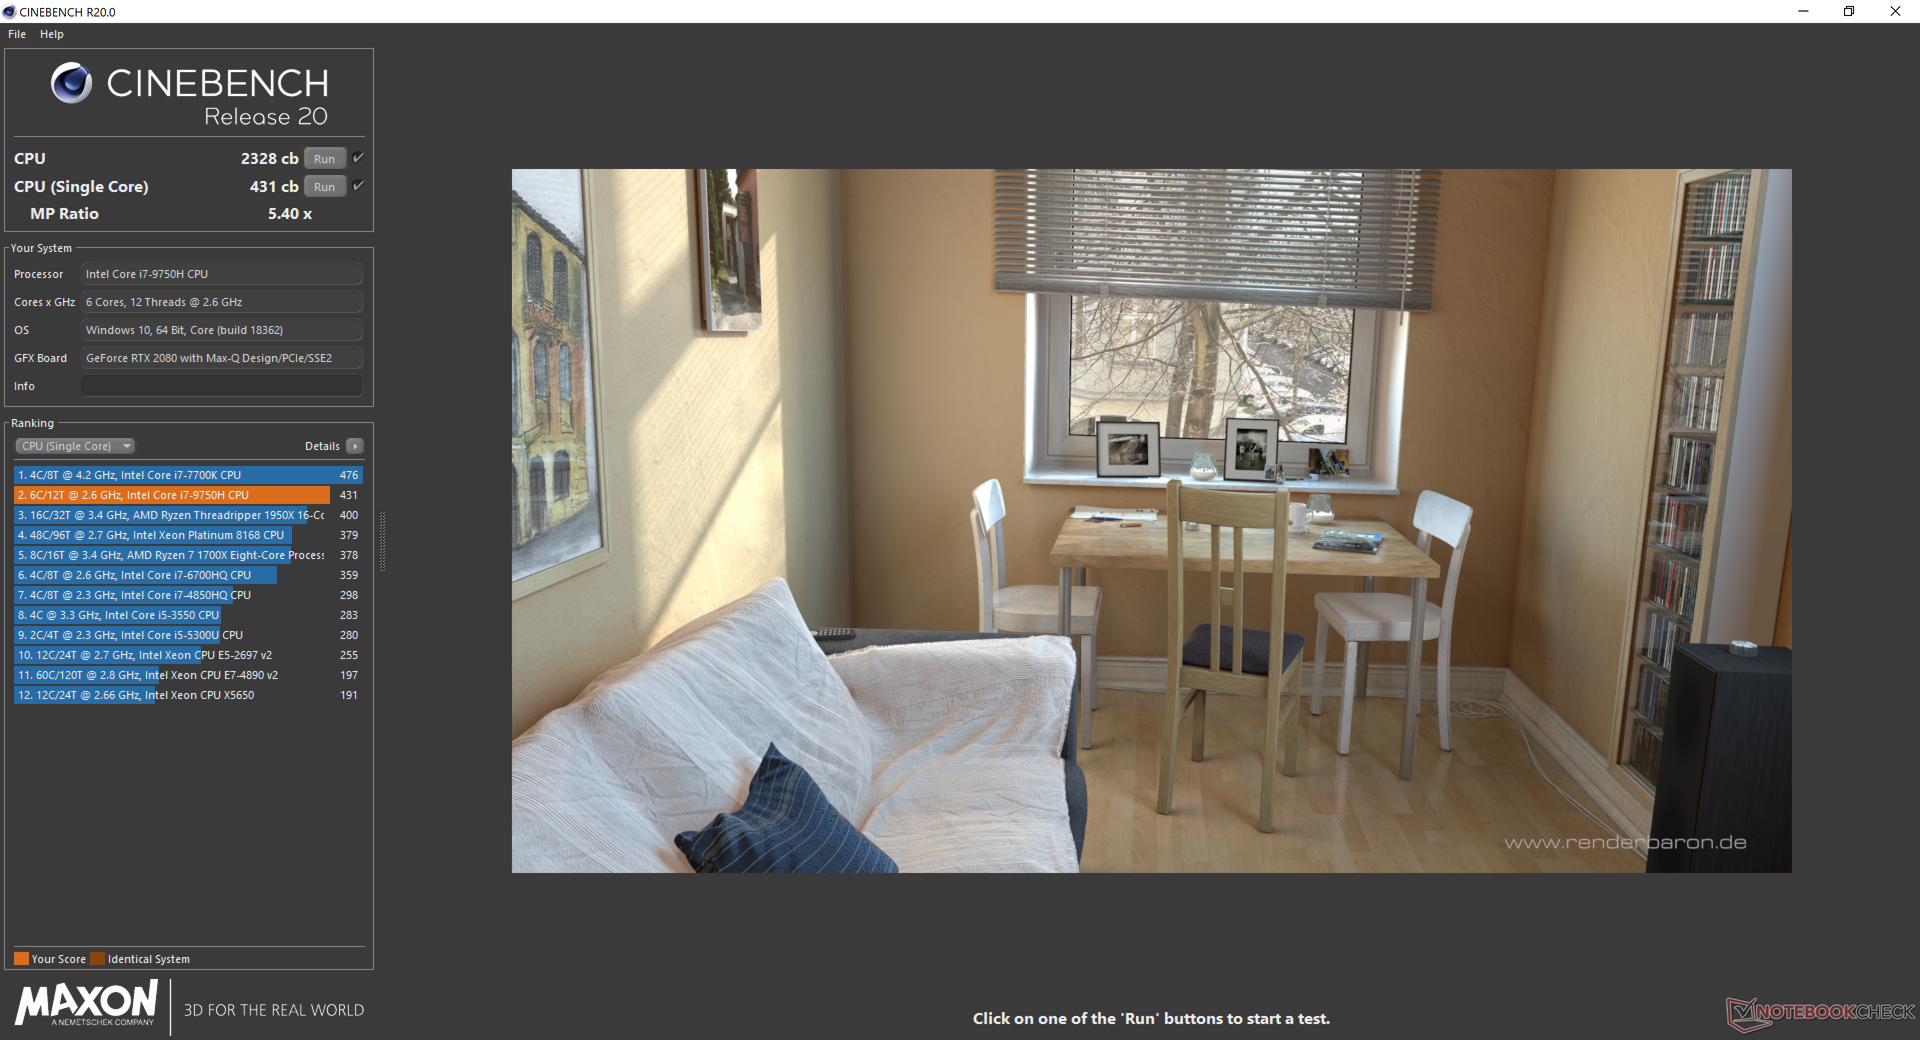
| Cinebench R11.5 | |
| CPU Single 64Bit | |
| Corsair One i160 | |
| MSI GE75 9SG | |
| Average Intel Core i7-9750H (1.96 - 2.19, n=10) | |
| Razer Blade Pro 2017 | |
| CPU Multi 64Bit | |
| Corsair One i160 | |
| MSI GE75 9SG | |
| Average Intel Core i7-9750H (11.3 - 14.1, n=10) | |
| Razer Blade Pro 2017 | |
| Cinebench R10 | |
| Rendering Multiple CPUs 32Bit | |
| Corsair One i160 | |
| Eurocom Nightsky RX15 | |
| MSI GE75 9SG | |
| Average Intel Core i7-9750H (28251 - 36304, n=13) | |
| HP Pavilion Gaming 15-ec0017ng | |
| Rendering Single 32Bit | |
| Eurocom Nightsky RX15 | |
| Corsair One i160 | |
| MSI GE75 9SG | |
| Average Intel Core i7-9750H (6659 - 7214, n=13) | |
| HP Pavilion Gaming 15-ec0017ng | |
| wPrime 2.10 - 1024m | |
| Average Intel Core i7-9750H (n=1) | |
| MSI GE75 9SG | |
| Eurocom Nightsky RX15 | |
| Corsair One i160 | |
* ... smaller is better
System Performance
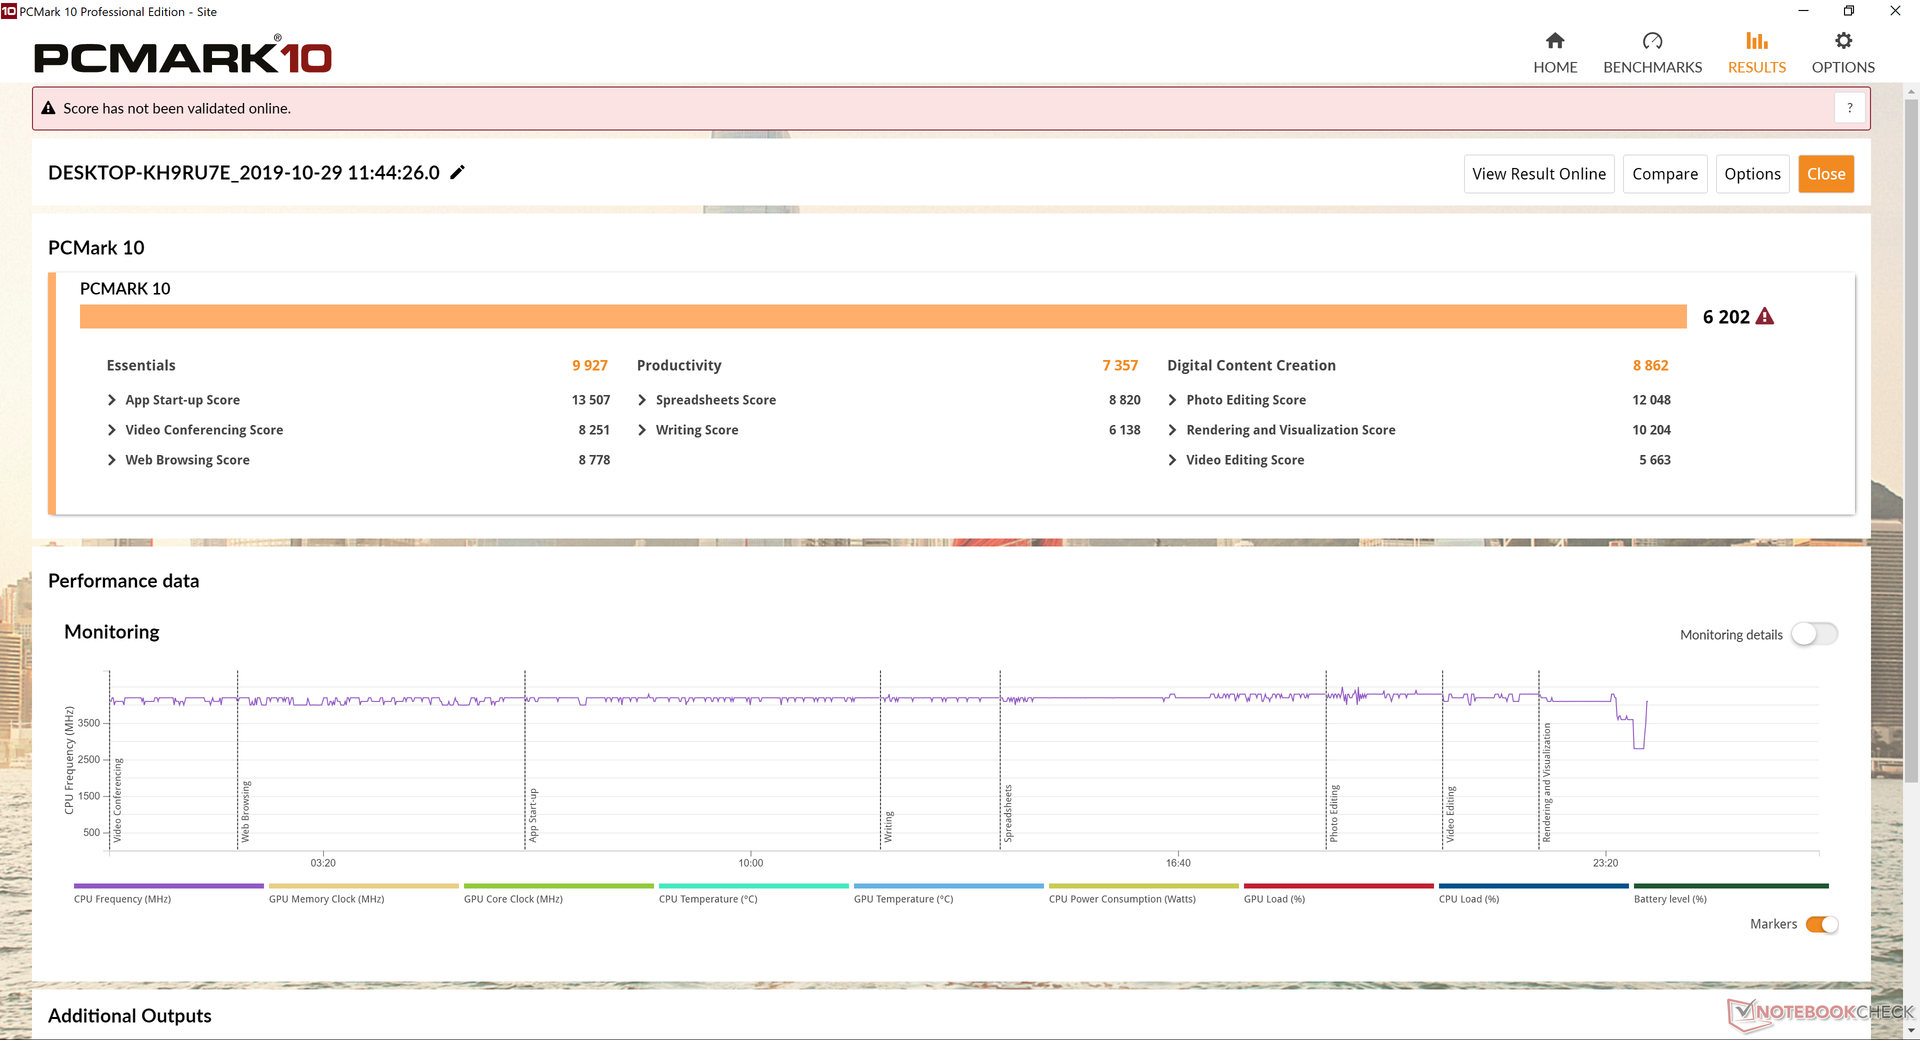
Interestingly, our PCMark 10 Digital Creation score is 23 percent higher than what we recorded on both the Blade Pro 17 FHD and MSI GS75 FHD systems even though they all share the same CPU and GPU.
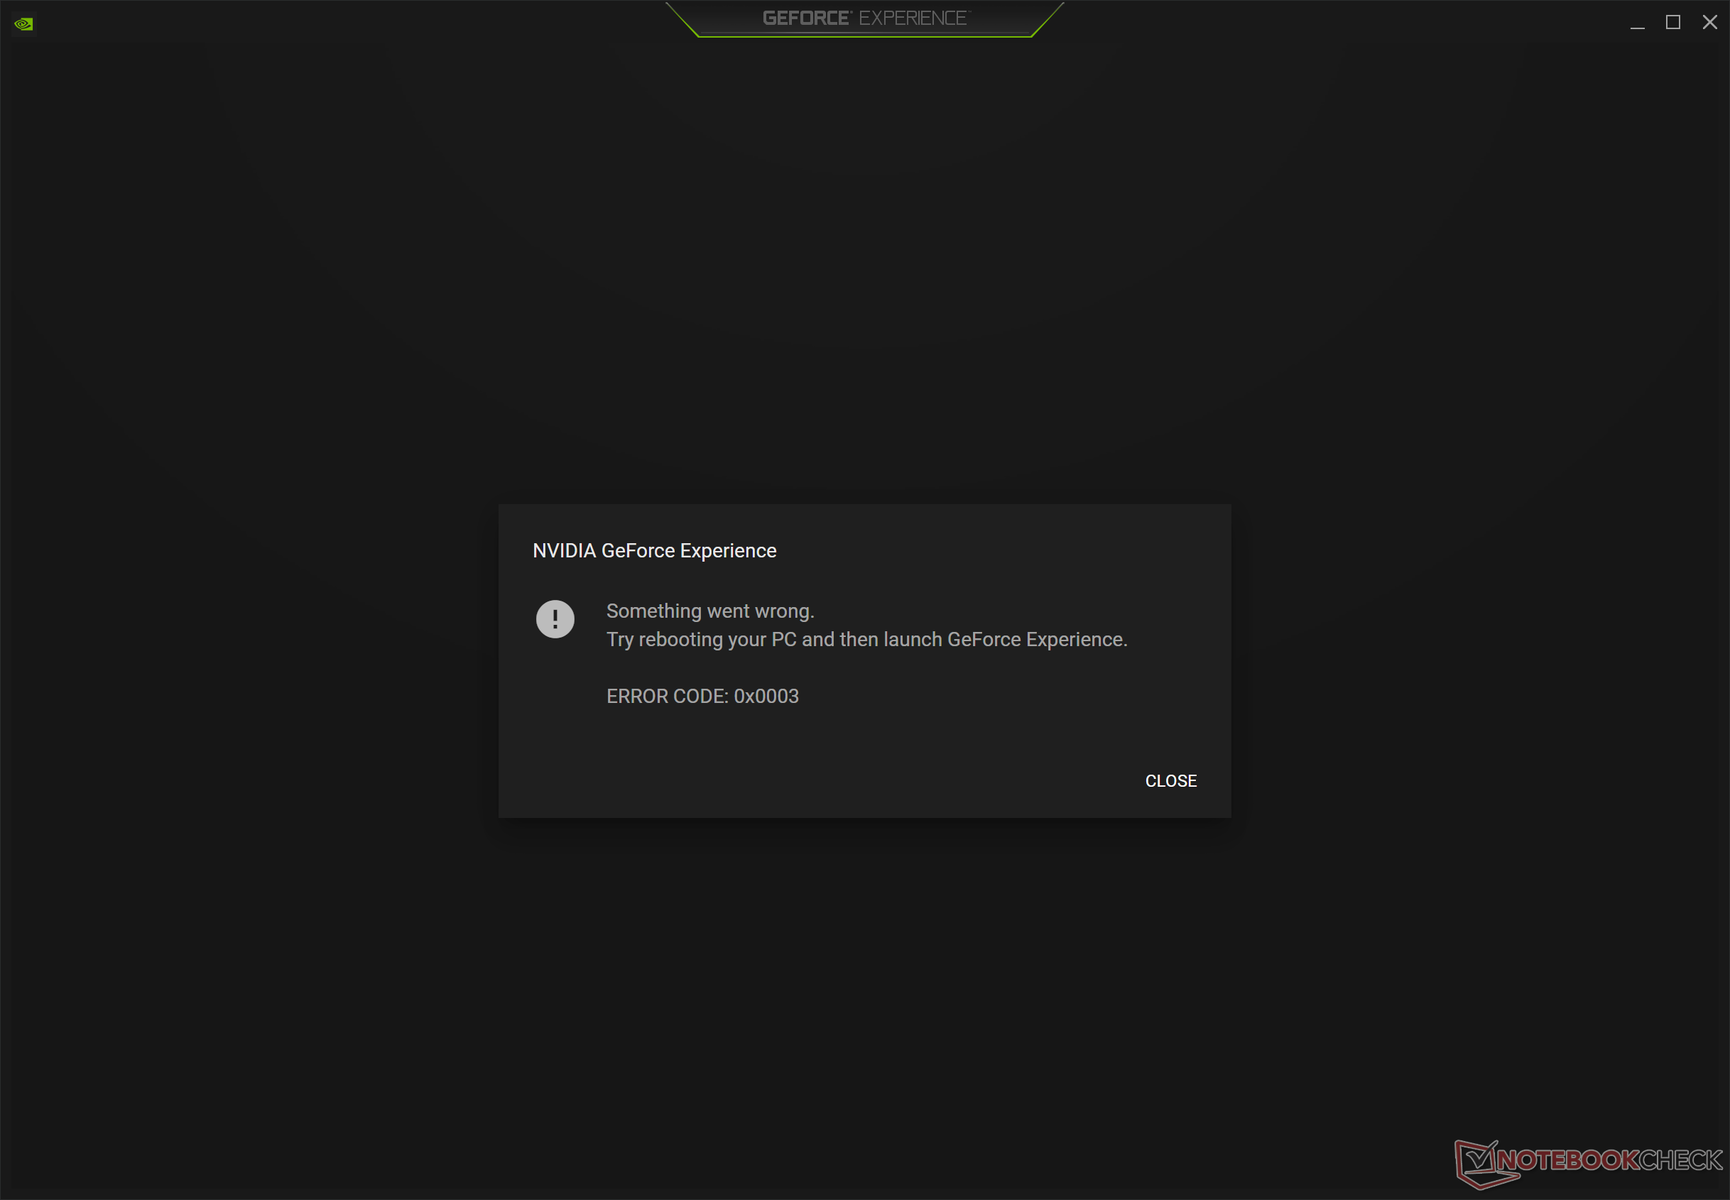
We encountered a few bugs on our test unit worth mentioning. Firstly, GeForce Experience would fail to launch no matter how many times we restarted the system as the error message suggested us to do. Secondly, activating the integrated GPU via Synapse will inexplicably cut off the top and bottom of the display upon rebooting. The Windows task bar, for example, would be impossible to see and any options to scale the display would be grayed out. Updating to the latest Intel drivers fixed this particular issue.
And finally, a third bug we encountered would crash the system when running both Prime95 and FurMark simultaneously as our Stress Test section below will detail.
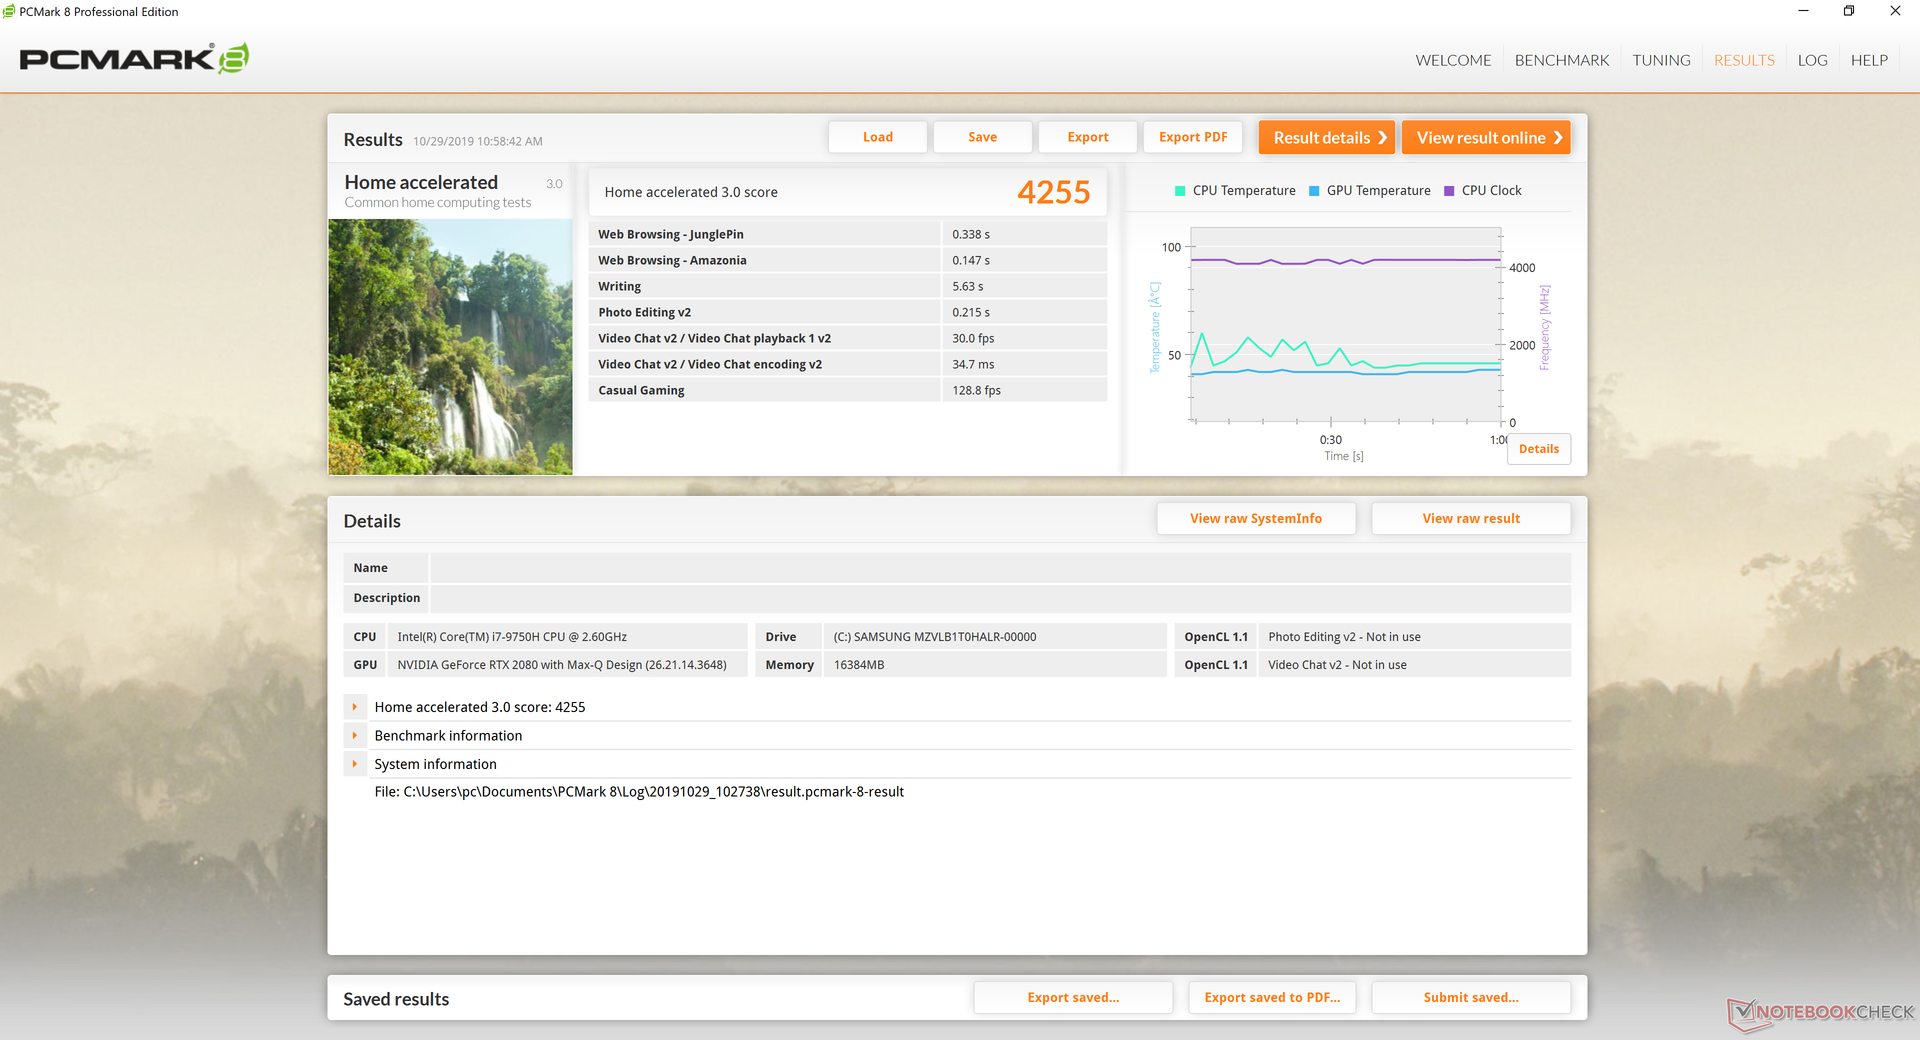
| PCMark 8 Home Score Accelerated v2 | 4255 points | |
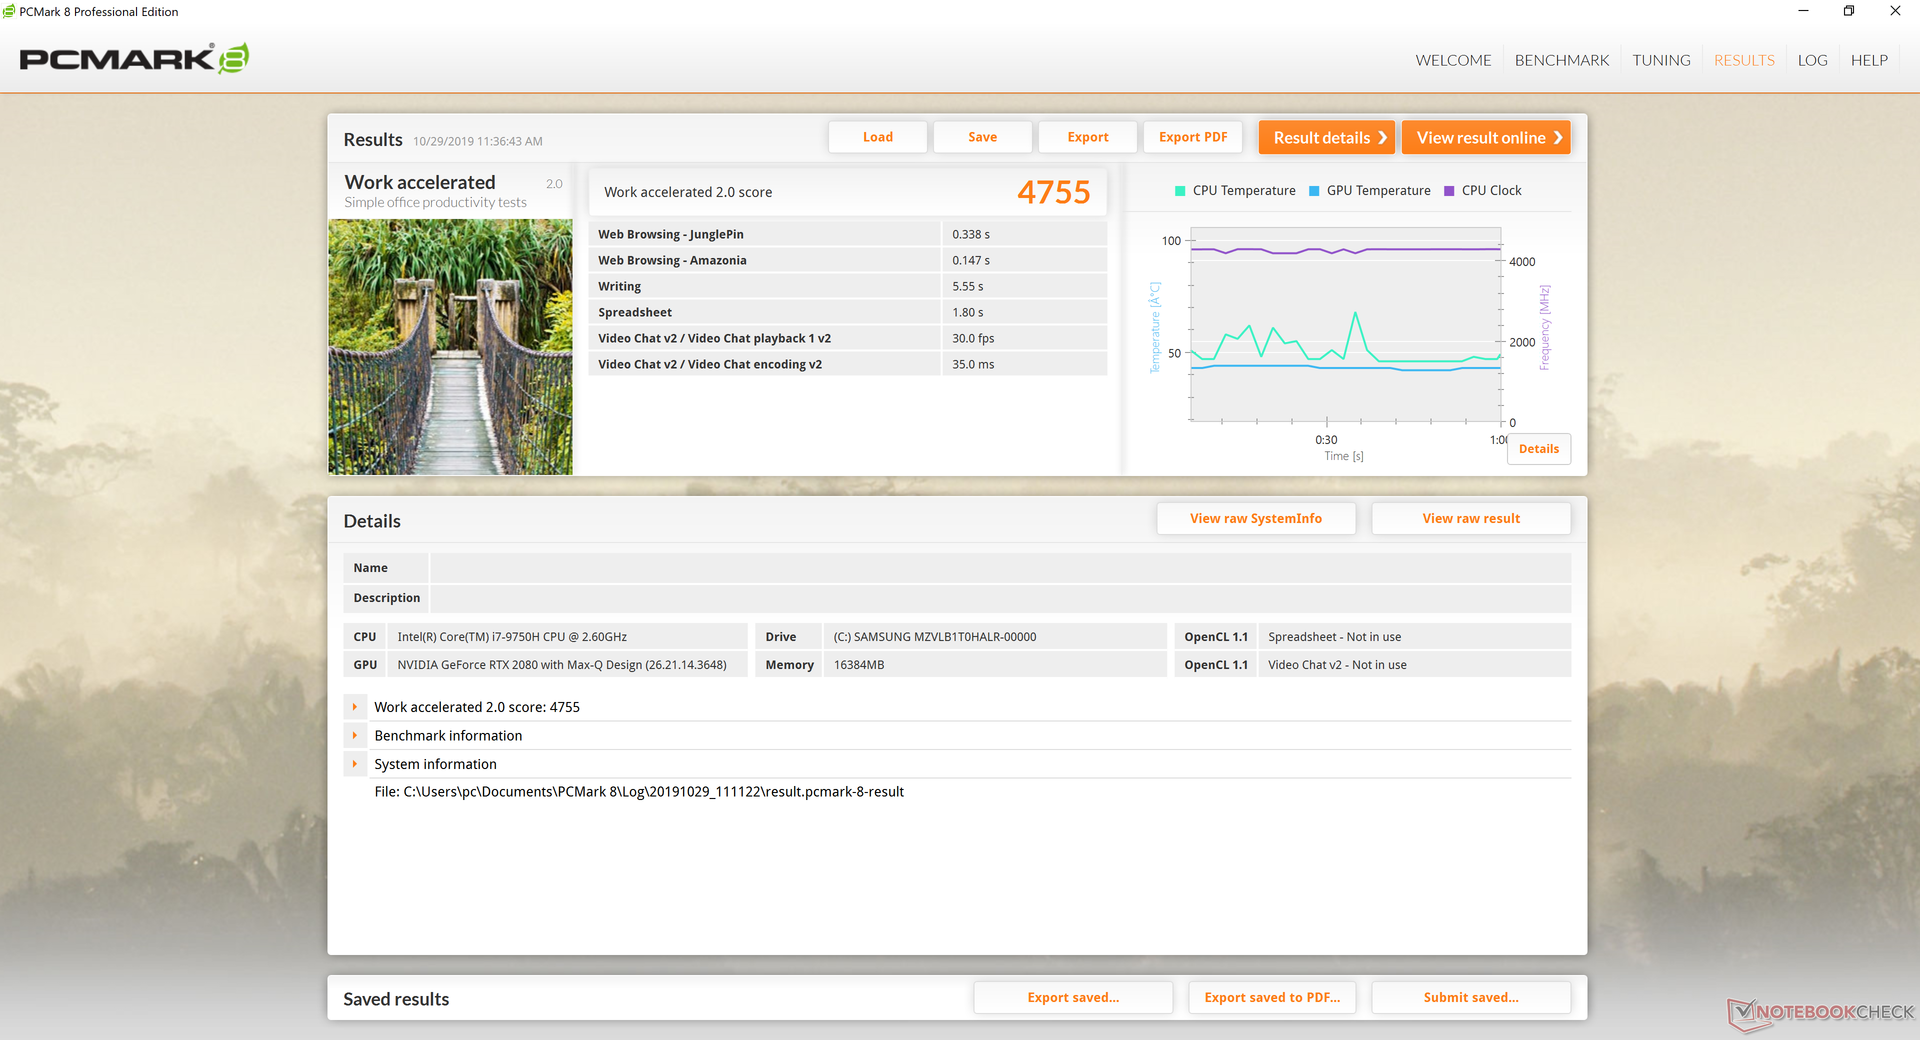
| PCMark 8 Work Score Accelerated v2 | 4755 points | |
| PCMark 10 Score | 6202 points | |
Help | ||
Storage Devices
| Razer Blade Pro 17 4K UHD 120 Hz Samsung SSD PM981 MZVLB1T0HALR | Razer Blade Pro 17 RTX 2080 Max-Q Samsung SSD PM981 MZVLB512HAJQ | Razer Blade Pro 17 RTX 2060 Samsung SSD PM981 MZVLB512HAJQ | Razer Blade Pro 2017 2x Samsung SSD PM951 MZVLV256HCHP (RAID 0) | MSI GS75 Stealth 9SG 2x Samsung SSD PM981 MZVLB1T0HALR (RAID 0) | Asus Zephyrus S GX701GX Samsung SSD PM981 MZVLB1T0HALR | |
|---|---|---|---|---|---|---|
| AS SSD | -11% | -6% | -22% | -3% | -4% | |
| Seq Read (MB/s) | 1881 | 1831 -3% | 1810 -4% | 2599 38% | 2855 52% | 911 -52% |
| Seq Write (MB/s) | 2354 | 1744 -26% | 1797 -24% | 588 -75% | 2687 14% | 2347 0% |
| 4K Read (MB/s) | 43.42 | 45.16 4% | 48.43 12% | 37.57 -13% | 30.31 -30% | 53 22% |
| 4K Write (MB/s) | 104.1 | 107.1 3% | 106 2% | 104.4 0% | 96.3 -7% | 122.5 18% |
| 4K-64 Read (MB/s) | 1805 | 1240 -31% | 1156 -36% | 1116 -38% | 1460 -19% | 1577 -13% |
| 4K-64 Write (MB/s) | 1775 | 1695 -5% | 1748 -2% | 513 -71% | 1224 -31% | 1734 -2% |
| Access Time Read * (ms) | 0.049 | 0.064 -31% | 0.057 -16% | 0.051 -4% | 0.054 -10% | 0.08 -63% |
| Access Time Write * (ms) | 0.106 | 0.037 65% | 0.035 67% | 0.036 66% | 0.038 64% | 0.031 71% |
| Score Read (Points) | 2037 | 1468 -28% | 1385 -32% | 1414 -31% | 1776 -13% | 1721 -16% |
| Score Write (Points) | 2115 | 1977 -7% | 2033 -4% | 676 -68% | 1589 -25% | 2091 -1% |
| Score Total (Points) | 5215 | 4197 -20% | 4135 -21% | 2715 -48% | 4259 -18% | 4771 -9% |
| Copy ISO MB/s (MB/s) | 1877 | 2086 11% | 1984 6% | 2226 19% | ||
| Copy Program MB/s (MB/s) | 539 | 425.5 -21% | 588 9% | 426.4 -21% | ||
| Copy Game MB/s (MB/s) | 1368 | 555 -59% | 835 -39% | 1152 -16% |
* ... smaller is better

GPU Performance
We noticed undesirable frame rate behavior when idling on Witcher 3 for one hour. Normally on most other laptops, frame rates would be steady throughout the entire session. On the Blade Pro 17 4K, however, frame rates would dip to as low as 10 FPS before immediately recovering and this would occur three times during our hour-long test as shown by our graph below. We're not sure what's going on during these instances, but they suggest that Razer may still need to optimize their software and any potential background activity that could be interfering with gameplay. Note that we observed similar frame rate dips on the Blade Pro 17 FHD SKU.
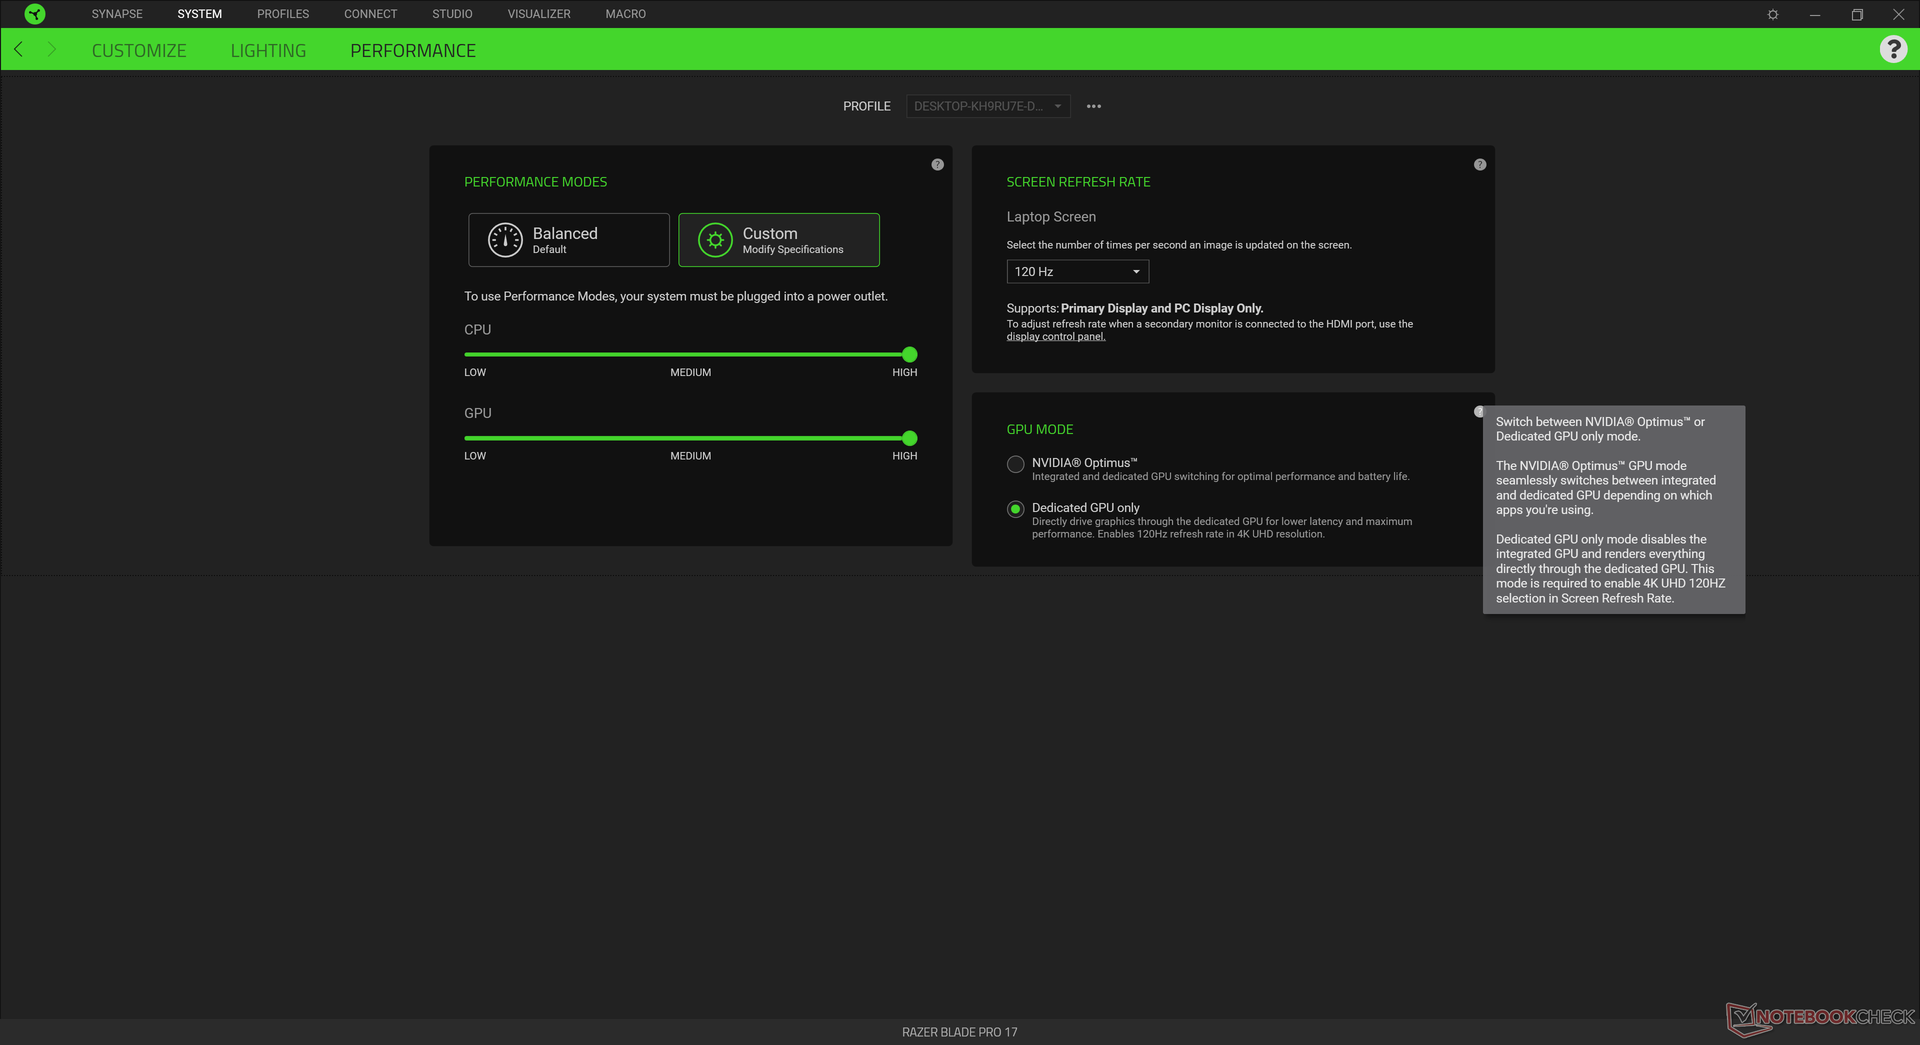
Manual graphics switching to the integrated UHD Graphics 630 is done via the Razer Synapse software and a reboot will be required. The display will be limited to 60 Hz if running on the integrated GPU.
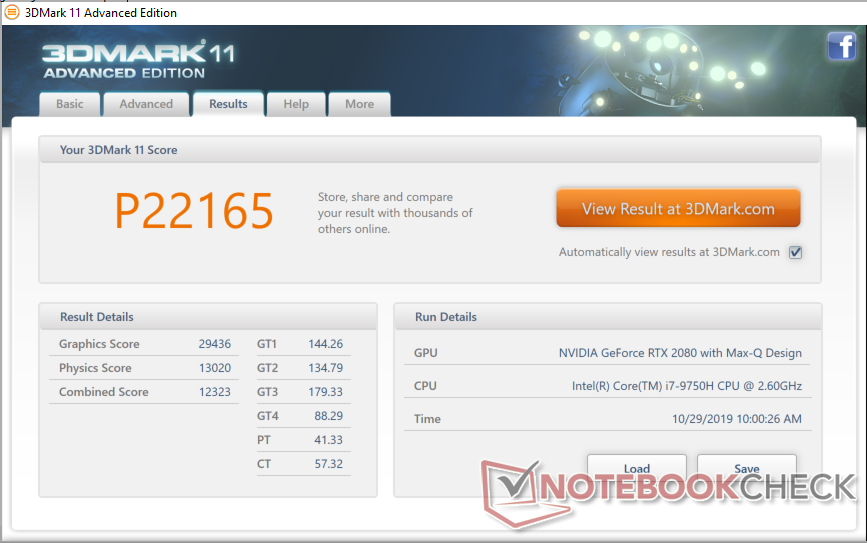
| 3DMark 11 Performance | 22165 points | |
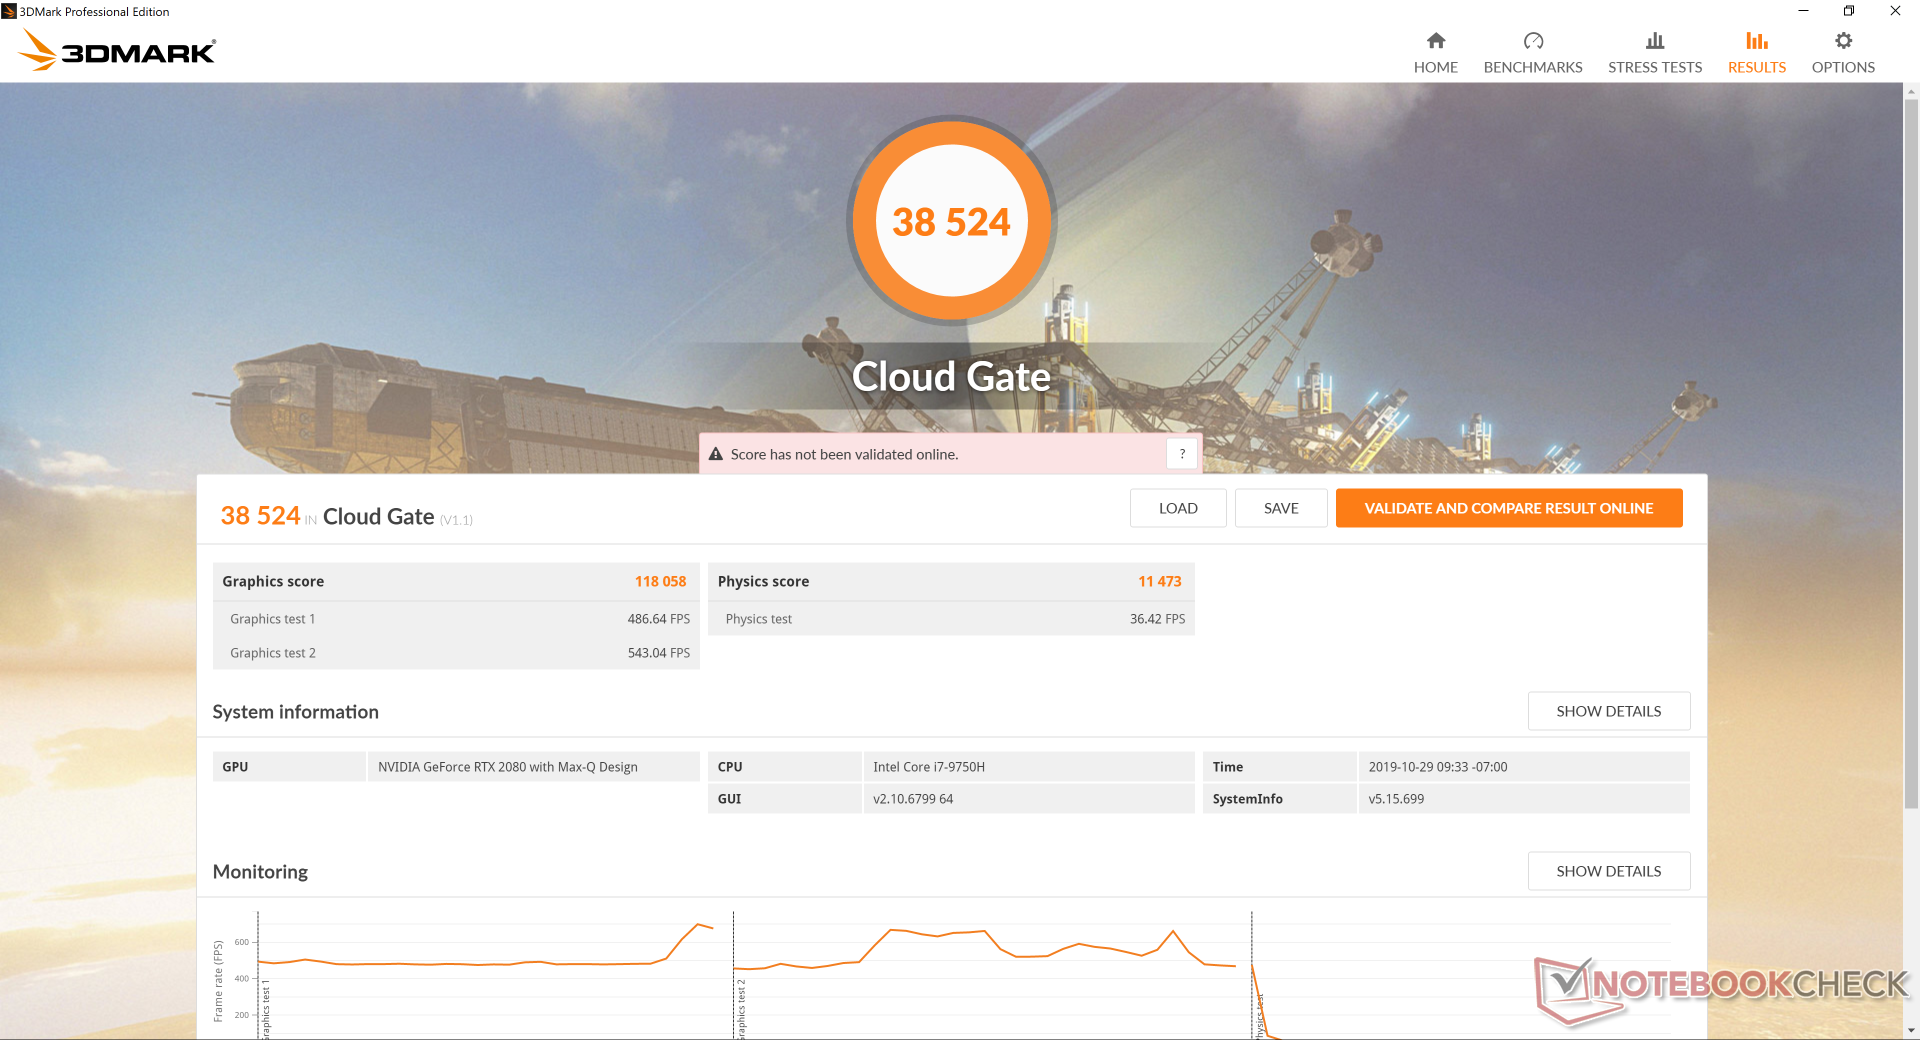
| 3DMark Cloud Gate Standard Score | 38524 points | |
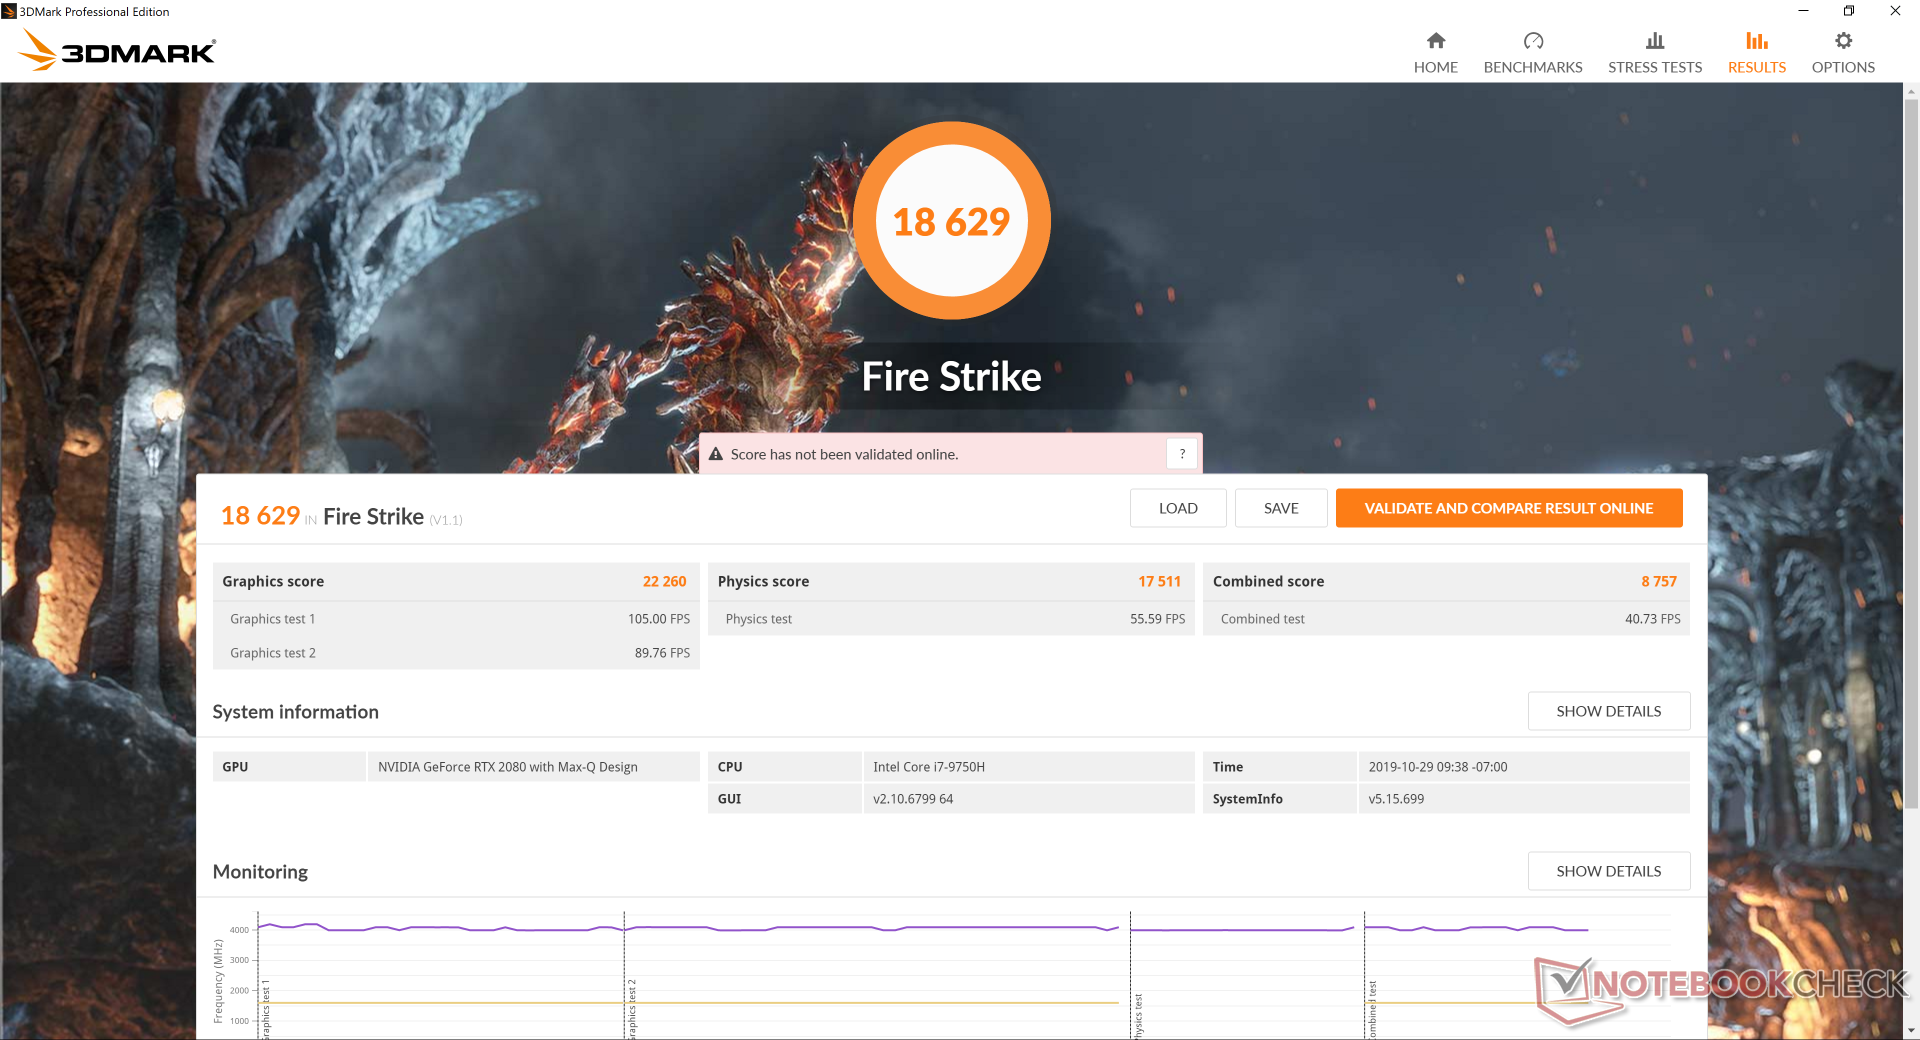
| 3DMark Fire Strike Score | 18629 points | |
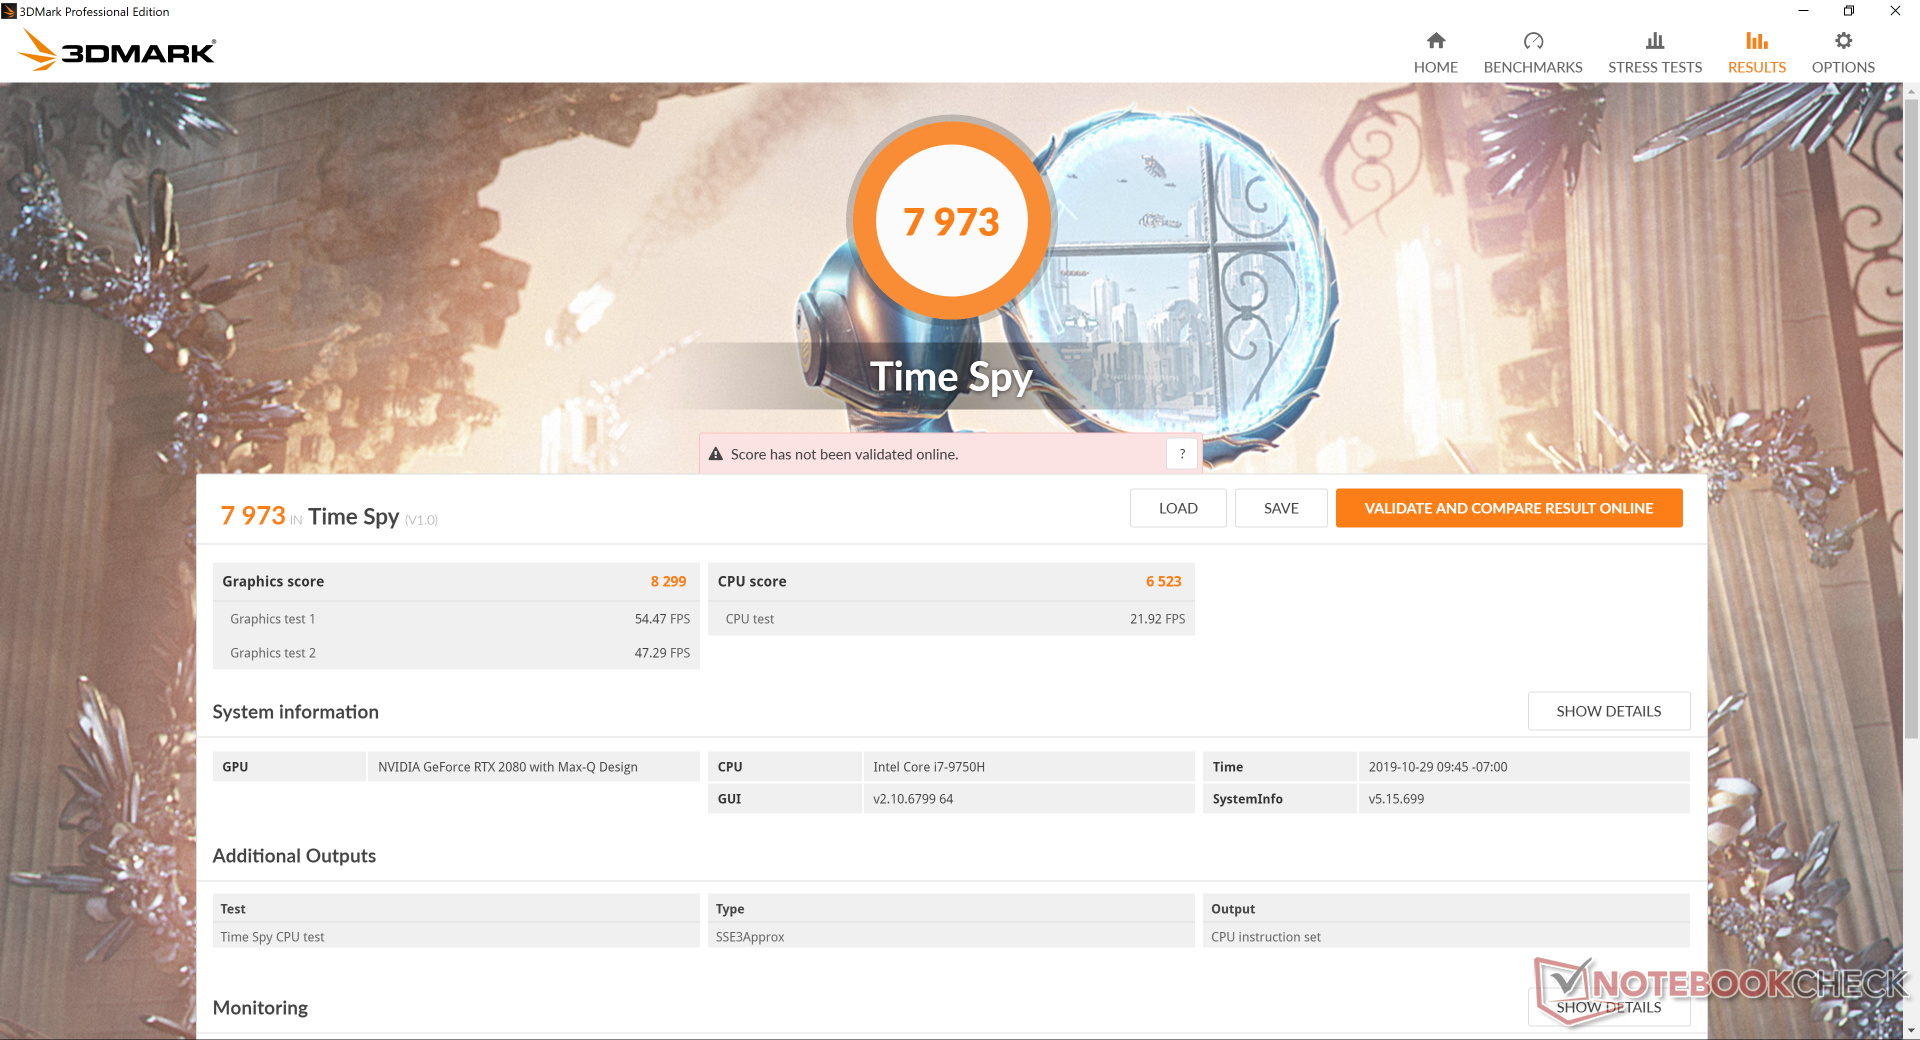
| 3DMark Time Spy Score | 7973 points | |
Help | ||
| low | med. | high | ultra | 4K | |
|---|---|---|---|---|---|
| BioShock Infinite (2013) | 349.6 | 311.9 | 284.1 | 189.5 | |
| The Witcher 3 (2015) | 325 | 258.7 | 179.9 | 92.7 | 65.5 |
| Shadow of the Tomb Raider (2018) | 132 | 118 | 111 | 105 | 40 |
Emissions
Temperature
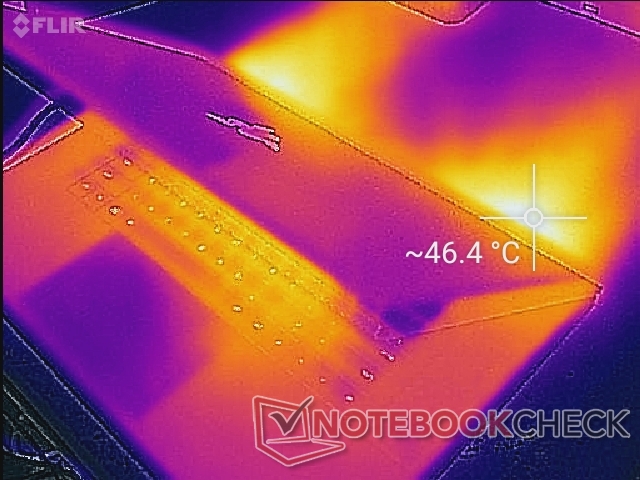
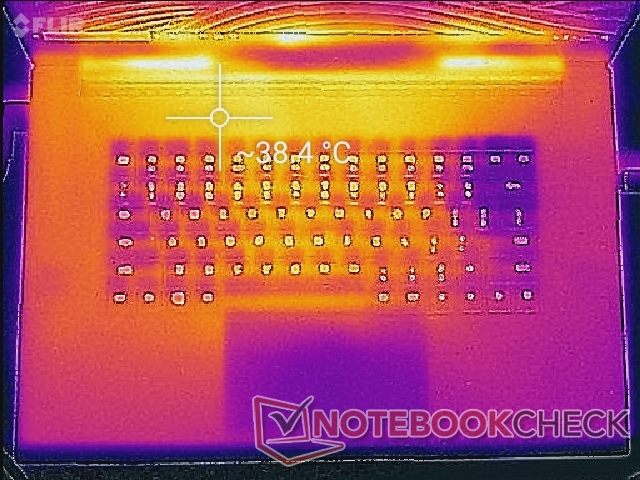
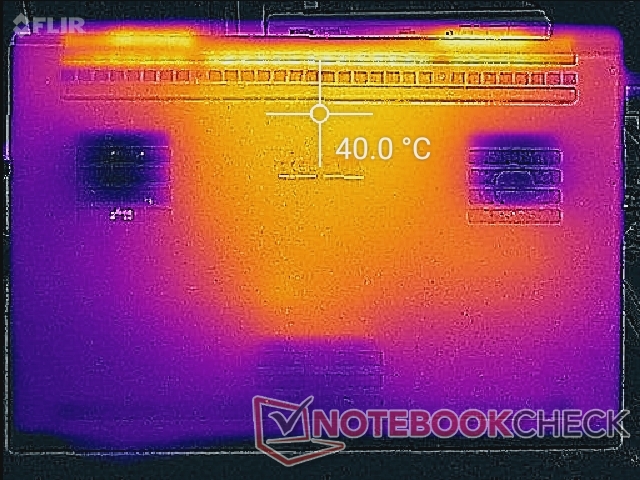
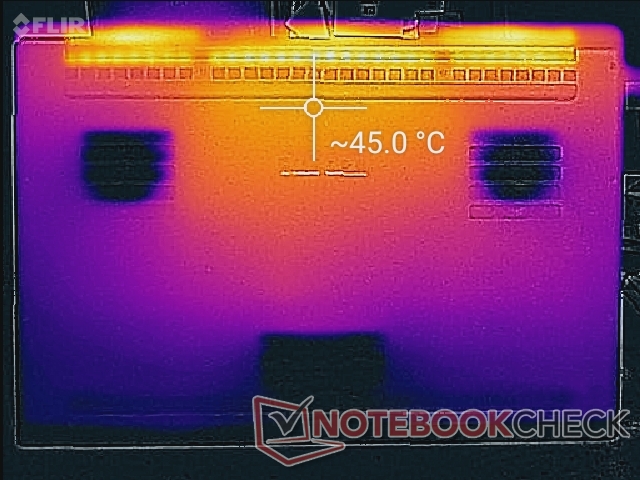
(±) Playing The Witcher 3, the average temperature for the upper side is 35.6 °C / 96 F, compared to the device average of 33.9 °C / 93 F.
(+) The palmrests and touchpad are reaching skin temperature as a maximum (34 °C / 93.2 F) and are therefore not hot.
(-) The average temperature of the palmrest area of similar devices was 28.8 °C / 83.8 F (-5.2 °C / -9.4 F).

Stress Test
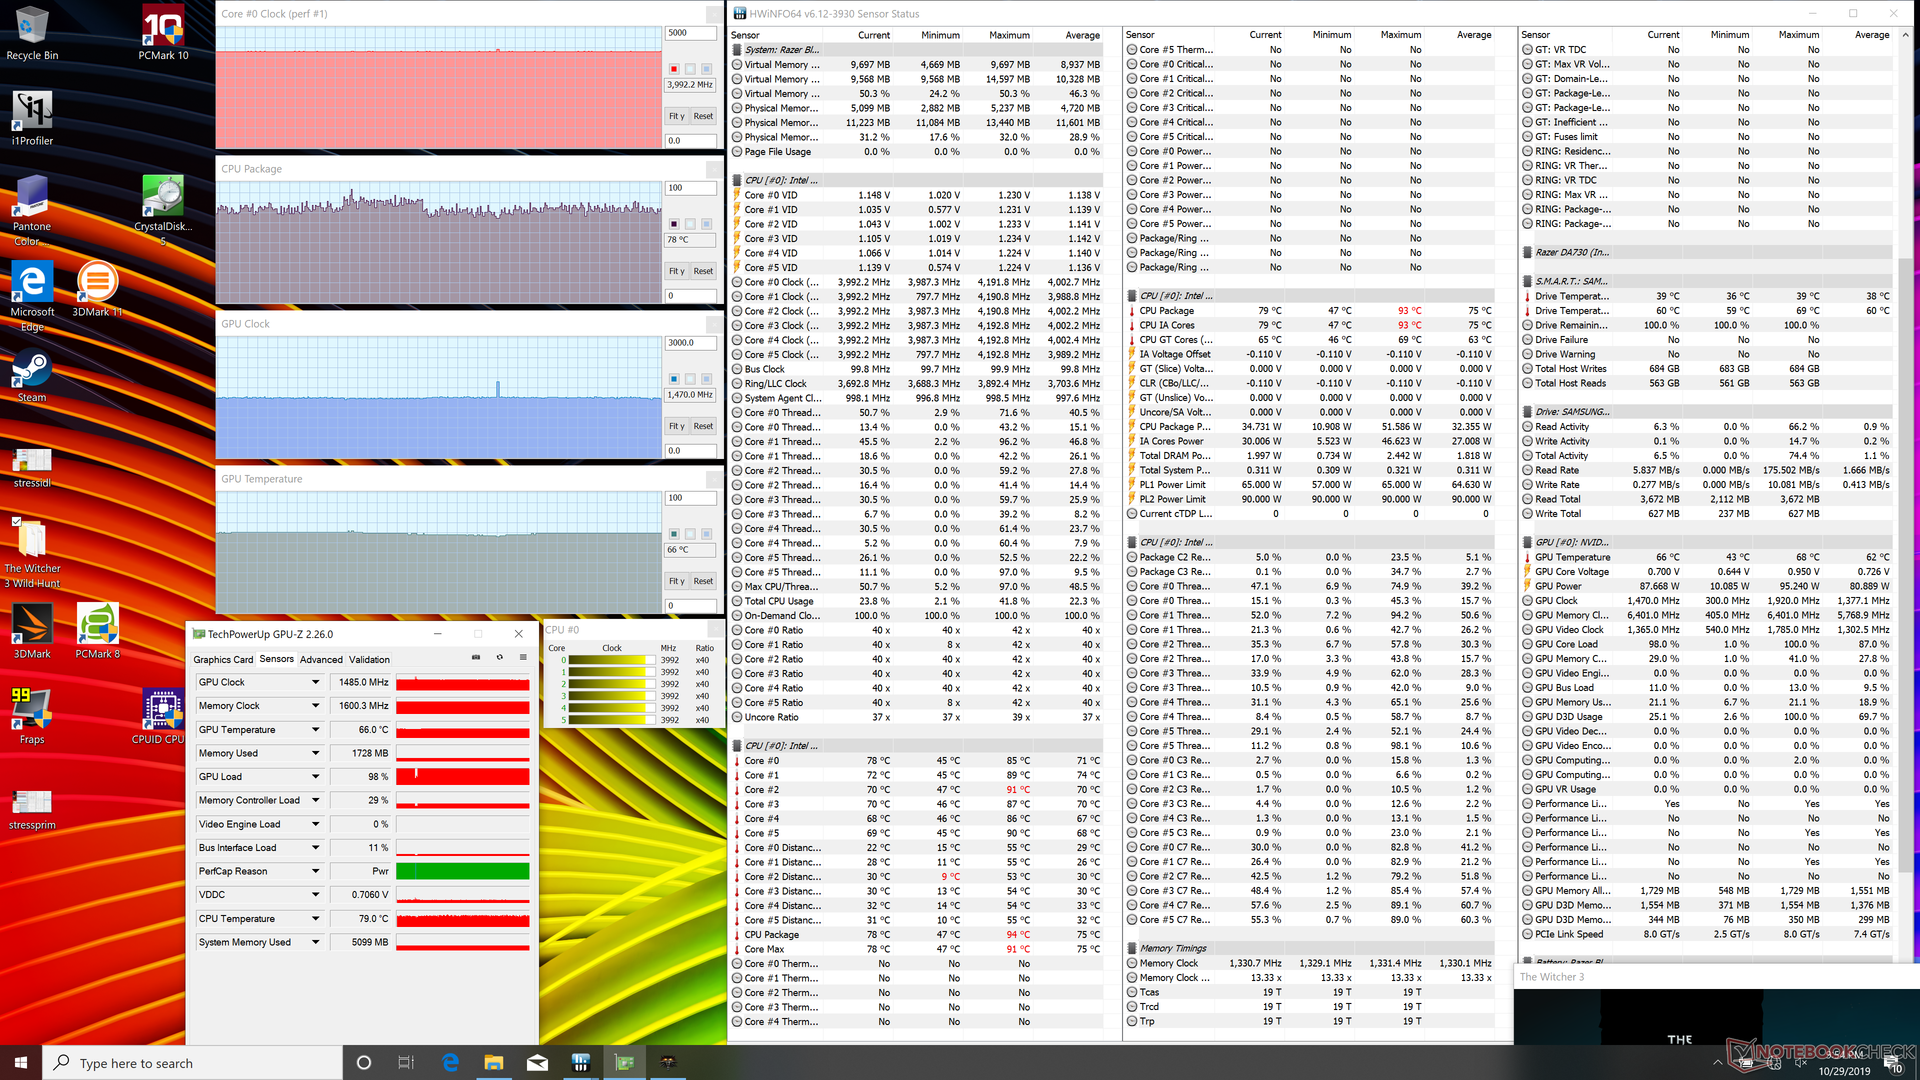
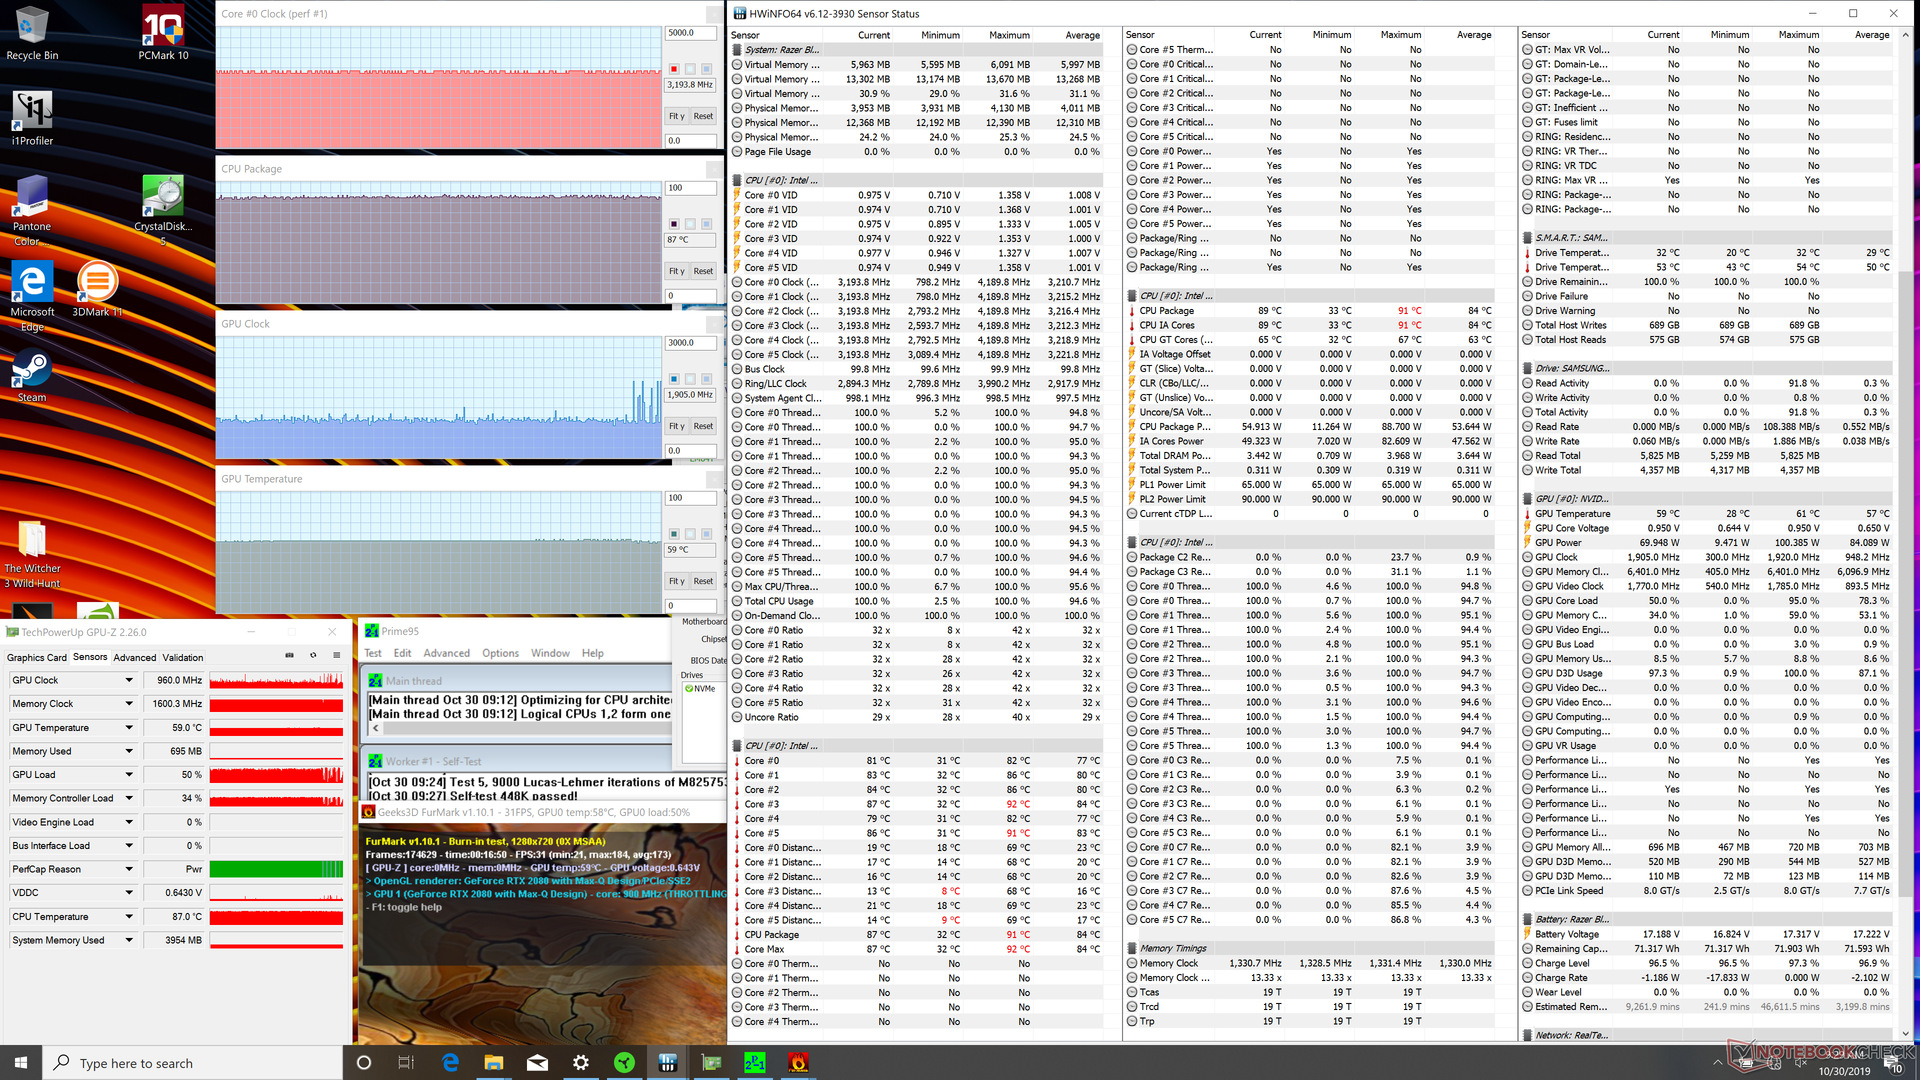
We stress the system with synthetic loads to identify for any potential throttling or stability issues. When running Prime95+FurMark simultaneously, performance would be steady for the first few minutes until the GPU inexplicably goes haywire. The GPU clock rate would begin fluctuating between ~1800 MHz and ~960 MHz with erratic frame rate behavior as a result as shown by our HWiNFO screenshot below. The laptop would eventually crash if we allow this to continue. We're able to repeat this behavior reliably on our Razer test unit even though this rarely occurs on any other laptop.
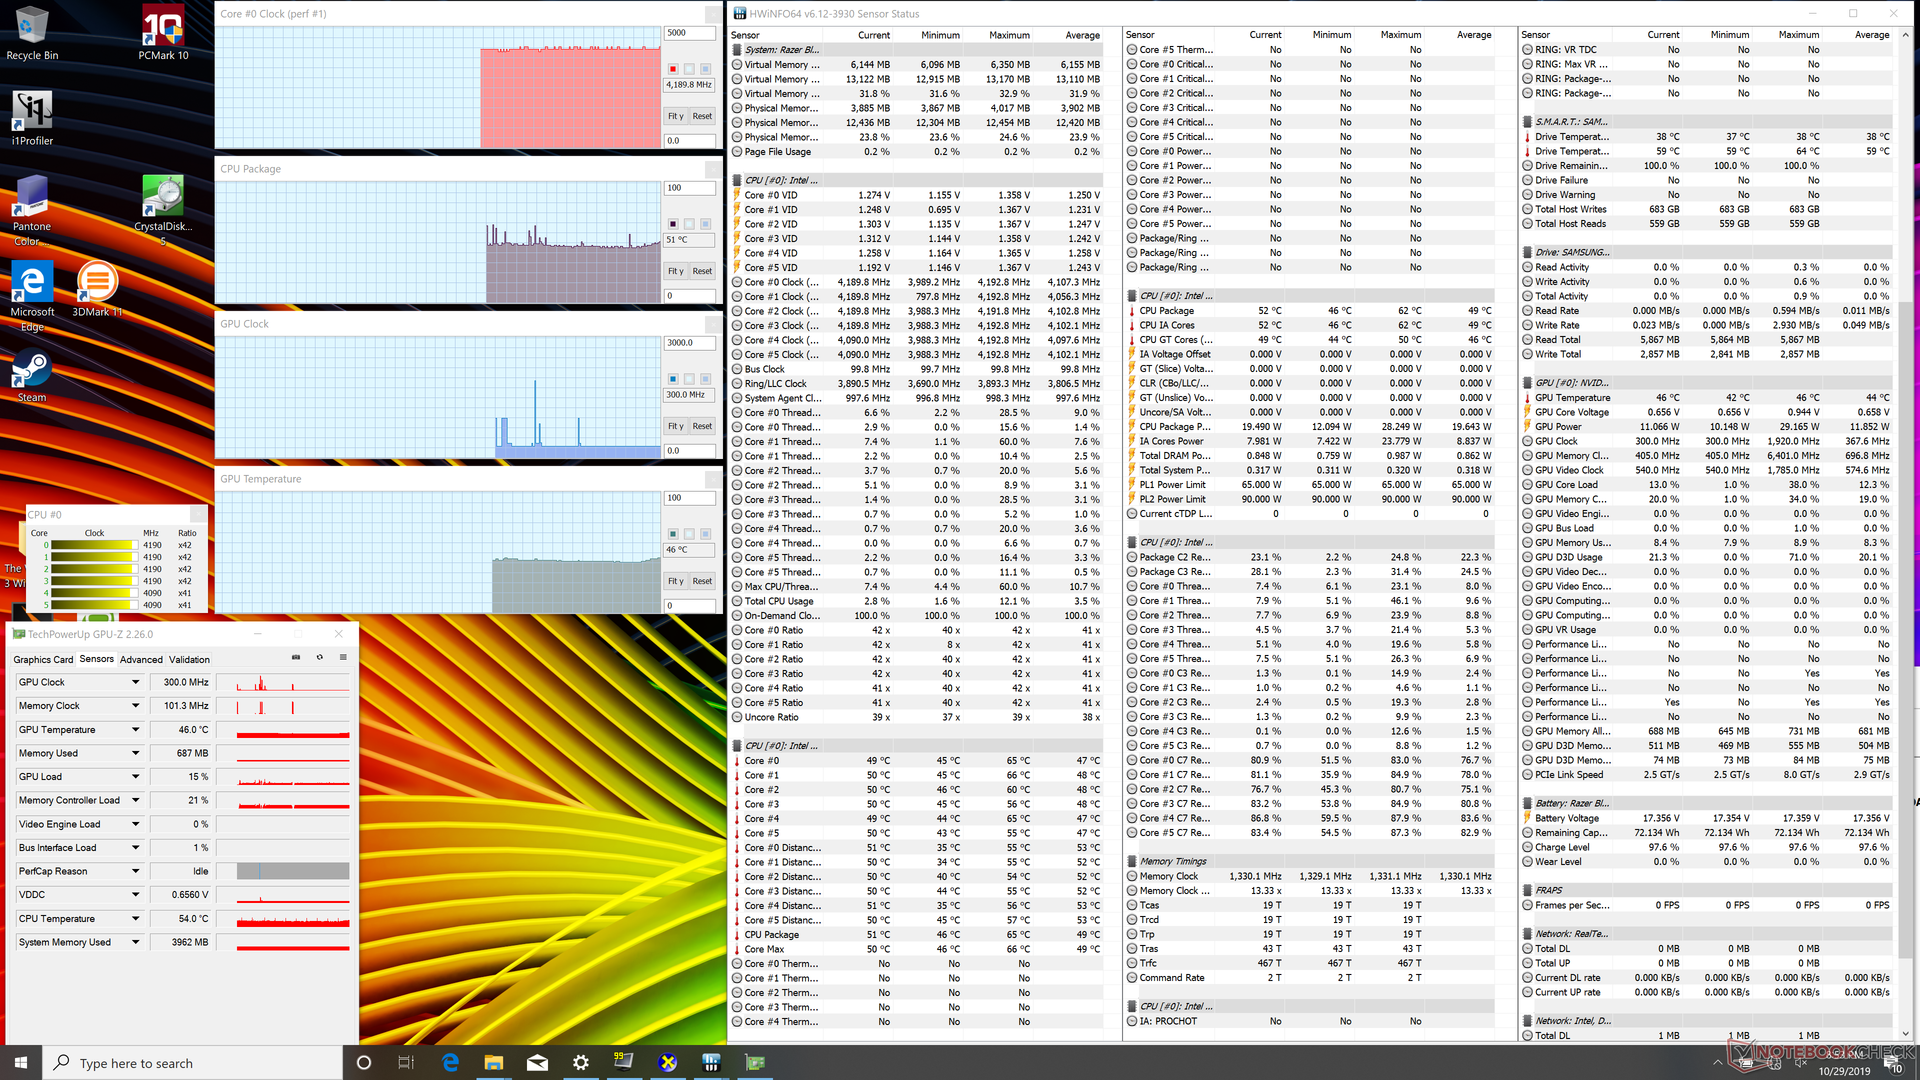
Aside from the above oddity, clock rates and temperatures appear to be otherwise normal when running Prime95 or Witcher 3. Prime95 load will cause CPU clock rates to spike to 4.0 GHz for the first few seconds before hitting a core temperature of 94 C. Clock rates eventually fall to 3.0 GHz in order to maintain a cooler core temperature of 71 C.
Running on batteries will limit performance substantially since maximum fan mode is disabled when disconnected from the outlet. A Fire Strike run on battery power returns Physics and Graphics scores of 8564 and 5055 points, respectively, compared to 17511 and 22260 points when on mains.
| CPU Clock (GHz) | GPU Clock (MHz) | Average CPU Temperature (°C) | Average GPU Temperature (°C) | |
| System Idle | -- | -- | 50 | 45 |
| Prime95 Stress | 3.0 | -- | 71 | 45 |
| Prime95 + FurMark Stress | System Crash | |||
| Witcher 3 Stress | 4.0 | ~1485 | ~78 | 66 |
Energy Management
Power Consumption
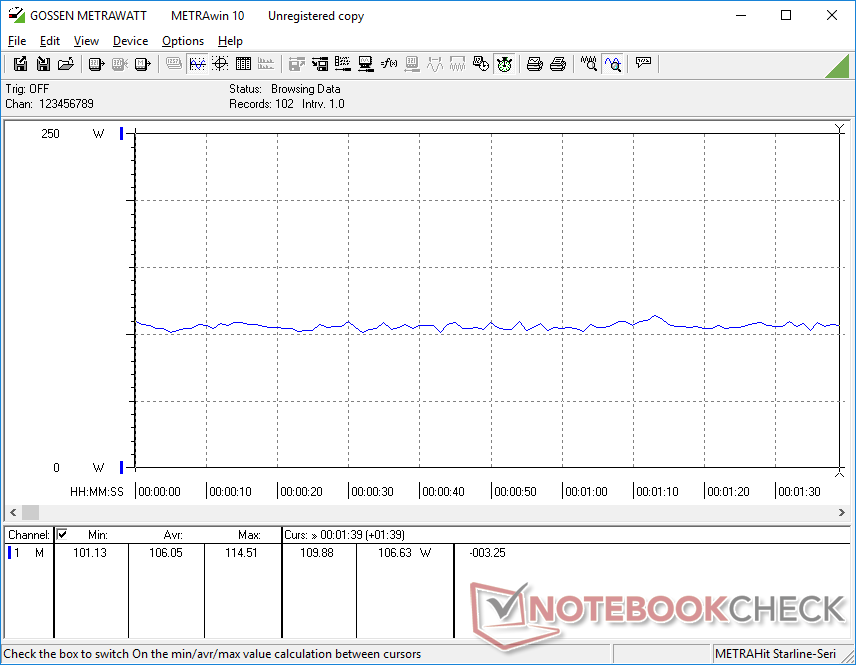
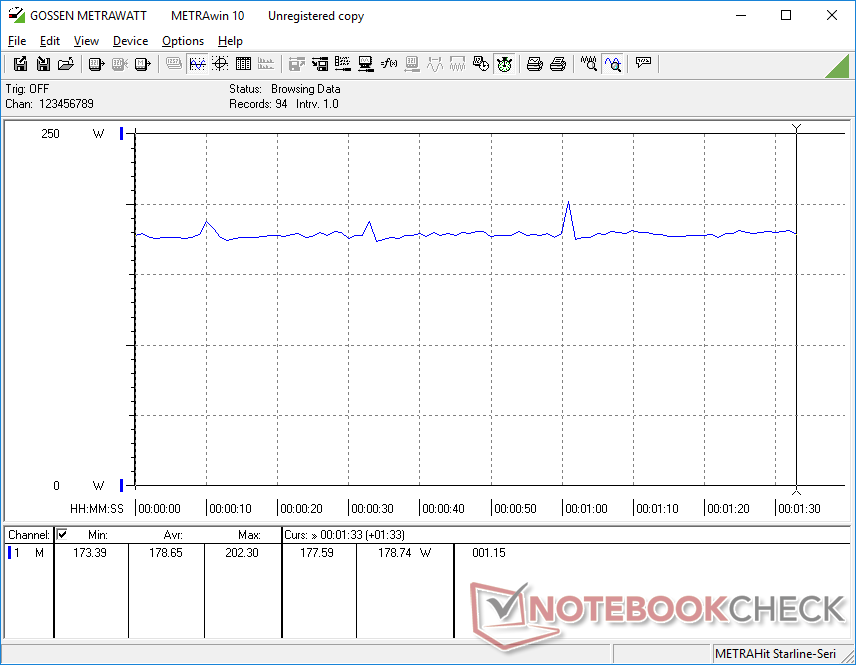
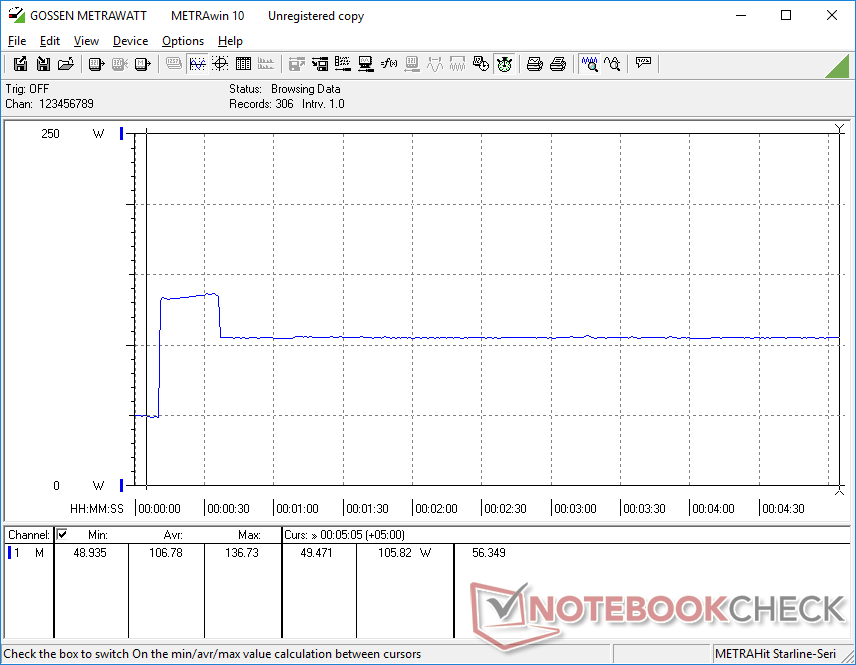
Power consumption when idling is higher than expected. After enabling the integrated GPU and setting Windows to Power Saver mode, simply sitting on desktop draws about 34 W on average compared to just 16 W on the Blade Pro 17 FHD. Consumption becomes more normal when gaming at about 179 W compared to 162 W on the slower Blade Pro 17 RTX 2060 configuration.
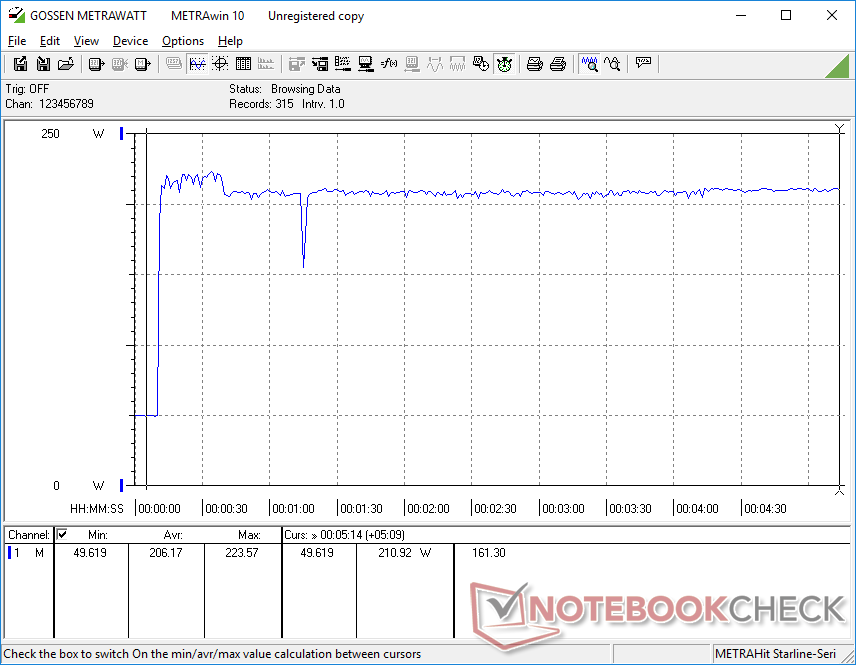
| Off / Standby | |
| Idle | |
| Load |
|
Key:
min: | |
| Razer Blade Pro 17 4K UHD 120 Hz i7-9750H, GeForce RTX 2080 Max-Q, Samsung SSD PM981 MZVLB1T0HALR, IPS, 3840x2160, 17.3" | Razer Blade Pro 17 RTX 2080 Max-Q i7-9750H, GeForce RTX 2080 Max-Q, Samsung SSD PM981 MZVLB512HAJQ, IPS, 1920x1080, 17.3" | Razer Blade Pro 17 RTX 2060 i7-9750H, GeForce RTX 2060 Mobile, Samsung SSD PM981 MZVLB512HAJQ, IPS, 1920x1080, 17.3" | Razer Blade Pro 2017 i7-7820HK, GeForce GTX 1080 Mobile, 2x Samsung SSD PM951 MZVLV256HCHP (RAID 0), IGZO, 3840x2160, 17.3" | MSI GS75 Stealth 9SG i7-9750H, GeForce RTX 2080 Max-Q, 2x Samsung SSD PM981 MZVLB1T0HALR (RAID 0), IPS, 1920x1080, 17.3" | Asus Zephyrus S GX701GX i7-8750H, GeForce RTX 2080 Max-Q, Samsung SSD PM981 MZVLB1T0HALR, IPS, 1920x1080, 17.3" | |
|---|---|---|---|---|---|---|
| Power Consumption | 26% | 25% | -2% | 30% | 24% | |
| Idle Minimum * (Watt) | 34.2 | 16.2 53% | 16 53% | 31 9% | 13 62% | 19 44% |
| Idle Average * (Watt) | 37.2 | 20.4 45% | 21.7 42% | 36 3% | 17 54% | 22 41% |
| Idle Maximum * (Watt) | 50 | 26.1 48% | 26.1 48% | 44 12% | 25 50% | 30 40% |
| Load Average * (Watt) | 106.1 | 96.5 9% | 105.6 -0% | 107 -1% | 96 10% | 104 2% |
| Witcher 3 ultra * (Watt) | 178.7 | 182.9 -2% | 161.8 9% | 212 -19% | 156 13% | 167 7% |
| Load Maximum * (Watt) | 223.6 | 214.3 4% | 225.3 -1% | 258 -15% | 239 -7% | 203 9% |
* ... smaller is better
Battery Life
We set the laptop to Balanced mode with the integrated GPU active for our WLAN test. Results are a full hour shorter than what we recorded on the Blade Pro 17 FHD SKU at just 3.5 hours of real-world browsing use.
| Razer Blade Pro 17 4K UHD 120 Hz i7-9750H, GeForce RTX 2080 Max-Q, 70 Wh | Razer Blade Pro 17 RTX 2080 Max-Q i7-9750H, GeForce RTX 2080 Max-Q, 70 Wh | Razer Blade Pro 17 RTX 2060 i7-9750H, GeForce RTX 2060 Mobile, 70 Wh | Razer Blade Pro 2017 i7-7820HK, GeForce GTX 1080 Mobile, 99 Wh | MSI GS75 Stealth 9SG i7-9750H, GeForce RTX 2080 Max-Q, 80.25 Wh | Asus Zephyrus S GX701GX i7-8750H, GeForce RTX 2080 Max-Q, 76 Wh | |
|---|---|---|---|---|---|---|
| Battery runtime | 27% | 22% | -11% | 62% | 3% | |
| WiFi v1.3 (h) | 3.7 | 4.7 27% | 4.5 22% | 3.3 -11% | 6 62% | 3.8 3% |
| Reader / Idle (h) | 4.9 | 4.2 | 7.7 | 5 | ||
| Load (h) | 1.4 | 1.4 | 1.2 | 0.9 |
Pros
Cons
Verdict
Gaming has never looked this smooth or crisp on a 17.3-inch laptop because of the new panel at play. Previously, gaming on a 4K 17.3-inch laptop would have entailed slow response times, a 60 Hz limiter, and very noticeable ghosting. The new 120 Hz display on the Razer addresses all of these concerns. Keep in mind that it's not necessary to reach a stable 120 FPS to exploit the advantages of a 120 Hz panel and we fully expect competing 17.3-inch laptops to eventually offer similar 4K 120 Hz options in the future. But for now, the Razer Blade Pro 17 is the only place where you can find this particular panel.
Nonetheless, the small bugs we encountered on our unit put a dent on the experience. Common apps and tasks like GeForce Experience and graphics switching should be working the first time around especially on a $3700 machine. These hiccups thankfully appear to be software issues instead of hardware that can hopefully be patched at a later date.
We'd like to see G-Sync on future revisions which would pair very well with a 4K panel. Manual graphics switching allows for both Optimus and G-Sync much like on some Asus Zephyrus models.
A smooth and nearly ghost-free 4K gaming experience on a 120 Hz 17.3-inch laptop for the first time. A few bugs need squashing and G-Sync would definitely be on our list of wanted features for the future.
Razer Blade Pro 17 4K UHD 120 Hz
- 10/31/2019 v7 (old)
Allen Ngo
Price comparison
