No RTX? No Problem — Razer Blade 15 GTX 1660 Ti Base Model Laptop Review
When Razer refreshed its Blade 15 series earlier this year, fans had the option between RTX 2060, RTX 2070 Max-Q, or RTX 2080 Max-Q graphics. It wasn't until a few months later that Nvidia launched the less expensive mobile GTX 1660 Ti for gamers who wanted the benefits of Turing without the fancy RT or DLSS features.
The latest Blade 15 configuration comes equipped with the GTX 1660 Ti to lower the barrier of entry for users on tighter budgets. Whereas the least expensive SKU used to be the RTX 2060 configuration for $2000, the new GTX 1660 Ti configuration is $400 less while sporting the exact same ports, RAM, and CPU as its pricier RTX siblings. Its display, however, will use a slower 60 Hz panel with an option to upgrade to 144 Hz.
As explained here, Blade 15 laptops come in slightly different thicknesses depending on the SKU. The GTX 1660 Ti chassis is the "Base Model" instead of the "Advanced Model" meaning that it is the thicker version with a different set of features as we will detail below.
The 15.6-inch Blade 15 GTX 1660 Ti competes directly against other mid-range to high-end ultrathin gaming laptops like the MSI GS65, Aorus 15, Asus Zephyrus S GX531, Lenovo Legion Y740-15, Alienware m15 R2, and the HP Omen X 2S 15. The Dell XPS 15 and Gigabyte Aero 15 can also be seen as alternatives since Razer wants to target content creators and professionals as well. We recommend checking out our existing review on the Blade 15 GTX 1060 Max-Q to learn more about the physical features of the Blade 15 GTX 1660 Ti since they share the same chassis.
Related news: Razer Blade Pro 17 has the fastest GeForce RTX 2080 Max-Q GPU
More Razer Blade reviews:
Case
All Blade 15 laptops thus far share the same footprint but with different thicknesses depending on the configuration. This particular SKU shares the same Base Model chassis as the Blade 15 RTX 2060 or Blade 15 GTX 1060 Max-Q instead of the thinner Advanced Model chassis of the Blade 15 RTX 2070 Max-Q or Blade 15 RTX 2080 Max-Q. The Base Model and Advanced Model designs are nearly identical save for some notable differences as listed here:
- Base Model includes single-zone RGB lighting only instead of per-key RGB
- Base Model is slightly thicker by 2.1 mm (17.8 mm vs. 19.9 mm)
- Base Model integrates gigabit RJ-45 and a 2.5-inch SATA III bay
- Base Model comes with a 200 W AC adapter instead of 230 W
- Battery capacity is smaller on the Base Model (65 Wh vs. 80 Wh)
- No IR camera for Base Model
- No vapor chamber cooler for Base Model
- 144 Hz IPS is optional for Base Model
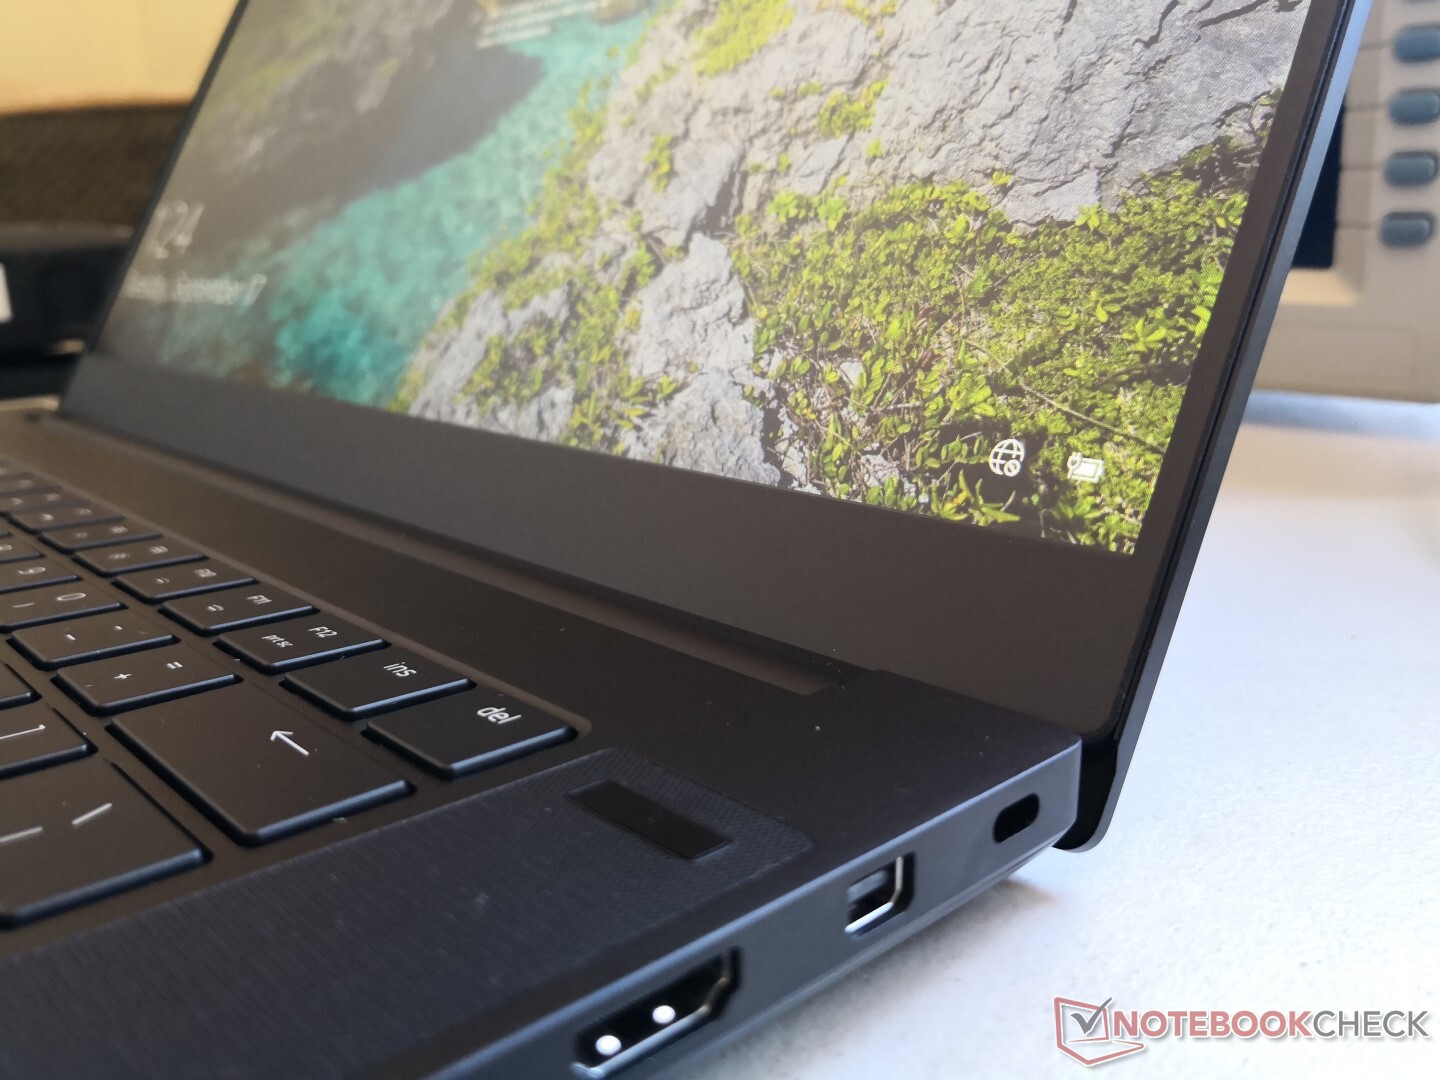
Connectivity
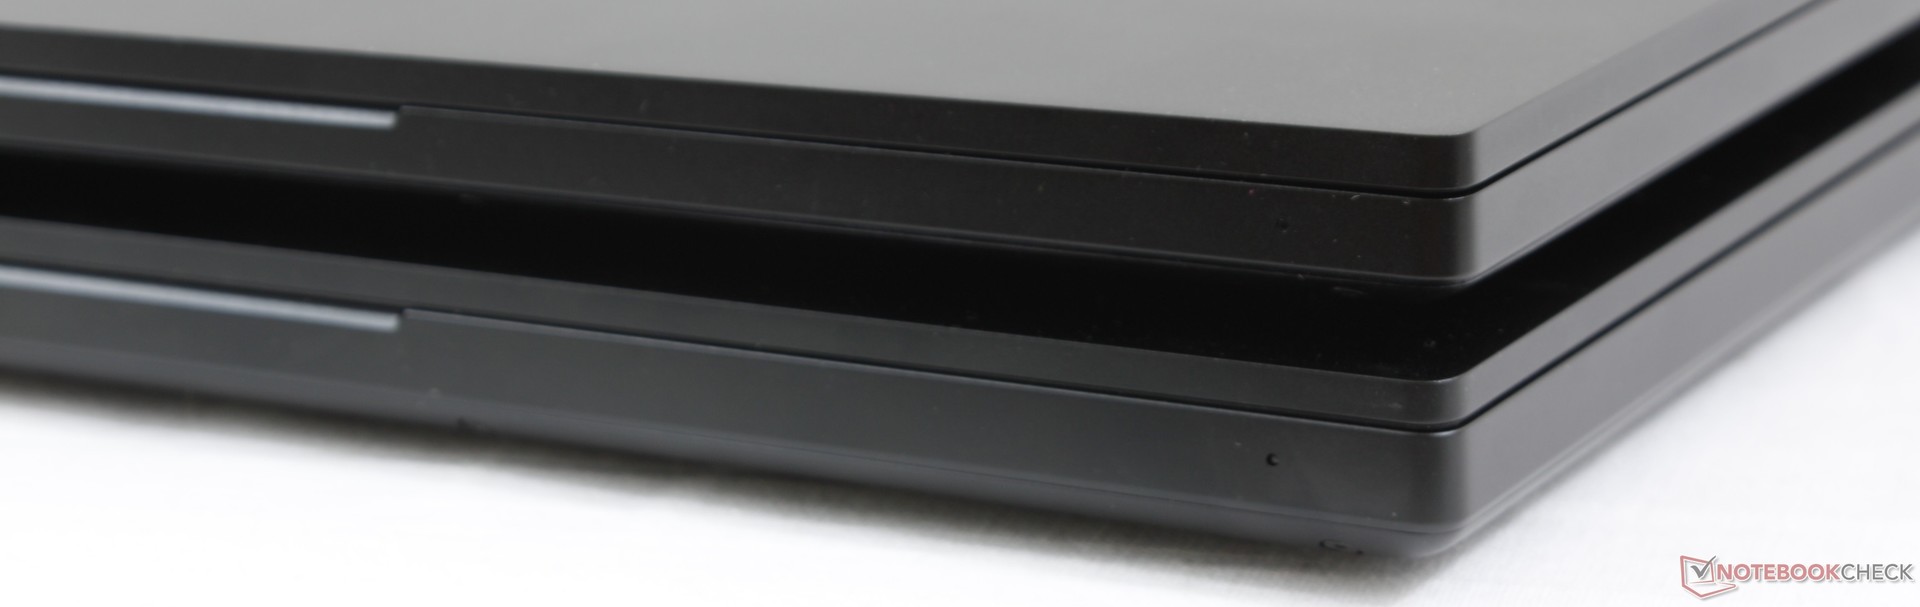
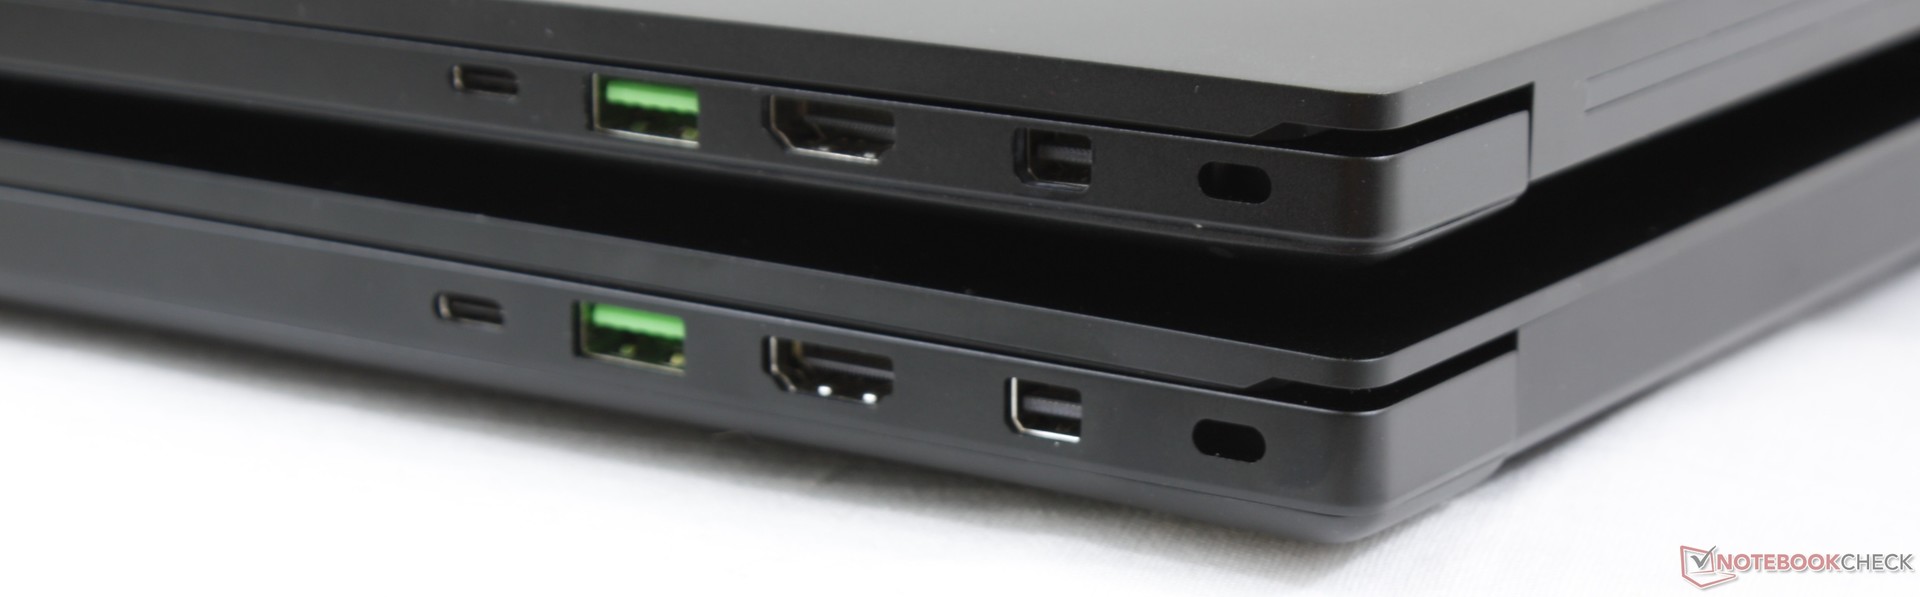
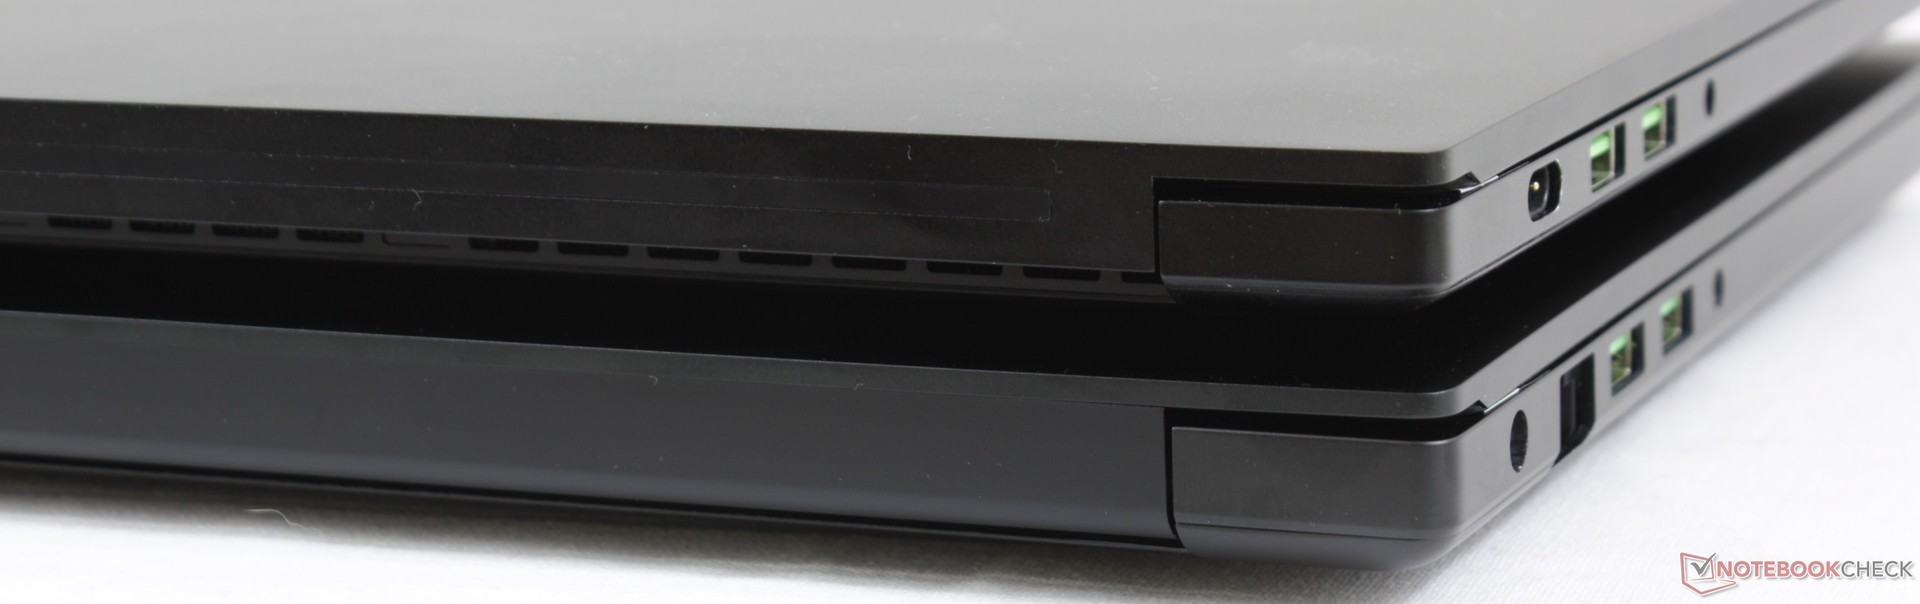
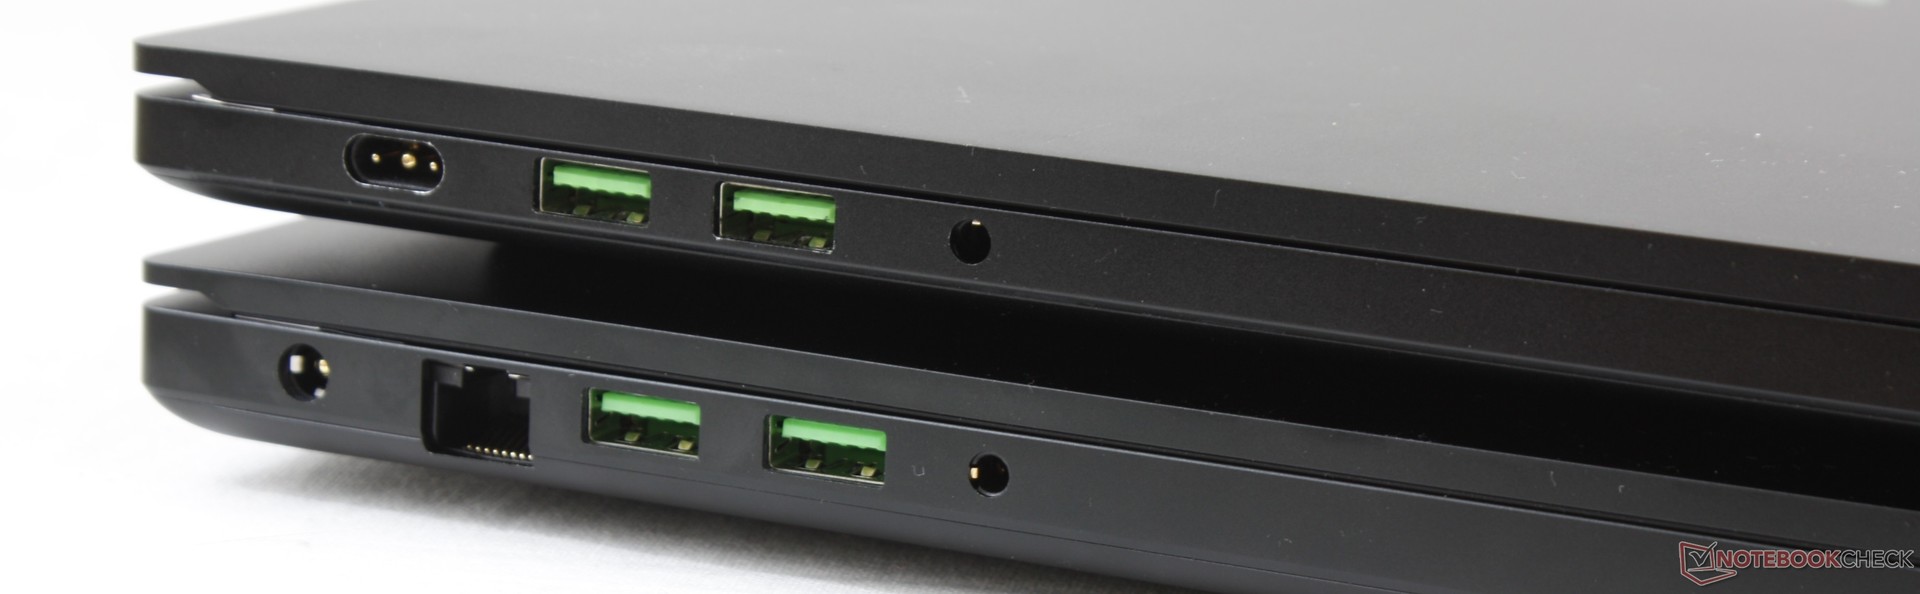
The images below compare the thicker Base Model Blade 15 GTX 1060 Max-Q (bottom) to the thinner Advanced Model Blade 15 RTX 2080 Max-Q (top). The Blade 15 GTX 1660 Ti is exactly the same as the Blade 15 GTX 1060 Max-Q except that its AC adapter port has changed to match the one on the Blade 15 RTX 2080 Max-Q. In other words, the Blade 15 GTX 1660 Ti AC adapter is compatible across all Blade 15 Turing laptops while being incompatible with last generation Blade 15 Pascal laptops.
Communication
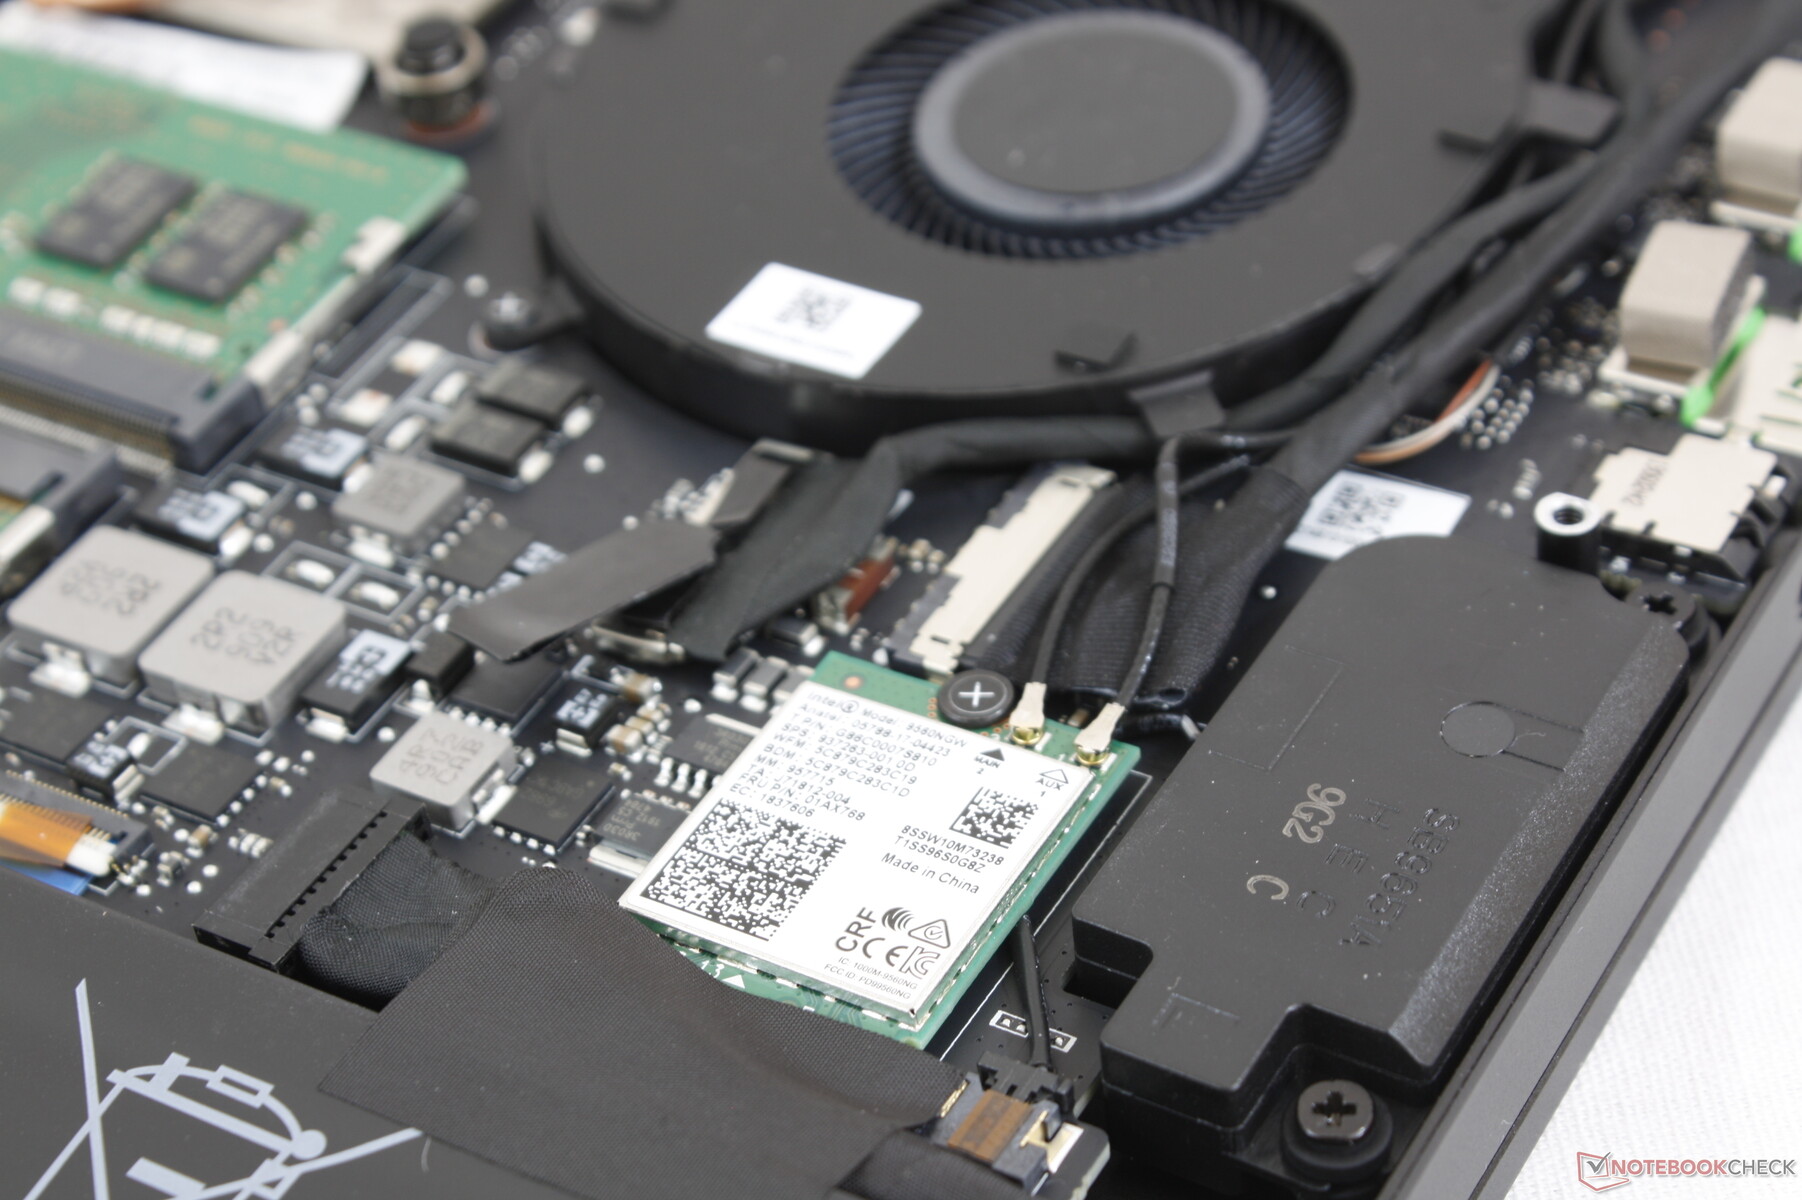
The Intel 9560 comes standard for theoretical transfer rates of up to 1.73 Gbps. Users can swap and upgrade to the Intel AX200 Wi-Fi 6 much like on our Blade 15 RTX 2080 Max-Q.
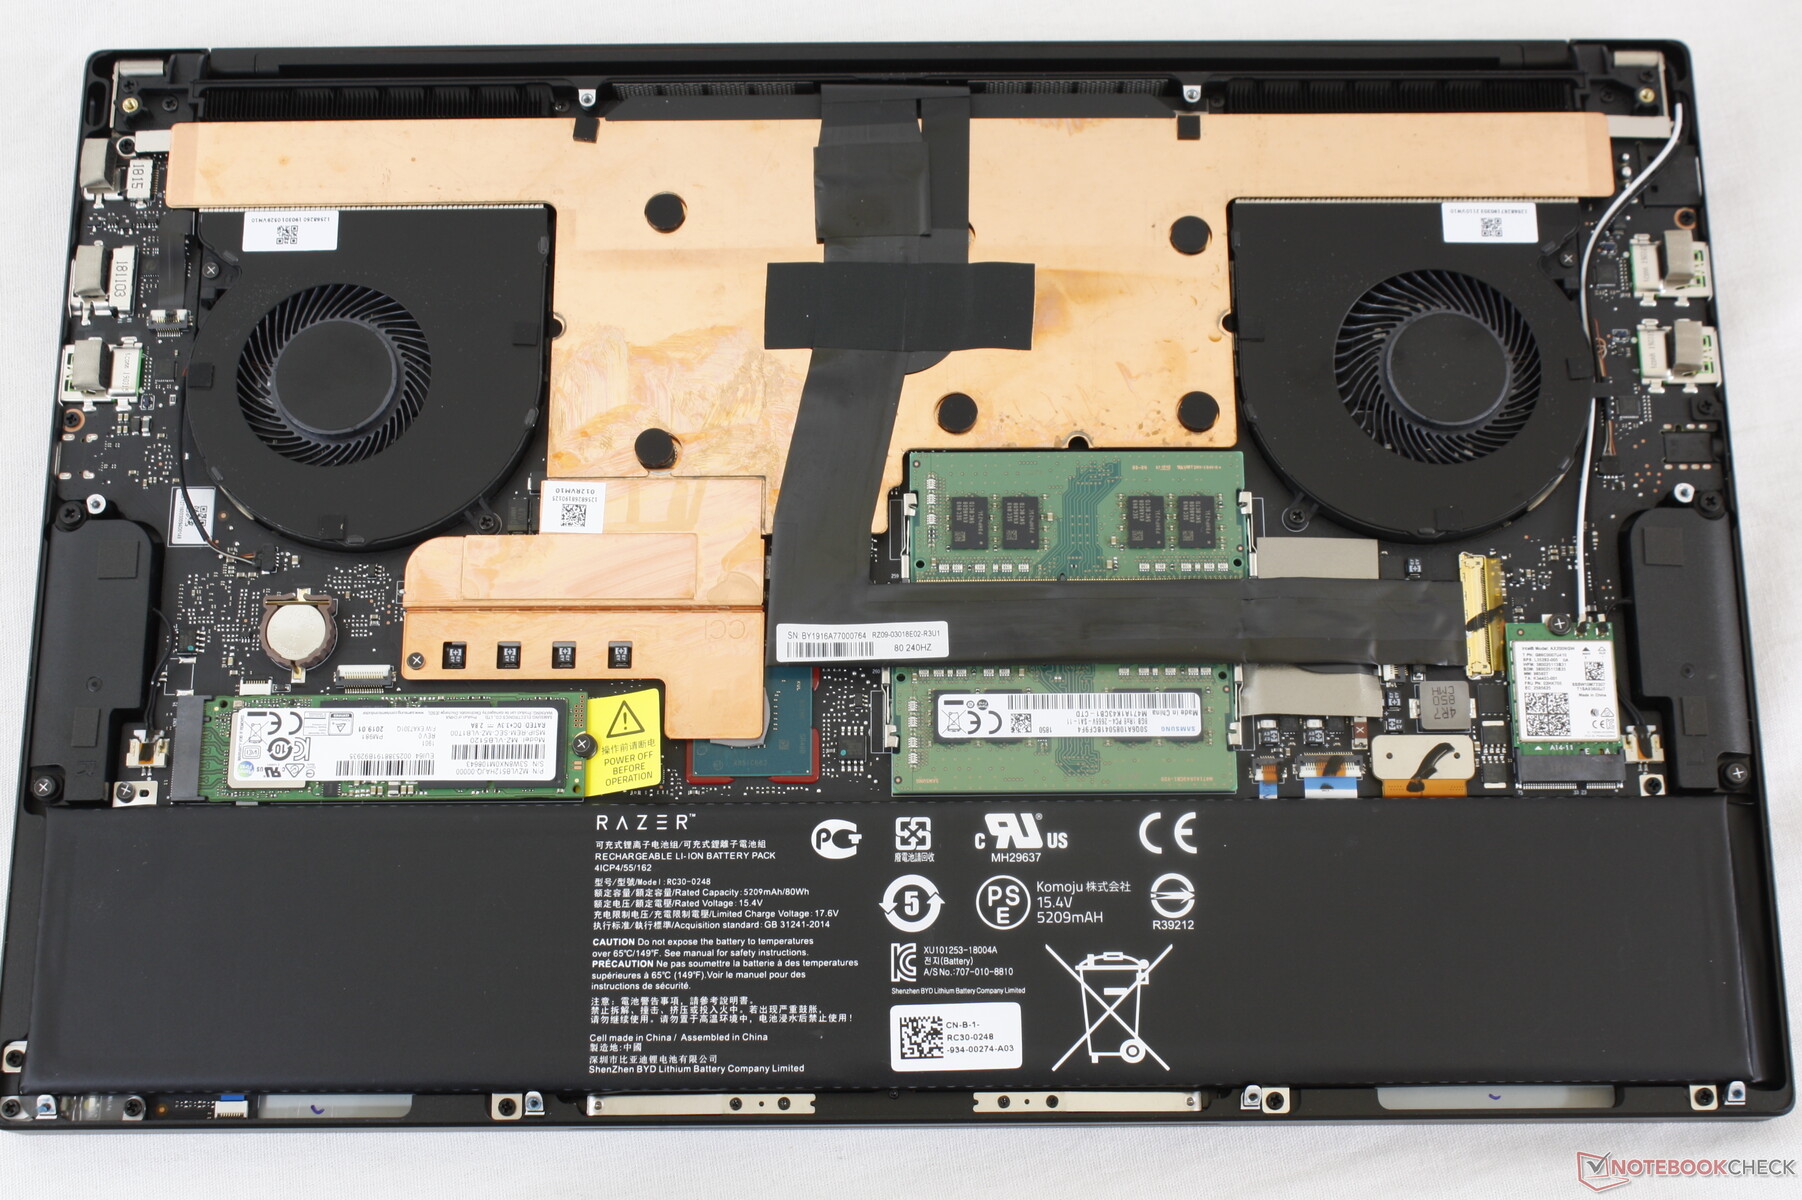
Maintenance
Warranty
The standard one-year limited warranty applies with the option to extend to three years for an additional $250. This is pricier than what Dell, HP, or Lenovo offer for their gaming laptops likely because they benefit from larger economies of scale than Razer.
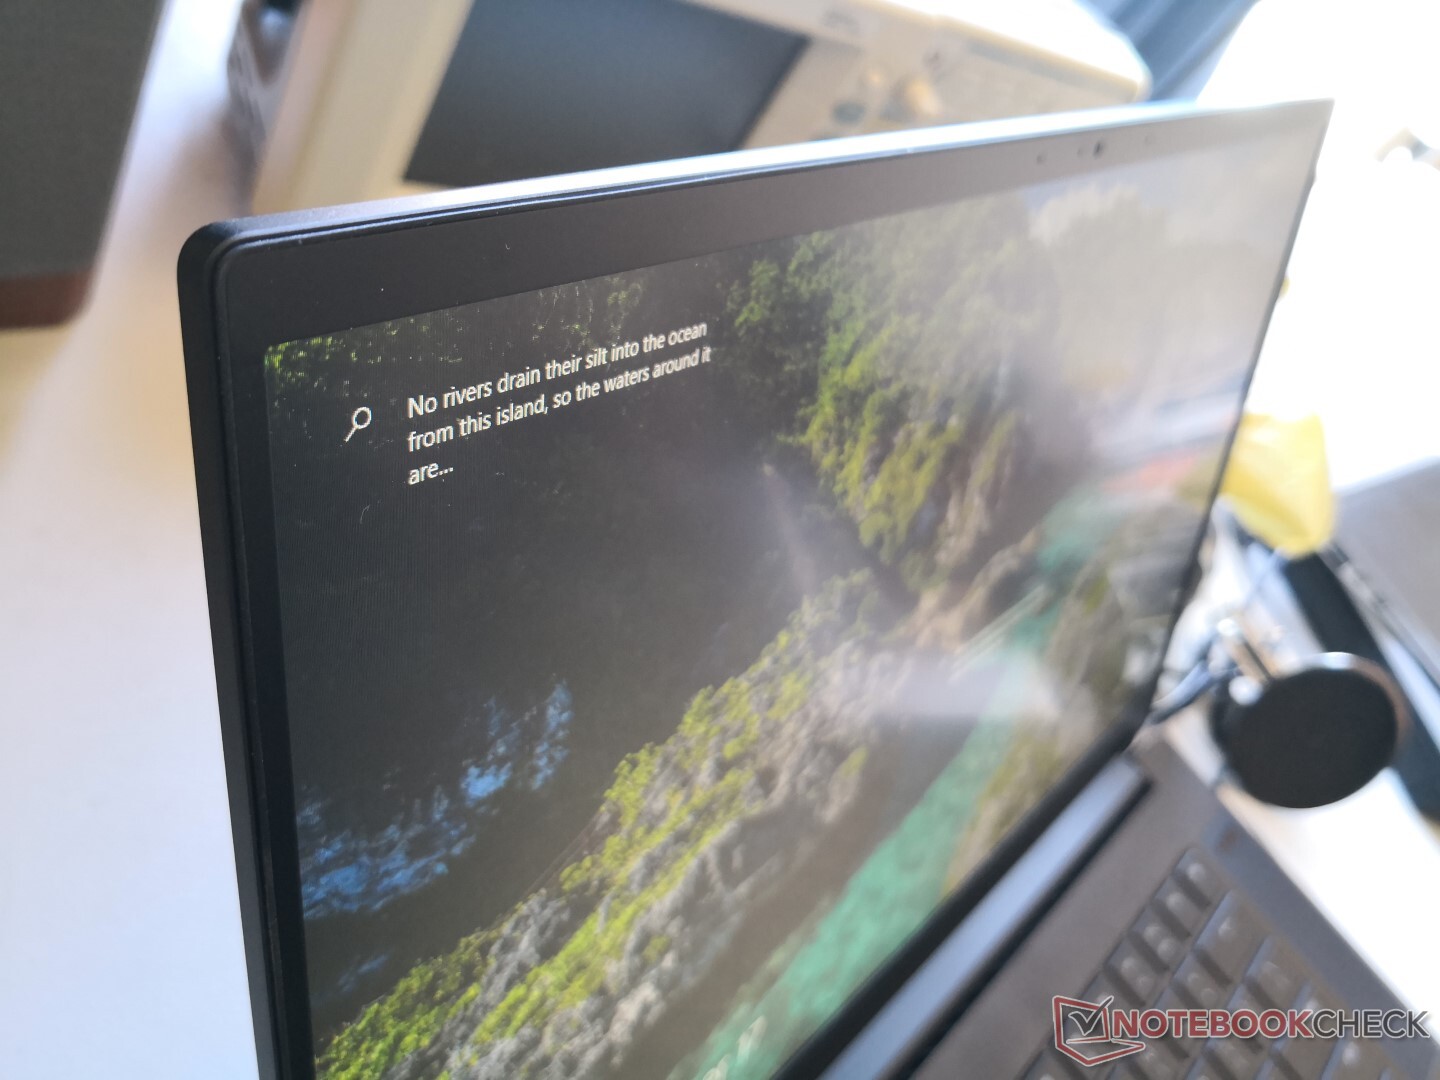
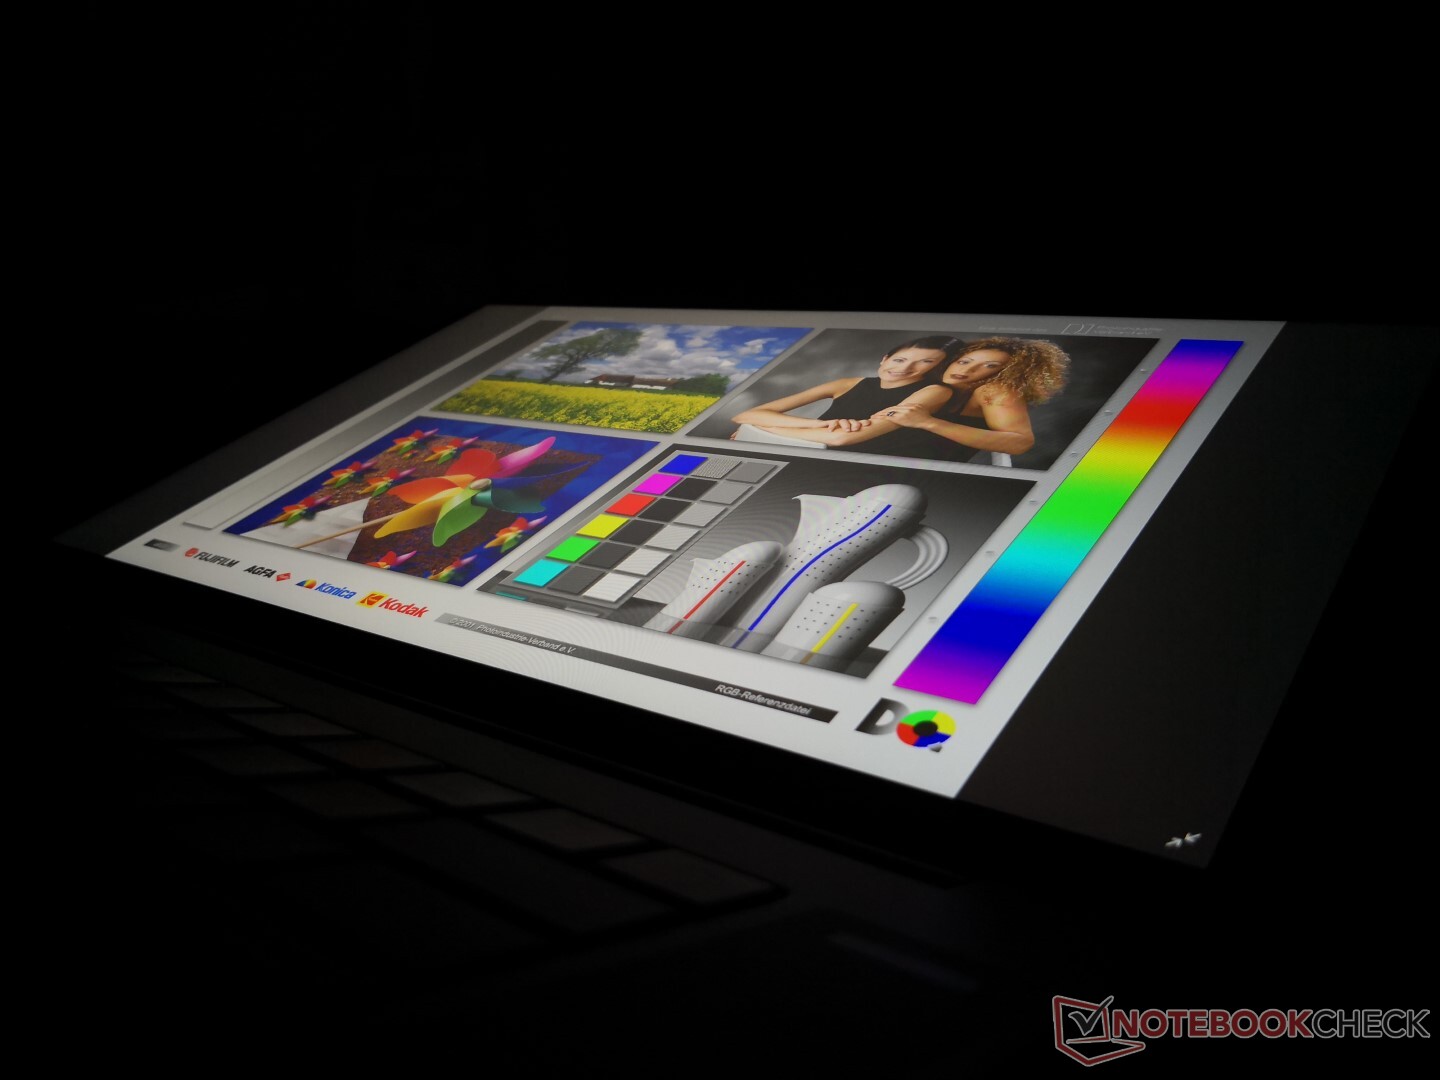
Display
We had anticipated the 144 Hz panel on our Blade 15 GTX 1660 Ti to be the same 144 Hz LG Philips panel as found on our Blade 15 RTX 2070 Max-Q, but this is not the case. Instead, the Blade 15 GTX 1660 Ti shares the same BOE NV156FHM-N4K IPS panel as found on the Acer Predator Triton 500. Characteristics like contrast ratio, color coverage, brightness, and response times are therefore slightly different between the Blade 15 GTX 1660 Ti and Blade 15 RTX 2070 Max-Q. They're thankfully marginal and so most users won't even notice that Razer has swapped panel providers, but this is noteworthy nonetheless.
An interesting find is that a pulse-width modulation of 200 Hz is now present on all brightness levels up to 99 percent whereas this phenomenon is almost completely absent on the Blade 15 RTX 2070 Max-Q and 2080 Max-Q SKUs. Users sensitive to onscreen flickering may want to avoid this GTX 1660 Ti SKU as a result.
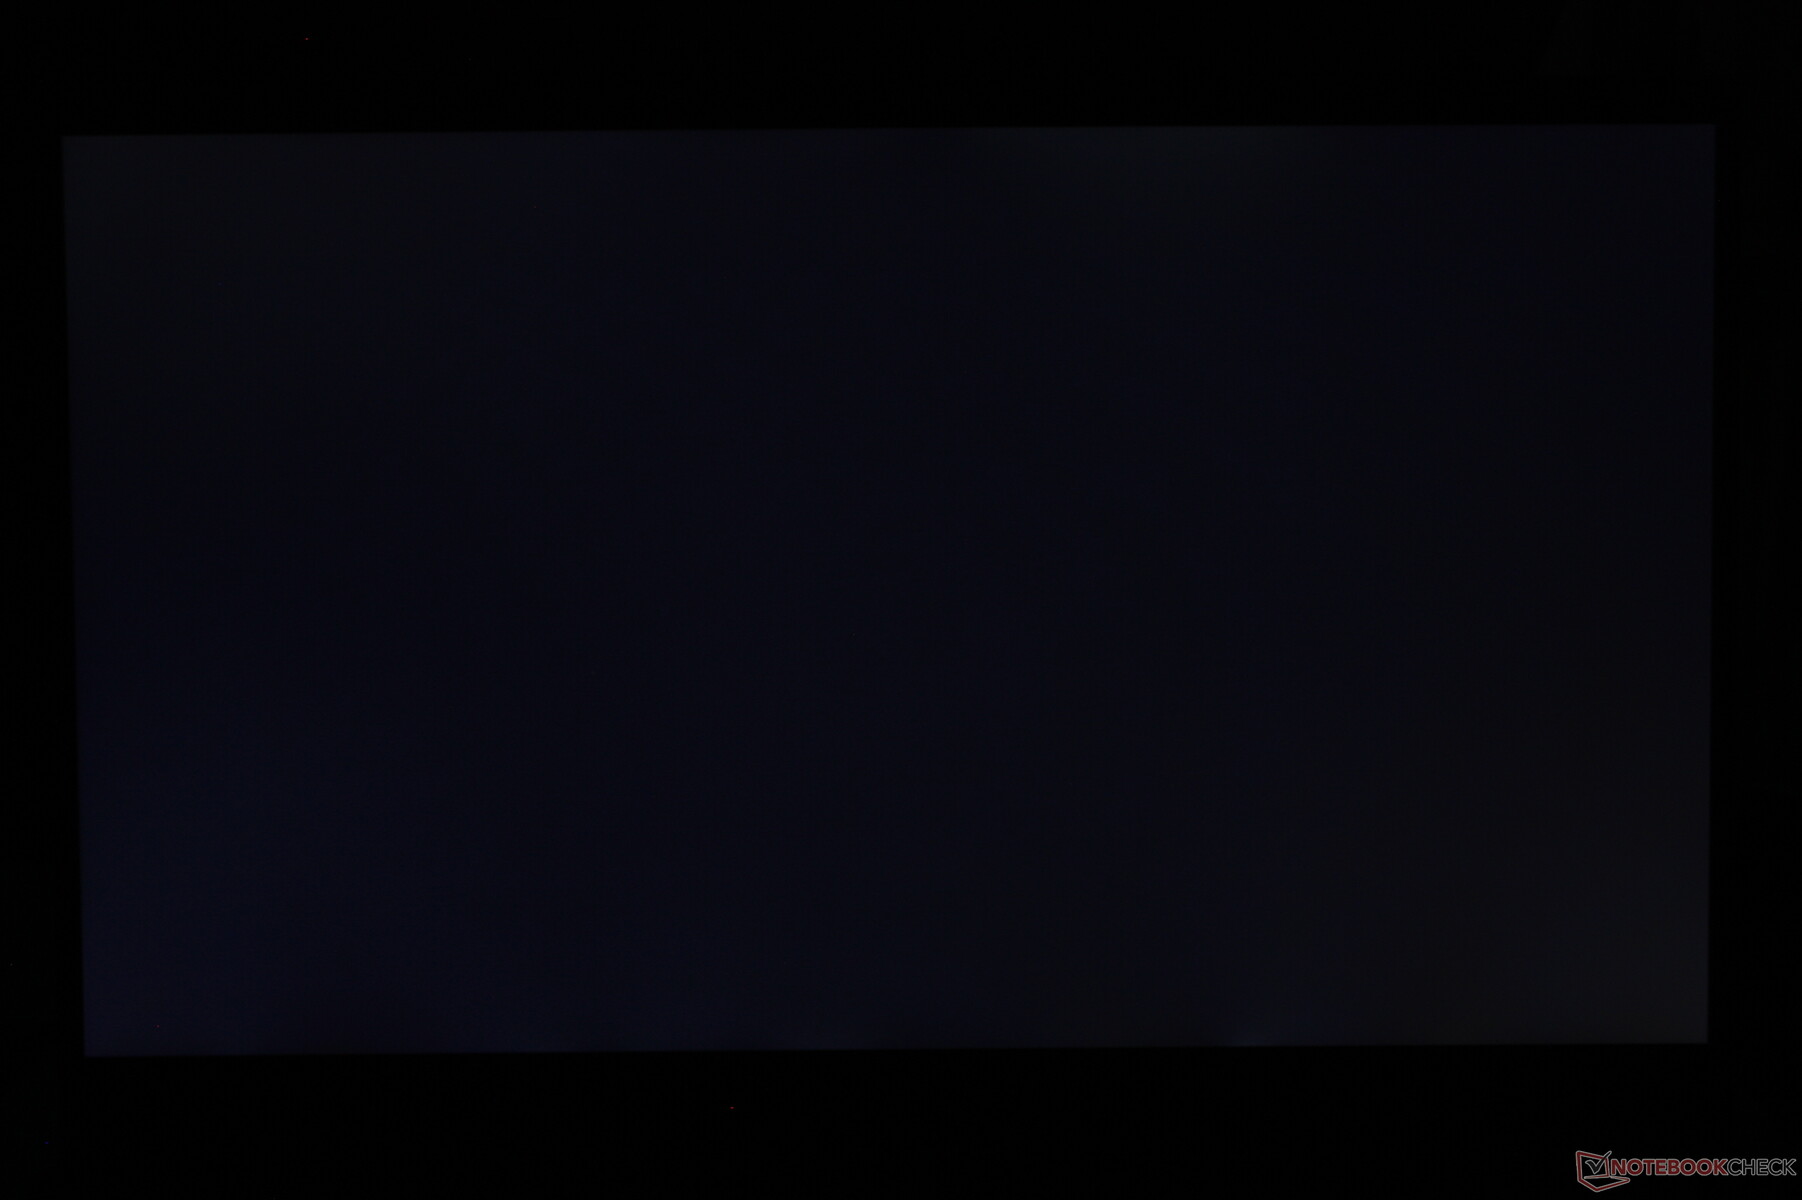
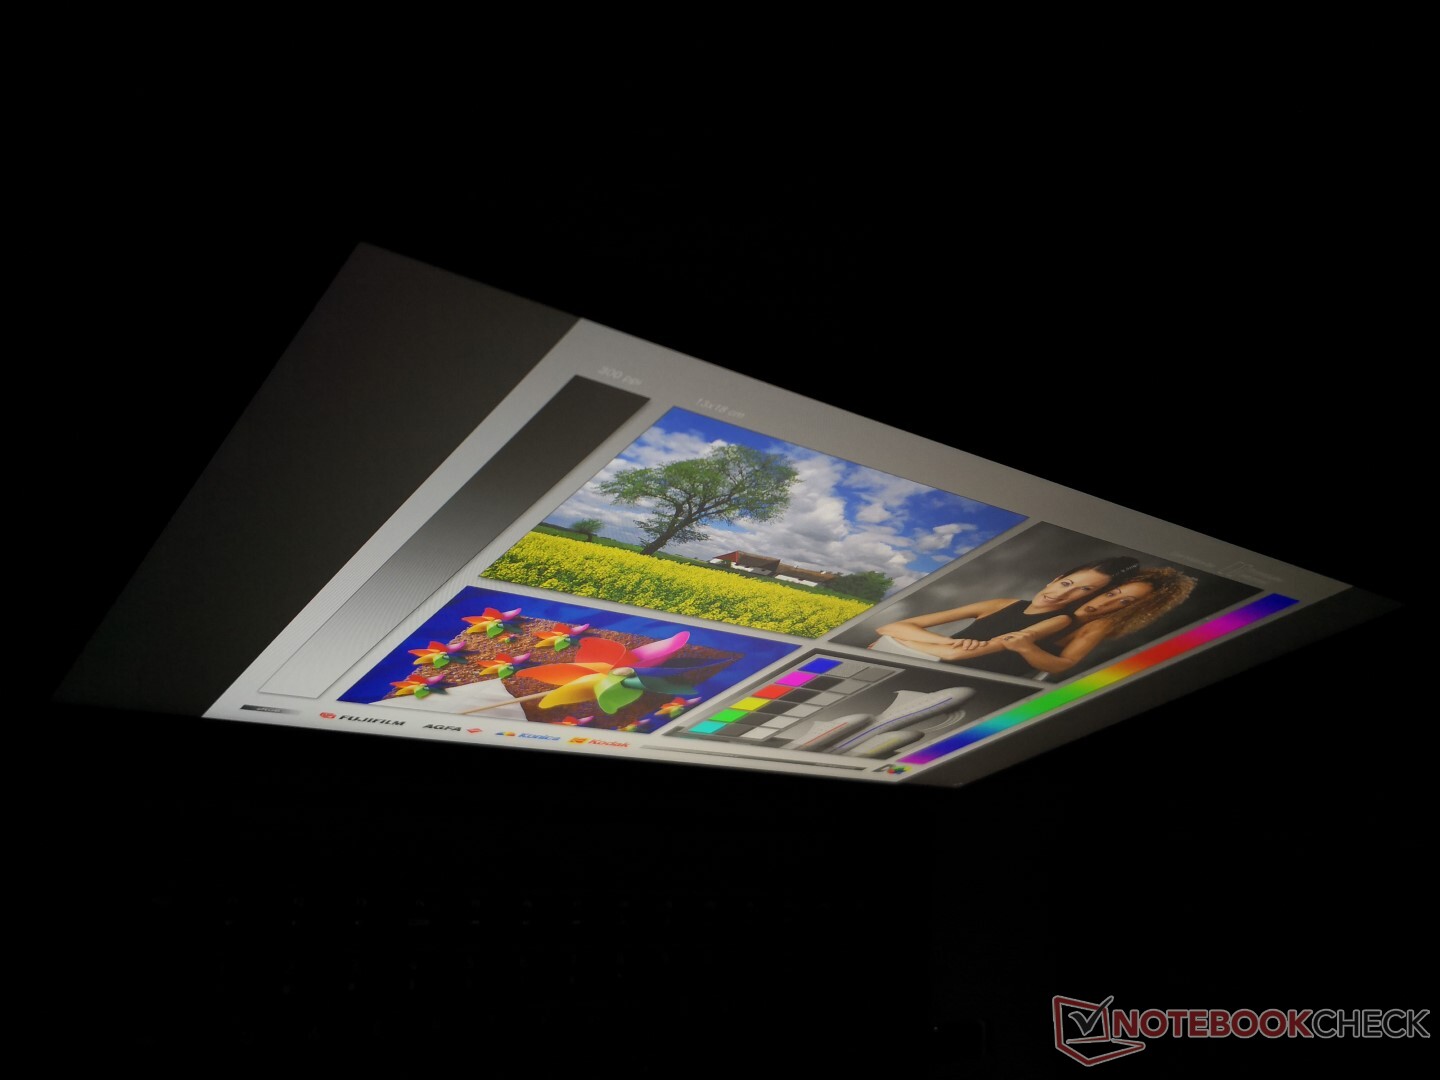
Uneven backlight bleeding is present and just barely noticeable on our test unit. It's not enough to be distracting during regular use or video playback.

| |||||||||||||||||||||||||
Brightness Distribution: 90 %
Center on Battery: 312.7 cd/m²
Contrast: 1158:1 (Black: 0.27 cd/m²)
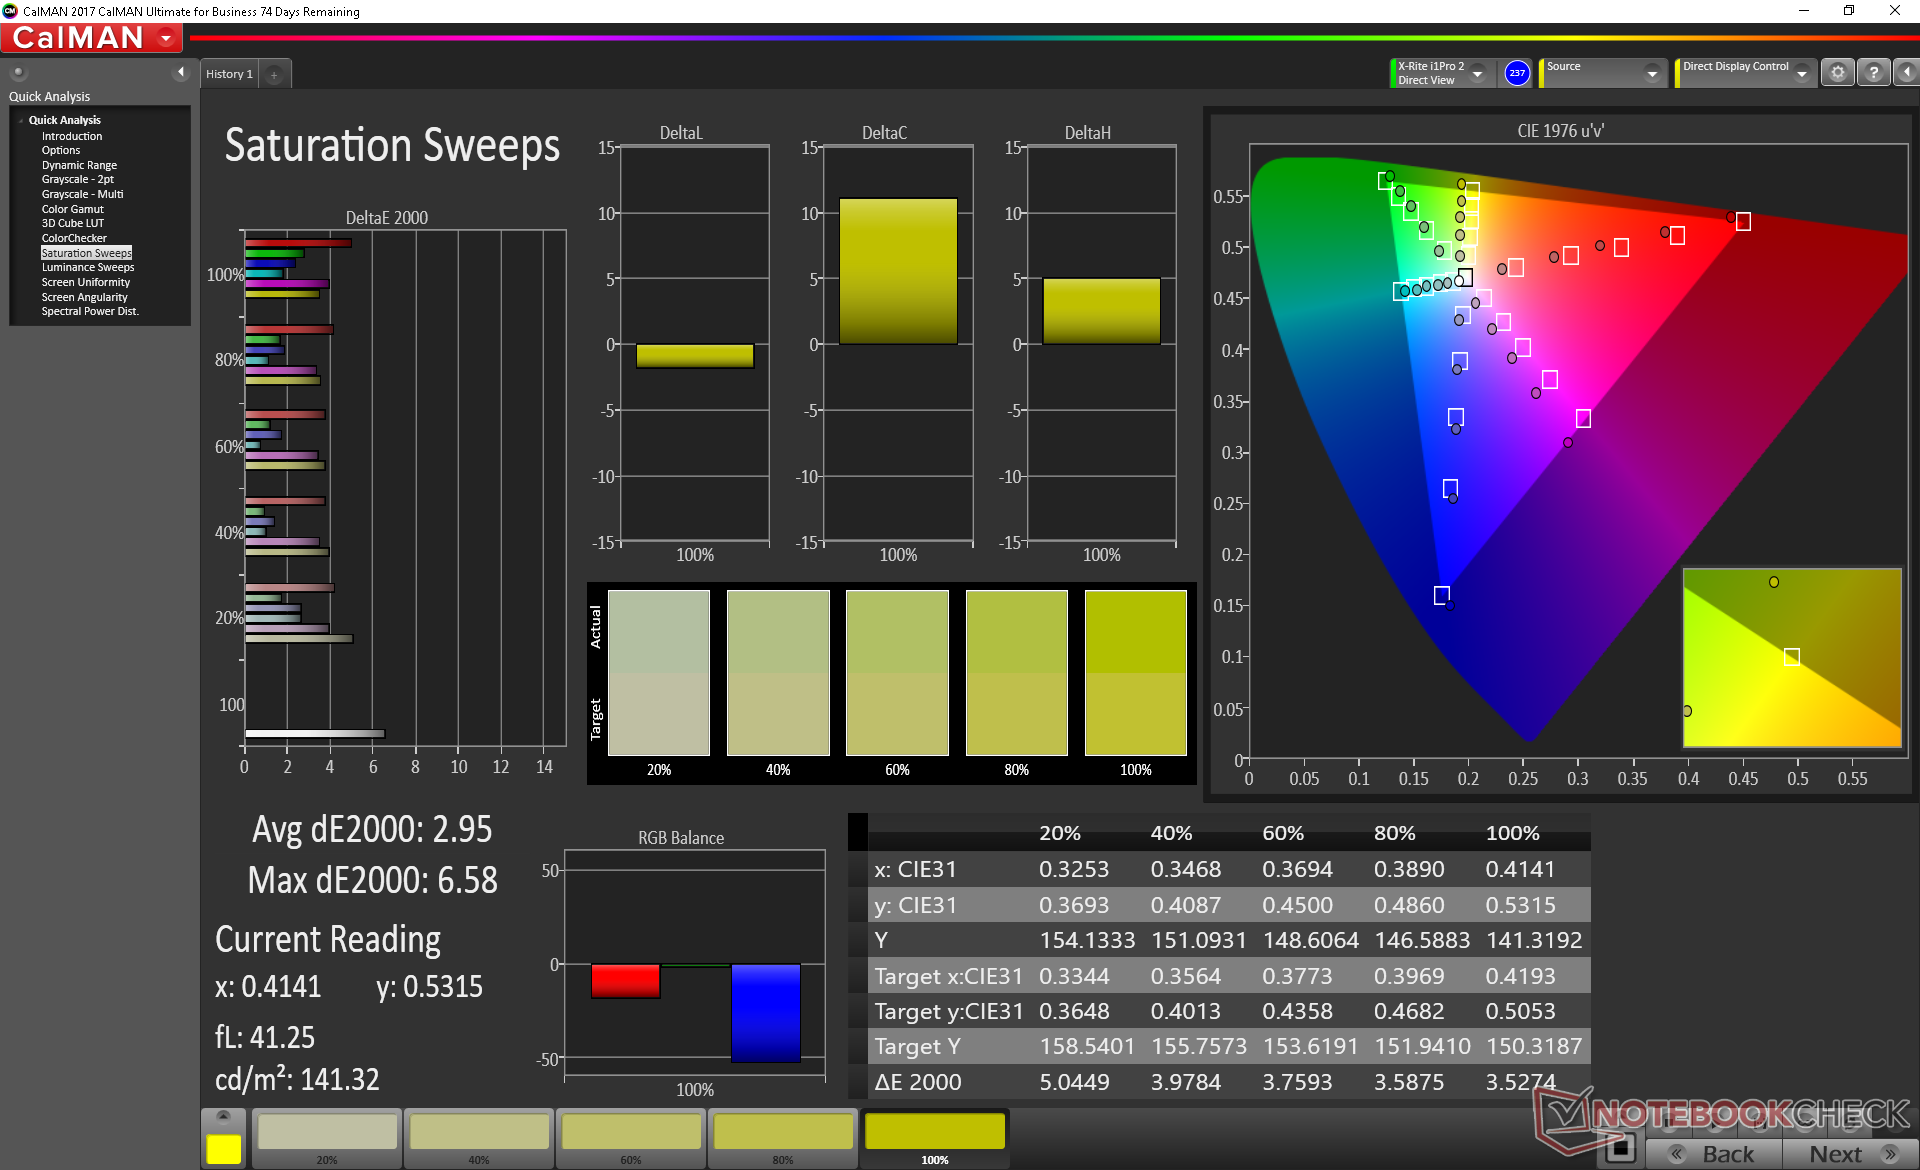
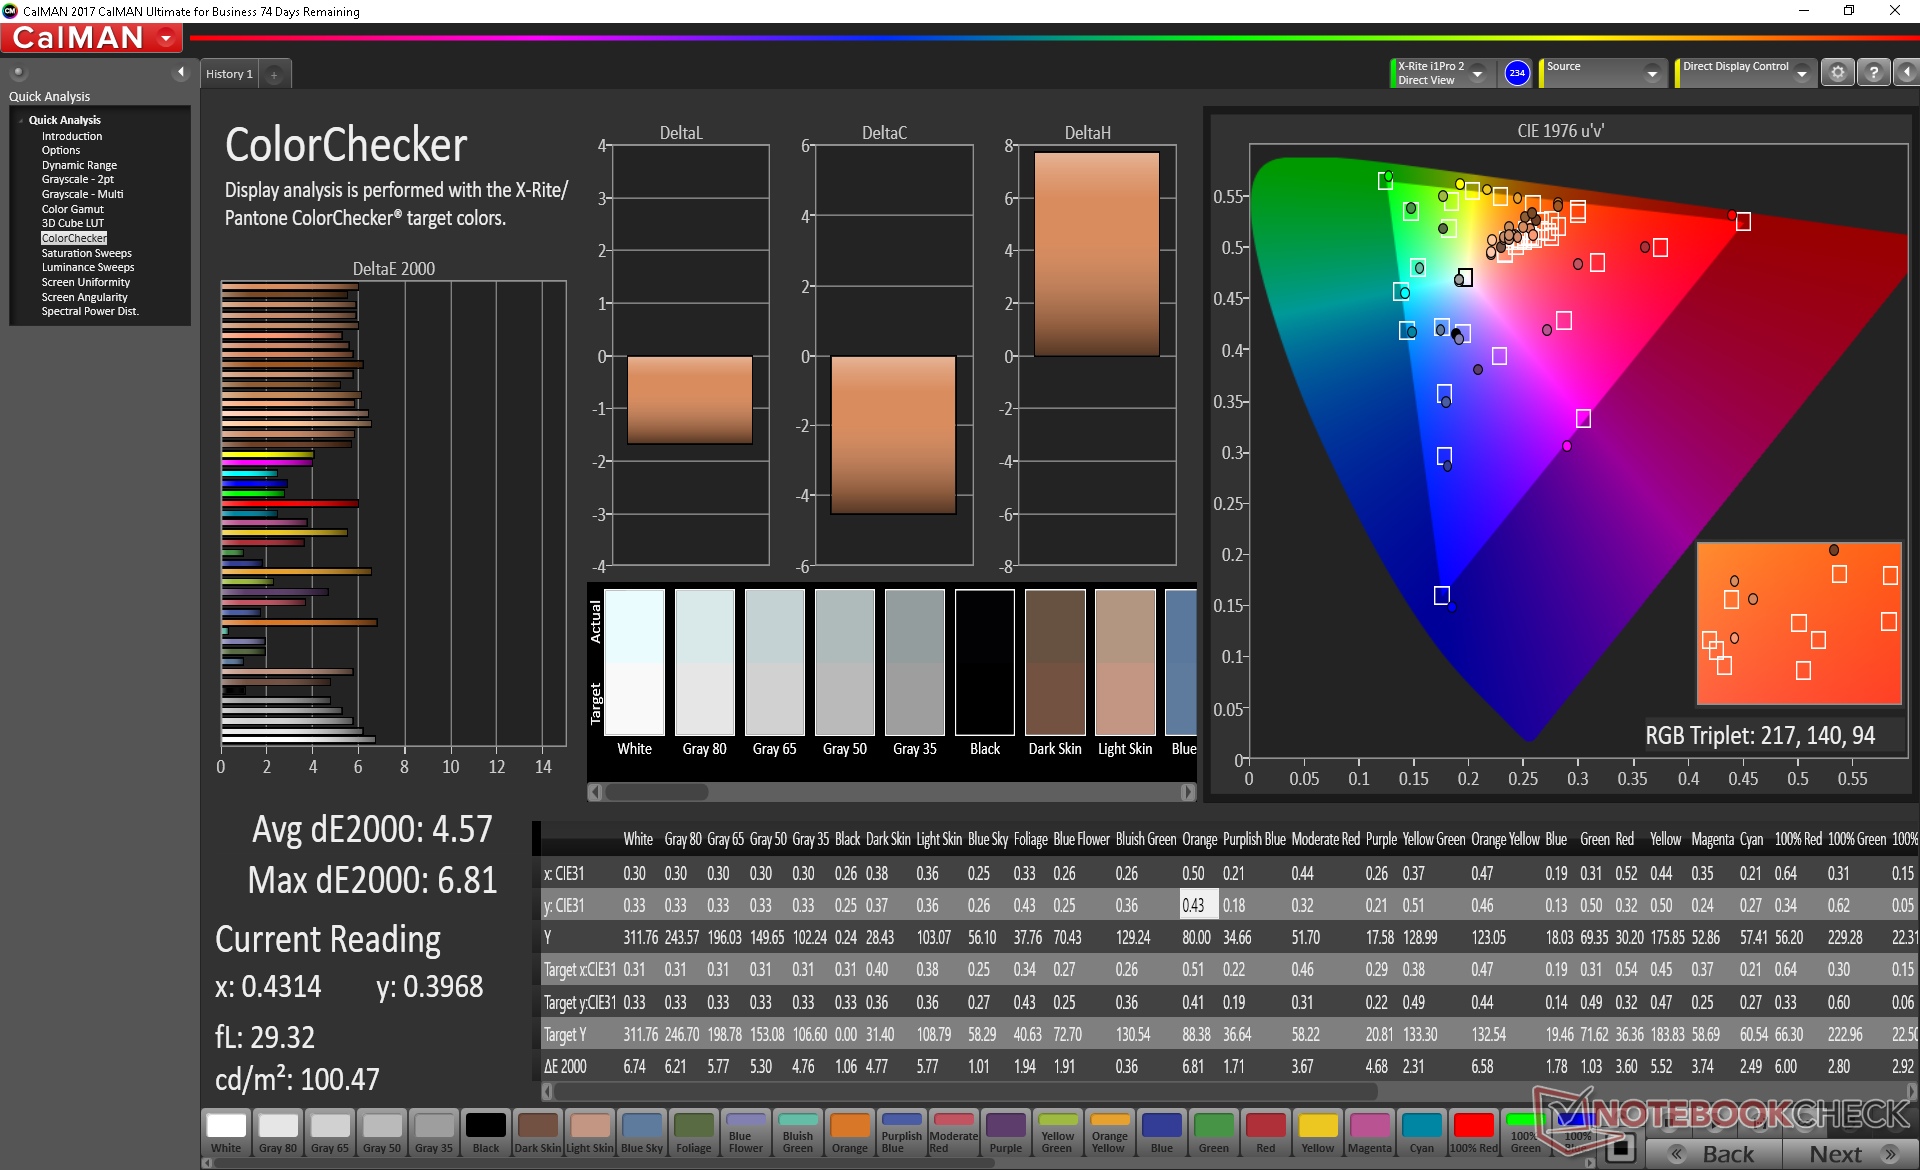
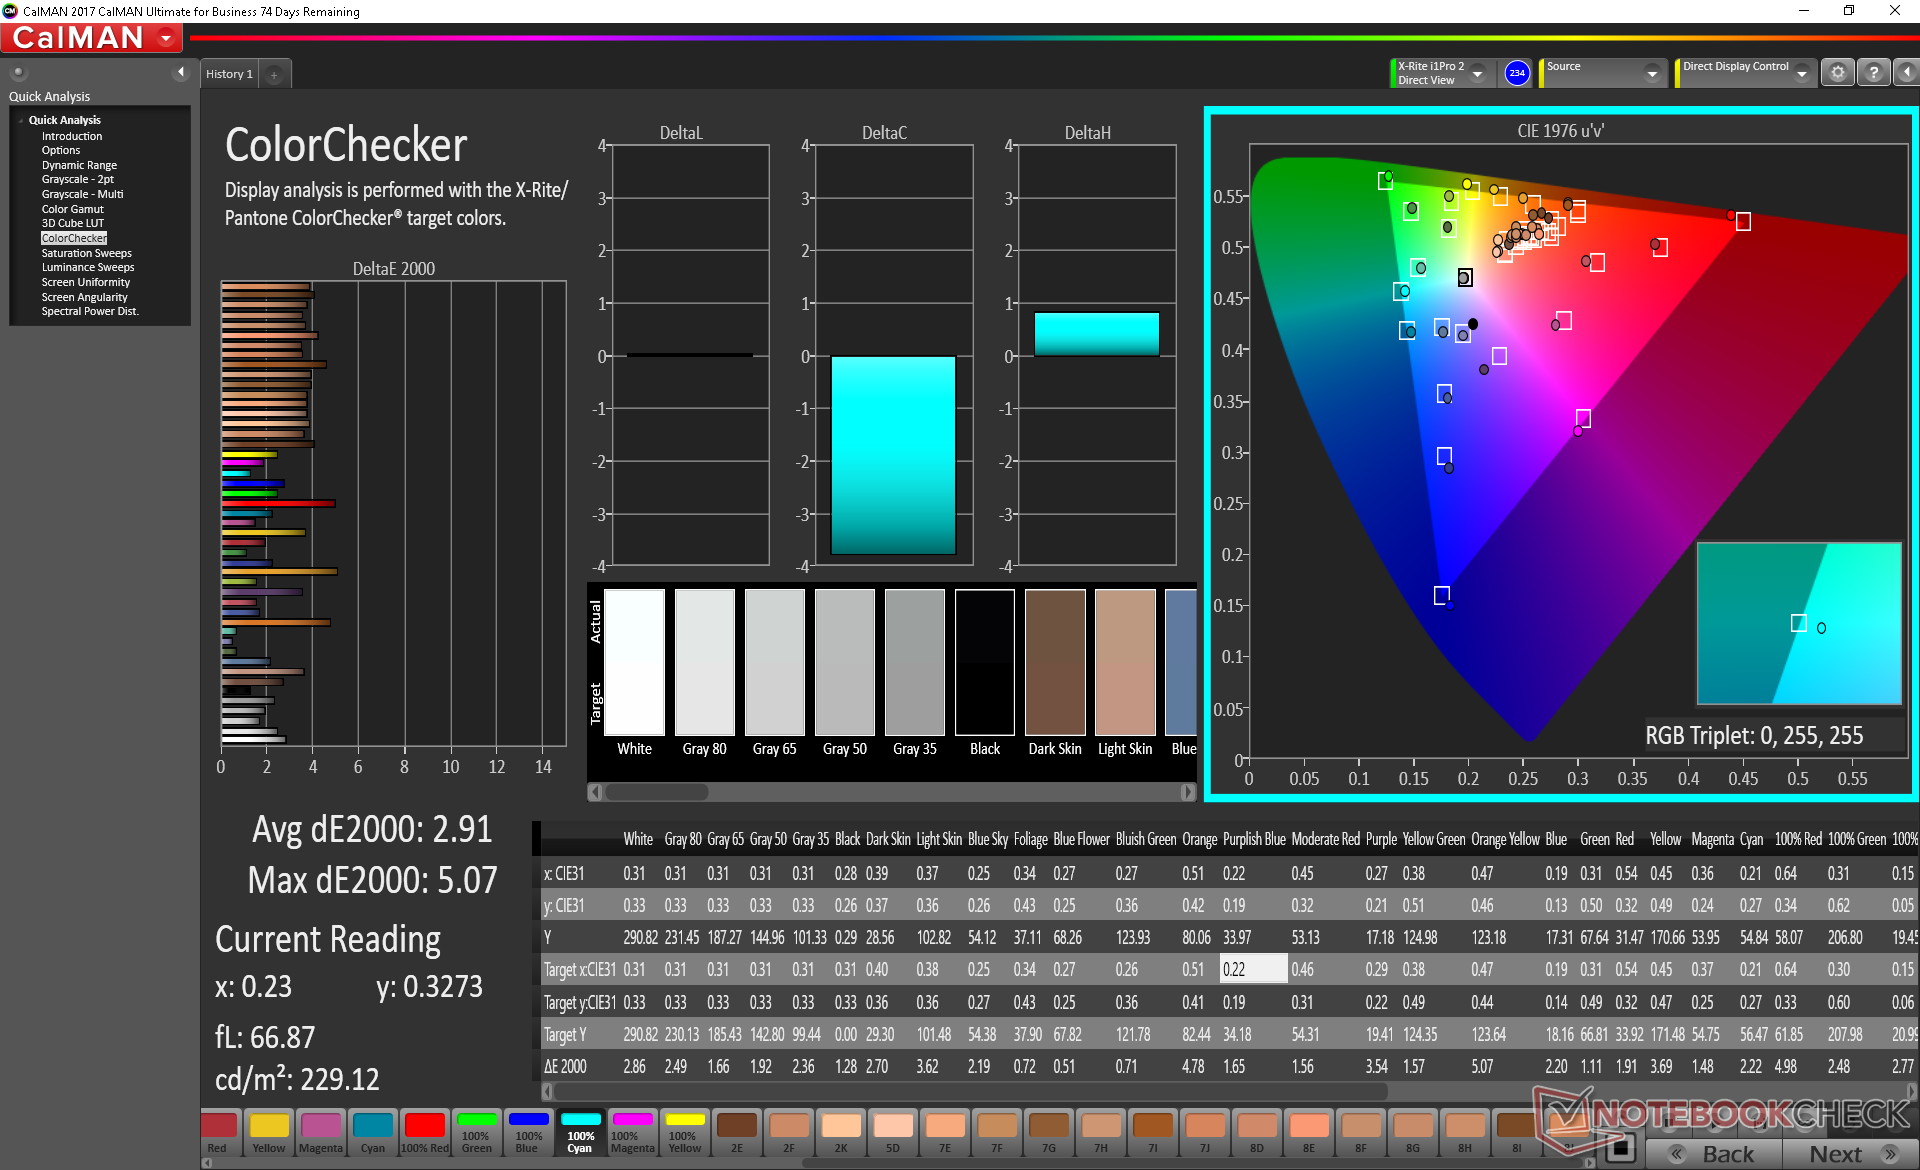
ΔE ColorChecker Calman: 4.57 | ∀{0.5-29.43 Ø4.71}
calibrated: 2.91
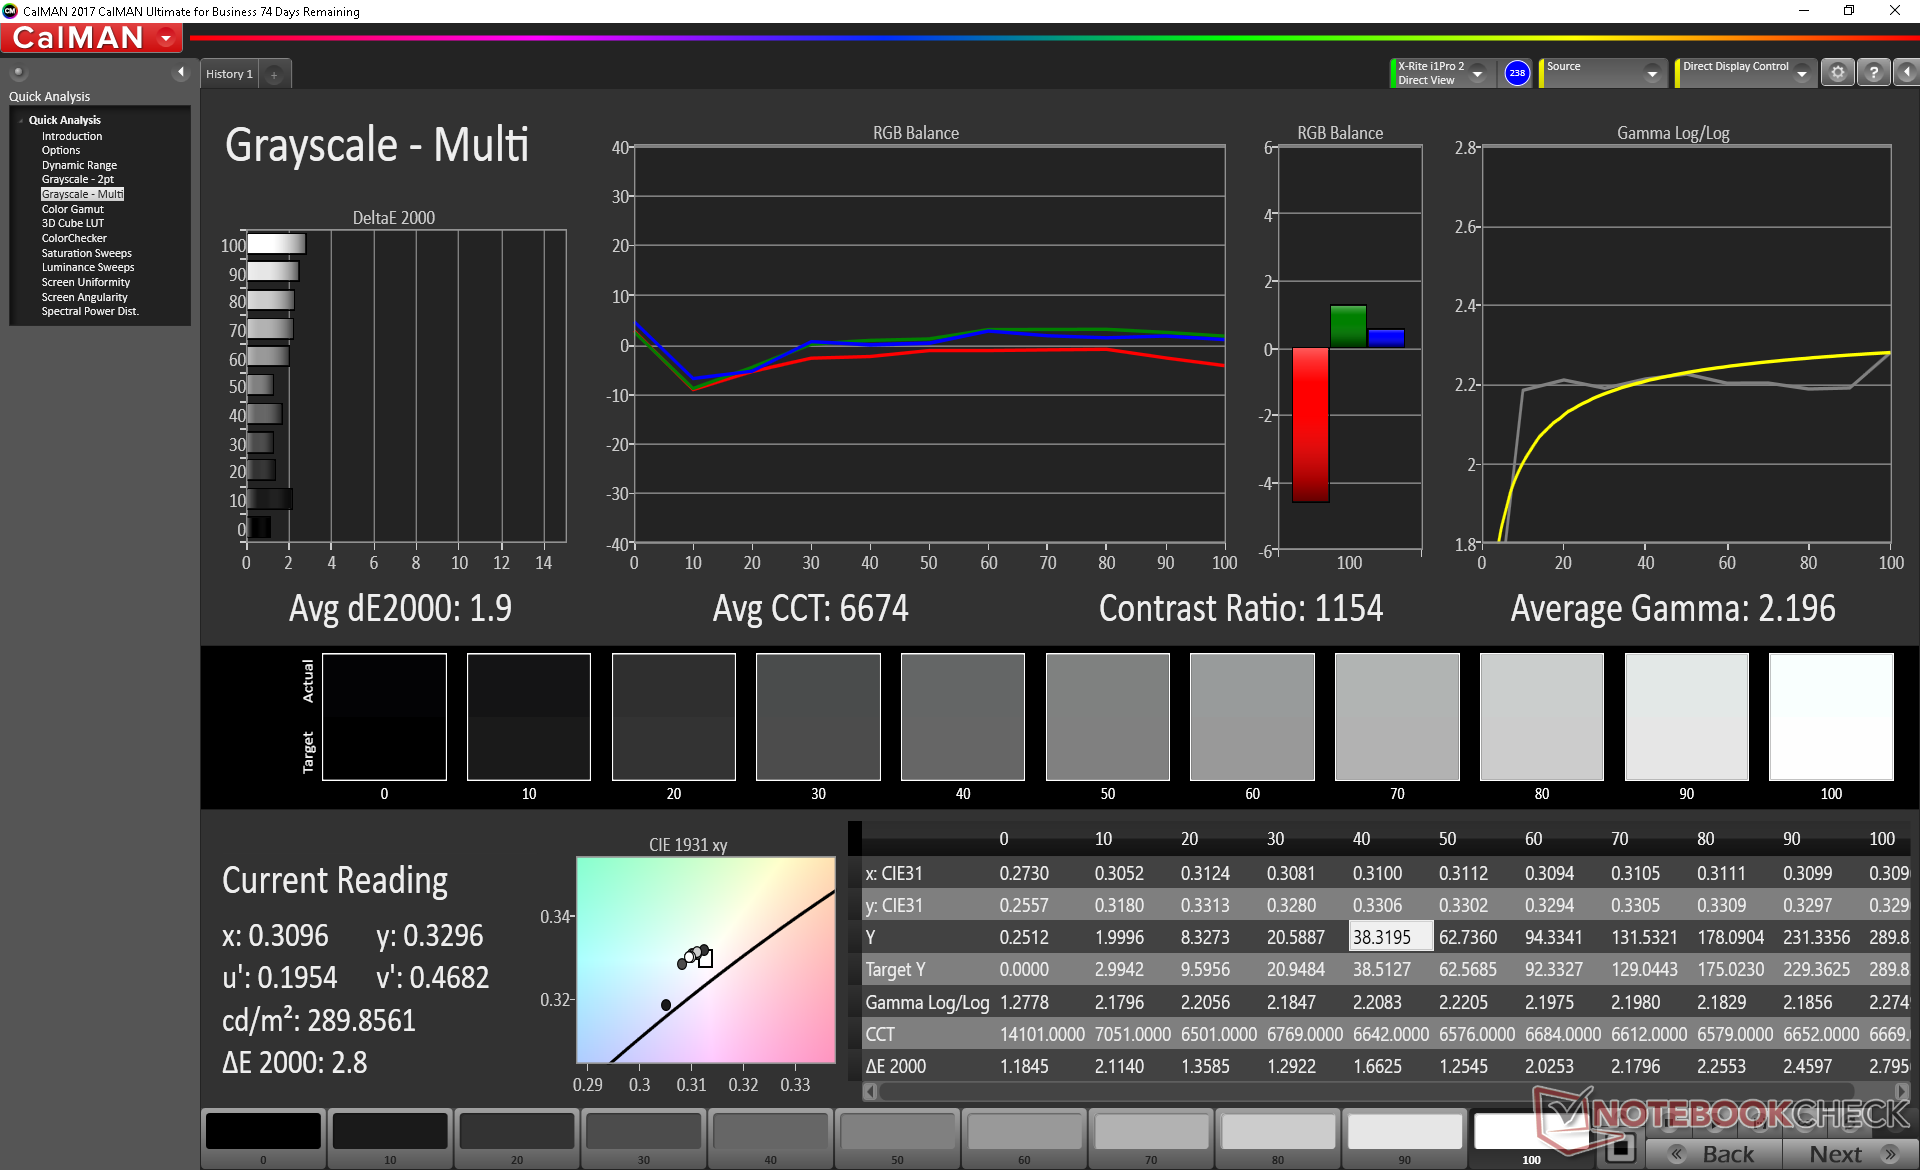
ΔE Greyscale Calman: 4.3 | ∀{0.09-98 Ø4.96}
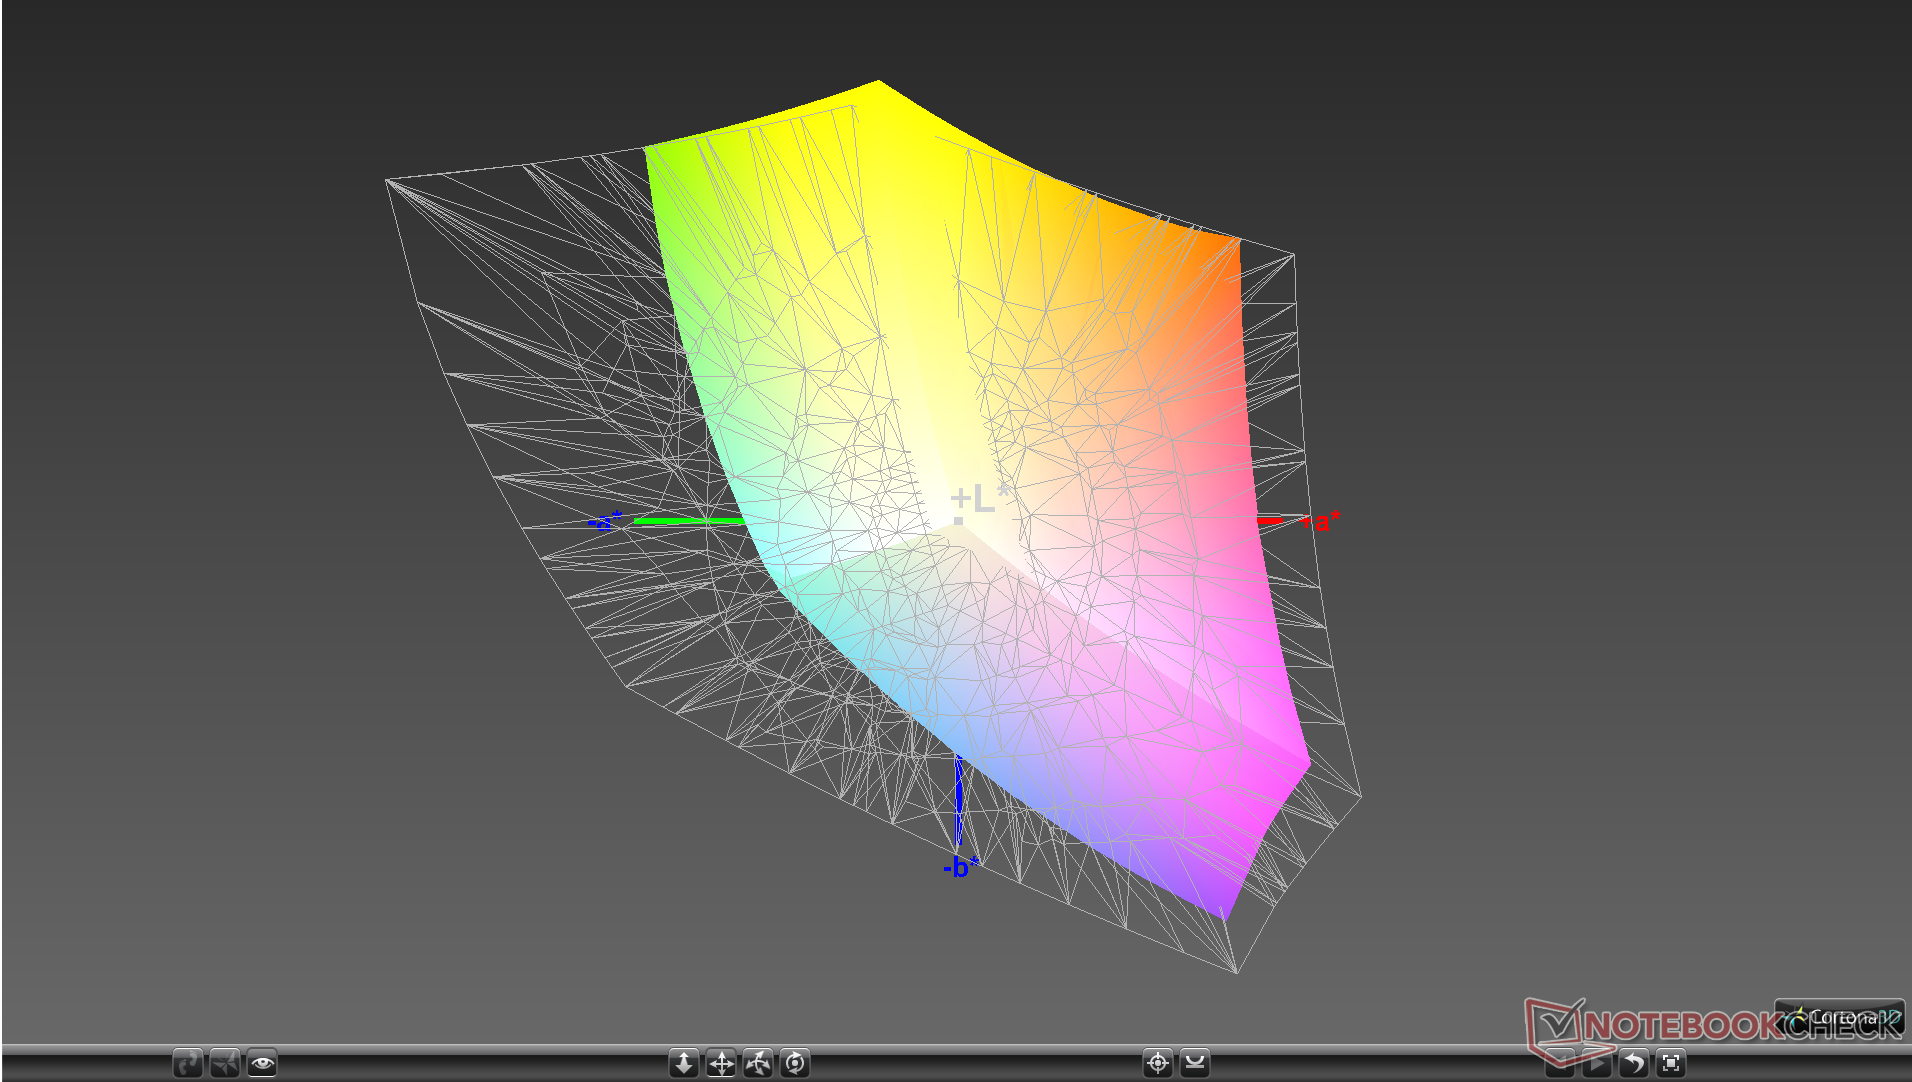
91.3% sRGB (Argyll 1.6.3 3D)
59.4% AdobeRGB 1998 (Argyll 1.6.3 3D)
66.5% AdobeRGB 1998 (Argyll 3D)
91.8% sRGB (Argyll 3D)
65.3% Display P3 (Argyll 3D)
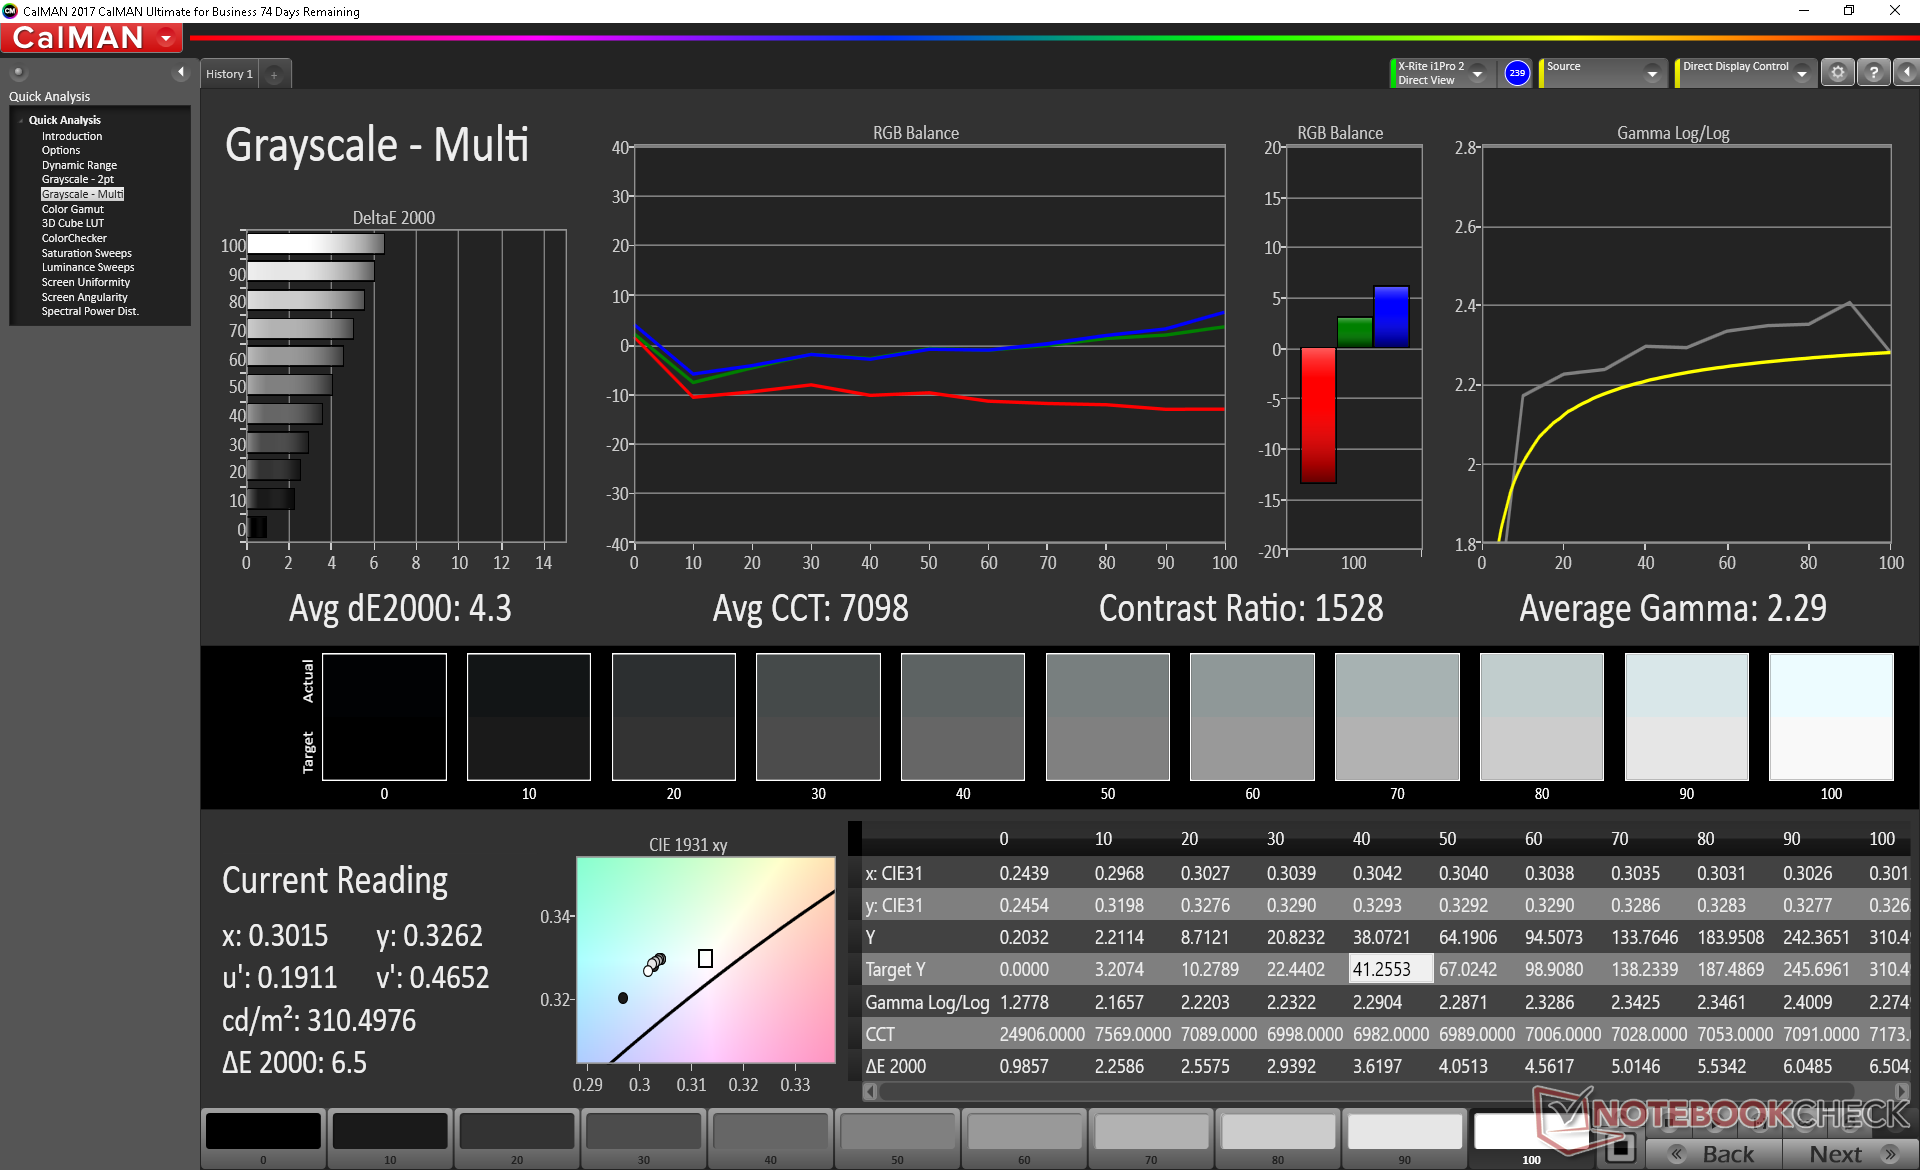
Gamma: 2.29
CCT: 7098 K
| Razer Blade 15 GTX 1660 Ti BOE NV156FHM-N4K, IPS, 15.6", 1920x1080 | Razer Blade 15 RTX 2080 Max-Q Sharp LQ156M1JW03 (SHP14C5), IPS, 15.6", 1920x1080 | Razer Blade 15 RTX 2070 Max-Q LG Philips LGD05C0, IPS, 15.6", 1920x1080 | Alienware m15 R2 P87F Sharp LQ156M1, IPS, 15.6", 1920x1080 | Dell XPS 15 7590 9980HK GTX 1650 Samsung 156WR04, SDCA029, OLED, 15.6", 3840x2160 | Gigabyte Aero 15 Classic-XA Sharp LQ156M1JW03 (SHP14C5), IGZO, 15.6", 1920x1080 | |
|---|---|---|---|---|---|---|
| Display | 4% | 1% | 1% | 27% | 1% | |
| Display P3 Coverage (%) | 65.3 | 66.9 2% | 65.3 0% | 65.3 0% | 88.1 35% | 65.3 0% |
| sRGB Coverage (%) | 91.8 | 98.1 7% | 94.9 3% | 95.1 4% | 99.6 8% | 95.5 4% |
| AdobeRGB 1998 Coverage (%) | 66.5 | 68.5 3% | 66.3 0% | 65.9 -1% | 91.8 38% | 66.5 0% |
| Response Times | 1% | -20% | -5% | 80% | -12% | |
| Response Time Grey 50% / Grey 80% * (ms) | 13.6 ? | 12.8 ? 6% | 16.8 ? -24% | 16.4 ? -21% | 2.3 ? 83% | 15.2 ? -12% |
| Response Time Black / White * (ms) | 10 ? | 10.4 ? -4% | 11.6 ? -16% | 8.8 ? 12% | 2.4 ? 76% | 11.2 ? -12% |
| PWM Frequency (Hz) | 200 ? | 23810 ? | 23810 ? | 59.5 ? | 23580 ? | |
| Screen | 17% | 7% | -17% | 6% | 6% | |
| Brightness middle (cd/m²) | 312.7 | 293 -6% | 314.7 1% | 324.2 4% | 421.2 35% | 266 -15% |
| Brightness (cd/m²) | 305 | 270 -11% | 312 2% | 304 0% | 417 37% | 248 -19% |
| Brightness Distribution (%) | 90 | 87 -3% | 90 0% | 90 0% | 94 4% | 89 -1% |
| Black Level * (cd/m²) | 0.27 | 0.29 -7% | 0.38 -41% | 0.38 -41% | 0.31 -15% | |
| Contrast (:1) | 1158 | 1010 -13% | 828 -28% | 853 -26% | 858 -26% | |
| Colorchecker dE 2000 * | 4.57 | 1.69 63% | 2.56 44% | 5.01 -10% | 6.06 -33% | 2.78 39% |
| Colorchecker dE 2000 max. * | 6.81 | 3.37 51% | 4.89 28% | 12.7 -86% | 11.89 -75% | 5.96 12% |
| Colorchecker dE 2000 calibrated * | 2.91 | 1.24 57% | 1.71 41% | 1.64 44% | 0.91 69% | |
| Greyscale dE 2000 * | 4.3 | 2.3 47% | 3.4 21% | 7.9 -84% | 2.8 35% | 3.58 17% |
| Gamma | 2.29 96% | 2.3 96% | 2.3 96% | 2.35 94% | 2.15 102% | 2.46 89% |
| CCT | 7098 92% | 6758 96% | 6435 101% | 8455 77% | 6235 104% | 7186 90% |
| Color Space (Percent of AdobeRGB 1998) (%) | 59.4 | 63 6% | 60.7 2% | 60.8 2% | 81 36% | 62 4% |
| Color Space (Percent of sRGB) (%) | 91.3 | 98.5 8% | 94.6 4% | 95.5 5% | 99.6 9% | 96 5% |
| Total Average (Program / Settings) | 7% /
13% | -4% /
2% | -7% /
-12% | 38% /
22% | -2% /
3% |
* ... smaller is better
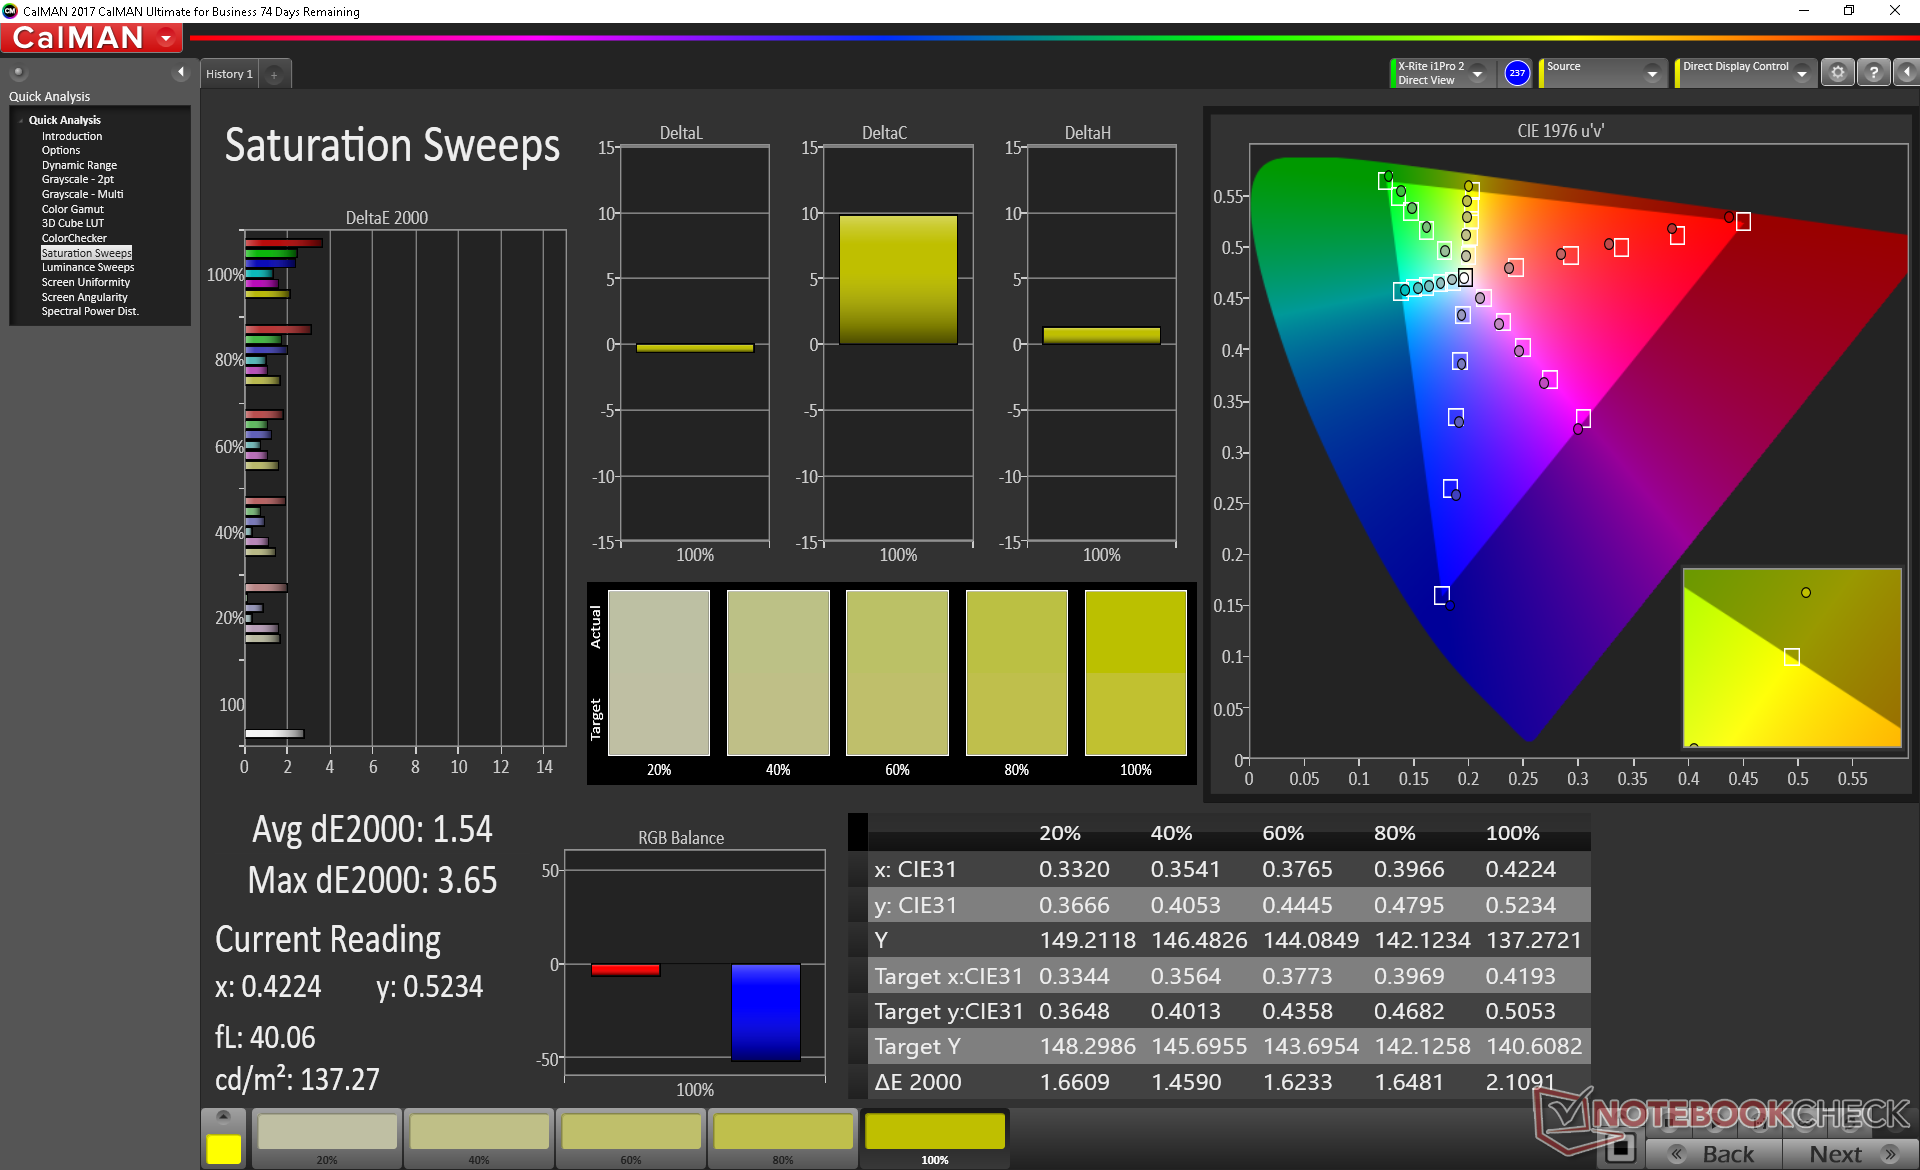
Color space is actually slightly narrower than on both the Sharp and LG Philips panels of the Blade 15 RTX 2080 Max-Q and Blade 15 RTX 2070 Max-Q, respectively, at 91 percent sRGB. This has no major implications on the actual gaming experience of the laptop.
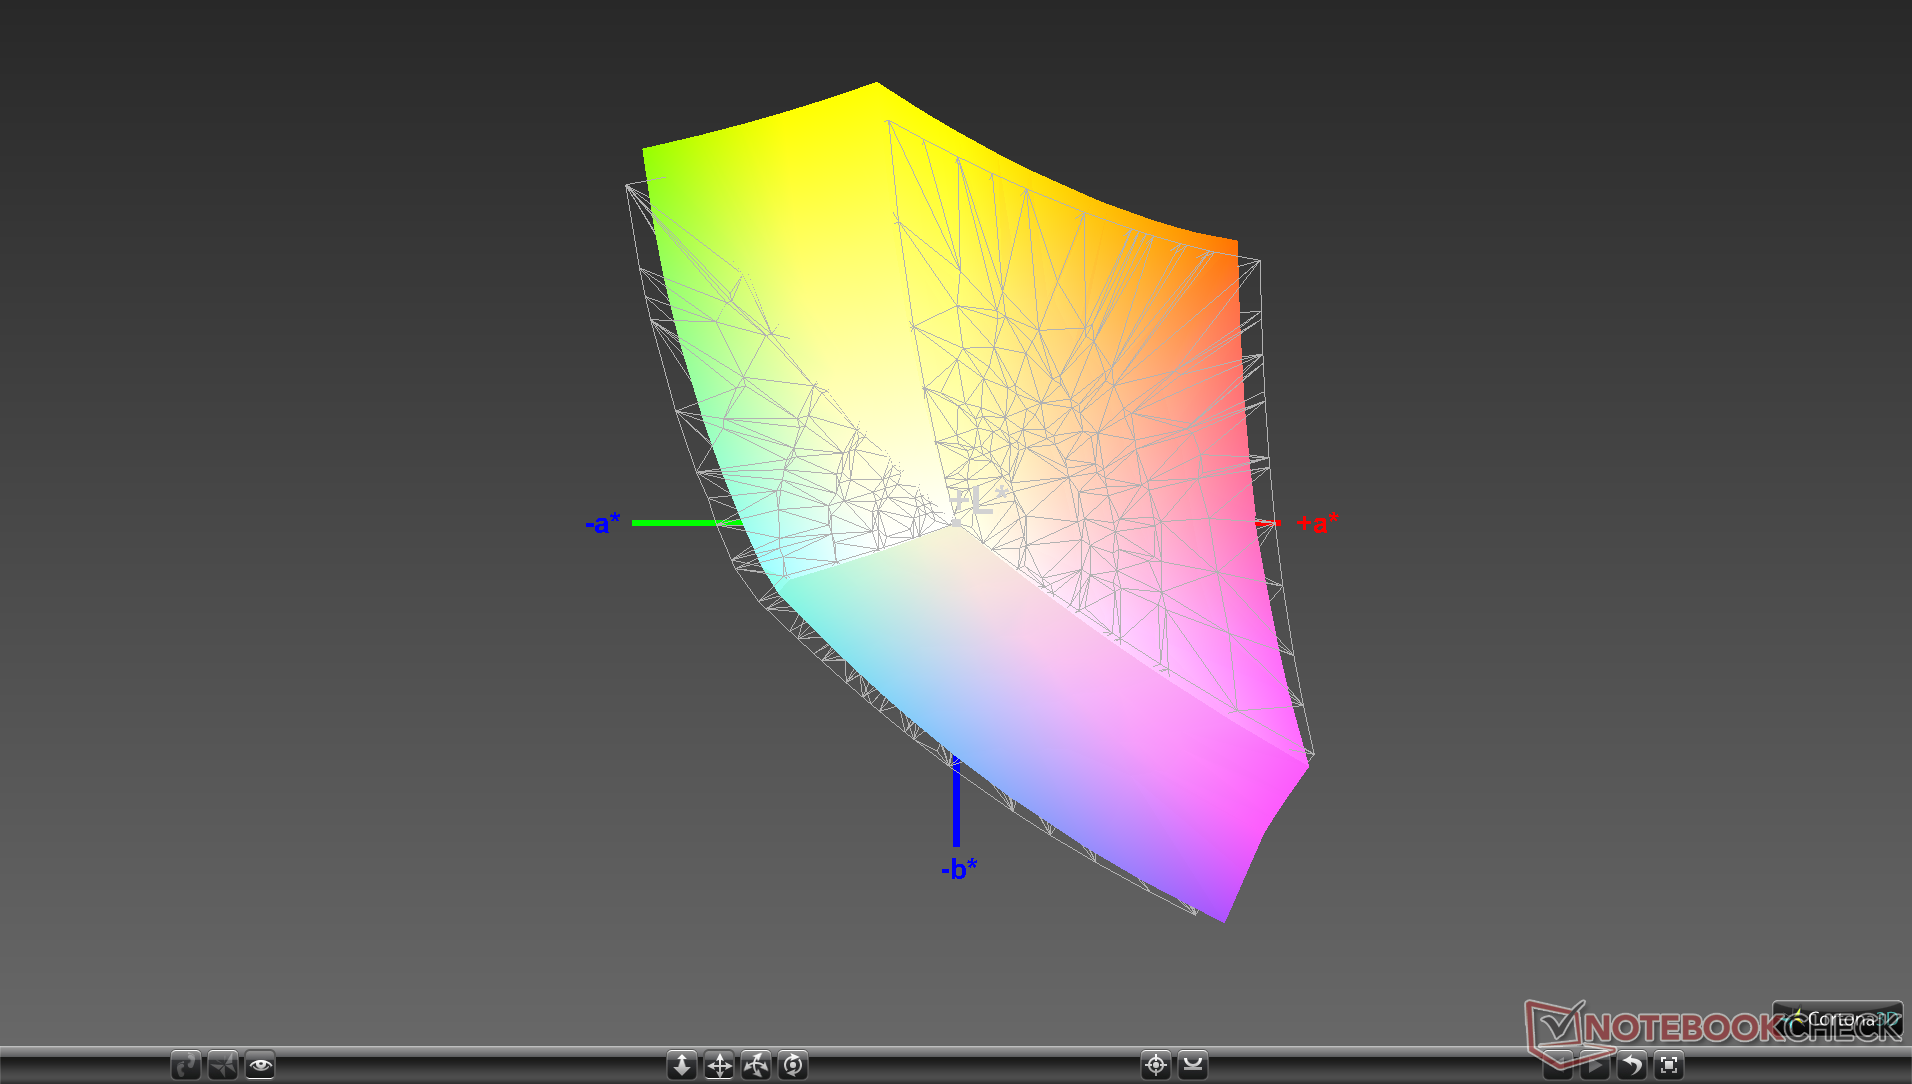
The panel is not as well calibrated as the displays of the pricier RTX options. Most notably, color temperature is slightly cooler than it should be at almost 7100K and so the average DeltaE values for grayscale and colors are impacted. Our calibration attempt addresses these shortcomings as shown by the Calman results below.
Display Response Times
| ↔ Response Time Black to White | ||
|---|---|---|
| 10 ms ... rise ↗ and fall ↘ combined | ↗ 6 ms rise | 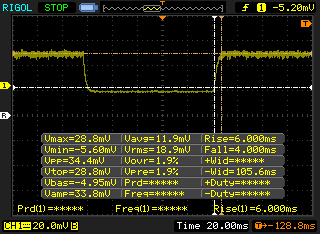 |
| ↘ 4 ms fall | ||
| The screen shows good response rates in our tests, but may be too slow for competitive gamers. In comparison, all tested devices range from 0.1 (minimum) to 240 (maximum) ms. » 27 % of all devices are better. This means that the measured response time is better than the average of all tested devices (19.8 ms). | ||
| ↔ Response Time 50% Grey to 80% Grey | ||
| 13.6 ms ... rise ↗ and fall ↘ combined | ↗ 7.2 ms rise | 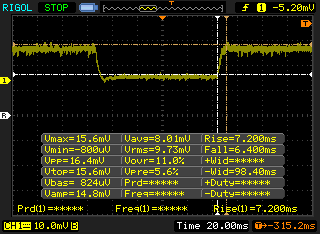 |
| ↘ 6.4 ms fall | ||
| The screen shows good response rates in our tests, but may be too slow for competitive gamers. In comparison, all tested devices range from 0.165 (minimum) to 636 (maximum) ms. » 27 % of all devices are better. This means that the measured response time is better than the average of all tested devices (30.9 ms). | ||
Screen Flickering / PWM (Pulse-Width Modulation)
| Screen flickering / PWM detected | 200 Hz | ≤ 99 % brightness setting | 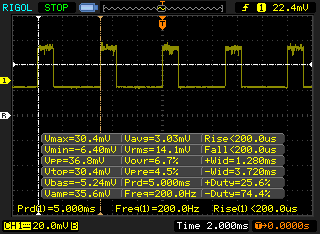 |
The display backlight flickers at 200 Hz (worst case, e.g., utilizing PWM) Flickering detected at a brightness setting of 99 % and below. There should be no flickering or PWM above this brightness setting. The frequency of 200 Hz is relatively low, so sensitive users will likely notice flickering and experience eyestrain at the stated brightness setting and below. In comparison: 52 % of all tested devices do not use PWM to dim the display. If PWM was detected, an average of 7748 (minimum: 5 - maximum: 343500) Hz was measured. | |||
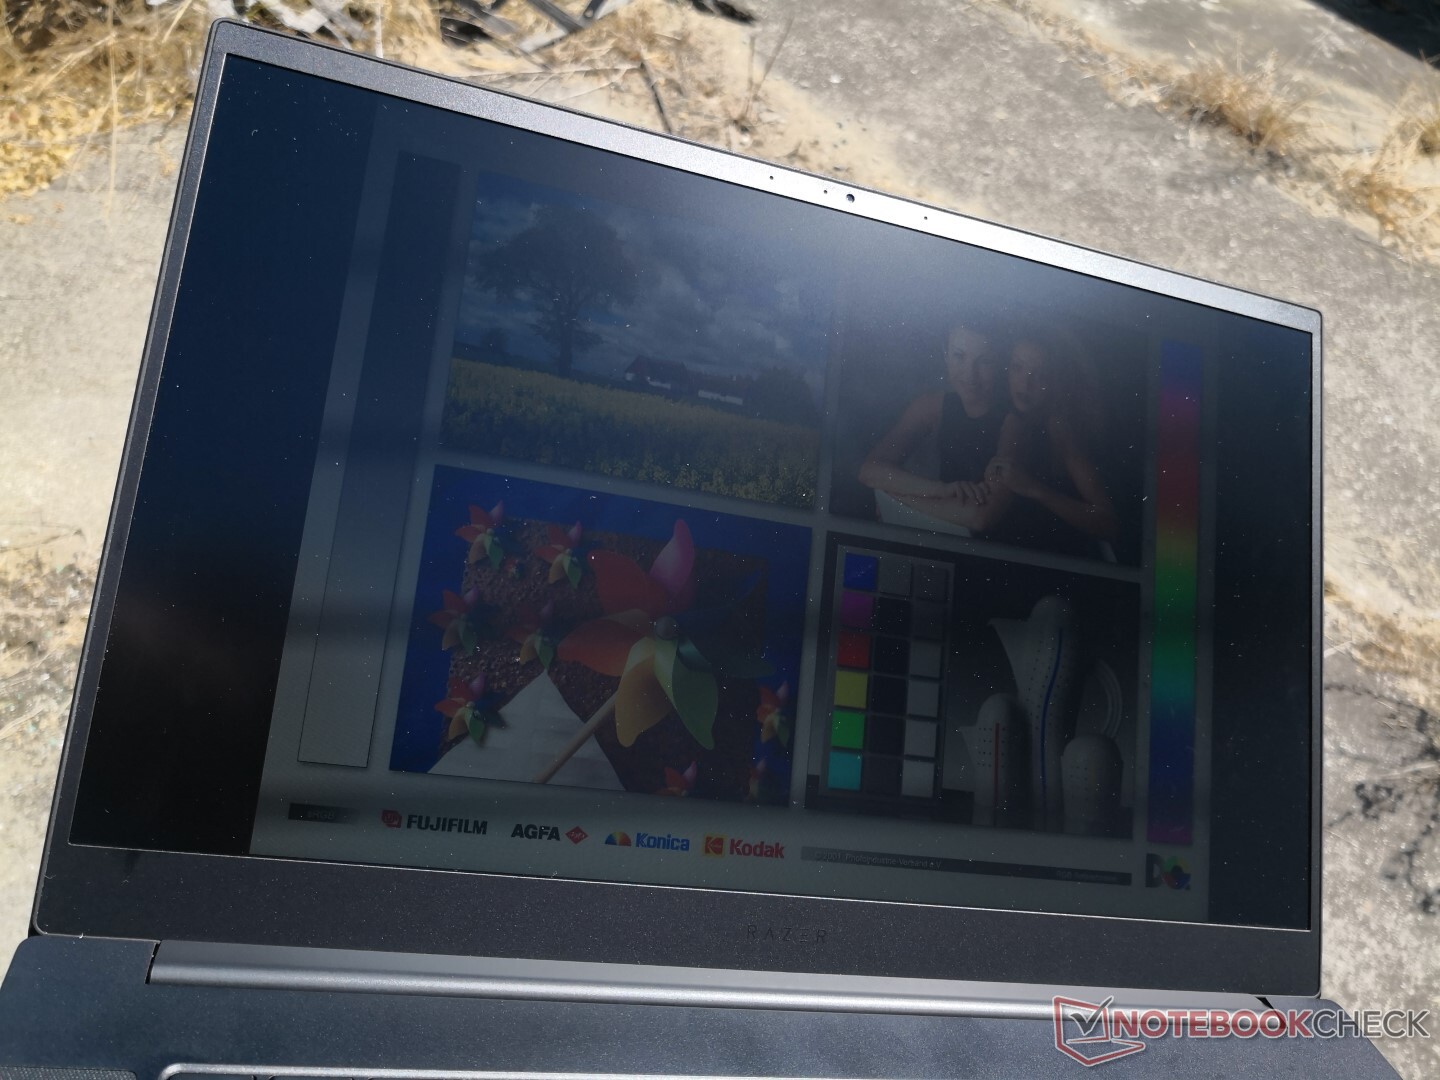
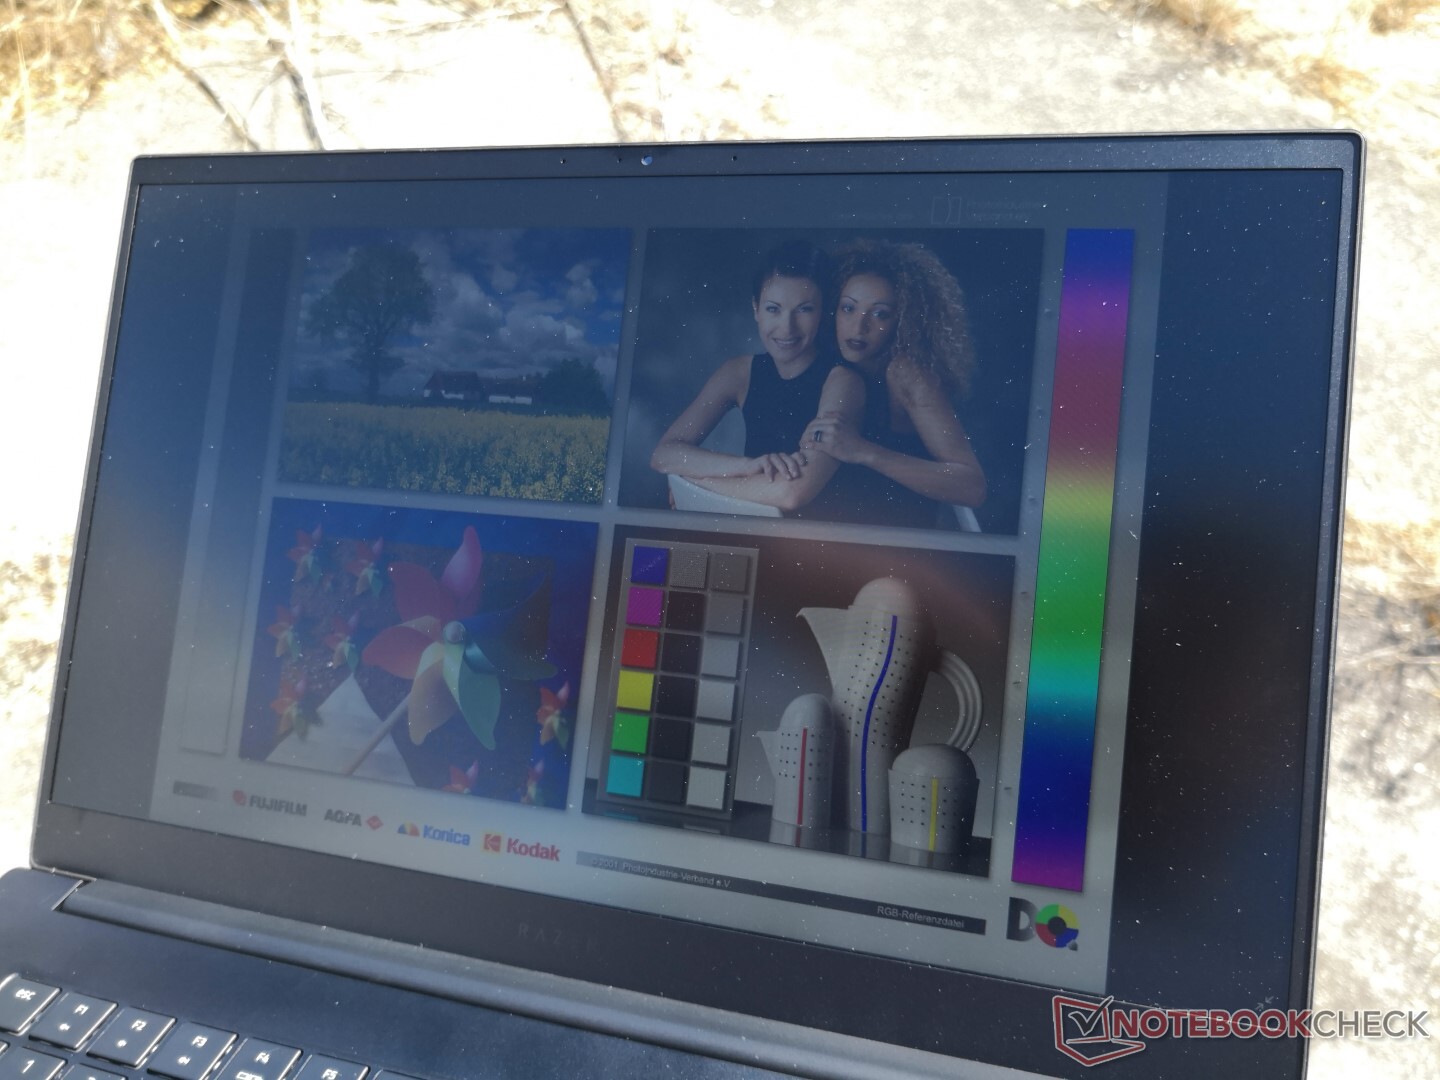
Outdoor visibility and viewing angles are similar to other Blade 15 IPS SKUs since maximum brightness and contrast ratios are not all that different between them. You'll want to stay under shade whenever possible or colors will become washed out.

Performance
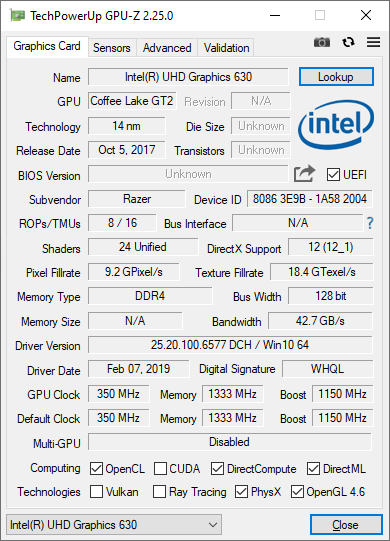
Unlike Asus or MSI who tend to offer a very wide range of CPU options for the same chassis, Razer's approach is more streamlined. All current Blade 15 SKUs ship with the same Core i7-9750H CPU with no Core i5 or Core i9 alternatives. A Core i9 option could have potentially made it easier to reach very high frame rate targets, but the Core i7 is a more balanced option given the GTX 1660 Ti GPU.
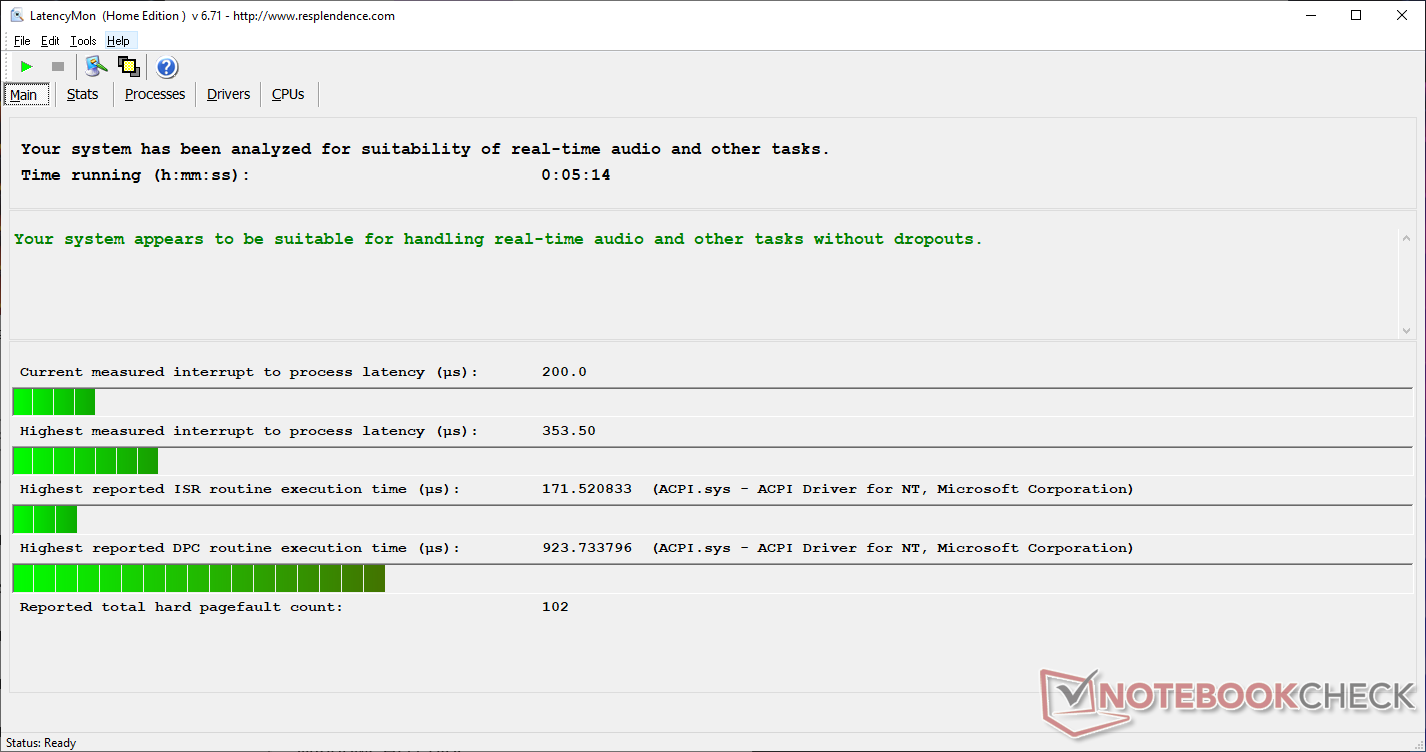
Nvidia Optimus comes standard across all SKUs and so G-Sync has been omitted. LatencyMon shows no DPC latency issues even with wireless enabled.
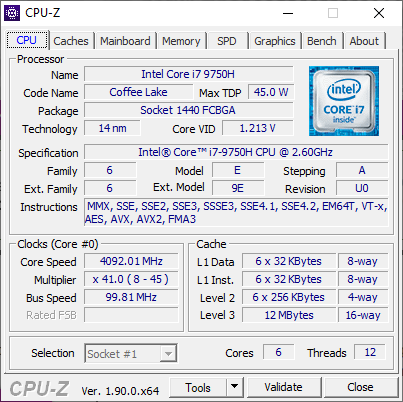
Processor
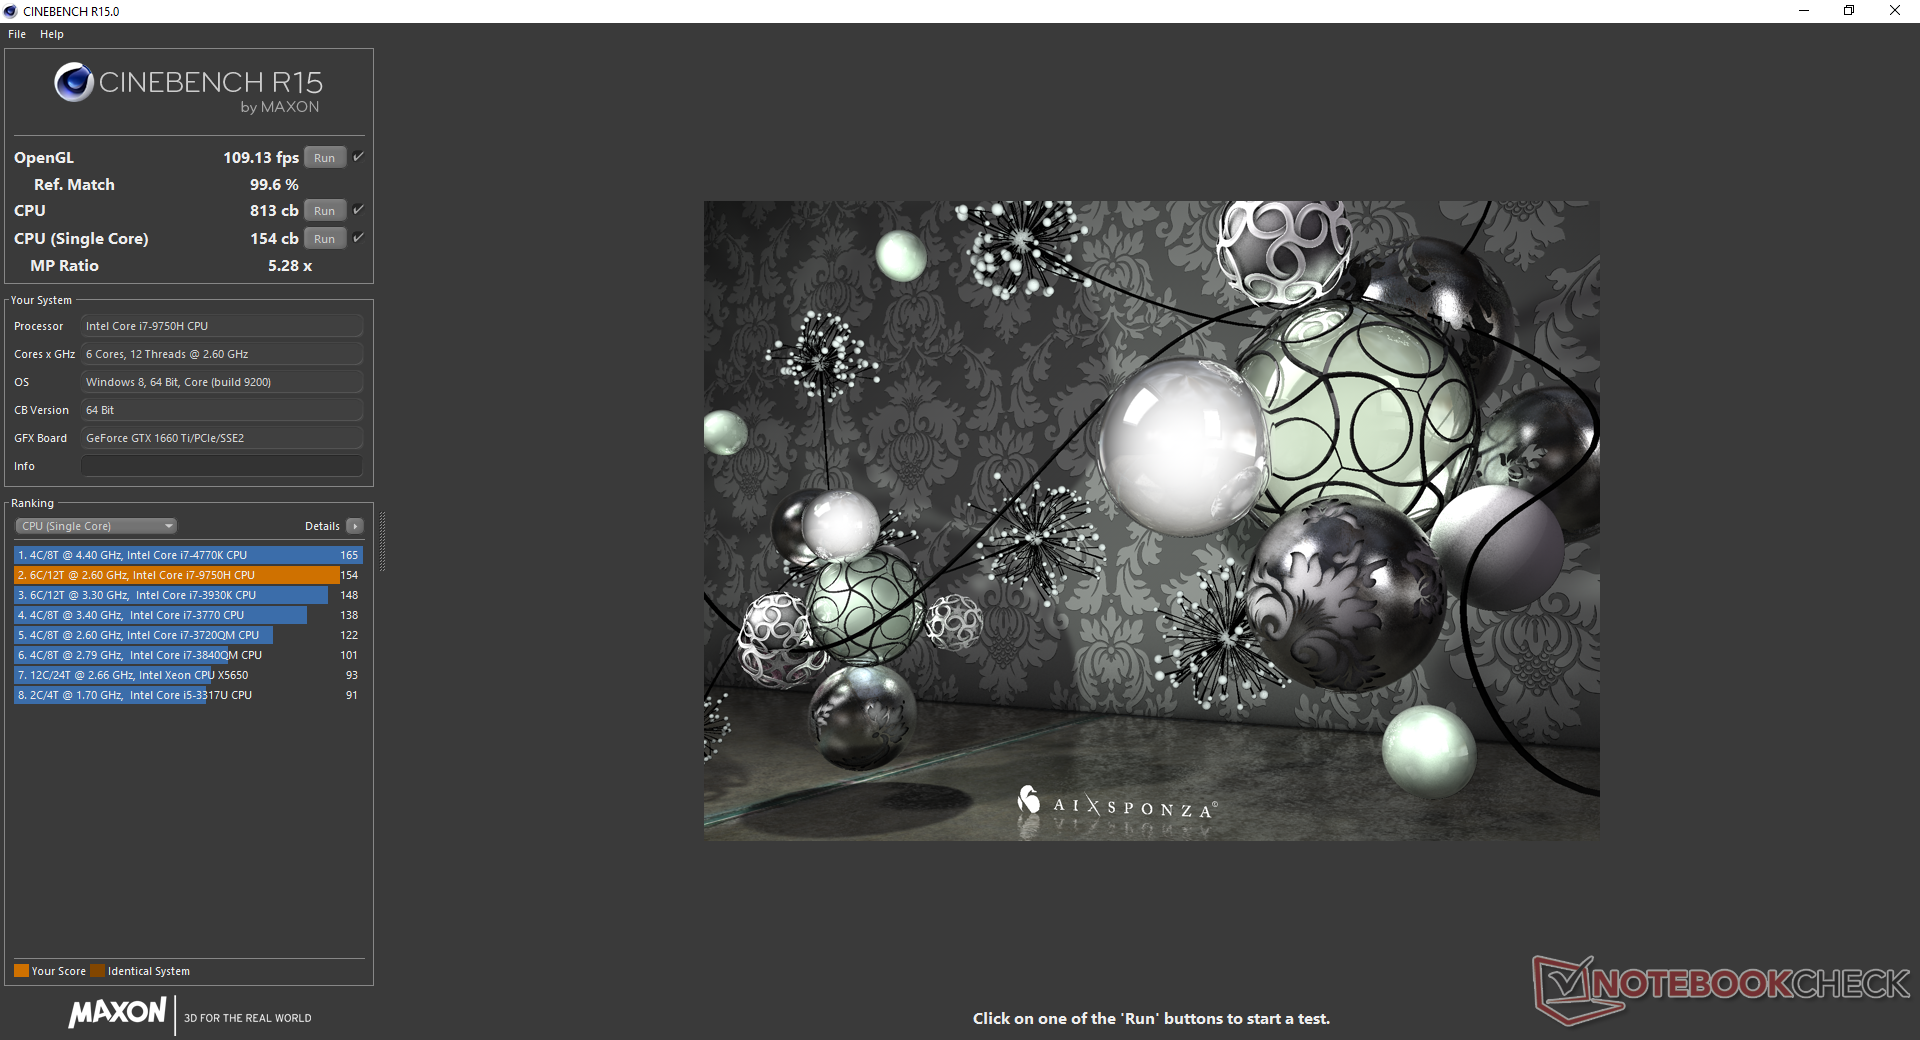
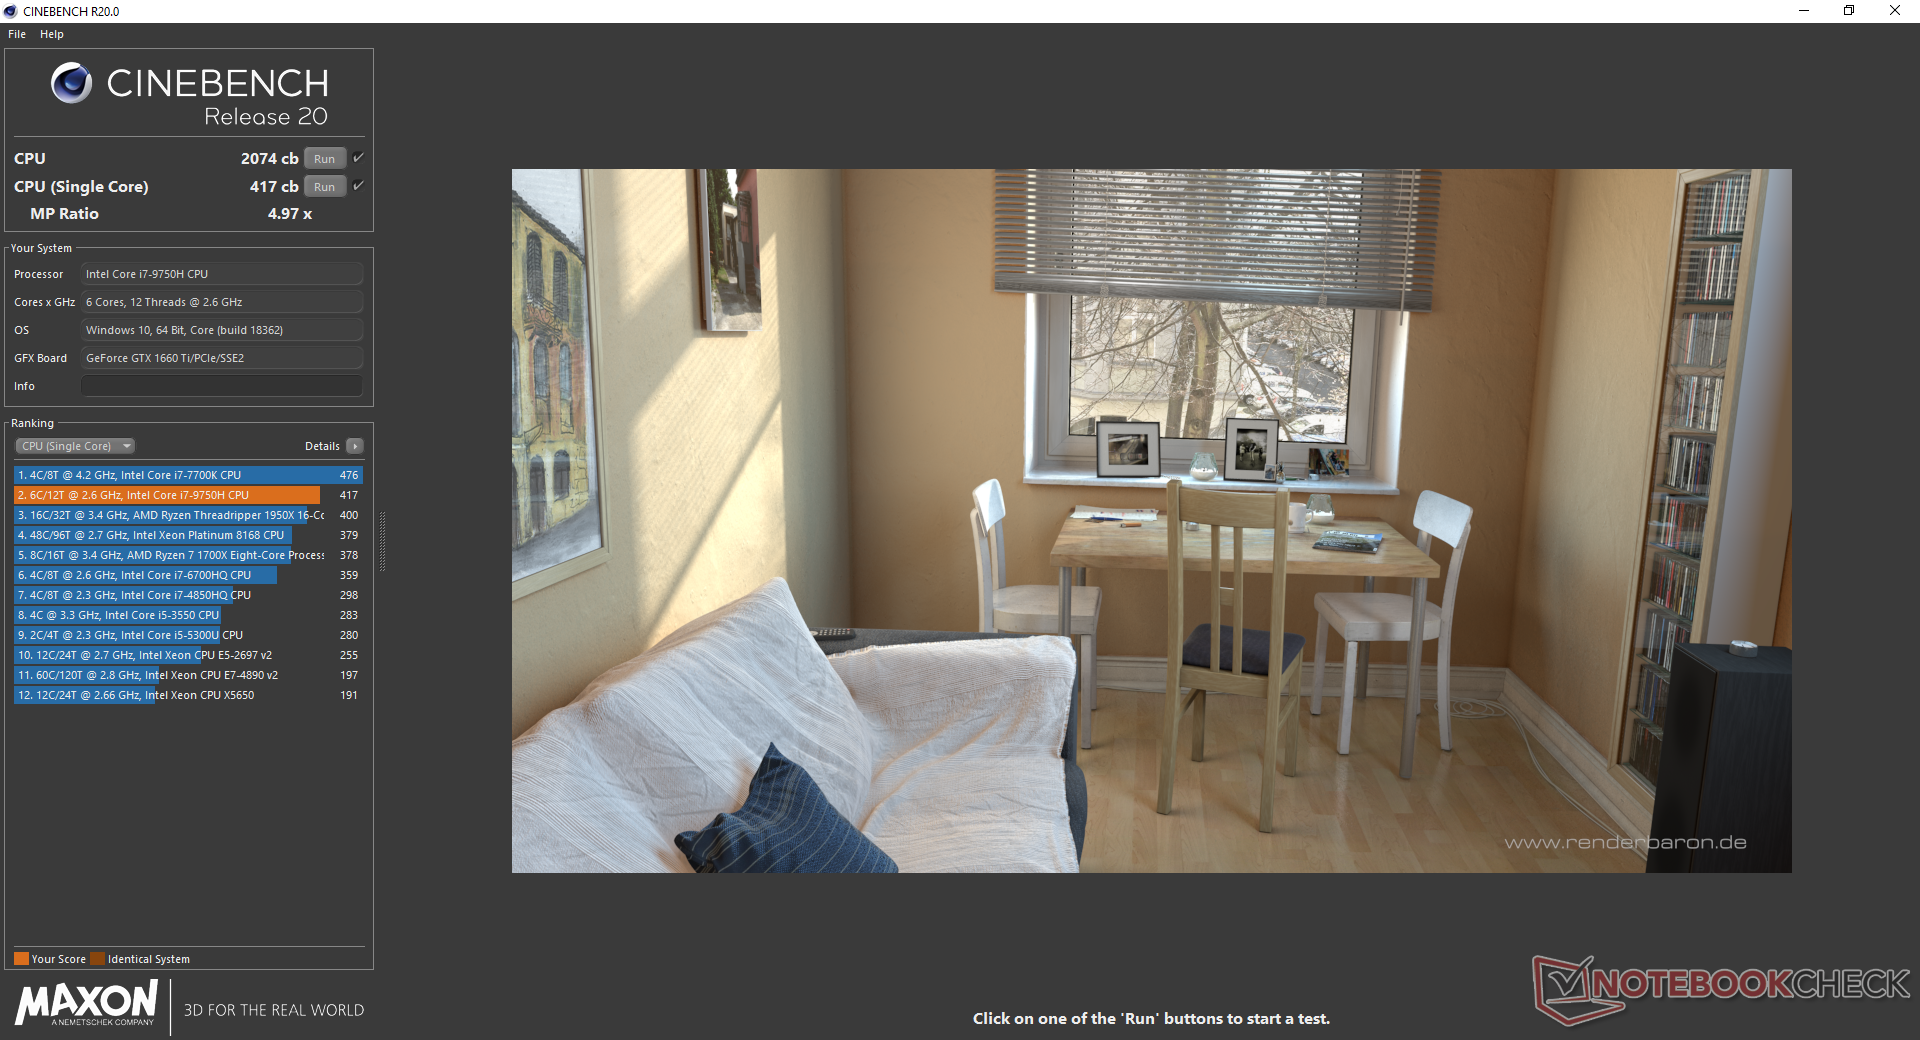
We always say that just because two laptops share the same CPU, their performances may not be the same. In this case, the Core i7-9750H in the Blade 15 RTX 2080 Max-Q is about 15 percent faster than the Core i7-9750H in our Blade 15 GTX 1660 Ti according to CineBench R15 Multi-Thread. The pricier RTX 2080 Max-Q SKU is able to maintain its CPU lead over our GTX 1660 Ti SKU even after extended periods of stress.
Perhaps the more disappointing aspect is that the CPU in our test unit is 18 percent slower than the average Core i7-9750H in our database taken from 43 other laptops. While raw performance is still faster than the Core i5-8300H, i5-9300H or older i7-7700HQ, we know that the i7-9750H in the Blade 15 GTX 1660 Ti is capable of much more based on what we've experienced on other laptops with this same processor.
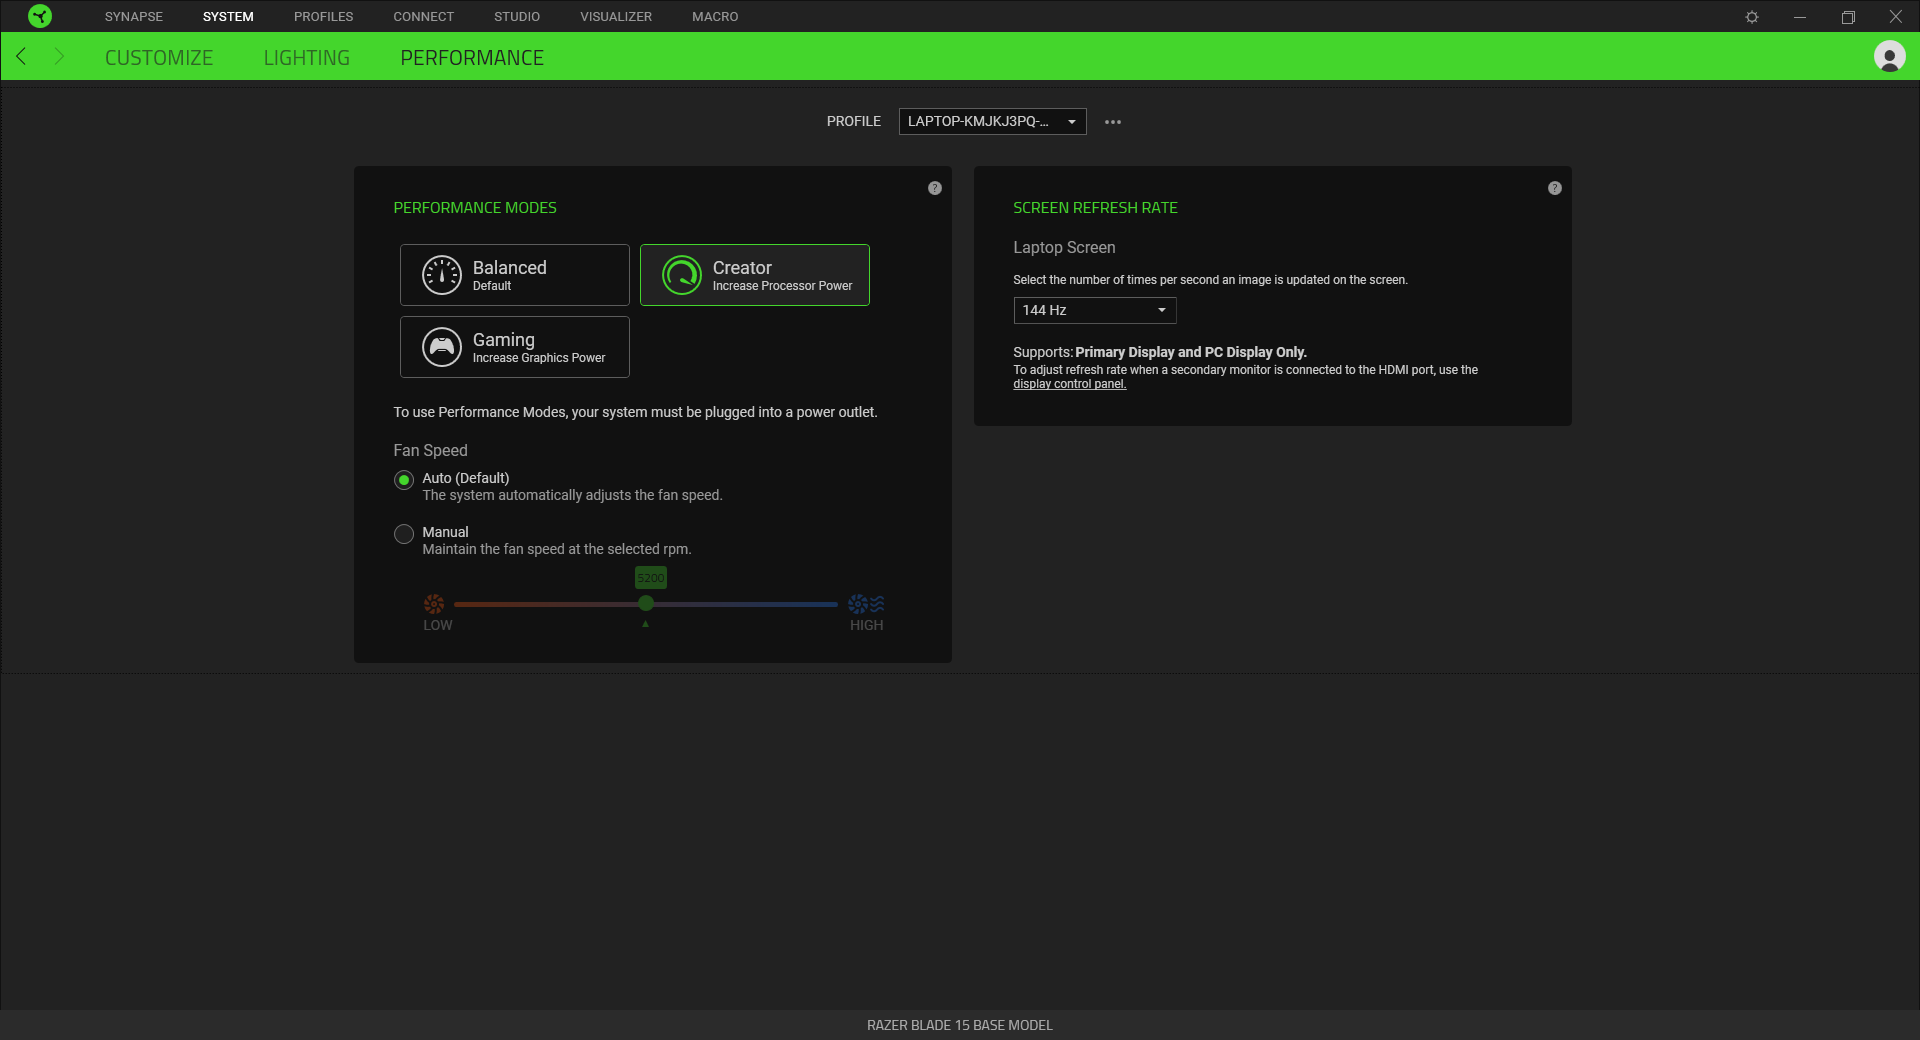
Our scores below were recorded with Razer's Creator Mode active. Running on Gaming Mode results in even slower CPU performance as shown by these CineBench screenshots.
See our dedicated page on the Core i7-9750H for more technical information and benchmarks.


| Cinebench R11.5 | |
| CPU Single 64Bit | |
| MSI GE75 9SG | |
| Average Intel Core i7-9750H (1.96 - 2.19, n=10) | |
| Asus FX503VM-EH73 | |
| Asus ROG Zephyrus G15 GA502DU | |
| CPU Multi 64Bit | |
| MSI GE75 9SG | |
| Average Intel Core i7-9750H (11.3 - 14.1, n=10) | |
| Asus ROG Zephyrus G15 GA502DU | |
| Asus FX503VM-EH73 | |
| wPrime 2.10 - 1024m | |
| MSI GF63 8RC-040XPL | |
| Asus FX503VM-EH73 | |
| Asus ROG Zephyrus G15 GA502DU | |
| Average Intel Core i7-9750H (n=1) | |
| MSI GE75 9SG | |
| Eurocom Nightsky RX15 | |
* ... smaller is better
System Performance
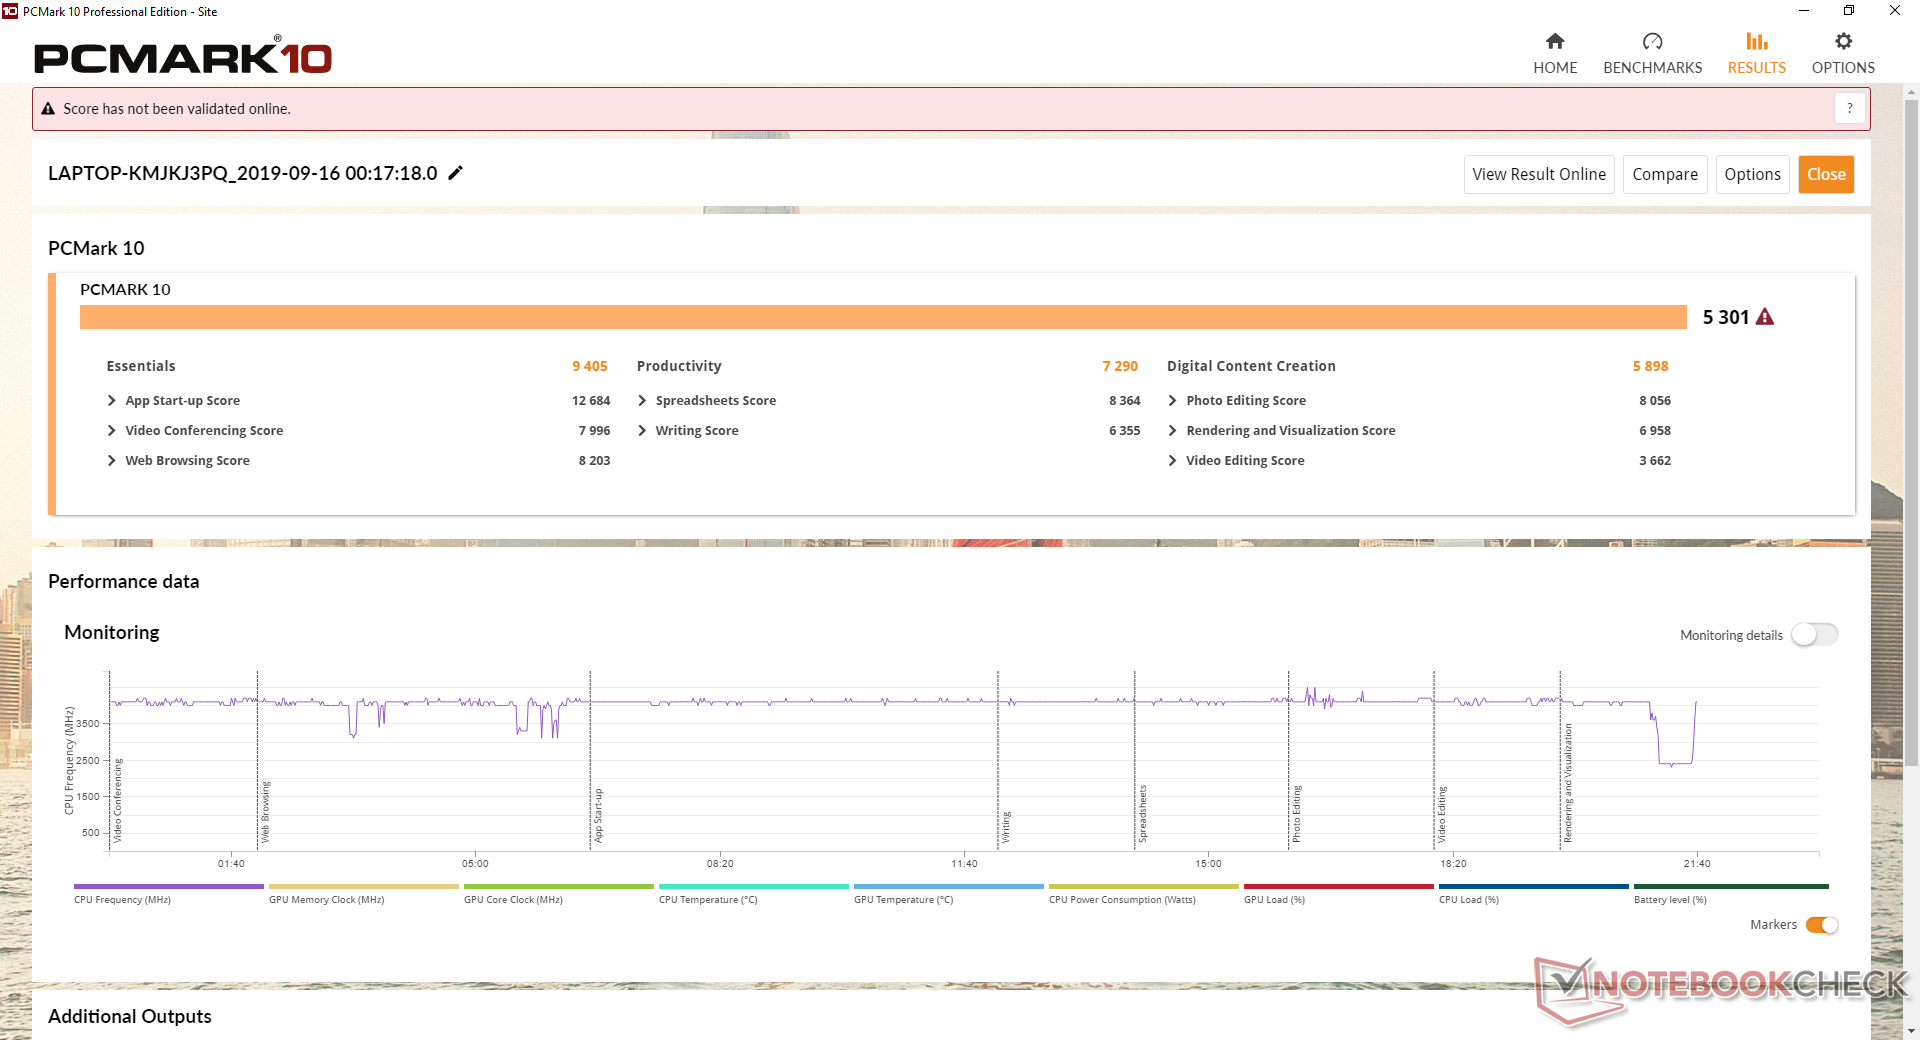
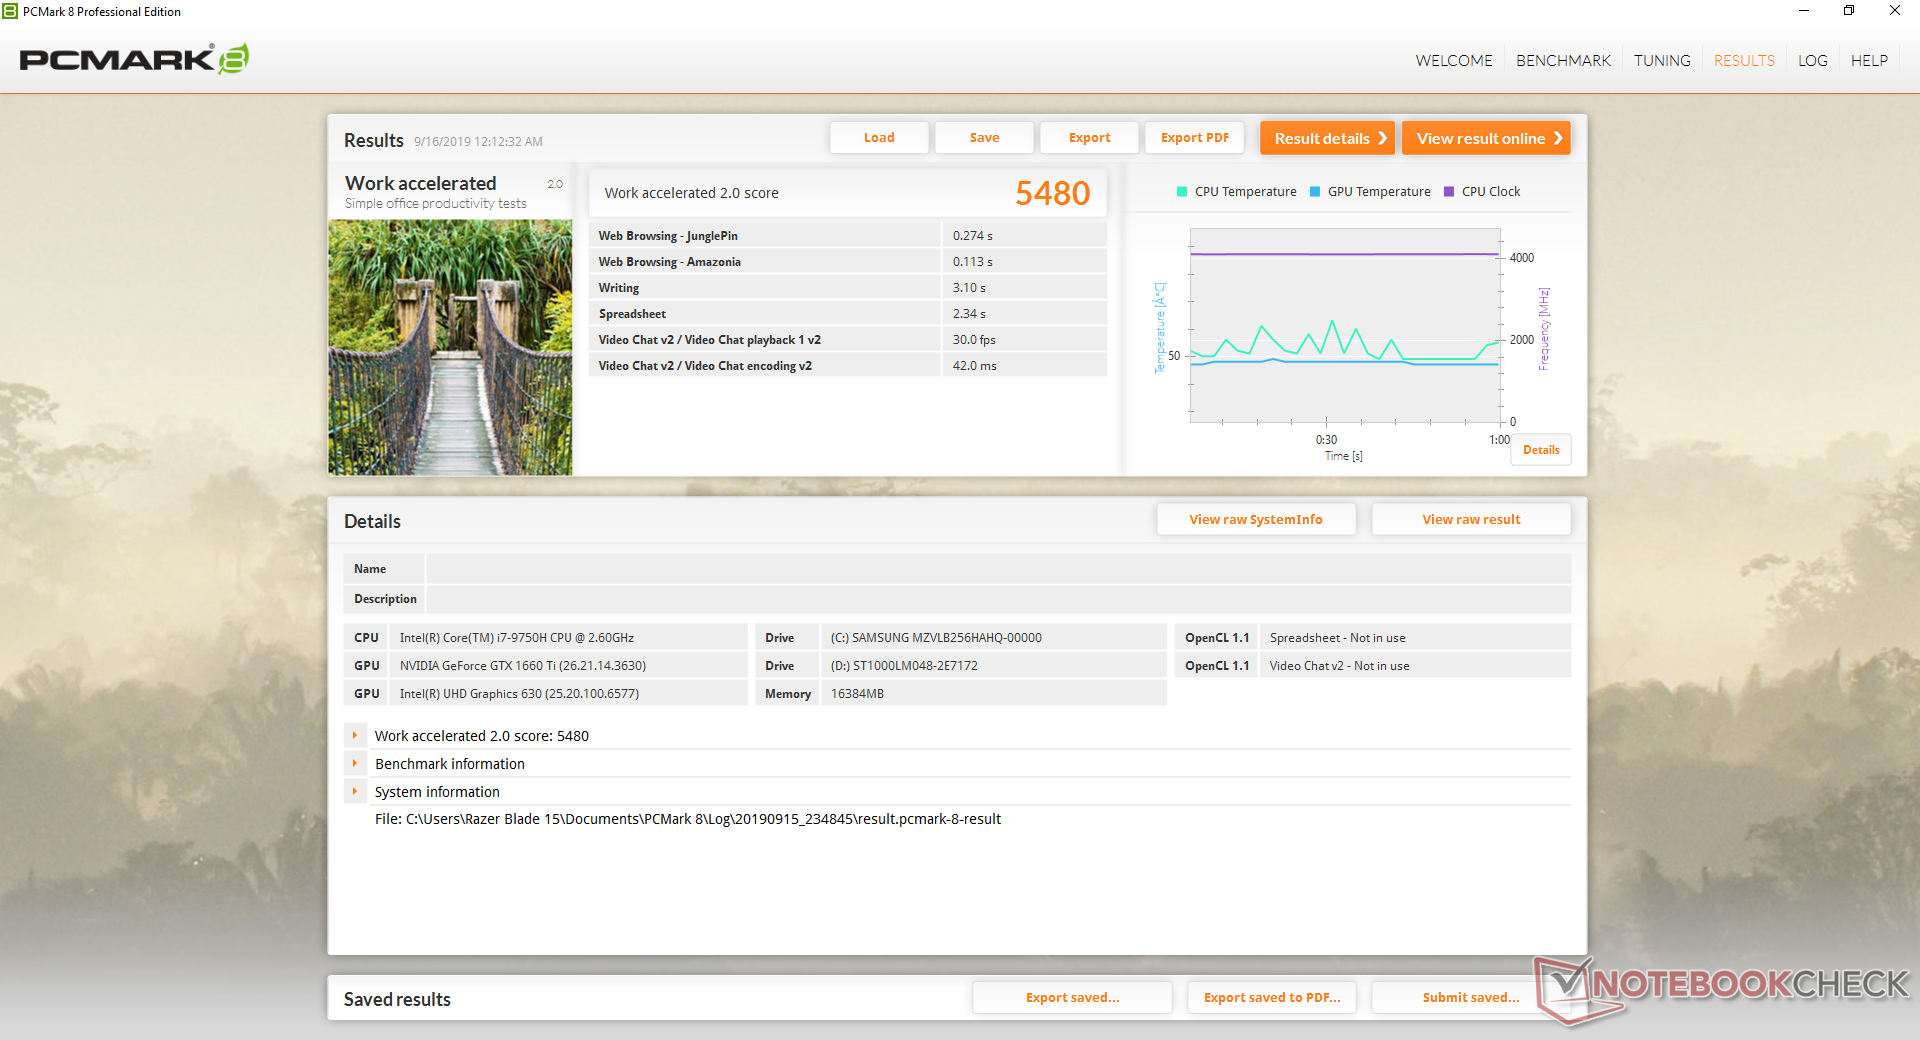
PCMark benchmarks are consistently below average when compared to other laptops equipped with the same i7-9750H CPU and GTX 1660 Ti GPU. We suspect that the poor CineBench results above have attributed to the lower PCMark numbers.
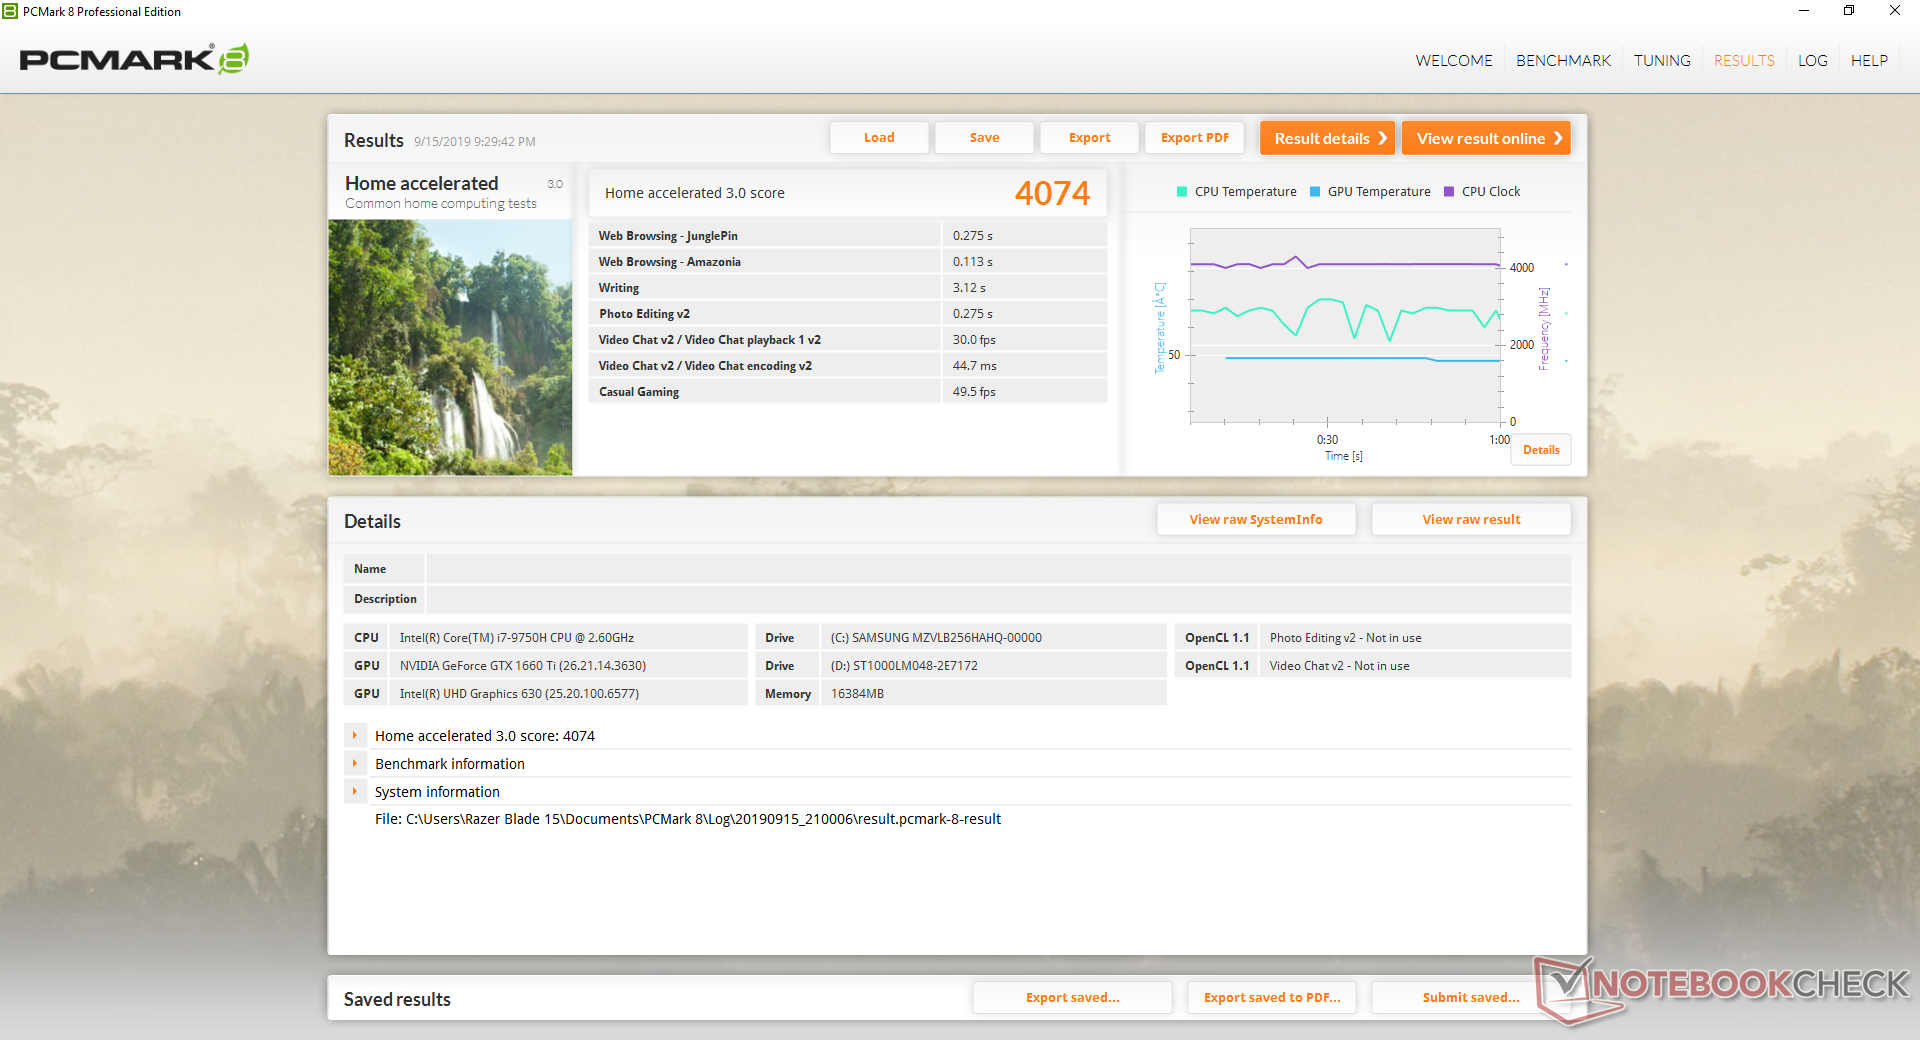
| PCMark 8 Home Score Accelerated v2 | 4074 points | |
| PCMark 8 Work Score Accelerated v2 | 5480 points | |
| PCMark 10 Score | 5301 points | |
Help | ||
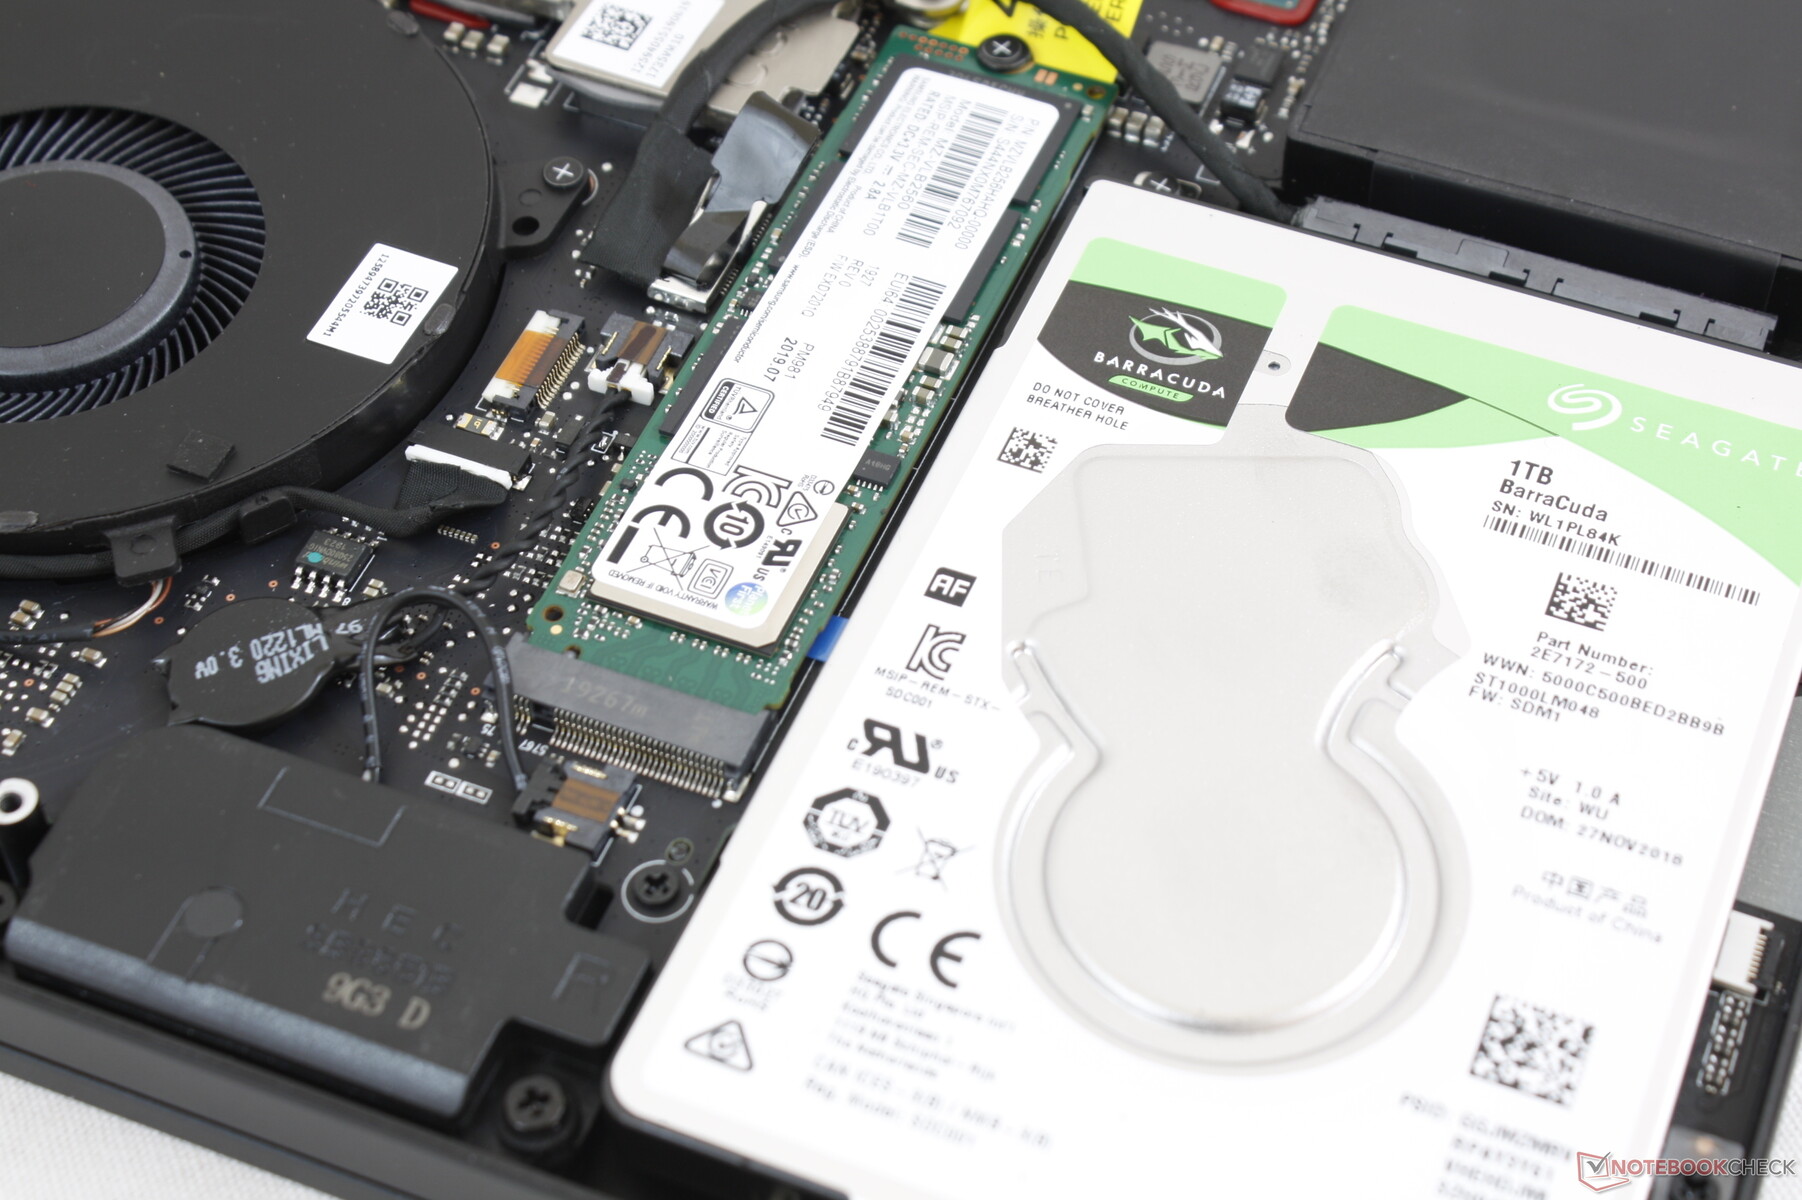
Storage Devices
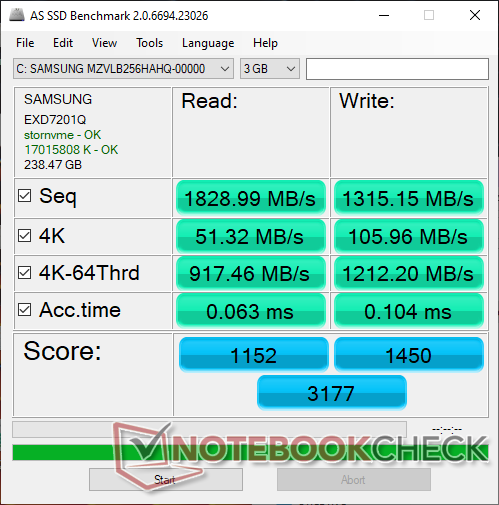
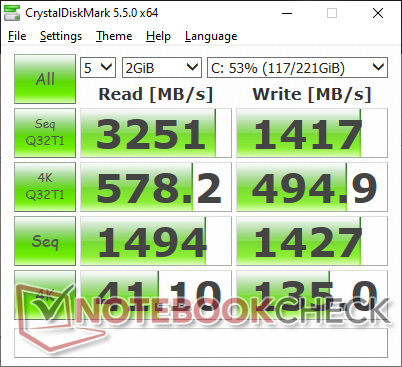
All Blade 15 and Blade Pro 17 configurations thus far ship with Samsung SSDs in contrast to most other OEMs where it can be difficult to know what drive you're going to get. The Dell Alienware series, for example, ships with drives from Lite-On, Toshiba, SK Hynix, and Samsung.
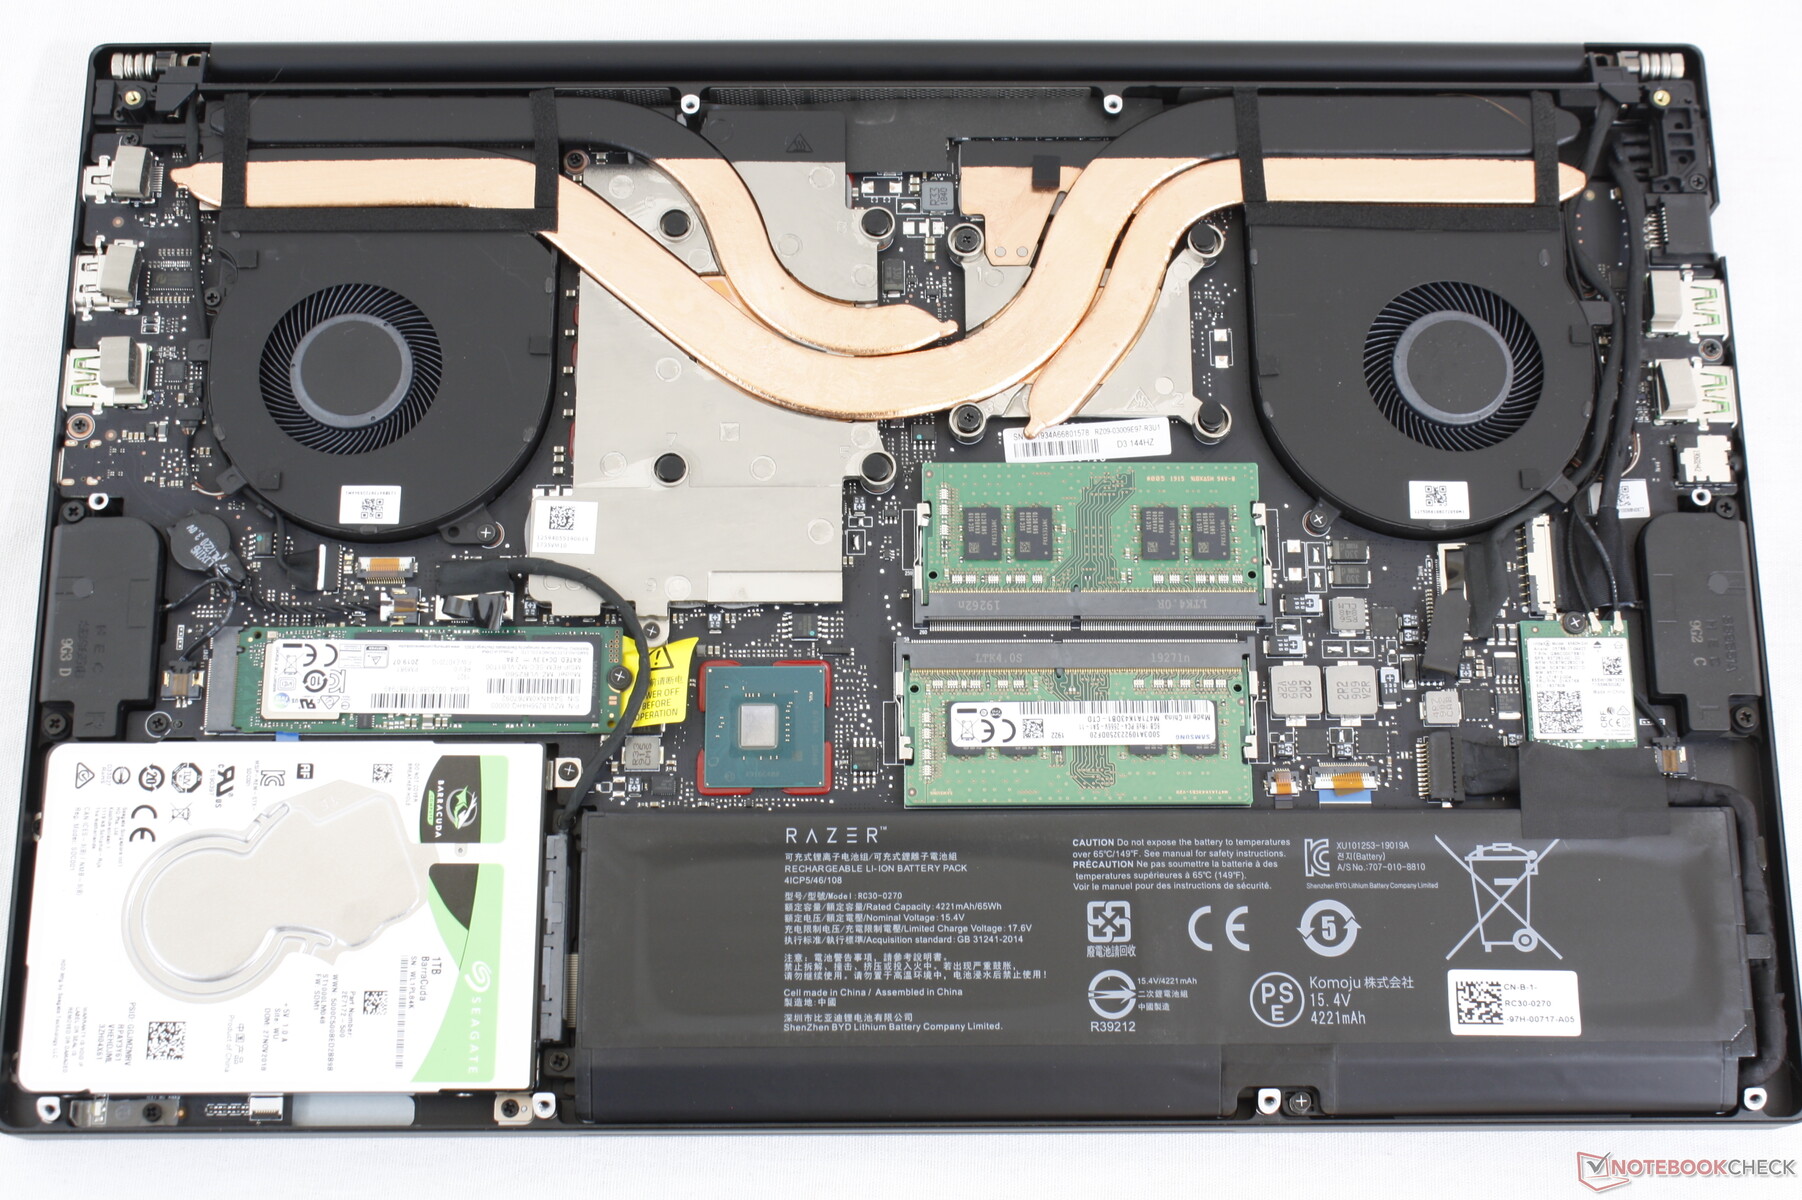
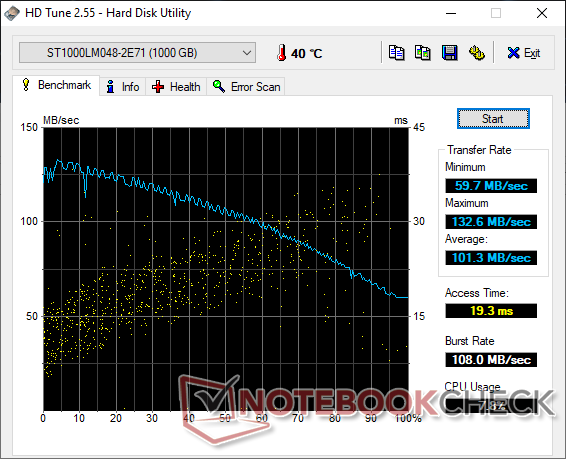
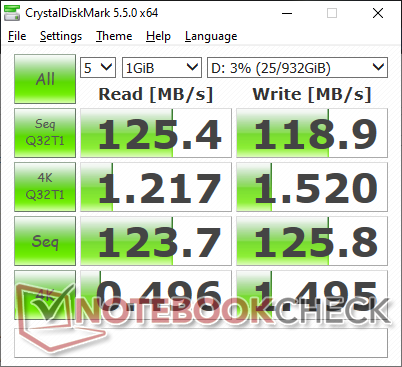
As mentioned earlier, the Blade 15 GTX 1660 Ti includes a secondary 2.5-inch SATA III bay that's missing on the thinner Blade 15 RTX 2070 Max-Q and RTX 2080 Max-Q SKUs. This is especially useful for cost-conscious users because investing in a 2 TB HDD is far cheaper than a 2 TB M.2 SSD. The 1 TB Seagate HDD in our unit returns an average transfer rate of 101 MB/s which is excellent for a 5400 drive.
| Razer Blade 15 GTX 1660 Ti Samsung SSD PM981 MZVLB256HAHQ | Razer Blade 15 RTX 2080 Max-Q Samsung SSD PM981 MZVLB512HAJQ | Alienware m15 R2 P87F 2x Toshiba XG6 KXG60ZNV512G (RAID 0) | Dell XPS 15 7590 9980HK GTX 1650 Toshiba XG6 KXG60ZNV1T02 | Gigabyte Aero 15 Classic-XA Intel SSD 760p SSDPEKKW512G8 | MSI GS65 Stealth Thin 8RE-051US Samsung SSD PM981 MZVLB256HAHQ | |
|---|---|---|---|---|---|---|
| AS SSD | 23% | 13% | 29% | 6% | -17% | |
| Seq Read (MB/s) | 1829 | 1832 0% | 1925 5% | 1723 -6% | 2517 38% | 1612 -12% |
| Seq Write (MB/s) | 1315 | 1864 42% | 2371 80% | 1386 5% | 924 -30% | 1475 12% |
| 4K Read (MB/s) | 51.3 | 52.1 2% | 37.2 -27% | 43.25 -16% | 59.1 15% | 43.09 -16% |
| 4K Write (MB/s) | 106 | 108.3 2% | 108.9 3% | 98.3 -7% | 126.5 19% | 83.8 -21% |
| 4K-64 Read (MB/s) | 917 | 1159 26% | 1177 28% | 1078 18% | 876 -4% | 611 -33% |
| 4K-64 Write (MB/s) | 1212 | 1807 49% | 1135 -6% | 1456 20% | 922 -24% | 570 -53% |
| Access Time Read * (ms) | 0.063 | 0.05 21% | 0.065 -3% | 0.05 21% | 0.042 33% | 0.071 -13% |
| Access Time Write * (ms) | 0.104 | 0.034 67% | 0.108 -4% | 0.039 62% | 0.065 37% | 0.045 57% |
| Score Read (Points) | 1152 | 1394 21% | 1407 22% | 1294 12% | 1186 3% | 815 -29% |
| Score Write (Points) | 1450 | 2102 45% | 1481 2% | 1693 17% | 1141 -21% | 802 -45% |
| Score Total (Points) | 3177 | 4221 33% | 3633 14% | 3638 15% | 2870 -10% | 2039 -36% |
| Copy ISO MB/s (MB/s) | 1539 | 2083 35% | 2073 35% | 3182 107% | 2086 36% | |
| Copy Program MB/s (MB/s) | 513 | 496.5 -3% | 576 12% | 984 92% | 454.2 -11% | |
| Copy Game MB/s (MB/s) | 1150 | 977 -15% | 1426 24% | 1824 59% | 1141 -1% |
* ... smaller is better

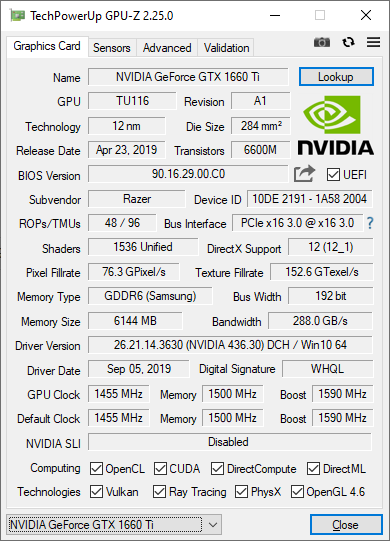
GPU Performance
Unlike the under-performing CPU, the GTX 1660 Ti GPU is performing where we expect it to be at within 5 percent of the average mobile GTX 1660 Ti in our database. Users can expect 40 to 50 percent faster performance than the last generation Blade 14 GTX 1060 and 50 to 60 percent faster performance than the mobile GTX 1650. The desktop GTX 1660 Ti is still about 10 to 15 percent faster than our mobile variant.
Keep in mind that the mobile RTX 2060 is only about 10 percent faster than our GTX 1660 Ti. If you're not interested in any RTX specific features, then the Blade 15 GTX 1660 Ti can offer higher performance-per-dollar than the Blade 15 RTX 2060. All current titles will run smoothly at 1080p60 with most settings on Medium or Medium-High.
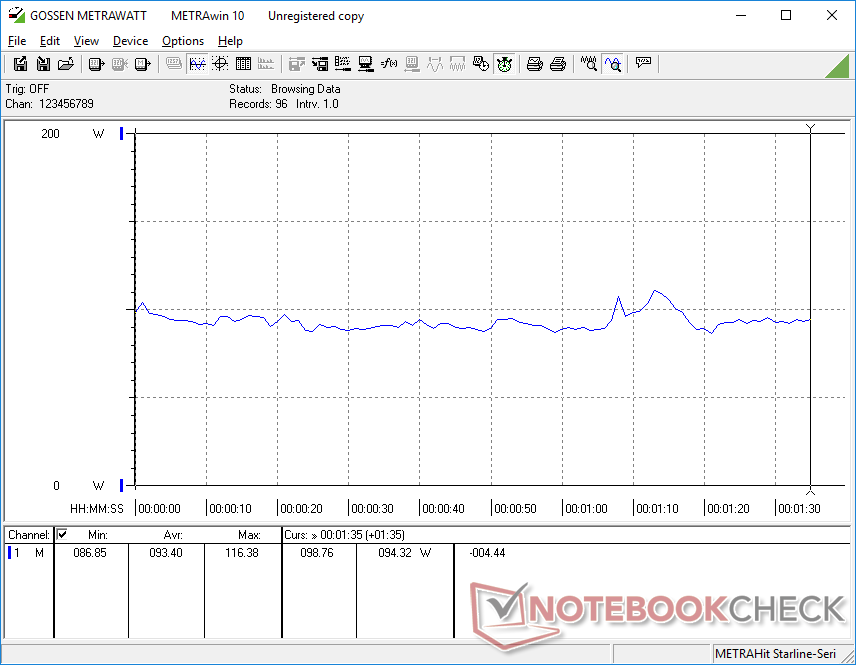
Idling on Witcher 3 for one hour shows no recurring frame dips to suggest no interrupting background activity when gaming. There was a small dip to 38 FPS near the beginning of the test as shown by our graph below, but this never occurred a second time.
See our dedicated page on the mobile GeForce GTX 1660 Ti for more technical information and benchmark comparisons.
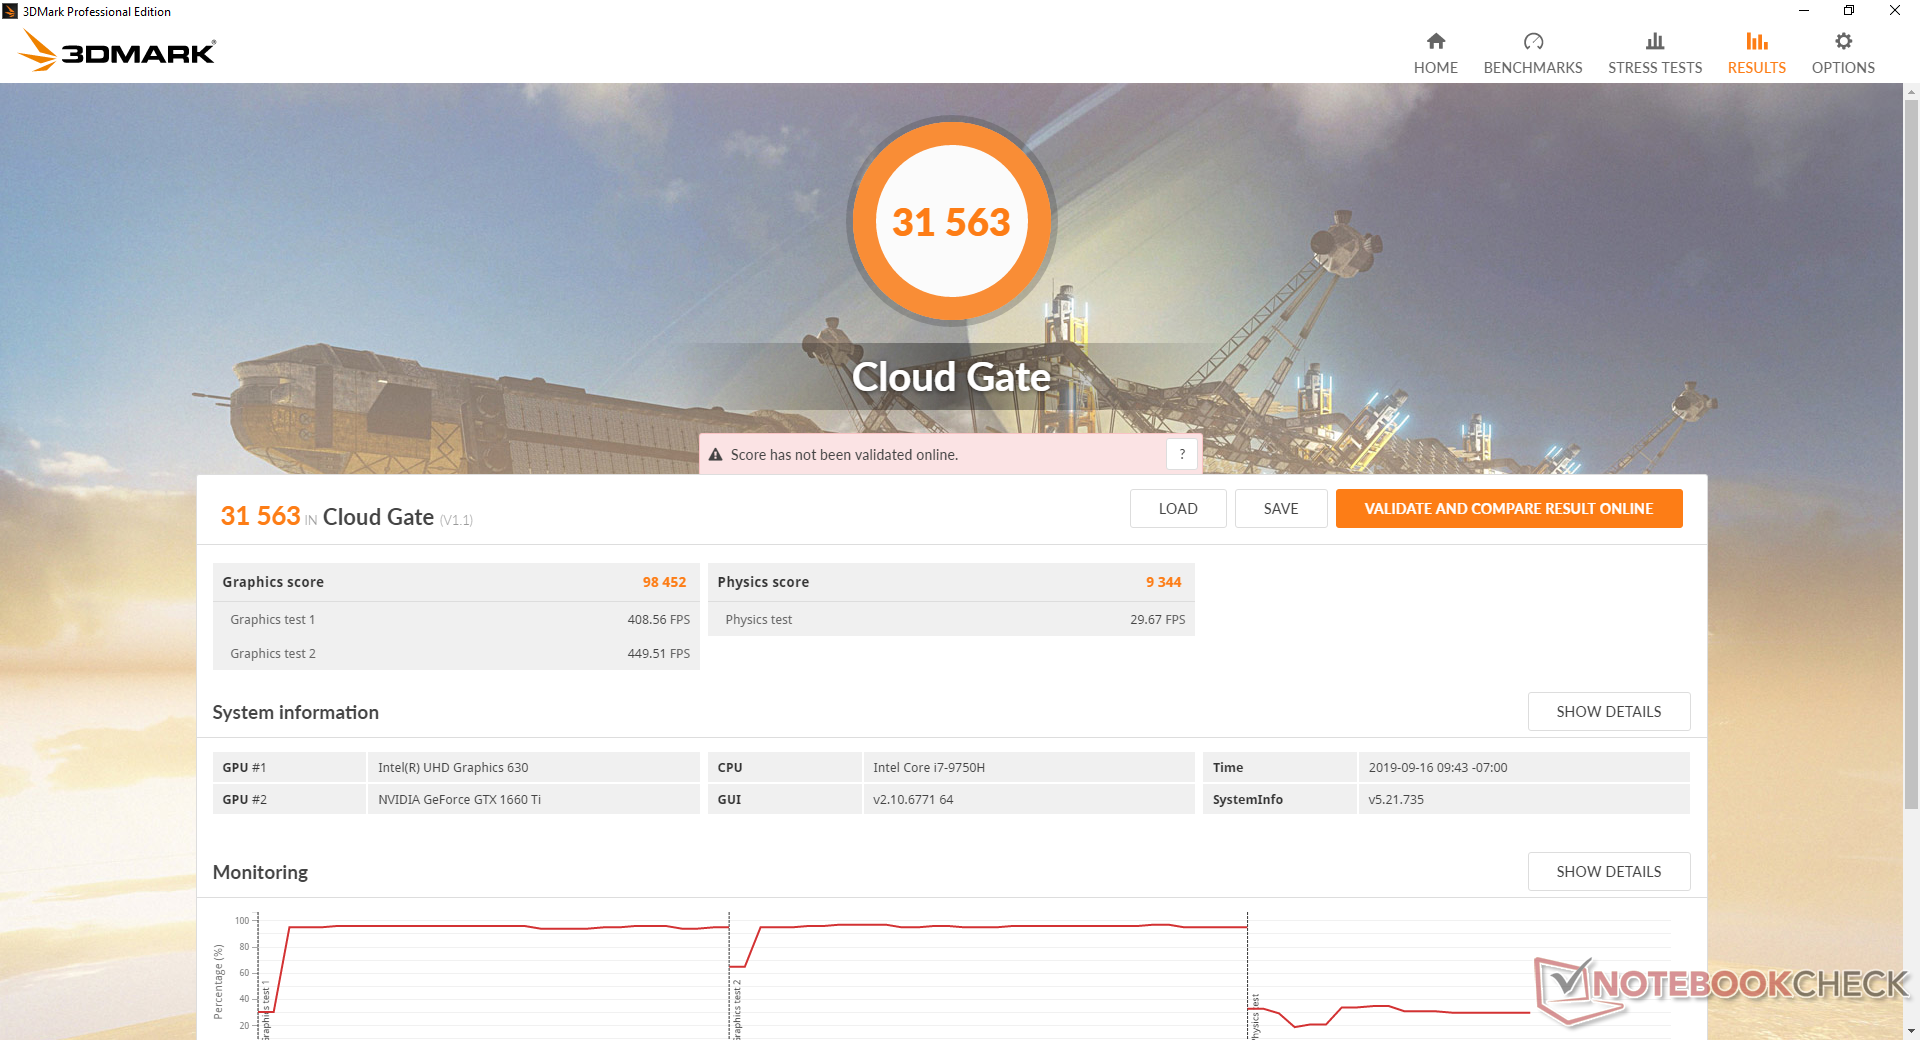
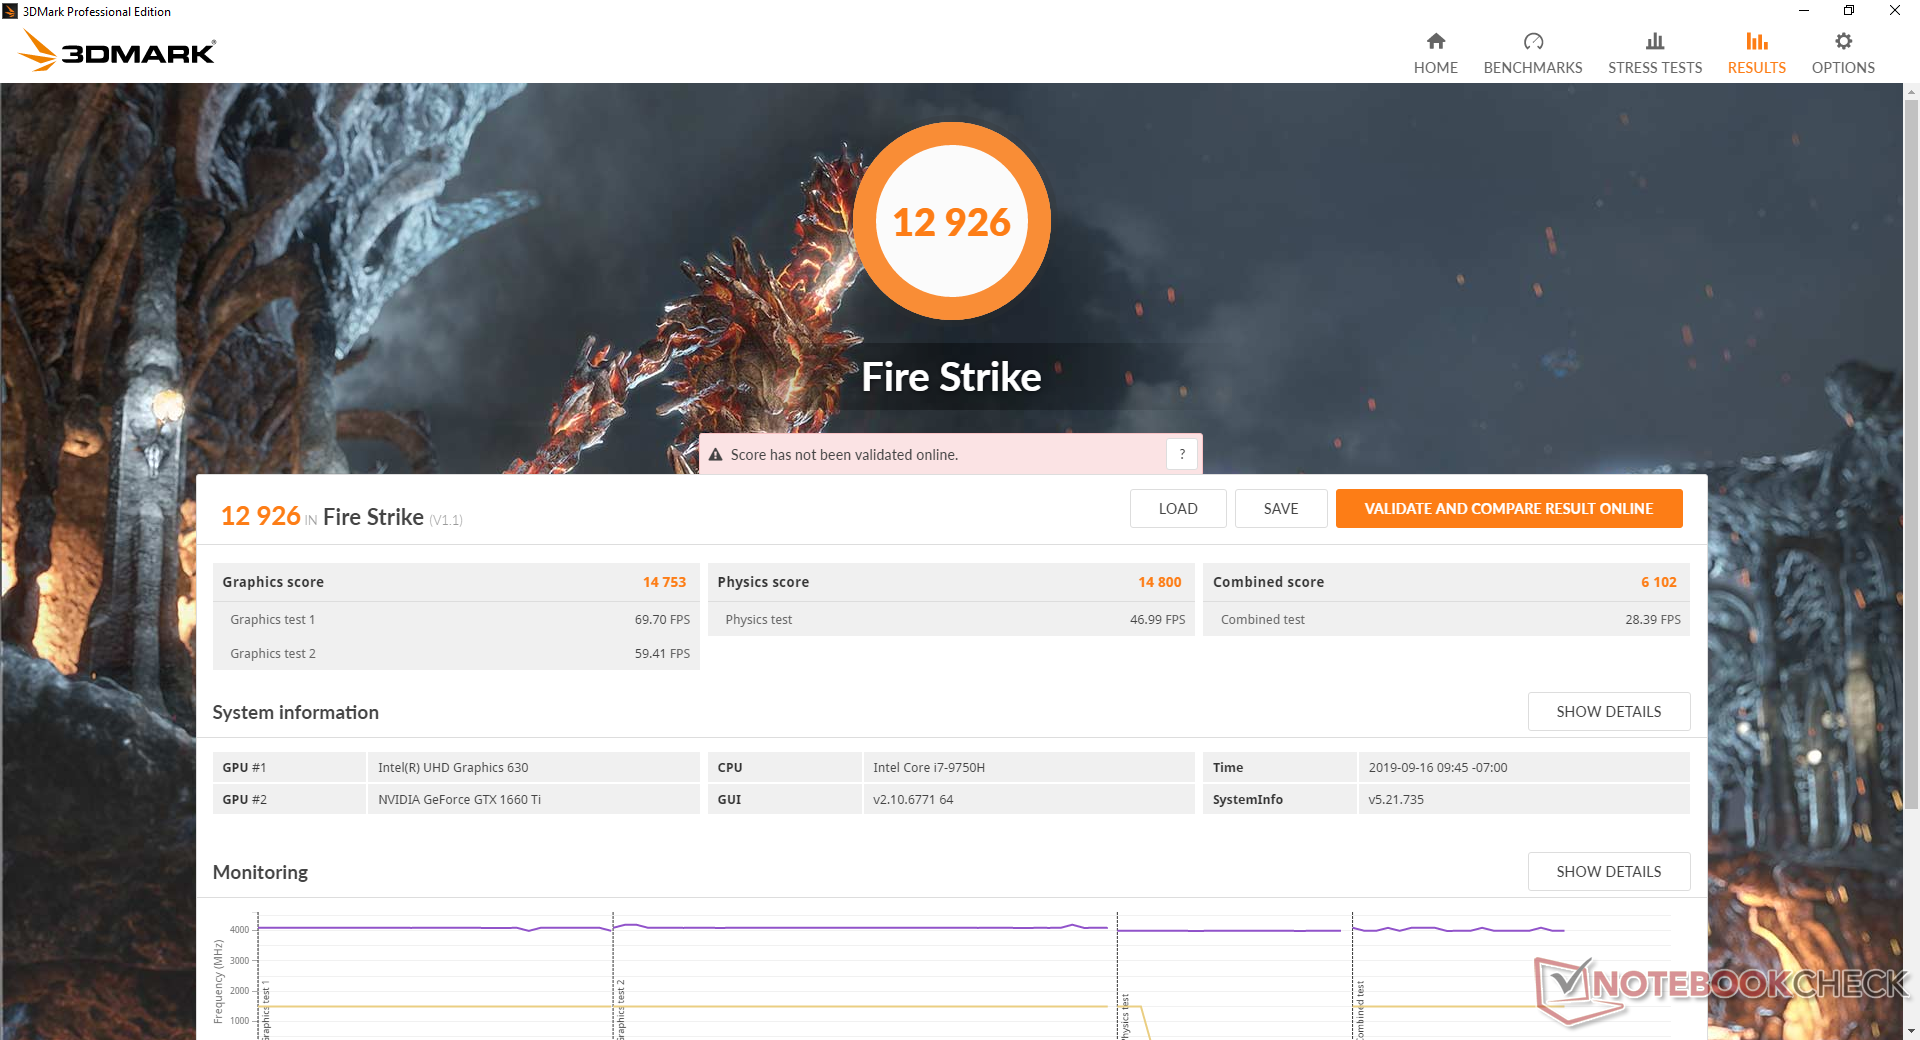


| 3DMark 11 Performance | 16594 points | |
| 3DMark Cloud Gate Standard Score | 31563 points | |
| 3DMark Fire Strike Score | 12926 points | |
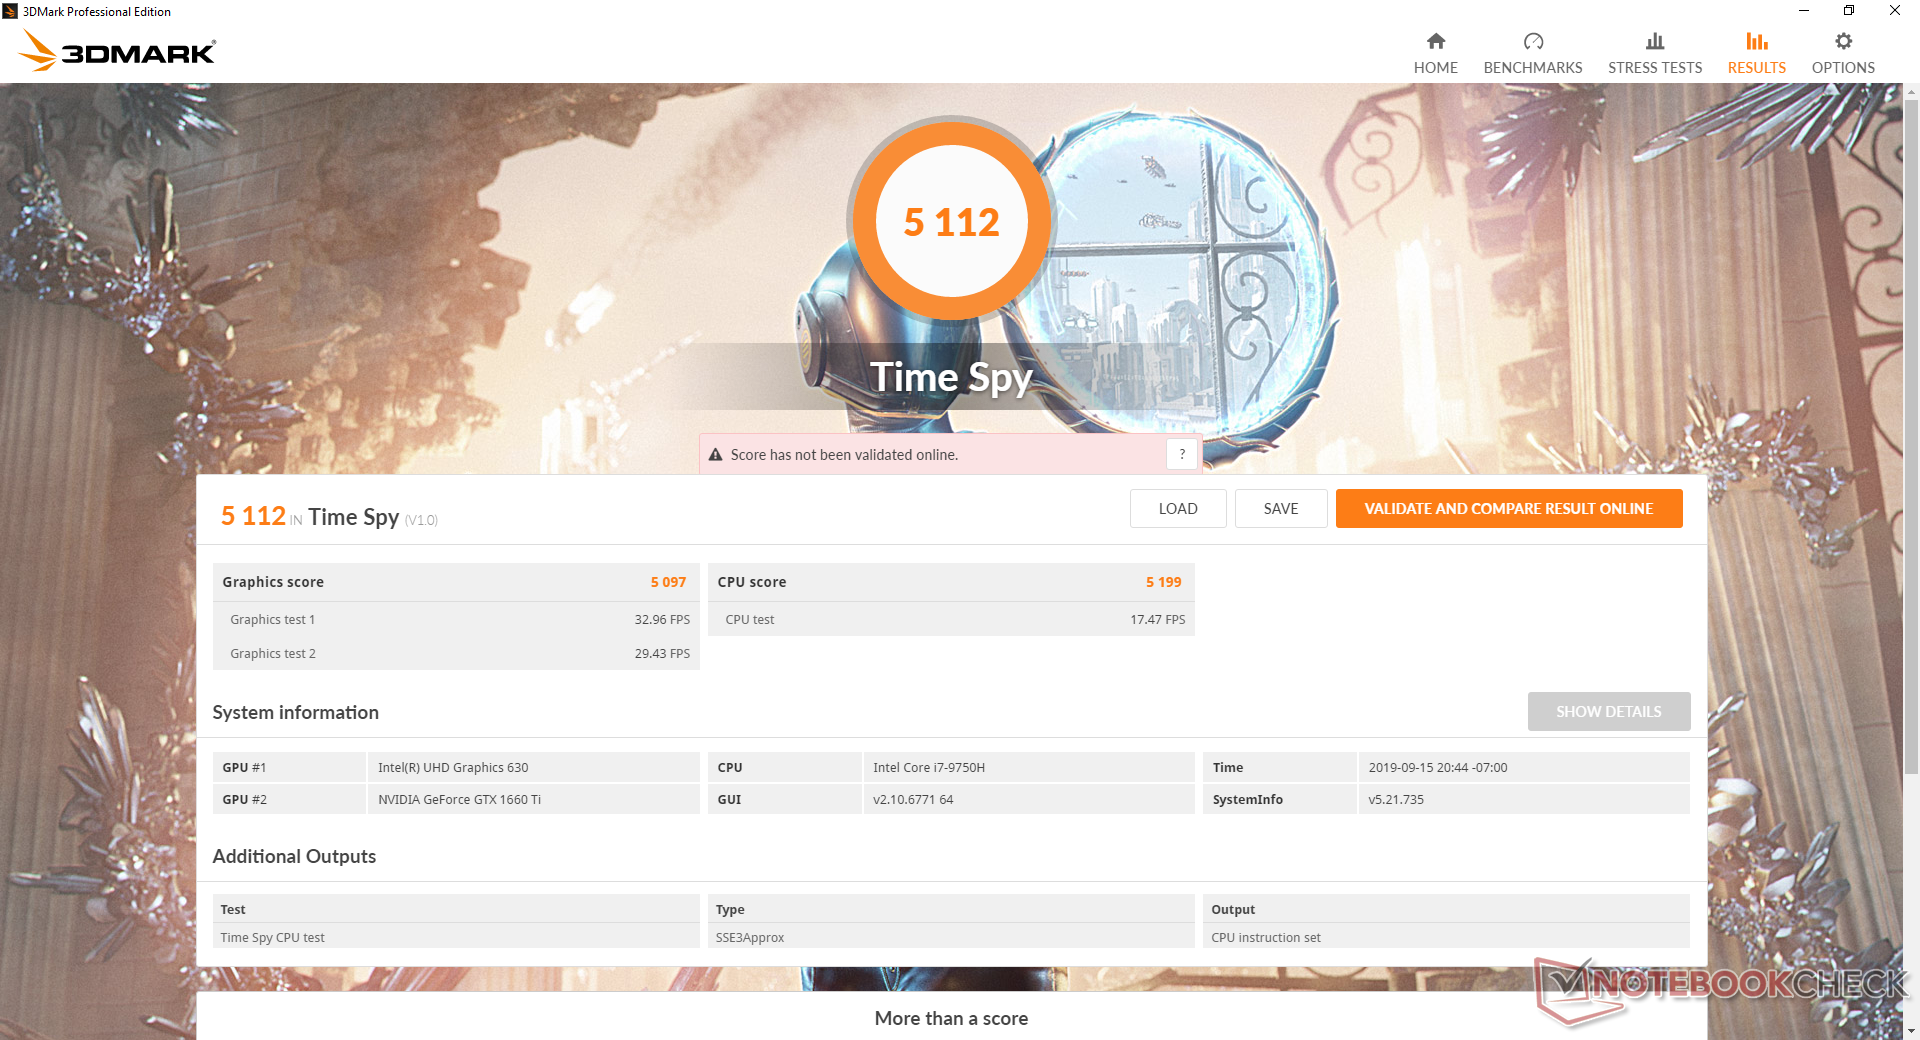
| 3DMark Time Spy Score | 5406 points | |
Help | ||
| low | med. | high | ultra | |
|---|---|---|---|---|
| BioShock Infinite (2013) | 291.2 | 259.6 | 241.3 | 132.5 |
| The Witcher 3 (2015) | 247.6 | 169.7 | 97.5 | 51.6 |
| Shadow of the Tomb Raider (2018) | 115 | 83 | 75 | 67 |
Emissions
System Noise
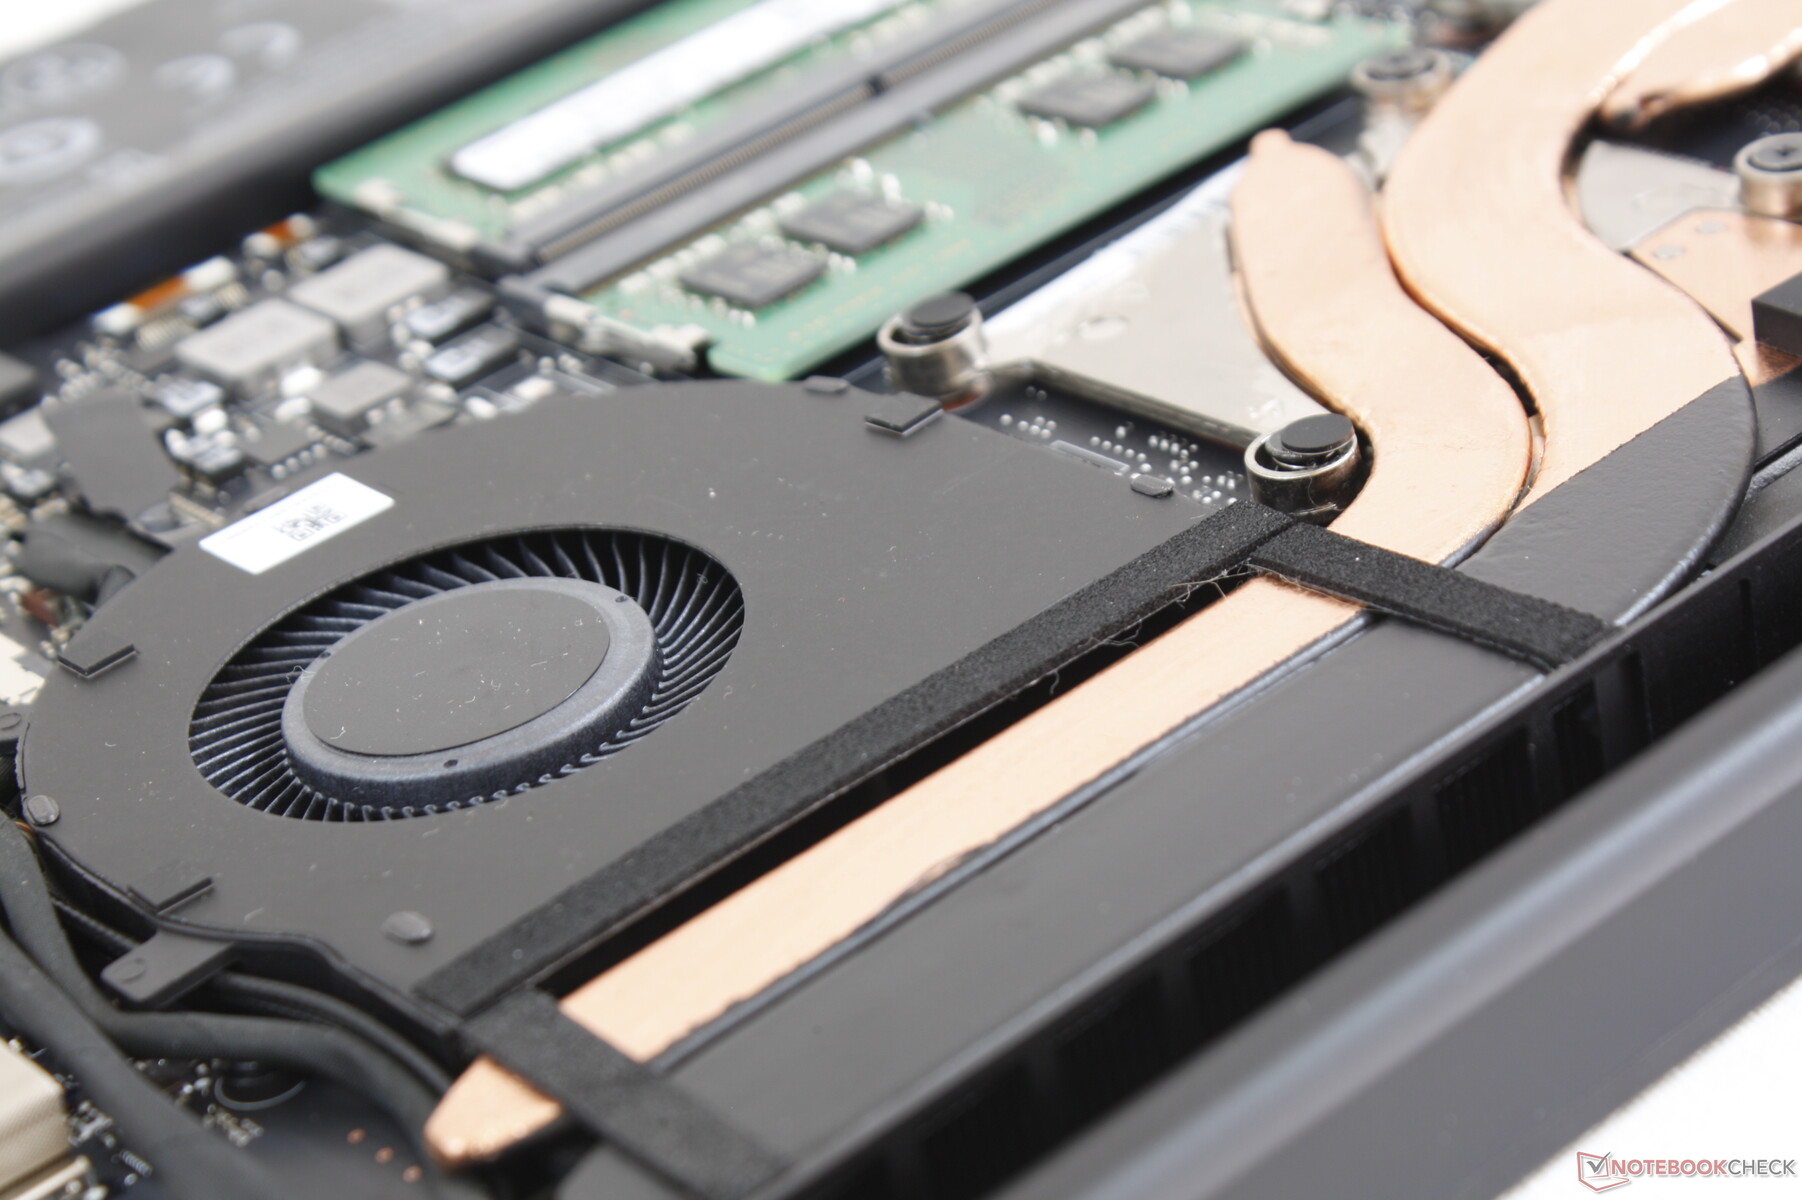
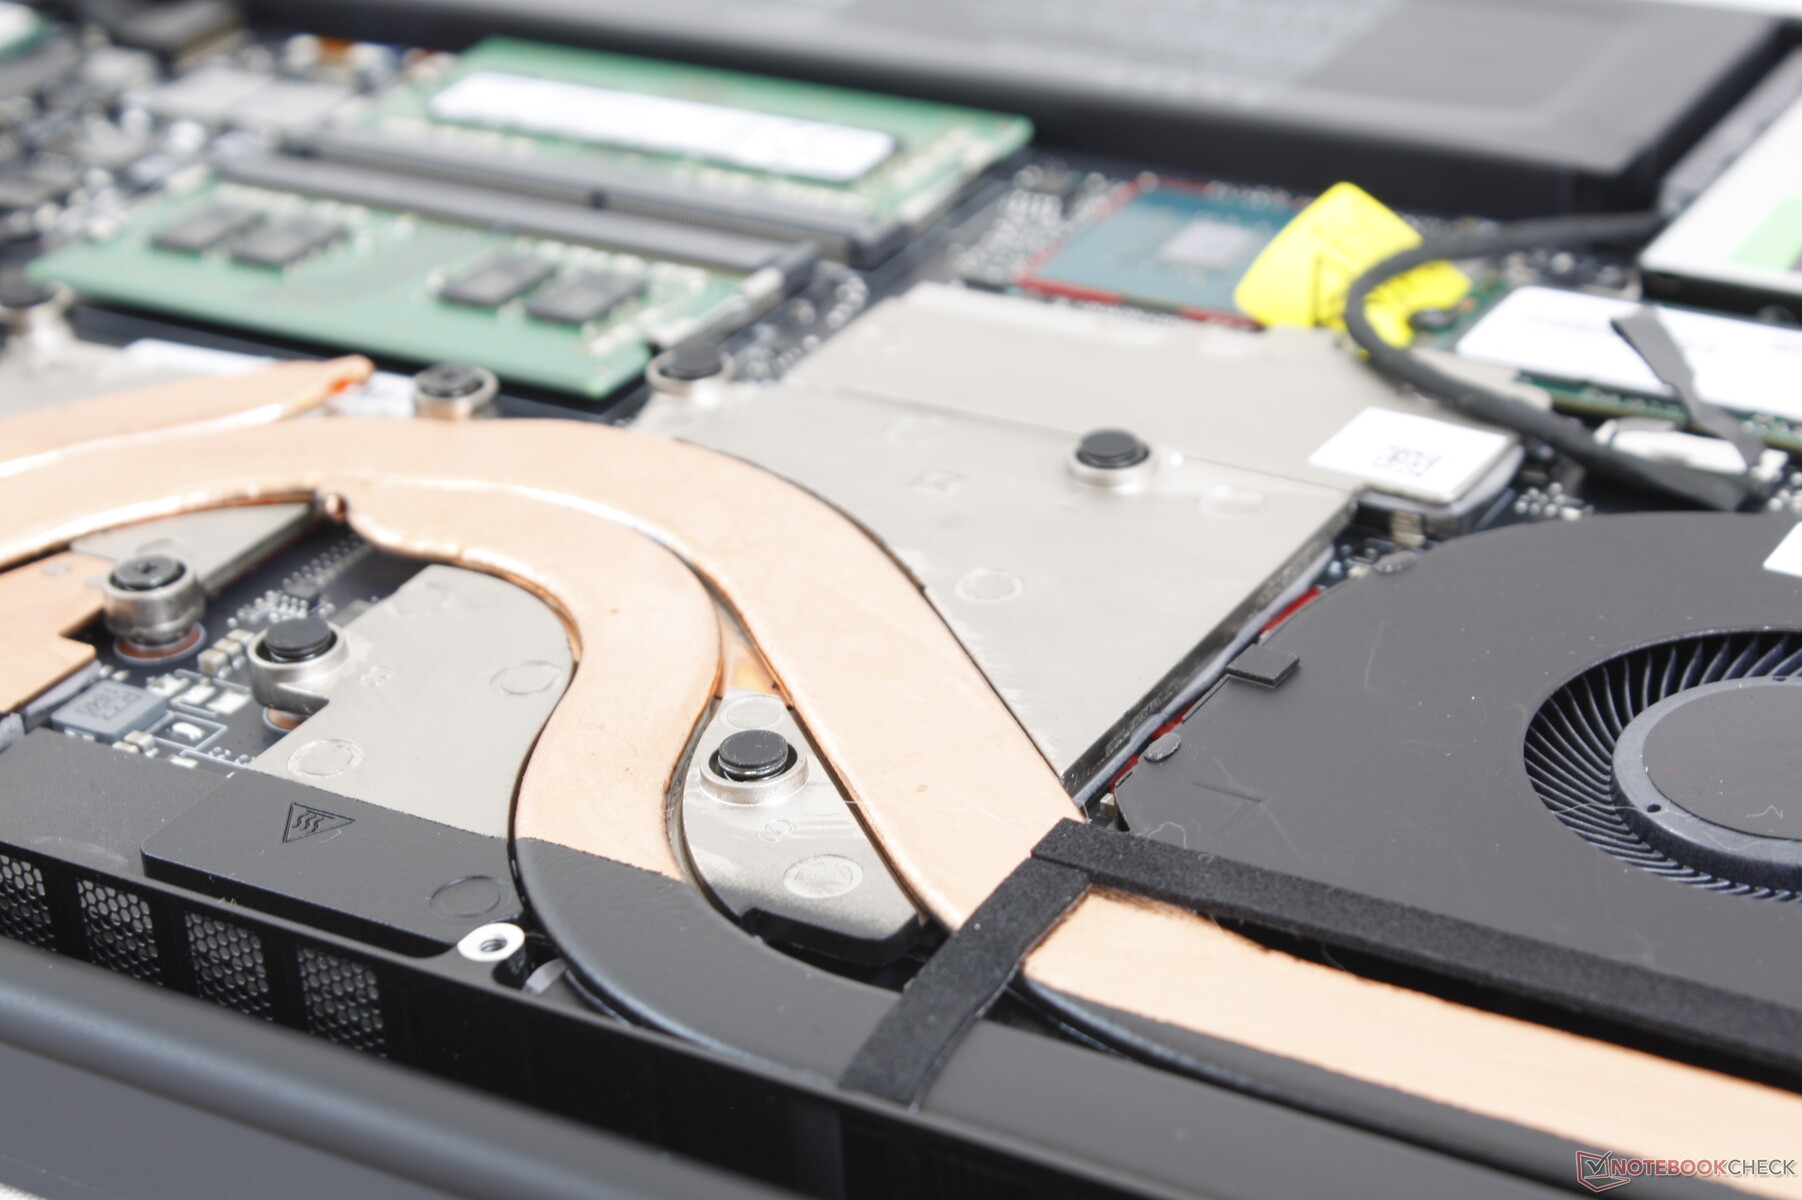
The cooling solution consists of twin 40 to 45 mm fans and three large copper heat pipes. Fan noise is generally louder than on the RTX 2070 Max-Q or 2080 Max-Q SKUs due in part to the spinning HDD adding another layer of noise on top of the fans. When gaming on Creator mode, expect fan noise to settle in the 48 to 51 dB(A) range compared to "only" 45 dB(A) on the Blade 15 RTX 2080 Max-Q.
Fan noise when gaming changes depending on the performance setting. When in Balanced mode, for example, fan noise will settle at 44 dB(A) for longer.
| Razer Blade 15 GTX 1660 Ti GeForce GTX 1660 Ti Mobile, i7-9750H, Samsung SSD PM981 MZVLB256HAHQ | Razer Blade 15 RTX 2080 Max-Q GeForce RTX 2080 Max-Q, i7-9750H, Samsung SSD PM981 MZVLB512HAJQ | Alienware m15 R2 P87F GeForce RTX 2080 Max-Q, i7-9750H, 2x Toshiba XG6 KXG60ZNV512G (RAID 0) | Dell XPS 15 7590 9980HK GTX 1650 GeForce GTX 1650 Mobile, i9-9980HK, Toshiba XG6 KXG60ZNV1T02 | Gigabyte Aero 15 Classic-XA GeForce RTX 2070 Max-Q, i7-9750H, Intel SSD 760p SSDPEKKW512G8 | MSI GS65 Stealth Thin 8RE-051US GeForce GTX 1060 Mobile, i7-8750H, Samsung SSD PM981 MZVLB256HAHQ | |
|---|---|---|---|---|---|---|
| Noise | 8% | -11% | 3% | -11% | 4% | |
| off / environment * (dB) | 28.5 | 28.3 1% | 28.3 1% | 28.2 1% | 30 -5% | 28.4 -0% |
| Idle Minimum * (dB) | 30.3 | 28.8 5% | 28.5 6% | 28.2 7% | 31 -2% | 28.4 6% |
| Idle Average * (dB) | 30.5 | 28.8 6% | 28.5 7% | 28.2 8% | 34 -11% | 28.4 7% |
| Idle Maximum * (dB) | 30.5 | 29 5% | 49 -61% | 30.4 -0% | 39 -28% | 29.6 3% |
| Load Average * (dB) | 41 | 33.5 18% | 49 -20% | 43.8 -7% | 46 -12% | 43.5 -6% |
| Witcher 3 ultra * (dB) | 48 | 45 6% | 49 -2% | 47.2 2% | 53 -10% | 45.7 5% |
| Load Maximum * (dB) | 51.9 | 45.2 13% | 55 -6% | 47.2 9% | 55 -6% | 45.7 12% |
* ... smaller is better
Noise level
| Idle |
| 30.3 / 30.5 / 30.5 dB(A) |
| Load |
| 41 / 51.9 dB(A) |
 | ||
30 dB silent 40 dB(A) audible 50 dB(A) loud |
||
min: | ||
Temperature
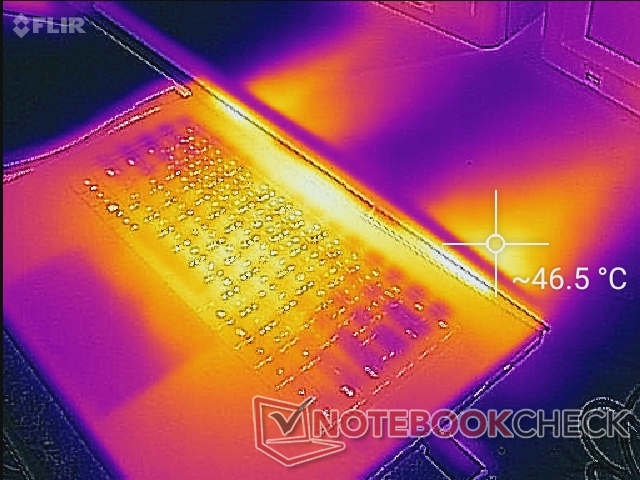
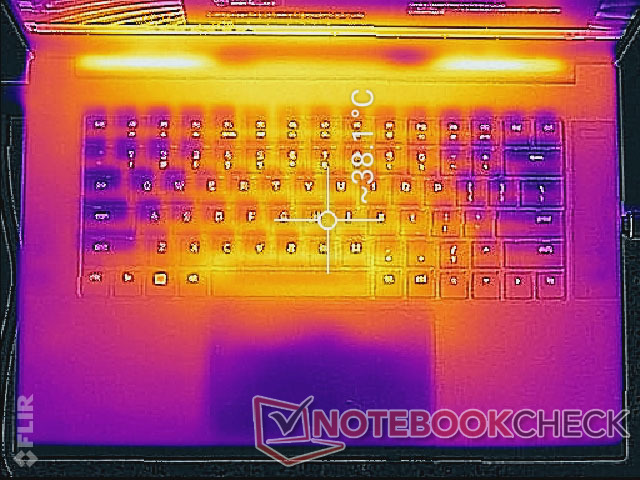
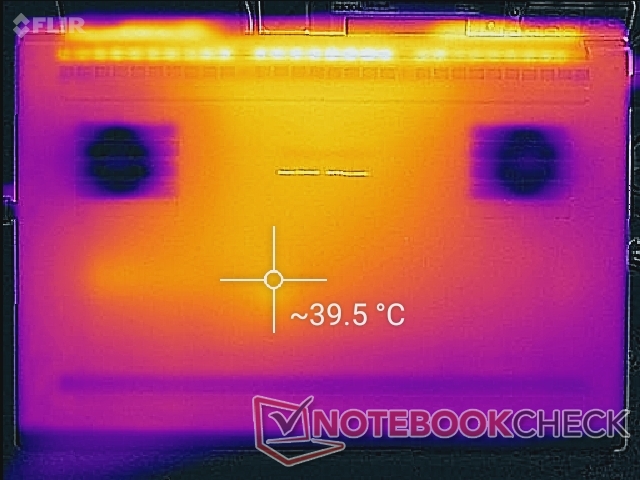
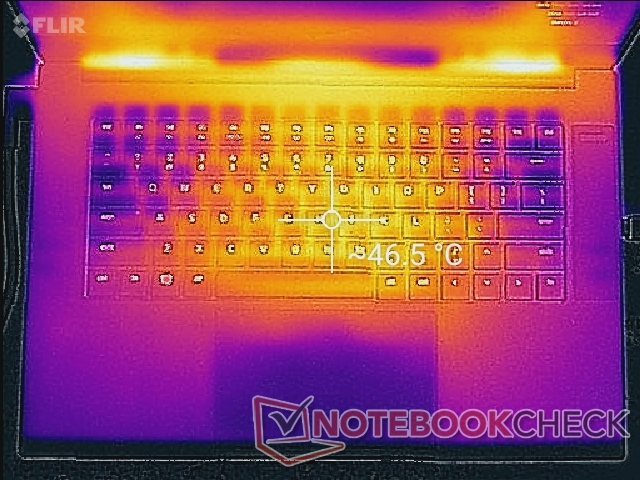
Put powerful components inside a thin metal chassis and high surface temperatures become inevitable. The palm rests and keyboard center could have been cooler as they can reach almost 40 C even without much onscreen activity.
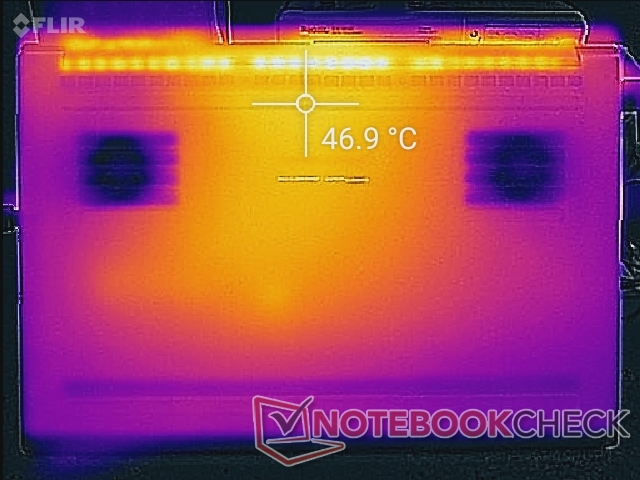
When gaming, surface temperatures will be just as warm as on the pricier Blade 15 RTX laptops even though performance is slower. We're able to measure hot spots of 51 C to 53 C on the top and bottom sides of the laptop compared to 49 C on the Blade 15 RTX 2070 Max-Q. The competing MSI GS65 9SG runs a bit cooler on average towards the center of the keyboard.
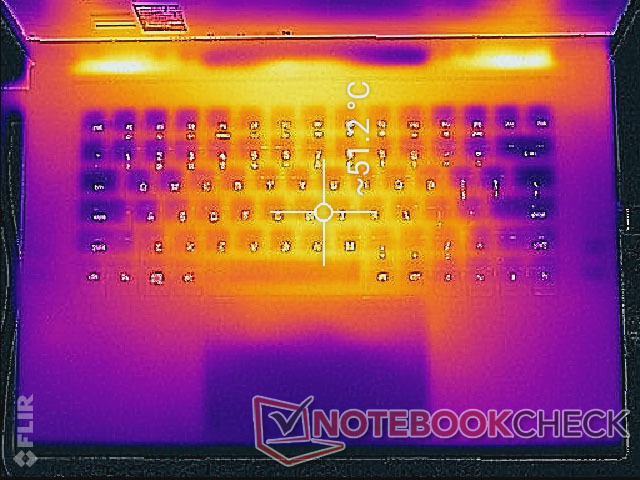
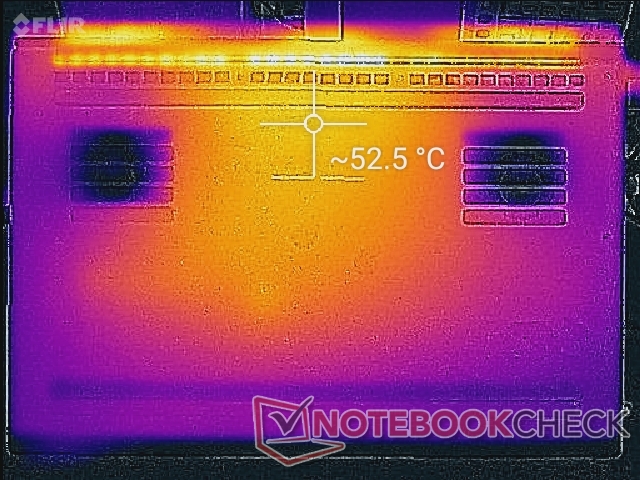
(-) The maximum temperature on the upper side is 52 °C / 126 F, compared to the average of 40.4 °C / 105 F, ranging from 21.2 to 68.8 °C for the class Gaming.
(-) The bottom heats up to a maximum of 52.2 °C / 126 F, compared to the average of 43.2 °C / 110 F
(±) In idle usage, the average temperature for the upper side is 34.3 °C / 94 F, compared to the device average of 33.9 °C / 93 F.
(-) Playing The Witcher 3, the average temperature for the upper side is 39.2 °C / 103 F, compared to the device average of 33.9 °C / 93 F.
(±) The palmrests and touchpad can get very hot to the touch with a maximum of 39.6 °C / 103.3 F.
(-) The average temperature of the palmrest area of similar devices was 28.8 °C / 83.8 F (-10.8 °C / -19.5 F).
Stress Test
Core temperatures are generally warmer than on the Blae 15 RTX 2080 Max-Q as shown by our screenshots and table below. Interestingly, overall performance and clock rates for both the CPU and GPU are faster when on Creator mode than Gaming mode.
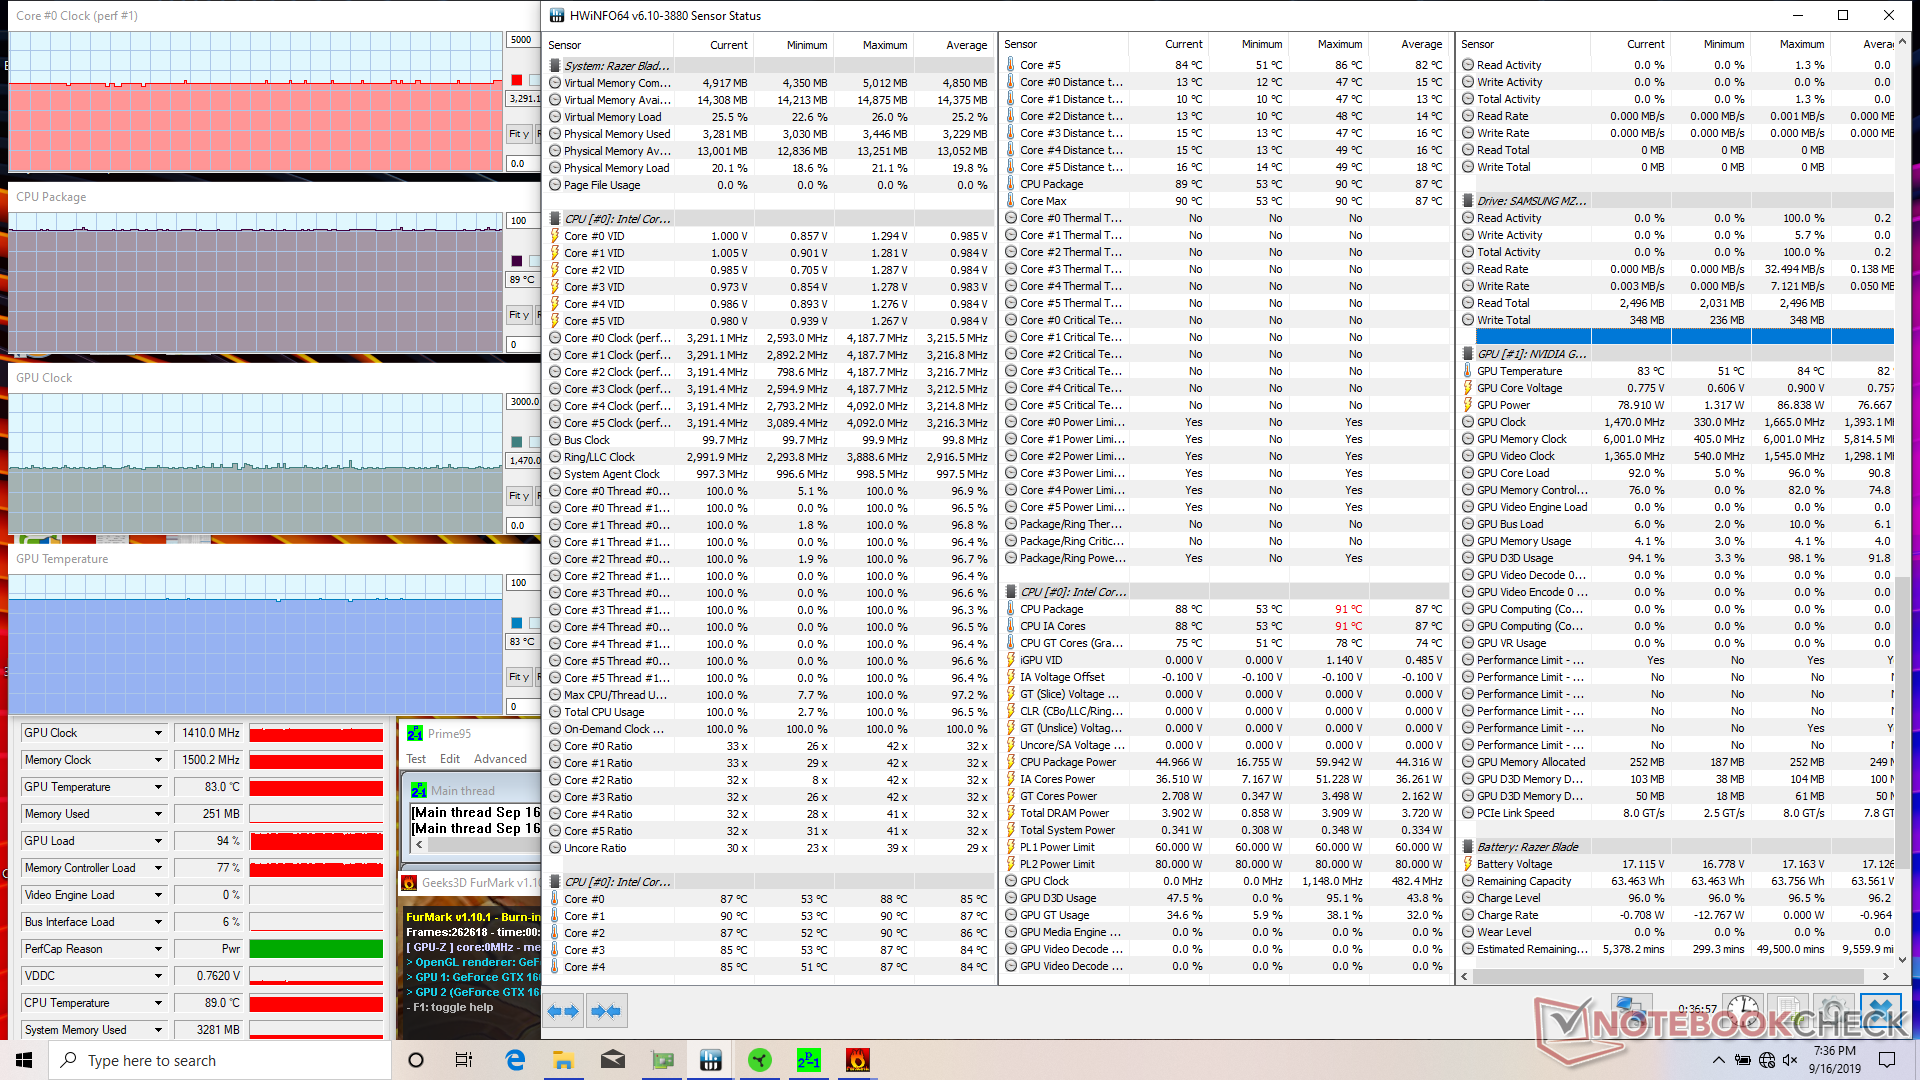
CPU clock rate stabilizes at just 2.8 GHz when running Prime95 compared to 3.1 GHz on the Blade 15 RTX 2080 Max-Q. These results line up with our CineBench loop test observations above where the Blade 15 GTX 1660 Ti performs slower despite having the same Core i7 processor.
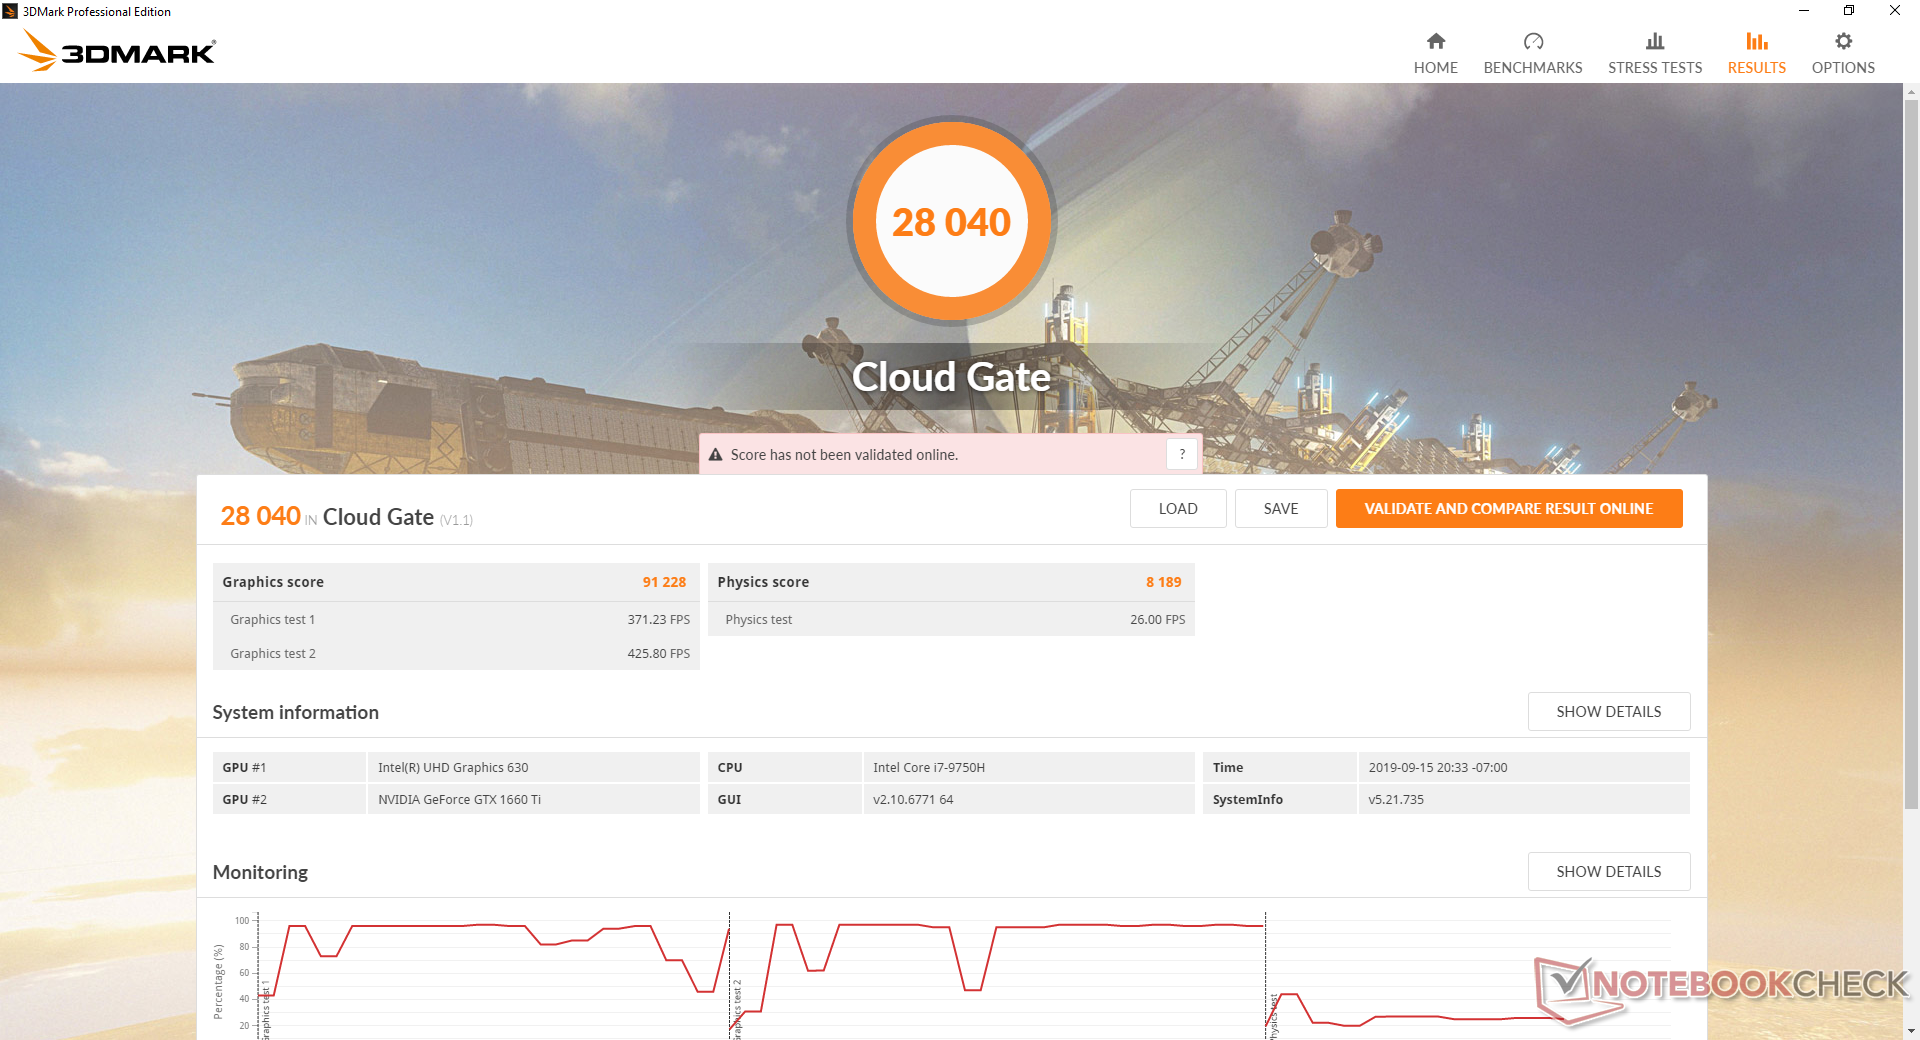
Running on batteries will impact performance. A Fire Strike run on batteries returns Physics and Graphics scores of 10394 and 3561 points, respectively, compared to 14800 and 14753 points when on mains.
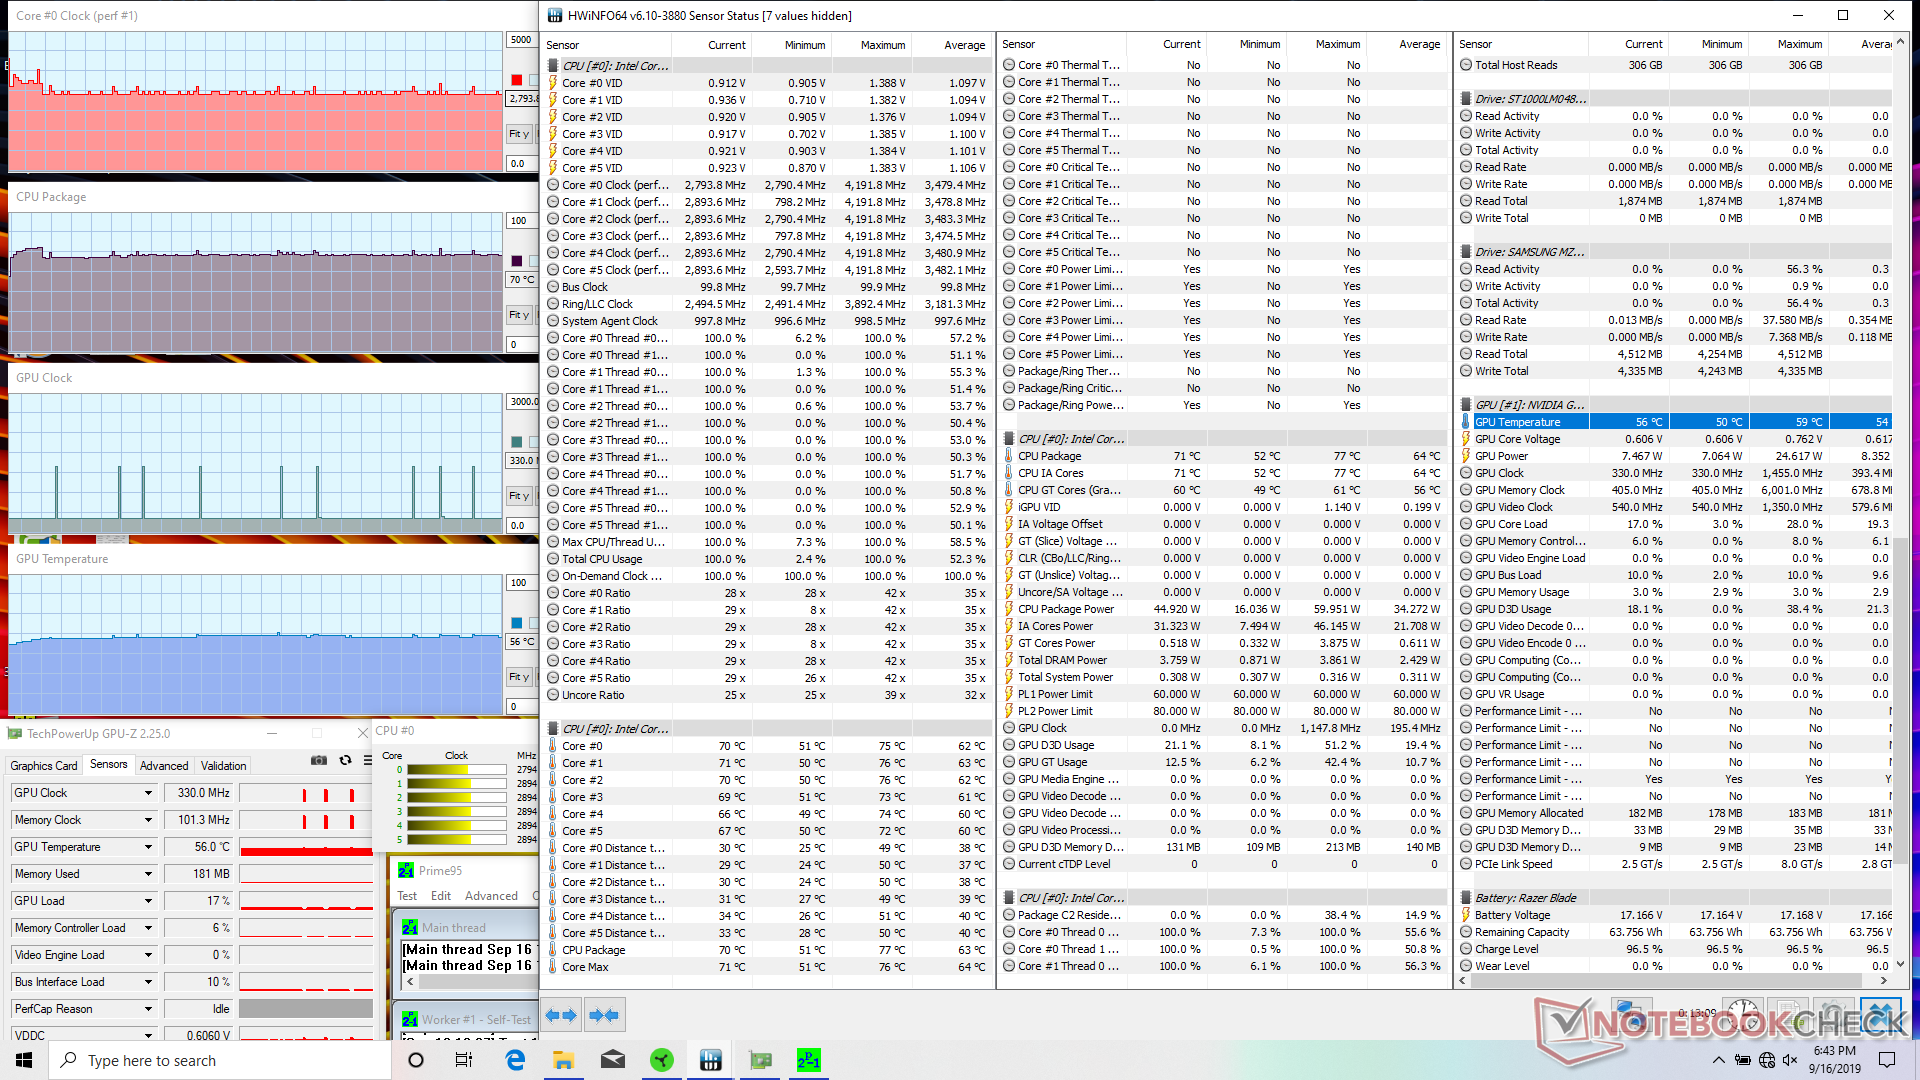
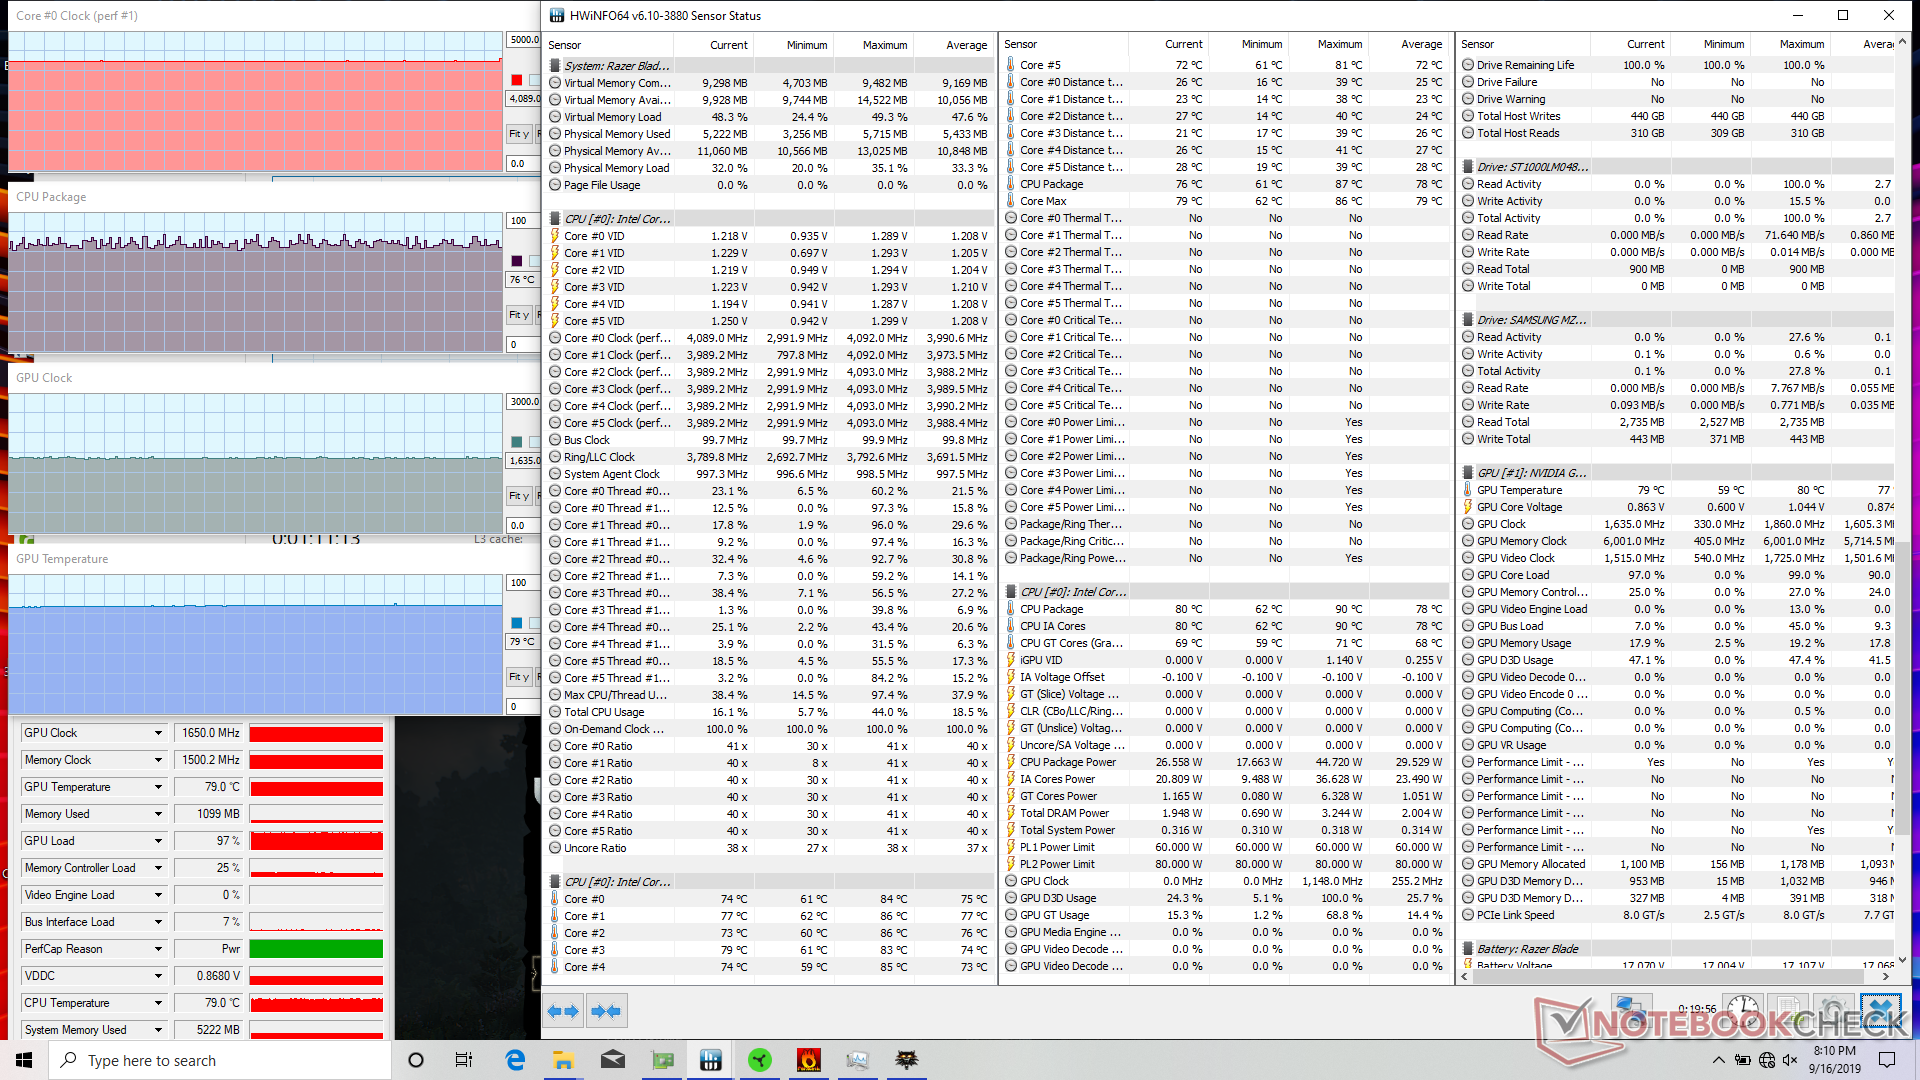
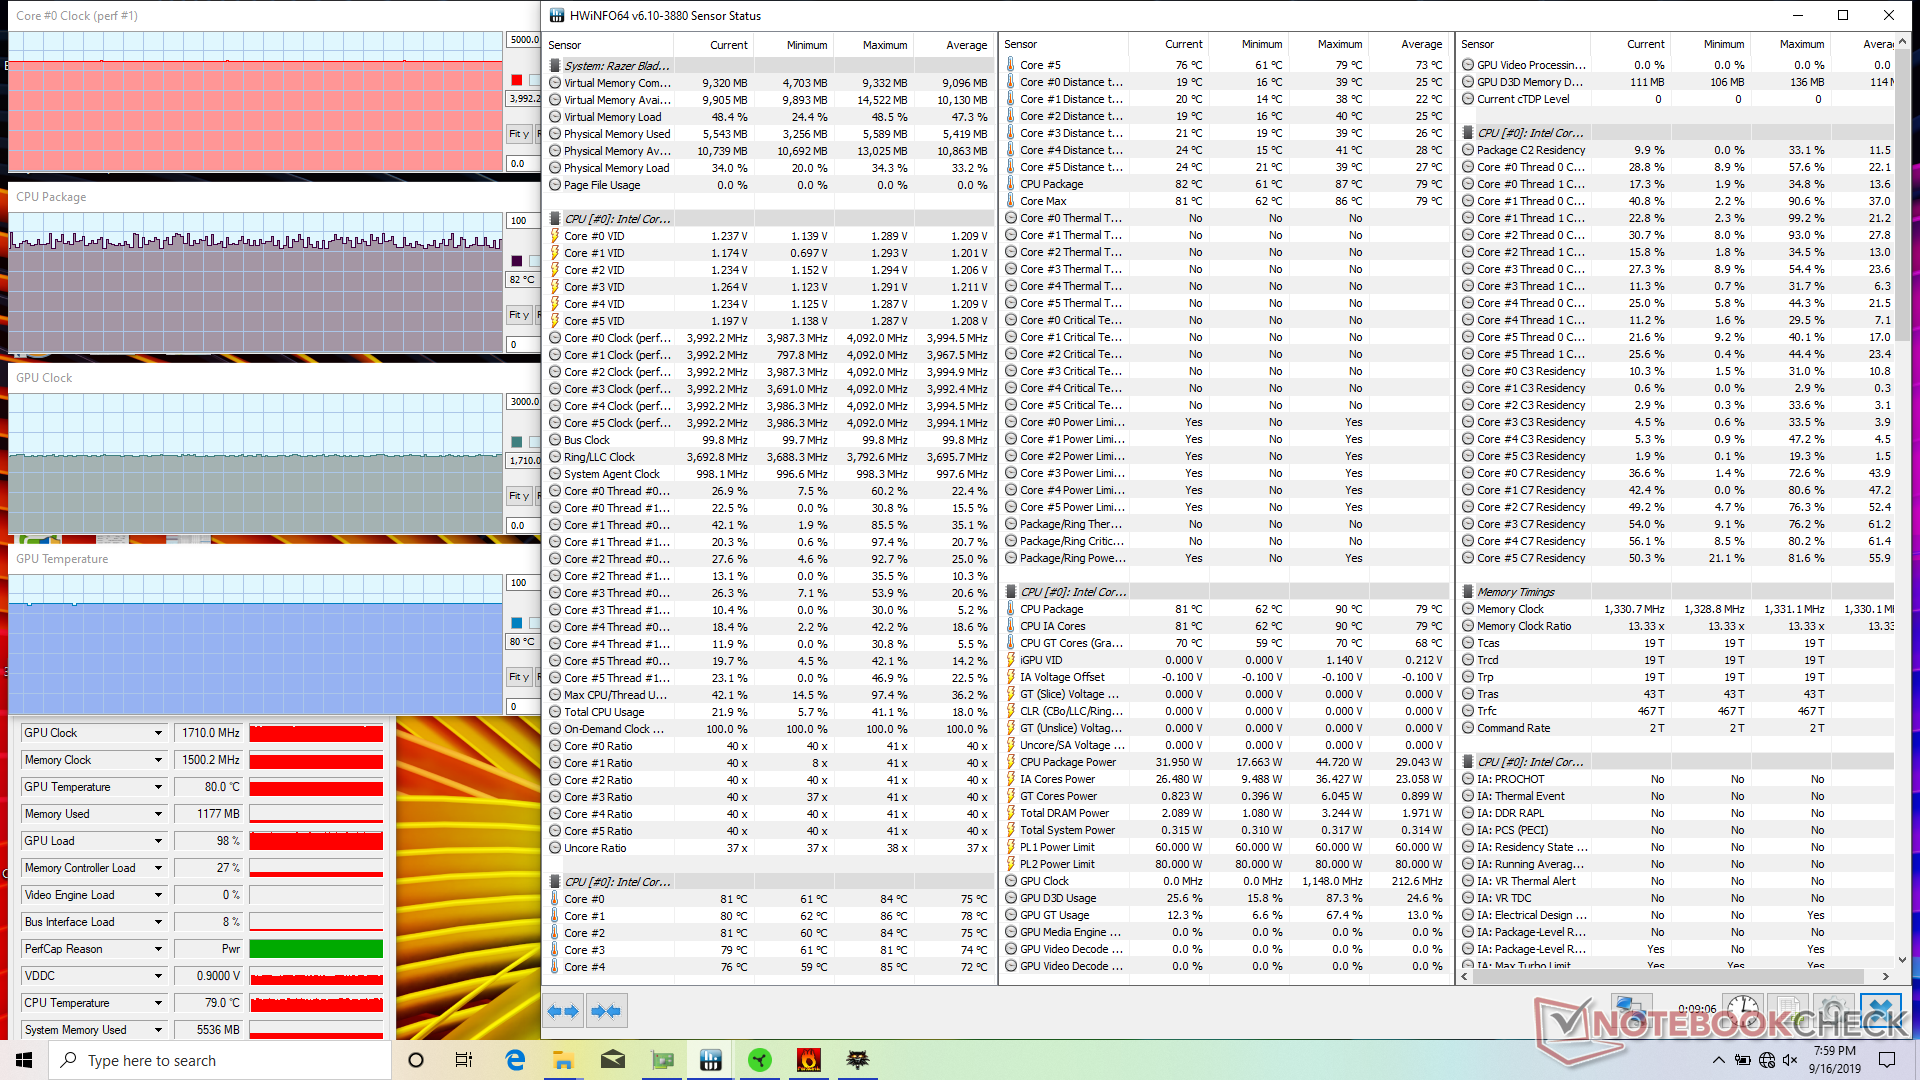
| CPU Clock (GHz) | GPU Clock (MHz) | Average CPU Temperature (°C) | Average GPU Temperature (°C) | |
| System Idle | -- | -- | 52 | 50 |
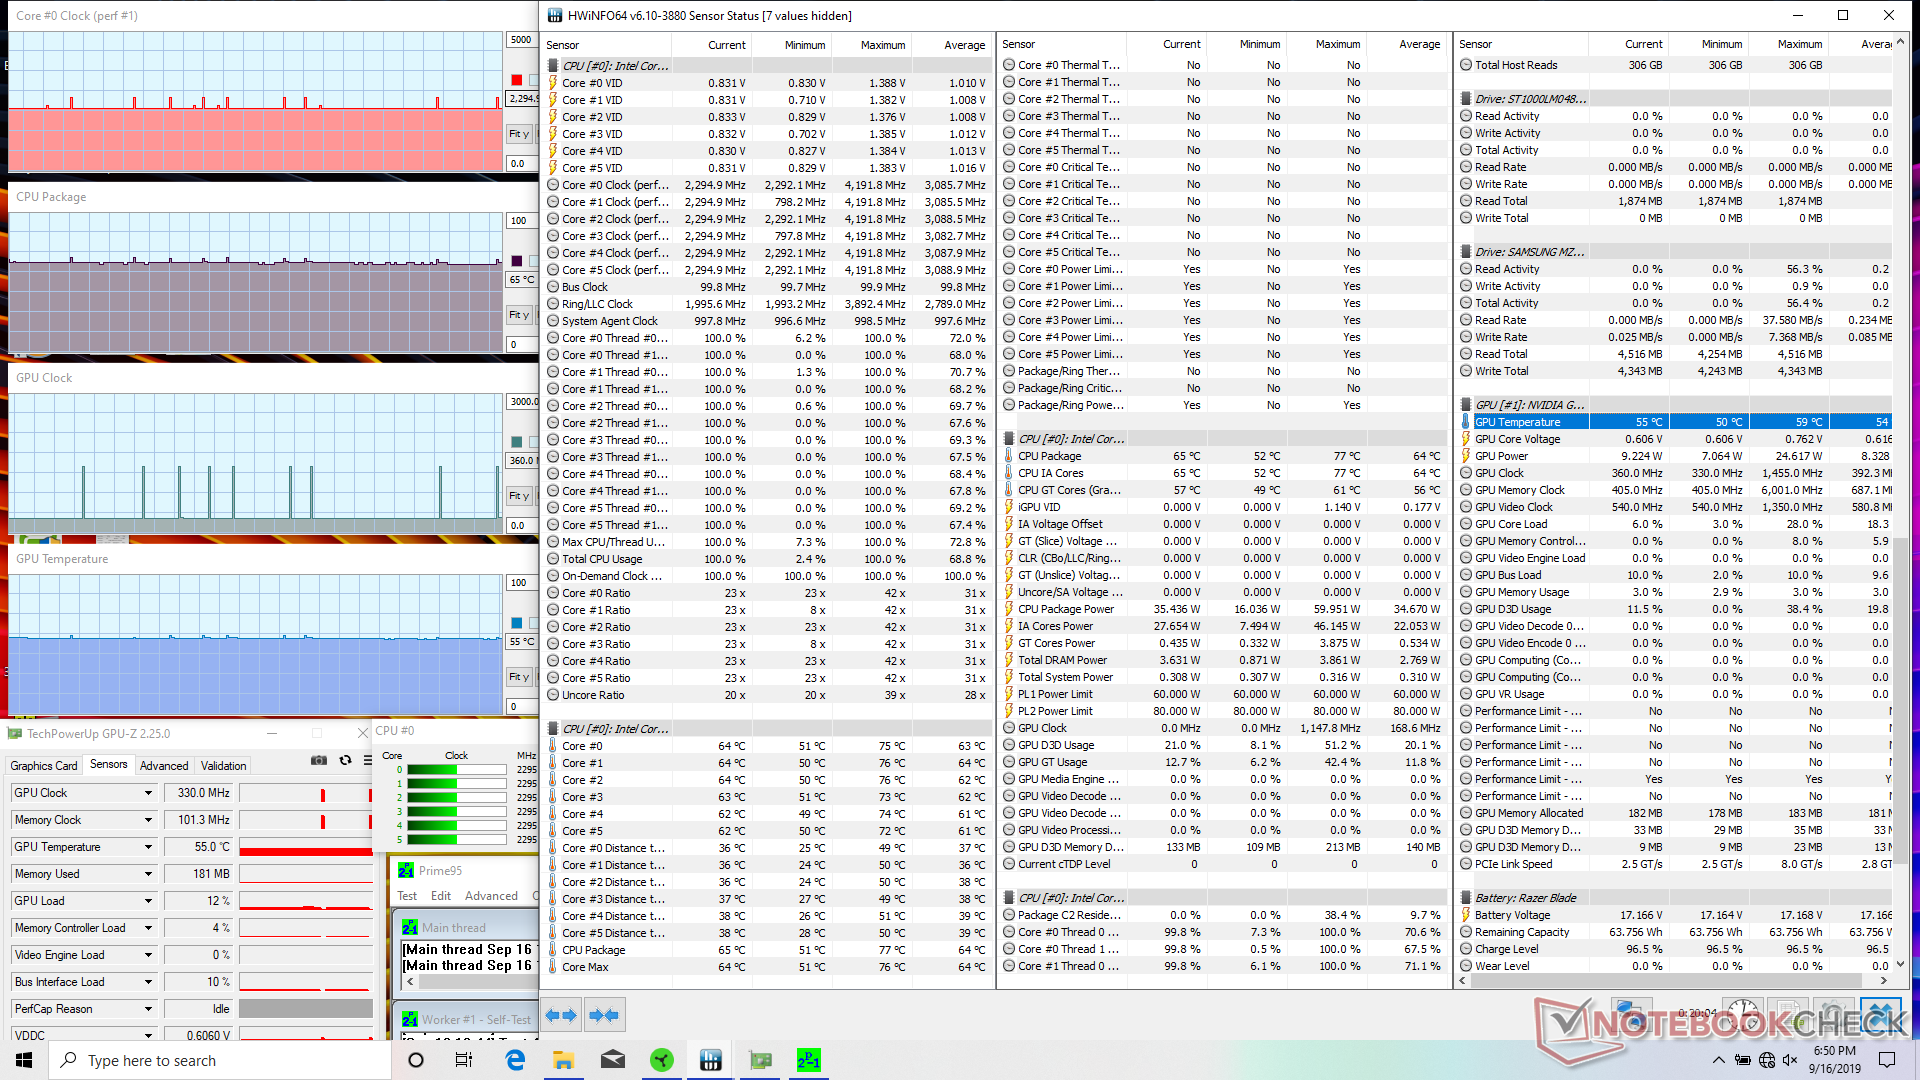
| Prime95 Stress (Gaming mode) | 2.3 | -- | 65 | -- |
| Prime95 Stress (Creator mode) | 2.8 | -- | 70 | -- |
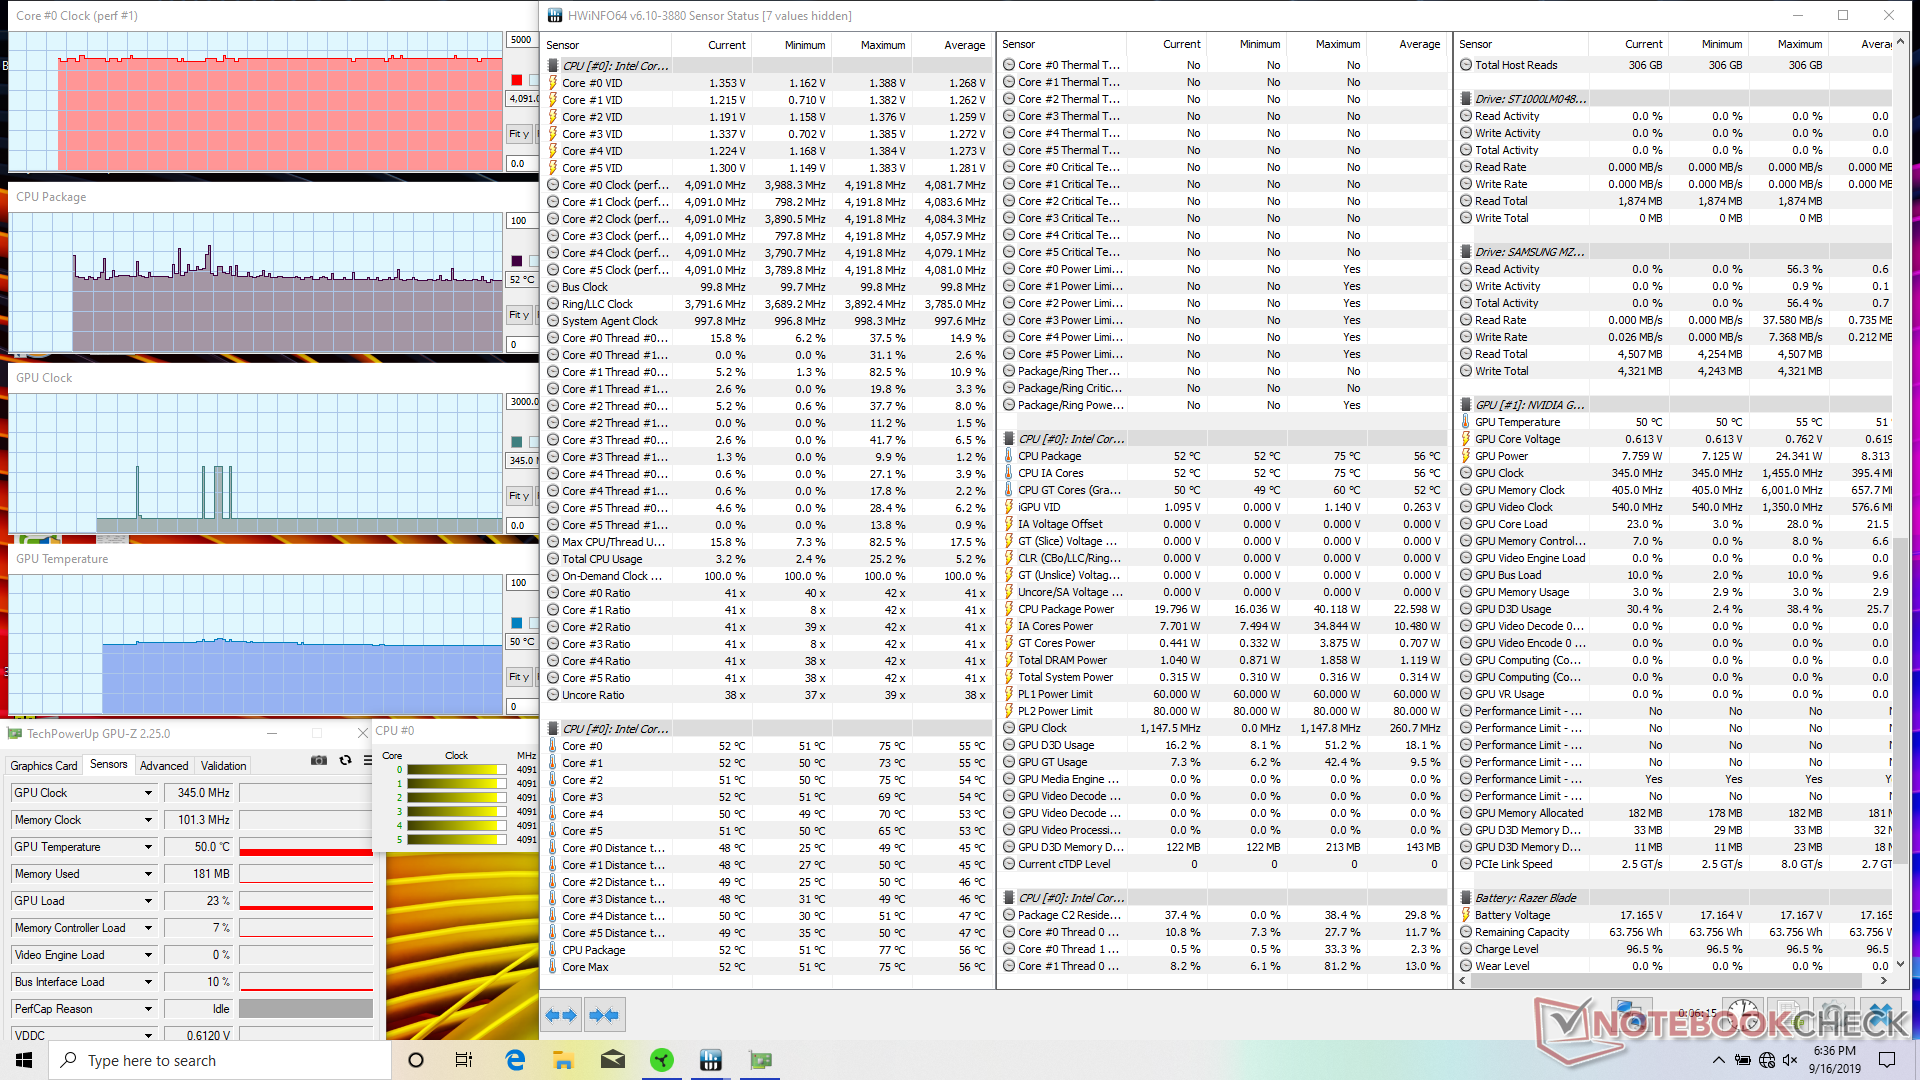
| Prime95 + FurMark Stress (Creator mode) | 3.2 - 3.3 | 1410 | 89 | 83 |
| Witcher 3 Stress (Gaming mode) | 4.0 | 1650 | 76 | 79 |
| Witcher 3 Stress (Creator mode) | 4.0 | 1710 | 82 | 80 |
Speakers

Razer Blade 15 GTX 1660 Ti audio analysis
(±) | speaker loudness is average but good (80.1 dB)
Bass 100 - 315 Hz
(±) | reduced bass - on average 13.5% lower than median
(±) | linearity of bass is average (13.2% delta to prev. frequency)
Mids 400 - 2000 Hz
(±) | higher mids - on average 5.3% higher than median
(+) | mids are linear (4.7% delta to prev. frequency)
Highs 2 - 16 kHz
(±) | reduced highs - on average 5.1% lower than median
(±) | linearity of highs is average (7.2% delta to prev. frequency)
Overall 100 - 16.000 Hz
(±) | linearity of overall sound is average (25.2% difference to median)
Compared to same class
» 90% of all tested devices in this class were better, 3% similar, 7% worse
» The best had a delta of 6%, average was 18%, worst was 132%
Compared to all devices tested
» 77% of all tested devices were better, 5% similar, 18% worse
» The best had a delta of 4%, average was 23%, worst was 134%
Apple MacBook 12 (Early 2016) 1.1 GHz audio analysis
(+) | speakers can play relatively loud (83.6 dB)
Bass 100 - 315 Hz
(±) | reduced bass - on average 11.3% lower than median
(±) | linearity of bass is average (14.2% delta to prev. frequency)
Mids 400 - 2000 Hz
(+) | balanced mids - only 2.4% away from median
(+) | mids are linear (5.5% delta to prev. frequency)
Highs 2 - 16 kHz
(+) | balanced highs - only 2% away from median
(+) | highs are linear (4.5% delta to prev. frequency)
Overall 100 - 16.000 Hz
(+) | overall sound is linear (10.2% difference to median)
Compared to same class
» 7% of all tested devices in this class were better, 2% similar, 90% worse
» The best had a delta of 5%, average was 18%, worst was 53%
Compared to all devices tested
» 5% of all tested devices were better, 1% similar, 94% worse
» The best had a delta of 4%, average was 23%, worst was 134%
Energy Management
Power Consumption
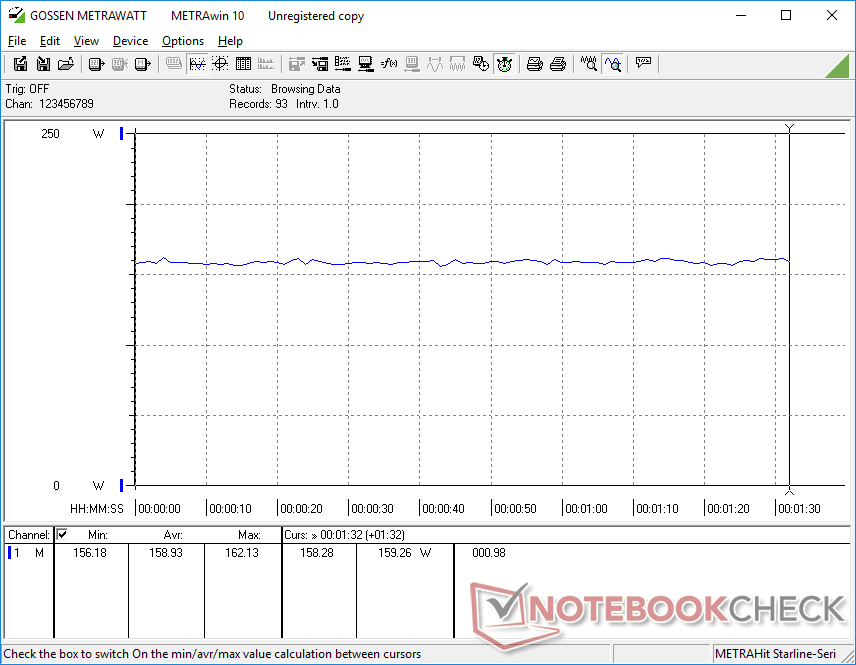
Perhaps counterintuitively, the Blade 15 GTX 1660 Ti consumes about the same amount of power as the Blade 15 RTX 2070 Max-Q and RTX 2080 Max-Q SKUs when gaming even though the latter systems offer 25 percent and 45 percent faster performance, respectively. This is because Nvidia specifies very similar GSP (Graphics Subsystem Power) ranges from its mobile GTX 1660 Ti up to the RTX 2080 Max-Q. The 160 W to 180 W range appears to be the most common amongst Max-Q laptops when gaming and the Blade 15 GTX 1660 Ti is no different.
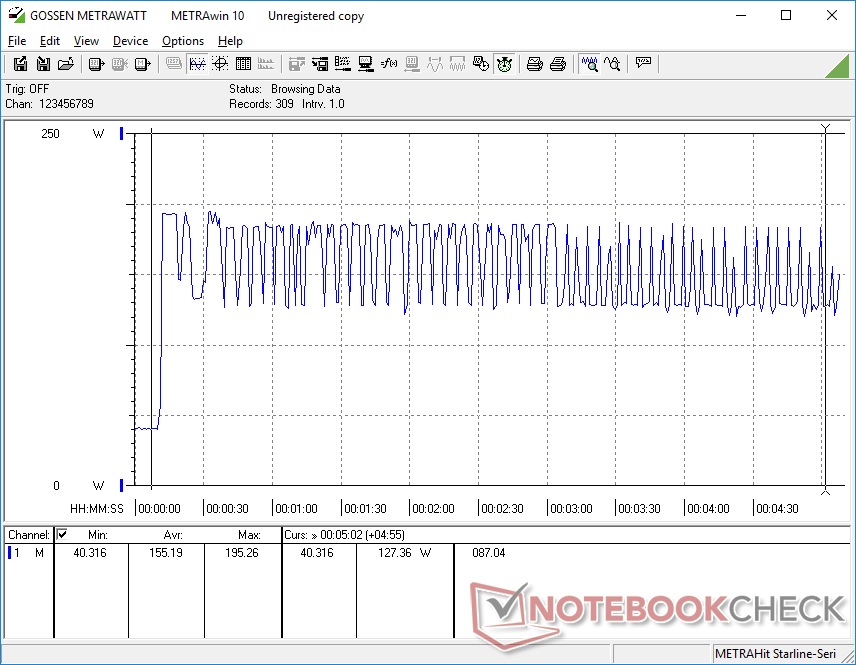
We're able to measure a maximum consumption of 195 W from the small-medium (~15.8 x 6.5 x 2.5 cm) 200 W AC adapter when running both Prime95 and FurMark simultaneously. Unlike what we observed on the Blade 15 RTX SKUs, however, consumption would fluctuate between 127 W and 190 W instead of remaining steady as shown below. Recharge rate will slow to a crawl when under such extreme processing conditions.
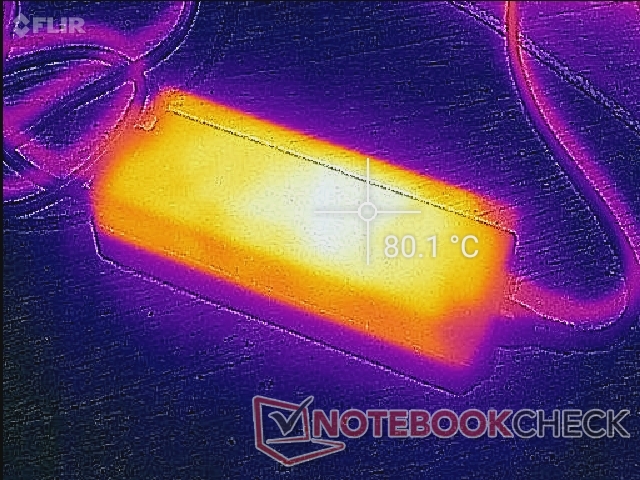
As reported earlier in the year, the AC adapters of Blade laptops can become much warmer than most other AC adapters at 60 C or higher when gaming. Avoid placing any sensitive items, surfaces, or cables in direct contact with AC adapters in general.
| Off / Standby | |
| Idle | |
| Load |
|
Key:
min: | |
| Razer Blade 15 GTX 1660 Ti i7-9750H, GeForce GTX 1660 Ti Mobile, Samsung SSD PM981 MZVLB256HAHQ, IPS, 1920x1080, 15.6" | Razer Blade 15 RTX 2080 Max-Q i7-9750H, GeForce RTX 2080 Max-Q, Samsung SSD PM981 MZVLB512HAJQ, IPS, 1920x1080, 15.6" | Dell XPS 15 7590 9980HK GTX 1650 i9-9980HK, GeForce GTX 1650 Mobile, Toshiba XG6 KXG60ZNV1T02, OLED, 3840x2160, 15.6" | Gigabyte Aero 15 Classic-XA i7-9750H, GeForce RTX 2070 Max-Q, Intel SSD 760p SSDPEKKW512G8, IGZO, 1920x1080, 15.6" | MSI GS65 Stealth Thin 8RE-051US i7-8750H, GeForce GTX 1060 Mobile, Samsung SSD PM981 MZVLB256HAHQ, IPS, 1920x1080, 15.6" | MSI GP65 Leopard 9SE-225US i7-9750H, GeForce RTX 2060 Mobile, Toshiba KBG30ZMT512G, IPS, 1920x1080, 15.6" | |
|---|---|---|---|---|---|---|
| Power Consumption | 19% | 39% | 2% | 33% | 16% | |
| Idle Minimum * (Watt) | 18.7 | 12.5 33% | 6.2 67% | 21 -12% | 8.7 53% | 13.6 27% |
| Idle Average * (Watt) | 30.7 | 15.3 50% | 9.6 69% | 23 25% | 13 58% | 17.9 42% |
| Idle Maximum * (Watt) | 33.9 | 20.7 39% | 21.2 37% | 32 6% | 14.3 58% | 20.6 39% |
| Load Average * (Watt) | 93.4 | 90.2 3% | 104.3 -12% | 97 -4% | 107.4 -15% | 96 -3% |
| Witcher 3 ultra * (Watt) | 158.9 | 162 -2% | 91.7 42% | 148 7% | 129 19% | 154.6 3% |
| Load Maximum * (Watt) | 195.3 | 209.3 -7% | 135.3 31% | 213 -9% | 151.5 22% | 218.6 -12% |
* ... smaller is better
Battery Life
Battery capacity is 19 percent smaller than on the Blade 15 RTX 2070 Max-Q or RTX 2080 Max-Q SKUs since the secondary SATA III bay prohibits a larger battery. Consequently, runtimes are shorter on the Blade 15 GTX 1660 Ti by about 16 percent according to our WLAN loop test designed to reproduce web browsing loads. Our final tally of 5.5 hours is great for a gaming laptop even though its a couple of hours shorter than most Ultrabooks with Core U CPUs.
Charging from empty to full capacity takes about 1.5 hours. The system cannot be recharged via USB Type-C.
| Razer Blade 15 GTX 1660 Ti i7-9750H, GeForce GTX 1660 Ti Mobile, 65 Wh | Razer Blade 15 RTX 2080 Max-Q i7-9750H, GeForce RTX 2080 Max-Q, 80 Wh | MSI GP65 Leopard 9SE-225US i7-9750H, GeForce RTX 2060 Mobile, 51 Wh | Alienware m15 R2 P87F i7-9750H, GeForce RTX 2080 Max-Q, 76 Wh | Dell XPS 15 7590 9980HK GTX 1650 i9-9980HK, GeForce GTX 1650 Mobile, 97 Wh | Gigabyte Aero 15 Classic-XA i7-9750H, GeForce RTX 2070 Max-Q, 94.24 Wh | |
|---|---|---|---|---|---|---|
| Battery runtime | 20% | -29% | 0% | 42% | 27% | |
| WiFi v1.3 (h) | 5.5 | 6.6 20% | 3.9 -29% | 5.5 0% | 7.8 42% | 7 27% |
| Reader / Idle (h) | 15.9 | 6 | 9.2 | 15.2 | 9.1 | |
| Load (h) | 1.7 | 1.1 | 0.7 | 3.3 | 3 |
Pros
Cons
Verdict
In the world of laptops, the GeForce RTX 2060 is only about 5 to 10 percent faster than the GTX 1660 Ti when RTX-specific features like RT or DLSS are disabled. If you have no interest in such options, then you can save yourself $400 without impacting your gaming experience all that much with the Blade 15 GTX 1660 Ti. This alone makes the new configuration more attractive for budget-conscious gamers.
Even though the Blade 15 GTX 1660 Ti is the least expensive Blade 15 Turing option, it is actually faster than the fastest last generation Blade 15 GTX 1070 Max-Q by about 10 to 15 percent when gaming. Users are still getting a superior gaming experience than what the best Blade 15 Pascal series had to offer in this regard.
There are a few hidden drawbacks to the Blade 15 GTX 1660 Ti aside from what we mentioned in the Case section above. Firstly, PWM is present on almost all brightness levels at a low enough frequency that it might affect some users sensitive to onscreen flickering. Secondly, the display is not calibrated as well as the displays of the Blade 15 RTX series. Color temperature, for example, is slightly cooler than it should be out of the box. Thirdly, fan noise and core temperature will be slightly louder and warmer, respectively, since the Blade 15 GTX 1660 Ti comes with no advanced vapor chamber cooling. Fourthly, games seem to run a little faster in Creator mode than Gaming mode since CPU performance is higher in Creator mode. You may as well skip Gaming mode entirely and just stick with Creator mode for maximum performance.
The most noteworthy drawback is CPU performance because it is slower than on the Blade 15 RTX 2070 Max-Q or 2080 Max-Q even though they all house the same Core i7-9750H processor. The ~15 percent deficit won't impact gaming performance all that much especially if your target is only 60 FPS, but it's unfortunate nonetheless for enthusiasts or content creators who want every ounce of juice possible from the Core i7-9750H.
Aside from the special notes above, most of our existing comments about the Blade 15 series apply here on the GTX 1660 Ti configuration. Surface temperatures, brightness, colors, and even power consumption are all very close between these Blade 15 Turing SKUs despite their differences in performance.
Razer Blade 15 GTX 1660 Ti
- 09/19/2019 v7 (old)
Allen Ngo
Price comparison
