Schenker XMG Ultra 15 (i7-9700K, RTX 2070) Clevo P751TM1-G Laptop Review

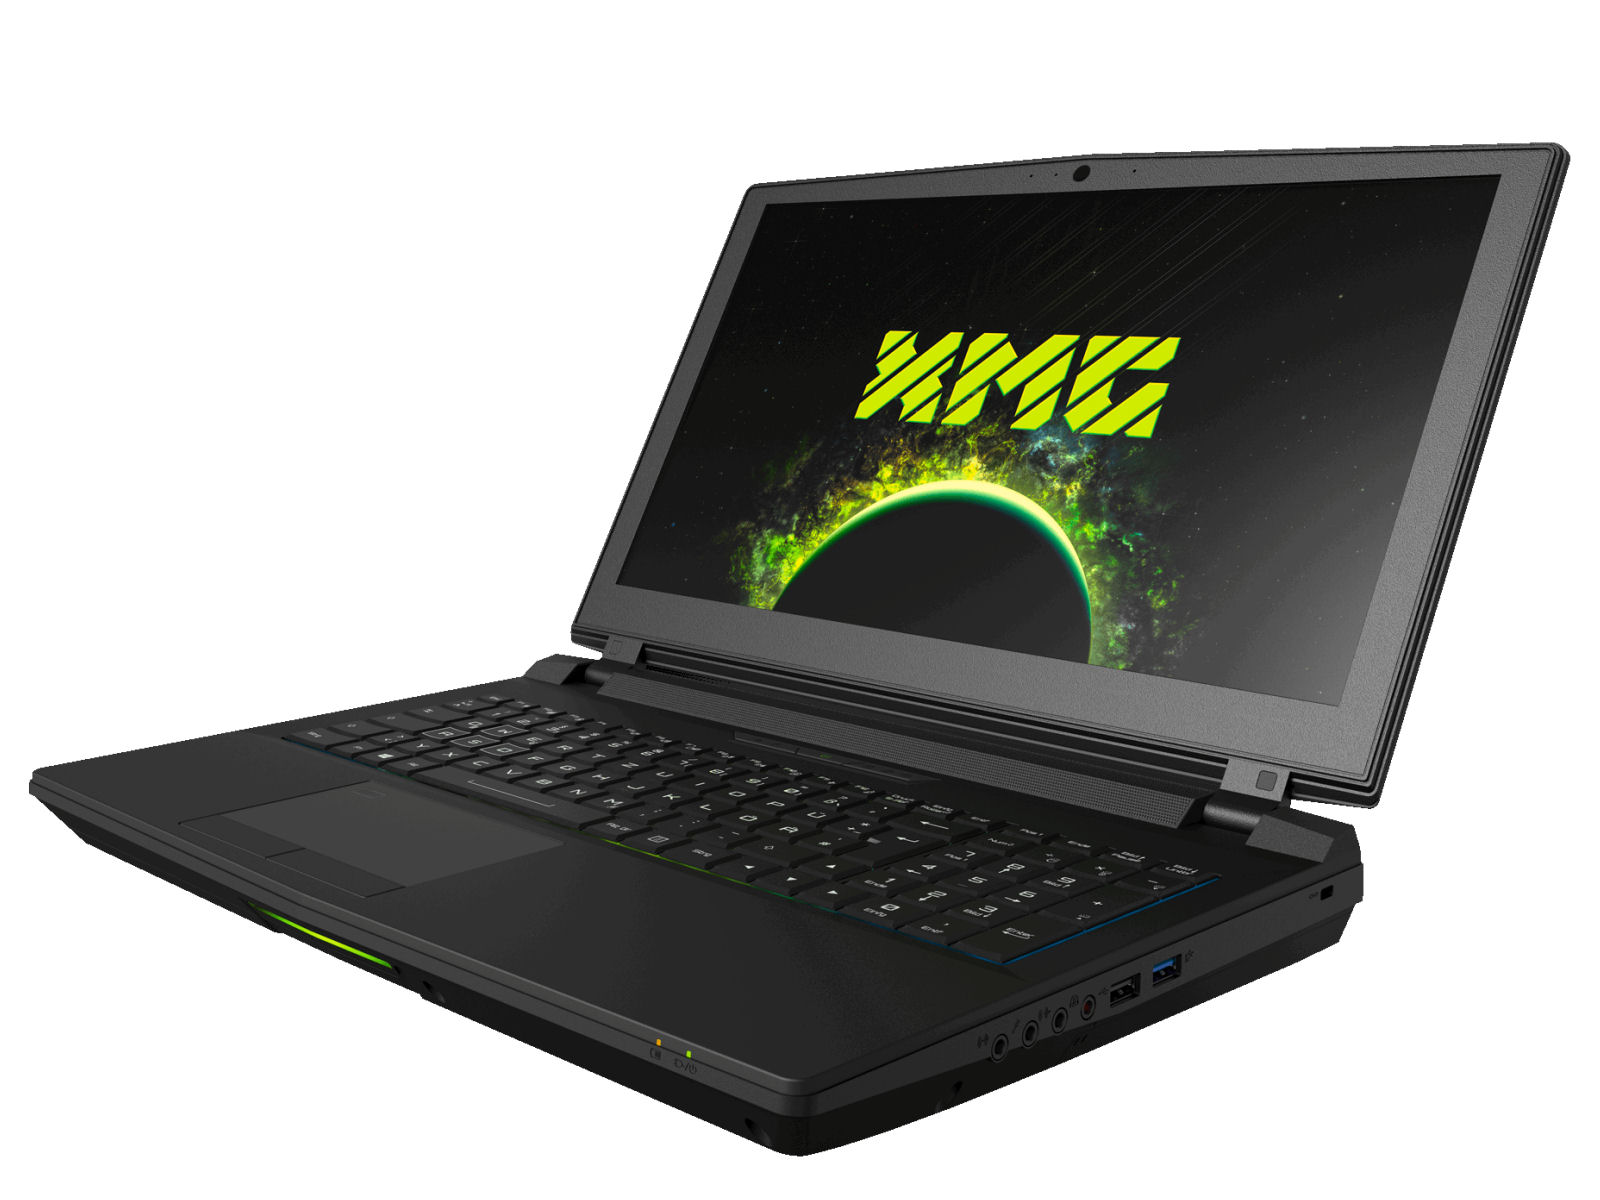
Schenker’s current XMG Ultra 15 looks just like its predecessor, which came as no surprise given that it is still based on the exact same Clevo PM751TM1 barebone as before. However, the internal hardware has undergone serious modernization efforts, and in addition to Nvidia’s latest Turing GPU we also find Intel’s Coffee Lake-S processors. It should be noted that the latter is a desktop-class CPU and not its mobile counterpart. As before, the CPU and GPU are swappable and can be upgraded retroactively. Our review unit was equipped with a Core i7-9700K and a GeForce RTX 2070.
The amount of directly comparable competitors with swappable CPU and GPU is pretty limited. The Eurocom Tornado F5 Killer Edition comes to mind. Other competitors with 15-inch displays include the Alienware 15 R4, the Gigabyte Aero 15-X9, the Acer Predator Triton 500, and the Razer Blade 15. The last three feature Turing GPUs as well.
Case
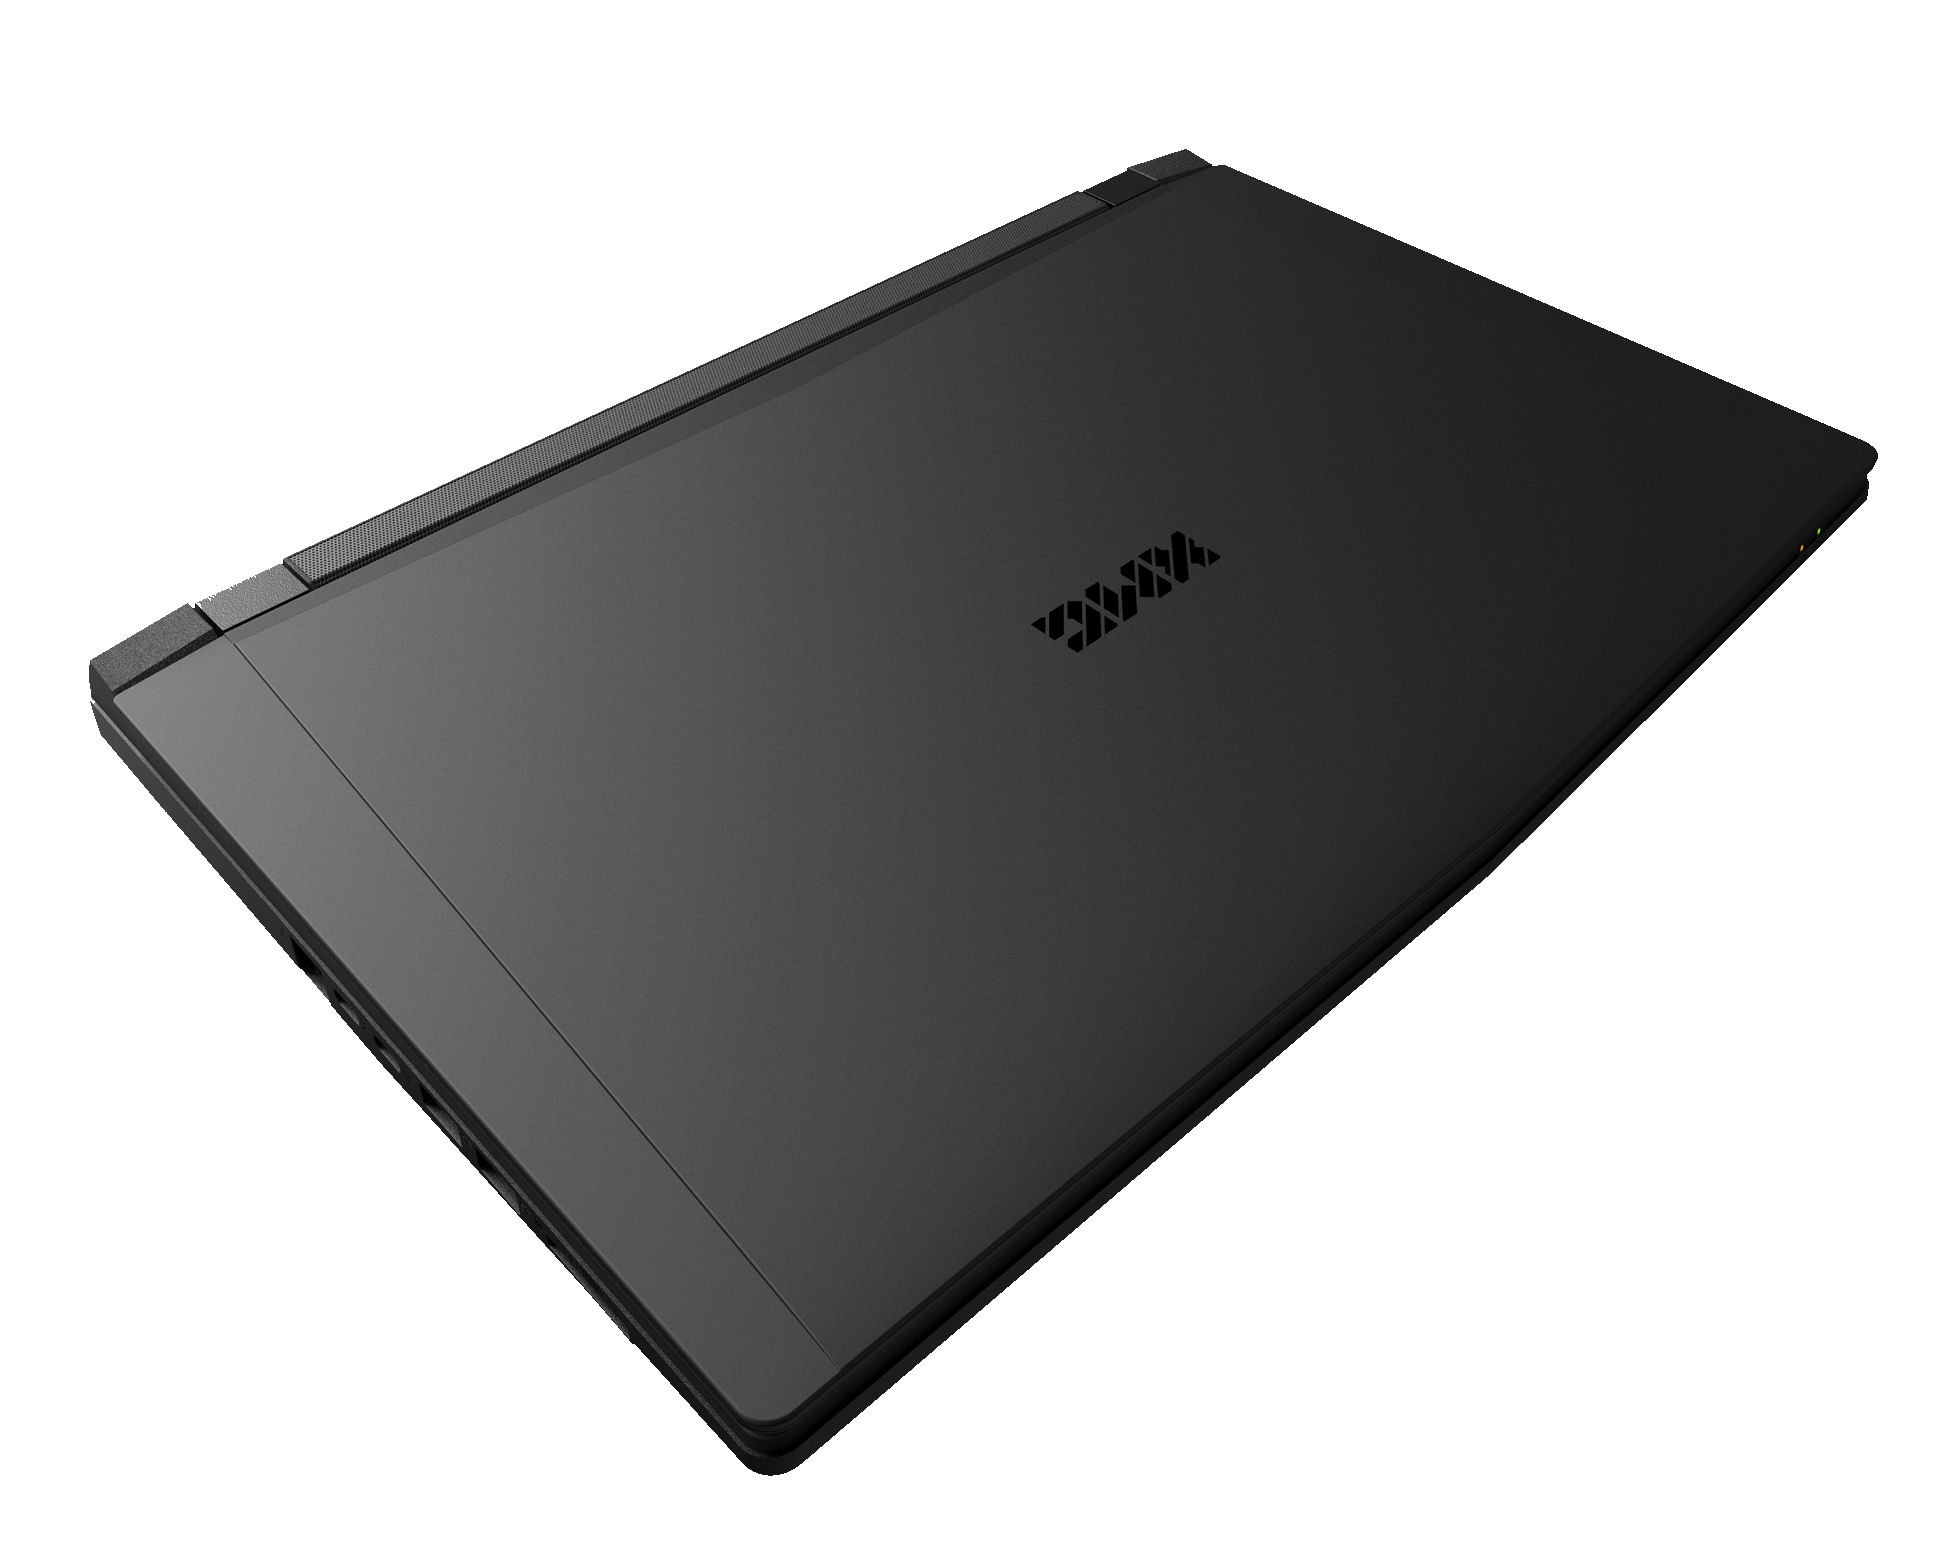
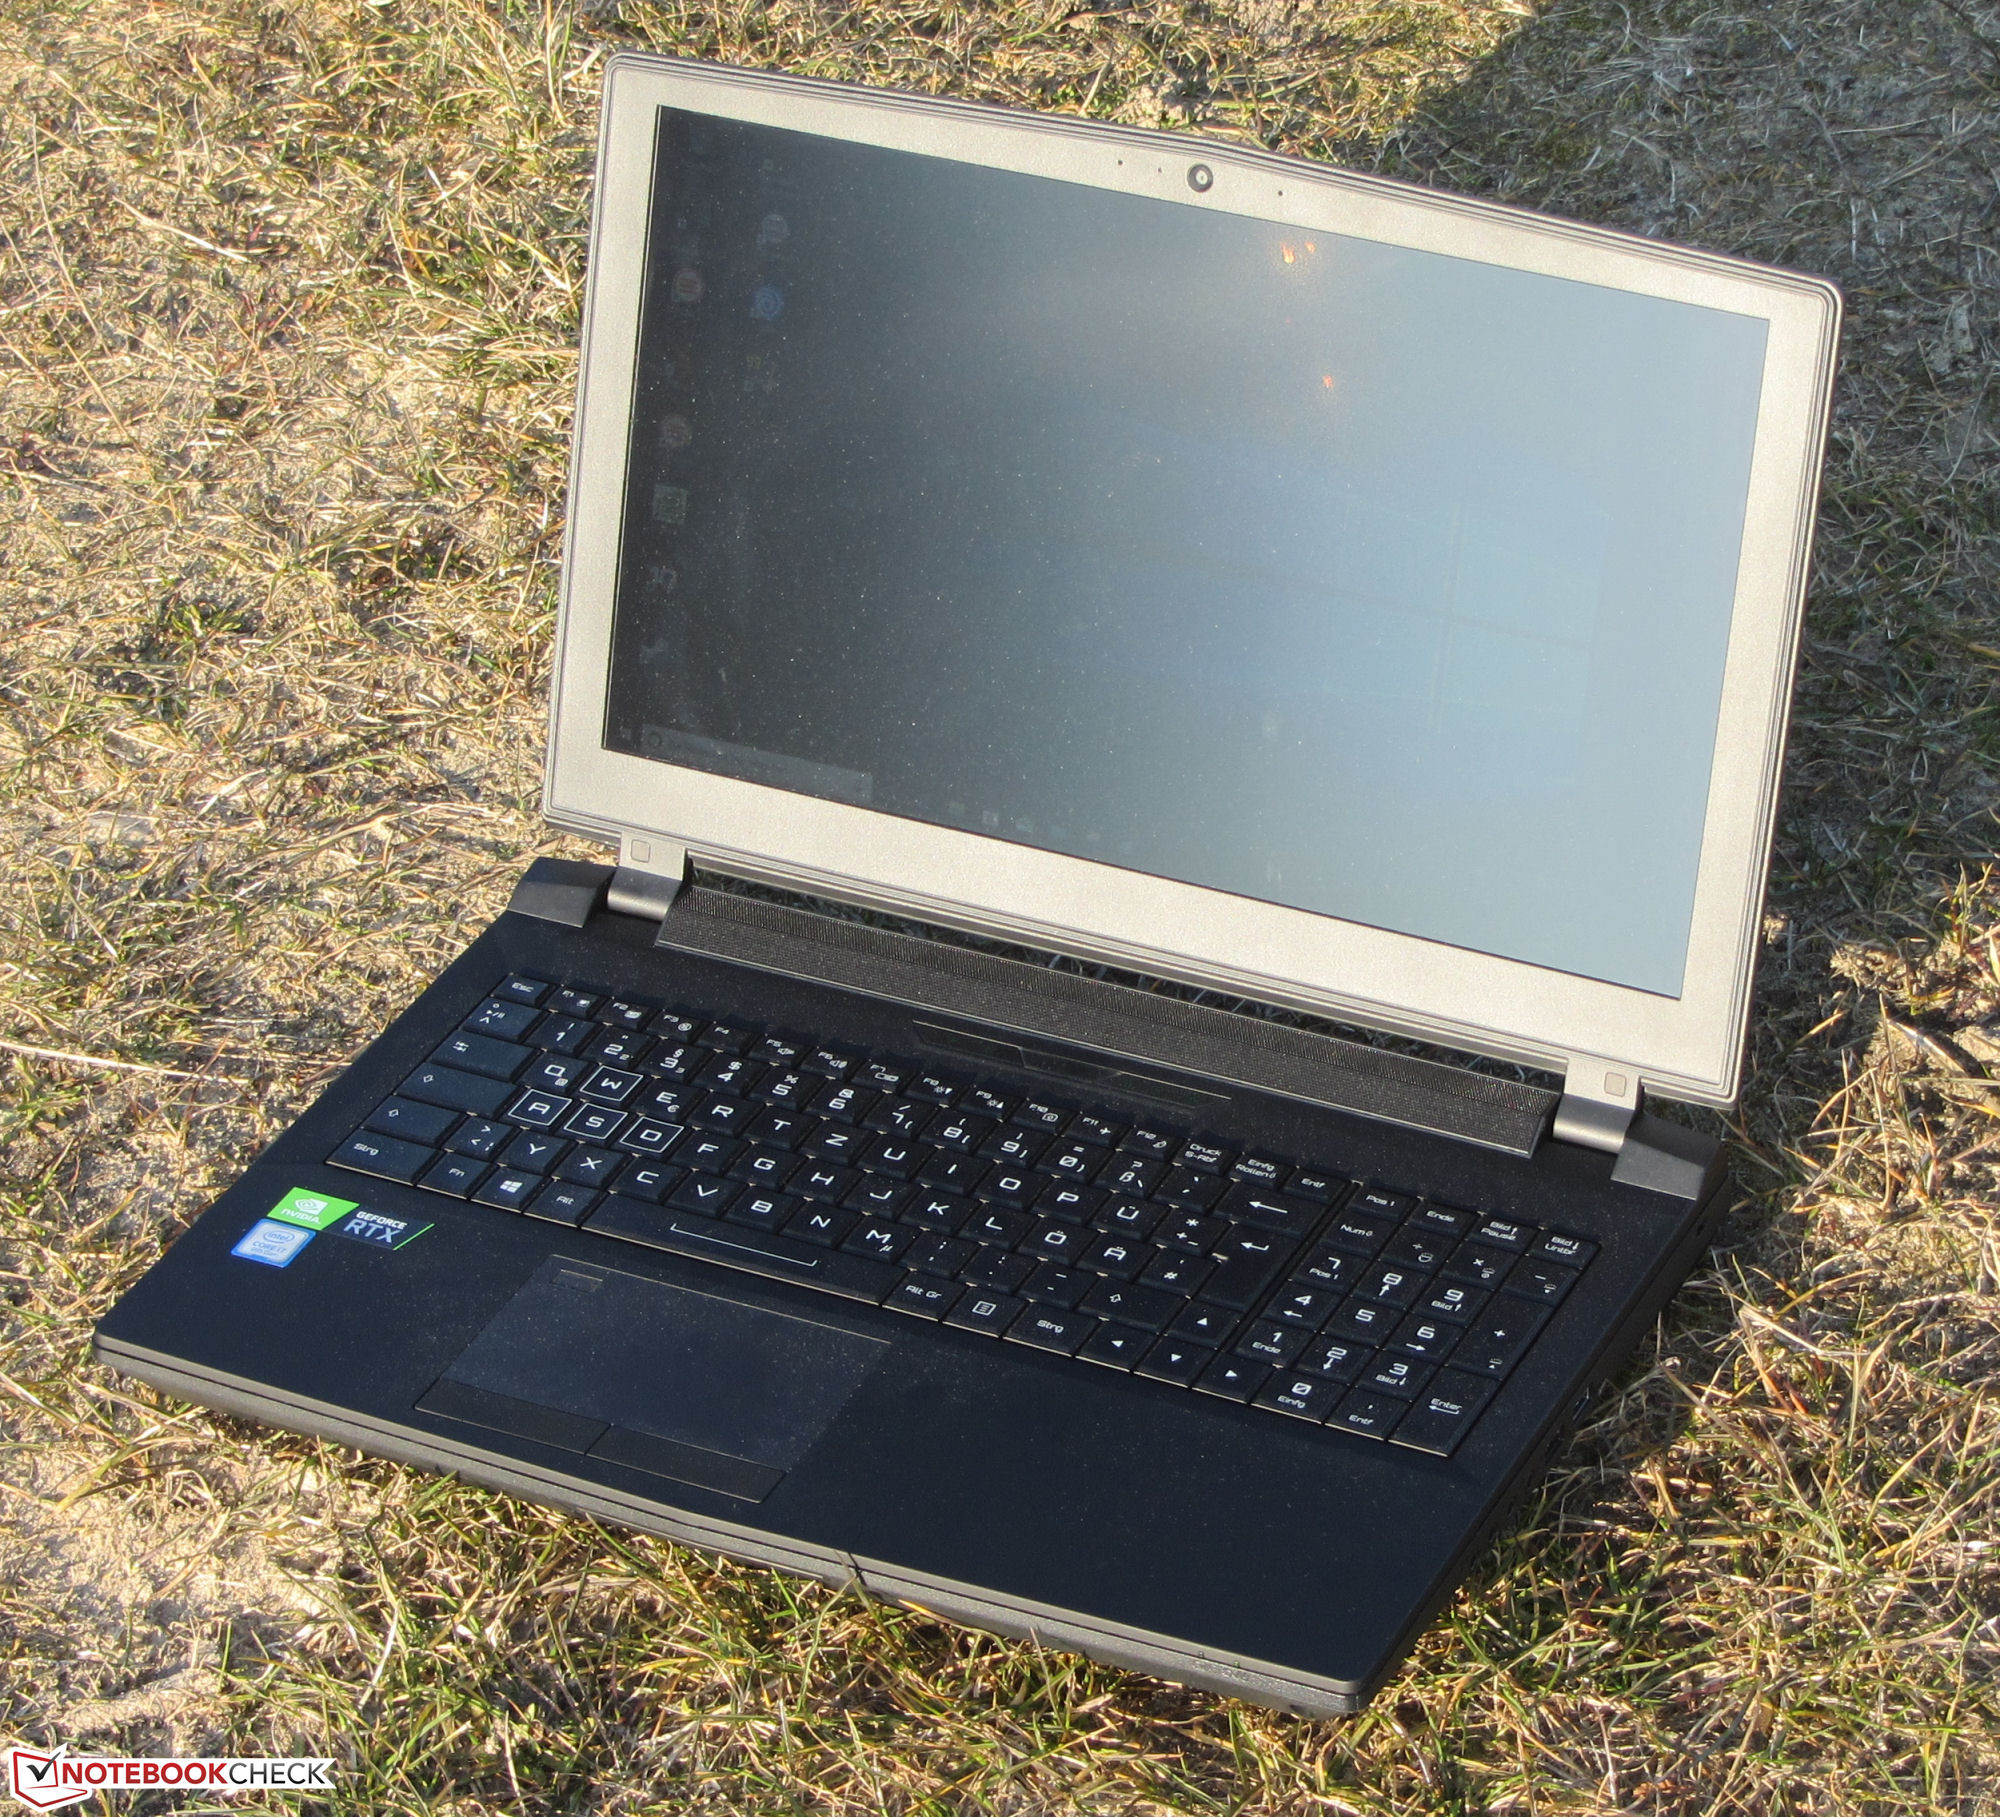
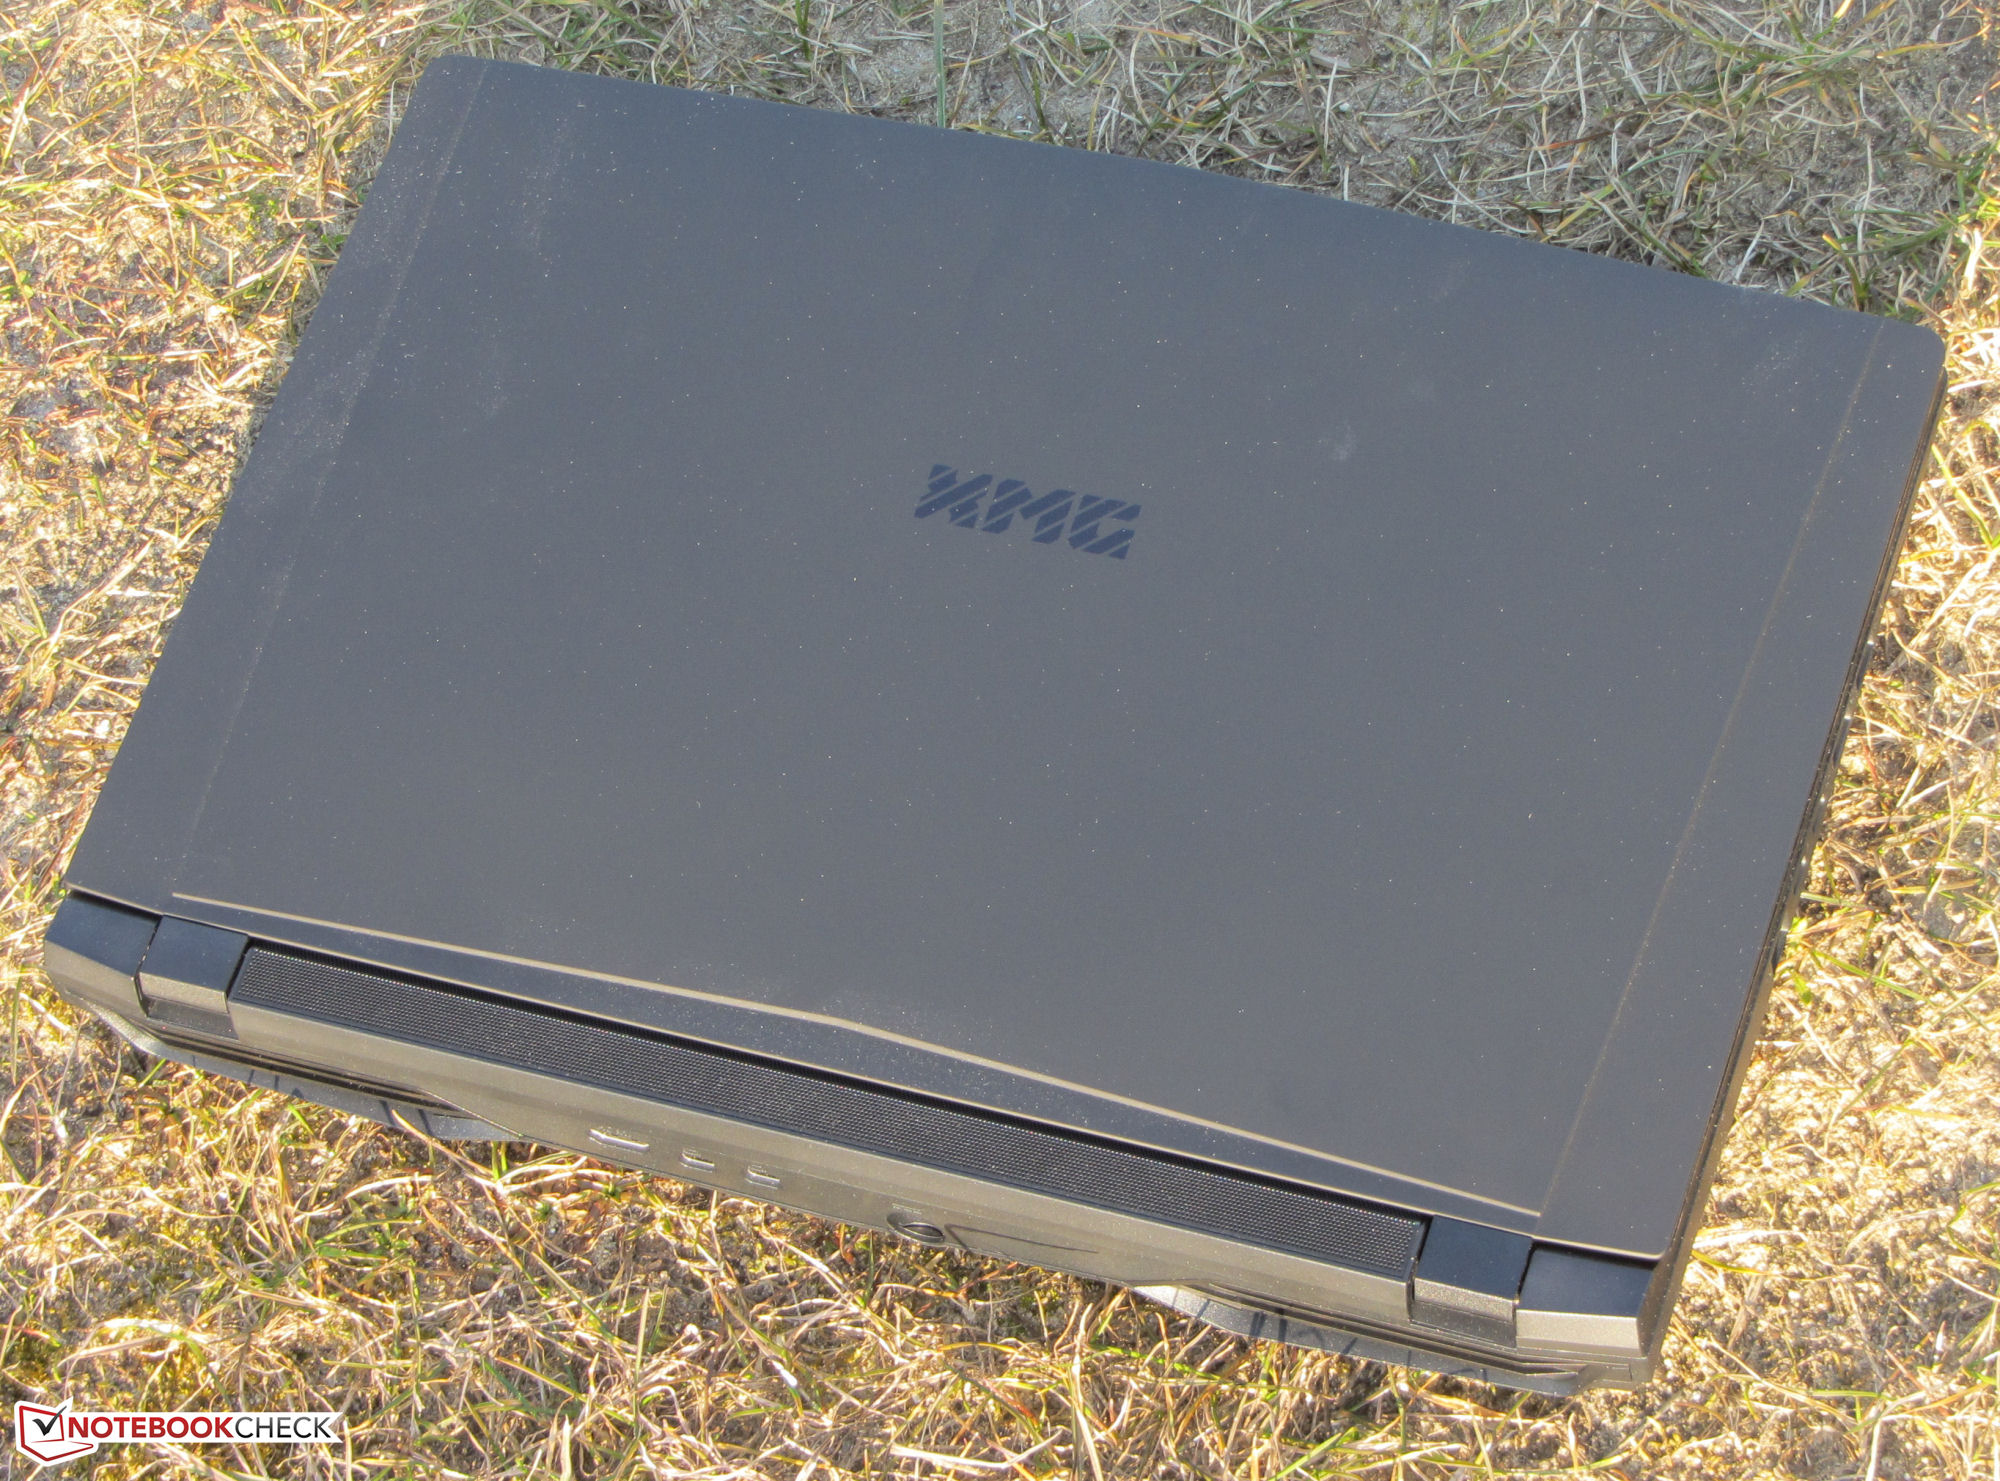
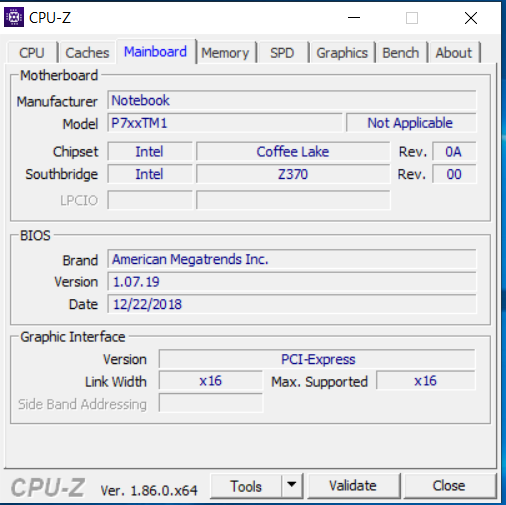
This latest Schenker XMG Ultra 15 model is still based on the same Clevo PM751TM1 barebone as its predecessors. The entire chassis is made of matte-black plastic with a soft-touch rubber surface on the display lid and the top of the base unit. At 3.52 kg (7.76 lbs) the device turned out to be quite hefty - most of its competitors are both lighter and smaller. The reason, however, is very simple: The XMG Ultra 15 features a desktop-class CPU and a powerful high-end GPU, and therefore it requires a massive high-performance cooling system to keep its components in check. In addition, both the CPU and GPU are swappable and not soldered onto the motherboard.
Overall build quality was good. The gaps all around the case were consistent and we found no protruding edges anywhere on the device. Rigidity, on the other hand, was not quite as great. Despite its bulk and heft, the base unit turned out to be somewhat twistable, and the display lid even more so. However, we should note that overall rigidity has been improved over the XMG Ultra 15’s predecessor. The latter suffered from massive screen artifacts that lasted for several seconds when we attempted to twist and warp the lid. The new model only showed minor short-term color distortions. Applying pressure to the back resulted in ripple effects in a few chosen locations. The hinges were quite firm yet perfectly adjusted and fine-tuned to allow for one-handed opening of the lid.
Connectivity
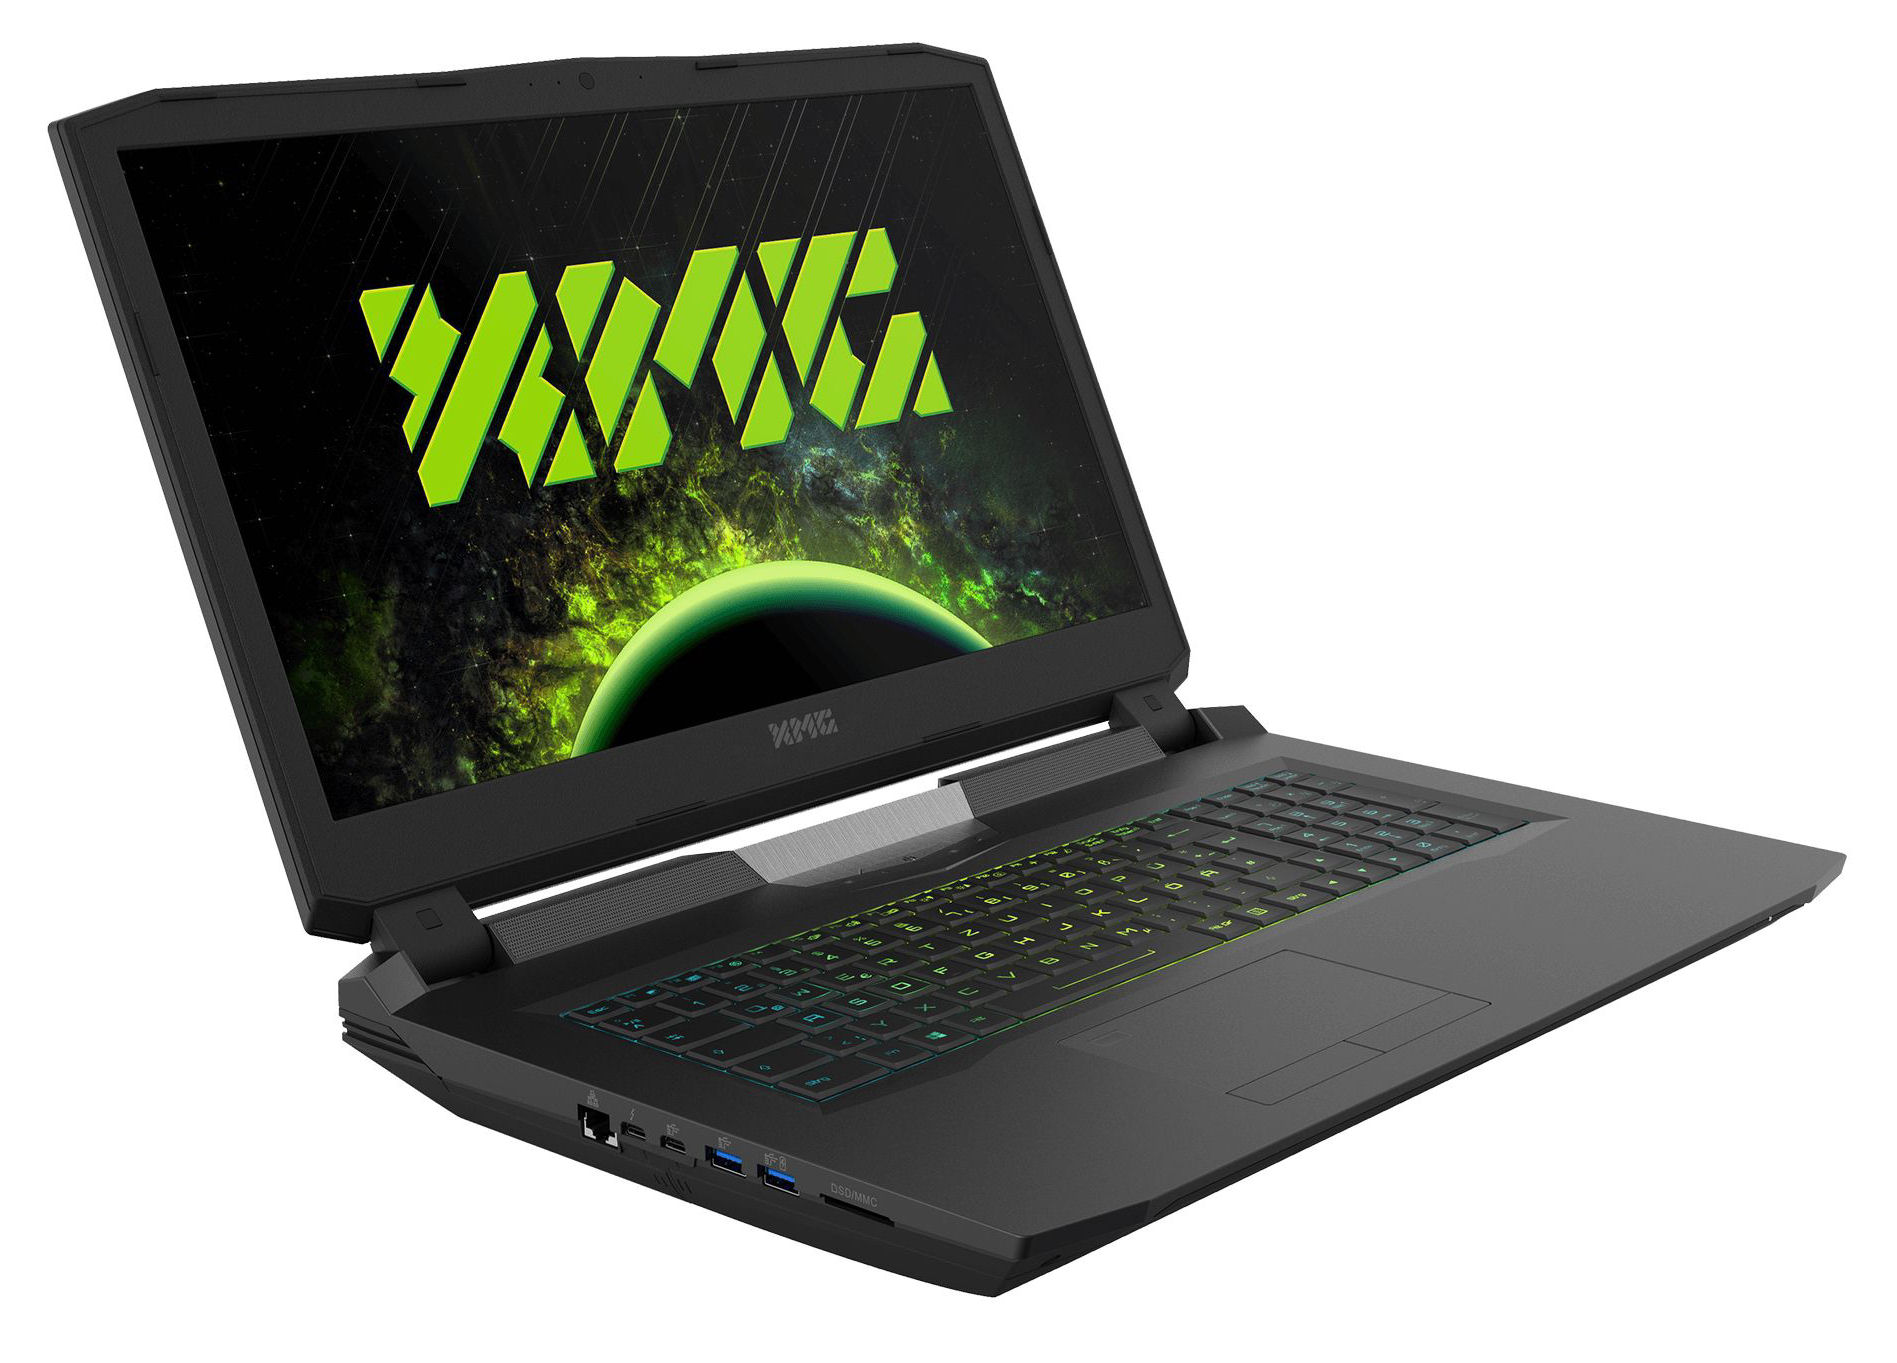
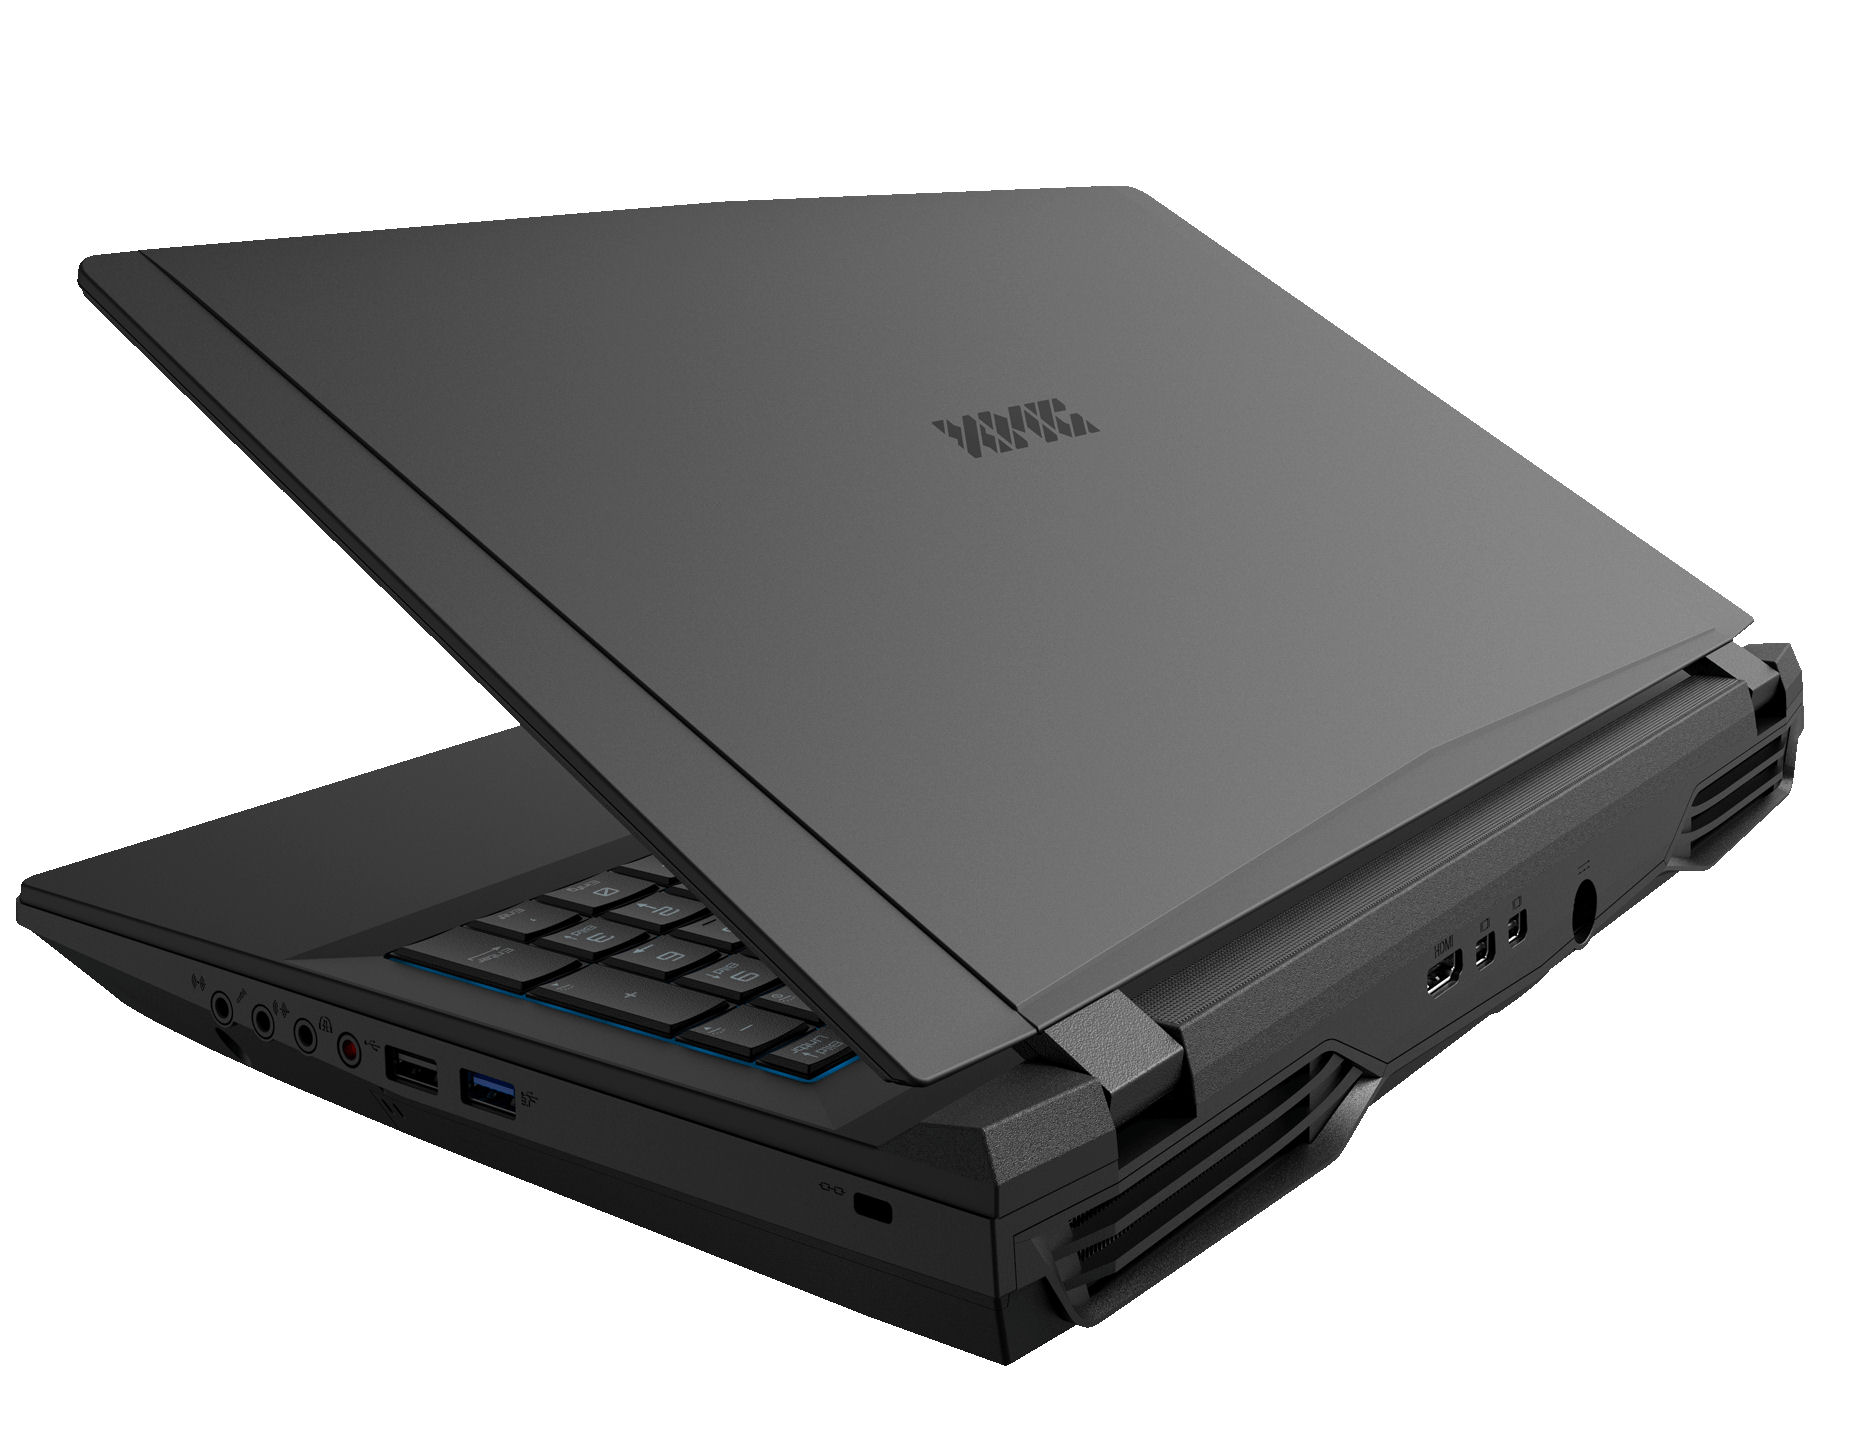
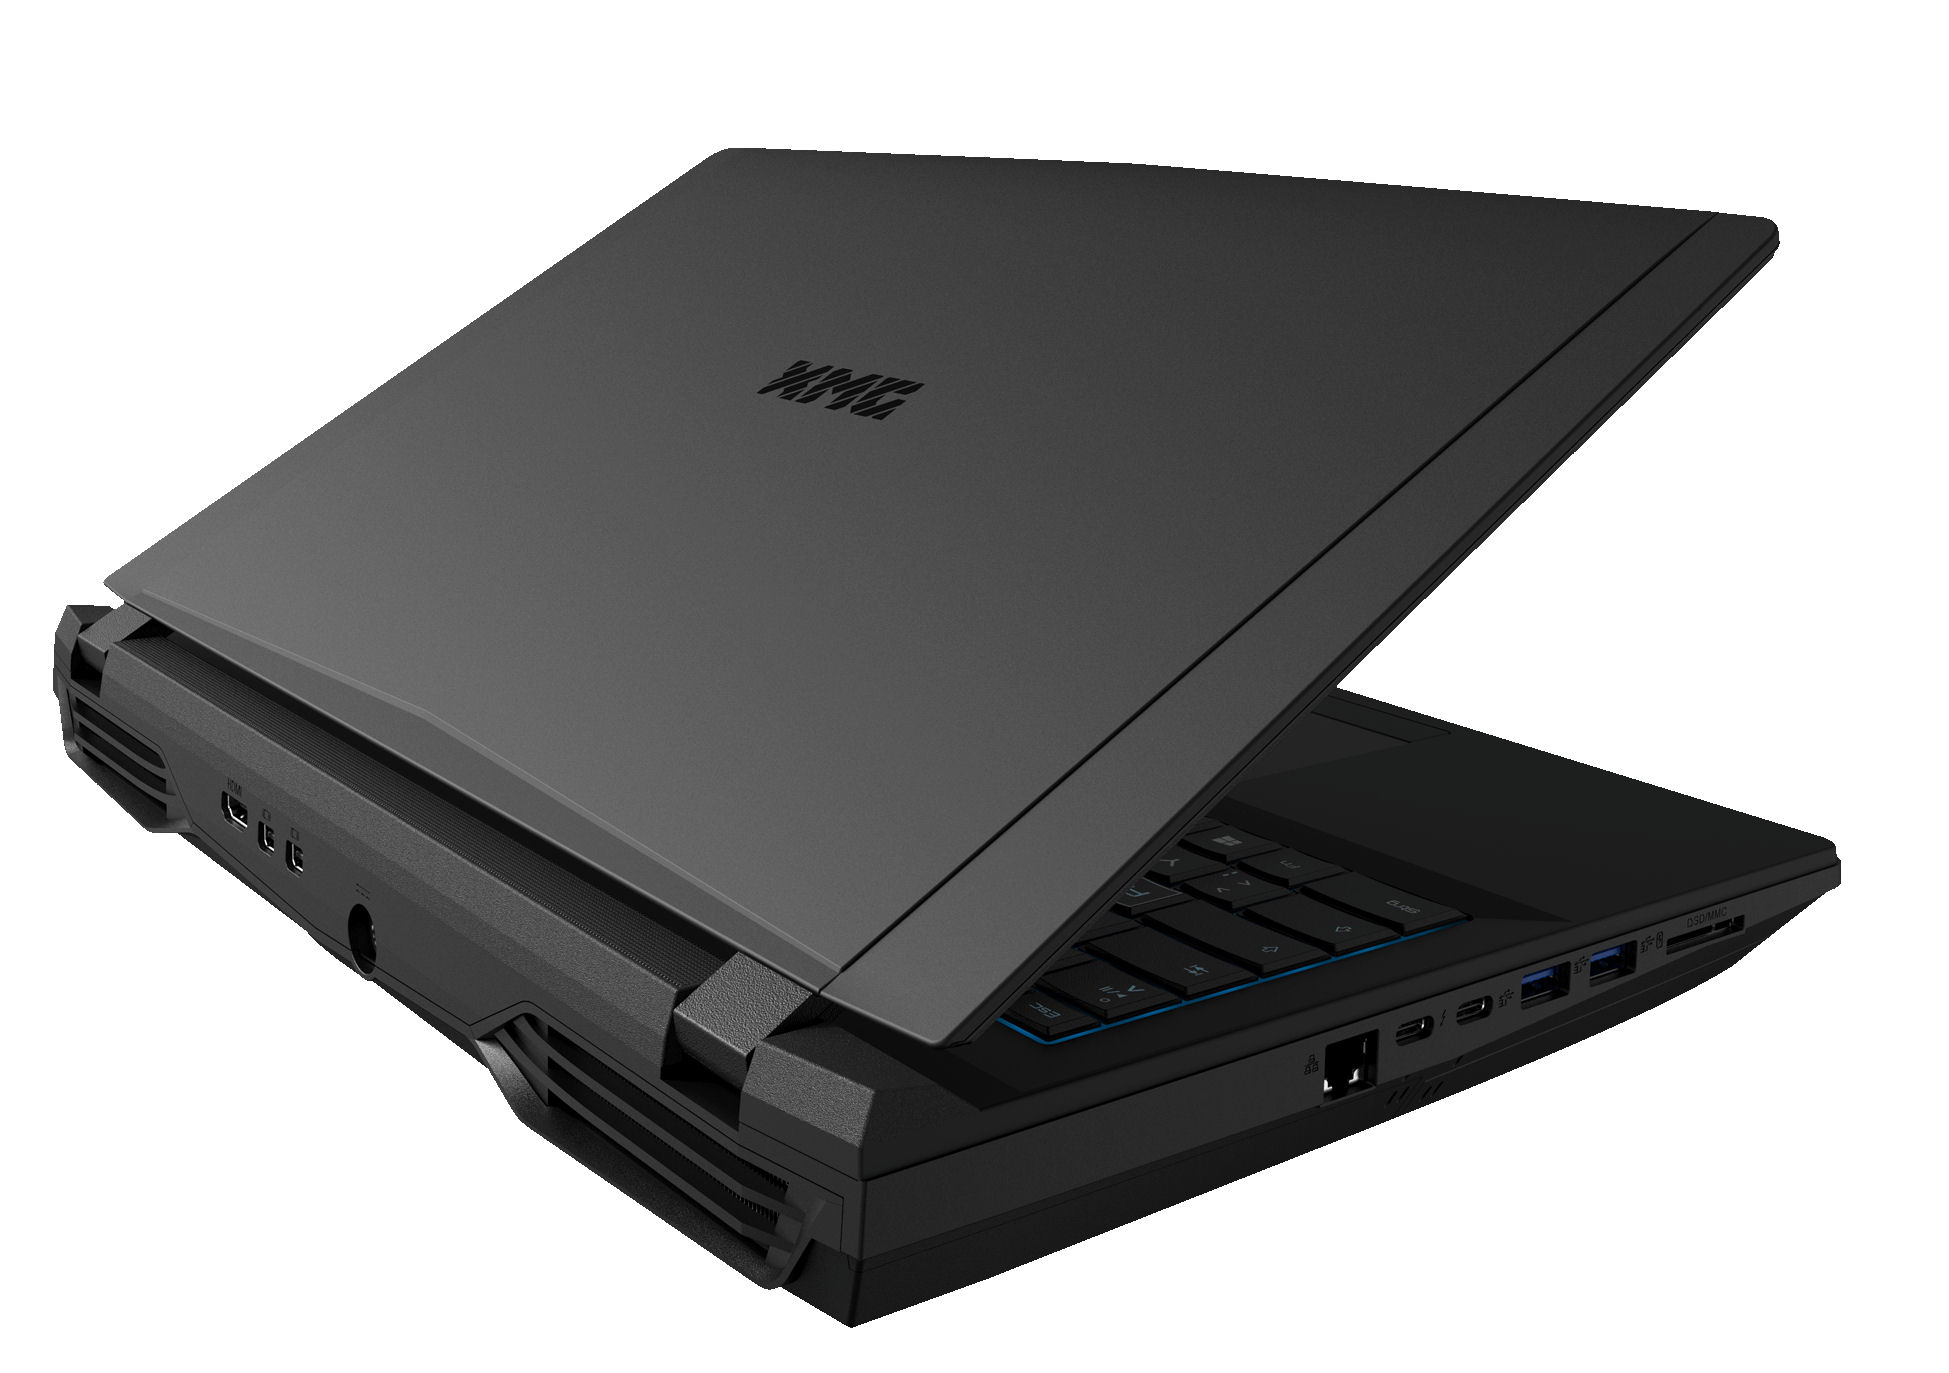
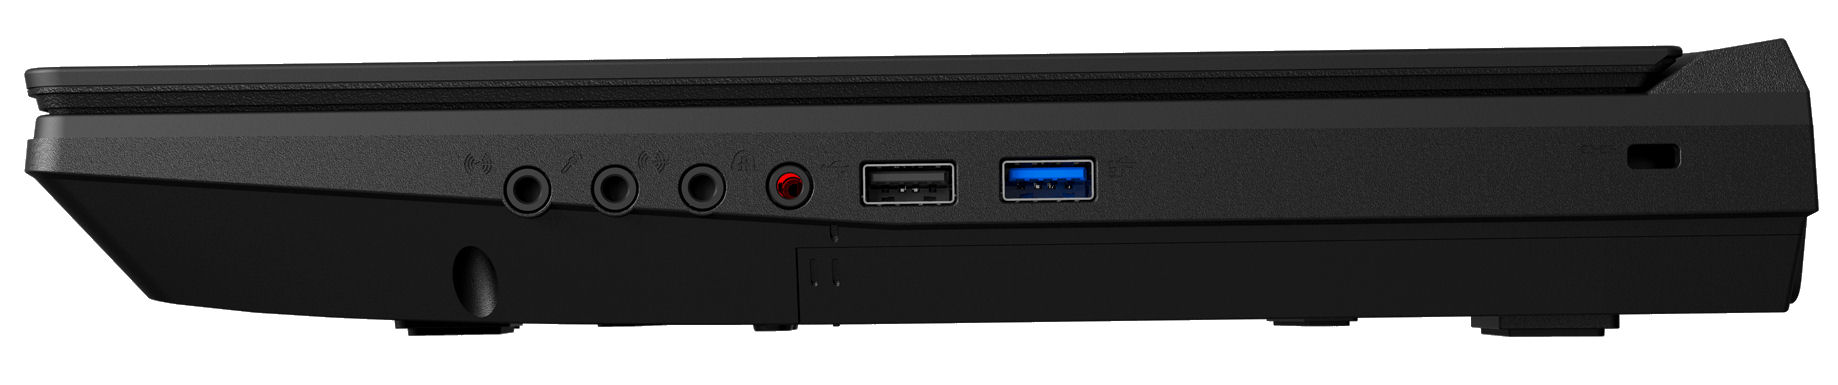
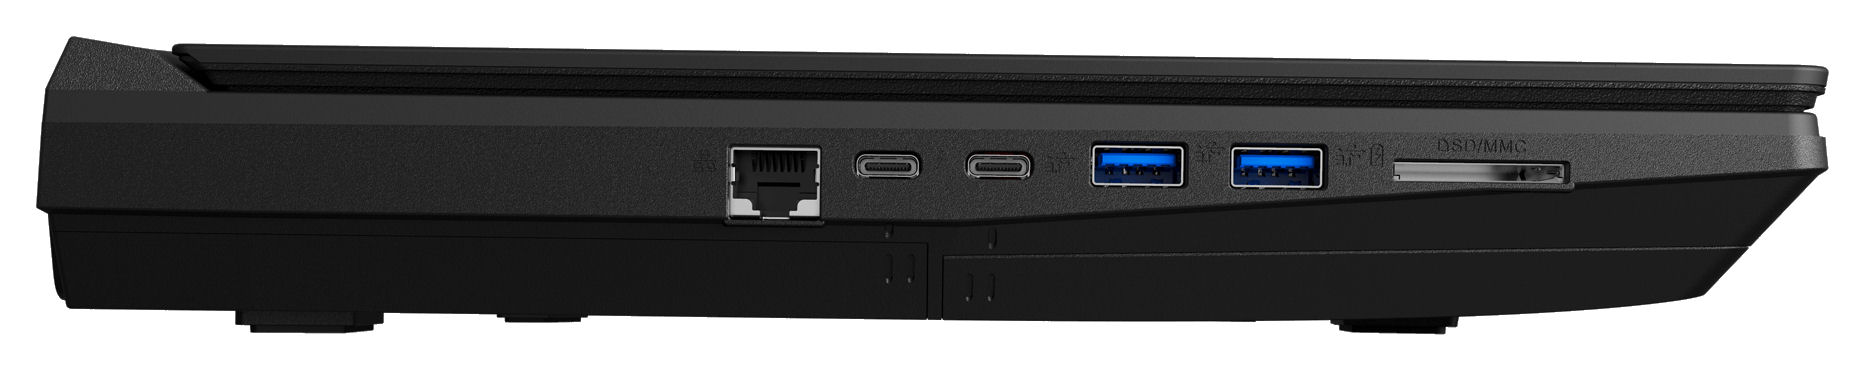
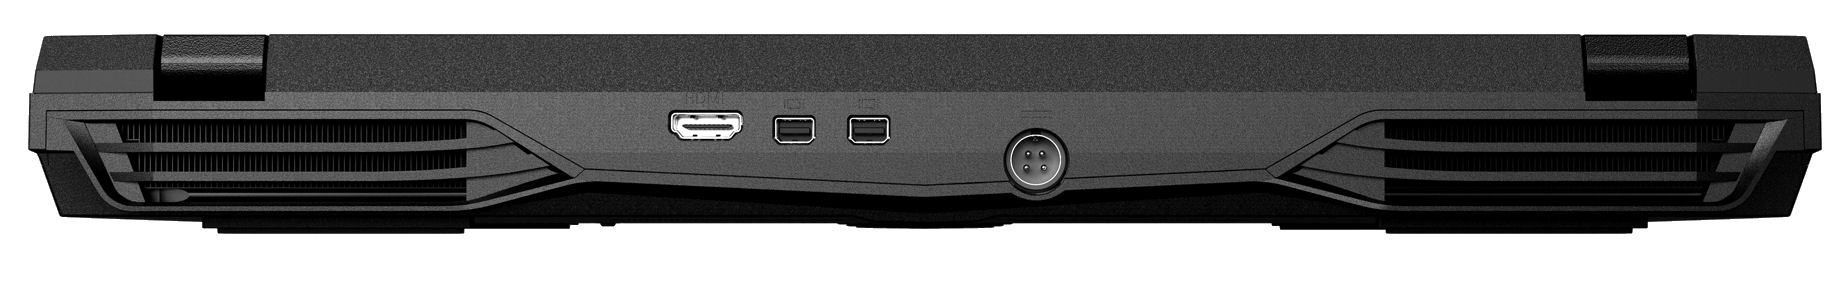
If there is one thing aplenty it is connectivity. The XMG Ultra 15 features a total of four USB-A ports (3x USB 3.1 Gen 1, 1x USB 2.0), one Thunderbolt 3 port carrying a DisplayPort signal, one USB-C 3.1 Gen 2 port, one HDMI 2.0 port, and two DisplayPort 1.4 ports. In other words: The 15.6-inch notebook comes with a total of four video-out ports.
SD Card Reader
The built-in 6-in-1 card reader is one of the fastest we’ve ever seen. When benchmarked with our 64 GB Toshiba Exceria Pro SDXC UHS-II reference card it managed a maximum transfer speed of 212 MB/s while transferring large blocks of data and around 193 MB/s when copying 250 JPEG files at roughly 5 MB each. The competition performed similarly.
| SD Card Reader | |
| average JPG Copy Test (av. of 3 runs) | |
| Gigabyte Aero 15-X9 (Toshiba Exceria Pro SDXC 64 GB UHS-II) | |
| Schenker XMG Ultra 15 Turing (Toshiba Exceria Pro SDXC 64 GB UHS-II) | |
| Schenker XMG Ultra 15 (Toshiba Exceria Pro SDXC 64 GB UHS-II) | |
| Average of class Gaming (20.9 - 210, n=54, last 2 years) | |
| maximum AS SSD Seq Read Test (1GB) | |
| Gigabyte Aero 15-X9 (Toshiba Exceria Pro SDXC 64 GB UHS-II) | |
| Schenker XMG Ultra 15 Turing (Toshiba Exceria Pro SDXC 64 GB UHS-II) | |
| Schenker XMG Ultra 15 (Toshiba Exceria Pro SDXC 64 GB UHS-II) | |
| Average of class Gaming (25.5 - 261, n=51, last 2 years) | |
Communication
The Killer Wi-Fi module features an Intel Wireless-AC 9260 chip with support for 802.11a/b/g/h/n and ac. When benchmarked under optimal conditions (no other Wi-Fi devices nearby, short distance between notebook and server PC) data transfer speeds were more than decent. Wired communications are handled by a Killer E2500 Gigabit Ethernet controller, which worked flawlessly.
Camera
The 2.1 MP camera features a native resolution of 1920x1080 and produced decent results.
Accessories
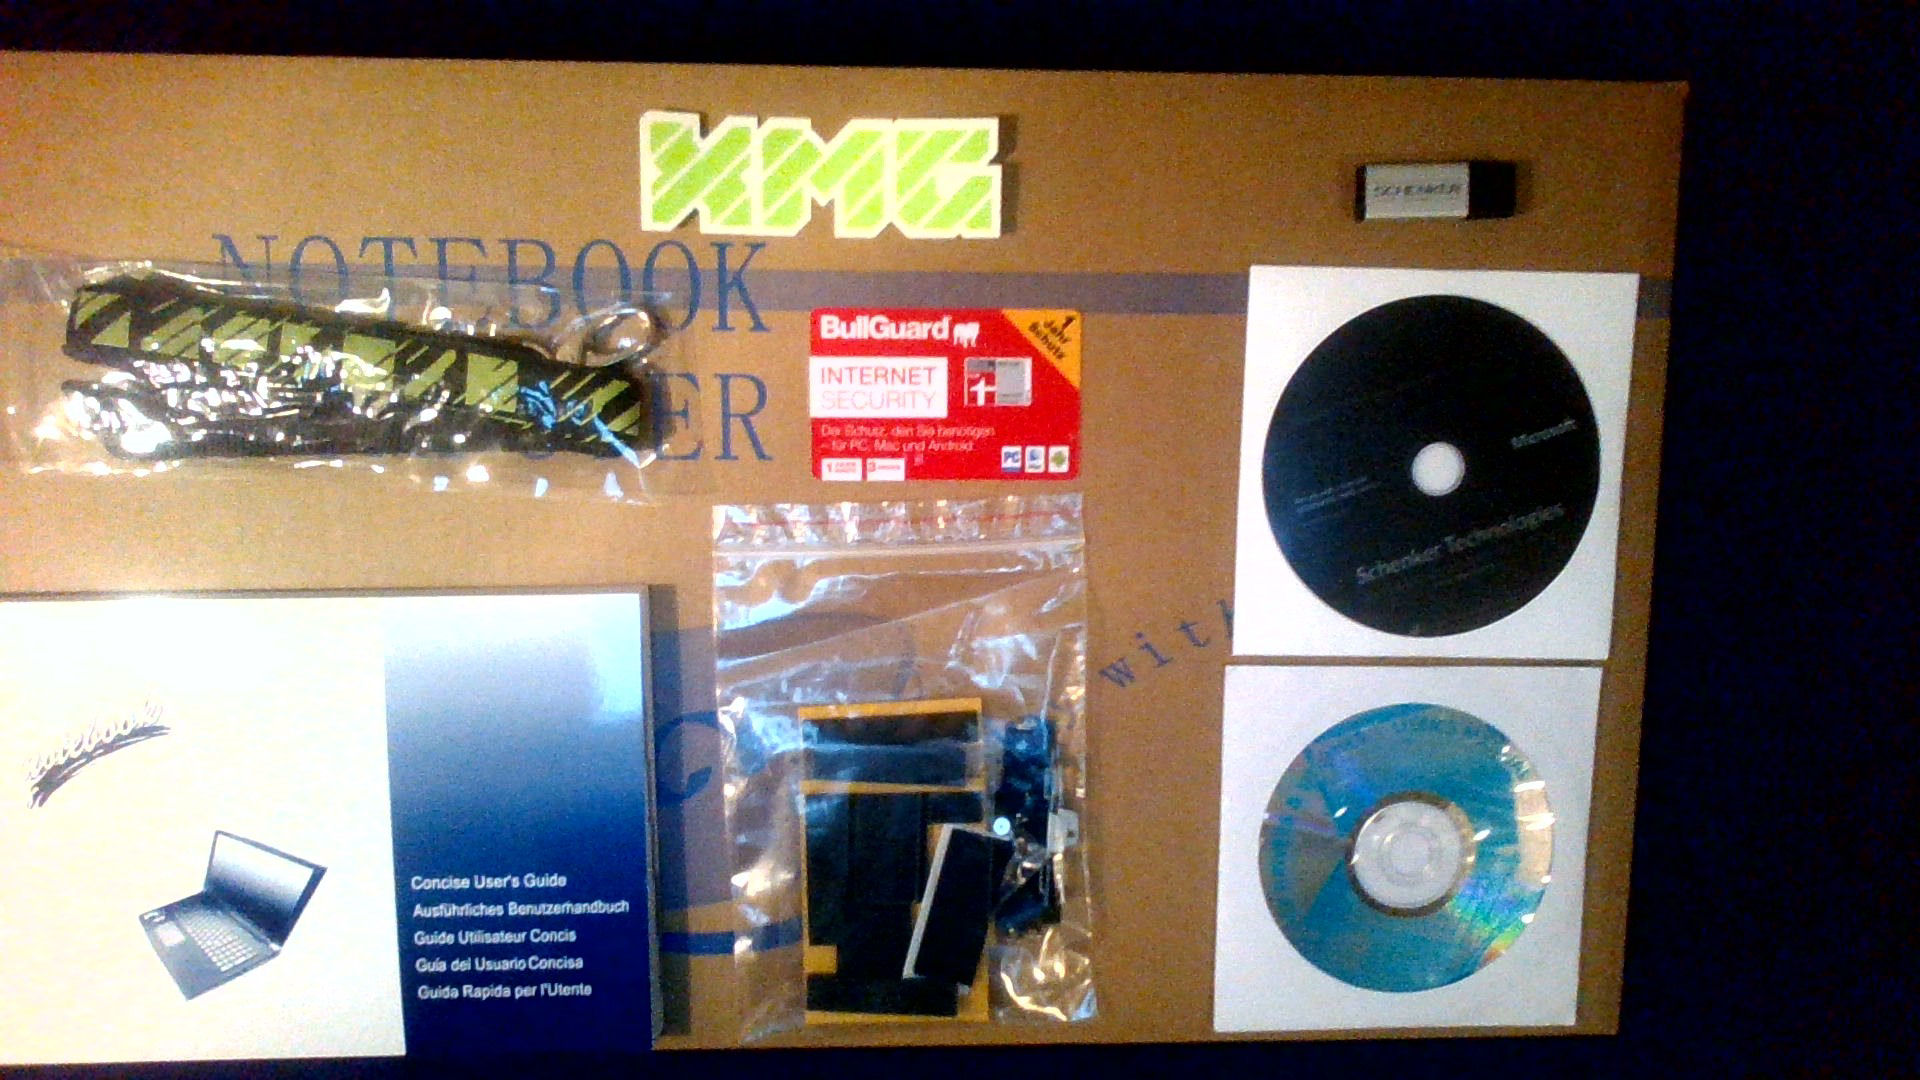
Schenker includes various accessories with its 15.6-inch XMG Ultra 15. In addition to a thick multi-language manual the manufacturer also includes a recovery DVD, a driver DVD, a 16 GB thumb drive containing the drivers and the manual as PDF, a key chain, a sticker, mounting frames for 2.5-inch hard disk drives, and a one-year license for Bullguard Internet Security for up to three computers.
Maintenance
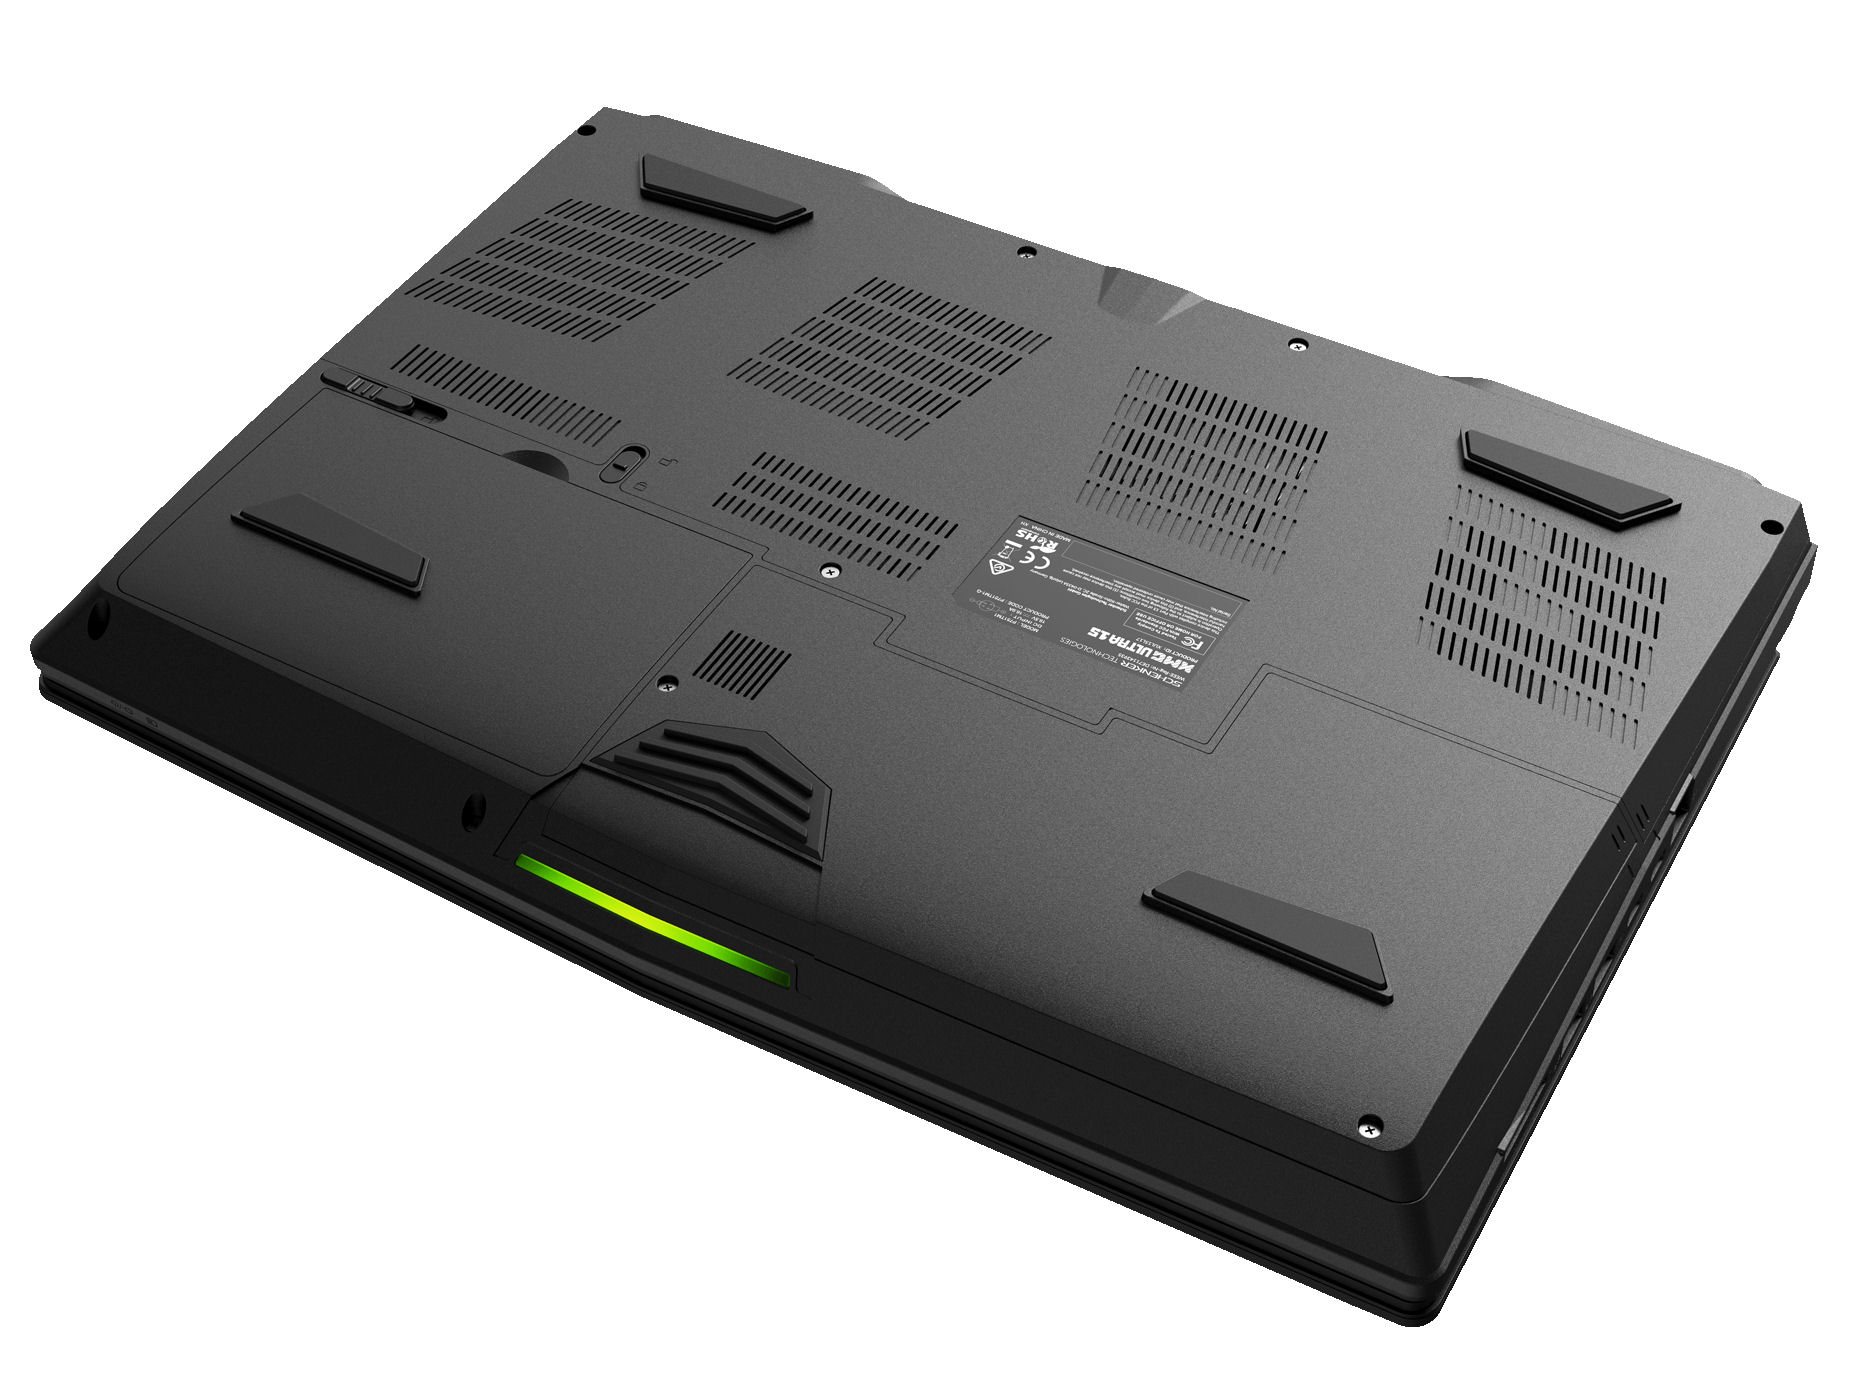
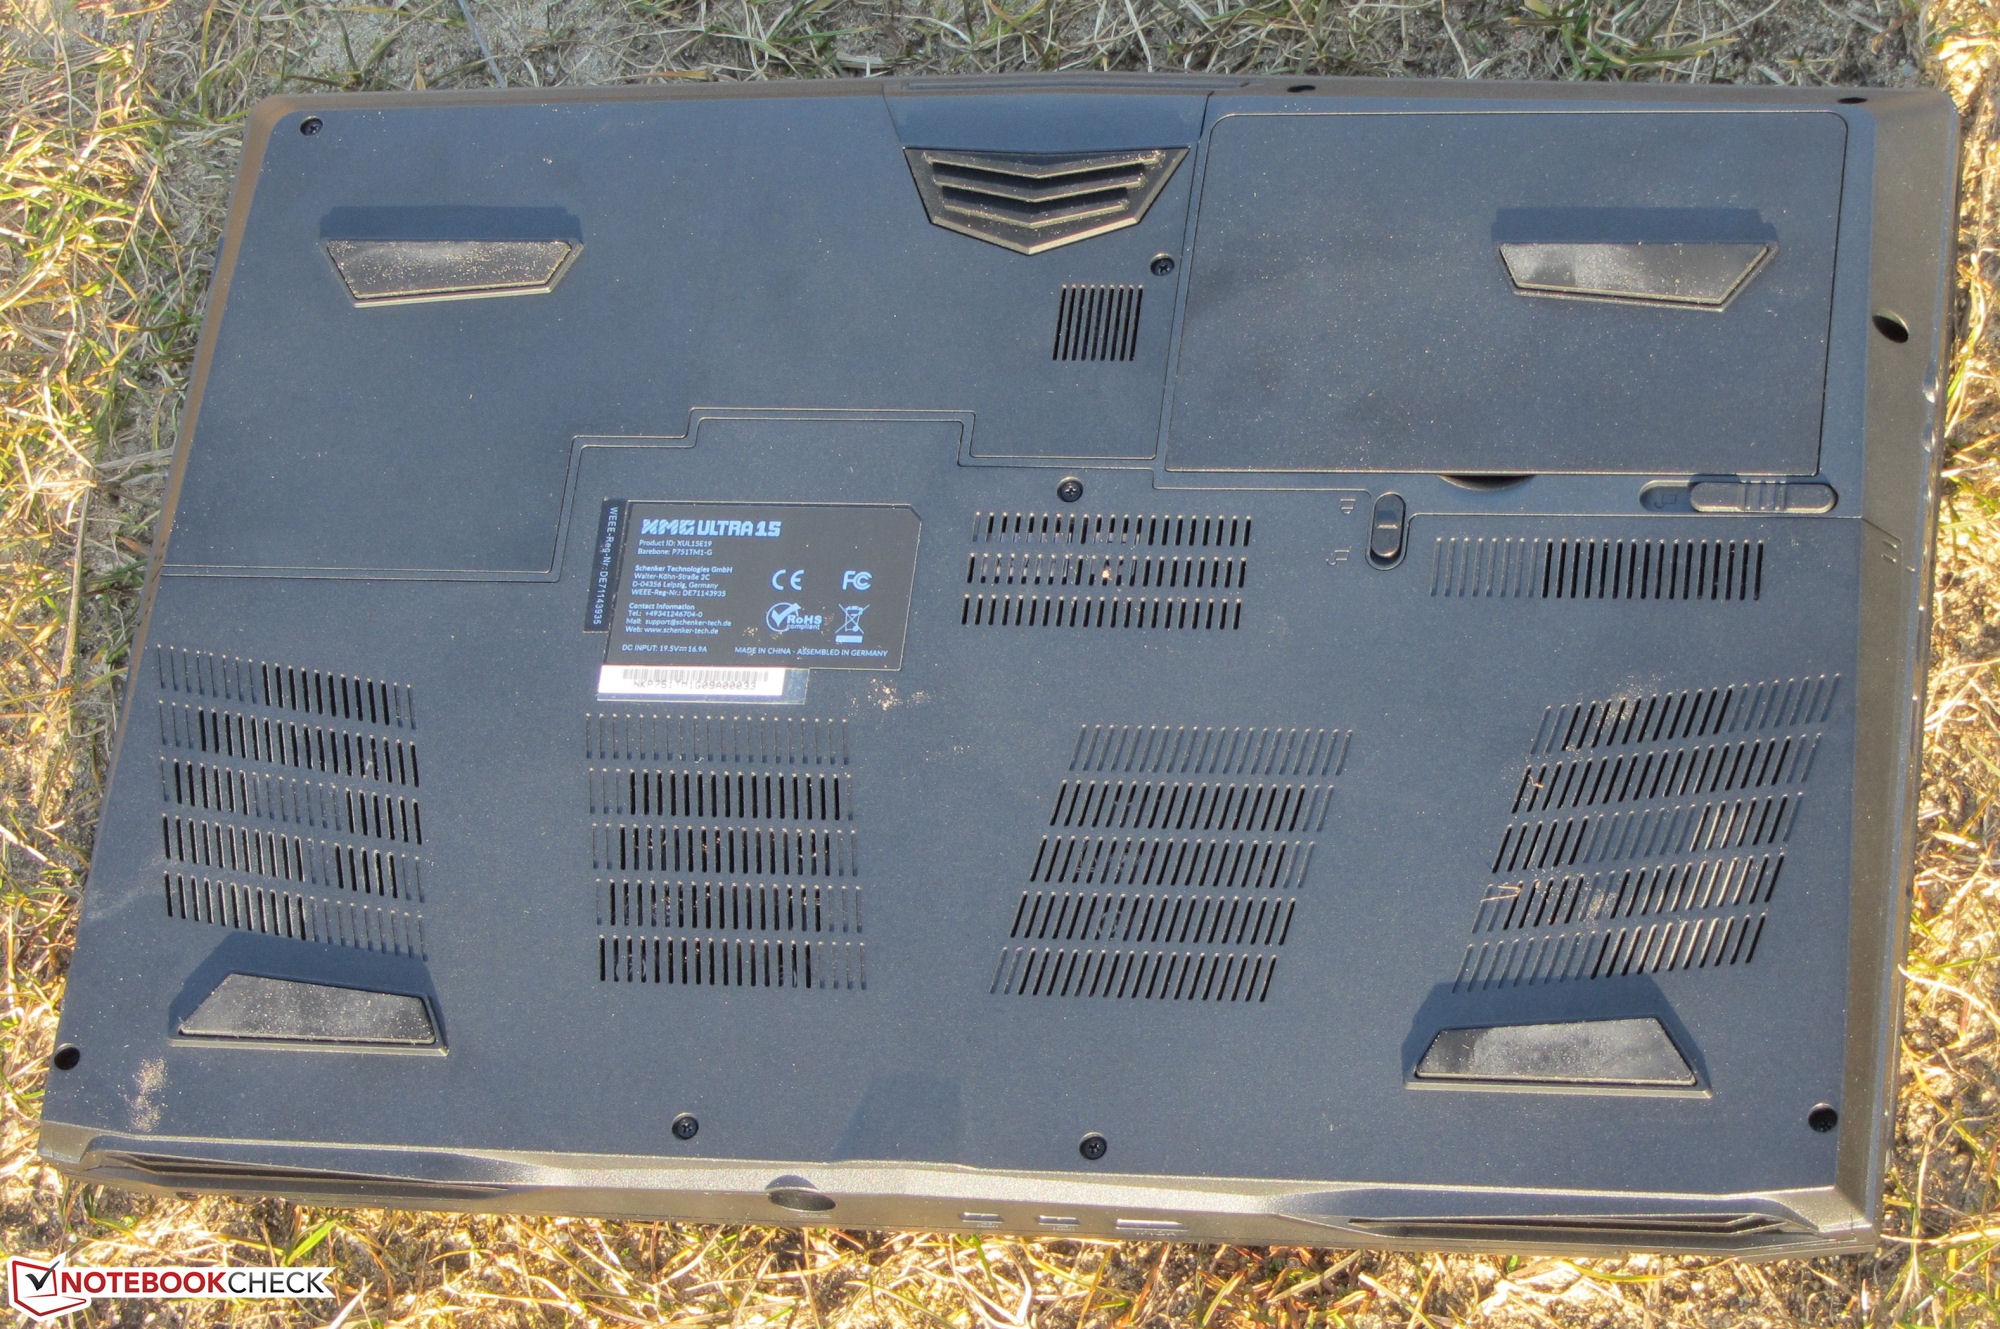
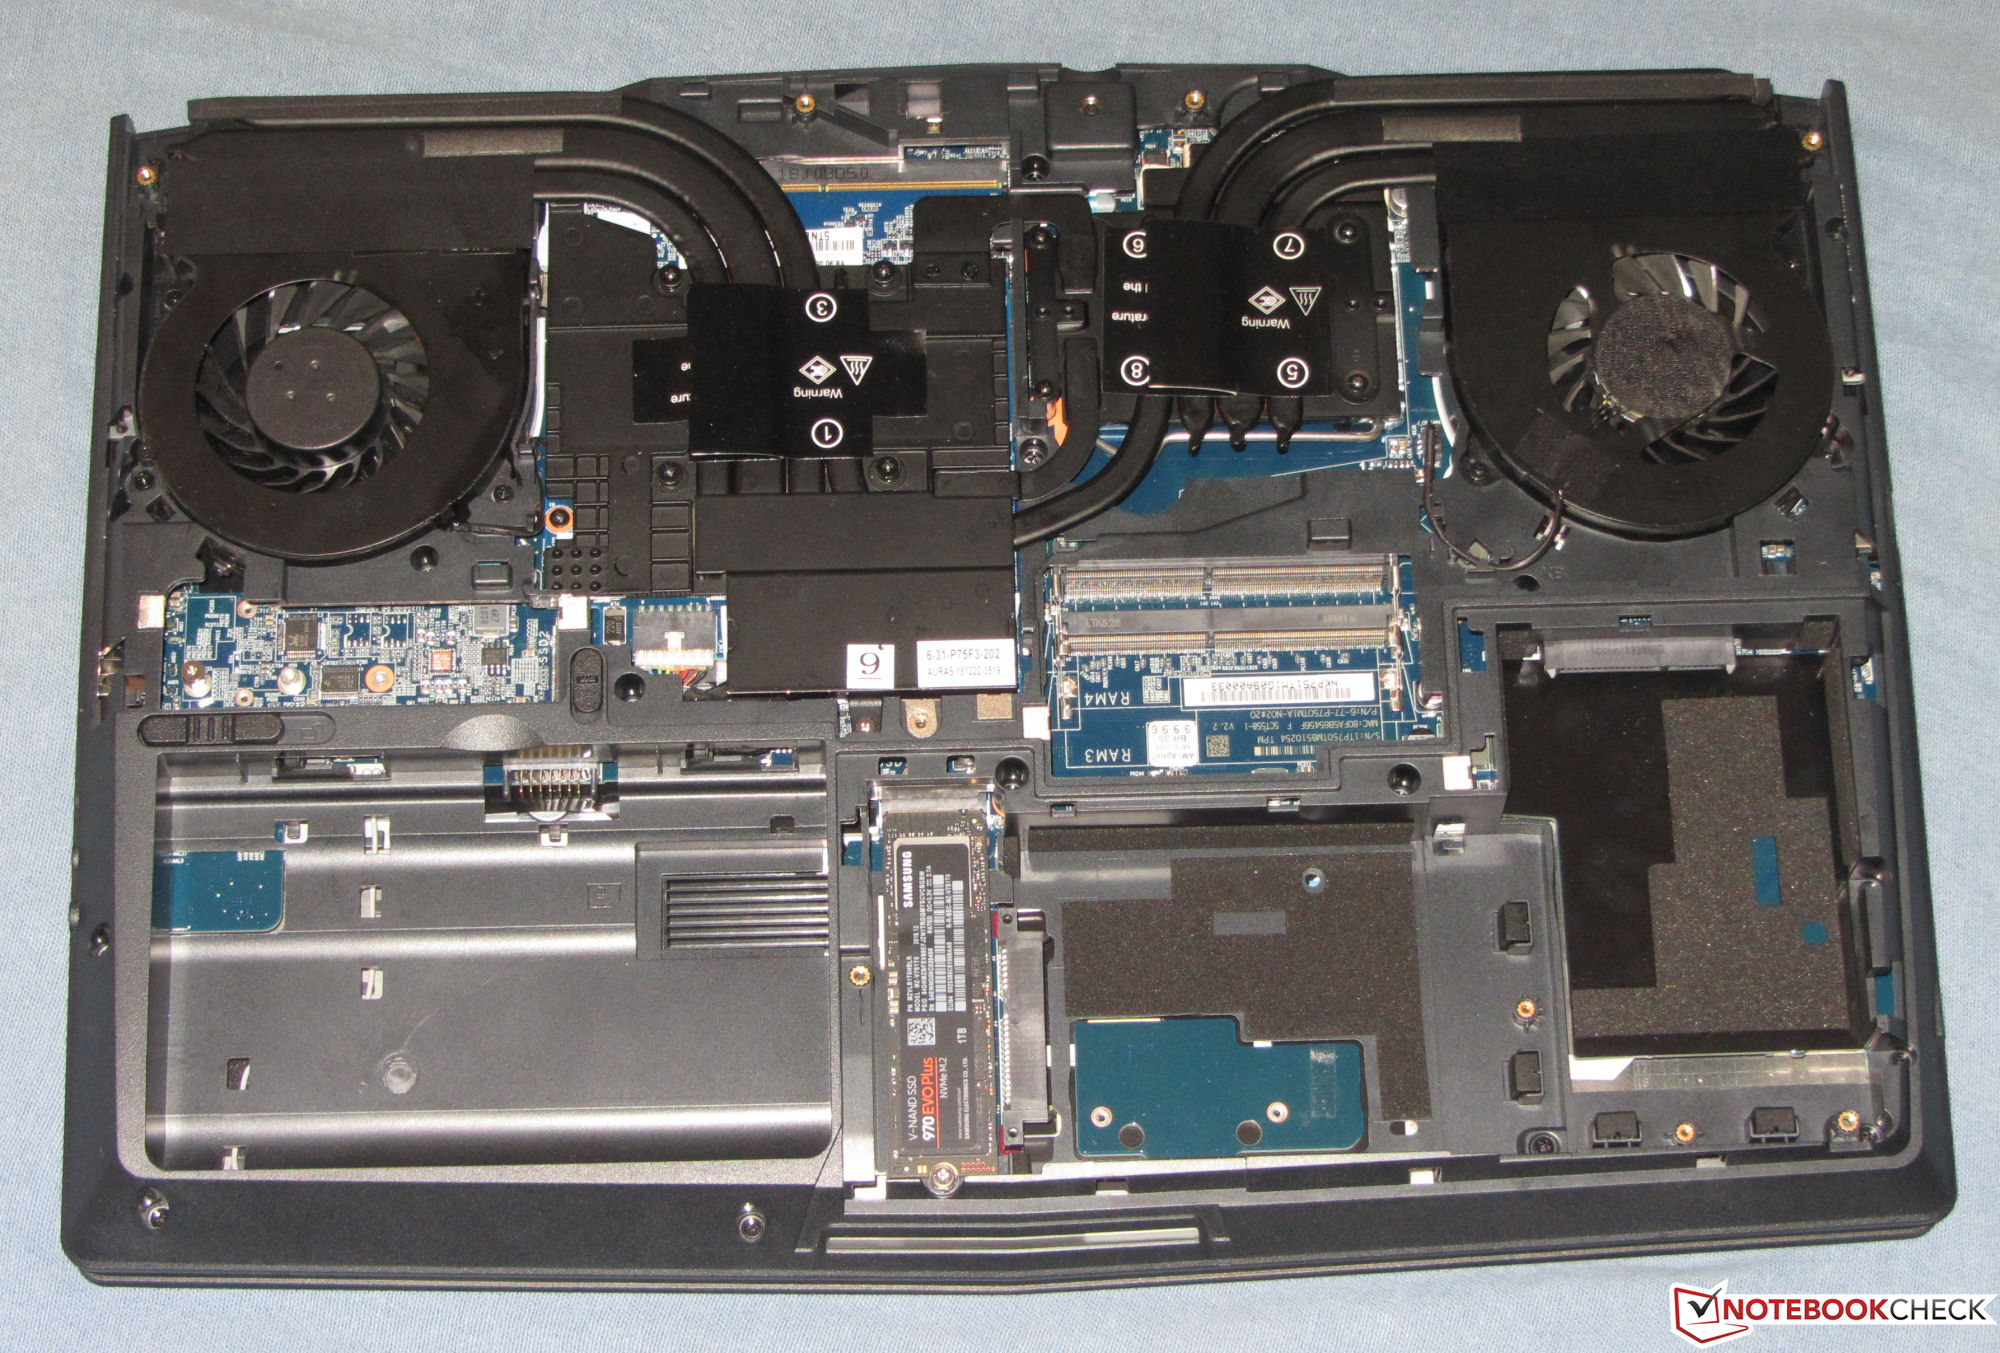
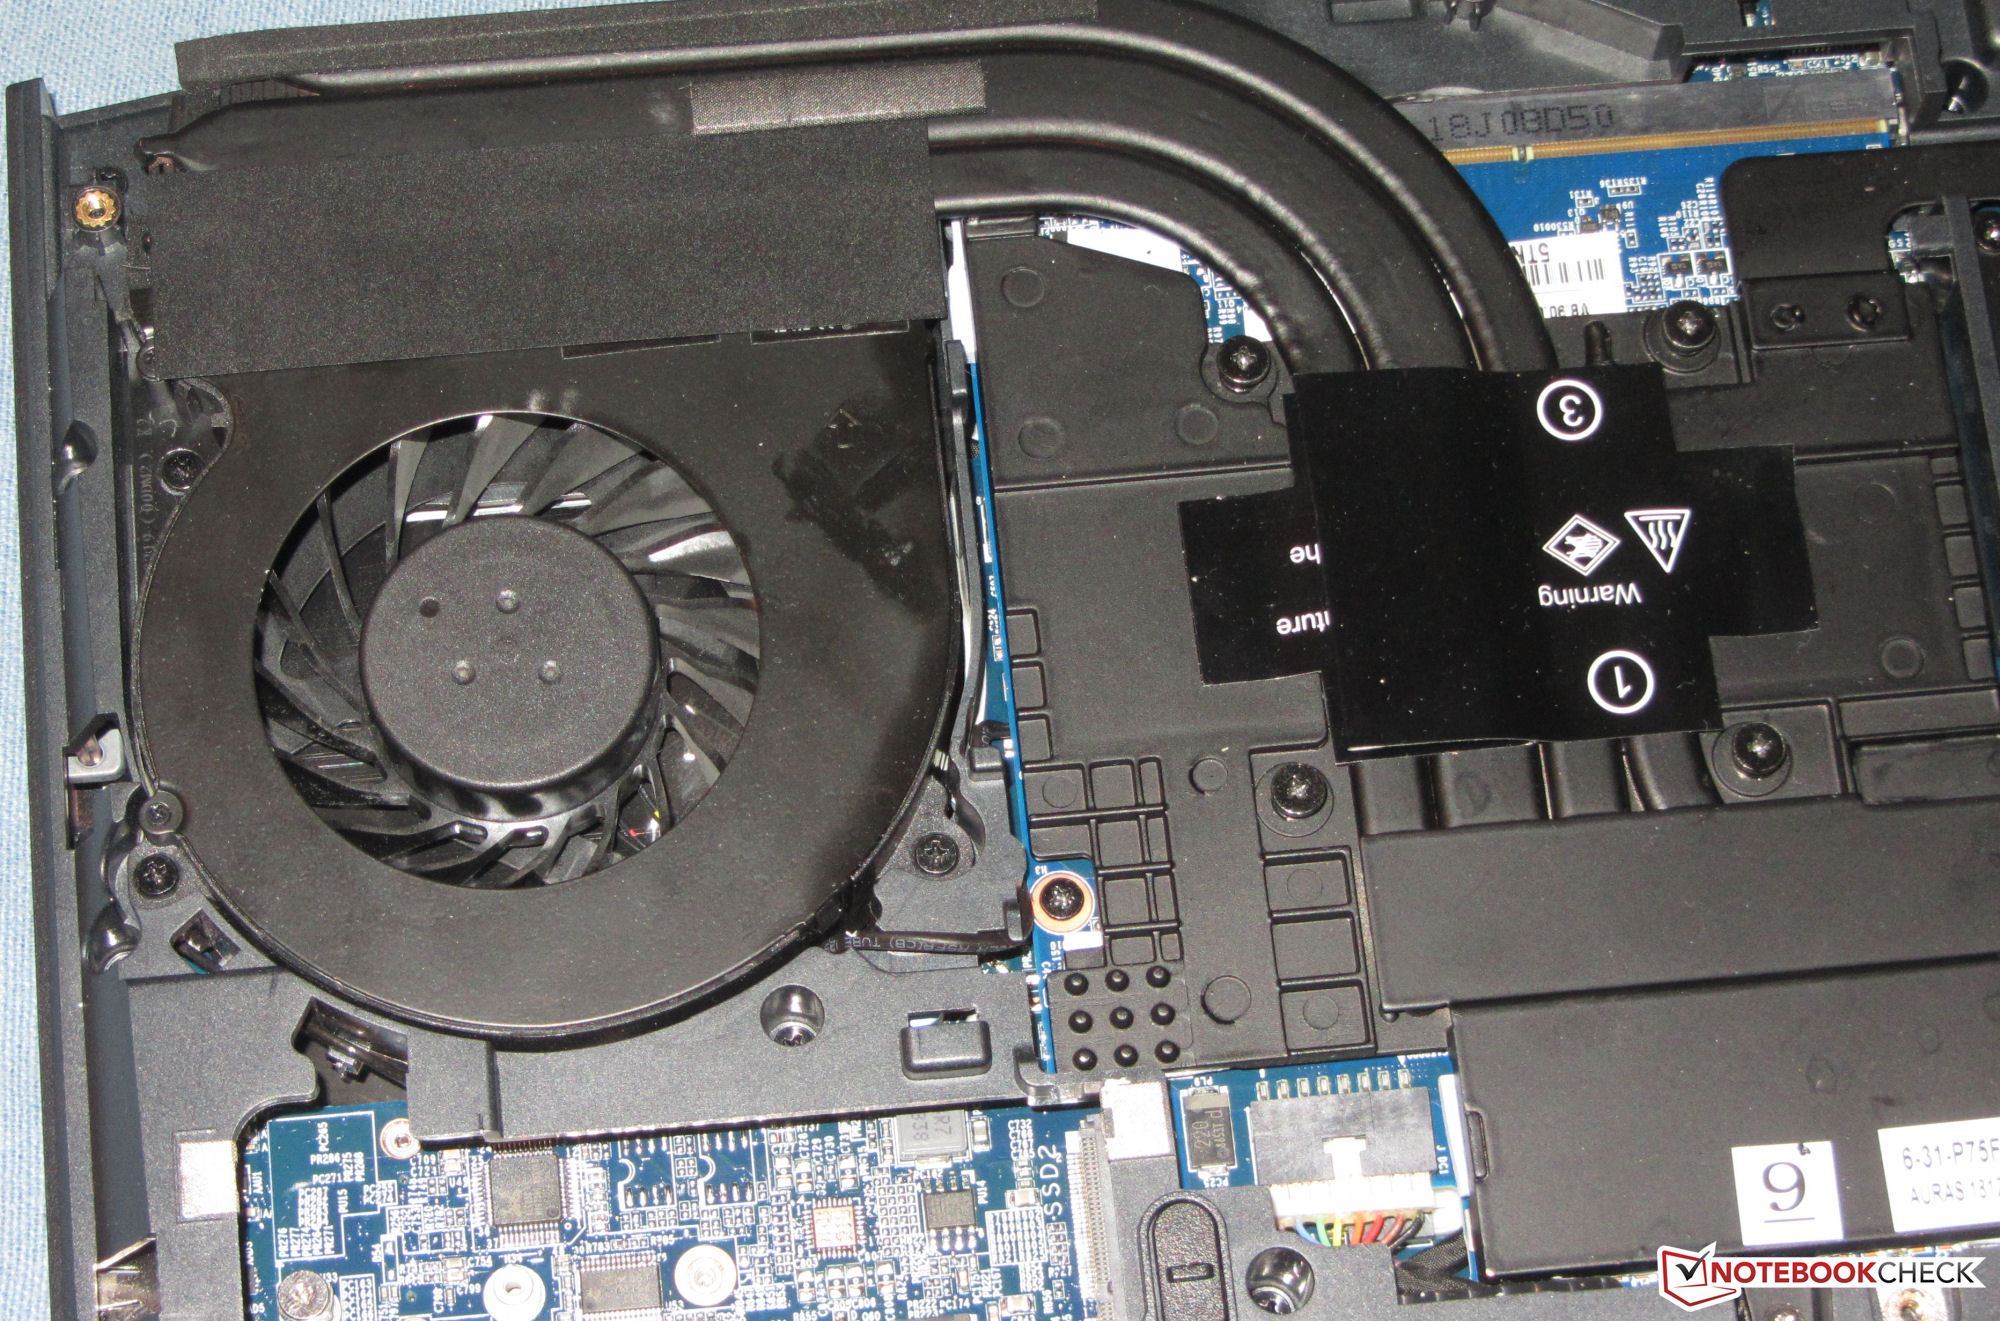
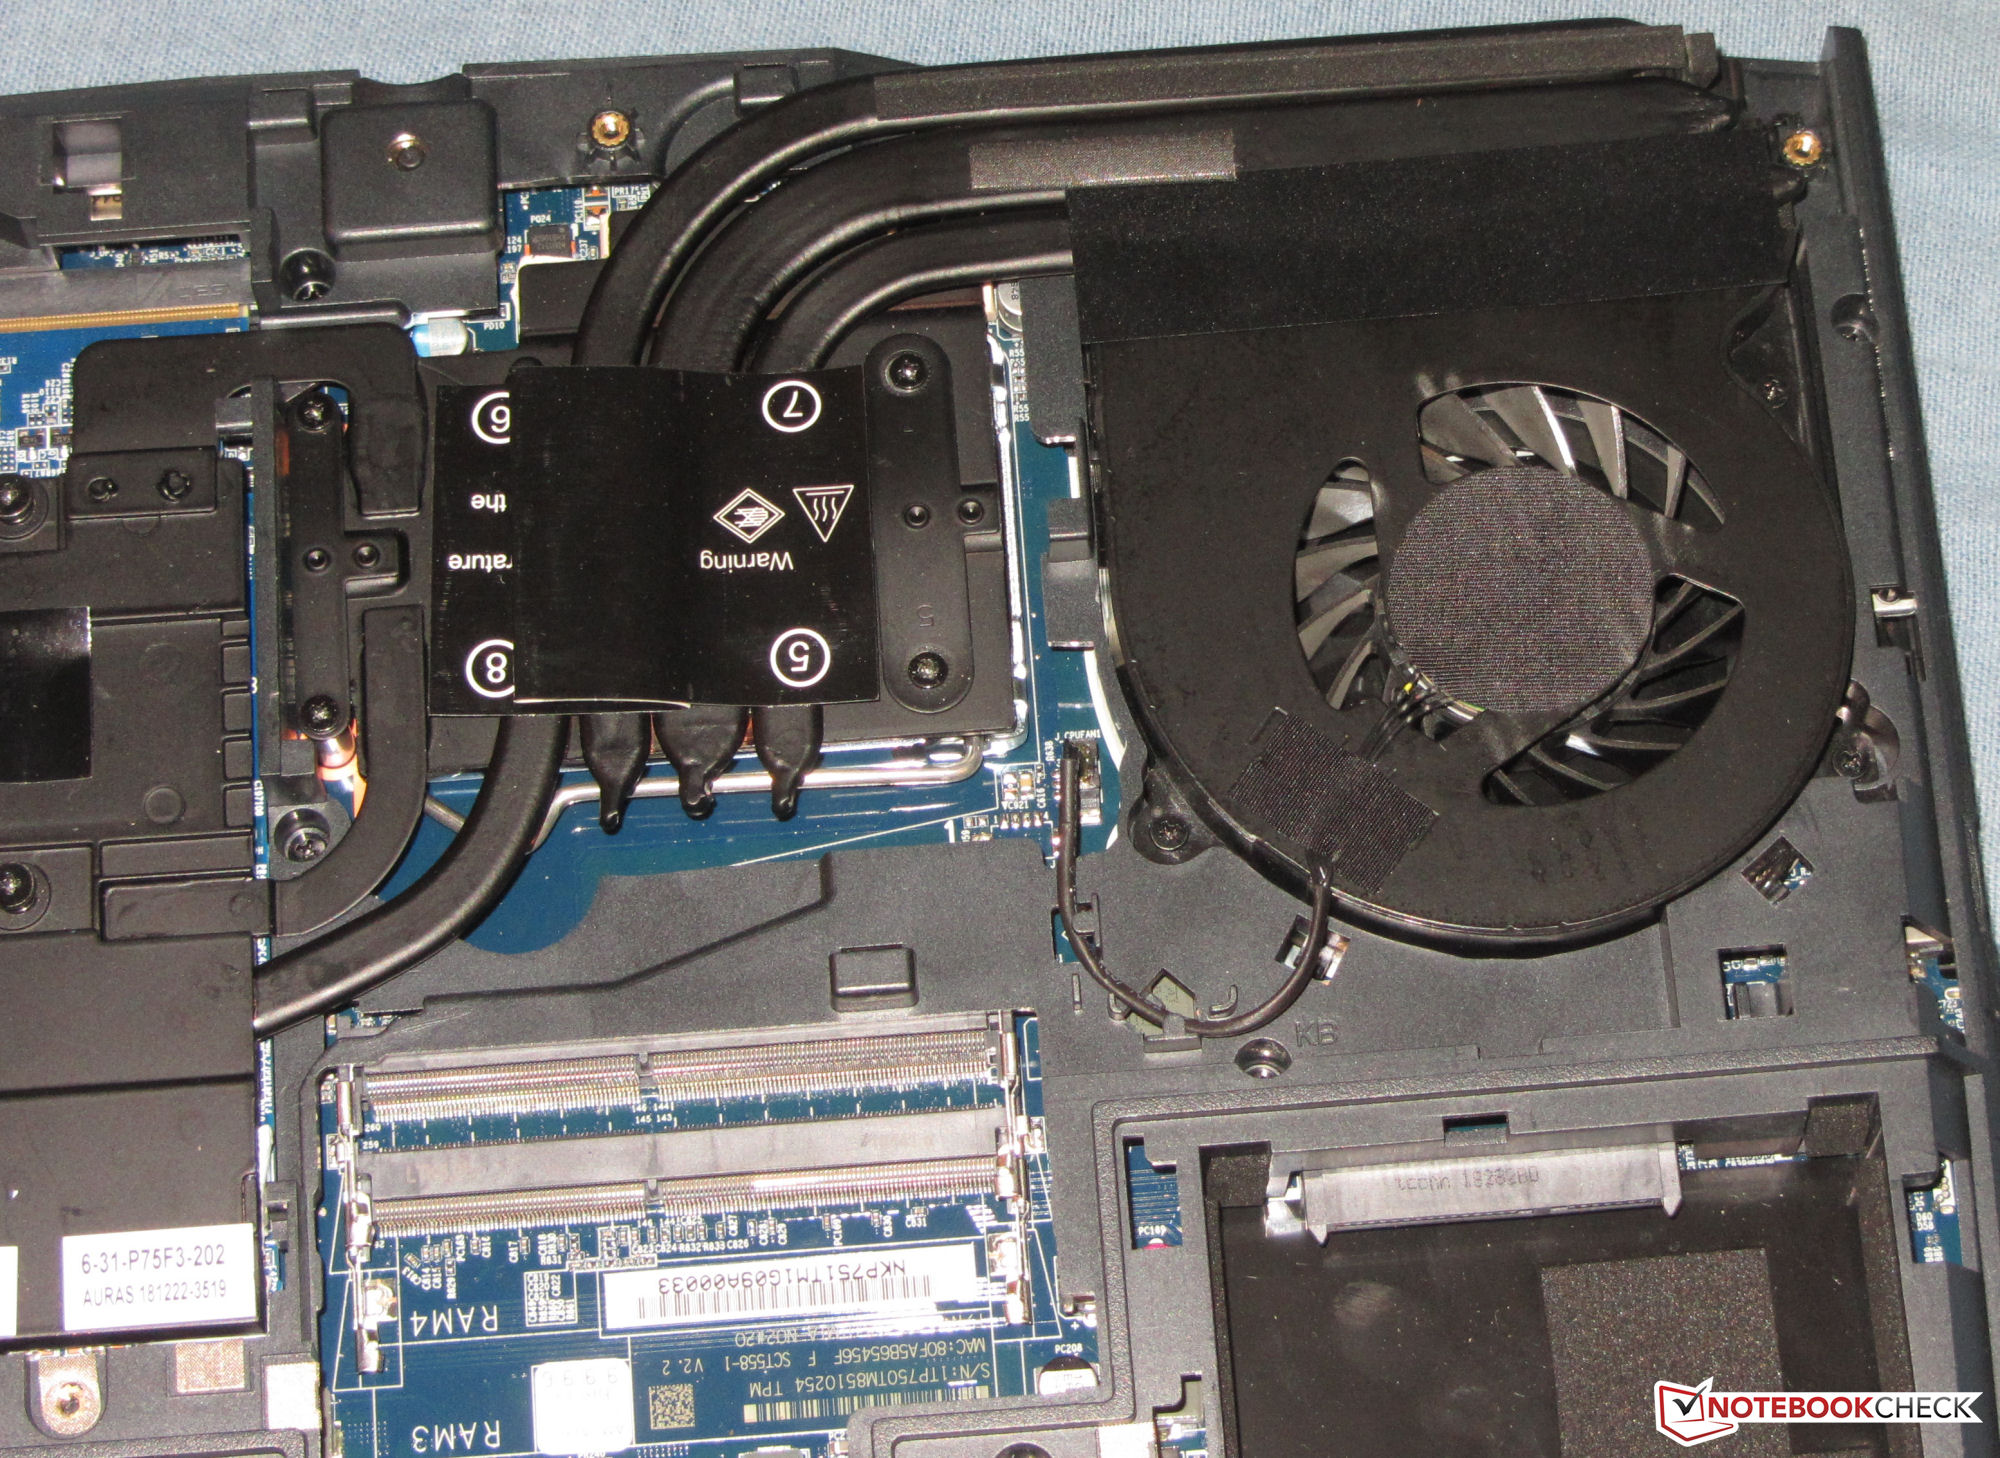
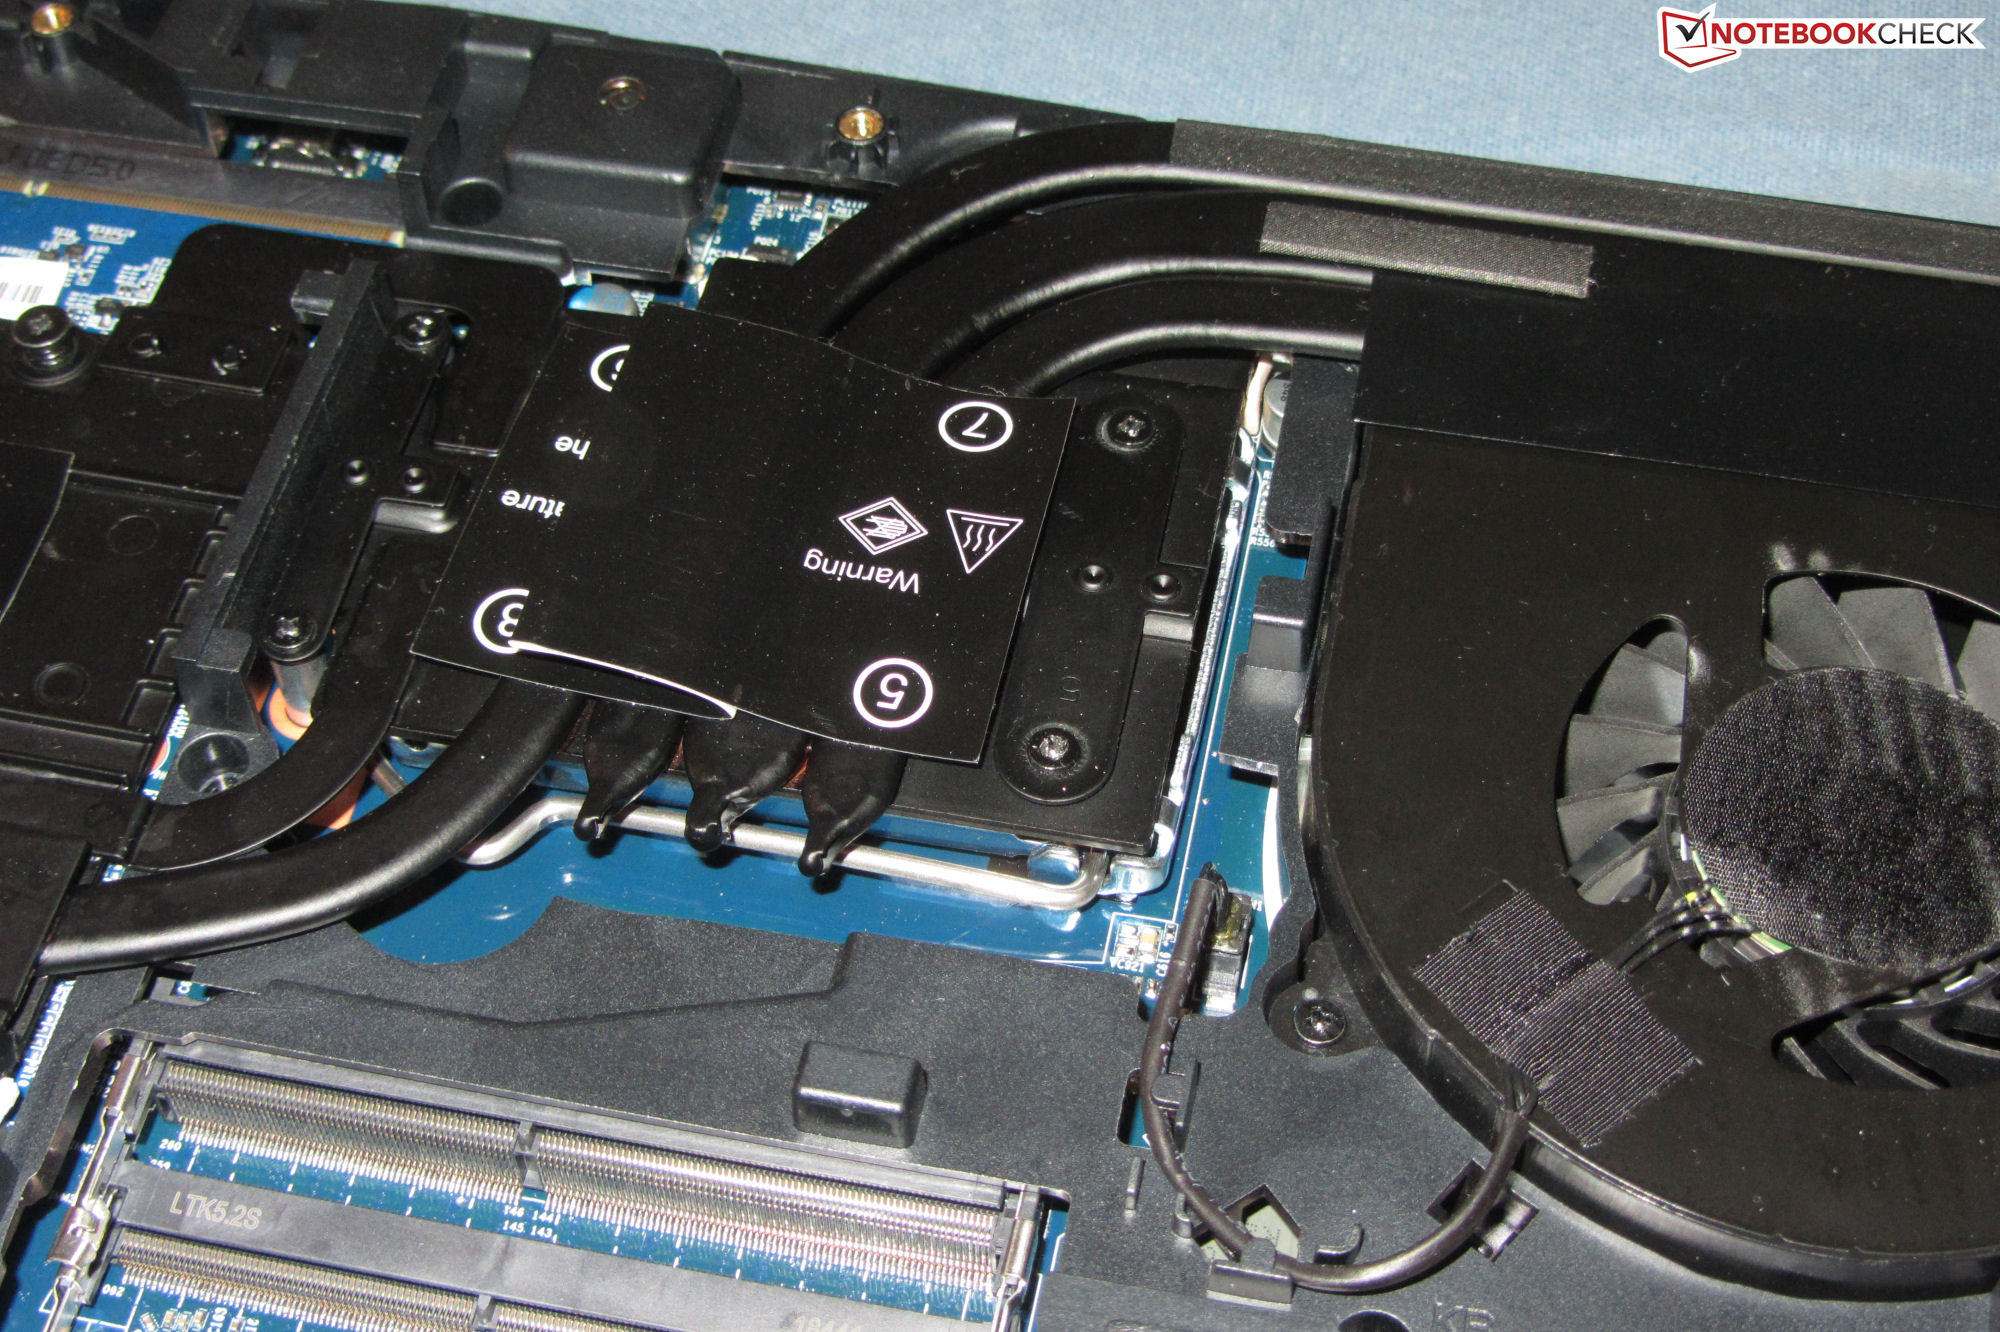
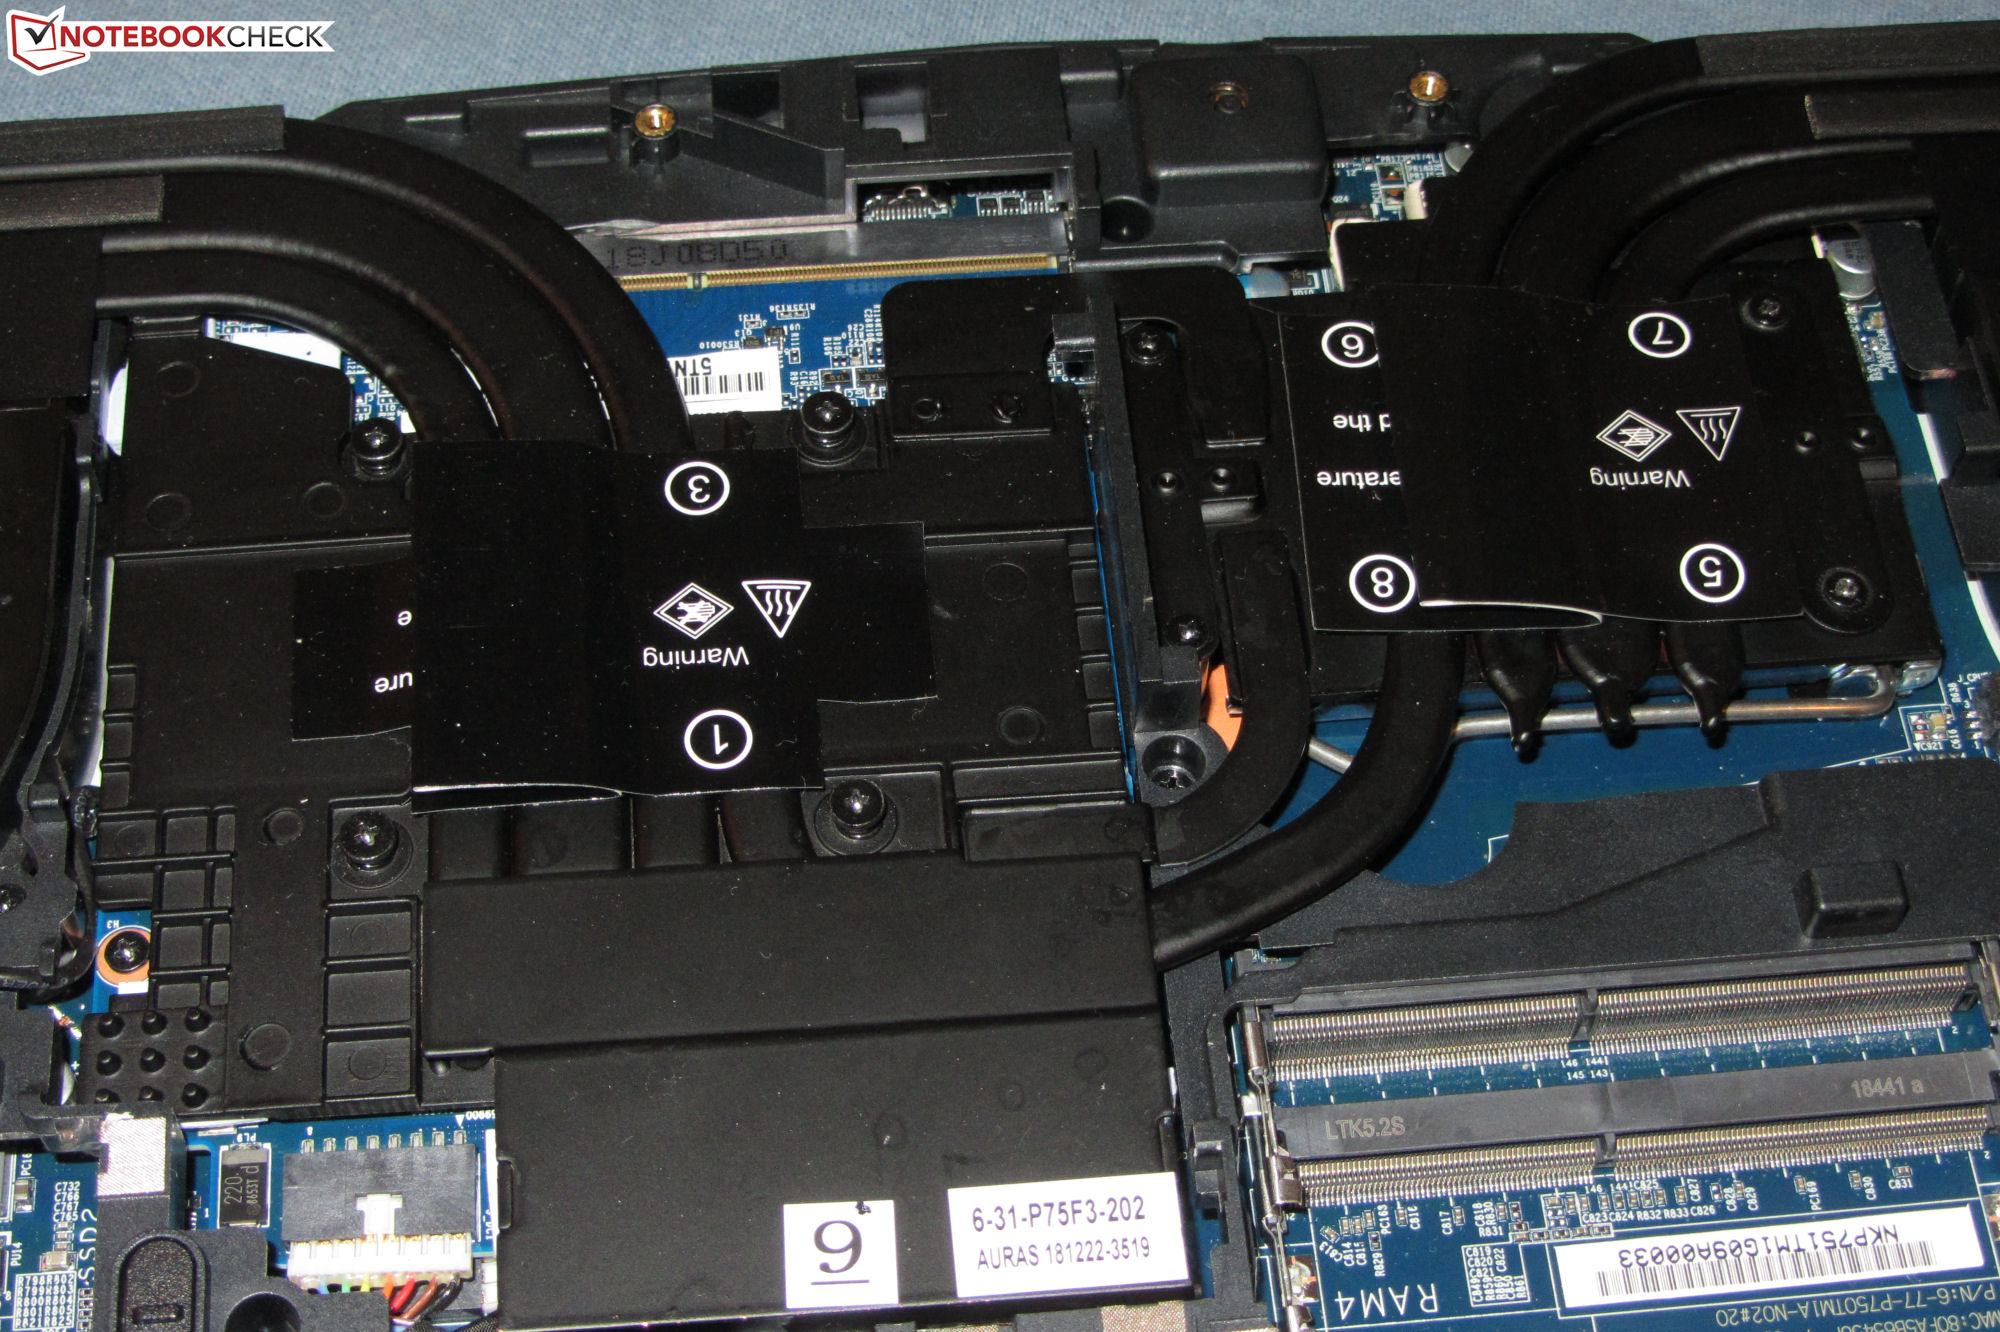
Maintaining and upgrading the notebook turned out to be a piece of cake. There are two large maintenance openings at the bottom giving you access to the two SATA III bays as well as the two M.2 slots (one used), and two of the four RAM slots. The other two slots are hidden behind the removable keyboard. As mentioned before both the CPU and GPU are socketed and therefore swappable. However, we advise you to contact the manufacturer beforehand to make sure your hardware of choice is supported.
Warranty
By default, Schenker sells its devices with a three-year pickup and return warranty. You can save some money by opting for a 24-month warranty instead.
Input Devices
Keyboard
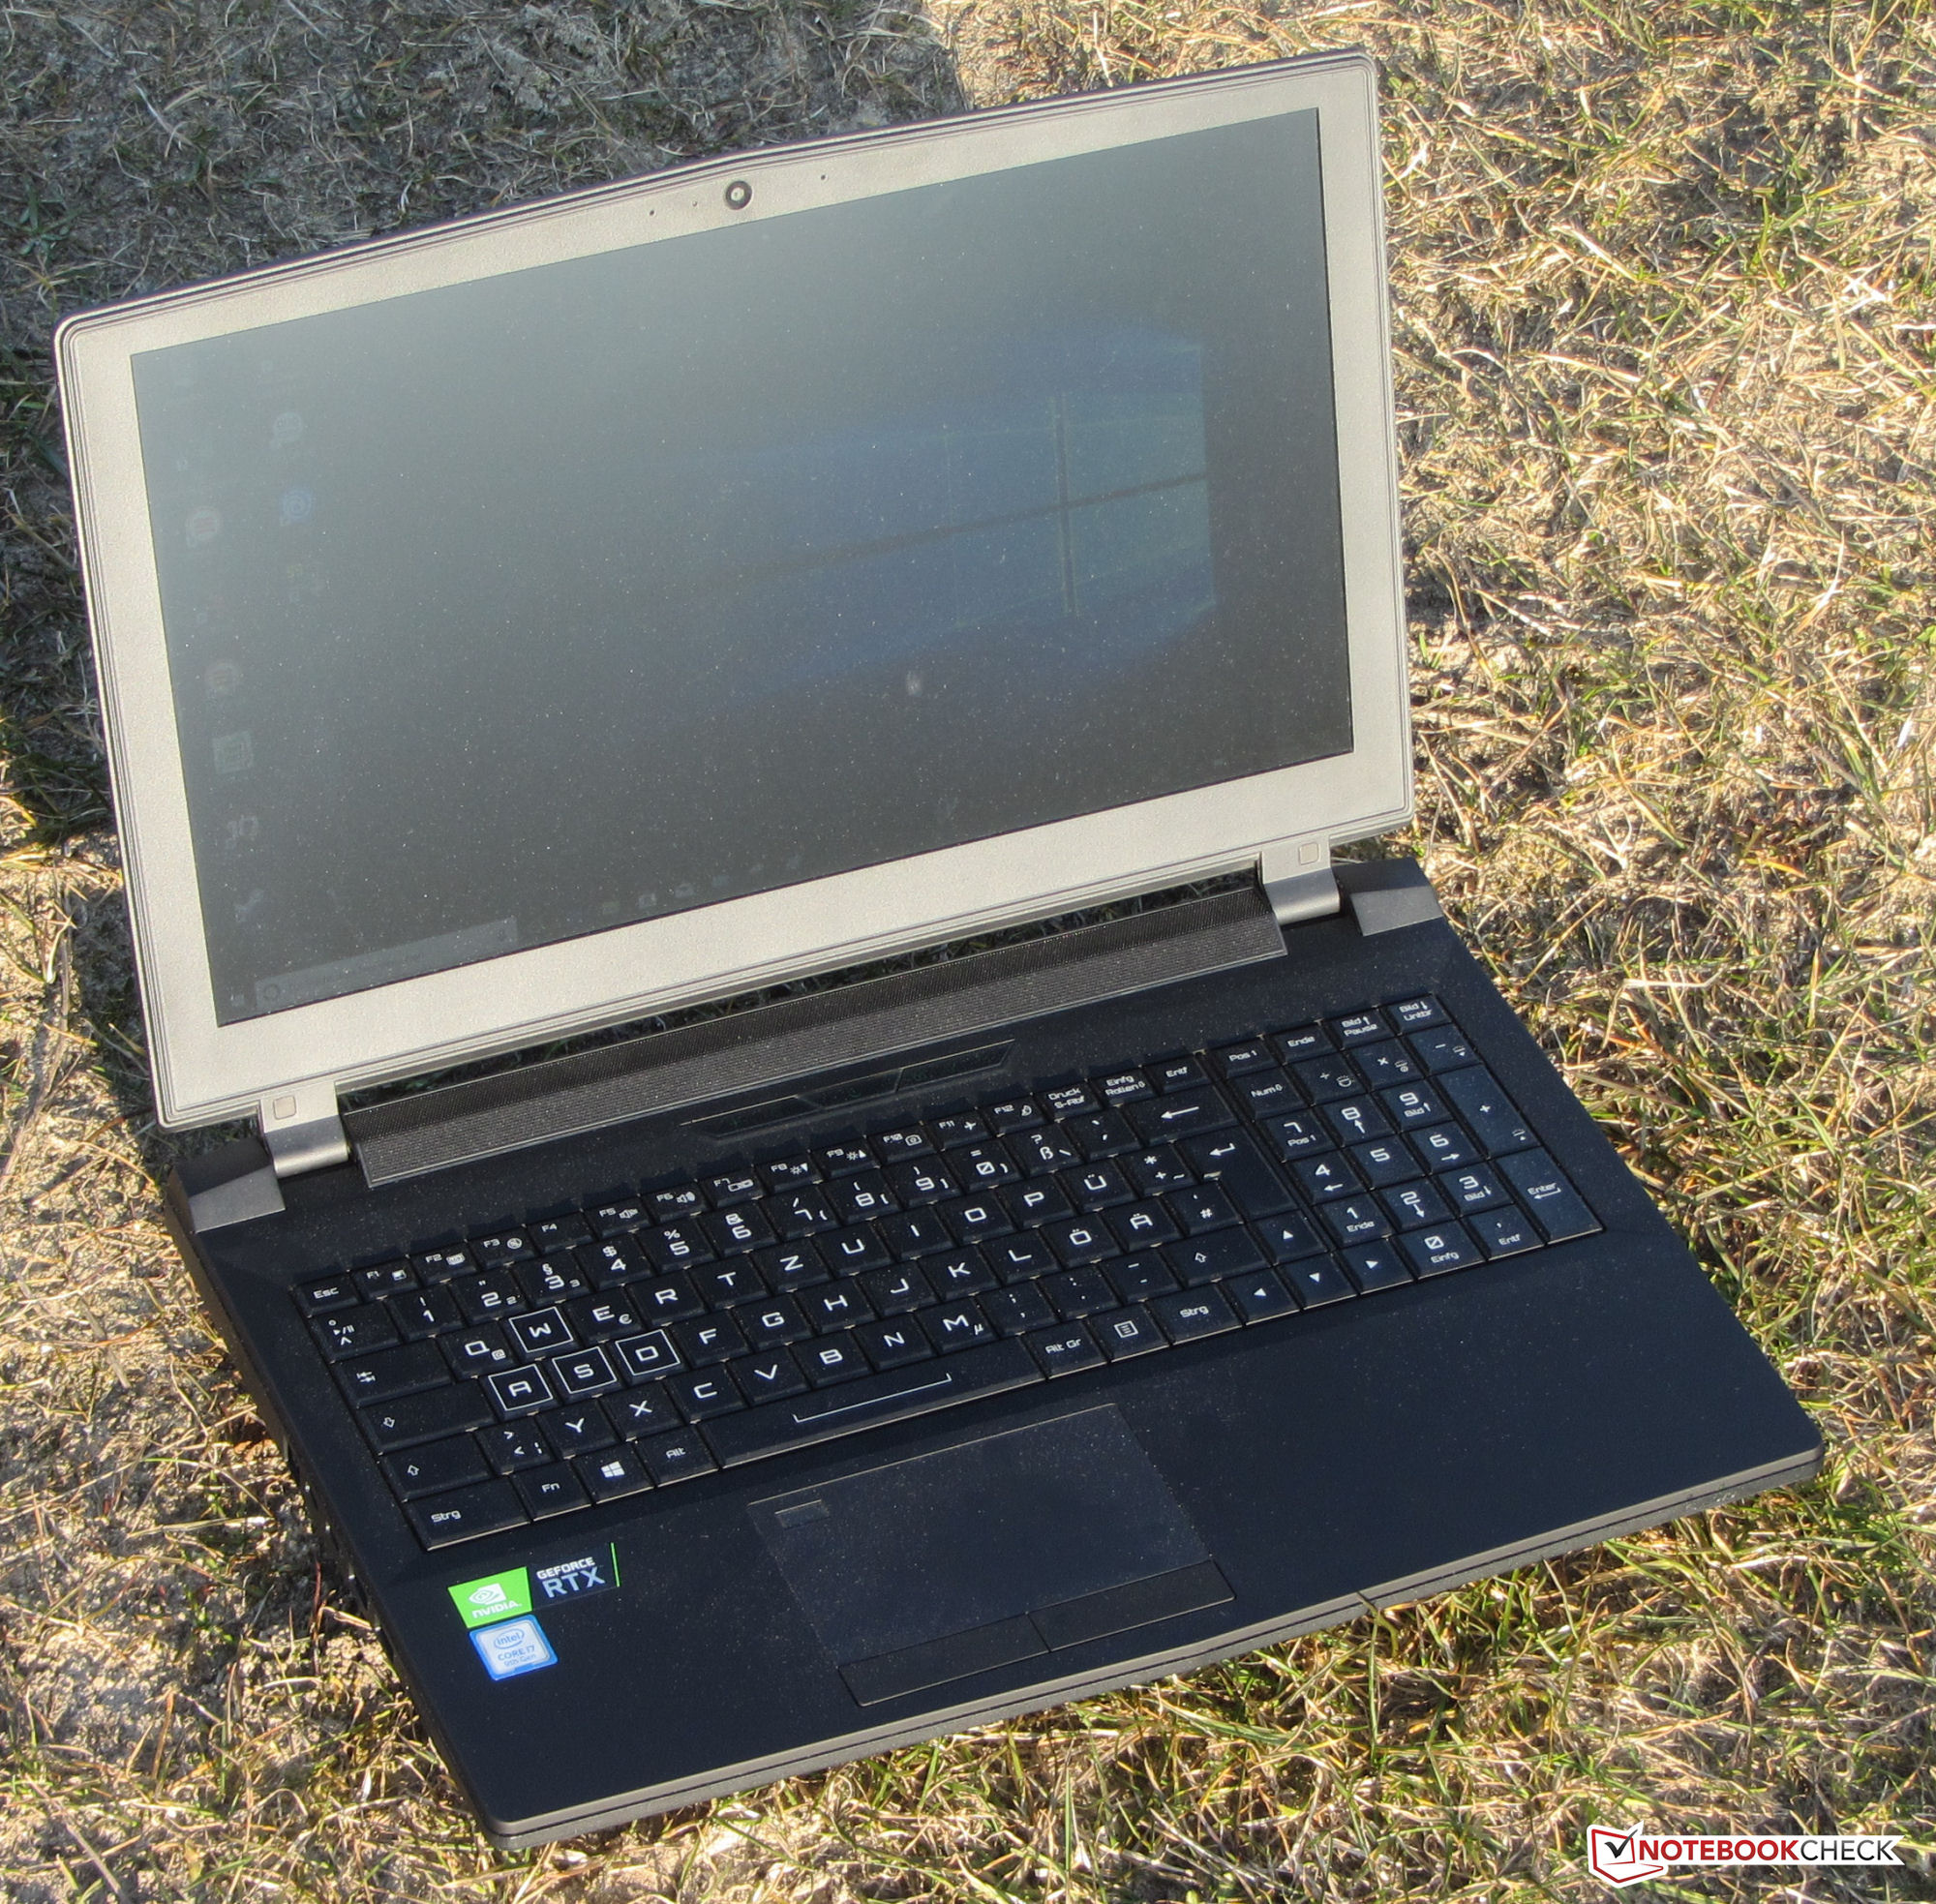
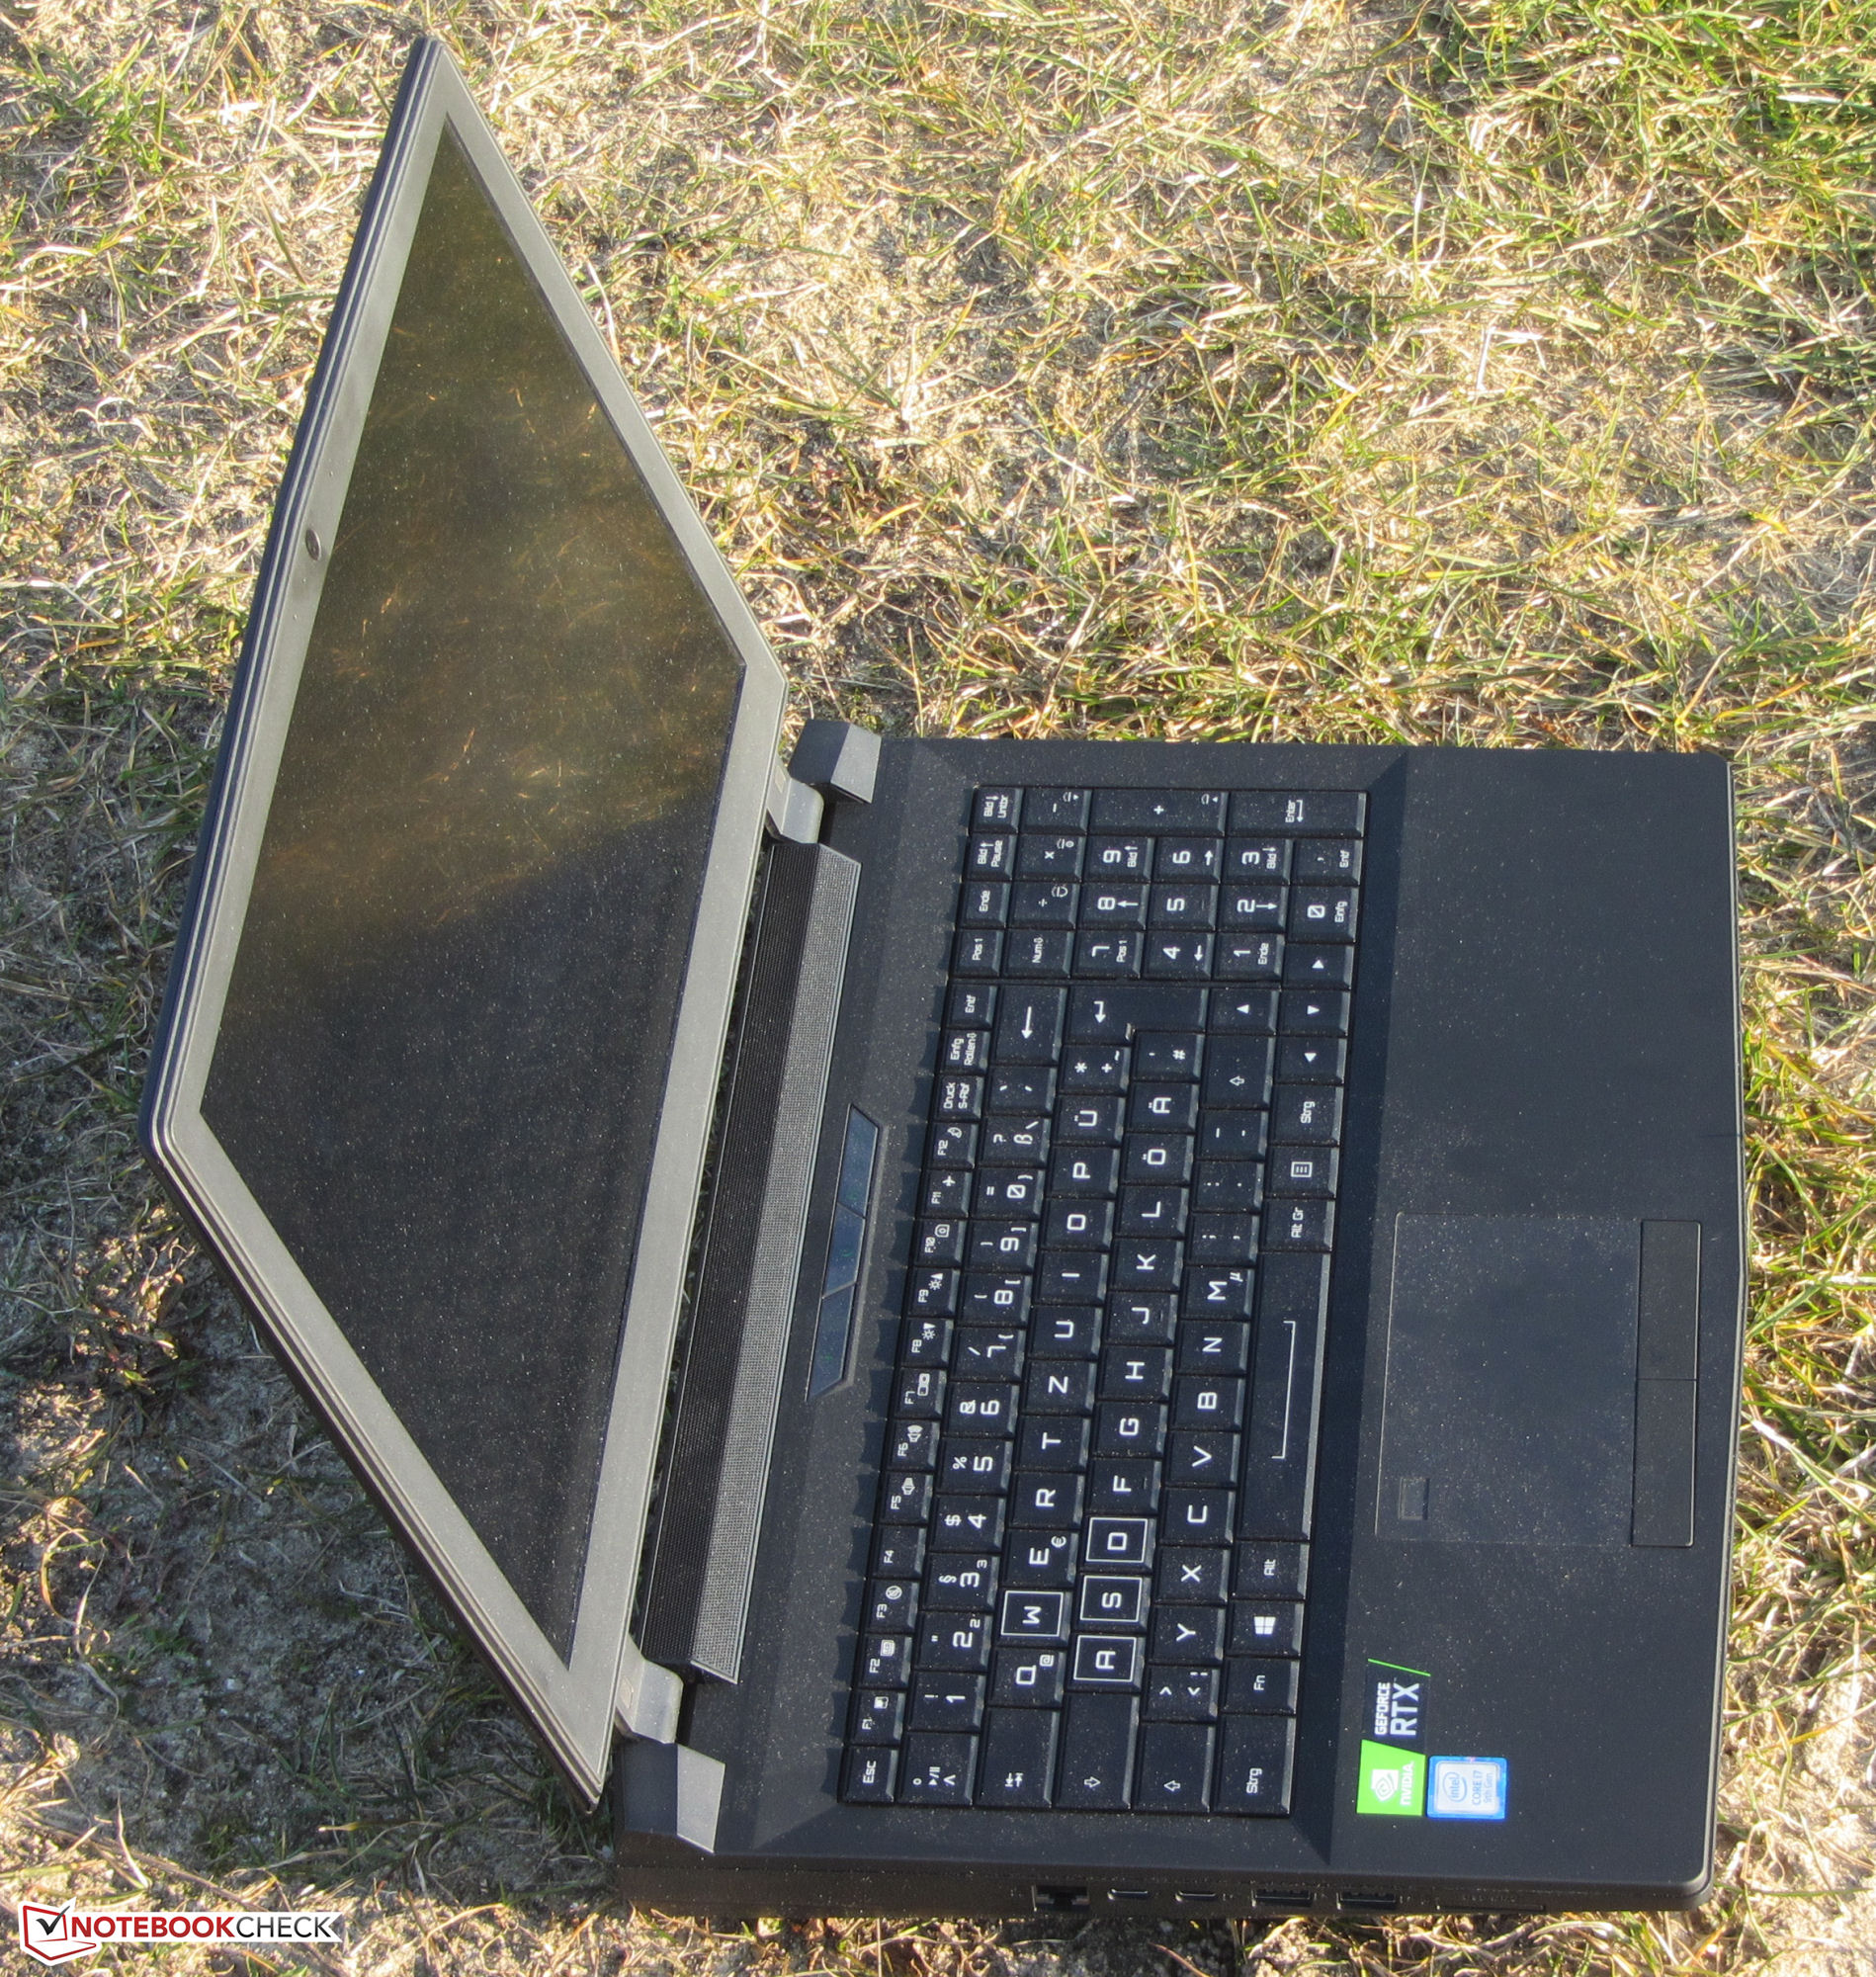
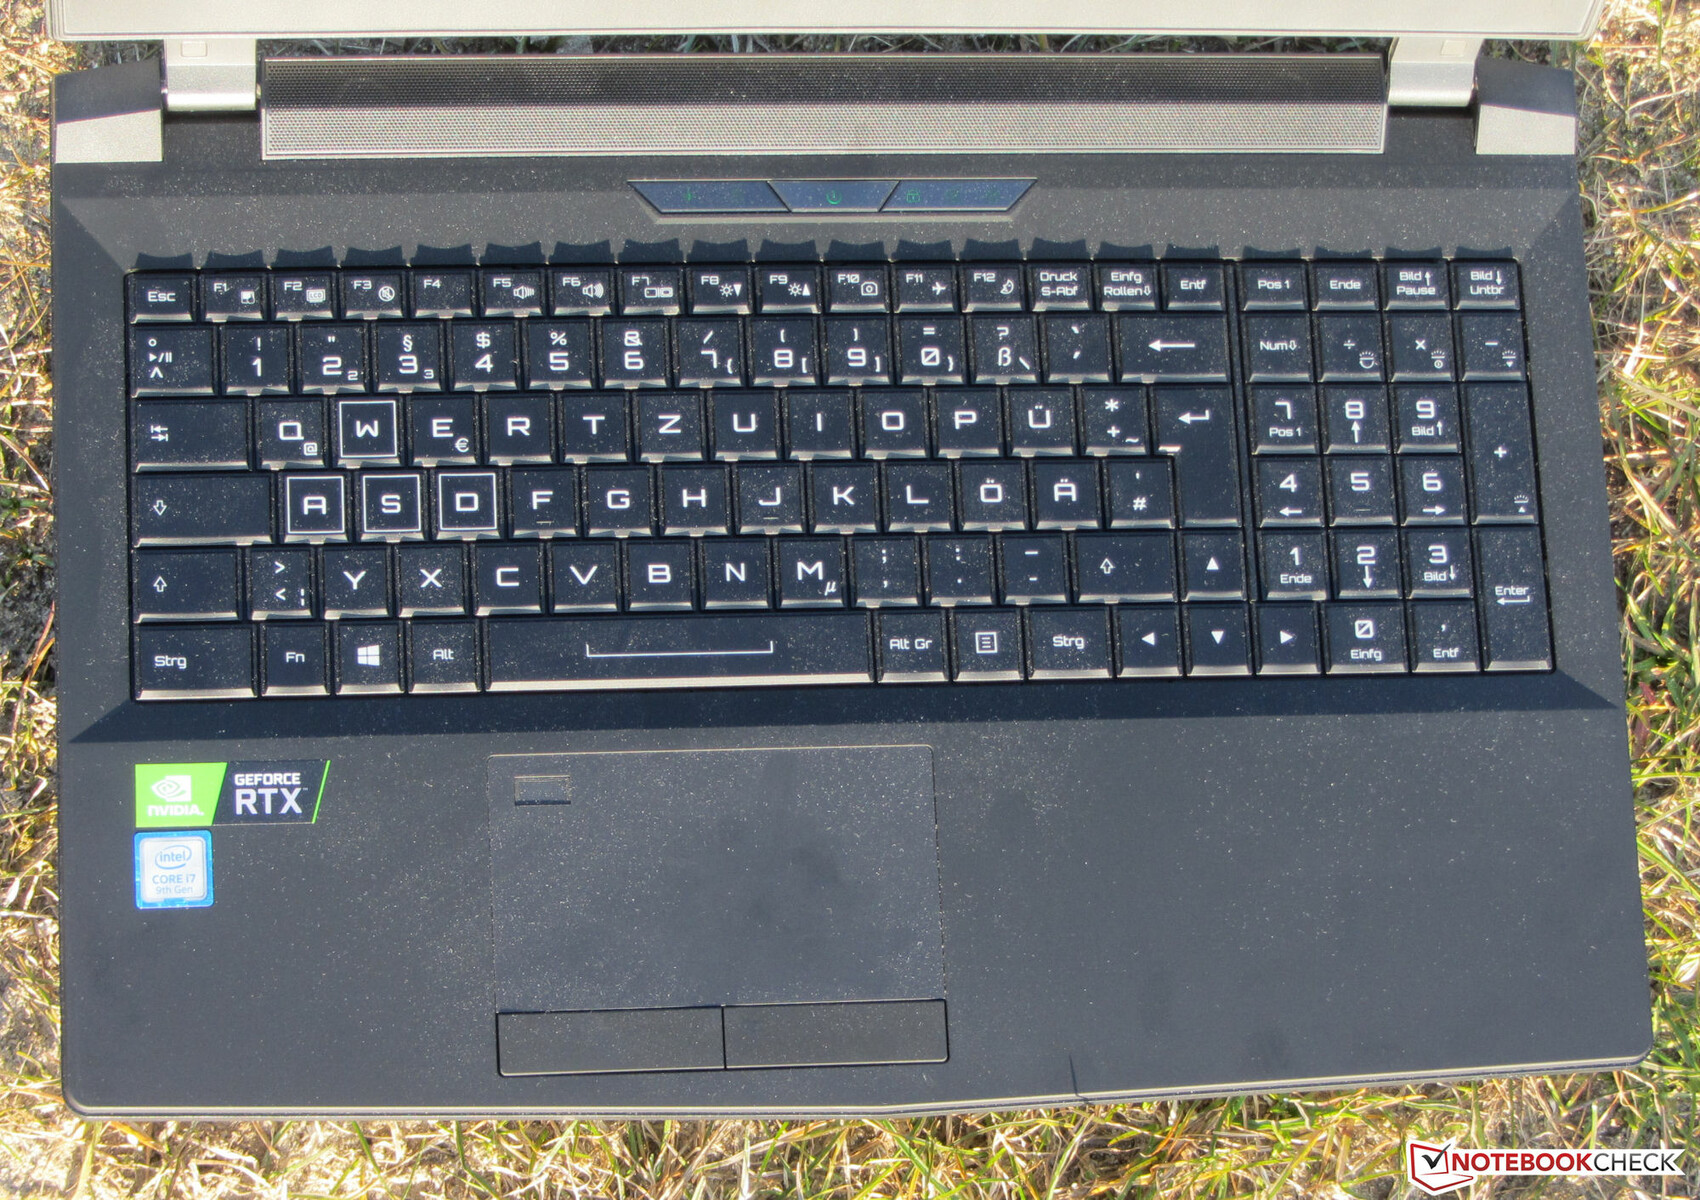
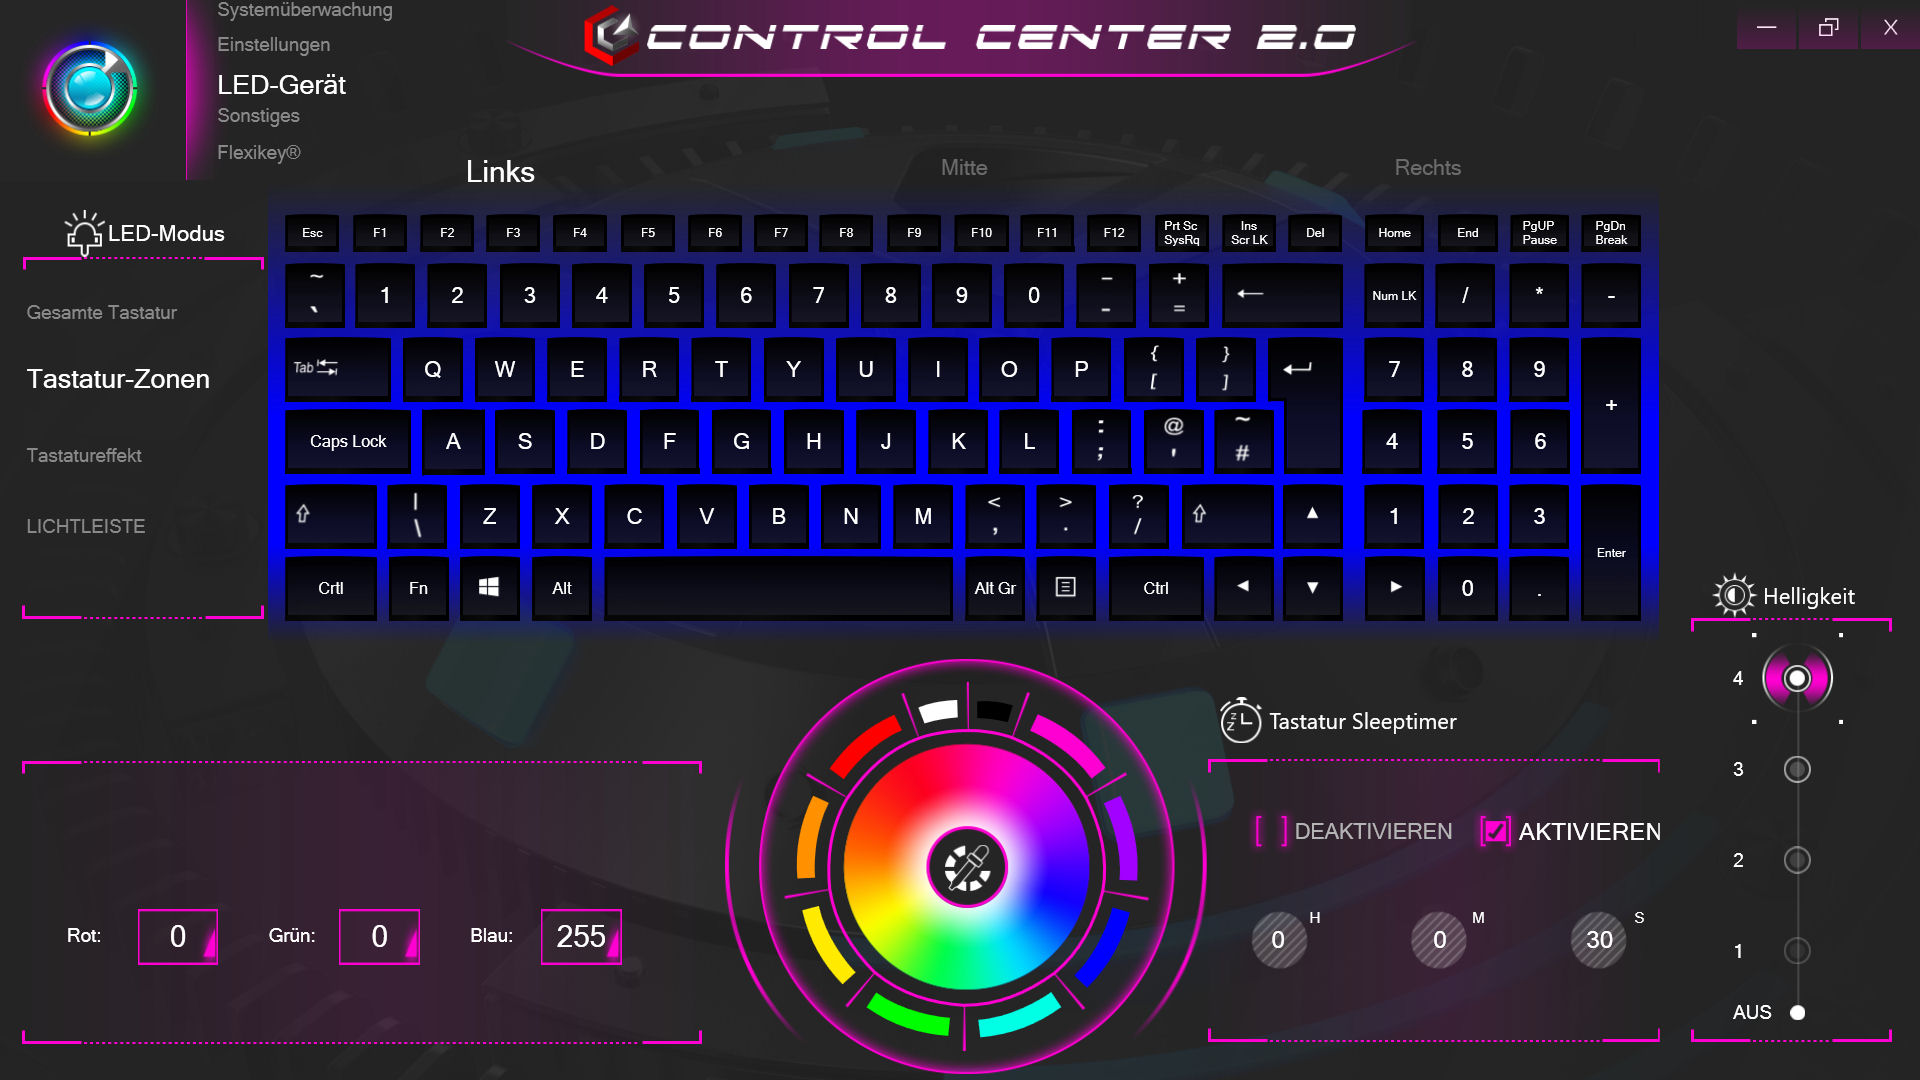
Unlike most other modern notebooks the XMG Ultra 15 does not have a chiclet keyboard. Instead, it features a regular keyboard with large 18 x 18 mm concave keycaps with medium travel, a well-defined accentuation point, and a very pleasant and agreeable level of resistance. The keyboard did not flex while typing, and it comes with a multi-level RGB backlight and a numpad. All things considered, the XMG Ultra 15 features a well-made and decent gaming keyboard usable for everyday tasks.
Touchpad
The multitouch-capable touchpad measured 10.7 x 6.2 cm and was therefore large enough for comfortable gesture input. Its surface was very smooth and precise. At the bottom edge we find two dedicated mouse buttons with medium travel and a well-defined accentuation point.
Display

The matte 15.6-inch display runs at a native resolution of 1920x1080. While its contrast ratio was very good (1.547:1), its brightness of just 264 nits was definitely too low for a device at this price point. We would have expected at least 300 nits. It also suffered from noticeable halations all around the edges that were even visible on non-black backgrounds. On a more positive note, we failed to detect any hints of PWM.
The 144 Hz panel supports Nvidia’s G-Sync technology which dynamically synchronizes the frame rates of the GPU and display in order to produce a smoother image when gaming.
| |||||||||||||||||||||||||
Brightness Distribution: 89 %
Center on Battery: 263 cd/m²
Contrast: 1547:1 (Black: 0.17 cd/m²)
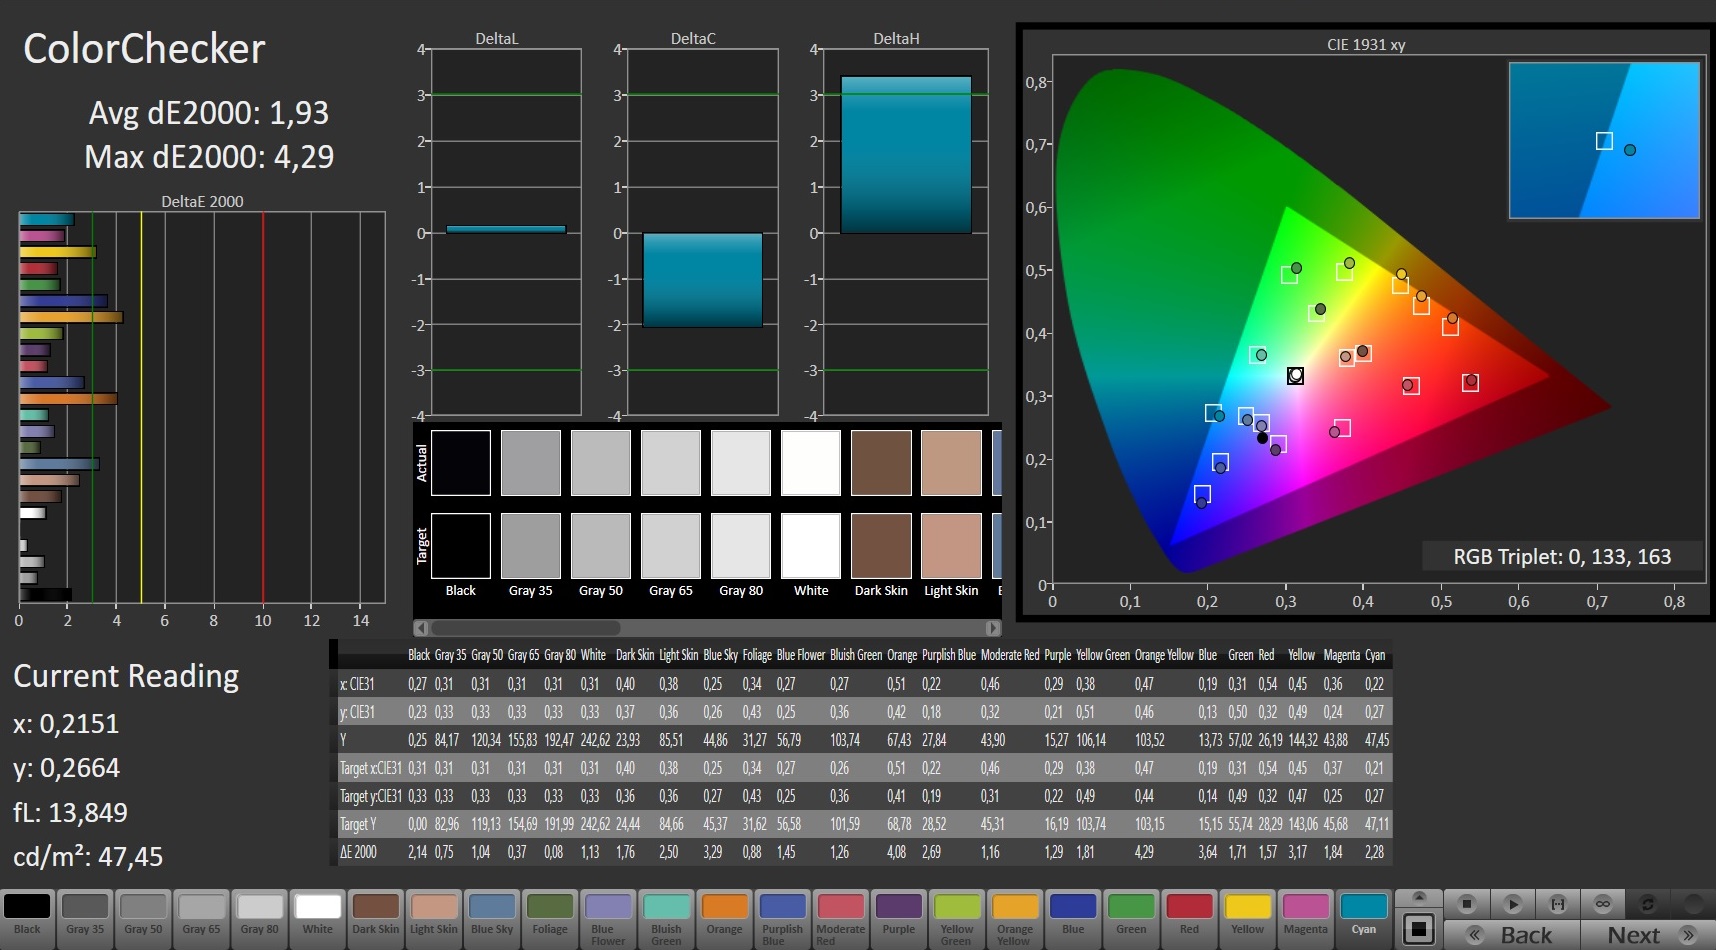
ΔE ColorChecker Calman: 4.45 | ∀{0.5-29.43 Ø4.73}
calibrated: 1.93
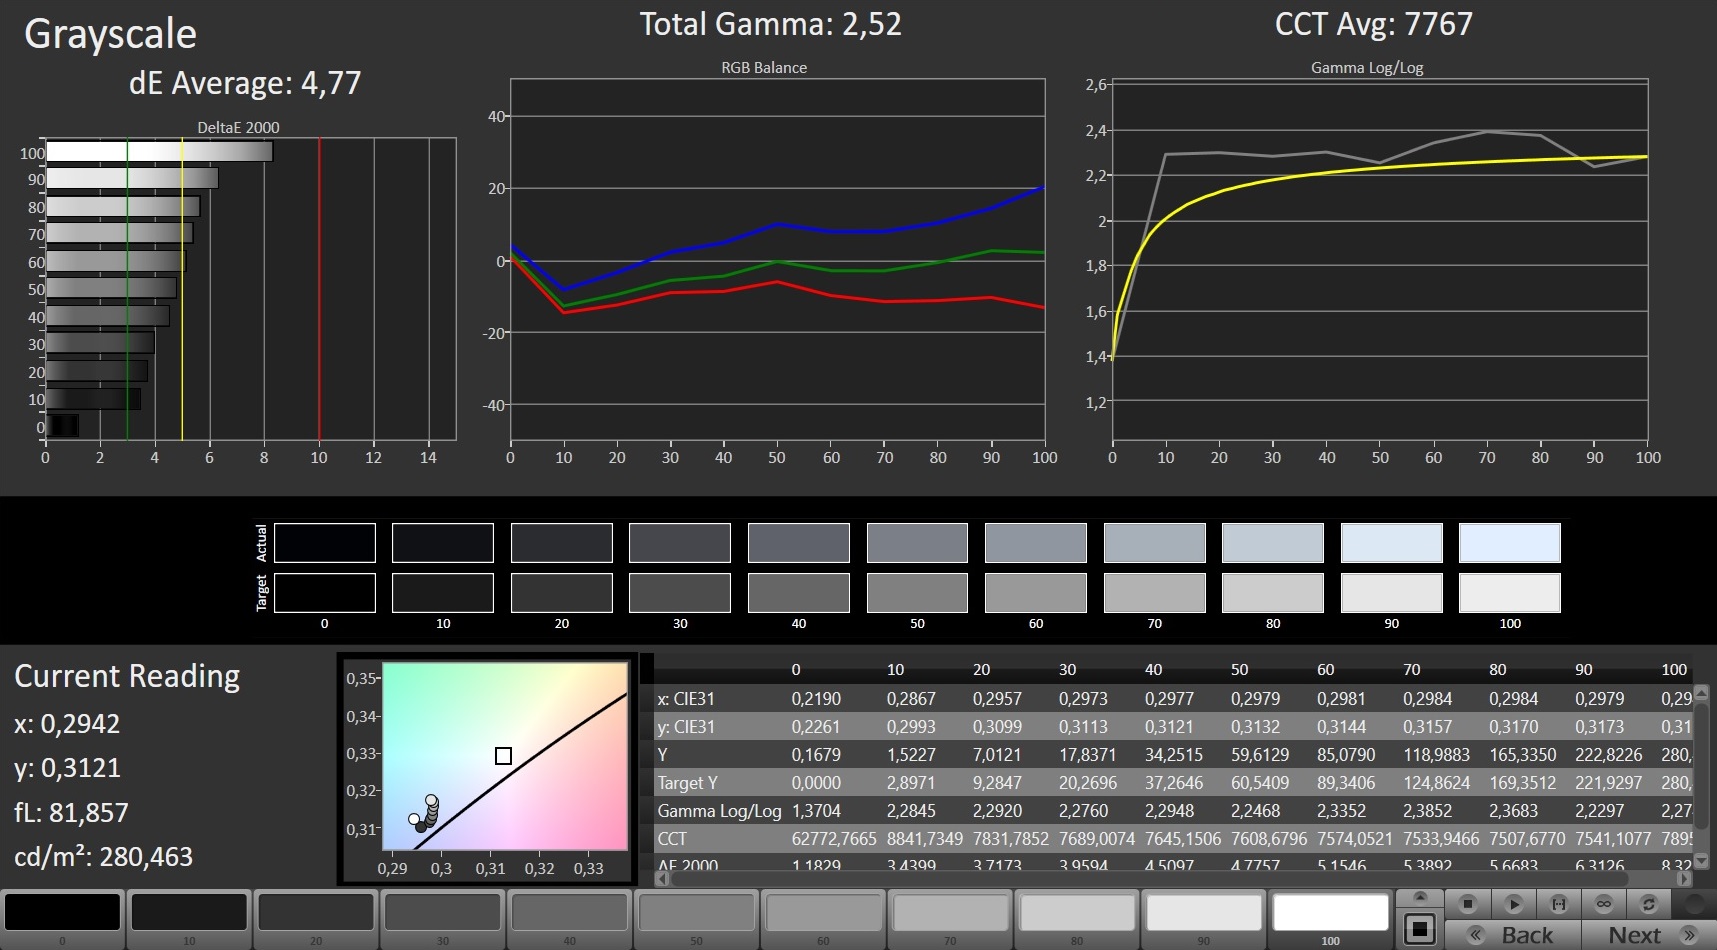
ΔE Greyscale Calman: 4.77 | ∀{0.09-98 Ø4.97}
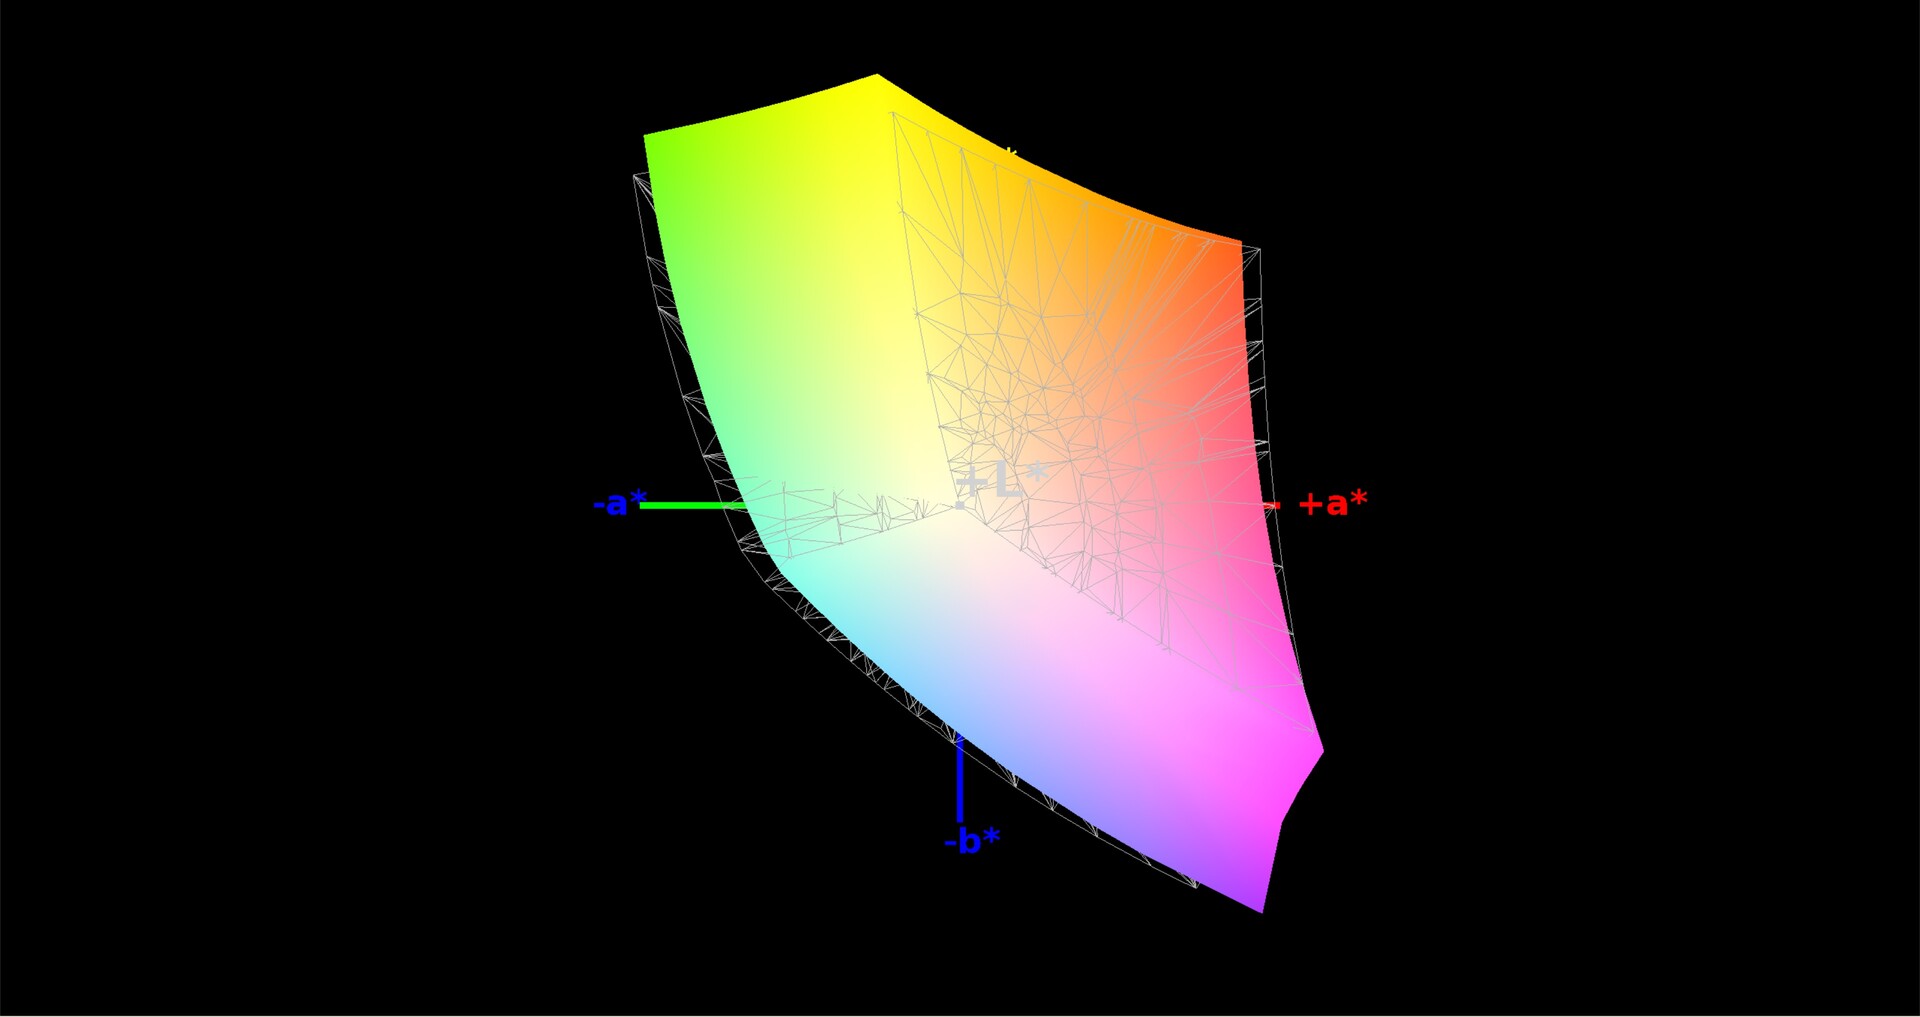
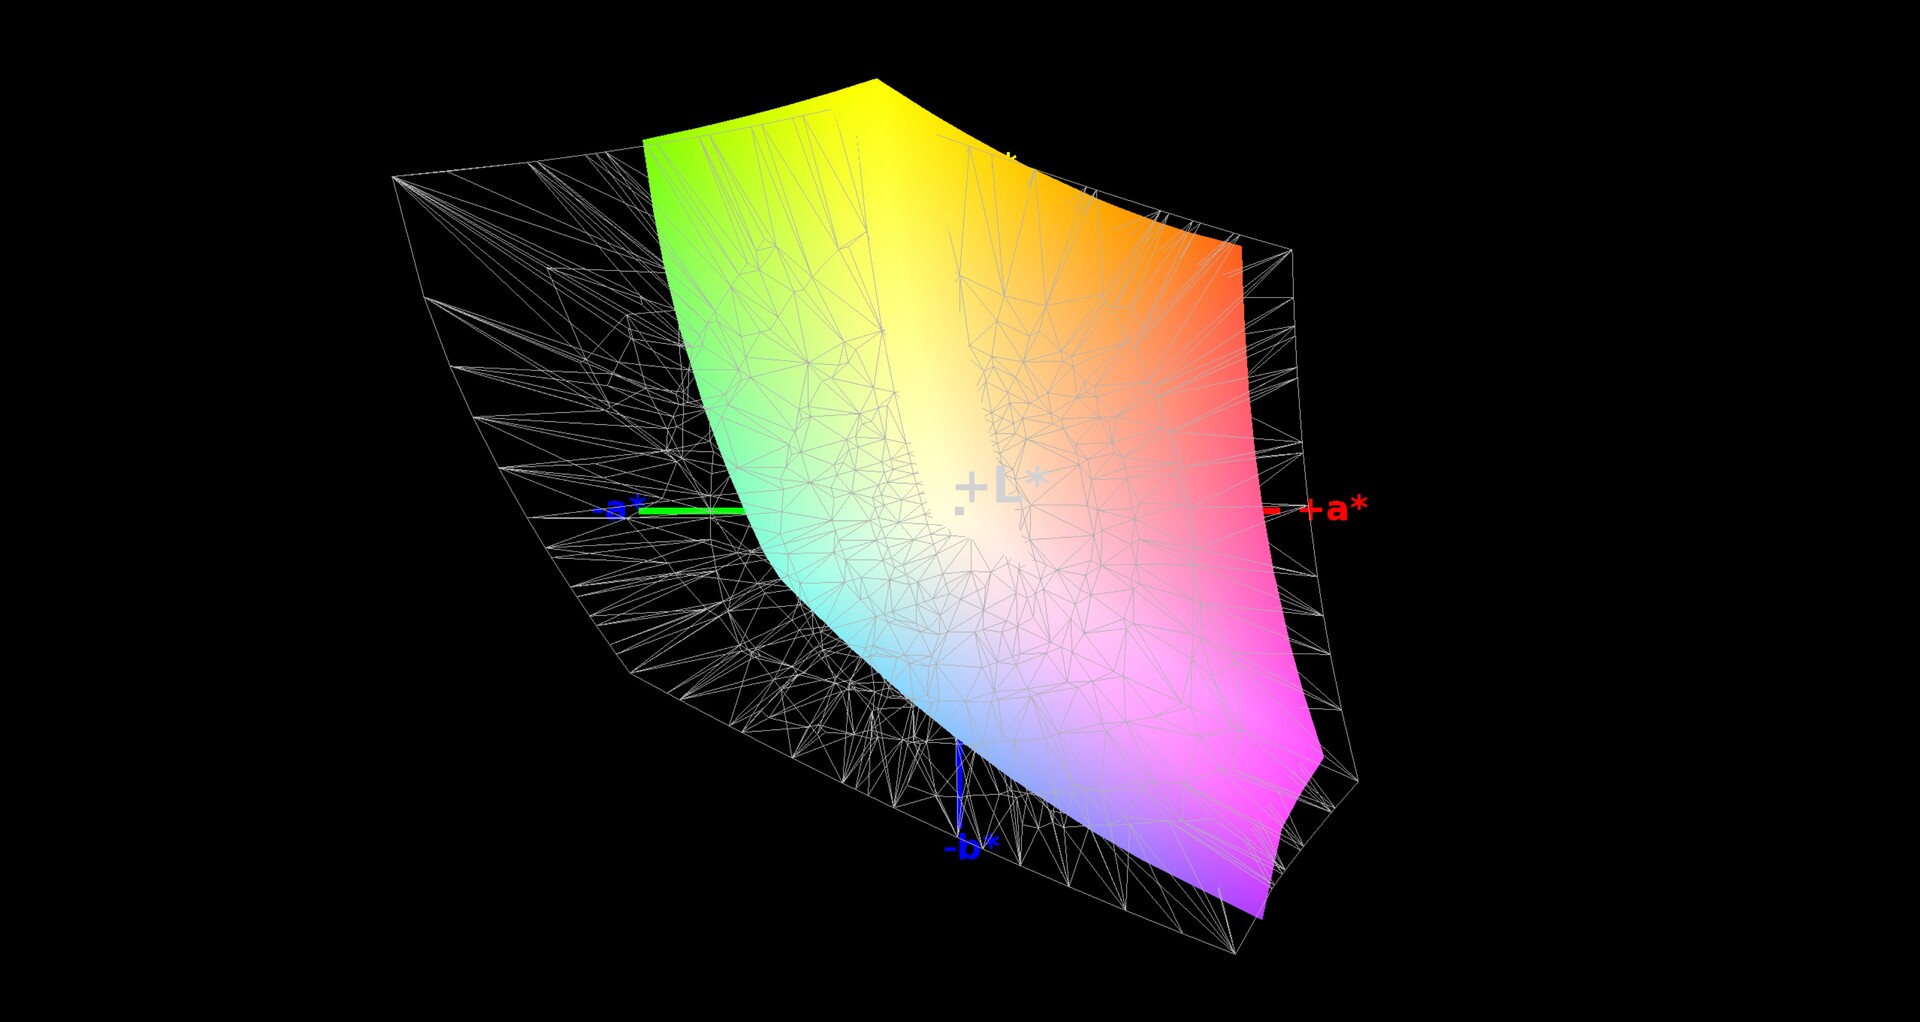
93% sRGB (Argyll 1.6.3 3D)
60% AdobeRGB 1998 (Argyll 1.6.3 3D)
67.1% AdobeRGB 1998 (Argyll 3D)
92.6% sRGB (Argyll 3D)
66.1% Display P3 (Argyll 3D)
Gamma: 2.52
CCT: 7767 K
| Schenker XMG Ultra 15 Turing AU Optronics B156HAN07.0 (AUO70ED), IPS, 1920x1080 | Schenker XMG Ultra 15 AU Optronics B156HTN05.2 (AUO52ED), TN, 1920x1080 | Alienware 15 R4 LG Philips LP156WF6 (LGD0540), IPS, 1920x1080 | Gigabyte Aero 15-X9 LGD05C0, IPS, 1920x1080 | Razer Blade 15 RTX 2070 Max-Q LG Philips LGD05C0, IPS, 1920x1080 | Acer Predator Triton 500 AU Optronics B156HAN08.2 (AUO82ED), IPS, 1920x1080 | |
|---|---|---|---|---|---|---|
| Display | -1% | -5% | -2% | 0% | -2% | |
| Display P3 Coverage (%) | 66.1 | 66.8 1% | 65.7 -1% | 63.5 -4% | 65.3 -1% | 64.2 -3% |
| sRGB Coverage (%) | 92.6 | 90.7 -2% | 86.4 -7% | 93.1 1% | 94.9 2% | 92.6 0% |
| AdobeRGB 1998 Coverage (%) | 67.1 | 66.3 -1% | 63.1 -6% | 64.5 -4% | 66.3 -1% | 65.7 -2% |
| Response Times | 0% | -101% | 1% | 7% | 34% | |
| Response Time Grey 50% / Grey 80% * (ms) | 17.6 ? | 24.2 ? -37% | 37.6 ? -114% | 16.4 ? 7% | 16.8 ? 5% | 8 ? 55% |
| Response Time Black / White * (ms) | 12.8 ? | 8 ? 37% | 24 ? -88% | 13.6 ? -6% | 11.6 ? 9% | 11.2 ? 13% |
| PWM Frequency (Hz) | 20830 ? | |||||
| Screen | -47% | -14% | 8% | -0% | -8% | |
| Brightness middle (cd/m²) | 263 | 363 38% | 292 11% | 250 -5% | 314.7 20% | 304 16% |
| Brightness (cd/m²) | 264 | 365 38% | 278 5% | 235 -11% | 312 18% | 299 13% |
| Brightness Distribution (%) | 89 | 74 -17% | 88 -1% | 85 -4% | 90 1% | 89 0% |
| Black Level * (cd/m²) | 0.17 | 0.58 -241% | 0.29 -71% | 0.29 -71% | 0.38 -124% | 0.27 -59% |
| Contrast (:1) | 1547 | 626 -60% | 1007 -35% | 862 -44% | 828 -46% | 1126 -27% |
| Colorchecker dE 2000 * | 4.45 | 8.7 -96% | 4.9 -10% | 1.46 67% | 2.56 42% | 4.66 -5% |
| Colorchecker dE 2000 max. * | 8.33 | 12.91 -55% | 10.08 -21% | 2.47 70% | 4.89 41% | 9.65 -16% |
| Colorchecker dE 2000 calibrated * | 1.93 | 2.36 -22% | 2.27 -18% | 1.71 11% | 1.72 11% | |
| Greyscale dE 2000 * | 4.77 | 9.26 -94% | 4.89 -3% | 1.27 73% | 3.4 29% | 5.53 -16% |
| Gamma | 2.52 87% | 2.16 102% | 2.36 93% | 2.4 92% | 2.3 96% | 2.5 88% |
| CCT | 7767 84% | 9390 69% | 7598 86% | 6749 96% | 6435 101% | 8028 81% |
| Color Space (Percent of AdobeRGB 1998) (%) | 60 | 59 -2% | 56 -7% | 60 0% | 60.7 1% | 60 0% |
| Color Space (Percent of sRGB) (%) | 93 | 91 -2% | 86 -8% | 93 0% | 94.6 2% | 93 0% |
| Total Average (Program / Settings) | -16% /
-32% | -40% /
-23% | 2% /
5% | 2% /
1% | 8% /
-1% |
* ... smaller is better
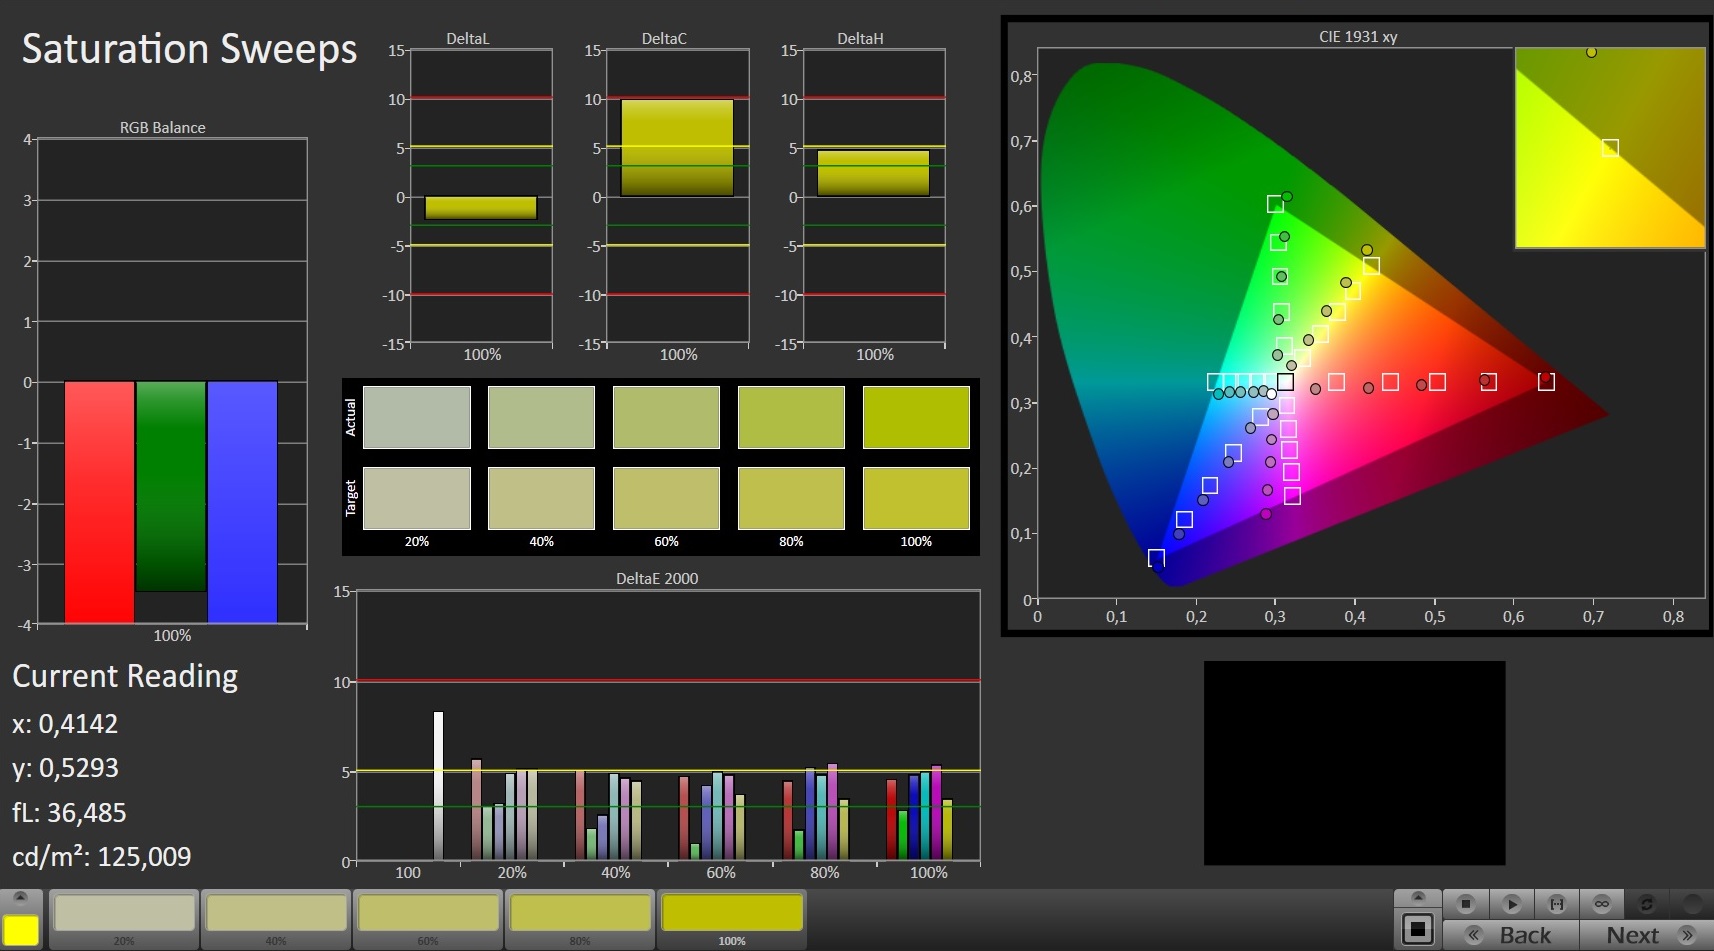
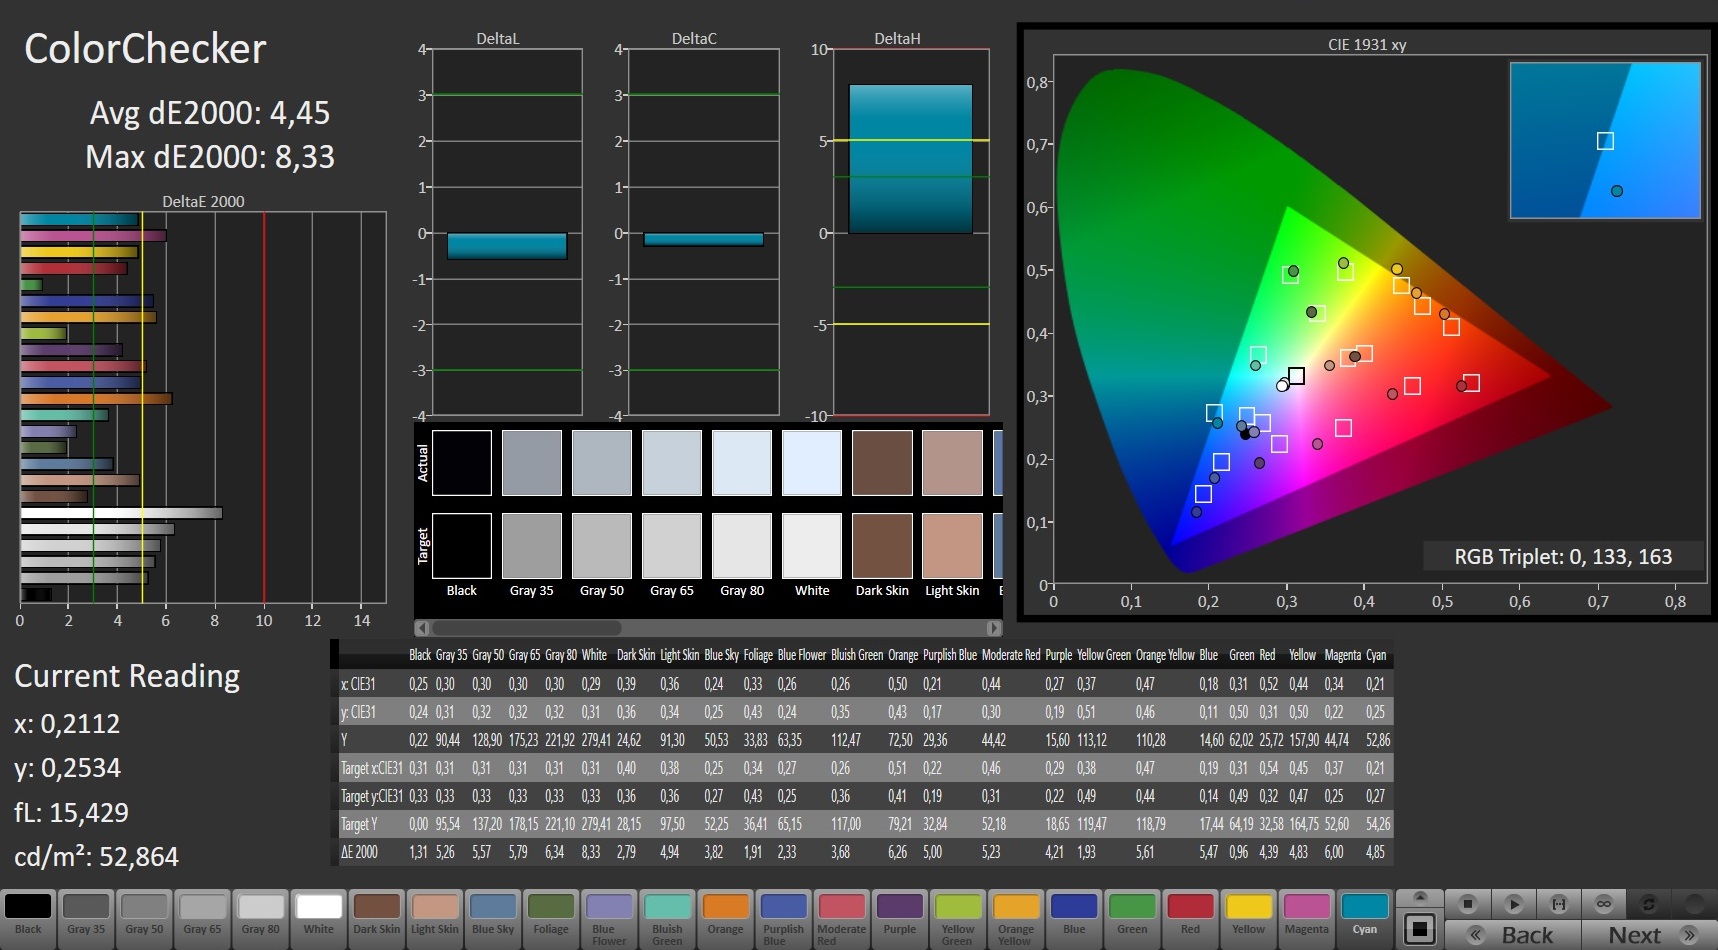
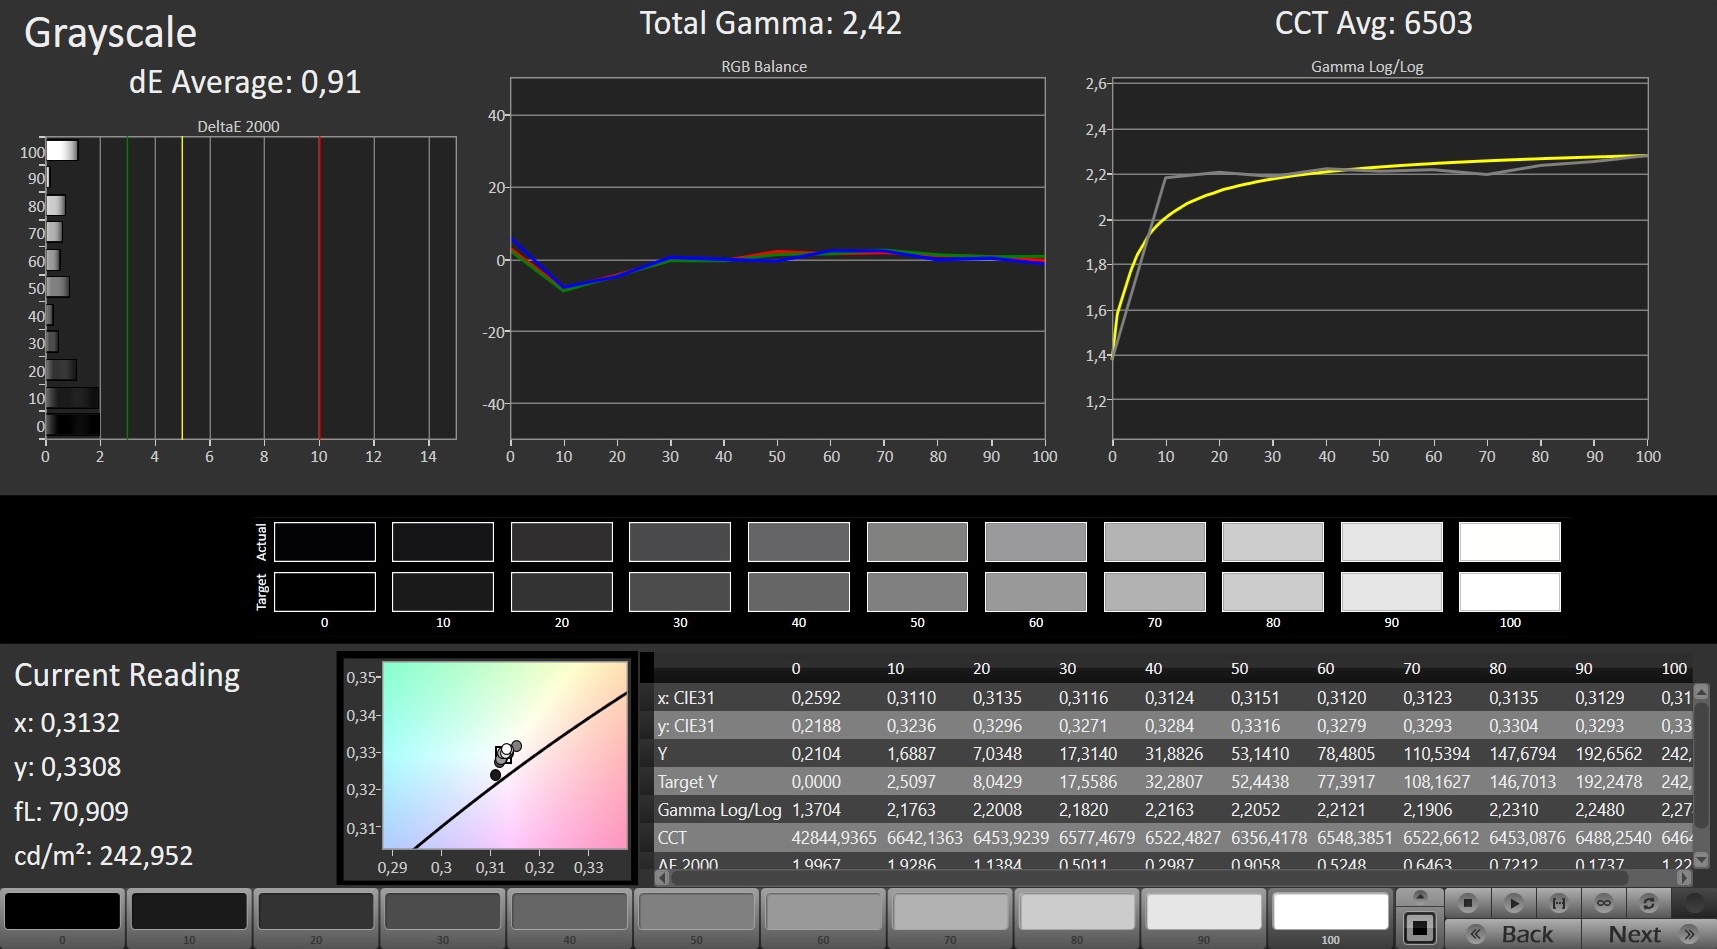
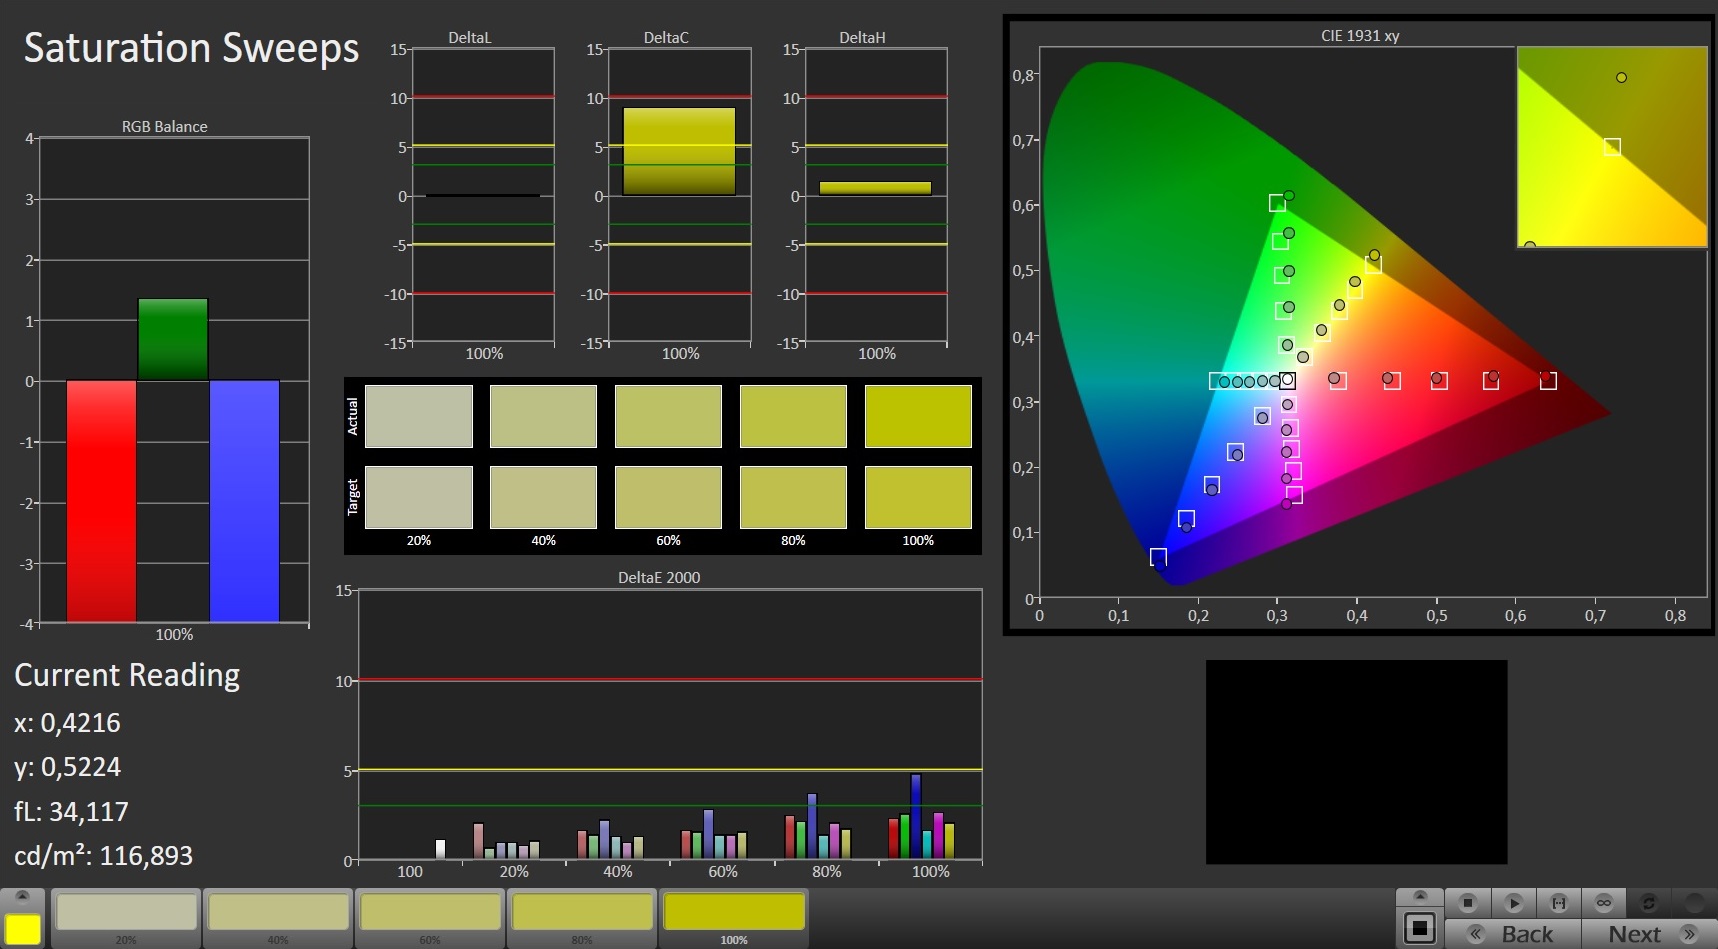
Color accuracy was fairly decent out of the box already, and a DeltaE 2000 deviation of 4.45 for colors was fairly close to the ideal of less than 3. The blue tint was very minor and basically non-existent. We were able to improve upon accuracy through calibration and managed to reduce the DeltaE for colors to 1.93 and simultaneously improve grayscale balance. Color-space coverage was determined to be a very decent 93% sRGB and 60% Adobe RGB.
As usual you can find the ICC profile for download in the box above. Make sure that your unit features the exact same display as ours (make & model), otherwise you might end up decreasing instead of increasing color accuracy. Many manufacturers source more than just one display manufacturer for a particular notebook model.
Display Response Times
| ↔ Response Time Black to White | ||
|---|---|---|
| 12.8 ms ... rise ↗ and fall ↘ combined | ↗ 7.6 ms rise | 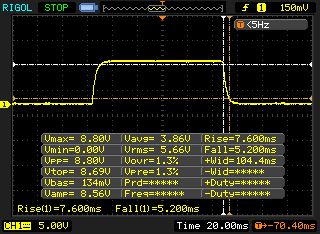 |
| ↘ 5.2 ms fall | ||
| The screen shows good response rates in our tests, but may be too slow for competitive gamers. In comparison, all tested devices range from 0.1 (minimum) to 240 (maximum) ms. » 33 % of all devices are better. This means that the measured response time is better than the average of all tested devices (19.9 ms). | ||
| ↔ Response Time 50% Grey to 80% Grey | ||
| 17.6 ms ... rise ↗ and fall ↘ combined | ↗ 9.2 ms rise | 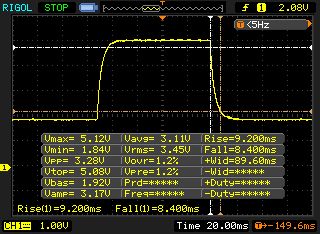 |
| ↘ 8.4 ms fall | ||
| The screen shows good response rates in our tests, but may be too slow for competitive gamers. In comparison, all tested devices range from 0.165 (minimum) to 636 (maximum) ms. » 31 % of all devices are better. This means that the measured response time is better than the average of all tested devices (31.1 ms). | ||
Screen Flickering / PWM (Pulse-Width Modulation)
| Screen flickering / PWM not detected | 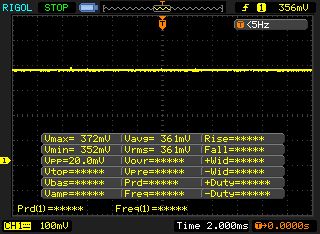 | ||
In comparison: 52 % of all tested devices do not use PWM to dim the display. If PWM was detected, an average of 7798 (minimum: 5 - maximum: 343500) Hz was measured. | |||
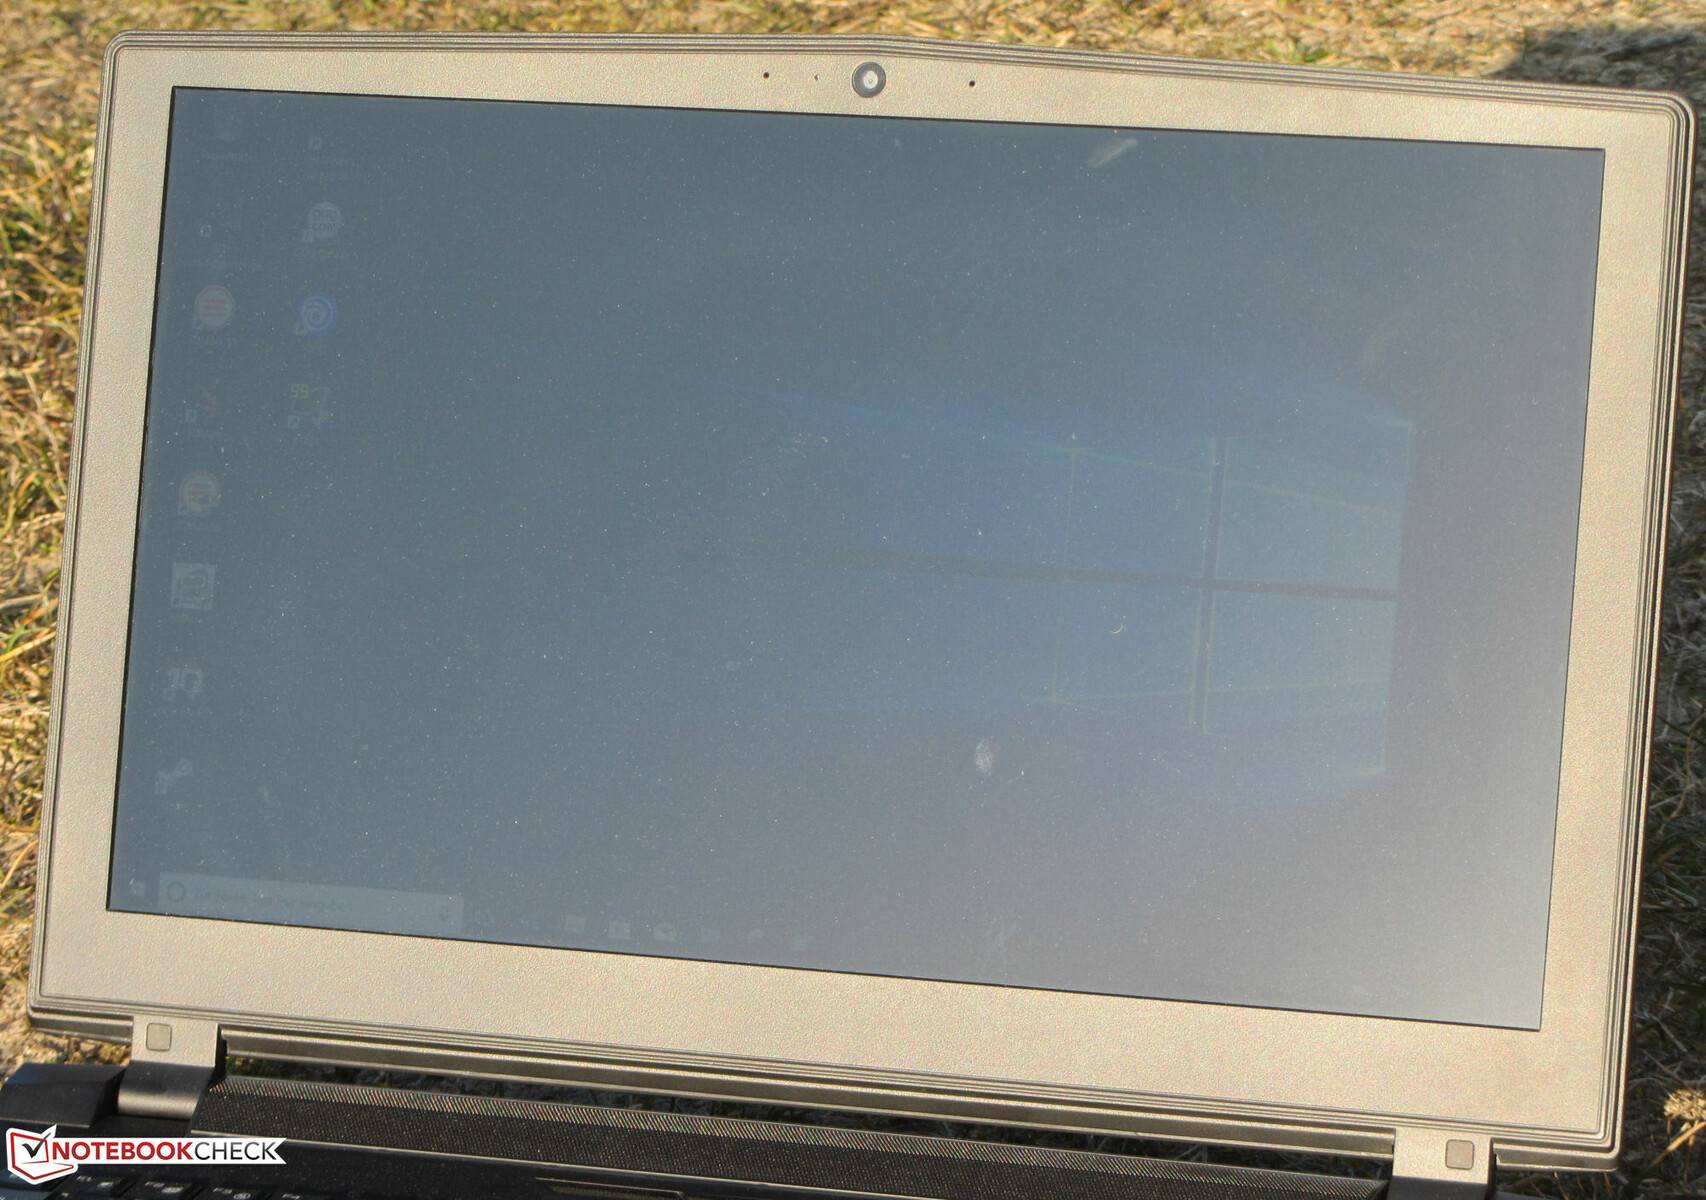
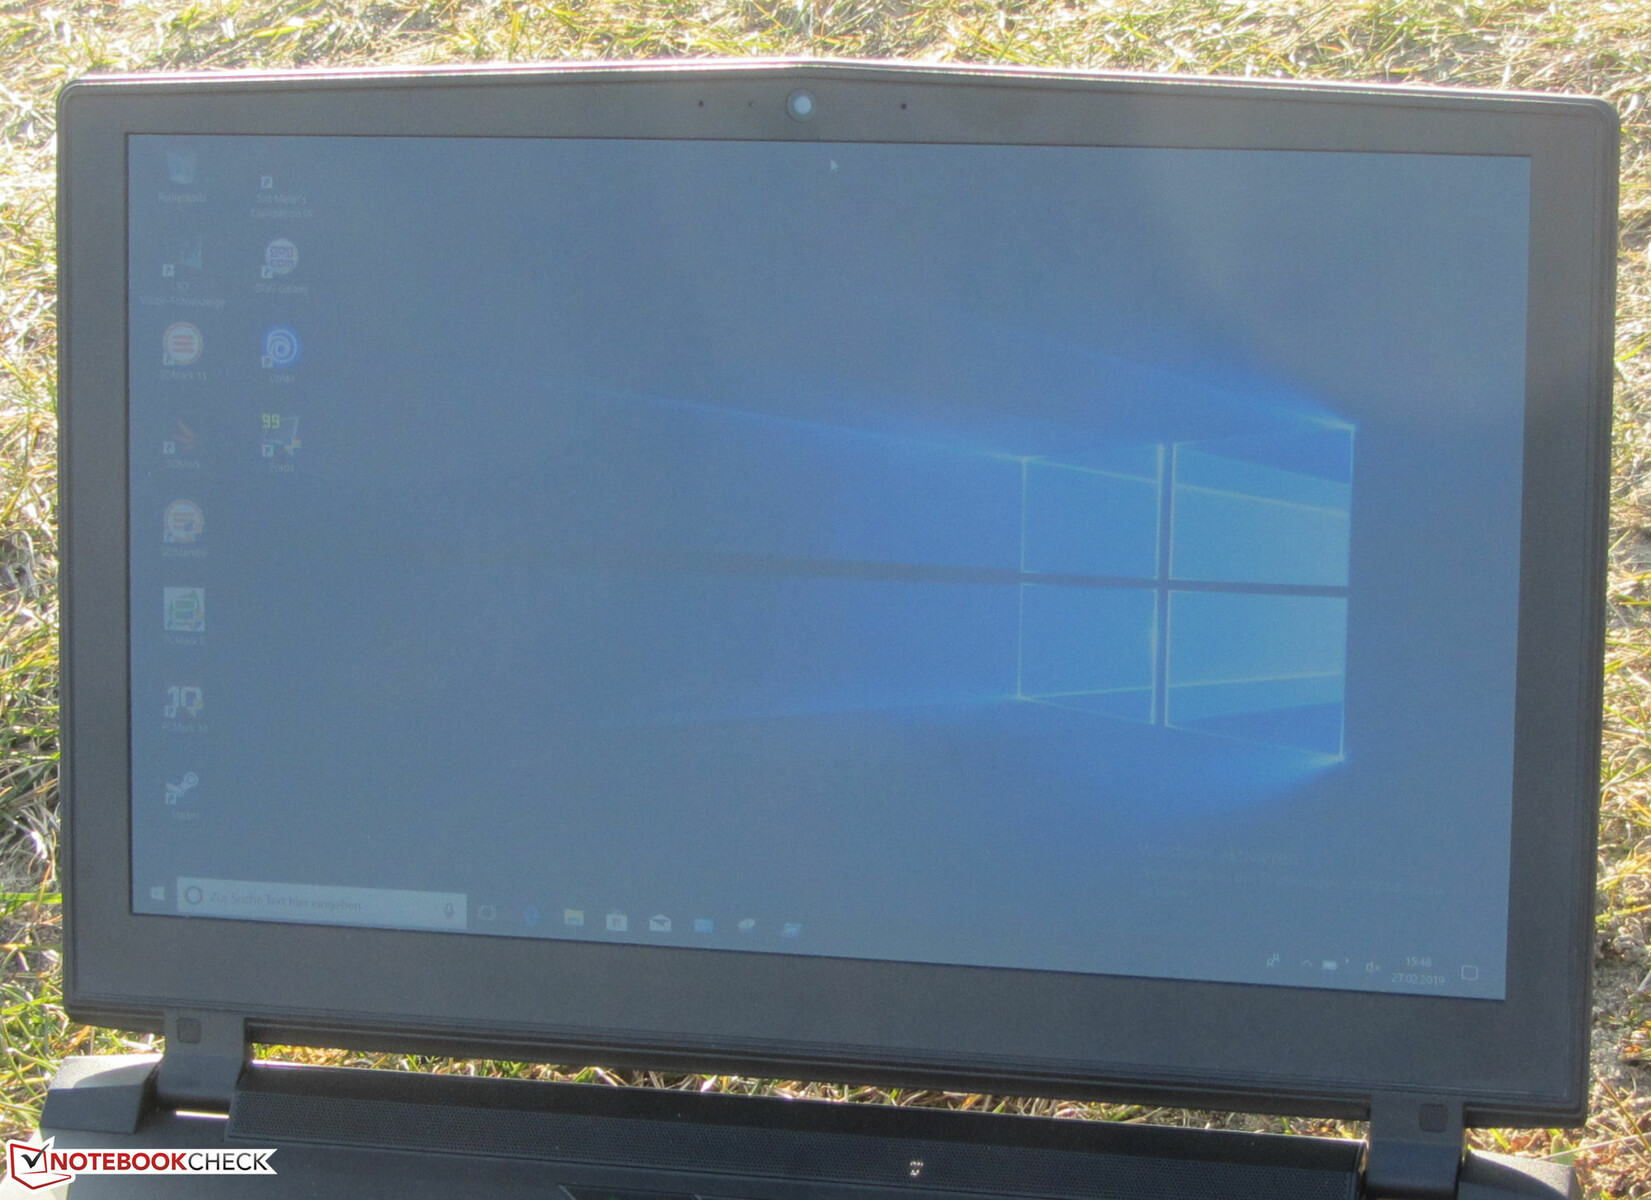
Thanks to the IPS panel the display remained readable even at odd and acute angles. It was bright enough for indoor usage; however, we ran into noticeable trouble outdoors, particularly in bright sunshine.

Performance
Schenker’s XMG Ultra 15 is a 15.6-inch high-end gaming notebook. The device can be freely and individually configured, and it even offers an optional LTE modem. Not only was it capable of running all current games very smoothly, but it also had no trouble whatsoever with everyday applications thanks to its powerful hardware. It starts at around 2,100 Euros (~$2,378), but our particular review unit clocked in at around 3,200 Euros (~$3,624). Expect to pay more than 4,000 Euros (~$4,530) with all the configuration boxes ticked.

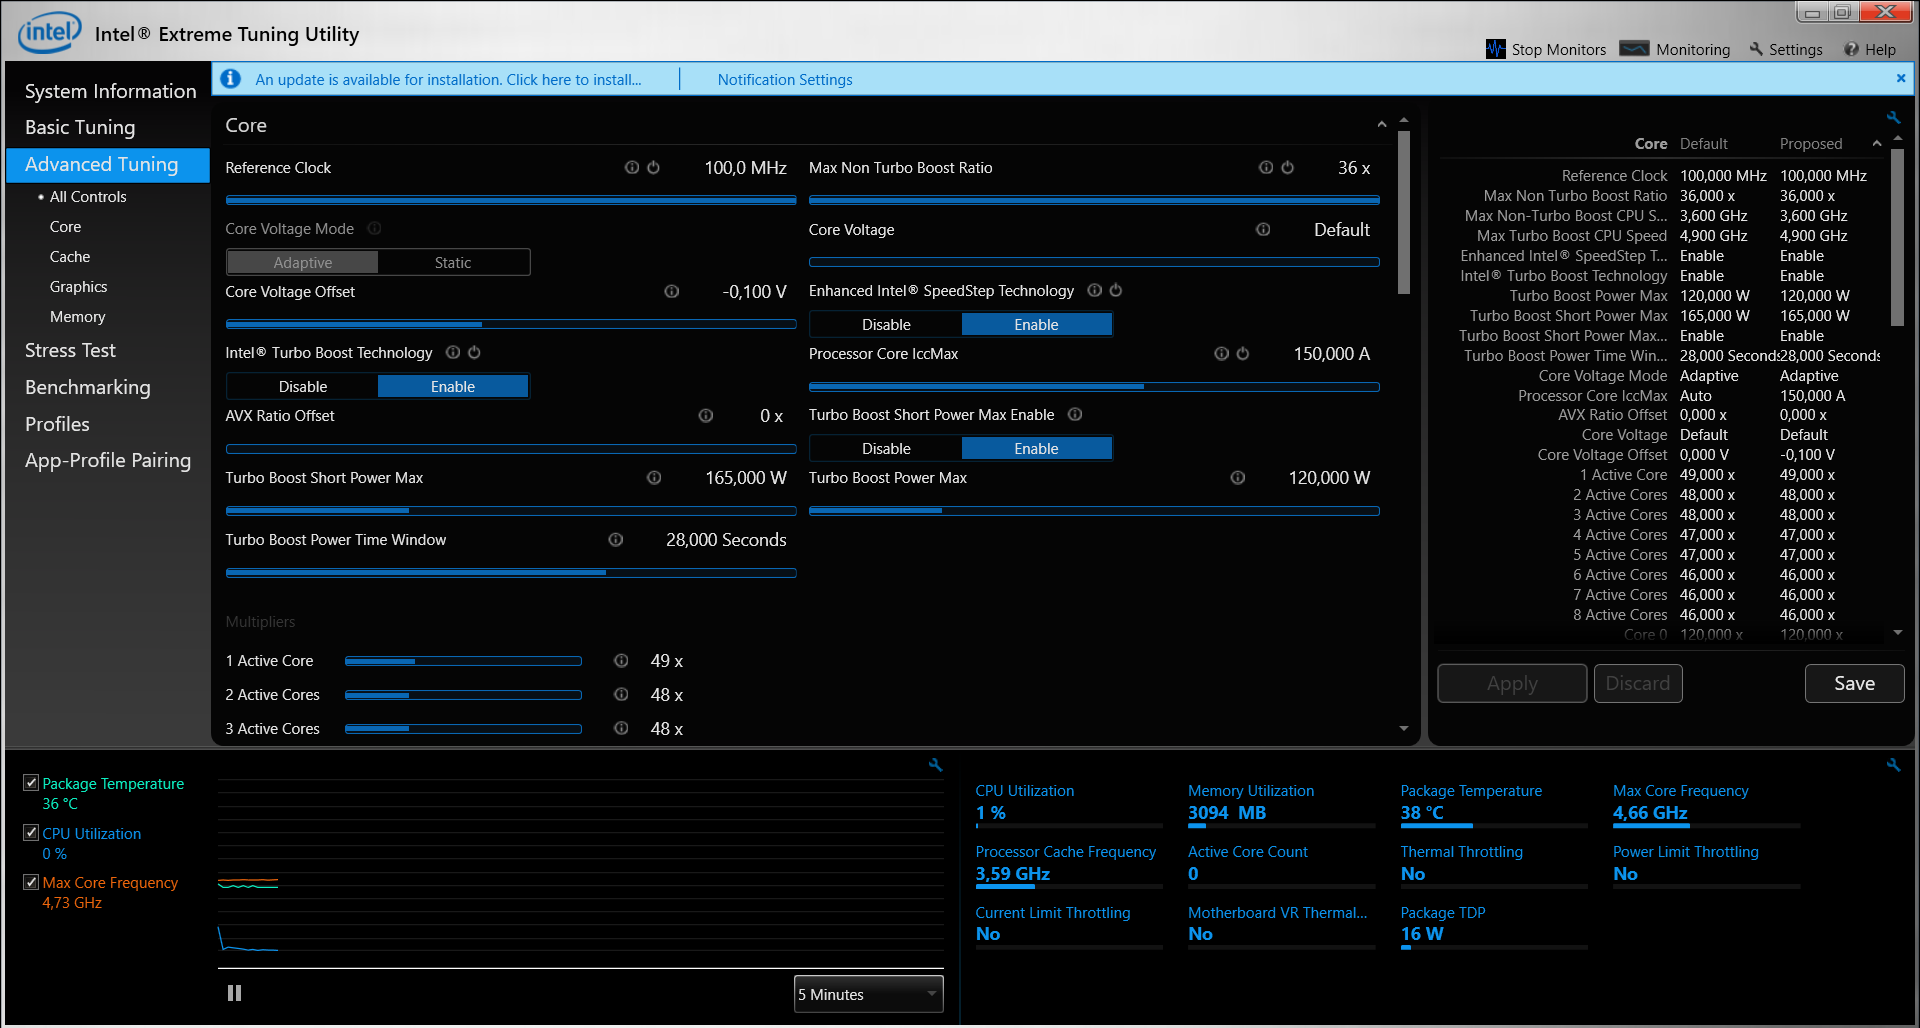
Test Conditions
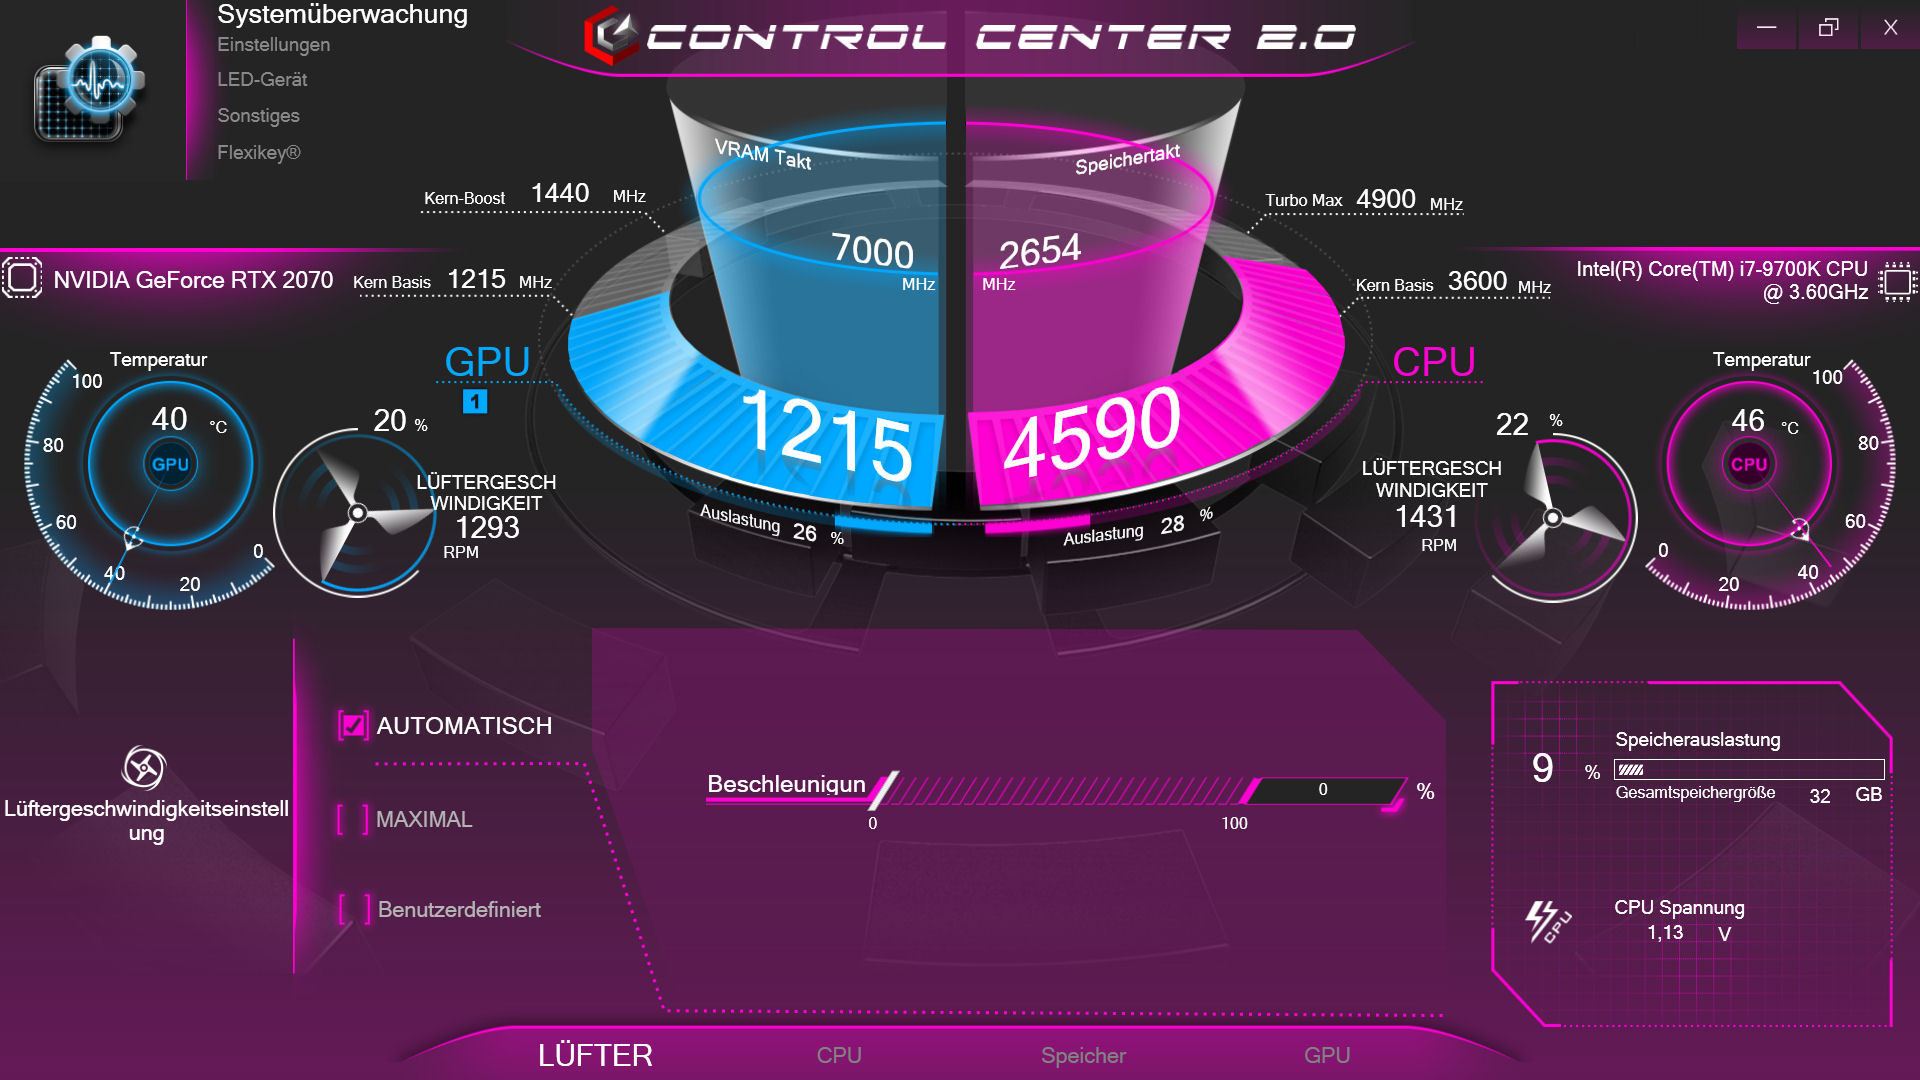
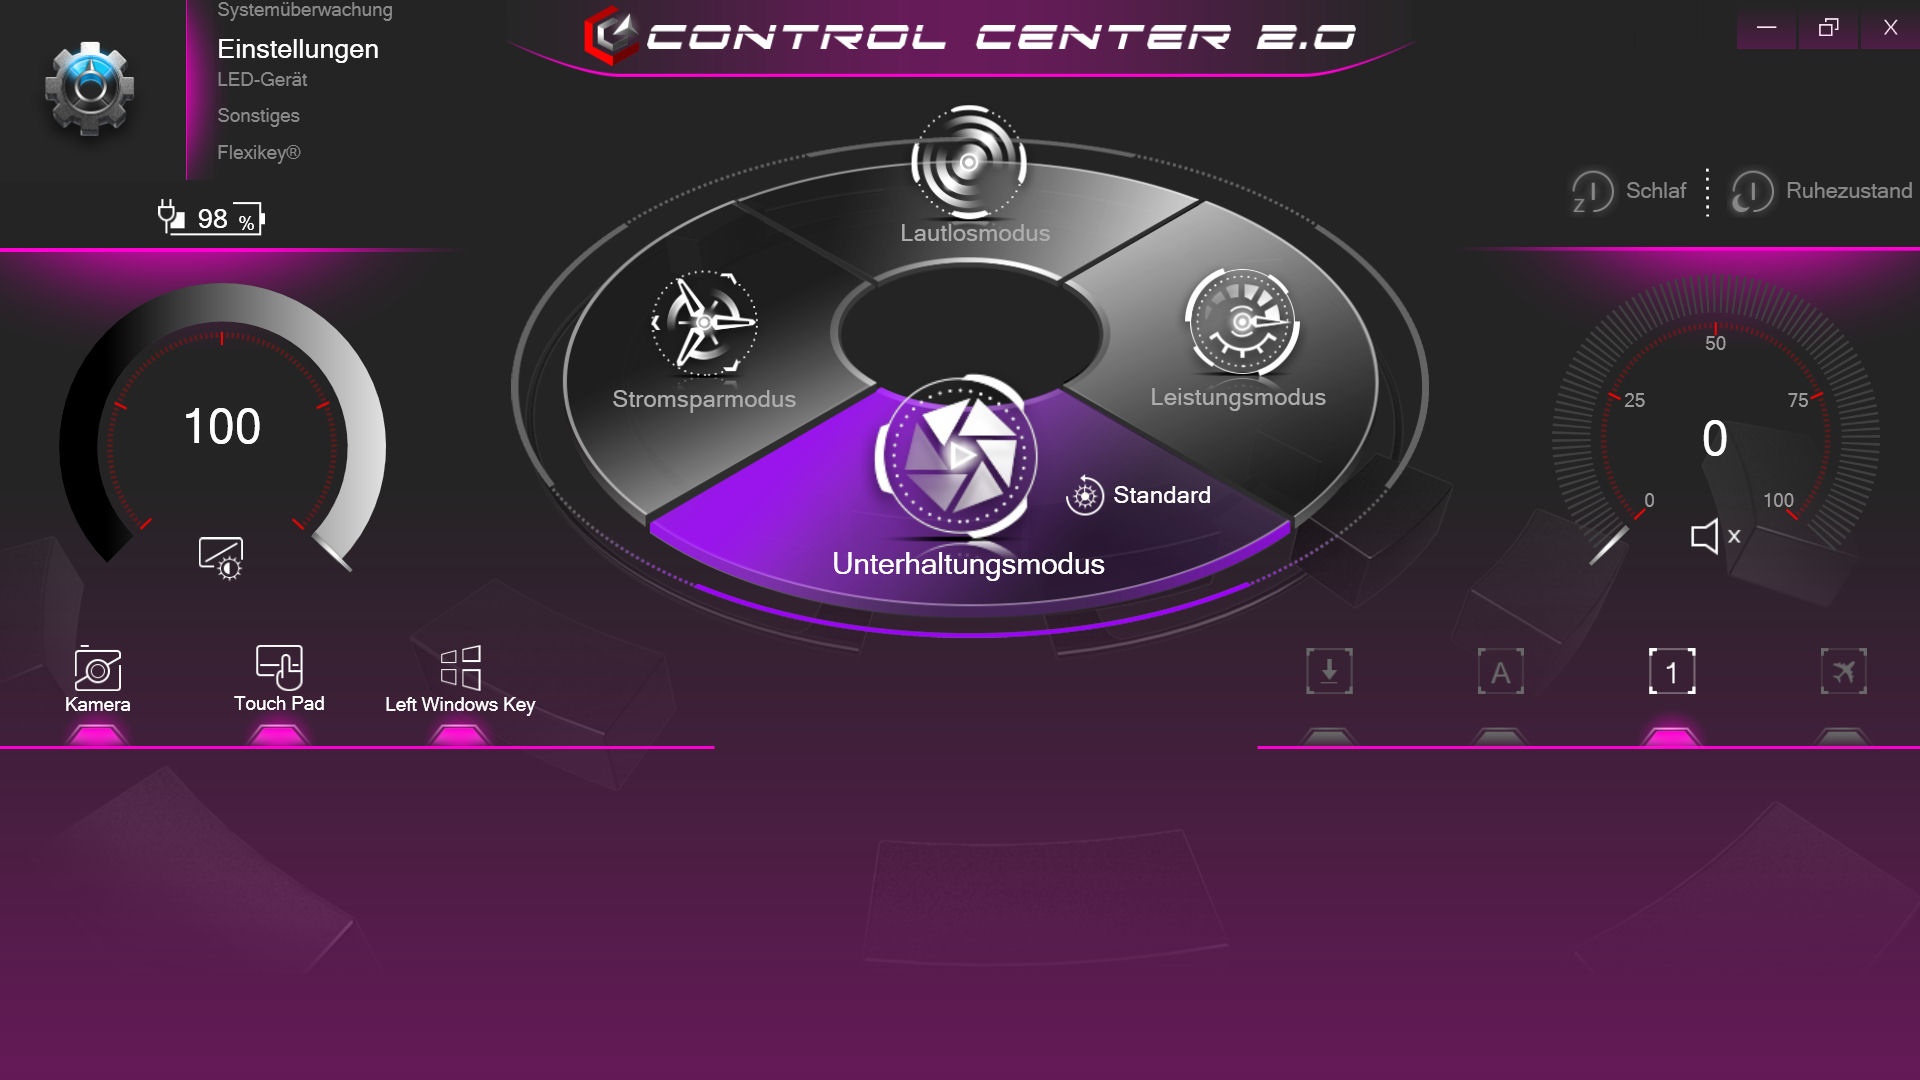
The preinstalled Control Center software allows for fan management and energy profile adjustments as well as CPU, GPU, and RAM overclocking. For the purpose of our benchmarks, we set the fan profile to “Auto” and disabled overclocking.
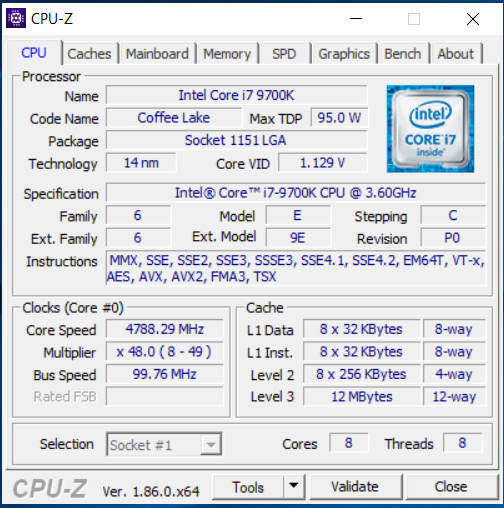
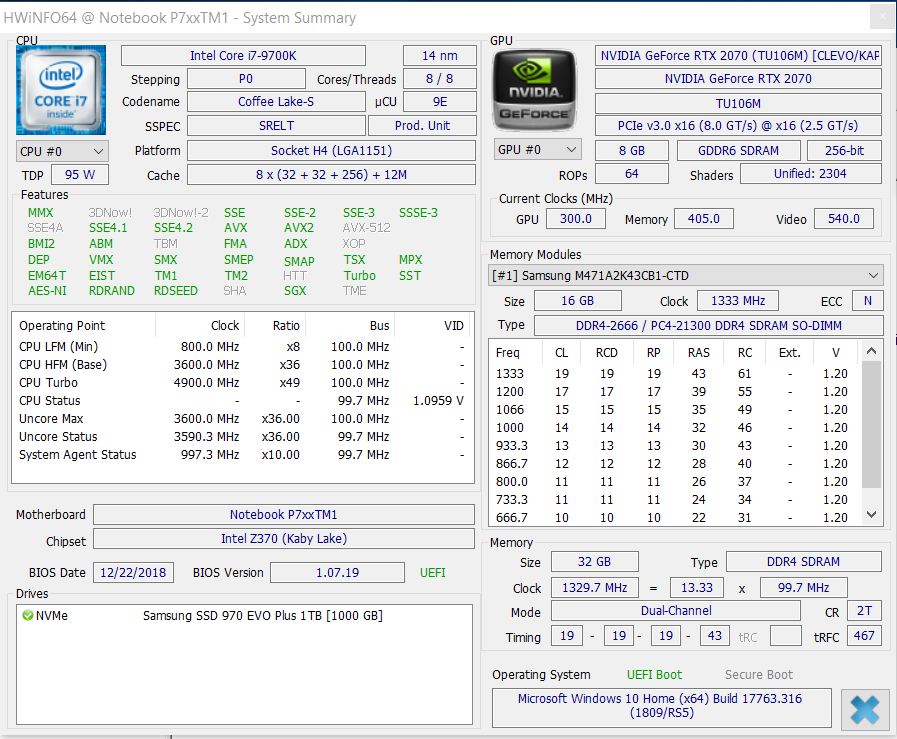
Processor
Intel’s Core i7-9700K Coffee-Lake octa-core CPU is not a mobile processor, it is a desktop-class CPU with a TDP of 95 W. It is not soldered onto the motherboard either but is socketed, and it can therefore be replaced if so desired. It runs at a base clock speed of 3.6 GHz and is capable of turbo-boosting up to 4.6 GHz (six to eight cores), 4.7 GHz (four cores), 4.8 GHz (two cores), or 4.9 GHz (one core) dynamically and on demand. Hyper-Threading, which would effectively double the amount of cores, is not supported. The CPU can be easily overclocked thanks to its open multiplicator.
In our Cinebench multithread test the CPU ran at 4.6 GHz. In the single-thread test, it oscillated between 4.6 and 4.9 GHz. On battery, it clocked down to just 2.5-2.9 GHz (multithread) and 2.5-4.9 GHz (single-thread), respectively.
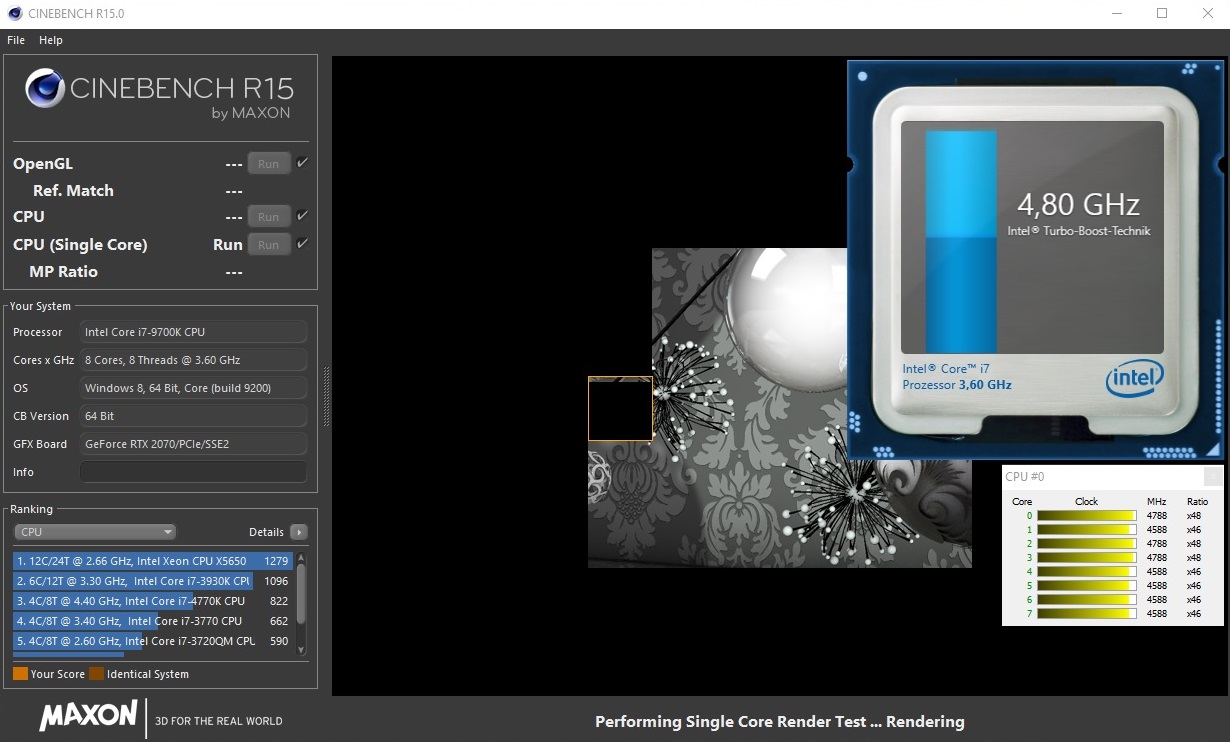
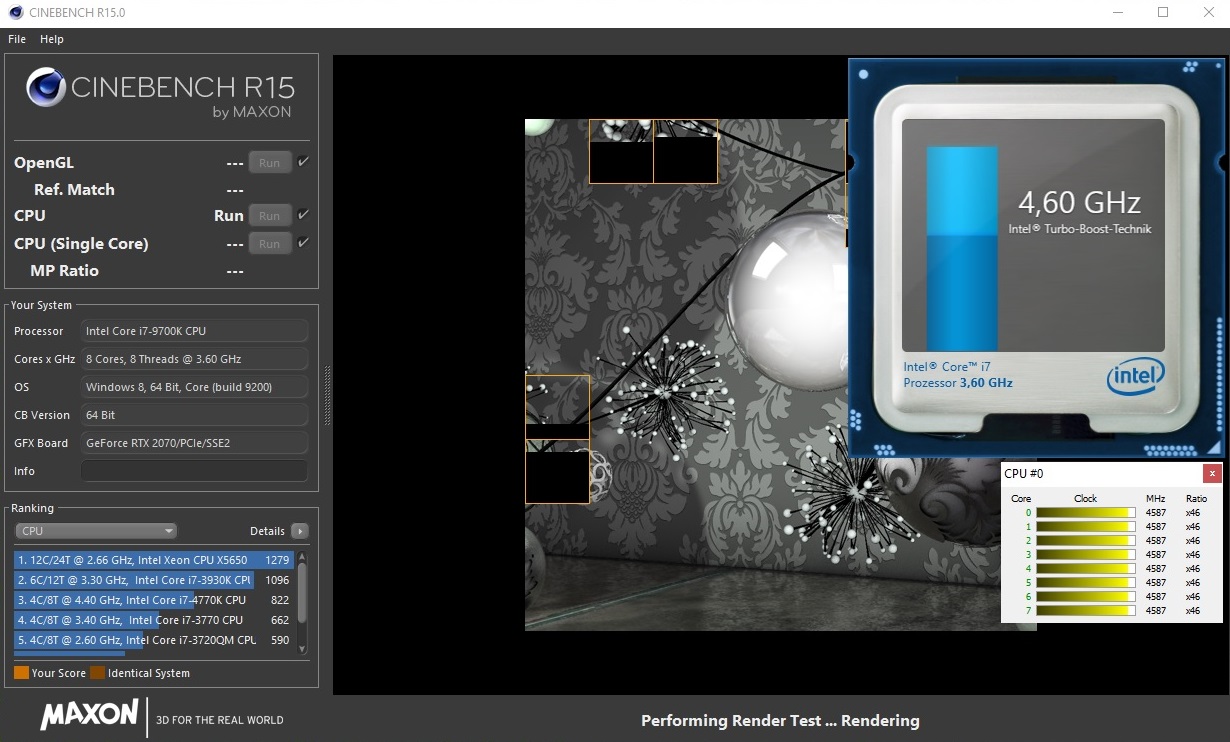
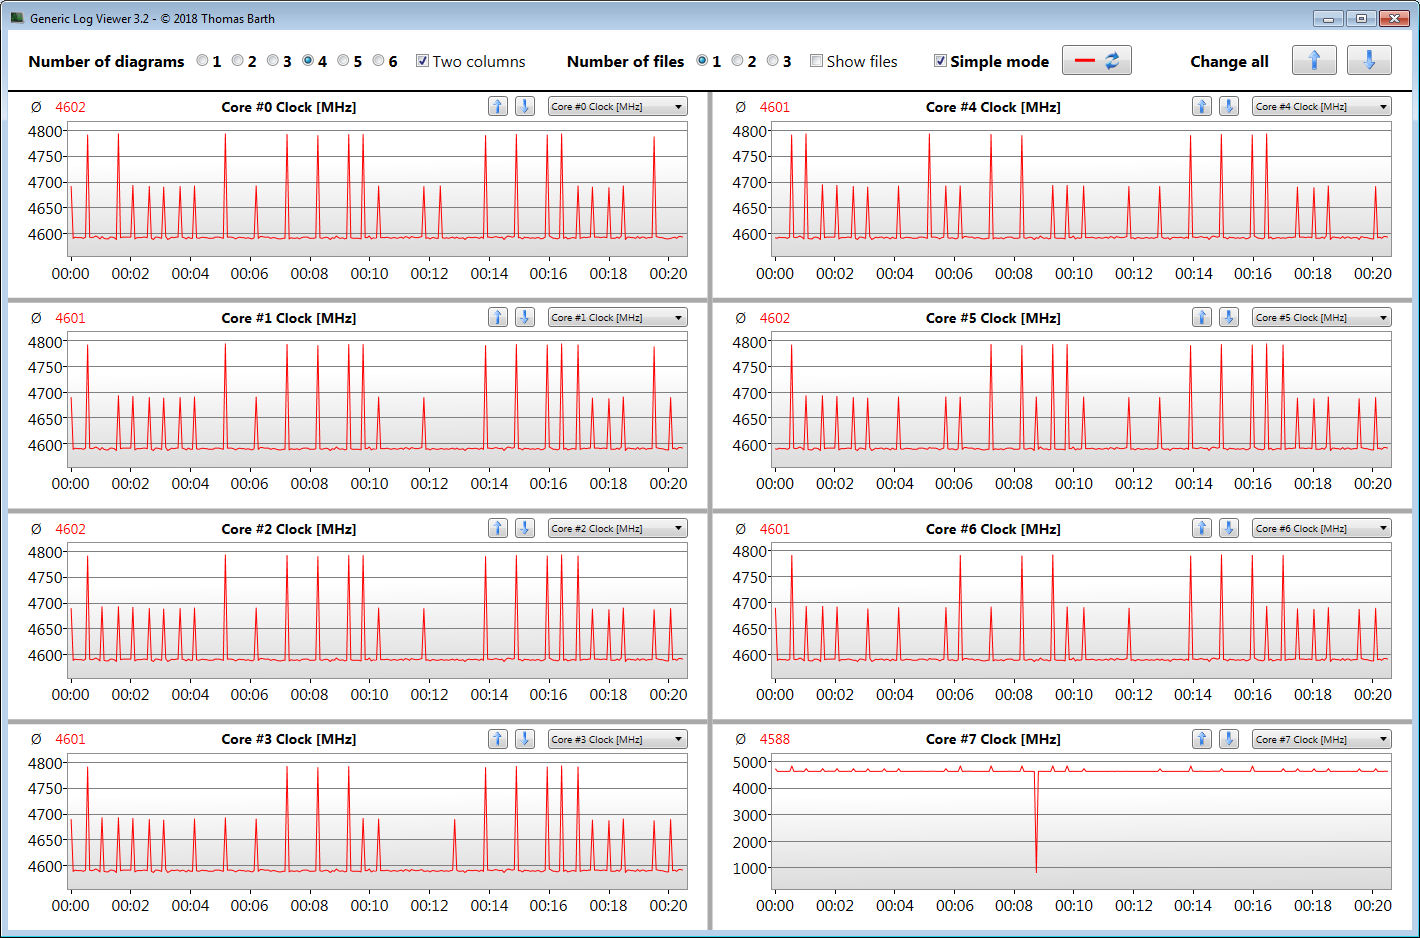
We run Cinebench R15’s multithread test in a loop for at least 30 minutes in order to determine whether or not a CPU is capable of maintaining its turbo boost over long periods of sustained load. In case of the XMG Ultra 15 we noticed a slight dip between the first and second run, after which the scores stabilized at a very high level. Throughout the test, the CPU ran very close to its maximum turbo-boost speed.
| Cinebench R10 | |
| Rendering Single 32Bit | |
| Average of class Gaming (7457 - 11779, n=8, last 2 years) | |
| Schenker XMG Ultra 15 Turing | |
| Schenker XMG Ultra 15 | |
| Gigabyte Aero 15-X9 | |
| Rendering Multiple CPUs 32Bit | |
| Average of class Gaming (42932 - 81339, n=8, last 2 years) | |
| Schenker XMG Ultra 15 Turing | |
| Gigabyte Aero 15-X9 | |
| Schenker XMG Ultra 15 | |
| Geekbench 3 | |
| 32 Bit Multi-Core Score | |
| Schenker XMG Ultra 15 Turing | |
| Gigabyte Aero 15-X9 | |
| Schenker XMG Ultra 15 | |
| 32 Bit Single-Core Score | |
| Schenker XMG Ultra 15 Turing | |
| Schenker XMG Ultra 15 | |
| Gigabyte Aero 15-X9 | |
| Geekbench 4.0 | |
| 64 Bit Multi-Core Score | |
| Average of class Gaming (40469 - 76142, n=4, last 2 years) | |
| Schenker XMG Ultra 15 Turing | |
| Gigabyte Aero 15-X9 | |
| 64 Bit Single-Core Score | |
| Average of class Gaming (7589 - 9053, n=4, last 2 years) | |
| Schenker XMG Ultra 15 Turing | |
| Gigabyte Aero 15-X9 | |
| Geekbench 4.4 | |
| 64 Bit Multi-Core Score | |
| Average of class Gaming (89200 - 97490, n=2, last 2 years) | |
| Schenker XMG Ultra 15 Turing | |
| Gigabyte Aero 15-X9 | |
| 64 Bit Single-Core Score | |
| Average of class Gaming (9335 - 9492, n=2, last 2 years) | |
| Schenker XMG Ultra 15 Turing | |
| Gigabyte Aero 15-X9 | |
| Mozilla Kraken 1.1 - Total | |
| Gigabyte Aero 15-X9 (Edge 44) | |
| Razer Blade 15 RTX 2070 Max-Q (Edge 44.17763.1.0) | |
| Schenker XMG Ultra 15 (Edge 41) | |
| Schenker XMG Ultra 15 Turing (Edge 44) | |
| Average of class Gaming (391 - 590, n=105, last 2 years) | |
| Octane V2 - Total Score | |
| Average of class Gaming (87588 - 139447, n=30, last 2 years) | |
| Schenker XMG Ultra 15 Turing (Edge 44) | |
| Gigabyte Aero 15-X9 (Edge 44) | |
| Razer Blade 15 RTX 2070 Max-Q (Edge 44.17763.1.0) | |
| JetStream 1.1 - 1.1 Total | |
| Average of class Gaming (518 - 647, n=5, last 2 years) | |
| Schenker XMG Ultra 15 Turing (Edge 44) | |
| Razer Blade 15 RTX 2070 Max-Q (Edge 44.17763.1.0) | |
| Schenker XMG Ultra 15 (Edge 41) | |
| Gigabyte Aero 15-X9 (Edge 44) | |
* ... smaller is better
System Performance
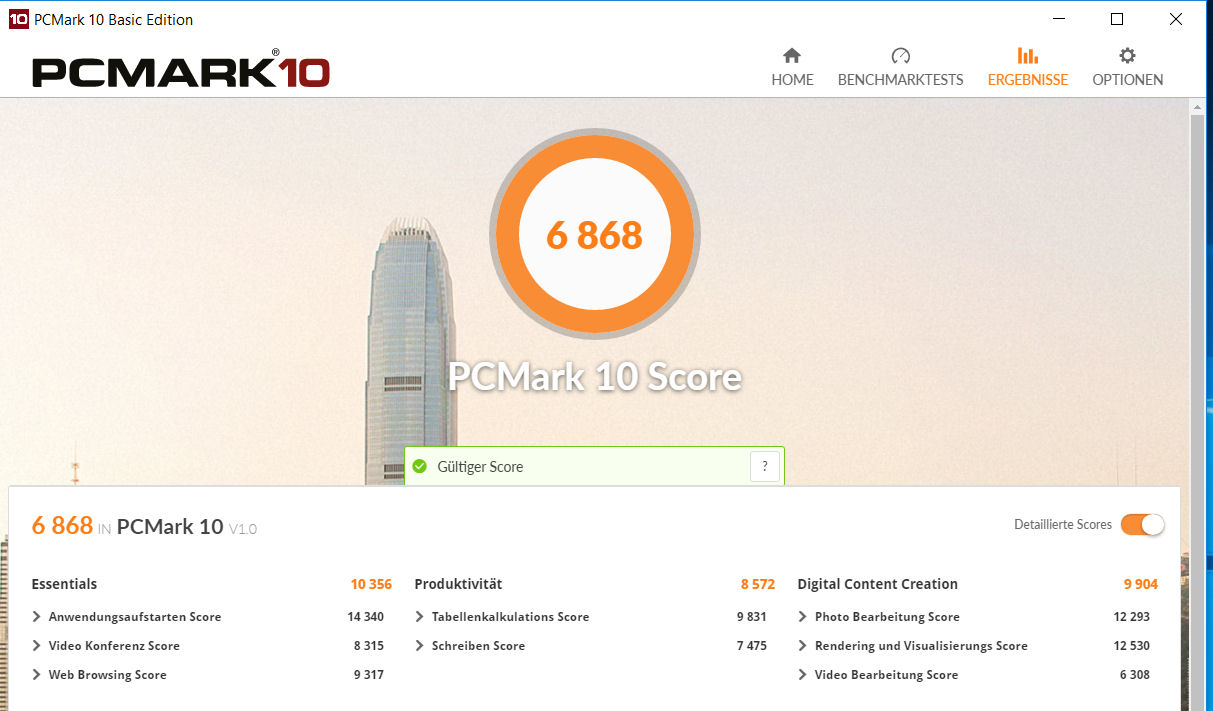
Overall system performance was very smooth, and we did not encounter any problems during everyday use. Considering the device’s hardware it came as no surprise that the 15-inch notebook was more than powerful enough for all common usage scenarios, be that gaming, video-editing, or photo-editing. This was further corroborated by the XMG Ultra 15’s great PCMark benchmark scores.
| PCMark 7 Score | 8114 points | |
| PCMark 8 Home Score Accelerated v2 | 5485 points | |
| PCMark 8 Creative Score Accelerated v2 | 6780 points | |
| PCMark 8 Work Score Accelerated v2 | 6258 points | |
| PCMark 10 Score | 6868 points | |
Help | ||
Storage Devices
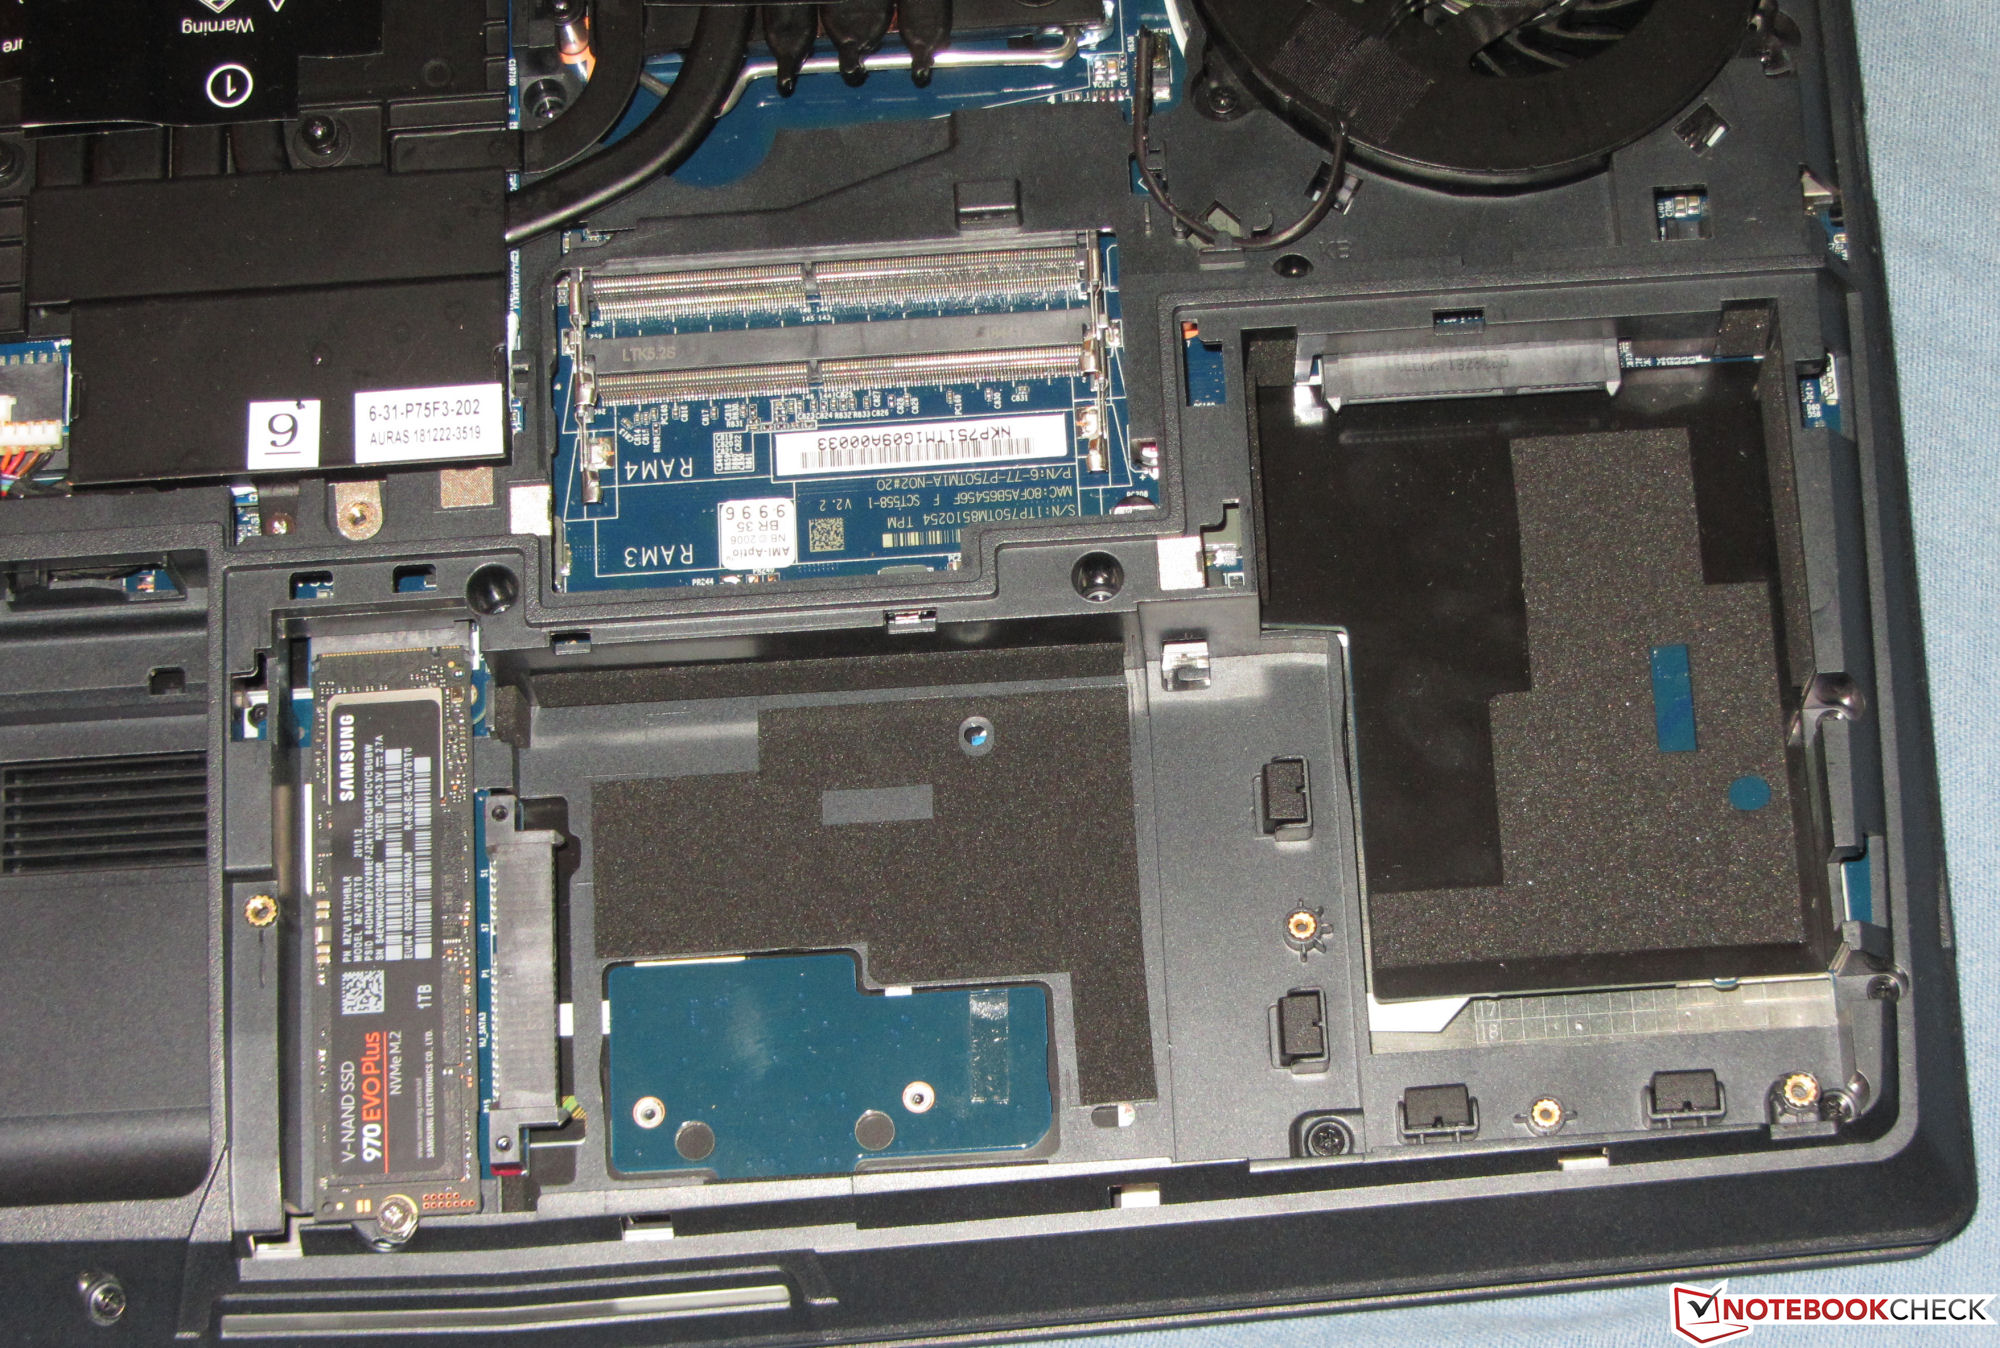
One of the main reasons for the device’s fast and smooth performance was its SSD, which is an M.2-2280 Samsung 970 Evo Plus - one of the fastest NVMe SSDs currently available. Its high transfer speeds are possible thanks to a PCIe 3.0 x4 connection. SATA III SSDs tend to perform much slower and top out at 600 MB/s.
Out of the box, the 1 TB SSD reported around 891 GB of free storage space available to the user. The rest is used by the recovery partition and the Windows installation.
Possibilities for storage expansion are aplenty. In addition to a second M.2-2280 slot, the XMG Ultra 15 also features two 2.5-inch SATA III bays, and the required mounting frames and screws are included by default. Both storage options, the M.2 slots as well as the SATA III ports, are RAID 0/1 capable.

| Schenker XMG Ultra 15 Turing Samsung SSD 970 EVO Plus 1TB | Schenker XMG Ultra 15 Samsung SSD 960 Evo 500GB m.2 NVMe | Alienware 15 R4 Toshiba XG5 KXG50ZNV256G | Gigabyte Aero 15-X9 Intel SSD 760p SSDPEKKW010T8 | Razer Blade 15 RTX 2070 Max-Q Samsung SSD PM981 MZVLB512HAJQ | Acer Predator Triton 500 2x WDC PC SN720 SDAPNTW-256G-1014 (RAID 0) | |
|---|---|---|---|---|---|---|
| CrystalDiskMark 5.2 / 6 | -5% | -27% | -15% | -16% | -2% | |
| Write 4K (MB/s) | 129.9 | 147.7 14% | 96.8 -25% | 97.1 -25% | 93.9 -28% | 93.6 -28% |
| Read 4K (MB/s) | 47.15 | 44.02 -7% | 35.73 -24% | 53.7 14% | 40.56 -14% | 38.82 -18% |
| Write Seq (MB/s) | 1840 | 1641 -11% | 362.3 -80% | 1526 -17% | 1468 -20% | 2455 33% |
| Read Seq (MB/s) | 1775 | 1830 3% | 2110 19% | 2020 14% | 1540 -13% | 2107 19% |
| Write 4K Q32T1 (MB/s) | 294.5 | 325.9 11% | 318.6 8% | 285.6 -3% | 293.5 0% | 298.7 1% |
| Read 4K Q32T1 (MB/s) | 373.6 | 369.1 -1% | 366.7 -2% | 321.8 -14% | 346 -7% | 338.7 -9% |
| Write Seq Q32T1 (MB/s) | 3295 | 1847 -44% | 351 -89% | 1533 -53% | 1941 -41% | 2902 -12% |
| Read Seq Q32T1 (MB/s) | 3535 | 3344 -5% | 2813 -20% | 2351 -33% | 3266 -8% | 3536 0% |
GPU Performance
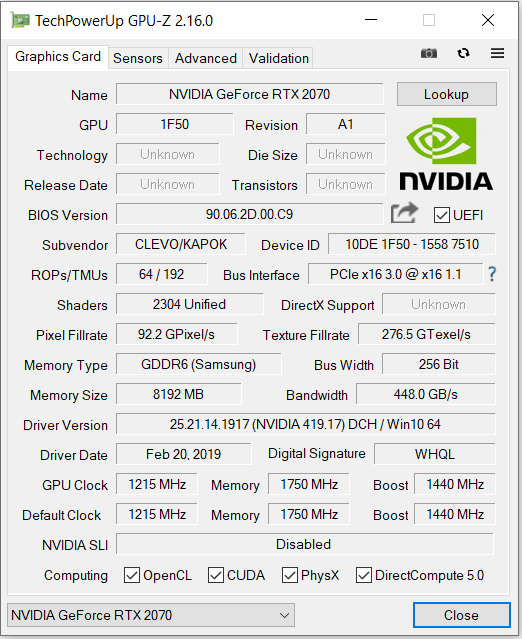
The XMG Ultra 15 is one of the few remaining notebooks with a swappable GPU. Our review unit was equipped with a GeForce RTX 2070, and alternatives include an RTX 2060 and RTX 2080. All three GPUs are based on Nvidia’s Turing architecture.
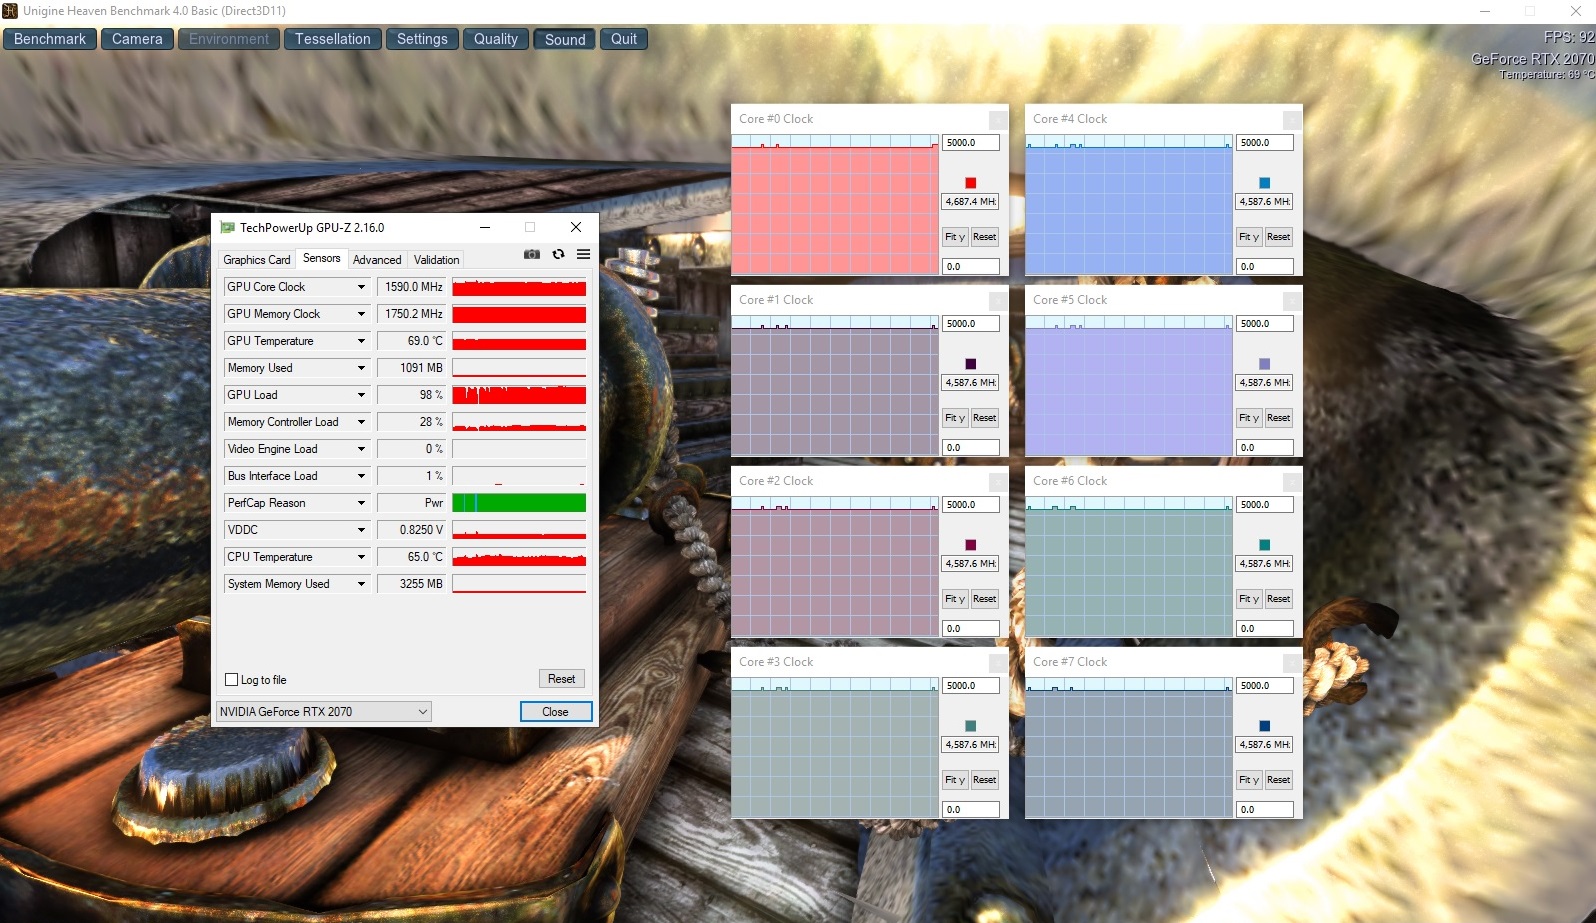
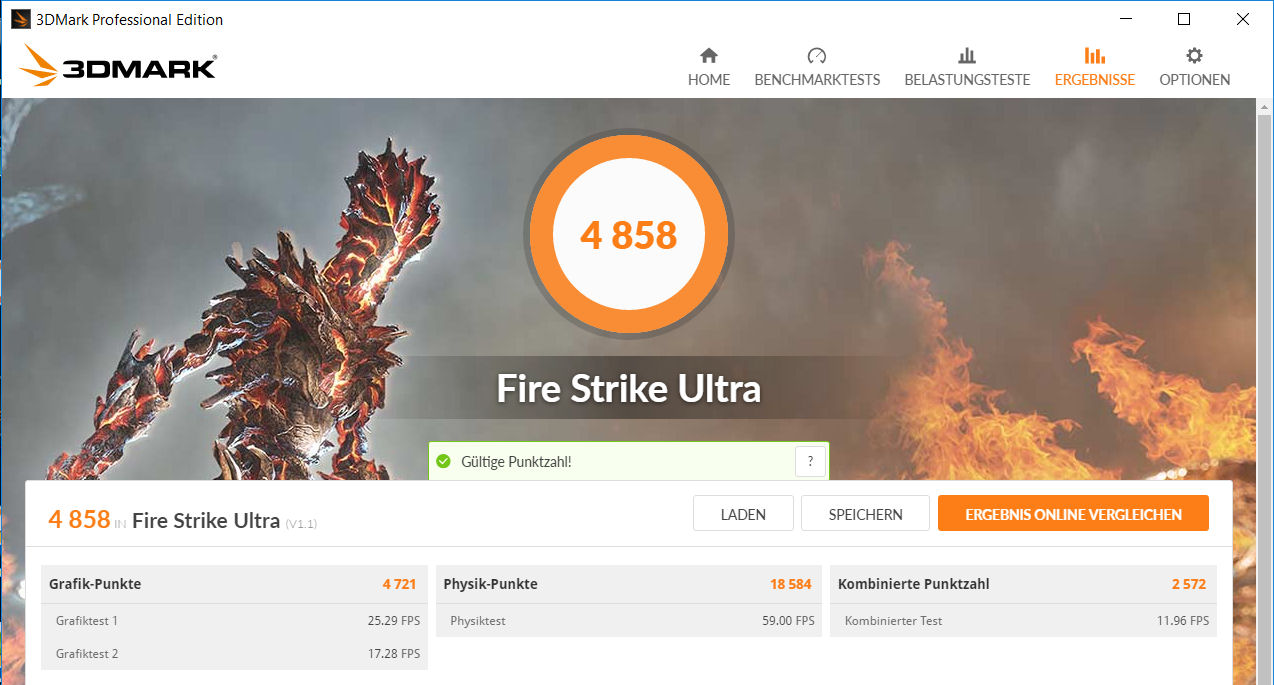
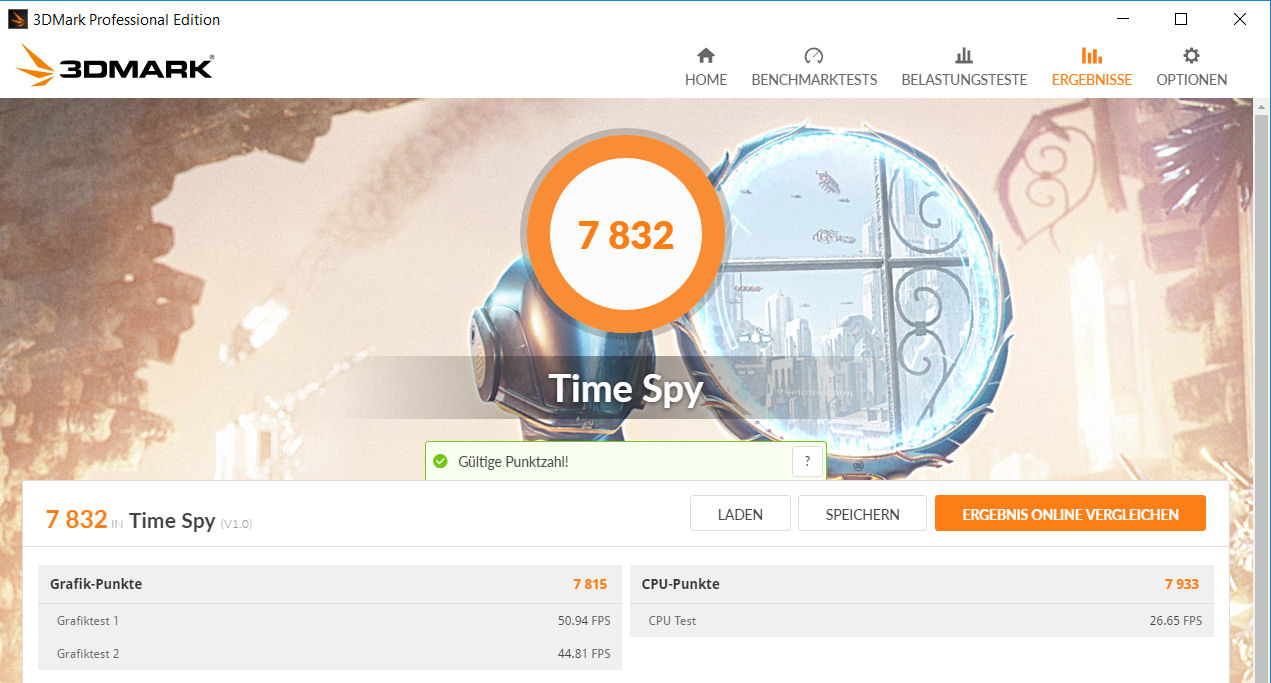
The RTX 2070 supports DirectX 12 and runs at up to 1,905 MHz. However, the notebook is not capable of maintaining this high level of performance for long periods of time. On average, the GPU’s clock speed was determined to be around 1,590 MHz. It has access to 8 GB of GDDR6 VRAM, and 3DMark benchmark results were fairly good. Overall, the Ultra 15 performed slightly better than its GTX 1070-equipped predecessor.
The integrated UHD Graphics 630 is disabled by default, and the notebook does not support on-demand graphics-switching (aka Nvidia Optimus). Thus, the RTX 2070 is the only GPU available and visible to the operating system.

| 3DMark 06 Standard Score | 43781 points | |
| 3DMark 11 Performance | 22748 points | |
| 3DMark Ice Storm Standard Score | 227837 points | |
| 3DMark Cloud Gate Standard Score | 43983 points | |
| 3DMark Fire Strike Score | 18616 points | |
| 3DMark Time Spy Score | 7832 points | |
Help | ||
Gaming Performance
Our review unit was capable of running all current games smoothly at 1920x1080 and maximum details. Higher resolutions are possible on external displays, although some games might require reduced details in that case.
| low | med. | high | ultra | |
|---|---|---|---|---|
| BioShock Infinite (2013) | 400.7 | 346 | 320.9 | 187.8 |
| The Witcher 3 (2015) | 331.2 | 223.1 | 128.4 | 73 |
| Batman: Arkham Knight (2015) | 214 | 202 | 159 | 108 |
| Ashes of the Singularity (2016) | 112.4 | 102 | 98.6 | |
| Civilization 6 (2016) | 224.1 | 163.6 | 129.8 | 121.1 |
| Destiny 2 (2017) | 206.1 | 181.2 | 169.5 | 144.5 |
| X-Plane 11.11 (2018) | 128.4 | 114.1 | 92.5 | |
| Far Cry 5 (2018) | 147 | 125 | 115 | 109 |
| The Witcher 3 - 1920x1080 Ultra Graphics & Postprocessing (HBAO+) | |
| Average of class Gaming (95 - 240, n=8, last 2 years) | |
| Acer Predator Triton 500 | |
| Schenker XMG Ultra 15 Turing | |
| Razer Blade 15 RTX 2070 Max-Q | |
| Schenker XMG Ultra 15 | |
| Alienware 15 R4 | |
| Gigabyte Aero 15-X9 | |
| BioShock Infinite - 1920x1080 Ultra Preset, DX11 (DDOF) | |
| Schenker XMG Ultra 15 Turing | |
| Razer Blade 15 RTX 2070 Max-Q | |
| Gigabyte Aero 15-X9 | |
| Far Cry 5 - 1920x1080 Ultra Preset AA:T | |
| Average of class Gaming (70 - 151, n=10, last 2 years) | |
| Schenker XMG Ultra 15 Turing | |
| Alienware 15 R4 | |
| Gigabyte Aero 15-X9 | |
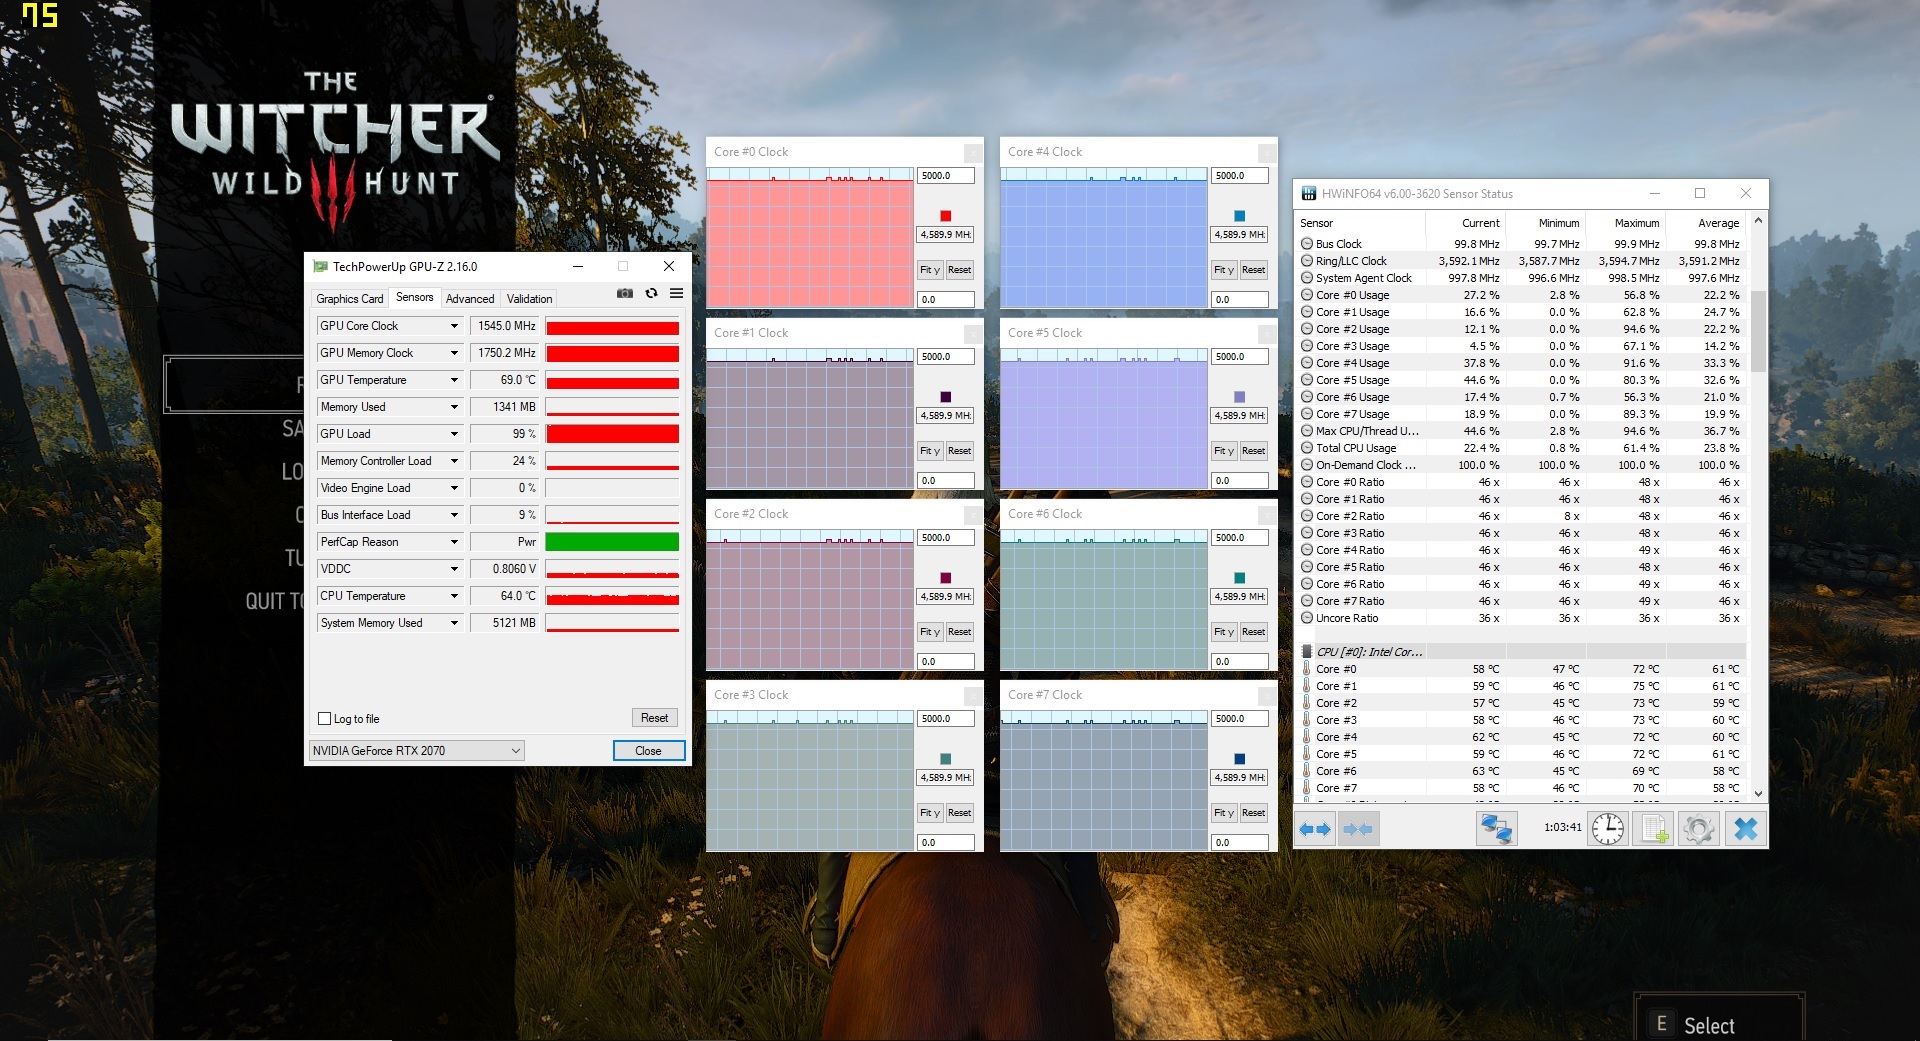
In order to determine whether or not a device is capable of maintaining a high level of GPU performance over long periods of time, we start The Witcher 3 in FHD resolution and maximum settings and leave it running for around 60 minutes without moving the avatar. We did not notice any drops in the resulting frame rates.
Emissions
System Noise
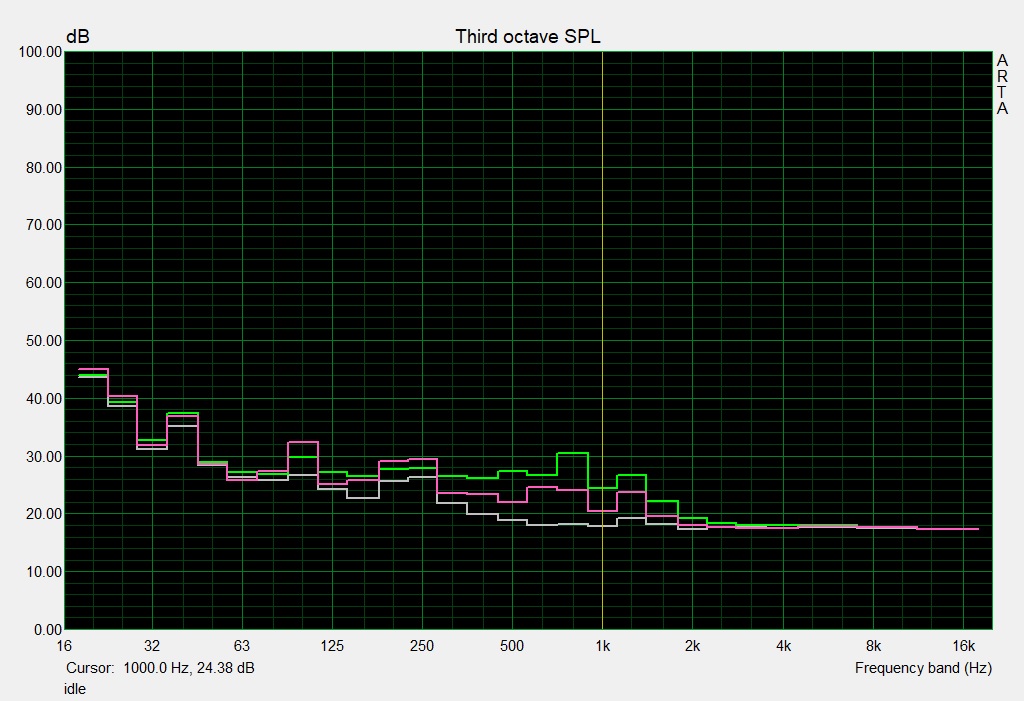
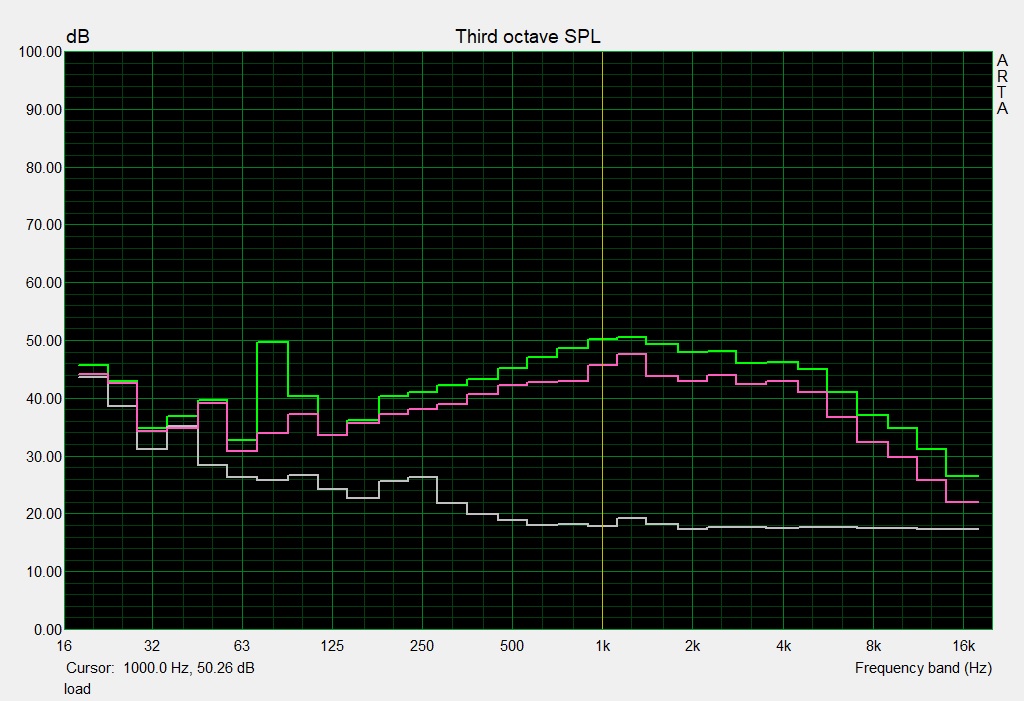
When idle, the fans run very slowly, and the resulting level of noise is tolerable. However, all hell breaks loose under load, and the sound pressure level maxes out at 59 dB(A) during our stress test. It was not much better when gaming, as we quickly found out when running The Witcher 3 while enjoying a 57 dB(A) loud wall of fan noise. Gaming without a headset is thus not really enjoyable or recommendable. Truth be told we were surprised by the loud fans given the comparatively low temperatures of just 60 °C for the CPU and 70 °C for the GPU. Other Turing-equipped notebooks are much quieter.
Noise level
| Idle |
| 32 / 33 / 36 dB(A) |
| Load |
| 55 / 59 dB(A) |
 | ||
30 dB silent 40 dB(A) audible 50 dB(A) loud |
||
min: | ||
| Schenker XMG Ultra 15 Turing i7-9700K, GeForce RTX 2070 Mobile | Schenker XMG Ultra 15 i5-8600K, GeForce GTX 1070 Mobile | Alienware 15 R4 i9-8950HK, GeForce GTX 1070 Mobile | Acer Predator Triton 500 i7-8750H, GeForce RTX 2080 Max-Q | Gigabyte Aero 15-X9 i7-8750H, GeForce RTX 2070 Max-Q | Razer Blade 15 RTX 2070 Max-Q i7-8750H, GeForce RTX 2070 Max-Q | Average of class Gaming | |
|---|---|---|---|---|---|---|---|
| Noise | 3% | -0% | 11% | 9% | 18% | 17% | |
| off / environment * (dB) | 30 | 30 -0% | 29 3% | 29 3% | 30 -0% | 28.8 4% | 24.1 ? 20% |
| Idle Minimum * (dB) | 32 | 32 -0% | 32 -0% | 30 6% | 32 -0% | 28.8 10% | 25.8 ? 19% |
| Idle Average * (dB) | 33 | 33 -0% | 33 -0% | 32 3% | 34 -3% | 28.8 13% | 27.4 ? 17% |
| Idle Maximum * (dB) | 36 | 35 3% | 50 -39% | 34 6% | 36 -0% | 29.4 18% | 30 ? 17% |
| Load Average * (dB) | 55 | 46 16% | 50 9% | 44 20% | 42 24% | 35.7 35% | 43 ? 22% |
| Witcher 3 ultra * (dB) | 57 | 54 5% | 51 11% | 46 19% | 44 23% | 42.5 25% | |
| Load Maximum * (dB) | 59 | 62 -5% | 51 14% | 47 20% | 48 19% | 45 24% | 54 ? 8% |
* ... smaller is better
Temperature
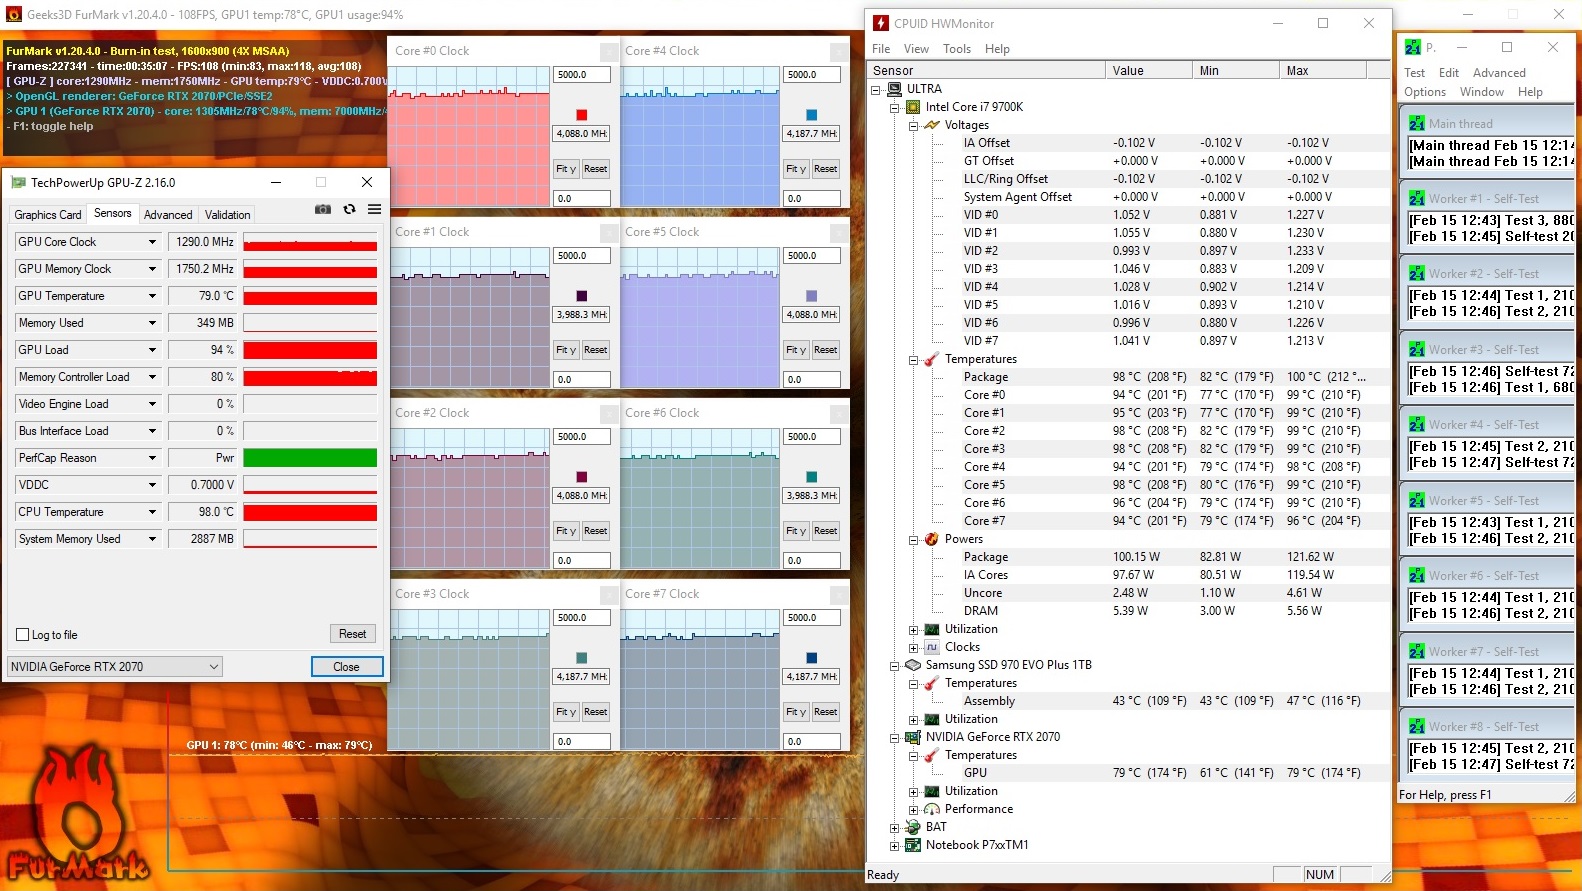
Our stress test (Prime95 and FurMark running simultaneously for at least a full hour) was completed differently on battery and on mains. When connected to external power, the CPU ran at between 4 and 4.2 GHz throughout the test, while the GPU clocked at 1,290 MHz. On battery, the CPU ran at a very consistent 2 GHz while the GPU ran at between 1,000 and 1,500 MHz.
By and large, the notebook remained comparatively cool with temperatures of less than 50 °C when running our stress test. It remained even cooler during our The Witcher 3 test, in which we run the game for a full hour in FHD with maximum details. Temperatures were thus fairly low during day to day use.
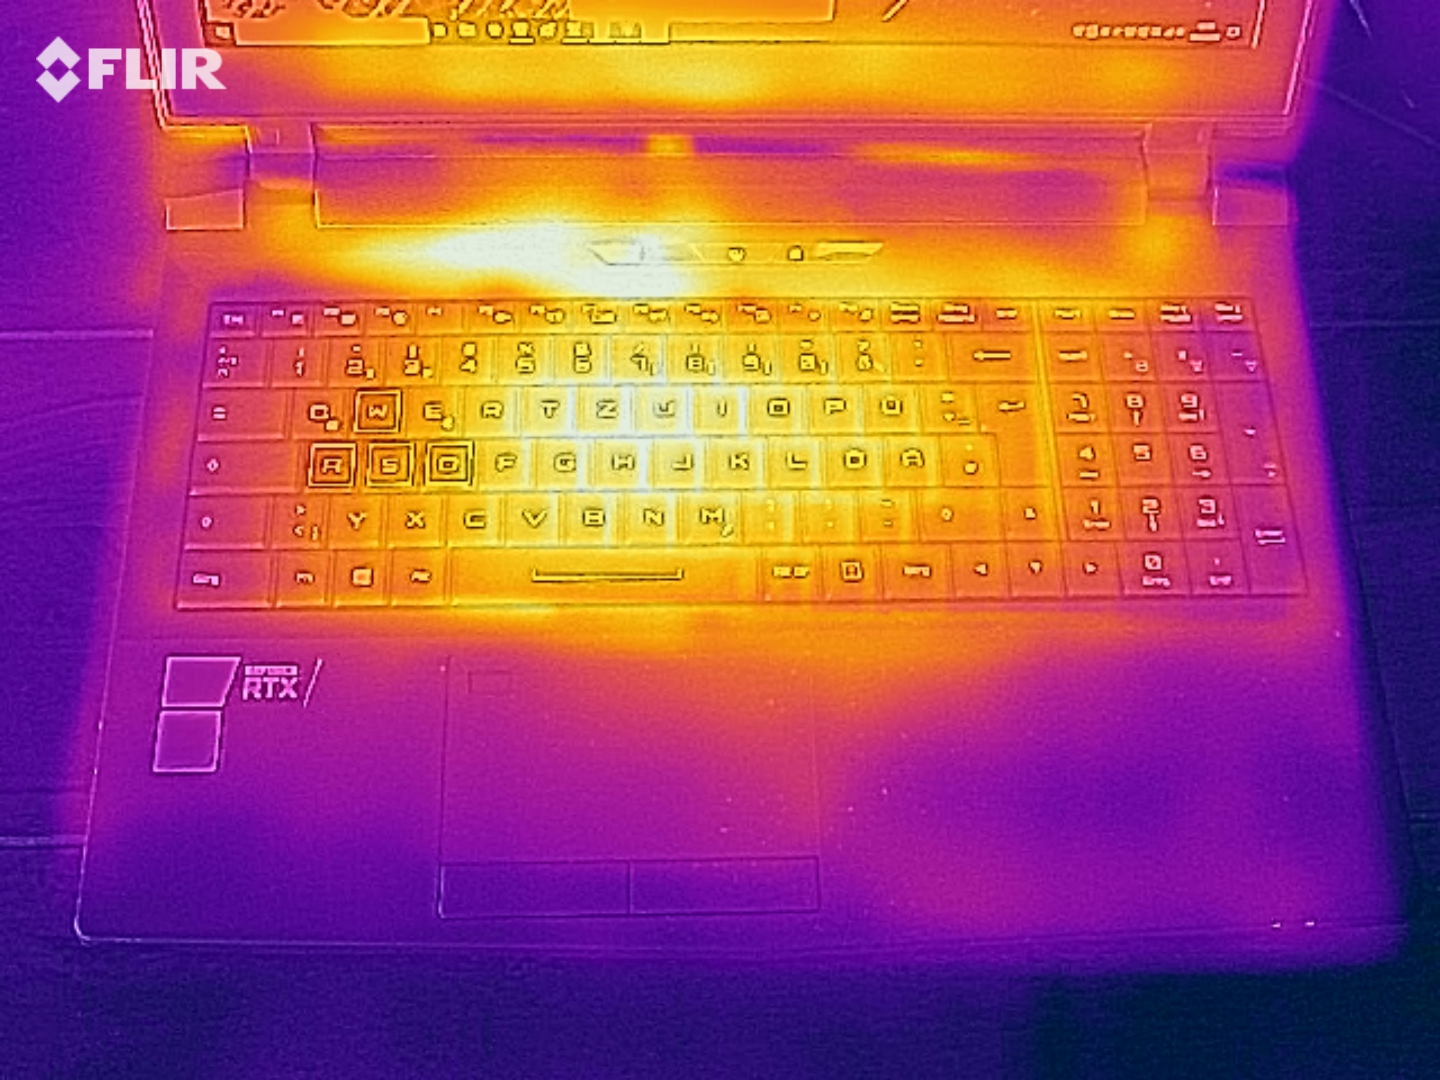
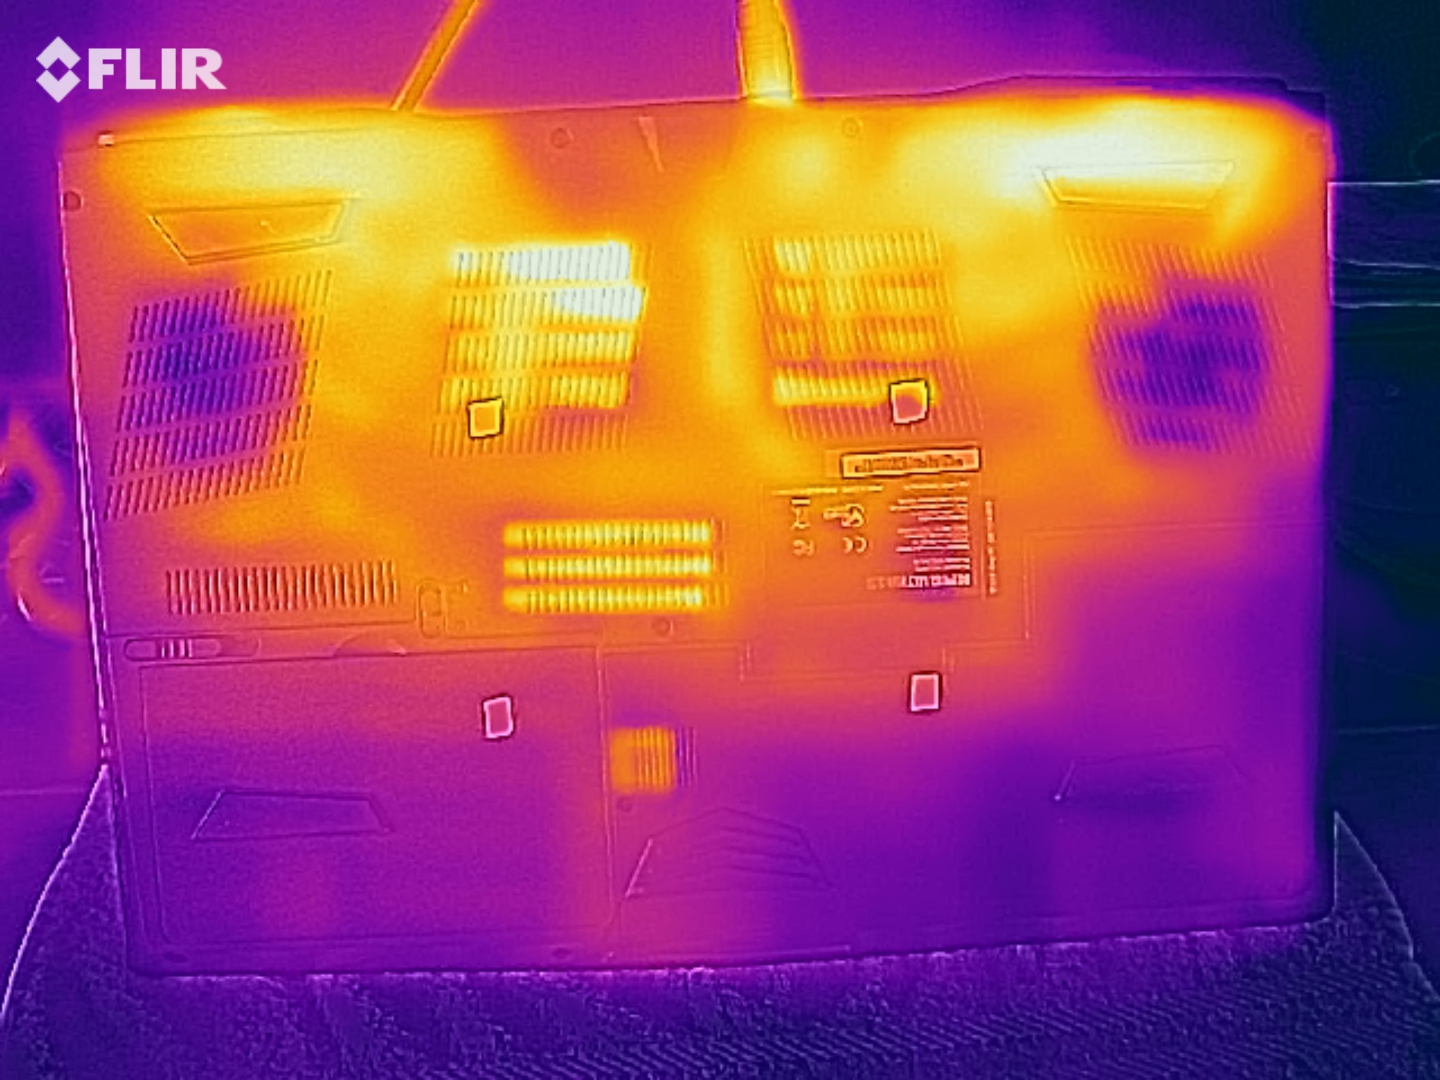
(±) The maximum temperature on the upper side is 45 °C / 113 F, compared to the average of 40.4 °C / 105 F, ranging from 21.2 to 68.8 °C for the class Gaming.
(-) The bottom heats up to a maximum of 48 °C / 118 F, compared to the average of 43.2 °C / 110 F
(+) In idle usage, the average temperature for the upper side is 28.7 °C / 84 F, compared to the device average of 33.9 °C / 93 F.
(±) Playing The Witcher 3, the average temperature for the upper side is 32.3 °C / 90 F, compared to the device average of 33.9 °C / 93 F.
(+) The palmrests and touchpad are reaching skin temperature as a maximum (34 °C / 93.2 F) and are therefore not hot.
(-) The average temperature of the palmrest area of similar devices was 28.8 °C / 83.8 F (-5.2 °C / -9.4 F).
| Schenker XMG Ultra 15 Turing i7-9700K, GeForce RTX 2070 Mobile | Schenker XMG Ultra 15 i5-8600K, GeForce GTX 1070 Mobile | Alienware 15 R4 i9-8950HK, GeForce GTX 1070 Mobile | Acer Predator Triton 500 i7-8750H, GeForce RTX 2080 Max-Q | Gigabyte Aero 15-X9 i7-8750H, GeForce RTX 2070 Max-Q | Razer Blade 15 RTX 2070 Max-Q i7-8750H, GeForce RTX 2070 Max-Q | Average of class Gaming | |
|---|---|---|---|---|---|---|---|
| Heat | 2% | -30% | -13% | -11% | 3% | -5% | |
| Maximum Upper Side * (°C) | 45 | 42 7% | 53 -18% | 49 -9% | 56 -24% | 49 -9% | 45.2 ? -0% |
| Maximum Bottom * (°C) | 48 | 50 -4% | 68 -42% | 58 -21% | 66 -38% | 49 -2% | 48 ? -0% |
| Idle Upper Side * (°C) | 30 | 29 3% | 39 -30% | 33 -10% | 27 10% | 25.4 15% | 31.1 ? -4% |
| Idle Bottom * (°C) | 30 | 29 3% | 39 -30% | 33 -10% | 27 10% | 27.2 9% | 34.2 ? -14% |
* ... smaller is better
Speakers
The speakers were surprisingly voluminous and enjoyable even for long periods of time. However, we would have wished for a better reproduction of bass. As always, headphones and external speakers offer a much better audio experience.
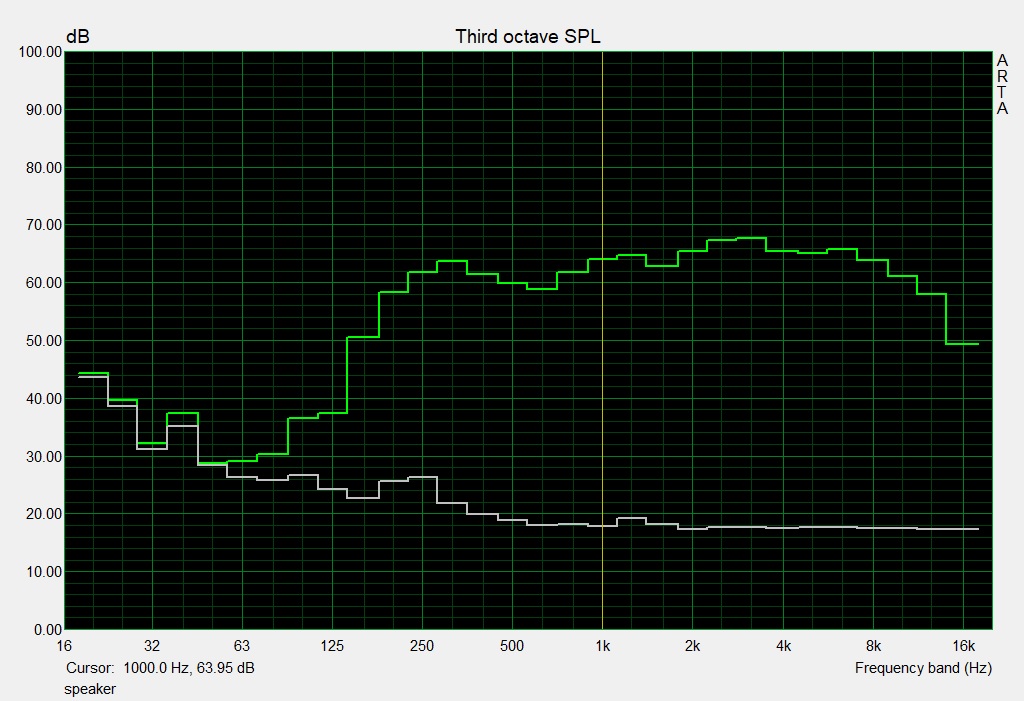
Schenker XMG Ultra 15 Turing audio analysis
(±) | speaker loudness is average but good (77 dB)
Bass 100 - 315 Hz
(±) | reduced bass - on average 11.1% lower than median
(±) | linearity of bass is average (12.7% delta to prev. frequency)
Mids 400 - 2000 Hz
(+) | balanced mids - only 1.9% away from median
(+) | mids are linear (4.3% delta to prev. frequency)
Highs 2 - 16 kHz
(+) | balanced highs - only 3.6% away from median
(+) | highs are linear (3.3% delta to prev. frequency)
Overall 100 - 16.000 Hz
(+) | overall sound is linear (14.5% difference to median)
Compared to same class
» 27% of all tested devices in this class were better, 7% similar, 66% worse
» The best had a delta of 6%, average was 18%, worst was 132%
Compared to all devices tested
» 18% of all tested devices were better, 4% similar, 78% worse
» The best had a delta of 4%, average was 24%, worst was 134%
Schenker XMG Ultra 15 audio analysis
(±) | speaker loudness is average but good (76 dB)
Bass 100 - 315 Hz
(±) | reduced bass - on average 10.7% lower than median
(±) | linearity of bass is average (12.1% delta to prev. frequency)
Mids 400 - 2000 Hz
(+) | balanced mids - only 1.5% away from median
(+) | mids are linear (3.2% delta to prev. frequency)
Highs 2 - 16 kHz
(+) | balanced highs - only 2.2% away from median
(+) | highs are linear (3.1% delta to prev. frequency)
Overall 100 - 16.000 Hz
(+) | overall sound is linear (13.3% difference to median)
Compared to same class
» 19% of all tested devices in this class were better, 5% similar, 76% worse
» The best had a delta of 6%, average was 18%, worst was 132%
Compared to all devices tested
» 14% of all tested devices were better, 3% similar, 83% worse
» The best had a delta of 4%, average was 24%, worst was 134%
Alienware 15 R4 audio analysis
(+) | speakers can play relatively loud (87 dB)
Bass 100 - 315 Hz
(-) | nearly no bass - on average 21% lower than median
(±) | linearity of bass is average (9.8% delta to prev. frequency)
Mids 400 - 2000 Hz
(±) | higher mids - on average 6.1% higher than median
(+) | mids are linear (5.8% delta to prev. frequency)
Highs 2 - 16 kHz
(+) | balanced highs - only 2.2% away from median
(+) | highs are linear (4.3% delta to prev. frequency)
Overall 100 - 16.000 Hz
(±) | linearity of overall sound is average (16.6% difference to median)
Compared to same class
» 43% of all tested devices in this class were better, 7% similar, 50% worse
» The best had a delta of 6%, average was 18%, worst was 132%
Compared to all devices tested
» 29% of all tested devices were better, 6% similar, 66% worse
» The best had a delta of 4%, average was 24%, worst was 134%
Energy Management
Power Consumption
Given that the XMG Ultra 15 does not support on-demand graphics-switching and is thus limited to the RTX 2070 GPU, the notebook’s idle power consumption of up to 47 W was at a level comparable to some business notebooks’ power consumption under load. During our stress test, the power meter read up to 299 W, which was reduced to around 196 W when gaming (The Witcher 3). The power supply is rated at 330 W.
| Off / Standby | |
| Idle | |
| Load |
|
Key:
min: | |
| Schenker XMG Ultra 15 Turing i7-9700K, GeForce RTX 2070 Mobile | Schenker XMG Ultra 15 i5-8600K, GeForce GTX 1070 Mobile | Alienware 15 R4 i9-8950HK, GeForce GTX 1070 Mobile | Acer Predator Triton 500 i7-8750H, GeForce RTX 2080 Max-Q | Gigabyte Aero 15-X9 i7-8750H, GeForce RTX 2070 Max-Q | Razer Blade 15 RTX 2070 Max-Q i7-8750H, GeForce RTX 2070 Max-Q | Average of class Gaming | |
|---|---|---|---|---|---|---|---|
| Power Consumption | 11% | 24% | 37% | 45% | 47% | 37% | |
| Idle Minimum * (Watt) | 35 | 28 20% | 23 34% | 16 54% | 16 54% | 10.4 70% | 13.2 ? 62% |
| Idle Average * (Watt) | 39 | 31 21% | 26 33% | 22 44% | 18 54% | 14.6 63% | 18.9 ? 52% |
| Idle Maximum * (Watt) | 47 | 38 19% | 30 36% | 32 32% | 23 51% | 16.3 65% | 24.3 ? 48% |
| Load Average * (Watt) | 117 | 100 15% | 111 5% | 89 24% | 88 25% | 88.5 24% | 108 ? 8% |
| Witcher 3 ultra * (Watt) | 196 | 206 -5% | 182 7% | 147 25% | 120 39% | 155.4 21% | |
| Load Maximum * (Watt) | 299 | 309 -3% | 222 26% | 173 42% | 167 44% | 182.4 39% | 254 ? 15% |
* ... smaller is better
Battery Life
In our real life Wi-Fi test, in which we simulate a load typical for browsing the web by loading various websites with the display brightness normalized to 150 nits and the energy plan set to “Balanced”, the XMG Ultra 15 lasted for just 2:37 hours. In our video test it ran out of power even faster and powered off after just 2:34 hours. In this test, we run the Big Buck Bunny short film (H.264-encoding, 1920x1080) in a loop with the energy plan set to “Power saver”, all wireless communications modules disabled, and the display brightness once again set to 150 nits.
| Schenker XMG Ultra 15 Turing i7-9700K, GeForce RTX 2070 Mobile, 82 Wh | Schenker XMG Ultra 15 i5-8600K, GeForce GTX 1070 Mobile, 82 Wh | Alienware 15 R4 i9-8950HK, GeForce GTX 1070 Mobile, 99 Wh | Acer Predator Triton 500 i7-8750H, GeForce RTX 2080 Max-Q, 82 Wh | Gigabyte Aero 15-X9 i7-8750H, GeForce RTX 2070 Max-Q, 94.24 Wh | Razer Blade 15 RTX 2070 Max-Q i7-8750H, GeForce RTX 2070 Max-Q, 80 Wh | Average of class Gaming | |
|---|---|---|---|---|---|---|---|
| Battery runtime | 25% | 54% | 33% | 144% | 138% | 141% | |
| Reader / Idle (h) | 3.2 | 3.7 16% | 6.2 94% | 5.6 75% | 9.2 187% | 11.4 256% | 8.71 ? 172% |
| H.264 (h) | 2.6 | 3.1 19% | 6.1 135% | 8.26 ? 218% | |||
| WiFi v1.3 (h) | 2.6 | 3.2 23% | 5.1 96% | 3.2 23% | 6.4 146% | 6.5 150% | 7.02 ? 170% |
| Load (h) | 1.4 | 2 43% | 1 -29% | 1.4 0% | 2.9 107% | 1.5 7% | 1.47 ? 5% |
Pros
Cons
Verdict
Schenker’s XMG Ultra 15 is a massive hunk. Its enormous size and weight are due to a specialty that can be rarely found in modern notebooks anymore: Socketed and thus swappable CPU and GPU (the latter as MXM module).
Schenker’s latest XMG Ultra 15 iteration is a well-made high-end gaming notebook for those who benefit from upgradeability.
The combination of a Core-i7 9700K octa-core CPU and a GeForce RTX 2070 GPU was more than capable to render all current games smoothly on the matte FHD display in high or even maximum details. The GPU was clearly capable of even higher resolutions.
Thanks to Nvidia G-Sync and a 144 Hz IPS display the result was incredibly smooth. The display featured a great contrast ratio, short response times, and wide viewing angles. Our only gripe was that its maximum brightness was too low. A blazingly fast NVMe SSD ensured a smooth and snappy system performance, and the case had room for another M.2 SSD as well as two 2.5-inch HDDs. The RGB-backlit keyboard was surprisingly good, and connectivity was very decent. In return, battery life was so poor it was barely worth mentioning.
Fan management definitely has room for improvement. Under load, the fans run much faster than necessary to ensure adequate cooling. We suspect that the cooling system was designed and developed for a much more powerful SKU (Core i9-9900K, GeForce RTX 2080).
Schenker XMG Ultra 15 Turing
- 03/04/2019 v6 (old)
Sascha Mölck
Price comparison

