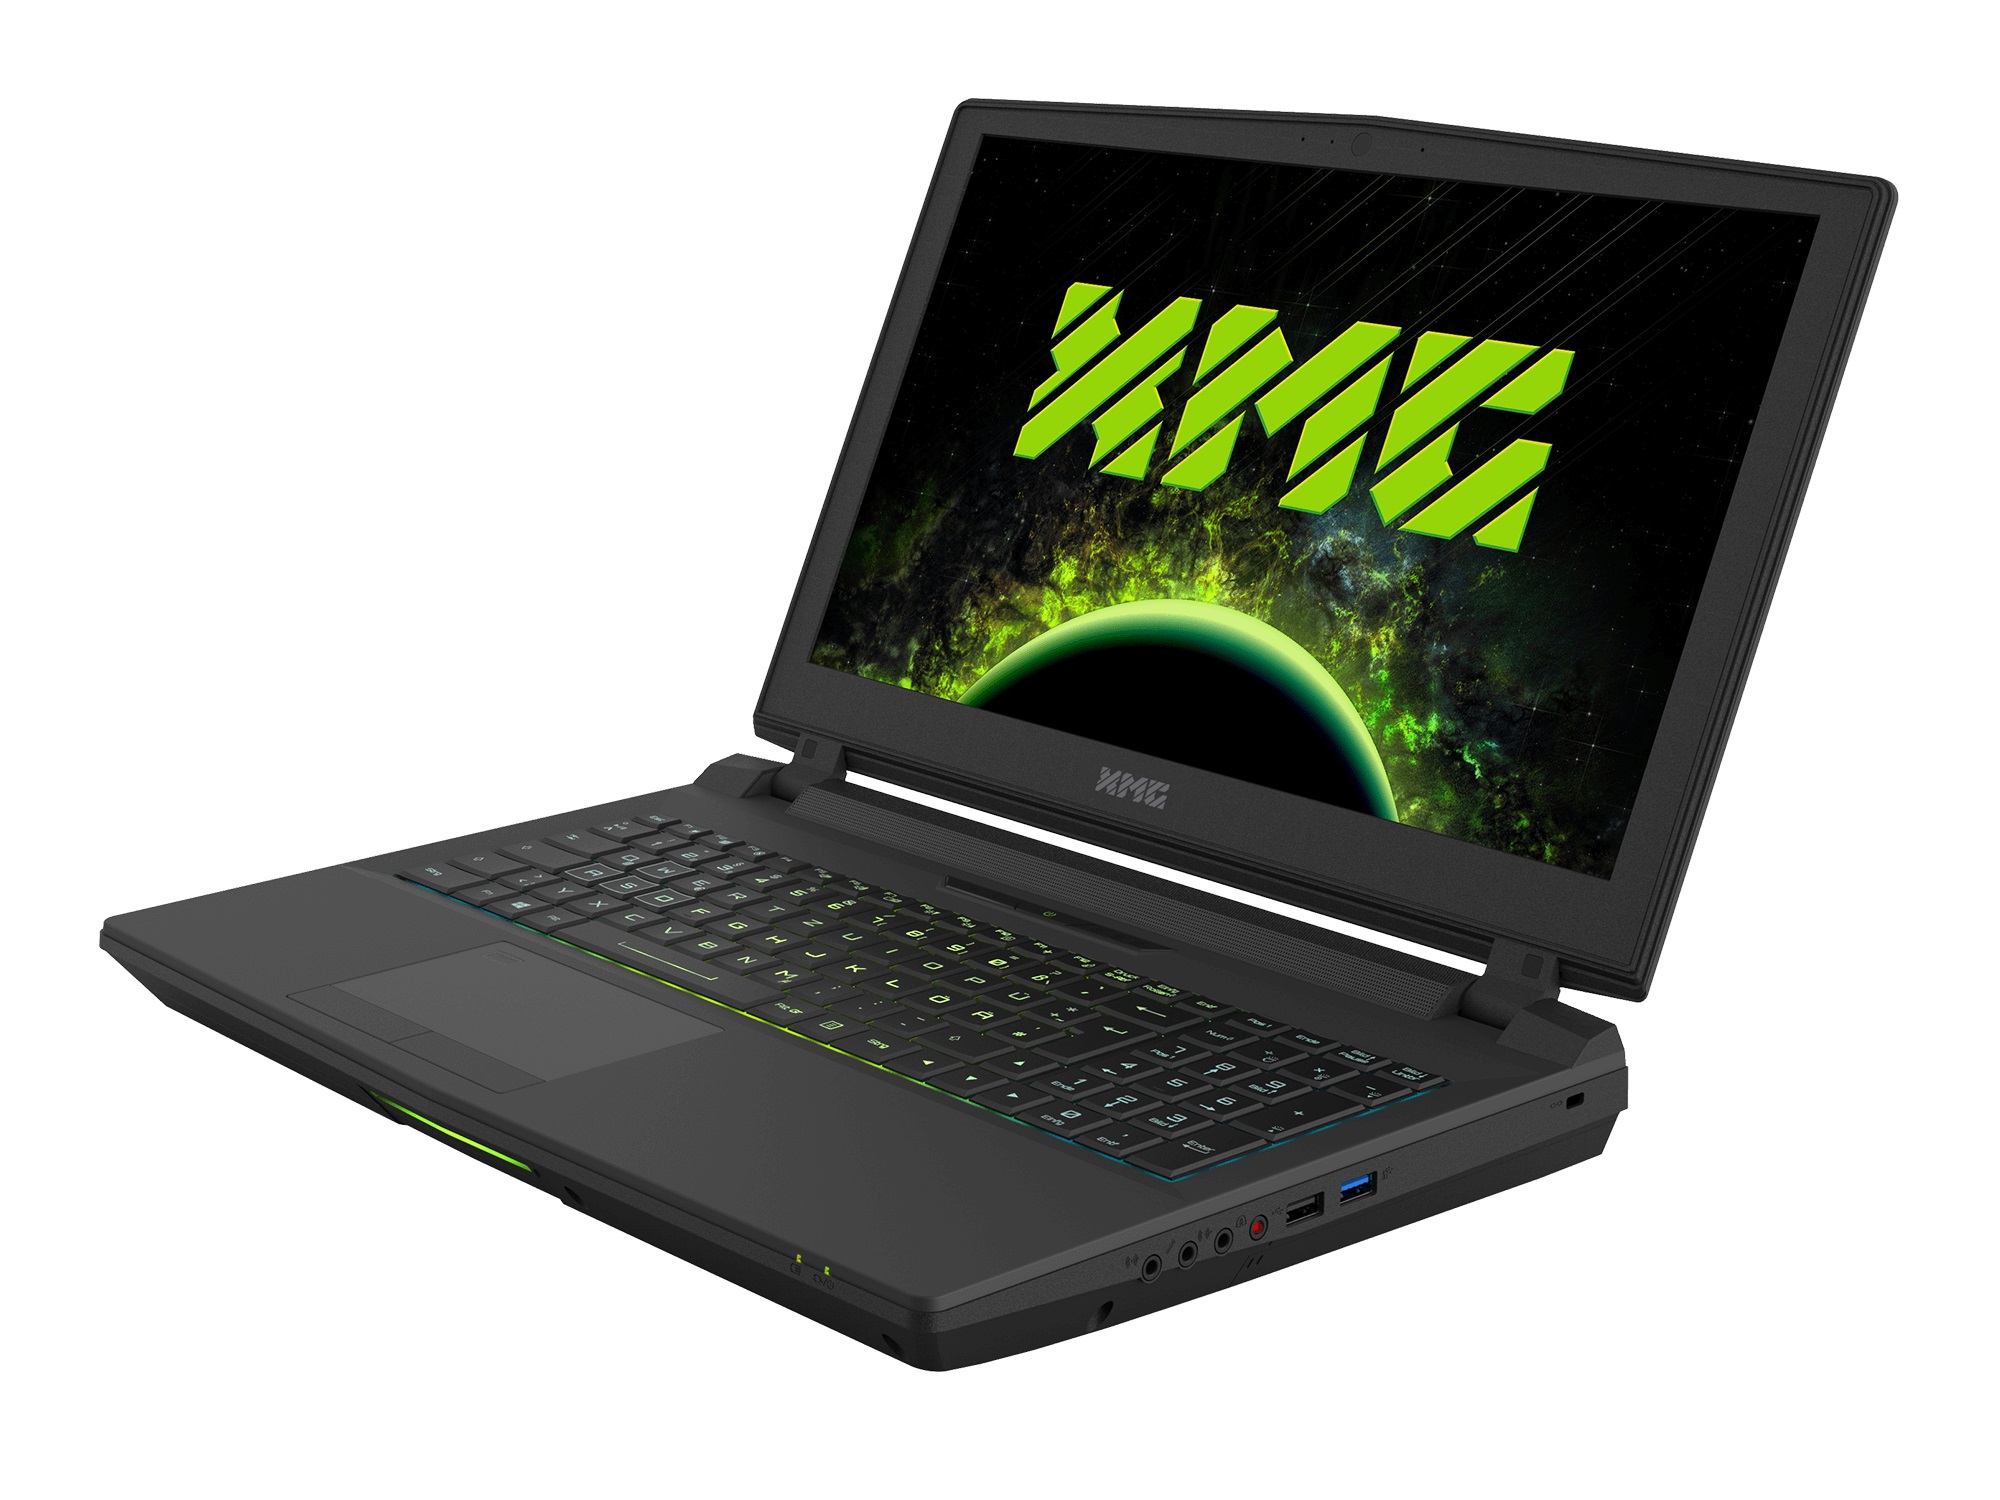
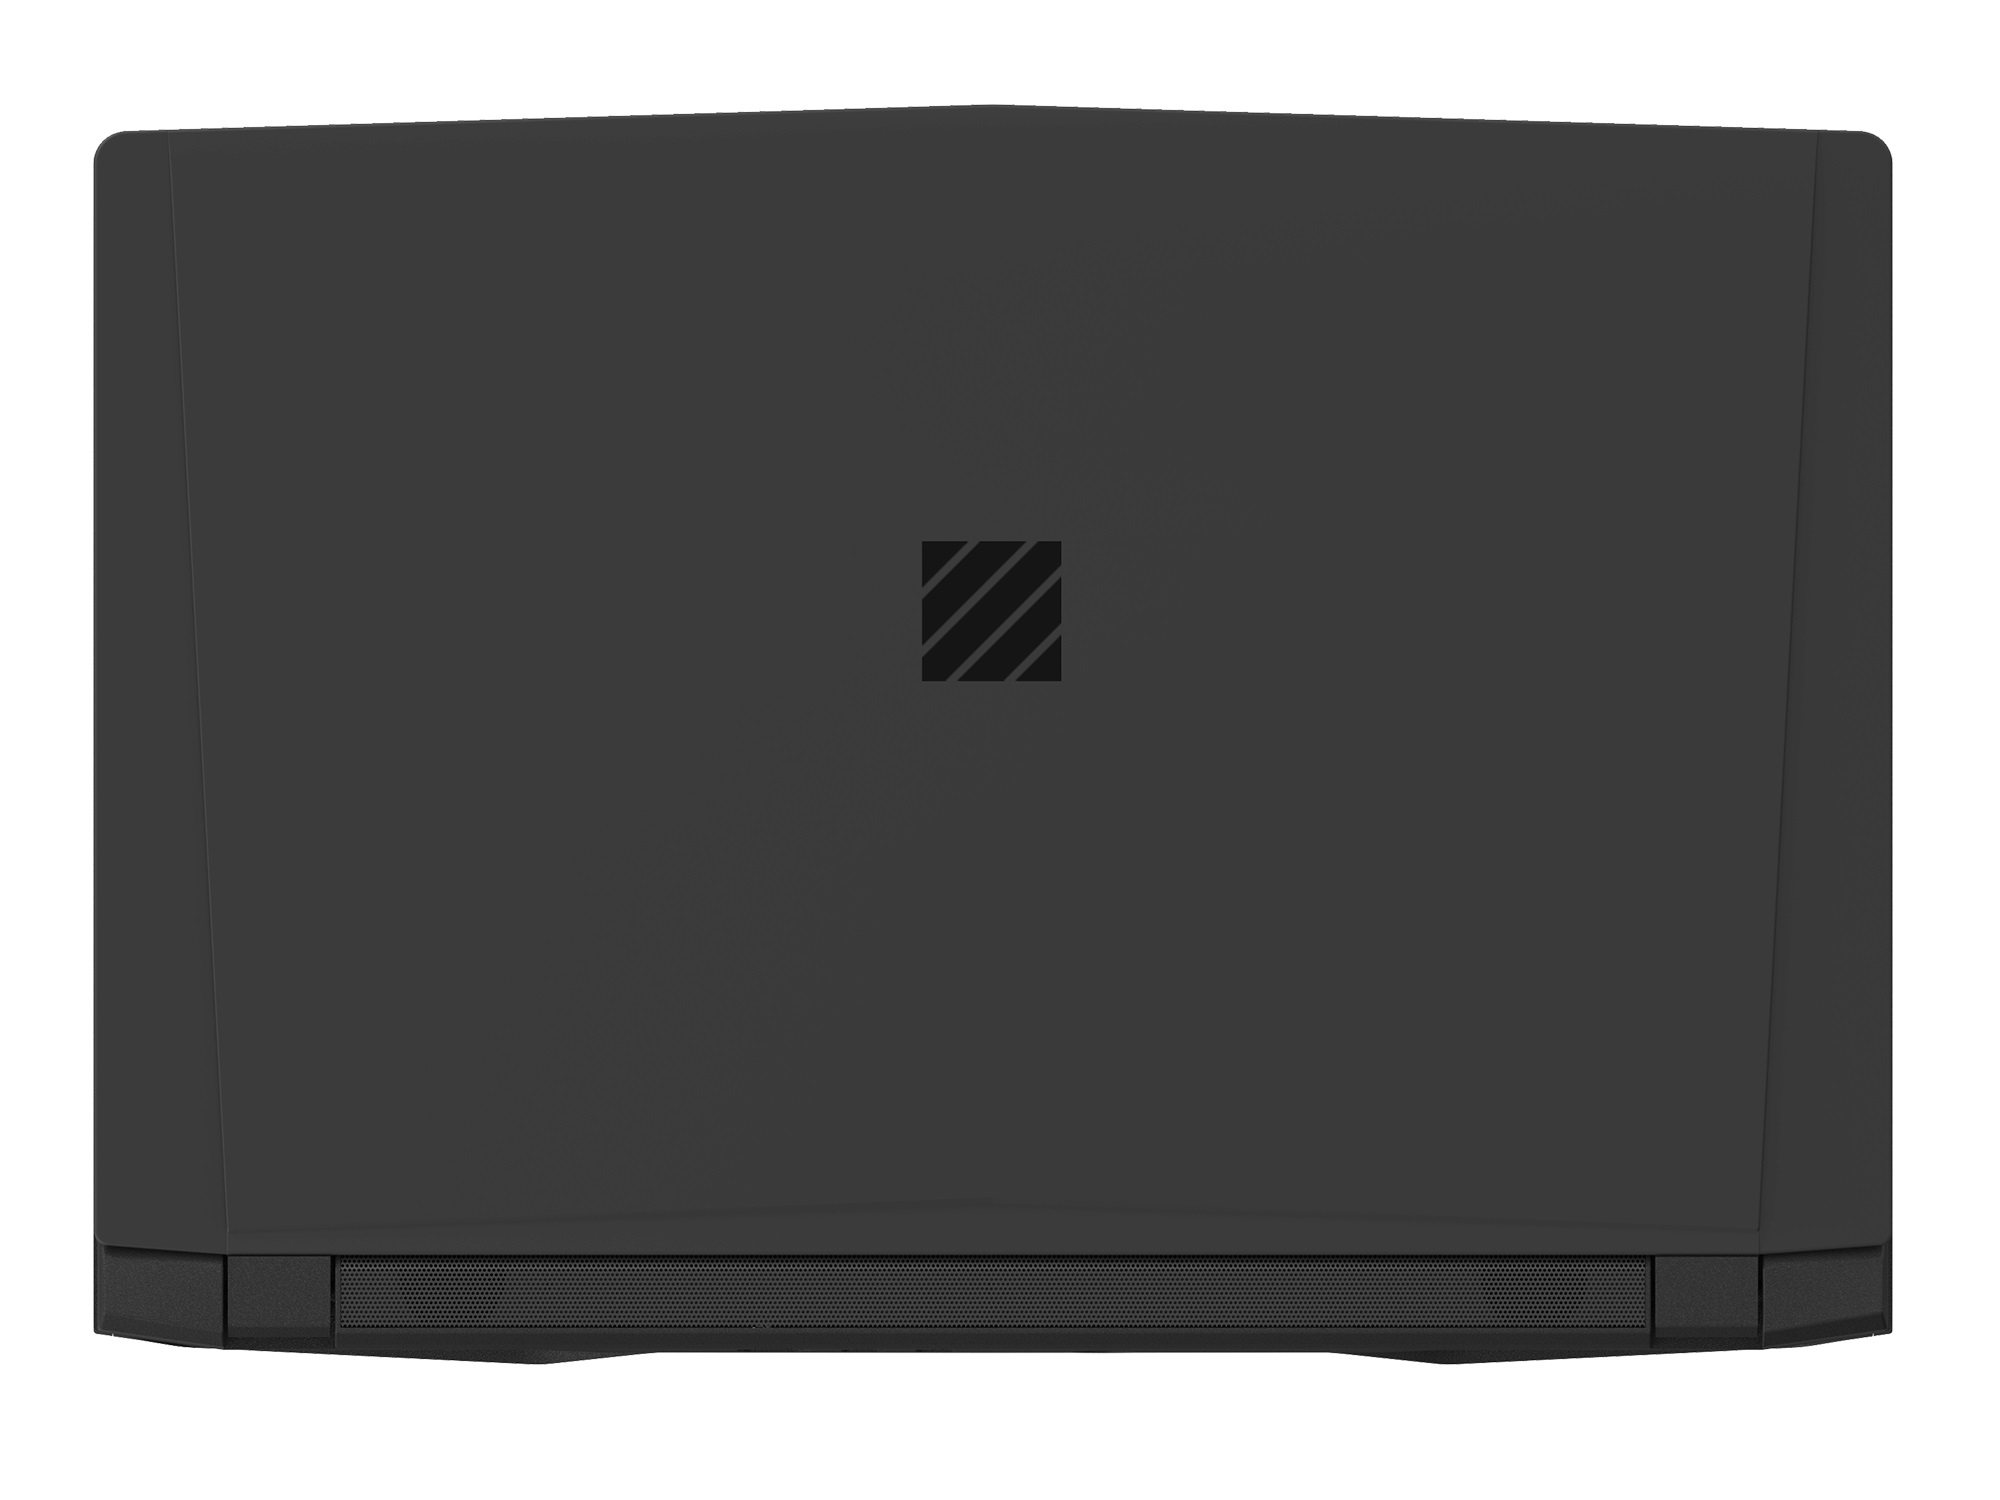
Schenker XMG Ultra 15 (Clevo P751TM1-G) Laptop Review

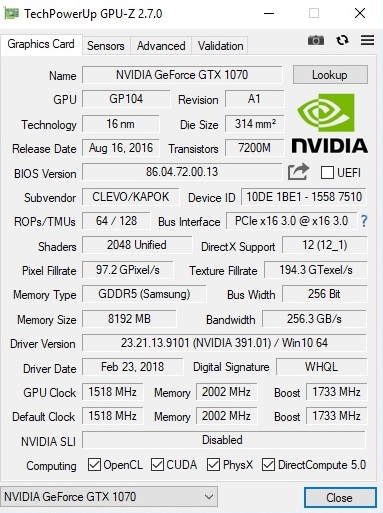
Not long after we reviewed the XMG Ultra 17 with a Core i7-8700, a GeForce GTX 1080 and a 4K display, we took a look at its more compact 15-inch sibling that is about 0.8 kg (1.76 lbs) lighter. Just like its brethren, the XMG Ultra 15 can be customized to fit your personal needs on Schenker’s website. This starts with the graphics card, which is based on Nvidia’s Pascal architecture and features either 6 GB (GeForce GTX 1060) or 8 GB (GeForce GTX 1070) of VRAM.
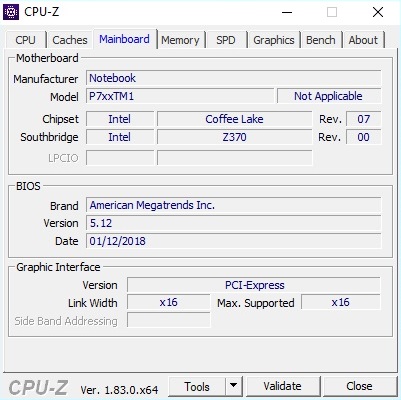
There is even more choice when it comes to the CPU. As opposed to 95% of all high-end notebooks, the XMG does not come with a mobile processor; instead it has a genuine desktop CPU from Intel’s Coffee Lake series. Besides the hexa-core models that do not support Hyper-Threading and come with 9 MB of L3 cache (Core i5-8400 and Core i5-8600K), there are also two more expensive hexa-core chips that come with 12 MB of cache and support Hyper-Threading (Core i7-8700 and Core i7-8700K) in Schenker’s online configurator. Exciting: For a premium, you can get “cut-down” versions of the latter chips. The TDP of the CPUs on offer ranges from 65 to 95 watts (notebook standard: 45 watts).
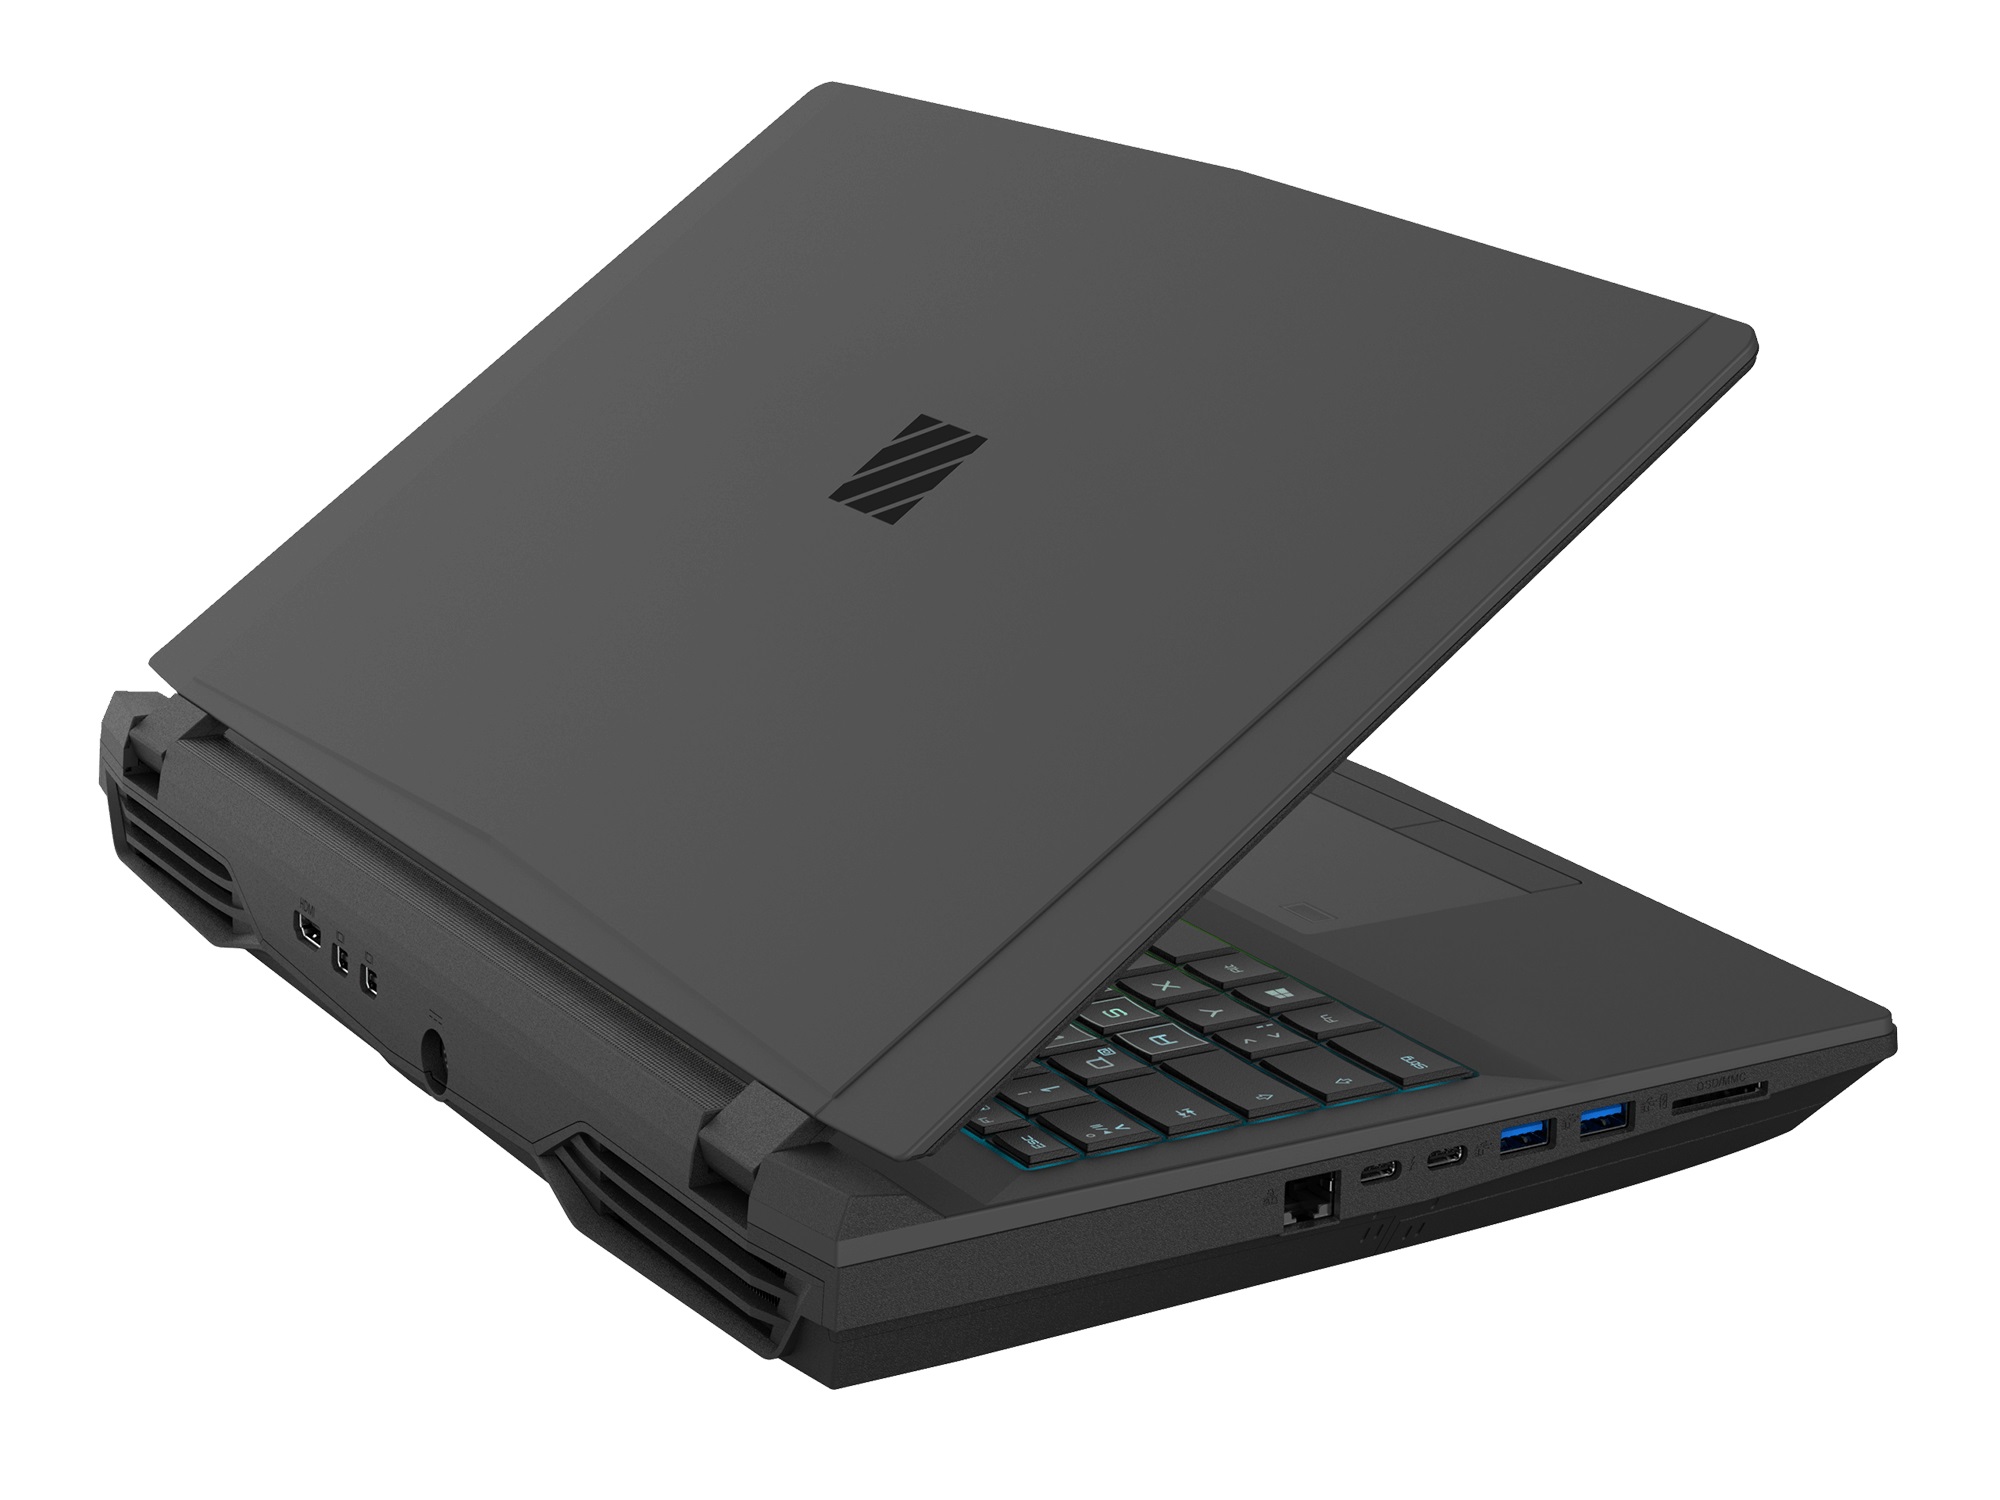
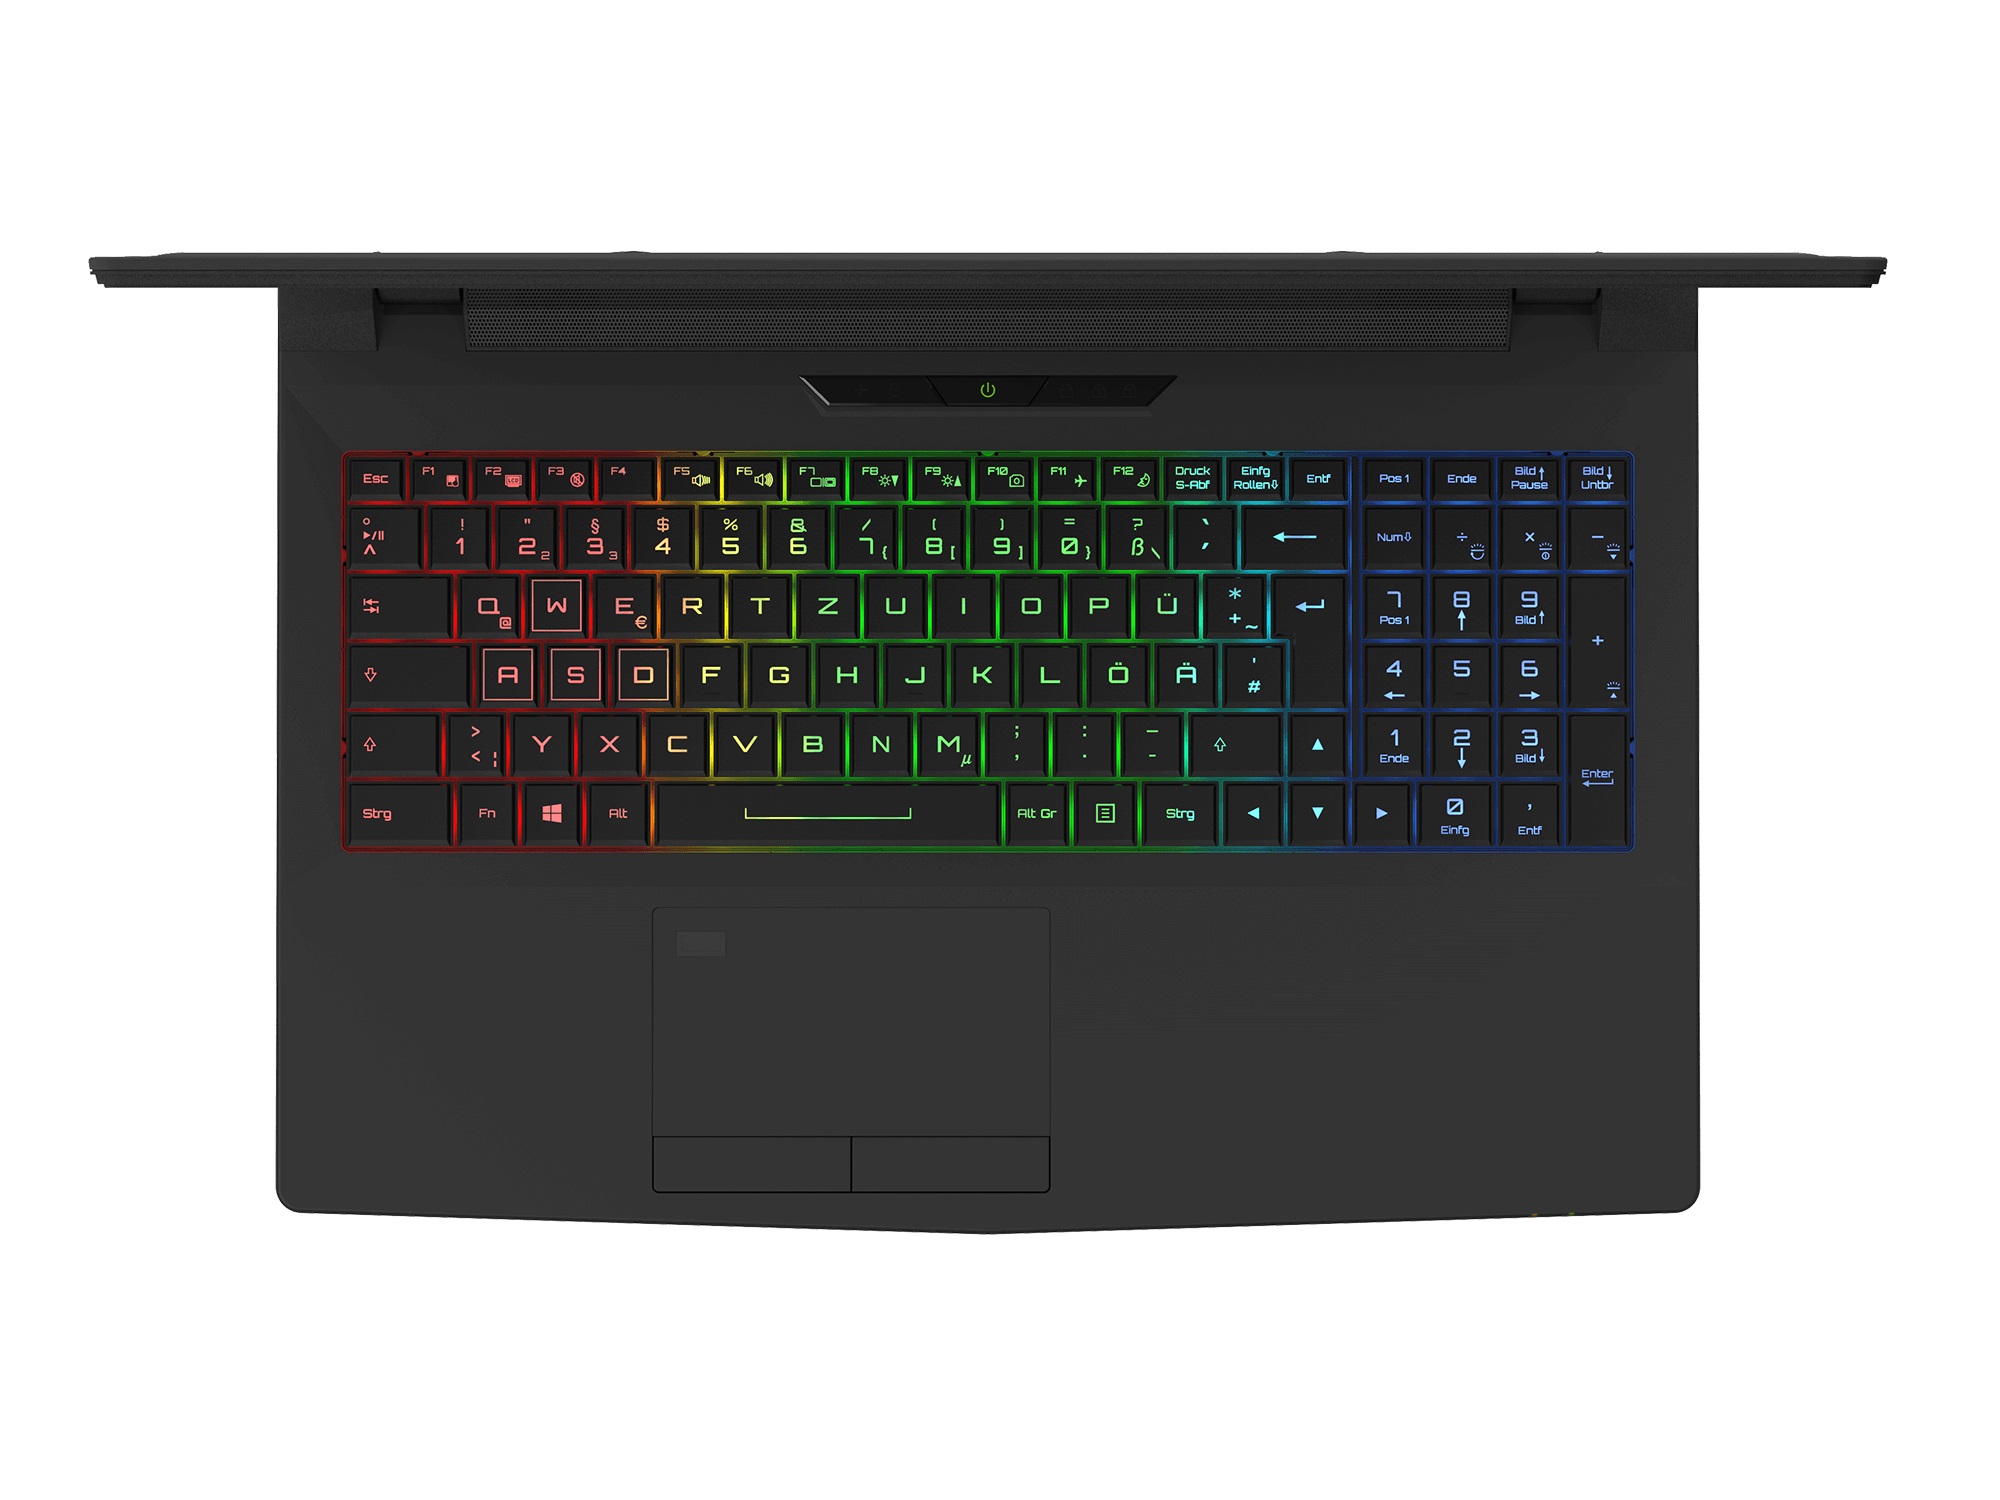
Choosing the RAM and the storage device will not be easy, either. The Clevo P751TM1-G boasts four DDR4 RAM slots (64 GB max.), two PCIe/NVMe M.2 slots and two 2.5-inch drive bays. The Wi-Fi module (UMTS/LTE modem is optional) and the keyboard language can also be customized during the ordering process. Buyers have no choice when it comes to the display, though. In keeping with Nvidia’s G-Sync technology, the Full HD panel supports 120 Hz. According to Schenker Technologies, a 144 Hz variant – something that the Asus G703 enjoys – is coming soon.
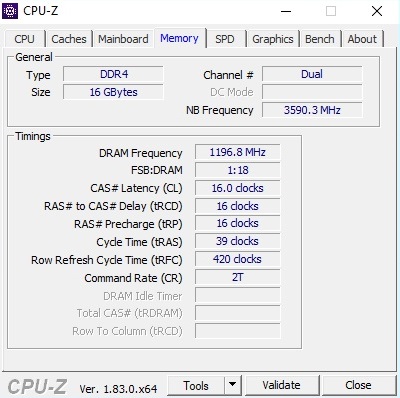
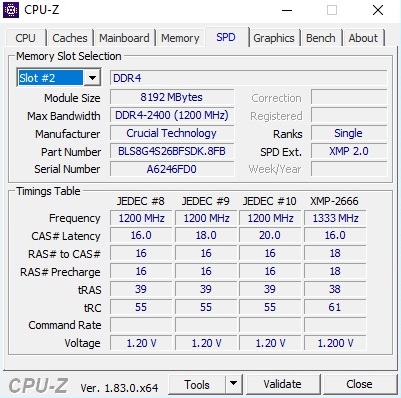
Prices for the XMG Ultra 15 start at 1699 Euros (~$2096). However, for this price you will only get 8 GB of RAM, a 500 GB HDD and no OS. Our review device, which comes with a Core i5-8600K, a GeForce GTX 1070, 16 GB of RAM (two 8 GB DIMMs) and a 500 GB SSD, costs roughly 2500 Euros (~$3092).
The competitors of the XMG Ultra 15 include other 15-inch notebooks with a GeForce GTX 1070 such as: The Acer Predator 15, the MSI GT62VR 7RE, the Gigabyte P56XT and the Alienware 15 R3. We included the above-mentioned devices in this review for comparison purposes.
| SD Card Reader | |
| average JPG Copy Test (av. of 3 runs) | |
| Schenker XMG Ultra 15 (Toshiba Exceria Pro SDXC 64 GB UHS-II) | |
| MSI GT62VR 7RE-223 (Toshiba Exceria Pro SDXC 64 GB UHS-II) | |
| Average of class Gaming (20.9 - 210, n=54, last 2 years) | |
| Acer Predator 15 G9-593-751X (Toshiba Exceria Pro SDXC 64 GB UHS-II) | |
| Gigabyte P56XT (Toshiba Exceria Pro SDXC 64 GB UHS-II) | |
| maximum AS SSD Seq Read Test (1GB) | |
| MSI GT62VR 7RE-223 (Toshiba Exceria Pro SDXC 64 GB UHS-II) | |
| Schenker XMG Ultra 15 (Toshiba Exceria Pro SDXC 64 GB UHS-II) | |
| Average of class Gaming (25.5 - 261, n=51, last 2 years) | |
| Acer Predator 15 G9-593-751X (Toshiba Exceria Pro SDXC 64 GB UHS-II) | |
| Gigabyte P56XT (Toshiba Exceria Pro SDXC 64 GB UHS-II) | |
| Networking | |
| iperf3 transmit AX12 | |
| Schenker XMG Ultra 15 | |
| Acer Predator 15 G9-593-751X | |
| MSI GT62VR 7RE-223 | |
| Alienware 15 R3 | |
| Gigabyte P56XT | |
| iperf3 receive AX12 | |
| Acer Predator 15 G9-593-751X | |
| Schenker XMG Ultra 15 | |
| Alienware 15 R3 | |
| Gigabyte P56XT | |
| MSI GT62VR 7RE-223 | |
Display
Displays with refresh rates above 60 to 75 Hz are becoming more and more popular among gamers. Almost all manufacturers of high-end notebooks are paying attention to this trend. Schenker Technologies is no exception. It puts high-refresh-rate panels in many of its products.
| |||||||||||||||||||||||||
Brightness Distribution: 74 %
Center on Battery: 363 cd/m²
Contrast: 626:1 (Black: 0.58 cd/m²)
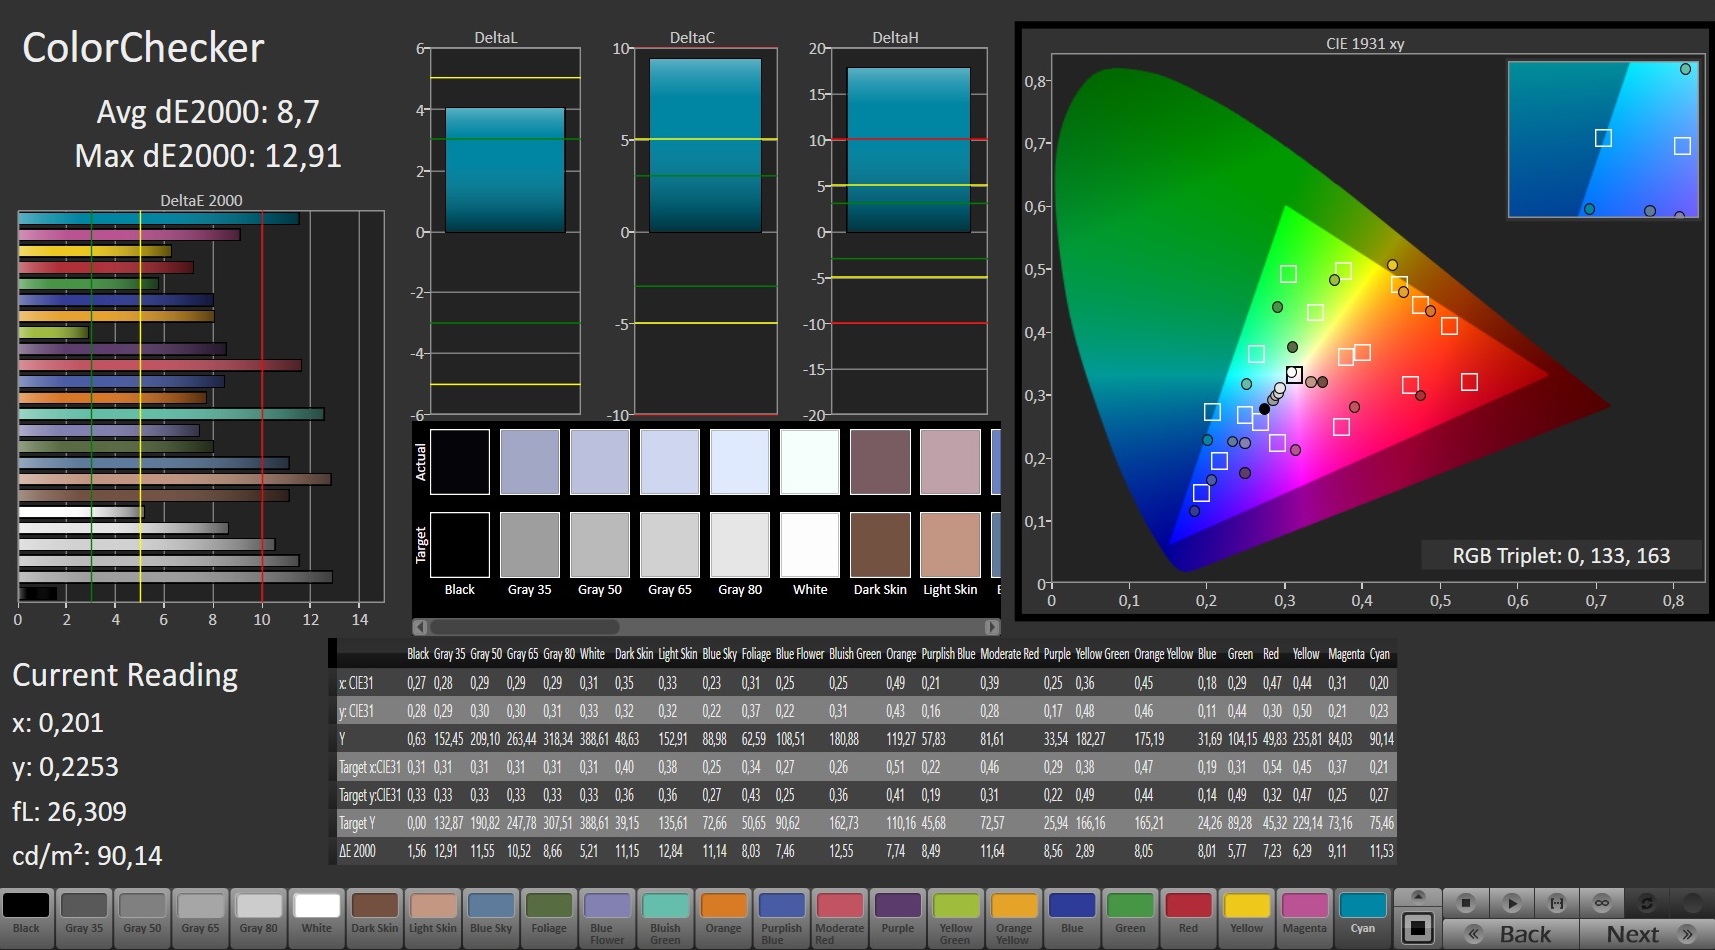
ΔE ColorChecker Calman: 8.7 | ∀{0.5-29.43 Ø4.71}
calibrated: 2.36
ΔE Greyscale Calman: 9.26 | ∀{0.09-98 Ø4.96}
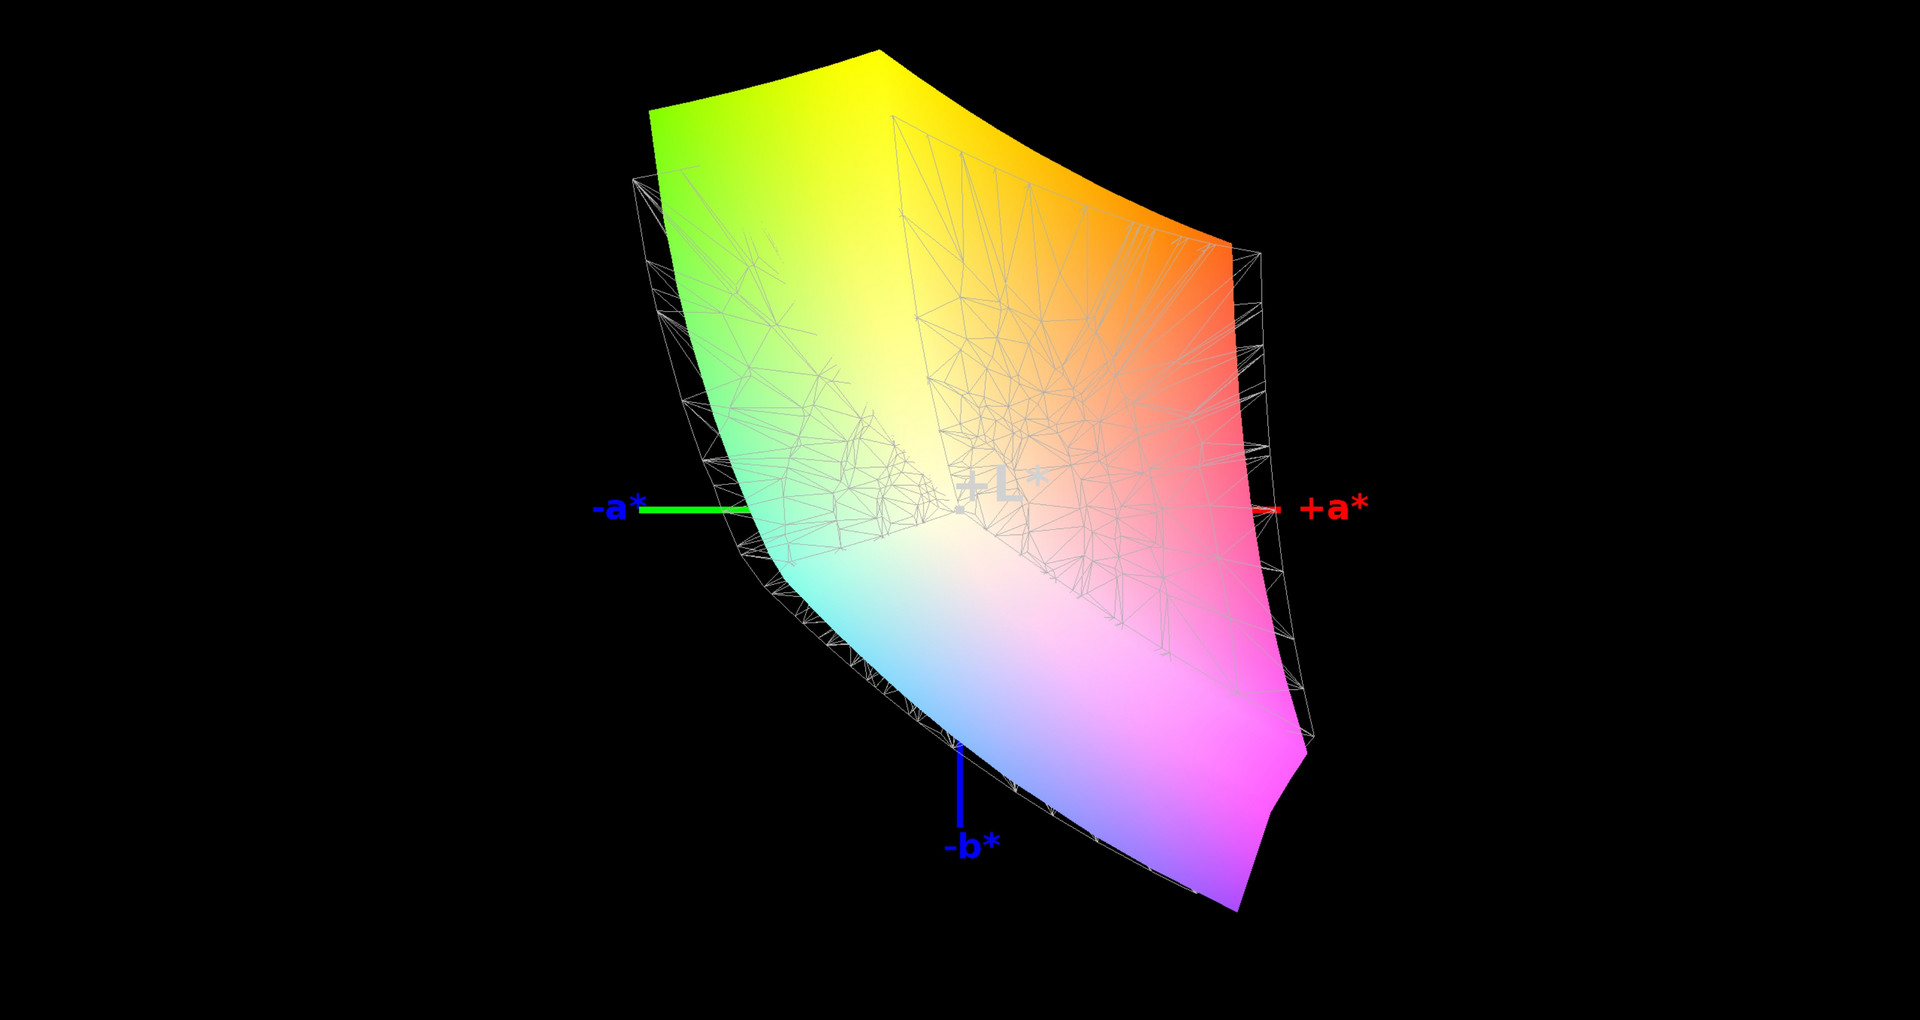
91% sRGB (Argyll 1.6.3 3D)
59% AdobeRGB 1998 (Argyll 1.6.3 3D)
66.3% AdobeRGB 1998 (Argyll 3D)
90.7% sRGB (Argyll 3D)
66.8% Display P3 (Argyll 3D)
Gamma: 2.16
CCT: 9390 K
| Schenker XMG Ultra 15 AU Optronics B156HTN05.2 (AUO52ED), TN, 1920x1080 | Acer Predator 15 G9-593-751X LG Philips LP156WF6-SPP1 (LGD04D5), IPS, 1920x1080 | MSI GT62VR 7RE-223 LG Philips LP156WF6 (LGD046F), IPS, 1920x1080 | Gigabyte P56XT LG Philips LP156WF6 (LGD046F), IPS, 1920x1080 | Alienware 15 R3 HPJGK_B156HTN (AUO51ED), TN, 1920x1080 | |
|---|---|---|---|---|---|
| Display | -5% | -7% | -6% | -0% | |
| Display P3 Coverage (%) | 66.8 | 65.4 -2% | 63.9 -4% | 64.8 -3% | 66 -1% |
| sRGB Coverage (%) | 90.7 | 85.5 -6% | 83.1 -8% | 84.6 -7% | 90.5 0% |
| AdobeRGB 1998 Coverage (%) | 66.3 | 62.5 -6% | 60.8 -8% | 61.8 -7% | 66.2 0% |
| Response Times | -140% | -133% | -132% | -27% | |
| Response Time Grey 50% / Grey 80% * (ms) | 24.2 ? | 36 ? -49% | 37 ? -53% | 37.2 ? -54% | 25 ? -3% |
| Response Time Black / White * (ms) | 8 ? | 26.4 ? -230% | 25 ? -213% | 24.8 ? -210% | 12 ? -50% |
| PWM Frequency (Hz) | 20830 ? | 20000 ? | |||
| Screen | 17% | 20% | 14% | 7% | |
| Brightness middle (cd/m²) | 363 | 295 -19% | 310 -15% | 301 -17% | 386 6% |
| Brightness (cd/m²) | 365 | 274 -25% | 311 -15% | 280 -23% | 382 5% |
| Brightness Distribution (%) | 74 | 88 19% | 85 15% | 87 18% | 93 26% |
| Black Level * (cd/m²) | 0.58 | 0.32 45% | 0.3 48% | 0.32 45% | 0.39 33% |
| Contrast (:1) | 626 | 922 47% | 1033 65% | 941 50% | 990 58% |
| Colorchecker dE 2000 * | 8.7 | 4.59 47% | 4.82 45% | 6.21 29% | 10.2 -17% |
| Colorchecker dE 2000 max. * | 12.91 | 11 15% | 10.14 21% | 10.78 16% | 15.81 -22% |
| Colorchecker dE 2000 calibrated * | 2.36 | ||||
| Greyscale dE 2000 * | 9.26 | 4.03 56% | 3.94 57% | 6.08 34% | 11.28 -22% |
| Gamma | 2.16 102% | 2.3 96% | 2.45 90% | 2.31 95% | 2.23 99% |
| CCT | 9390 69% | 7229 90% | 6877 95% | 7375 88% | 11383 57% |
| Color Space (Percent of AdobeRGB 1998) (%) | 59 | 56 -5% | 54 -8% | 55 -7% | 59 0% |
| Color Space (Percent of sRGB) (%) | 91 | 85 -7% | 83 -9% | 84 -8% | 90 -1% |
| Total Average (Program / Settings) | -43% /
-8% | -40% /
-5% | -41% /
-10% | -7% /
1% |
* ... smaller is better
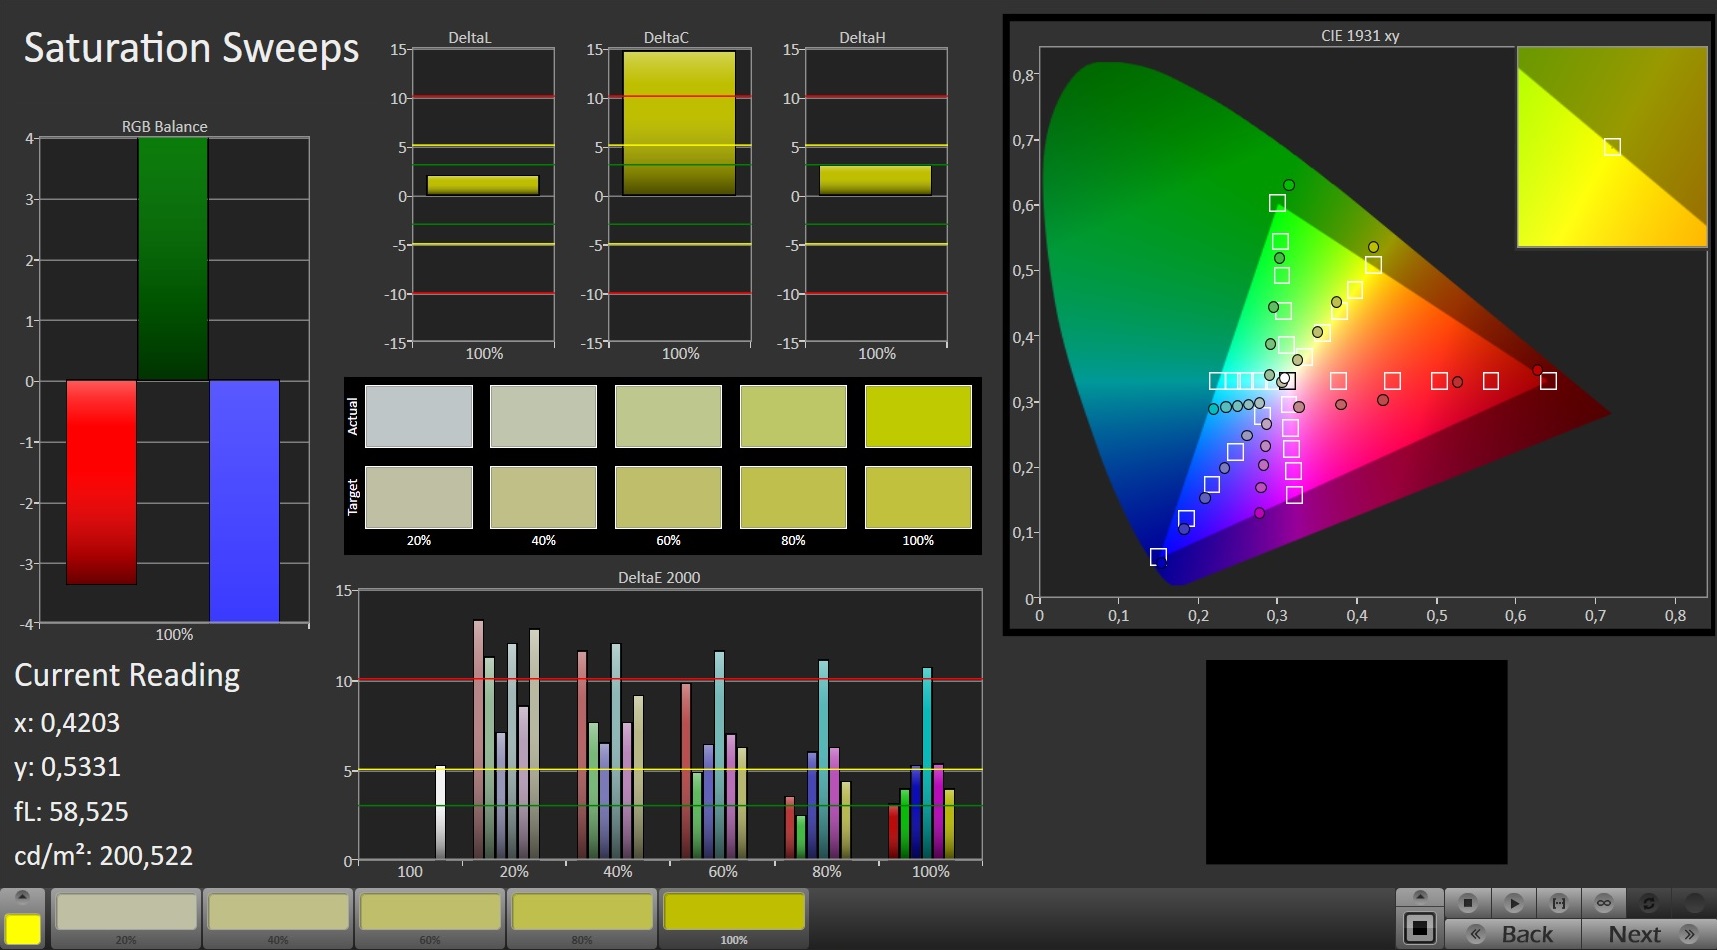
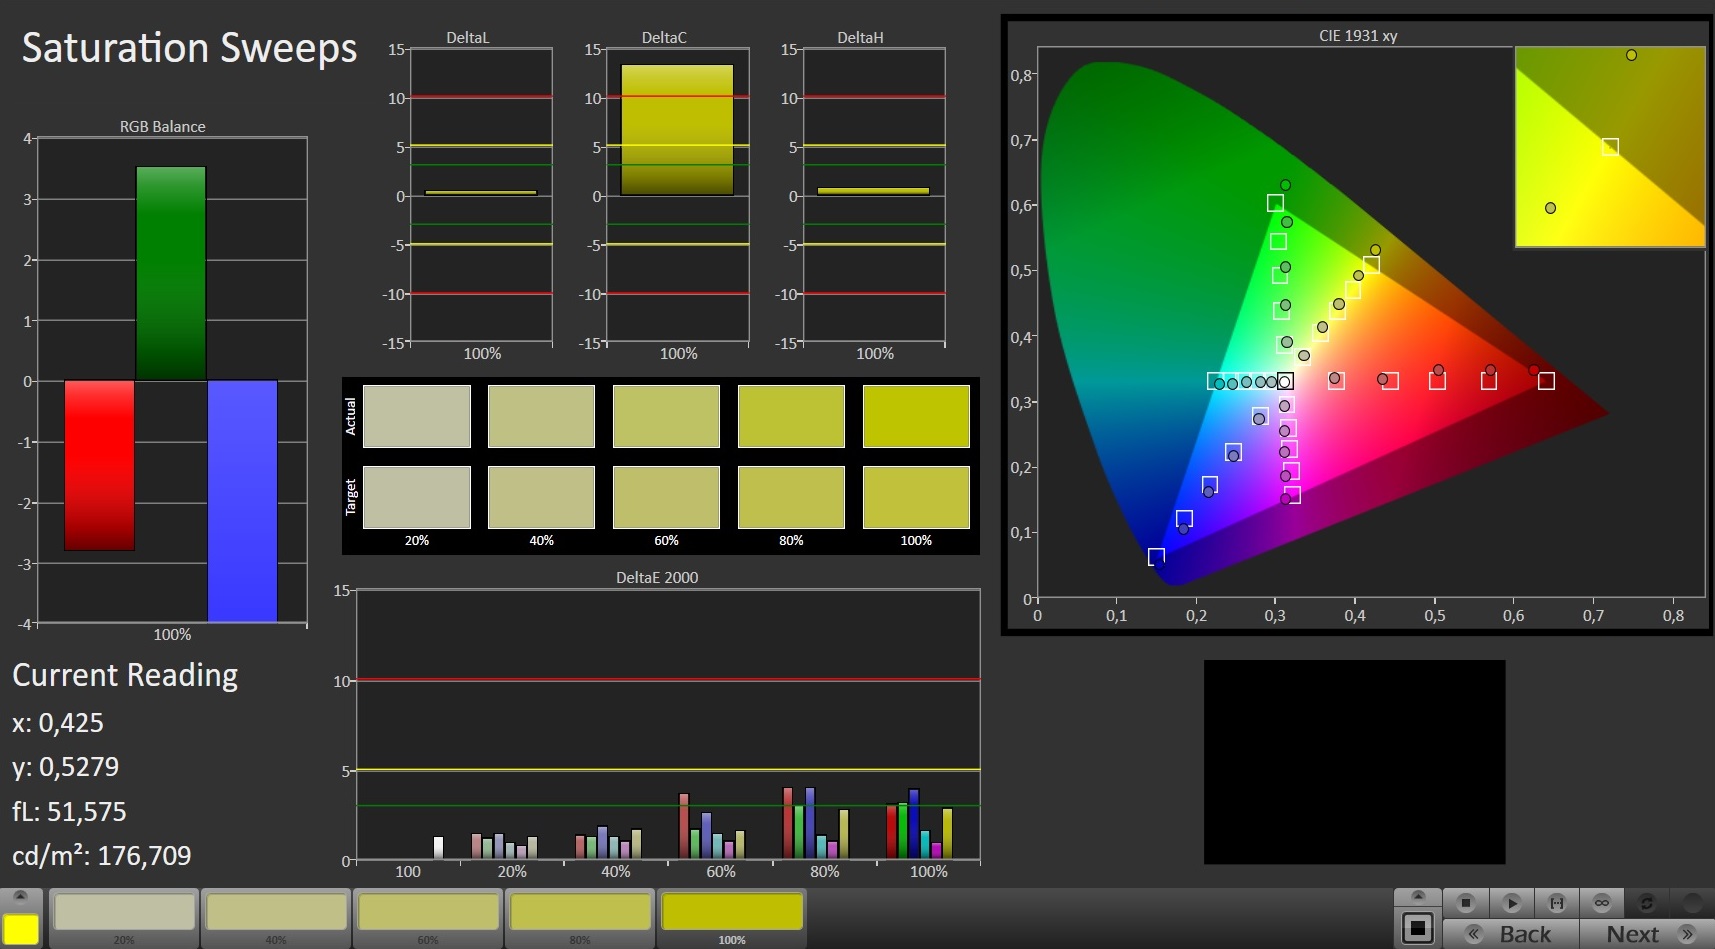
The XMG Ultra 15 comes with a 120 Hz panel with the designation “AU Optronics B156HTN05.2”, which struggles to impress us because it is a TN-based panel. Besides the poor viewing angles (as opposed to IPS displays), there is also the poor color-space coverage to be mentioned. Straight out of the box, the panel suffers from a noticeable bluish cast, which can fortunately be removed by means of calibration (our ICC-profile is linked above).
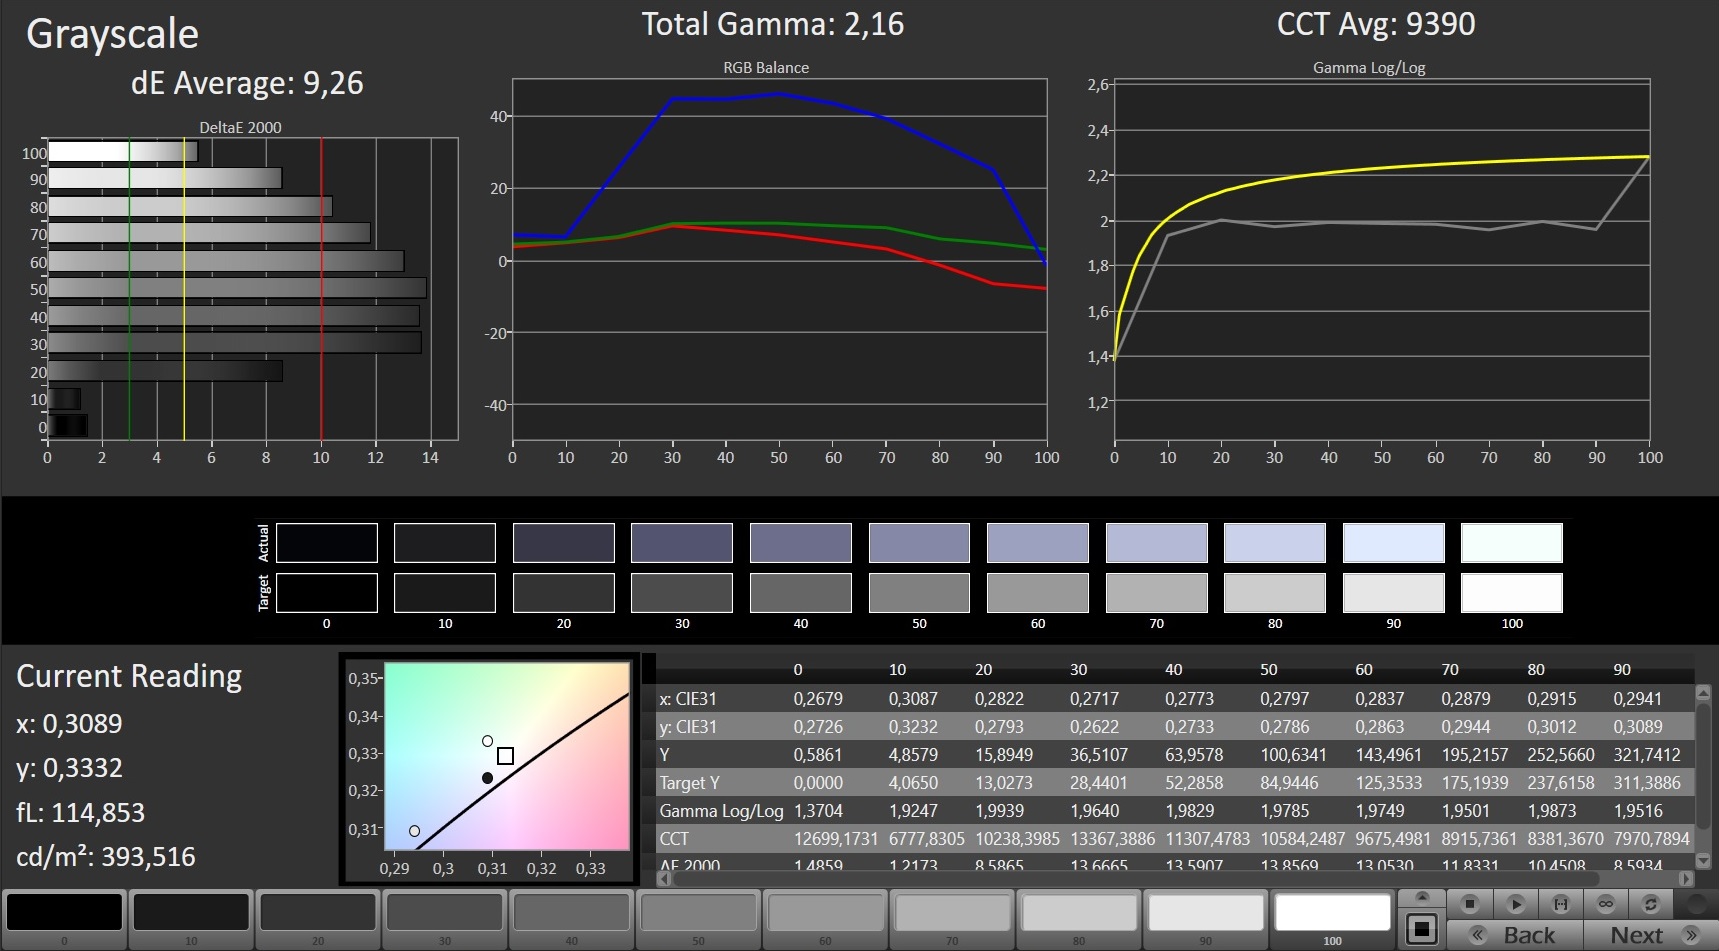
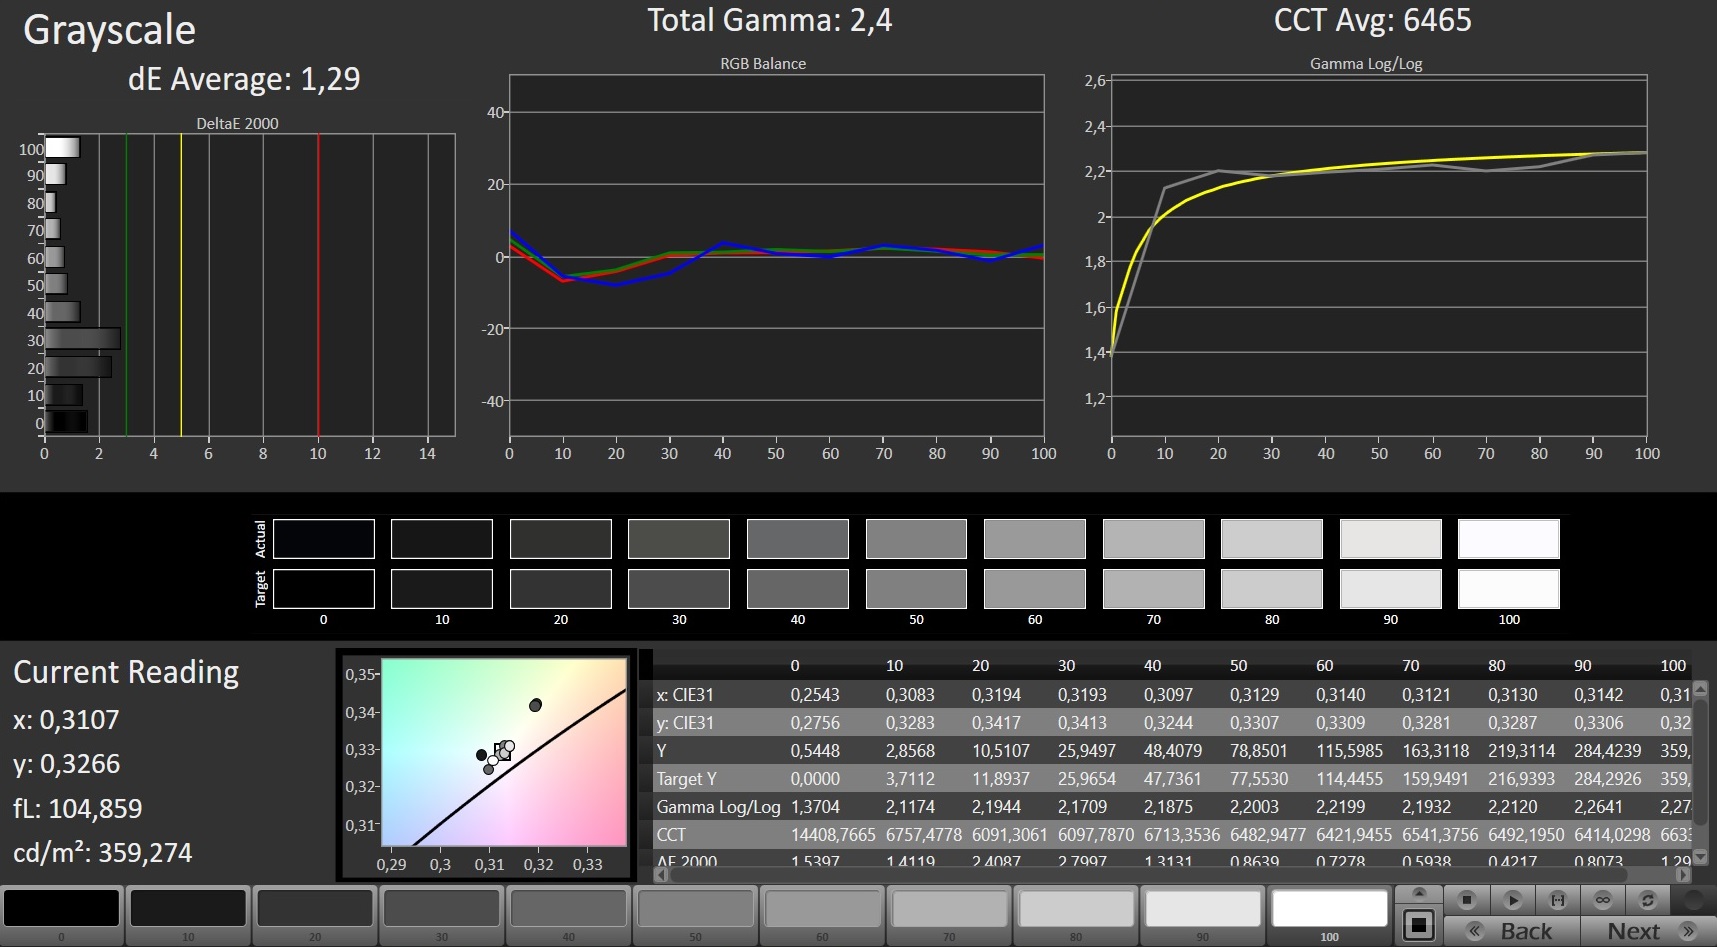
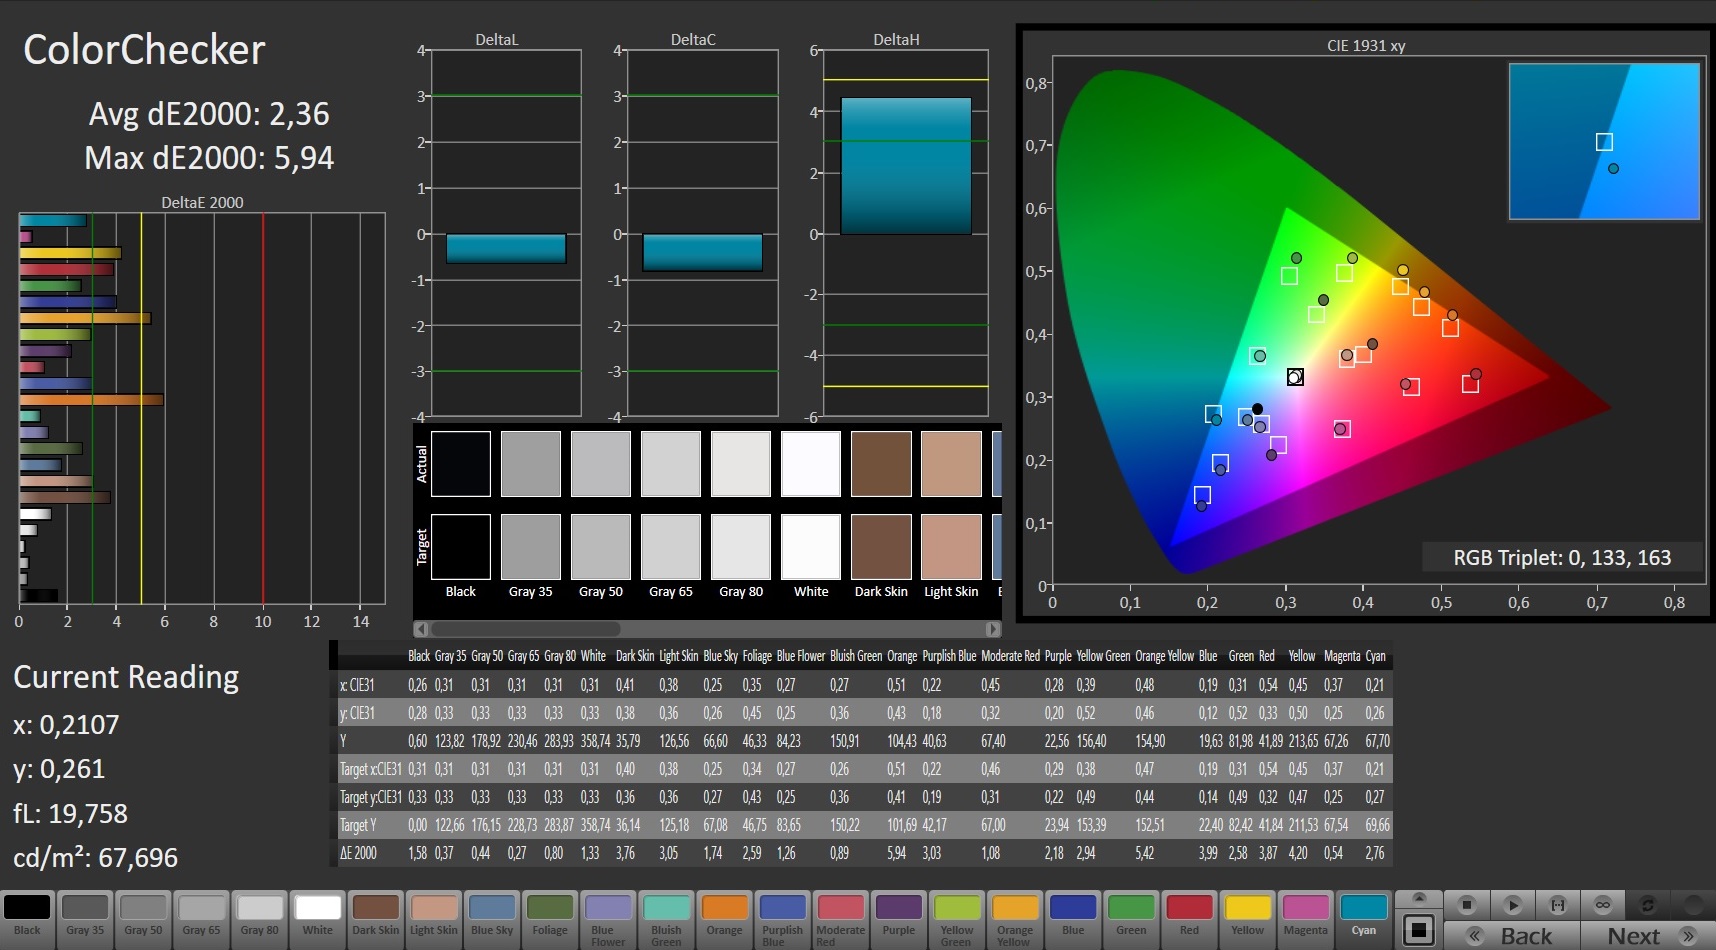

The rest of the display measurements are more or less black and white. While the average brightness of around 365 cd/m² is quite good, the contrast ratio of 626:1 can only be described as mediocre. In the comparison chart above, all competitors manage to achieve a contrast ratio of over 900:1. The main reason for the mediocre contrast ratio is the really high black value. The black value of 0.58 cd/m² is going to make dark tones appear grayish.

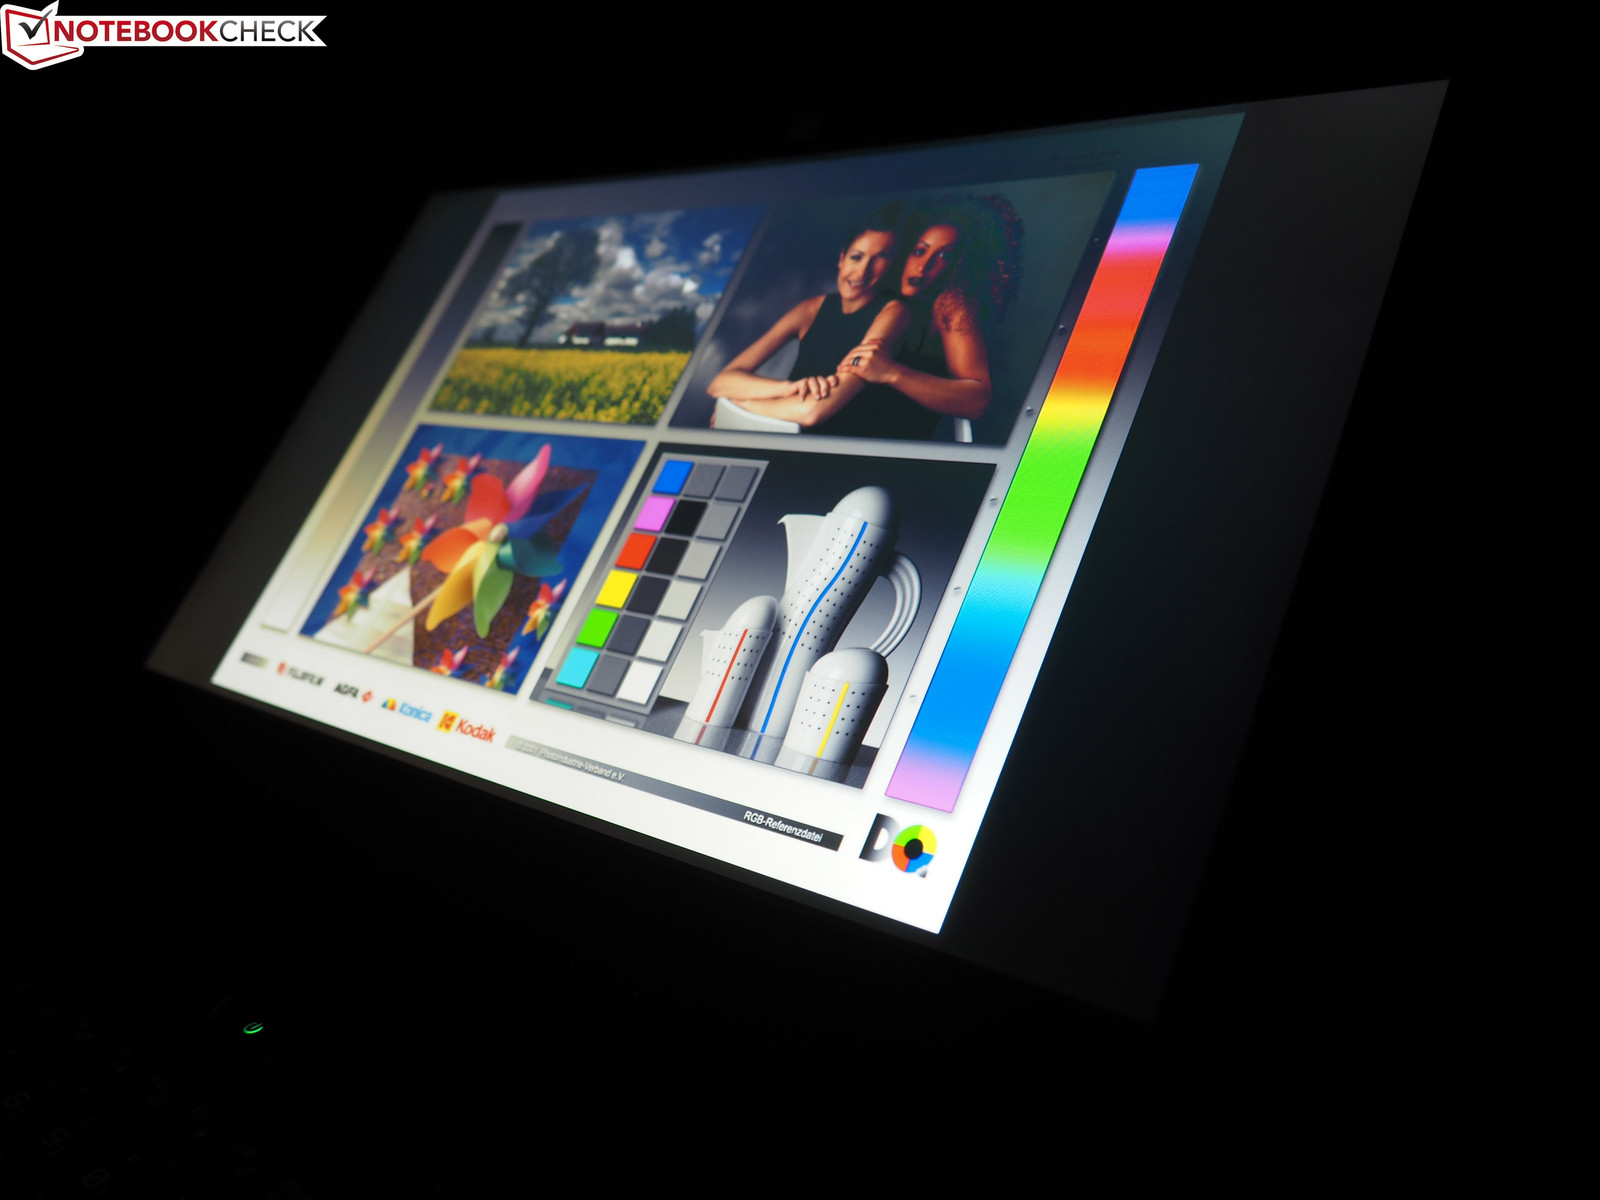
The 15-incher also receives criticism for its brightness distribution. 74% is not what high-quality displays tend to offer (most devices achieve at least 80%). The clouding makes itself noticeable only in certain situations (for instance: during unicolored scenes in dimly-lit rooms). The panel deserves respect for its low response times. 8 ms for black-to-white and 24 ms for gray-to-gray shows IPS-based displays who’s the boss. Among the competitors, only the Alienware 15 R3 can keep up with these results.
Display Response Times
| ↔ Response Time Black to White | ||
|---|---|---|
| 8 ms ... rise ↗ and fall ↘ combined | ↗ 5.6 ms rise | 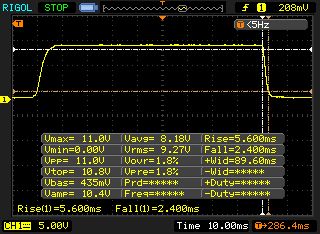 |
| ↘ 2.4 ms fall | ||
| The screen shows fast response rates in our tests and should be suited for gaming. In comparison, all tested devices range from 0.1 (minimum) to 240 (maximum) ms. » 22 % of all devices are better. This means that the measured response time is better than the average of all tested devices (19.8 ms). | ||
| ↔ Response Time 50% Grey to 80% Grey | ||
| 24.2 ms ... rise ↗ and fall ↘ combined | ↗ 13.4 ms rise | 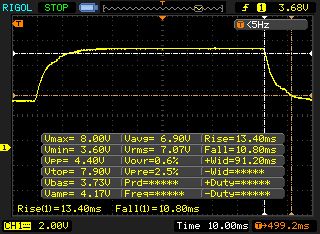 |
| ↘ 10.8 ms fall | ||
| The screen shows good response rates in our tests, but may be too slow for competitive gamers. In comparison, all tested devices range from 0.165 (minimum) to 636 (maximum) ms. » 35 % of all devices are better. This means that the measured response time is better than the average of all tested devices (30.9 ms). | ||
Screen Flickering / PWM (Pulse-Width Modulation)
| Screen flickering / PWM not detected | 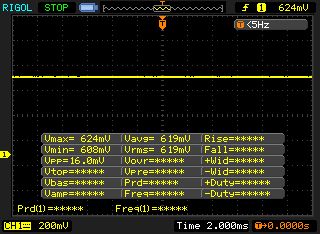 | ||
In comparison: 52 % of all tested devices do not use PWM to dim the display. If PWM was detected, an average of 7744 (minimum: 5 - maximum: 343500) Hz was measured. | |||
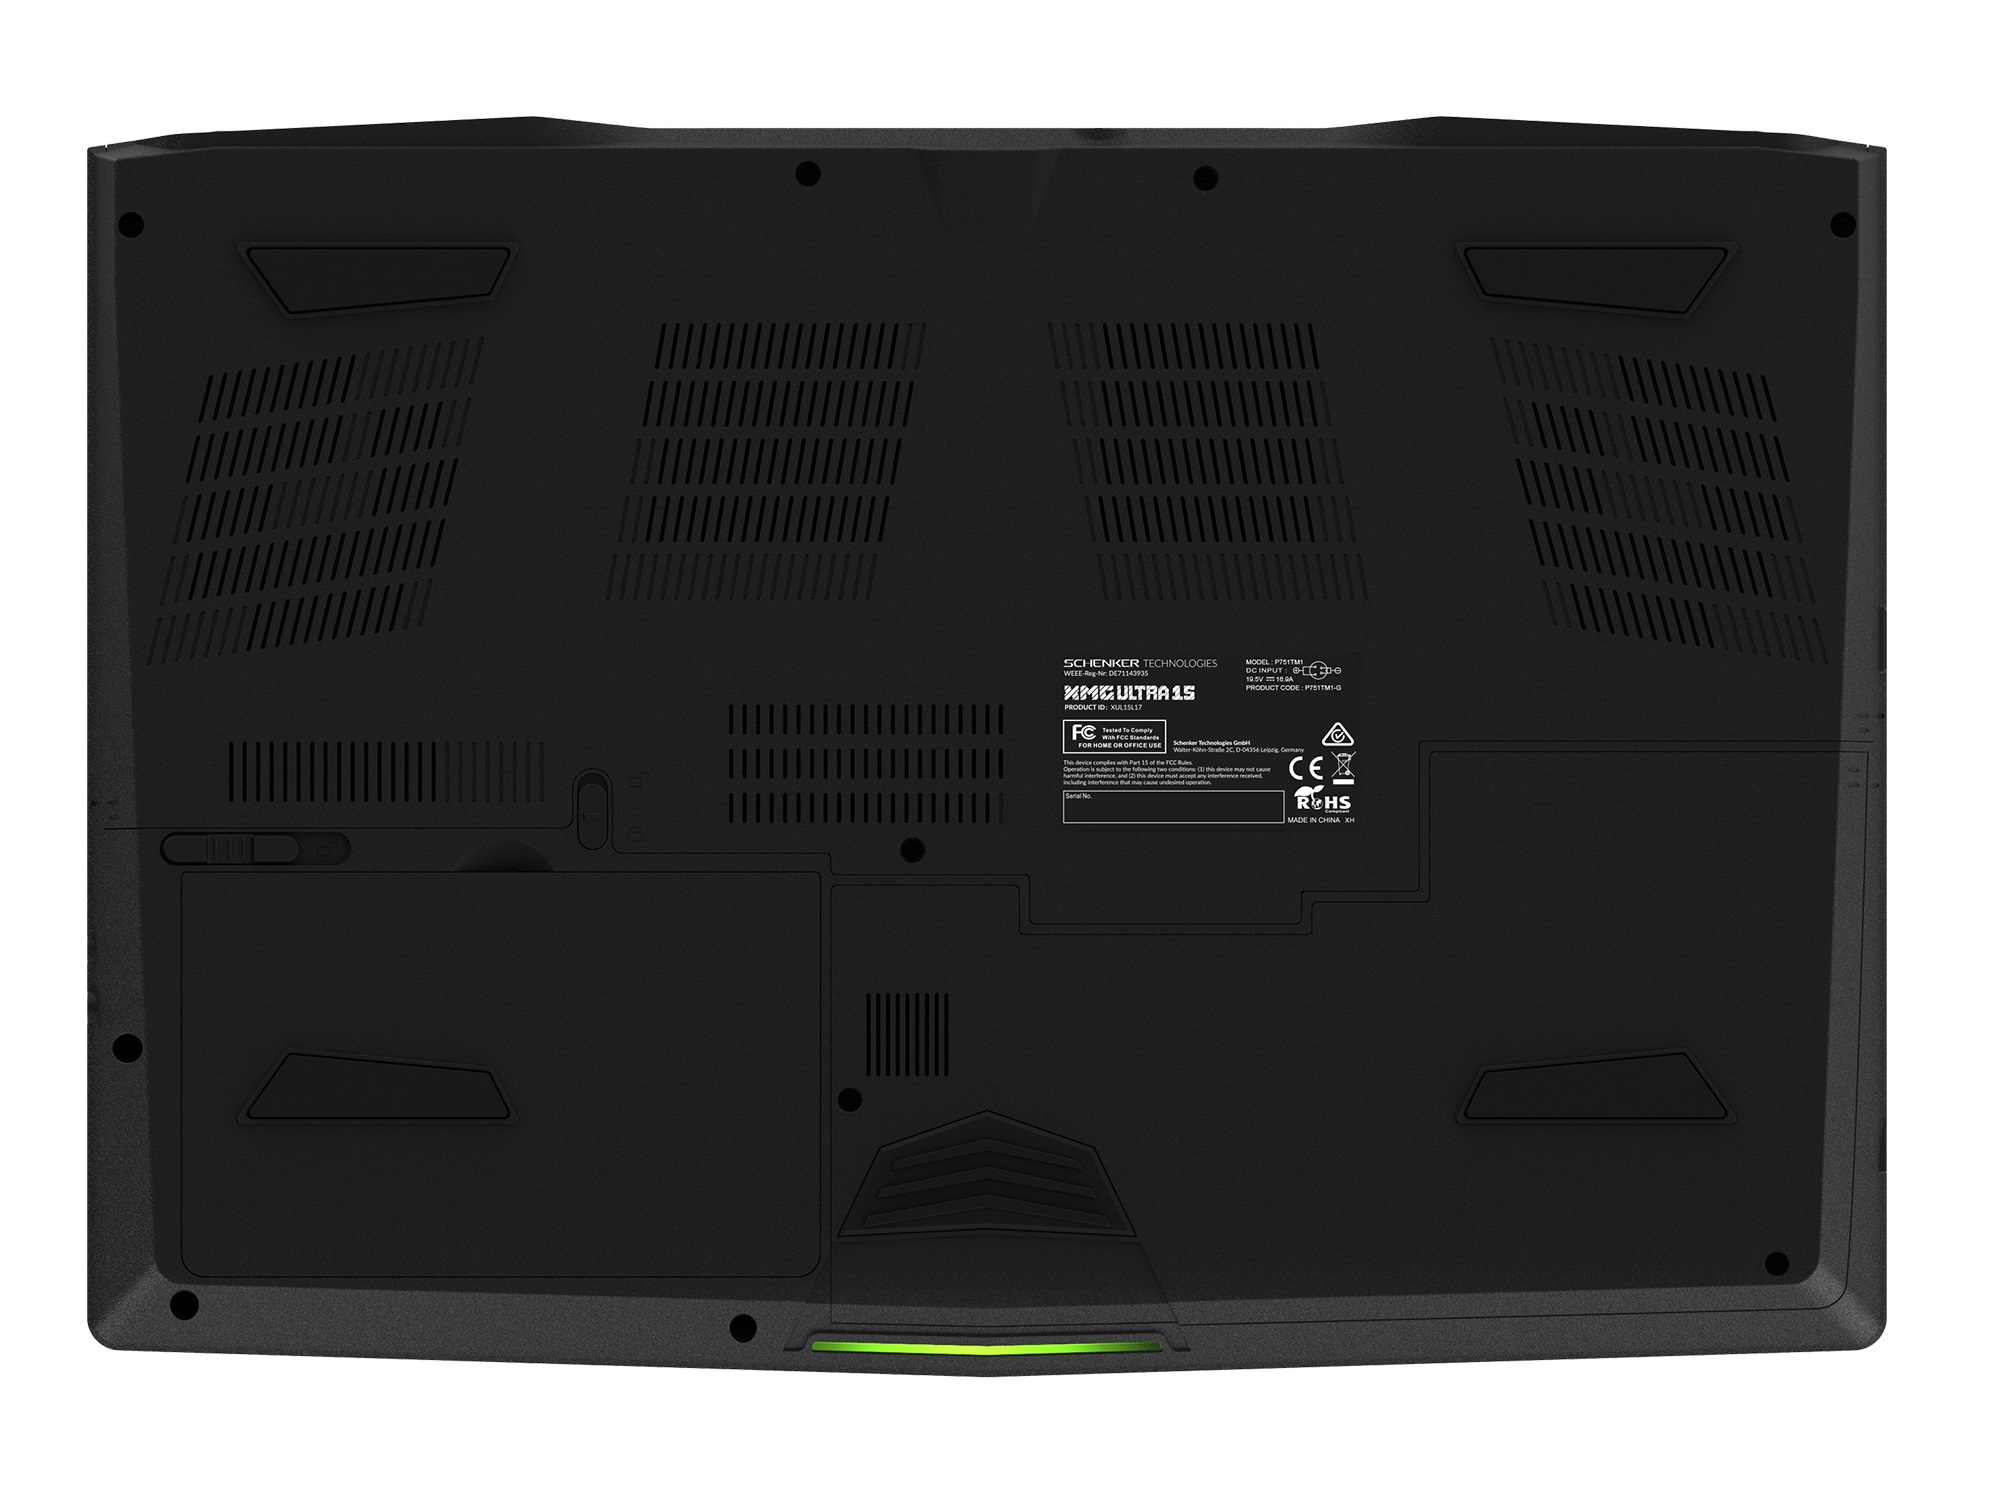
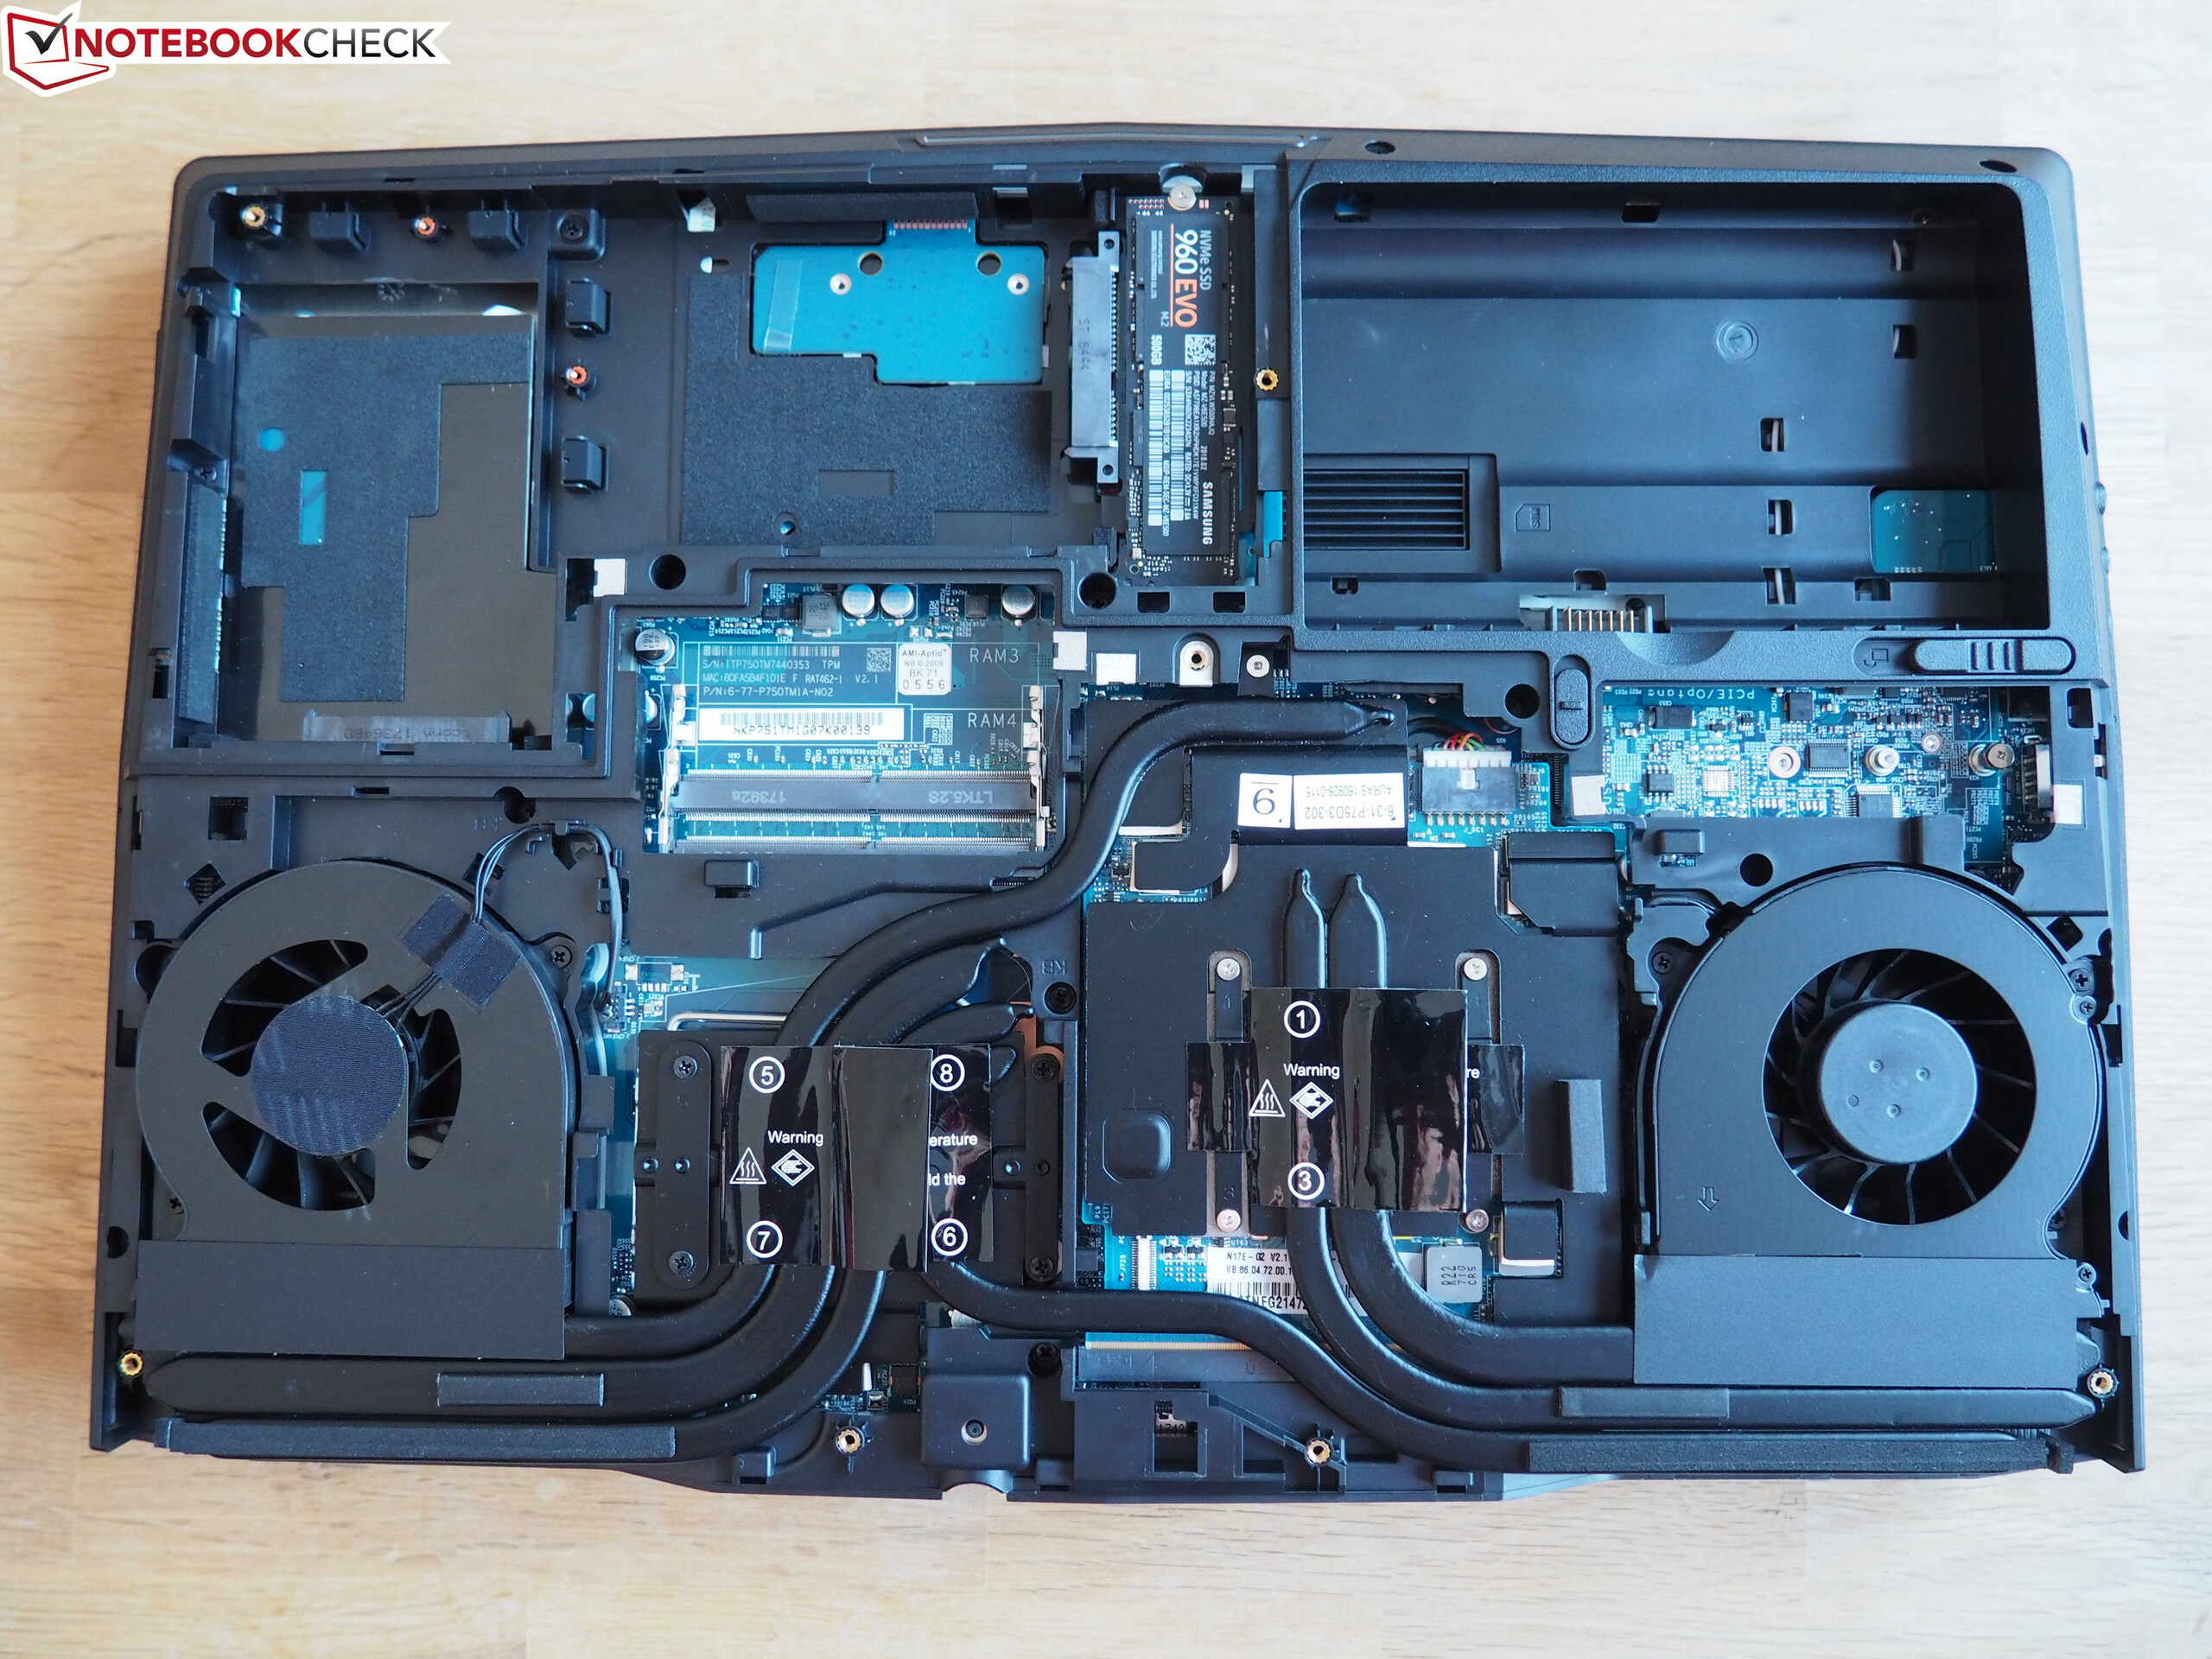
Performance
When it comes to upgradability and maintenance options, the XMG Ultra 15 can give any desktop PC a run for its money. With a replaceable CPU and GPU, up to four RAM slots and a maximum of four storage devices, it represents a true replacement for a traditional desktop.
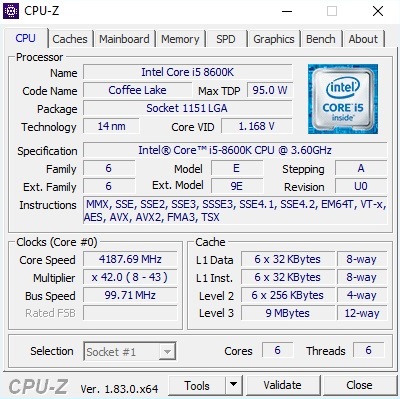
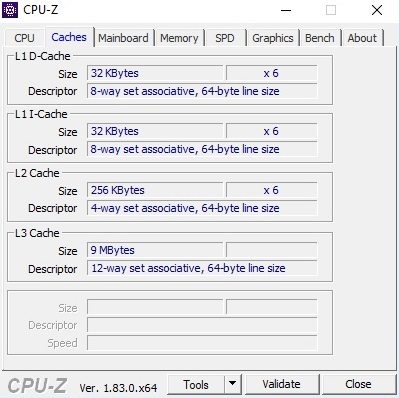
Processor
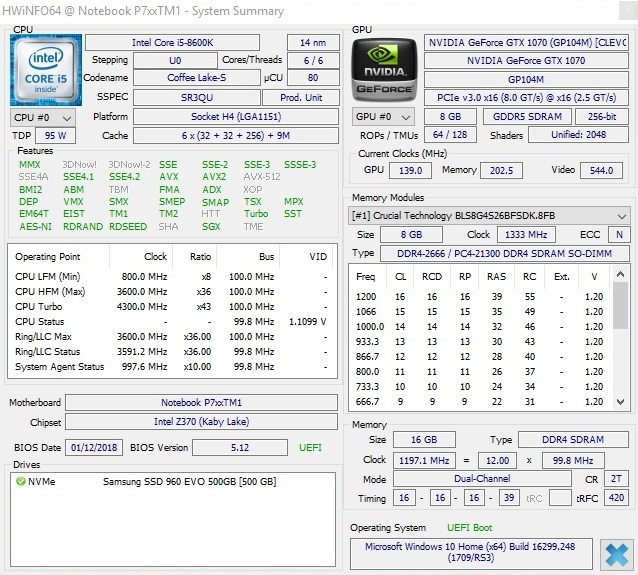
As was mentioned previously, the XMG Ultra 15 is powered not by a mobile CPU but by a veritable desktop processor. The Core i5-8600K in our review device can process up to six threads at the same time and is very easy to overclock due to an unlocked multiplier. Thanks to Intel’s Turbo Boost Technology, the processor can be overclocked above its standard clock rate automatically. Here, the boost clock amounts to 3.6 GHz.
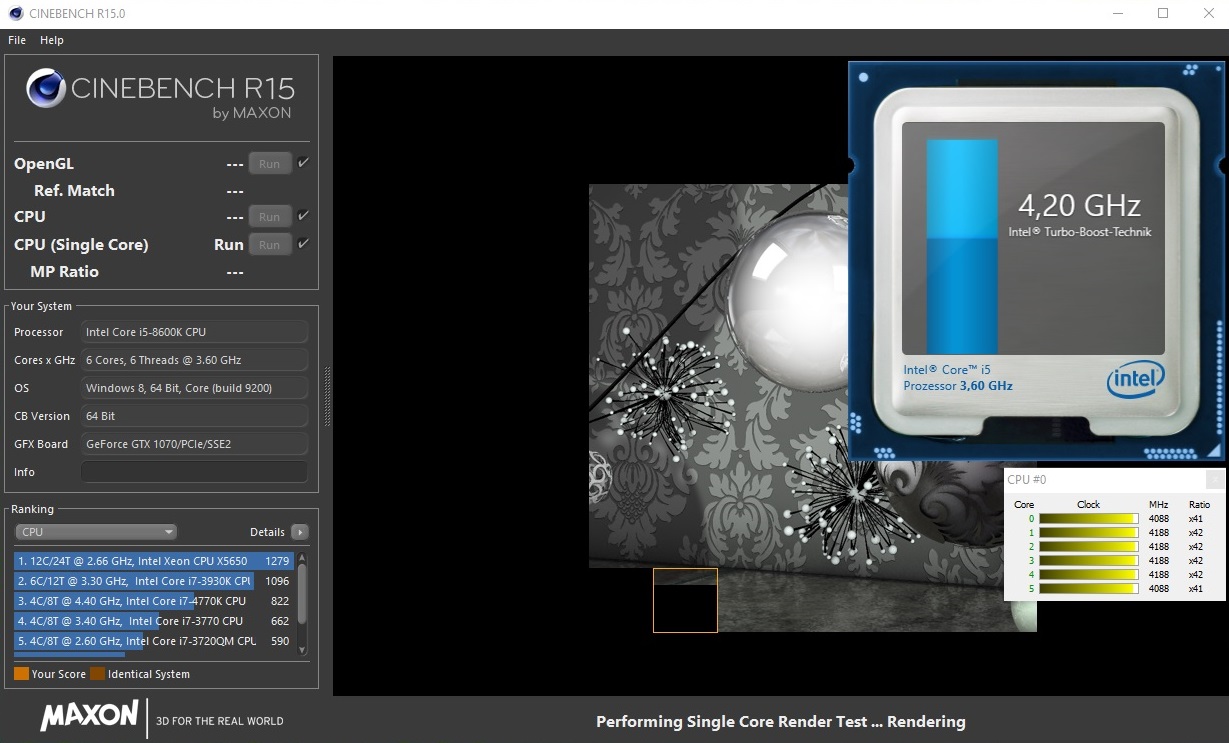
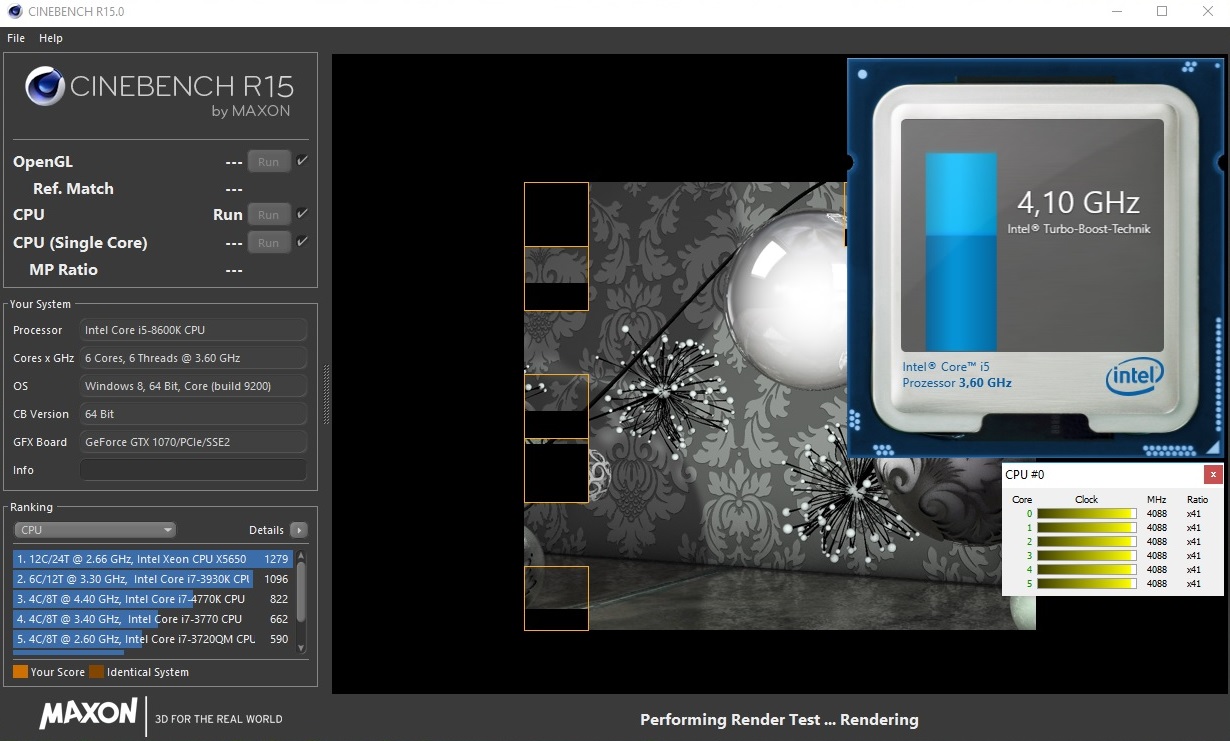
Under load, the i5-8600K manages to achieve 4.1 to 4.3 GHz. Here, the king of mobile processors itself - the Core i7-7820HK - can only hit 3900 MHz. This is why the XMG Ultra 15 takes first place in the comparison chart below. The gap between the XMG Ultra 15 and the competing devices, which come equipped with a Core i7-7700HQ, is, at the very least, 12% in the single-core benchmarks and 32% in the multi-core benchmarks.
We check whether or not the Turbo boost can be used over prolonged periods of time by running the Cinebench R15 multi-core benchmark in a continuous loop for 30 minutes. As you can see in the chart below, the performance remains constant over time.
System Performance
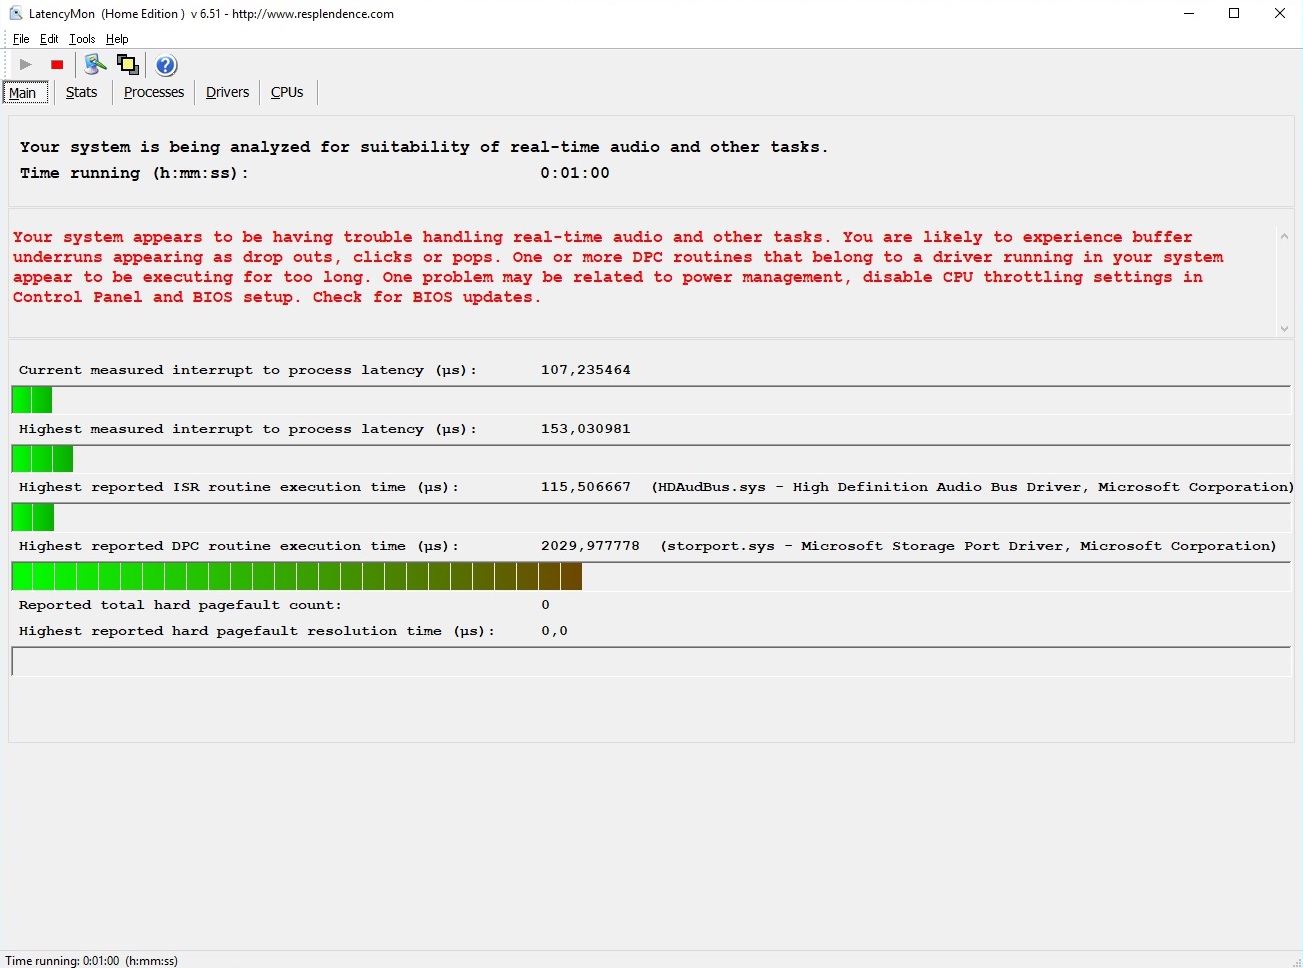
There are no bad surprises in terms of system performance. It does not matter whether it is PCMark 8 or PCMark 10 involved: The review device always takes first place. In practice, the XMG Ultra 15 also turns out to be very responsive and fast, featuring very short boot-up and loading times. However, according to the LatencyMon utility, the latency could have been somewhat lower.
| PCMark 10 - Score | |
| Average of class Gaming (5828 - 12414, n=93, last 2 years) | |
| Schenker XMG Ultra 15 | |
| Average Intel Core i5-8600K, NVIDIA GeForce GTX 1070 Mobile (n=1) | |
| Gigabyte P56XT | |
| PCMark 8 Home Score Accelerated v2 | 5512 points | |
| PCMark 8 Work Score Accelerated v2 | 5618 points | |
| PCMark 10 Score | 5779 points | |
Help | ||
Storage Devices
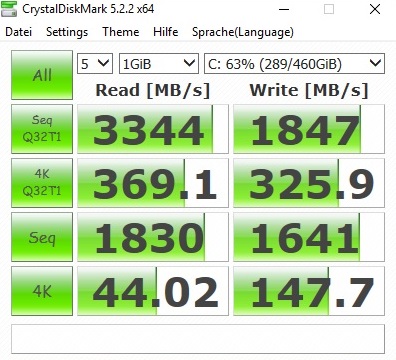
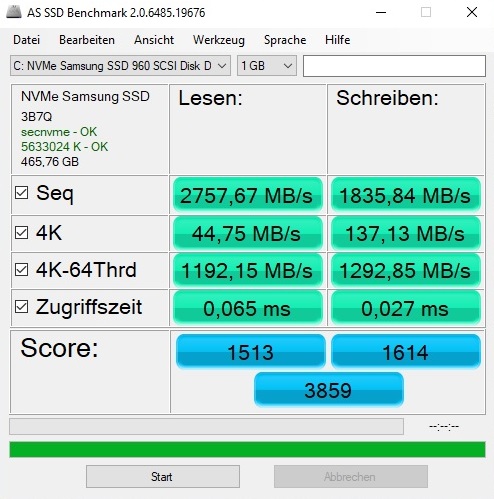
The built-in SSD makes the Windows 10 OS feel very smooth and responsive. Although most buyers are still quite happy with a simple SATA-III SSD, the PCIe/NVMe drives have lately become the standard. No wonder: Such SSDs offer excellent sequential read and write speeds. Whereas SATA-III models are limited to about 500 to 550 MB/s (see the MSI GT62VR 7RE in the chart below), modern solid state drives can easily go above 1000 or even 2000 MB/s. The latter figure applies to the Samsung 960 EVO in our review device. Its 500 GB version manages to beat most other competitors.
| Schenker XMG Ultra 15 Samsung SSD 960 Evo 500GB m.2 NVMe | Acer Predator 15 G9-593-751X Samsung SM951 MZVPV256HDGL m.2 PCI-e | MSI GT62VR 7RE-223 Samsung SSD PM871a MZNLN256HMHQ | Gigabyte P56XT LiteOn CX2-8B256 | Alienware 15 R3 | Average Samsung SSD 960 Evo 500GB m.2 NVMe | |
|---|---|---|---|---|---|---|
| AS SSD | -27% | -62% | -1% | |||
| Seq Read (MB/s) | 2758 | 1941 -30% | 510 -82% | 2433 ? -12% | ||
| Seq Write (MB/s) | 1836 | 1067 -42% | 288.2 -84% | 1647 ? -10% | ||
| 4K Read (MB/s) | 44.75 | 46.35 4% | 37.2 -17% | 45.5 ? 2% | ||
| 4K Write (MB/s) | 137.1 | 117.3 -14% | 104 -24% | 142.4 ? 4% | ||
| Score Read (Points) | 1513 | 1350 -11% | 472 -69% | 1645 ? 9% | ||
| Score Write (Points) | 1614 | 570 -65% | 304 -81% | 1518 ? -6% | ||
| Score Total (Points) | 3859 | 2574 -33% | 1019 -74% | 3968 ? 3% |

Graphics Card
People who want to make the most of the 120 Hz panel cannot go wrong with the GeForce GTX 1070. Analogous to the GTX 1060, the 1070 is a high-end DirectX 12-capable graphics card based on Nvidia’s Pascal architecture that can run all the latest titles at 1080p smoothly. Thanks to a desktop-grade CPU, the XMG Ultra 15 can often overtake other competing devices that have a GTX 1070. While the XMG Ultra 15 enjoys a performance advantage of less than 10% in the synthetic benchmarks, in actual games it often does 10 to 20% better than the competing devices, at least in Full HD resolution (when gaming in 4K with the XMG Ultra 17, the differences in performance are much smaller).
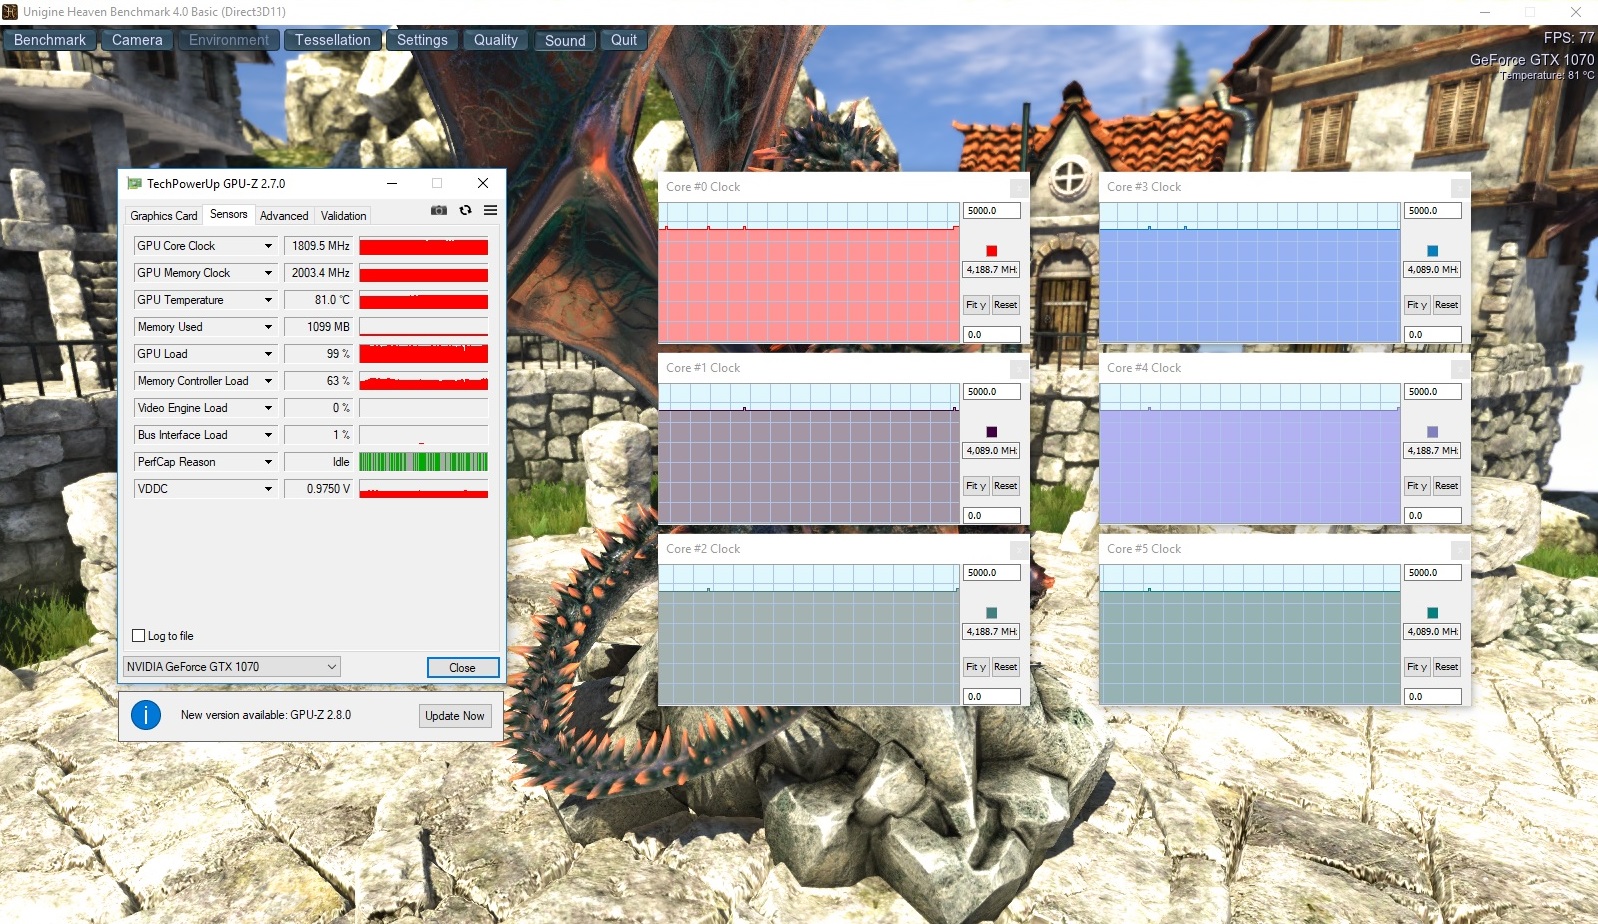
The XMG Ultra 15 achieves better performance thanks to its higher GPU clocks. According to the GPU-Z utility, the Turbo boost has a wiggle room of 1518 to 1733 MHz. However, Nvidia’s Pascal chips are designed in such a way that they will clock higher and higher automatically until they reach the thermal limit. After 60 minutes in our The Witcher 3 stress test (1920x1080, ultra settings), the GTX 1070 still ran above 1800 MHz.
| 3DMark 06 Standard Score | 32601 points | |
| 3DMark 11 Performance | 18972 points | |
| 3DMark Cloud Gate Standard Score | 30865 points | |
| 3DMark Fire Strike Score | 15777 points | |
Help | ||
The 15-incher loses brownie points due to the strange behavior of its CPU. Even though the Core i5-8600K reached only 60 to 65 °C (140 to 149 °F) in our The Witcher 3 stress test, the Turbo Boost function had been disabled completely. Because this phenomenon seems to affect only demanding 3D applications and not pure CPU loads, the manufacturer must have had a hand in this. The XMG Ultra 17 suffered from the same problem.
Gaming Performance
As long as you do not connect the XMG Ultra 15 to an external 4K monitor, the GeForce GTX 1070 should be able to run even extremely demanding titles on the high to maximum graphics settings without any problems.
| The Witcher 3 | |
| 1920x1080 Ultra Graphics & Postprocessing (HBAO+) | |
| Average of class Gaming (104.7 - 240, n=7, last 2 years) | |
| Schenker XMG Ultra 15 | |
| Acer Predator 15 G9-593-751X | |
| Average NVIDIA GeForce GTX 1070 Mobile (48.2 - 68.4, n=41) | |
| Gigabyte P56XT | |
| 1920x1080 High Graphics & Postprocessing (Nvidia HairWorks Off) | |
| Average of class Gaming (341 - 404, n=2, last 2 years) | |
| Schenker XMG Ultra 15 | |
| Acer Predator 15 G9-593-751X | |
| Average NVIDIA GeForce GTX 1070 Mobile (83 - 123, n=30) | |
| Gigabyte P56XT | |
Out of 14 games we benchmarked, every single one of them could achieve at least 60 FPS at 1080p. Seven titles actually managed to hit over 100 FPS, which means that the 120 Hz panel can be properly utilized in these games.
| low | med. | high | ultra | |
|---|---|---|---|---|
| The Witcher 3 (2015) | 123 | 65.3 | ||
| F1 2017 (2017) | 137 | 102 | ||
| FIFA 18 (2017) | 349 | 345 | ||
| Middle-earth: Shadow of War (2017) | 108 | 84 | ||
| The Evil Within 2 (2017) | 67.5 | 65.4 | ||
| ELEX (2017) | 113 | 89.1 | ||
| Wolfenstein II: The New Colossus (2017) | 125 | 117 | ||
| Assassin´s Creed Origins (2017) | 87 | 72 | ||
| Call of Duty WWII (2017) | 146 | 122 | ||
| Need for Speed Payback (2017) | 129 | 122 | ||
| Star Wars Battlefront 2 (2017) | 135 | 104 | ||
| Fortnite (2018) | 181 | 131 | ||
| Final Fantasy XV Benchmark (2018) | 65 | |||
| Kingdom Come: Deliverance (2018) | 87.4 | 66.5 |
Emissions
System Noise
Barebones laptops from Clevo tend to exhibit an above-average noise level. When it comes to our review device, which is based on Clevo’s P751TM1-G chassis, the fan noise could also have been lower. A maximum CPU temperature of 75 °C (167 °F) during the stress test cannot justify the maximum noise level of 62 dB(A) under extreme load. Roughly 54 dB(A) in our The Witcher 3 stress test is also very loud. This sort of noise level can hardly be tolerated without a headset. In general, noise-sensitive users should look for a quieter alternative. For comparison: The Acer Predator 15 produces only 42 dB(A) under gaming load.
The XMG Ultra 15 is significantly quieter when it is idle. The noise level of 32 to 35 dB(A) is comparable to other high-end laptops. That being said, the 15-incher tends to produce a lot more noise when launching or installing programs. But this kind of behavior is not uncommon among Clevo’s barebones notebooks, which are especially badly affected by this problem.
Noise level
| Idle |
| 32 / 33 / 35 dB(A) |
| Load |
| 46 / 62 dB(A) |
 | ||
30 dB silent 40 dB(A) audible 50 dB(A) loud |
||
min: | ||
| Schenker XMG Ultra 15 GeForce GTX 1070 Mobile, i5-8600K | Acer Predator 15 G9-593-751X GeForce GTX 1070 Mobile, i7-7700HQ | MSI GT62VR 7RE-223 GeForce GTX 1070 Mobile, i7-7700HQ | Gigabyte P56XT GeForce GTX 1070 Mobile, i7-7700HQ | Alienware 15 R3 GeForce GTX 1070 Mobile, i7-7700HQ | |
|---|---|---|---|---|---|
| Noise | 3% | 4% | 3% | -0% | |
| off / environment * (dB) | 30 | 32 -7% | 30 -0% | 30 -0% | 30 -0% |
| Idle Minimum * (dB) | 32 | 34 -6% | 34 -6% | 34 -6% | 31 3% |
| Idle Average * (dB) | 33 | 36 -9% | 35 -6% | 35 -6% | 32 3% |
| Idle Maximum * (dB) | 35 | 38 -9% | 36 -3% | 39 -11% | 42 -20% |
| Load Average * (dB) | 46 | 41 11% | 40 13% | 39 15% | 49 -7% |
| Witcher 3 ultra * (dB) | 54 | 42 22% | 48 11% | ||
| Load Maximum * (dB) | 62 | 50 19% | 46 26% | 49 21% | 50 19% |
* ... smaller is better
Temperature
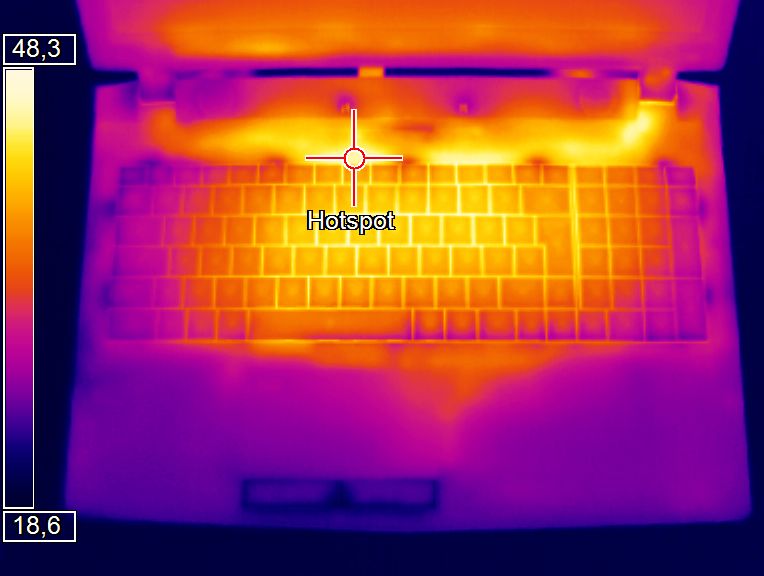
We are quite pleased with the moderate temperatures of the XMG Ultra 15. While the cases of some gaming notebooks can exceed 60 or even 70 °C (140 to 158 °F) (see the Gigabyte P56XT, which is also thinner), the XMG Ultra 15 manages to keep its case temperatures below 50 °C (122 °F) at all times. Because the wrist-rest and the WASD-keys area reach only a maximum temperature of 32 and 41 °C (89.6 to 105.8 °F) respectively, long gaming sessions should not present any problems. When idle, the case temperatures remain comfortably cool at 23 to 29 °C (73.4 to 84.2 °F).
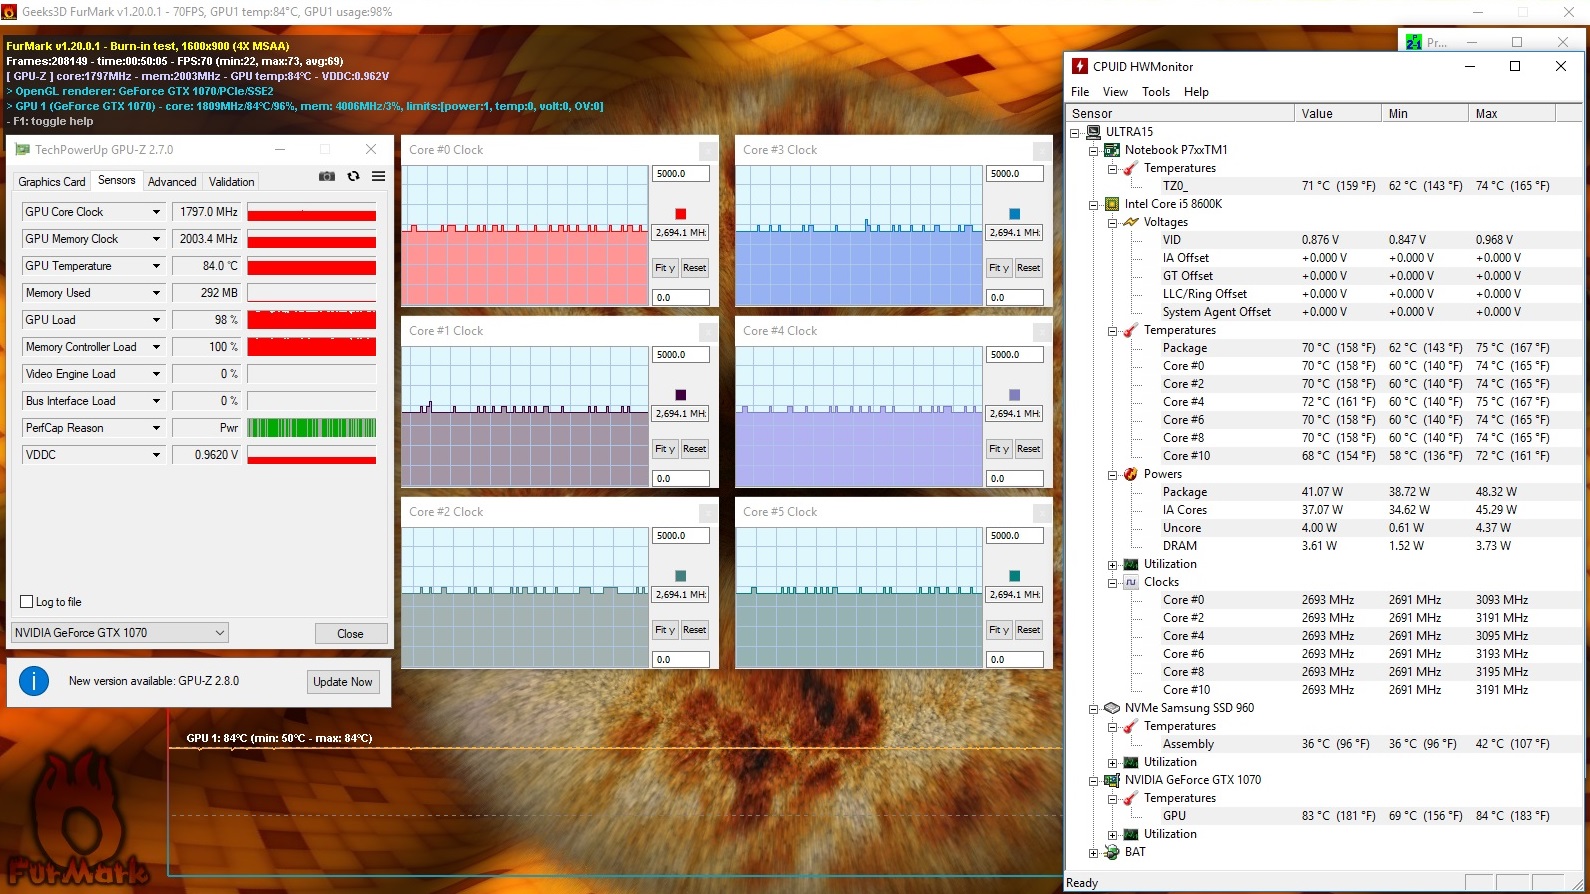
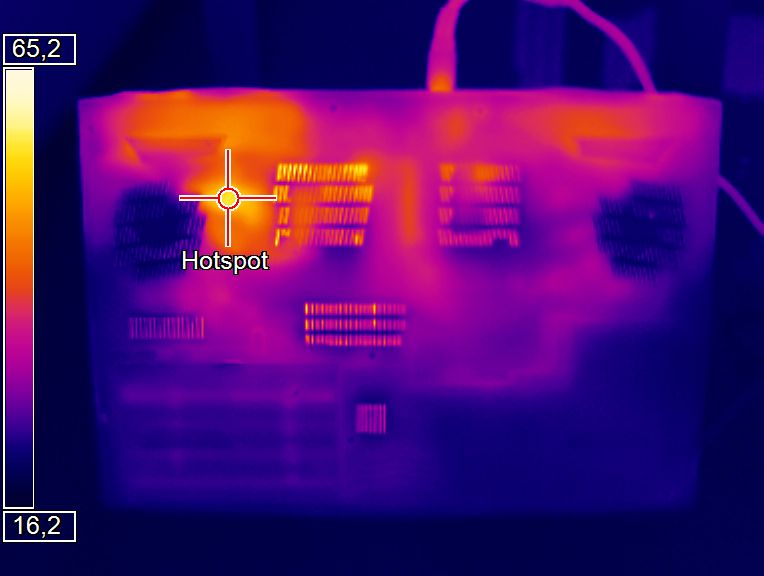
Under the hood, only the GeForce GTX 1070 reaches its thermal limit. However, 84 °C (183.2 °F) is not a critical temperature. During the stress test, the Core i5-8600K operates at around 70 °C (158 °F). Nevertheless, it still throttles down to 2.7 GHz.
(±) The maximum temperature on the upper side is 42 °C / 108 F, compared to the average of 40.4 °C / 105 F, ranging from 21.2 to 68.8 °C for the class Gaming.
(-) The bottom heats up to a maximum of 50 °C / 122 F, compared to the average of 43.2 °C / 110 F
(+) In idle usage, the average temperature for the upper side is 27.6 °C / 82 F, compared to the device average of 33.9 °C / 93 F.
(±) Playing The Witcher 3, the average temperature for the upper side is 35.4 °C / 96 F, compared to the device average of 33.9 °C / 93 F.
(+) The palmrests and touchpad are reaching skin temperature as a maximum (32 °C / 89.6 F) and are therefore not hot.
(-) The average temperature of the palmrest area of similar devices was 28.8 °C / 83.8 F (-3.2 °C / -5.8 F).
| Schenker XMG Ultra 15 GeForce GTX 1070 Mobile, i5-8600K | Acer Predator 15 G9-593-751X GeForce GTX 1070 Mobile, i7-7700HQ | MSI GT62VR 7RE-223 GeForce GTX 1070 Mobile, i7-7700HQ | Gigabyte P56XT GeForce GTX 1070 Mobile, i7-7700HQ | Alienware 15 R3 GeForce GTX 1070 Mobile, i7-7700HQ | |
|---|---|---|---|---|---|
| Heat | 8% | 6% | -30% | -18% | |
| Maximum Upper Side * (°C) | 42 | 42.3 -1% | 40.6 3% | 65 -55% | 46 -10% |
| Maximum Bottom * (°C) | 50 | 40.9 18% | 48.4 3% | 71 -42% | 51.8 -4% |
| Idle Upper Side * (°C) | 29 | 28.4 2% | 26.8 8% | 35 -21% | 36.5 -26% |
| Idle Bottom * (°C) | 29 | 25.2 13% | 26.4 9% | 30 -3% | 38.2 -32% |
* ... smaller is better
Speakers
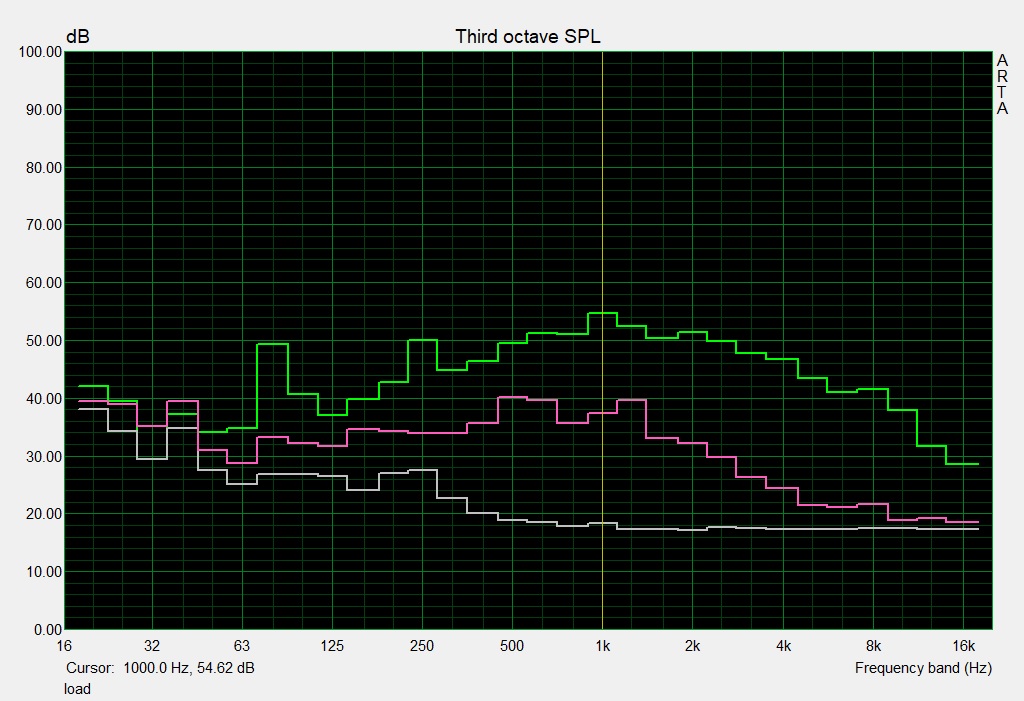
According to our measurements, the sound quality of the XMG Ultra 15 is identical to that of the XMG U507.
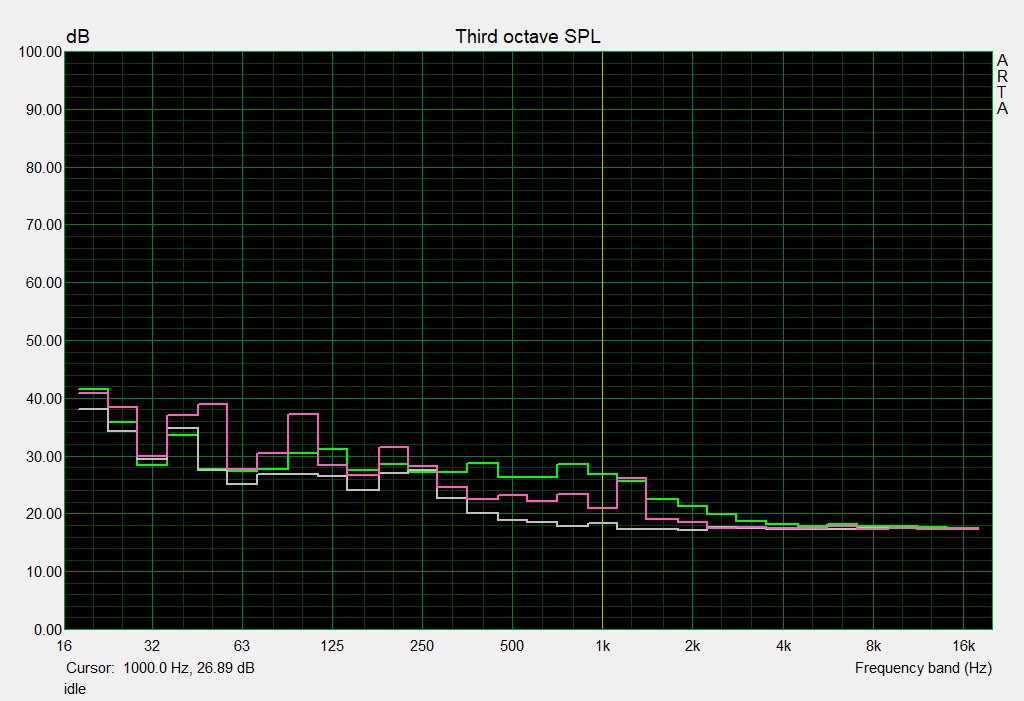
Schenker XMG Ultra 15 audio analysis
(±) | speaker loudness is average but good (76 dB)
Bass 100 - 315 Hz
(±) | reduced bass - on average 10.7% lower than median
(±) | linearity of bass is average (12.1% delta to prev. frequency)
Mids 400 - 2000 Hz
(+) | balanced mids - only 1.5% away from median
(+) | mids are linear (3.2% delta to prev. frequency)
Highs 2 - 16 kHz
(+) | balanced highs - only 2.2% away from median
(+) | highs are linear (3.1% delta to prev. frequency)
Overall 100 - 16.000 Hz
(+) | overall sound is linear (13.3% difference to median)
Compared to same class
» 19% of all tested devices in this class were better, 5% similar, 76% worse
» The best had a delta of 6%, average was 18%, worst was 132%
Compared to all devices tested
» 14% of all tested devices were better, 3% similar, 83% worse
» The best had a delta of 4%, average was 23%, worst was 134%
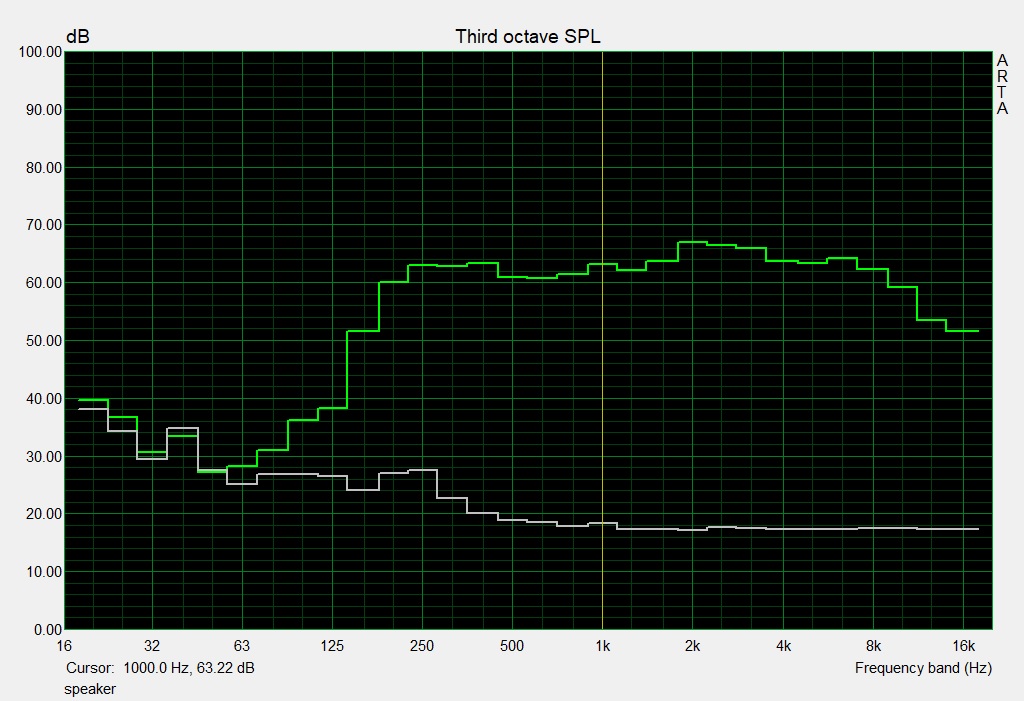
Acer Predator 15 G9-593-751X audio analysis
(+) | speakers can play relatively loud (91 dB)
Bass 100 - 315 Hz
(±) | reduced bass - on average 14.1% lower than median
(±) | linearity of bass is average (10.6% delta to prev. frequency)
Mids 400 - 2000 Hz
(+) | balanced mids - only 3.2% away from median
(+) | mids are linear (4.9% delta to prev. frequency)
Highs 2 - 16 kHz
(+) | balanced highs - only 3.7% away from median
(+) | highs are linear (5.3% delta to prev. frequency)
Overall 100 - 16.000 Hz
(+) | overall sound is linear (14.1% difference to median)
Compared to same class
» 24% of all tested devices in this class were better, 8% similar, 68% worse
» The best had a delta of 6%, average was 18%, worst was 132%
Compared to all devices tested
» 17% of all tested devices were better, 4% similar, 79% worse
» The best had a delta of 4%, average was 23%, worst was 134%
Frequency diagram in comparison (checkboxes can be checked and unchecked!)
Energy Management
Energy Consumption
The XMG Ultra 15 had to pass on Nvidia’s Optimus technology (this technology enables automatic switching between a dedicated and an integrated graphics adapter), because it already uses Nvidia’s G-Sync technology. Notebooks with Nvidia’s Optimus technology and/or a mobile CPU would draw significantly less than 30 watts when idle, as you can see from the competing devices. Under load, the XMG Ultra 15 also draws more power than most high-end notebooks. A maximum power draw of 309 watts during the stress test resembles more a desktop PC tower than a notebook. In order to reliably supply the device with enough power, the XGM Ultra 15 includes a huge 330-watt AC adapter.
| Off / Standby | |
| Idle | |
| Load |
|
Key:
min: | |
| Schenker XMG Ultra 15 GeForce GTX 1070 Mobile, i5-8600K | Acer Predator 15 G9-593-751X GeForce GTX 1070 Mobile, i7-7700HQ | MSI GT62VR 7RE-223 GeForce GTX 1070 Mobile, i7-7700HQ | Gigabyte P56XT GeForce GTX 1070 Mobile, i7-7700HQ | Alienware 15 R3 GeForce GTX 1070 Mobile, i7-7700HQ | |
|---|---|---|---|---|---|
| Power Consumption | 24% | 26% | 36% | 27% | |
| Idle Minimum * (Watt) | 28 | 18 36% | 20 29% | 13 54% | 19 32% |
| Idle Average * (Watt) | 31 | 23 26% | 24 23% | 17 45% | 23 26% |
| Idle Maximum * (Watt) | 38 | 30 21% | 29 24% | 22 42% | 29 24% |
| Load Average * (Watt) | 100 | 89 11% | 82 18% | 85 15% | 85 15% |
| Witcher 3 ultra * (Watt) | 206 | 168 18% | 154 25% | ||
| Load Maximum * (Watt) | 309 | 213 31% | 193 38% | 208 33% | 192 38% |
* ... smaller is better
Battery Life
You should not expect a good battery life from the XMG Ultra 15. With the brightness set to minimum, the notebook dies after 3 hours 40 minutes. In our Wi-Fi and video tests, which are conducted with the brightness level set to around 50%, the laptop can last only for 3 hours and 14 minutes and 3 hours and 6 minutes, respectively. If you stress the system by setting the brightness to maximum and running demanding 3D applications, the 82-Wh battery will die after about 2 hours.
| Schenker XMG Ultra 15 GeForce GTX 1070 Mobile, i5-8600K, 82 Wh | Acer Predator 15 G9-593-751X GeForce GTX 1070 Mobile, i7-7700HQ, 90 Wh | MSI GT62VR 7RE-223 GeForce GTX 1070 Mobile, i7-7700HQ, 75 Wh | Gigabyte P56XT GeForce GTX 1070 Mobile, i7-7700HQ, 91.2 Wh | Alienware 15 R3 GeForce GTX 1070 Mobile, i7-7700HQ, 99 Wh | Average of class Gaming | |
|---|---|---|---|---|---|---|
| Battery runtime | 64% | 28% | 89% | 35% | 94% | |
| Reader / Idle (h) | 3.7 | 8.4 127% | 6.3 70% | 9.5 157% | 6.4 73% | 7.84 ? 112% |
| H.264 (h) | 3.1 | 4.9 58% | 4.2 35% | 6.2 100% | 4.4 42% | 8.27 ? 167% |
| WiFi v1.3 (h) | 3.2 | 5.5 72% | 4.1 28% | 6.4 100% | 4.4 38% | 7.08 ? 121% |
| Load (h) | 2 | 2 0% | 1.6 -20% | 2 0% | 1.7 -15% | 1.496 ? -25% |
Verdict
Pros
Cons
The Schenker XMG Ultra 15 inherits the strengths and the weaknesses of its 17-inch sibling, the XMG Ultra 17. In our opinion, the easy-to-service case deserves a lot of credit (both the CPU and the GPU can theoretically be replaced!). It can be extensively customized in Schenker’s online configuration tool. The input devices, the audio quality and the ports (Thunderbolt 3) all live up to the XMG’s price tag.
However, the 120-Hz G-Sync-capable display leaves a rather mixed impression. The good brightness and the low response times can hardly wash away the feeling of disappointment left by the poor color accuracy, the mediocre brightness uniformity, poor viewing angles and the somewhat high black value.
The biggest point of criticism we have concerns the fan noise. Despite the thick case, the 15-incher produces a lot of noise during gaming sessions. It also tends to produce a whole lot of unnecessary noise when working on small tasks. Because the processor and the graphics card never reach critical temperatures, there is some wiggle room for a quieter cooling solution. To that end, you can always adjust the fan speed manually via the Control Center utility. The modest battery life is another reason why the XMG Ultra 15 does not get an “A” from us.
However, when you take every aspect into consideration, you will see that the XMG Ultra 15 stacks up quite well against competitors like the Acer Predator 15, MSI GT62VR 7RE and the Alienware 15 R3.
Schenker XMG Ultra 15
- 03/05/2018 v6 (old)
Florian Glaser
Price comparison
