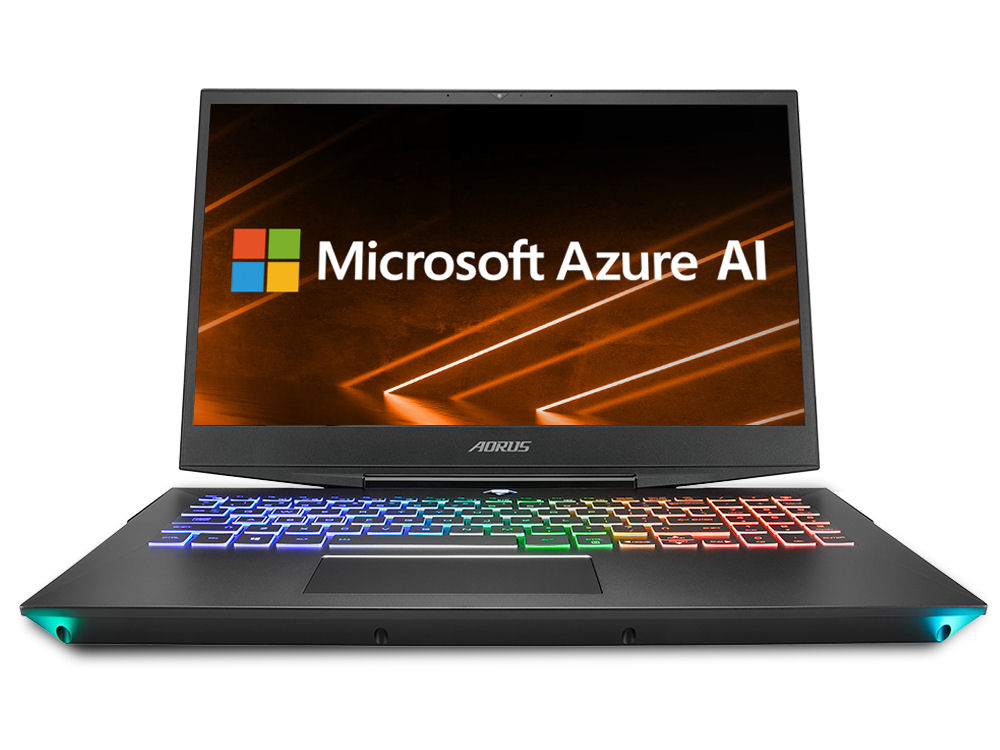
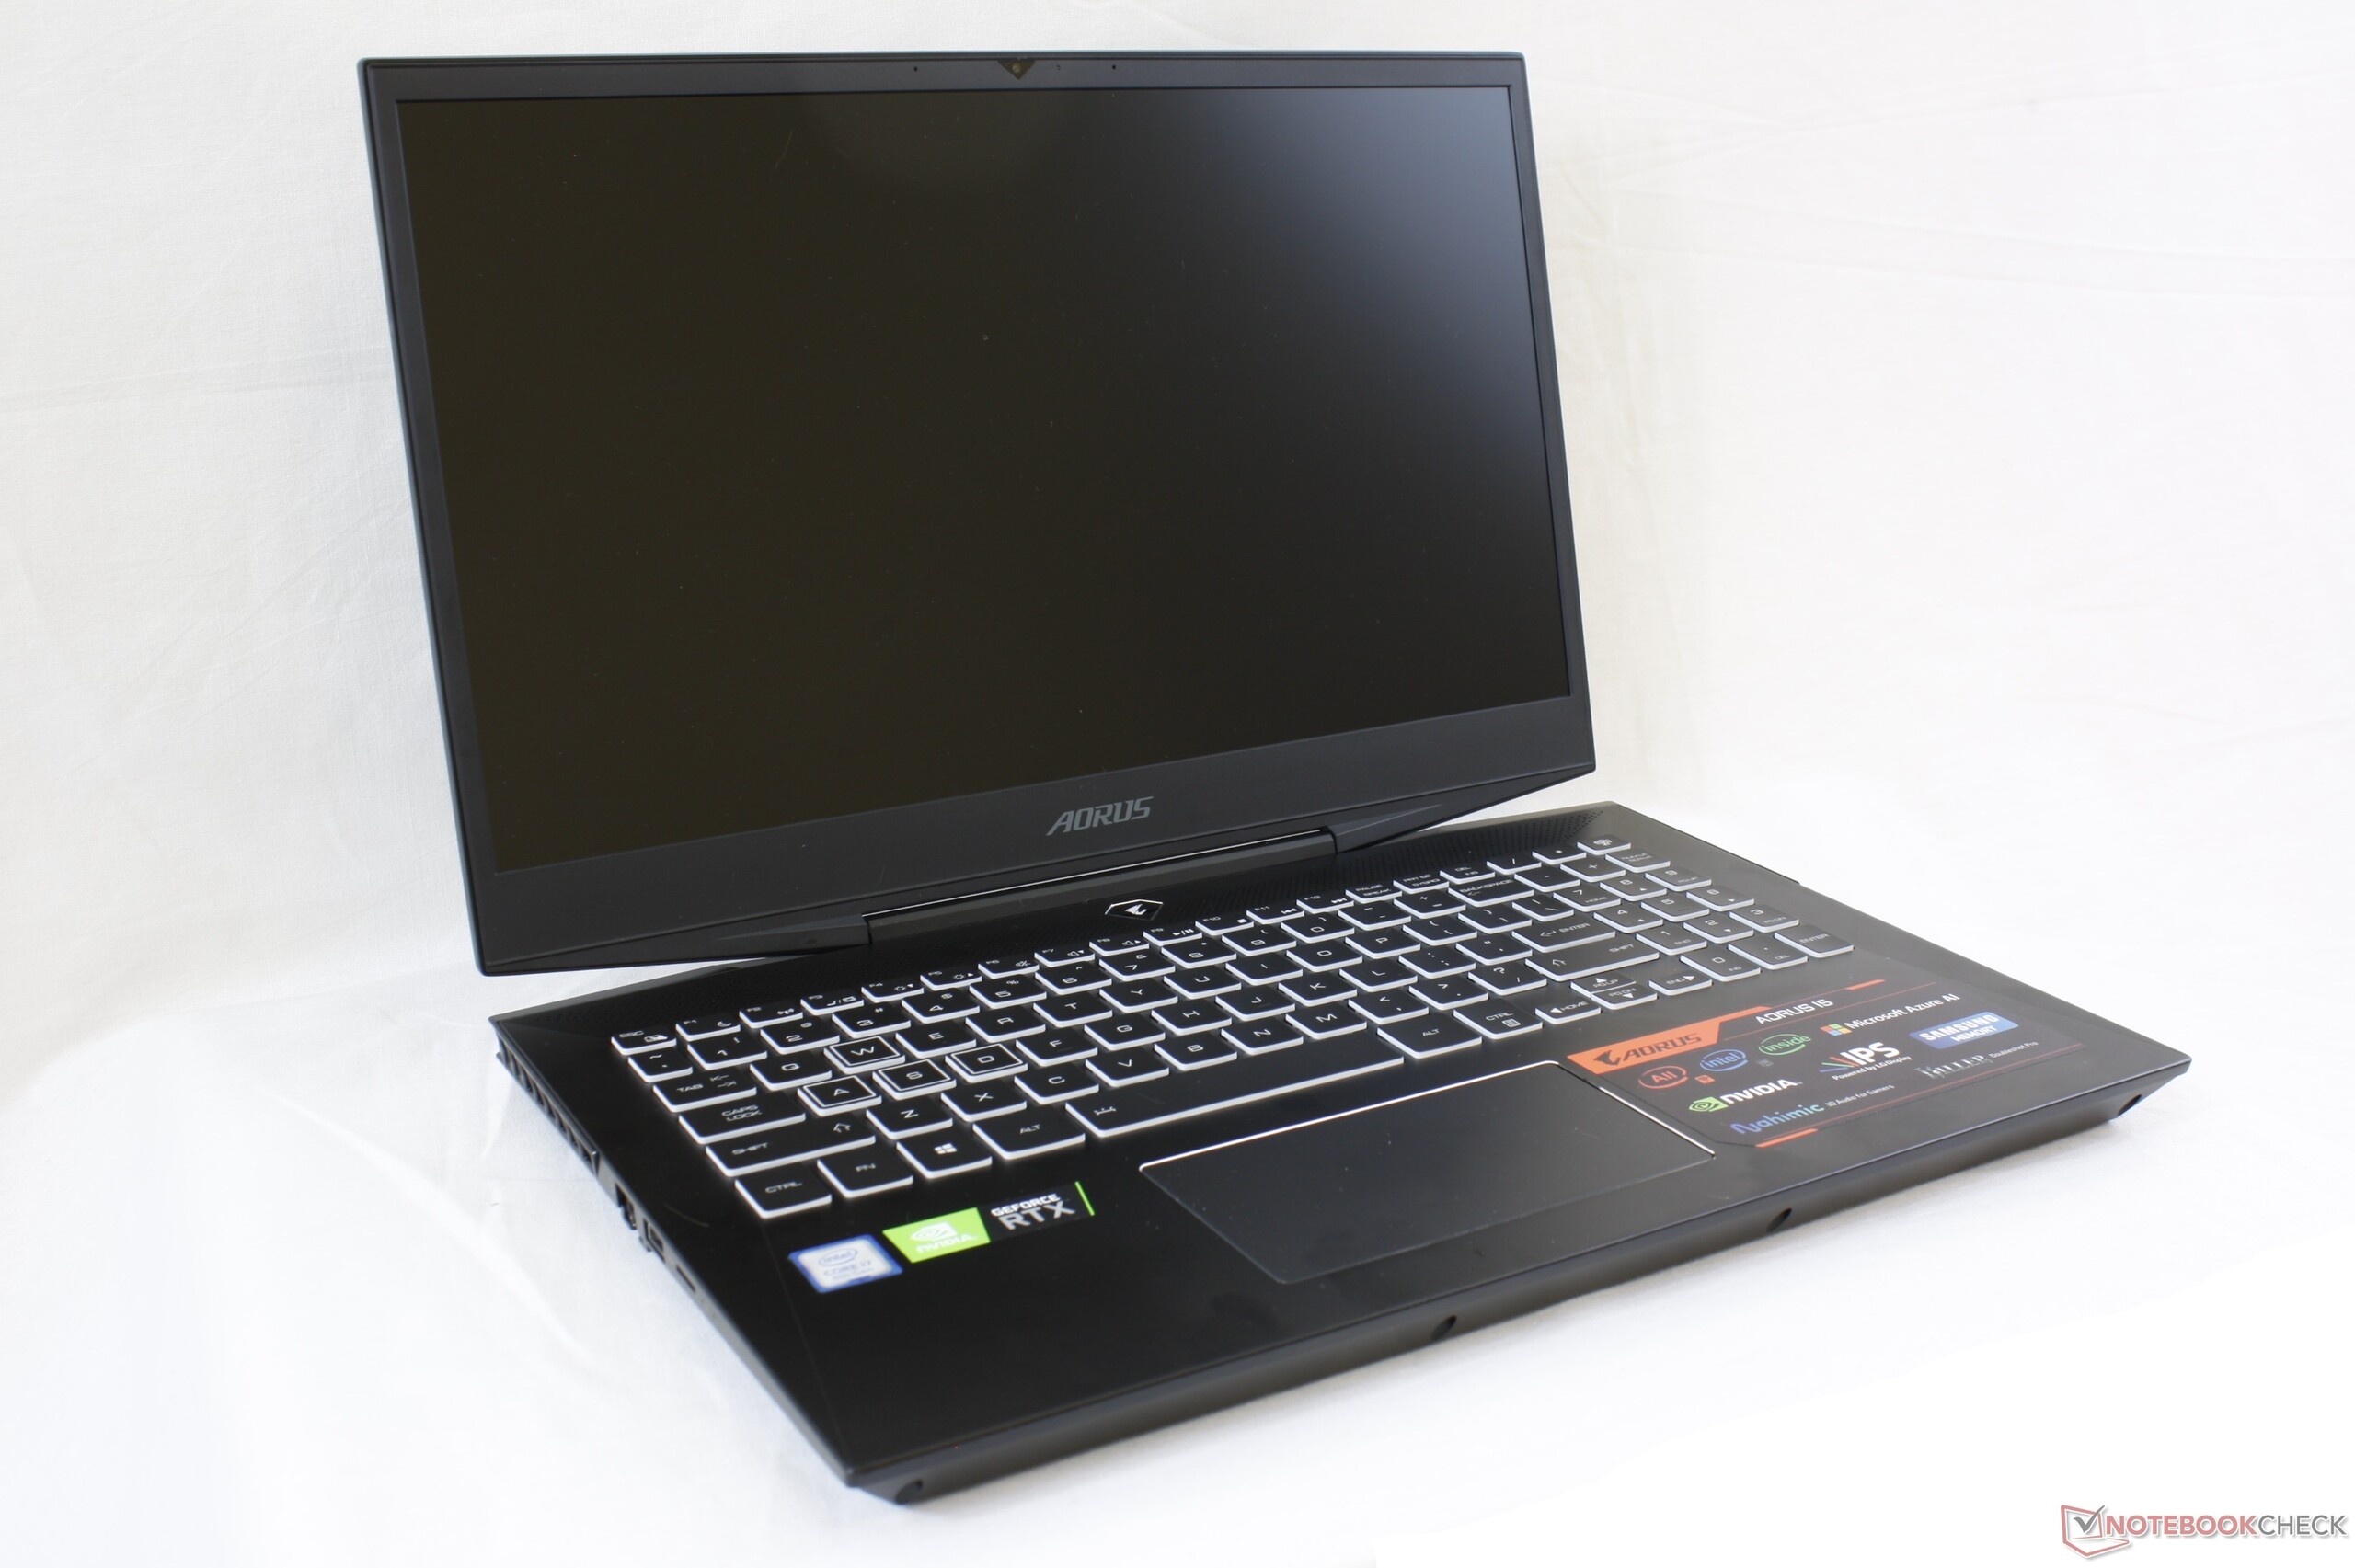
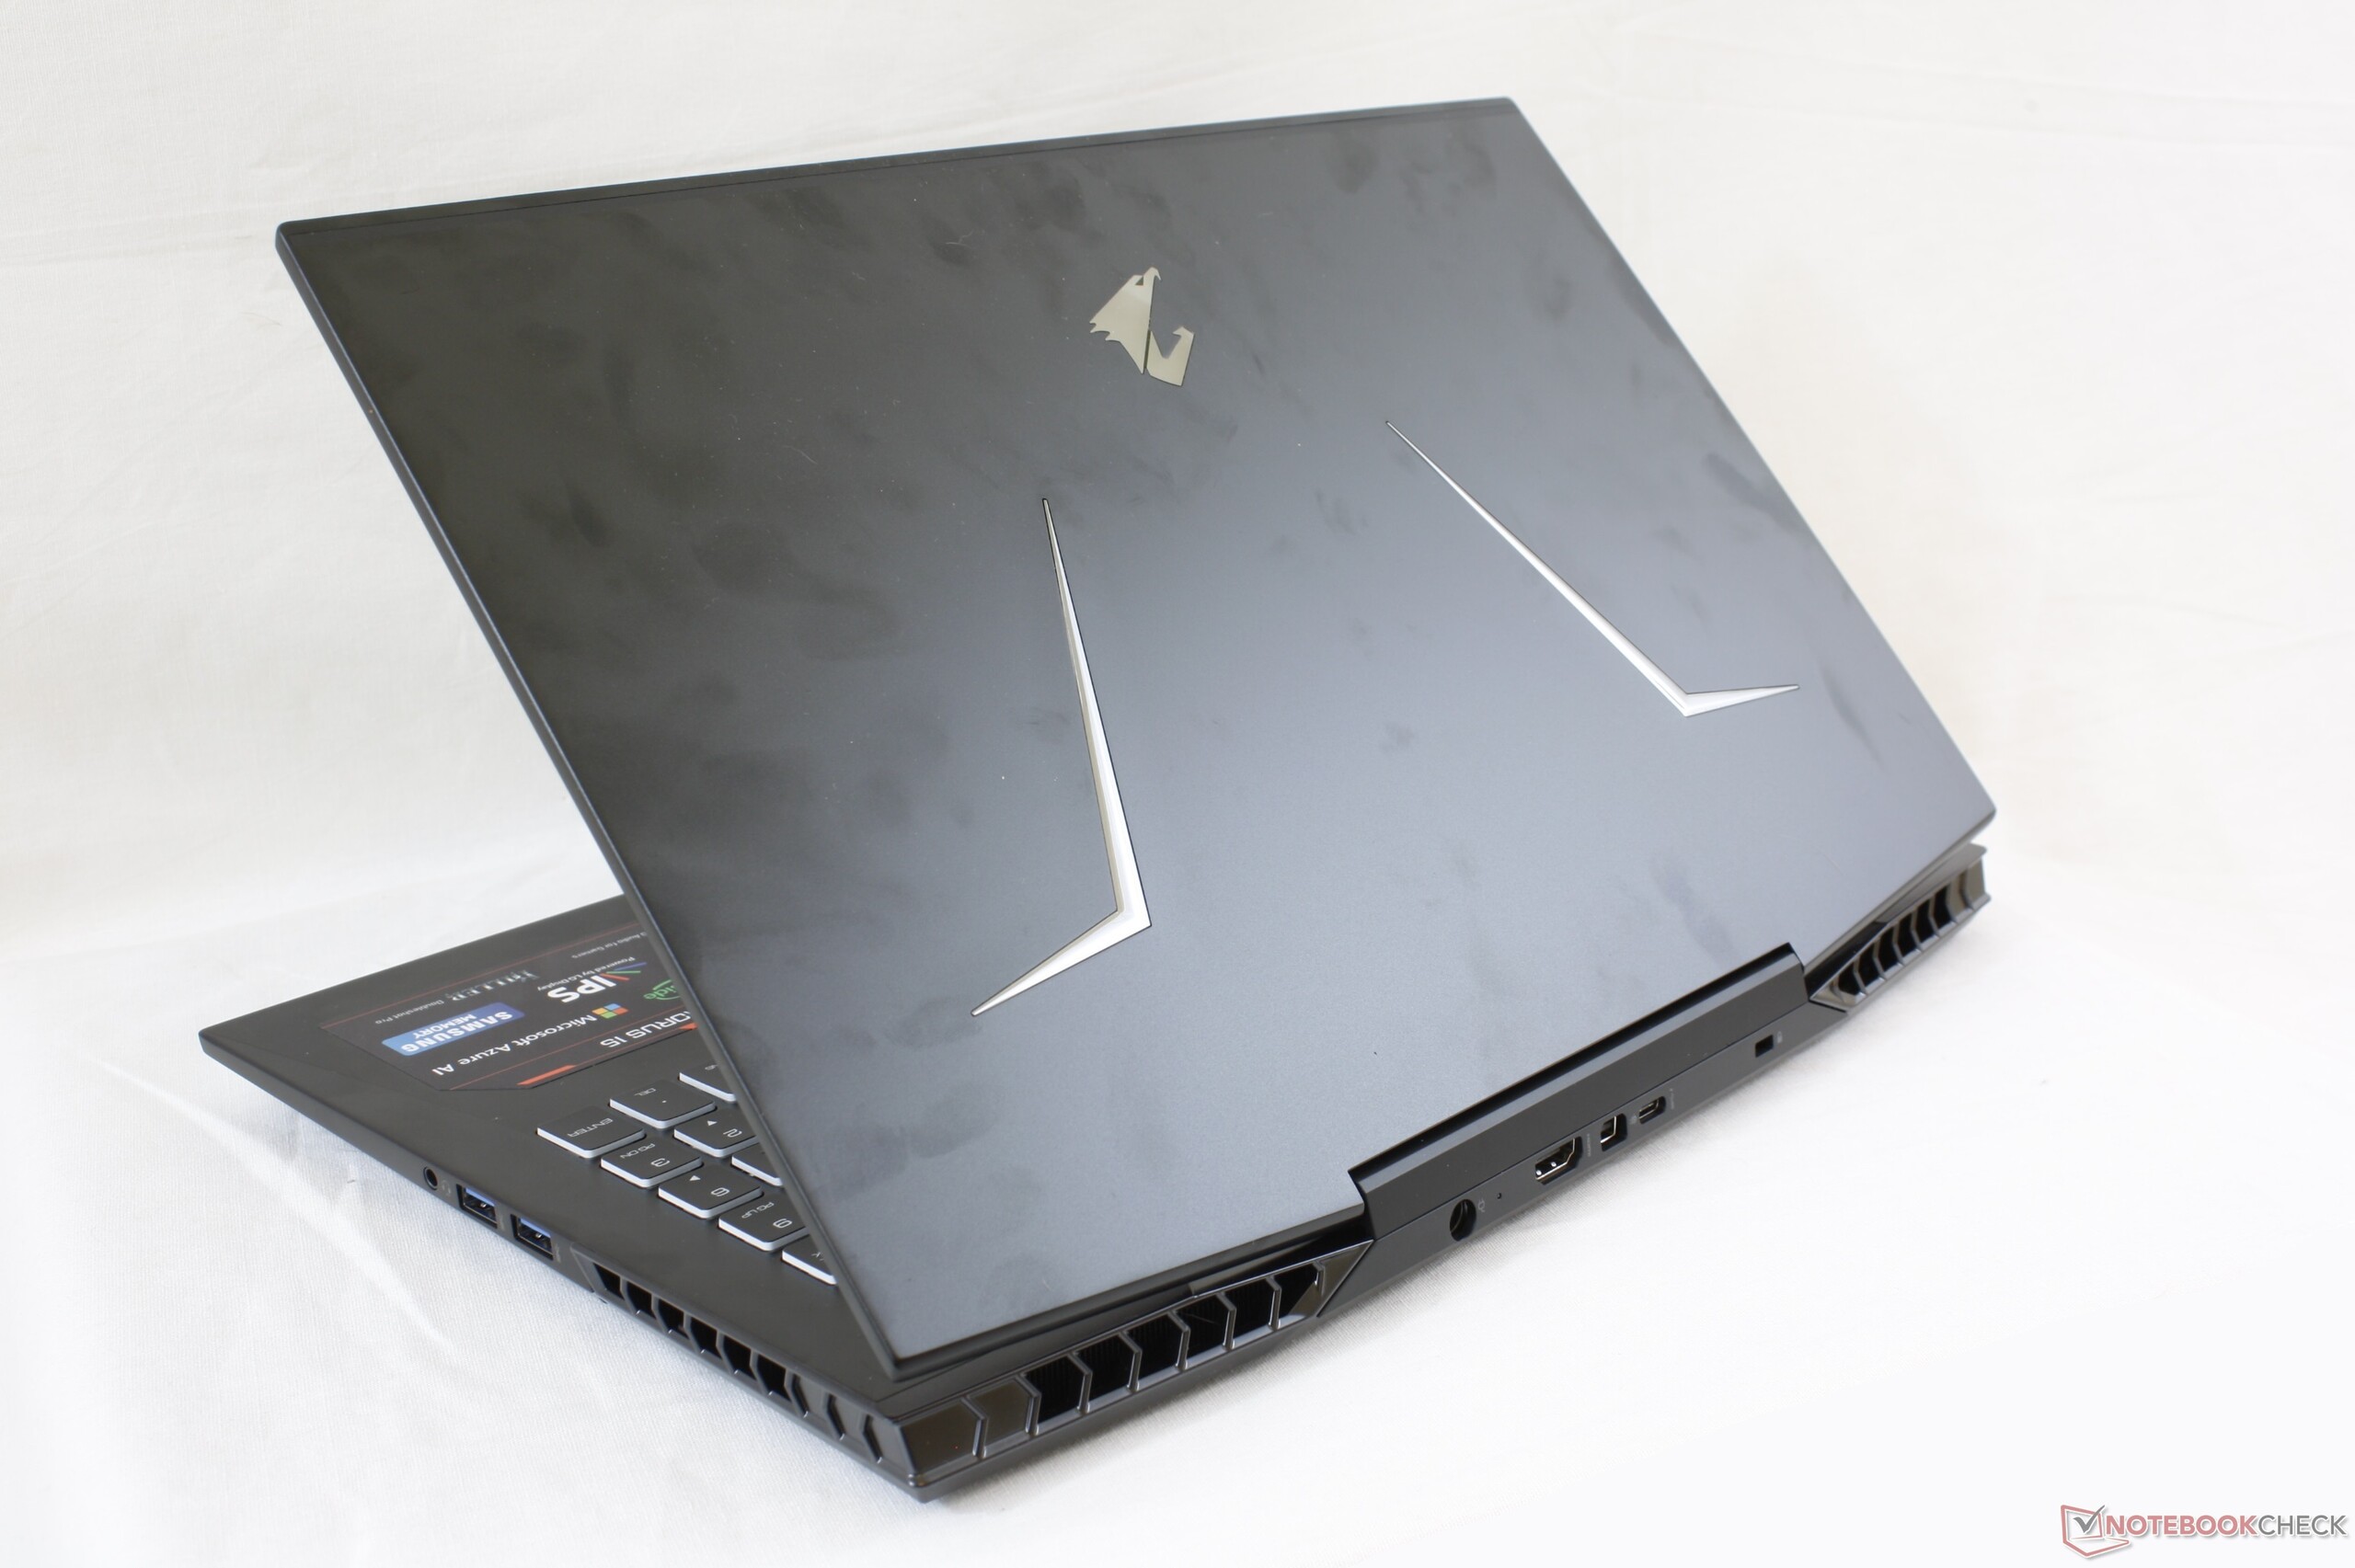
Gigabyte Aorus 15-SA (Core i7-9750H, GTX 1660 Ti, 144 Hz FHD) Laptop Review
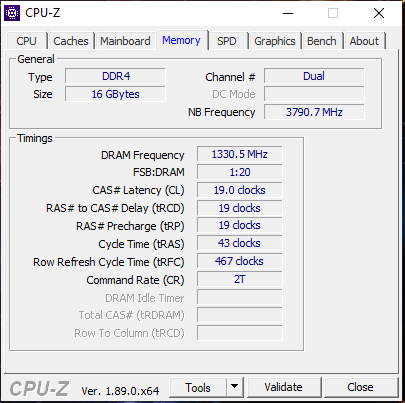
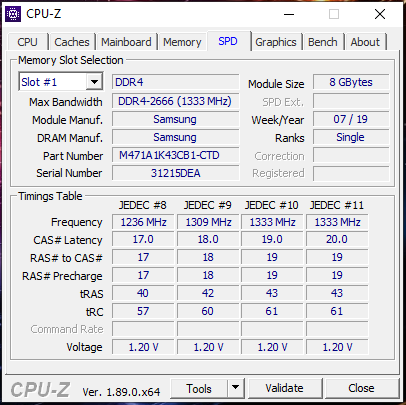
You would be forgiven for thinking that we have already covered the Gigabyte Aorus 15-SA. The 15.6-inch gaming laptop is the sibling to the Aorus 15-W9 and Aorus 15-X9, which we have also reviewed this year. The 15-SA comes with an Intel Core i7-9750H processor, an NVIDIA GeForce GTX 1660 Ti GPU, 16 GB of DDR4-2666 RAM and a 512 GB PCIe SSD.
We shall compare the 15-SA against other midrange and comparably priced 15.6-inch gaming laptops. Our comparison devices will include the Alienware m15, the ASUS ROG Zephyrus S GX531GM, the Lenovo Legion Y530, MSI GS65 8RF, Razer Blade 15 and Gigabyte’s own Aero 15 Classic-XA.
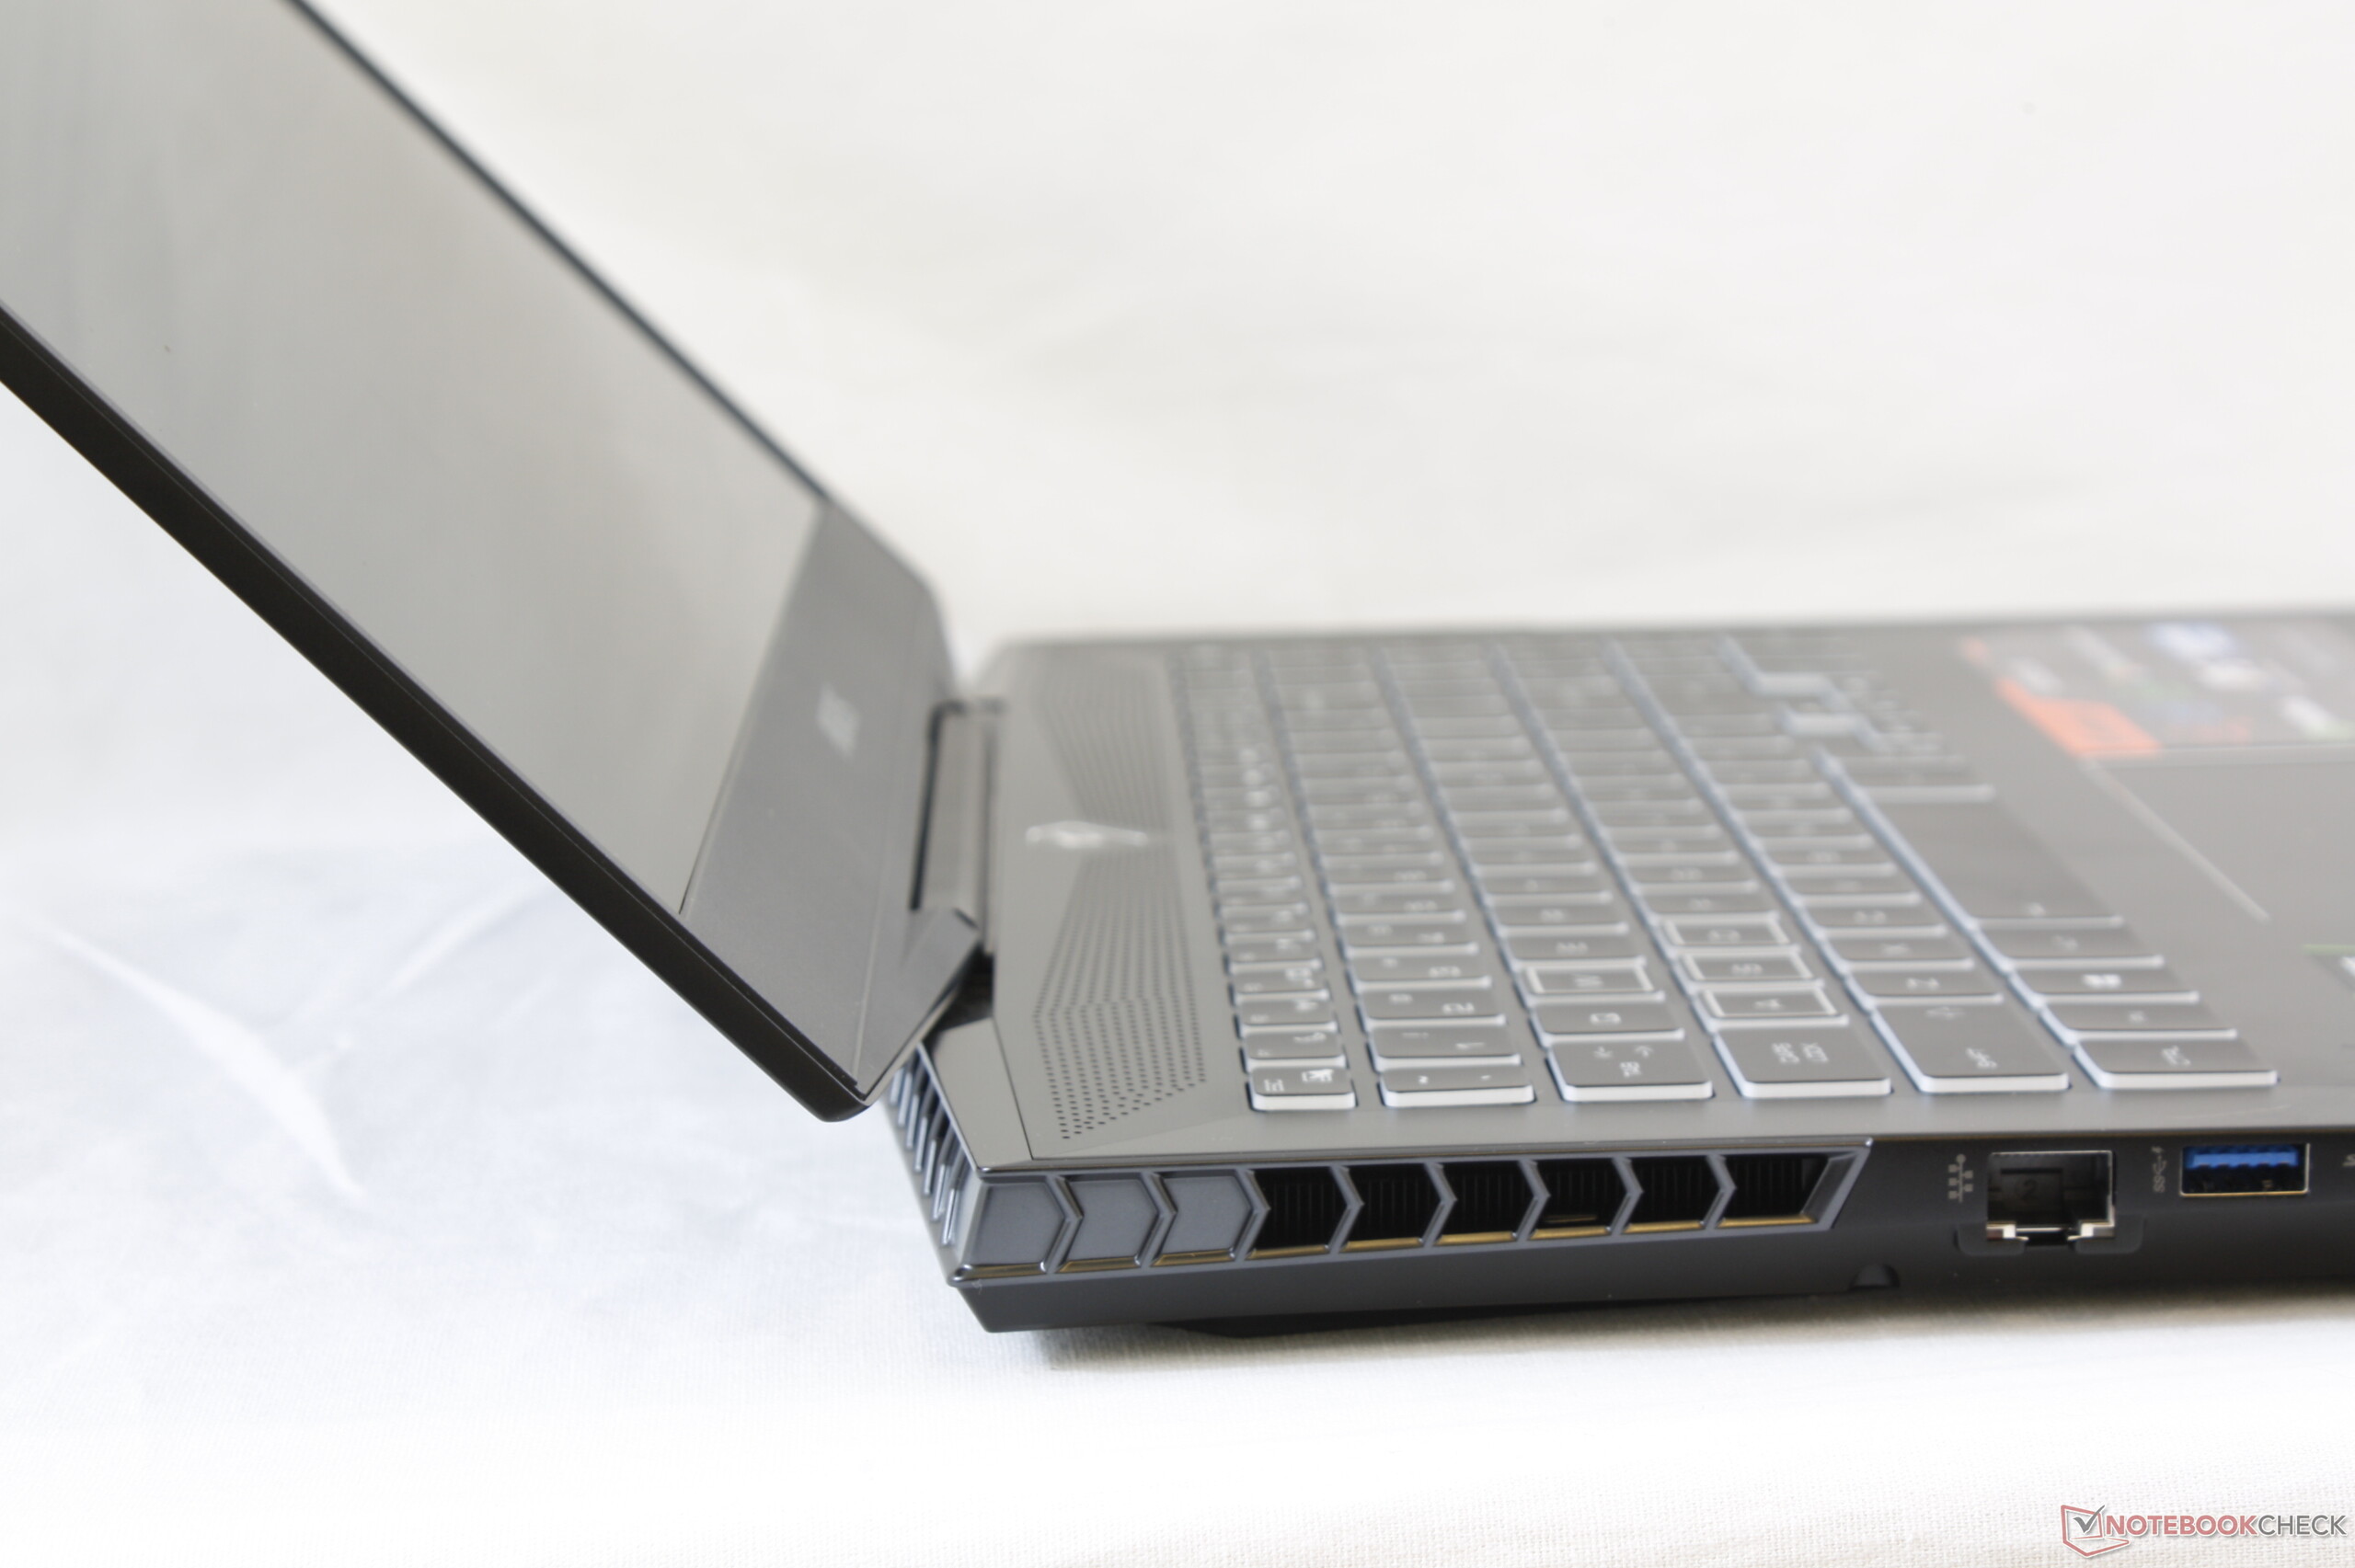
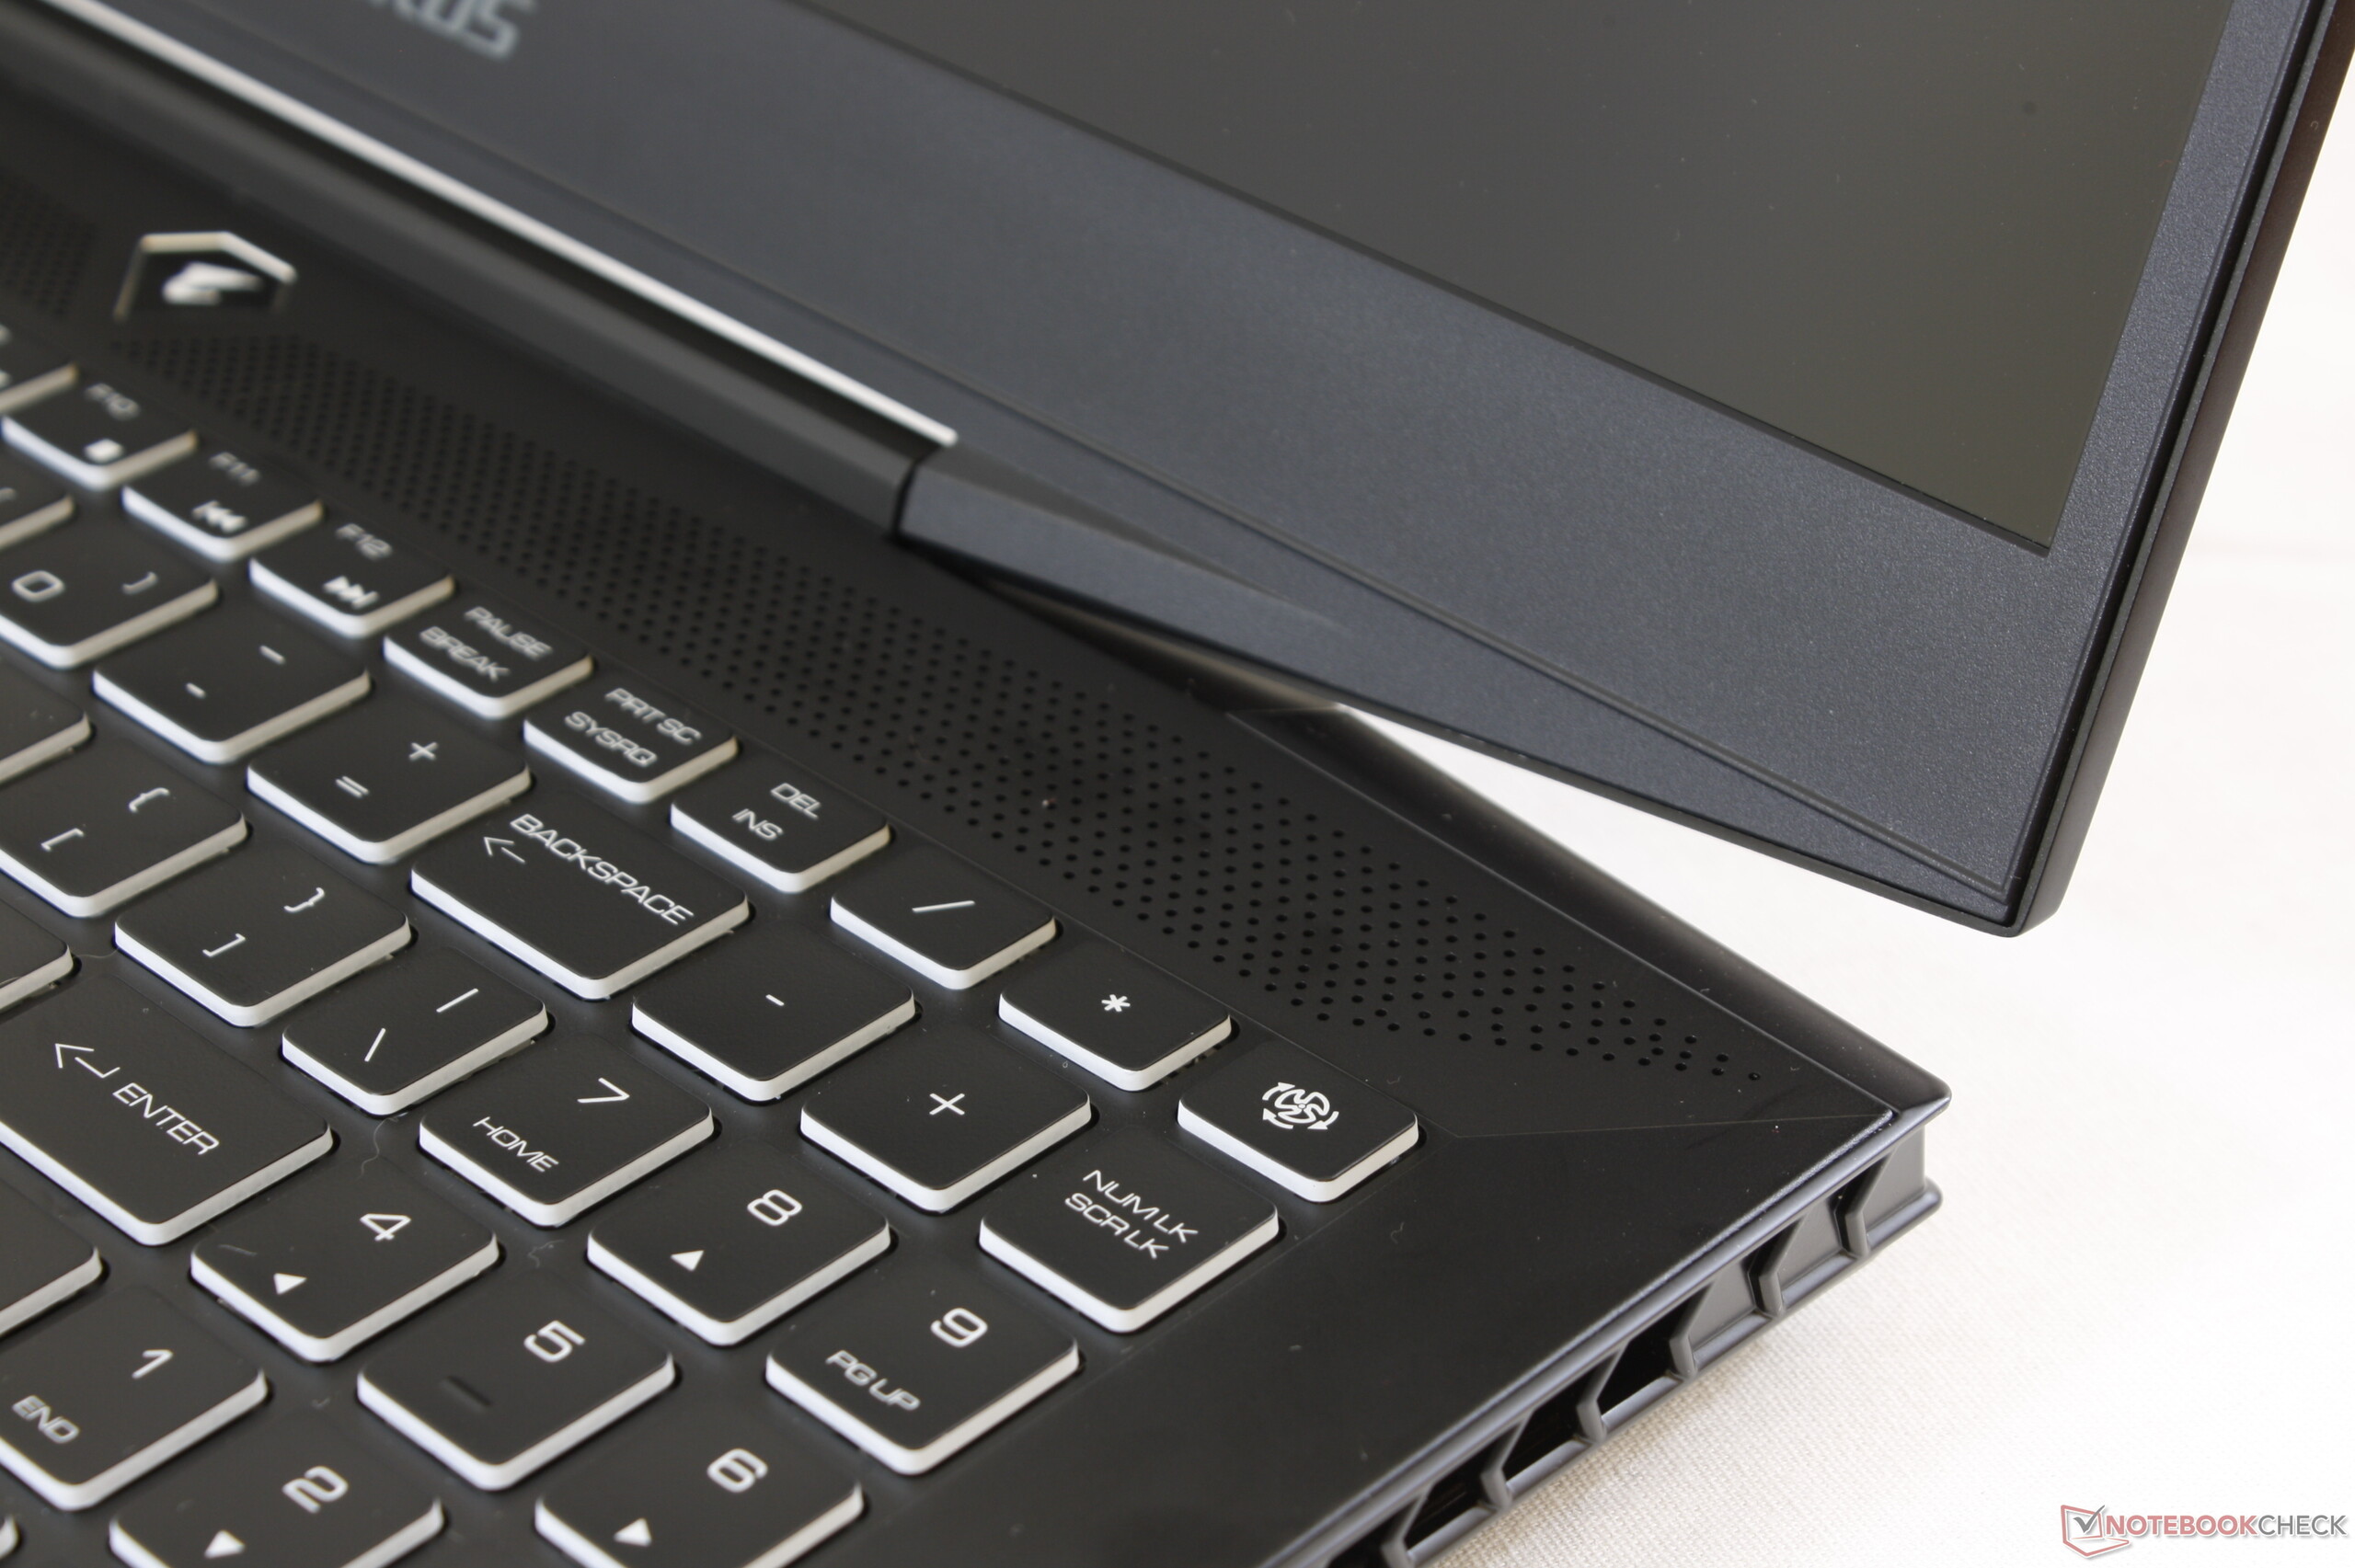
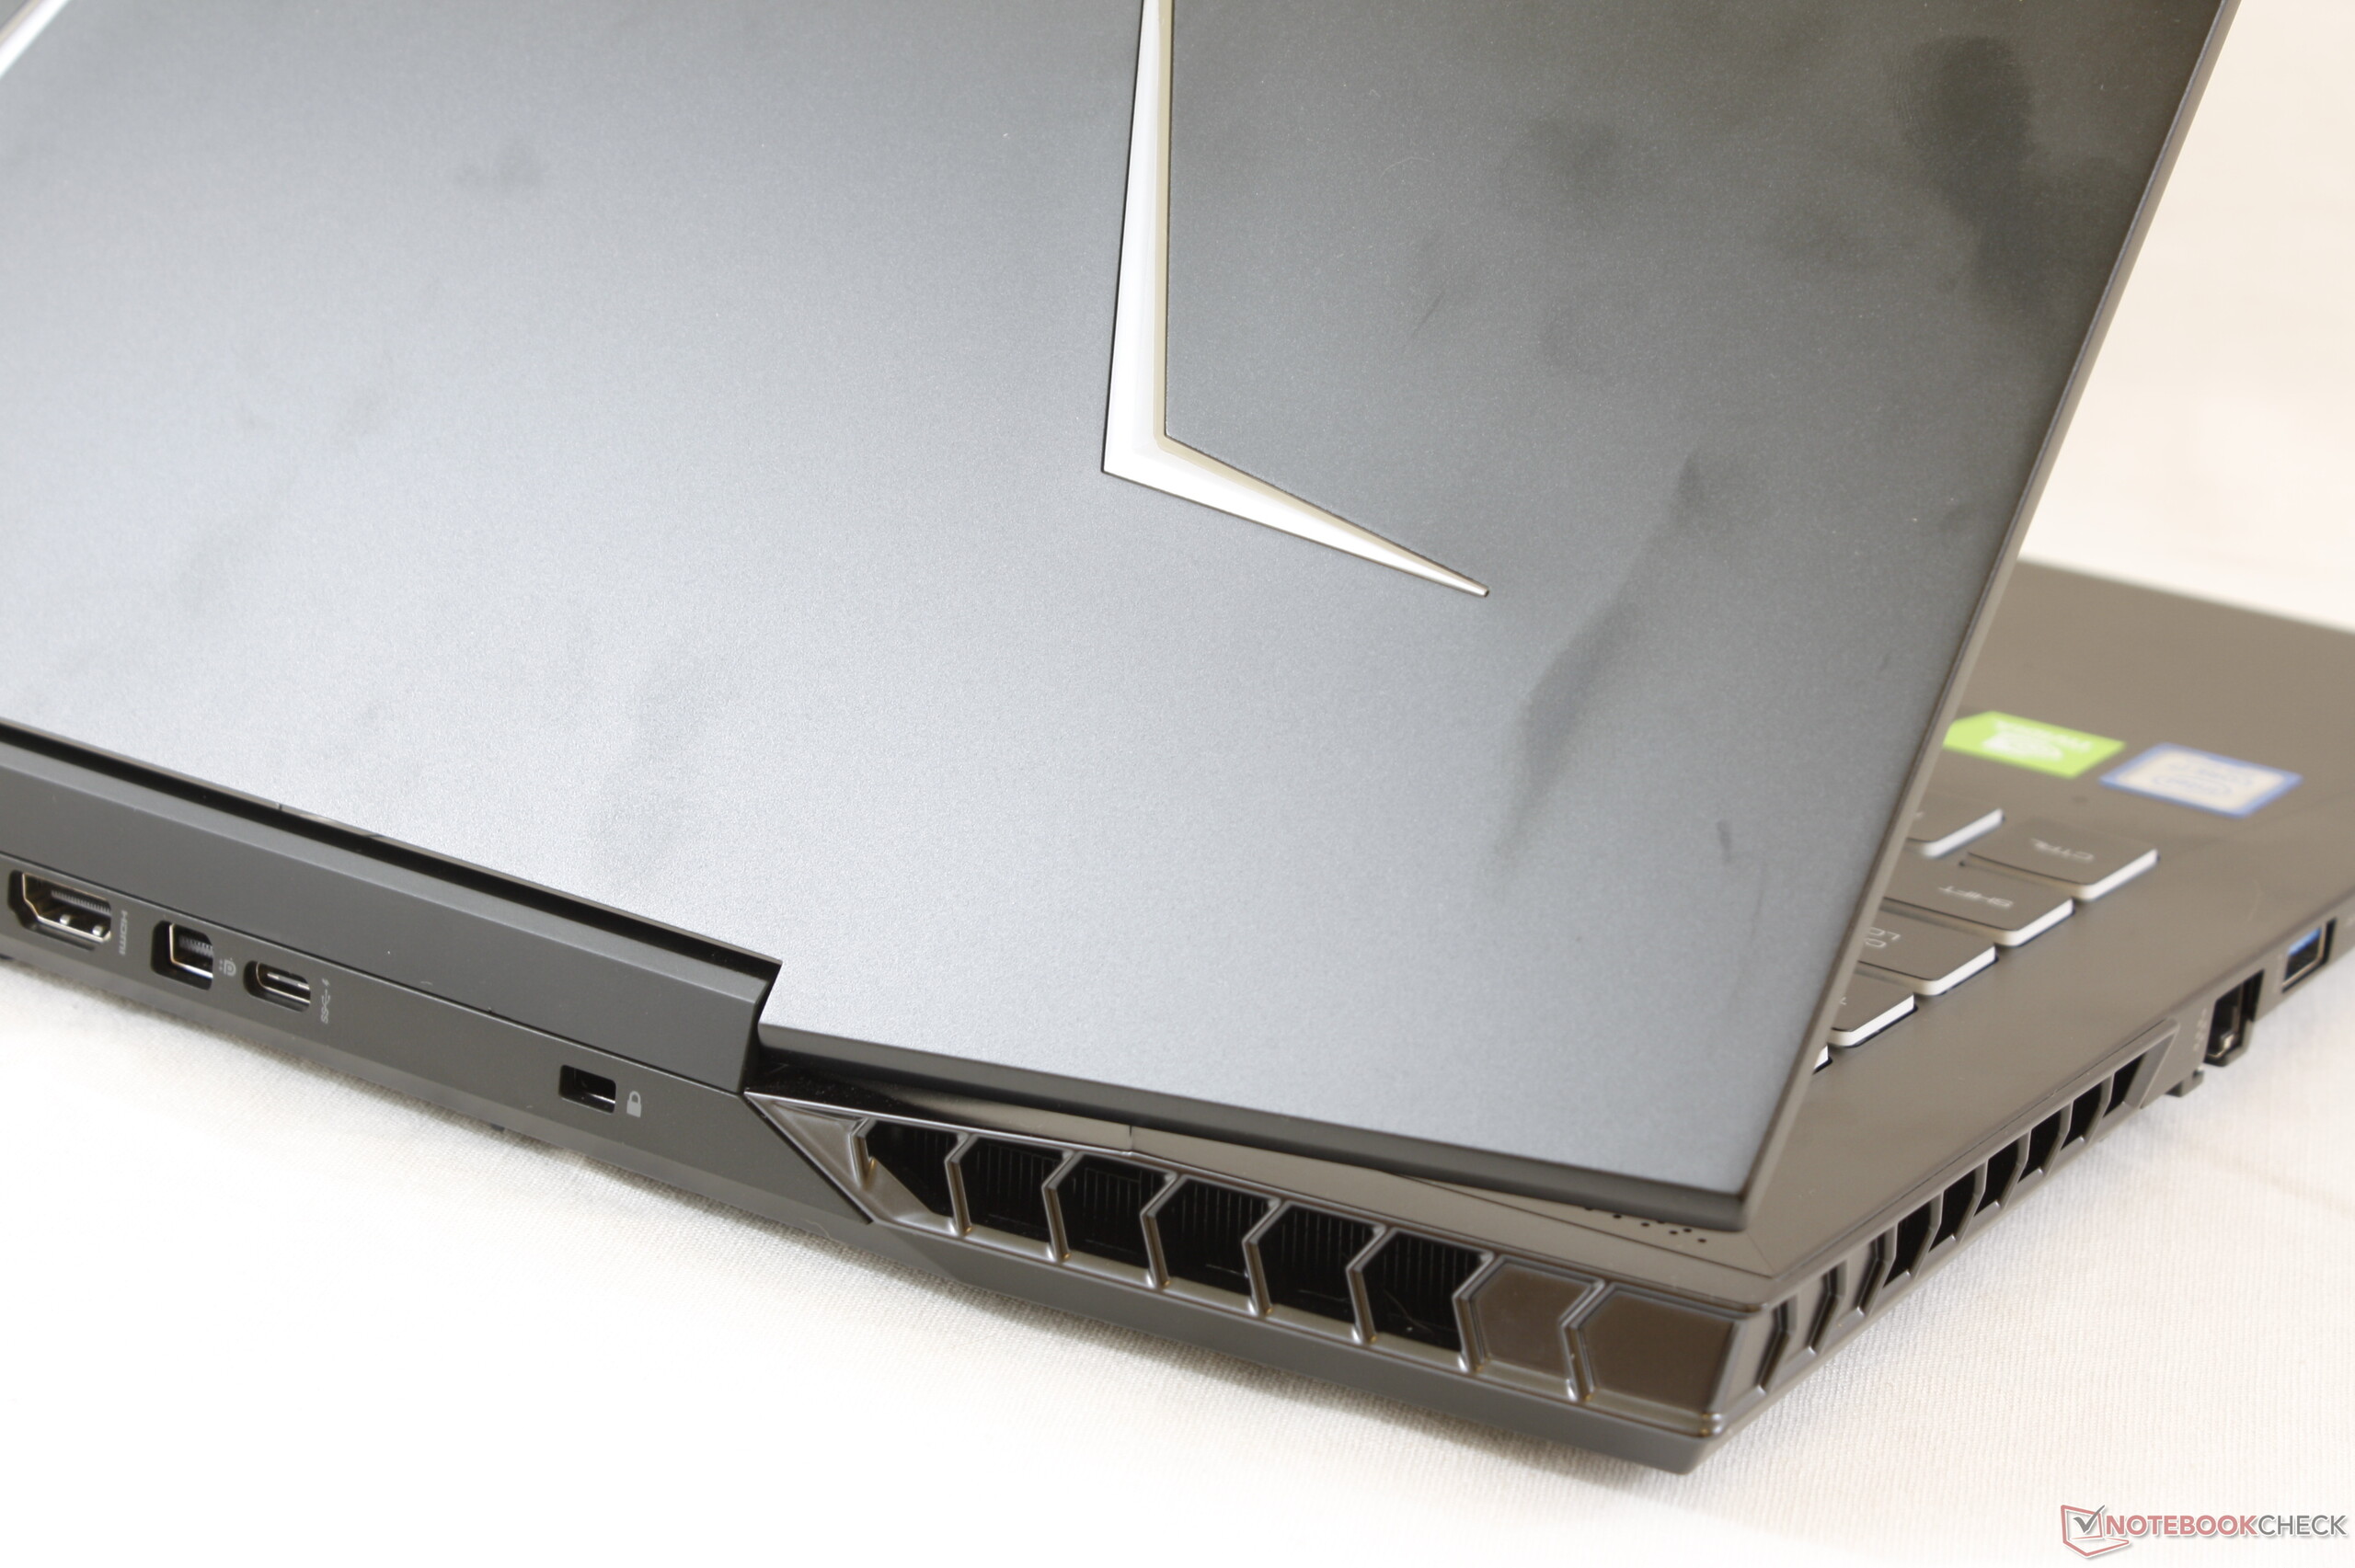
Since Gigabyte only separates the Aorus 15-SA, Aorus 15-W9 and Aorus 15-X9 by internal components, we shall skip straight to the Display section of this review. Please see our Aorus 15-X9 review for our thoughts on the case, connectivity, input devices and speakers. We have also covered the Display section in greater detail in the above review too.
Display
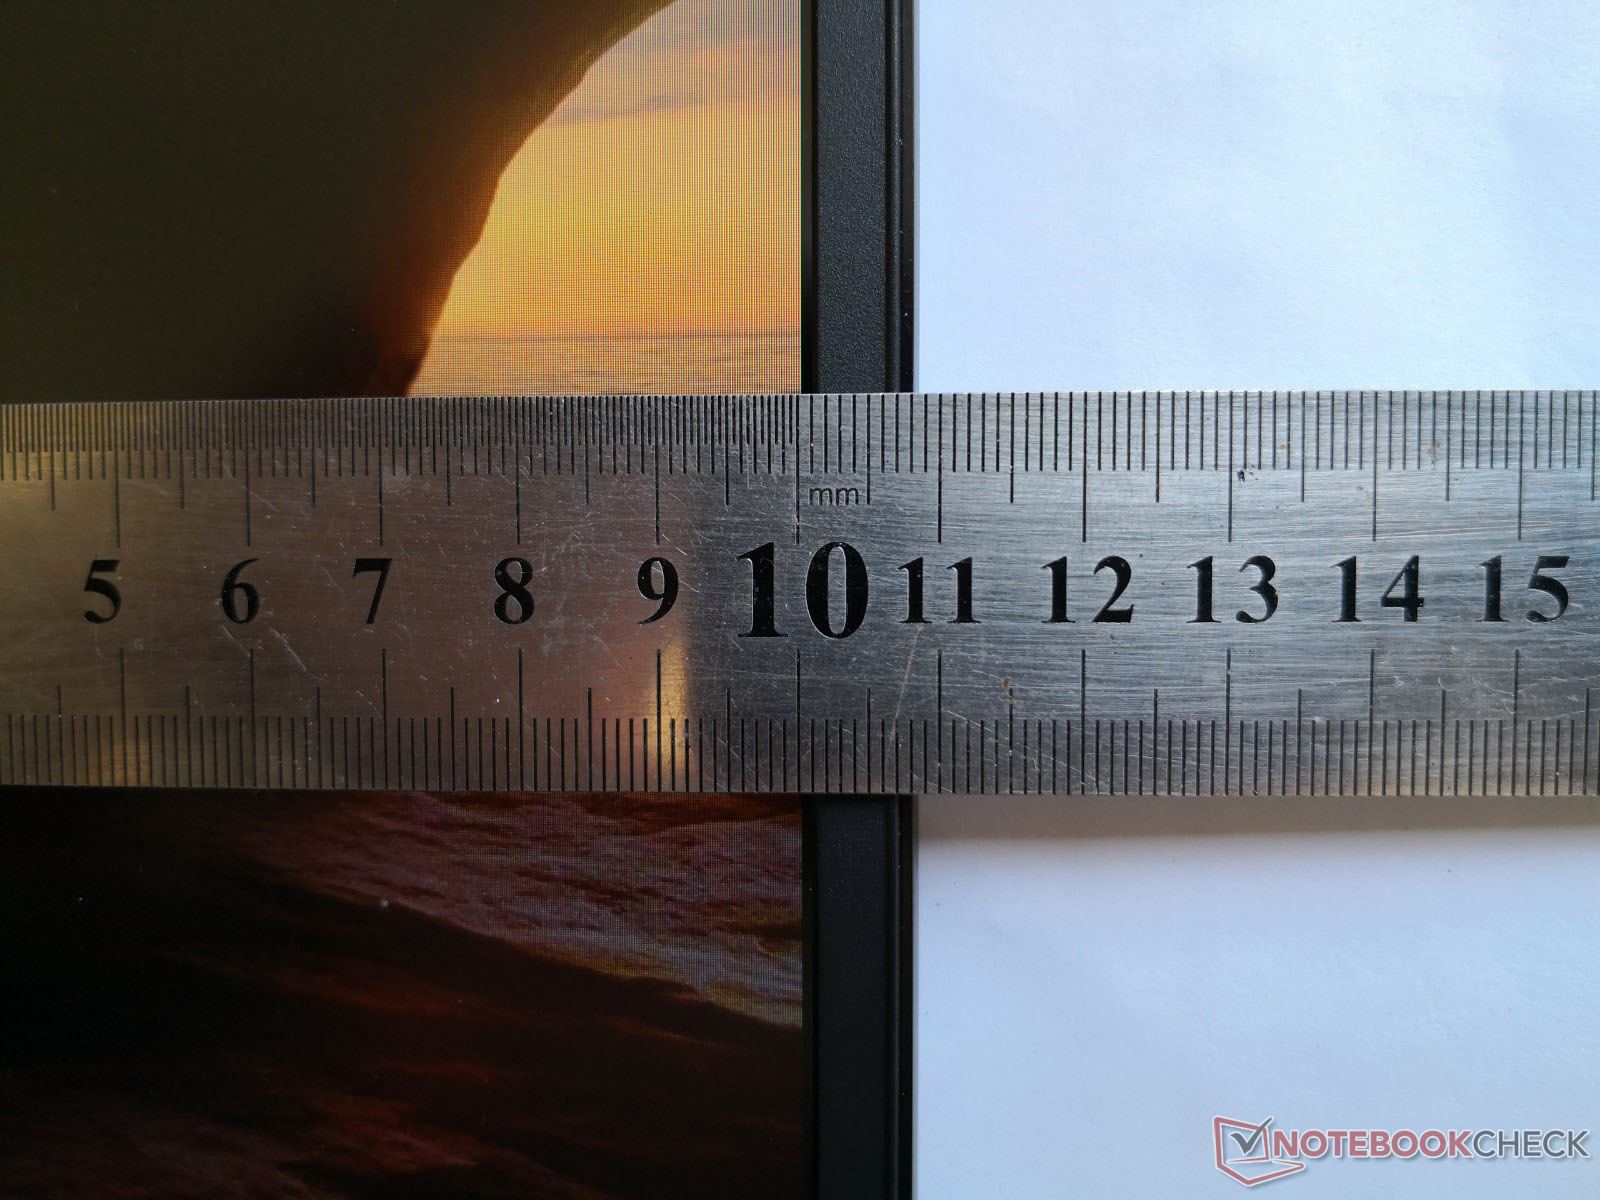
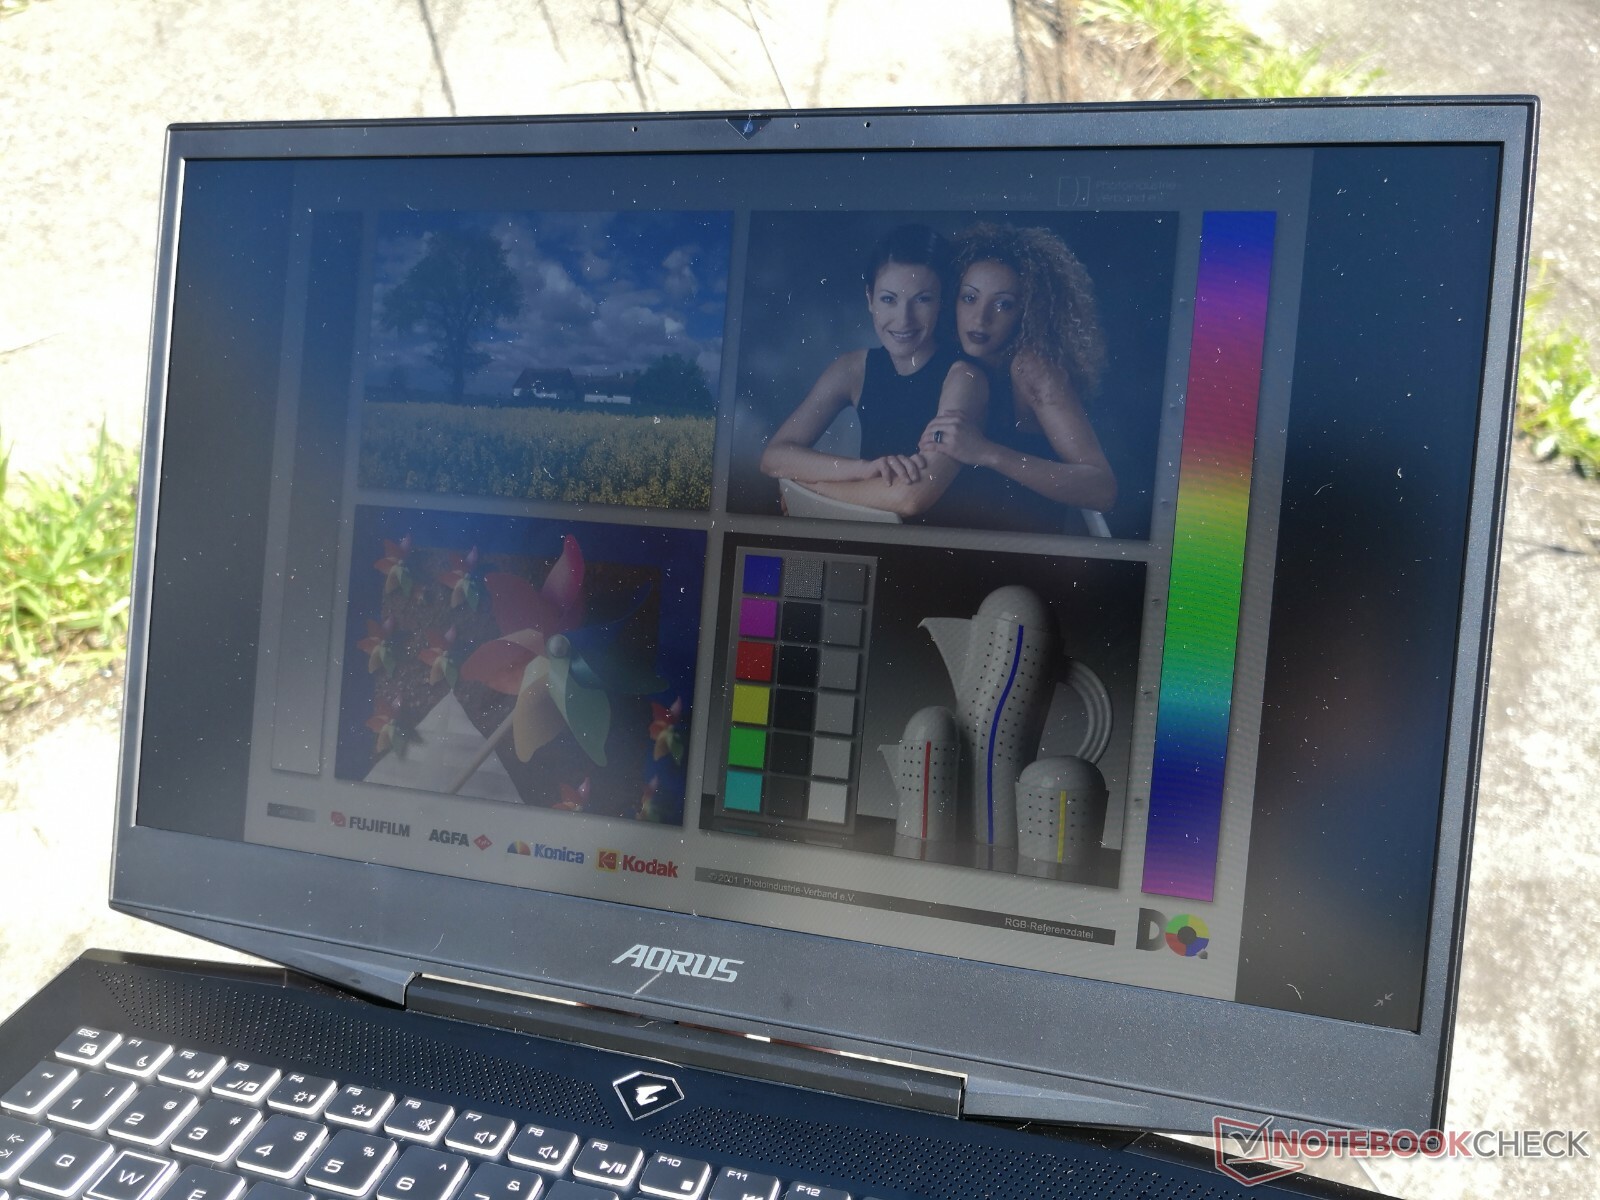
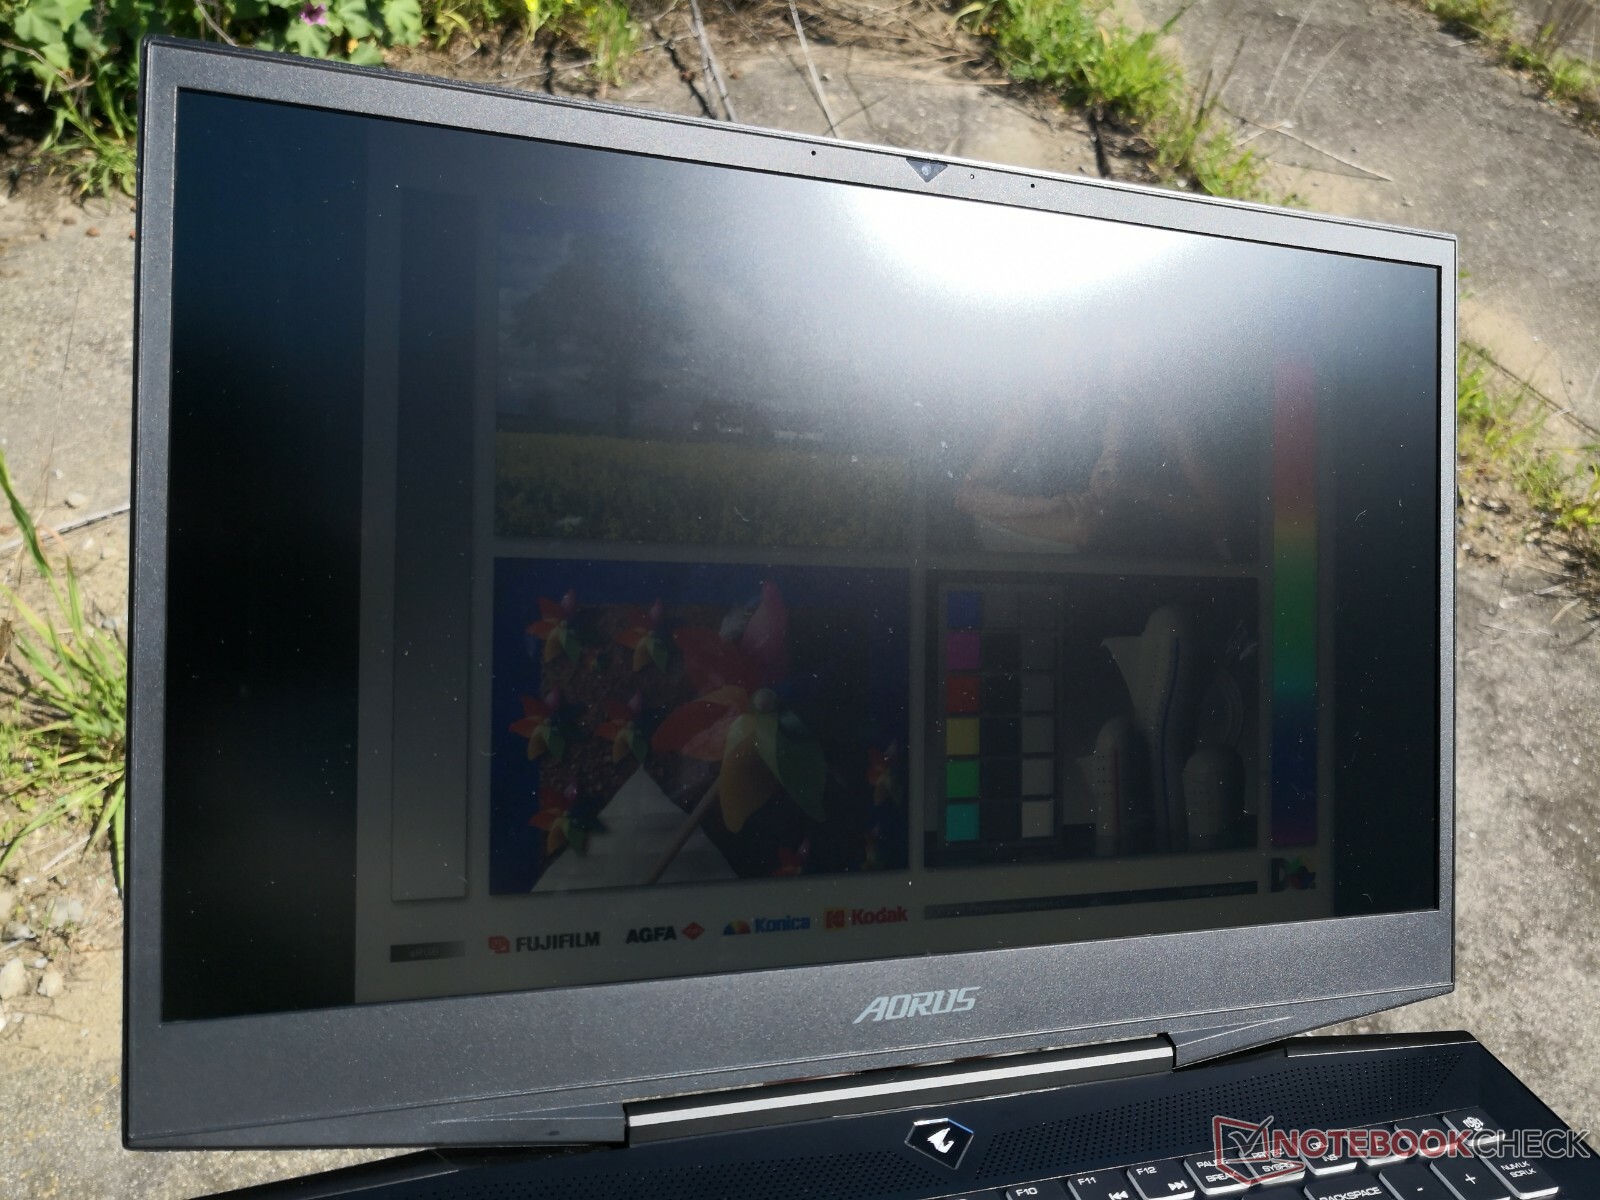
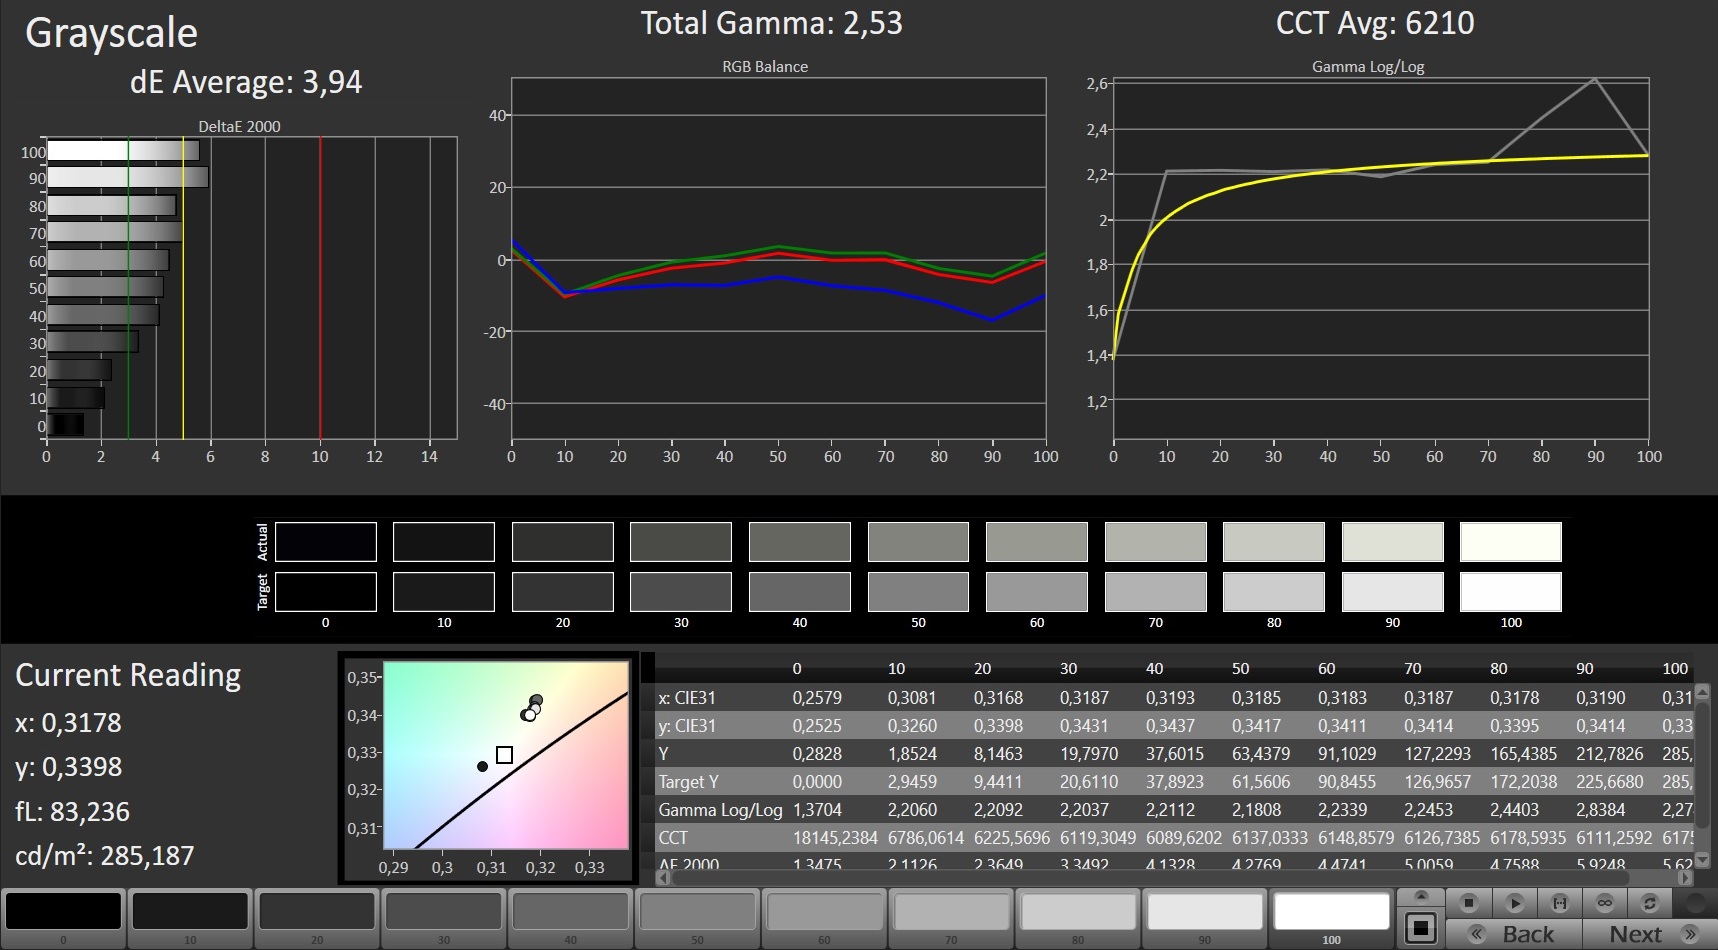
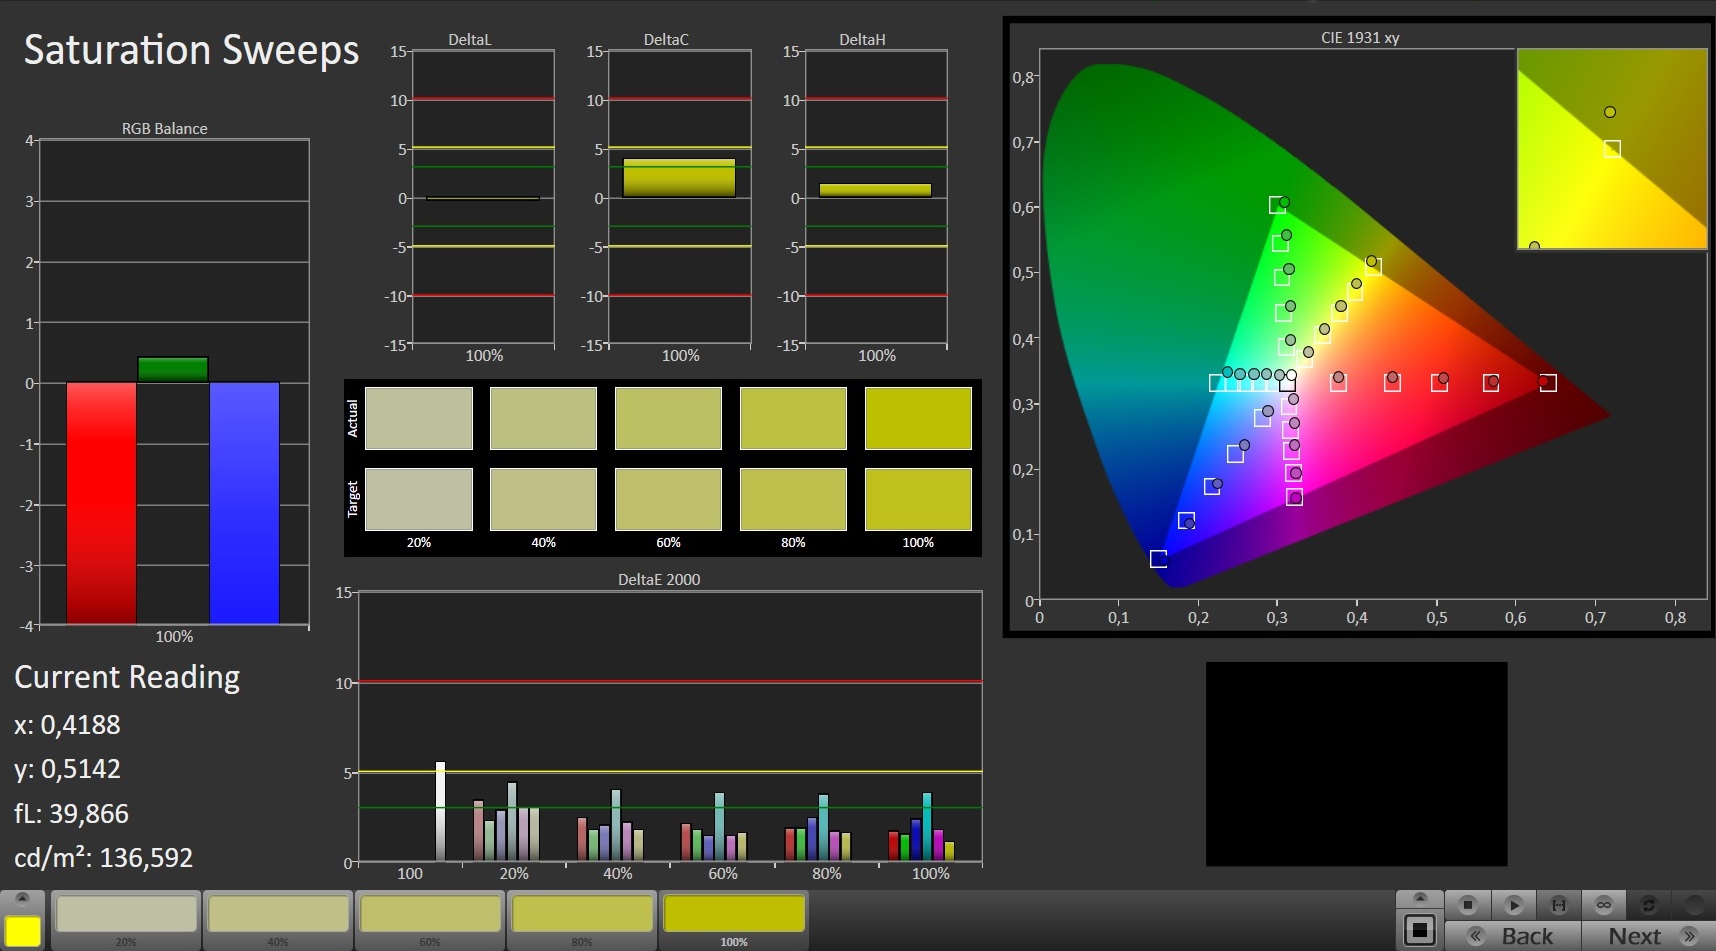
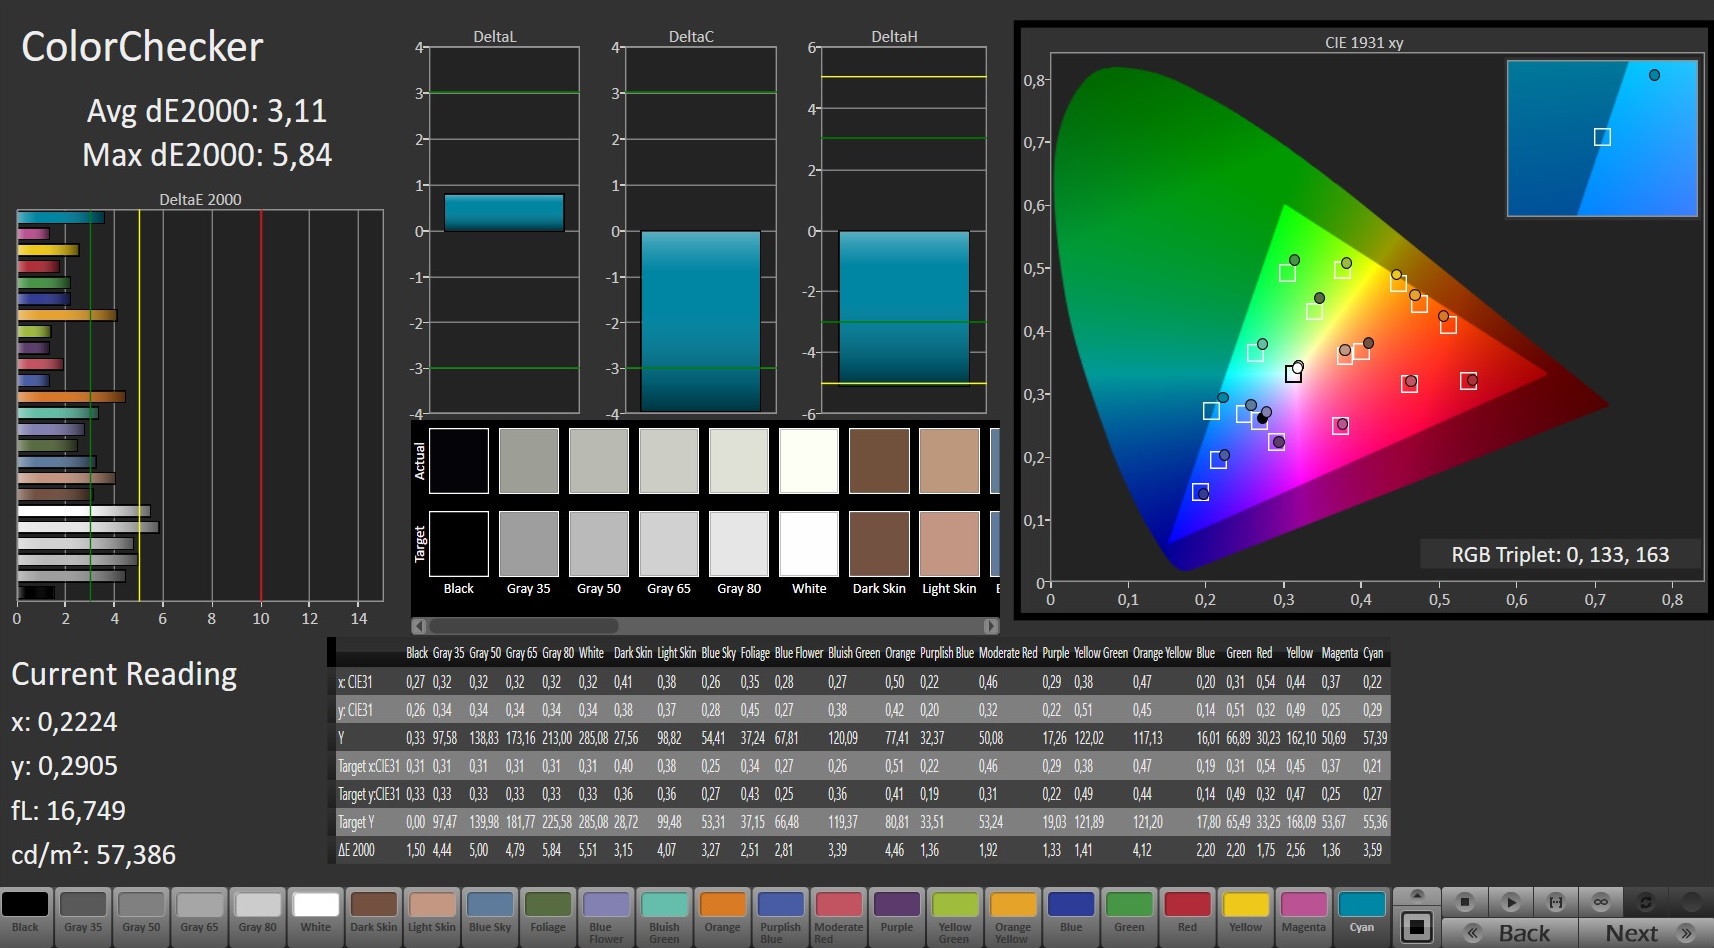
Gigabyte has equipped our review unit with an LG Philips LP156WFG-SPB2 (LGD05E8) panel, which is something of a mixed bag. The 1080p display has low reaction times and a 144 Hz refresh rate, which should please gamers. However, its 254.2 cd/m² peak brightness is too low for a laptop at this price, as is its 950:1 contrast ratio. We would expect a display to reach at least 300 cd/m² peak brightness with a 1000:1 contrast ratio for a gaming laptop that costs almost 2,000 Euros (~$2,246). Only the Zephyrus S GX531GM and m15 meet these criteria of our comparison devices too though, so the 15-SA is not alone here.
| |||||||||||||||||||||||||
Brightness Distribution: 90 %
Center on Battery: 266 cd/m²
Contrast: 950:1 (Black: 0.28 cd/m²)
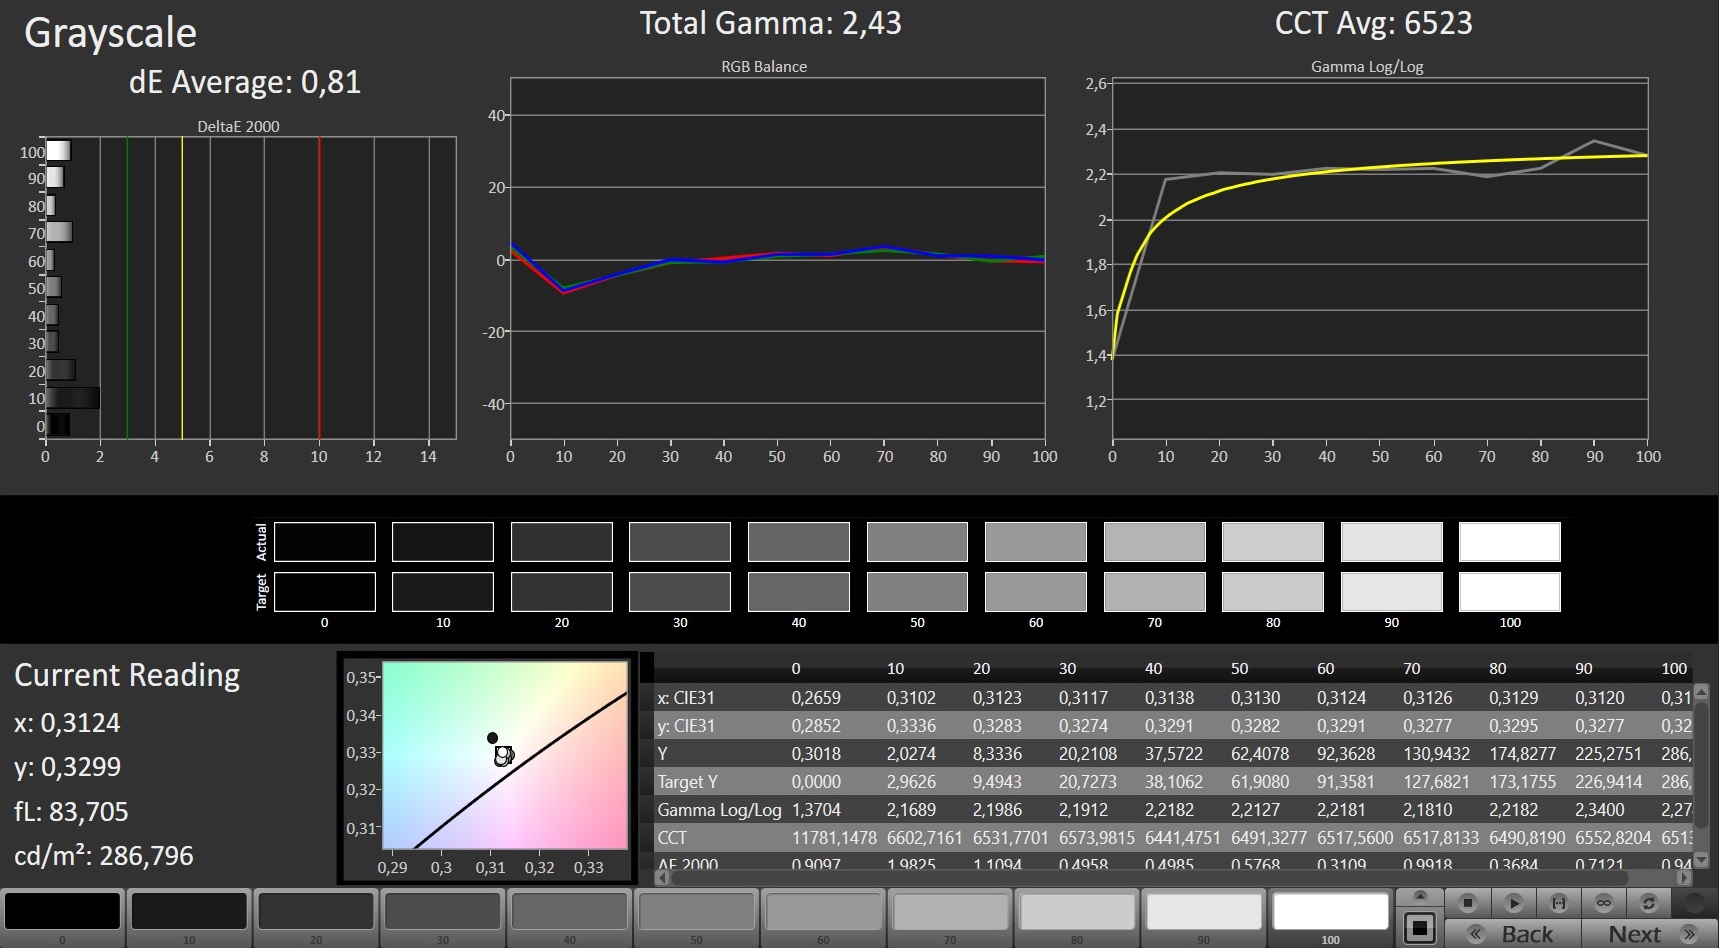
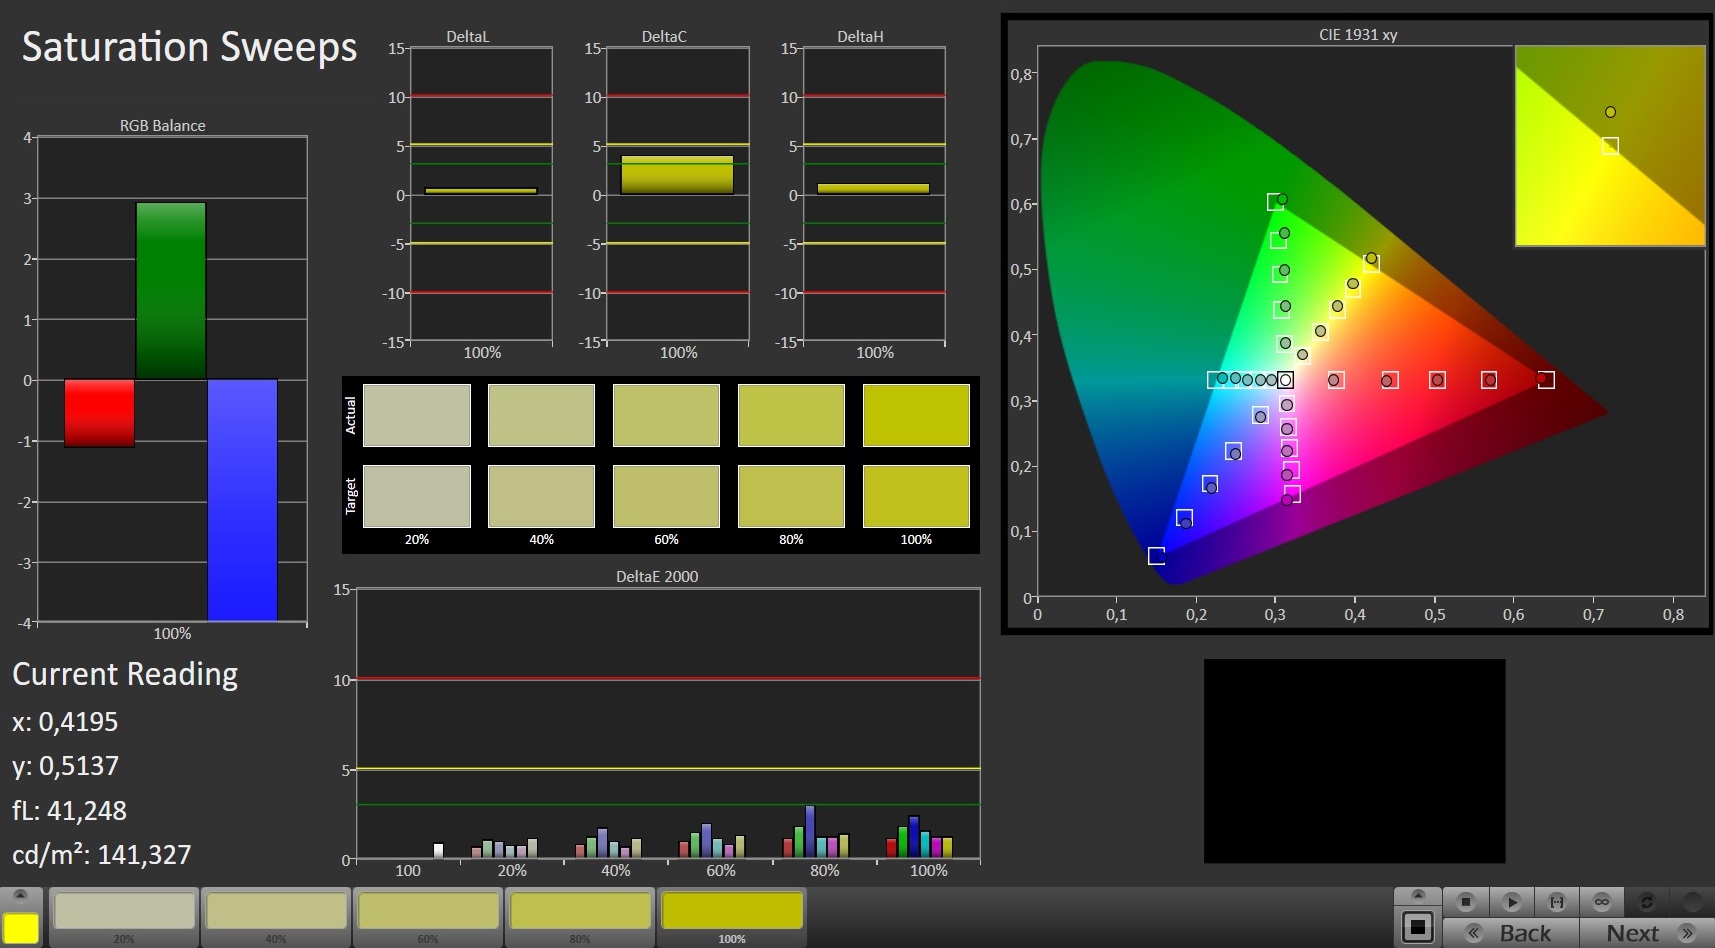
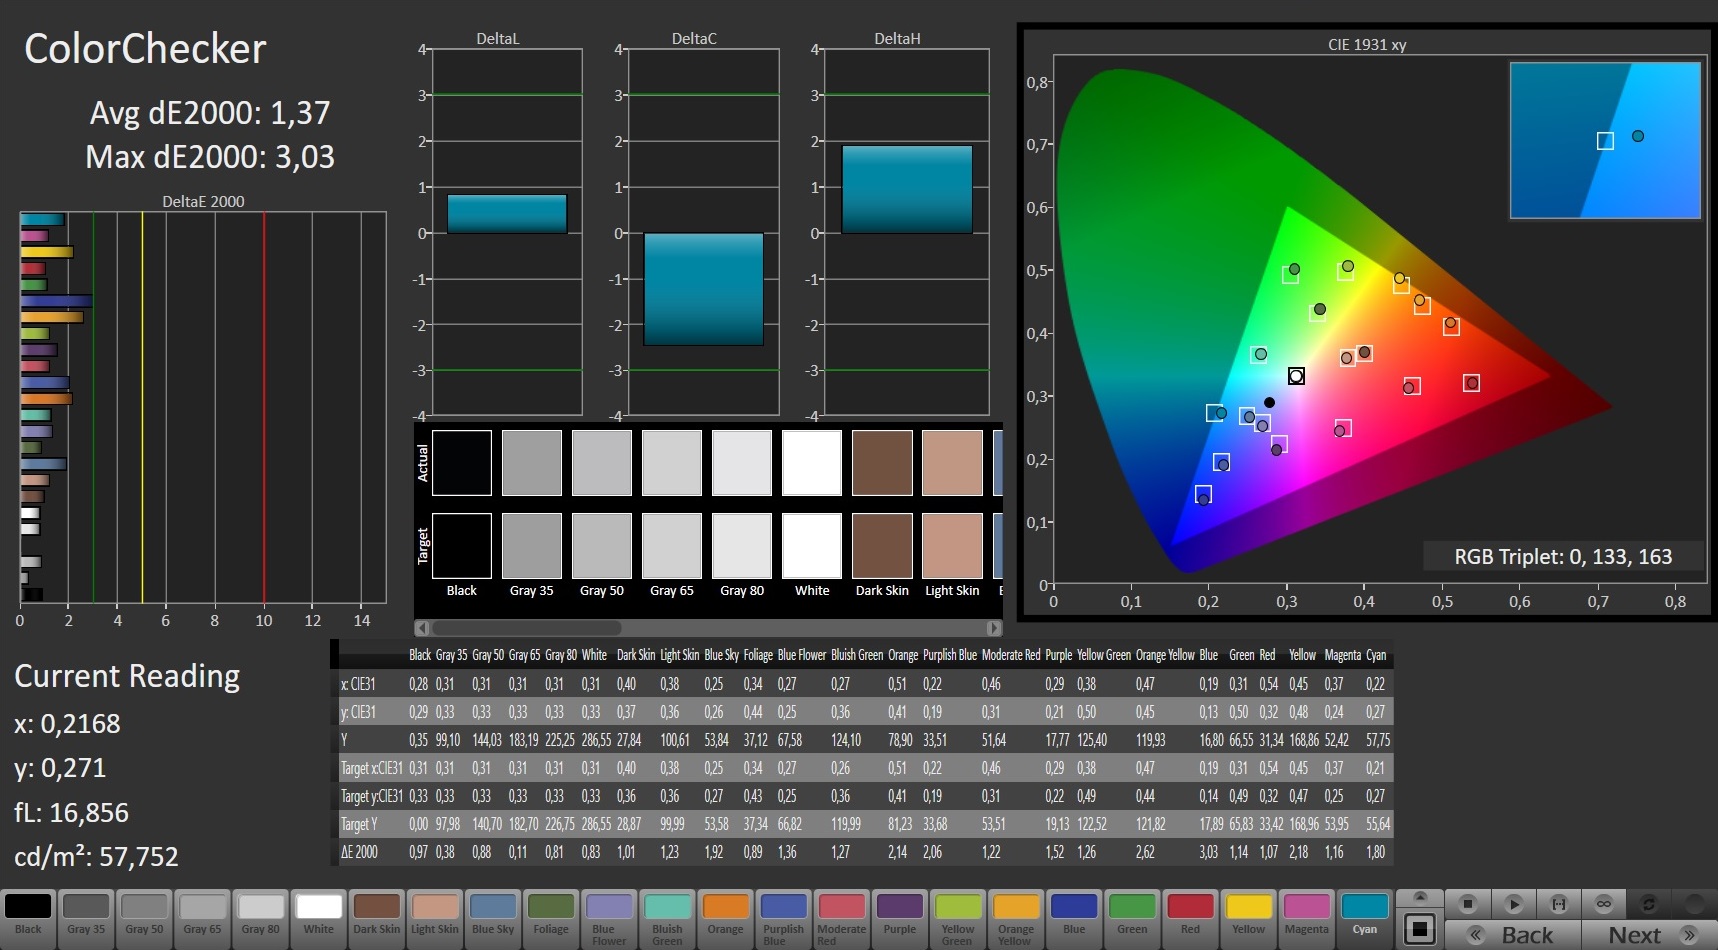
ΔE ColorChecker Calman: 3.11 | ∀{0.5-29.43 Ø4.73}
calibrated: 1.37
ΔE Greyscale Calman: 3.94 | ∀{0.09-98 Ø4.97}
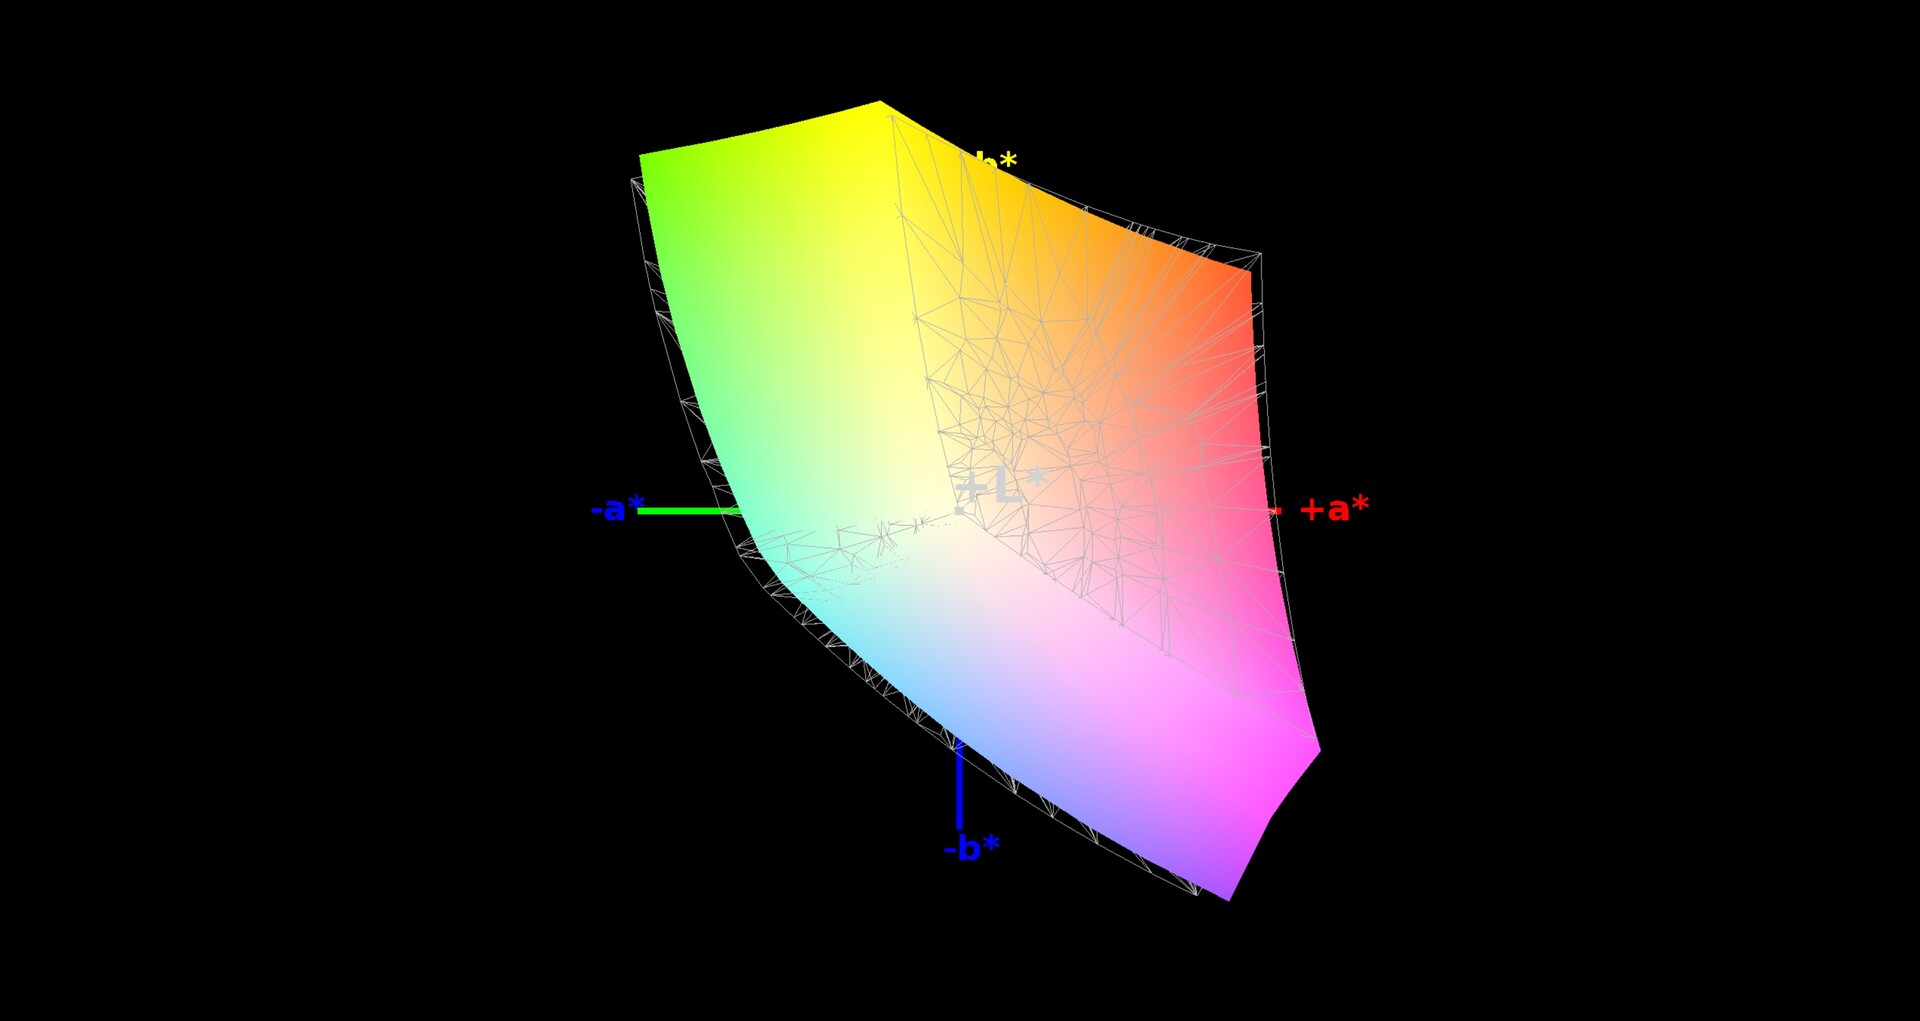
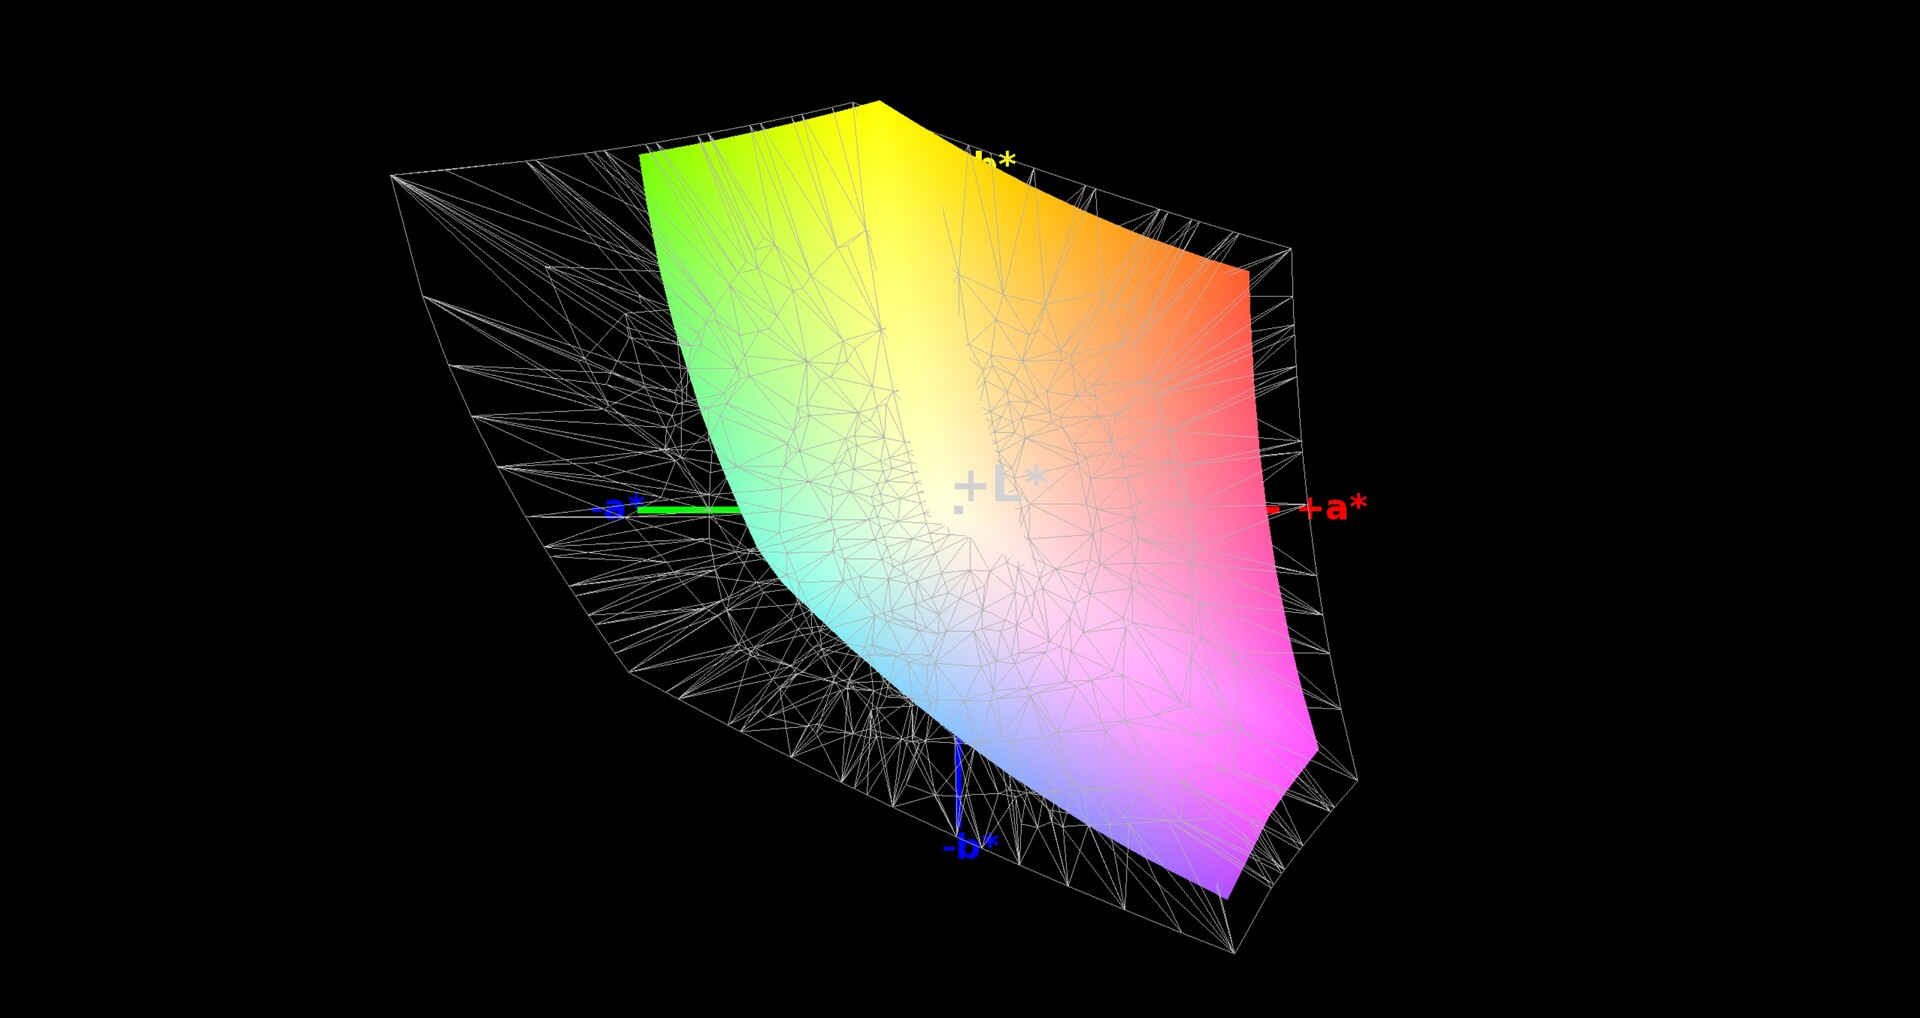
93% sRGB (Argyll 1.6.3 3D)
60% AdobeRGB 1998 (Argyll 1.6.3 3D)
65.6% AdobeRGB 1998 (Argyll 3D)
93.6% sRGB (Argyll 3D)
64.3% Display P3 (Argyll 3D)
Gamma: 2.53
CCT: 6210 K
| Aorus 15-SA LG Philips LP156WFG-SPB2 (LGD05E8), IPS, 1920x1080 | Razer Blade 15 Base Model BOE NV156FHM-N61, IPS, 1920x1080 | Asus Zephyrus S GX531GM AU Optronics B156HAN08.2, IPS, 1920x1080 | Lenovo Legion Y530-15ICH LG Display LP156WFG-SPB2, IPS, 1920x1080 | MSI GS65 8RF-019DE Stealth Thin AU Optronics B156HAN08.0 (AUO80ED), IPS, 1920x1080 | Alienware m15 GTX 1070 Max-Q AU Optronics B156HAN, IPS, 1920x1080 | Gigabyte Aero 15 Classic-XA Sharp LQ156M1JW03 (SHP14C5), IGZO, 1920x1080 | |
|---|---|---|---|---|---|---|---|
| Display | -3% | -1% | -2% | 1% | -2% | 2% | |
| Display P3 Coverage (%) | 64.3 | 66.3 3% | 64.9 1% | 62.5 -3% | 66.2 3% | 63.5 -1% | 65.3 2% |
| sRGB Coverage (%) | 93.6 | 86.6 -7% | 90.1 -4% | 93 -1% | 92.1 -2% | 89.4 -4% | 95.5 2% |
| AdobeRGB 1998 Coverage (%) | 65.6 | 63.3 -4% | 65.8 0% | 63.8 -3% | 67.2 2% | 64.5 -2% | 66.5 1% |
| Response Times | -163% | 35% | 9% | -7% | -5% | 8% | |
| Response Time Grey 50% / Grey 80% * (ms) | 15.6 ? | 39.2 ? -151% | 7 ? 55% | 15 ? 4% | 17.6 ? -13% | 18 ? -15% | 15.2 ? 3% |
| Response Time Black / White * (ms) | 12.8 ? | 35.2 ? -175% | 11 ? 14% | 11 ? 14% | 12.8 ? -0% | 12 ? 6% | 11.2 ? 13% |
| PWM Frequency (Hz) | 21190 ? | 23580 ? | |||||
| Screen | -17% | -2% | -16% | 10% | -14% | 3% | |
| Brightness middle (cd/m²) | 266 | 273.6 3% | 323 21% | 305 15% | 254 -5% | 353.6 33% | 266 0% |
| Brightness (cd/m²) | 254 | 262 3% | 309 22% | 284 12% | 262 3% | 346 36% | 248 -2% |
| Brightness Distribution (%) | 90 | 86 -4% | 93 3% | 83 -8% | 89 -1% | 86 -4% | 89 -1% |
| Black Level * (cd/m²) | 0.28 | 0.3 -7% | 0.29 -4% | 0.52 -86% | 0.22 21% | 0.3 -7% | 0.31 -11% |
| Contrast (:1) | 950 | 912 -4% | 1114 17% | 587 -38% | 1155 22% | 1179 24% | 858 -10% |
| Colorchecker dE 2000 * | 3.11 | 3.22 -4% | 4.33 -39% | 3.63 -17% | 2.37 24% | 4.55 -46% | 2.78 11% |
| Colorchecker dE 2000 max. * | 5.84 | 7.61 -30% | 7.64 -31% | 8.18 -40% | 4.71 19% | 7.91 -35% | 5.96 -2% |
| Colorchecker dE 2000 calibrated * | 1.37 | 4.1 -199% | 1.31 4% | 1.84 -34% | 3.37 -146% | 0.91 34% | |
| Greyscale dE 2000 * | 3.94 | 1.4 64% | 4.12 -5% | 4.77 -21% | 1.58 60% | 4.1 -4% | 3.58 9% |
| Gamma | 2.53 87% | 2.24 98% | 2.43 91% | 2.54 87% | 2.48 89% | 2.27 97% | 2.46 89% |
| CCT | 6210 105% | 6636 98% | 7427 88% | 7500 87% | 6785 96% | 7434 87% | 7186 90% |
| Color Space (Percent of AdobeRGB 1998) (%) | 60 | 56.4 -6% | 59 -2% | 59 -2% | 60 0% | 57.9 -3% | 62 3% |
| Color Space (Percent of sRGB) (%) | 93 | 86.2 -7% | 90 -3% | 93 0% | 92 -1% | 88.9 -4% | 96 3% |
| Total Average (Program / Settings) | -61% /
-33% | 11% /
3% | -3% /
-11% | 1% /
6% | -7% /
-11% | 4% /
3% |
* ... smaller is better
Display Response Times
| ↔ Response Time Black to White | ||
|---|---|---|
| 12.8 ms ... rise ↗ and fall ↘ combined | ↗ 8.4 ms rise | 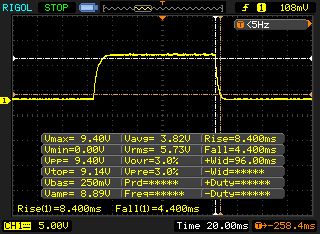 |
| ↘ 4.4 ms fall | ||
| The screen shows good response rates in our tests, but may be too slow for competitive gamers. In comparison, all tested devices range from 0.1 (minimum) to 240 (maximum) ms. » 33 % of all devices are better. This means that the measured response time is better than the average of all tested devices (19.9 ms). | ||
| ↔ Response Time 50% Grey to 80% Grey | ||
| 15.6 ms ... rise ↗ and fall ↘ combined | ↗ 8 ms rise | 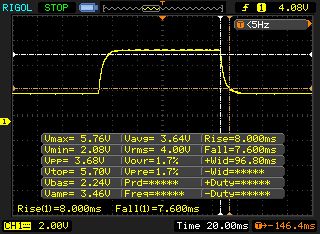 |
| ↘ 7.6 ms fall | ||
| The screen shows good response rates in our tests, but may be too slow for competitive gamers. In comparison, all tested devices range from 0.165 (minimum) to 636 (maximum) ms. » 30 % of all devices are better. This means that the measured response time is better than the average of all tested devices (31.1 ms). | ||
Screen Flickering / PWM (Pulse-Width Modulation)
| Screen flickering / PWM not detected | 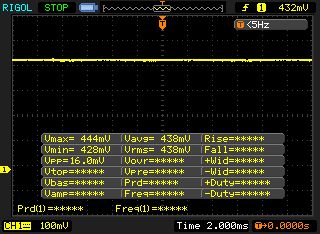 | ||
In comparison: 52 % of all tested devices do not use PWM to dim the display. If PWM was detected, an average of 7798 (minimum: 5 - maximum: 343500) Hz was measured. | |||
Performance
Gigabyte has equipped the 15-SA with an array of potent hardware including a hexa-core CPU and a cutting-edge GPU. The device has no problems with playing all modern triple-A games smoothly on its 144 Hz display. Heavy video-editing is well within its capabilities too. Our review unit currently retails for around 1,900 Euros (~$2,134), for reference. Gigabyte sells other configurations too.
Test Conditions
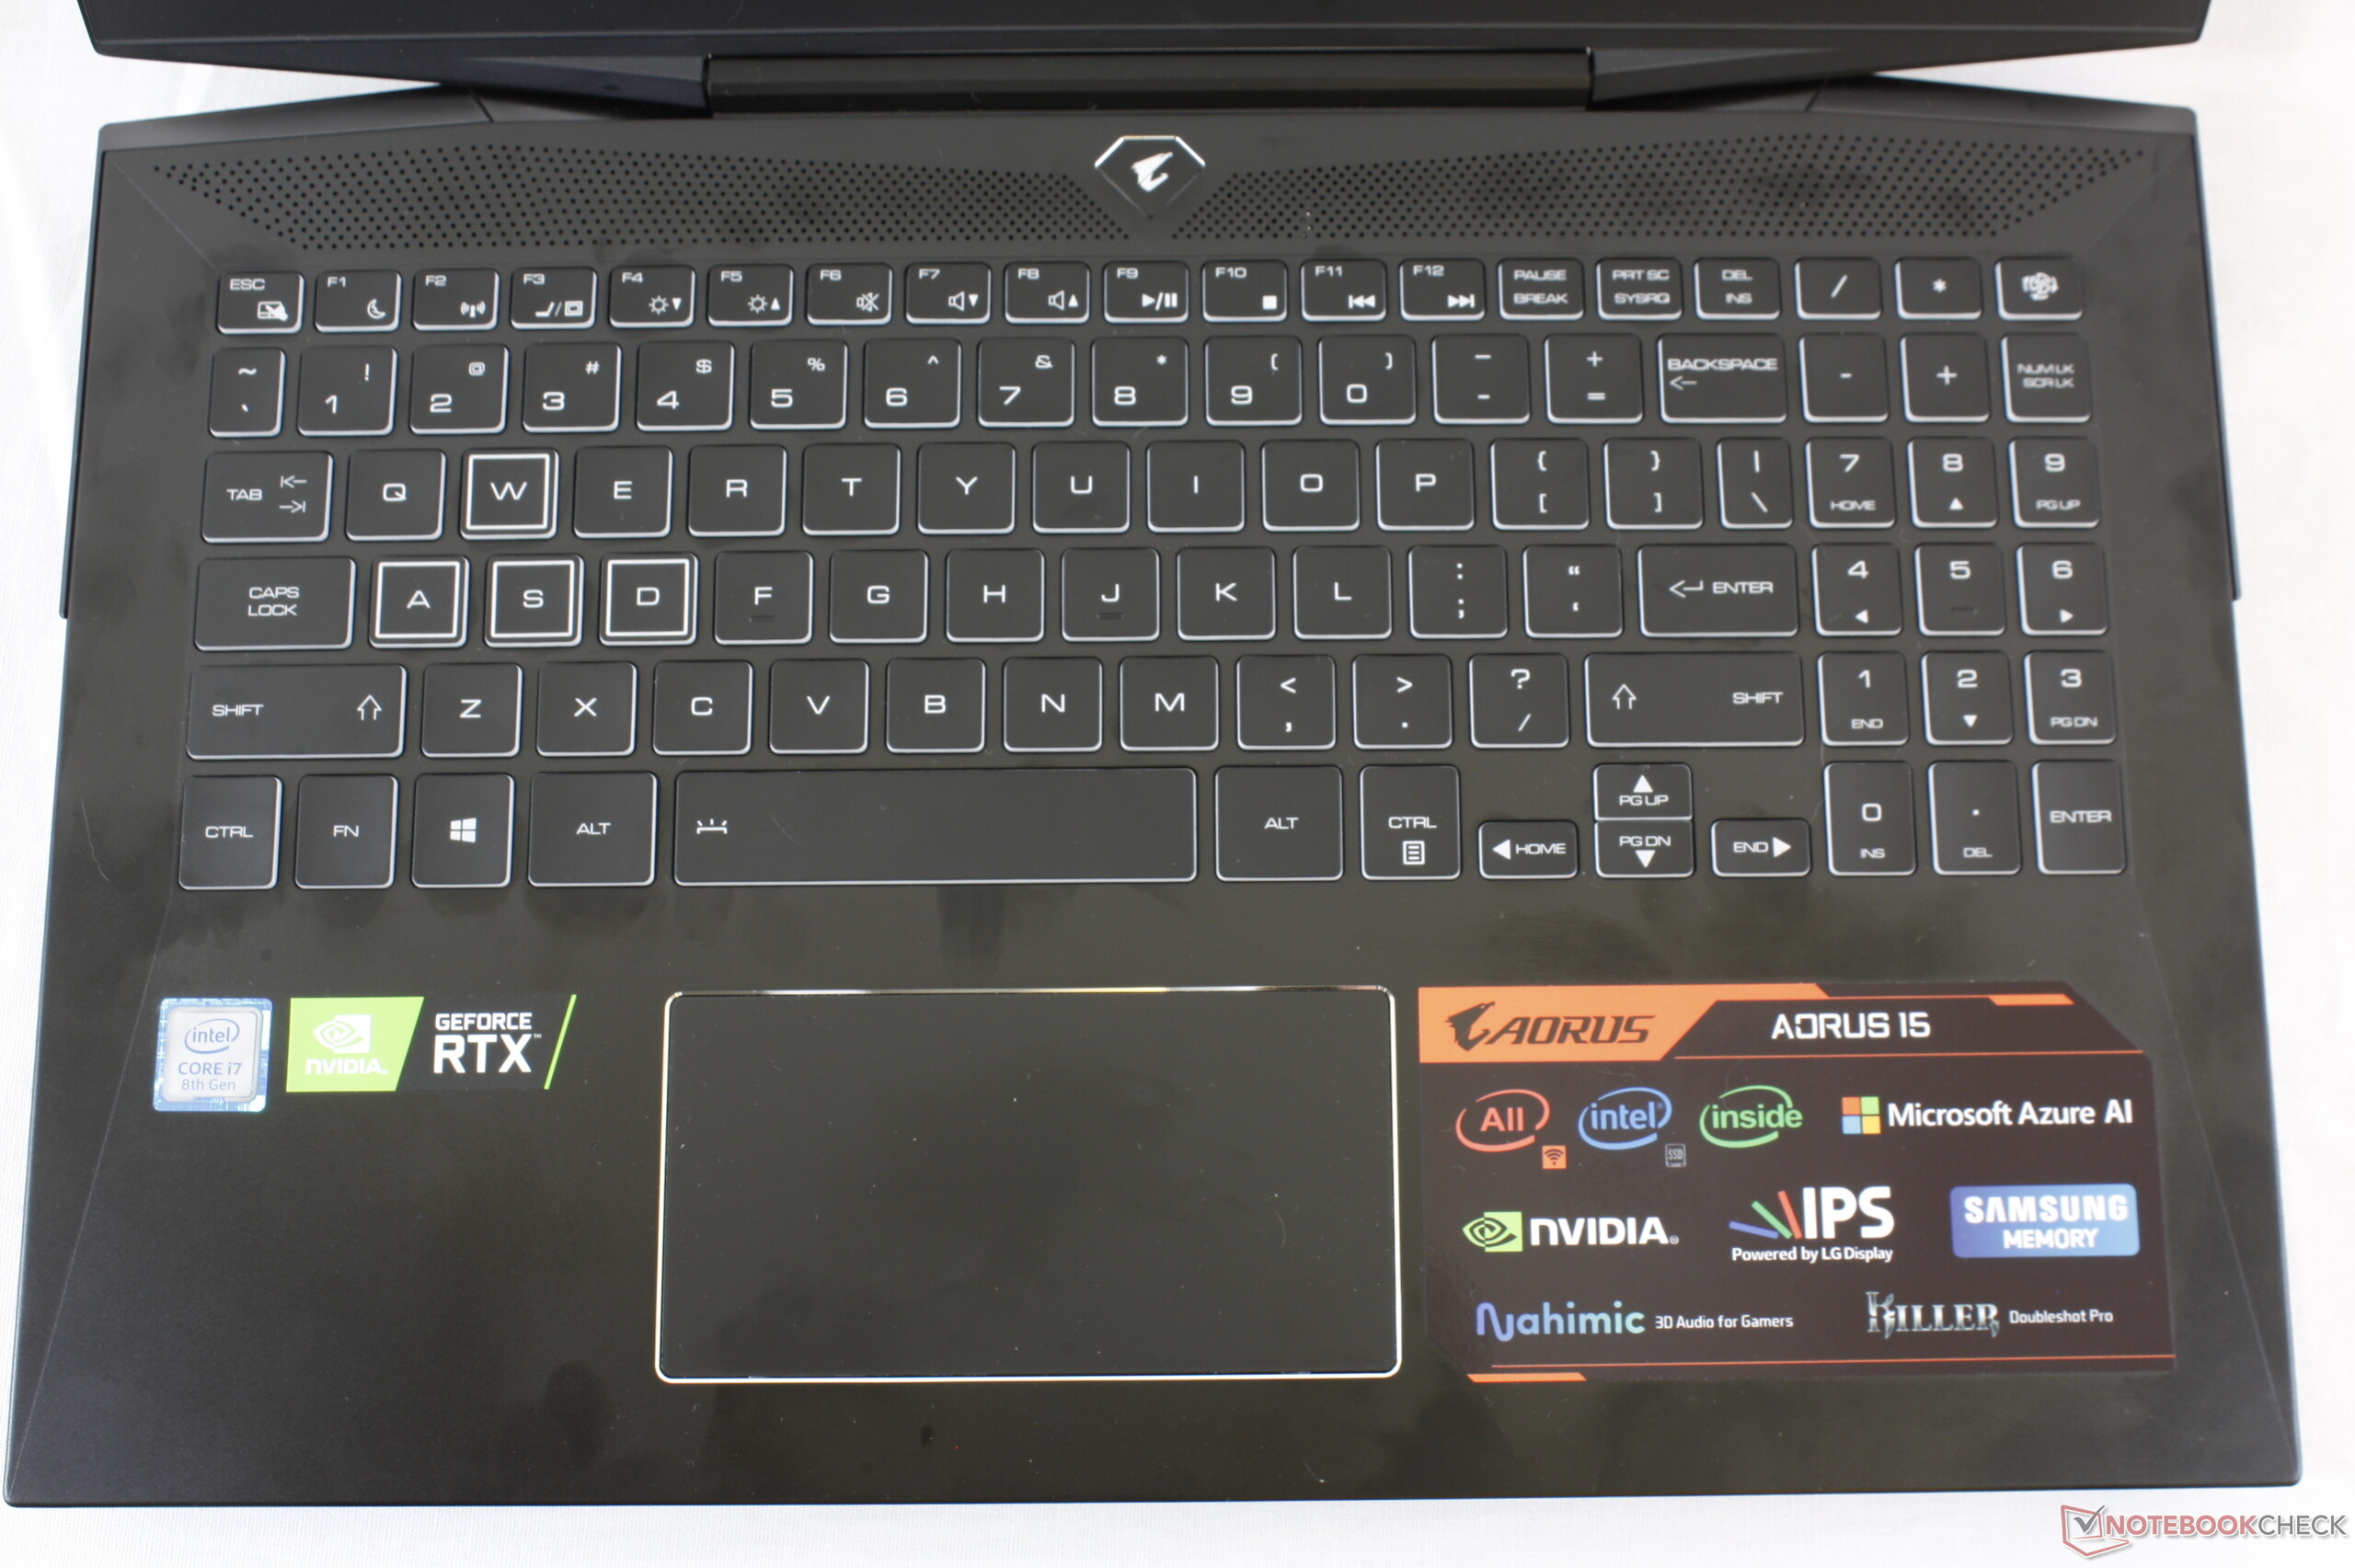
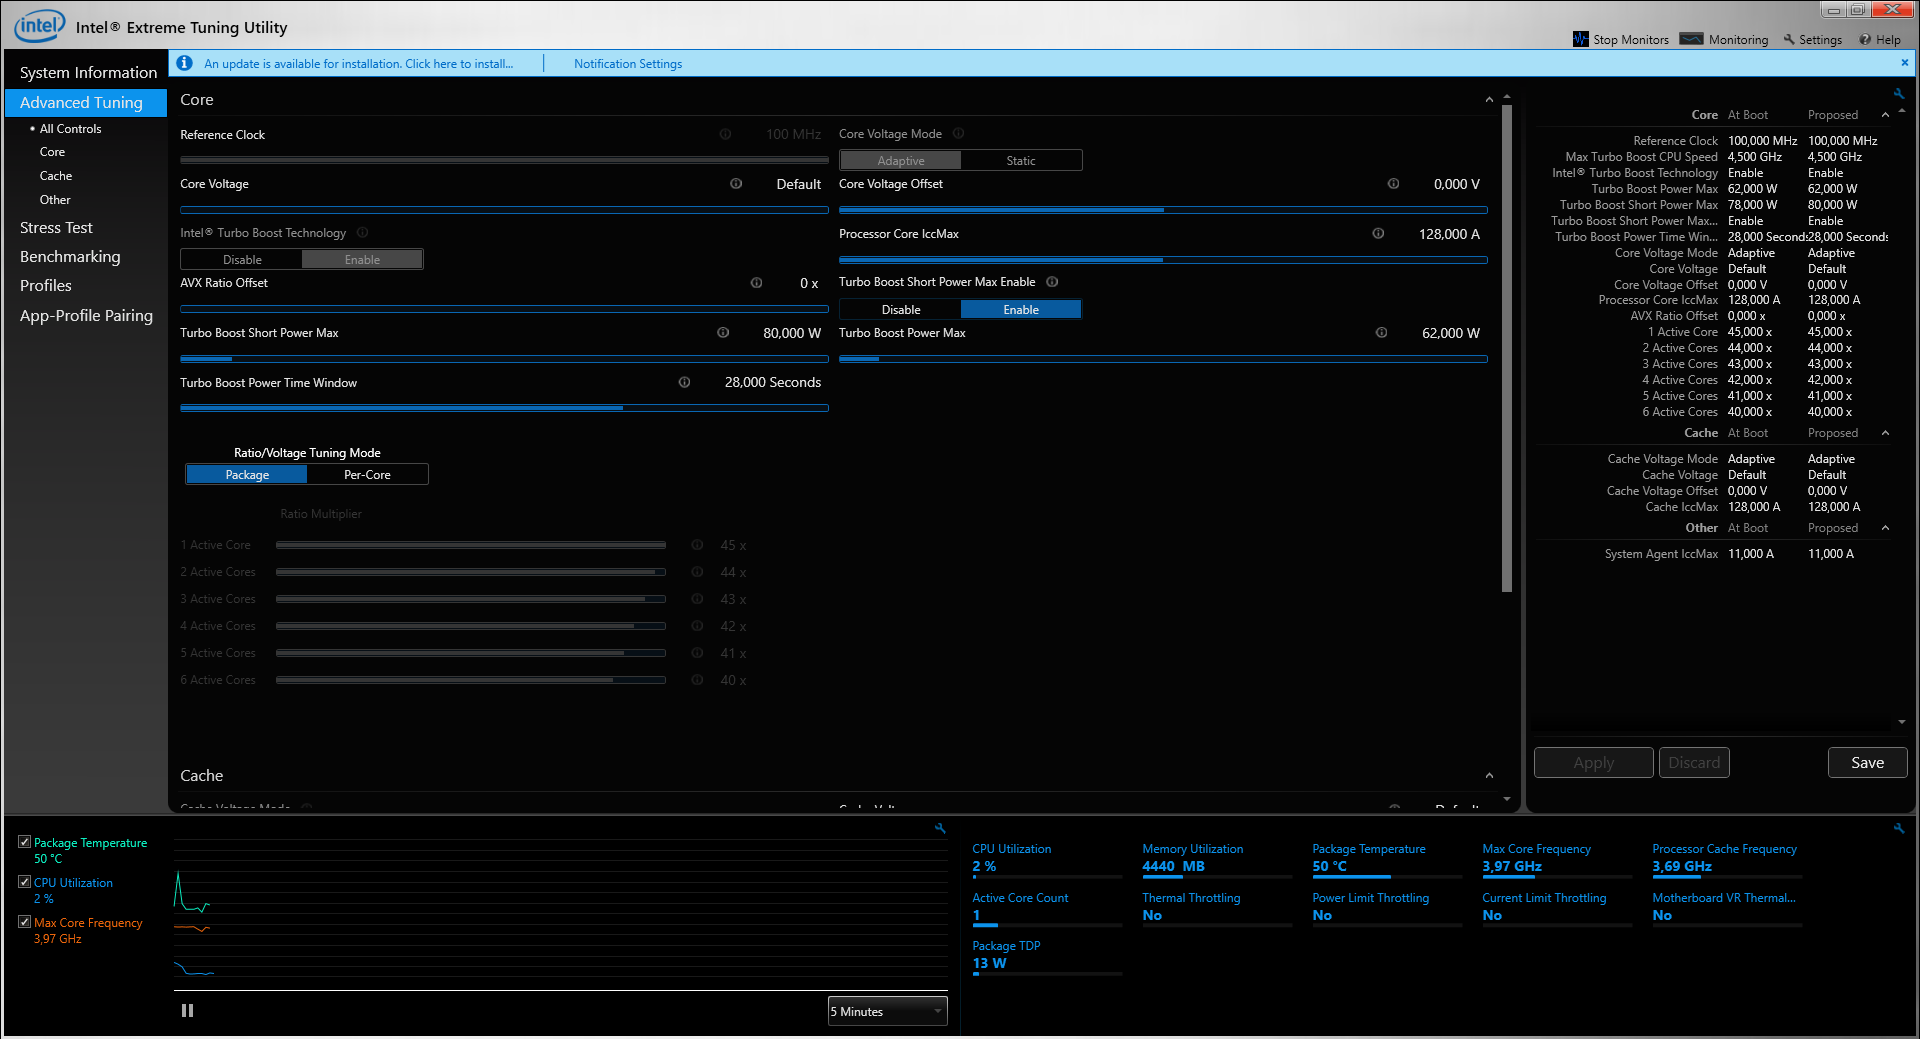
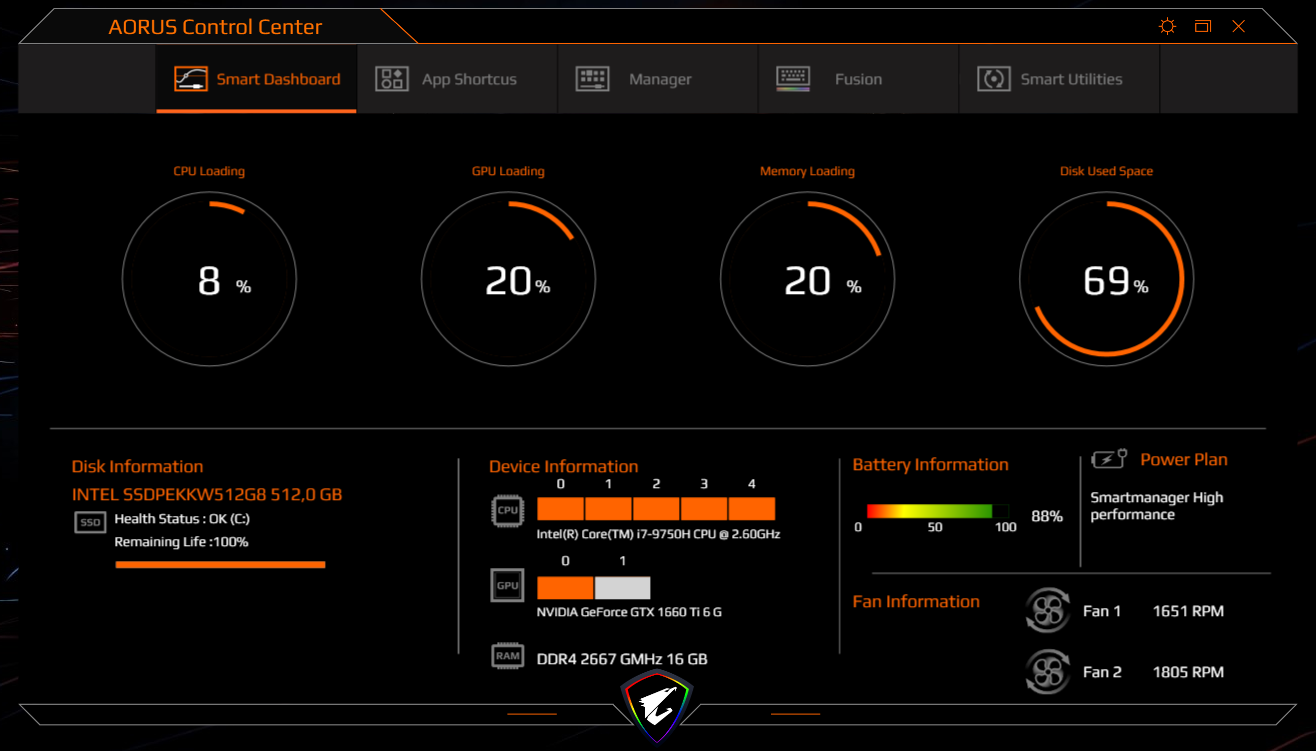
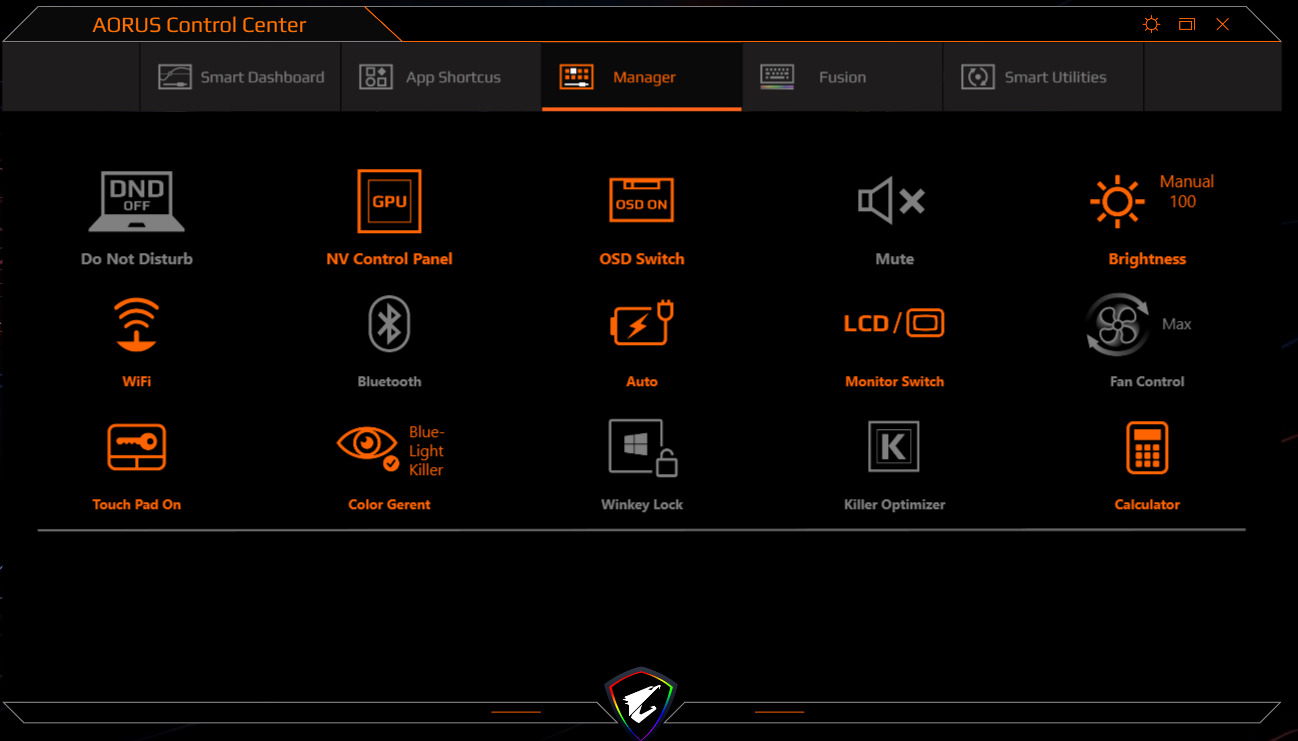
The 15-SA comes with Gigabyte Control Center preinstalled, which contains numerous settings including the option to change the fan curve, the RGB keyboard backlighting and the power mode among others. We left our review unit on the Auto power mode for our tests, which Gigabyte claims includes active AI functionality. We only used the Windows 10 power modes for our battery life tests.

Processor
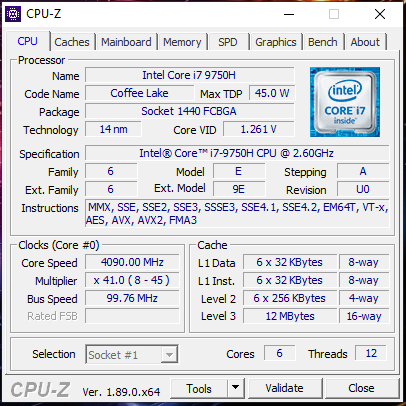
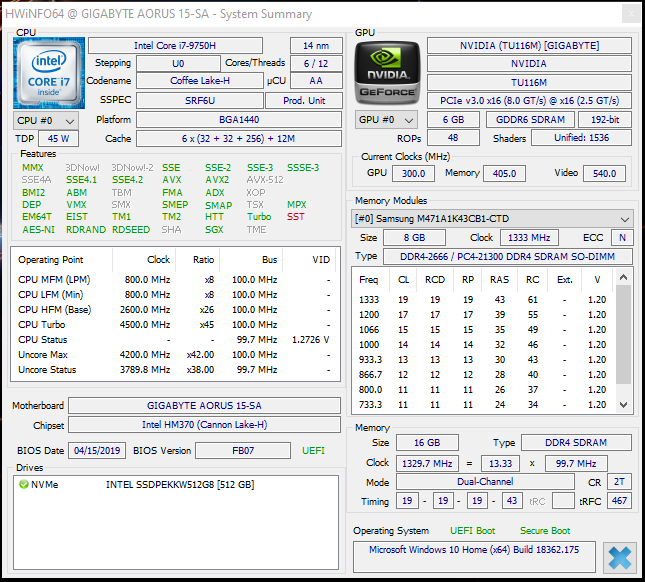
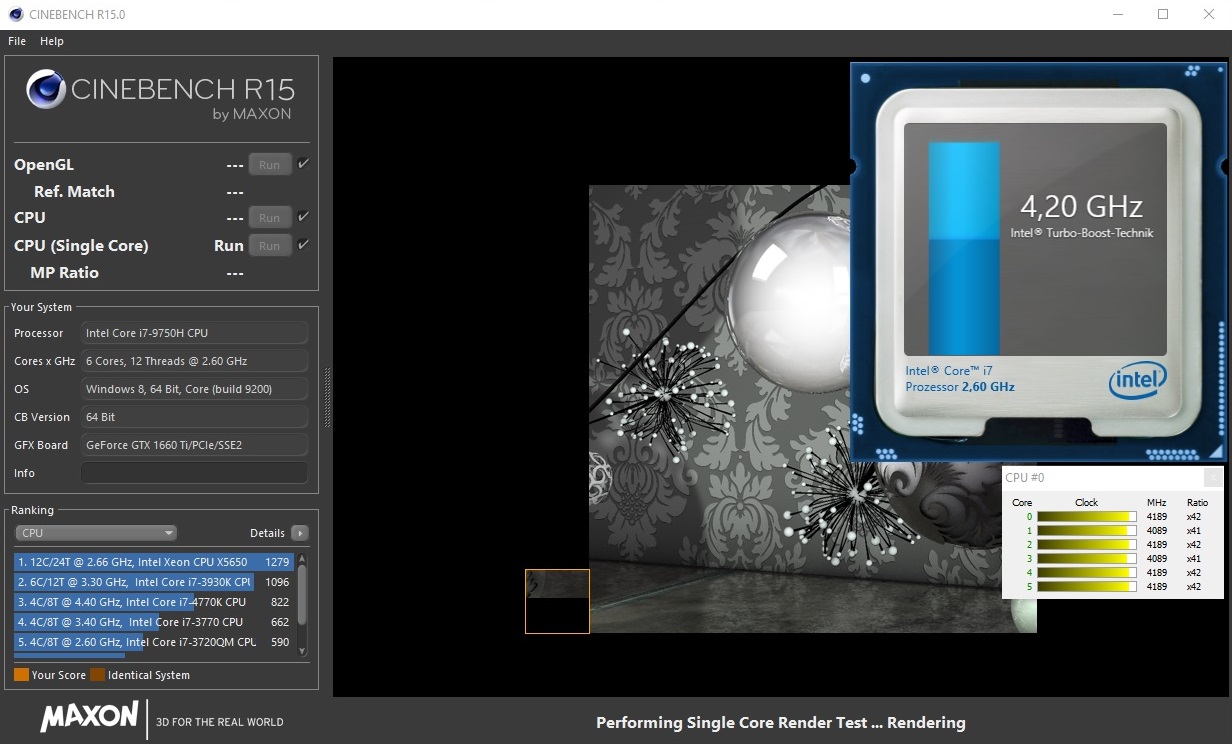
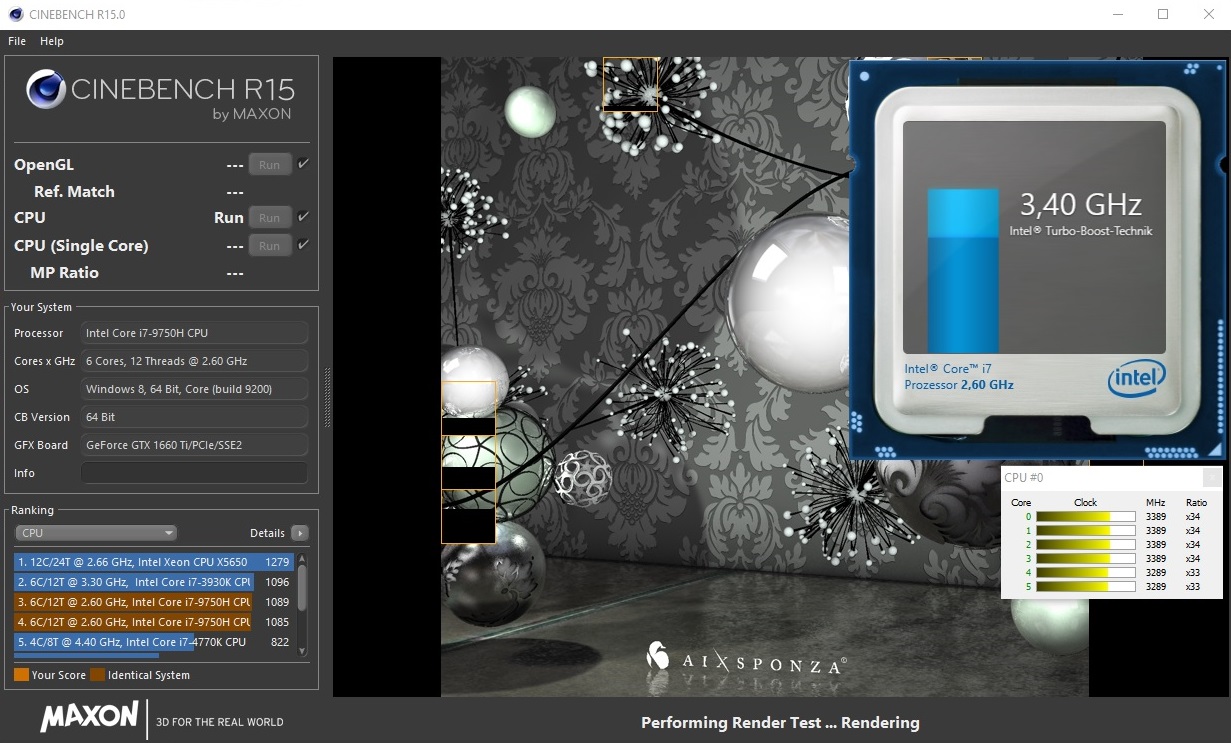
Gigabyte equips the 15-SA with a Core i7-9750H processor, a hexa-core chip based on Intel’s Coffee Lake Refresh architecture. The Core i7-9750H offers a good compromise between performance and power consumption, just like its predecessor, the Core i7-8750H. The Core i7-9750H has a 45 W thermal design power (TDP) and a 2.6 GHz base clock speed, which it can boost to 4 GHz on six cores thanks to Intel Turbo Boost. The CPU can increase the clock speed by 100 MHz for every one fewer core that it uses, culminating in a 4.5 GHz maximum Turbo Boost clock speed on a single core.
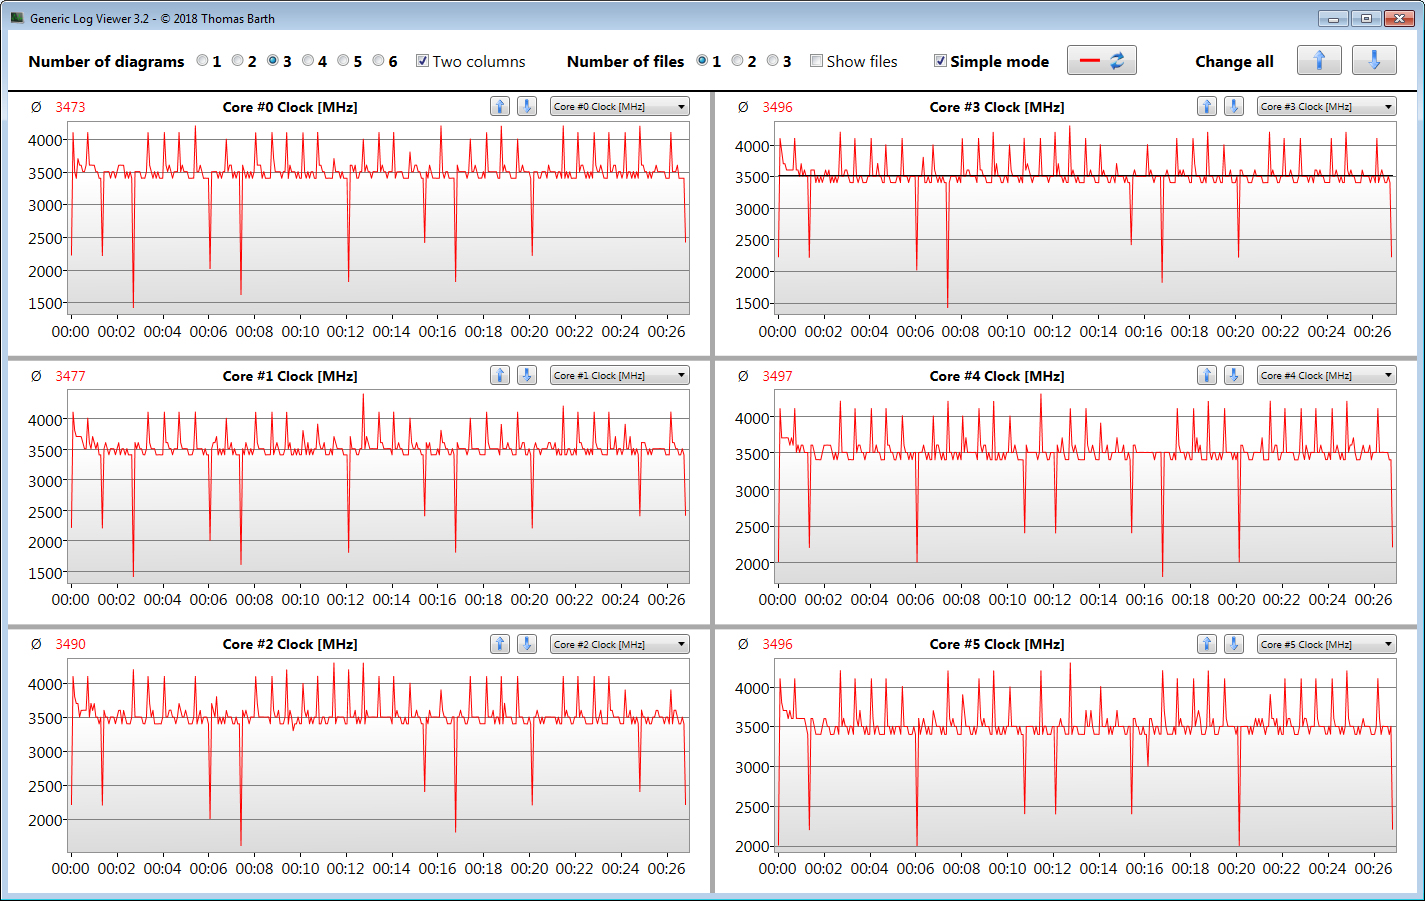
These specifications sound good on paper, but our review unit cannot match them in practice. The CPU fluctuated between 2.6 GHz and 3.9 GHz in Cinebench R15 Multi 64bit, with it averaging 3.4 GHz, around 600 MHz short of its maximum potential. Likewise, the CPU operates at between 300 and 400 MHz less than it is capable of in single-core benchmarks like CB R15 Single 64Bit. Some cores only reach 3.6 GHz though, for some reason. The CPU also operates at between 2.5 GHz to 2.9 GHz in multi-threaded benchmarks and 0.8 GHz to 4.2 GHz in single-threaded benchmarks when running on battery.
We also subjected our review unit to a loop of the CB R15 Multi 64Bit benchmark, which we left running for 60 minutes to determine how the system managed its CPU performance under sustained load. The 15-SA initially scored 1,129 points before throttling back to 1,088 points by the fourth run through. The CPU constantly maintains turbo clock speeds here and averaged around 1,090 points for the remainder of the benchmark loop.
Our graph below is an ambiguous picture. On the one hand, the 15-SA consistently outscores the Aero 15 Classic-XA, which Gigabyte also equips with a Core i7-9750H and does not throttle as hard as the former device does too. Our review unit trounces most of our Core i7-8750H powered comparison devices throughout our benchmark loop too, but it somehow lags behind the Legion Y530 and the m15, despite them also having Core i7-8750H processors. In short, the 15-SA does not get the most from its CPU, which is unsurprising considering that it can only keep it at around 3.4 GHz in multi-core benchmarks.
| Cinebench R10 | |
| Rendering Single 32Bit | |
| Average of class Gaming (7457 - 11779, n=8, last 2 years) | |
| Gigabyte Aero 15 Classic-XA | |
| Aorus 15-SA | |
| Asus Zephyrus S GX531GM | |
| Rendering Multiple CPUs 32Bit | |
| Average of class Gaming (42932 - 81339, n=8, last 2 years) | |
| Gigabyte Aero 15 Classic-XA | |
| Aorus 15-SA | |
| Asus Zephyrus S GX531GM | |
| Cinebench R20 | |
| CPU (Single Core) | |
| Average of class Gaming (442 - 895, n=111, last 2 years) | |
| Gigabyte Aero 15 Classic-XA | |
| Aorus 15-SA | |
| CPU (Multi Core) | |
| Average of class Gaming (4029 - 16108, n=111, last 2 years) | |
| Gigabyte Aero 15 Classic-XA | |
| Aorus 15-SA | |
| Geekbench 3 | |
| 32 Bit Multi-Core Score | |
| Gigabyte Aero 15 Classic-XA | |
| Asus Zephyrus S GX531GM | |
| Aorus 15-SA | |
| 32 Bit Single-Core Score | |
| Gigabyte Aero 15 Classic-XA | |
| Aorus 15-SA | |
| Asus Zephyrus S GX531GM | |
| Geekbench 4.4 | |
| 64 Bit Multi-Core Score | |
| Average of class Gaming (89200 - 97490, n=2, last 2 years) | |
| Gigabyte Aero 15 Classic-XA | |
| Aorus 15-SA | |
| Asus Zephyrus S GX531GM | |
| 64 Bit Single-Core Score | |
| Average of class Gaming (9335 - 9492, n=2, last 2 years) | |
| Gigabyte Aero 15 Classic-XA | |
| Aorus 15-SA | |
| Asus Zephyrus S GX531GM | |
| Mozilla Kraken 1.1 - Total | |
| Razer Blade 15 Base Model (Edge 42.17134.1.0) | |
| Alienware m15 GTX 1070 Max-Q (Edge 42.17134.1.0) | |
| Aorus 15-SA (Edge 44) | |
| Gigabyte Aero 15 Classic-XA (Edge 44) | |
| Lenovo Legion Y530-15ICH | |
| Average of class Gaming (391 - 590, n=105, last 2 years) | |
| Octane V2 - Total Score | |
| Average of class Gaming (87588 - 139447, n=30, last 2 years) | |
| Lenovo Legion Y530-15ICH | |
| Gigabyte Aero 15 Classic-XA (Edge 44) | |
| Aorus 15-SA (Edge 44) | |
| Alienware m15 GTX 1070 Max-Q (Edge 42.17134.1.0) | |
| Razer Blade 15 Base Model (Edge 42.17134.1.0) | |
| JetStream 1.1 - 1.1 Total | |
| Average of class Gaming (518 - 647, n=5, last 2 years) | |
| Alienware m15 GTX 1070 Max-Q (Edge 42.17134.1.0) | |
| Gigabyte Aero 15 Classic-XA (Edge 44) | |
| Asus Zephyrus S GX531GM (Edge 44) | |
| Aorus 15-SA (Edge 44) | |
| Razer Blade 15 Base Model (Edge 42.17134.1.0) | |
| Lenovo Legion Y530-15ICH | |
* ... smaller is better
System Performance
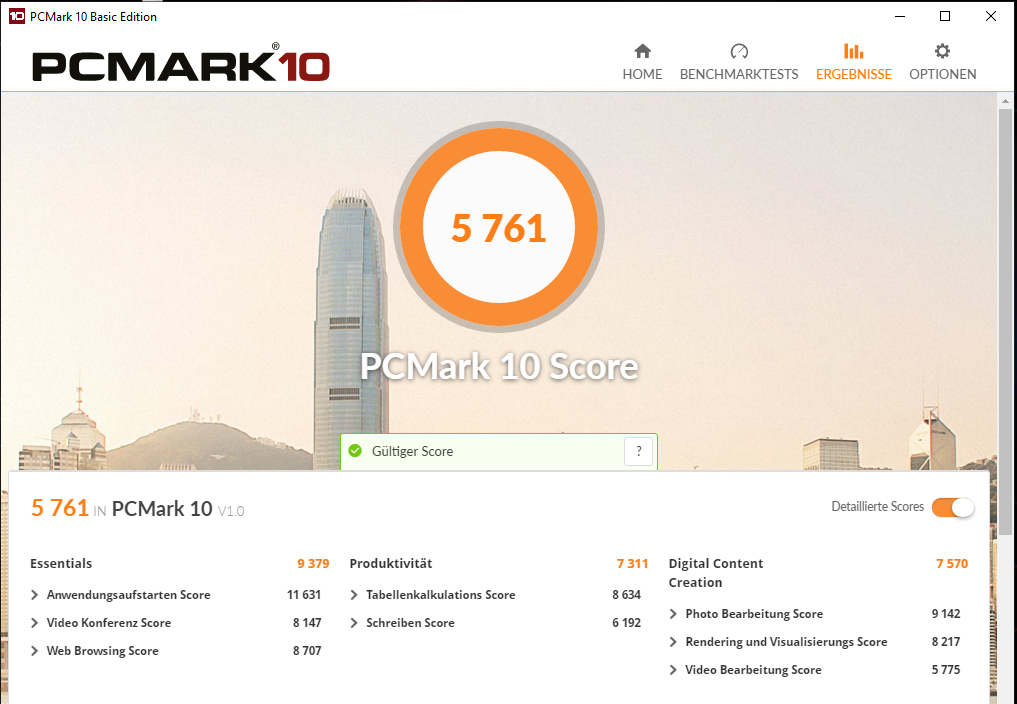
The 15-SA motors through system performance benchmarks like PCMark 10, in which it scored more than all our comparison devices overall. In short, its powerful CPU, GPU and fast SSD should be sufficiently future-proofed for several years to come.
| PCMark 7 Score | 7445 points | |
| PCMark 8 Home Score Accelerated v2 | 5081 points | |
| PCMark 8 Creative Score Accelerated v2 | 6075 points | |
| PCMark 8 Work Score Accelerated v2 | 5913 points | |
| PCMark 10 Score | 5761 points | |
Help | ||
Storage Devices
Gigabyte has equipped the 15-SA with a 512 GB Intel 760p SSD, which utilises the NVMe protocol and four lanes of PCIe 3.0. The M.2 2280 drive has approximately 427 GB upon first use, with Windows 10 occupying the remainder of its capacity. The Intel 760p SSD achieved exemplary transfer speeds in CrystalDiskMark and finished ahead of all the drives in our comparison devices bar another Intel 760p in the Aero 15 Classic-XA.
The 15-SA has an additional M.2 2280 slot for adding a second NVMe or SATA III SSD should you need more storage. If you are feeling adventurous, you could even run the system in RAID 0 for faster transfer speeds. There is room for a 2.5-inch drive too, giving the 15-SA a total of three storage options. Gigabyte includes the necessary mounting frame and SATA III cable for adding a 2.5-inch drive.

| Aorus 15-SA Intel SSD 760p SSDPEKKW512G8 | Razer Blade 15 Base Model Samsung SSD PM981 MZVLB256HAHQ | Asus Zephyrus S GX531GM Intel SSD 660p SSDPEKNW512G8 | Lenovo Legion Y530-15ICH Samsung SSD PM981 MZVLB256HAHQ | MSI GS65 8RF-019DE Stealth Thin Samsung SSD PM981 MZVLB512HAJQ | Alienware m15 GTX 1070 Max-Q Toshiba XG5 KXG50ZNV512G | Gigabyte Aero 15 Classic-XA Intel SSD 760p SSDPEKKW512G8 | |
|---|---|---|---|---|---|---|---|
| CrystalDiskMark 5.2 / 6 | -6% | -26% | -11% | -8% | -23% | 6% | |
| Write 4K (MB/s) | 104 | 112.5 8% | 100.8 -3% | 108.9 5% | 95.3 -8% | 107.4 3% | 115.5 11% |
| Read 4K (MB/s) | 55.1 | 43.09 -22% | 48.75 -12% | 40.23 -27% | 40.13 -27% | 42.91 -22% | 58 5% |
| Write Seq (MB/s) | 1519 | 1450 -5% | 975 -36% | 1390 -8% | 1883 24% | 467.5 -69% | 1555 2% |
| Read Seq (MB/s) | 2486 | 1392 -44% | 1344 -46% | 964 -61% | 1322 -47% | 2335 -6% | 2590 4% |
| Write 4K Q32T1 (MB/s) | 320.5 | 356.1 11% | 283.7 -11% | 314.2 -2% | 309.9 -3% | 289.7 -10% | 369.3 15% |
| Read 4K Q32T1 (MB/s) | 431.8 | 406.9 -6% | 330.3 -24% | 369.2 -14% | 353.7 -18% | 354.4 -18% | 441.7 2% |
| Write Seq Q32T1 (MB/s) | 1498 | 1451 -3% | 986 -34% | 1506 1% | 1919 28% | 460.9 -69% | 1547 3% |
| Read Seq Q32T1 (MB/s) | 2868 | 3272 14% | 1579 -45% | 3446 20% | 2466 -14% | 3111 8% | 2969 4% |
Graphics Card
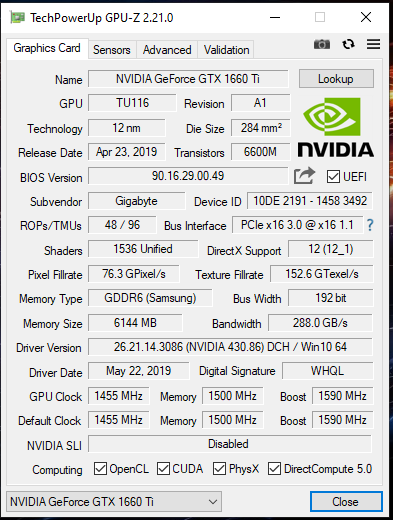
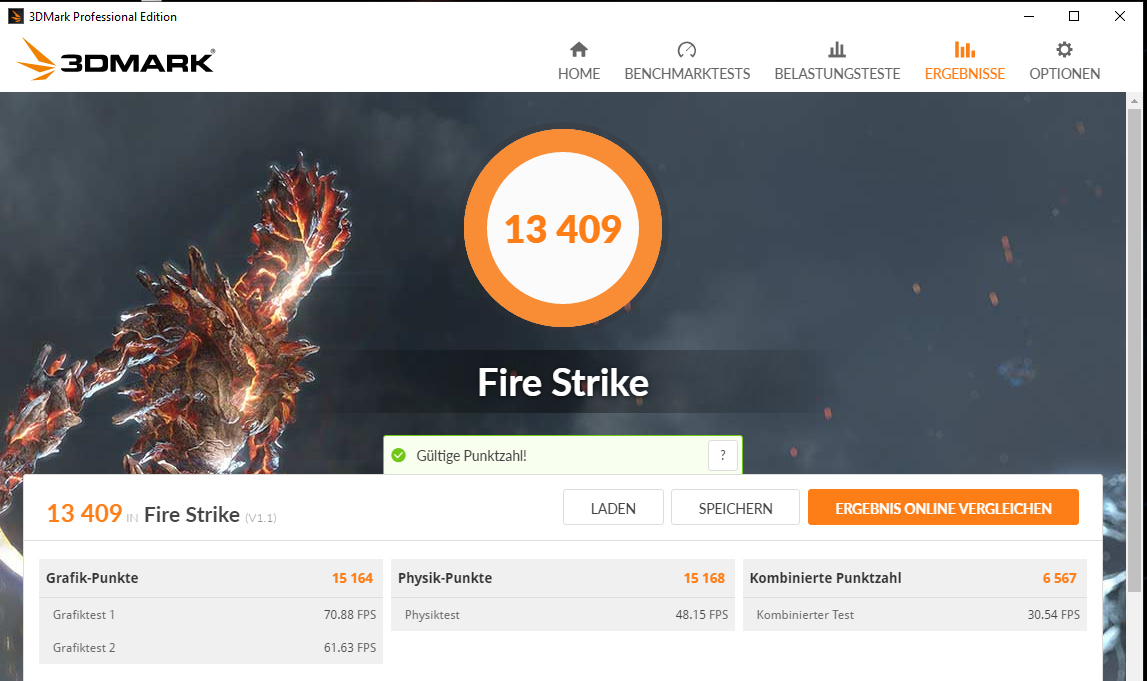
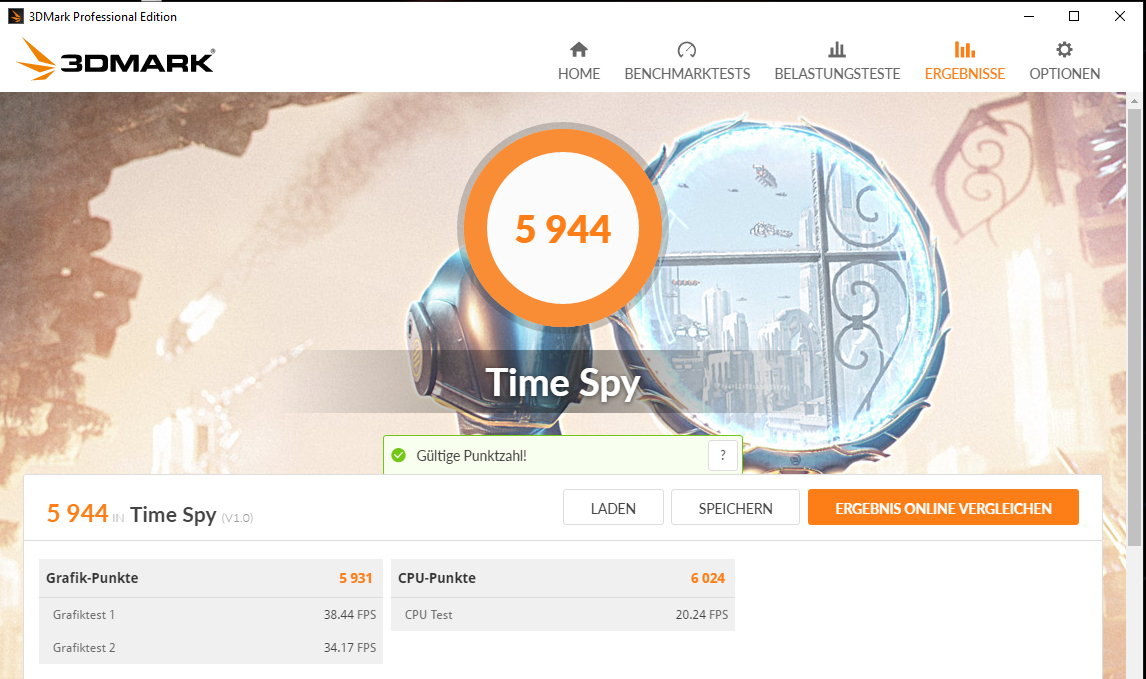
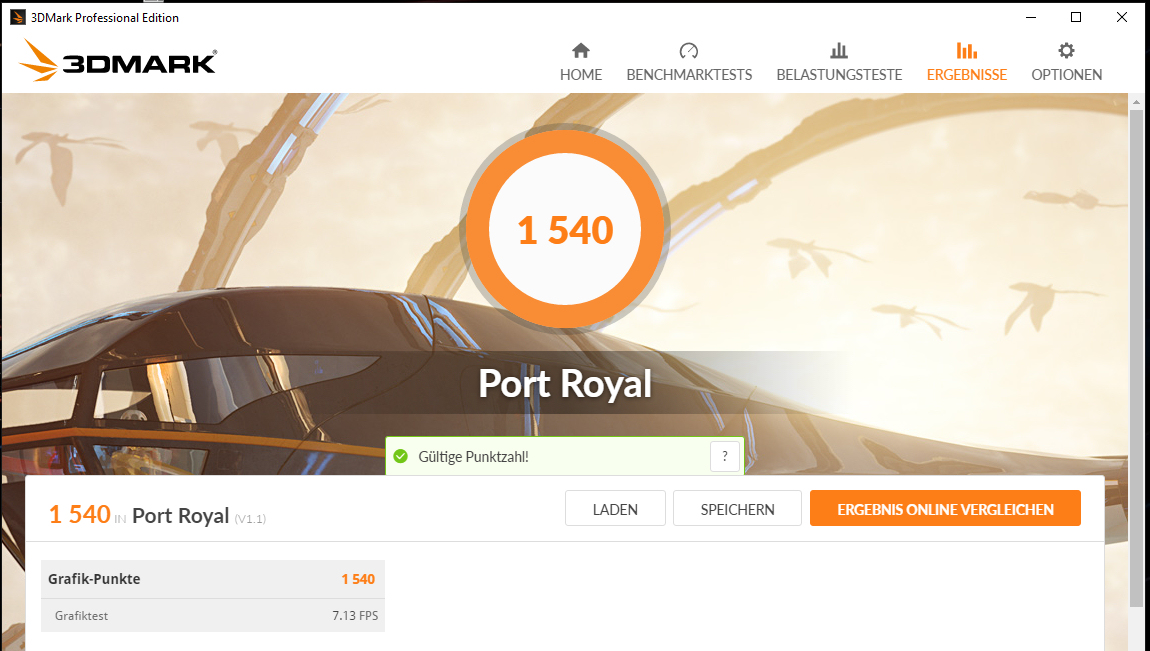
Gigabyte equips the 15-SA with a GeForce GTX 1660 Ti GPU, which is currently the most powerful GTX 1600 series card on the market. The GeForce GTX 1660 Ti does not support DLSS or ray tracing like its RTX 20 series counterparts though, nor does it have tensor cores. Our review unit achieved expected results in 3DMark benchmarks for a GeForce GTX 1660 Ti-powered device, which puts the 15-SA on par with its GeForce GTX 1070-powered competitors and significantly ahead of those equipped with GeForce GTX 1060 GPUs like the Zephyrus S GX531GM.
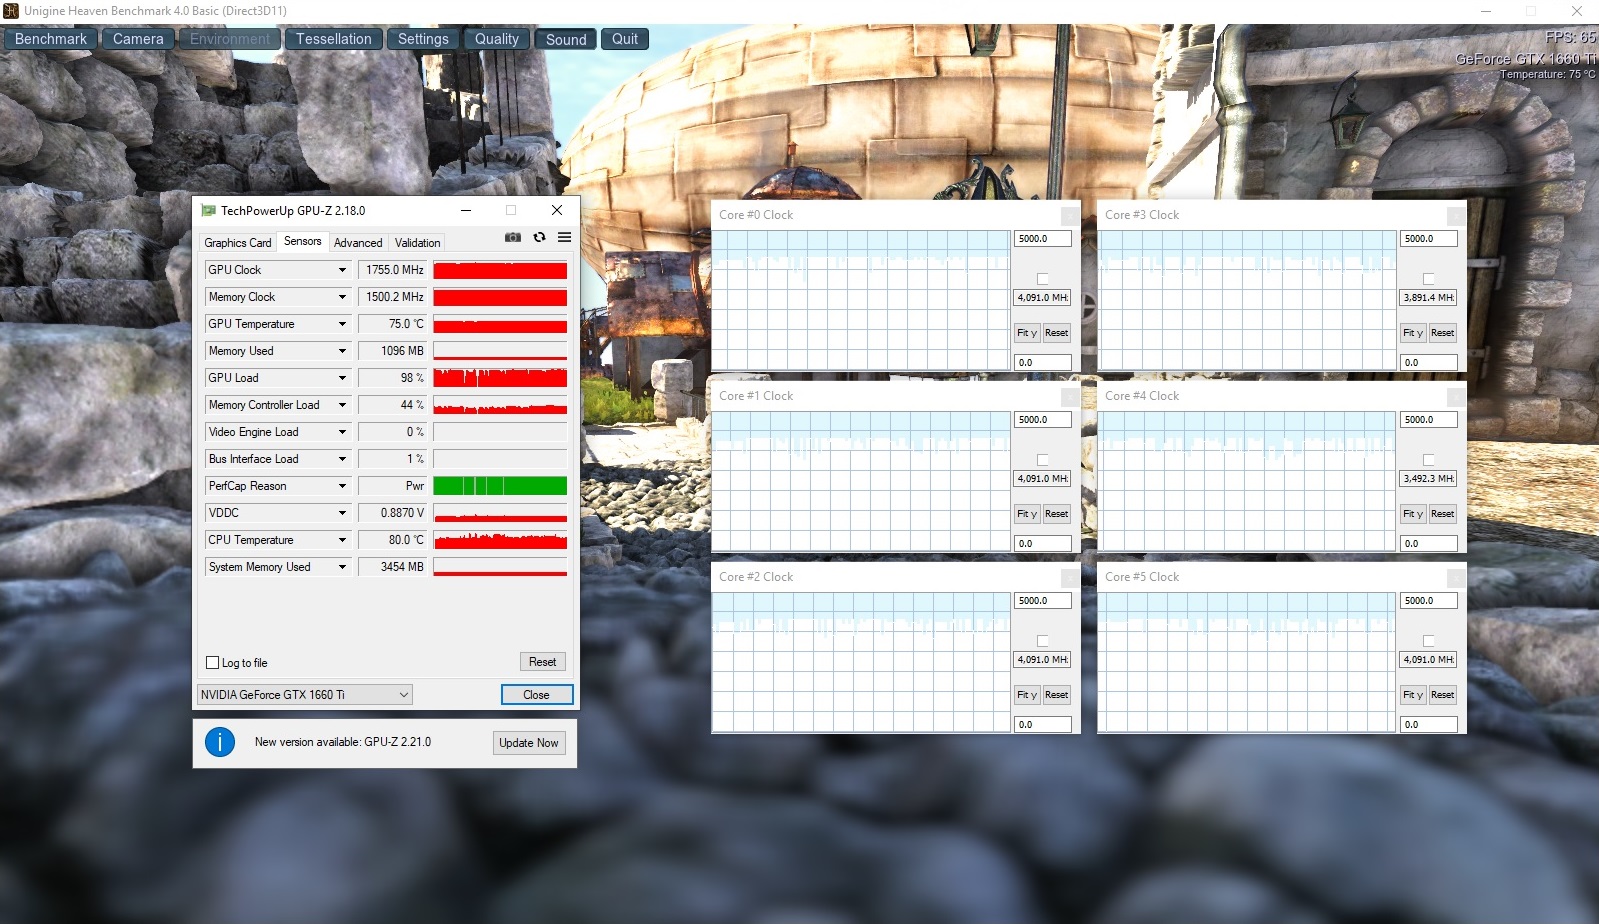
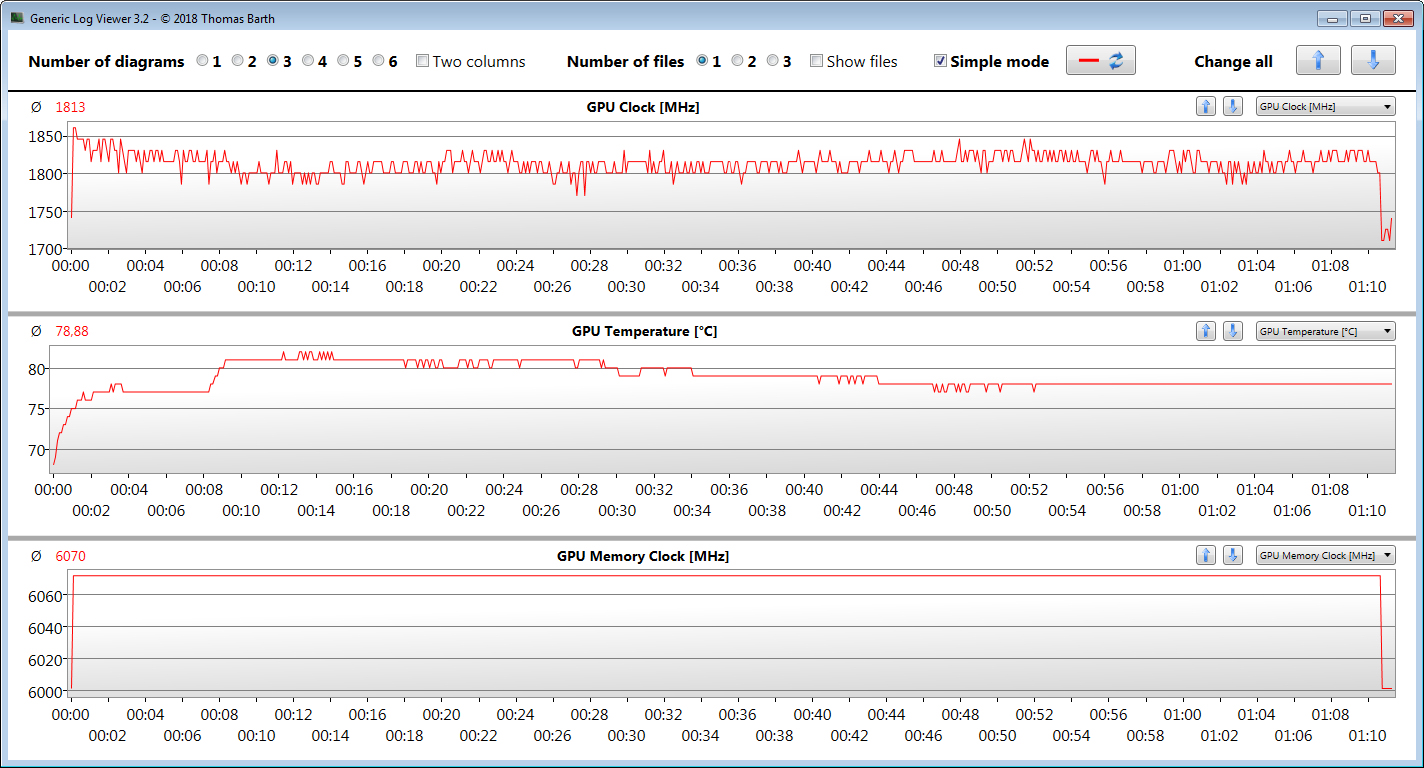
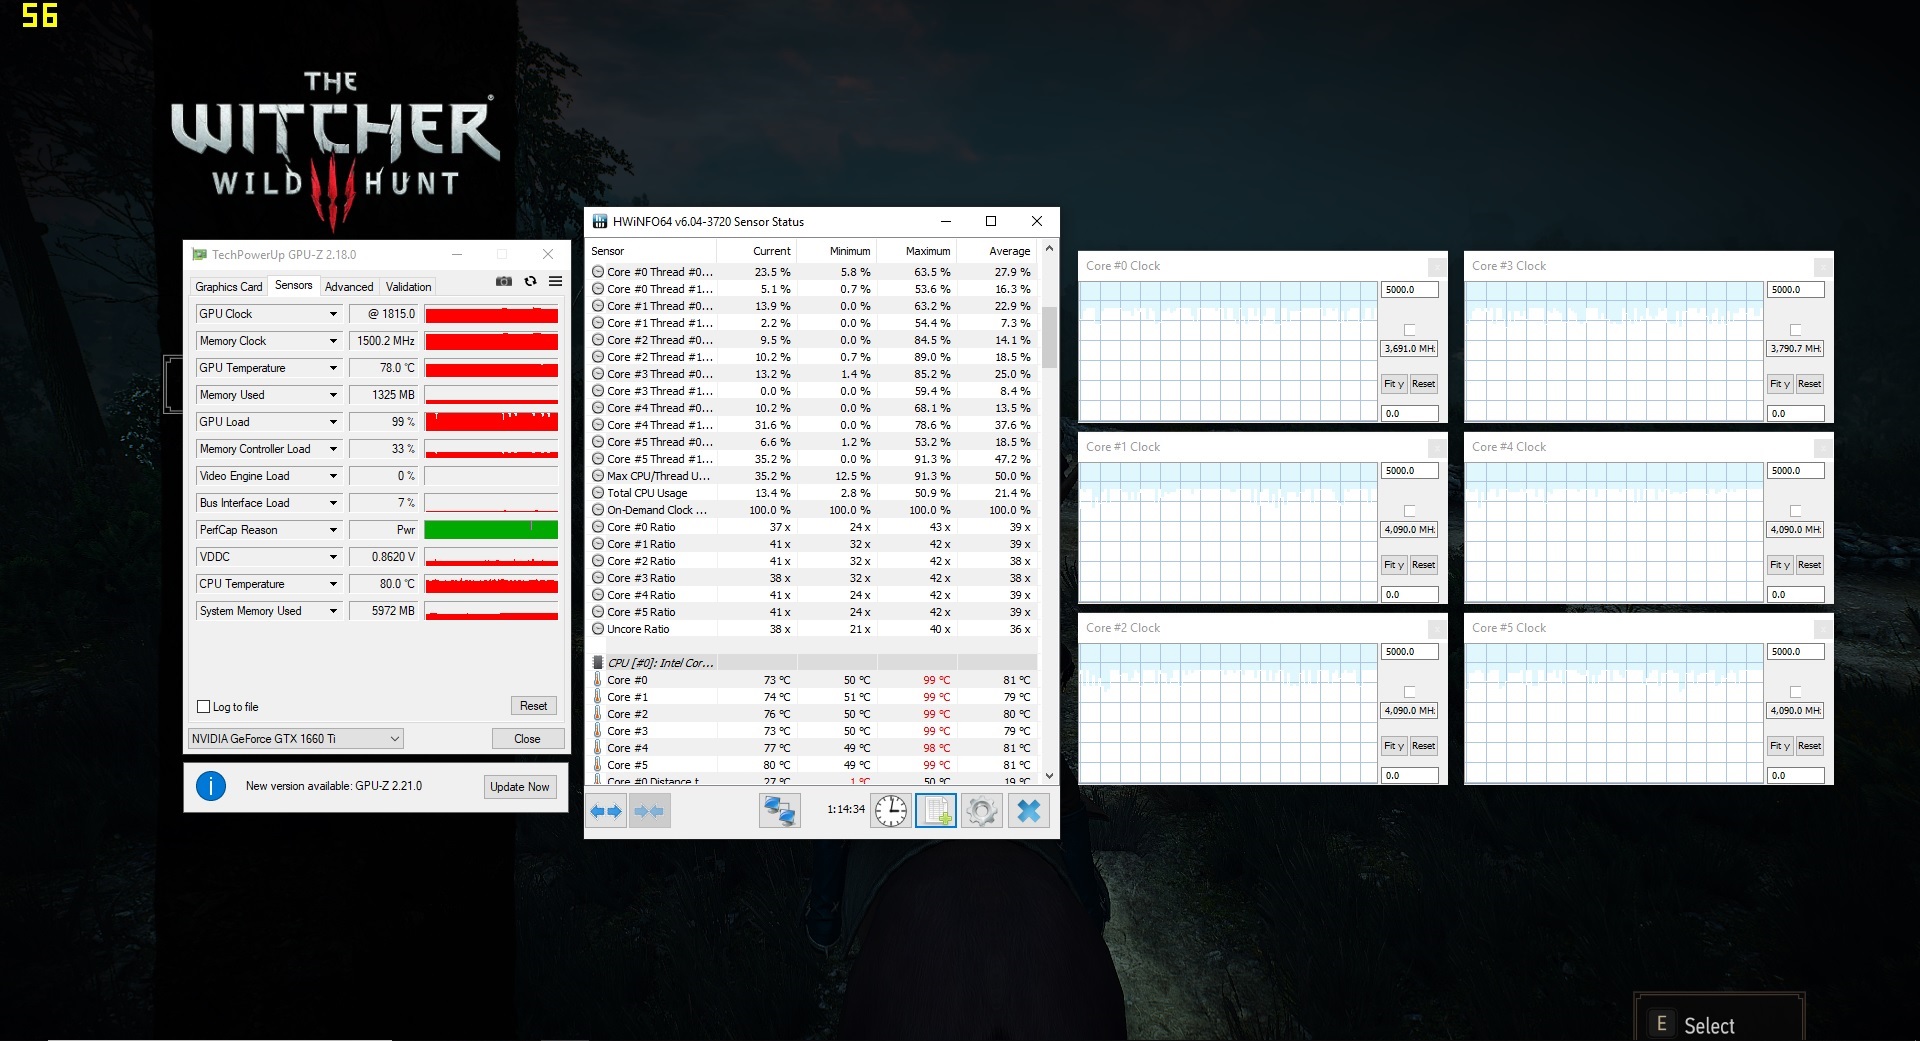
The GeForce GTX 1660 Ti supports DirectX 12 and 6 GB of GDDR6 VRAM along with a 1,455 MHz base clock speed, which it can boost up to 1,590 MHz. The GPU can exceed that boost clock speed if it does not reach its critical operating temperature or its maximum power limit, which explains why the one in our review unit can peak at 1,890 MHz. The GPU can only temporarily maintain this though and typically operates at 1,755 MHz in synthetic benchmarks. It averaged 1,815 MHz while running The Witcher 3 though, so it appears that Gigabyte has done a good job at optimising the 15-SA’s cooling system.
The 15-SA also has a UHD Graphics 630 GPU, which Intel integrates within the CPU. However, Gigabyte disables this at the factory and does not include any graphics-switching technology like NVIDIA Optimus. Hence, the NVIDIA card always remains active, the effects of which we shall cover in the Power Consumption section of this review.
| 3DMark 06 Standard Score | 38166 points | |
| 3DMark 11 Performance | 17701 points | |
| 3DMark Ice Storm Standard Score | 167159 points | |
| 3DMark Cloud Gate Standard Score | 33672 points | |
| 3DMark Fire Strike Score | 13409 points | |
| 3DMark Time Spy Score | 5944 points | |
Help | ||
Gaming Performance
The 15-SA has no problems with playing all modern triple-A titles at maximum graphics in 1080p. Only Metro Exodus and The Witcher 3 averaged below 60 FPS of the games that we tested on our review unit, but both are still playable. You may have to reduce the graphics settings if you want to game in 4K on an external monitor though.
| The Witcher 3 - 1920x1080 Ultra Graphics & Postprocessing (HBAO+) | |
| Average of class Gaming (95 - 240, n=8, last 2 years) | |
| Gigabyte Aero 15 Classic-XA | |
| Aorus 15-SA | |
| Alienware m15 GTX 1070 Max-Q | |
| MSI GS65 8RF-019DE Stealth Thin | |
| Lenovo Legion Y530-15ICH | |
| Asus Zephyrus S GX531GM | |
| Razer Blade 15 Base Model | |
| BioShock Infinite - 1920x1080 Ultra Preset, DX11 (DDOF) | |
| Gigabyte Aero 15 Classic-XA | |
| Aorus 15-SA | |
| Alienware m15 GTX 1070 Max-Q | |
| Lenovo Legion Y530-15ICH | |
| Razer Blade 15 Base Model | |
| Asus Zephyrus S GX531GM | |
| GTA V - 1920x1080 Highest AA:4xMSAA + FX AF:16x | |
| Average of class Gaming (48.3 - 186.9, n=102, last 2 years) | |
| Aorus 15-SA | |
| Asus Zephyrus S GX531GM | |
| X-Plane 11.11 - 1920x1080 high (fps_test=3) | |
| Average of class Gaming (52.1 - 143.5, n=115, last 2 years) | |
| Aorus 15-SA | |
| Asus Zephyrus S GX531GM | |
| World of Tanks enCore - 1920x1080 Ultra AA:TSSAA HQ | |
| Gigabyte Aero 15 Classic-XA | |
| Aorus 15-SA | |
We also ran The Witcher 3 for 60 minutes at maximum graphics in 1080p to check how the system managed performance under sustained load. We leave the playable character stationary for the entire play-through, for reference. Frame rates always remained playable save for a short aberration, although they had dropped by around 20% by the end of the test.
| low | med. | high | ultra | |
|---|---|---|---|---|
| BioShock Infinite (2013) | 331.2 | 287.2 | 252 | 140.3 |
| GTA V (2015) | 152.7 | 142.5 | 123.7 | 68.1 |
| The Witcher 3 (2015) | 257.1 | 180.8 | 104.3 | 57.1 |
| World of Warships (2015) | 220.1 | 179.7 | 148.2 | 141.1 |
| X-Plane 11.11 (2018) | 105.3 | 95 | 79.8 | |
| World of Tanks enCore (2018) | 559 | 247.6 | 119.3 | |
| Forza Horizon 4 (2018) | 161 | 134 | 125 | 99 |
| Far Cry New Dawn (2019) | 104 | 90 | 86 | 78 |
| Metro Exodus (2019) | 123.9 | 64.1 | 48.7 | 39.6 |
| Rage 2 (2019) | 162.7 | 81.6 | 69.5 | 67.9 |
Emissions
Fan Noise
The 15-SA is a noisy device. Its two fans remain audible even when the system is idling and reach a maximum of 41 dB(A). The fans peaked at 56 dB(A) during our stress test and at 52 dB(A) while playing The Witcher 3, both of which are loud enough to drown out the internal speakers at maximum volume. In short, headphones are indispensable if you are gaming.
Noise level
| Idle |
| 32 / 35 / 41 dB(A) |
| Load |
| 54 / 56 dB(A) |
 | ||
30 dB silent 40 dB(A) audible 50 dB(A) loud |
||
min: | ||
| Aorus 15-SA i7-9750H, GeForce GTX 1660 Ti Mobile | Razer Blade 15 Base Model i7-8750H, GeForce GTX 1060 Max-Q | Asus Zephyrus S GX531GM i7-8750H, GeForce GTX 1060 Mobile | Lenovo Legion Y530-15ICH i7-8750H, GeForce GTX 1060 Mobile | MSI GS65 8RF-019DE Stealth Thin i7-8750H, GeForce GTX 1070 Max-Q | Alienware m15 GTX 1070 Max-Q i7-8750H, GeForce GTX 1070 Max-Q | Gigabyte Aero 15 Classic-XA i7-9750H, GeForce RTX 2070 Max-Q | Average of class Gaming | |
|---|---|---|---|---|---|---|---|---|
| Noise | 11% | 16% | 14% | 13% | 14% | 3% | 18% | |
| off / environment * (dB) | 29 | 27.8 4% | 30.3 -4% | 30.2 -4% | 30 -3% | 28.6 1% | 30 -3% | 24.1 ? 17% |
| Idle Minimum * (dB) | 32 | 31 3% | 30.3 5% | 30.9 3% | 30 6% | 28.6 11% | 31 3% | 25.8 ? 19% |
| Idle Average * (dB) | 35 | 31.2 11% | 33.2 5% | 30.9 12% | 31 11% | 28.6 18% | 34 3% | 27.4 ? 22% |
| Idle Maximum * (dB) | 41 | 31.3 24% | 33.2 19% | 31.6 23% | 34 17% | 28.6 30% | 39 5% | 30 ? 27% |
| Load Average * (dB) | 54 | 47.2 13% | 32.3 40% | 42.3 22% | 43 20% | 40.8 24% | 46 15% | 43 ? 20% |
| Witcher 3 ultra * (dB) | 52 | 51.3 1% | 42 19% | 49.6 5% | 53 -2% | |||
| Load Maximum * (dB) | 56 | 44.3 21% | 39 30% | 40 29% | 44 21% | 49.6 11% | 55 2% | 54 ? 4% |
* ... smaller is better
Temperature
We subjected our review unit to a FurMark and Prime95 stress test, which we ran for at least an hour to determine how well it manages its performance under extreme load conditions. Notably, the 15-SA performs better when on charge than when we ran our stress test on battery. The CPU operated at between 2.7 and 2.9 GHz in the former scenario, with the GPU able to maintain a clock speed of 1,515 MHz. By contrast, the CPU downclocks to 800 MHz on battery, although it occasionally reached 1.4 GHz. Additionally, the GPU fluctuates between 1,300 MHz and 1,450 MHz.
You should not experience such heavy throttling either on battery or on charge in daily use though. We have designed our stress test to push our test devices to their limits, which works systems harder than even the most demanding triple-A games do.

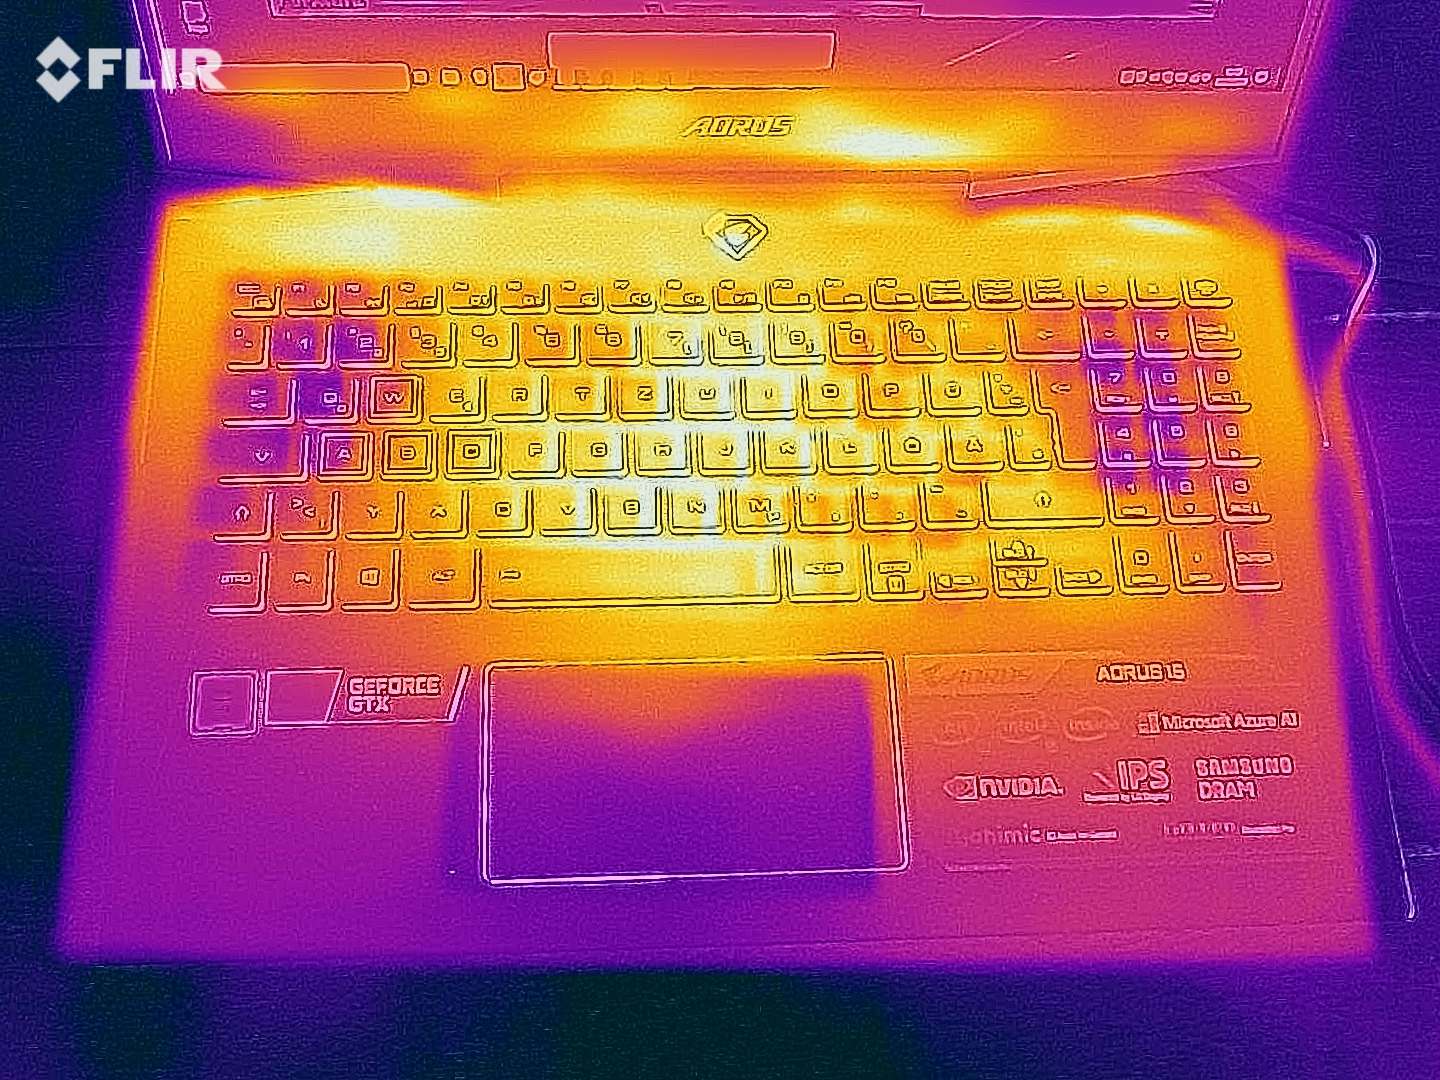
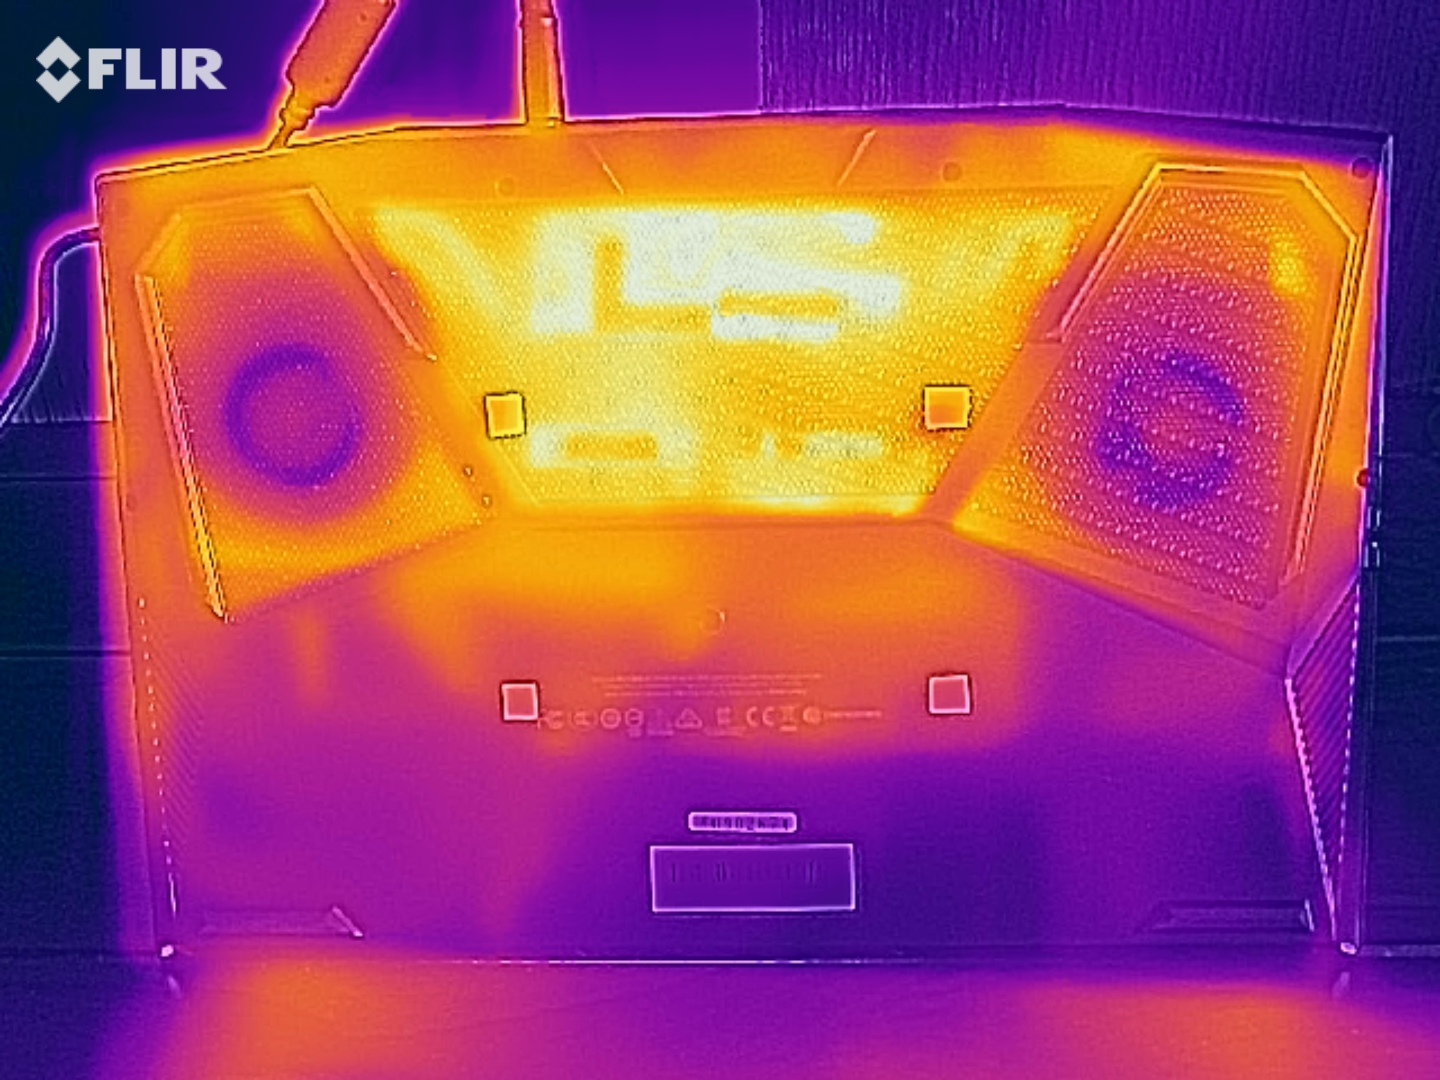
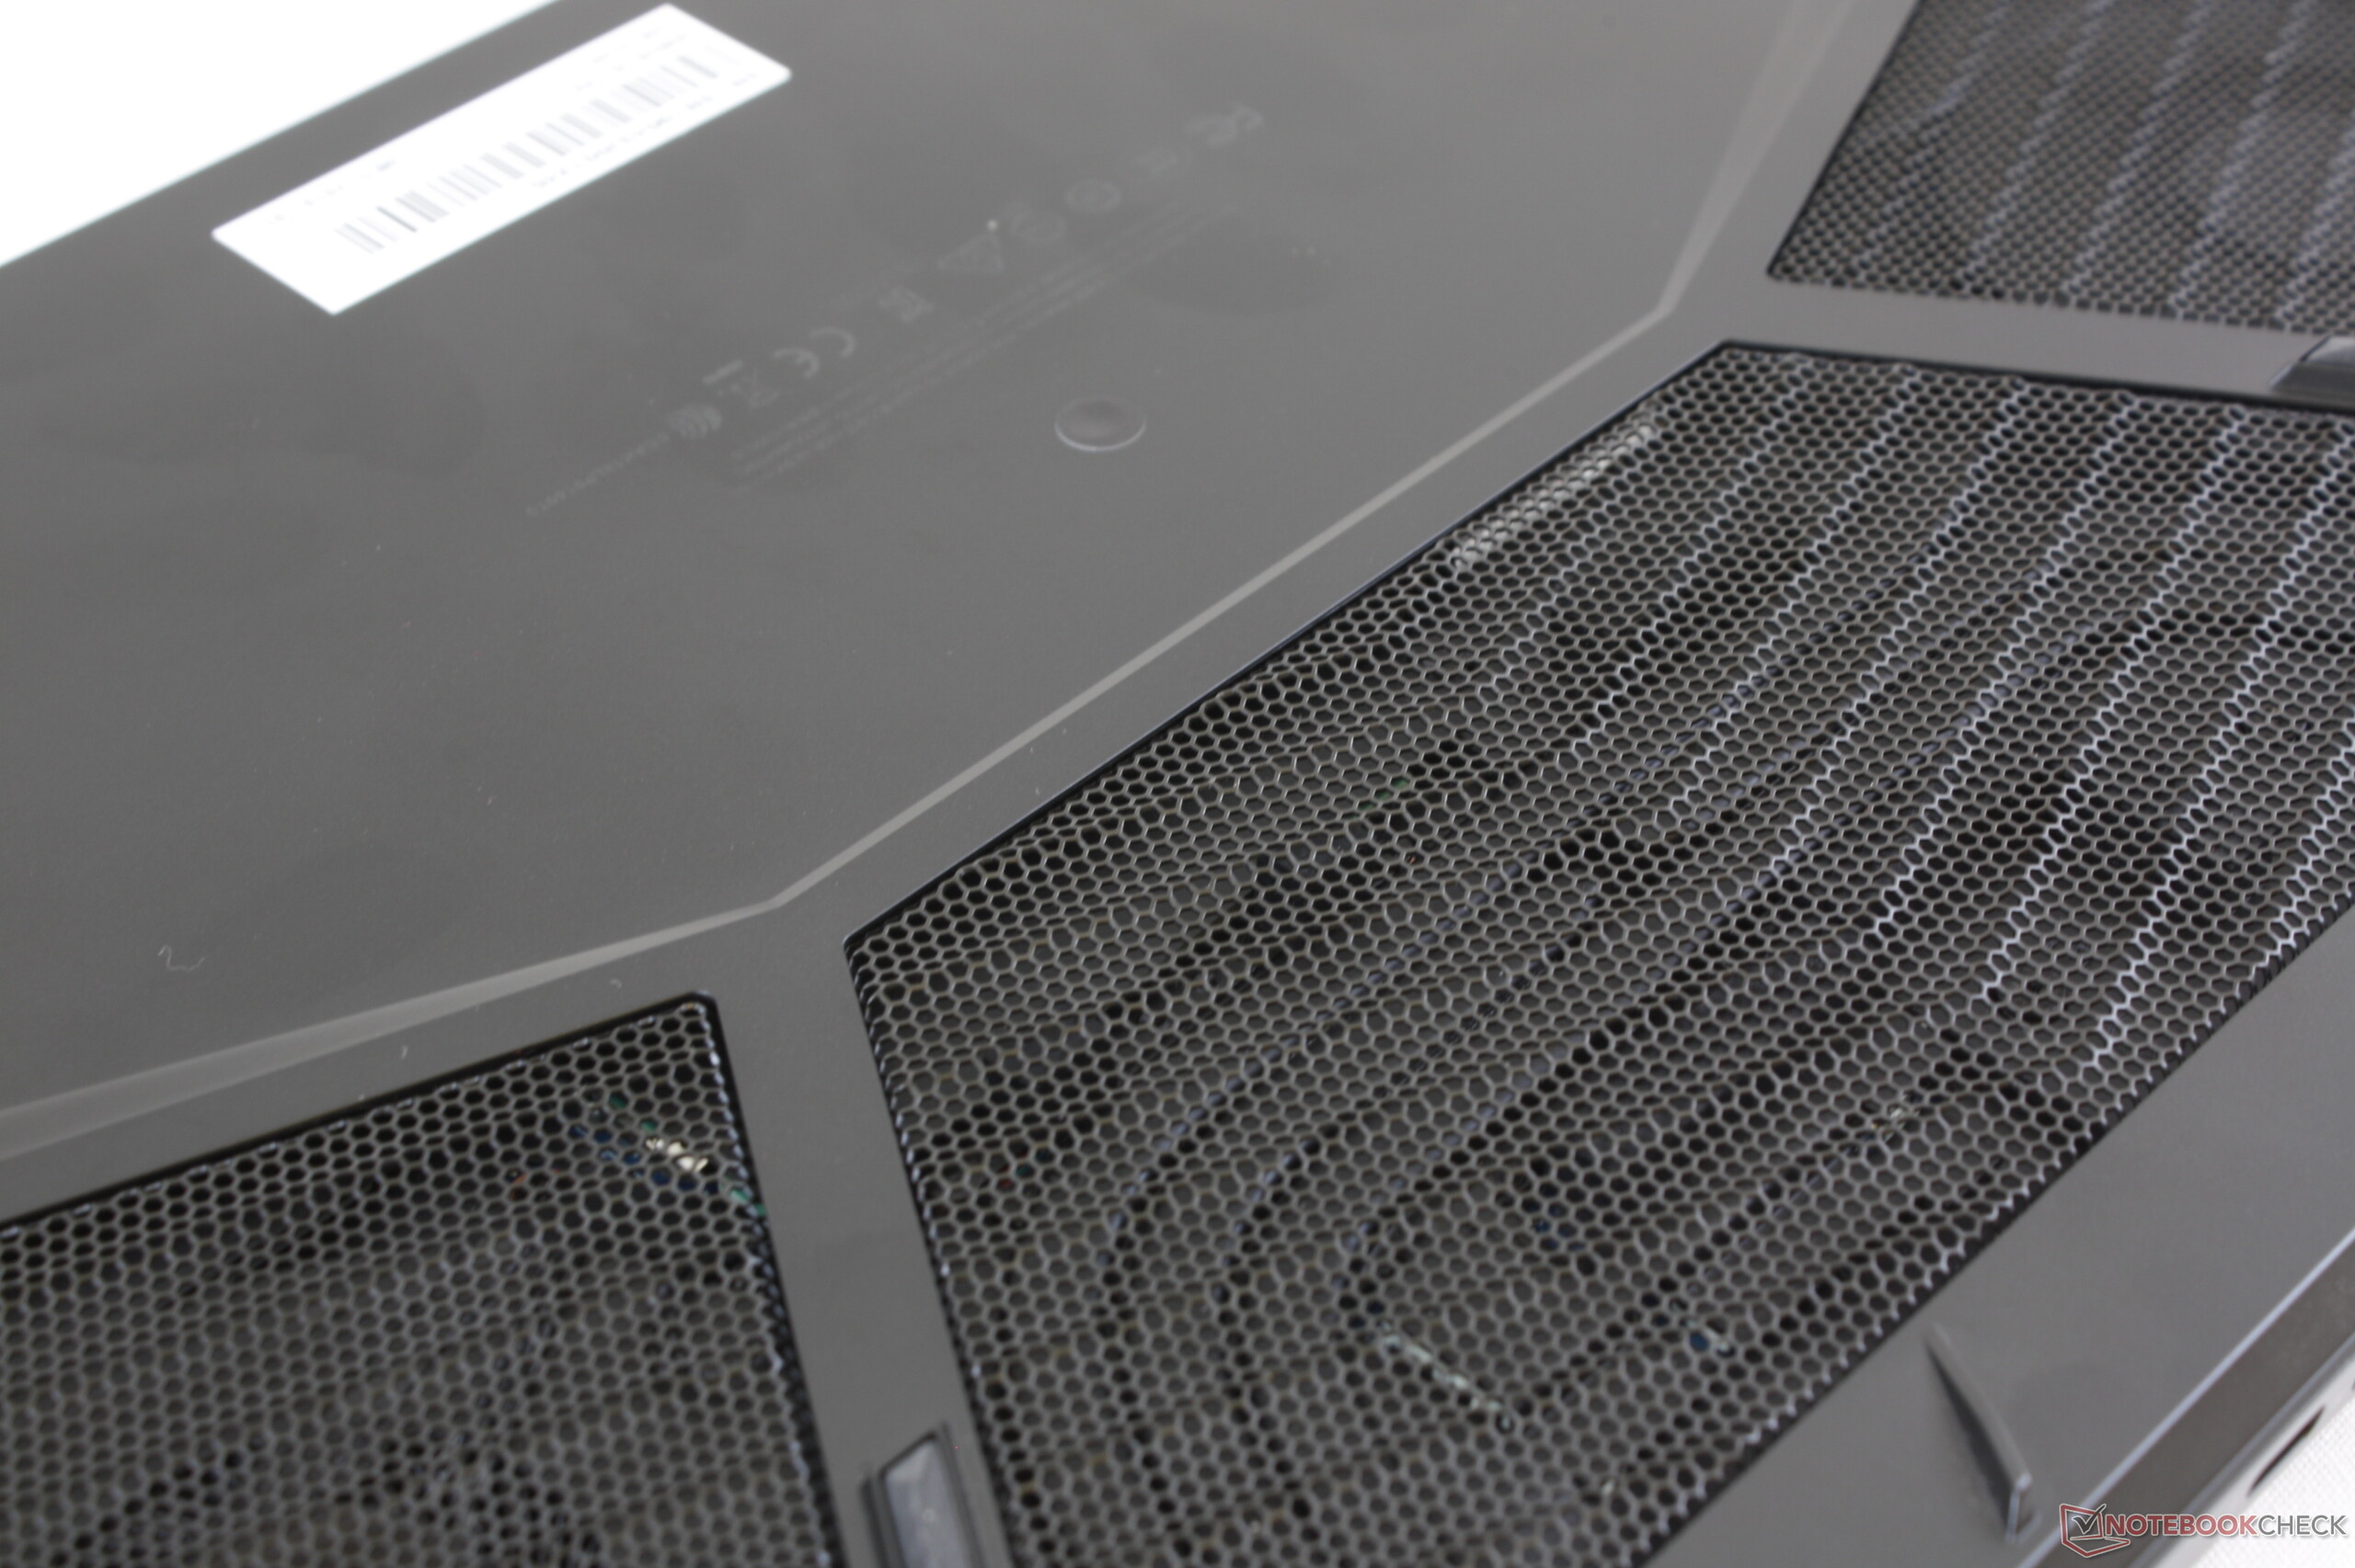
The 15-SA gets incredibly hot to the touch under load, especially on its underside. Some areas of our review unit exceeded 50 °C during our stress tests, with two areas peaking at 58 °C. Surface temperatures are slightly lower when gaming as demonstrated by our The Witcher 3 results, but most of the bottom case still exceeds 50 °C. In short, we would advise against using the 15-SA on your lap if you are pushing the machine hard.
Our review unit also runs rather hot when idling. Most of the case peaks at over 30 °C. Even the palm rest will never feel cool to the touch. The 15-SA runs slightly cooler than its sister model, the 15-W9, although this is unsurprising considering that the latter has a GeForce RTX 2060 GPU on board.
(±) The maximum temperature on the upper side is 44 °C / 111 F, compared to the average of 40.4 °C / 105 F, ranging from 21.2 to 68.8 °C for the class Gaming.
(-) The bottom heats up to a maximum of 58 °C / 136 F, compared to the average of 43.2 °C / 110 F
(+) In idle usage, the average temperature for the upper side is 28.9 °C / 84 F, compared to the device average of 33.9 °C / 93 F.
(±) Playing The Witcher 3, the average temperature for the upper side is 37.6 °C / 100 F, compared to the device average of 33.9 °C / 93 F.
(±) The palmrests and touchpad can get very hot to the touch with a maximum of 39 °C / 102.2 F.
(-) The average temperature of the palmrest area of similar devices was 28.8 °C / 83.8 F (-10.2 °C / -18.4 F).
| Aorus 15-SA i7-9750H, GeForce GTX 1660 Ti Mobile | Razer Blade 15 Base Model i7-8750H, GeForce GTX 1060 Max-Q | Asus Zephyrus S GX531GM i7-8750H, GeForce GTX 1060 Mobile | Lenovo Legion Y530-15ICH i7-8750H, GeForce GTX 1060 Mobile | MSI GS65 8RF-019DE Stealth Thin i7-8750H, GeForce GTX 1070 Max-Q | Alienware m15 GTX 1070 Max-Q i7-8750H, GeForce GTX 1070 Max-Q | Gigabyte Aero 15 Classic-XA i7-9750H, GeForce RTX 2070 Max-Q | Average of class Gaming | |
|---|---|---|---|---|---|---|---|---|
| Heat | 8% | 12% | 10% | 7% | -1% | -8% | 2% | |
| Maximum Upper Side * (°C) | 44 | 45.2 -3% | 47.7 -8% | 48.4 -10% | 49 -11% | 52 -18% | 58 -32% | 45.2 ? -3% |
| Maximum Bottom * (°C) | 58 | 46.4 20% | 46.1 21% | 48 17% | 63 -9% | 55.6 4% | 64 -10% | 48 ? 17% |
| Idle Upper Side * (°C) | 30 | 27.2 9% | 26.2 13% | 26.7 11% | 24 20% | 29.8 1% | 30 -0% | 31.1 ? -4% |
| Idle Bottom * (°C) | 34 | 32.8 4% | 27.1 20% | 26.9 21% | 25 26% | 31 9% | 31 9% | 34.2 ? -1% |
* ... smaller is better
Speakers
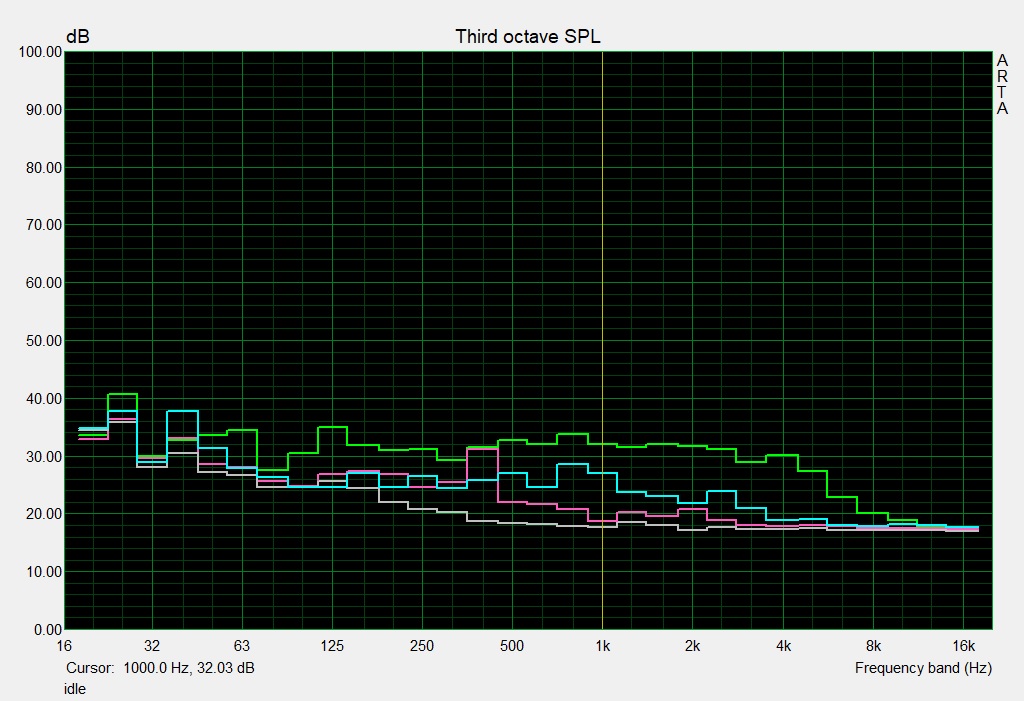
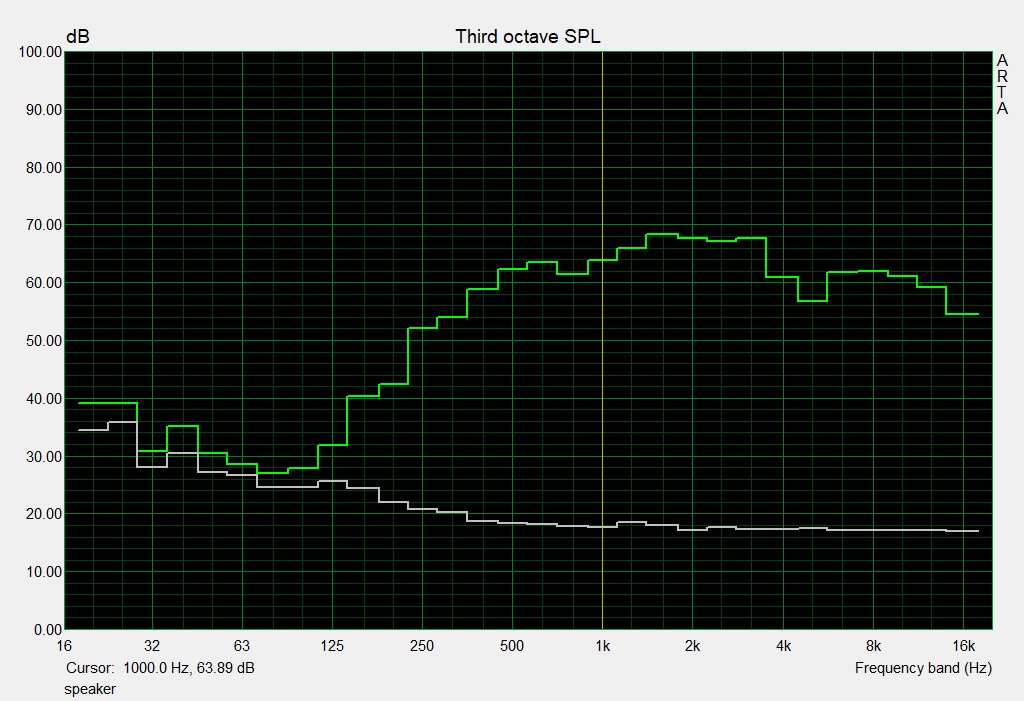
Aorus 15-SA audio analysis
(±) | speaker loudness is average but good (77 dB)
Bass 100 - 315 Hz
(-) | nearly no bass - on average 19.7% lower than median
(±) | linearity of bass is average (10.4% delta to prev. frequency)
Mids 400 - 2000 Hz
(+) | balanced mids - only 3.5% away from median
(+) | mids are linear (5.6% delta to prev. frequency)
Highs 2 - 16 kHz
(+) | balanced highs - only 2.7% away from median
(+) | highs are linear (5.9% delta to prev. frequency)
Overall 100 - 16.000 Hz
(±) | linearity of overall sound is average (19.5% difference to median)
Compared to same class
» 67% of all tested devices in this class were better, 7% similar, 26% worse
» The best had a delta of 6%, average was 18%, worst was 132%
Compared to all devices tested
» 48% of all tested devices were better, 7% similar, 44% worse
» The best had a delta of 4%, average was 24%, worst was 134%
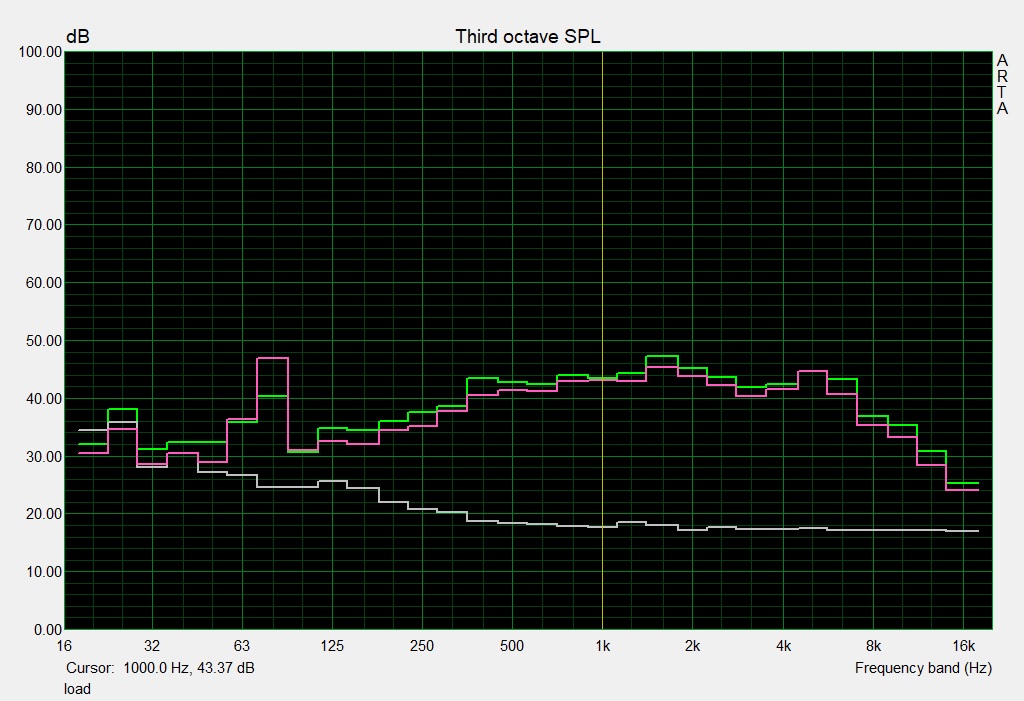
Gigabyte Aero 15 Classic-XA audio analysis
(+) | speakers can play relatively loud (82 dB)
Bass 100 - 315 Hz
(-) | nearly no bass - on average 17% lower than median
(±) | linearity of bass is average (10.2% delta to prev. frequency)
Mids 400 - 2000 Hz
(+) | balanced mids - only 4.7% away from median
(+) | mids are linear (6.2% delta to prev. frequency)
Highs 2 - 16 kHz
(+) | balanced highs - only 2.3% away from median
(+) | highs are linear (5.5% delta to prev. frequency)
Overall 100 - 16.000 Hz
(±) | linearity of overall sound is average (15.5% difference to median)
Compared to same class
» 35% of all tested devices in this class were better, 7% similar, 58% worse
» The best had a delta of 6%, average was 18%, worst was 132%
Compared to all devices tested
» 23% of all tested devices were better, 4% similar, 73% worse
» The best had a delta of 4%, average was 24%, worst was 134%
Power Management
Power Consumption
The 15-SA has comparatively high power consumption and is less efficient than all but the Aero 15 Classic-XA of our comparison devices. This is perhaps unsurprising considering the 15-SA’s powerful components, but the lack of NVIDIA Optimus integration takes its toll.
Our review unit consumes a minimum of 20 W when idling, which is up to 65% higher than our most efficient comparison device. We also recorded a maximum consumption of 173 W under load and 136 W while playing The Witcher 3. These values are in line with expectations, with the 15-SA consuming roughly as much as the 15-W9 does.
Gigabyte includes a 180 W power supply in the box. Our power consumption tests certify that the power supply will keep the 15-SA charging even when it is operating under sustained load.
| Off / Standby | |
| Idle | |
| Load |
|
Key:
min: | |
| Aorus 15-SA i7-9750H, GeForce GTX 1660 Ti Mobile | Razer Blade 15 Base Model i7-8750H, GeForce GTX 1060 Max-Q | Asus Zephyrus S GX531GM i7-8750H, GeForce GTX 1060 Mobile | Lenovo Legion Y530-15ICH i7-8750H, GeForce GTX 1060 Mobile | MSI GS65 8RF-019DE Stealth Thin i7-8750H, GeForce GTX 1070 Max-Q | Alienware m15 GTX 1070 Max-Q i7-8750H, GeForce GTX 1070 Max-Q | Gigabyte Aero 15 Classic-XA i7-9750H, GeForce RTX 2070 Max-Q | Average of class Gaming | |
|---|---|---|---|---|---|---|---|---|
| Power Consumption | 26% | 14% | 30% | 22% | 22% | -10% | -1% | |
| Idle Minimum * (Watt) | 20 | 10.2 49% | 13.8 31% | 7.3 63% | 7 65% | 7.6 62% | 21 -5% | 13.2 ? 34% |
| Idle Average * (Watt) | 23 | 13.2 43% | 20.9 9% | 11.1 52% | 11 52% | 13.8 40% | 23 -0% | 18.9 ? 18% |
| Idle Maximum * (Watt) | 29 | 17.6 39% | 26 10% | 12.6 57% | 20 31% | 14.6 50% | 32 -10% | 24.3 ? 16% |
| Load Average * (Watt) | 87 | 99.5 -14% | 89 -2% | 109 -25% | 98 -13% | 97.6 -12% | 97 -11% | 108 ? -24% |
| Witcher 3 ultra * (Watt) | 136 | 113.6 16% | 132 3% | 145.8 -7% | 148 -9% | |||
| Load Maximum * (Watt) | 173 | 133.3 23% | 131 24% | 168 3% | 182 -5% | 172.5 -0% | 213 -23% | 254 ? -47% |
* ... smaller is better
Battery Life
The 15-SA has a 62 Wh battery, which is a smaller capacity than all but the Zephyrus S GX531GM and the Legion Y530 of our comparison devices. Moreover, some laptops like the m15 and Aero 15 Classic-XA have around 50% larger batteries than our review unit.
Unsurprisingly, the 15-SA has comparatively poor battery life. Worse still, all our comparison devices lasted longer than our review unit in our battery life tests, including those that have smaller batteries. The 15-SA lasted just 2:49 hours in our Wi-Fi battery life test, which is appalling. We conduct this test by running a script that simulates the load required to render websites and set the display to approximately 150 cd/m². We also left the device on its Balanced power mode, for reference.
The 15-SA fares no better in our battery life tests, lasting just 2:46 hours in our looped H.264 video test, 2:02 hours under sustained load and 3:28 hours when idling.
Overall, the 15-SA would last longer between charges if it supported NVIDIA Optimus, which would have allowed it to reduce power consumption by disabling its dedicated GPU when it is not being used. Nevertheless, the 15-SA lasts a little longer than its sibling, the 15-W9.
| Aorus 15-SA i7-9750H, GeForce GTX 1660 Ti Mobile, 62 Wh | Razer Blade 15 Base Model i7-8750H, GeForce GTX 1060 Max-Q, 65 Wh | Asus Zephyrus S GX531GM i7-8750H, GeForce GTX 1060 Mobile, 53 Wh | Lenovo Legion Y530-15ICH i7-8750H, GeForce GTX 1060 Mobile, 52 Wh | MSI GS65 8RF-019DE Stealth Thin i7-8750H, GeForce GTX 1070 Max-Q, 82 Wh | Alienware m15 GTX 1070 Max-Q i7-8750H, GeForce GTX 1070 Max-Q, 90 Wh | Gigabyte Aero 15 Classic-XA i7-9750H, GeForce RTX 2070 Max-Q, 94.24 Wh | Average of class Gaming | |
|---|---|---|---|---|---|---|---|---|
| Battery runtime | 100% | 14% | 31% | 85% | 120% | 126% | 117% | |
| Reader / Idle (h) | 3.5 | 11.5 229% | 8.3 137% | 8.5 143% | 10.5 200% | 9.1 160% | 8.71 ? 149% | |
| H.264 (h) | 2.8 | 5.9 111% | 6.8 143% | 8.26 ? 195% | ||||
| WiFi v1.3 (h) | 2.8 | 5.5 96% | 3.2 14% | 3.8 36% | 6 114% | 7.7 175% | 7 150% | 7.02 ? 151% |
| Load (h) | 2 | 1.5 -25% | 0.4 -80% | 1.4 -30% | 1.7 -15% | 3 50% | 1.47 ? -26% |
Pros
Cons
Verdict
Gigabyte has equipped the Aorus 15-SA with a cutting-edge combination of hardware. Its Core i7-9750H processor and GeForce GTX 1660 Ti GPU handle all triple-A games without issue and make full use of the 15-SA’s 144 Hz display. Do not underestimate the GTX 1660 Ti either, as it almost reaches the performance of the GeForce RTX 2060. The Aorus 15-SA is not a cool and quiet gaming laptop though.
The Gigabyte Aorus 15-SA is the genuine article: A true 15.6-inch gaming laptop that blitzes through all modern games. The device is not without its shortcomings though.
Gigabyte has also equipped the device with a fast NVMe SSD, which ensures that the system always runs smoothly. If 512 GB of storage is not enough, you can always add a second M.2 2280 drive and even a 2.5-inch drive.
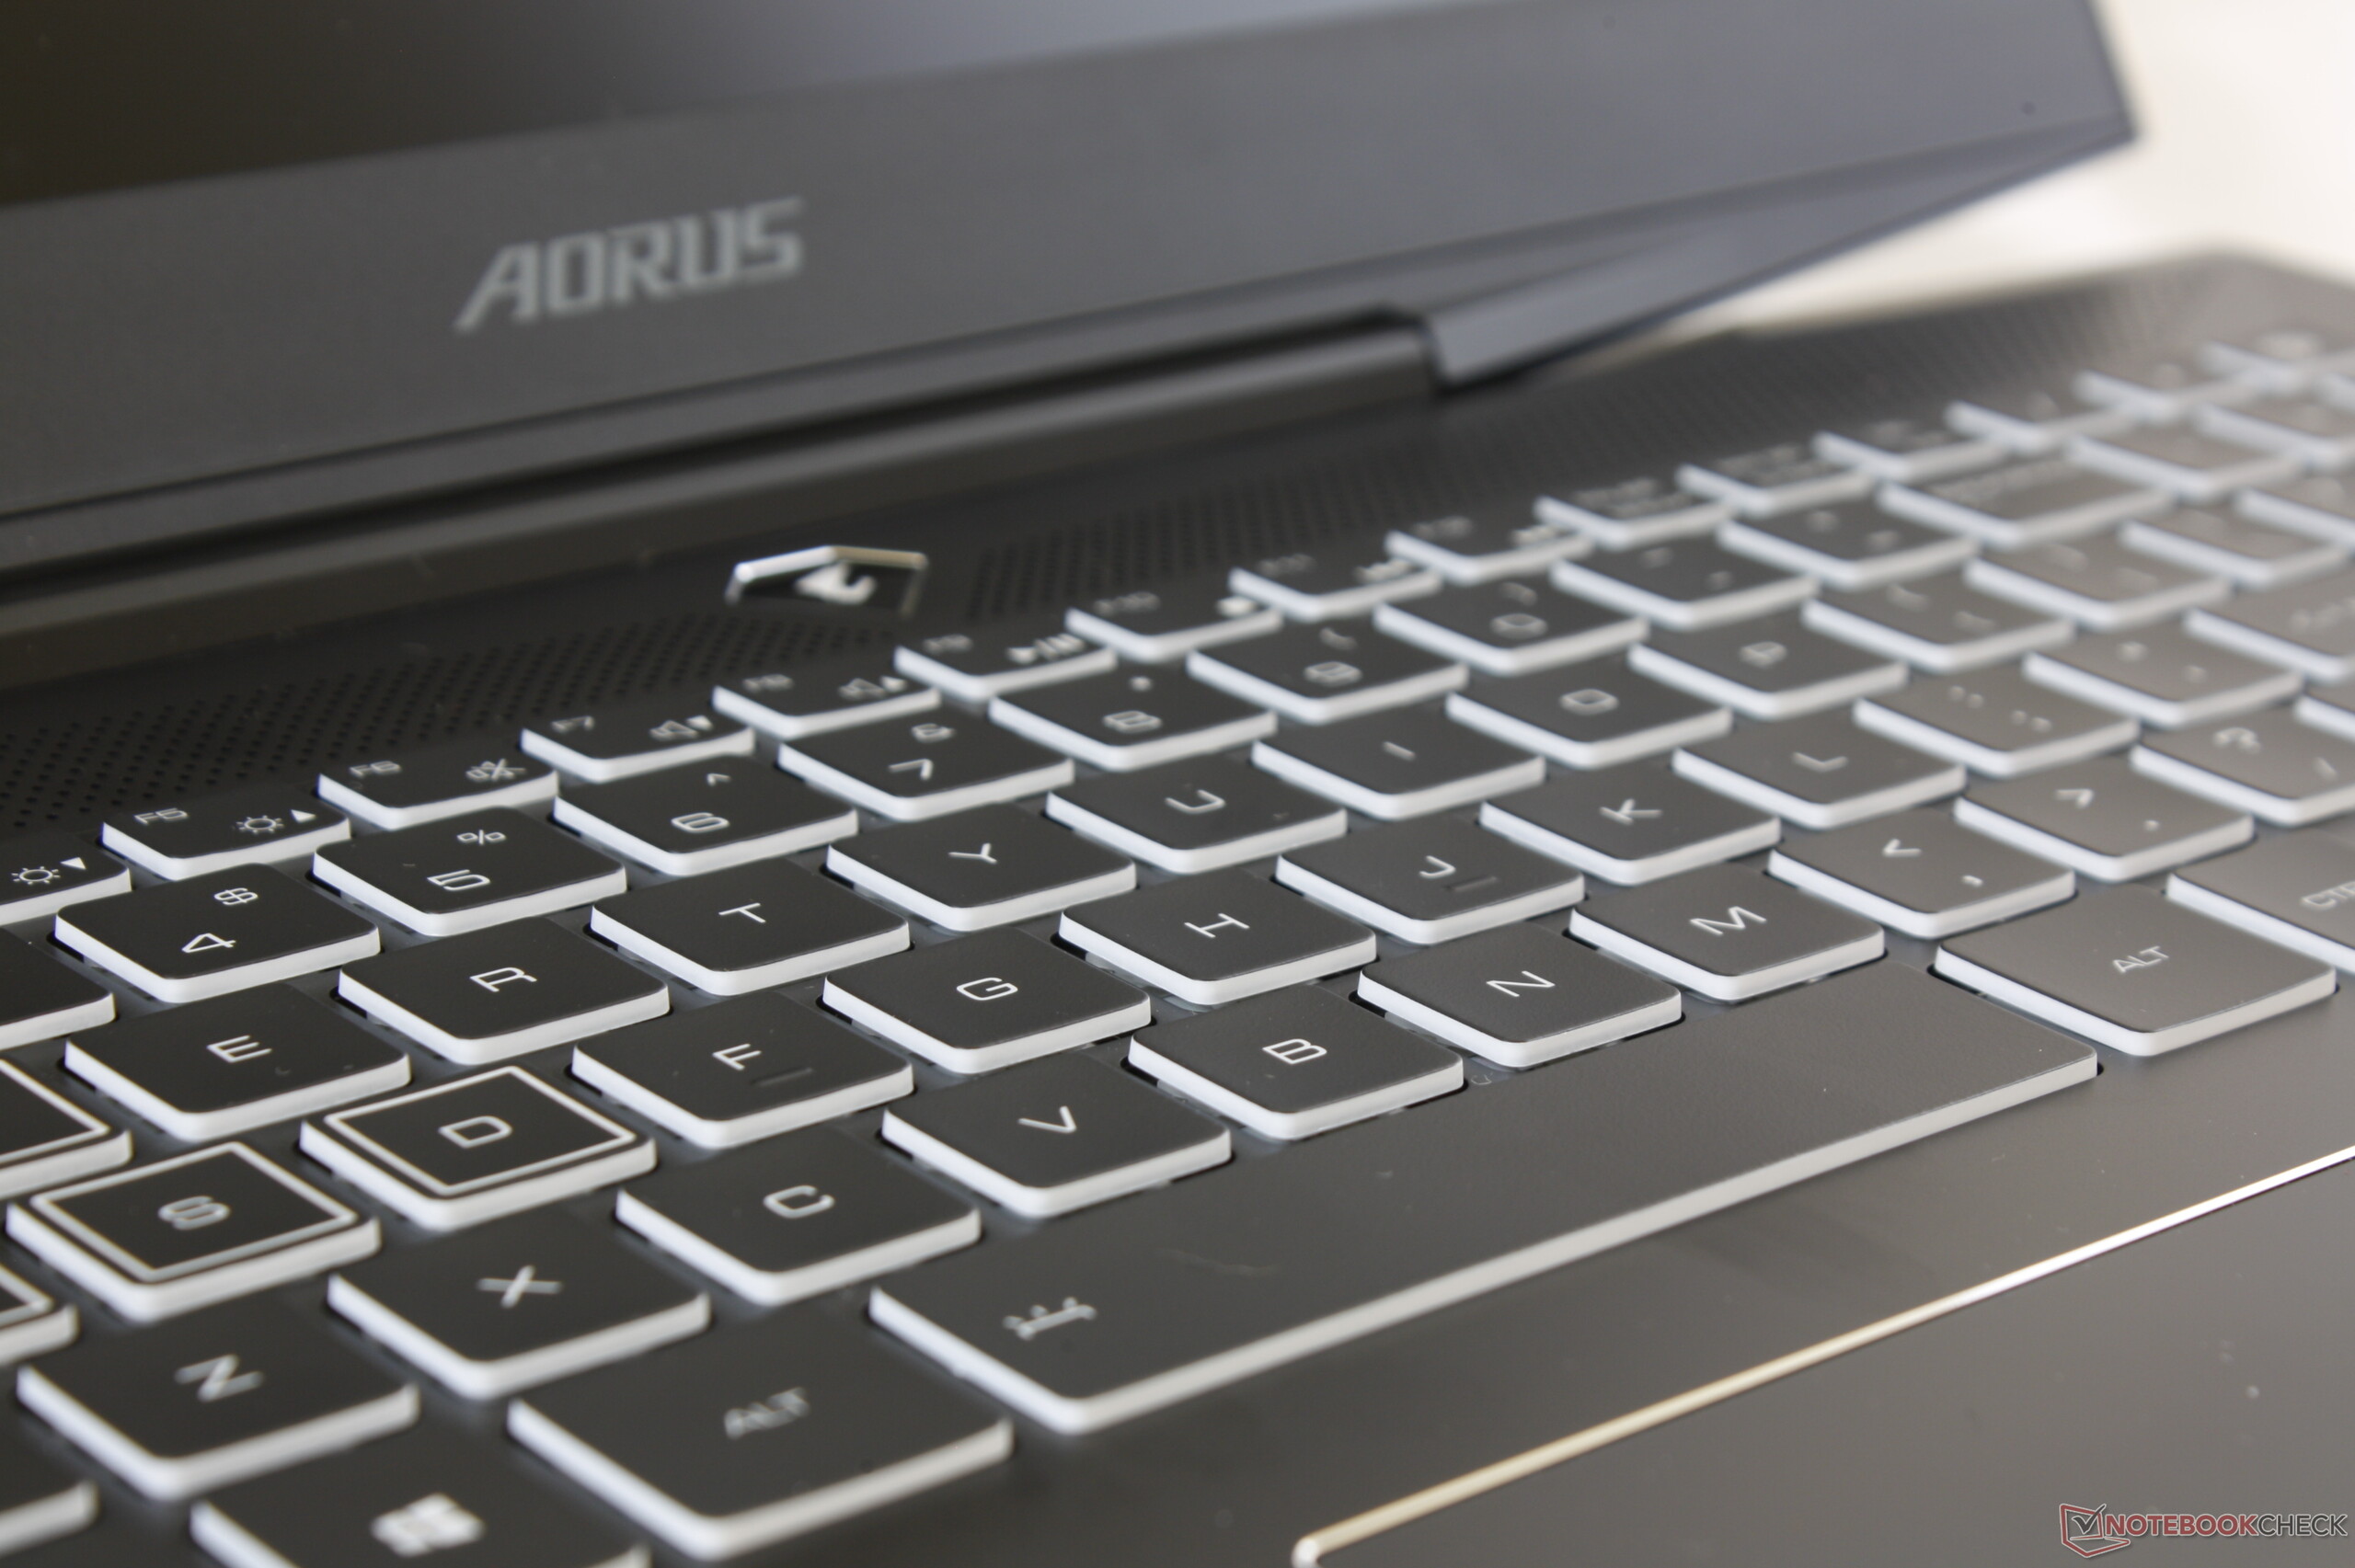
The 144 Hz IPS display is a mixed bag. On the one hand, it has stable viewing angles and fast response times. However, its contrast ratio and maximum brightness should be higher for a gaming laptop at this price. The RGB backlit keyboard impressed us though and is pleasant to type on. However, the battery life is not worth mentioning.
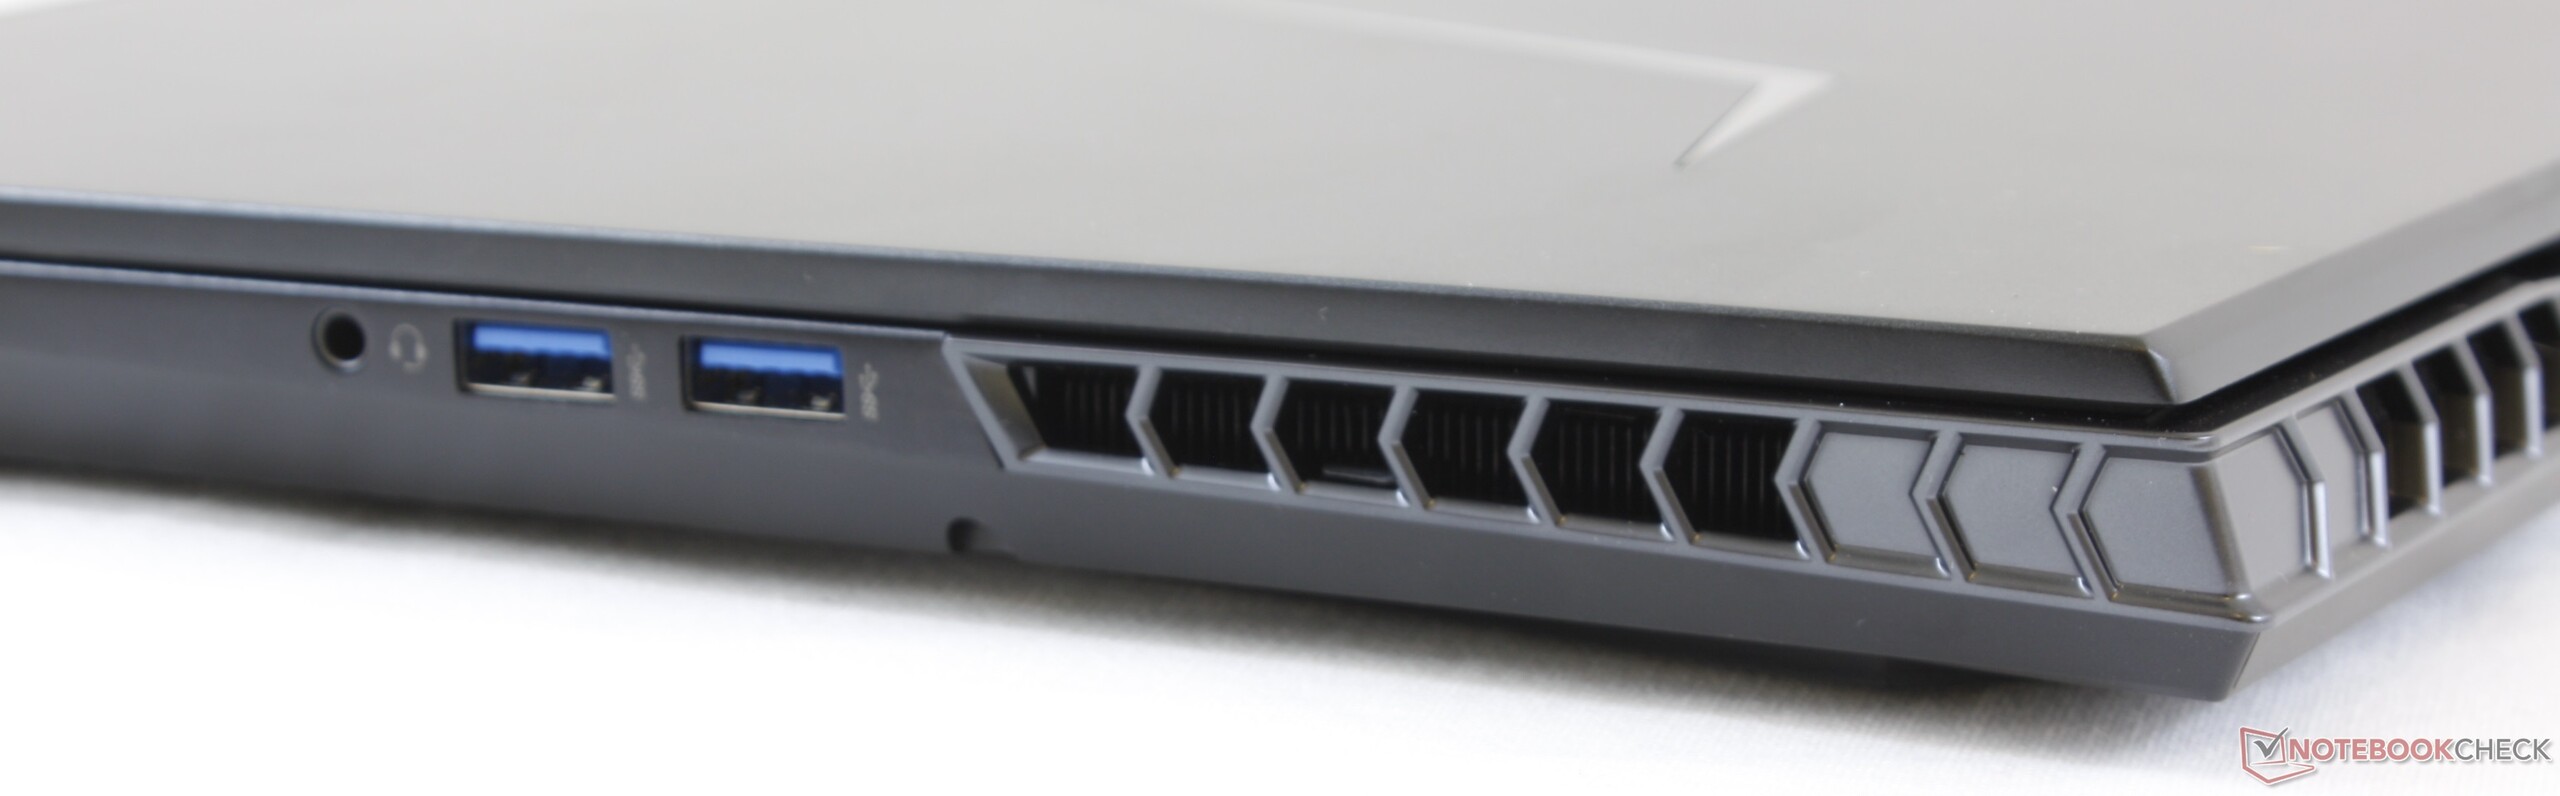
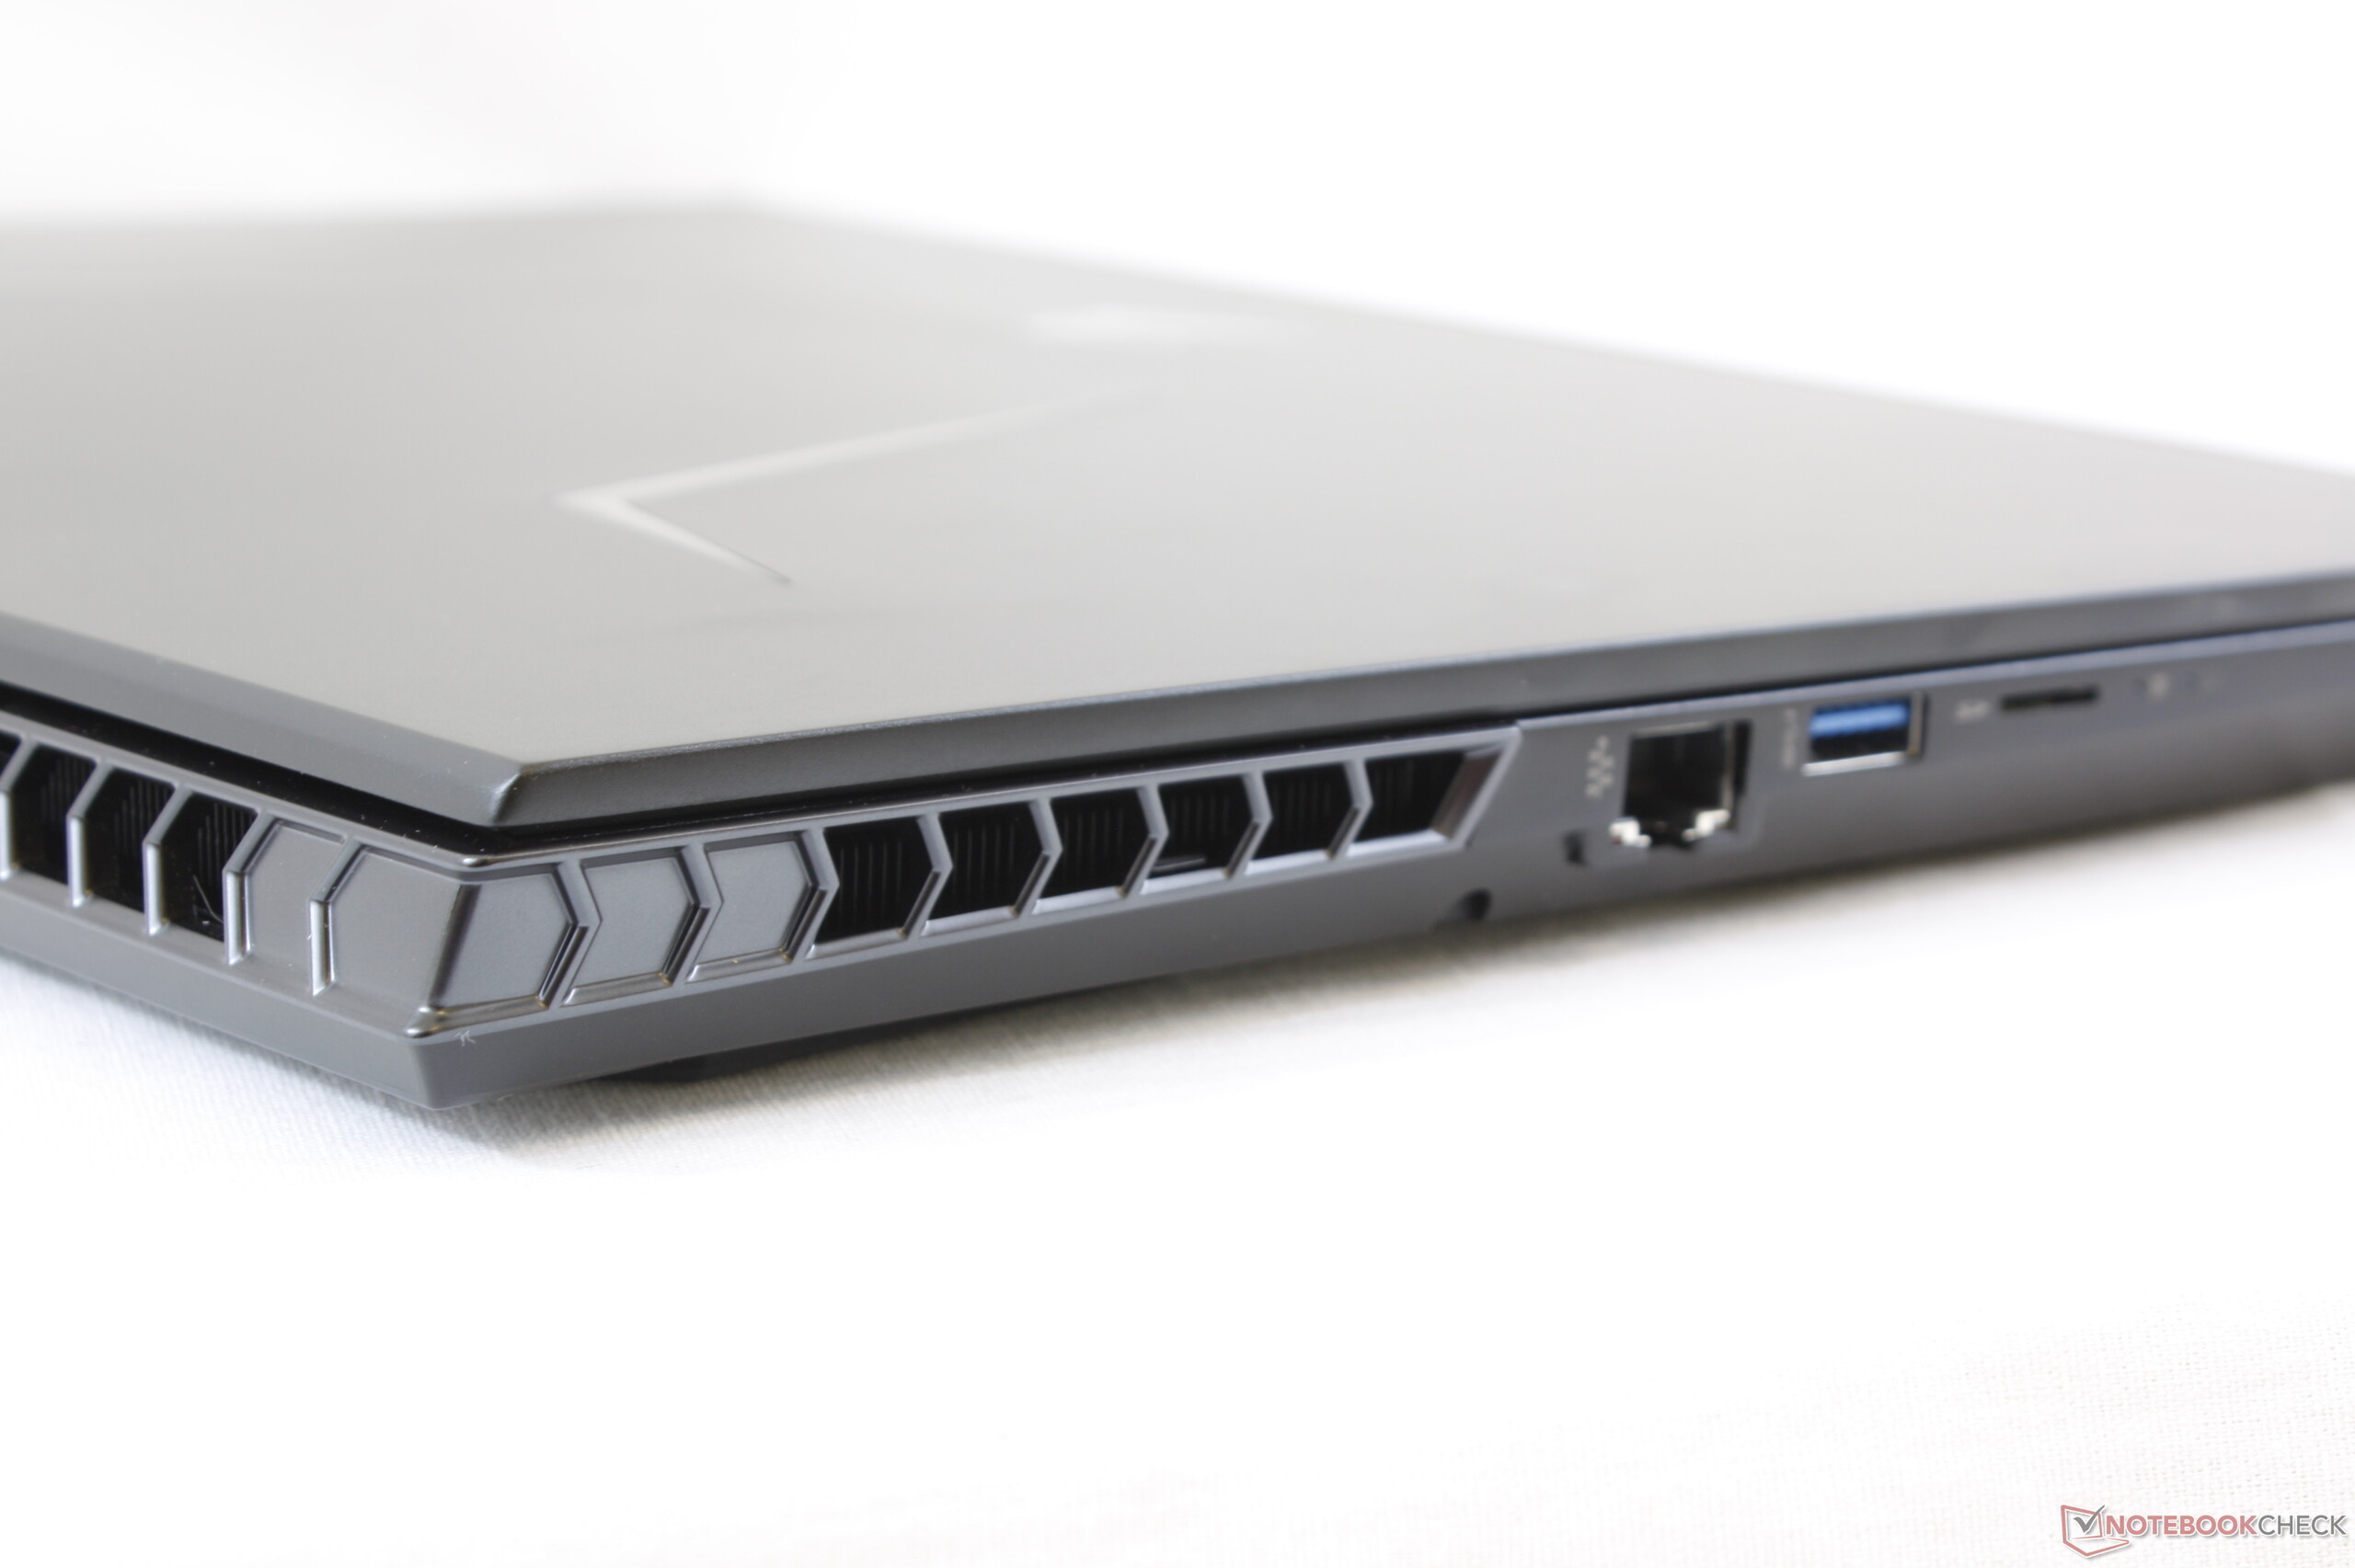
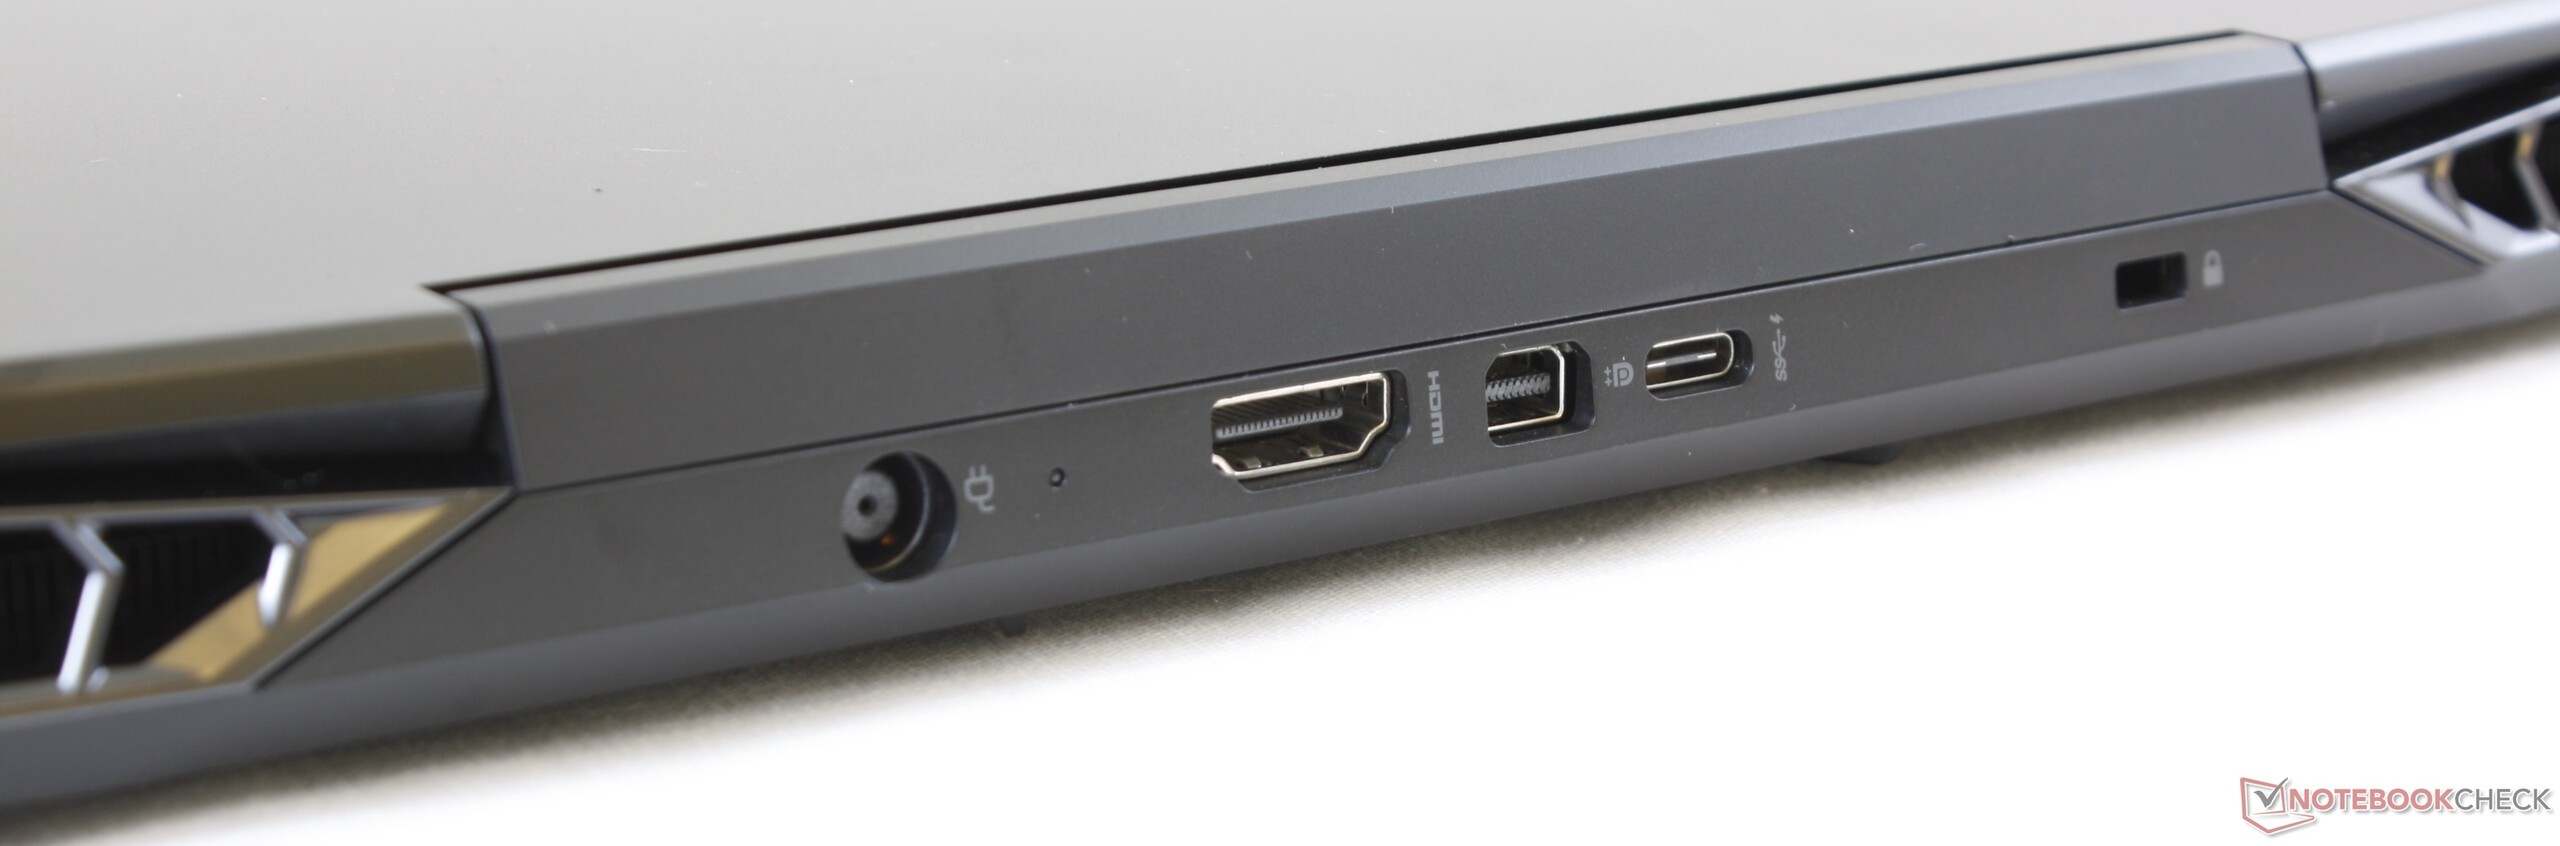
Moreover, we cannot fathom why Gigabyte only included a USB 3.1 Gen2 Type-C port rather than a more versatile Thunderbolt 3 port. The inclusion of just a microSD card reader is disappointing too, especially as there is space for Gigabyte to have included a full-sized one. Overall, the Gigabyte Aorus 15-SA is an excellent gaming laptop, which is let down by its dim display, limited selection of ports and poor battery life.
Aorus 15-SA
- 06/16/2019 v6 (old)
Sascha Mölck
Price comparison

