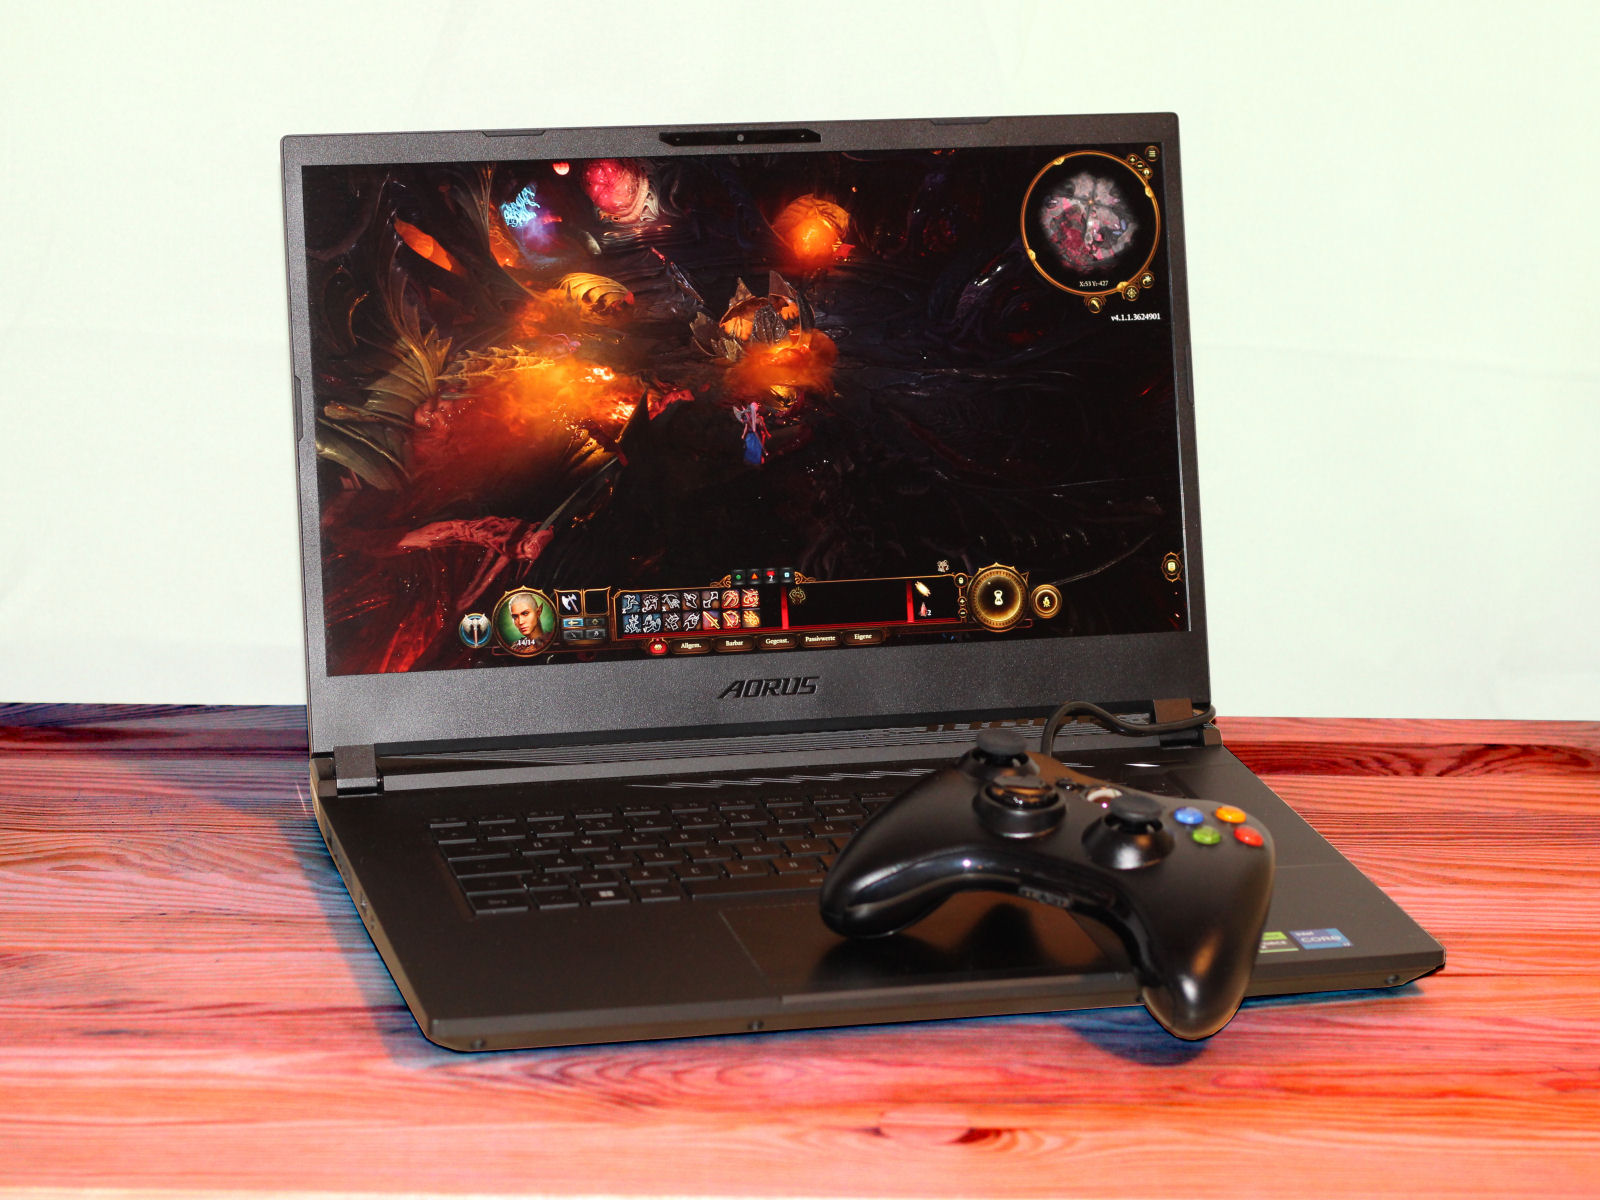
Aorus 15 BSF review: The QHD gaming laptop with an RTX 4070 and great runtimes
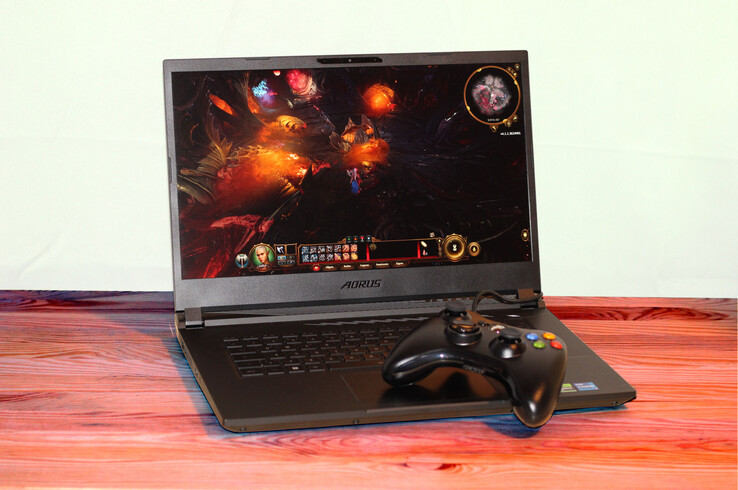
Gigabyte's Aorus 15 BSF is a mid-range 15.6-inch gaming laptop that relies on up-to-date hardware: Raptor Lake, Ada Lovelace, DDR5, PCIe 4. The total package is available for around US$1,700. Competitors include the HP Omen Transcend 16, MSI Pulse 17 B13VGK, Lenovo Legion Slim 7i 16 Gen 8, Acer Nitro 16 AN16-41 and the Asus TUF Gaming A16 FA617XS.
Possible competitors compared
Rating | Date | Model | Weight | Height | Size | Resolution | Price |
|---|---|---|---|---|---|---|---|
| 85.7 % v7 (old) | 08 / 2023 | Aorus 15 BSF i7-13700H, GeForce RTX 4070 Laptop GPU | 2.4 kg | 20.9 mm | 15.60" | 2560x1440 | |
| 87.9 % v7 (old) | 08 / 2023 | HP Omen Transcend 16 i9-13900HX, GeForce RTX 4070 Laptop GPU | 2.3 kg | 19.8 mm | 16.00" | 2560x1600 | |
| 86.3 % v7 (old) | 07 / 2023 | MSI Pulse 17 B13VGK i7-13700H, GeForce RTX 4070 Laptop GPU | 2.7 kg | 27.2 mm | 17.30" | 1920x1080 | |
| 90 % v7 (old) | 07 / 2023 | Lenovo Legion Slim 7i 16 Gen 8 i9-13900H, GeForce RTX 4070 Laptop GPU | 2.1 kg | 19.9 mm | 16.00" | 2560x1600 | |
| 88.1 % v7 (old) | 06 / 2023 | Acer Nitro 16 AN16-41 R7 7735HS, GeForce RTX 4070 Laptop GPU | 2.7 kg | 27.9 mm | 16.00" | 2560x1600 | |
| 86.9 % v7 (old) | 06 / 2023 | Asus TUF Gaming A16 FA617XS R9 7940HS, Radeon RX 7600S | 2.2 kg | 22.1 mm | 16.00" | 1920x1200 |
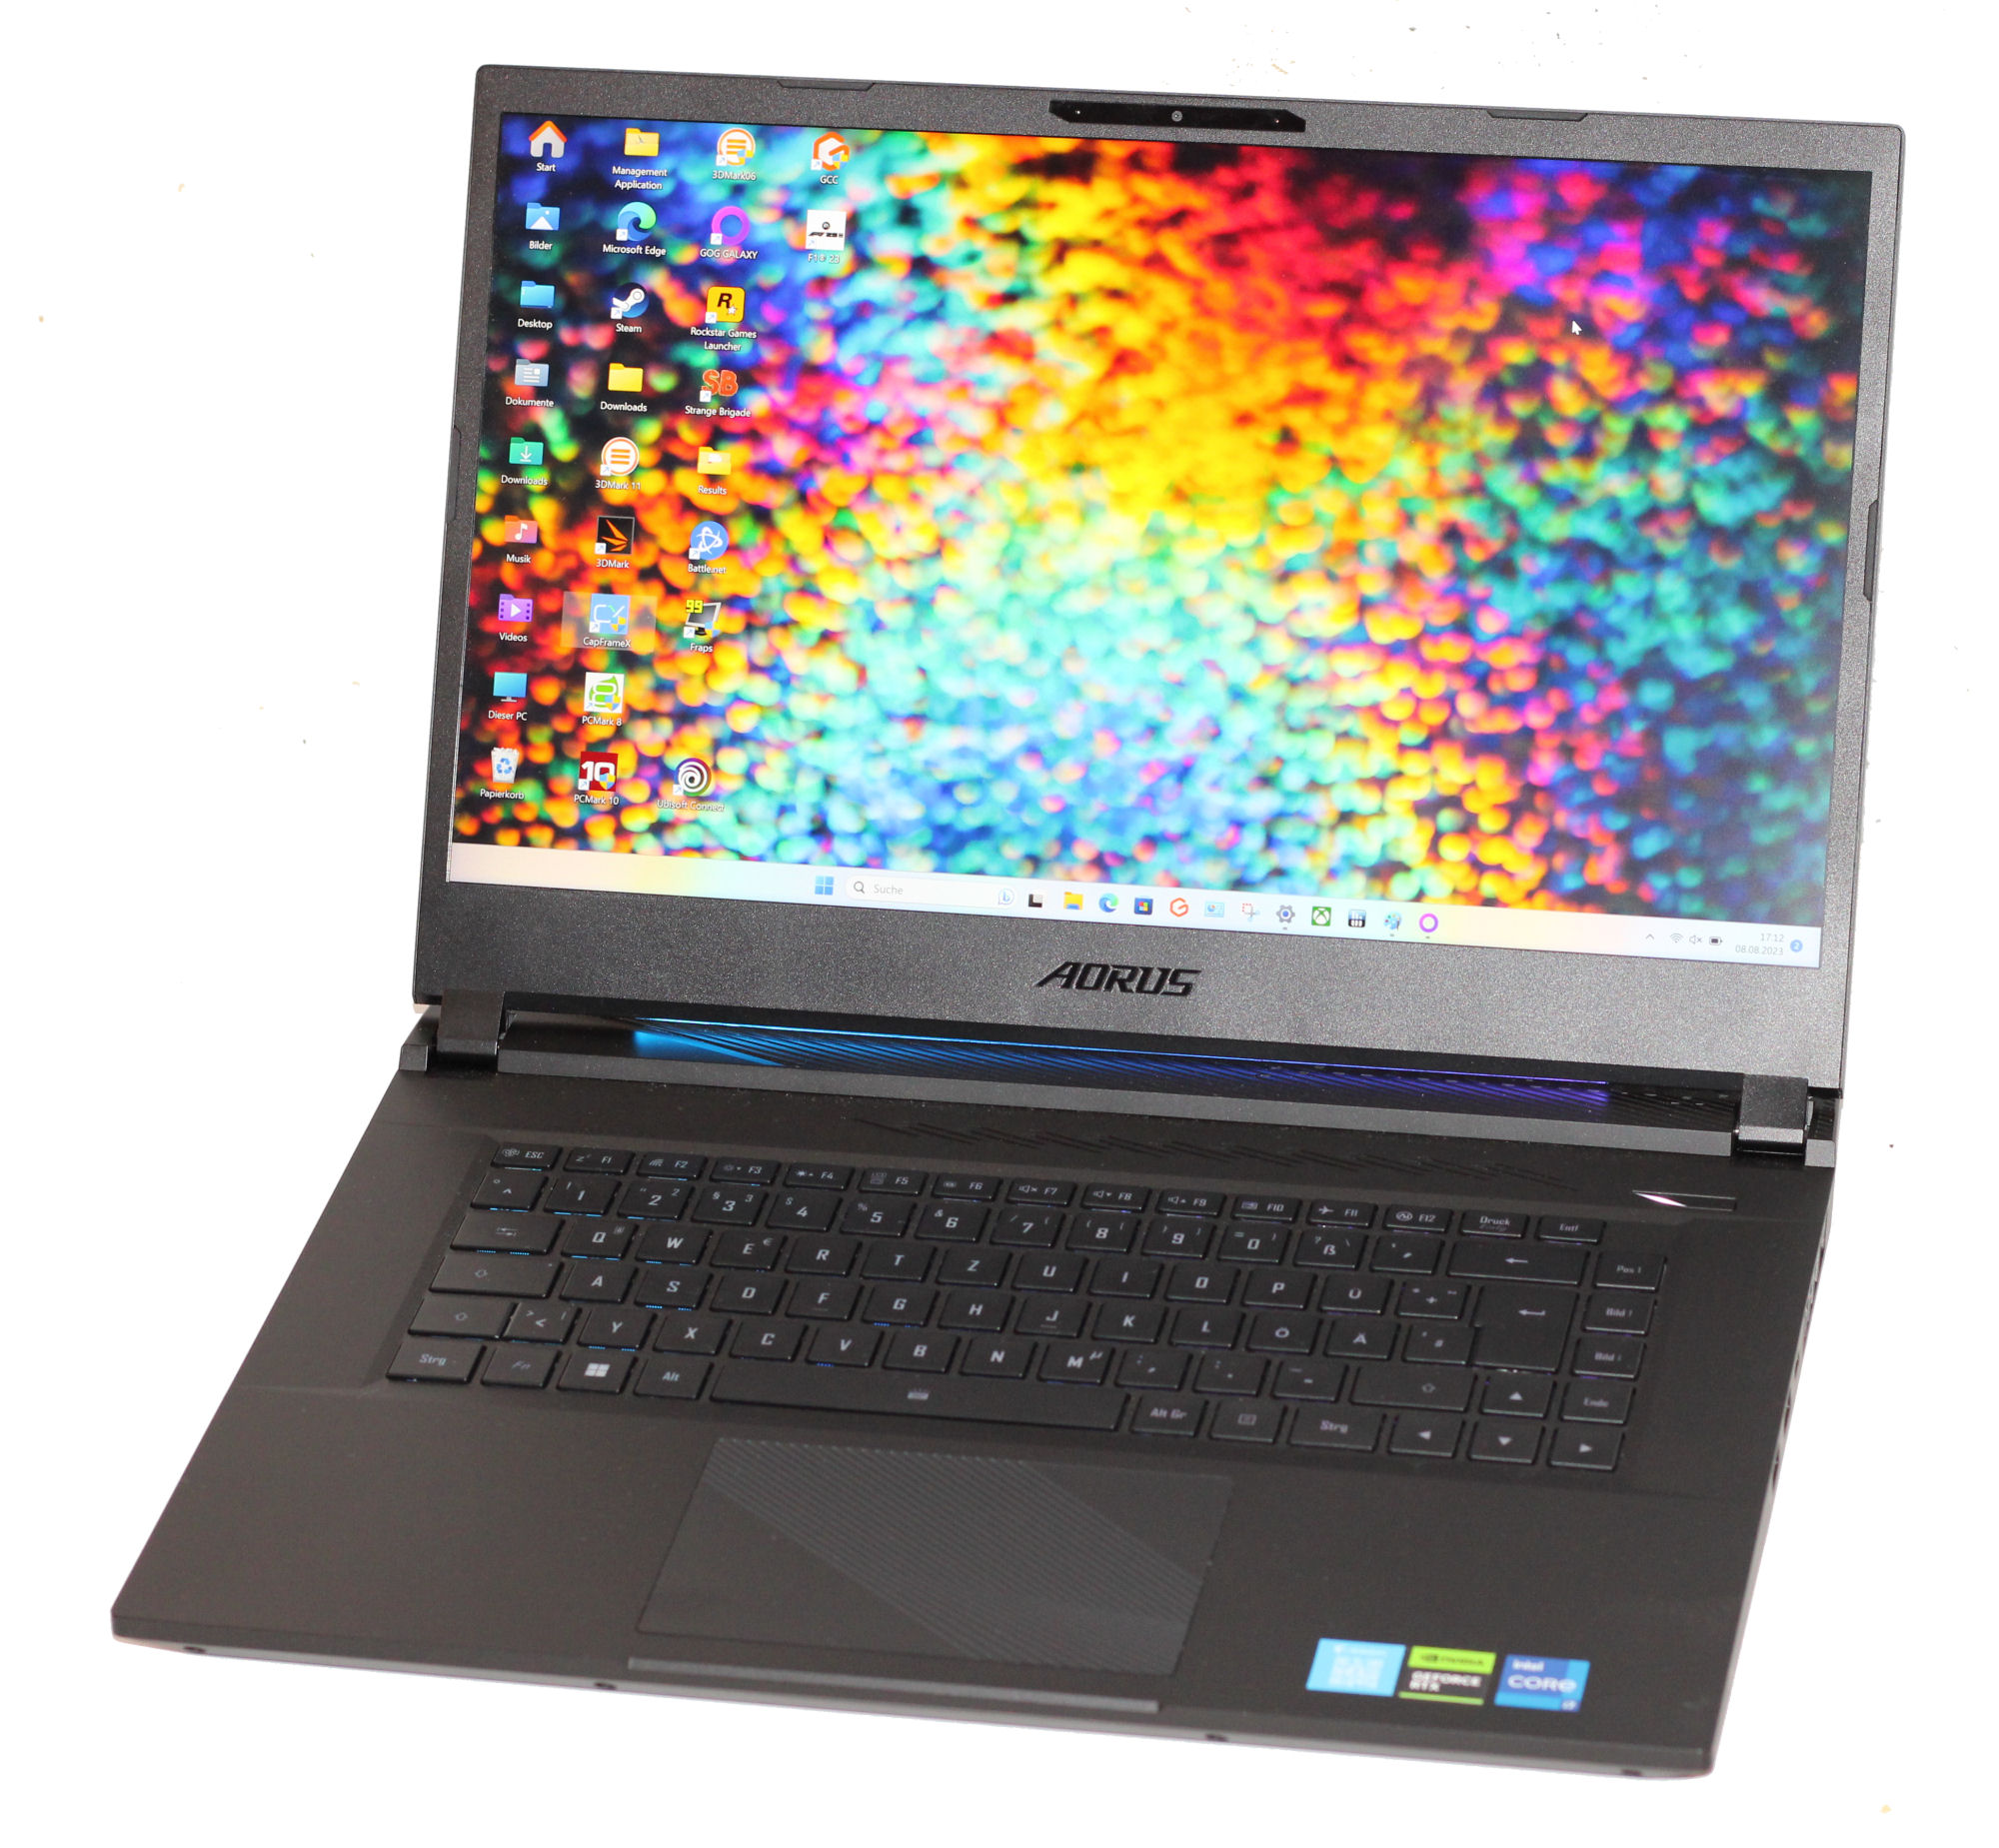
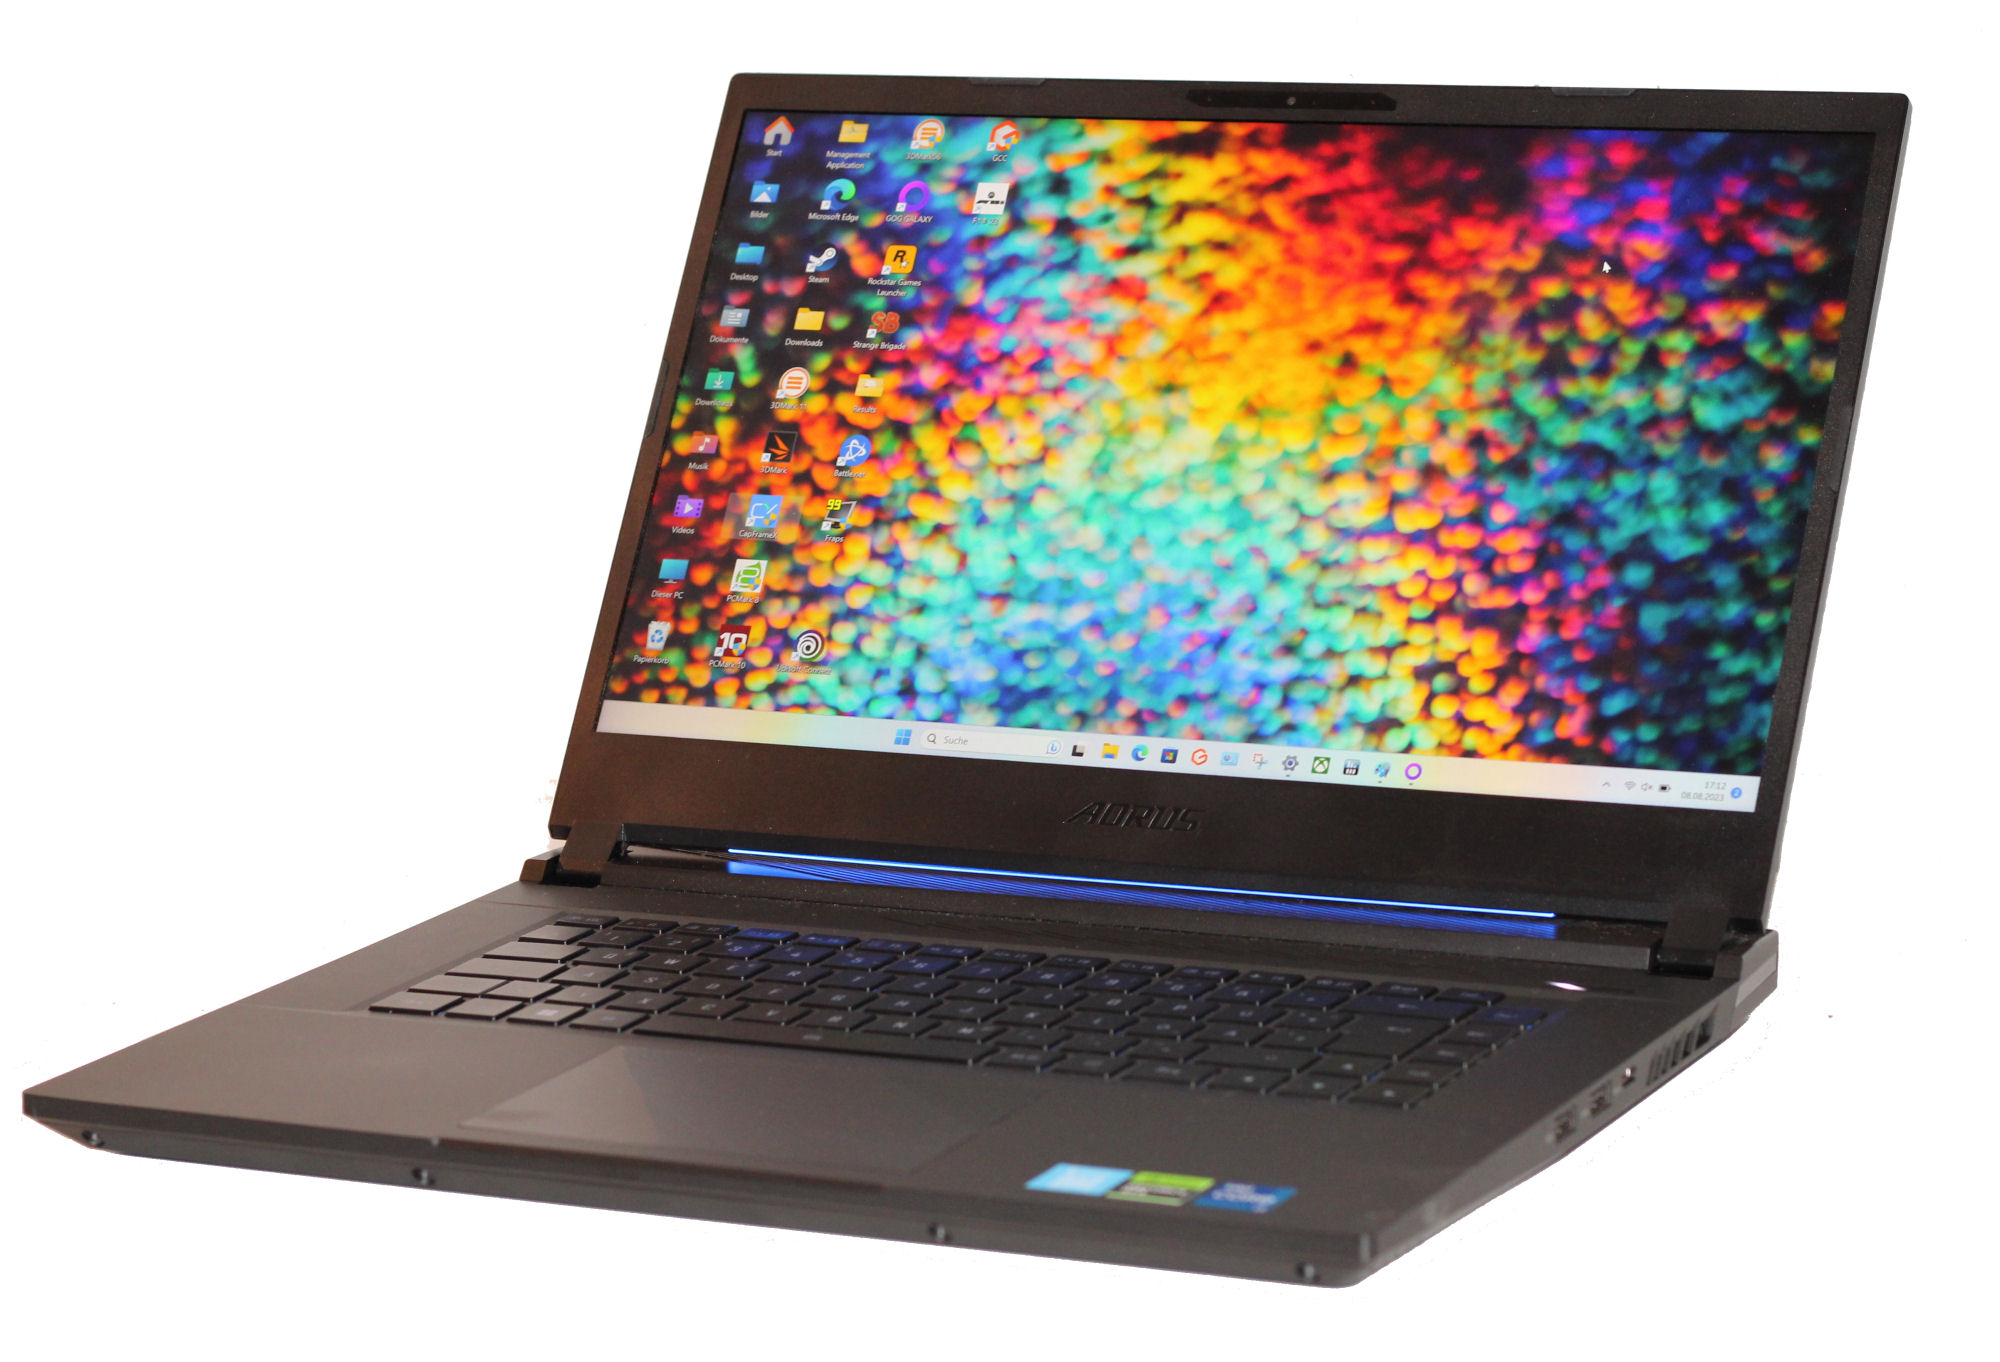
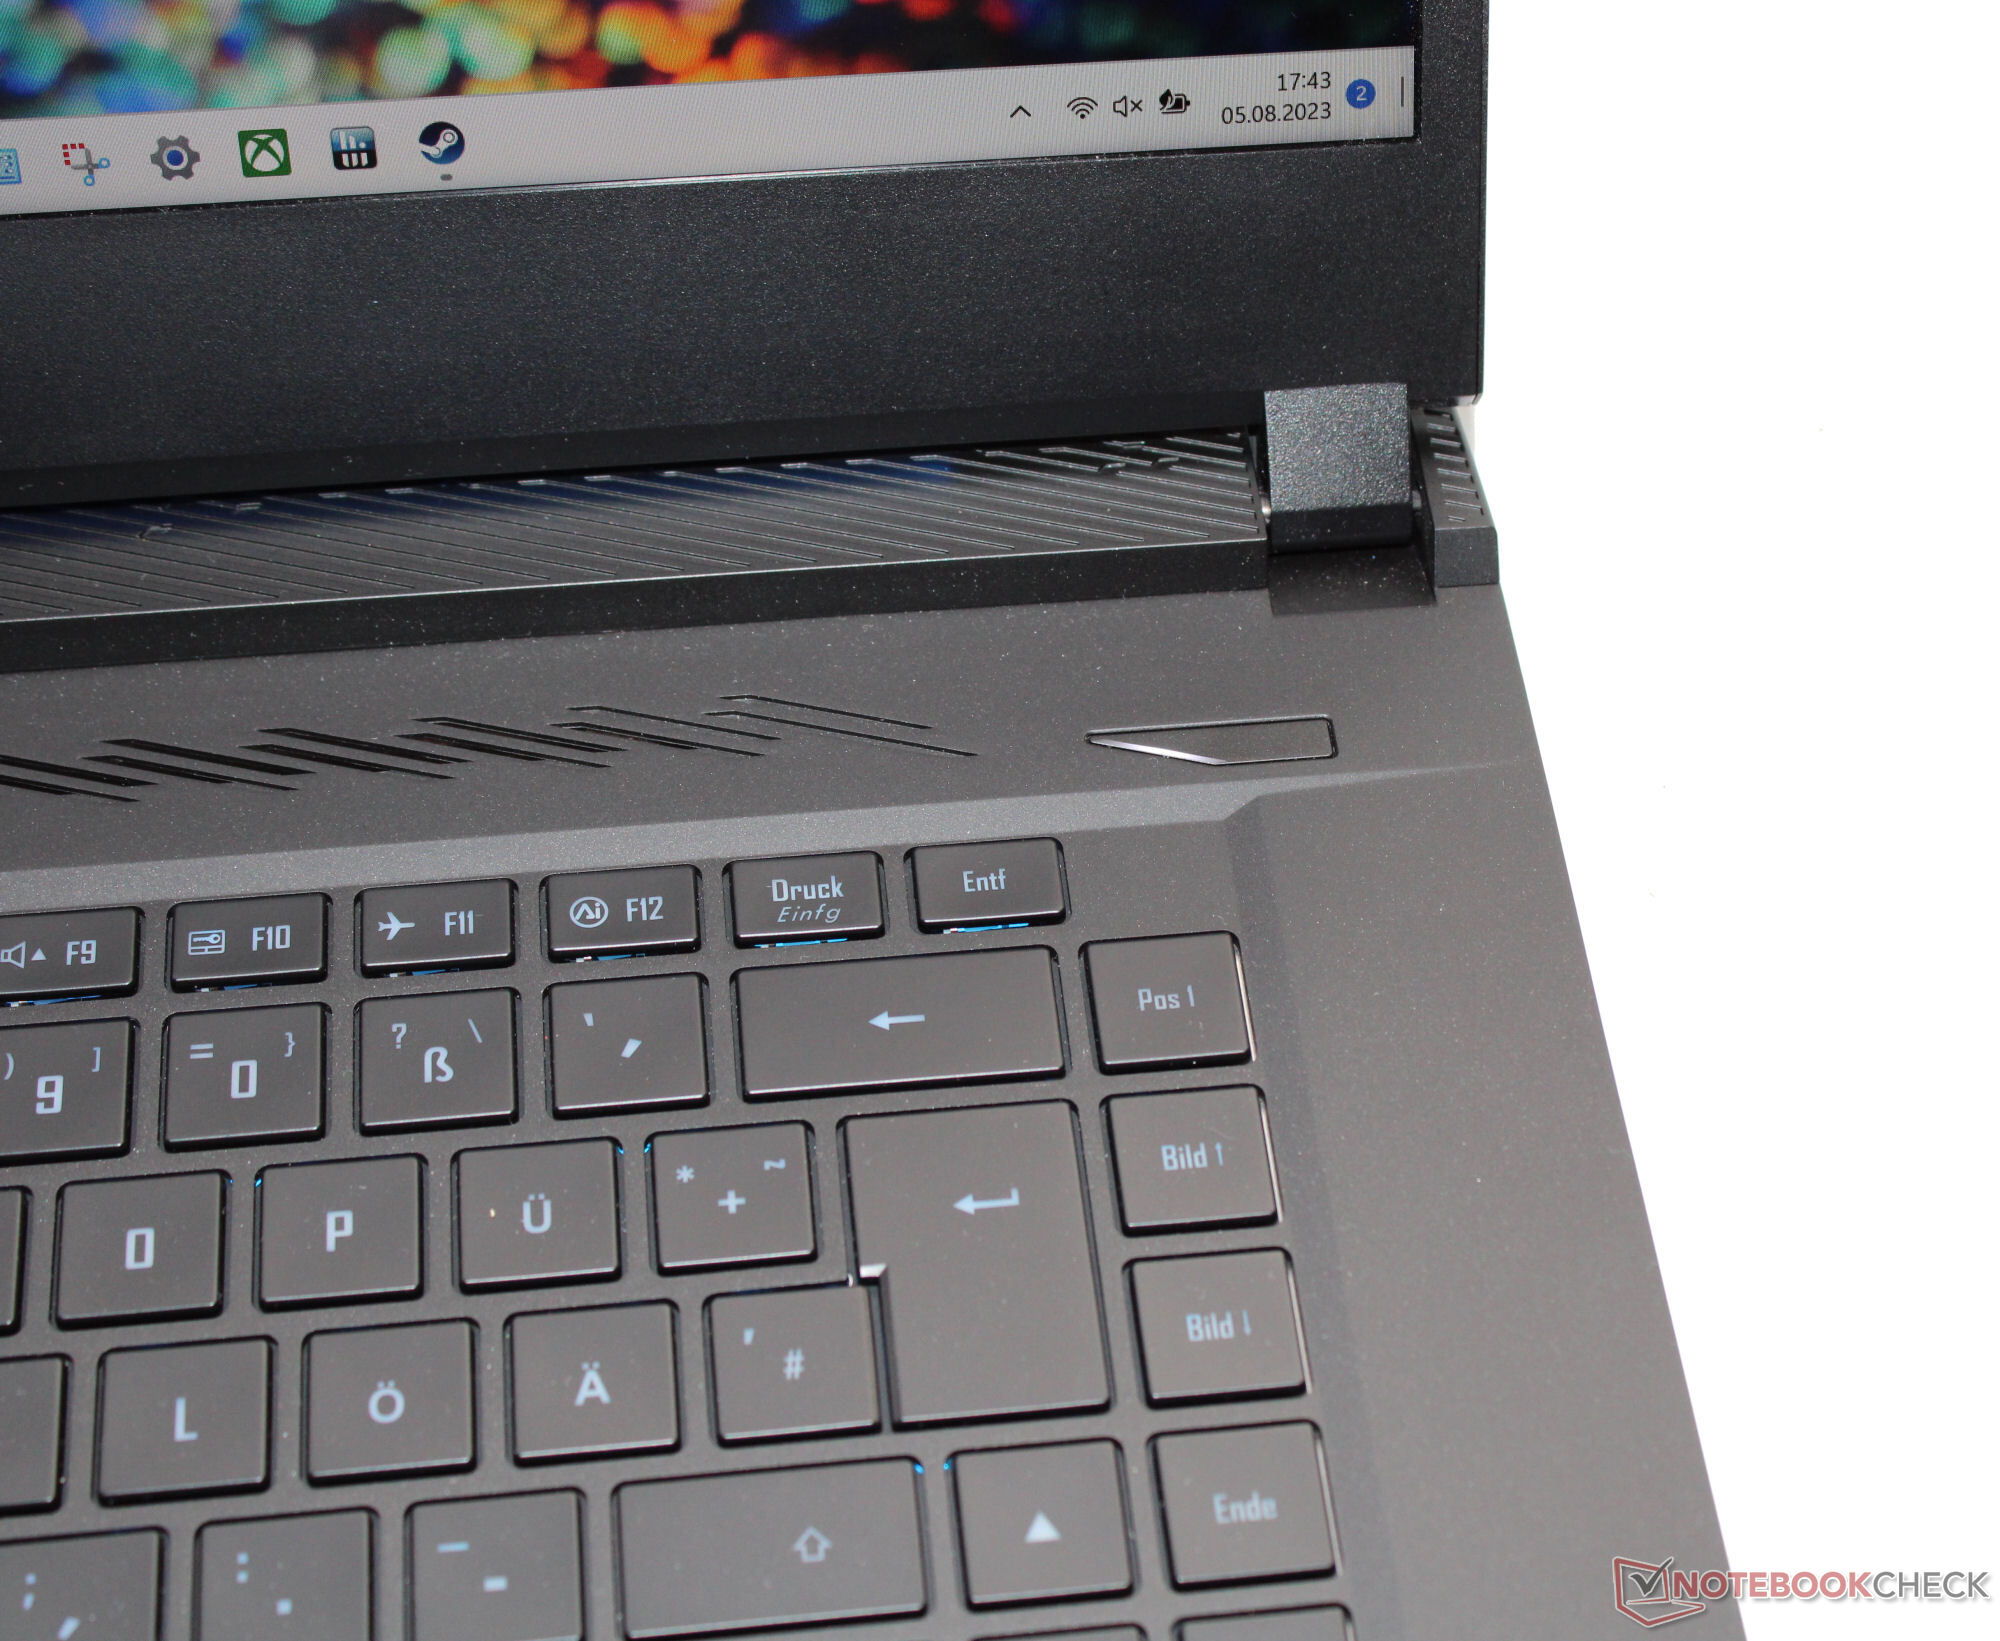
Case - Gigabyte has housed the tech inside a metal case
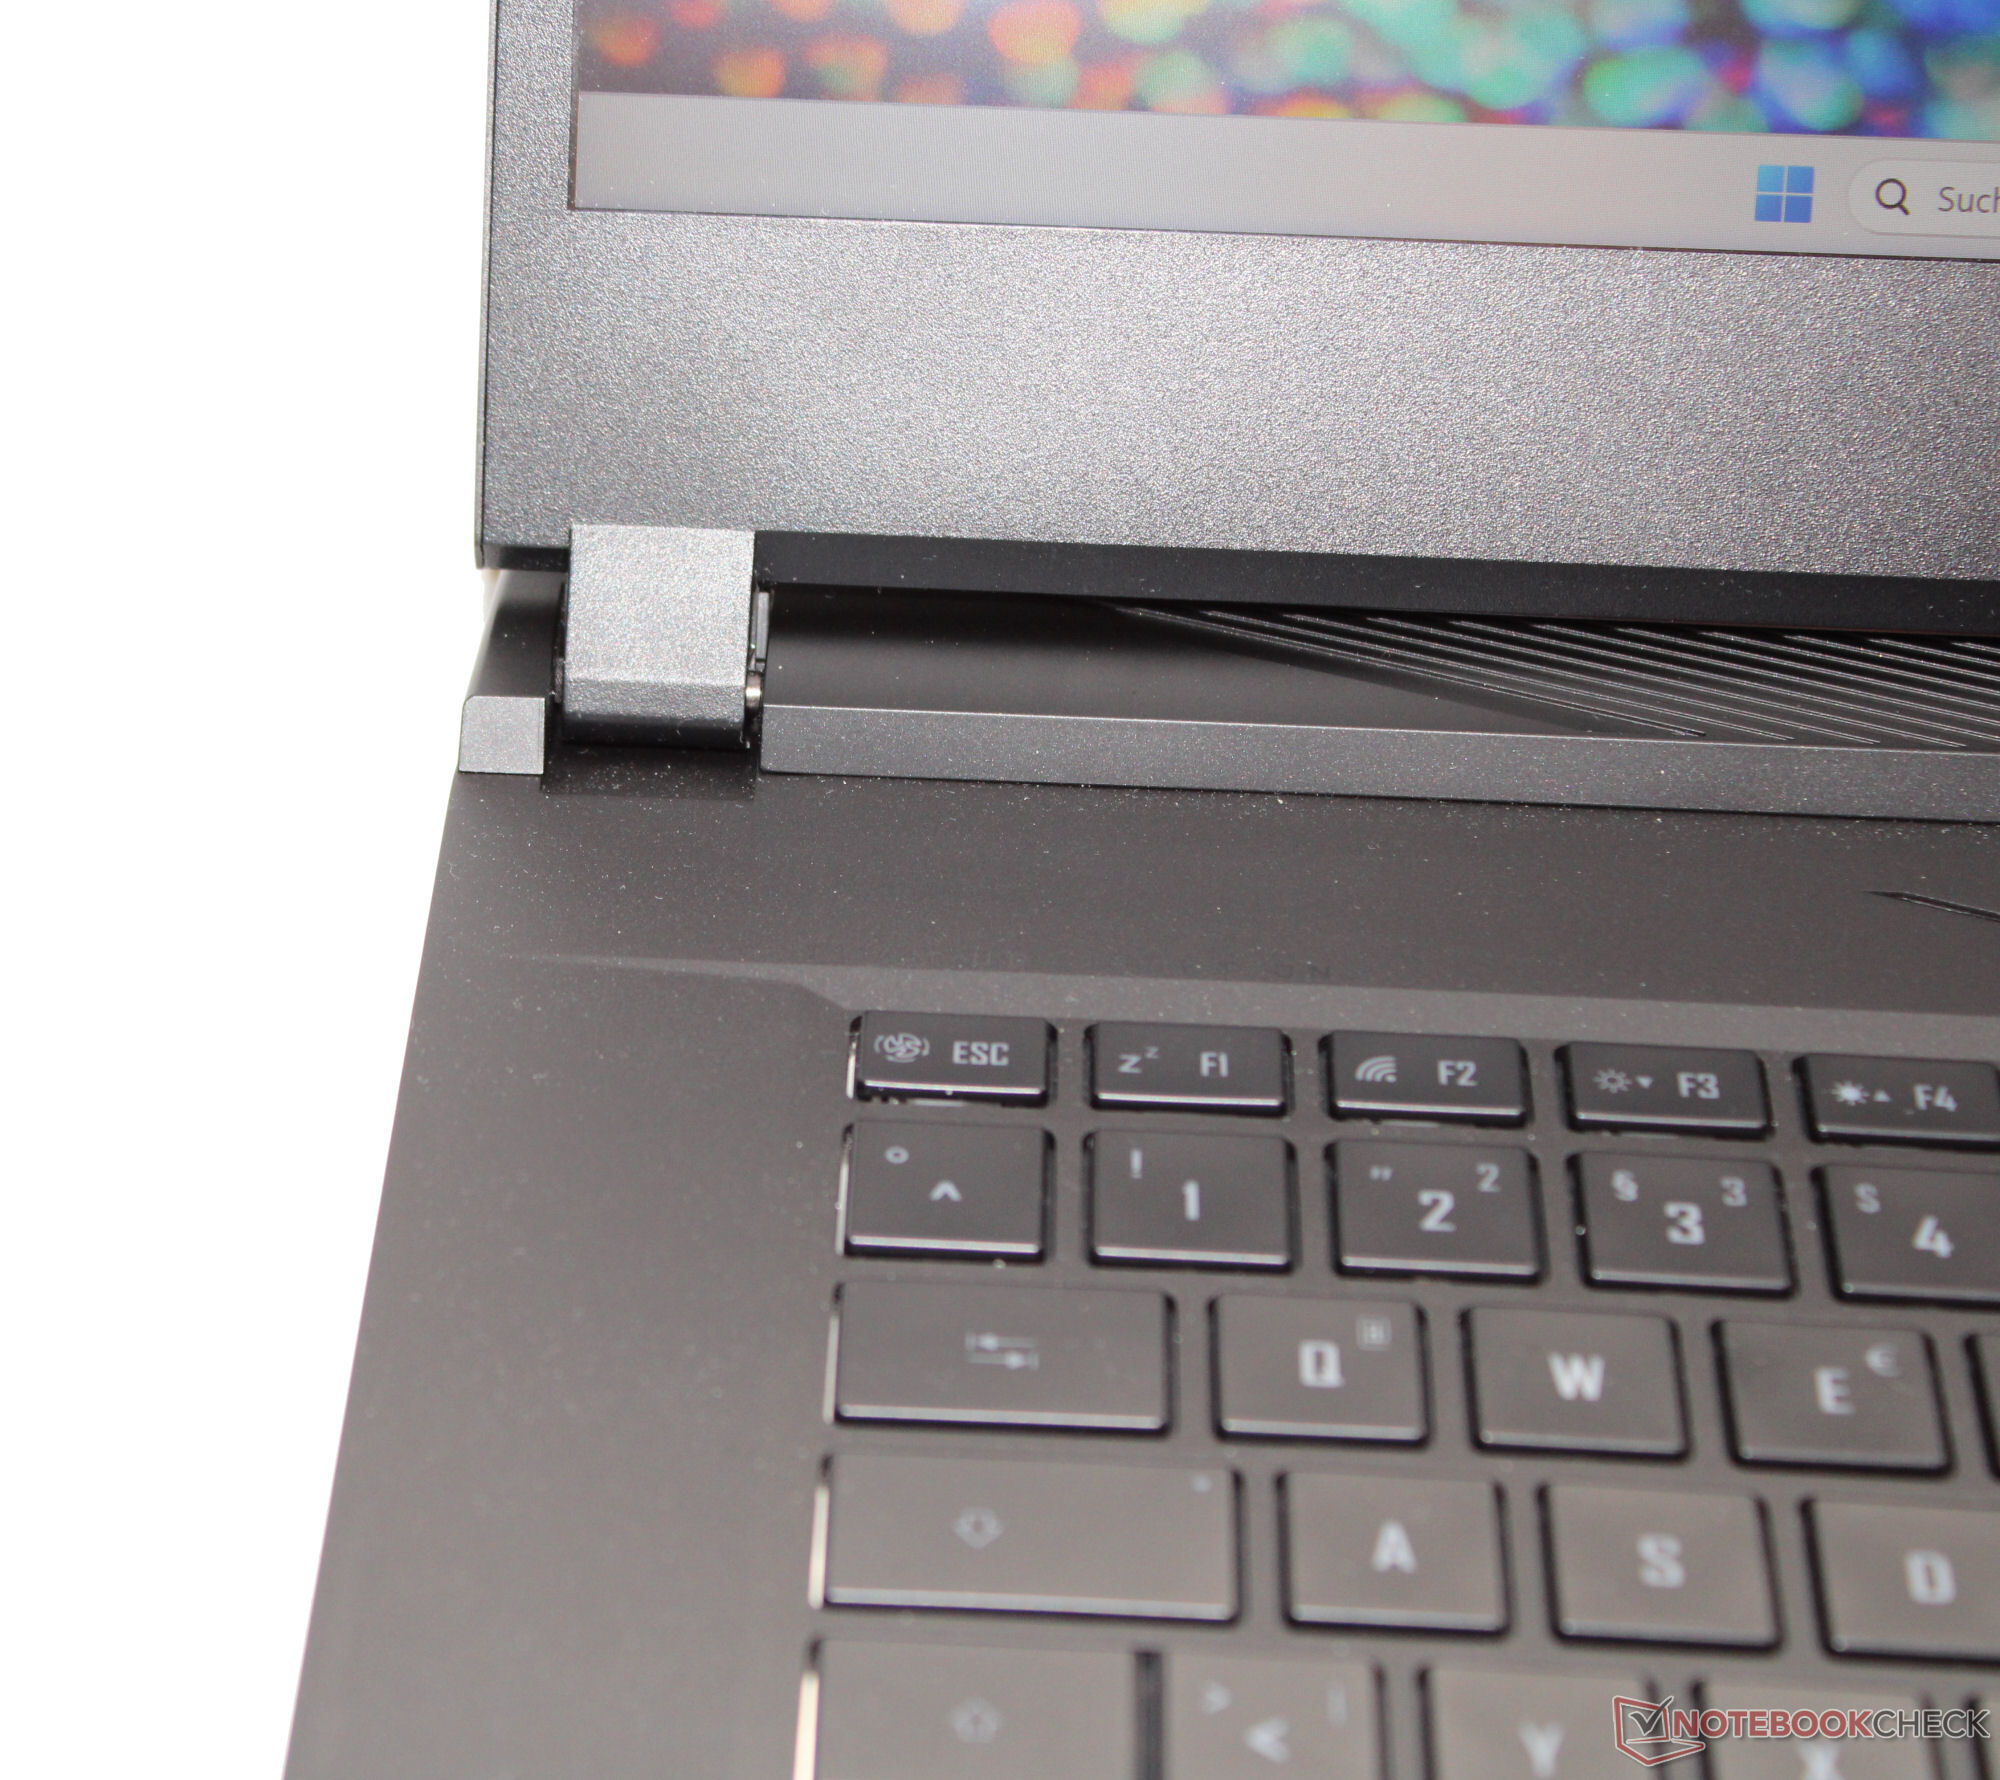
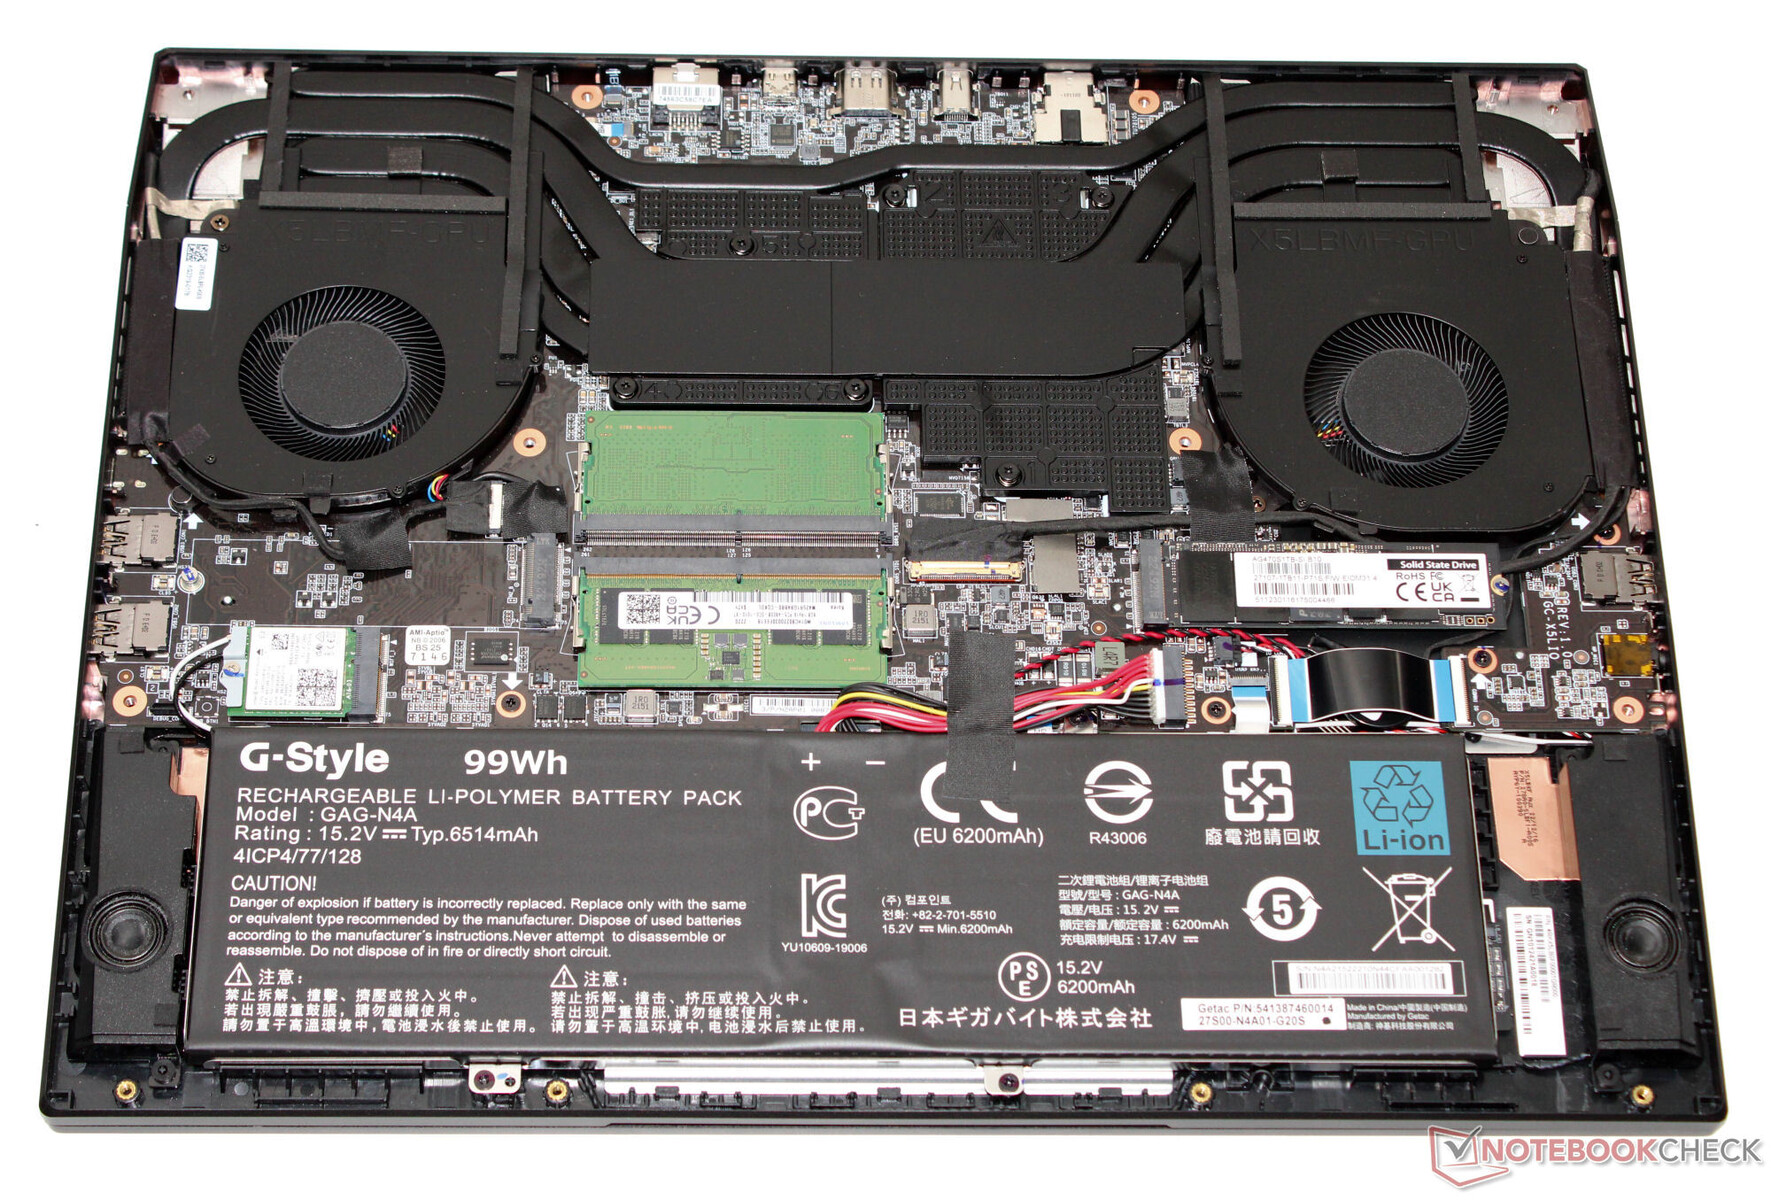
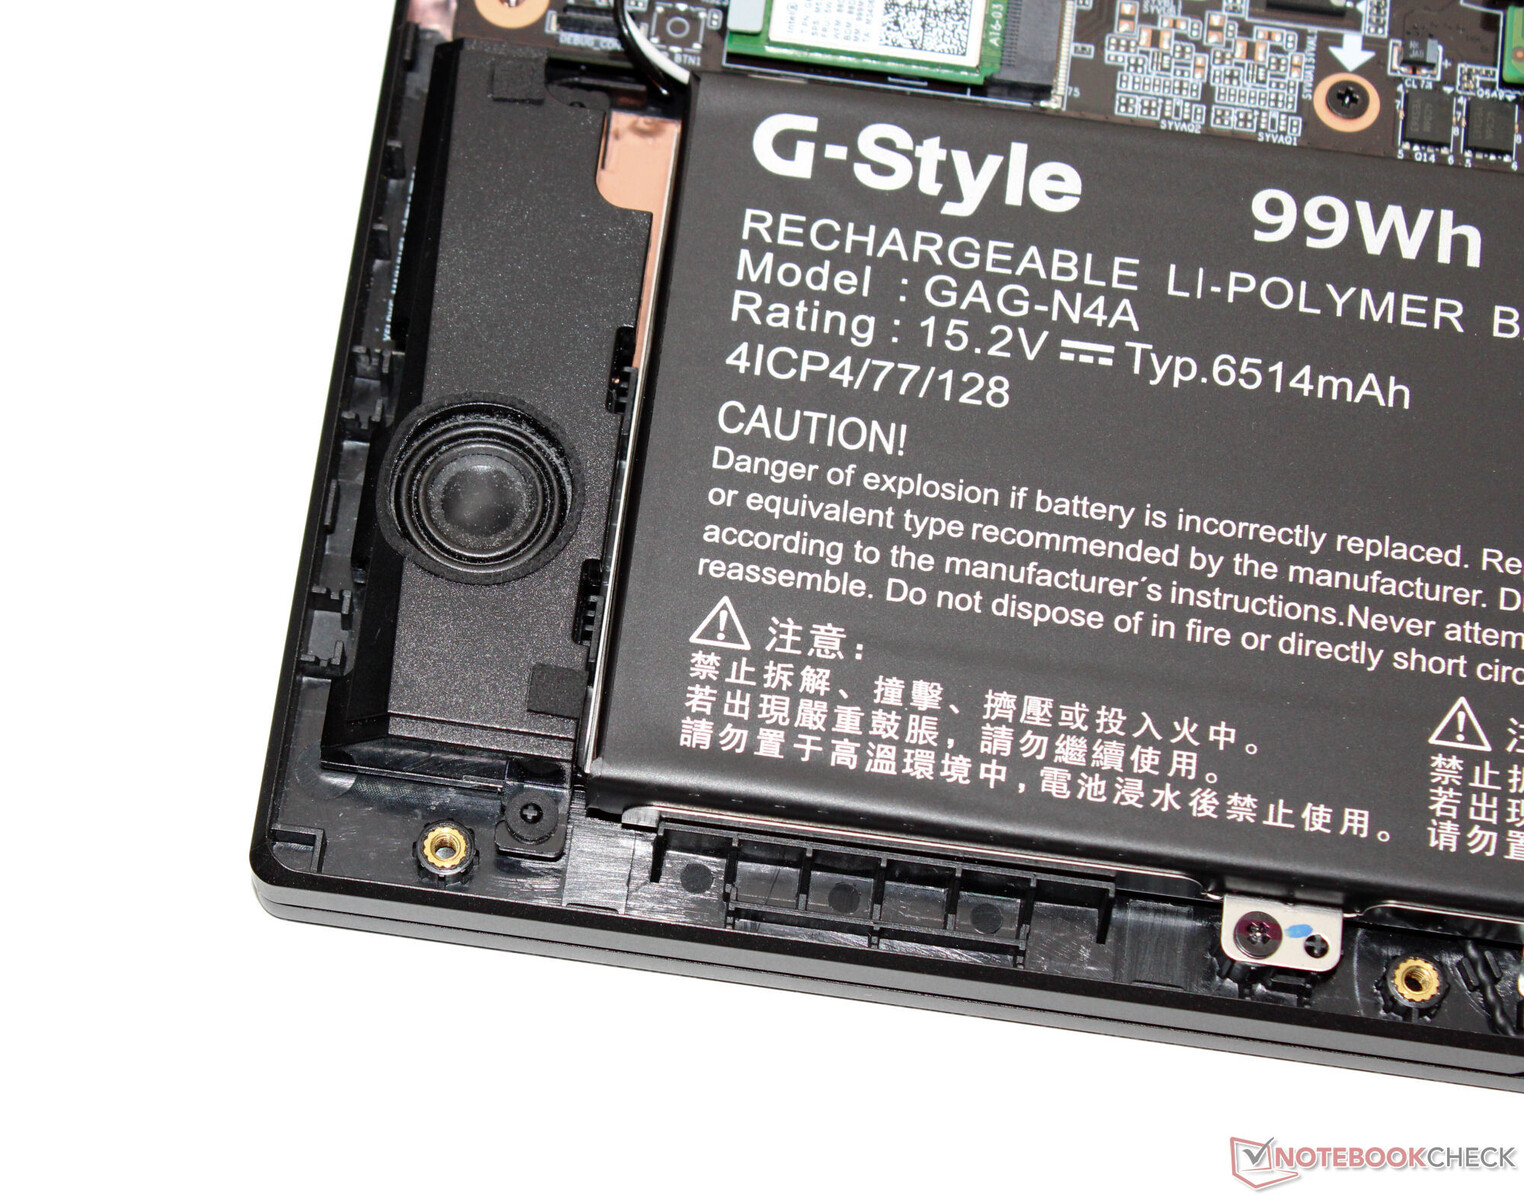
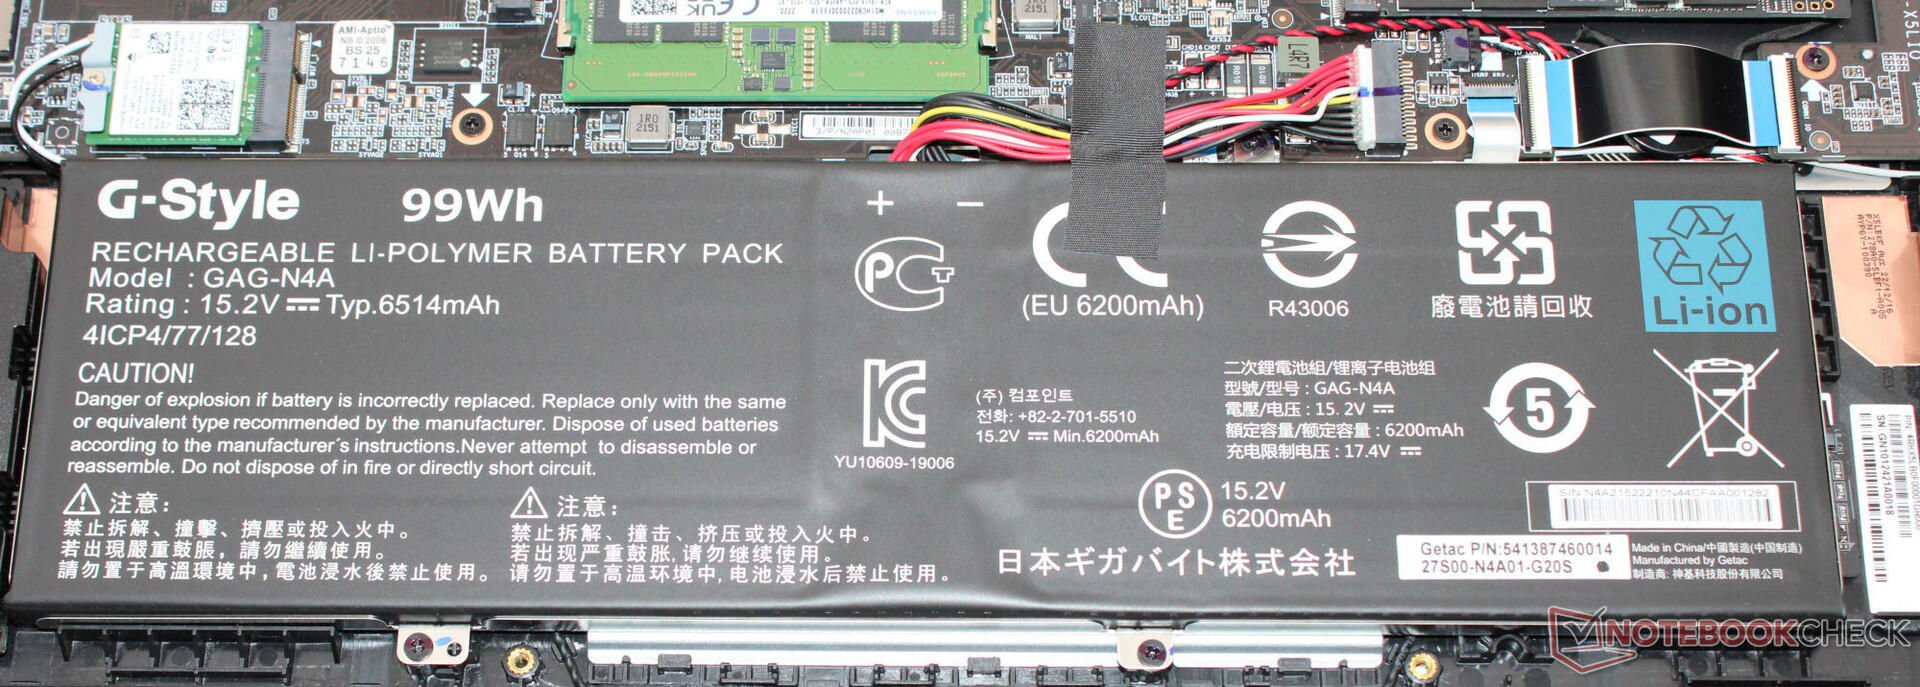
Gigabyte has gone for a black metal case with smooth, matte surfaces. The laptop doesn't feature any extroverted design features. An LED strip attached to the bottom front of the lid (when the laptop is open) brings some color to the device - along with its illuminated keyboard. The battery (screwed in, not glued on) as well as the rest of the laptop's innards can be accessed after removing the bottom of the case.
The laptop doesn't seem to have any design or build flaws. All the gaps line up and there is no material excess to be seen. The base unit can only be slightly twisted - the lid more so. Although: Pressing the back doesn't lead to any changes in picture. The hinges hold the lid securely in position and its maximum opening angle is about 130 degrees. It is possible to open the device with one hand.
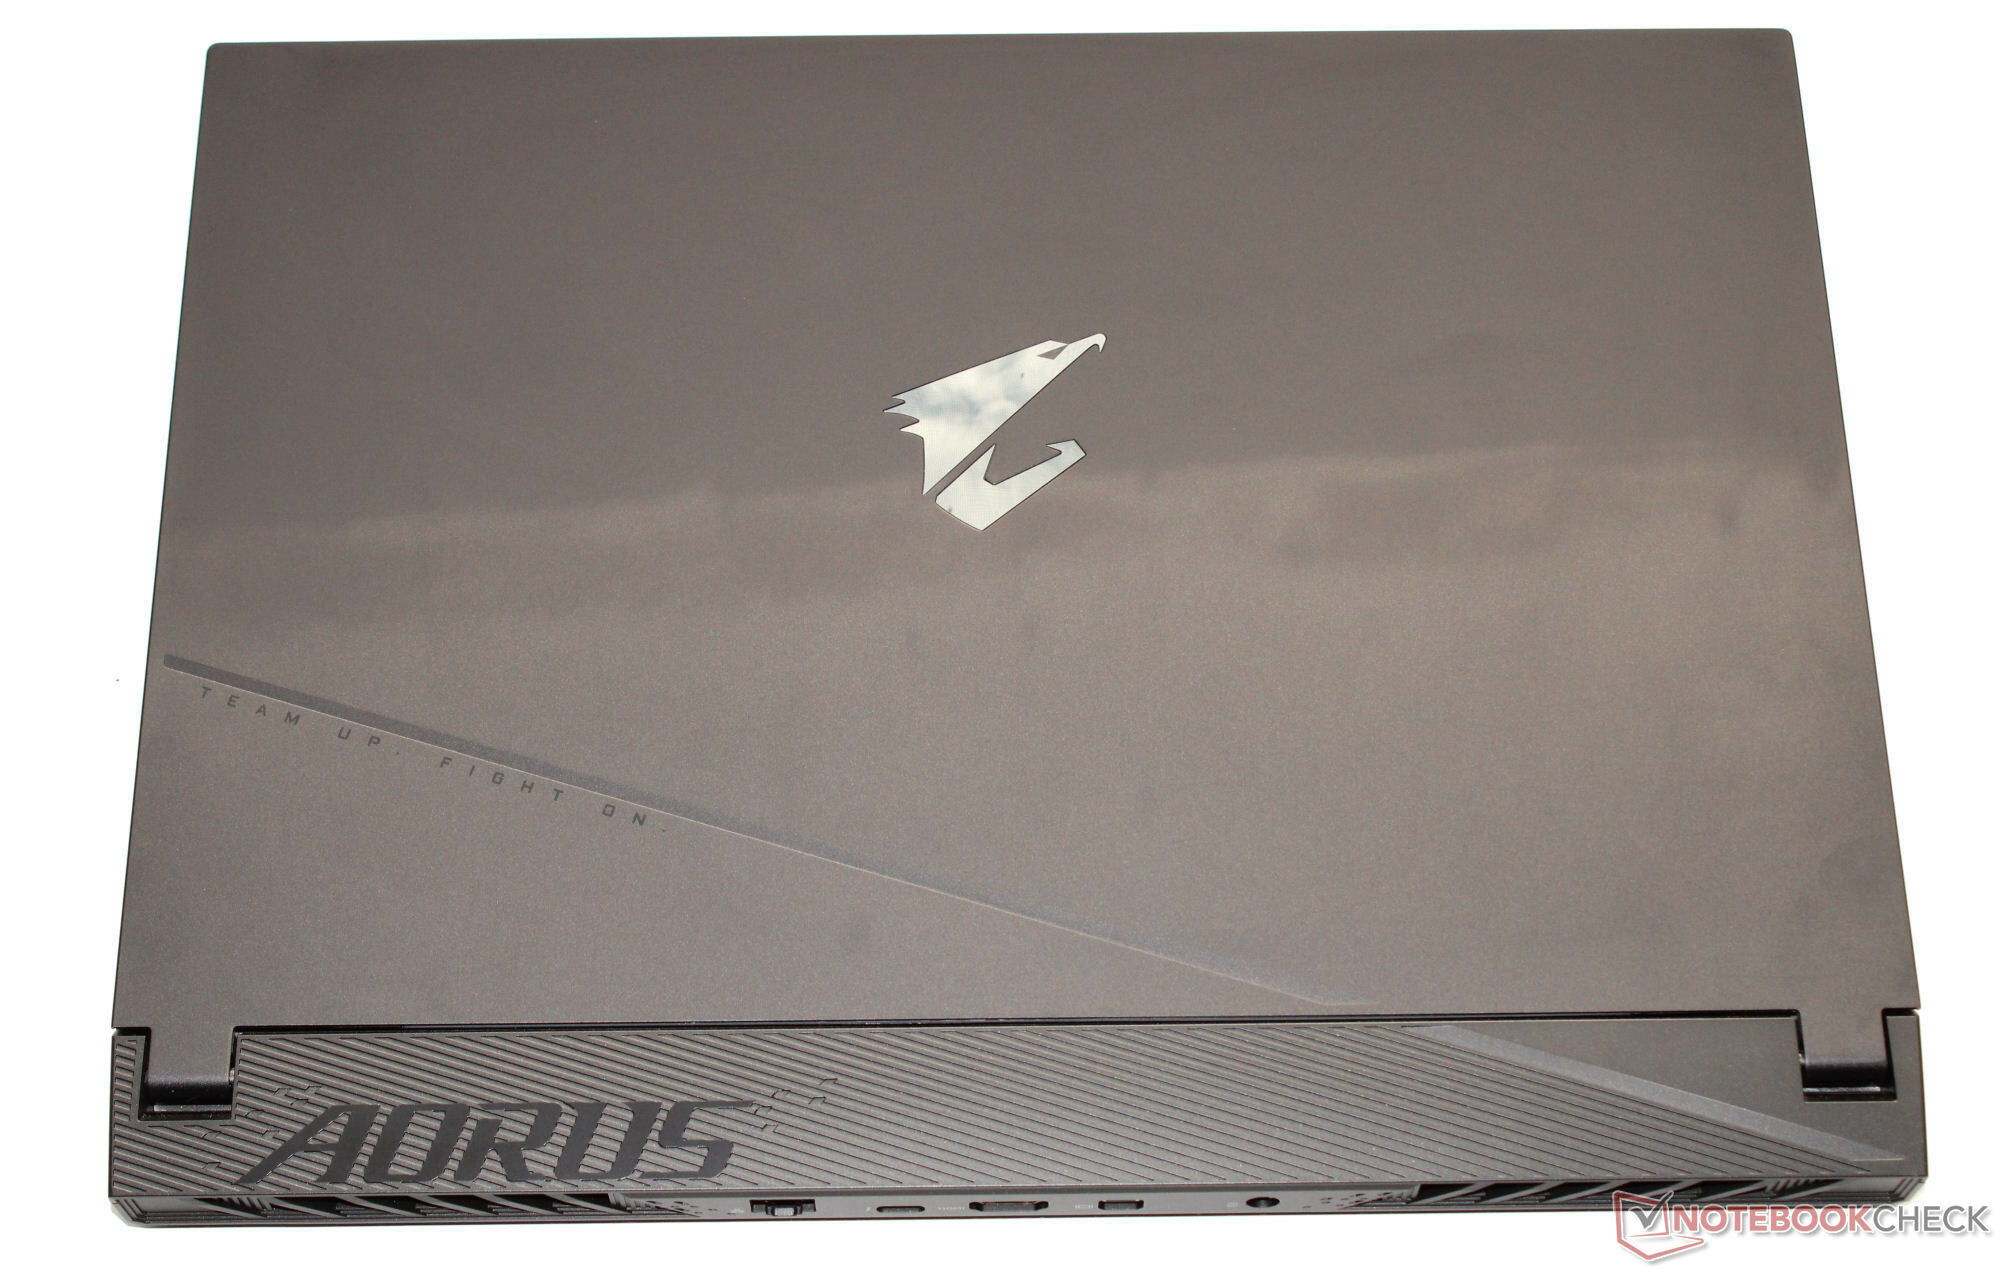

Within the comparison field, the Aorus 15 counts as one of the largest laptops in terms of footprint. Its weight is about average.
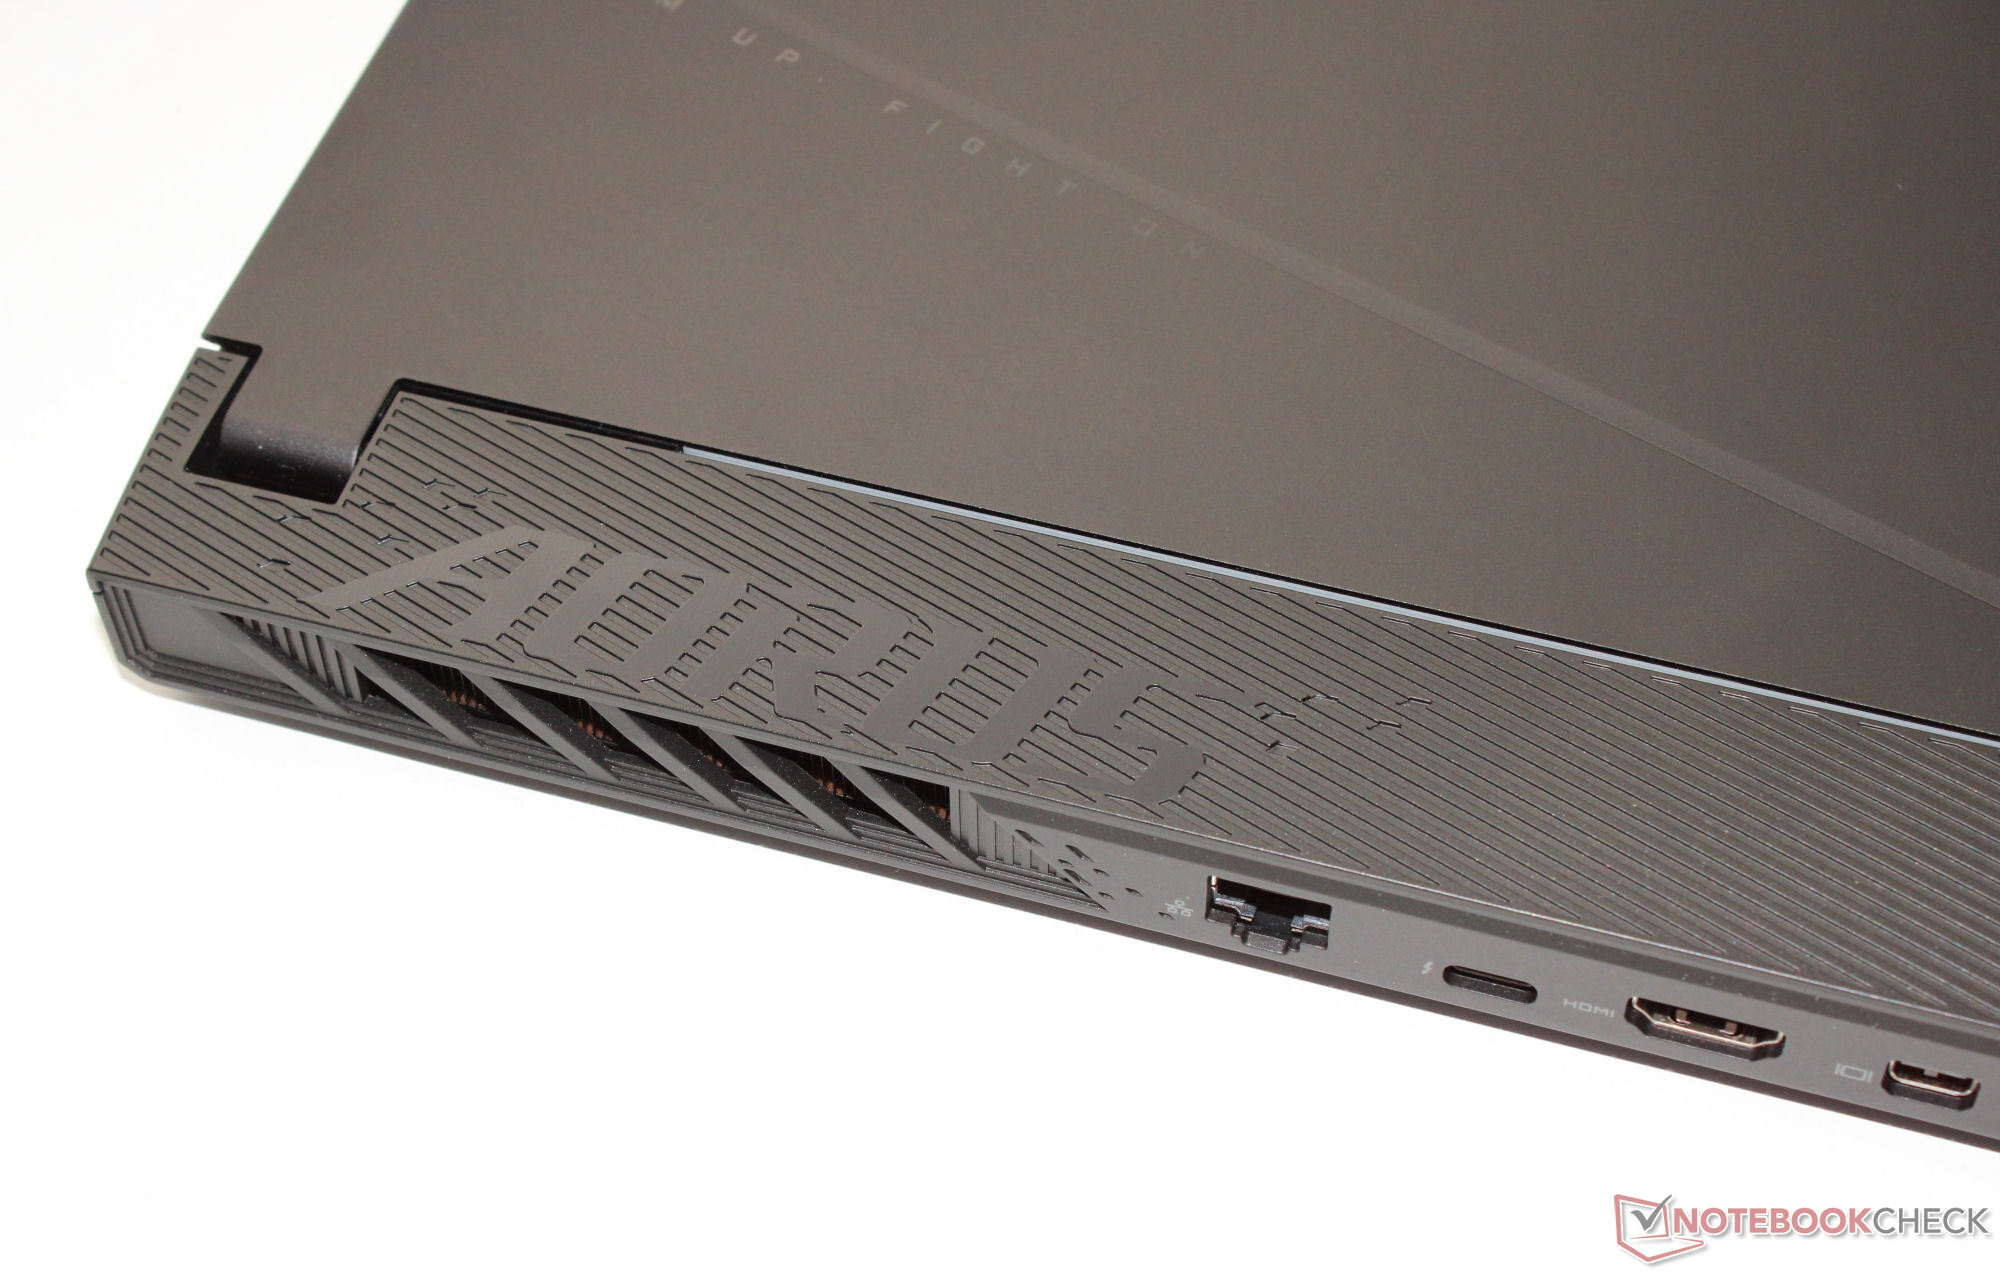
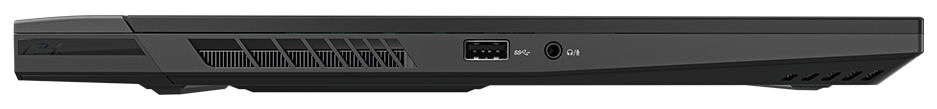
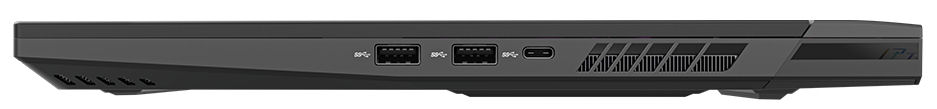
Connectivity - Thunderbolt 4 is included
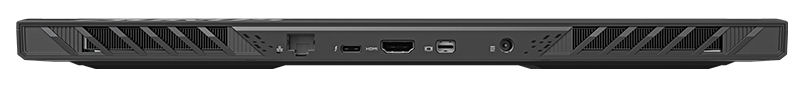
The Aorus features three USB-A ports (2x USB 3.2 Gen 2, 1x USB 3.2 Gen 1) and two USB-C connections (1x Thunderbolt 4, 1x USB 3.2 Gen 2). The TB4 port supports Power Delivery but it can't output a DisplayPort signal. This means it has a total of two video outputs, namely one HDMI port (2.1) and one dedicated Mini DisplayPort (1.4). The laptop doesn't have an SD card reader.
Its video outputs, power connection and Gigabit Ethernet port are all situated on the back of the device, meaning cables all run out the back and will likely not get in your way.
Communication
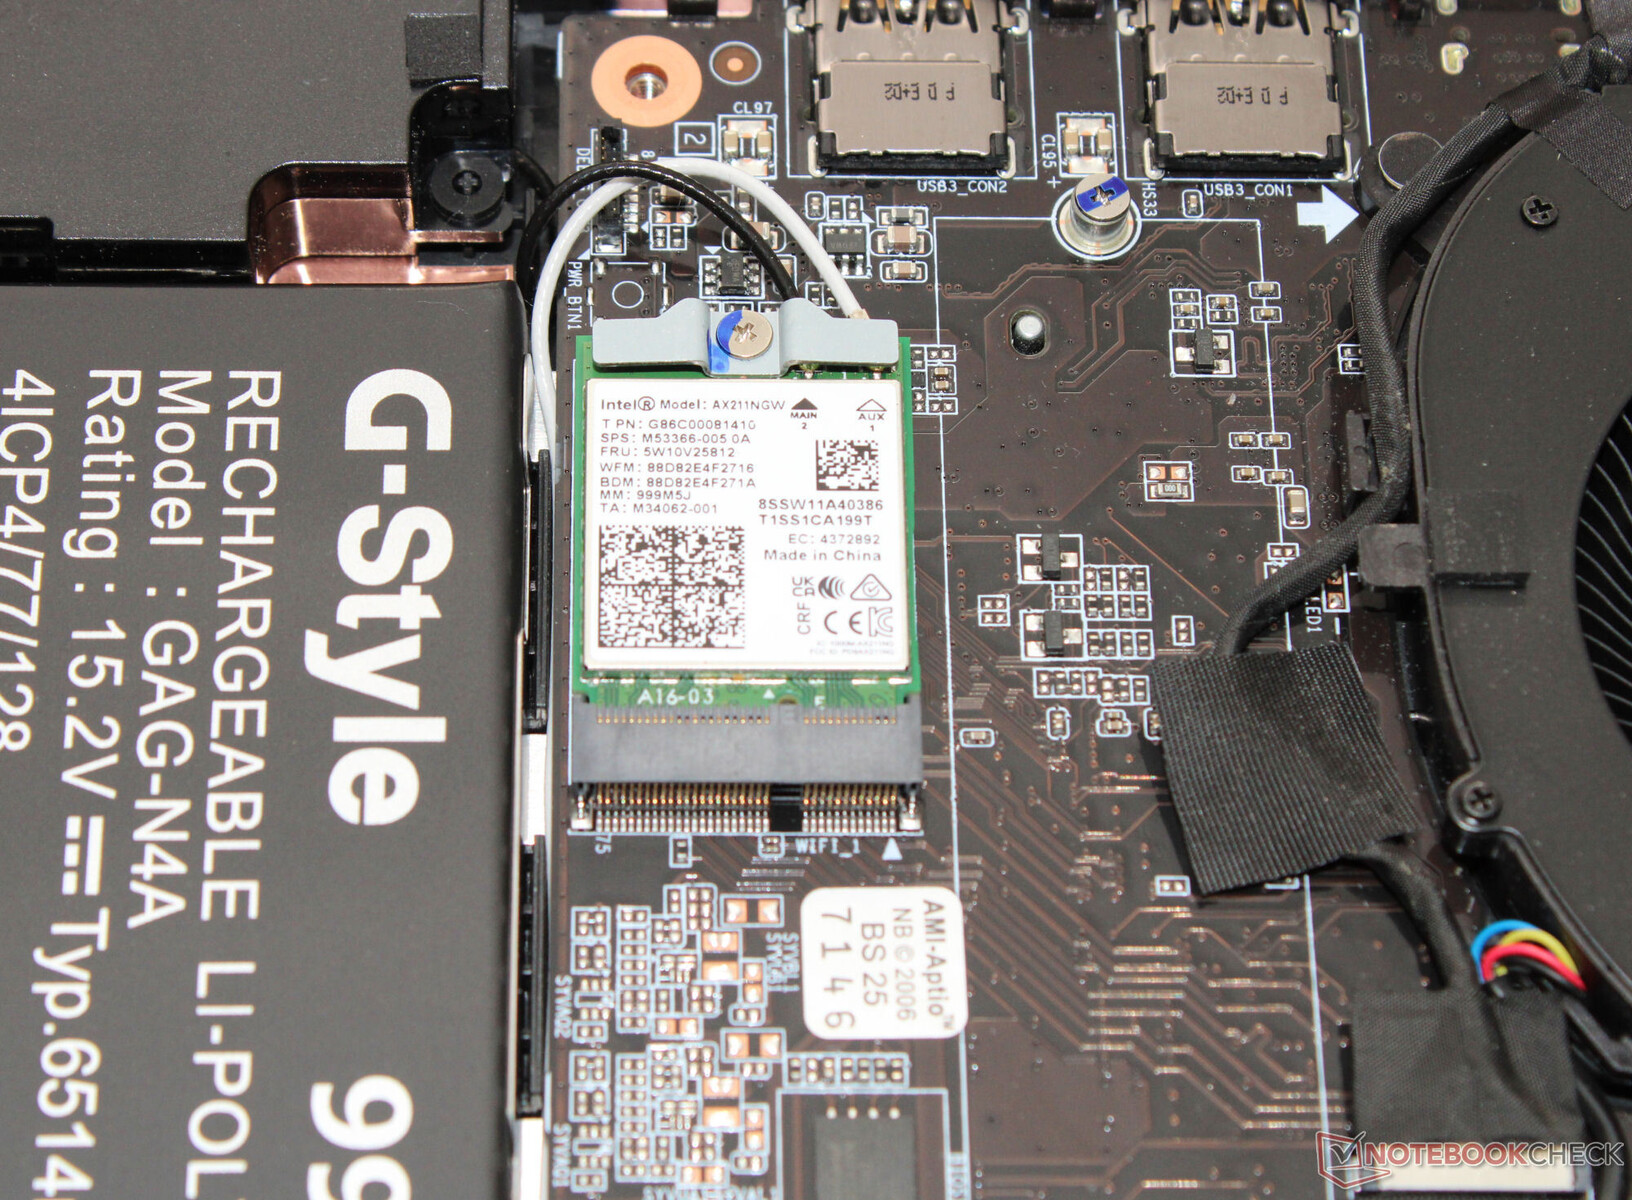
In ideal conditions (no WLAN devices in close vicinity, short distance between laptop and server PC), the laptop achieves excellent WiFi data rates. The device uses a WiFi 6E chip (Intel AX211). Wired connections are taken care of by a controller (RTL8125; 2.5 GBit) from Realtek.
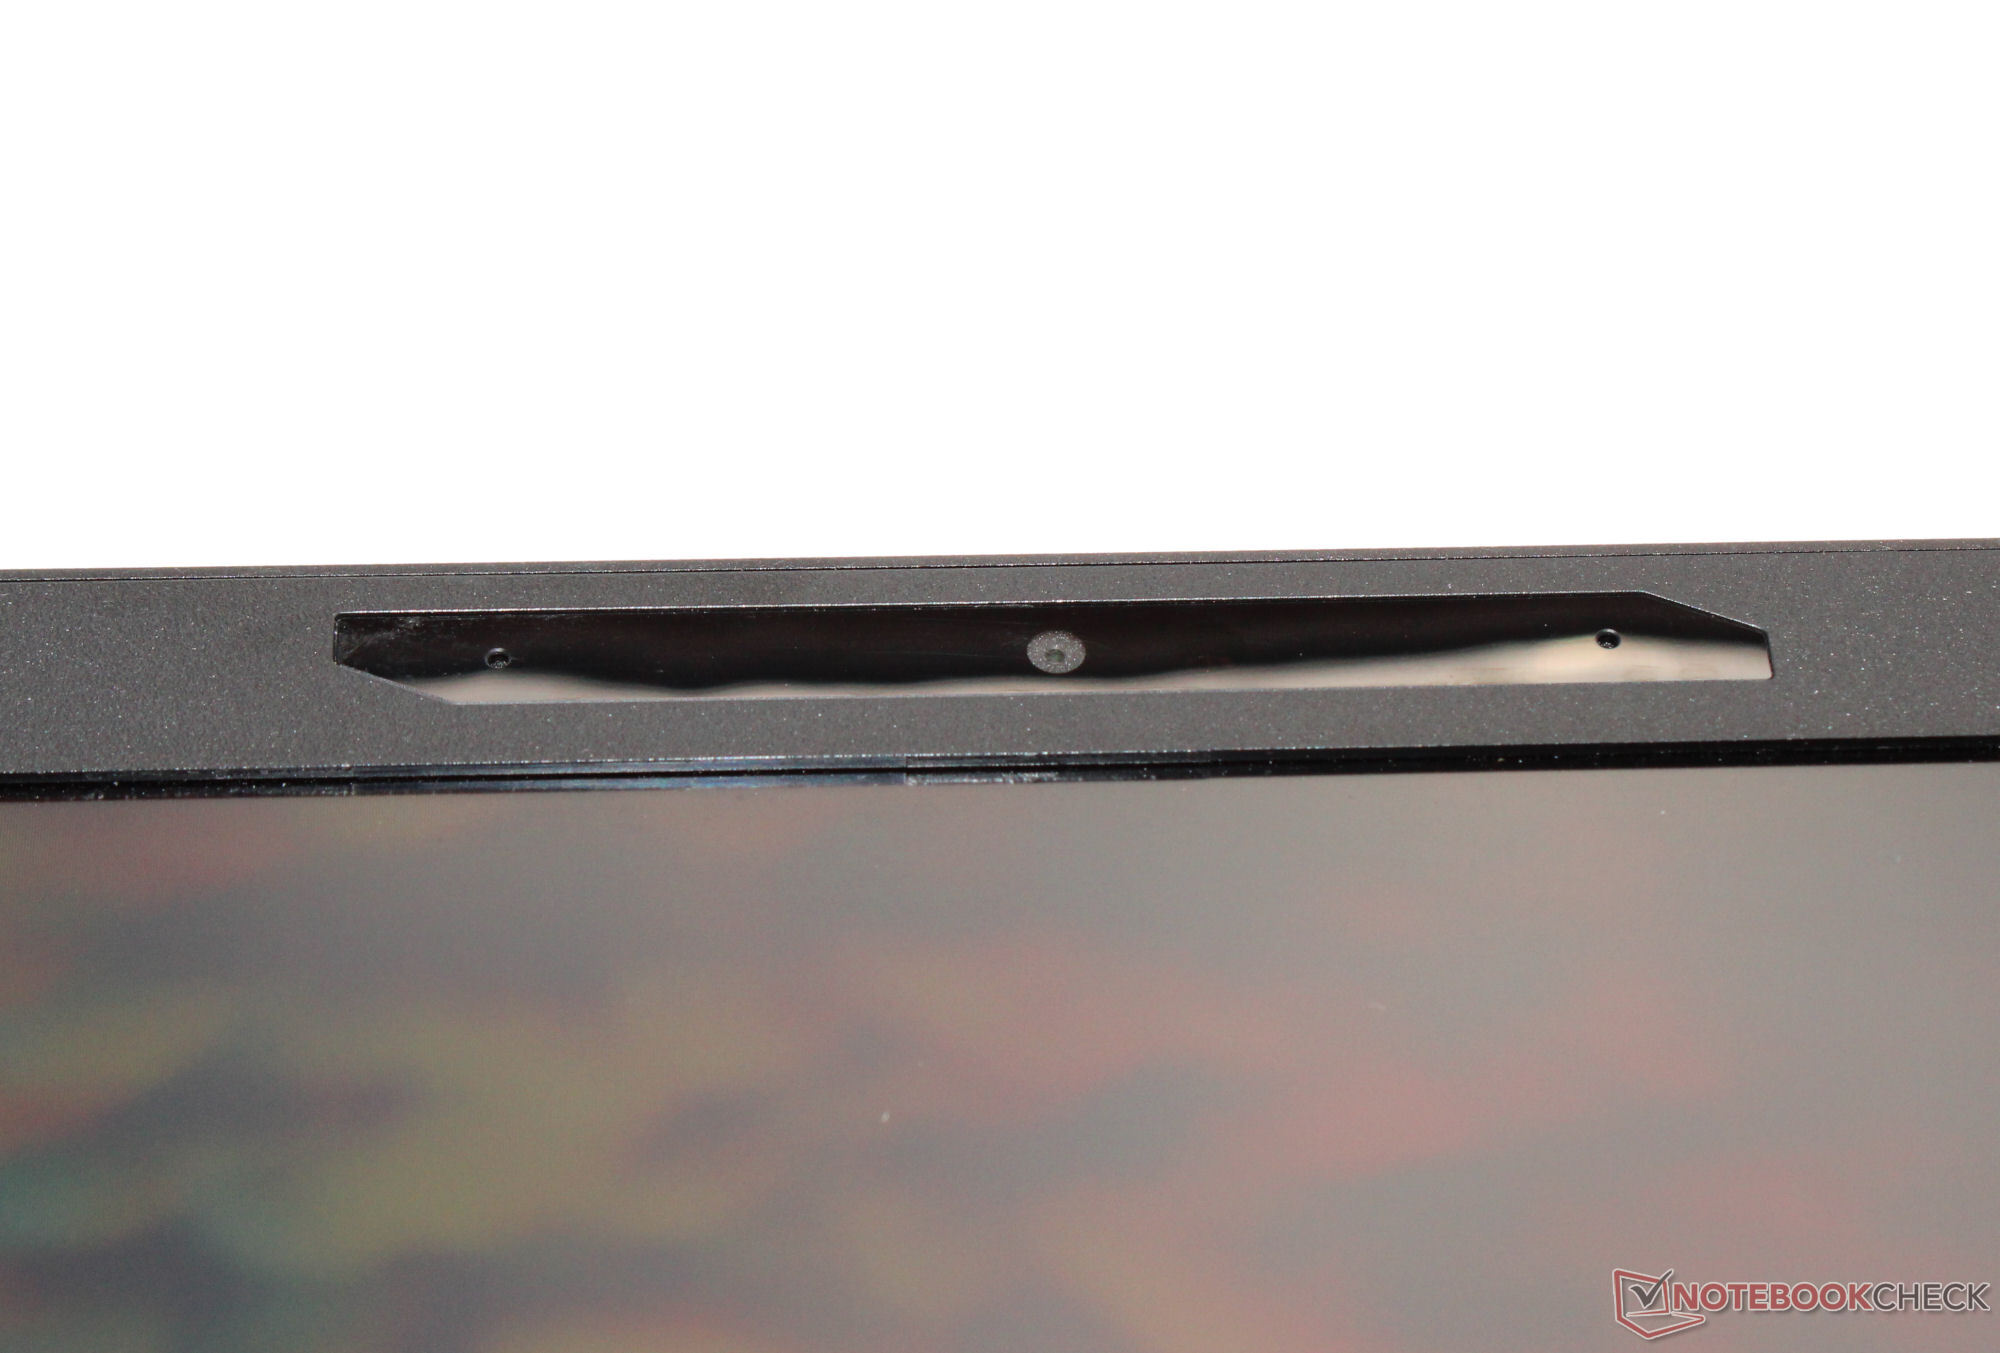
Webcam
The quality of its webcam (2.1 MP, max. 1,920 x 1,080 pixels) doesn't differ compared to the competition. It doesn't feature a mechanical cover.


Accessories
Aside from the usual documents (quick start guide and warranty information), the laptop doesn't come with any additional accessories.
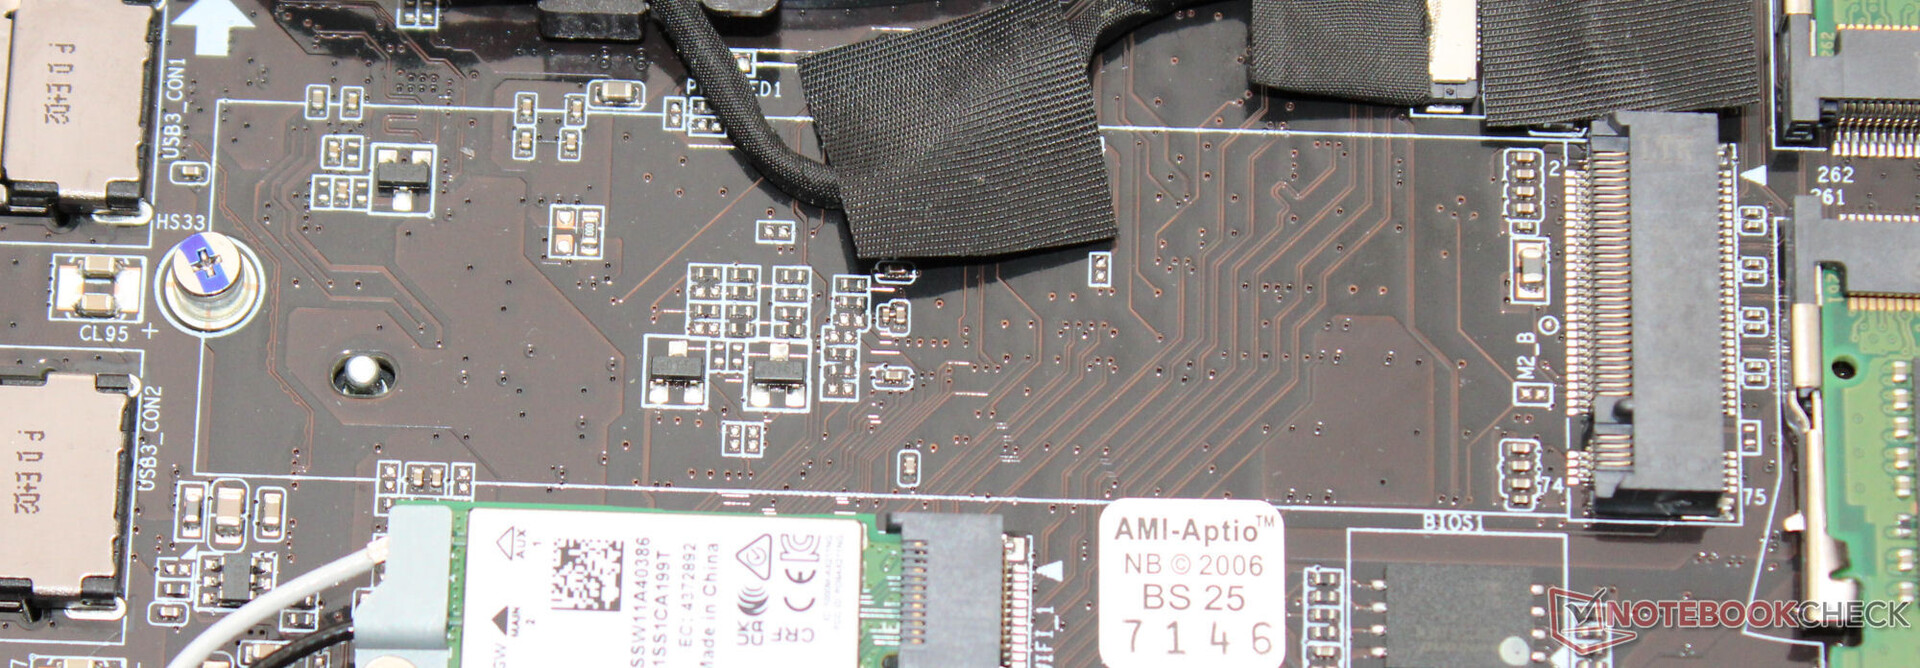
Maintenance
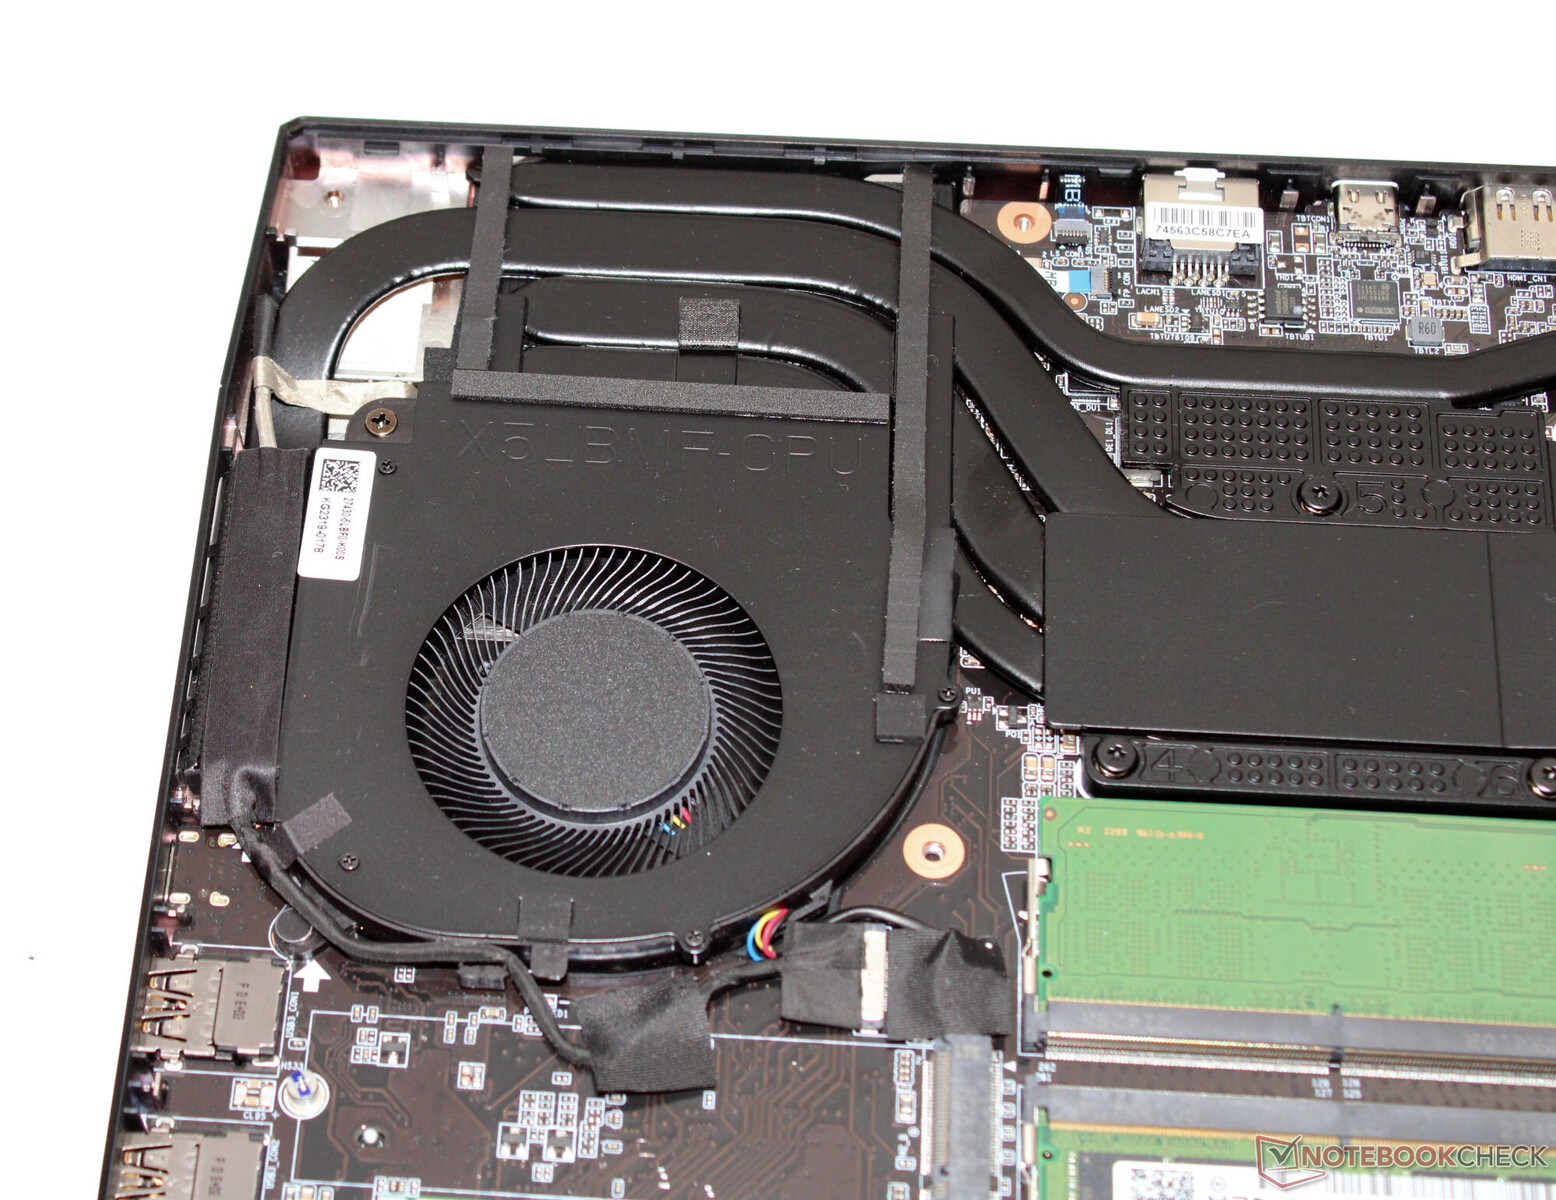
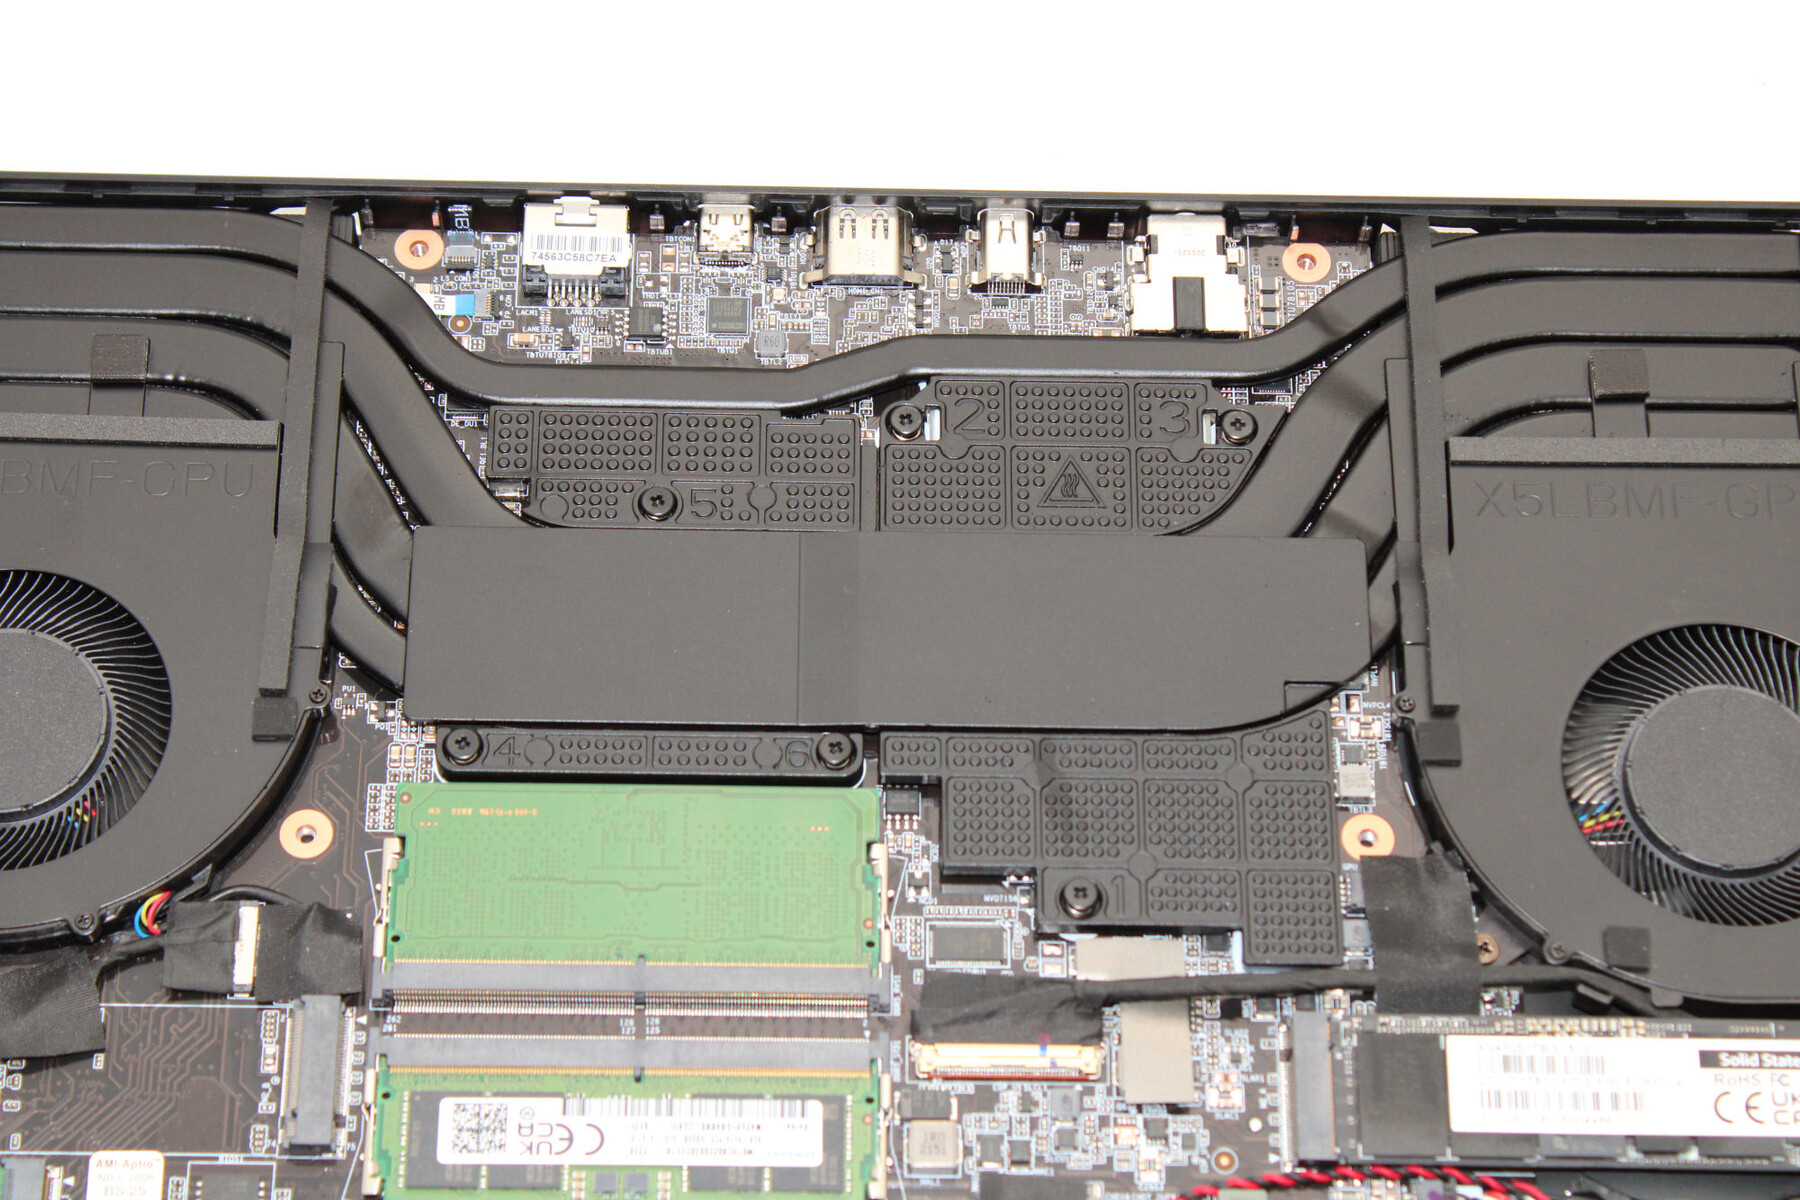
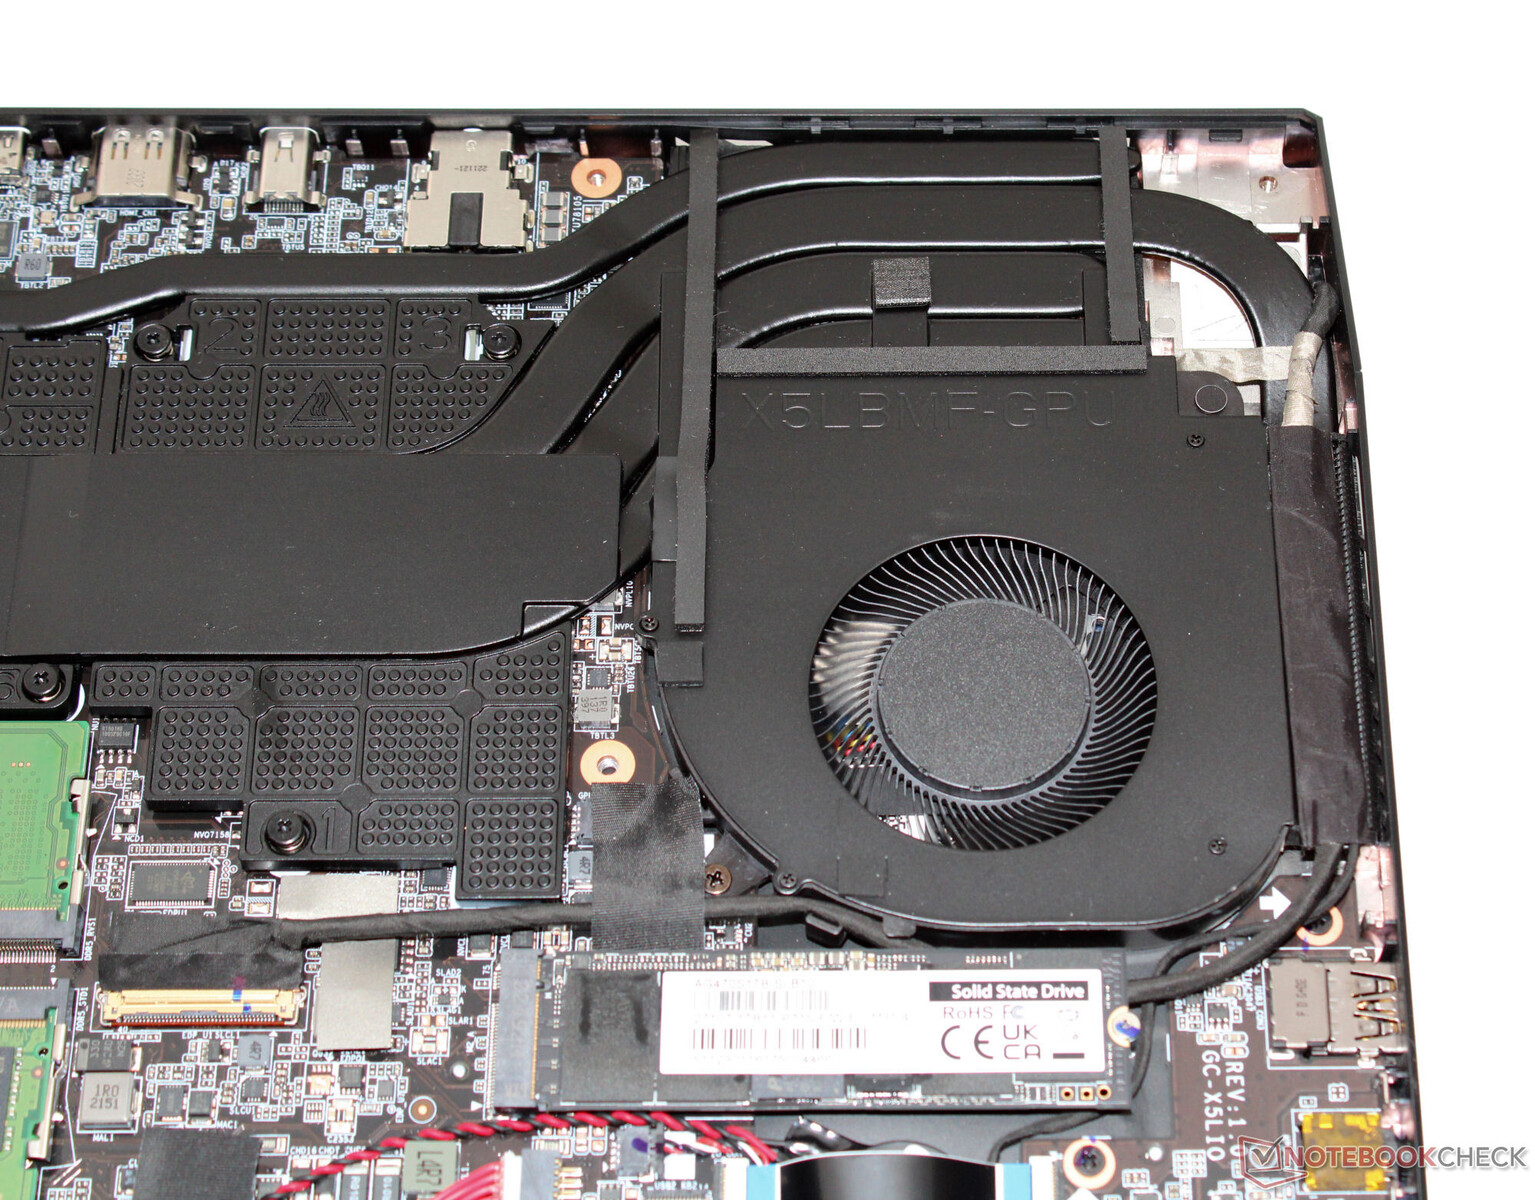
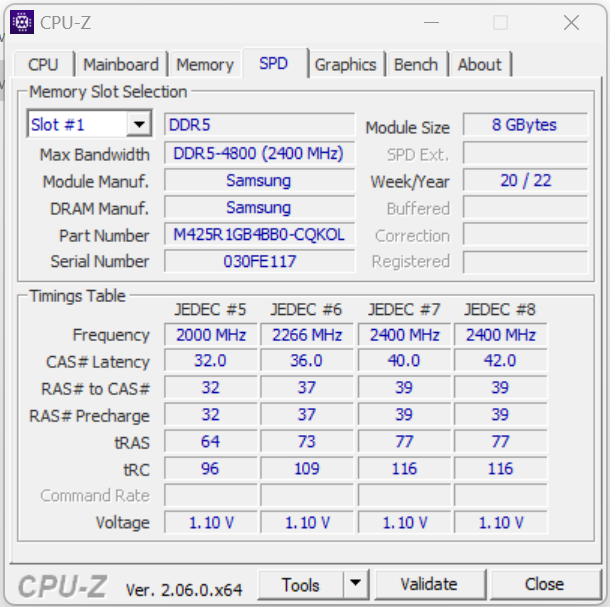
After removing all of the screws on the bottom of the device, the bottom section of the case can be removed with the help of a spatula or a plectrum. Subsequently, you can access the RAM slots (both occupied), the SSD (PCIe 4, M.2 2280), the second M.2 2280 slot (PCIe 4, M.2 2280), the BIOS battery, the WLAN module, the fans, the speakers and the battery.
Warranty
The 15.6-inch Gigabyte laptop comes with a one-year warranty. It isn't possible to extend this.
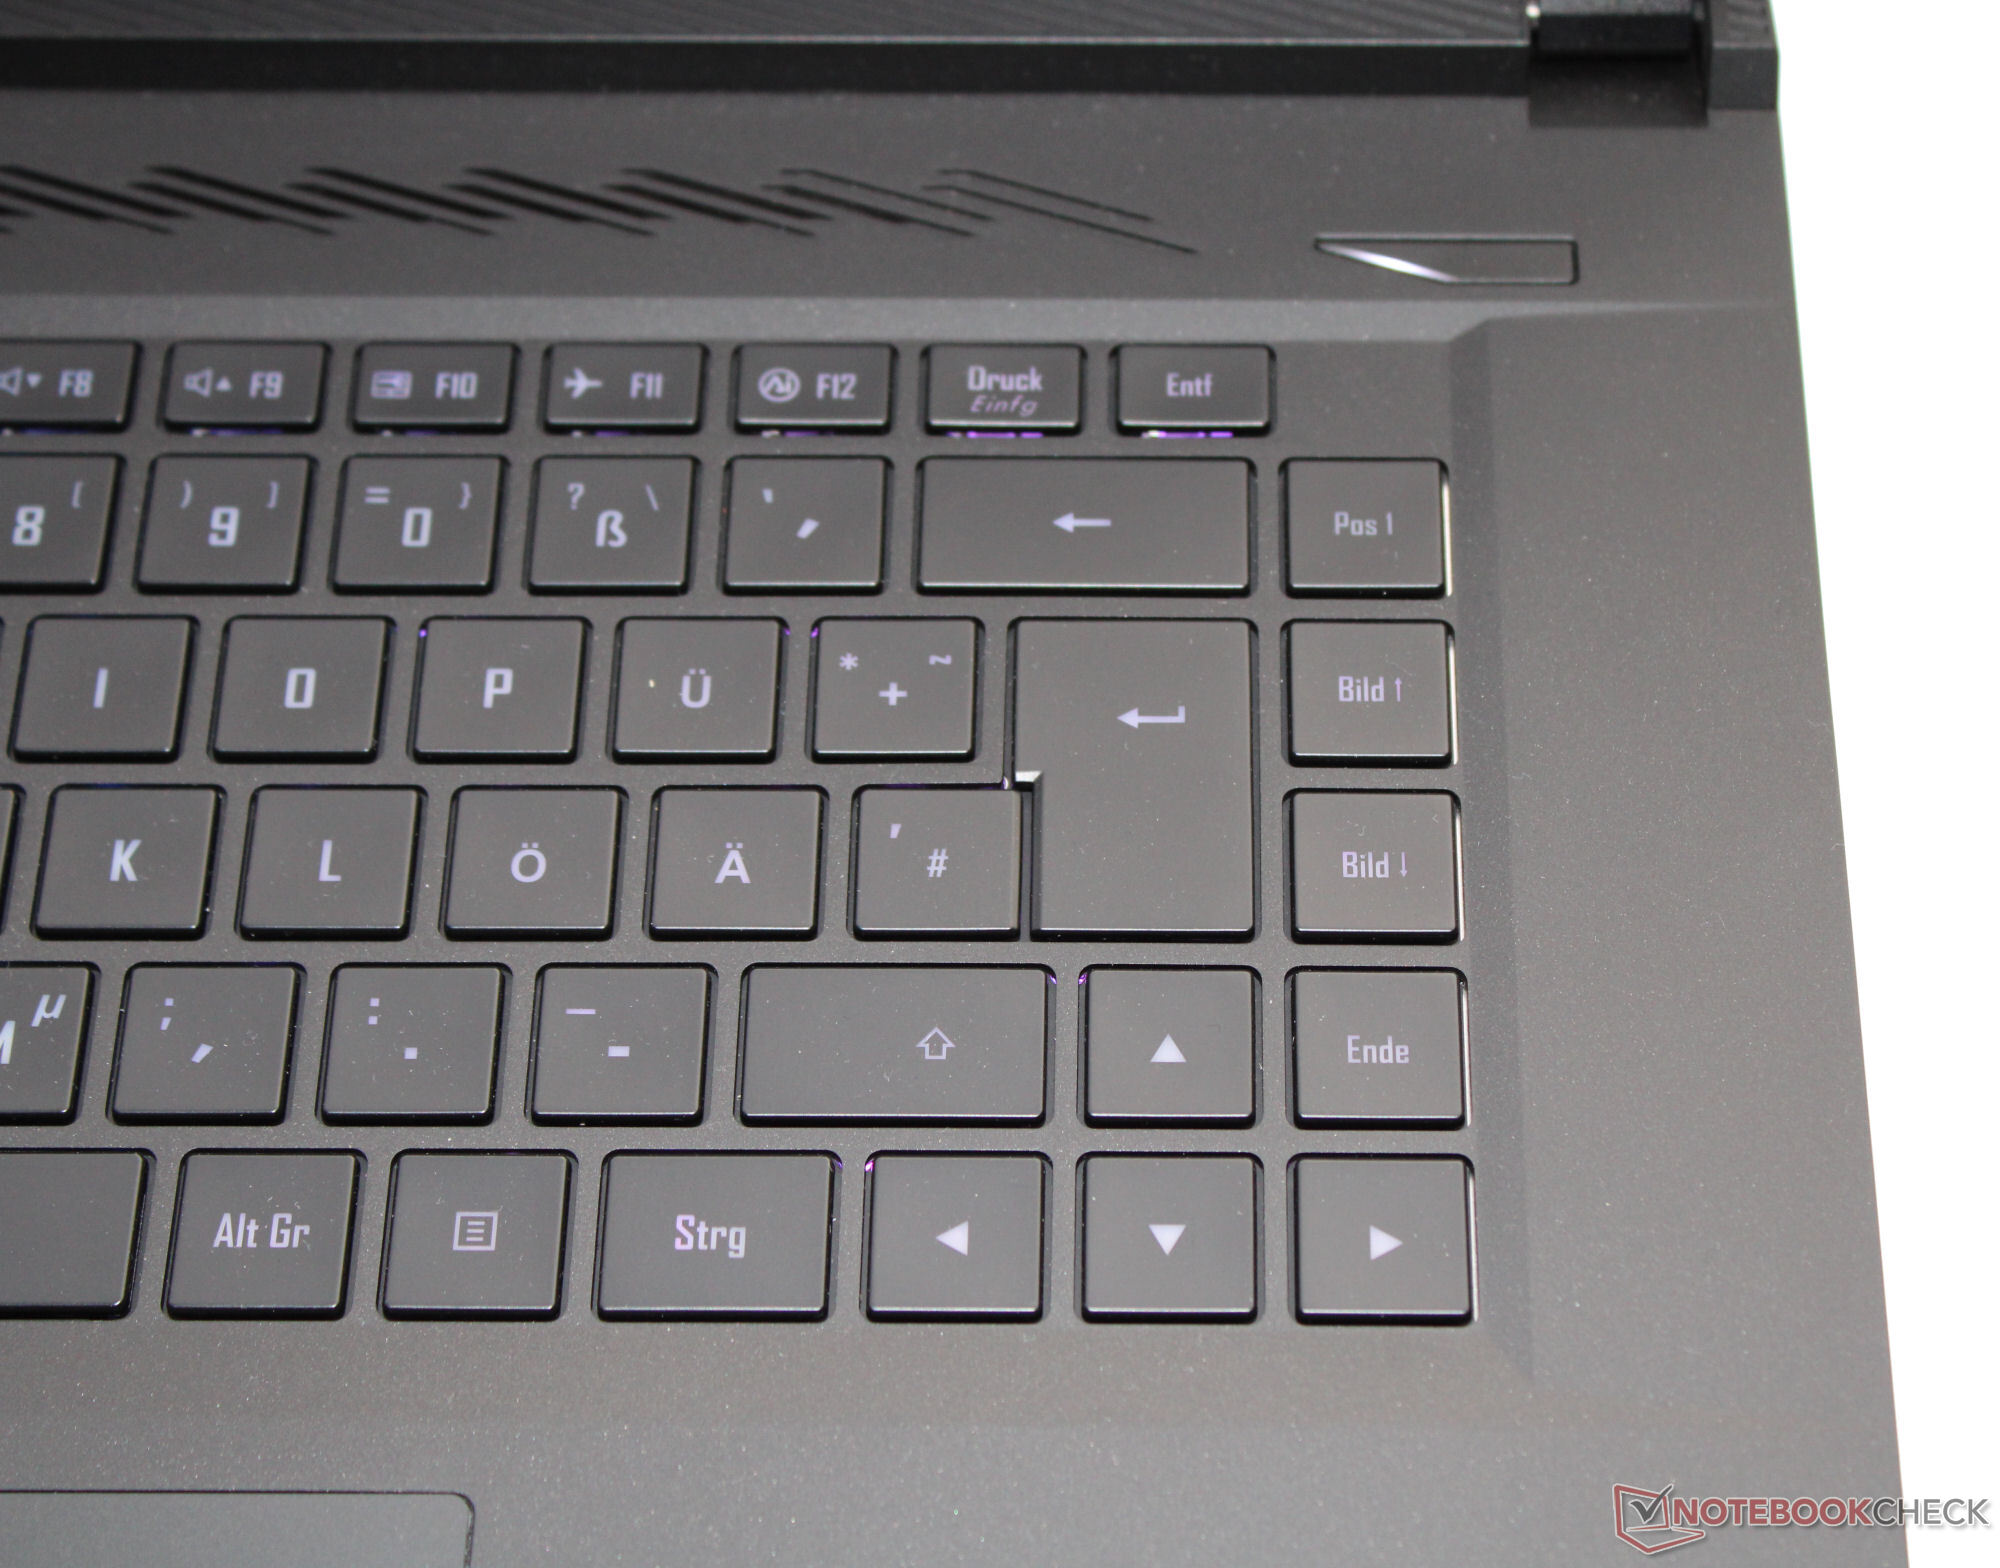
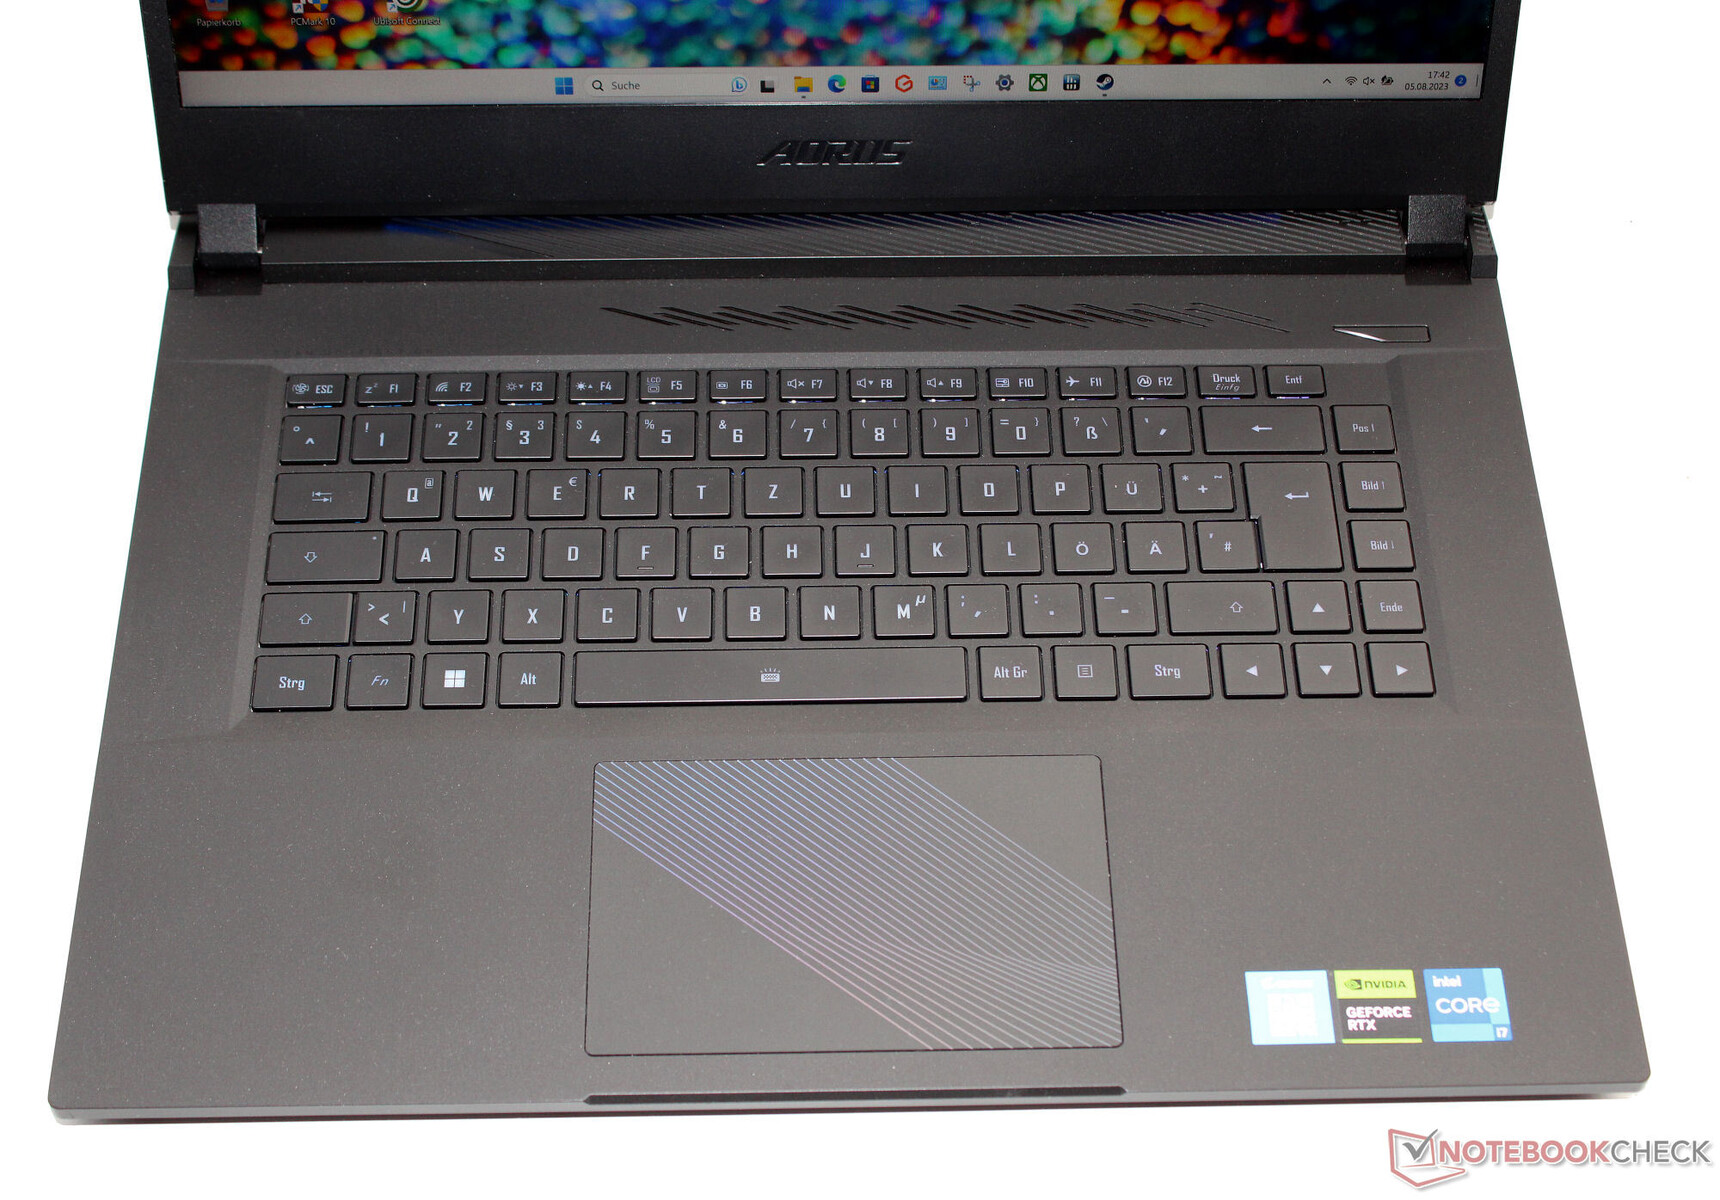
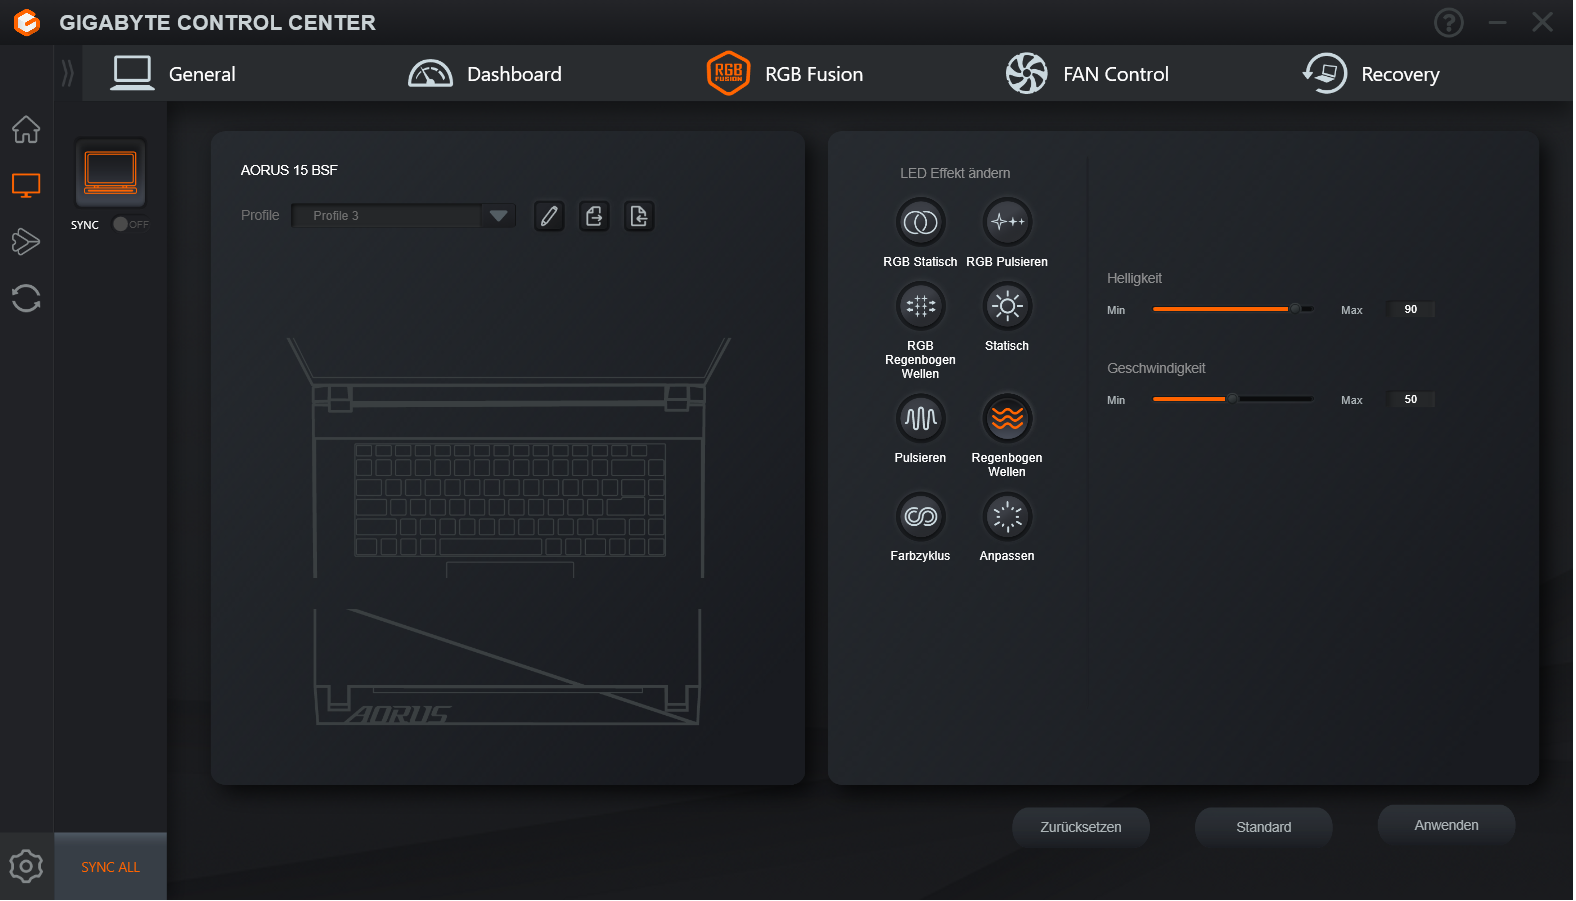
Input devices - The gaming laptop with RGB lighting
Keyboard
The illuminated chiclet keyboard's smooth keys have a medium lift and a clear pressure point. The keys' resistance is fine - while typing, they have a small amount of give, but this shouldn't be too annoying. Positive: All four arrow keys are regularly sized. All-in-all, this is a good keyboard for everyday use.
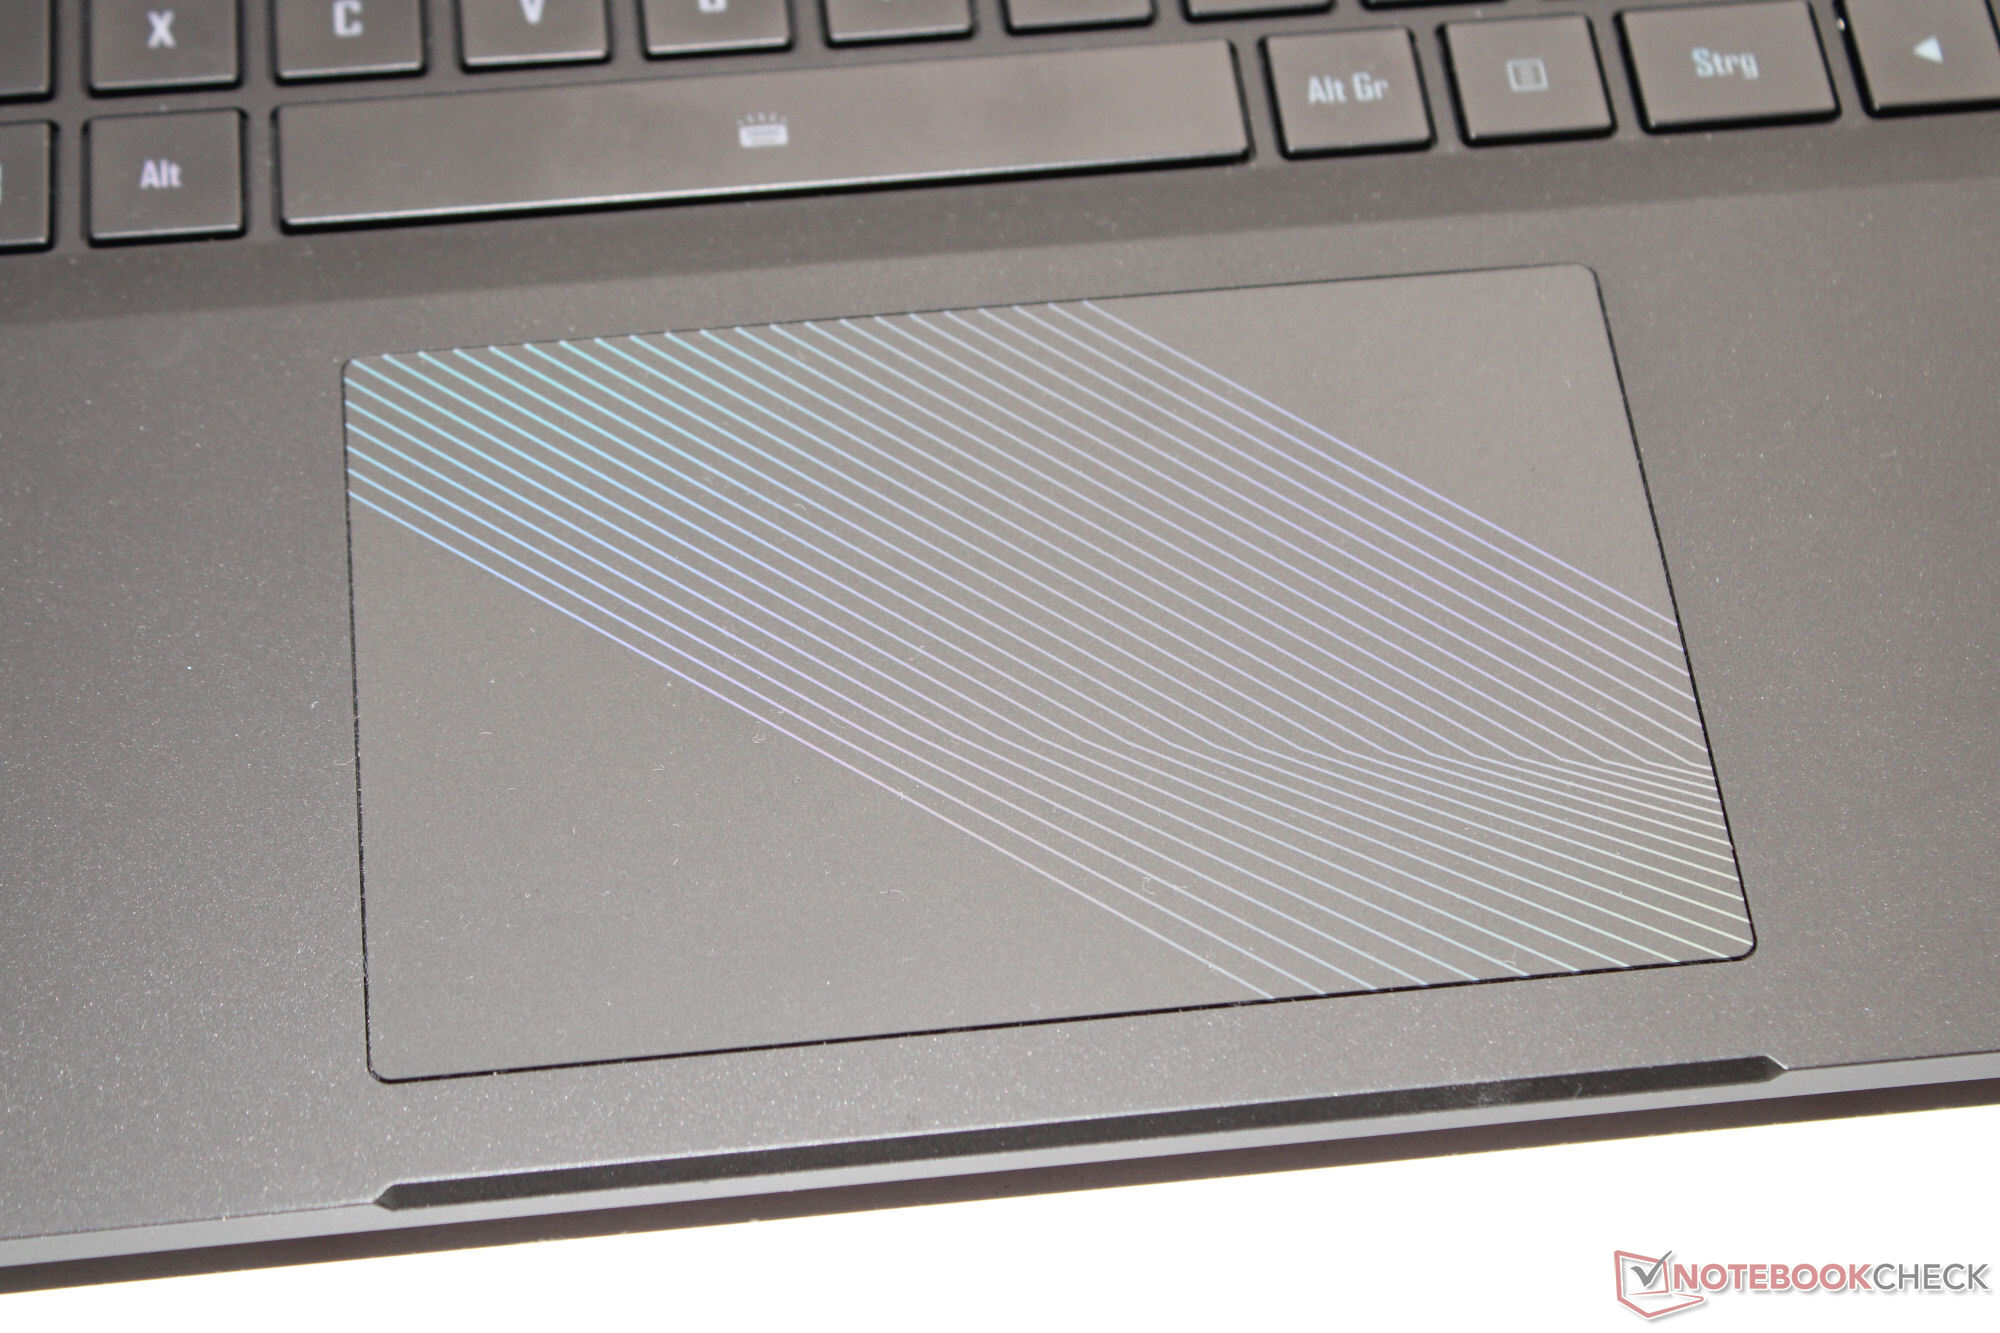
Touchpad
A click pad (12.1 x 7.6 cm) acts as a replacement for a mouse and your fingers glide over its smooth surface nicely. It has a short lift and a clear pressure point.
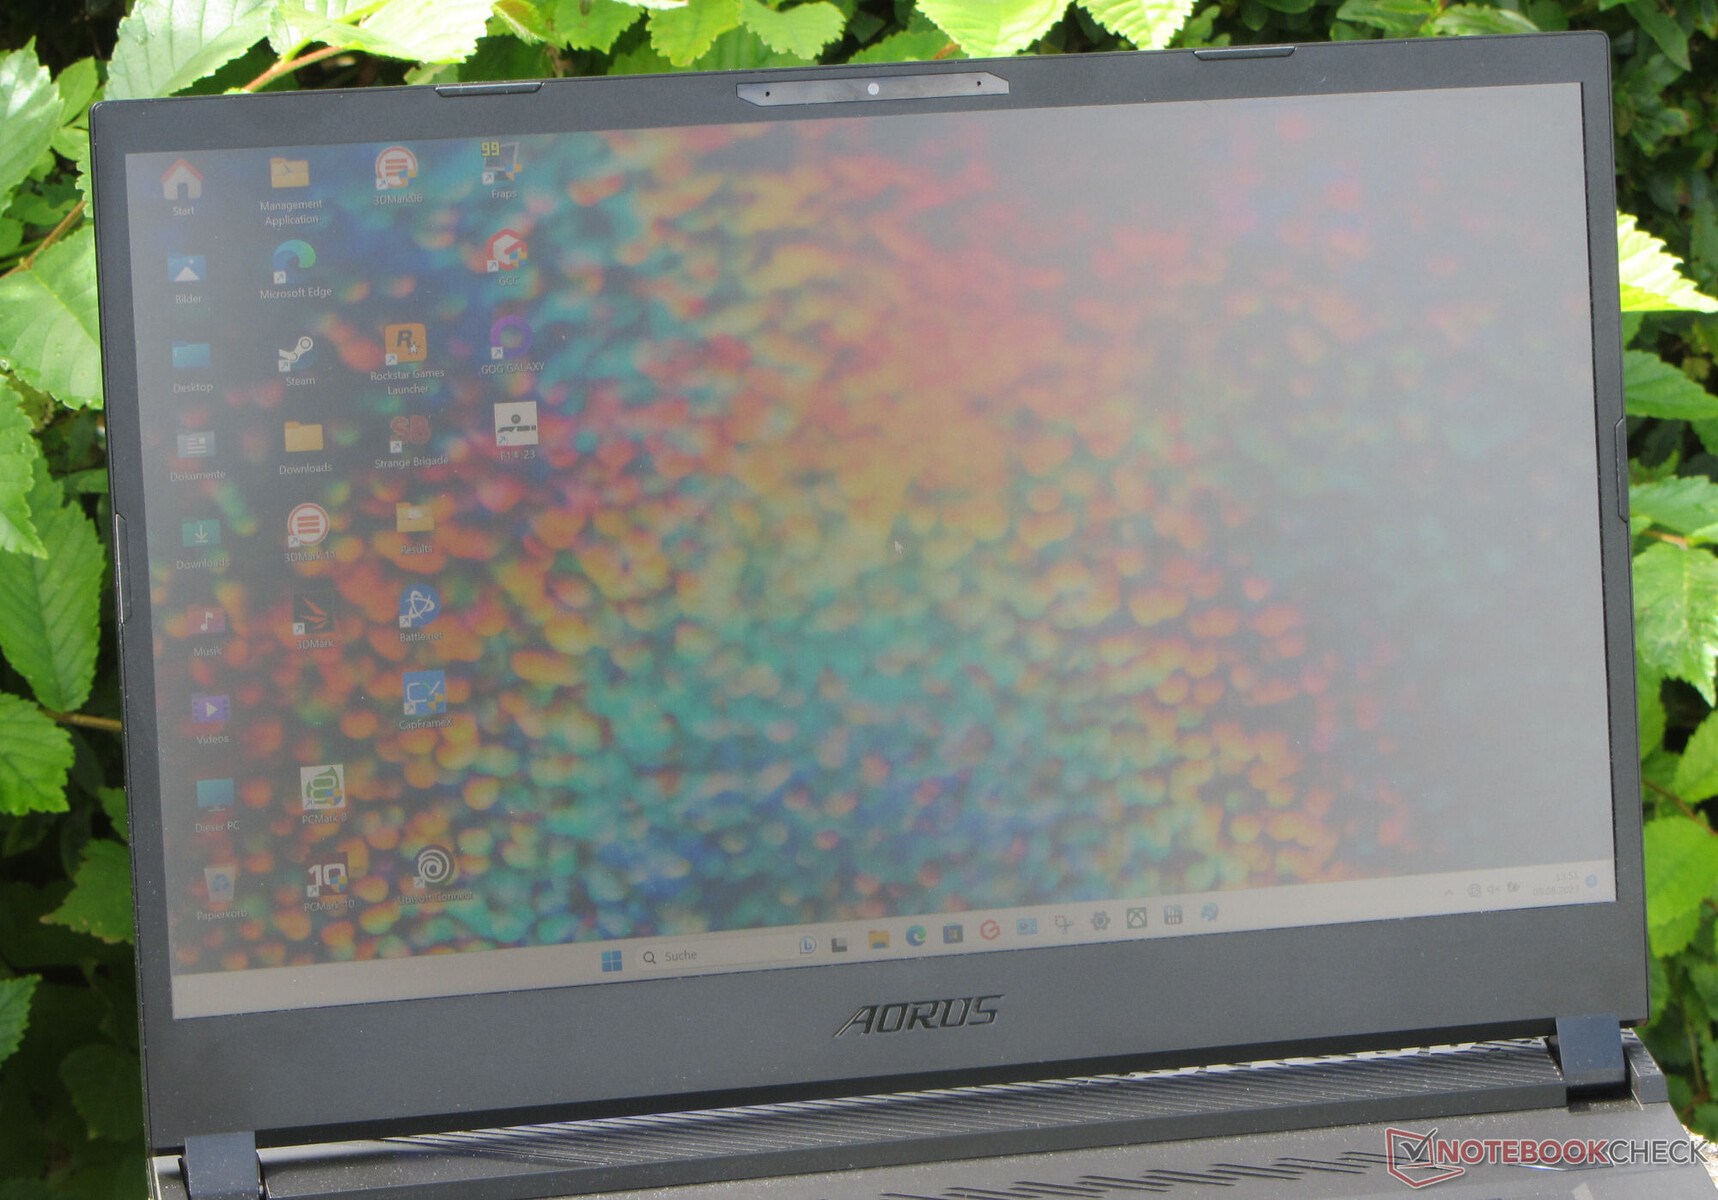
Display - A QHD panel with DCI-P3 coverage
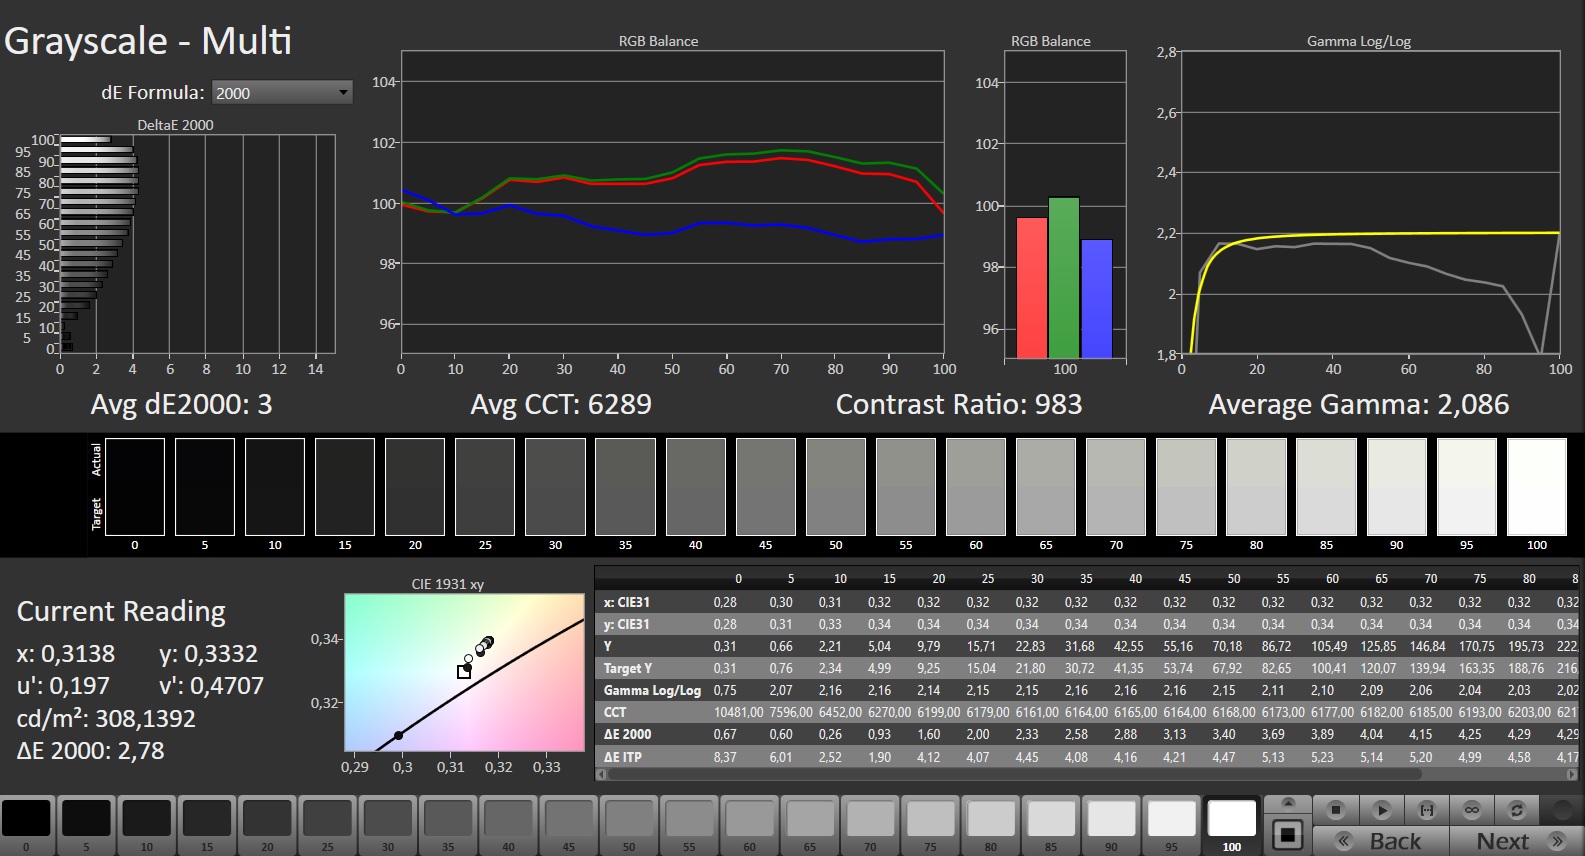
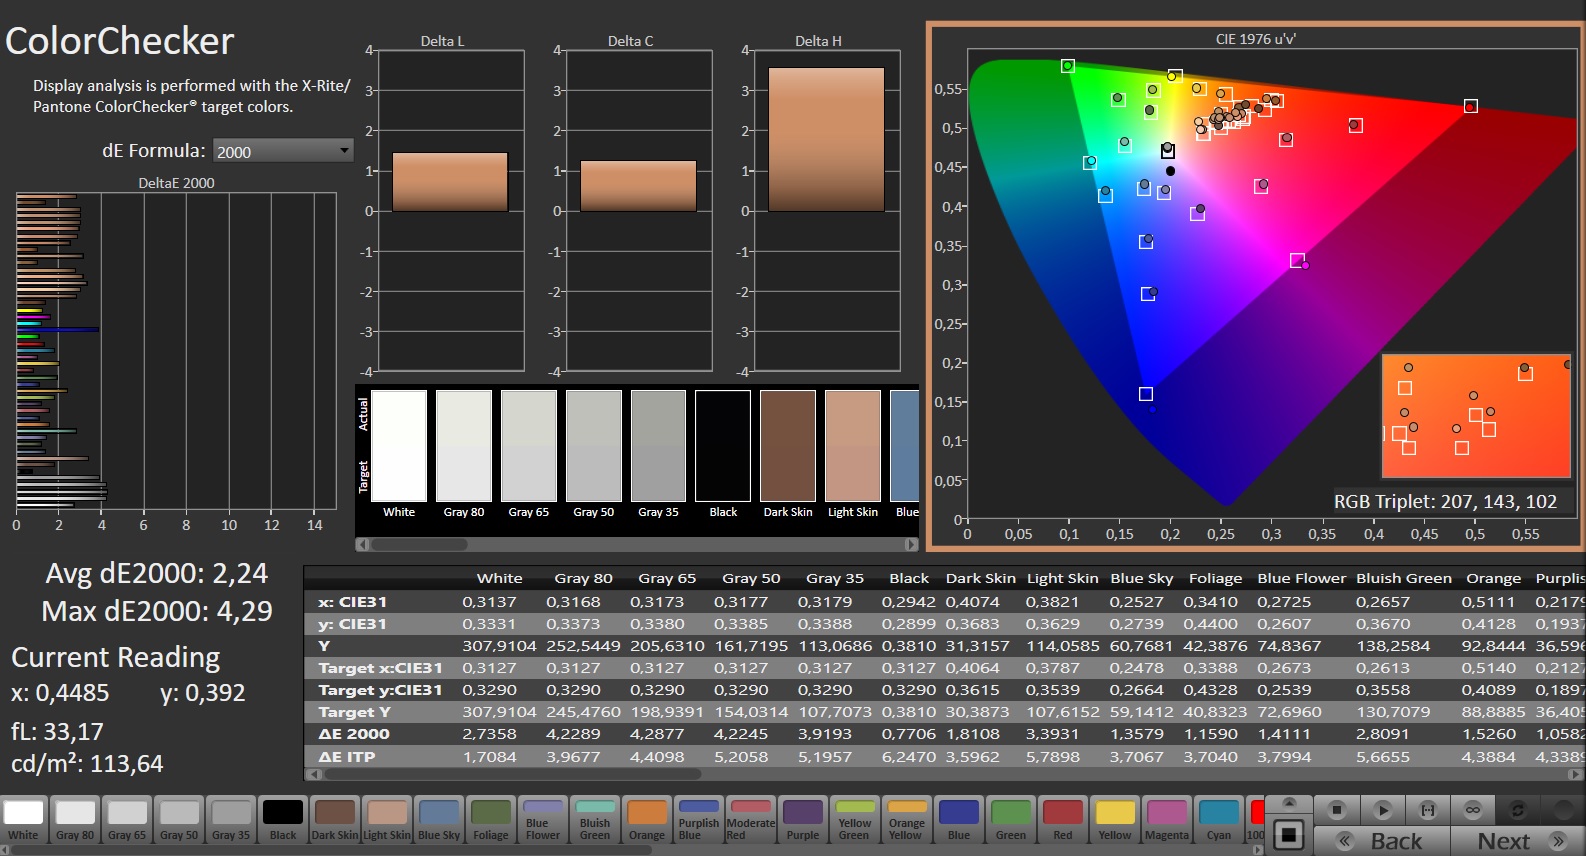
The fast-reacting 165-Hz screen scores points thanks to its matte surface and lack of PWM flickering. The 15.6-inch display (2,560 x 1,440 pixels, IPS), which has a ratio of 16:9, achieved brightness and contrast levels which failed to meet their respective targets (> 300 cd/m² and 1.000:1).
| |||||||||||||||||||||||||
Brightness Distribution: 82 %
Center on Battery: 299 cd/m²
Contrast: 965:1 (Black: 0.31 cd/m²)
ΔE ColorChecker Calman: 2.24 | ∀{0.5-29.43 Ø4.73}
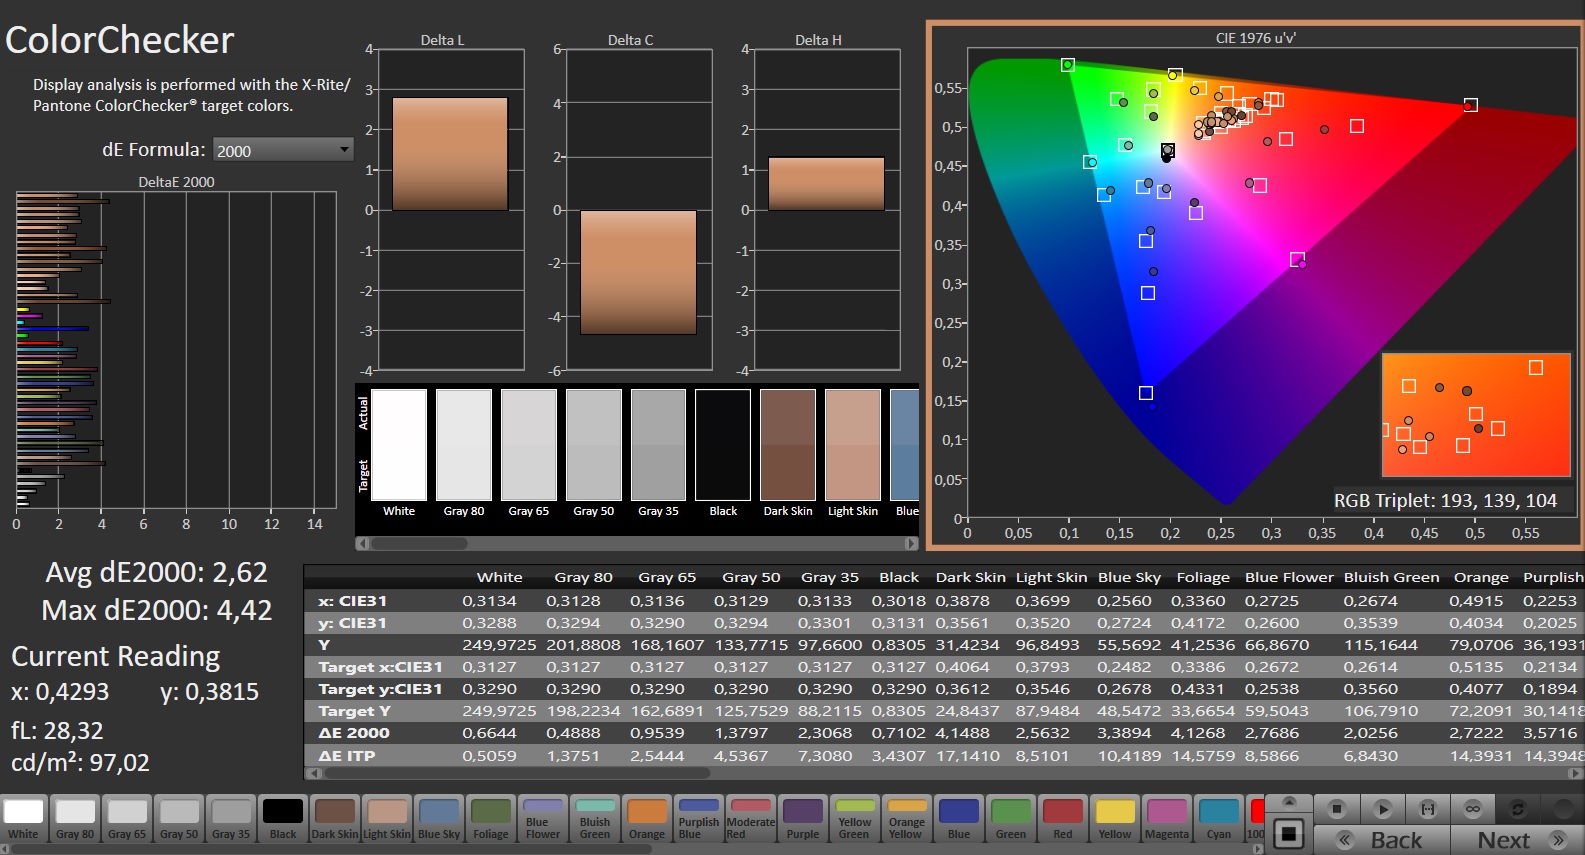
calibrated: 2.62
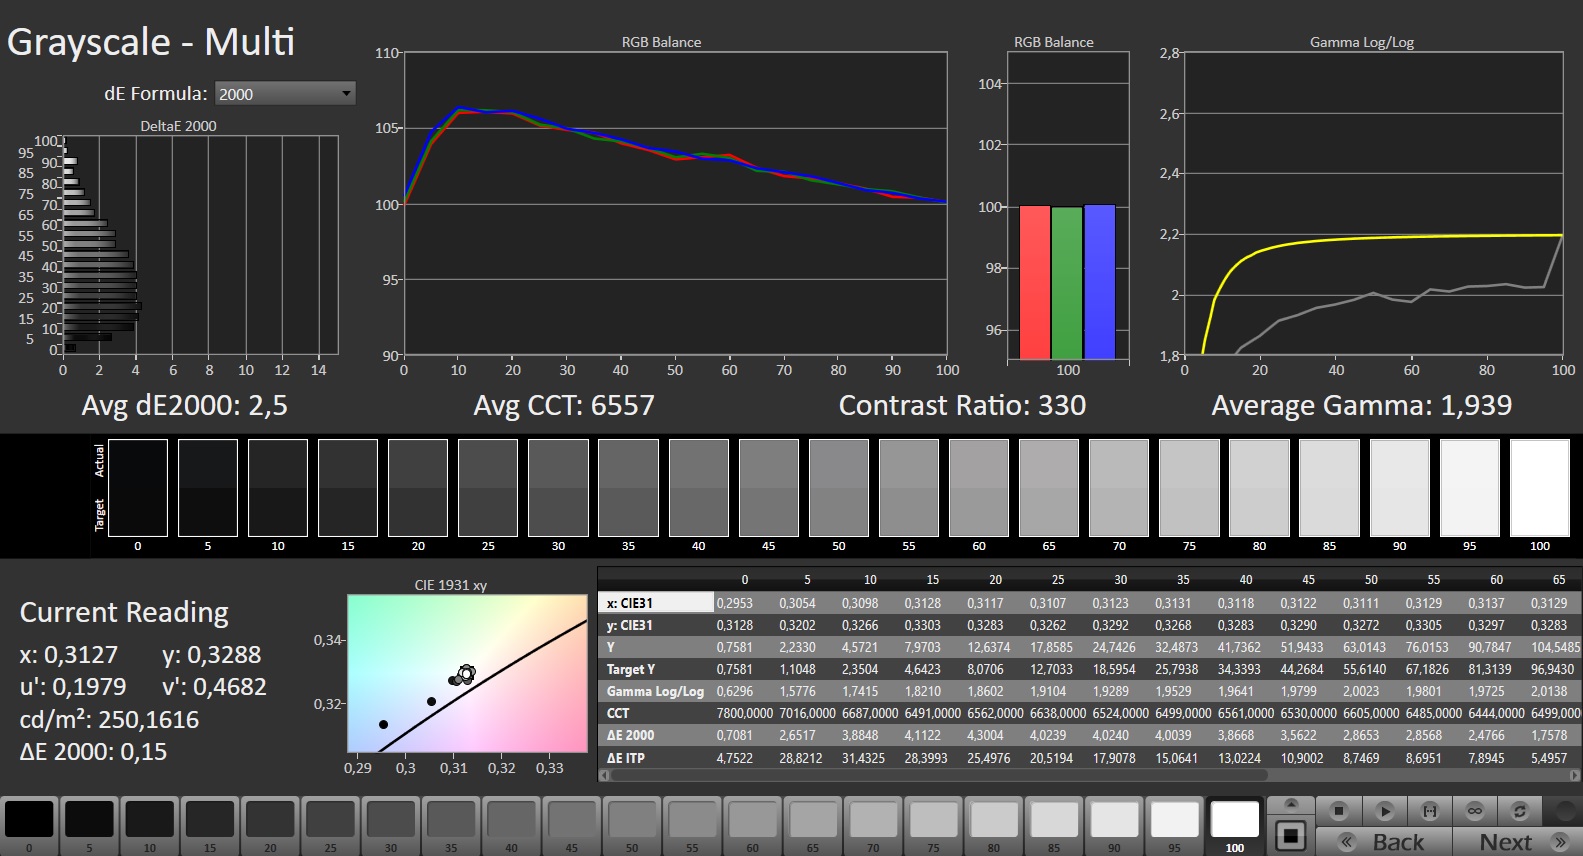
ΔE Greyscale Calman: 3 | ∀{0.09-98 Ø4.97}
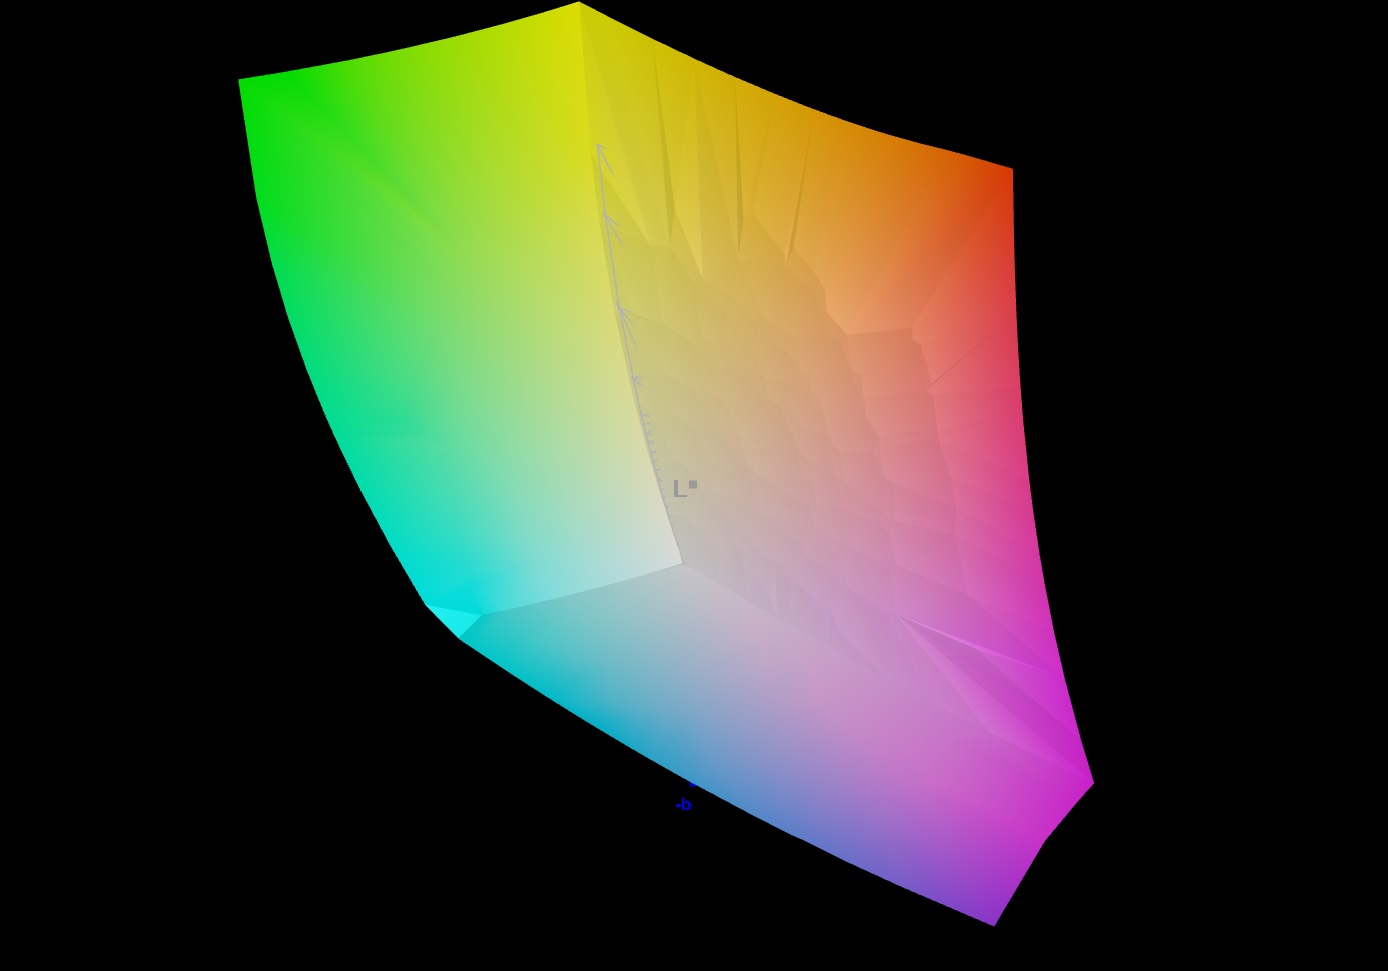
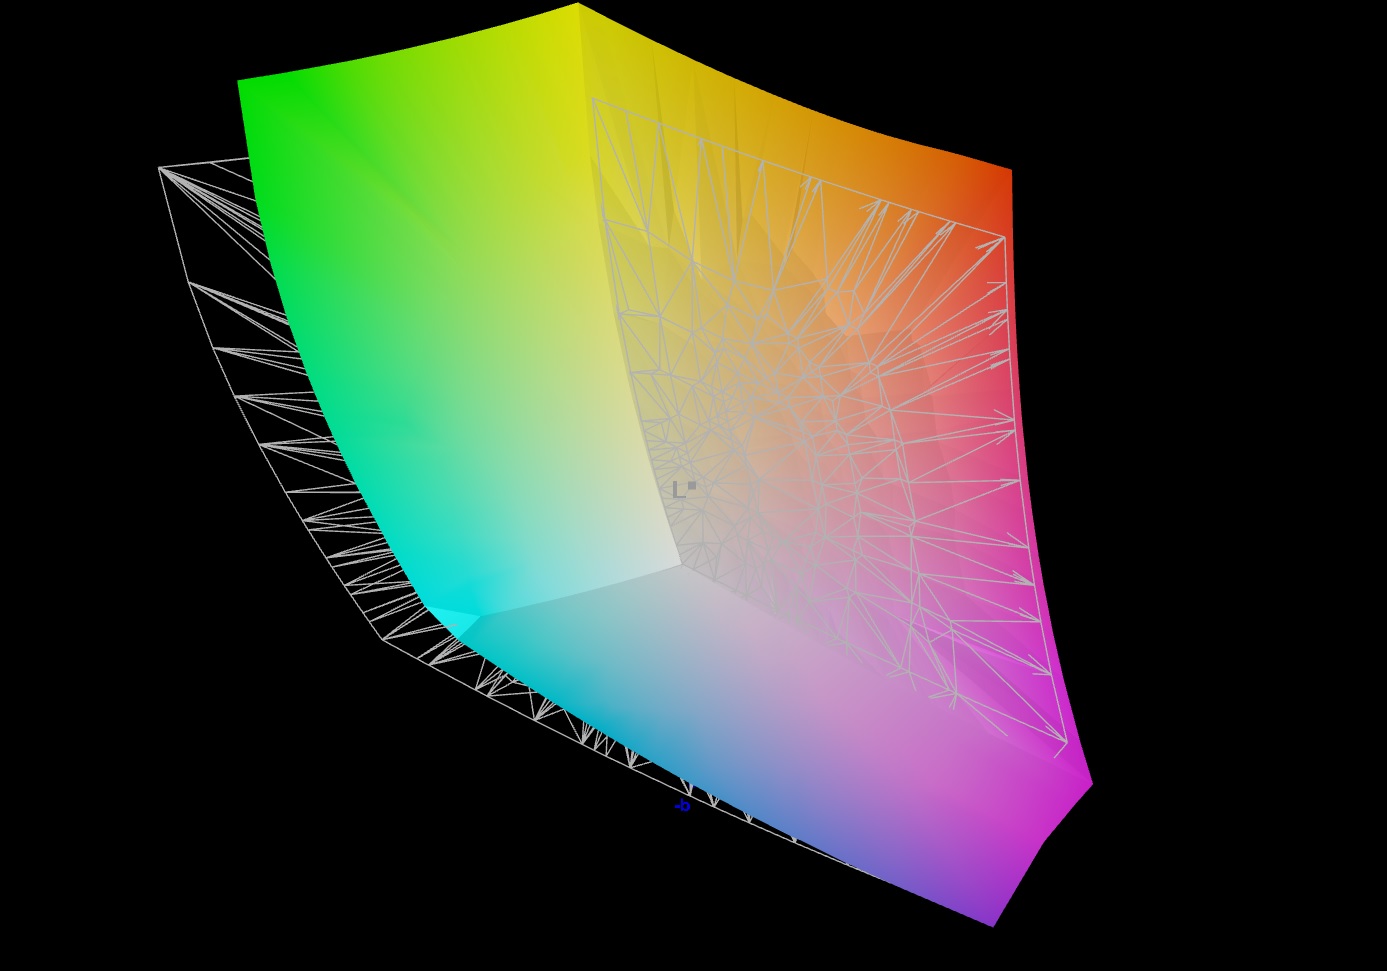
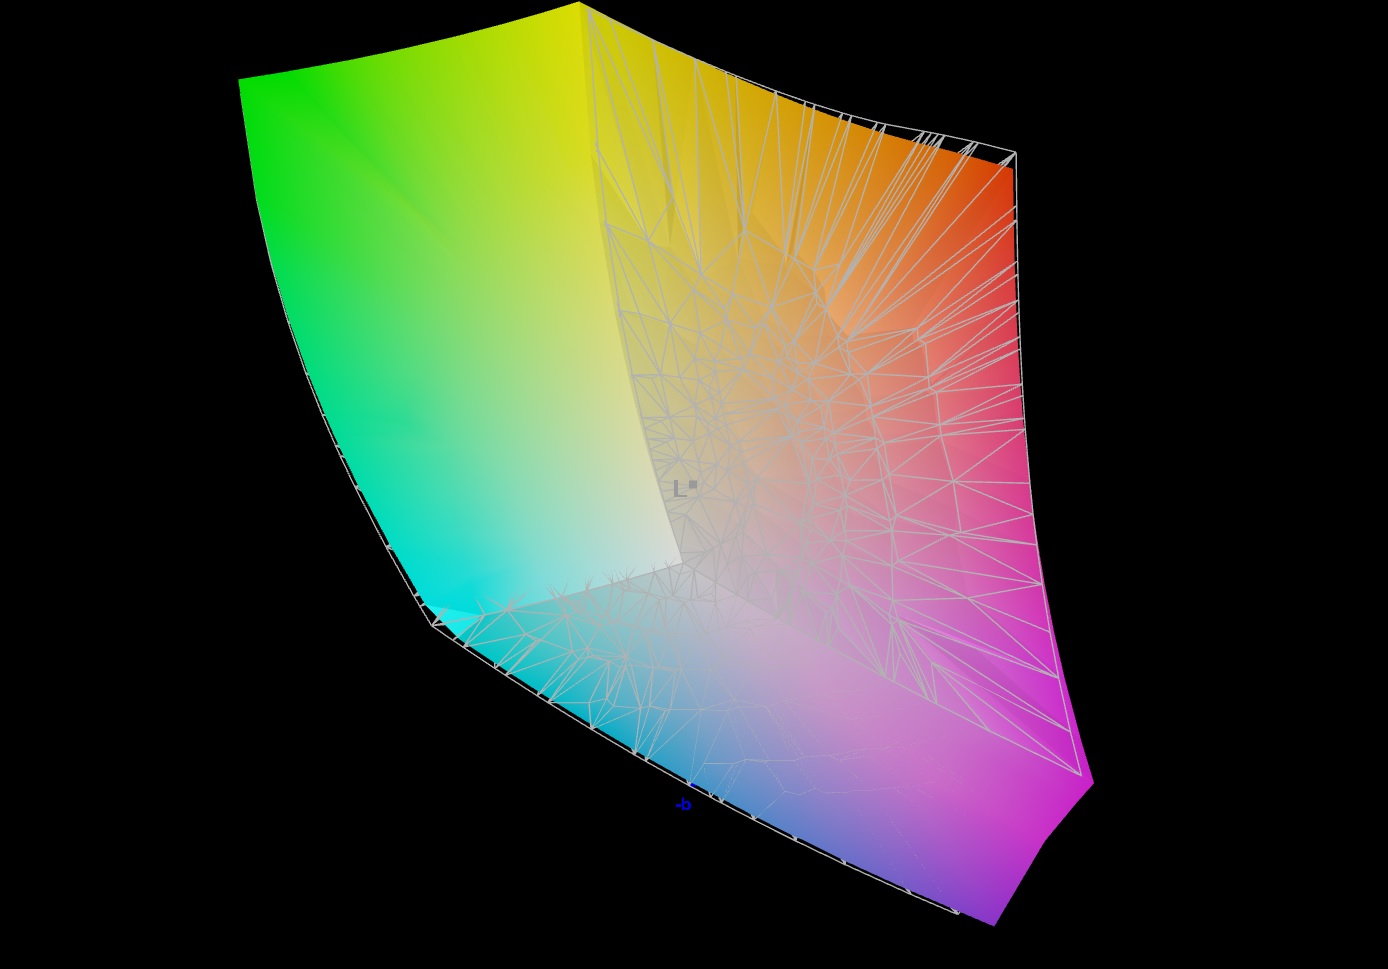
85.7% AdobeRGB 1998 (Argyll 3D)
99.9% sRGB (Argyll 3D)
98.2% Display P3 (Argyll 3D)
Gamma: 2.086
CCT: 6289 K
| Aorus 15 BSF Sharp LQ156T1JW05, IPS, 2560x1440, 15.6" | HP Omen Transcend 16 AUOA3A6, Mini-LED, 2560x1600, 16" | MSI Pulse 17 B13VGK AU Optronics B173HAN04.9, IPS, 1920x1080, 17.3" | Lenovo Legion Slim 7i 16 Gen 8 CSOT T3 MNG007DA2-3, IPS, 2560x1600, 16" | Acer Nitro 16 AN16-41 BOE CQ NE16QDM-NY1, IPS, 2560x1600, 16" | Asus TUF Gaming A16 FA617XS BOE NE160WUM-NX2, IPS, 1920x1200, 16" | |
|---|---|---|---|---|---|---|
| Display | 1% | -52% | -15% | -17% | -17% | |
| Display P3 Coverage (%) | 98.2 | 99.2 1% | 38.4 -61% | 70.4 -28% | 67.9 -31% | 69.3 -29% |
| sRGB Coverage (%) | 99.9 | 100 0% | 57.5 -42% | 99.4 -1% | 99.1 -1% | 97.3 -3% |
| AdobeRGB 1998 Coverage (%) | 85.7 | 87.6 2% | 39.7 -54% | 72.5 -15% | 69.9 -18% | 70.7 -18% |
| Response Times | -219% | -207% | -17% | 16% | -41% | |
| Response Time Grey 50% / Grey 80% * (ms) | 11.3 ? | 26.4 ? -134% | 31.2 ? -176% | 12 ? -6% | 11 ? 3% | 15.6 ? -38% |
| Response Time Black / White * (ms) | 7 ? | 28.2 ? -303% | 23.6 ? -237% | 8.9 ? -27% | 5 ? 29% | 10 ? -43% |
| PWM Frequency (Hz) | 3506 ? | |||||
| Screen | 234% | -42% | 22% | 25% | 23% | |
| Brightness middle (cd/m²) | 299 | 791.1 165% | 254 -15% | 474.6 59% | 520 74% | 301 1% |
| Brightness (cd/m²) | 282 | 800 184% | 250 -11% | 445 58% | 494 75% | 294 4% |
| Brightness Distribution (%) | 82 | 95 16% | 91 11% | 86 5% | 91 11% | 94 15% |
| Black Level * (cd/m²) | 0.31 | 0.04 87% | 0.14 55% | 0.39 -26% | 0.39 -26% | 0.21 32% |
| Contrast (:1) | 965 | 19778 1950% | 1814 88% | 1217 26% | 1333 38% | 1433 48% |
| Colorchecker dE 2000 * | 2.24 | 4.37 -95% | 4.52 -102% | 2.12 5% | 1.94 13% | 1.79 20% |
| Colorchecker dE 2000 max. * | 4.29 | 10.39 -142% | 21.22 -395% | 4.73 -10% | 5.62 -31% | 3.48 19% |
| Colorchecker dE 2000 calibrated * | 2.62 | 1.04 60% | 4.52 -73% | 0.57 78% | 0.74 72% | 1.2 54% |
| Greyscale dE 2000 * | 3 | 6.5 -117% | 1 67% | 2.8 7% | 2.94 2% | 2.5 17% |
| Gamma | 2.086 105% | 2.28 96% | 2.44 90% | 2.22 99% | 2.37 93% | 2.265 97% |
| CCT | 6289 103% | 6000 108% | 6502 100% | 6542 99% | 6443 101% | 6157 106% |
| Total Average (Program / Settings) | 5% /
120% | -100% /
-68% | -3% /
9% | 8% /
15% | -12% /
6% |
* ... smaller is better
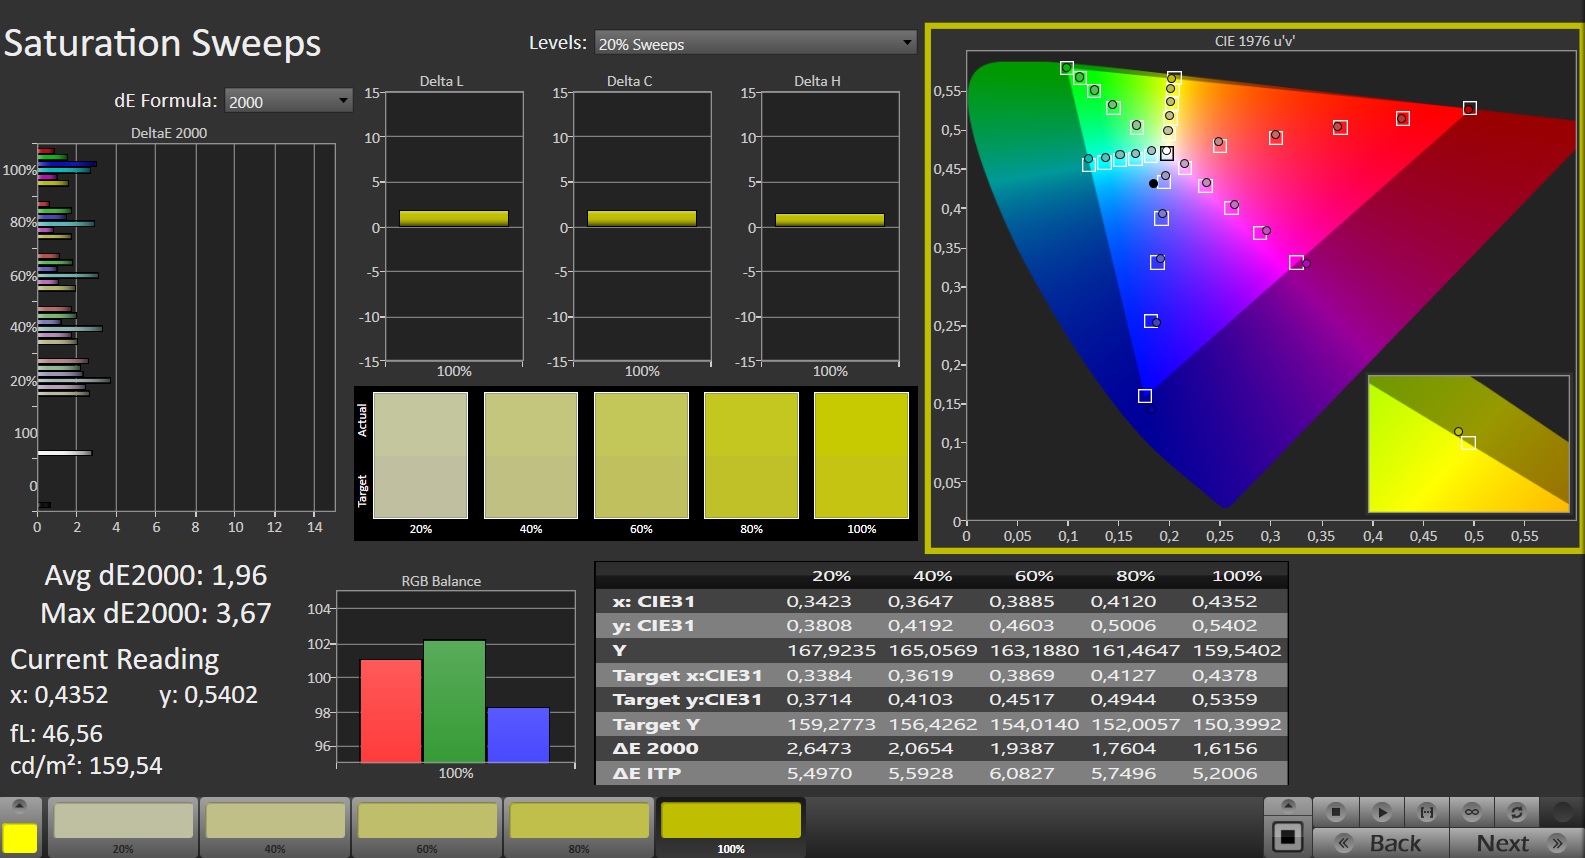
The display already showed a good color depiction in its delivered state: With a deviation of 2.24, its target was met (DeltaE < 3). Calibrating didn't lead to any noticeable difference. Color accuracy is present: The panel can completely depict the sRGB and DCI-P3 color spaces and 86 per cent of the Adobe RGB space can be depicted.

Display Response Times
| ↔ Response Time Black to White | ||
|---|---|---|
| 7 ms ... rise ↗ and fall ↘ combined | ↗ 3.4 ms rise | 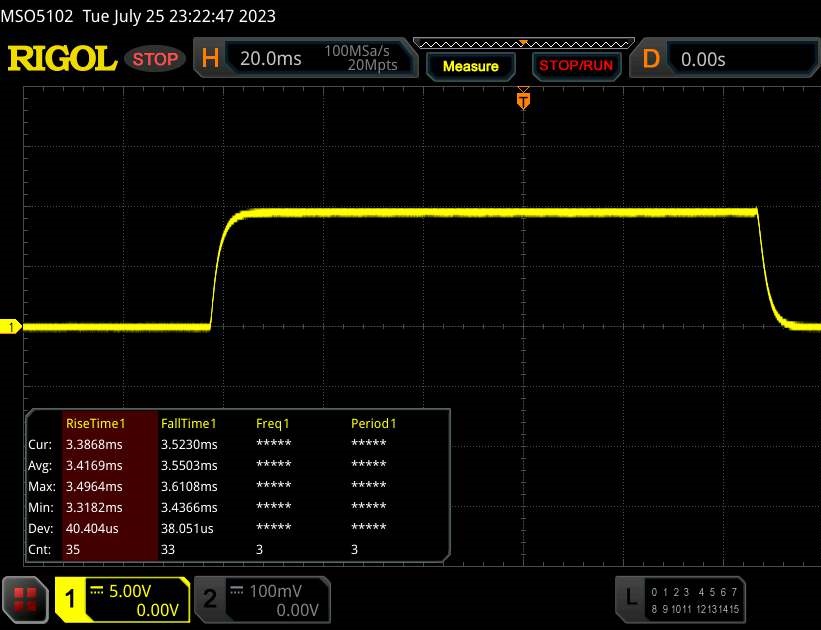 |
| ↘ 3.6 ms fall | ||
| The screen shows very fast response rates in our tests and should be very well suited for fast-paced gaming. In comparison, all tested devices range from 0.1 (minimum) to 240 (maximum) ms. » 21 % of all devices are better. This means that the measured response time is better than the average of all tested devices (19.9 ms). | ||
| ↔ Response Time 50% Grey to 80% Grey | ||
| 11.3 ms ... rise ↗ and fall ↘ combined | ↗ 5.2 ms rise | 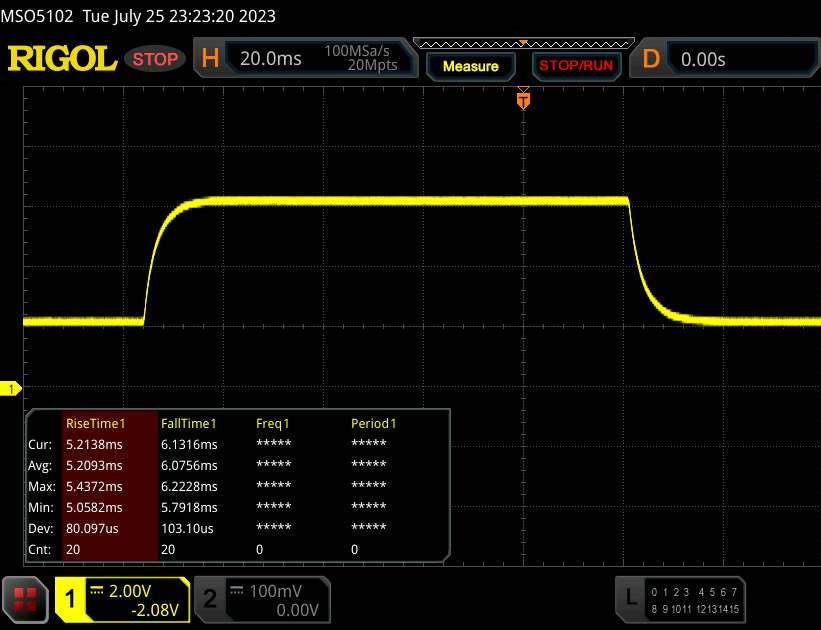 |
| ↘ 6.1 ms fall | ||
| The screen shows good response rates in our tests, but may be too slow for competitive gamers. In comparison, all tested devices range from 0.165 (minimum) to 636 (maximum) ms. » 25 % of all devices are better. This means that the measured response time is better than the average of all tested devices (31.1 ms). | ||
Screen Flickering / PWM (Pulse-Width Modulation)
| Screen flickering / PWM not detected |  | ||
In comparison: 52 % of all tested devices do not use PWM to dim the display. If PWM was detected, an average of 7794 (minimum: 5 - maximum: 343500) Hz was measured. | |||
The viewing-angle stable IPS panel can be read from any position. Outside, you can read from the screen if the sun isn't shining all too brightly.

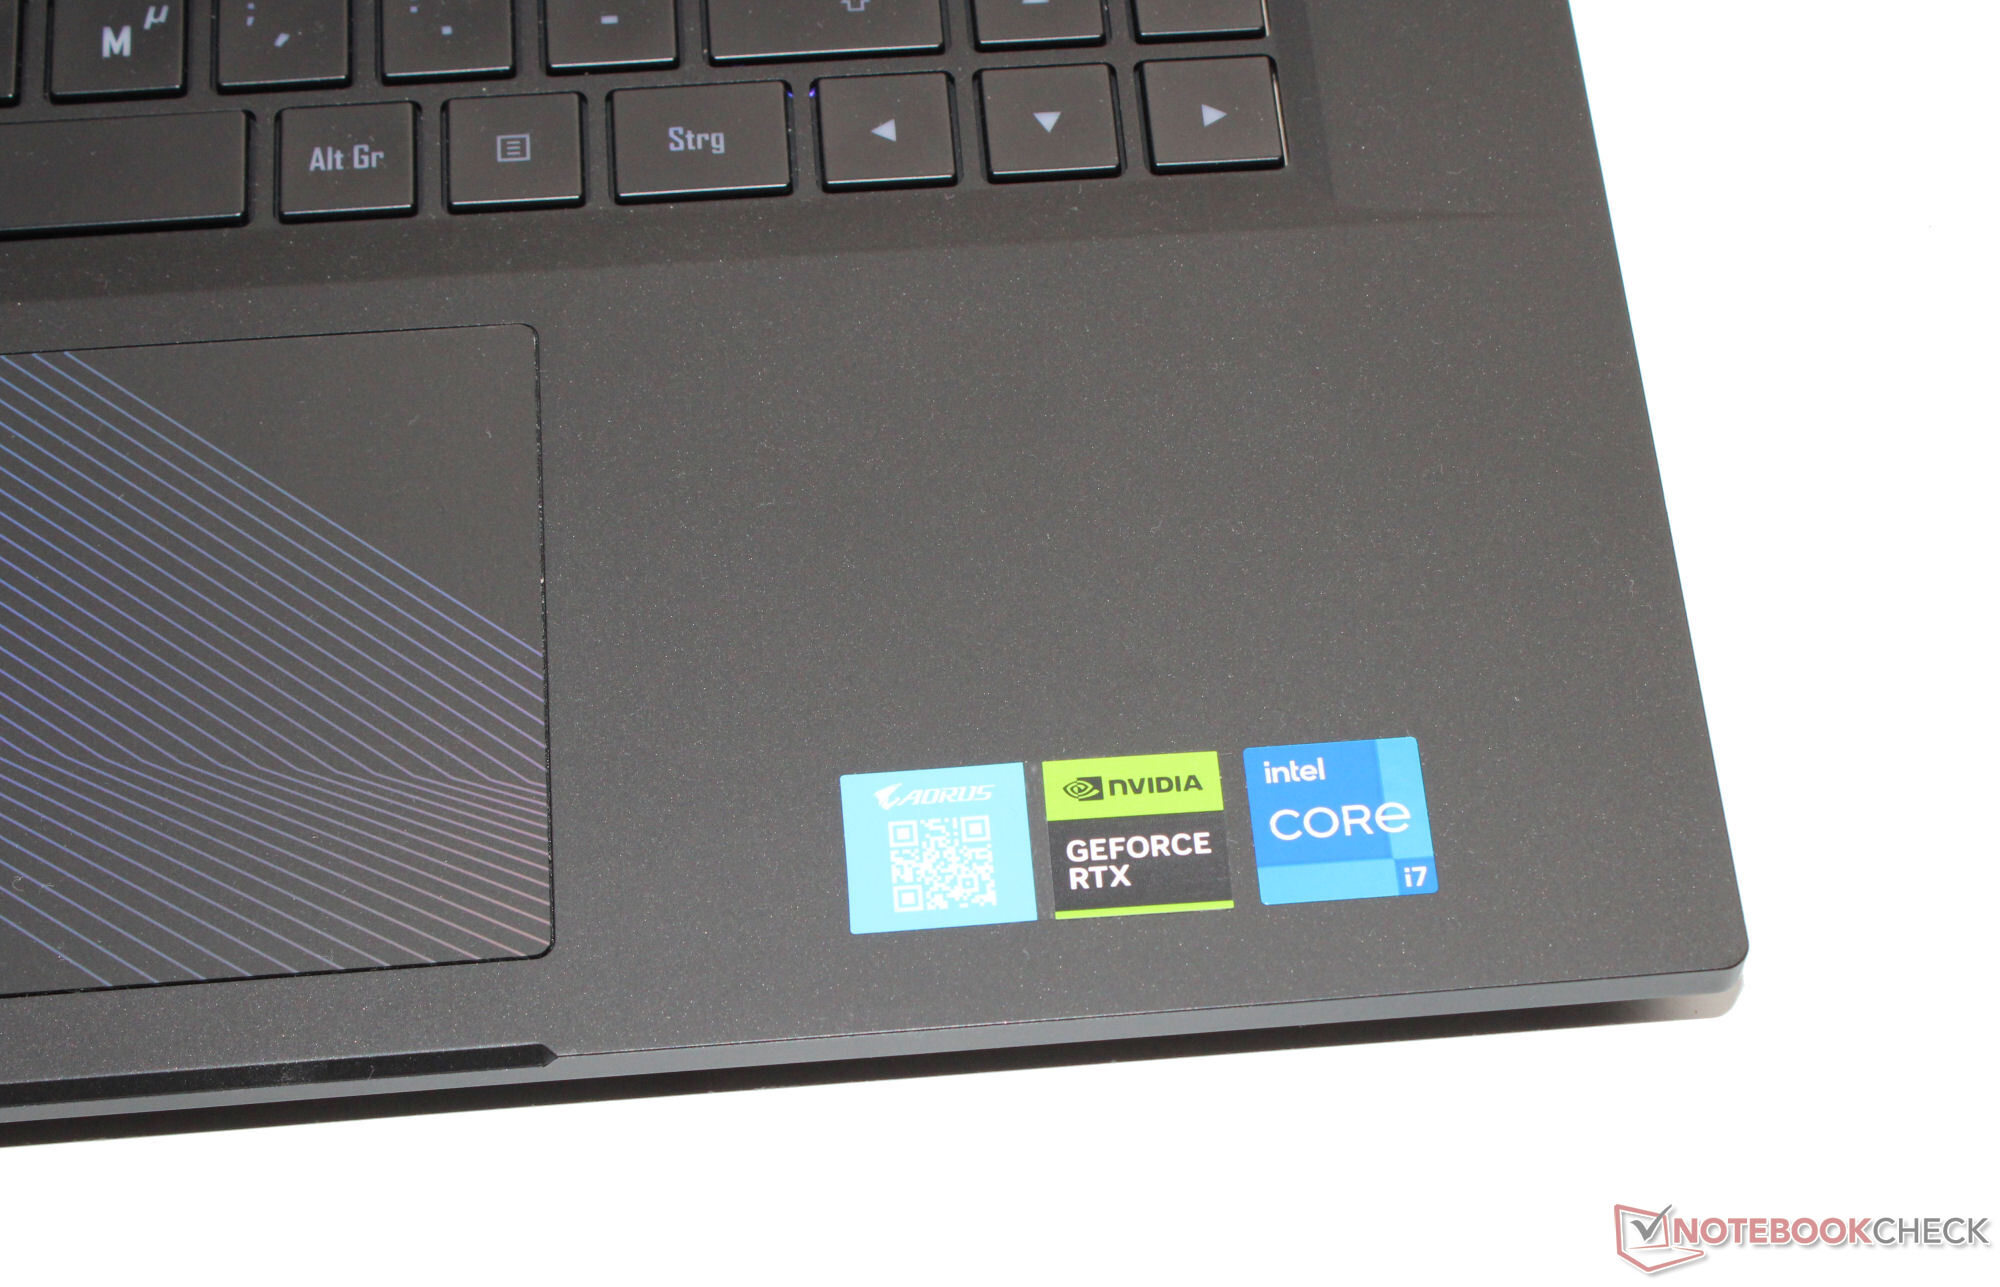
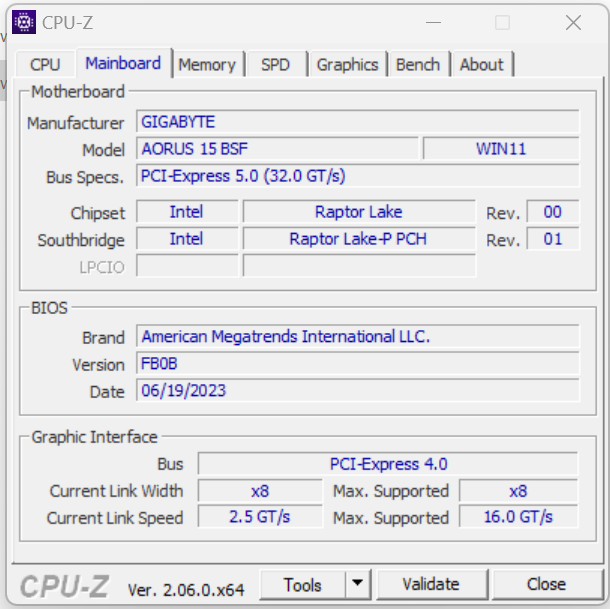
Performance - Raptor Lake and Ada Lovelace power the Gigabyte computer
The Aorus 15 BSF counts as one of the more powerful mid-range gaming laptops and it can also be used in different fields. The necessary performance is provided by Raptor Lake and Ada Lovelace. The present device can be found for around US$1,700.

Testing conditions
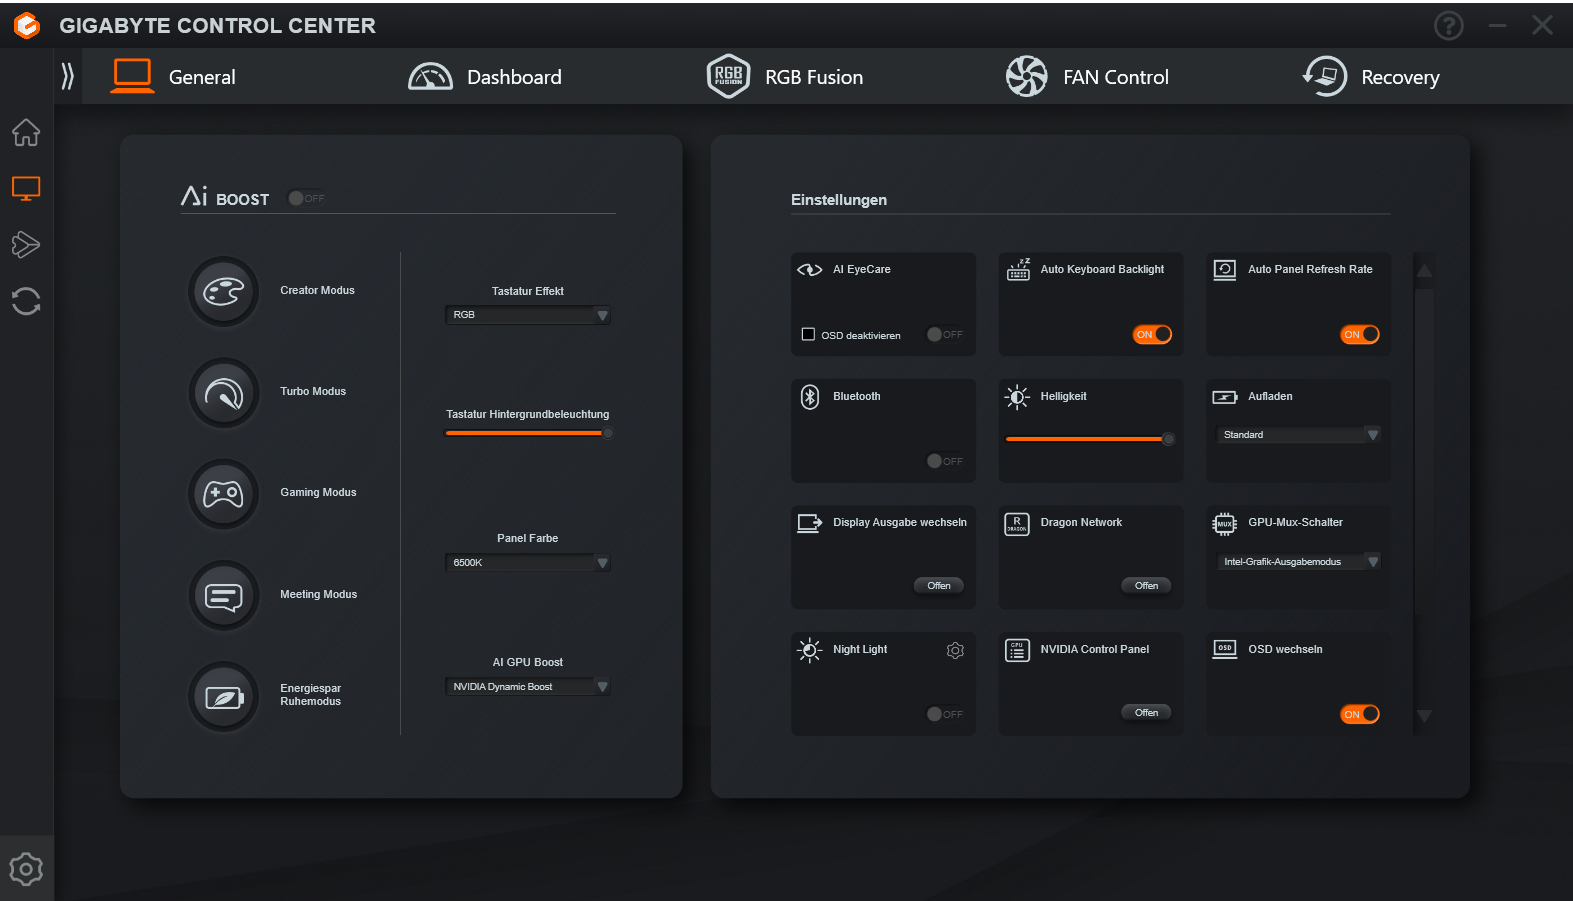
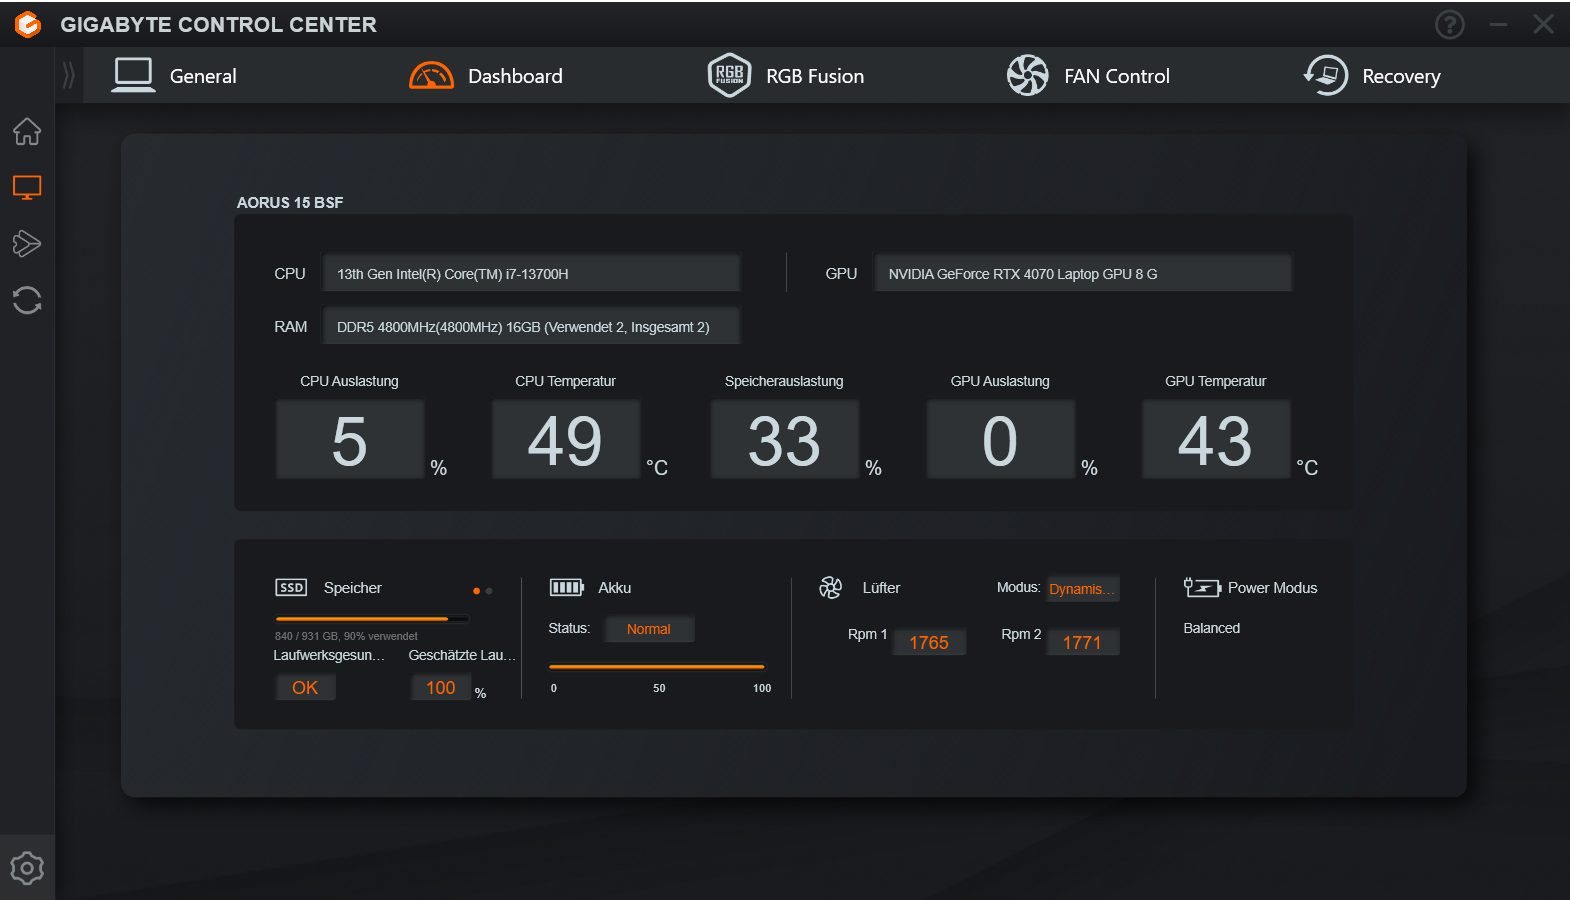
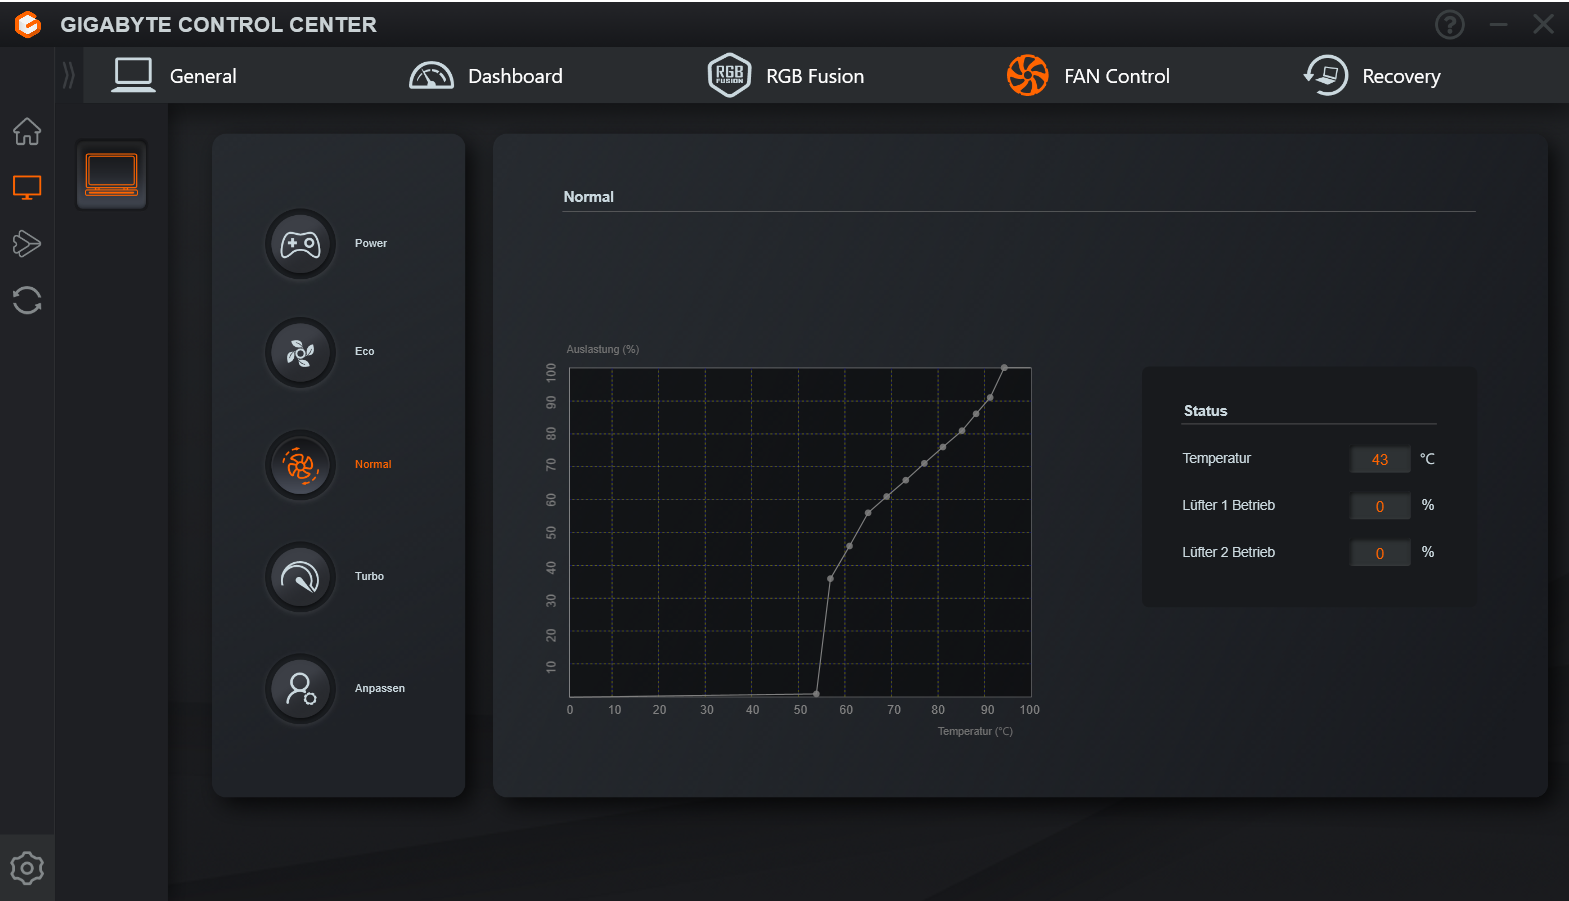
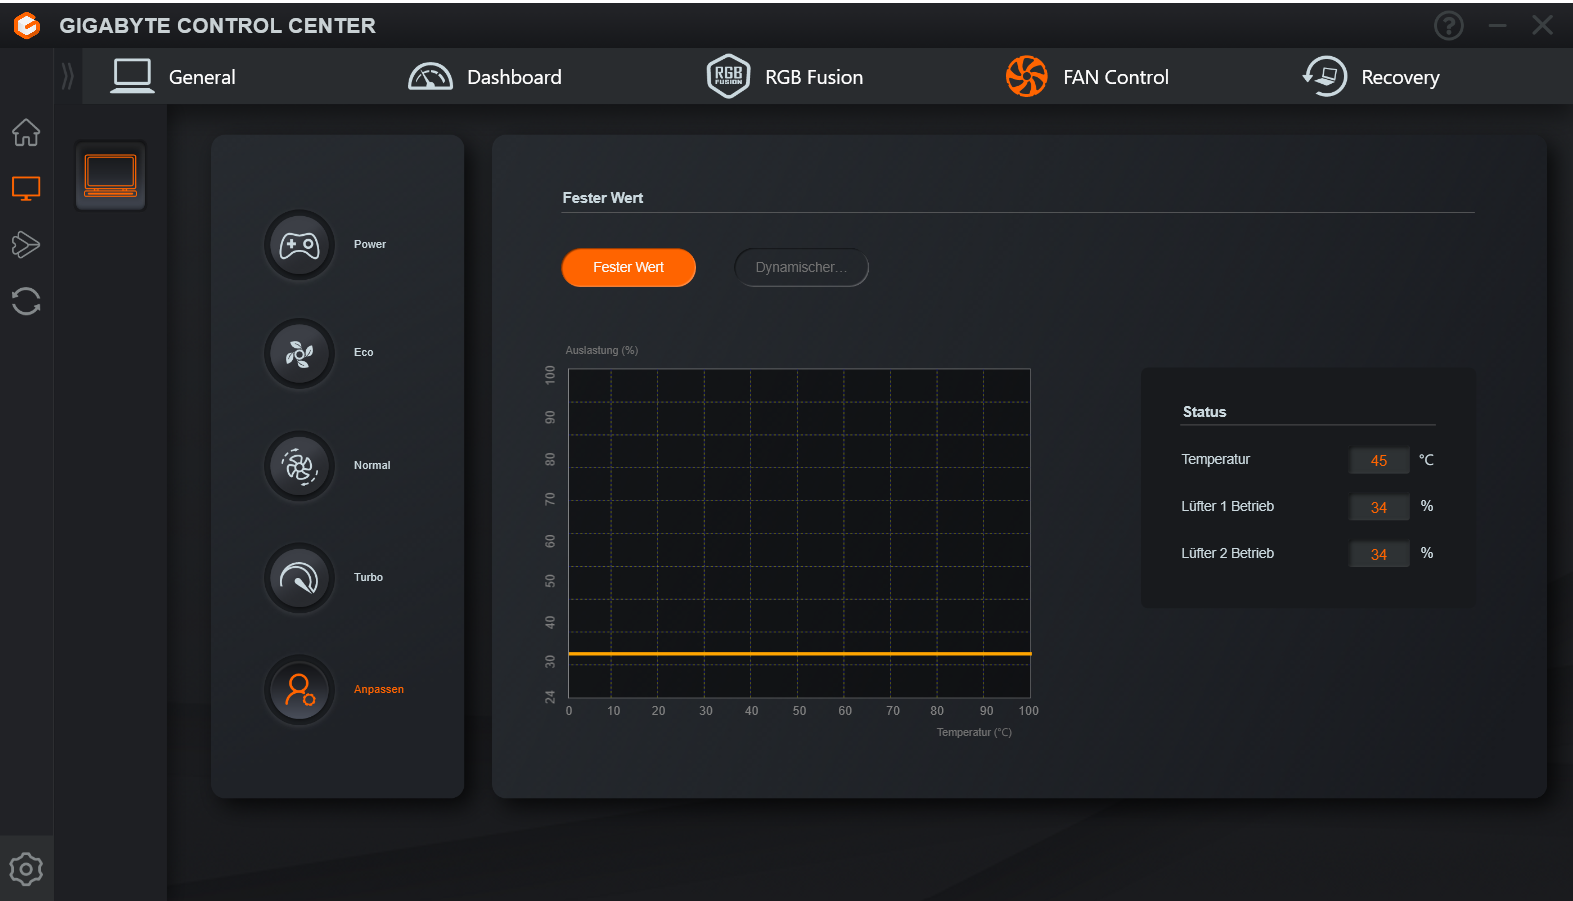
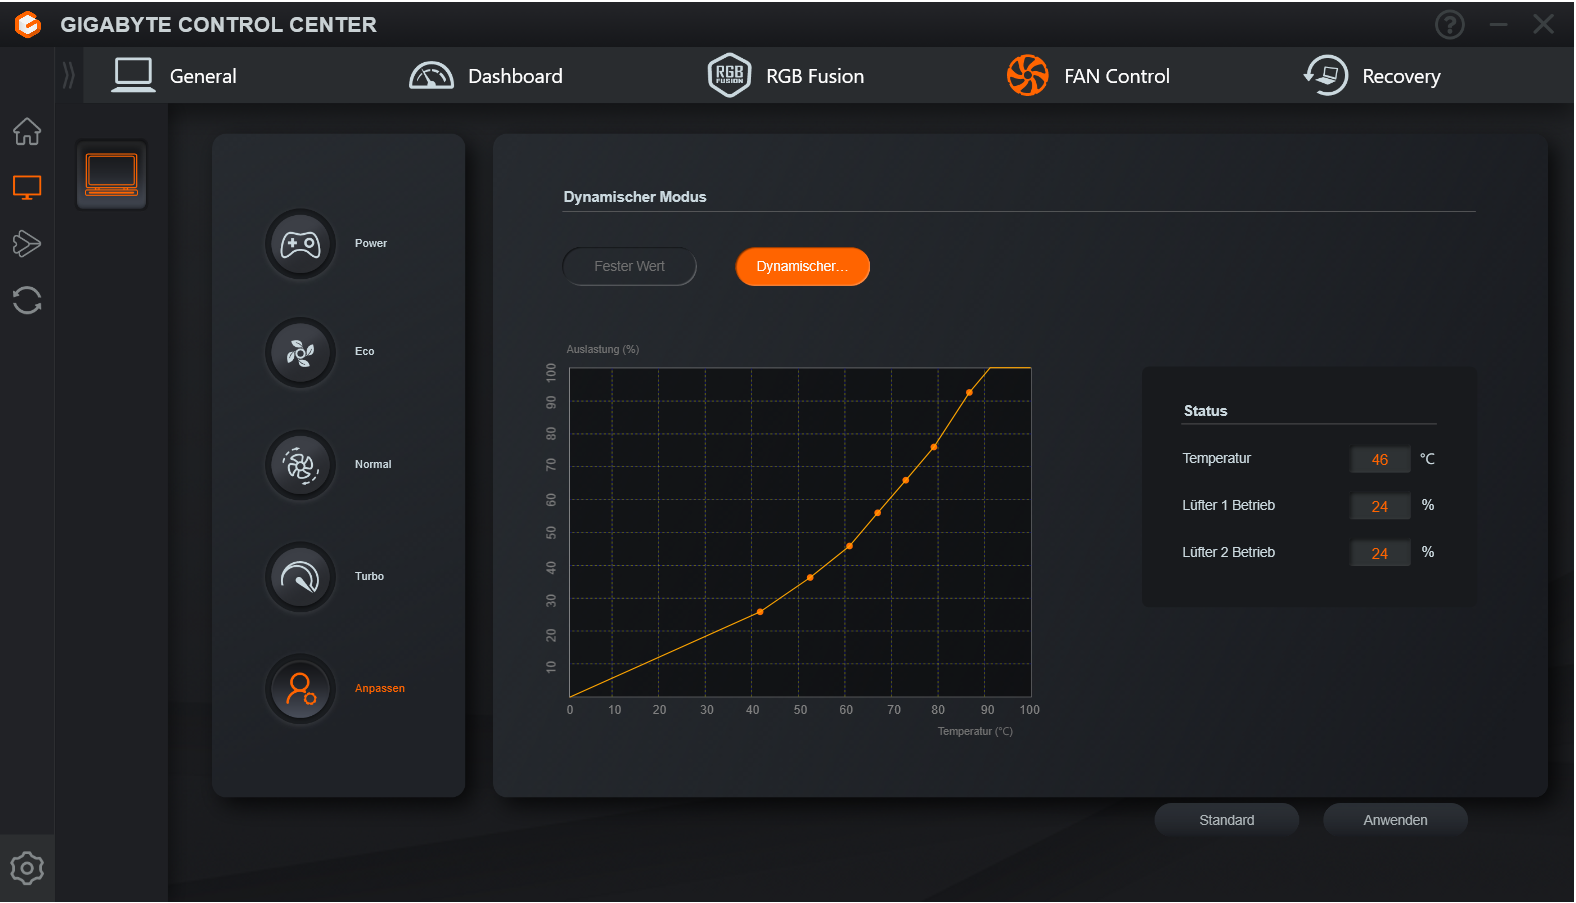
The computer's control center (Gigabyte Control Center) provides a higher-level AI Boost function which we used in addition to the typical performance modes (see table). Subsequently, the Control Center selected the appropriate profile - "Gaming Mode" and "Creator Mode" for the benchmarks, "Energy Saving Sleep Mode" for the battery tests.
| AI Boost | Creator | Turbo | Gaming | Meeting | Energy Saving Sleep Mode | |
|---|---|---|---|---|---|---|
| Power Limit 1 (HWInfo) | 55-70 watts | 70 watts | 70 watts | 55 watts | 27 watts | 27 watts |
| Power Limit 2 (HWInfo) | 115 watts | 115 watts | 115 watts | 115 watts | 45 watts | 45 watts |
| Noise (Witcher 3) | 53 dB(A) | 52 dB(A) | 55 dB(A) | 53 dB(A) | 46 dB(A) | 46 dB(A) |
| Performance (Witcher 3) | 118 fps | 118 fps | 118 fps | 118 fps | 118 fps | 118 fps |
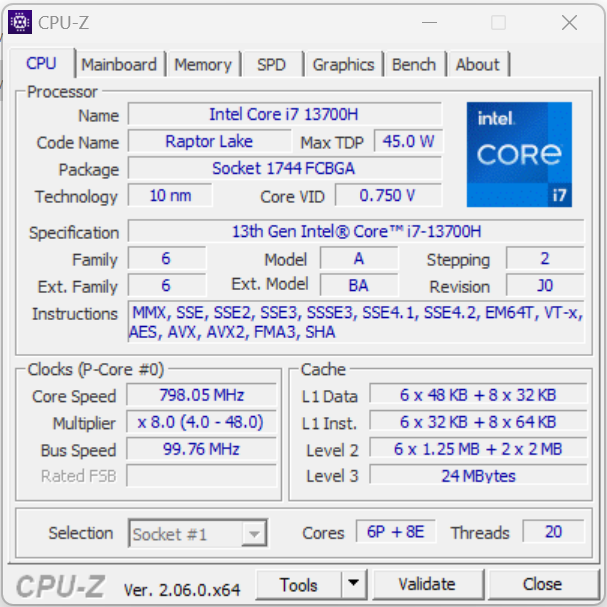
Processor
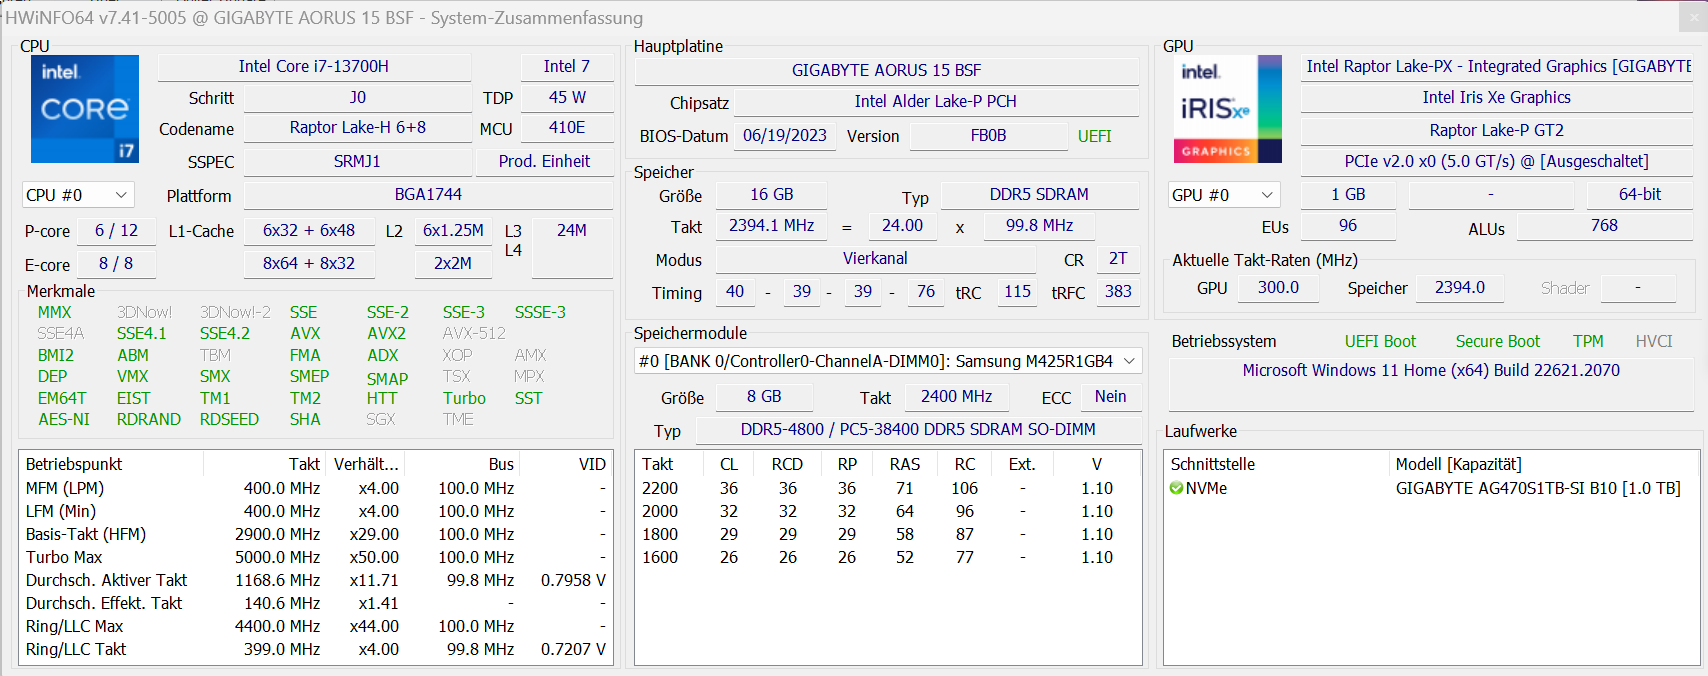
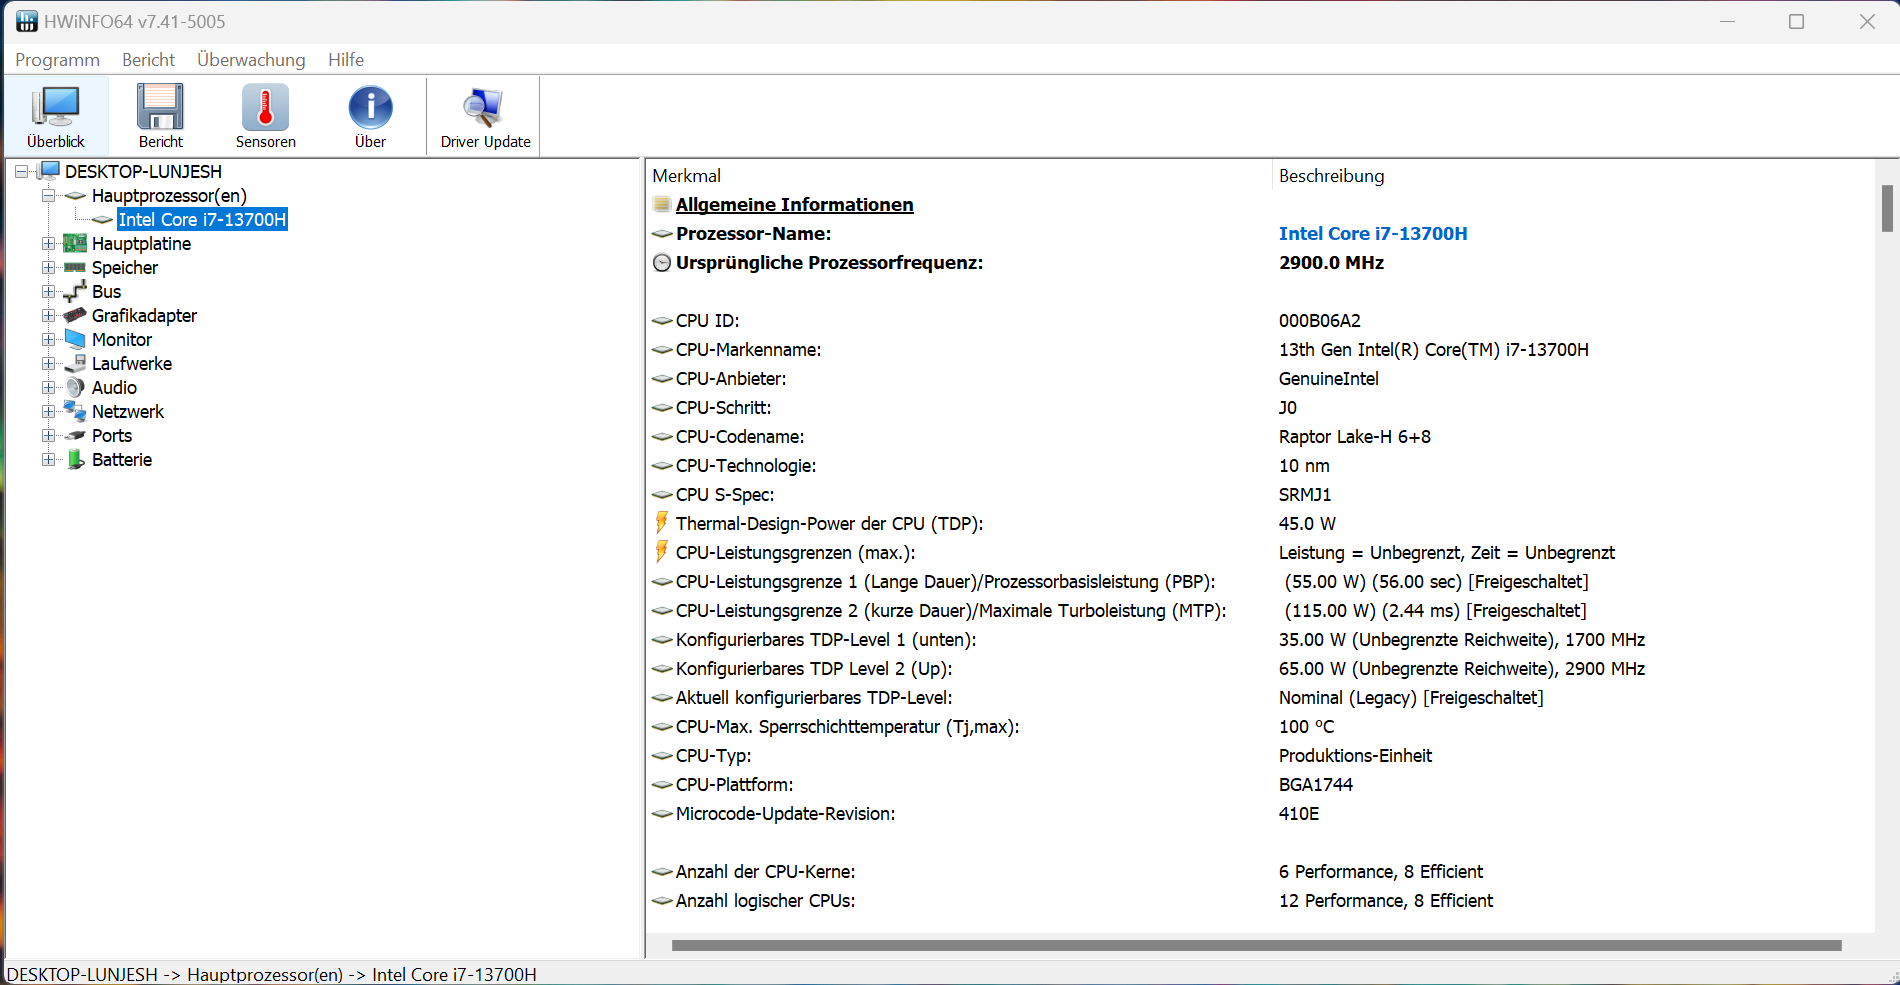
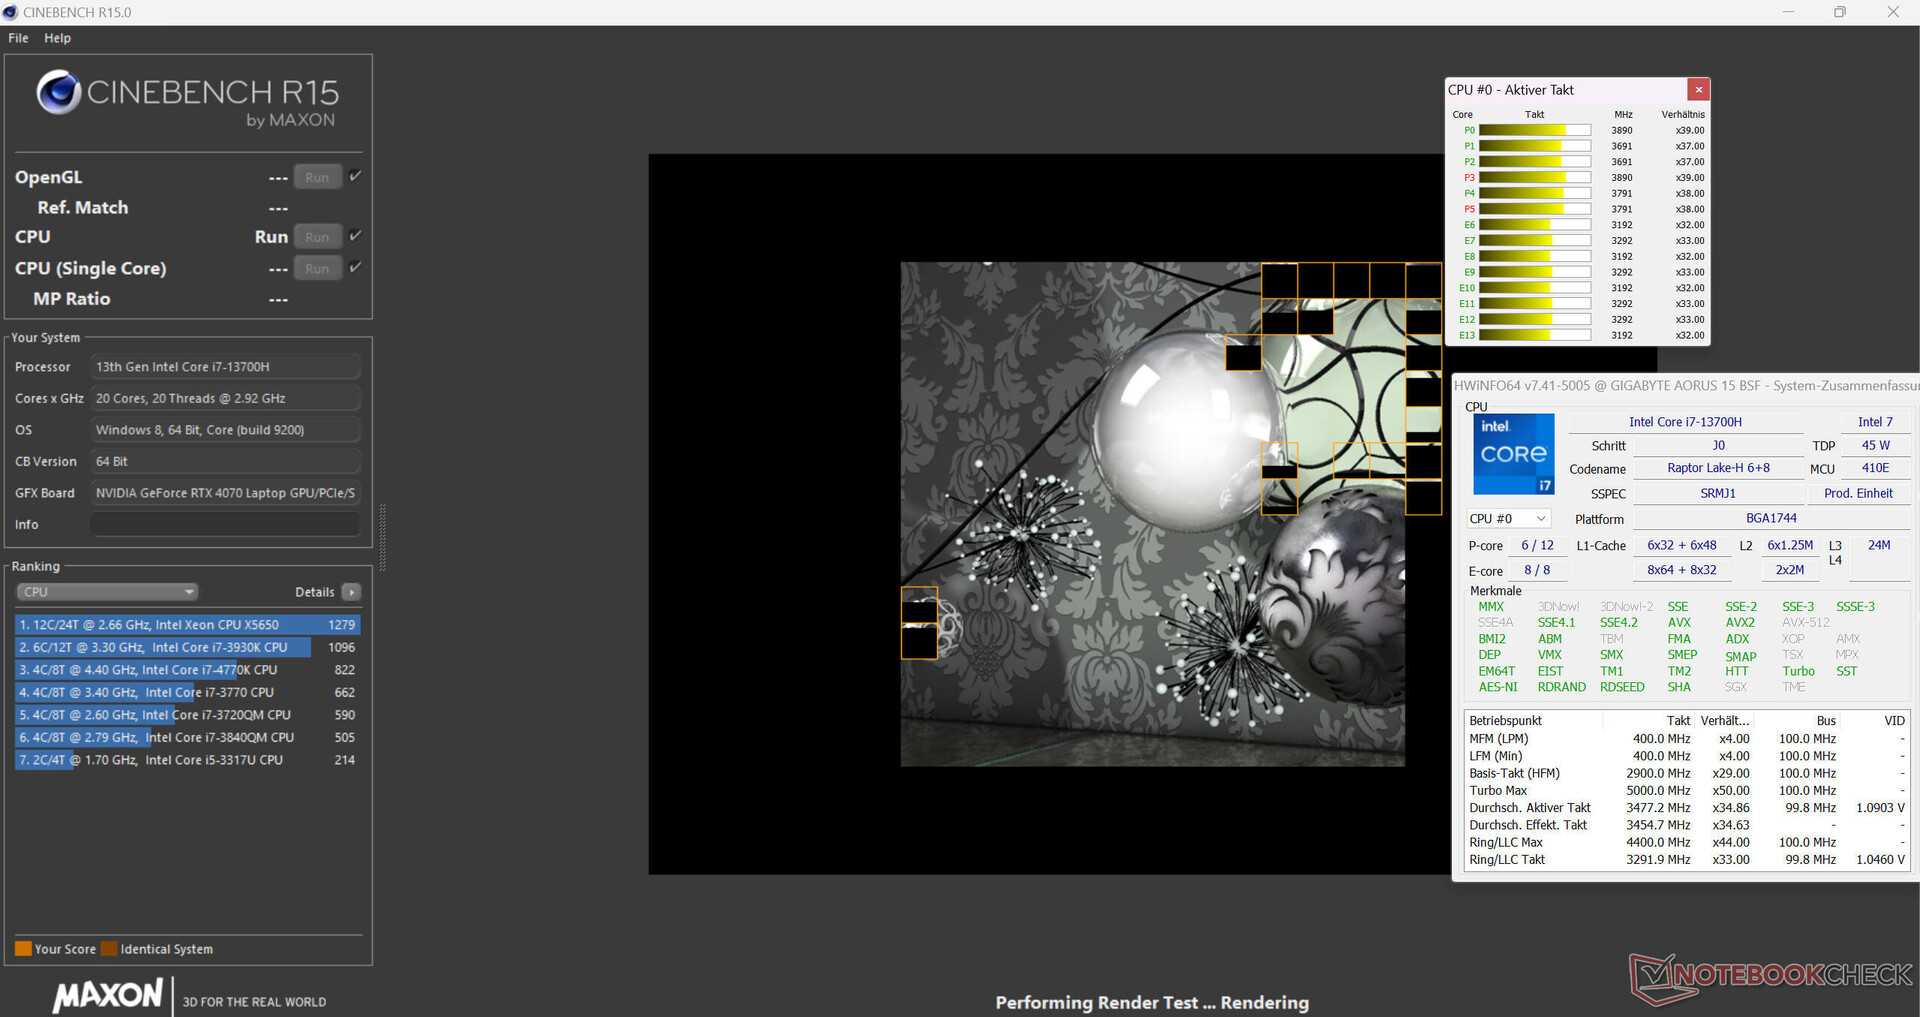
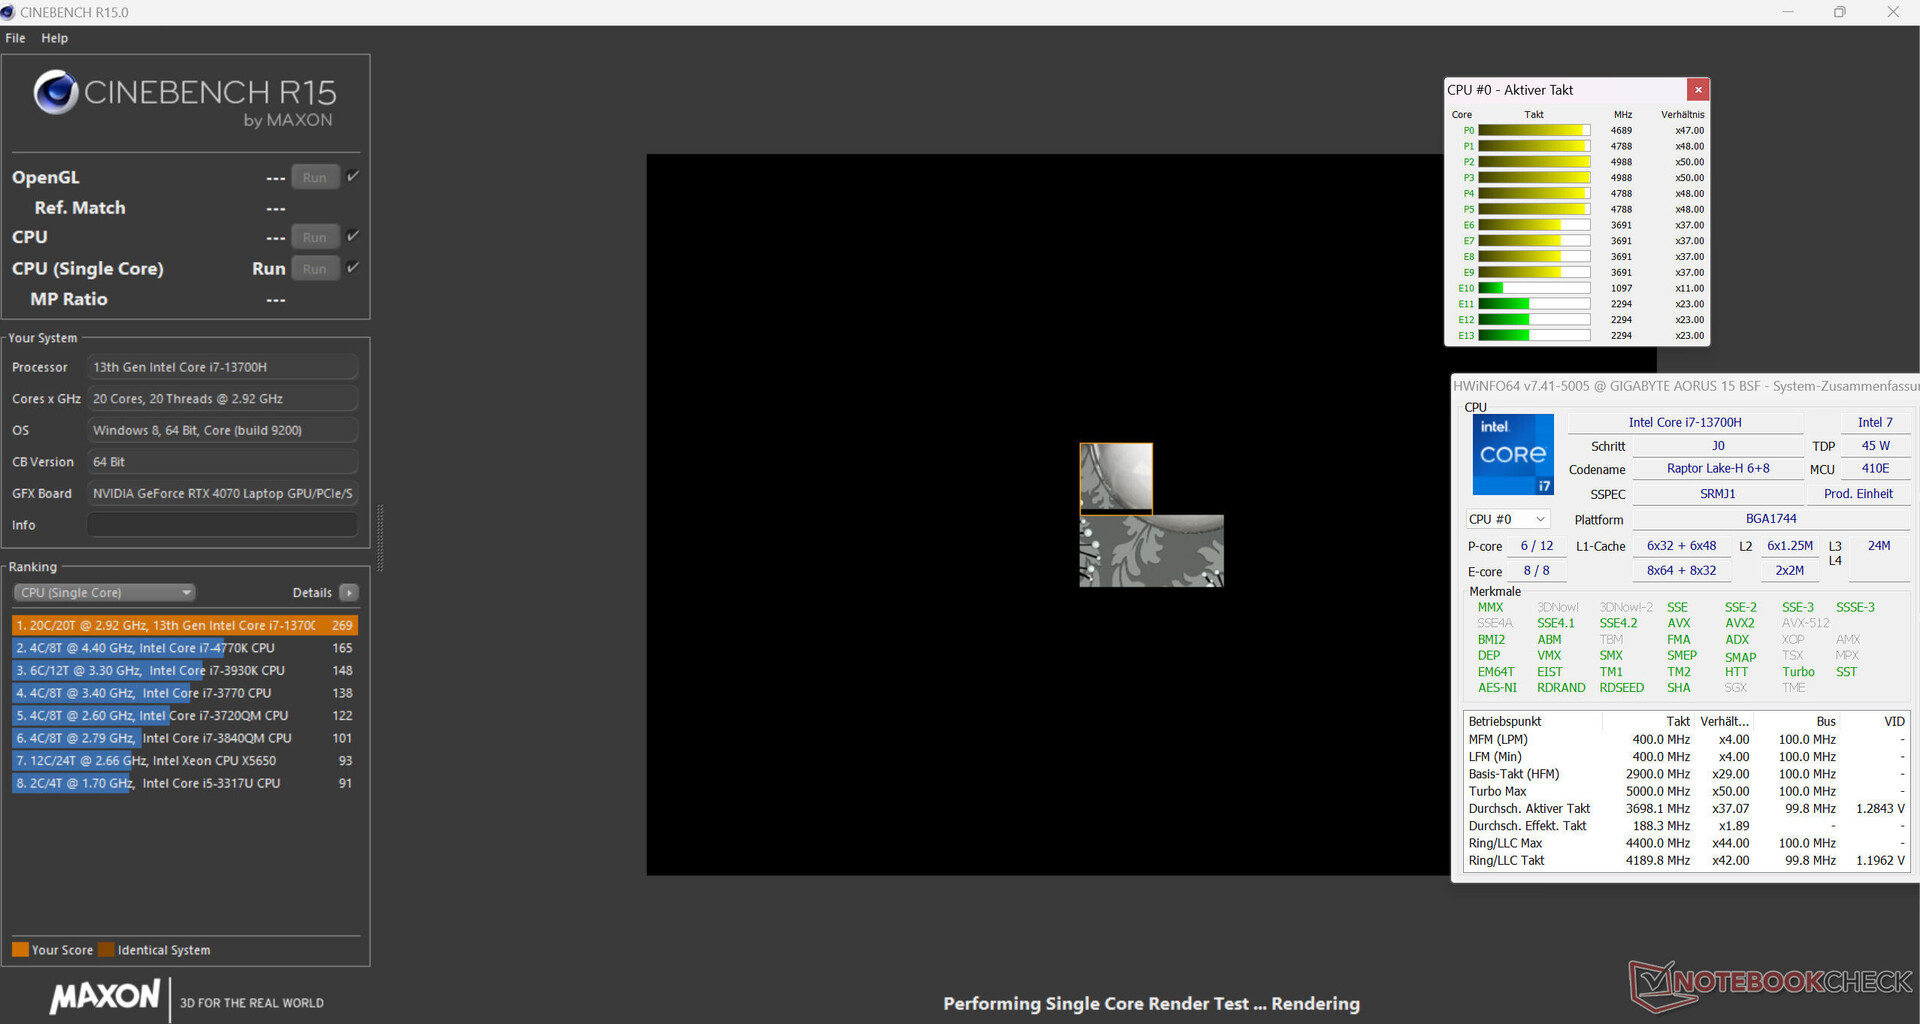
The Core-i7-13700H processor (Raptor Lake) consists of eight efficiency cores (no hyper threading, 1.8 - 3.7 GHz) and six performance cores (hyper threading, 2.4 - 5 GHz). In total, this adds up to 20 logical CPU cores.
The laptop's benchmark results when connected to the power were above the CPU average. In battery use, its more relevant single-thread performance (163 points) dropped a similar amount to its multi-thread performance (1,614 points).
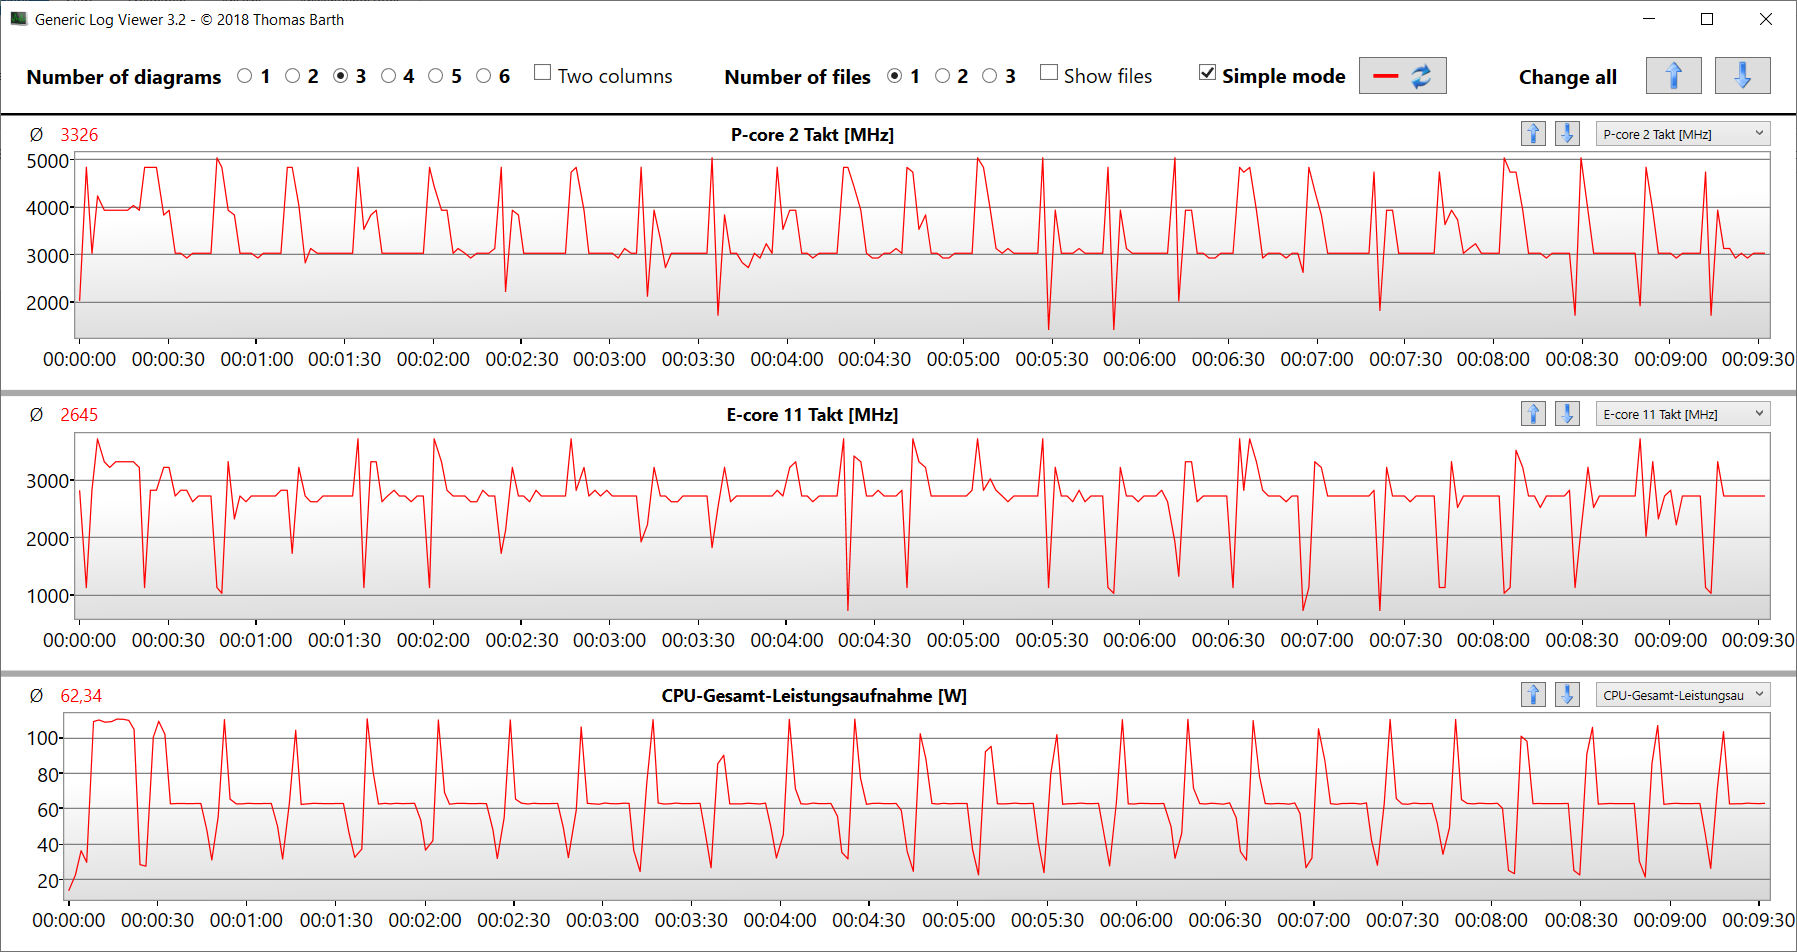
The CB15 loop test confirmed the CPU turbo as being permanently used. although, the clock rate sank a bit after the first run, regardless of which profile was used. "Turbo" affected the in total higher performance level.
Cinebench R15 Multi continuous test
* ... smaller is better
AIDA64: FP32 Ray-Trace | FPU Julia | CPU SHA3 | CPU Queen | FPU SinJulia | FPU Mandel | CPU AES | CPU ZLib | FP64 Ray-Trace | CPU PhotoWorxx
| Performance rating | |
| Average of class Gaming | |
| HP Omen Transcend 16 | |
| Asus TUF Gaming A16 FA617XS | |
| MSI Pulse 17 B13VGK | |
| Lenovo Legion Slim 7i 16 Gen 8 | |
| Acer Nitro 16 AN16-41 | |
| Aorus 15 BSF | |
| Average Intel Core i7-13700H | |
| AIDA64 / FP32 Ray-Trace | |
| Average of class Gaming (10227 - 85542, n=109, last 2 years) | |
| Asus TUF Gaming A16 FA617XS | |
| HP Omen Transcend 16 | |
| MSI Pulse 17 B13VGK | |
| Lenovo Legion Slim 7i 16 Gen 8 | |
| Acer Nitro 16 AN16-41 | |
| Average Intel Core i7-13700H (4986 - 18908, n=29) | |
| Aorus 15 BSF | |
| AIDA64 / FPU Julia | |
| Average of class Gaming (51376 - 238426, n=109, last 2 years) | |
| Asus TUF Gaming A16 FA617XS | |
| HP Omen Transcend 16 | |
| Acer Nitro 16 AN16-41 | |
| MSI Pulse 17 B13VGK | |
| Lenovo Legion Slim 7i 16 Gen 8 | |
| Average Intel Core i7-13700H (25360 - 92359, n=29) | |
| Aorus 15 BSF | |
| AIDA64 / CPU SHA3 | |
| Average of class Gaming (2180 - 9817, n=109, last 2 years) | |
| HP Omen Transcend 16 | |
| Asus TUF Gaming A16 FA617XS | |
| MSI Pulse 17 B13VGK | |
| Lenovo Legion Slim 7i 16 Gen 8 | |
| Acer Nitro 16 AN16-41 | |
| Aorus 15 BSF | |
| Average Intel Core i7-13700H (1339 - 4224, n=29) | |
| AIDA64 / CPU Queen | |
| HP Omen Transcend 16 | |
| Asus TUF Gaming A16 FA617XS | |
| Lenovo Legion Slim 7i 16 Gen 8 | |
| Average of class Gaming (49785 - 173351, n=100, last 2 years) | |
| Acer Nitro 16 AN16-41 | |
| Aorus 15 BSF | |
| MSI Pulse 17 B13VGK | |
| Average Intel Core i7-13700H (59324 - 107159, n=29) | |
| AIDA64 / FPU SinJulia | |
| Asus TUF Gaming A16 FA617XS | |
| Average of class Gaming (4424 - 33636, n=109, last 2 years) | |
| HP Omen Transcend 16 | |
| Acer Nitro 16 AN16-41 | |
| Lenovo Legion Slim 7i 16 Gen 8 | |
| MSI Pulse 17 B13VGK | |
| Aorus 15 BSF | |
| Average Intel Core i7-13700H (4800 - 11050, n=29) | |
| AIDA64 / FPU Mandel | |
| Average of class Gaming (25115 - 128721, n=109, last 2 years) | |
| Asus TUF Gaming A16 FA617XS | |
| HP Omen Transcend 16 | |
| Acer Nitro 16 AN16-41 | |
| MSI Pulse 17 B13VGK | |
| Lenovo Legion Slim 7i 16 Gen 8 | |
| Average Intel Core i7-13700H (12321 - 45118, n=29) | |
| Aorus 15 BSF | |
| AIDA64 / CPU AES | |
| Aorus 15 BSF | |
| HP Omen Transcend 16 | |
| Average of class Gaming (39258 - 247074, n=109, last 2 years) | |
| Asus TUF Gaming A16 FA617XS | |
| MSI Pulse 17 B13VGK | |
| Lenovo Legion Slim 7i 16 Gen 8 | |
| Average Intel Core i7-13700H (28769 - 151254, n=29) | |
| Acer Nitro 16 AN16-41 | |
| AIDA64 / CPU ZLib | |
| HP Omen Transcend 16 | |
| Average of class Gaming (574 - 2531, n=109, last 2 years) | |
| Lenovo Legion Slim 7i 16 Gen 8 | |
| MSI Pulse 17 B13VGK | |
| Asus TUF Gaming A16 FA617XS | |
| Average Intel Core i7-13700H (389 - 1215, n=29) | |
| Aorus 15 BSF | |
| Acer Nitro 16 AN16-41 | |
| AIDA64 / FP64 Ray-Trace | |
| Average of class Gaming (5509 - 45446, n=109, last 2 years) | |
| Asus TUF Gaming A16 FA617XS | |
| HP Omen Transcend 16 | |
| MSI Pulse 17 B13VGK | |
| Lenovo Legion Slim 7i 16 Gen 8 | |
| Acer Nitro 16 AN16-41 | |
| Average Intel Core i7-13700H (2540 - 10135, n=29) | |
| Aorus 15 BSF | |
| AIDA64 / CPU PhotoWorxx | |
| HP Omen Transcend 16 | |
| Average of class Gaming (12271 - 89891, n=109, last 2 years) | |
| Average Intel Core i7-13700H (12872 - 52727, n=29) | |
| MSI Pulse 17 B13VGK | |
| Aorus 15 BSF | |
| Asus TUF Gaming A16 FA617XS | |
| Acer Nitro 16 AN16-41 | |
| Lenovo Legion Slim 7i 16 Gen 8 | |
System performance
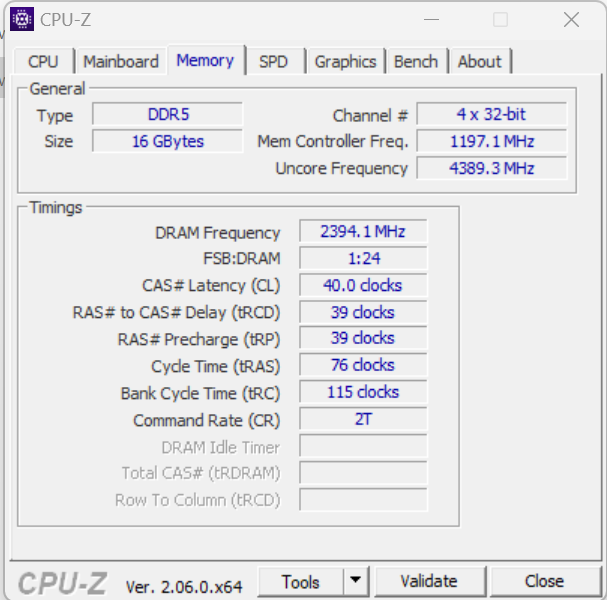
The smooth-running system isn't missing any computing performance. Rendering and gaming proves to be no problem for the laptop. The RAM's transfer rates were about on an average level for DDR5 4800 RAM.

CrossMark: Overall | Productivity | Creativity | Responsiveness
| PCMark 10 / Score | |
| Lenovo Legion Slim 7i 16 Gen 8 | |
| Average of class Gaming (5828 - 11574, n=95, last 2 years) | |
| HP Omen Transcend 16 | |
| Asus TUF Gaming A16 FA617XS | |
| MSI Pulse 17 B13VGK | |
| Average Intel Core i7-13700H, NVIDIA GeForce RTX 4070 Laptop GPU (7158 - 7956, n=8) | |
| Aorus 15 BSF | |
| Acer Nitro 16 AN16-41 | |
| PCMark 10 / Essentials | |
| Lenovo Legion Slim 7i 16 Gen 8 | |
| HP Omen Transcend 16 | |
| Asus TUF Gaming A16 FA617XS | |
| Aorus 15 BSF | |
| Average Intel Core i7-13700H, NVIDIA GeForce RTX 4070 Laptop GPU (10252 - 11449, n=8) | |
| Average of class Gaming (8810 - 12600, n=99, last 2 years) | |
| Acer Nitro 16 AN16-41 | |
| MSI Pulse 17 B13VGK | |
| PCMark 10 / Productivity | |
| Lenovo Legion Slim 7i 16 Gen 8 | |
| MSI Pulse 17 B13VGK | |
| Average of class Gaming (6845 - 18766, n=97, last 2 years) | |
| Asus TUF Gaming A16 FA617XS | |
| HP Omen Transcend 16 | |
| Average Intel Core i7-13700H, NVIDIA GeForce RTX 4070 Laptop GPU (8501 - 10769, n=8) | |
| Acer Nitro 16 AN16-41 | |
| Aorus 15 BSF | |
| PCMark 10 / Digital Content Creation | |
| Average of class Gaming (7602 - 19657, n=97, last 2 years) | |
| Lenovo Legion Slim 7i 16 Gen 8 | |
| HP Omen Transcend 16 | |
| Asus TUF Gaming A16 FA617XS | |
| MSI Pulse 17 B13VGK | |
| Average Intel Core i7-13700H, NVIDIA GeForce RTX 4070 Laptop GPU (10358 - 12908, n=8) | |
| Aorus 15 BSF | |
| Acer Nitro 16 AN16-41 | |
| CrossMark / Overall | |
| Aorus 15 BSF | |
| Average of class Gaming (1366 - 2409, n=97, last 2 years) | |
| Lenovo Legion Slim 7i 16 Gen 8 | |
| HP Omen Transcend 16 | |
| MSI Pulse 17 B13VGK | |
| Average Intel Core i7-13700H, NVIDIA GeForce RTX 4070 Laptop GPU (1768 - 2073, n=6) | |
| Asus TUF Gaming A16 FA617XS | |
| Acer Nitro 16 AN16-41 | |
| CrossMark / Productivity | |
| Aorus 15 BSF | |
| Lenovo Legion Slim 7i 16 Gen 8 | |
| Average of class Gaming (1386 - 2254, n=97, last 2 years) | |
| HP Omen Transcend 16 | |
| MSI Pulse 17 B13VGK | |
| Average Intel Core i7-13700H, NVIDIA GeForce RTX 4070 Laptop GPU (1645 - 2006, n=6) | |
| Asus TUF Gaming A16 FA617XS | |
| Acer Nitro 16 AN16-41 | |
| CrossMark / Creativity | |
| HP Omen Transcend 16 | |
| Average of class Gaming (1343 - 2729, n=97, last 2 years) | |
| Aorus 15 BSF | |
| Lenovo Legion Slim 7i 16 Gen 8 | |
| MSI Pulse 17 B13VGK | |
| Average Intel Core i7-13700H, NVIDIA GeForce RTX 4070 Laptop GPU (1936 - 2137, n=6) | |
| Asus TUF Gaming A16 FA617XS | |
| Acer Nitro 16 AN16-41 | |
| CrossMark / Responsiveness | |
| Aorus 15 BSF | |
| Lenovo Legion Slim 7i 16 Gen 8 | |
| MSI Pulse 17 B13VGK | |
| Average Intel Core i7-13700H, NVIDIA GeForce RTX 4070 Laptop GPU (1451 - 2202, n=6) | |
| Average of class Gaming (1226 - 2334, n=97, last 2 years) | |
| HP Omen Transcend 16 | |
| Asus TUF Gaming A16 FA617XS | |
| Acer Nitro 16 AN16-41 | |
| PCMark 10 Score | 7309 points | |
Help | ||
| AIDA64 / Memory Copy | |
| HP Omen Transcend 16 | |
| Average of class Gaming (21750 - 129946, n=109, last 2 years) | |
| Average Intel Core i7-13700H (24334 - 78081, n=29) | |
| MSI Pulse 17 B13VGK | |
| Aorus 15 BSF | |
| Asus TUF Gaming A16 FA617XS | |
| Acer Nitro 16 AN16-41 | |
| Lenovo Legion Slim 7i 16 Gen 8 | |
| AIDA64 / Memory Read | |
| HP Omen Transcend 16 | |
| Average of class Gaming (22956 - 118858, n=109, last 2 years) | |
| MSI Pulse 17 B13VGK | |
| Aorus 15 BSF | |
| Average Intel Core i7-13700H (23681 - 79656, n=29) | |
| Asus TUF Gaming A16 FA617XS | |
| Acer Nitro 16 AN16-41 | |
| Lenovo Legion Slim 7i 16 Gen 8 | |
| AIDA64 / Memory Write | |
| Aorus 15 BSF | |
| HP Omen Transcend 16 | |
| Average of class Gaming (22297 - 135096, n=109, last 2 years) | |
| Asus TUF Gaming A16 FA617XS | |
| Average Intel Core i7-13700H (22986 - 99898, n=29) | |
| MSI Pulse 17 B13VGK | |
| Acer Nitro 16 AN16-41 | |
| Lenovo Legion Slim 7i 16 Gen 8 | |
| AIDA64 / Memory Latency | |
| Average of class Gaming (75.3 - 259, n=109, last 2 years) | |
| MSI Pulse 17 B13VGK | |
| Average Intel Core i7-13700H (82.4 - 136.8, n=29) | |
| Acer Nitro 16 AN16-41 | |
| Aorus 15 BSF | |
| Asus TUF Gaming A16 FA617XS | |
| HP Omen Transcend 16 | |
| Lenovo Legion Slim 7i 16 Gen 8 | |
* ... smaller is better
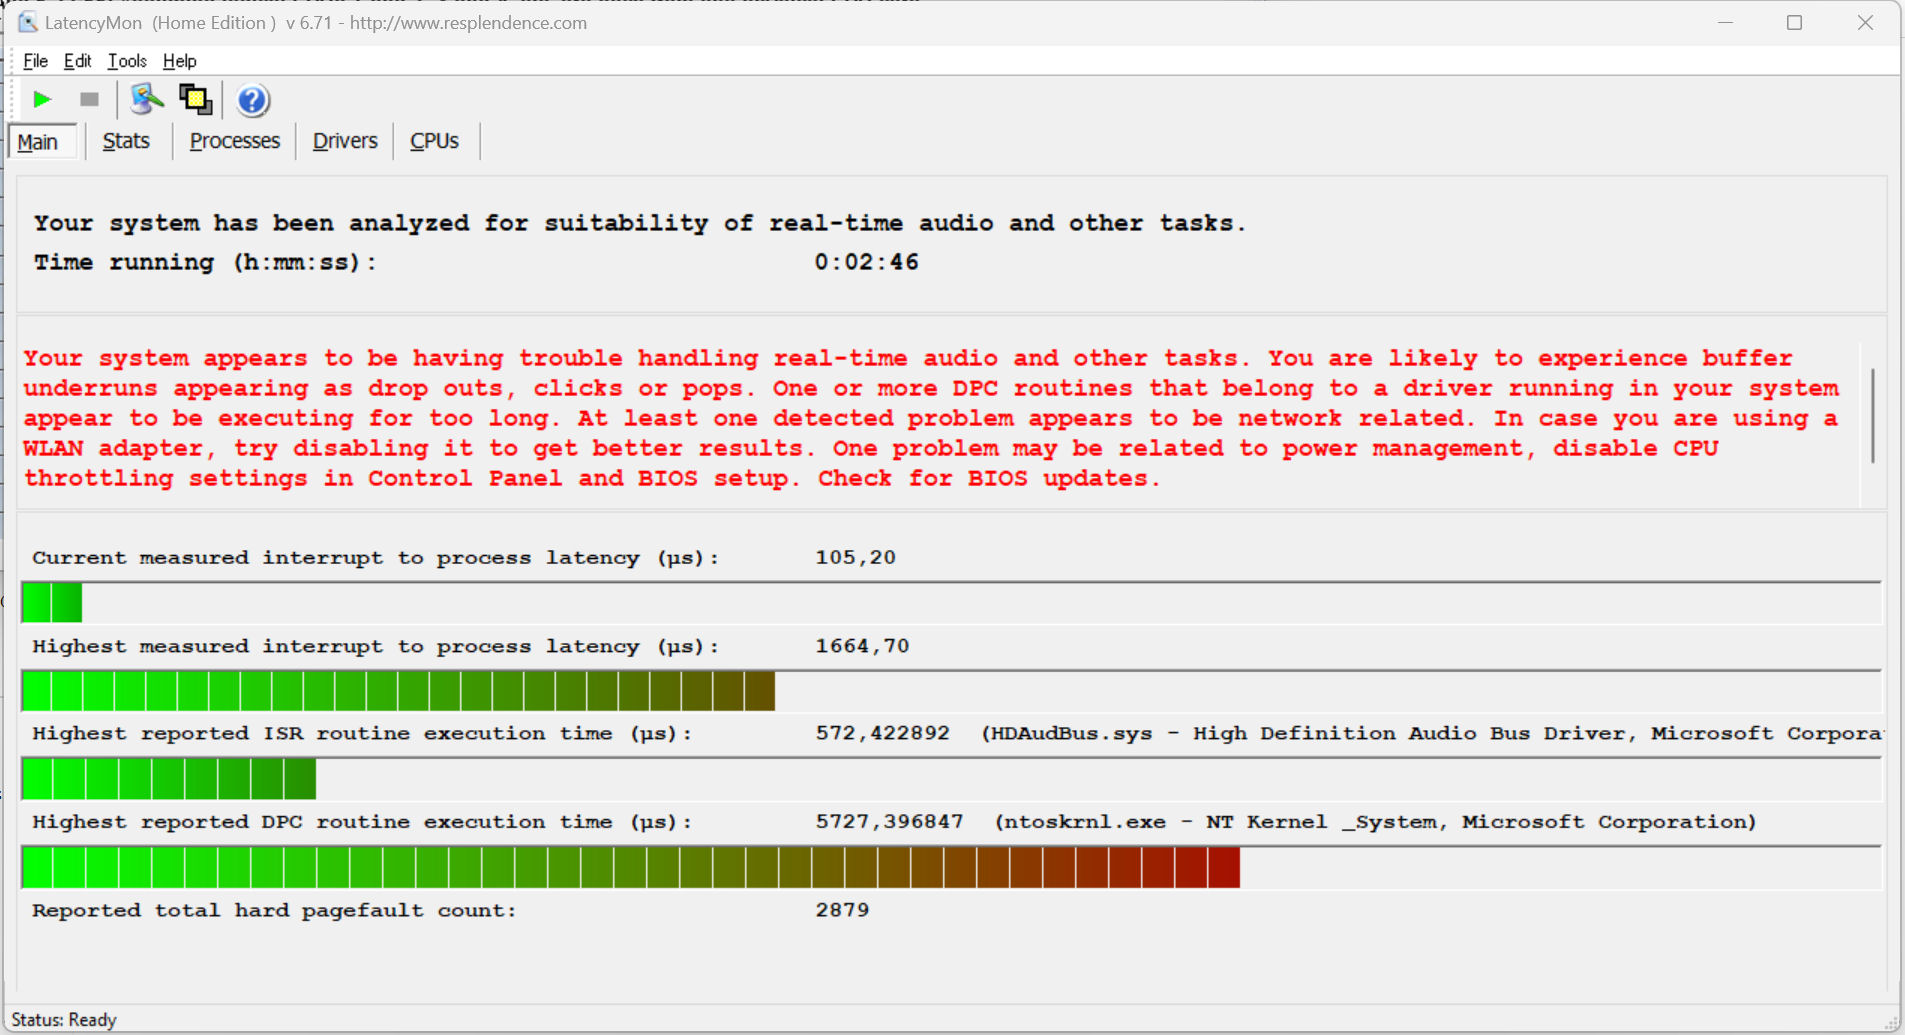
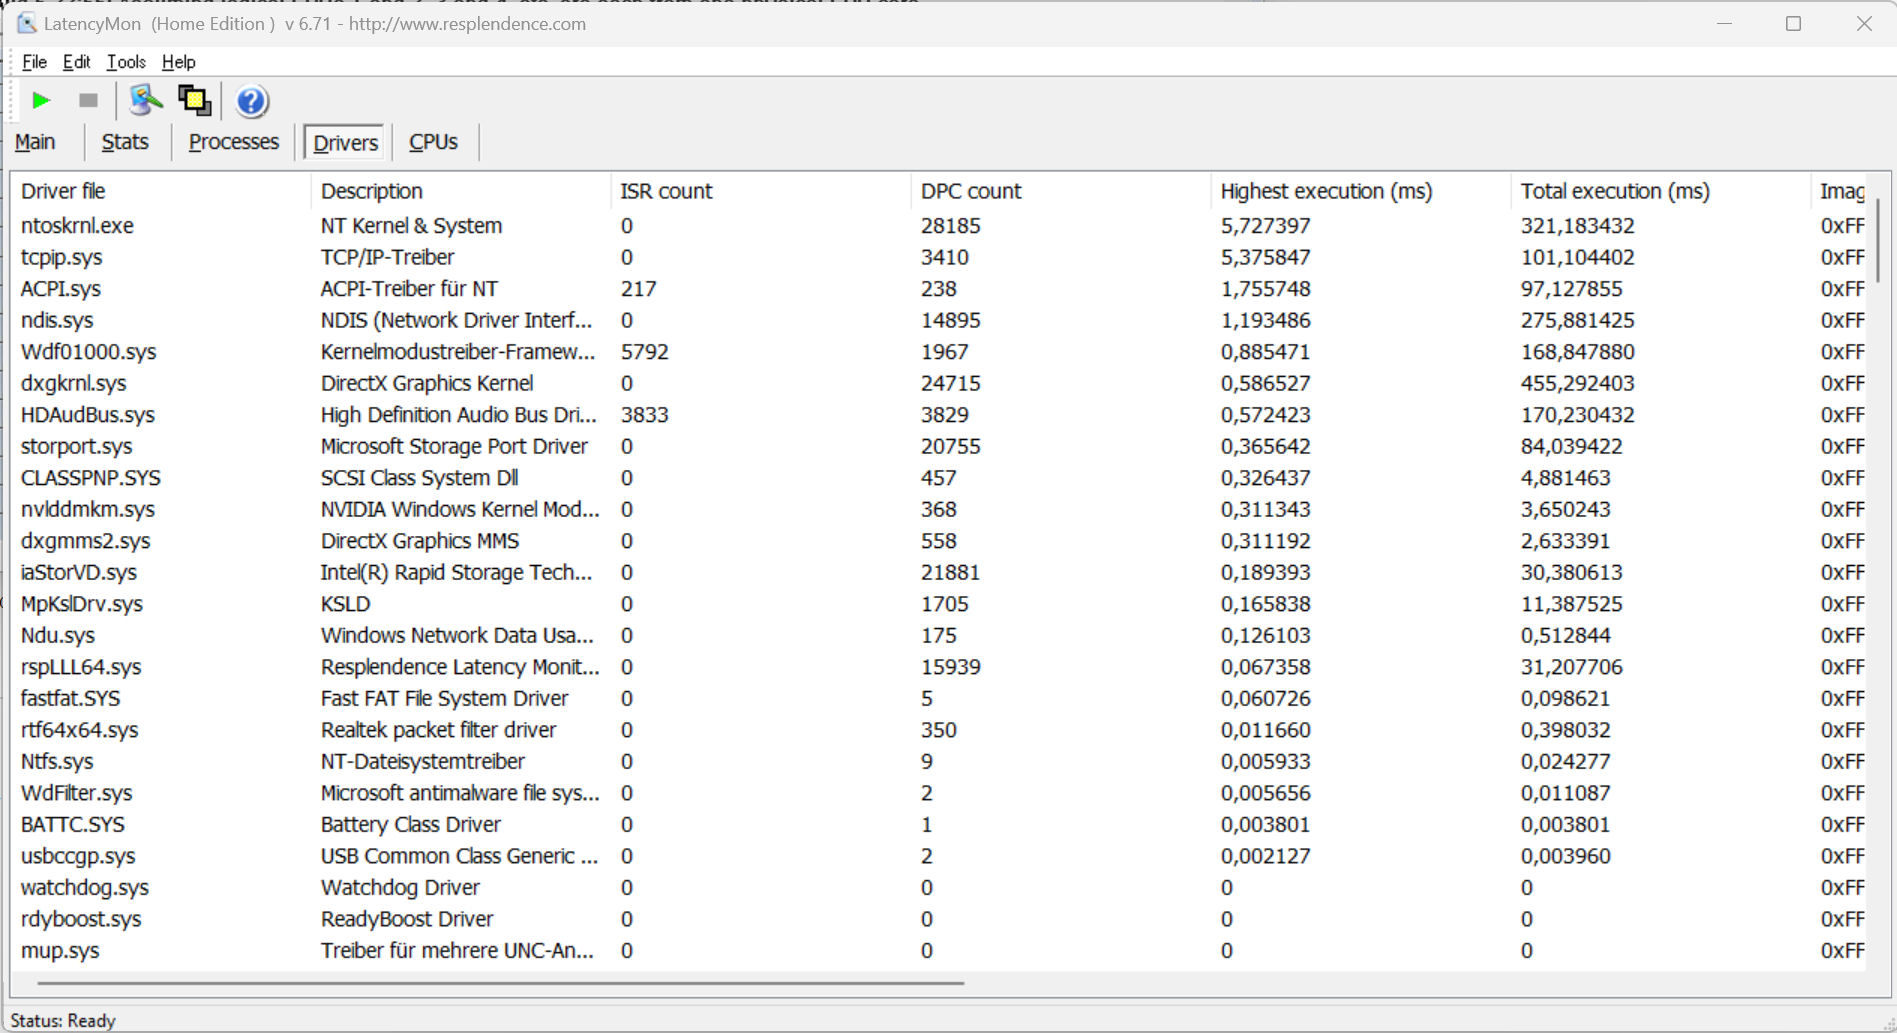
DPC latency
The standardized latency monitor test (web surfing, 4k video playback, Prime95 high-load) revealed some anomalies. The system does not seem to be suitable for real-time video and audio editing. Future software updates could lead to improvements or even degradations.
| DPC Latencies / LatencyMon - interrupt to process latency (max), Web, Youtube, Prime95 | |
| Lenovo Legion Slim 7i 16 Gen 8 | |
| Aorus 15 BSF | |
| HP Omen Transcend 16 | |
| Acer Nitro 16 AN16-41 | |
| Asus TUF Gaming A16 FA617XS | |
| MSI Pulse 17 B13VGK | |
* ... smaller is better
Storage devices
The laptop is fitted with a 1-TB SSD (PCIe 4, M.2 2280) from Gigabyte which showed very good data rates. Positive: We didn't note any temperature related throttling. The device has space for a further SSD.


* ... smaller is better
Reading continuous performance: DiskSpd Read Loop, Queue Depth 8
Graphics card
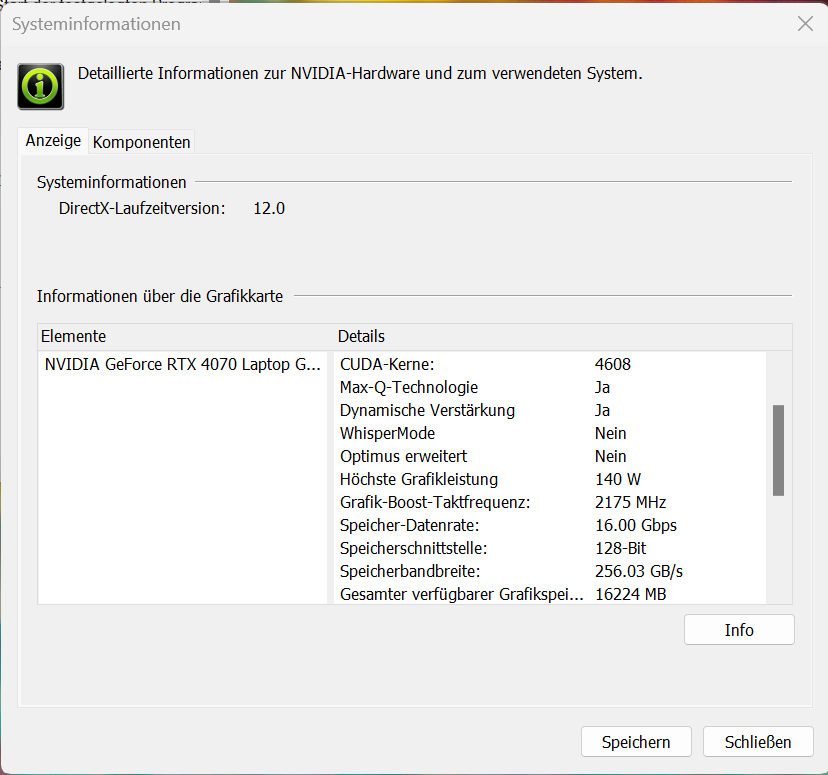
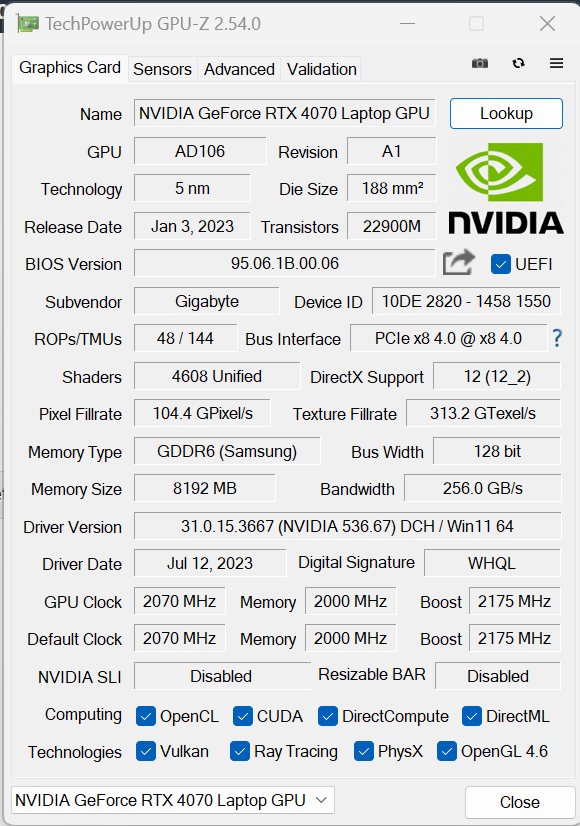
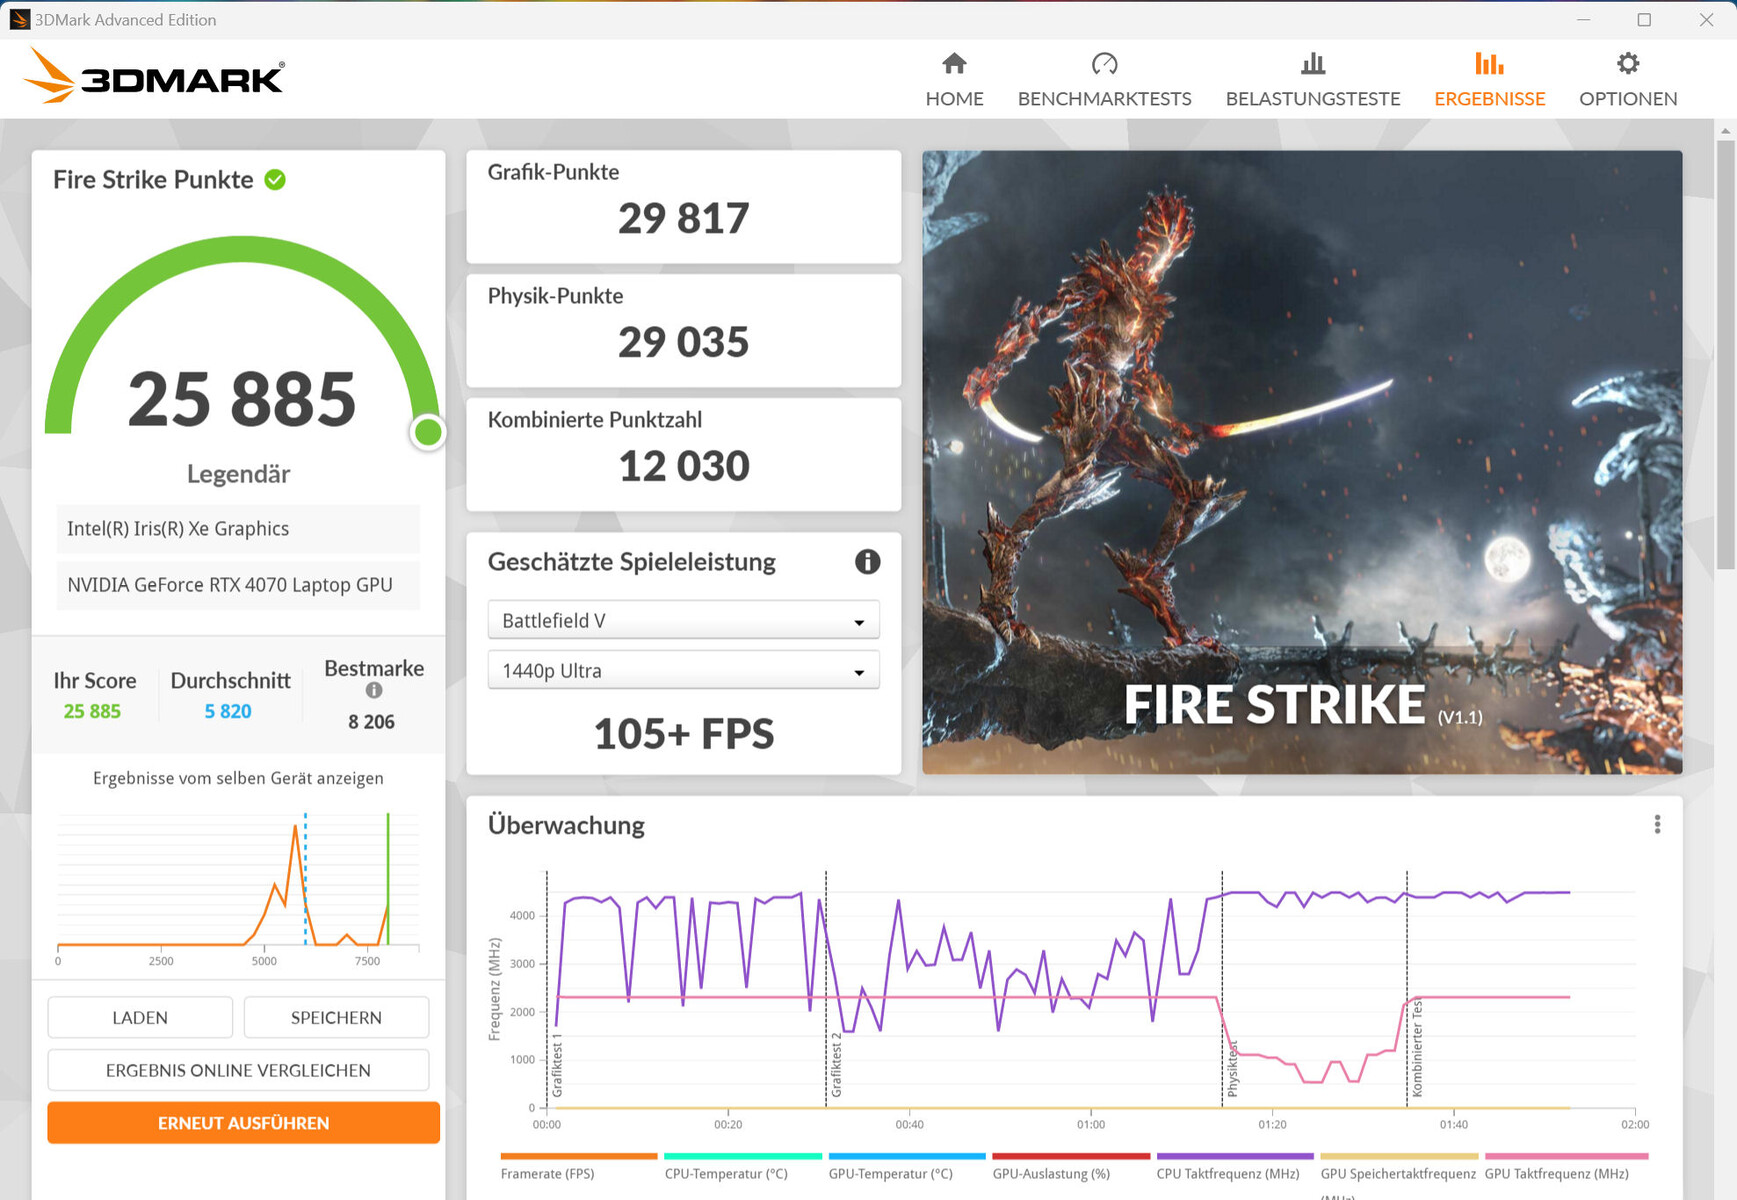
The GeForce RTX 4070 features 4,608 shaders, fast GDDR6 memory (although only 8,192 MB) and a 128 bit wide bus. Gigabyte has given it a maximum TGP of 140 watts (115 watts + 25 watts) - more isn't possible. According to the Witcher 3 test, the full TGP isn't taken advantage of.
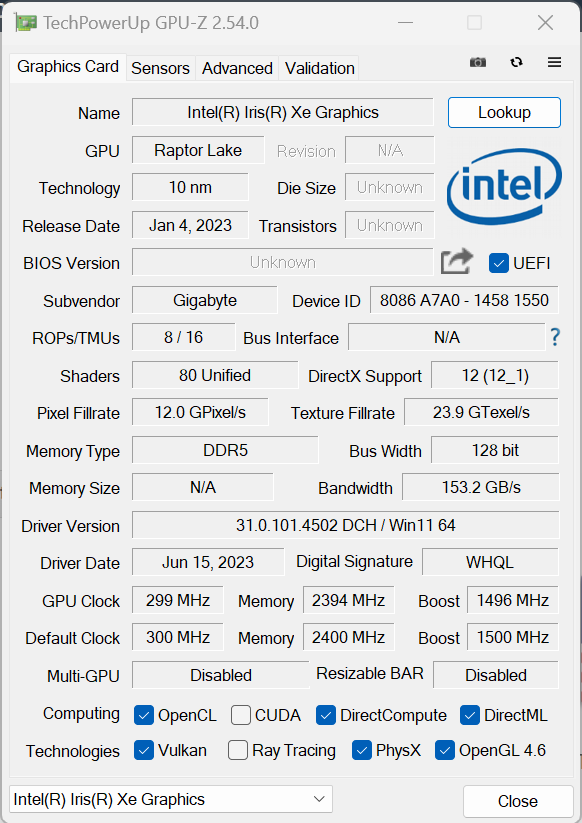
Its benchmark results were above the previous RTX 4070 average. Using dGPU mode didn't lead to any improvements. Changing between Optimus Mode ("Intel graphics output mode") and dGPU Mode ("Nvidia graphics output mode") can be done by through the Control Center (general -> GPU MUX switch). You always have to restart the laptop. Gigabyte relies on a MUX switch - Advanced Optimus is not supported.
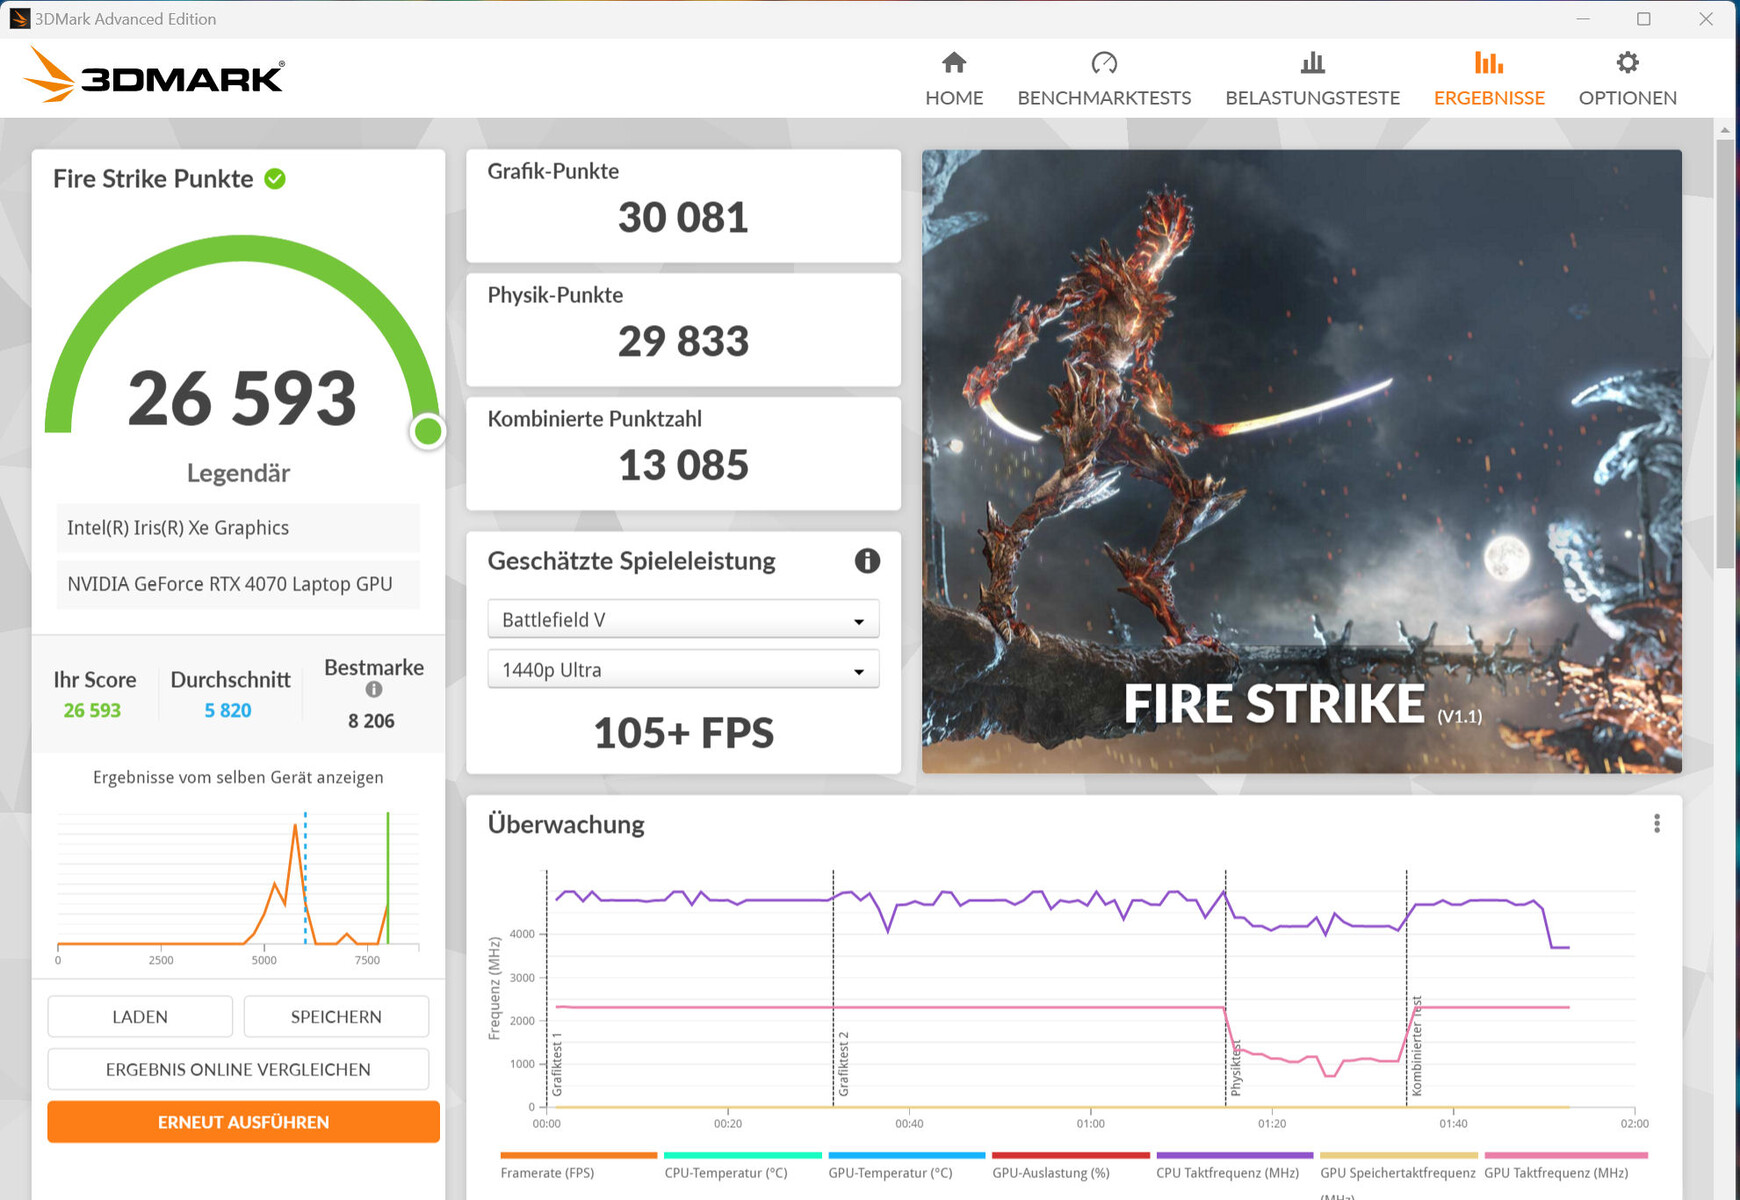


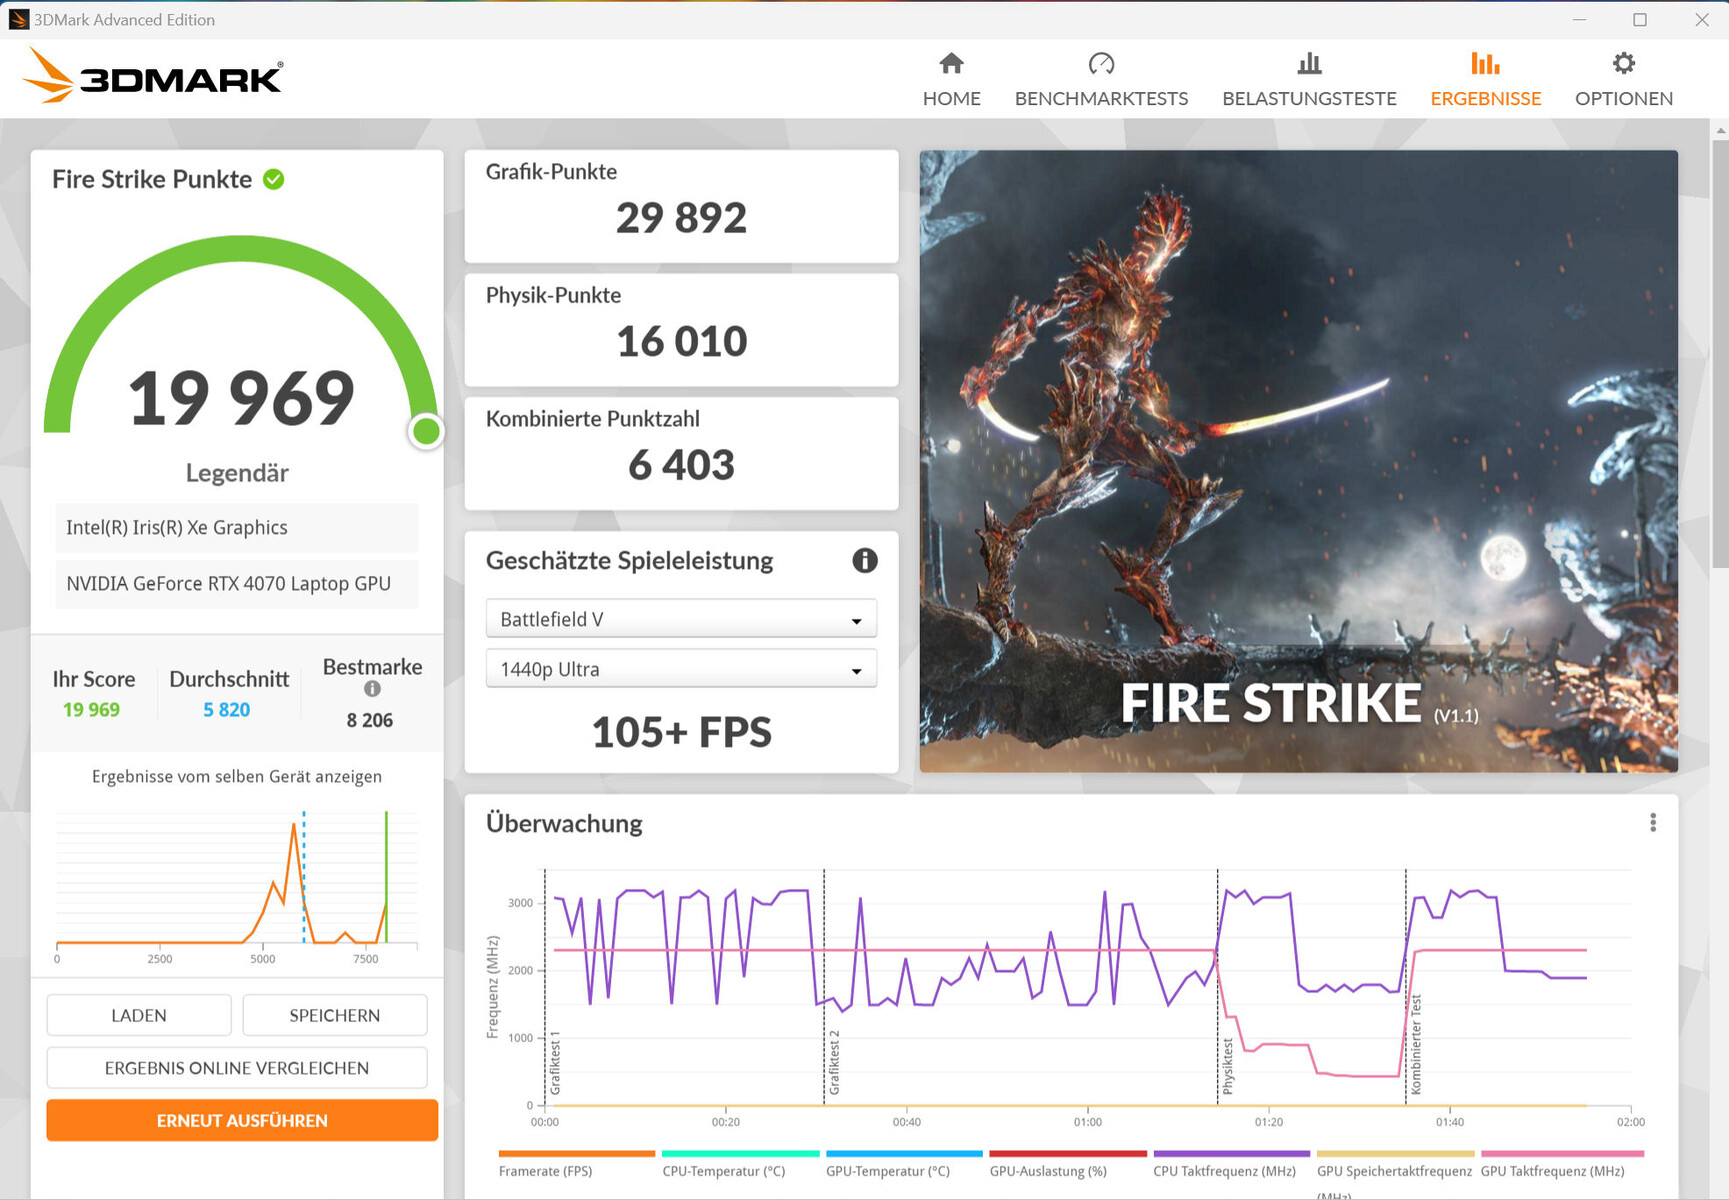
| 3DMark 06 Standard Score | 55084 points | |
| 3DMark 11 Performance | 33789 points | |
| 3DMark Cloud Gate Standard Score | 57822 points | |
| 3DMark Fire Strike Score | 26593 points | |
| 3DMark Time Spy Score | 12234 points | |
Help | ||
| Geekbench 6.7 - GPU OpenCL | |
| Average of class Gaming (67235 - 253130, n=108, last 2 years) | |
| Aorus 15 BSF | |
| MSI Pulse 17 B13VGK | |
| Average NVIDIA GeForce RTX 4070 Laptop GPU (85488 - 129836, n=45) | |
* ... smaller is better
Gaming performance
The laptop is intended for QHD gaming at high to maximum settings. Higher resolutions would work in combination with a suitable monitor - at times, with reduced settings. The frame rates on the games we tested ranged above the determined RTX 4070 average. Using dGPU mode didn't lead to any higher performance.
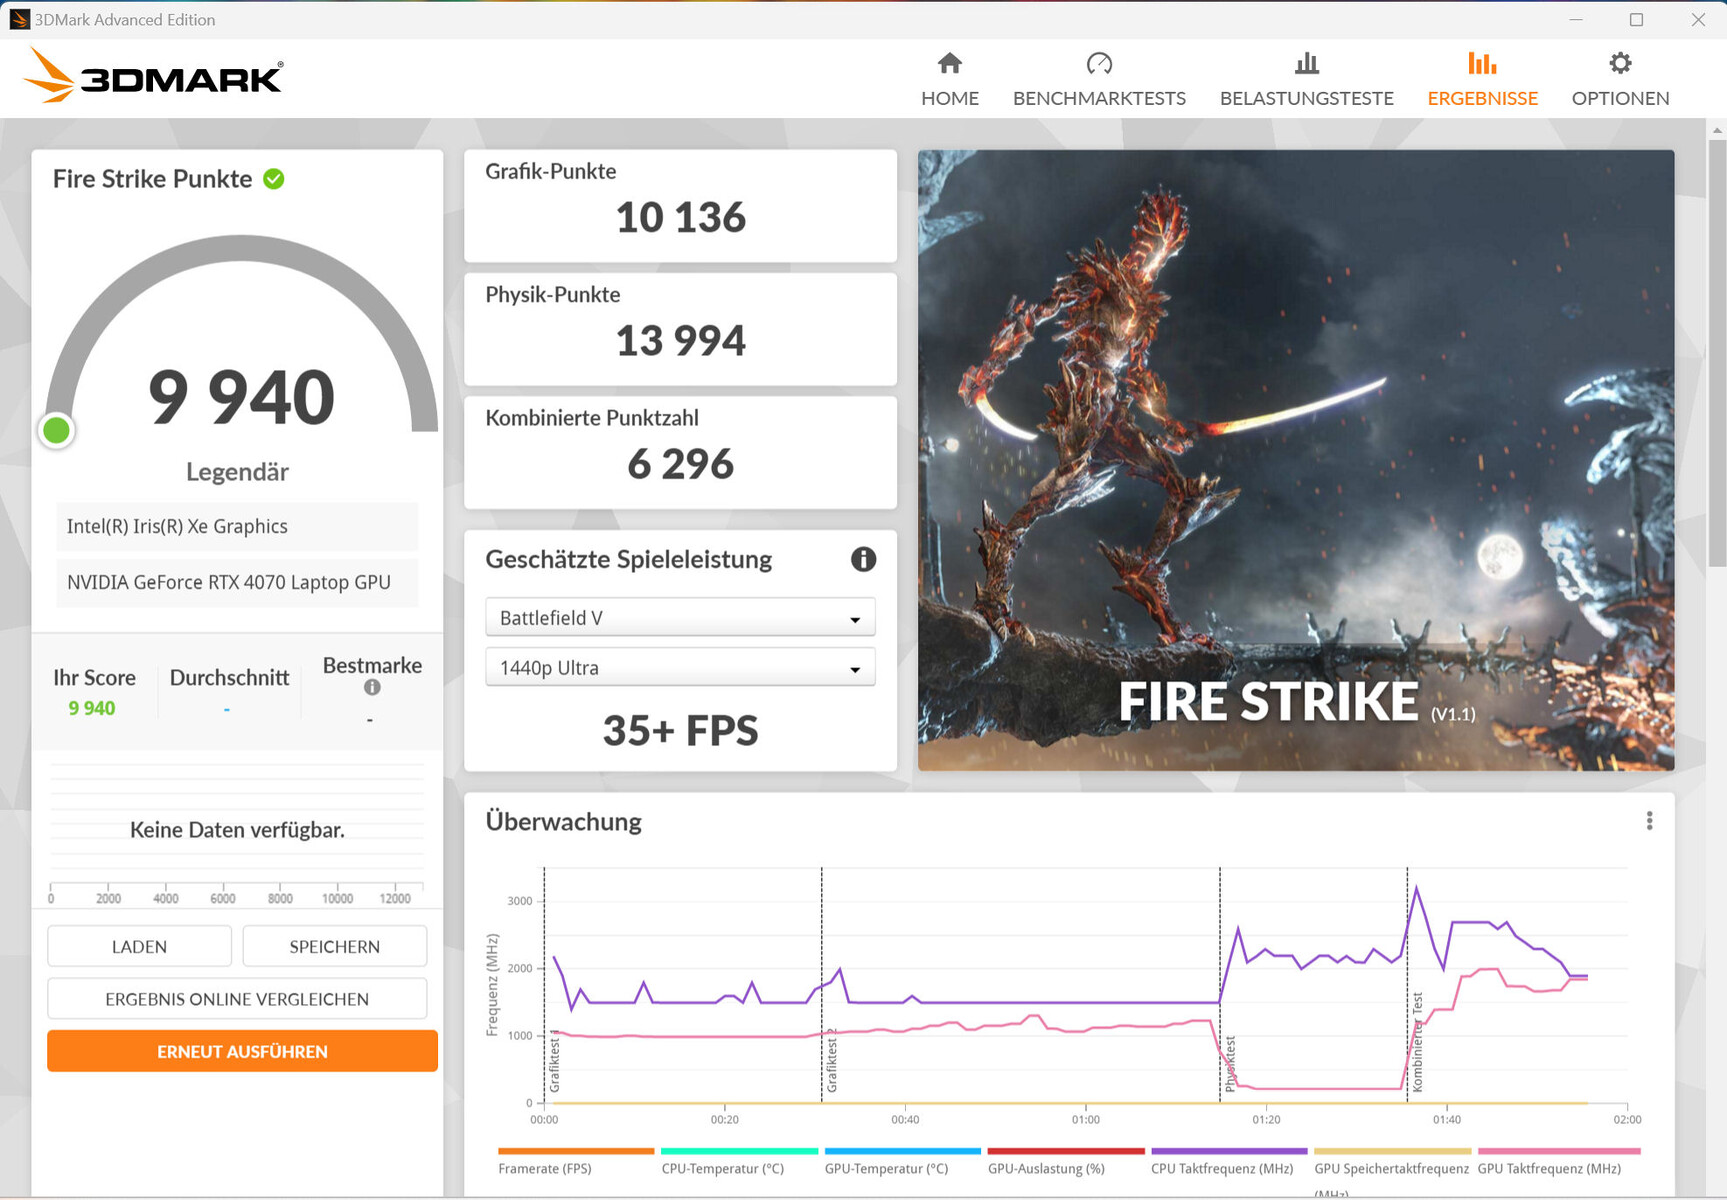
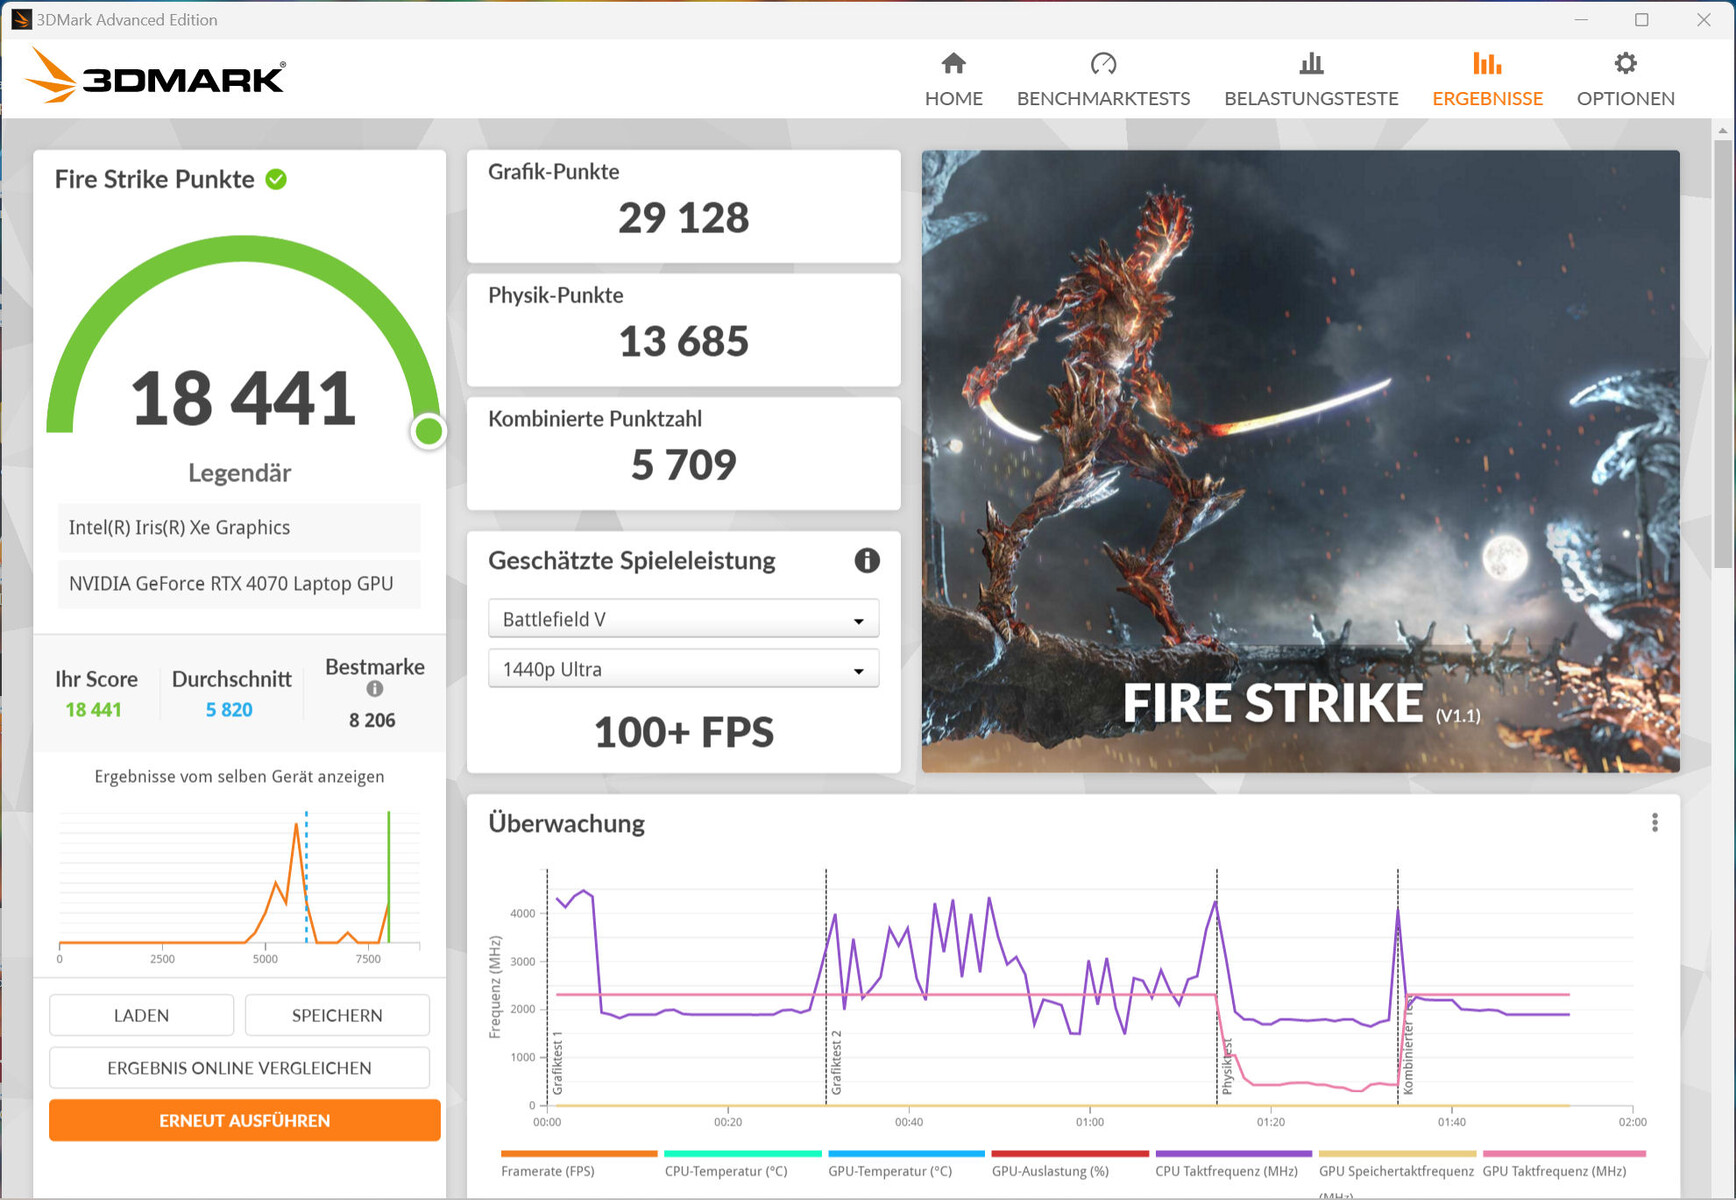
Using Meeting Mode allows for gaming with lower noise emissions: While the GPU performance remains on the same level, the CPU performance sinks due to its reduced Power Limit. The settings may have to be reduced then.
| The Witcher 3 - 1920x1080 Ultra Graphics & Postprocessing (HBAO+) | |
| Average of class Gaming (95 - 240, n=8, last 2 years) | |
| Lenovo Legion Slim 7i 16 Gen 8 | |
| Aorus 15 BSF | |
| Acer Nitro 16 AN16-41 | |
| Average NVIDIA GeForce RTX 4070 Laptop GPU (69.8 - 133.7, n=57) | |
| HP Omen Transcend 16 | |
| MSI Pulse 17 B13VGK | |
| Asus TUF Gaming A16 FA617XS | |
| Final Fantasy XV Benchmark - 1920x1080 High Quality | |
| Average of class Gaming (41 - 215, n=103, last 2 years) | |
| Lenovo Legion Slim 7i 16 Gen 8 | |
| Aorus 15 BSF | |
| MSI Pulse 17 B13VGK | |
| Average NVIDIA GeForce RTX 4070 Laptop GPU (41 - 131.9, n=65) | |
| Acer Nitro 16 AN16-41 | |
| Asus TUF Gaming A16 FA617XS | |
| Cyberpunk 2077 1.6 | |
| 1920x1080 Ultra Preset | |
| Lenovo Legion Slim 7i 16 Gen 8 | |
| Aorus 15 BSF | |
| HP Omen Transcend 16 | |
| Acer Nitro 16 AN16-41 | |
| Average NVIDIA GeForce RTX 4070 Laptop GPU (48 - 110, n=24) | |
| 2560x1440 Ultra Preset | |
| HP Omen Transcend 16 | |
| Lenovo Legion Slim 7i 16 Gen 8 | |
| Acer Nitro 16 AN16-41 | |
| Aorus 15 BSF | |
| Average NVIDIA GeForce RTX 4070 Laptop GPU (30 - 63.9, n=24) | |
| 1920x1080 Ray Tracing Ultra Preset (DLSS off) | |
| Average NVIDIA GeForce RTX 4070 Laptop GPU (36.2 - 65, n=5) | |
| Aorus 15 BSF | |
| The Callisto Protocol | |
| 1920x1080 Ultra Preset (without FSR Upscaling) | |
| Aorus 15 BSF | |
| Acer Nitro 16 AN16-41 | |
| Average NVIDIA GeForce RTX 4070 Laptop GPU (78.9 - 88, n=4) | |
| 2560x1440 Ultra Preset (without FSR Upscaling) | |
| Aorus 15 BSF | |
| Acer Nitro 16 AN16-41 | |
| Average NVIDIA GeForce RTX 4070 Laptop GPU (58.4 - 68.3, n=4) | |
| 1920x1080 Ultra Preset (without FSR Upscaling) + Full Ray-Tracing | |
| Aorus 15 BSF | |
| Average NVIDIA GeForce RTX 4070 Laptop GPU (50.8 - 70, n=4) | |
| Acer Nitro 16 AN16-41 | |
| Returnal | |
| 1920x1080 Epic Preset | |
| Aorus 15 BSF | |
| HP Omen Transcend 16 | |
| Average NVIDIA GeForce RTX 4070 Laptop GPU (54 - 90, n=12) | |
| Asus TUF Gaming A16 FA617XS | |
| Lenovo Legion Slim 7i 16 Gen 8 | |
| 2560x1440 Epic Preset | |
| Aorus 15 BSF | |
| HP Omen Transcend 16 | |
| Average NVIDIA GeForce RTX 4070 Laptop GPU (39 - 66, n=12) | |
| Lenovo Legion Slim 7i 16 Gen 8 | |
| 1920x1080 Epic Preset + Epic Ray-Tracing | |
| Aorus 15 BSF | |
| Average NVIDIA GeForce RTX 4070 Laptop GPU (71 - 75, n=5) | |
| Asus TUF Gaming A16 FA617XS | |
| Baldur's Gate 3 | |
| 1920x1080 Ultra Preset AA:T | |
| Average of class Gaming (59.4 - 246, n=106, last 2 years) | |
| Average NVIDIA GeForce RTX 4070 Laptop GPU (66.7 - 128.5, n=30) | |
| Aorus 15 BSF | |
| 2560x1440 Ultra Preset AA:T | |
| Average of class Gaming (56.5 - 175.5, n=84, last 2 years) | |
| Average NVIDIA GeForce RTX 4070 Laptop GPU (54.4 - 89.6, n=25) | |
| Aorus 15 BSF | |
| Ratchet & Clank Rift Apart | |
| 1920x1080 Very High Preset AA:T | |
| Aorus 15 BSF | |
| Average NVIDIA GeForce RTX 4070 Laptop GPU (52.3 - 58.1, n=4) | |
| 2560x1440 Very High Preset AA:T | |
| Average NVIDIA GeForce RTX 4070 Laptop GPU (48.7 - 49.1, n=3) | |
| Aorus 15 BSF | |
| 1920x1080 Very High Preset + Very High Raytracing AA:T | |
| Average NVIDIA GeForce RTX 4070 Laptop GPU (43.4 - 44.8, n=2) | |
| Aorus 15 BSF | |
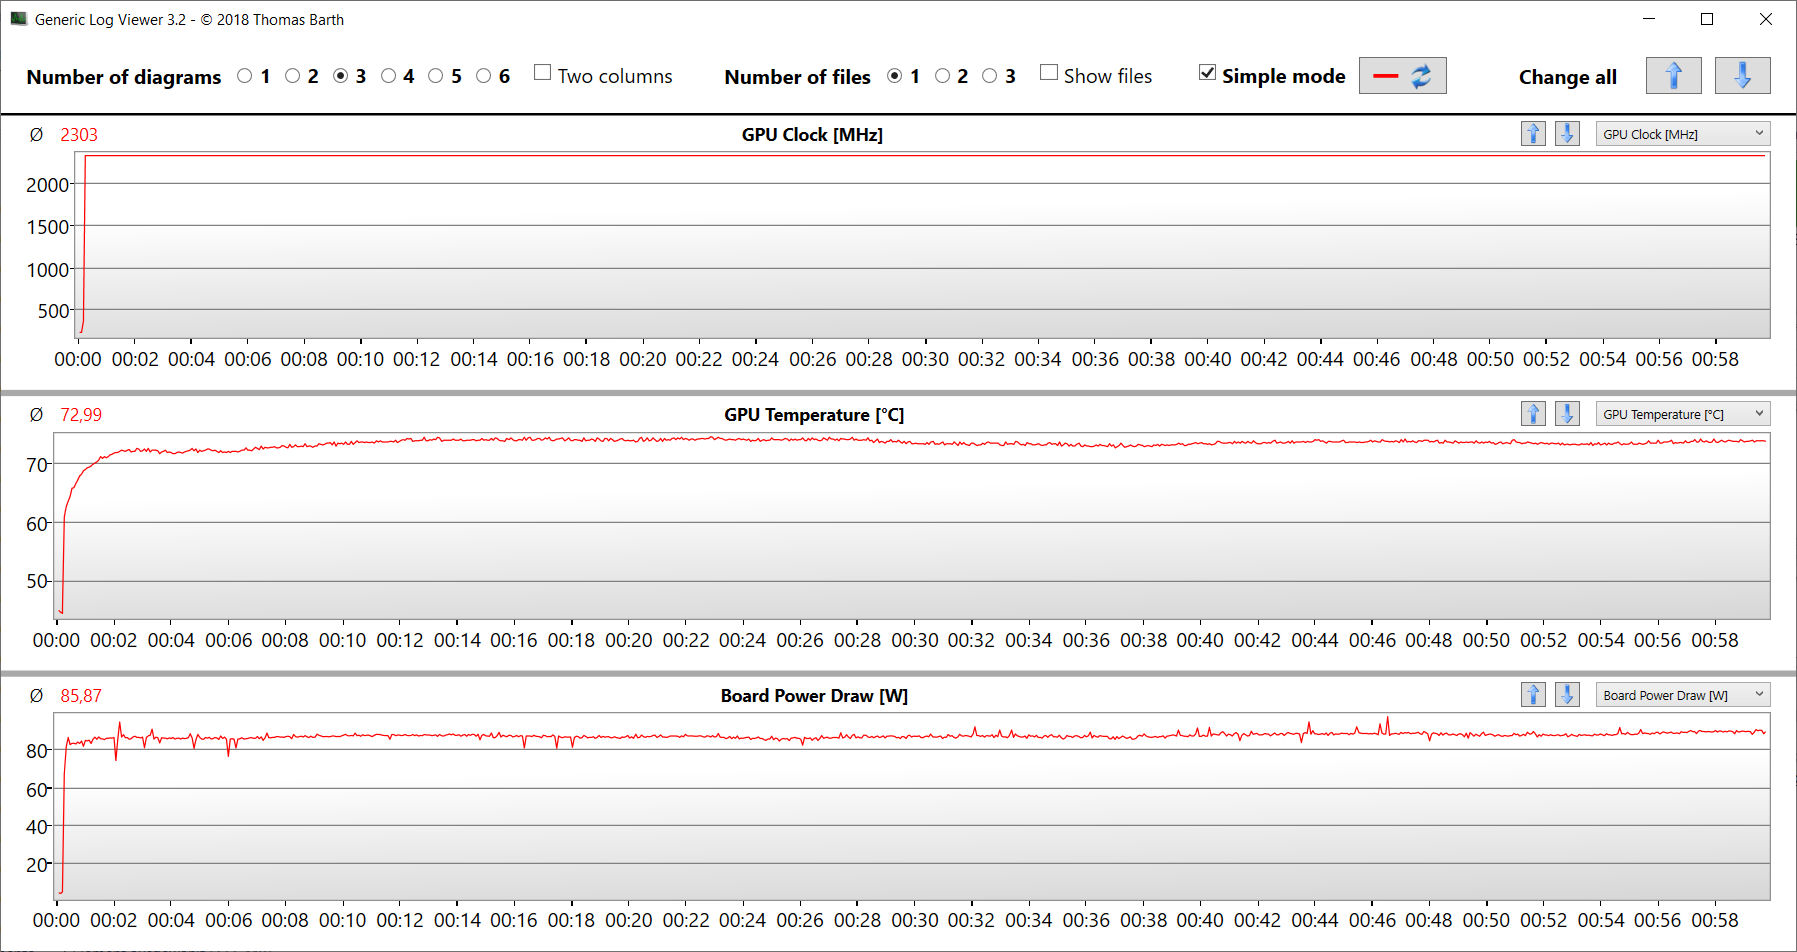
In order to test whether frame rates remain stable over a longer period of time, we let the game The Witcher 3 run for around 60 minutes in Full HD resolution and using maximum quality settings. We didn't move the character. We didn't note any drops in frame rate.
Witcher 3 FPS diagram
| low | med. | high | ultra | QHD | |
|---|---|---|---|---|---|
| The Witcher 3 (2015) | 432.4 | 371.8 | 230.9 | 117 | |
| Dota 2 Reborn (2015) | 186.9 | 167.6 | 162.4 | 149.9 | |
| Final Fantasy XV Benchmark (2018) | 213 | 163.9 | 115.4 | 84.4 | |
| X-Plane 11.11 (2018) | 160 | 142.1 | 113.4 | ||
| Far Cry 5 (2018) | 178 | 156 | 149 | 140 | 117 |
| Strange Brigade (2018) | 485 | 295 | 231 | 202 | 133.6 |
| Cyberpunk 2077 1.6 (2022) | 135.4 | 113.8 | 96.7 | 90 | 53.4 |
| The Callisto Protocol (2022) | 162.8 | 142.2 | 136 | 88 | 68.3 |
| Returnal (2023) | 117 | 114 | 104 | 87 | 64 |
| F1 23 (2023) | 248 | 255 | 209 | 71.7 | 46.3 |
| Ratchet & Clank Rift Apart (2023) | 90.4 | 78.8 | 62.3 | 57.1 | 48.8 |
| Baldur's Gate 3 (2023) | 137.1 | 114.2 | 91.4 | 88.5 | 60.2 |
Emissions - The Aorus laptop can get quite noisy
Noise emissions
While gaming, noise emissions rise up to 55 dB(A) ("Turbo"). When we used "AI Boost" mode, we measured 53 dB(A). Meeting Mode offers a more balanced combination of performance, emissions and power consumption.
In idle mode and in everyday use (office, internet), the two fans generally don't make too much noise - they sometimes don't turn at all. That doesn't mean they stay silent all the time - we measured up to 37 dB(A).
Noise level
| Idle |
| 25 / 31 / 37 dB(A) |
| Load |
| 51 / 57 dB(A) |
 | ||
30 dB silent 40 dB(A) audible 50 dB(A) loud |
||
min: | ||
| Aorus 15 BSF i7-13700H, GeForce RTX 4070 Laptop GPU | HP Omen Transcend 16 i9-13900HX, GeForce RTX 4070 Laptop GPU | MSI Pulse 17 B13VGK i7-13700H, GeForce RTX 4070 Laptop GPU | Lenovo Legion Slim 7i 16 Gen 8 i9-13900H, GeForce RTX 4070 Laptop GPU | Acer Nitro 16 AN16-41 R7 7735HS, GeForce RTX 4070 Laptop GPU | Asus TUF Gaming A16 FA617XS R9 7940HS, Radeon RX 7600S | |
|---|---|---|---|---|---|---|
| Noise | 5% | 19% | 20% | 10% | 10% | |
| off / environment * (dB) | 24 | 22.9 5% | 24 -0% | 22.8 5% | 25.7 -7% | 25 -4% |
| Idle Minimum * (dB) | 25 | 29.1 -16% | 24 4% | 23.6 6% | 25.7 -3% | 25 -0% |
| Idle Average * (dB) | 31 | 29.1 6% | 24 23% | 23.6 24% | 25.7 17% | 26 16% |
| Idle Maximum * (dB) | 37 | 29.1 21% | 24 35% | 25.7 31% | 26.3 29% | 28 24% |
| Load Average * (dB) | 51 | 45.7 10% | 32.49 36% | 27.6 46% | 33.9 34% | 43 16% |
| Load Maximum * (dB) | 57 | 54.3 5% | 46.51 18% | 54.4 5% | 62 -9% | 53 7% |
| Witcher 3 ultra * (dB) | 54.3 | 46.51 | 54.4 | 51 |
* ... smaller is better
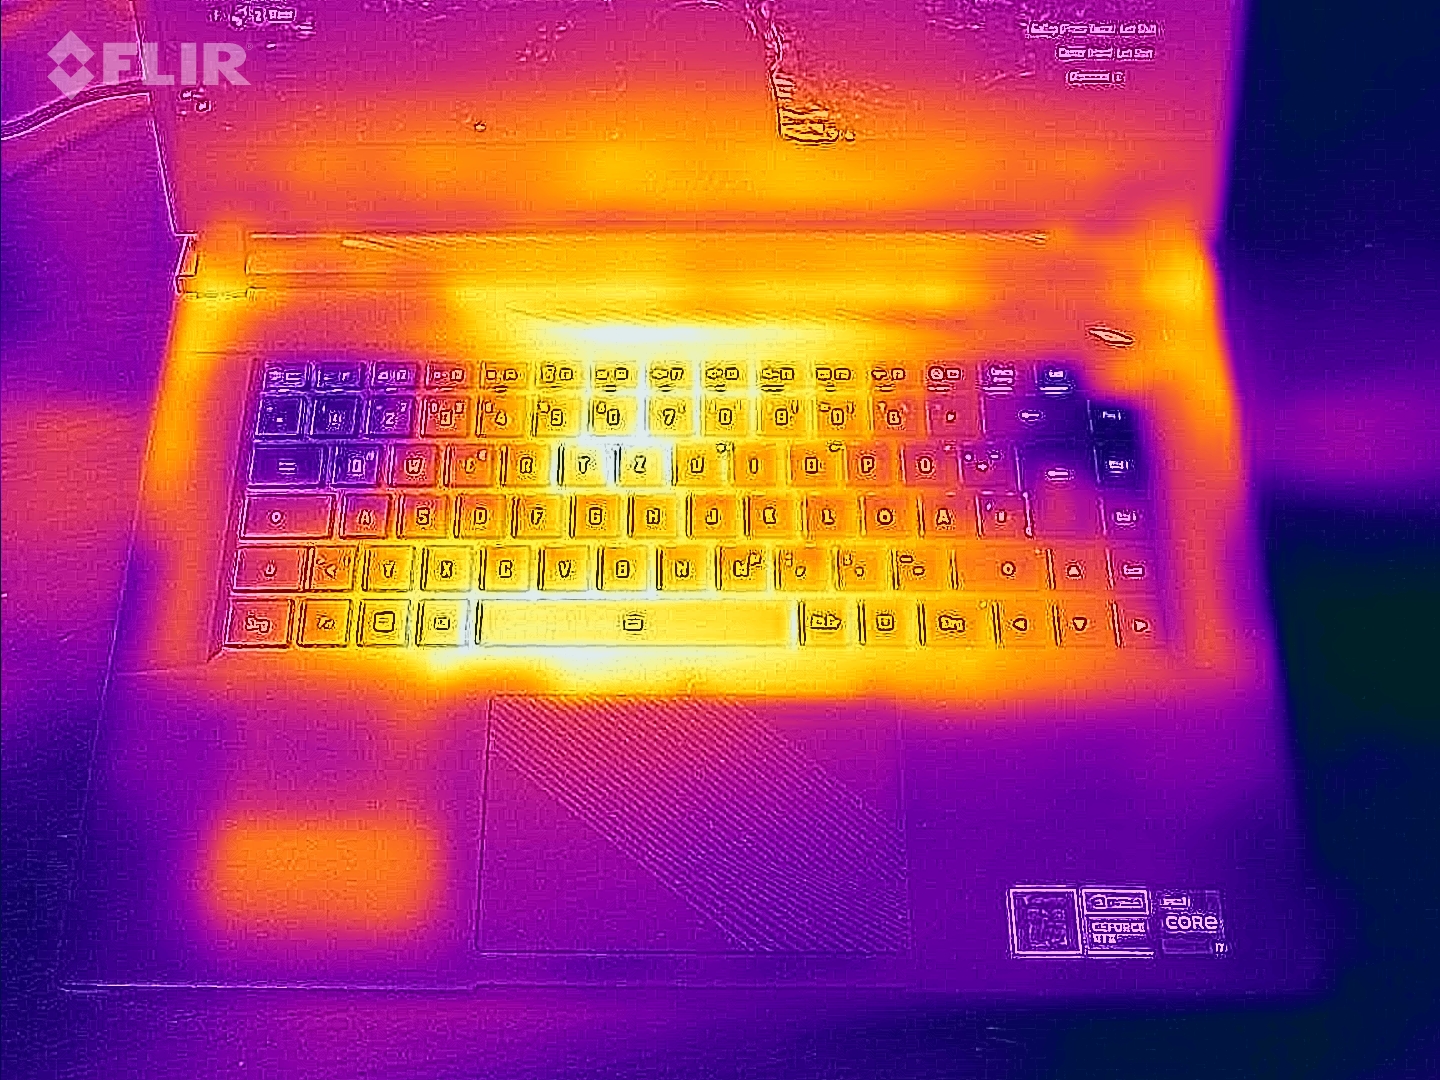
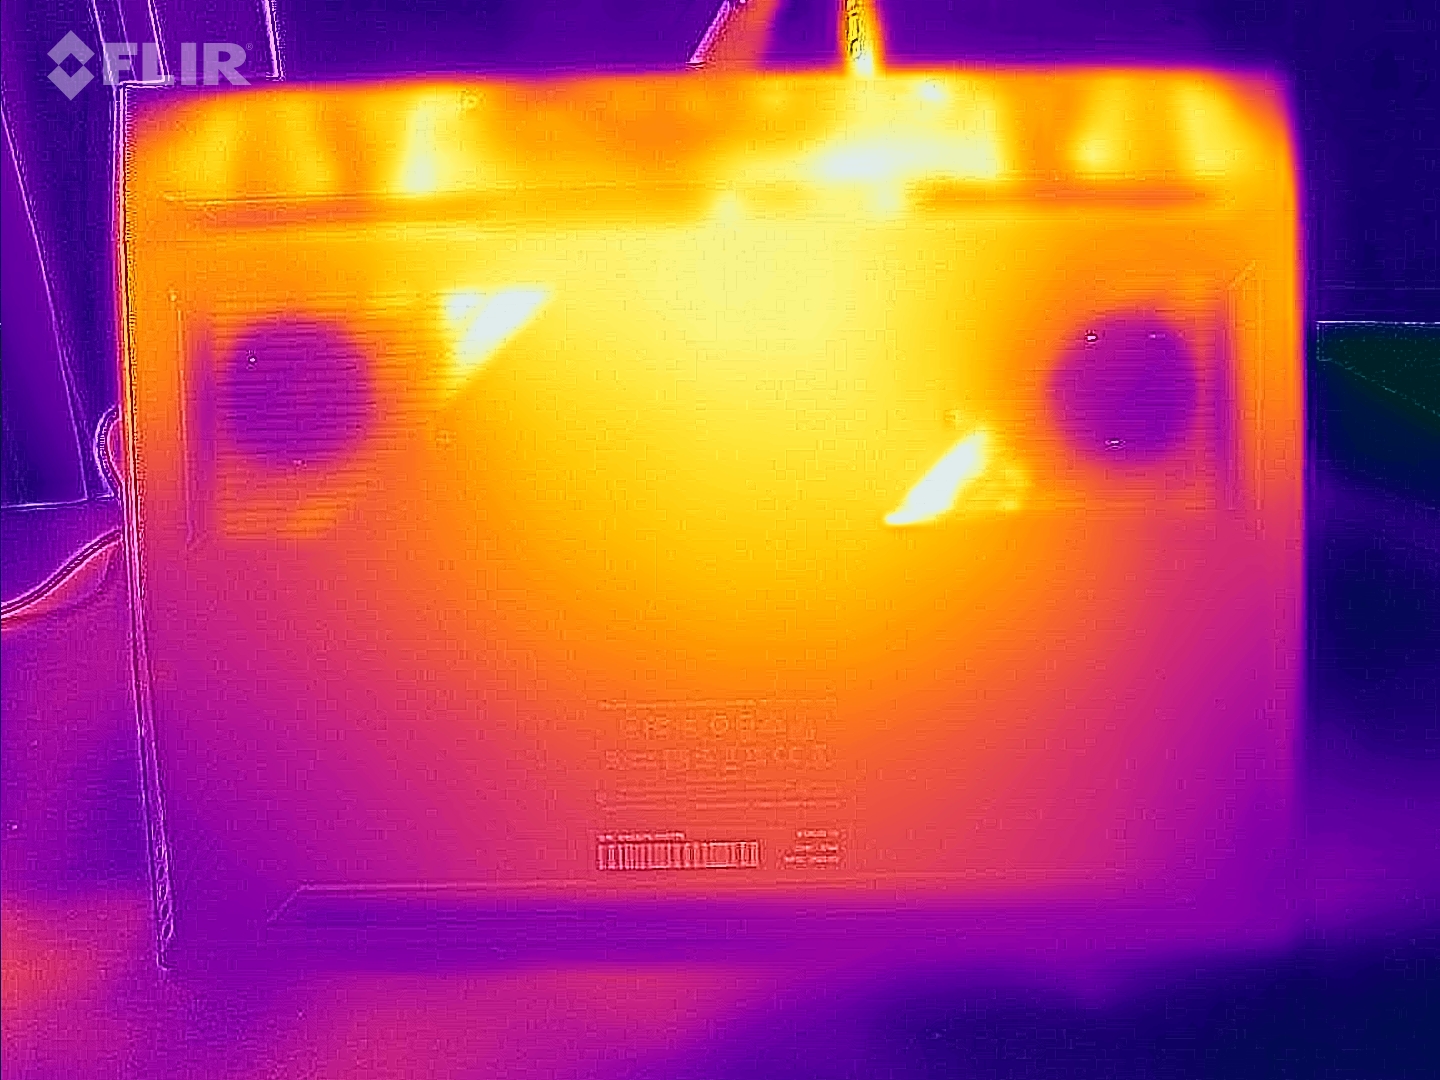
Temperature
Our stress test and Witcher 3 test caused the laptop to heat up noticeably, but not extremely. In everyday use (office, internet), case temperatures generally remain within the green area - compared to similar laptops, they are a little on the high side.
(-) The maximum temperature on the upper side is 48 °C / 118 F, compared to the average of 40.4 °C / 105 F, ranging from 21.2 to 68.8 °C for the class Gaming.
(-) The bottom heats up to a maximum of 47 °C / 117 F, compared to the average of 43.2 °C / 110 F
(±) In idle usage, the average temperature for the upper side is 35.6 °C / 96 F, compared to the device average of 33.9 °C / 93 F.
(-) Playing The Witcher 3, the average temperature for the upper side is 41.9 °C / 107 F, compared to the device average of 33.9 °C / 93 F.
(-) The palmrests and touchpad can get very hot to the touch with a maximum of 42 °C / 107.6 F.
(-) The average temperature of the palmrest area of similar devices was 28.8 °C / 83.8 F (-13.2 °C / -23.8 F).
| Aorus 15 BSF Intel Core i7-13700H, NVIDIA GeForce RTX 4070 Laptop GPU | HP Omen Transcend 16 Intel Core i9-13900HX, NVIDIA GeForce RTX 4070 Laptop GPU | MSI Pulse 17 B13VGK Intel Core i7-13700H, NVIDIA GeForce RTX 4070 Laptop GPU | Lenovo Legion Slim 7i 16 Gen 8 Intel Core i9-13900H, NVIDIA GeForce RTX 4070 Laptop GPU | Acer Nitro 16 AN16-41 AMD Ryzen 7 7735HS, NVIDIA GeForce RTX 4070 Laptop GPU | Asus TUF Gaming A16 FA617XS AMD Ryzen 9 7940HS, AMD Radeon RX 7600S | |
|---|---|---|---|---|---|---|
| Heat | 7% | 6% | 8% | 6% | 6% | |
| Maximum Upper Side * (°C) | 48 | 47.4 1% | 48 -0% | 49.8 -4% | 41.5 14% | 53 -10% |
| Maximum Bottom * (°C) | 47 | 54.4 -16% | 50 -6% | 48.8 -4% | 51.8 -10% | 48 -2% |
| Idle Upper Side * (°C) | 39 | 28.4 27% | 30 23% | 29.4 25% | 31.6 19% | 30 23% |
| Idle Bottom * (°C) | 35 | 29.2 17% | 33 6% | 30 14% | 34.5 1% | 30 14% |
* ... smaller is better
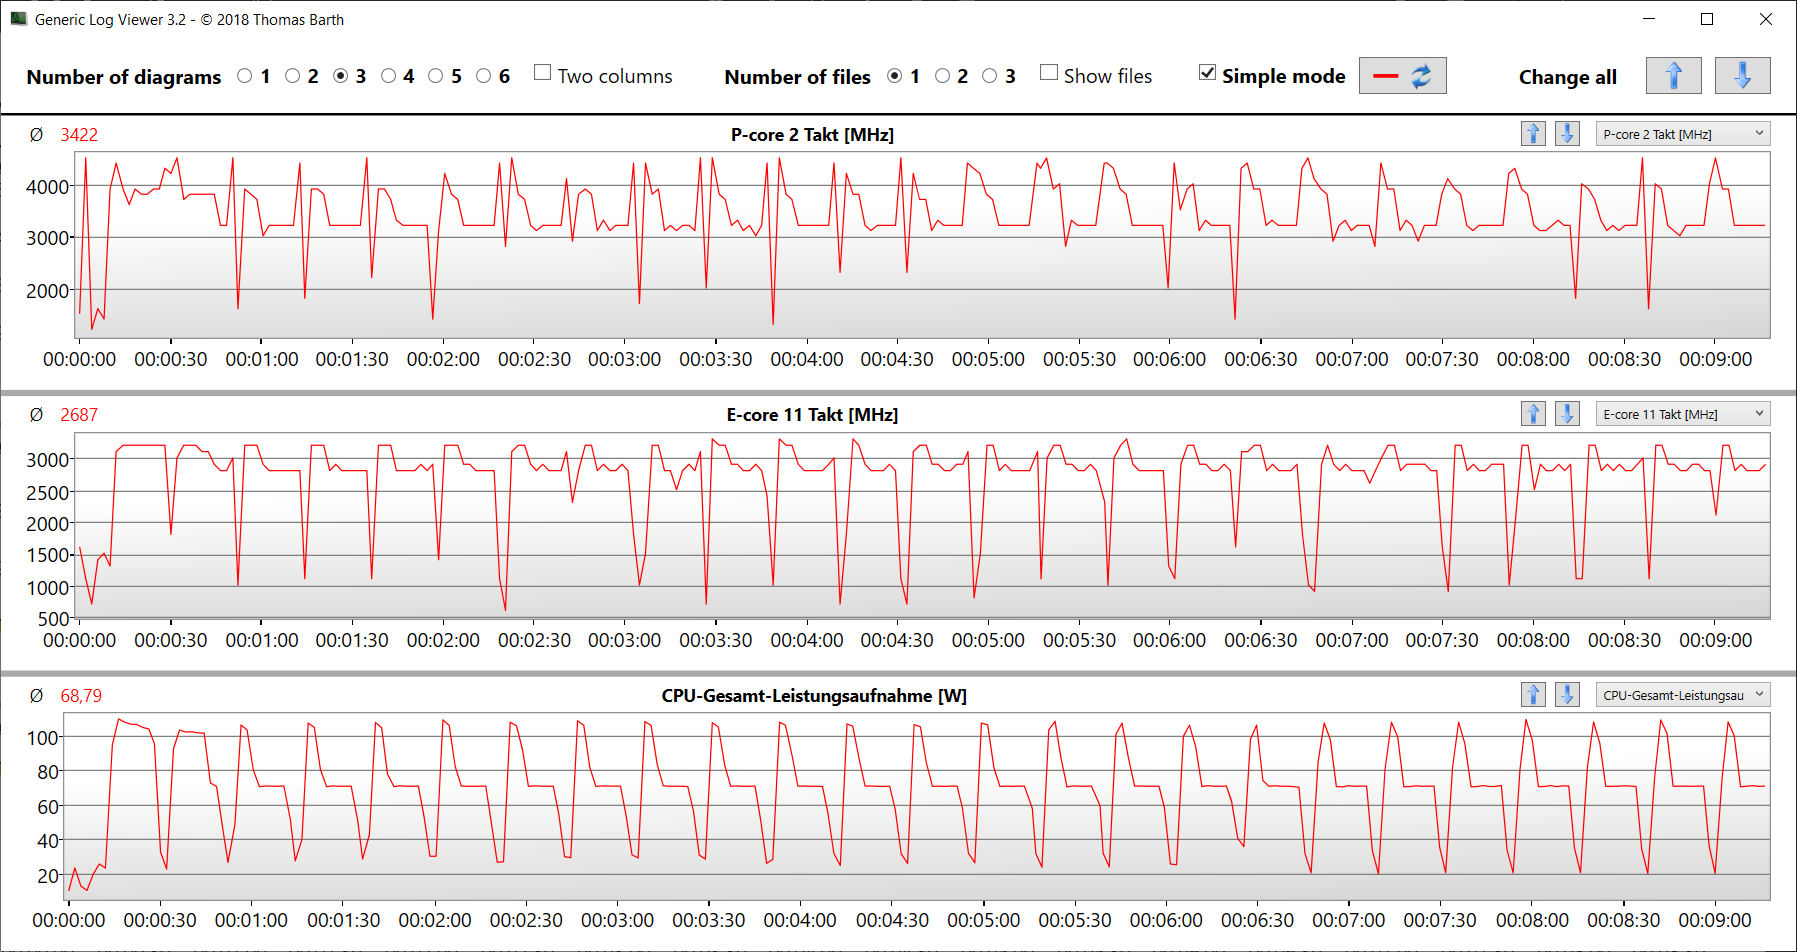
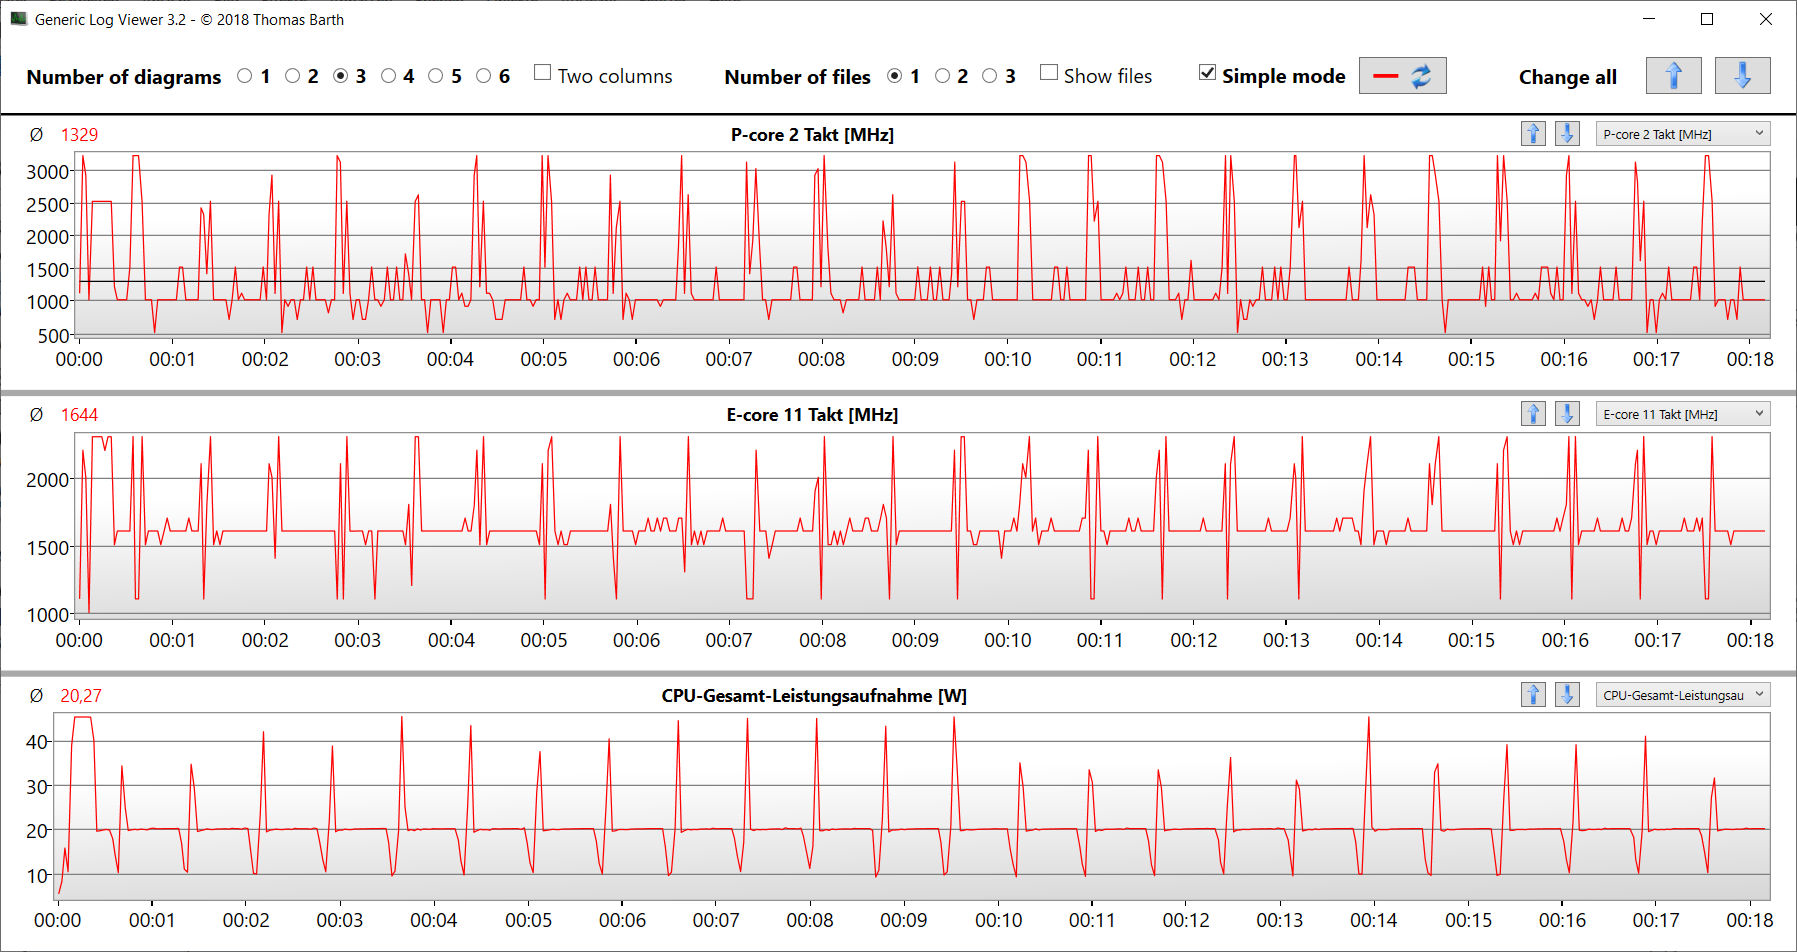
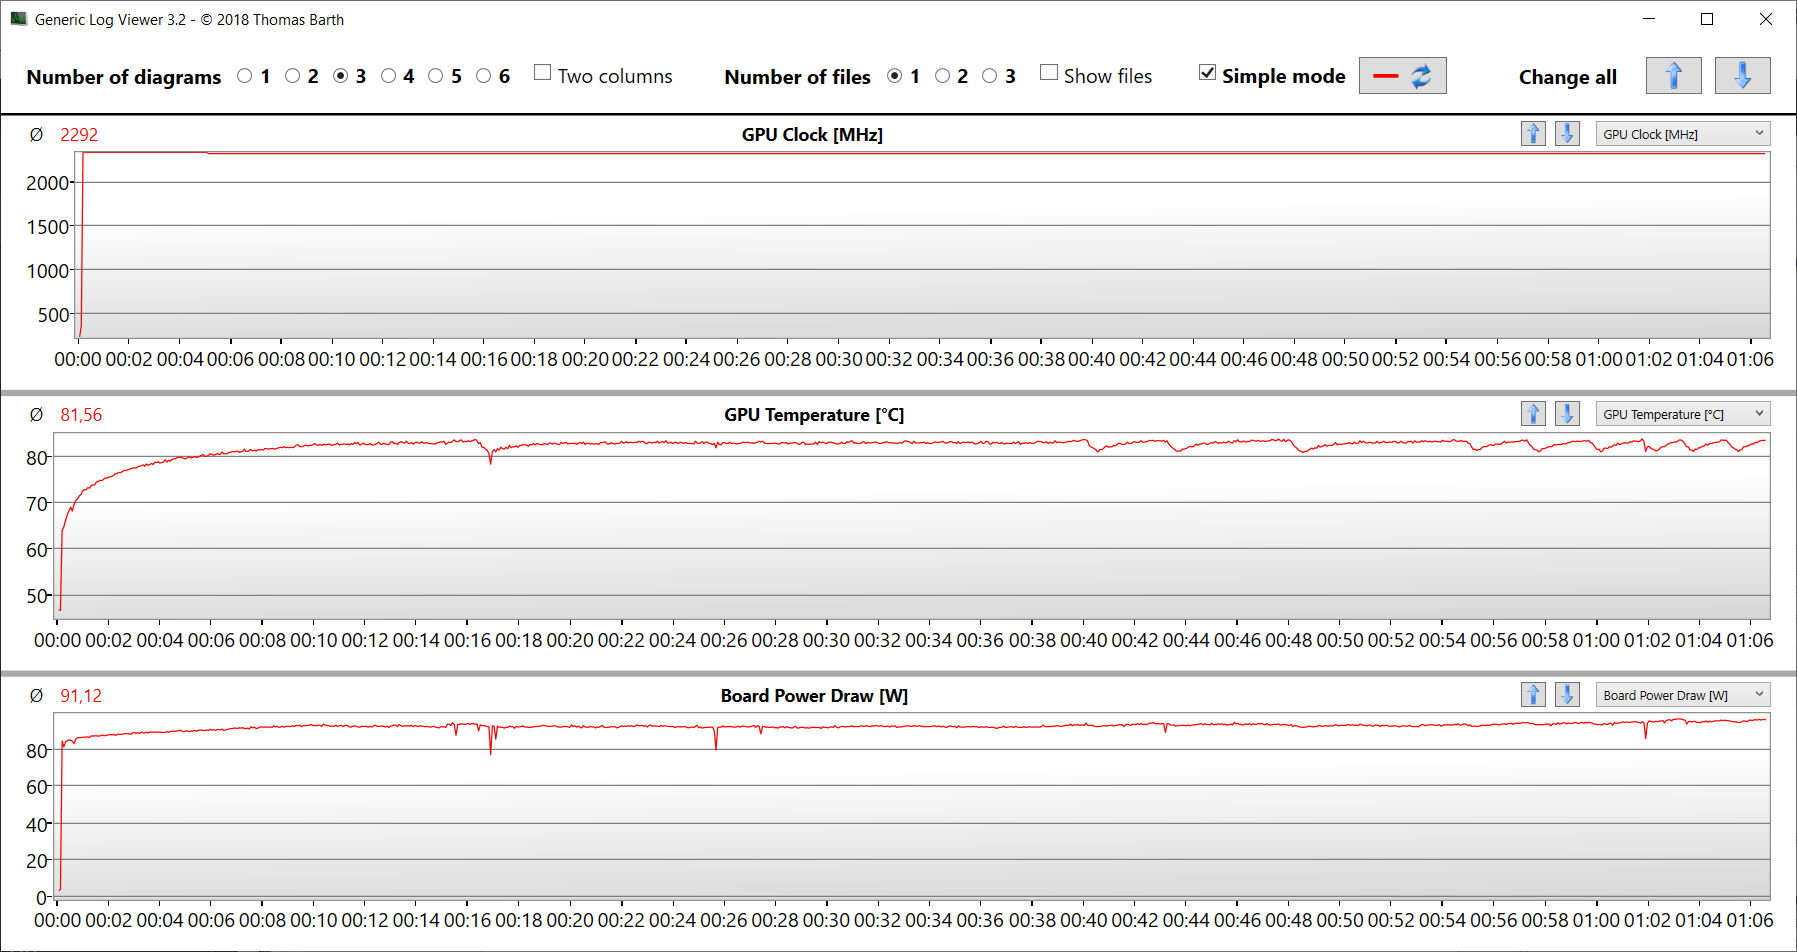
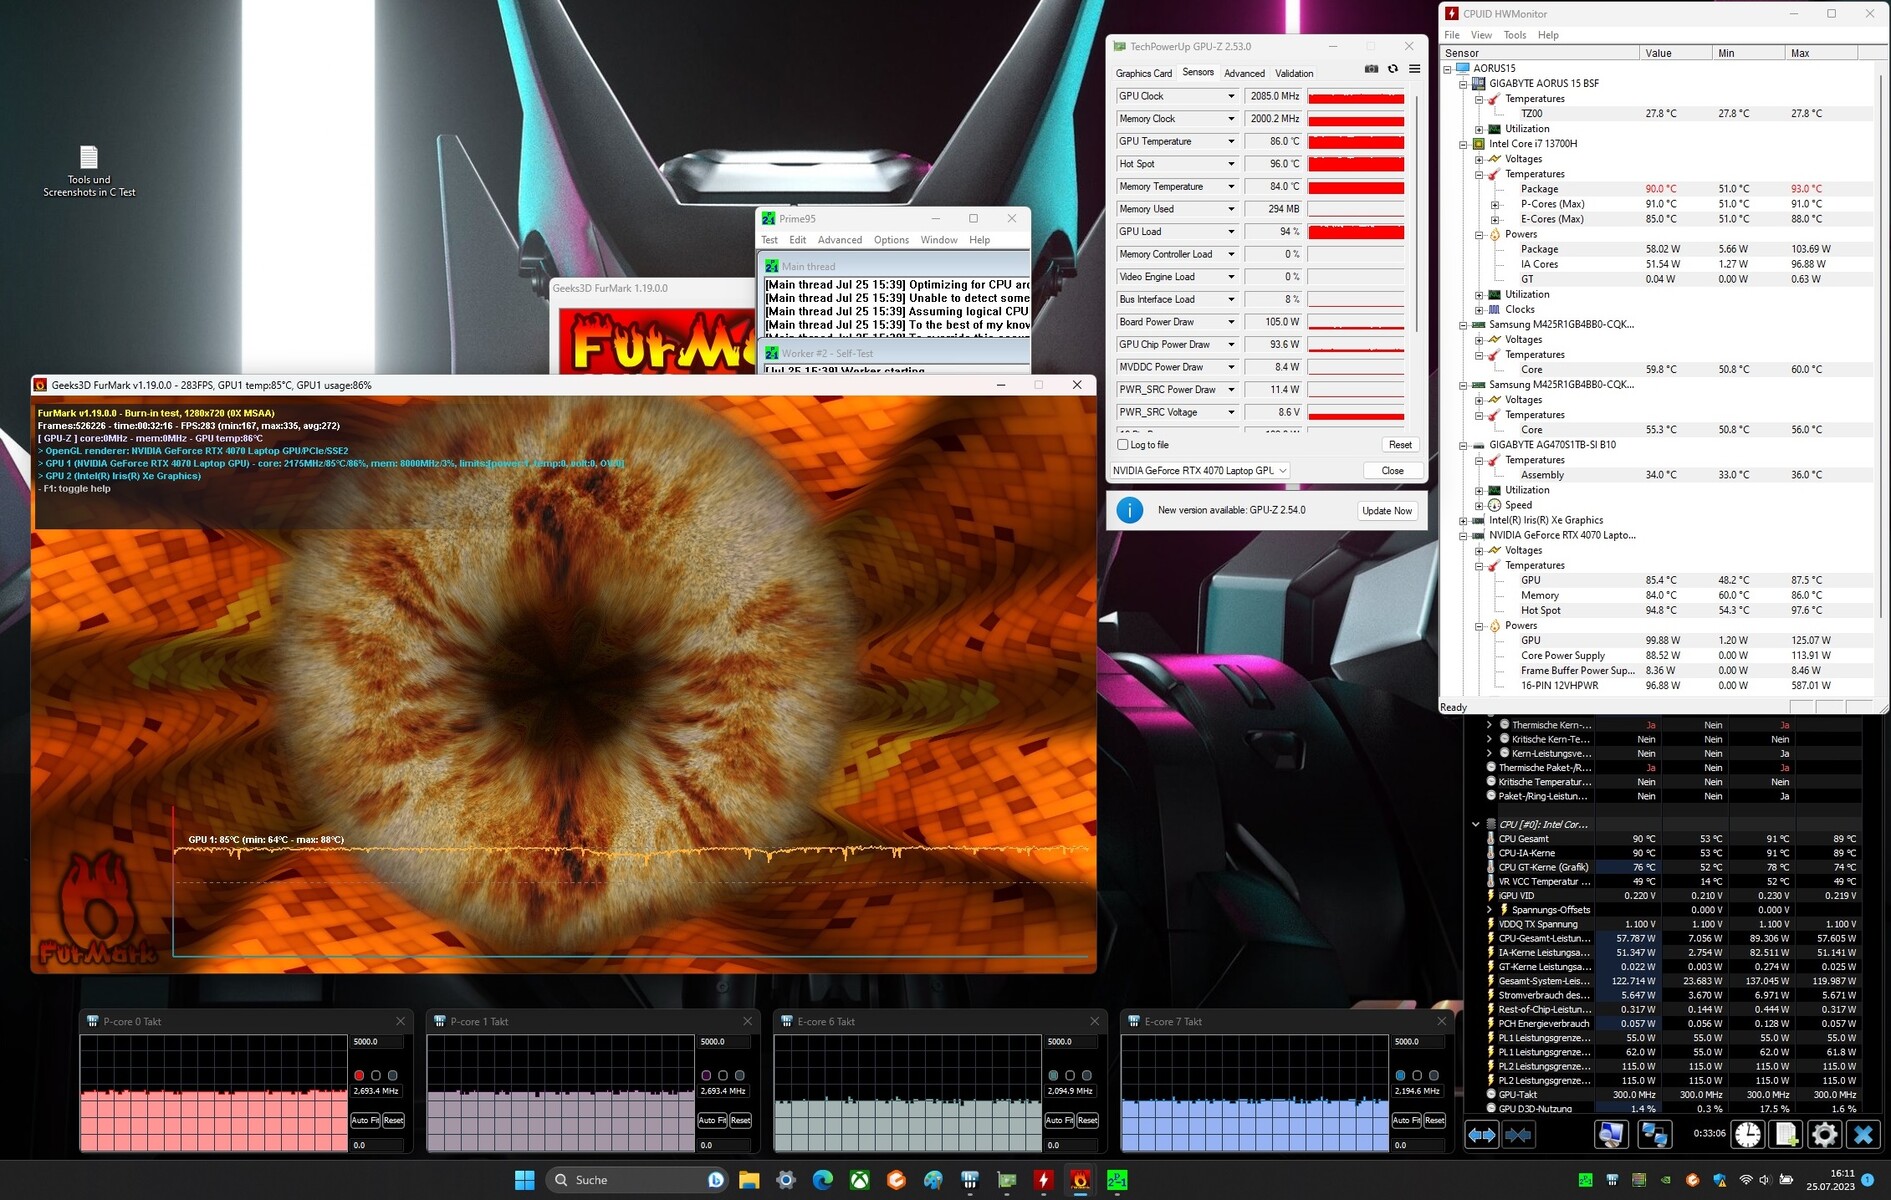
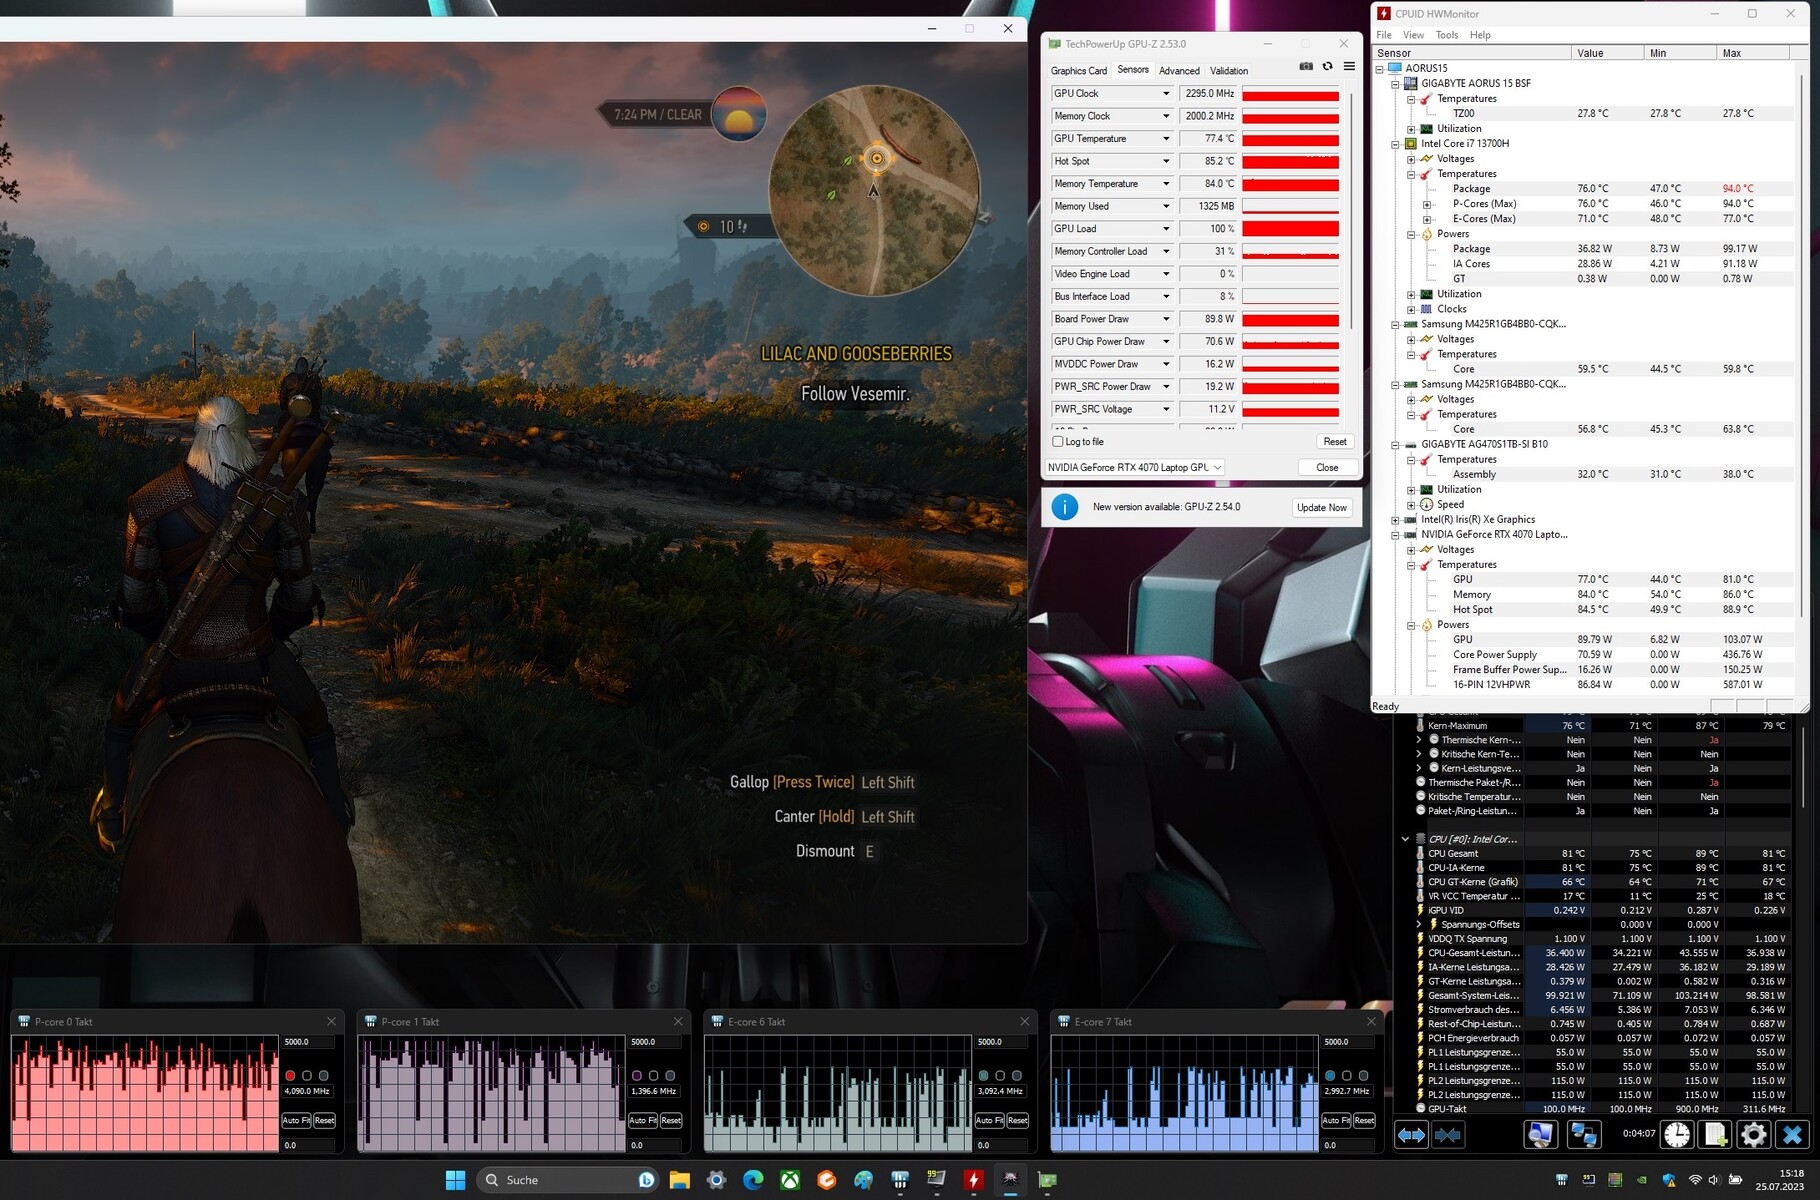
Stress test
The stress test (Prime95 and Furmark in continuous use) creates an extreme scenario in order to check the system stability under full load. The CPU (P: 2.7 - 2.8 GHz, E: 2.5 GHz) began the test with average clock speeds. After a short while, the clock sank down to around 2.6 - 2.7 GHz (P cores) and 2.1 - 2.2 GHz (E cores). The GPU's clock sank from 2.3 GHz to 2.1 GHz.


Speakers
The stereo speakers produce a decent sound, but there is hardly any bass. Headphones or external speakers are recommended for a better sound experience.
Aorus 15 BSF audio analysis
(+) | speakers can play relatively loud (83 dB)
Bass 100 - 315 Hz
(-) | nearly no bass - on average 27.1% lower than median
(-) | bass is not linear (16% delta to prev. frequency)
Mids 400 - 2000 Hz
(+) | balanced mids - only 4.2% away from median
(+) | mids are linear (3.6% delta to prev. frequency)
Highs 2 - 16 kHz
(+) | balanced highs - only 2.8% away from median
(+) | highs are linear (6.8% delta to prev. frequency)
Overall 100 - 16.000 Hz
(±) | linearity of overall sound is average (17.3% difference to median)
Compared to same class
» 47% of all tested devices in this class were better, 12% similar, 41% worse
» The best had a delta of 6%, average was 18%, worst was 132%
Compared to all devices tested
» 32% of all tested devices were better, 8% similar, 59% worse
» The best had a delta of 4%, average was 24%, worst was 134%
Acer Nitro 16 AN16-41 audio analysis
(+) | speakers can play relatively loud (83.9 dB)
Bass 100 - 315 Hz
(-) | nearly no bass - on average 33.5% lower than median
(±) | linearity of bass is average (13.2% delta to prev. frequency)
Mids 400 - 2000 Hz
(+) | balanced mids - only 2.4% away from median
(+) | mids are linear (4.9% delta to prev. frequency)
Highs 2 - 16 kHz
(+) | balanced highs - only 3.6% away from median
(+) | highs are linear (4.2% delta to prev. frequency)
Overall 100 - 16.000 Hz
(±) | linearity of overall sound is average (19.6% difference to median)
Compared to same class
» 68% of all tested devices in this class were better, 6% similar, 25% worse
» The best had a delta of 6%, average was 18%, worst was 132%
Compared to all devices tested
» 49% of all tested devices were better, 7% similar, 44% worse
» The best had a delta of 4%, average was 24%, worst was 134%
Power management - The Gigabyte computer does not lack endurance
Power consumption
The Gigabyte laptop didn't flag up any issues in terms of power consumption. The rates are on a normal level for the installed hardware. The Witcher 3 test and stress test were run with relatively constant power consumption. The power supply (240 watts) is sufficiently sized.
| Off / Standby | |
| Idle | |
| Load |
|
Key:
min: | |
| Aorus 15 BSF i7-13700H, GeForce RTX 4070 Laptop GPU | HP Omen Transcend 16 i9-13900HX, GeForce RTX 4070 Laptop GPU | MSI Pulse 17 B13VGK i7-13700H, GeForce RTX 4070 Laptop GPU | Lenovo Legion Slim 7i 16 Gen 8 i9-13900H, GeForce RTX 4070 Laptop GPU | Acer Nitro 16 AN16-41 R7 7735HS, GeForce RTX 4070 Laptop GPU | Asus TUF Gaming A16 FA617XS R9 7940HS, Radeon RX 7600S | Average of class Gaming | |
|---|---|---|---|---|---|---|---|
| Power Consumption | -85% | 15% | -74% | -19% | 15% | -37% | |
| Idle Minimum * (Watt) | 7 | 19.2 -174% | 9 -29% | 22 -214% | 11.6 -66% | 7 -0% | 13.2 ? -89% |
| Idle Average * (Watt) | 12 | 22.7 -89% | 10.2 15% | 29 -142% | 15.6 -30% | 10 17% | 18.9 ? -58% |
| Idle Maximum * (Watt) | 20 | 55.4 -177% | 10.8 46% | 39.5 -98% | 16.5 17% | 15 25% | 24.3 ? -22% |
| Load Average * (Watt) | 94 | 128.4 -37% | 72 23% | 98.7 -5% | 155 -65% | 86 9% | 108 ? -15% |
| Witcher 3 ultra * (Watt) | 175.8 | 206 -17% | 130 26% | 171.8 2% | 154.8 12% | 160.6 9% | |
| Load Maximum * (Watt) | 247 | 292 -18% | 221 11% | 213.2 14% | 205 17% | 172 30% | 254 ? -3% |
* ... smaller is better
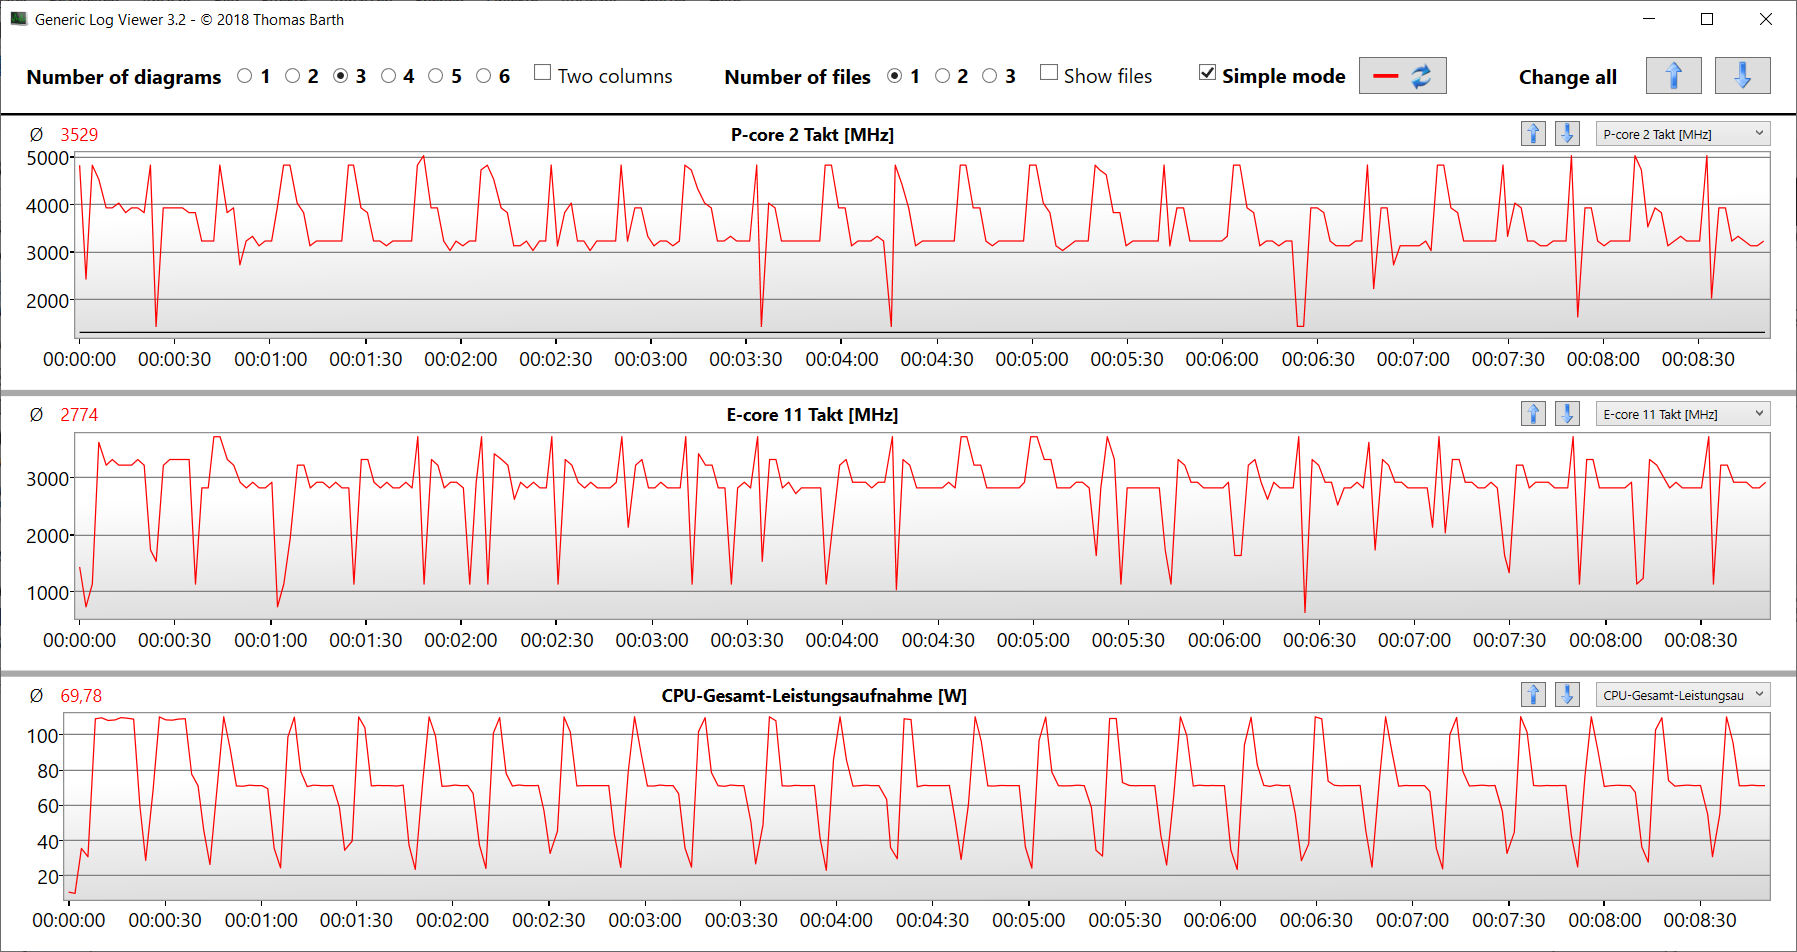
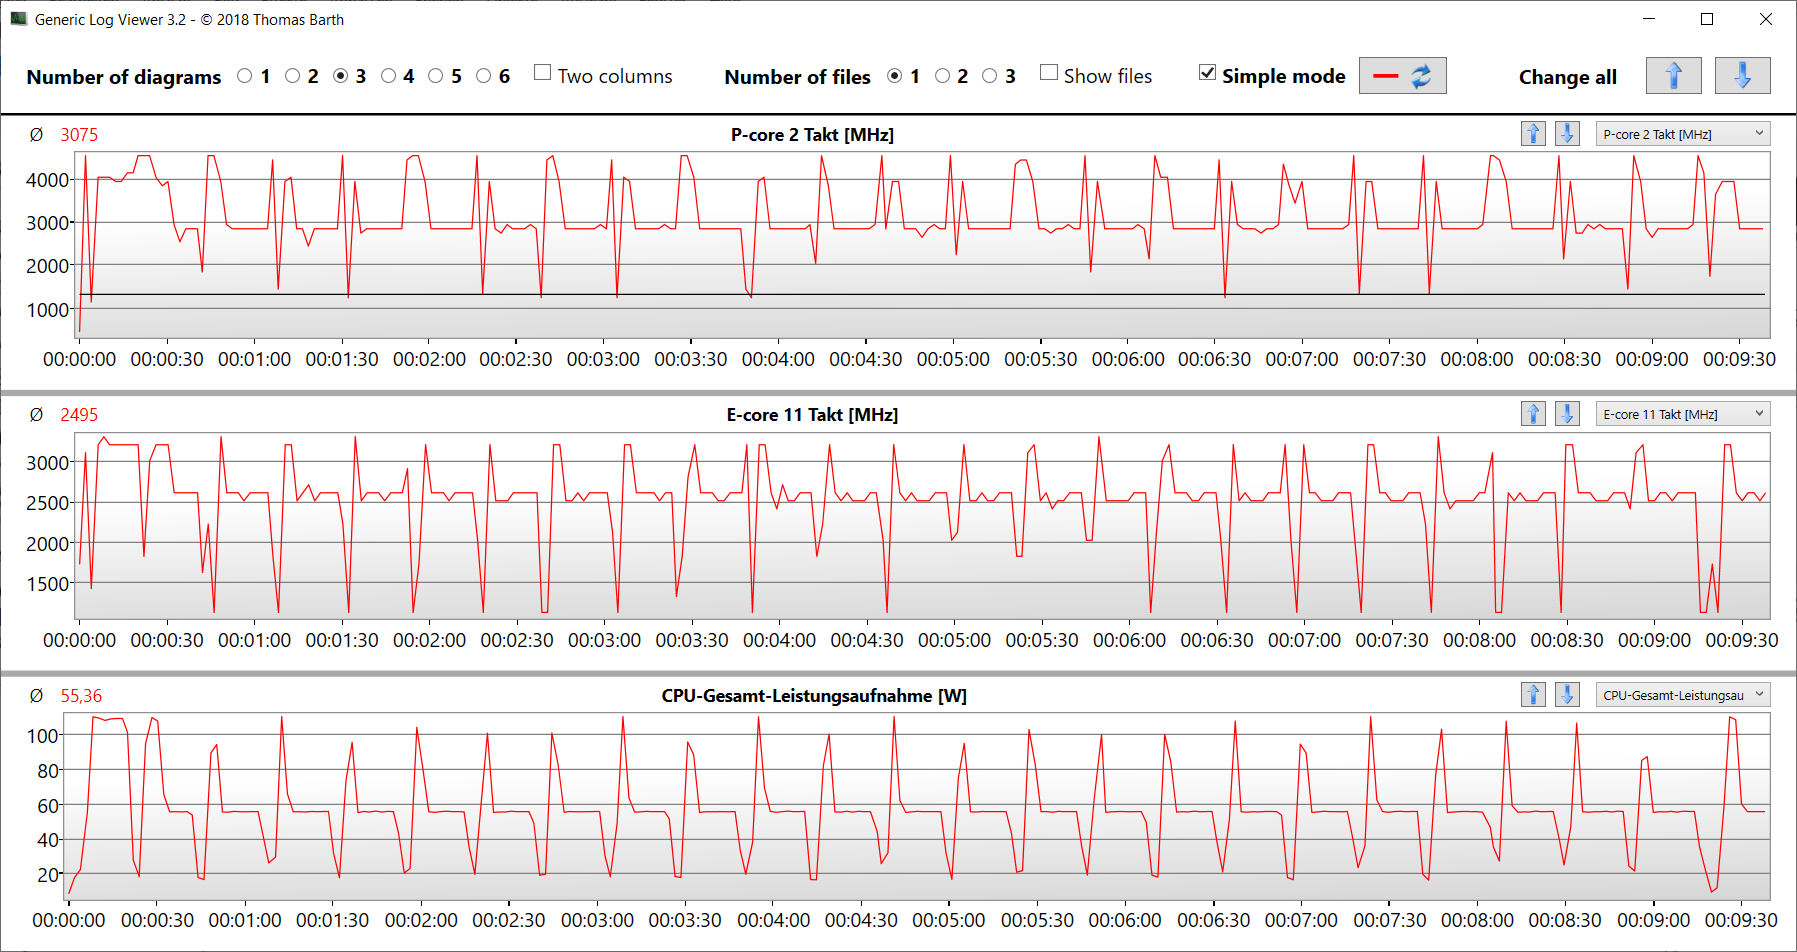
Power consumption Witcher 3 / stress test
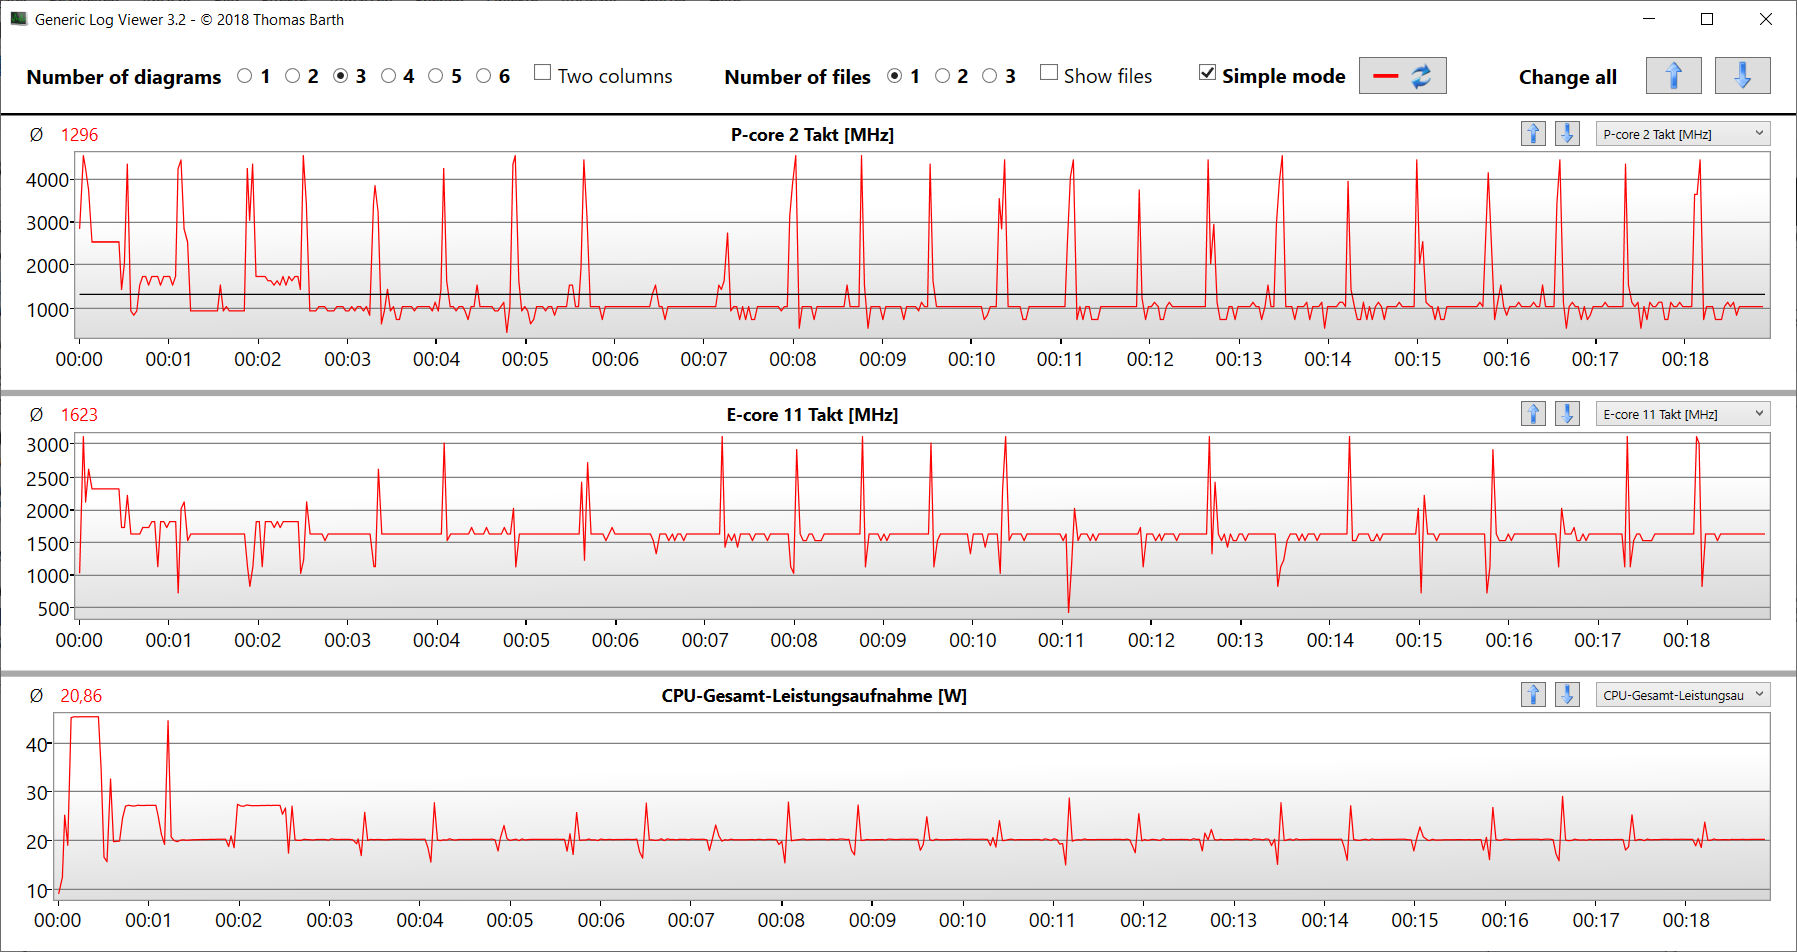
Power consumption with external monitor
Battery life
The 15.6-inch device achieved runtimes of 10:19 h and 9:01 h in the WLAN test (calling up websites via a script) and video test (short movie Big Buck Bunny (H.264 encoding, FHD) in a loop), respectively. During both tests, the laptop's energy-saving features were disabled and the display brightness was set to about 150 cd/m². The wireless modules were also disabled for the video test.
The device delivered very good runtimes. Many of the competitors came in far behind the Aorus 15 despite their similar battery capacities. The Aorus laptop still couldn't come close to the Asus TUF Gaming A16's incredible results. The Asus computer benefits from its more frugal AMD APU.
| Aorus 15 BSF i7-13700H, GeForce RTX 4070 Laptop GPU, 99 Wh | HP Omen Transcend 16 i9-13900HX, GeForce RTX 4070 Laptop GPU, 97 Wh | MSI Pulse 17 B13VGK i7-13700H, GeForce RTX 4070 Laptop GPU, 90 Wh | Lenovo Legion Slim 7i 16 Gen 8 i9-13900H, GeForce RTX 4070 Laptop GPU, 99.9 Wh | Acer Nitro 16 AN16-41 R7 7735HS, GeForce RTX 4070 Laptop GPU, 90 Wh | Asus TUF Gaming A16 FA617XS R9 7940HS, Radeon RX 7600S, 90 Wh | Average of class Gaming | |
|---|---|---|---|---|---|---|---|
| Battery runtime | -49% | -7% | -56% | -2% | 21% | -23% | |
| Reader / Idle (h) | 10.9 | 6.3 -42% | 5.1 -53% | 12.2 12% | 20.3 86% | 8.71 ? -20% | |
| H.264 (h) | 9 | 10.2 13% | 12.4 38% | 8.26 ? -8% | |||
| WiFi v1.3 (h) | 10.3 | 4.2 -59% | 9 -13% | 4.4 -57% | 9 -13% | 12.4 20% | 7.02 ? -32% |
| Load (h) | 2.2 | 1.2 -45% | 2.2 0% | 0.9 -59% | 1.8 -18% | 0.9 -59% | 1.47 ? -33% |
Pros
Cons
Verdict - The QHD gaming laptop is worth the money
The Aorus 15 is made for QHD gaming (high to maximum settings), but it also does great in other fields of use (video editing, rendering). Its Core i7-13700H and GeForce RTX 4070 deliver the necessary performance. Both chips run with a consistently high clock rate. A fast PCIe 4 SSD (1 TB) delivers the required storage and makes sure loading times are kept short.
Gigabyte's Aorus 15 BSF is a great and well-rounded mid-range gaming laptop.
Noise and heat emissions are on the expected levels for this price-range. Lower noise emissions could be achieved at the expense of some of the laptop's performance. Its matte IPS panel (15.6 inches, 2,560 x 1,440 pixels, 165 Hz, DCI P3) generally made a good impression. Although, its brightness and contrast could be a little better.
Charging the battery fully (99 Wh) leads to practical runtimes of around 9 to 10 h - a very good result. Positive: The battery can be charged via a USB-C cable (min 65 watts, 20 V) - its USB-C port (Thunderbolt 4) supports Power Delivery. This means the bulky proprietary power connector (240 watts) doesn't always have to be transported with the device.
An alternative to this laptop could be the Asus TUF Gaming A16 FA617XS, which offers better CPU performance, a 16:10 display and even longer runtimes. In terms of graphics performance, it is at a bit of a disadvantage compared to the Aorus 15.
Price and availability
The version of the Aorus 15 BSF which we tested can be found on Amazon for US$1,699.
Aorus 15 BSF
- 08/12/2023 v7 (old)
Sascha Mölck
Transparency
The selection of devices to be reviewed is made by our editorial team. The test sample was provided to the author as a loan by the manufacturer or retailer for the purpose of this review. The lender had no influence on this review, nor did the manufacturer receive a copy of this review before publication. There was no obligation to publish this review. As an independent media company, Notebookcheck is not subjected to the authority of manufacturers, retailers or publishers.
This is how Notebookcheck is testing
Every year, Notebookcheck independently reviews hundreds of laptops and smartphones using standardized procedures to ensure that all results are comparable. We have continuously developed our test methods for around 20 years and set industry standards in the process. In our test labs, high-quality measuring equipment is utilized by experienced technicians and editors. These tests involve a multi-stage validation process. Our complex rating system is based on hundreds of well-founded measurements and benchmarks, which maintains objectivity. Further information on our test methods can be found here.
Price comparison

