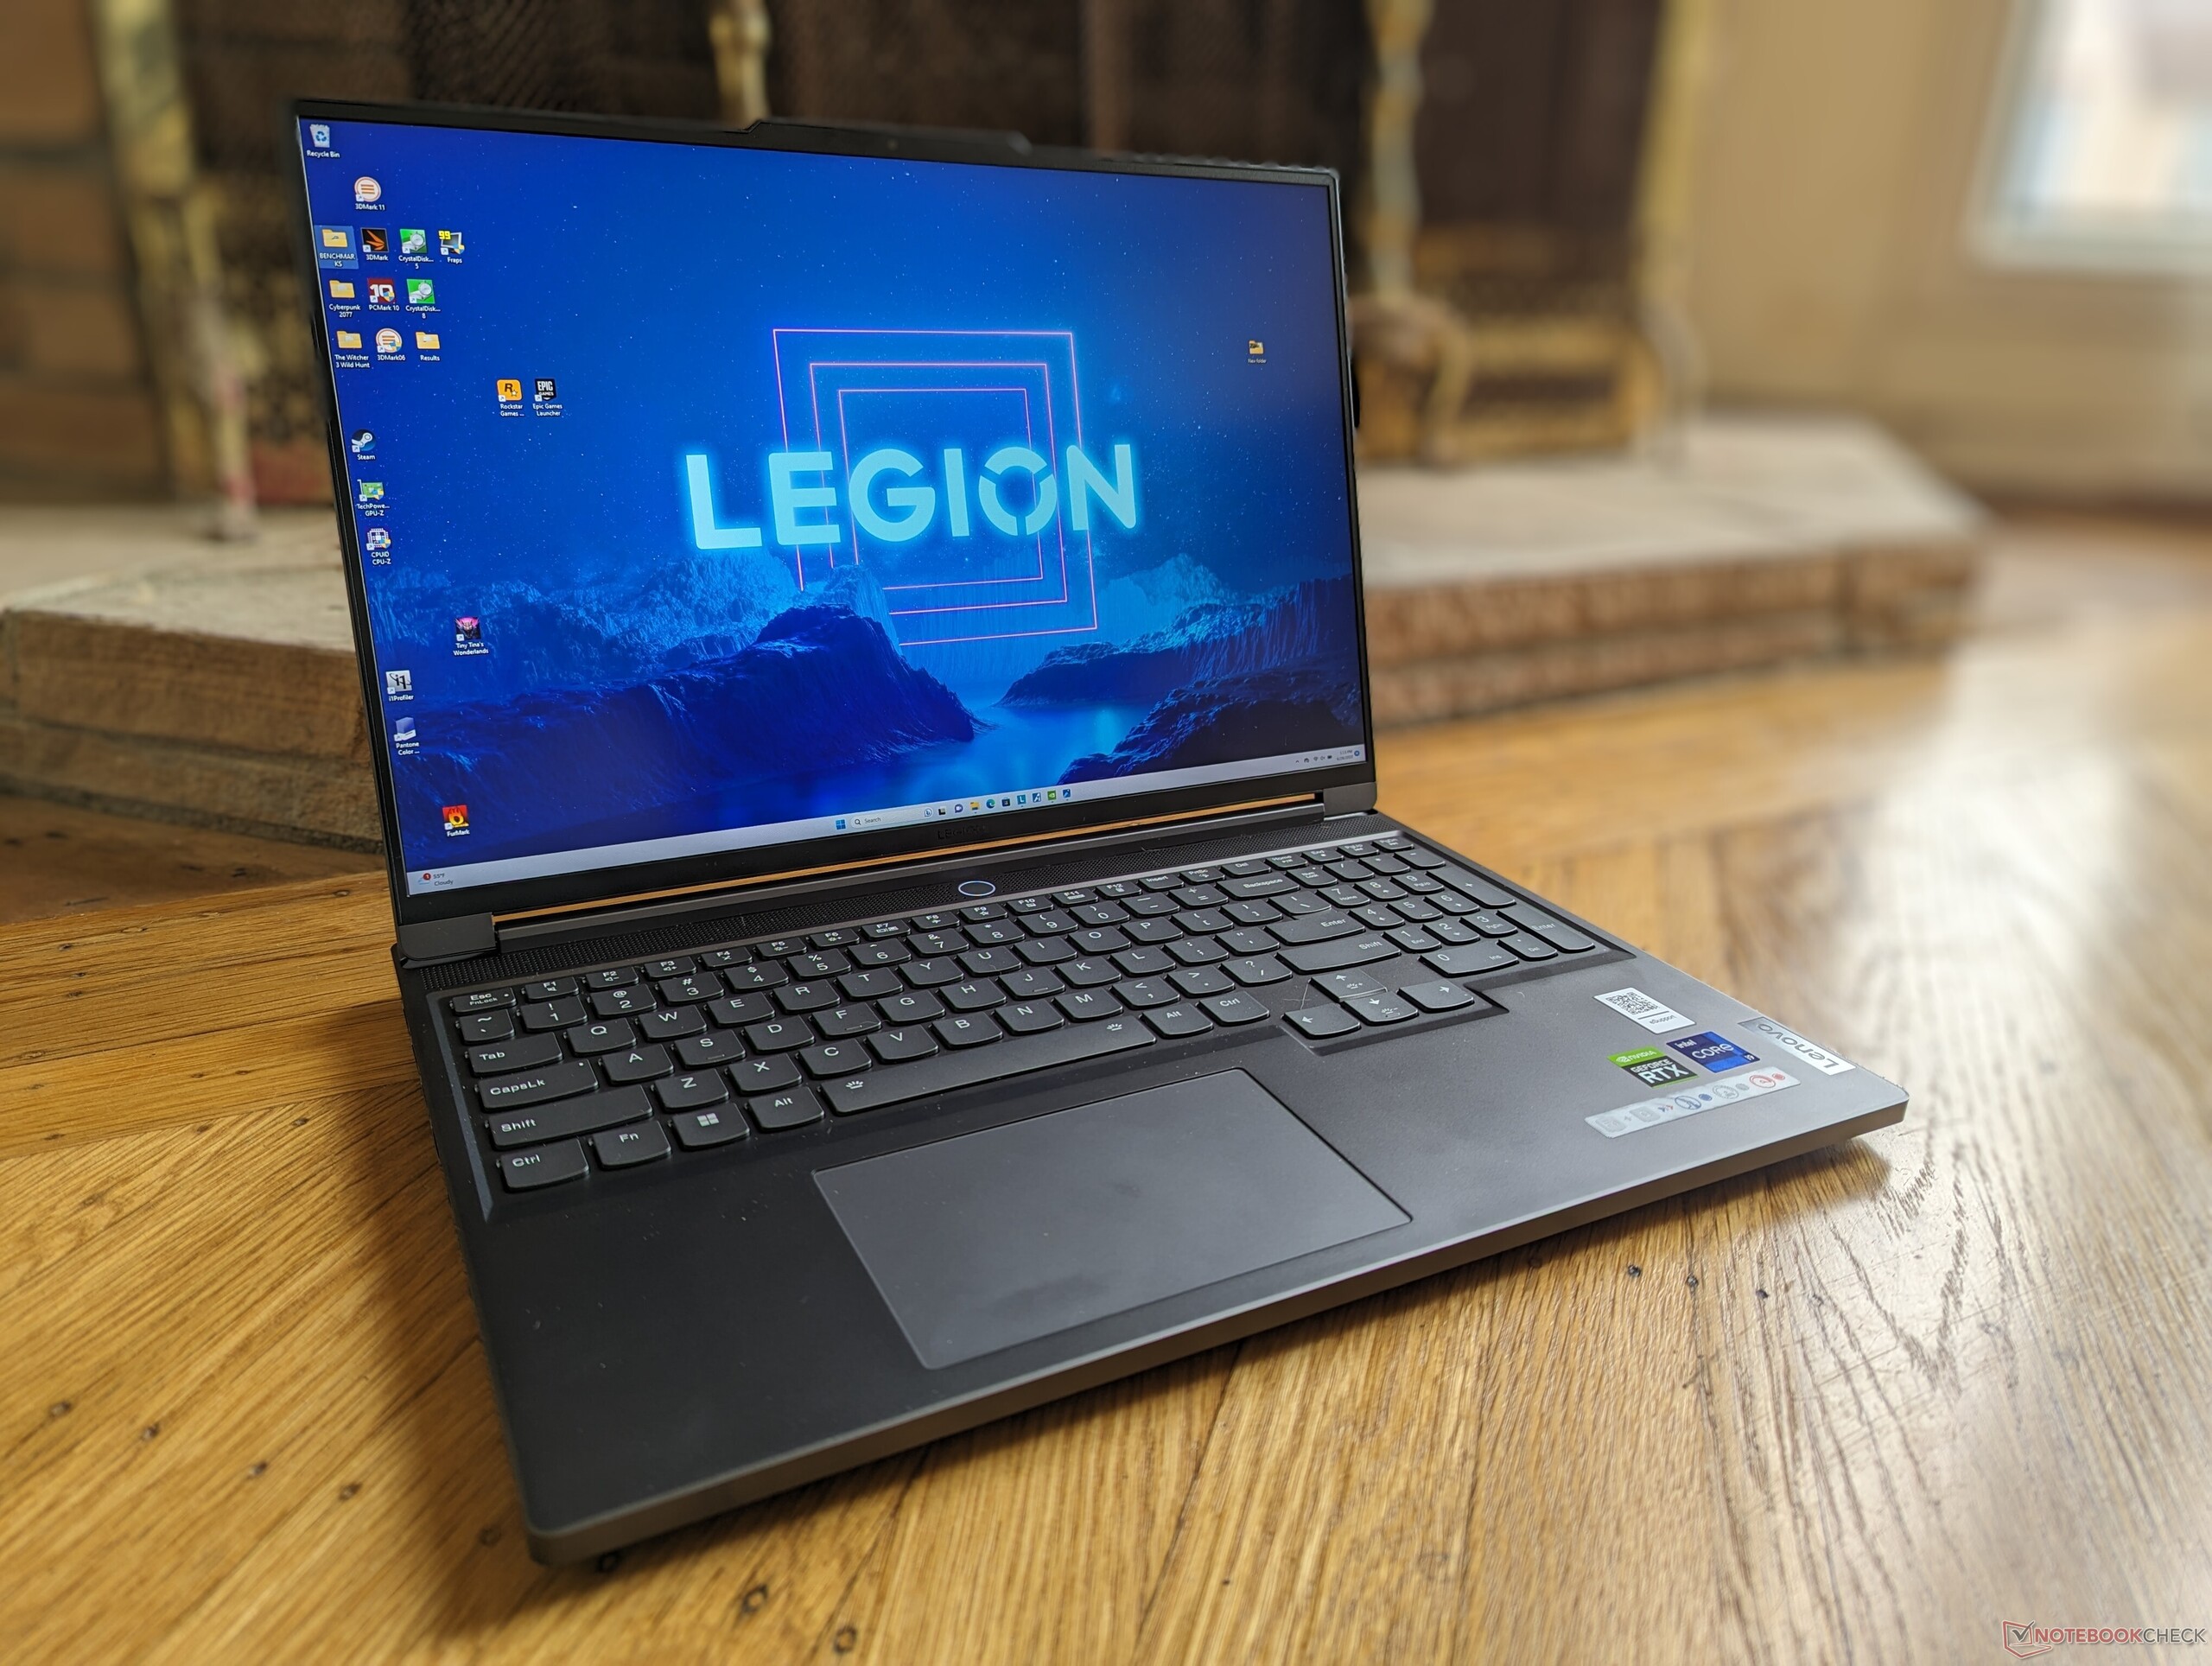
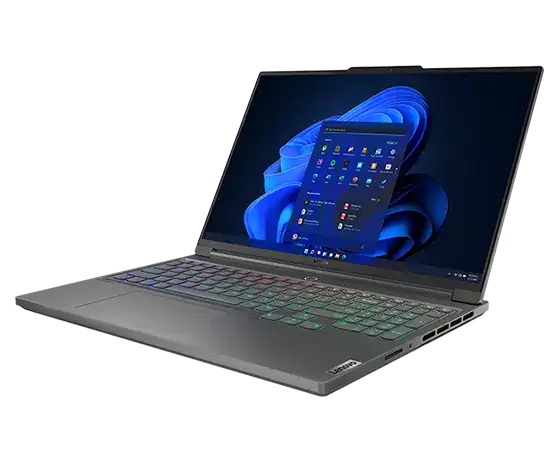
Lenovo Legion Slim 7i 16 Gen 8 laptop review: Slimmer than the Razer Blade 16

The Lenovo Legion Slim 7i Gen 8 replaces last year's Legion Slim 7i Gen 7 with newer 13th gen Raptor Lake-H CPUs, Nvidia Ada Lovelace GPUs, and a revised chassis design. It complements the thicker and more powerful Legion Pro 7 series.
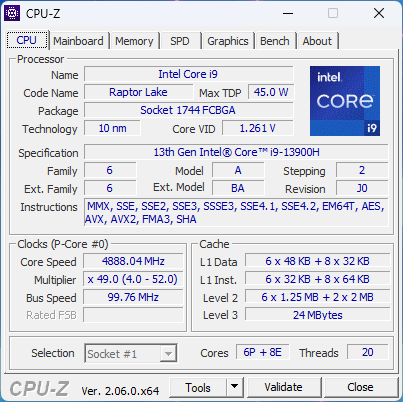
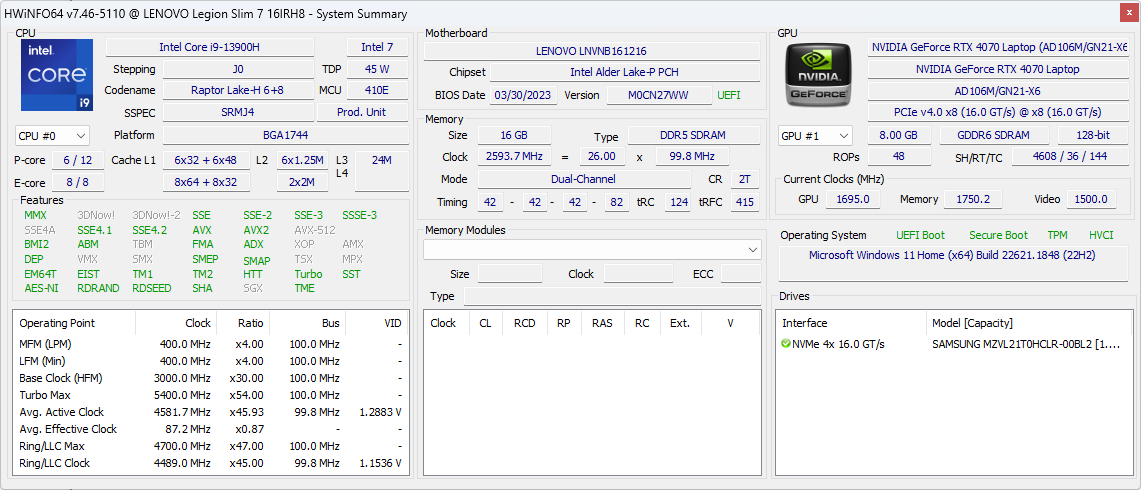
Our review unit is a higher-end configuration with the Core i9-13900H, 140 W GeForce RTX 4070 GPU, and 2560 x 1600 240 Hz IPS display for approximately $1600 USD retail. Other SKUs are available with the lesser Core i7-13700H, RTX 4060, or higher resolution 3200 x 2000 165 Hz display starting at about $1500.
Competitors to the Legion Slim 7i G8 include other thin-and-light 16-inch gaming laptops like the Razer Blade 16, HP Omen 16, Asus ROG Zephyrus M16, or the Alienware x16 R1.
More Lenovo reviews:
Potential Competitors in Comparison
Rating | Date | Model | Weight | Height | Size | Resolution | Price |
|---|---|---|---|---|---|---|---|
| 90 % v7 (old) | 07 / 2023 | Lenovo Legion Slim 7i 16 Gen 8 i9-13900H, GeForce RTX 4070 Laptop GPU | 2.1 kg | 19.9 mm | 16.00" | 2560x1600 | |
| 87.4 % v7 (old) | 06 / 2023 | HP Omen 16-wf000 i7-13700HX, GeForce RTX 4080 Laptop GPU | 2.4 kg | 23.6 mm | 16.10" | 2560x1440 | |
| 88.4 % v7 (old) | 06 / 2023 | Alienware x16 R1 i9-13900HK, GeForce RTX 4080 Laptop GPU | 2.6 kg | 18.57 mm | 16.00" | 2560x1600 | |
| 88.8 % v7 (old) | 06 / 2023 | Lenovo Legion Pro 7 RTX4090 i9-13900HX, GeForce RTX 4090 Laptop GPU | 2.7 kg | 26 mm | 16.00" | 2560x1600 | |
| 88.4 % v7 (old) | 03 / 2023 | Asus ROG Strix G16 G614JZ i9-13980HX, GeForce RTX 4080 Laptop GPU | 2.4 kg | 30.4 mm | 16.00" | 2560x1600 | |
| 91.2 % v7 (old) | 02 / 2023 | Razer Blade 16 Early 2023 i9-13950HX, GeForce RTX 4080 Laptop GPU | 2.4 kg | 21.99 mm | 16.00" | 2560x1600 |
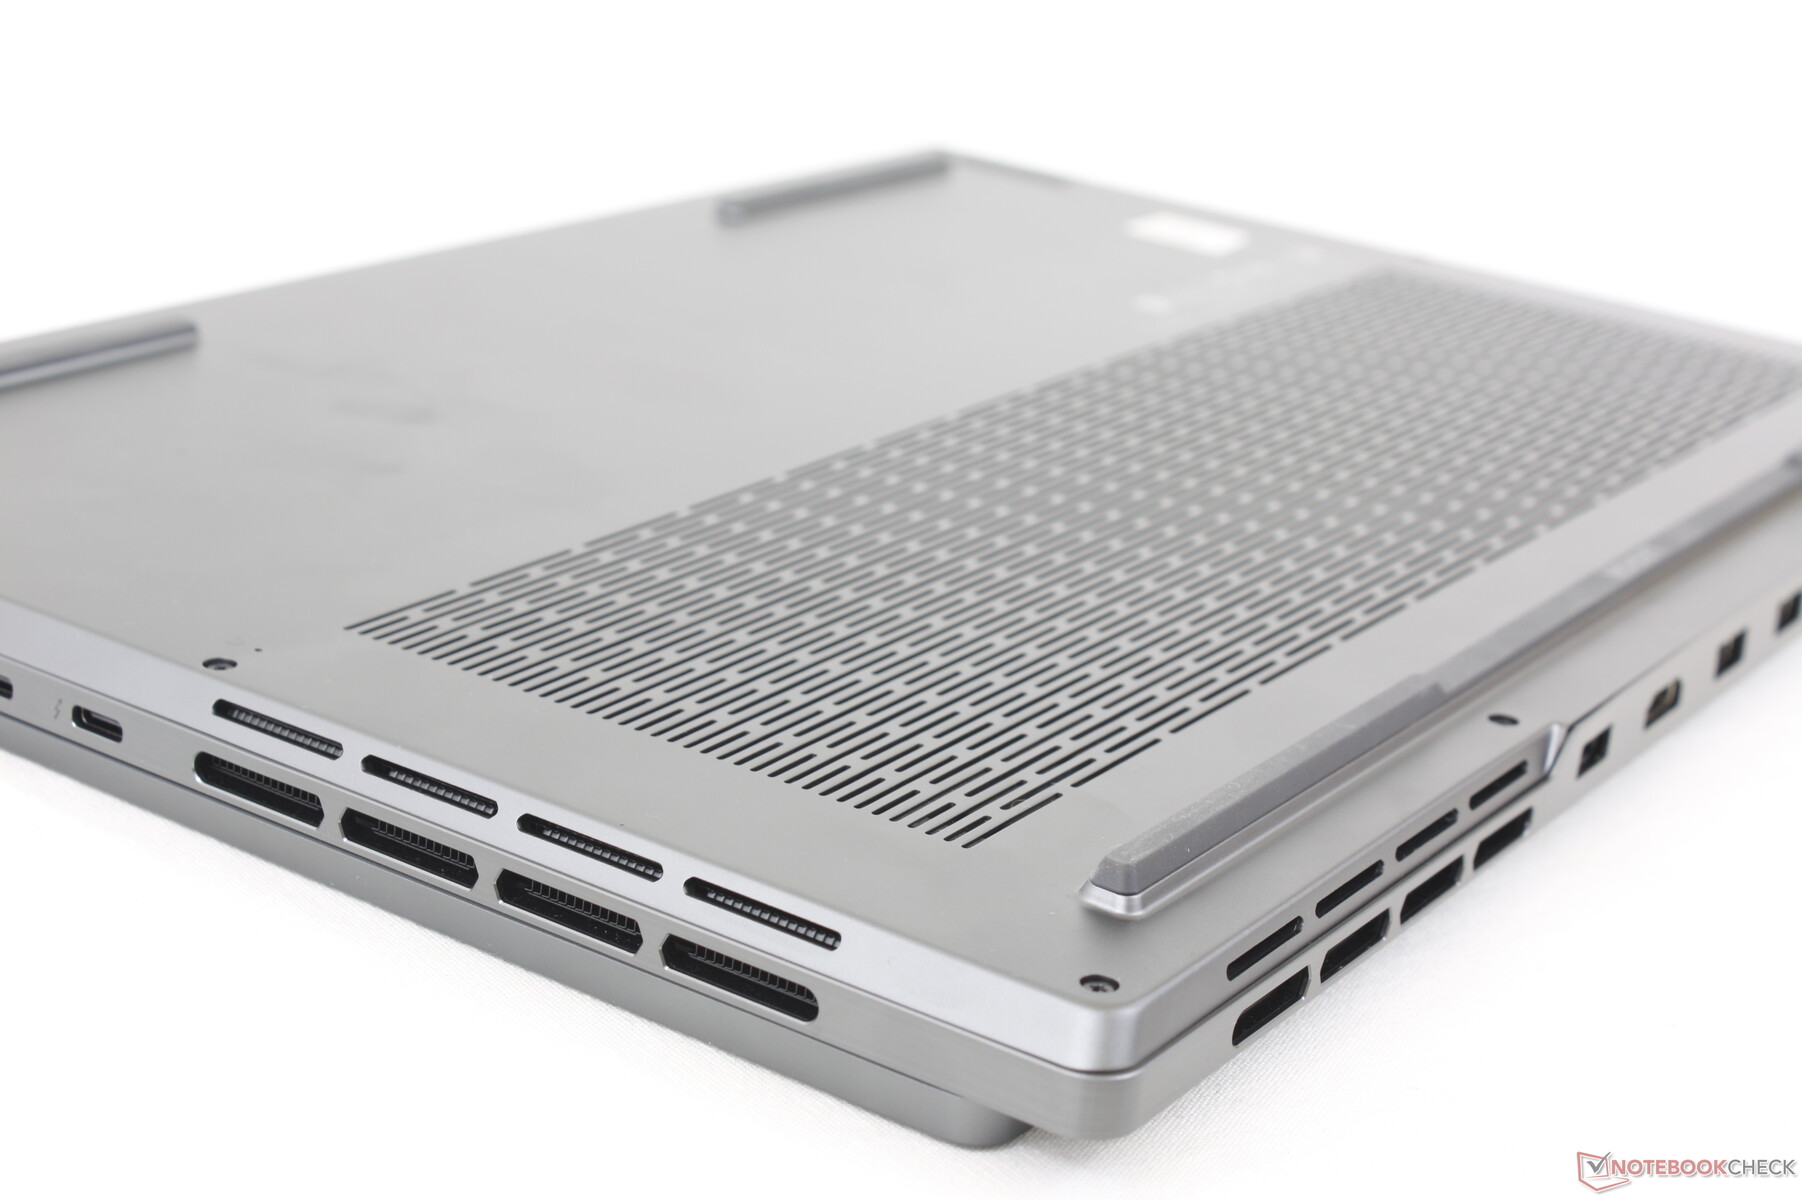
Case — Now With More Ventilation Grilles
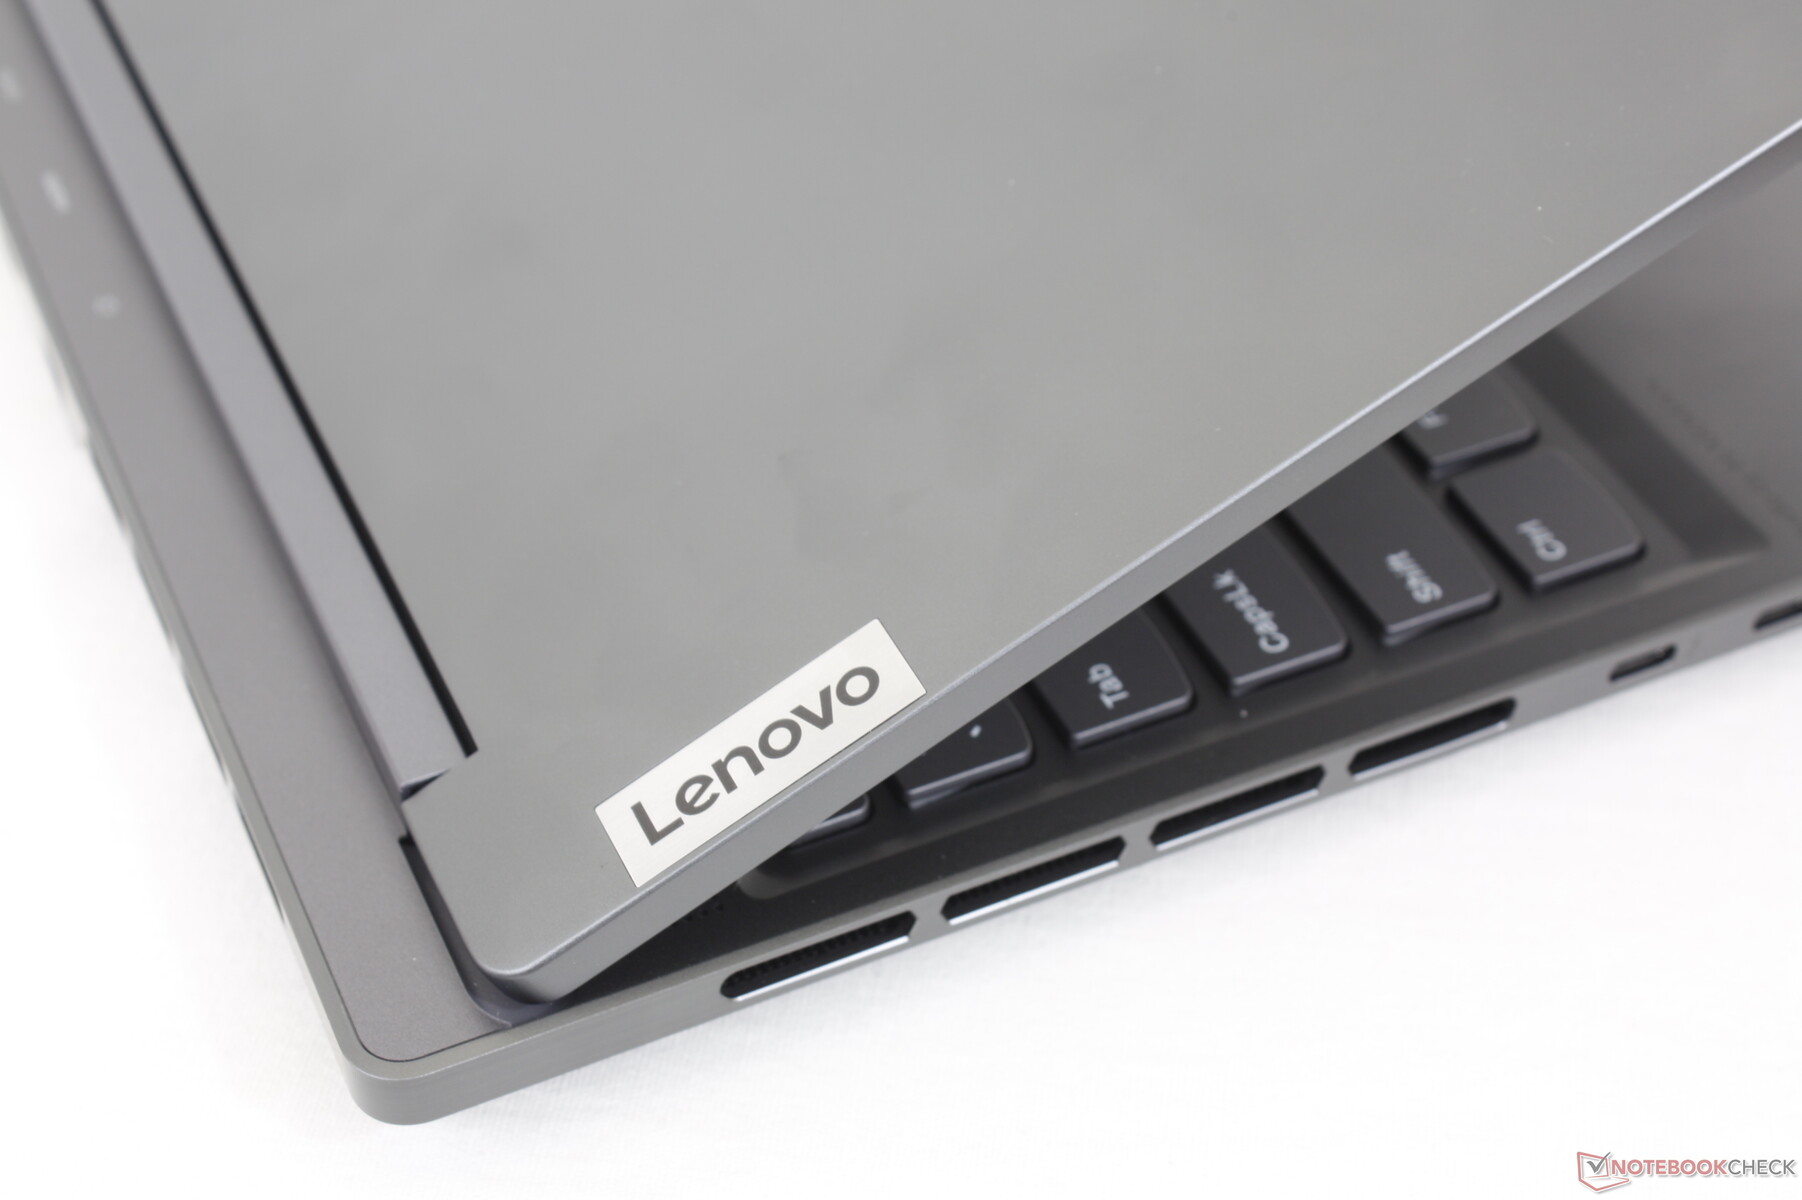
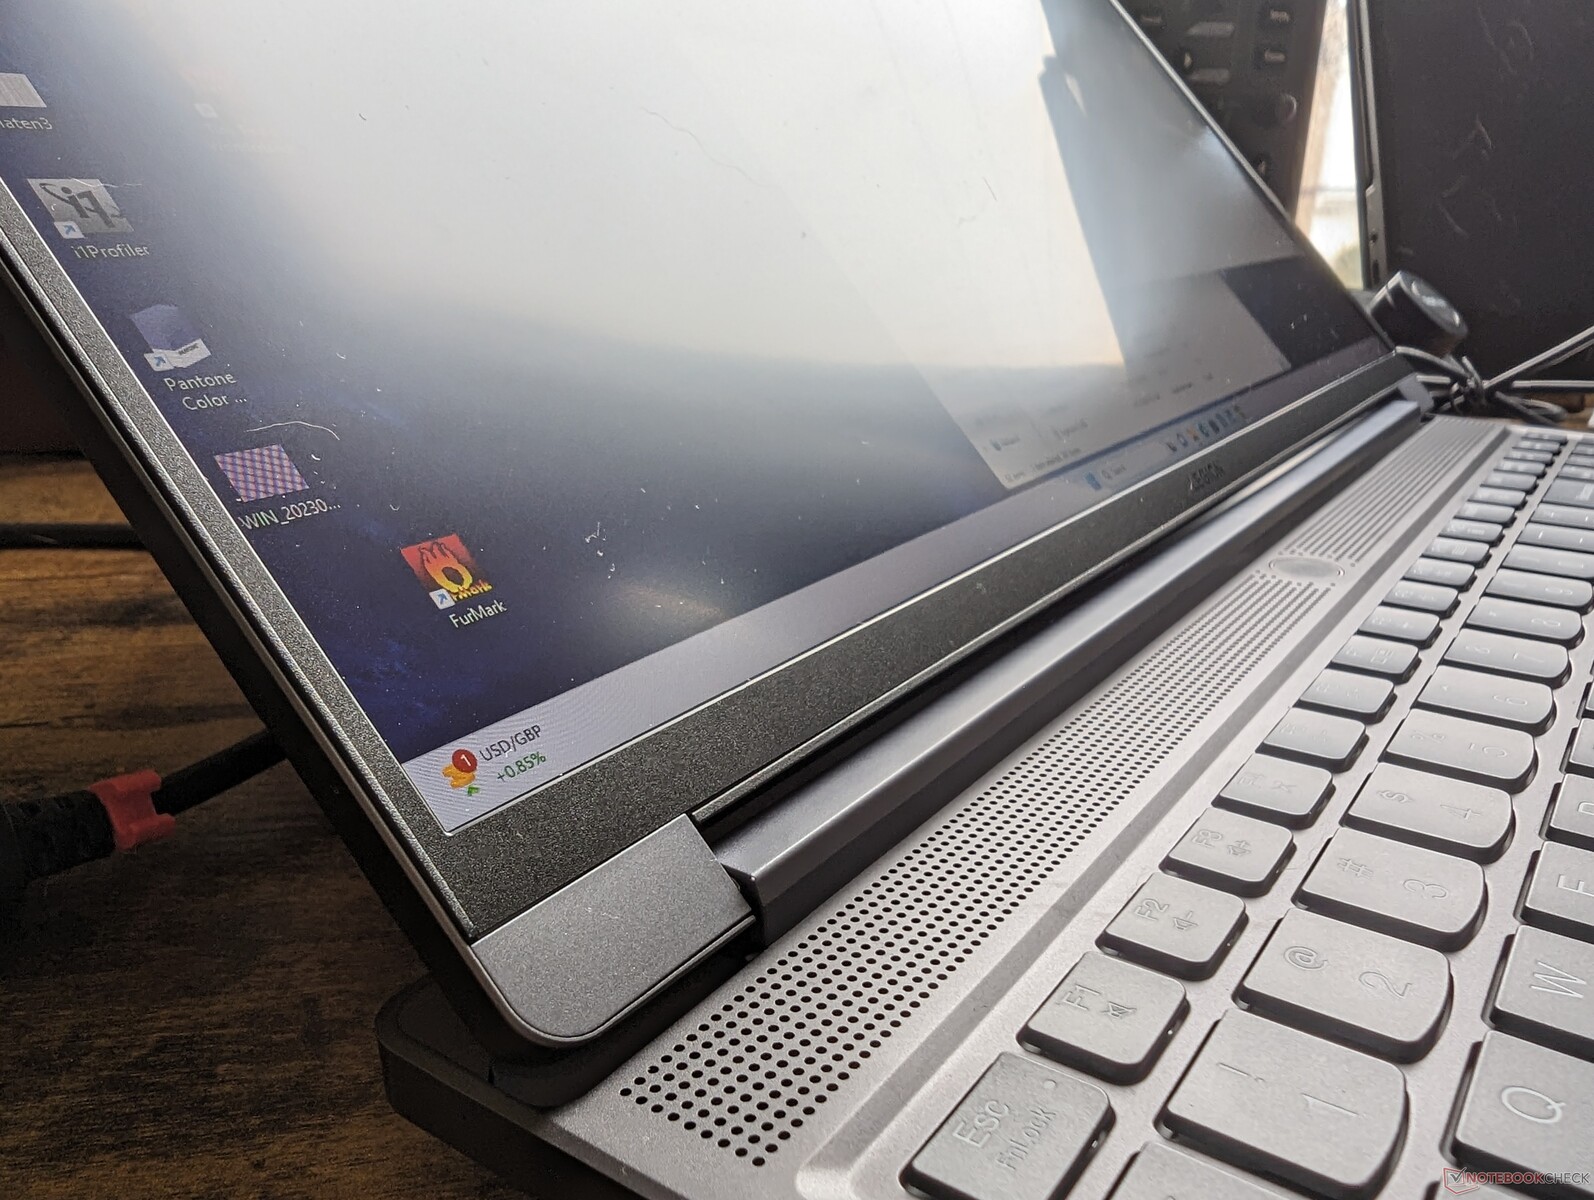
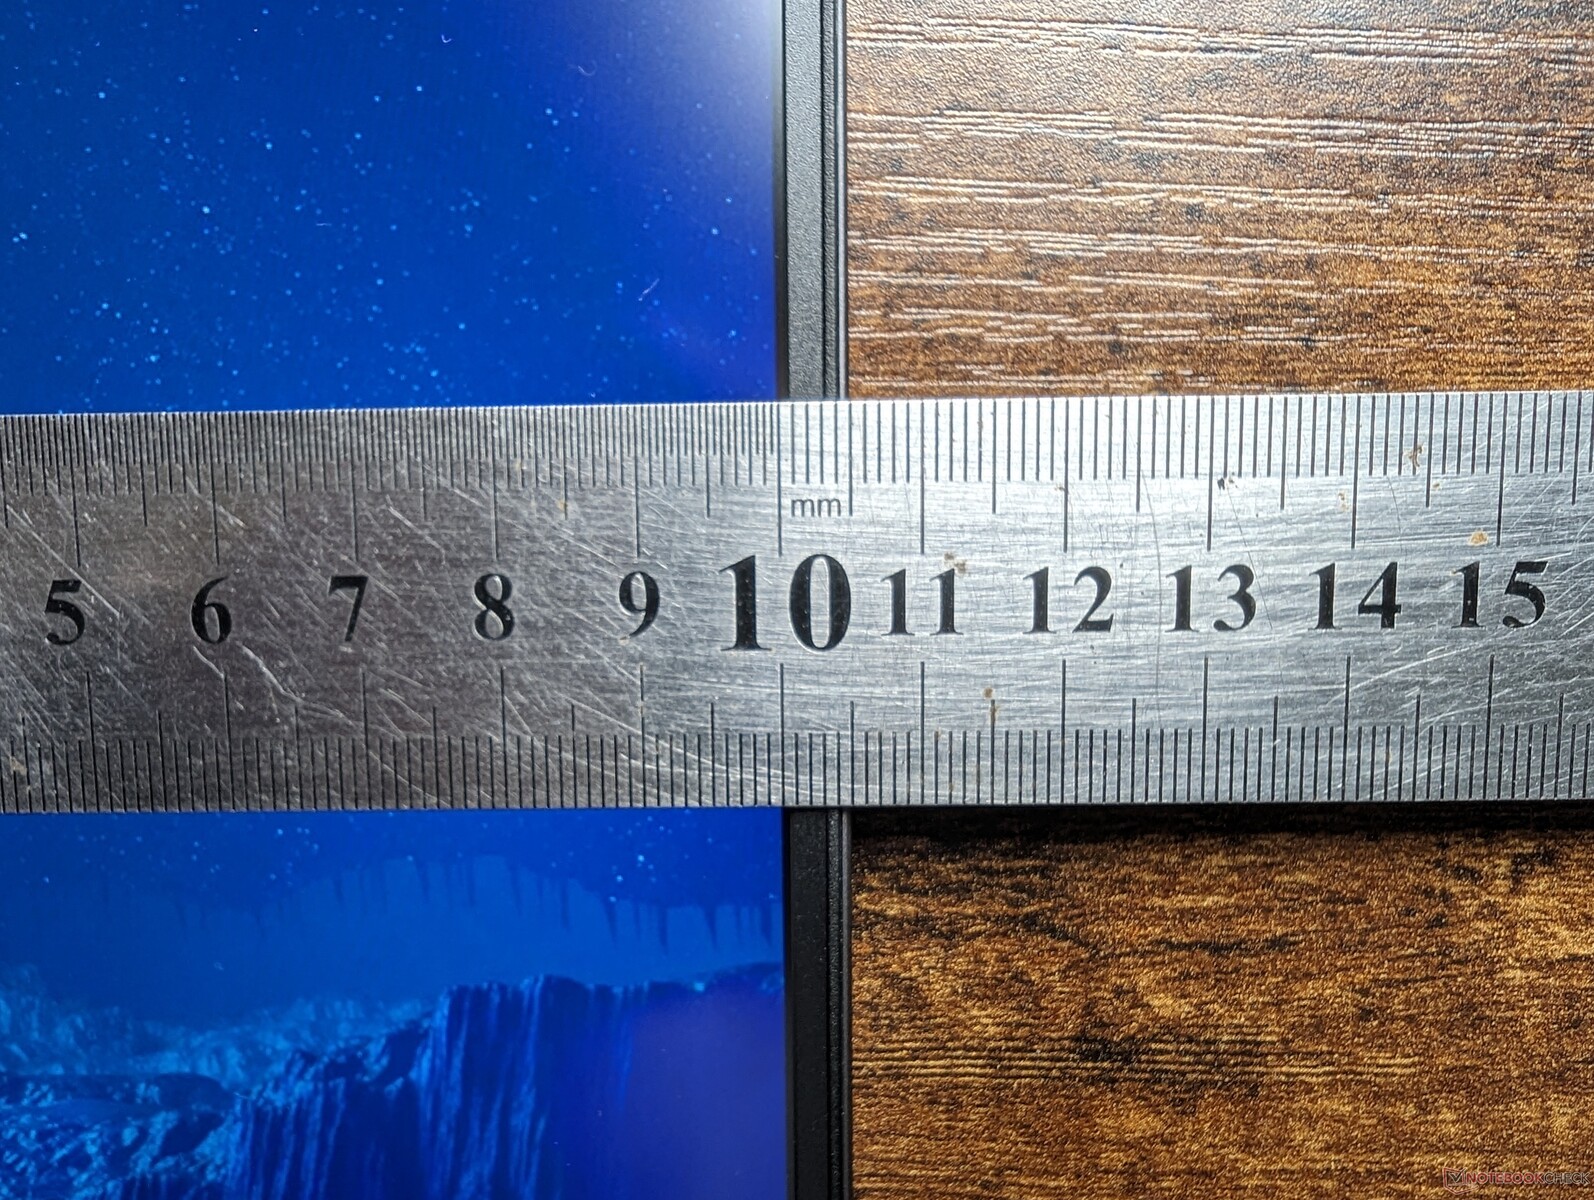
The chassis may appear similar to last year's Legion Slim 7i 16 G7 from the front, but most of the external changes are along the back and bottom sides. The rear edge, for example, is now flat for a cleaner look while the ventilation grilles are noticeably larger this time around for improved cooling.
Chassis materials are otherwise the same gray aluminum finish and feel as seen on other Legion 7 models. The base remains rigid despite the thin profile and the lid is relatively firm as well. The small hinges aren't as solid as the larger ones on the Asus ROG Strix G16, but they allow for a full 180-degree opening which is uncommon on gaming laptops.
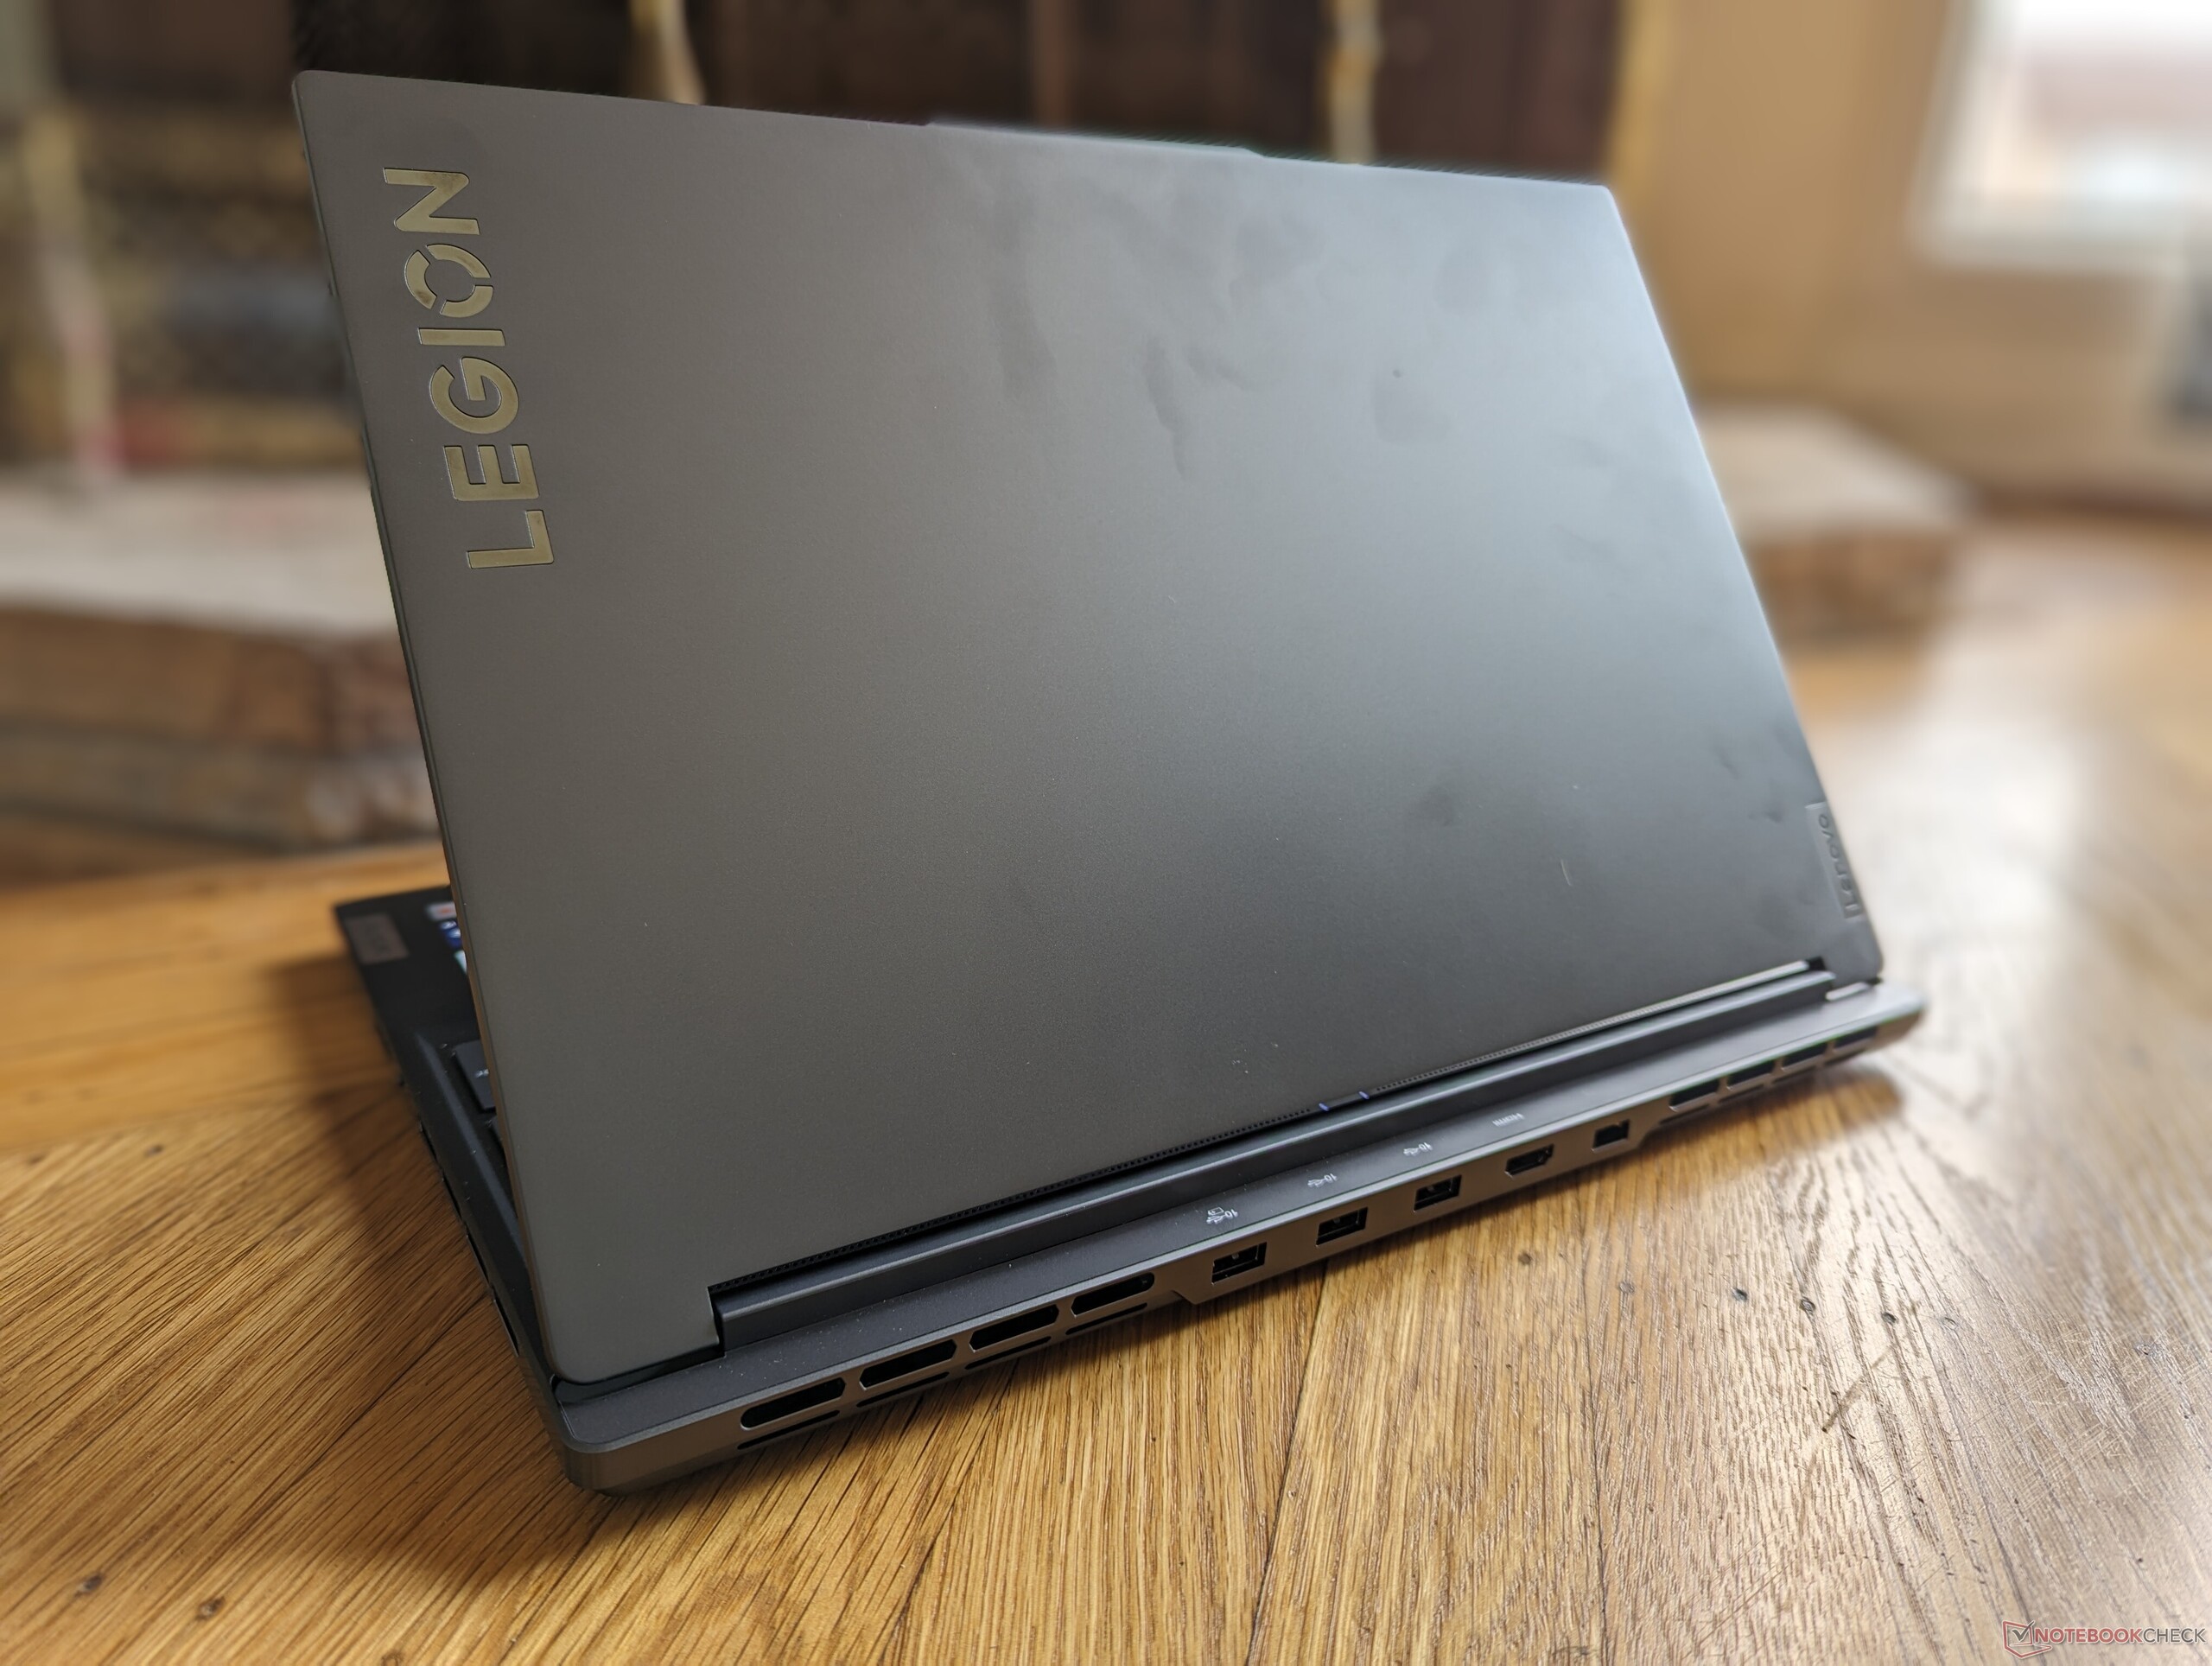
Lenovo doesn't call it the Legion Slim 7 for nothing. When compared to the Legion Pro 7, our Slim version is significantly lighter by 600 g and noticeably thinner by over 6 mm. In fact, the Legion Slim 7 is one of the thinnest and lightest 16-inch gaming laptops available second only to the slightly thinner and lighter MSI GS66.
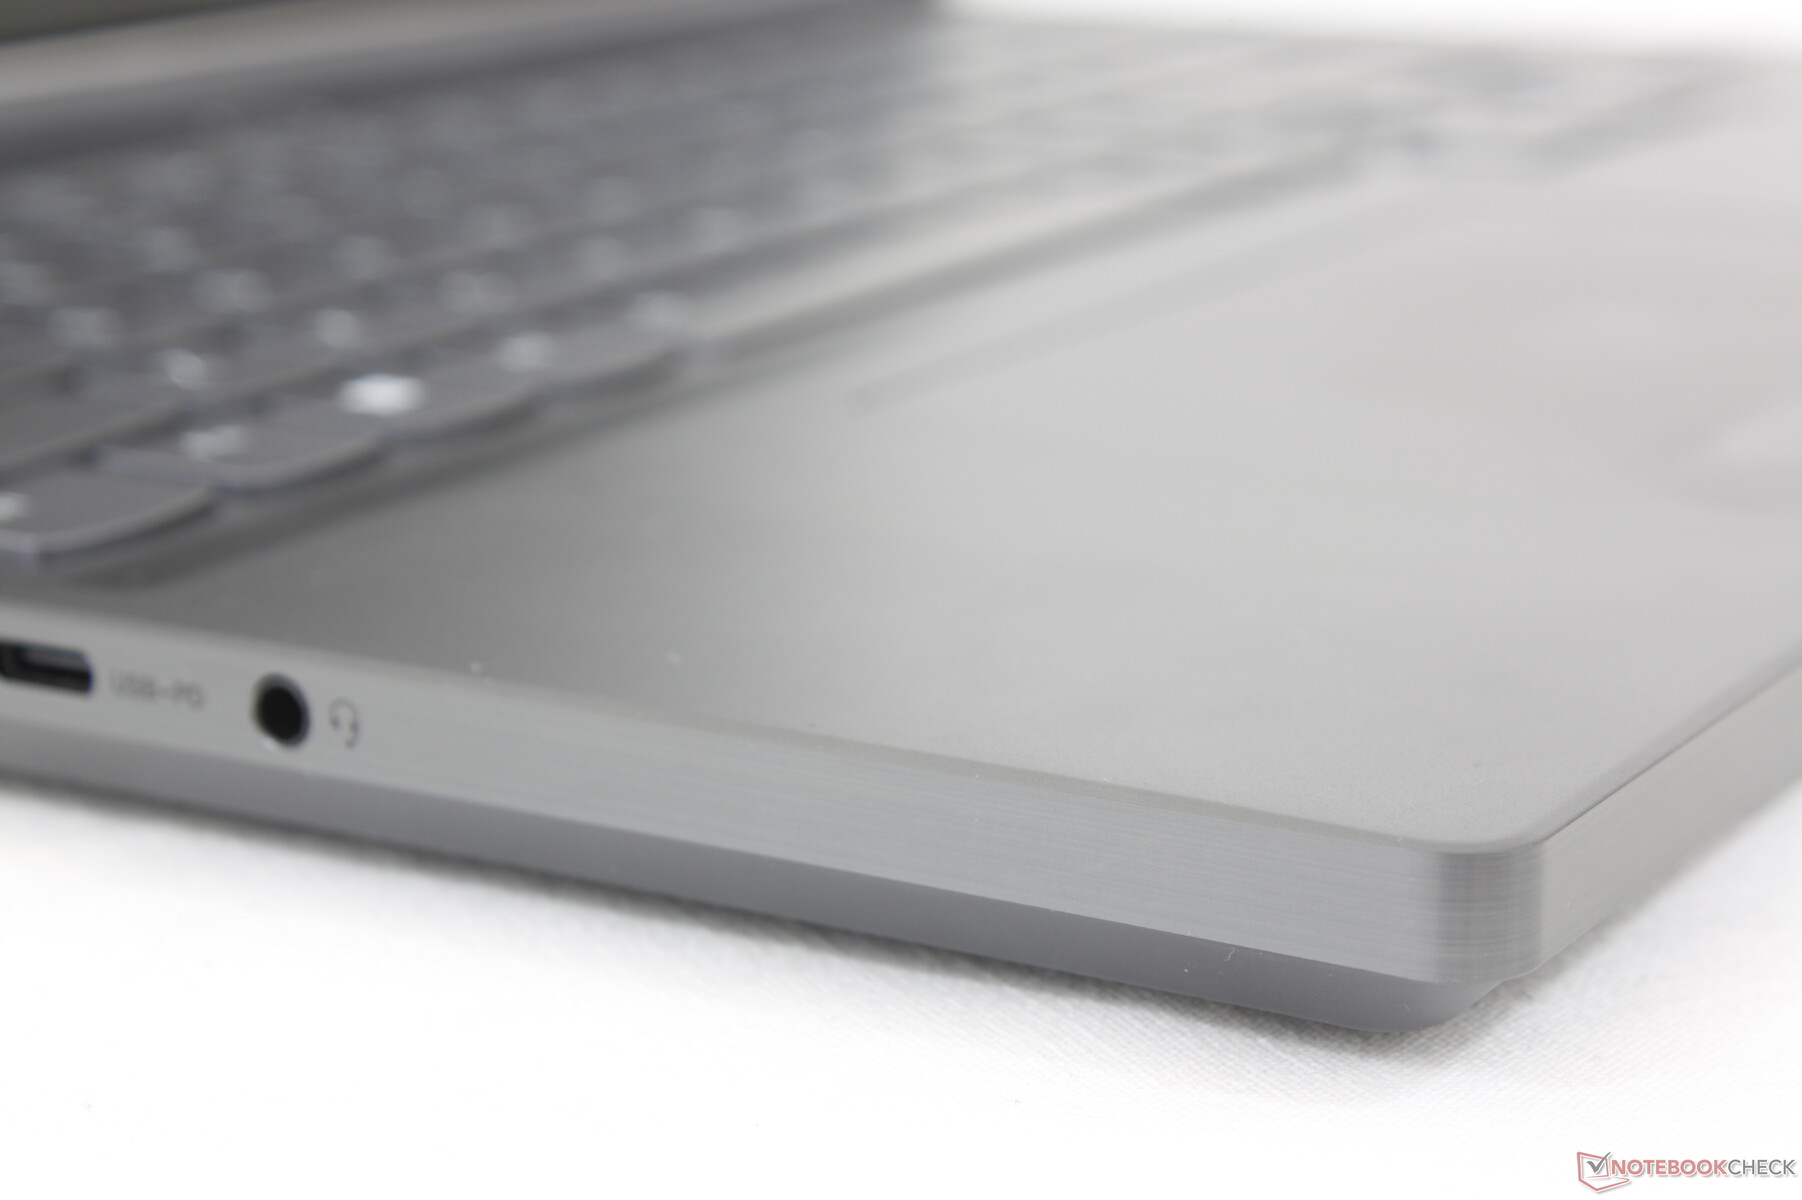
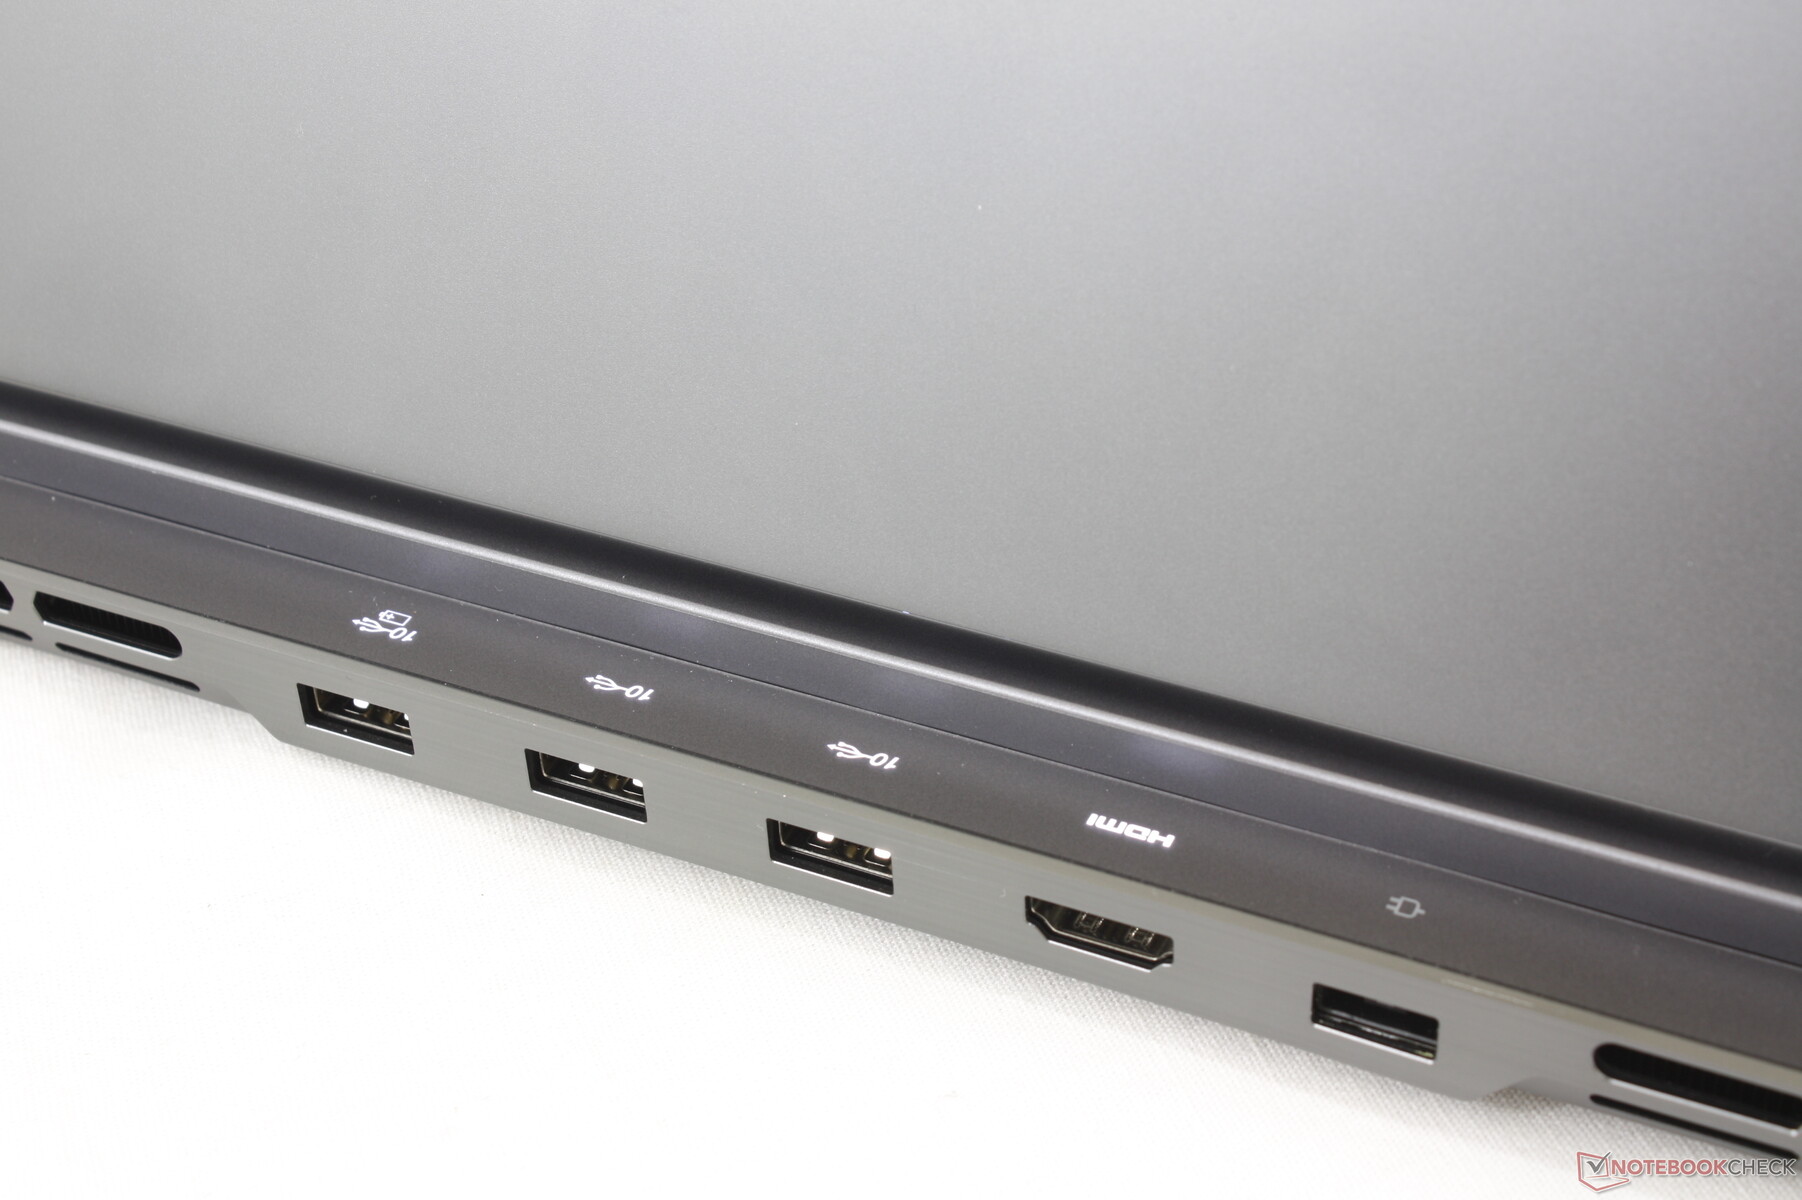
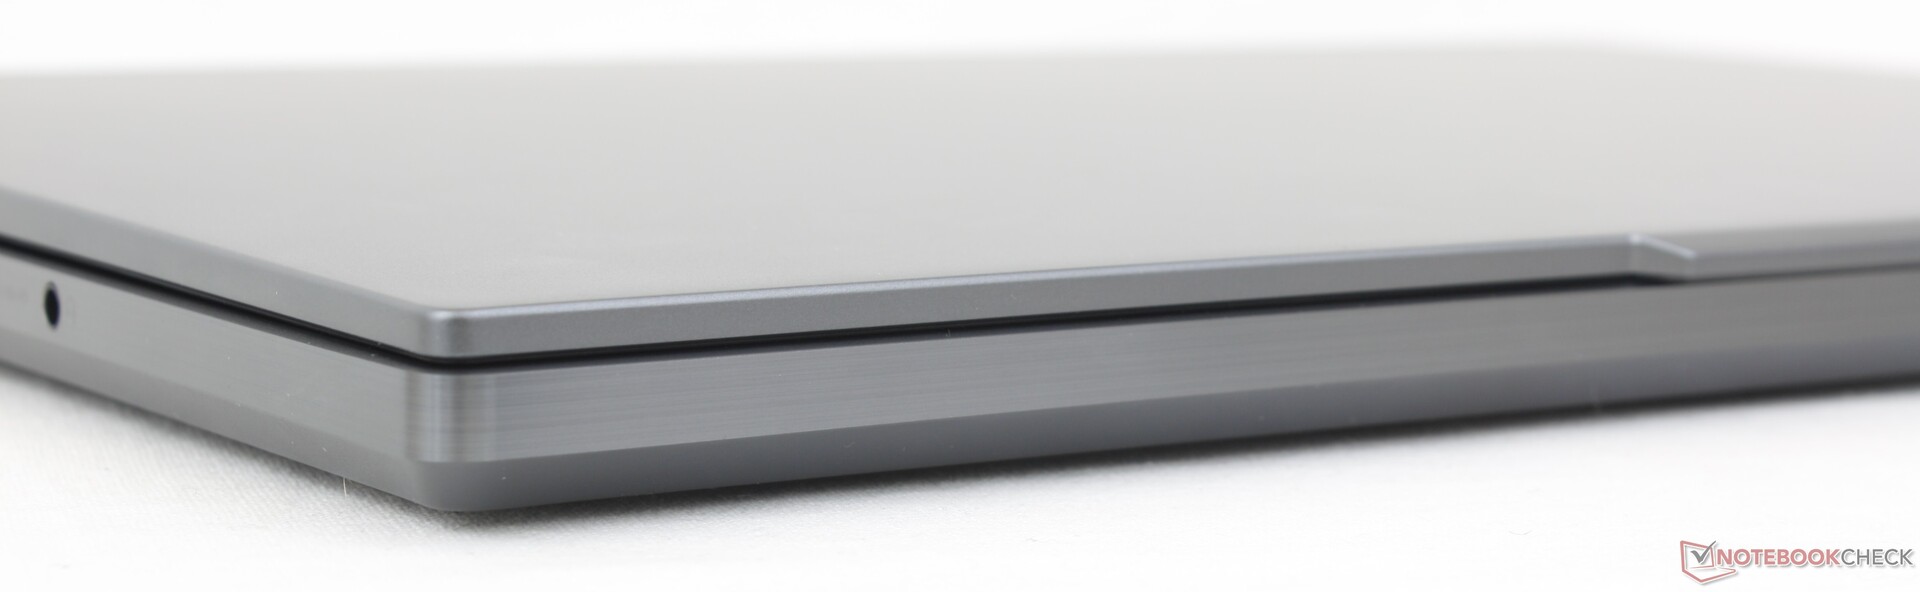
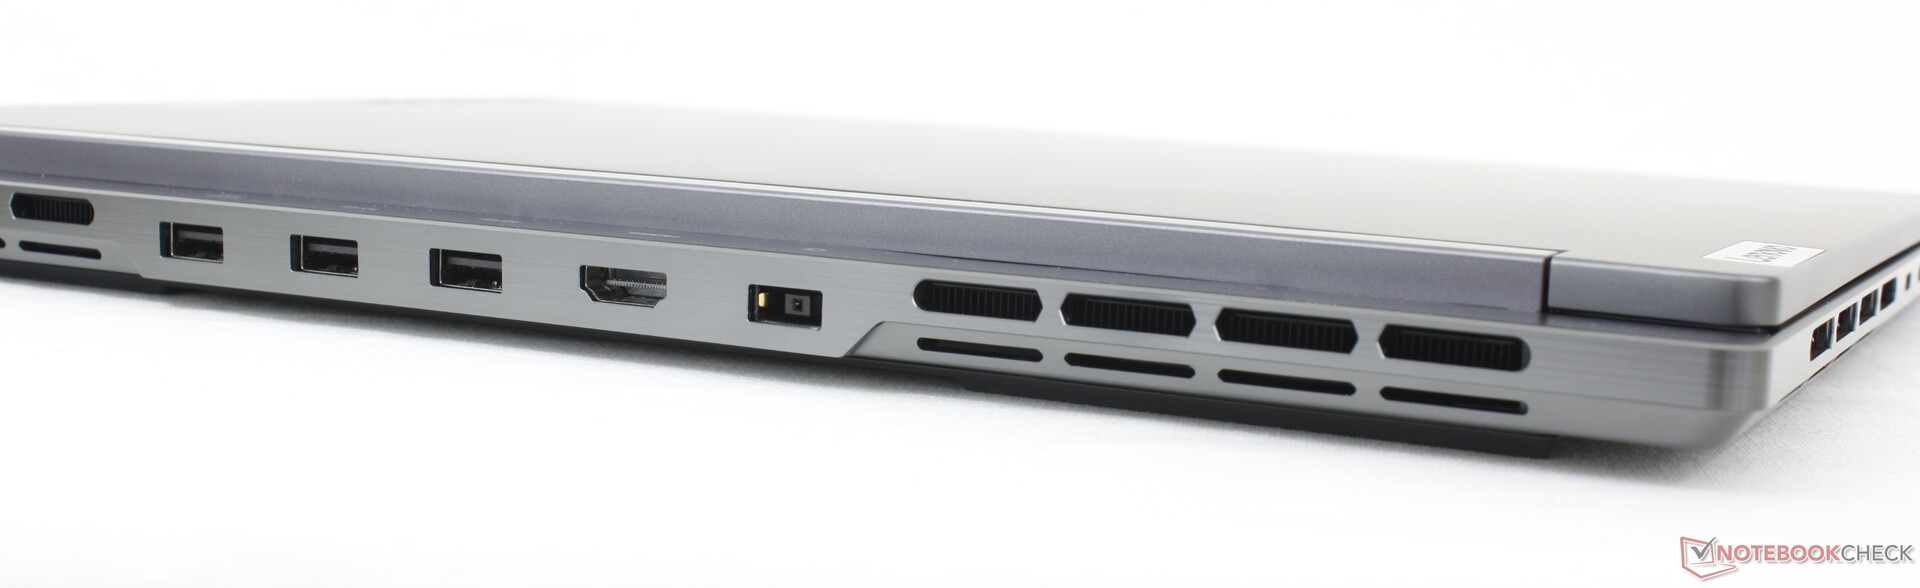
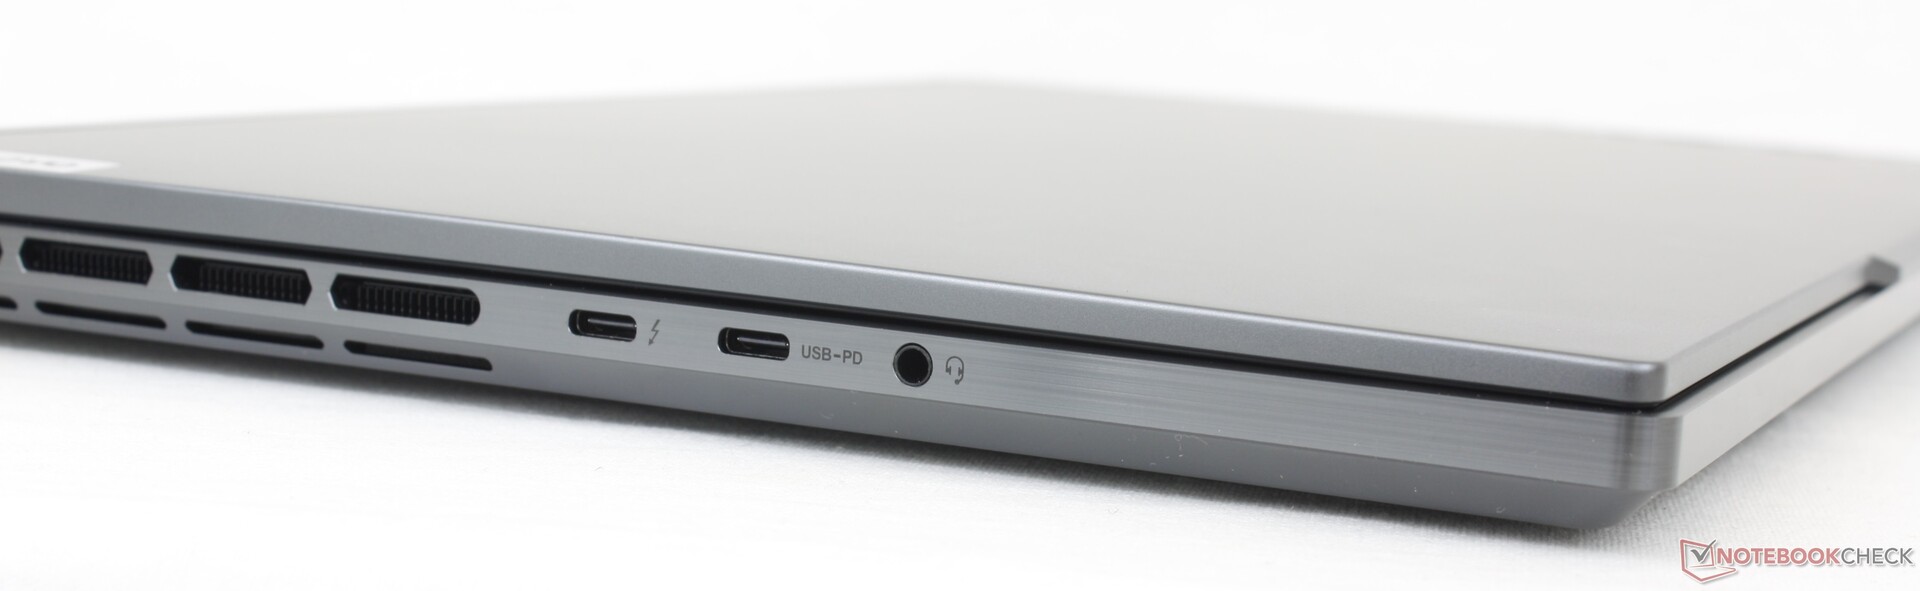
Connectivity — Thunderbolt 4 Support
Port options are varied with most along the rear edge much like on the Alienware series. Unlike on the Alienware, however, the two USB-C ports on our Lenovo are along the left edge for easier access.
Note that only one of the two USB-C ports supports Thunderbolt 4. If certain accessories don't work on one port, then be sure to try the other. Our Lepow external monitor, for example, would work on the USB-C 3.2 port but not the USB-C Thunderbolt port.
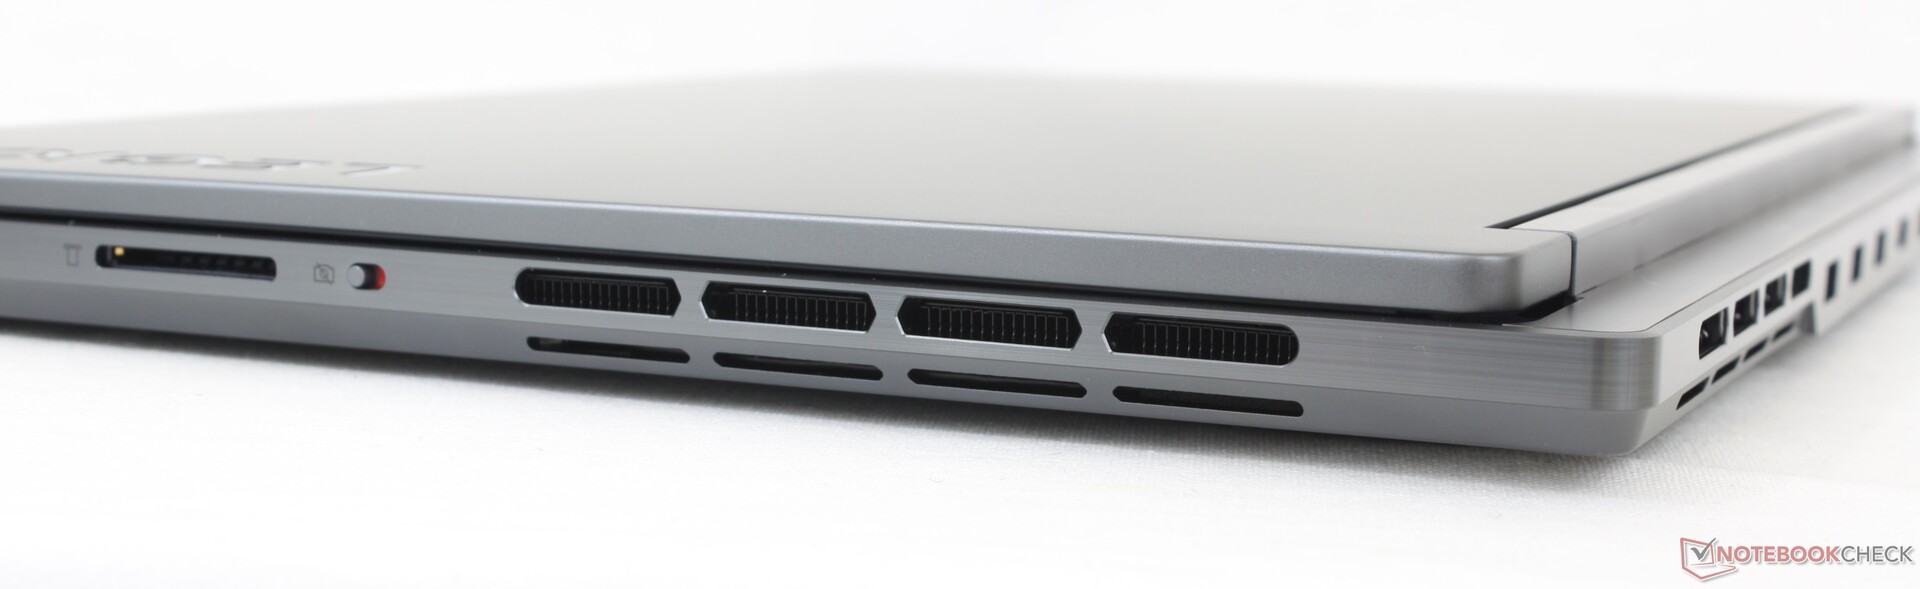
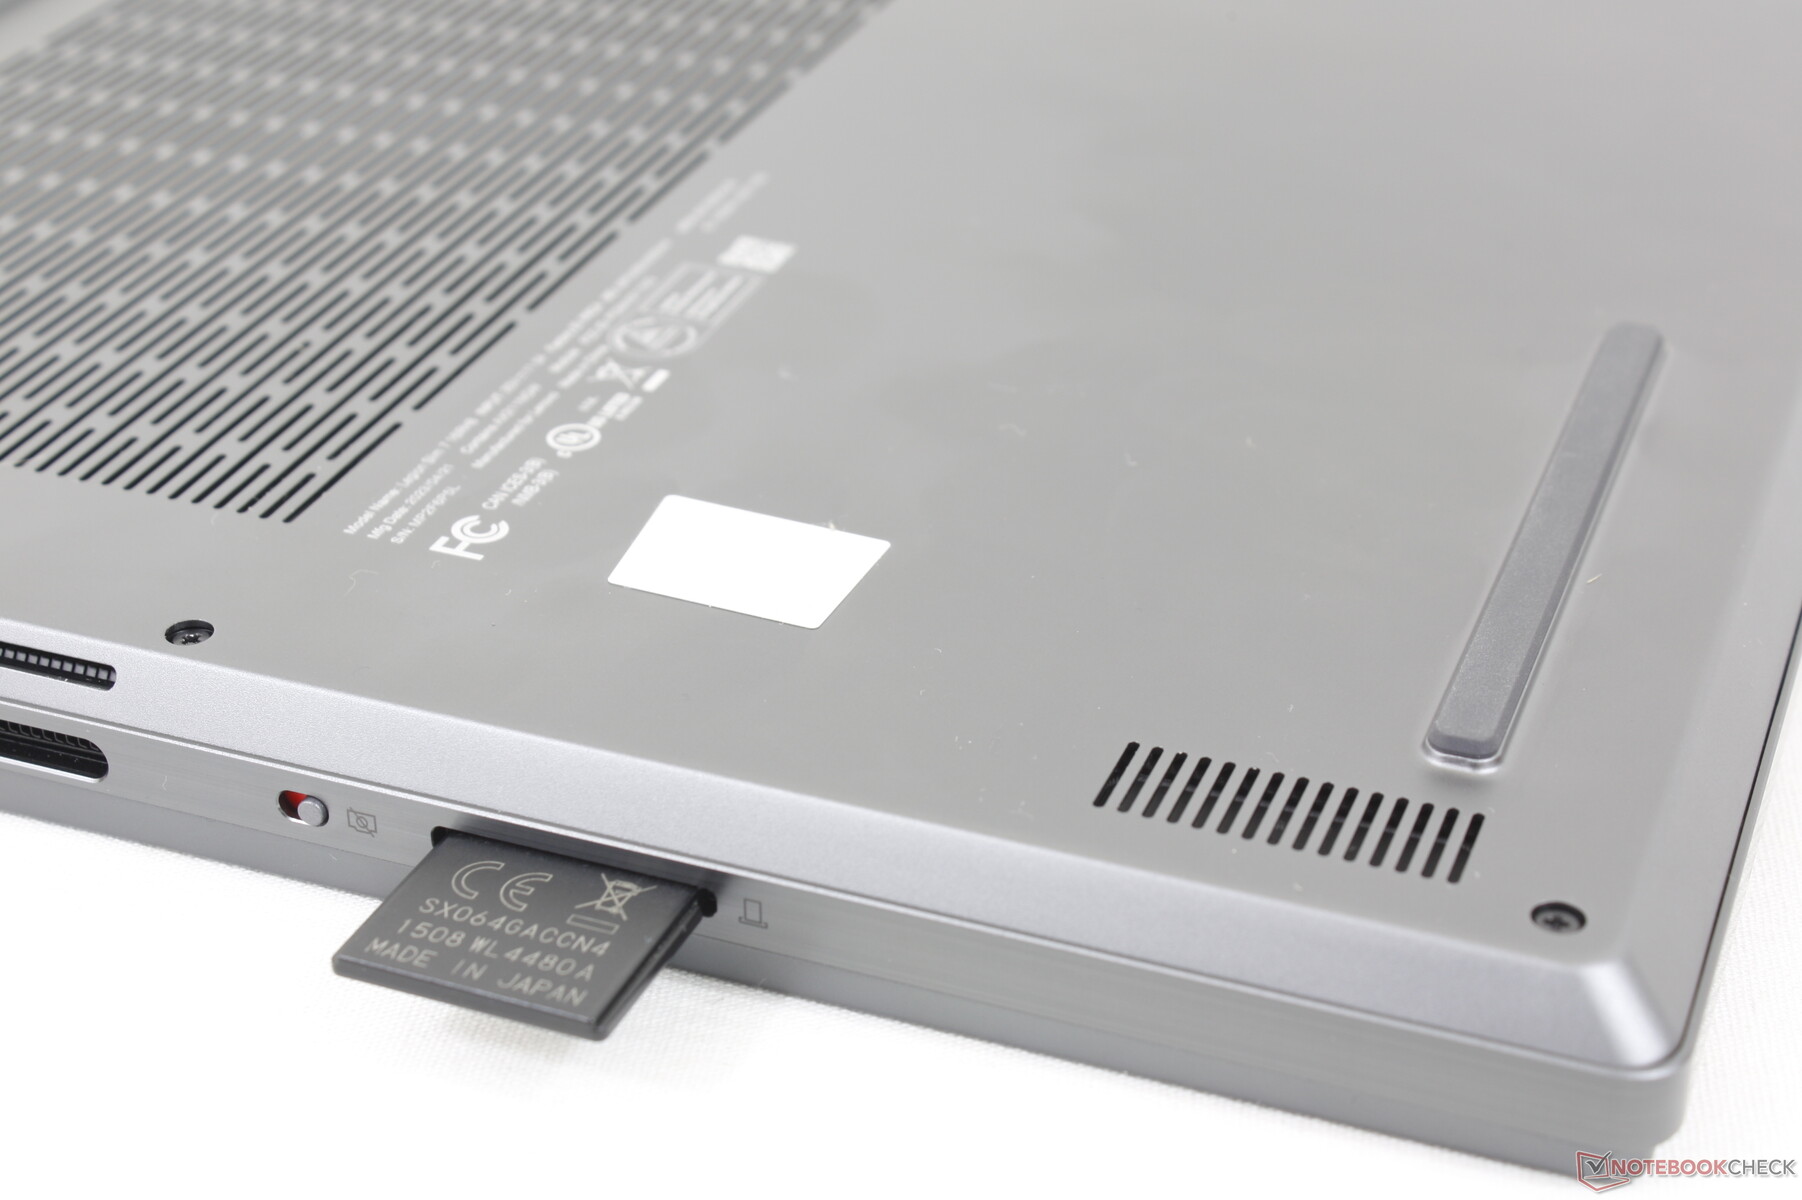
SD Card Reader
Transfer rates through the SD card reader are average at around 80 MB/s with our UHS-II test card which is about half the speed of the card reader on the Blade 16.
| SD Card Reader | |
| average JPG Copy Test (av. of 3 runs) | |
| Razer Blade 16 Early 2023 (AV PRO microSD 128 GB V60) | |
| Lenovo Legion Slim 7i 16 Gen 8 (Toshiba Exceria Pro SDXC 64 GB UHS-II) | |
| Alienware x16 R1 (AV PRO microSD 128 GB V60) | |
| maximum AS SSD Seq Read Test (1GB) | |
| Alienware x16 R1 (AV PRO microSD 128 GB V60) | |
| Razer Blade 16 Early 2023 (AV PRO microSD 128 GB V60) | |
| Lenovo Legion Slim 7i 16 Gen 8 (Toshiba Exceria Pro SDXC 64 GB UHS-II) | |
Communication
An Intel AX211 comes standard for Wi-Fi 6E and Bluetooth 5.3 connectivity. Performance is steady and reliable when paired to our 6 GHz Asus AXE11000 network.
| Networking | |
| iperf3 transmit AXE11000 | |
| Lenovo Legion Pro 7 RTX4090 | |
| Asus ROG Strix G16 G614JZ | |
| Razer Blade 16 Early 2023 | |
| Lenovo Legion Slim 7i 16 Gen 8 | |
| HP Omen 16-wf000 | |
| Alienware x16 R1 | |
| iperf3 receive AXE11000 | |
| Lenovo Legion Pro 7 RTX4090 | |
| Asus ROG Strix G16 G614JZ | |
| Razer Blade 16 Early 2023 | |
| Alienware x16 R1 | |
| HP Omen 16-wf000 | |
| Lenovo Legion Slim 7i 16 Gen 8 | |
| iperf3 transmit AXE11000 6GHz | |
| Lenovo Legion Slim 7i 16 Gen 8 | |
| Razer Blade 16 Early 2023 | |
| HP Omen 16-wf000 | |
| Alienware x16 R1 | |
| iperf3 receive AXE11000 6GHz | |
| Lenovo Legion Slim 7i 16 Gen 8 | |
| Razer Blade 16 Early 2023 | |
| HP Omen 16-wf000 | |
| Alienware x16 R1 | |
Webcam
The 2 MP webcam remains the same as on last year's model. There is no IR support, but a webcam kill switch comes standard.


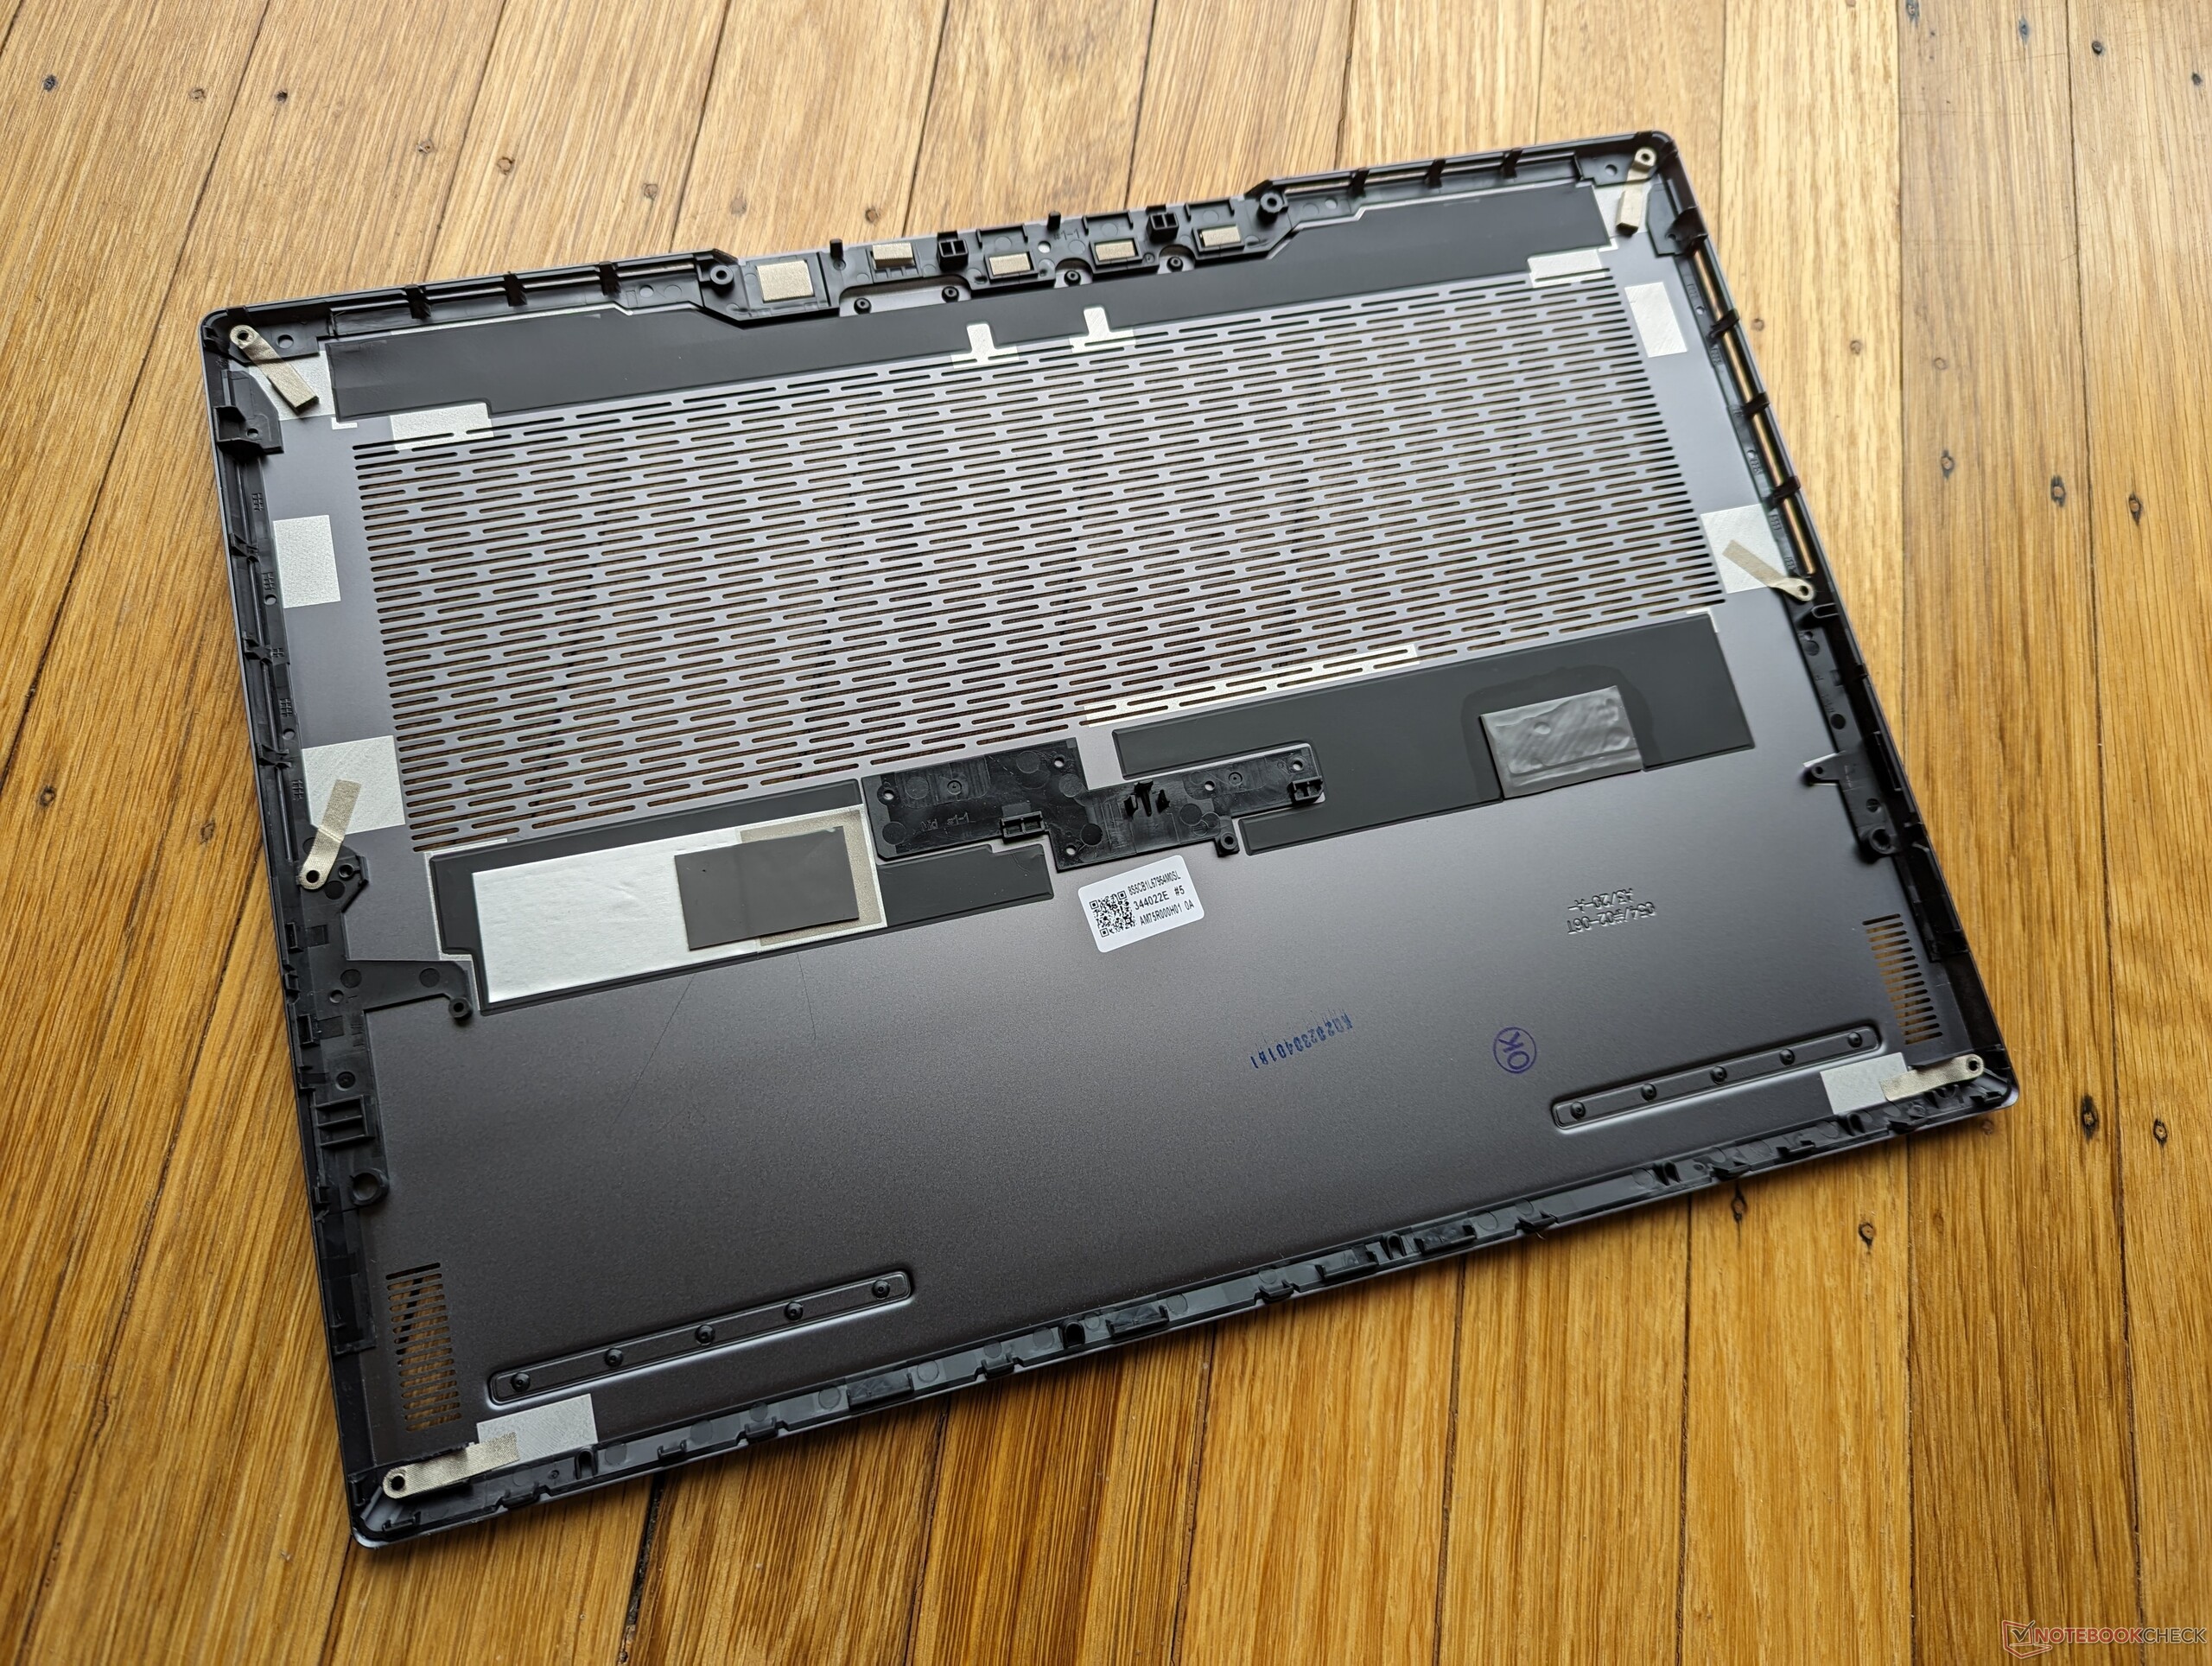
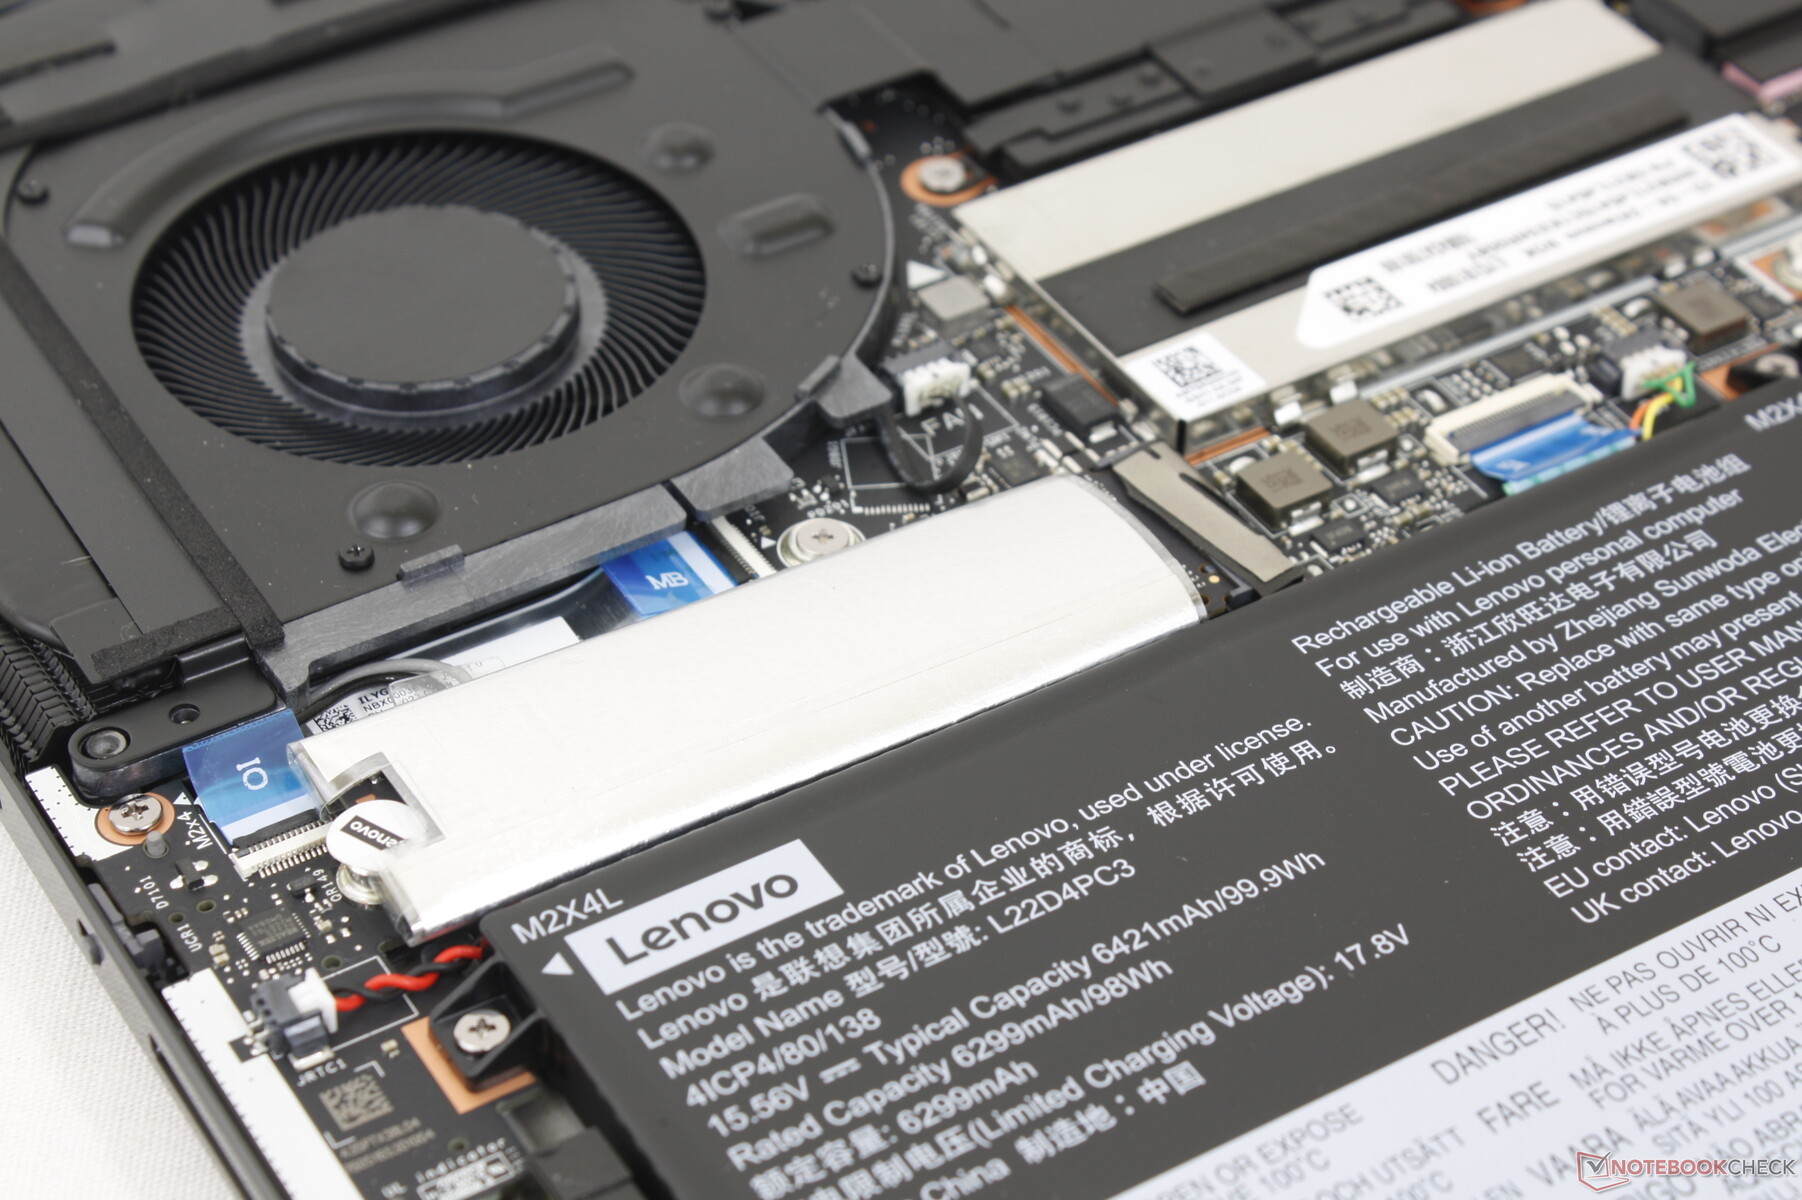
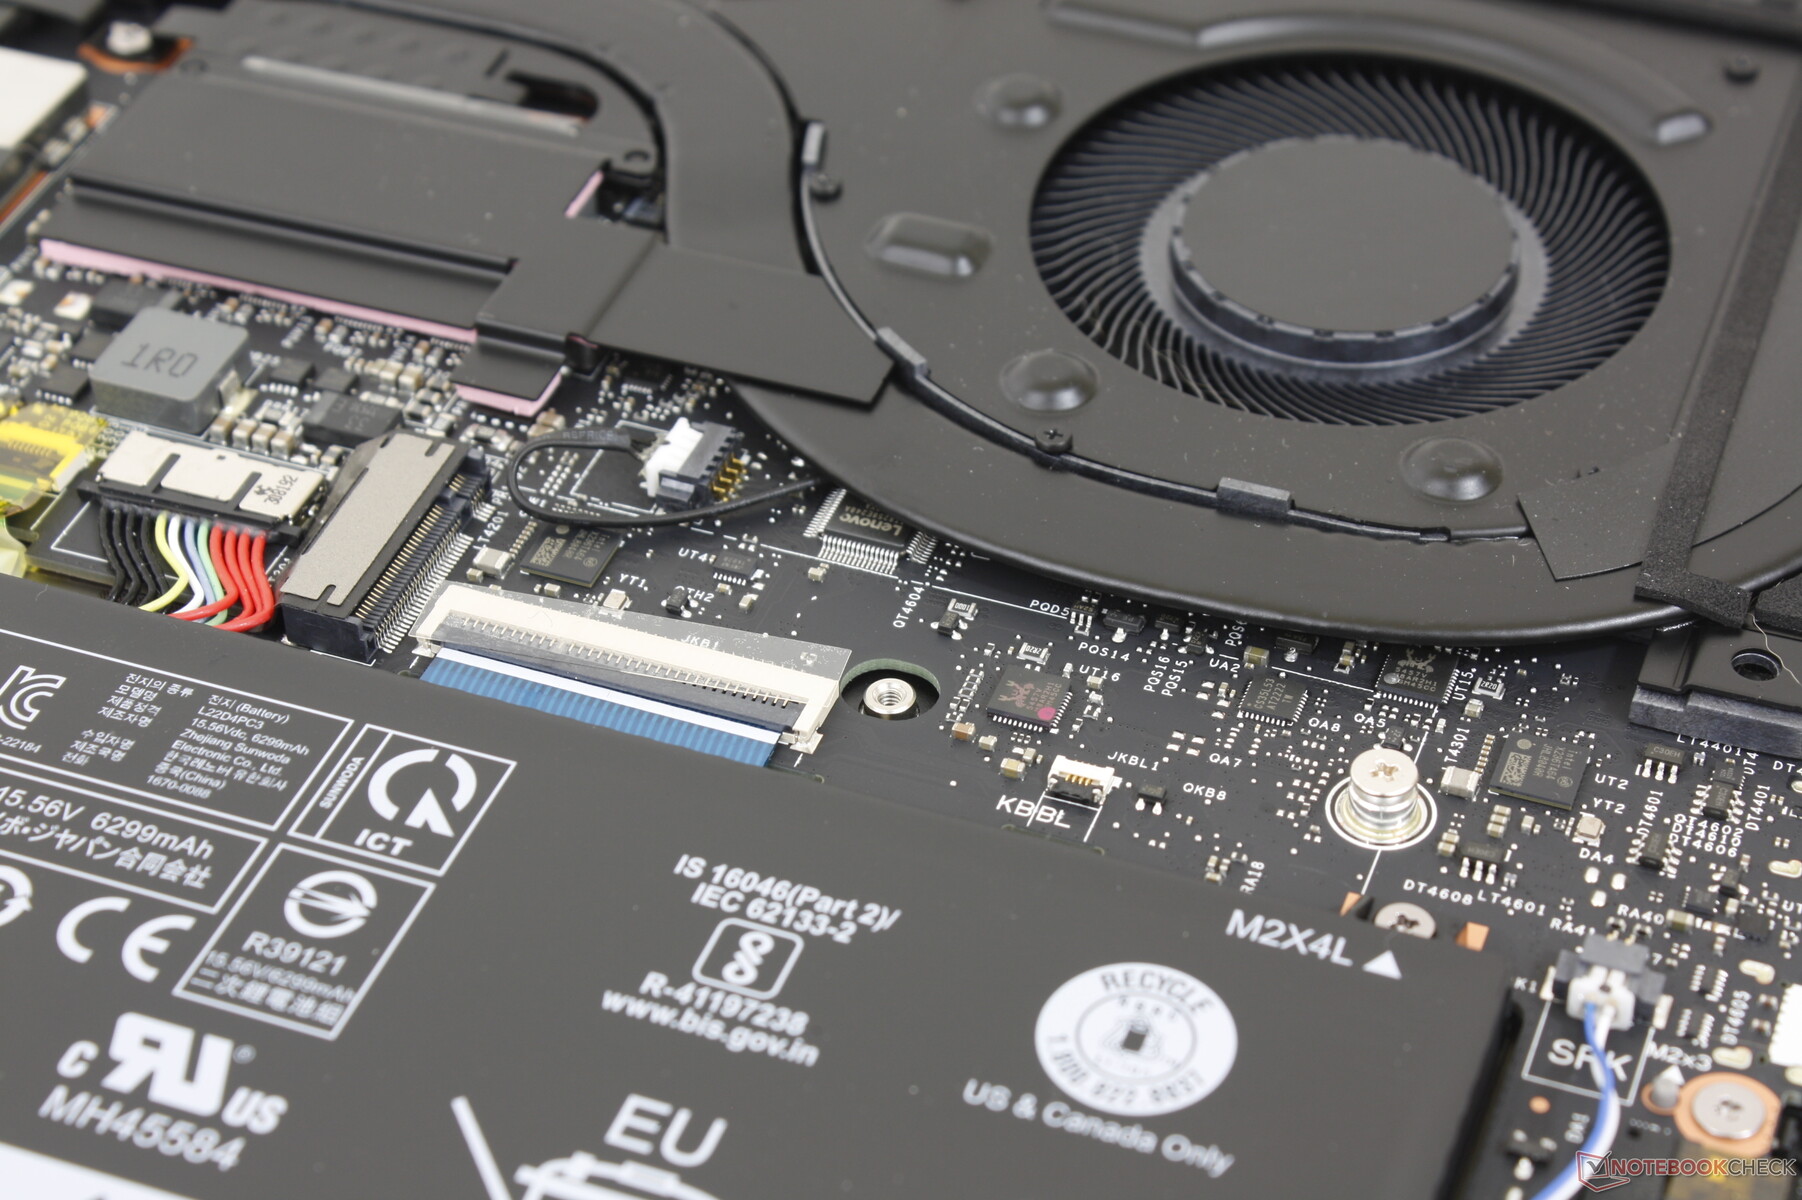
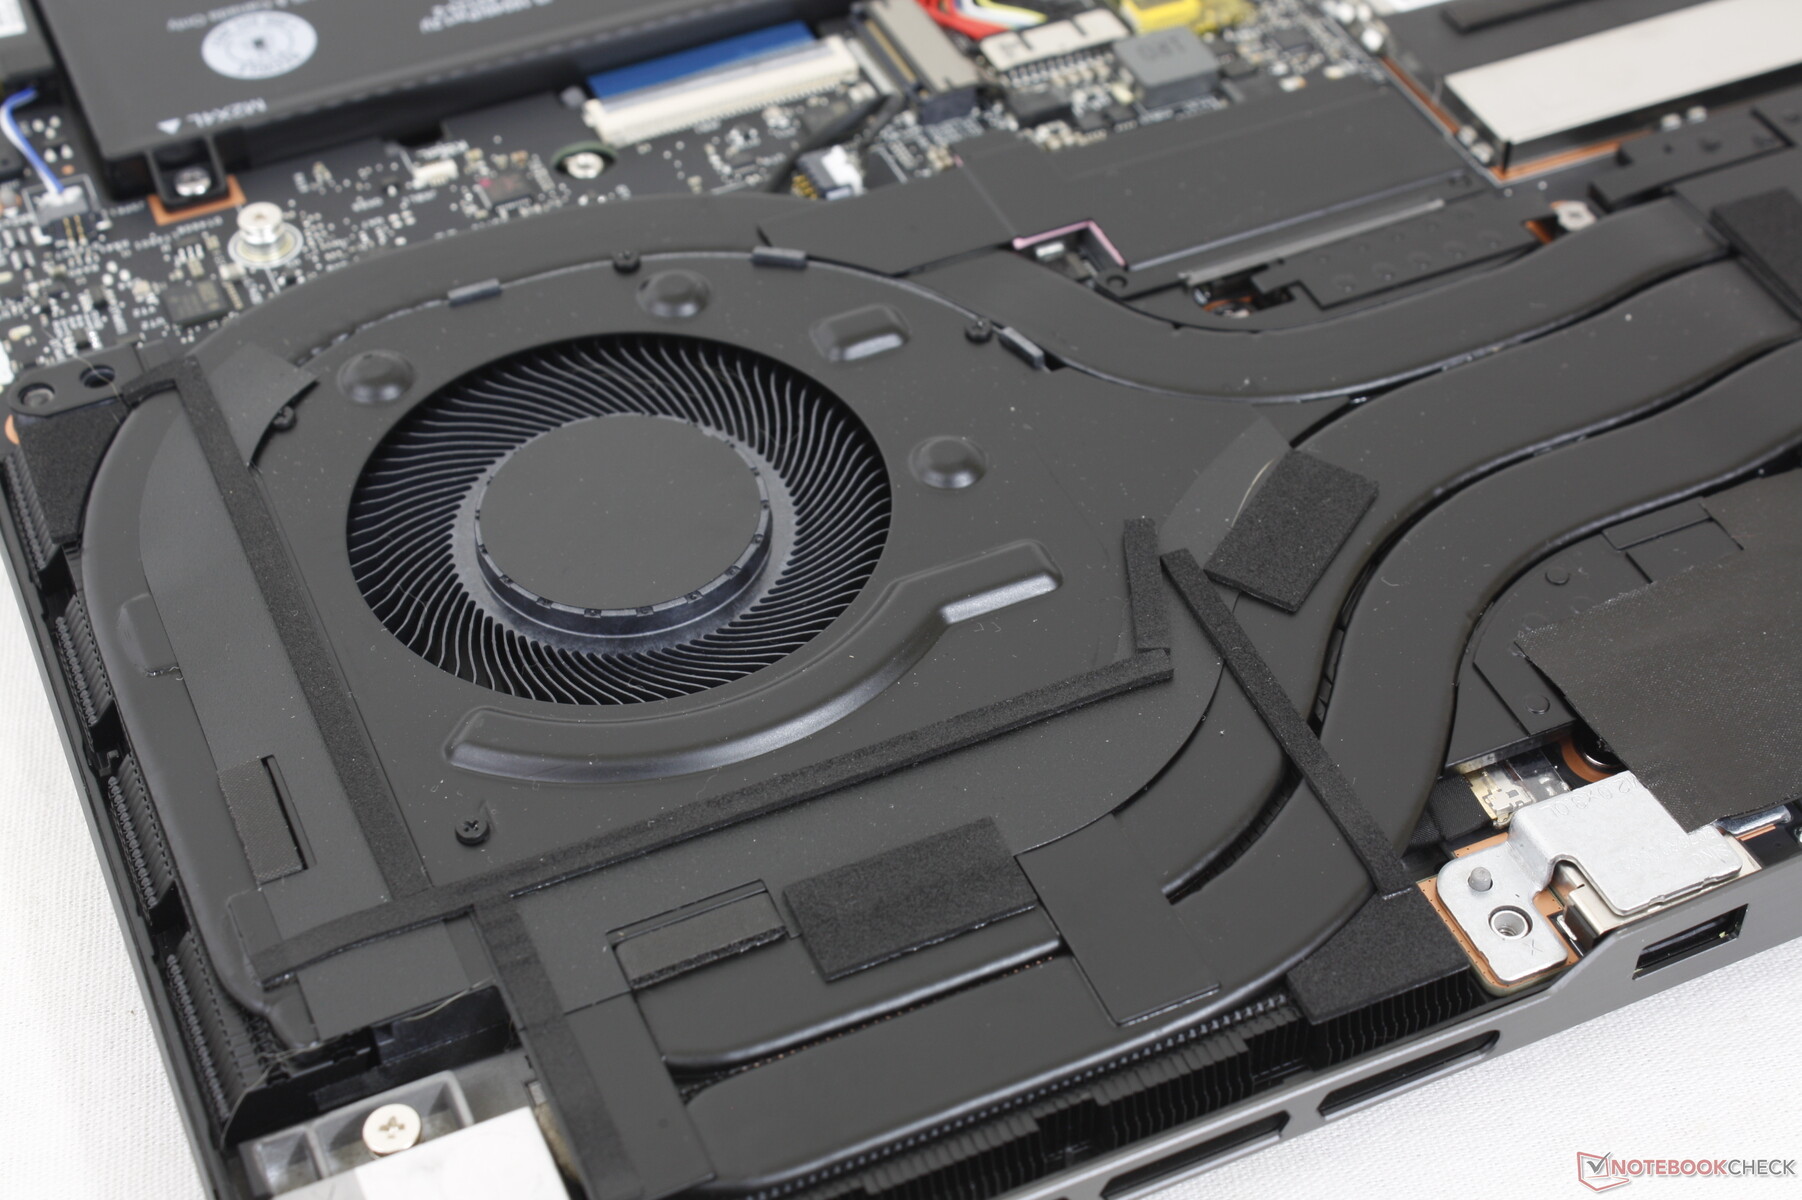
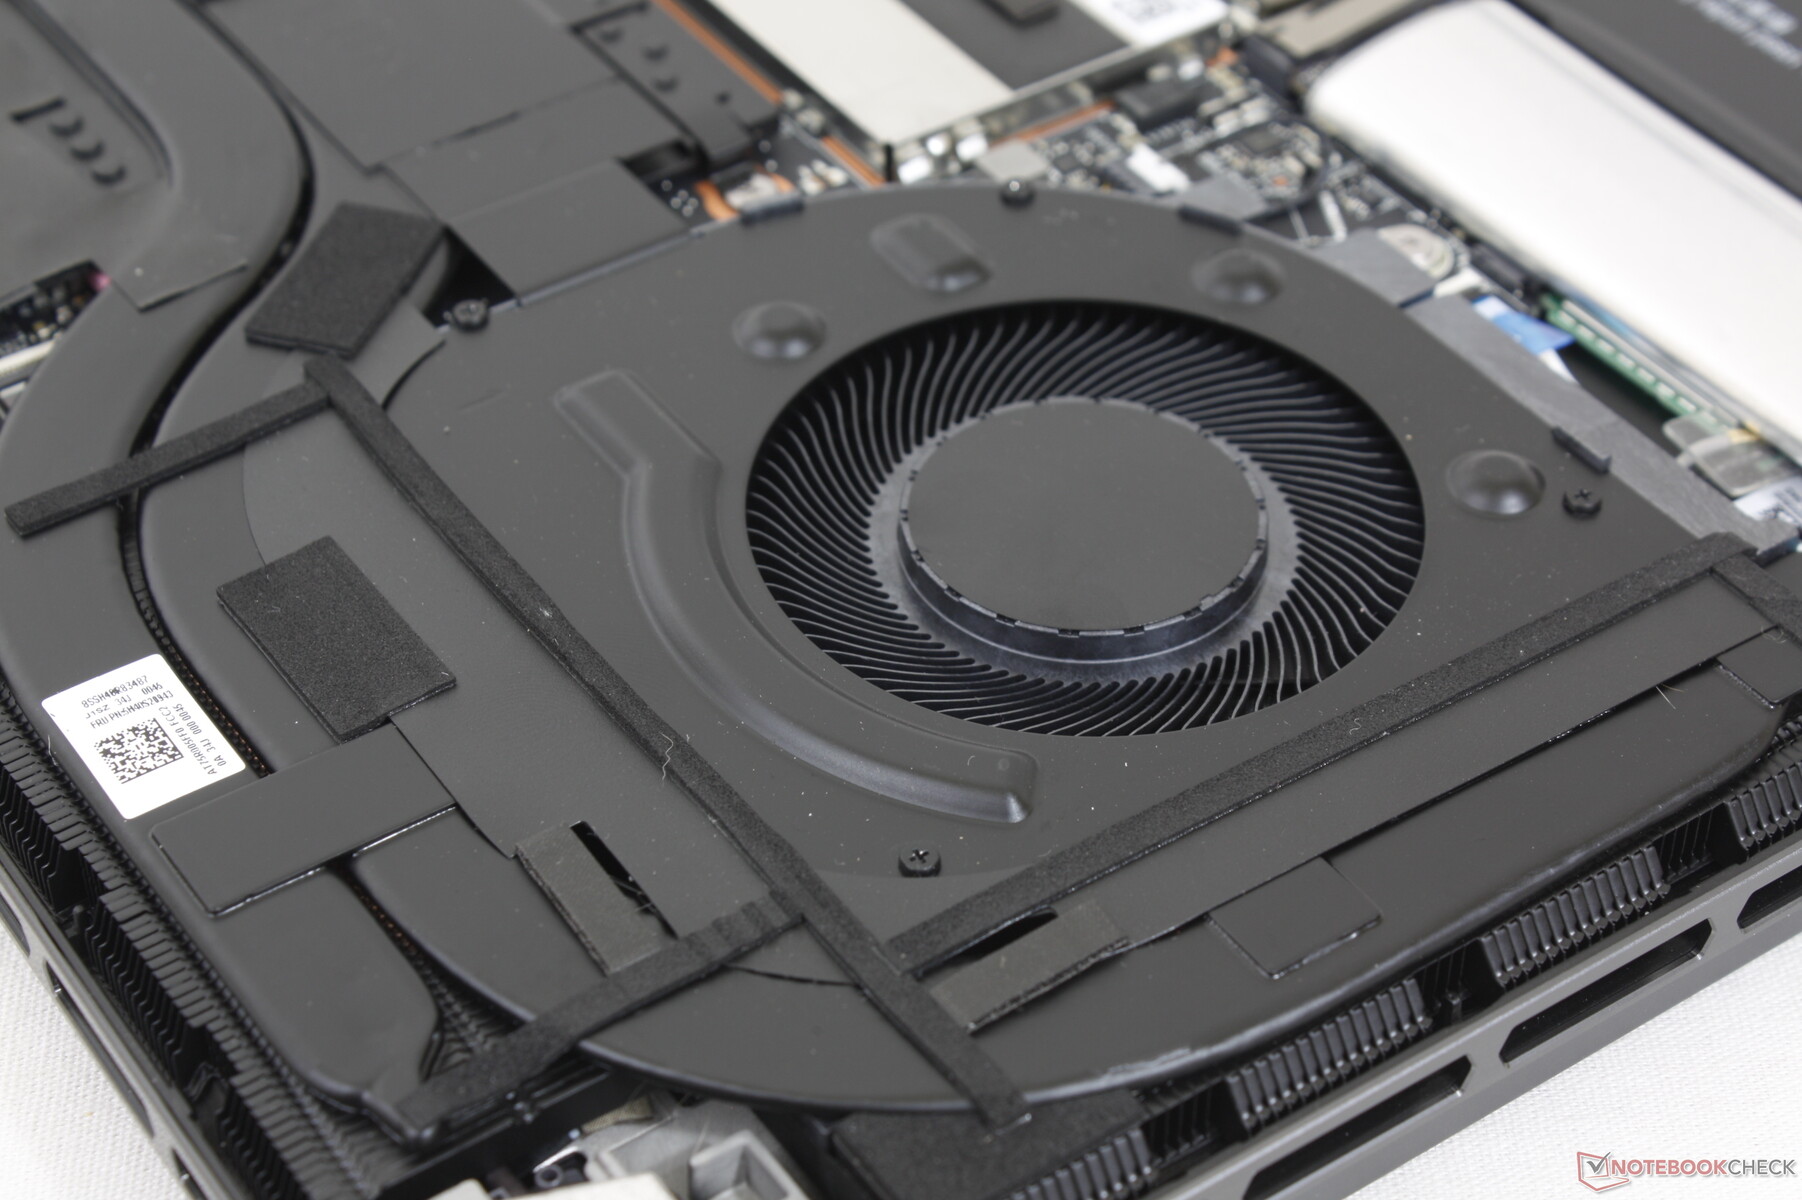
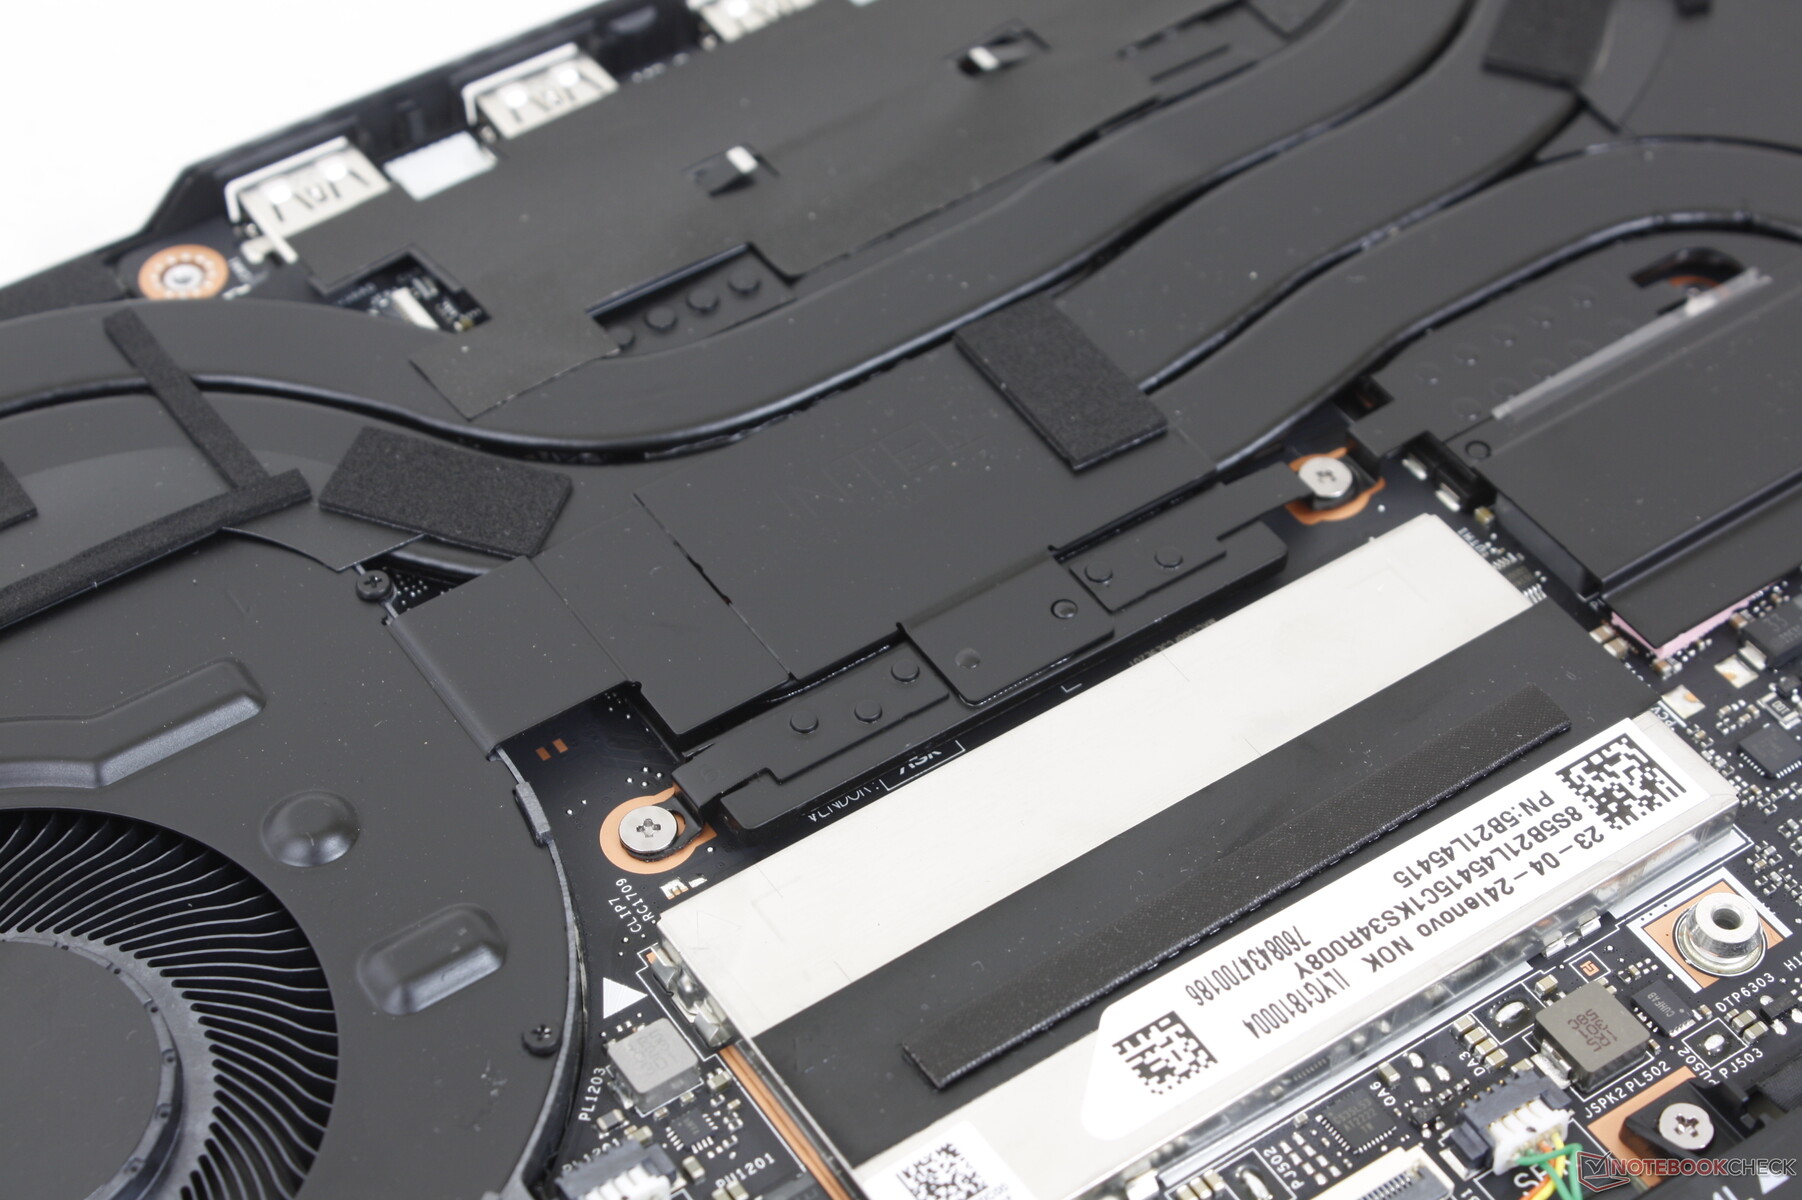
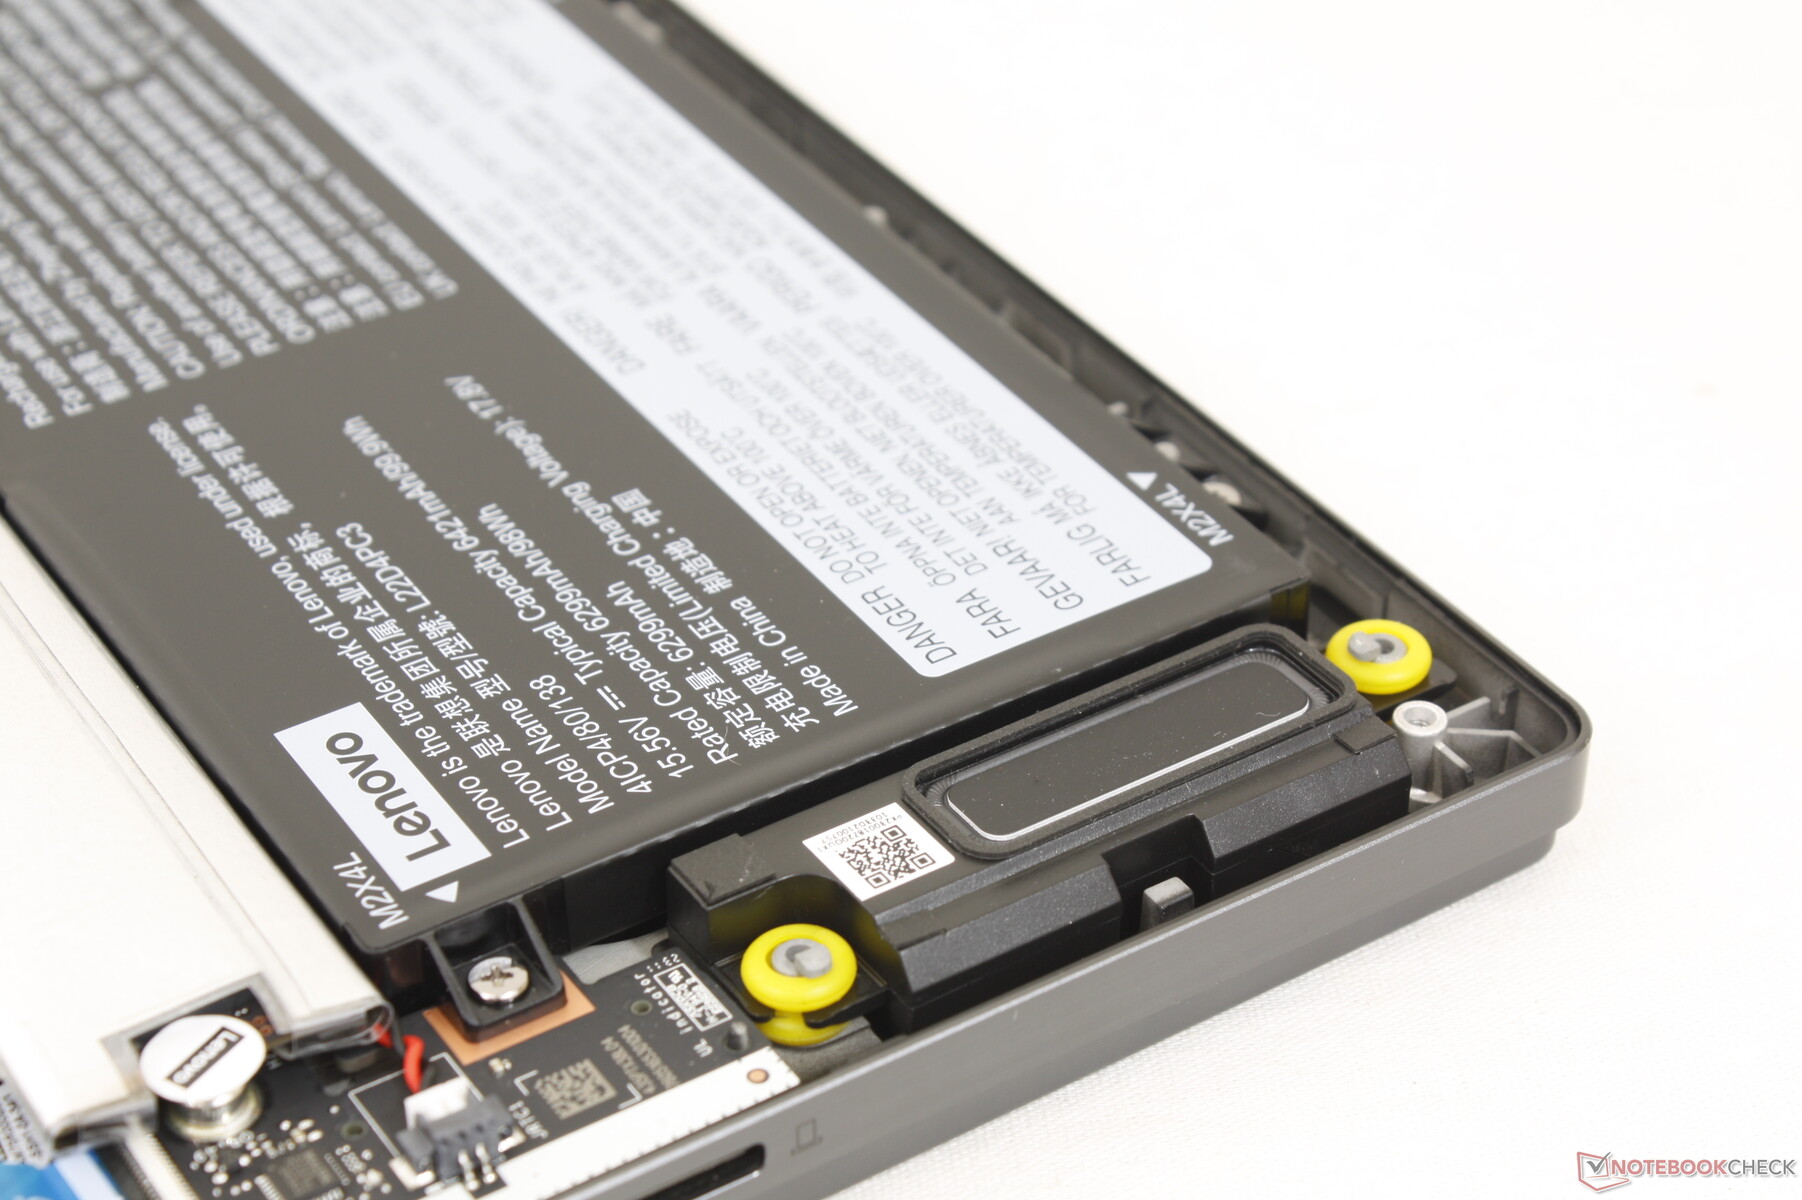
Maintenance
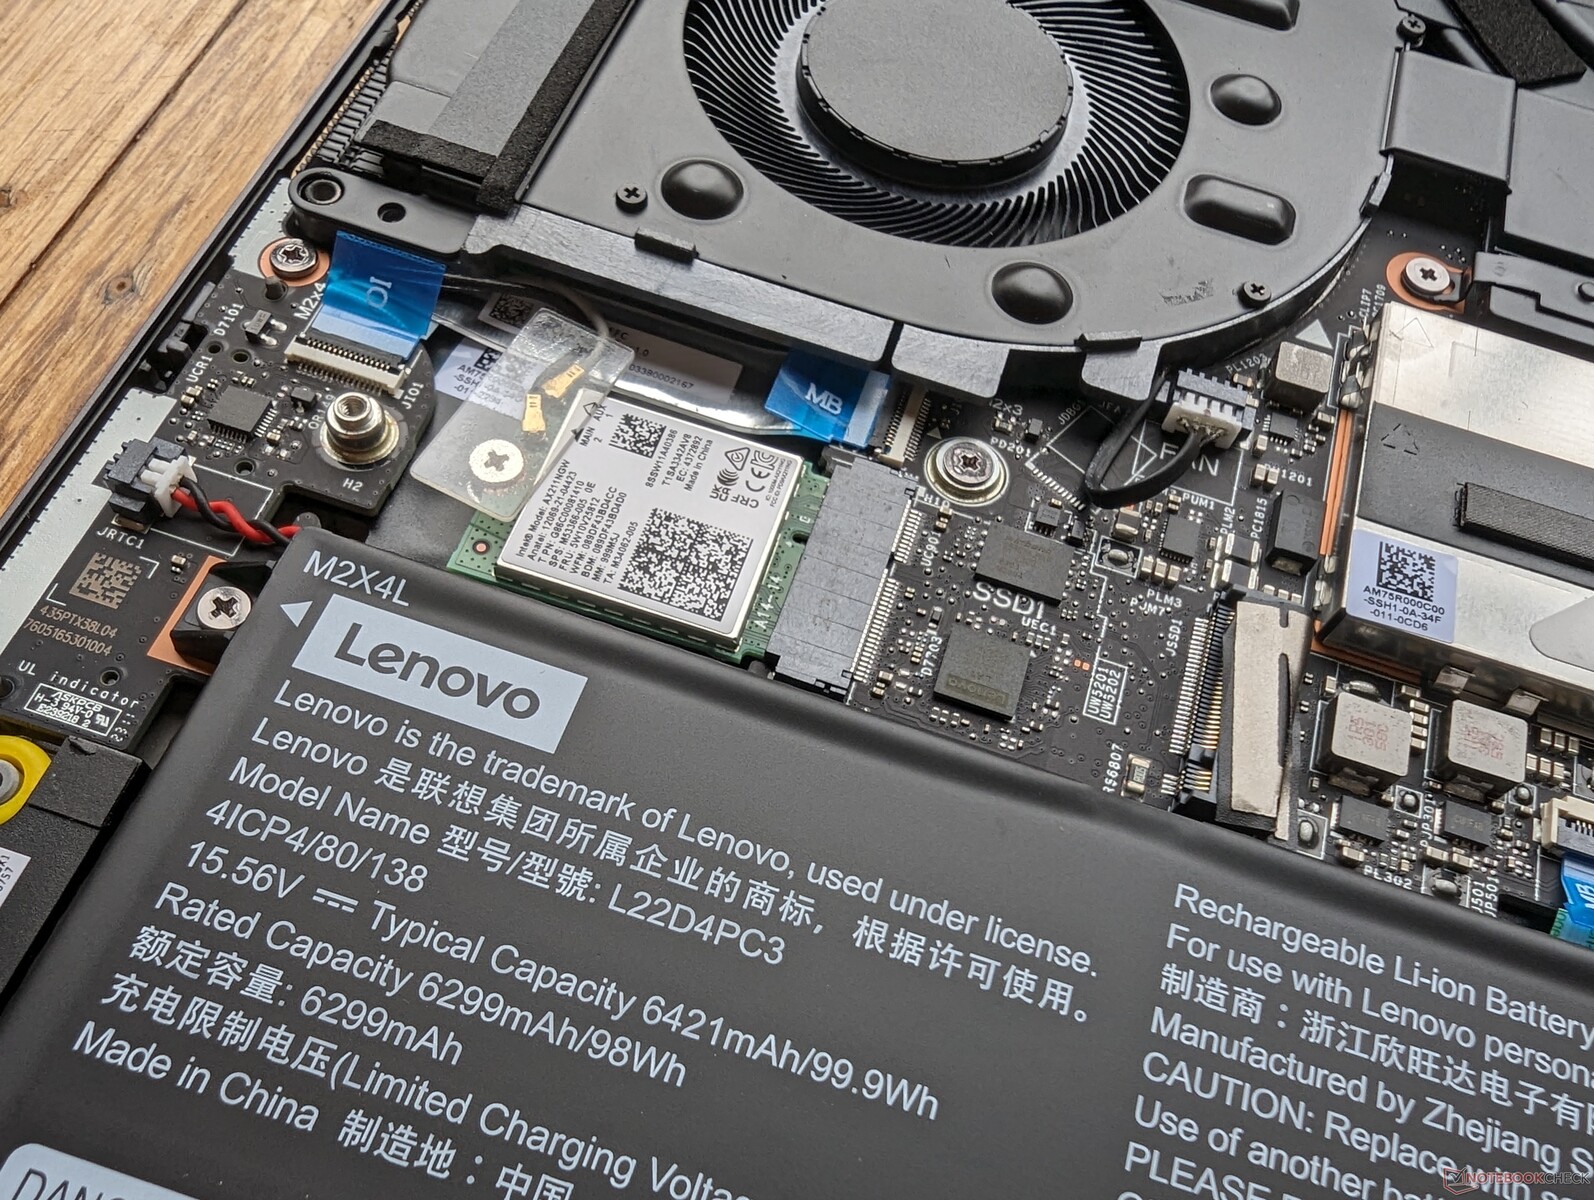
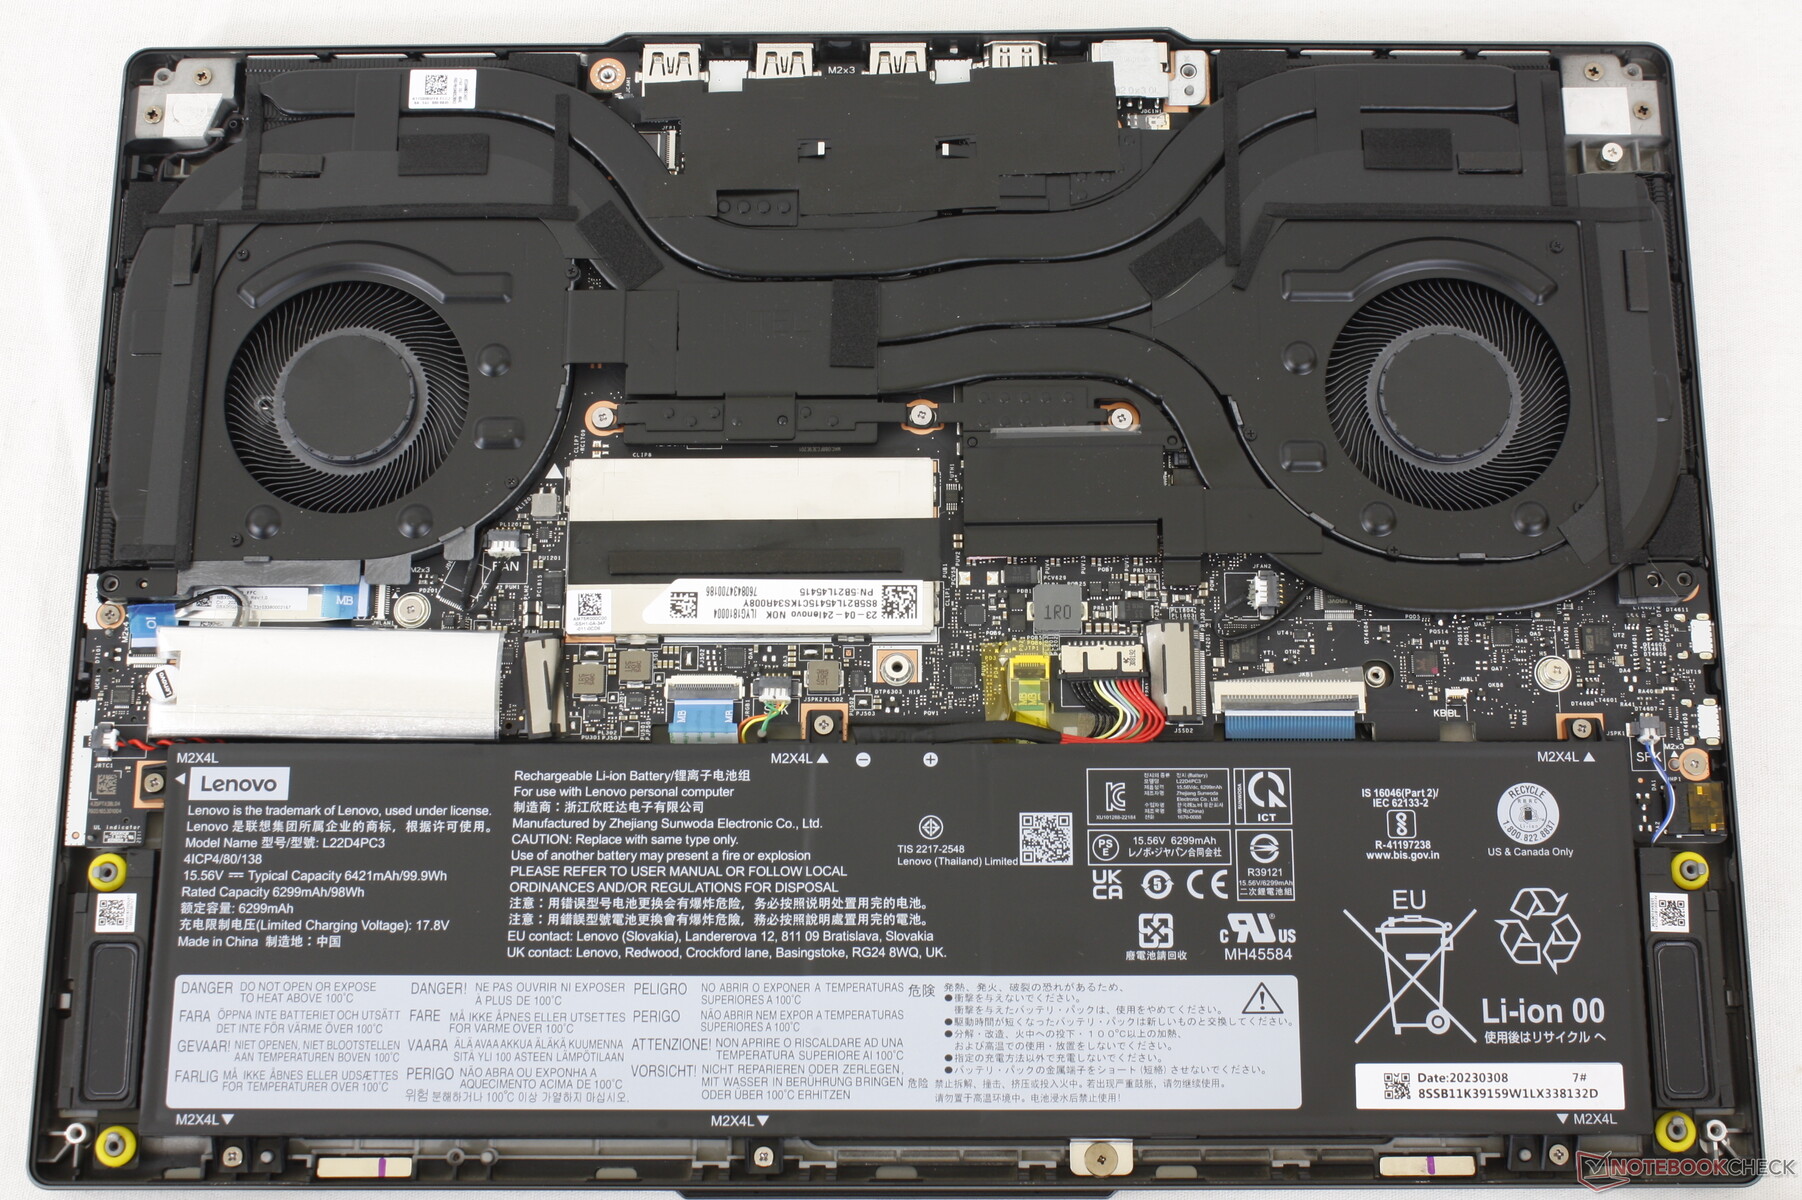
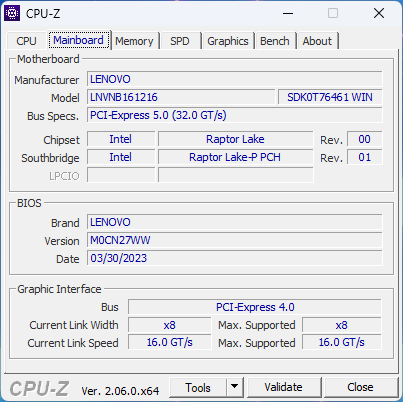
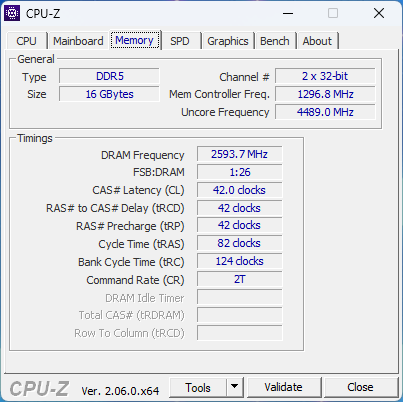
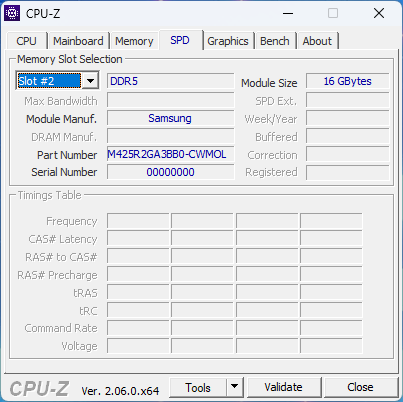
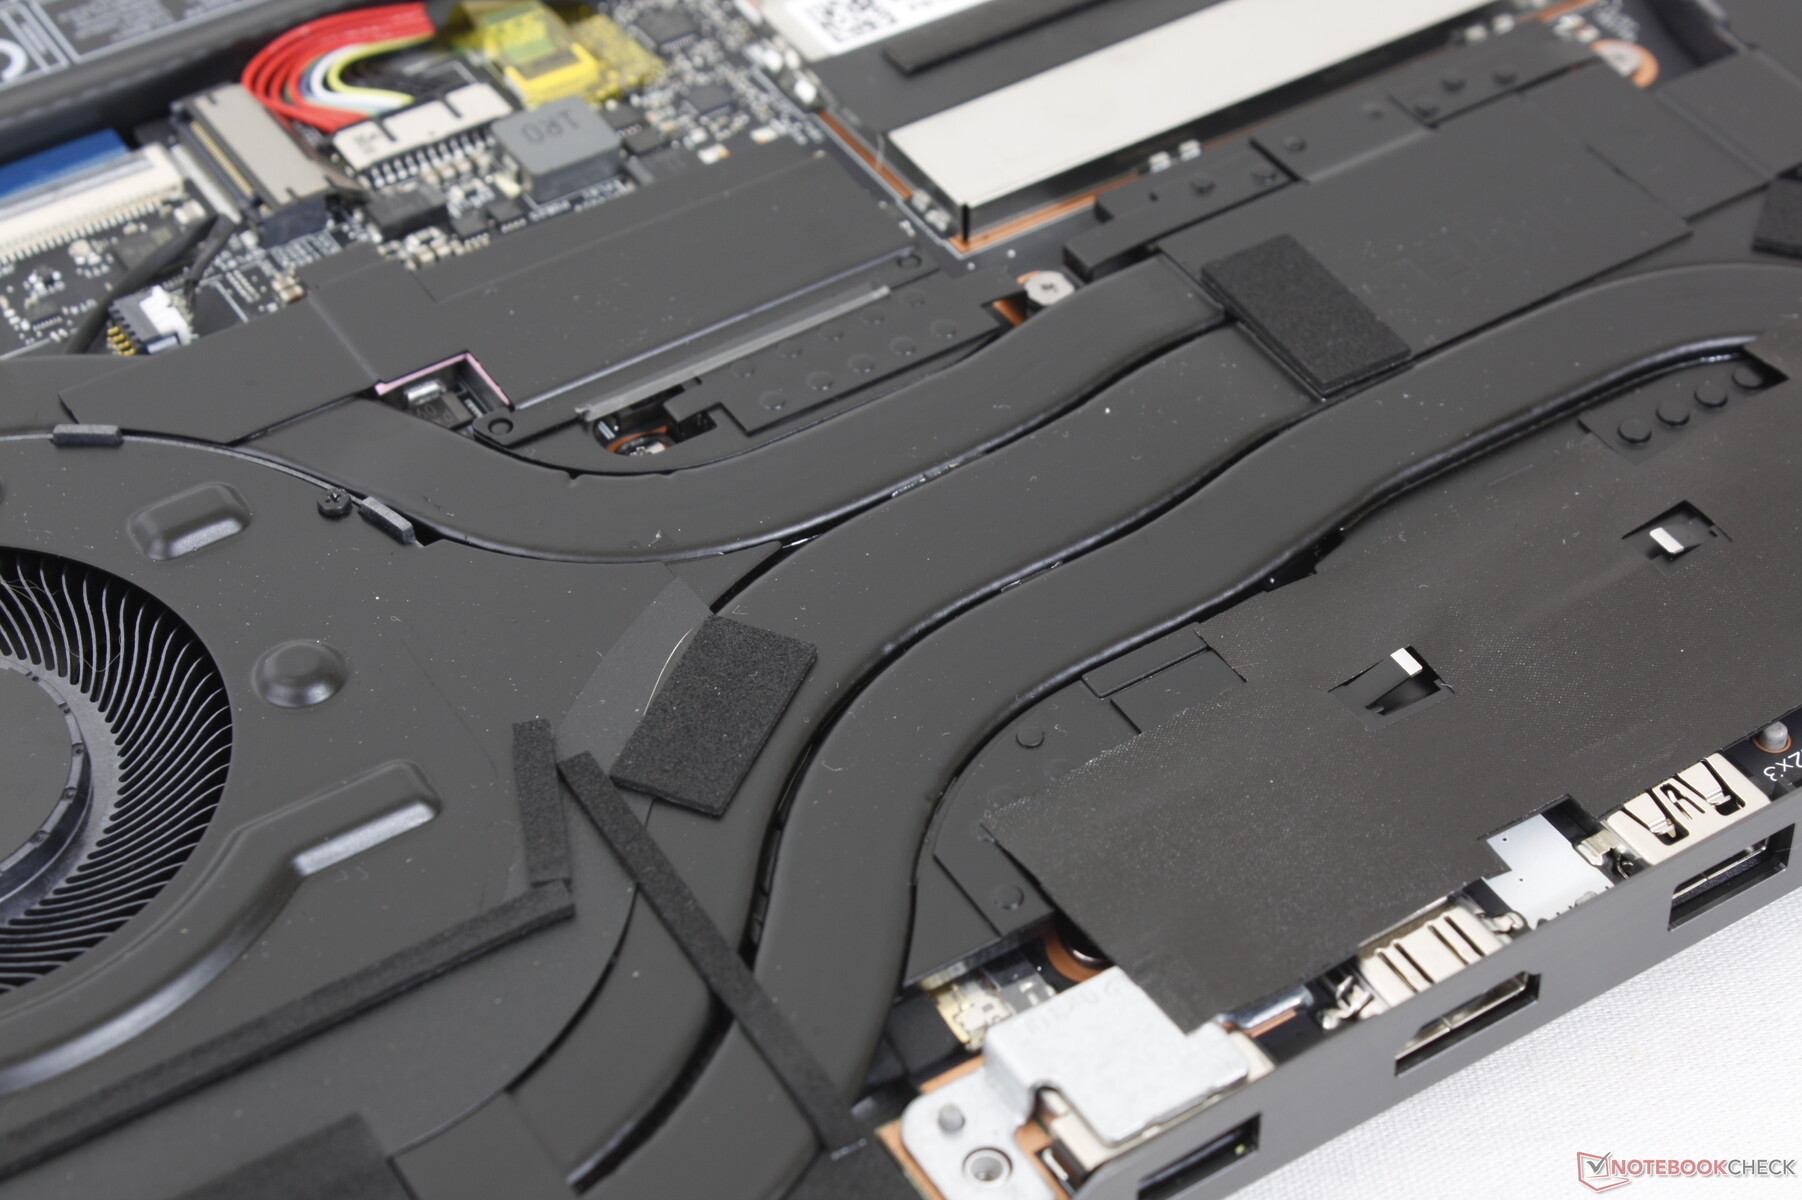
The bottom panel is secured by eight Phillips screws for easy removal. Owners have direct access to two M.2 2280 PCIe4 slots, WLAN module, and battery. RAM consists of 16 GB of soldered DDR5-5200 plus one expandable SODIMM slot underneath the aluminum shielding near the center.
Accessories And Warranty
There are no extras in the box other than the AC adapter and paperwork. The standard one-year limited manufacturer warranty applies if purchased in the US.
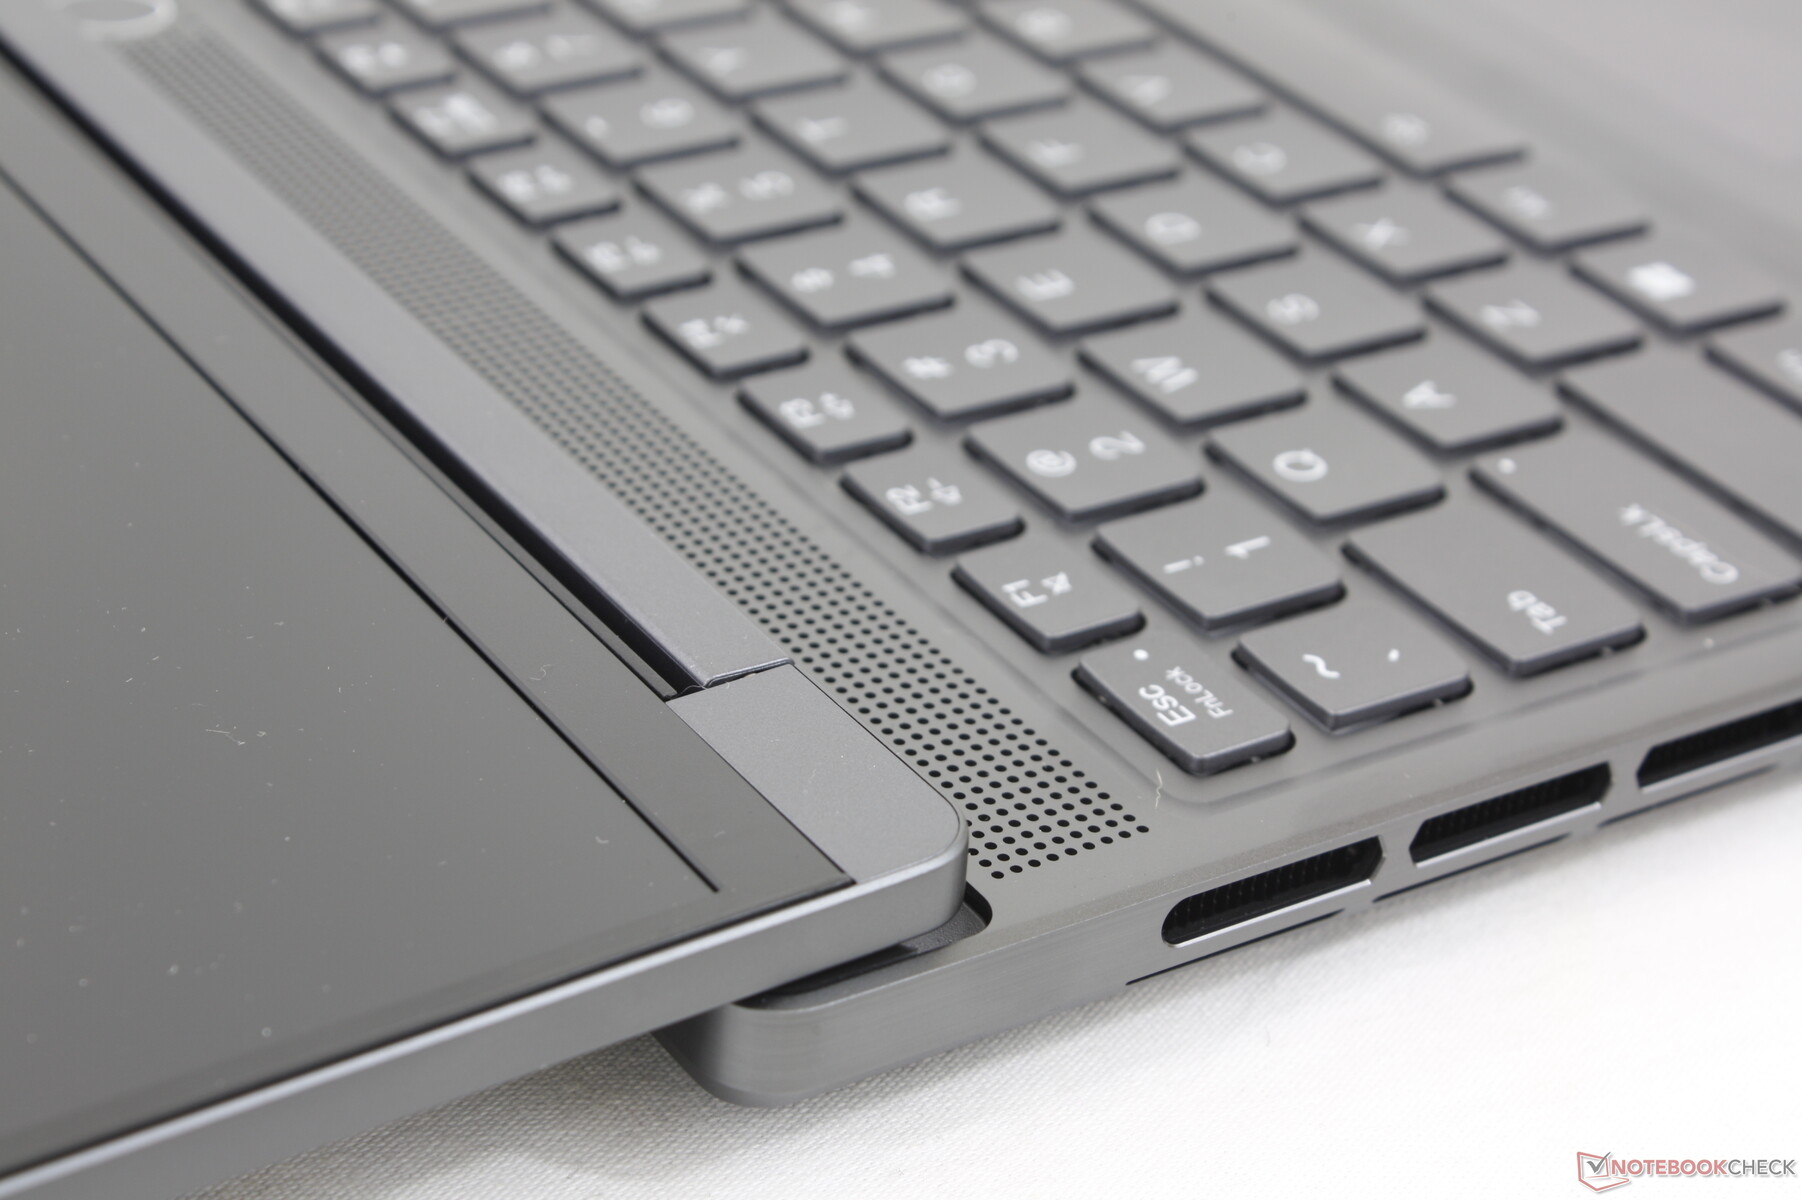
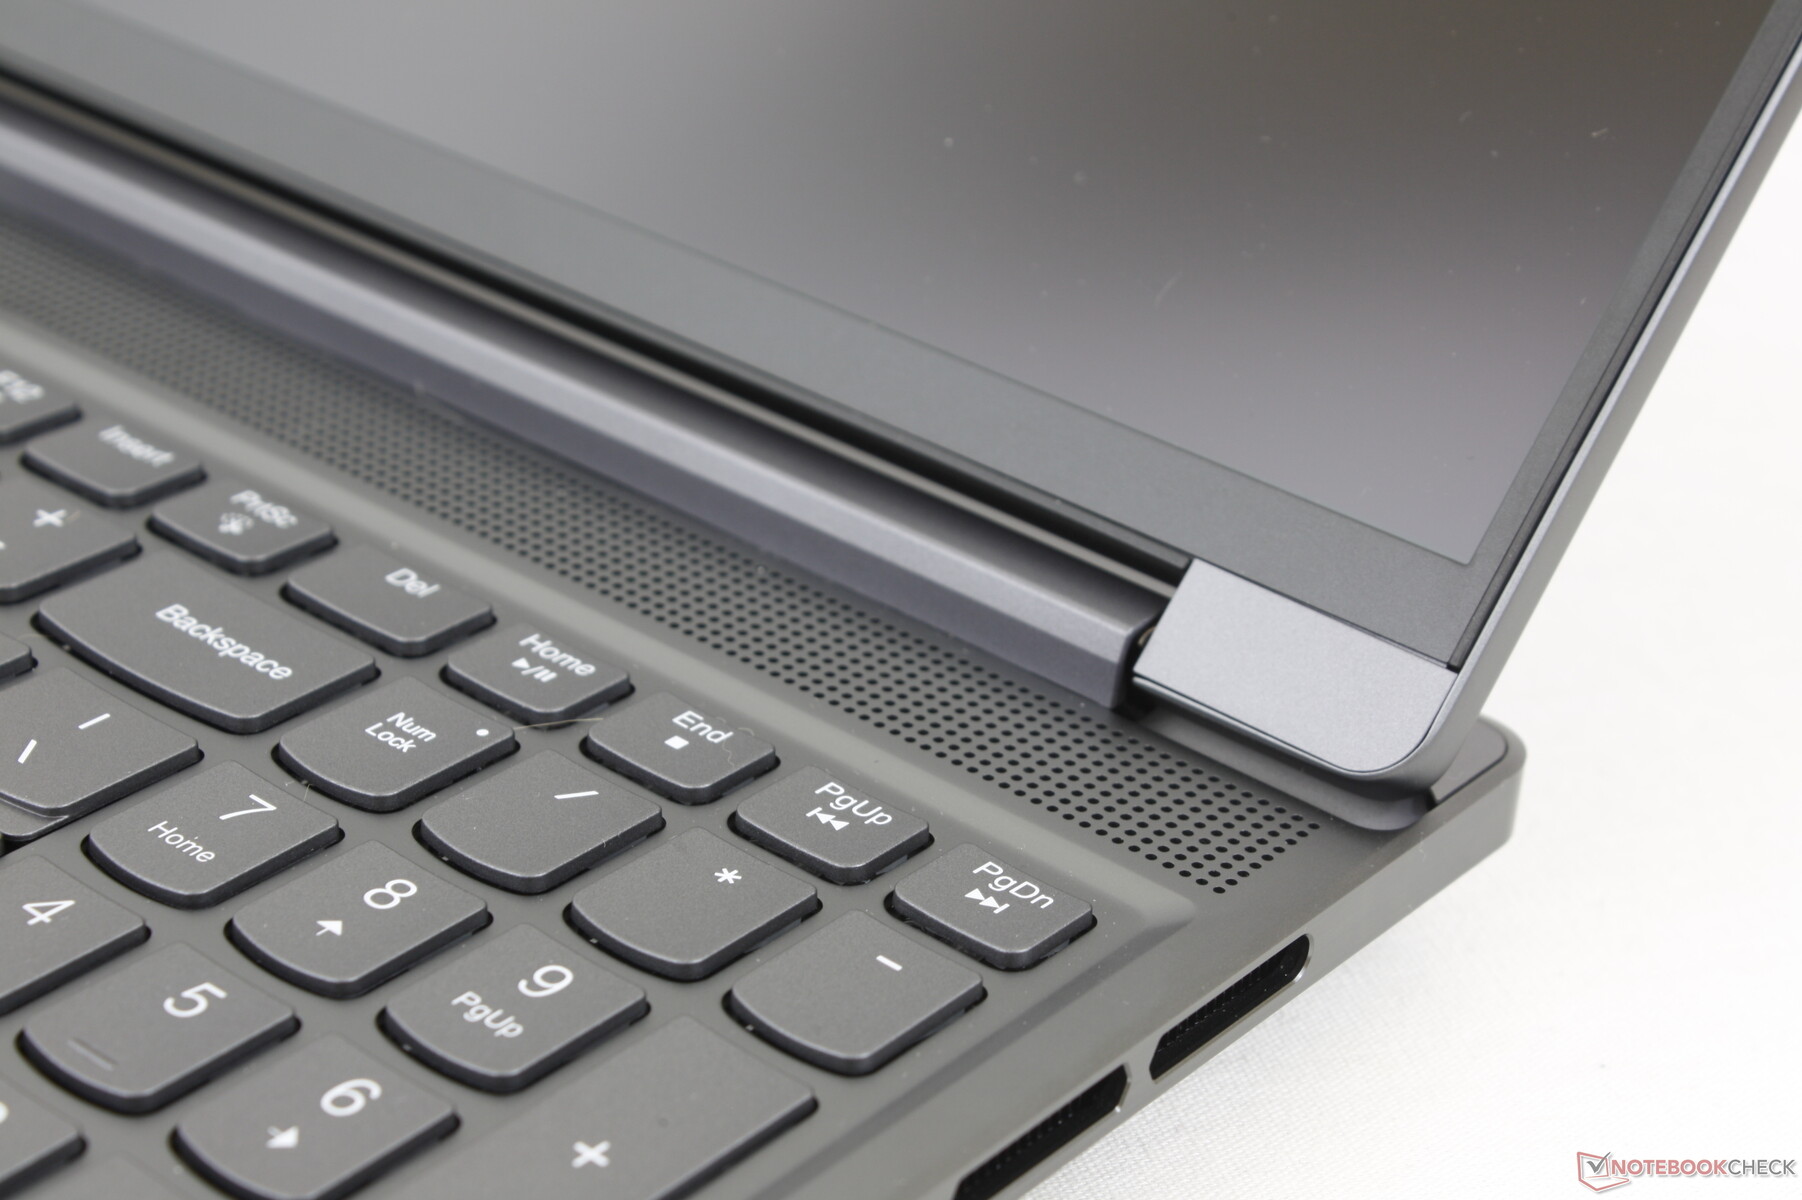
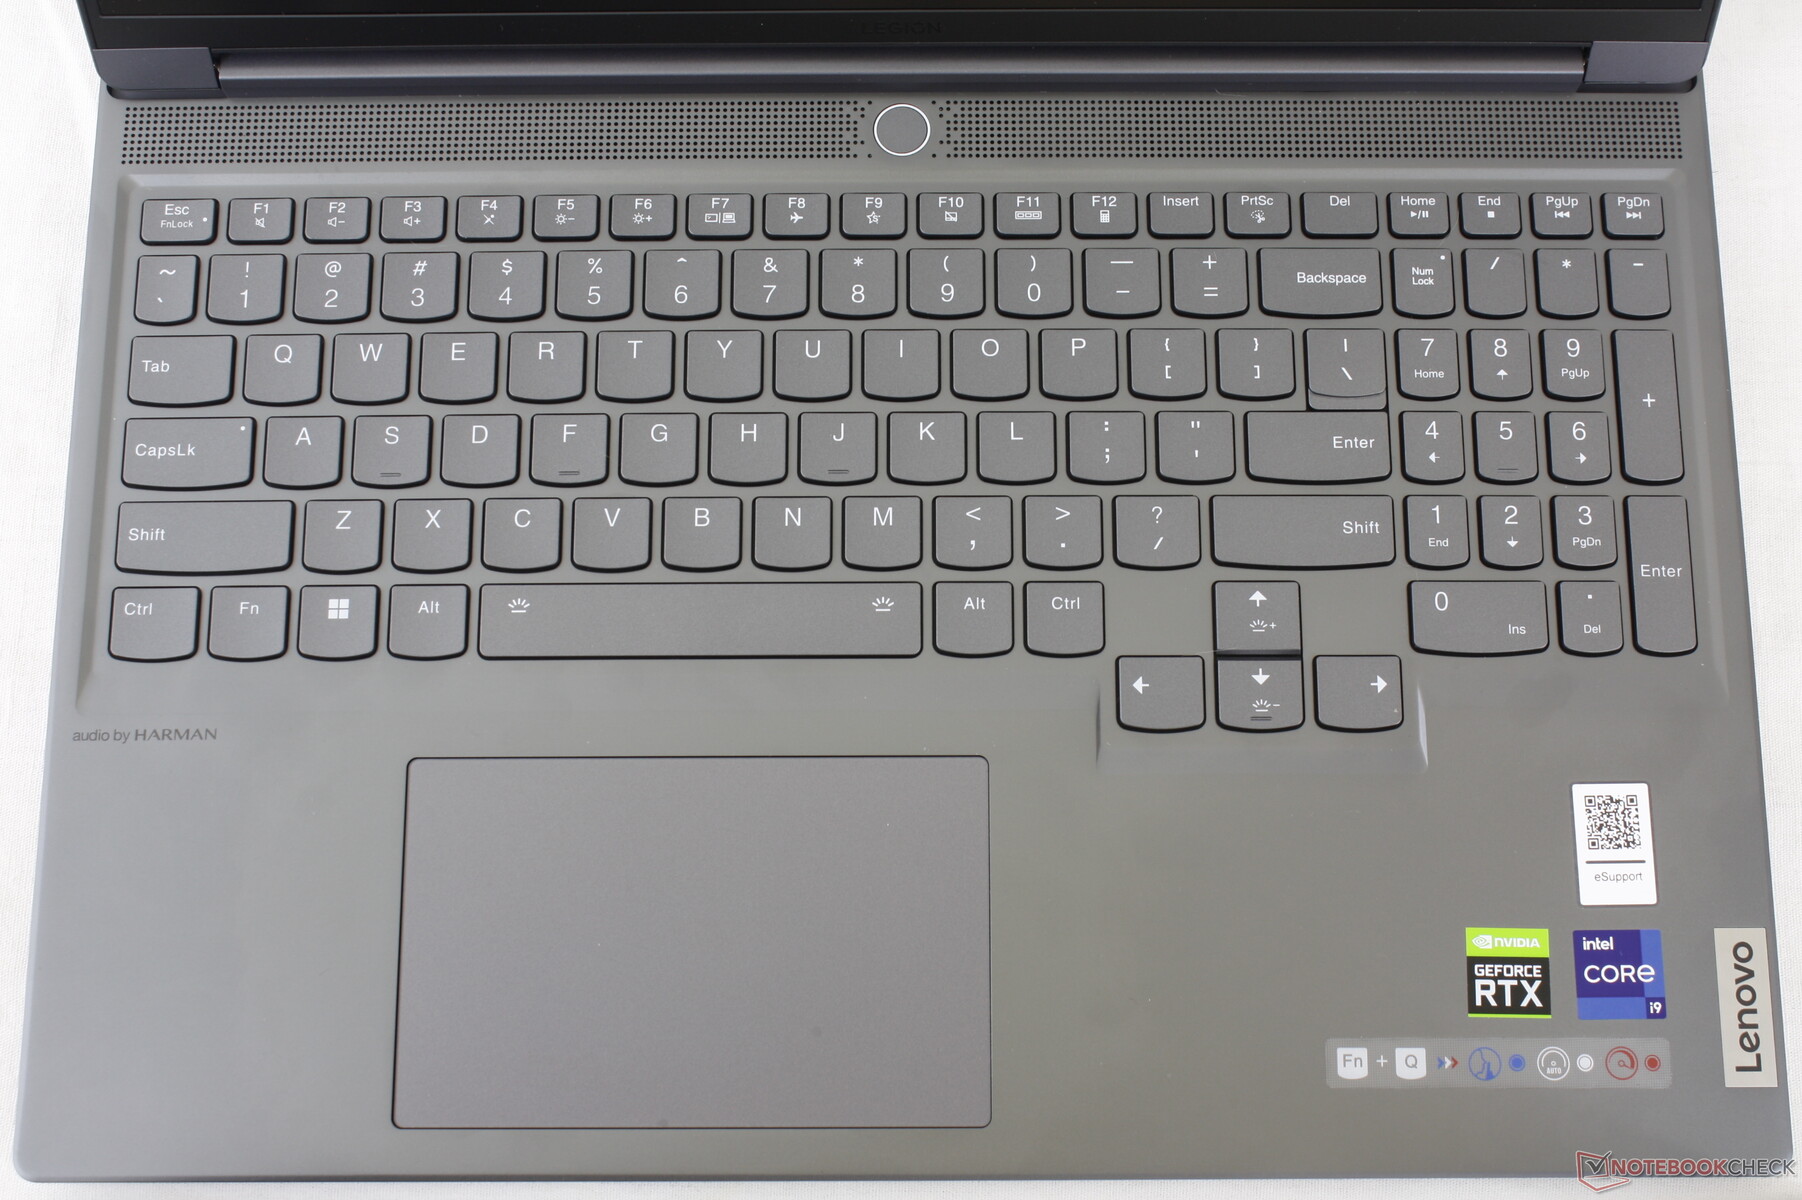
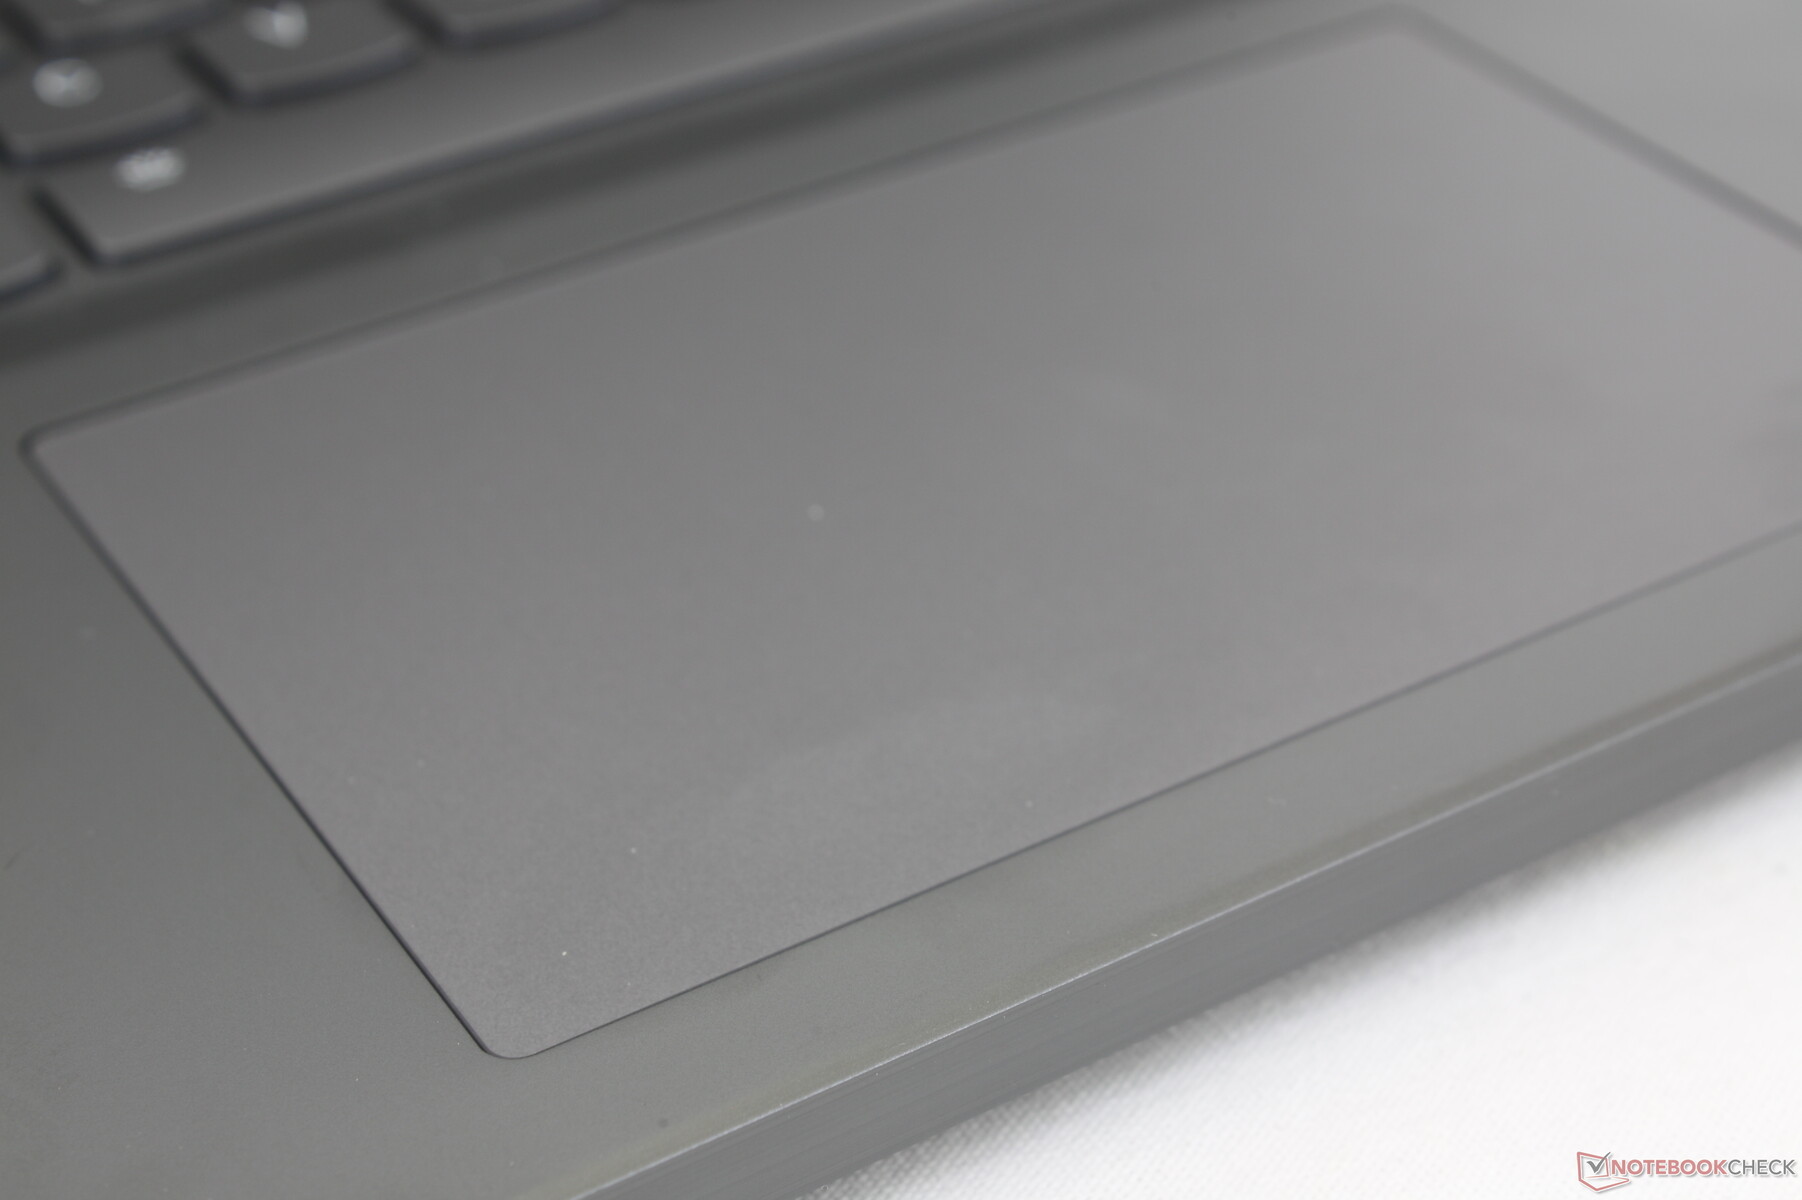
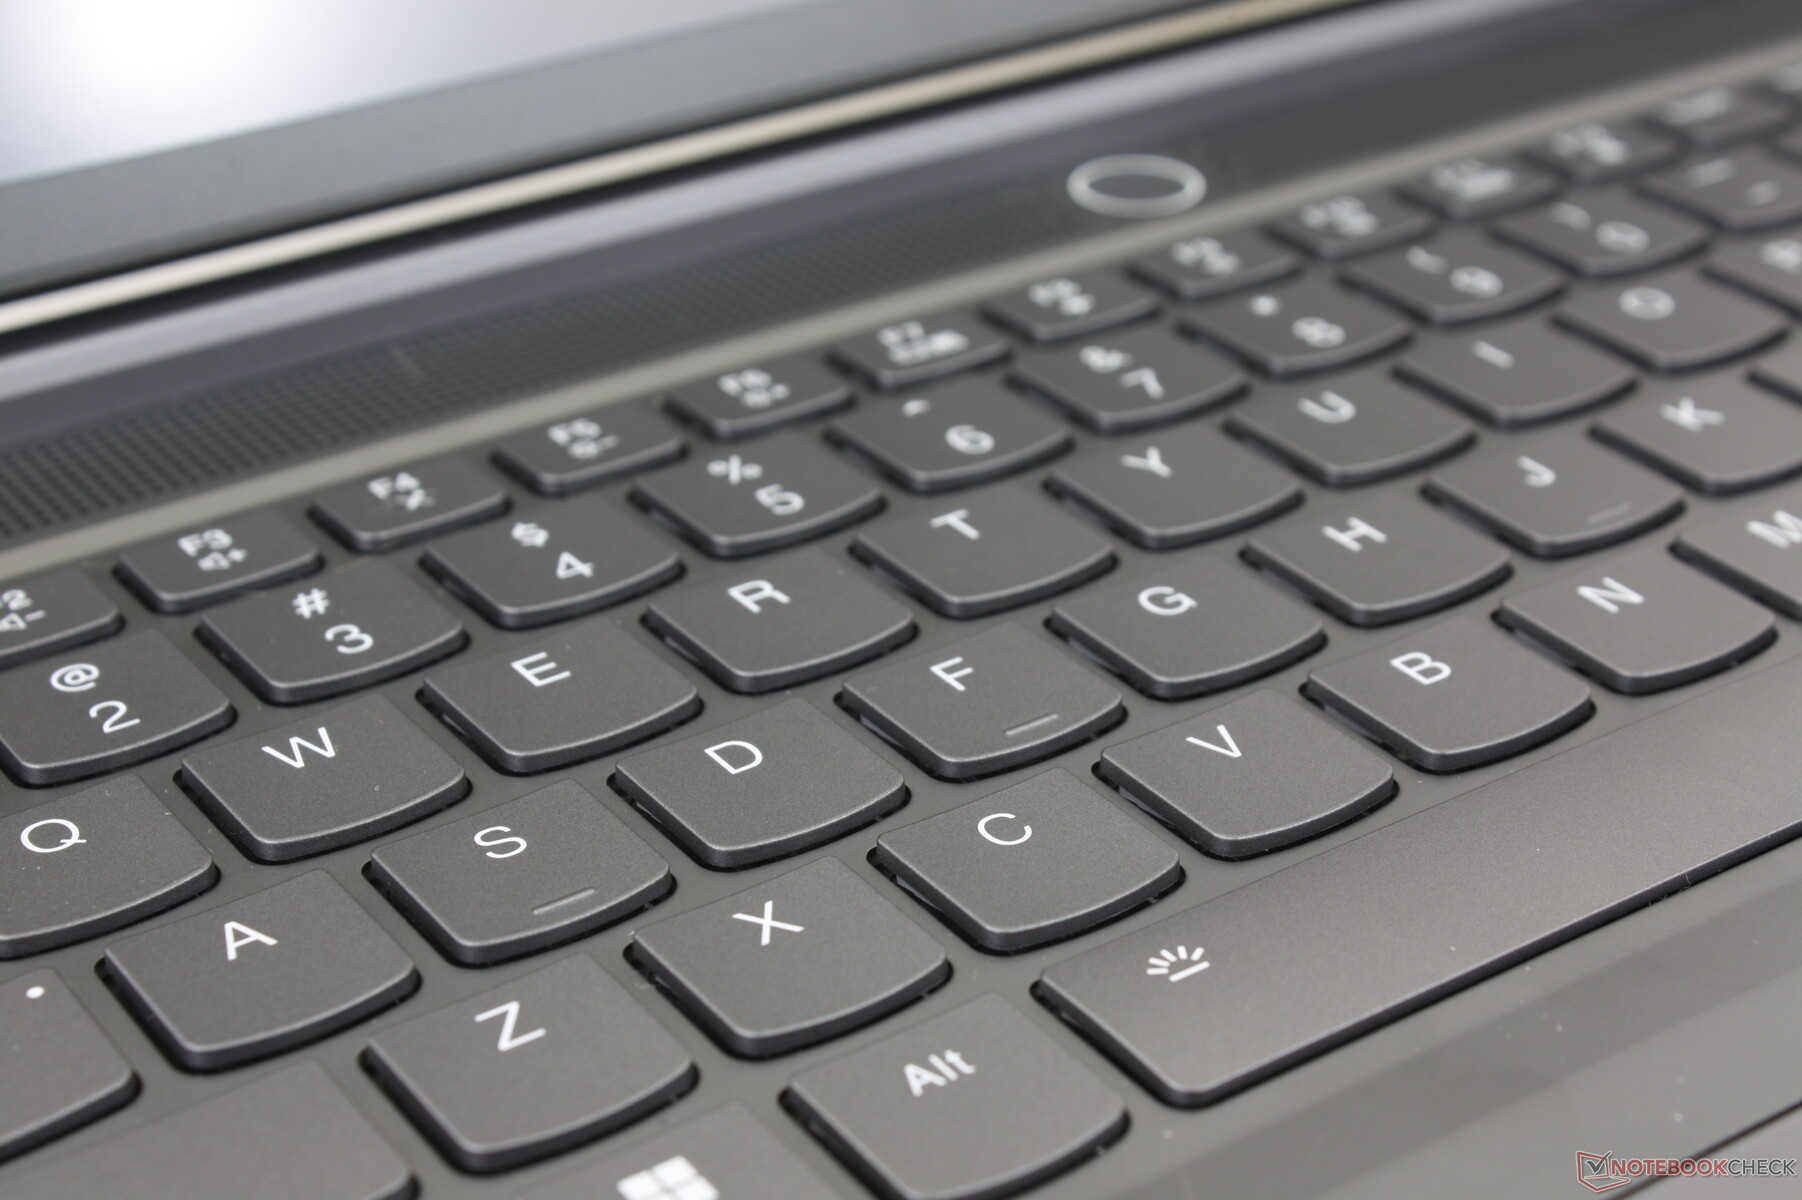
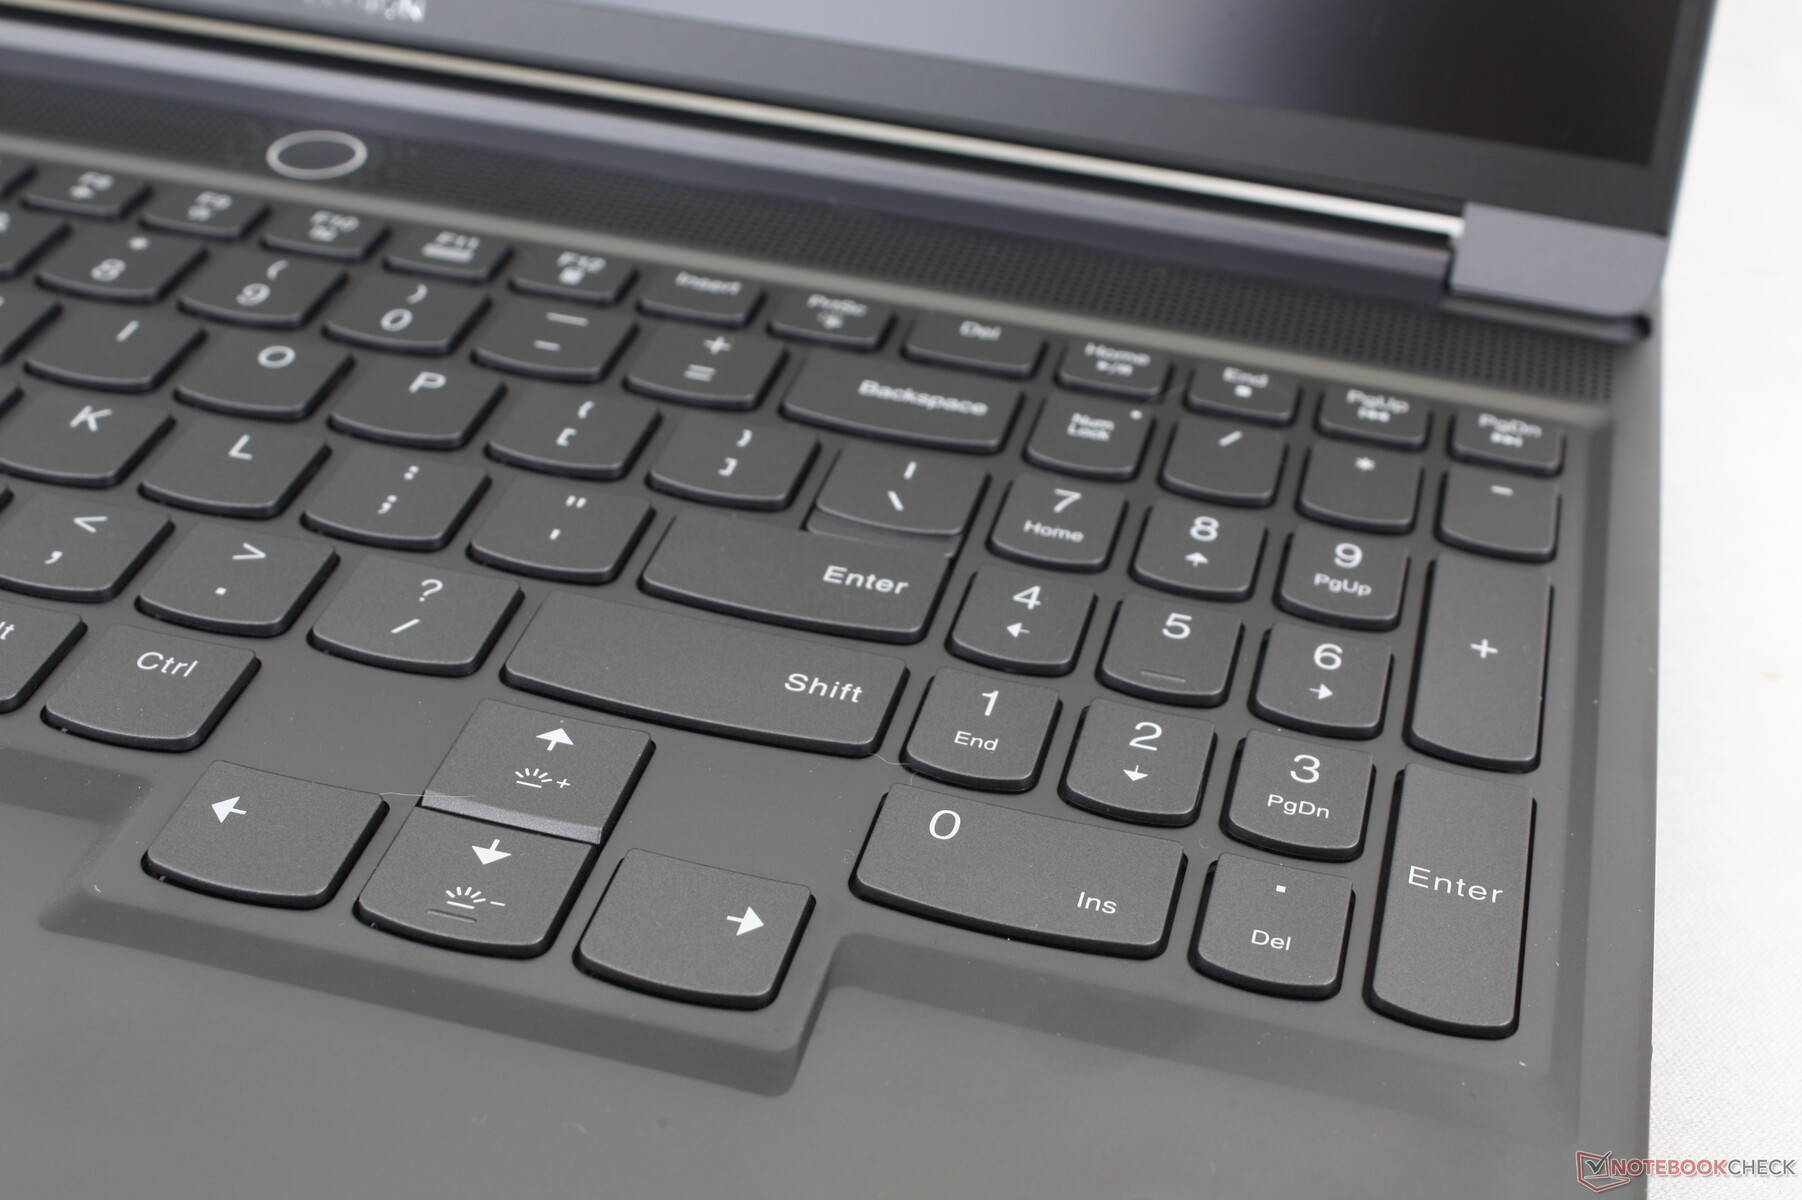
Input Devices — Spacious With Per-Key RGB Lighting
The keyboard and clickpad have not changed when compared to last year's Legion Slim 7i G7 and so the UI experience remains the same. This isn't necessarily a bad thing as the 1.5 mm key travel and firm feedback are still more comfortable for typing when compared to the shallower keys of the Blade 16. We also appreciate the large arrow keys since these same keys are often frustratingly small on other gaming laptops like the Asus ROG Strix series or the MSI Pulse series.
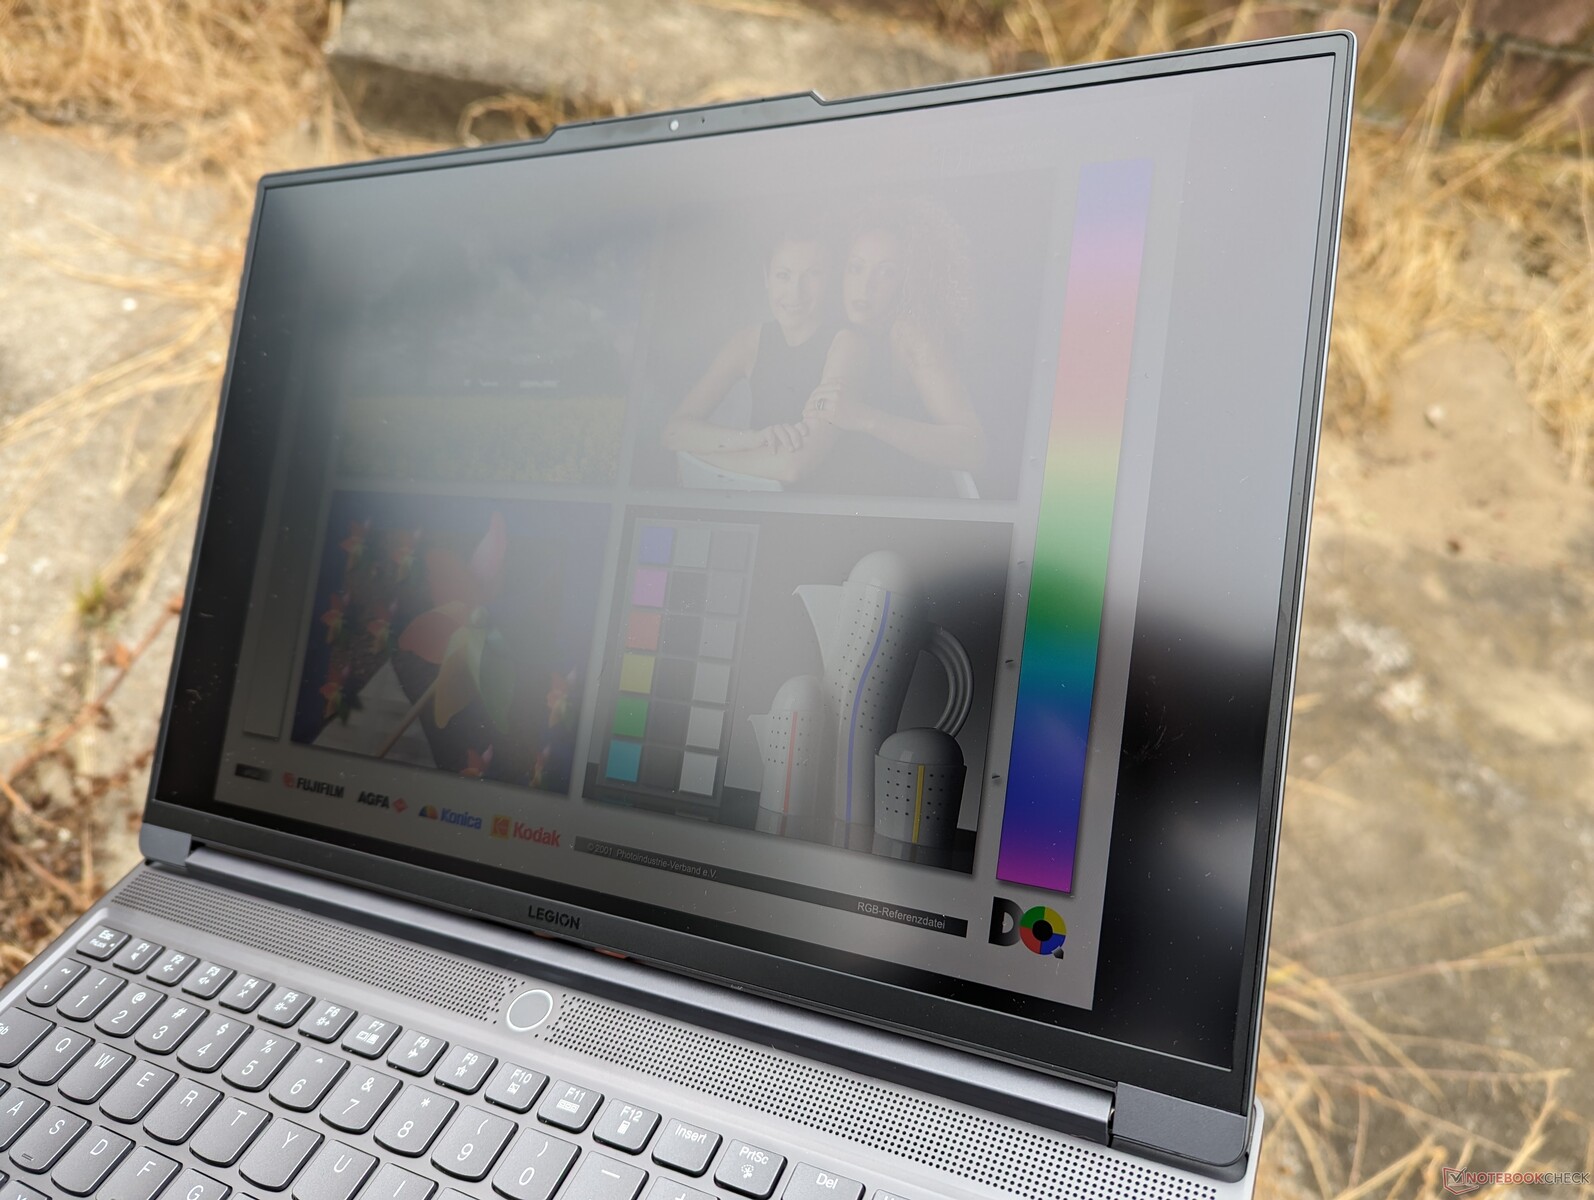
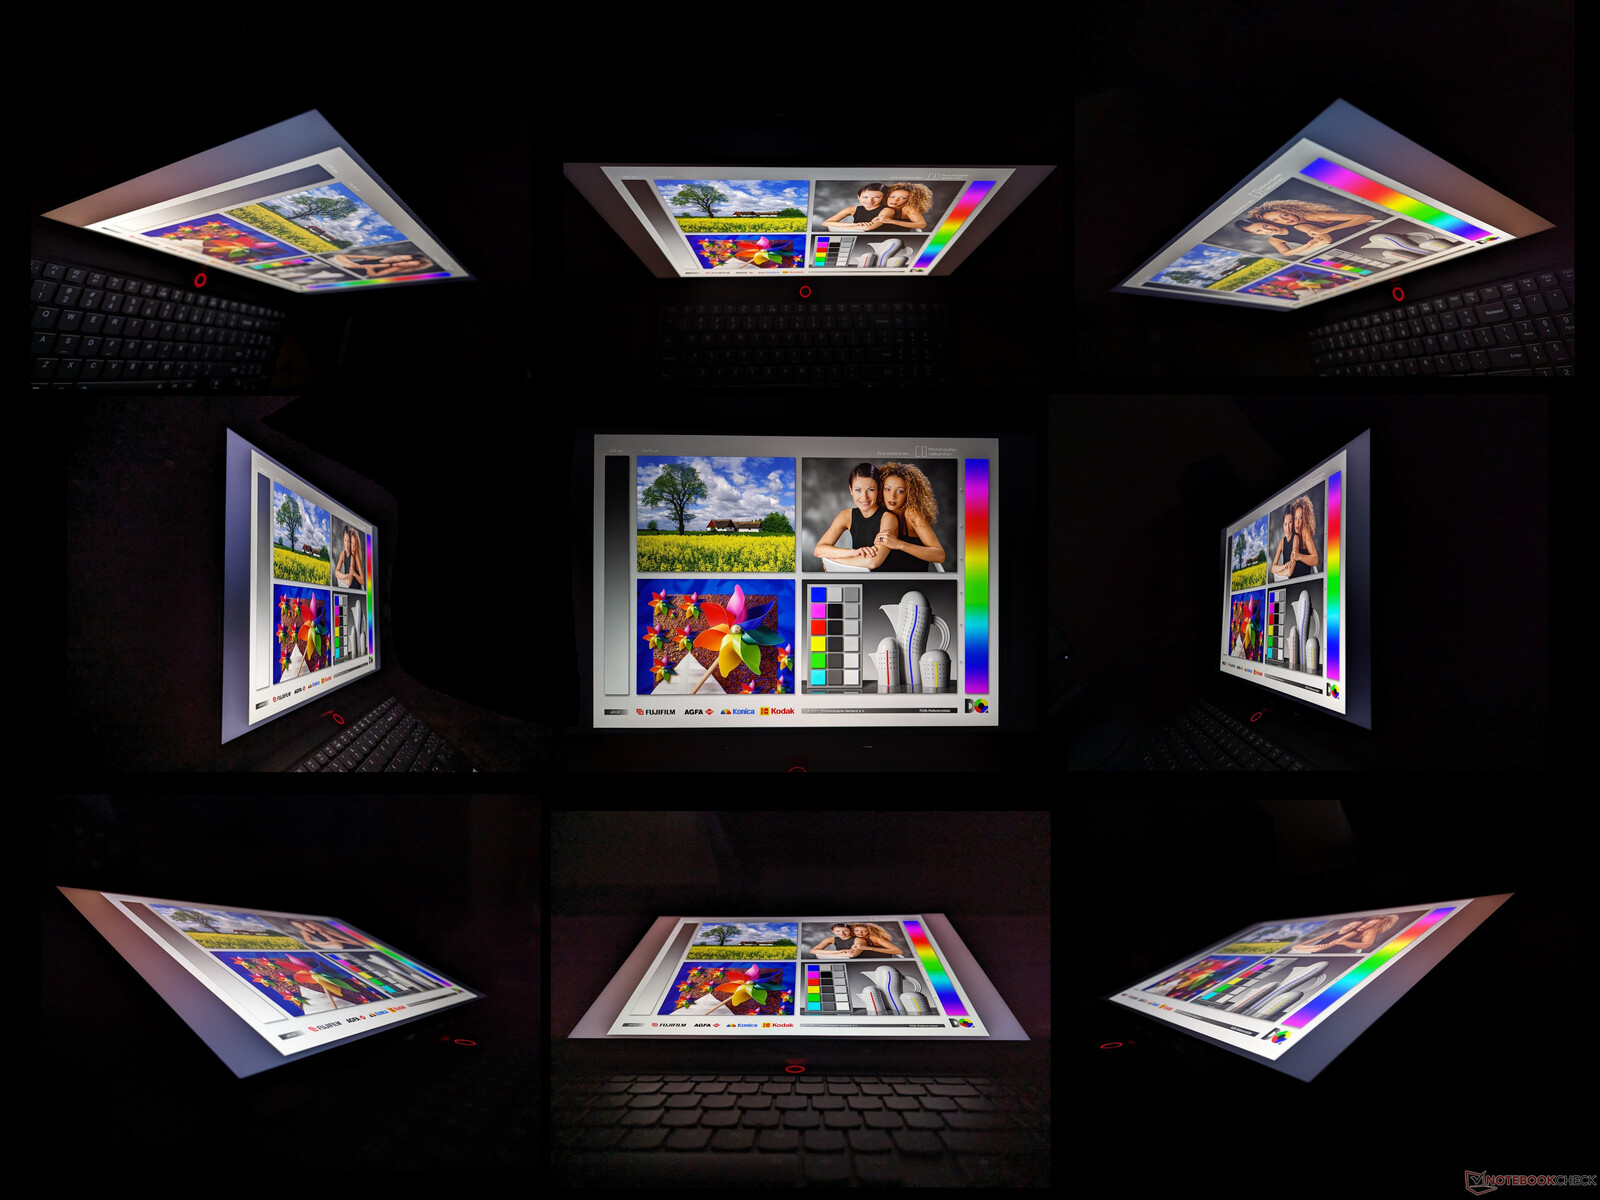
Display — Identical To The Legion Pro 7
Two panel options are available as follows both with G-Sync support:
- 2560 x 1600, 240 Hz, 5 ms response times, 100% sRGB, 500 nits, Pantone certified
- 3000 x 2000, 165 Hz, 3 ms response times, 100% DCI-P3, 430 nits, Pantone certified
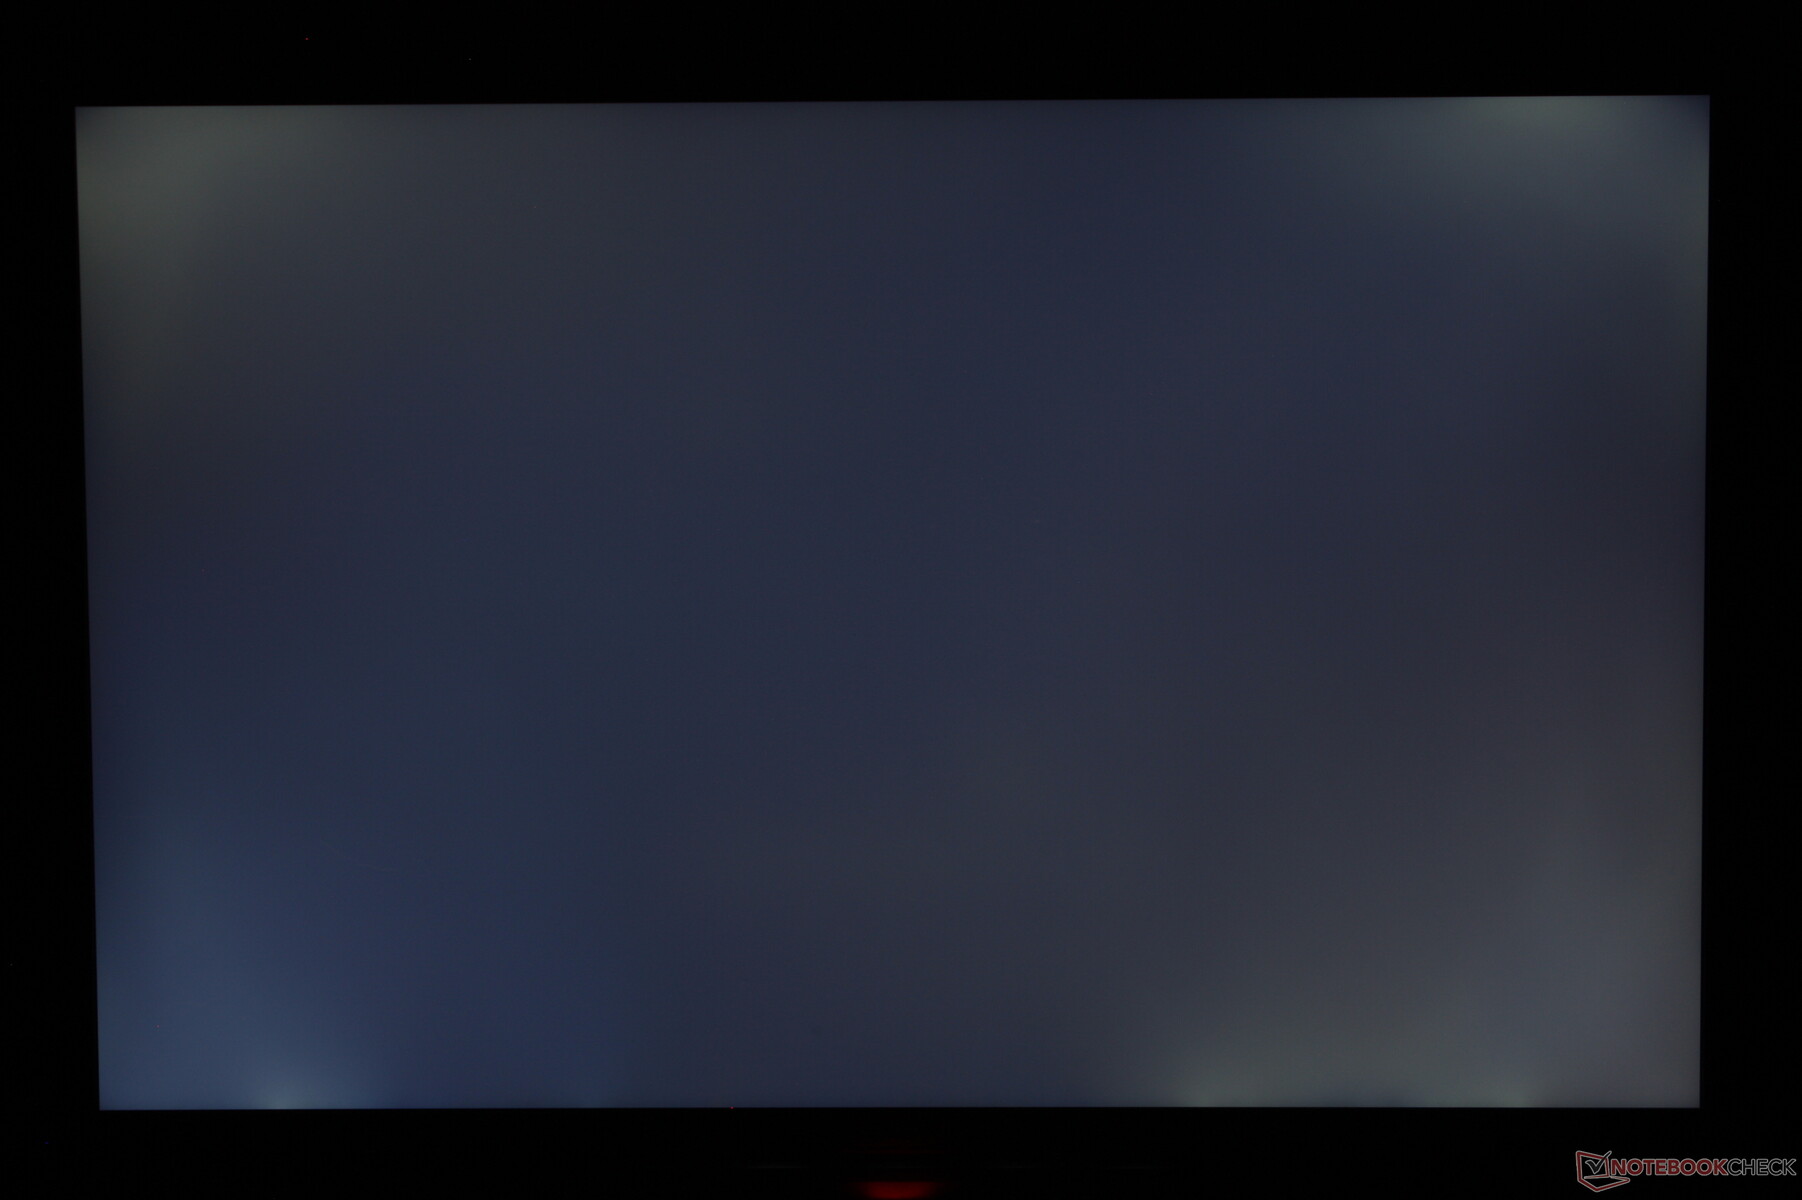
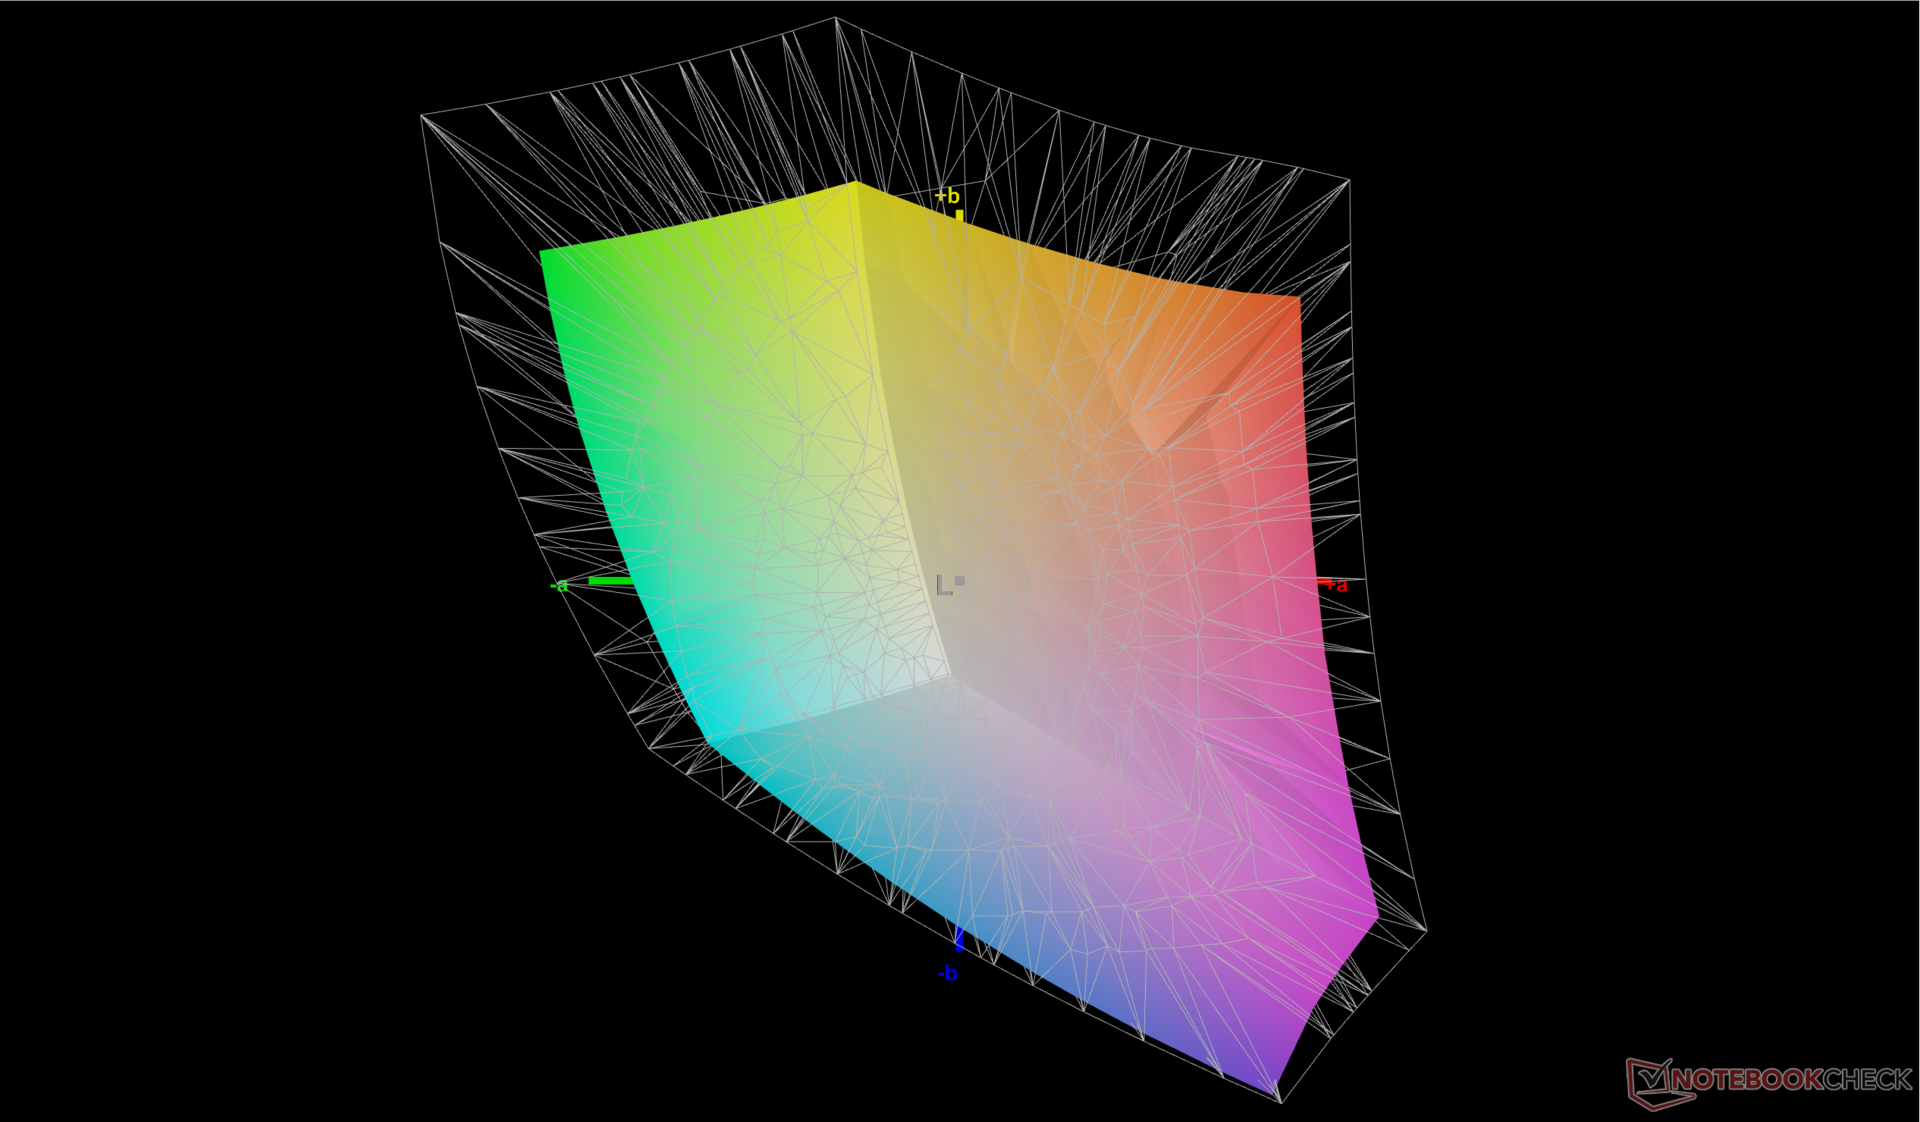
Our 1600p configuration comes with the exact same MNG007DA2-3 IPS panel as found on the larger and more expensive Legion Pro 7 for an identical viewing experience between the two models. This is a high-end panel fit for both gaming and amateur graphics editing despite being the base option. Backlight bleeding, however, is more noticeable than we would like as shown by the screenshot below.

| |||||||||||||||||||||||||
Brightness Distribution: 86 %
Center on Battery: 474.6 cd/m²
Contrast: 1217:1 (Black: 0.39 cd/m²)
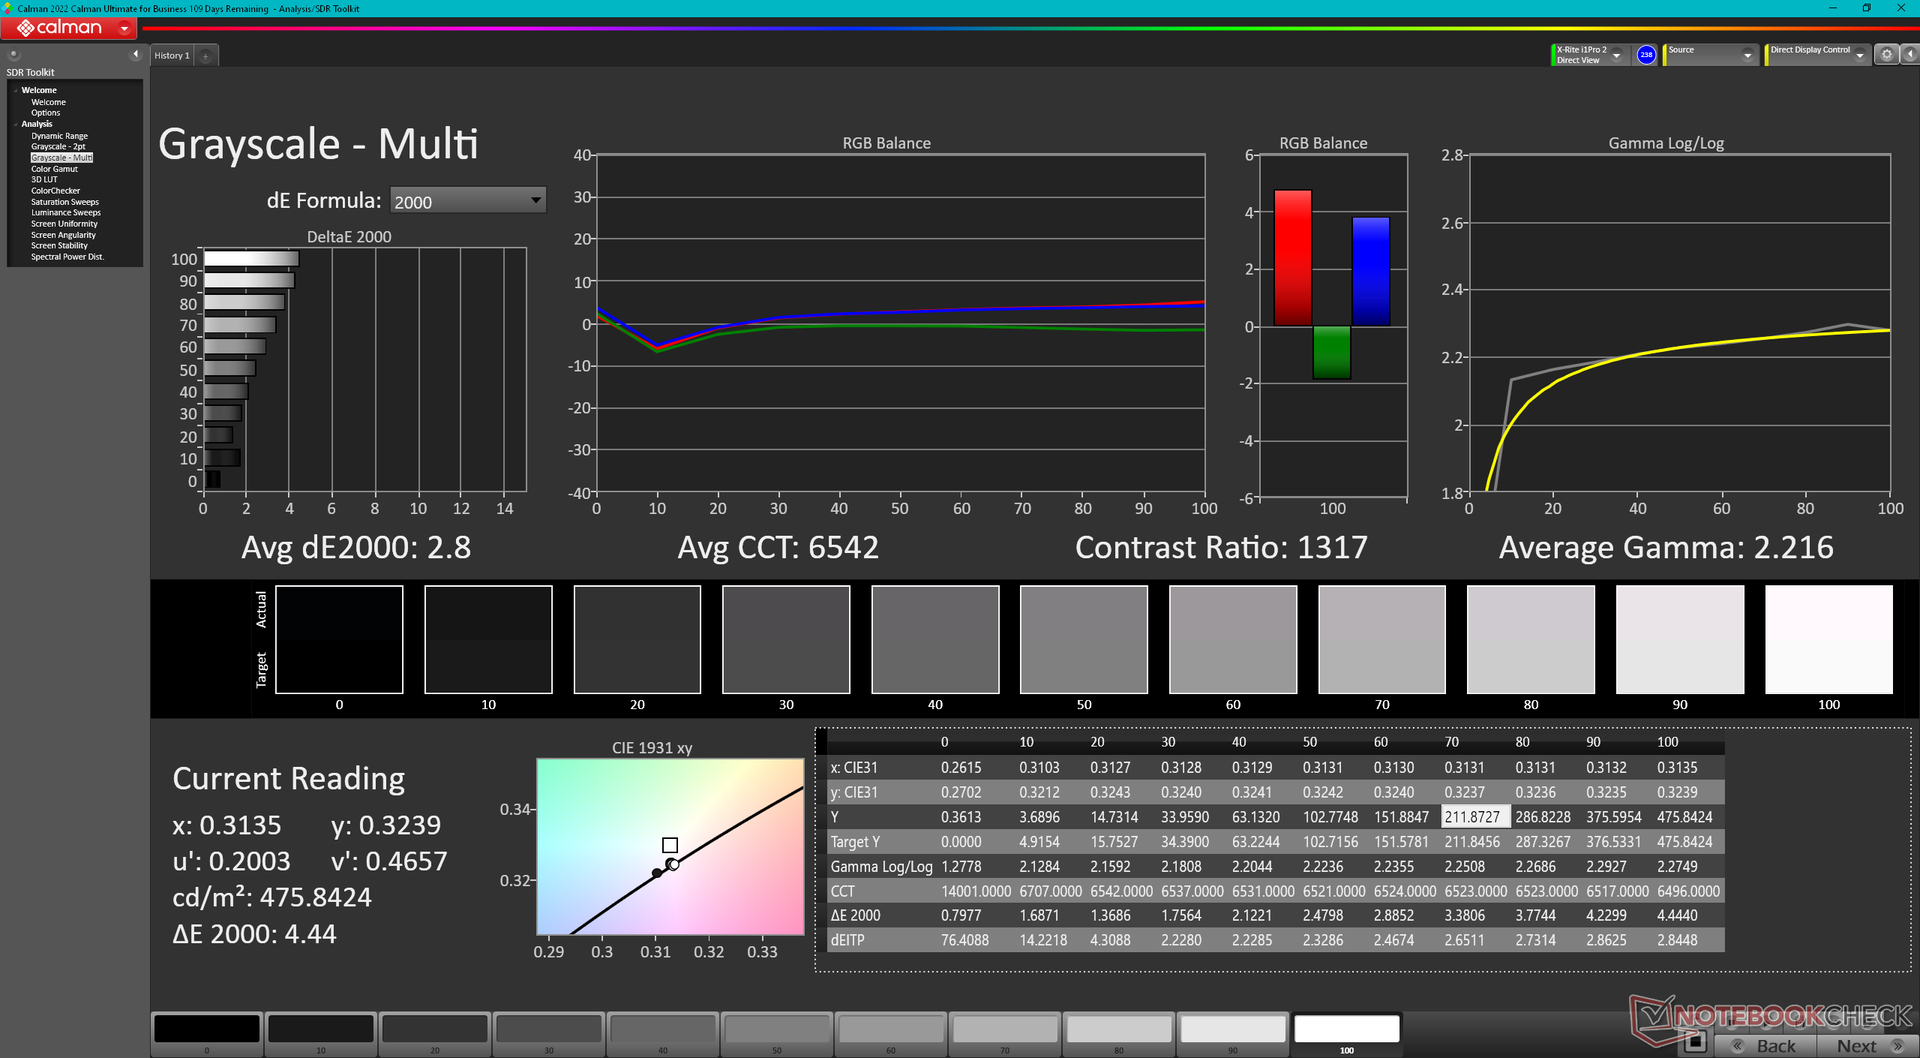
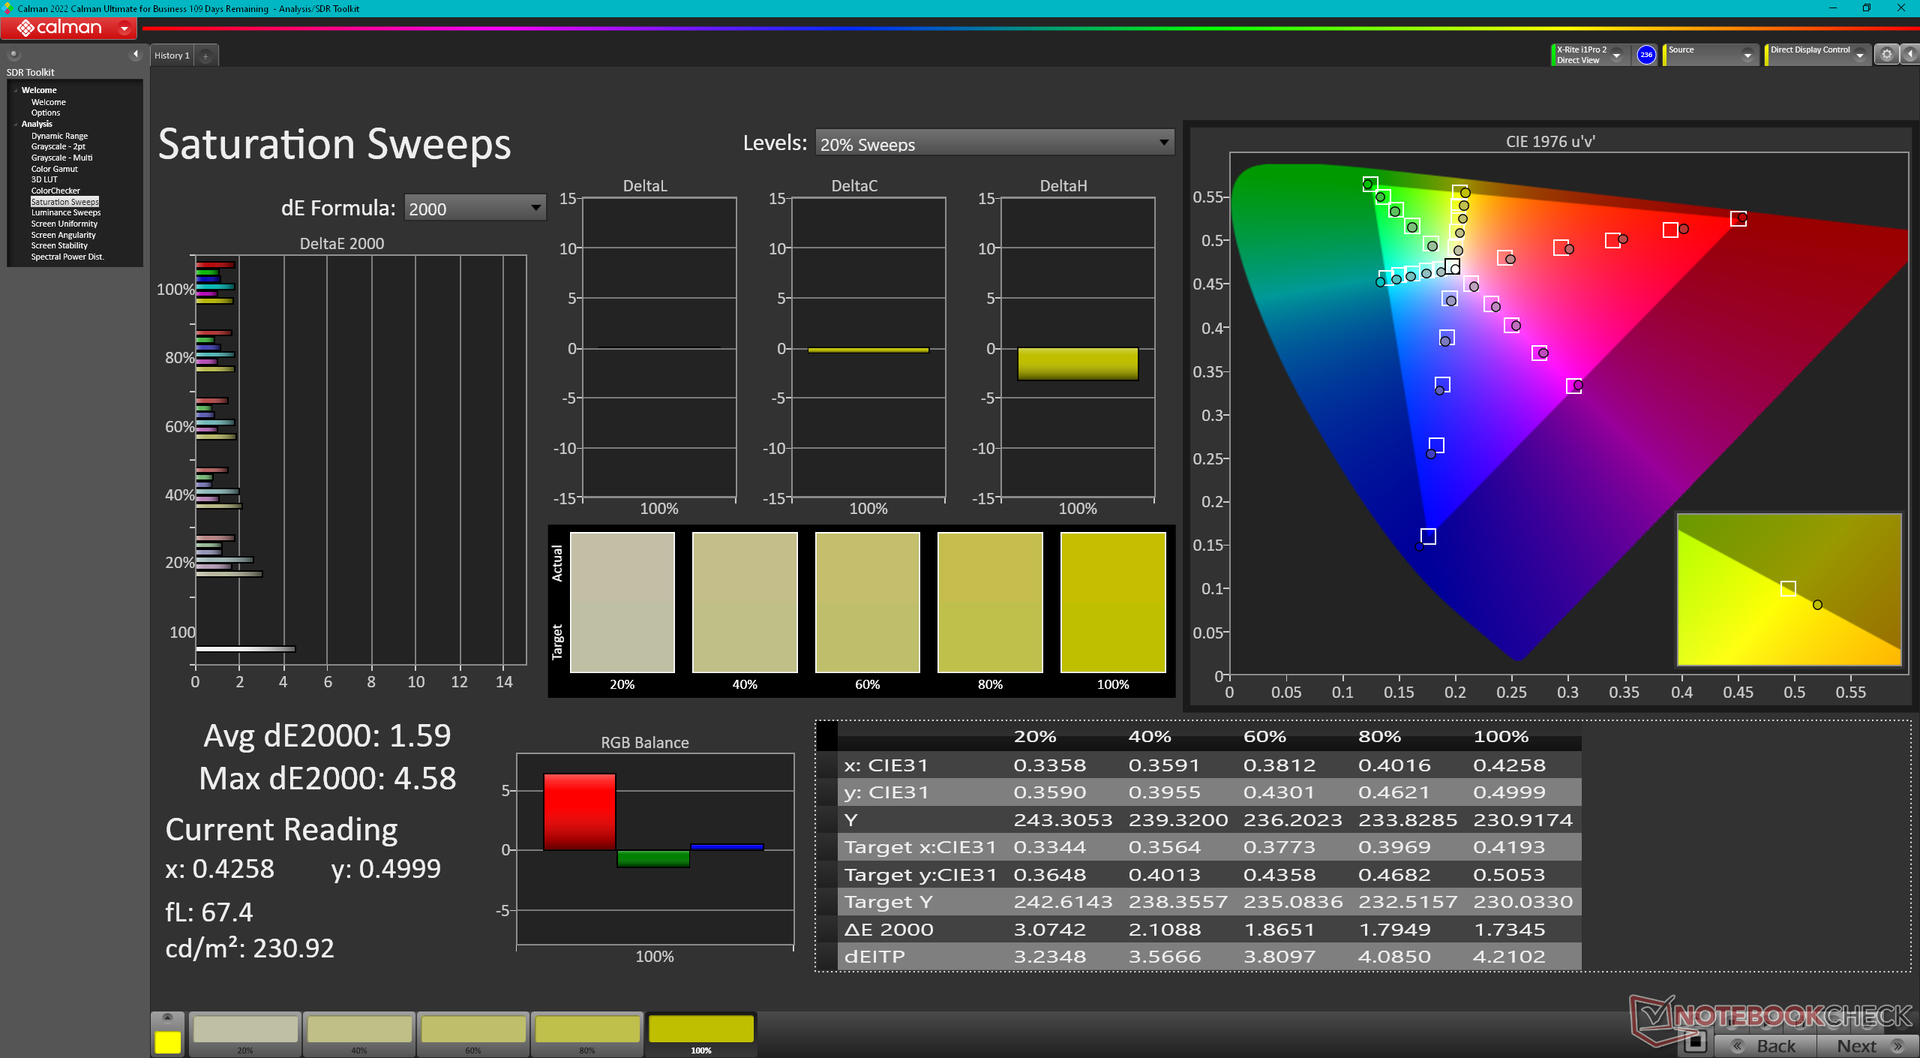
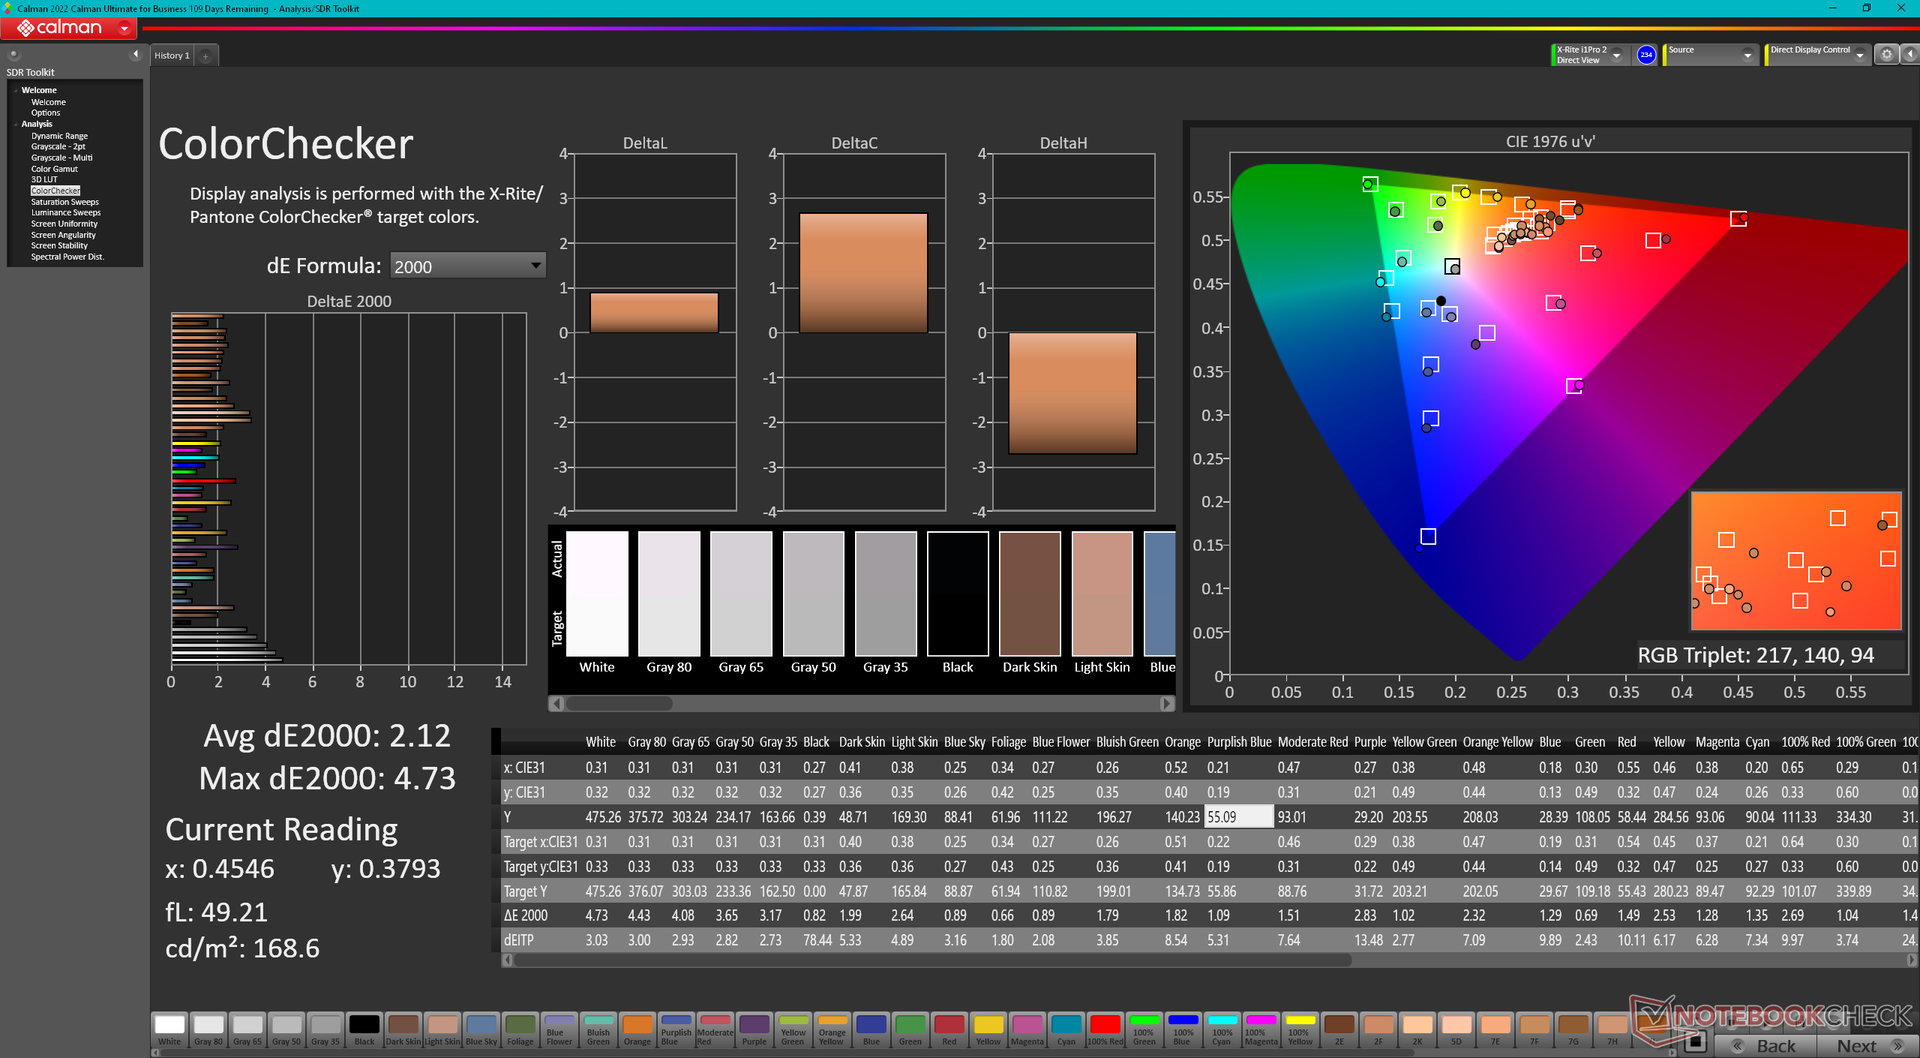
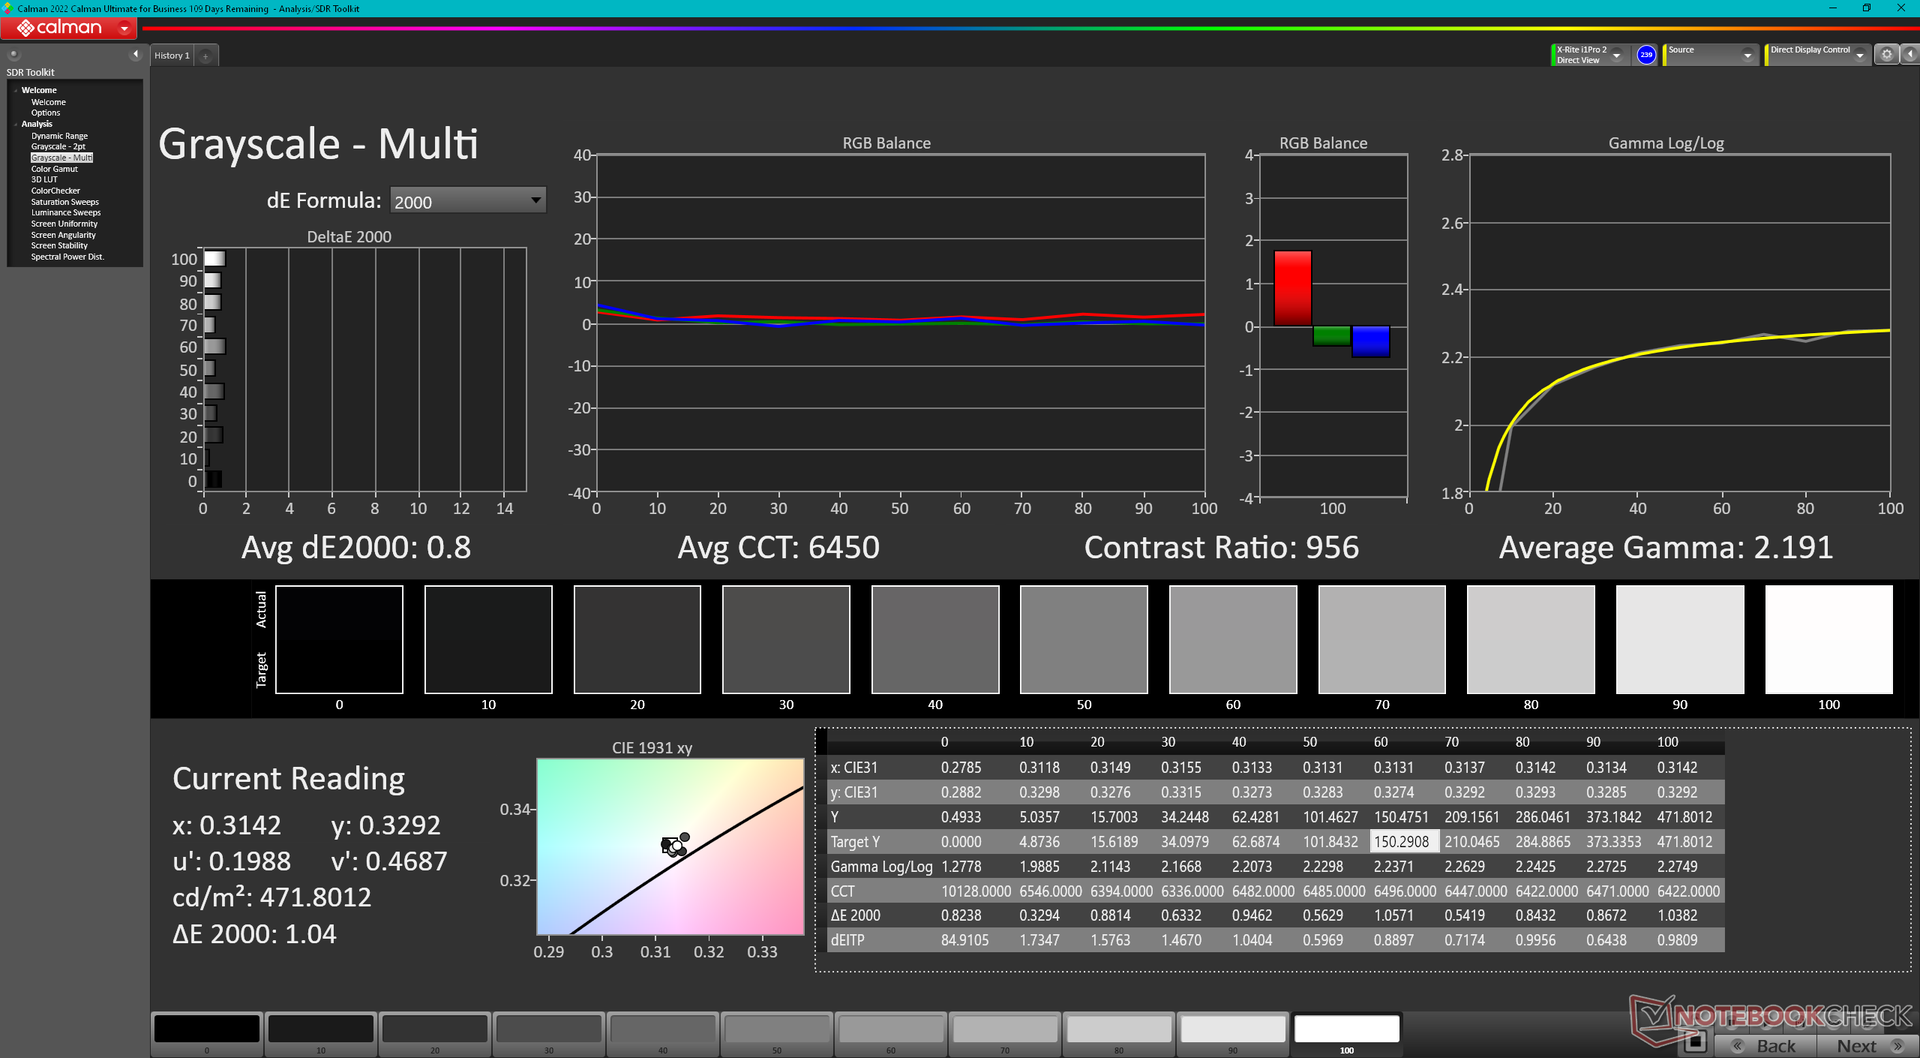
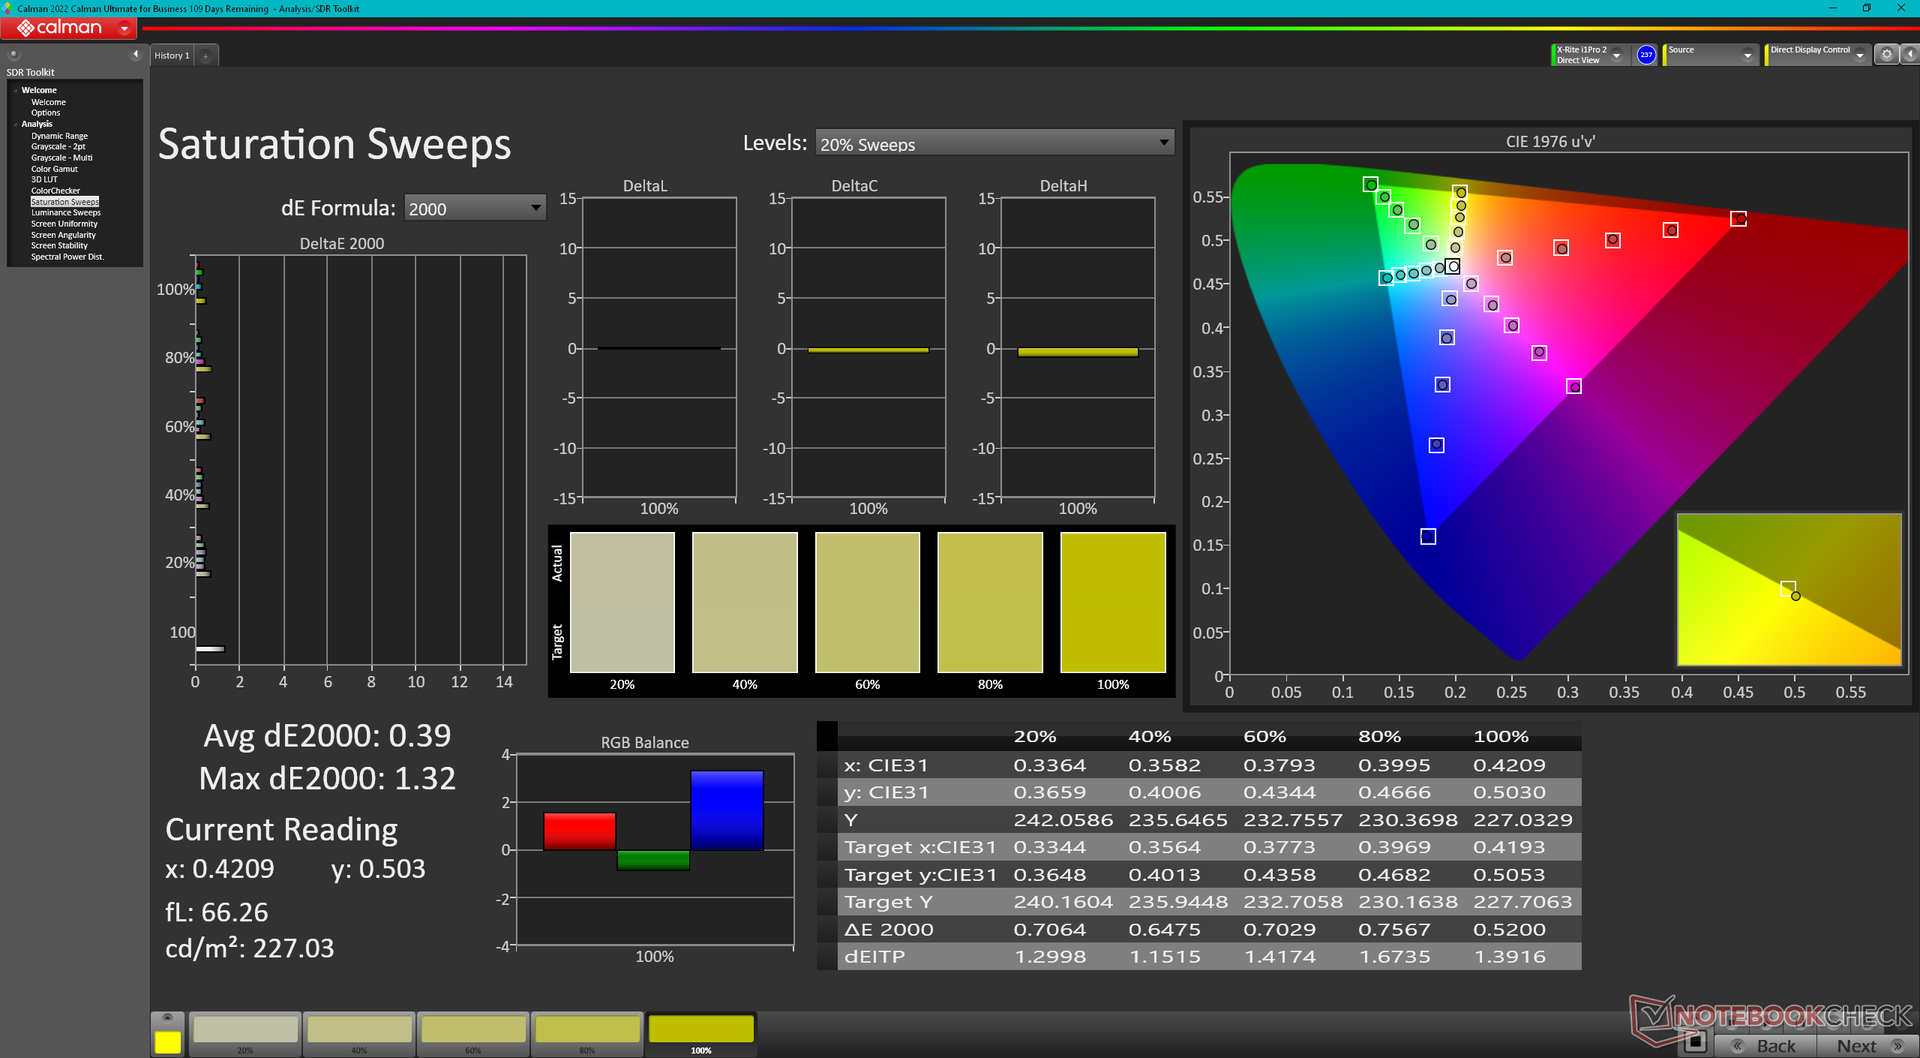
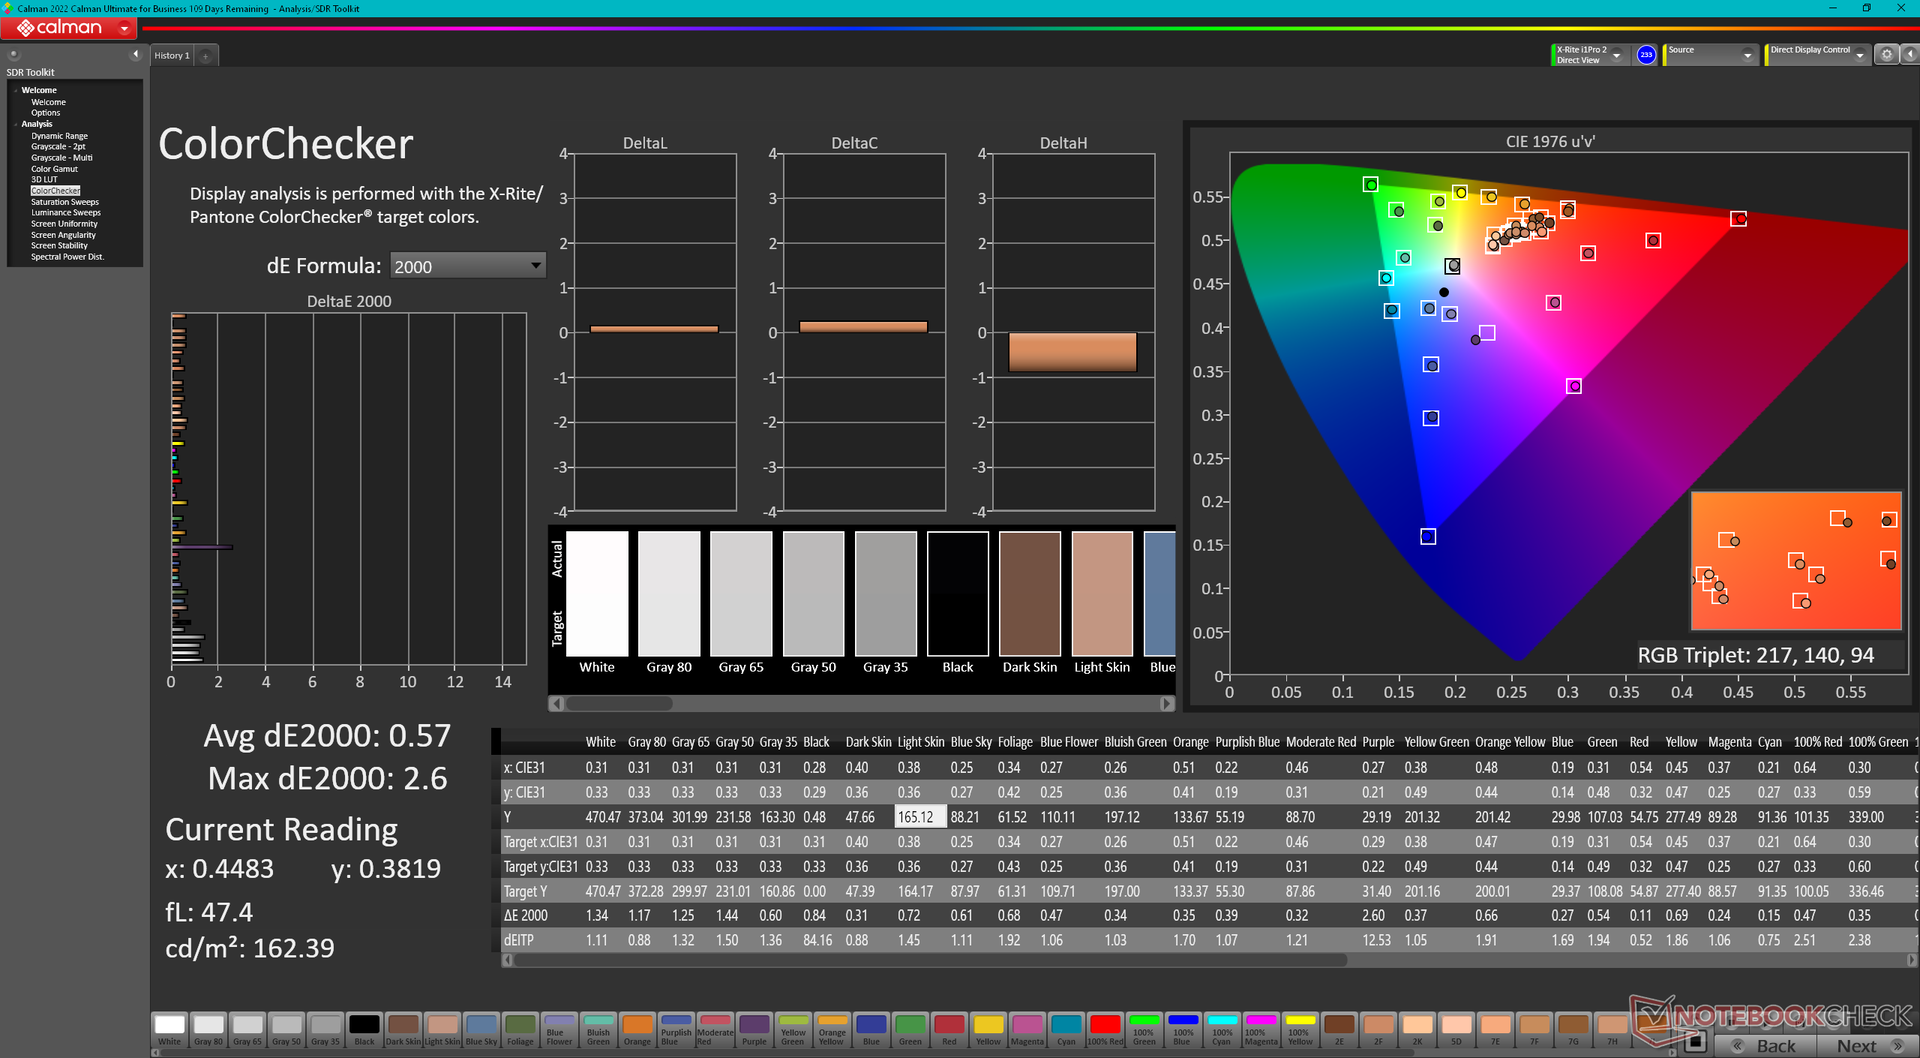
ΔE ColorChecker Calman: 2.12 | ∀{0.5-29.43 Ø4.71}
calibrated: 0.57
ΔE Greyscale Calman: 2.8 | ∀{0.09-98 Ø4.96}
72.5% AdobeRGB 1998 (Argyll 3D)
99.4% sRGB (Argyll 3D)
70.4% Display P3 (Argyll 3D)
Gamma: 2.22
CCT: 6542 K
| Lenovo Legion Slim 7i 16 Gen 8 CSOT T3 MNG007DA2-3, IPS, 2560x1600, 16" | HP Omen 16-wf000 BOE0B7D, IPS, 2560x1440, 16.1" | Alienware x16 R1 BOE NE16NZ4, IPS, 2560x1600, 16" | Lenovo Legion Pro 7 RTX4090 MNG007DA2-3 (CSO1628), IPS, 2560x1600, 16" | Asus ROG Strix G16 G614JZ TL160ADMP03-0, IPS, 2560x1600, 16" | Razer Blade 16 Early 2023 CSOT T3 MNG007DA4-1, IPS, 2560x1600, 16" | |
|---|---|---|---|---|---|---|
| Display | -1% | 21% | -1% | 19% | 22% | |
| Display P3 Coverage (%) | 70.4 | 69 -2% | 99.2 41% | 69.5 -1% | 97 38% | 98.5 40% |
| sRGB Coverage (%) | 99.4 | 99.2 0% | 100 1% | 99.8 0% | 99.9 1% | 100 1% |
| AdobeRGB 1998 Coverage (%) | 72.5 | 71.2 -2% | 88.6 22% | 71.6 -1% | 84.9 17% | 89.7 24% |
| Response Times | 27% | 21% | 29% | 42% | 5% | |
| Response Time Grey 50% / Grey 80% * (ms) | 12 ? | 4.6 ? 62% | 5.1 ? 57% | 10.9 ? 9% | 5.1 ? 57% | 6.6 ? 45% |
| Response Time Black / White * (ms) | 8.9 ? | 9.7 ? -9% | 10.3 ? -16% | 4.6 ? 48% | 6.6 ? 26% | 12 ? -35% |
| PWM Frequency (Hz) | ||||||
| Screen | -5% | -11% | -5% | -4% | -12% | |
| Brightness middle (cd/m²) | 474.6 | 310.9 -34% | 302.2 -36% | 491 3% | 470 -1% | 456.8 -4% |
| Brightness (cd/m²) | 445 | 296 -33% | 285 -36% | 472 6% | 459 3% | 437 -2% |
| Brightness Distribution (%) | 86 | 91 6% | 89 3% | 91 6% | 93 8% | 83 -3% |
| Black Level * (cd/m²) | 0.39 | 0.35 10% | 0.26 33% | 0.4 -3% | 0.42 -8% | 0.35 10% |
| Contrast (:1) | 1217 | 888 -27% | 1162 -5% | 1228 1% | 1119 -8% | 1305 7% |
| Colorchecker dE 2000 * | 2.12 | 2.18 -3% | 1.63 23% | 1.6 25% | 1.86 12% | 3.7 -75% |
| Colorchecker dE 2000 max. * | 4.73 | 3.58 24% | 4.13 13% | 5.15 -9% | 3.87 18% | 6.42 -36% |
| Colorchecker dE 2000 calibrated * | 0.57 | 0.52 9% | 1.17 -105% | 0.97 -70% | 0.93 -63% | 0.66 -16% |
| Greyscale dE 2000 * | 2.8 | 2.8 -0% | 2.5 11% | 3 -7% | 2.7 4% | 2.6 7% |
| Gamma | 2.22 99% | 2.18 101% | 2.23 99% | 2.211 100% | 2.246 98% | 2.3 96% |
| CCT | 6542 99% | 6002 108% | 6590 99% | 6979 93% | 6711 97% | 6108 106% |
| Total Average (Program / Settings) | 7% /
0% | 10% /
0% | 8% /
1% | 19% /
7% | 5% /
-3% |
* ... smaller is better
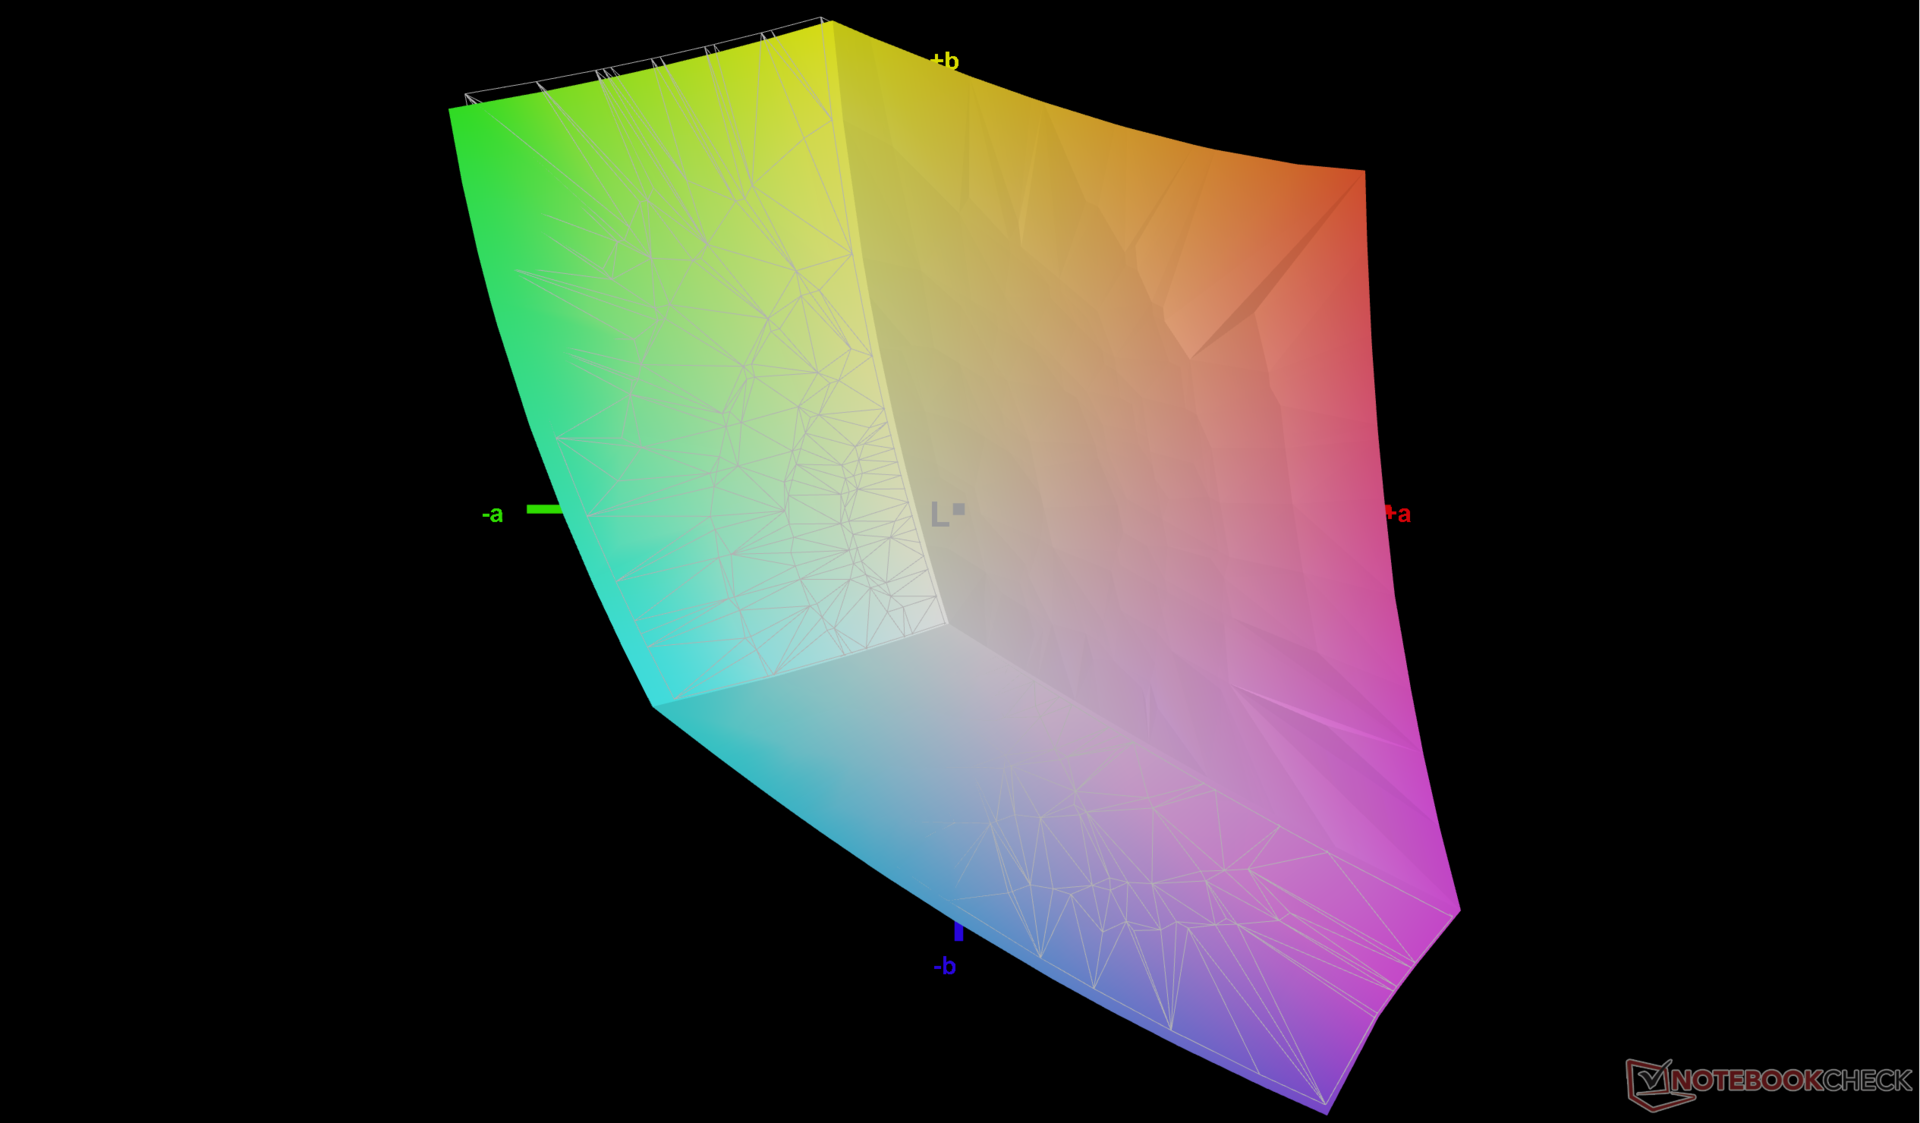
The display comes pre-calibrated with average grayscale and color deltaE values of just 2.8 and 2.12, respectively. Calibrating it ourselves with an X-Rite colorimeter would improve these averages even further to just 0.8 and 0.57, respectively. An end-user calibration is therefore not entirely necessary, but our calibrated ICM profile is nevertheless available above for free for interested users.
Display Response Times
| ↔ Response Time Black to White | ||
|---|---|---|
| 8.9 ms ... rise ↗ and fall ↘ combined | ↗ 5.1 ms rise | 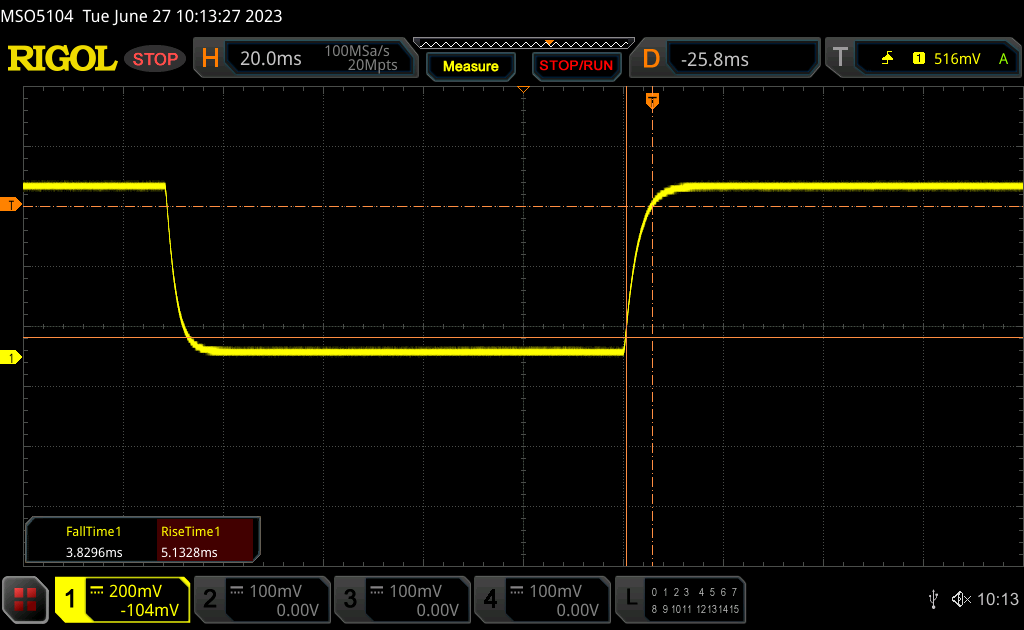 |
| ↘ 3.8 ms fall | ||
| The screen shows fast response rates in our tests and should be suited for gaming. In comparison, all tested devices range from 0.1 (minimum) to 240 (maximum) ms. » 25 % of all devices are better. This means that the measured response time is better than the average of all tested devices (19.8 ms). | ||
| ↔ Response Time 50% Grey to 80% Grey | ||
| 12 ms ... rise ↗ and fall ↘ combined | ↗ 6 ms rise | 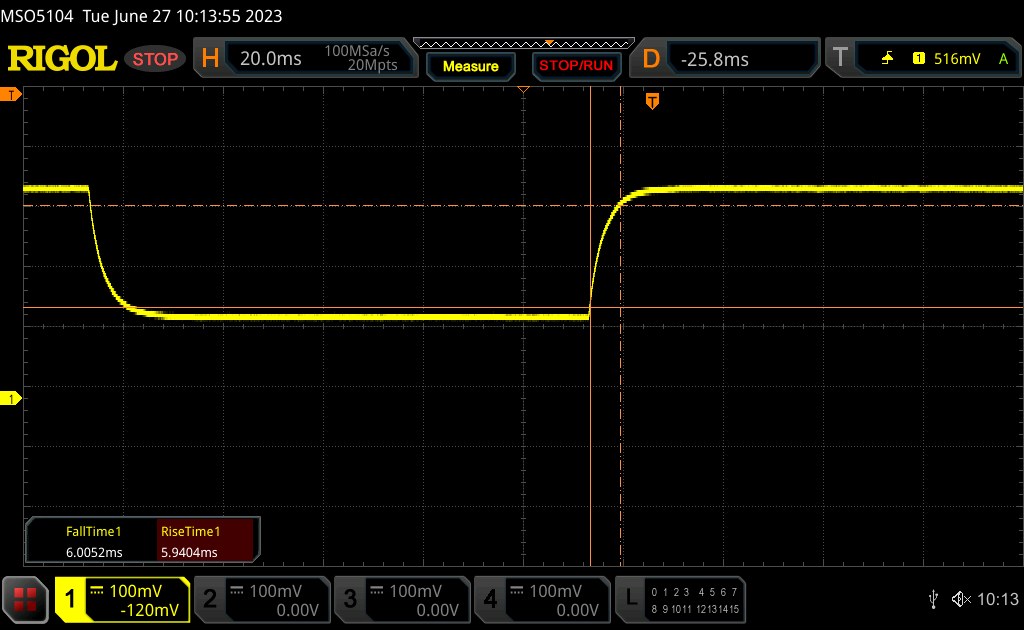 |
| ↘ 6 ms fall | ||
| The screen shows good response rates in our tests, but may be too slow for competitive gamers. In comparison, all tested devices range from 0.165 (minimum) to 636 (maximum) ms. » 25 % of all devices are better. This means that the measured response time is better than the average of all tested devices (30.9 ms). | ||
Screen Flickering / PWM (Pulse-Width Modulation)
| Screen flickering / PWM not detected | 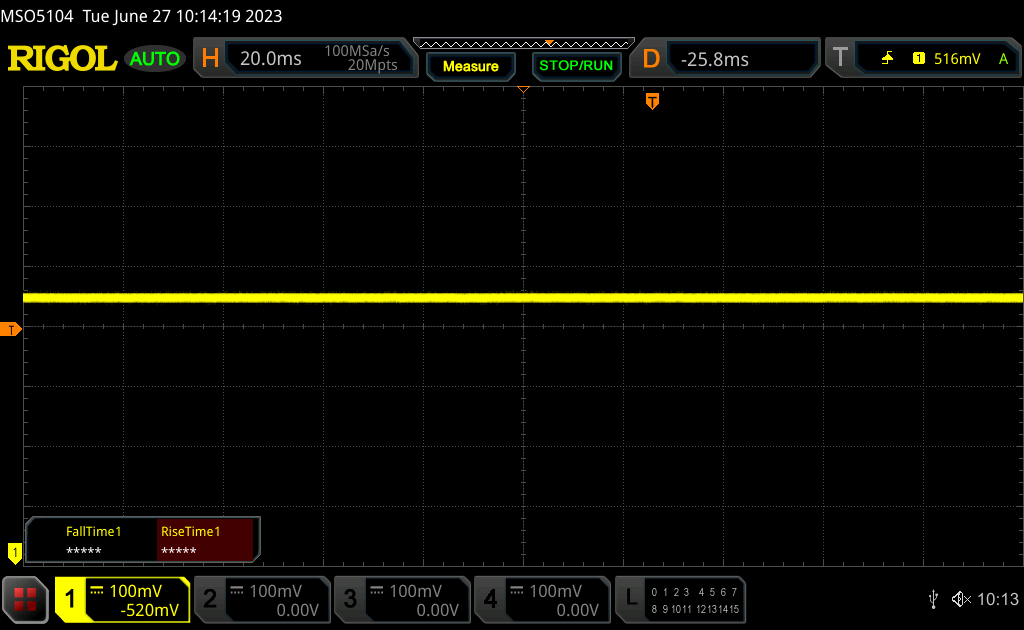 | ||
In comparison: 52 % of all tested devices do not use PWM to dim the display. If PWM was detected, an average of 7741 (minimum: 5 - maximum: 343500) Hz was measured. | |||
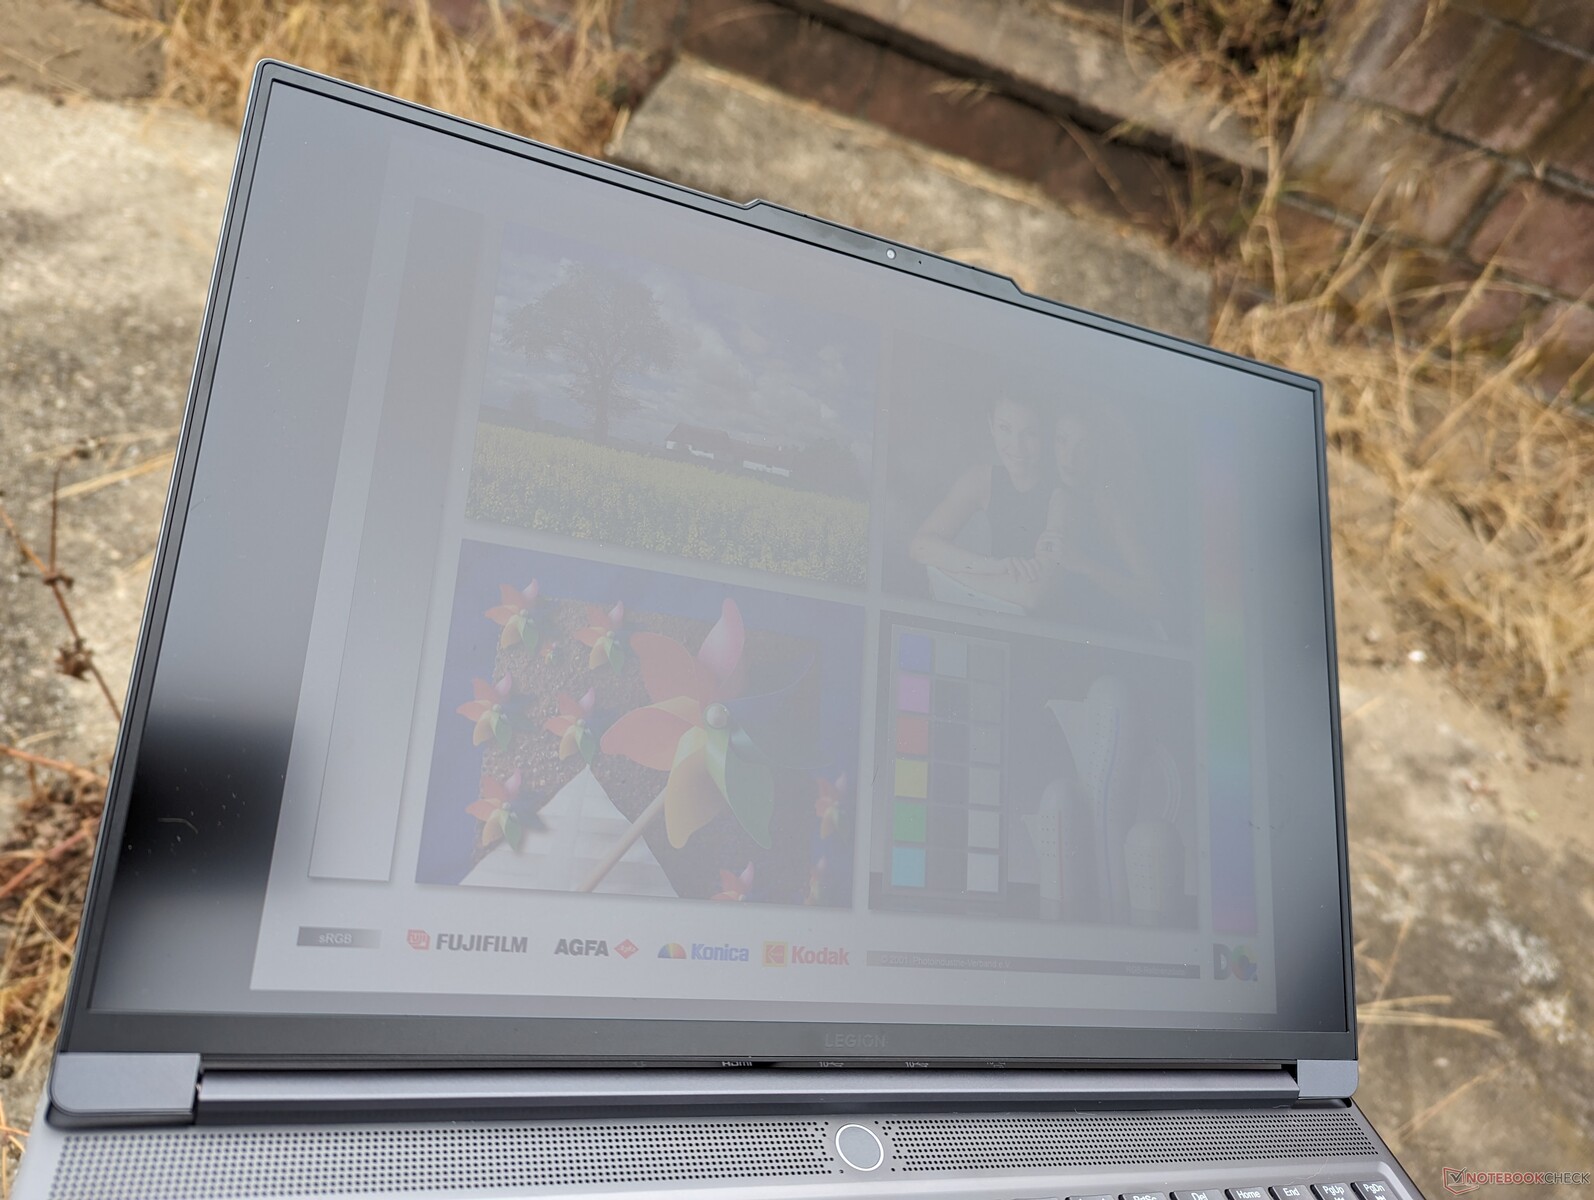
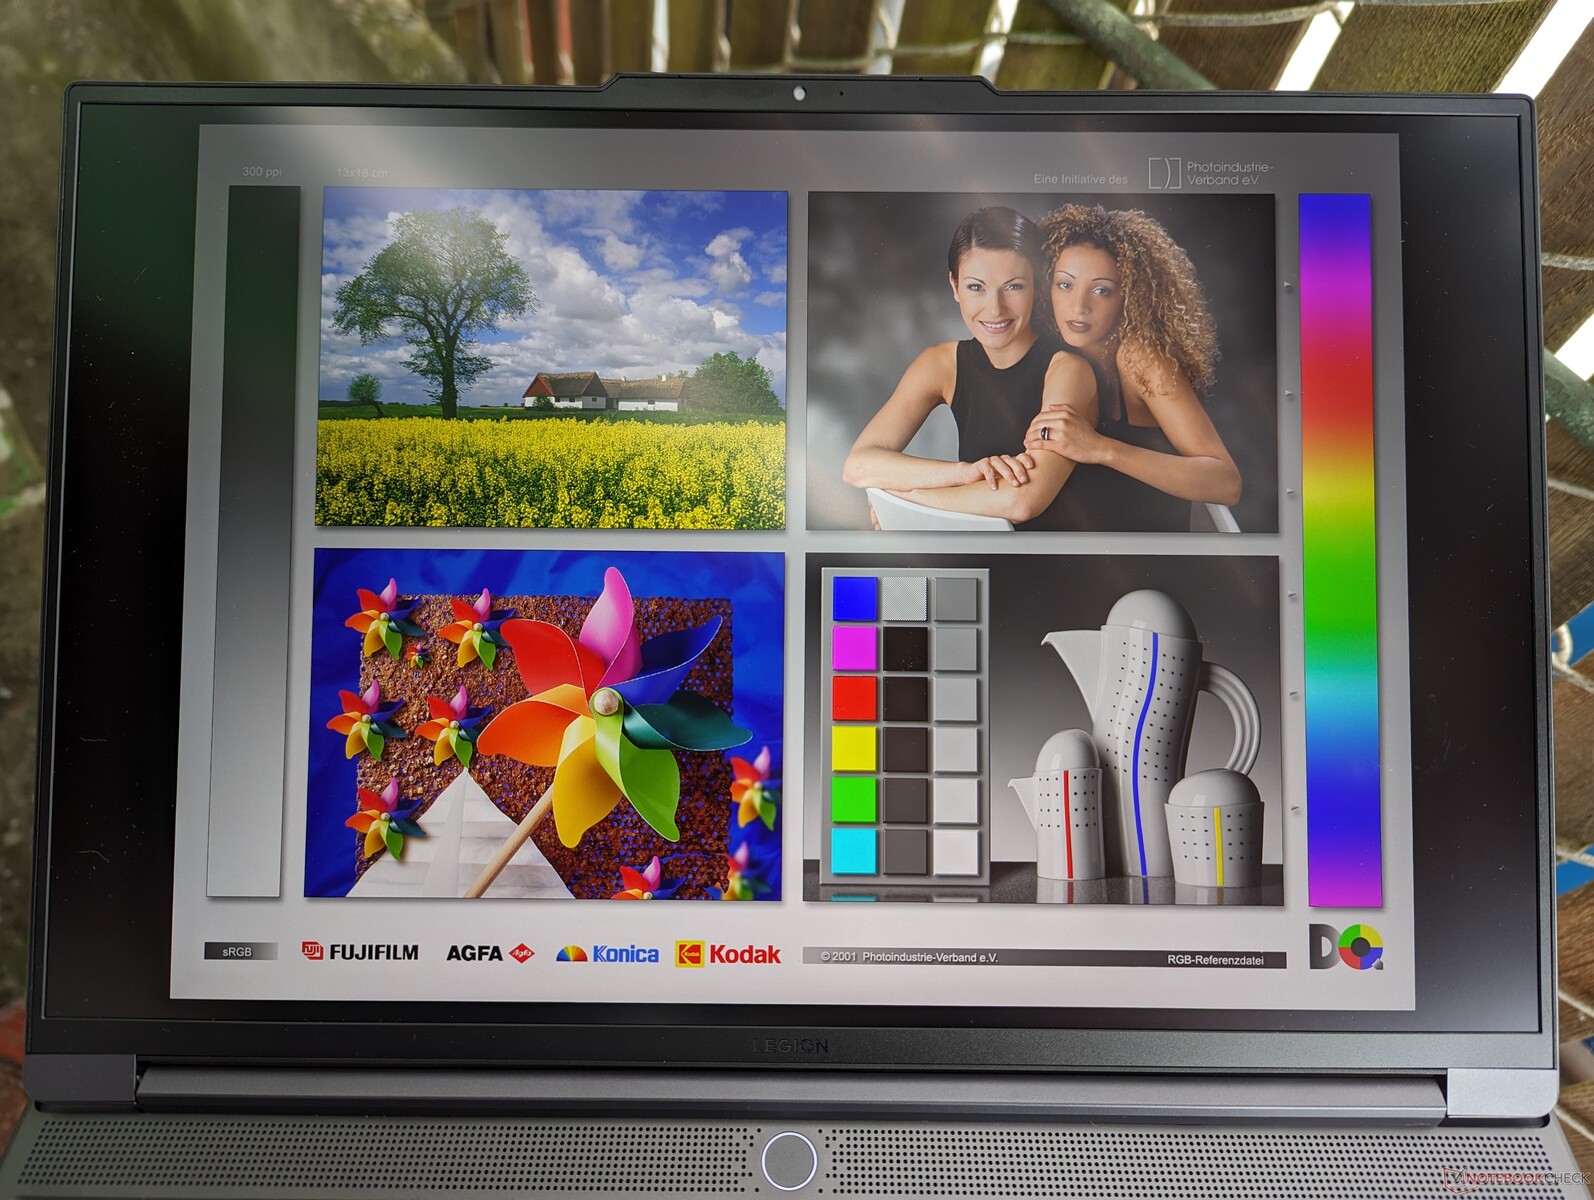
The display is noticeably brighter than on the Omen 16 or Alienware x16 R1 for easier readability outdoors. In fact, its maximum brightness setting is only about 10 percent dimmer than on the MacBook Pro 16.
Performance — 13th Gen Core i9
Testing Conditions
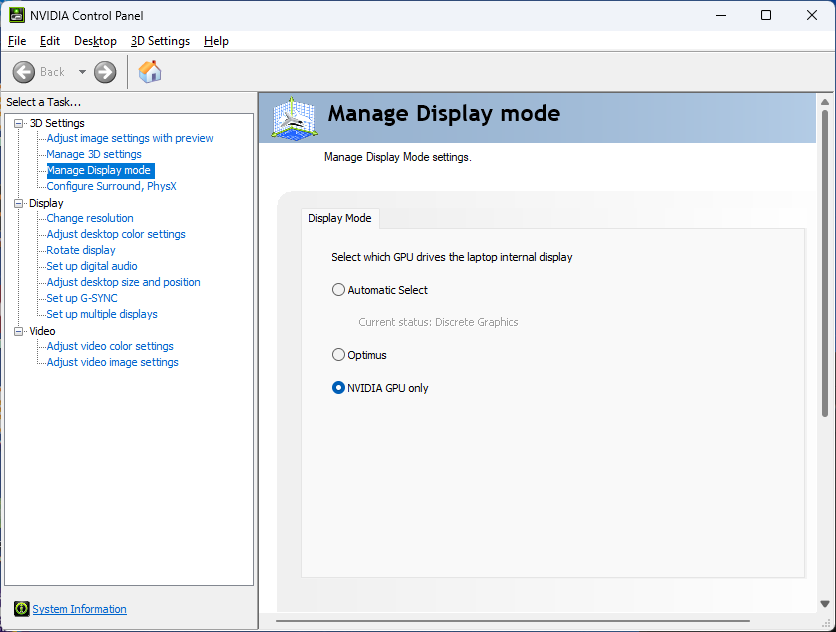
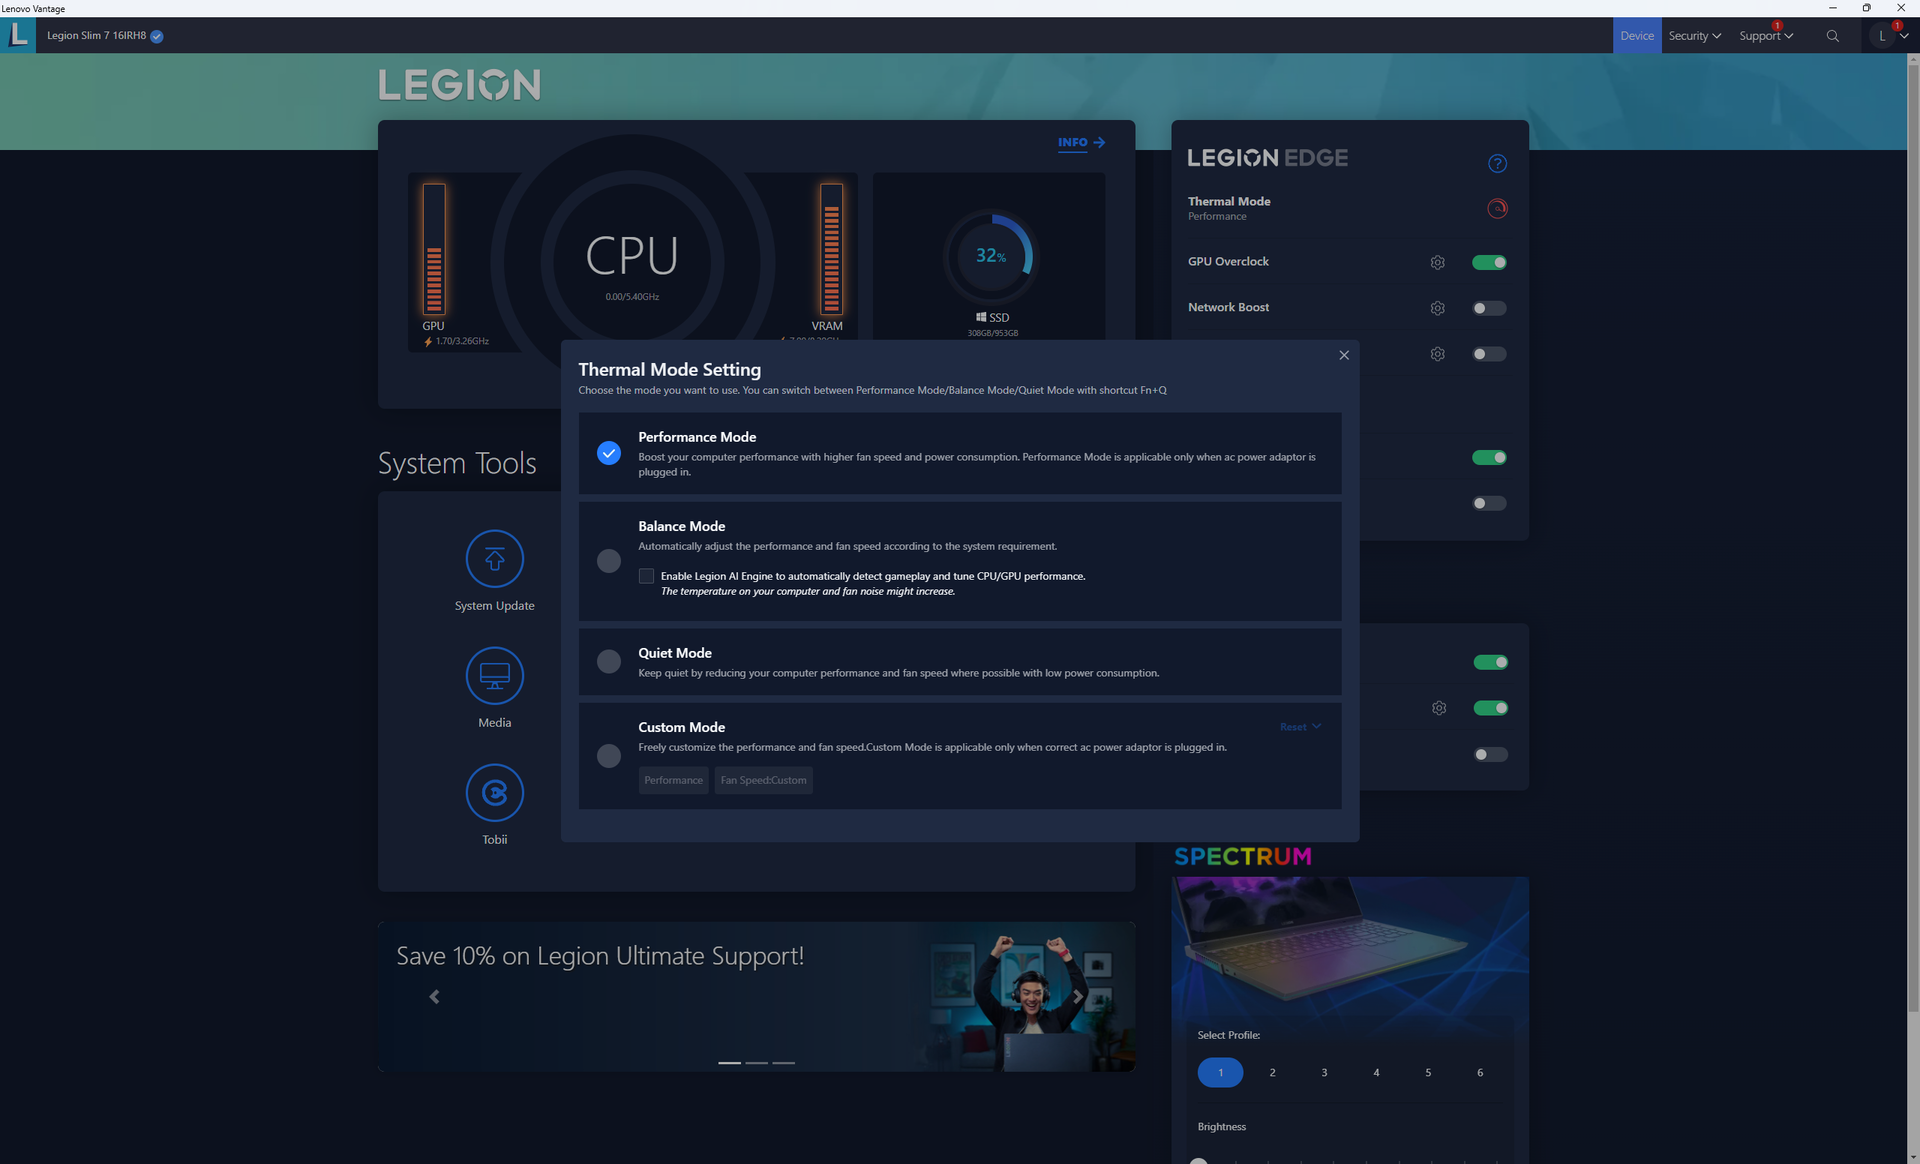
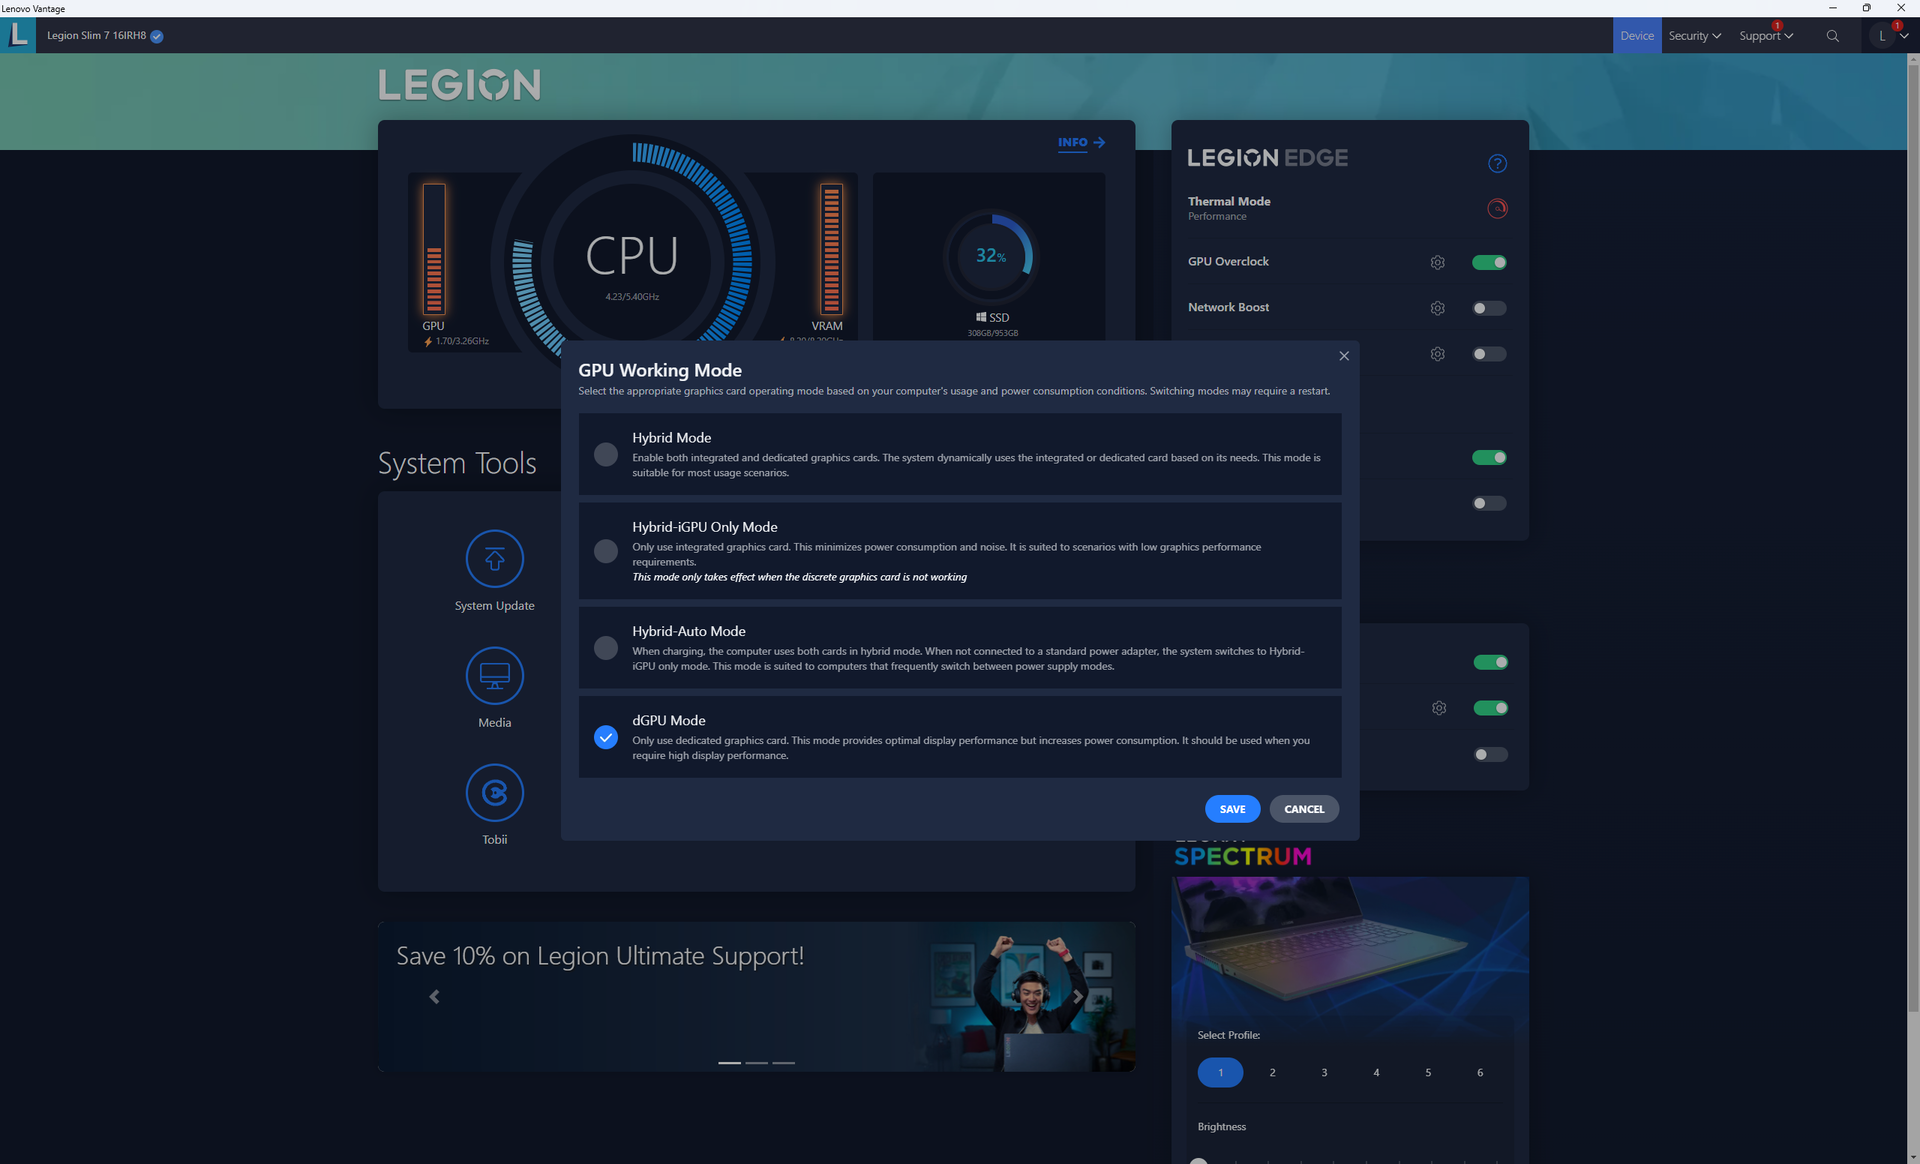
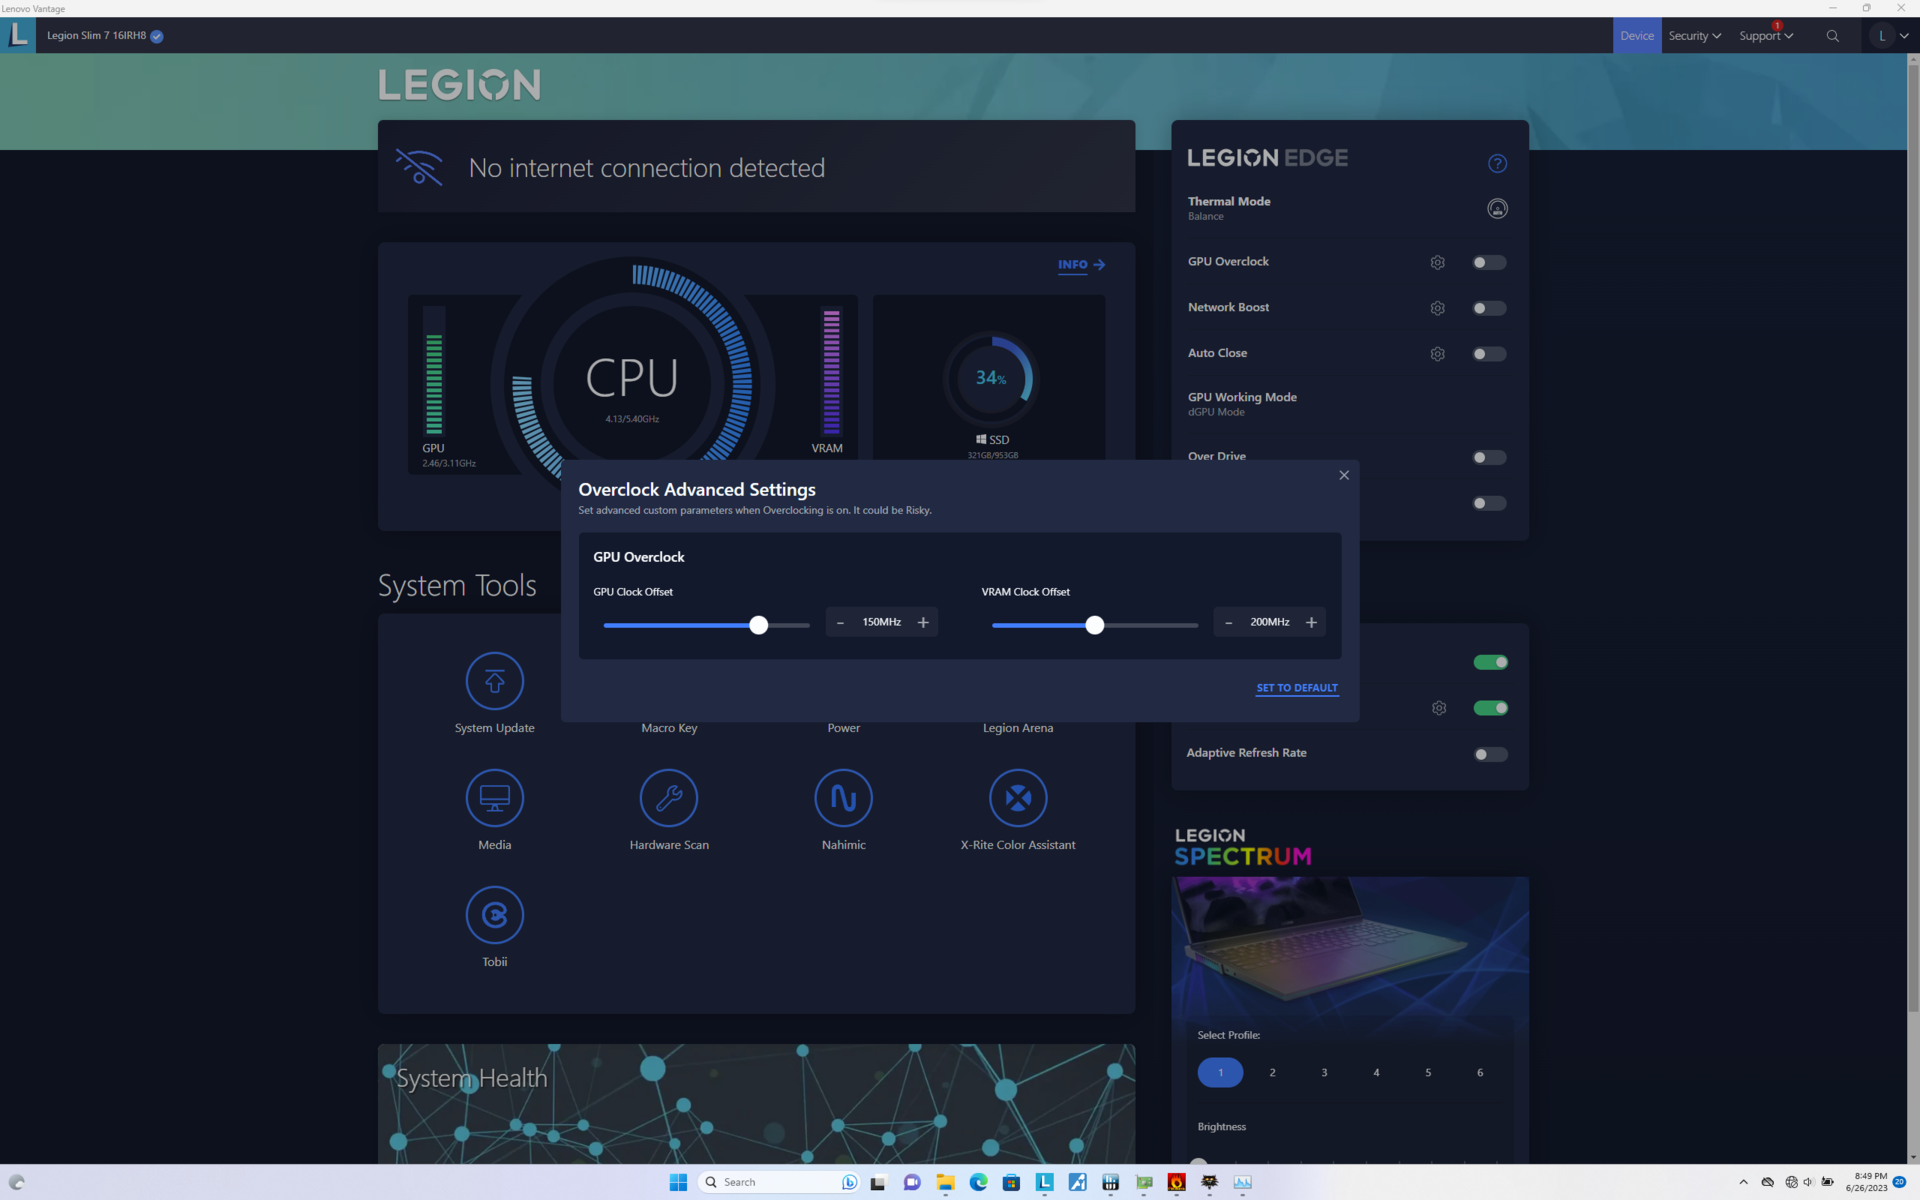
We set our unit to dGPU mode and Performance mode with both GPU Overclock and Overdrive active prior to running the benchmarks below. Lenovo Vantage is the control center for adjusting performance, updates, warranty, RGB, and other features.
Advanced Optimus or MUX is supported.
It's important to note that our unit has an unoccupied SODIMM slot and so it is running on 16 GB of single-channel soldered RAM only. AIDA64 memory benchmark results are therefore much lower than on most other gaming laptops.
Processor
The Raptor Lake-H Core i9-13900H offers a respectable 25 percent boost in multi-thread performance over the Alder Lake-H Core i9-12900H. Most notably, it performs essentially identically to the more expensive Core i7-13700HX and Core i9-13900HK. If you ever find yourself deciding between any of these three 13th gen CPUs, then the Core i9-13900H option would be the best bang for the buck.
Downgrading to the base Core i7-13700H configuration is expected to decrease processor performance by about 20 to 25 percent.
Cinebench R15 Multi Loop
Cinebench R20: CPU (Multi Core) | CPU (Single Core)
Cinebench R23: Multi Core | Single Core
Cinebench R15: CPU Multi 64Bit | CPU Single 64Bit
Blender: v2.79 BMW27 CPU
7-Zip 18.03: 7z b 4 | 7z b 4 -mmt1
Geekbench 5.5: Multi-Core | Single-Core
HWBOT x265 Benchmark v2.2: 4k Preset
LibreOffice : 20 Documents To PDF
R Benchmark 2.5: Overall mean
* ... smaller is better
AIDA64: FP32 Ray-Trace | FPU Julia | CPU SHA3 | CPU Queen | FPU SinJulia | FPU Mandel | CPU AES | CPU ZLib | FP64 Ray-Trace | CPU PhotoWorxx
| Performance rating | |
| Lenovo Legion Pro 7 RTX4090 | |
| Asus ROG Strix G16 G614JZ | |
| Razer Blade 16 Early 2023 | |
| Alienware x16 R1 | |
| HP Omen 16-wf000 | |
| Lenovo Legion Slim 7i 16 Gen 8 | |
| Average Intel Core i9-13900H | |
| AIDA64 / FP32 Ray-Trace | |
| Asus ROG Strix G16 G614JZ | |
| Lenovo Legion Pro 7 RTX4090 | |
| Razer Blade 16 Early 2023 | |
| Razer Blade 16 Early 2023 | |
| Razer Blade 16 Early 2023 | |
| HP Omen 16-wf000 | |
| Alienware x16 R1 | |
| Lenovo Legion Slim 7i 16 Gen 8 | |
| Average Intel Core i9-13900H (6788 - 19557, n=25) | |
| AIDA64 / CPU Queen | |
| Asus ROG Strix G16 G614JZ | |
| Lenovo Legion Pro 7 RTX4090 | |
| Razer Blade 16 Early 2023 | |
| Razer Blade 16 Early 2023 | |
| Lenovo Legion Slim 7i 16 Gen 8 | |
| Alienware x16 R1 | |
| Average Intel Core i9-13900H (65121 - 120936, n=25) | |
| HP Omen 16-wf000 | |
| AIDA64 / FPU SinJulia | |
| Asus ROG Strix G16 G614JZ | |
| Razer Blade 16 Early 2023 | |
| Razer Blade 16 Early 2023 | |
| Razer Blade 16 Early 2023 | |
| Lenovo Legion Pro 7 RTX4090 | |
| HP Omen 16-wf000 | |
| Alienware x16 R1 | |
| Lenovo Legion Slim 7i 16 Gen 8 | |
| Average Intel Core i9-13900H (6108 - 11631, n=25) | |
| AIDA64 / FP64 Ray-Trace | |
| Asus ROG Strix G16 G614JZ | |
| Lenovo Legion Pro 7 RTX4090 | |
| Razer Blade 16 Early 2023 | |
| Razer Blade 16 Early 2023 | |
| Razer Blade 16 Early 2023 | |
| HP Omen 16-wf000 | |
| Alienware x16 R1 | |
| Lenovo Legion Slim 7i 16 Gen 8 | |
| Average Intel Core i9-13900H (3655 - 10716, n=25) | |
| AIDA64 / CPU PhotoWorxx | |
| Razer Blade 16 Early 2023 | |
| Razer Blade 16 Early 2023 | |
| Razer Blade 16 Early 2023 | |
| Lenovo Legion Pro 7 RTX4090 | |
| Alienware x16 R1 | |
| HP Omen 16-wf000 | |
| Average Intel Core i9-13900H (10871 - 50488, n=25) | |
| Asus ROG Strix G16 G614JZ | |
| Lenovo Legion Slim 7i 16 Gen 8 | |
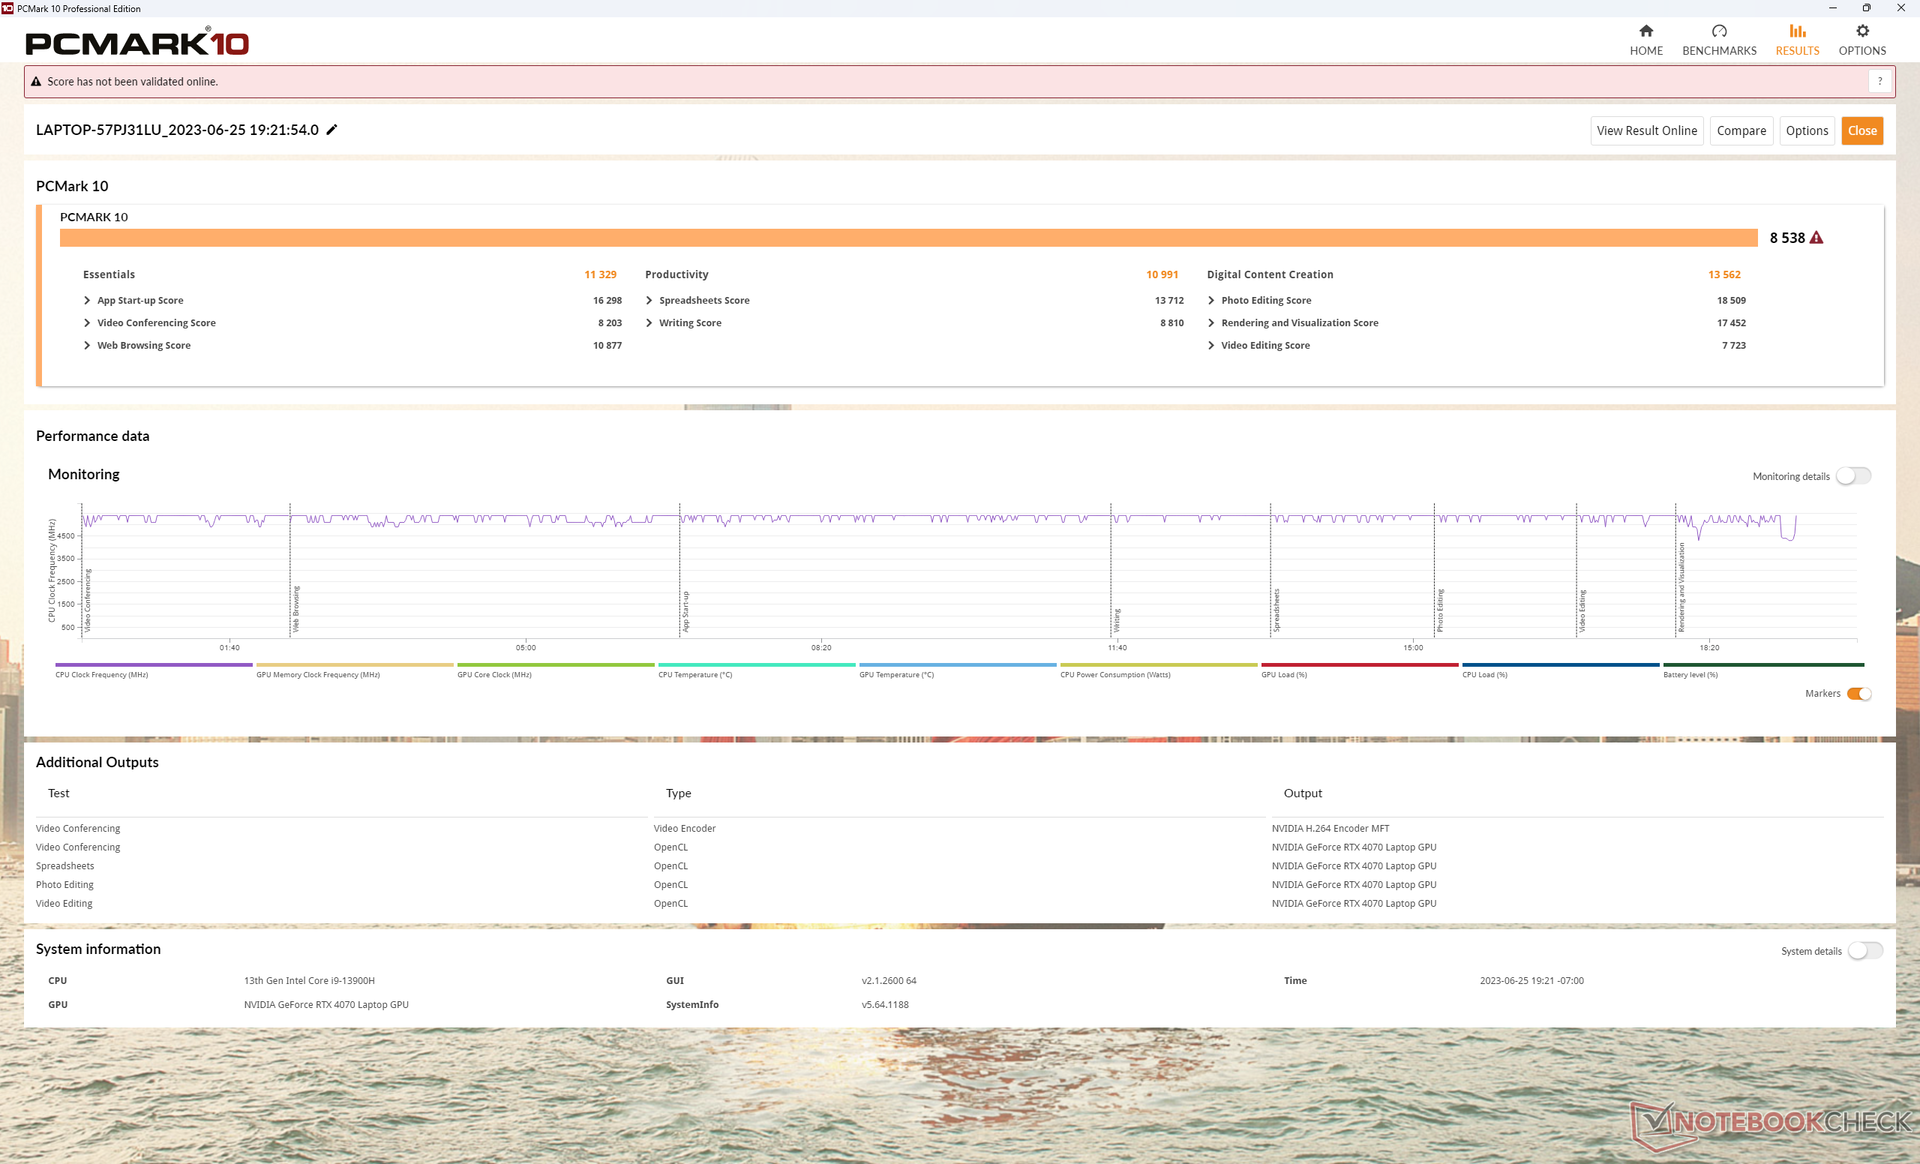
System Performance
PCMark results are excellent with results that are comparable to other high-end gaming laptops. However, we experienced wake-from-sleep issues where the laptop would frequently take up to 10 seconds before the screen would properly turn on compared to just a couple of seconds at most on other laptops.
CrossMark: Overall | Productivity | Creativity | Responsiveness
| PCMark 10 / Score | |
| Lenovo Legion Slim 7i 16 Gen 8 | |
| Alienware x16 R1 | |
| Lenovo Legion Pro 7 RTX4090 | |
| Razer Blade 16 Early 2023 | |
| HP Omen 16-wf000 | |
| Average Intel Core i9-13900H, NVIDIA GeForce RTX 4070 Laptop GPU (5855 - 8538, n=8) | |
| Asus ROG Strix G16 G614JZ | |
| PCMark 10 / Essentials | |
| Asus ROG Strix G16 G614JZ | |
| Lenovo Legion Slim 7i 16 Gen 8 | |
| Alienware x16 R1 | |
| Lenovo Legion Pro 7 RTX4090 | |
| Razer Blade 16 Early 2023 | |
| Average Intel Core i9-13900H, NVIDIA GeForce RTX 4070 Laptop GPU (8835 - 11940, n=8) | |
| HP Omen 16-wf000 | |
| PCMark 10 / Productivity | |
| Lenovo Legion Slim 7i 16 Gen 8 | |
| Alienware x16 R1 | |
| Average Intel Core i9-13900H, NVIDIA GeForce RTX 4070 Laptop GPU (7967 - 10991, n=8) | |
| HP Omen 16-wf000 | |
| Lenovo Legion Pro 7 RTX4090 | |
| Razer Blade 16 Early 2023 | |
| Asus ROG Strix G16 G614JZ | |
| PCMark 10 / Digital Content Creation | |
| Lenovo Legion Pro 7 RTX4090 | |
| Razer Blade 16 Early 2023 | |
| Alienware x16 R1 | |
| Lenovo Legion Slim 7i 16 Gen 8 | |
| HP Omen 16-wf000 | |
| Average Intel Core i9-13900H, NVIDIA GeForce RTX 4070 Laptop GPU (7738 - 13575, n=8) | |
| Asus ROG Strix G16 G614JZ | |
| CrossMark / Overall | |
| Asus ROG Strix G16 G614JZ | |
| Lenovo Legion Slim 7i 16 Gen 8 | |
| Alienware x16 R1 | |
| Average Intel Core i9-13900H, NVIDIA GeForce RTX 4070 Laptop GPU (1104 - 1974, n=7) | |
| HP Omen 16-wf000 | |
| Razer Blade 16 Early 2023 | |
| CrossMark / Productivity | |
| Asus ROG Strix G16 G614JZ | |
| Lenovo Legion Slim 7i 16 Gen 8 | |
| Alienware x16 R1 | |
| Average Intel Core i9-13900H, NVIDIA GeForce RTX 4070 Laptop GPU (1058 - 1914, n=7) | |
| HP Omen 16-wf000 | |
| Razer Blade 16 Early 2023 | |
| CrossMark / Creativity | |
| Asus ROG Strix G16 G614JZ | |
| Lenovo Legion Slim 7i 16 Gen 8 | |
| Alienware x16 R1 | |
| Average Intel Core i9-13900H, NVIDIA GeForce RTX 4070 Laptop GPU (1178 - 2254, n=7) | |
| HP Omen 16-wf000 | |
| Razer Blade 16 Early 2023 | |
| CrossMark / Responsiveness | |
| Asus ROG Strix G16 G614JZ | |
| Alienware x16 R1 | |
| Lenovo Legion Slim 7i 16 Gen 8 | |
| Average Intel Core i9-13900H, NVIDIA GeForce RTX 4070 Laptop GPU (1037 - 1952, n=7) | |
| HP Omen 16-wf000 | |
| Razer Blade 16 Early 2023 | |
| PCMark 10 Score | 8538 points | |
Help | ||
| AIDA64 / Memory Copy | |
| Razer Blade 16 Early 2023 | |
| Razer Blade 16 Early 2023 | |
| Razer Blade 16 Early 2023 | |
| Lenovo Legion Pro 7 RTX4090 | |
| Alienware x16 R1 | |
| HP Omen 16-wf000 | |
| Asus ROG Strix G16 G614JZ | |
| Average Intel Core i9-13900H (37448 - 74486, n=25) | |
| Lenovo Legion Slim 7i 16 Gen 8 | |
| AIDA64 / Memory Read | |
| Lenovo Legion Pro 7 RTX4090 | |
| Razer Blade 16 Early 2023 | |
| Razer Blade 16 Early 2023 | |
| Razer Blade 16 Early 2023 | |
| Asus ROG Strix G16 G614JZ | |
| Alienware x16 R1 | |
| HP Omen 16-wf000 | |
| Average Intel Core i9-13900H (41599 - 75433, n=25) | |
| Lenovo Legion Slim 7i 16 Gen 8 | |
| AIDA64 / Memory Write | |
| Alienware x16 R1 | |
| Razer Blade 16 Early 2023 | |
| Razer Blade 16 Early 2023 | |
| Razer Blade 16 Early 2023 | |
| Lenovo Legion Pro 7 RTX4090 | |
| HP Omen 16-wf000 | |
| Average Intel Core i9-13900H (36152 - 88505, n=25) | |
| Asus ROG Strix G16 G614JZ | |
| Lenovo Legion Slim 7i 16 Gen 8 | |
| AIDA64 / Memory Latency | |
| Alienware x16 R1 | |
| Razer Blade 16 Early 2023 | |
| Razer Blade 16 Early 2023 | |
| Razer Blade 16 Early 2023 | |
| Average Intel Core i9-13900H (75.8 - 102.3, n=25) | |
| Asus ROG Strix G16 G614JZ | |
| HP Omen 16-wf000 | |
| Lenovo Legion Pro 7 RTX4090 | |
| Lenovo Legion Slim 7i 16 Gen 8 | |
* ... smaller is better
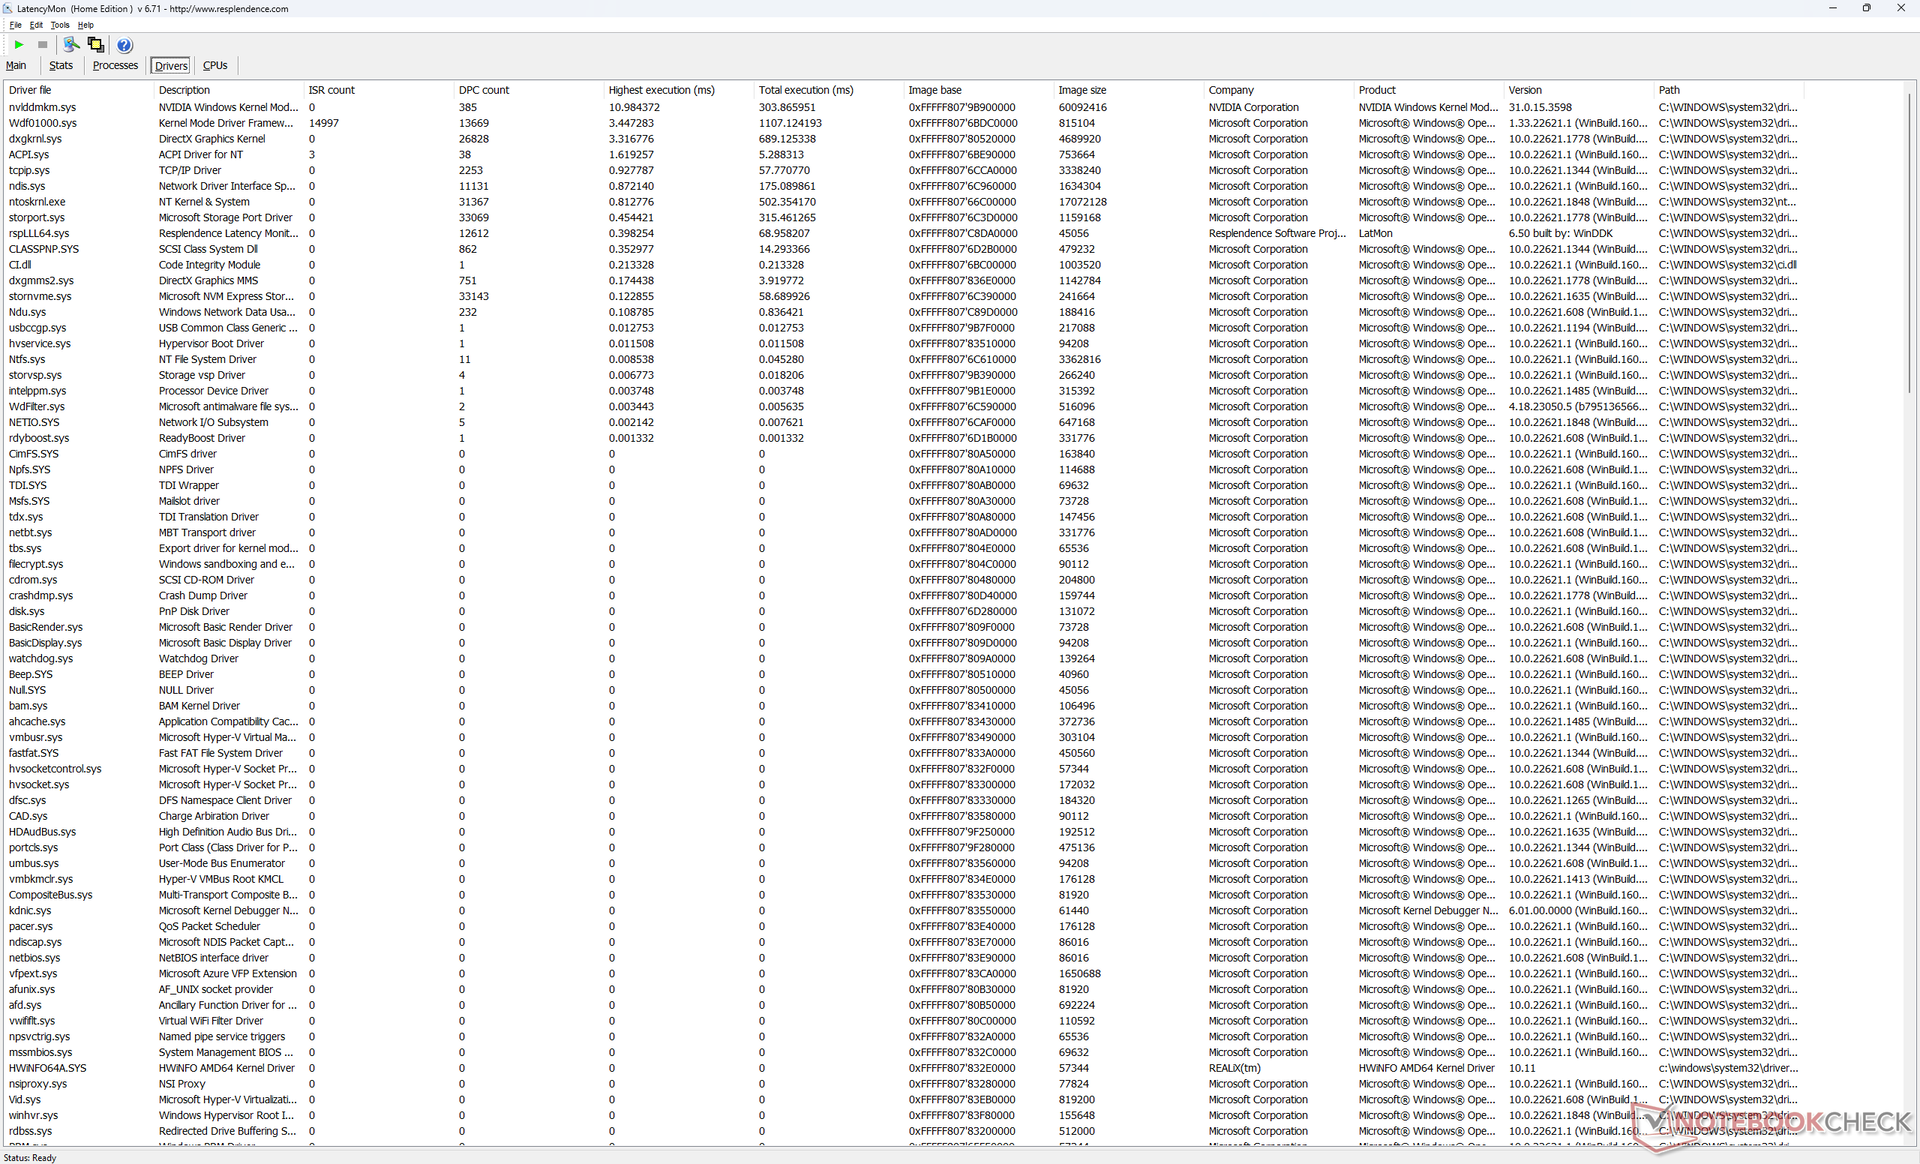
DPC Latency
LatencyMon reveals DPC issues related to the Nvidia NVLDDMKM driver much like what we observed on the Legion Pro 7 even after several retries. 4K video playback at 60 FPS is nearly perfect with just one dropped frame during our test video.

| DPC Latencies / LatencyMon - interrupt to process latency (max), Web, Youtube, Prime95 | |
| Lenovo Legion Pro 7 RTX4090 | |
| Lenovo Legion Slim 7i 16 Gen 8 | |
| HP Omen 16-wf000 | |
| Asus ROG Strix G16 G614JZ | |
| Razer Blade 16 Early 2023 | |
| Alienware x16 R1 | |
* ... smaller is better
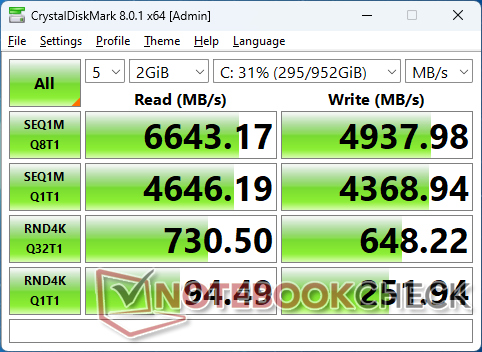
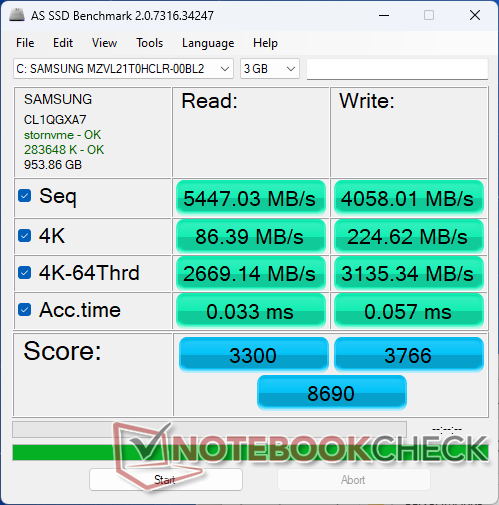
Storage Devices — Up To Two M.2 SSDs
Our unit ships with a 1 TB Samsung PM9A1 which is one of the fastest consumer-based PCIe4 x4 drives available. Unfortunately, transfer rates would throttle from 6700 MB/s to as low as 3300 MB/s when stressed as shown by our table below to suggest poor heat dissipation. The Razer Blade 14 ships with the exact same Samsung SSD and it would exhibit no such problems.

| Drive Performance rating - Percent | |
| Alienware x16 R1 | |
| Lenovo Legion Slim 7i 16 Gen 8 | |
| Lenovo Legion Pro 7 RTX4090 | |
| HP Omen 16-wf000 | |
| Razer Blade 16 Early 2023 | |
| Asus ROG Strix G16 G614JZ | |
* ... smaller is better
Disk Throttling: DiskSpd Read Loop, Queue Depth 8
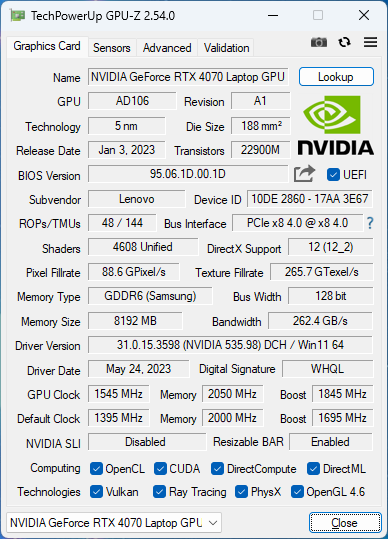
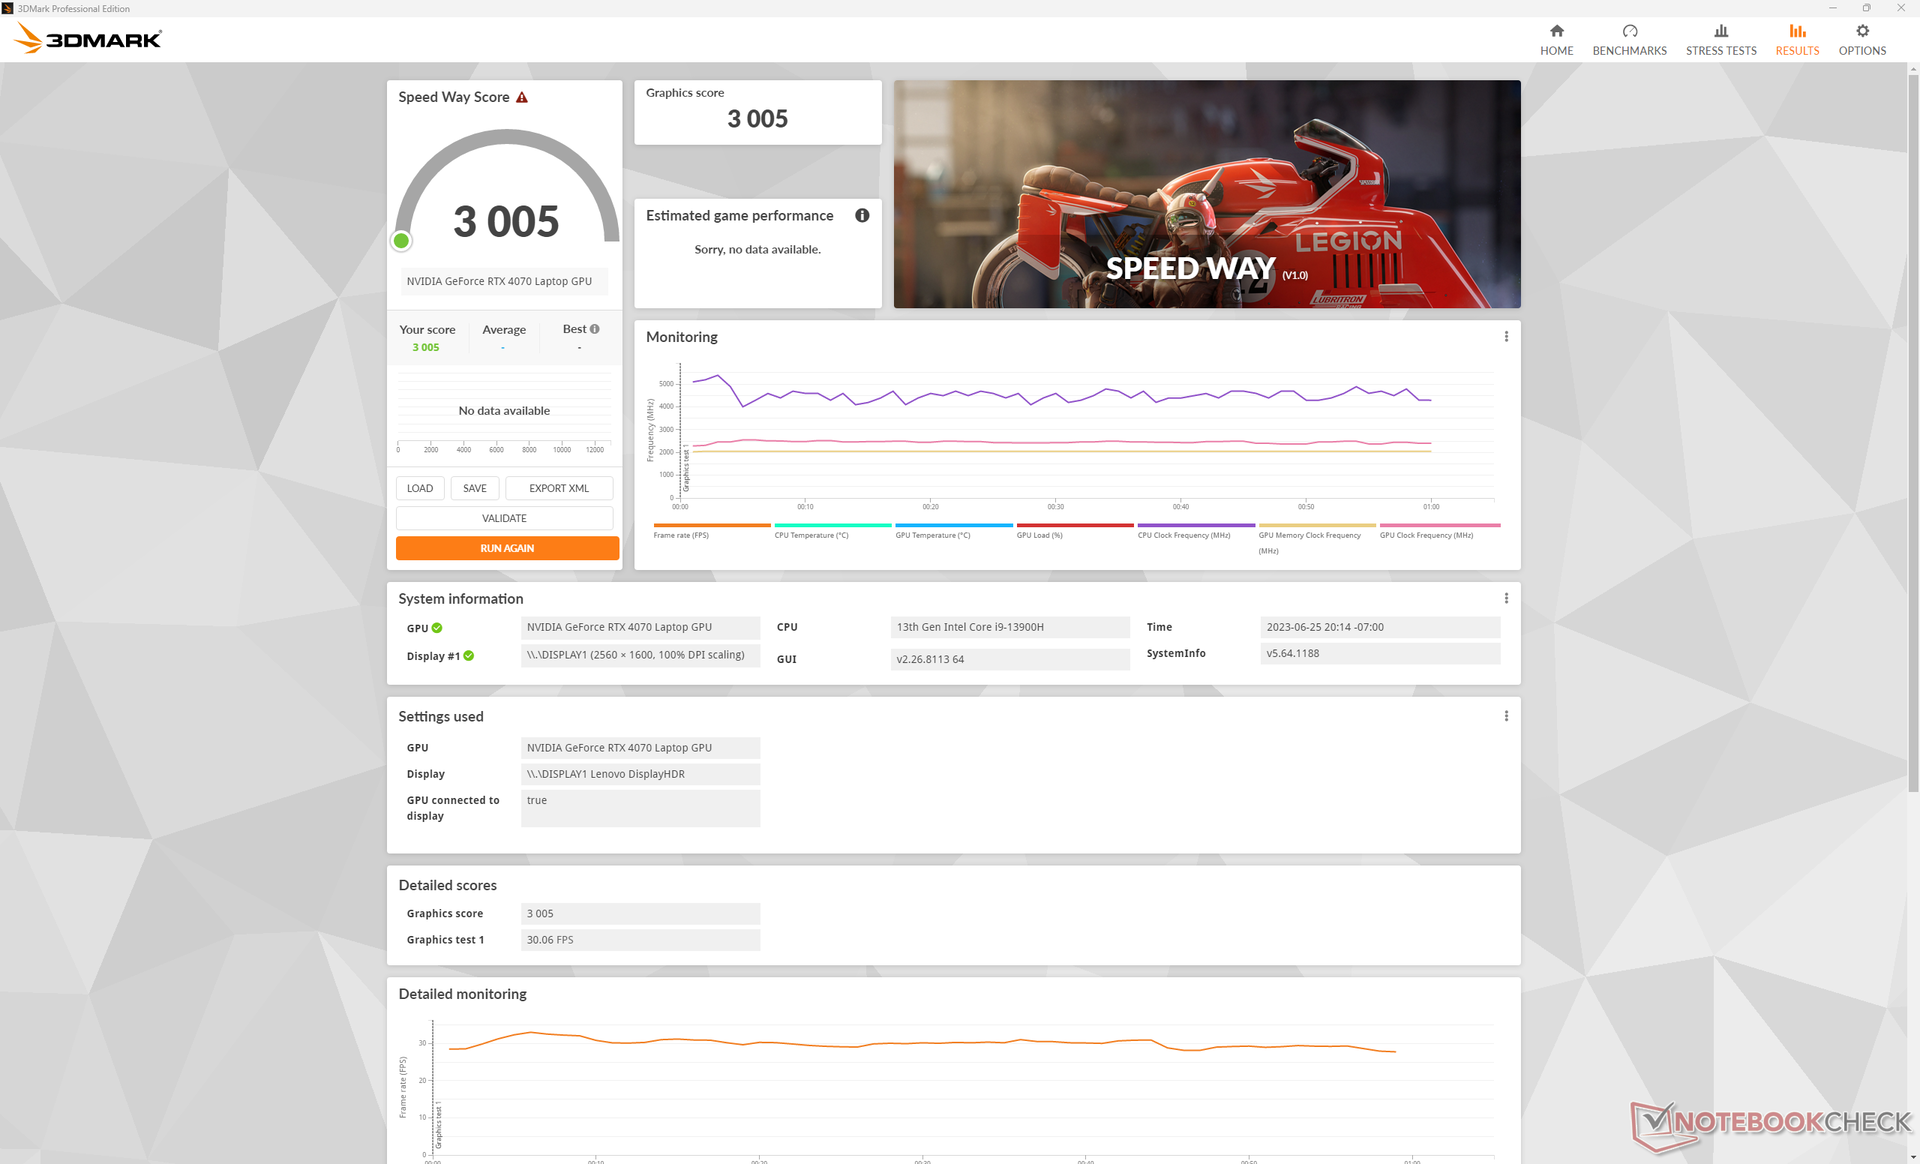
GPU Performance — 140 W RTX Graphics
Raw graphics performance is about 5 to 10 percent faster than the average laptop in our database with the same mobile RTX 4070 GPU. Overall performance is thus roughly on par with last year's mobile RTX 3080 Ti.
GPU performance drops by 5 percent if the Overclock feature is disabled. If on Balanced mode, CPU and GPU performance would fall by about 10 percent and 15 percent, respectively, as shown by the table below. Some users may prefer the quieter fans of Balanced mode even if it means slower performance.
Downgrading to the RTX 4060 configuration from our RTX 4070 is expected to impact GPU performance by roughly 10 to 15 percent based on our experience with the Legion Pro 5 16.
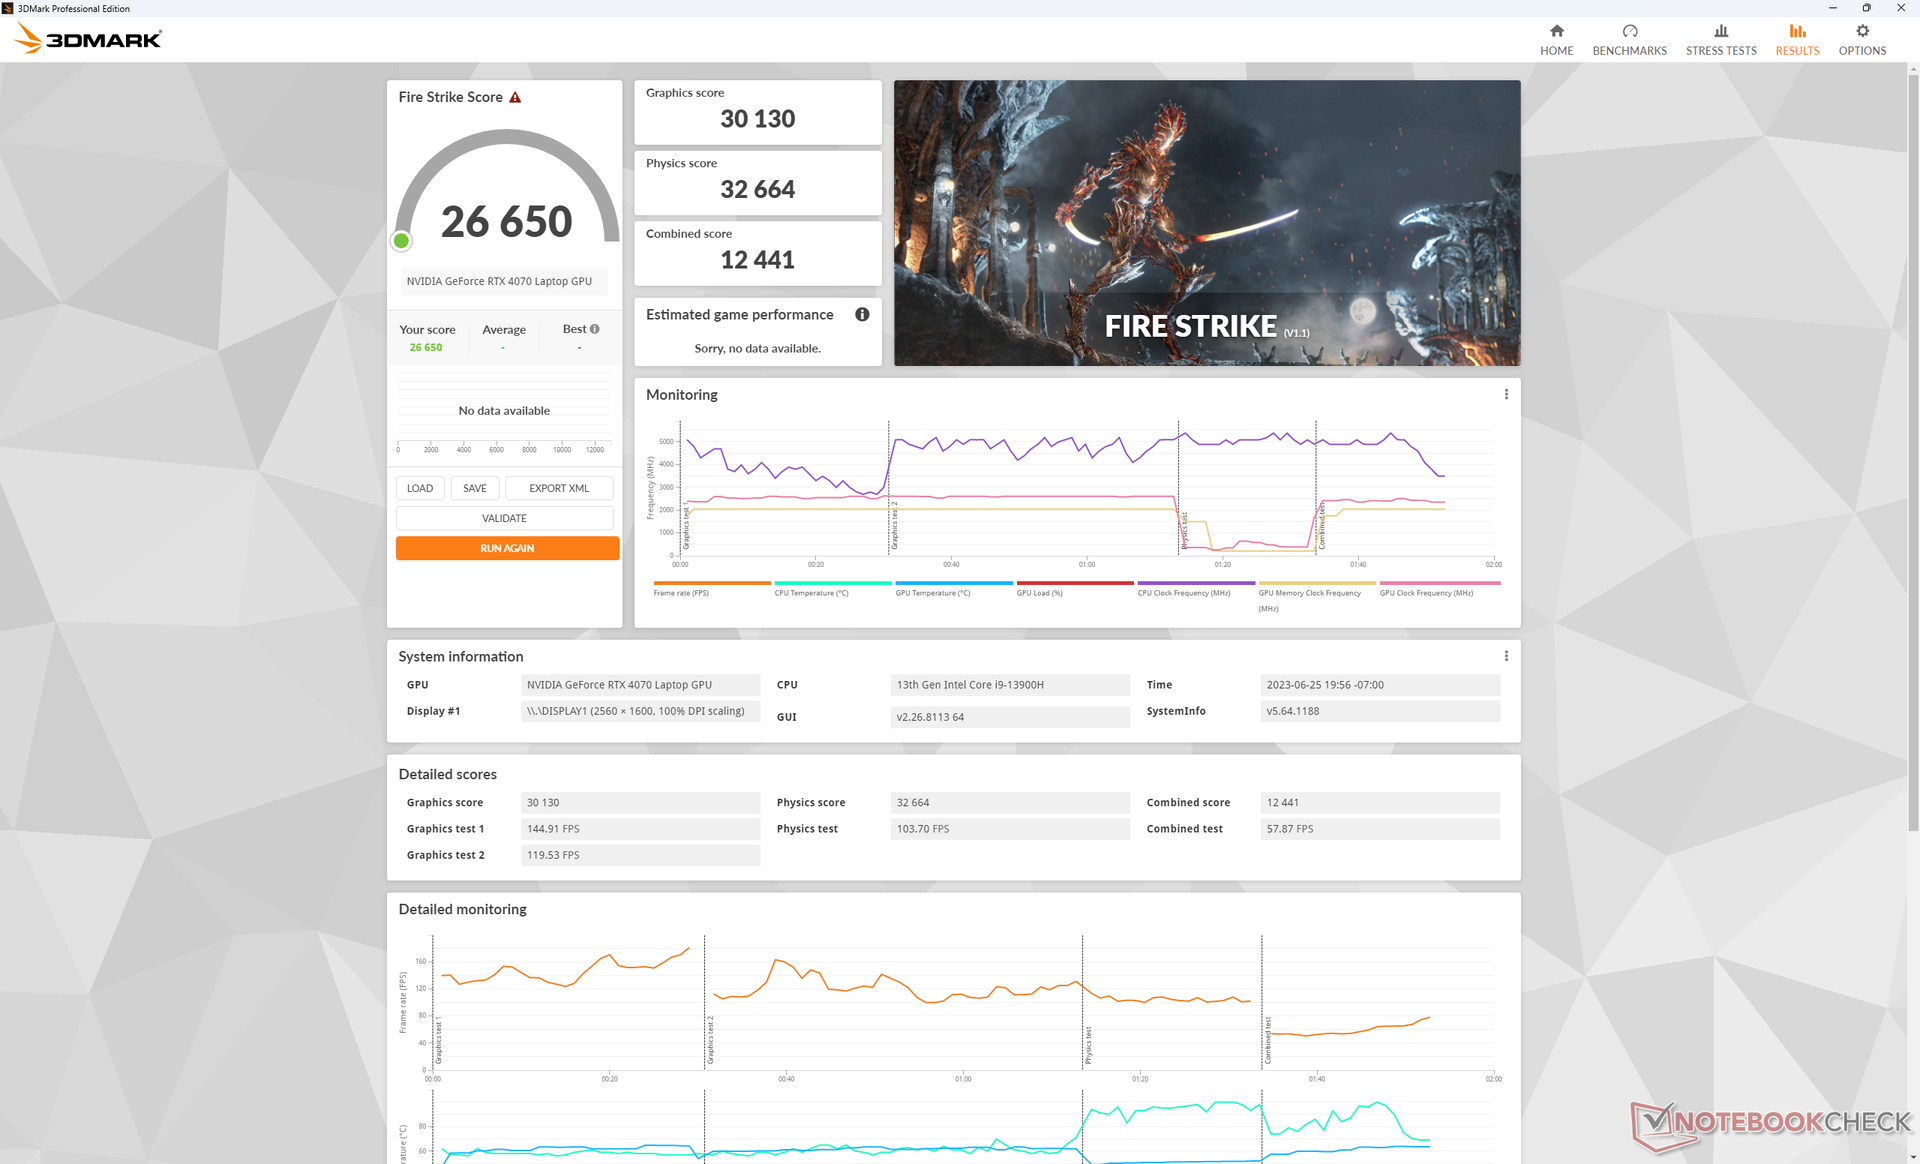
| Power Profile Setting | Fire Strike Physics Score | Fire Strike GPU Score | Fire Strike Combined Score |
| Performance + GPU Overclock On + Overdrive On | 32664 | 30130 | 12441 |
| Performance + GPU Overclock On + Overdrive Off | 32439 | 30153 | 13360 |
| Performance + GPU Overclock Off + Overdrive Off | 32550 | 28629 (-5%) | 12319 |
| Balanced | 27499 (-16%) | 27708 (-8%) | 11295 (-9%) |
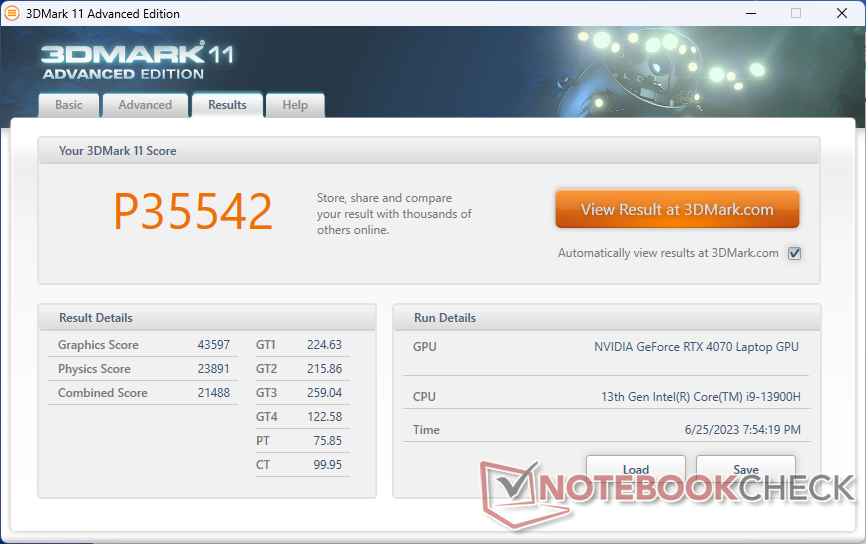
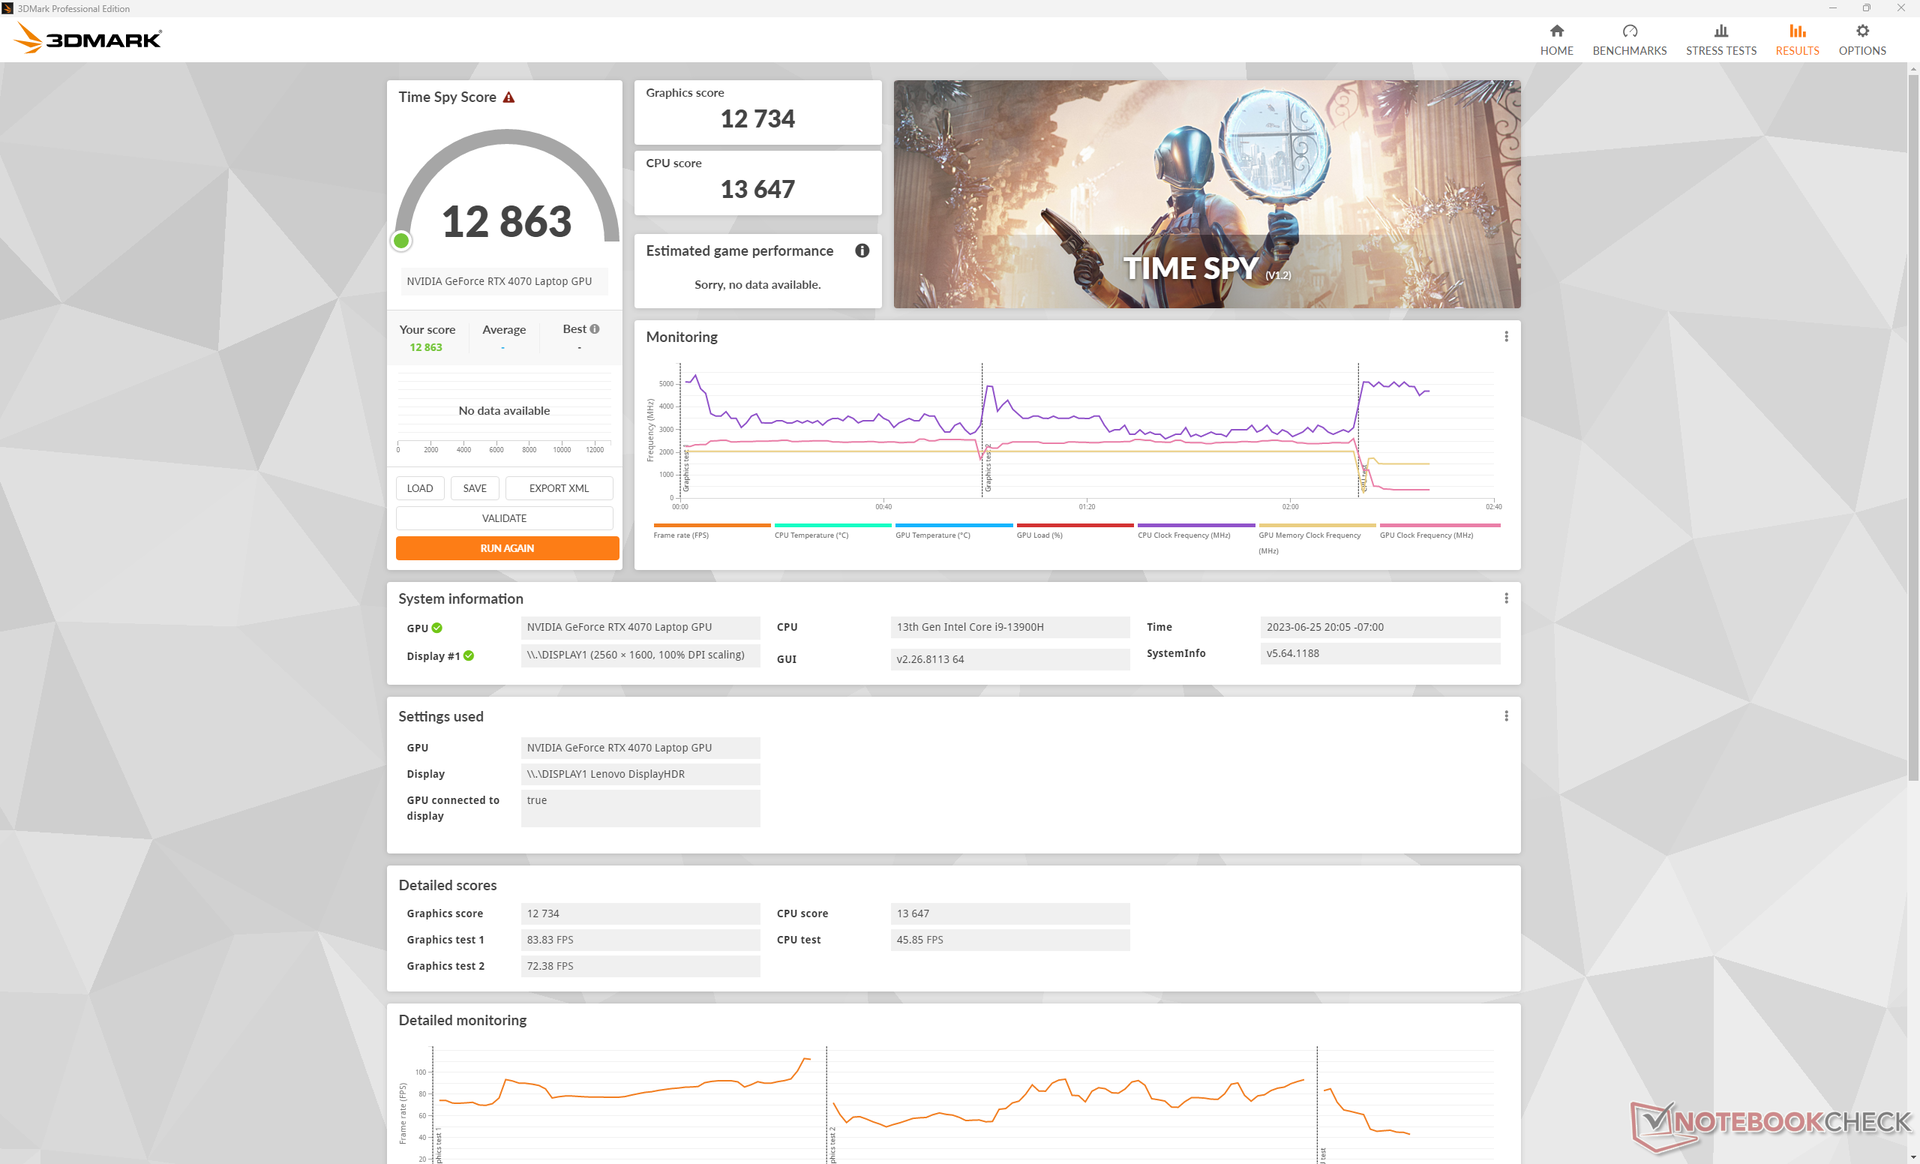
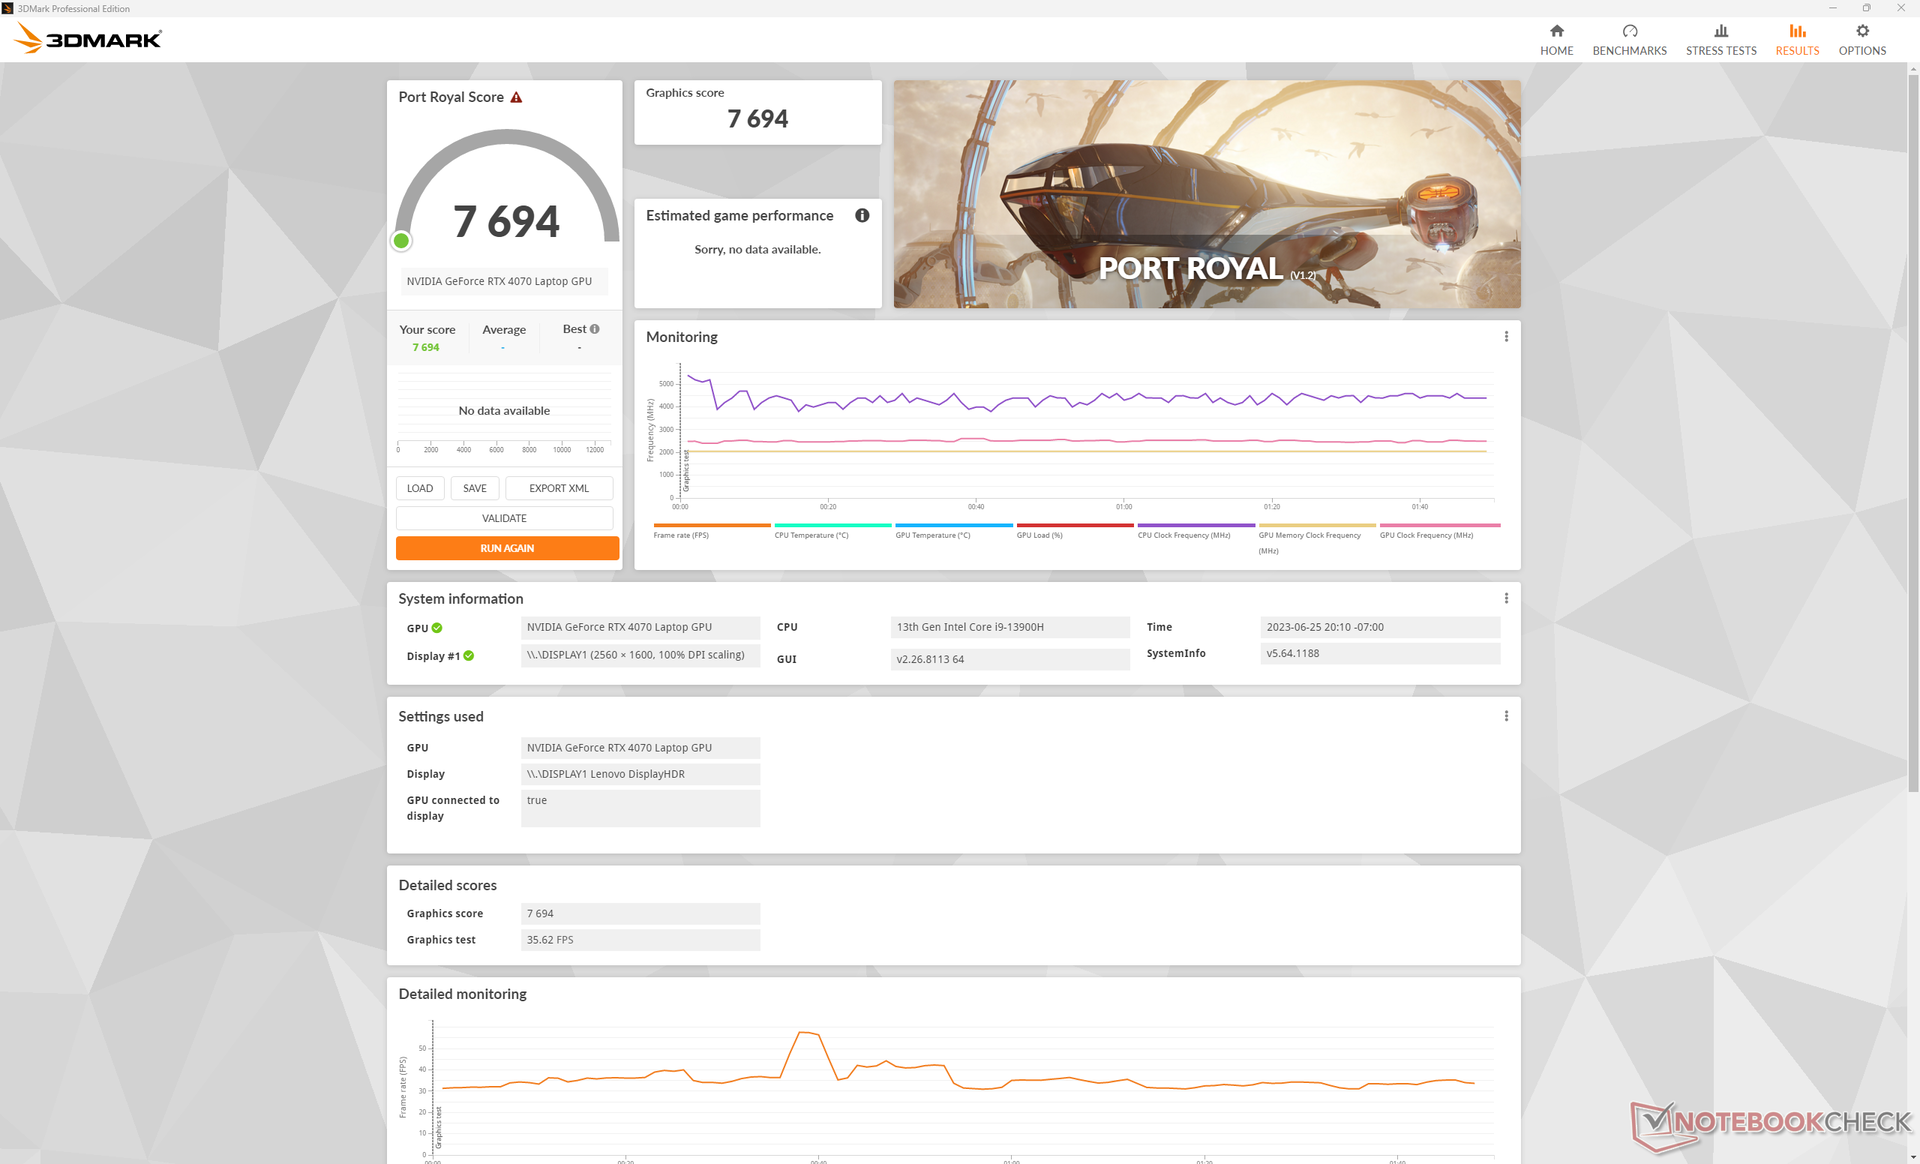
| 3DMark 11 Performance | 35542 points | |
| 3DMark Fire Strike Score | 26650 points | |
| 3DMark Time Spy Score | 12863 points | |
Help | ||
* ... smaller is better
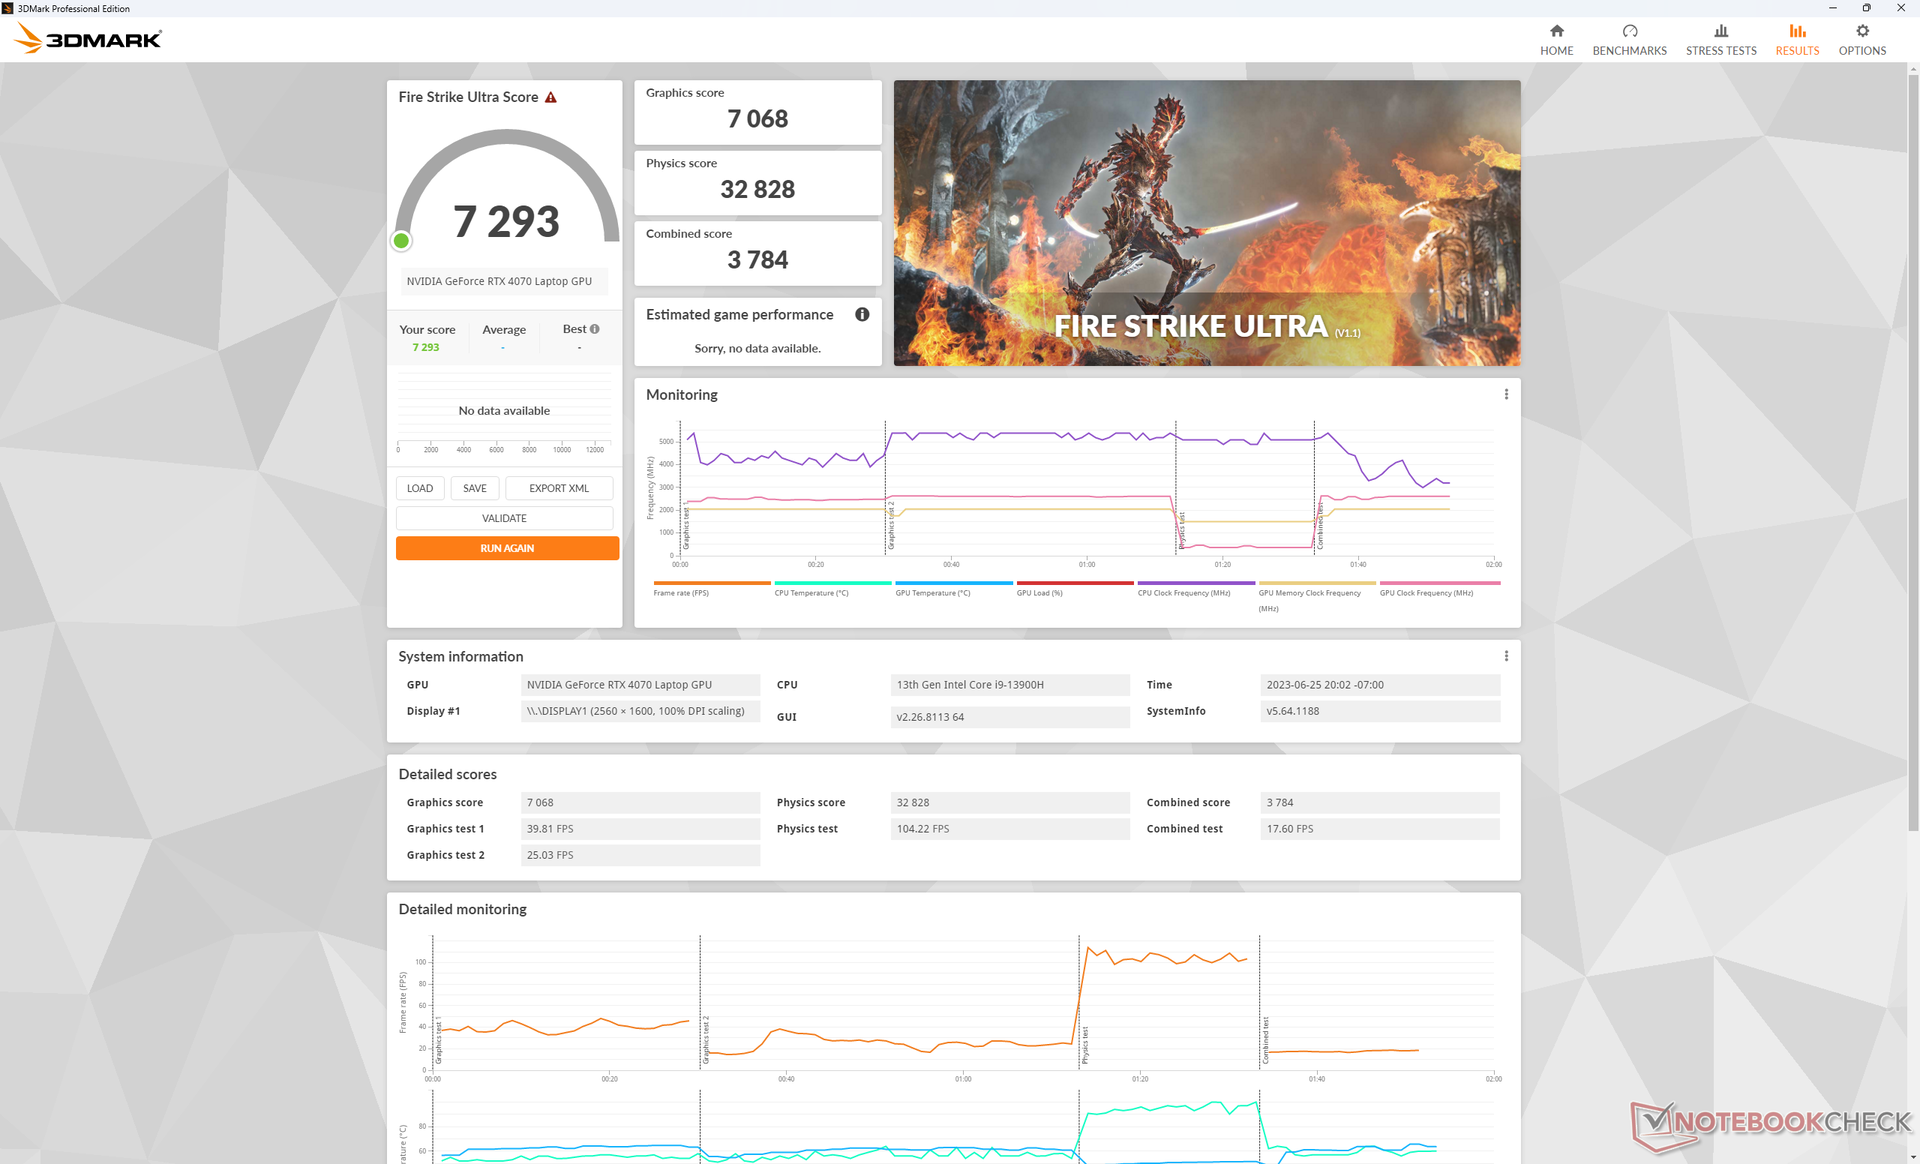
Gaming Performance
The mobile RTX 4070 works well for targeting 1440p/1600p and 60 FPS at High settings whereas the much faster desktop RTX 4070 Ti can target Ultra or maximum settings. Running Returnal on maximum 1440p settings with our Lenovo, for example, would barely crack the 50 FPS mark.
DLSS becomes much more important for when the RTX 4070 starts feeling underpowered. Running Cyberpunk 2077 in 4K Ultra settings, for example, would average just 23 FPS without DLSS to a more playable 38 FPS with DLSS2 enabled.
| Final Fantasy XV Benchmark - 1920x1080 High Quality | |
| Lenovo Legion Pro 7 RTX4090 | |
| Zotac Gaming GeForce RTX 4070 AMP Airo | |
| Alienware x16 R1 | |
| Lenovo Legion Slim 7i 16 Gen 8 | |
| Lenovo Legion Pro 5 16IRX8 | |
| Asus ROG Zephyrus Duo 16 GX650RX | |
| HP Omen 16-b1090ng | |
| Dell G16 7620 | |
| Strange Brigade - 1920x1080 ultra AA:ultra AF:16 | |
| Lenovo Legion Pro 7 RTX4090 | |
| Alienware x16 R1 | |
| Zotac Gaming GeForce RTX 4070 AMP Airo | |
| Lenovo Legion Slim 7i 16 Gen 8 | |
| Asus ROG Zephyrus Duo 16 GX650RX | |
| Dell G16 7620 | |
| HP Omen 16-b1090ng | |
Witcher 3 FPS Chart
| low | med. | high | ultra | QHD | 4K | |
|---|---|---|---|---|---|---|
| GTA V (2015) | 184 | 180.3 | 175 | 115.2 | 94.3 | 98.7 |
| The Witcher 3 (2015) | 459.3 | 356.8 | 225.9 | 117.9 | 70 | |
| Dota 2 Reborn (2015) | 203 | 183.2 | 175.8 | 165.3 | 141.3 | |
| Final Fantasy XV Benchmark (2018) | 213 | 168.8 | 122.7 | 91.4 | 51.5 | |
| X-Plane 11.11 (2018) | 182.9 | 158.7 | 122.4 | 105.7 | ||
| Strange Brigade (2018) | 483 | 316 | 259 | 228 | 149.2 | 75.7 |
| Cyberpunk 2077 1.6 (2022) | 138.3 | 141.9 | 106.1 | 91 | 54.4 | 23.1 |
| Tiny Tina's Wonderlands (2022) | 244.3 | 204.8 | 143.7 | 113.9 | 78.1 | 37 |
| F1 22 (2022) | 258 | 261 | 219 | 81.5 | 46.2 | 25.9 |
| Returnal (2023) | 83 | 81 | 76 | 61 | 52 | 27 |
Emissions
System Noise
The internal fans are always active at just under 26 dB(A) against a silent background of 23 dB(A). It's not loud enough to be distracting in most office of conference settings and they do an excellent job at remaining quiet for longer periods even when higher loads like 3DMark 06 are introduced.
Gaming on Performance mode would induce a steady fan noise of 54.4 dB(A) which is similar to the Alienware x16 R1 but louder than on the Blade 16. Dropping to Balanced mode trades away some performance as mentioned above for a noticeably quieter fan noise of 48.9 dB(A).
Noise level
| Idle |
| 23.6 / 23.6 / 25.7 dB(A) |
| Load |
| 27.6 / 54.4 dB(A) |
 | ||
30 dB silent 40 dB(A) audible 50 dB(A) loud |
||
min: | ||
| Lenovo Legion Slim 7i 16 Gen 8 GeForce RTX 4070 Laptop GPU, i9-13900H, Samsung PM9A1 MZVL21T0HCLR | HP Omen 16-wf000 GeForce RTX 4080 Laptop GPU, i7-13700HX, SK hynix PC801 HFS002TEJ9X101N | Alienware x16 R1 GeForce RTX 4080 Laptop GPU, i9-13900HK, SK hynix PC801 HFS001TEJ9X101N | Lenovo Legion Pro 7 RTX4090 GeForce RTX 4090 Laptop GPU, i9-13900HX, Samsung PM9A1 MZVL21T0HCLR | Asus ROG Strix G16 G614JZ GeForce RTX 4080 Laptop GPU, i9-13980HX, WD PC SN560 SDDPNQE-1T00 | Razer Blade 16 Early 2023 GeForce RTX 4080 Laptop GPU, i9-13950HX, SSSTC CA6-8D1024 | |
|---|---|---|---|---|---|---|
| Noise | -15% | -6% | -25% | -17% | -2% | |
| off / environment * (dB) | 22.8 | 23 -1% | 22.7 -0% | 25 -10% | 25 -10% | 23 -1% |
| Idle Minimum * (dB) | 23.6 | 29.6 -25% | 23.1 2% | 28 -19% | 26 -10% | 23 3% |
| Idle Average * (dB) | 23.6 | 29.8 -26% | 25.8 -9% | 30 -27% | 28 -19% | 23 3% |
| Idle Maximum * (dB) | 25.7 | 30.4 -18% | 25.8 -0% | 38 -48% | 30 -17% | 23.6 8% |
| Load Average * (dB) | 27.6 | 33.8 -22% | 39.3 -42% | 48 -74% | 48 -74% | 39 -41% |
| Witcher 3 ultra * (dB) | 54.4 | 57 -5% | 49.9 8% | 53 3% | 49 10% | 51.6 5% |
| Load Maximum * (dB) | 54.4 | 58.3 -7% | 54.8 -1% | 55 -1% | 52 4% | 51.3 6% |
* ... smaller is better
Temperature
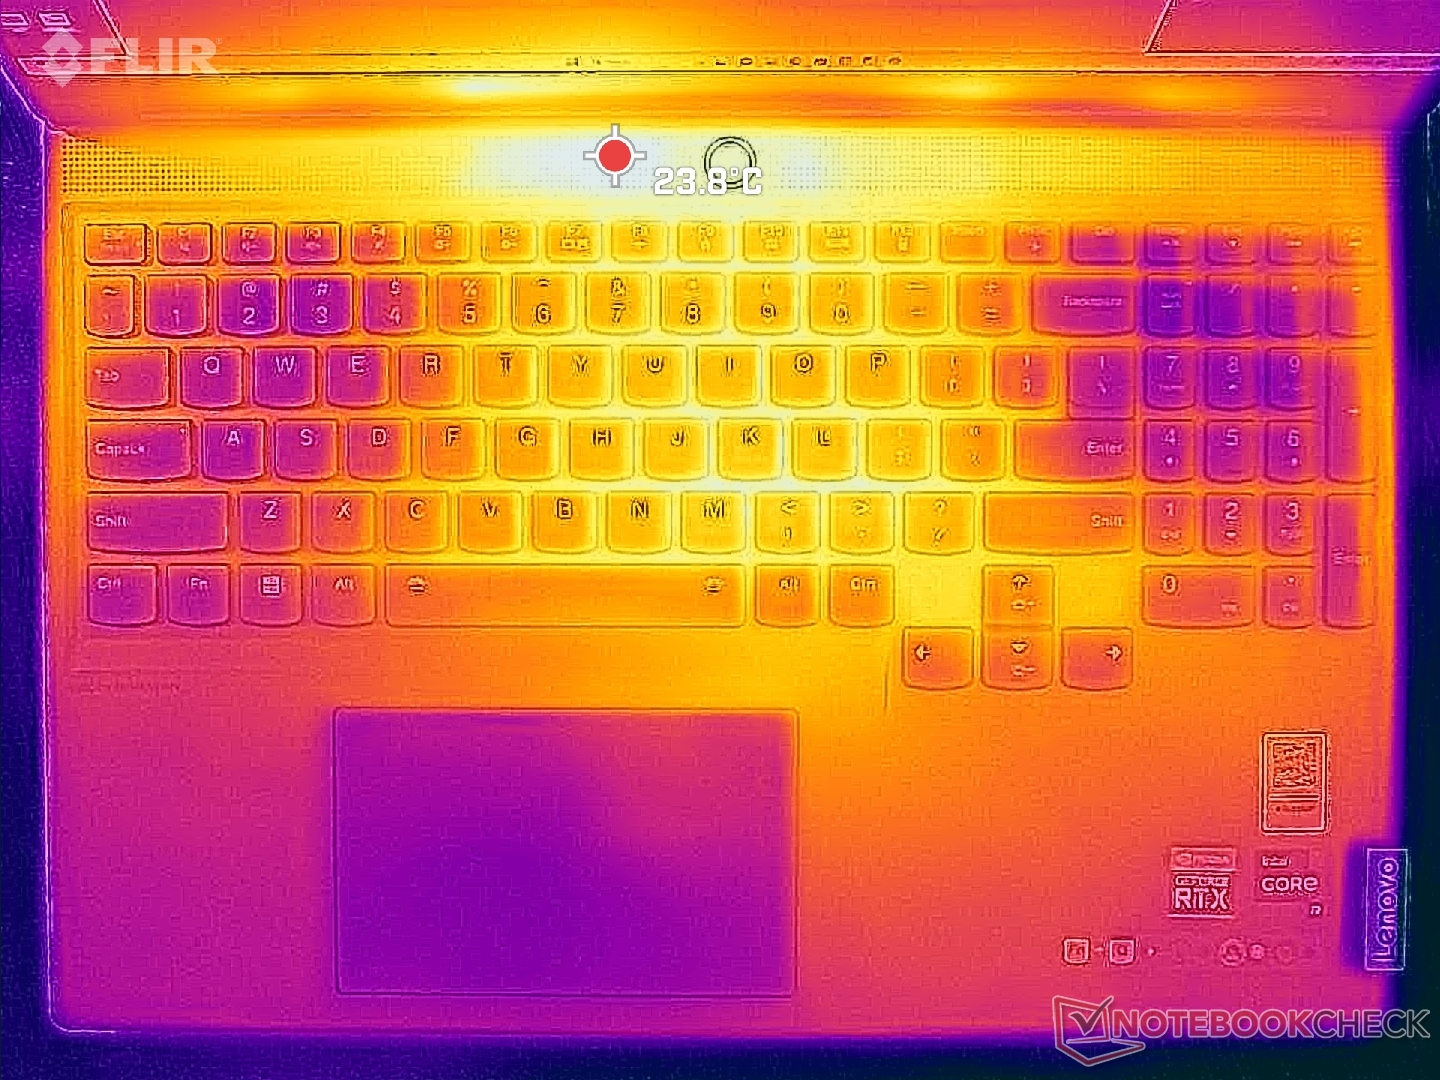
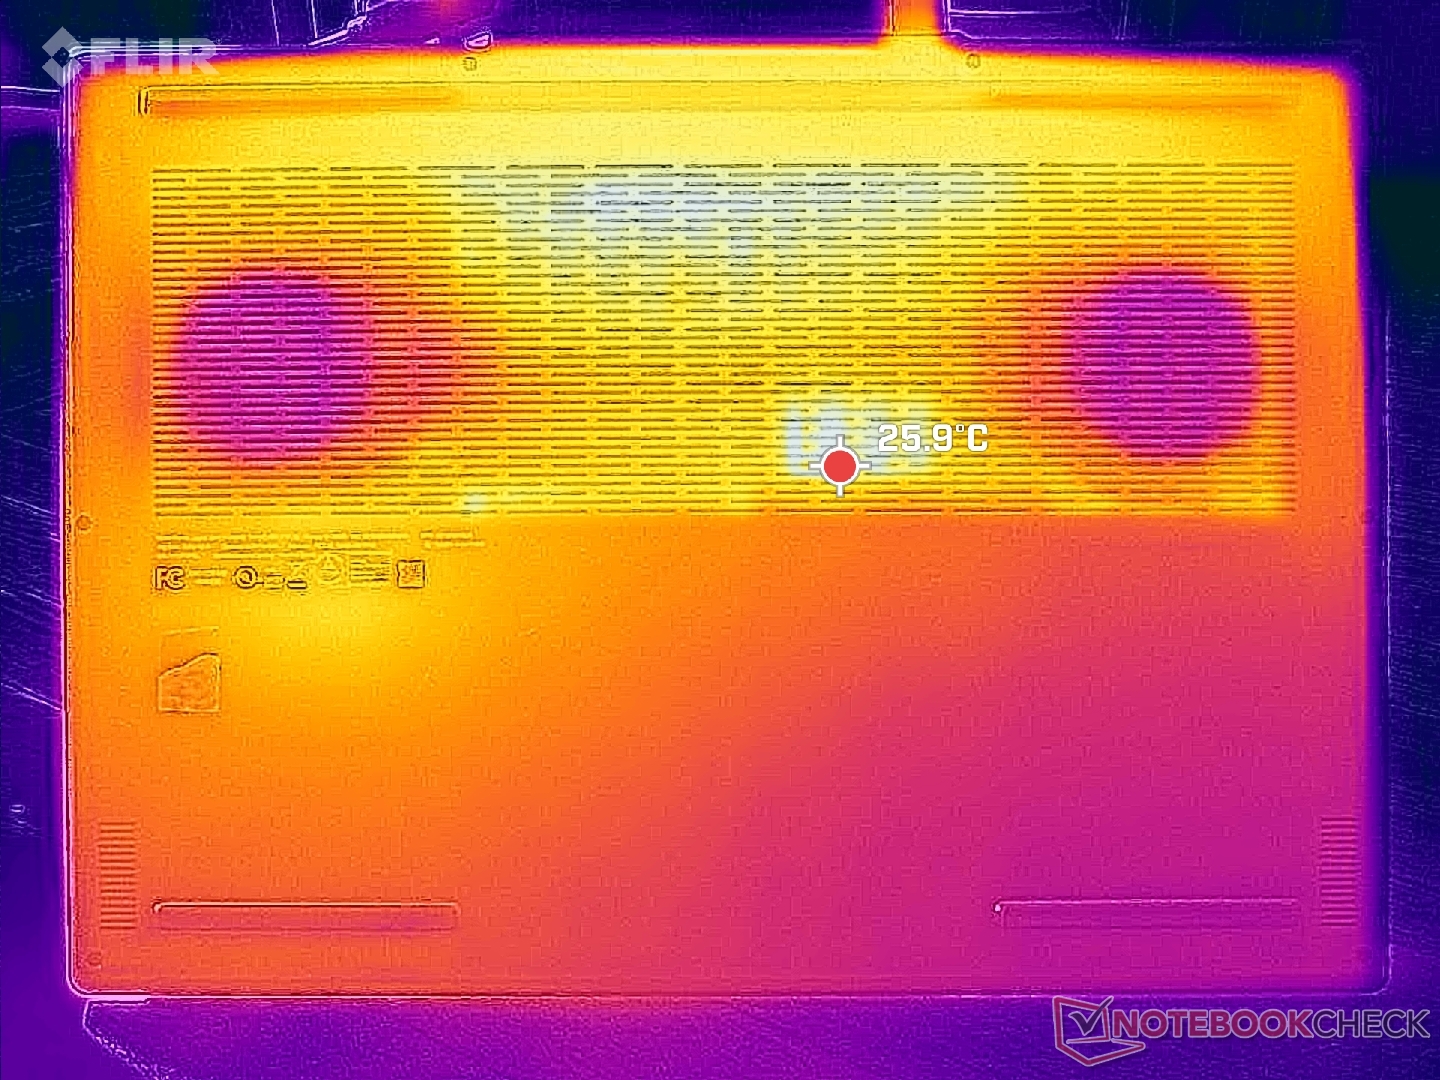
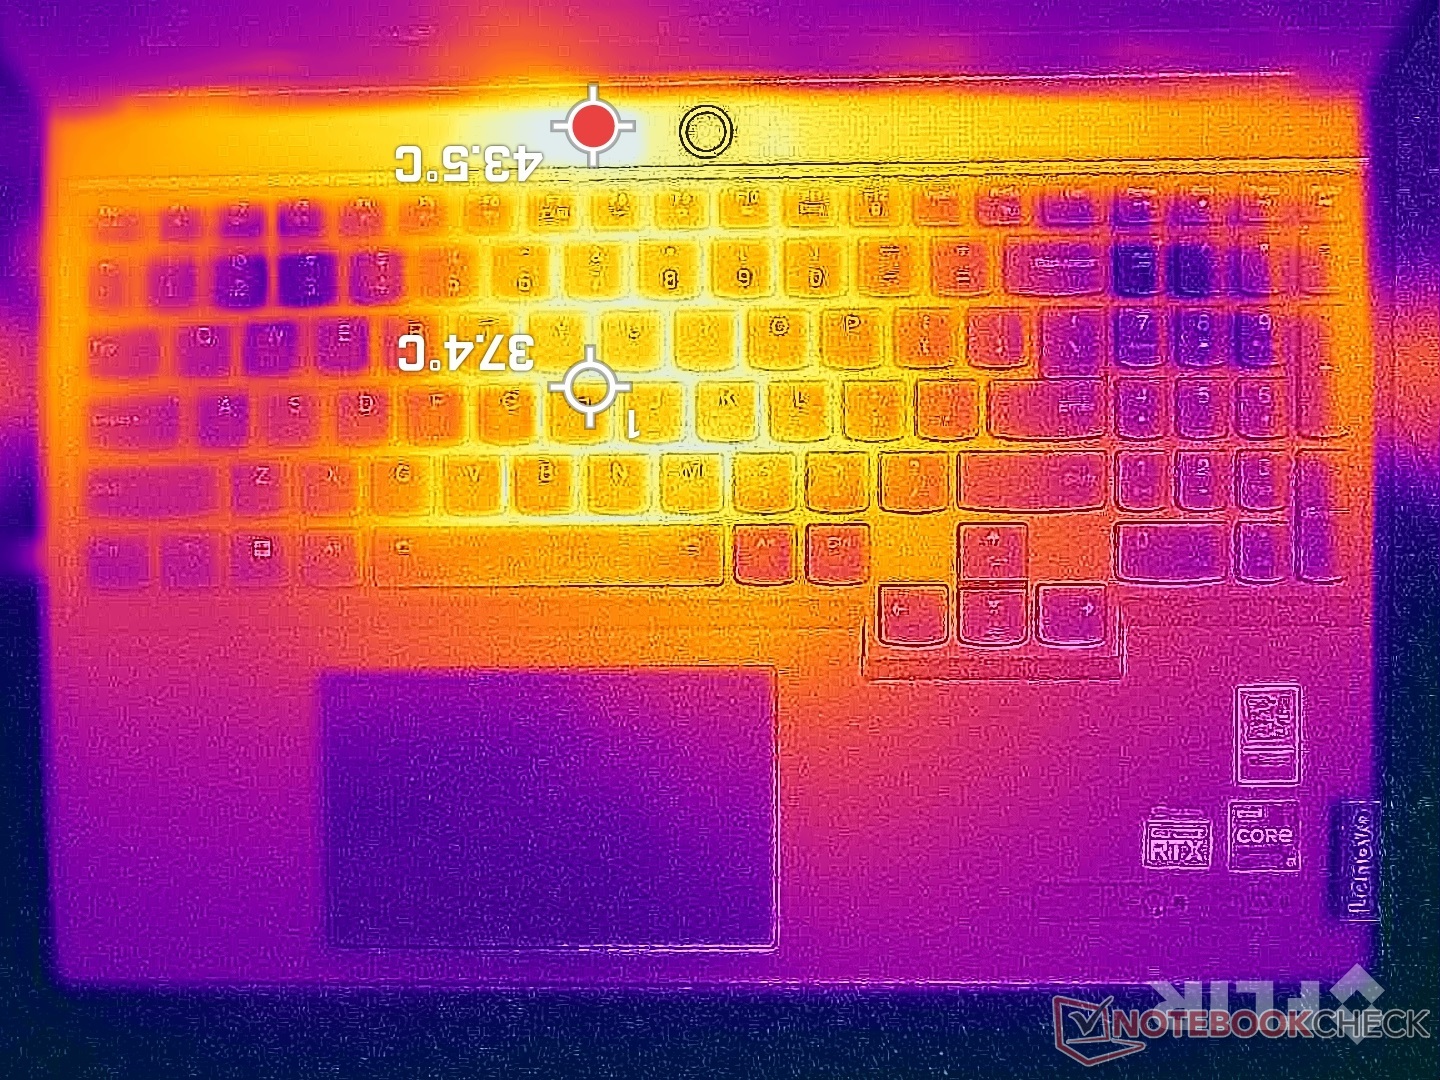
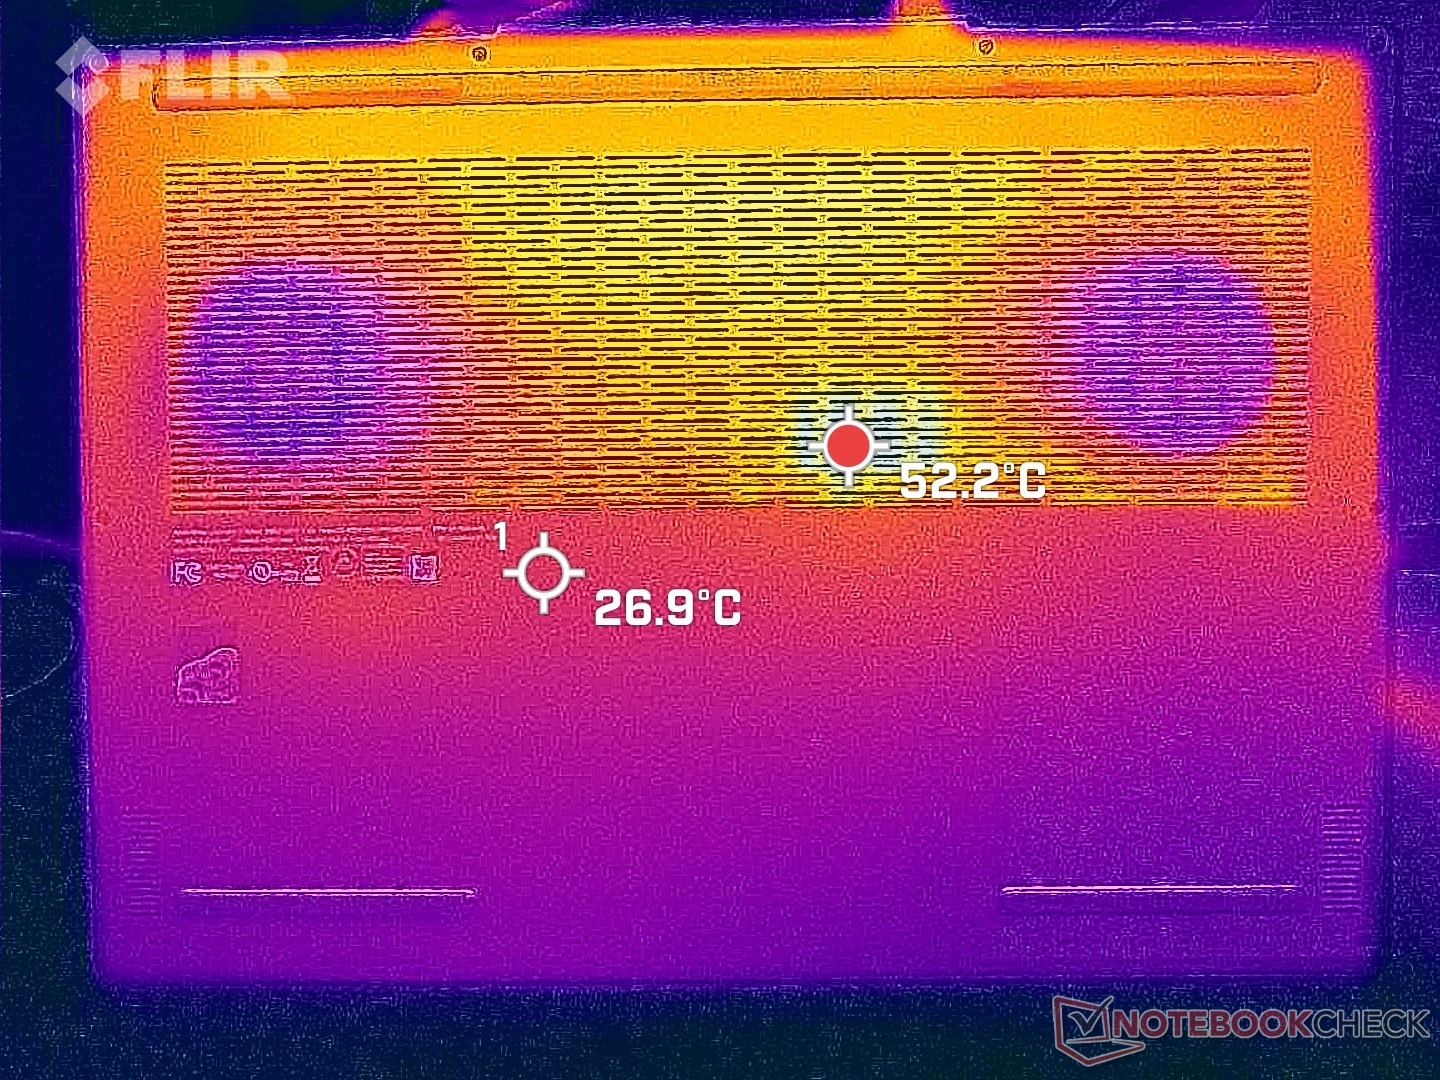
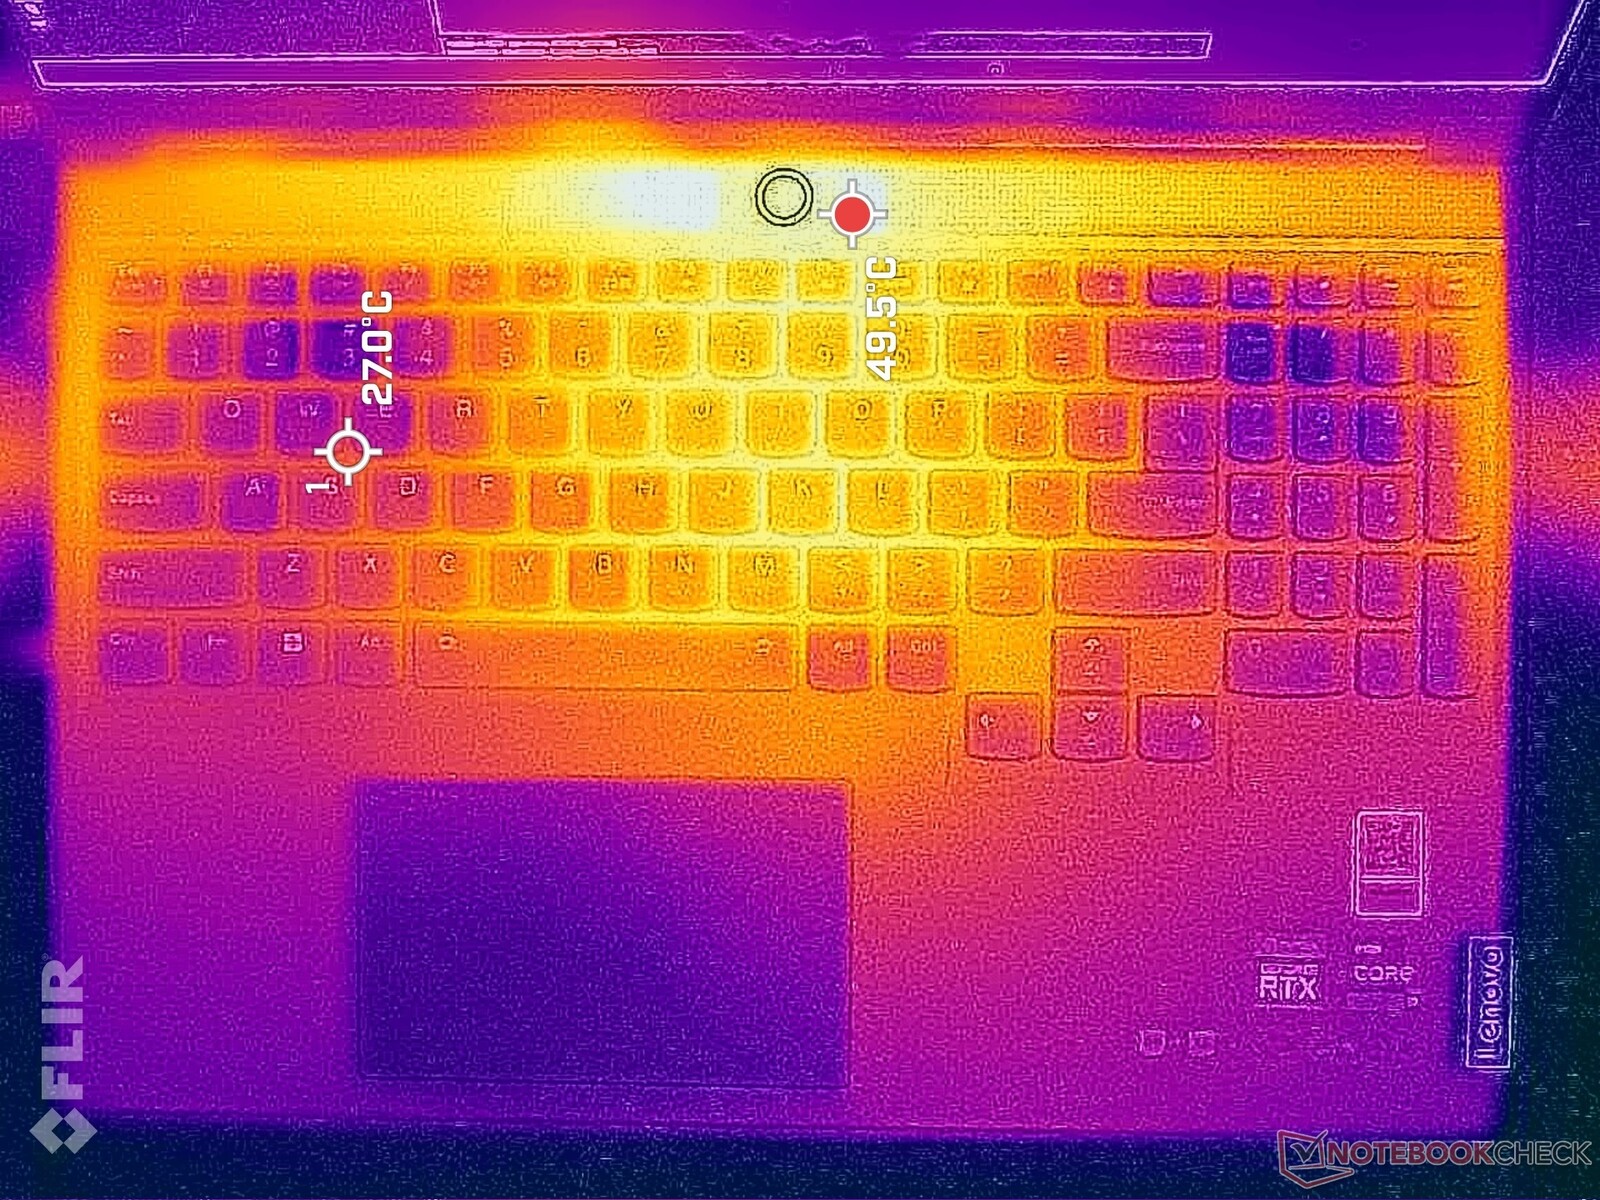
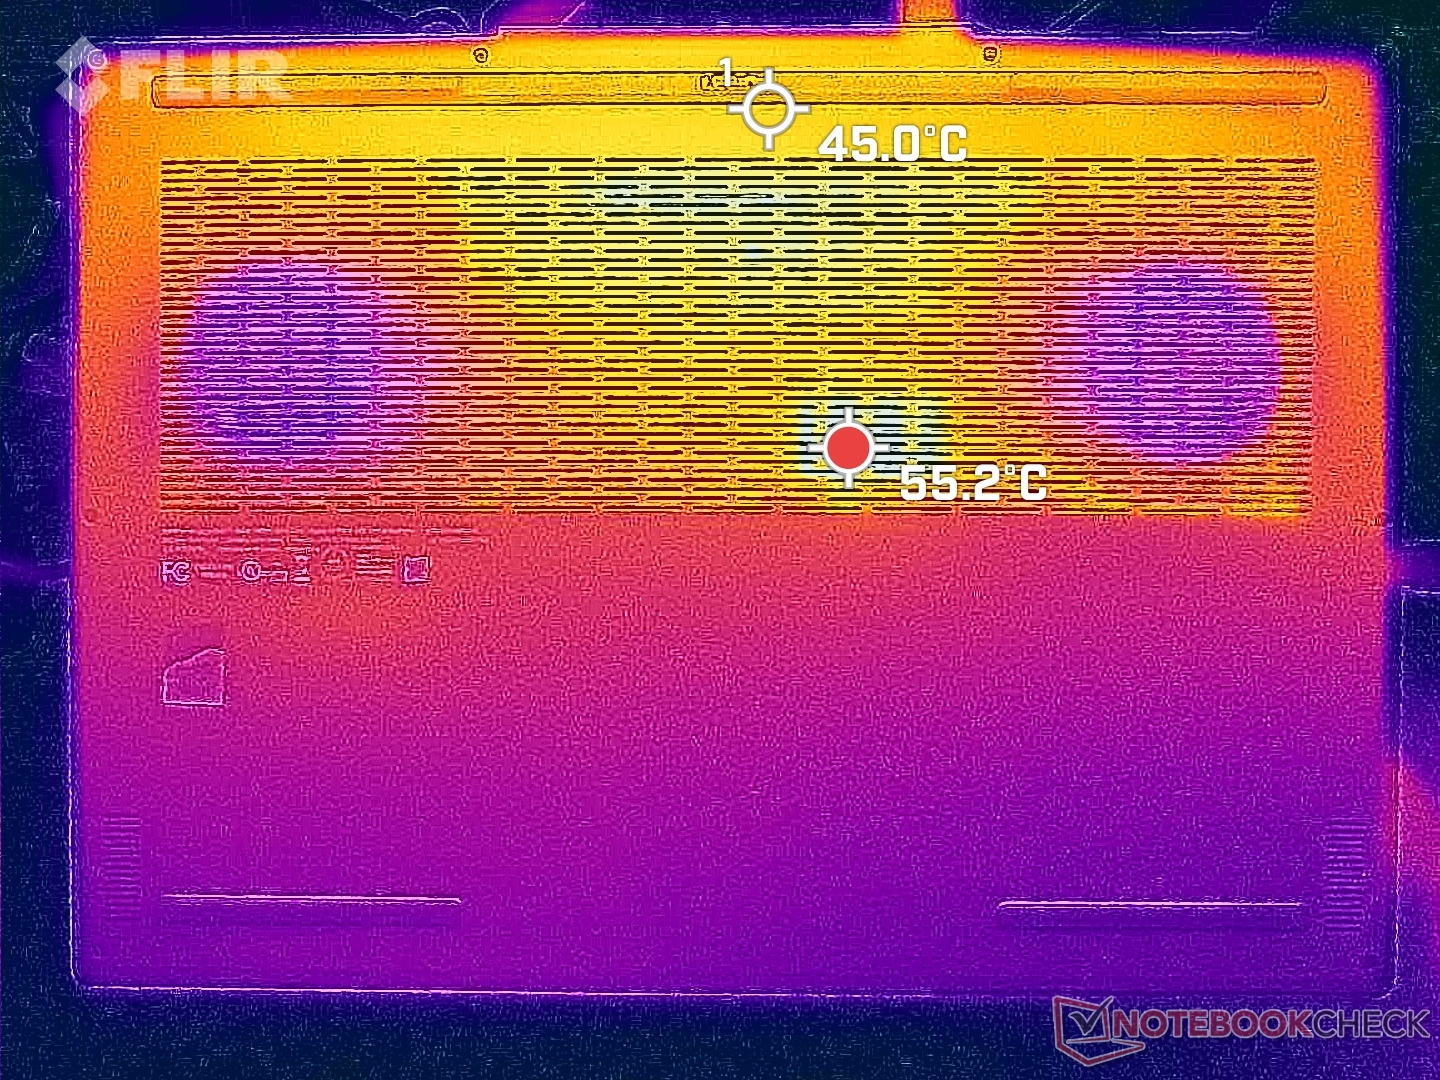
Surface temperature hot spots can reach up to 43 C to 50 C similar to the Alienware x16 R1 when running demanding loads like games. Fortunately, the hot spot is nearest the rear edge and just above the first row of keyboard keys as shown by the temperature maps below where fingers and skin are unlikely to touch. The palm rests and WASD keys remain cooler in comparison.
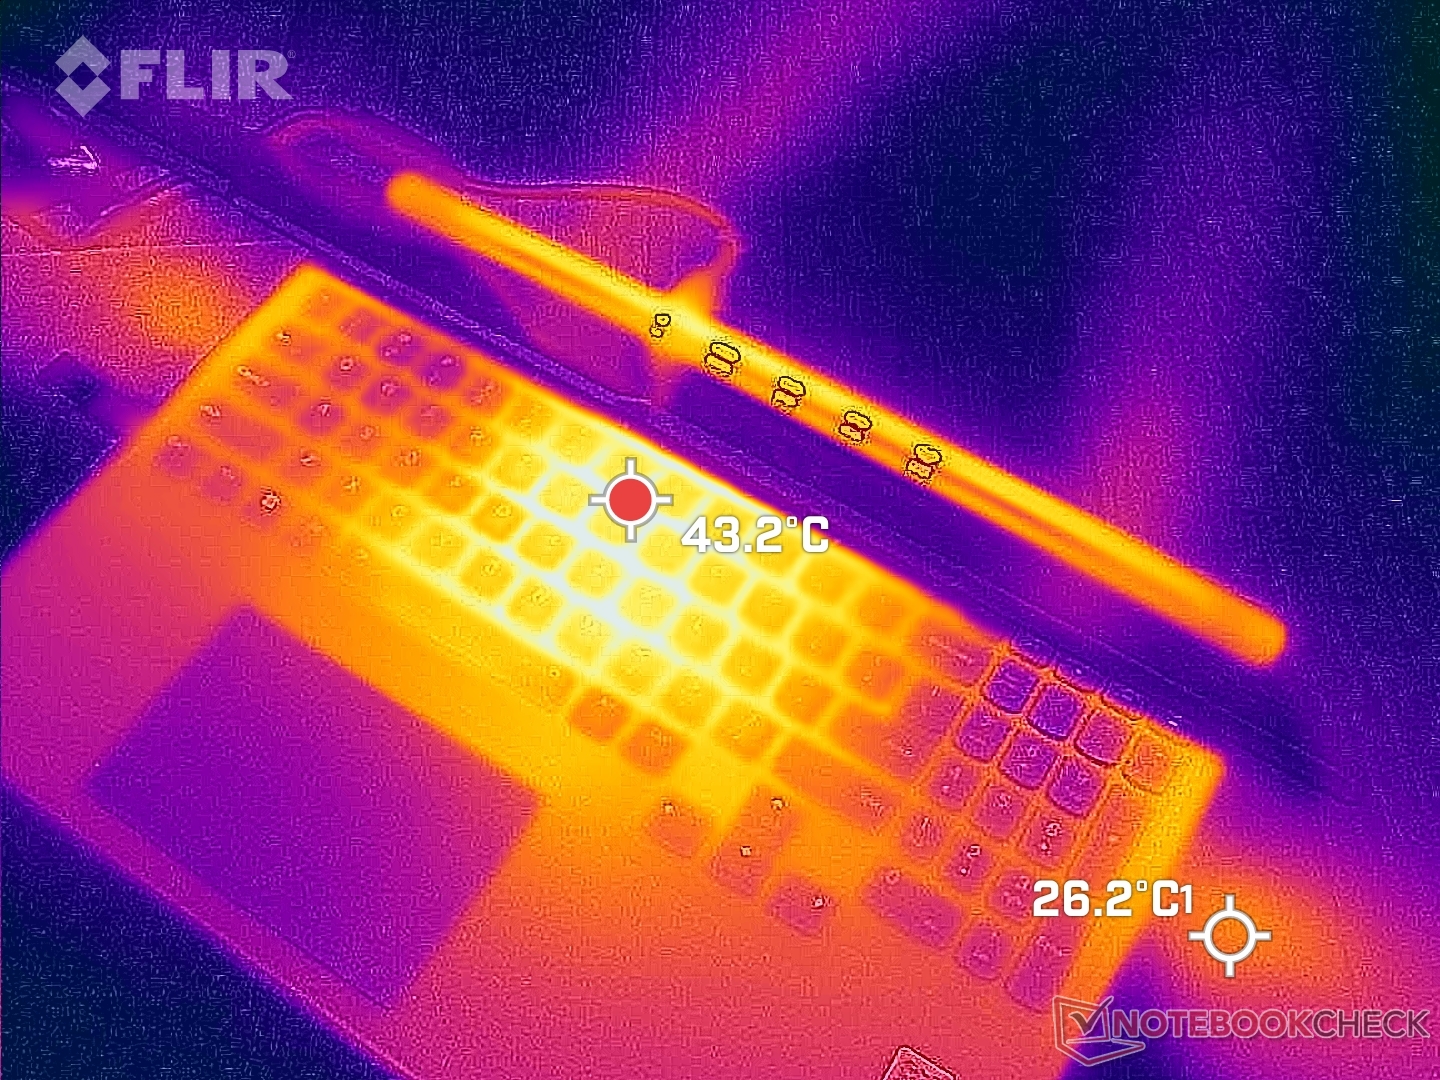
(-) The maximum temperature on the upper side is 49.8 °C / 122 F, compared to the average of 40.4 °C / 105 F, ranging from 21.2 to 68.8 °C for the class Gaming.
(-) The bottom heats up to a maximum of 48.8 °C / 120 F, compared to the average of 43.2 °C / 110 F
(+) In idle usage, the average temperature for the upper side is 26 °C / 79 F, compared to the device average of 33.9 °C / 93 F.
(±) Playing The Witcher 3, the average temperature for the upper side is 35.1 °C / 95 F, compared to the device average of 33.9 °C / 93 F.
(+) The palmrests and touchpad are cooler than skin temperature with a maximum of 29.4 °C / 84.9 F and are therefore cool to the touch.
(±) The average temperature of the palmrest area of similar devices was 28.8 °C / 83.8 F (-0.6 °C / -1.1 F).
| Lenovo Legion Slim 7i 16 Gen 8 Intel Core i9-13900H, NVIDIA GeForce RTX 4070 Laptop GPU | HP Omen 16-wf000 Intel Core i7-13700HX, NVIDIA GeForce RTX 4080 Laptop GPU | Alienware x16 R1 Intel Core i9-13900HK, NVIDIA GeForce RTX 4080 Laptop GPU | Lenovo Legion Pro 7 RTX4090 Intel Core i9-13900HX, NVIDIA GeForce RTX 4090 Laptop GPU | Asus ROG Strix G16 G614JZ Intel Core i9-13980HX, NVIDIA GeForce RTX 4080 Laptop GPU | Razer Blade 16 Early 2023 Intel Core i9-13950HX, NVIDIA GeForce RTX 4080 Laptop GPU | |
|---|---|---|---|---|---|---|
| Heat | 4% | -9% | -13% | -8% | 7% | |
| Maximum Upper Side * (°C) | 49.8 | 45 10% | 47.2 5% | 53 -6% | 54 -8% | 40 20% |
| Maximum Bottom * (°C) | 48.8 | 48.8 -0% | 47.8 2% | 59 -21% | 55 -13% | 37.6 23% |
| Idle Upper Side * (°C) | 29.4 | 29.2 1% | 36.8 -25% | 34 -16% | 29 1% | 32.4 -10% |
| Idle Bottom * (°C) | 30 | 28.8 4% | 35.8 -19% | 32 -7% | 33 -10% | 31.4 -5% |
* ... smaller is better
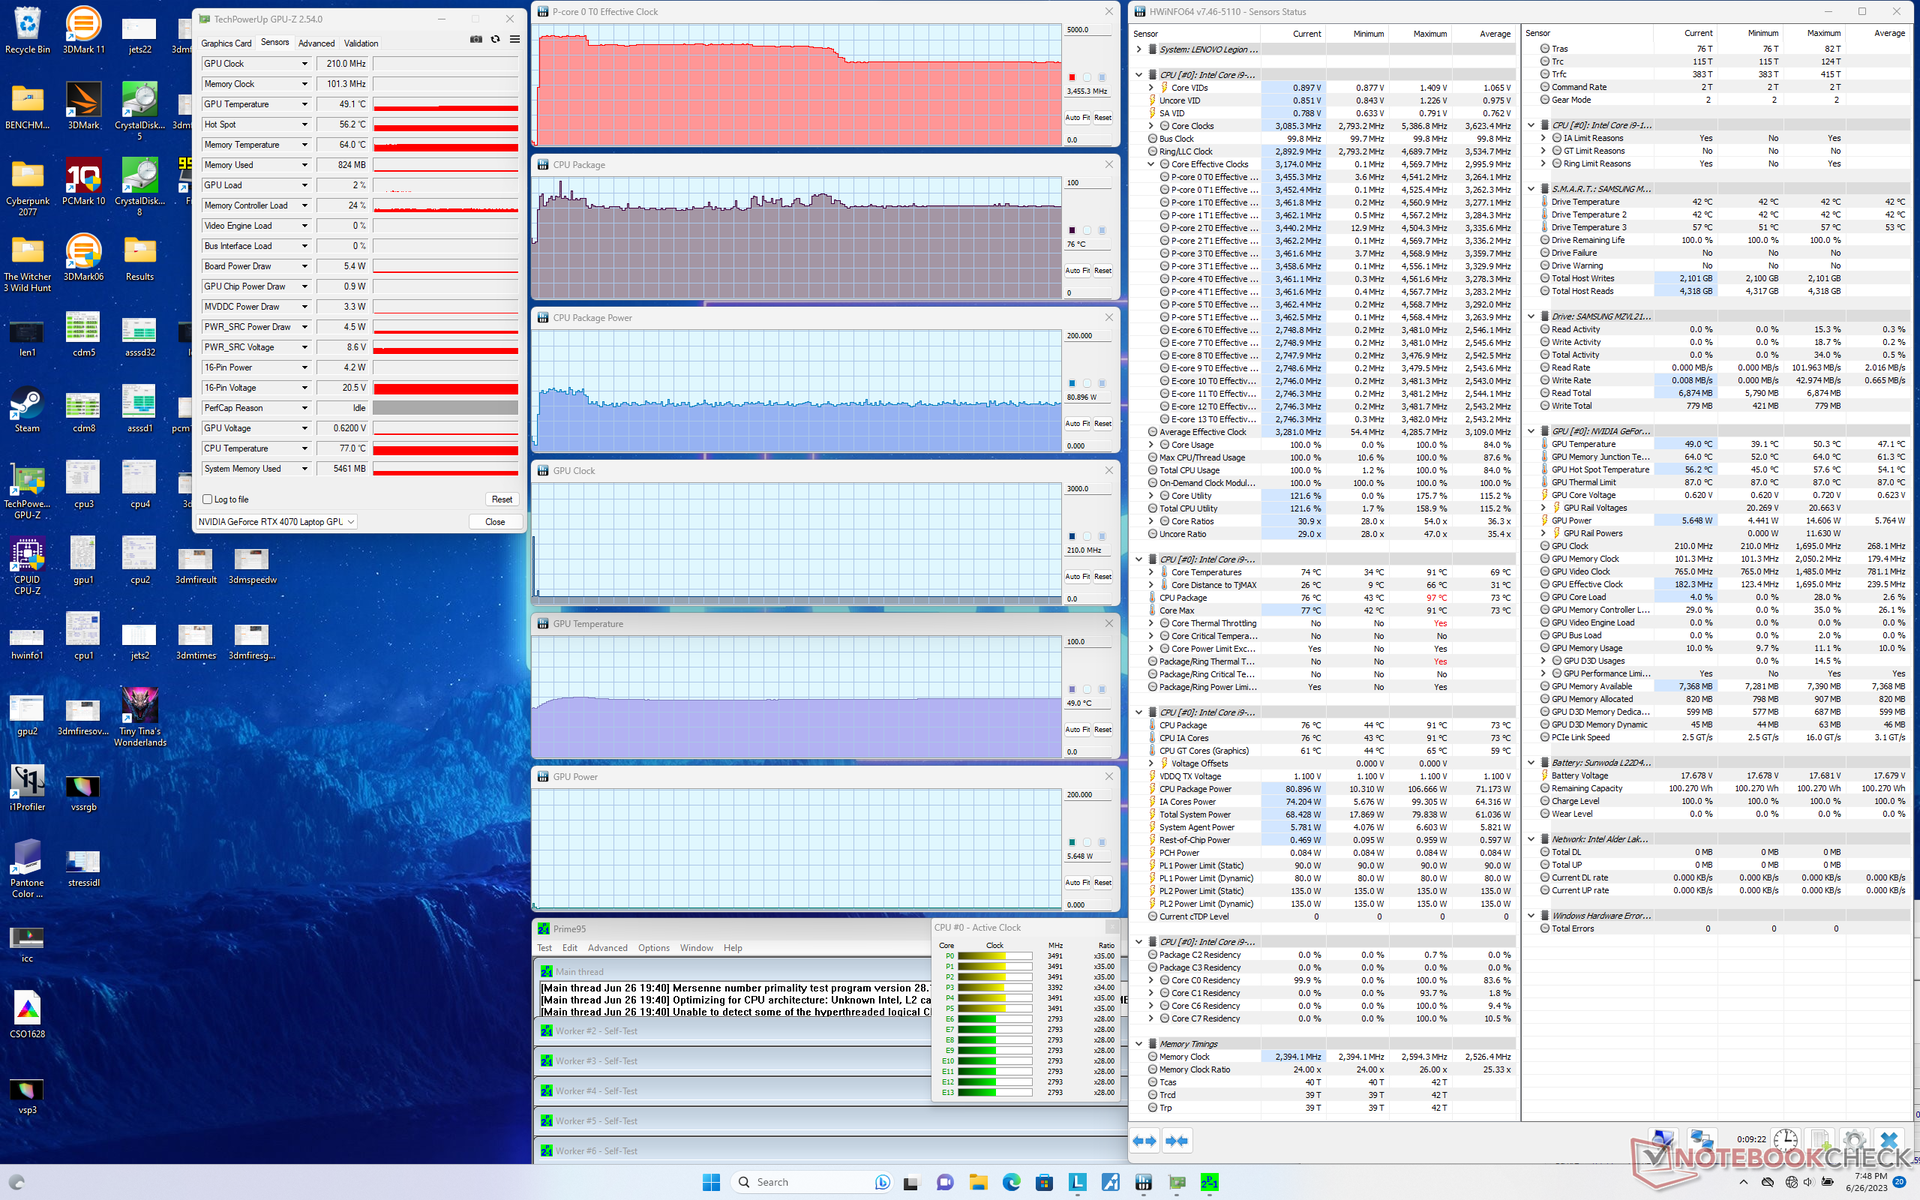
Stress Test
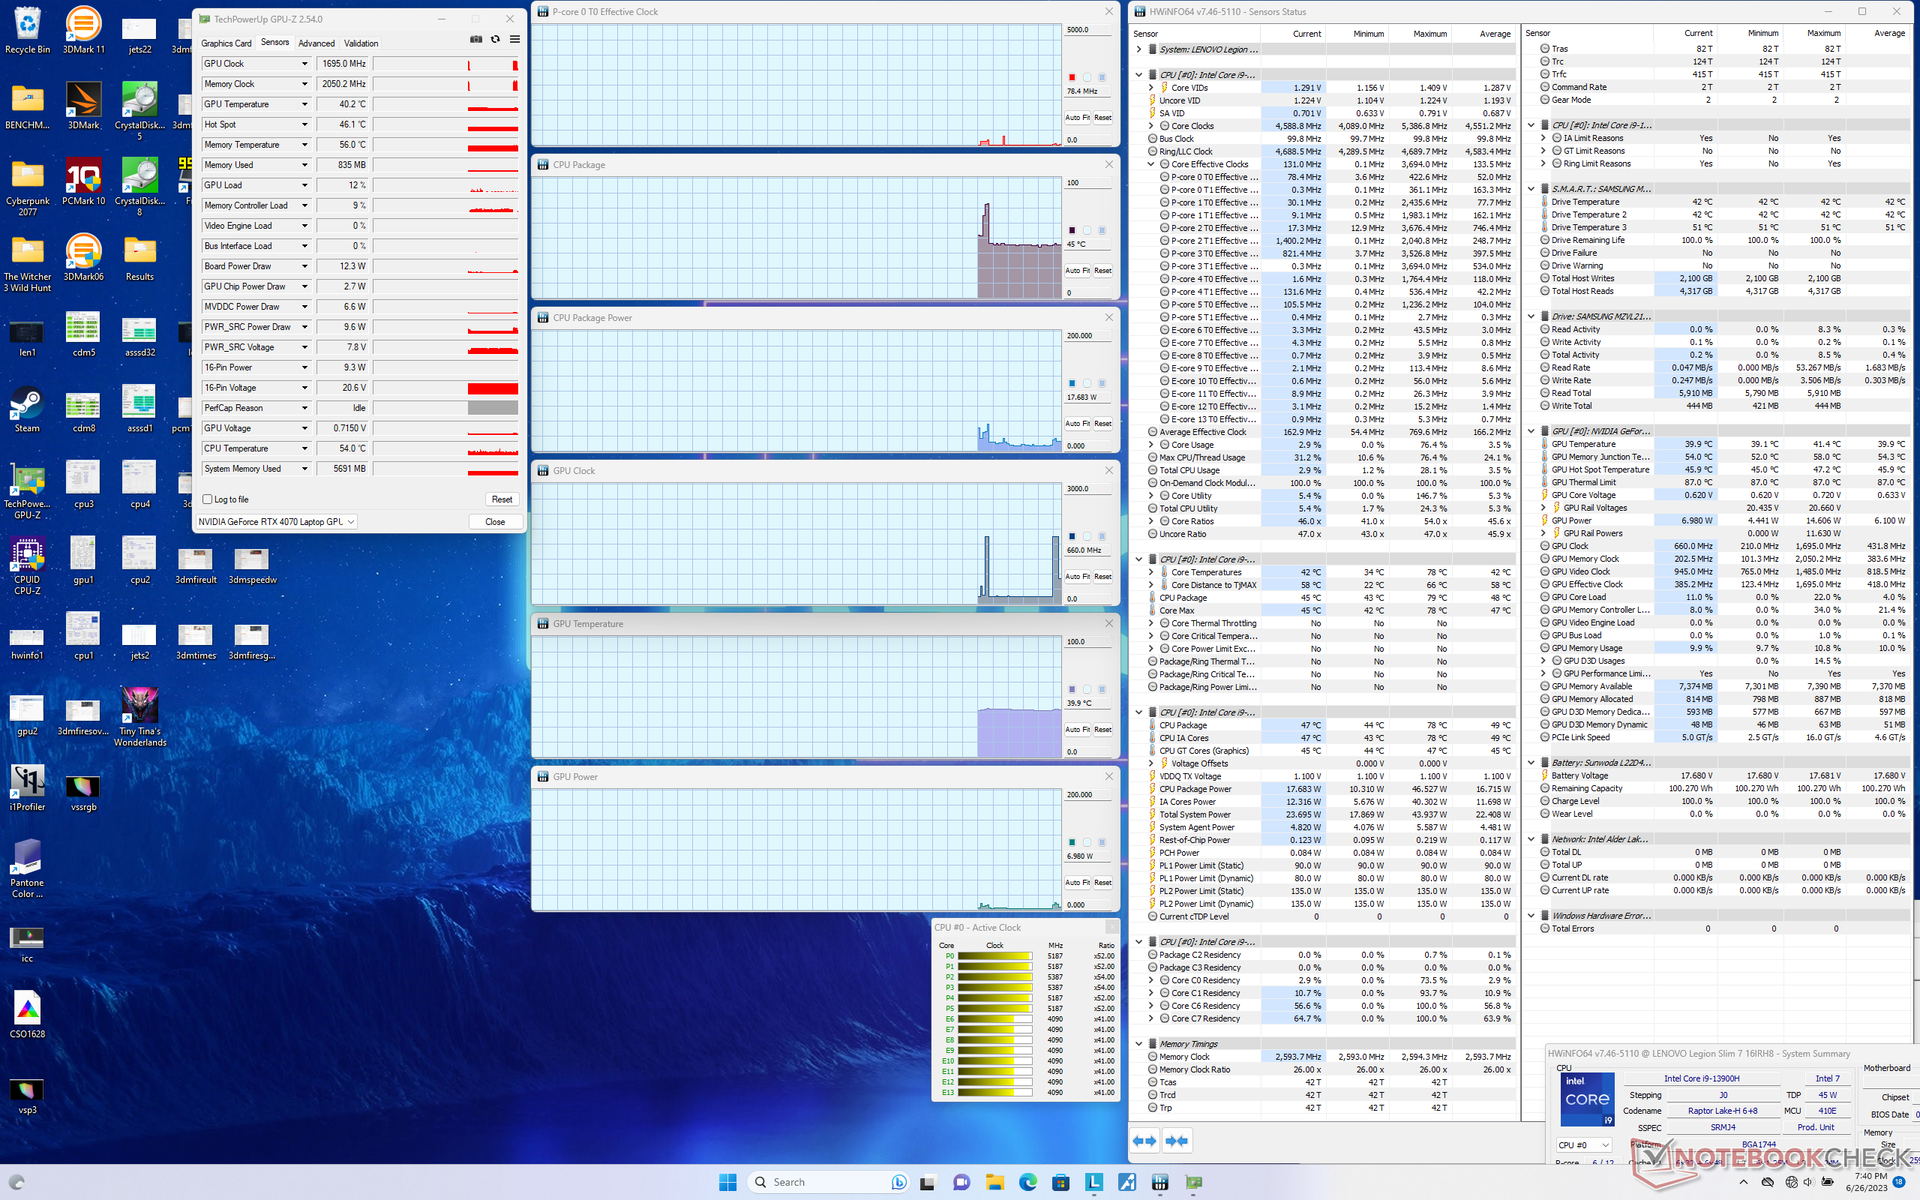
CPU clock rates, temperature, and board power draw when running Prime95 would spike to 4.5 GHz, 87 C, and 100 W, respectively, lasting for about a minute or so. The CPU would then eventually stabilize at 3.5 GHz and 80 W in order to maintain a reasonable core temperature of 76 C. Repeating this same test on the Blade 16 with the faster Core i9-13950HX would result in a warmer core temperature of 82 C.
The Nvidia GPU would stabilize at 2580 MHz, 114 W, and 71 C, respectively, when set to Performance mode with both Overdrive and GPU Overclock active. The GPU targets 140 W on paper, but we're only able to achieve 123 W even when running Cyberpunk 2077. Board power draw and core temperature would fall to just 84 W and 64 C, respectively, if gaming on Balanced mode. Core temperatures are on the cool side for a thin-and-light gaming laptop; CPU and GPU temperatures on the Alienware x16 R1, for example, would be as warm as 80 to 95 C when running the same games.
Running on battery power limits performance as the Performance power profile becomes grayed out. Fire Strike on batteries would return Physics and Graphics scores of just 25602 and 21049 points, respectively, compared to 32664 and 30130 points when on mains.
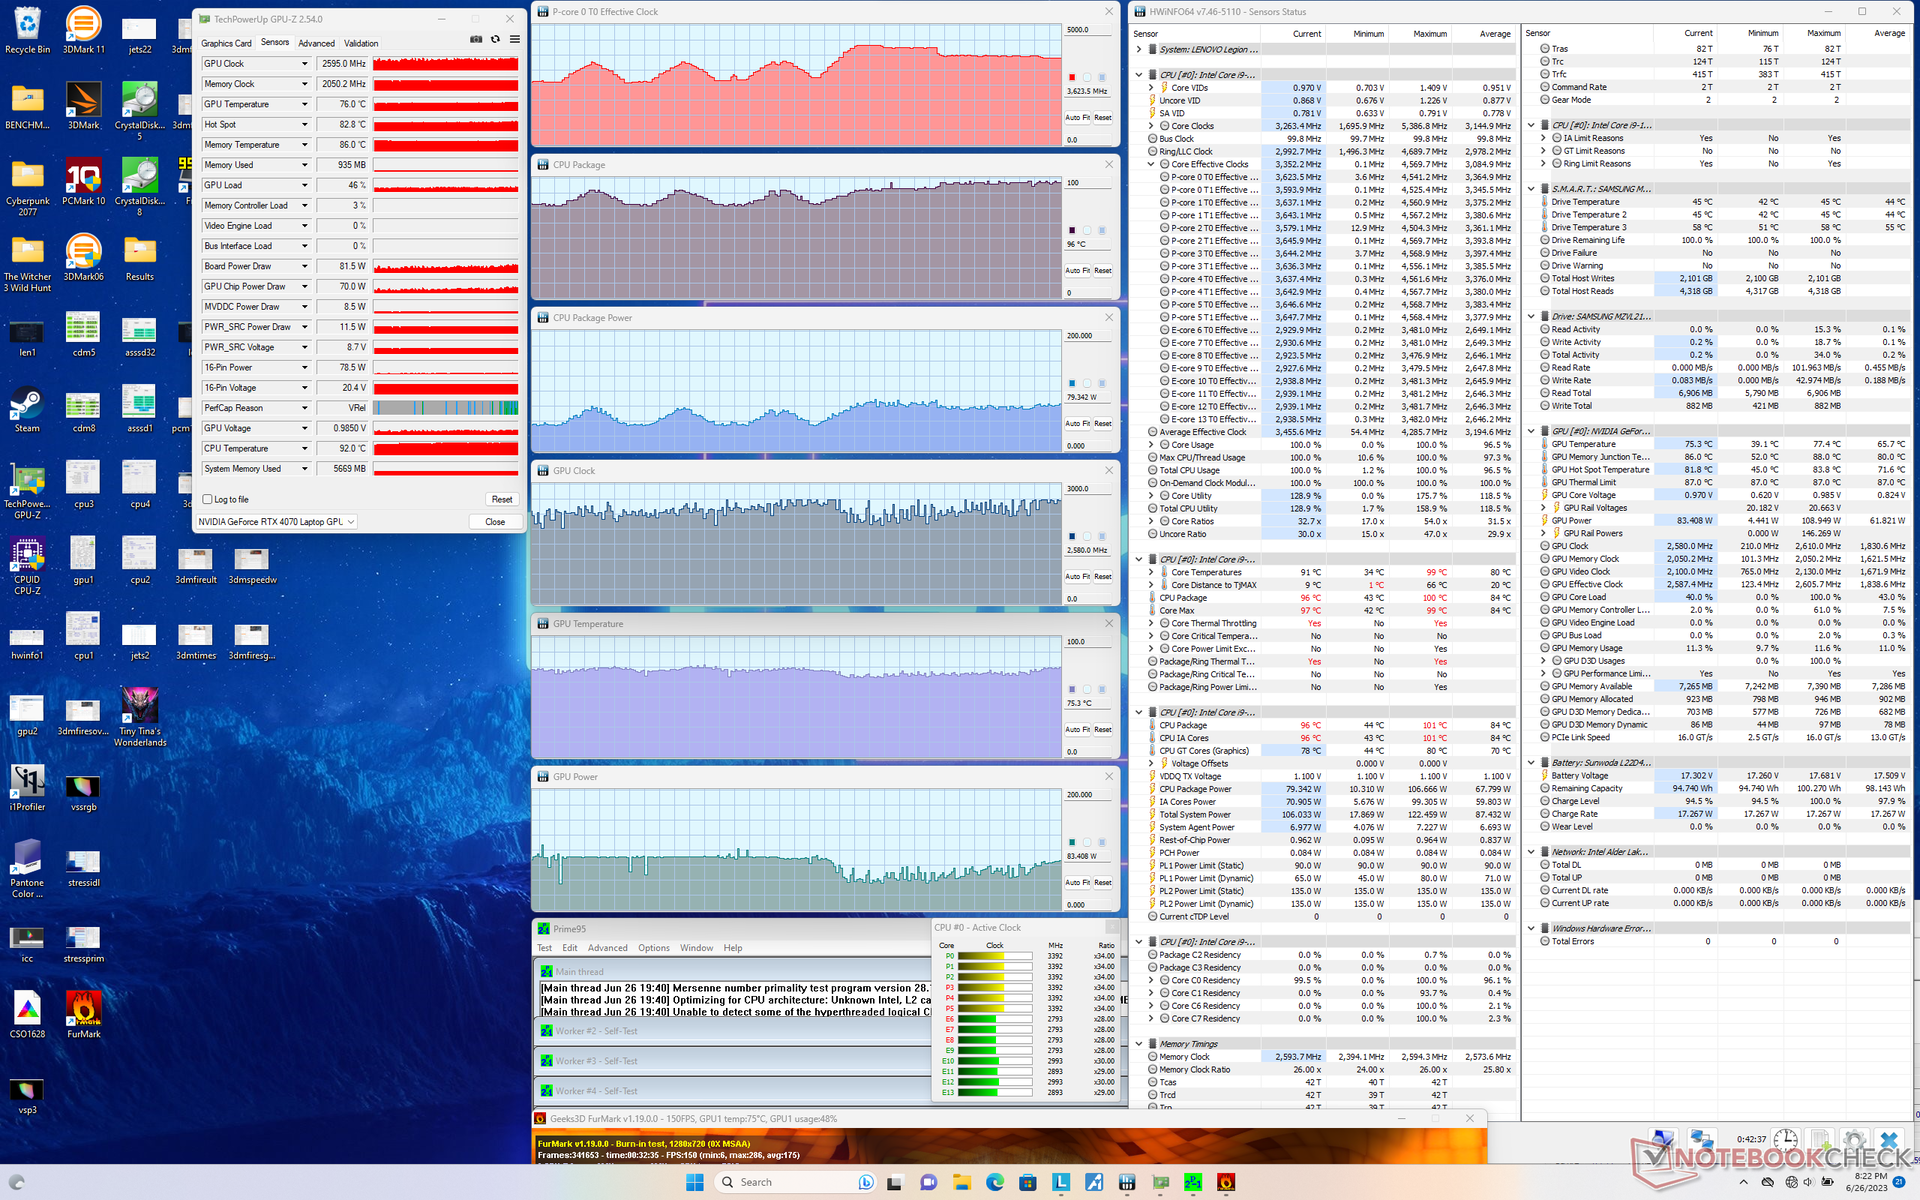
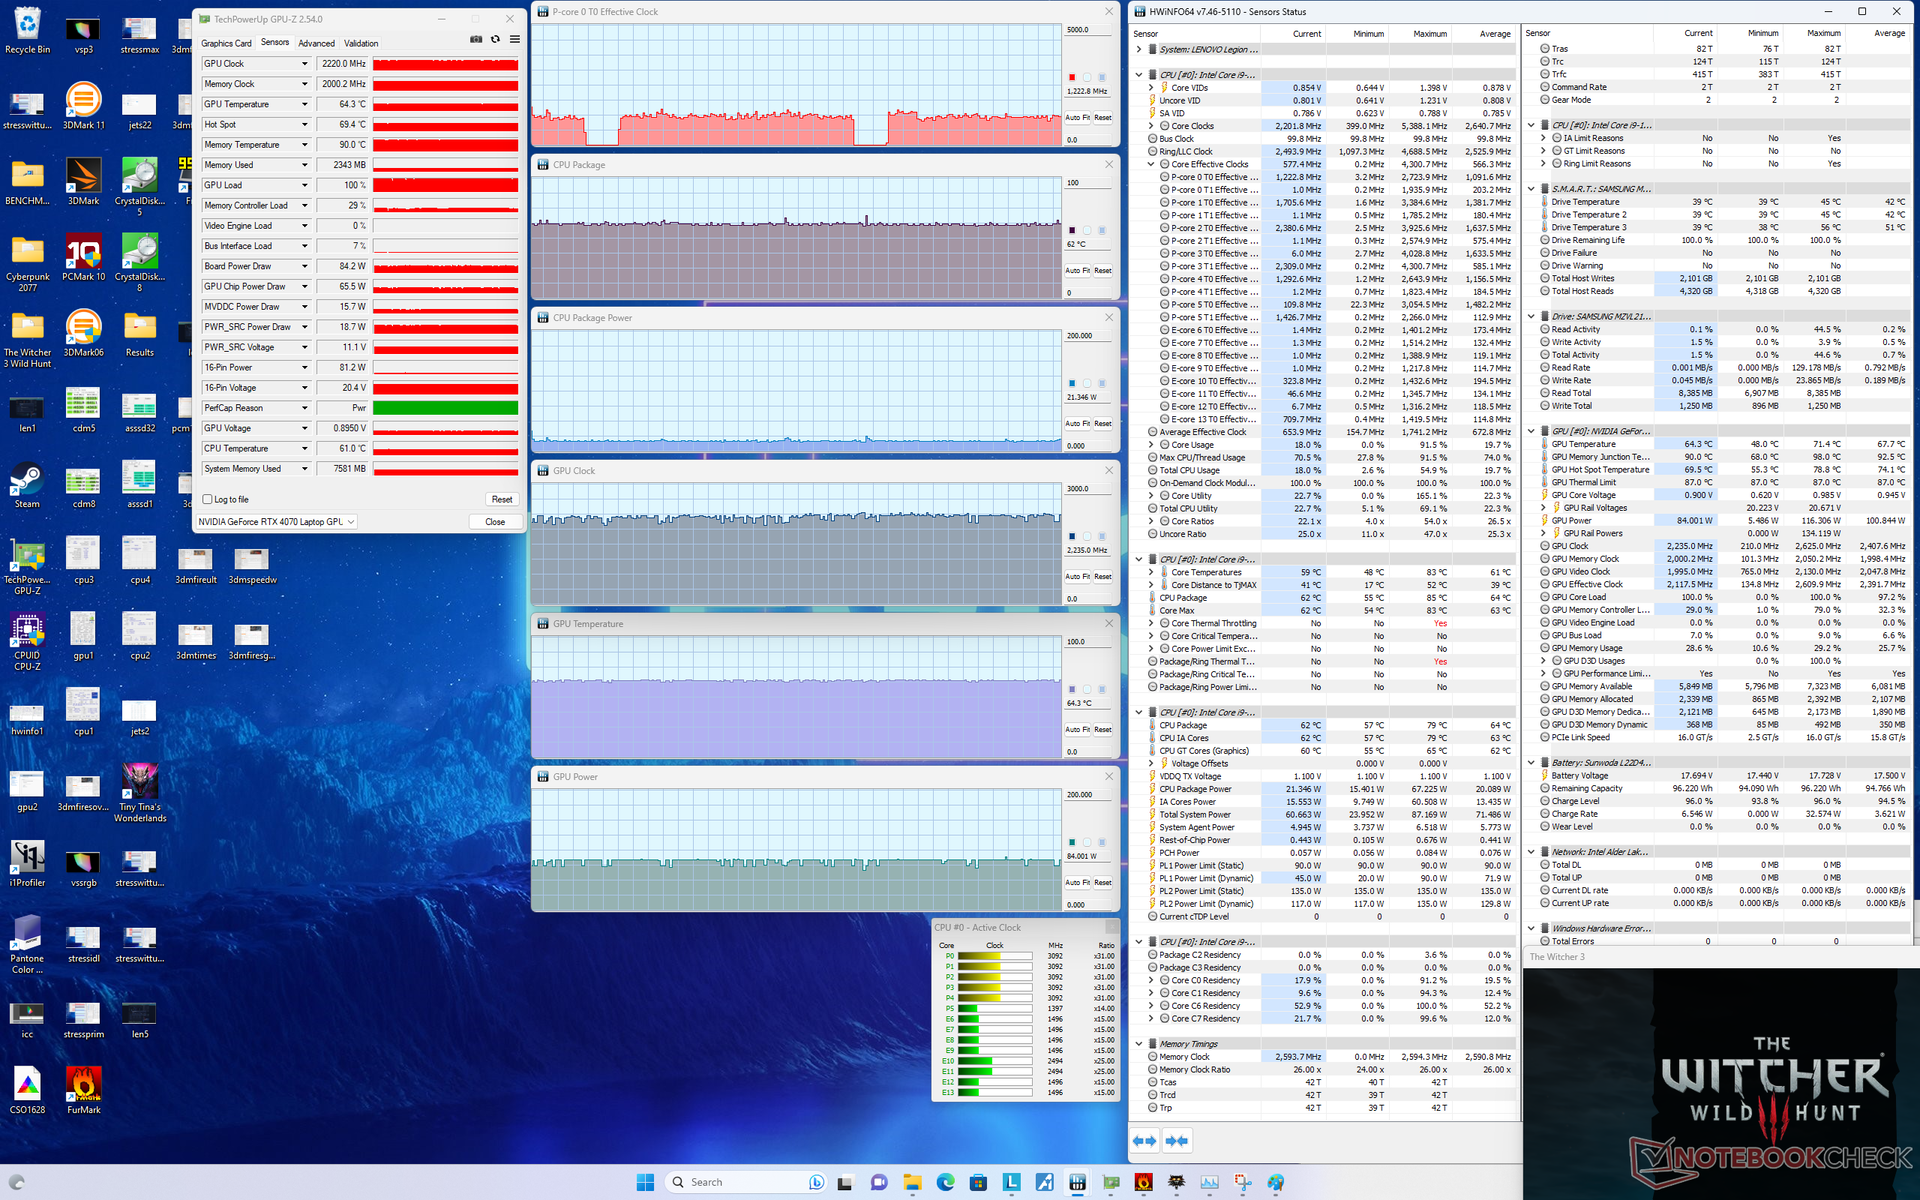
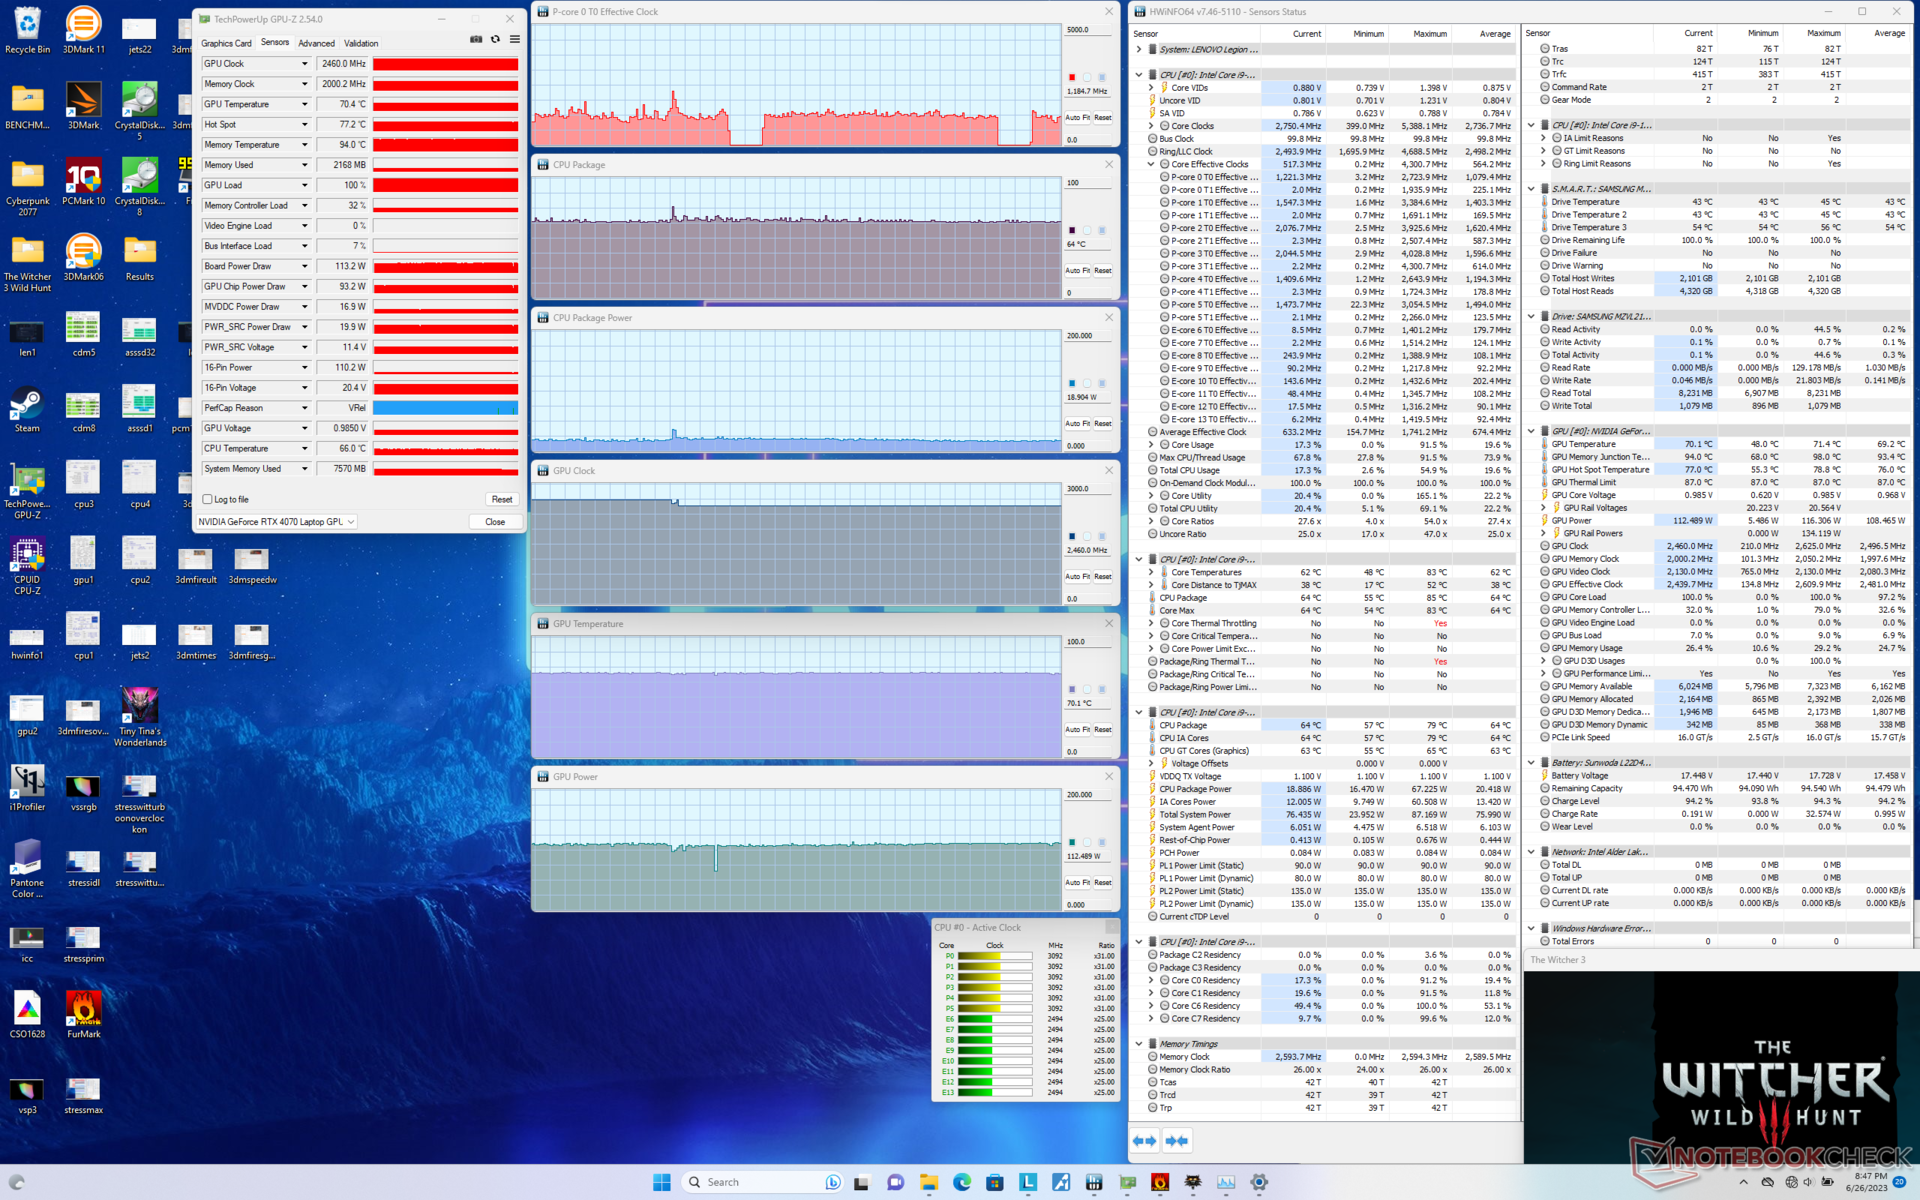
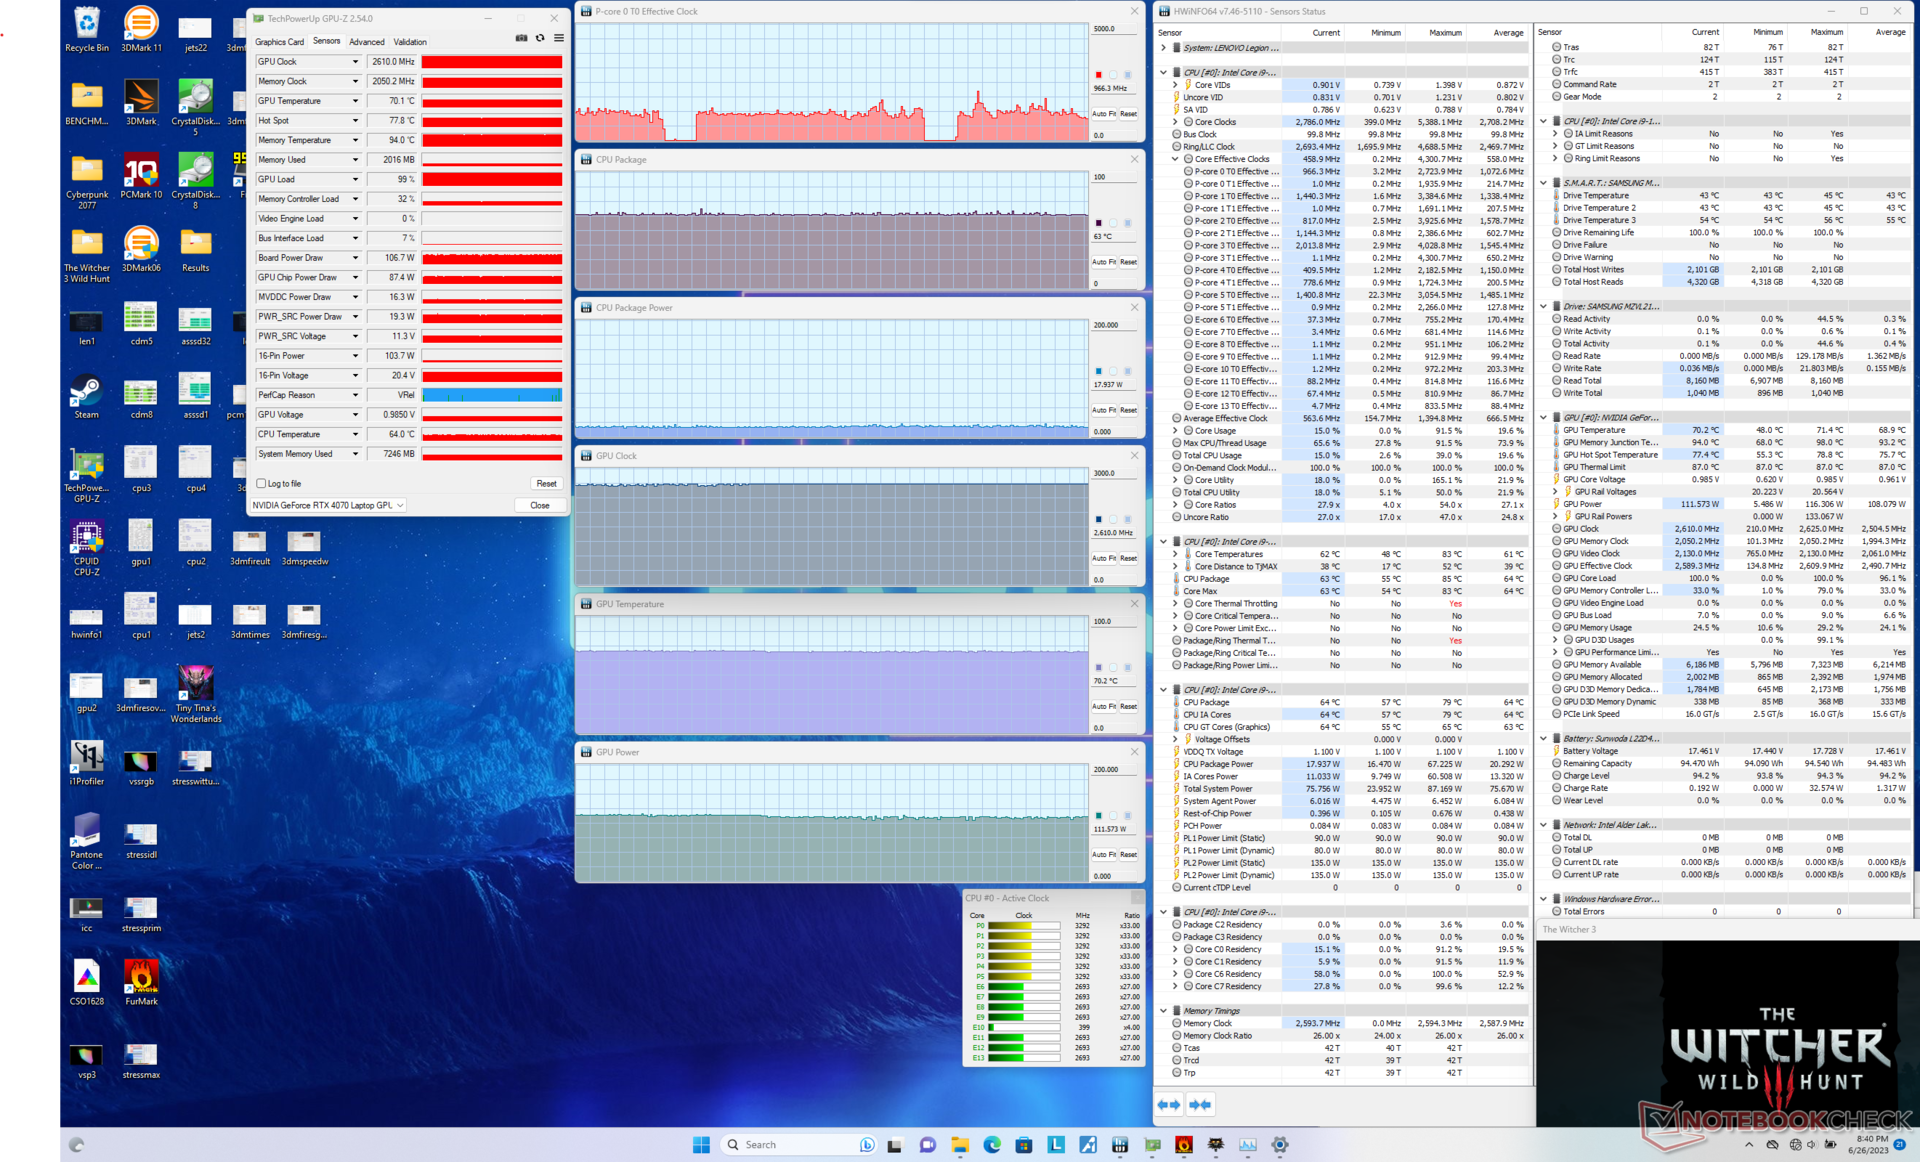
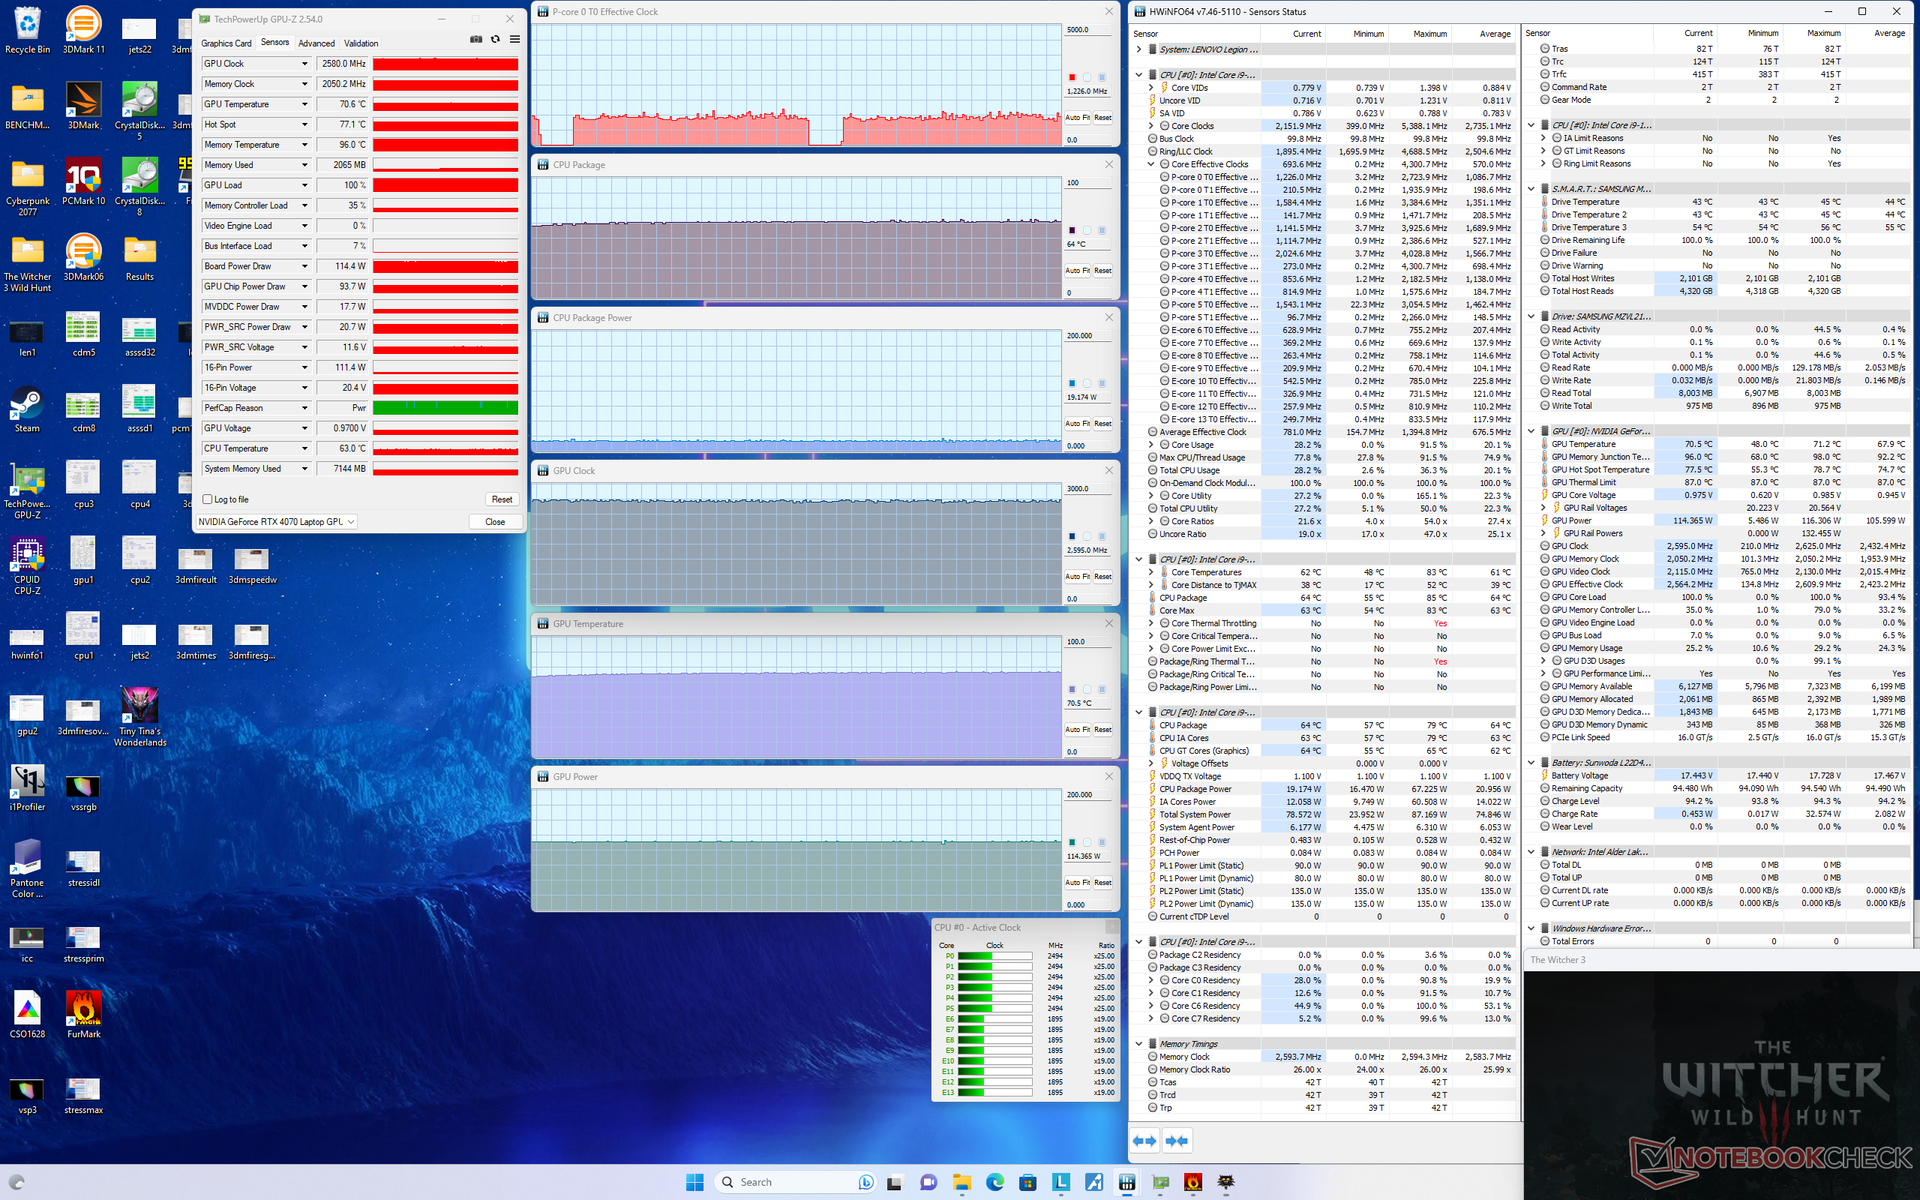
| CPU Clock (GHz) | GPU Clock (MHz) | Average CPU Temperature (°C) | Average GPU Temperature (°C) | |
| System Idle | -- | -- | 45 | 40 |
| Prime95 Stress | 3.5 | -- | 76 | 49 |
| Prime95 + FurMark Stress | 2.6 - 3.5 | 1920 - 2610 | 77 - 90 | 75 |
| Witcher 3 Stress (Balanced mode) | ~1.2 | 2220 | 62 | 64 |
| Witcher 3 Stress (Performance w/ GPU Overclock Off + Overdrive Off) | ~1.2 | 2460 | 64 | 70 |
| Witcher 3 Stress (Performance w/ GPU Overclock On + Overdrive Off) | ~1.2 | 2610 | 63 | 70 |
| Witcher 3 Stress (Performance w/ GPU Overclock On + Overdrive On) | ~1.2 | 2580 | 64 | 71 |
Speakers
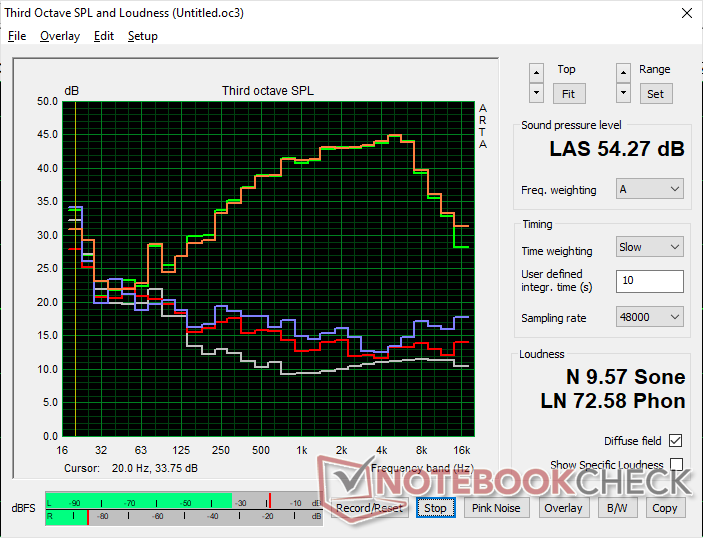
At about 85 dB(A) maximum, the speakers are about as loud as on most other gaming laptops. There isn't anything special about the audio quality or bass reproduction, either. The speakers perform better when gaming on Balanced mode since the fans aren't as loud.
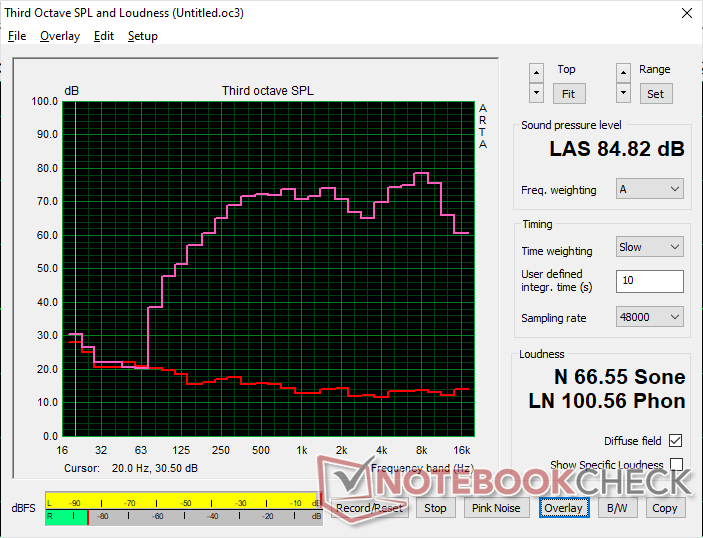
Lenovo Legion Slim 7i 16 Gen 8 audio analysis
(+) | speakers can play relatively loud (84.8 dB)
Bass 100 - 315 Hz
(±) | reduced bass - on average 12.1% lower than median
(±) | linearity of bass is average (9% delta to prev. frequency)
Mids 400 - 2000 Hz
(+) | balanced mids - only 1.4% away from median
(+) | mids are linear (3.3% delta to prev. frequency)
Highs 2 - 16 kHz
(+) | balanced highs - only 4.4% away from median
(+) | highs are linear (5.6% delta to prev. frequency)
Overall 100 - 16.000 Hz
(+) | overall sound is linear (10.5% difference to median)
Compared to same class
» 6% of all tested devices in this class were better, 2% similar, 92% worse
» The best had a delta of 6%, average was 18%, worst was 132%
Compared to all devices tested
» 5% of all tested devices were better, 1% similar, 93% worse
» The best had a delta of 4%, average was 23%, worst was 134%
Apple MacBook Pro 16 2021 M1 Pro audio analysis
(+) | speakers can play relatively loud (84.7 dB)
Bass 100 - 315 Hz
(+) | good bass - only 3.8% away from median
(+) | bass is linear (5.2% delta to prev. frequency)
Mids 400 - 2000 Hz
(+) | balanced mids - only 1.3% away from median
(+) | mids are linear (2.1% delta to prev. frequency)
Highs 2 - 16 kHz
(+) | balanced highs - only 1.9% away from median
(+) | highs are linear (2.7% delta to prev. frequency)
Overall 100 - 16.000 Hz
(+) | overall sound is linear (4.6% difference to median)
Compared to same class
» 0% of all tested devices in this class were better, 0% similar, 100% worse
» The best had a delta of 5%, average was 17%, worst was 45%
Compared to all devices tested
» 0% of all tested devices were better, 0% similar, 100% worse
» The best had a delta of 4%, average was 23%, worst was 134%
Energy Management
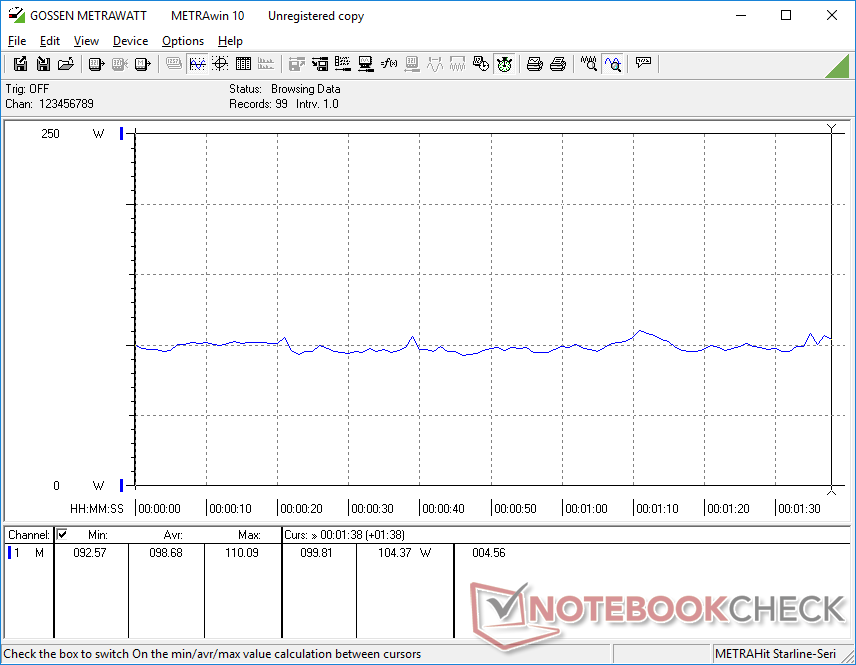
Power Consumption — High Idle Rates
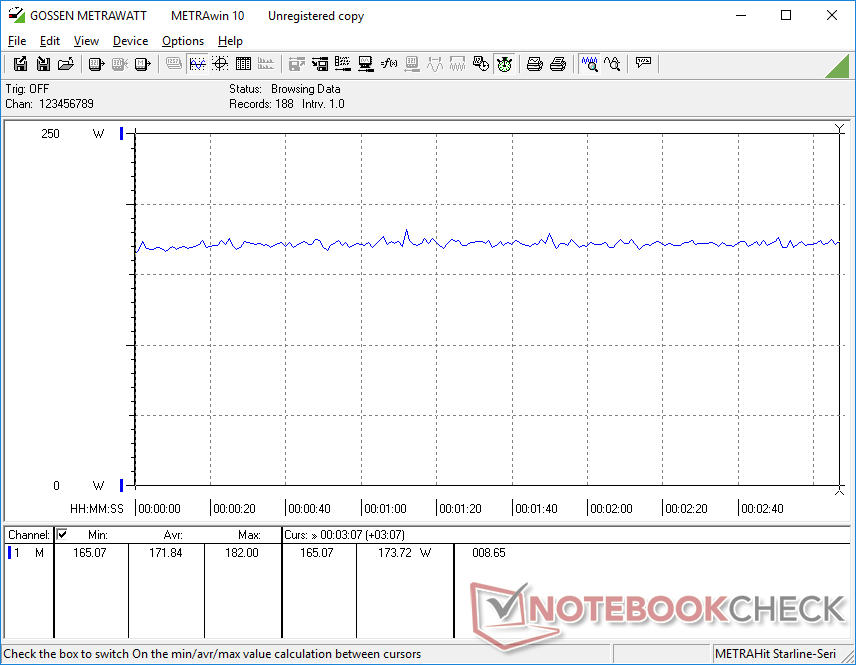
Power consumption when idling on desktop is relatively high at 22 W even when on Power Saver and the minimum brightness settings. This appears to be a common trait amongst gaming laptops powered by 13th gen Core-H CPUs as shown by the table below which is likely contributing to the mediocre battery runtimes. In comparison, the AMD Zen 4-powered Legion Pro 5 16 can go as low as 8 W when under similar conditions.
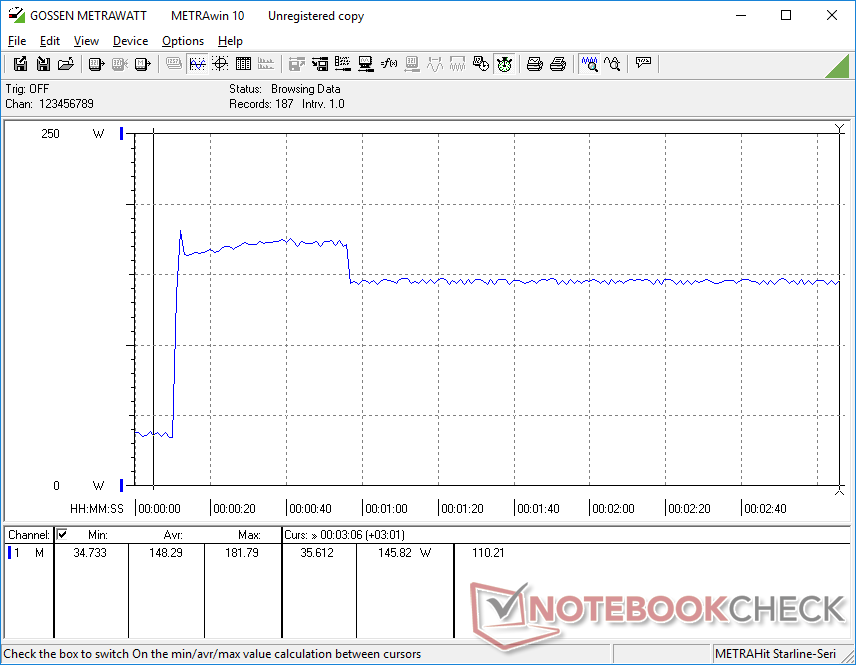
Gaming consumes about 172 W which is very similar to the older Zephyrus M16 powered by the Core i9-12900H and RTX 3070 Ti. Our Legion Slim 7 is therefore able to provide about 15 percent faster graphics performance without needing to consume more power for higher performance-per-watt over older Ampere-powered gaming laptops.
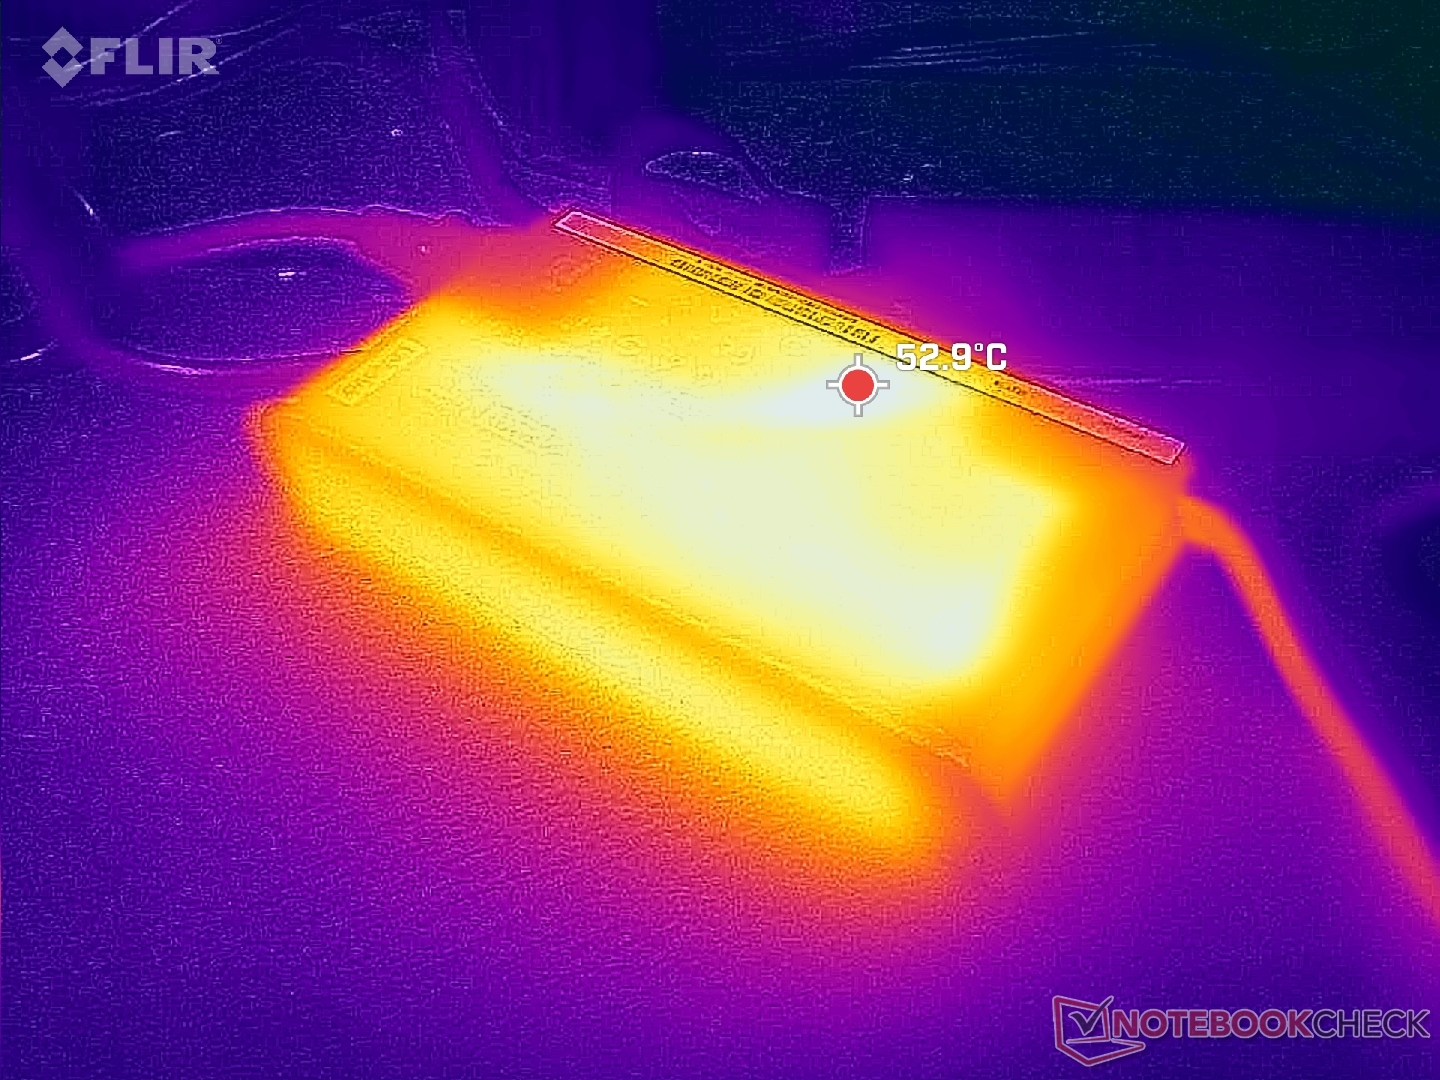
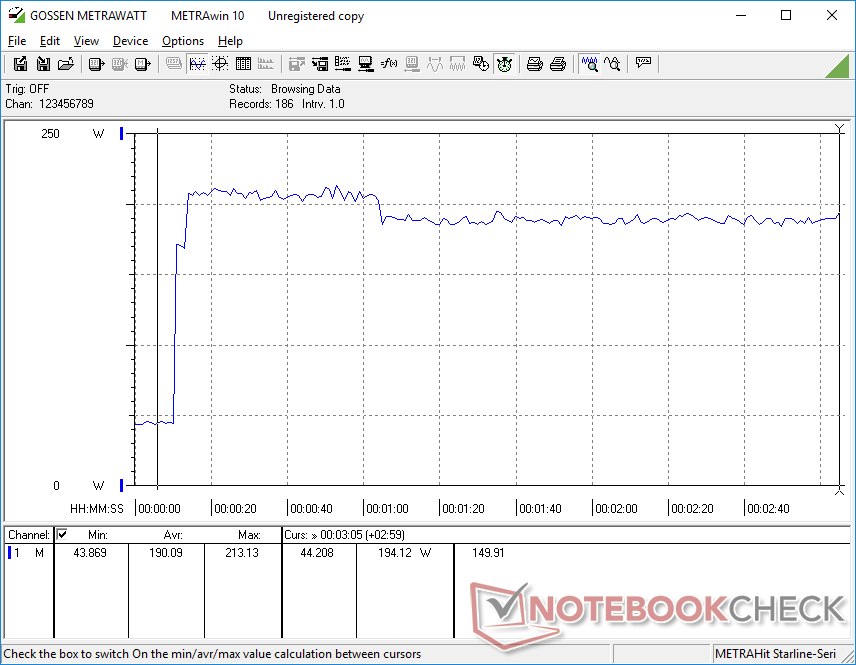
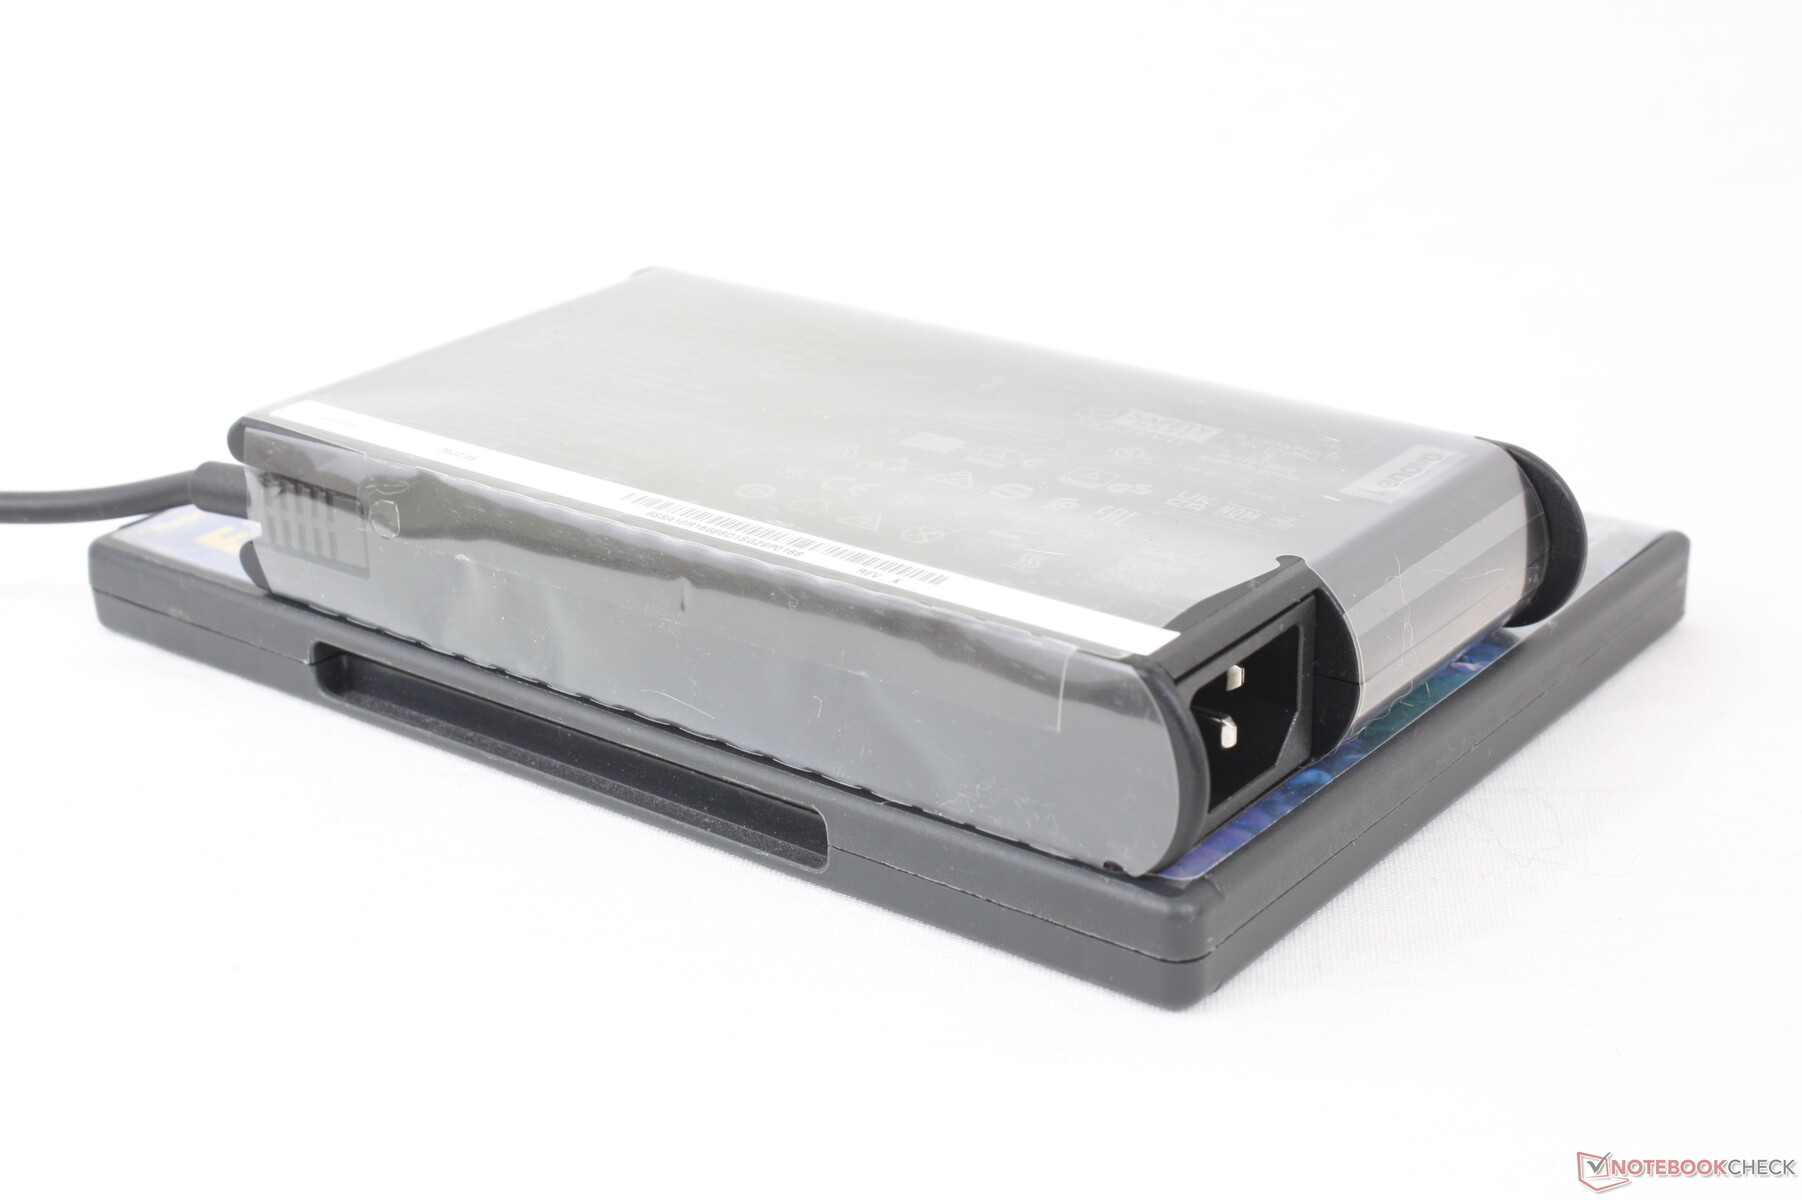
We're able to measure a peak consumption of 213 W from the medium-sized (~16.9 x 8.8 x 2.6 cm) 230 W AC adapter. A higher 330 W adapter is included with the larger Legion Pro 7 which comes with the much more powerful Core i9-13900HX and RTX 4080.
| Off / Standby | |
| Idle | |
| Load |
|
Key:
min: | |
| Lenovo Legion Slim 7i 16 Gen 8 i9-13900H, GeForce RTX 4070 Laptop GPU, Samsung PM9A1 MZVL21T0HCLR, IPS, 2560x1600, 16" | Acer Predator Helios 16 PH16-71-731Q i7-13700HX, GeForce RTX 4060 Laptop GPU, Micron 3400 1TB MTFDKBA1T0TFH, IPS-LED, 2560x1600, 16" | HP Omen 16-wf000 i7-13700HX, GeForce RTX 4080 Laptop GPU, SK hynix PC801 HFS002TEJ9X101N, IPS, 2560x1440, 16.1" | Lenovo Legion Pro 7 RTX4090 i9-13900HX, GeForce RTX 4090 Laptop GPU, Samsung PM9A1 MZVL21T0HCLR, IPS, 2560x1600, 16" | Alienware x16 R1 i9-13900HK, GeForce RTX 4080 Laptop GPU, SK hynix PC801 HFS001TEJ9X101N, IPS, 2560x1600, 16" | Lenovo Legion Pro 5 16ARX8 R7 7745HX, GeForce RTX 4070 Laptop GPU, Samsung PM9A1 MZVL21T0HCLR, IPS, 2560x1600, 16" | |
|---|---|---|---|---|---|---|
| Power Consumption | 11% | -8% | -20% | -25% | 15% | |
| Idle Minimum * (Watt) | 22 | 15.9 28% | 21.8 1% | 20 9% | 25.2 -15% | 8.1 63% |
| Idle Average * (Watt) | 29 | 20.5 29% | 26 10% | 25 14% | 29.9 -3% | 15.9 45% |
| Idle Maximum * (Watt) | 39.5 | 20.9 47% | 36 9% | 35 11% | 49.8 -26% | 37.2 6% |
| Load Average * (Watt) | 98.7 | 106 -7% | 115.5 -17% | 136 -38% | 105.4 -7% | 90.9 8% |
| Witcher 3 ultra * (Watt) | 171.8 | 175 -2% | 214 -25% | 282 -64% | 263 -53% | 189.6 -10% |
| Load Maximum * (Watt) | 213.2 | 276 -29% | 269.7 -27% | 320 -50% | 313.8 -47% | 263.5 -24% |
* ... smaller is better
Power Consumption Witcher 3 / Stresstest
Power Consumption external Monitor
Battery Life
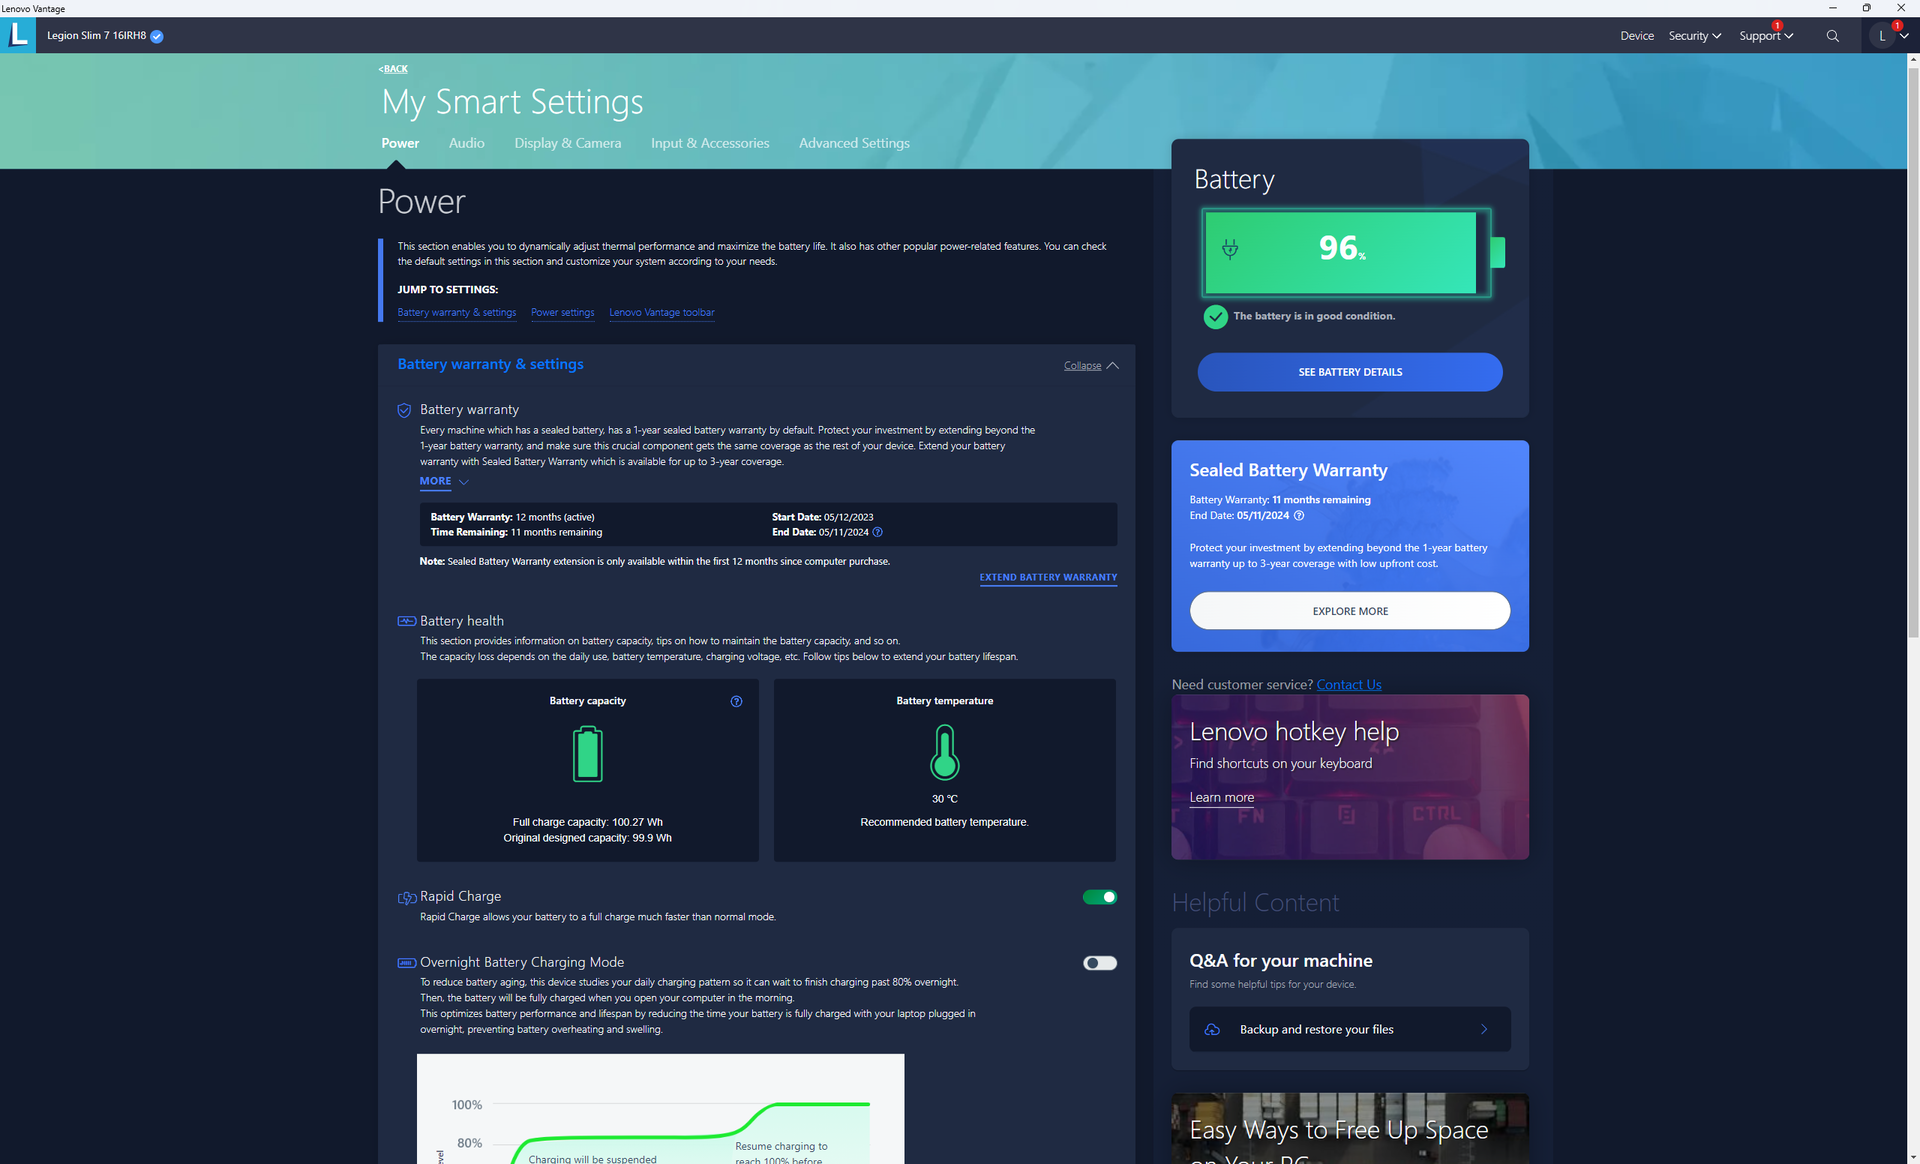
Battery capacity is surprisingly just as big as on the Legion Pro 7 17 despite the thinner profile of our Slim 7i design. Nonetheless, battery life is sill average at best at just under 4.5 hours of real-world browsing use. Most other gaming laptops with 13th gen Intel CPUs would return similar or shorter runtimes including the Omen 16 or Alienware x16 R1.
Charging from empty to full takes just 70 minutes with Rapid Charge enabled compared to 90 minutes or longer on most other gaming laptops. The system can also be recharged via USB-C at up to 140 W.
| Lenovo Legion Slim 7i 16 Gen 8 i9-13900H, GeForce RTX 4070 Laptop GPU, 99.9 Wh | HP Omen 16-wf000 i7-13700HX, GeForce RTX 4080 Laptop GPU, 83 Wh | Alienware x16 R1 i9-13900HK, GeForce RTX 4080 Laptop GPU, 90 Wh | Lenovo Legion Pro 7 RTX4090 i9-13900HX, GeForce RTX 4090 Laptop GPU, 99.9 Wh | Asus ROG Strix G16 G614JZ i9-13980HX, GeForce RTX 4080 Laptop GPU, 90 Wh | Razer Blade 16 Early 2023 i9-13950HX, GeForce RTX 4080 Laptop GPU, 95.2 Wh | |
|---|---|---|---|---|---|---|
| Battery runtime | 15% | -7% | 16% | 71% | 57% | |
| Reader / Idle (h) | 5.1 | 5.5 8% | 7.3 43% | 8.9 75% | ||
| WiFi v1.3 (h) | 4.4 | 5.1 16% | 2.5 -43% | 5.1 16% | 9.7 120% | 6.1 39% |
| Load (h) | 0.9 | 1.1 22% | 0.7 -22% | 1.1 22% | 1.4 56% |
Pros
Cons
Verdict — Compelling In Almost Every Aspect
The Legion Slim 7i 16 Gen 8 is one of the most balanced gaming laptops in the Legion family. Not only is it thinner and lighter than most in the 16-inch size category, it also doesn't cut any corners when it comes to port options, the spacious per-key RGB keyboard, respectable display options for both gamers and content creators, and even battery capacity and an SD reader. The model checks off a lot of boxes considering its thin profile.
The Lenovo Legion Slim 7i 16 G8 sacrifices some performance options for the thinner size and lighter weight, but the model is otherwise so well-balanced in terms of performance and portability that most gamers likely would not mind.
A few cracks begin to show when you dive deeper into the machine. The soldered and expandable RAM configuration, for example, is uncommon on gaming laptops while the SSD tends to throttle when under stress. CPU and GPU options omit the higher-end Core i9-13900HX and RTX 4080, respectively, which are only available on the thicker and heavier Legion Pro 7 16. Enthusiasts who want everything and the kitchen sink would therefore have to settle on larger and heavier alternatives like the Legion Pro 7, Alienware m16, or the Razer Blade 16 each of which offer faster processors and graphics options.
Price and Availability
Lenovo is now shipping its Legion Slim 7i 16 Gen 8 starting at $1500 USD for the base Core i7-13700H and RTX 4060 configuration up to $1800 USD with our Core i9-13900H and RTX 4070 configuration. The higher-end configuration is also available at Best Buy.
Lenovo Legion Slim 7i 16 Gen 8
- 07/03/2023 v7 (old)
Allen Ngo
Transparency
The selection of devices to be reviewed is made by our editorial team. The test sample was provided to the author as a loan by the manufacturer or retailer for the purpose of this review. The lender had no influence on this review, nor did the manufacturer receive a copy of this review before publication. There was no obligation to publish this review. As an independent media company, Notebookcheck is not subjected to the authority of manufacturers, retailers or publishers.
This is how Notebookcheck is testing
Every year, Notebookcheck independently reviews hundreds of laptops and smartphones using standardized procedures to ensure that all results are comparable. We have continuously developed our test methods for around 20 years and set industry standards in the process. In our test labs, high-quality measuring equipment is utilized by experienced technicians and editors. These tests involve a multi-stage validation process. Our complex rating system is based on hundreds of well-founded measurements and benchmarks, which maintains objectivity. Further information on our test methods can be found here.
Price comparison
