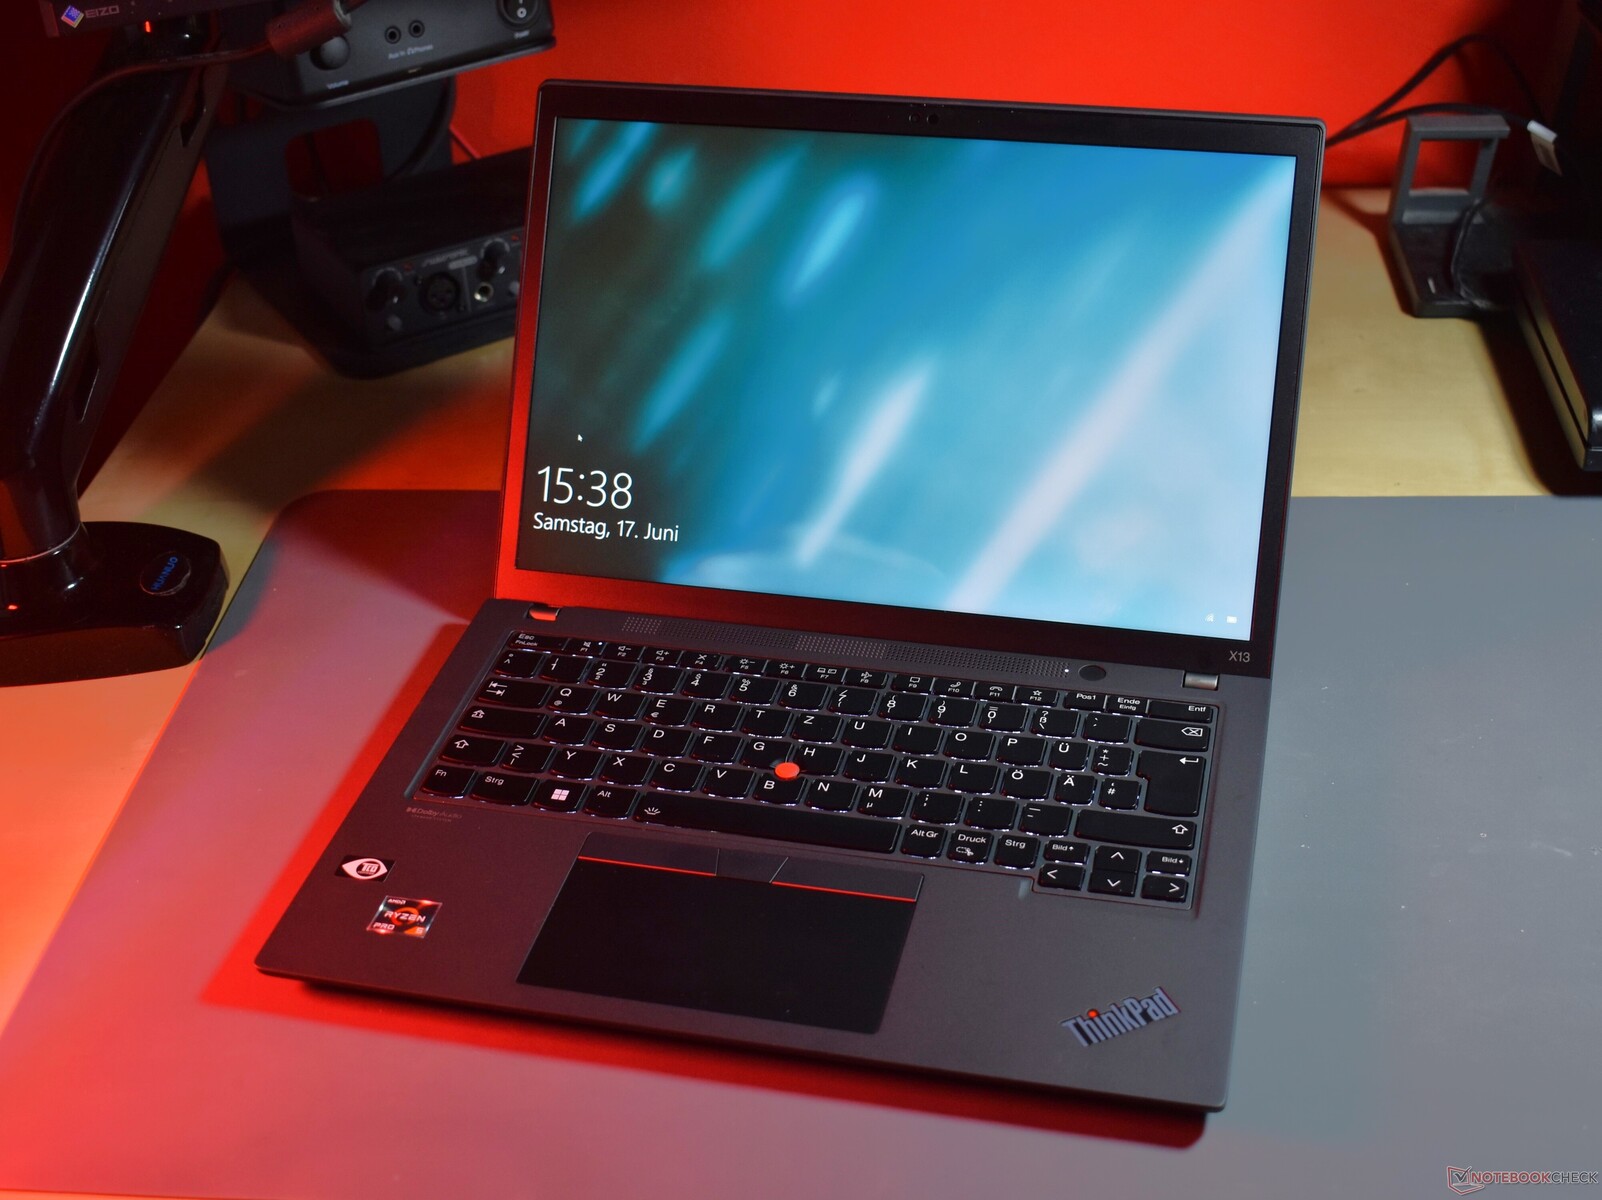
Lenovo ThinkPad X13 G3 AMD Laptop Review: Already very good ThinkPad even better with Ryzen 6000

A review of a 2022 ThinkPad in 2023 - sounds like a contradiction, but it can make sense. Today's review device, the Lenovo ThinkPad X13 Gen 3 AMD may be "yesterday's tech", but that does not mean its bad. The successor of this compact business laptop, the Lenovo ThinkPad X13 Gen 4, is not available in its AMD version yet. Enough of a reason to take one last look at the older variant - maybe it could be worth buying in a coming discounted sale.
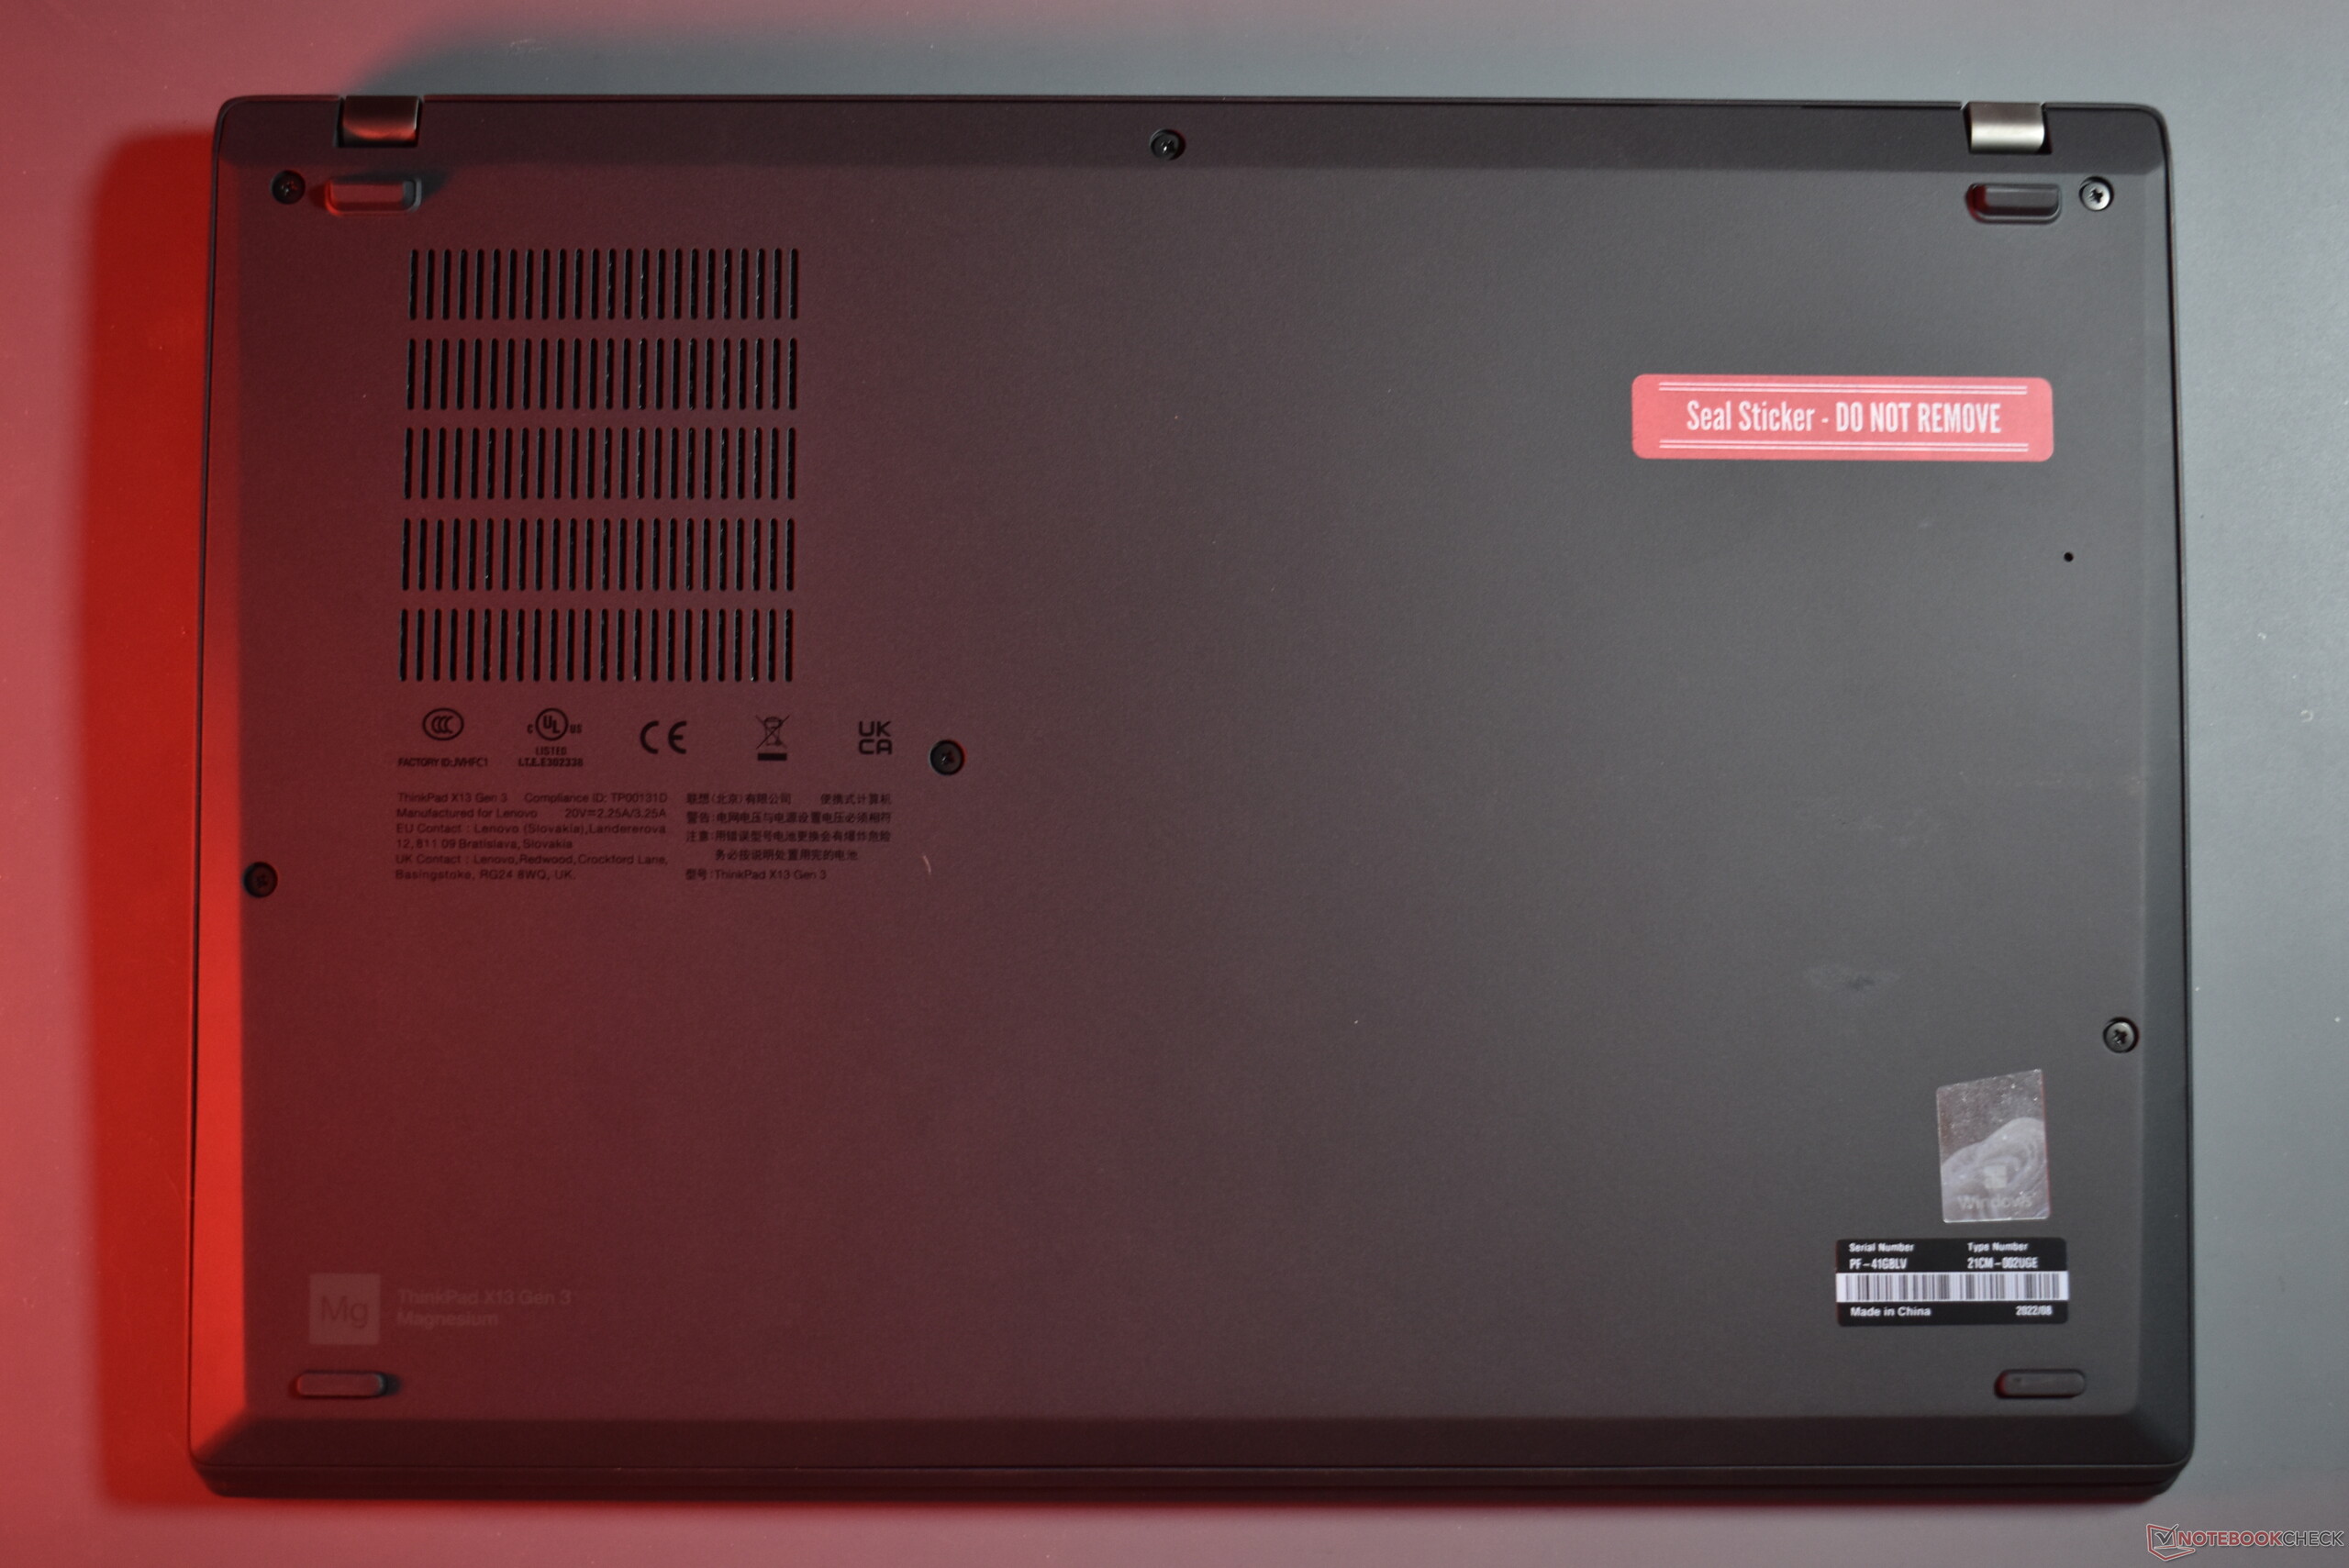
Since this is an update of an existing design, we will not waste time on another description of the design, the input devices and the connectivity. Detailed info on these topics can be found in the review of the ThinkPad X13 Gen 2.
Possible competitors for comparison
Rating | Date | Model | Weight | Height | Size | Resolution | Price |
|---|---|---|---|---|---|---|---|
| 90.6 % v7 (old) | 06 / 2023 | Lenovo ThinkPad X13 G3 21CM002UGE R5 PRO 6650U, Radeon 660M | 1.3 kg | 18.1 mm | 13.30" | 1920x1200 | |
| 90.6 % v7 (old) | 11 / 2021 | Lenovo ThinkPad X13 G2 AMD 20XH001KGE R5 PRO 5650U, Vega 7 | 1.4 kg | 18.19 mm | 13.30" | 1920x1200 | |
| 89.2 % v7 (old) | 01 / 2023 | HP EliteBook 835 G9 R7 PRO 6850U, Radeon 680M | 1.3 kg | 19.2 mm | 13.30" | 1920x1200 | |
| 89 % v7 (old) | 07 / 2022 | Dell Latitude 13 7330 i7-1265U, Iris Xe G7 96EUs | 1 kg | 16.96 mm | 13.30" | 1920x1080 | |
| 89.4 % v7 (old) | 11 / 2022 | Lenovo ThinkPad X13 G3 21BN0046GE i5-1235U, Iris Xe G7 80EUs | 1.3 kg | 18.9 mm | 13.30" | 1920x1200 |
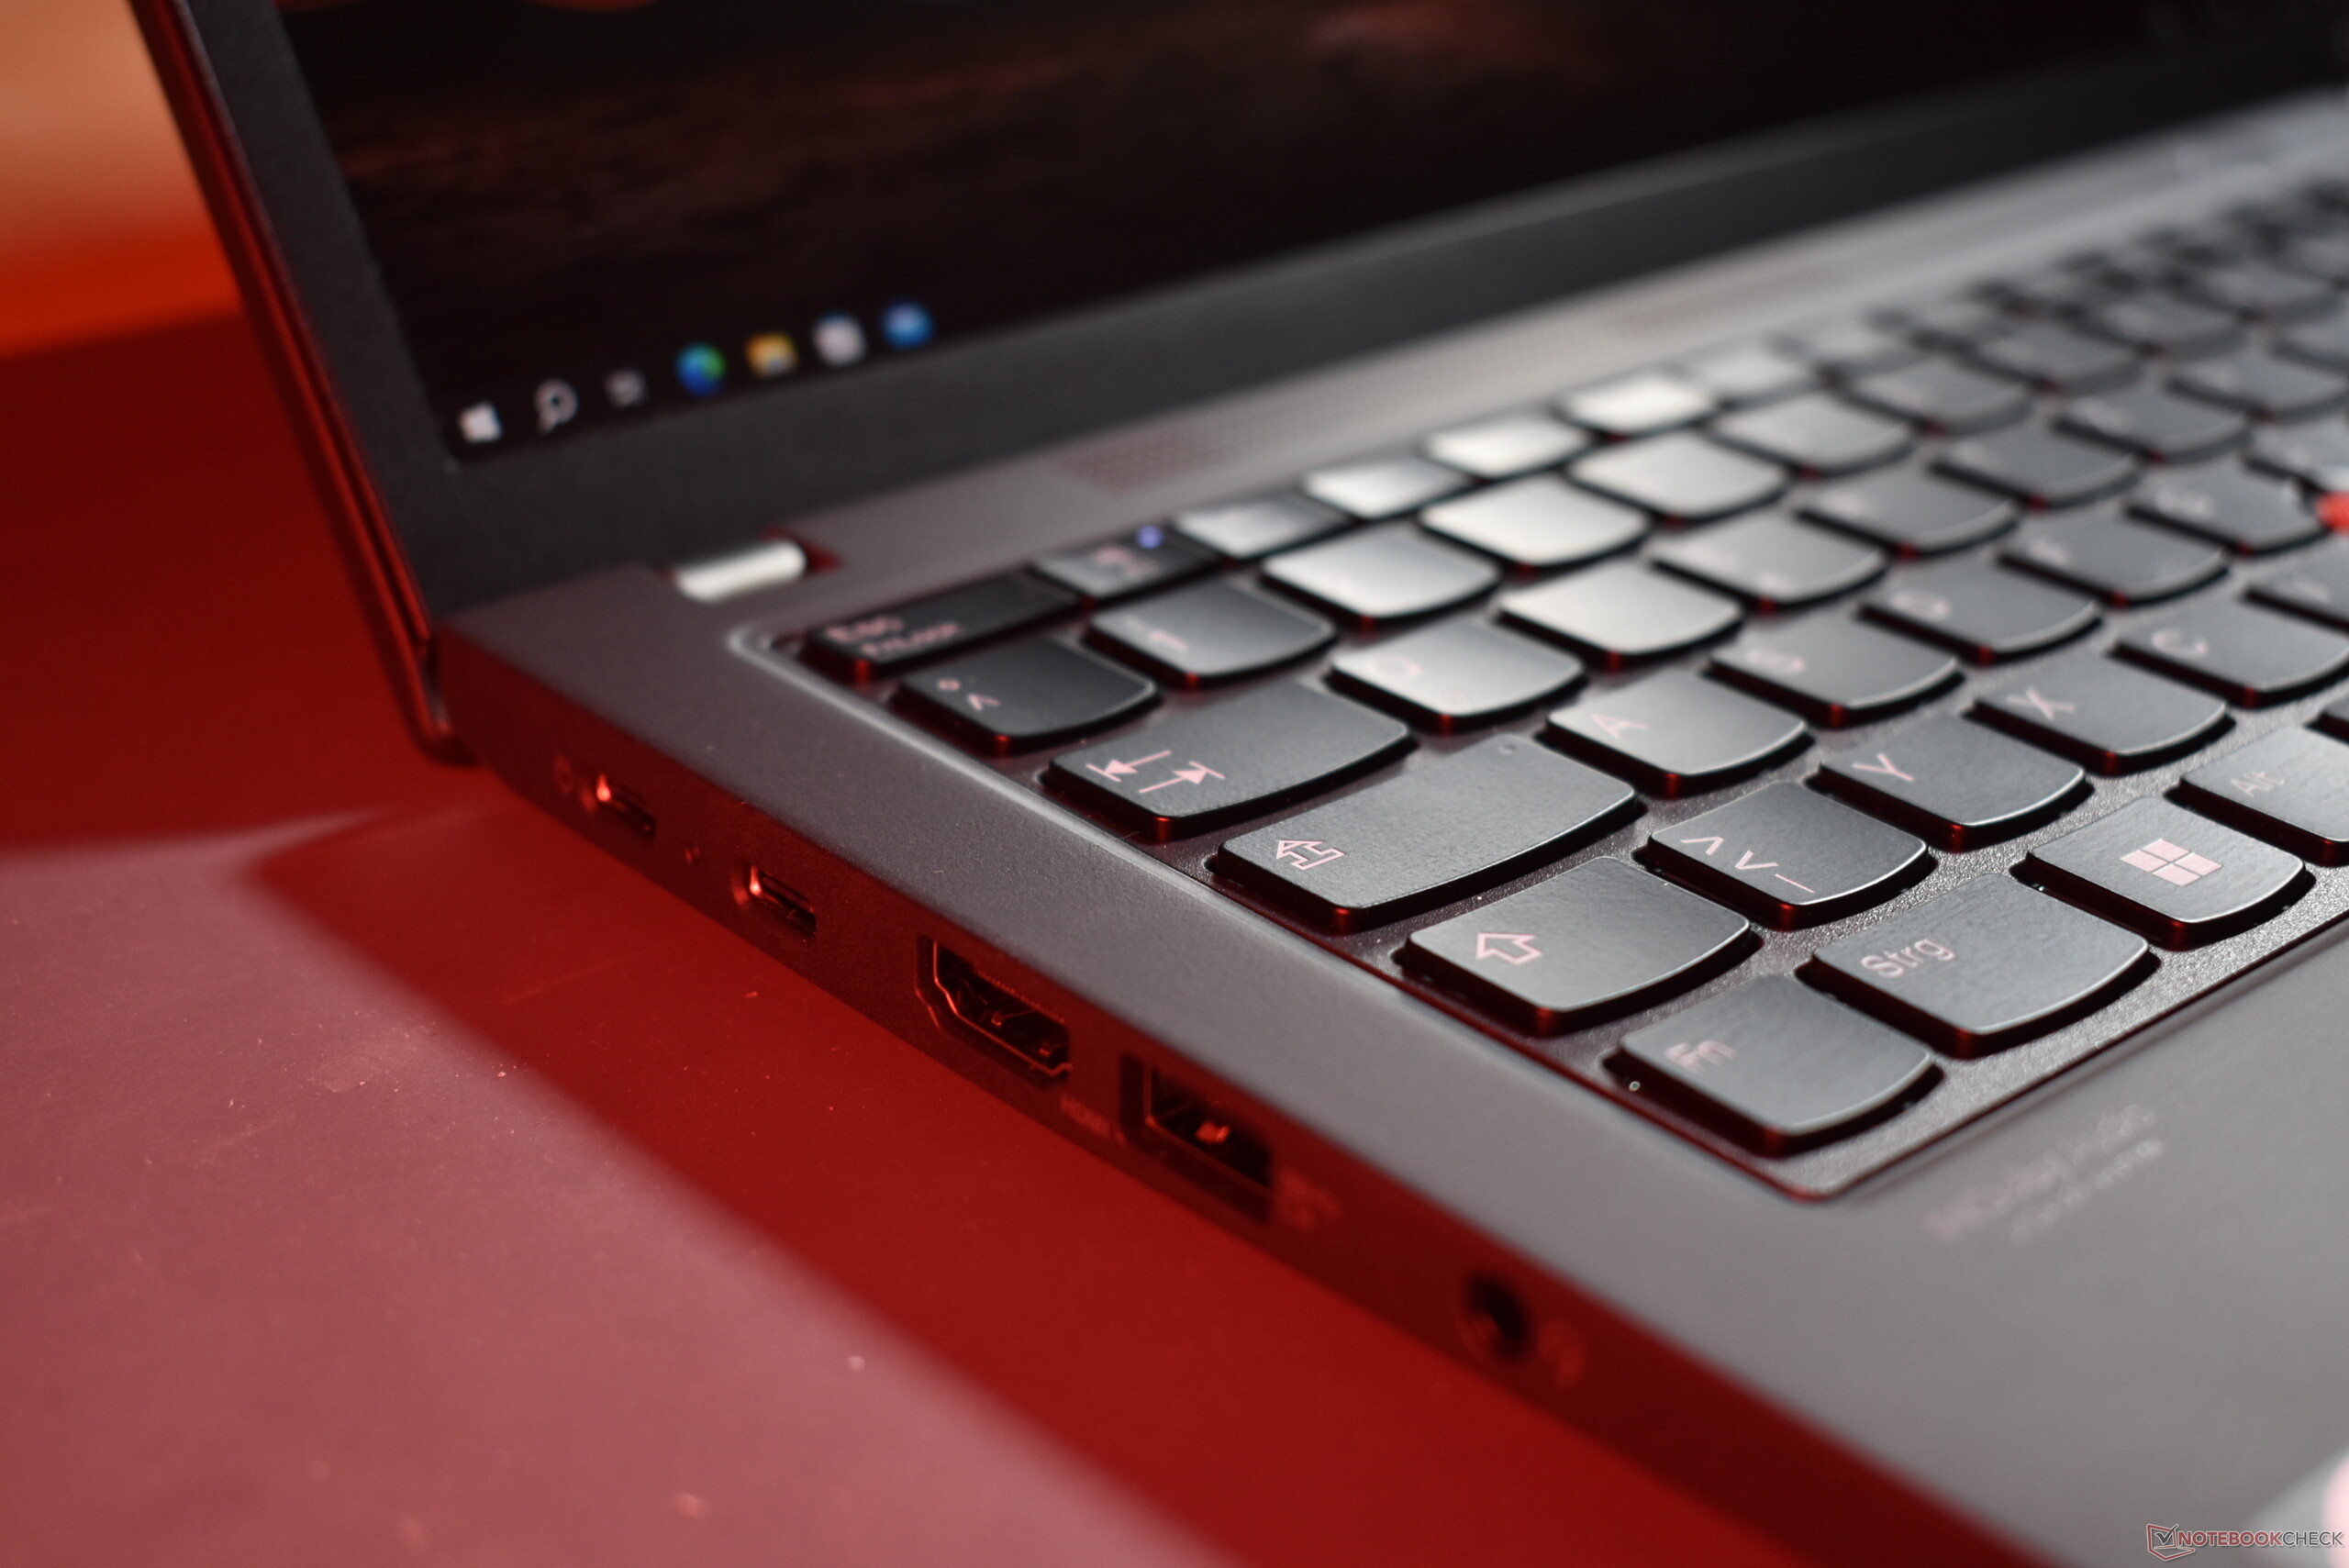
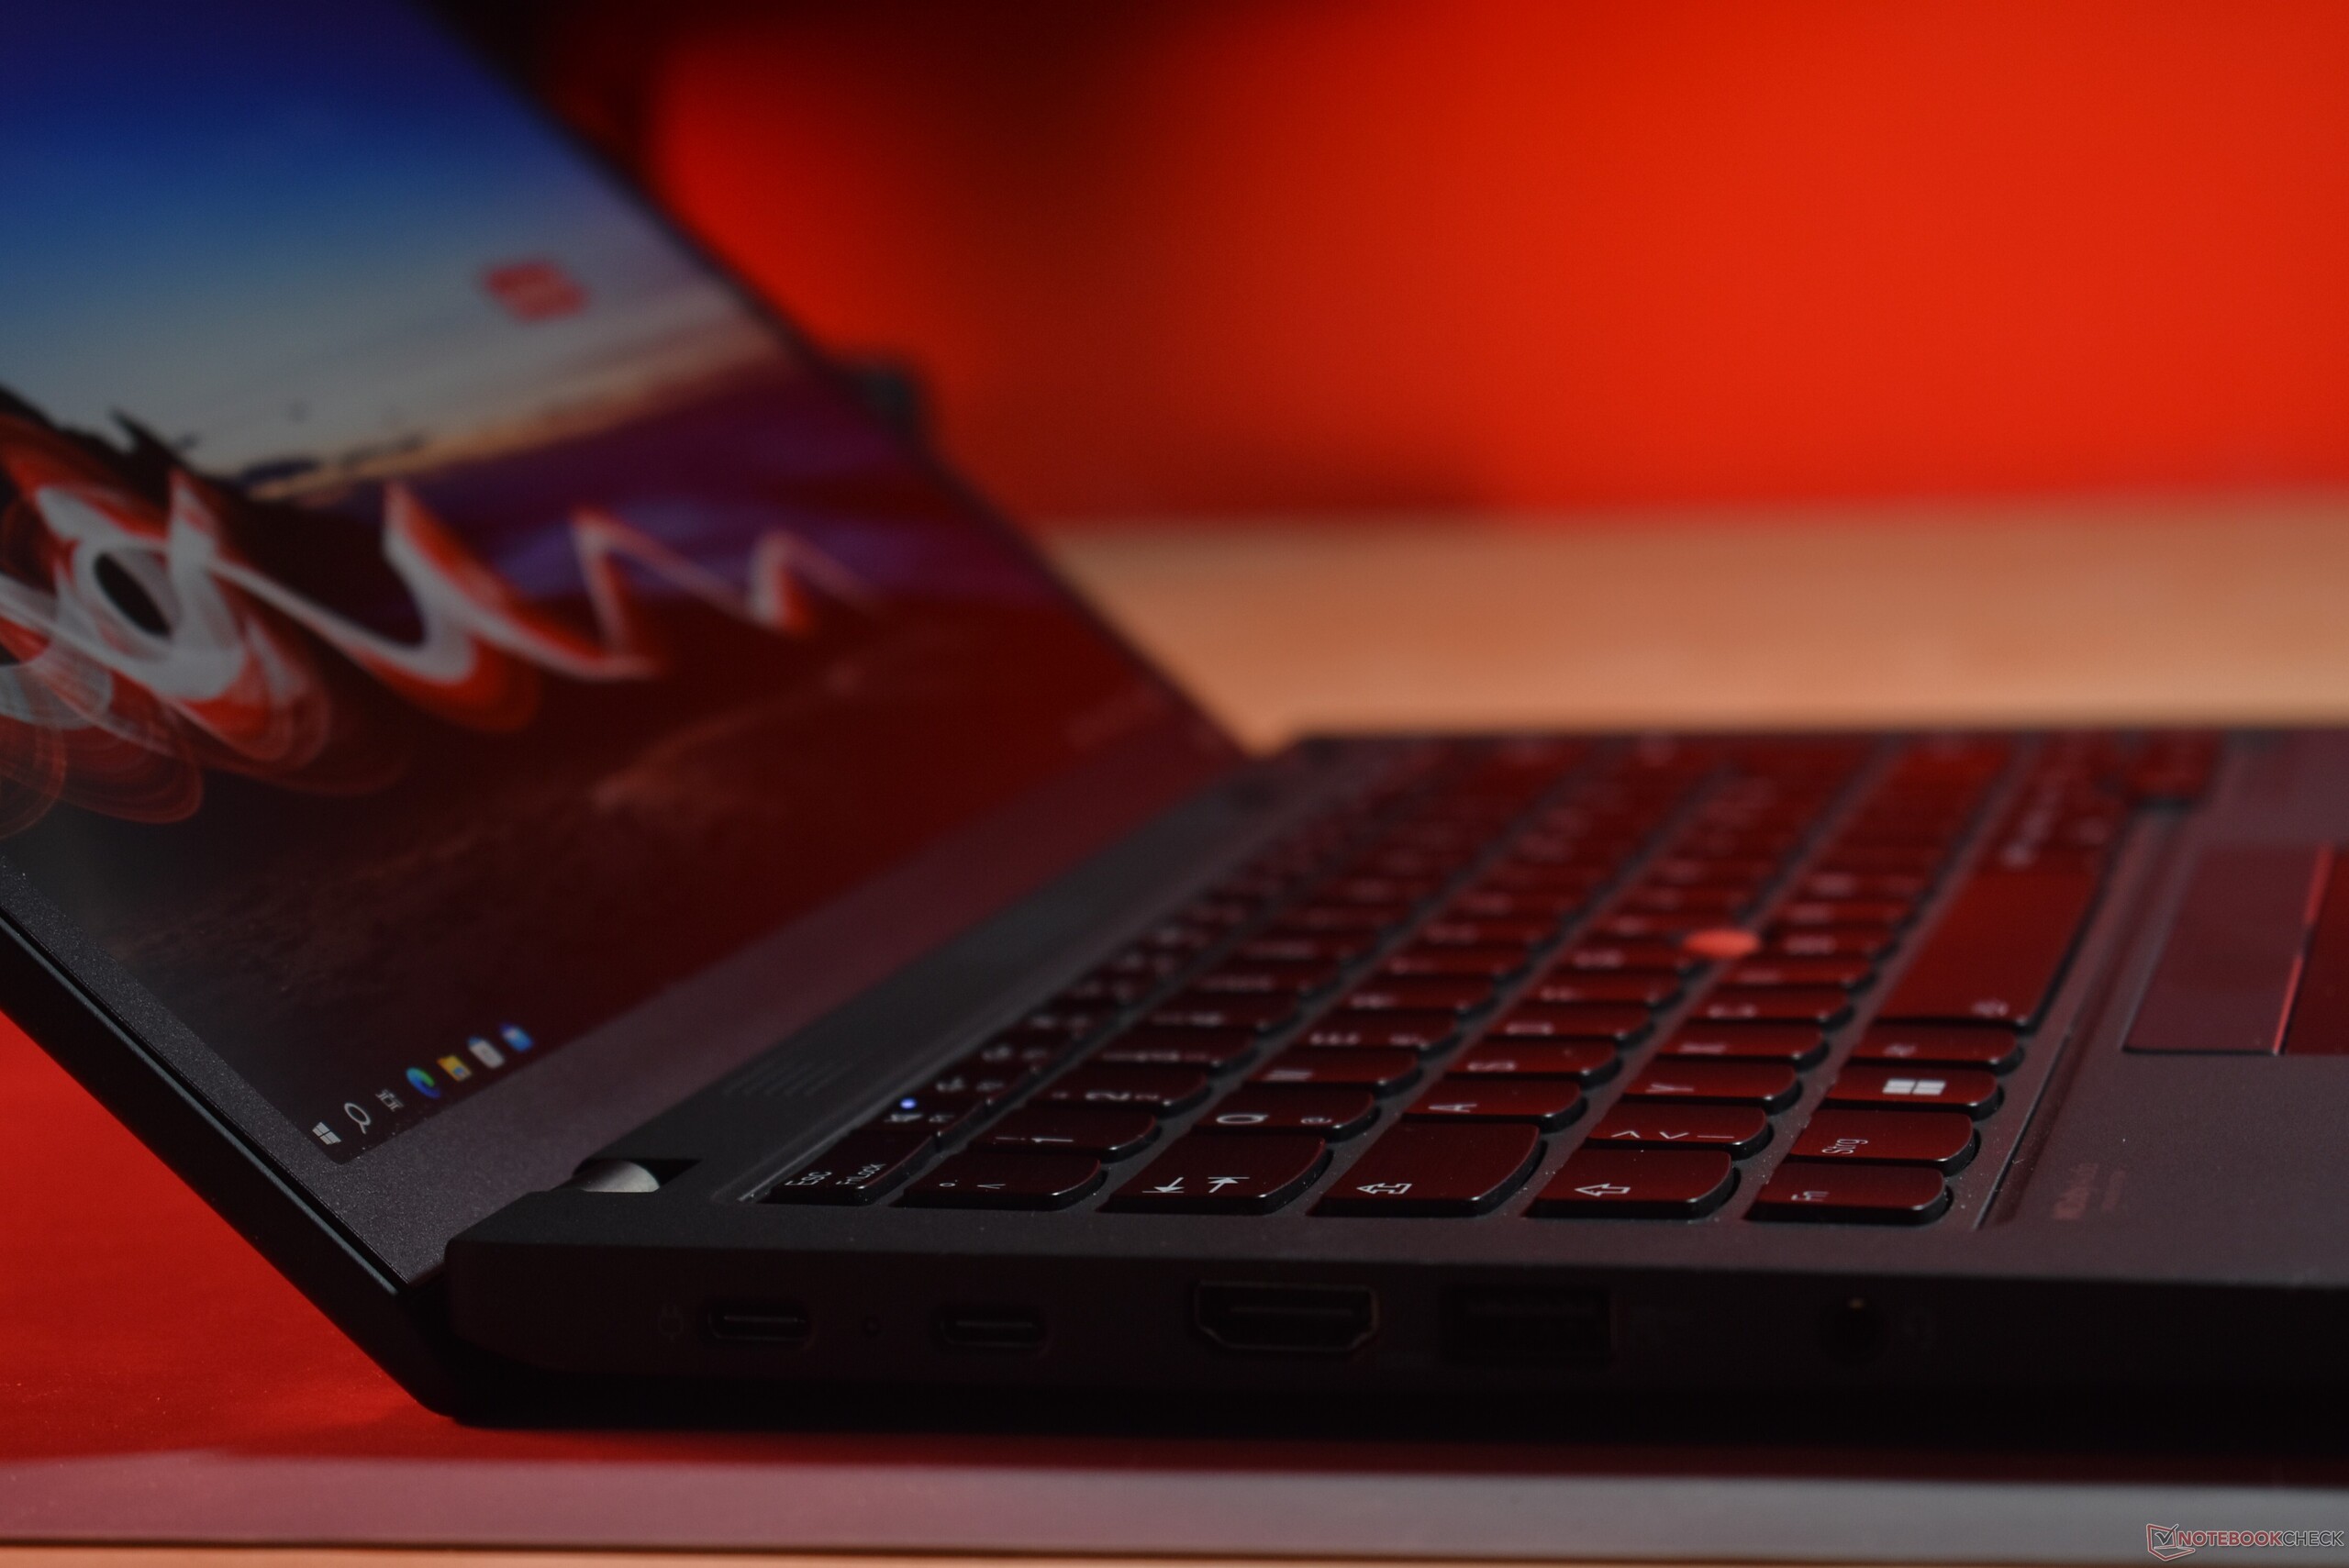
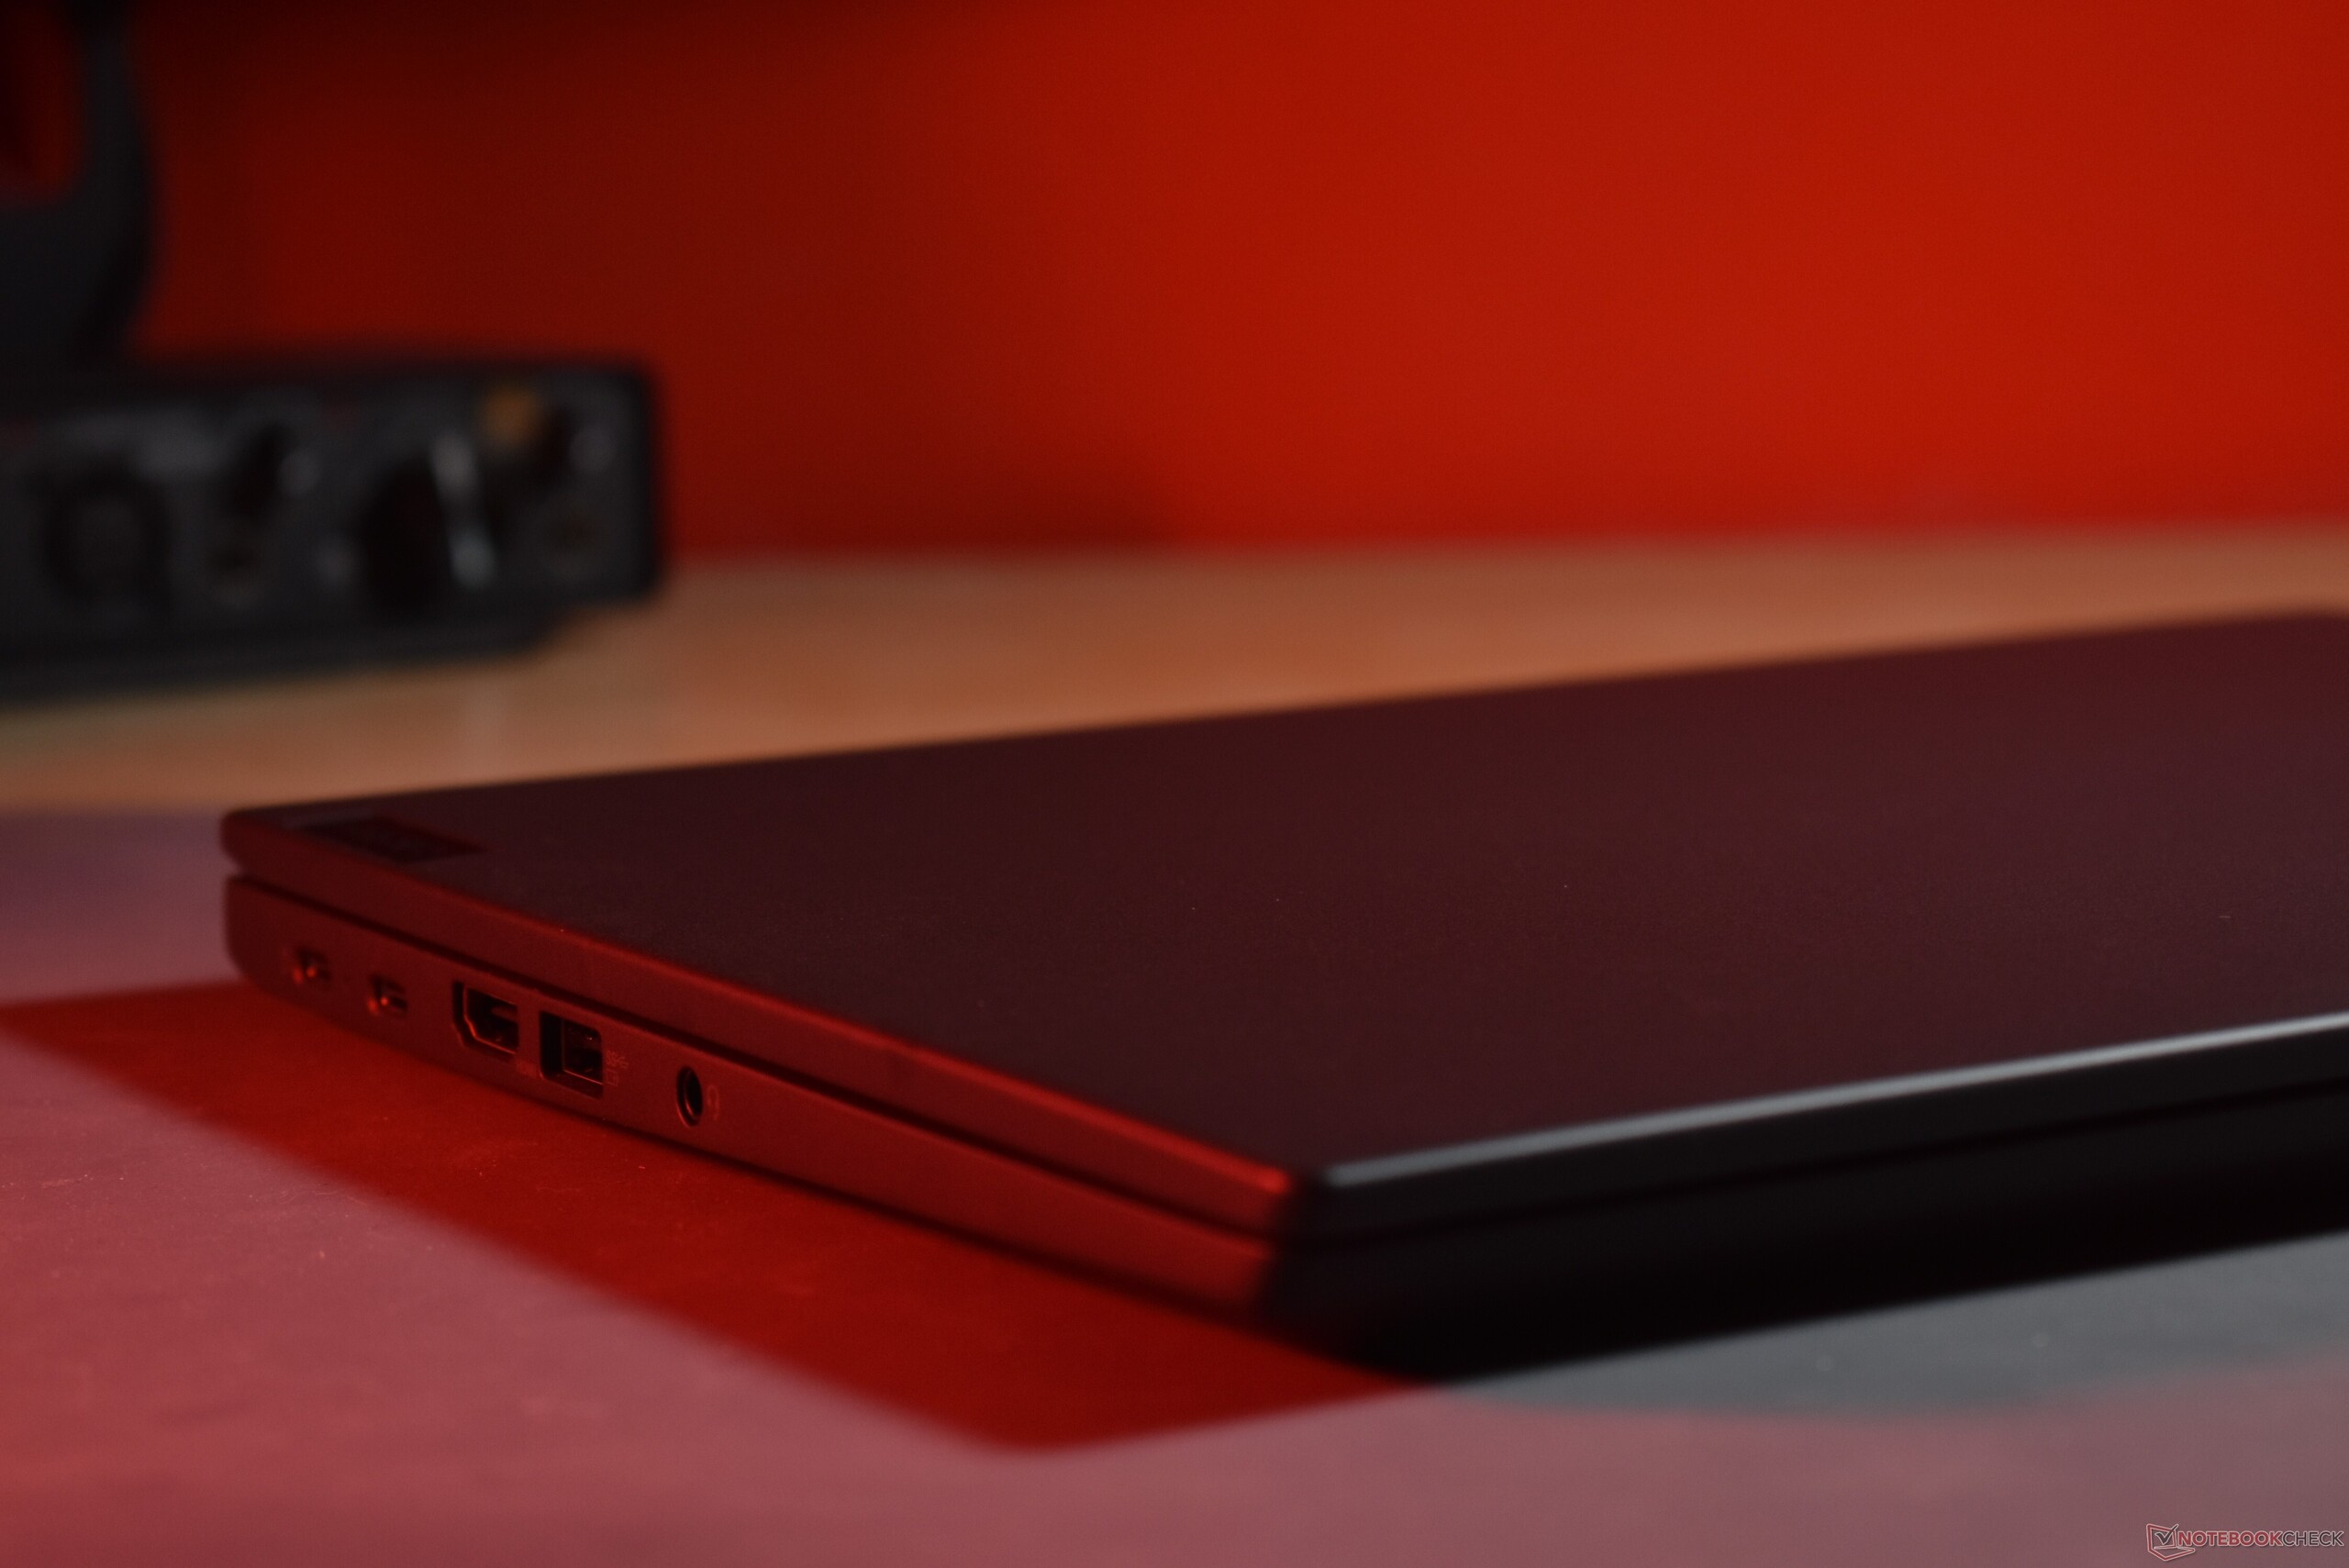
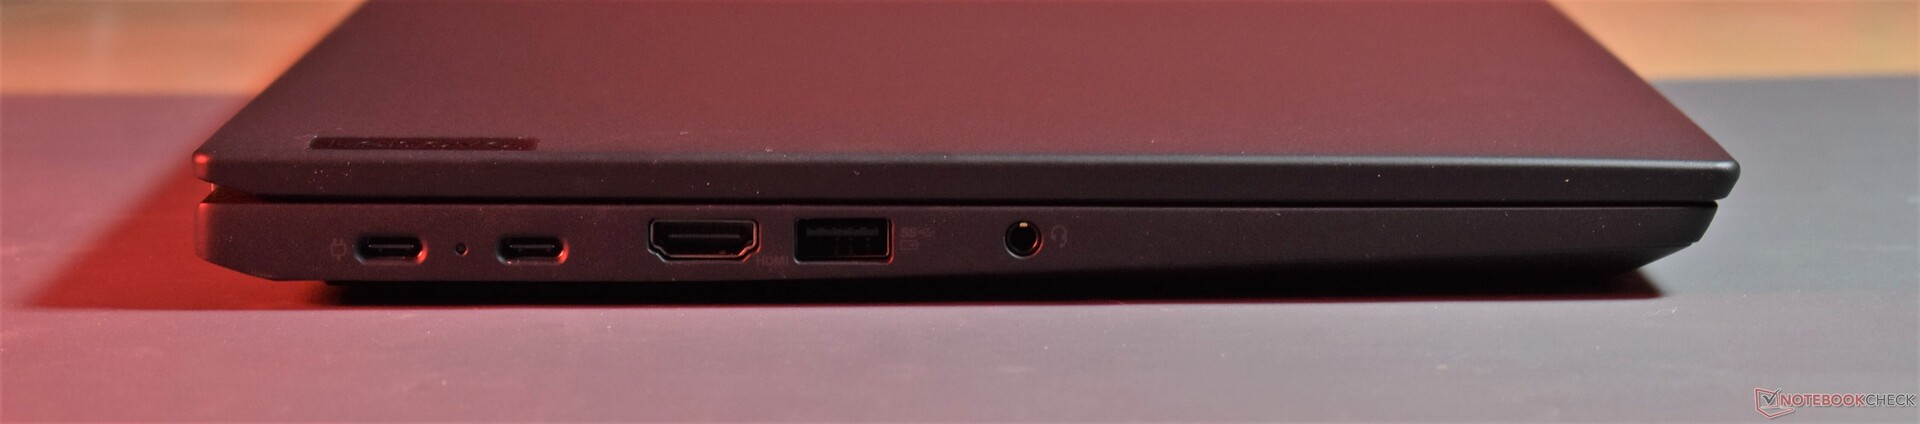
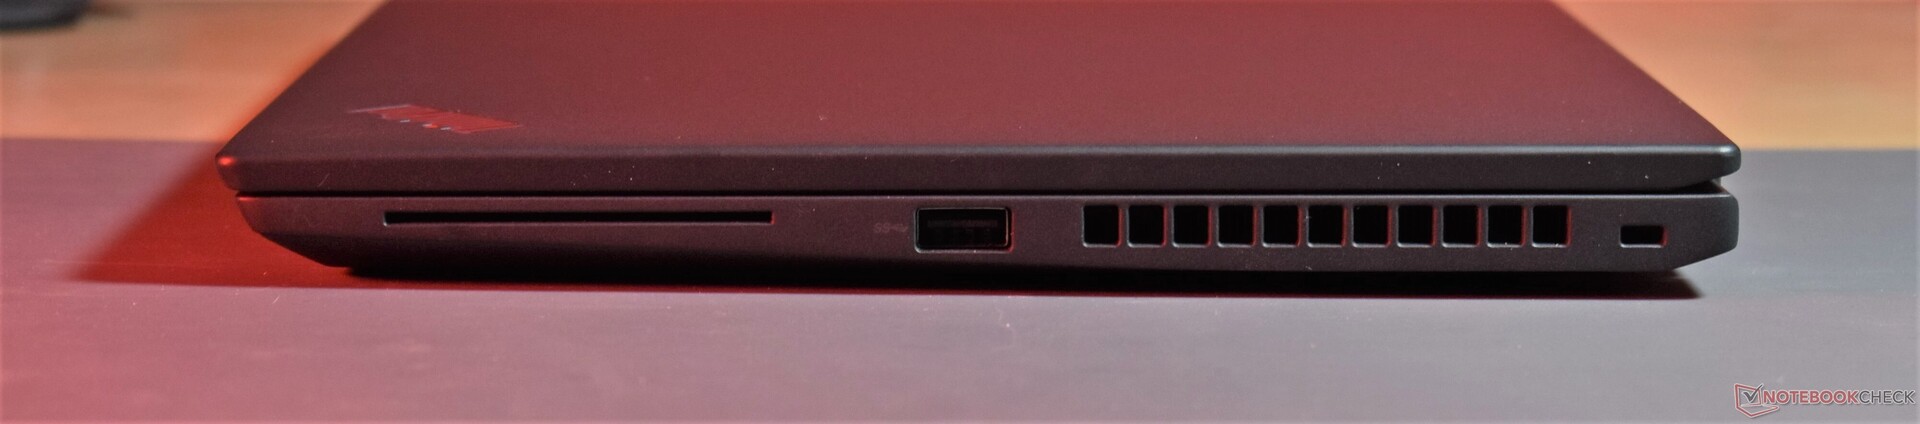
Connectivity
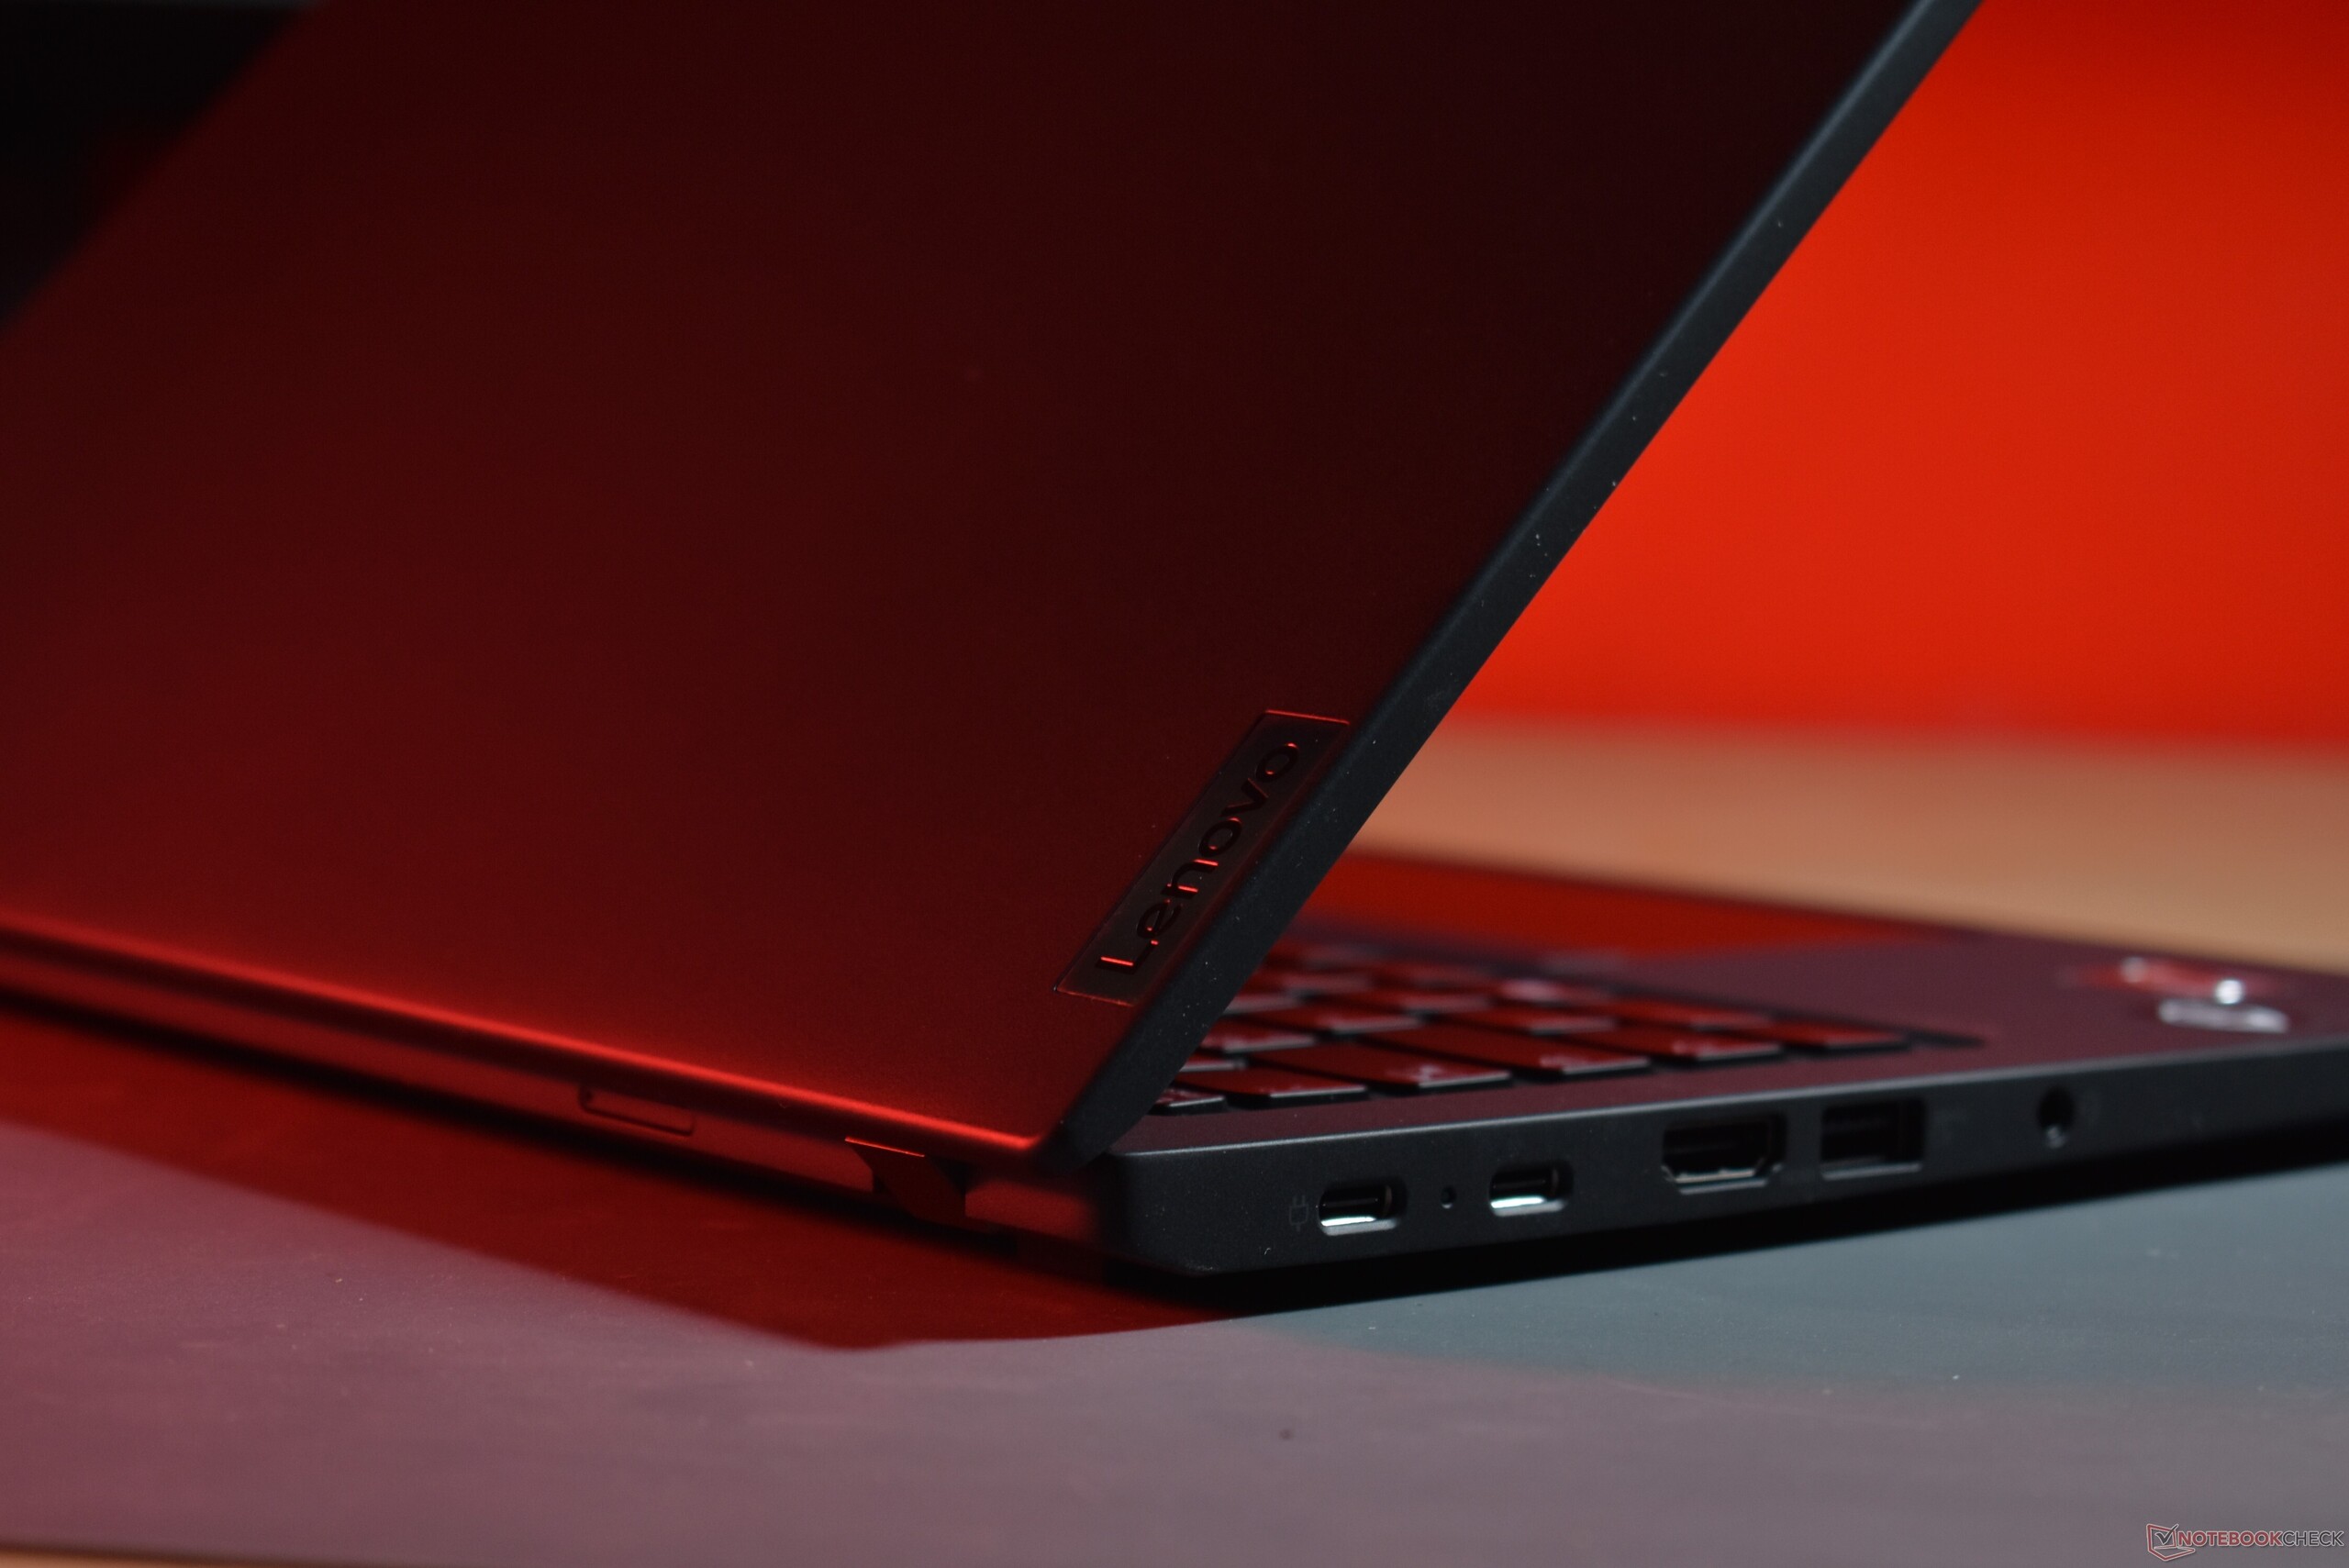
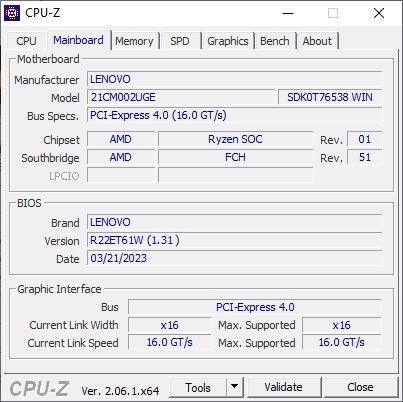
Compared with the Lenovo ThinkPad X13 Gen 2 AMD port selection is basically unchanged. New is the addition of USB4, which means Thunderbolt compatibility.
Communication
Notably weak are the upload transfer rates of the Lenovo ThinkPad X13 G3 AMD or rather of its Qualcomm WiFi solution. The download rates on the other hand are perfectly good.
| Networking | |
| Lenovo ThinkPad X13 G3 21CM002UGE | |
| iperf3 transmit AXE11000 | |
| iperf3 receive AXE11000 | |
| iperf3 transmit AXE11000 6GHz | |
| iperf3 receive AXE11000 6GHz | |
| HP EliteBook 835 G9 | |
| iperf3 transmit AXE11000 | |
| iperf3 receive AXE11000 | |
| Dell Latitude 13 7330 | |
| iperf3 transmit AXE11000 6GHz | |
| iperf3 receive AXE11000 6GHz | |
| Lenovo ThinkPad X13 G3 21BN0046GE | |
| iperf3 transmit AXE11000 | |
| iperf3 receive AXE11000 | |
| Average Qualcomm WCN685x | |
| iperf3 transmit AXE11000 | |
| iperf3 receive AXE11000 | |
| iperf3 transmit AXE11000 6GHz | |
| iperf3 receive AXE11000 6GHz | |
Webcam
In comparison to the Lenovo ThinkPad X13 Gen 2, there are no changes to the quality of the 1080p webcam.


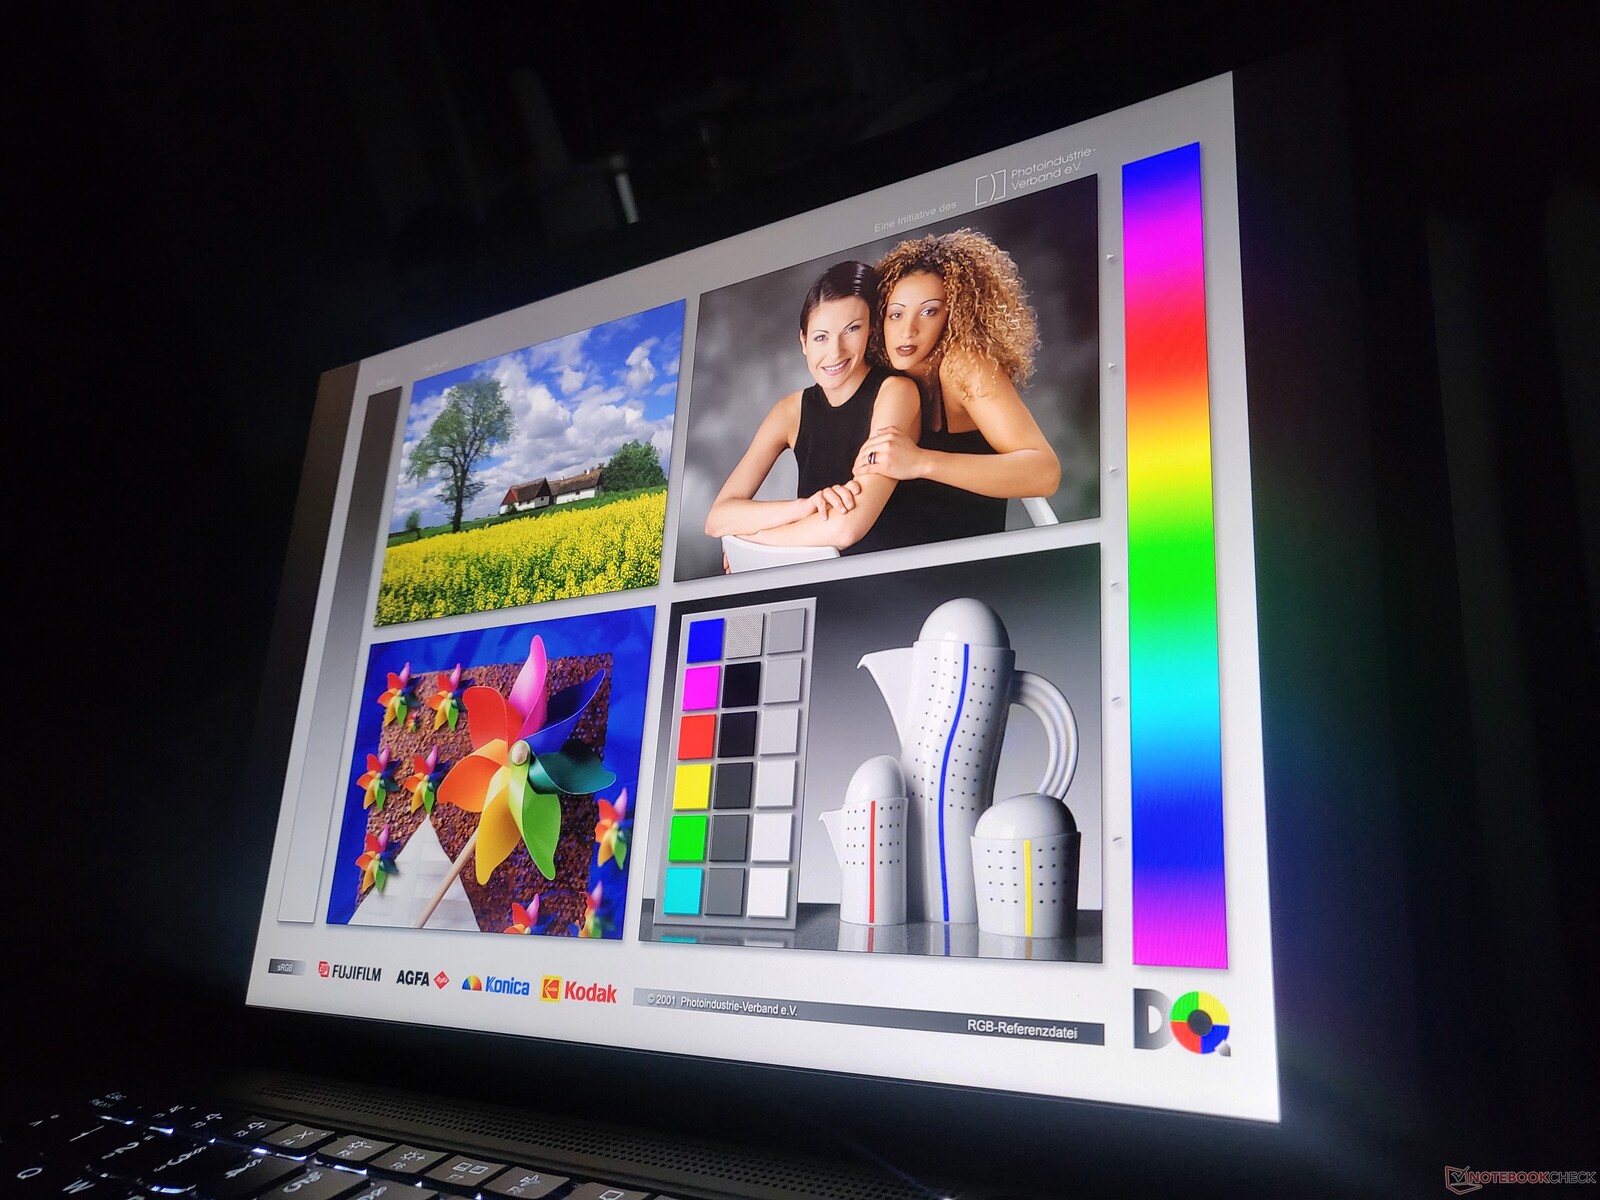
Display: screen brightness of the Lenovo laptop could be better

The selection of 13.3 inch screens remains unchanged compared to the 2022 model. All available screens have a matte surface, the 16:10 aspect ratio and a refresh rate of 60 Hz:
- 1,920 x 1,200 (WUXGA), 300 cd/m², 72 % NTSC
- 1,920 x 1,200 (WUXGA), 300 cd/m², 72 % NTSC, On-Cell Touch
- 1,920 x 1,200 (WUXGA), 500 cd/m², 72 % NTSC, PrivacyGuard
- 2,560 x 1,600 (WQXGA), 400 cd/m², 100 % sRGB, Low Power, Dolby Vision
The measured average brightness of 321 cd/m² is slightly above the advertised 300 cd/m² threshold. Notable: The competition in the form of Dell and HP offers much brighter screens. An average of 830 cd/m² like the HP EliteBook 835 G9 offers is not really needed on the base panel, but it would be nice if Lenovo would grant the X13 brighter screens - without forcing the user to upgrade to the WQXGA or PrivacyGuard panels. 400 cd/m² plus X like the Dell Latitude 7330 offers would be reasonable.
| |||||||||||||||||||||||||
Brightness Distribution: 85 %
Center on Battery: 348 cd/m²
Contrast: 1024:1 (Black: 0.34 cd/m²)
ΔE ColorChecker Calman: 1.3 | ∀{0.5-29.43 Ø4.72}
calibrated: 1
ΔE Greyscale Calman: 0.9 | ∀{0.09-98 Ø4.97}
70.3% AdobeRGB 1998 (Argyll 3D)
98.4% sRGB (Argyll 3D)
69% Display P3 (Argyll 3D)
Gamma: 2.16
CCT: 6431 K
| Lenovo ThinkPad X13 G3 21CM002UGE M133NW4J R3, IPS LED, 1920x1200, 13.3" | Lenovo ThinkPad X13 G2 AMD 20XH001KGE NV133WUM-N61, IPS LED, 1920x1200, 13.3" | HP EliteBook 835 G9 InfoVision X133NV4M R0, IPS, 1920x1200, 13.3" | Dell Latitude 13 7330 LG Philips 133WF9, IPS, 1920x1080, 13.3" | Lenovo ThinkPad X13 G3 21BN0046GE NV133WUM-N61, IPS Grade, 1920x1200, 13.3" | |
|---|---|---|---|---|---|
| Display | 1% | 2% | -4% | 1% | |
| Display P3 Coverage (%) | 69 | 70.1 2% | 70.7 2% | 66.1 -4% | 70.4 2% |
| sRGB Coverage (%) | 98.4 | 99.4 1% | 100 2% | 93.5 -5% | 99.8 1% |
| AdobeRGB 1998 Coverage (%) | 70.3 | 71.3 1% | 72.1 3% | 68.2 -3% | 71 1% |
| Response Times | 23% | 17% | -8% | 48% | |
| Response Time Grey 50% / Grey 80% * (ms) | 44.2 ? | 34 ? 23% | 37.7 ? 15% | 48.4 ? -10% | 22.9 ? 48% |
| Response Time Black / White * (ms) | 28.1 ? | 22 ? 22% | 22.7 ? 19% | 29.6 ? -5% | 14.8 ? 47% |
| PWM Frequency (Hz) | |||||
| Screen | -14% | 21% | -16% | -25% | |
| Brightness middle (cd/m²) | 348 | 309 -11% | 928 167% | 460.1 32% | 290 -17% |
| Brightness (cd/m²) | 321 | 297 -7% | 828 158% | 445 39% | 288 -10% |
| Brightness Distribution (%) | 85 | 81 -5% | 65 -24% | 89 5% | 88 4% |
| Black Level * (cd/m²) | 0.34 | 0.26 24% | 0.35 -3% | 0.31 9% | 0.21 38% |
| Contrast (:1) | 1024 | 1188 16% | 2651 159% | 1484 45% | 1381 35% |
| Colorchecker dE 2000 * | 1.3 | 1.6 -23% | 1.76 -35% | 2.42 -86% | 1.9 -46% |
| Colorchecker dE 2000 max. * | 2.5 | 3 -20% | 3.94 -58% | 3.97 -59% | 4 -60% |
| Colorchecker dE 2000 calibrated * | 1 | 0.8 20% | 1.09 -9% | 0.77 23% | 0.8 20% |
| Greyscale dE 2000 * | 0.9 | 2 -122% | 2.4 -167% | 2.3 -156% | 2.6 -189% |
| Gamma | 2.16 102% | 2.24 98% | 2.324 95% | 2.23 99% | 2.23 99% |
| CCT | 6431 101% | 6315 103% | 6689 97% | 6262 104% | 6195 105% |
| Total Average (Program / Settings) | 3% /
-6% | 13% /
16% | -9% /
-13% | 8% /
-9% |
* ... smaller is better
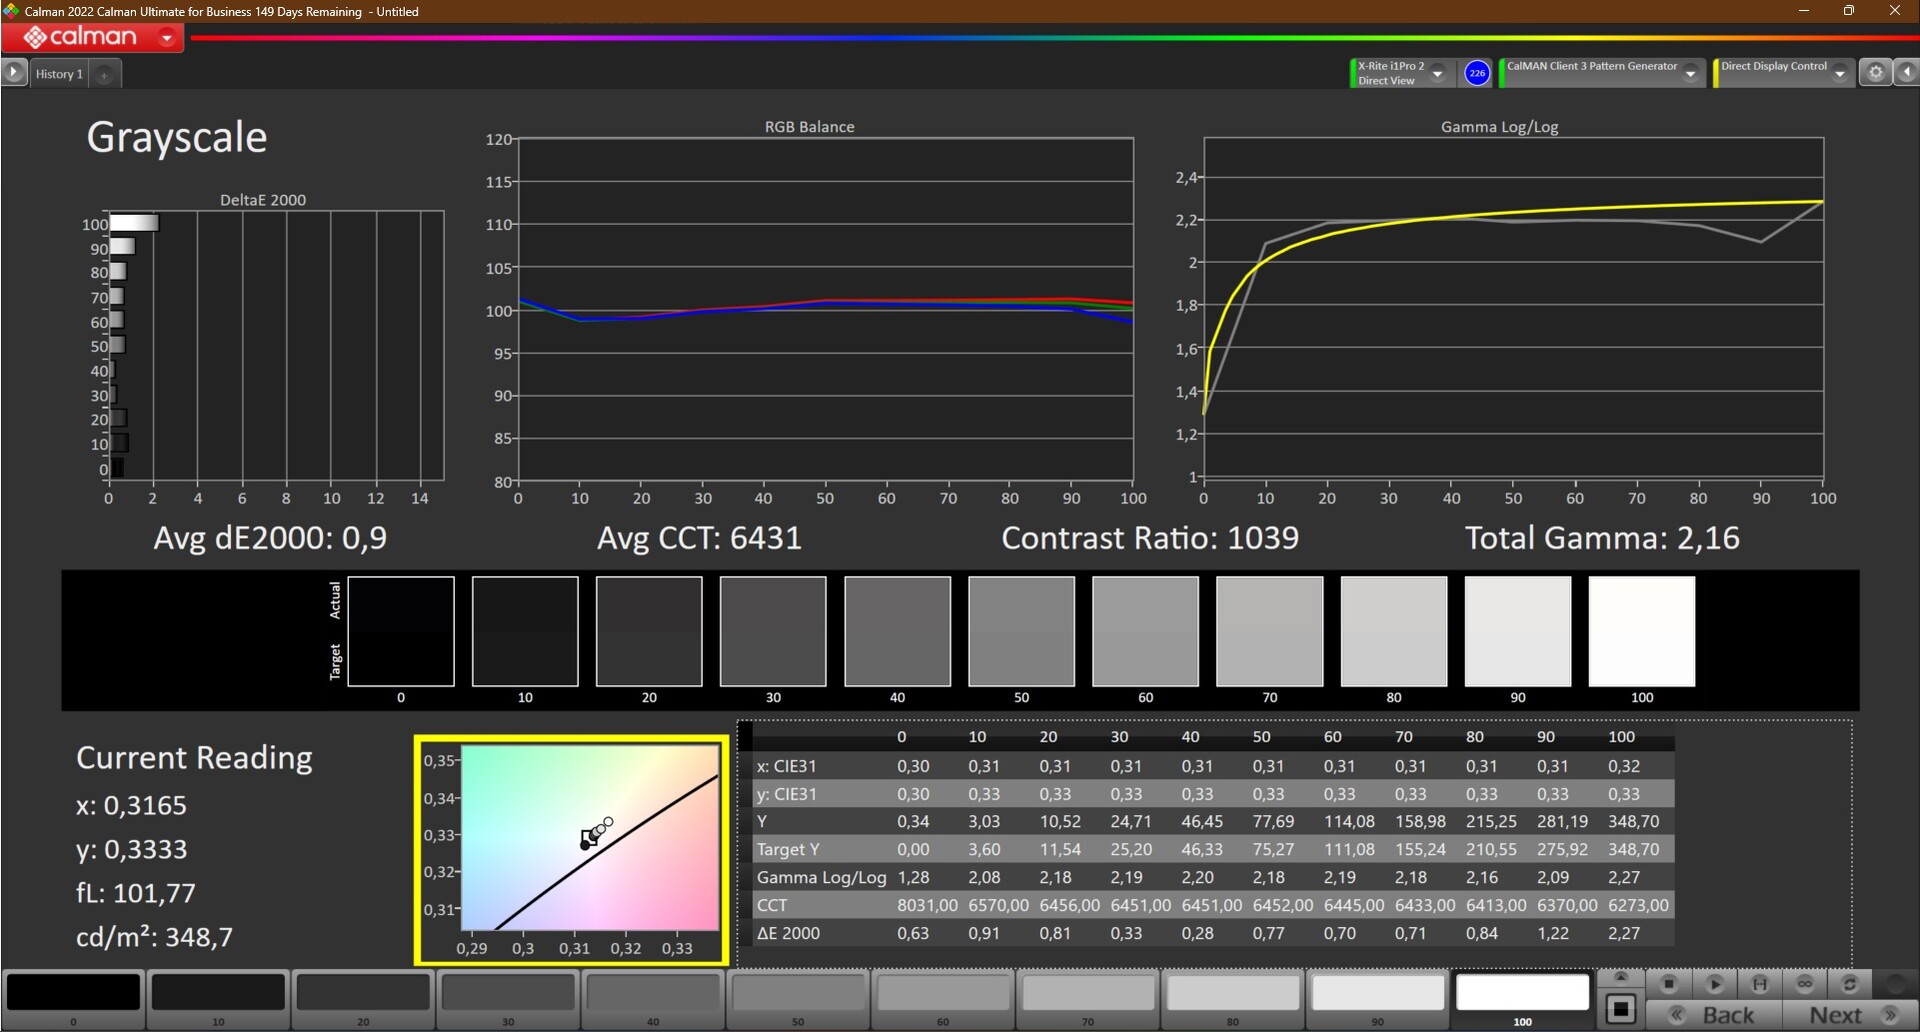

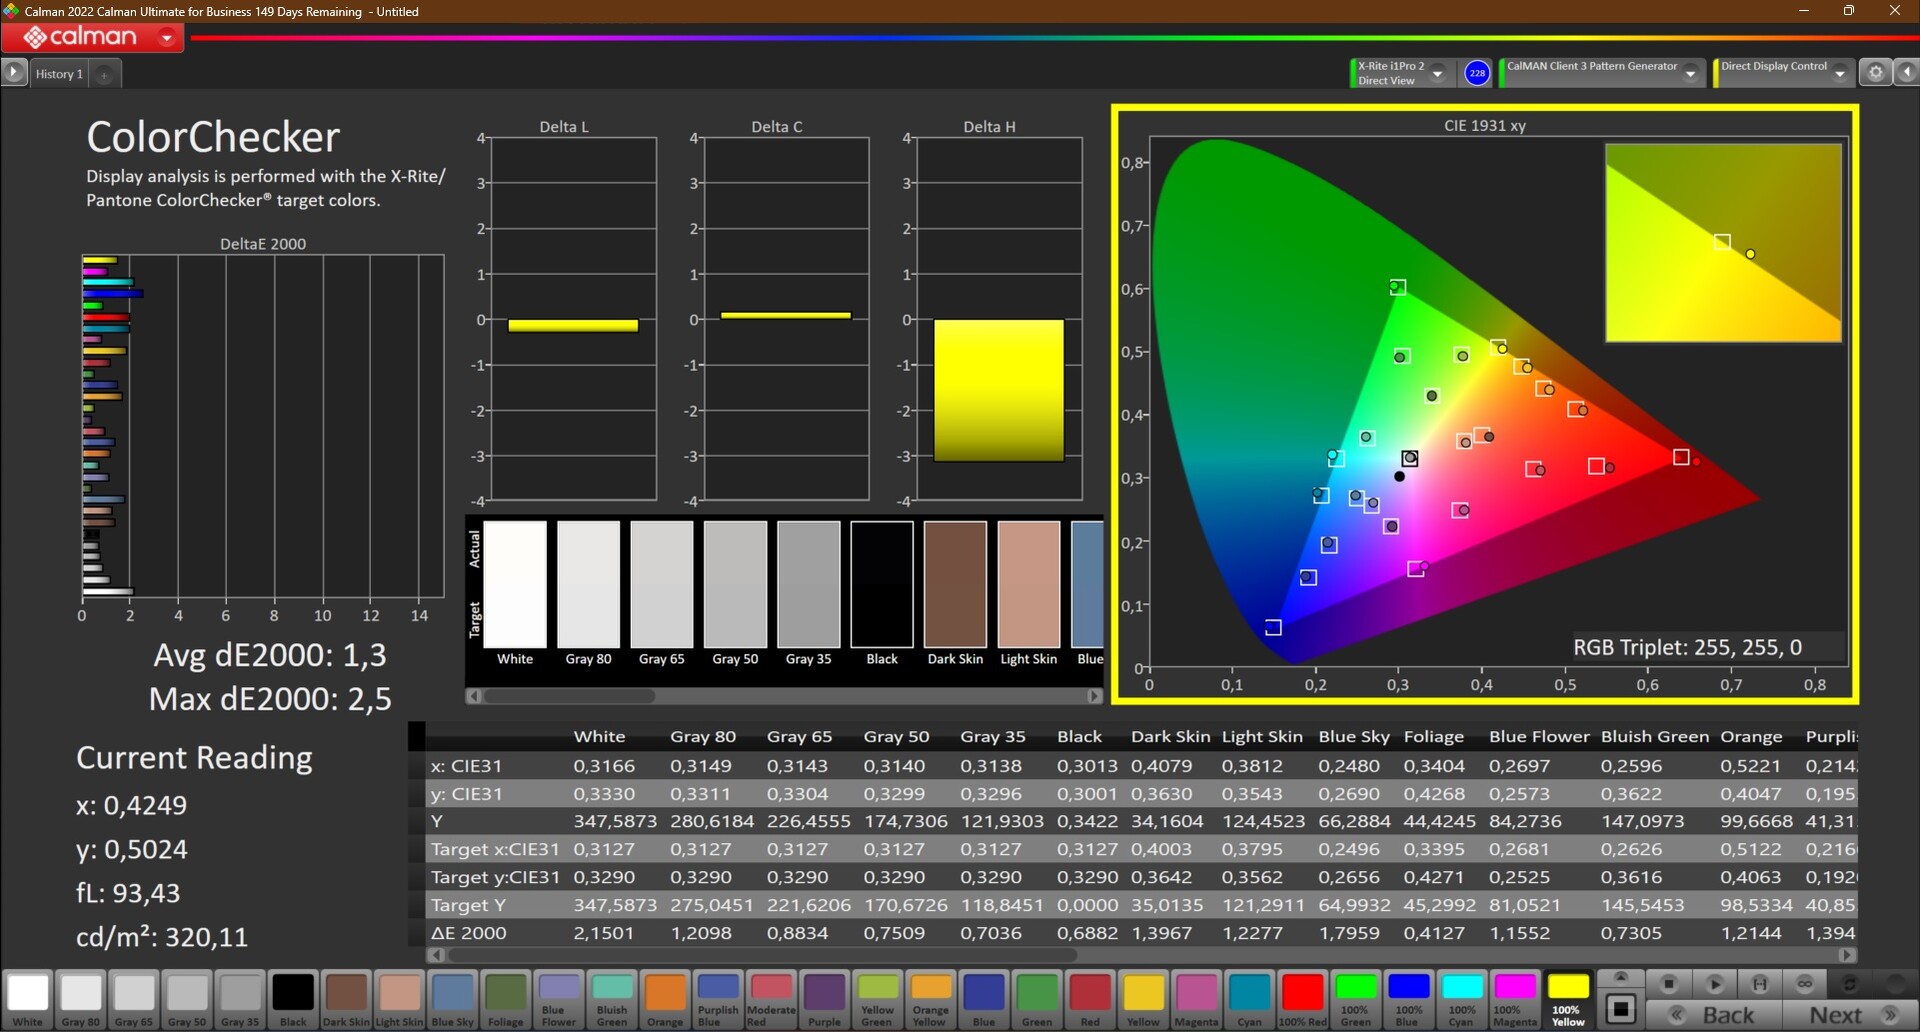
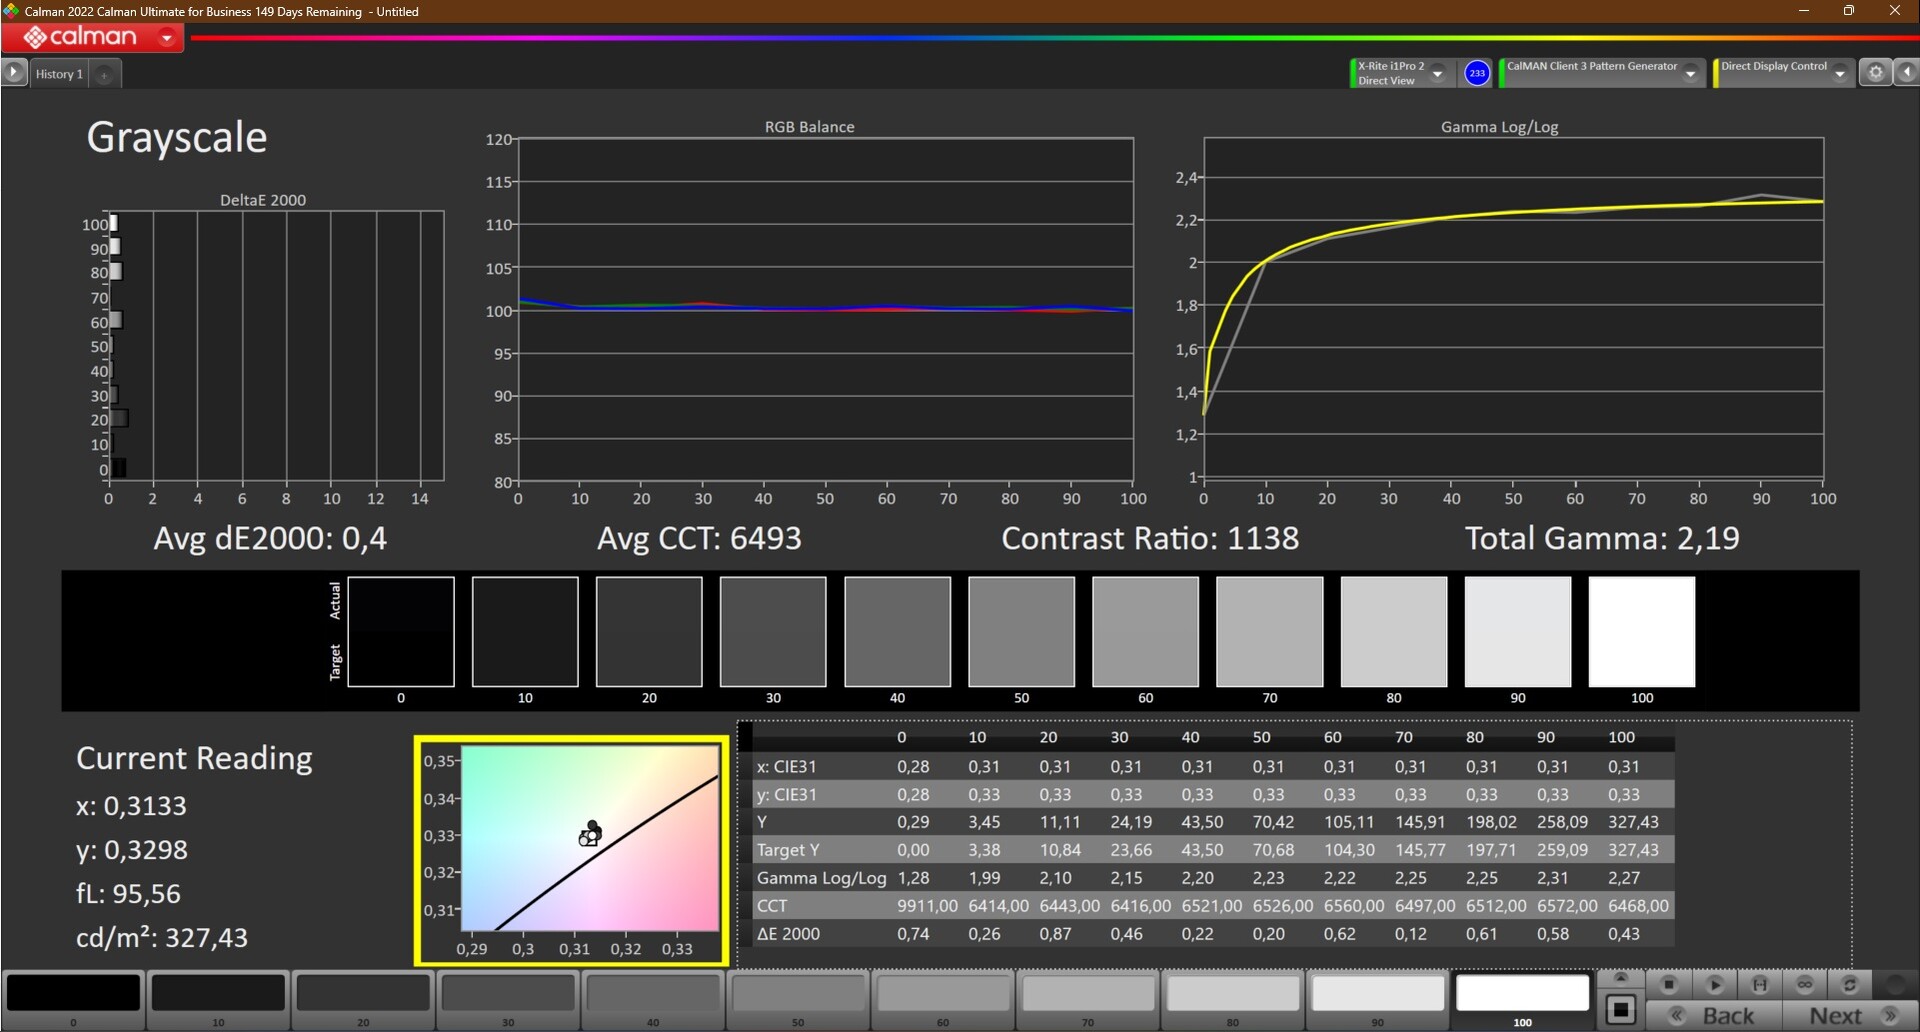
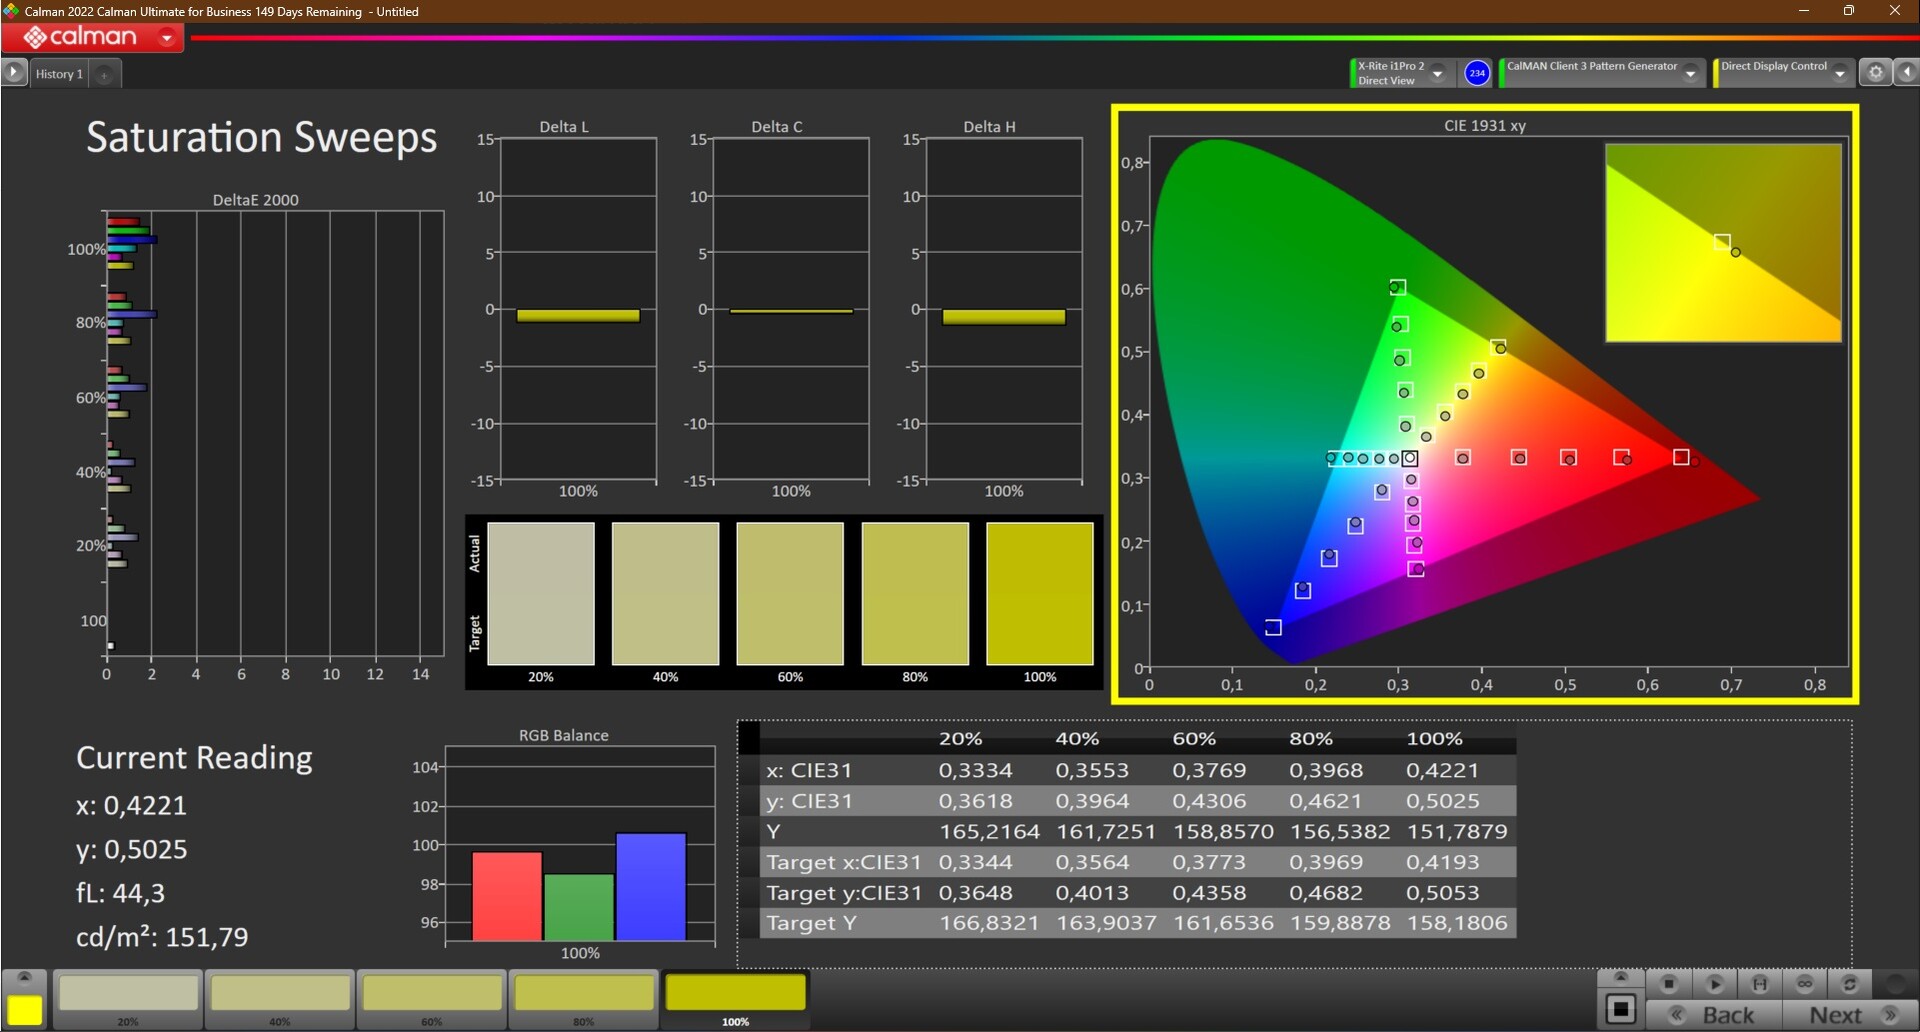
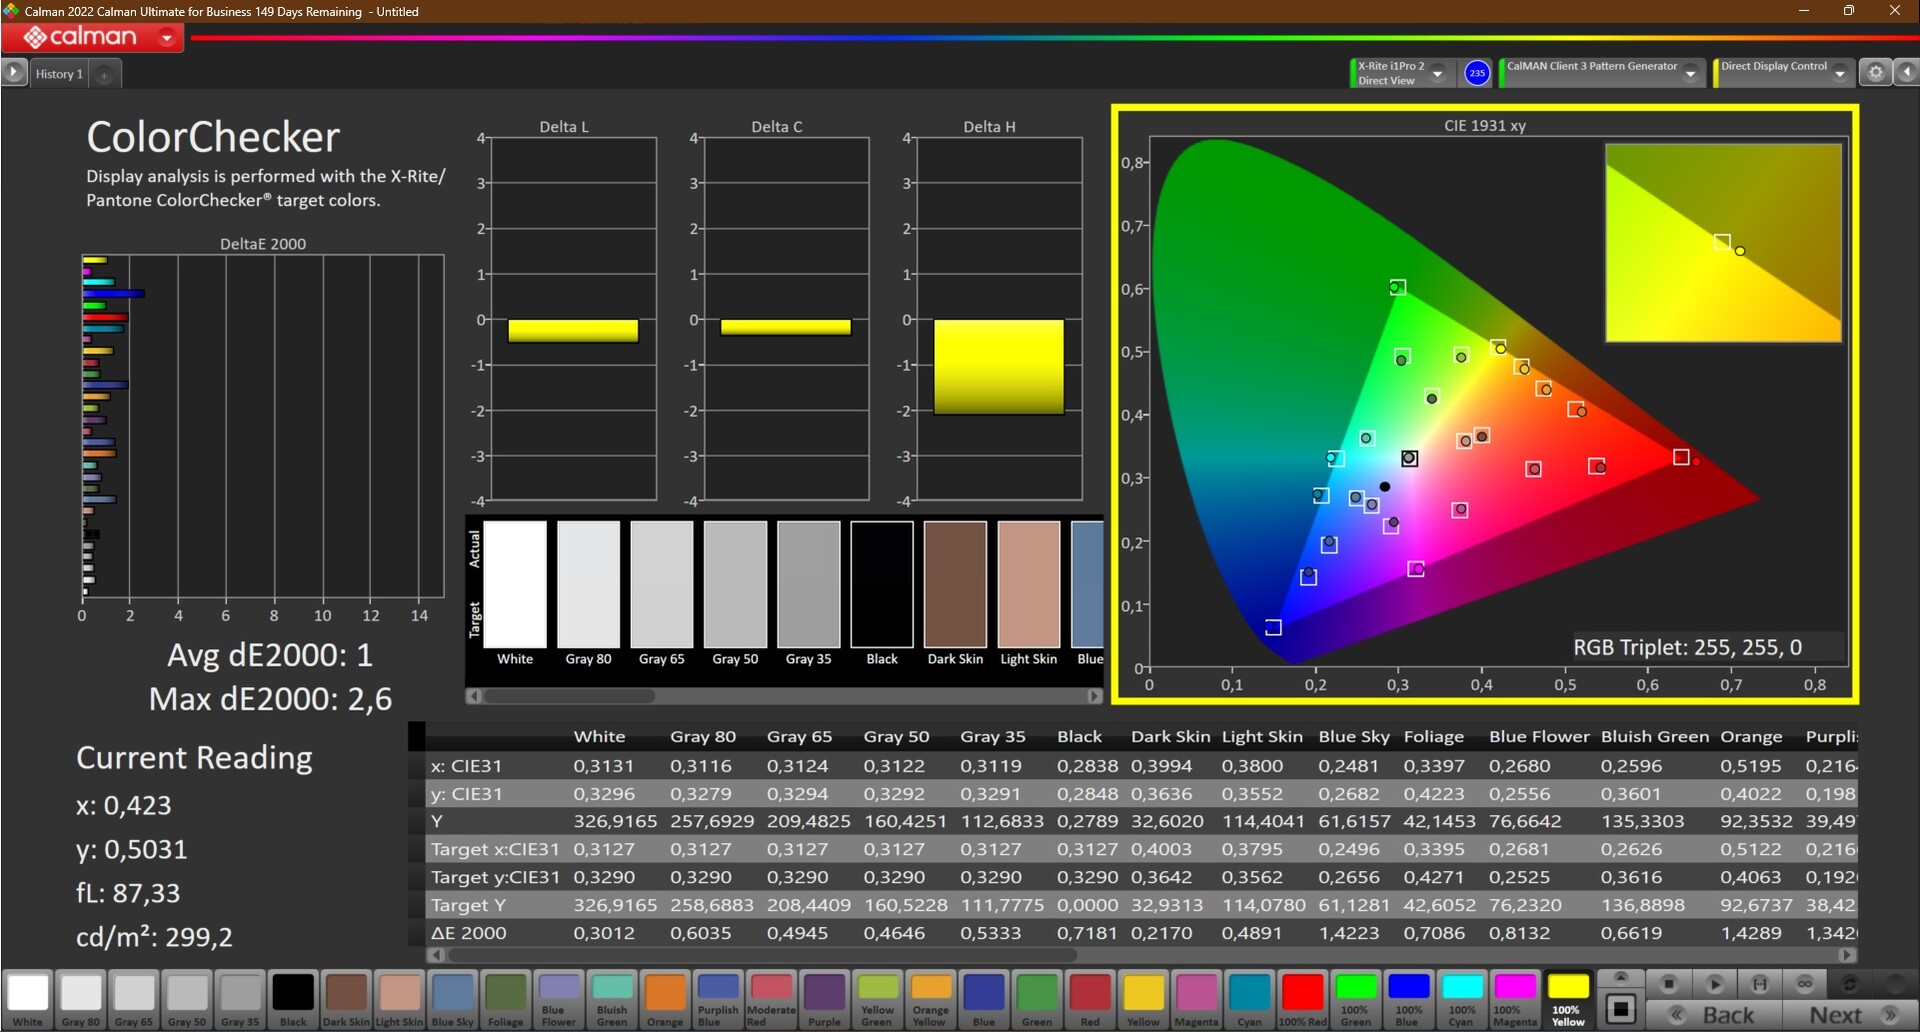
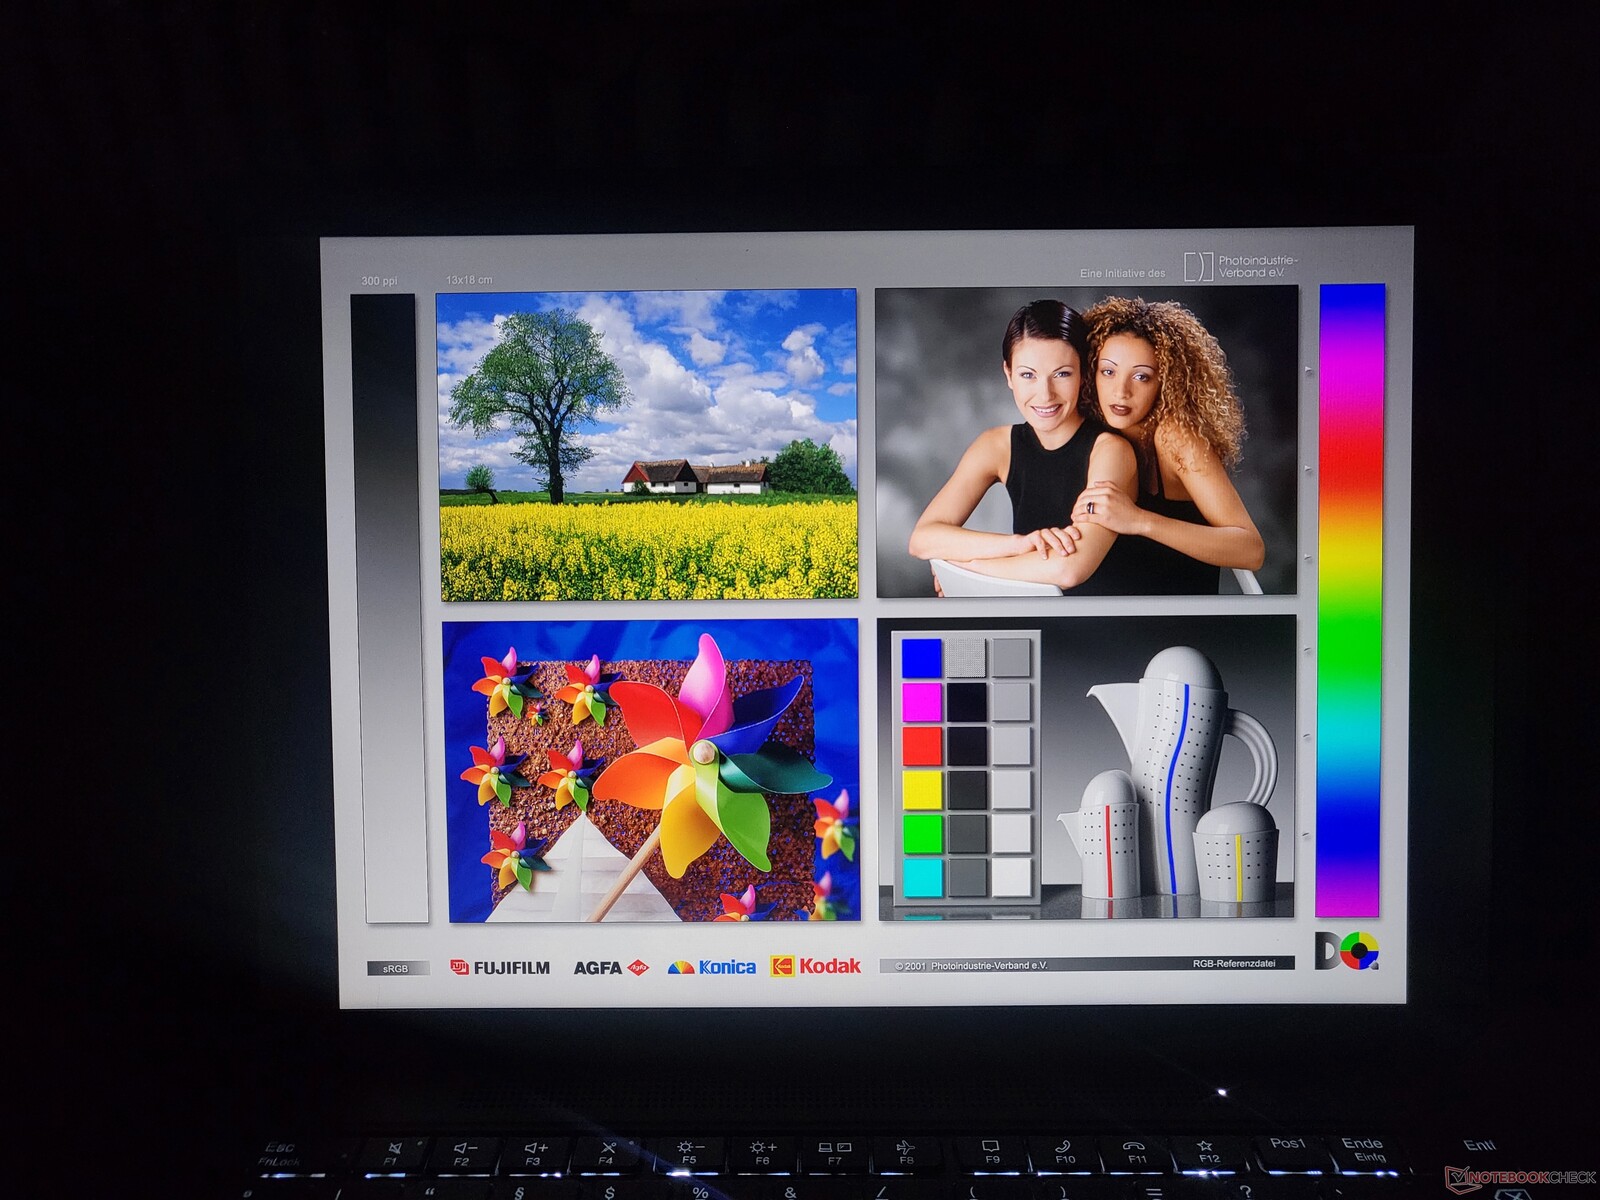
The panel is already pretty well adjusted in terms of colors ex factory. The low average deltaE of just 1.3, measured with CalMan and the X-Rite i1Pro 2 Colorimeter, is testament to that. After a calibration with the X-Rite i1Profiler, the screen becomes slightly more color accurate (1.0 instead of 1.3). The color profile we created for this purpose is available to download for free, as always.
In terms of color gamut coverage, the panel of the Lenovo ThinkPad X13 G3 AMD is nearly completely covering the sRGB color gamut. It is usable for basic photo editing tasks.


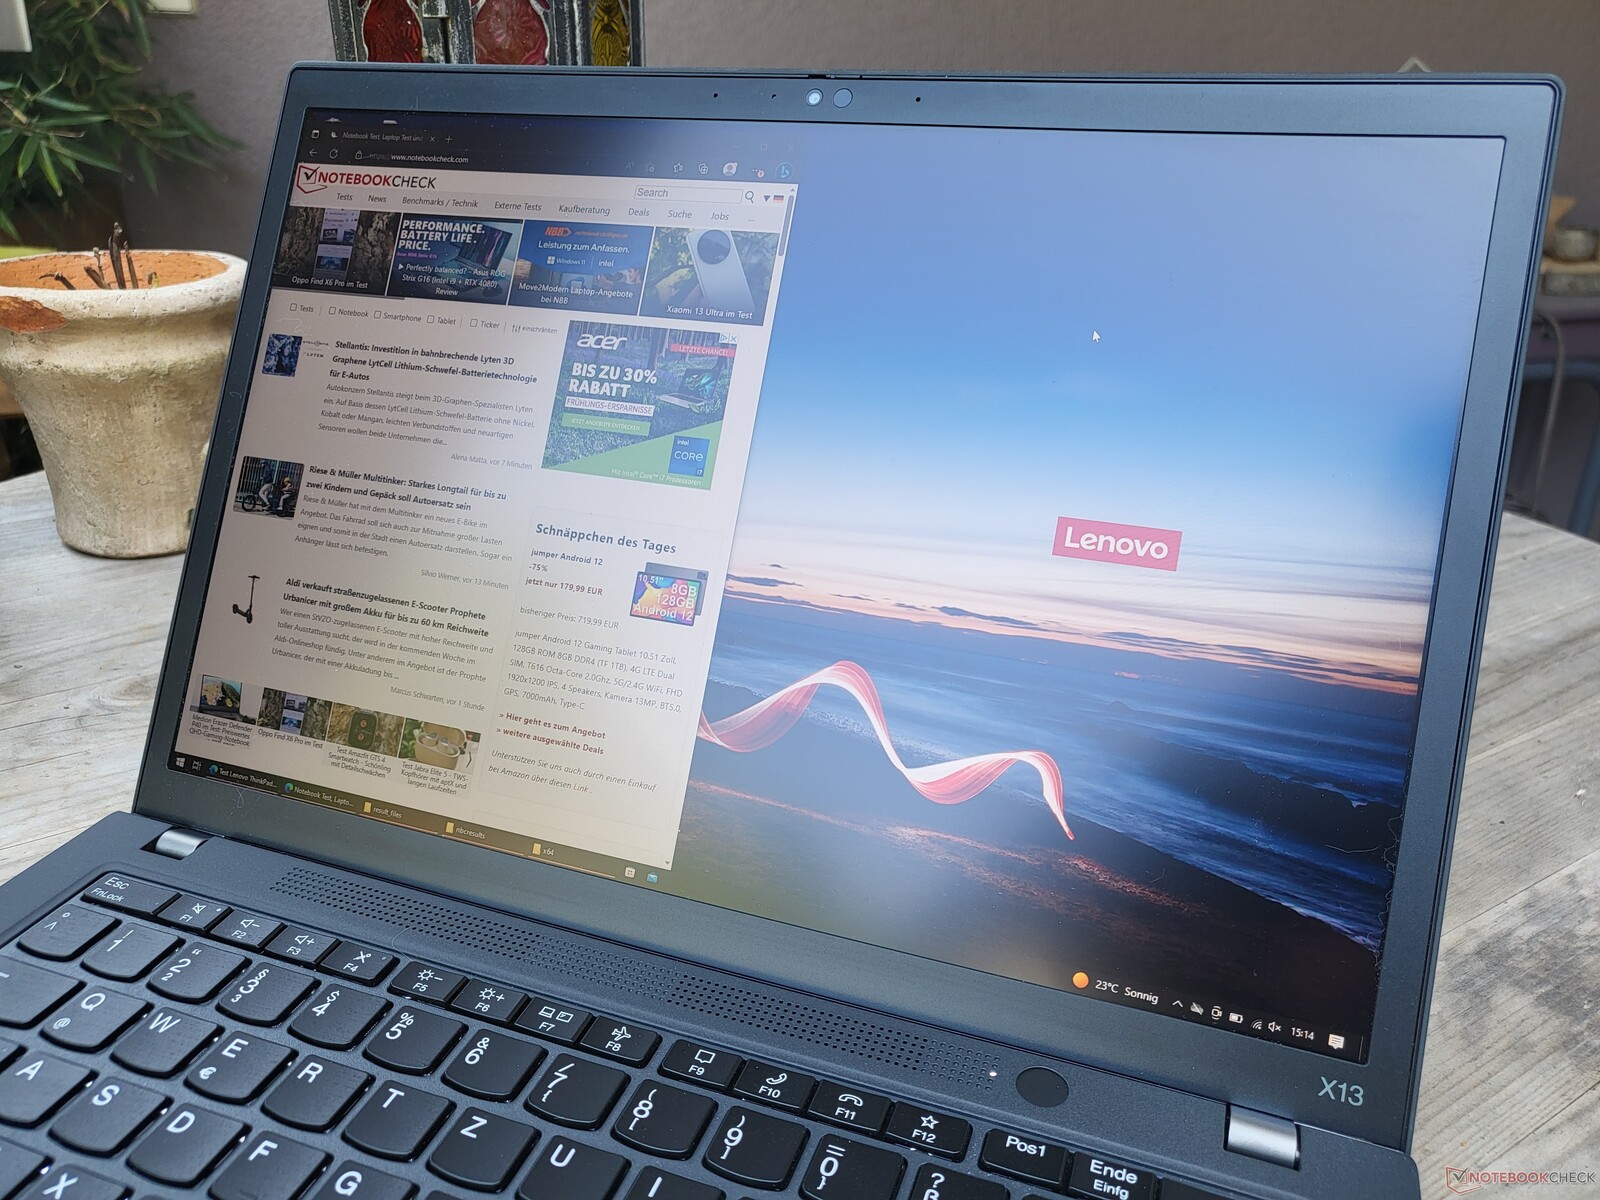
Outdoors, the ThinkPad X13 Gen 3 is usable, thanks to the matte screen surface. As before: we would appreciate a brighter screen, especially for a laptop of this mobile device class.
Display Response Times
| ↔ Response Time Black to White | ||
|---|---|---|
| 28.1 ms ... rise ↗ and fall ↘ combined | ↗ 14.2 ms rise | 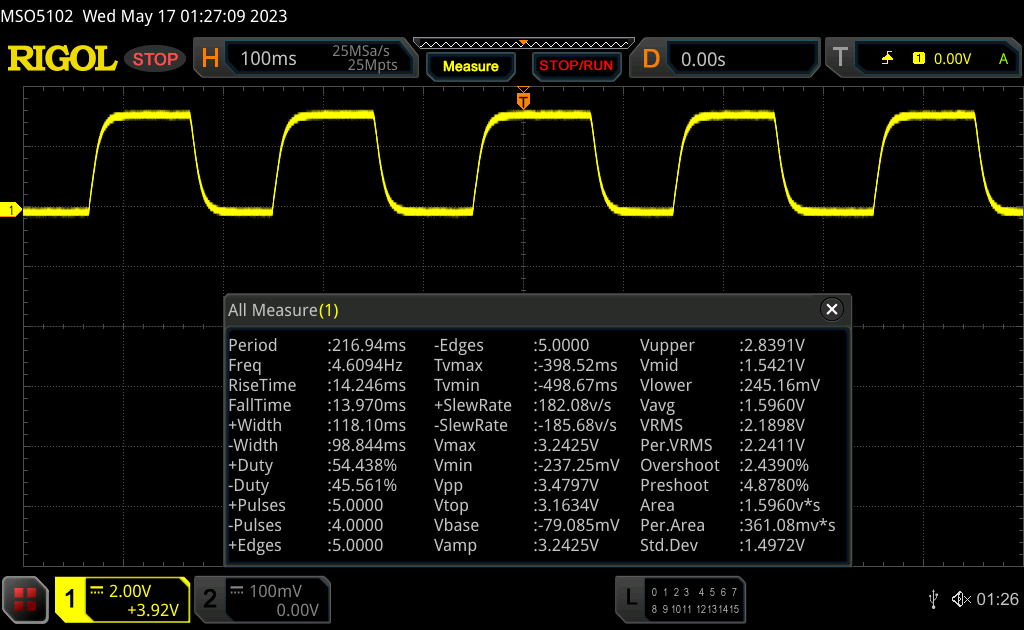 |
| ↘ 13.9 ms fall | ||
| The screen shows relatively slow response rates in our tests and may be too slow for gamers. In comparison, all tested devices range from 0.1 (minimum) to 240 (maximum) ms. » 75 % of all devices are better. This means that the measured response time is worse than the average of all tested devices (19.8 ms). | ||
| ↔ Response Time 50% Grey to 80% Grey | ||
| 44.2 ms ... rise ↗ and fall ↘ combined | ↗ 20.7 ms rise | 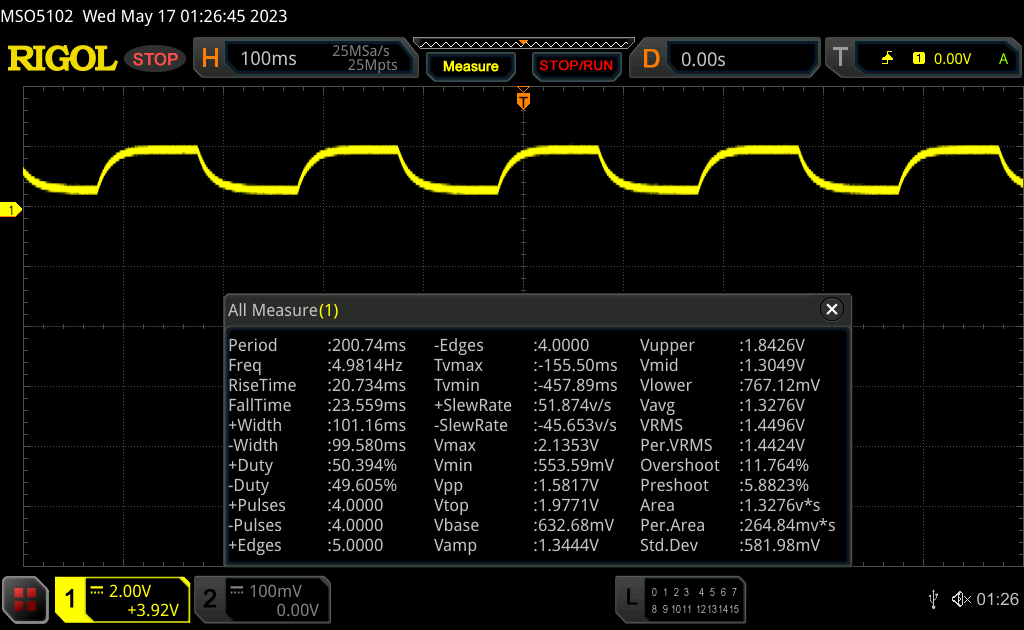 |
| ↘ 23.5 ms fall | ||
| The screen shows slow response rates in our tests and will be unsatisfactory for gamers. In comparison, all tested devices range from 0.165 (minimum) to 636 (maximum) ms. » 76 % of all devices are better. This means that the measured response time is worse than the average of all tested devices (31 ms). | ||
Screen Flickering / PWM (Pulse-Width Modulation)
| Screen flickering / PWM not detected | 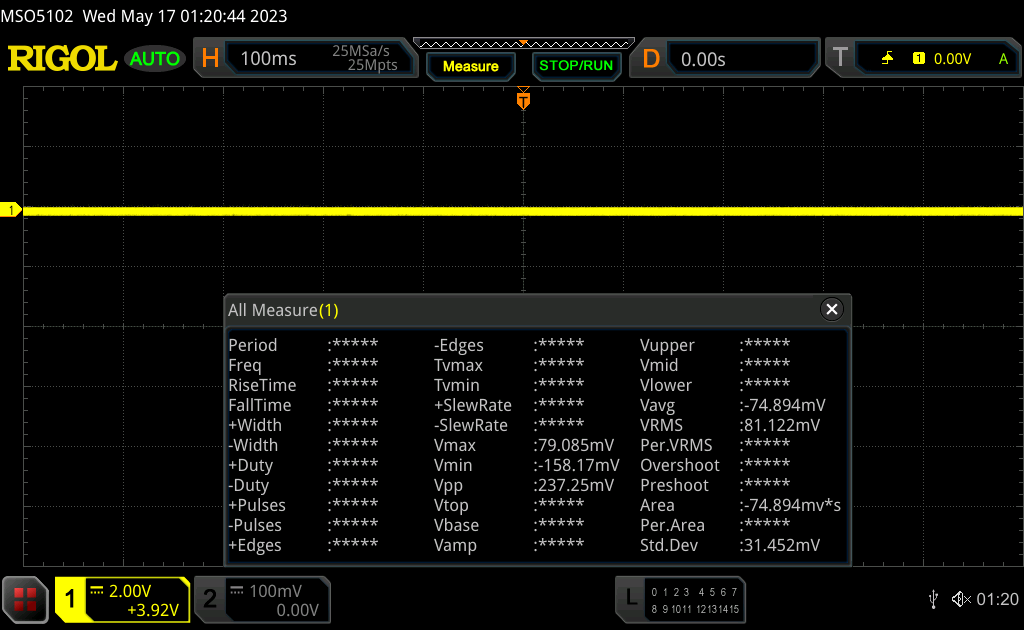 | ||
In comparison: 52 % of all tested devices do not use PWM to dim the display. If PWM was detected, an average of 7747 (minimum: 5 - maximum: 343500) Hz was measured. | |||


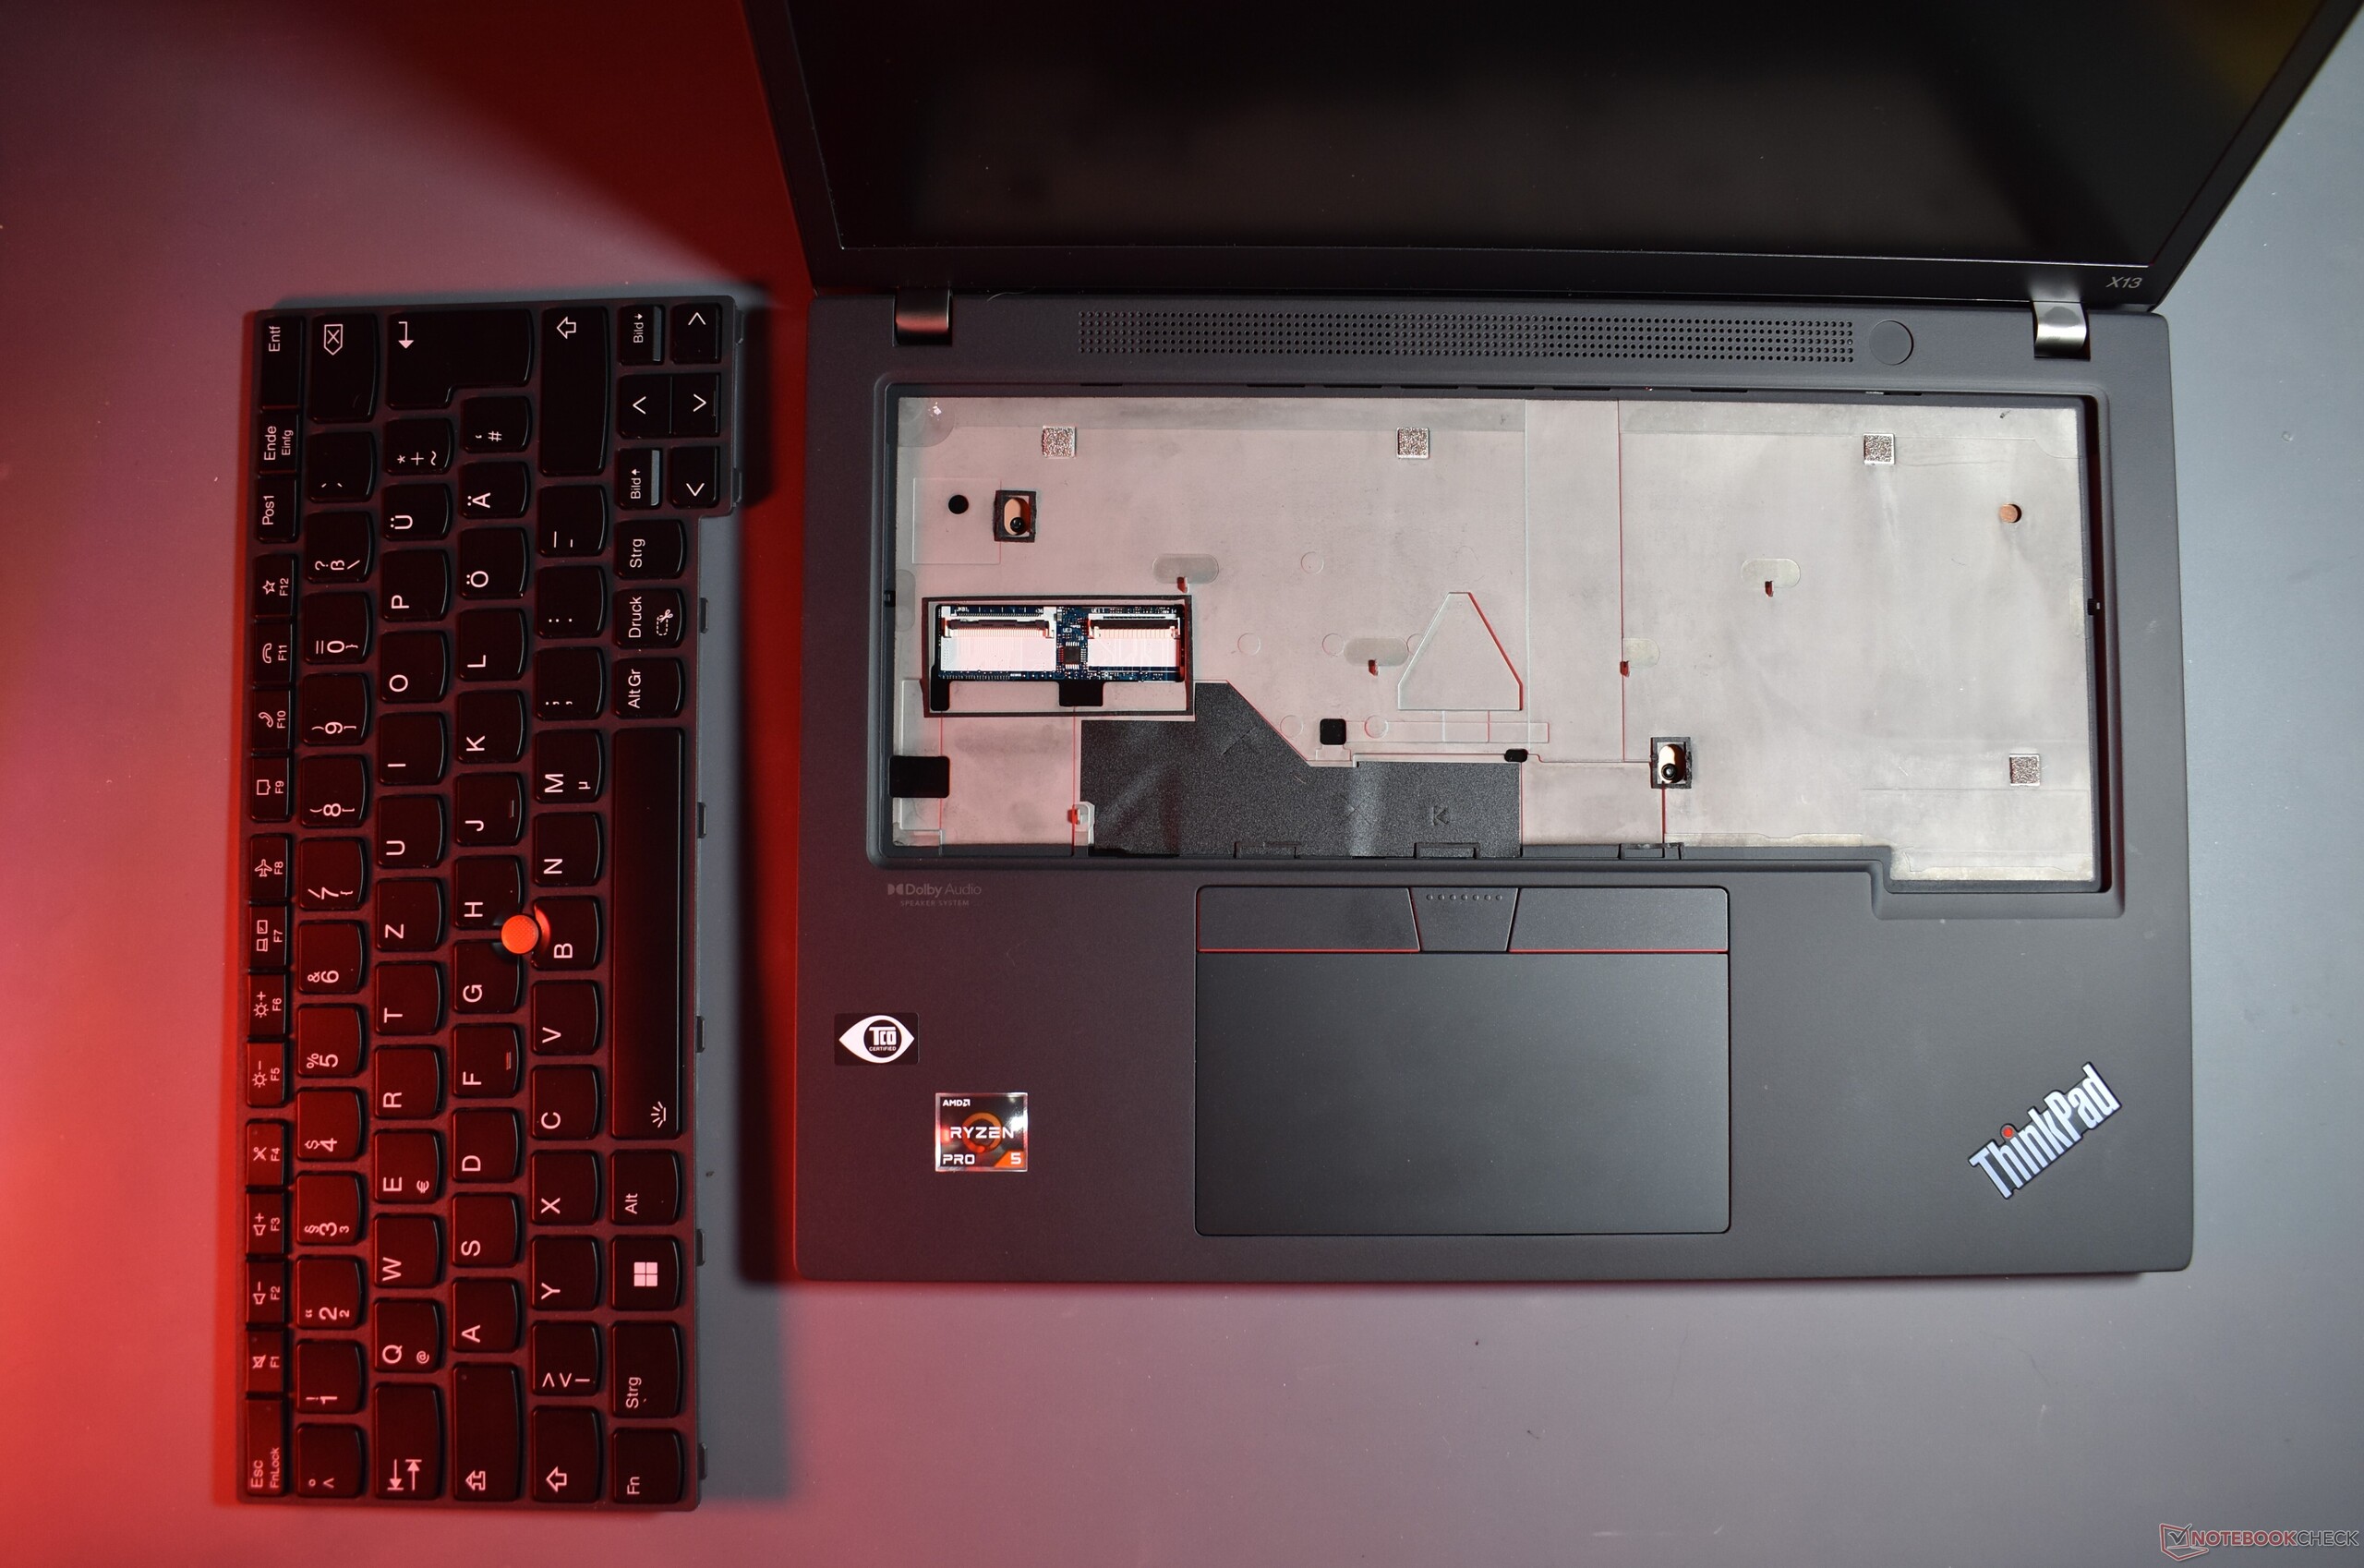
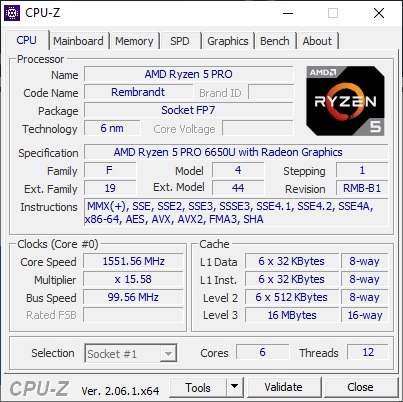
Performance: AMD Ryzen 5 delivers good performance
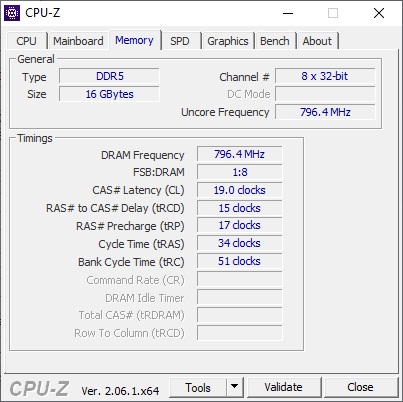
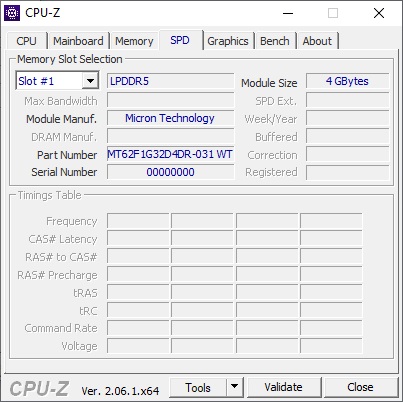
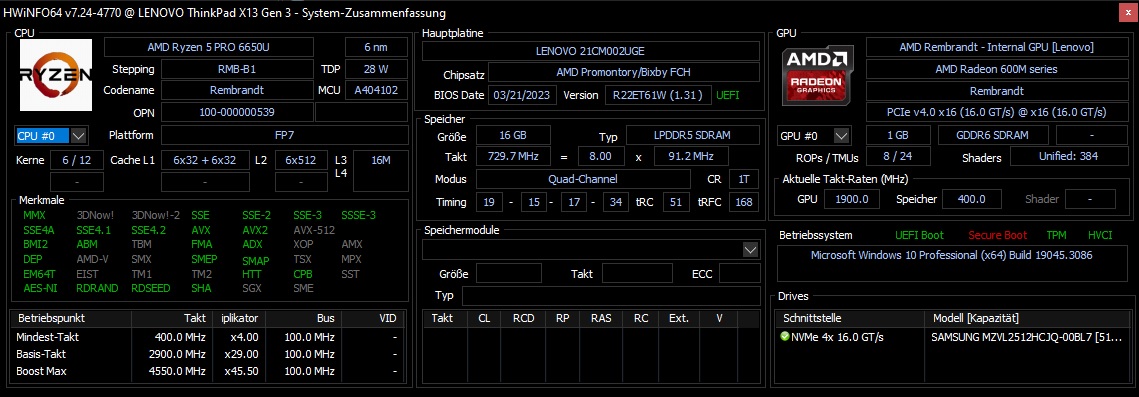
Lenovo sells the ThinkPad X13 Gen 3 AMD with two different AMD CPUs, with the available choices being the AMD Ryzen 5 Pro 6650U and the Ryzen 7 Pro 6850U. Depending on the chosen CPU, either the Radeon 660M or the Radeon 680M serve as the GPU solution. The RAM is always soldered, there are variants with 8, 16 or 32 GB LPDDR5-6400 memory. Not soldered is the M.2 2280 SSD, Lenovo offers a max of 2 TB SSD storage.
Test conditions
As usual for Lenovo ThinkPads, there is no proprietary OEM software to manage the power profiles. Instead, the Windows energy profiles are utilized to manage the power limits (PL1 = performance under sustained load, PL2 = short term boost performance).
- More battery efficiency: PL1 12 W / PL2 12 W
- Better performance: PL1 17 W / PL2 25 W
- Best performance: PL1 22,5 W / PL2 30 W
Processor
The AMD Ryzen 5 Pro 6650U is a U processor of the Rembrandt generation, meant for compact business laptops. As a "Pro" CPU, this chip directly competes with Intel's vPro processors. The typical TDP is rated for 15 W, the CPU has six cores and twelve threads. Comprehensive benchmark comparisons with other CPUs are possible with our CPU comparison tool.
The performance of the ThinkPad X13 Gen 3 AMD is slightly better than the predecessor. The Intel based models ThinkPad X13 G3 Intel and Dell Latitude 7330 offer a better single core performance and partially a better boost performance, but they pale when it comes to sustained multicore testing. Meanwhile, the HP EliteBook 835 G9 offers a huge leap in power, but this model is equipped with the octacore chip AMD Ryzen 7 Pro 6850U, which is also available for the X13 Gen 3 AMD.
CPU performance is not throttled in battery mode.
Cinebench R15 Multi sustained load
Cinebench R23: Multi Core | Single Core
Cinebench R20: CPU (Multi Core) | CPU (Single Core)
Cinebench R15: CPU Multi 64Bit | CPU Single 64Bit
Blender: v2.79 BMW27 CPU
7-Zip 18.03: 7z b 4 | 7z b 4 -mmt1
Geekbench 5.5: Multi-Core | Single-Core
HWBOT x265 Benchmark v2.2: 4k Preset
LibreOffice : 20 Documents To PDF
R Benchmark 2.5: Overall mean
| CPU Performance rating | |
| Average of class Subnotebook | |
| HP EliteBook 835 G9 | |
| Dell Latitude 13 7330 | |
| Average AMD Ryzen 5 PRO 6650U | |
| Lenovo ThinkPad X13 G3 21BN0046GE | |
| Lenovo ThinkPad X13 G3 21CM002UGE | |
| Lenovo ThinkPad X13 G2 AMD 20XH001KGE | |
| Cinebench R23 / Multi Core | |
| Average of class Subnotebook (1555 - 21812, n=60, last 2 years) | |
| HP EliteBook 835 G9 | |
| Average AMD Ryzen 5 PRO 6650U (7805 - 9534, n=4) | |
| Dell Latitude 13 7330 | |
| Lenovo ThinkPad X13 G3 21CM002UGE | |
| Lenovo ThinkPad X13 G2 AMD 20XH001KGE | |
| Lenovo ThinkPad X13 G3 21BN0046GE | |
| Cinebench R23 / Single Core | |
| Average of class Subnotebook (358 - 2213, n=61, last 2 years) | |
| Dell Latitude 13 7330 | |
| Lenovo ThinkPad X13 G3 21BN0046GE | |
| HP EliteBook 835 G9 | |
| Average AMD Ryzen 5 PRO 6650U (1439 - 1476, n=4) | |
| Lenovo ThinkPad X13 G3 21CM002UGE | |
| Lenovo ThinkPad X13 G2 AMD 20XH001KGE | |
| Cinebench R20 / CPU (Multi Core) | |
| Average of class Subnotebook (579 - 8541, n=57, last 2 years) | |
| HP EliteBook 835 G9 | |
| Lenovo ThinkPad X13 G3 21BN0046GE | |
| Average AMD Ryzen 5 PRO 6650U (3057 - 3684, n=4) | |
| Dell Latitude 13 7330 | |
| Lenovo ThinkPad X13 G3 21CM002UGE | |
| Lenovo ThinkPad X13 G2 AMD 20XH001KGE | |
| Cinebench R20 / CPU (Single Core) | |
| Average of class Subnotebook (128 - 832, n=57, last 2 years) | |
| Dell Latitude 13 7330 | |
| Lenovo ThinkPad X13 G3 21BN0046GE | |
| HP EliteBook 835 G9 | |
| Average AMD Ryzen 5 PRO 6650U (548 - 578, n=4) | |
| Lenovo ThinkPad X13 G3 21CM002UGE | |
| Lenovo ThinkPad X13 G2 AMD 20XH001KGE | |
| Cinebench R15 / CPU Multi 64Bit | |
| Average of class Subnotebook (327 - 3345, n=57, last 2 years) | |
| HP EliteBook 835 G9 | |
| Average AMD Ryzen 5 PRO 6650U (1299 - 1555, n=4) | |
| Dell Latitude 13 7330 | |
| Lenovo ThinkPad X13 G3 21CM002UGE | |
| Lenovo ThinkPad X13 G2 AMD 20XH001KGE | |
| Lenovo ThinkPad X13 G3 21BN0046GE | |
| Cinebench R15 / CPU Single 64Bit | |
| Average of class Subnotebook (72.4 - 322, n=57, last 2 years) | |
| Dell Latitude 13 7330 | |
| Average AMD Ryzen 5 PRO 6650U (230 - 234, n=4) | |
| Lenovo ThinkPad X13 G3 21CM002UGE | |
| HP EliteBook 835 G9 | |
| Lenovo ThinkPad X13 G2 AMD 20XH001KGE | |
| Lenovo ThinkPad X13 G3 21BN0046GE | |
| Blender / v2.79 BMW27 CPU | |
| Lenovo ThinkPad X13 G3 21CM002UGE | |
| Lenovo ThinkPad X13 G3 21CM002UGE | |
| Lenovo ThinkPad X13 G3 21BN0046GE | |
| Lenovo ThinkPad X13 G2 AMD 20XH001KGE | |
| Average AMD Ryzen 5 PRO 6650U (328 - 548, n=5) | |
| Dell Latitude 13 7330 | |
| Average of class Subnotebook (159 - 2271, n=58, last 2 years) | |
| HP EliteBook 835 G9 | |
| 7-Zip 18.03 / 7z b 4 | |
| HP EliteBook 835 G9 | |
| Average of class Subnotebook (11668 - 77867, n=57, last 2 years) | |
| Lenovo ThinkPad X13 G3 21BN0046GE | |
| Lenovo ThinkPad X13 G3 21CM002UGE | |
| Average AMD Ryzen 5 PRO 6650U (32613 - 41530, n=4) | |
| Lenovo ThinkPad X13 G2 AMD 20XH001KGE | |
| Dell Latitude 13 7330 | |
| 7-Zip 18.03 / 7z b 4 -mmt1 | |
| Dell Latitude 13 7330 | |
| Average of class Subnotebook (2643 - 6699, n=59, last 2 years) | |
| HP EliteBook 835 G9 | |
| Average AMD Ryzen 5 PRO 6650U (5175 - 5427, n=4) | |
| Lenovo ThinkPad X13 G3 21BN0046GE | |
| Lenovo ThinkPad X13 G3 21CM002UGE | |
| Lenovo ThinkPad X13 G2 AMD 20XH001KGE | |
| Geekbench 5.5 / Multi-Core | |
| Average of class Subnotebook (2557 - 17218, n=48, last 2 years) | |
| Lenovo ThinkPad X13 G3 21BN0046GE | |
| HP EliteBook 835 G9 | |
| Dell Latitude 13 7330 | |
| Average AMD Ryzen 5 PRO 6650U (6171 - 7227, n=4) | |
| Lenovo ThinkPad X13 G3 21CM002UGE | |
| Lenovo ThinkPad X13 G2 AMD 20XH001KGE | |
| Geekbench 5.5 / Single-Core | |
| Average of class Subnotebook (726 - 2224, n=48, last 2 years) | |
| Dell Latitude 13 7330 | |
| HP EliteBook 835 G9 | |
| Lenovo ThinkPad X13 G3 21BN0046GE | |
| Average AMD Ryzen 5 PRO 6650U (1433 - 1487, n=4) | |
| Lenovo ThinkPad X13 G3 21CM002UGE | |
| Lenovo ThinkPad X13 G2 AMD 20XH001KGE | |
| HWBOT x265 Benchmark v2.2 / 4k Preset | |
| Average of class Subnotebook (0.97 - 25.1, n=57, last 2 years) | |
| HP EliteBook 835 G9 | |
| Average AMD Ryzen 5 PRO 6650U (8.71 - 11.8, n=4) | |
| Lenovo ThinkPad X13 G3 21CM002UGE | |
| Dell Latitude 13 7330 | |
| Lenovo ThinkPad X13 G2 AMD 20XH001KGE | |
| Lenovo ThinkPad X13 G3 21BN0046GE | |
| LibreOffice / 20 Documents To PDF | |
| Lenovo ThinkPad X13 G3 21CM002UGE | |
| Average AMD Ryzen 5 PRO 6650U (50.3 - 63.2, n=4) | |
| HP EliteBook 835 G9 | |
| Average of class Subnotebook (39.9 - 220, n=56, last 2 years) | |
| Lenovo ThinkPad X13 G2 AMD 20XH001KGE | |
| Dell Latitude 13 7330 | |
| Lenovo ThinkPad X13 G3 21BN0046GE | |
| R Benchmark 2.5 / Overall mean | |
| Lenovo ThinkPad X13 G3 21CM002UGE | |
| Lenovo ThinkPad X13 G2 AMD 20XH001KGE | |
| Average AMD Ryzen 5 PRO 6650U (0.521 - 0.59, n=4) | |
| Average of class Subnotebook (0.4024 - 1.456, n=58, last 2 years) | |
| Lenovo ThinkPad X13 G3 21BN0046GE | |
| HP EliteBook 835 G9 | |
| Dell Latitude 13 7330 | |
* ... smaller is better
AIDA64: FP32 Ray-Trace | FPU Julia | CPU SHA3 | CPU Queen | FPU SinJulia | FPU Mandel | CPU AES | CPU ZLib | FP64 Ray-Trace | CPU PhotoWorxx
| Performance rating | |
| Average of class Subnotebook | |
| HP EliteBook 835 G9 | |
| Average AMD Ryzen 5 PRO 6650U | |
| Lenovo ThinkPad X13 G2 AMD 20XH001KGE | |
| Lenovo ThinkPad X13 G3 21CM002UGE | |
| Lenovo ThinkPad X13 G3 21BN0046GE | |
| Dell Latitude 13 7330 | |
| AIDA64 / FP32 Ray-Trace | |
| Average of class Subnotebook (1135 - 32888, n=58, last 2 years) | |
| HP EliteBook 835 G9 | |
| Average AMD Ryzen 5 PRO 6650U (8854 - 10630, n=4) | |
| Lenovo ThinkPad X13 G3 21CM002UGE | |
| Lenovo ThinkPad X13 G2 AMD 20XH001KGE | |
| Lenovo ThinkPad X13 G3 21BN0046GE | |
| Dell Latitude 13 7330 | |
| AIDA64 / FPU Julia | |
| HP EliteBook 835 G9 | |
| Average of class Subnotebook (5218 - 123315, n=58, last 2 years) | |
| Average AMD Ryzen 5 PRO 6650U (56214 - 68106, n=4) | |
| Lenovo ThinkPad X13 G3 21CM002UGE | |
| Lenovo ThinkPad X13 G2 AMD 20XH001KGE | |
| Lenovo ThinkPad X13 G3 21BN0046GE | |
| Dell Latitude 13 7330 | |
| AIDA64 / CPU SHA3 | |
| Average of class Subnotebook (444 - 5287, n=58, last 2 years) | |
| HP EliteBook 835 G9 | |
| Average AMD Ryzen 5 PRO 6650U (1881 - 2326, n=4) | |
| Lenovo ThinkPad X13 G3 21BN0046GE | |
| Dell Latitude 13 7330 | |
| Lenovo ThinkPad X13 G3 21CM002UGE | |
| Lenovo ThinkPad X13 G2 AMD 20XH001KGE | |
| AIDA64 / CPU Queen | |
| HP EliteBook 835 G9 | |
| Average AMD Ryzen 5 PRO 6650U (69023 - 78797, n=4) | |
| Lenovo ThinkPad X13 G3 21CM002UGE | |
| Lenovo ThinkPad X13 G2 AMD 20XH001KGE | |
| Dell Latitude 13 7330 | |
| Lenovo ThinkPad X13 G3 21BN0046GE | |
| Average of class Subnotebook (10579 - 95002, n=49, last 2 years) | |
| AIDA64 / FPU SinJulia | |
| HP EliteBook 835 G9 | |
| Average AMD Ryzen 5 PRO 6650U (8320 - 9488, n=4) | |
| Lenovo ThinkPad X13 G3 21CM002UGE | |
| Lenovo ThinkPad X13 G2 AMD 20XH001KGE | |
| Average of class Subnotebook (744 - 18418, n=58, last 2 years) | |
| Lenovo ThinkPad X13 G3 21BN0046GE | |
| Dell Latitude 13 7330 | |
| AIDA64 / FPU Mandel | |
| HP EliteBook 835 G9 | |
| Average AMD Ryzen 5 PRO 6650U (30969 - 37461, n=4) | |
| Average of class Subnotebook (3341 - 65433, n=58, last 2 years) | |
| Lenovo ThinkPad X13 G3 21CM002UGE | |
| Lenovo ThinkPad X13 G2 AMD 20XH001KGE | |
| Lenovo ThinkPad X13 G3 21BN0046GE | |
| Dell Latitude 13 7330 | |
| AIDA64 / CPU AES | |
| Lenovo ThinkPad X13 G2 AMD 20XH001KGE | |
| Average AMD Ryzen 5 PRO 6650U (37259 - 93914, n=4) | |
| Average of class Subnotebook (638 - 96917, n=58, last 2 years) | |
| HP EliteBook 835 G9 | |
| Lenovo ThinkPad X13 G3 21BN0046GE | |
| Dell Latitude 13 7330 | |
| Lenovo ThinkPad X13 G3 21CM002UGE | |
| AIDA64 / CPU ZLib | |
| Average of class Subnotebook (164.9 - 1379, n=58, last 2 years) | |
| HP EliteBook 835 G9 | |
| Lenovo ThinkPad X13 G3 21BN0046GE | |
| Dell Latitude 13 7330 | |
| Average AMD Ryzen 5 PRO 6650U (504 - 602, n=4) | |
| Lenovo ThinkPad X13 G3 21CM002UGE | |
| Lenovo ThinkPad X13 G2 AMD 20XH001KGE | |
| AIDA64 / FP64 Ray-Trace | |
| Average of class Subnotebook (610 - 17495, n=58, last 2 years) | |
| HP EliteBook 835 G9 | |
| Average AMD Ryzen 5 PRO 6650U (4620 - 5468, n=4) | |
| Lenovo ThinkPad X13 G3 21CM002UGE | |
| Lenovo ThinkPad X13 G2 AMD 20XH001KGE | |
| Lenovo ThinkPad X13 G3 21BN0046GE | |
| Dell Latitude 13 7330 | |
| AIDA64 / CPU PhotoWorxx | |
| Average of class Subnotebook (6569 - 85600, n=58, last 2 years) | |
| Lenovo ThinkPad X13 G3 21BN0046GE | |
| HP EliteBook 835 G9 | |
| Lenovo ThinkPad X13 G3 21CM002UGE | |
| Average AMD Ryzen 5 PRO 6650U (19643 - 26137, n=4) | |
| Dell Latitude 13 7330 | |
| Lenovo ThinkPad X13 G2 AMD 20XH001KGE | |
System performance
When it comes to system performance, the AMD model is better than their Intel variant. In everyday use, the performance is perfectly good.
CrossMark: Overall | Productivity | Creativity | Responsiveness
| PCMark 10 / Score | |
| Average of class Subnotebook (4920 - 9939, n=45, last 2 years) | |
| HP EliteBook 835 G9 | |
| Lenovo ThinkPad X13 G2 AMD 20XH001KGE | |
| Average AMD Ryzen 5 PRO 6650U, AMD Radeon 660M (5513 - 5958, n=4) | |
| Lenovo ThinkPad X13 G3 21CM002UGE | |
| Dell Latitude 13 7330 | |
| Lenovo ThinkPad X13 G3 21BN0046GE | |
| PCMark 10 / Essentials | |
| Dell Latitude 13 7330 | |
| Average of class Subnotebook (8552 - 11646, n=45, last 2 years) | |
| Lenovo ThinkPad X13 G2 AMD 20XH001KGE | |
| HP EliteBook 835 G9 | |
| Lenovo ThinkPad X13 G3 21CM002UGE | |
| Average AMD Ryzen 5 PRO 6650U, AMD Radeon 660M (9578 - 9982, n=4) | |
| Lenovo ThinkPad X13 G3 21BN0046GE | |
| PCMark 10 / Productivity | |
| Average of class Subnotebook (5435 - 16606, n=45, last 2 years) | |
| Lenovo ThinkPad X13 G2 AMD 20XH001KGE | |
| HP EliteBook 835 G9 | |
| Average AMD Ryzen 5 PRO 6650U, AMD Radeon 660M (7848 - 9094, n=4) | |
| Lenovo ThinkPad X13 G3 21CM002UGE | |
| Dell Latitude 13 7330 | |
| Lenovo ThinkPad X13 G3 21BN0046GE | |
| PCMark 10 / Digital Content Creation | |
| Average of class Subnotebook (5722 - 13779, n=45, last 2 years) | |
| HP EliteBook 835 G9 | |
| Average AMD Ryzen 5 PRO 6650U, AMD Radeon 660M (5837 - 6447, n=4) | |
| Lenovo ThinkPad X13 G3 21CM002UGE | |
| Lenovo ThinkPad X13 G2 AMD 20XH001KGE | |
| Dell Latitude 13 7330 | |
| Lenovo ThinkPad X13 G3 21BN0046GE | |
| CrossMark / Overall | |
| Average of class Subnotebook (365 - 2356, n=60, last 2 years) | |
| Dell Latitude 13 7330 | |
| HP EliteBook 835 G9 | |
| Average AMD Ryzen 5 PRO 6650U, AMD Radeon 660M (1338 - 1432, n=3) | |
| Lenovo ThinkPad X13 G3 21BN0046GE | |
| Lenovo ThinkPad X13 G3 21CM002UGE | |
| CrossMark / Productivity | |
| Average of class Subnotebook (364 - 2277, n=60, last 2 years) | |
| Dell Latitude 13 7330 | |
| HP EliteBook 835 G9 | |
| Average AMD Ryzen 5 PRO 6650U, AMD Radeon 660M (1366 - 1440, n=3) | |
| Lenovo ThinkPad X13 G3 21CM002UGE | |
| Lenovo ThinkPad X13 G3 21BN0046GE | |
| CrossMark / Creativity | |
| Average of class Subnotebook (372 - 2743, n=60, last 2 years) | |
| Dell Latitude 13 7330 | |
| Lenovo ThinkPad X13 G3 21BN0046GE | |
| Average AMD Ryzen 5 PRO 6650U, AMD Radeon 660M (1397 - 1517, n=3) | |
| HP EliteBook 835 G9 | |
| Lenovo ThinkPad X13 G3 21CM002UGE | |
| CrossMark / Responsiveness | |
| Average of class Subnotebook (312 - 1854, n=60, last 2 years) | |
| Lenovo ThinkPad X13 G3 21BN0046GE | |
| Dell Latitude 13 7330 | |
| HP EliteBook 835 G9 | |
| Average AMD Ryzen 5 PRO 6650U, AMD Radeon 660M (1106 - 1229, n=3) | |
| Lenovo ThinkPad X13 G3 21CM002UGE | |
| PCMark 10 Score | 5685 points | |
Help | ||
| AIDA64 / Memory Copy | |
| Average of class Subnotebook (14554 - 131023, n=58, last 2 years) | |
| Lenovo ThinkPad X13 G3 21BN0046GE | |
| Lenovo ThinkPad X13 G3 21CM002UGE | |
| HP EliteBook 835 G9 | |
| Average AMD Ryzen 5 PRO 6650U (31014 - 48558, n=4) | |
| Dell Latitude 13 7330 | |
| Lenovo ThinkPad X13 G2 AMD 20XH001KGE | |
| AIDA64 / Memory Read | |
| Average of class Subnotebook (15948 - 127174, n=58, last 2 years) | |
| Lenovo ThinkPad X13 G3 21BN0046GE | |
| HP EliteBook 835 G9 | |
| Dell Latitude 13 7330 | |
| Lenovo ThinkPad X13 G3 21CM002UGE | |
| Average AMD Ryzen 5 PRO 6650U (34690 - 39833, n=4) | |
| Lenovo ThinkPad X13 G2 AMD 20XH001KGE | |
| AIDA64 / Memory Write | |
| Average of class Subnotebook (15709 - 135141, n=58, last 2 years) | |
| Lenovo ThinkPad X13 G3 21BN0046GE | |
| Lenovo ThinkPad X13 G3 21CM002UGE | |
| HP EliteBook 835 G9 | |
| Average AMD Ryzen 5 PRO 6650U (34563 - 51117, n=4) | |
| Dell Latitude 13 7330 | |
| Lenovo ThinkPad X13 G2 AMD 20XH001KGE | |
| AIDA64 / Memory Latency | |
| Lenovo ThinkPad X13 G3 21CM002UGE | |
| Average AMD Ryzen 5 PRO 6650U (91.6 - 126.5, n=4) | |
| Lenovo ThinkPad X13 G2 AMD 20XH001KGE | |
| HP EliteBook 835 G9 | |
| Average of class Subnotebook (6.1 - 159.9, n=56, last 2 years) | |
| Lenovo ThinkPad X13 G3 21BN0046GE | |
| Dell Latitude 13 7330 | |
* ... smaller is better
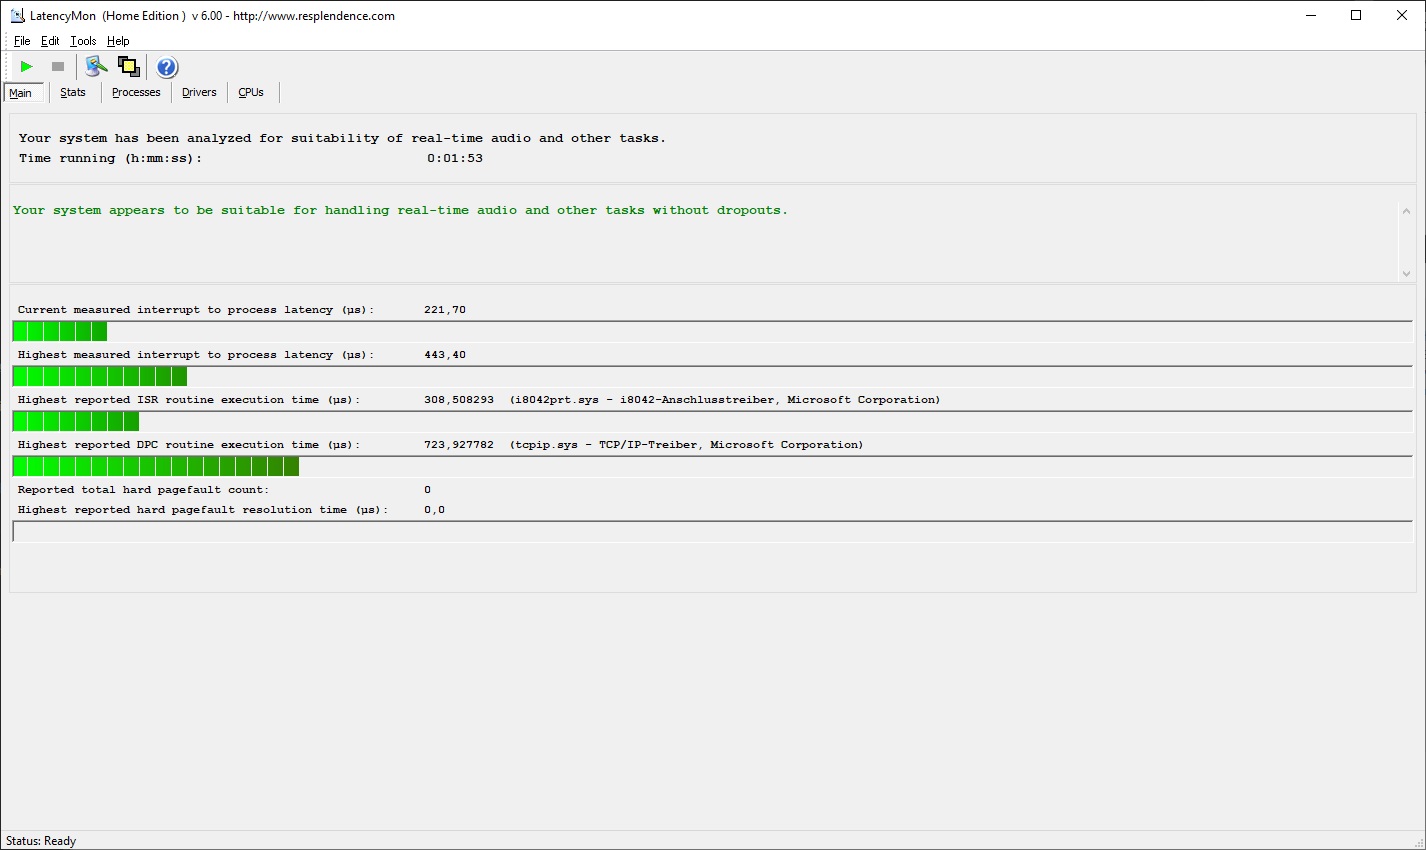
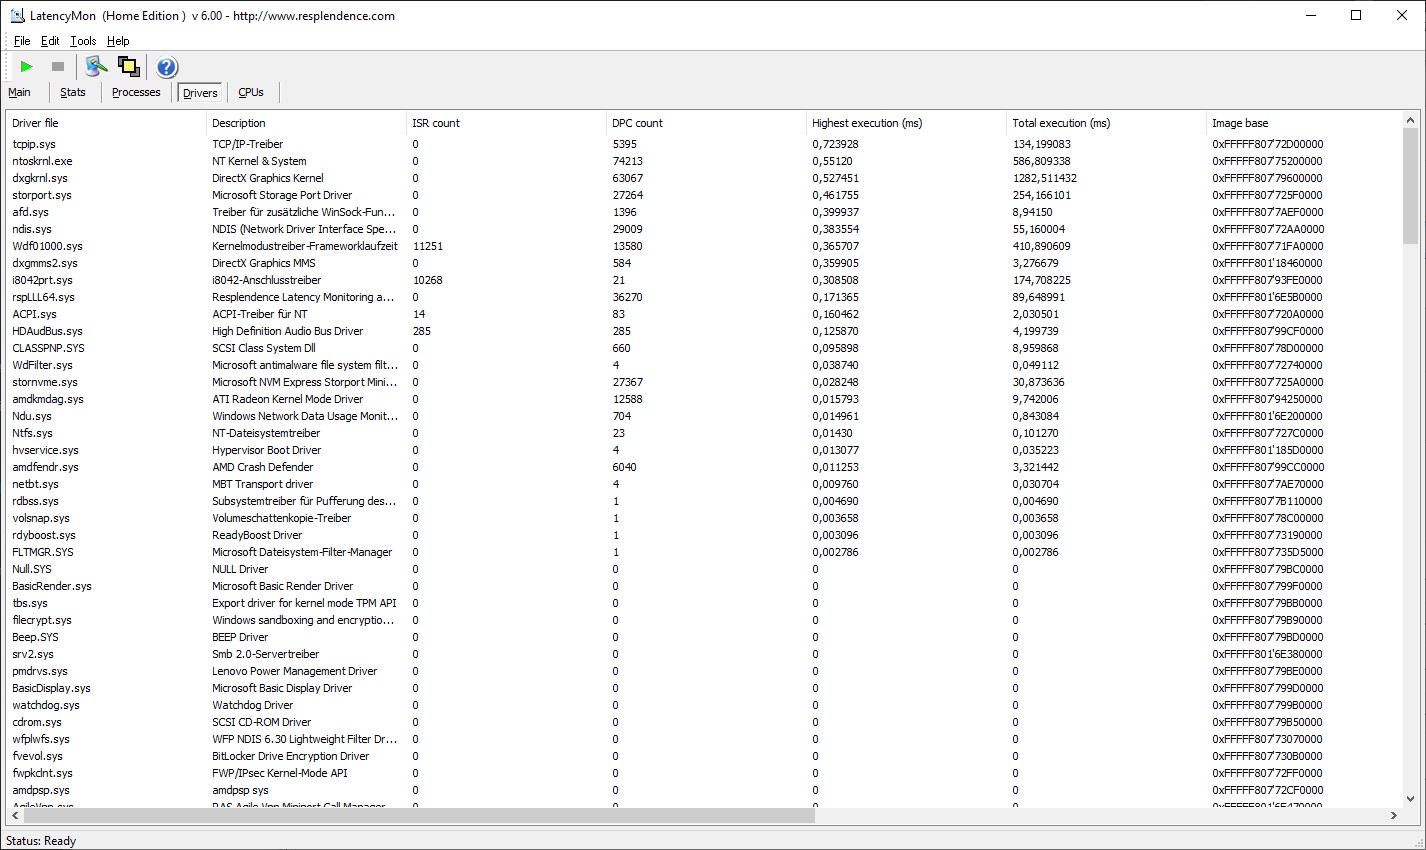
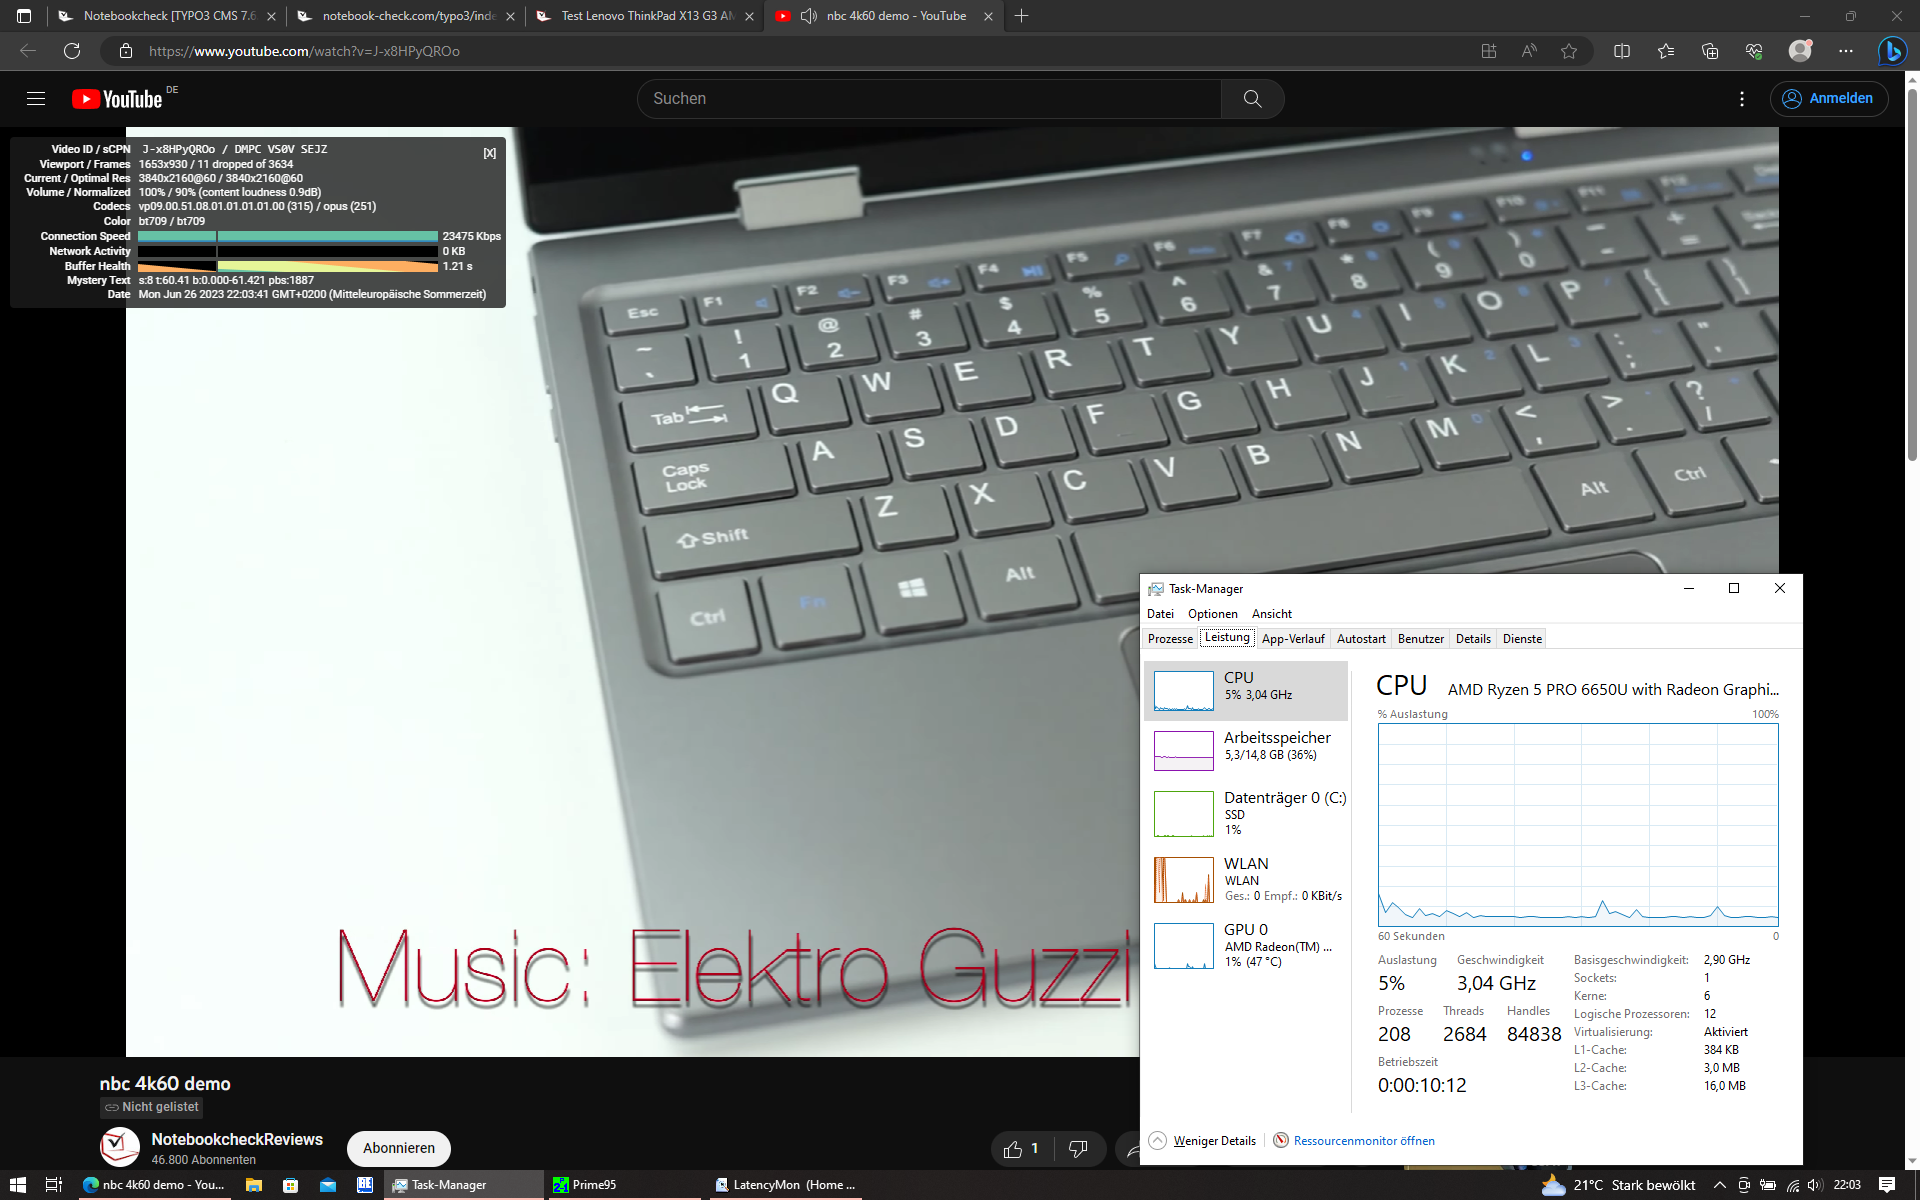
DPC latency
In the tested configuration, the Lenovo ThinkPad X13 Gen 3 AMD had no problem with DPC latency issues.
| DPC Latencies / LatencyMon - interrupt to process latency (max), Web, Youtube, Prime95 | |
| Lenovo ThinkPad X13 G2 AMD 20XH001KGE | |
| Lenovo ThinkPad X13 G3 21BN0046GE | |
| HP EliteBook 835 G9 | |
| Dell Latitude 13 7330 | |
| Lenovo ThinkPad X13 G3 21CM002UGE | |
* ... smaller is better
Storage
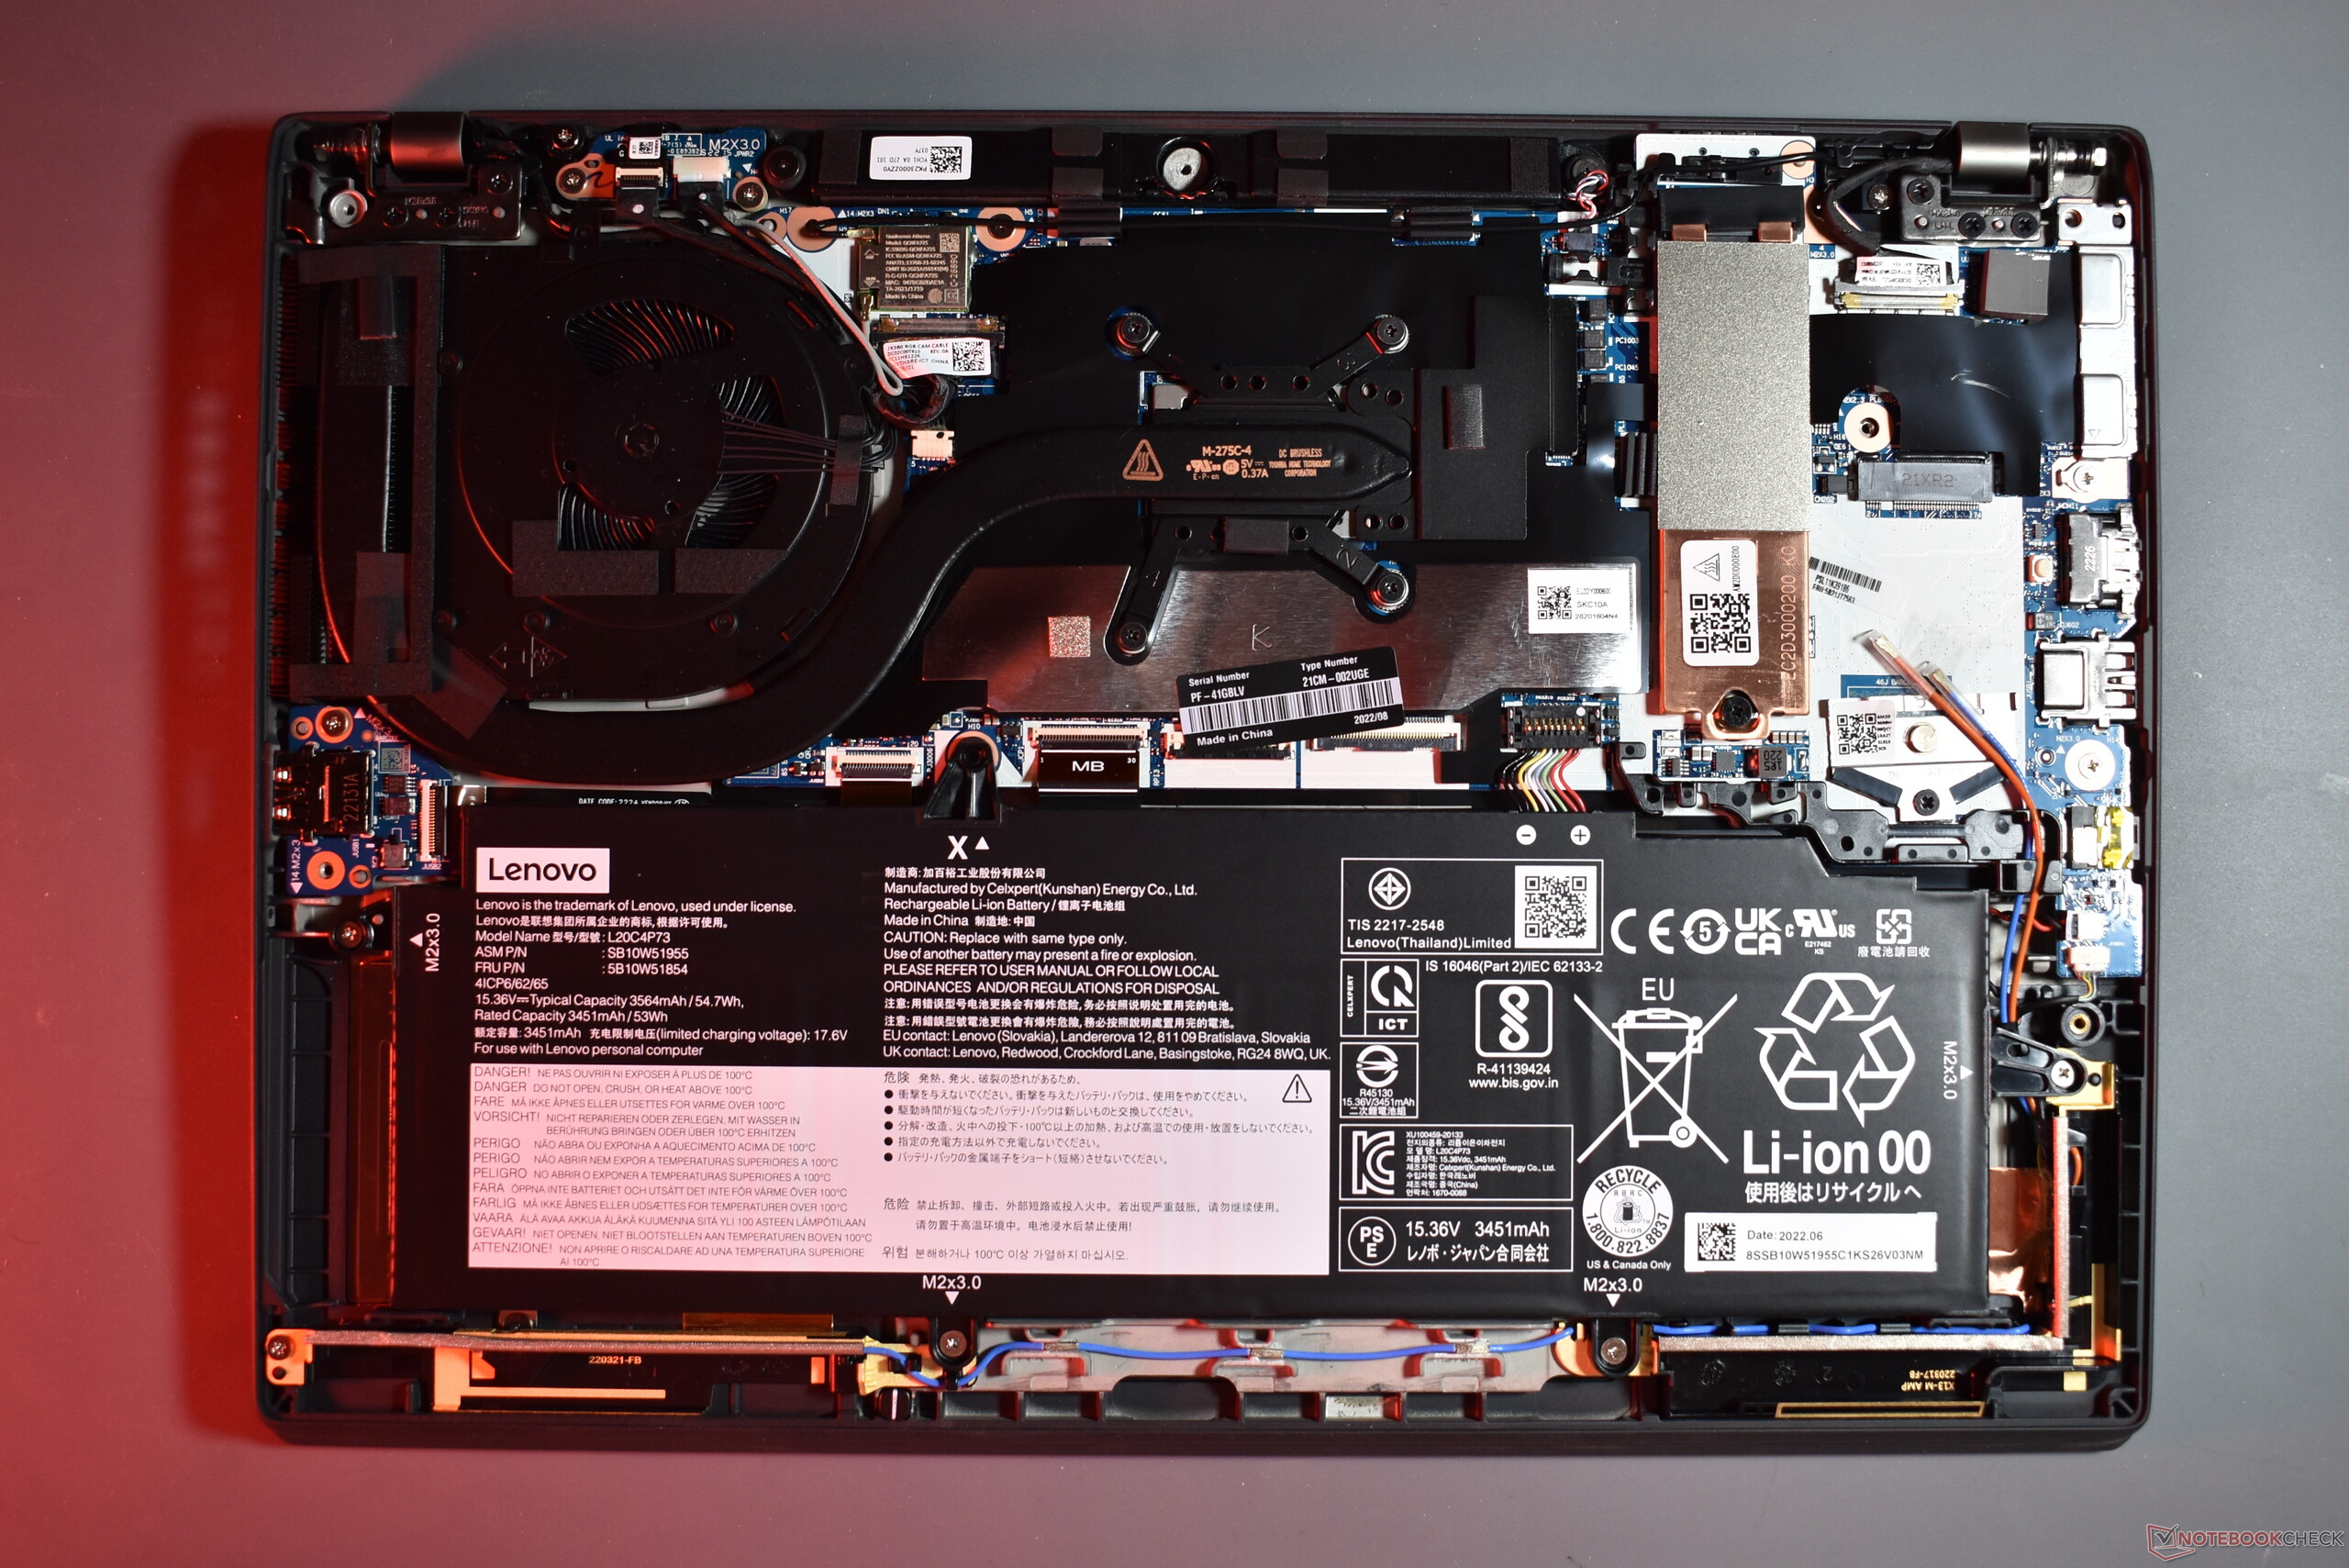
The M.2 2280 SSD of the Lenovo ThinkPad X13 G3 AMD comes from Samsung. The PM9A1 has a capacity of 512 GB and is connected via the NVMe PCIe 4.0 standard. This SSD could be even faster, but it still runs faster in the X13 G3 compared with the SSDs in the comparison devices.

* ... smaller is better
Sustained load read: DiskSpd Read Loop, Queue Depth 8
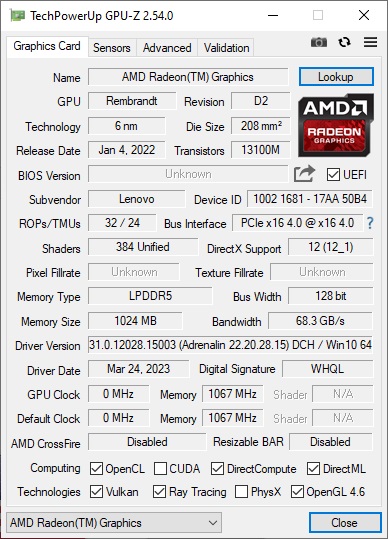
Graphics card
The AMD Radeon 660M is the standard graphics solution of the Ryzen 5 class. As an integrated GPU, the Radeon 660M does not have its own memory, it has to rely on the main system memory. The logical conclusion: the performance of the GPU depends on the speed of the RAM and if the RAM runs in single or dual channel mode.
In the ThinkPad X13 G3 AMD, the iGPU can rely on fast LPDDR5-6400 memory, which runs in dual channel mode. Those are pretty much ideal conditions, and the ThinkPad X13 Gen 3 is far ahead of the Intel models with i5 and its own predecessor. Again, the HP EliteBook 835 G9 with the stronger Radeon 680M comes out ahead of the ThinkPad.
This business laptop is not made for gaming, recent games are still playable though - on low.
Like the CPU, the GPU delivers 100 percent of its performance in battery mode.
| 3DMark 11 Performance | 7067 points | |
| 3DMark Cloud Gate Standard Score | 21798 points | |
| 3DMark Fire Strike Score | 4472 points | |
| 3DMark Time Spy Score | 1729 points | |
Help | ||
* ... smaller is better
| The Witcher 3 - 1920x1080 Ultra Graphics & Postprocessing (HBAO+) | |
| Average of class Subnotebook (13.9 - 34.6, n=13, last 2 years) | |
| HP EliteBook 835 G9 | |
| Lenovo ThinkPad X13 G3 21CM002UGE | |
| Dell Latitude 13 7330 | |
| Lenovo ThinkPad X13 G3 21BN0046GE | |
| GTA V - 1920x1080 Highest AA:4xMSAA + FX AF:16x | |
| Average of class Subnotebook (10.7 - 43.7, n=56, last 2 years) | |
| HP EliteBook 835 G9 | |
| Lenovo ThinkPad X13 G3 21CM002UGE | |
| Lenovo ThinkPad X13 G2 AMD 20XH001KGE | |
| Lenovo ThinkPad X13 G3 21BN0046GE | |
| Dell Latitude 13 7330 | |
| Final Fantasy XV Benchmark - 1920x1080 High Quality | |
| Average of class Subnotebook (11.6 - 54.5, n=54, last 2 years) | |
| HP EliteBook 835 G9 | |
| Lenovo ThinkPad X13 G3 21BN0046GE | |
| Lenovo ThinkPad X13 G3 21CM002UGE | |
| Dell Latitude 13 7330 | |
| Strange Brigade - 1920x1080 ultra AA:ultra AF:16 | |
| Average of class Subnotebook (19 - 101.3, n=50, last 2 years) | |
| HP EliteBook 835 G9 | |
| Lenovo ThinkPad X13 G3 21CM002UGE | |
| Lenovo ThinkPad X13 G2 AMD 20XH001KGE | |
| Dell Latitude 13 7330 | |
| Lenovo ThinkPad X13 G3 21BN0046GE | |
| Dota 2 Reborn - 1920x1080 ultra (3/3) best looking | |
| Average of class Subnotebook (13 - 97, n=61, last 2 years) | |
| HP EliteBook 835 G9 | |
| Lenovo ThinkPad X13 G2 AMD 20XH001KGE | |
| Dell Latitude 13 7330 | |
| Lenovo ThinkPad X13 G3 21BN0046GE | |
| Lenovo ThinkPad X13 G3 21CM002UGE | |
Witcher 3 FPS graph
| low | med. | high | ultra | |
|---|---|---|---|---|
| GTA V (2015) | 118.8 | 103.2 | 36.4 | 14.2 |
| The Witcher 3 (2015) | 86.7 | 27.6 | 17.9 | |
| Dota 2 Reborn (2015) | 93.7 | 72.2 | 37.4 | 32.8 |
| Final Fantasy XV Benchmark (2018) | 45.5 | 21.9 | 16 | |
| X-Plane 11.11 (2018) | 36 | 24.2 | 22.1 | |
| Strange Brigade (2018) | 99.5 | 40 | 31.5 | 26.7 |
| F1 22 (2022) | 42.4 | 37 | 26.2 | 5.13 |
Emissions: ThinkPad X13 is cool and quiet
Noise
The Lenovo ThinkPad X13 G3 AMD is a rather quiet laptop. In pretty much every case, it is less noisy than the competition. It should be noted though that the direct predecessor X13 Gen 2 AMD was even less noisy.
We did detect a faint hissing noise when using the ThinkPad, but it was only noticeable when holding an ear directly over the keyboard. Sensitive ears might still be bothered though.
Noise level
| Idle |
| 23.1 / 23.1 / 23.1 dB(A) |
| Load |
| 27 / 35.5 dB(A) |
 | ||
30 dB silent 40 dB(A) audible 50 dB(A) loud |
||
min: | ||
| Lenovo ThinkPad X13 G3 21CM002UGE Radeon 660M, R5 PRO 6650U, Samsung PM9A1 MZVL2512HCJQ | Lenovo ThinkPad X13 G2 AMD 20XH001KGE Vega 7, R5 PRO 5650U, Samsung SSD PM981a MZVLB512HBJQ | HP EliteBook 835 G9 Radeon 680M, R7 PRO 6850U, Kioxia BG5 KBG50ZNV512G | Dell Latitude 13 7330 Iris Xe G7 96EUs, i7-1265U, Toshiba KBG40ZNS512G NVMe | Lenovo ThinkPad X13 G3 21BN0046GE Iris Xe G7 80EUs, i5-1235U, SK Hynix HFS512 GDE9X081N | |
|---|---|---|---|---|---|
| Noise | -3% | -13% | -9% | -4% | |
| off / environment * (dB) | 23.1 | 24.17 -5% | 26 -13% | 23.4 -1% | 24.6 -6% |
| Idle Minimum * (dB) | 23.1 | 24.17 -5% | 26 -13% | 23.4 -1% | 24.6 -6% |
| Idle Average * (dB) | 23.1 | 24.17 -5% | 27 -17% | 23.4 -1% | 24.6 -6% |
| Idle Maximum * (dB) | 23.1 | 24.17 -5% | 28 -21% | 23.4 -1% | 25.9 -12% |
| Load Average * (dB) | 27 | 29.92 -11% | 35 -30% | 37.8 -40% | 30.7 -14% |
| Witcher 3 ultra * (dB) | 38.7 | 37 4% | 39.2 -1% | 34.6 11% | |
| Load Maximum * (dB) | 35.5 | 31.52 11% | 37 -4% | 43 -21% | 34.6 3% |
* ... smaller is better
Heat
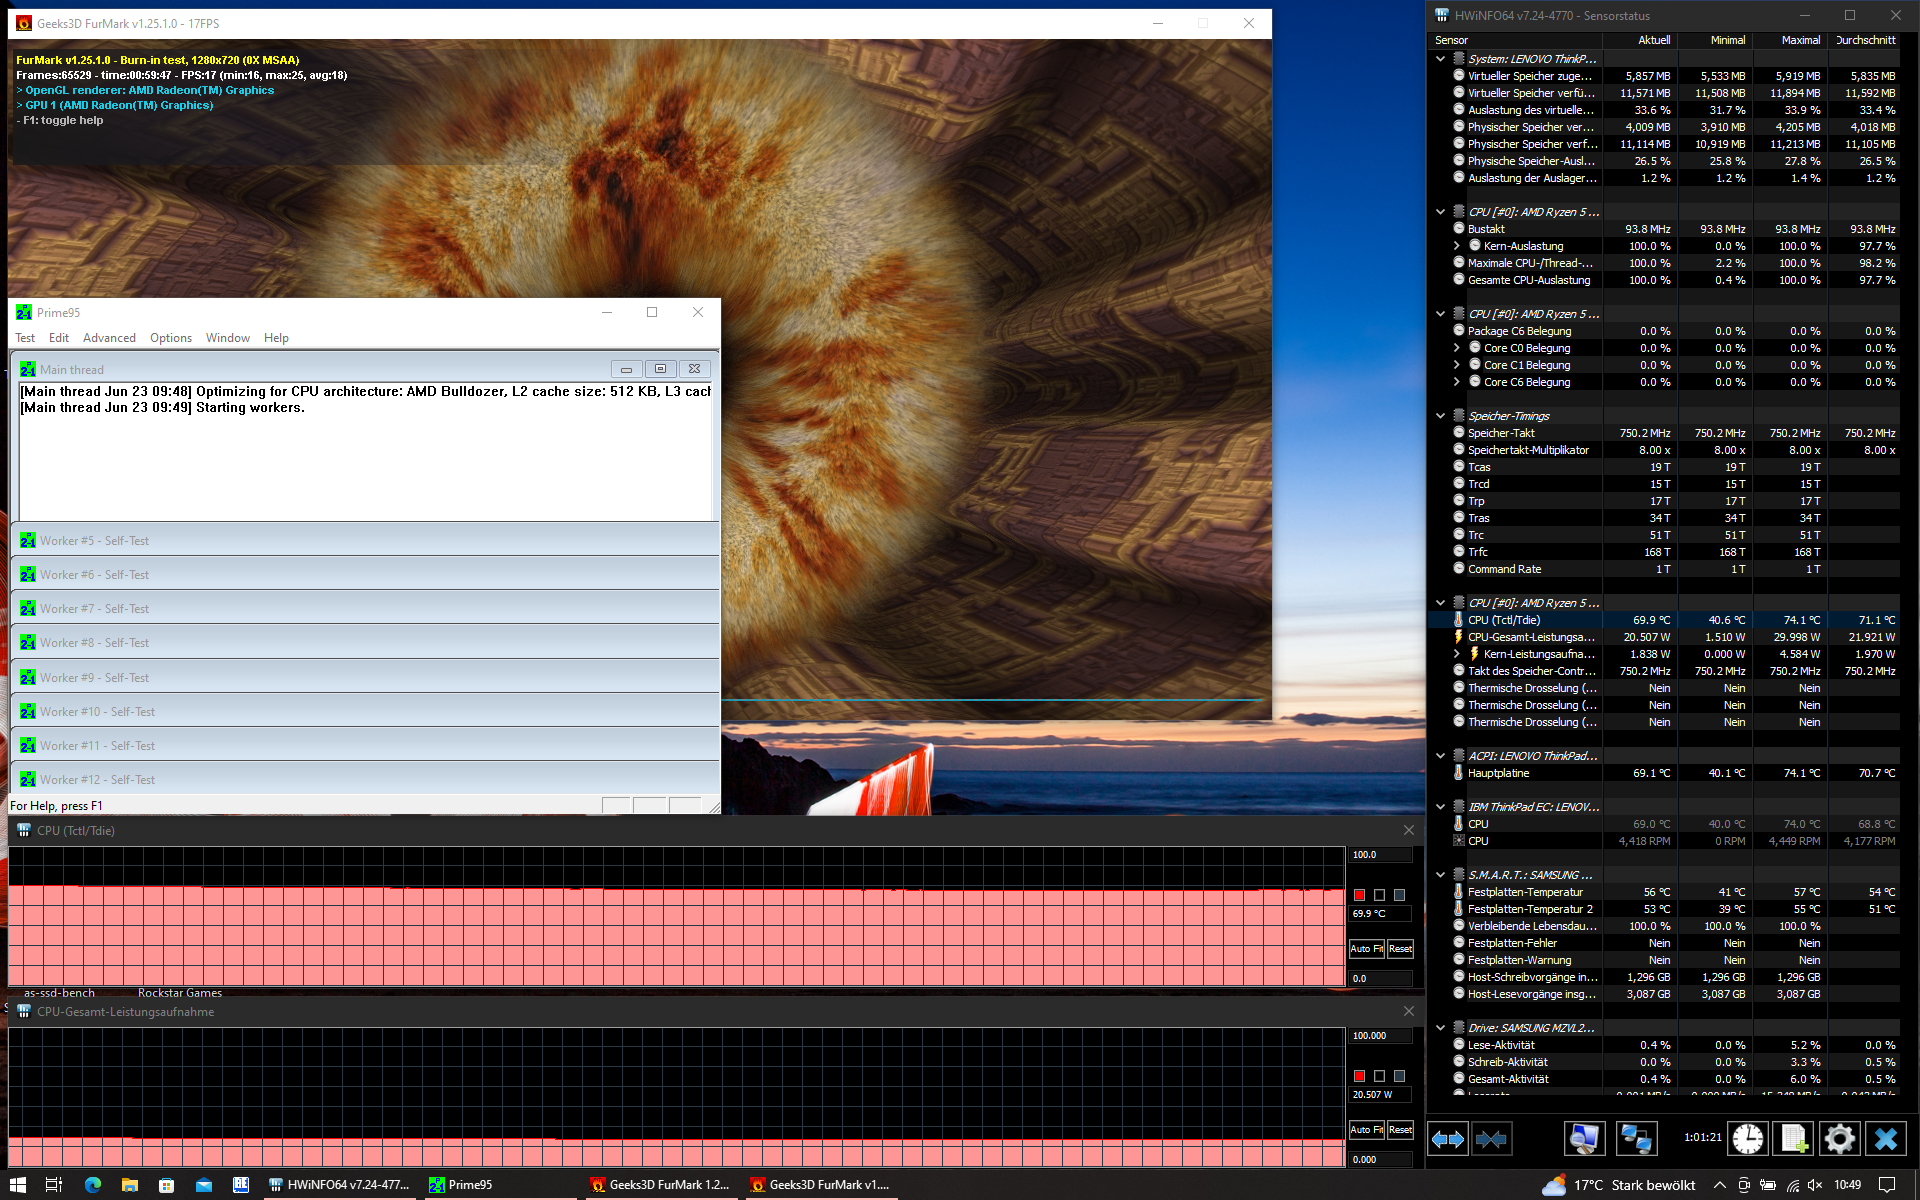
The Lenovo ThinkPad X13 Gen 3 does not get very warm. Even under full load, the chassis temperatures barely breach the 40 degree celsius / 100 degree Fahrenheit mark.
During the stress test, the processor can sustain a power consumption of 20 W. We could not detect throttling.
(+) The maximum temperature on the upper side is 38.1 °C / 101 F, compared to the average of 35.9 °C / 97 F, ranging from 21.4 to 59 °C for the class Subnotebook.
(±) The bottom heats up to a maximum of 40.1 °C / 104 F, compared to the average of 39.2 °C / 103 F
(+) In idle usage, the average temperature for the upper side is 30.9 °C / 88 F, compared to the device average of 30.8 °C / 87 F.
(±) Playing The Witcher 3, the average temperature for the upper side is 34.3 °C / 94 F, compared to the device average of 30.8 °C / 87 F.
(+) The palmrests and touchpad are cooler than skin temperature with a maximum of 31.6 °C / 88.9 F and are therefore cool to the touch.
(-) The average temperature of the palmrest area of similar devices was 28.2 °C / 82.8 F (-3.4 °C / -6.1 F).
| Lenovo ThinkPad X13 G3 21CM002UGE AMD Ryzen 5 PRO 6650U, AMD Radeon 660M | Lenovo ThinkPad X13 G2 AMD 20XH001KGE AMD Ryzen 5 PRO 5650U, AMD Radeon RX Vega 7 | HP EliteBook 835 G9 AMD Ryzen 7 PRO 6850U, AMD Radeon 680M | Dell Latitude 13 7330 Intel Core i7-1265U, Intel Iris Xe Graphics G7 96EUs | Lenovo ThinkPad X13 G3 21BN0046GE Intel Core i5-1235U, Intel Iris Xe Graphics G7 80EUs | |
|---|---|---|---|---|---|
| Heat | 9% | 4% | 12% | -4% | |
| Maximum Upper Side * (°C) | 38.1 | 43.7 -15% | 46 -21% | 38.6 -1% | 45.3 -19% |
| Maximum Bottom * (°C) | 40.1 | 38 5% | 49 -22% | 42 -5% | 41.8 -4% |
| Idle Upper Side * (°C) | 33.6 | 25.8 23% | 24 29% | 23.8 29% | 31.6 6% |
| Idle Bottom * (°C) | 33.4 | 26.2 22% | 24 28% | 24.6 26% | 32.6 2% |
* ... smaller is better
Speakers
The user facing speakers emit sound of middling quality, without base - only in the higher part of the sound wave spectrum, the sound is balanced. The speakers of the HP EliteBook 835 G9 are not much better, but at least slightly louder.
Lenovo ThinkPad X13 G3 21CM002UGE audio analysis
(±) | speaker loudness is average but good (76.1 dB)
Bass 100 - 315 Hz
(-) | nearly no bass - on average 24% lower than median
(±) | linearity of bass is average (14.2% delta to prev. frequency)
Mids 400 - 2000 Hz
(+) | balanced mids - only 2.9% away from median
(+) | mids are linear (2.8% delta to prev. frequency)
Highs 2 - 16 kHz
(+) | balanced highs - only 2.7% away from median
(+) | highs are linear (3.9% delta to prev. frequency)
Overall 100 - 16.000 Hz
(±) | linearity of overall sound is average (19.3% difference to median)
Compared to same class
» 60% of all tested devices in this class were better, 7% similar, 34% worse
» The best had a delta of 5%, average was 18%, worst was 53%
Compared to all devices tested
» 47% of all tested devices were better, 8% similar, 46% worse
» The best had a delta of 4%, average was 23%, worst was 134%
HP EliteBook 835 G9 audio analysis
(±) | speaker loudness is average but good (79 dB)
Bass 100 - 315 Hz
(-) | nearly no bass - on average 17.8% lower than median
(±) | linearity of bass is average (11.2% delta to prev. frequency)
Mids 400 - 2000 Hz
(+) | balanced mids - only 1.7% away from median
(+) | mids are linear (3.2% delta to prev. frequency)
Highs 2 - 16 kHz
(+) | balanced highs - only 3.2% away from median
(±) | linearity of highs is average (8% delta to prev. frequency)
Overall 100 - 16.000 Hz
(+) | overall sound is linear (14.7% difference to median)
Compared to same class
» 31% of all tested devices in this class were better, 5% similar, 64% worse
» The best had a delta of 5%, average was 18%, worst was 53%
Compared to all devices tested
» 19% of all tested devices were better, 4% similar, 77% worse
» The best had a delta of 4%, average was 23%, worst was 134%
Energy management: efficient Lenovo ThinkPad
Power consumption
The Lenovo laptop can boast a pretty low power consumption, all review devices run less efficient on average. Especially when idling, the difference is important. In this area, the HP EliteBook 835 G9 is notably worse.
The maximum consumption of 49.1 W is well within the capability of the 65 W charger.
| Off / Standby | |
| Idle | |
| Load |
|
Key:
min: | |
| Lenovo ThinkPad X13 G3 21CM002UGE R5 PRO 6650U, Radeon 660M, Samsung PM9A1 MZVL2512HCJQ, IPS LED, 1920x1200, 13.3" | Lenovo ThinkPad X13 G2 AMD 20XH001KGE R5 PRO 5650U, Vega 7, Samsung SSD PM981a MZVLB512HBJQ, IPS LED, 1920x1200, 13.3" | HP EliteBook 835 G9 R7 PRO 6850U, Radeon 680M, Kioxia BG5 KBG50ZNV512G, IPS, 1920x1200, 13.3" | Dell Latitude 13 7330 i7-1265U, Iris Xe G7 96EUs, Toshiba KBG40ZNS512G NVMe, IPS, 1920x1080, 13.3" | Lenovo ThinkPad X13 G3 21BN0046GE i5-1235U, Iris Xe G7 80EUs, SK Hynix HFS512 GDE9X081N, IPS Grade, 1920x1200, 13.3" | Average AMD Radeon 660M | Average of class Subnotebook | |
|---|---|---|---|---|---|---|---|
| Power Consumption | -7% | -33% | -10% | -7% | -38% | -26% | |
| Idle Minimum * (Watt) | 3.2 | 3.82 -19% | 5 -56% | 2.8 13% | 2.7 16% | 4.68 ? -46% | 3.76 ? -17% |
| Idle Average * (Watt) | 5.2 | 5.74 -10% | 6 -15% | 4.8 8% | 5.2 -0% | 7.08 ? -36% | 6.54 ? -26% |
| Idle Maximum * (Watt) | 6.1 | 7.65 -25% | 11 -80% | 7.3 -20% | 6.2 -2% | 9.12 ? -50% | 7.89 ? -29% |
| Load Average * (Watt) | 33.6 | 35.79 -7% | 45 -34% | 48.1 -43% | 38.4 -14% | 44.2 ? -32% | 42 ? -25% |
| Witcher 3 ultra * (Watt) | 39.3 | 35.6 9% | 45.2 -15% | 35.4 10% | 41.9 -7% | ||
| Load Maximum * (Watt) | 49.1 | 45.04 8% | 48 2% | 63.6 -30% | 66.7 -36% | 62.4 ? -27% | 64.8 ? -32% |
* ... smaller is better
Power consumption Witcher 3 / stress test
Energieaufnahme mit externem Monitor
Battery life
The internal battery still has a capacity of 54.7 Wh, though there also is a variant with 41 Wh. The model we tested achieved great battery runtimes: The 12 hours and 30 minutes in the WiFi test (150 cd/m² screen brightness) are already formidable, but the 10 hours and 40 minutes in the same test with max screen brightness are even better in relative terms. The ThinkPad X13 G3 AMD is a device capable of lasting the entire workday.
| Lenovo ThinkPad X13 G3 21CM002UGE R5 PRO 6650U, Radeon 660M, 54.7 Wh | Lenovo ThinkPad X13 G2 AMD 20XH001KGE R5 PRO 5650U, Vega 7, 54.7 Wh | HP EliteBook 835 G9 R7 PRO 6850U, Radeon 680M, 51 Wh | Dell Latitude 13 7330 i7-1265U, Iris Xe G7 96EUs, 41 Wh | Lenovo ThinkPad X13 G3 21BN0046GE i5-1235U, Iris Xe G7 80EUs, 54.7 Wh | Average of class Subnotebook | |
|---|---|---|---|---|---|---|
| Battery runtime | -17% | -27% | -21% | 8% | 22% | |
| WiFi v1.3 (h) | 12.5 | 9.3 -26% | 9.1 -27% | 8.3 -34% | 10.2 -18% | 14 ? 12% |
| Load (h) | 1.5 | 1.4 -7% | 1.1 -27% | 1.4 -7% | 2 33% | 1.969 ? 31% |
Pros
Cons
Verdict: ThinkPad X13 AMD still a very good subnotebook
With the Lenovo ThinkPad X13 Gen 3 AMD, the manufacturer builds upon an already very good laptop, the Lenovo ThinkPad X13 Gen 2. The new model has all the aspects that made the old one good, but adds USB4 and Rembrandt. Logically, it is no big wonder that the new model also reaches a very good rating.
In addition to the existing strengths, like the robust and lightweight chassis, the agreeable input devices and the good connectivity options, the new model has an improved battery life. The ThinkPad X13 Gen 3 achieves a good performance and still runs cool and quiet, which is not a given when compared with the Intel competition.
Of course, there still is room for improvements. The screen brightness could be better, especially when taking the competitors into account. We would also like to see a higher-res webcam as well as upgradable RAM. Also, the WiFi upload rates were rather low.
Compact, performant, long battery life, cool and quiet - the Lenovo ThinkPad X13 Gen 3 AMD combines many positive attributes.
That is mostly high-level criticism. If you are searching for a fast, ultra-mobile work-device, which lasts the whole day, the ThinkPad X13 G3 AMD should definitely be a contender. The same is pretty much true for the HP EliteBook 835 G9 - buyers of the Dell Latitude 7330 have to contend with Intel CPUs, which deliver a better single core performance, but run less efficient otherwise. The Lenovo ThinkPad X13 Gen 4 with AMD Phoenix is already on the horizon, but not available yet - buying the predecessor is definitely not a bad choice.
Pricing and availability
Amazon offers the Lenovo ThinkPad X13 G3 AMD for $1,200.
Lenovo ThinkPad X13 G3 21CM002UGE
- 06/27/2023 v7 (old)
Benjamin Herzig
Transparency
The selection of devices to be reviewed is made by our editorial team. The test sample was provided to the author as a loan by the manufacturer or retailer for the purpose of this review. The lender had no influence on this review, nor did the manufacturer receive a copy of this review before publication. There was no obligation to publish this review. As an independent media company, Notebookcheck is not subjected to the authority of manufacturers, retailers or publishers.
This is how Notebookcheck is testing
Every year, Notebookcheck independently reviews hundreds of laptops and smartphones using standardized procedures to ensure that all results are comparable. We have continuously developed our test methods for around 20 years and set industry standards in the process. In our test labs, high-quality measuring equipment is utilized by experienced technicians and editors. These tests involve a multi-stage validation process. Our complex rating system is based on hundreds of well-founded measurements and benchmarks, which maintains objectivity. Further information on our test methods can be found here.
Price comparison
