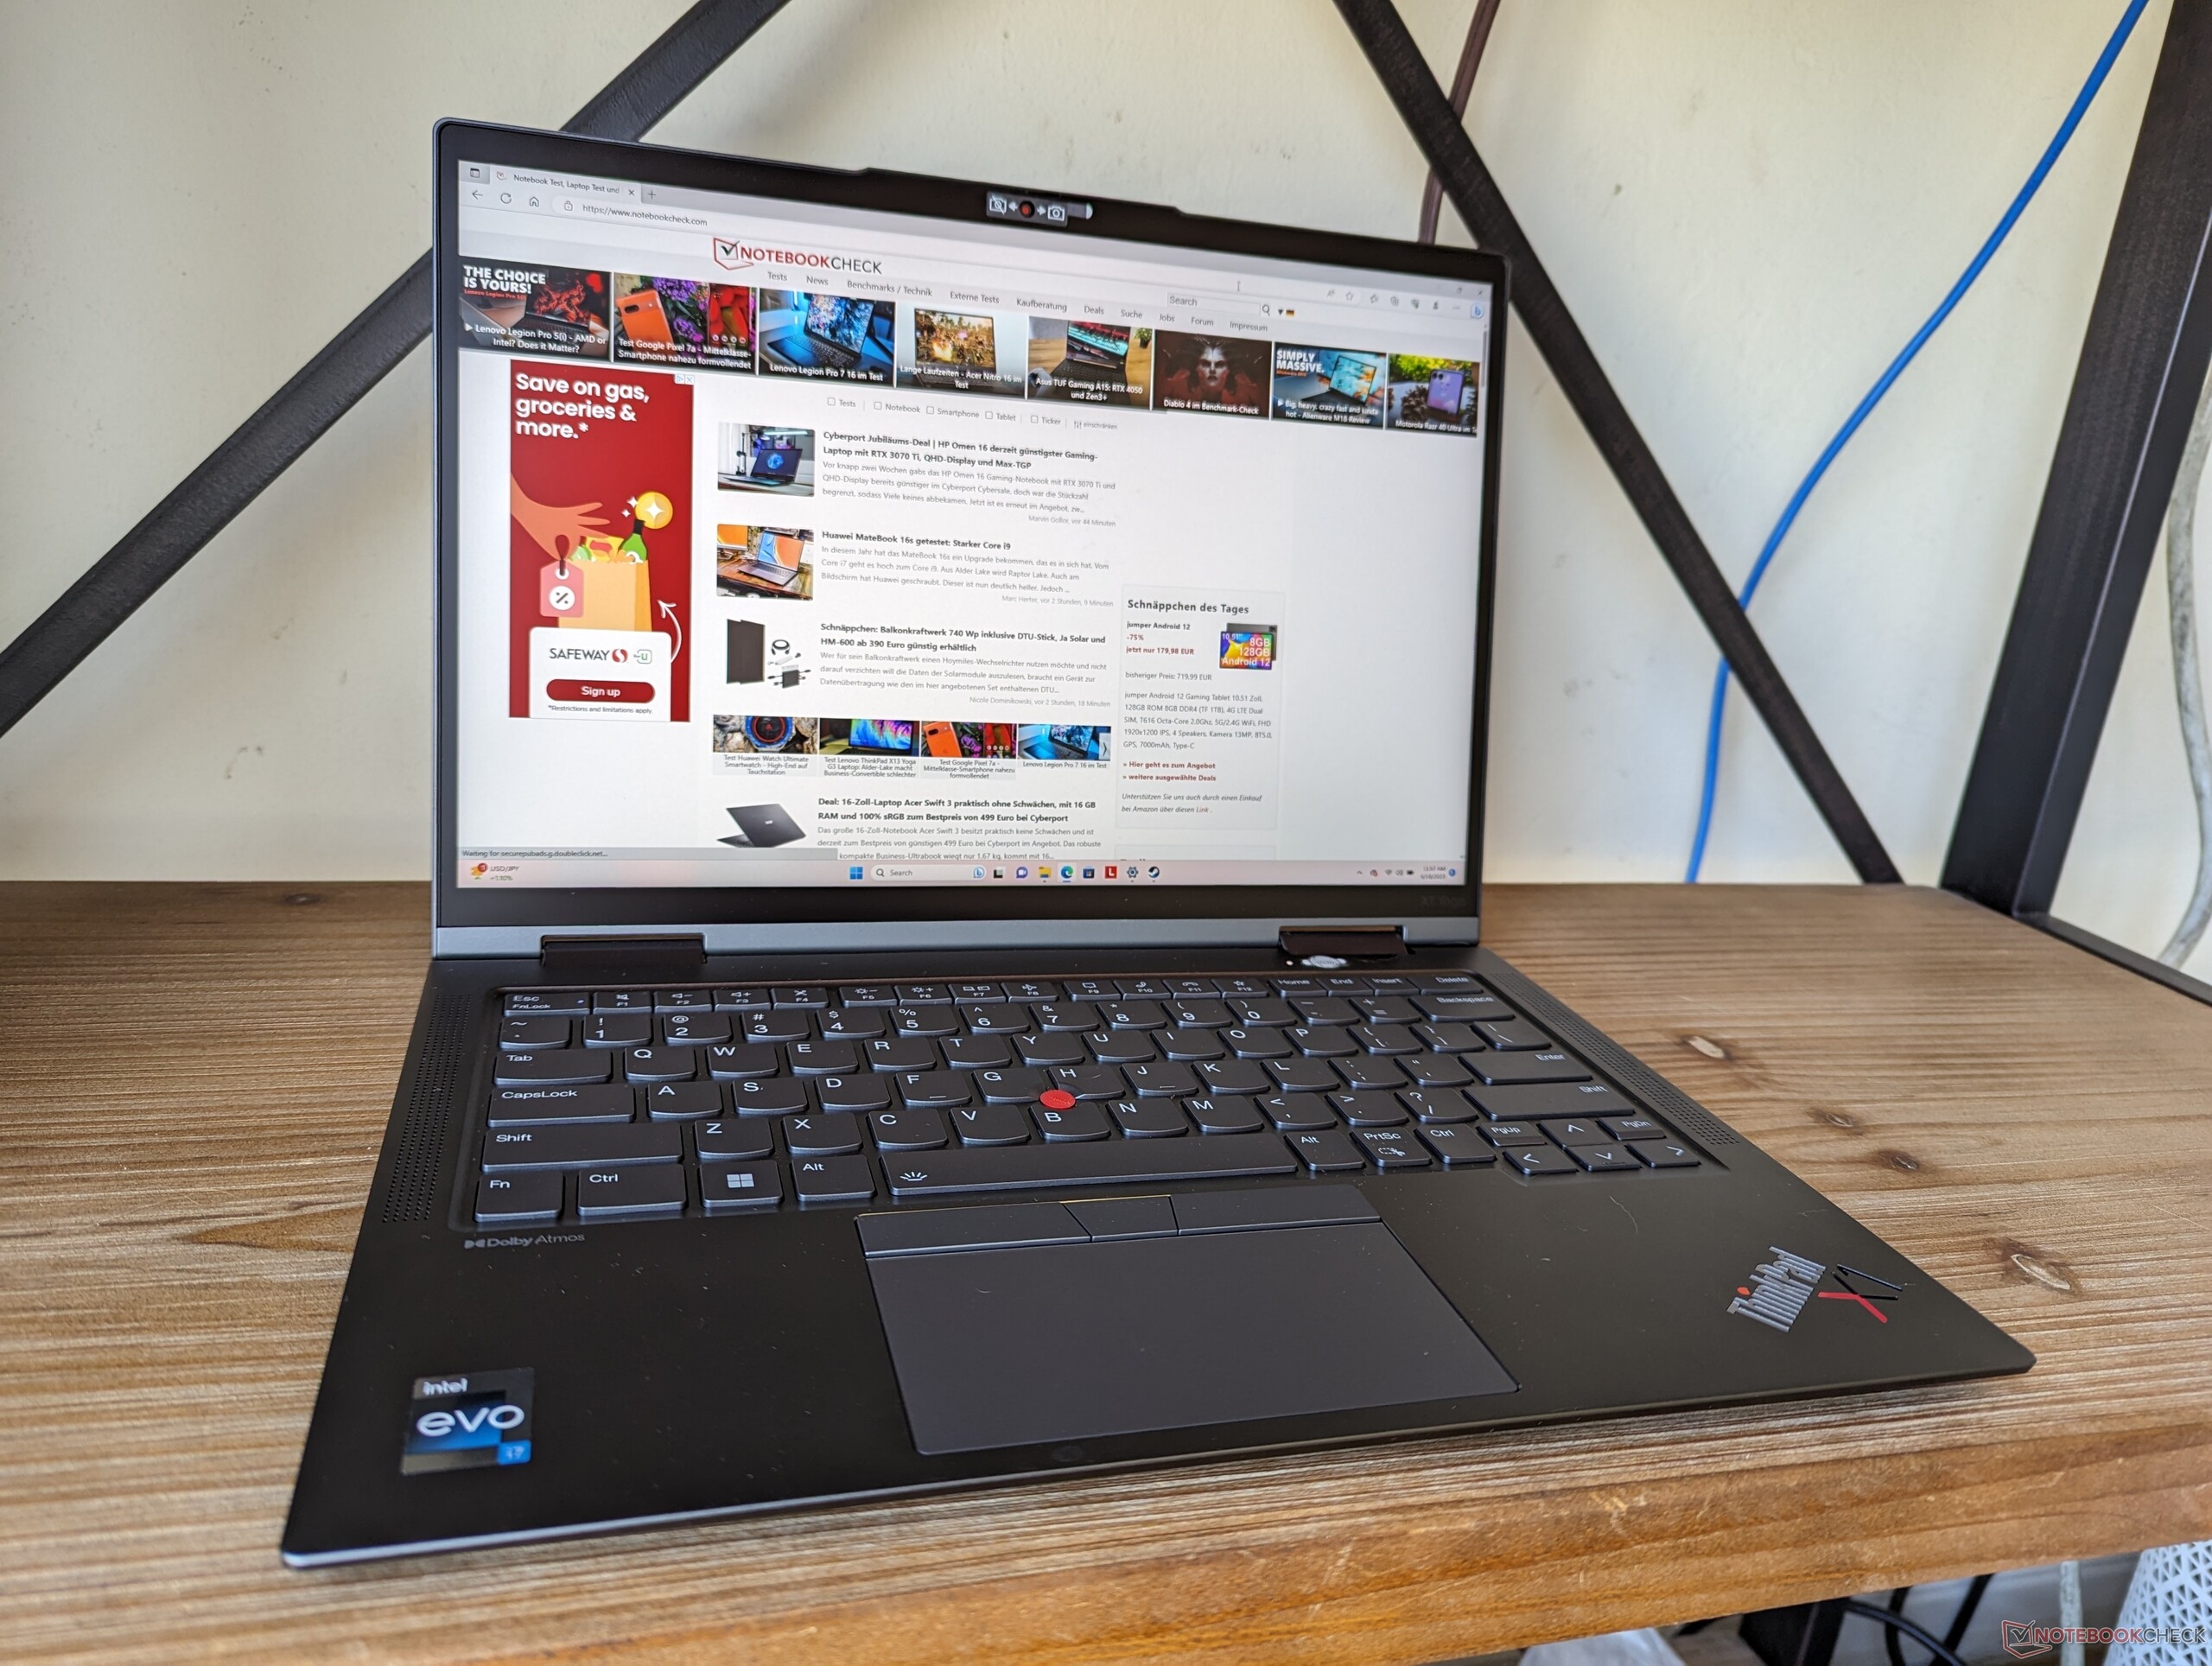
New CPU, same problems: Lenovo ThinkPad X1 Yoga G8 convertible review

The ThinkPad X1 Yoga G8 replaces the 12th gen Alder Lake processor options on the ThinkPad X1 Yoga G7 with newer 13th gen Raptor Lake options. Otherwise, both models share the same chassis design and exterior features. We recommend checking our our reviews on last year's model and the older ThinkPad X1 Yoga G6 to learn more about the physical features of the ThinkPad X1 Yoga G8.
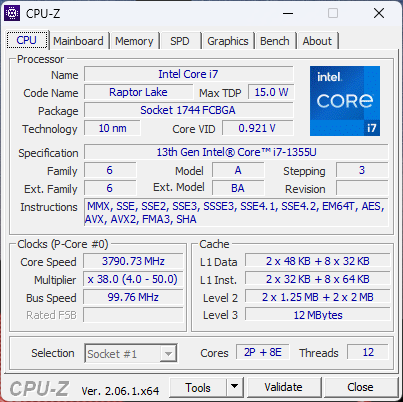
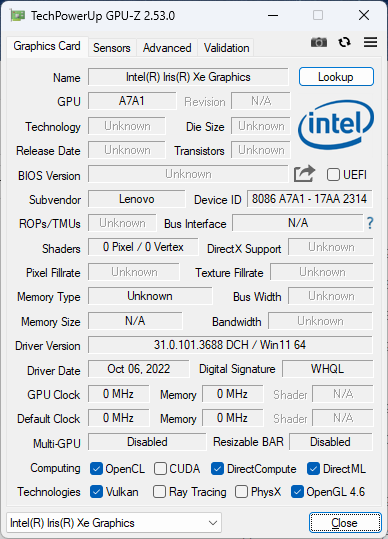
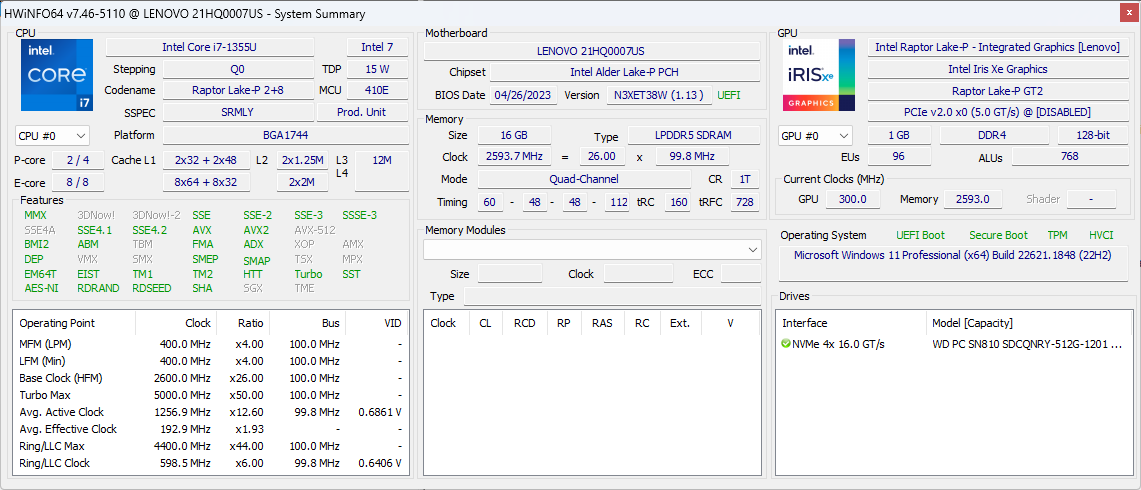
Our review unit is a mid-level configuration with the Core i7-1355U CPU and 16:10 1920 x 1200p IPS matte touchscreen for approximately $2100 USD. Lower-end options with the Core i5-1335U are available in addition to higher-end options with the Core i7-1370P, 2400p OLED panel, and nano-SIM connectivity ranging from $1600 to over $2600. All SKUs otherwise ship with integrated Iris Xe graphics only.
Alternatives to the ThinkPad X1 Yoga G8 include other high-end 14-inch business convertibles like the HP EliteBook x360 1040, Dell Latitude 9430 2-in-1, or the MSI Summit E14 Flip.
More Lenovo reviews:
Potential Competitors in Comparison
Rating | Date | Model | Weight | Height | Size | Resolution | Price |
|---|---|---|---|---|---|---|---|
| 90 % v7 (old) | 06 / 2023 | Lenovo ThinkPad X1 Yoga G8 i7-1355U i7-1355U, Iris Xe G7 96EUs | 1.4 kg | 15.53 mm | 14.00" | 1920x1200 | |
| 89.4 % v7 (old) | 05 / 2022 | Lenovo ThinkPad X1 Yoga G7 21CE002HGE i7-1270P, Iris Xe G7 96EUs | 1.5 kg | 15.53 mm | 14.00" | 1920x1200 | |
| 89.8 % v7 (old) | 08 / 2022 | Dell Latitude 9430 2-in-1 i7-1265U, Iris Xe G7 96EUs | 1.5 kg | 13.94 mm | 14.00" | 2560x1600 | |
| 87.5 % v7 (old) | 05 / 2022 | LG Gram 14T90P i5-1135G7, Iris Xe G7 80EUs | 1.2 kg | 17 mm | 14.00" | 1900x1200 | |
| 86.5 % v7 (old) | 05 / 2022 | Asus ZenBook Flip 14 UN5401QA-KN085W R7 5800H, Vega 8 | 1.4 kg | 15.9 mm | 14.00" | 2880x1800 | |
| 90.6 % v7 (old) | 03 / 2021 | HP EliteBook x360 1040 G7, i7-10810U i7-10810U, UHD Graphics 620 | 1.4 kg | 16.5 mm | 14.00" | 1920x1080 |
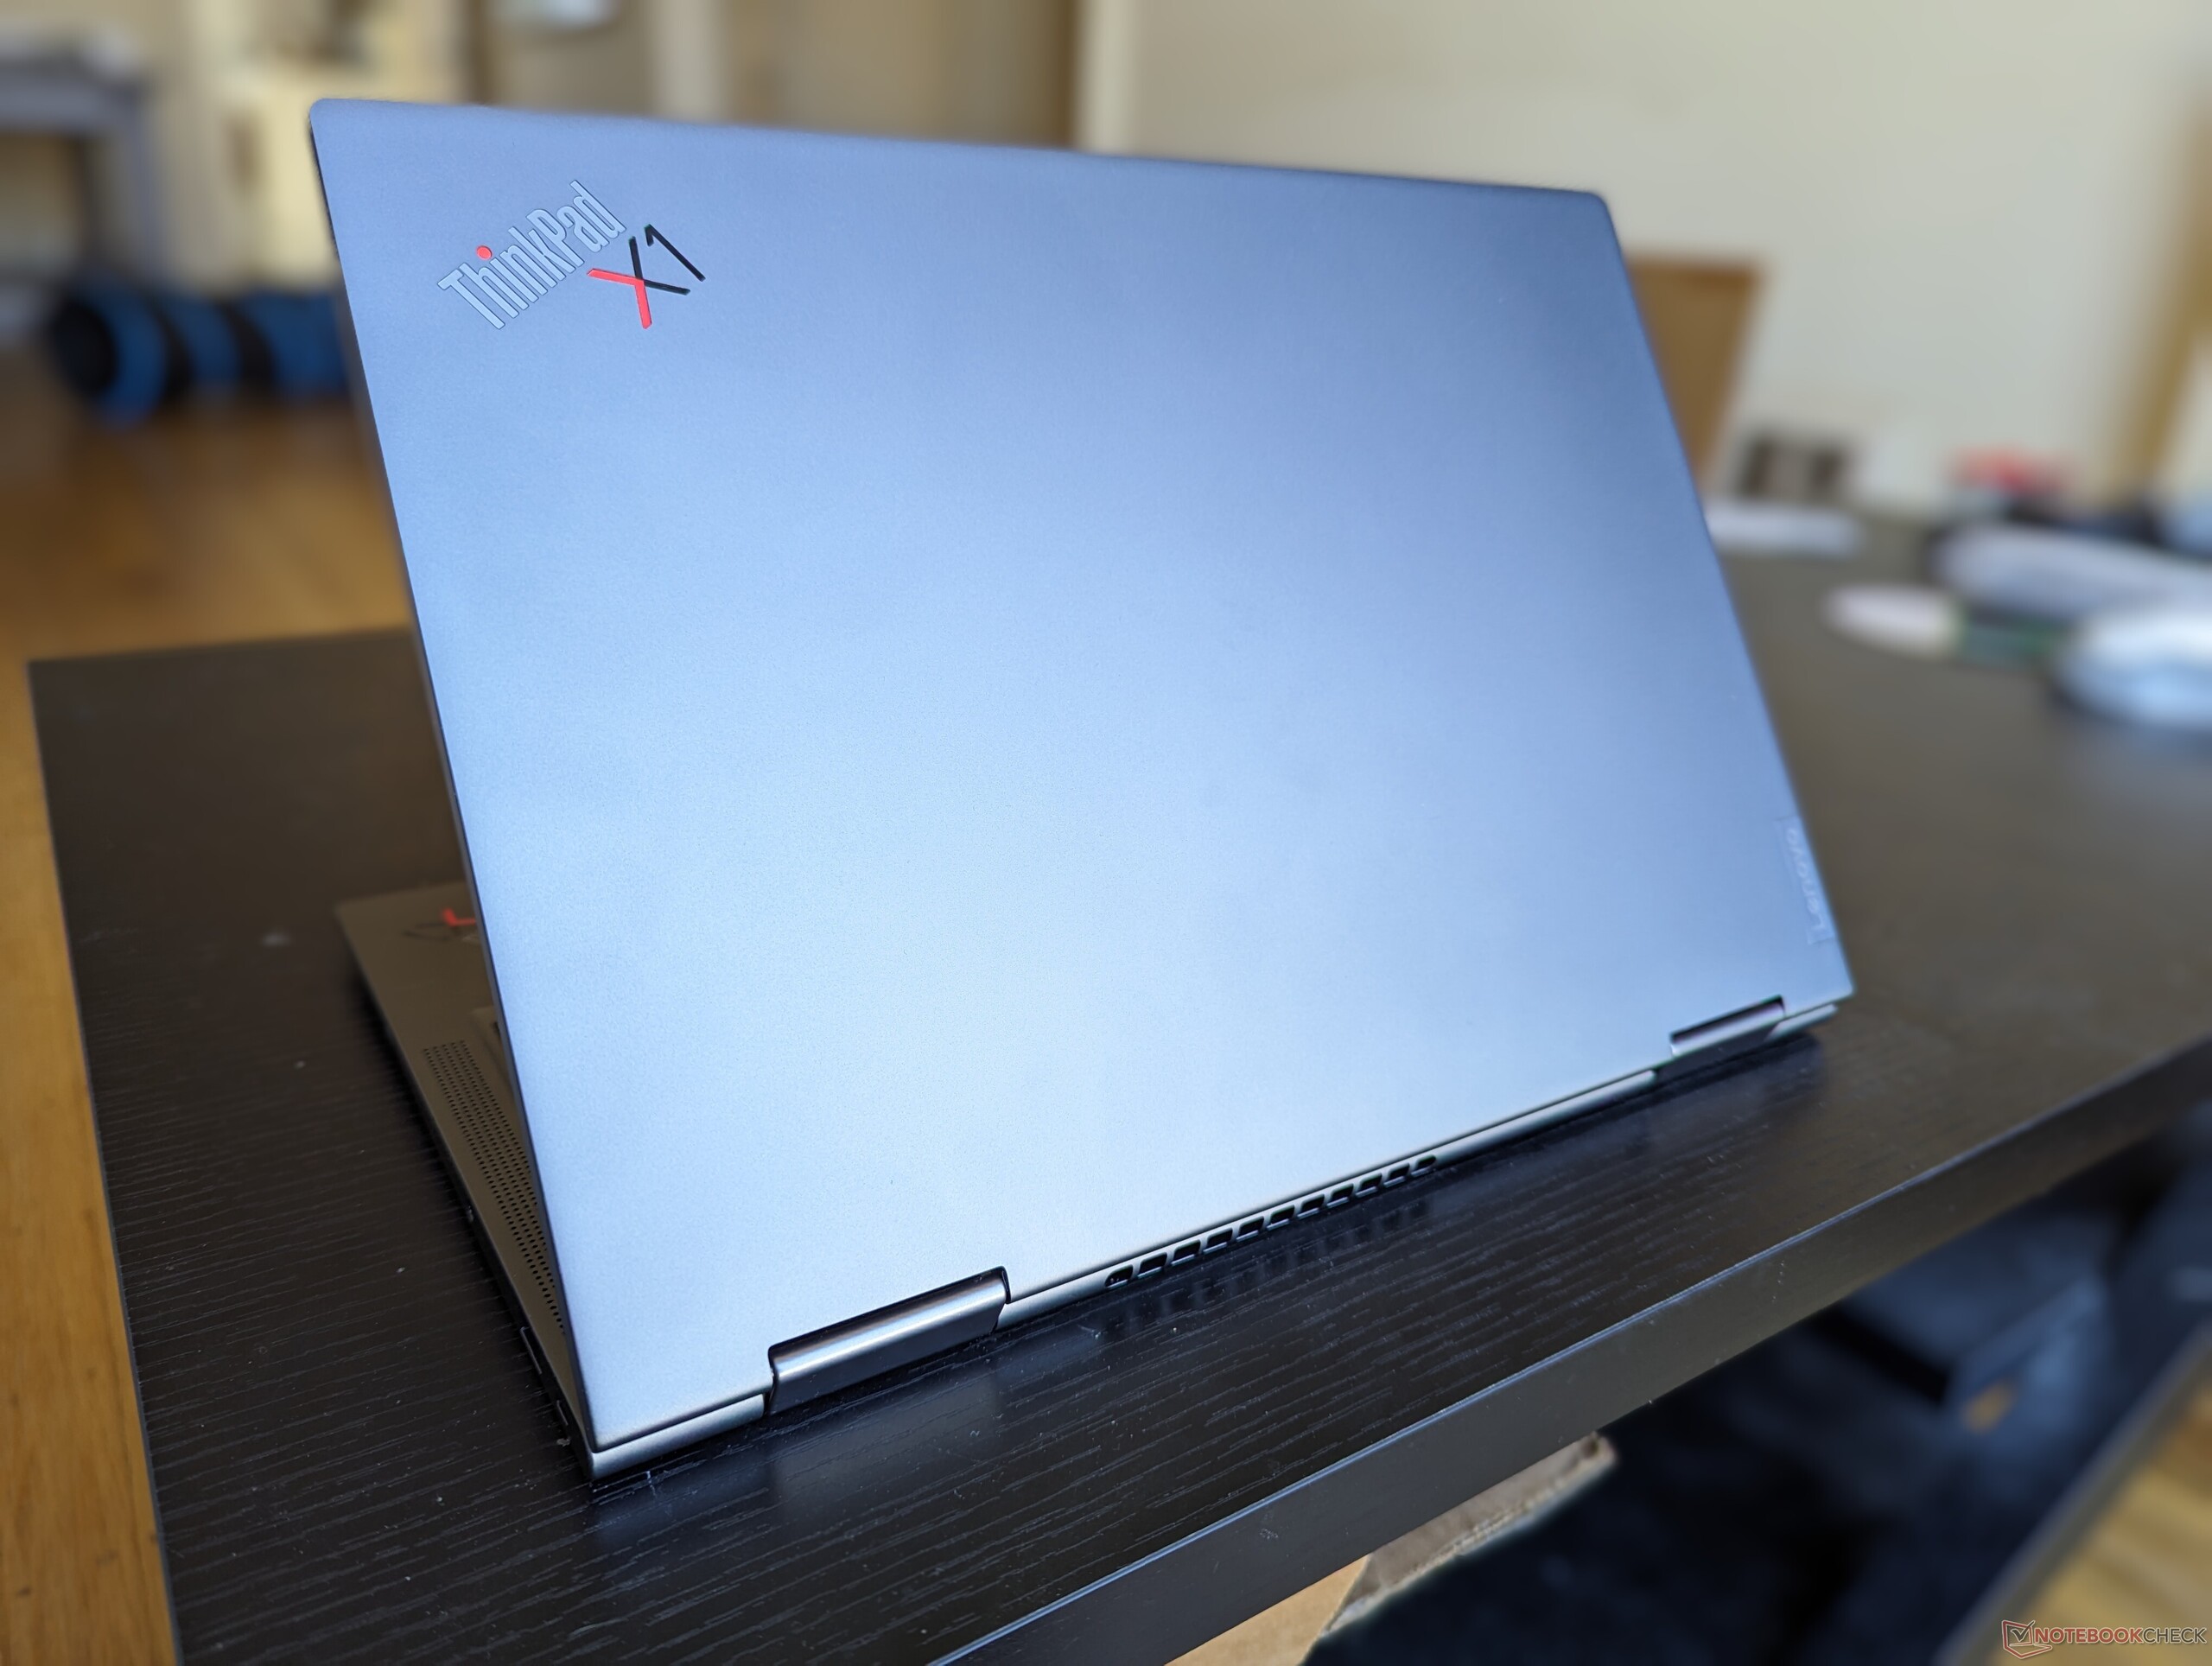
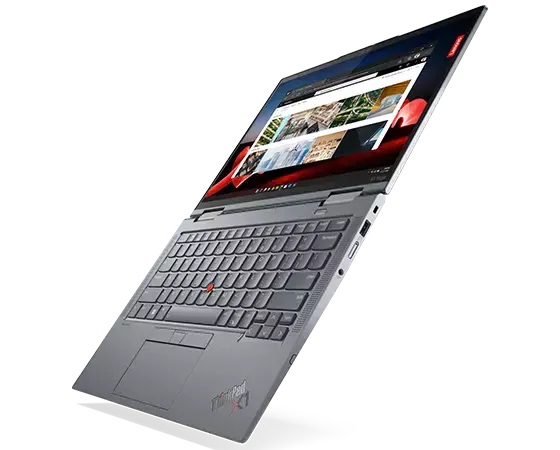
Case — Exact Same Design Three Years Running
Communication
| Networking | |
| iperf3 transmit AX12 | |
| Asus ZenBook Flip 14 UN5401QA-KN085W | |
| HP EliteBook x360 1040 G7, i7-10810U | |
| iperf3 receive AX12 | |
| Asus ZenBook Flip 14 UN5401QA-KN085W | |
| HP EliteBook x360 1040 G7, i7-10810U | |
| iperf3 transmit AXE11000 | |
| Lenovo ThinkPad X1 Yoga G8 i7-1355U | |
| LG Gram 14T90P | |
| iperf3 receive AXE11000 | |
| Lenovo ThinkPad X1 Yoga G8 i7-1355U | |
| LG Gram 14T90P | |
| iperf3 transmit AXE11000 6GHz | |
| Lenovo ThinkPad X1 Yoga G7 21CE002HGE | |
| Dell Latitude 9430 2-in-1 | |
| Lenovo ThinkPad X1 Yoga G8 i7-1355U | |
| iperf3 receive AXE11000 6GHz | |
| Lenovo ThinkPad X1 Yoga G7 21CE002HGE | |
| Dell Latitude 9430 2-in-1 | |
| Lenovo ThinkPad X1 Yoga G8 i7-1355U | |
Webcam
The model continues to ship with a 2 MP camera whereas the HP Spectre and EliteBook series come with 5 MP or 8 MP sensors.


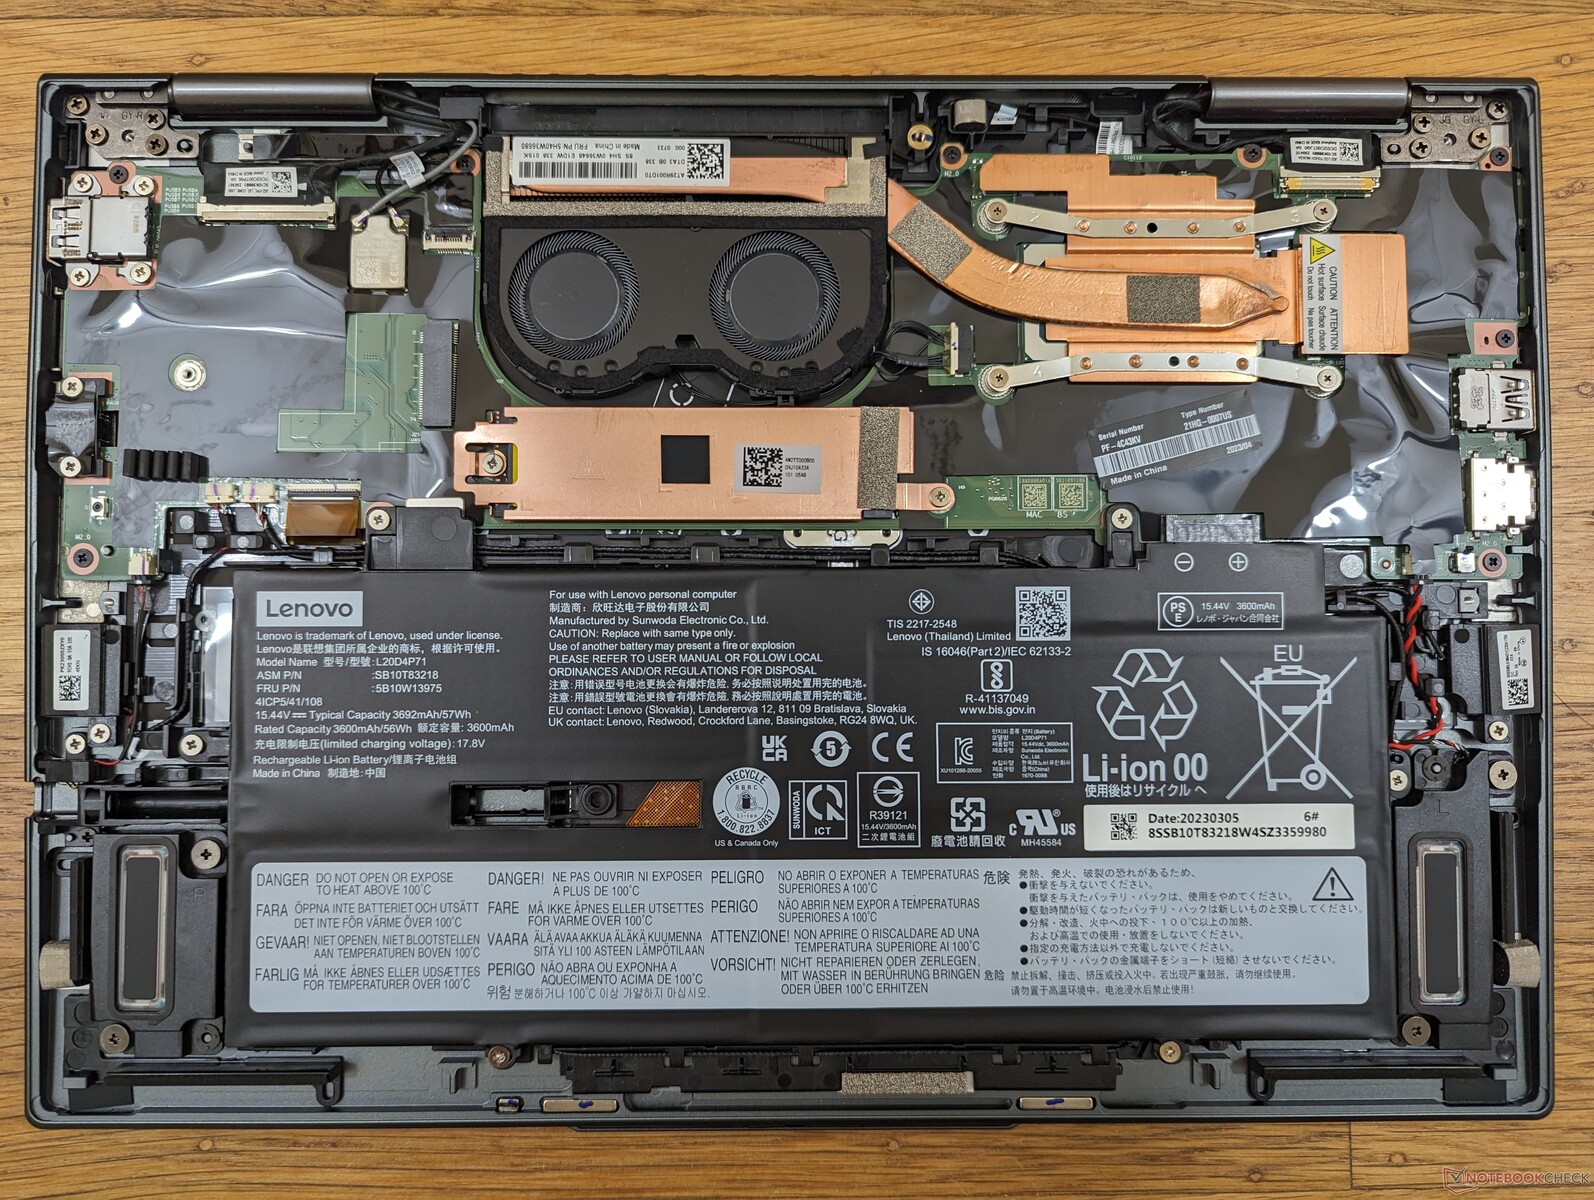
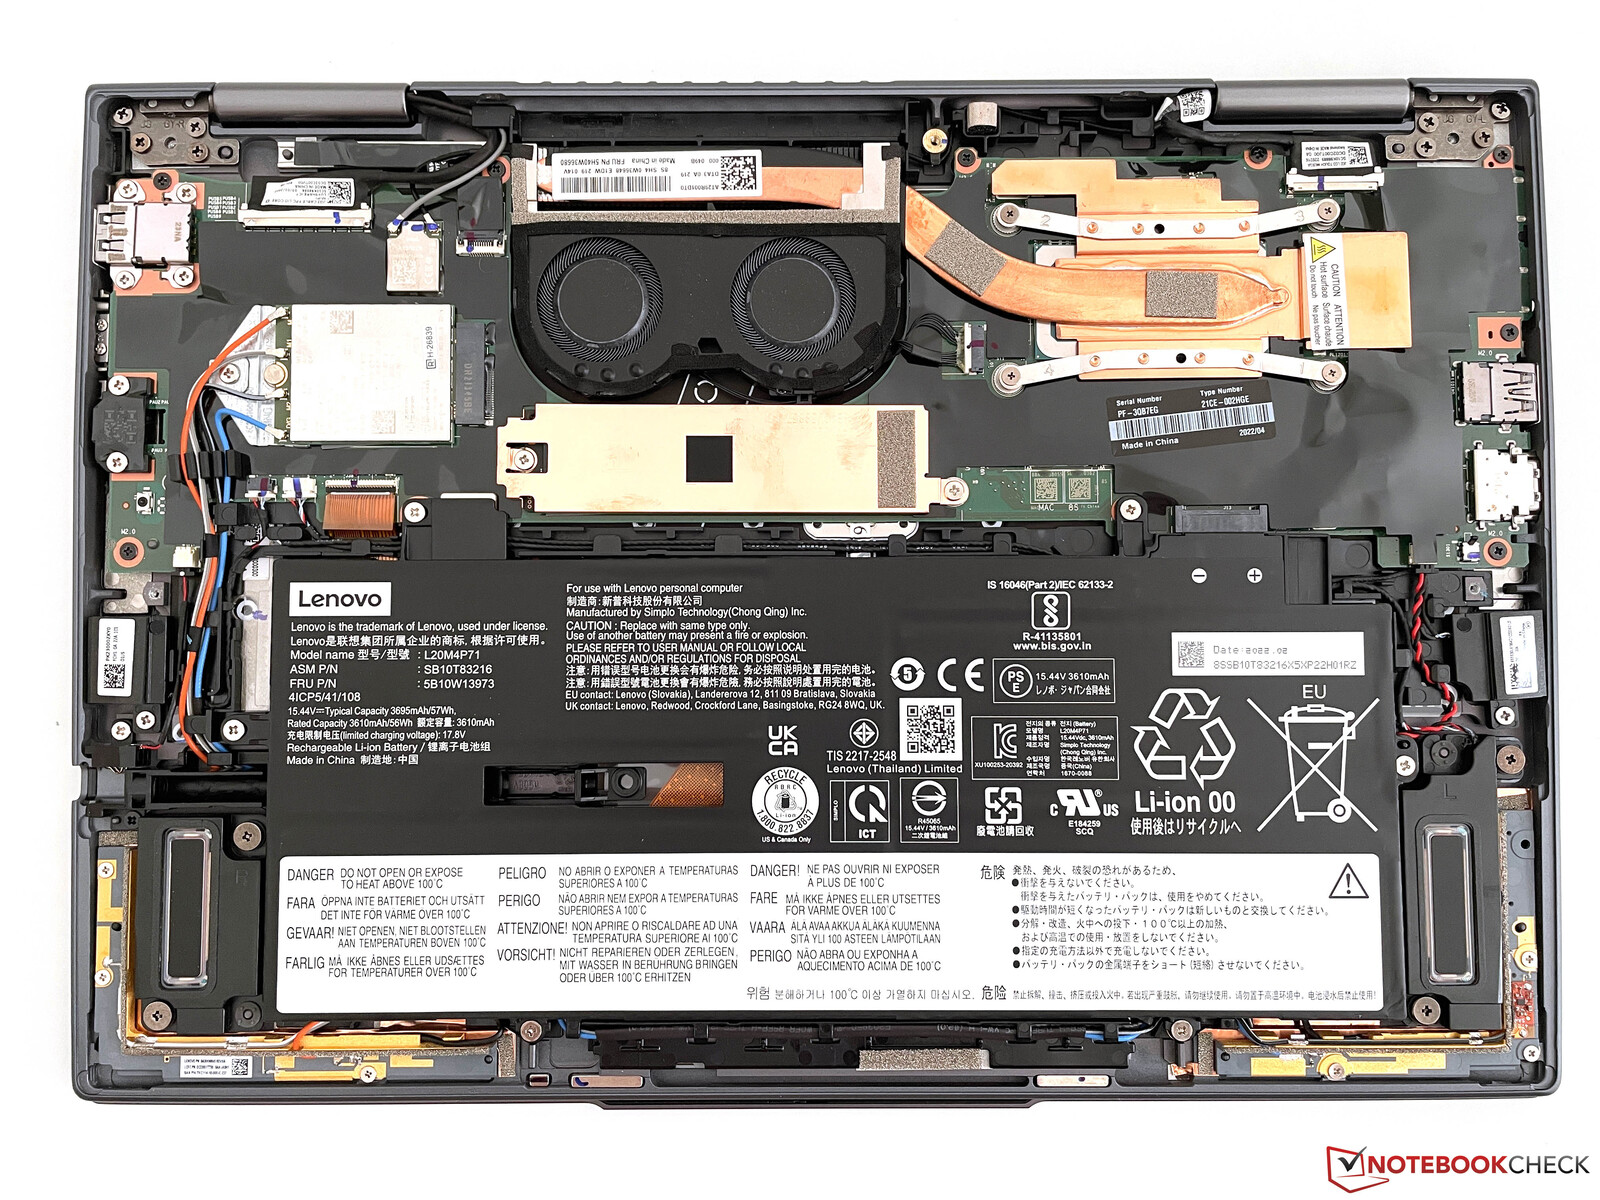
Maintenance
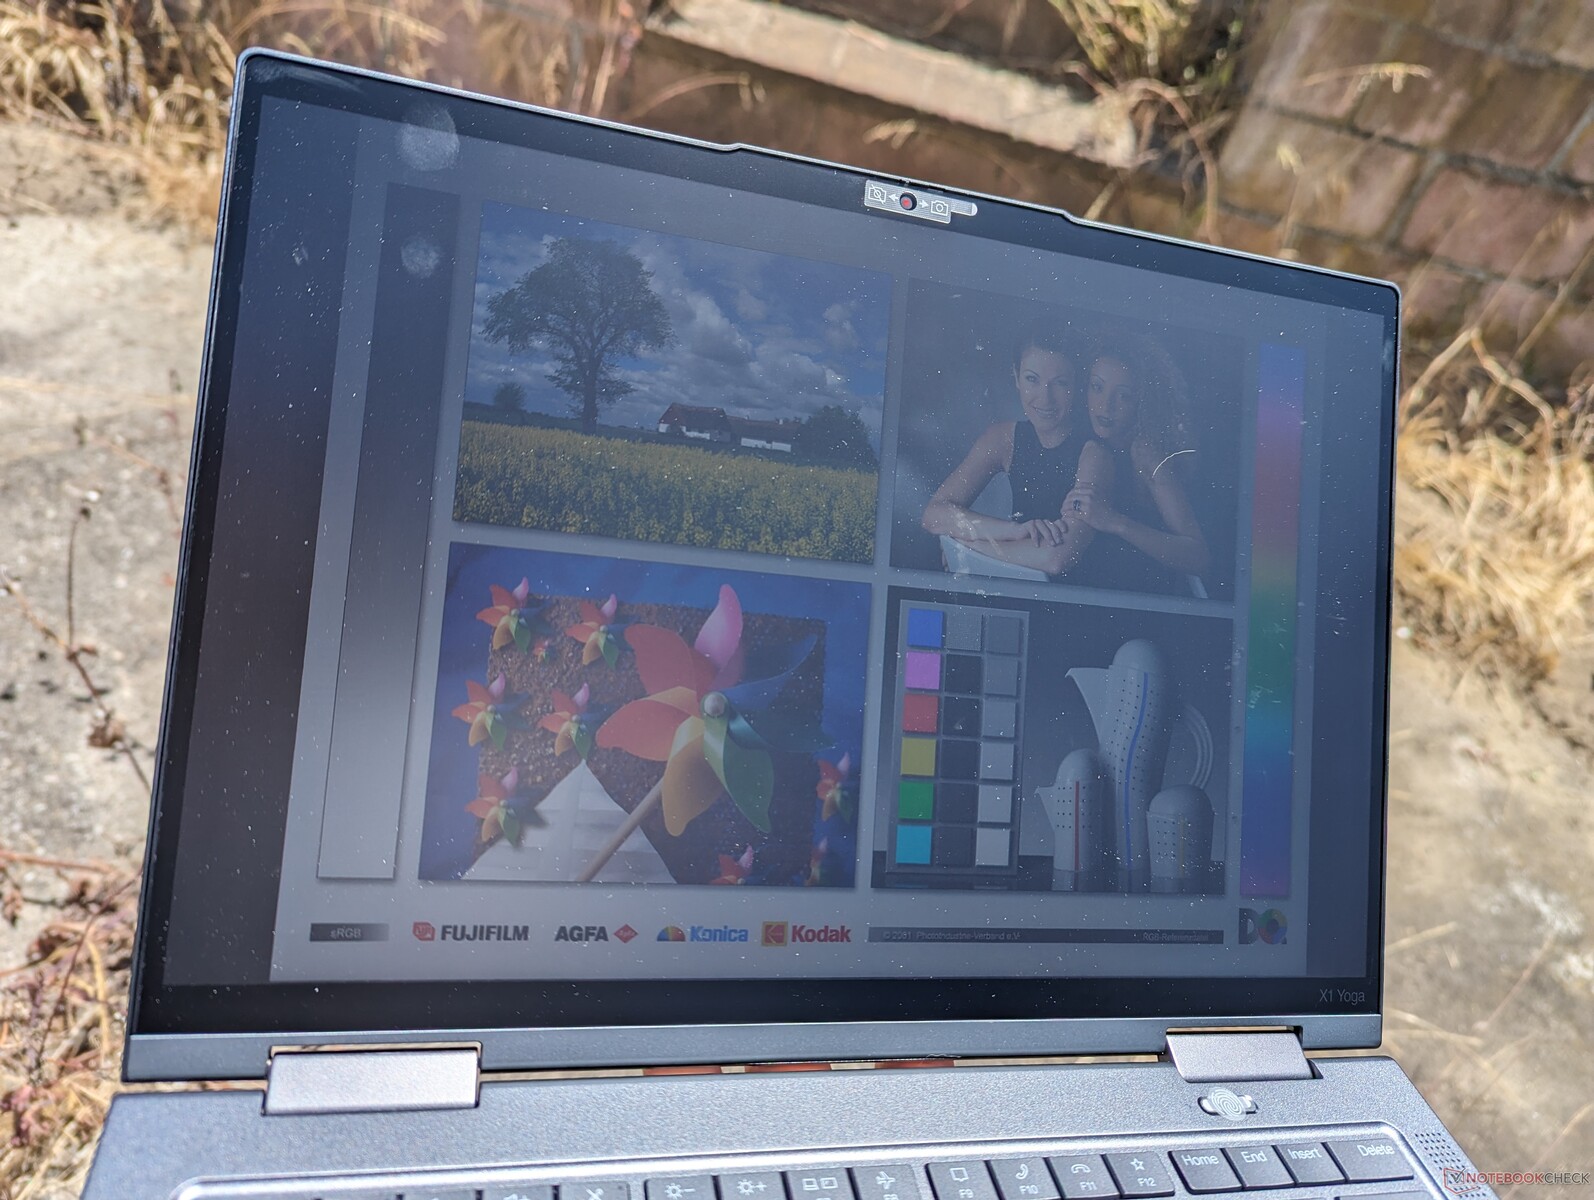
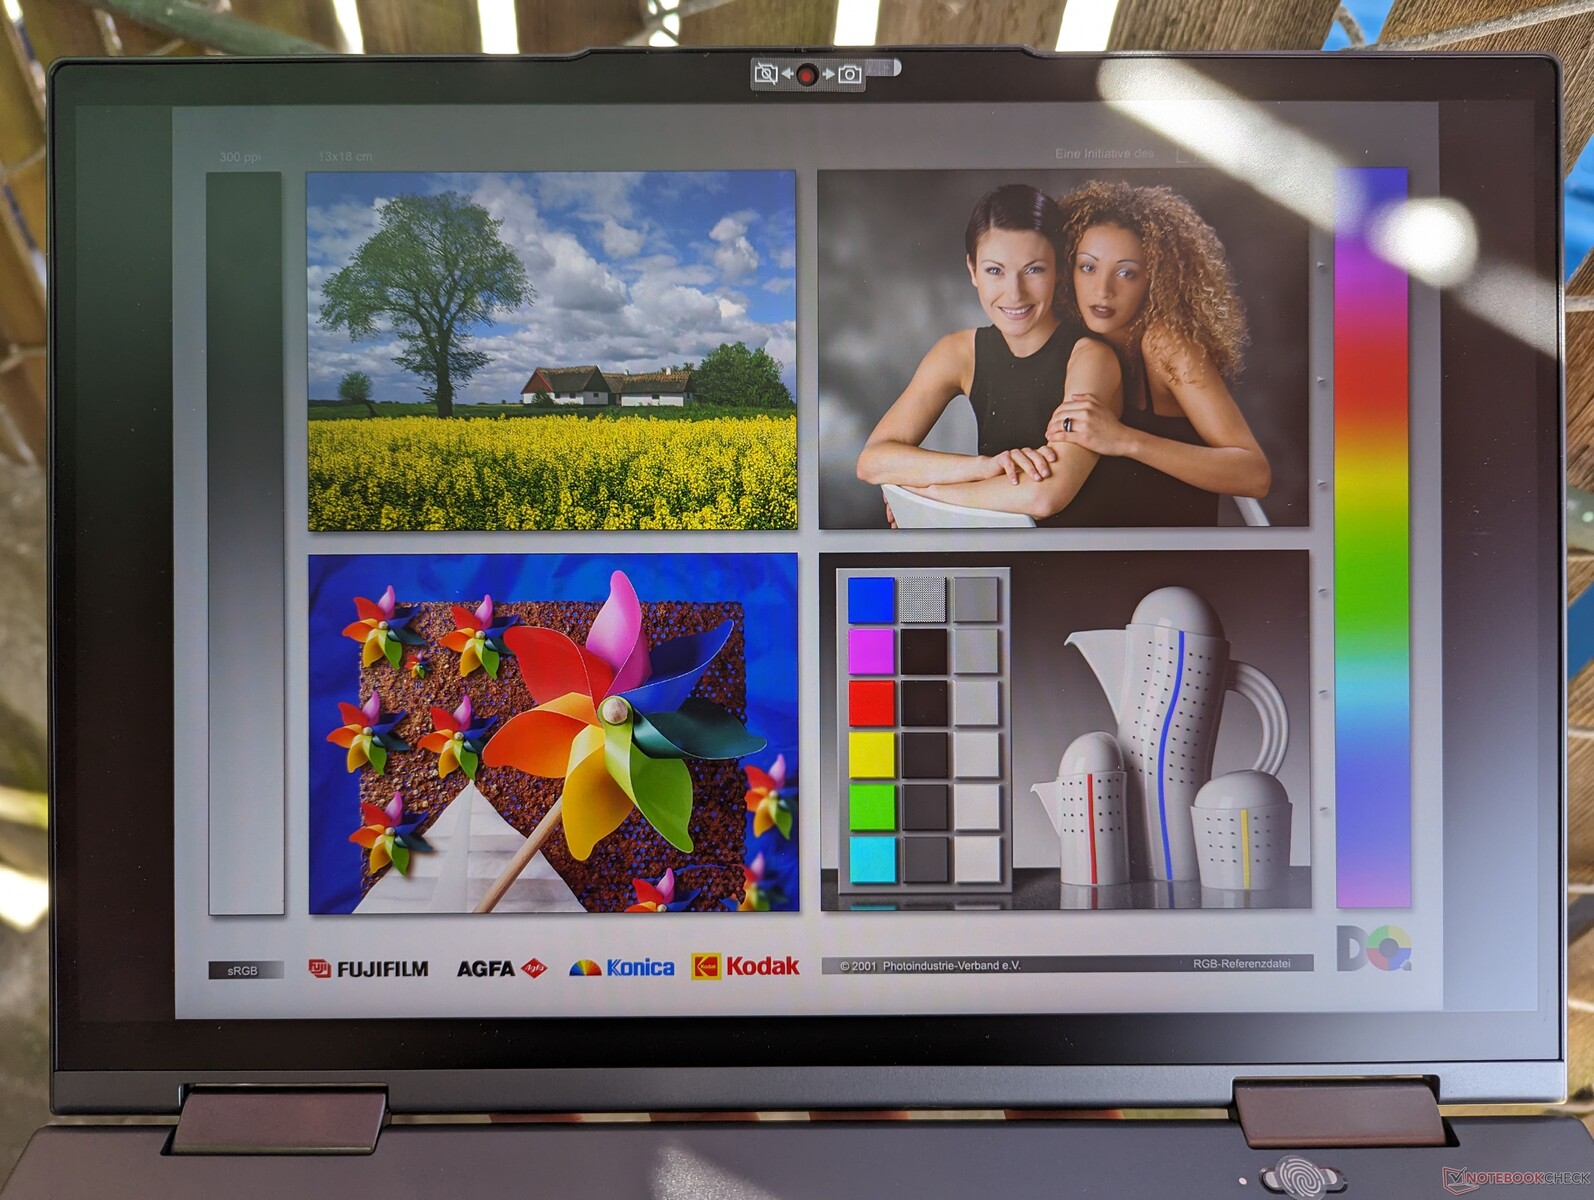
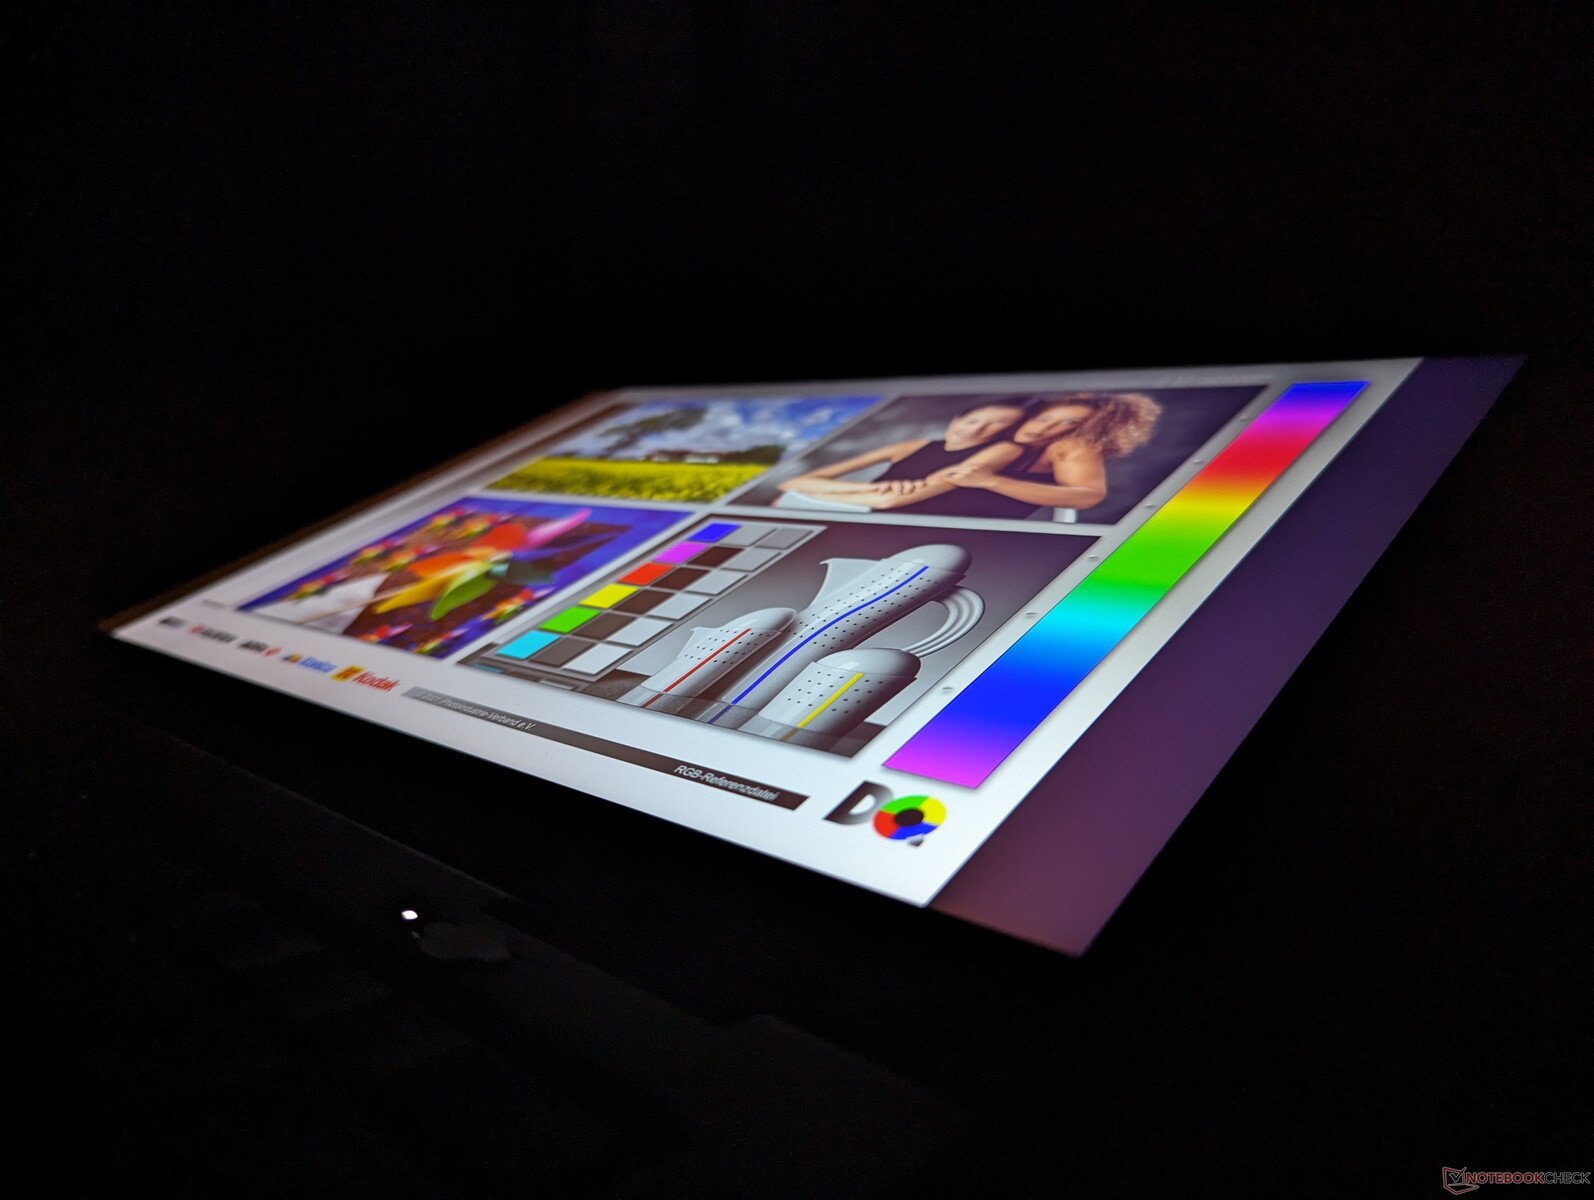
Display — 1200p IPS or 2400p OLED
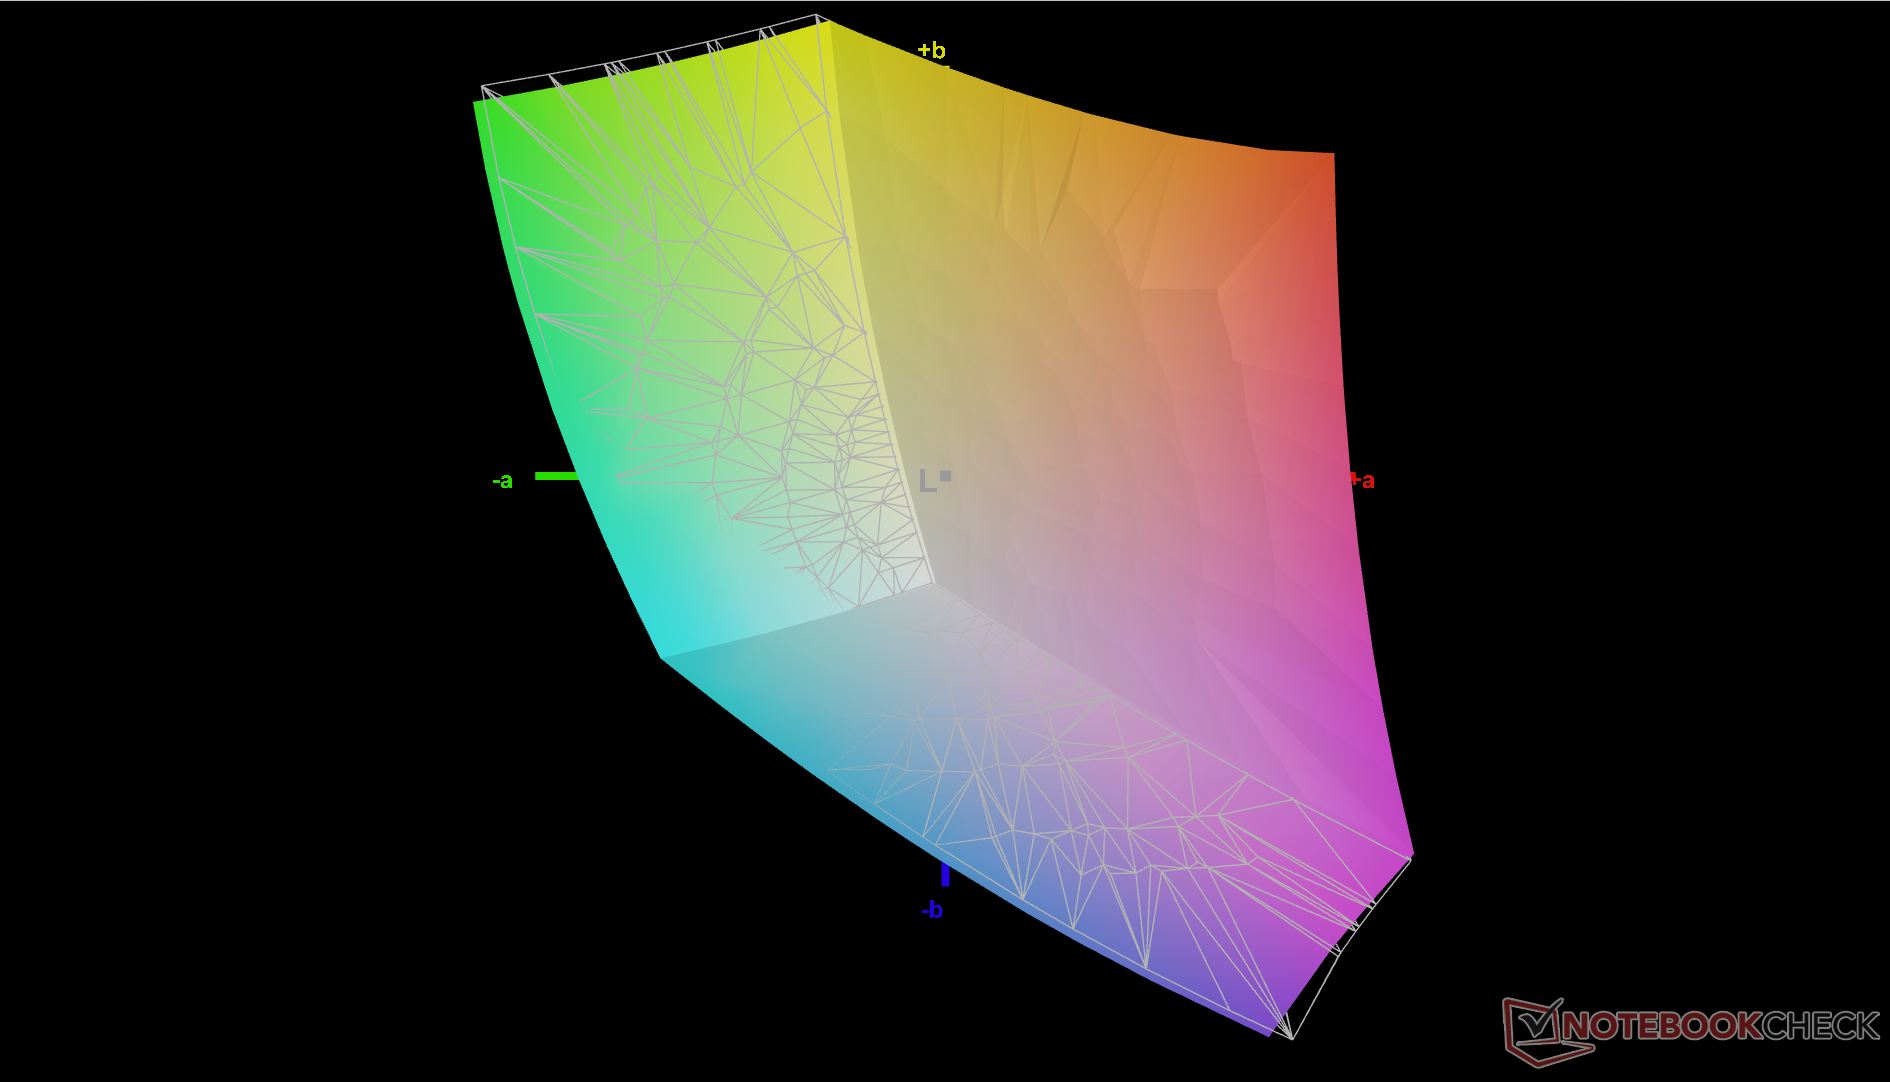
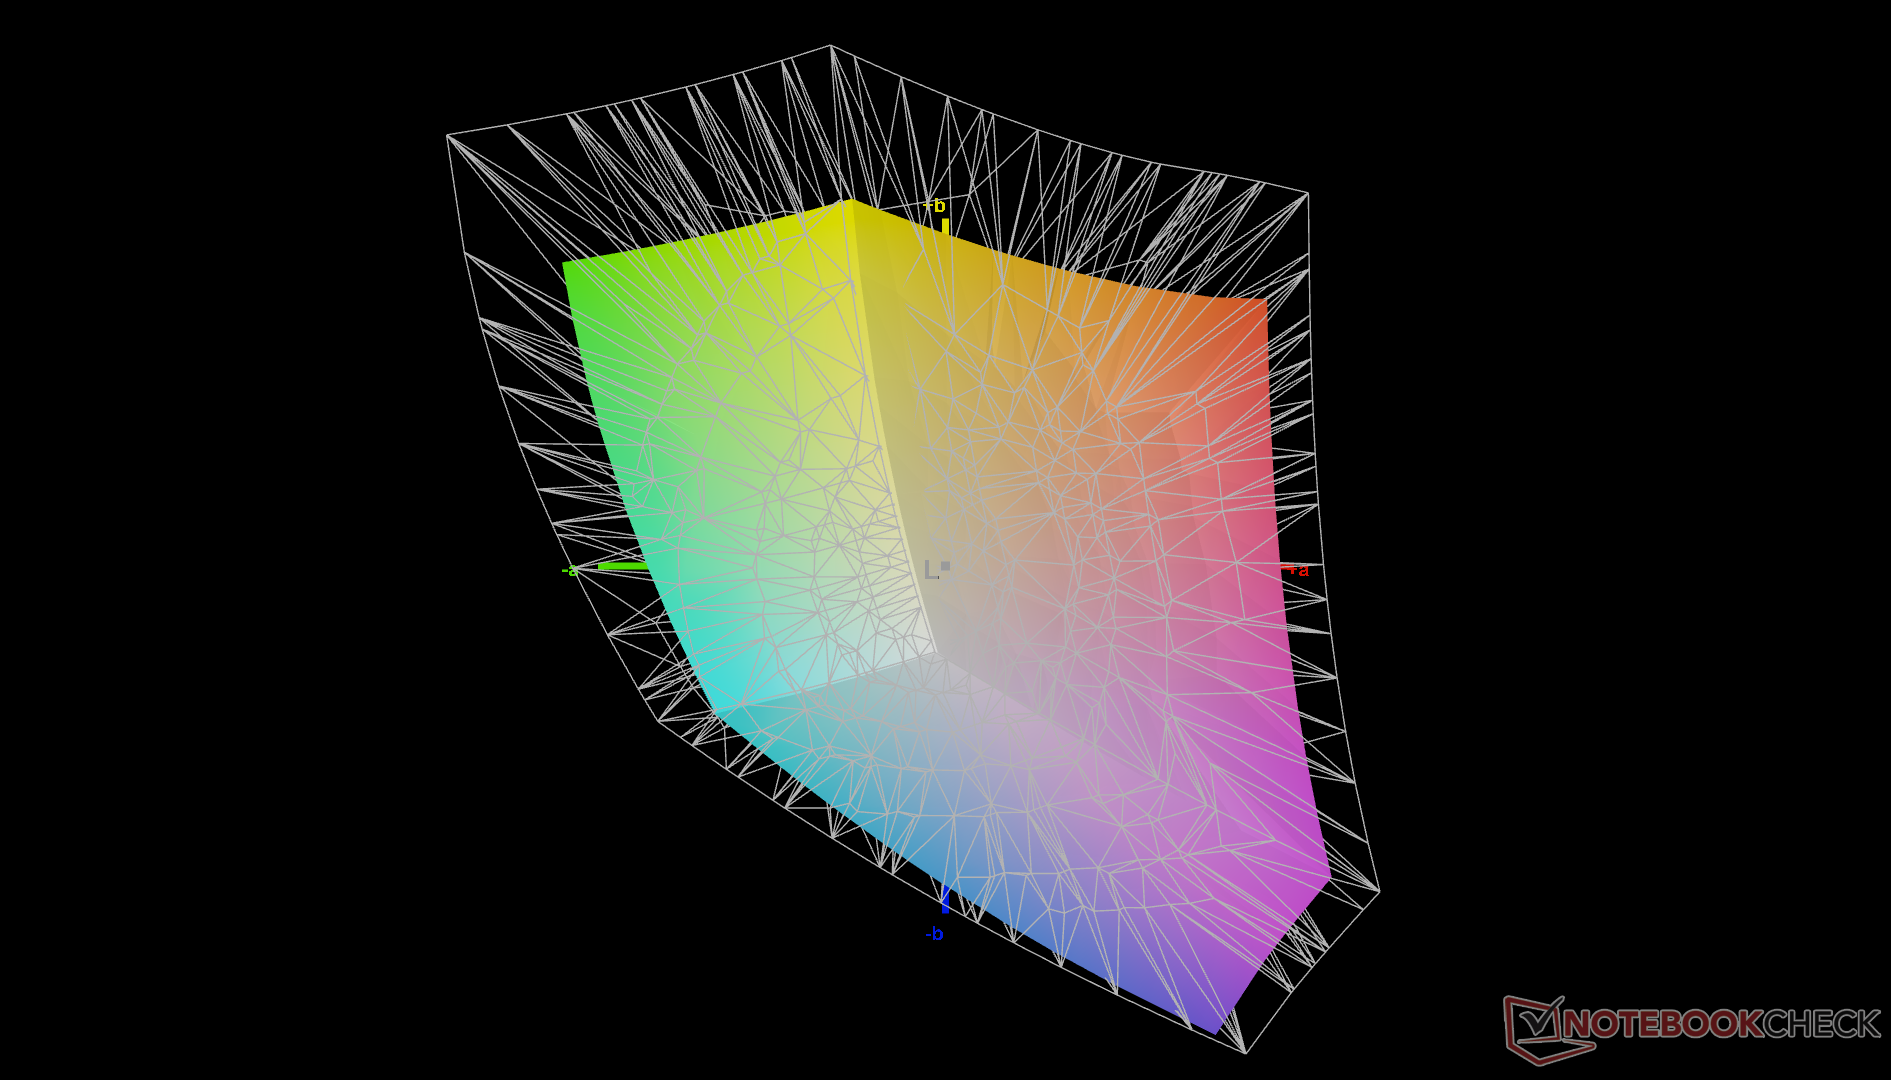
The Yoga G8 utilizes a different panel than the one found on the Yoga G7 (BOE NE140WUM-N62 vs. MNE007JA1-1). Other than the name difference, however, core attributes remain nearly identical between them including their response times, brightness levels, contrast ratio, and color coverage.
Moving up to the OLED option doubles the screen resolution from 1200p to 2400p while widening the gamut from sRGB to DCI-P3.
| |||||||||||||||||||||||||
Brightness Distribution: 87 %
Center on Battery: 425.2 cd/m²
Contrast: 1849:1 (Black: 0.23 cd/m²)
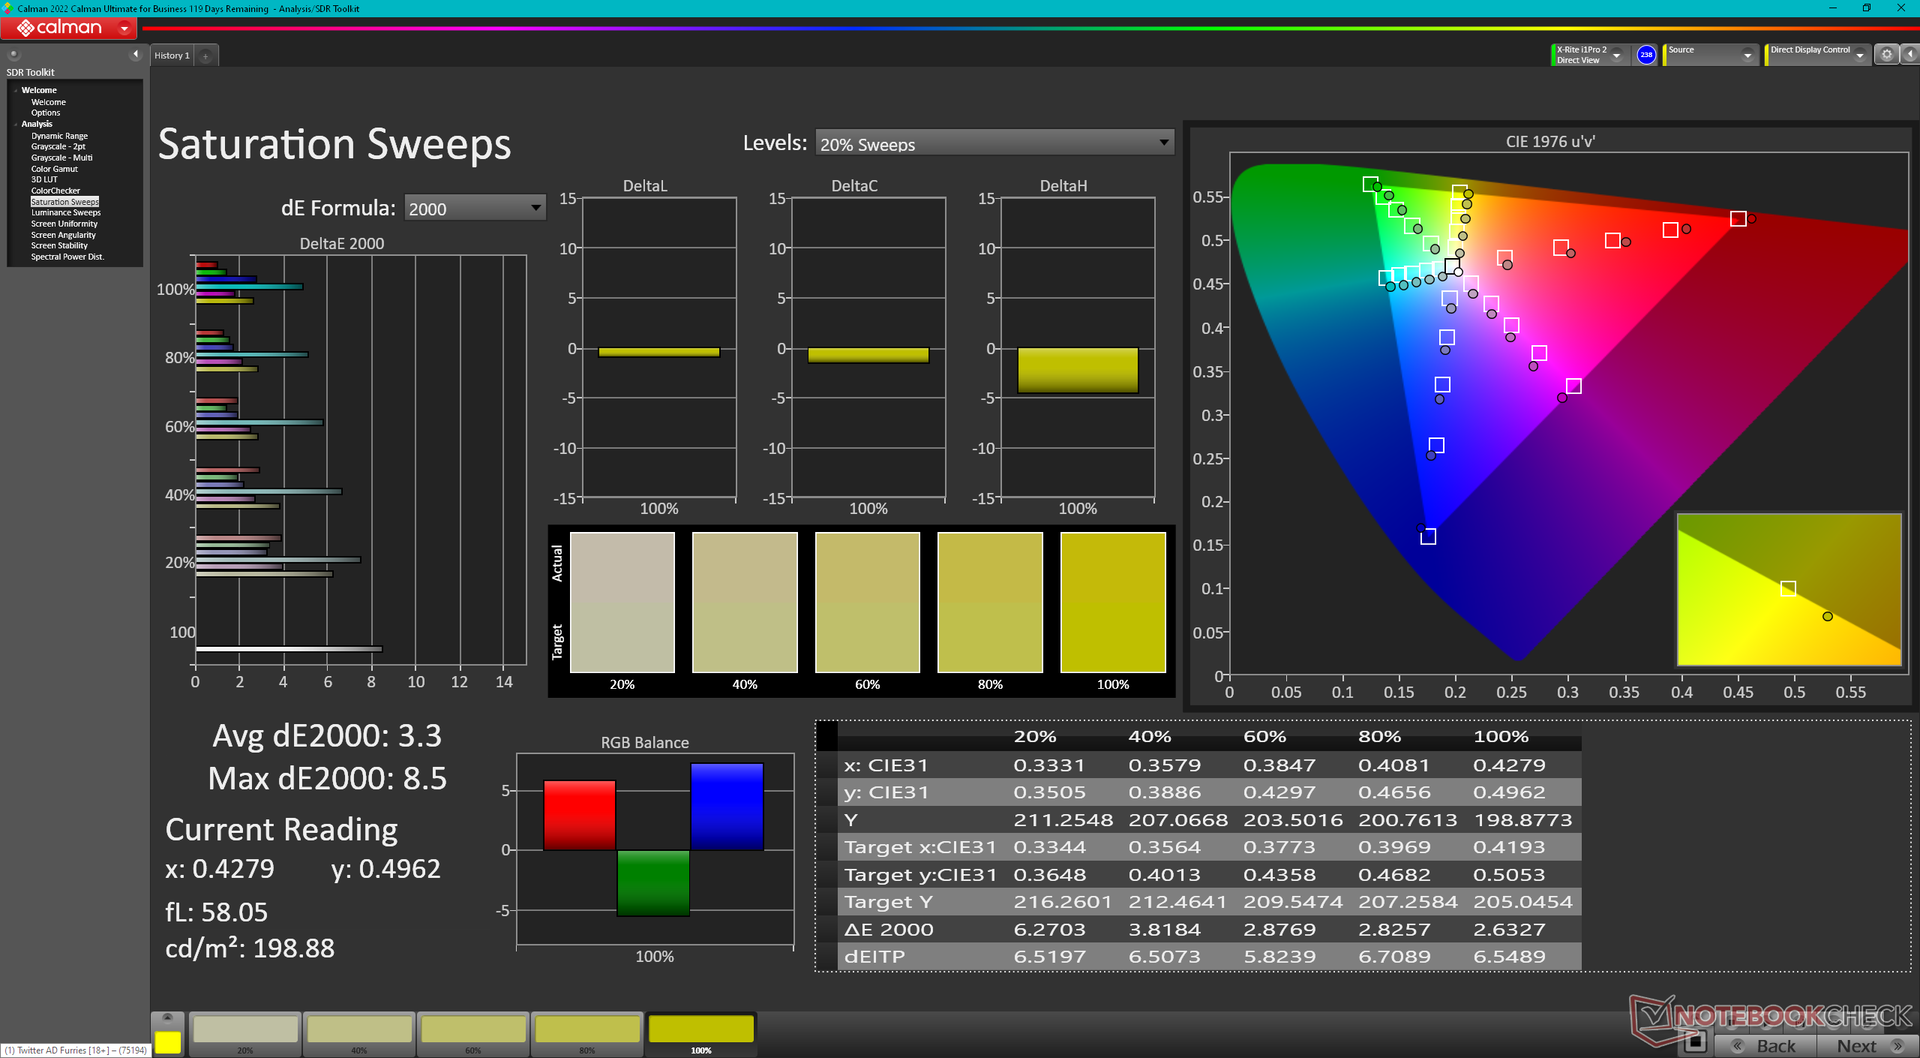
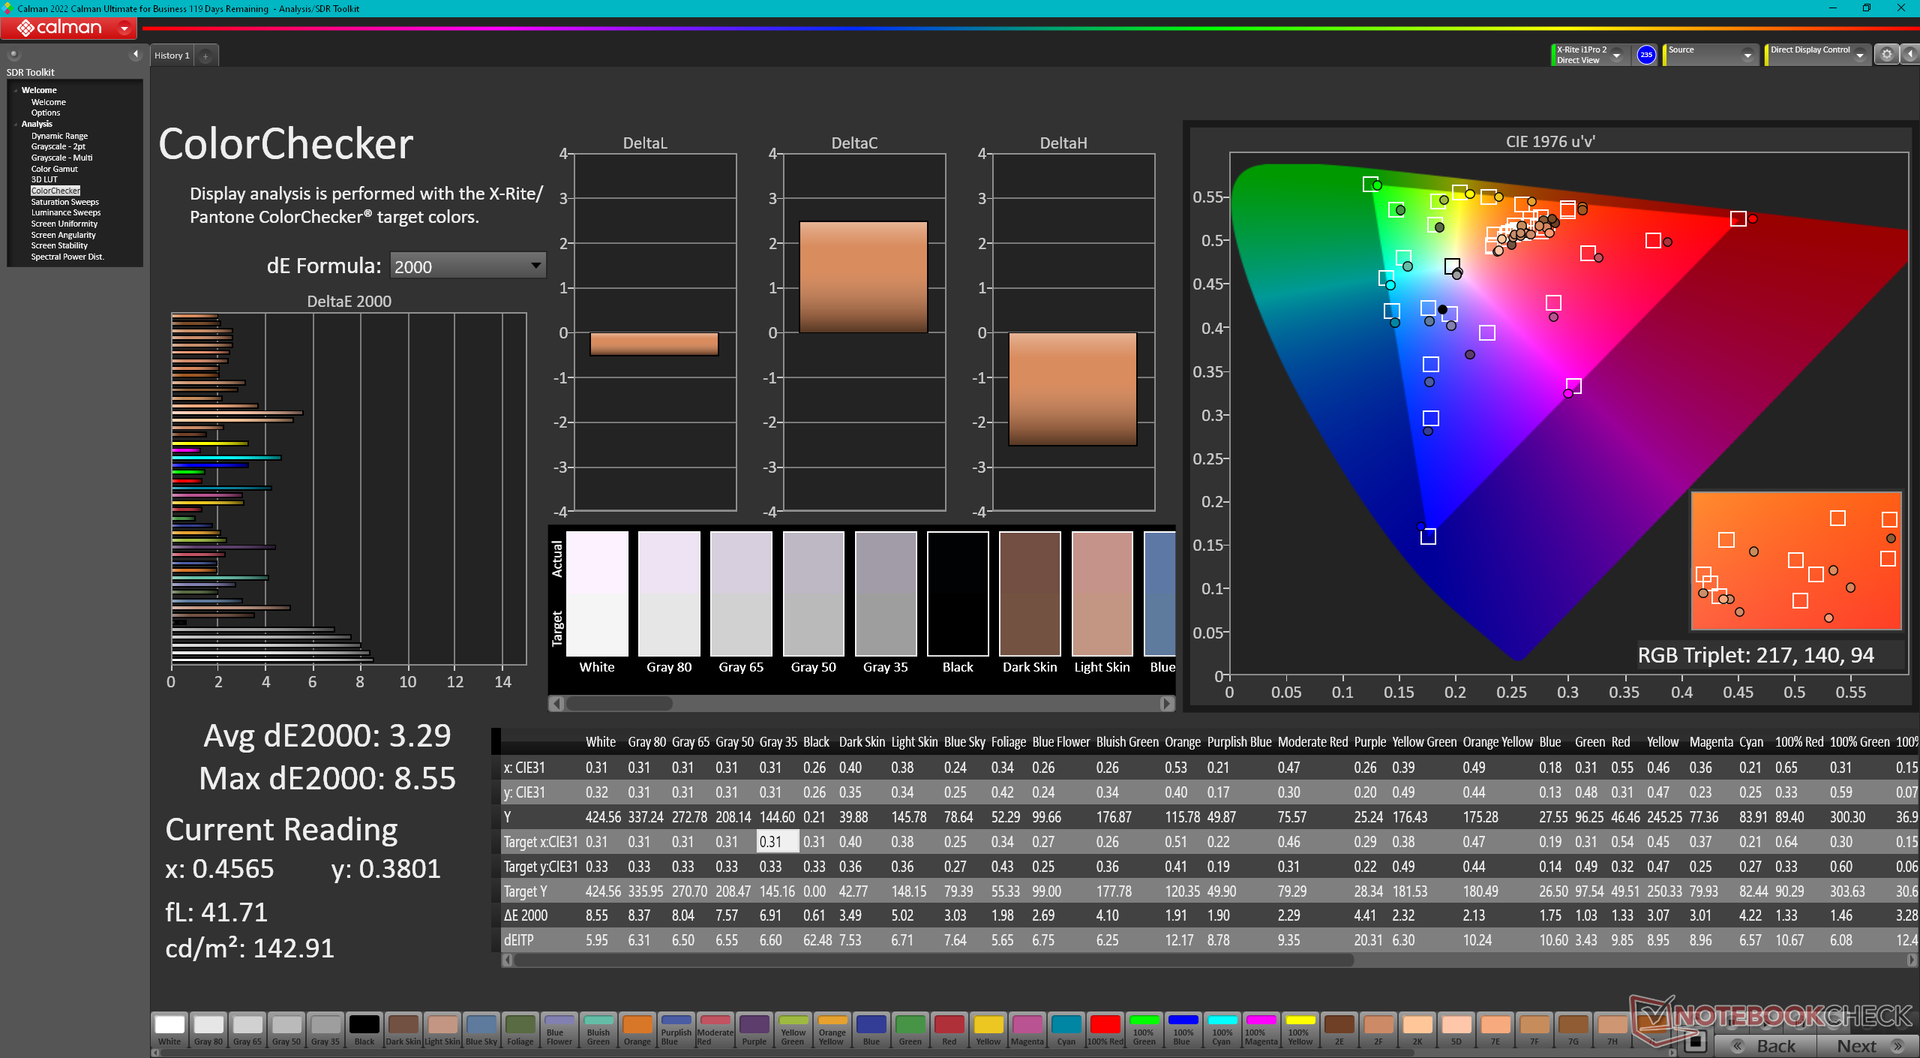
ΔE ColorChecker Calman: 3.29 | ∀{0.5-29.43 Ø4.73}
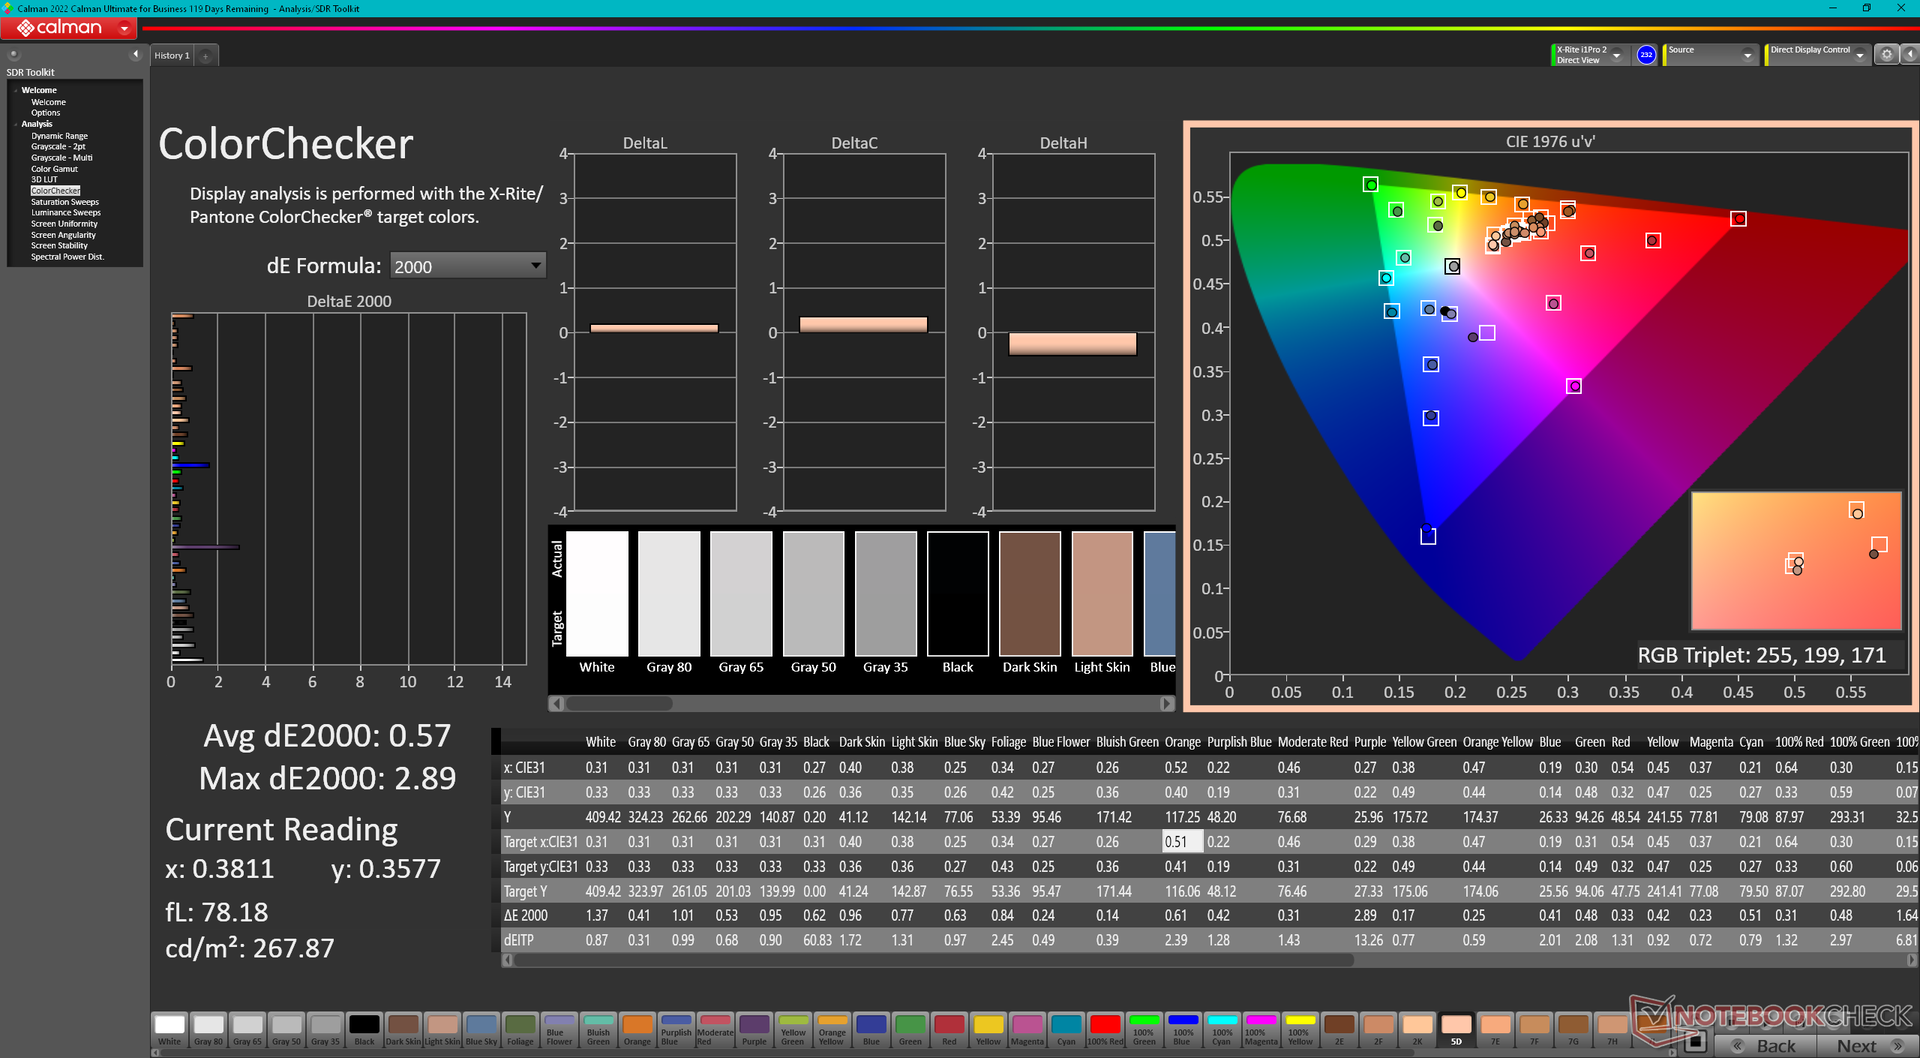
calibrated: 0.57
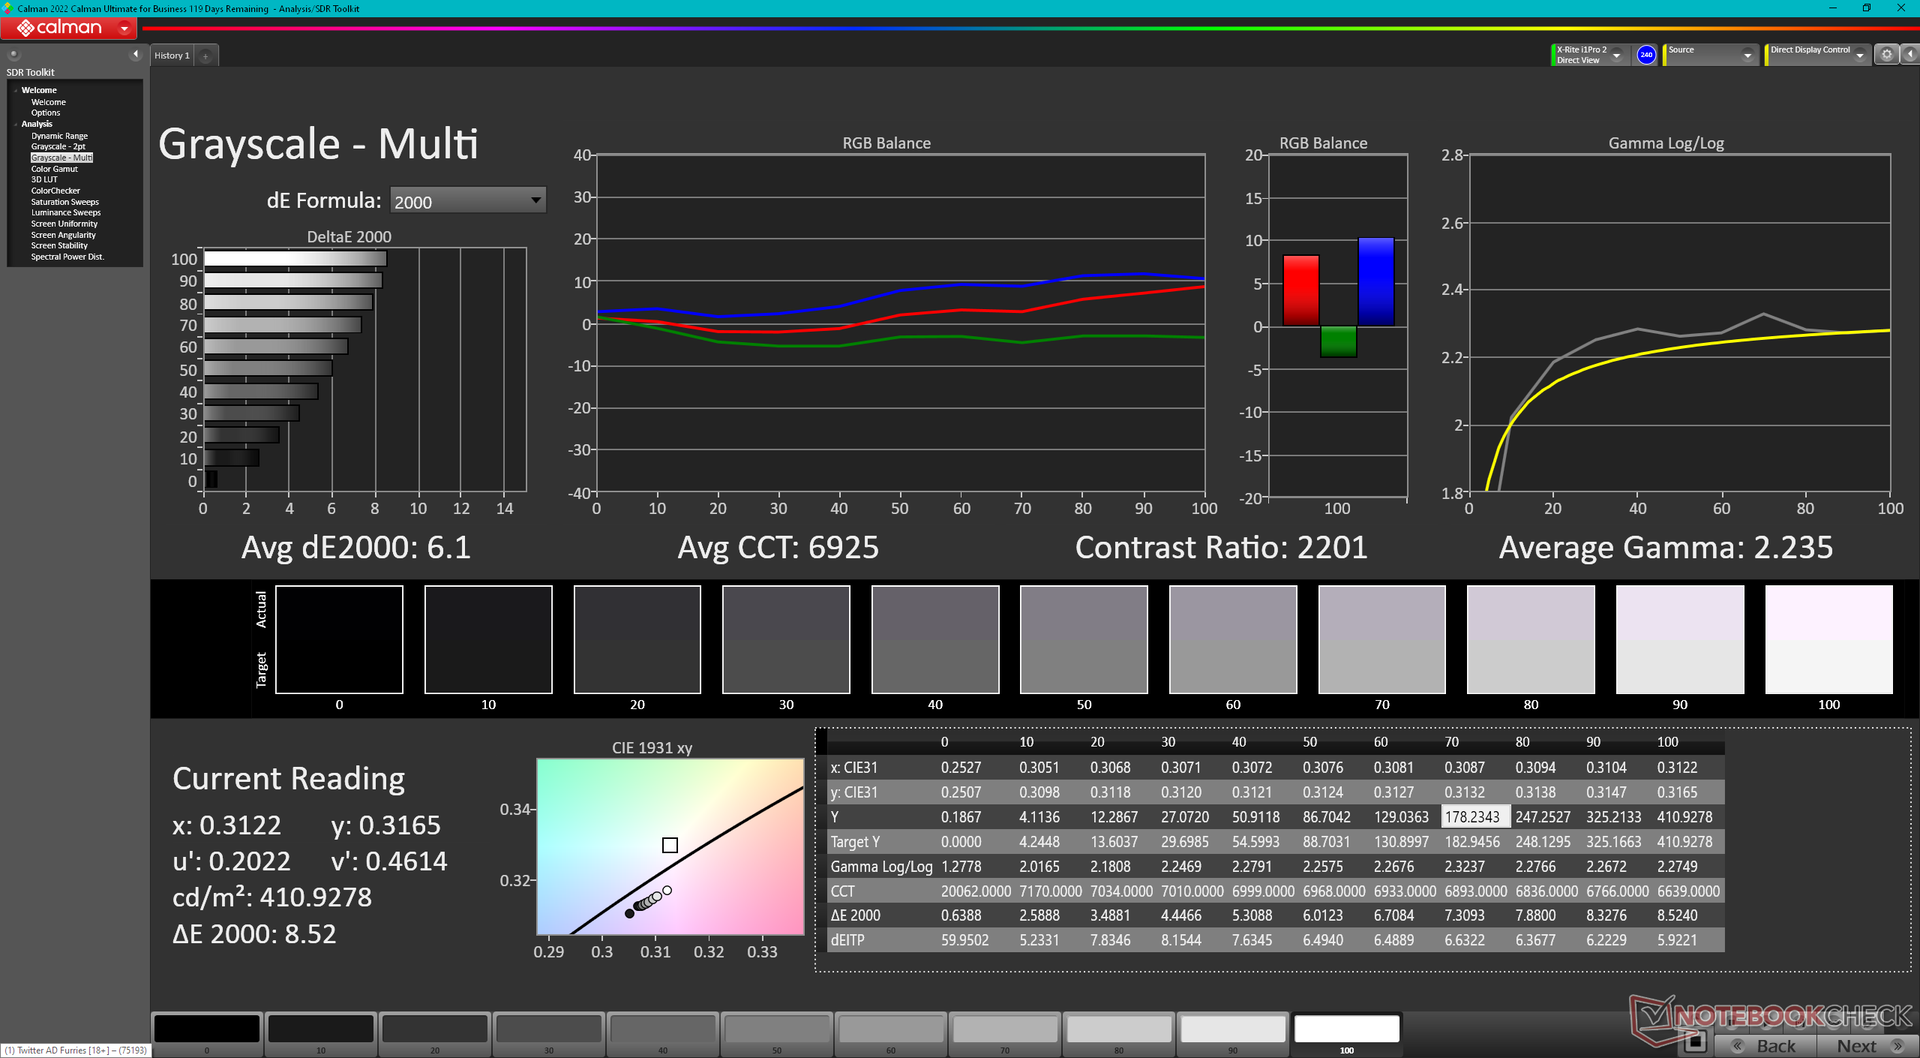
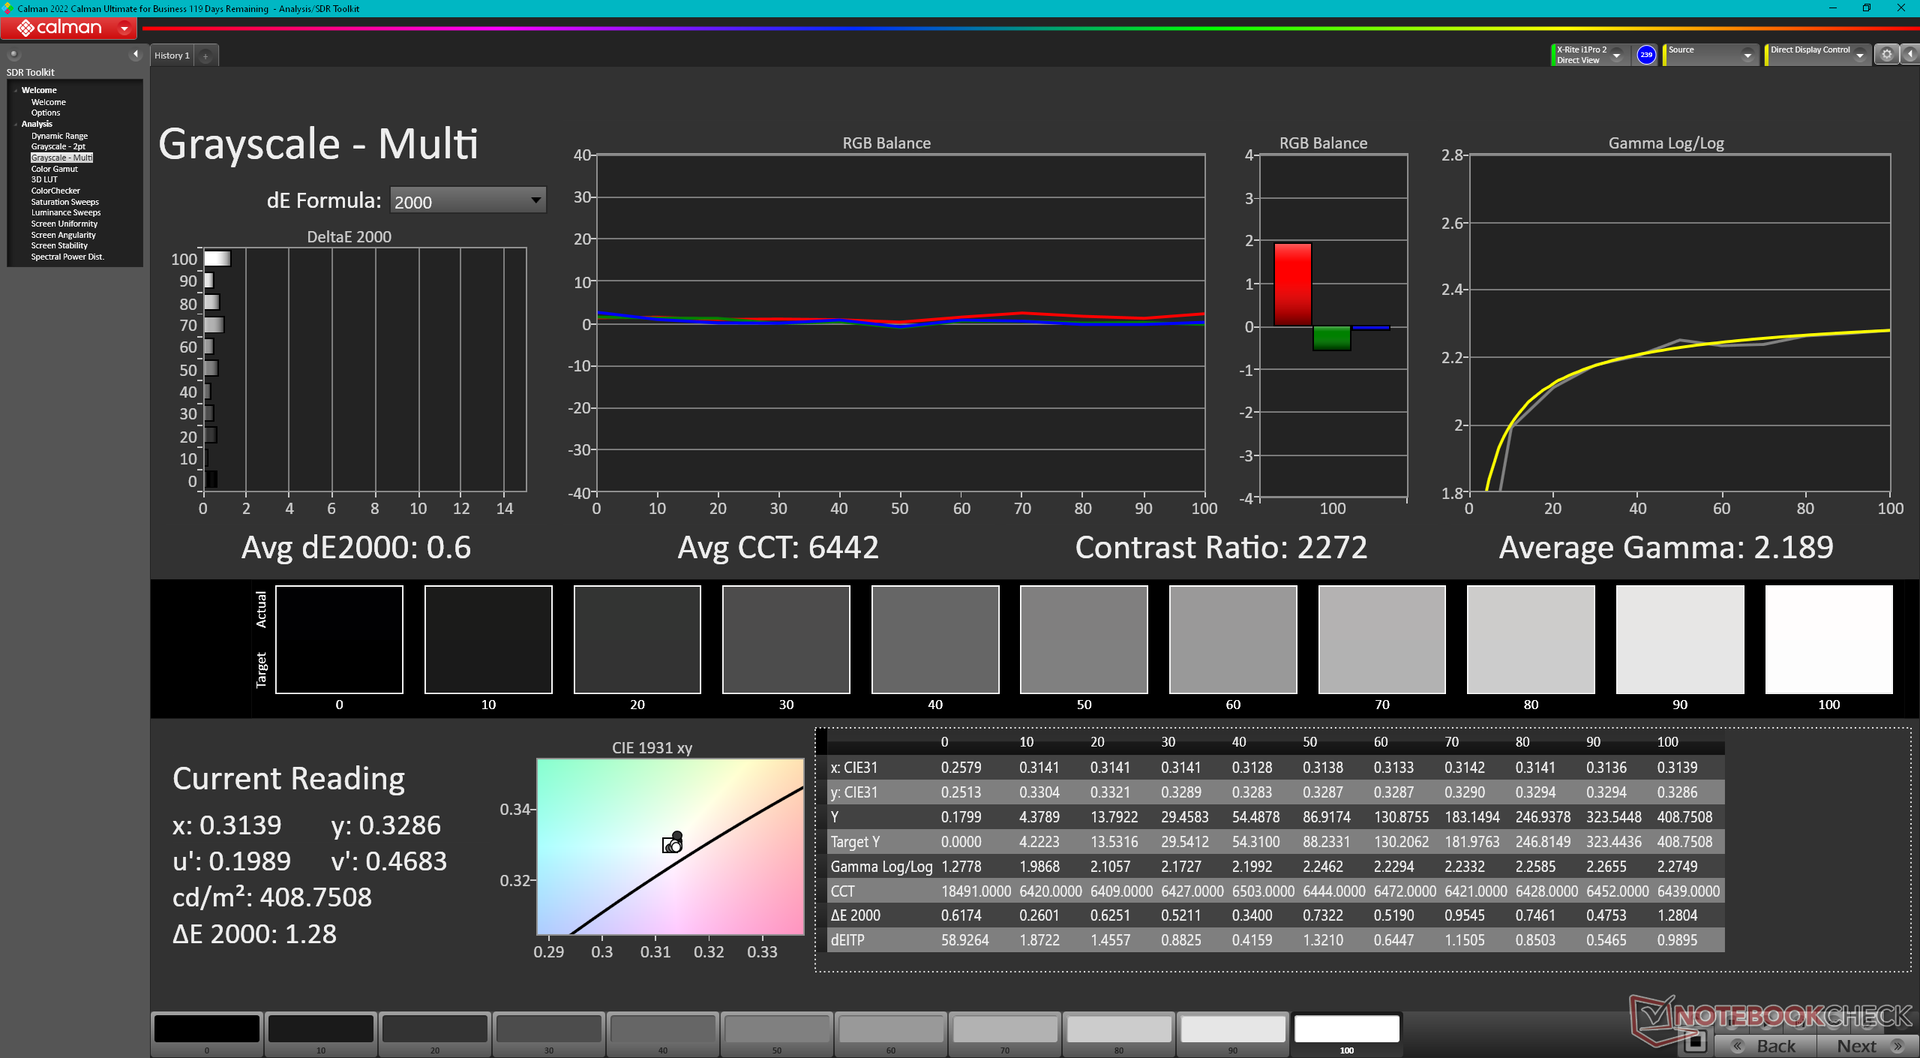
ΔE Greyscale Calman: 6.1 | ∀{0.09-98 Ø4.97}
71.1% AdobeRGB 1998 (Argyll 3D)
98.6% sRGB (Argyll 3D)
69.3% Display P3 (Argyll 3D)
Gamma: 2.24
CCT: 6925 K
| Lenovo ThinkPad X1 Yoga G8 i7-1355U BOE NE140WUM-N62, IPS, 1920x1200, 14" | Lenovo ThinkPad X1 Yoga G7 21CE002HGE MNE007JA1-1, IPS, 1920x1200, 14" | Dell Latitude 9430 2-in-1 AU Optronics B140QAN, IPS, 2560x1600, 14" | LG Gram 14T90P LG Philips LP140WU1-SPA1, IPS, 1900x1200, 14" | Asus ZenBook Flip 14 UN5401QA-KN085W SDC4154, OLED, 2880x1800, 14" | HP EliteBook x360 1040 G7, i7-10810U BOE08A3, IPS, 1920x1080, 14" | |
|---|---|---|---|---|---|---|
| Display | 0% | 9% | 22% | 28% | -4% | |
| Display P3 Coverage (%) | 69.3 | 69.3 0% | 79.4 15% | 98.8 43% | 99.7 44% | 66.1 -5% |
| sRGB Coverage (%) | 98.6 | 99.7 1% | 100 1% | 100 1% | 100 1% | 95.5 -3% |
| AdobeRGB 1998 Coverage (%) | 71.1 | 71.3 0% | 79.4 12% | 98.6 39% | 68.1 -4% | |
| Response Times | 7% | -42% | -11% | 94% | -26% | |
| Response Time Grey 50% / Grey 80% * (ms) | 43.1 ? | 42 ? 3% | 63.6 ? -48% | 44 ? -2% | 2 ? 95% | 52.4 ? -22% |
| Response Time Black / White * (ms) | 24.9 ? | 22.4 ? 10% | 33.6 ? -35% | 30 ? -20% | 2 ? 92% | 32 ? -29% |
| PWM Frequency (Hz) | ||||||
| Screen | 17% | 9% | -2% | -41% | -31% | |
| Brightness middle (cd/m²) | 425.2 | 371 -13% | 517.7 22% | 305.5 -28% | 366 -14% | 406.7 -4% |
| Brightness (cd/m²) | 381 | 363 -5% | 493 29% | 289 -24% | 369 -3% | 382 0% |
| Brightness Distribution (%) | 87 | 92 6% | 90 3% | 87 0% | 96 10% | 88 1% |
| Black Level * (cd/m²) | 0.23 | 0.21 9% | 0.33 -43% | 0.27 -17% | 0.28 -22% | |
| Contrast (:1) | 1849 | 1767 -4% | 1569 -15% | 1131 -39% | 1452 -21% | |
| Colorchecker dE 2000 * | 3.29 | 1.3 60% | 3.38 -3% | 3.31 -1% | 2.84 14% | 3.74 -14% |
| Colorchecker dE 2000 max. * | 8.55 | 2.6 70% | 6.25 27% | 6.12 28% | 5.29 38% | 5.92 31% |
| Colorchecker dE 2000 calibrated * | 0.57 | 0.8 -40% | 0.41 28% | 2.81 -393% | 2.18 -282% | |
| Greyscale dE 2000 * | 6.1 | 2.1 66% | 4 34% | 1.9 69% | 2.32 62% | 4.3 30% |
| Gamma | 2.24 98% | 2.15 102% | 2.13 103% | 2.04 108% | 2.44 90% | 2.19 100% |
| CCT | 6925 94% | 6759 96% | 6186 105% | 6706 97% | 6170 105% | 6781 96% |
| Color Space (Percent of AdobeRGB 1998) (%) | 61.6 | |||||
| Color Space (Percent of sRGB) (%) | 95.1 | |||||
| Total Average (Program / Settings) | 8% /
12% | -8% /
2% | 3% /
1% | 27% /
-1% | -20% /
-25% |
* ... smaller is better
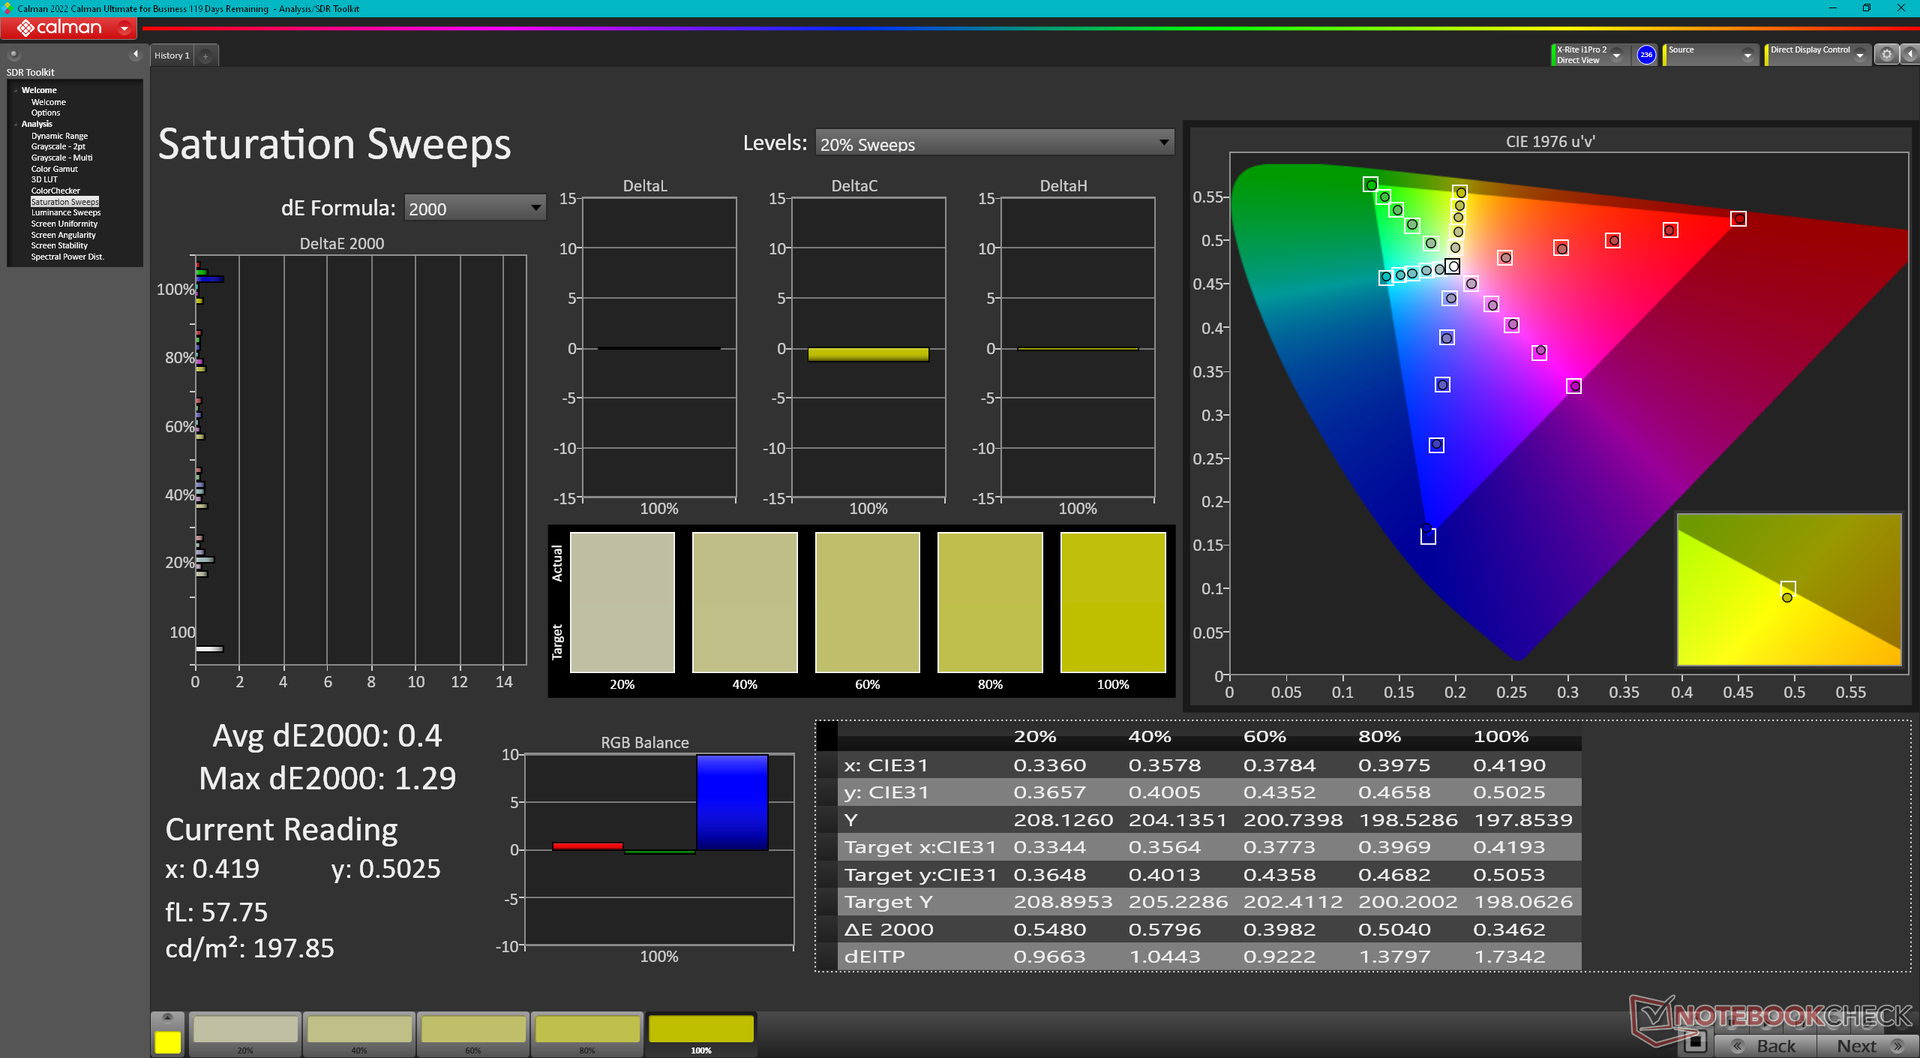
The display is not calibrated out of the box. Calibrating it with our X-Rite colorimeter would improve average grayscale and color deltaE values from 6.1 and 3.29 to just 0.6 and 0.57, respectively. We recommend applying our calibrated ICM profile above to get the most out of the display.
Display Response Times
| ↔ Response Time Black to White | ||
|---|---|---|
| 24.9 ms ... rise ↗ and fall ↘ combined | ↗ 14.2 ms rise | 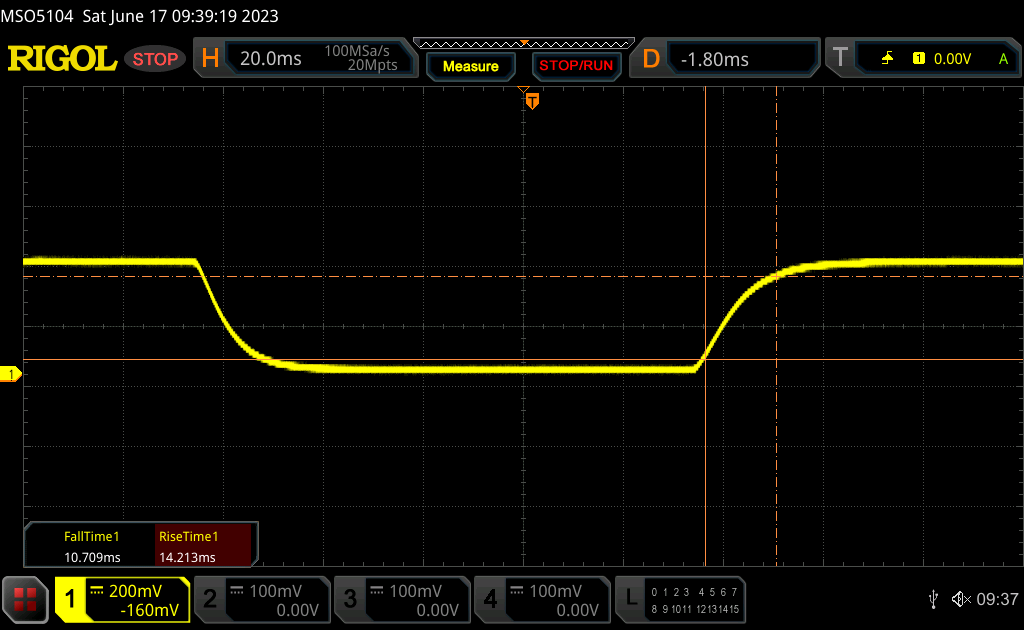 |
| ↘ 10.7 ms fall | ||
| The screen shows good response rates in our tests, but may be too slow for competitive gamers. In comparison, all tested devices range from 0.1 (minimum) to 240 (maximum) ms. » 59 % of all devices are better. This means that the measured response time is worse than the average of all tested devices (19.9 ms). | ||
| ↔ Response Time 50% Grey to 80% Grey | ||
| 43.1 ms ... rise ↗ and fall ↘ combined | ↗ 20.7 ms rise | 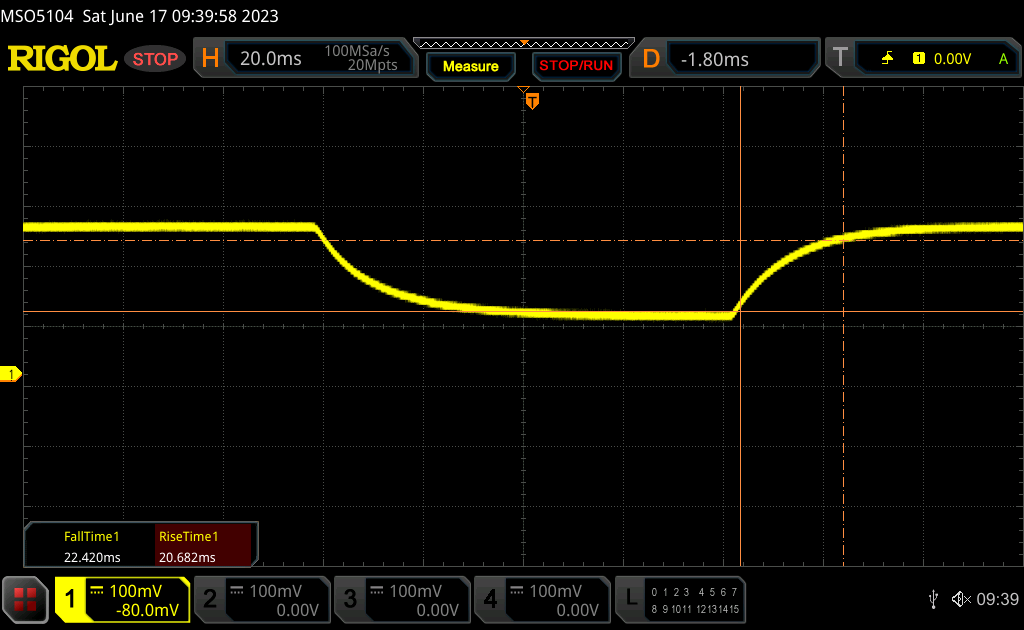 |
| ↘ 22.4 ms fall | ||
| The screen shows slow response rates in our tests and will be unsatisfactory for gamers. In comparison, all tested devices range from 0.165 (minimum) to 636 (maximum) ms. » 72 % of all devices are better. This means that the measured response time is worse than the average of all tested devices (31.1 ms). | ||
Screen Flickering / PWM (Pulse-Width Modulation)
| Screen flickering / PWM not detected | 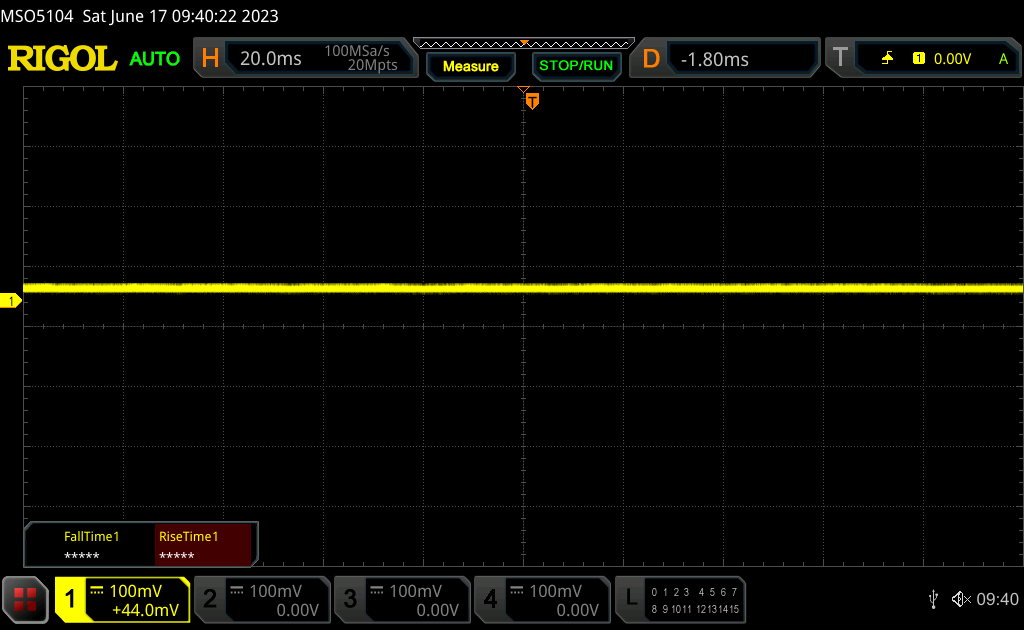 | ||
In comparison: 52 % of all tested devices do not use PWM to dim the display. If PWM was detected, an average of 7801 (minimum: 5 - maximum: 343500) Hz was measured. | |||
Performance
Testing Conditions
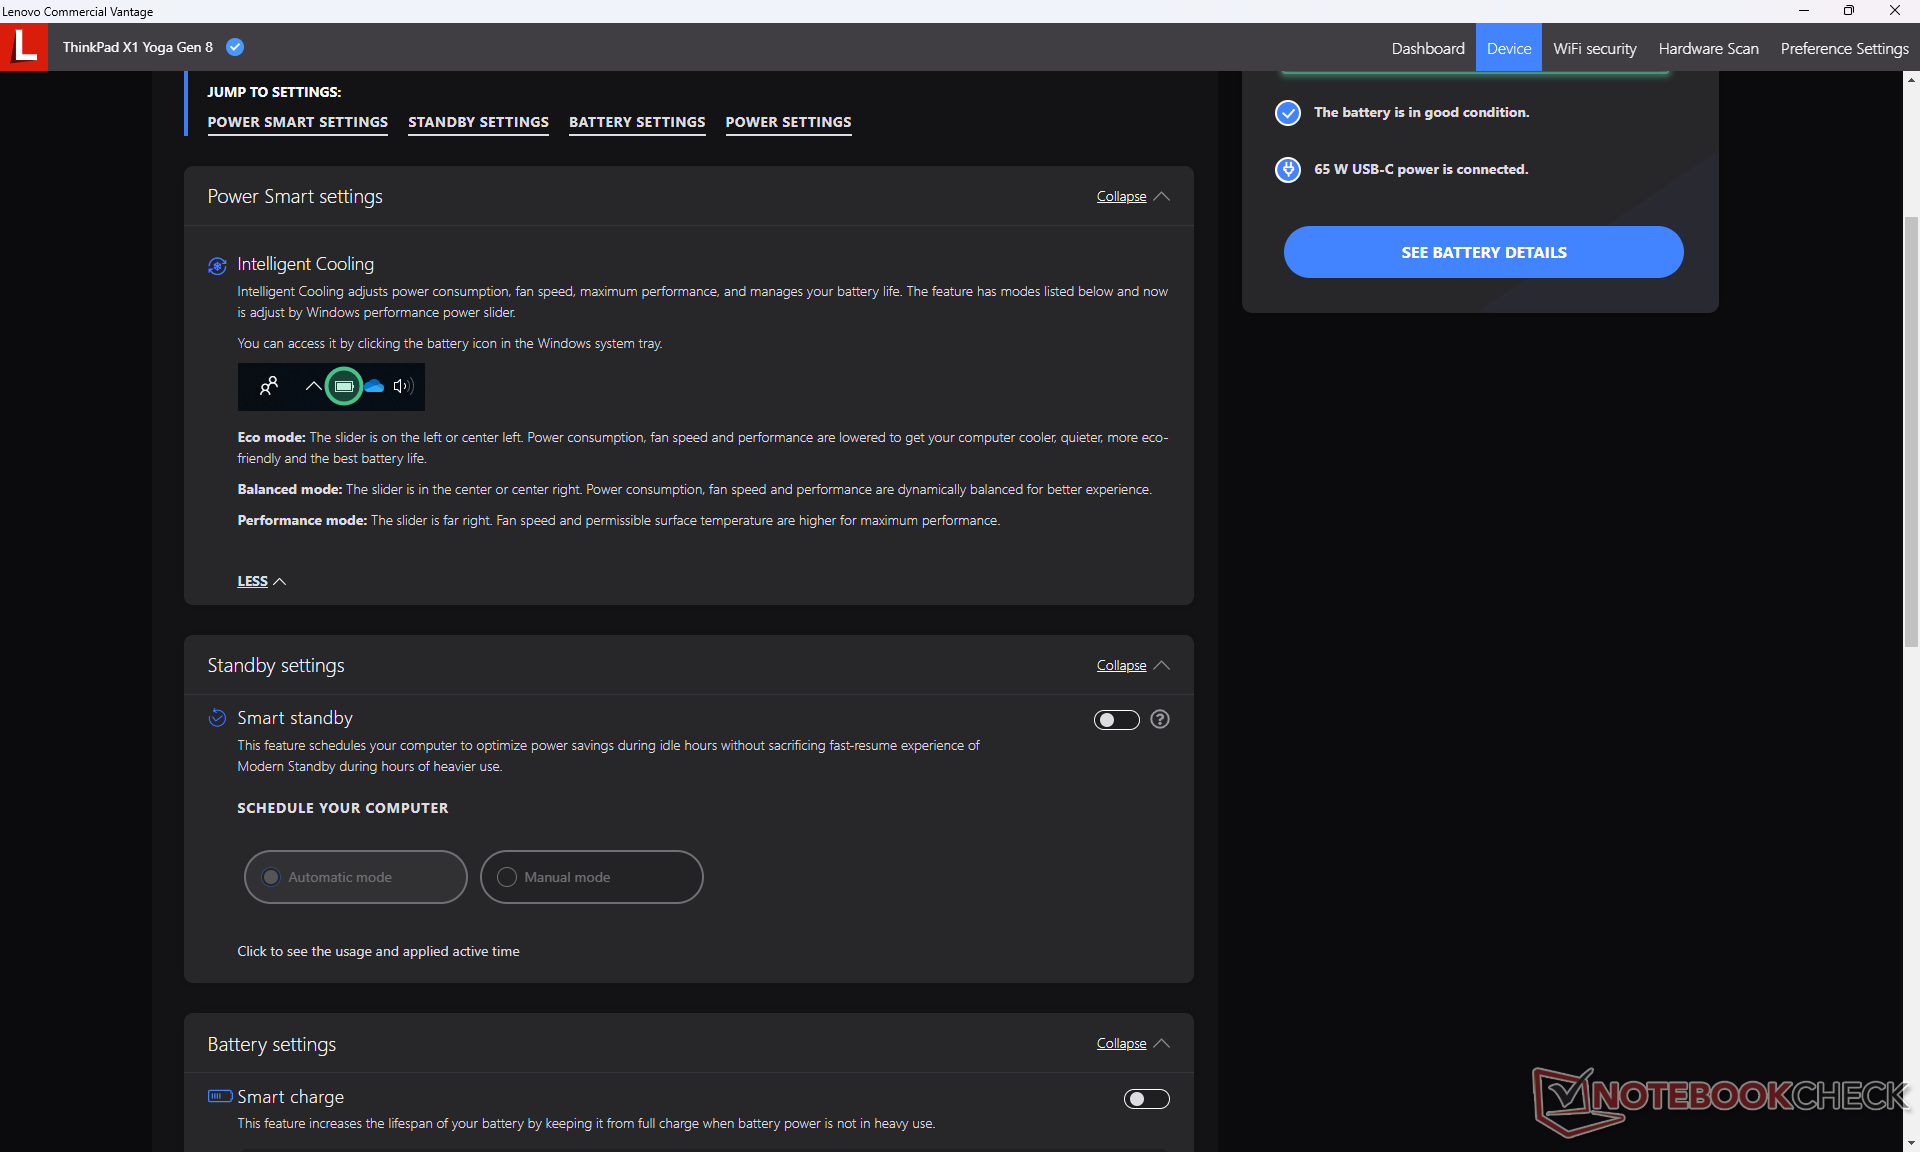
We set Windows to Performance mode prior to running the benchmarks below. Unlike most other OEMs, the model offers no specialized power profiles on top of the ones already available on Windows to simplify the number of settings for the end user.
Processor
CPU performance is about 15 to 20 percent faster than the underwhelming Core i7-1270P on last year's Yoga G7 even though our yoga G8 is powered by a Core U-series processor. Moving up to the Core i7-1370P could boost multi-thread performance by as much as 35 percent based on our experience with the Framework Laptop while moving down to the Core i5-1335U may entail a 20 percent performance deficit based on our experience with the Acer Aspire 5 Spin 14. However, it's unlikely that the higher-end Core i7-1370P option would bring significant performance benefits on this specific model due to the throttling issues we experienced on our Core i7-1355U unit as detailed in the Stress Test section below.
Cinebench R15 Multi Loop
Cinebench R20: CPU (Multi Core) | CPU (Single Core)
Cinebench R23: Multi Core | Single Core
Cinebench R15: CPU Multi 64Bit | CPU Single 64Bit
Blender: v2.79 BMW27 CPU
7-Zip 18.03: 7z b 4 | 7z b 4 -mmt1
Geekbench 5.5: Multi-Core | Single-Core
HWBOT x265 Benchmark v2.2: 4k Preset
LibreOffice : 20 Documents To PDF
R Benchmark 2.5: Overall mean
* ... smaller is better
| Blender | |
| v3.3 Classroom HIP/AMD | |
| Lenovo Yoga 7-14ARB G7 | |
| v3.3 Classroom OPTIX/RTX | |
| Lenovo ThinkPad T14 G3-21AJS00400 | |
| v3.3 Classroom CUDA | |
| Lenovo ThinkPad T14 G3-21AJS00400 | |
| v3.3 Classroom CPU | |
| Dell Latitude 9430 2-in-1 | |
| Average Intel Iris Xe Graphics G7 96EUs (336 - 1259, n=109) | |
| HP EliteBook 840 G9 | |
| Lenovo ThinkPad T14 G3-21AJS00400 | |
| Lenovo ThinkPad X1 Yoga G8 i7-1355U | |
| Lenovo Yoga 7-14ARB G7 | |
| Asus ROG Zephyrus G14 GA402XY | |
* ... smaller is better
AIDA64: FP32 Ray-Trace | FPU Julia | CPU SHA3 | CPU Queen | FPU SinJulia | FPU Mandel | CPU AES | CPU ZLib | FP64 Ray-Trace | CPU PhotoWorxx
| Performance rating | |
| Asus ZenBook Flip 14 UN5401QA-KN085W | |
| Dell Latitude 9430 2-in-1 | |
| Lenovo ThinkPad X1 Yoga G8 i7-1355U | |
| Average Intel Core i7-1355U | |
| LG Gram 14T90P | |
| Lenovo ThinkPad X1 Yoga G7 21CE002HGE | |
| AIDA64 / FP32 Ray-Trace | |
| Asus ZenBook Flip 14 UN5401QA-KN085W | |
| Dell Latitude 9430 2-in-1 | |
| Lenovo ThinkPad X1 Yoga G8 i7-1355U | |
| Average Intel Core i7-1355U (5673 - 8424, n=18) | |
| LG Gram 14T90P | |
| Lenovo ThinkPad X1 Yoga G7 21CE002HGE | |
| AIDA64 / FPU Julia | |
| Asus ZenBook Flip 14 UN5401QA-KN085W | |
| Lenovo ThinkPad X1 Yoga G8 i7-1355U | |
| Dell Latitude 9430 2-in-1 | |
| Average Intel Core i7-1355U (29580 - 42706, n=18) | |
| LG Gram 14T90P | |
| Lenovo ThinkPad X1 Yoga G7 21CE002HGE | |
| AIDA64 / CPU SHA3 | |
| Asus ZenBook Flip 14 UN5401QA-KN085W | |
| Dell Latitude 9430 2-in-1 | |
| Lenovo ThinkPad X1 Yoga G8 i7-1355U | |
| Average Intel Core i7-1355U (1529 - 2200, n=18) | |
| LG Gram 14T90P | |
| Lenovo ThinkPad X1 Yoga G7 21CE002HGE | |
| AIDA64 / CPU Queen | |
| Asus ZenBook Flip 14 UN5401QA-KN085W | |
| Dell Latitude 9430 2-in-1 | |
| Lenovo ThinkPad X1 Yoga G8 i7-1355U | |
| Average Intel Core i7-1355U (21547 - 66907, n=18) | |
| Lenovo ThinkPad X1 Yoga G7 21CE002HGE | |
| LG Gram 14T90P | |
| AIDA64 / FPU SinJulia | |
| Asus ZenBook Flip 14 UN5401QA-KN085W | |
| Lenovo ThinkPad X1 Yoga G7 21CE002HGE | |
| Dell Latitude 9430 2-in-1 | |
| Lenovo ThinkPad X1 Yoga G8 i7-1355U | |
| Average Intel Core i7-1355U (4045 - 5426, n=18) | |
| LG Gram 14T90P | |
| AIDA64 / FPU Mandel | |
| Asus ZenBook Flip 14 UN5401QA-KN085W | |
| Dell Latitude 9430 2-in-1 | |
| Lenovo ThinkPad X1 Yoga G8 i7-1355U | |
| Average Intel Core i7-1355U (14596 - 21627, n=18) | |
| LG Gram 14T90P | |
| Lenovo ThinkPad X1 Yoga G7 21CE002HGE | |
| AIDA64 / CPU AES | |
| Asus ZenBook Flip 14 UN5401QA-KN085W | |
| LG Gram 14T90P | |
| Dell Latitude 9430 2-in-1 | |
| Average Intel Core i7-1355U (31432 - 75408, n=18) | |
| Lenovo ThinkPad X1 Yoga G8 i7-1355U | |
| Lenovo ThinkPad X1 Yoga G7 21CE002HGE | |
| AIDA64 / CPU ZLib | |
| Asus ZenBook Flip 14 UN5401QA-KN085W | |
| Lenovo ThinkPad X1 Yoga G8 i7-1355U | |
| Dell Latitude 9430 2-in-1 | |
| Average Intel Core i7-1355U (454 - 684, n=18) | |
| Lenovo ThinkPad X1 Yoga G7 21CE002HGE | |
| LG Gram 14T90P | |
| AIDA64 / FP64 Ray-Trace | |
| Asus ZenBook Flip 14 UN5401QA-KN085W | |
| Dell Latitude 9430 2-in-1 | |
| Lenovo ThinkPad X1 Yoga G8 i7-1355U | |
| Average Intel Core i7-1355U (2991 - 4453, n=18) | |
| LG Gram 14T90P | |
| Lenovo ThinkPad X1 Yoga G7 21CE002HGE | |
| AIDA64 / CPU PhotoWorxx | |
| Dell Latitude 9430 2-in-1 | |
| Lenovo ThinkPad X1 Yoga G8 i7-1355U | |
| LG Gram 14T90P | |
| Average Intel Core i7-1355U (21800 - 46154, n=18) | |
| Lenovo ThinkPad X1 Yoga G7 21CE002HGE | |
| Asus ZenBook Flip 14 UN5401QA-KN085W | |
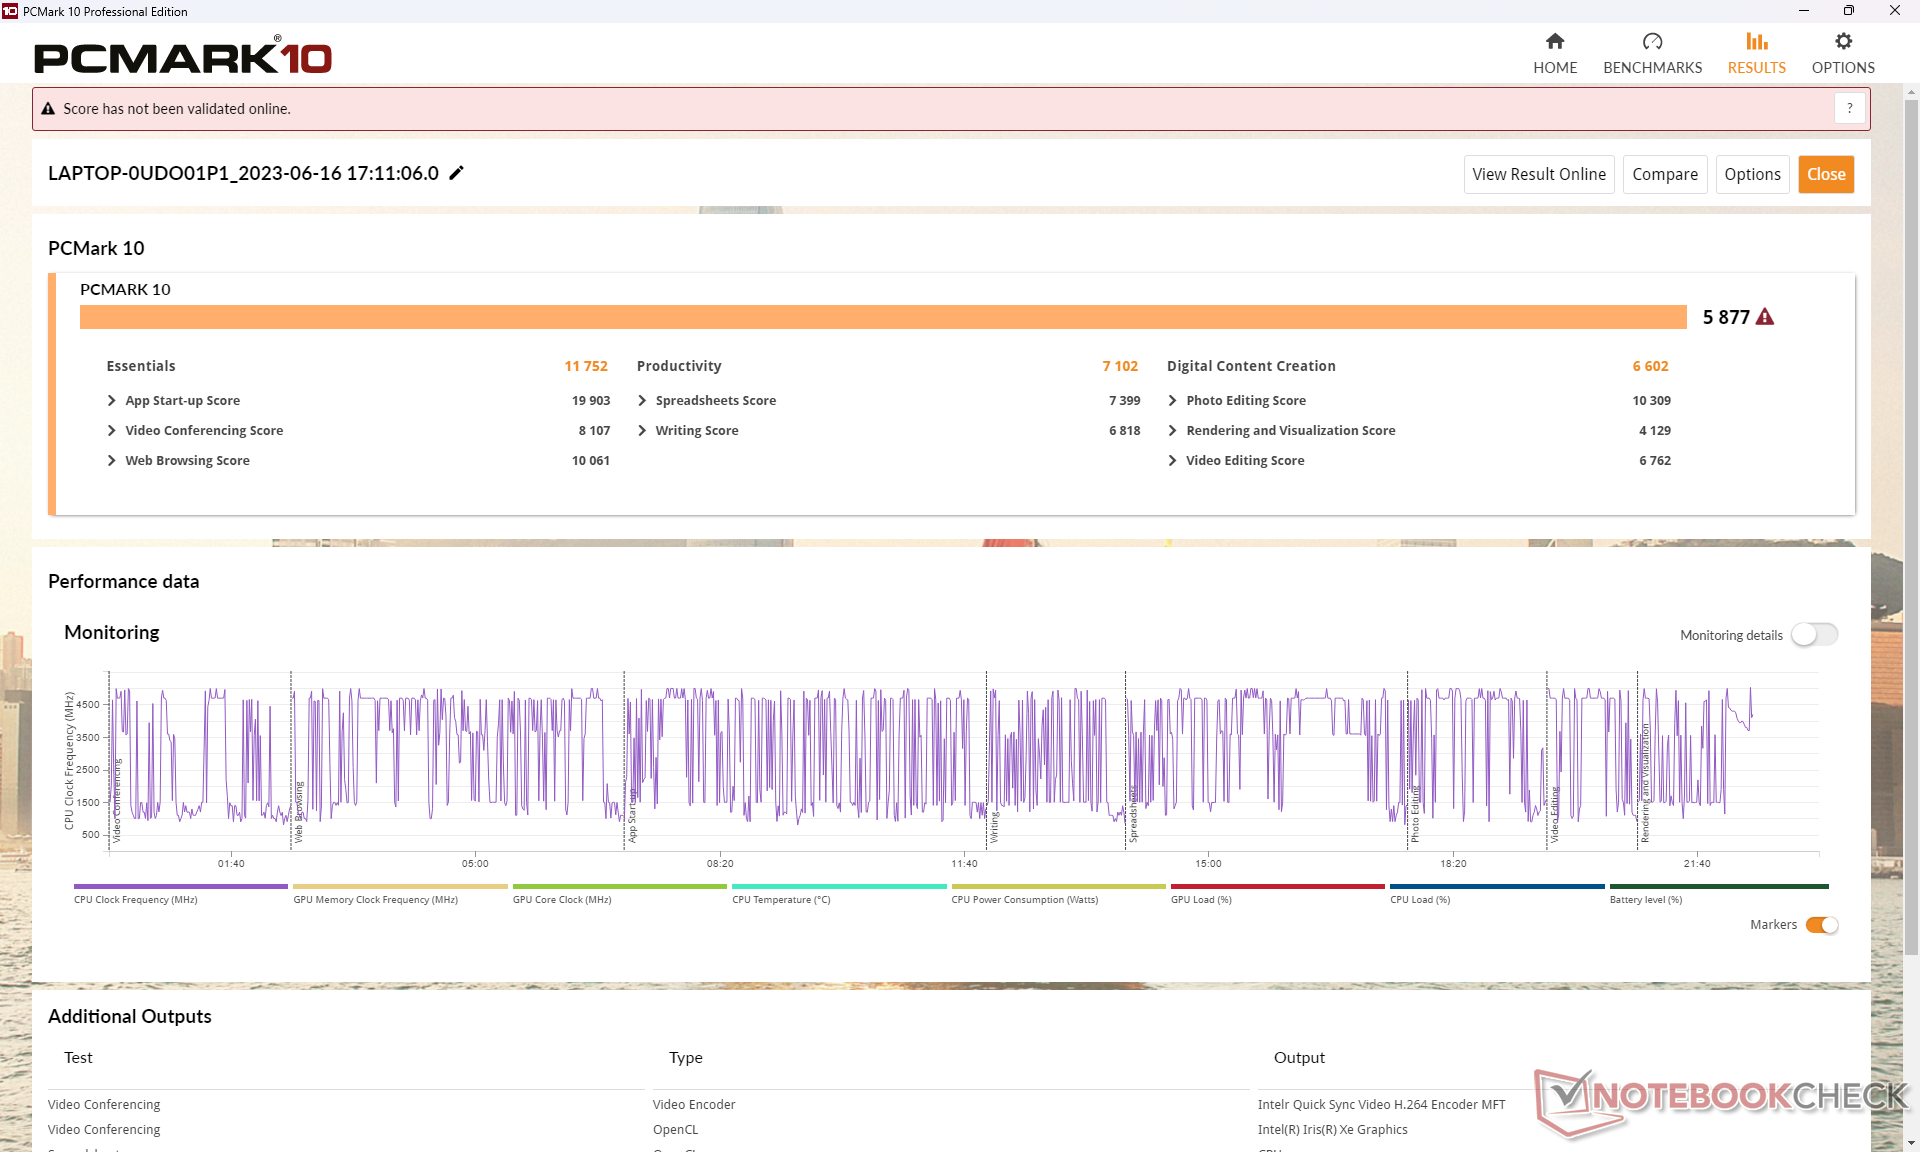
System Performance
CrossMark: Overall | Productivity | Creativity | Responsiveness
| PCMark 10 / Score | |
| Asus ZenBook Flip 14 UN5401QA-KN085W | |
| Lenovo ThinkPad X1 Yoga G8 i7-1355U | |
| Average Intel Core i7-1355U, Intel Iris Xe Graphics G7 96EUs (5455 - 5933, n=15) | |
| Lenovo ThinkPad X1 Yoga G7 21CE002HGE | |
| Dell Latitude 9430 2-in-1 | |
| LG Gram 14T90P | |
| HP EliteBook x360 1040 G7, i7-10810U | |
| PCMark 10 / Essentials | |
| Lenovo ThinkPad X1 Yoga G8 i7-1355U | |
| Lenovo ThinkPad X1 Yoga G7 21CE002HGE | |
| Average Intel Core i7-1355U, Intel Iris Xe Graphics G7 96EUs (10203 - 11822, n=15) | |
| Dell Latitude 9430 2-in-1 | |
| Asus ZenBook Flip 14 UN5401QA-KN085W | |
| LG Gram 14T90P | |
| HP EliteBook x360 1040 G7, i7-10810U | |
| PCMark 10 / Productivity | |
| Asus ZenBook Flip 14 UN5401QA-KN085W | |
| Average Intel Core i7-1355U, Intel Iris Xe Graphics G7 96EUs (6763 - 7536, n=15) | |
| HP EliteBook x360 1040 G7, i7-10810U | |
| Lenovo ThinkPad X1 Yoga G8 i7-1355U | |
| Dell Latitude 9430 2-in-1 | |
| Lenovo ThinkPad X1 Yoga G7 21CE002HGE | |
| LG Gram 14T90P | |
| PCMark 10 / Digital Content Creation | |
| Lenovo ThinkPad X1 Yoga G8 i7-1355U | |
| Lenovo ThinkPad X1 Yoga G7 21CE002HGE | |
| Asus ZenBook Flip 14 UN5401QA-KN085W | |
| Average Intel Core i7-1355U, Intel Iris Xe Graphics G7 96EUs (5723 - 6712, n=15) | |
| Dell Latitude 9430 2-in-1 | |
| LG Gram 14T90P | |
| HP EliteBook x360 1040 G7, i7-10810U | |
| CrossMark / Overall | |
| Lenovo ThinkPad X1 Yoga G7 21CE002HGE | |
| Lenovo ThinkPad X1 Yoga G8 i7-1355U | |
| Dell Latitude 9430 2-in-1 | |
| Average Intel Core i7-1355U, Intel Iris Xe Graphics G7 96EUs (1478 - 1643, n=15) | |
| LG Gram 14T90P | |
| CrossMark / Productivity | |
| Lenovo ThinkPad X1 Yoga G7 21CE002HGE | |
| Lenovo ThinkPad X1 Yoga G8 i7-1355U | |
| Dell Latitude 9430 2-in-1 | |
| Average Intel Core i7-1355U, Intel Iris Xe Graphics G7 96EUs (1444 - 1665, n=15) | |
| LG Gram 14T90P | |
| CrossMark / Creativity | |
| Lenovo ThinkPad X1 Yoga G7 21CE002HGE | |
| Lenovo ThinkPad X1 Yoga G8 i7-1355U | |
| Dell Latitude 9430 2-in-1 | |
| Average Intel Core i7-1355U, Intel Iris Xe Graphics G7 96EUs (1563 - 1732, n=15) | |
| LG Gram 14T90P | |
| CrossMark / Responsiveness | |
| Lenovo ThinkPad X1 Yoga G7 21CE002HGE | |
| Dell Latitude 9430 2-in-1 | |
| Average Intel Core i7-1355U, Intel Iris Xe Graphics G7 96EUs (1217 - 1681, n=15) | |
| Lenovo ThinkPad X1 Yoga G8 i7-1355U | |
| LG Gram 14T90P | |
| PCMark 10 Score | 5877 points | |
Help | ||
| AIDA64 / Memory Copy | |
| Dell Latitude 9430 2-in-1 | |
| Lenovo ThinkPad X1 Yoga G8 i7-1355U | |
| LG Gram 14T90P | |
| Lenovo ThinkPad X1 Yoga G7 21CE002HGE | |
| Average Intel Core i7-1355U (35017 - 71600, n=18) | |
| Asus ZenBook Flip 14 UN5401QA-KN085W | |
| AIDA64 / Memory Read | |
| Lenovo ThinkPad X1 Yoga G7 21CE002HGE | |
| LG Gram 14T90P | |
| Dell Latitude 9430 2-in-1 | |
| Lenovo ThinkPad X1 Yoga G8 i7-1355U | |
| Average Intel Core i7-1355U (38551 - 73377, n=18) | |
| Asus ZenBook Flip 14 UN5401QA-KN085W | |
| AIDA64 / Memory Write | |
| Lenovo ThinkPad X1 Yoga G8 i7-1355U | |
| Average Intel Core i7-1355U (35910 - 93342, n=18) | |
| LG Gram 14T90P | |
| Dell Latitude 9430 2-in-1 | |
| Lenovo ThinkPad X1 Yoga G7 21CE002HGE | |
| Asus ZenBook Flip 14 UN5401QA-KN085W | |
| AIDA64 / Memory Latency | |
| Average Intel Core i7-1355U (72.2 - 346, n=18) | |
| Asus ZenBook Flip 14 UN5401QA-KN085W | |
| Dell Latitude 9430 2-in-1 | |
| Lenovo ThinkPad X1 Yoga G8 i7-1355U | |
| LG Gram 14T90P | |
| Lenovo ThinkPad X1 Yoga G7 21CE002HGE | |
* ... smaller is better
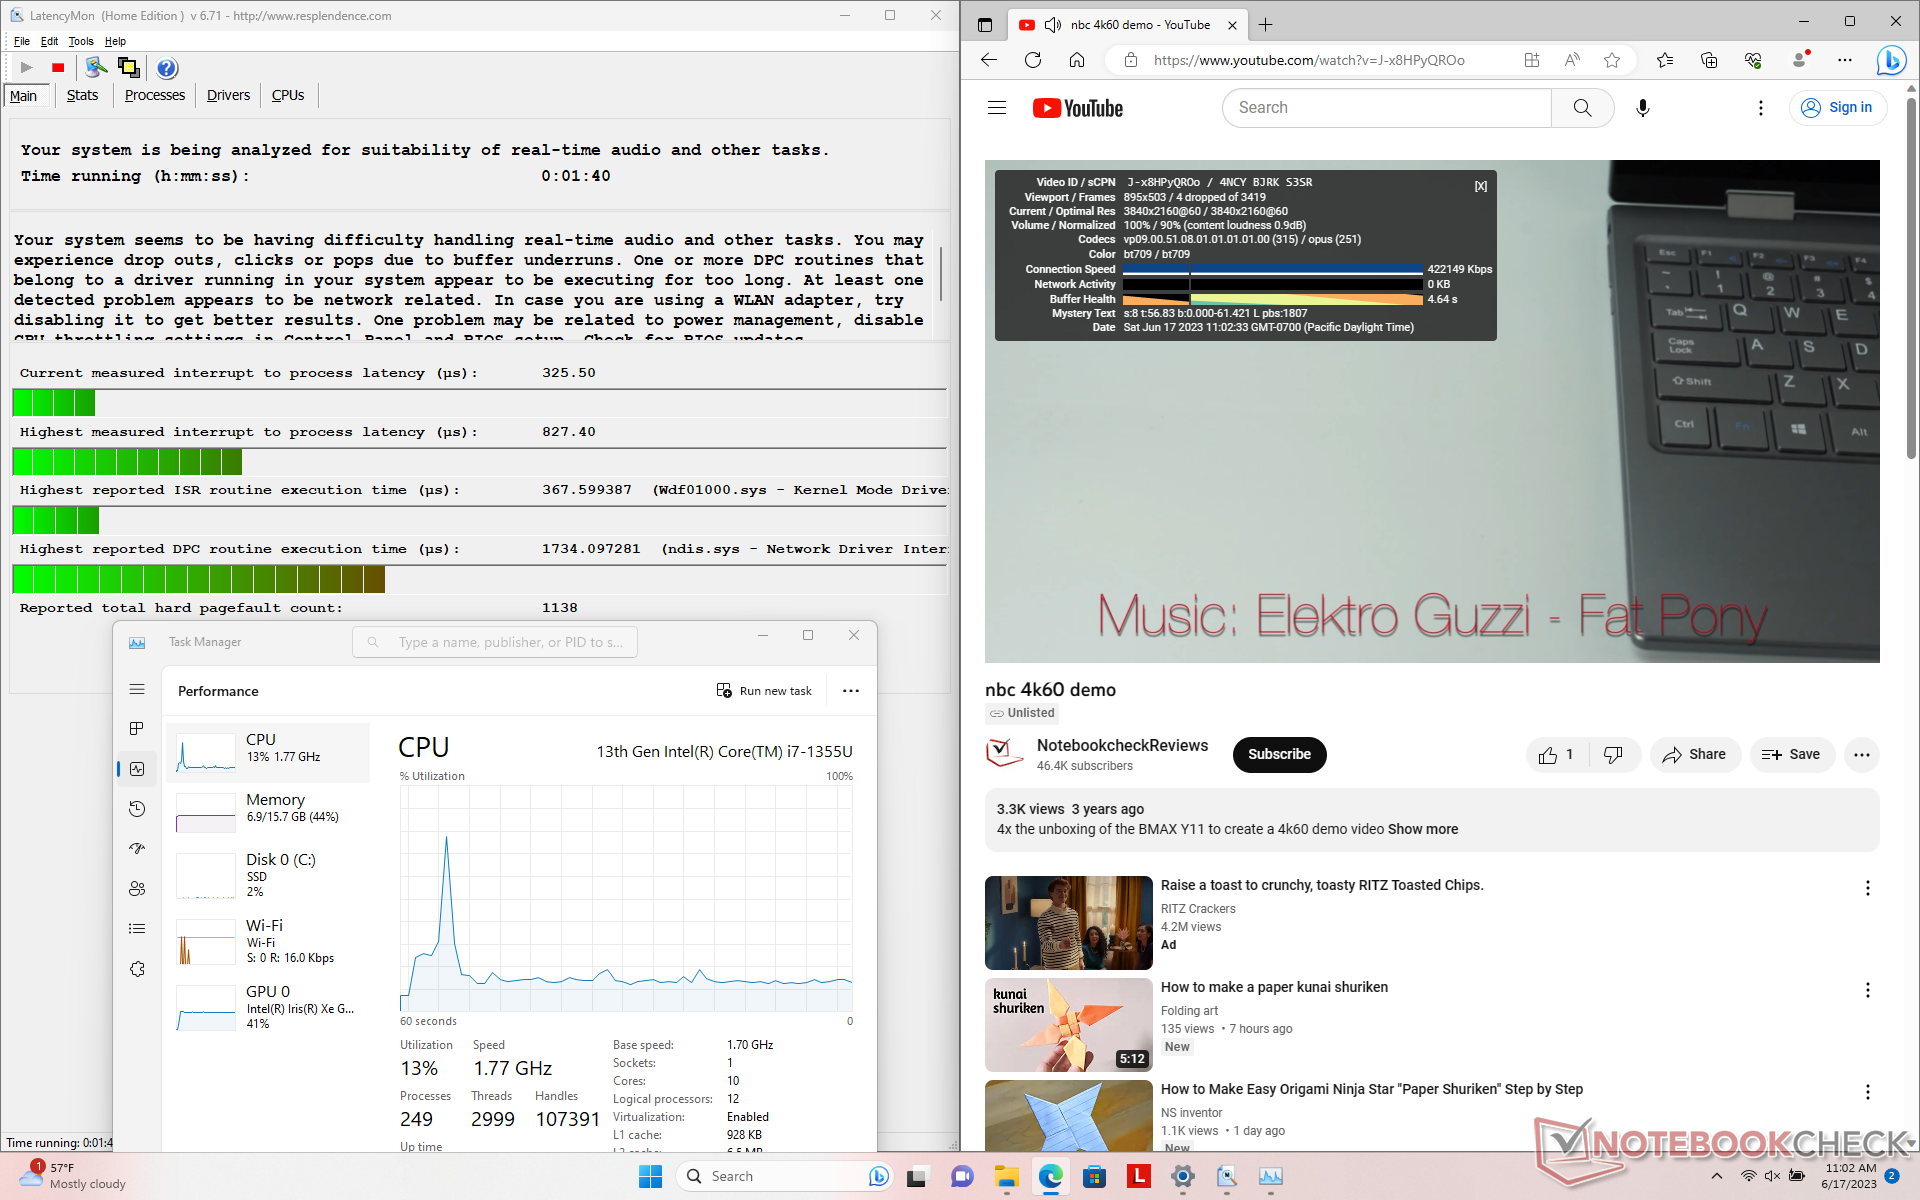
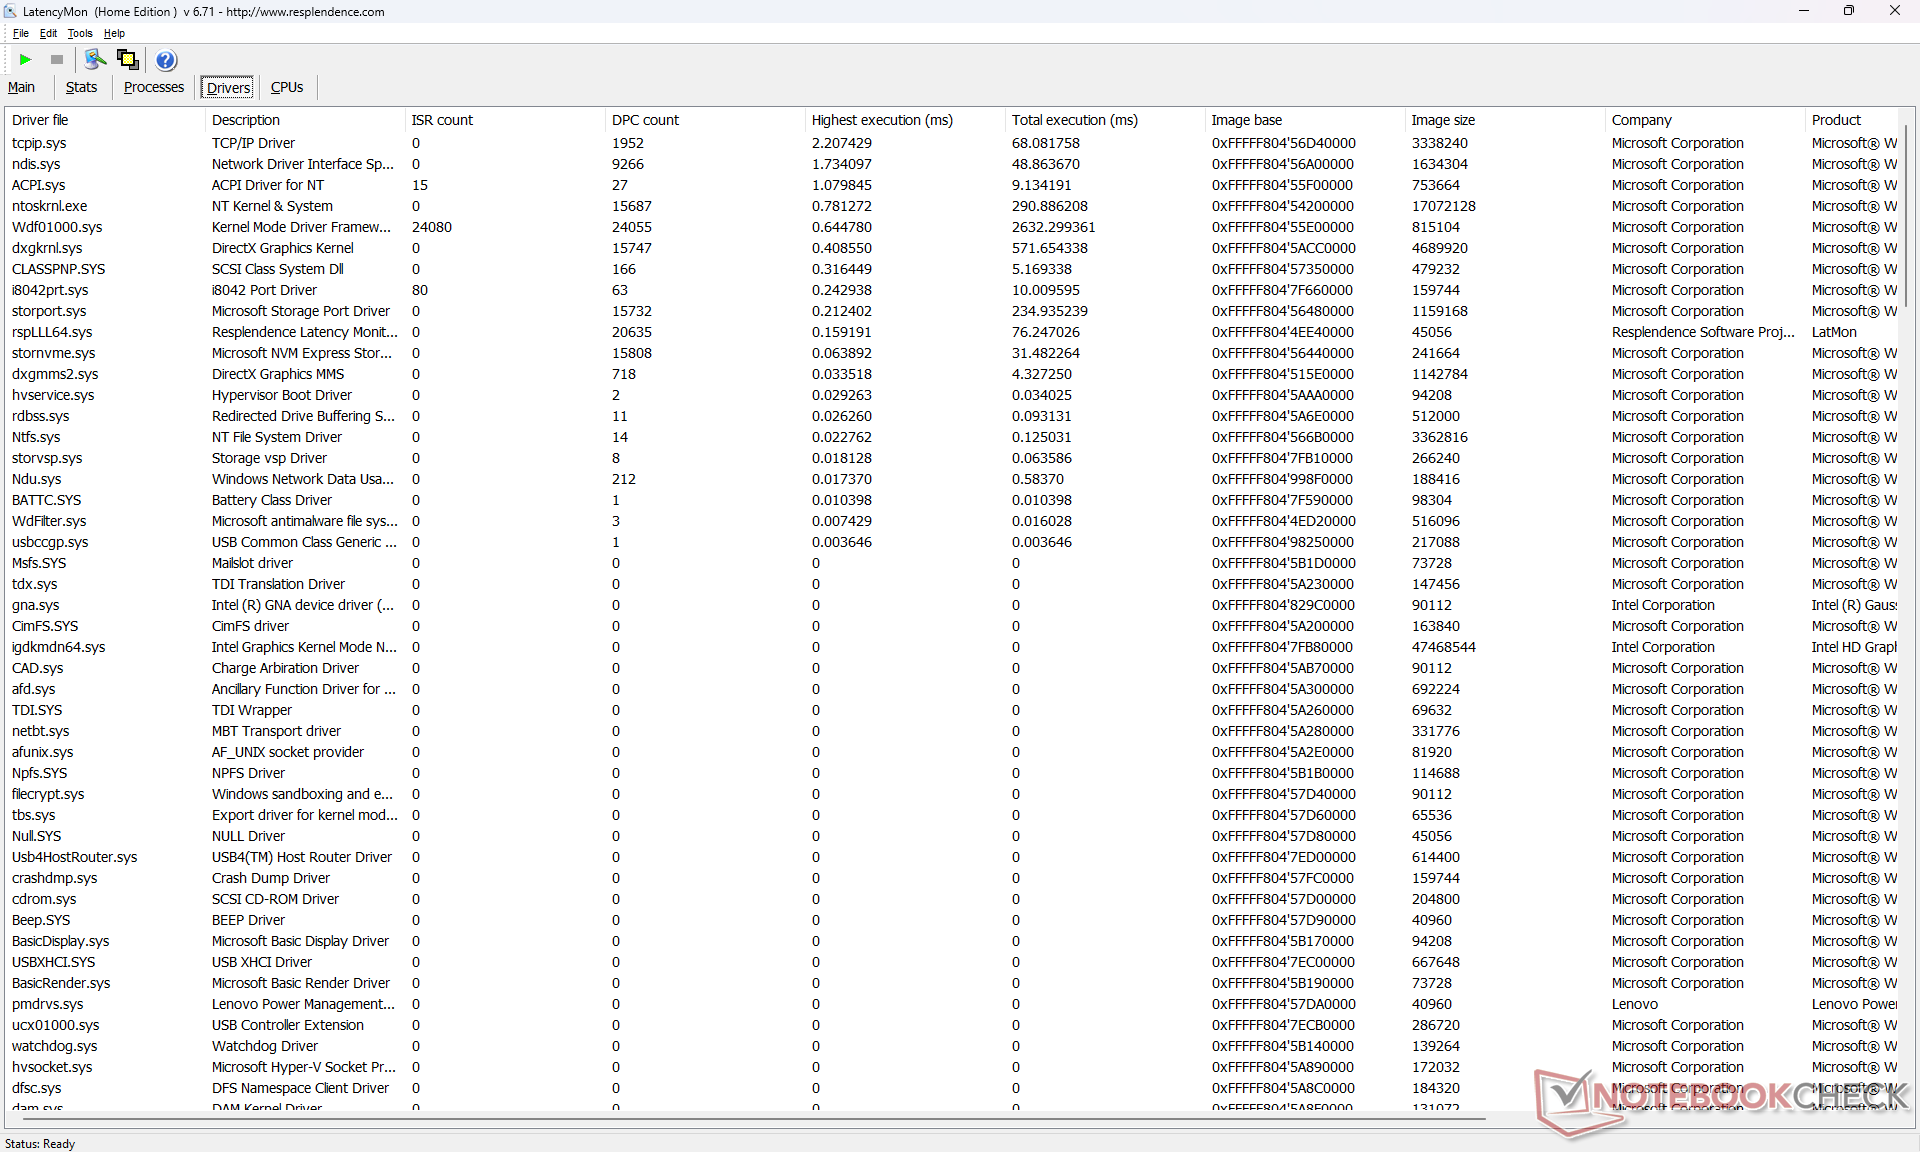
DPC Latency
LatencyMon reveals DPC issues when opening multiple browser tabs of our homepage. 4K video playback at 60 FPS is imperfect as well with 4 dropped frames during the minute-long test video.
| DPC Latencies / LatencyMon - interrupt to process latency (max), Web, Youtube, Prime95 | |
| HP EliteBook x360 1040 G7, i7-10810U | |
| Lenovo ThinkPad X1 Yoga G7 21CE002HGE | |
| LG Gram 14T90P | |
| Asus ZenBook Flip 14 UN5401QA-KN085W | |
| Lenovo ThinkPad X1 Yoga G8 i7-1355U | |
| Dell Latitude 9430 2-in-1 | |
* ... smaller is better
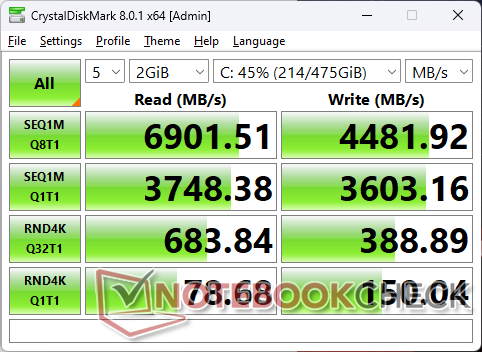
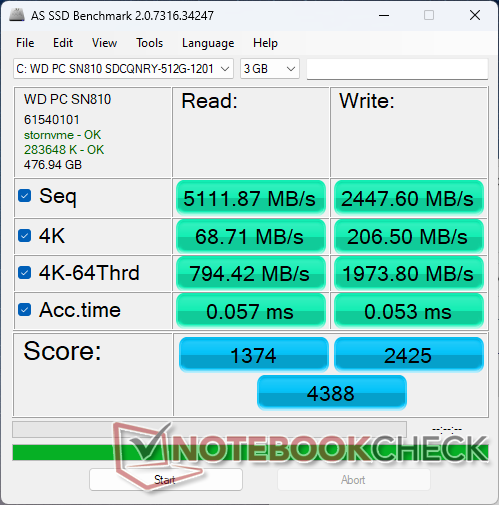
Storage Devices
Our test unit comes configured with the Western Digital SN810 instead of the Samsung PM9A1 on last year's ThinkPad X1 Yoga G7. Performance is generally slower than the Samsung drive particularly when reading and writing smaller block sizes.

* ... smaller is better
Disk Throttling: DiskSpd Read Loop, Queue Depth 8
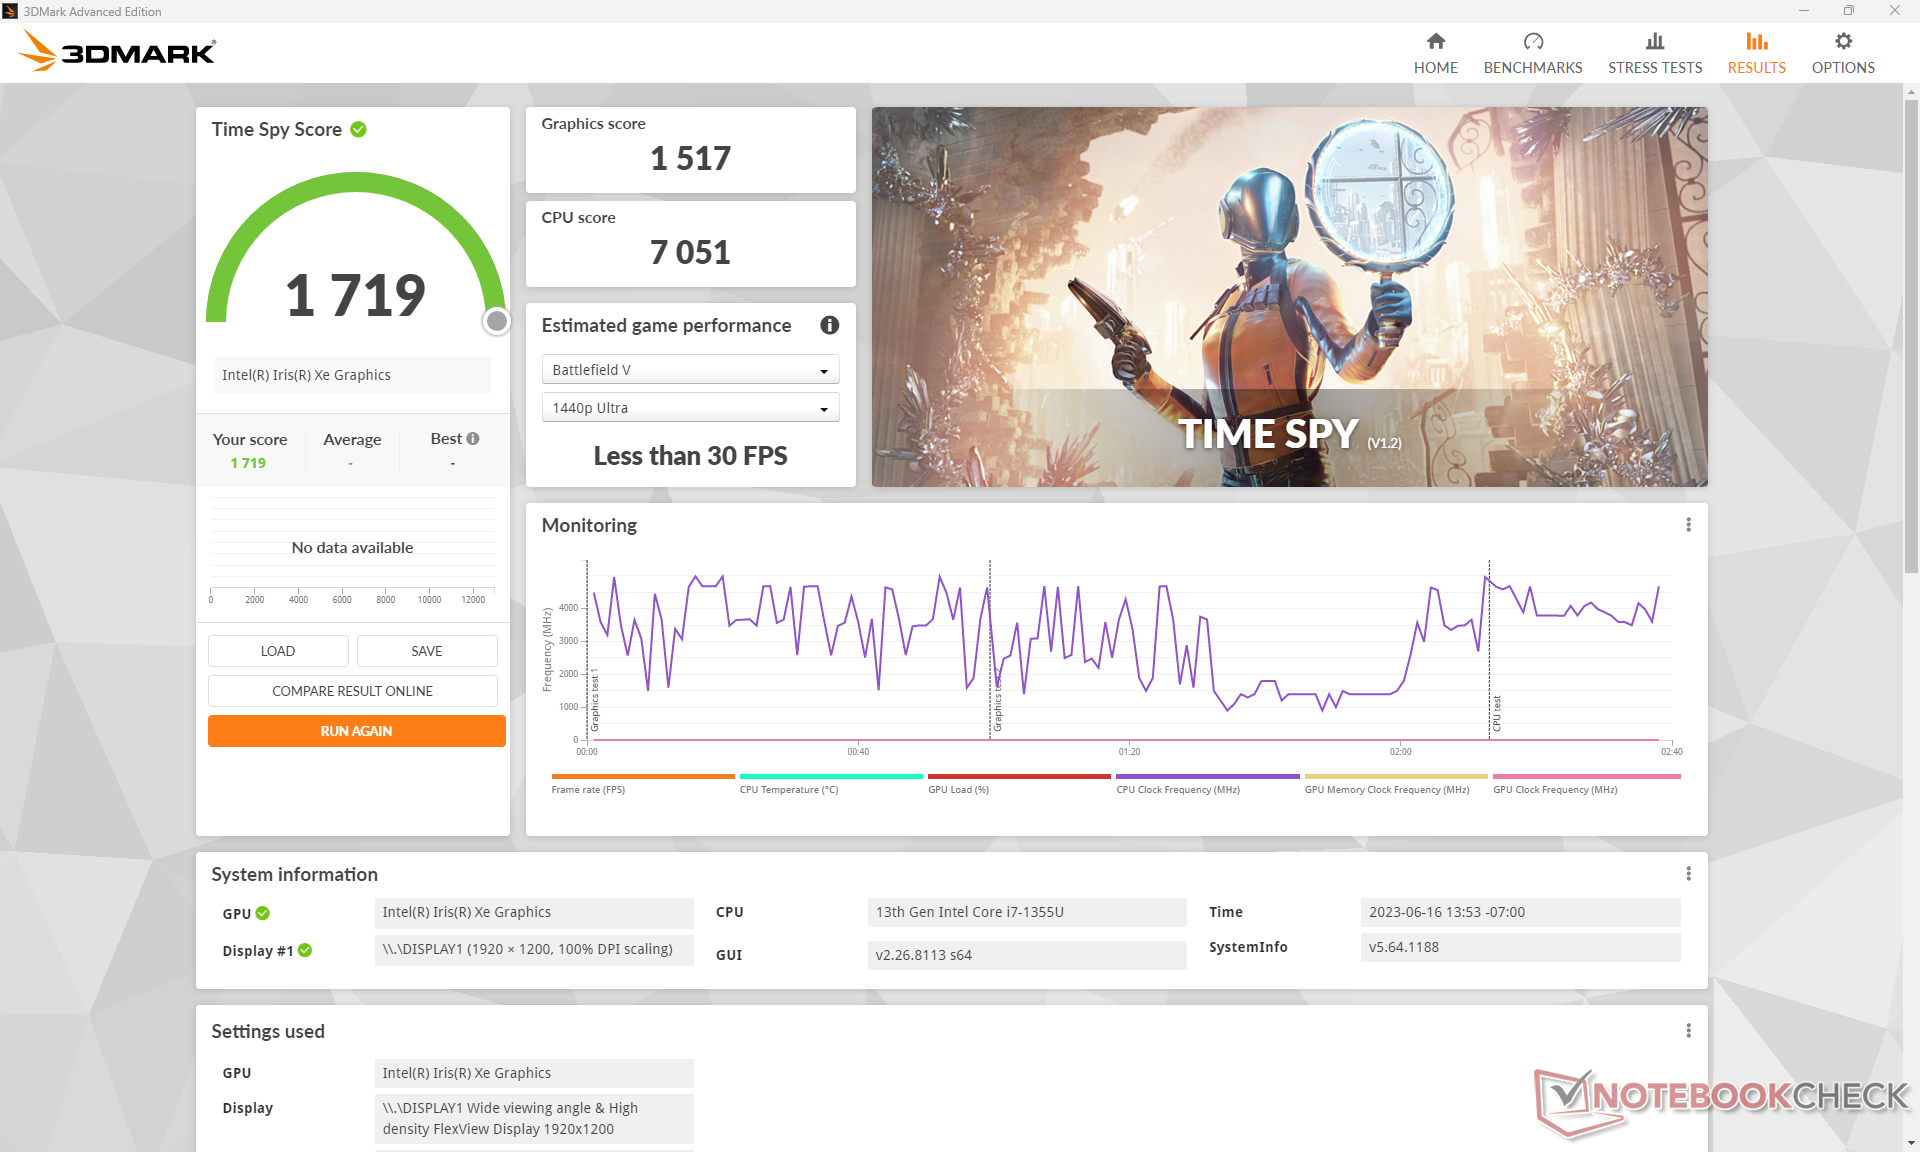
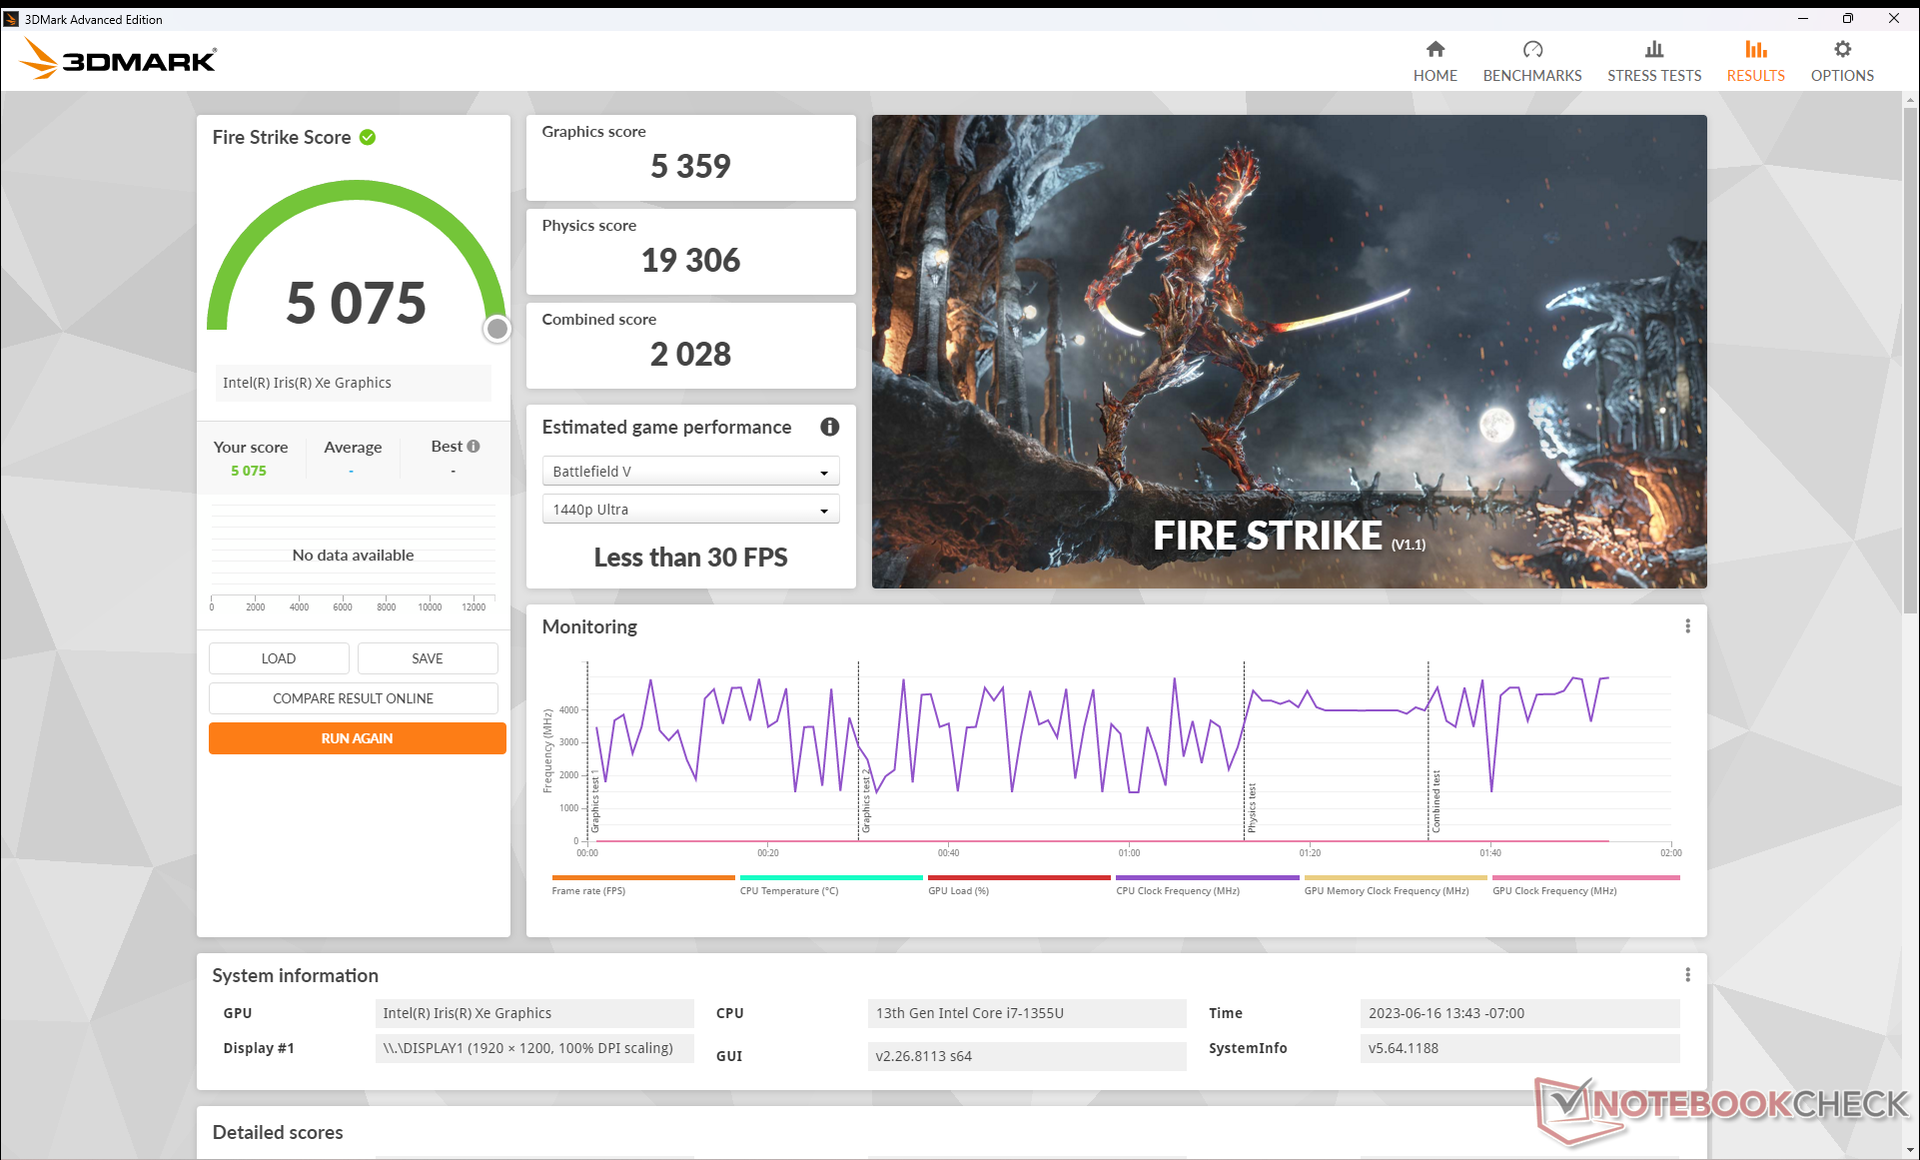
GPU Performance — Aging Iris Xe
Graphics performance remains the same as on last year's model since the integrated Iris Xe 96 EUs GPU has not changed. However, performance may be worse on the newer model since the system tends to throttle. When idling on Witcher 3, for example, frame rates would frequently cycle between 50 and 90 FPS due to unsteady GPU clock rates.
Certain titles like Returnal would fail to launch.
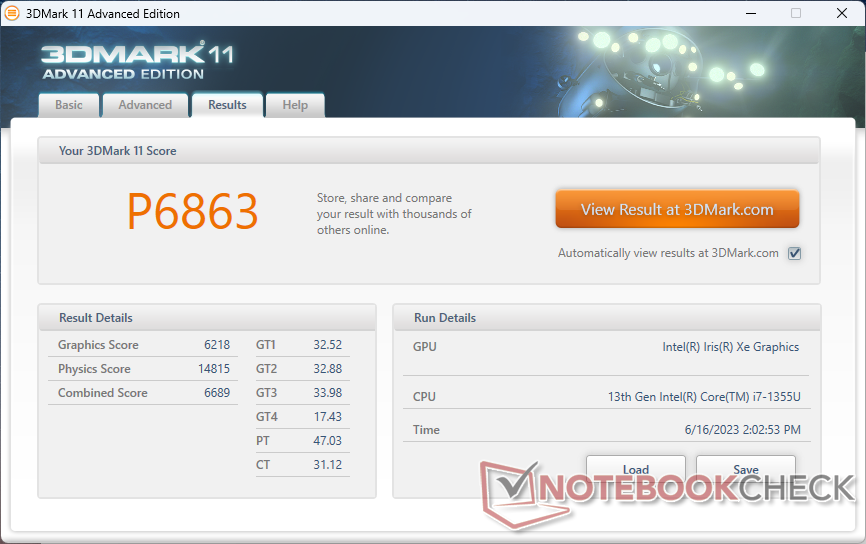
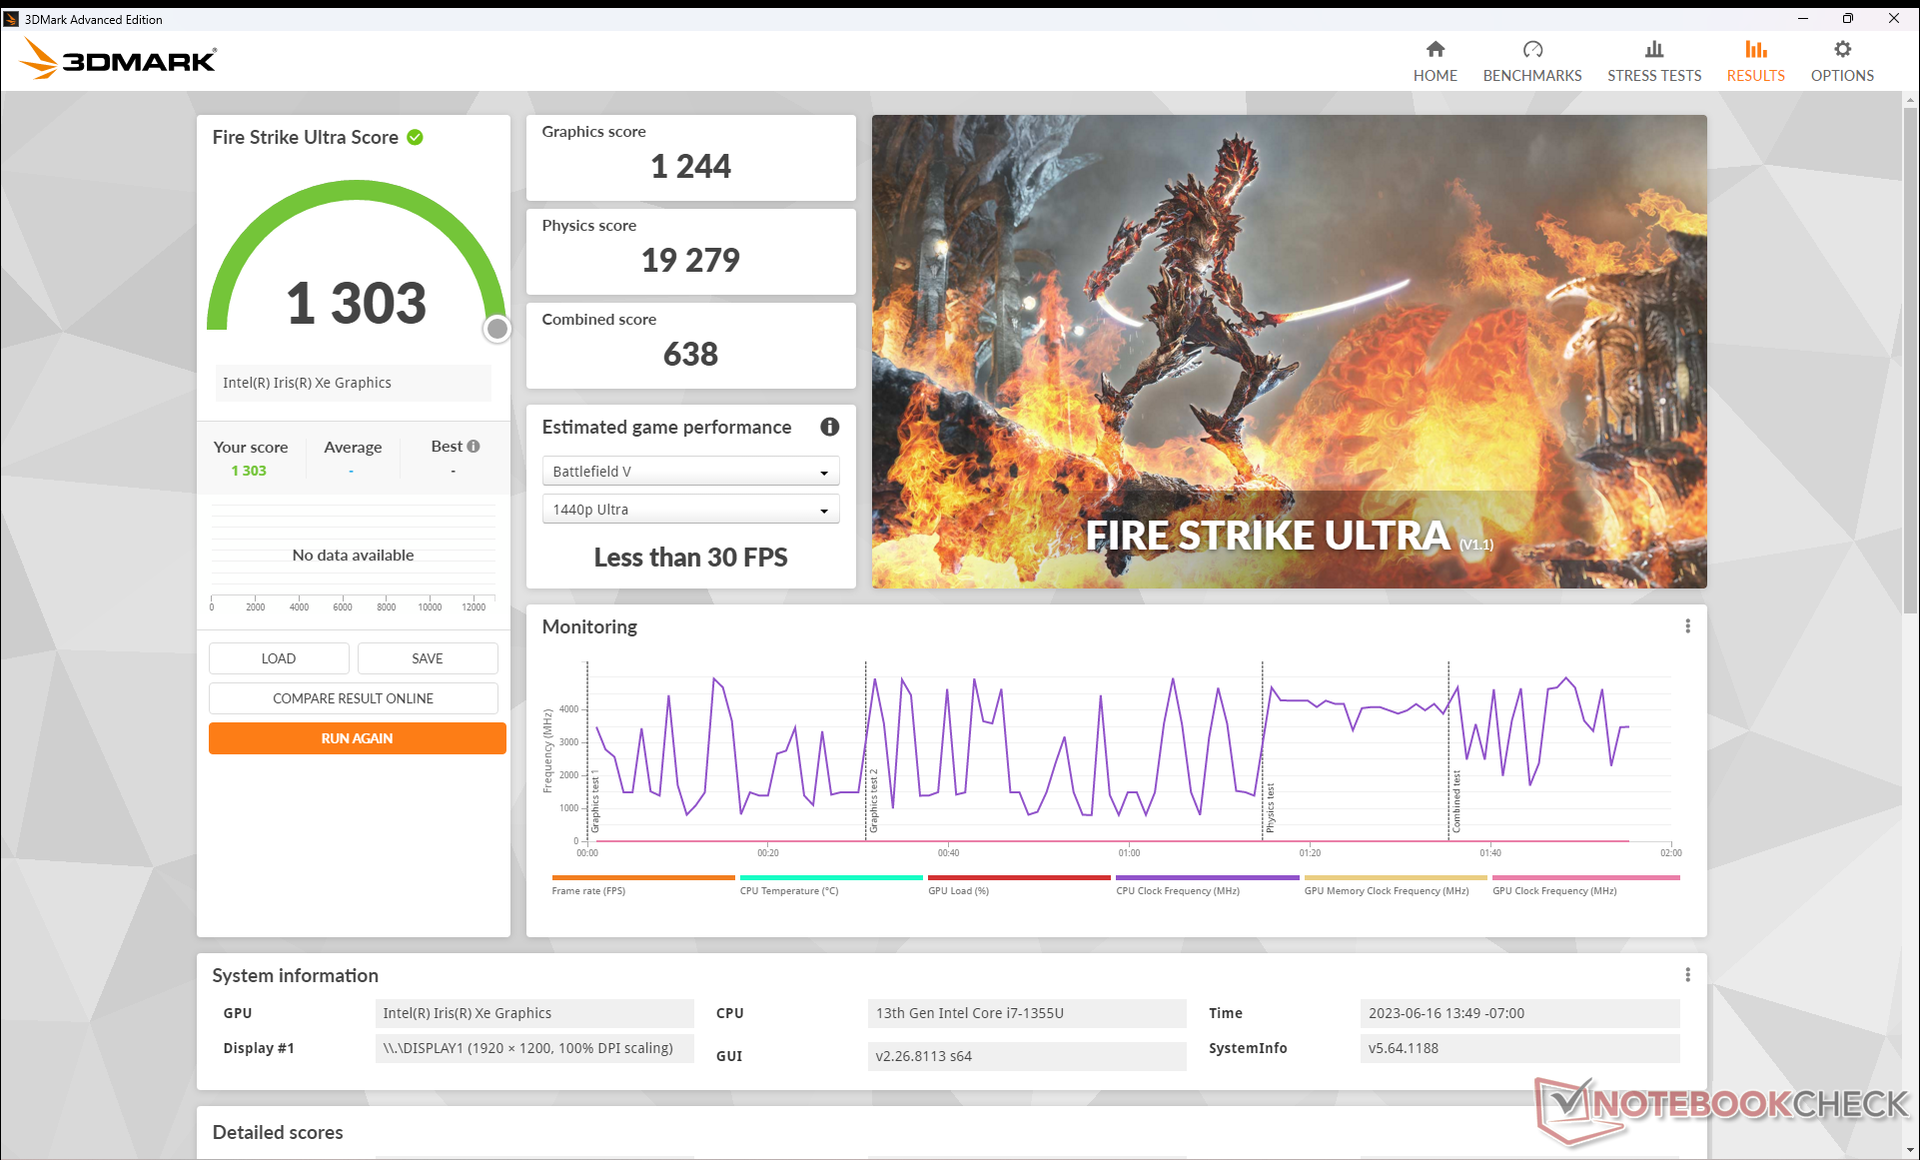
| 3DMark 11 Performance | 6863 points | |
| 3DMark Fire Strike Score | 5075 points | |
| 3DMark Time Spy Score | 1719 points | |
Help | ||
| Tiny Tina's Wonderlands | |
| 1280x720 Lowest Preset (DX12) | |
| Asus ROG Zephyrus G14 GA402XY | |
| Average Intel Iris Xe Graphics G7 96EUs (25.9 - 67.3, n=32) | |
| Lenovo ThinkPad X1 Yoga G8 i7-1355U | |
| 1920x1080 Low Preset (DX12) | |
| Asus ROG Zephyrus G14 GA402XY | |
| Average Intel Iris Xe Graphics G7 96EUs (22.3 - 53, n=32) | |
| Lenovo ThinkPad X1 Yoga G8 i7-1355U | |
| 1920x1080 Medium Preset (DX12) | |
| Asus ROG Zephyrus G14 GA402XY | |
| Average Intel Iris Xe Graphics G7 96EUs (17 - 40.1, n=30) | |
| Lenovo ThinkPad X1 Yoga G8 i7-1355U | |
| 1920x1080 High Preset (DX12) | |
| Asus ROG Zephyrus G14 GA402XY | |
| Average Intel Iris Xe Graphics G7 96EUs (10.6 - 24.1, n=29) | |
| Lenovo ThinkPad X1 Yoga G8 i7-1355U | |
| 1920x1080 Badass Preset (DX12) | |
| Asus ROG Zephyrus G14 GA402XY | |
| Average Intel Iris Xe Graphics G7 96EUs (8.4 - 18.4, n=26) | |
| Lenovo ThinkPad X1 Yoga G8 i7-1355U | |
Witcher 3 FPS Chart
| low | med. | high | ultra | |
|---|---|---|---|---|
| GTA V (2015) | 100.1 | 88.7 | 23.4 | 10 |
| The Witcher 3 (2015) | 96.8 | 35 | 35.9 | 10.2 |
| Dota 2 Reborn (2015) | 112.7 | 91.3 | 51.4 | 65.6 |
| Final Fantasy XV Benchmark (2018) | 40.5 | 23.9 | 16.2 | |
| X-Plane 11.11 (2018) | 46.2 | 34.4 | 31.4 | |
| Strange Brigade (2018) | 83.5 | 36.6 | 29 | 22.7 |
| Cyberpunk 2077 1.6 (2022) | 16.8 | 13.7 | 10.3 | 9.2 |
| Tiny Tina's Wonderlands (2022) | 24.2 | 19.5 | 13 | 10.3 |
| F1 22 (2022) | 40.1 | 36.9 | 26.5 | 20.1 |
Emissions
System Noise
Fan noise behavior is about the same as on last year's model. The internal fan is silent when running low or undemanding loads, but it tends to hover around a quiet 25.6 dB(A) against a silent background of 22.7 dB(A) when browsing or video streaming. More demanding loads like games would induce a fan noise of 36 dB(A) up to 42 dB(A) if on the High Performance power profile which is a similar maximum to the Latitude 9430 2-in-1.
Noise level
| Idle |
| 22.8 / 22.8 / 22.8 dB(A) |
| Load |
| 29.4 / 42 dB(A) |
 | ||
30 dB silent 40 dB(A) audible 50 dB(A) loud |
||
min: | ||
| Lenovo ThinkPad X1 Yoga G8 i7-1355U Iris Xe G7 96EUs, i7-1355U, WDC PC SN810 512GB | Lenovo ThinkPad X1 Yoga G7 21CE002HGE Iris Xe G7 96EUs, i7-1270P, Samsung PM9A1 MZVL2512HCJQ | Dell Latitude 9430 2-in-1 Iris Xe G7 96EUs, i7-1265U | LG Gram 14T90P Iris Xe G7 80EUs, i5-1135G7, Samsung SSD PM981a MZVLB512HBJQ | Asus ZenBook Flip 14 UN5401QA-KN085W Vega 8, R7 5800H, Intel SSD 600p SSDPEKKW512G7 | HP EliteBook x360 1040 G7, i7-10810U UHD Graphics 620, i7-10810U, Samsung SSD PM981a MZVLB512HBJQ | |
|---|---|---|---|---|---|---|
| Noise | -4% | -8% | -4% | -17% | -6% | |
| off / environment * (dB) | 22.7 | 22.7 -0% | 23.7 -4% | 25.4 -12% | 26 -15% | 25.2 -11% |
| Idle Minimum * (dB) | 22.8 | 22.7 -0% | 23.7 -4% | 25.5 -12% | 26 -14% | 25.2 -11% |
| Idle Average * (dB) | 22.8 | 22.7 -0% | 23.7 -4% | 25.5 -12% | 26 -14% | 25.2 -11% |
| Idle Maximum * (dB) | 22.8 | 27.1 -19% | 23.7 -4% | 25.5 -12% | 27.3 -20% | 25.2 -11% |
| Load Average * (dB) | 29.4 | 34.5 -17% | 35.1 -19% | 28.3 4% | 39.8 -35% | 30 -2% |
| Witcher 3 ultra * (dB) | 35.5 | 34.5 3% | 43.3 -22% | 35 1% | ||
| Load Maximum * (dB) | 42 | 38.7 8% | 43 -2% | 35 17% | 42.4 -1% | 38.1 9% |
* ... smaller is better
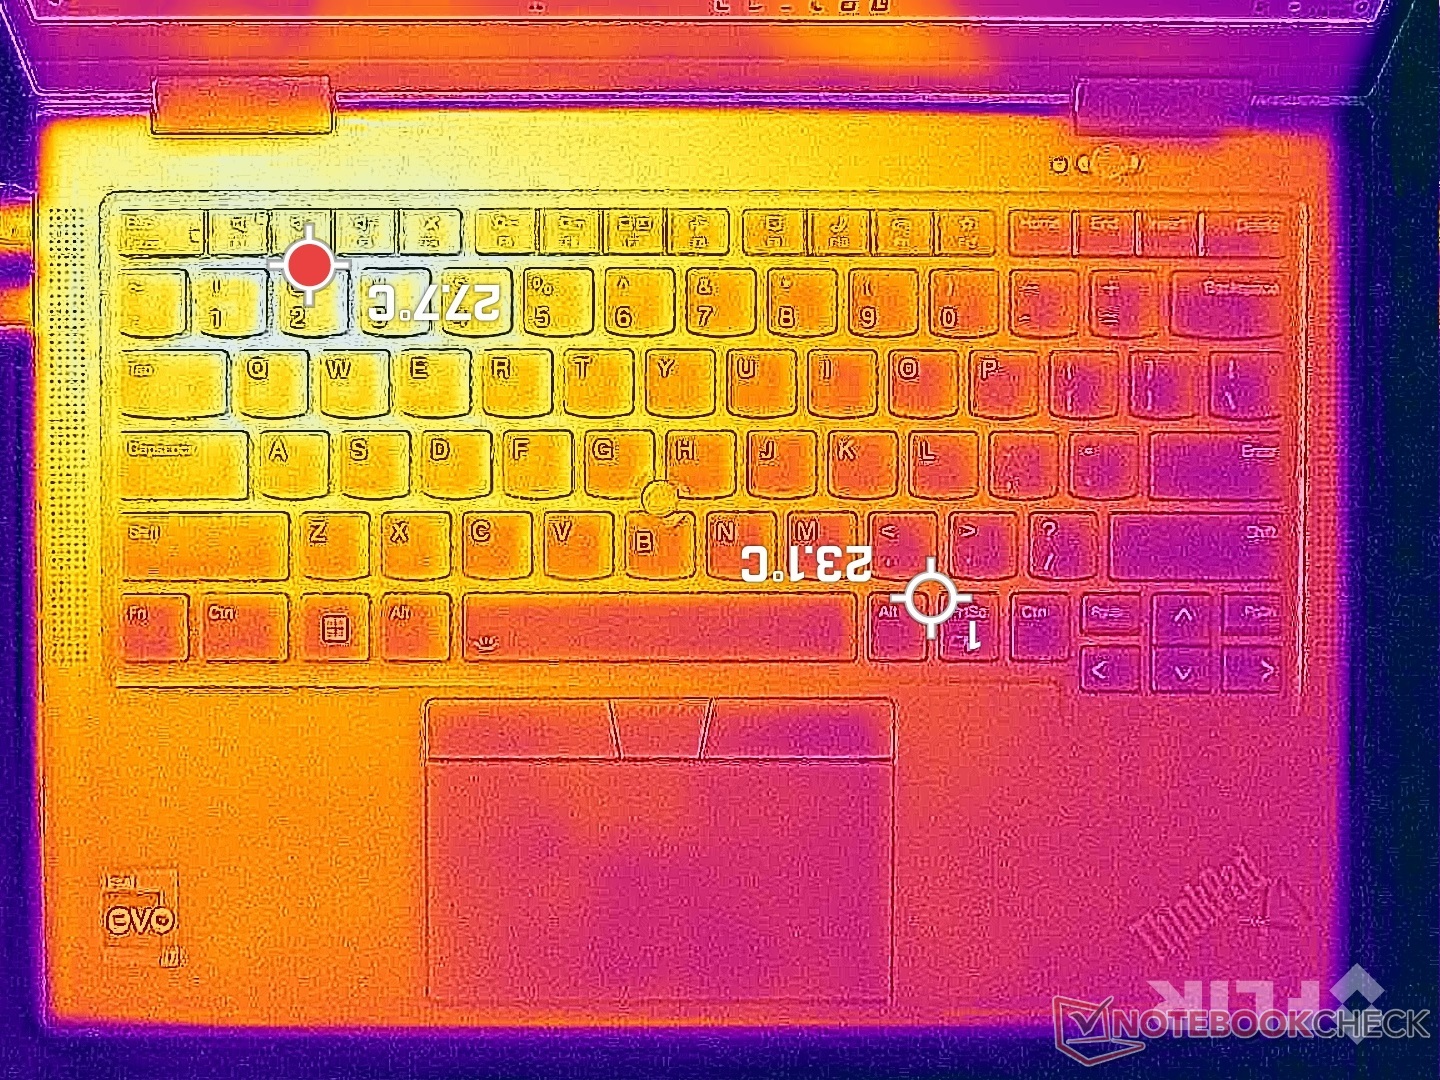
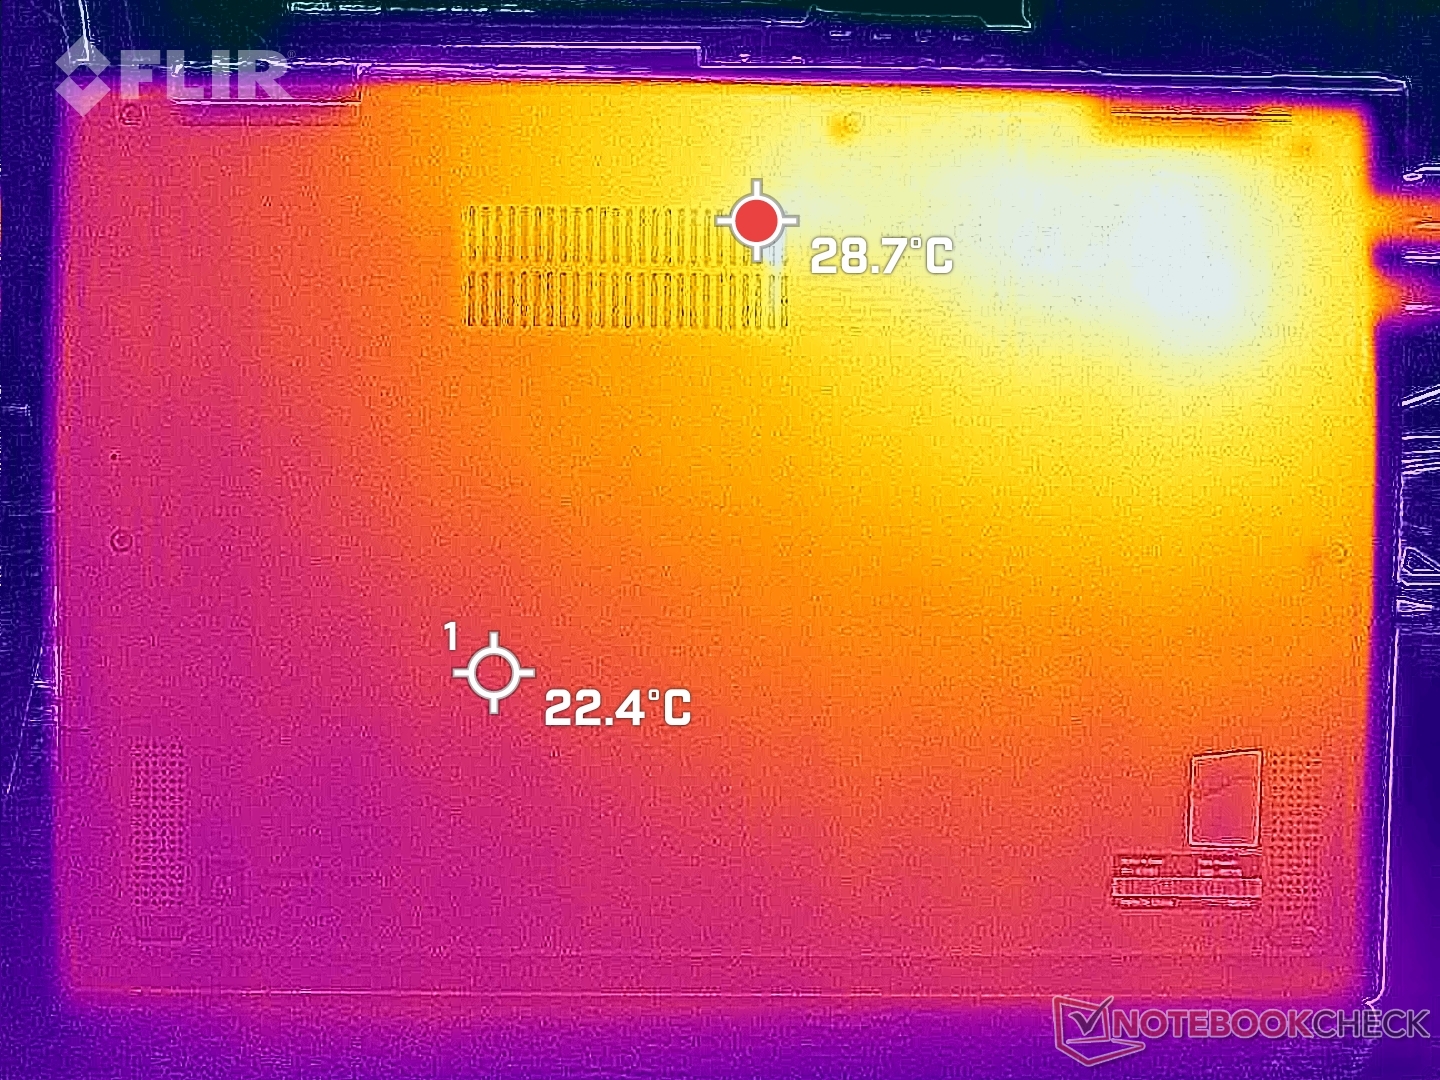
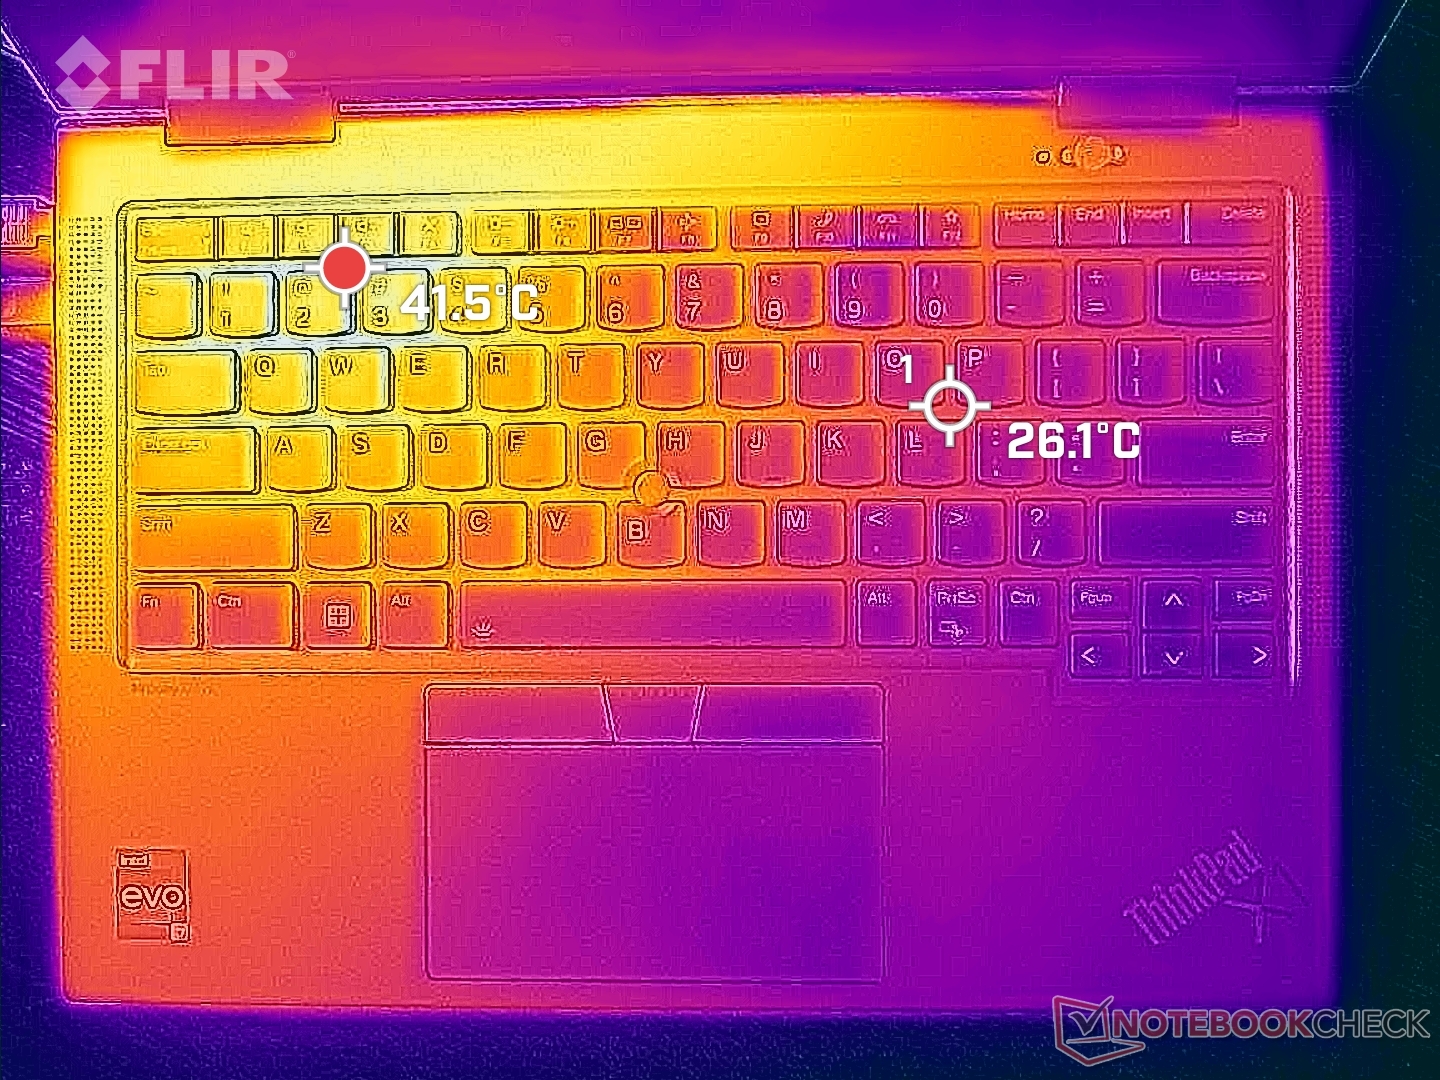
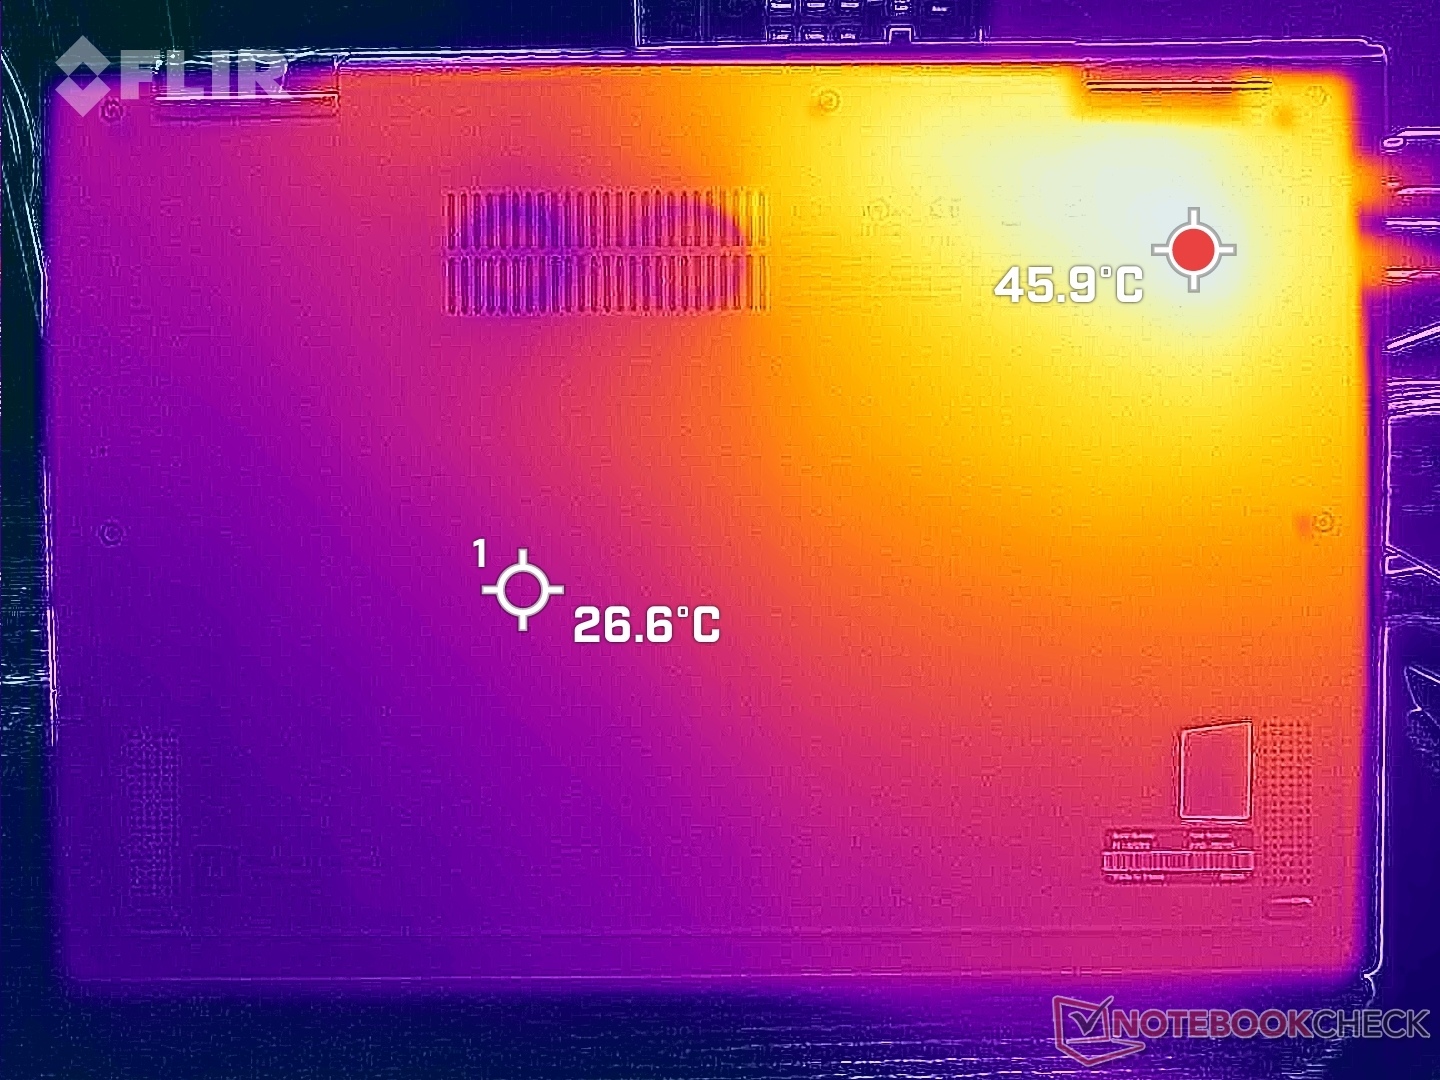
Temperature
The left half of the laptop will always be warmer than the right due to the positioning of the cooling solution inside. Hot spots can reach up to 42 C and 46 C on the top and bottom, respectively, compared to 40 C on both sides of the Dell Latitude 9430 2-in-1.
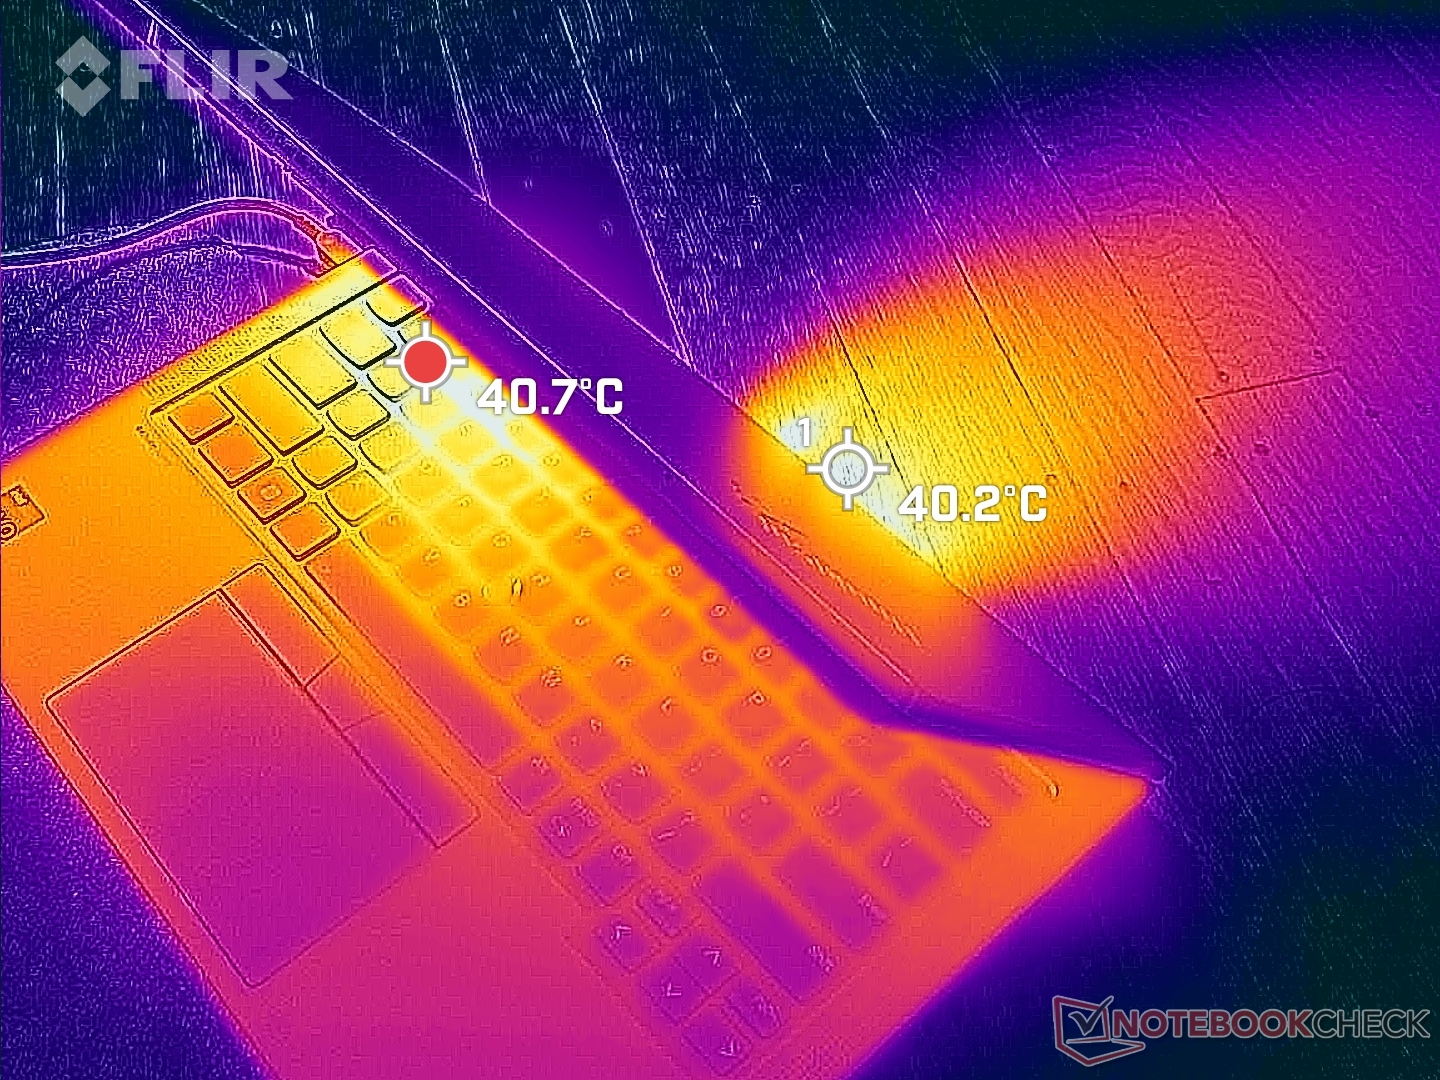
(±) The maximum temperature on the upper side is 41.6 °C / 107 F, compared to the average of 35.4 °C / 96 F, ranging from 19.6 to 60 °C for the class Convertible.
(-) The bottom heats up to a maximum of 47.6 °C / 118 F, compared to the average of 36.9 °C / 98 F
(+) In idle usage, the average temperature for the upper side is 28.4 °C / 83 F, compared to the device average of 30.3 °C / 87 F.
(+) The palmrests and touchpad are reaching skin temperature as a maximum (32 °C / 89.6 F) and are therefore not hot.
(-) The average temperature of the palmrest area of similar devices was 28 °C / 82.4 F (-4 °C / -7.2 F).
| Lenovo ThinkPad X1 Yoga G8 i7-1355U Intel Core i7-1355U, Intel Iris Xe Graphics G7 96EUs | Lenovo ThinkPad X1 Yoga G7 21CE002HGE Intel Core i7-1270P, Intel Iris Xe Graphics G7 96EUs | Dell Latitude 9430 2-in-1 Intel Core i7-1265U, Intel Iris Xe Graphics G7 96EUs | LG Gram 14T90P Intel Core i5-1135G7, Intel Iris Xe Graphics G7 80EUs | Asus ZenBook Flip 14 UN5401QA-KN085W AMD Ryzen 7 5800H, AMD Radeon RX Vega 8 (Ryzen 4000/5000) | HP EliteBook x360 1040 G7, i7-10810U Intel Core i7-10810U, Intel UHD Graphics 620 | |
|---|---|---|---|---|---|---|
| Heat | 8% | 19% | 15% | -7% | 10% | |
| Maximum Upper Side * (°C) | 41.6 | 43.3 -4% | 39.2 6% | 41.6 -0% | 42.7 -3% | 36.6 12% |
| Maximum Bottom * (°C) | 47.6 | 45.1 5% | 44.8 6% | 46.2 3% | 53.1 -12% | 46.2 3% |
| Idle Upper Side * (°C) | 30.6 | 26.5 13% | 21.4 30% | 22.6 26% | 32.9 -8% | 25.8 16% |
| Idle Bottom * (°C) | 33.2 | 27.6 17% | 22.4 33% | 23.2 30% | 35.2 -6% | 29.8 10% |
* ... smaller is better
Stress Test
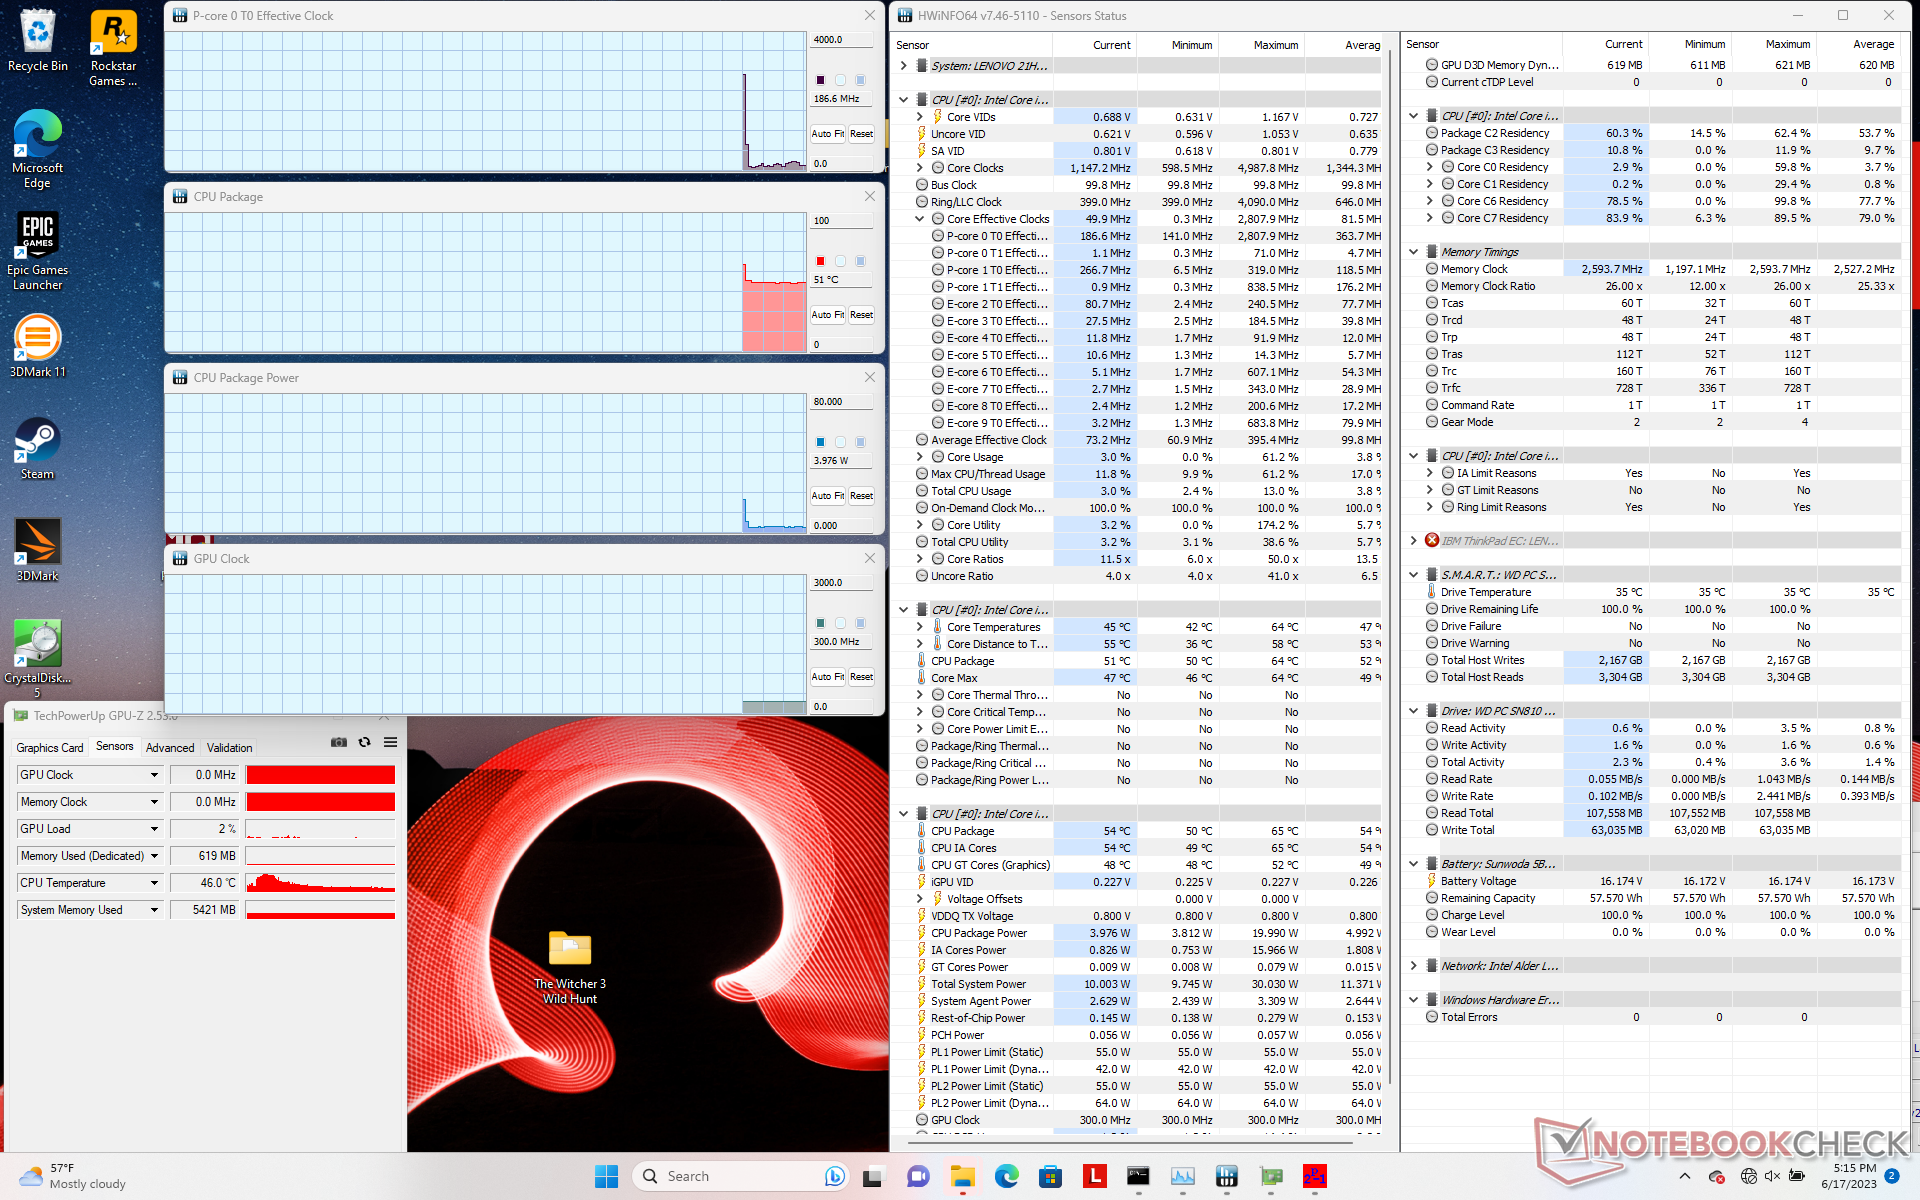
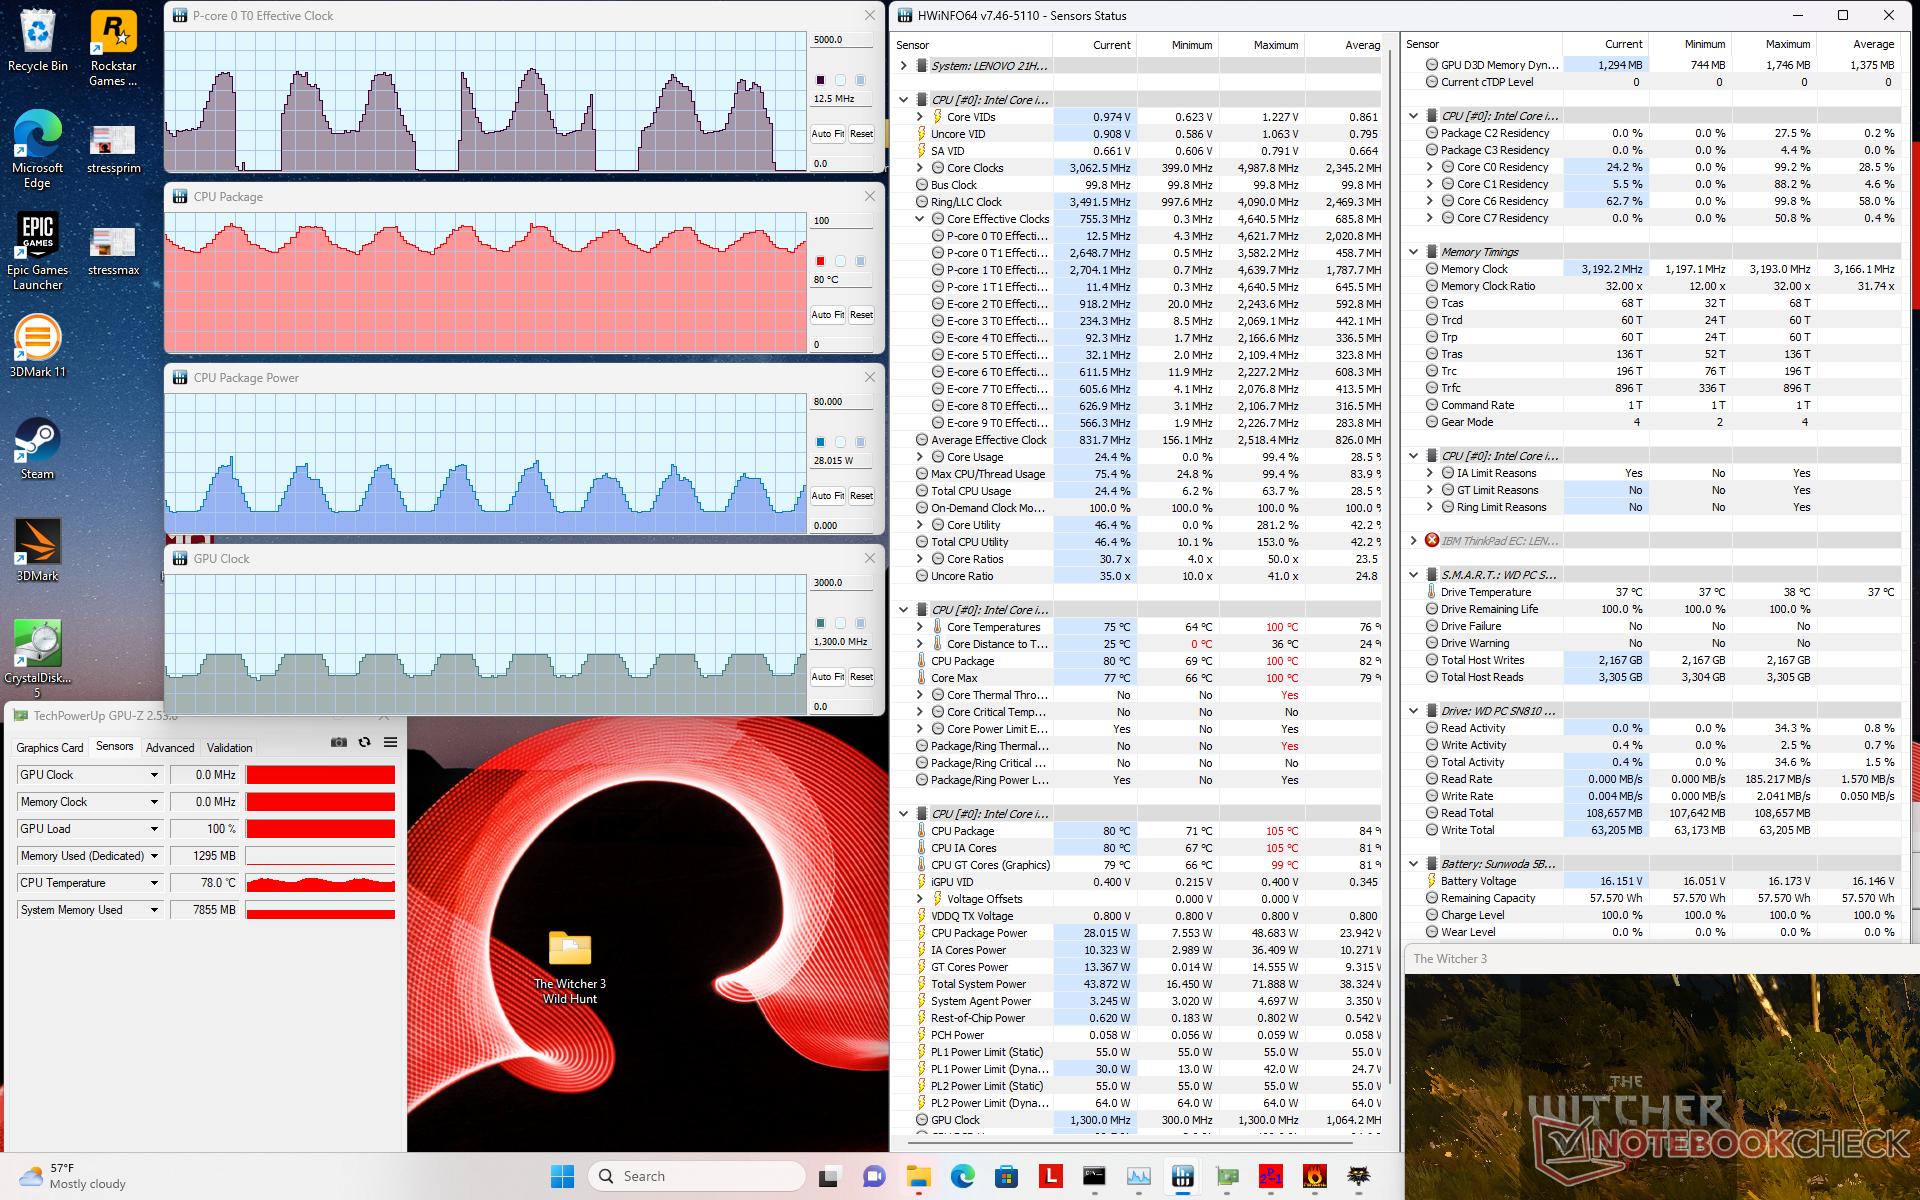
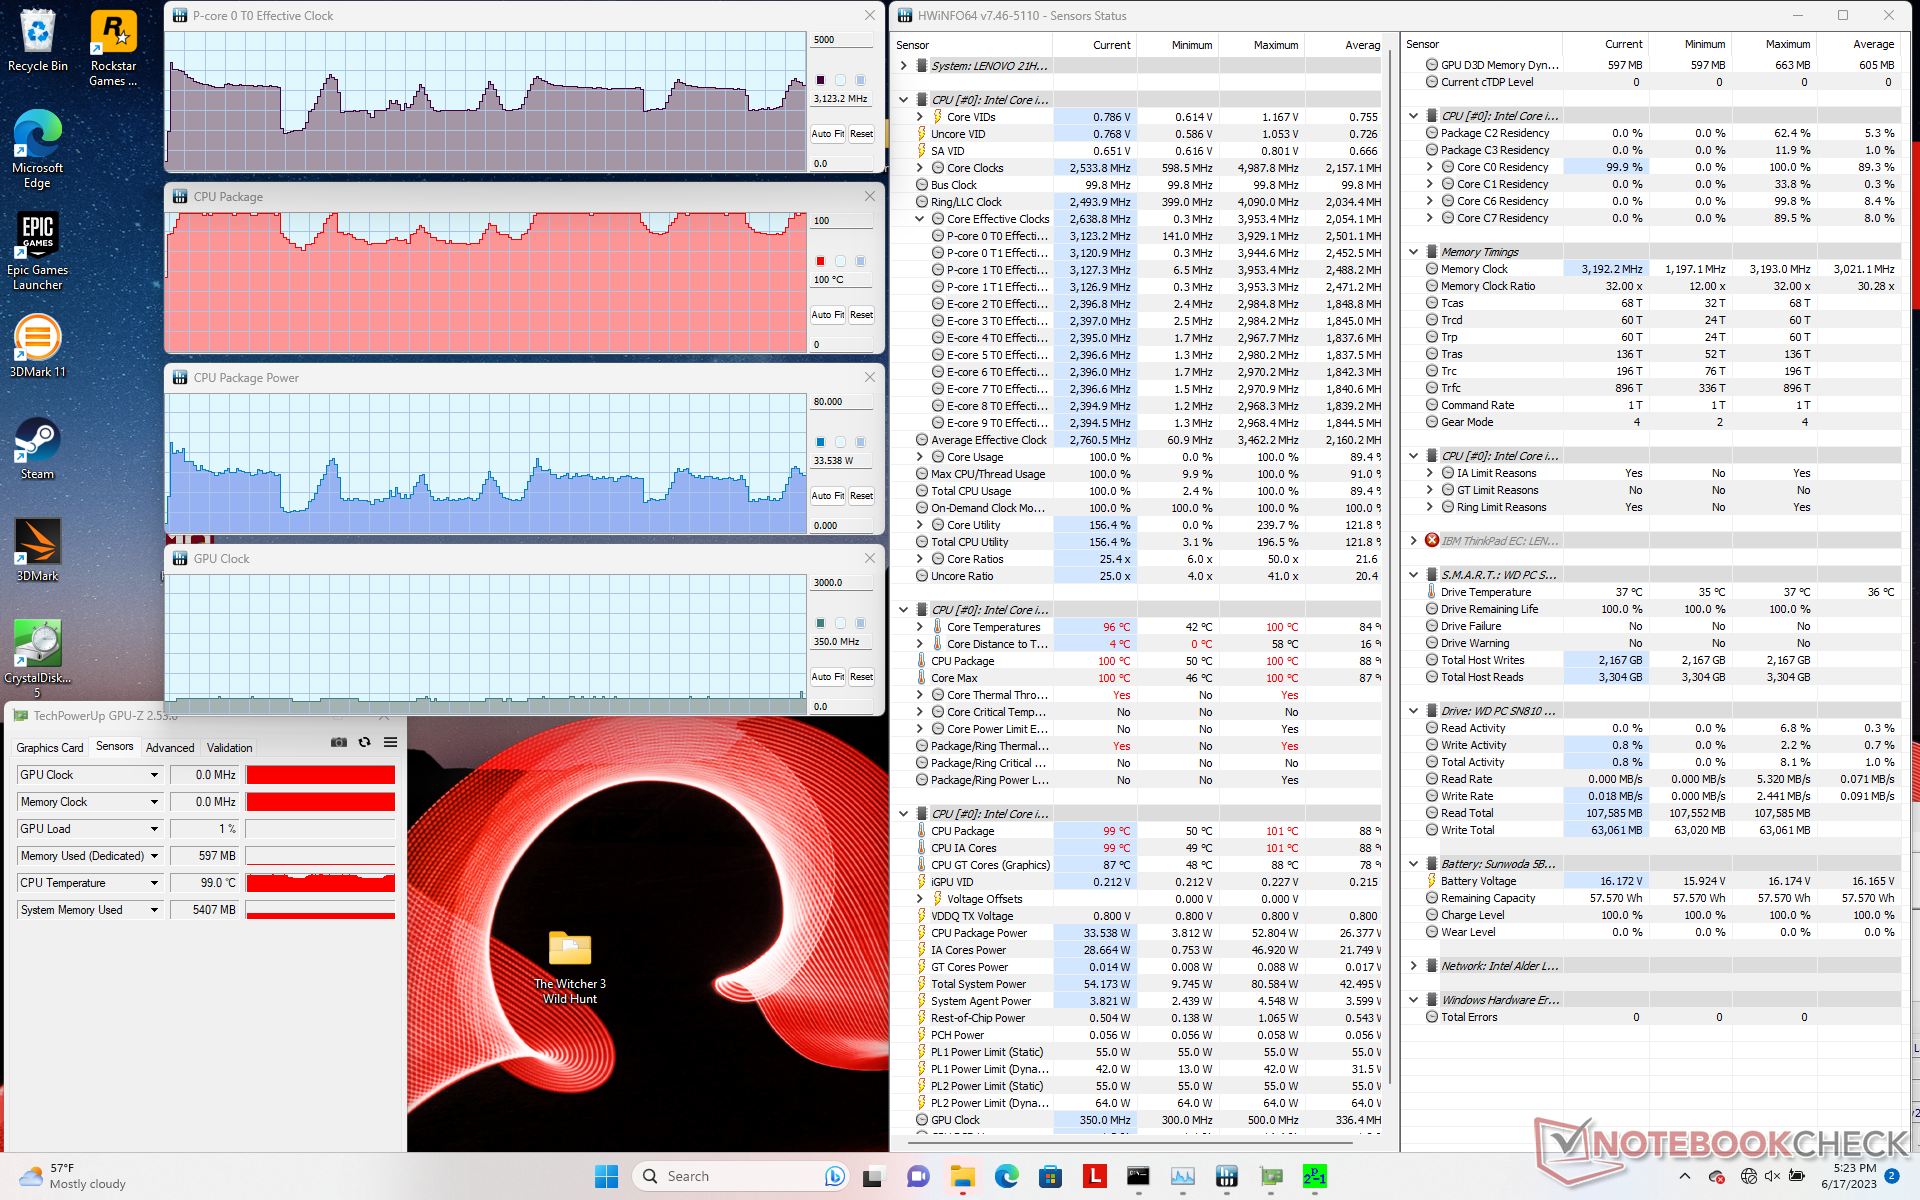
When initiating Prime95 stress, the CPU would boost to 4 GHz and 53 W for only a second or so before approaching a core temperature of 100 C. Thereafter, clock rates, board power draw, and temperature would eventually begin cycling between 1.4 to 3.5 GHz, 13 to 44 W, and 74 to 100 C, respectively. This behavior is different from most other Core U-series laptops where steadier clock rates and temperatures are much more common.
When running Witcher 3, GPU clock rates and temperature would cycle between 800 to 1300 MHz and 73 to 91 C, respectively. This cycling behavior leads to unsteady frame rates when gaming as exemplified by our Witcher 3 frame rate graph above.
Performance is not throttled if gaming on battery power. Running 3DMark 11 on batteries would return essentially identical numbers to mains.

| CPU Clock (GHz) | GPU Clock (MHz) | Average CPU Temperature (°C) | |
| System Idle | -- | -- | 51 |
| Prime95 Stress | 1.4 - 3.5 | -- | 74 - 100 |
| Prime95 + FurMark Stress | 0.8 - 2.6 | 350 - 1000 | 73 - 91 |
| Witcher 3 Stress | 1.5 - 3.7 | 800 - 1300 | 73 - 91 |
Speakers
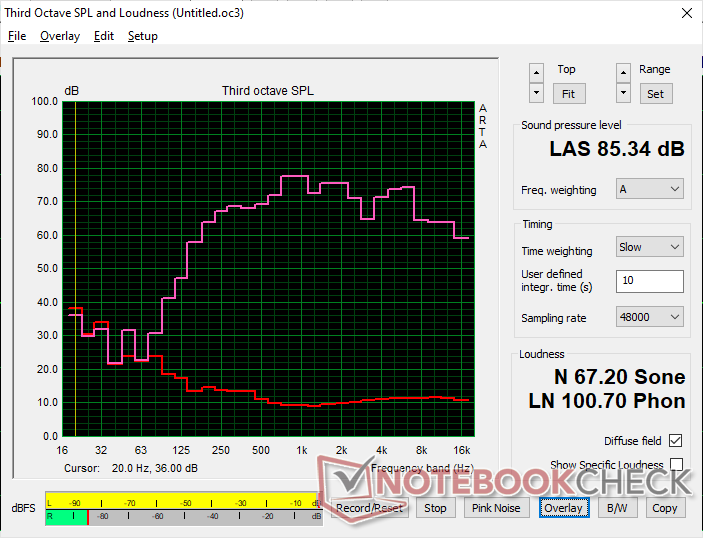
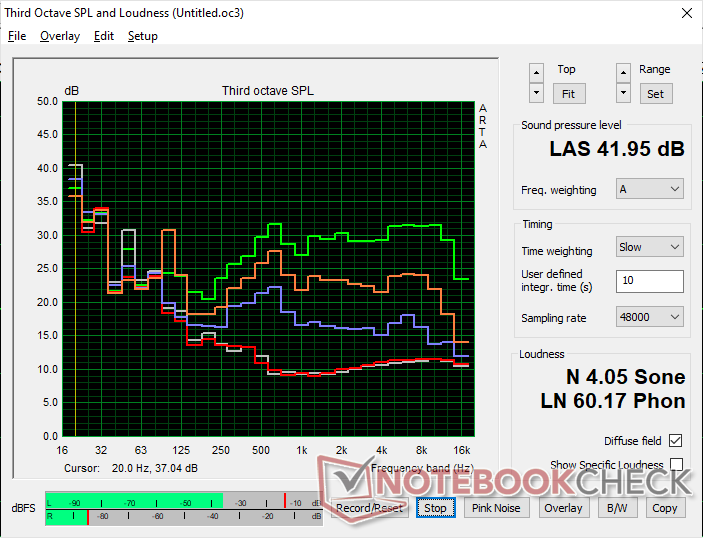
Lenovo ThinkPad X1 Yoga G8 i7-1355U audio analysis
(+) | speakers can play relatively loud (85.3 dB)
Bass 100 - 315 Hz
(±) | reduced bass - on average 10.9% lower than median
(±) | linearity of bass is average (11% delta to prev. frequency)
Mids 400 - 2000 Hz
(±) | higher mids - on average 5.1% higher than median
(+) | mids are linear (4% delta to prev. frequency)
Highs 2 - 16 kHz
(+) | balanced highs - only 4.1% away from median
(±) | linearity of highs is average (7.7% delta to prev. frequency)
Overall 100 - 16.000 Hz
(+) | overall sound is linear (11.7% difference to median)
Compared to same class
» 10% of all tested devices in this class were better, 4% similar, 86% worse
» The best had a delta of 6%, average was 20%, worst was 57%
Compared to all devices tested
» 8% of all tested devices were better, 3% similar, 89% worse
» The best had a delta of 4%, average was 24%, worst was 134%
Apple MacBook Pro 16 2021 M1 Pro audio analysis
(+) | speakers can play relatively loud (84.7 dB)
Bass 100 - 315 Hz
(+) | good bass - only 3.8% away from median
(+) | bass is linear (5.2% delta to prev. frequency)
Mids 400 - 2000 Hz
(+) | balanced mids - only 1.3% away from median
(+) | mids are linear (2.1% delta to prev. frequency)
Highs 2 - 16 kHz
(+) | balanced highs - only 1.9% away from median
(+) | highs are linear (2.7% delta to prev. frequency)
Overall 100 - 16.000 Hz
(+) | overall sound is linear (4.6% difference to median)
Compared to same class
» 0% of all tested devices in this class were better, 0% similar, 100% worse
» The best had a delta of 5%, average was 17%, worst was 45%
Compared to all devices tested
» 0% of all tested devices were better, 0% similar, 100% worse
» The best had a delta of 4%, average was 24%, worst was 134%
Energy Management
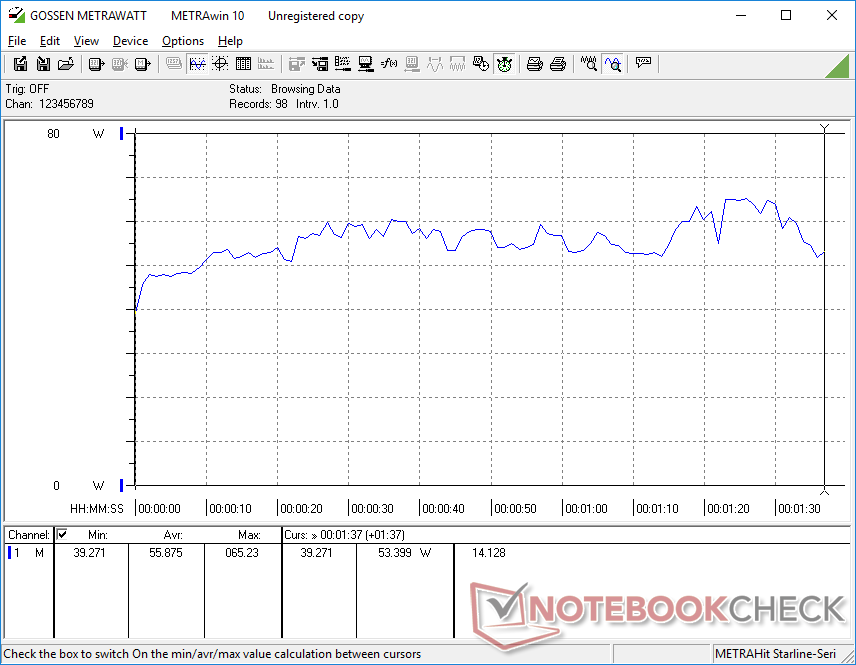
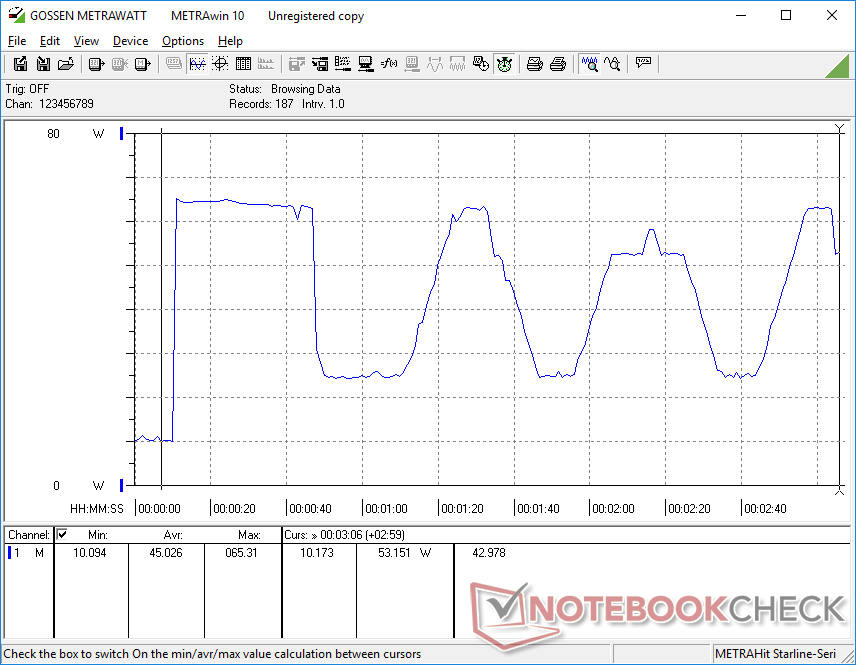
Power Consumption
Power consumption when running low loads is largely the same as on last year's model despite the more power-efficient Core U-series CPU in our ThinkPad X1 Yoga G8. When running more demanding loads equivalent to games or Prime95, consumption would cycle as shown by our graphs below whereas consumption would be steadier on the ThinkPad X1 Yoga G7. The cycling behavior mirrors our clock rate and board power draw observations in our Stress Test section above.


| Off / Standby | |
| Idle | |
| Load |
|
Key:
min: | |
| Lenovo ThinkPad X1 Yoga G8 i7-1355U i7-1355U, Iris Xe G7 96EUs, WDC PC SN810 512GB, IPS, 1920x1200, 14" | Lenovo ThinkPad X1 Yoga G7 21CE002HGE i7-1270P, Iris Xe G7 96EUs, Samsung PM9A1 MZVL2512HCJQ, IPS, 1920x1200, 14" | Dell Latitude 9430 2-in-1 i7-1265U, Iris Xe G7 96EUs, , IPS, 2560x1600, 14" | LG Gram 14T90P i5-1135G7, Iris Xe G7 80EUs, Samsung SSD PM981a MZVLB512HBJQ, IPS, 1900x1200, 14" | Asus ZenBook Flip 14 UN5401QA-KN085W R7 5800H, Vega 8, Intel SSD 600p SSDPEKKW512G7, OLED, 2880x1800, 14" | HP EliteBook x360 1040 G7, i7-10810U i7-10810U, UHD Graphics 620, Samsung SSD PM981a MZVLB512HBJQ, IPS, 1920x1080, 14" | |
|---|---|---|---|---|---|---|
| Power Consumption | -3% | 9% | 12% | -38% | 25% | |
| Idle Minimum * (Watt) | 2.9 | 4.2 -45% | 2.9 -0% | 2.8 3% | 6.4 -121% | 1.6 45% |
| Idle Average * (Watt) | 5.4 | 6.9 -28% | 5.8 -7% | 5.5 -2% | 9.4 -74% | 4.5 17% |
| Idle Maximum * (Watt) | 9.6 | 7.6 21% | 6.6 31% | 6.4 33% | 10.7 -11% | 5.2 46% |
| Load Average * (Watt) | 55.9 | 36.2 35% | 49.2 12% | 45.4 19% | 52.2 7% | 41.7 25% |
| Witcher 3 ultra * (Watt) | 42.6 | 43.2 -1% | 35.3 17% | 34 20% | 53 -24% | |
| Load Maximum * (Watt) | 65.3 | 63.5 3% | 63.1 3% | 65.9 -1% | 69 -6% | 70.8 -8% |
* ... smaller is better
Power Consumption Witcher 3 / Stresstest
Power Consumption external Monitor
Battery Life
Runtimes have not improved from last year's model and it may even be shorter. Our real-world WLAN test would last for almost 7 hours compared to almost 9 hours on last year's ThinkPad X1 Yoga G7.
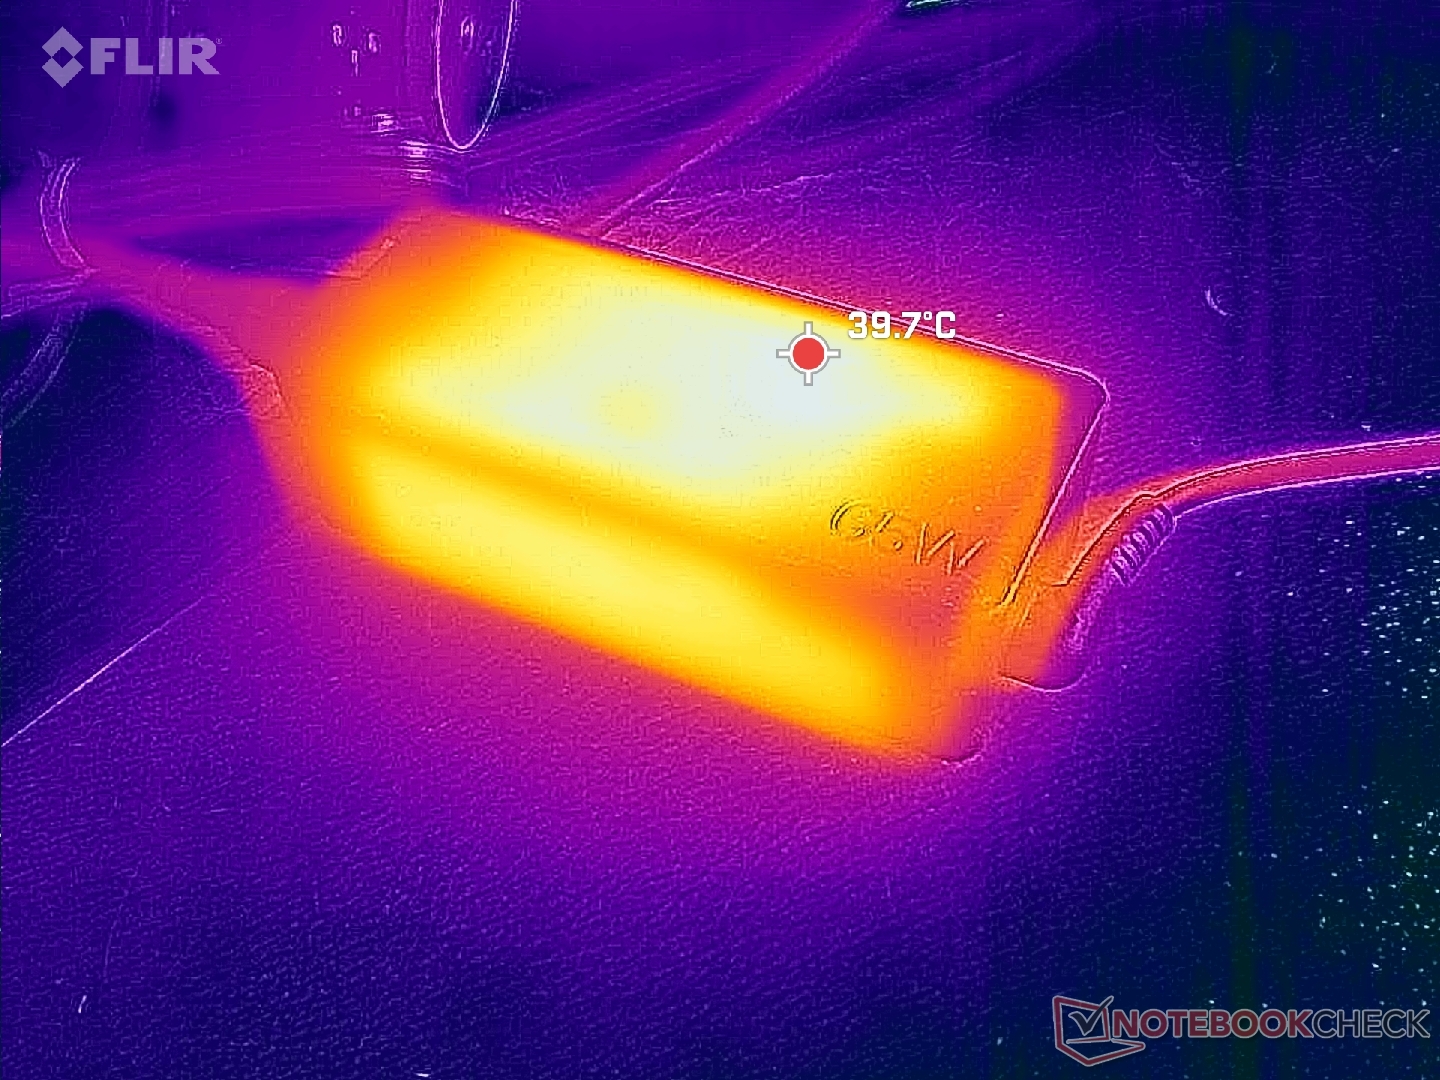
Charging from empty to full capacity is still relatively fast at around 90 minutes.
| Lenovo ThinkPad X1 Yoga G8 i7-1355U i7-1355U, Iris Xe G7 96EUs, 57 Wh | Lenovo ThinkPad X1 Yoga G7 21CE002HGE i7-1270P, Iris Xe G7 96EUs, 57 Wh | Dell Latitude 9430 2-in-1 i7-1265U, Iris Xe G7 96EUs, 60 Wh | LG Gram 14T90P i5-1135G7, Iris Xe G7 80EUs, 72 Wh | Asus ZenBook Flip 14 UN5401QA-KN085W R7 5800H, Vega 8, 63 Wh | HP EliteBook x360 1040 G7, i7-10810U i7-10810U, UHD Graphics 620, 78.6 Wh | |
|---|---|---|---|---|---|---|
| Battery runtime | 33% | 91% | 81% | 30% | 181% | |
| WiFi v1.3 (h) | 6.7 | 8.9 33% | 12.8 91% | 12.1 81% | 8.7 30% | 18.8 181% |
| H.264 (h) | 12.2 | 9 | ||||
| Load (h) | 1.7 | 2.4 | 2.3 | 2.1 | 5.6 | |
| Reader / Idle (h) | 27.8 | 62.8 |
Pros
Cons
Verdict — The Thinkpad X1 Yoga Year To Skip
Yearly updates can sometimes be significant such as the jump from the 2020 ThinkPad X1 Yoga to the 2021 ThinkPad X1 Yoga G6. Unfortunately, the 2023 ThinkPad X1 Yoga G8 is a step sideways when compared to the 2022 ThinkPad X1 Yoga G7. The uptick in processor performance is appreciated, but the unsteady Turbo Boost clock rates and graphics performance may be unfavorable for users.
The ThinkPad X1 Yoga G8 does little to improve upon the already excellent ThinkPad X1 Yoga G7.
There are no other notable changes beyond the CPU swap from 12th gen to 13th gen. If the CPU boost isn't needed for your workloads, then you can get essentially the same experience with the ThinkPad X1 Yoga G7 for less. This isn't to say that the ThinkPad X1 Yoga G8 is a poor convertible as the Yoga G7 is still very good, but we were expecting a bit for a refresh such as a higher resolution webcam, longer battery life, SD card reader, and 1000-nit panel options to better compete against the Dell Latitude 9430 2-in-1 or HP Elite series.
Price and Availability
Lenovo is now shipping its ThinkPad X1 Yoga G8 starting at $1600 USD for the base Core i5 model to over $2400 if fully configured.
Lenovo ThinkPad X1 Yoga G8 i7-1355U
- 06/19/2023 v7 (old)
Allen Ngo
Transparency
The selection of devices to be reviewed is made by our editorial team. The test sample was provided to the author as a loan by the manufacturer or retailer for the purpose of this review. The lender had no influence on this review, nor did the manufacturer receive a copy of this review before publication. There was no obligation to publish this review. As an independent media company, Notebookcheck is not subjected to the authority of manufacturers, retailers or publishers.
This is how Notebookcheck is testing
Every year, Notebookcheck independently reviews hundreds of laptops and smartphones using standardized procedures to ensure that all results are comparable. We have continuously developed our test methods for around 20 years and set industry standards in the process. In our test labs, high-quality measuring equipment is utilized by experienced technicians and editors. These tests involve a multi-stage validation process. Our complex rating system is based on hundreds of well-founded measurements and benchmarks, which maintains objectivity. Further information on our test methods can be found here.
Price comparison
