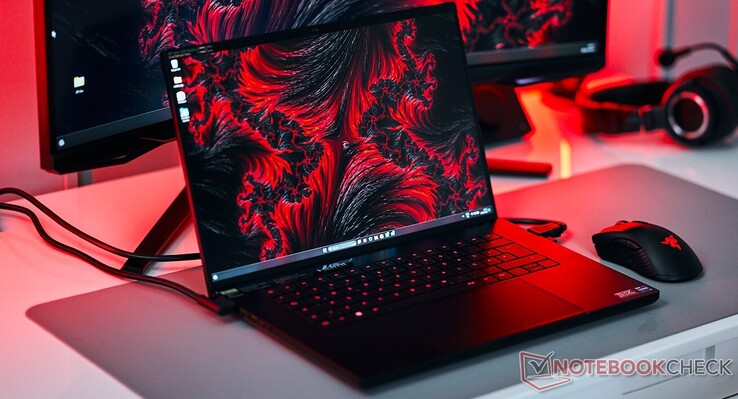
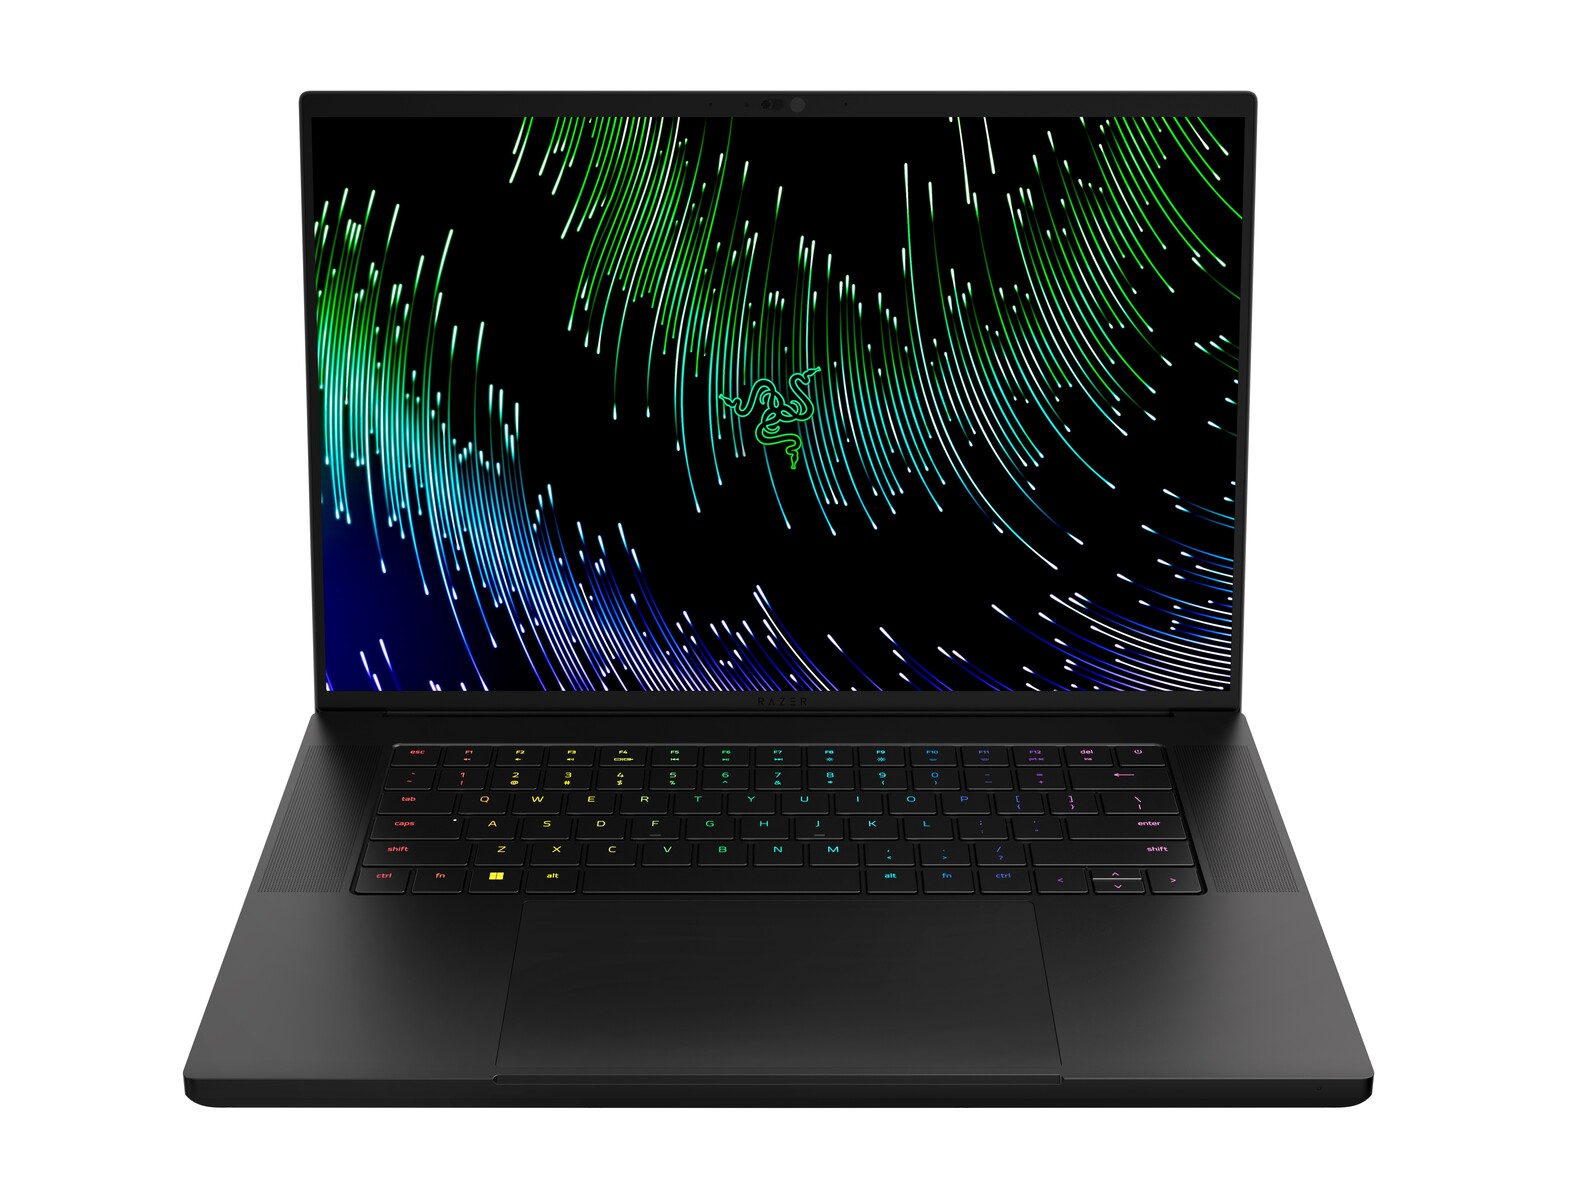
Razer Blade 16 Early 2023 RTX 4090 Review: Core i9-13950HX beast with world's first dual-mode mini-LED UHD+ display
The new Razer Blade 16 joins the growing list of Raptor Lake-HX and RTX 40 series gaming laptops that cram in everything but the kitchen sink and cost as much as a used car.
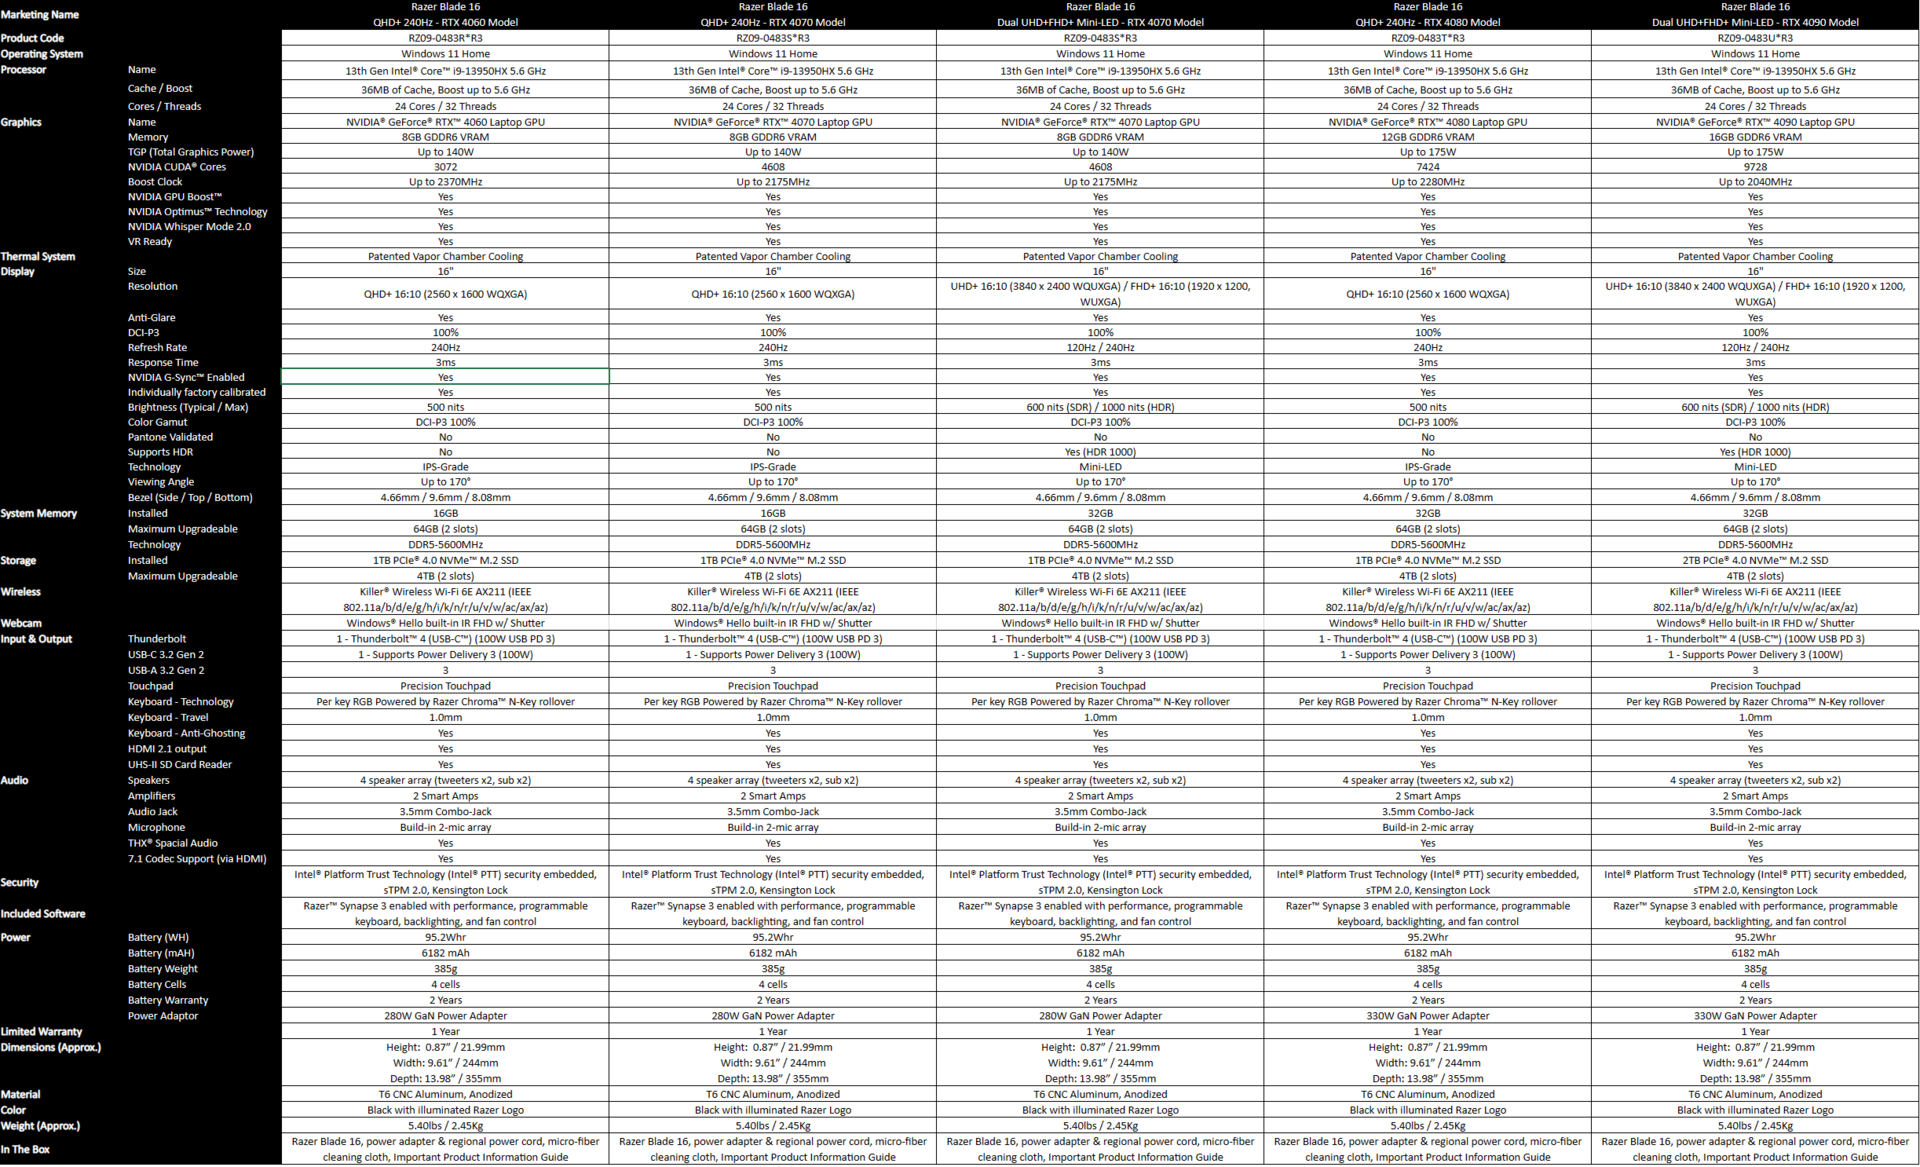
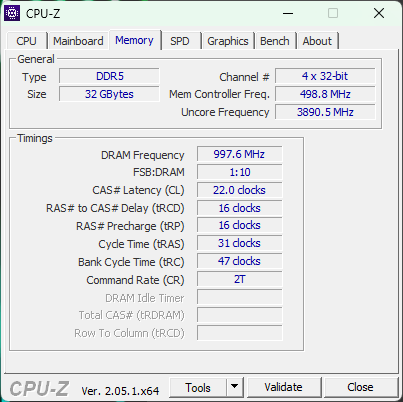
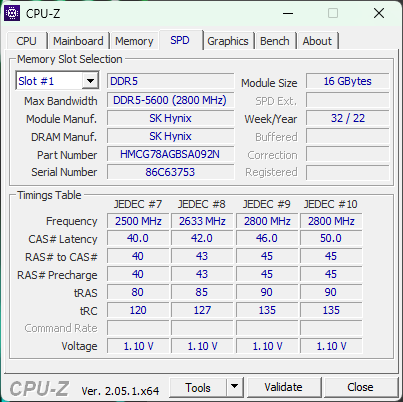
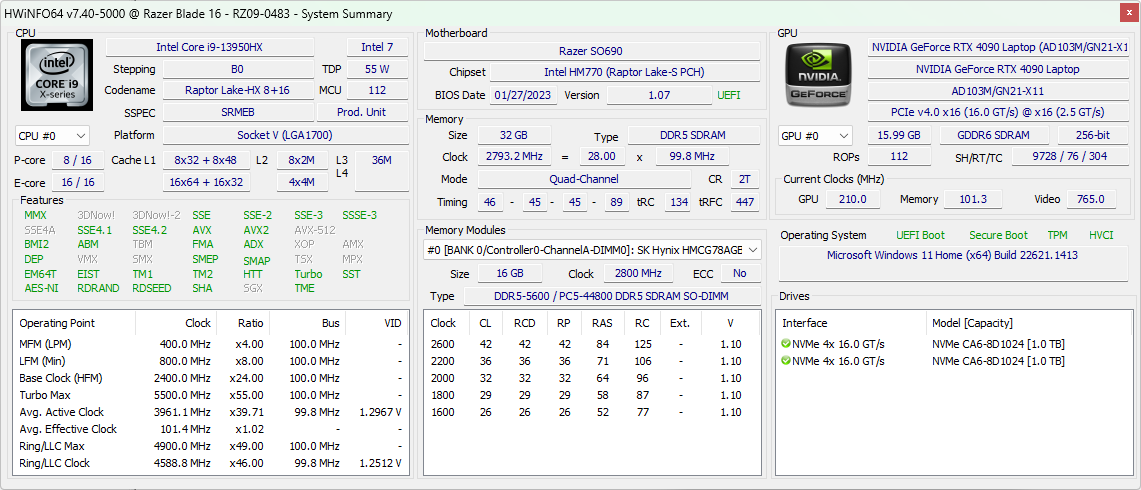
Our test sample provided by Nvidia India is powered by the Core i9-13950HX, RTX 4090 Laptop GPU, a 16-inch dual-mode mini-LED UHD display, 32 GB DDR5-5600 RAM, 2x 1 TB NVMe SSDs, and a 95.2 WHr battery. Razer does not sell its products in India, but this configuration will set you back by US$4,300 or €5,000.
We have previously reviewed the Razer Blade 16 Early 2023 powered by the Intel Core i9-13950HX and Nvidia GeForce RTX 4080 Laptop GPU and also the Blade 18 featuring the same CPU and the RTX 4070 Laptop GPU.
In this review, we test the RTX 4090 Laptop GPU variant of the Blade 16 Early 2023, compare it with the latest devices this year, and see if there's any real benefit to splurging an additional US$700 on what is already quite a big-ticket configuration.
The chassis, input devices, and other internals are identical to the RTX 4080 version of the Blade 16, so we'll only touch upon them briefly here.
Potential Competitors in Comparison
Rating | Date | Model | Weight | Height | Size | Resolution | Price |
|---|---|---|---|---|---|---|---|
| 89.8 % v7 (old) | 03 / 2023 | Razer Blade 16 Early 2023 RTX 4090 i9-13950HX, GeForce RTX 4090 Laptop GPU | 2.5 kg | 21.99 mm | 16.00" | 3840x2400 | |
| 89.9 % v7 (old) | 03 / 2023 | Eluktronics Mech-17 GP2 i9-13900HX, GeForce RTX 4090 Laptop GPU | 2.9 kg | 27 mm | 17.00" | 2560x1600 | |
| 88 % v7 (old) | 04 / 2023 | Asus Zephyrus Duo 16 GX650PY-NM006W R9 7945HX, GeForce RTX 4090 Laptop GPU | 2.7 kg | 29.7 mm | 16.00" | 2560x1600 | |
| 89 % v7 (old) | 02 / 2023 | MSI Titan GT77 HX 13VI i9-13950HX, GeForce RTX 4090 Laptop GPU | 3.5 kg | 23 mm | 17.30" | 3840x2160 | |
| 86.6 % v7 (old) | 02 / 2023 | Asus ROG Strix Scar 18 2023 G834JY-N6005W i9-13980HX, GeForce RTX 4090 Laptop GPU | 3.1 kg | 30.8 mm | 18.00" | 2560x1600 | |
| 89.4 % v7 (old) | 03 / 2023 | Asus ROG Zephyrus M16 GU604VY-NM042X i9-13900H, GeForce RTX 4090 Laptop GPU | 2.3 kg | 22.9 mm | 16.00" | 2560x1600 | |
| 88.4 % v7 (old) | 03 / 2023 | Asus ROG Strix G16 G614JZ i9-13980HX, GeForce RTX 4080 Laptop GPU | 2.4 kg | 30.4 mm | 16.00" | 2560x1600 | |
| 91.2 % v7 (old) | 02 / 2023 | Razer Blade 16 Early 2023 i9-13950HX, GeForce RTX 4080 Laptop GPU | 2.4 kg | 21.99 mm | 16.00" | 2560x1600 | |
| 89.4 % v7 (old) | 02 / 2023 | Lenovo Legion Pro 7 16IRX8H i9-13900HX, GeForce RTX 4080 Laptop GPU | 2.7 kg | 26 mm | 16.00" | 2560x1600 | |
| 91.4 % v7 (old) | 02 / 2023 | Razer Blade 18 RTX 4070 i9-13950HX, GeForce RTX 4070 Laptop GPU | 3 kg | 21.9 mm | 18.00" | 2560x1600 |
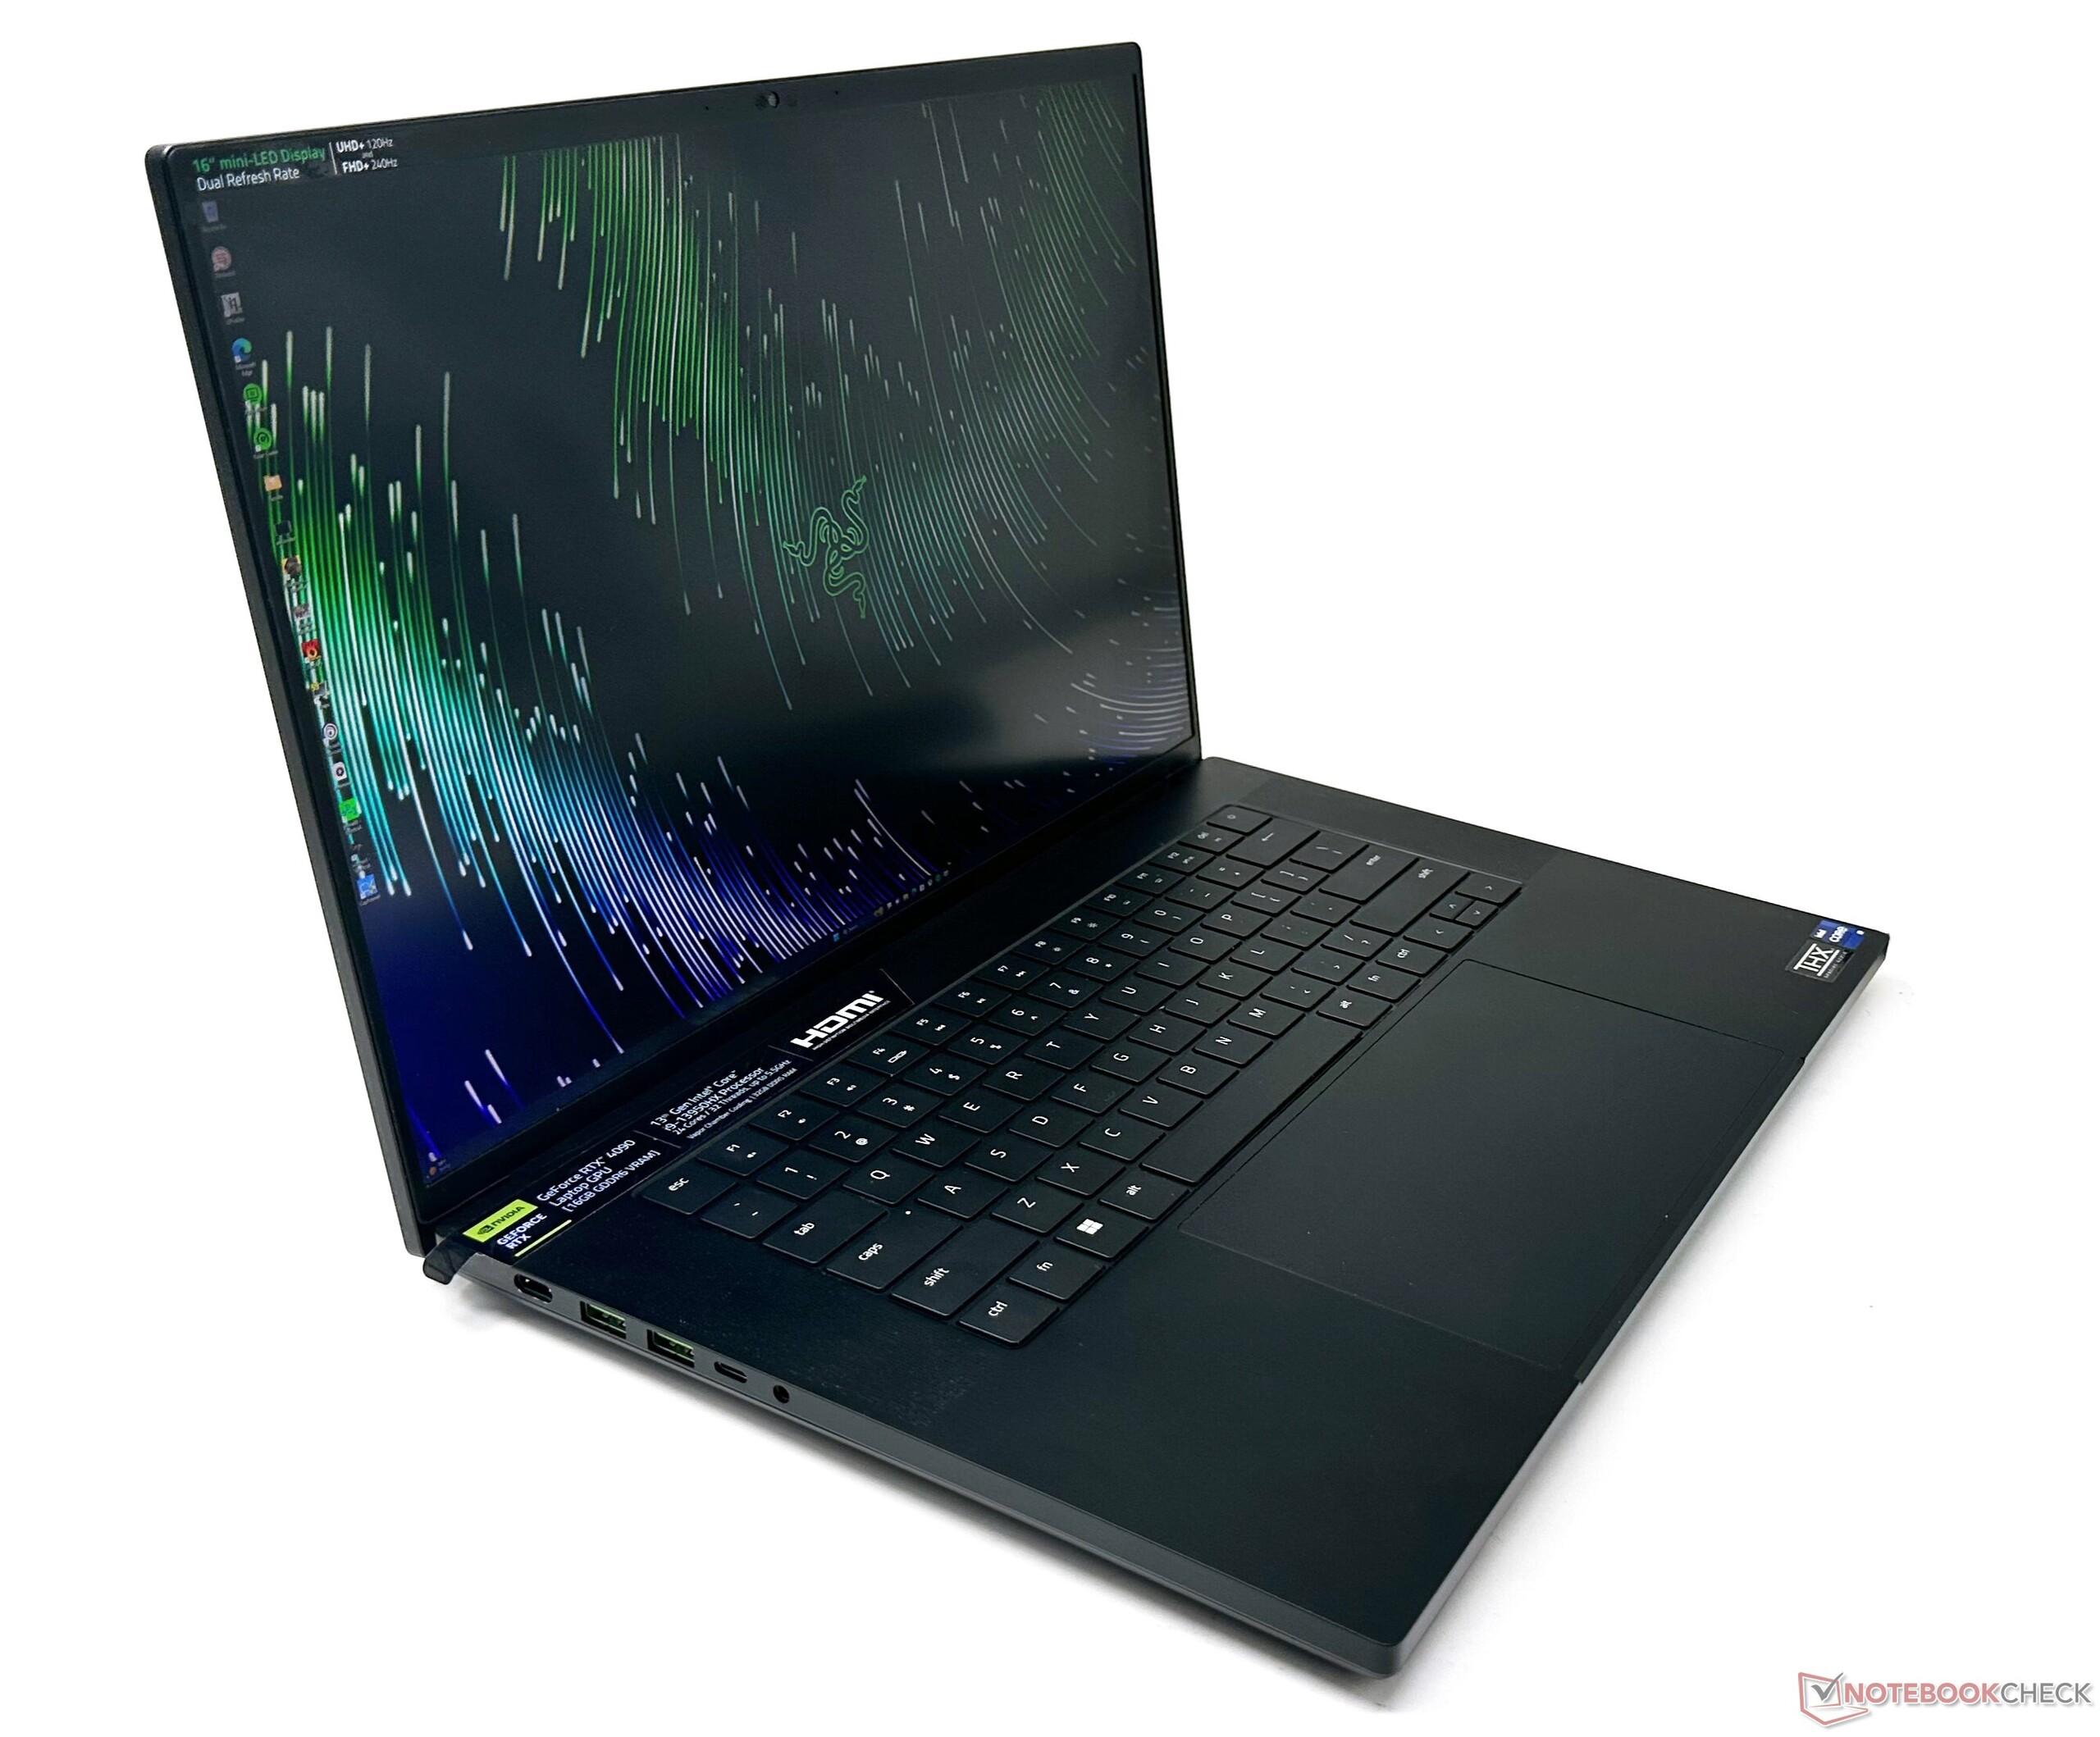
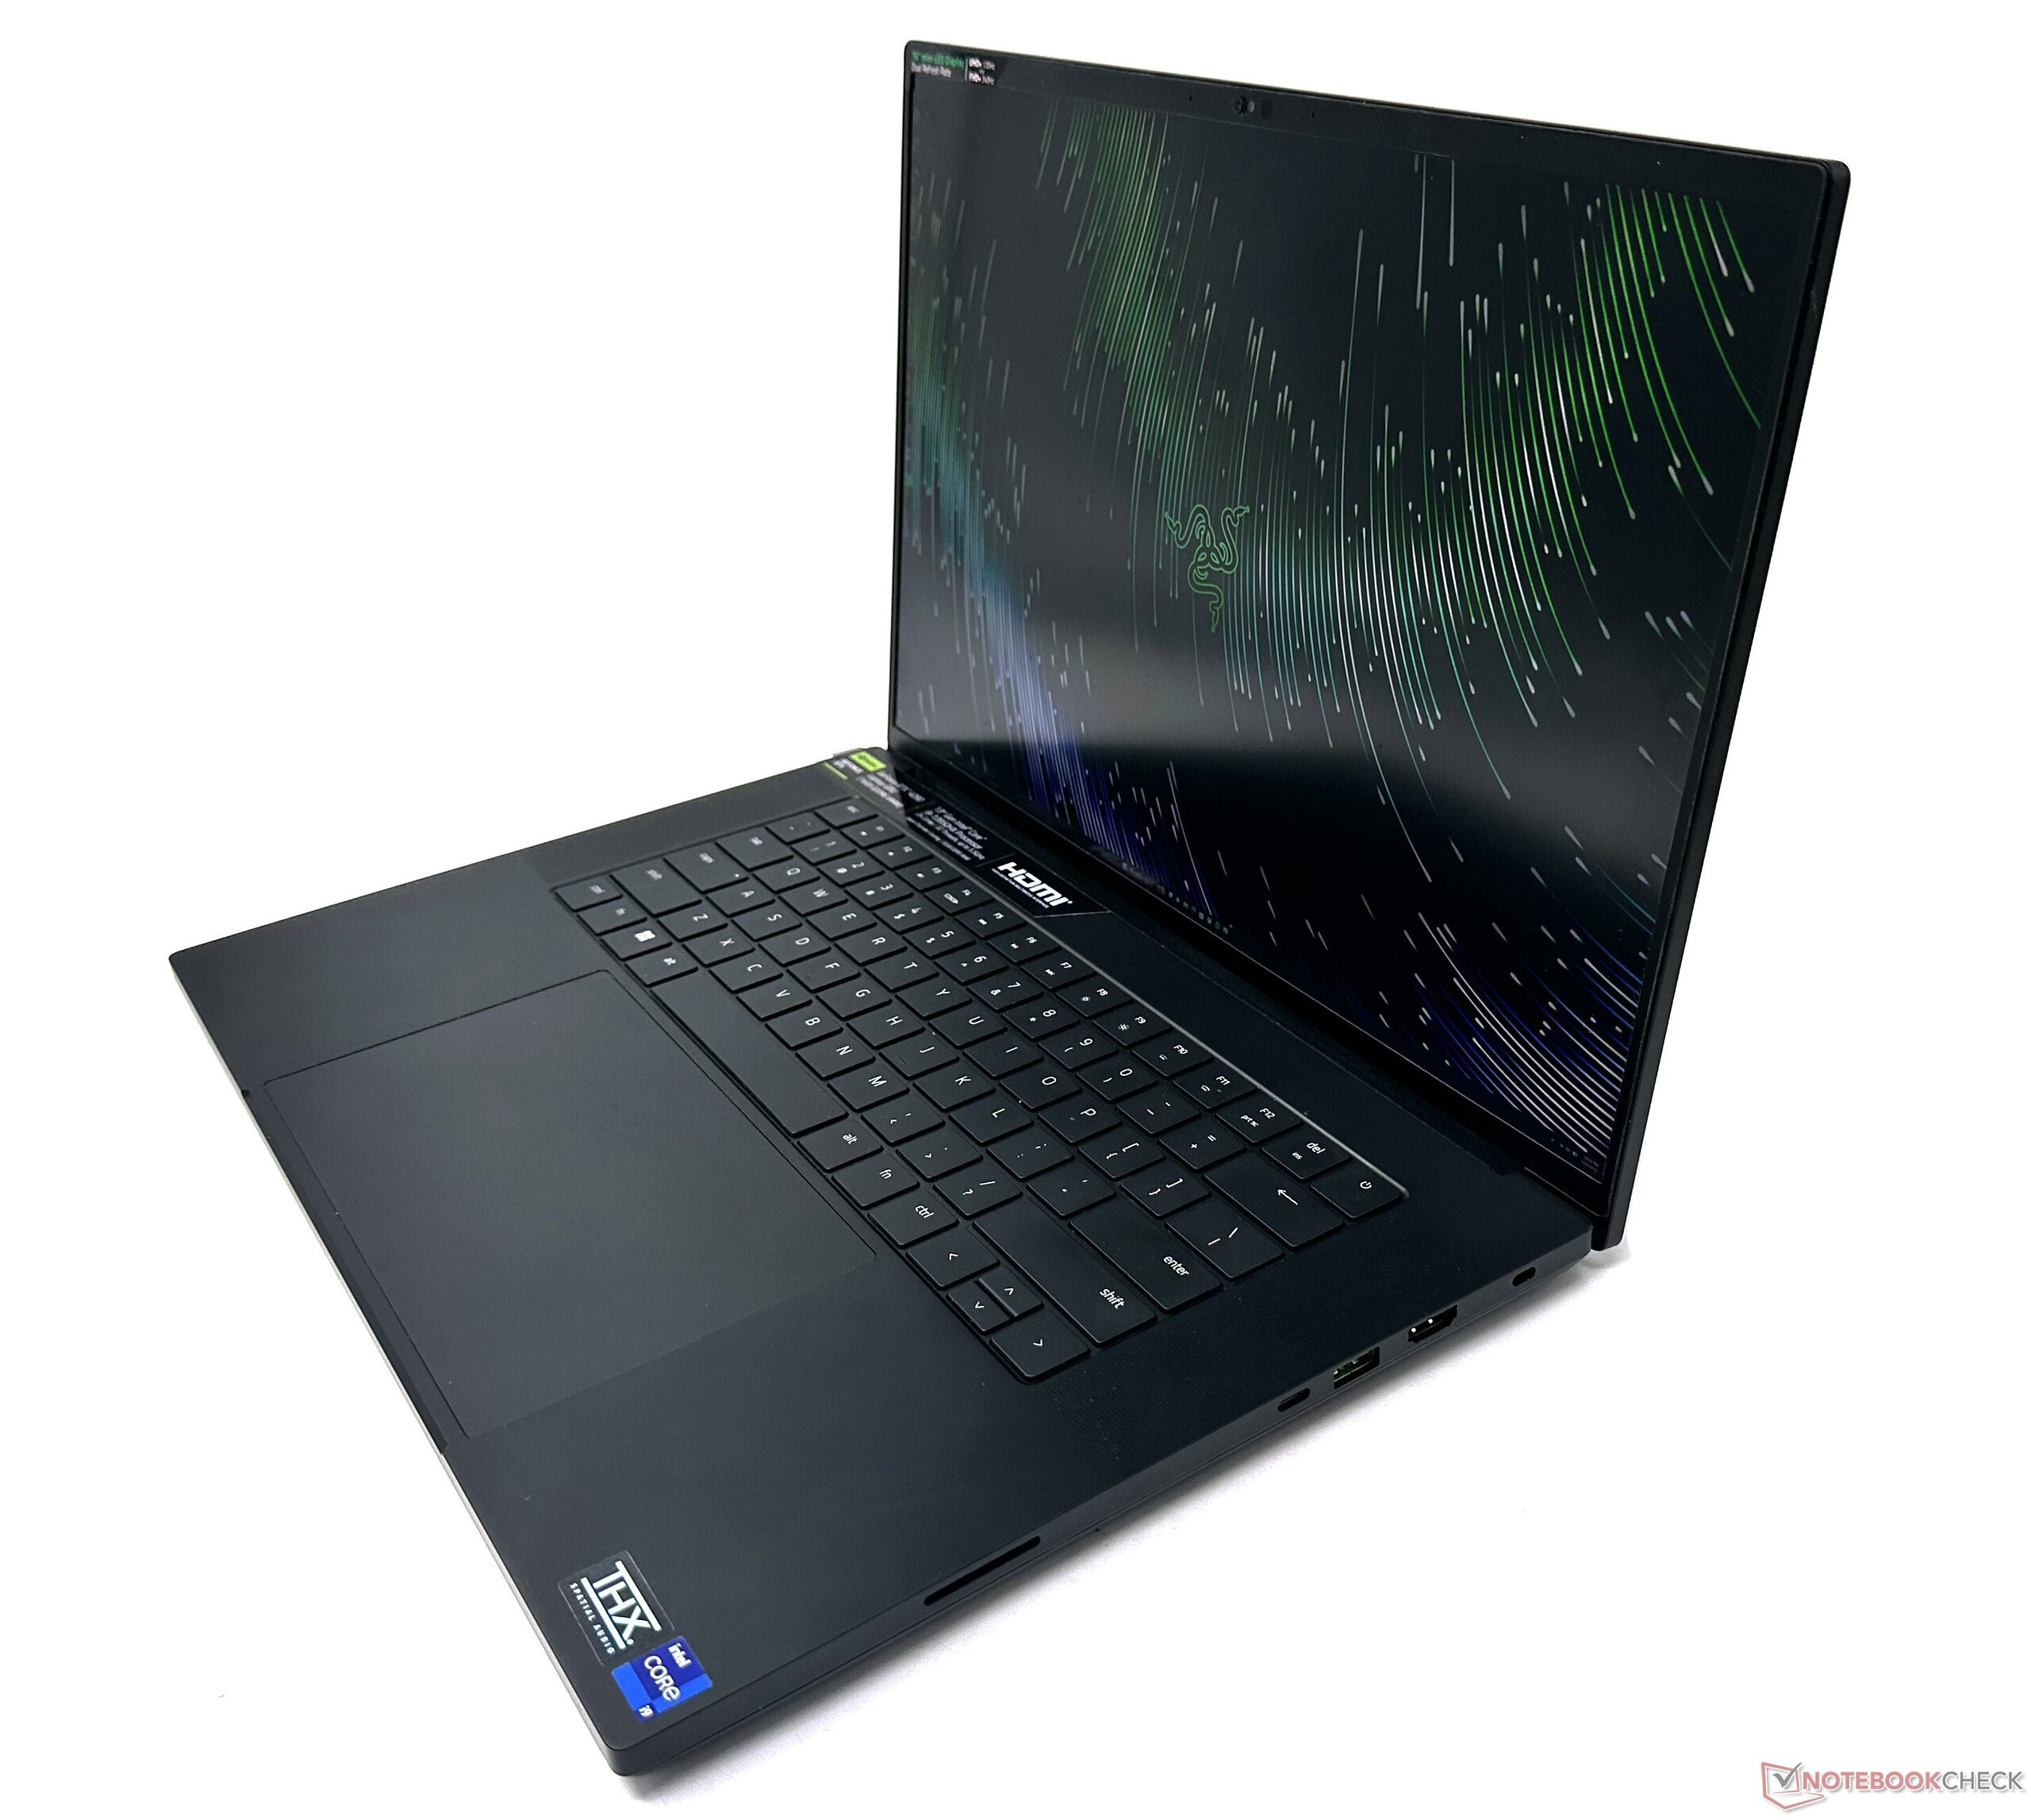
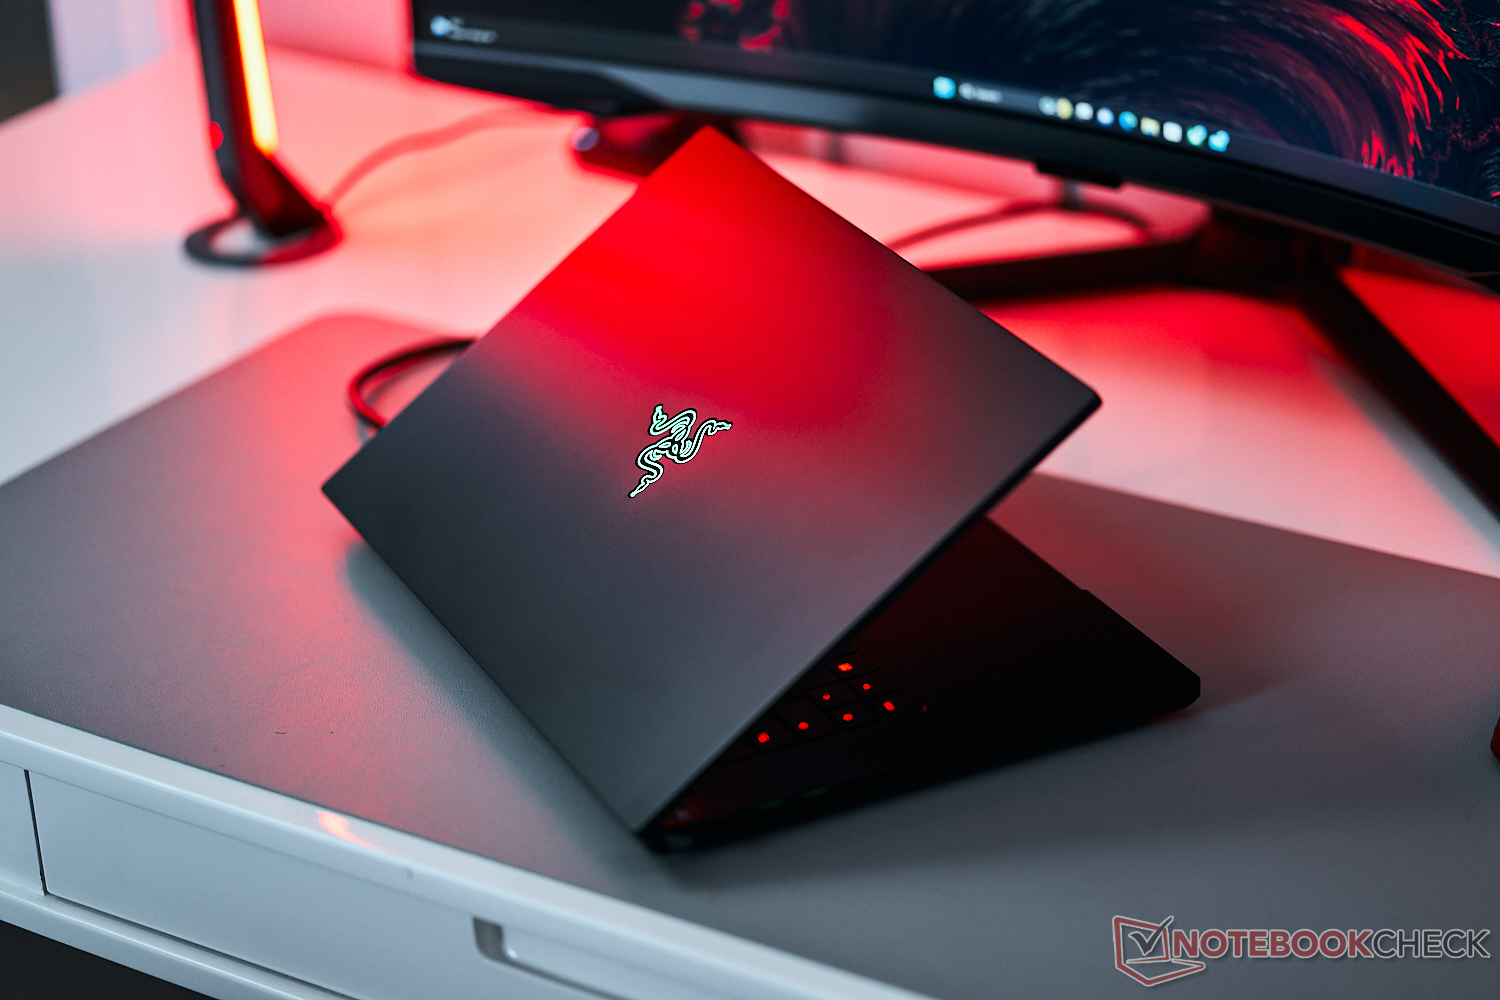
Case: Premium and sturdy in true Razer fashion
The Blade 16 sports an anodized aluminum finish that is reminiscent of a MacBook Pro, similar to a good number of previous Razers we've tested. The premium chassis feels extremely sturdy with very minimal flex, that too only upon deliberately applying a good amount of pressure.
The Razer Blade 16 is slimmer than the Asus ROG Zephyrus Duo 16 and definitely a lot sleeker than the Lenovo Legion Pro 7 and the MSI Titan GT77 HX 13VI. The Asus ROG Zephyrus M16 is nearly identical to the Blade 16 Early 2023 in terms of overall dimensions.
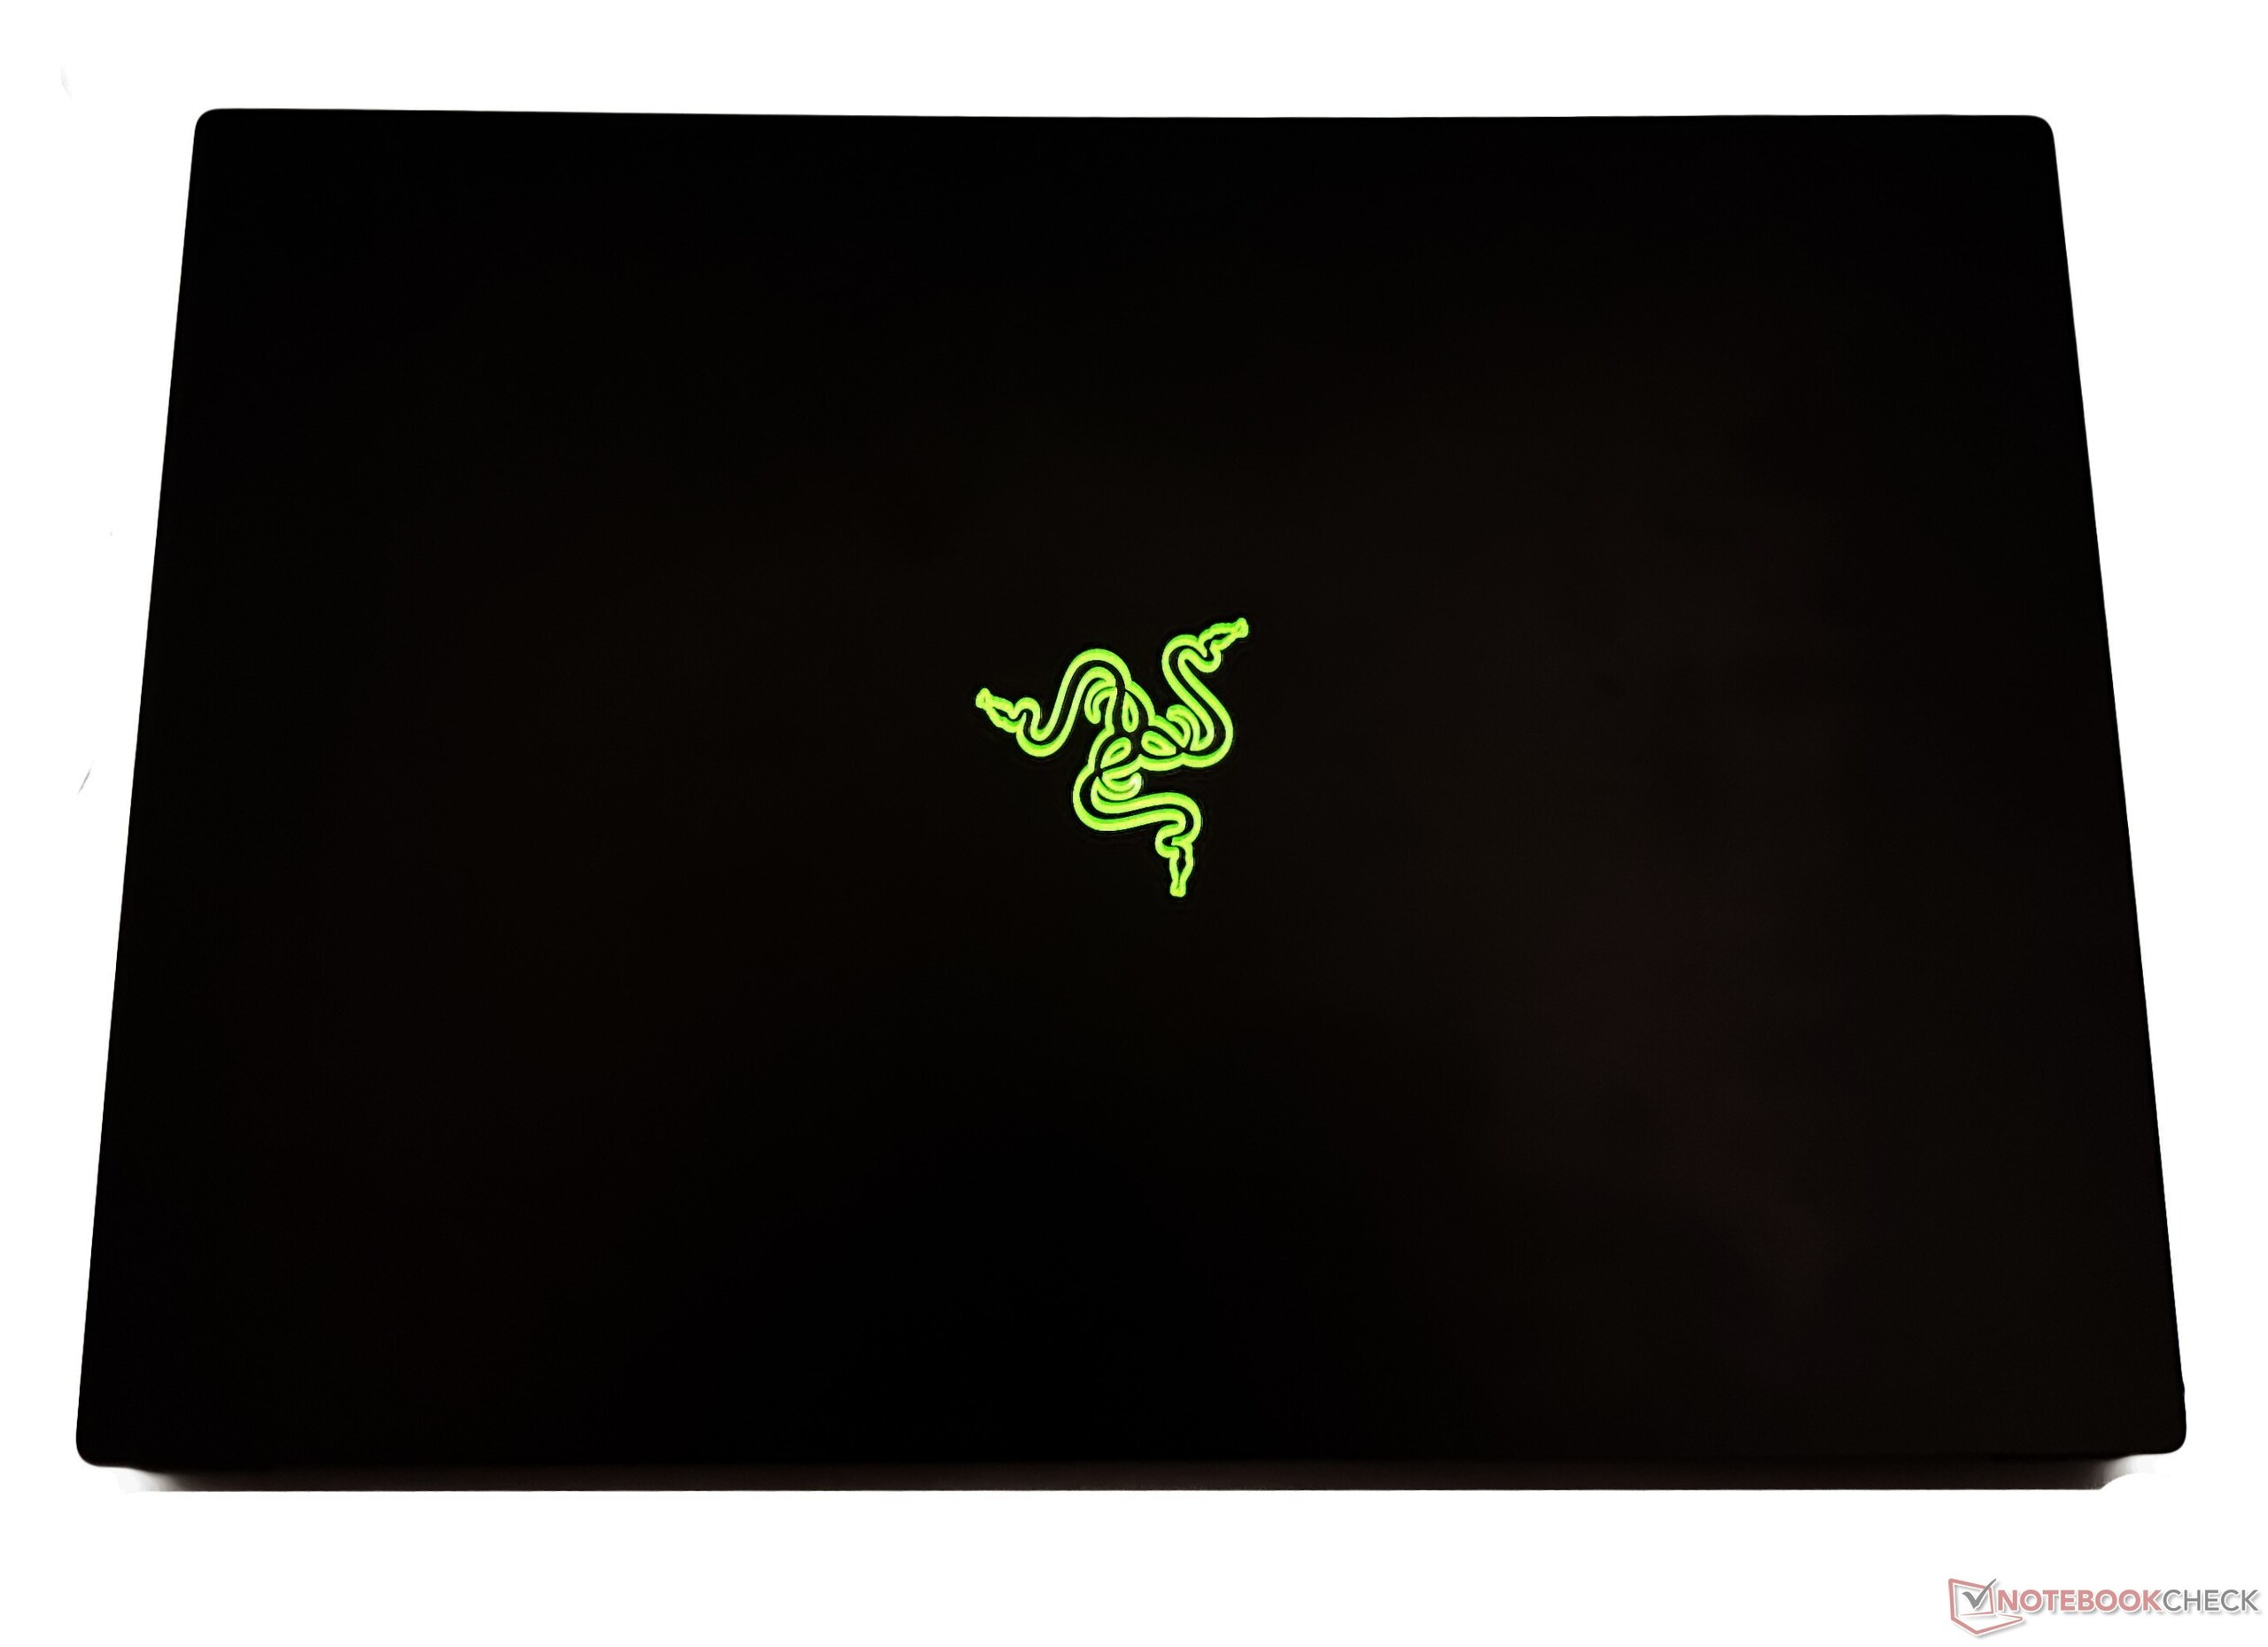
The chassis sports a minimalist design, and the only lighting effect is the characteristic Razer snake logo on the back of the lid. The lid, however, is a grime and fingerprint magnet and is irksome to keep it clean. It is easy to open the lid with a single finger without stability issues.
Connectivity: High throughput SD card and Wi-Fi
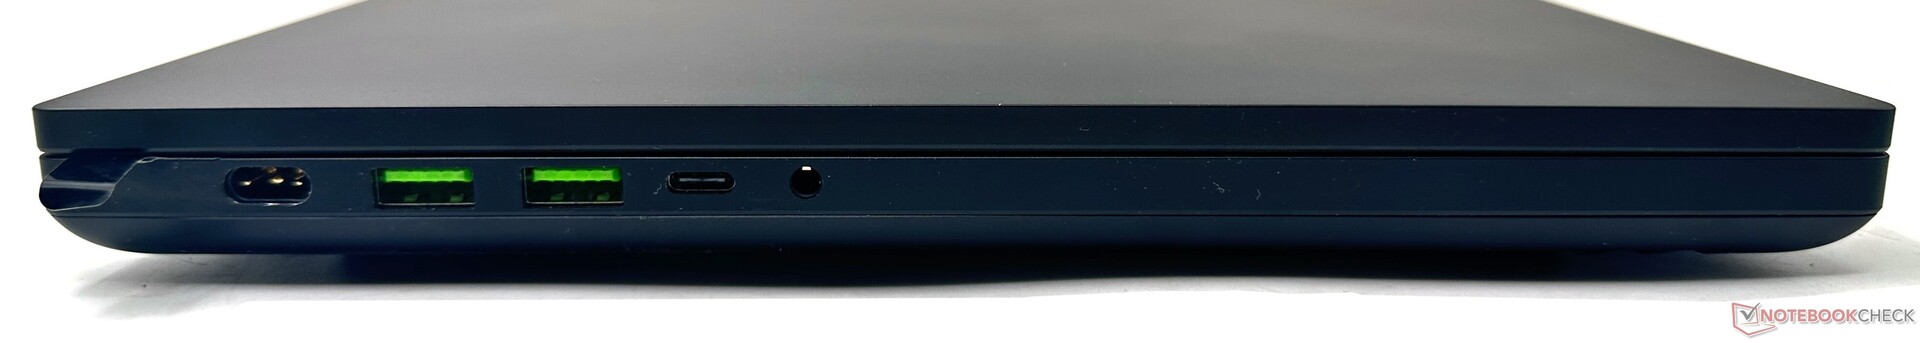
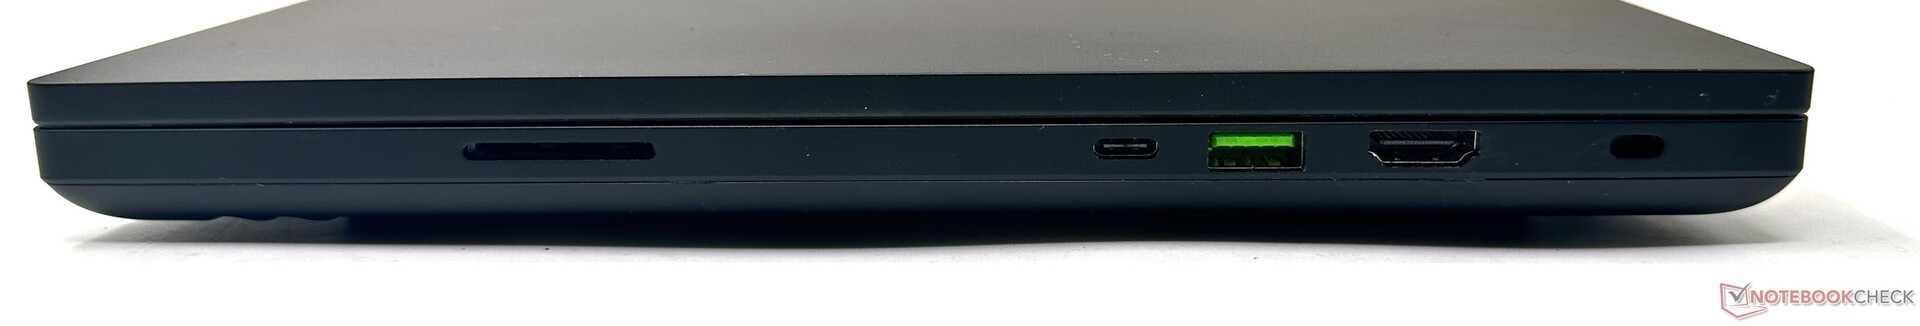
The Blade 16 offers an adequate port selection. Razer uses a proprietary charging port that is backwards compatible with last year's Blade 15 and Blade 17. The connector does not sit flush with the chassis, which can be a peeve for some.
Power delivery up to 100 W is possible on both the USB Type-C ports. Speaking of Type-C, the Blade 16 offers only one Thunderbolt 4 while the other is a USB 3.2 Gen2 Type-C.
Razer could have equipped the Blade 16 with two Thunderbolt 4 ports instead. Also, the Type-C ports aren't labelled, so you will have to note that Thunderbolt 4 is actually the one on the right and not the one on the left.
A Kensington lock slot is present. However, the absence of an RJ-45 Gigabit Ethernet port comes as a bummer given that the laptop isn't exactly aspiring to be scrawny.
SD Card Reader
Razer continues to use some of the fastest SD card readers in gaming laptops, and the Blade 16 is no different. Although the Blade 16 Early 2023's card reader lags behind the Asus ROG Zephyrus Duo 16 in sequential tests, it is able to inch past the latter in JPG file copy tests.
| SD Card Reader | |
| average JPG Copy Test (av. of 3 runs) | |
| Razer Blade 18 RTX 4070 (Angelibird AV Pro V60) | |
| Razer Blade 16 Early 2023 RTX 4090 (Angelbird AV PRO 128 GB V60) | |
| Asus ROG Zephyrus M16 GU604VY-NM042X | |
| Asus Zephyrus Duo 16 GX650PY-NM006W (Angelbird AV Pro V60) | |
| Average of class Gaming (20.9 - 210, n=54, last 2 years) | |
| Razer Blade 16 Early 2023 (AV PRO microSD 128 GB V60) | |
| MSI Titan GT77 HX 13VI (Angelibird AV Pro V60) | |
| Eluktronics Mech-17 GP2 (Angelibird AV Pro V60) | |
| maximum AS SSD Seq Read Test (1GB) | |
| Asus Zephyrus Duo 16 GX650PY-NM006W (Angelbird AV Pro V60) | |
| Razer Blade 18 RTX 4070 (Angelibird AV Pro V60) | |
| Razer Blade 16 Early 2023 (AV PRO microSD 128 GB V60) | |
| Razer Blade 16 Early 2023 RTX 4090 (Angelbird AV PRO 128 GB V60) | |
| Asus ROG Zephyrus M16 GU604VY-NM042X | |
| Average of class Gaming (25.5 - 261, n=51, last 2 years) | |
| Eluktronics Mech-17 GP2 (Angelibird AV Pro V60) | |
| MSI Titan GT77 HX 13VI (Angelibird AV Pro V60) | |
Communication
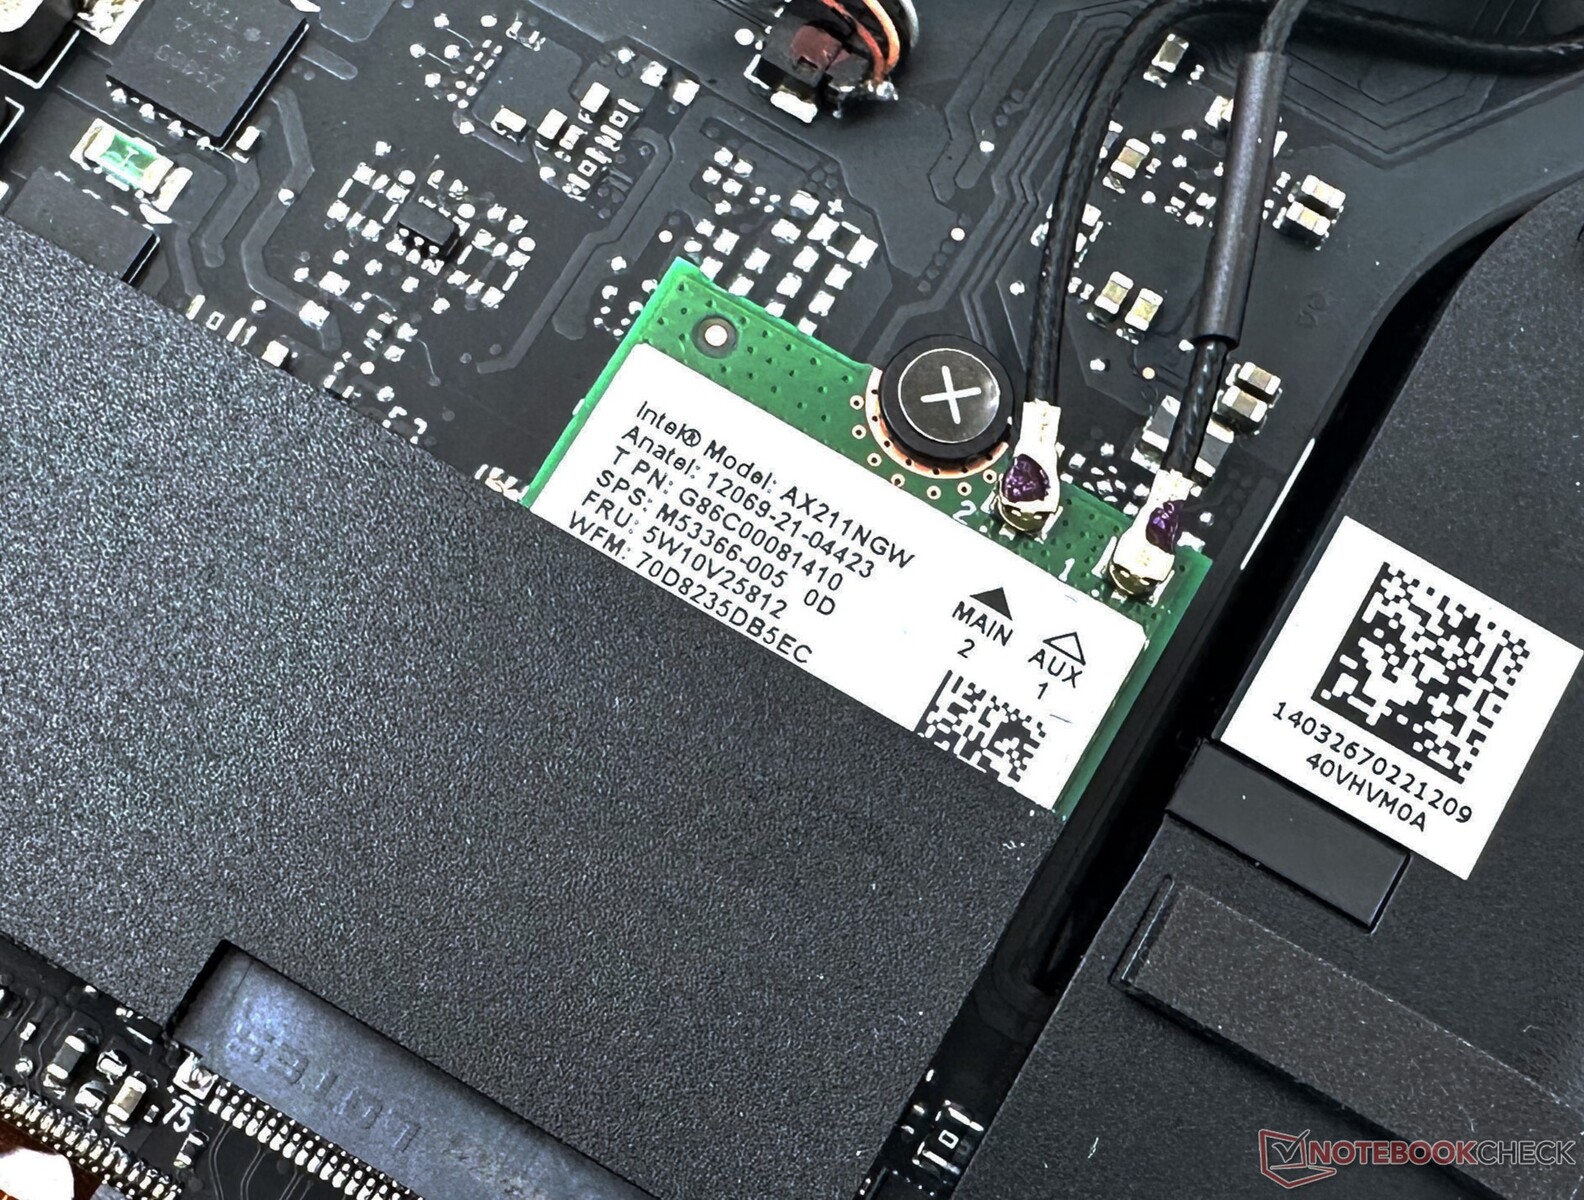
The Blade 16 comes fitted with an Intel Wi-Fi 6E AX211 WLAN module. Wi-Fi performance was tested using our reference Asus ROG Rapture GT-AXE11000 router at a distance of 1 m from the laptop in clear line of sight with no other connected device or external interference.
Networking performance is quite stable in both 5 GHz and 6 GHz bands. There is no real throughput benefit in using the 6 GHz band over 5 GHz as the transfer rates are largely identical in both.
That being said, the 6 GHz option is still a nice one to have if you have a compatible router and would like to reduce interference from the plethora of other 5 GHz clients.
Webcam
The 1080p webcam shows somewhat higher color deviations, particularly with blue shades. The sharpness is serviceable but with perceivable amounts of noise. Overall, the output is decent-enough for video calls and the works.


Security
The Blade 16 supports Windows Hello-based logins via the IR sensor. Facial recognition is fast and works without much trouble. Unlike the Blade 18, a physical shutter is provided for the webcam. A TPM 2.0 module is present.
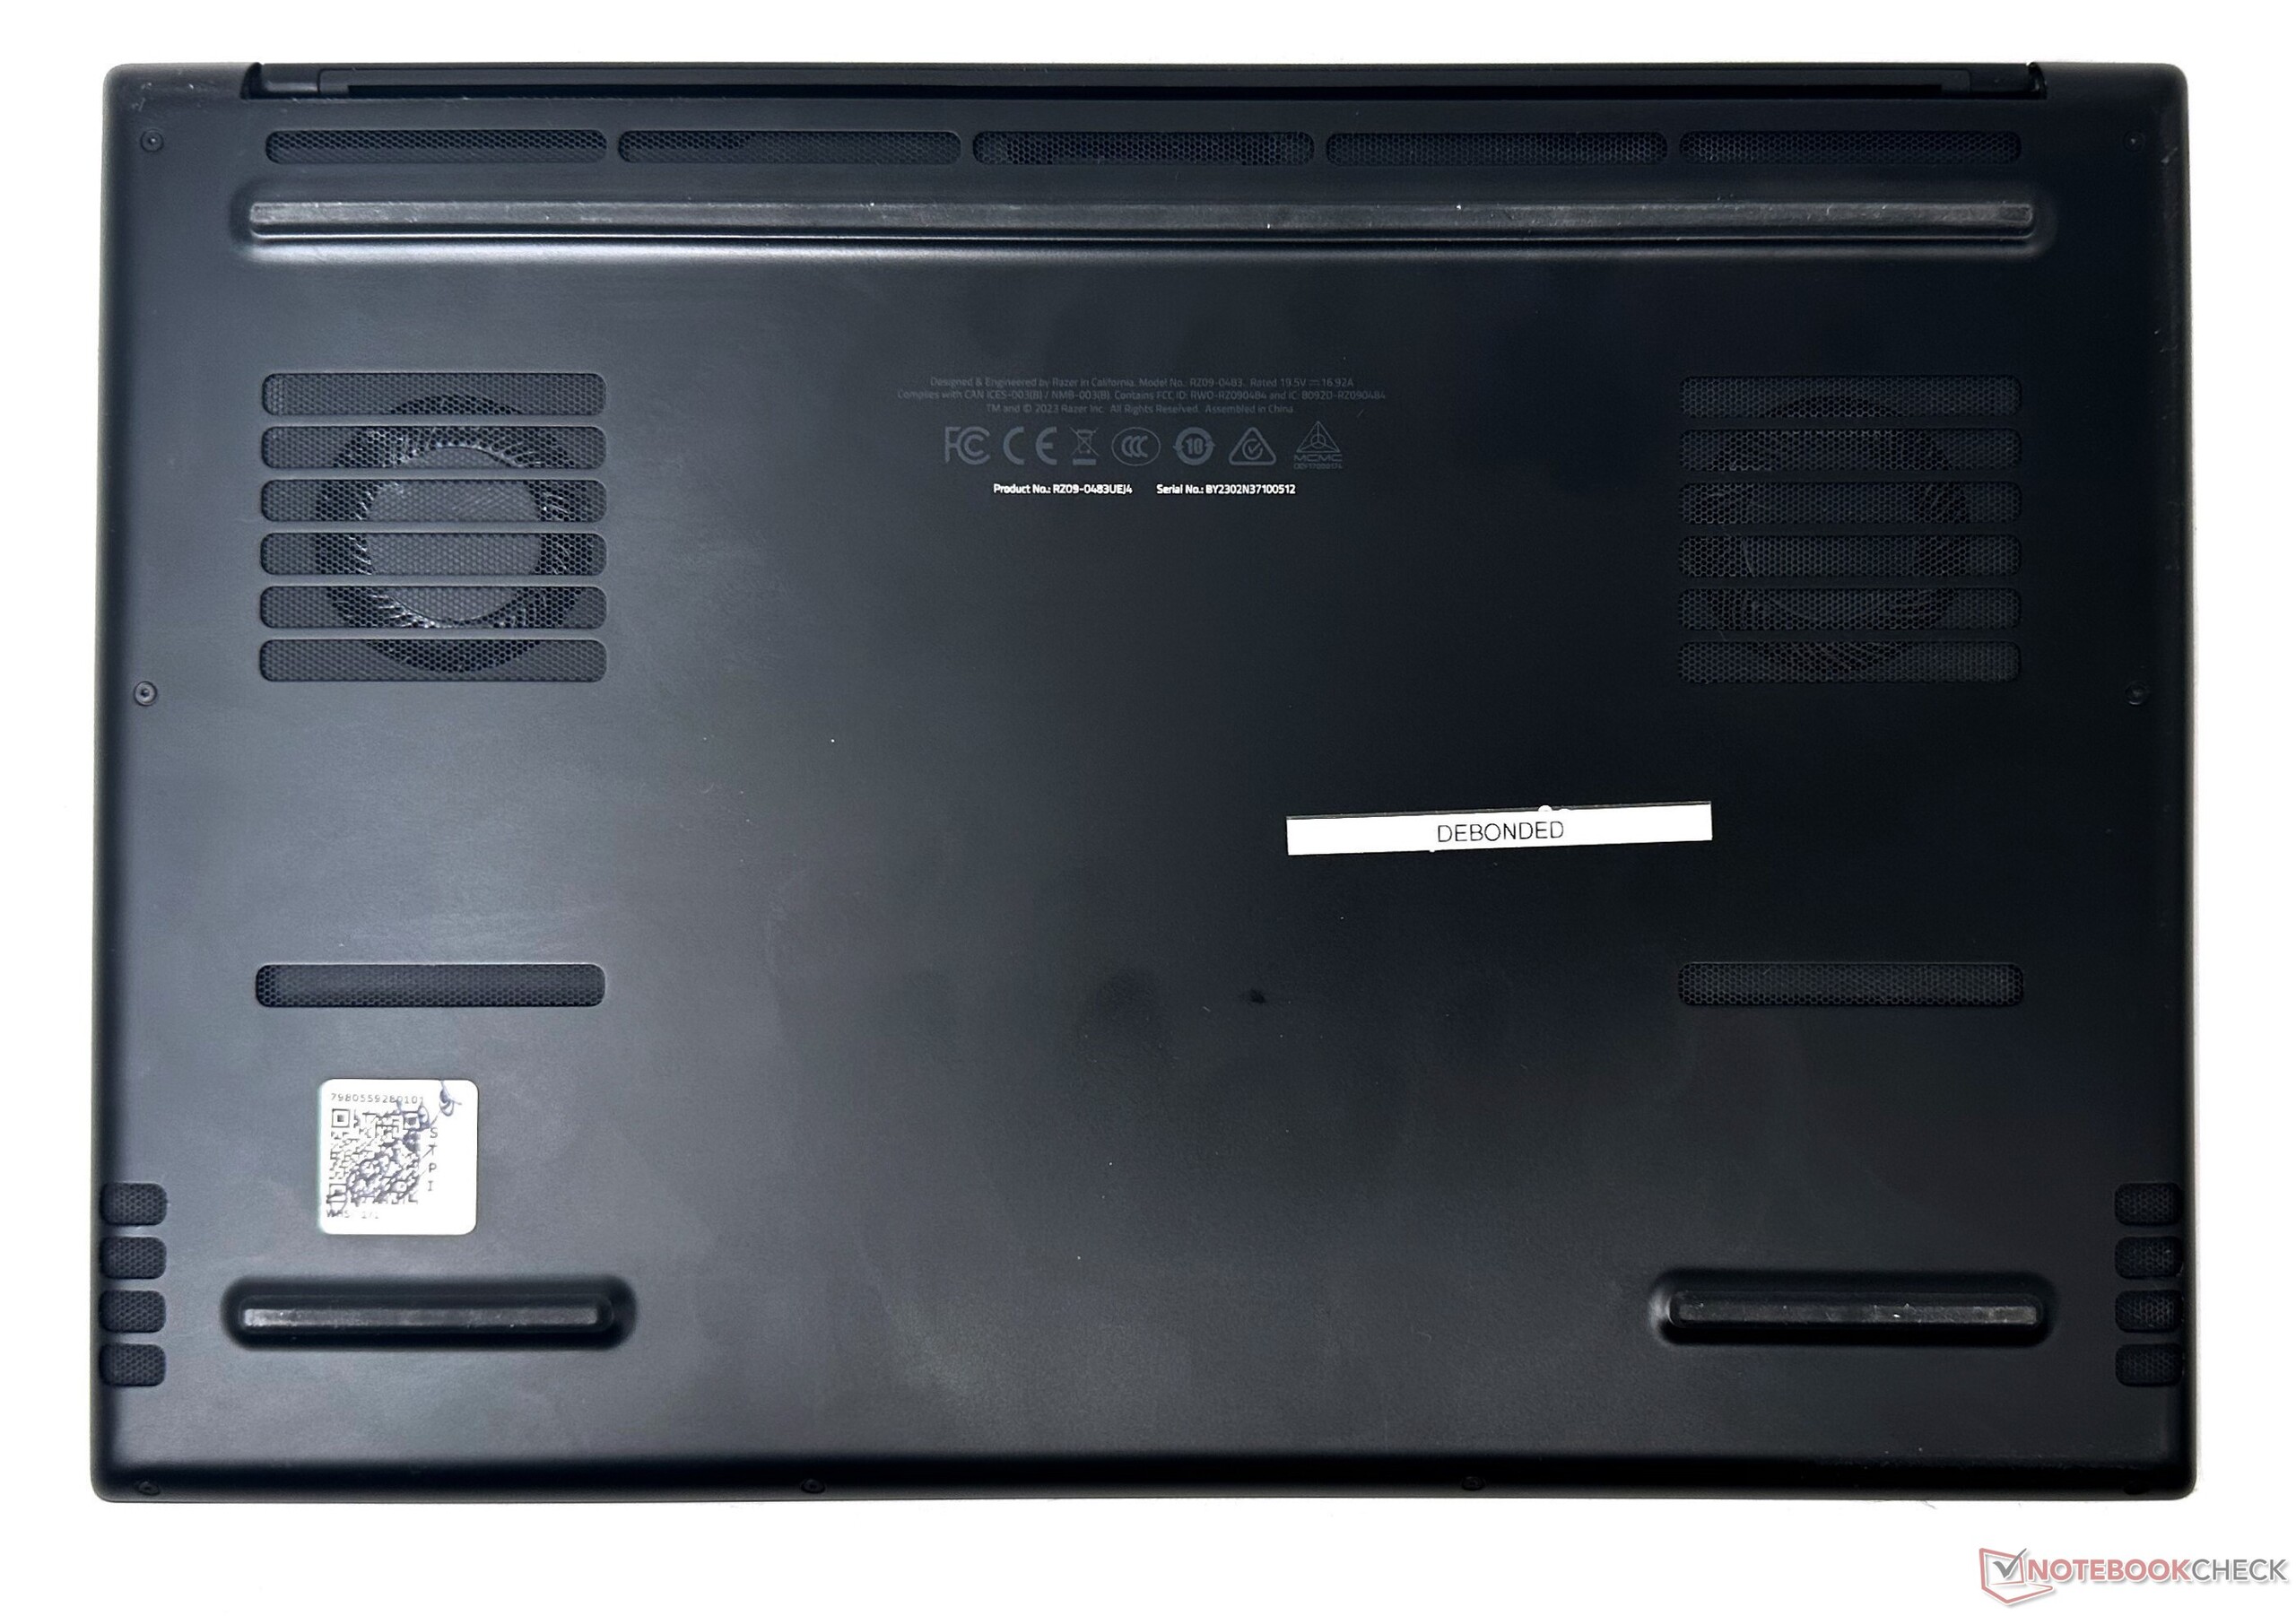
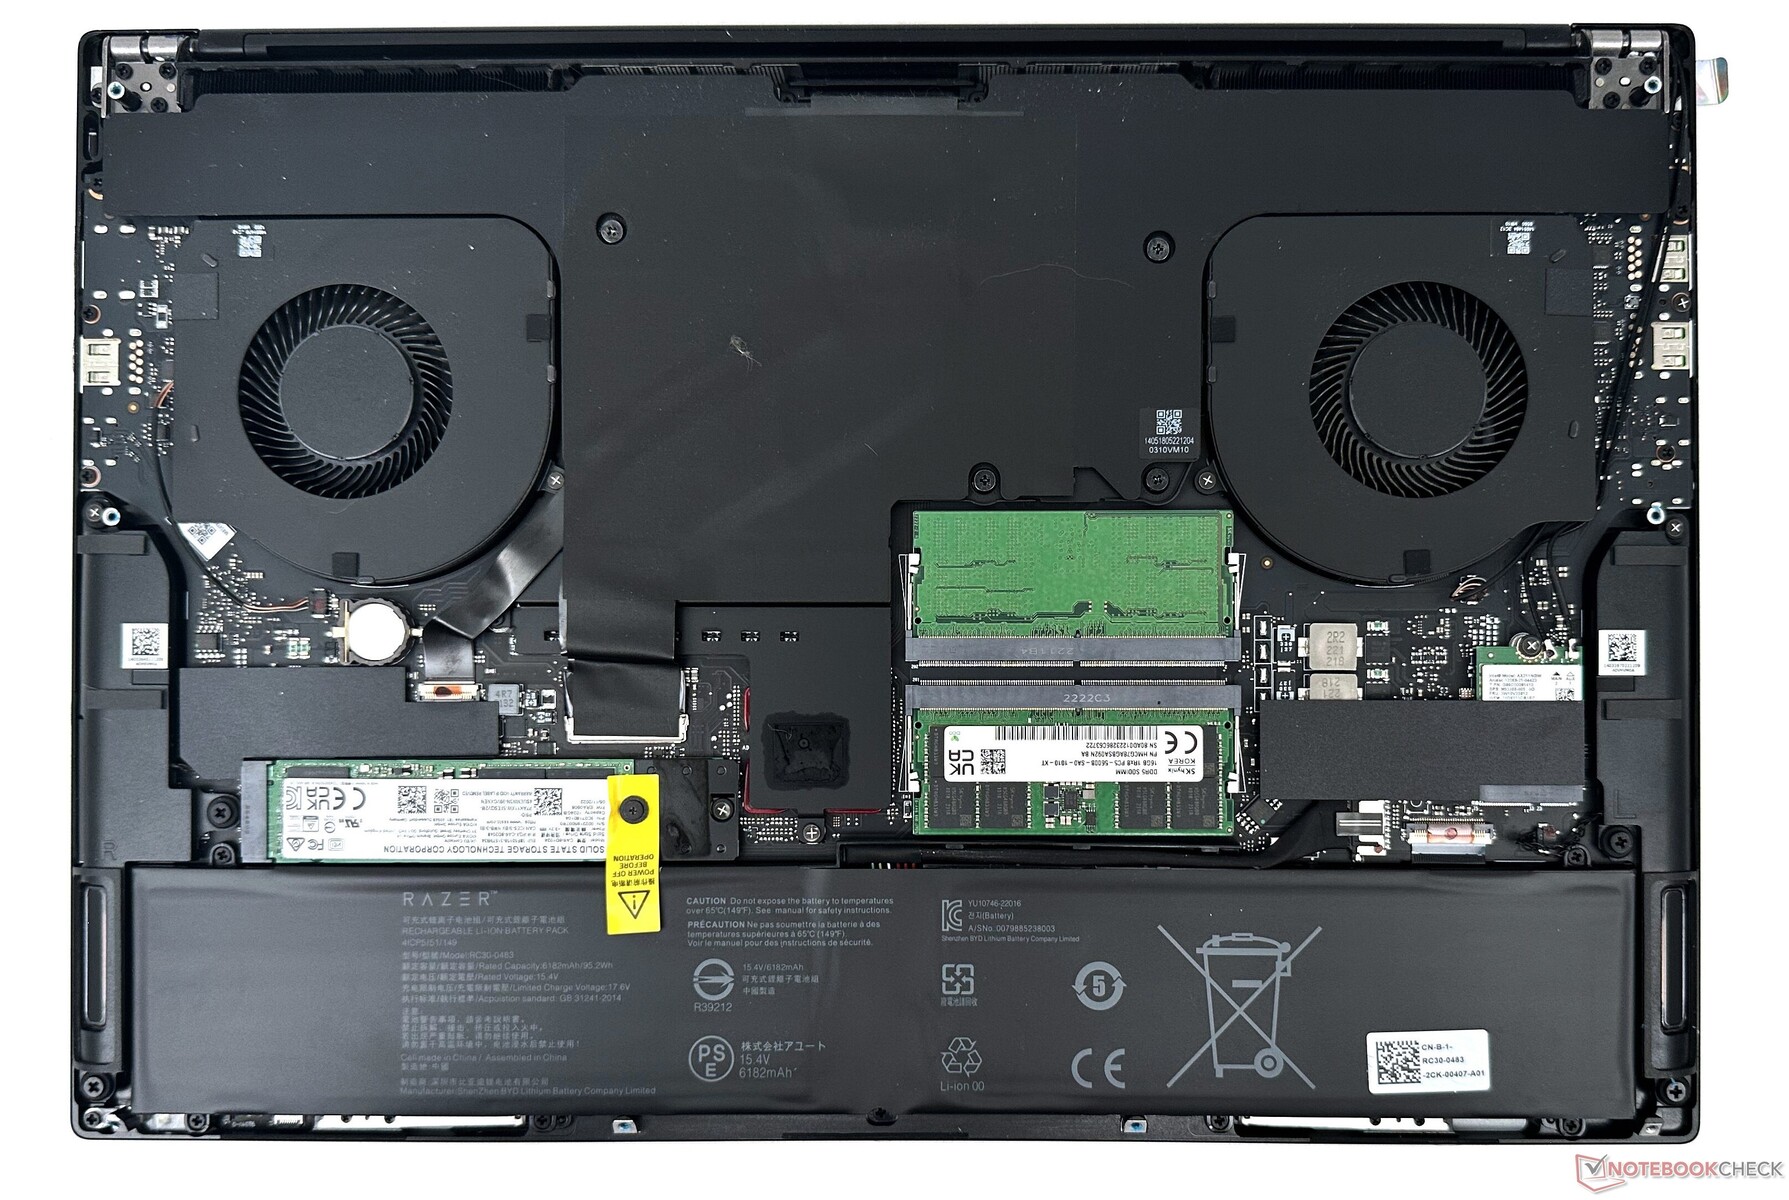
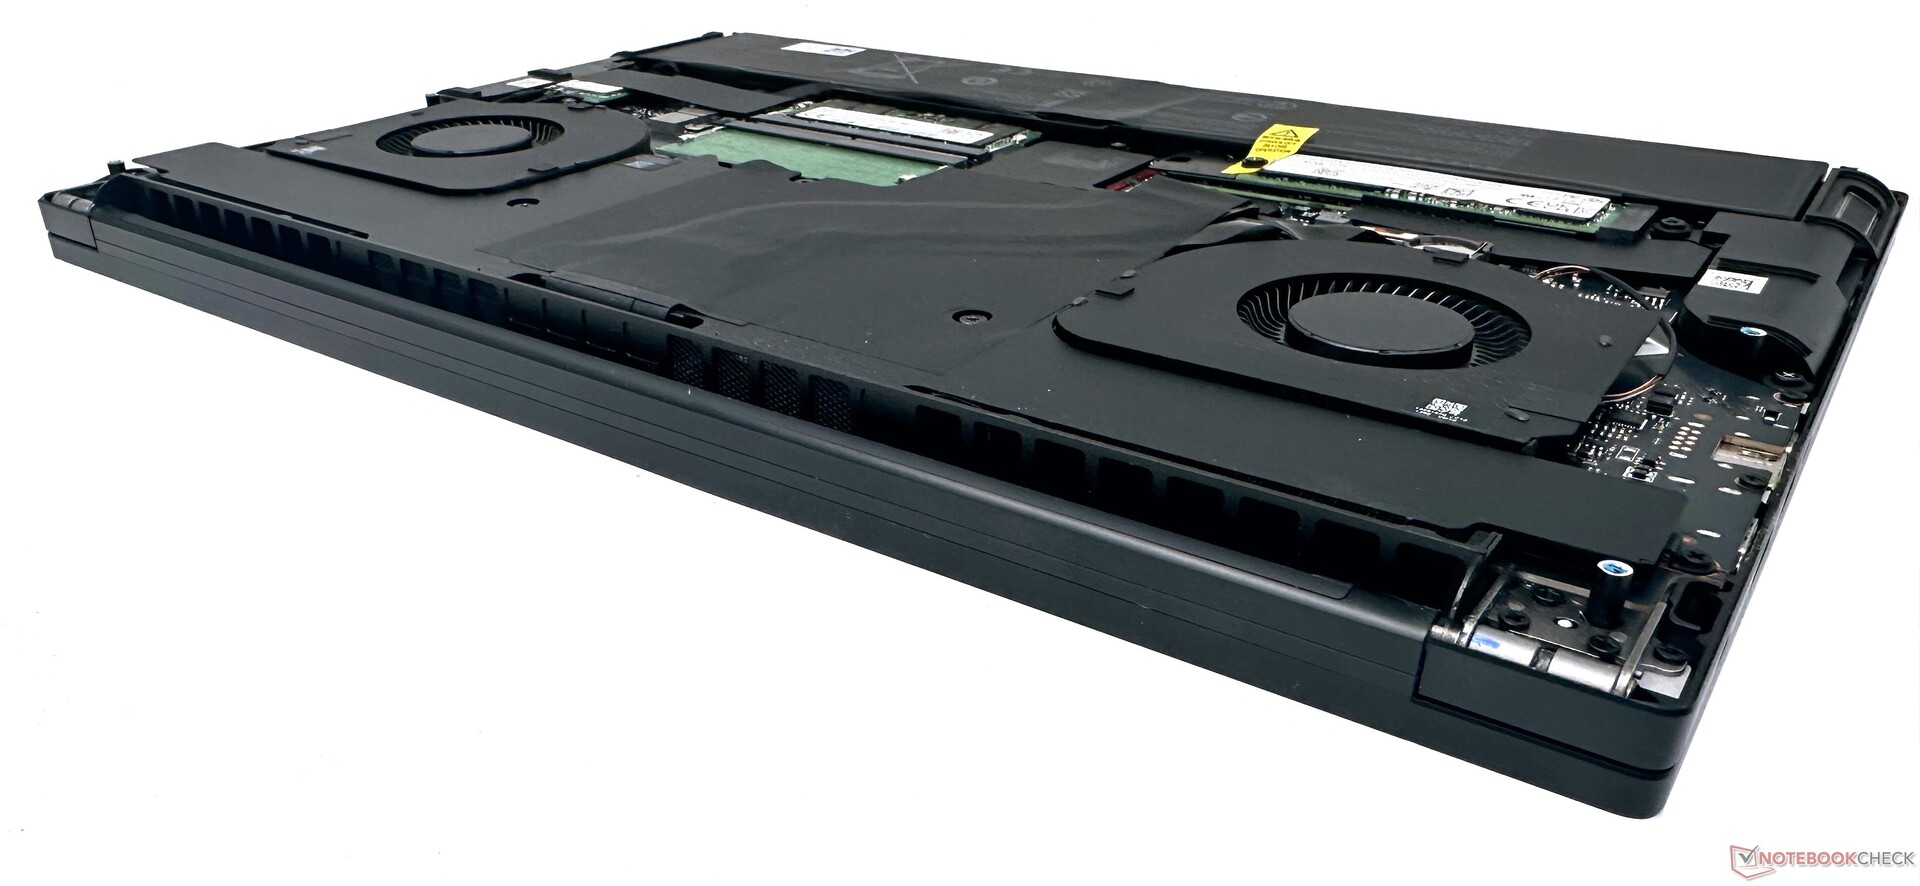
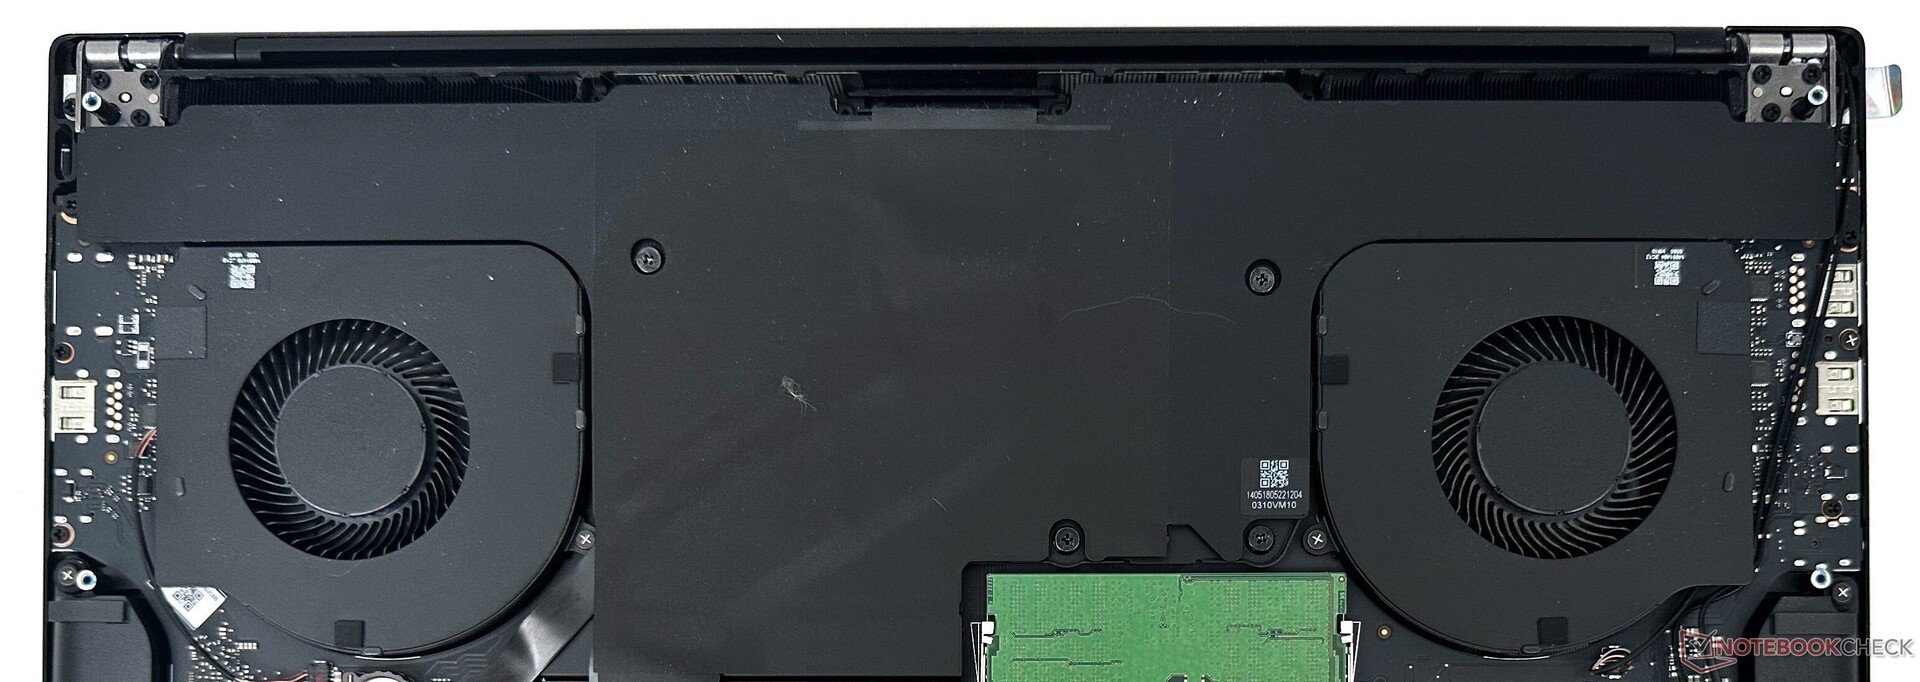
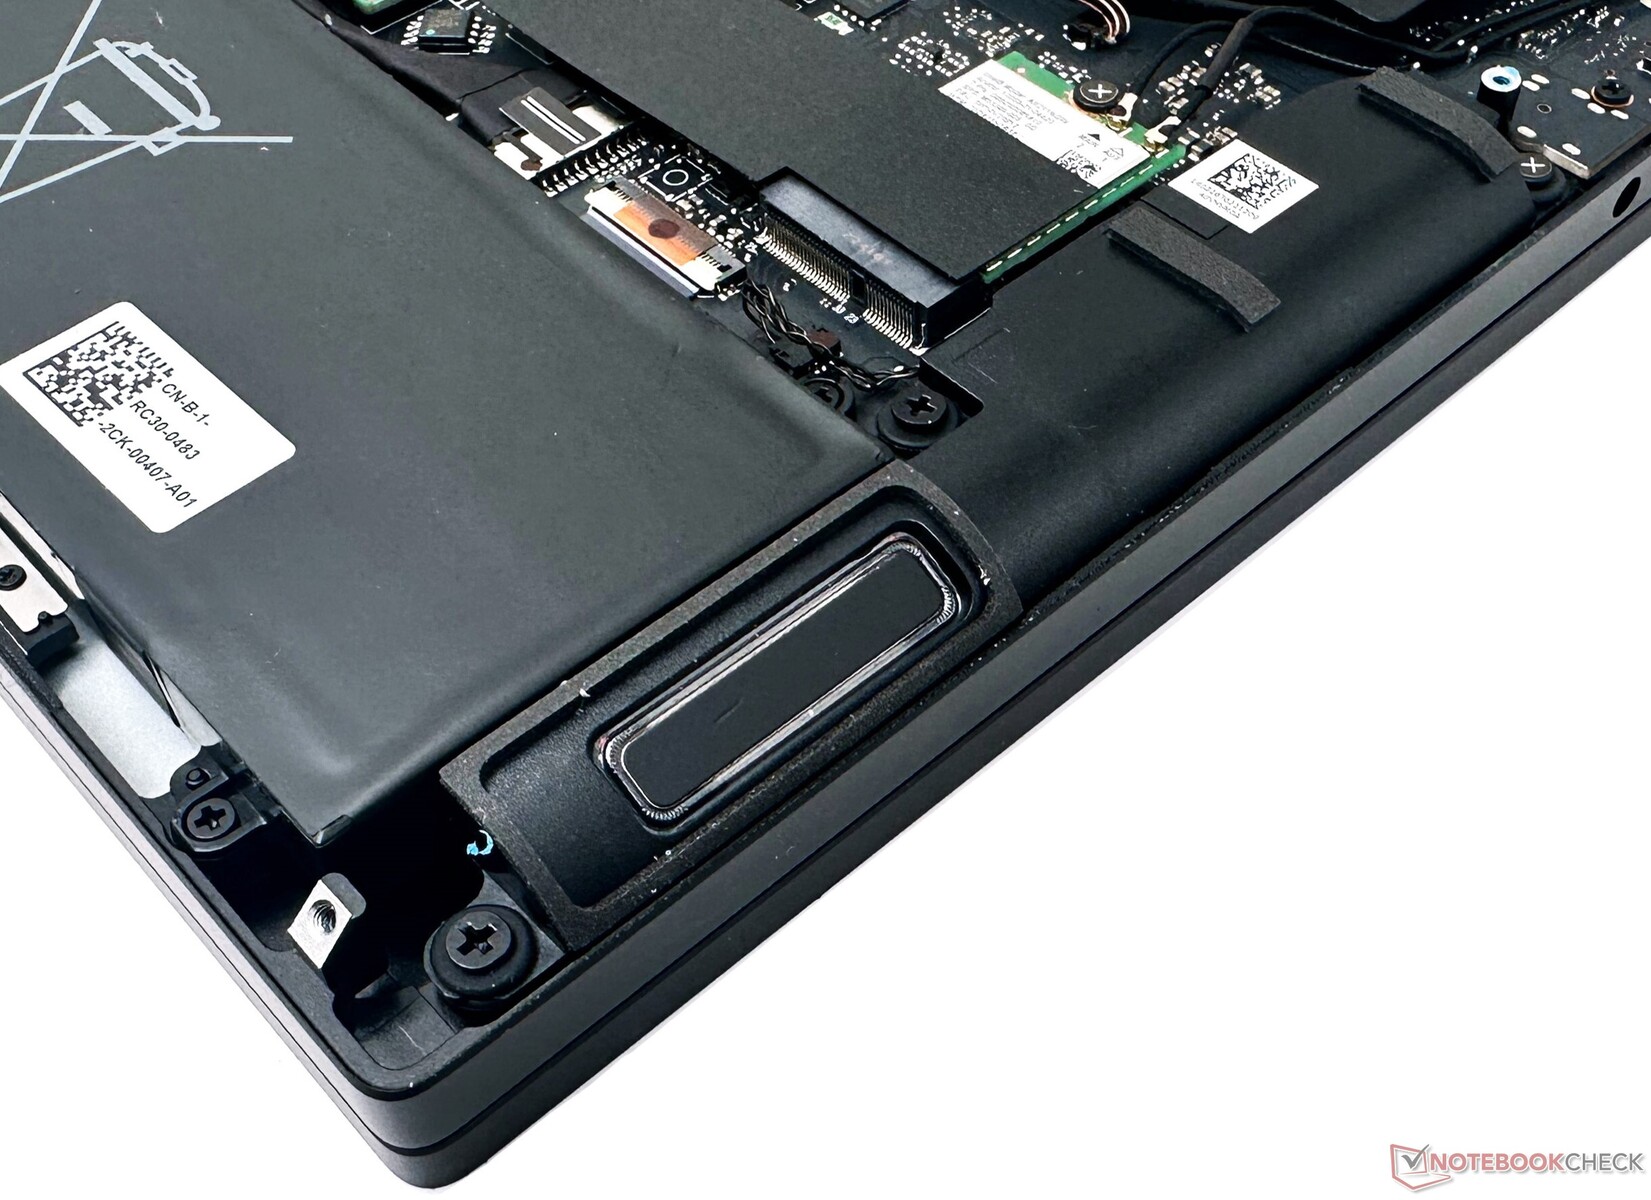
Maintenance
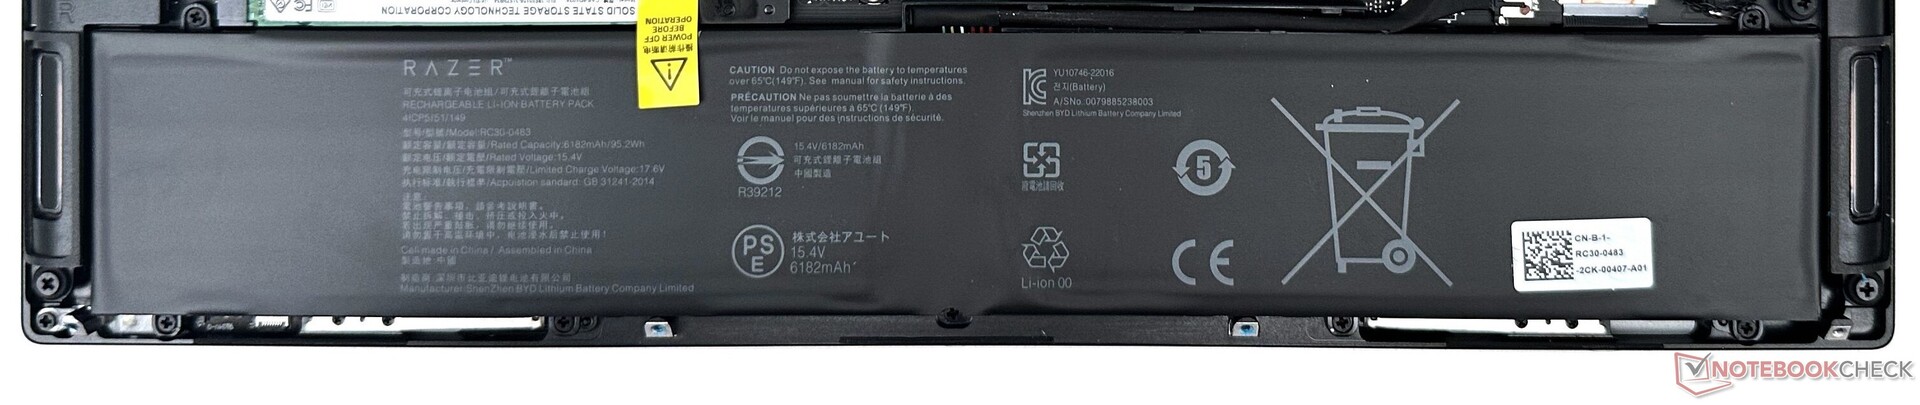
Removing the eight T5 screws pops open the bottom panel revealing the huge vapor chamber cooling system. The DDR5-5600 RAM, NVMe SSDs, and Wi-Fi card can be swapped out if needed. The dual-battery pack can be unscrewed and replaced as well.
A point to note here is that Razer only offers BIOS and firmware updates on its support site. For the most part, official generic drivers from Intel and Nvidia for WLAN and graphics work without issues.
But if you have to wipe out or replace the entire drive for some reason, be sure to have a copy of the factory recovery image beforehand. Downloading the recovery image requires signing in with a Razer account and entering the serial number of the device.
Accessories and Warranty
Our Blade 16 unit came with a 330 W GaN power adapter and the usual paperwork as standard.
Razer offers a one-year standard warranty for the Blade 16 and two years for the battery. An Extended Warranty for another year can be separately purchased, but this is not applicable for the battery.
Input Devices: Not very different from earlier Blades
Keyboard
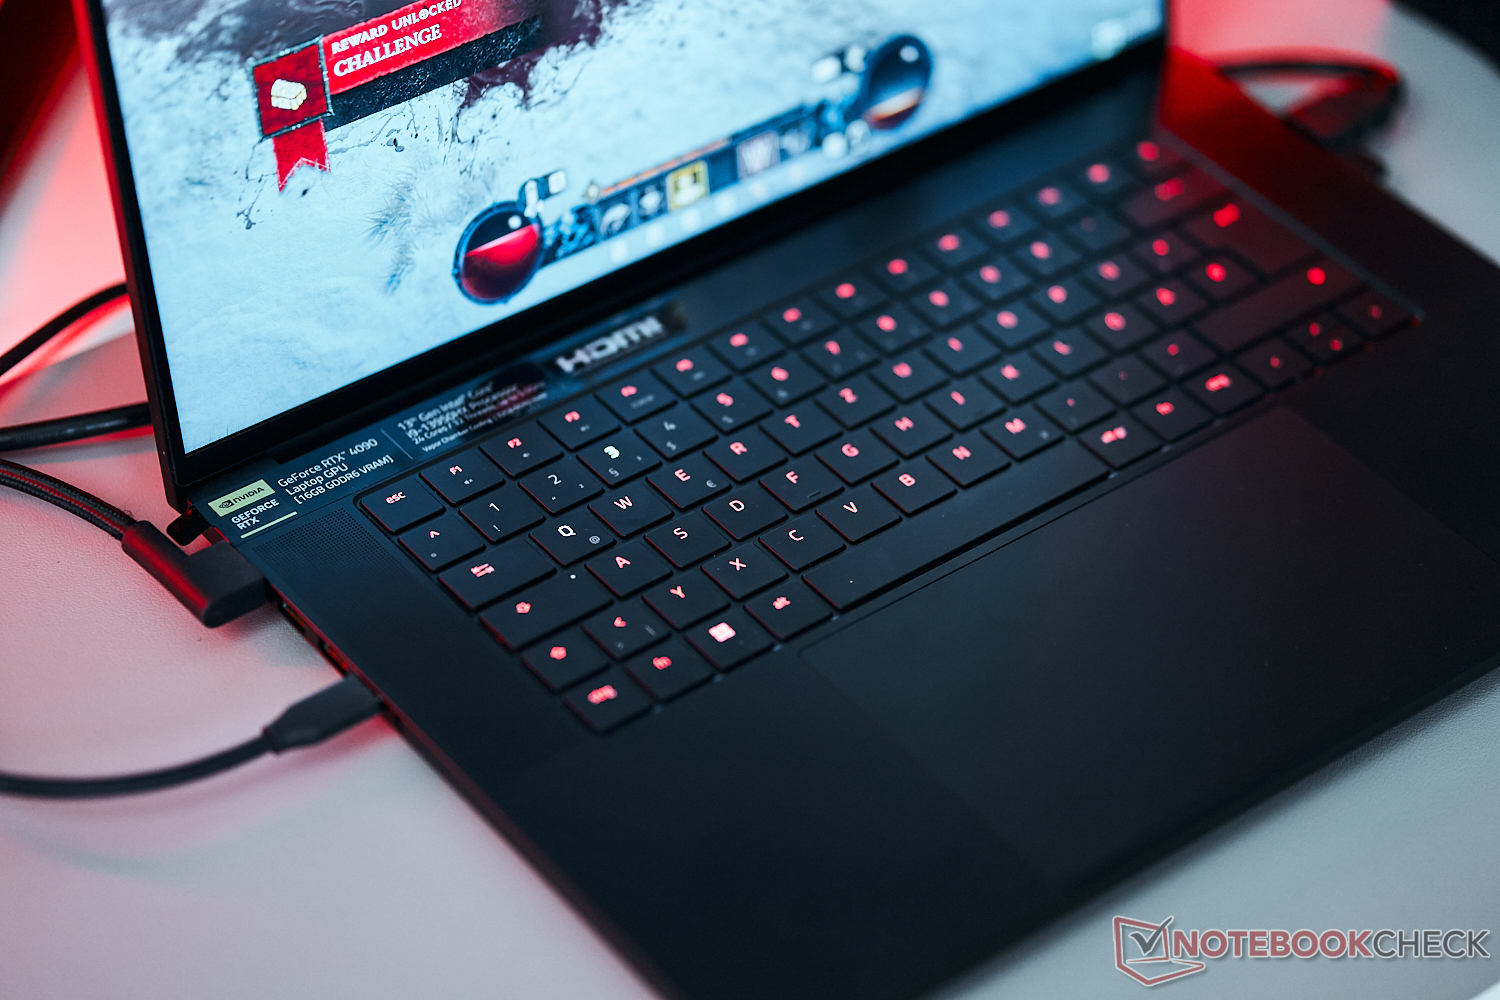
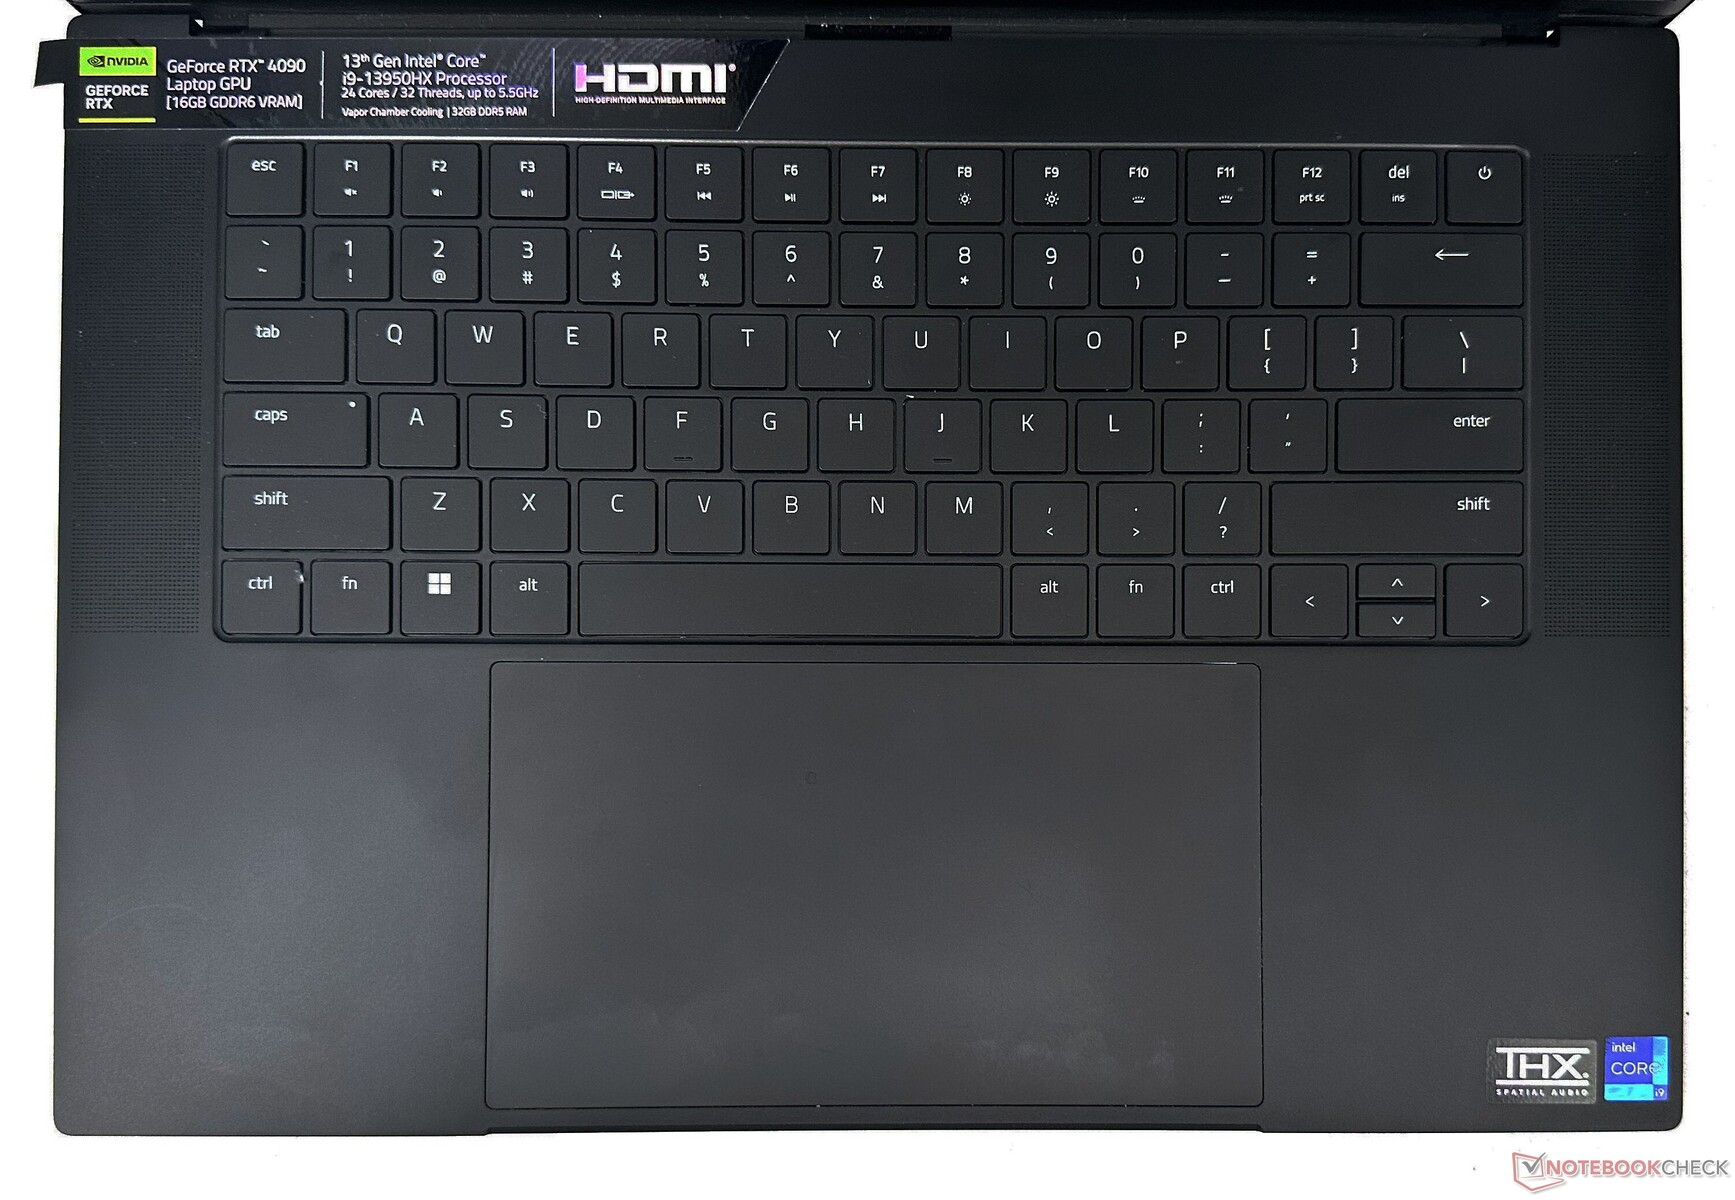
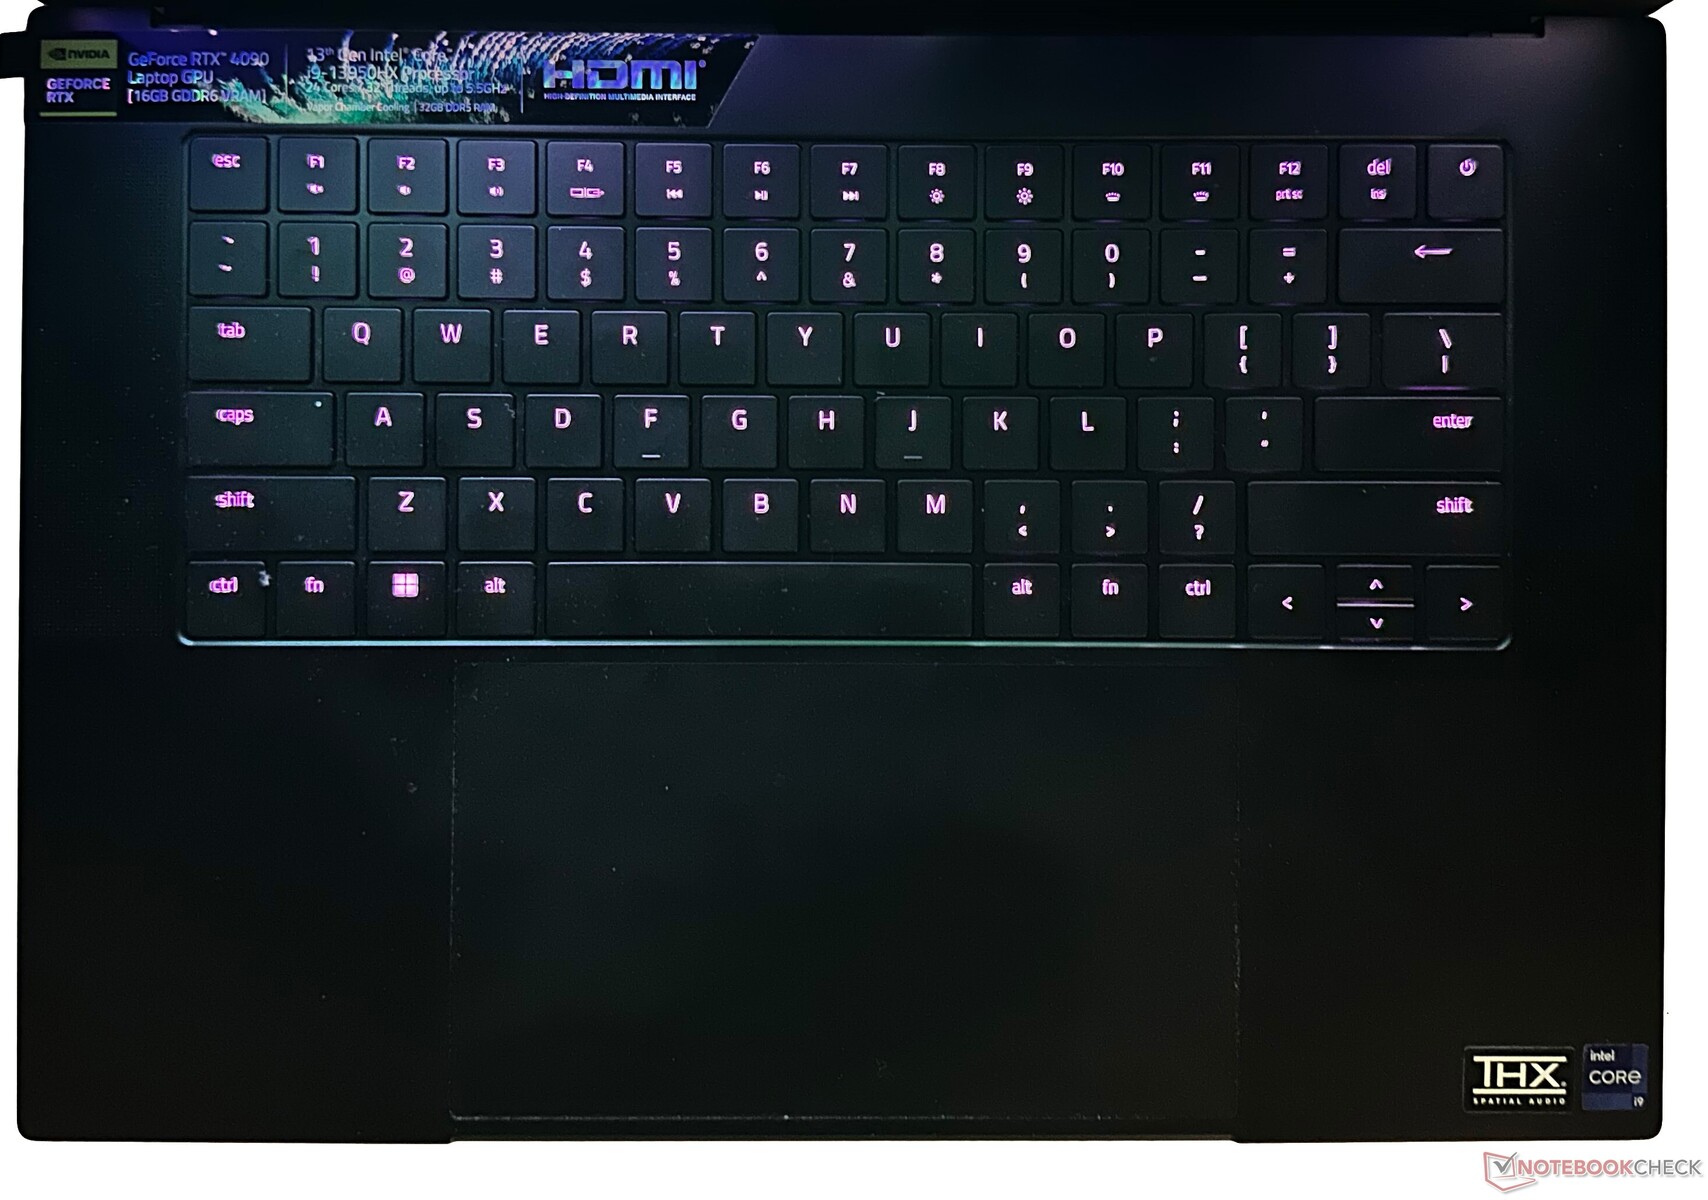
Razer relies on traditional membrane key switches for the keyboard. The keys are flat with decent actuation and tactility but offer a short 1 mm travel distance. The keyboard supports Razer Chroma RGB effects and N-key rollover. The backlight intensity is adjustable in 15 steps.
The centered positioning will appeal to those who don't mind the absence of a numeric keypad. However, getting used to the longer right Shift key and short Up and Down arrow keys can seem cumbersome.
The Blade 16's keyboard cannot match up to the likes of the MSI Titan GT77 or the Schenker XMG Neo 17 M22 that offer mechanical switches. Though Razer's implementation serves well for the most part, typing lengthy documents does feel a tad bit strenuous on this keyboard.
Touchpad
The spacious 9.5 cm x 17 cm glass touchpad is a new offering for the 2023 Blades with a large gliding area and support for Windows Precision gestures. The entire surface is clickable and highly responsive, but the haptics feel somewhat mushy.
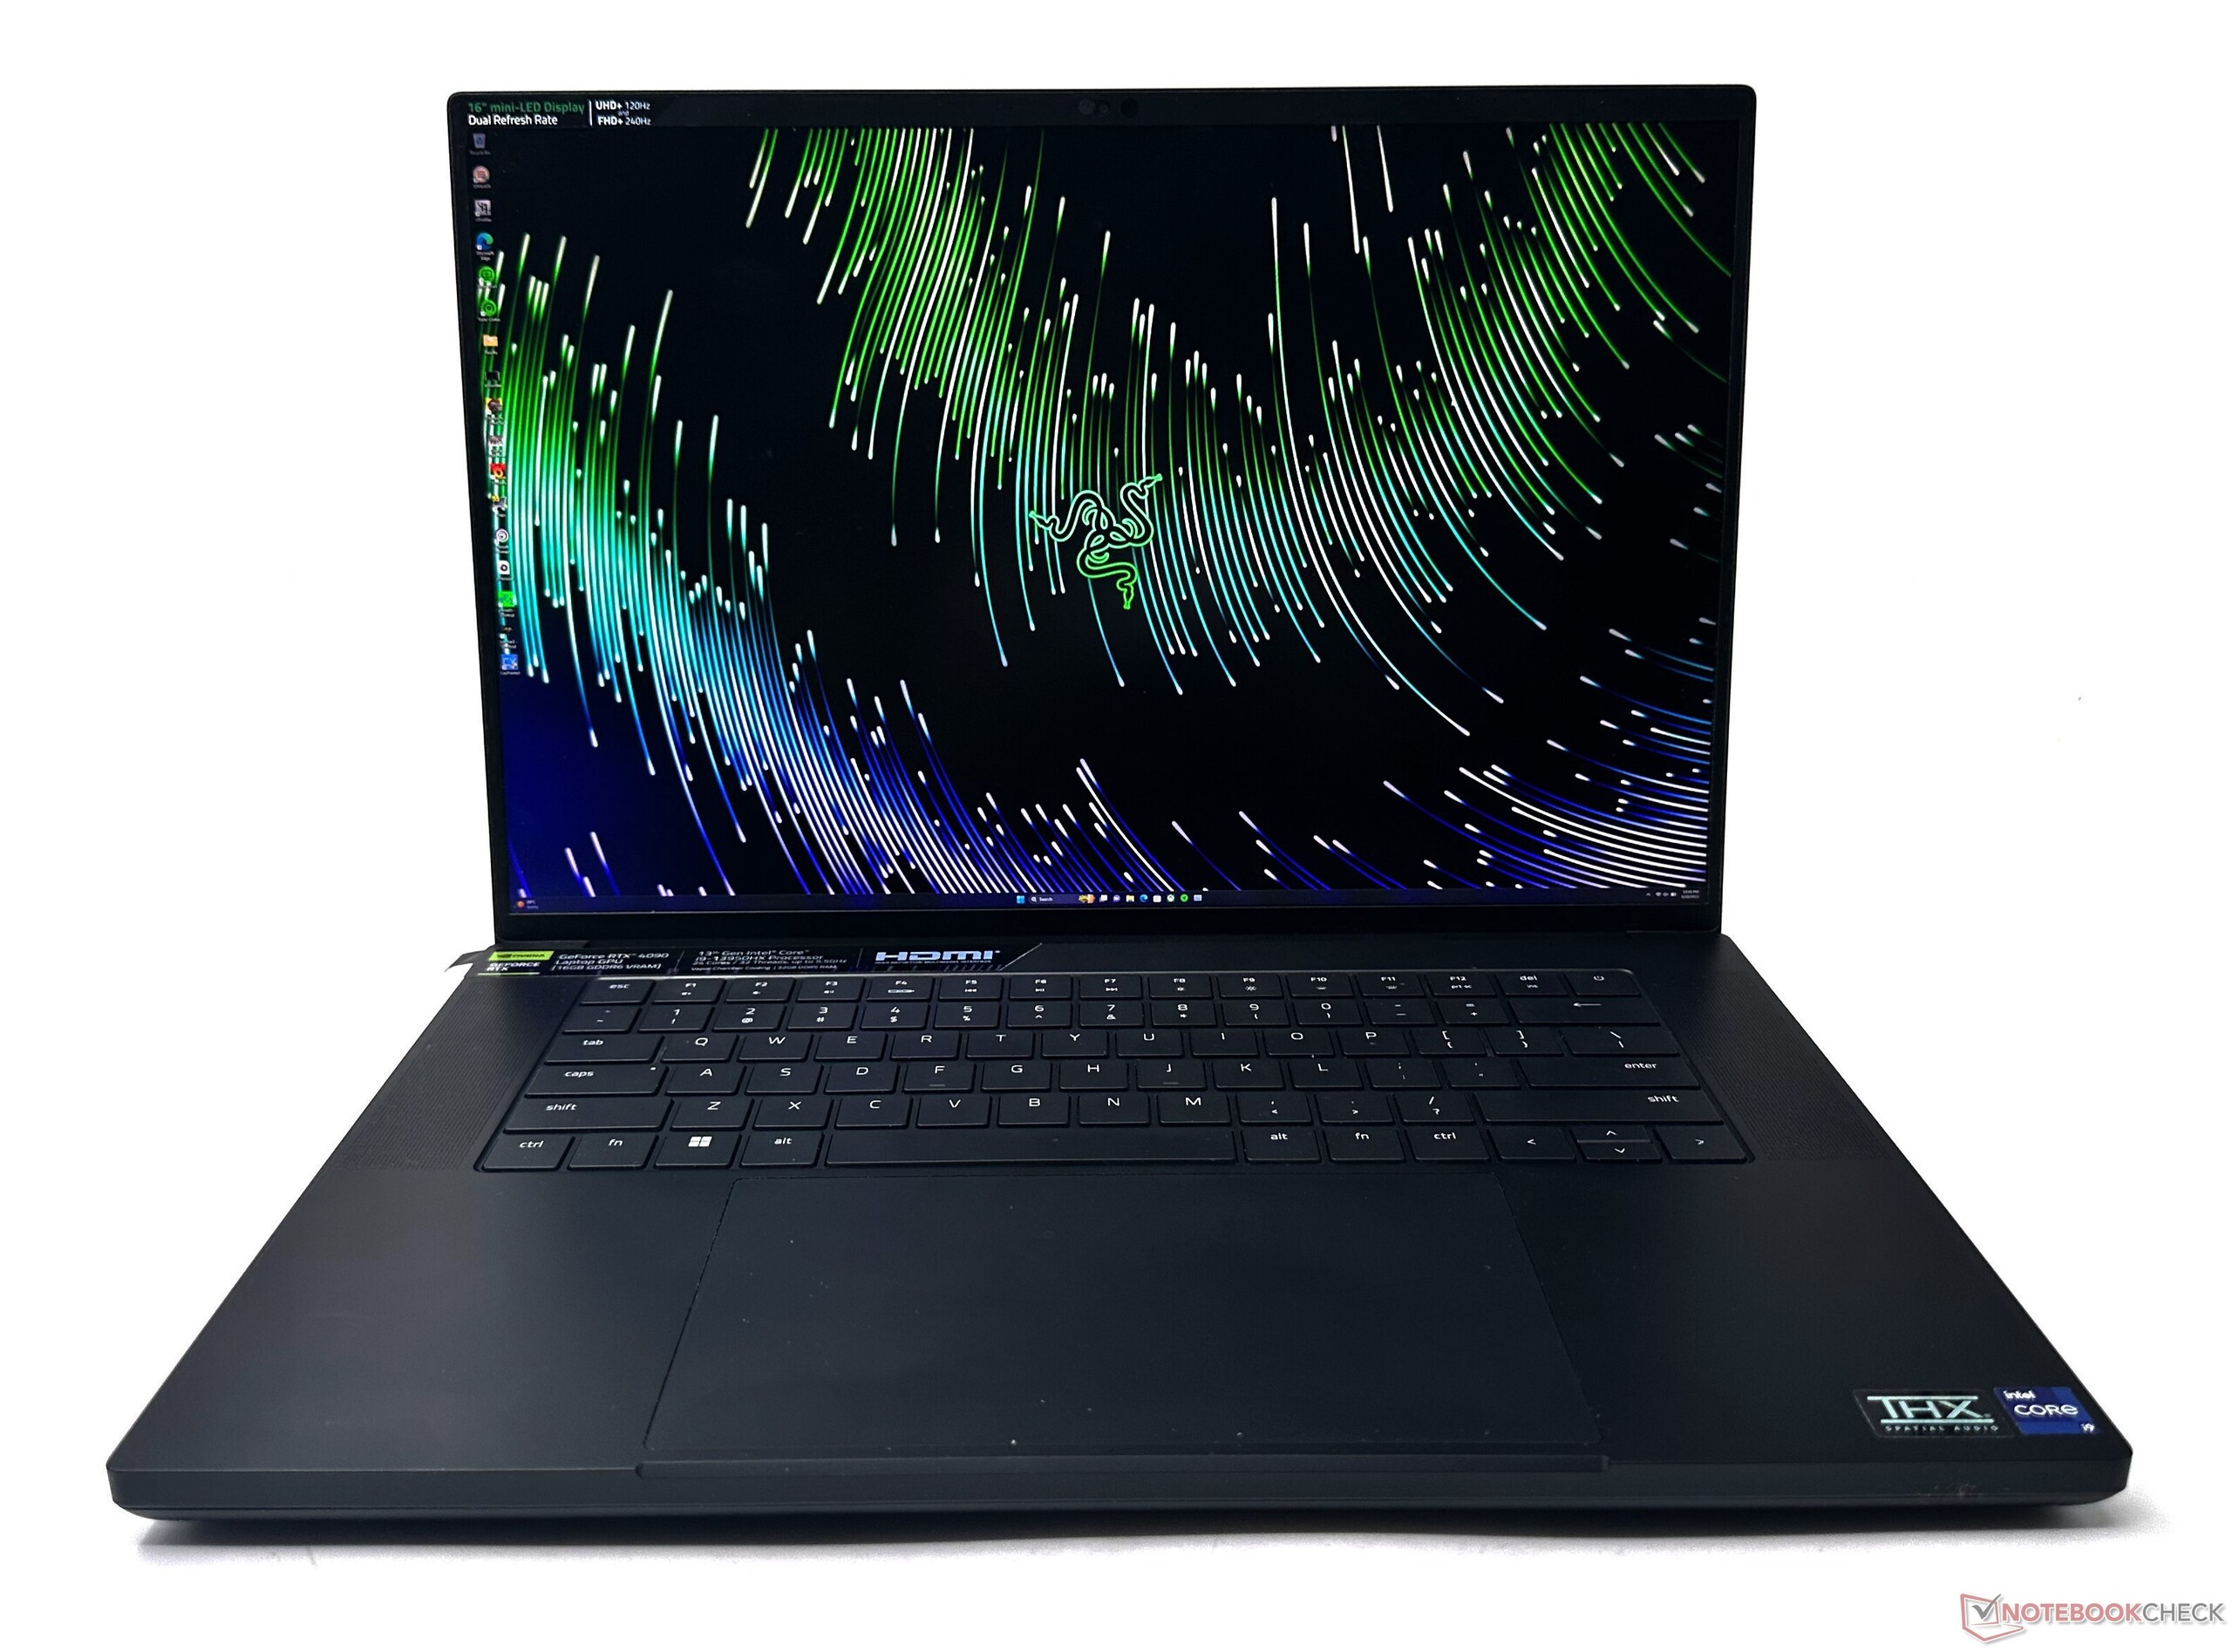
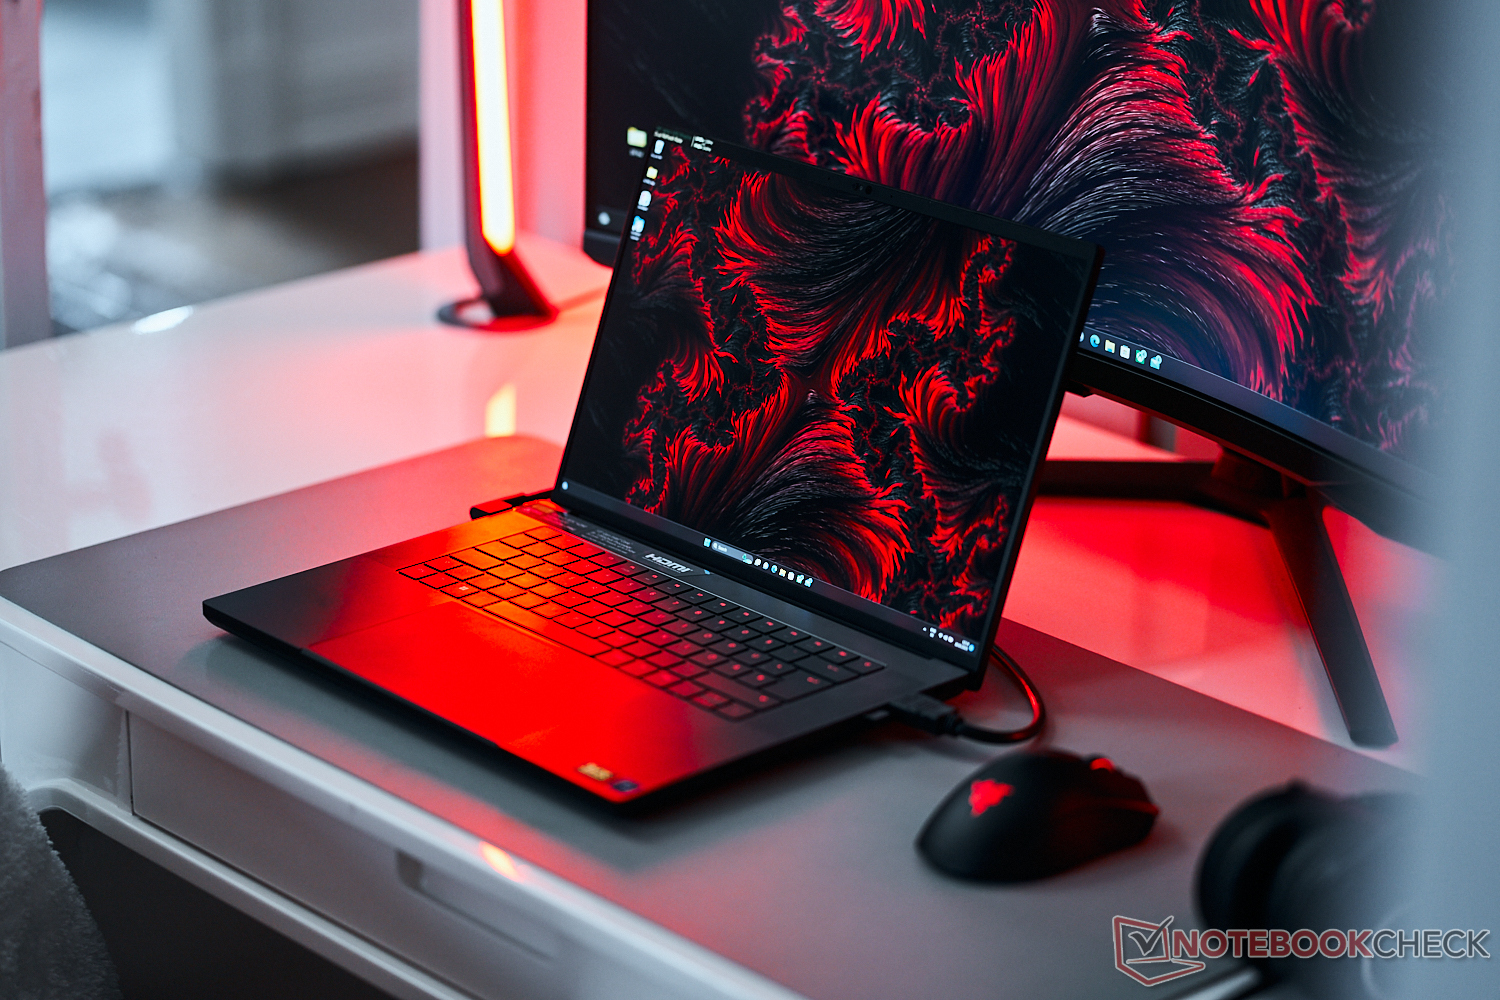
Display: Bright, near-OLED quality dual-mode mini-LED with high PWM
The Blade 16 Early 2023 offers a first of its kind dual-mode mini-LED display. Our test unit presented several intriguing insights during the course of our testing.
Our unit's AUO panel initially suffered from an image retention bug that etched parts of the wallpaper permanently on the display (except when turned off), which was an annoying experience. However, Razer has now issued a firmware patch that fully fixes this issue.
The Blade 16 Early 2023 is the first laptop to offer a 16:10 dual-mode display option. Users can change between UHD+ (3840 x 2400) 120 Hz and FHD+ (1920 x 1200) 240 Hz native panel modes, which is a perfect integer scaling. The higher resolution can help with creative workflows while the FHD+ at 240 Hz comes in handy during competitive gaming.
Razer does not specify the exact number of dimming zones, but we expect them to be more than 1,000 similar to the MSI Titan GT77 HX 13VI. Nvidia G-Sync is supported but only in the dGPU mode.
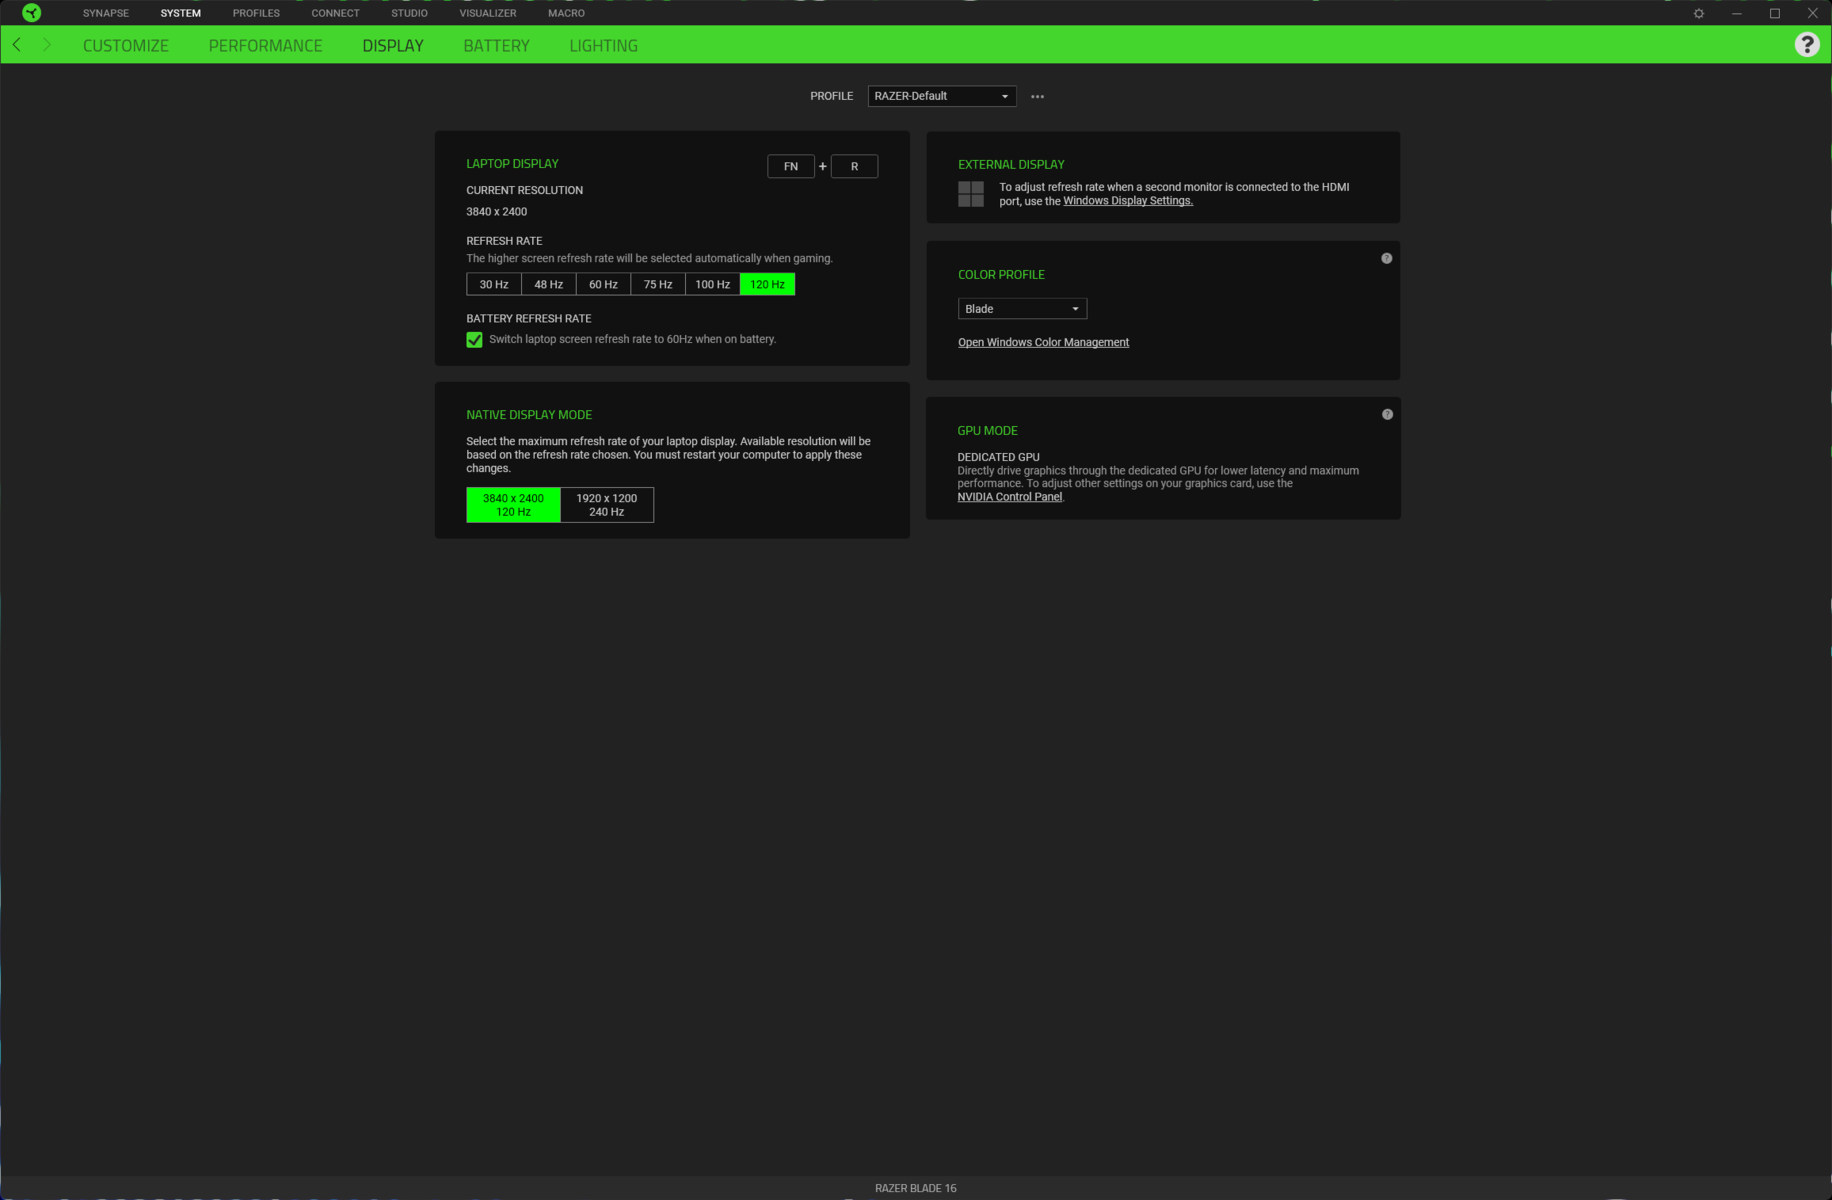
The display mode can be changed either via Razer Synapse (requires a restart) or from the BIOS. Here, we encounter the first of several peculiarties. If you do change the resolution to FHD+ in the BIOS, you cannot change back to UHD+ from the UEFI interface. Rather, you'll have to rely on Synapse to switch to UHD+. This is not detailed clearly and can confuse first timers.
We performed all testing in the UHD+ 120 Hz mode as it's the logical choice for anyone spending upwards of four grand on a laptop.
The sub-pixel matrix looks somewhat grainy when viewed up close. Interestingly, we see that the matrix in UHD+ mode looks quite sharp and well-defined. One would expect a larger pixel size upon switching to FHD+ mode, but we see identically sized pixels here.
We also get to see fuzziness and aliasing artefacts in the sub-pixel matrix — it is not as sharp as the UHD+ mode and is definitely not as sharp compared to a native FHD panel. It seems as if Razer is simply scaling down the 4K resolution and using temporal dithering.
This may not pose much of a problem while playing a fast-paced shooter, but we recommend sticking with the native UHD+ resolution for the most part. There's no backlight bleeding observed under high exposure.


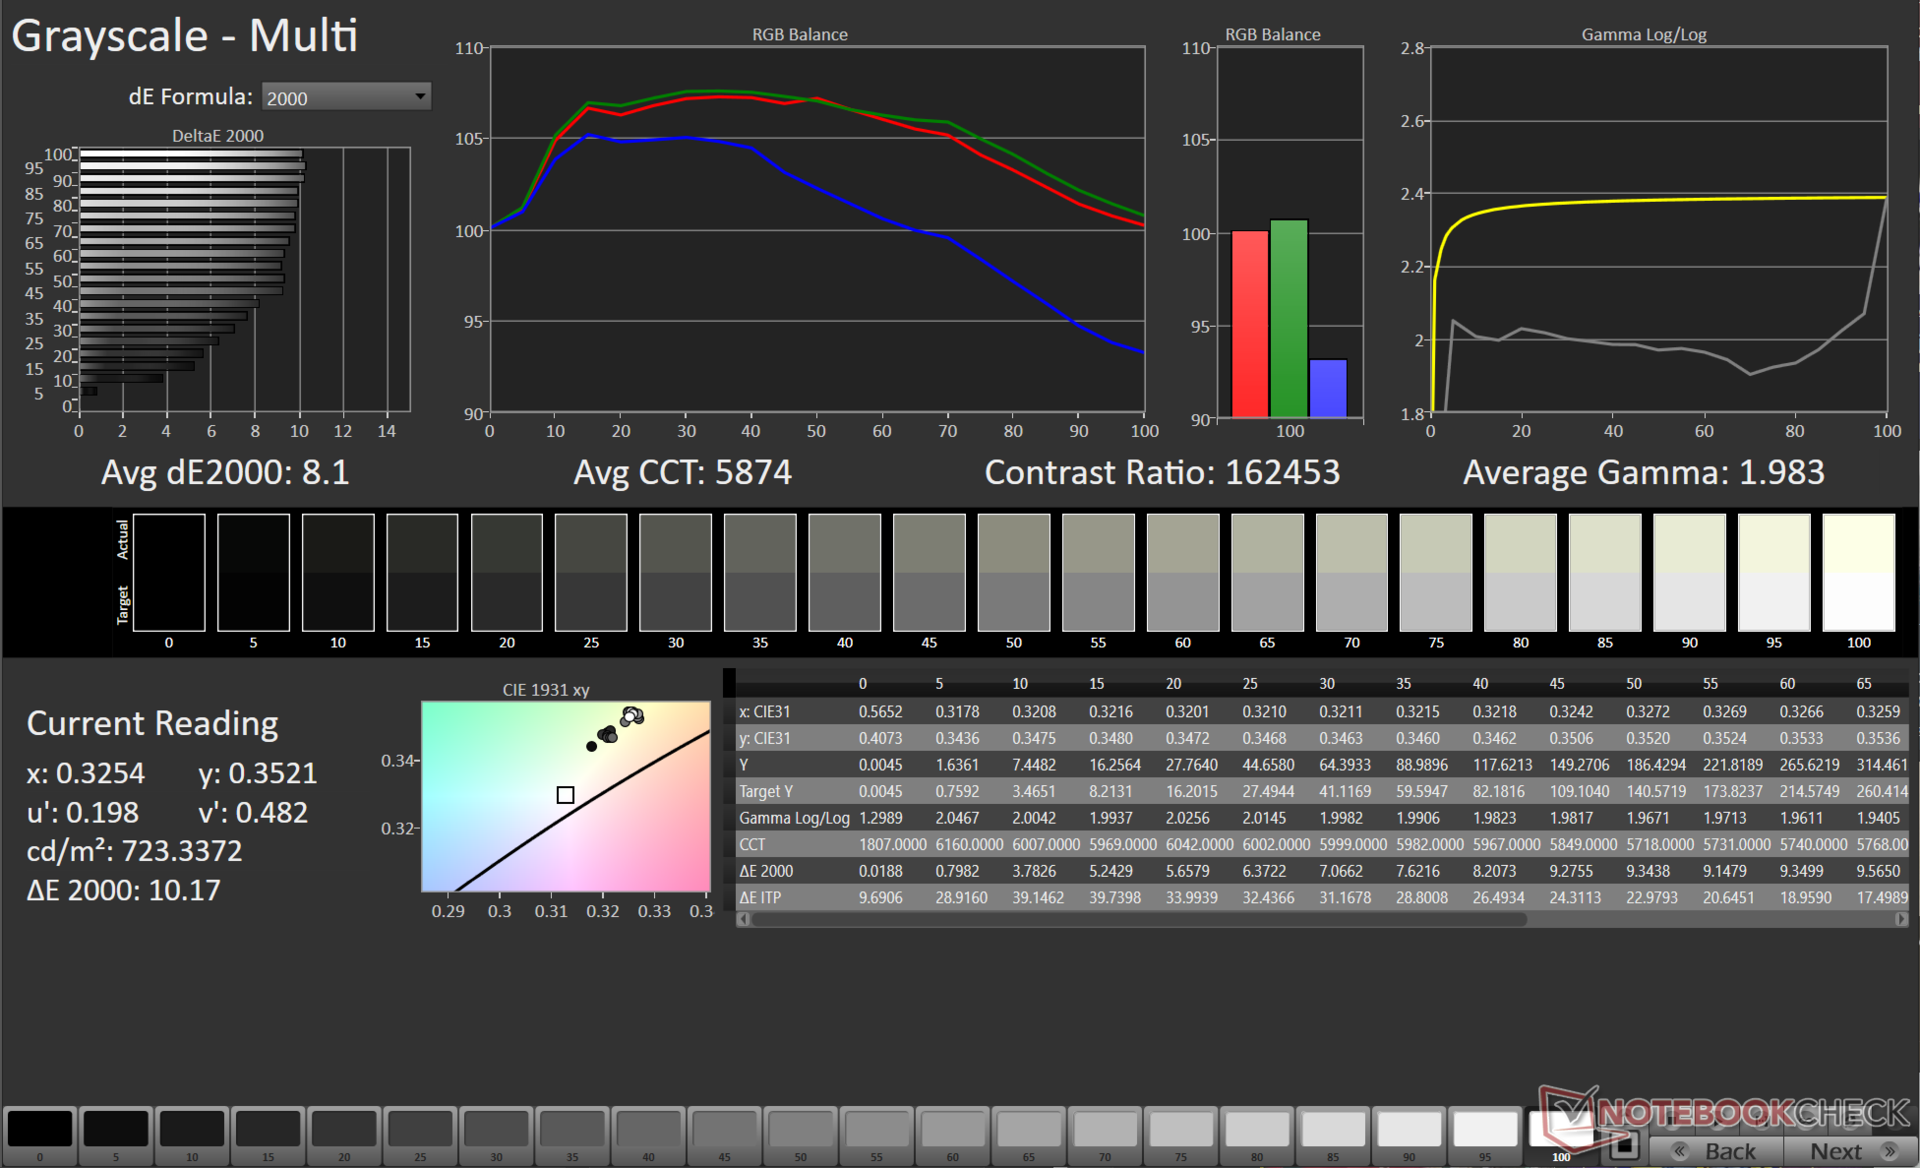
The 2023 Razer Blade 16's panel is officially rated to offer a 1,000 nits peak brightness. We observed an excellent brightness distribution of 94% with a peak value of 752 nits in SDR mode.
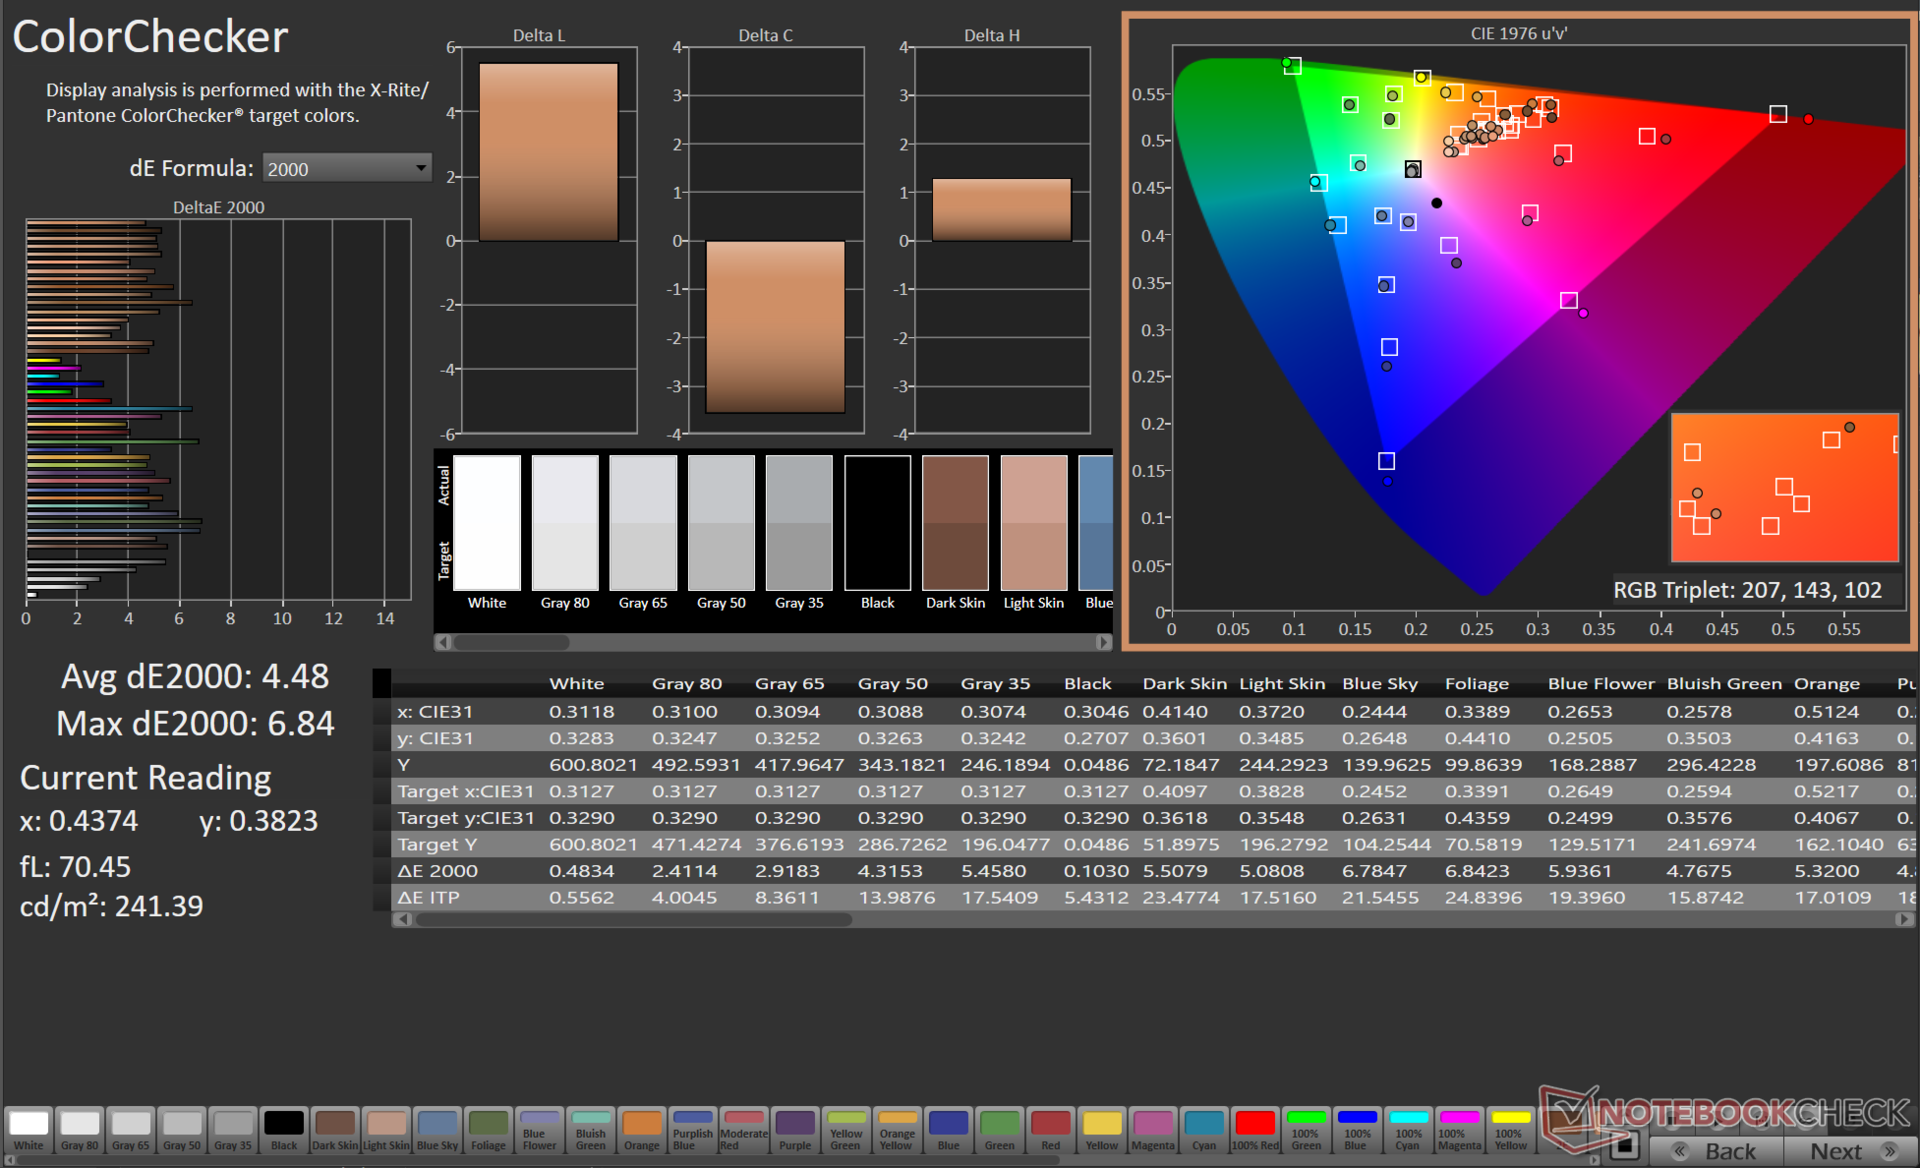
For some reason, these values are obtained only when using the default Windows color profile, which is the basis for our measurements below. The Blade 16 comes factory-calibrated but using this ICC profile drops the brightness levels by a good 100 nits.
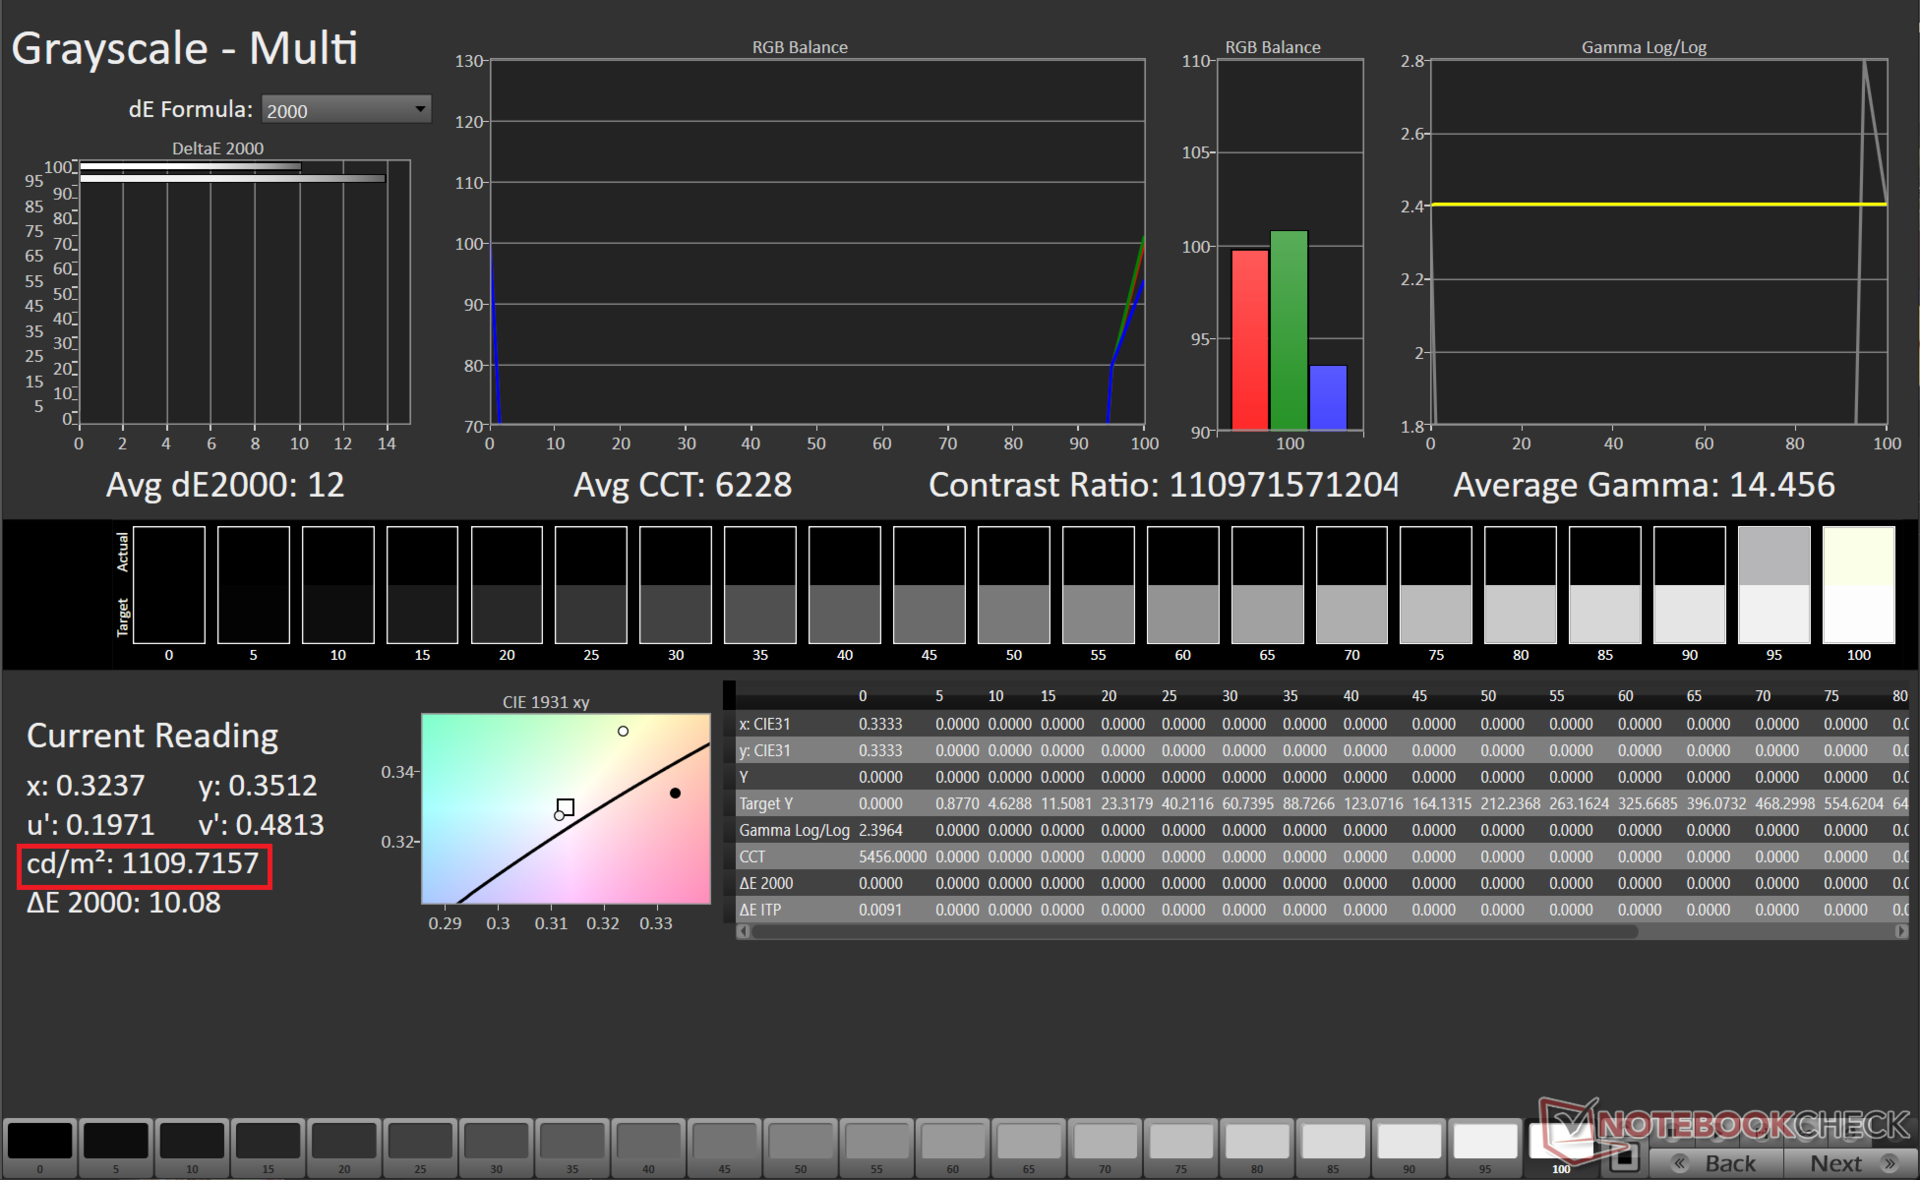
We measured close to 1,110 nits in HDR mode with a 100% white image. It is not exactly Apple MacBook Pro 16 level but is still an excellent luminance, nonetheless.
There are no preset color profiles apart from the one factory-calibrated ICC file. In the UHD+ mode, users can select the desired profile directly from Windows display settings or Razer Synapse. These options are unavailable in the FHD+ mode, however.
| |||||||||||||||||||||||||
Brightness Distribution: 94 %
Center on Battery: 723 cd/m²
Contrast: 162222:1 (Black: 0.0045 cd/m²)
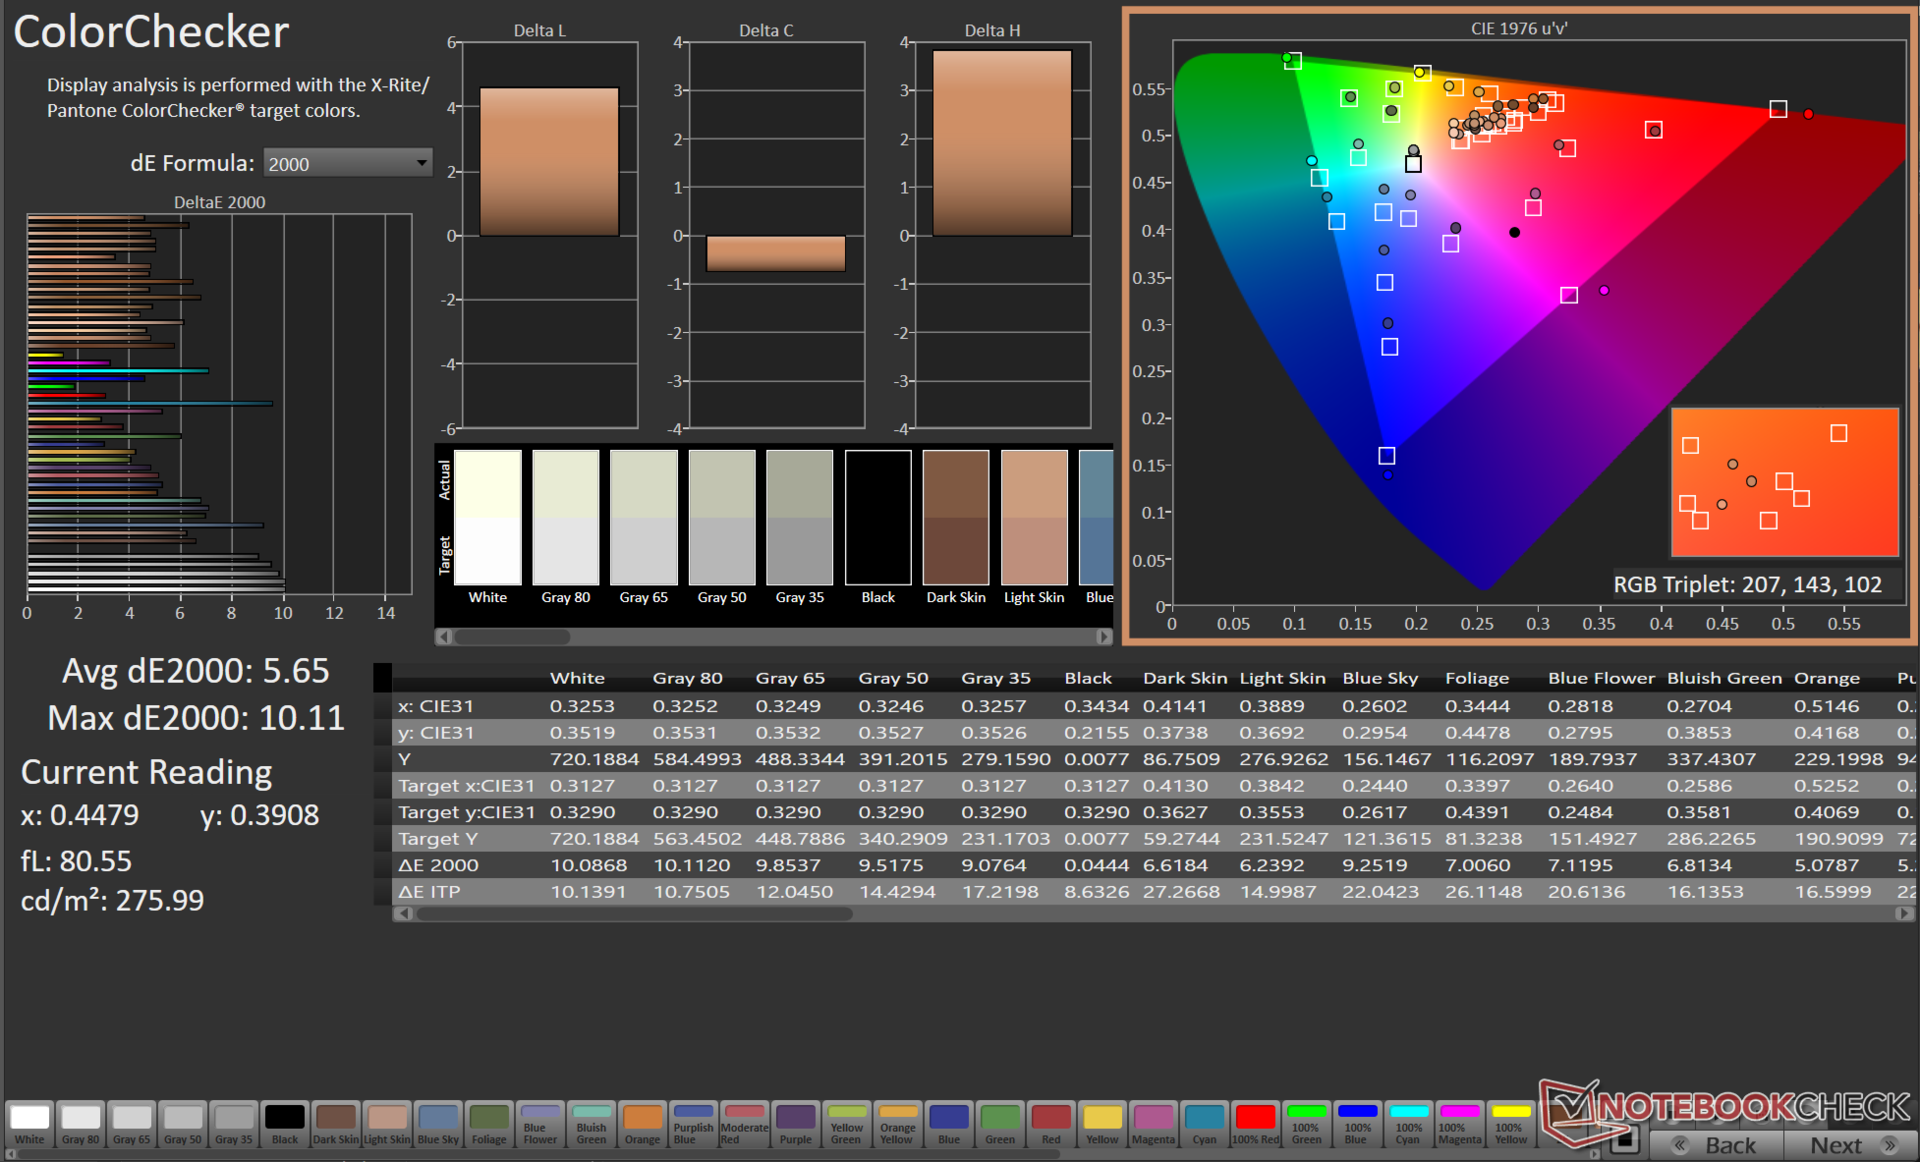
ΔE ColorChecker Calman: 5.65 | ∀{0.5-29.43 Ø4.72}
calibrated: 1.85
ΔE Greyscale Calman: 8.1 | ∀{0.09-98 Ø4.97}
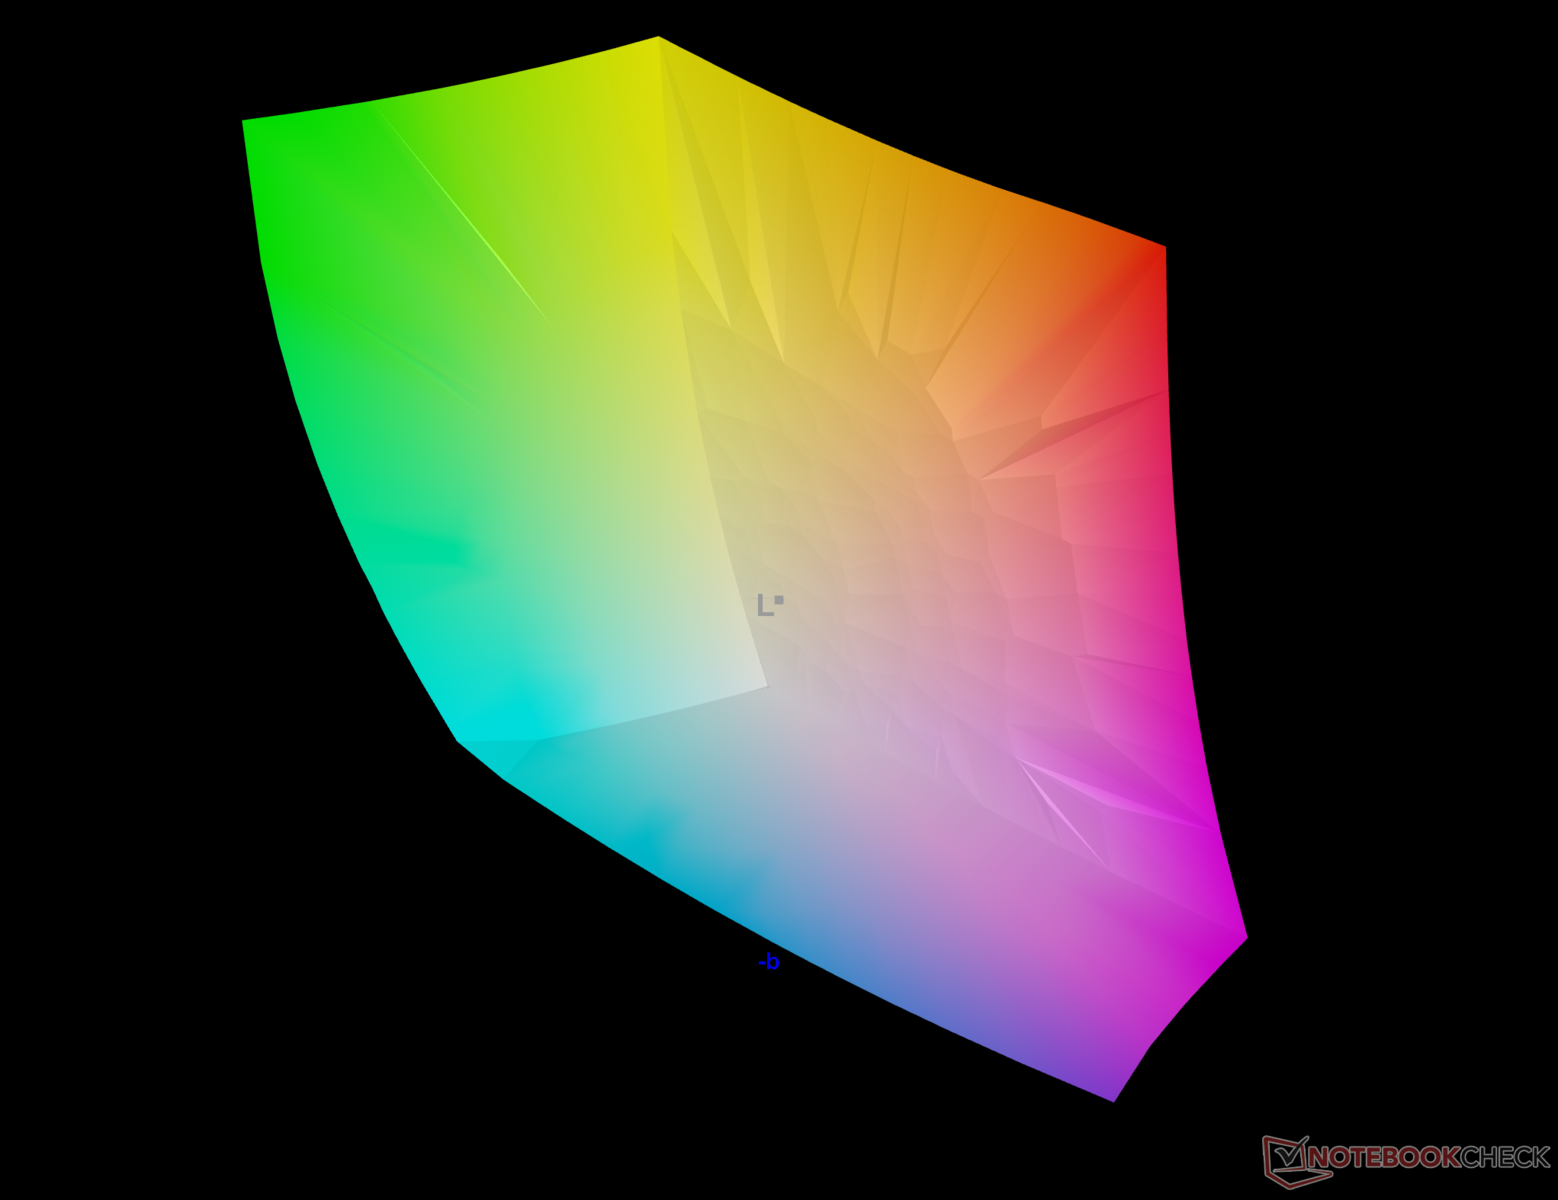
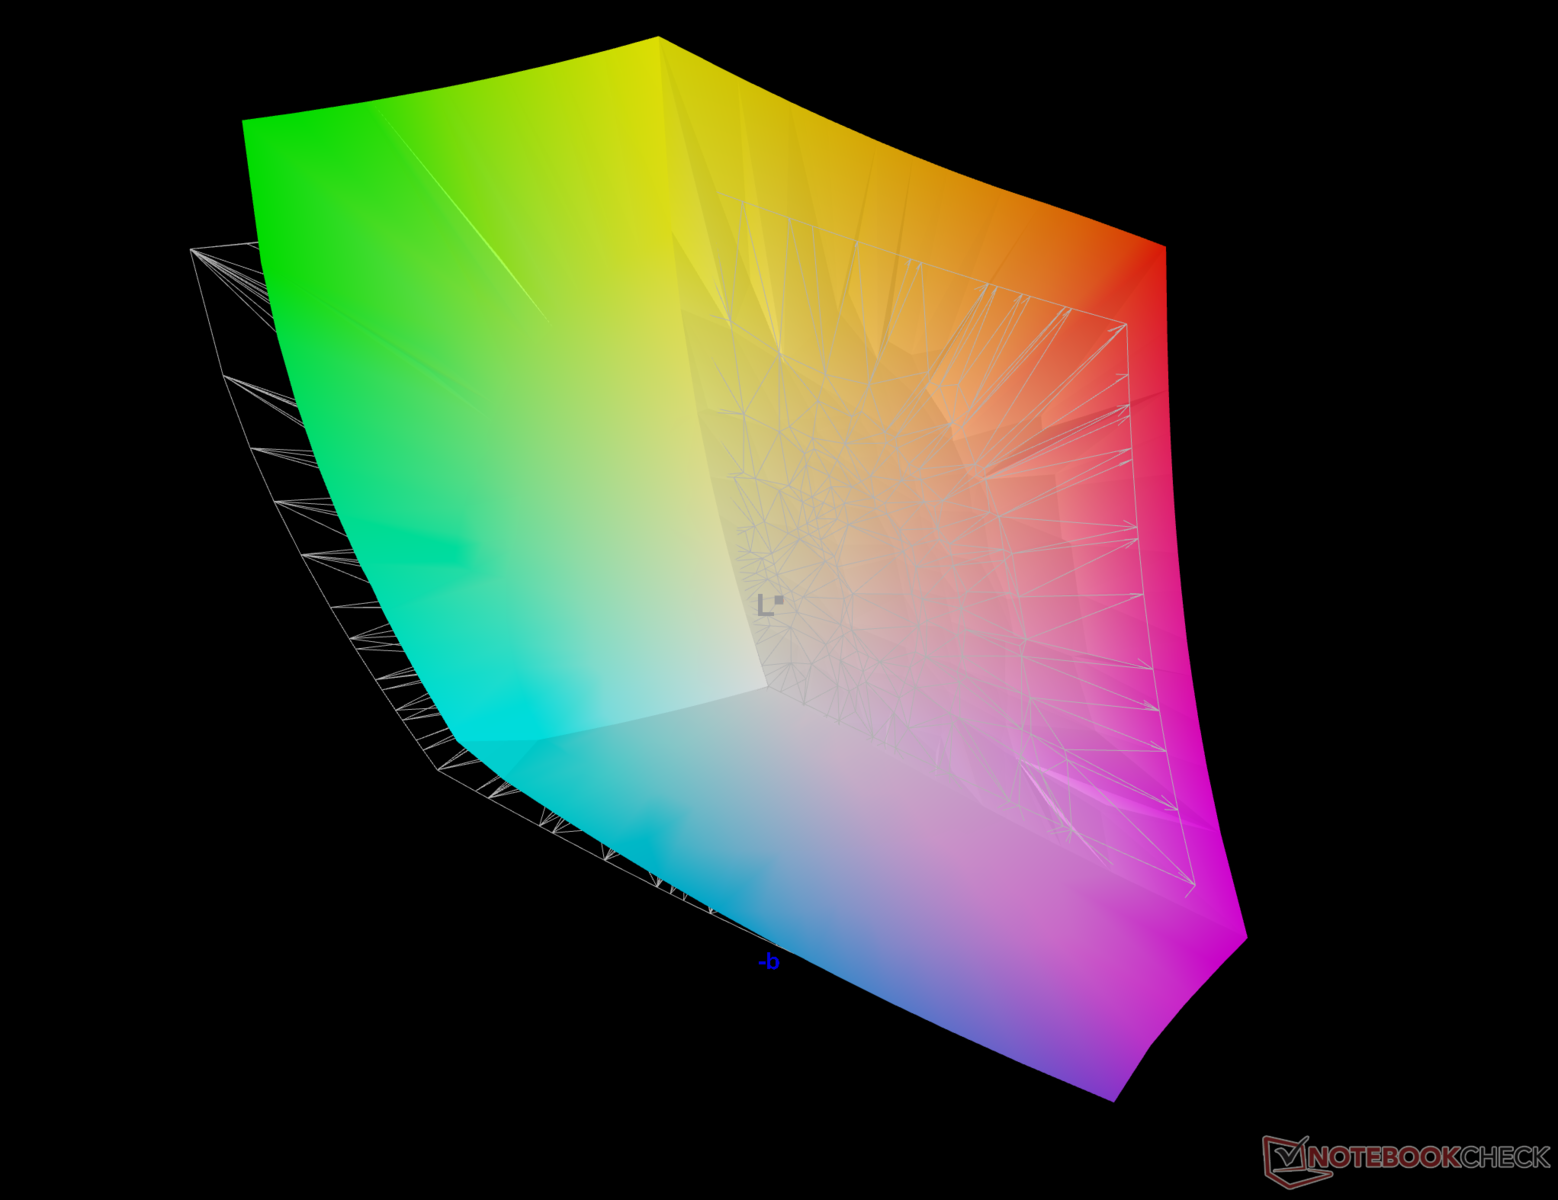
90.9% AdobeRGB 1998 (Argyll 3D)
100% sRGB (Argyll 3D)
99.9% Display P3 (Argyll 3D)
Gamma: 1.98
CCT: 5874 K
| Razer Blade 16 Early 2023 RTX 4090 AUO B160ZAN01.U, mini-LED, 3840x2400, 16" | Asus Zephyrus Duo 16 GX650PY-NM006W NE160QDM-NM4, MiniLED, 2560x1600, 16" | MSI Titan GT77 HX 13VI B173ZAN06.C, Mini-LED, 3840x2160, 17.3" | Asus ROG Strix G16 G614JZ TL160ADMP03-0, IPS, 2560x1600, 16" | Lenovo Legion Pro 7 16IRX8H MNG007DA2-3 (CSO1628), IPS, 2560x1600, 16" | Razer Blade 18 RTX 4070 AU Optronics B180QAN01.0, IPS, 2560x1600, 18" | |
|---|---|---|---|---|---|---|
| Display | -0% | -1% | -3% | -18% | -3% | |
| Display P3 Coverage (%) | 99.9 | 99.4 -1% | 94.9 -5% | 97 -3% | 69.1 -31% | 96.9 -3% |
| sRGB Coverage (%) | 100 | 100 0% | 99.9 0% | 99.9 0% | 99.7 0% | 99.8 0% |
| AdobeRGB 1998 Coverage (%) | 90.9 | 90.8 0% | 92.4 2% | 84.9 -7% | 71.2 -22% | 85.3 -6% |
| Response Times | 10% | -110% | 70% | 35% | 73% | |
| Response Time Grey 50% / Grey 80% * (ms) | 10.2 ? | 15.2 ? -49% | 38.4 ? -276% | 5.1 ? 50% | 12.3 ? -21% | 4.2 ? 59% |
| Response Time Black / White * (ms) | 62.04 ? | 19 ? 69% | 26.6 ? 57% | 6.6 ? 89% | 5.9 ? 90% | 8 ? 87% |
| PWM Frequency (Hz) | 2420 ? | 12000 ? | 2380 ? | |||
| Screen | -147% | 417% | -1018% | -962% | -1303% | |
| Brightness middle (cd/m²) | 730 | 712 -2% | 606 -17% | 470 -36% | 511 -30% | 549.6 -25% |
| Brightness (cd/m²) | 729 | 703 -4% | 602 -17% | 459 -37% | 469 -36% | 524 -28% |
| Brightness Distribution (%) | 94 | 95 1% | 93 -1% | 93 -1% | 86 -9% | 89 -5% |
| Black Level * (cd/m²) | 0.0045 | 0.07 -1456% | 0.0001 98% | 0.42 -9233% | 0.4 -8789% | 0.53 -11678% |
| Contrast (:1) | 162222 | 10171 -94% | 6060000 3636% | 1119 -99% | 1278 -99% | 1037 -99% |
| Colorchecker dE 2000 * | 5.65 | 1.7 70% | 4.8 15% | 1.86 67% | 0.95 83% | 3.32 41% |
| Colorchecker dE 2000 max. * | 10.11 | 4 60% | 8.2 19% | 3.87 62% | 2.07 80% | 6.63 34% |
| Colorchecker dE 2000 calibrated * | 1.85 | 1.2 35% | 1.8 3% | 0.93 50% | 0.91 51% | 2.7 -46% |
| Greyscale dE 2000 * | 8.1 | 2.8 65% | 6.5 20% | 2.7 67% | 0.6 93% | 2 75% |
| Gamma | 1.98 111% | 2.21 100% | 2.63 84% | 2.246 98% | 2.176 101% | 2.29 96% |
| CCT | 5874 111% | 6978 93% | 6596 99% | 6711 97% | 6545 99% | 6319 103% |
| Total Average (Program / Settings) | -46% /
-93% | 102% /
252% | -317% /
-645% | -315% /
-617% | -411% /
-828% |
* ... smaller is better
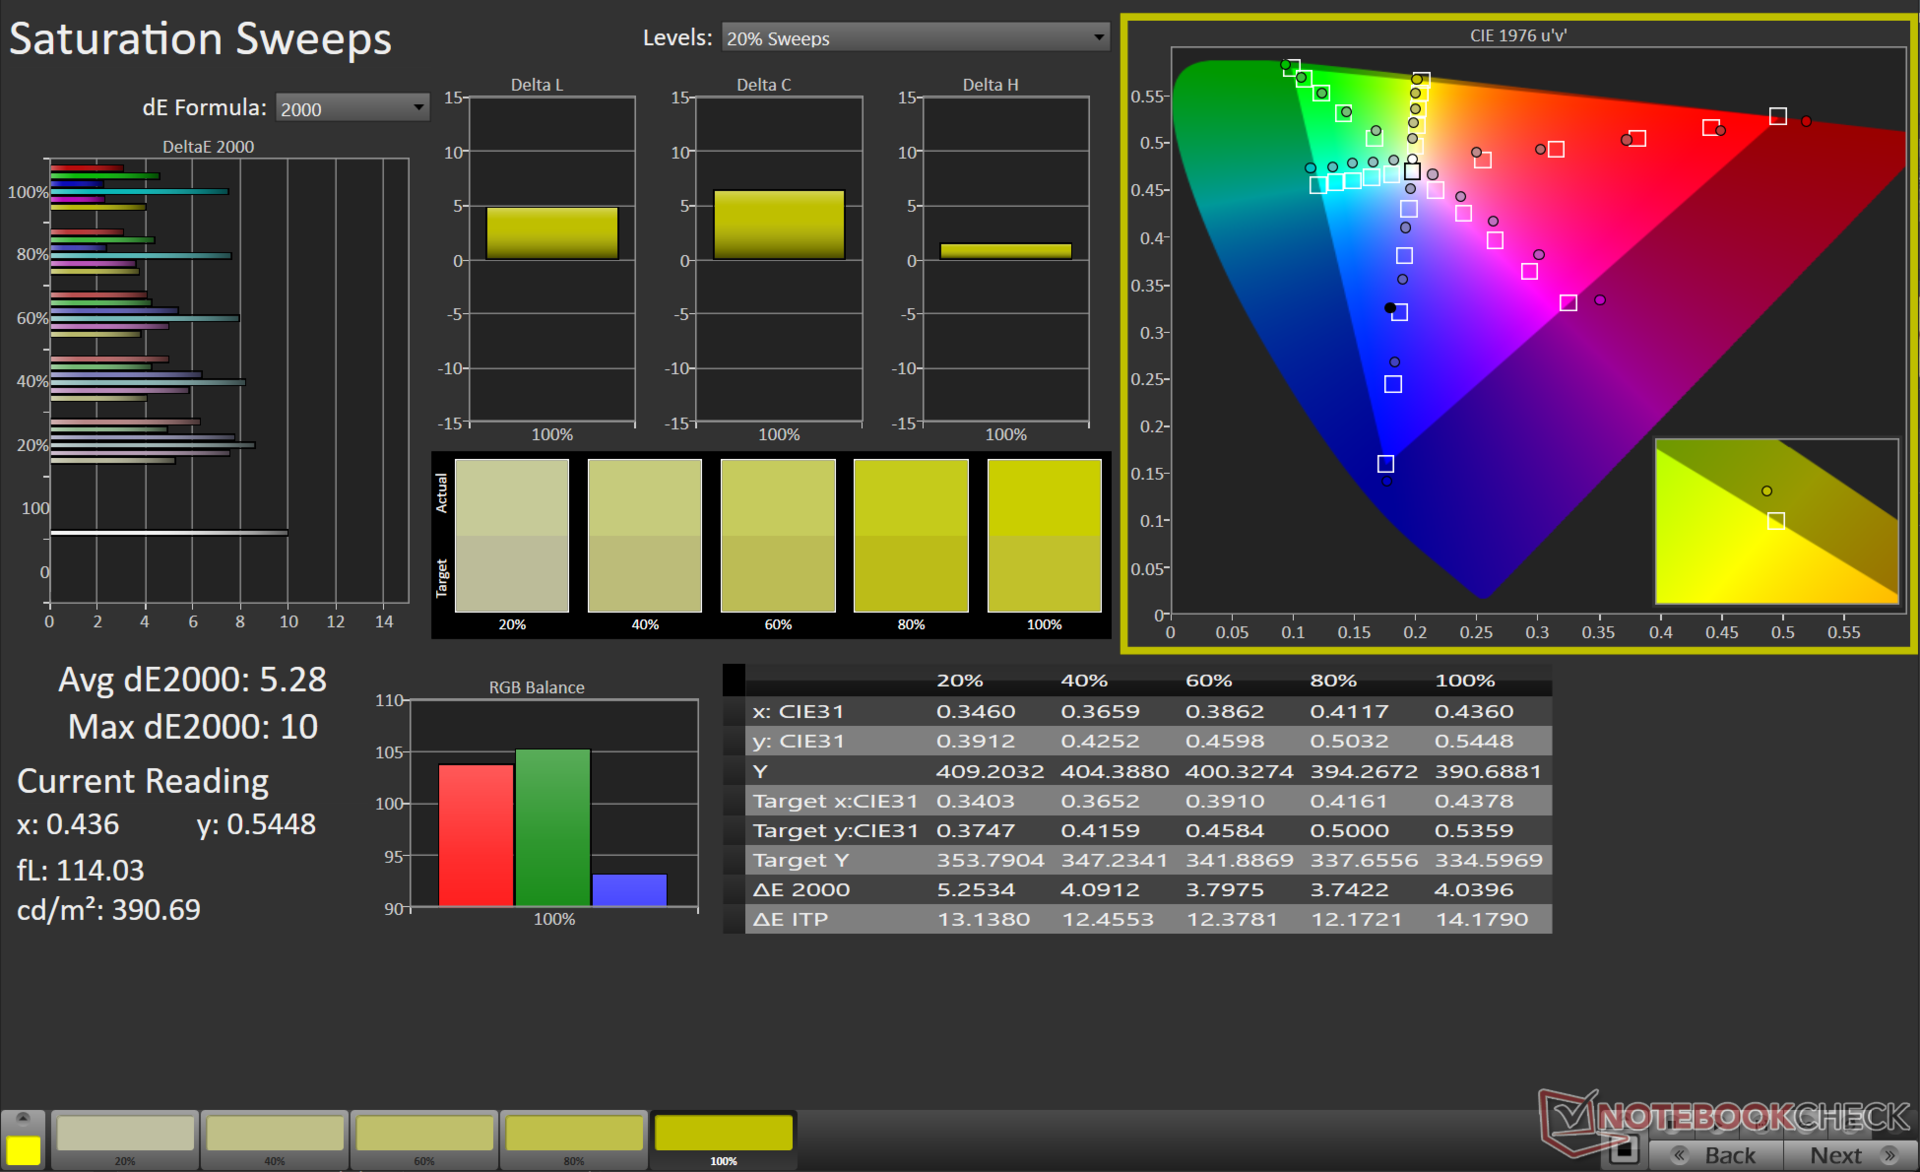
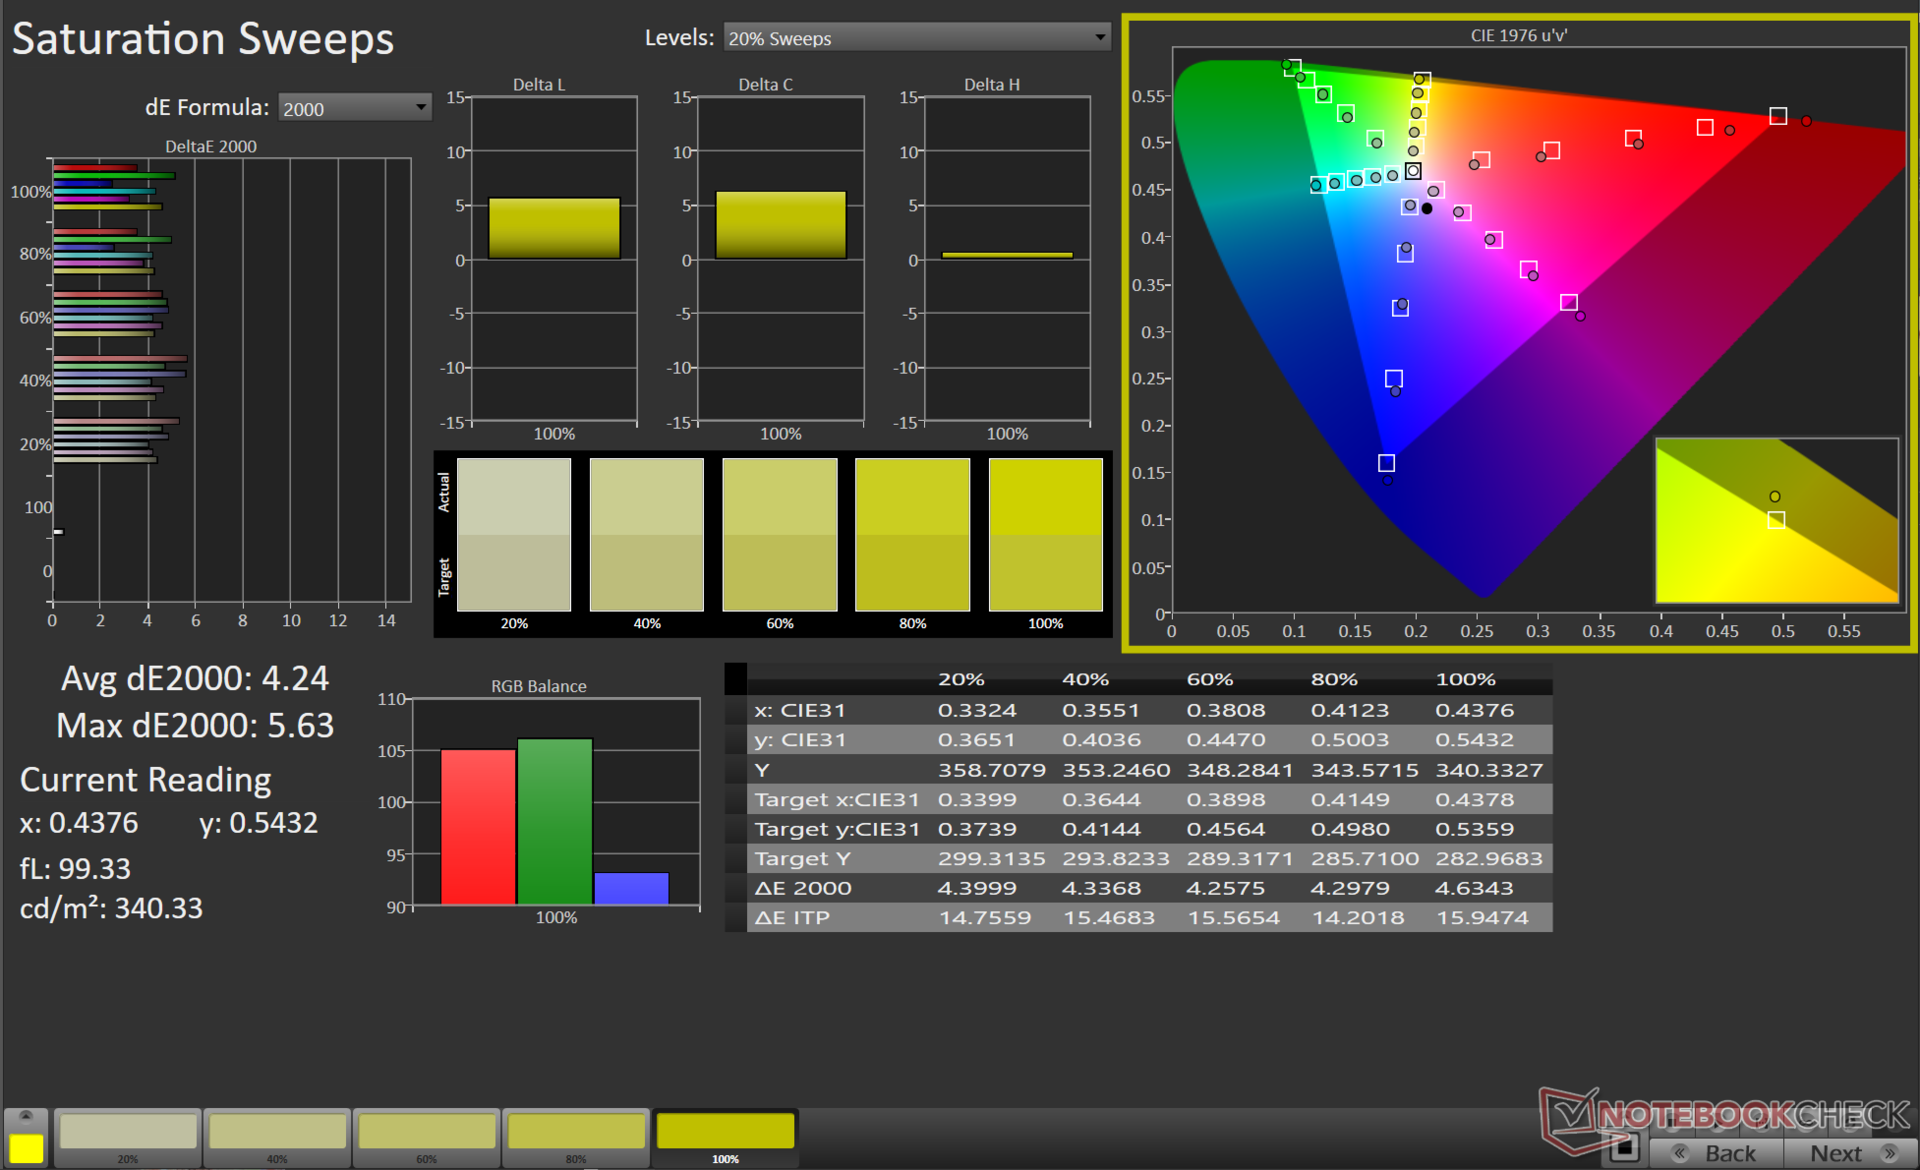
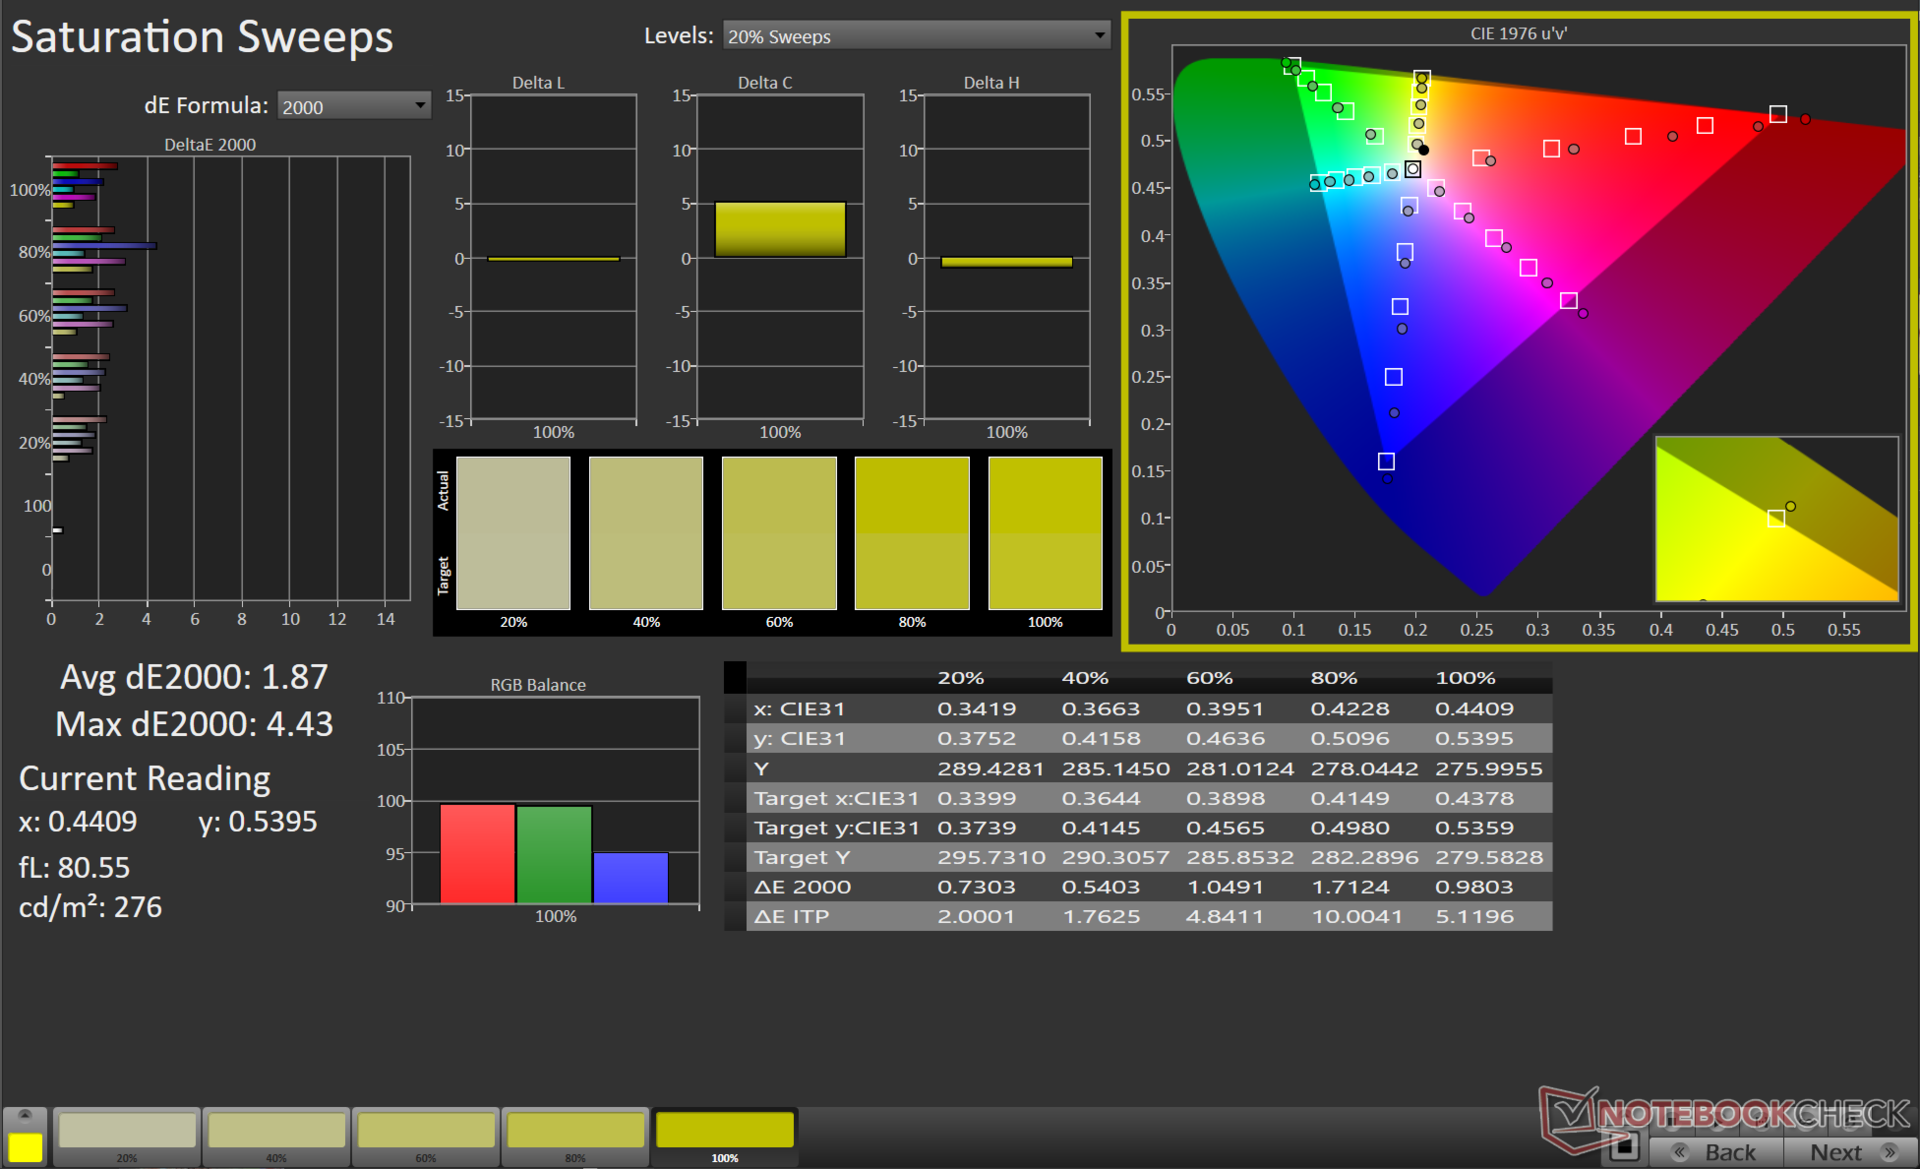
Razer advertises a 100% DCI-P3 coverage for this panel, and our measurements confirm the same as well. We also observe complete coverage of the sRGB color gamut and an excellent 91% coverage of Adobe RGB, which means that the Blade 16's display is amenable to both gamers and content creators alike.
Subjectively, the mini-LED display is a visual treat with near-infinite blacks and punchy colors. There is some blooming observed at close inspection, but it is not distracting and won't hamper the viewing experience.
This is the closest you can get to OLED quality while also reaping the benefits of high luminance levels.

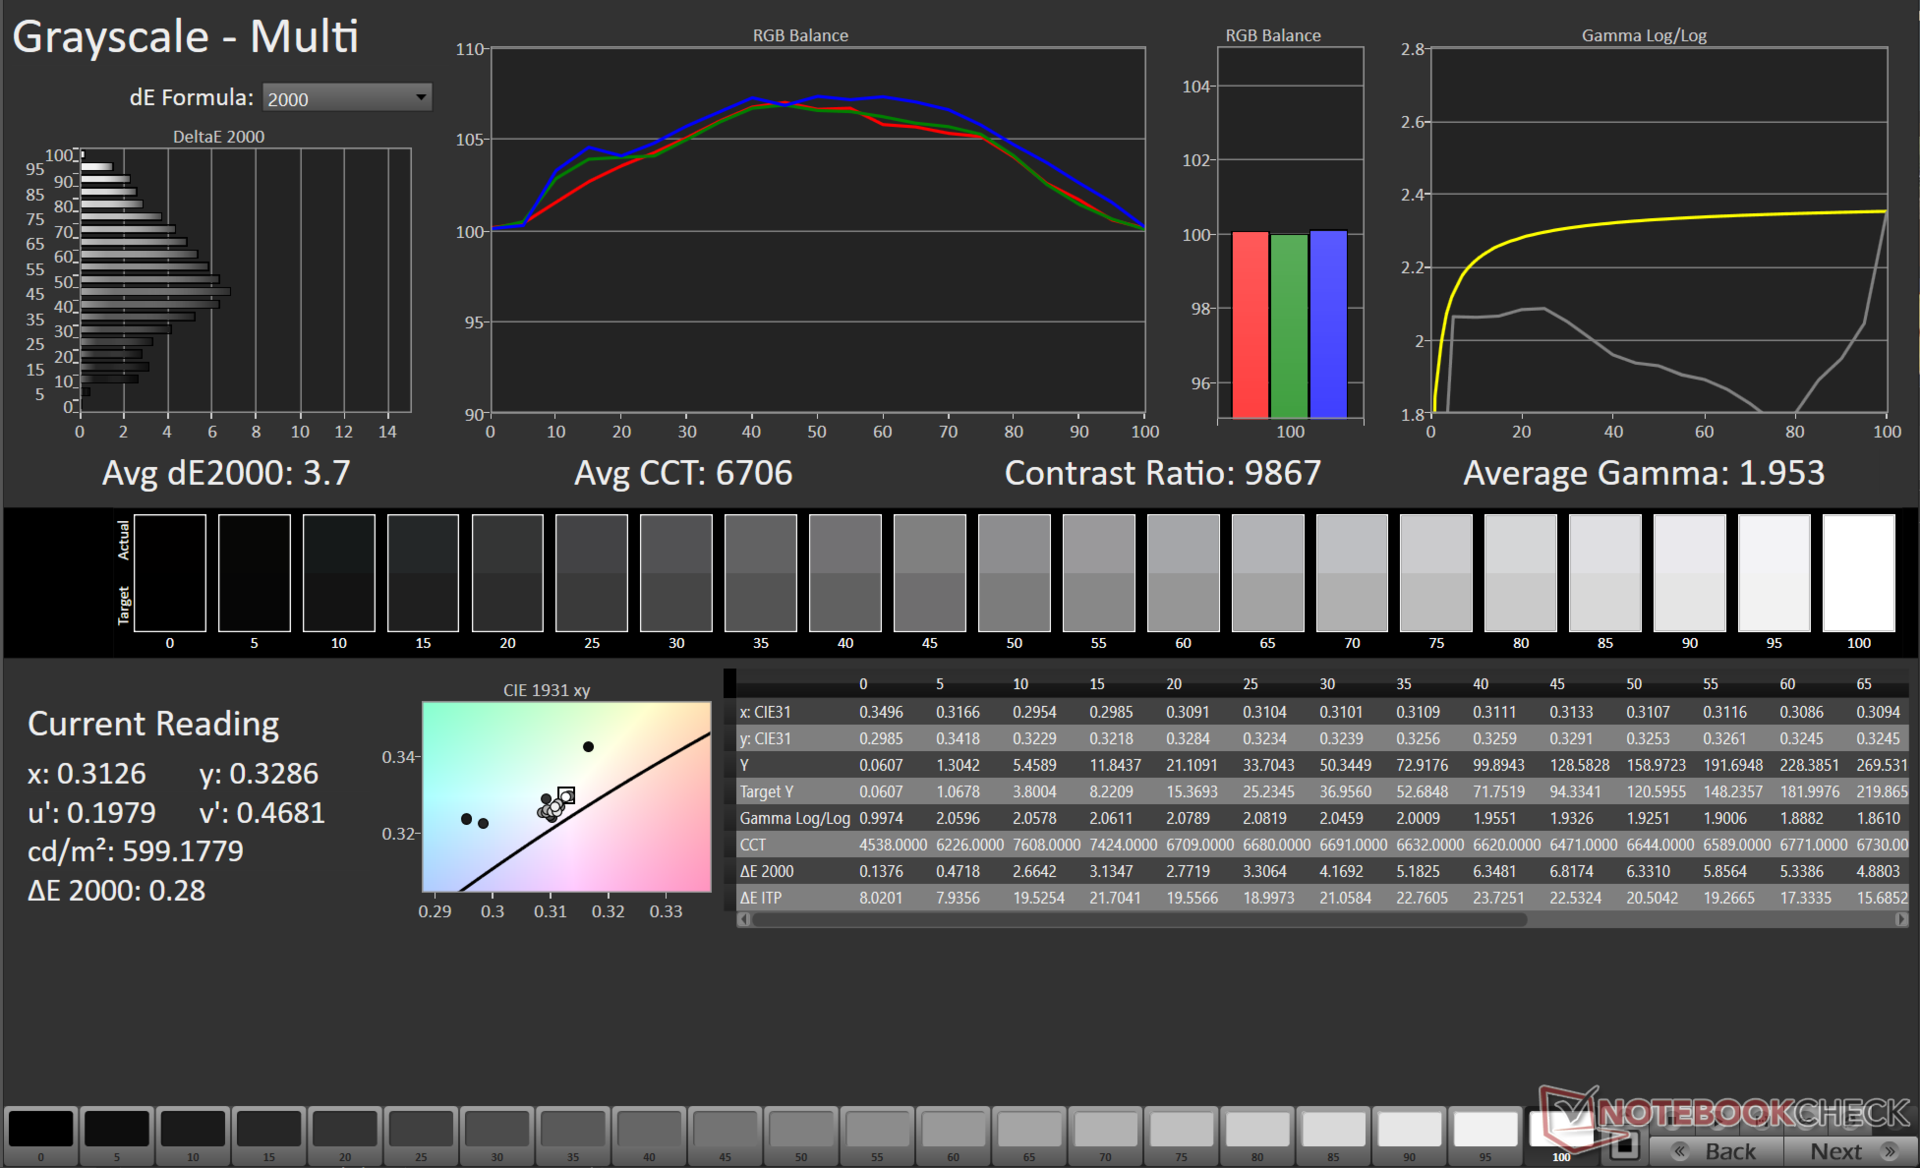
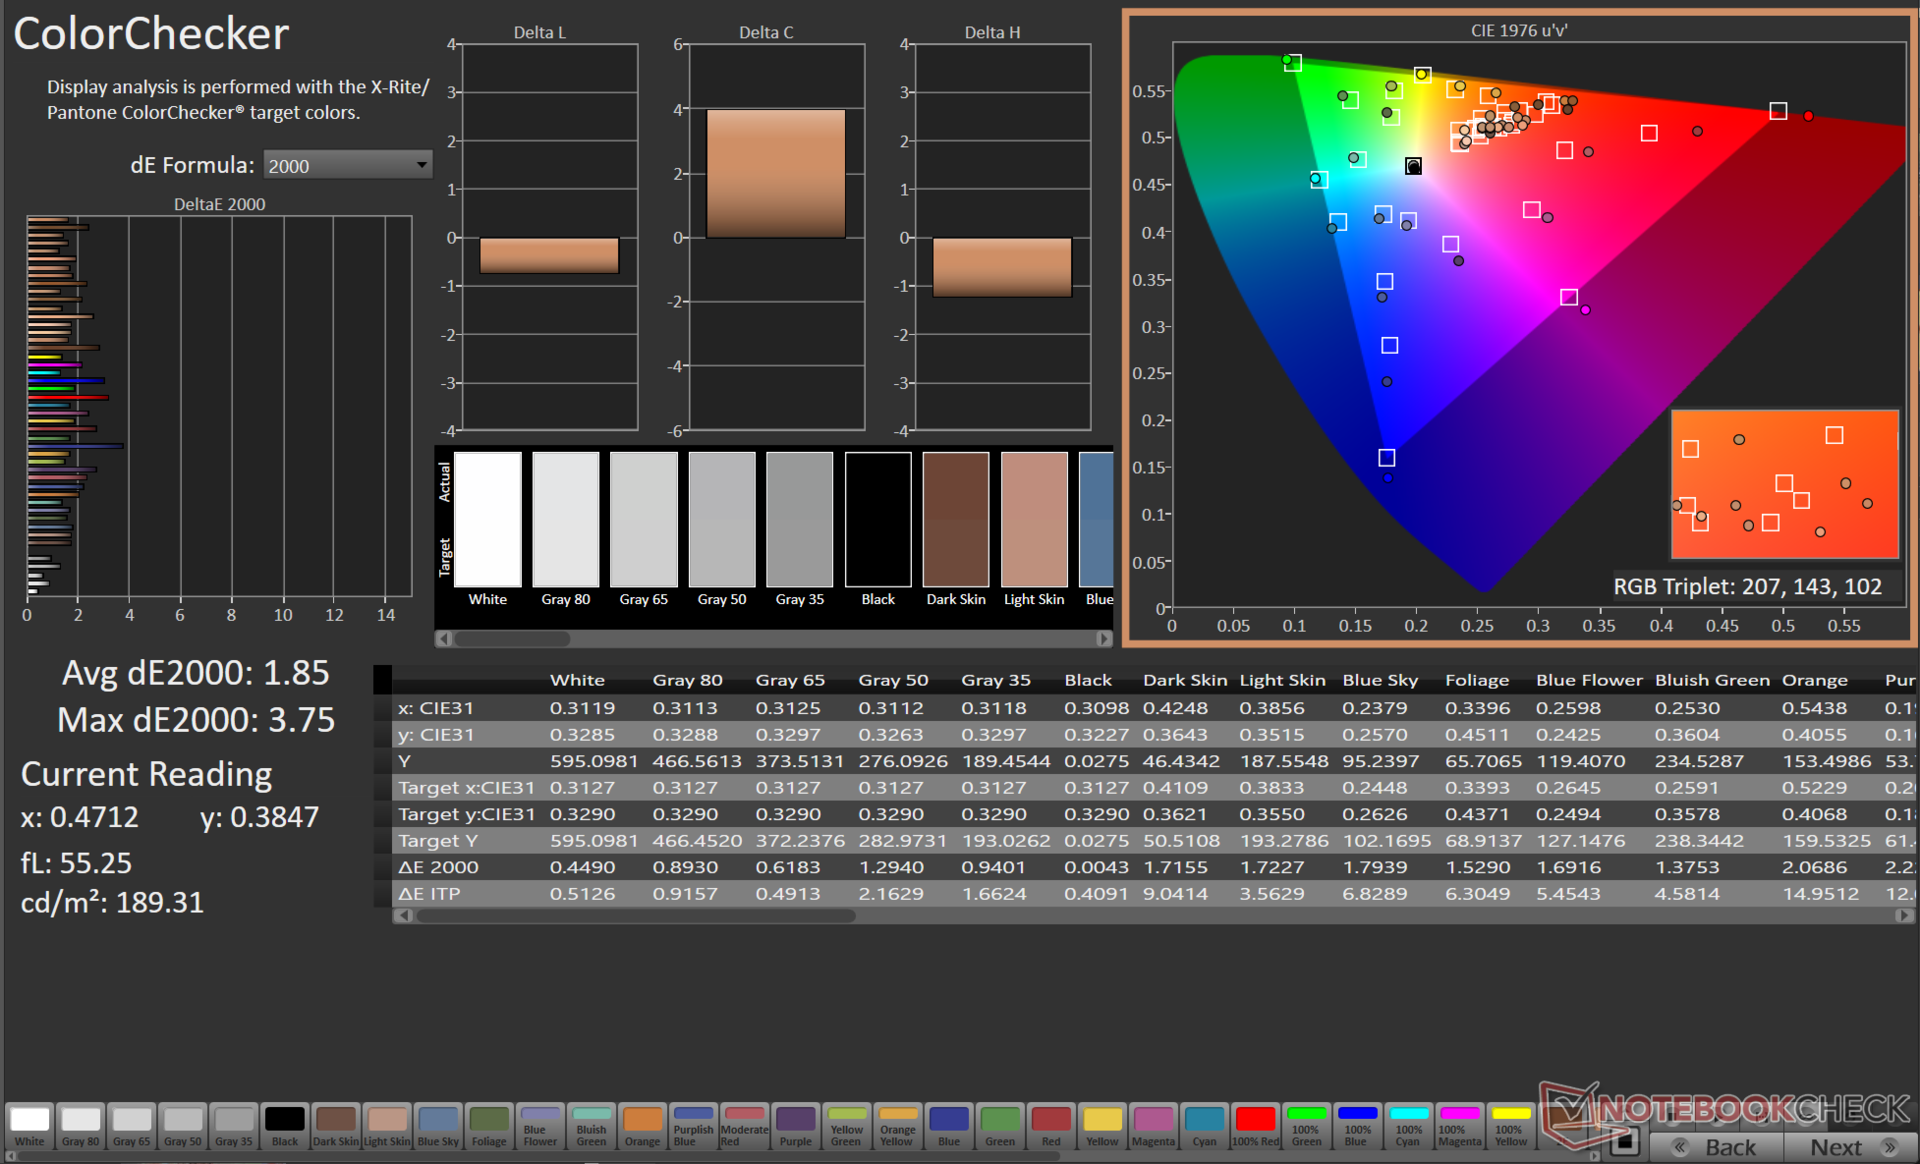
Although the factory calibration seems to reduce the overall SDR brightness, the Delta E values are much better compared to those of the Windows default ICC profile. That being said, the factory color calibration is not perfect and has lots of scope for improvement.
We calibrated the Blade 16's display using the X-Rite i1Basic Pro 3 spectrophotometer and Calman Ultimate color calibration software from Portrait Displays in the DCI-P3 color space.
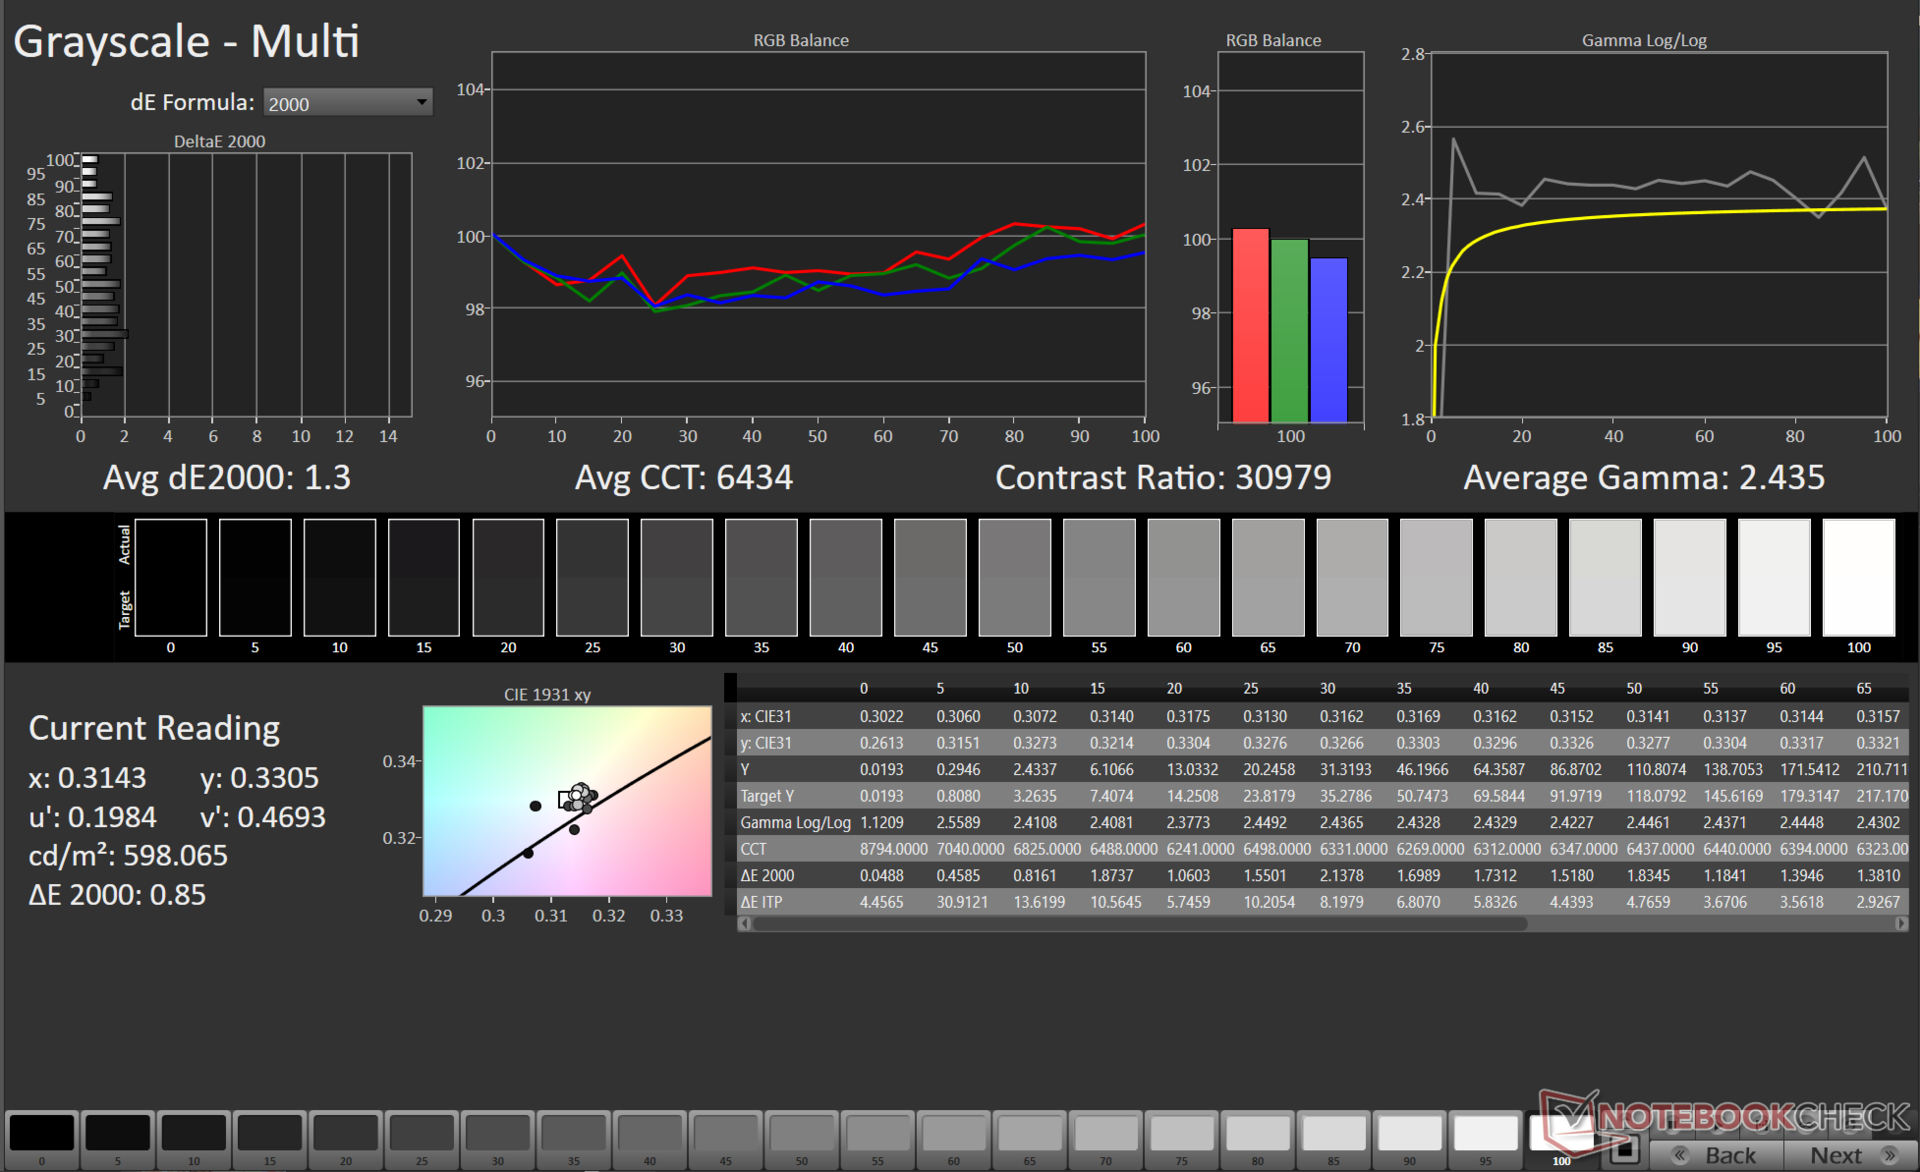
Our calibration routine results in significantly improved average Delta E values of 1.3 and 1.85 in Grayscale and ColorChecker measurements, respectively. Red and 100% blue show the highest deviations, but the maximum Delta E of 3.75 is still quite serviceable for most creative workflows. Do note that the brightness levels once again drop here upon calibration.
The calibrated ICC file can be downloaded from the link above.
Display Response Times
| ↔ Response Time Black to White | ||
|---|---|---|
| 62.04 ms ... rise ↗ and fall ↘ combined | ↗ 58.04 ms rise | 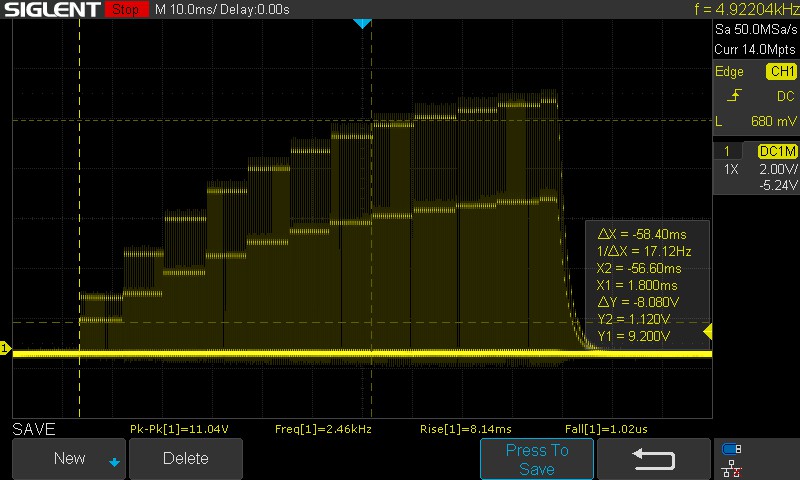  |
| ↘ 4 ms fall | ||
| The screen shows slow response rates in our tests and will be unsatisfactory for gamers. In comparison, all tested devices range from 0.1 (minimum) to 240 (maximum) ms. » 100 % of all devices are better. This means that the measured response time is worse than the average of all tested devices (19.8 ms). | ||
| ↔ Response Time 50% Grey to 80% Grey | ||
| 10.2 ms ... rise ↗ and fall ↘ combined | ↗ 5.8 ms rise |  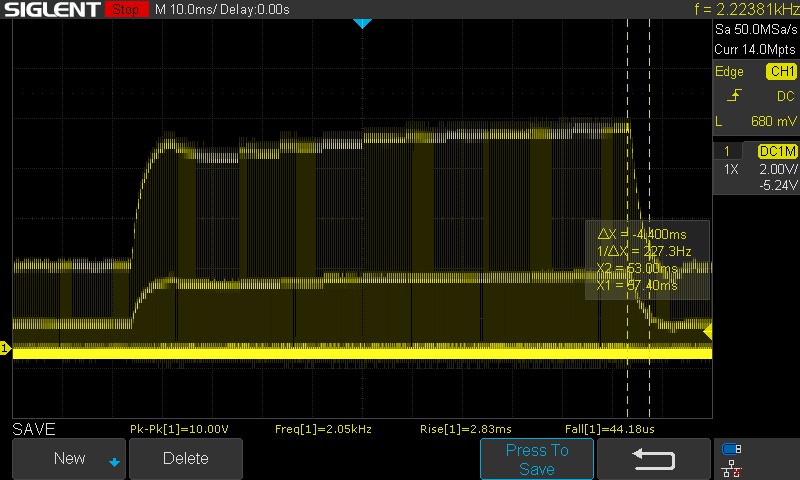 |
| ↘ 4.4 ms fall | ||
| The screen shows good response rates in our tests, but may be too slow for competitive gamers. In comparison, all tested devices range from 0.165 (minimum) to 636 (maximum) ms. » 24 % of all devices are better. This means that the measured response time is better than the average of all tested devices (31 ms). | ||
The mini-LED array makes accurate measurement of response times a tad bit convoluted. The high flickering meant that we had to sample data over the entire pulsing range and manually determine rise and fall times. The values noted above, therefore, will seem higher than normal for a gaming laptop, particularly with the 100% black to 100% white transition.
Razer advertises a response time of 3 ms, but it is not clear under what conditions this value is obtained. We used a 100% SDR brightness setting, but it is possible that Razer might have chosen a much lower brightness. That being said, the 120 Hz refresh rate does not seem to result in any perceivable ghosting issues.
Screen Flickering / PWM (Pulse-Width Modulation)
| Screen flickering / PWM detected | 2420 Hz | ≤ 100 % brightness setting | 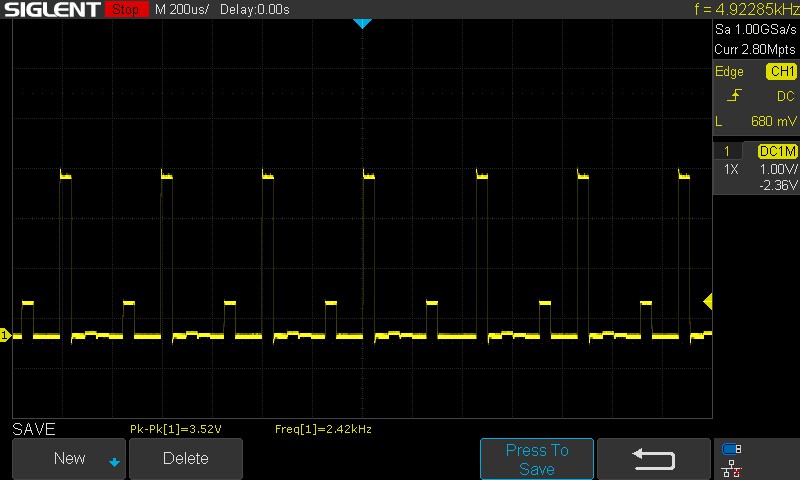 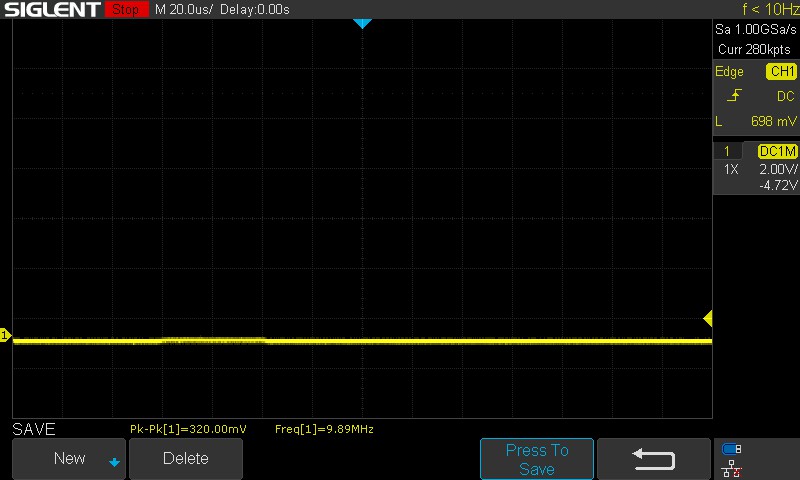 |
The display backlight flickers at 2420 Hz (worst case, e.g., utilizing PWM) Flickering detected at a brightness setting of 100 % and below. There should be no flickering or PWM above this brightness setting. The frequency of 2420 Hz is quite high, so most users sensitive to PWM should not notice any flickering. In comparison: 52 % of all tested devices do not use PWM to dim the display. If PWM was detected, an average of 7747 (minimum: 5 - maximum: 343500) Hz was measured. | |||
We observed a PWM of 2,420 Hz across all tested brightness levels, which is sufficiently high. The PWM increases to 9.89 MHz at 0% brightness, which is as good as having no flickering.
The high brightness levels lend to a good viewing experience outdoors even under direct sunlight. Viewing angles are very stable with only minimal loss of brightness at the extremes.


Performance: Core i9-13950HX and RTX 4090 combo trails behind the competition
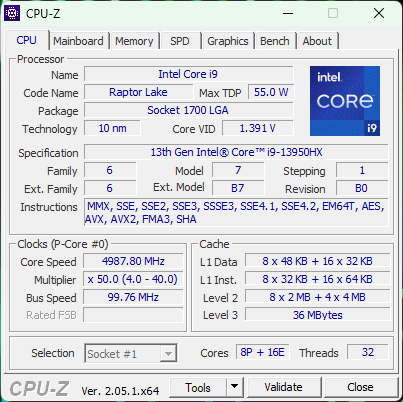
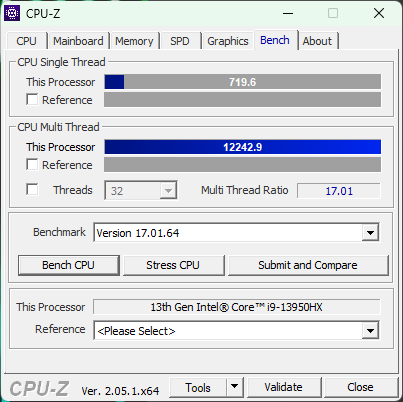
Our Razer Blade 16 Early 2023 unit is powered by the Intel Core i9-13950HX and the Nvidia GeForce RTX 4090 Laptop GPU. Buyers also have the option of choosing from several other Blade 16 configurations as indicated in the introduction.
Note that dual-mode mini-LED displays are only available on configurations featuring the RTX 4070 Laptop GPU and the RTX 4090 Laptop GPU.
Testing Conditions
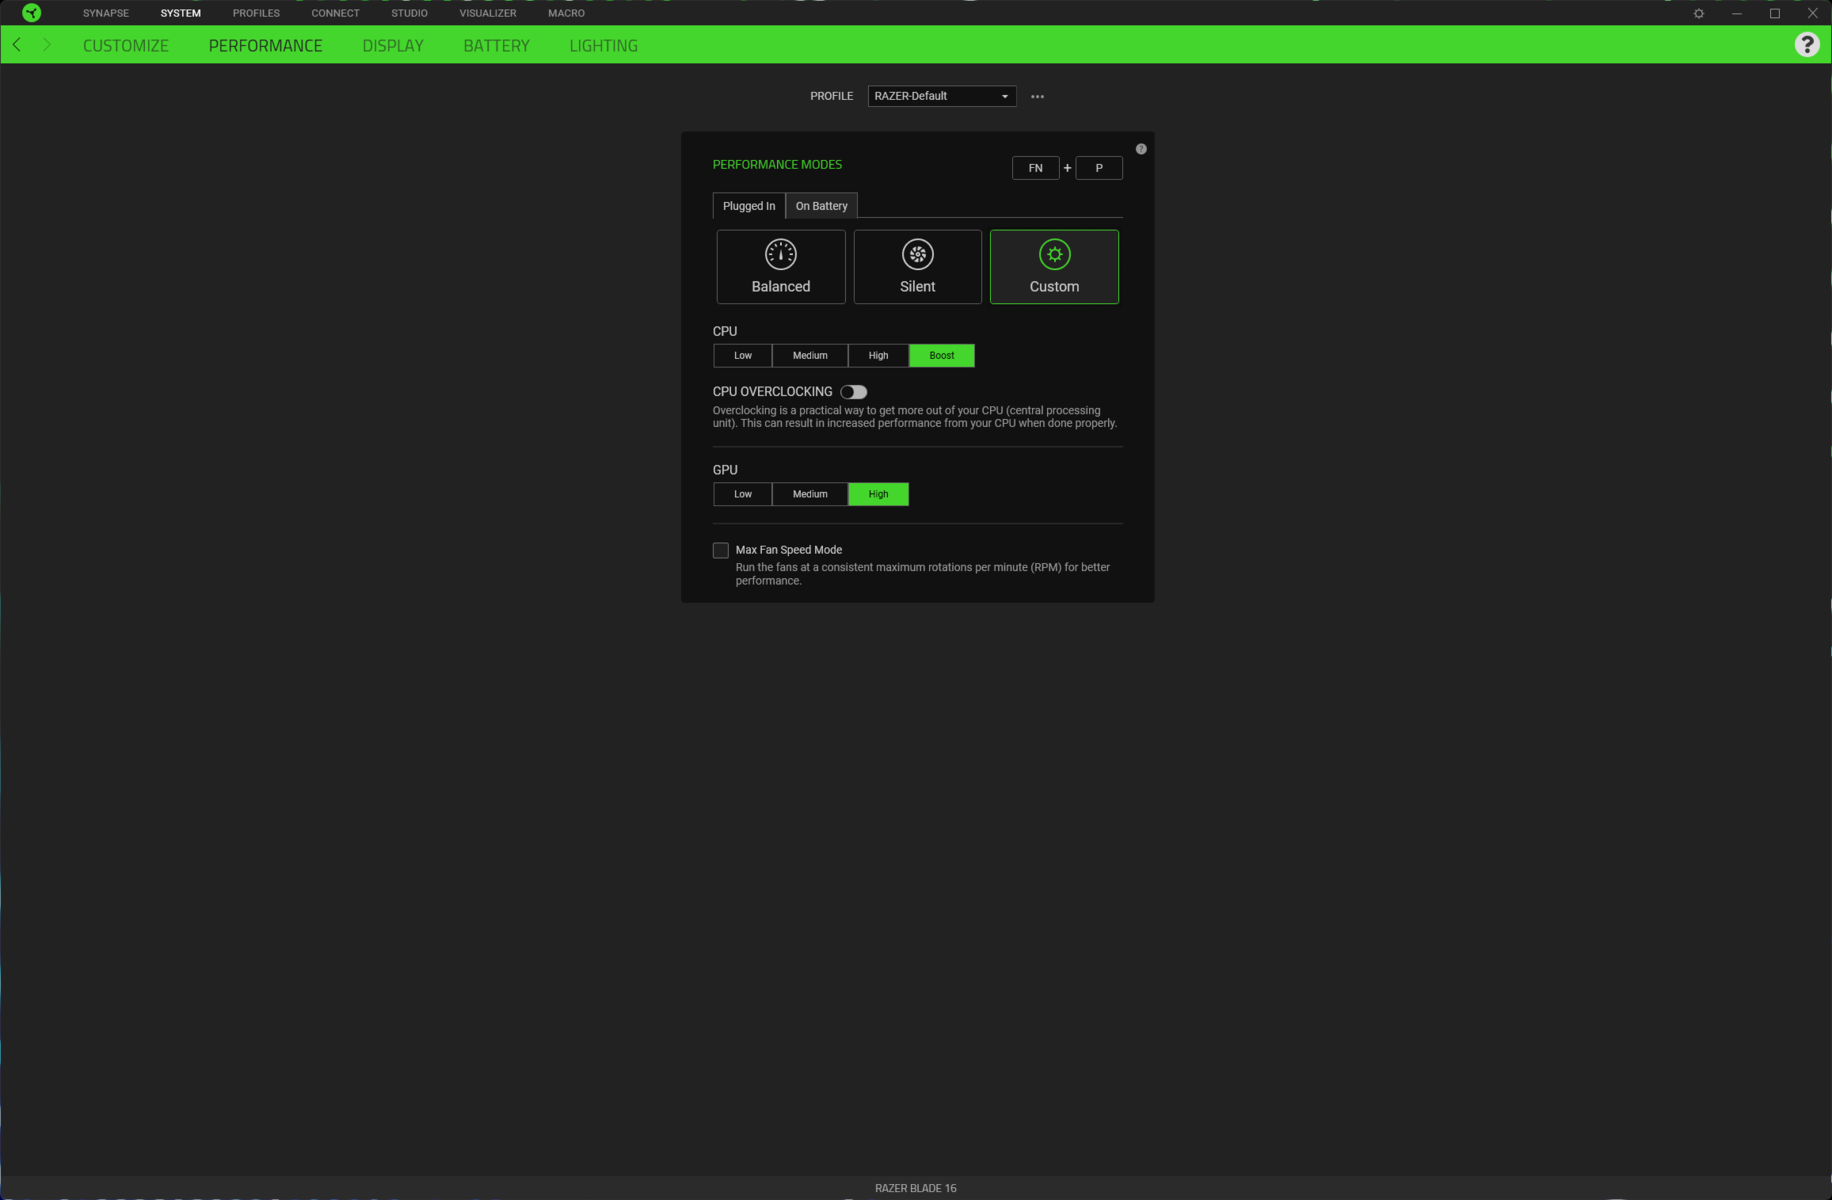
Razer Synapse allows changing various performance modes depending on need. To allow the Core i9-13950HX and the RTX 4090 to fully flex their muscles, we used the Custom mode with CPU Boost and GPU High options. This results in a sustained PL1 of 110 W and a short burst boost of 130 W.
We used the dGPU mode for running graphics tests. The laptop supports Advanced Optimus, so you can easily switch between MSHybrid and dGPU directly from the Nvidia Control Panel without having to reboot. G-Sync was disabled during testing.
The choice of performance modes can have an impact on thermal and noise emissions. The table below illustrates how PL1 and PL2 vary with each performance setting.
Only the Balanced profile is offered on battery power. We used this mode for our battery tests and enabled the option to auto switch to a 60 Hz refresh rate.
| Performance Mode | PL1 (PBP) / Tau | PL2 (MTP) / Tau |
|---|---|---|
| Silent | 32.5 W / 56 s | 37 W / 2.44 ms |
| Balanced | 54 W / 56 s | 55 W / 2.44 ms |
| Custom (CPU Boost / GPU High) | 110 W / 56 s | 130 W / 2.44 ms |
Processor
The Intel Core i9-13950HX is a Raptor Lake-HX part with 24 cores and 32 threads that can achieve a 5.5 GHz single-core boost.
When we reviewed the Razer Blade 16 with the RTX 4080, the competition mostly consisted of devices powered by Intel Alder Lake and AMD Ryzen 6000 series chips.
Over the past month or so, there has been a steady influx of Intel 13th gen and AMD Ryzen 7000 series notebooks. This allows us to do a more contemporary comparison, and unfortunately both the 2023 Blade 16s struggle against the latest competition.
Despite sporting a capable vapor chamber cooler, the Blade 16 with the RTX 4090 fails to sustain well in the Cinebench R15 multi-core loop test. We see up to a 29% drop towards the 19th run before getting up to speed in the 21st loop. This is unlike the RTX 4080-powered Blade 16, which shows a well-sustained performance.
Cinebench R15 Multi Loop
The cumulative performance is a decent 17% uplift over an average Core i9-12950HX. The Core i9-13900HX in the Lenovo Legion Pro 7 easily surpasses the Blade 16's Core i9-13950HX owing to its high 130 W/185 W PL1/PL2 values.
Similarly, the MSI Titan GT77 HX 13VI with the same CPU as that of the Blade 16 is able to score higher cumulatively in CPU benchmarks thanks to its 150 W PL1 and 220 W PL2.
The AMD Ryzen 9 7945HX in the Asus ROG Zephyrus Duo 16 is placed at a comfortable 12% lead overall than the Core i9-13950HX in the Blade 16.
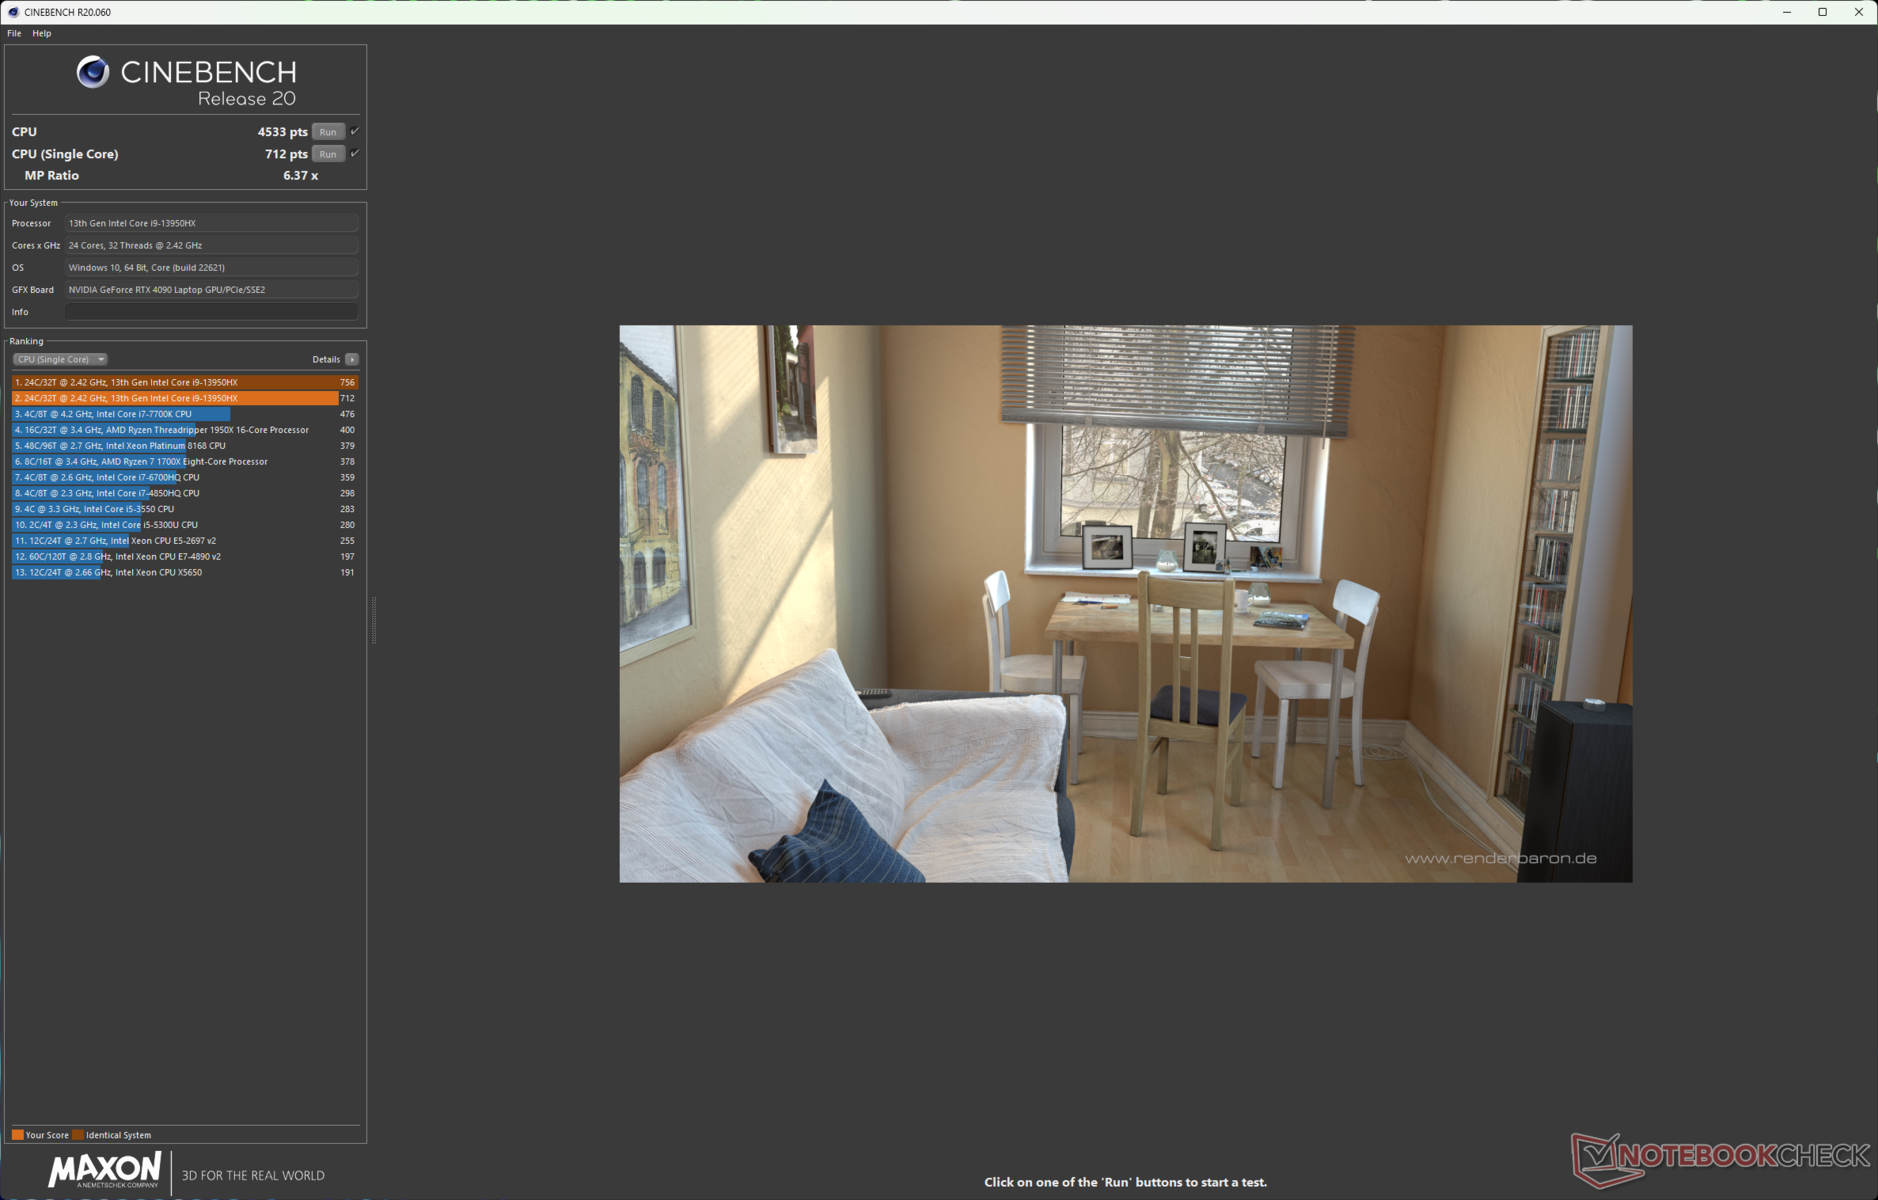
Cinebench R23: Multi Core | Single Core
Cinebench R20: CPU (Multi Core) | CPU (Single Core)
Cinebench R15: CPU Multi 64Bit | CPU Single 64Bit
Blender: v2.79 BMW27 CPU
7-Zip 18.03: 7z b 4 | 7z b 4 -mmt1
Geekbench 5.5: Multi-Core | Single-Core
HWBOT x265 Benchmark v2.2: 4k Preset
LibreOffice : 20 Documents To PDF
R Benchmark 2.5: Overall mean
| CPU Performance rating | |
| Average Intel Core i9-13900K | |
| Eluktronics Mech-17 GP2 | |
| Asus ROG Strix Scar 18 2023 G834JY-N6005W | |
| Asus Zephyrus Duo 16 GX650PY-NM006W | |
| MSI Titan GT77 HX 13VI | |
| Lenovo Legion Pro 7 16IRX8H | |
| Asus ROG Strix G16 G614JZ | |
| Razer Blade 18 RTX 4070 | |
| Razer Blade 16 Early 2023 RTX 4090 | |
| Razer Blade 16 Early 2023 | |
| Average of class Gaming | |
| Asus ROG Zephyrus M16 GU604VY-NM042X | |
| Average Intel Core i9-12950HX | |
| Cinebench R23 / Multi Core | |
| Average Intel Core i9-13900K (32592 - 40103, n=4) | |
| Asus Zephyrus Duo 16 GX650PY-NM006W | |
| MSI Titan GT77 HX 13VI | |
| Eluktronics Mech-17 GP2 | |
| Asus ROG Strix Scar 18 2023 G834JY-N6005W | |
| Lenovo Legion Pro 7 16IRX8H | |
| Asus ROG Strix G16 G614JZ | |
| Razer Blade 18 RTX 4070 | |
| Razer Blade 16 Early 2023 RTX 4090 | |
| Razer Blade 16 Early 2023 | |
| Average of class Gaming (10488 - 40970, n=106, last 2 years) | |
| Average Intel Core i9-12950HX (16277 - 23113, n=7) | |
| Asus ROG Zephyrus M16 GU604VY-NM042X | |
| Cinebench R23 / Single Core | |
| Average Intel Core i9-13900K (2203 - 2272, n=4) | |
| Asus ROG Strix Scar 18 2023 G834JY-N6005W | |
| Asus ROG Strix G16 G614JZ | |
| MSI Titan GT77 HX 13VI | |
| Eluktronics Mech-17 GP2 | |
| Razer Blade 18 RTX 4070 | |
| Lenovo Legion Pro 7 16IRX8H | |
| Razer Blade 16 Early 2023 | |
| Average of class Gaming (1166 - 2387, n=106, last 2 years) | |
| Asus ROG Zephyrus M16 GU604VY-NM042X | |
| Razer Blade 16 Early 2023 RTX 4090 | |
| Asus Zephyrus Duo 16 GX650PY-NM006W | |
| Average Intel Core i9-12950HX (1465 - 1922, n=7) | |
| Cinebench R20 / CPU (Multi Core) | |
| Average Intel Core i9-13900K (13415 - 15181, n=4) | |
| Asus Zephyrus Duo 16 GX650PY-NM006W | |
| MSI Titan GT77 HX 13VI | |
| Eluktronics Mech-17 GP2 | |
| Asus ROG Strix Scar 18 2023 G834JY-N6005W | |
| Asus ROG Strix G16 G614JZ | |
| Lenovo Legion Pro 7 16IRX8H | |
| Razer Blade 18 RTX 4070 | |
| Razer Blade 16 Early 2023 RTX 4090 | |
| Average of class Gaming (4029 - 16108, n=105, last 2 years) | |
| Razer Blade 16 Early 2023 | |
| Average Intel Core i9-12950HX (6625 - 8777, n=7) | |
| Asus ROG Zephyrus M16 GU604VY-NM042X | |
| Cinebench R20 / CPU (Single Core) | |
| Average Intel Core i9-13900K (828 - 870, n=4) | |
| Asus ROG Strix Scar 18 2023 G834JY-N6005W | |
| Asus ROG Strix G16 G614JZ | |
| MSI Titan GT77 HX 13VI | |
| Eluktronics Mech-17 GP2 | |
| Razer Blade 18 RTX 4070 | |
| Lenovo Legion Pro 7 16IRX8H | |
| Average of class Gaming (442 - 904, n=105, last 2 years) | |
| Asus Zephyrus Duo 16 GX650PY-NM006W | |
| Razer Blade 16 Early 2023 RTX 4090 | |
| Asus ROG Zephyrus M16 GU604VY-NM042X | |
| Razer Blade 16 Early 2023 | |
| Average Intel Core i9-12950HX (703 - 741, n=7) | |
| Cinebench R15 / CPU Multi 64Bit | |
| Average Intel Core i9-13900K (5321 - 6191, n=8) | |
| Asus Zephyrus Duo 16 GX650PY-NM006W | |
| MSI Titan GT77 HX 13VI | |
| Eluktronics Mech-17 GP2 | |
| Lenovo Legion Pro 7 16IRX8H | |
| Asus ROG Strix Scar 18 2023 G834JY-N6005W | |
| Asus ROG Strix G16 G614JZ | |
| Asus ROG Strix G16 G614JZ | |
| Razer Blade 16 Early 2023 | |
| Razer Blade 18 RTX 4070 | |
| Razer Blade 16 Early 2023 RTX 4090 | |
| Average of class Gaming (1578 - 6271, n=104, last 2 years) | |
| Average Intel Core i9-12950HX (2464 - 3530, n=7) | |
| Asus ROG Zephyrus M16 GU604VY-NM042X | |
| Cinebench R15 / CPU Single 64Bit | |
| Average Intel Core i9-13900K (299 - 328, n=8) | |
| Asus ROG Strix Scar 18 2023 G834JY-N6005W | |
| Asus Zephyrus Duo 16 GX650PY-NM006W | |
| Asus ROG Strix G16 G614JZ | |
| Asus ROG Strix G16 G614JZ | |
| Lenovo Legion Pro 7 16IRX8H | |
| MSI Titan GT77 HX 13VI | |
| Eluktronics Mech-17 GP2 | |
| Razer Blade 18 RTX 4070 | |
| Average of class Gaming (188.8 - 344, n=105, last 2 years) | |
| Asus ROG Zephyrus M16 GU604VY-NM042X | |
| Razer Blade 16 Early 2023 RTX 4090 | |
| Razer Blade 16 Early 2023 | |
| Average Intel Core i9-12950HX (167 - 276, n=7) | |
| Blender / v2.79 BMW27 CPU | |
| Average Intel Core i9-12950HX (138 - 193, n=7) | |
| Asus ROG Zephyrus M16 GU604VY-NM042X | |
| Average of class Gaming (80 - 330, n=103, last 2 years) | |
| Razer Blade 16 Early 2023 RTX 4090 | |
| Razer Blade 16 Early 2023 | |
| Razer Blade 18 RTX 4070 | |
| Asus ROG Strix G16 G614JZ | |
| Lenovo Legion Pro 7 16IRX8H | |
| Asus ROG Strix Scar 18 2023 G834JY-N6005W | |
| Eluktronics Mech-17 GP2 | |
| MSI Titan GT77 HX 13VI | |
| Asus Zephyrus Duo 16 GX650PY-NM006W | |
| Average Intel Core i9-13900K (80 - 101, n=7) | |
| 7-Zip 18.03 / 7z b 4 | |
| Average Intel Core i9-13900K (127201 - 148053, n=5) | |
| Asus Zephyrus Duo 16 GX650PY-NM006W | |
| MSI Titan GT77 HX 13VI | |
| Eluktronics Mech-17 GP2 | |
| Asus ROG Strix Scar 18 2023 G834JY-N6005W | |
| Lenovo Legion Pro 7 16IRX8H | |
| Razer Blade 18 RTX 4070 | |
| Asus ROG Strix G16 G614JZ | |
| Razer Blade 16 Early 2023 | |
| Razer Blade 16 Early 2023 RTX 4090 | |
| Average of class Gaming (33491 - 148086, n=104, last 2 years) | |
| Asus ROG Zephyrus M16 GU604VY-NM042X | |
| Average Intel Core i9-12950HX (65637 - 85019, n=7) | |
| 7-Zip 18.03 / 7z b 4 -mmt1 | |
| Average Intel Core i9-13900K (7176 - 7539, n=5) | |
| Asus Zephyrus Duo 16 GX650PY-NM006W | |
| Asus ROG Strix Scar 18 2023 G834JY-N6005W | |
| Lenovo Legion Pro 7 16IRX8H | |
| Eluktronics Mech-17 GP2 | |
| Asus ROG Strix G16 G614JZ | |
| MSI Titan GT77 HX 13VI | |
| Razer Blade 18 RTX 4070 | |
| Razer Blade 16 Early 2023 RTX 4090 | |
| Razer Blade 16 Early 2023 | |
| Average of class Gaming (4199 - 7436, n=104, last 2 years) | |
| Asus ROG Zephyrus M16 GU604VY-NM042X | |
| Average Intel Core i9-12950HX (6022 - 6318, n=7) | |
| Geekbench 5.5 / Multi-Core | |
| Average Intel Core i9-13900K (22448 - 24157, n=5) | |
| Lenovo Legion Pro 7 16IRX8H | |
| Asus ROG Strix Scar 18 2023 G834JY-N6005W | |
| Eluktronics Mech-17 GP2 | |
| MSI Titan GT77 HX 13VI | |
| Razer Blade 18 RTX 4070 | |
| Asus Zephyrus Duo 16 GX650PY-NM006W | |
| Asus ROG Strix G16 G614JZ | |
| Razer Blade 16 Early 2023 | |
| Average of class Gaming (6460 - 27010, n=104, last 2 years) | |
| Razer Blade 16 Early 2023 RTX 4090 | |
| Asus ROG Zephyrus M16 GU604VY-NM042X | |
| Average Intel Core i9-12950HX (14028 - 16009, n=7) | |
| Geekbench 5.5 / Single-Core | |
| Average Intel Core i9-13900K (2106 - 2290, n=5) | |
| Asus Zephyrus Duo 16 GX650PY-NM006W | |
| Asus ROG Strix Scar 18 2023 G834JY-N6005W | |
| Eluktronics Mech-17 GP2 | |
| Average of class Gaming (986 - 2474, n=104, last 2 years) | |
| Asus ROG Strix G16 G614JZ | |
| MSI Titan GT77 HX 13VI | |
| Razer Blade 18 RTX 4070 | |
| Lenovo Legion Pro 7 16IRX8H | |
| Asus ROG Zephyrus M16 GU604VY-NM042X | |
| Razer Blade 16 Early 2023 RTX 4090 | |
| Average Intel Core i9-12950HX (1847 - 1945, n=7) | |
| Razer Blade 16 Early 2023 | |
| HWBOT x265 Benchmark v2.2 / 4k Preset | |
| Average Intel Core i9-13900K (34.5 - 42.6, n=5) | |
| Asus Zephyrus Duo 16 GX650PY-NM006W | |
| Eluktronics Mech-17 GP2 | |
| Asus ROG Strix Scar 18 2023 G834JY-N6005W | |
| MSI Titan GT77 HX 13VI | |
| Lenovo Legion Pro 7 16IRX8H | |
| Razer Blade 18 RTX 4070 | |
| Razer Blade 16 Early 2023 RTX 4090 | |
| Asus ROG Strix G16 G614JZ | |
| Razer Blade 16 Early 2023 | |
| Average of class Gaming (11.5 - 44.3, n=104, last 2 years) | |
| Average Intel Core i9-12950HX (18.6 - 26.5, n=7) | |
| Asus ROG Zephyrus M16 GU604VY-NM042X | |
| LibreOffice / 20 Documents To PDF | |
| Asus Zephyrus Duo 16 GX650PY-NM006W | |
| Razer Blade 16 Early 2023 RTX 4090 | |
| Asus ROG Zephyrus M16 GU604VY-NM042X | |
| Average of class Gaming (33.2 - 88.8, n=104, last 2 years) | |
| Asus ROG Strix G16 G614JZ | |
| Razer Blade 16 Early 2023 | |
| MSI Titan GT77 HX 13VI | |
| Lenovo Legion Pro 7 16IRX8H | |
| Razer Blade 18 RTX 4070 | |
| Average Intel Core i9-12950HX (34.7 - 45.4, n=7) | |
| Asus ROG Strix Scar 18 2023 G834JY-N6005W | |
| Average Intel Core i9-13900K (30.3 - 41.6, n=5) | |
| Eluktronics Mech-17 GP2 | |
| R Benchmark 2.5 / Overall mean | |
| Average Intel Core i9-12950HX (0.4251 - 0.4515, n=7) | |
| Average of class Gaming (0.3439 - 0.759, n=105, last 2 years) | |
| Razer Blade 16 Early 2023 | |
| Asus ROG Zephyrus M16 GU604VY-NM042X | |
| MSI Titan GT77 HX 13VI | |
| Asus Zephyrus Duo 16 GX650PY-NM006W | |
| Lenovo Legion Pro 7 16IRX8H | |
| Razer Blade 16 Early 2023 RTX 4090 | |
| Razer Blade 18 RTX 4070 | |
| Asus ROG Strix G16 G614JZ | |
| Eluktronics Mech-17 GP2 | |
| Asus ROG Strix Scar 18 2023 G834JY-N6005W | |
| Average Intel Core i9-13900K (0.3468 - 0.3911, n=5) | |
* ... smaller is better
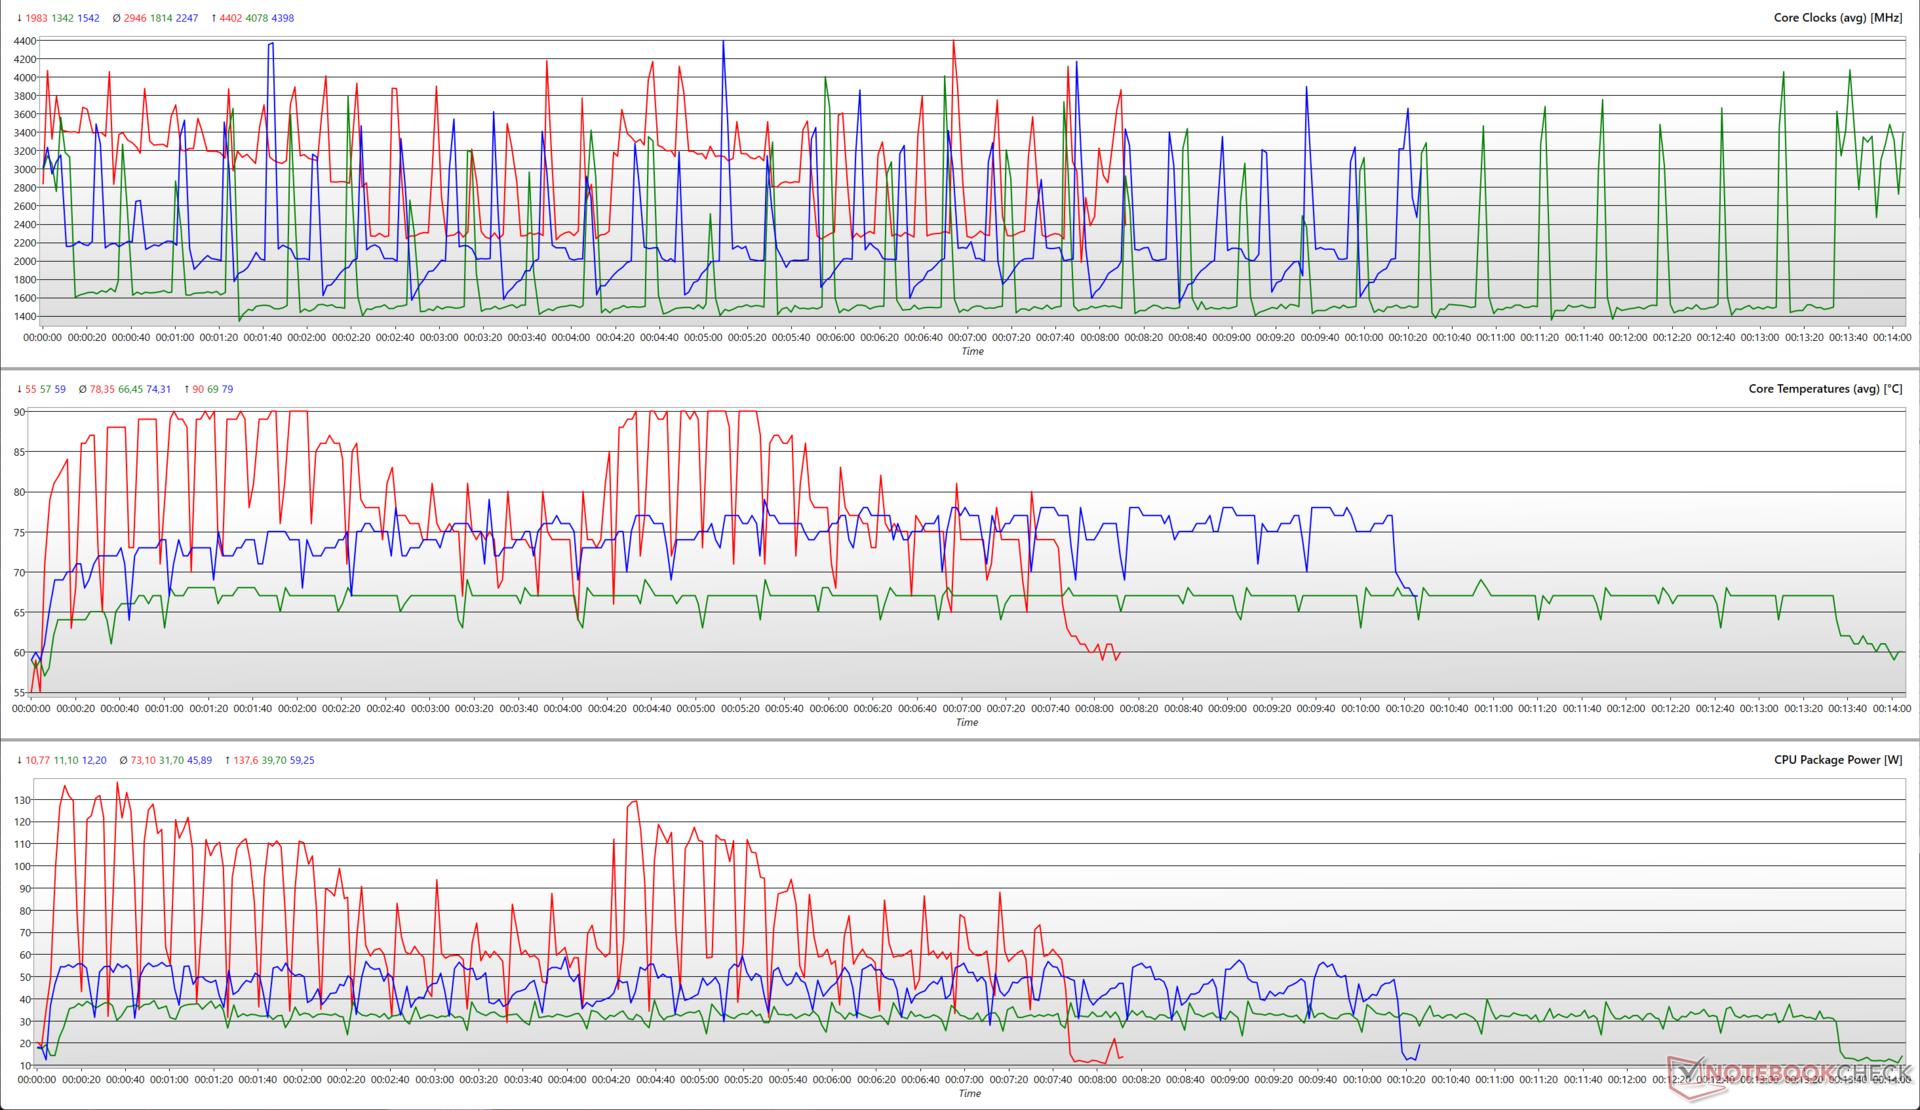
The unusual graph seen above in the Cinebench R15 loop is also reflected while evaluating various CPU parameters in available performance modes. Such a pattern is not seen when running the loop test in Balanced and Silent profiles.
In the Custom setting, we see the package power hitting a maximum of 137.6 W resulting in a max boost of 4.4 GHz and core temperature up to 90 °C. It is possible that Razer has implemented a harsh temperature tolerance as soon as the core temperature hits the 90 °C mark. This results in the package power dropping as low as 74 W before it recovers again to 130 W and the cycle repeats.
The Balanced mode seems to be a bit forgiving in this case. We see the clocks hitting close to 4.4 GHz at a peak package power of 59 W and a maximum core temperature of 79 °C. This mode should be sufficient for most use cases.
Silent mode takes quite a hit in terms of clocks, but the peak core temperature is a manageable 69 °C while consuming a maximum of 39.7 W.
On battery, the Blade 16 runs in the Balanced profile. While single-core performance takes just a 5% hit, multi-core scores drop by 57% in Cinebench R20. That being said, the reduced performance should still be sufficient to get some work done on the move.
The Razer Blade 16 Early 2023 offers good CPU performance overall, but the relatively lower power limits put it at a disadvantage vis-à-vis the competition.
AIDA64: FP32 Ray-Trace | FPU Julia | CPU SHA3 | CPU Queen | FPU SinJulia | FPU Mandel | CPU AES | CPU ZLib | FP64 Ray-Trace | CPU PhotoWorxx
| Performance rating | |
| Eluktronics Mech-17 GP2 | |
| MSI Titan GT77 HX 13VI | |
| Asus ROG Strix Scar 18 2023 G834JY-N6005W | |
| Lenovo Legion Pro 7 16IRX8H | |
| Asus ROG Strix G16 G614JZ | |
| Average of class Gaming | |
| Razer Blade 18 RTX 4070 | |
| Average Intel Core i9-13950HX | |
| Razer Blade 16 Early 2023 RTX 4090 | |
| Razer Blade 16 Early 2023 | |
| Asus ROG Zephyrus M16 GU604VY-NM042X | |
Check out our dedicated Intel Core i9-13950HX page for more information and performance comparisons.
System Performance
PCMark 10 total scores see the Razer Blade 16 trailing behind the Ryzen 9 7945HX-powered Zephyrus Duo 16 by 17%, but these devices show more or less identical performance in overall CrossMark scores.
We did not encounter any issues with system performance and responsiveness in daily usage.
CrossMark: Overall | Productivity | Creativity | Responsiveness
| PCMark 10 / Score | |
| Asus Zephyrus Duo 16 GX650PY-NM006W | |
| Eluktronics Mech-17 GP2 | |
| MSI Titan GT77 HX 13VI | |
| Asus ROG Strix Scar 18 2023 G834JY-N6005W | |
| Average of class Gaming (5828 - 11730, n=92, last 2 years) | |
| Asus ROG Zephyrus M16 GU604VY-NM042X | |
| Average Intel Core i9-13950HX, NVIDIA GeForce RTX 4090 Laptop GPU (7597 - 8884, n=2) | |
| Razer Blade 16 Early 2023 | |
| Lenovo Legion Pro 7 16IRX8H | |
| Razer Blade 18 RTX 4070 | |
| Razer Blade 16 Early 2023 RTX 4090 | |
| Asus ROG Strix G16 G614JZ | |
| PCMark 10 / Essentials | |
| Asus Zephyrus Duo 16 GX650PY-NM006W | |
| Asus ROG Strix G16 G614JZ | |
| Eluktronics Mech-17 GP2 | |
| MSI Titan GT77 HX 13VI | |
| Lenovo Legion Pro 7 16IRX8H | |
| Razer Blade 18 RTX 4070 | |
| Asus ROG Zephyrus M16 GU604VY-NM042X | |
| Average Intel Core i9-13950HX, NVIDIA GeForce RTX 4090 Laptop GPU (10903 - 11761, n=2) | |
| Razer Blade 16 Early 2023 | |
| Razer Blade 16 Early 2023 RTX 4090 | |
| Average of class Gaming (8810 - 11935, n=96, last 2 years) | |
| PCMark 10 / Productivity | |
| Asus Zephyrus Duo 16 GX650PY-NM006W | |
| Average of class Gaming (6845 - 21327, n=94, last 2 years) | |
| Asus ROG Zephyrus M16 GU604VY-NM042X | |
| Lenovo Legion Pro 7 16IRX8H | |
| Eluktronics Mech-17 GP2 | |
| MSI Titan GT77 HX 13VI | |
| Razer Blade 18 RTX 4070 | |
| Average Intel Core i9-13950HX, NVIDIA GeForce RTX 4090 Laptop GPU (8330 - 9851, n=2) | |
| Razer Blade 16 Early 2023 RTX 4090 | |
| Razer Blade 16 Early 2023 | |
| Asus ROG Strix G16 G614JZ | |
| PCMark 10 / Digital Content Creation | |
| MSI Titan GT77 HX 13VI | |
| Eluktronics Mech-17 GP2 | |
| Average Intel Core i9-13950HX, NVIDIA GeForce RTX 4090 Laptop GPU (13099 - 16424, n=2) | |
| Razer Blade 16 Early 2023 | |
| Asus Zephyrus Duo 16 GX650PY-NM006W | |
| Average of class Gaming (7602 - 19954, n=94, last 2 years) | |
| Razer Blade 16 Early 2023 RTX 4090 | |
| Asus ROG Zephyrus M16 GU604VY-NM042X | |
| Asus ROG Strix G16 G614JZ | |
| Razer Blade 18 RTX 4070 | |
| Lenovo Legion Pro 7 16IRX8H | |
| CrossMark / Overall | |
| Eluktronics Mech-17 GP2 | |
| Asus ROG Strix G16 G614JZ | |
| MSI Titan GT77 HX 13VI | |
| Razer Blade 18 RTX 4070 | |
| Asus ROG Strix Scar 18 2023 G834JY-N6005W | |
| Average Intel Core i9-13950HX, NVIDIA GeForce RTX 4090 Laptop GPU (2019 - 2139, n=2) | |
| Asus Zephyrus Duo 16 GX650PY-NM006W | |
| Razer Blade 16 Early 2023 RTX 4090 | |
| Average of class Gaming (1366 - 2409, n=93, last 2 years) | |
| Asus ROG Zephyrus M16 GU604VY-NM042X | |
| Razer Blade 16 Early 2023 | |
| CrossMark / Productivity | |
| Asus ROG Strix G16 G614JZ | |
| Eluktronics Mech-17 GP2 | |
| MSI Titan GT77 HX 13VI | |
| Razer Blade 18 RTX 4070 | |
| Asus Zephyrus Duo 16 GX650PY-NM006W | |
| Average Intel Core i9-13950HX, NVIDIA GeForce RTX 4090 Laptop GPU (1909 - 1977, n=2) | |
| Asus ROG Strix Scar 18 2023 G834JY-N6005W | |
| Razer Blade 16 Early 2023 RTX 4090 | |
| Average of class Gaming (1386 - 2254, n=93, last 2 years) | |
| Asus ROG Zephyrus M16 GU604VY-NM042X | |
| Razer Blade 16 Early 2023 | |
| CrossMark / Creativity | |
| Eluktronics Mech-17 GP2 | |
| Asus ROG Strix Scar 18 2023 G834JY-N6005W | |
| MSI Titan GT77 HX 13VI | |
| Asus ROG Strix G16 G614JZ | |
| Razer Blade 18 RTX 4070 | |
| Asus Zephyrus Duo 16 GX650PY-NM006W | |
| Average Intel Core i9-13950HX, NVIDIA GeForce RTX 4090 Laptop GPU (2222 - 2423, n=2) | |
| Average of class Gaming (1343 - 2729, n=93, last 2 years) | |
| Asus ROG Zephyrus M16 GU604VY-NM042X | |
| Razer Blade 16 Early 2023 RTX 4090 | |
| Razer Blade 16 Early 2023 | |
| CrossMark / Responsiveness | |
| Asus ROG Strix G16 G614JZ | |
| Razer Blade 18 RTX 4070 | |
| MSI Titan GT77 HX 13VI | |
| Eluktronics Mech-17 GP2 | |
| Average Intel Core i9-13950HX, NVIDIA GeForce RTX 4090 Laptop GPU (1792 - 1861, n=2) | |
| Razer Blade 16 Early 2023 RTX 4090 | |
| Average of class Gaming (1226 - 2334, n=93, last 2 years) | |
| Asus Zephyrus Duo 16 GX650PY-NM006W | |
| Asus ROG Zephyrus M16 GU604VY-NM042X | |
| Asus ROG Strix Scar 18 2023 G834JY-N6005W | |
| Razer Blade 16 Early 2023 | |
| PCMark 8 Home Score Accelerated v2 | 4861 points | |
| PCMark 8 Creative Score Accelerated v2 | 5206 points | |
| PCMark 10 Score | 7597 points | |
Help | ||
* ... smaller is better
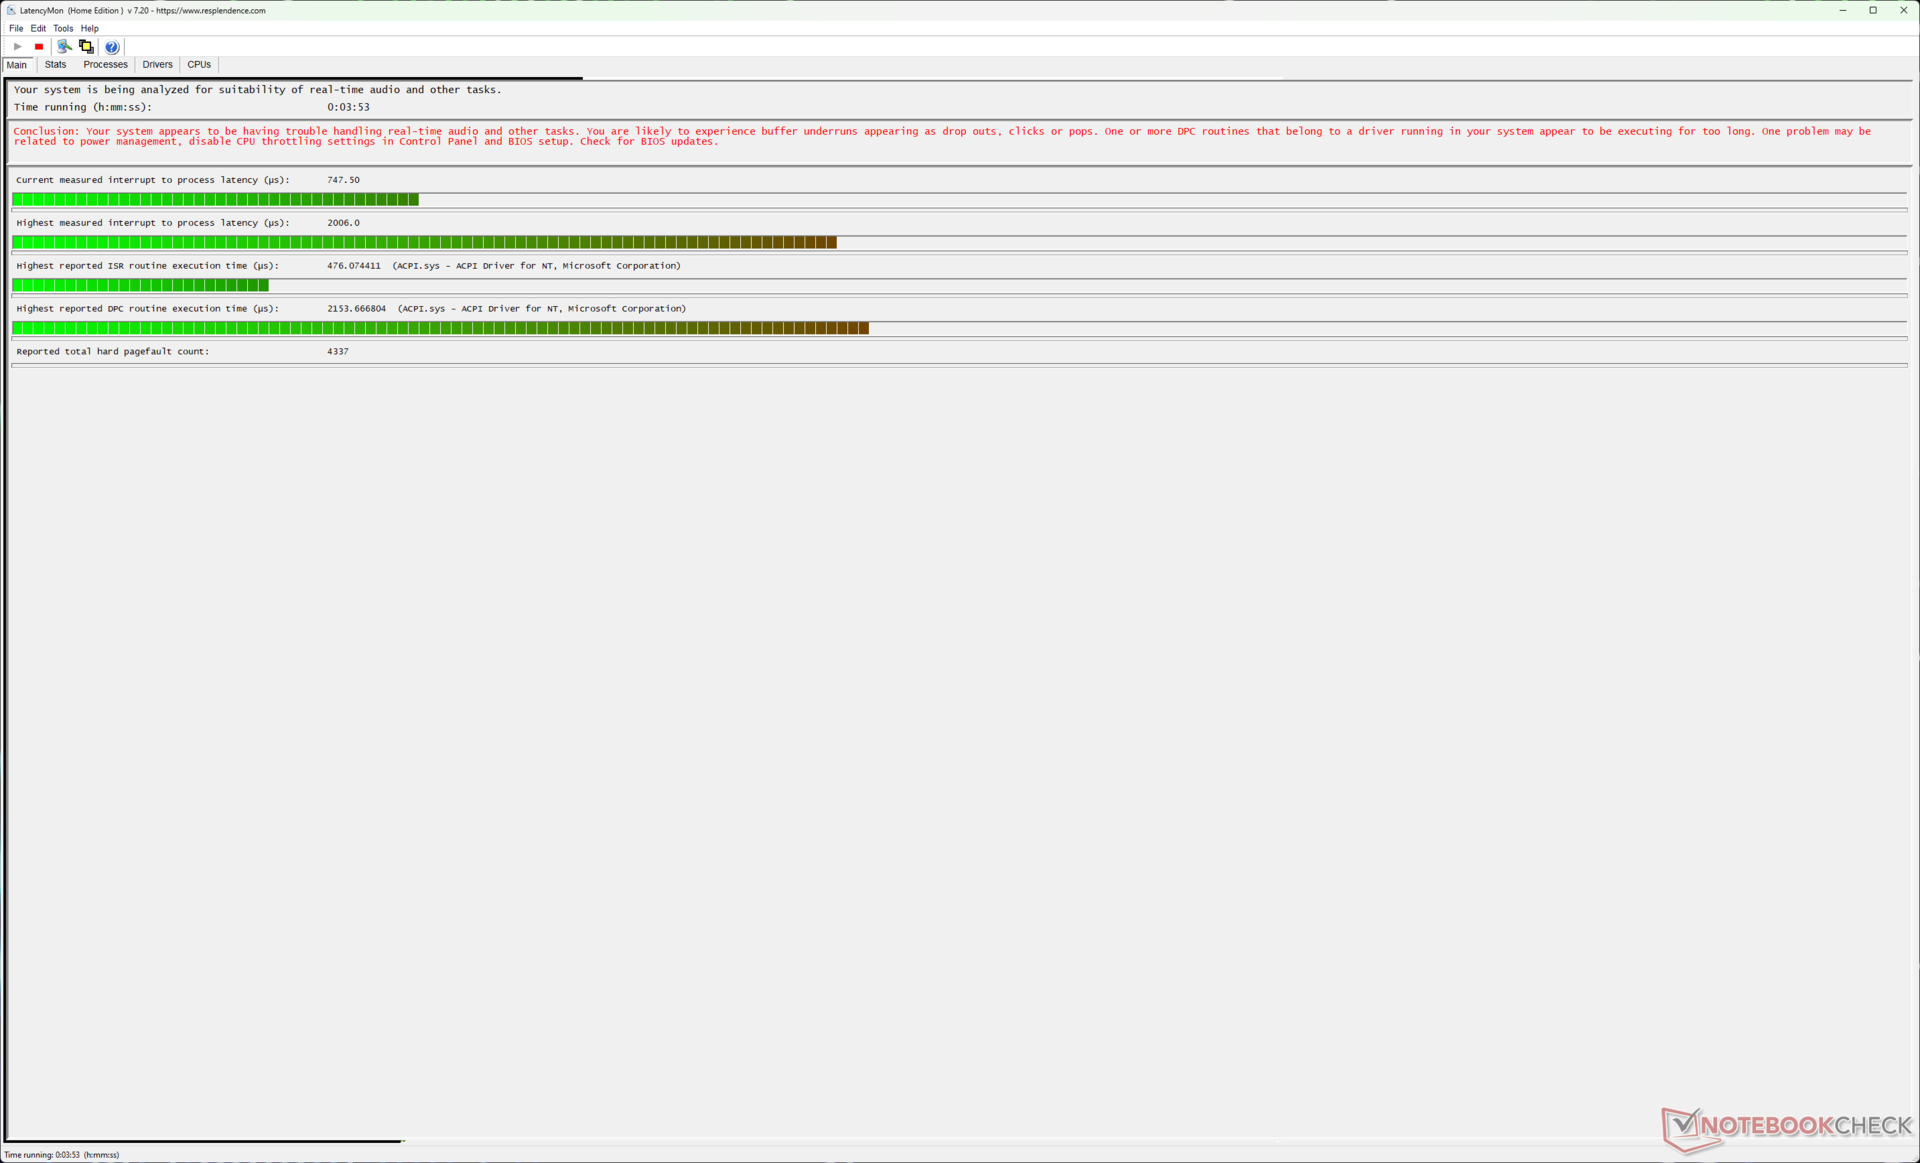
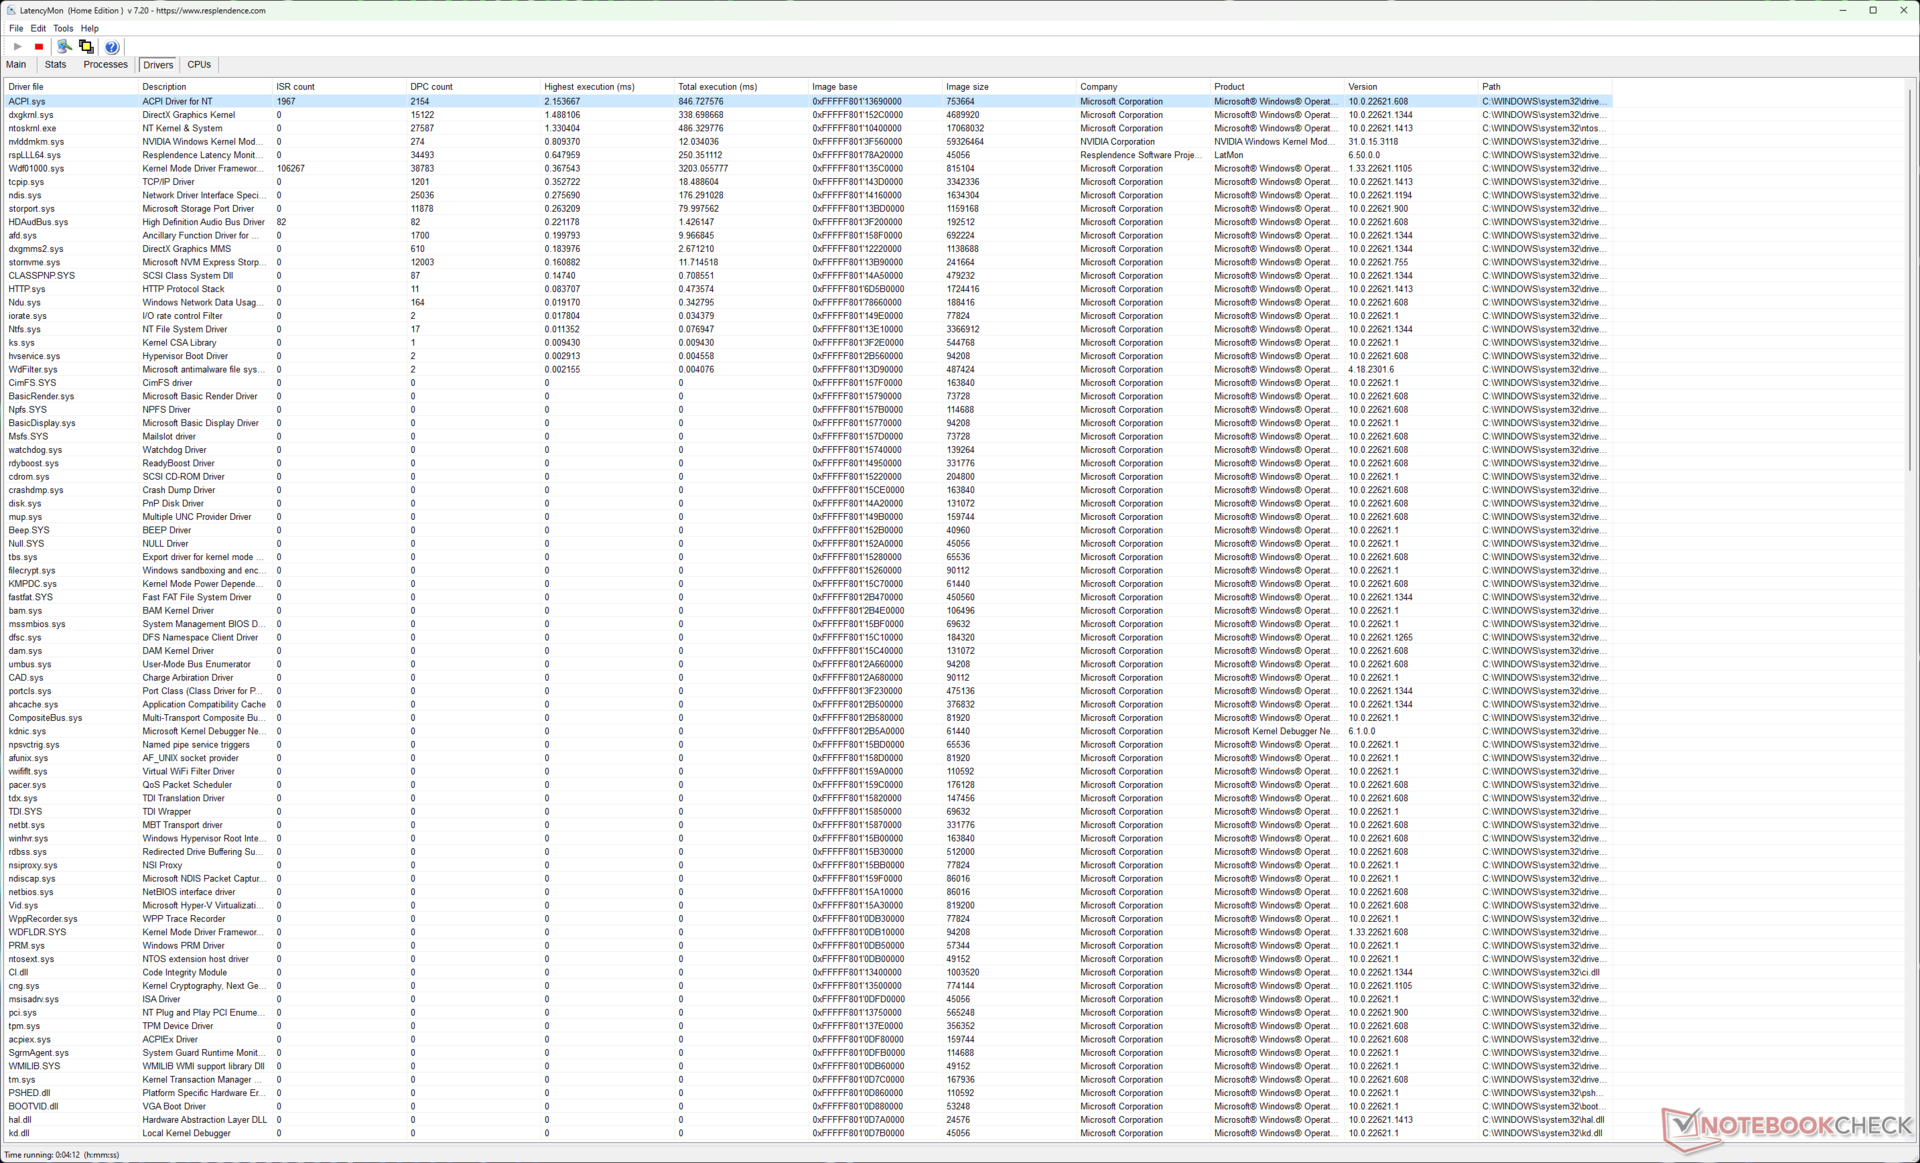
DPC Latency
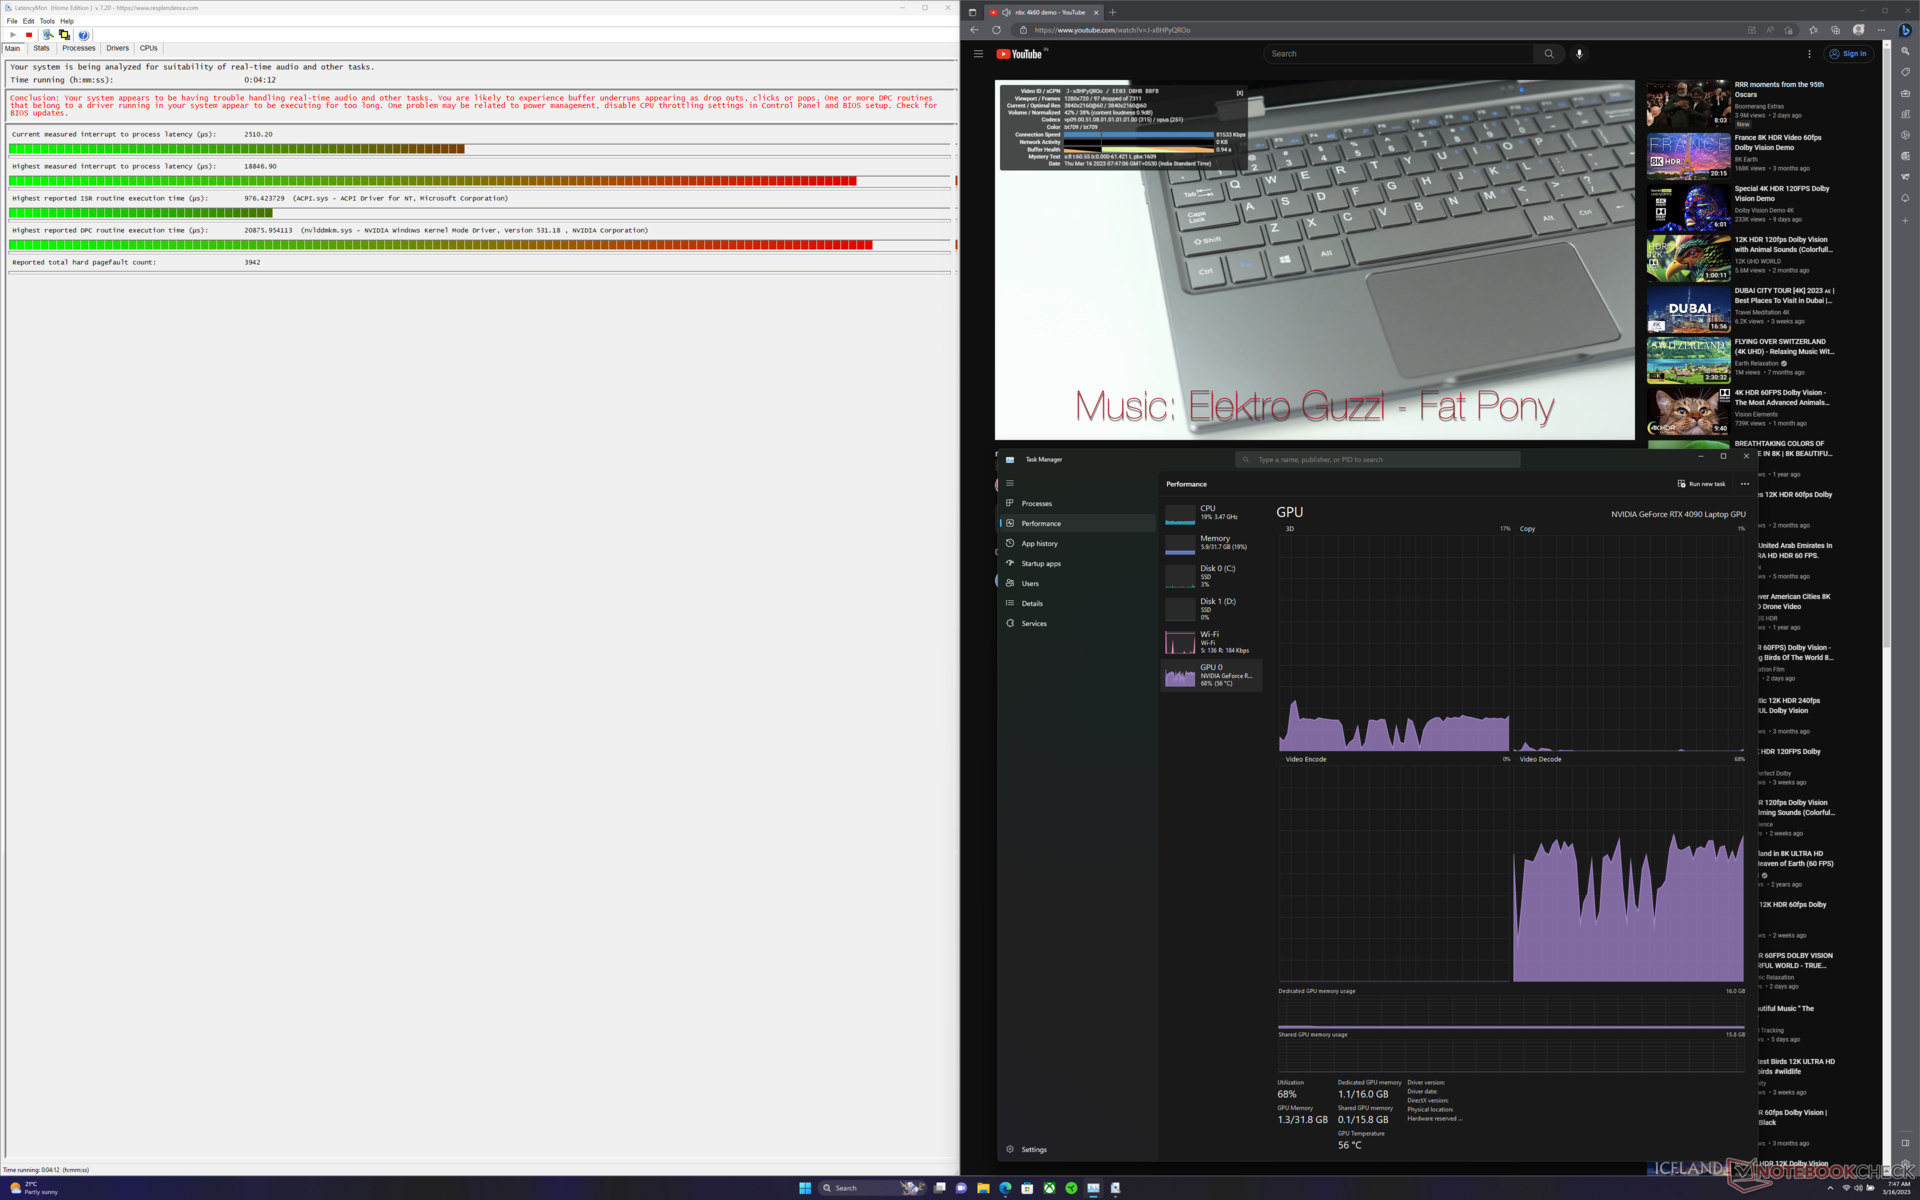
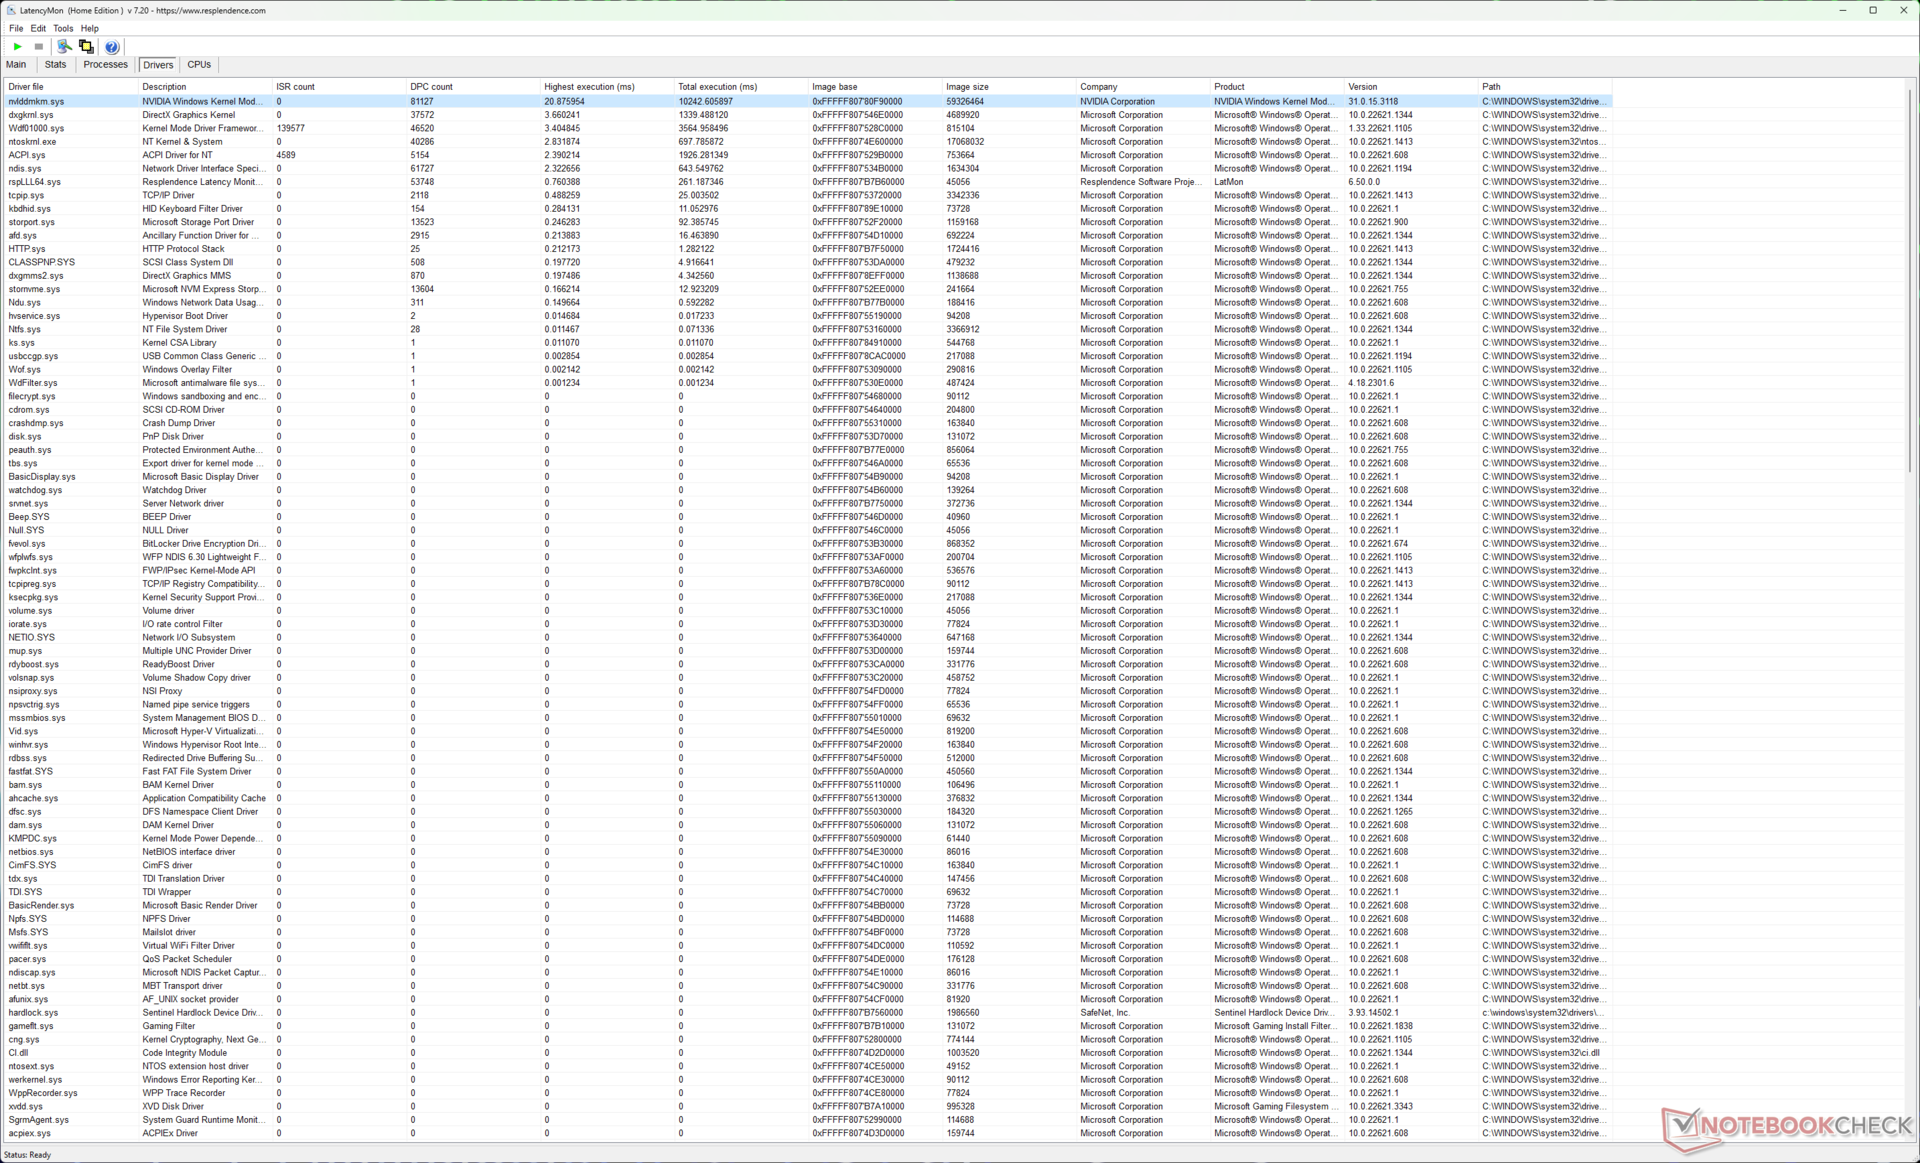
There's a known bug in GeForce drivers that causes high DPC latency. Nvidia has also acknowledged that the Release 530 Driver for Windows results in increased DPC latency when measured with LatencyMon.
Accordingly, we observed a very high interrupt to process latency of 18,846.9 µs in dGPU mode together with high GPU usage. This can be traced to the high execution time of 20.87 ms for the Nvidia Kernel Mode driver.
The highest interrupt to process latency value drops to a more reasonable but still high 2,006 µs in MSHybrid mode.
Such high DPC latency can pose issues with real-time audio and video editing workflows, which is not ideal for this configuration and price.
| DPC Latencies / LatencyMon - interrupt to process latency (max), Web, Youtube, Prime95 | |
| Razer Blade 16 Early 2023 RTX 4090 (dGPU) | |
| Razer Blade 16 Early 2023 RTX 4090 (MSHybrid) | |
| Asus Zephyrus Duo 16 GX650PY-NM006W | |
| MSI Titan GT77 HX 13VI | |
| Asus ROG Zephyrus M16 GU604VY-NM042X | |
| Asus ROG Strix G16 G614JZ | |
| Razer Blade 16 Early 2023 (Edge 109.0.1518.70) | |
| Razer Blade 18 RTX 4070 (Edge 110.0.1587.46) | |
| Asus ROG Strix Scar 18 2023 G834JY-N6005W | |
| Eluktronics Mech-17 GP2 (Edge 110.0.1587.57) | |
| Lenovo Legion Pro 7 16IRX8H | |
* ... smaller is better
More LatencyMon comparisons can be seen in our DPC Latency Ranking page.
Storage Devices
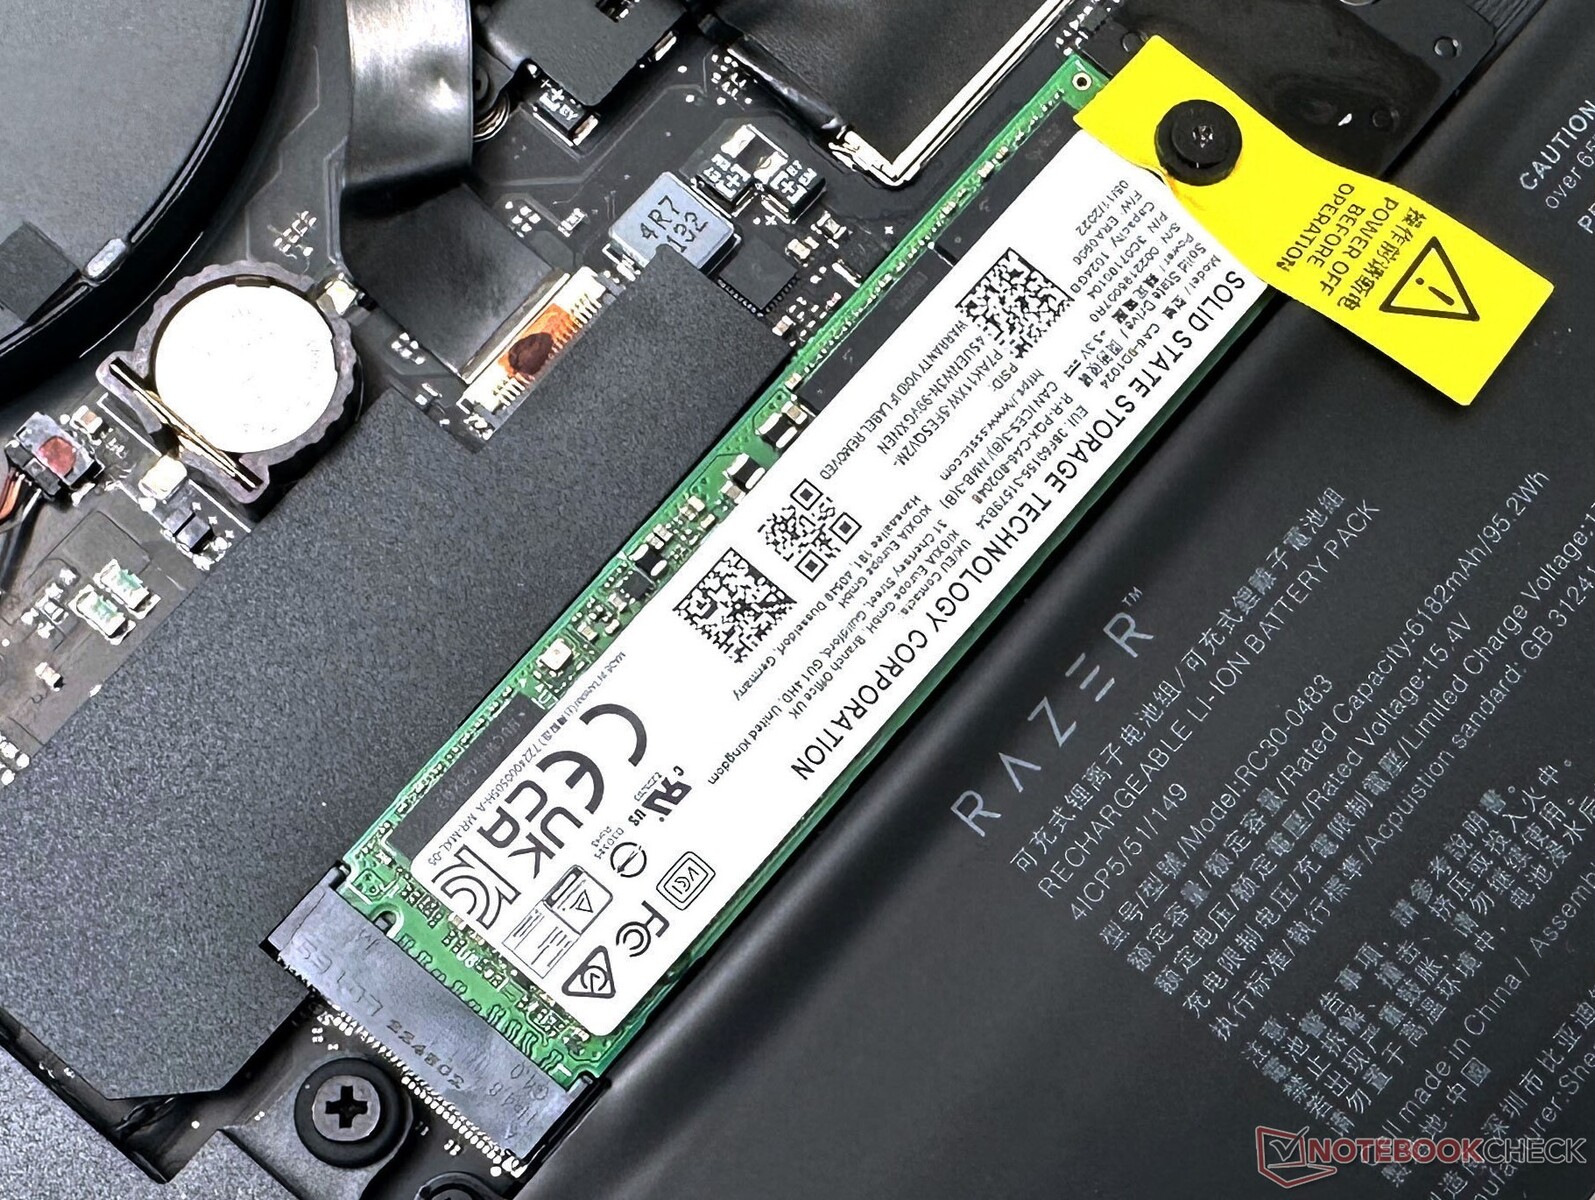
Our Blade 16 Early 2023 unit came equipped with two 1 TB NVMe SSDs from Solid State Storage Technology Corporation (SSSTC). The NVMe drives are stacked on one another, with the primary drive below, for effective motherboard space utilization.
Overall disk performance is on expected lines, but it cannot match up to configurations based on the Samsung PM9A1. 4K write performance, however, is better than most of the competition.
The drive is able to sustain fairly well in the initial part of our DiskSpd read loop test at a queue depth of 8 before beginning to throttle from loop 31 onwards.
There is no scope for adding a 2.5-inch SATA drive.

* ... smaller is better
Disk Throttling: DiskSpd Read Loop, Queue Depth 8
Refer to our SSD and HDD Benchmarks page for more storage device comparisons.
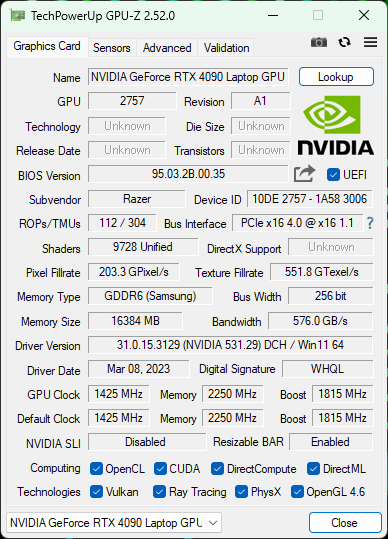
GPU Performance
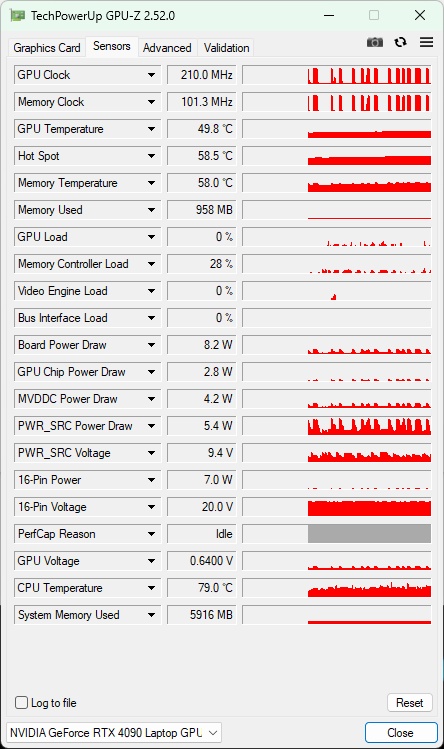
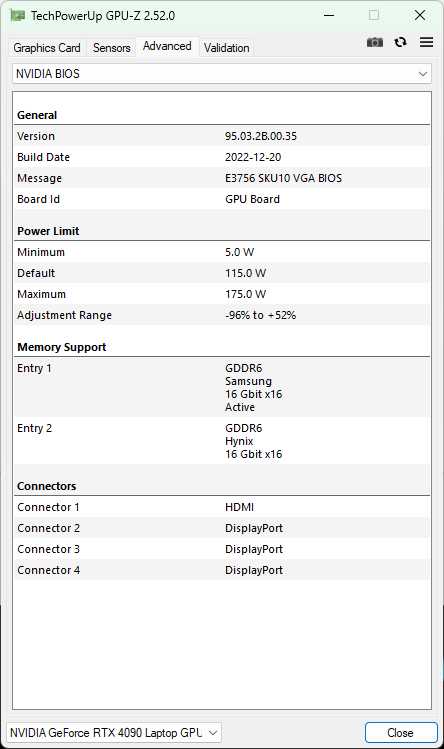
Our Blade 16 unit came equipped with an Nvidia GeForce RTX 4090 Laptop GPU that is rated to perform at a 175 W TGP. Razer does not specify the Dynamic Boost values, but we assume it to be 25 W given that the RTX 4090 Laptop GPU actually maxes out at a 150 W TGP.
The RTX 4090 in the Blade 16 does not really top the charts in overall 3DMark performance. The Blade 16 Early 2023 RTX 4090 leads the RTX 4080 SKU by 8% overall but trails behind other RTX 4090 heavyweights such as the MSI Titan GT77 HX 13VI, Asus ROG Strix Scar 18, Eluktronics Mech-17 GP2, and the Asus ROG Zephyrus Duo 16.
The Asus ROG Strix G16 with the RTX 4080 inches past the Blade 16 by a whisker.
| 3DMark 11 Performance | 41433 points | |
| 3DMark Ice Storm Standard Score | 244104 points | |
| 3DMark Cloud Gate Standard Score | 52227 points | |
| 3DMark Fire Strike Score | 31174 points | |
| 3DMark Fire Strike Extreme Score | 22713 points | |
| 3DMark Time Spy Score | 18599 points | |
Help | ||
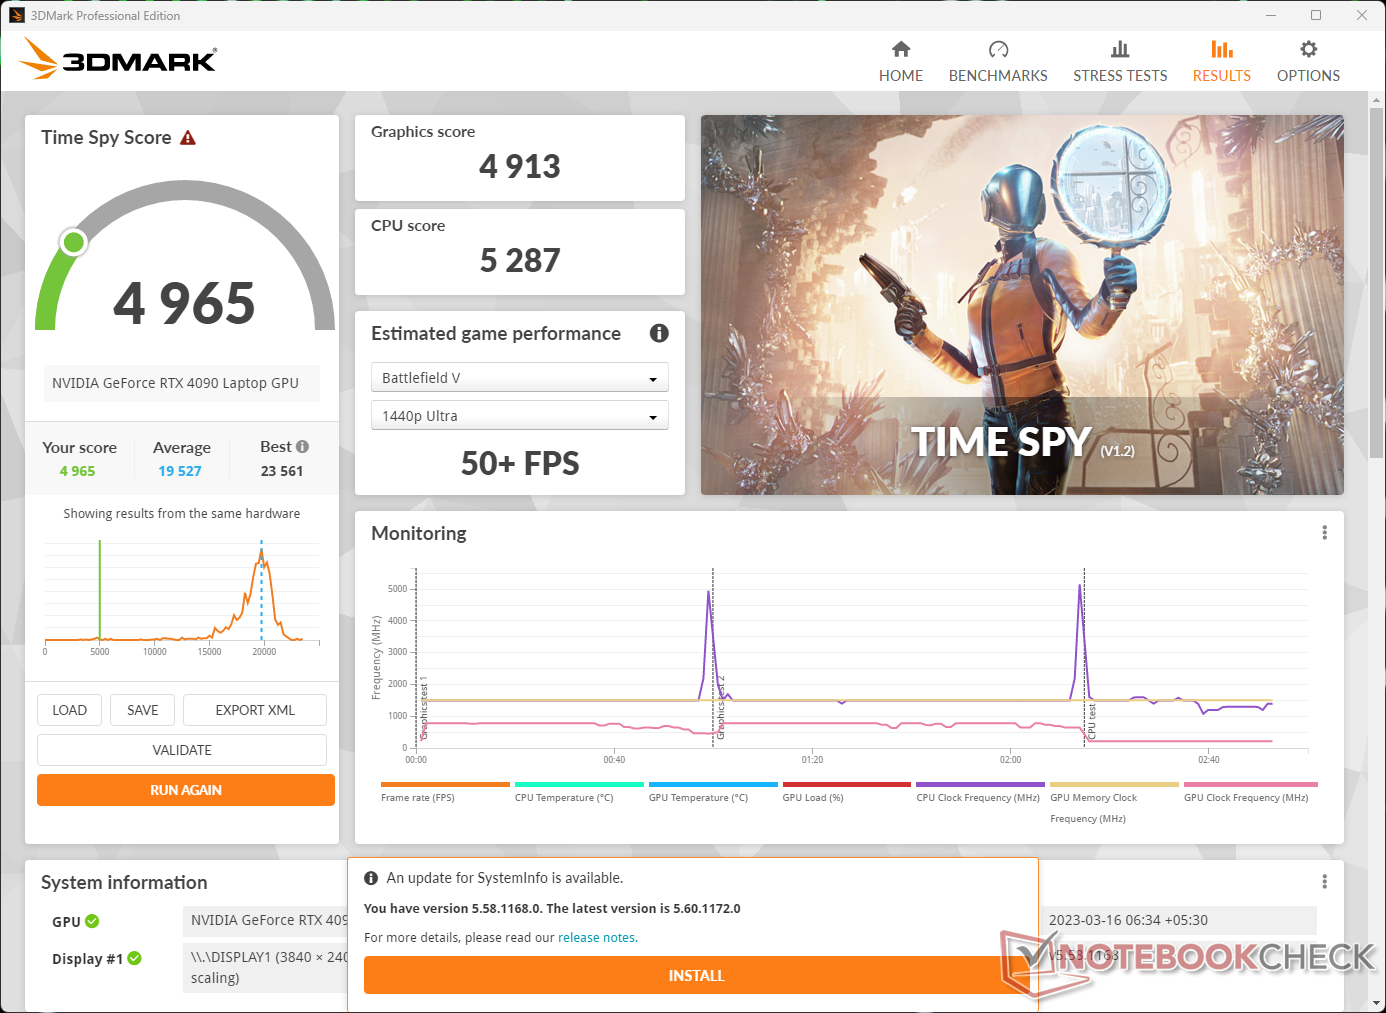
GPU performance on battery can take quite a beating. 3DMark Time Spy graphics scores drop by a massive 75% on battery power. According to the benchmark, this should still offer enough performance to play Battlefield V at 50 fps in 1440p Ultra.
Blender 3.3 sees the RTX 4090 in the Blade 16 perform at par with other similarly configured laptops in Optix and Classroom CUDA tests, but the laptop is a good 52% slower compared to the Ryzen 9 7945HX-powered Zephyrus Duo 16 in Classroom CPU.
| Blender / v3.3 Classroom OPTIX/RTX | |
| Razer Blade 18 RTX 4070 | |
| Average of class Gaming (9 - 32, n=105, last 2 years) | |
| Razer Blade 16 Early 2023 | |
| Asus ROG Zephyrus M16 GU604VY-NM042X | |
| Lenovo Legion Pro 7 16IRX8H | |
| Asus ROG Strix G16 G614JZ | |
| Asus Zephyrus Duo 16 GX650PY-NM006W | |
| Average NVIDIA GeForce RTX 4090 Laptop GPU (9 - 19, n=39) | |
| MSI Titan GT77 HX 13VI | |
| Razer Blade 16 Early 2023 RTX 4090 | |
| Asus ROG Strix Scar 18 2023 G834JY-N6005W | |
| Eluktronics Mech-17 GP2 | |
| Blender / v3.3 Classroom CUDA | |
| Razer Blade 18 RTX 4070 | |
| Average of class Gaming (15 - 228, n=105, last 2 years) | |
| Lenovo Legion Pro 7 16IRX8H | |
| Razer Blade 16 Early 2023 | |
| Asus ROG Strix G16 G614JZ | |
| Asus Zephyrus Duo 16 GX650PY-NM006W | |
| Average NVIDIA GeForce RTX 4090 Laptop GPU (16 - 24, n=39) | |
| Asus ROG Strix Scar 18 2023 G834JY-N6005W | |
| Asus ROG Strix Scar 18 2023 G834JY-N6005W | |
| Asus ROG Zephyrus M16 GU604VY-NM042X | |
| MSI Titan GT77 HX 13VI | |
| Razer Blade 16 Early 2023 RTX 4090 | |
| Eluktronics Mech-17 GP2 | |
| Blender / v3.3 Classroom CPU | |
| Asus ROG Zephyrus M16 GU604VY-NM042X | |
| Average of class Gaming (122 - 565, n=101, last 2 years) | |
| Razer Blade 16 Early 2023 RTX 4090 | |
| Razer Blade 16 Early 2023 | |
| Average NVIDIA GeForce RTX 4090 Laptop GPU (144 - 305, n=39) | |
| Razer Blade 18 RTX 4070 | |
| Lenovo Legion Pro 7 16IRX8H | |
| Asus ROG Strix G16 G614JZ | |
| Asus ROG Strix Scar 18 2023 G834JY-N6005W | |
| MSI Titan GT77 HX 13VI | |
| Eluktronics Mech-17 GP2 | |
| Asus Zephyrus Duo 16 GX650PY-NM006W | |
* ... smaller is better
Gaming Performance
The Blade 16 RTX 4090's cumulative gaming performance at 1080p Ultra sits just below that of the Zephyrus Duo 16 but shows a decent 15% gain over the Blade 18 with an RTX 4070 Laptop GPU. Both the MSI Titan GT77 and the ROG Strix Scar 18 lead our test unit by 13% while the Eluktronics Mech-17 GP2 tops the charts.
These laptops have a higher PL2, which can come in handy in CPU-limited resolutions like 1080p.
We see a similar trend in higher resolutions as well in most games. Ray tracing at native 4K Ultra with playable frame rates is not a pleasant experience. However, gamers can make use of DLSS 3 Frame Generation in supported titles to achieve a significant fps boost.
| F1 2021 | |
| 1920x1080 Ultra High Preset + Raytracing AA:T AF:16x | |
| MSI Titan GT77 HX 13VI | |
| Average NVIDIA GeForce RTX 4090 Laptop GPU (151.6 - 271, n=7) | |
| Asus Zephyrus Duo 16 GX650PY-NM006W | |
| Razer Blade 16 Early 2023 RTX 4090 | |
| 2560x1440 Ultra High Preset + Raytracing AA:T AF:16x | |
| MSI Titan GT77 HX 13VI | |
| Average NVIDIA GeForce RTX 4090 Laptop GPU (140 - 204, n=7) | |
| Asus Zephyrus Duo 16 GX650PY-NM006W | |
| Razer Blade 16 Early 2023 RTX 4090 | |
| 3840x2160 Ultra High Preset + Raytracing AA:T AF:16x | |
| MSI Titan GT77 HX 13VI | |
| Average NVIDIA GeForce RTX 4090 Laptop GPU (89.9 - 115.1, n=5) | |
| Razer Blade 16 Early 2023 RTX 4090 | |
The Witcher 3 FPS Chart
The Blade 16 remains relatively stable when stressed with The Witcher 3 at 1080p Ultra, but we do see occasional frame drops.
| low | med. | high | ultra | QHD | 4K DLSS | 4K | |
|---|---|---|---|---|---|---|---|
| GTA V (2015) | 186.6 | 187.3 | 181.6 | 128.7 | 120.5 | 153.5 | |
| The Witcher 3 (2015) | 452 | 408 | 322 | 174.8 | 130 | ||
| Dota 2 Reborn (2015) | 234.8 | 209.9 | 200.2 | 183.5 | 170.8 | ||
| Final Fantasy XV Benchmark (2018) | 194.5 | 155.9 | 122.2 | 115.7 | 83.9 | ||
| X-Plane 11.11 (2018) | 197.3 | 172.1 | 135.6 | 113.1 | |||
| Far Cry 5 (2018) | 162 | 167 | 144 | 146 | 100 | ||
| Strange Brigade (2018) | 432 | 380 | 350 | 328 | 256 | 129.5 | |
| F1 2021 (2021) | 433 | 341 | 299 | 151.6 | 151.5 | 103.6 | |
| Cyberpunk 2077 1.6 (2022) | 100.7 | 97.5 | 96.6 | 86.7 | 45.4 | ||
| F1 22 (2022) | 254 | 264 | 223 | 114.3 | 79.7 | 44 | |
| Call of Duty Modern Warfare 2 2022 (2022) | 177 | 169 | 160 | 154 | 122 | 112 | 75 |
| The Witcher 3 v4 (2023) | 220 | 154.1 | 137.5 | 120.4 | 83.3 | 41.6 |
More information can be found in our dedicated Nvidia GeForce RTX 4090 Laptop GPU page. Also, be sure to check out our in-depth analysis of the RTX 4080 and RTX 4090, and the RTX 4050, RTX 4060, and RTX 4070 Laptop GPUs for detailed performance comparisons.
Emissions: High noise and heat output
System Noise
The Blade 16 can rev-up its fans considerably loud when stressed. We recorded a maximum sound pressure level (SPL) of 46.7 db(A) under a combined load of Prime95 and FurMark and also in The Witcher 3 at 1080p Ultra in the tested Custom profile.
Fan noise in the Balanced profile is much more tolerable with maximum emissions hovering just short of the 41 dB(A) mark. In Silent mode, the fan noise always remains under 35 db(A) no matter the load.
| Performance setting | Idle dB(A) | Load average dB(A) | Load maximum dB(A) | The Witcher 3 dB(A) |
|---|---|---|---|---|
| Silent | 23.65 | 33.12 | 31.03 | 33.90 |
| Balanced | 23.65 | 30.03 | 38.20 | 40.69 |
| Custom (CPU Boost / GPU High) | 23.65 | 43.35 | 46.72 | 46.65 |
Noise level
| Idle |
| 23.65 / 23.65 / 23.65 dB(A) |
| Load |
| 43.35 / 46.72 dB(A) |
 | ||
30 dB silent 40 dB(A) audible 50 dB(A) loud |
||
min: | ||
| Razer Blade 16 Early 2023 RTX 4090 i9-13950HX, GeForce RTX 4090 Laptop GPU | Eluktronics Mech-17 GP2 i9-13900HX, GeForce RTX 4090 Laptop GPU | Asus Zephyrus Duo 16 GX650PY-NM006W R9 7945HX, GeForce RTX 4090 Laptop GPU | MSI Titan GT77 HX 13VI i9-13950HX, GeForce RTX 4090 Laptop GPU | Razer Blade 16 Early 2023 i9-13950HX, GeForce RTX 4080 Laptop GPU | Lenovo Legion Pro 7 16IRX8H i9-13900HX, GeForce RTX 4080 Laptop GPU | Razer Blade 18 RTX 4070 i9-13950HX, GeForce RTX 4070 Laptop GPU | |
|---|---|---|---|---|---|---|---|
| Noise | -15% | -20% | -21% | -2% | -19% | -5% | |
| off / environment * (dB) | 20.84 | 25.2 -21% | 23.9 -15% | 24.6 -18% | 23 -10% | 24 -15% | 23.5 -13% |
| Idle Minimum * (dB) | 23.65 | 28 -18% | 23.9 -1% | 29.2 -23% | 23 3% | 26 -10% | 23.8 -1% |
| Idle Average * (dB) | 23.65 | 28 -18% | 32.9 -39% | 29.2 -23% | 23 3% | 28 -18% | 23.8 -1% |
| Idle Maximum * (dB) | 23.65 | 30.4 -29% | 36.5 -54% | 29.2 -23% | 23.6 -0% | 34 -44% | 26.8 -13% |
| Load Average * (dB) | 43.35 | 41 5% | 42.9 1% | 50.7 -17% | 39 10% | 47 -8% | 37.3 14% |
| Witcher 3 ultra * (dB) | 46.7 | 50.7 -9% | 51.2 -10% | 53.3 -14% | 51.6 -10% | 55 -18% | 48 -3% |
| Load Maximum * (dB) | 46.72 | 52.6 -13% | 56 -20% | 61 -31% | 51.3 -10% | 56 -20% | 53.5 -15% |
* ... smaller is better
Temperature
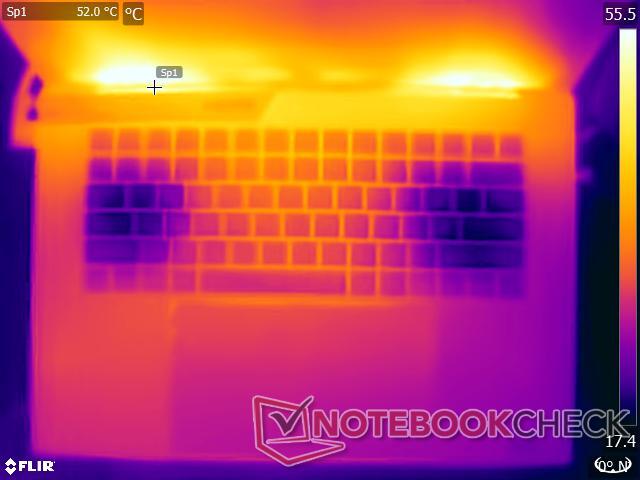
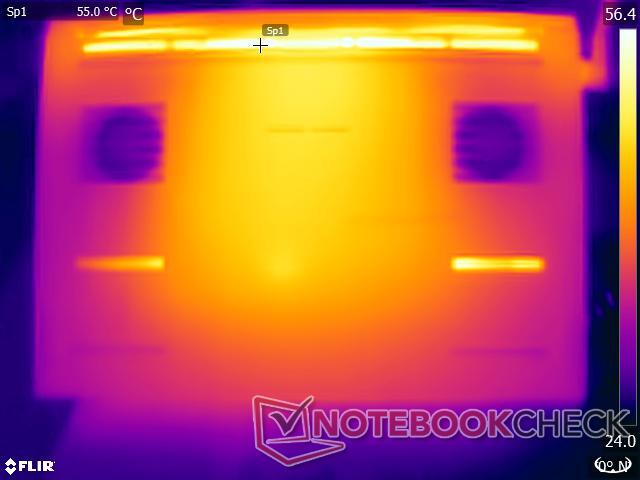
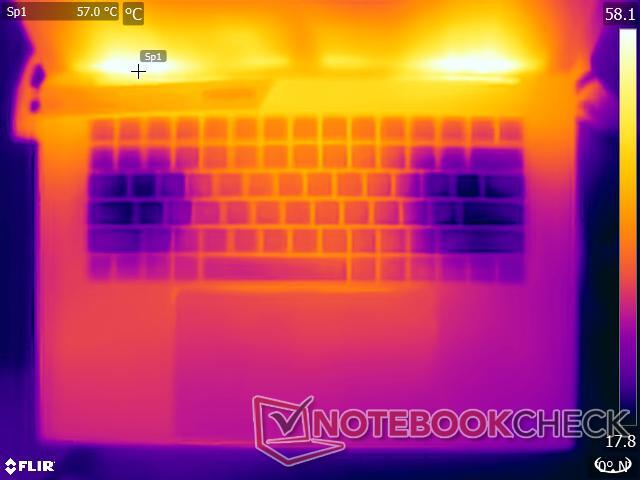
The Razer Blade 16 is not exactly a cool customer when it comes to surface temperatures under load. We recorded a maximum of 54.2 °C while stressing with The Witcher 3 at 1080p Ultra while a combined Prime95 and FurMark load results in a hotspot of 52 °C at the top center of the chassis.
Most of the heat is concentrated on the top row. The underside of the laptop can get considerably hot, so we do not recommend using the device on the lap while running heavy loads. The Balanced or Silent profile is better suited in such cases.
The palm rest areas do not get abnormally hot, but we did record hotspots around 40 °C on the left and right palm rests and the touchpad.
(-) The maximum temperature on the upper side is 52 °C / 126 F, compared to the average of 40.4 °C / 105 F, ranging from 21.2 to 68.8 °C for the class Gaming.
(-) The bottom heats up to a maximum of 47.6 °C / 118 F, compared to the average of 43.2 °C / 110 F
(+) In idle usage, the average temperature for the upper side is 30.6 °C / 87 F, compared to the device average of 33.9 °C / 93 F.
(-) Playing The Witcher 3, the average temperature for the upper side is 44.9 °C / 113 F, compared to the device average of 33.9 °C / 93 F.
(-) The palmrests and touchpad can get very hot to the touch with a maximum of 40.6 °C / 105.1 F.
(-) The average temperature of the palmrest area of similar devices was 28.8 °C / 83.8 F (-11.8 °C / -21.3 F).
The display partially blocks the air exhausts leading to excess heat buildup in that area. The display base also warms up quite considerably as a result.
Ideally, Razer should have offered more clearance between the display base and the exhaust vents.


| Razer Blade 16 Early 2023 RTX 4090 i9-13950HX, GeForce RTX 4090 Laptop GPU | Eluktronics Mech-17 GP2 i9-13900HX, GeForce RTX 4090 Laptop GPU | Asus Zephyrus Duo 16 GX650PY-NM006W R9 7945HX, GeForce RTX 4090 Laptop GPU | MSI Titan GT77 HX 13VI i9-13950HX, GeForce RTX 4090 Laptop GPU | Razer Blade 16 Early 2023 i9-13950HX, GeForce RTX 4080 Laptop GPU | Lenovo Legion Pro 7 16IRX8H i9-13900HX, GeForce RTX 4080 Laptop GPU | Razer Blade 18 RTX 4070 i9-13950HX, GeForce RTX 4070 Laptop GPU | |
|---|---|---|---|---|---|---|---|
| Heat | 11% | 8% | 15% | 11% | -6% | 12% | |
| Maximum Upper Side * (°C) | 52 | 39 25% | 44.2 15% | 40.6 22% | 40 23% | 48 8% | 39.2 25% |
| Maximum Bottom * (°C) | 47.6 | 44 8% | 46.8 2% | 41.1 14% | 37.6 21% | 49 -3% | 35.6 25% |
| Idle Upper Side * (°C) | 33 | 31 6% | 29.2 12% | 26.2 21% | 32.4 2% | 40 -21% | 31.8 4% |
| Idle Bottom * (°C) | 30.6 | 29.8 3% | 30.2 1% | 30.3 1% | 31.4 -3% | 33 -8% | 33.2 -8% |
* ... smaller is better
Stress Test
The Blade 16 uses a vapor chamber cooling system to keep its powerful components cool. The vapor chamber does a decent job in preventing excessive throttling as evidenced by our stress tests.
While stressing with Prime95 in-place large FFTs shows the Core i9-13950HX boosting up to 4.36 GHz while core temperatures hit the 90 °C mark. The CPU can utilize up to 137 W momentarily before dropping down to about 100 W for the remainder of the test.
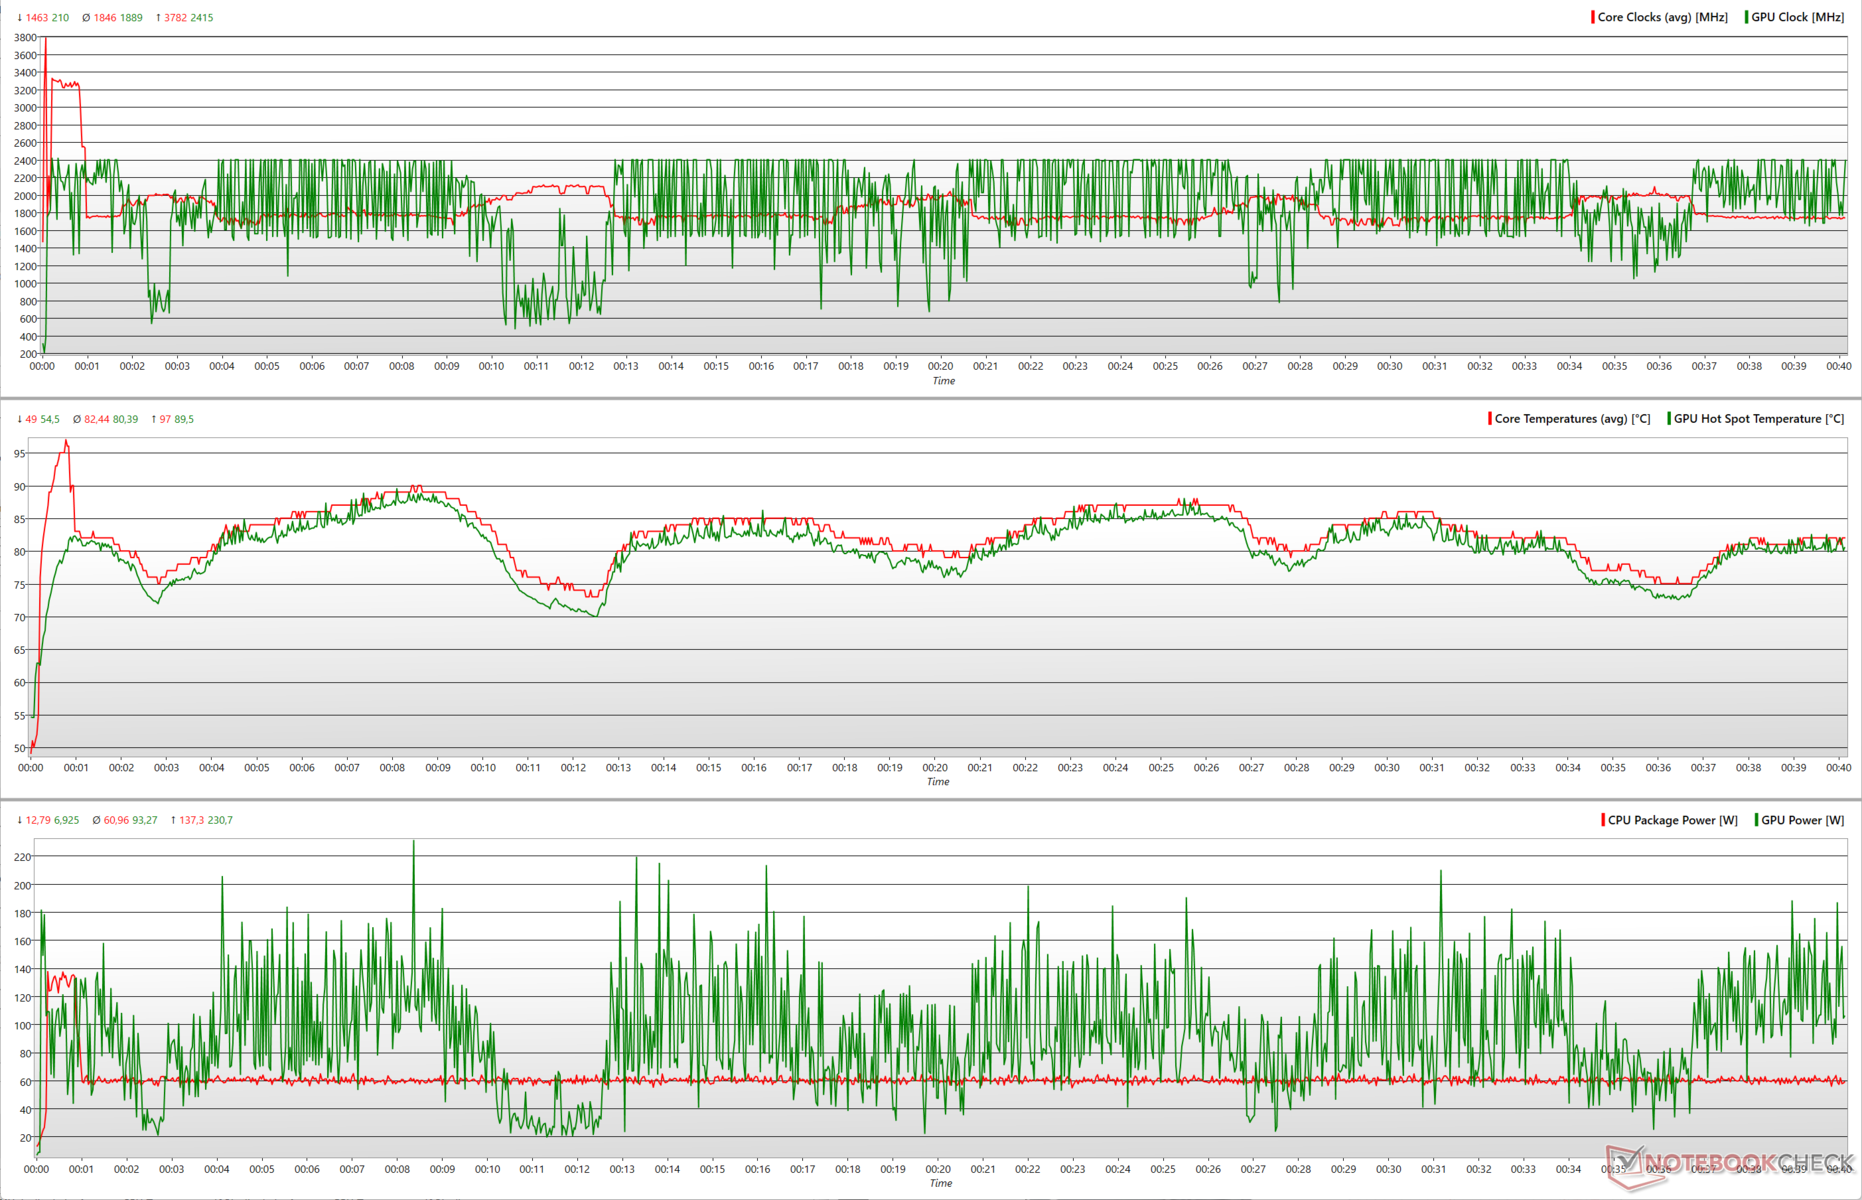
Upon adding FurMark to the mix running at 1280 x 720 with no AA, the Blade 16 sacrifices some of its CPU power to allow some headroom for the RTX 4090 Laptop GPU. However, GPU clocks drop significantly whenever the CPU tries to boost from 1.8 GHz to about 2.2 GHz.
Compared to Prime95 stress alone, the average CPU package power in the combined load drops from 108 W to 61 W. This allows the RTX 4090 to soak up that extra power for momentary spikes up to 231 W resulting in peak clocks of 2,415 MHz.
GPU clocks and power remain relatively stable during The Witcher 3 stress at 1080p Ultra. The average CPU package power gets further reduced to 42.7 W allowing the RTX 4090 to comfortably coast around the 157 W mark on average. Both the Core i9-13950HX and the RTX 4090 clock close to 2.1 GHz on average.
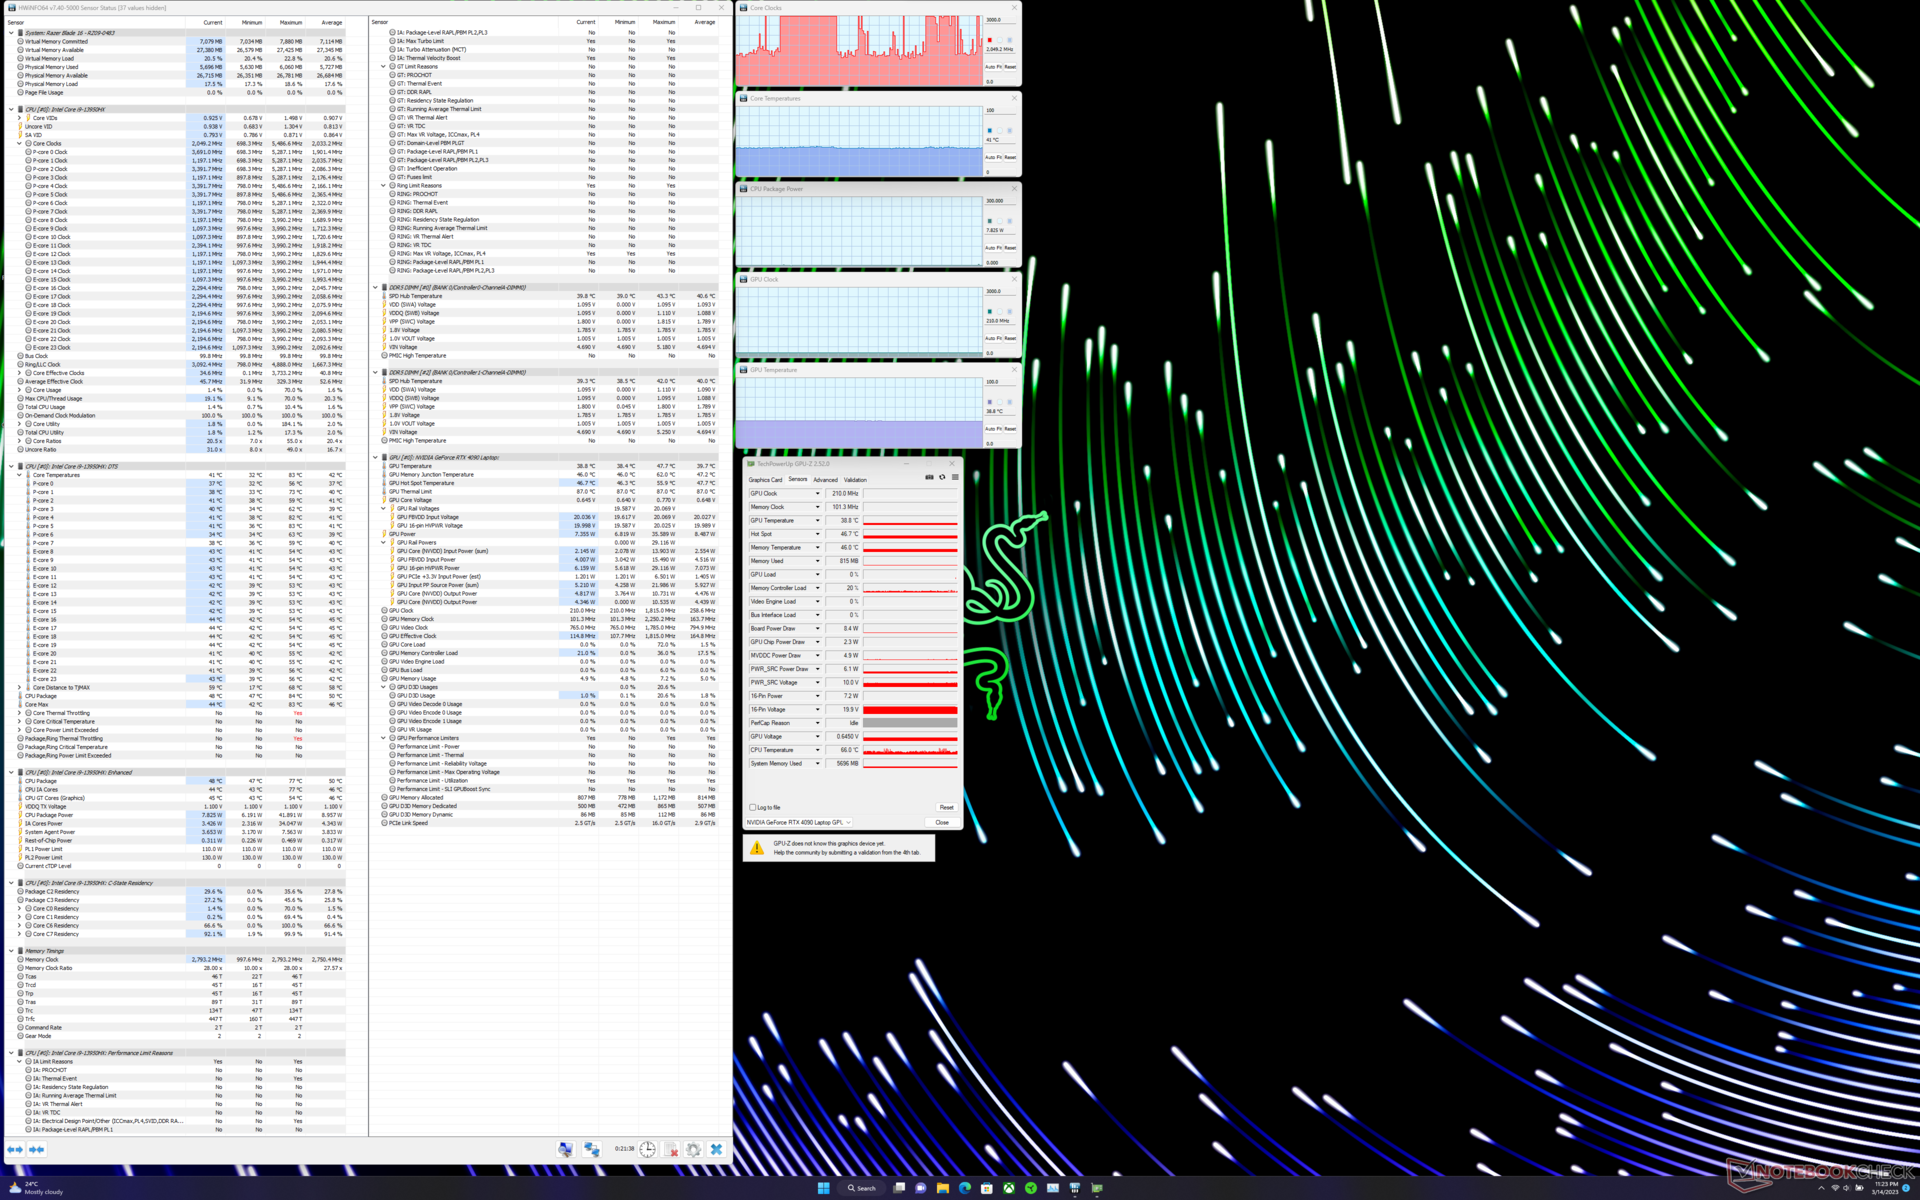
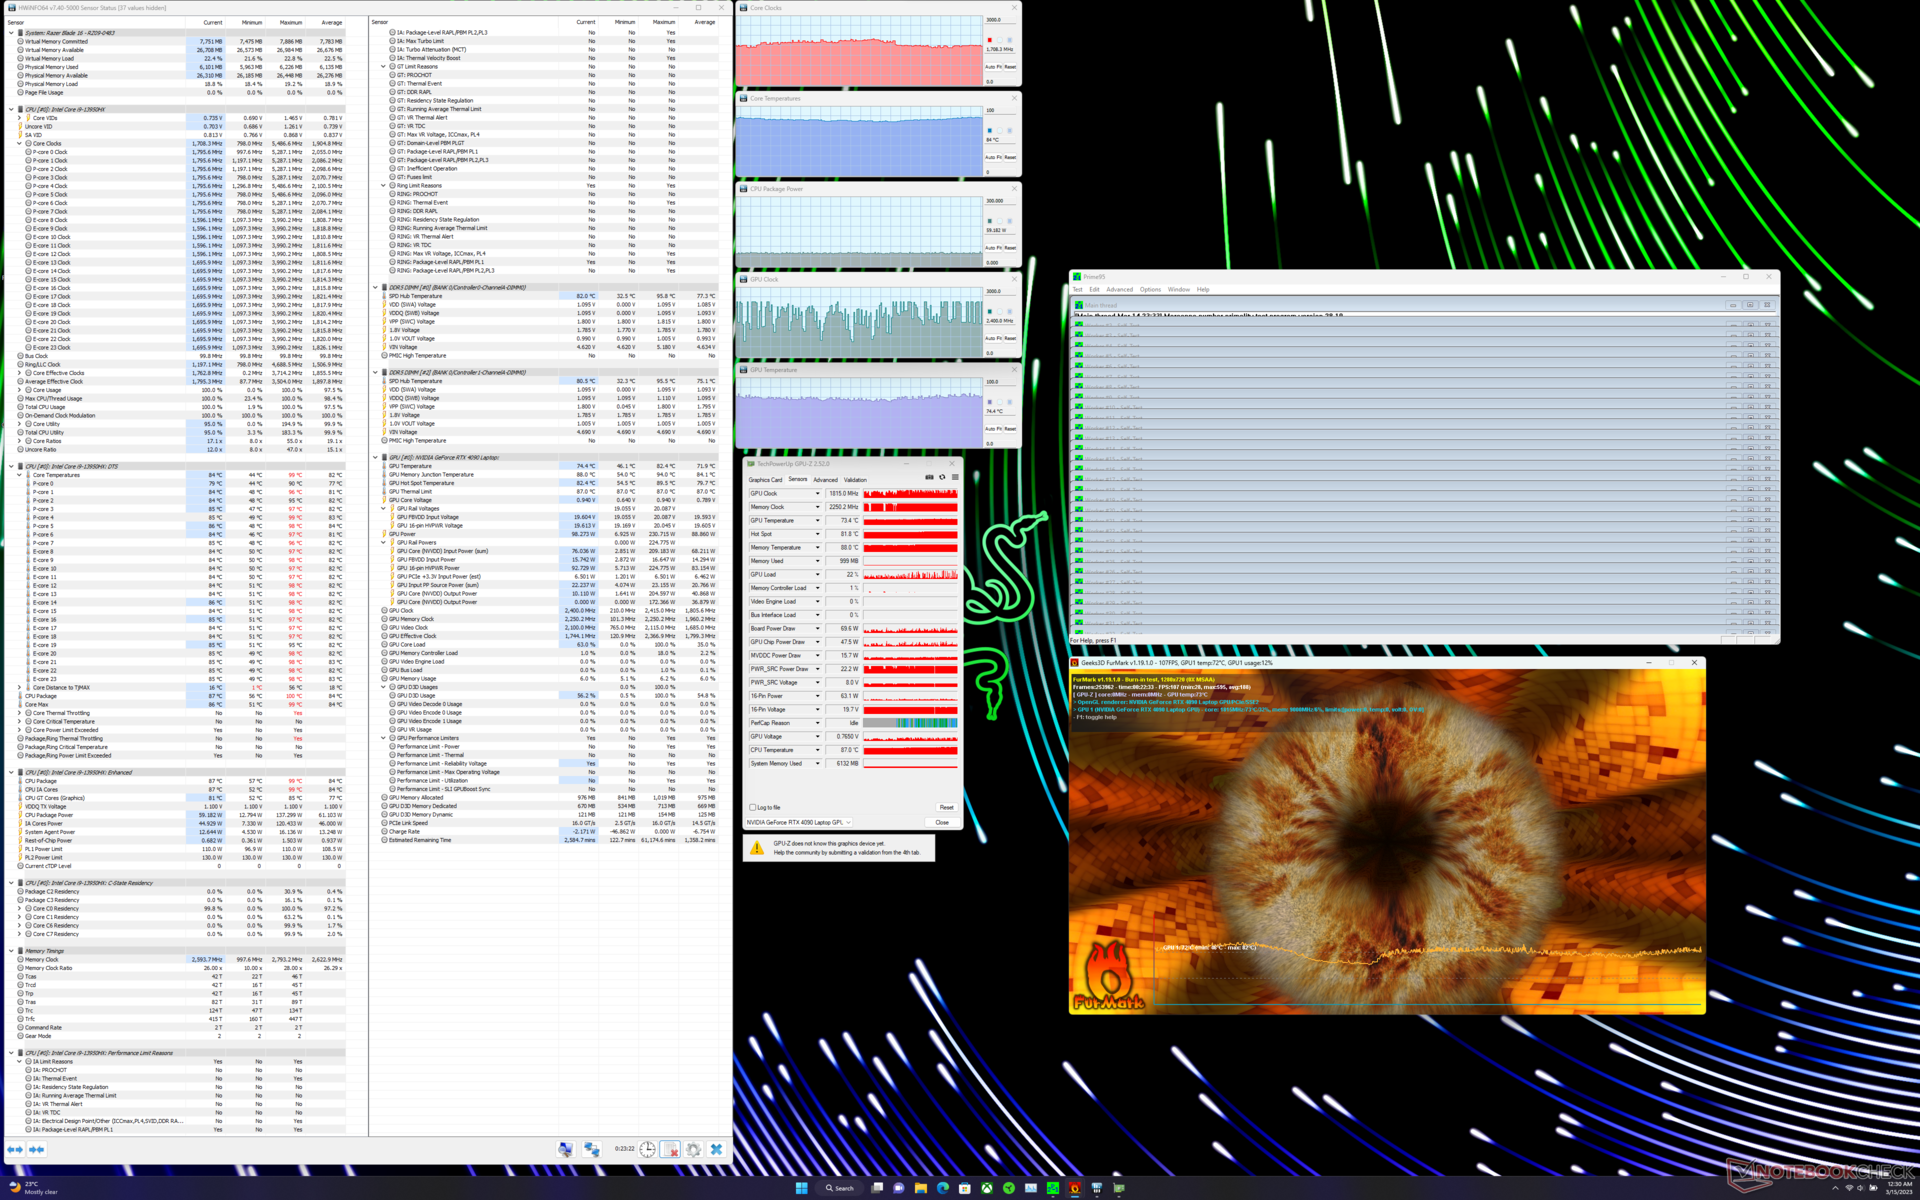
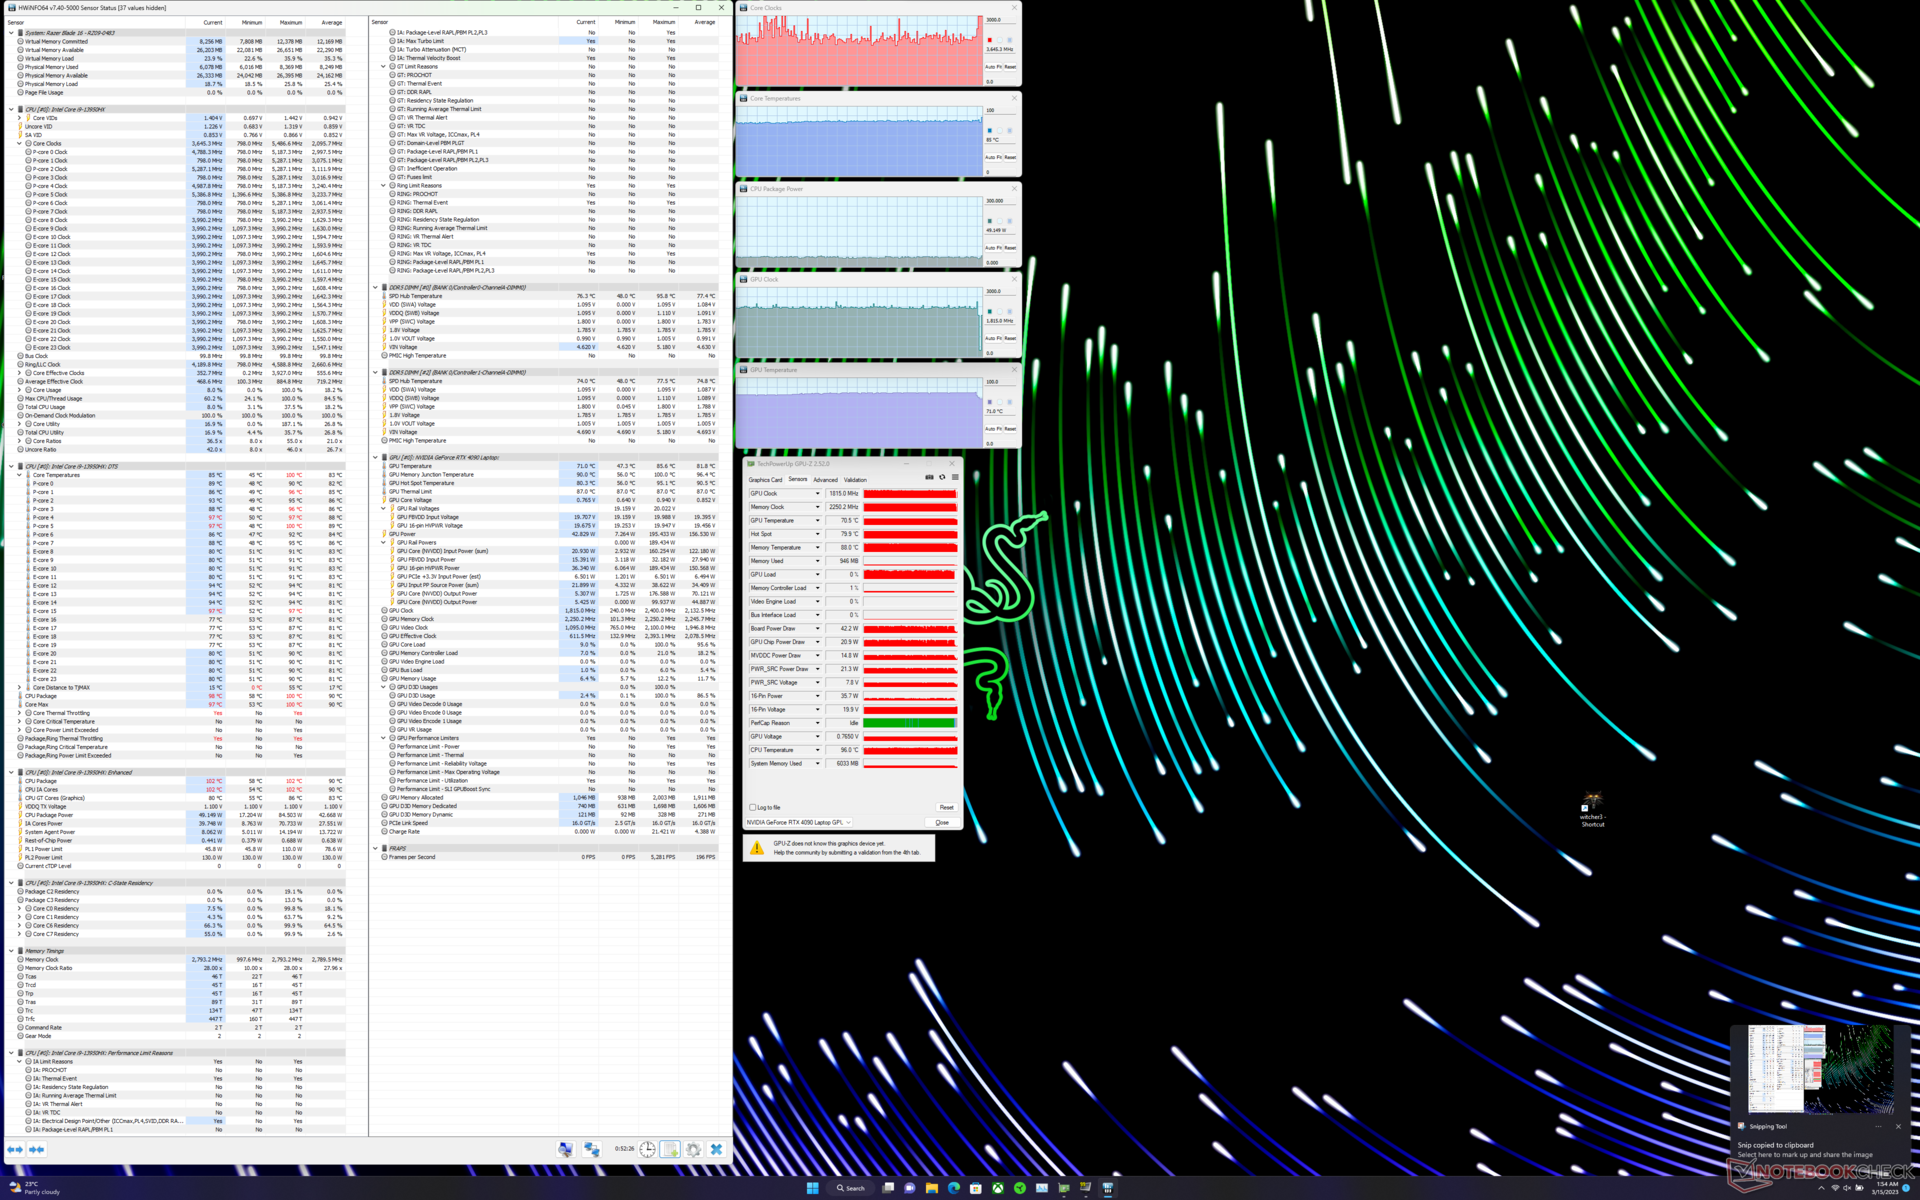
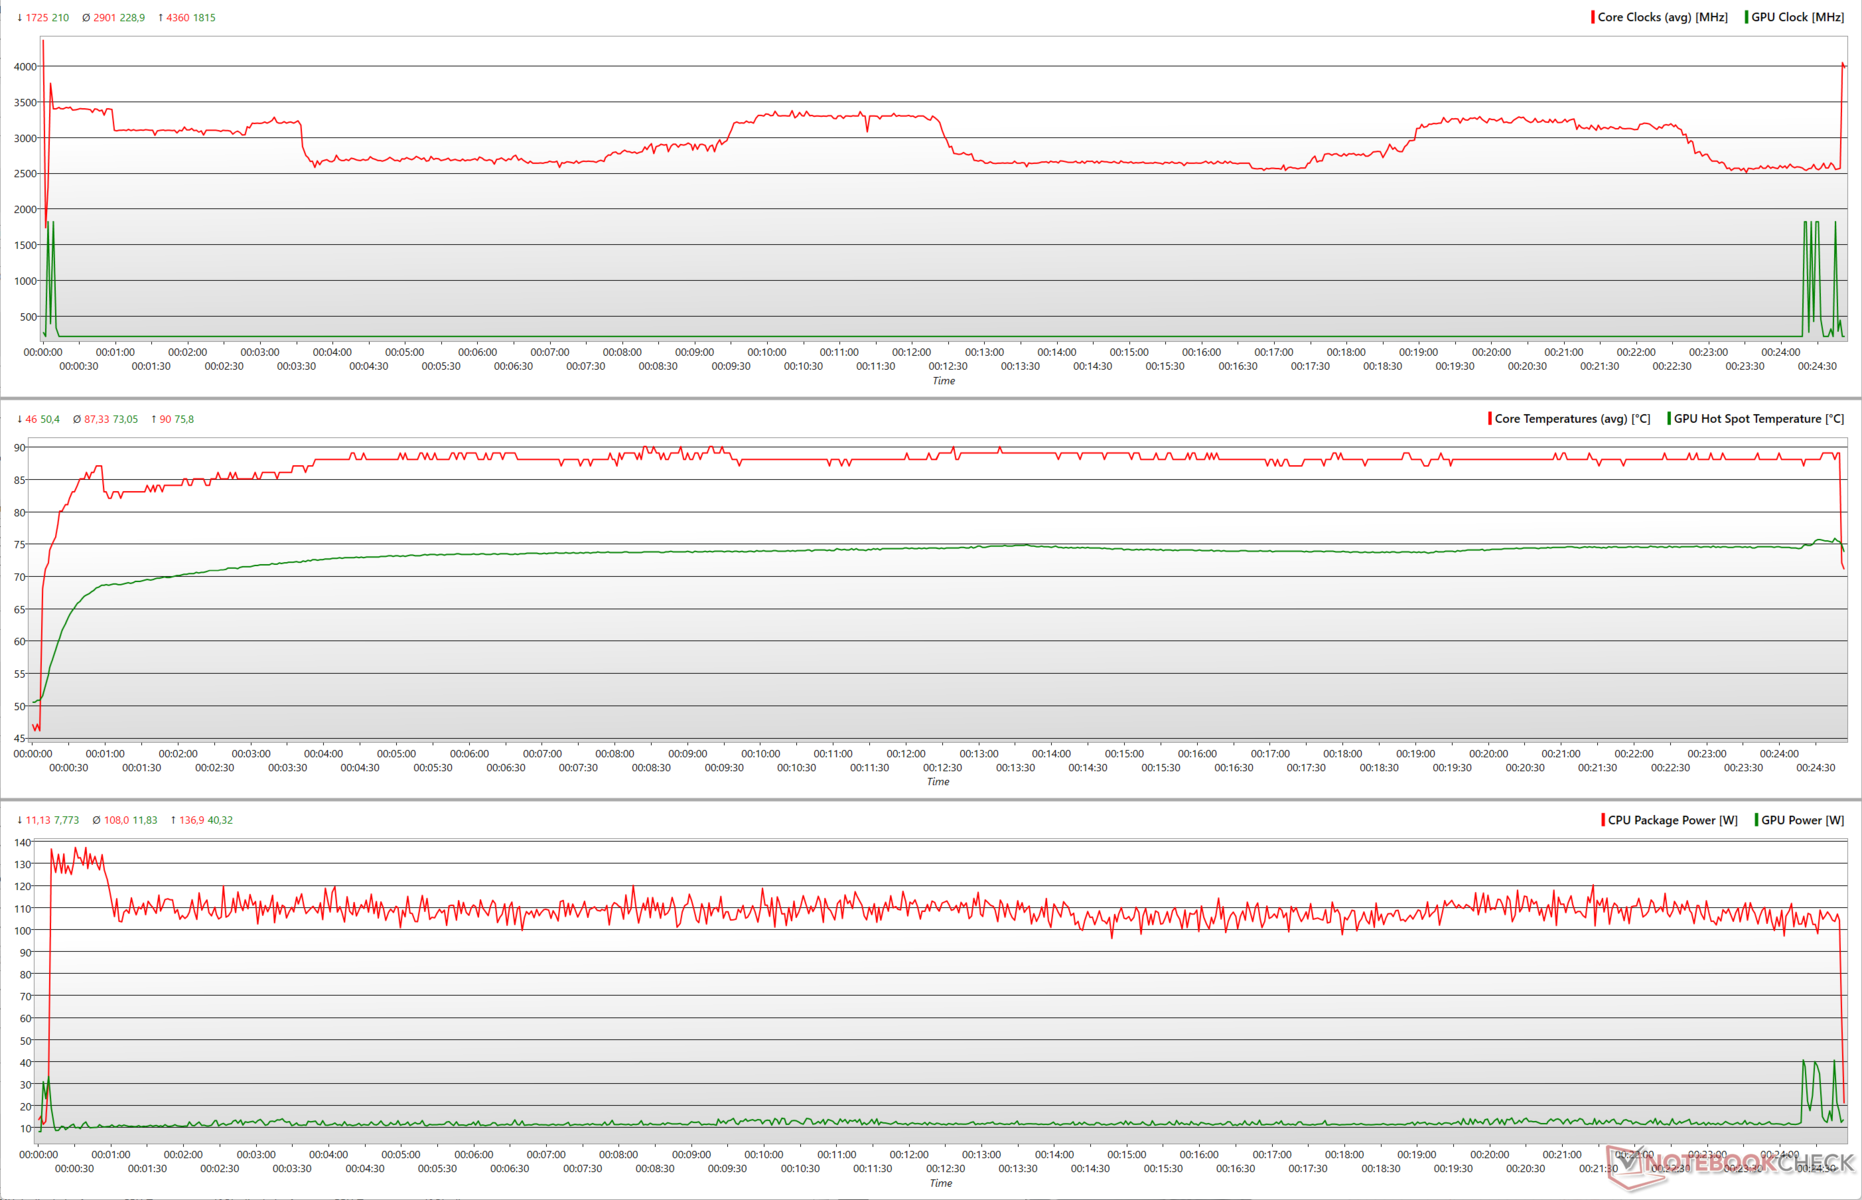
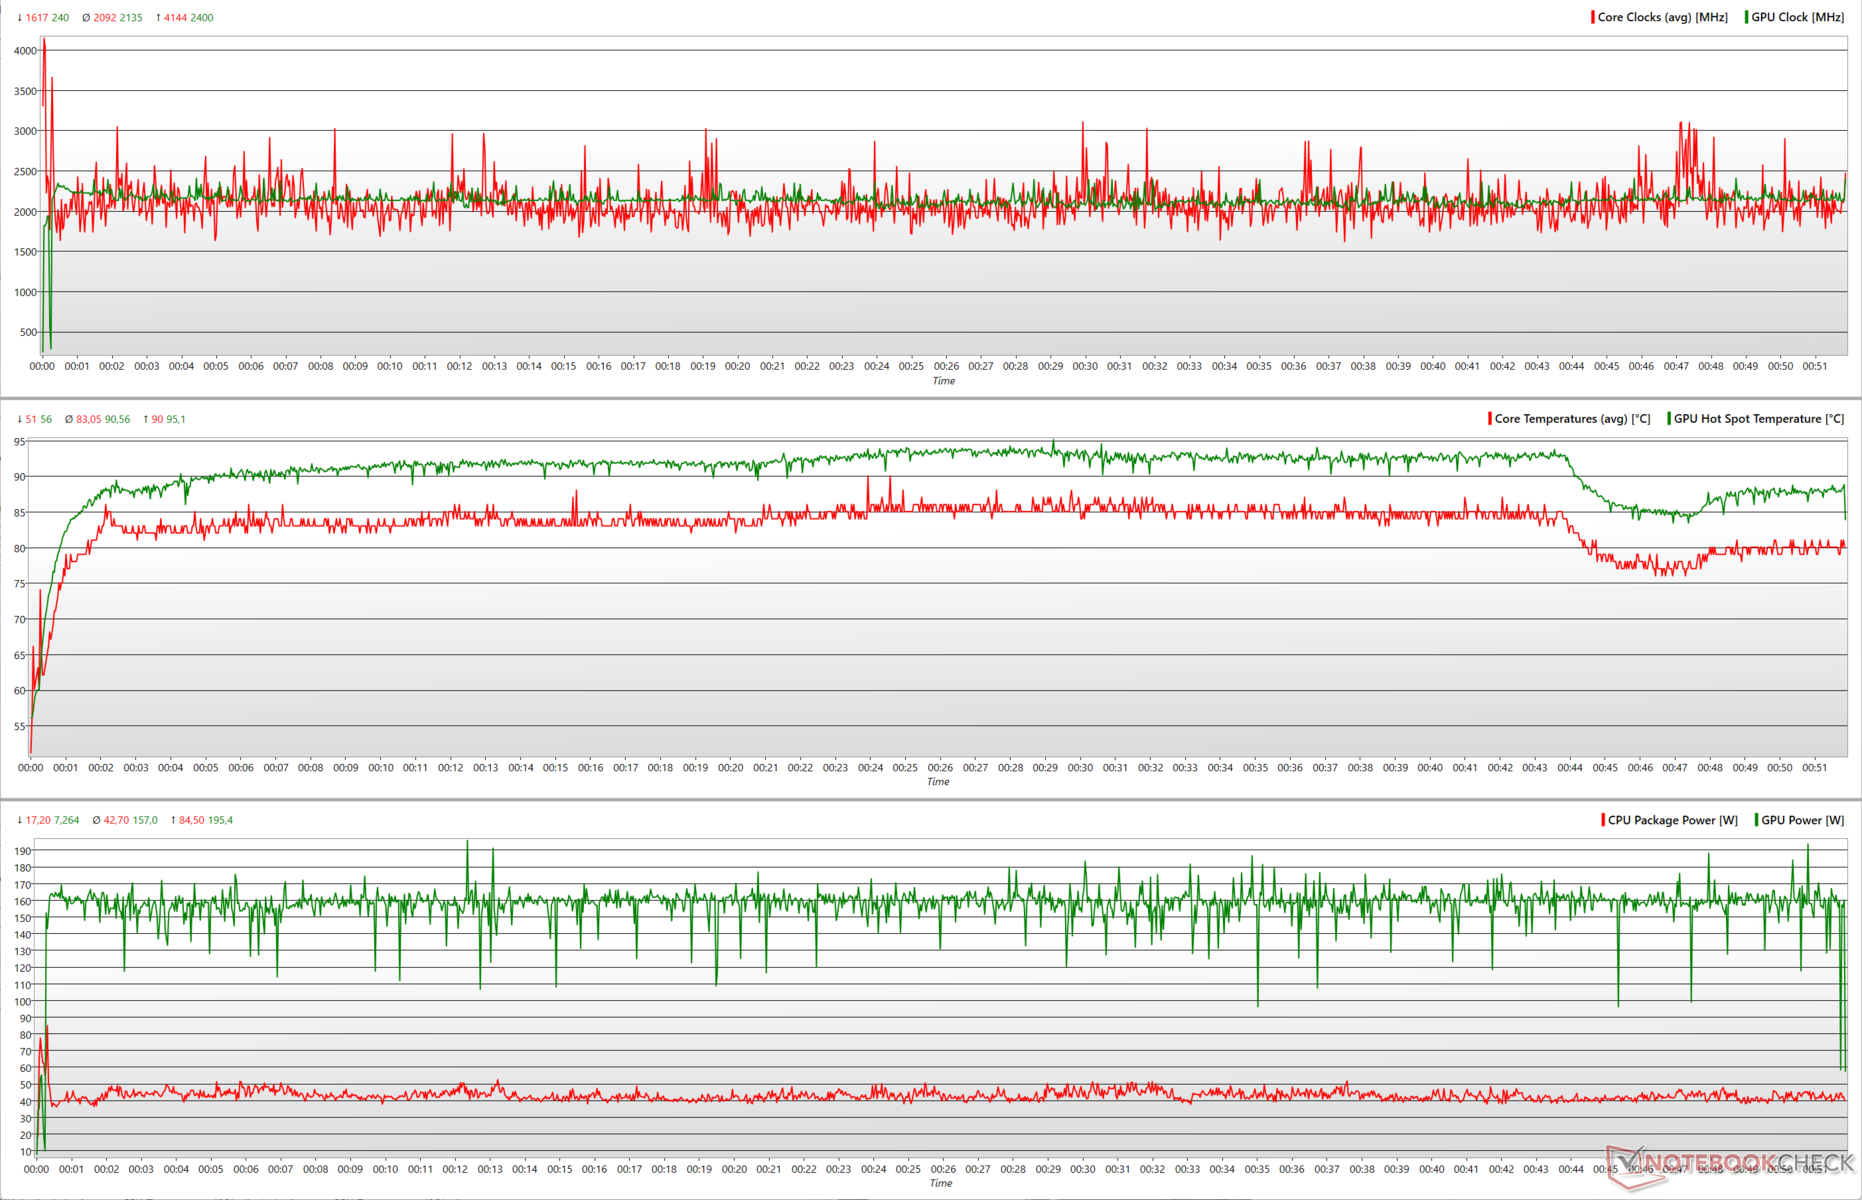
| Stress Test | CPU Clock (GHz) | GPU Clock (MHz) | Average CPU Temperature (°C) | Average GPU Temperature (°C) |
| System Idle | 2.05 | 210 | 42 | 39.7 |
| Prime95 | 2.56 | 210 | 87 | 63.1 |
| Prime95 + FurMark | 1.70 | 1,815 | 82 | 72 |
| The Witcher 3 | 3.64 | 1,815 | 83 | 81.8 |
Speakers
Razer is known to equip its Blades with decent onboard speakers, and the Blade 16 is no different. The Blade 16 comes with two speakers and two woofers powered by two Smart Amps.
The 75 dB(A) peak SPL seems to be a bit lower than what we've seen before with the Blade 16 RTX 4080 and the Blade 18, but it is loud enough to fill a mid-sized room.
Bass response is decent but could have been definitely better considering the presence of dedicated woofers. The mids and highs are well-defined, which should be adequate for casual listening. Other audio connectivity options include a 3.5 mm combo audio jack and Bluetooth 5.3.
Razer offers THX Spatial Audio functionality but unfortunately, we couldn't get the app to work even after updating the audio drivers.
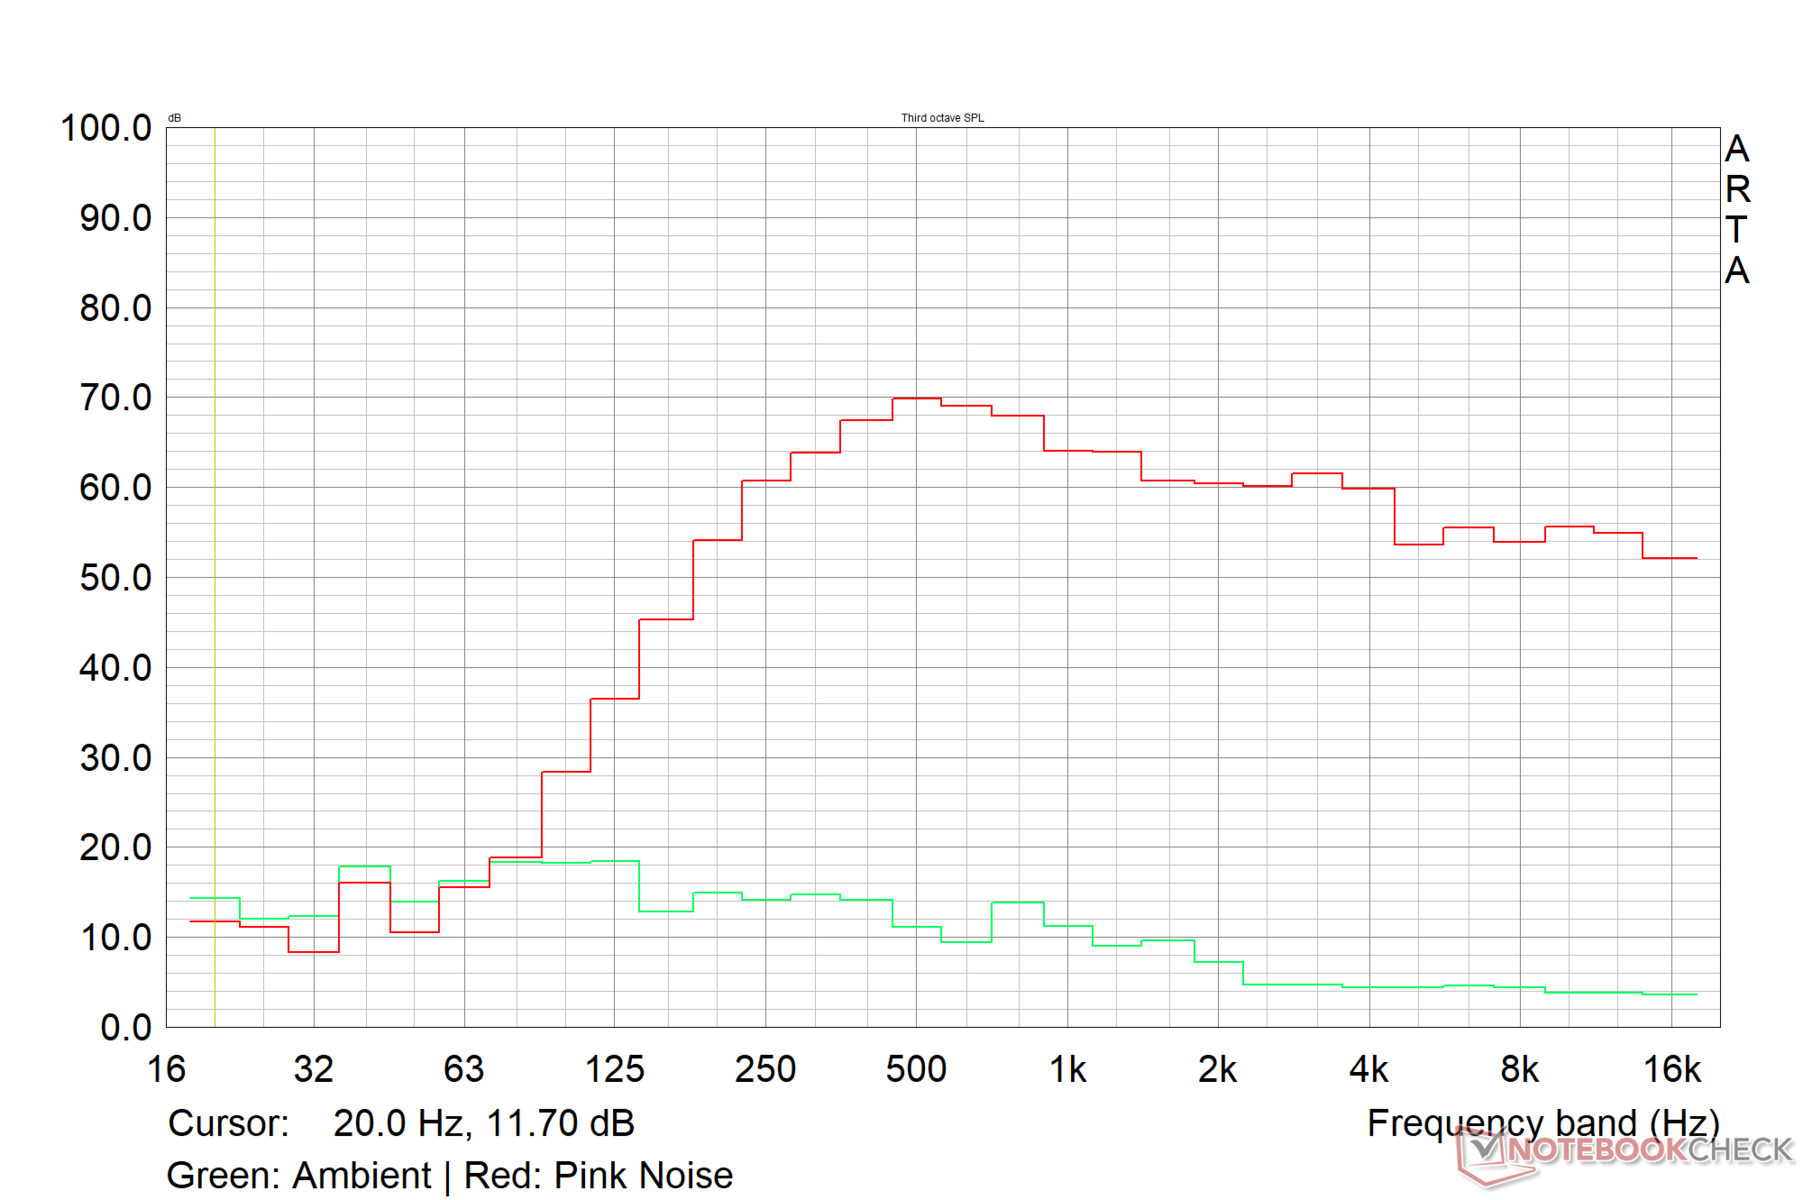
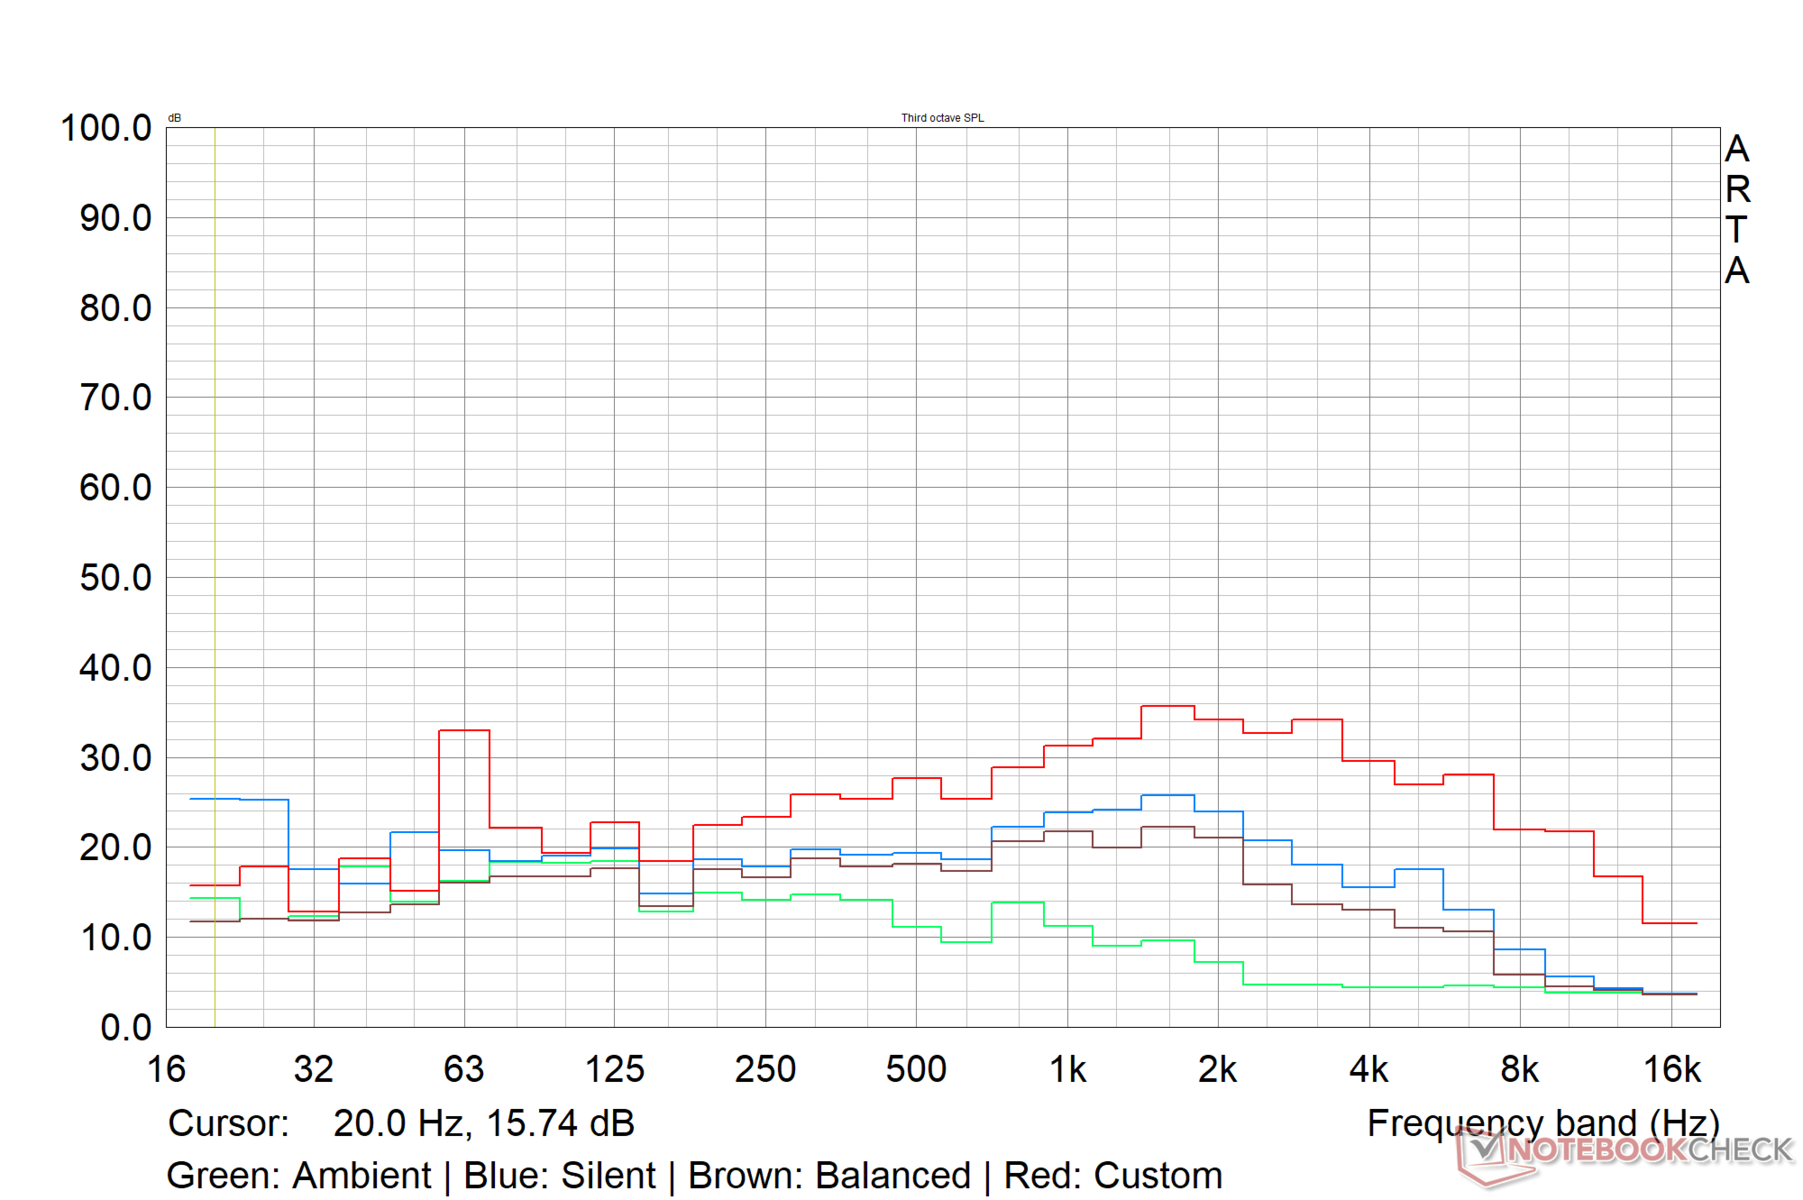
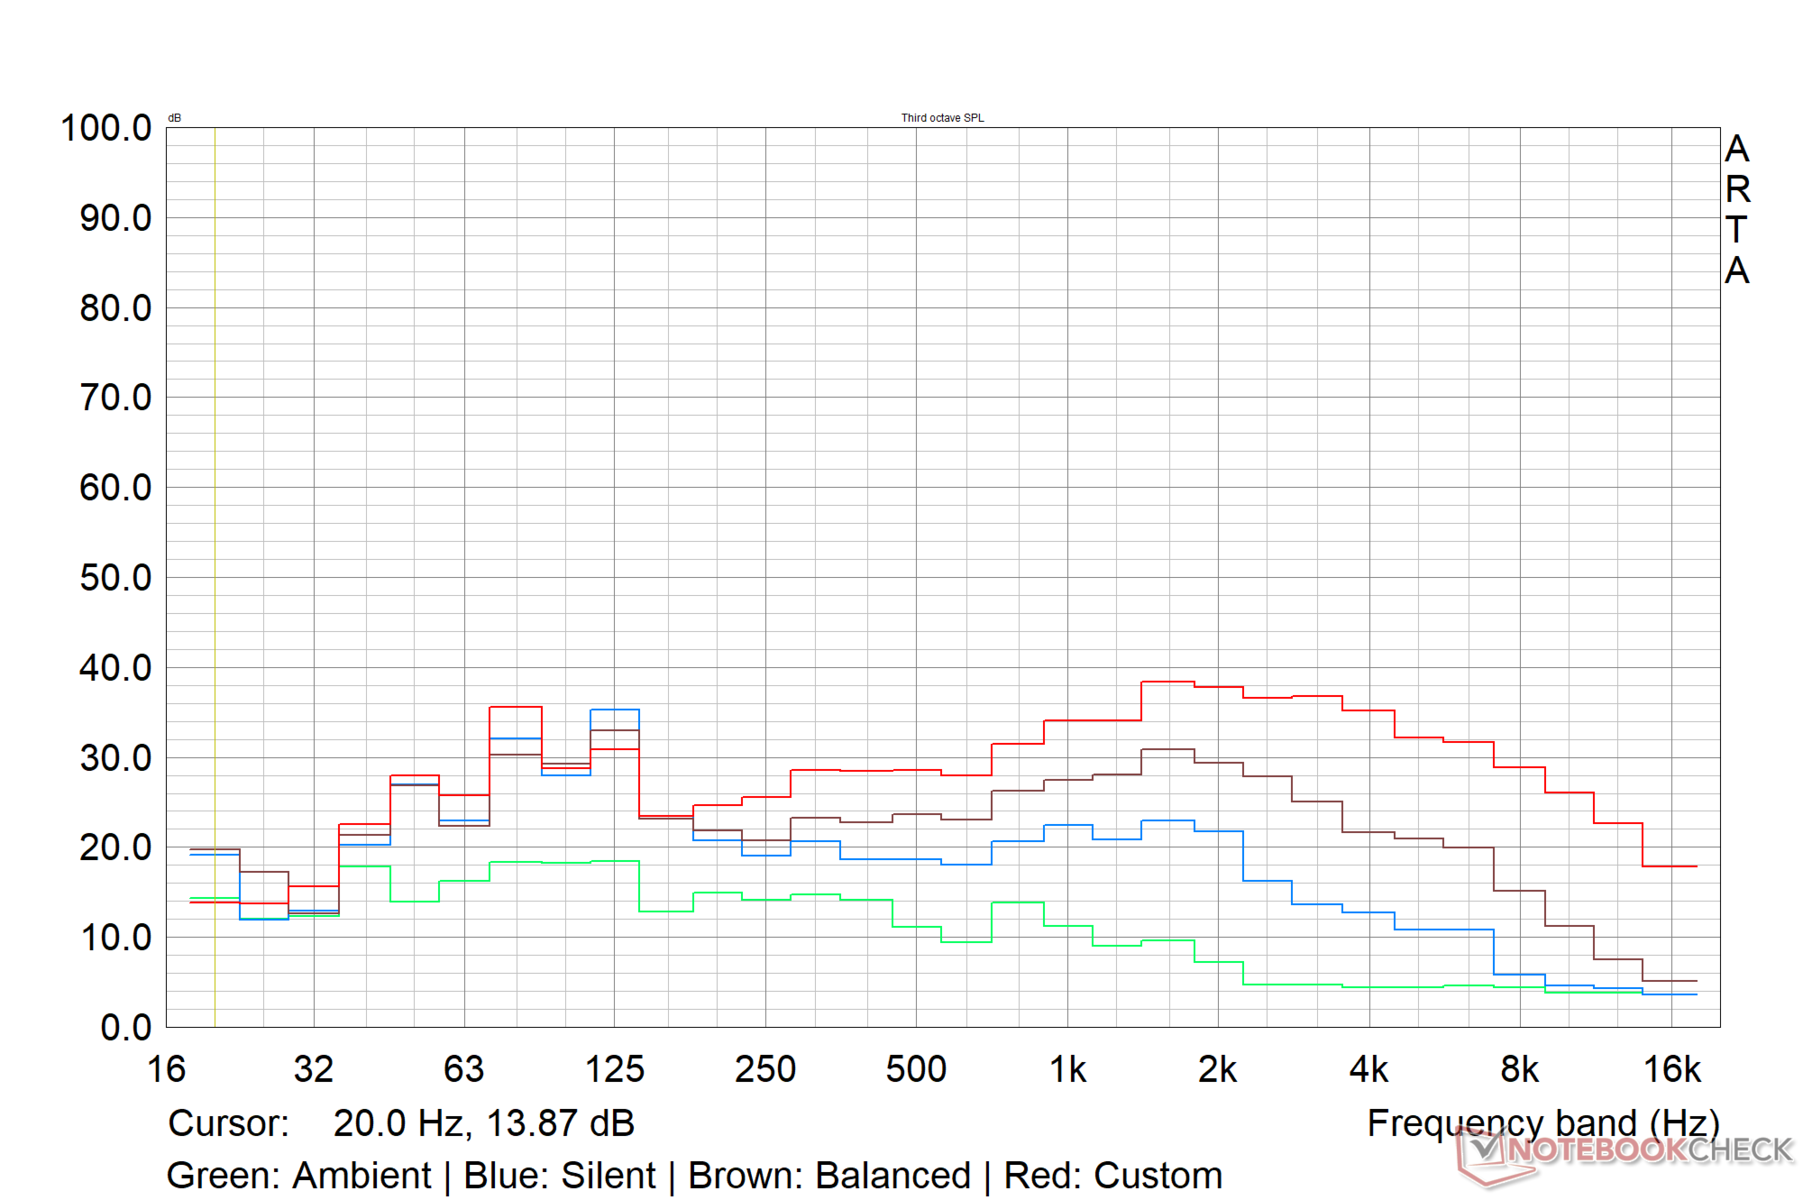
Razer Blade 16 Early 2023 RTX 4090 audio analysis
(±) | speaker loudness is average but good (75 dB)
Bass 100 - 315 Hz
(±) | reduced bass - on average 13.4% lower than median
(±) | linearity of bass is average (14.8% delta to prev. frequency)
Mids 400 - 2000 Hz
(±) | higher mids - on average 5.3% higher than median
(+) | mids are linear (3.8% delta to prev. frequency)
Highs 2 - 16 kHz
(+) | balanced highs - only 3.4% away from median
(+) | highs are linear (4.2% delta to prev. frequency)
Overall 100 - 16.000 Hz
(±) | linearity of overall sound is average (15.6% difference to median)
Compared to same class
» 36% of all tested devices in this class were better, 6% similar, 58% worse
» The best had a delta of 6%, average was 18%, worst was 132%
Compared to all devices tested
» 23% of all tested devices were better, 5% similar, 72% worse
» The best had a delta of 4%, average was 23%, worst was 134%
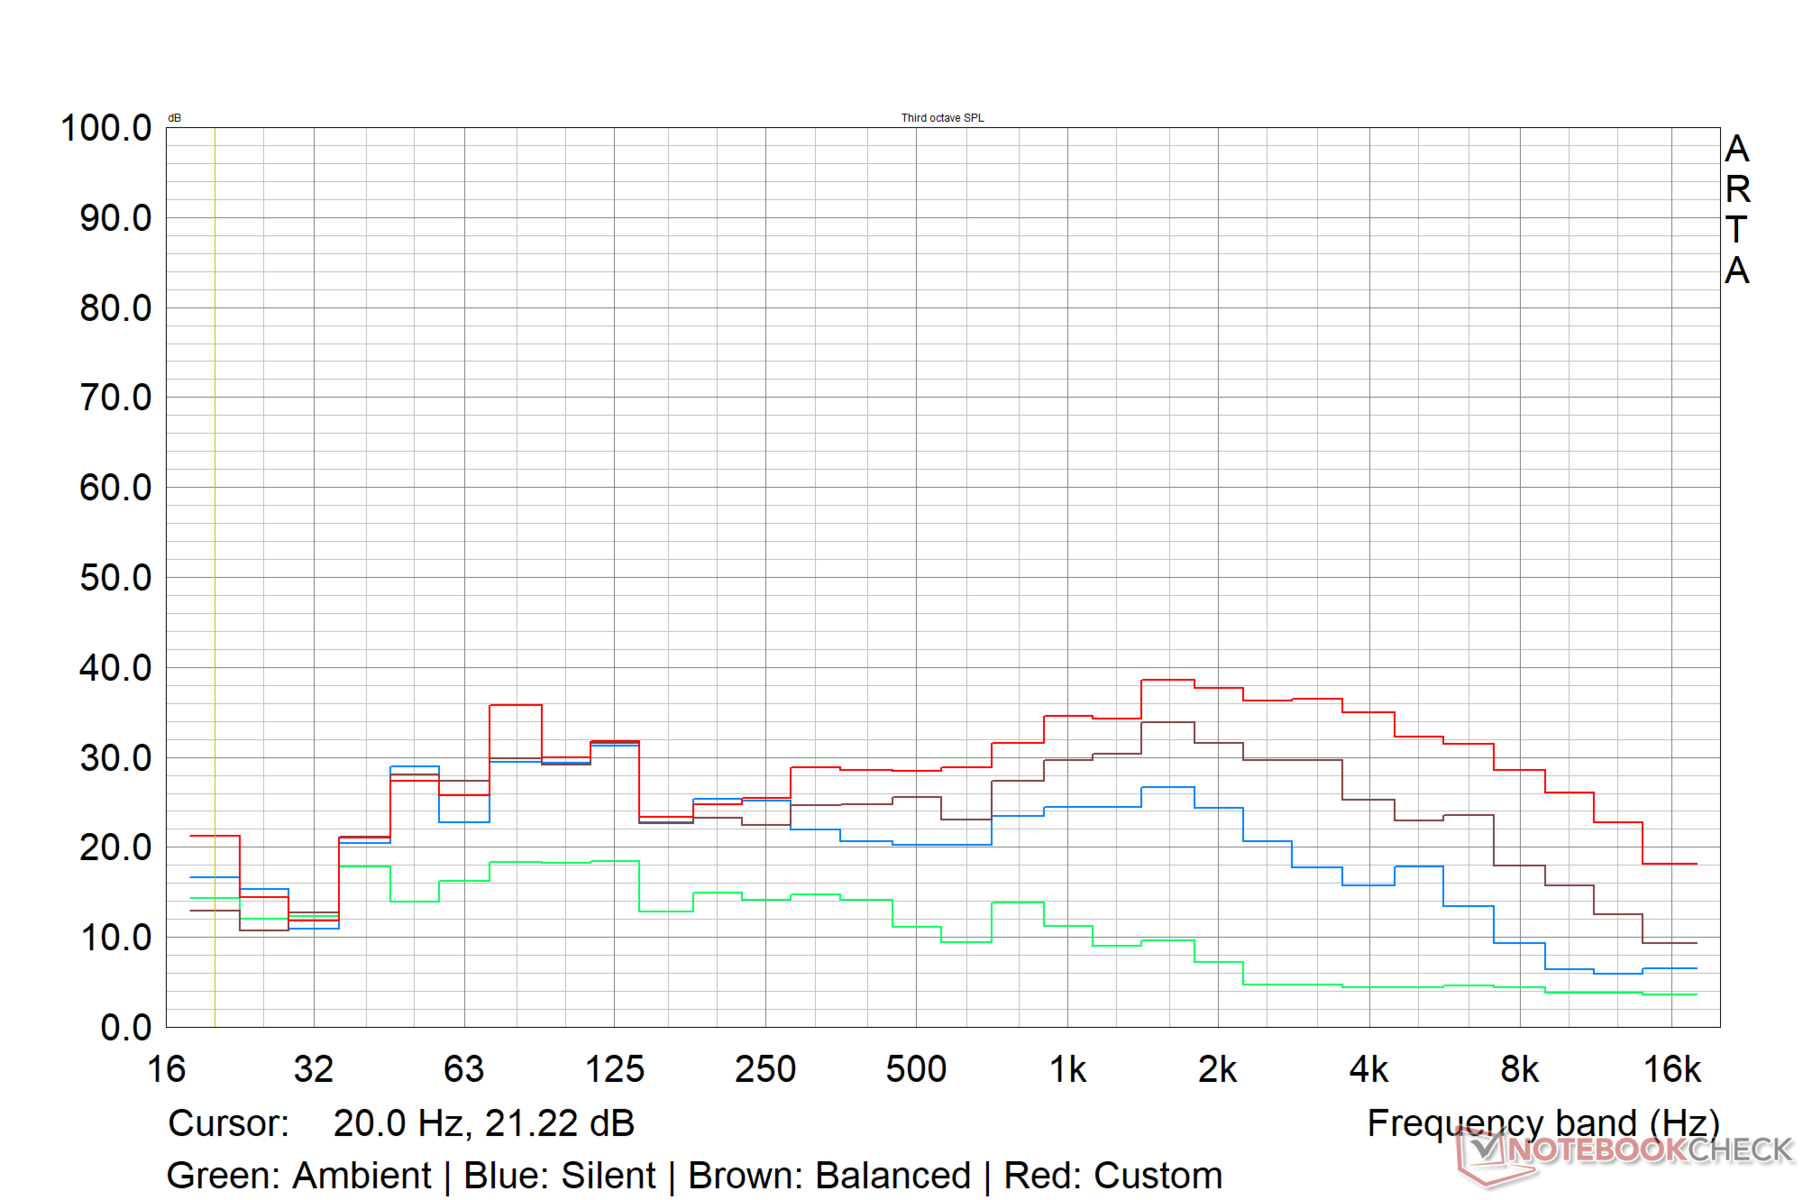
Apple MacBook Pro 16 2021 M1 Pro audio analysis
(+) | speakers can play relatively loud (84.7 dB)
Bass 100 - 315 Hz
(+) | good bass - only 3.8% away from median
(+) | bass is linear (5.2% delta to prev. frequency)
Mids 400 - 2000 Hz
(+) | balanced mids - only 1.3% away from median
(+) | mids are linear (2.1% delta to prev. frequency)
Highs 2 - 16 kHz
(+) | balanced highs - only 1.9% away from median
(+) | highs are linear (2.7% delta to prev. frequency)
Overall 100 - 16.000 Hz
(+) | overall sound is linear (4.6% difference to median)
Compared to same class
» 0% of all tested devices in this class were better, 0% similar, 100% worse
» The best had a delta of 5%, average was 17%, worst was 45%
Compared to all devices tested
» 0% of all tested devices were better, 0% similar, 100% worse
» The best had a delta of 4%, average was 23%, worst was 134%
Energy Management: Economical power draw for the configuration
Power Consumption
The Blade 16 RTX 4090's idle power consumption is on the higher side, but power draw under load seems quite economical for the given configuration. The power consumption pattern largely tallies with our observations during the stress test above.
We recorded a peak power draw close to 287 W under max load in the Custom profile, so the supplied 330 W GaN power adapter should be more than adequate for the Blade 16's energy needs. Compared to similarly rated adapters with the competition, Razer's GaN power brick is more compact and portable.
| Off / Standby | |
| Idle | |
| Load |
|
Key:
min: | |
| Razer Blade 16 Early 2023 RTX 4090 i9-13950HX, GeForce RTX 4090 Laptop GPU, mini-LED, 3840x2400, 16" | Eluktronics Mech-17 GP2 i9-13900HX, GeForce RTX 4090 Laptop GPU, IPS, 2560x1600, 17" | Asus Zephyrus Duo 16 GX650PY-NM006W R9 7945HX, GeForce RTX 4090 Laptop GPU, MiniLED, 2560x1600, 16" | MSI Titan GT77 HX 13VI i9-13950HX, GeForce RTX 4090 Laptop GPU, Mini-LED, 3840x2160, 17.3" | Razer Blade 16 Early 2023 i9-13950HX, GeForce RTX 4080 Laptop GPU, IPS, 2560x1600, 16" | Lenovo Legion Pro 7 16IRX8H i9-13900HX, GeForce RTX 4080 Laptop GPU, IPS, 2560x1600, 16" | Razer Blade 18 RTX 4070 i9-13950HX, GeForce RTX 4070 Laptop GPU, IPS, 2560x1600, 18" | Average NVIDIA GeForce RTX 4090 Laptop GPU | Average of class Gaming | |
|---|---|---|---|---|---|---|---|---|---|
| Power Consumption | 12% | 9% | 14% | 11% | 12% | 2% | 15% | 33% | |
| Idle Minimum * (Watt) | 27.5 | 14 49% | 19.2 30% | 14 49% | 15.2 45% | 18 35% | 24.5 11% | 16.2 ? 41% | 13 ? 53% |
| Idle Average * (Watt) | 34.4 | 19.3 44% | 29.7 14% | 21.6 37% | 22.8 34% | 24 30% | 34.1 1% | 23.1 ? 33% | 18.7 ? 46% |
| Idle Maximum * (Watt) | 35.4 | 36.8 -4% | 30.8 13% | 24.8 30% | 49.8 -41% | 32 10% | 47.7 -35% | 34.2 ? 3% | 24.3 ? 31% |
| Load Average * (Watt) | 147.8 | 117.2 21% | 126 15% | 122.5 17% | 121.2 18% | 130 12% | 140 5% | 130.5 ? 12% | 110.2 ? 25% |
| Witcher 3 ultra * (Watt) | 256 | 304 -19% | 258 -1% | 265 -4% | 242 5% | 260 -2% | 202 21% | ||
| Load Maximum * (Watt) | 286.7 | 342.5 -19% | 330 -15% | 418 -46% | 273.7 5% | 320 -12% | 261 9% | 324 ? -13% | 258 ? 10% |
* ... smaller is better
Power Consumption: The Witcher 3 / Stress test
Power Consumption: External monitor
Battery Life
The provided 95.2 WHr dual-battery pack achieves 5.45 hours run time in our standardized Wi-Fi browsing test at 150 nits. This is only bested slightly by the Razer Blade 16 RTX 4080.
Video playback run time at 150 nits is much better than the competition at close to 8.5 hours.
Given the powerful internals, the battery lasts for only about 1.5 hours under load. The Lenovo Legion Pro 7 with an RTX 4080 and a 99.9 WHr battery can last 53% longer.
| Razer Blade 16 Early 2023 RTX 4090 i9-13950HX, GeForce RTX 4090 Laptop GPU, 95.2 Wh | Eluktronics Mech-17 GP2 i9-13900HX, GeForce RTX 4090 Laptop GPU, 99 Wh | Asus Zephyrus Duo 16 GX650PY-NM006W R9 7945HX, GeForce RTX 4090 Laptop GPU, 90 Wh | MSI Titan GT77 HX 13VI i9-13950HX, GeForce RTX 4090 Laptop GPU, 99.9 Wh | Razer Blade 16 Early 2023 i9-13950HX, GeForce RTX 4080 Laptop GPU, 95.2 Wh | Lenovo Legion Pro 7 16IRX8H i9-13900HX, GeForce RTX 4080 Laptop GPU, 99.9 Wh | Razer Blade 18 RTX 4070 i9-13950HX, GeForce RTX 4070 Laptop GPU, 91.7 Wh | Average of class Gaming | |
|---|---|---|---|---|---|---|---|---|
| Battery runtime | -12% | -38% | -13% | 3% | 19% | -19% | 11% | |
| H.264 (h) | 8.4 | 3.8 -55% | 6 -29% | 8.64 ? 3% | ||||
| WiFi v1.3 (h) | 5.8 | 5.1 -12% | 4 -31% | 5.3 -9% | 6.1 5% | 5.1 -12% | 4 -31% | 7.15 ? 23% |
| Witcher 3 ultra (h) | 1.6 | |||||||
| Load (h) | 1.4 | 1 -29% | 1.4 0% | 1.4 0% | 2.1 50% | 1.3 -7% | 1.502 ? 7% | |
| Reader / Idle (h) | 8.9 | 6.4 | 7 | 8.71 ? |
Pros
Cons
Verdict: A Blade 16 for enthusiasts, not so much for performance connoisseurs
The Razer Blade 16 Early 2023 with the RTX 4090 Laptop GPU evokes excitement at first look. The sleek 16-inch chassis looks and feels premium, and Razer must be commended for striking the right balance between minimalism and gaming aesthetics. While sturdy, it can quickly turn into an eyesore thanks to all the smudginess.
Razer gets a lot of things right with the 2023 Blade 16. A high-throughput SD card reader, stable Wi-Fi 6E, decent 1080p webcam, adequate I/O, and an increased touchpad area all augur well for the Blade 16. The keyboard is good with a bright backlight, but Razer could have implemented longer travel and/or incorporated optical keys.
The dual-mode mini-LED display is the main USP of the Blade 16 Early 2023, and this is the world's first laptop to feature one. The ability to switch between UHD+ 120 Hz and FHD+ 240 Hz modes can be useful for creators who also game.
However, beyond all the hype is the fact that the dual-mode implementation is not perfect. The switching is not dynamic, requiring a restart each time. Also, the FHD+ mode shows a noticeably fuzzy picture, and one loses the ability to change color profiles. In UHD+ mode, however, the Blade 16's display stands out with high luminance and gorgeous SDR/HDR visuals that are as close as you can get to OLED quality.
The Razer Blade 16 Early 2023 is an enticing prospect with an eye-watering price. Featuring a Core i9-13950HX, a 175 W RTX 4090 Laptop GPU, and a vibrant dual-mode UHD+ mini-LED display, the new Razer Blade 16 checks most boxes for a high-end gaming laptop in 2023. However, at US$4,300, one would expect a near-perfect laptop in all aspects, which is not the case here."
The Blade 16 Early 2023 sports top-of-the-line hardware including the Intel Core i9-13950HX and the Nvidia GeForce RTX 4090 Laptop GPU. While this combination easily trumps last year's top-end flagship gaming laptops without breaking a sweat, things have started to become extremely competitive in 2023.
The Blade 16 trails behind other high-end gaming laptops such as the MSI Titan GT77 HX 13VI, Lenovo Legion Pro 7, and the Asus ROG Zephyrus Duo 16 in CPU performance. The performance deltas are somewhat narrowed when it comes to graphics loads.
The RTX 4090 Laptop GPU is sometimes overshadowed by the RTX 4080 Laptop GPU at 1080p Ultra owing to CPU bottlenecks, but the card performs well in QHD and 4K depending on the title. Any plans of gaming at 4K Ultra with ray tracing will require enabling DLSS 2 or DLSS 3 Frame Generation for playable frame rates.
The Blade 16's thermals are quite capable but there's definitely scope for improvement. The vapor chamber does a decent job of keeping components cool, but it is not able to fully tame the CPU and GPU in max load in the Custom power profile.
The high surface temperatures can be a deterrent. Fan noise levels are on par for the course for a gaming laptop of this caliber. Onboard sound quality is serviceable for the most part.
Power consumption is high in idle but surprisingly economical under load given the configuration. The new GaN power adapter has a much-reduced footprint and is capable of supplying 330 W without issues. Battery life is decent for simple web browsing and video playback at low brightness levels. Any amount of stress will see the battery life tanking.
Overall, for an asking price of US$4,300, the Razer Blade 16 Early 2023 is a mixed bag. If you're already a Razer fan, the upgrade to the latest specs should offer tangible performance benefits together with all the shenanigans Razer laptops are famous for.
Or you can save US$700 by opting for the Blade 16 Early 2023 RTX 4080. The performance difference between these two SKUs is not worth the extra asking price at this point.
The new Blade 16 will also appeal to those who prioritize display quality over other aspects. However, if you are chasing performance numbers alone, the Blade 16 has serious contenders this year who kick ass.
And we are just getting started!
Price and Availability
Razer Blade 16 Early 2023 RTX 4090
- 03/23/2023 v7 (old)
Vaidyanathan Subramaniam
Transparency
The selection of devices to be reviewed is made by our editorial team. The test sample was provided to the author as a loan by the manufacturer or retailer for the purpose of this review. The lender had no influence on this review, nor did the manufacturer receive a copy of this review before publication. There was no obligation to publish this review. As an independent media company, Notebookcheck is not subjected to the authority of manufacturers, retailers or publishers.
This is how Notebookcheck is testing
Every year, Notebookcheck independently reviews hundreds of laptops and smartphones using standardized procedures to ensure that all results are comparable. We have continuously developed our test methods for around 20 years and set industry standards in the process. In our test labs, high-quality measuring equipment is utilized by experienced technicians and editors. These tests involve a multi-stage validation process. Our complex rating system is based on hundreds of well-founded measurements and benchmarks, which maintains objectivity. Further information on our test methods can be found here.
Price comparison
