Asus ROG Zephyrus M16 (2023) laptop review: RTX 4090 with a super bright, Mini-LED display
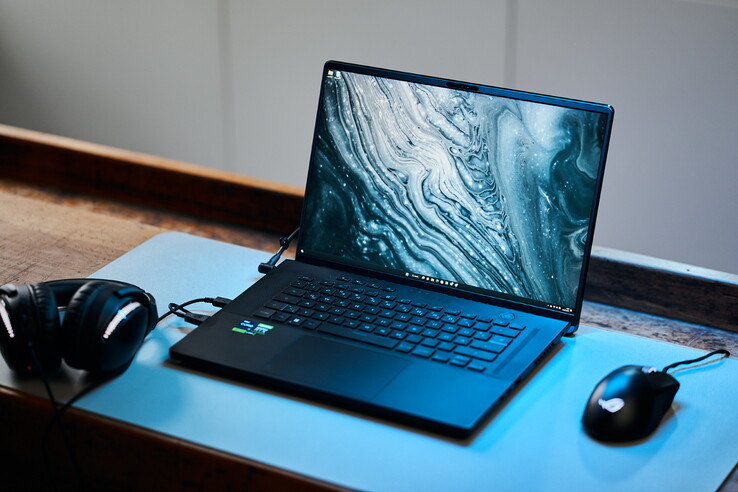
As one of the last examples of the "old" CPU/GPU generation, we recently reviewed the ROG Zephyrus M16 which came equipped with a Core i9-12900H and an RTX 3070 Ti. But now, a changing of the guard has come in the shape of the M16, this time with a Core i9-13900H and an RTX 4090 packed inside an "AniMe Matrix" case. The latter has changed slightly, as the matrix has become somewhat finer. We have taken a detailed look at these changes and investigated whether the M16 can get along with the RTX 4090.
It goes without saying, we compare the new device with the predecessor as well as other high-end gaming machines. As the RTX 4090 is normally found in larger laptops, we also look at the 18-inch Asus ROG Strix Scar 18 or the 17-inch MSI Titan GT77. We also consider both the Lenovo Legion Pro 7 16IRX and the Razer Blade 16 to be competitors.
Possible competitors compared
Rating | Date | Model | Weight | Height | Size | Resolution | Price |
|---|---|---|---|---|---|---|---|
| 89.4 % v7 (old) | 03 / 2023 | Asus ROG Zephyrus M16 GU604VY-NM042X i9-13900H, GeForce RTX 4090 Laptop GPU | 2.3 kg | 22.9 mm | 16.00" | 2560x1600 | |
| 87.8 % v7 (old) | 02 / 2023 | Asus ROG Zephyrus M16 GU603Z i9-12900H, GeForce RTX 3070 Ti Laptop GPU | 2.1 kg | 19.9 mm | 16.00" | 2560x1600 | |
| 86.6 % v7 (old) | 02 / 2023 | Asus ROG Strix Scar 18 2023 G834JY-N6005W i9-13980HX, GeForce RTX 4090 Laptop GPU | 3.1 kg | 30.8 mm | 18.00" | 2560x1600 | |
| 89 % v7 (old) | 02 / 2023 | MSI Titan GT77 HX 13VI i9-13950HX, GeForce RTX 4090 Laptop GPU | 3.5 kg | 23 mm | 17.30" | 3840x2160 | |
| 89.4 % v7 (old) | 02 / 2023 | Lenovo Legion Pro 7 16IRX8H i9-13900HX, GeForce RTX 4080 Laptop GPU | 2.7 kg | 26 mm | 16.00" | 2560x1600 | |
| 91.2 % v7 (old) | 02 / 2023 | Razer Blade 16 Early 2023 i9-13950HX, GeForce RTX 4080 Laptop GPU | 2.4 kg | 21.99 mm | 16.00" | 2560x1600 |
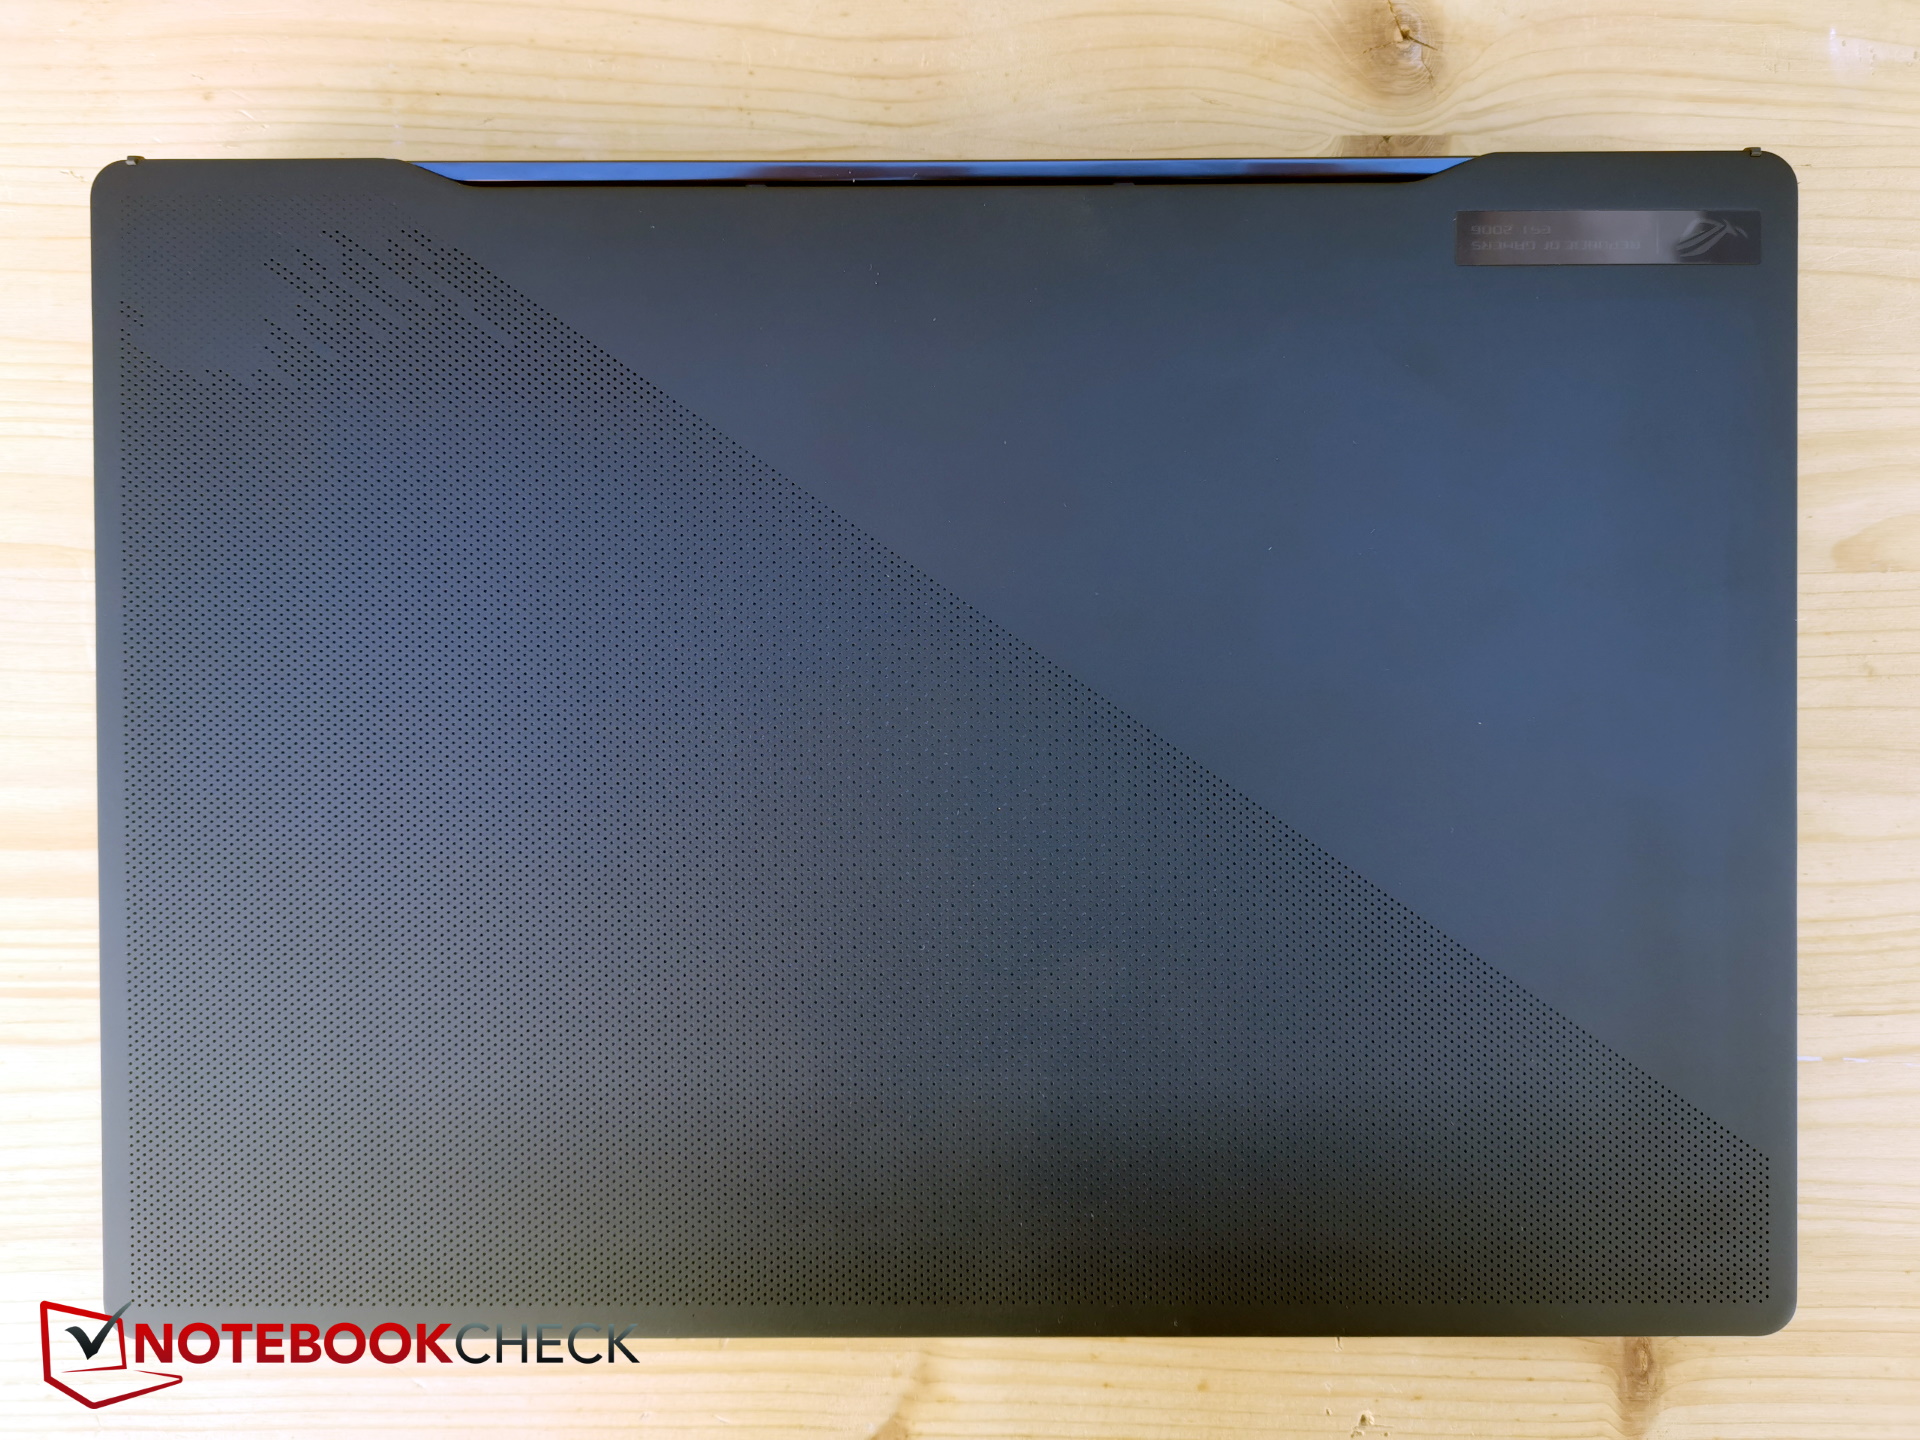
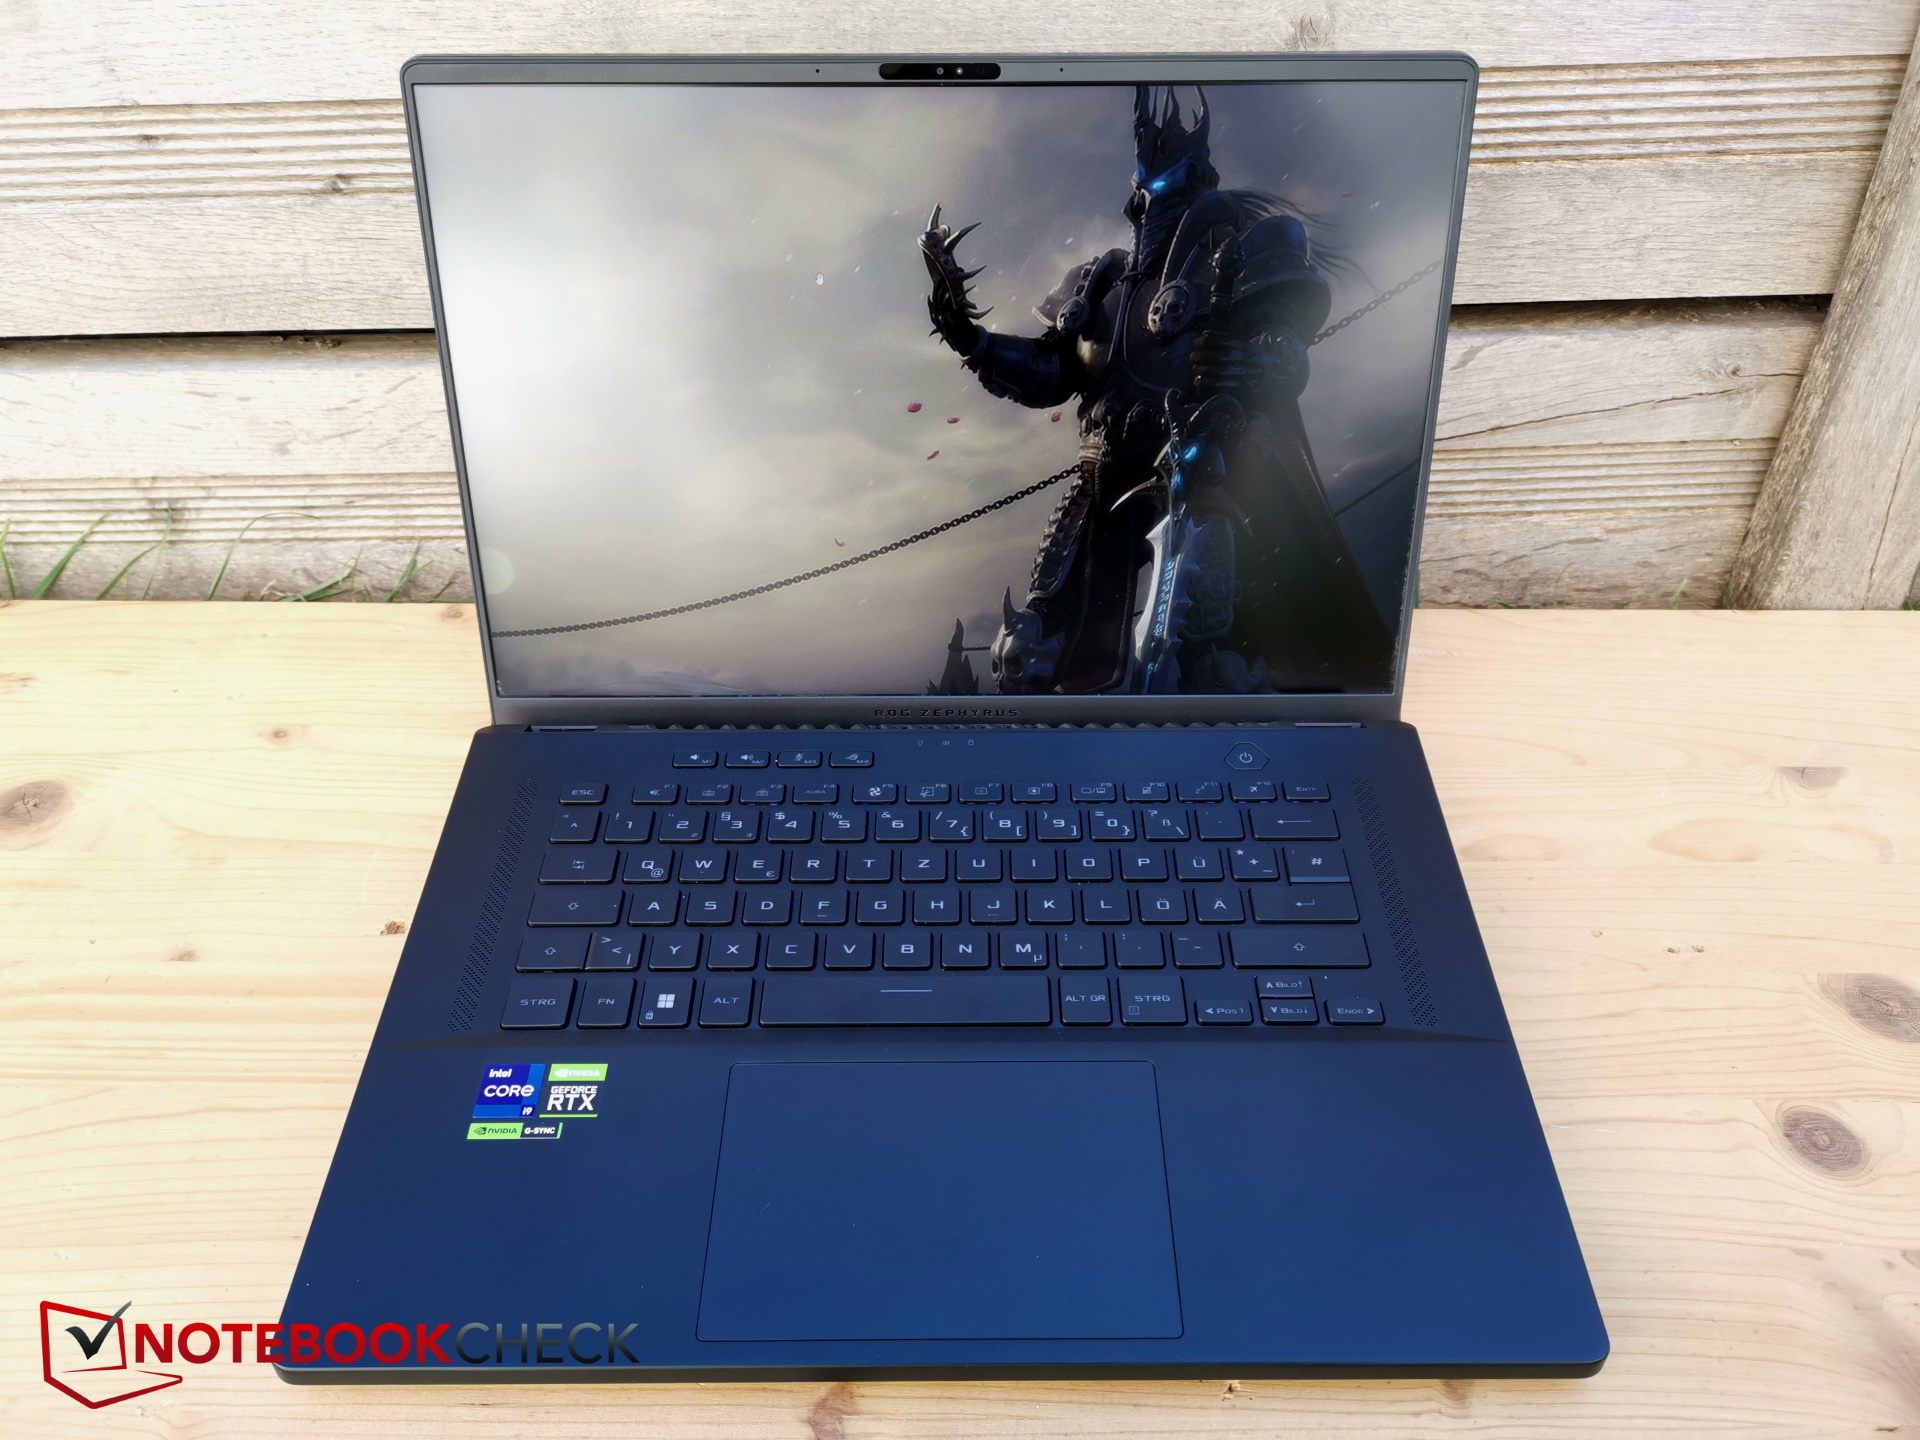
Case - An AniMe Matrix head-turner
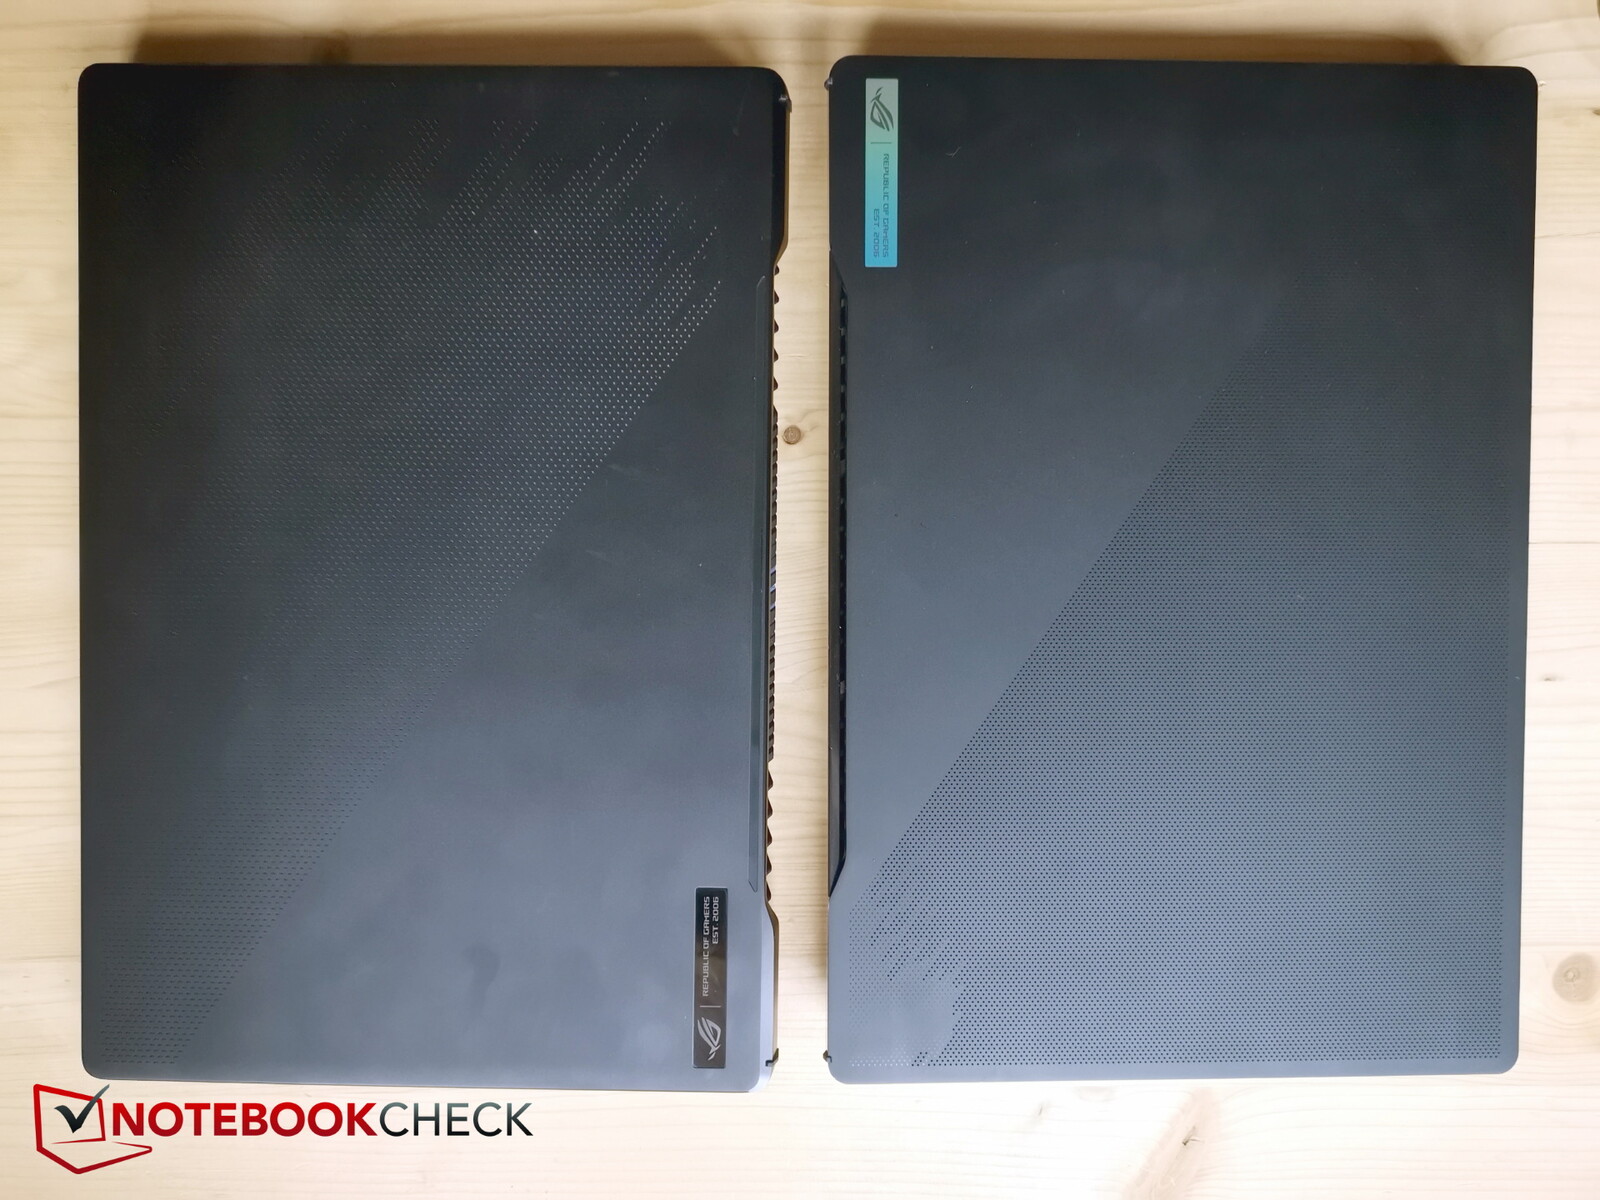
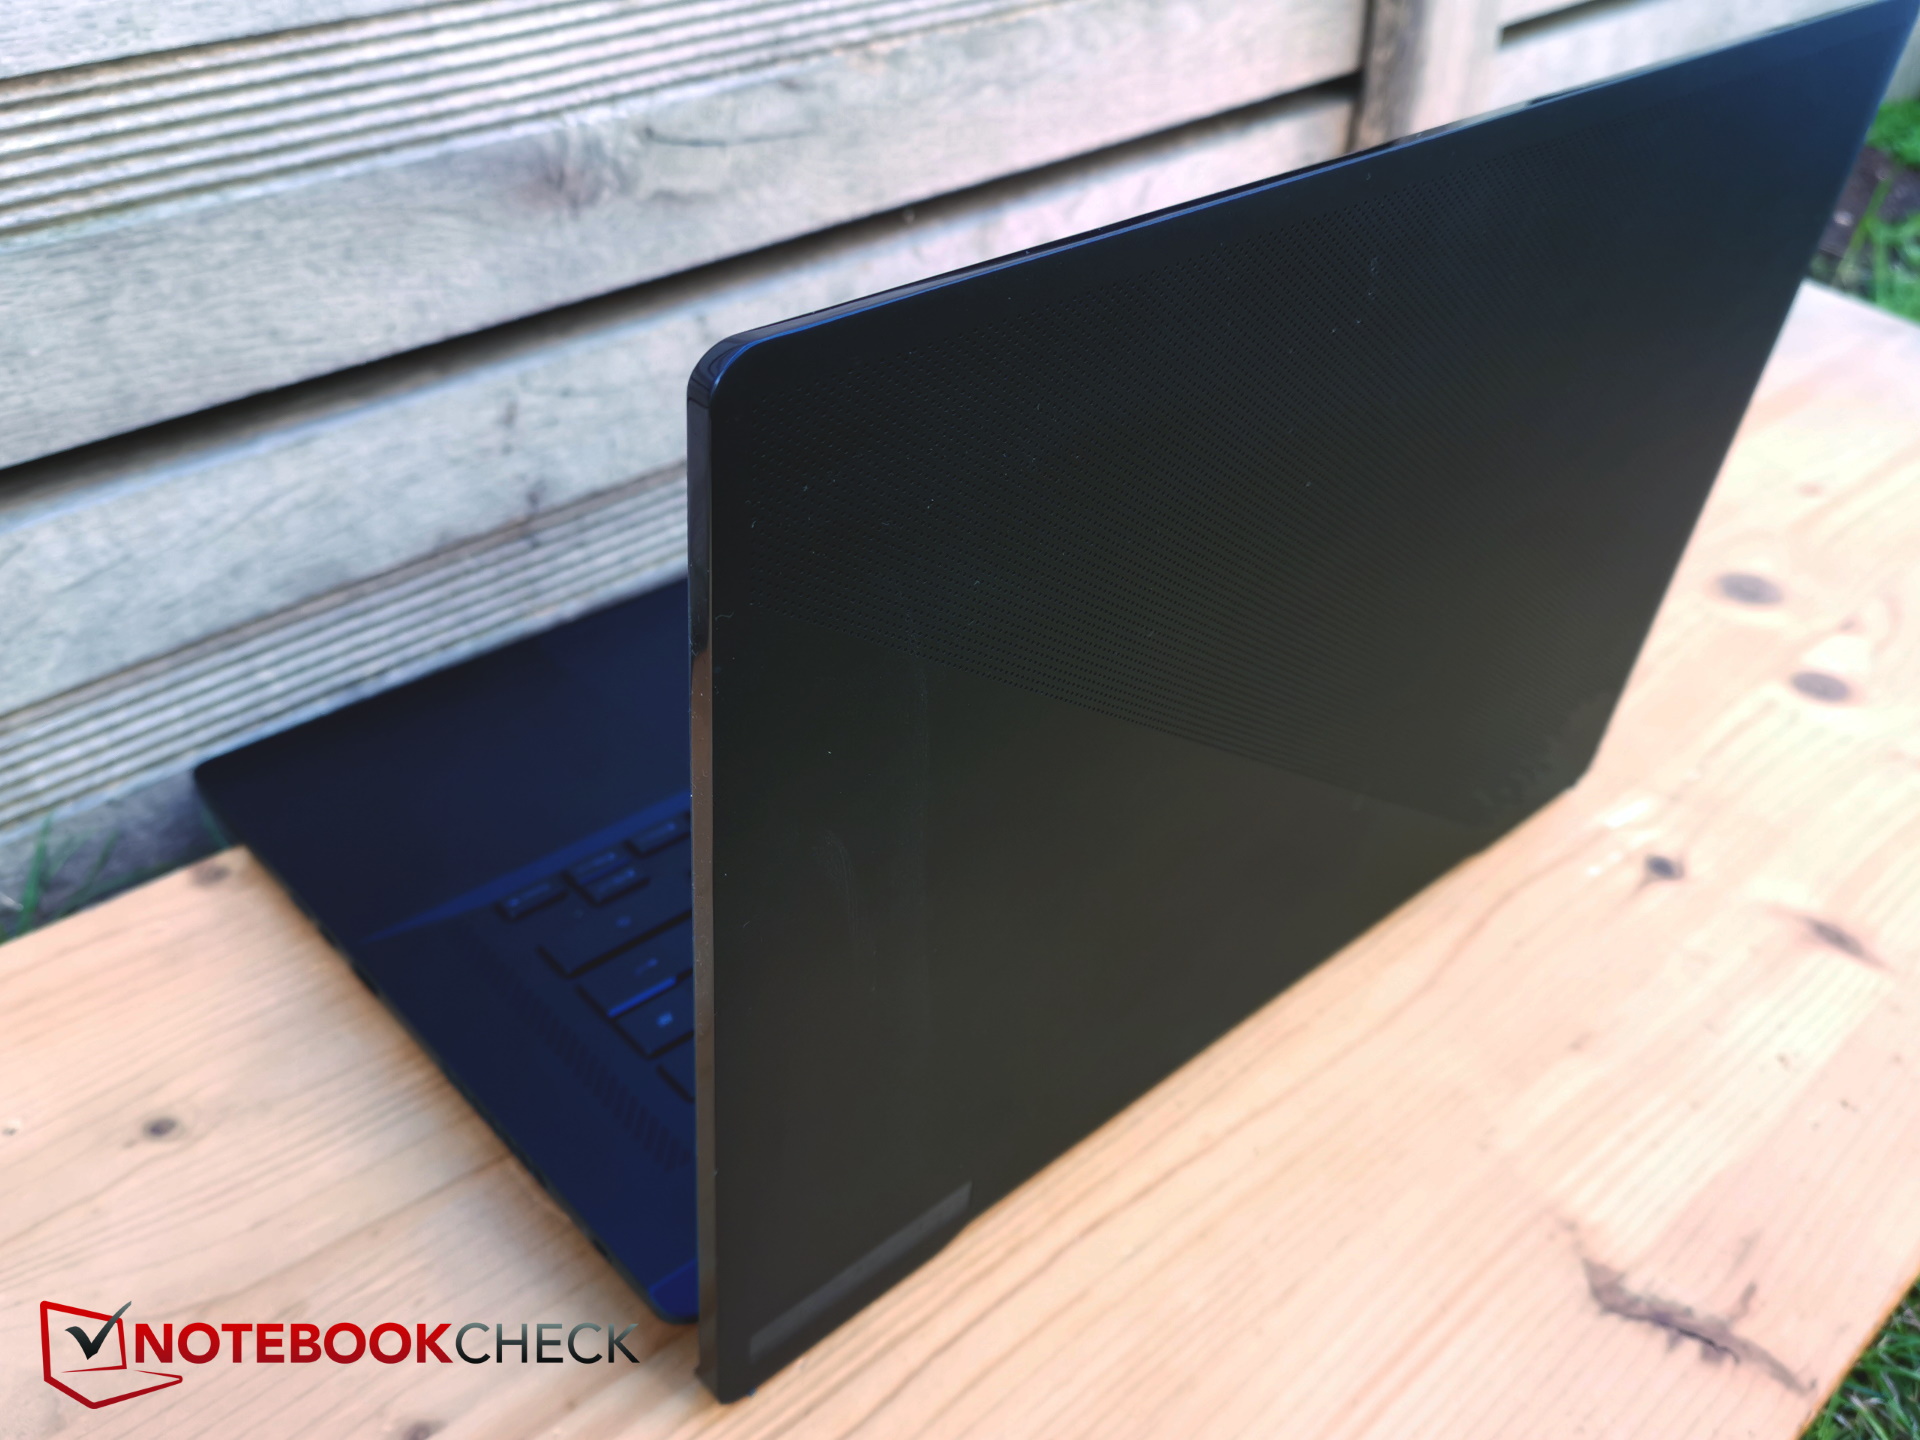
Gigabyte has revised the case this year but, at first glance, it's difficult to spot any obvious differences. The chassis continues to be made of black plastic which is now slightly thicker.
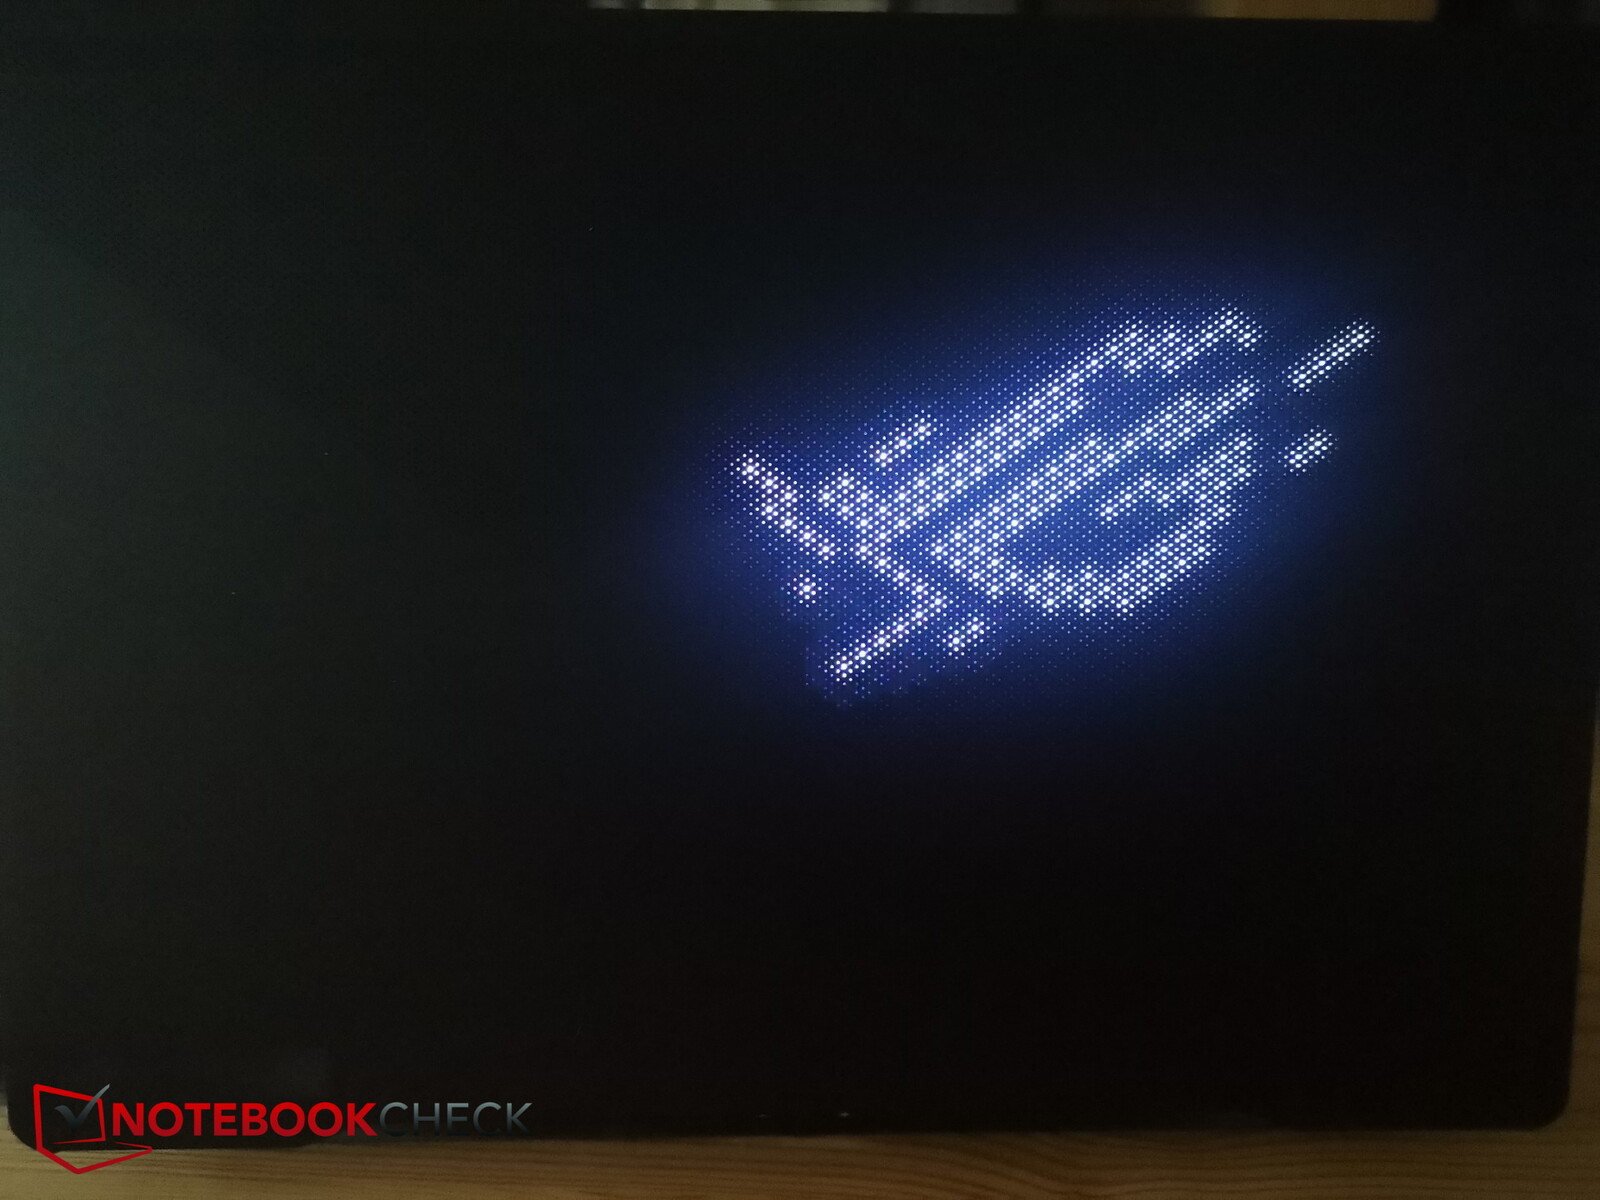
The so-called AniMe Matrix on the top surface is finer and more detailed than before and can display simple, moving logos or text with additional effects. On the one hand, this is cool, but not only is it likely to increase the device's power consumption but it is largely invisible to the user when the laptop is open. For this reason, the effect is more aimed towards impressing onlookers.
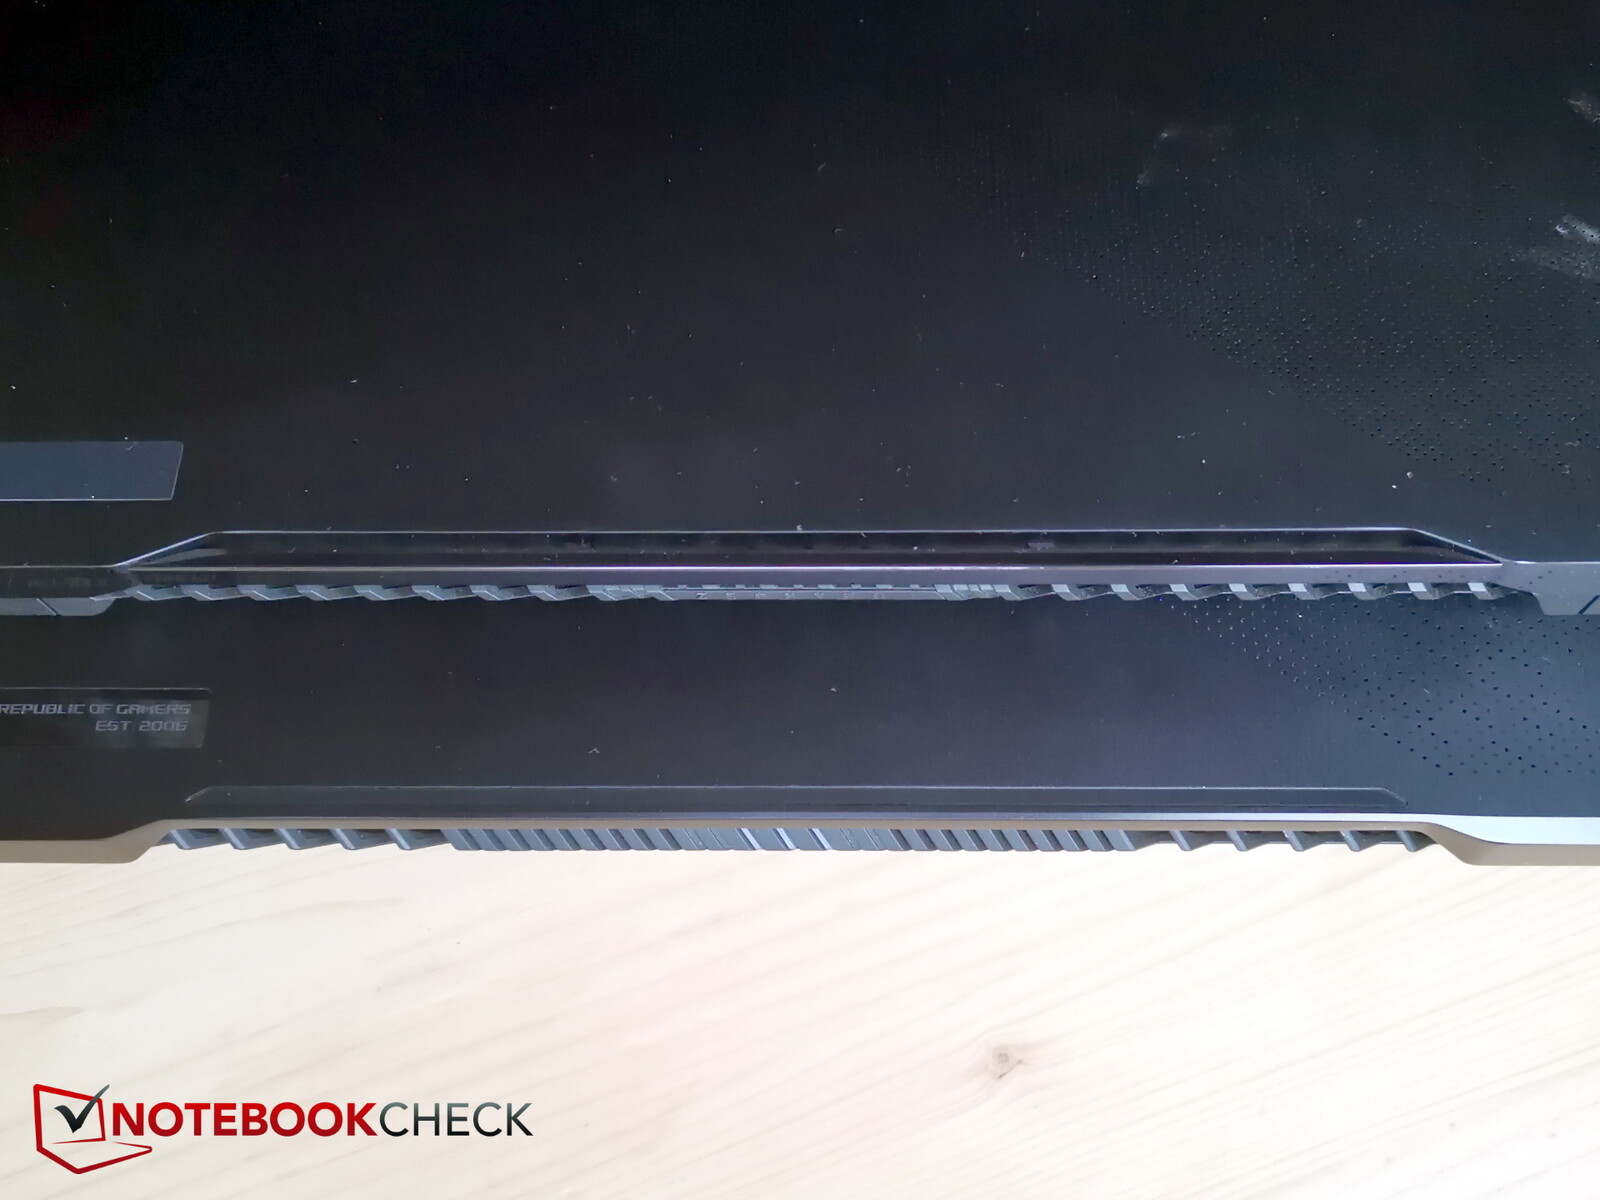
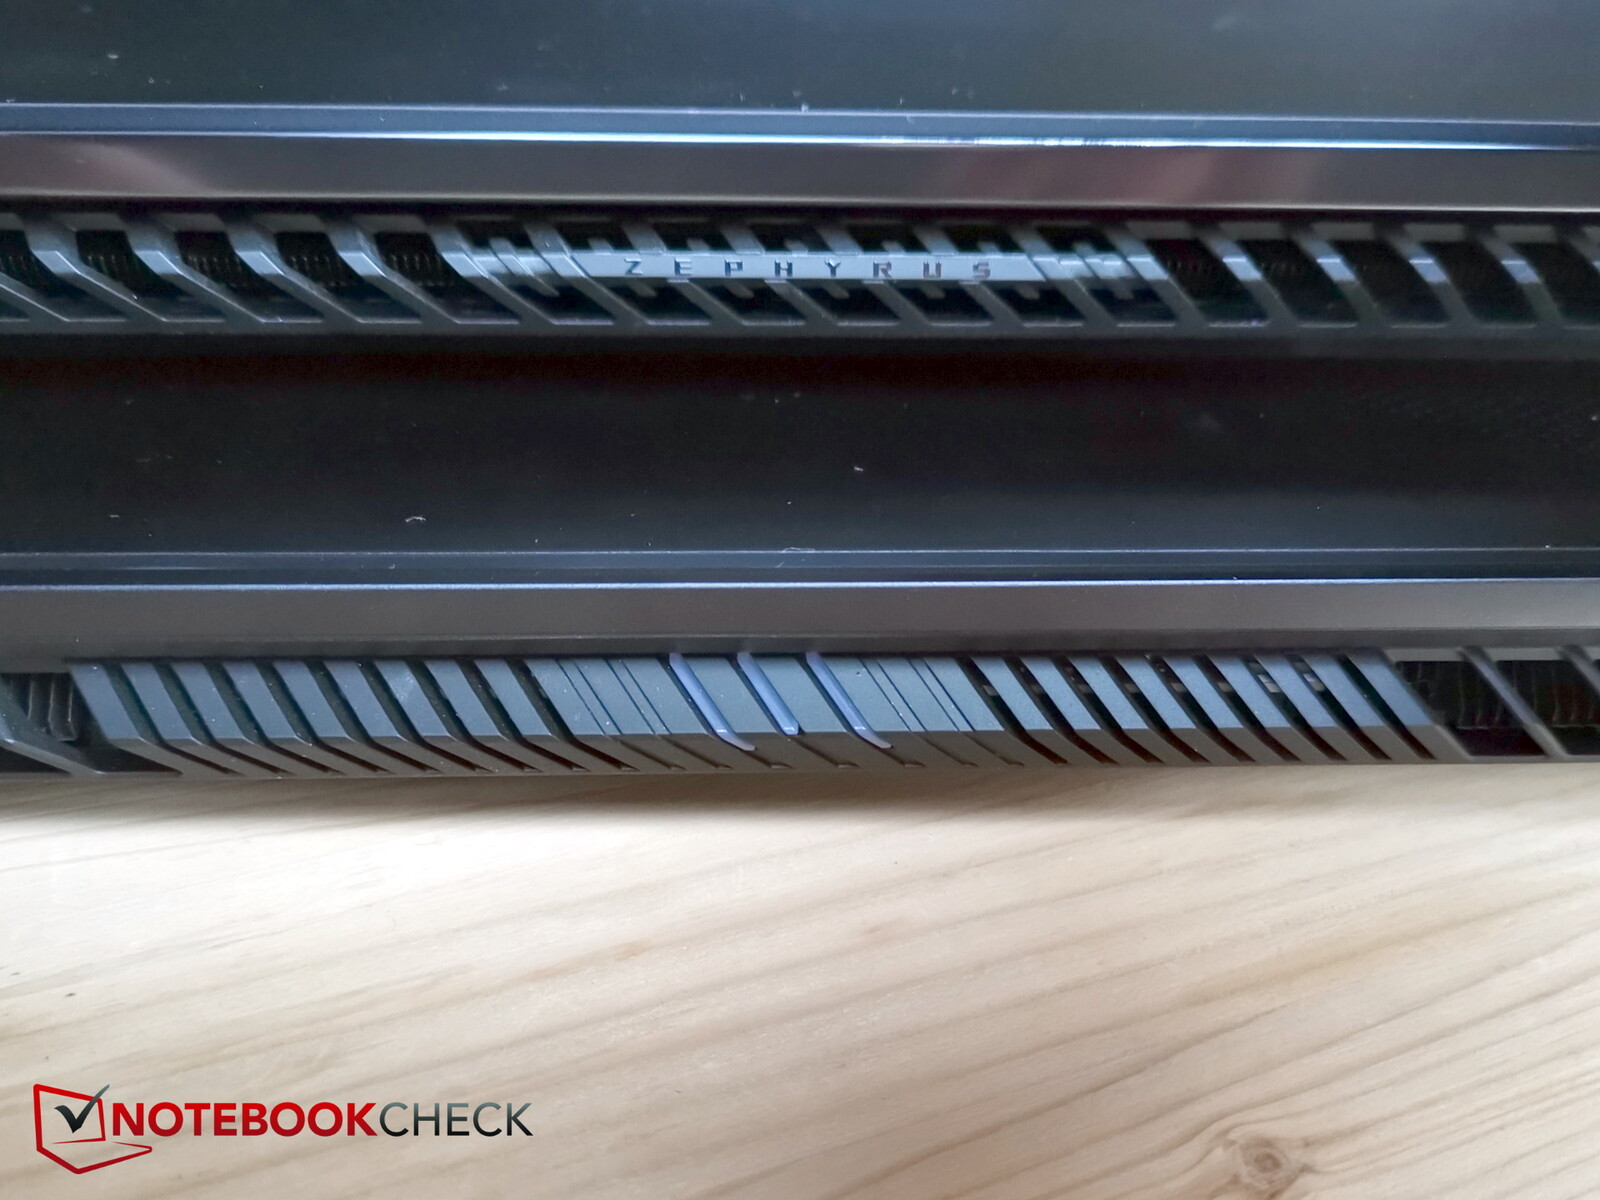
We weren't impressed by the blank, black plastic bar at the top of the rear of the lid. It is somewhat cheap-looking, not very stable and had already started showing signs of wear and tear. All in all, almost all of the ventilation grilles on the sides have been changed slightly, as has the port location.
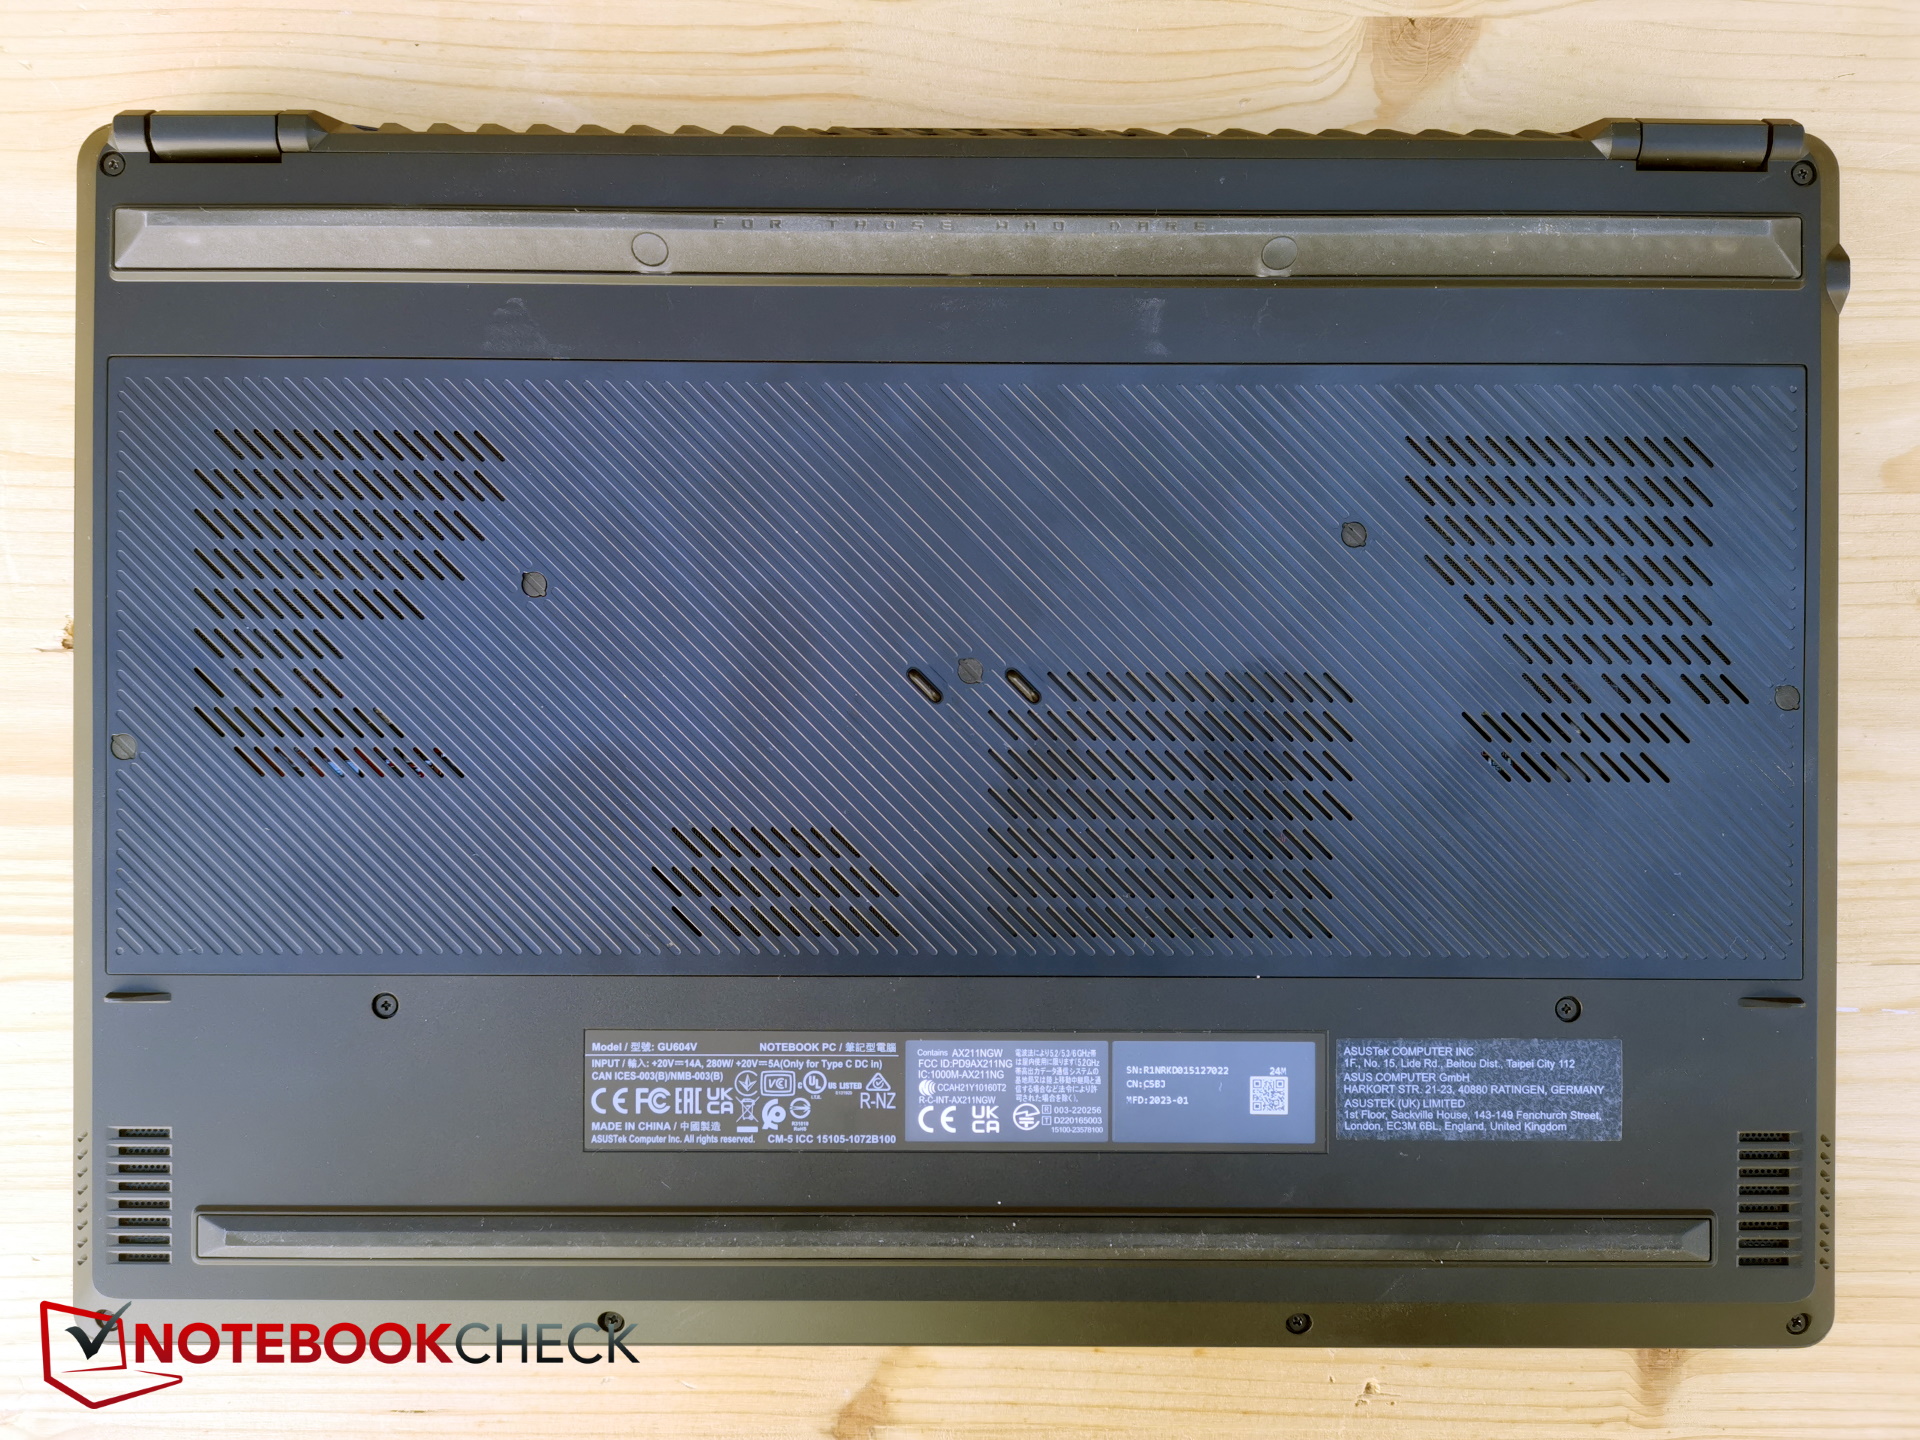
The base seems sturdy but creaks and crackles quite loudly on attempting to twist the case. Similarly, that's the same with the display lid which can be bent quite easily. The hinges hold the display quite securely and ensure the lid can be opened to an angle of up to 180 degrees. On opening the laptop, two things reveal themselves to the user - the keyboard lifts slightly and the display bezels are quite slim.


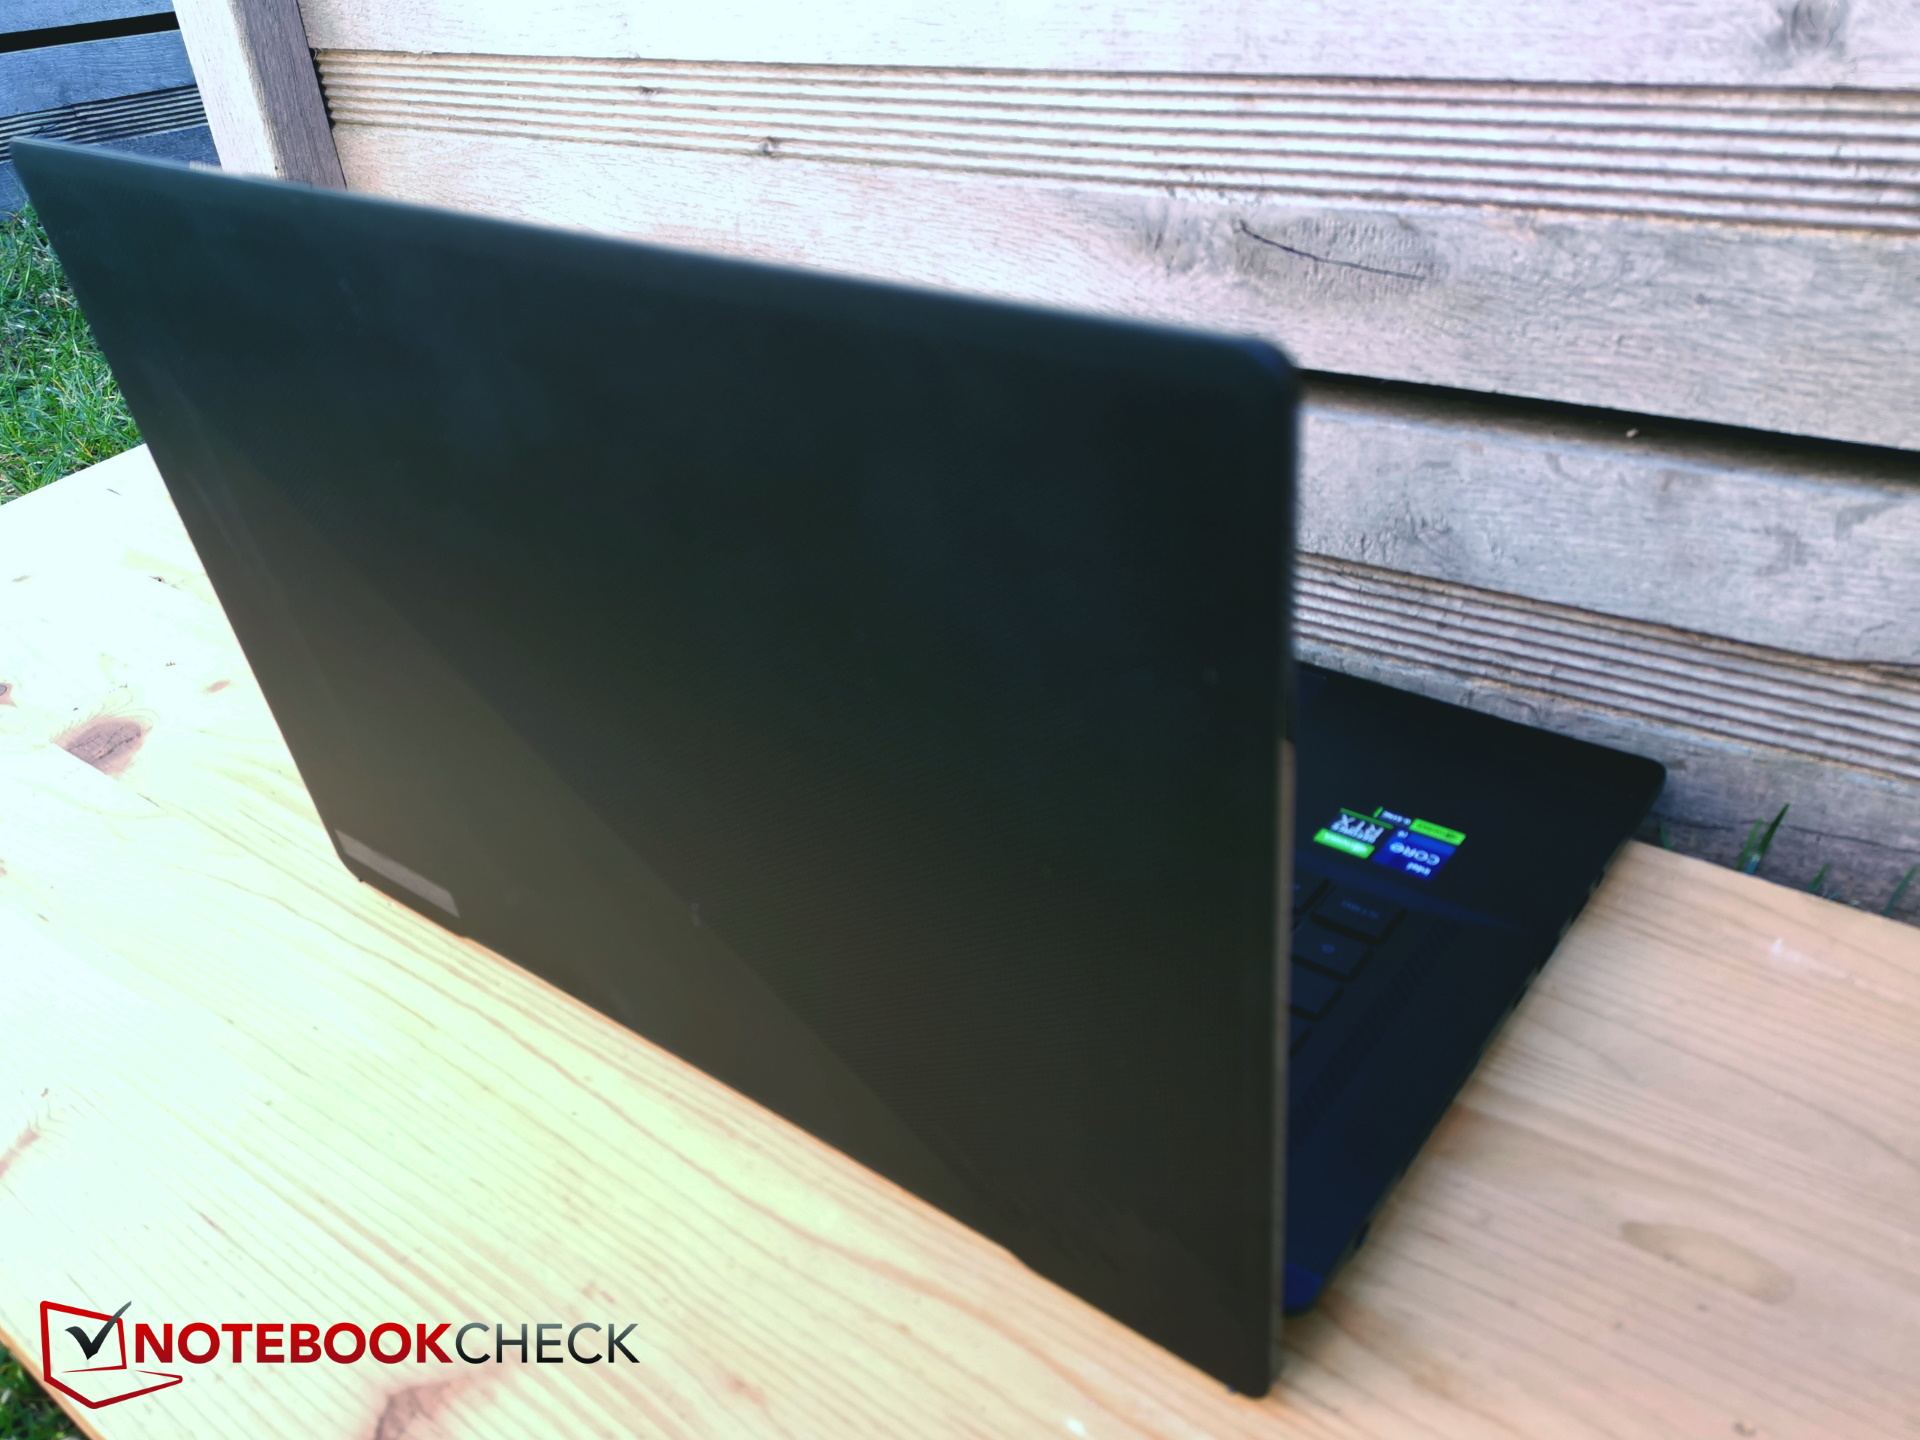
What is unusual is that the device's footprint has increased compared to its predecessor. Contrary to the trend of making devices smaller, thinner and lighter, the new M16 is slightly larger and also 3 mm thicker than last gen's model.
The Razer Blade 16 is only 1 mm thinner, and the Lenovo Legion Pro 7 is marginally thicker, which means the new M16 sits somewhere in the middle, also when it comes to weight.
Features - A gaming machine with no LAN port
Not everything has changed for the better in this area either: The LAN port has simply been omitted, meaning a speedy internet connection is only possible with an adapter for those gamers looking for the shortest latency and fastest connection.
One of the USB-C ports has wandered from the left to the right side. This means more space is available on the left of the device. On the rear, you can still only find fan grilles which result in a lack of space for bulkier connectors such as HDMI or the missing LAN port.
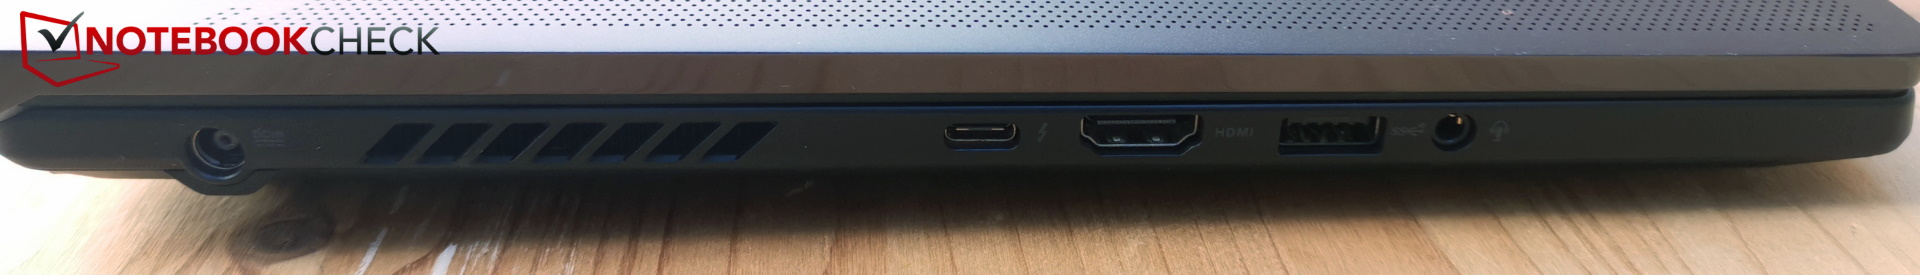
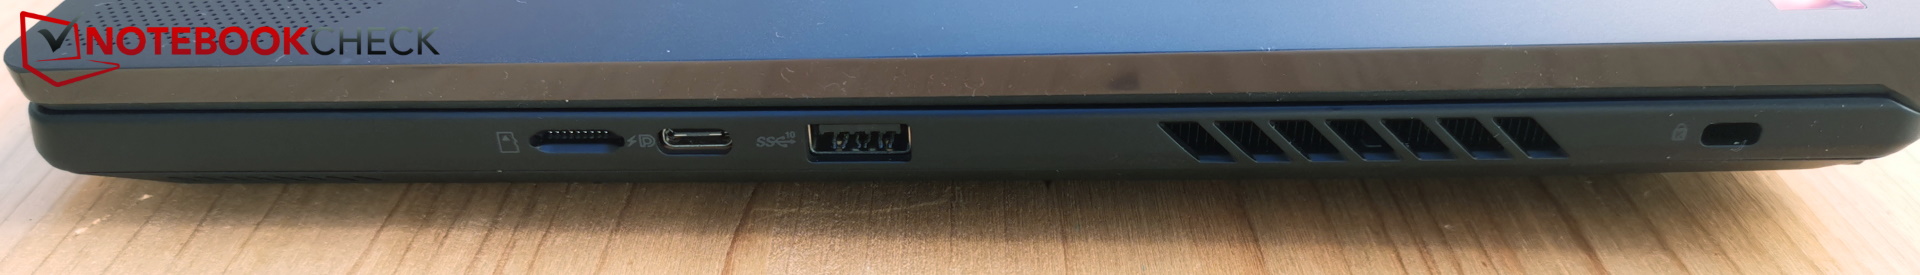
SD Card Reader
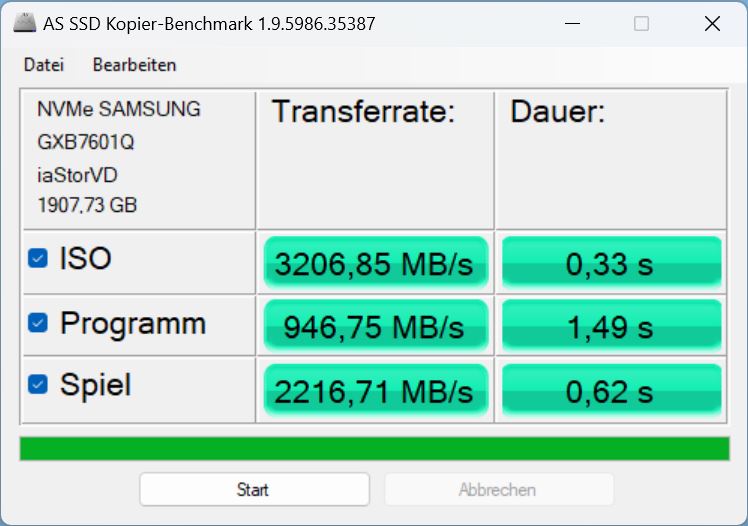
At least the laptop comes with a built-in SD card reader, and, although this is unfortunately only intended for microSD cards, it is still very fast. We were able to copy a 1 GB image onto the desktop in under 6 seconds using our AV PRO microSD 128 GB V60 reference card.
| SD Card Reader | |
| average JPG Copy Test (av. of 3 runs) | |
| Asus ROG Zephyrus M16 GU604VY-NM042X | |
| Asus ROG Zephyrus M16 GU603Z | |
| Average of class Gaming (20.9 - 210, n=55, last 2 years) | |
| Razer Blade 16 Early 2023 (AV PRO microSD 128 GB V60) | |
| MSI Titan GT77 HX 13VI (Angelibird AV Pro V60) | |
| maximum AS SSD Seq Read Test (1GB) | |
| Asus ROG Zephyrus M16 GU603Z | |
| Razer Blade 16 Early 2023 (AV PRO microSD 128 GB V60) | |
| Asus ROG Zephyrus M16 GU604VY-NM042X | |
| Average of class Gaming (25.5 - 261, n=52, last 2 years) | |
| MSI Titan GT77 HX 13VI (Angelibird AV Pro V60) | |
Communication
Unfortunately, the manufacturer has done away with the LAN port and has not included an adapter.
Wireless connections are taken care of by the Intel AX210 WiFi 6E module. This transmits at 2.4 GHz, 5 GHz and 6 GHz.
Transfer rates are fast and constant.
Webcam
In this area, the manufacturer has finally upgraded to a FullHD camera and this model even has an IR sensor for logging into Windows using Windows Hello. However, images have an obvious yellow tint and color deviation is relatively high.


Security
TPM and a Kensington connector are both on board but a fingerprint sensor is missing, as is, unfortunately, a physical webcam shutter.
Accessories
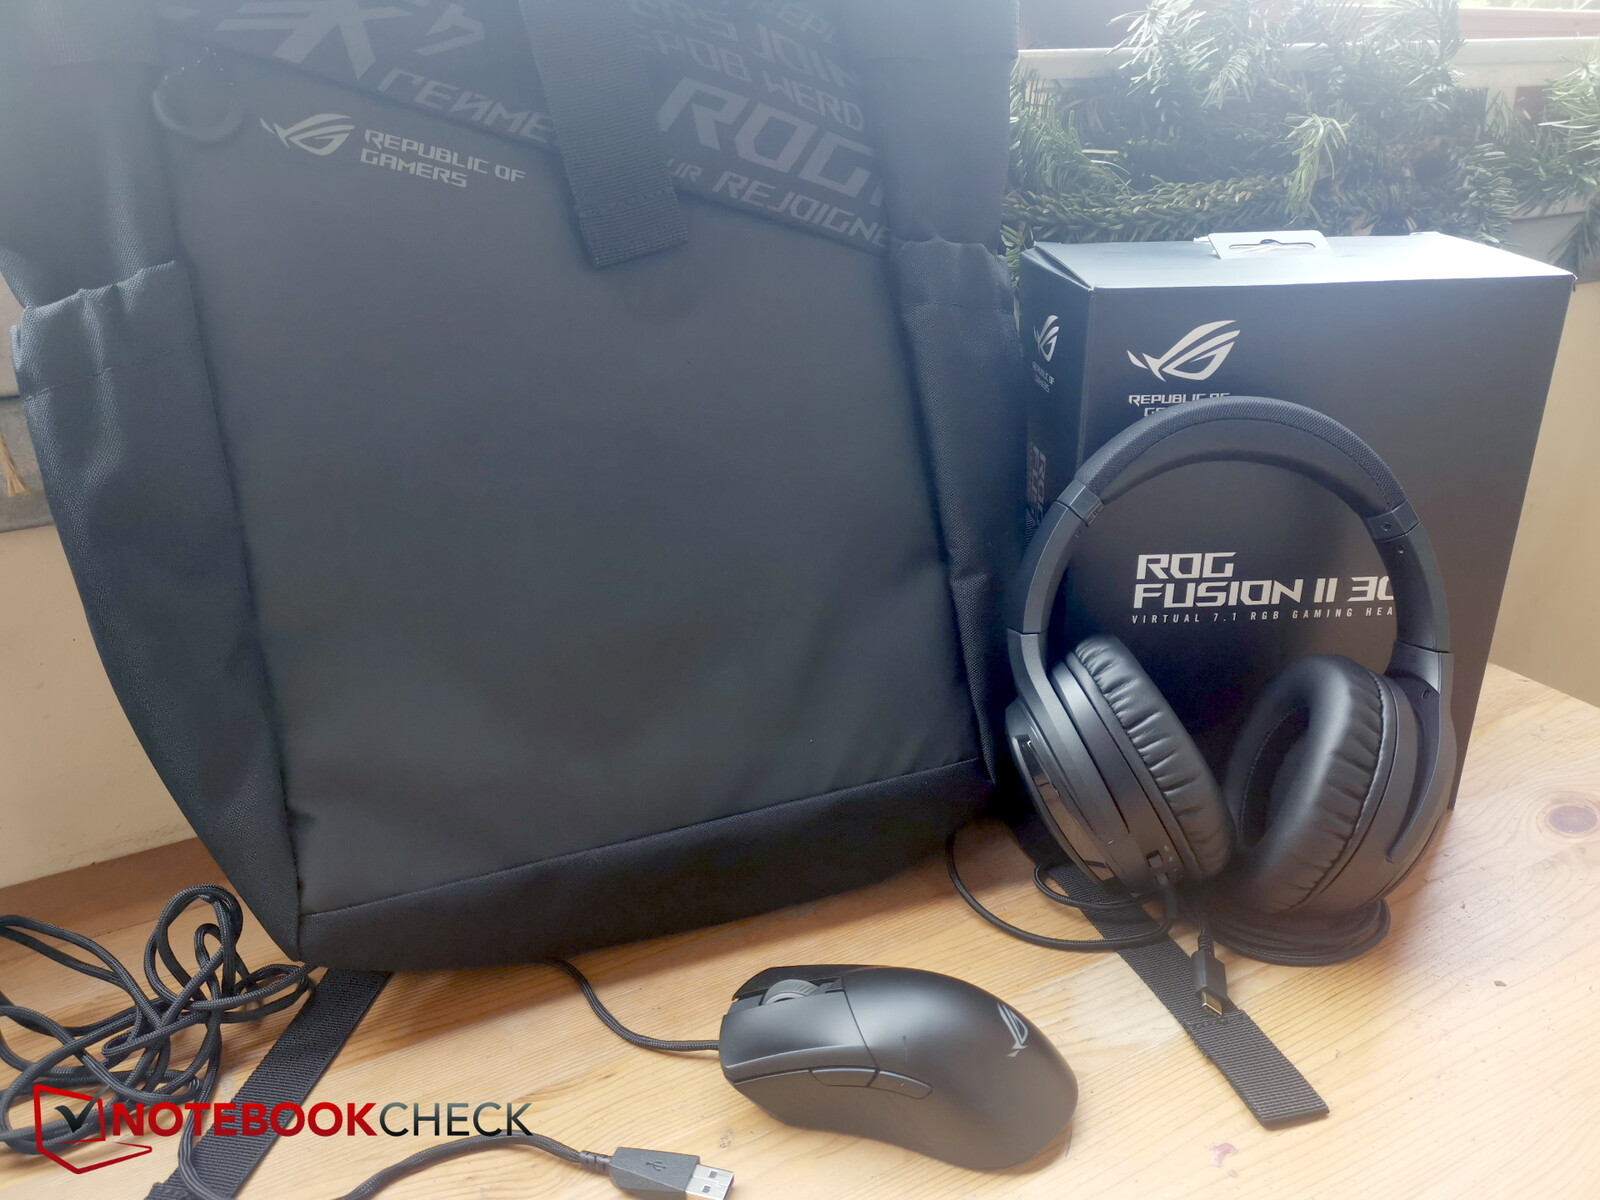
Our review model came in a huge package that reminded us more of a power station. By contrast, quite a few accessories were included. For example, a tote bag with a laptop compartment, a mouse (ROG Gladius III) as well as headphones (ROG Fusion II 300), all emblazoned with ROG branding.
According to Asus, these accessories come with our configuration model but the M16 can also be purchased as a stand-alone device.
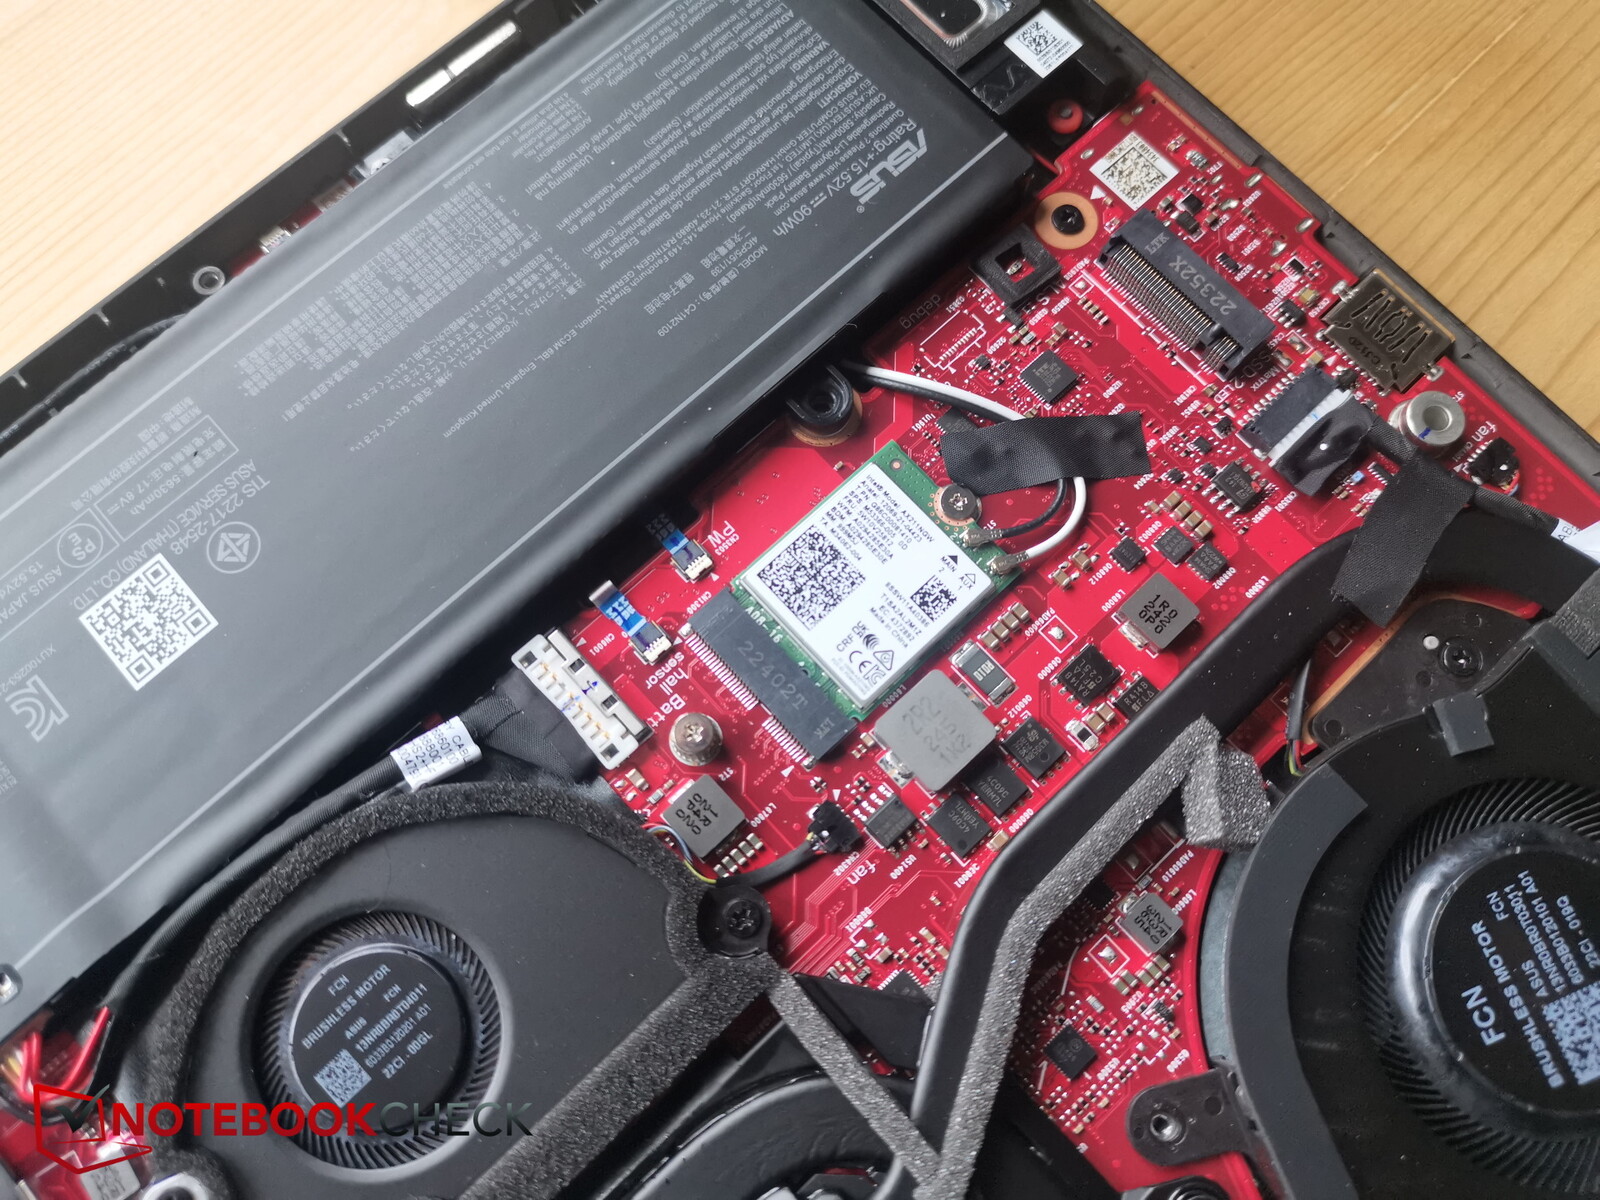
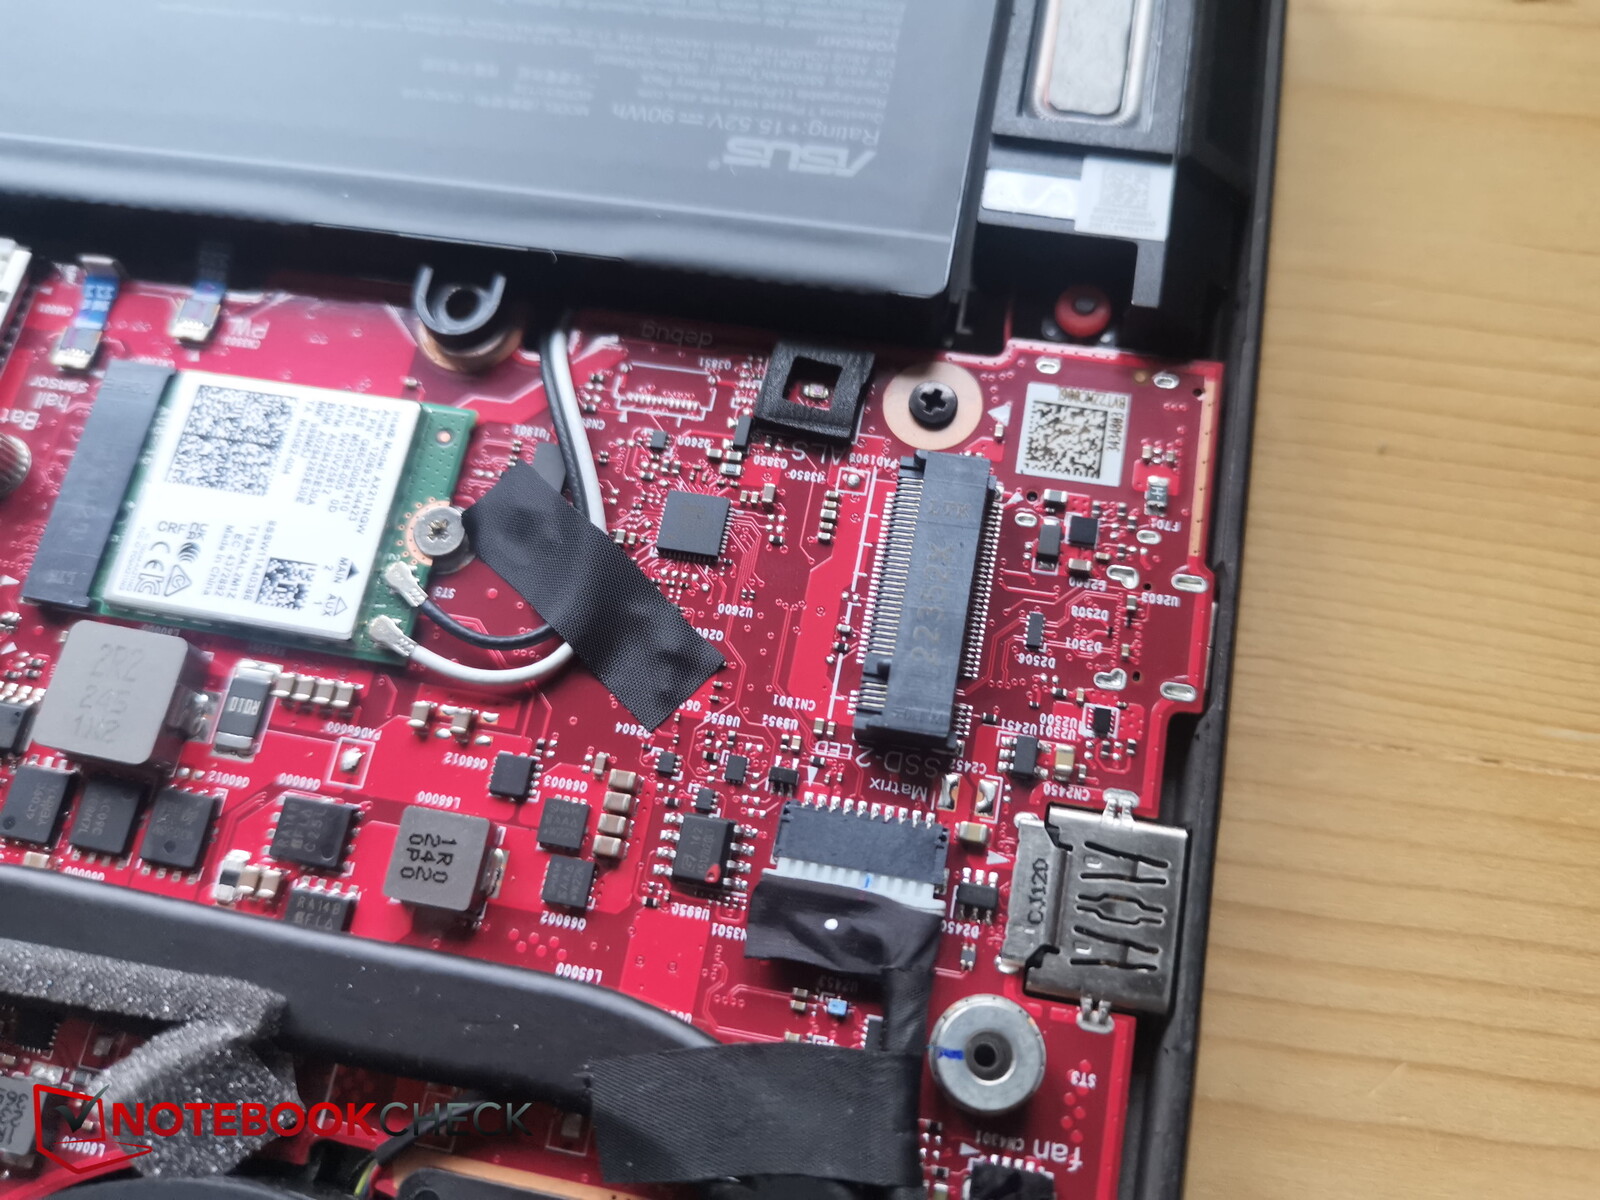
Maintenance
On the base of the unit, 15 crosshead screws await removal. Unfortunately, seven (!) of them sit underneath glued rubber stoppers, the removal of which is fiddly, annoying and comes across as unnecessary user-unfriendliness.
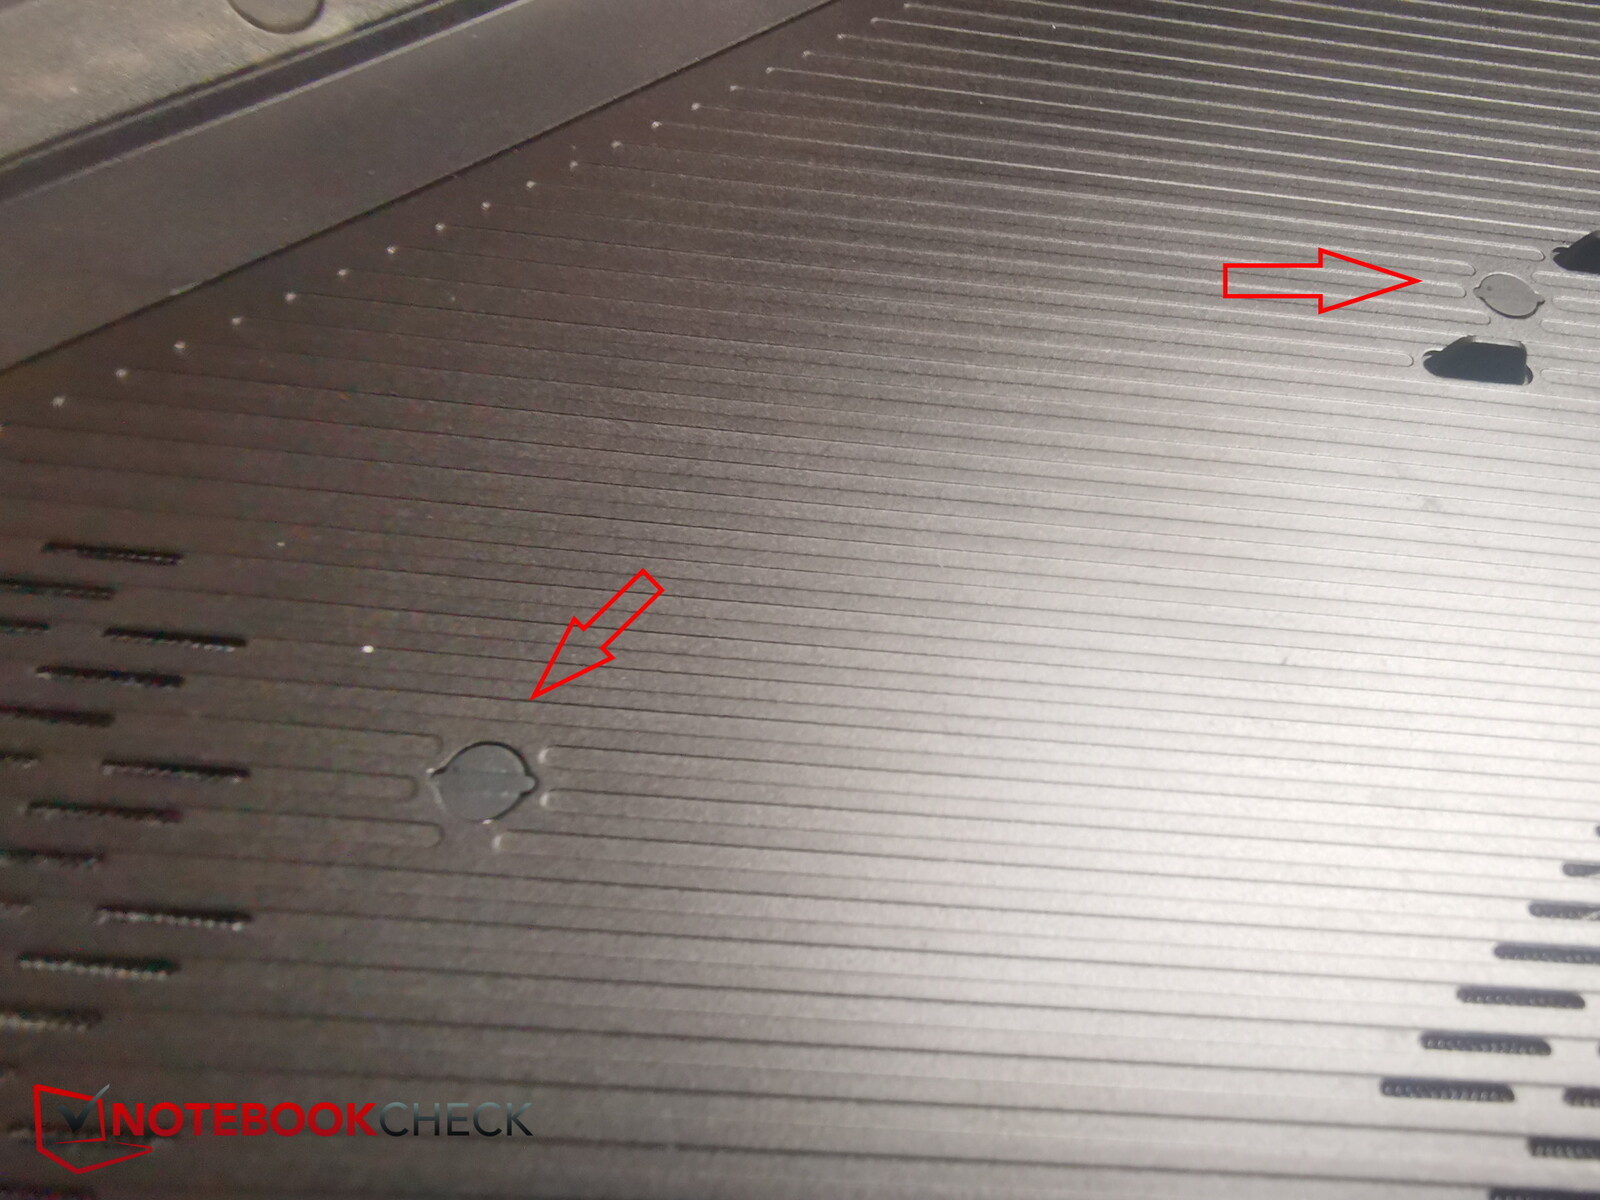
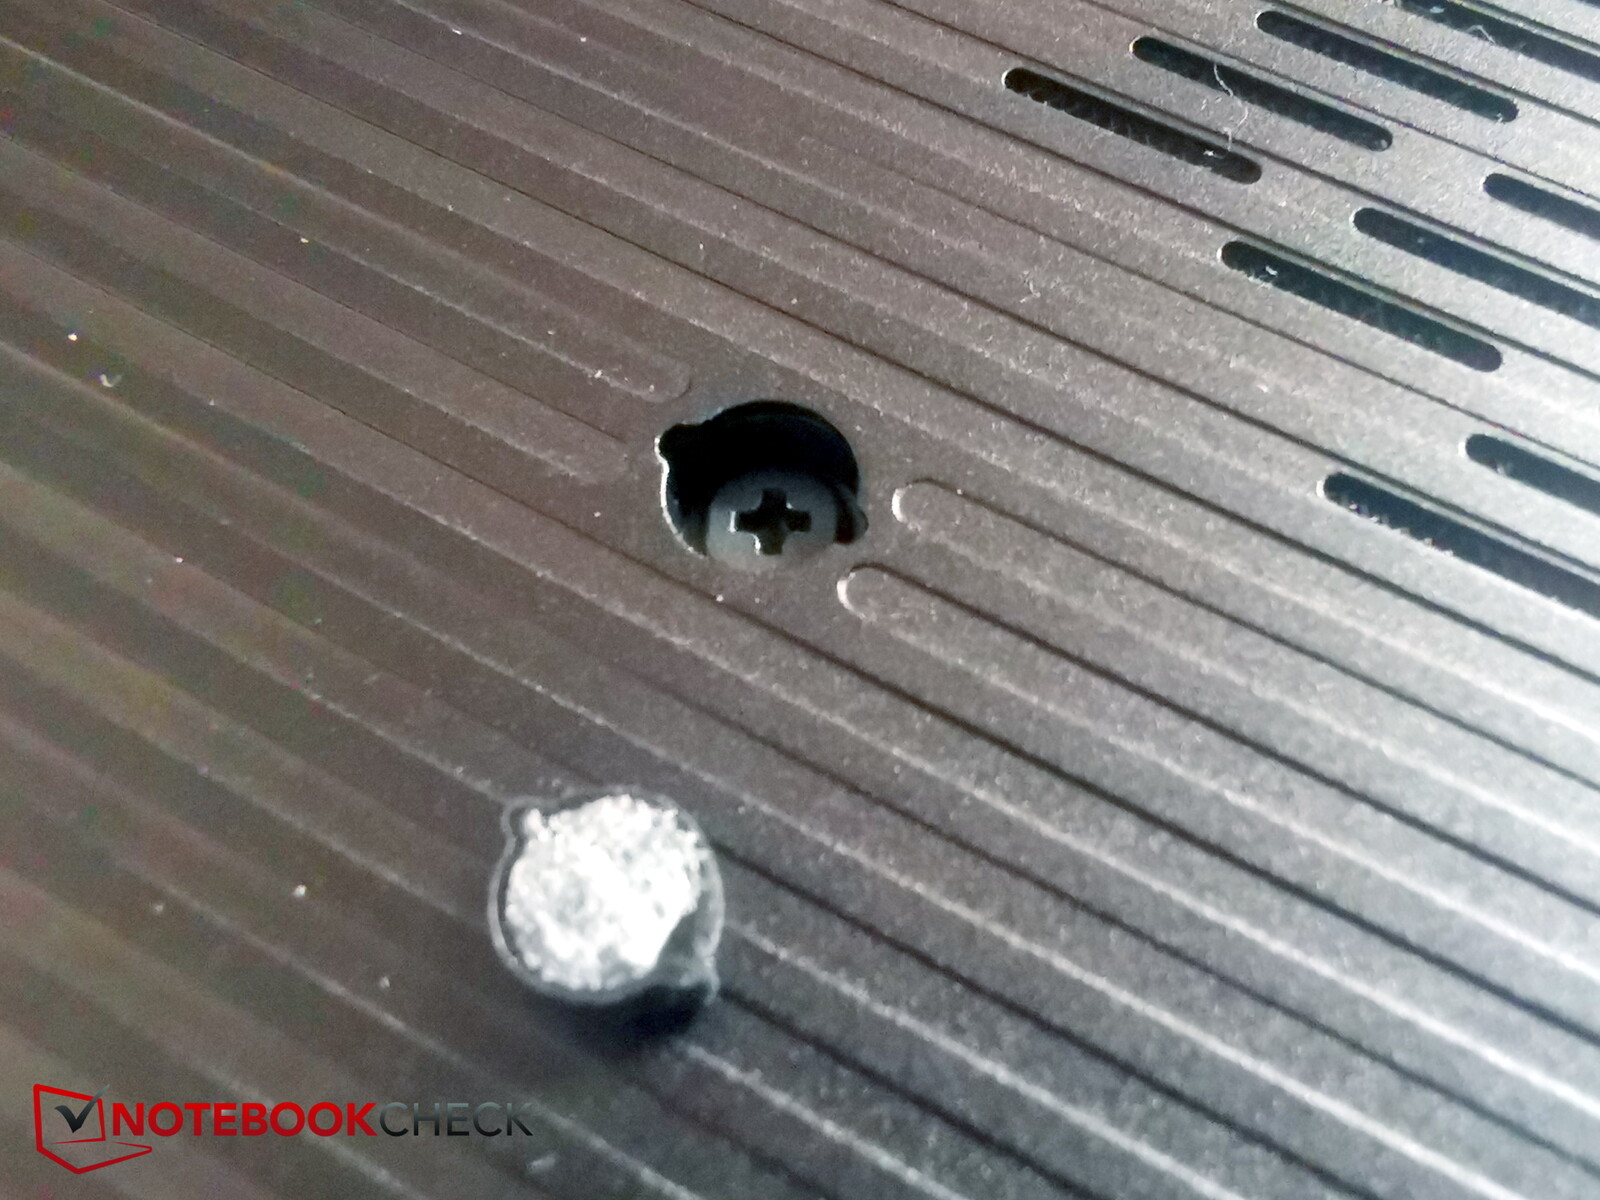
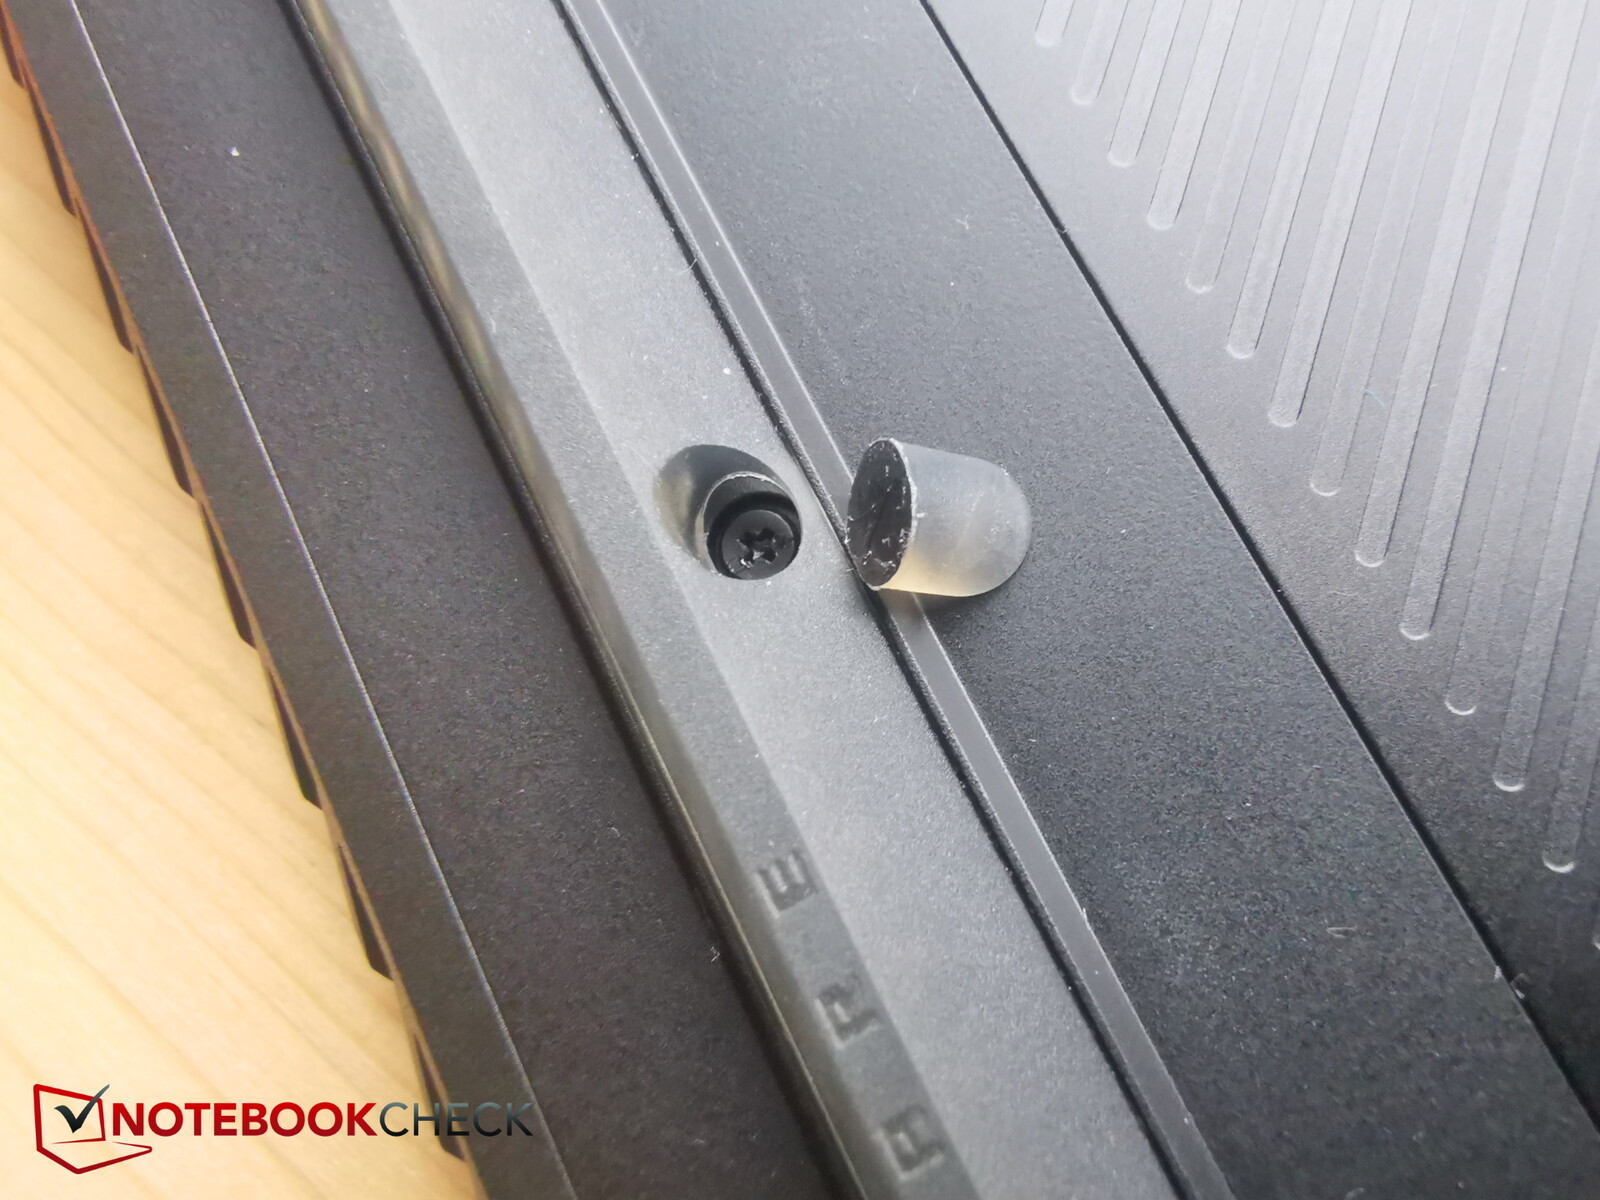
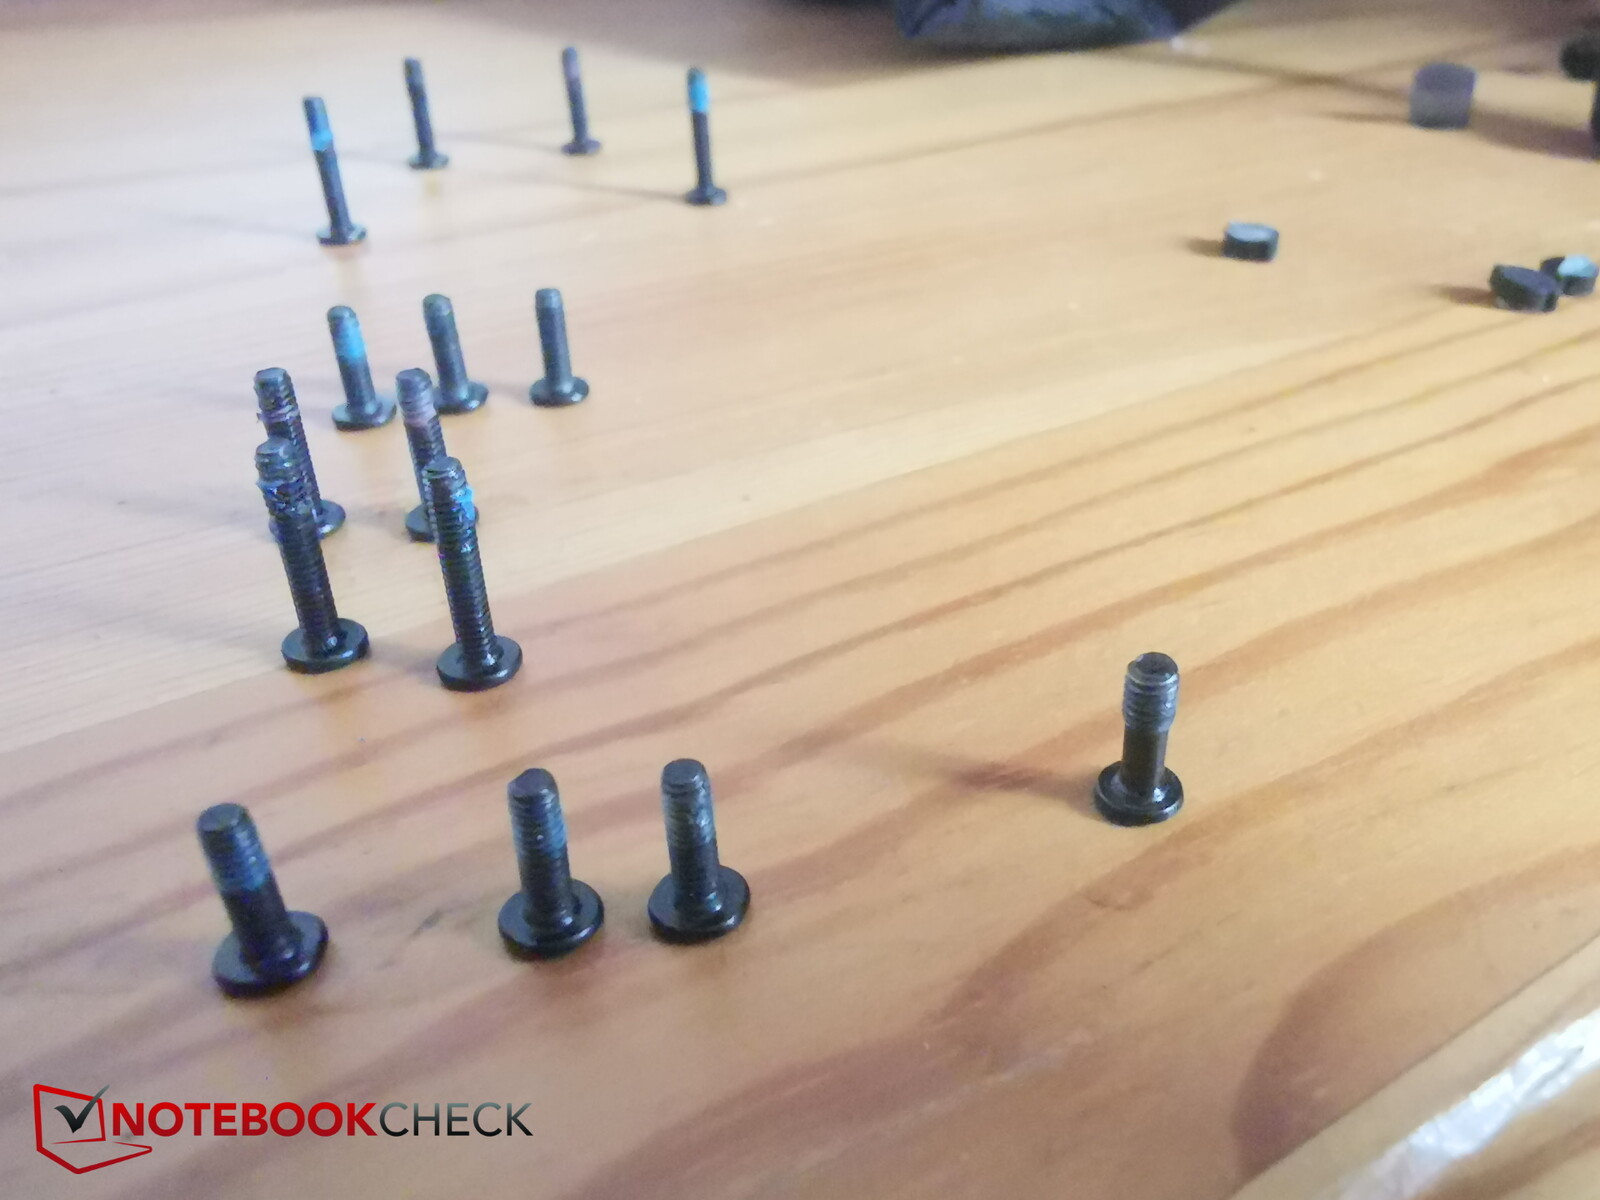
All in all, we uncovered 4 different lengths/types of screws! Therefore, it's worth noting which ones belong where. Along with the 7 hidden screws and the SO-DIMM RAM, the M16 can be considered difficult to upgrade or repair.
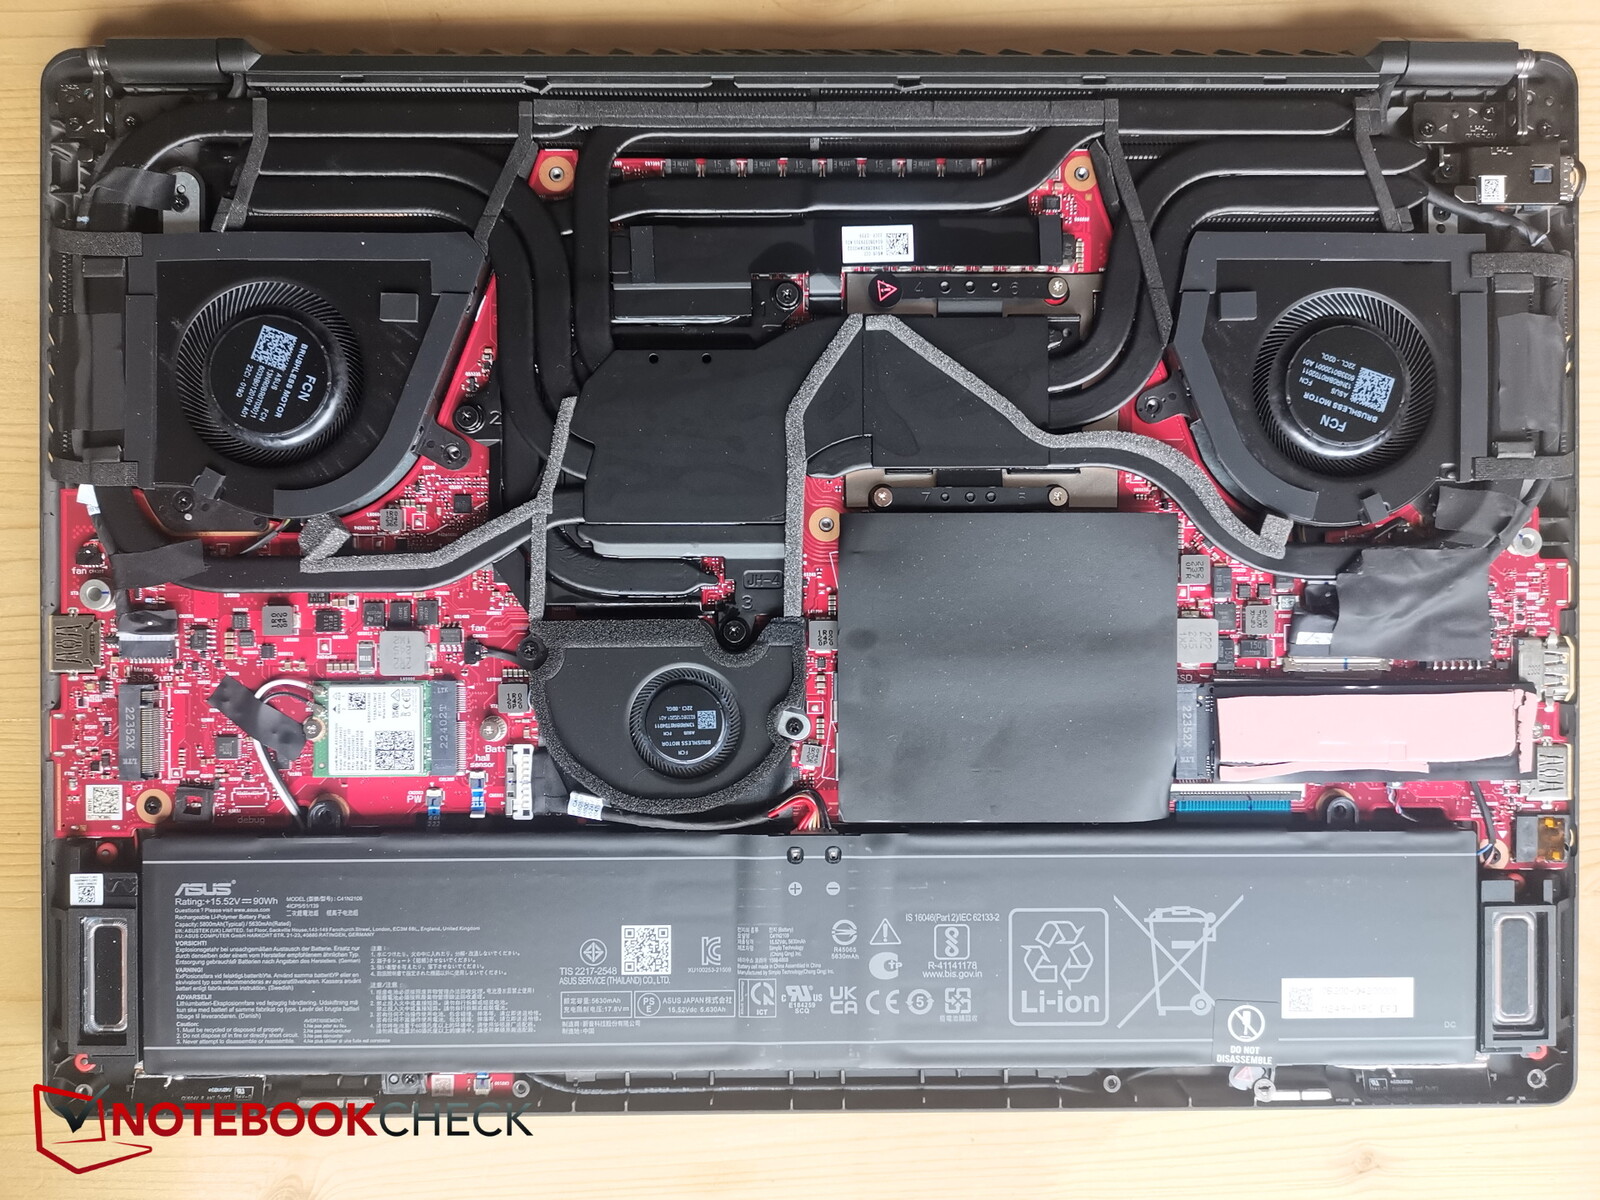
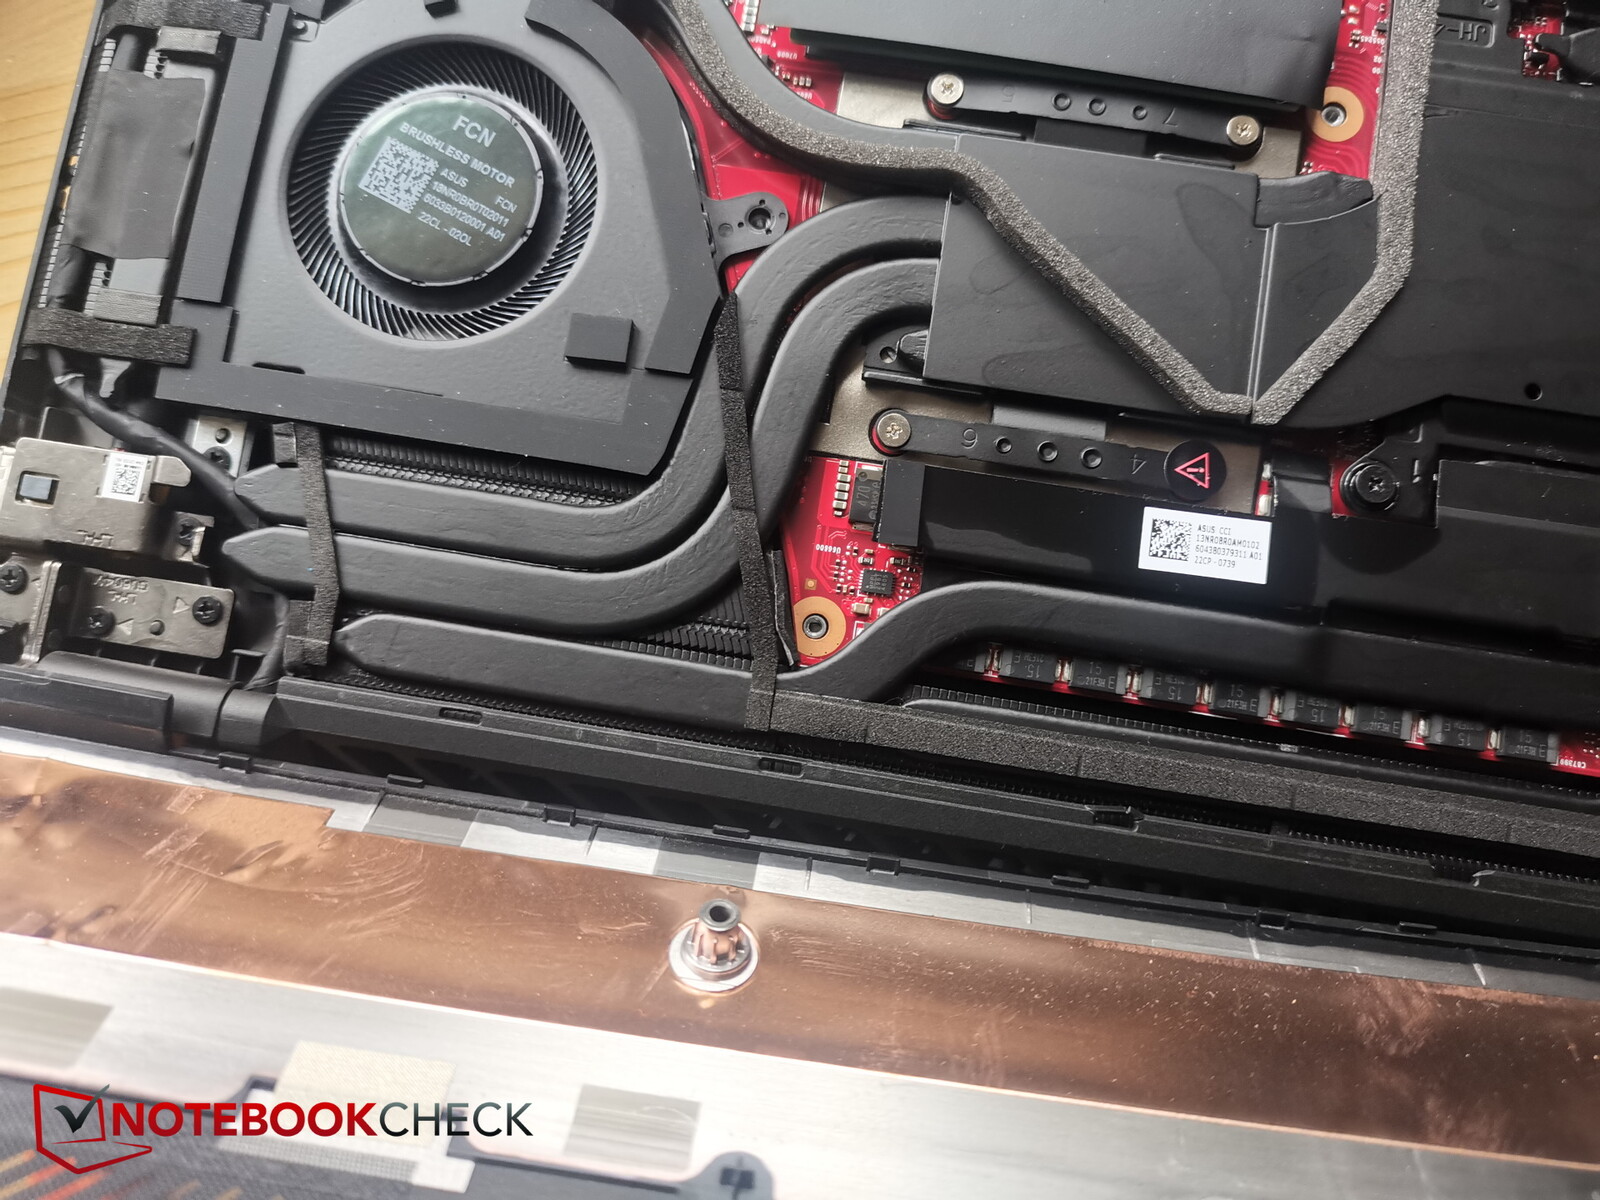
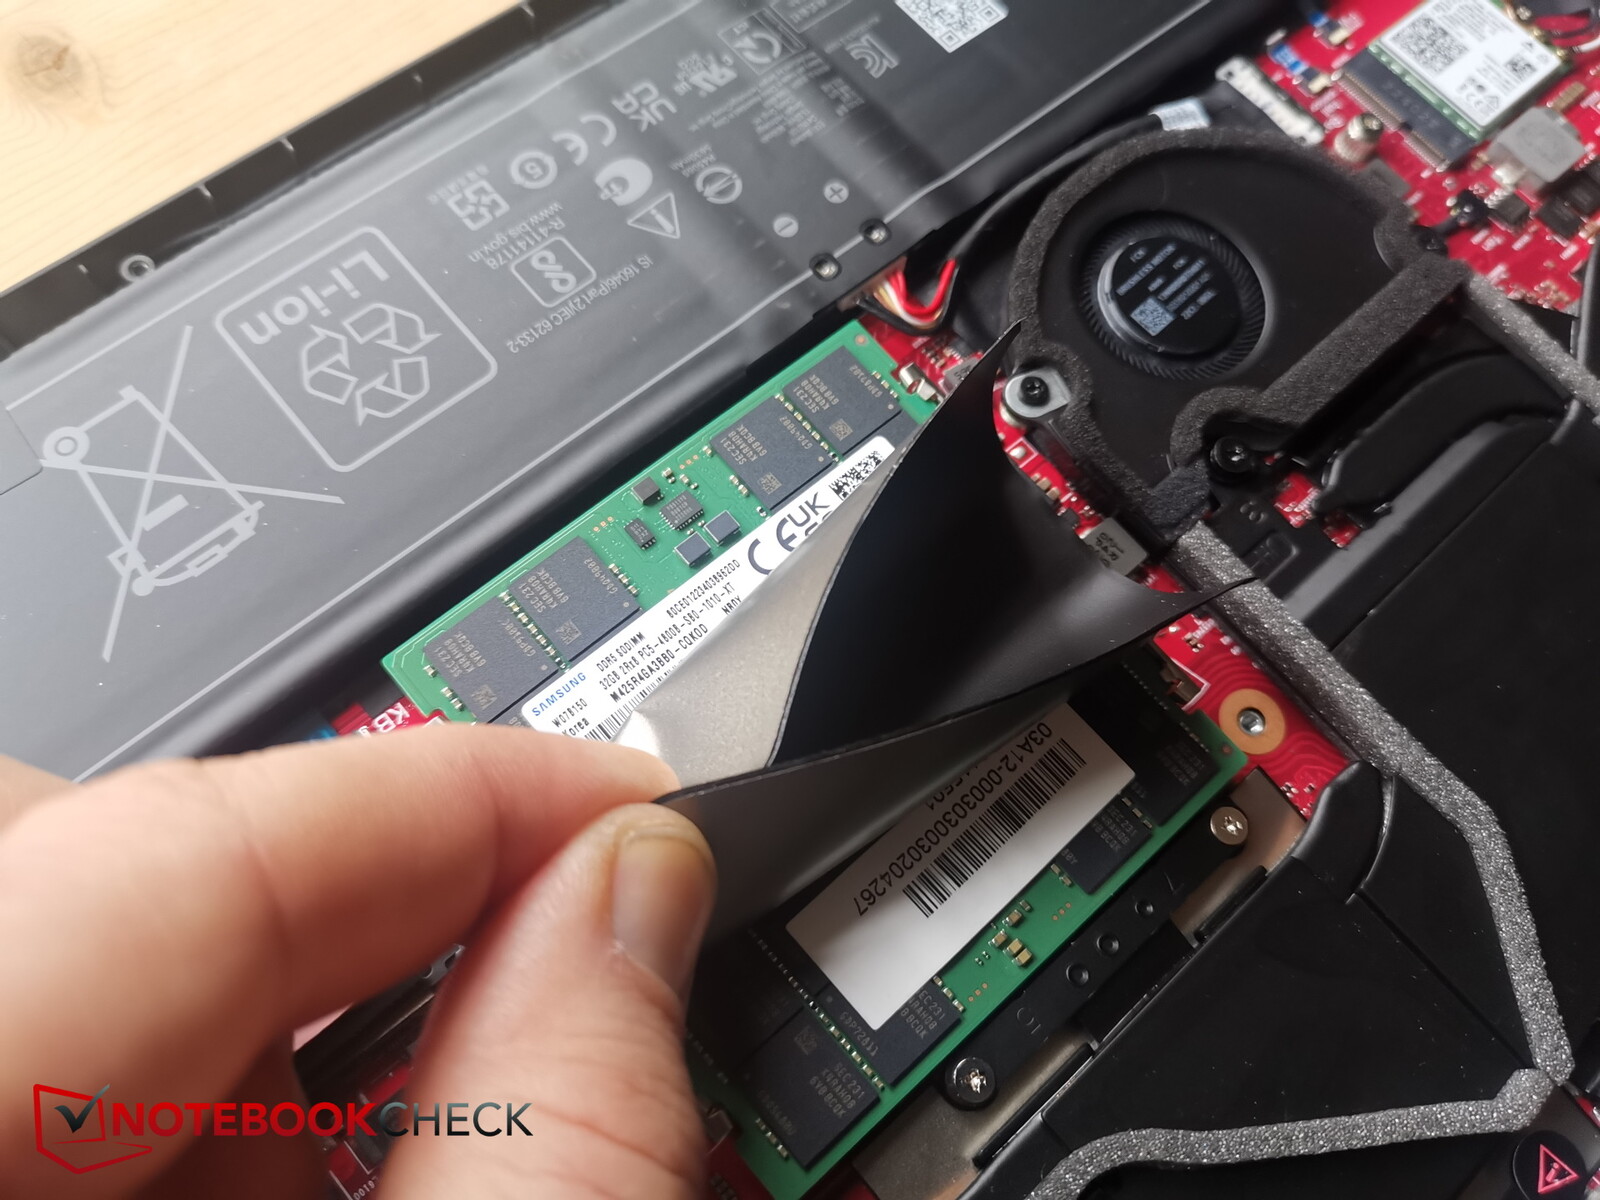
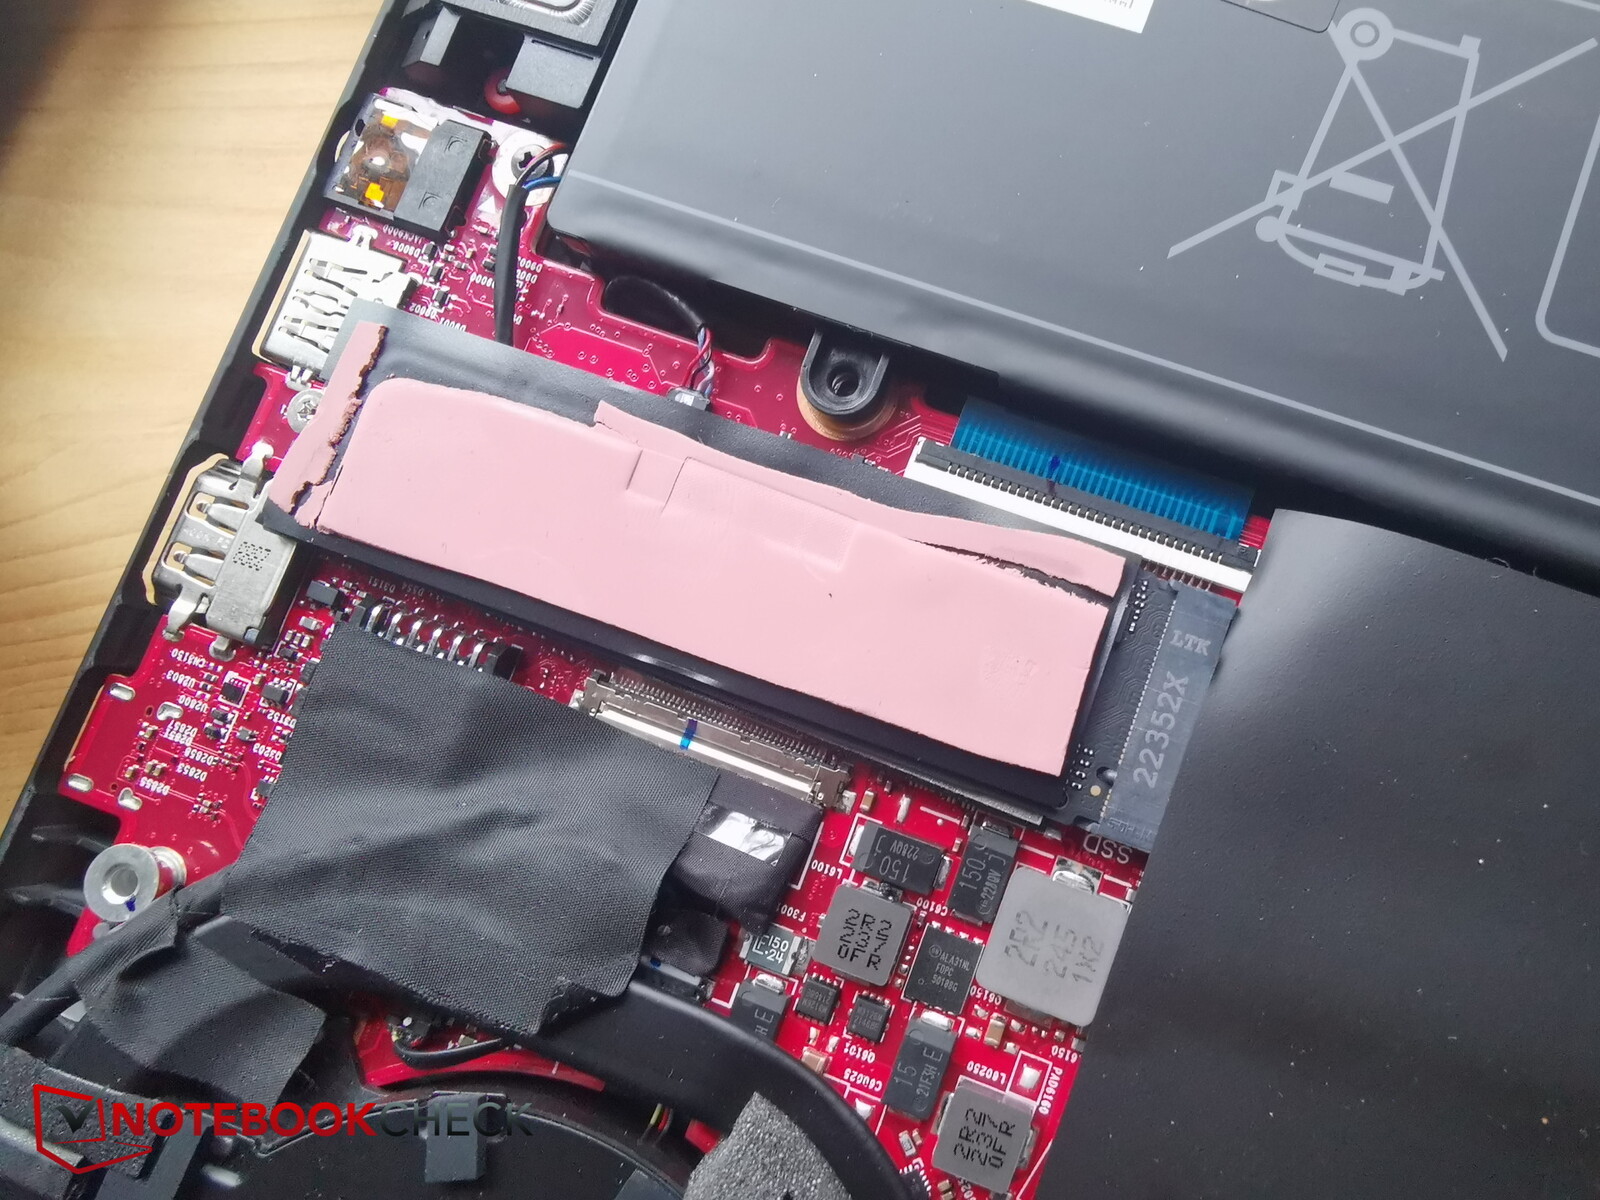
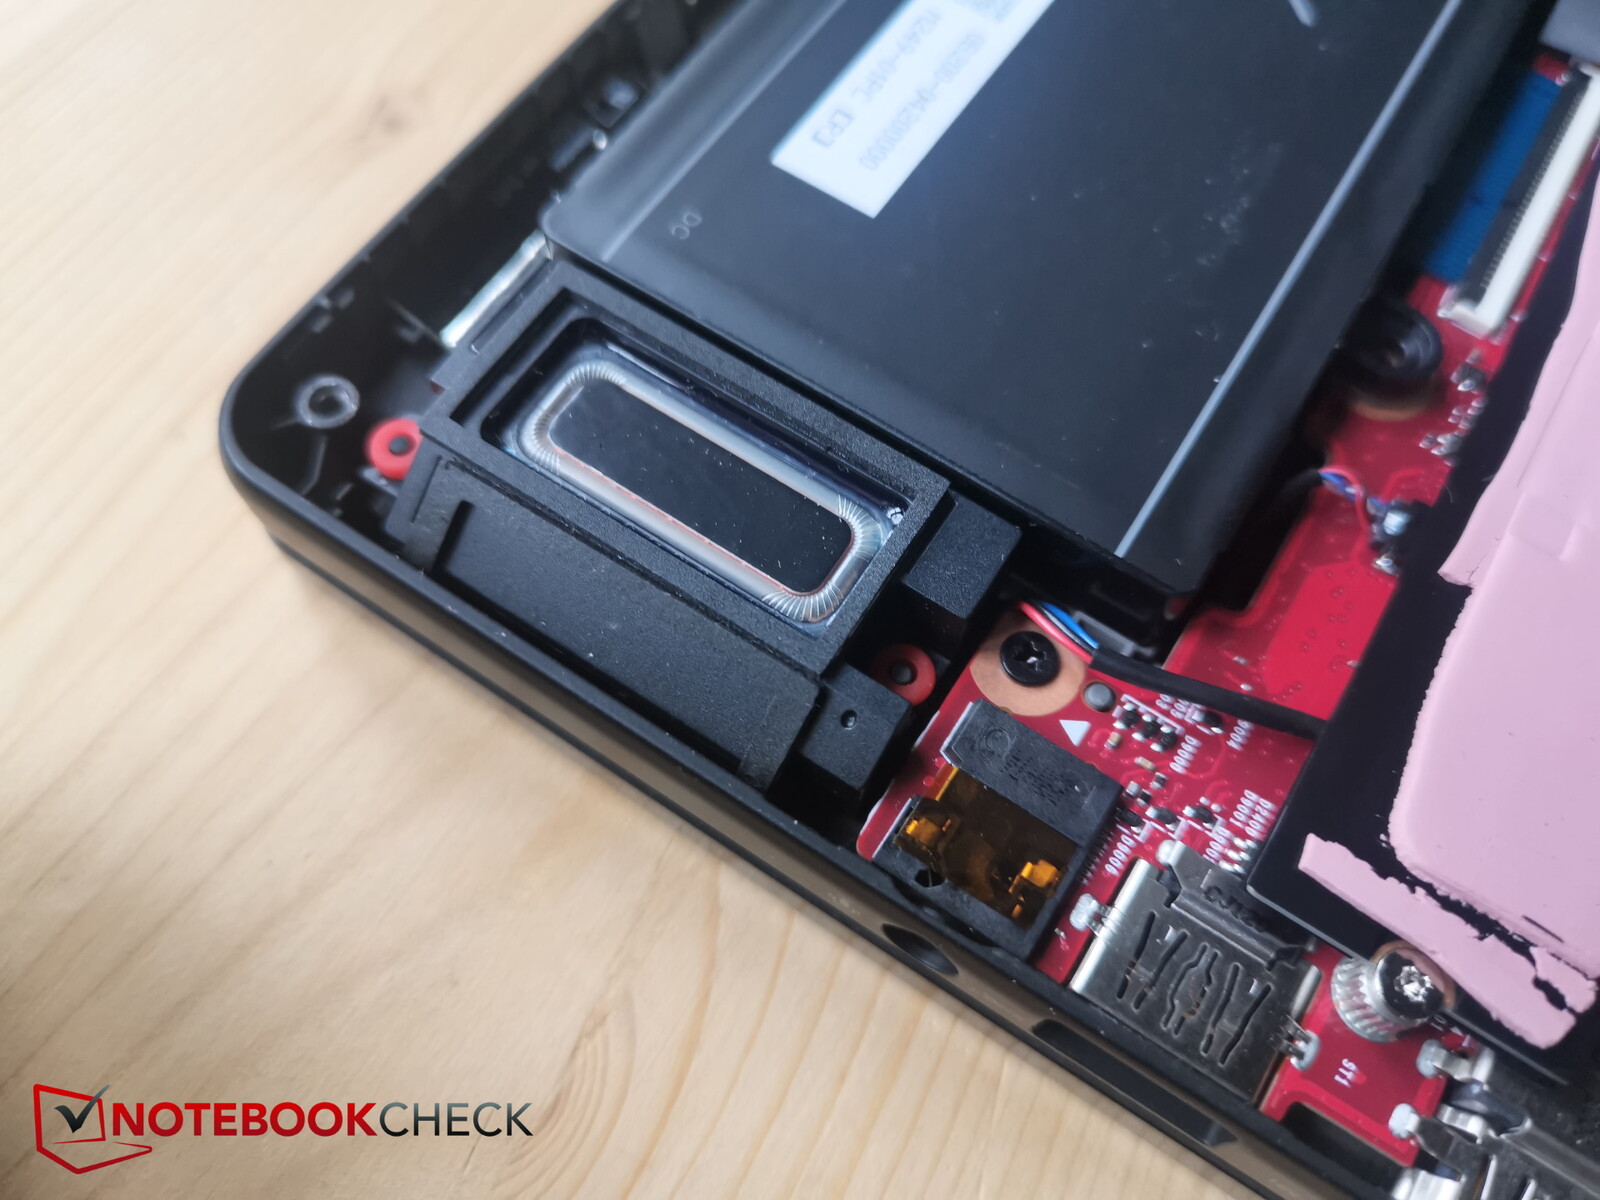
At least the base plate can be easily pried open. Internally, it's possible to access the three fans, the battery, the SSD, the second M.2 SSD slot, the replaceable WiFi module. as well as the SO-DIMM RAM slot.
The cooling system consists of 2 normal-sized fans and an additional small fan which presumably sits on top of the graphics unit. The SSD possesses a cooling pad which looks quite frayed in our review model.
Warranty
Gigabyte's laptops come with a 24-month guarantee.
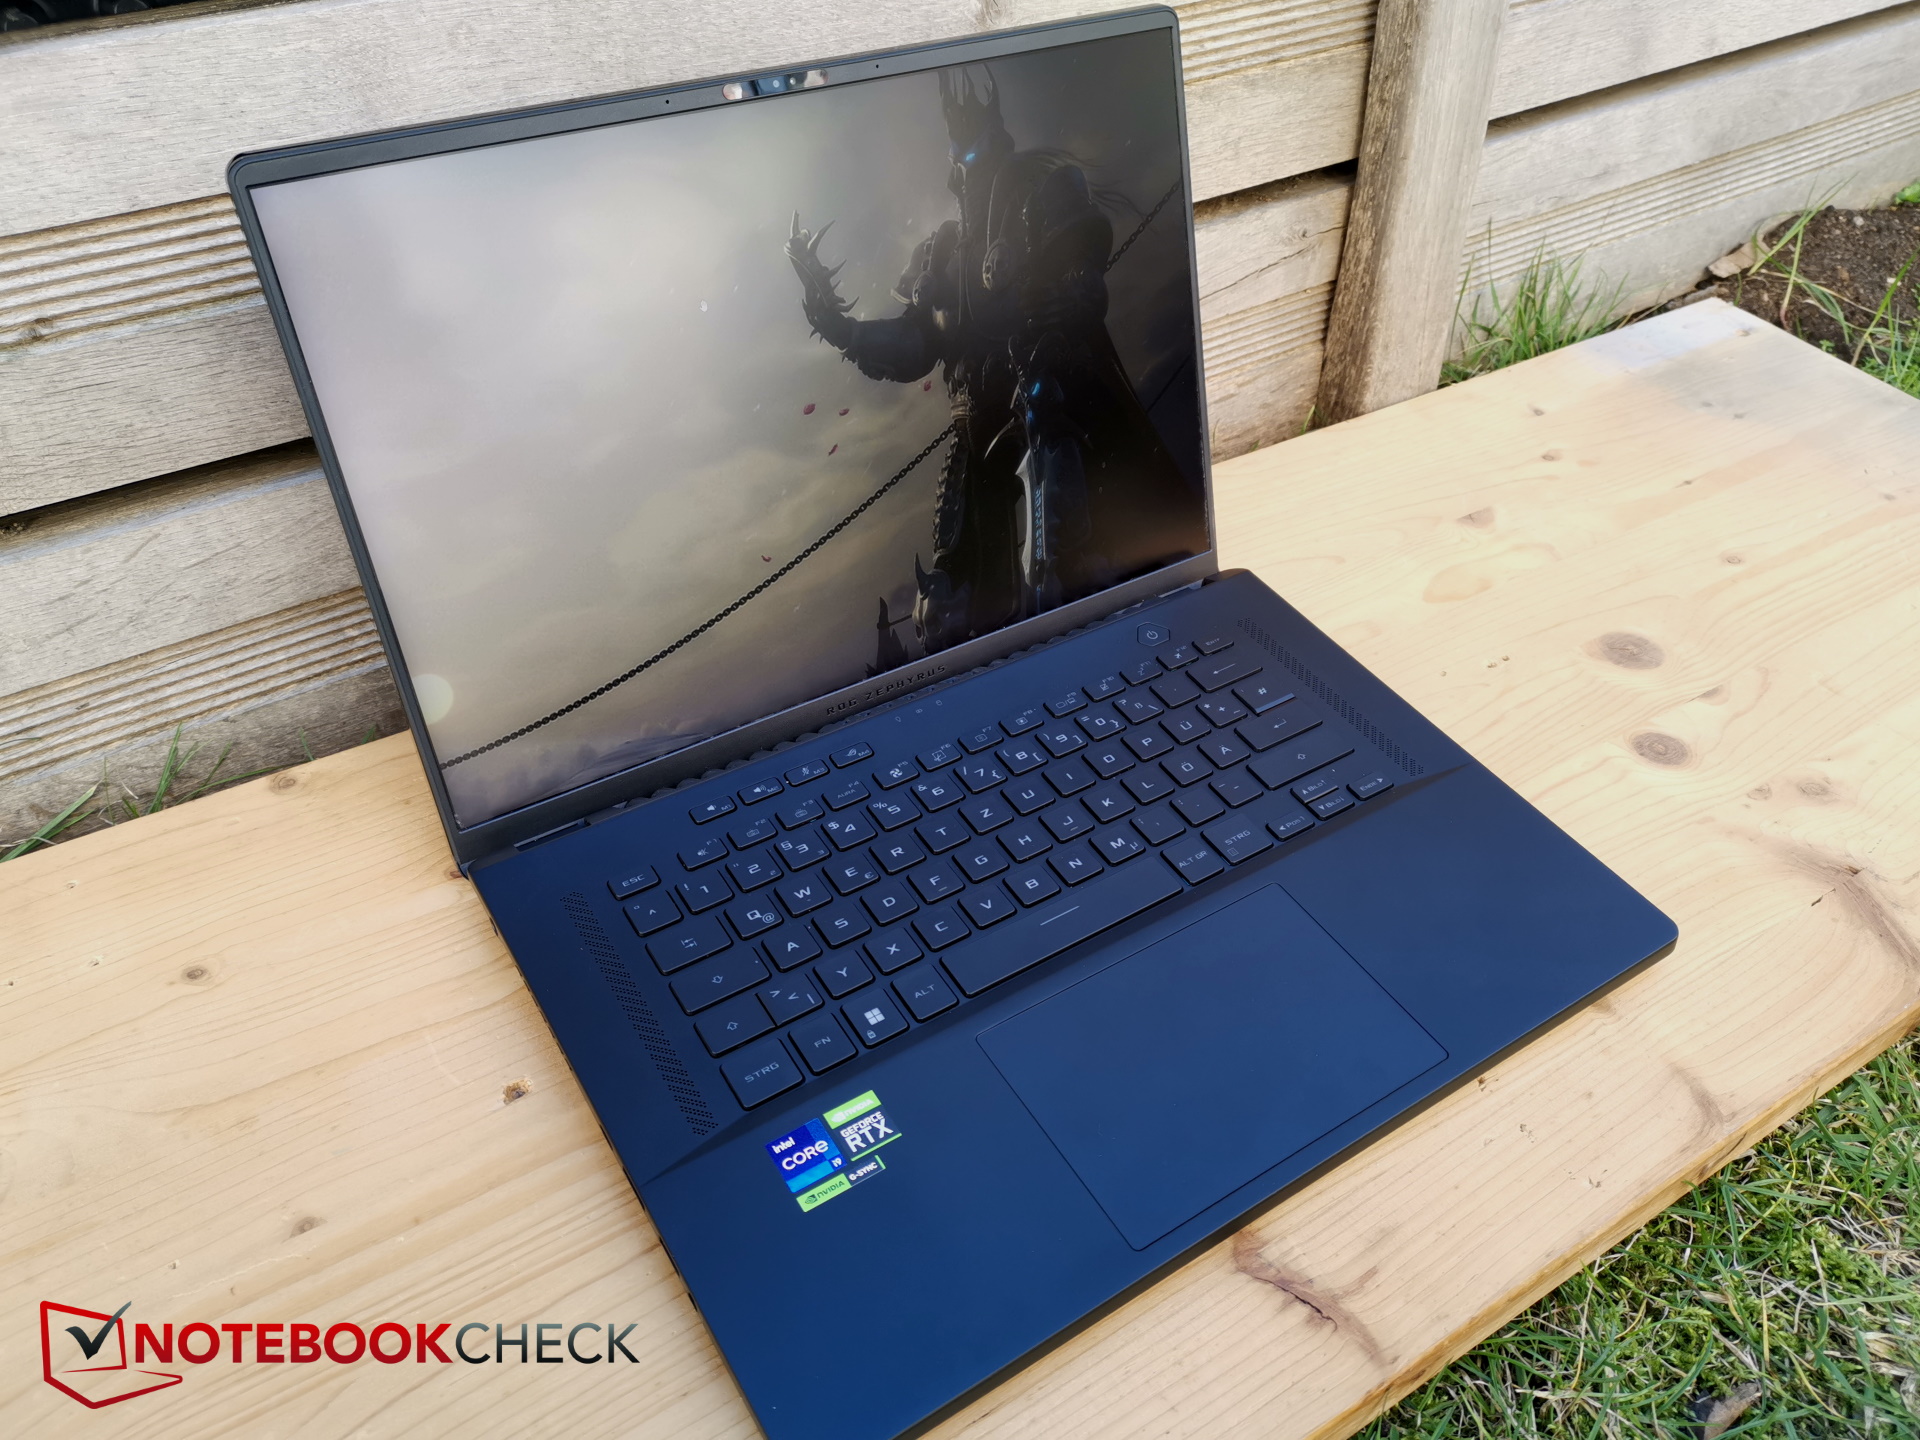
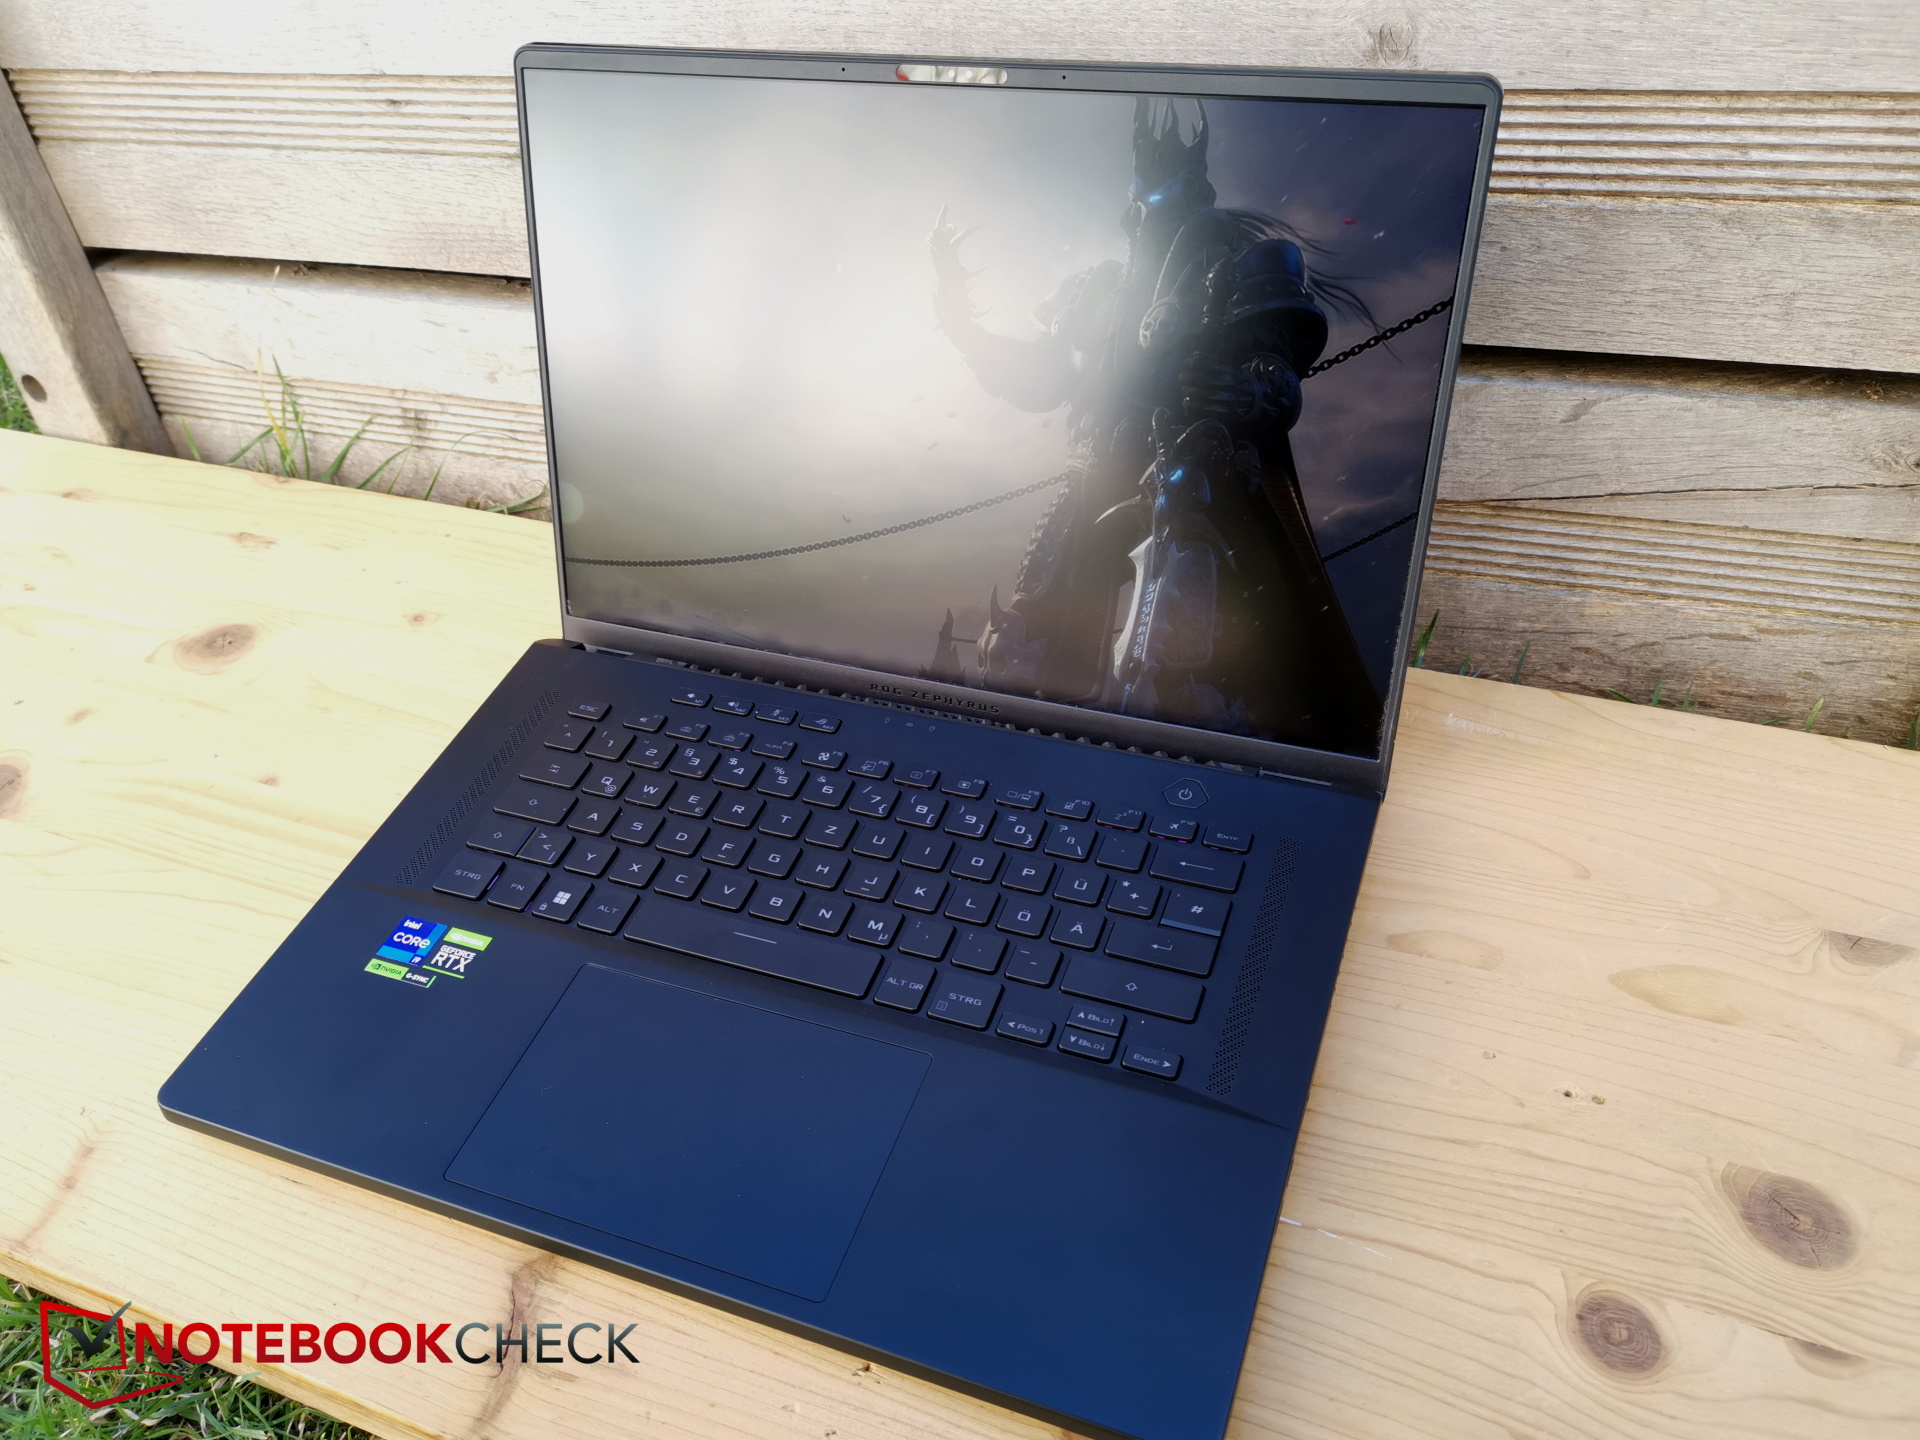
Input devices - Somewhat shallow keys and a large touchpad
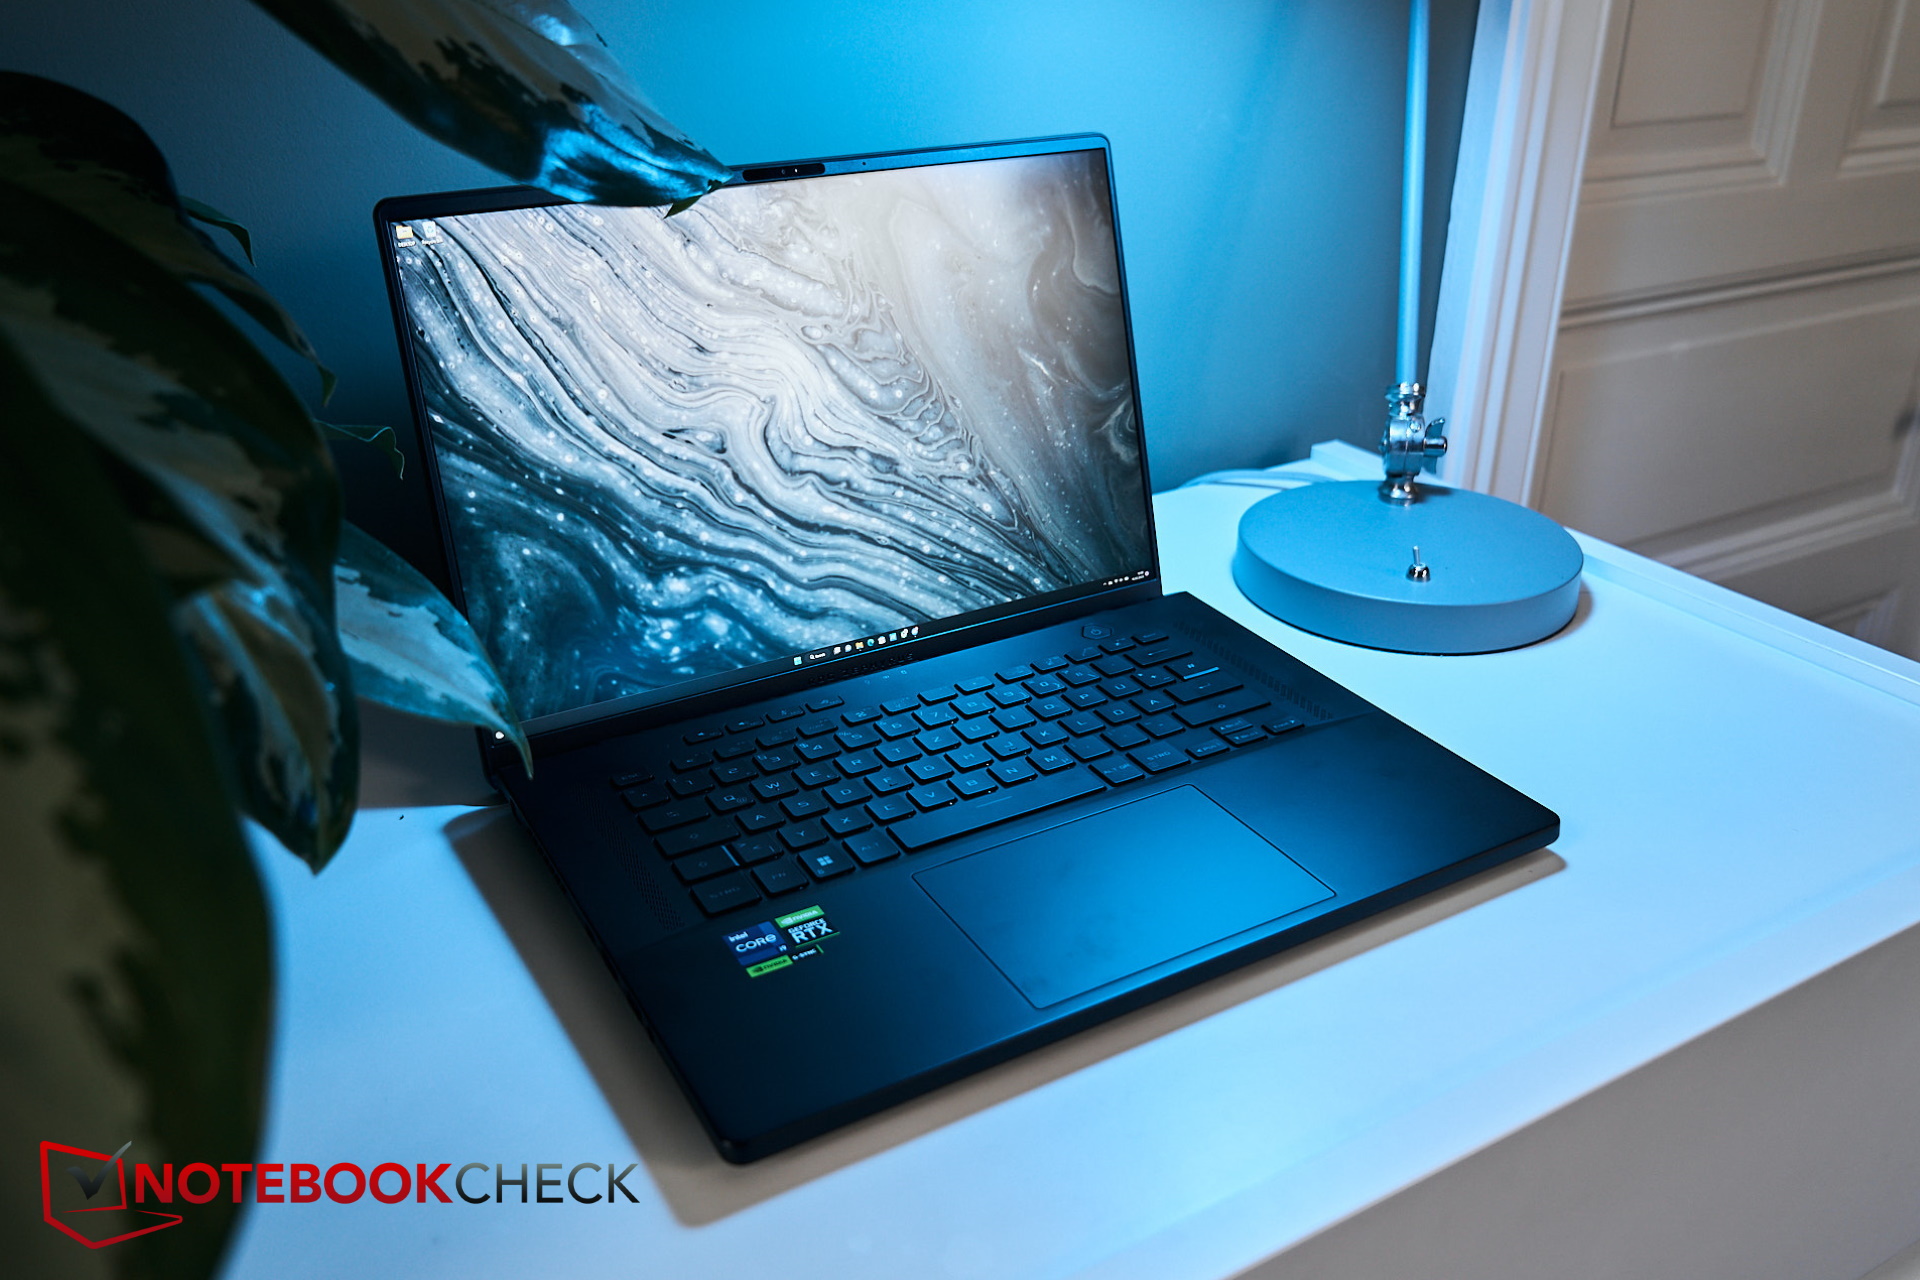
Keyboard
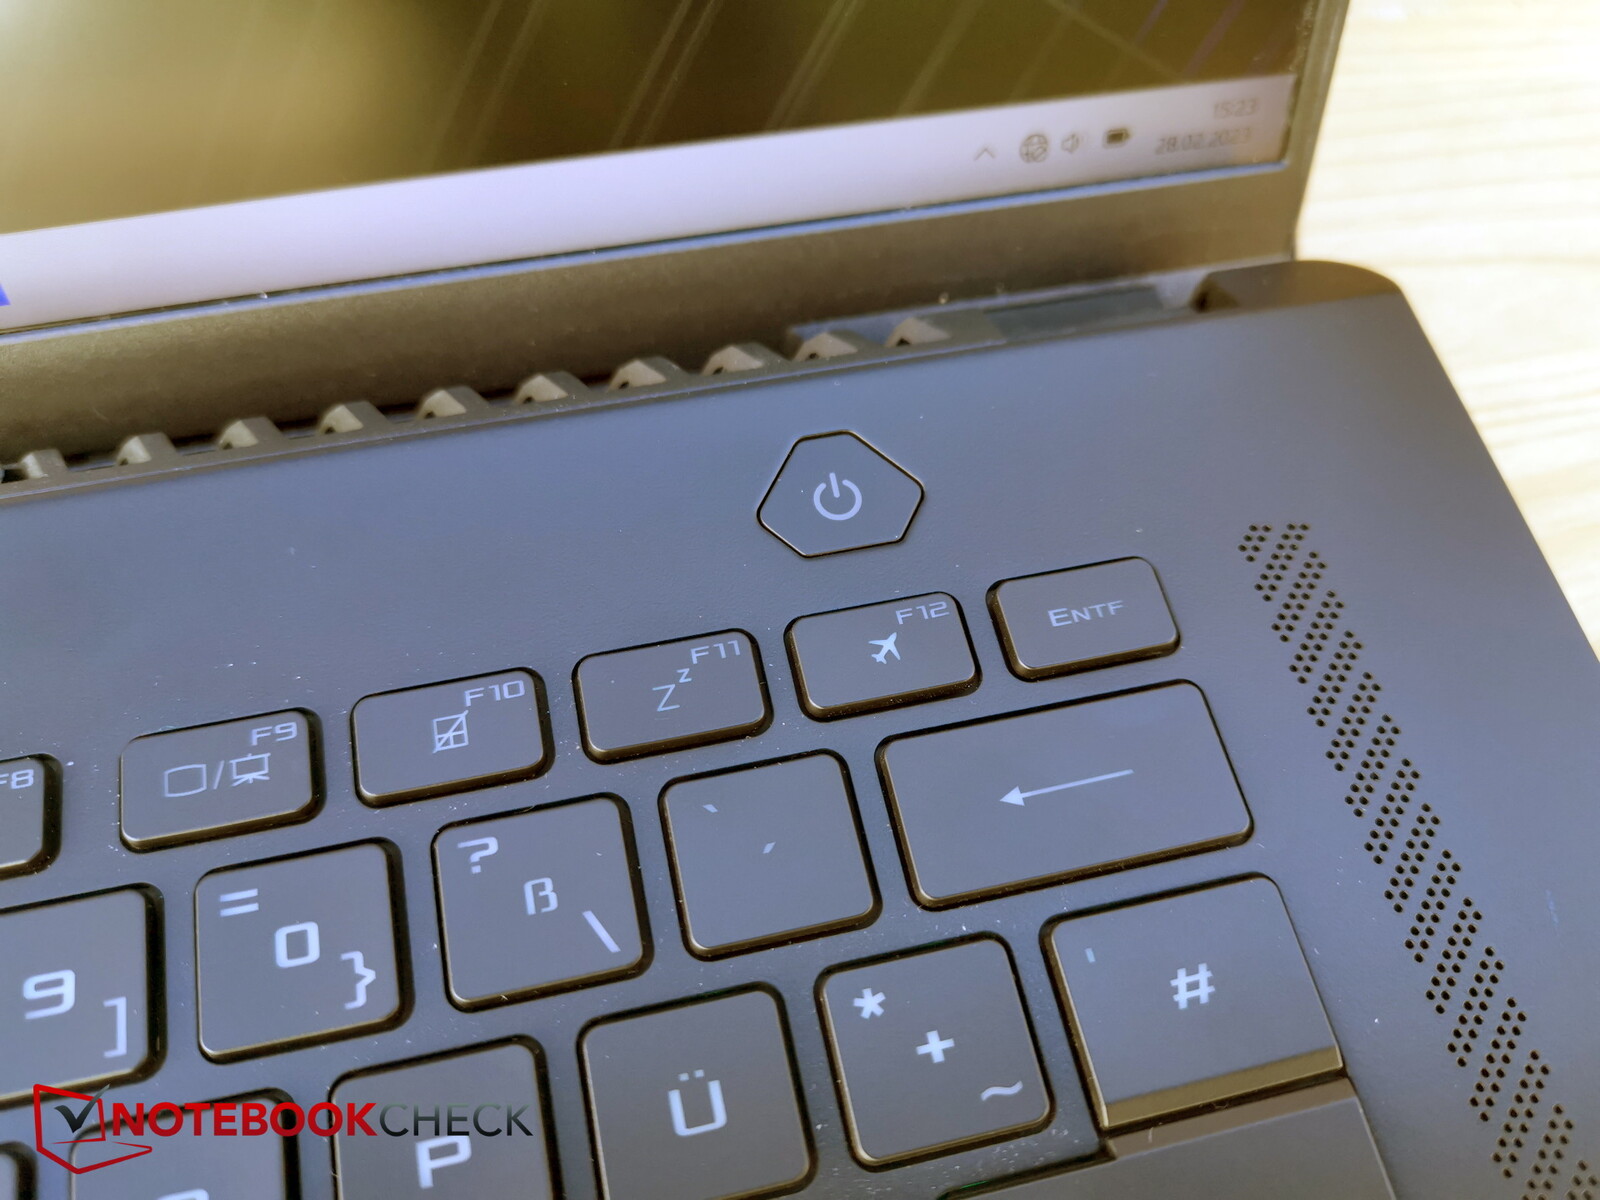
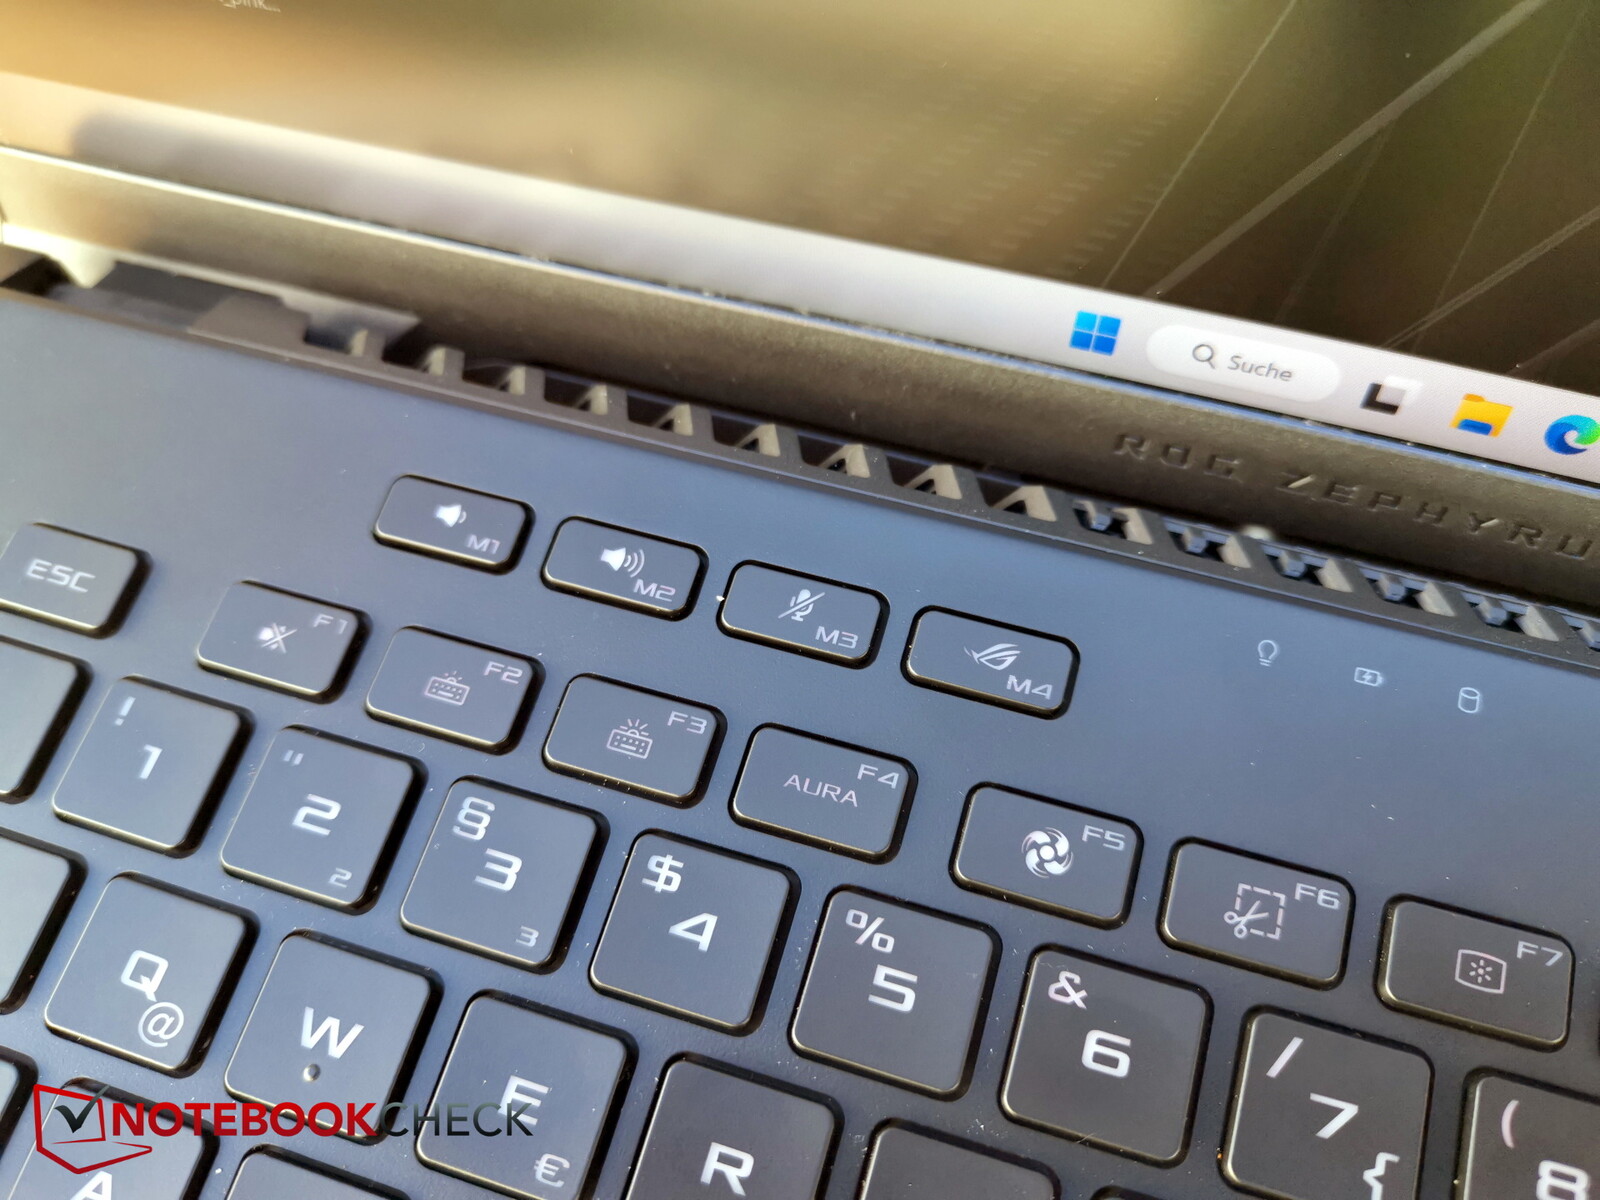
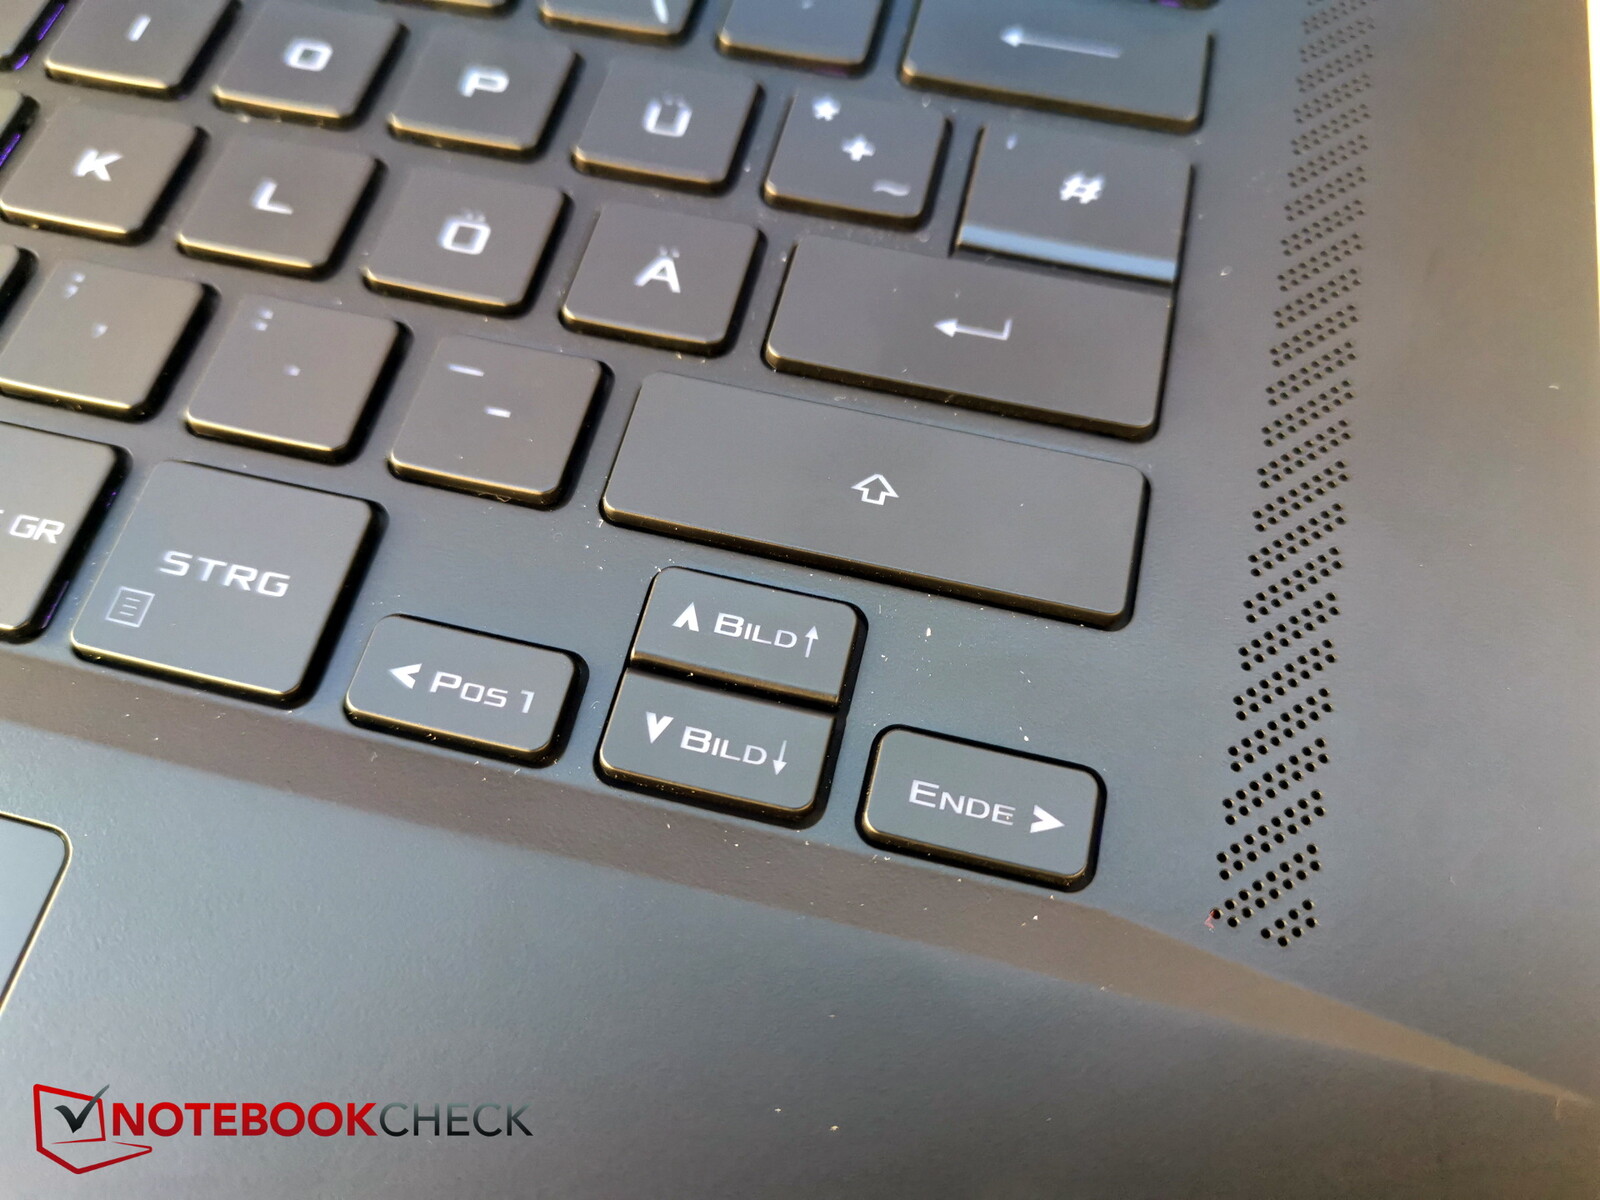
The layout seems very spacious. On the top left, Asus has included four additional special keys for volume control, the microphone and Asus' control center. These can also be configured manually.
Unfortunately, the arrow keys are very narrow, and the power button, typical for this kind of keyboard, is a separate key. Despite being a 16-inch device, there is no numerical keypad.
The keys possess very short travel and the feedback is a little shallow but still just precise enough. Overall, although the typing experience is quite good we would have preferred somewhat crisper keys. The typing noise is moderate.
The 3-level backlight illuminates in diverse RGB colors but only single-zone.
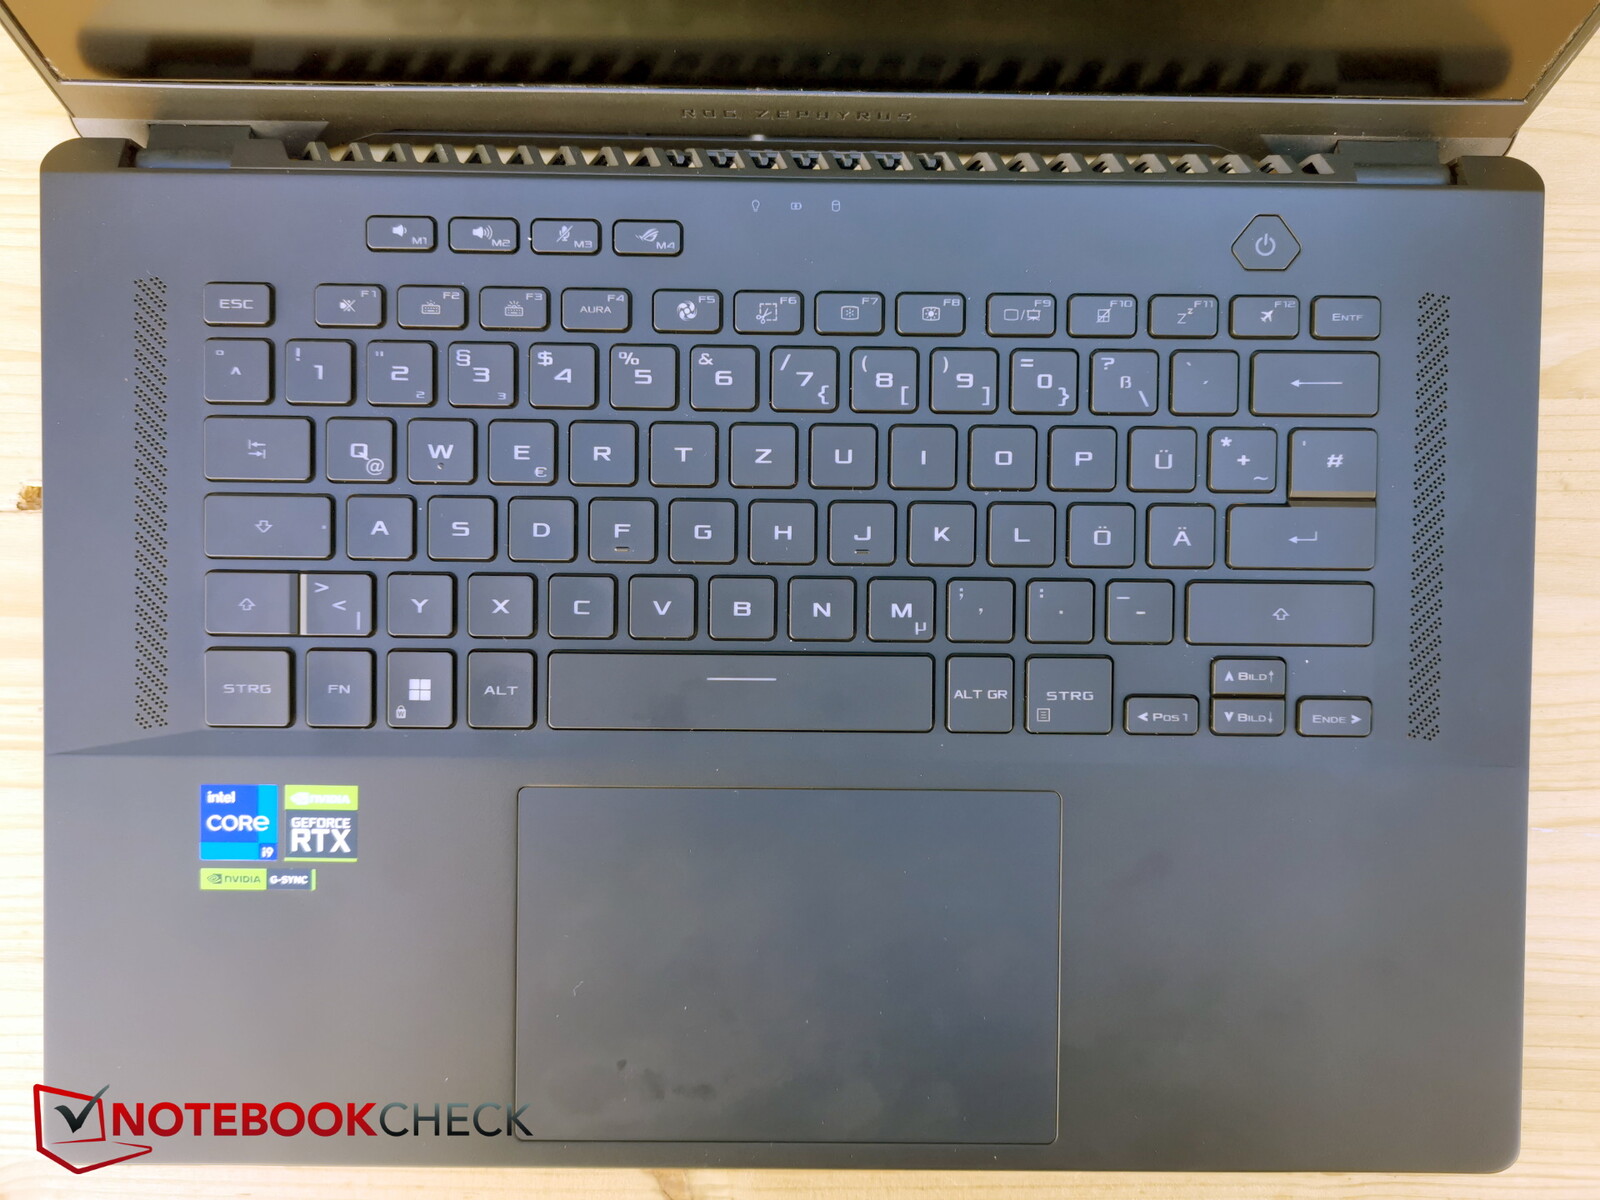
Touchpad
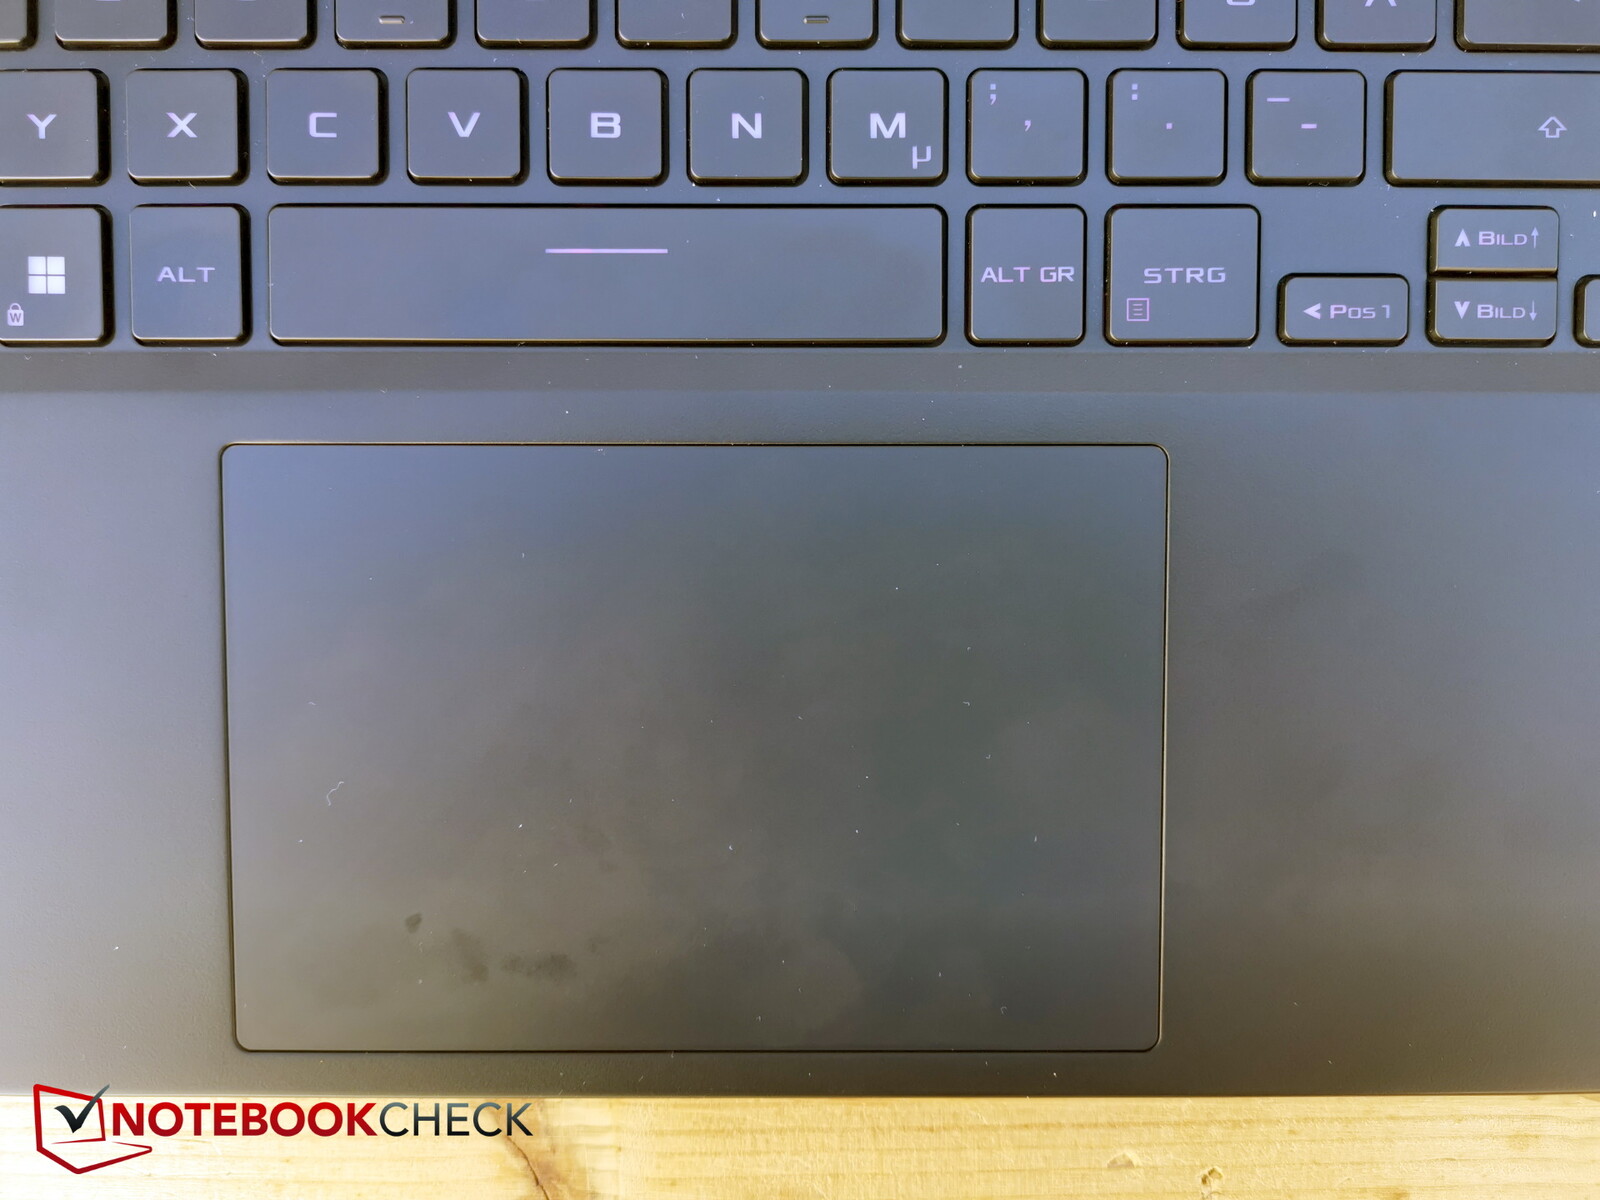
The large touchpad (approx. 13 x 8.5 cm) is slightly off-centered to the right and offers a smooth swiping experience even when performing longer movements.
The integrated keys have a short but good pressure point with clear feedback. The clicking noises can be described as quiet to moderate.
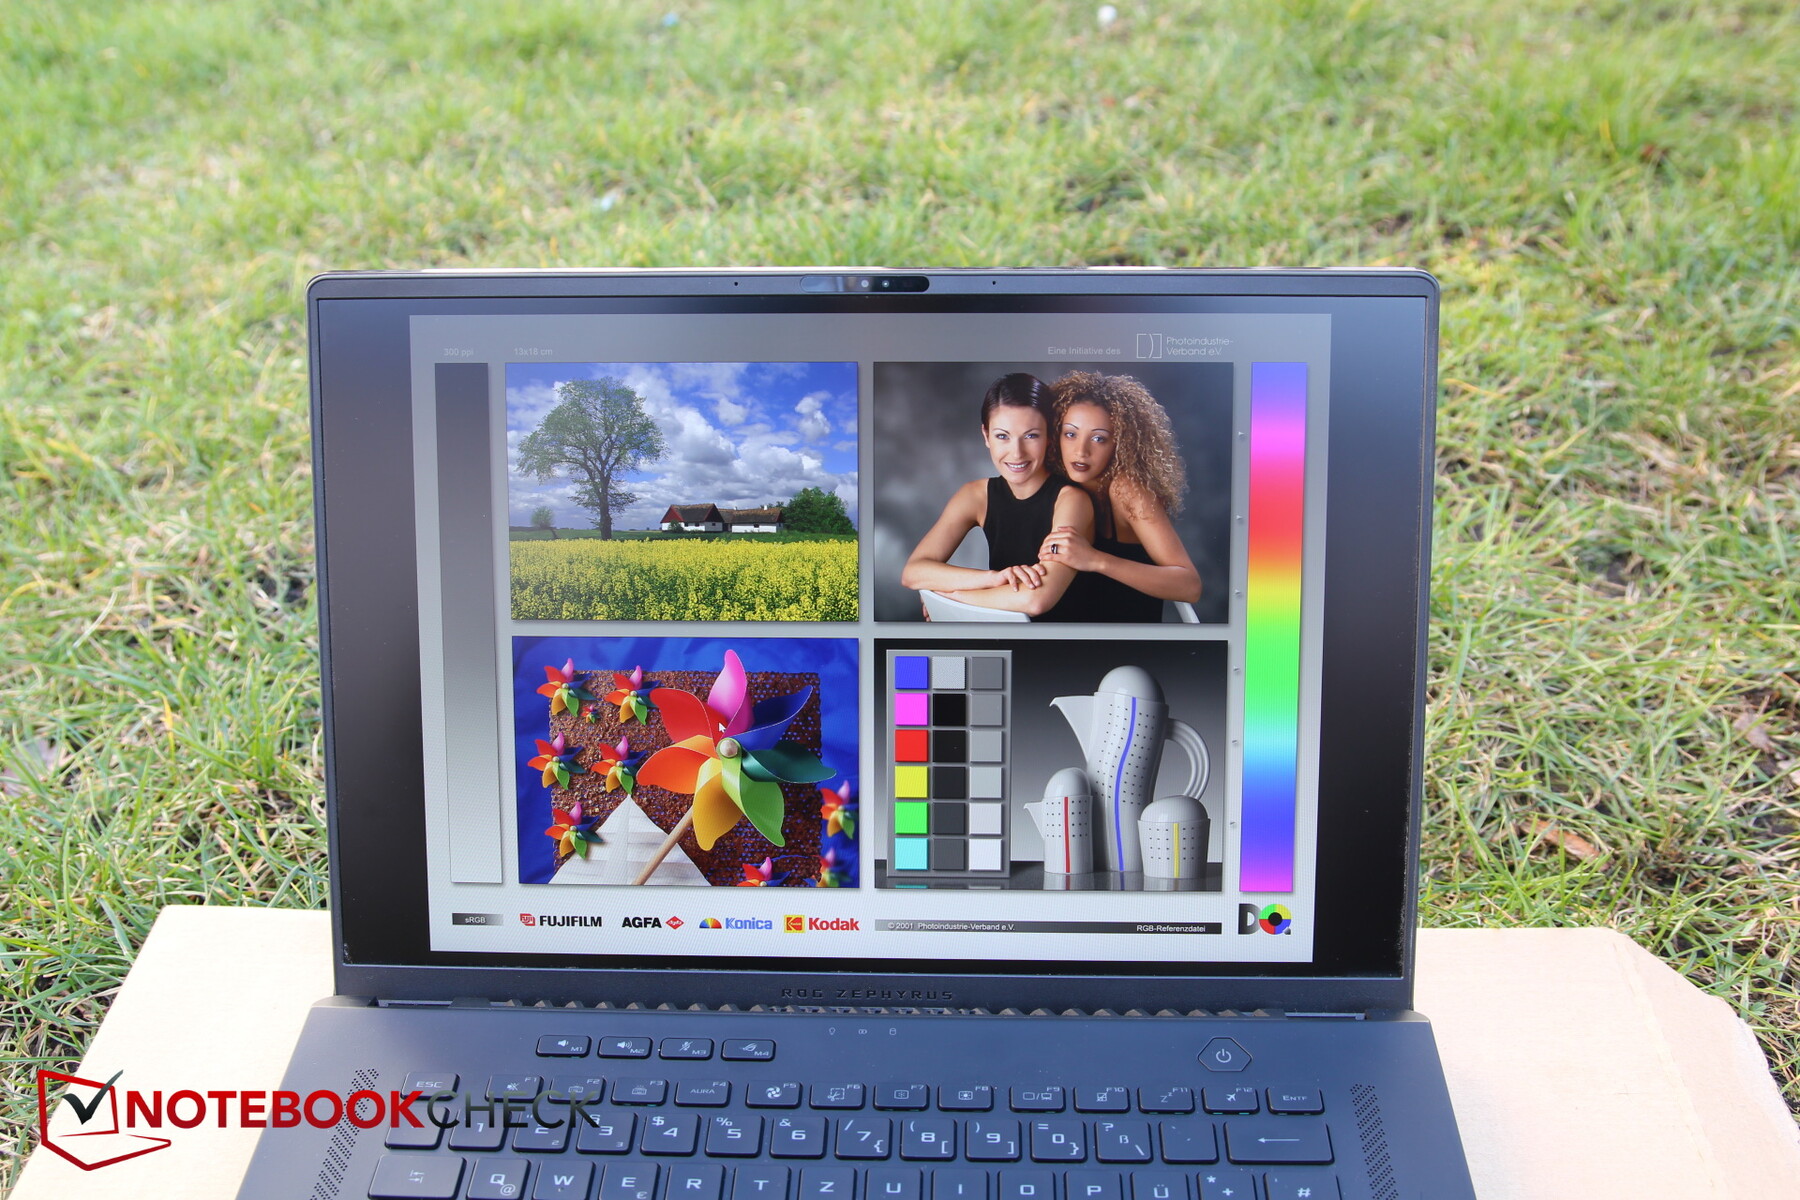
Display - A very bright Mini-LED with HDR
Once more, the manufacturer has chosen a matte, 16:10, IPS display with a resolution of 2,560 x 1,600 pixels. However, it is not the same panel as it carries a new version number and is now backlit by Mini-LED technology. Asus has not revealed the number of dimming zones employed by the panel.
A few things have to be considered when dealing with Mini-LEDs: The maximum brightness can only be achieved when the backlighting is set to multi-zones using Asus' own control center, the Armory Crate software. In HDR mode, this is set automatically and if HDR is deactivated (SDR mode is calibrated and has less color deviation), the panel automatically illuminates individual areas. Using this setting, the brightness is around 100 nits lower.
In the following, we highlight the SDR mode values with multi-zones activated. However, this mode is not ideal for image processing.
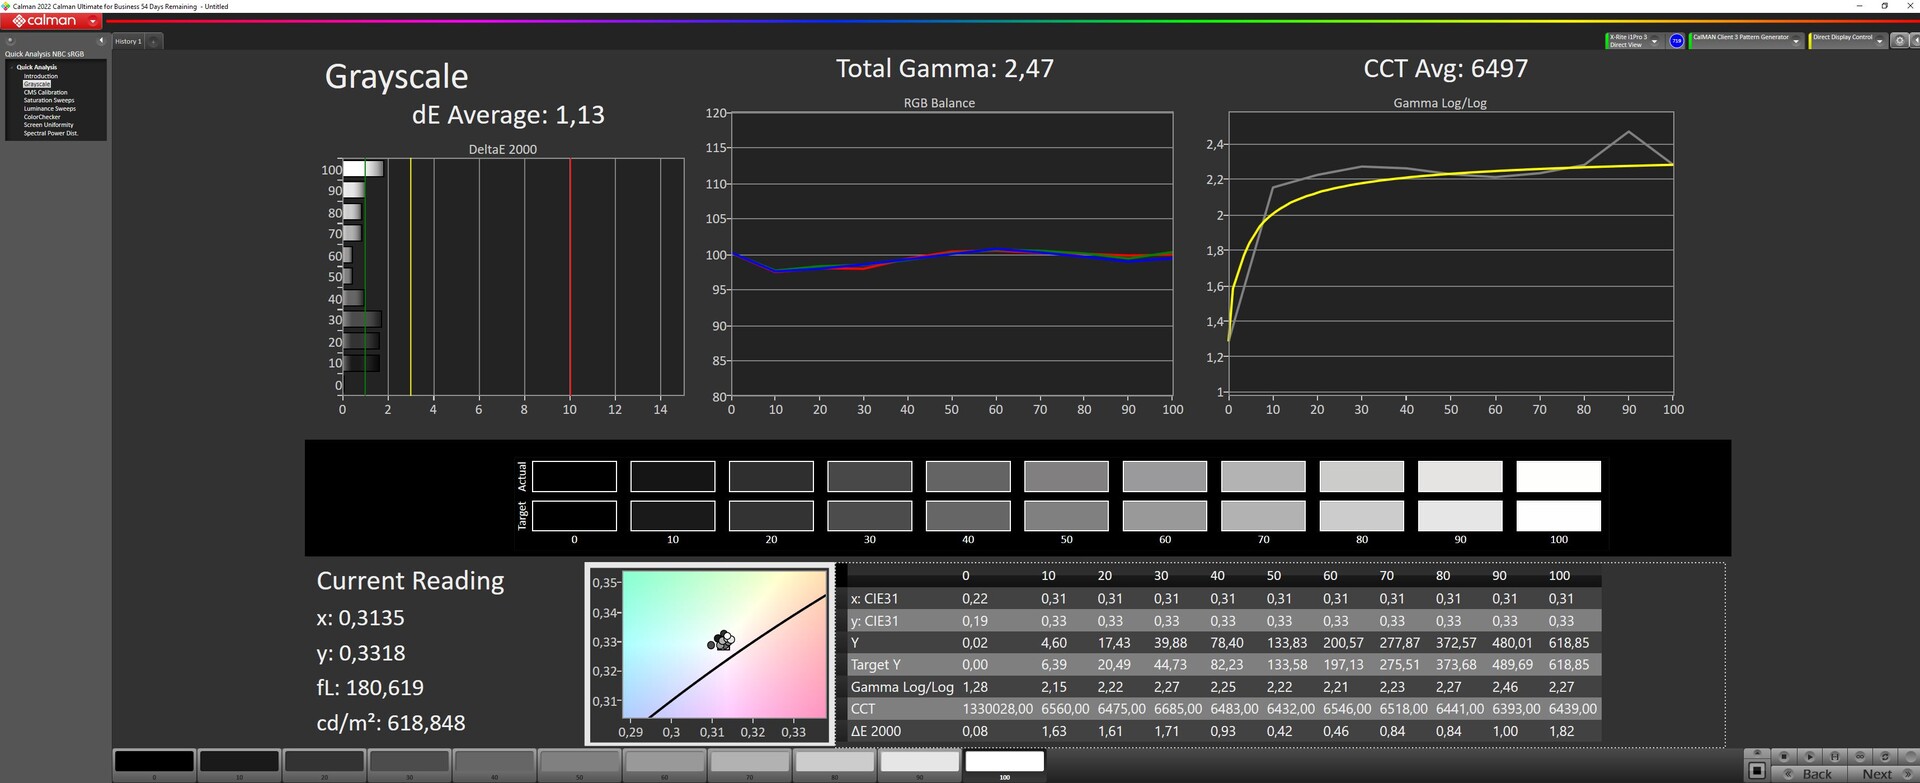
Black levels are also surprising. Using single-zone backlighting this is only 0.55 but the contrast is poor. Only when using the multi-zone setting this drops to an excellent 0.03. This is one of the reasons why we carried out our measurements with multi-zone activated.
We measured the brightness to be around 627 nits (multi-zone, otherwise around 519 nits). At 92 percent, illumination is very good with brightness tailing off toward the right-hand side of the display. Compared to its predecessor, the panel's refresh rate has increased from 165 to 240 Hz.
| |||||||||||||||||||||||||
Brightness Distribution: 92 %
Center on Battery: 634 cd/m²
Contrast: 21133:1 (Black: 0.03 cd/m²)
ΔE ColorChecker Calman: 0.89 | ∀{0.5-29.43 Ø4.73}
calibrated: 0.91
ΔE Greyscale Calman: 1.13 | ∀{0.09-98 Ø4.97}
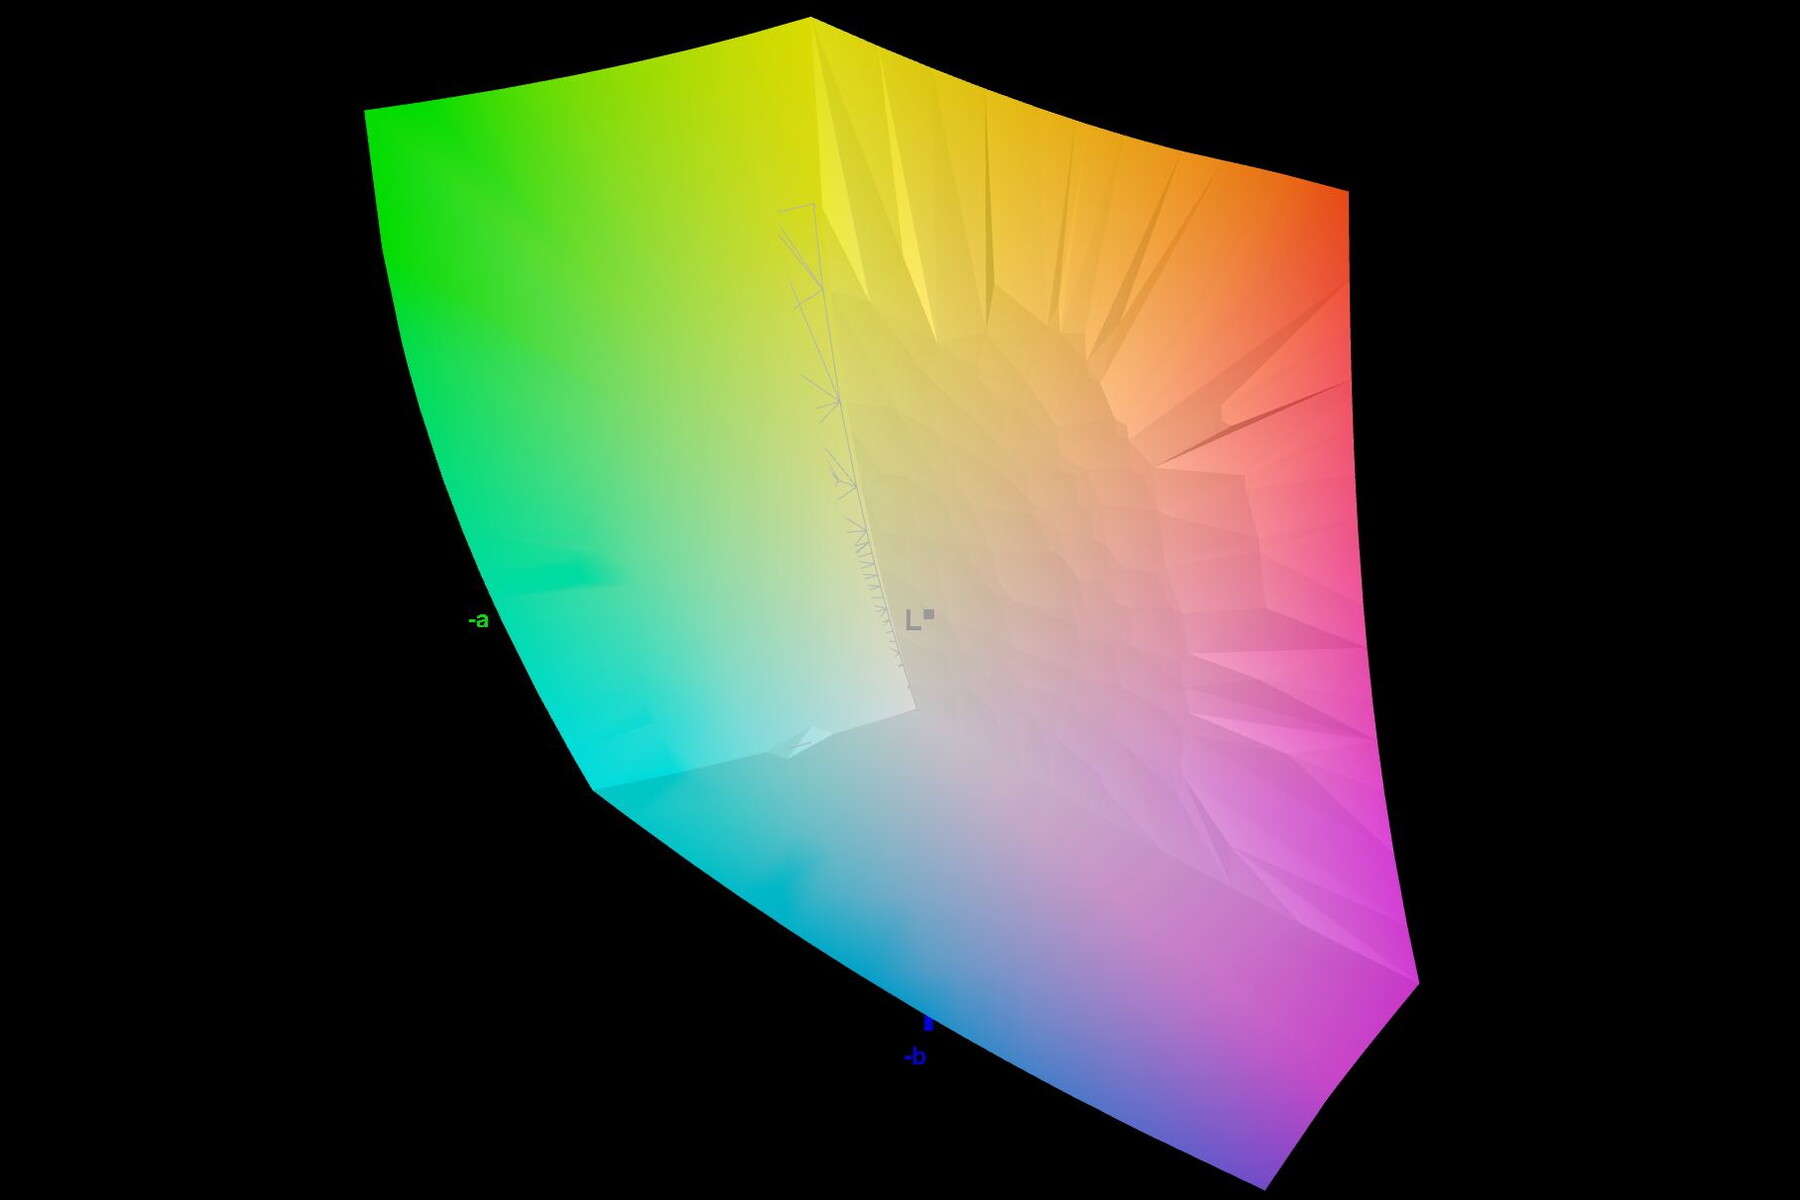
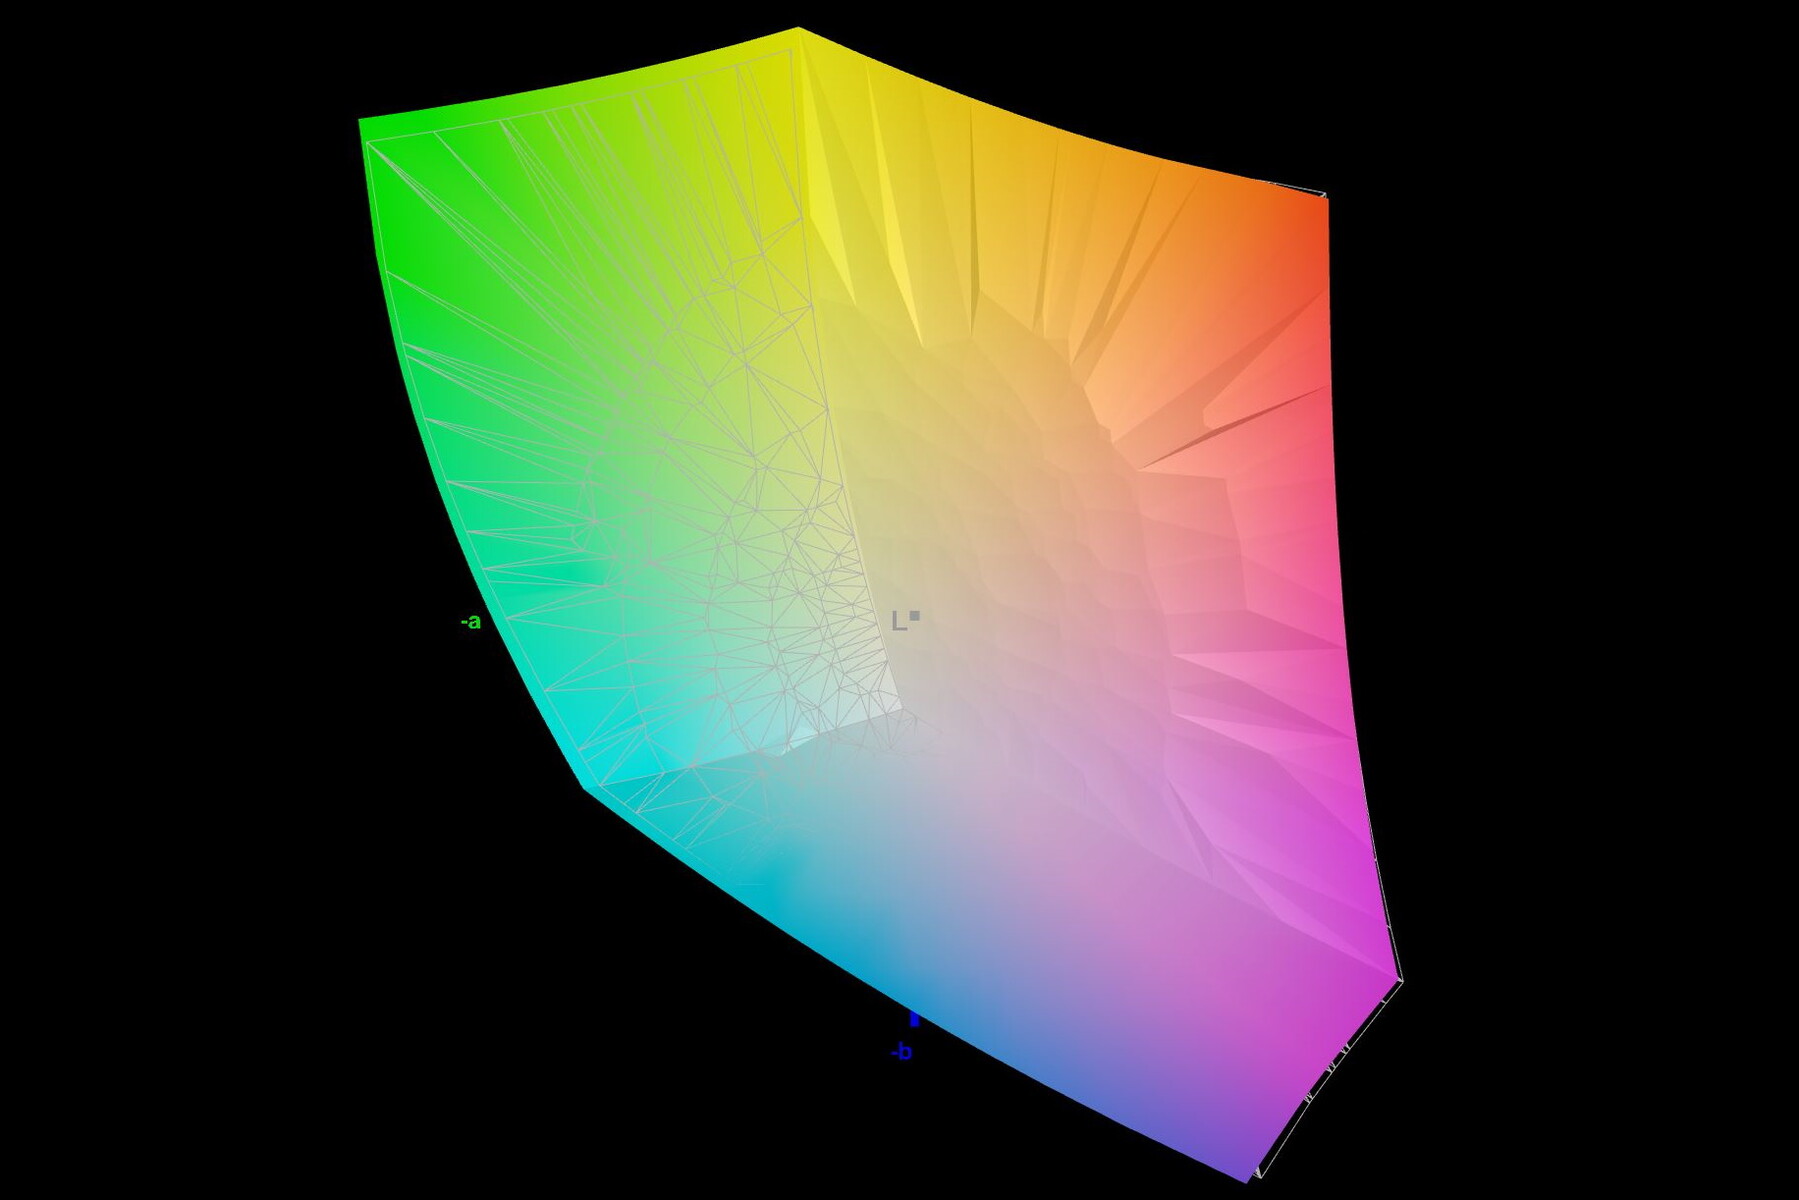
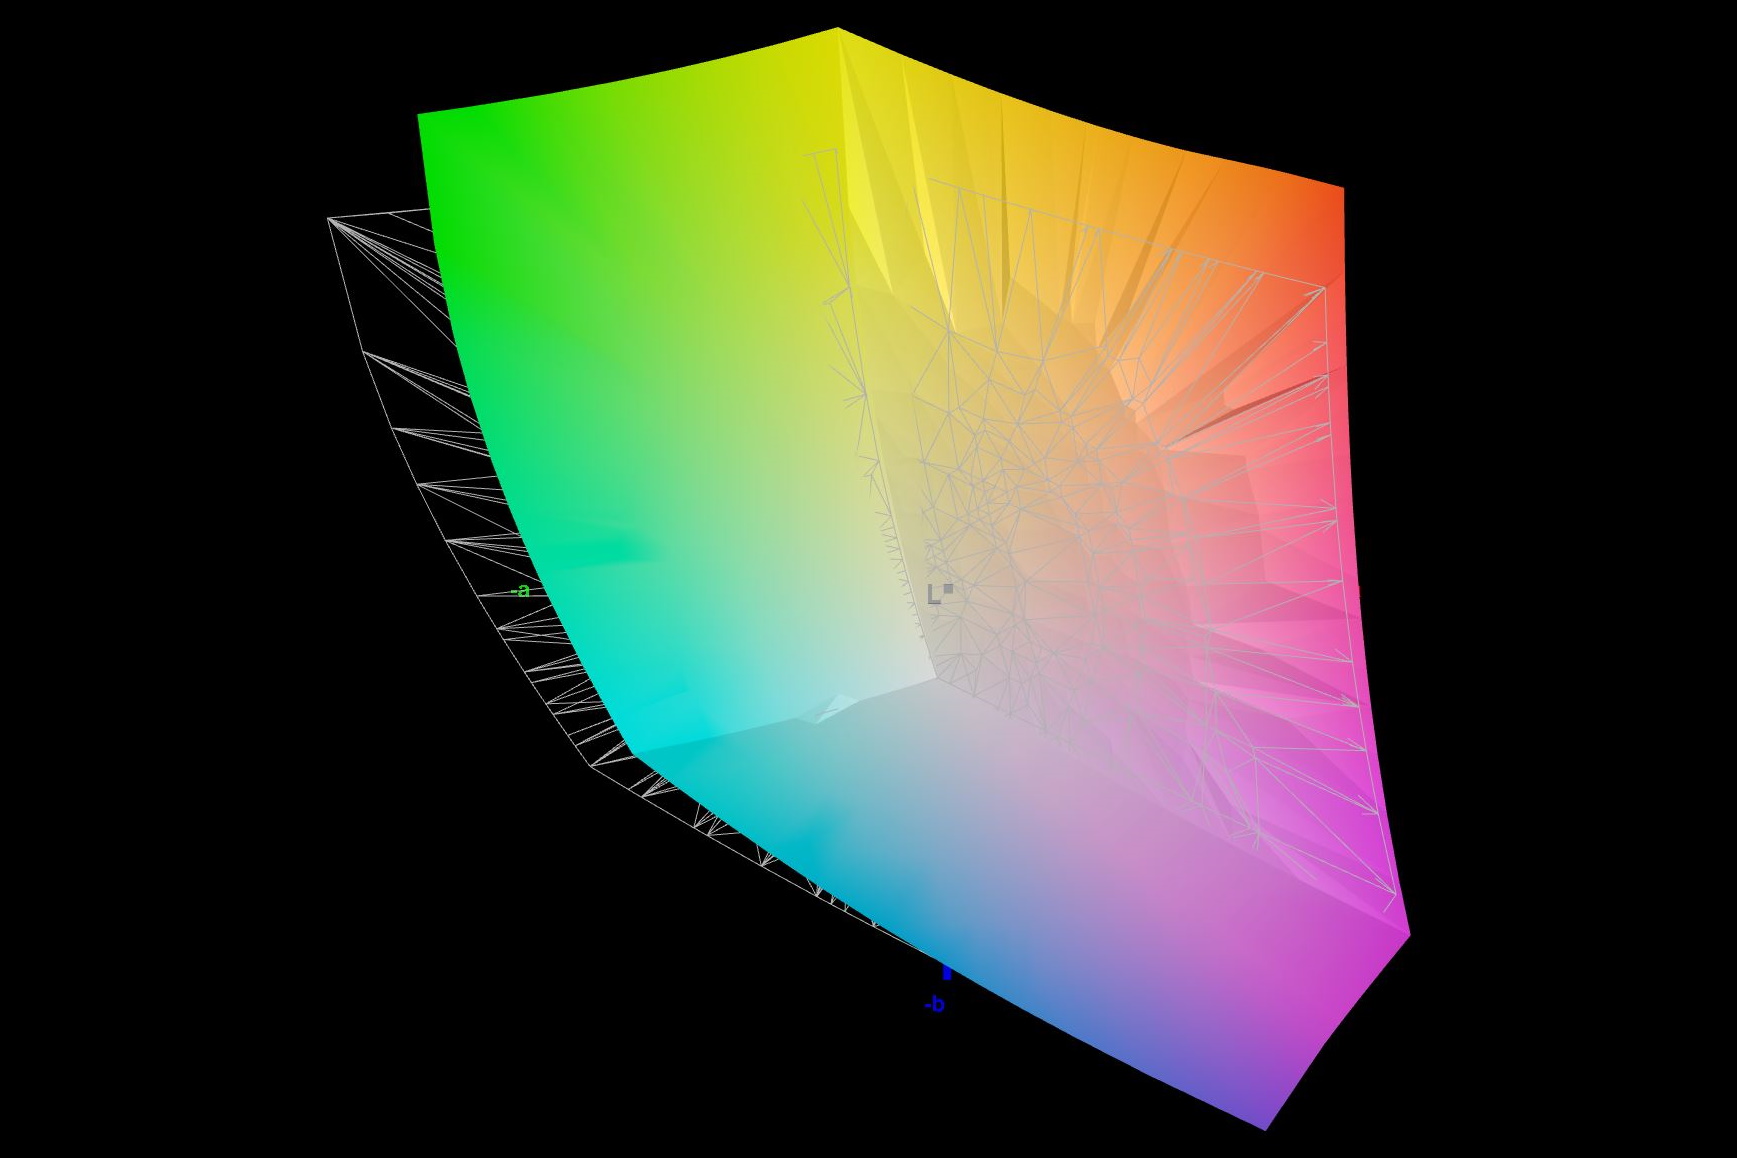
90.01% AdobeRGB 1998 (Argyll 3D)
99.9% sRGB (Argyll 3D)
99.33% Display P3 (Argyll 3D)
Gamma: 2.47
CCT: 6497 K
| Asus ROG Zephyrus M16 GU604VY-NM042X BOE0B74 (NE160QDM-NM4, IPS, 2560x1600, 16" | Asus ROG Zephyrus M16 GU603Z BOE0A0B (BOE CQ NE160QDM-NY3), IPS, 2560x1600, 16" | Asus ROG Strix Scar 18 2023 G834JY-N6005W NE180QDM-NZ2, IPS, 2560x1600, 18" | MSI Titan GT77 HX 13VI B173ZAN06.C, Mini-LED, 3840x2160, 17.3" | Lenovo Legion Pro 7 16IRX8H MNG007DA2-3 (CSO1628), IPS, 2560x1600, 16" | Razer Blade 16 Early 2023 CSOT T3 MNG007DA4-1, IPS, 2560x1600, 16" | |
|---|---|---|---|---|---|---|
| Display | -5% | -3% | -0% | -17% | -0% | |
| Display P3 Coverage (%) | 99.33 | 92.8 -7% | 97.2 -2% | 94.9 -4% | 69.1 -30% | 98.5 -1% |
| sRGB Coverage (%) | 99.9 | 98.5 -1% | 99.9 0% | 99.9 0% | 99.7 0% | 100 0% |
| AdobeRGB 1998 Coverage (%) | 90.01 | 83.1 -8% | 84.9 -6% | 92.4 3% | 71.2 -21% | 89.7 0% |
| Response Times | 76% | 80% | 17% | 78% | 73% | |
| Response Time Grey 50% / Grey 80% * (ms) | 50.8 ? | 7.6 ? 85% | 5.41 ? 89% | 38.4 ? 24% | 12.3 ? 76% | 6.6 ? 87% |
| Response Time Black / White * (ms) | 29.6 ? | 10 ? 66% | 8.62 ? 71% | 26.6 ? 10% | 5.9 ? 80% | 12 ? 59% |
| PWM Frequency (Hz) | 12000 | 2380 ? | ||||
| Screen | -181% | -399% | 3033% | -150% | -212% | |
| Brightness middle (cd/m²) | 634 | 497 -22% | 490 -23% | 606 -4% | 511 -19% | 456.8 -28% |
| Brightness (cd/m²) | 627 | 481 -23% | 468 -25% | 602 -4% | 469 -25% | 437 -30% |
| Brightness Distribution (%) | 92 | 82 -11% | 86 -7% | 93 1% | 86 -7% | 83 -10% |
| Black Level * (cd/m²) | 0.03 | 0.21 -600% | 0.54 -1700% | 0.0001 100% | 0.4 -1233% | 0.35 -1067% |
| Contrast (:1) | 21133 | 2367 -89% | 907 -96% | 6060000 28576% | 1278 -94% | 1305 -94% |
| Colorchecker dE 2000 * | 0.89 | 3.53 -297% | 4.97 -458% | 4.8 -439% | 0.95 -7% | 3.7 -316% |
| Colorchecker dE 2000 max. * | 1.79 | 6.15 -244% | 11.02 -516% | 8.2 -358% | 2.07 -16% | 6.42 -259% |
| Colorchecker dE 2000 calibrated * | 0.91 | 3.53 -288% | 2.97 -226% | 1.8 -98% | 0.91 -0% | 0.66 27% |
| Greyscale dE 2000 * | 1.13 | 1.74 -54% | 7.2 -537% | 6.5 -475% | 0.6 47% | 2.6 -130% |
| Gamma | 2.47 89% | 2.2 100% | 2.161 102% | 2.63 84% | 2.176 101% | 2.3 96% |
| CCT | 6497 100% | 6418 101% | 6515 100% | 6596 99% | 6545 99% | 6108 106% |
| Total Average (Program / Settings) | -37% /
-107% | -107% /
-245% | 1017% /
1952% | -30% /
-89% | -46% /
-126% |
* ... smaller is better
Asus advertises the device as having 100 percent DCI P3 and this is something our analysis was able to confirm. AdobeRGB is reproduced to 90 percent.
Out of the box, the panel is very well calibrated (SDR) and has a DeltaE grayscale and ColorChecker value of only 1.13 and 0.89. A fresh calibration hardly manages to improve matters. The grayscale DeltaE dipped a little while the ColorChecker deviation increased slightly.
However, in HDR mode the calibration is gone (see the last row of our screenshots below).


Determining the response times is not easy with our review model as the PWM frequency of at least 12 kHz (see below) overlaps with the response time curves. Asus specifies this as 3 ms but does so without revealing which measuring technique they used. At full brightness, we measured it to be more in the region of 30 to 50 ms which, on the one hand, is high but is also possibly influenced by the overlapping PWM frequency.
Display Response Times
| ↔ Response Time Black to White | ||
|---|---|---|
| 29.6 ms ... rise ↗ and fall ↘ combined | ↗ 25 ms rise | 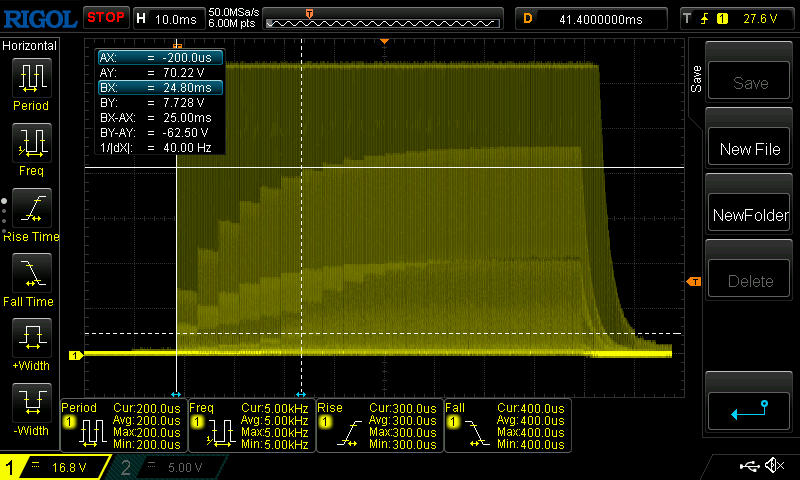 |
| ↘ 4.6 ms fall | ||
| The screen shows relatively slow response rates in our tests and may be too slow for gamers. In comparison, all tested devices range from 0.1 (minimum) to 240 (maximum) ms. » 79 % of all devices are better. This means that the measured response time is worse than the average of all tested devices (19.9 ms). | ||
| ↔ Response Time 50% Grey to 80% Grey | ||
| 50.8 ms ... rise ↗ and fall ↘ combined | ↗ 27.6 ms rise | 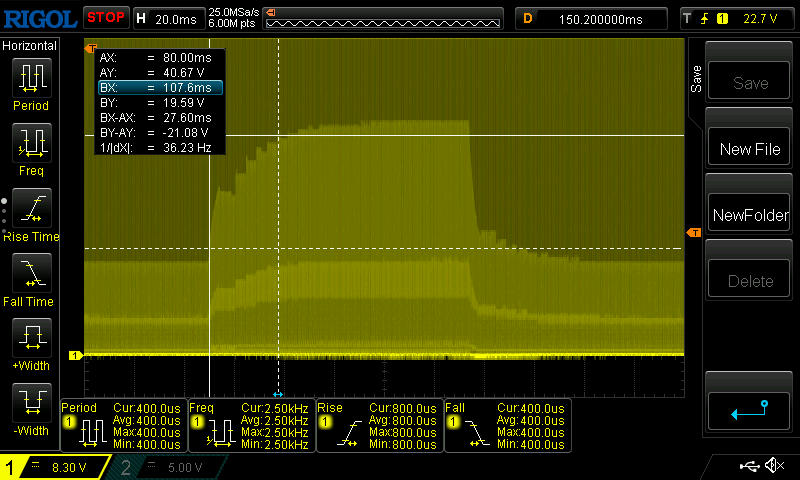 |
| ↘ 23.2 ms fall | ||
| The screen shows slow response rates in our tests and will be unsatisfactory for gamers. In comparison, all tested devices range from 0.165 (minimum) to 636 (maximum) ms. » 87 % of all devices are better. This means that the measured response time is worse than the average of all tested devices (31.1 ms). | ||
Screen Flickering / PWM (Pulse-Width Modulation)
| Screen flickering / PWM detected | 12000 Hz | 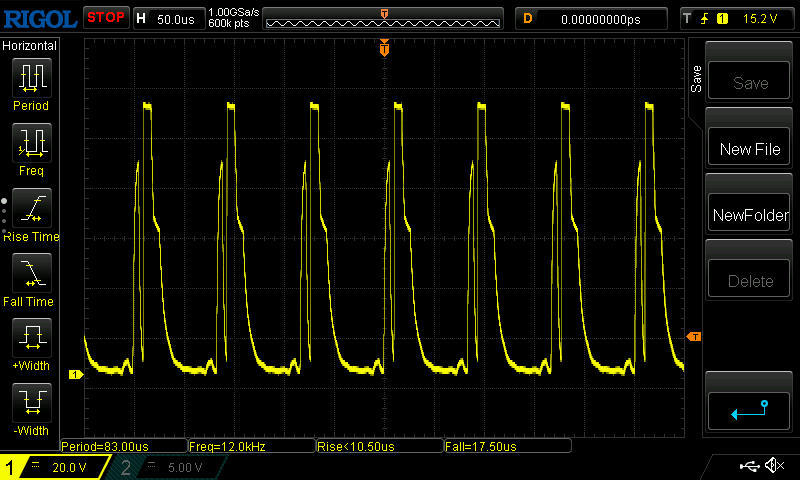 | |
The display backlight flickers at 12000 Hz (worst case, e.g., utilizing PWM) . The frequency of 12000 Hz is quite high, so most users sensitive to PWM should not notice any flickering. In comparison: 52 % of all tested devices do not use PWM to dim the display. If PWM was detected, an average of 7798 (minimum: 5 - maximum: 343500) Hz was measured. | |||
PWM is used to regulate brightness. At a brightness of 100 to 83 percent, the frequency sat at 12 kHz which shouldn't even be noticeable to people normally sensitive to PWM. Below that, the frequency continued to rise and was between 69 to 100 kHz.
Outdoors, the matte surface ensures a comparatively high level of brightness as well as very good legibility, at least in the shade. Care should be taken when viewing the display from above as images become very quickly washed out.


Performance - The turbo is missing a spark
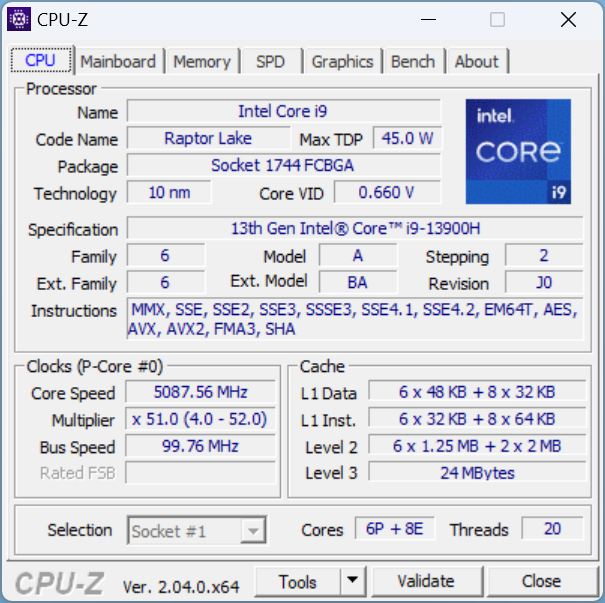
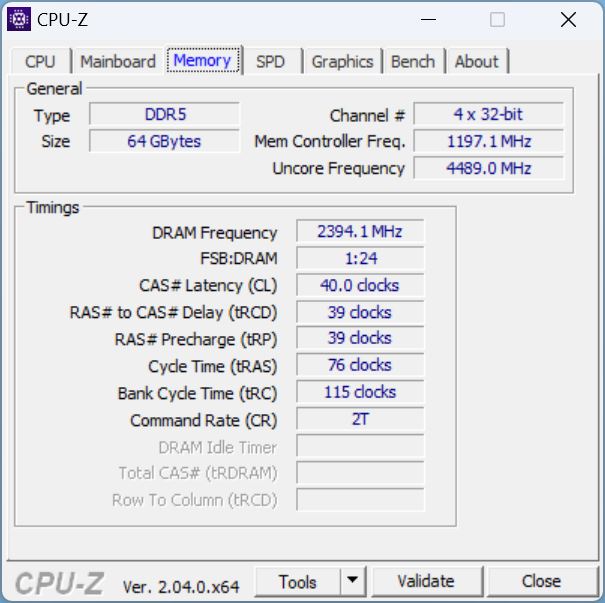
On paper, the new M16 ought to be a performance heavyweight in a 16-inch body: Raptor Lake Core i9-13900H, Nvidia Geforce RTX 4090 and 64 GB of RAM throw down the gauntlet to all would-be contenders to the performance throne.

Test conditions
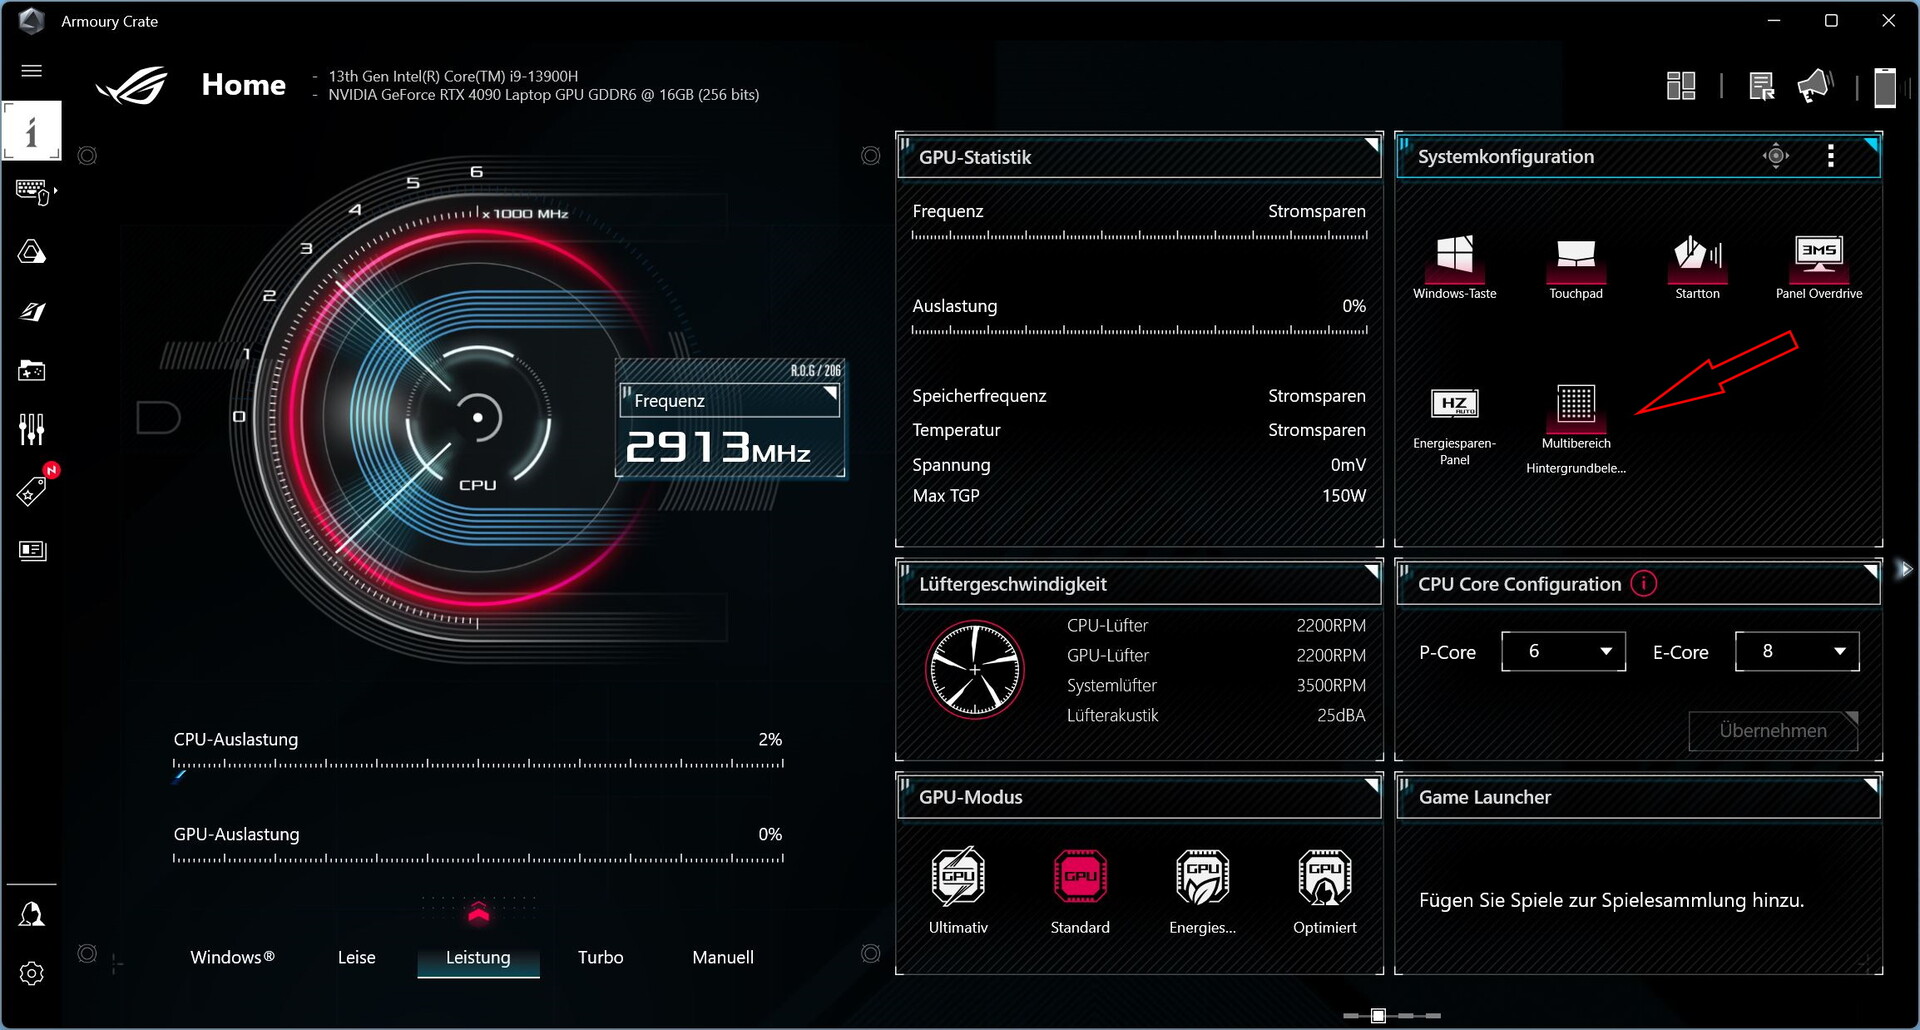
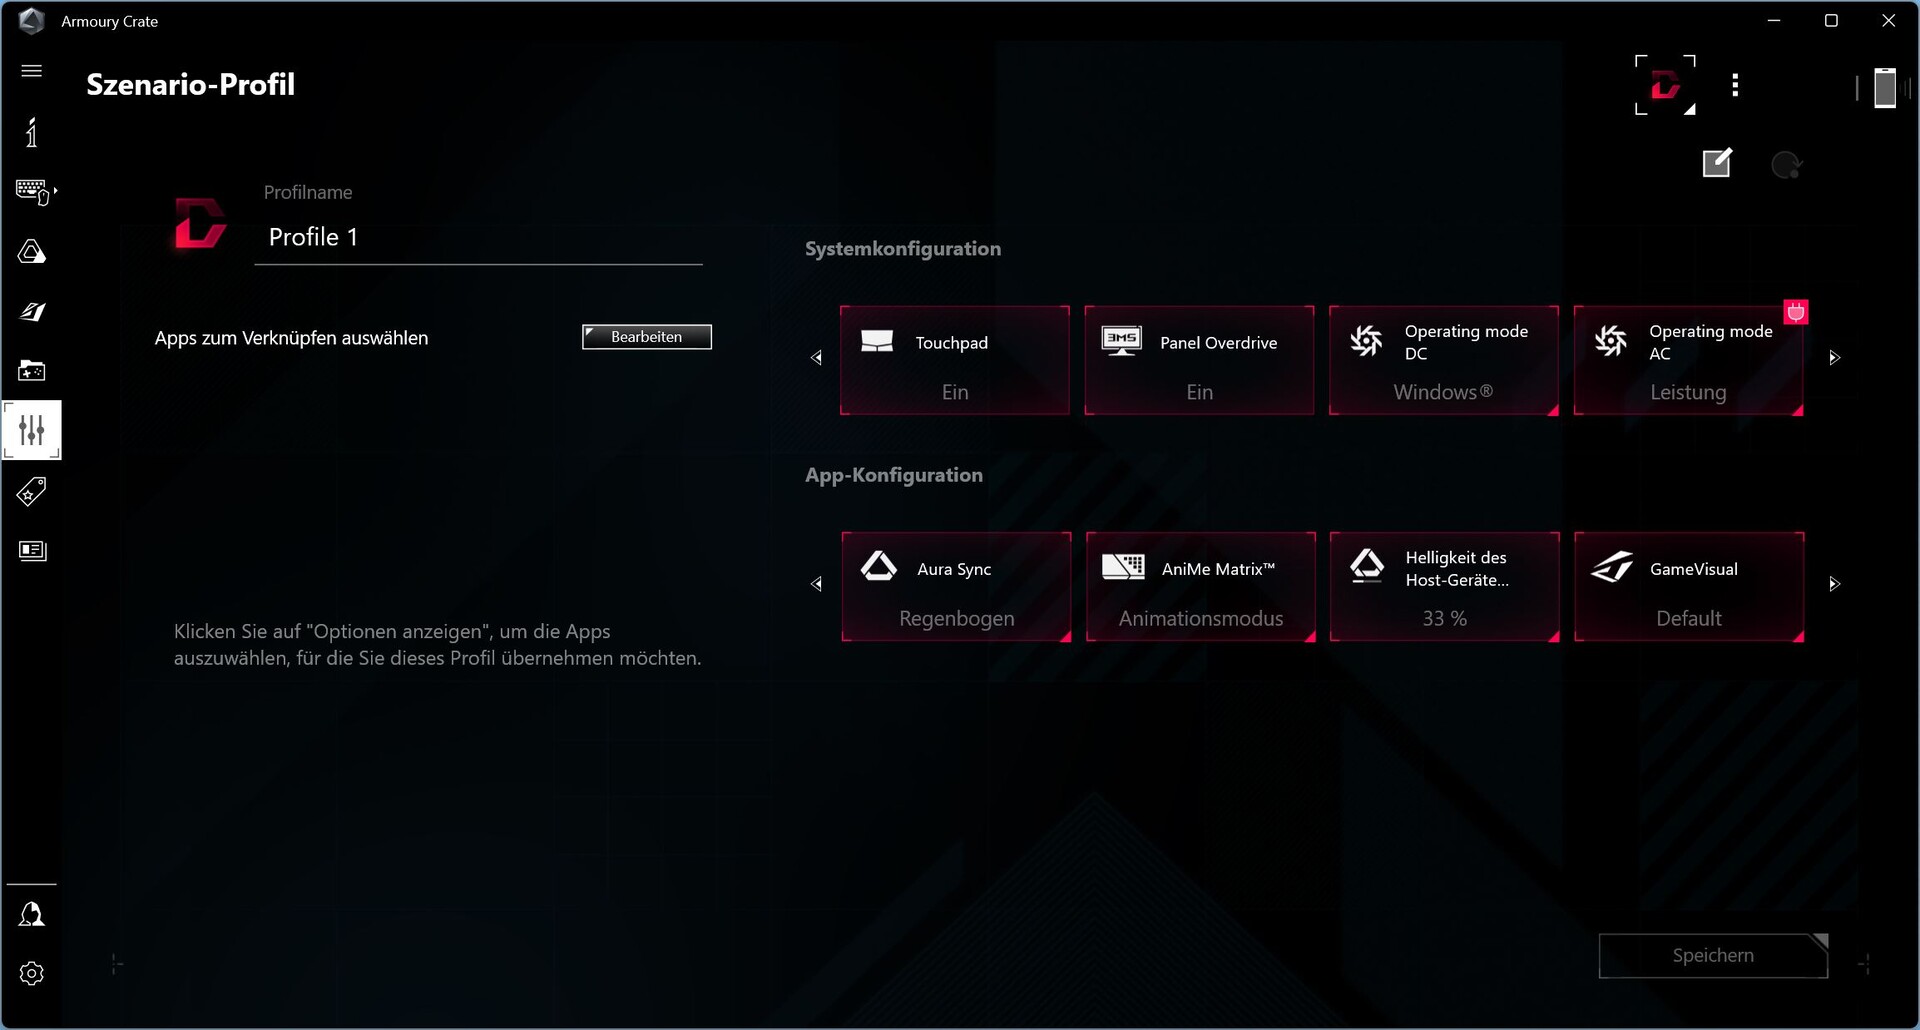
Asus' control center for gamers is the software, Amoury Crate. In addition to the various performance modes, this is where all the important settings are made and also where things such as the AniMe Matrix and fan curves can be customized.
For our benchmarks, we selected Turbo mode in the app in order to achieve the best possible results. Its predecessor was tested using Performance mode due to the previous gen's high noise emissions and is something more akin to Balanced mode.

Processor
Up to now, the Core i9-13900H is the sole CPU option and one of the most powerful processors in Intel's new Raptor Lake series. It offers 6 P and 8 E-cores, the former clocking in at up to 5.4 GHz in turbo. The E-core's base clock speed sits at 1.9 GHz.
In our Cinebench loop, the M16 overtook the entire competition configured with the last-gen CPUs. However, the gap is relatively small even when compared to the significantly less powerful i7-12700H found in the HP Omen 16. The lead over its predecessor is similarly small with a Performance mode score likely to be almost identical.
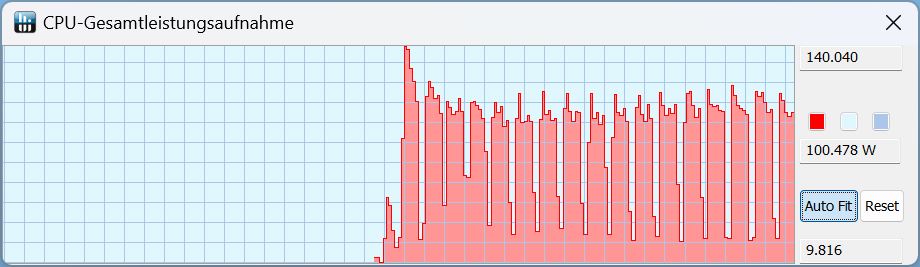
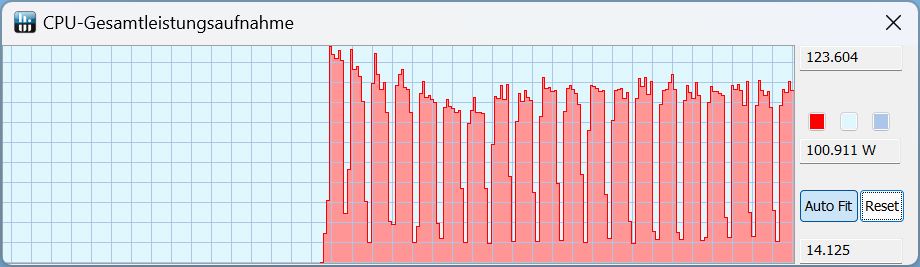
Taking a glance at TDP, the first Turbo mode run peaked at 140 watts with the other runs sitting at around 100 watts.
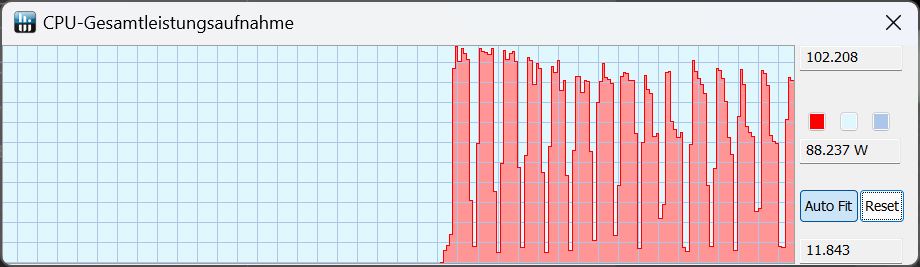
In Performance mode, the initial peak of 140 watts dropped to approximately 120 watts but also here the TDP normally sits at roughly 100 watts.
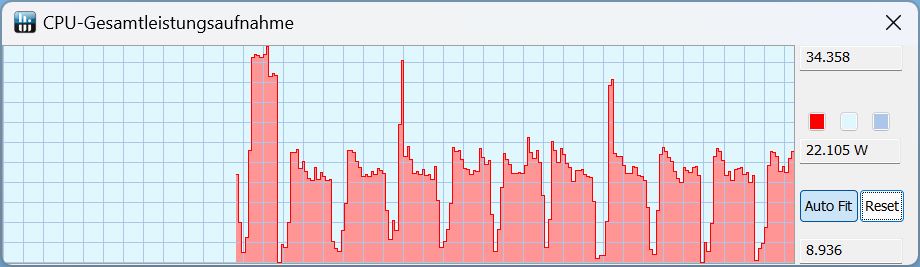
In Quiet mode, the peak disappeared with the TDP ranging between 60 and a maximum of 100 watts.
In battery mode, performance in the same mode (Quiet) is even lower with a maximum of 34 watts briefly available and only just over 20 watts being reached during lengthier periods of sustained load.
Cinebench R15 Multi Continuous
Cinebench R23: Multi Core | Single Core
Cinebench R20: CPU (Multi Core) | CPU (Single Core)
Cinebench R15: CPU Multi 64Bit | CPU Single 64Bit
Blender: v2.79 BMW27 CPU
7-Zip 18.03: 7z b 4 | 7z b 4 -mmt1
Geekbench 5.5: Multi-Core | Single-Core
HWBOT x265 Benchmark v2.2: 4k Preset
LibreOffice : 20 Documents To PDF
R Benchmark 2.5: Overall mean
| CPU Performance rating | |
| Schenker XMG Neo 16 Raptor Lake | |
| Average of class Gaming | |
| Asus ROG Zephyrus M16 GU604VY-NM042X | |
| MSI Creator Z16P B12UHST | |
| Lenovo Legion 5 Pro 16 G7 i7 RTX 3070Ti | |
| Asus ROG Zephyrus M16 GU603Z | |
| Acer Predator Triton 300 SE | |
| Average Intel Core i9-13900H | |
| HP Omen 17-ck1075ng | |
| Razer Blade 15 RZ09-0421NGG3-R3G1 | |
| Cinebench R23 / Multi Core | |
| Schenker XMG Neo 16 Raptor Lake | |
| Schenker XMG Neo 16 Raptor Lake | |
| Schenker XMG Neo 16 Raptor Lake | |
| Average of class Gaming (10488 - 40970, n=113, last 2 years) | |
| Asus ROG Zephyrus M16 GU604VY-NM042X | |
| Lenovo Legion 5 Pro 16 G7 i7 RTX 3070Ti | |
| MSI Creator Z16P B12UHST | |
| Average Intel Core i9-13900H (11997 - 20385, n=28) | |
| Razer Blade 15 RZ09-0421NGG3-R3G1 | |
| Acer Predator Triton 300 SE | |
| Asus ROG Zephyrus M16 GU603Z | |
| HP Omen 17-ck1075ng | |
| Cinebench R23 / Single Core | |
| Schenker XMG Neo 16 Raptor Lake | |
| Average of class Gaming (1166 - 2356, n=113, last 2 years) | |
| Asus ROG Zephyrus M16 GU604VY-NM042X | |
| MSI Creator Z16P B12UHST | |
| Acer Predator Triton 300 SE | |
| Average Intel Core i9-13900H (1297 - 2054, n=26) | |
| Asus ROG Zephyrus M16 GU603Z | |
| Lenovo Legion 5 Pro 16 G7 i7 RTX 3070Ti | |
| HP Omen 17-ck1075ng | |
| Razer Blade 15 RZ09-0421NGG3-R3G1 | |
| Cinebench R20 / CPU (Multi Core) | |
| Schenker XMG Neo 16 Raptor Lake | |
| Average of class Gaming (4029 - 16108, n=112, last 2 years) | |
| Asus ROG Zephyrus M16 GU604VY-NM042X | |
| Lenovo Legion 5 Pro 16 G7 i7 RTX 3070Ti | |
| MSI Creator Z16P B12UHST | |
| Average Intel Core i9-13900H (4935 - 7716, n=25) | |
| Razer Blade 15 RZ09-0421NGG3-R3G1 | |
| Acer Predator Triton 300 SE | |
| Asus ROG Zephyrus M16 GU603Z | |
| HP Omen 17-ck1075ng | |
| Cinebench R20 / CPU (Single Core) | |
| Average of class Gaming (442 - 895, n=112, last 2 years) | |
| Schenker XMG Neo 16 Raptor Lake | |
| Asus ROG Zephyrus M16 GU604VY-NM042X | |
| MSI Creator Z16P B12UHST | |
| Acer Predator Triton 300 SE | |
| Average Intel Core i9-13900H (428 - 792, n=25) | |
| Asus ROG Zephyrus M16 GU603Z | |
| Lenovo Legion 5 Pro 16 G7 i7 RTX 3070Ti | |
| HP Omen 17-ck1075ng | |
| Razer Blade 15 RZ09-0421NGG3-R3G1 | |
| Cinebench R15 / CPU Multi 64Bit | |
| Schenker XMG Neo 16 Raptor Lake | |
| Schenker XMG Neo 16 Raptor Lake | |
| Average of class Gaming (1578 - 6271, n=113, last 2 years) | |
| Asus ROG Zephyrus M16 GU604VY-NM042X | |
| Lenovo Legion 5 Pro 16 G7 i7 RTX 3070Ti | |
| MSI Creator Z16P B12UHST | |
| Average Intel Core i9-13900H (2061 - 3100, n=26) | |
| Razer Blade 15 RZ09-0421NGG3-R3G1 | |
| Asus ROG Zephyrus M16 GU603Z | |
| HP Omen 17-ck1075ng | |
| HP Omen 17-ck1075ng | |
| Acer Predator Triton 300 SE | |
| Cinebench R15 / CPU Single 64Bit | |
| Schenker XMG Neo 16 Raptor Lake | |
| Schenker XMG Neo 16 Raptor Lake | |
| Average of class Gaming (188.8 - 343, n=112, last 2 years) | |
| Asus ROG Zephyrus M16 GU604VY-NM042X | |
| MSI Creator Z16P B12UHST | |
| Acer Predator Triton 300 SE | |
| Average Intel Core i9-13900H (211 - 297, n=26) | |
| Lenovo Legion 5 Pro 16 G7 i7 RTX 3070Ti | |
| Asus ROG Zephyrus M16 GU603Z | |
| HP Omen 17-ck1075ng | |
| HP Omen 17-ck1075ng | |
| Razer Blade 15 RZ09-0421NGG3-R3G1 | |
| Blender / v2.79 BMW27 CPU | |
| HP Omen 17-ck1075ng | |
| Razer Blade 15 RZ09-0421NGG3-R3G1 | |
| Average Intel Core i9-13900H (166 - 268, n=24) | |
| Acer Predator Triton 300 SE | |
| Asus ROG Zephyrus M16 GU603Z | |
| MSI Creator Z16P B12UHST | |
| Lenovo Legion 5 Pro 16 G7 i7 RTX 3070Ti | |
| Asus ROG Zephyrus M16 GU604VY-NM042X | |
| Average of class Gaming (80 - 330, n=110, last 2 years) | |
| Schenker XMG Neo 16 Raptor Lake | |
| 7-Zip 18.03 / 7z b 4 | |
| Schenker XMG Neo 16 Raptor Lake | |
| Average of class Gaming (33491 - 148086, n=111, last 2 years) | |
| Asus ROG Zephyrus M16 GU604VY-NM042X | |
| MSI Creator Z16P B12UHST | |
| Lenovo Legion 5 Pro 16 G7 i7 RTX 3070Ti | |
| Average Intel Core i9-13900H (45045 - 79032, n=25) | |
| Asus ROG Zephyrus M16 GU603Z | |
| Acer Predator Triton 300 SE | |
| Razer Blade 15 RZ09-0421NGG3-R3G1 | |
| HP Omen 17-ck1075ng | |
| 7-Zip 18.03 / 7z b 4 -mmt1 | |
| Schenker XMG Neo 16 Raptor Lake | |
| Average of class Gaming (4199 - 7436, n=111, last 2 years) | |
| Asus ROG Zephyrus M16 GU604VY-NM042X | |
| Asus ROG Zephyrus M16 GU603Z | |
| MSI Creator Z16P B12UHST | |
| Average Intel Core i9-13900H (3665 - 6600, n=25) | |
| Lenovo Legion 5 Pro 16 G7 i7 RTX 3070Ti | |
| HP Omen 17-ck1075ng | |
| Acer Predator Triton 300 SE | |
| Razer Blade 15 RZ09-0421NGG3-R3G1 | |
| Geekbench 5.5 / Multi-Core | |
| Schenker XMG Neo 16 Raptor Lake | |
| Average of class Gaming (6460 - 27010, n=111, last 2 years) | |
| Asus ROG Zephyrus M16 GU604VY-NM042X | |
| MSI Creator Z16P B12UHST | |
| Lenovo Legion 5 Pro 16 G7 i7 RTX 3070Ti | |
| Acer Predator Triton 300 SE | |
| Asus ROG Zephyrus M16 GU603Z | |
| Average Intel Core i9-13900H (9094 - 15410, n=26) | |
| Razer Blade 15 RZ09-0421NGG3-R3G1 | |
| HP Omen 17-ck1075ng | |
| Geekbench 5.5 / Single-Core | |
| Average of class Gaming (986 - 2474, n=111, last 2 years) | |
| Schenker XMG Neo 16 Raptor Lake | |
| Asus ROG Zephyrus M16 GU604VY-NM042X | |
| Average Intel Core i9-13900H (1140 - 2043, n=26) | |
| MSI Creator Z16P B12UHST | |
| Acer Predator Triton 300 SE | |
| Asus ROG Zephyrus M16 GU603Z | |
| HP Omen 17-ck1075ng | |
| Lenovo Legion 5 Pro 16 G7 i7 RTX 3070Ti | |
| Razer Blade 15 RZ09-0421NGG3-R3G1 | |
| HWBOT x265 Benchmark v2.2 / 4k Preset | |
| Schenker XMG Neo 16 Raptor Lake | |
| Average of class Gaming (11.5 - 44.3, n=111, last 2 years) | |
| Asus ROG Zephyrus M16 GU604VY-NM042X | |
| Lenovo Legion 5 Pro 16 G7 i7 RTX 3070Ti | |
| MSI Creator Z16P B12UHST | |
| Asus ROG Zephyrus M16 GU603Z | |
| Acer Predator Triton 300 SE | |
| Average Intel Core i9-13900H (14.1 - 22.3, n=25) | |
| Razer Blade 15 RZ09-0421NGG3-R3G1 | |
| HP Omen 17-ck1075ng | |
| LibreOffice / 20 Documents To PDF | |
| Razer Blade 15 RZ09-0421NGG3-R3G1 | |
| Asus ROG Zephyrus M16 GU604VY-NM042X | |
| Average of class Gaming (19 - 88.8, n=111, last 2 years) | |
| Average Intel Core i9-13900H (34.4 - 82.8, n=25) | |
| Schenker XMG Neo 16 Raptor Lake | |
| HP Omen 17-ck1075ng | |
| Asus ROG Zephyrus M16 GU603Z | |
| Lenovo Legion 5 Pro 16 G7 i7 RTX 3070Ti | |
| Acer Predator Triton 300 SE | |
| MSI Creator Z16P B12UHST | |
| R Benchmark 2.5 / Overall mean | |
| Razer Blade 15 RZ09-0421NGG3-R3G1 | |
| HP Omen 17-ck1075ng | |
| Lenovo Legion 5 Pro 16 G7 i7 RTX 3070Ti | |
| Average Intel Core i9-13900H (0.4052 - 0.723, n=25) | |
| Asus ROG Zephyrus M16 GU603Z | |
| MSI Creator Z16P B12UHST | |
| Average of class Gaming (0.3439 - 0.759, n=112, last 2 years) | |
| Acer Predator Triton 300 SE | |
| Asus ROG Zephyrus M16 GU604VY-NM042X | |
| Schenker XMG Neo 16 Raptor Lake | |
* ... smaller is better
AIDA64: FP32 Ray-Trace | FPU Julia | CPU SHA3 | CPU Queen | FPU SinJulia | FPU Mandel | CPU AES | CPU ZLib | FP64 Ray-Trace | CPU PhotoWorxx
| Performance rating | |
| MSI Titan GT77 HX 13VI | |
| Asus ROG Strix Scar 18 2023 G834JY-N6005W | |
| Lenovo Legion Pro 7 16IRX8H | |
| Average of class Gaming | |
| Razer Blade 16 Early 2023 | |
| Asus ROG Zephyrus M16 GU604VY-NM042X | |
| Asus ROG Zephyrus M16 GU603Z | |
| Average Intel Core i9-13900H | |
| AIDA64 / FP32 Ray-Trace | |
| Average of class Gaming (10227 - 85542, n=110, last 2 years) | |
| MSI Titan GT77 HX 13VI | |
| Asus ROG Strix Scar 18 2023 G834JY-N6005W | |
| Lenovo Legion Pro 7 16IRX8H | |
| Razer Blade 16 Early 2023 | |
| Razer Blade 16 Early 2023 | |
| Razer Blade 16 Early 2023 | |
| Asus ROG Zephyrus M16 GU604VY-NM042X | |
| Asus ROG Zephyrus M16 GU603Z | |
| Average Intel Core i9-13900H (6788 - 19557, n=25) | |
| AIDA64 / FPU Julia | |
| MSI Titan GT77 HX 13VI | |
| Asus ROG Strix Scar 18 2023 G834JY-N6005W | |
| Average of class Gaming (51376 - 238426, n=110, last 2 years) | |
| Lenovo Legion Pro 7 16IRX8H | |
| Razer Blade 16 Early 2023 | |
| Razer Blade 16 Early 2023 | |
| Razer Blade 16 Early 2023 | |
| Asus ROG Zephyrus M16 GU604VY-NM042X | |
| Average Intel Core i9-13900H (22551 - 95579, n=25) | |
| Asus ROG Zephyrus M16 GU603Z | |
| AIDA64 / CPU SHA3 | |
| MSI Titan GT77 HX 13VI | |
| Asus ROG Strix Scar 18 2023 G834JY-N6005W | |
| Lenovo Legion Pro 7 16IRX8H | |
| Razer Blade 16 Early 2023 | |
| Razer Blade 16 Early 2023 | |
| Razer Blade 16 Early 2023 | |
| Average of class Gaming (2180 - 9817, n=110, last 2 years) | |
| Asus ROG Zephyrus M16 GU604VY-NM042X | |
| Average Intel Core i9-13900H (2491 - 4270, n=25) | |
| Asus ROG Zephyrus M16 GU603Z | |
| AIDA64 / CPU Queen | |
| Asus ROG Strix Scar 18 2023 G834JY-N6005W | |
| MSI Titan GT77 HX 13VI | |
| Razer Blade 16 Early 2023 | |
| Razer Blade 16 Early 2023 | |
| Lenovo Legion Pro 7 16IRX8H | |
| Asus ROG Zephyrus M16 GU604VY-NM042X | |
| Average of class Gaming (49785 - 173351, n=101, last 2 years) | |
| Asus ROG Zephyrus M16 GU603Z | |
| Average Intel Core i9-13900H (65121 - 120936, n=25) | |
| AIDA64 / FPU SinJulia | |
| Asus ROG Strix Scar 18 2023 G834JY-N6005W | |
| MSI Titan GT77 HX 13VI | |
| Razer Blade 16 Early 2023 | |
| Razer Blade 16 Early 2023 | |
| Razer Blade 16 Early 2023 | |
| Lenovo Legion Pro 7 16IRX8H | |
| Average of class Gaming (4424 - 33636, n=110, last 2 years) | |
| Asus ROG Zephyrus M16 GU604VY-NM042X | |
| Average Intel Core i9-13900H (6108 - 11631, n=25) | |
| Asus ROG Zephyrus M16 GU603Z | |
| AIDA64 / FPU Mandel | |
| MSI Titan GT77 HX 13VI | |
| Asus ROG Strix Scar 18 2023 G834JY-N6005W | |
| Average of class Gaming (25115 - 128721, n=110, last 2 years) | |
| Lenovo Legion Pro 7 16IRX8H | |
| Razer Blade 16 Early 2023 | |
| Razer Blade 16 Early 2023 | |
| Razer Blade 16 Early 2023 | |
| Asus ROG Zephyrus M16 GU604VY-NM042X | |
| Average Intel Core i9-13900H (11283 - 48474, n=25) | |
| Asus ROG Zephyrus M16 GU603Z | |
| AIDA64 / CPU AES | |
| Razer Blade 16 Early 2023 | |
| Razer Blade 16 Early 2023 | |
| Razer Blade 16 Early 2023 | |
| MSI Titan GT77 HX 13VI | |
| Asus ROG Strix Scar 18 2023 G834JY-N6005W | |
| Asus ROG Zephyrus M16 GU603Z | |
| Lenovo Legion Pro 7 16IRX8H | |
| Average of class Gaming (39258 - 247074, n=110, last 2 years) | |
| Average Intel Core i9-13900H (3691 - 149377, n=25) | |
| Asus ROG Zephyrus M16 GU604VY-NM042X | |
| AIDA64 / CPU ZLib | |
| MSI Titan GT77 HX 13VI | |
| Asus ROG Strix Scar 18 2023 G834JY-N6005W | |
| Lenovo Legion Pro 7 16IRX8H | |
| Razer Blade 16 Early 2023 | |
| Razer Blade 16 Early 2023 | |
| Razer Blade 16 Early 2023 | |
| Average of class Gaming (574 - 2531, n=110, last 2 years) | |
| Asus ROG Zephyrus M16 GU604VY-NM042X | |
| Average Intel Core i9-13900H (789 - 1254, n=25) | |
| Asus ROG Zephyrus M16 GU603Z | |
| AIDA64 / FP64 Ray-Trace | |
| Average of class Gaming (5509 - 45446, n=110, last 2 years) | |
| MSI Titan GT77 HX 13VI | |
| Asus ROG Strix Scar 18 2023 G834JY-N6005W | |
| Lenovo Legion Pro 7 16IRX8H | |
| Razer Blade 16 Early 2023 | |
| Razer Blade 16 Early 2023 | |
| Razer Blade 16 Early 2023 | |
| Asus ROG Zephyrus M16 GU604VY-NM042X | |
| Asus ROG Zephyrus M16 GU603Z | |
| Average Intel Core i9-13900H (3655 - 10716, n=25) | |
| AIDA64 / CPU PhotoWorxx | |
| Razer Blade 16 Early 2023 | |
| Razer Blade 16 Early 2023 | |
| Razer Blade 16 Early 2023 | |
| Lenovo Legion Pro 7 16IRX8H | |
| Asus ROG Zephyrus M16 GU604VY-NM042X | |
| Average of class Gaming (12271 - 89891, n=110, last 2 years) | |
| Asus ROG Strix Scar 18 2023 G834JY-N6005W | |
| Asus ROG Zephyrus M16 GU603Z | |
| MSI Titan GT77 HX 13VI | |
| Average Intel Core i9-13900H (10871 - 50488, n=25) | |
System performance
Our M16 didn't show any big weaknesses in PCMark10 but it can't exactly be accused of outperforming the last-gen competition either. The Legion 7 is actually a few percentage points quicker. In the digital content creation test, scores are somewhat disappointing, especially in the areas of editing and rendering.

CrossMark: Overall | Productivity | Creativity | Responsiveness
| PCMark 10 / Score | |
| Lenovo Legion 7 16IAX7-82TD004SGE | |
| Average of class Gaming (5828 - 11574, n=96, last 2 years) | |
| Asus ROG Zephyrus M16 GU604VY-NM042X | |
| Alienware x17 R2 P48E | |
| Average Intel Core i9-13900H, NVIDIA GeForce RTX 4090 Laptop GPU (7985 - 8277, n=2) | |
| MSI Creator Z16P B12UHST | |
| Acer Predator Triton 500 SE PT516-52s-70KX | |
| Alienware x15 R2 P111F | |
| Asus ROG Zephyrus Duo 16 GX650RX | |
| PCMark 10 / Essentials | |
| Asus ROG Zephyrus M16 GU604VY-NM042X | |
| Average Intel Core i9-13900H, NVIDIA GeForce RTX 4090 Laptop GPU (11500 - 11659, n=2) | |
| Alienware x17 R2 P48E | |
| Lenovo Legion 7 16IAX7-82TD004SGE | |
| Alienware x15 R2 P111F | |
| MSI Creator Z16P B12UHST | |
| Acer Predator Triton 500 SE PT516-52s-70KX | |
| Average of class Gaming (8810 - 12600, n=100, last 2 years) | |
| Asus ROG Zephyrus Duo 16 GX650RX | |
| PCMark 10 / Productivity | |
| MSI Creator Z16P B12UHST | |
| Asus ROG Zephyrus M16 GU604VY-NM042X | |
| Lenovo Legion 7 16IAX7-82TD004SGE | |
| Average Intel Core i9-13900H, NVIDIA GeForce RTX 4090 Laptop GPU (10526 - 11046, n=2) | |
| Average of class Gaming (6845 - 18766, n=98, last 2 years) | |
| Alienware x15 R2 P111F | |
| Alienware x17 R2 P48E | |
| Acer Predator Triton 500 SE PT516-52s-70KX | |
| Asus ROG Zephyrus Duo 16 GX650RX | |
| PCMark 10 / Digital Content Creation | |
| Lenovo Legion 7 16IAX7-82TD004SGE | |
| Average of class Gaming (7602 - 19657, n=98, last 2 years) | |
| Alienware x17 R2 P48E | |
| Asus ROG Zephyrus M16 GU604VY-NM042X | |
| Average Intel Core i9-13900H, NVIDIA GeForce RTX 4090 Laptop GPU (11412 - 11949, n=2) | |
| MSI Creator Z16P B12UHST | |
| Acer Predator Triton 500 SE PT516-52s-70KX | |
| Alienware x15 R2 P111F | |
| Asus ROG Zephyrus Duo 16 GX650RX | |
| CrossMark / Overall | |
| Lenovo Legion 7 16IAX7-82TD004SGE | |
| Schenker XMG Neo 16 Raptor Lake | |
| Average of class Gaming (1366 - 2409, n=98, last 2 years) | |
| Asus ROG Zephyrus M16 GU604VY-NM042X | |
| Average Intel Core i9-13900H, NVIDIA GeForce RTX 4090 Laptop GPU (n=1) | |
| Alienware x15 R2 P111F | |
| Alienware x17 R2 P48E | |
| Acer Predator Triton 500 SE PT516-52s-70KX | |
| Asus ROG Zephyrus Duo 16 GX650RX | |
| Razer Blade 15 RZ09-0421NGG3-R3G1 | |
| CrossMark / Productivity | |
| Lenovo Legion 7 16IAX7-82TD004SGE | |
| Alienware x15 R2 P111F | |
| Average of class Gaming (1386 - 2254, n=98, last 2 years) | |
| Asus ROG Zephyrus M16 GU604VY-NM042X | |
| Average Intel Core i9-13900H, NVIDIA GeForce RTX 4090 Laptop GPU (n=1) | |
| Schenker XMG Neo 16 Raptor Lake | |
| Alienware x17 R2 P48E | |
| Acer Predator Triton 500 SE PT516-52s-70KX | |
| Asus ROG Zephyrus Duo 16 GX650RX | |
| Razer Blade 15 RZ09-0421NGG3-R3G1 | |
| CrossMark / Creativity | |
| Schenker XMG Neo 16 Raptor Lake | |
| Lenovo Legion 7 16IAX7-82TD004SGE | |
| Asus ROG Zephyrus M16 GU604VY-NM042X | |
| Average Intel Core i9-13900H, NVIDIA GeForce RTX 4090 Laptop GPU (n=1) | |
| Average of class Gaming (1343 - 2729, n=98, last 2 years) | |
| Alienware x15 R2 P111F | |
| Alienware x17 R2 P48E | |
| Acer Predator Triton 500 SE PT516-52s-70KX | |
| Razer Blade 15 RZ09-0421NGG3-R3G1 | |
| Asus ROG Zephyrus Duo 16 GX650RX | |
| CrossMark / Responsiveness | |
| Lenovo Legion 7 16IAX7-82TD004SGE | |
| Acer Predator Triton 500 SE PT516-52s-70KX | |
| Alienware x15 R2 P111F | |
| Asus ROG Zephyrus Duo 16 GX650RX | |
| Average of class Gaming (1226 - 2334, n=98, last 2 years) | |
| Alienware x17 R2 P48E | |
| Asus ROG Zephyrus M16 GU604VY-NM042X | |
| Average Intel Core i9-13900H, NVIDIA GeForce RTX 4090 Laptop GPU (n=1) | |
| Schenker XMG Neo 16 Raptor Lake | |
| Razer Blade 15 RZ09-0421NGG3-R3G1 | |
| PCMark 10 Score | 8277 points | |
Help | ||
| AIDA64 / Memory Copy | |
| Razer Blade 16 Early 2023 | |
| Razer Blade 16 Early 2023 | |
| Razer Blade 16 Early 2023 | |
| Lenovo Legion Pro 7 16IRX8H | |
| Average of class Gaming (21750 - 129946, n=110, last 2 years) | |
| Asus ROG Zephyrus M16 GU604VY-NM042X | |
| Asus ROG Strix Scar 18 2023 G834JY-N6005W | |
| MSI Titan GT77 HX 13VI | |
| Asus ROG Zephyrus M16 GU603Z | |
| Average Intel Core i9-13900H (37448 - 74486, n=25) | |
| AIDA64 / Memory Read | |
| Razer Blade 16 Early 2023 | |
| Razer Blade 16 Early 2023 | |
| Razer Blade 16 Early 2023 | |
| Lenovo Legion Pro 7 16IRX8H | |
| Asus ROG Strix Scar 18 2023 G834JY-N6005W | |
| Average of class Gaming (22956 - 118858, n=110, last 2 years) | |
| Asus ROG Zephyrus M16 GU604VY-NM042X | |
| Asus ROG Zephyrus M16 GU603Z | |
| MSI Titan GT77 HX 13VI | |
| Average Intel Core i9-13900H (41599 - 75433, n=25) | |
| AIDA64 / Memory Write | |
| Razer Blade 16 Early 2023 | |
| Razer Blade 16 Early 2023 | |
| Razer Blade 16 Early 2023 | |
| Average of class Gaming (22297 - 135096, n=110, last 2 years) | |
| Asus ROG Zephyrus M16 GU604VY-NM042X | |
| Lenovo Legion Pro 7 16IRX8H | |
| Asus ROG Strix Scar 18 2023 G834JY-N6005W | |
| Asus ROG Zephyrus M16 GU603Z | |
| Average Intel Core i9-13900H (36152 - 88505, n=25) | |
| MSI Titan GT77 HX 13VI | |
| AIDA64 / Memory Latency | |
| Average of class Gaming (75.3 - 259, n=110, last 2 years) | |
| Razer Blade 16 Early 2023 | |
| Razer Blade 16 Early 2023 | |
| Razer Blade 16 Early 2023 | |
| MSI Titan GT77 HX 13VI | |
| Asus ROG Strix Scar 18 2023 G834JY-N6005W | |
| Average Intel Core i9-13900H (75.8 - 102.3, n=25) | |
| Asus ROG Zephyrus M16 GU603Z | |
| Asus ROG Zephyrus M16 GU604VY-NM042X | |
| Lenovo Legion Pro 7 16IRX8H | |
* ... smaller is better
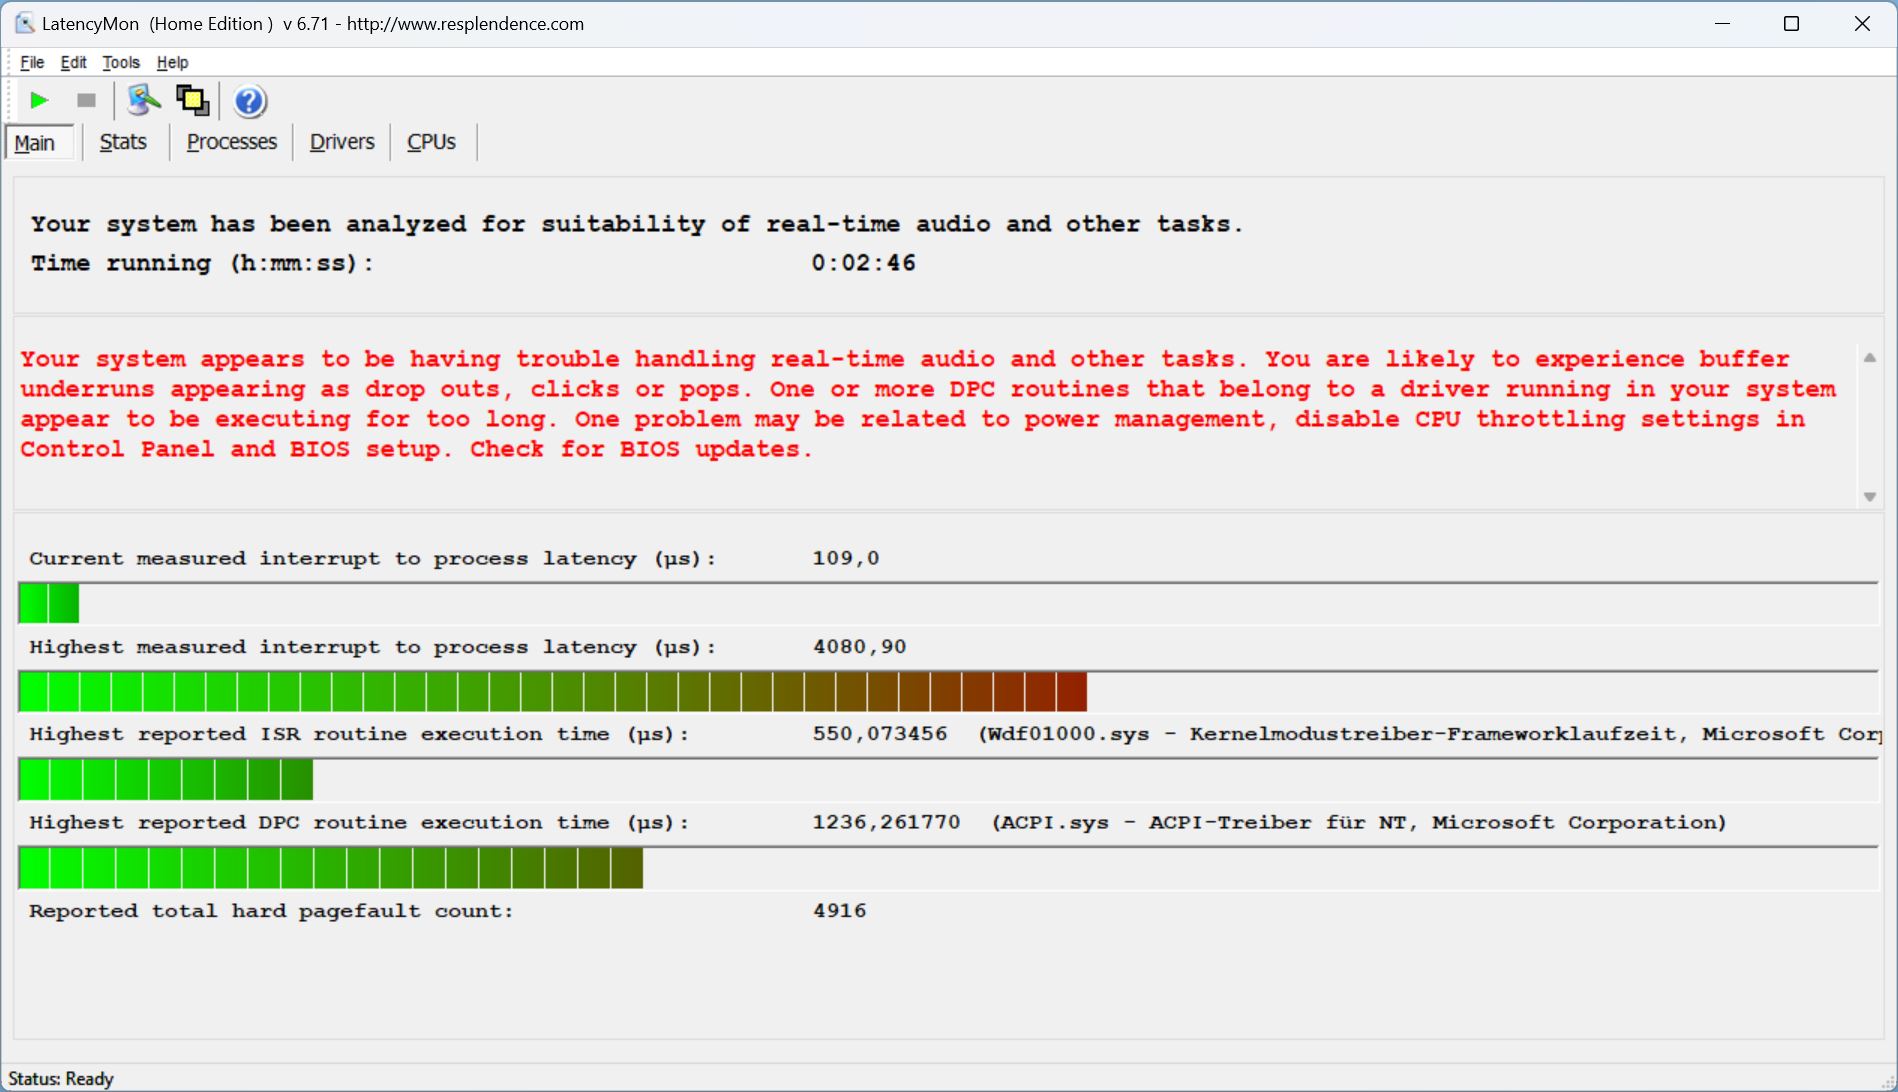
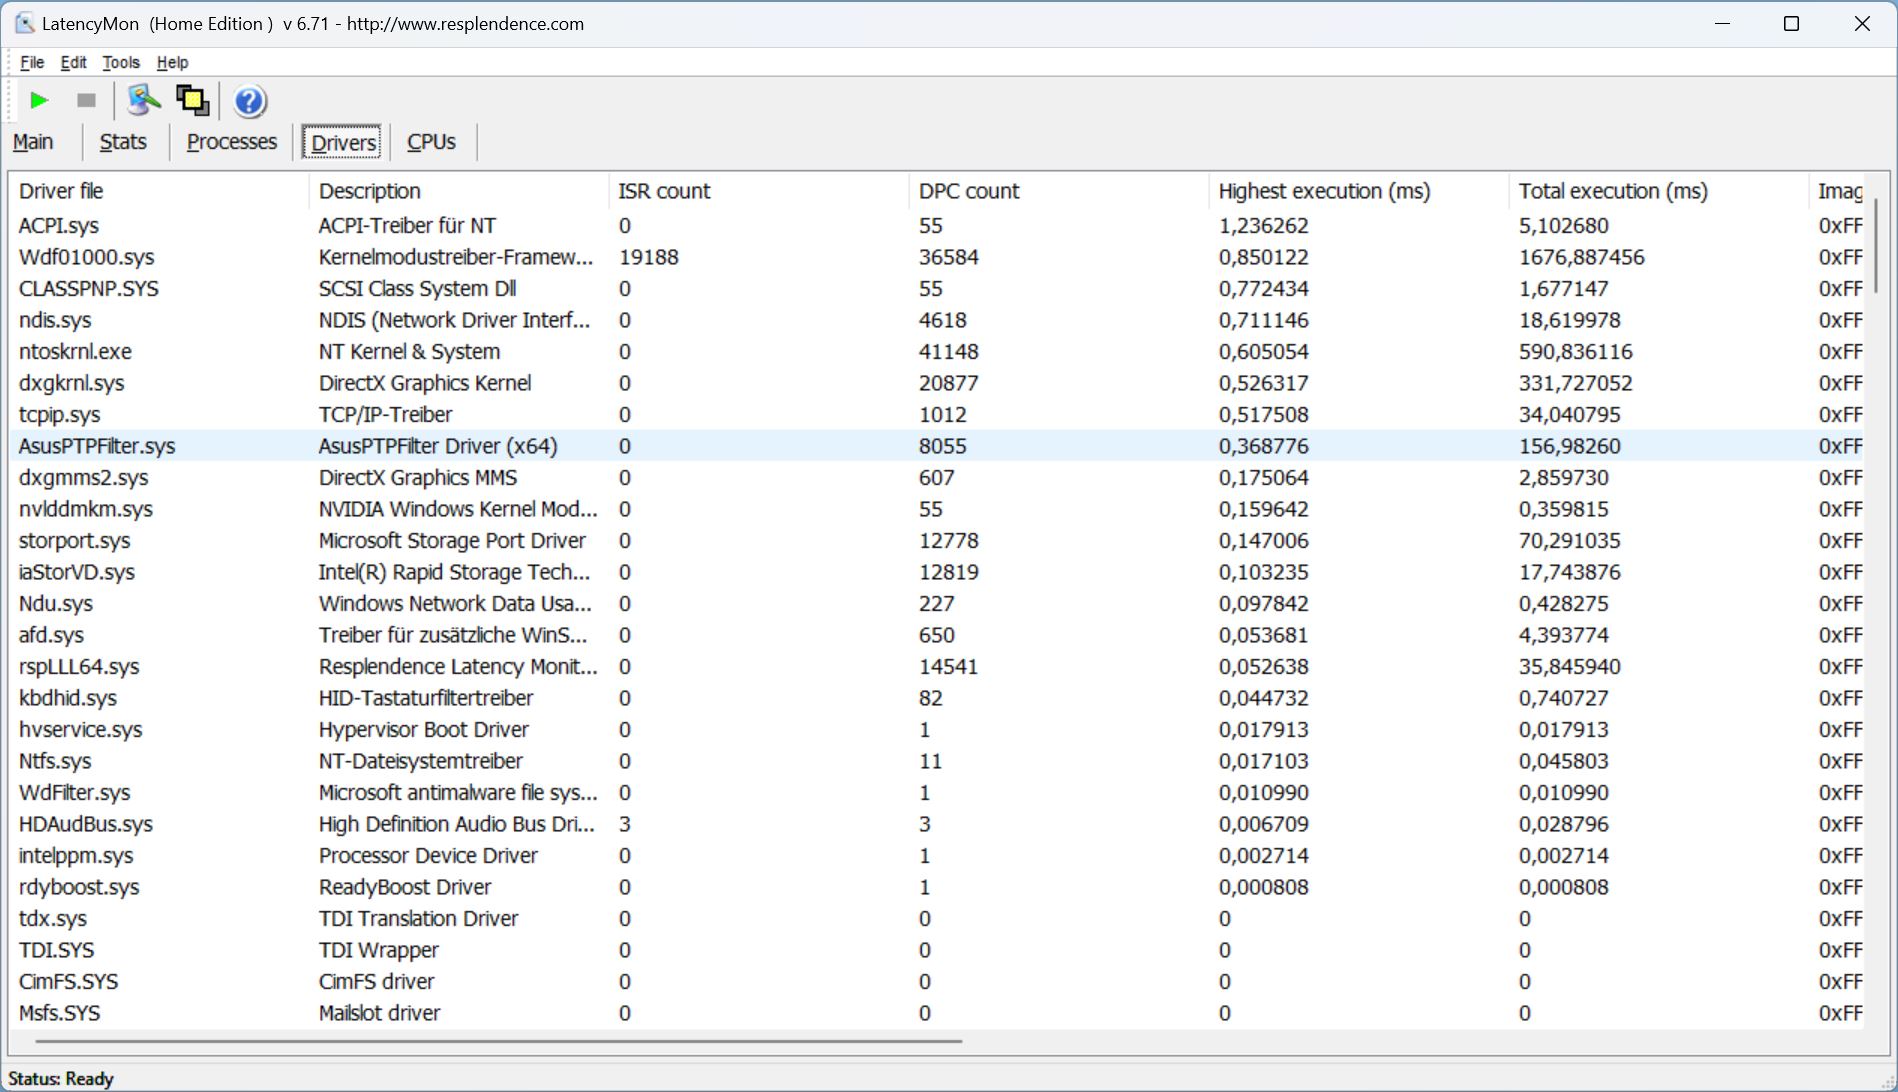
DPC latencies
The M16 doesn't break a sweat when challenged with opening multiple browser tabs. Everything actually looked good until large latencies set in during playback of our 4k/60 fps YouTube videos and subsequently in Prime95. What had actually been good values up to then, skyrocketed several times.
In this way, the M16 has significantly higher latencies than the last-gen competition. The new generation's drivers don't appear to be mature enough and this is demonstrated by the similarly high latencies values seen in the MSI Titan.

| DPC Latencies / LatencyMon - interrupt to process latency (max), Web, Youtube, Prime95 | |
| MSI Titan GT77 HX 13VI | |
| Asus ROG Zephyrus M16 GU604VY-NM042X | |
| Razer Blade 16 Early 2023 | |
| Asus ROG Strix Scar 18 2023 G834JY-N6005W | |
| Asus ROG Zephyrus M16 GU603Z | |
| Lenovo Legion Pro 7 16IRX8H | |
* ... smaller is better
Mass storage
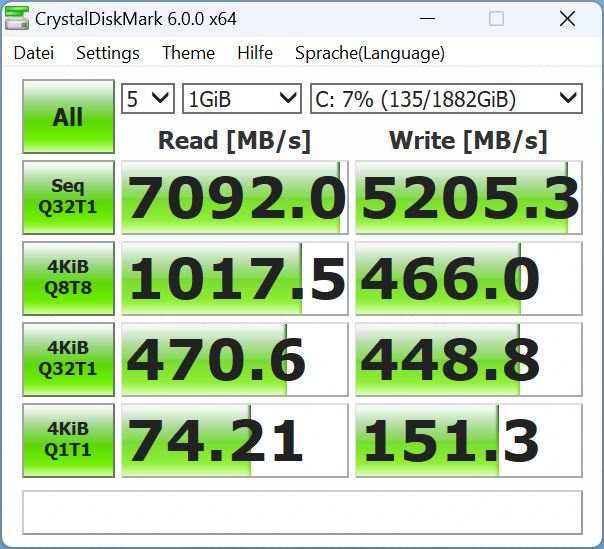
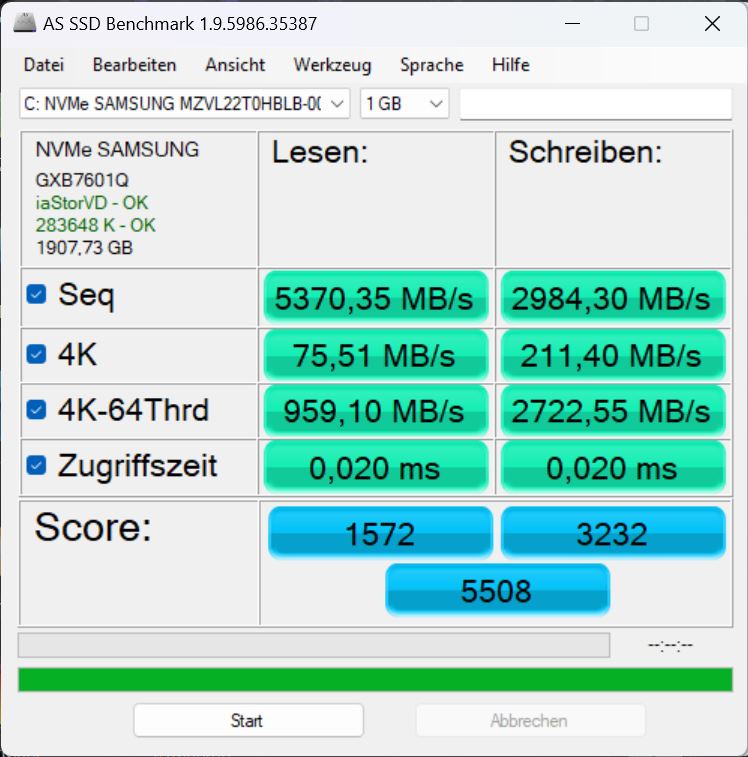
Our configuration has an NVMe SSD Samsung PM9A1 with four PCIe 4 lanes and a capacity of 2 TB and sits in 11th place in our best SSDs list.
The M16's SSD performance is around 20 percent below what can be expected for this type of SSD. However, in real-life use, this will largely go unnoticed and, on the positive side, performance is stable over longer periods of time.

* ... smaller is better
Continuous performance Read: DiskSpd Read Loop, Queue Depth 8
Graphics card
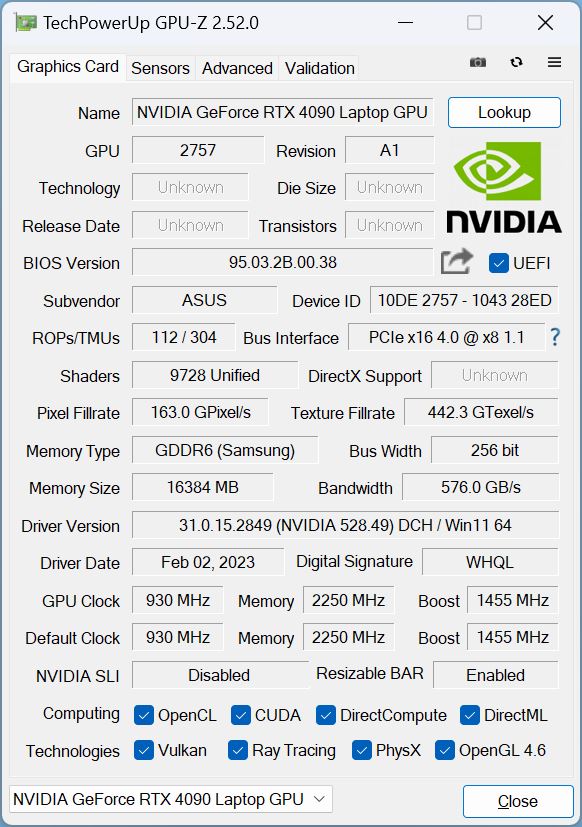
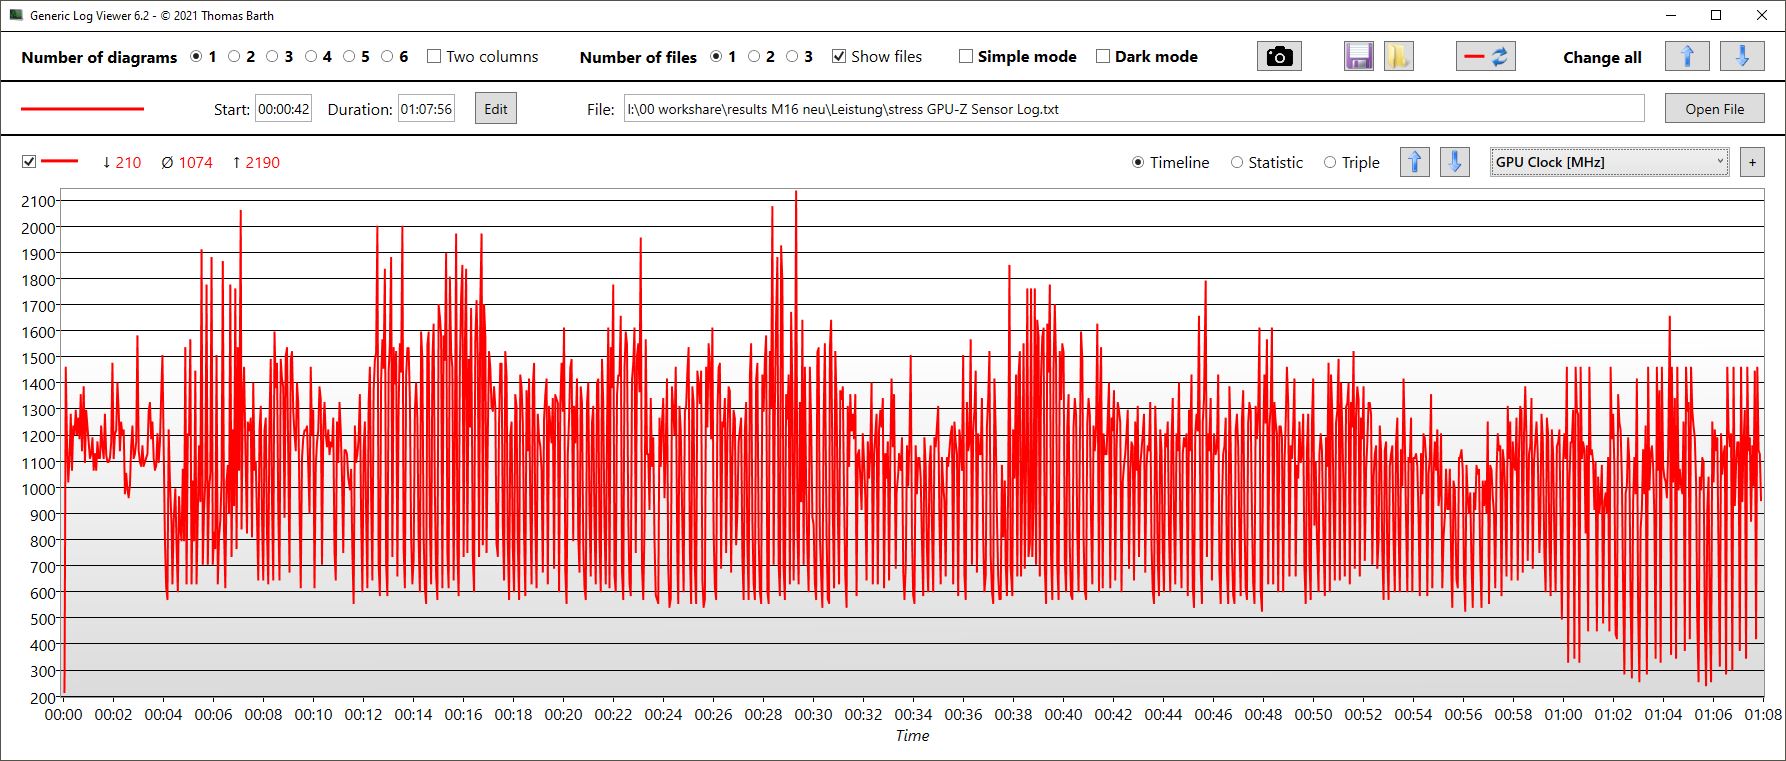
With the new M16, you have a choice between the RTX 4070, RTX 4080 and RTX 4090. In our configuration, the top model is the fastest laptop GPU currently available with its power consumption varying between 80 and 150 watts plus 15 watts dynamic boost. The M16 can draw a maximum of 150 watts which includes the 25-watt dynamic boost.
In the 3DMark benchmarks, there were occasional problems switching the display device to the dGPU via Optimus or MSHybrid/Standard which sometimes resulted in the tests being initiated by the iGPU. Also in this area, it would appear the drivers are not fully mature. If in doubt, the dGPU should be activated manually (MUX).
Up to now, we have only tested the RTX 4090 paired with an HX processor (see the competition). It's somewhat unsurprising that the M16's GPU is, in all tests, around 10 percent slower than the card's average according to our (still) limited database. The Razer Blade 16, paired with a marginally slower RTX 4080, lags a mere 4 percent behind.
In battery mode, 3D performance dropped sharply and in Fire Strike, only 9,000 points from an initial 44,000 remain, representing a drop of almost 80 percent!

| 3DMark Performance rating - Percent | |
| Schenker XMG Neo 16 Raptor Lake | |
| Average NVIDIA GeForce RTX 4090 Laptop GPU | |
| Asus ROG Zephyrus M16 GU604VY-NM042X | |
| Razer Blade 16 Early 2023 | |
| Average of class Gaming | |
| Lenovo Legion 7 16IAX7-82TD004SGE -1! | |
| Asus ROG Strix Scar 17 SE G733CX-LL014W | |
| MSI Raider GE66 12UHS | |
| Alienware x15 R2 P111F | |
| Acer Predator Triton 500 SE PT516-52s-70KX -1! | |
| Razer Blade 15 RZ09-0421NGG3-R3G1 -1! | |
| Asus ROG Zephyrus M16 GU603Z -1! | |
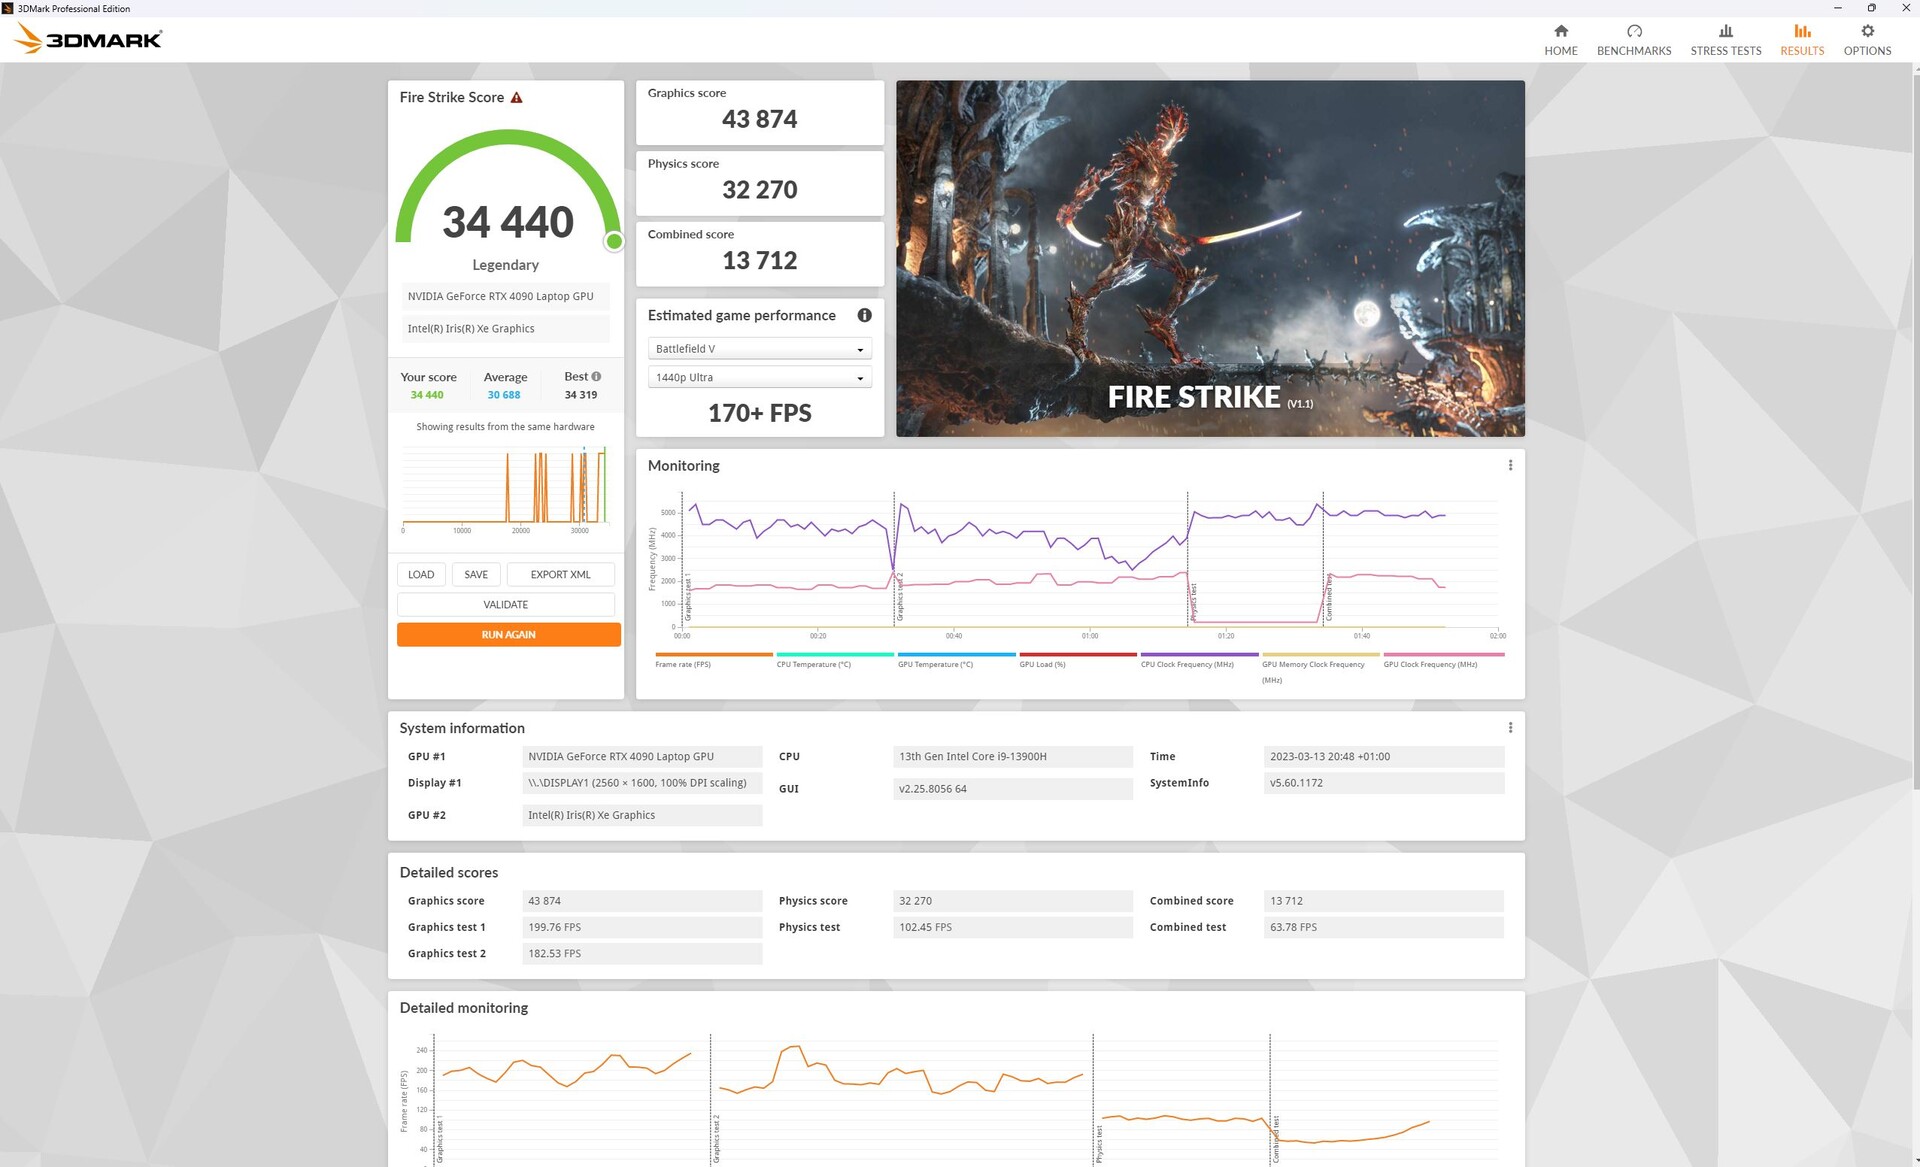
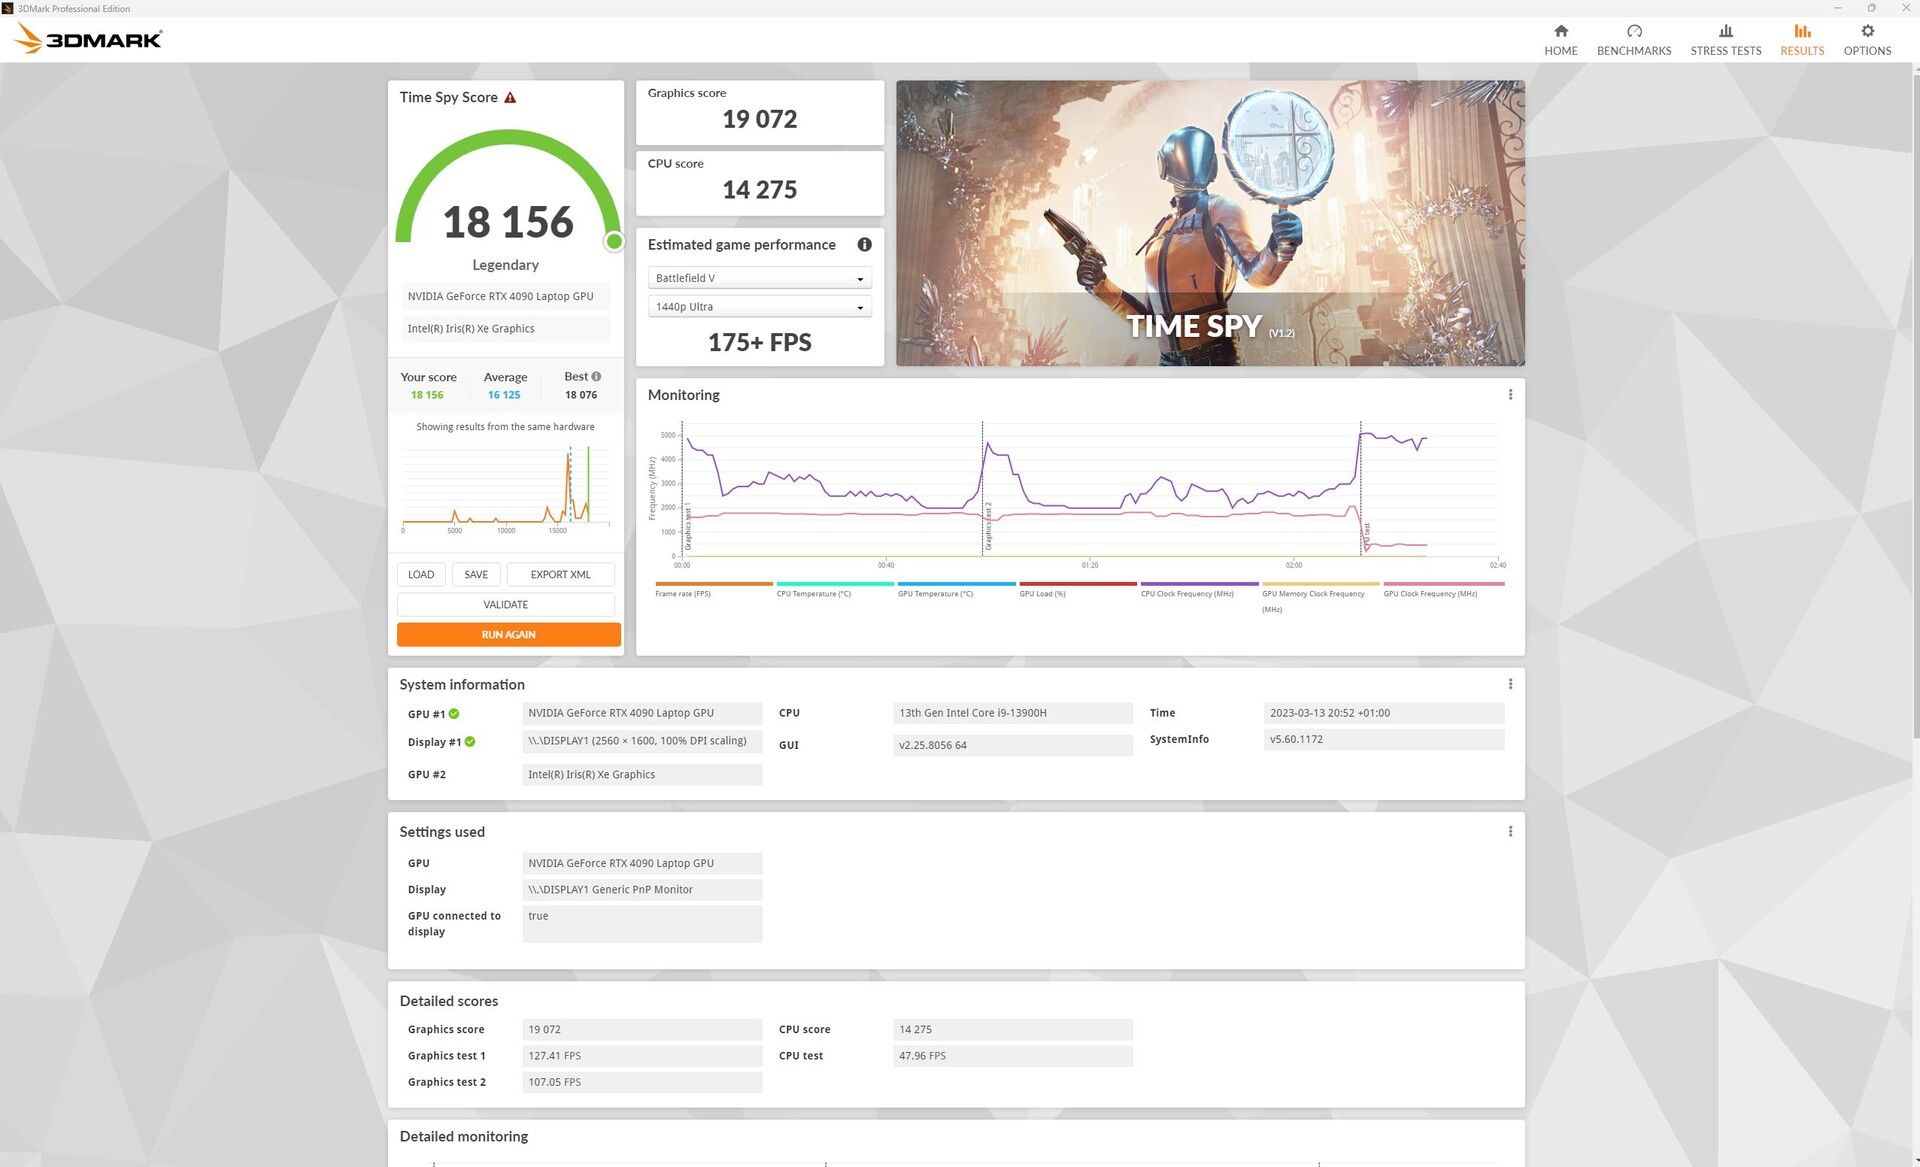
| 3DMark 11 Performance | 41060 points | |
| 3DMark Fire Strike Score | 33550 points | |
| 3DMark Time Spy Score | 15939 points | |
Help | ||
* ... smaller is better
Gaming performance
Also when gaming you notice the M16's RTX 4090 is not paired with an HX CPU. Laptops with an HX CPU and RTX 4080 such as the Blade 16 or the Legion 7 are usually faster, especially when set to low resolutions. The MSI Titan with an RTX 4090 enjoys the biggest performance lead over the M16.
Apart from that, the M16 still has plenty of power to spare at 4K, with enough left in the tank for ray tracing, especially combined with the DLSS 3, AI upscaling technology. You can find additional benchmarks and information regarding the new RTX 40 cards, in our analysis article.
| The Witcher 3 - 1920x1080 Ultra Graphics & Postprocessing (HBAO+) | |
| MSI Titan GT77 HX 13VI | |
| Asus ROG Zephyrus M16 GU604VY-NM042X | |
| Lenovo Legion Pro 7 16IRX8H | |
| Razer Blade 16 Early 2023 | |
| Average of class Gaming (95 - 240, n=8, last 2 years) | |
| Asus ROG Zephyrus M16 GU603Z | |
| Far Cry 6 | |
| 2560x1440 Ultra Graphics Quality + HD Textures AA:T | |
| MSI Titan GT77 HX 13VI | |
| Schenker XMG Neo 16 Raptor Lake | |
| Average NVIDIA GeForce RTX 4090 Laptop GPU (85 - 146, n=12) | |
| Razer Blade 16 Early 2023 | |
| Asus ROG Zephyrus M16 GU604VY-NM042X | |
| Average of class Gaming (74.5 - 116.7, n=2, last 2 years) | |
| 1920x1080 Ultra Graphics Quality + HD Textures + DXR AA:T | |
| Razer Blade 16 Early 2023 | |
| MSI Titan GT77 HX 13VI | |
| Schenker XMG Neo 16 Raptor Lake | |
| Average of class Gaming (n=1last 2 years) | |
| Asus ROG Zephyrus M16 GU604VY-NM042X | |
| Average NVIDIA GeForce RTX 4090 Laptop GPU (81 - 116, n=5) | |
| Tiny Tina's Wonderlands - 2560x1440 Badass Preset (DX12) | |
| Schenker XMG Neo 16 Raptor Lake | |
| MSI Titan GT77 HX 13VI | |
| Average NVIDIA GeForce RTX 4090 Laptop GPU (103.4 - 137.8, n=14) | |
| Asus ROG Zephyrus M16 GU604VY-NM042X | |
| Average of class Gaming (58.9 - 111.2, n=3, last 2 years) | |
| Spider-Man Miles Morales - 2560x1440 Very High Preset AA:T | |
| Schenker XMG Neo 16 Raptor Lake | |
| MSI Titan GT77 HX 13VI | |
| Average NVIDIA GeForce RTX 4090 Laptop GPU (93.3 - 119.8, n=7) | |
| Asus ROG Strix Scar 18 2023 G834JY-N6005W | |
| Lenovo Legion Pro 7 16IRX8H | |
| Asus ROG Zephyrus M16 GU604VY-NM042X | |
After one hour in our Witcher 3 stress test, it's really obvious that performance is on the same level as an RTX 4080 paired with an HX processor. Nevertheless, performance is as high as it is constant.
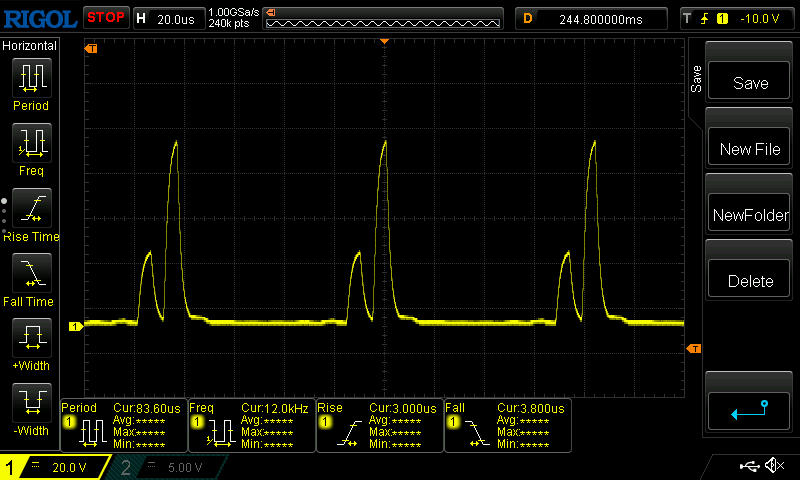
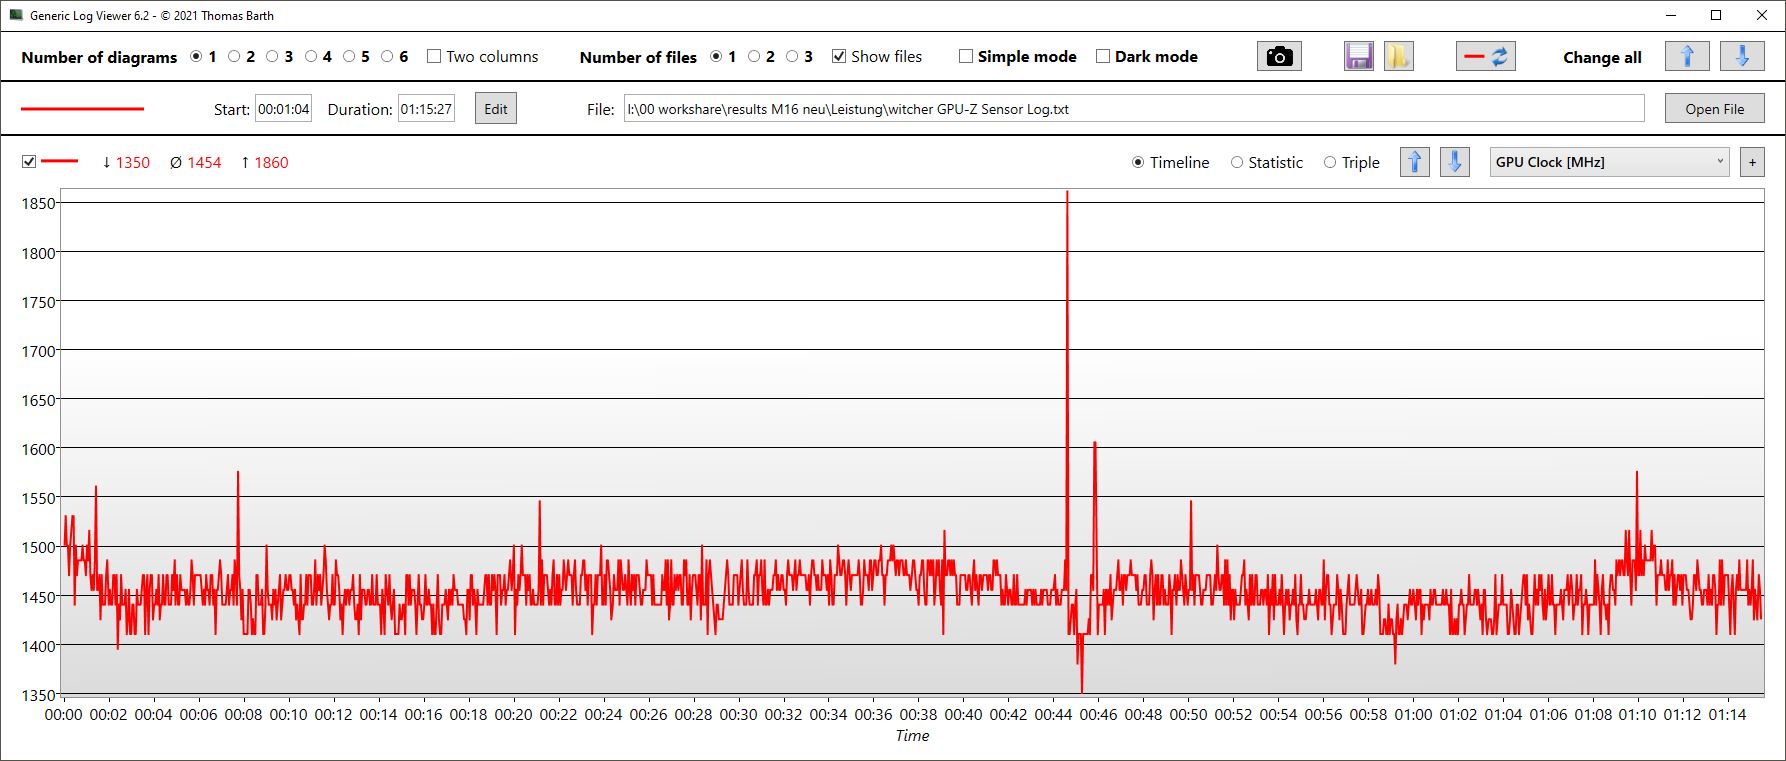
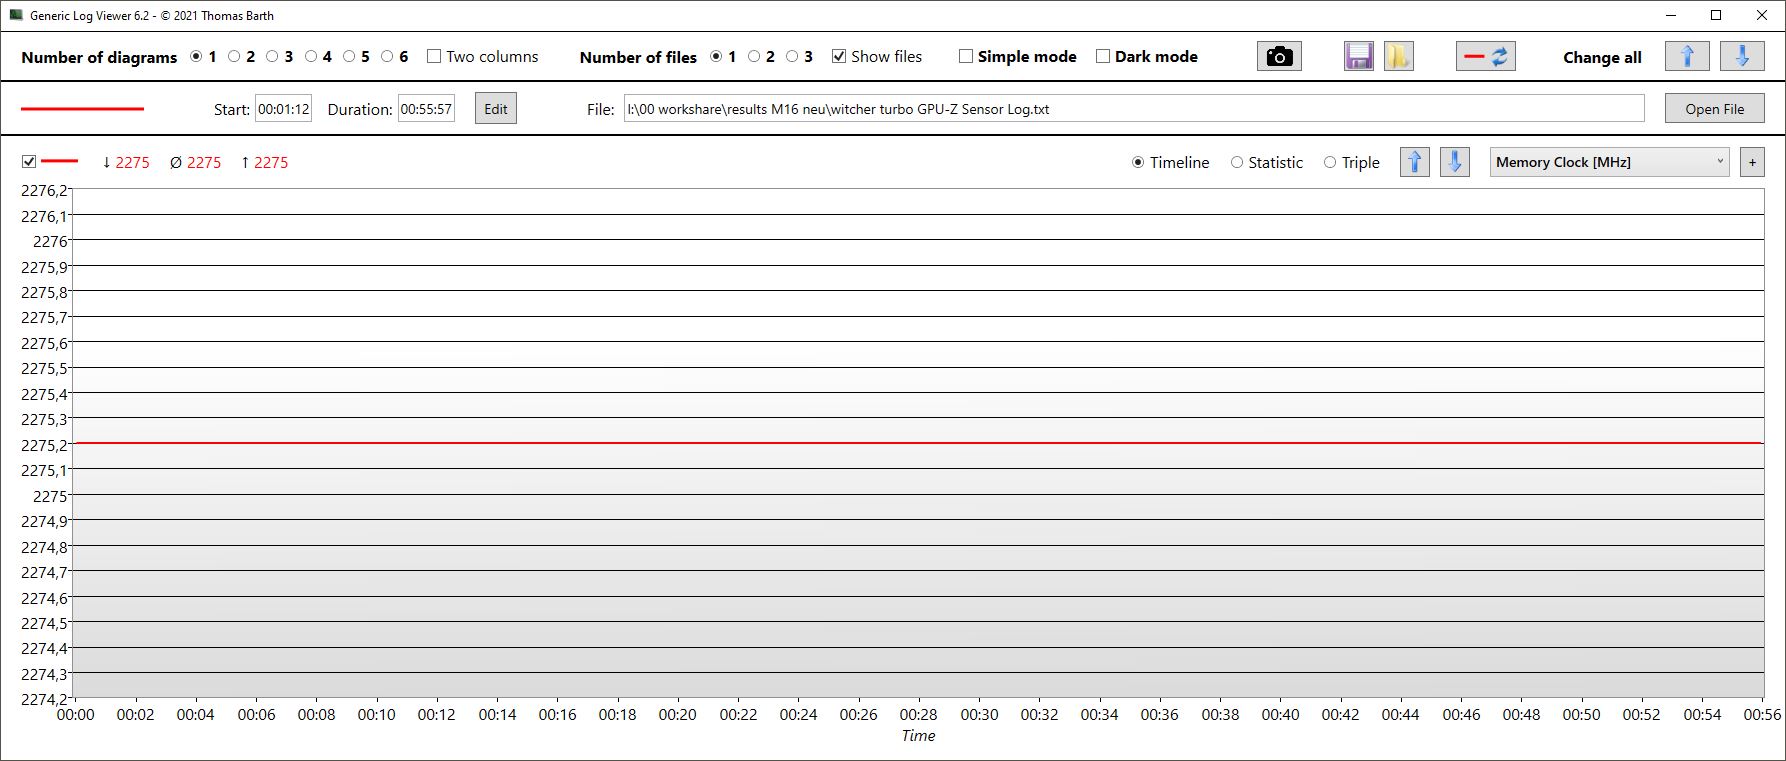
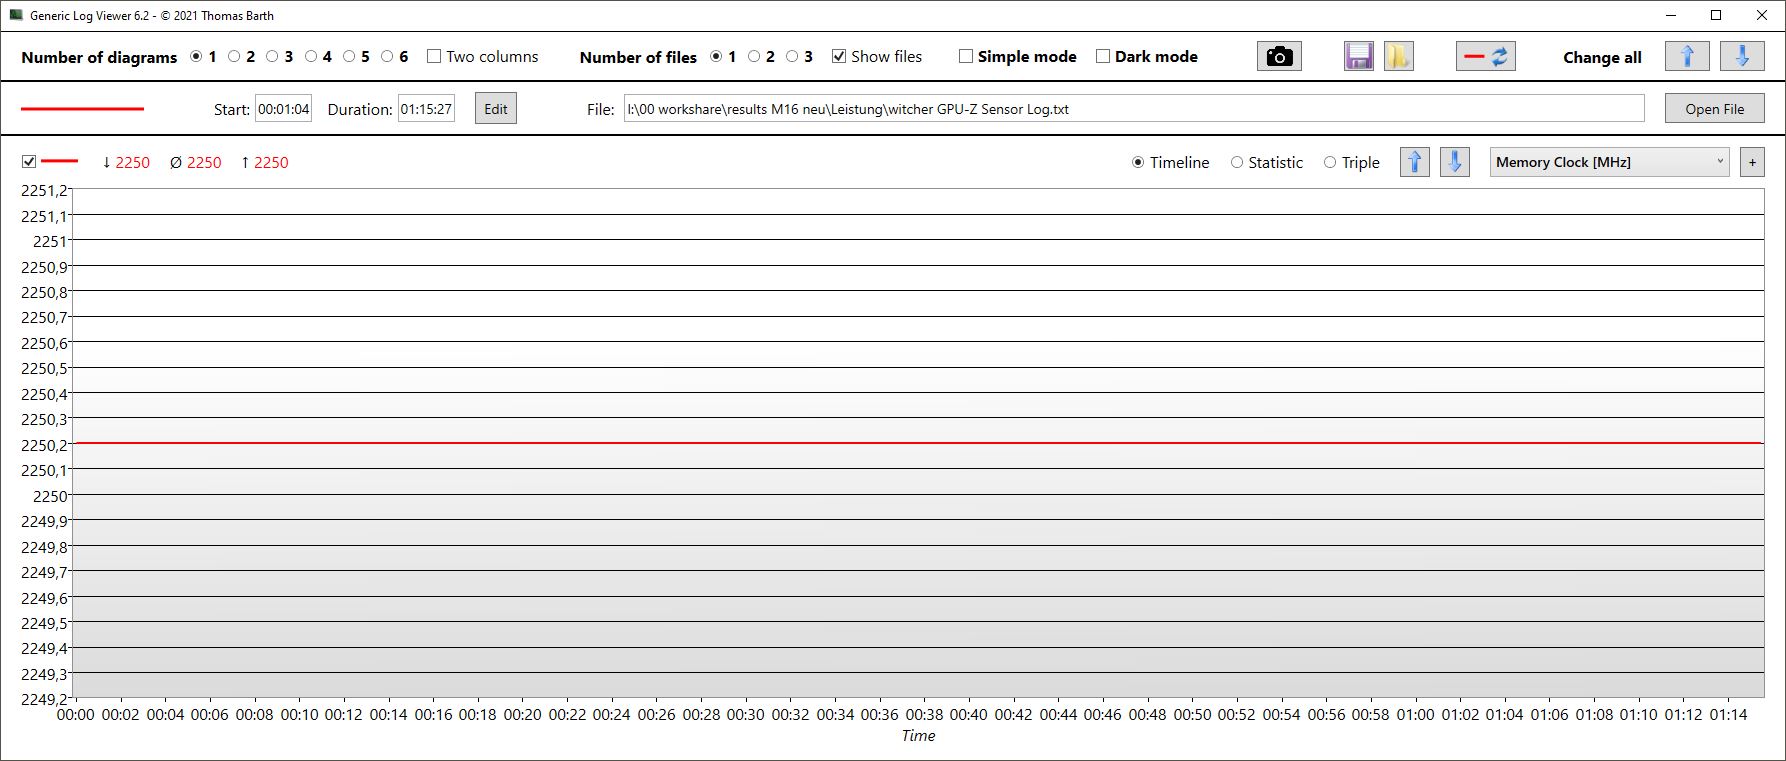
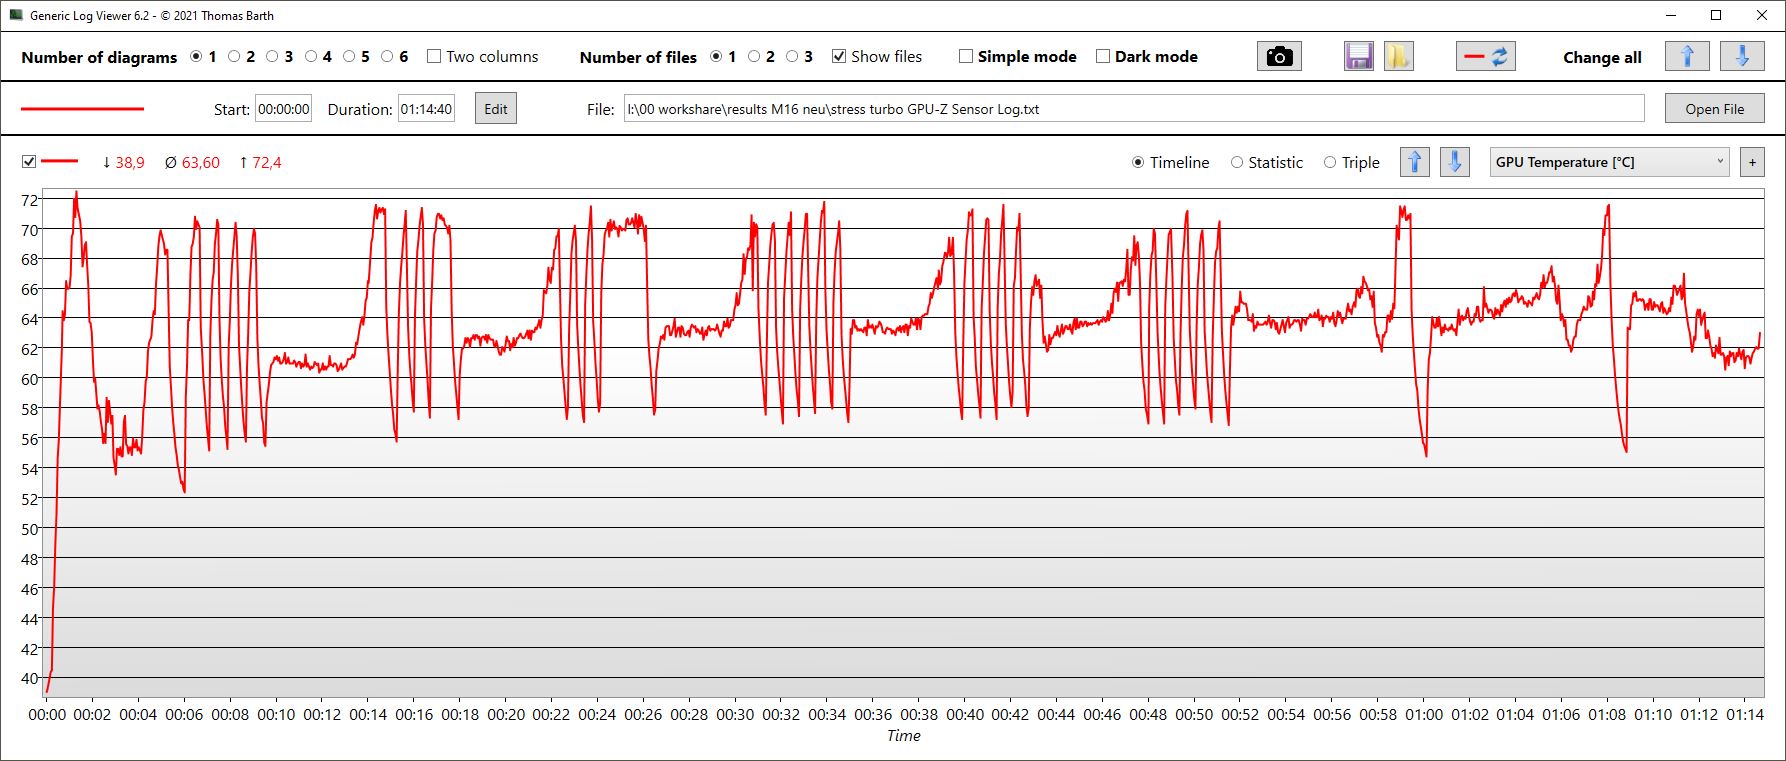
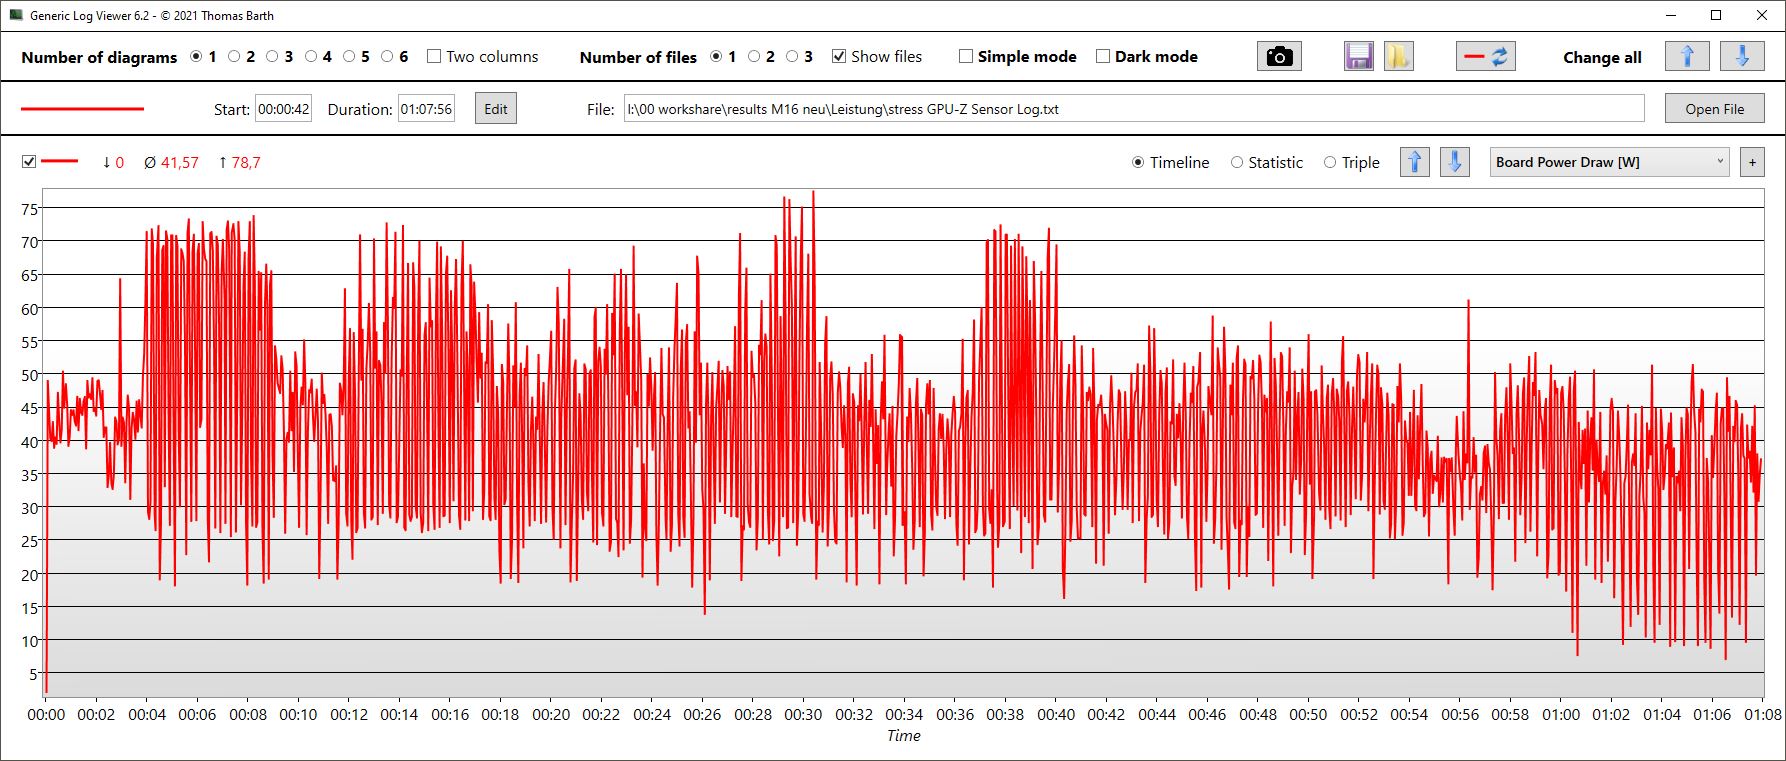
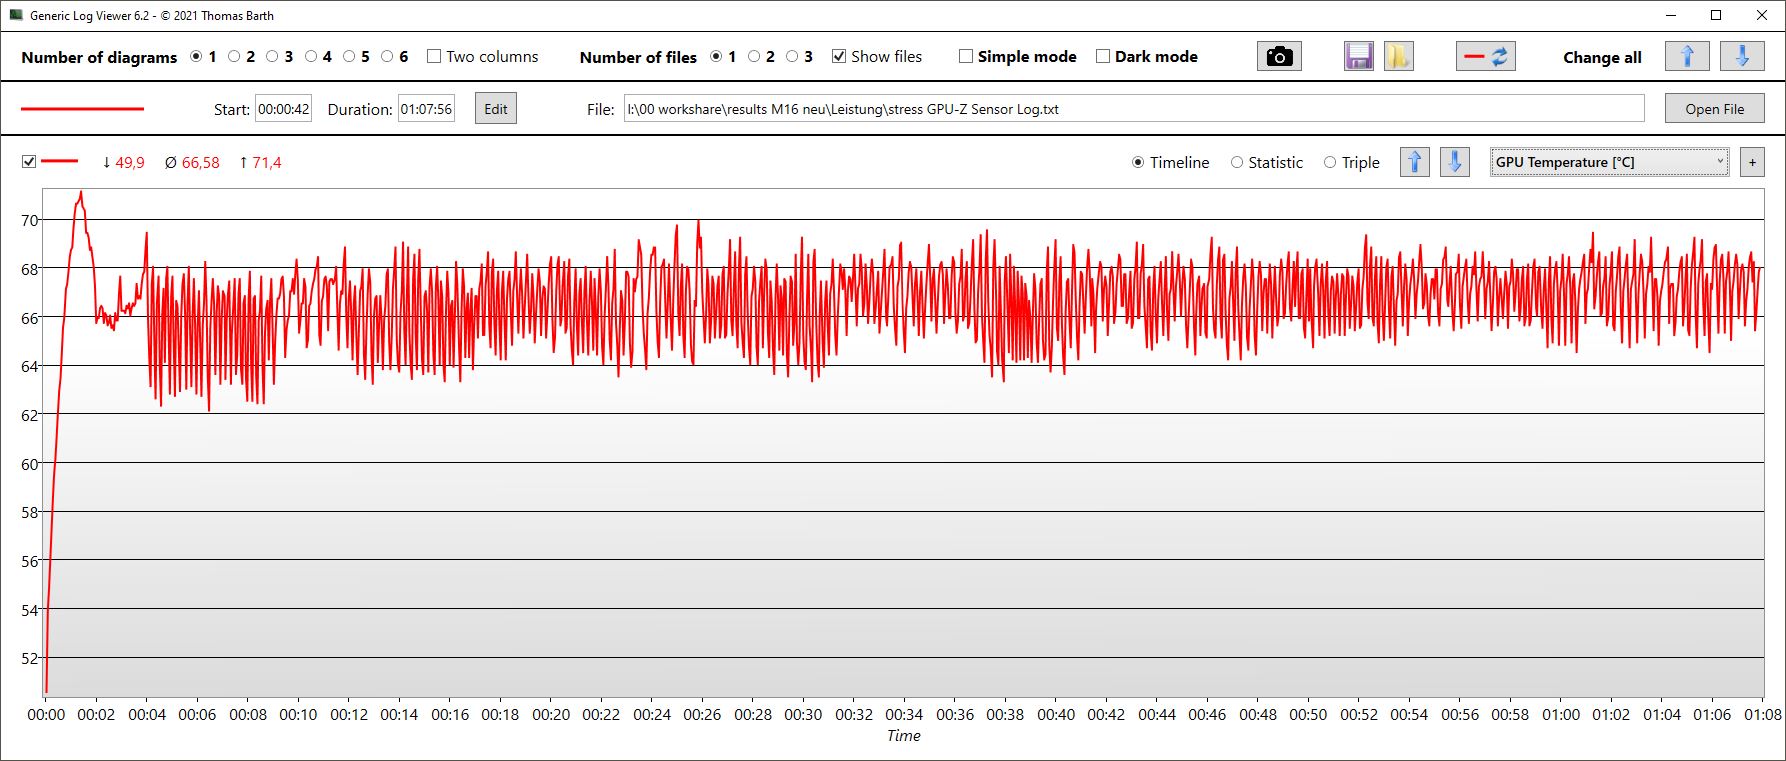
Our GPU-Z log data does a good job of highlighting the difference between Turbo and Performance modes: The clock frequency (1.9 vs. 1.5 GHz), temperature (70 vs. 66 °C), power consumption (140 vs 93 watts) and even the memory clock speed (2,275 vs 2,250 MHz) are all different. The frame rate dropped from around 175 to approximately 145 fps.
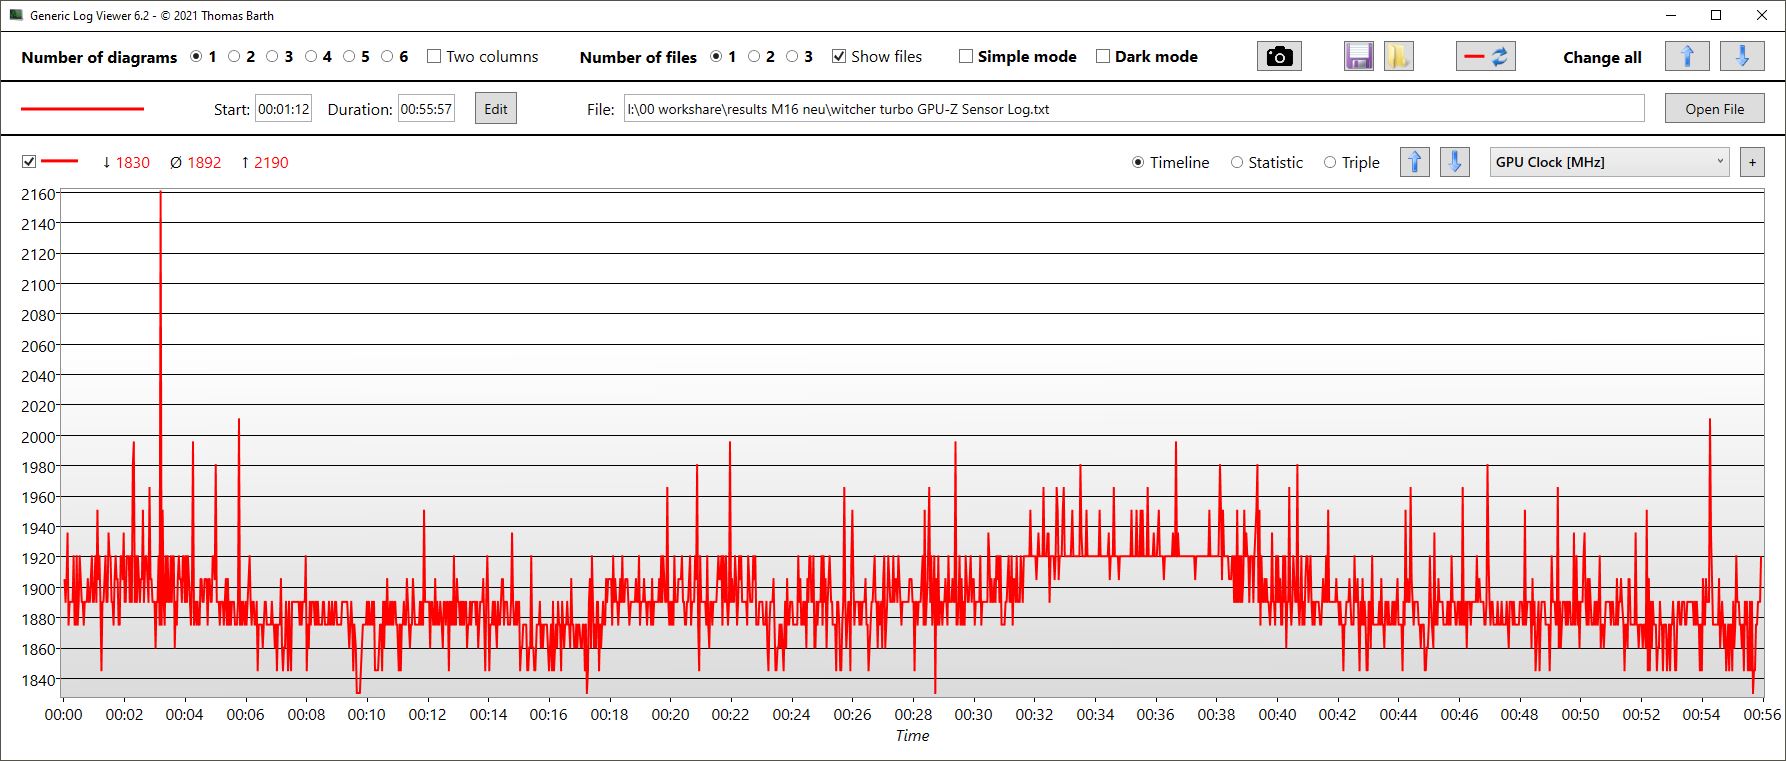
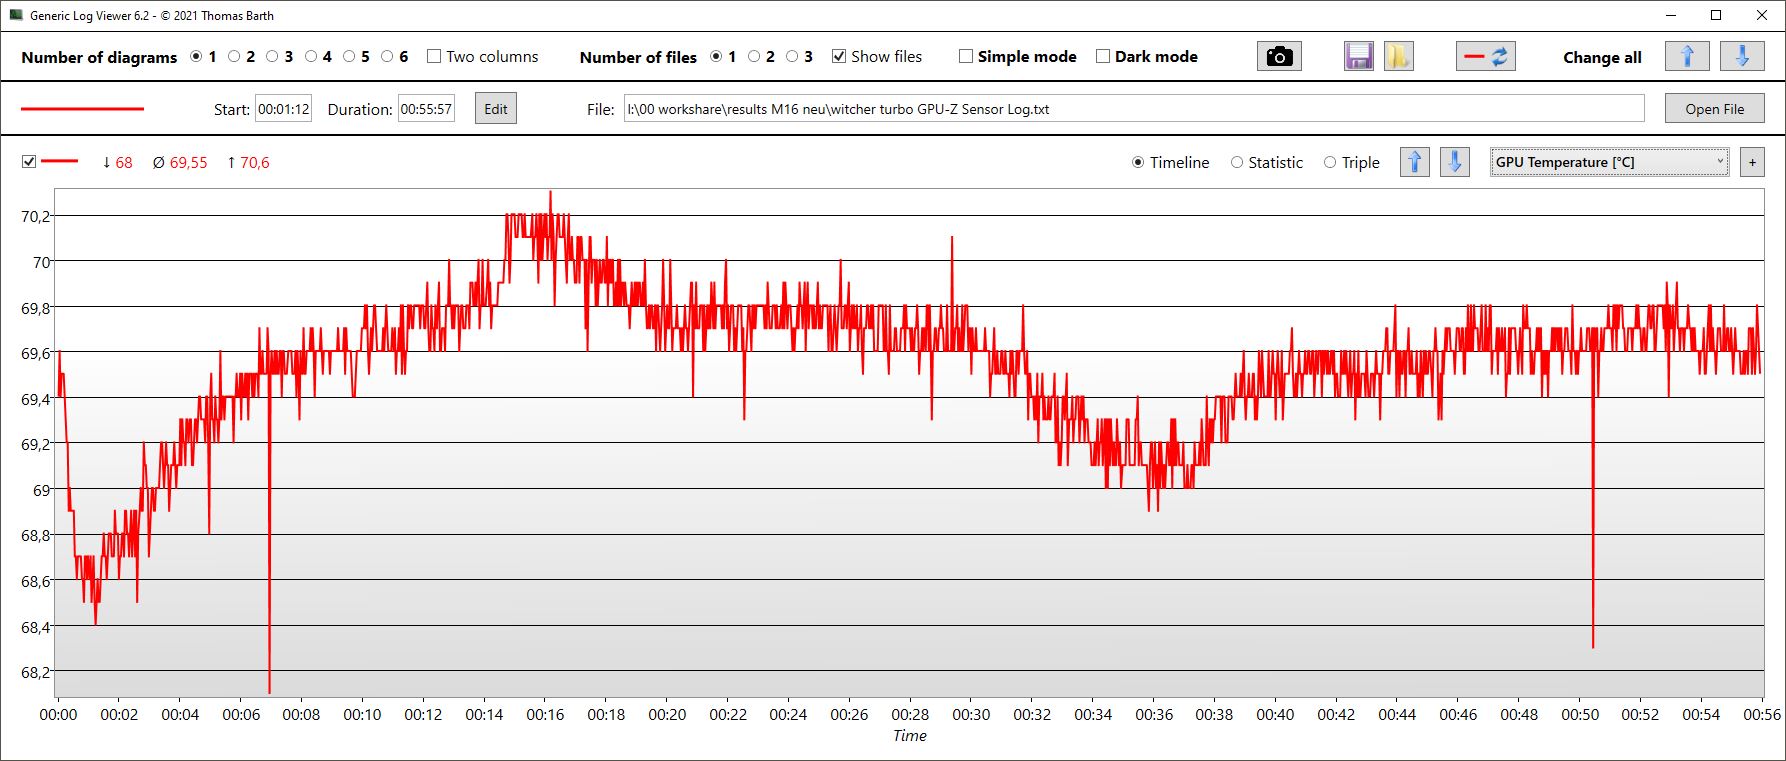
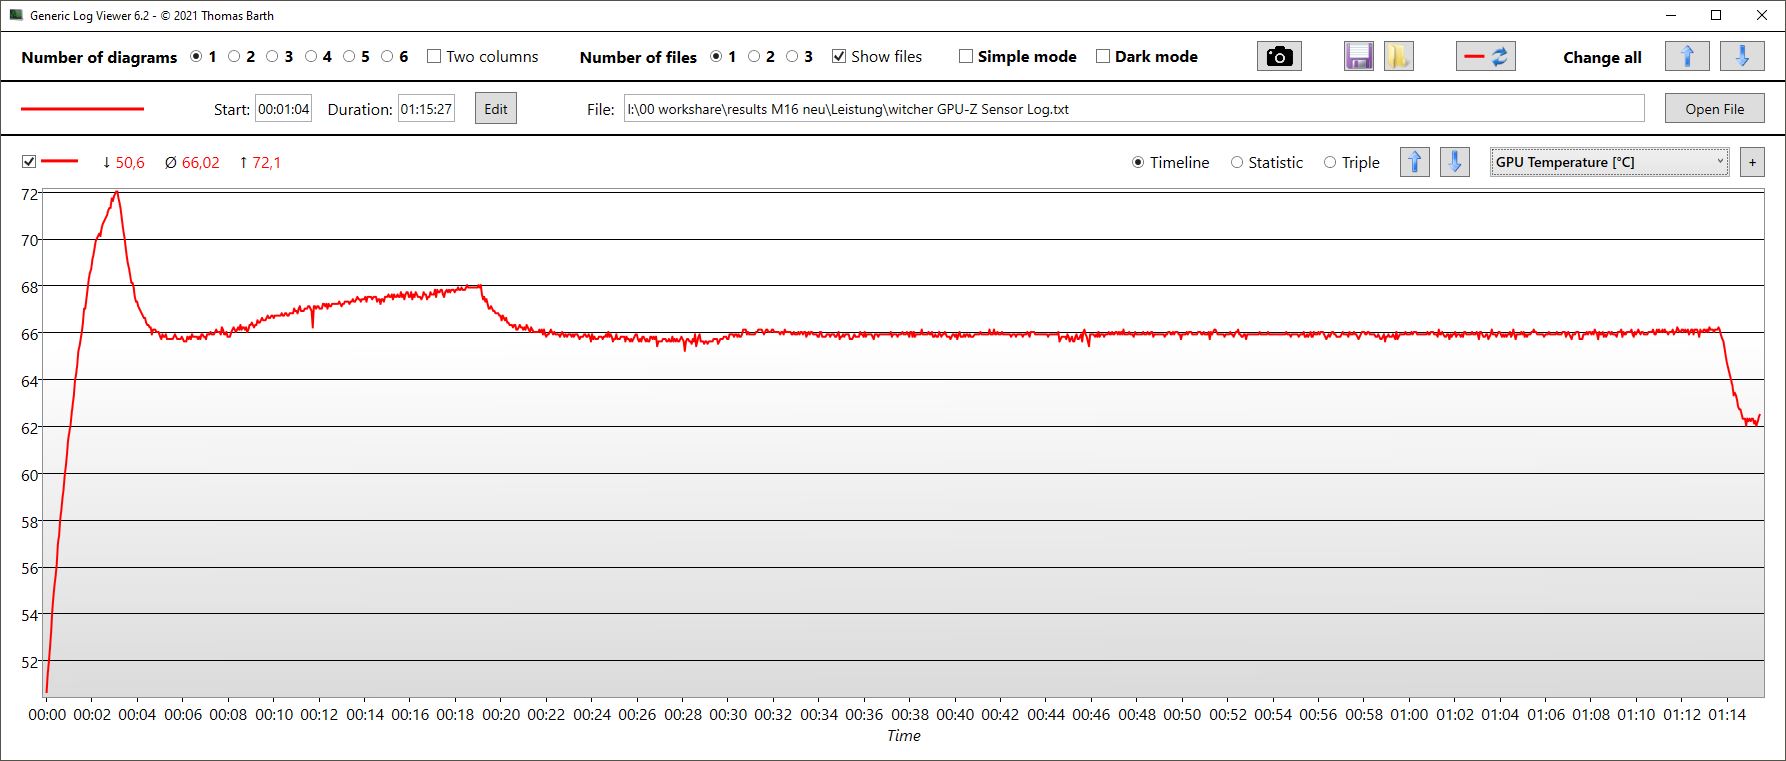
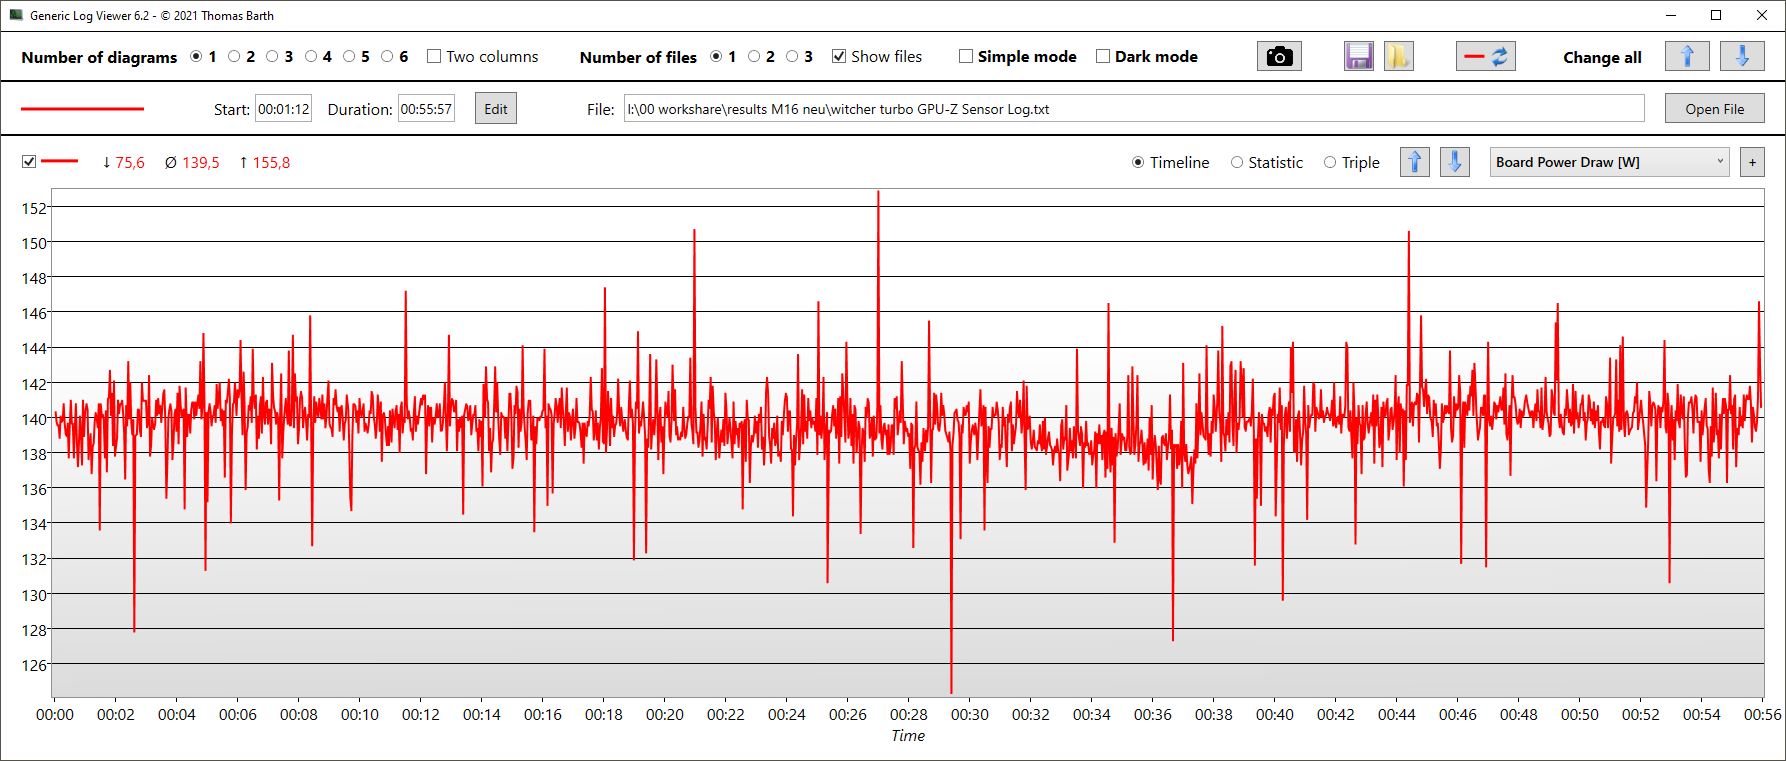
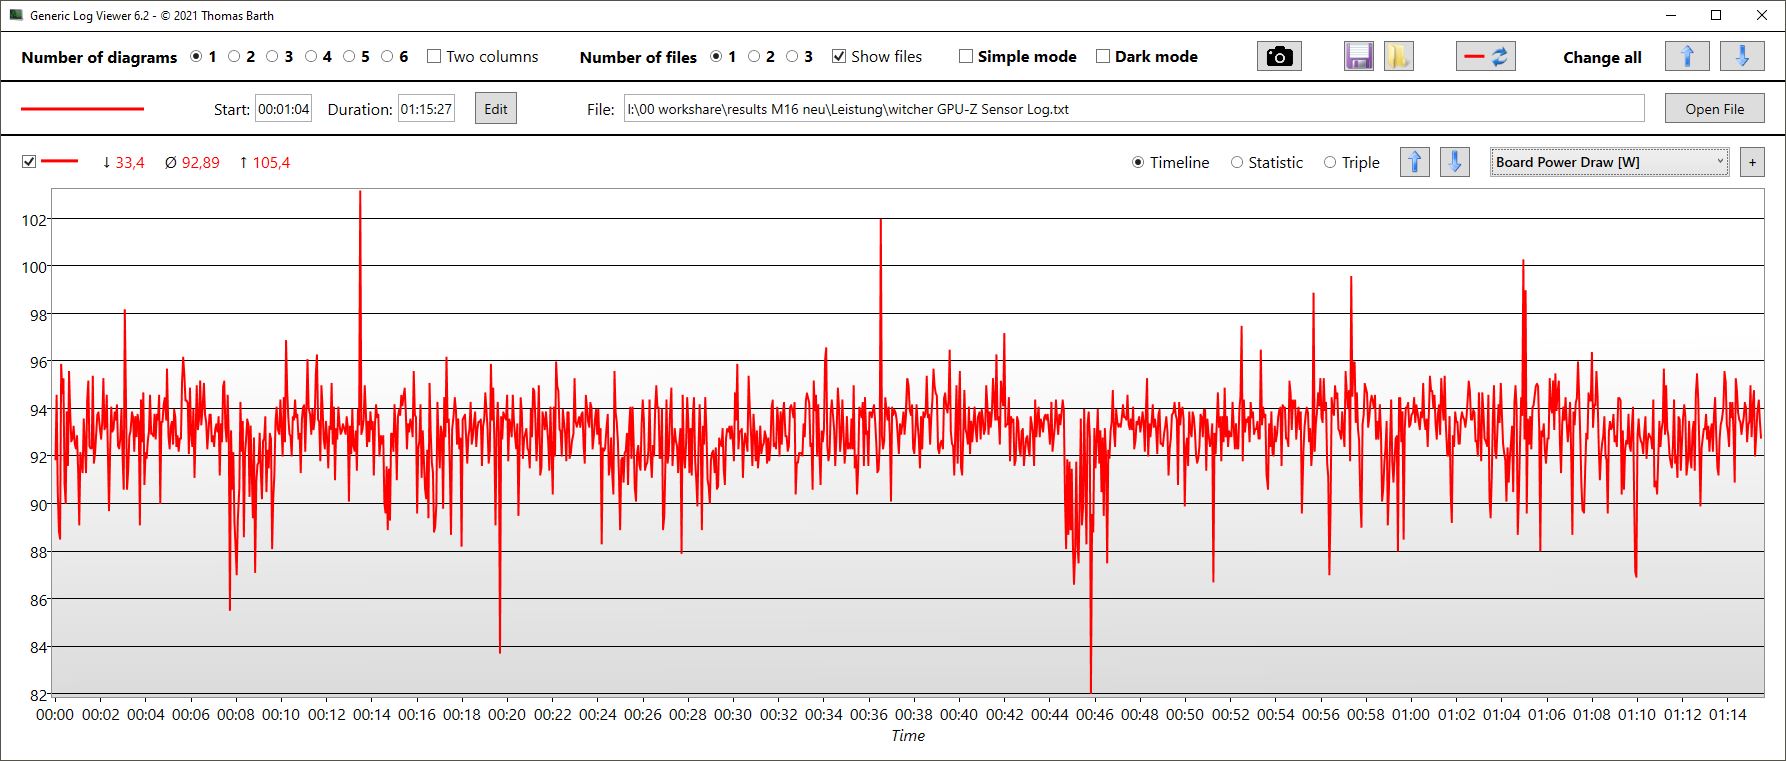
Witcher 3 FPS diagram
| low | med. | high | ultra | QHD | 4K DLSS | 4K | |
|---|---|---|---|---|---|---|---|
| GTA V (2015) | 186 | 183.1 | 179.8 | 127.7 | 123 | ||
| The Witcher 3 (2015) | 444 | 371 | 305 | 178 | |||
| Dota 2 Reborn (2015) | 192.9 | 177.3 | 169.9 | 160.7 | 161.9 | ||
| Final Fantasy XV Benchmark (2018) | 199.1 | 184.5 | 158.6 | 129.5 | |||
| X-Plane 11.11 (2018) | 177.2 | 154.7 | 116.4 | 121.8 | |||
| Far Cry 5 (2018) | 195 | 168 | 156 | 133 | 145 | ||
| Strange Brigade (2018) | 445 | 357 | 343 | 315 | 255 | ||
| Shadow of the Tomb Raider (2018) | 172 | 150 | 90 | ||||
| Watch Dogs Legion (2020) | 102 | 91 | 58 | ||||
| Assassin´s Creed Valhalla (2020) | 126 | 111 | 69 | ||||
| Far Cry 6 (2021) | 111 | 108 | 73 | ||||
| Dying Light 2 (2022) | 145.2 | 103.4 | 53.6 | ||||
| Cyberpunk 2077 1.6 (2022) | 104.49 | 75.69 | 41.9 | ||||
| Tiny Tina's Wonderlands (2022) | 144.06 | 109.64 | 62.33 | ||||
| A Plague Tale Requiem (2022) | 59.4 | ||||||
| Call of Duty Modern Warfare 2 2022 (2022) | 148 | 111 | 98 | 69 | |||
| Spider-Man Miles Morales (2022) | 98.1 | 93.3 | 65.7 | ||||
| The Callisto Protocol (2022) | 113.23 | 90.48 | 53.5 |
Emissions - No question, turbos are loud
Noise emissions
In quiet mode, the fans are mostly inactive in idle use and also remain so under light loads such as writing or surfing the internet. Even in Performance mode, which the manufacturer considers being similar to a balanced mode, the fans are often running, when idle.
For our benchmarks, we use Turbo mode. The fans are only tolerable in idle use, are never silent and only roar to their maximum under heavy load. At this point, they remain at a constant 57 dB, making it one of the loudest laptops in its class. Only the MSI Titan GT77 is louder under maximum load but is at least quieter when gaming. It's worth pointing out that many laptops have a turbo mode where the fans run at maximum in idle usage which is why we often refrain from this test mode. The M16's Turbo mode is somewhat different but headphones are still a must when gaming.
In performance mode, noise levels are tolerable and comparable to the competition. In Witcher 3, we only measured 49 dB instead of 57. In return, gaming performance dropped by around 15 to 18 percent.
Noise level
| Idle |
| 24 / 29.96 / 34.27 dB(A) |
| Load |
| 35.89 / 57.54 dB(A) |
 | ||
30 dB silent 40 dB(A) audible 50 dB(A) loud |
||
min: | ||
| Asus ROG Zephyrus M16 GU604VY-NM042X GeForce RTX 4090 Laptop GPU, i9-13900H, Samsung PM9A1 MZVL22T0HBLB | Asus ROG Zephyrus M16 GU603Z GeForce RTX 3070 Ti Laptop GPU, i9-12900H, Micron 3400 1TB MTFDKBA1T0TFH | Asus ROG Strix Scar 18 2023 G834JY-N6005W GeForce RTX 4090 Laptop GPU, i9-13980HX, 2x Samsung PM9A1 MZVL21T0HCLR (RAID 0) | MSI Titan GT77 HX 13VI GeForce RTX 4090 Laptop GPU, i9-13950HX, Samsung PM9A1 MZVL22T0HBLB | Lenovo Legion Pro 7 16IRX8H GeForce RTX 4080 Laptop GPU, i9-13900HX, Samsung PM9A1 MZVL21T0HCLR | Razer Blade 16 Early 2023 GeForce RTX 4080 Laptop GPU, i9-13950HX, SSSTC CA6-8D1024 | |
|---|---|---|---|---|---|---|
| Noise | -2% | -0% | -7% | -3% | 11% | |
| off / environment * (dB) | 24 | 23 4% | 23.9 -0% | 24.6 -3% | 24 -0% | 23 4% |
| Idle Minimum * (dB) | 24 | 23 4% | 23.9 -0% | 29.2 -22% | 26 -8% | 23 4% |
| Idle Average * (dB) | 29.96 | 24 20% | 32.6 -9% | 29.2 3% | 28 7% | 23 23% |
| Idle Maximum * (dB) | 34.27 | 47 -37% | 32.6 5% | 29.2 15% | 34 1% | 23.6 31% |
| Load Average * (dB) | 35.89 | 47.91 -33% | 35.9 -0% | 50.7 -41% | 47 -31% | 39 -9% |
| Witcher 3 ultra * (dB) | 57.5 | 48.91 15% | 53.3 7% | 55 4% | 51.6 10% | |
| Load Maximum * (dB) | 57.54 | 50.25 13% | 55.8 3% | 61 -6% | 56 3% | 51.3 11% |
* ... smaller is better
Temperature
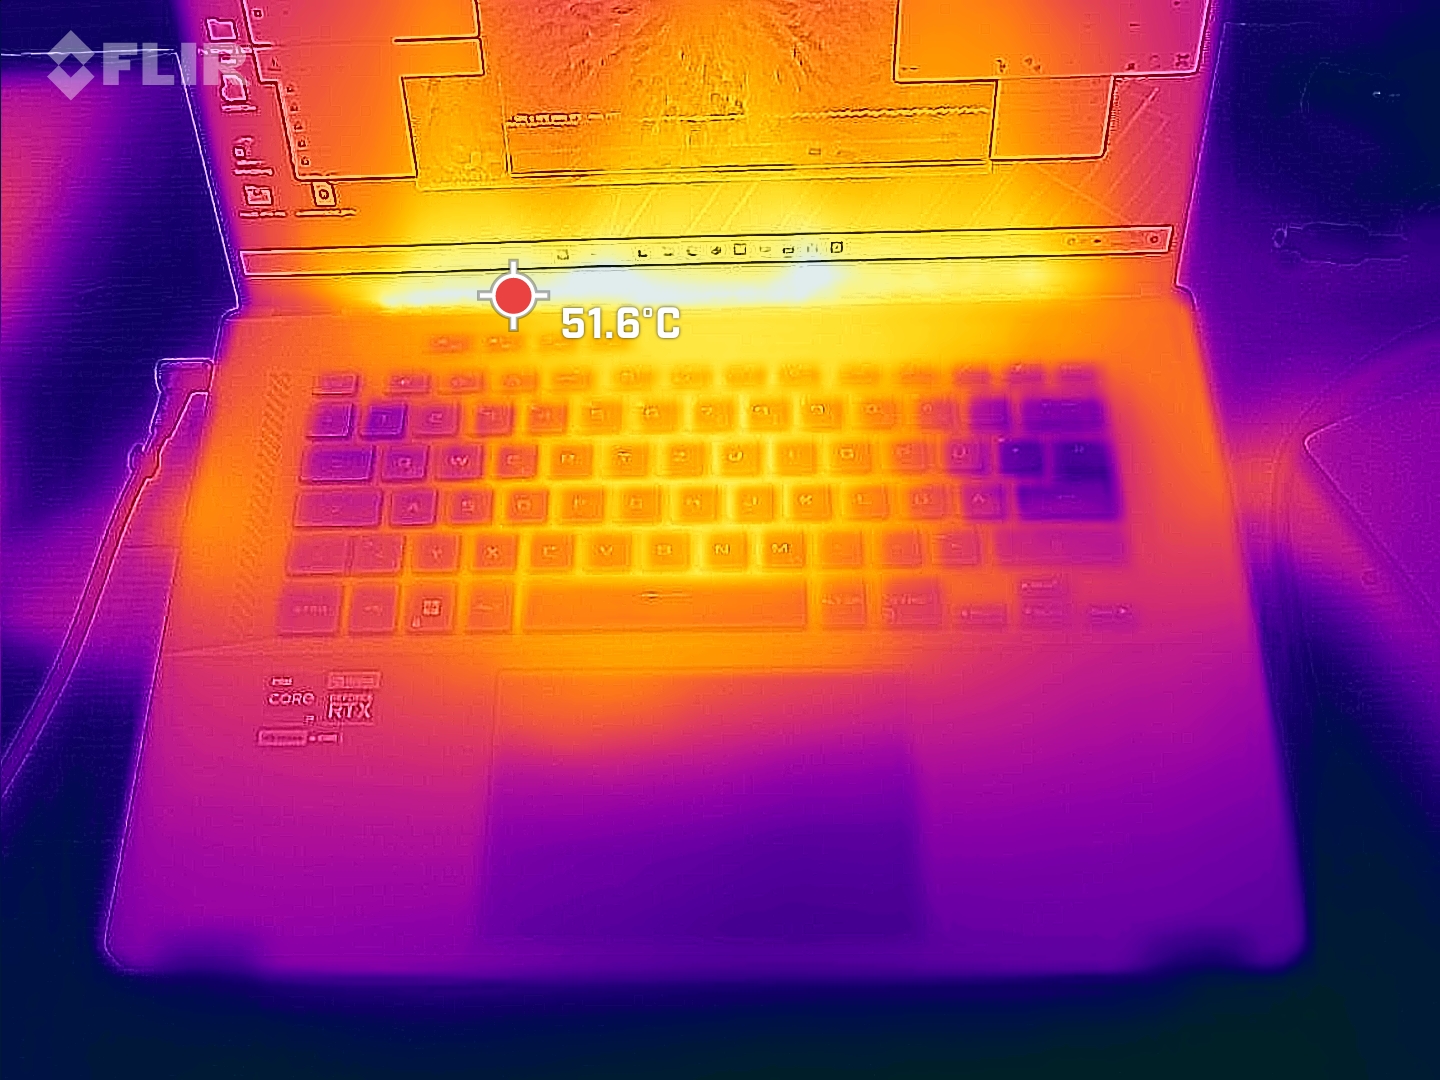
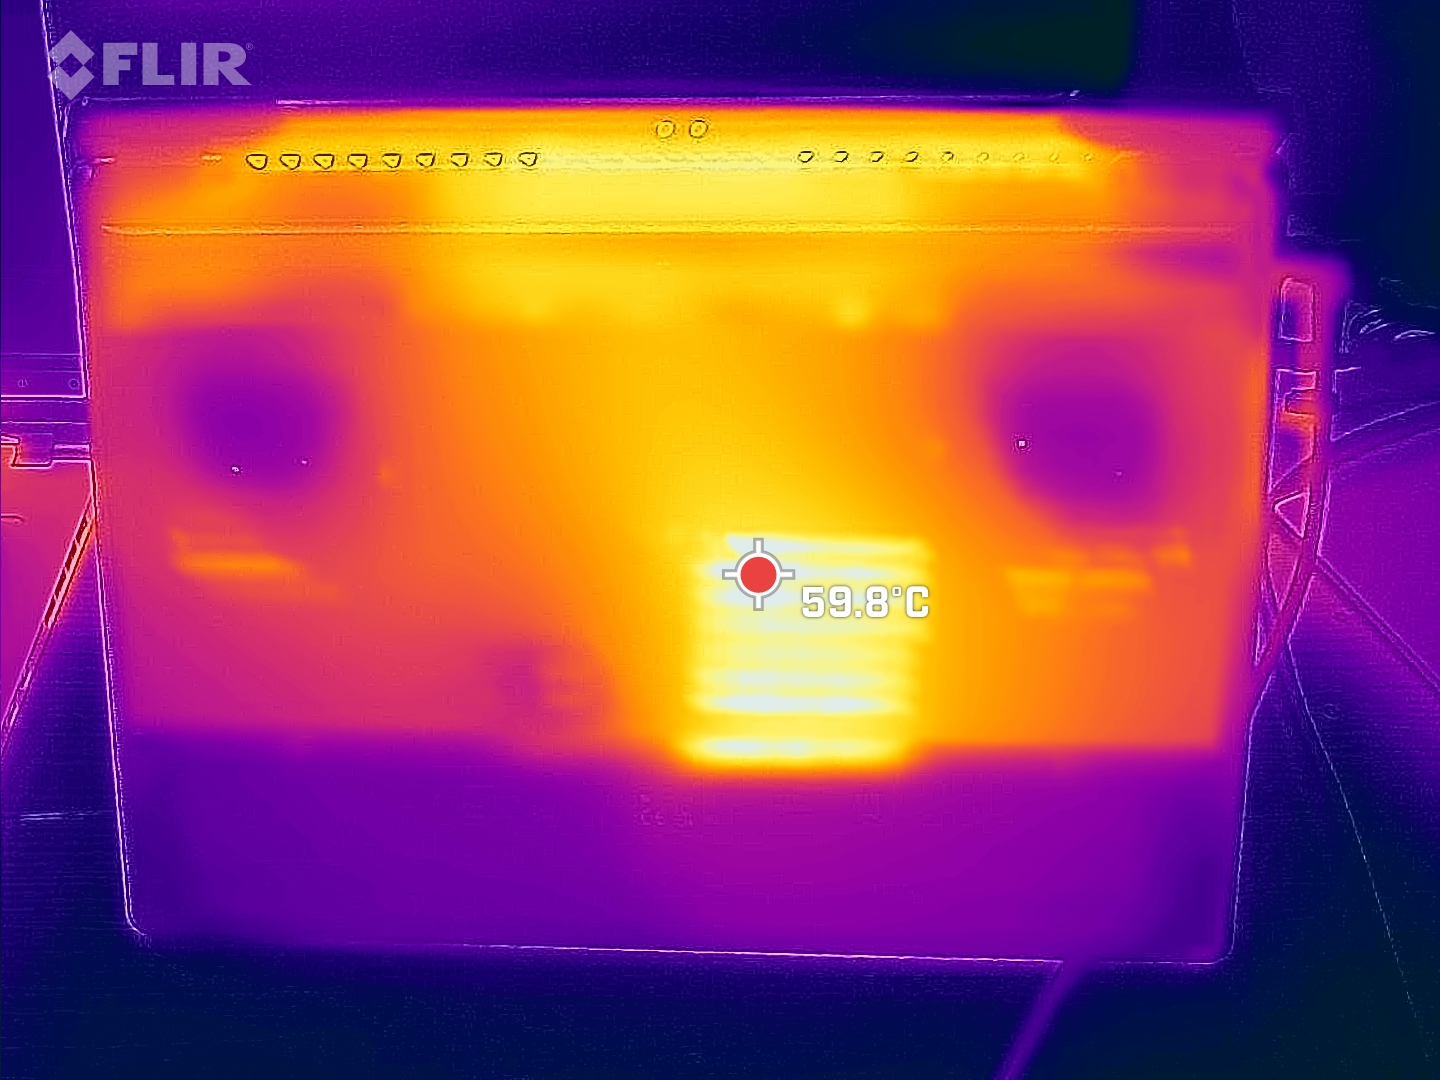
The M16 gets a little warm, especially on the underside of the device. The measured hot spots were just short of 60 °C under maximum stress and they can be found in the center and back. When gaming, the hot spots themselves reached temperatures of only around 50 °C.
By contrast, the palm rest remained mostly cool which also partially applies to the WASD keys.
(-) The maximum temperature on the upper side is 50 °C / 122 F, compared to the average of 40.4 °C / 105 F, ranging from 21.2 to 68.8 °C for the class Gaming.
(-) The bottom heats up to a maximum of 58 °C / 136 F, compared to the average of 43.2 °C / 110 F
(+) In idle usage, the average temperature for the upper side is 24 °C / 75 F, compared to the device average of 33.9 °C / 93 F.
(-) Playing The Witcher 3, the average temperature for the upper side is 38.1 °C / 101 F, compared to the device average of 33.9 °C / 93 F.
(±) The palmrests and touchpad can get very hot to the touch with a maximum of 37 °C / 98.6 F.
(-) The average temperature of the palmrest area of similar devices was 28.8 °C / 83.8 F (-8.2 °C / -14.8 F).
| Asus ROG Zephyrus M16 GU604VY-NM042X Intel Core i9-13900H, NVIDIA GeForce RTX 4090 Laptop GPU | Asus ROG Zephyrus M16 GU603Z Intel Core i9-12900H, NVIDIA GeForce RTX 3070 Ti Laptop GPU | Asus ROG Strix Scar 18 2023 G834JY-N6005W Intel Core i9-13980HX, NVIDIA GeForce RTX 4090 Laptop GPU | MSI Titan GT77 HX 13VI Intel Core i9-13950HX, NVIDIA GeForce RTX 4090 Laptop GPU | Lenovo Legion Pro 7 16IRX8H Intel Core i9-13900HX, NVIDIA GeForce RTX 4080 Laptop GPU | Razer Blade 16 Early 2023 Intel Core i9-13950HX, NVIDIA GeForce RTX 4080 Laptop GPU | |
|---|---|---|---|---|---|---|
| Heat | -6% | -3% | 10% | -13% | 5% | |
| Maximum Upper Side * (°C) | 50 | 52 -4% | 54 -8% | 40.6 19% | 48 4% | 40 20% |
| Maximum Bottom * (°C) | 58 | 51 12% | 46 21% | 41.1 29% | 49 16% | 37.6 35% |
| Idle Upper Side * (°C) | 26 | 29 -12% | 30 -15% | 26.2 -1% | 40 -54% | 32.4 -25% |
| Idle Bottom * (°C) | 28 | 33 -18% | 31 -11% | 30.3 -8% | 33 -18% | 31.4 -12% |
* ... smaller is better
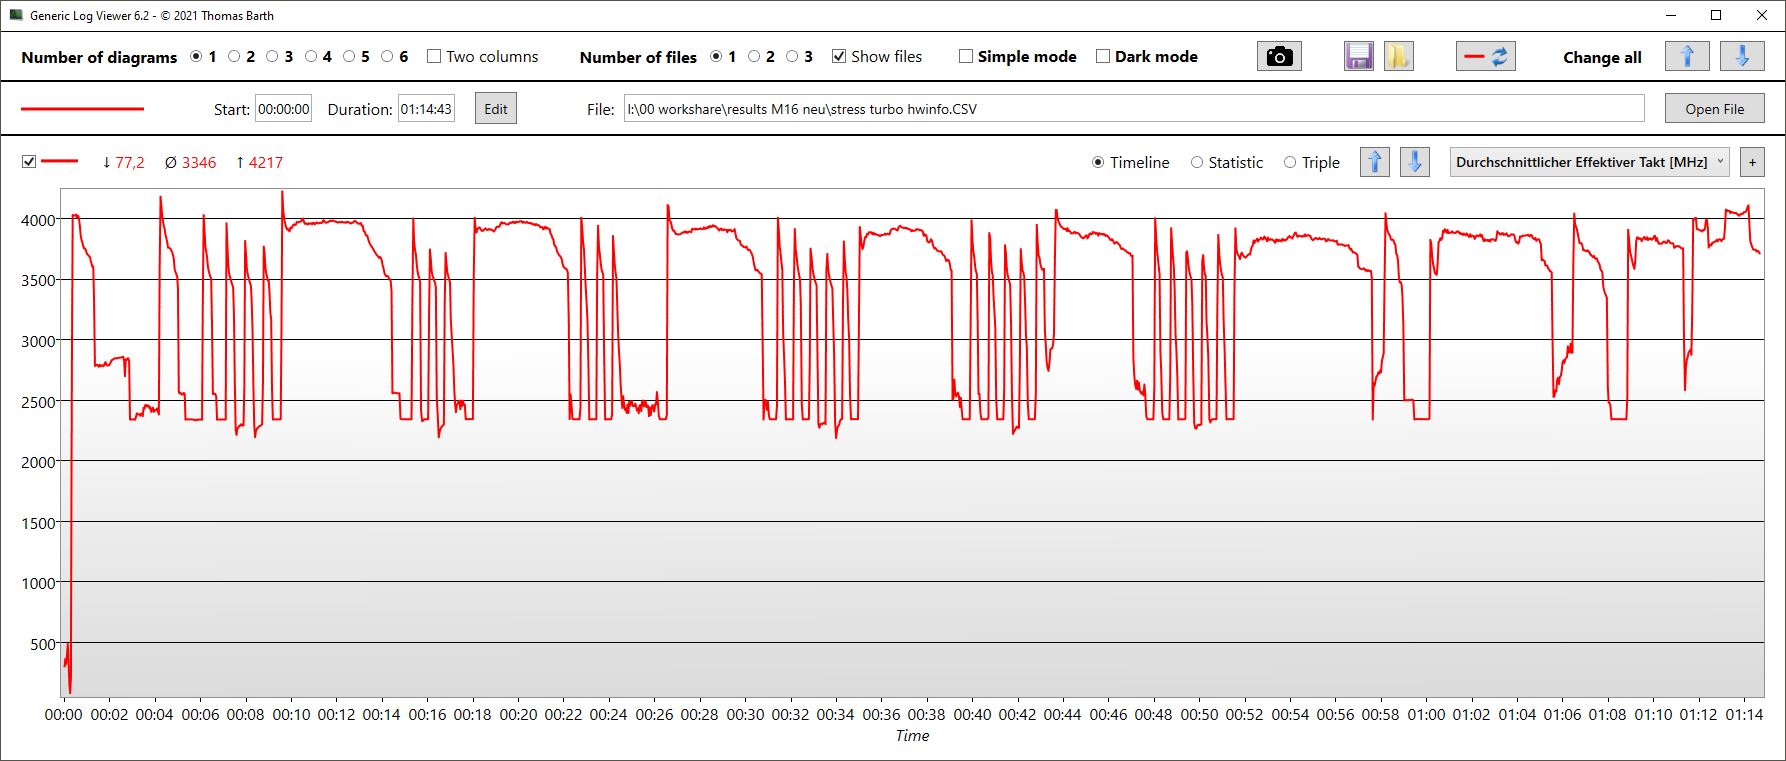
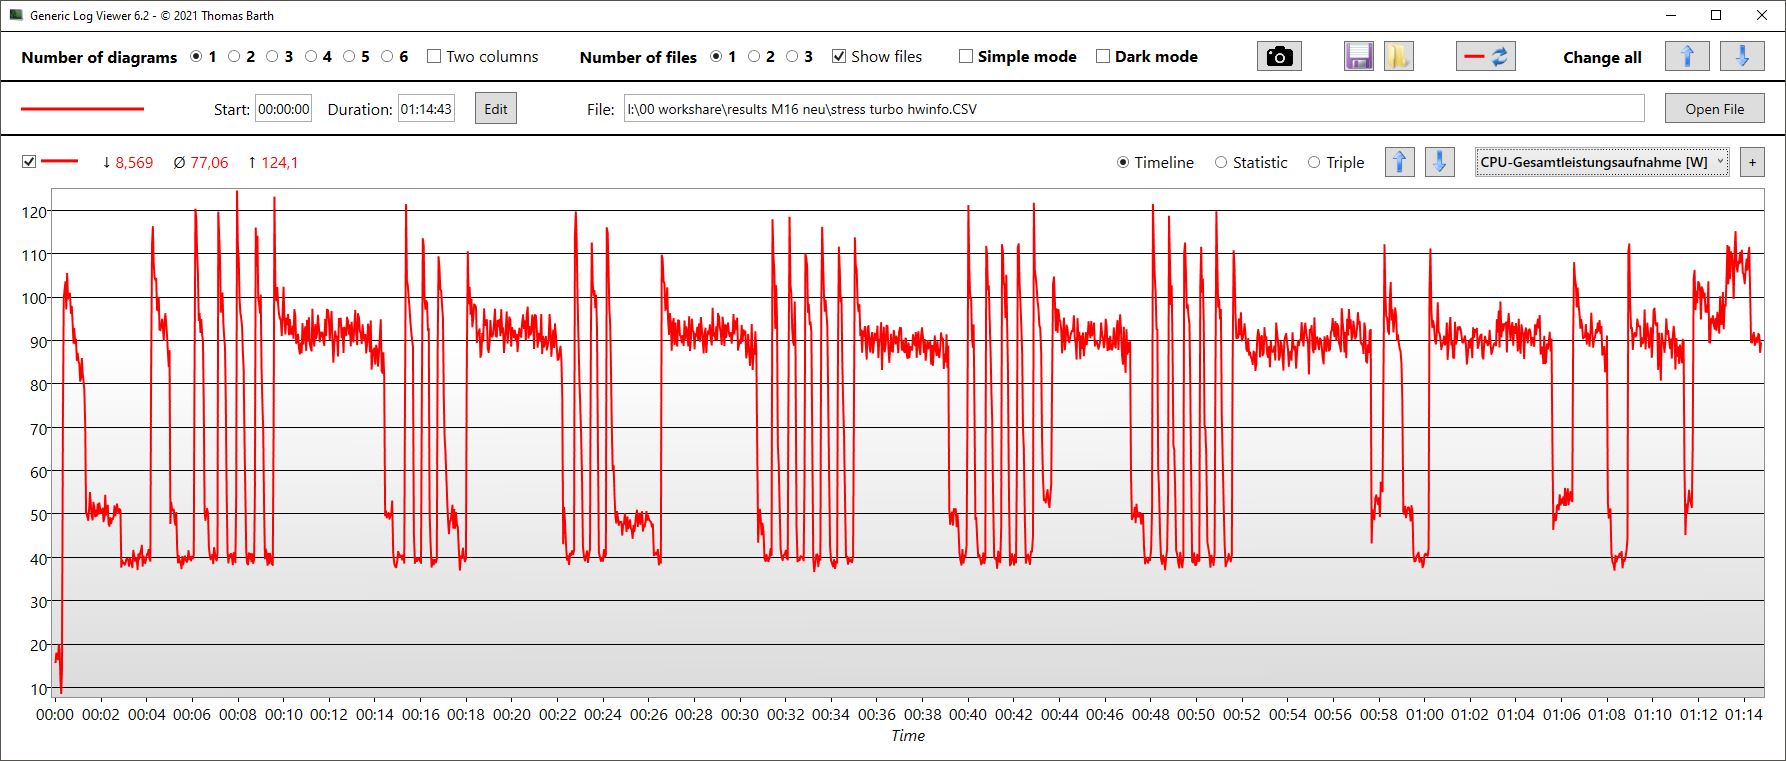
Stress test
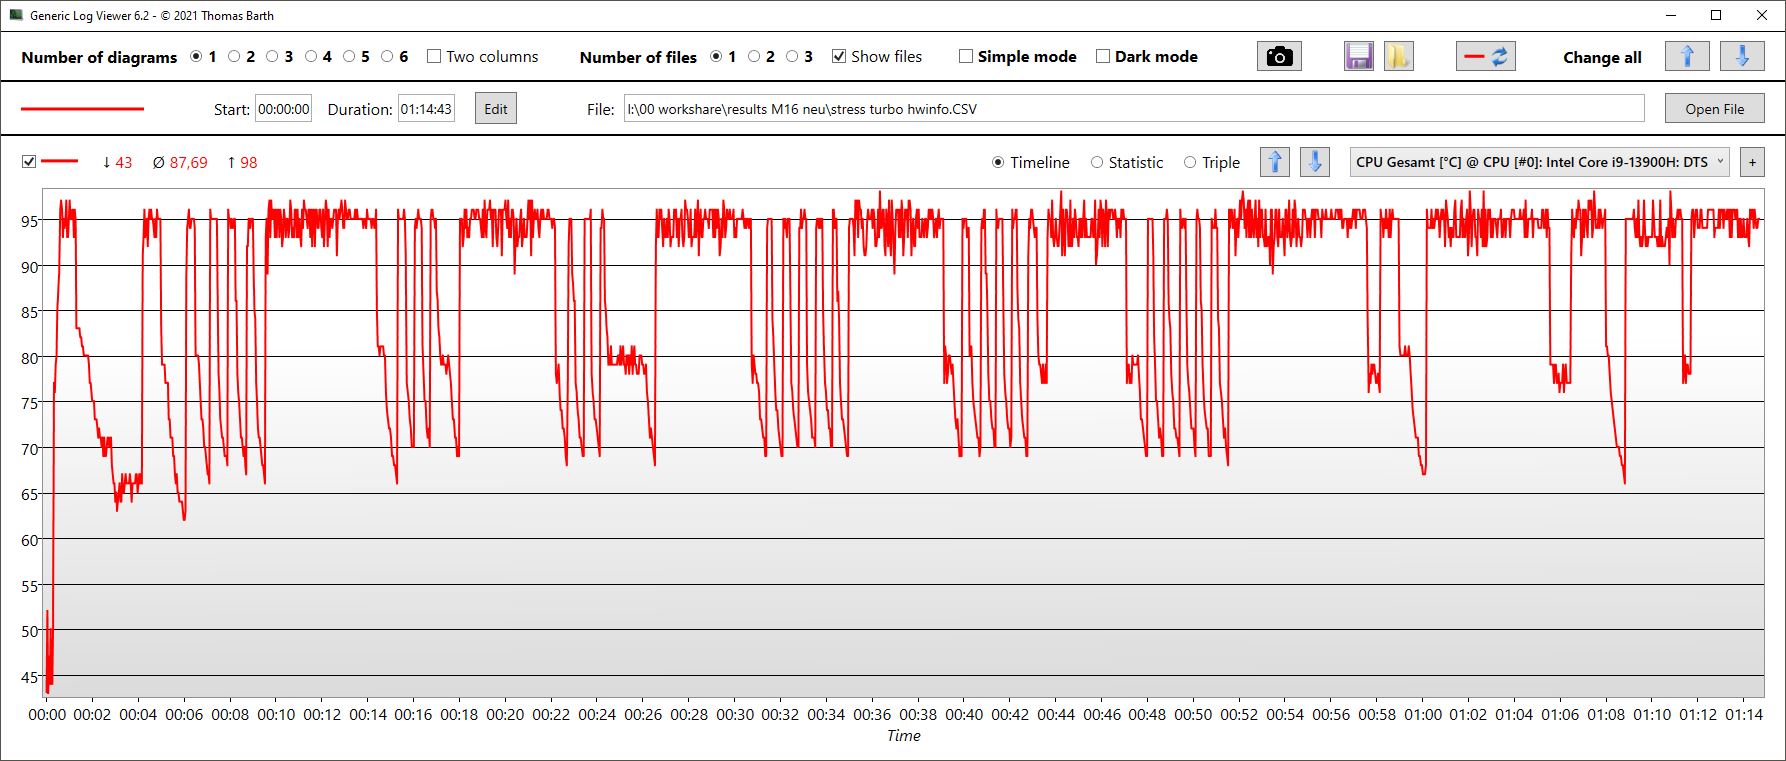
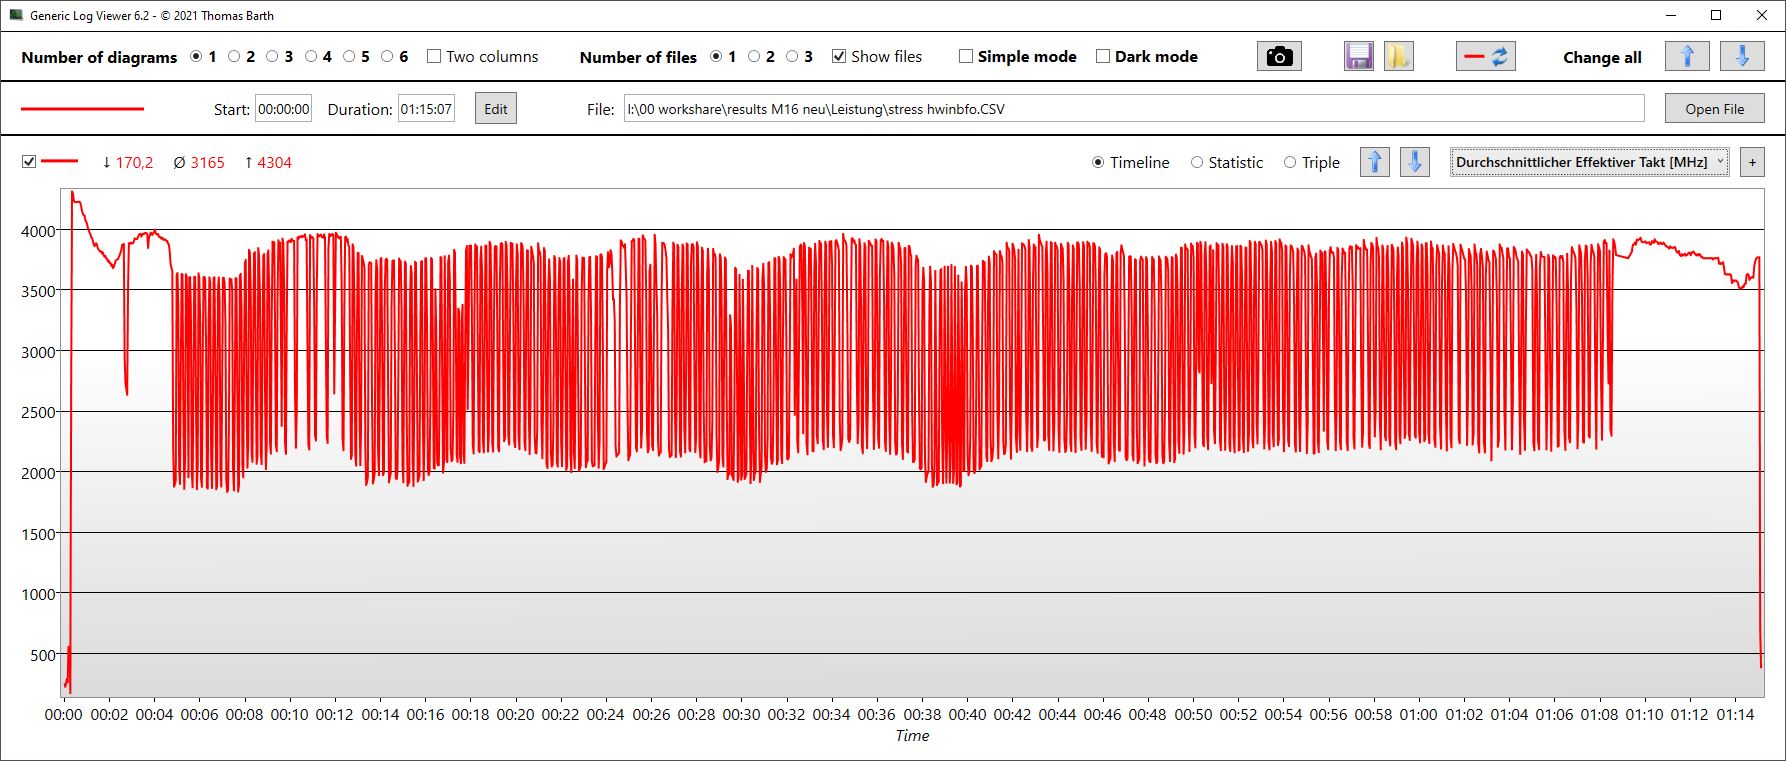
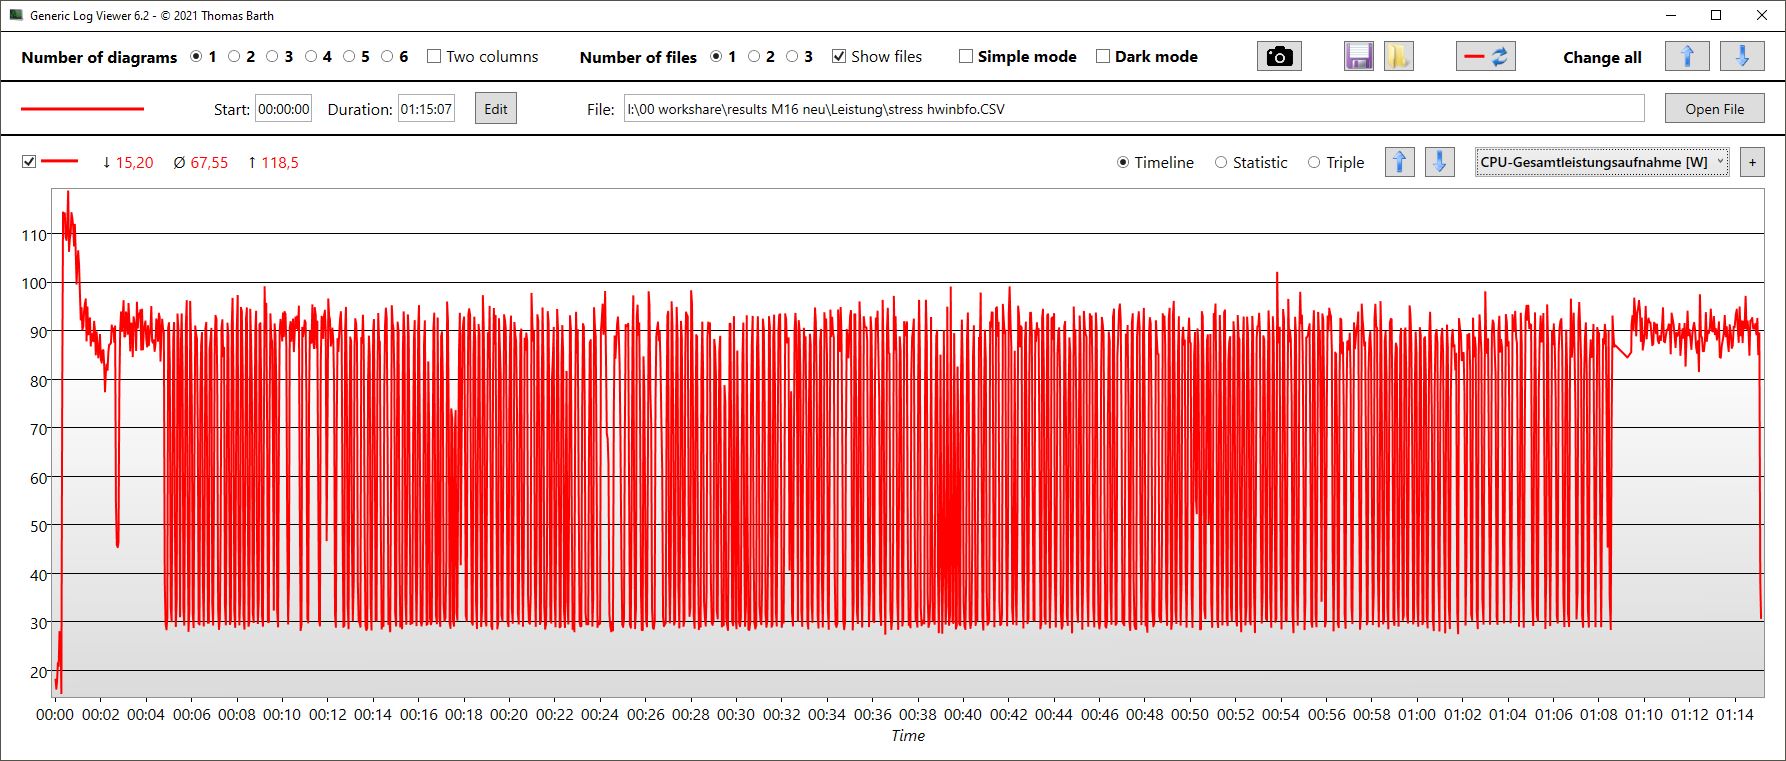
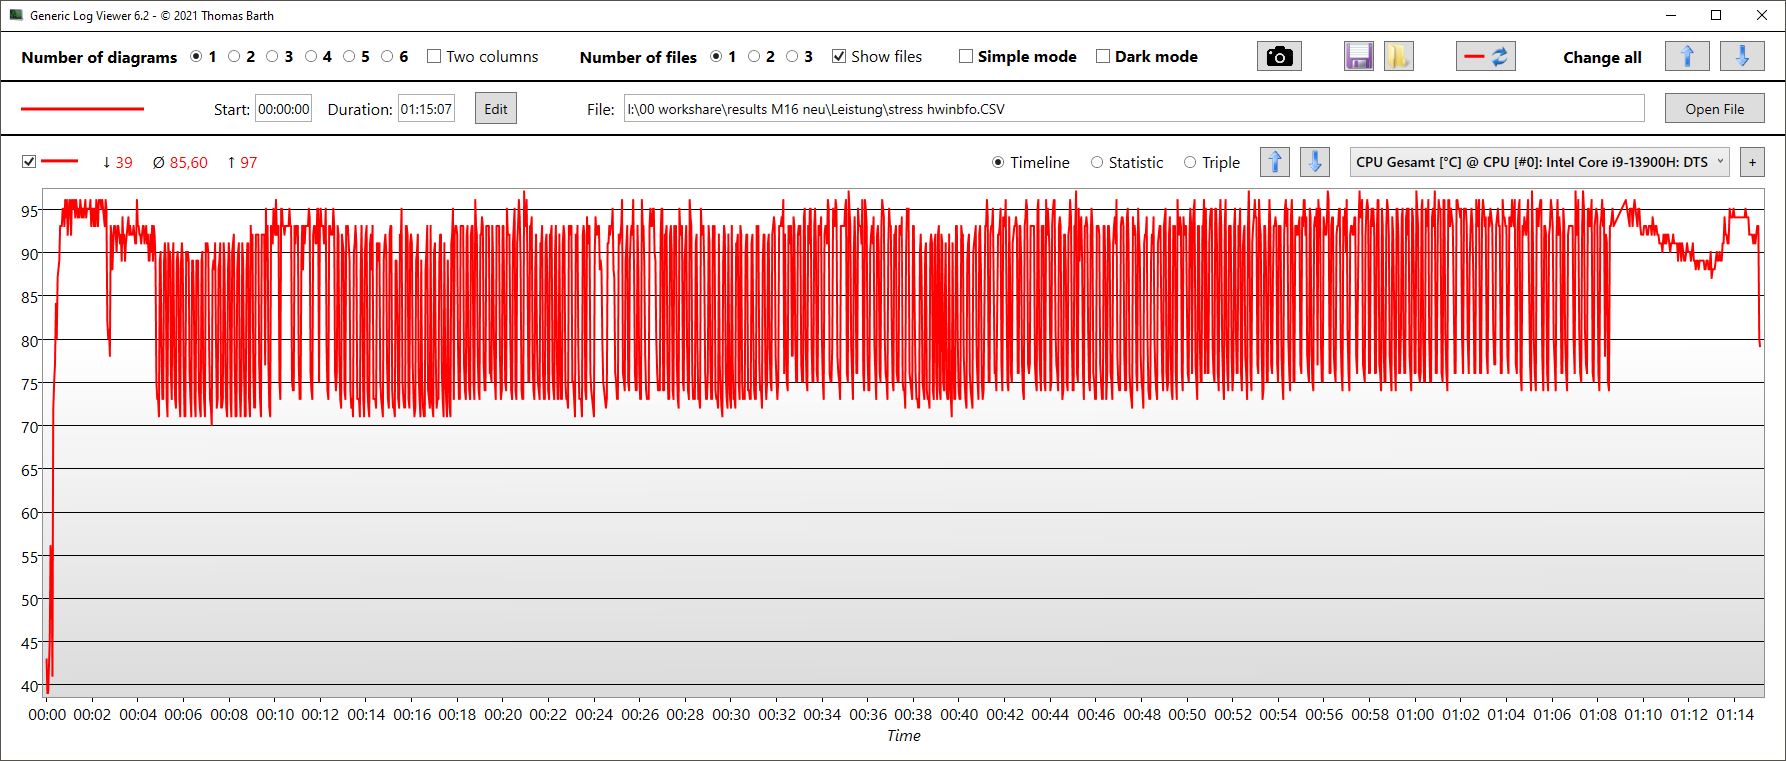
The CPU clock fluctuated between 2.2 and 4 GHz in the stress test, whereby the clock speeds hover around the upper end for a longer period of time. Running parallel to this, the CPU's power consumption varies and sits, on average, at 77 watts. However, it can also go up to 120 watts and drop again to 40 watts. Depending on the other values, the temperatures fluctuate in a similar way with the CPU heating up to 98 °C and averaging 88 °C.
In Performance mode, the difference to the CPU is actually not that big and the temperatures, power consumption and clock speeds are not particularly different from one another but still fluctuate at high rates.
The GPU values (even the memory clock) fluctuate very strongly. The core clock speed sits around an average of 1.3 GHz, the power consumption averages 58 watts and the temperatures are around 64 °C.
In Performance mode, the values are only marginally lower. The clock speed drops by around 200 MHz, the temperature is similarly high and the power consumption sits at around 42 watts.
| CPU Clock (GHz) | GPU Clock (MHz) | Average CPU Temperature (°C) | Average GPU Temperature (°C) | |
| Prime95 + FurMark Stress | 3,3 | 1.324 | 88 | 64 |
| Witcher 3 Stress | 668 | 1.830 | 69 | 70 |
Speakers
Compared to many other manufacturers, Asus has equipped the laptop with four speakers instead of two. This has a positive effect as they can get relatively loud, offer balanced mids and highs and even the bass is a little punchier than is unfortunately and typically the case when it comes to the competition.
Additional audio pleasure can be had by connecting an external analogue device via the 3.5 mm audio jack.
Asus ROG Zephyrus M16 GU604VY-NM042X audio analysis
(+) | speakers can play relatively loud (84.45 dB)
Bass 100 - 315 Hz
(±) | reduced bass - on average 11.5% lower than median
(±) | linearity of bass is average (10.1% delta to prev. frequency)
Mids 400 - 2000 Hz
(+) | balanced mids - only 4.1% away from median
(+) | mids are linear (4.9% delta to prev. frequency)
Highs 2 - 16 kHz
(+) | balanced highs - only 1.9% away from median
(+) | highs are linear (4.9% delta to prev. frequency)
Overall 100 - 16.000 Hz
(+) | overall sound is linear (11.1% difference to median)
Compared to same class
» 8% of all tested devices in this class were better, 3% similar, 89% worse
» The best had a delta of 6%, average was 18%, worst was 132%
Compared to all devices tested
» 7% of all tested devices were better, 2% similar, 92% worse
» The best had a delta of 4%, average was 24%, worst was 134%
Razer Blade 16 Early 2023 audio analysis
(+) | speakers can play relatively loud (88.2 dB)
Bass 100 - 315 Hz
(-) | nearly no bass - on average 16.4% lower than median
(±) | linearity of bass is average (10.8% delta to prev. frequency)
Mids 400 - 2000 Hz
(+) | balanced mids - only 2.5% away from median
(+) | mids are linear (2.4% delta to prev. frequency)
Highs 2 - 16 kHz
(+) | balanced highs - only 4.9% away from median
(±) | linearity of highs is average (7.9% delta to prev. frequency)
Overall 100 - 16.000 Hz
(+) | overall sound is linear (12.6% difference to median)
Compared to same class
» 16% of all tested devices in this class were better, 3% similar, 81% worse
» The best had a delta of 6%, average was 18%, worst was 132%
Compared to all devices tested
» 11% of all tested devices were better, 2% similar, 86% worse
» The best had a delta of 4%, average was 24%, worst was 134%
Power management - Efficient gaming, high idle consumption
Power consumption
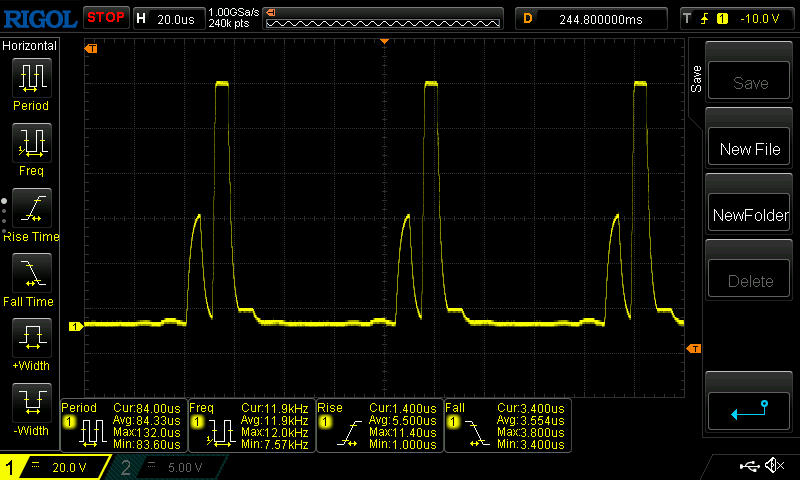
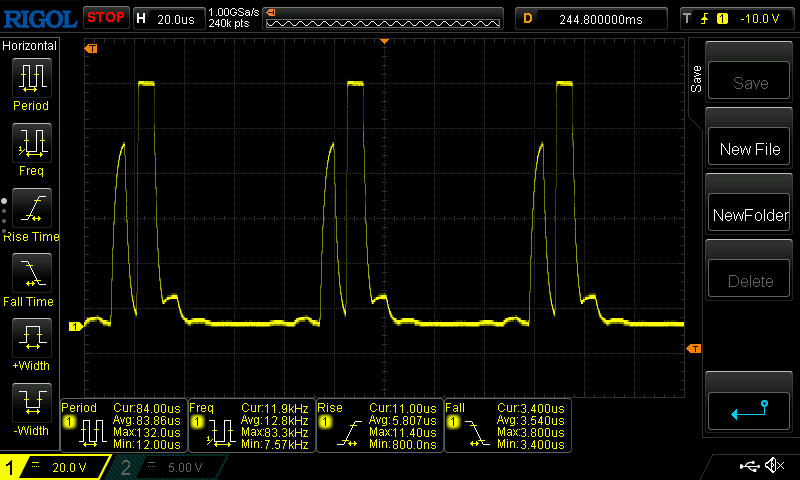
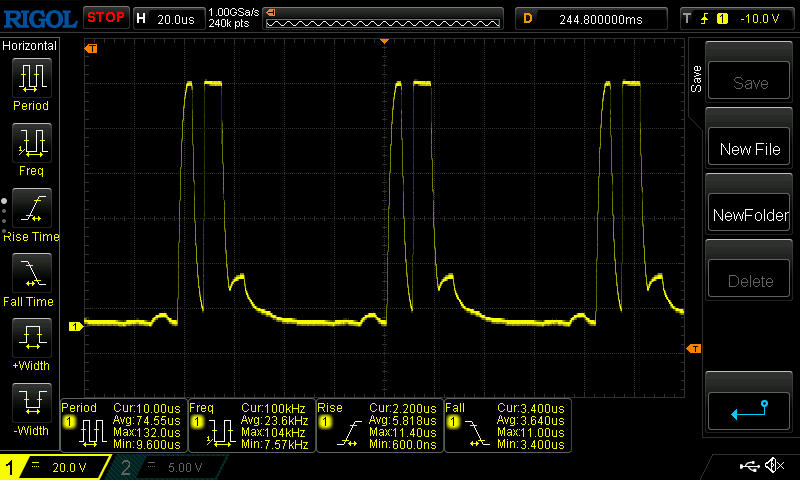
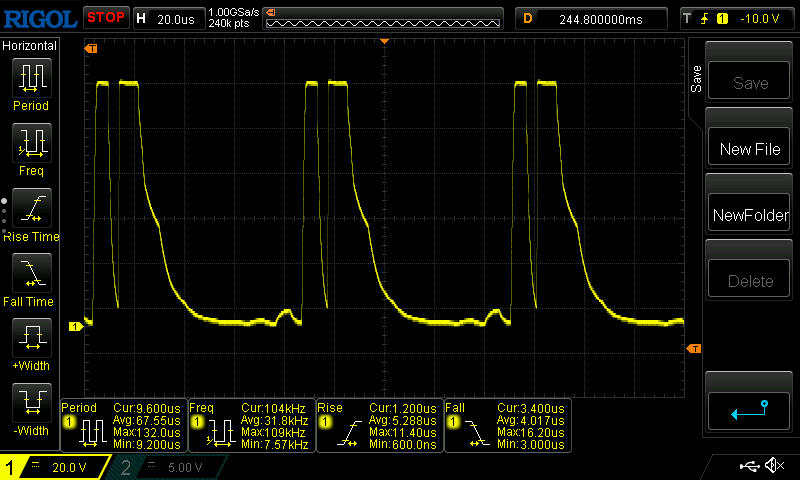
Set to minimal brightness, quiet and flight modes, the idle use consumption of around 20 watts is somewhat high. When gaming and under heavy load, the Intel HX processors would appear to draw significantly more power than some of the similarly capable HX competitors (even those with an RTX 4080) consuming more power.
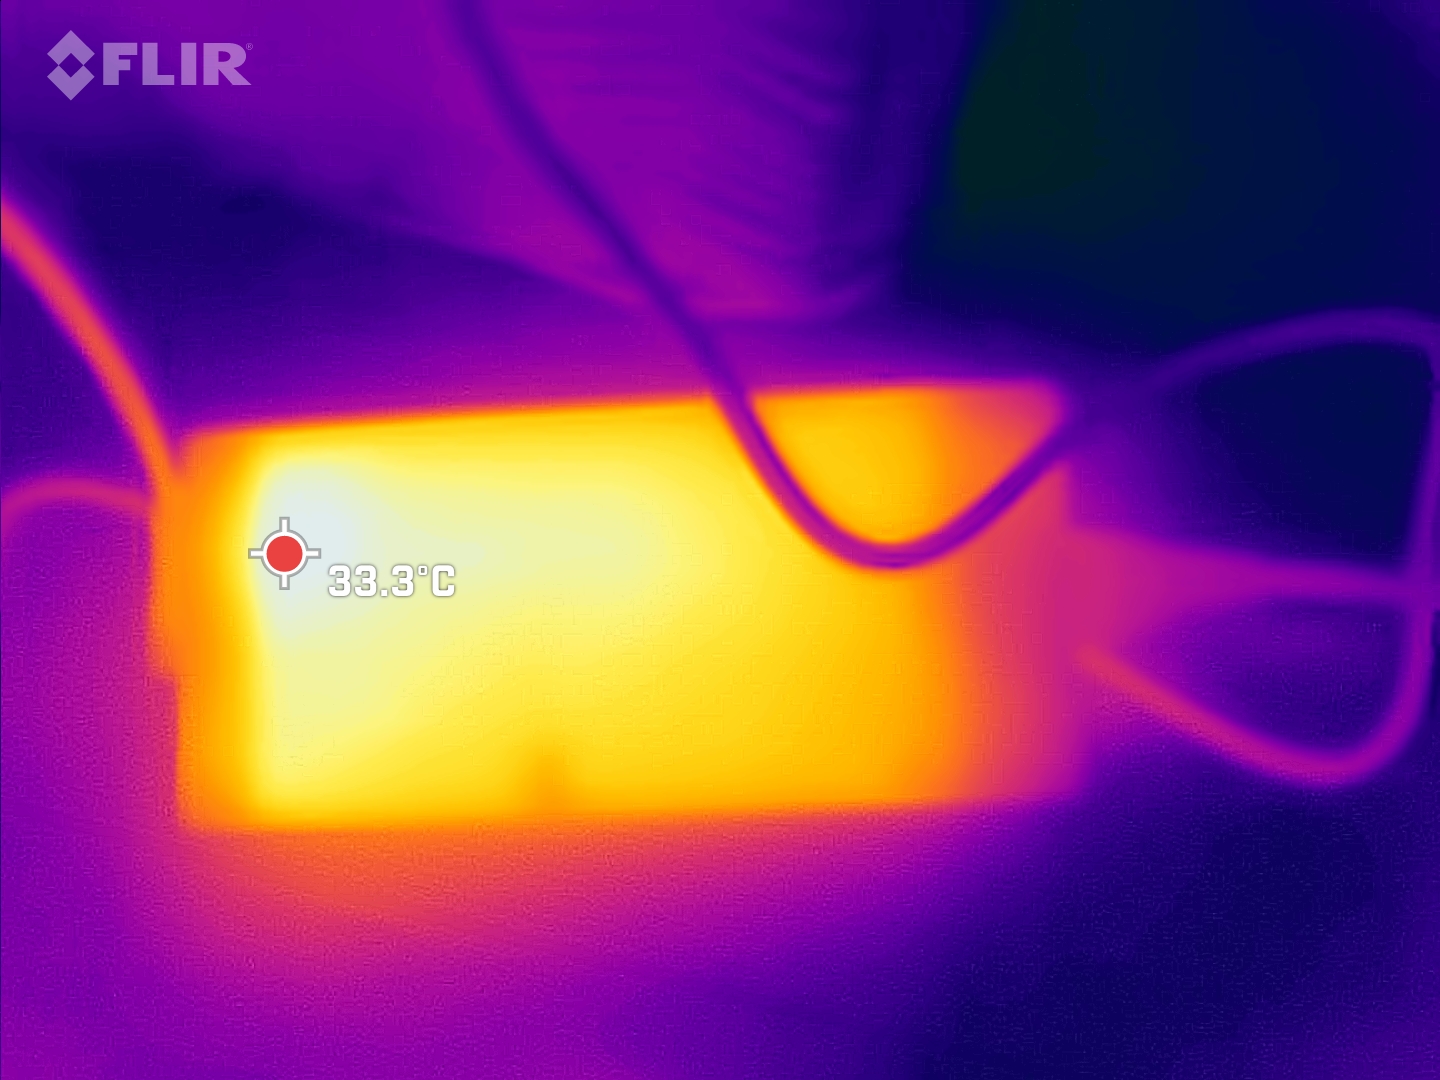
For a short time, we measured load peaks of a maximum of 267 watts on the large but flat power supply unit (around 18 x 8.3 x 2.5 cm). This is designed for 280 watts and thus offers plenty of reserves.
| Off / Standby | |
| Idle | |
| Load |
|
Key:
min: | |
| Asus ROG Zephyrus M16 GU604VY-NM042X i9-13900H, GeForce RTX 4090 Laptop GPU, Samsung PM9A1 MZVL22T0HBLB, IPS, 2560x1600, 16" | Asus ROG Zephyrus M16 GU603Z i9-12900H, GeForce RTX 3070 Ti Laptop GPU, Micron 3400 1TB MTFDKBA1T0TFH, IPS, 2560x1600, 16" | Asus ROG Strix Scar 18 2023 G834JY-N6005W i9-13980HX, GeForce RTX 4090 Laptop GPU, 2x Samsung PM9A1 MZVL21T0HCLR (RAID 0), IPS, 2560x1600, 18" | MSI Titan GT77 HX 13VI i9-13950HX, GeForce RTX 4090 Laptop GPU, Samsung PM9A1 MZVL22T0HBLB, Mini-LED, 3840x2160, 17.3" | Lenovo Legion Pro 7 16IRX8H i9-13900HX, GeForce RTX 4080 Laptop GPU, Samsung PM9A1 MZVL21T0HCLR, IPS, 2560x1600, 16" | Razer Blade 16 Early 2023 i9-13950HX, GeForce RTX 4080 Laptop GPU, SSSTC CA6-8D1024, IPS, 2560x1600, 16" | Average NVIDIA GeForce RTX 4090 Laptop GPU | Average of class Gaming | |
|---|---|---|---|---|---|---|---|---|
| Power Consumption | 24% | -26% | -10% | -14% | -17% | -11% | 12% | |
| Idle Minimum * (Watt) | 20 | 10.8 46% | 17.3 13% | 14 30% | 18 10% | 15.2 24% | 16.2 ? 19% | 13.3 ? 33% |
| Idle Average * (Watt) | 24 | 17 29% | 27 -13% | 21.6 10% | 24 -0% | 22.8 5% | 23.1 ? 4% | 19 ? 21% |
| Idle Maximum * (Watt) | 25 | 17.8 29% | 46 -84% | 24.8 1% | 32 -28% | 49.8 -99% | 34.2 ? -37% | 24.5 ? 2% |
| Load Average * (Watt) | 107 | 116 -8% | 133 -24% | 122.5 -14% | 130 -21% | 121.2 -13% | 130.5 ? -22% | 108.1 ? -1% |
| Witcher 3 ultra * (Watt) | 208 | 144 31% | 265 -27% | 260 -25% | 242 -16% | |||
| Load Maximum * (Watt) | 267 | 220 18% | 329 -23% | 418 -57% | 320 -20% | 273.7 -3% | 324 ? -21% | 254 ? 5% |
* ... smaller is better
Power consumption Witcher 3 / Stress test
Power consumption with an external monitor
Battery life
The Zephyrus M16 has a battery with a capacity of 90 watts which means the Asus laptop can achieve around 4.5 hours of WiFi use at reduced brightness.
At full brightness, 3 hours of internet surfing (multi-zone Mini-LED) are possible. At reduced brightness, this can rise to almost 4.5 hours.
All in all, battery life is not particularly good and this is down to high idle consumption.
| Asus ROG Zephyrus M16 GU604VY-NM042X i9-13900H, GeForce RTX 4090 Laptop GPU, 90 Wh | Asus ROG Zephyrus M16 GU603Z i9-12900H, GeForce RTX 3070 Ti Laptop GPU, 90 Wh | Asus ROG Strix Scar 18 2023 G834JY-N6005W i9-13980HX, GeForce RTX 4090 Laptop GPU, 90 Wh | MSI Titan GT77 HX 13VI i9-13950HX, GeForce RTX 4090 Laptop GPU, 99.9 Wh | Lenovo Legion Pro 7 16IRX8H i9-13900HX, GeForce RTX 4080 Laptop GPU, 99.9 Wh | Razer Blade 16 Early 2023 i9-13950HX, GeForce RTX 4080 Laptop GPU, 95.2 Wh | Average of class Gaming | |
|---|---|---|---|---|---|---|---|
| Battery runtime | 24% | 14% | -1% | -5% | -5% | 29% | |
| H.264 (h) | 4.8 | 7.3 52% | 7 46% | 6 25% | 8.26 ? 72% | ||
| WiFi v1.3 (h) | 4.3 | 7.4 72% | 7.1 65% | 5.3 23% | 5.1 19% | 6.1 42% | 7.01 ? 63% |
| Load (h) | 2.9 | 1.4 -52% | 0.9 -69% | 1.4 -52% | 2.1 -28% | 1.4 -52% | 1.47 ? -49% |
| Witcher 3 ultra (h) | 0.9 | ||||||
| Reader / Idle (h) | 6.4 | 8.9 | 8.71 ? |
Pros
Cons
Verdict - Not (yet) as optimised as its predecessor

When it comes to the newest laptop generations, manufacturers like to send us high-end systems. And yes, the RTX 4090 and Intel Gen13 are not only impressive on paper. Compared to the previous gen, performance and efficiency have improved significantly. What's more, the wonderful, Mini-LED Nebula display is a contender for the main highlight and almost manages to put the CPU and GPU in the shade.
We already found its predecessor to be a well-rounded and well-optimised gaming machine. Generally, but not unequivocally, that also applies to the new Asus M16. Similar to most of the current, new laptops, we are dealing with a double generational leap in terms of the CPU and GPU. However, this change doesn't always run smoothly. Many RTX 40 laptops currently suffer from high latencies due to not yet finalized driver optimizations. In addition, the M16's idle power consumption is somewhat too high. This leads to sub-optimum battery life but is something that could be ironed out with the help of a software update. It's also a little annoying that Asus has made maintenance unnecessarily difficult due to many hidden screws and SO-DIMM RAM. Also, the omission of a LAN port is difficult for gamers to understand and the top-end RTX 4090 with an H CPU "only" runs as fast as an RTX 4080 paired with an HX CPU.
The Asus ROG Zephyrus M16 paired with an RTX 4090 is a powerful gaming package, complete with a fantastic, Mini-LED display and power to spare - even in 4K. However, the price is steep and there are a few small niggles which require ironing out.
For many, the very high price will come as a real downside but, as always, we will be extensively reviewing possible (cheaper) alternatives as and when they arrive.
Price and availability
Currently, it's only possible to preorder the new M16. However, the machine is planned to appear this month (March 2023).
Asus ROG Zephyrus M16 GU604VY-NM042X
- 03/15/2023 v7 (old)
Christian Hintze
Transparency
The selection of devices to be reviewed is made by our editorial team. The test sample was provided to the author as a loan by the manufacturer or retailer for the purpose of this review. The lender had no influence on this review, nor did the manufacturer receive a copy of this review before publication. There was no obligation to publish this review. As an independent media company, Notebookcheck is not subjected to the authority of manufacturers, retailers or publishers.
This is how Notebookcheck is testing
Every year, Notebookcheck independently reviews hundreds of laptops and smartphones using standardized procedures to ensure that all results are comparable. We have continuously developed our test methods for around 20 years and set industry standards in the process. In our test labs, high-quality measuring equipment is utilized by experienced technicians and editors. These tests involve a multi-stage validation process. Our complex rating system is based on hundreds of well-founded measurements and benchmarks, which maintains objectivity. Further information on our test methods can be found here.
Price comparison

