Asus ROG Strix Scar 17 G733PY laptop review: Intel is no longer king

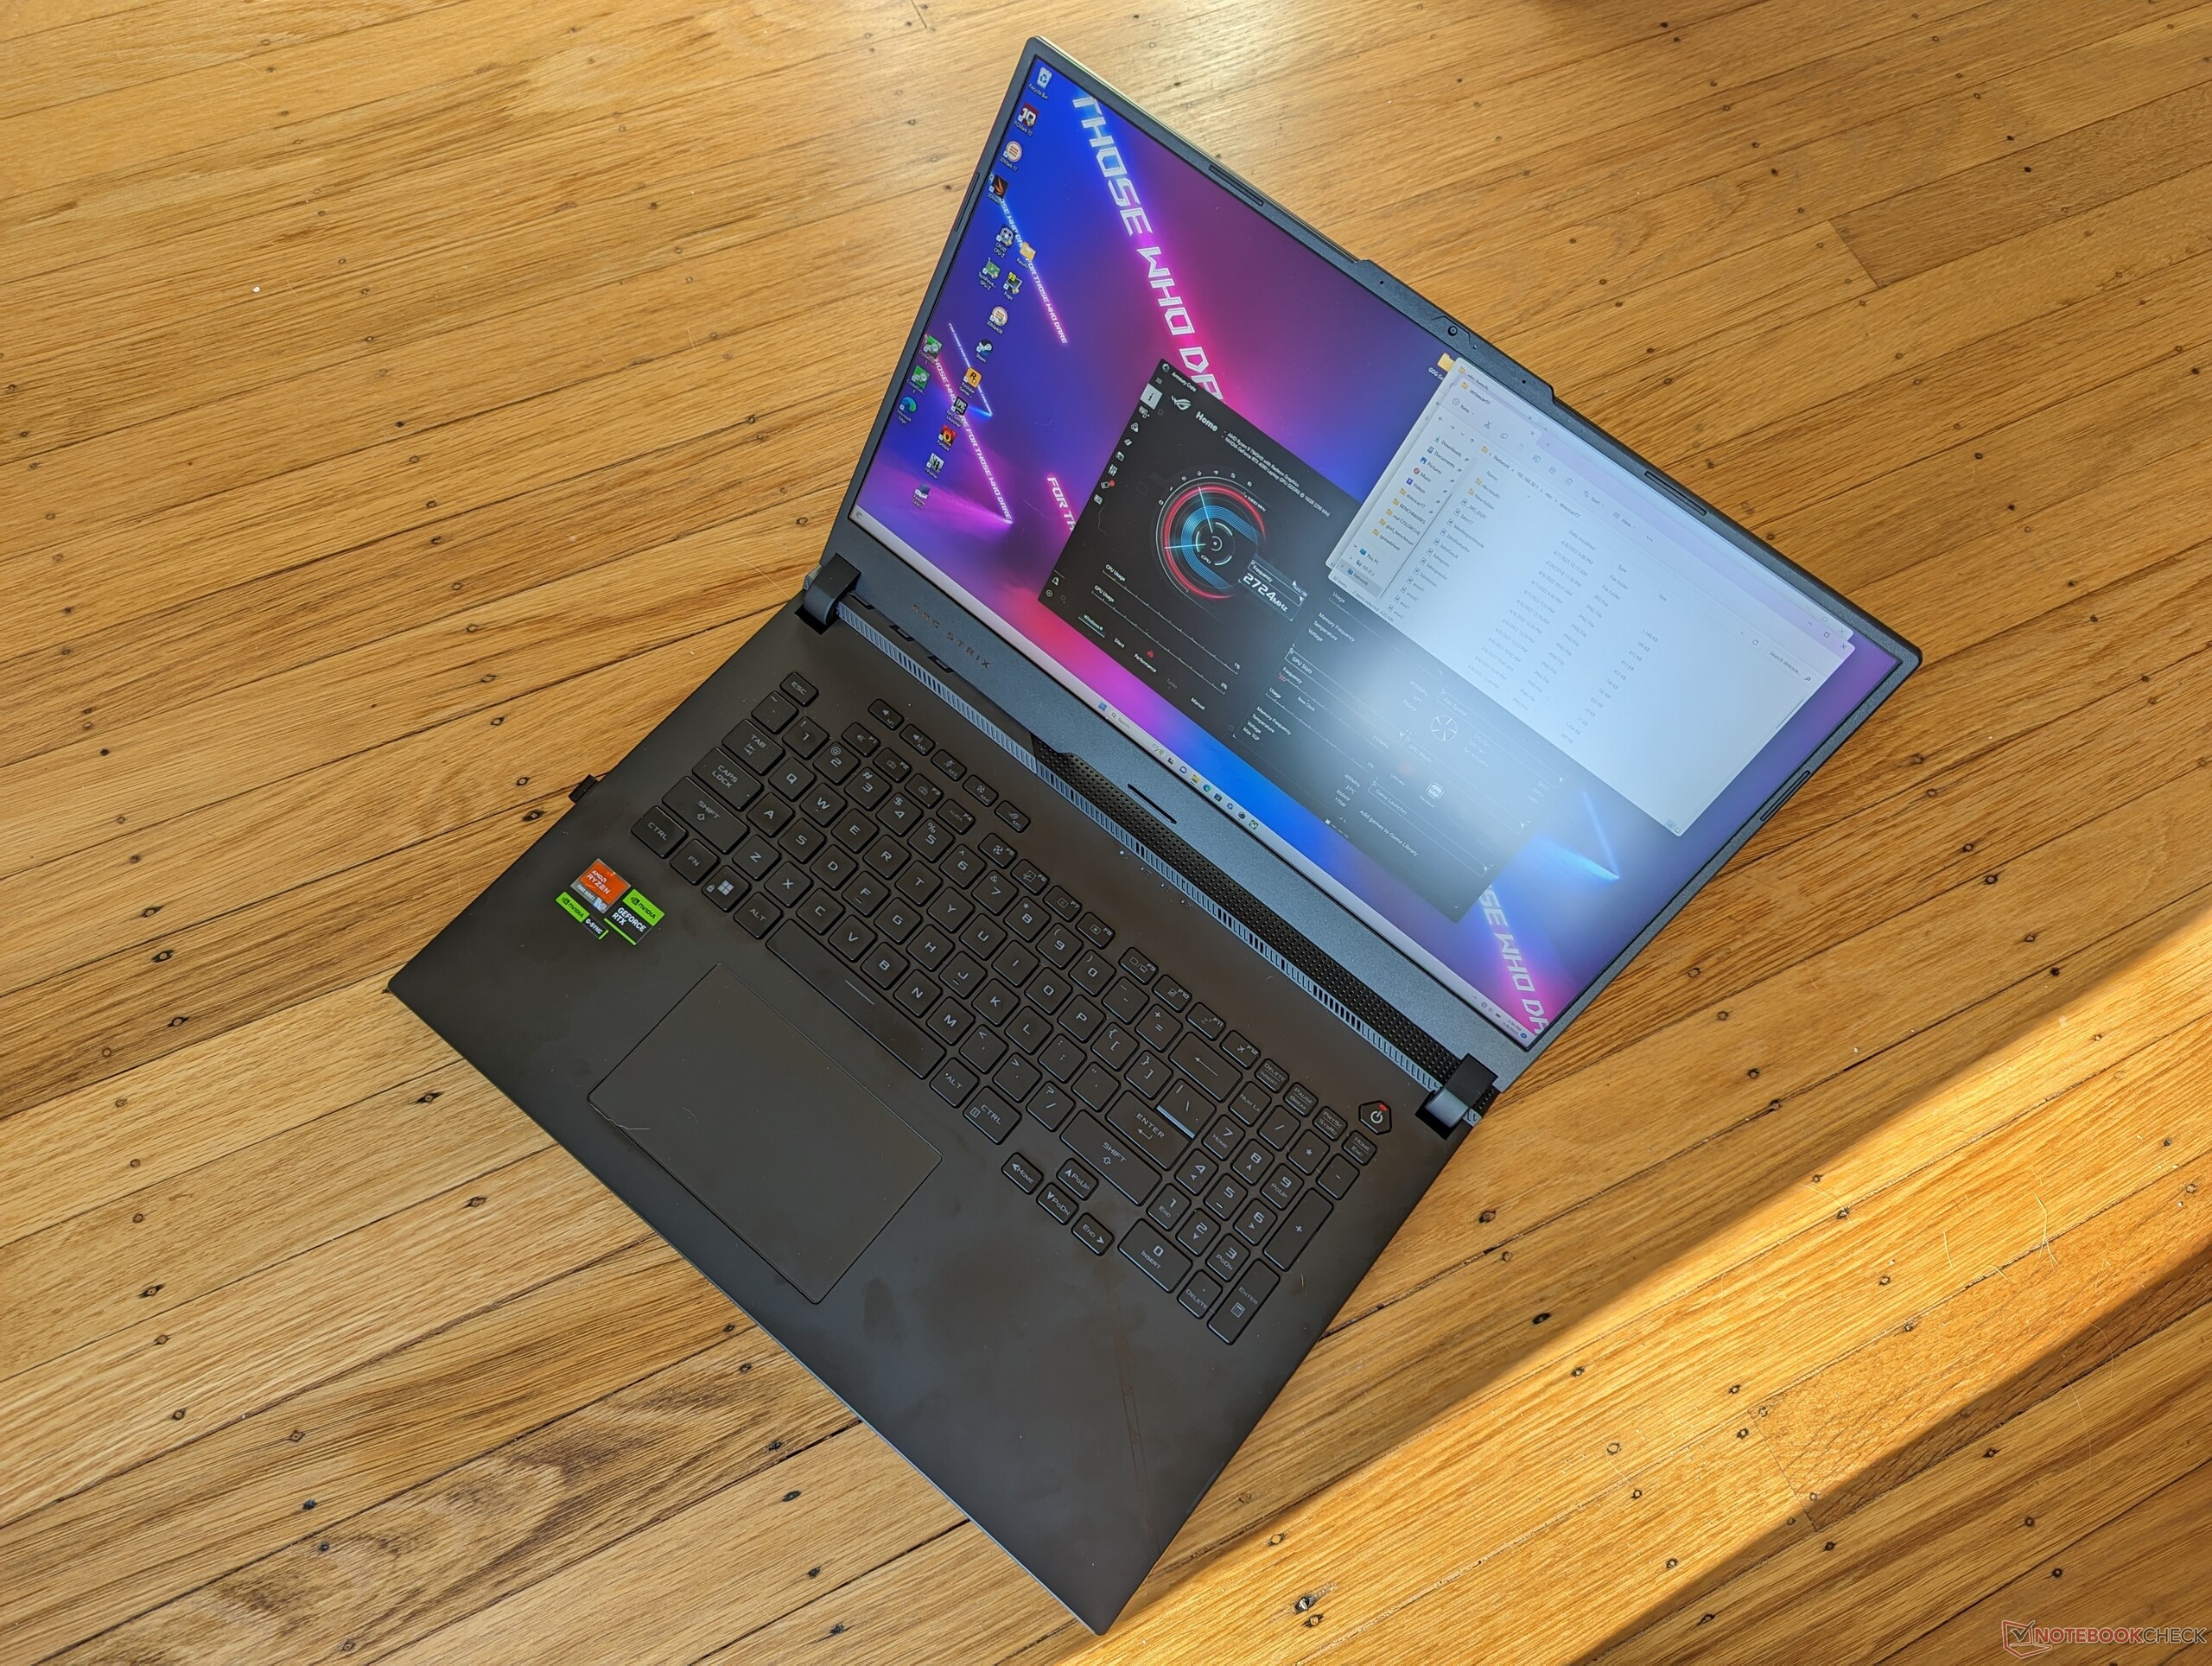
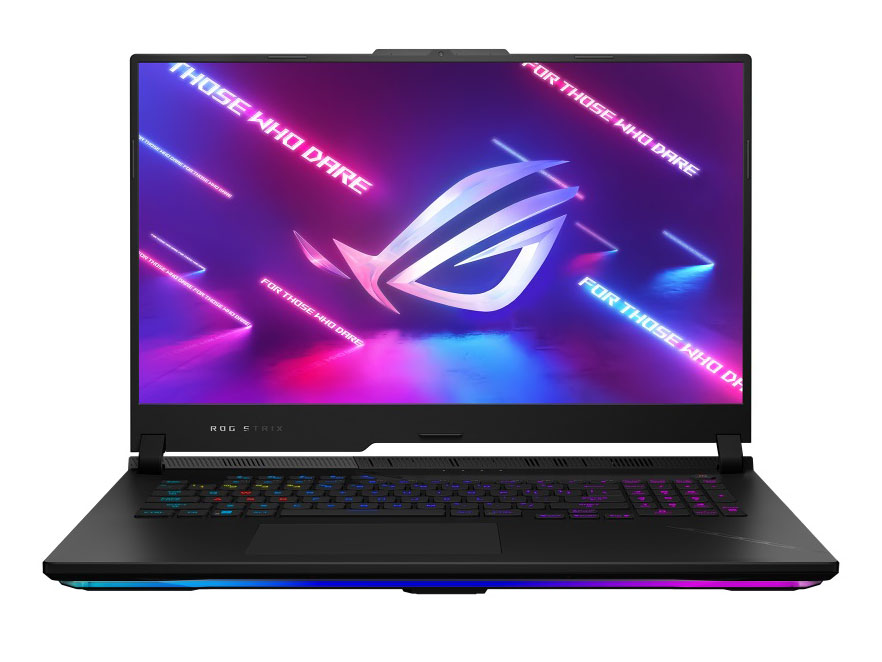
Unveiled at CES 2023, Asus has refreshed its top-end 17.3-inch ROG Strix Scar 17 series with the latest 13th gen Intel CPUs, Zen 4 AMD CPUs, and Nvidia Ada Lovelace GPUs to replace last year's lineup. Other than these internal upgrades, however, the external chassis design remains almost identical year-over-year. We recommend checking out our existing reviews on the 2022 ROG Strix Scar 17 to learn more about the physical features of the 2023 model. Any differences between them will be noted below.
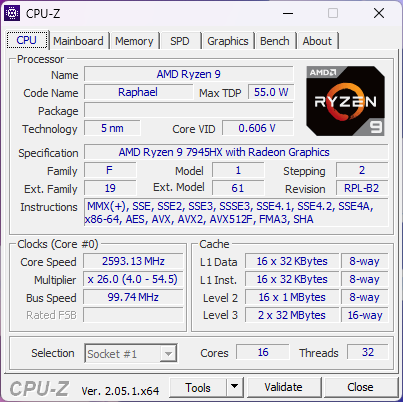
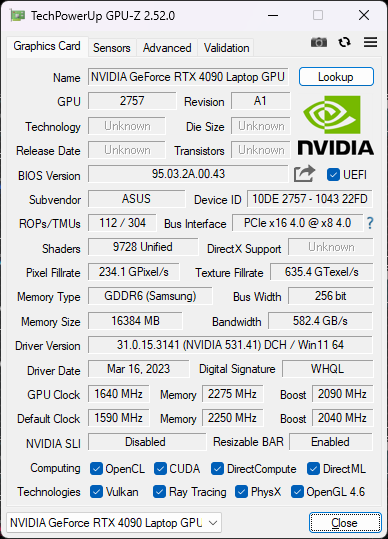
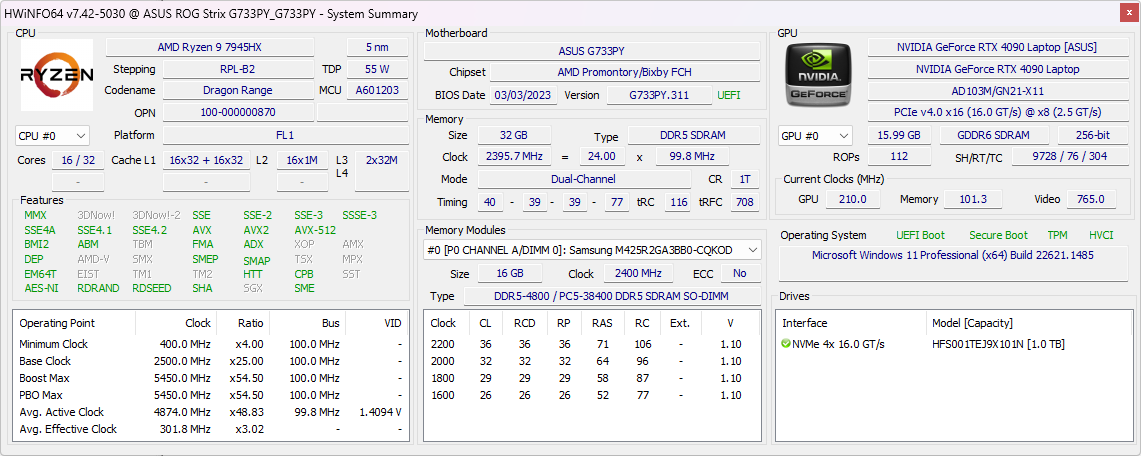
Our configuration in review is the highest-end SKU equipped with the Ryzen 9 7945HX CPU and 175 W GeForce RTX 4090 GPU. Other SKUs are available down to the RTX 4060, but they all carry the same 240 Hz 1440p IPS panel as of this writing.
Competitors to the Strix Scar 17 include other high-end 17-inch gaming laptops like the Razer Blade 17, Alienware m17, MSI GE77, or Aorus 17.
More Asus reviews:
Potential Competitors in Comparison
Rating | Date | Model | Weight | Height | Size | Resolution | Price |
|---|---|---|---|---|---|---|---|
| 88.3 % v7 (old) | 04 / 2023 | Asus ROG Strix Scar 17 G733PY-XS96 R9 7945HX, GeForce RTX 4090 Laptop GPU | 2.9 kg | 28.3 mm | 17.30" | 2560x1440 | |
| 88.3 % v7 (old) | 03 / 2023 | MSI GE78HX 13VH-070US i9-13950HX, GeForce RTX 4080 Laptop GPU | 3 kg | 23 mm | 17.00" | 2560x1600 | |
| 89.9 % v7 (old) | 03 / 2023 | Eluktronics Mech-17 GP2 i9-13900HX, GeForce RTX 4090 Laptop GPU | 2.9 kg | 27 mm | 17.00" | 2560x1600 | |
| 88.4 % v7 (old) | 04 / 2023 | Asus ROG Strix G17 G713PI R9 7945HX, GeForce RTX 4070 Laptop GPU | 2.8 kg | 30.7 mm | 17.30" | 2560x1440 | |
| 83.7 % v7 (old) | 08 / 2022 | Aorus 17X XES i9-12900HX, GeForce RTX 3070 Ti Laptop GPU | 2.7 kg | 30 mm | 17.30" | 1920x1080 | |
| 86.1 % v7 (old) | 01 / 2023 | Alienware m17 R5 (R9 6900HX, RX 6850M XT) R9 6900HX, Radeon RX 6850M XT | 3.4 kg | 26.7 mm | 17.00" | 3840x2160 |
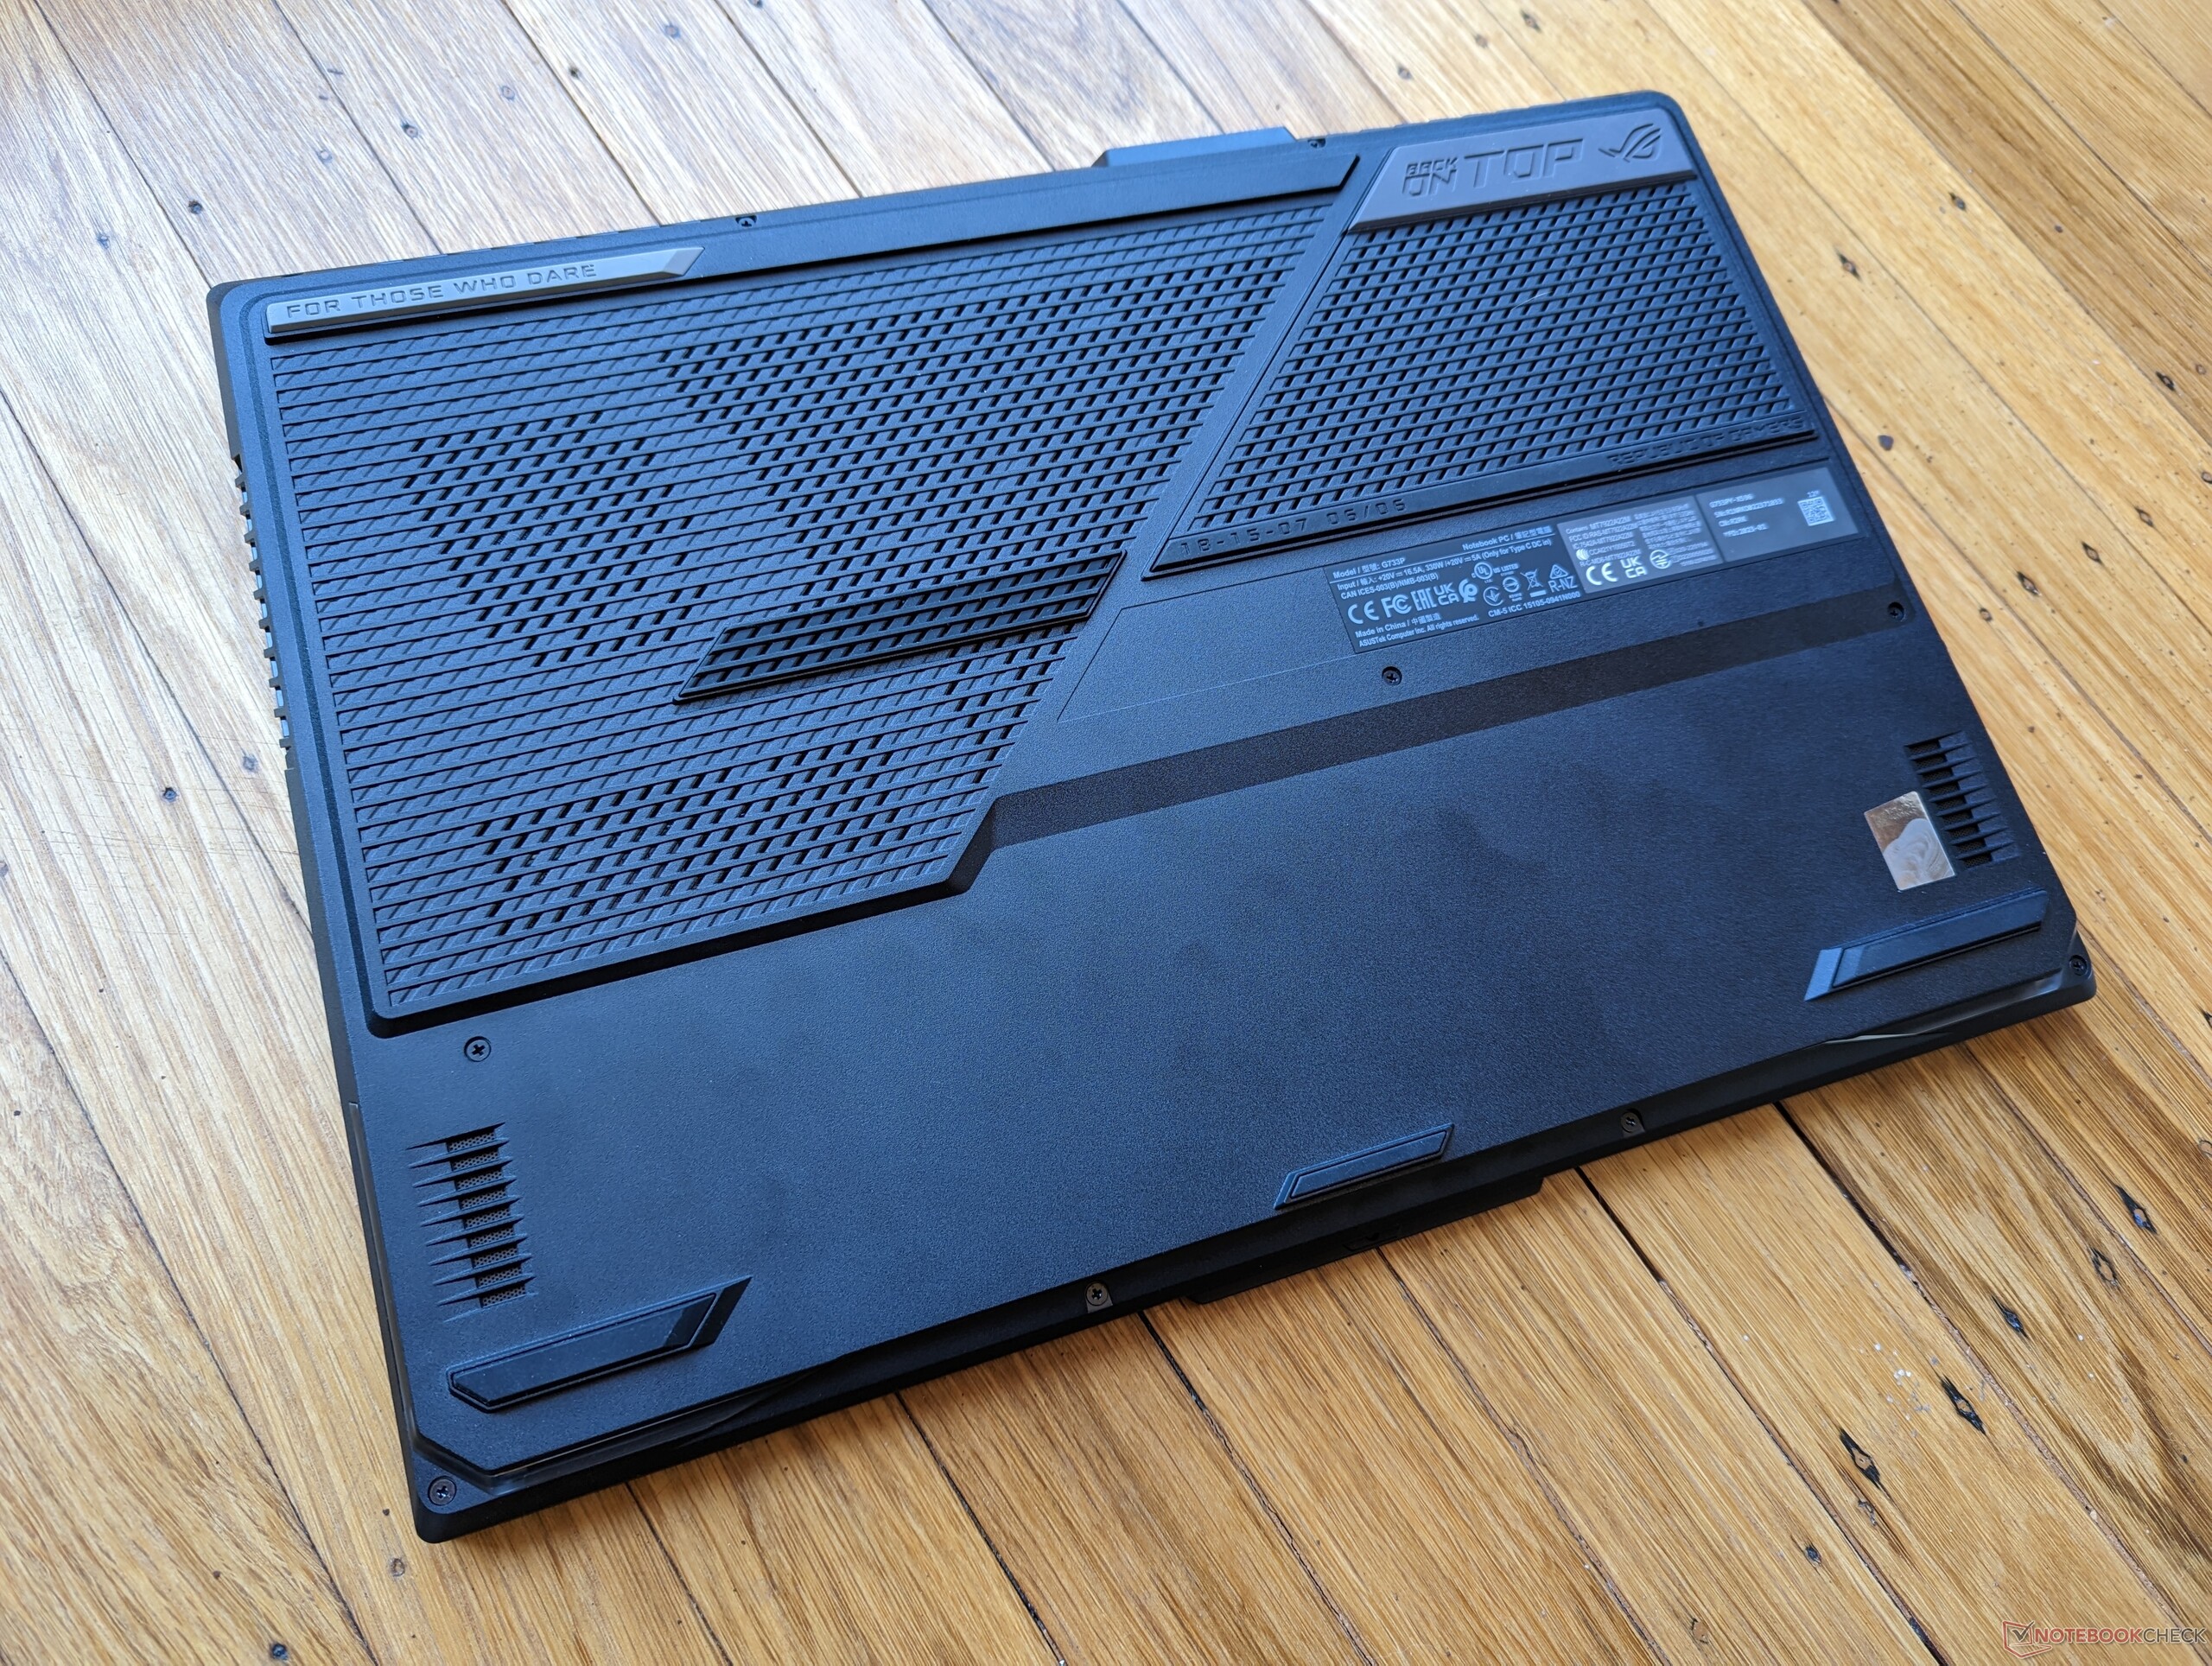
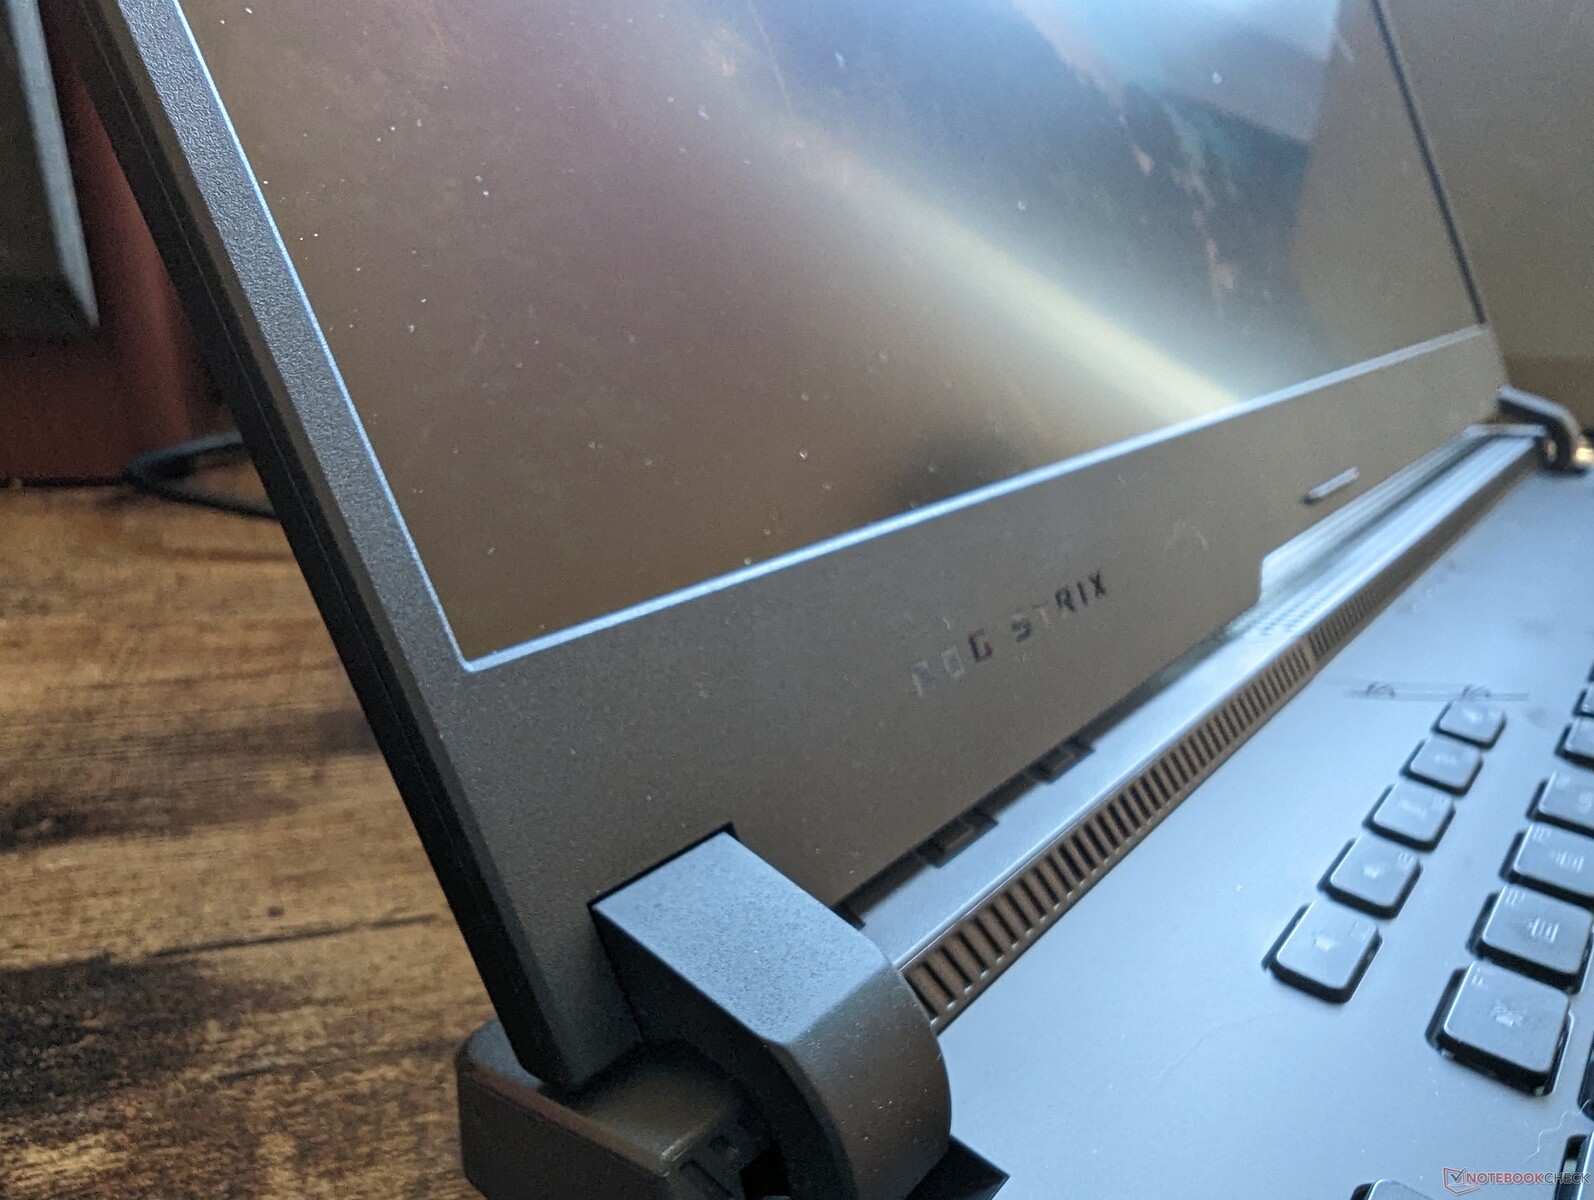
Case — No Changes... Almost
There are three important differences between the 2023 and 2022 models as follows:
- Asus Keystone is no longer supported. The manufacturer likely recognized that very few owners were using the feature in the first place.
- New webcam. There is now an integrated webcam whereas last year's model would lack one completely.
- New superficial markings on the palm rests and outer lid.
The overall chassis is otherwise identical to the year before.

Communication
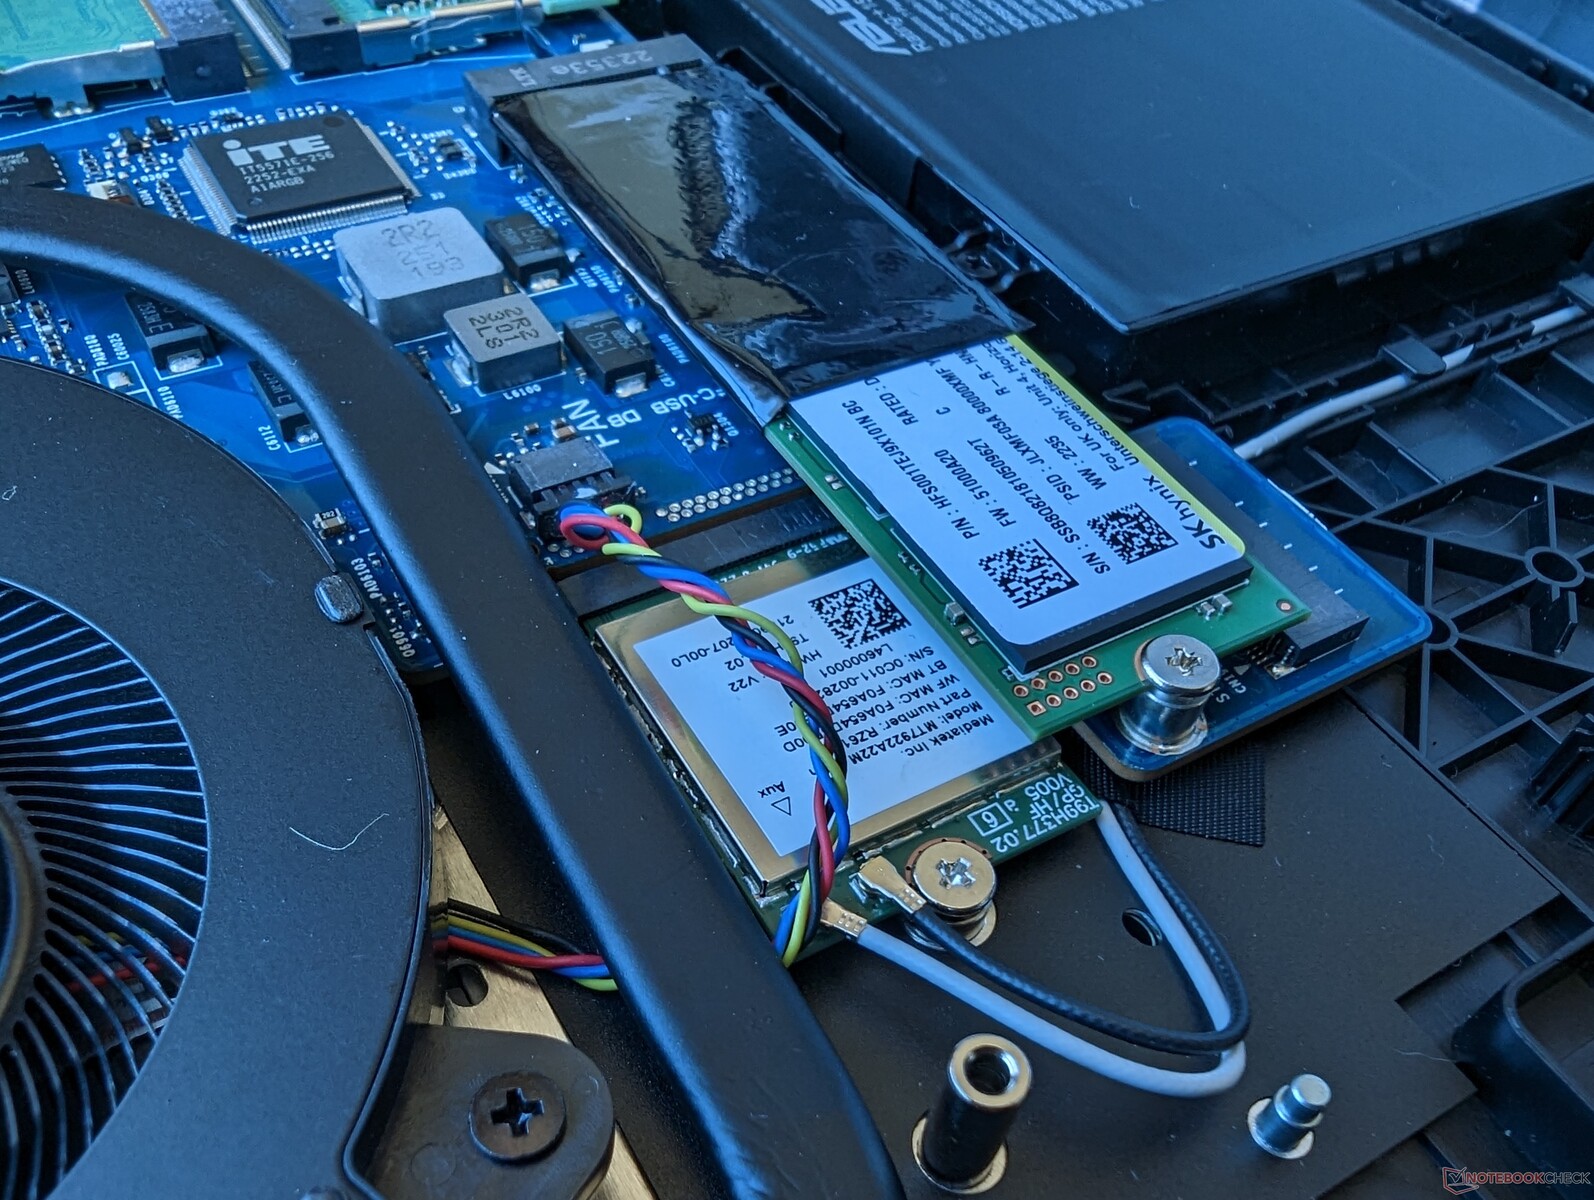
Wi-Fi 6E is provided by a MediaTek MT7922 instead of the more common Intel AX211 likely because this is an AMD-Nvidia-focused design. Transfer rates and performance are nonetheless steady and reliable when paired to our Asus AXE11000 test router.
| Networking | |
| iperf3 transmit AXE11000 | |
| Asus ROG Strix G17 G713PI | |
| Eluktronics Mech-17 GP2 | |
| MSI GE78HX 13VH-070US | |
| Alienware m17 R5 (R9 6900HX, RX 6850M XT) | |
| Asus ROG Strix Scar 17 G733PY-XS96 | |
| iperf3 receive AXE11000 | |
| Asus ROG Strix G17 G713PI | |
| Eluktronics Mech-17 GP2 | |
| Asus ROG Strix Scar 17 G733PY-XS96 | |
| MSI GE78HX 13VH-070US | |
| Alienware m17 R5 (R9 6900HX, RX 6850M XT) | |
| iperf3 transmit AXE11000 6GHz | |
| Aorus 17X XES | |
| Asus ROG Strix Scar 17 G733PY-XS96 | |
| MSI GE78HX 13VH-070US | |
| iperf3 receive AXE11000 6GHz | |
| Aorus 17X XES | |
| MSI GE78HX 13VH-070US | |
| Asus ROG Strix Scar 17 G733PY-XS96 | |
Webcam
Though a webcam is better than no webcam at all, Asus went with the lowest common denominator by installing a 1 MP sensor instead of a 2 MP or 5 MP sensor. Other gaming laptops like the Alienware m17 R1 or Razer Blade have higher resolution webcams in comparison. IR is not supported on the Asus.


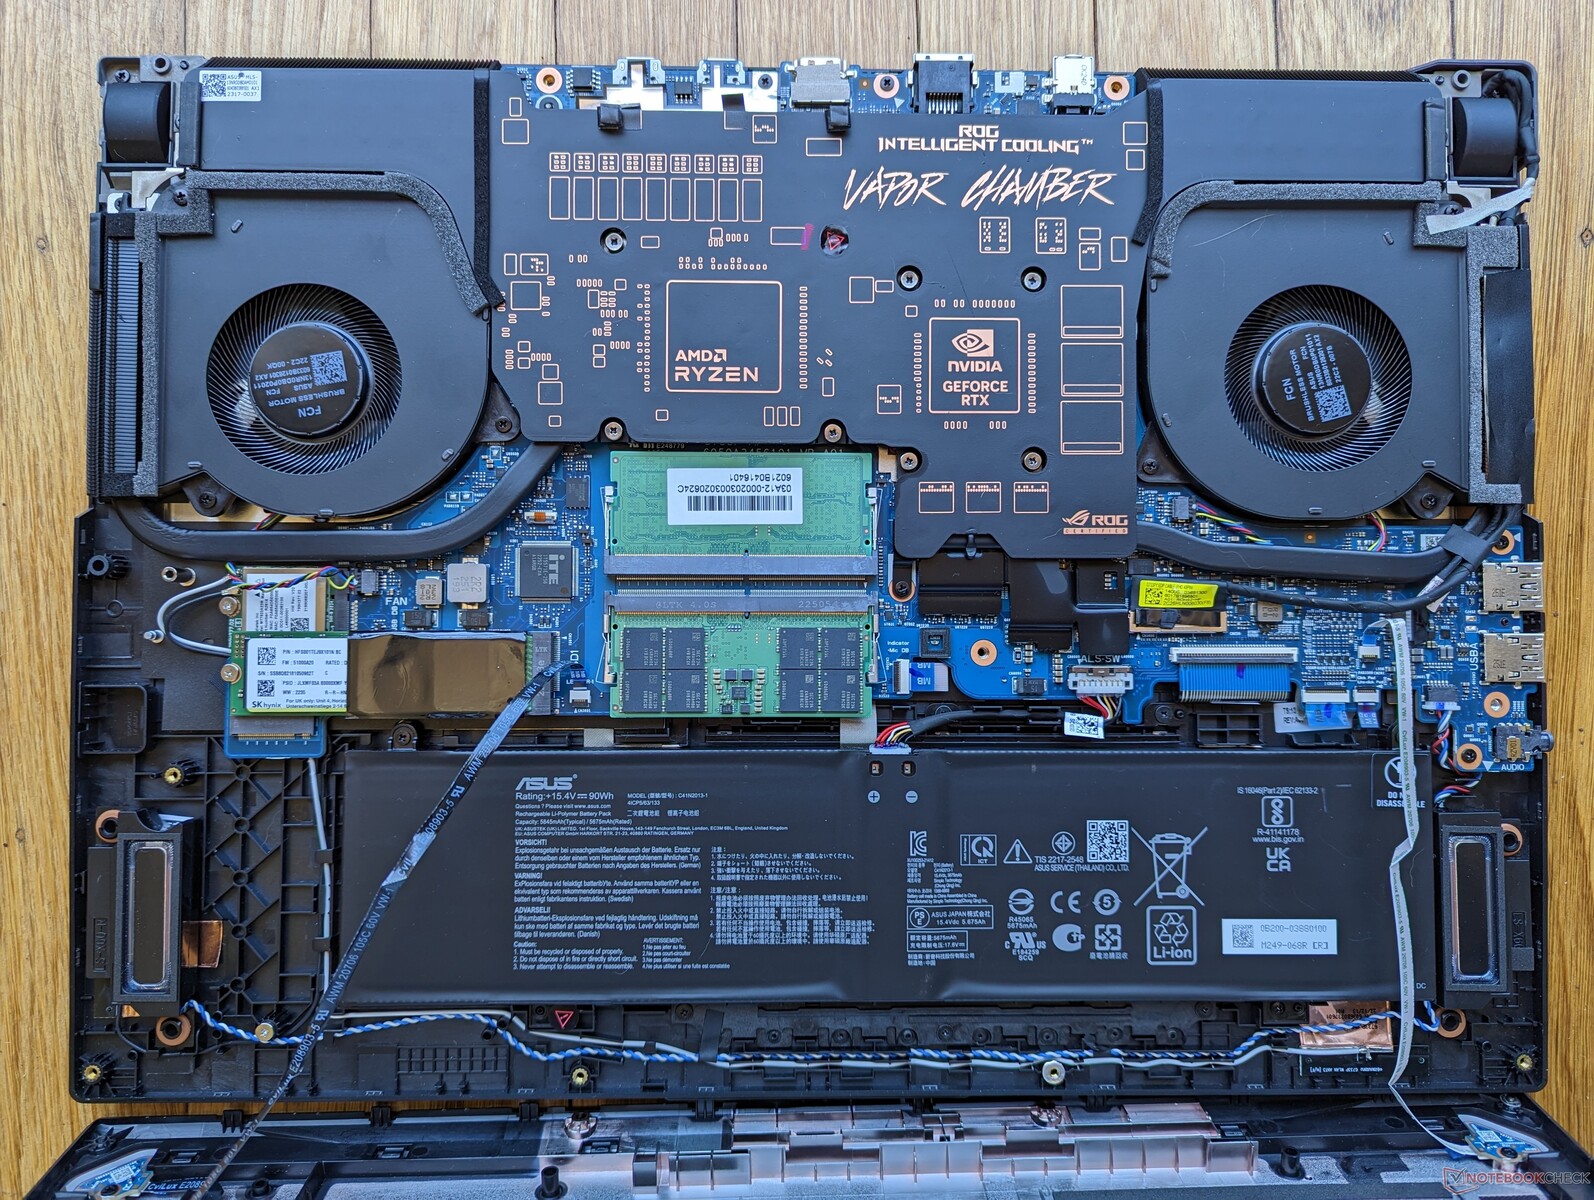
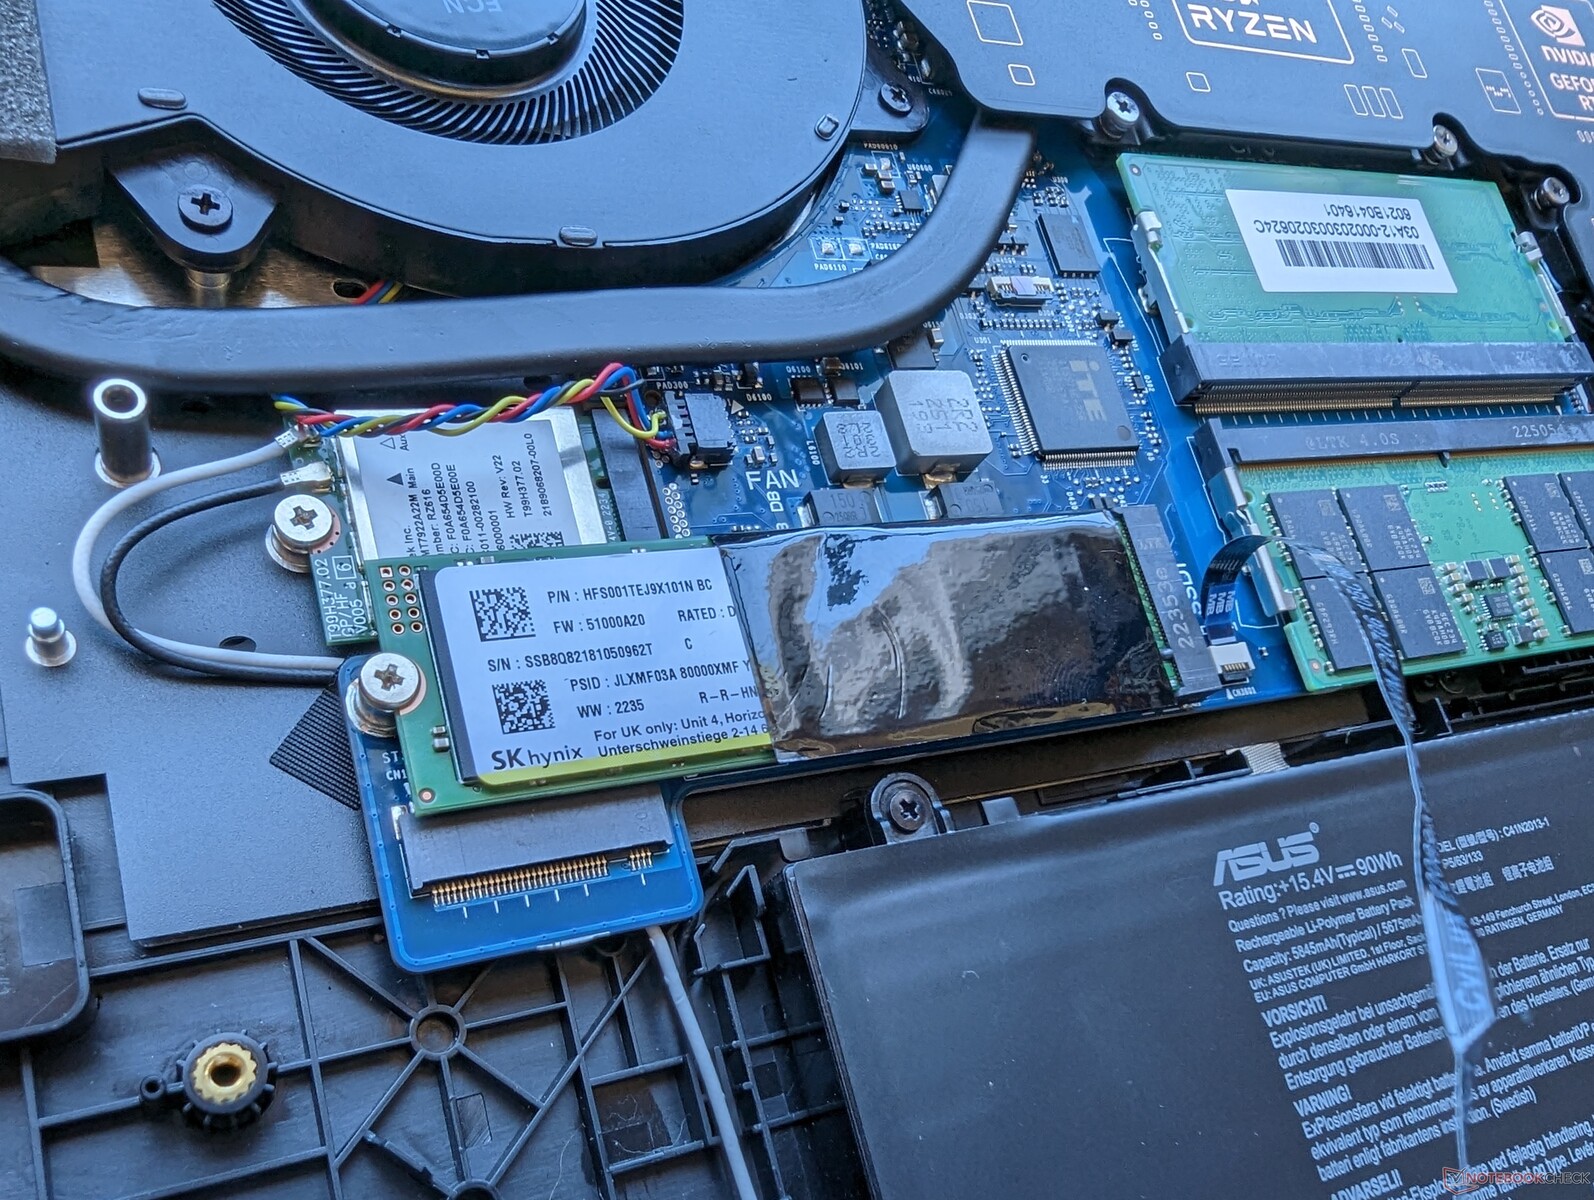
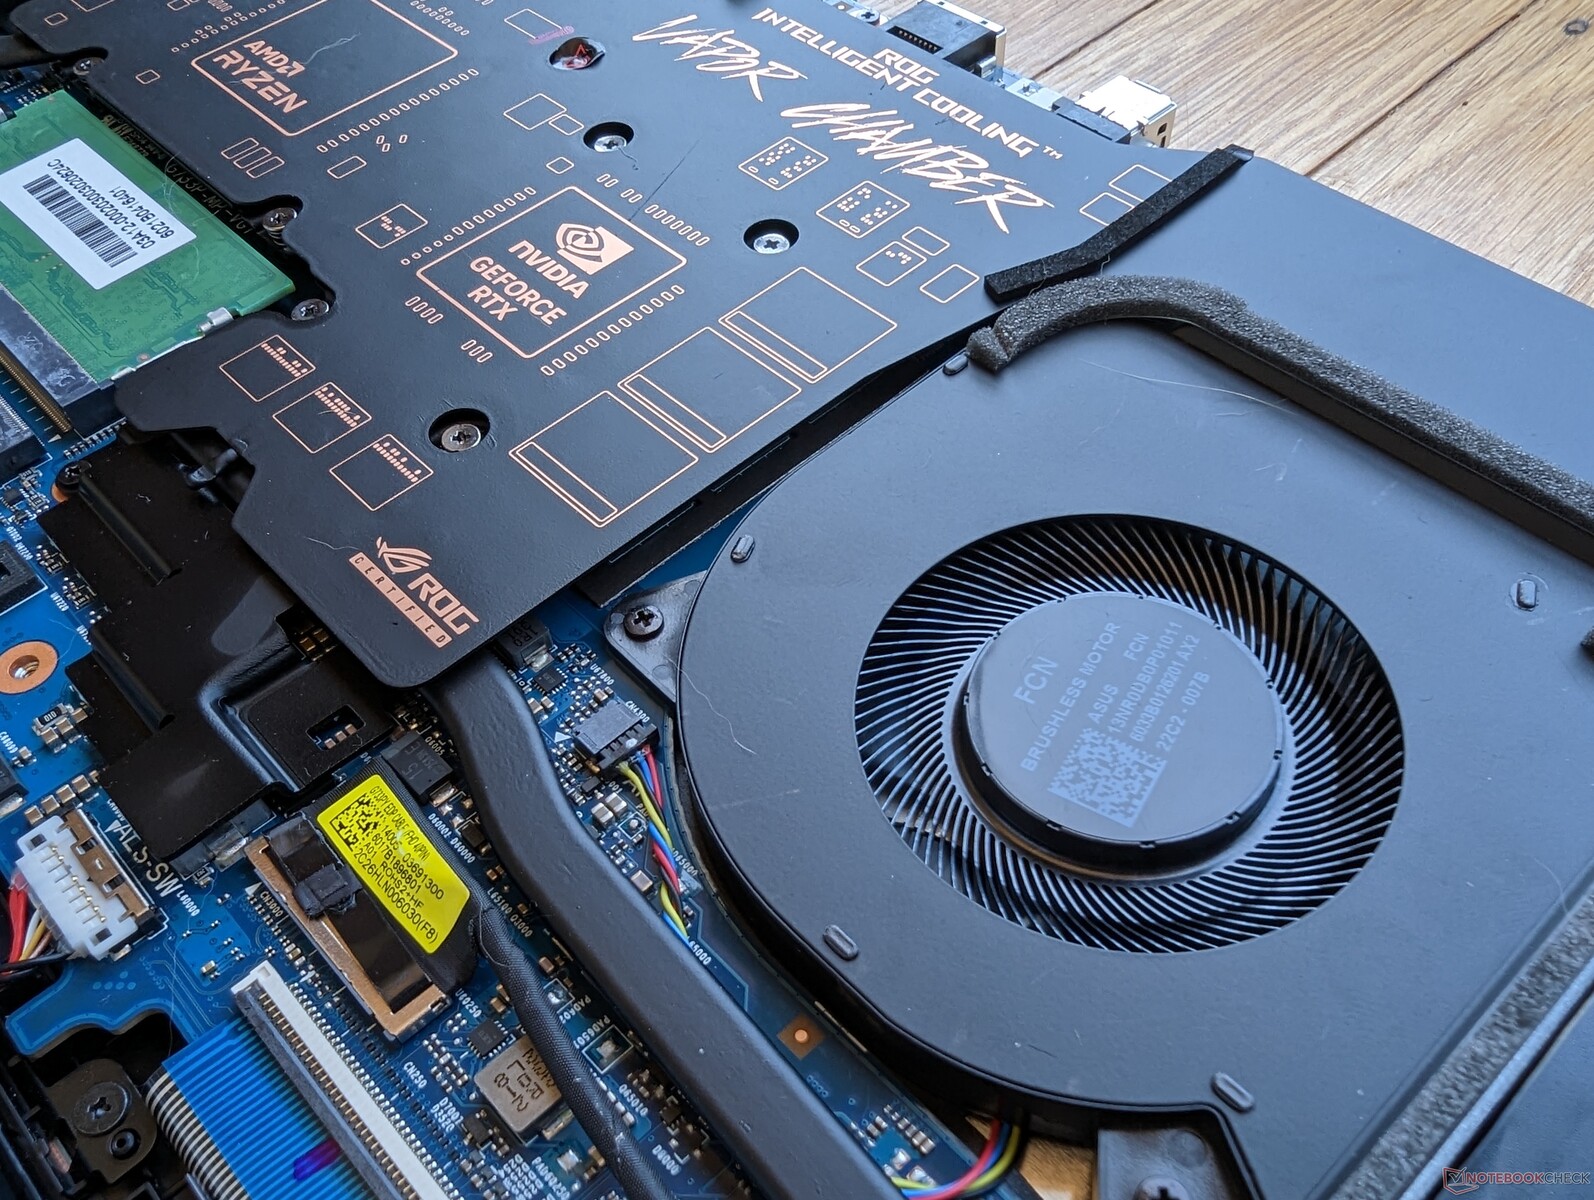
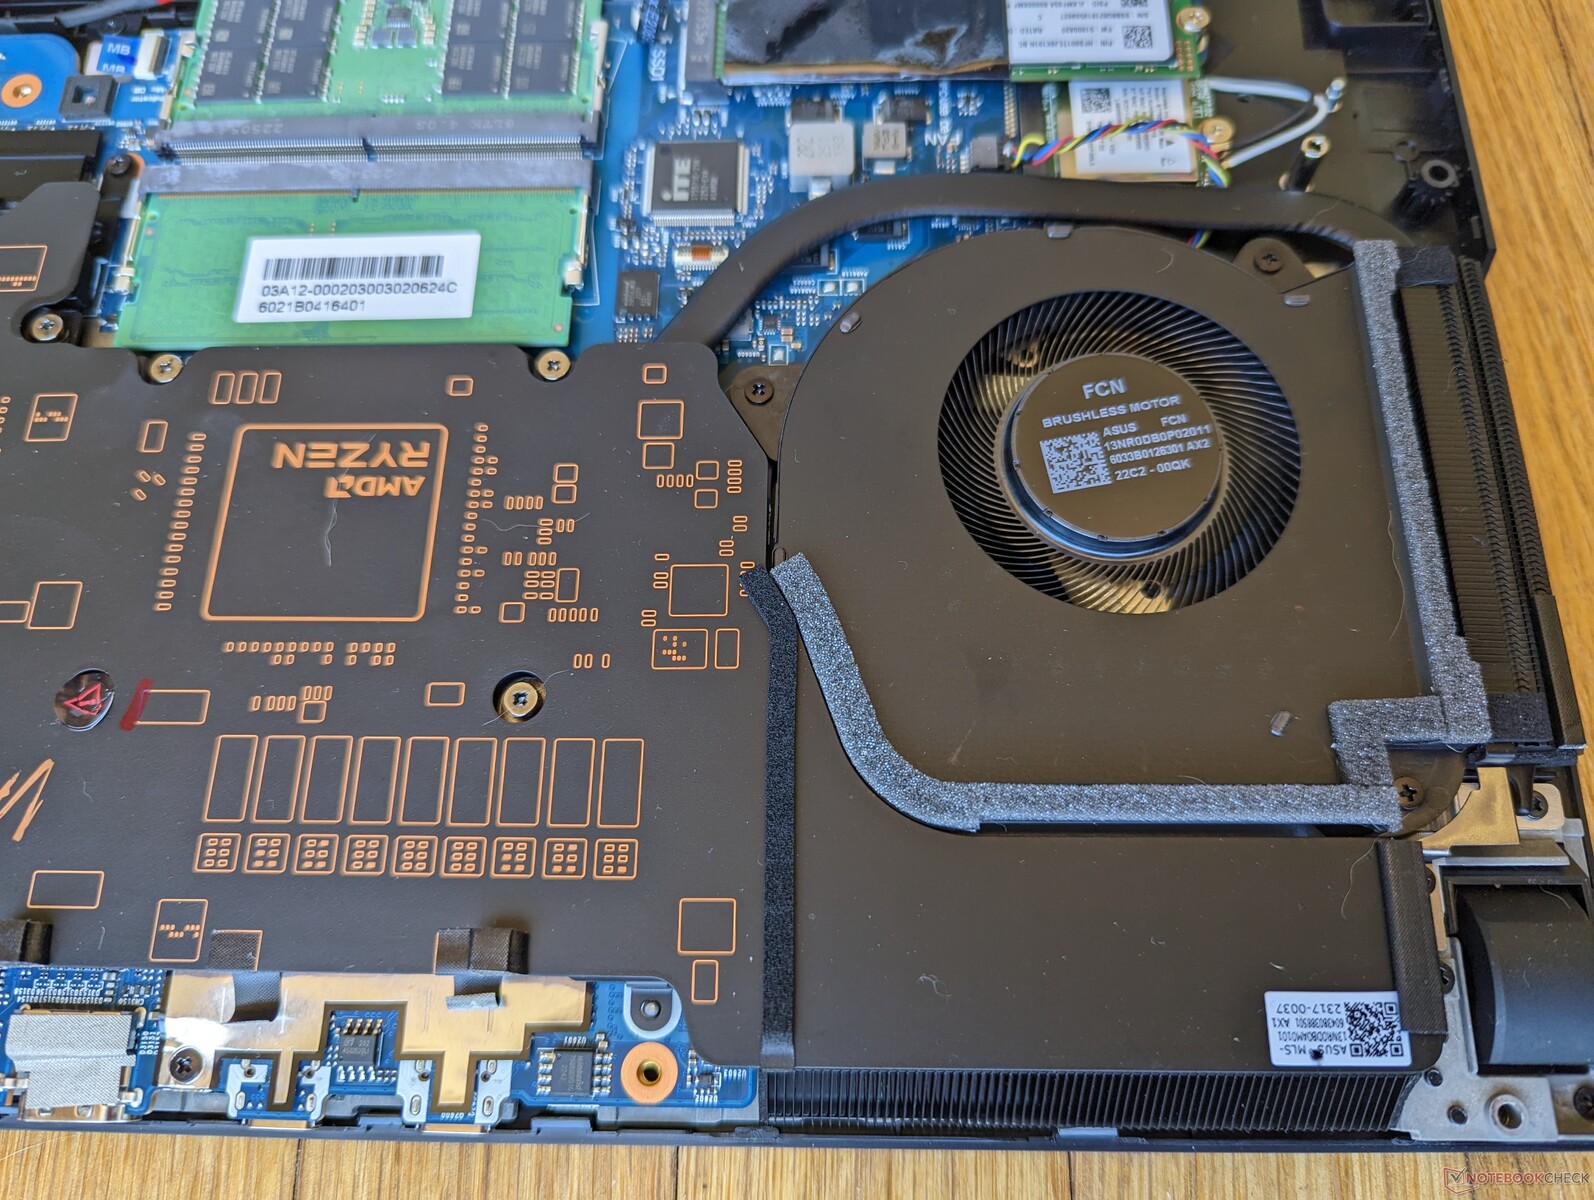
Maintenance

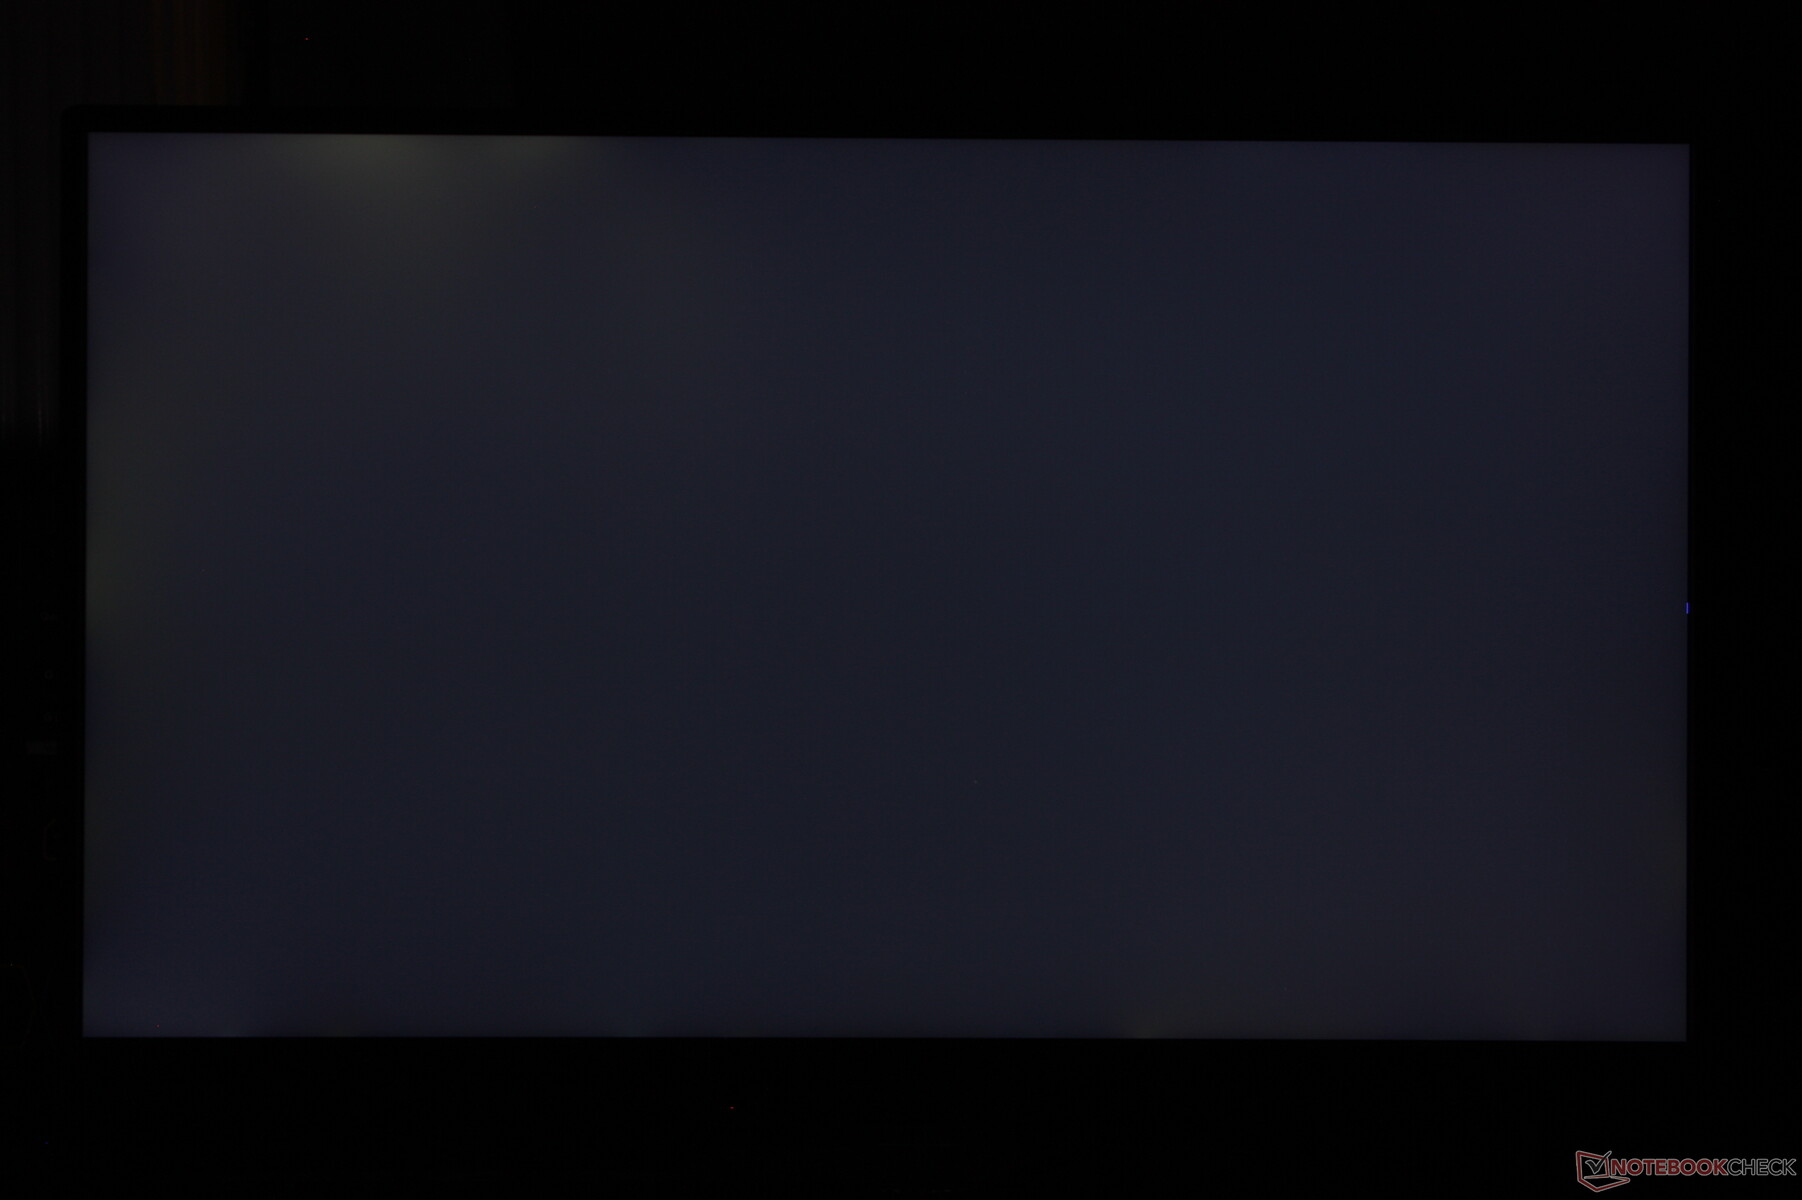
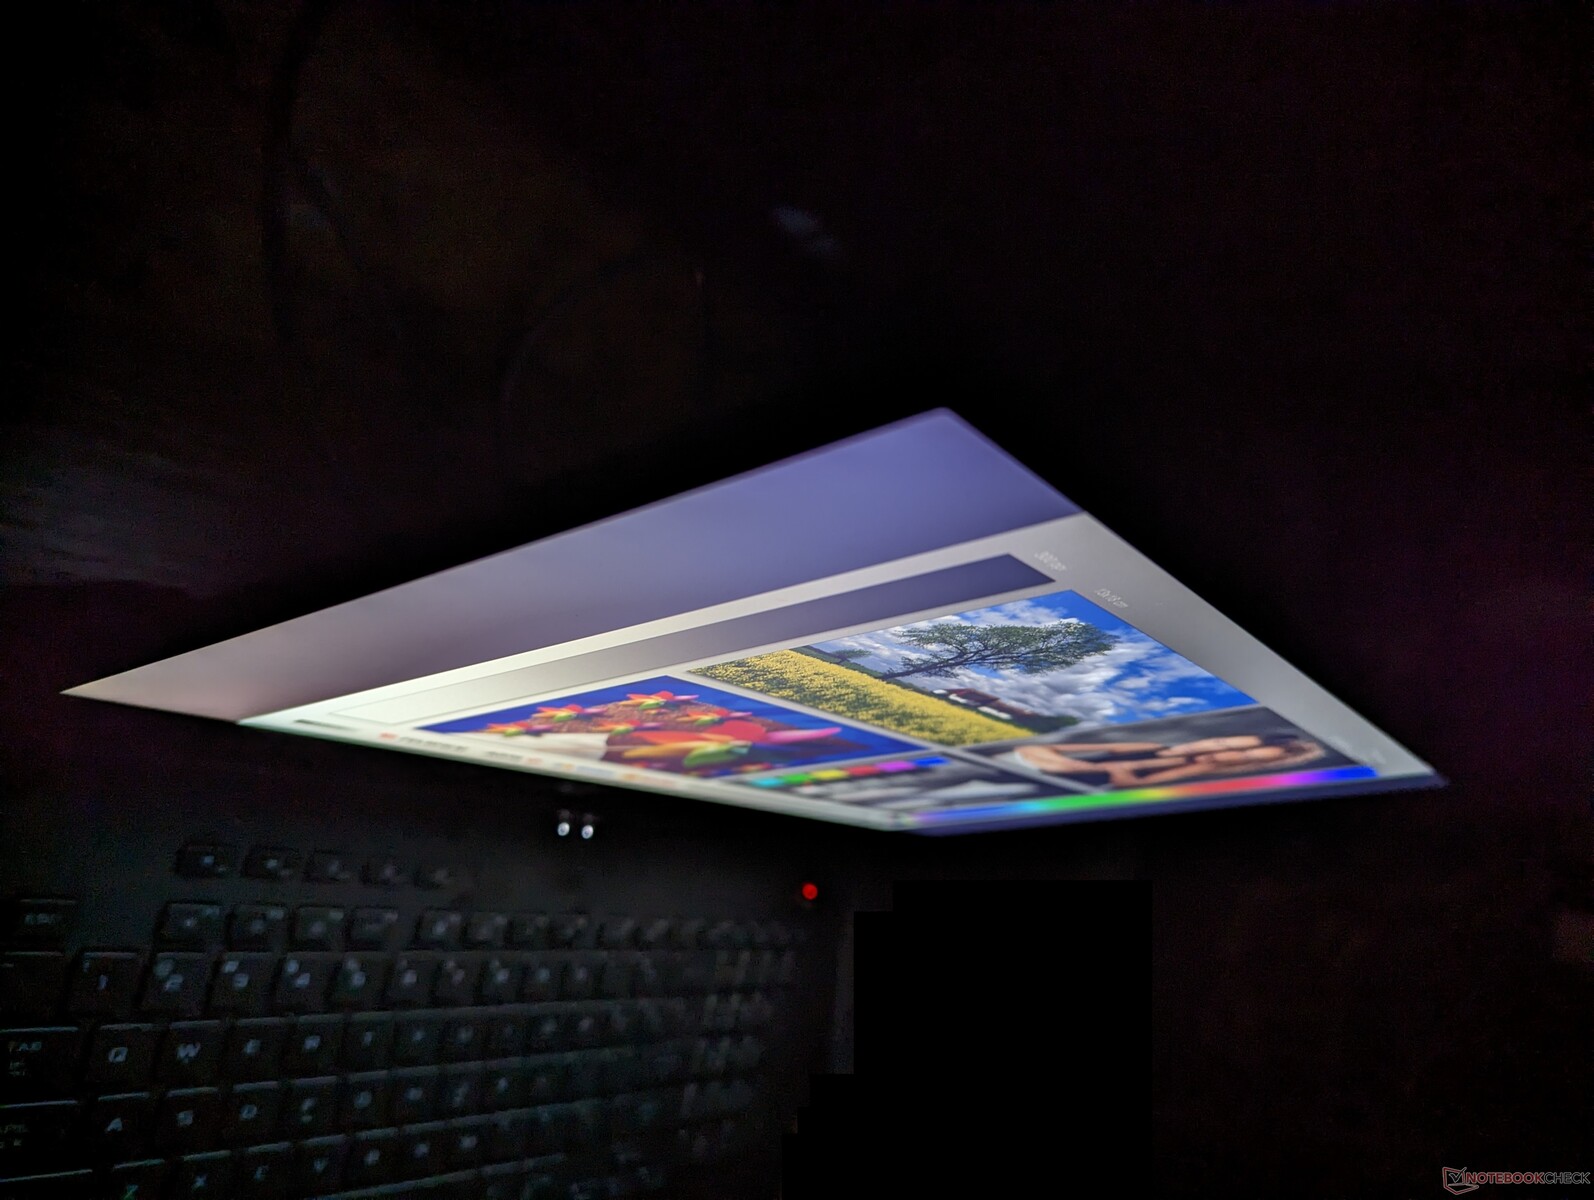
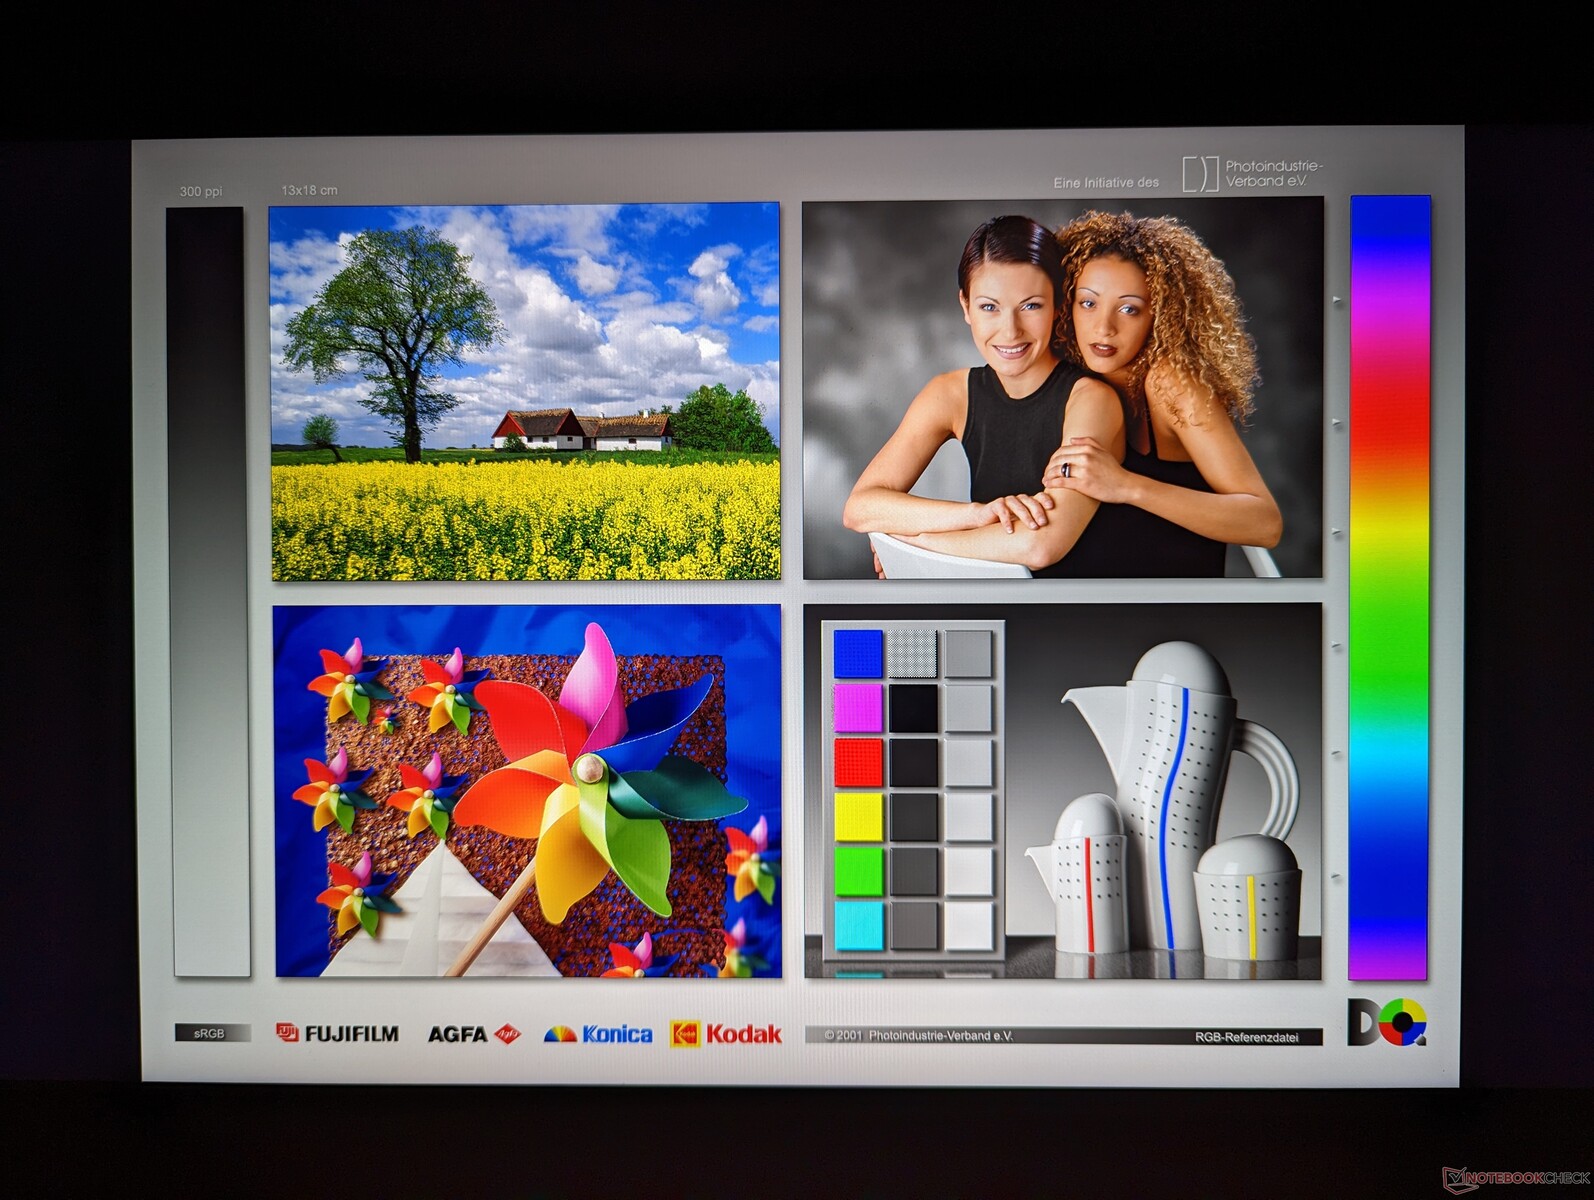
Display — 1440p Sweet Spot
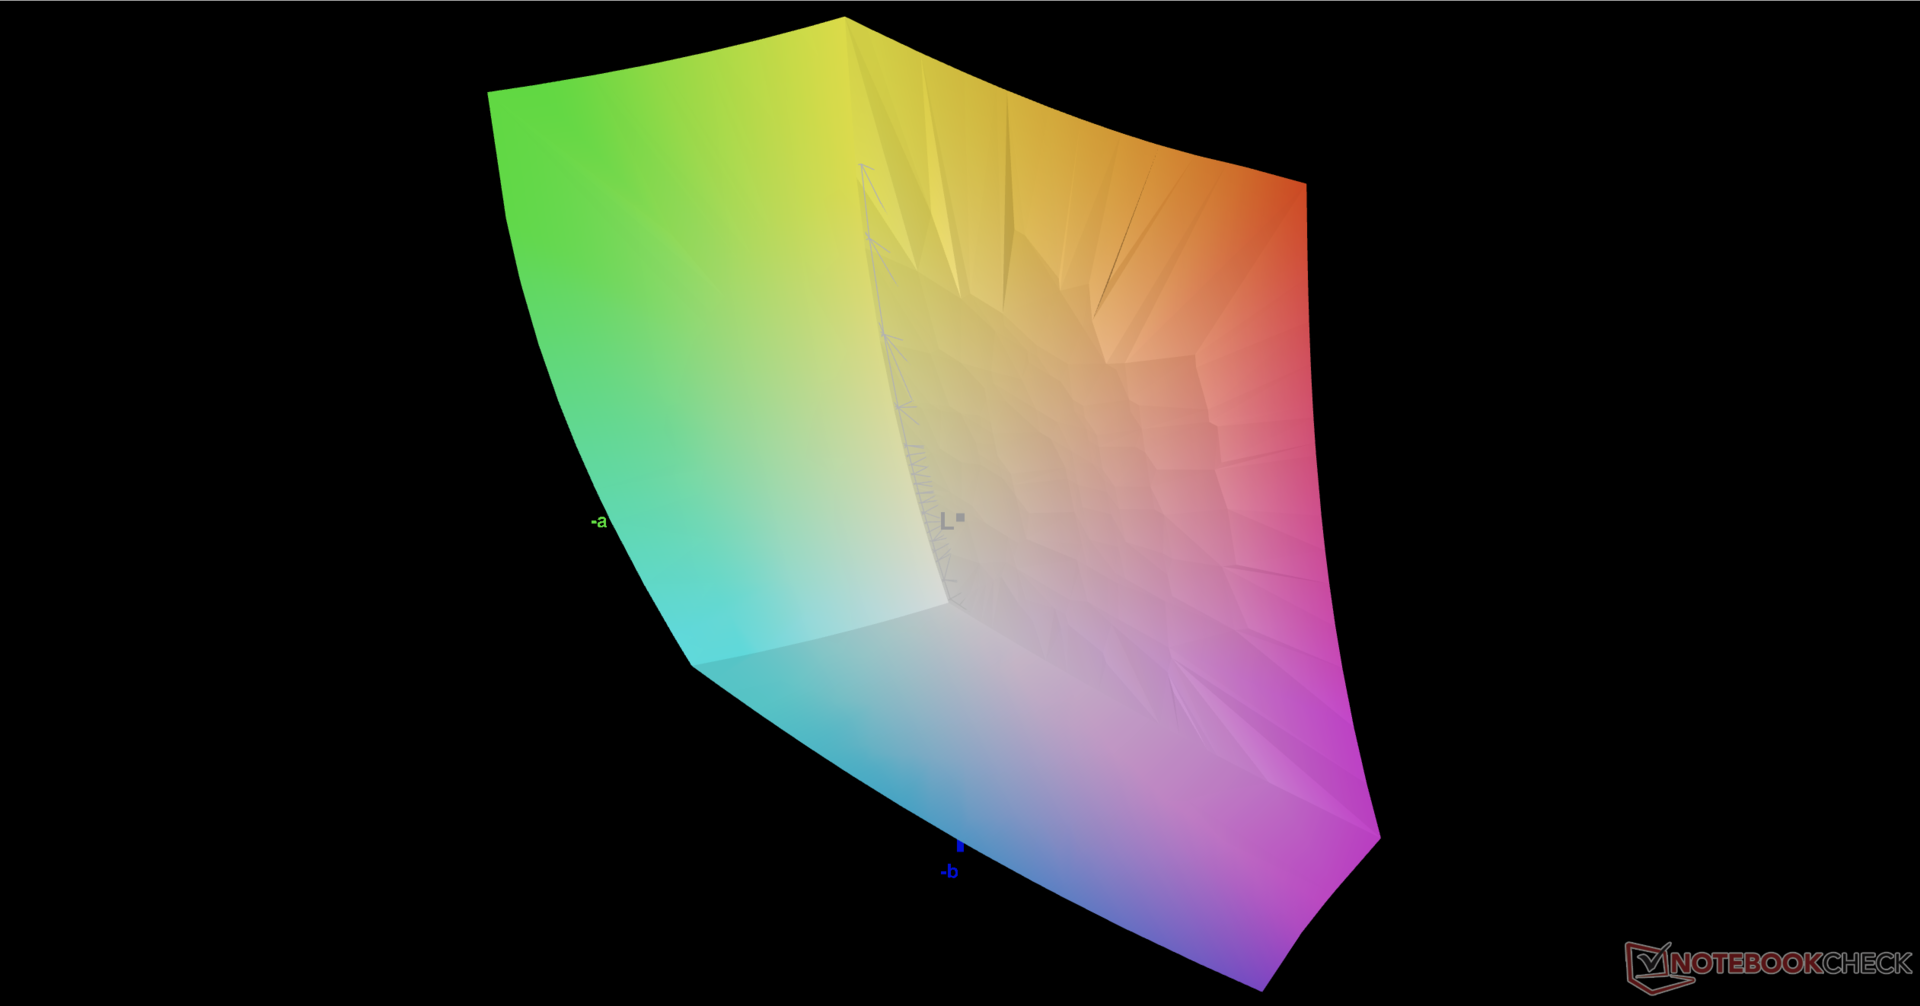
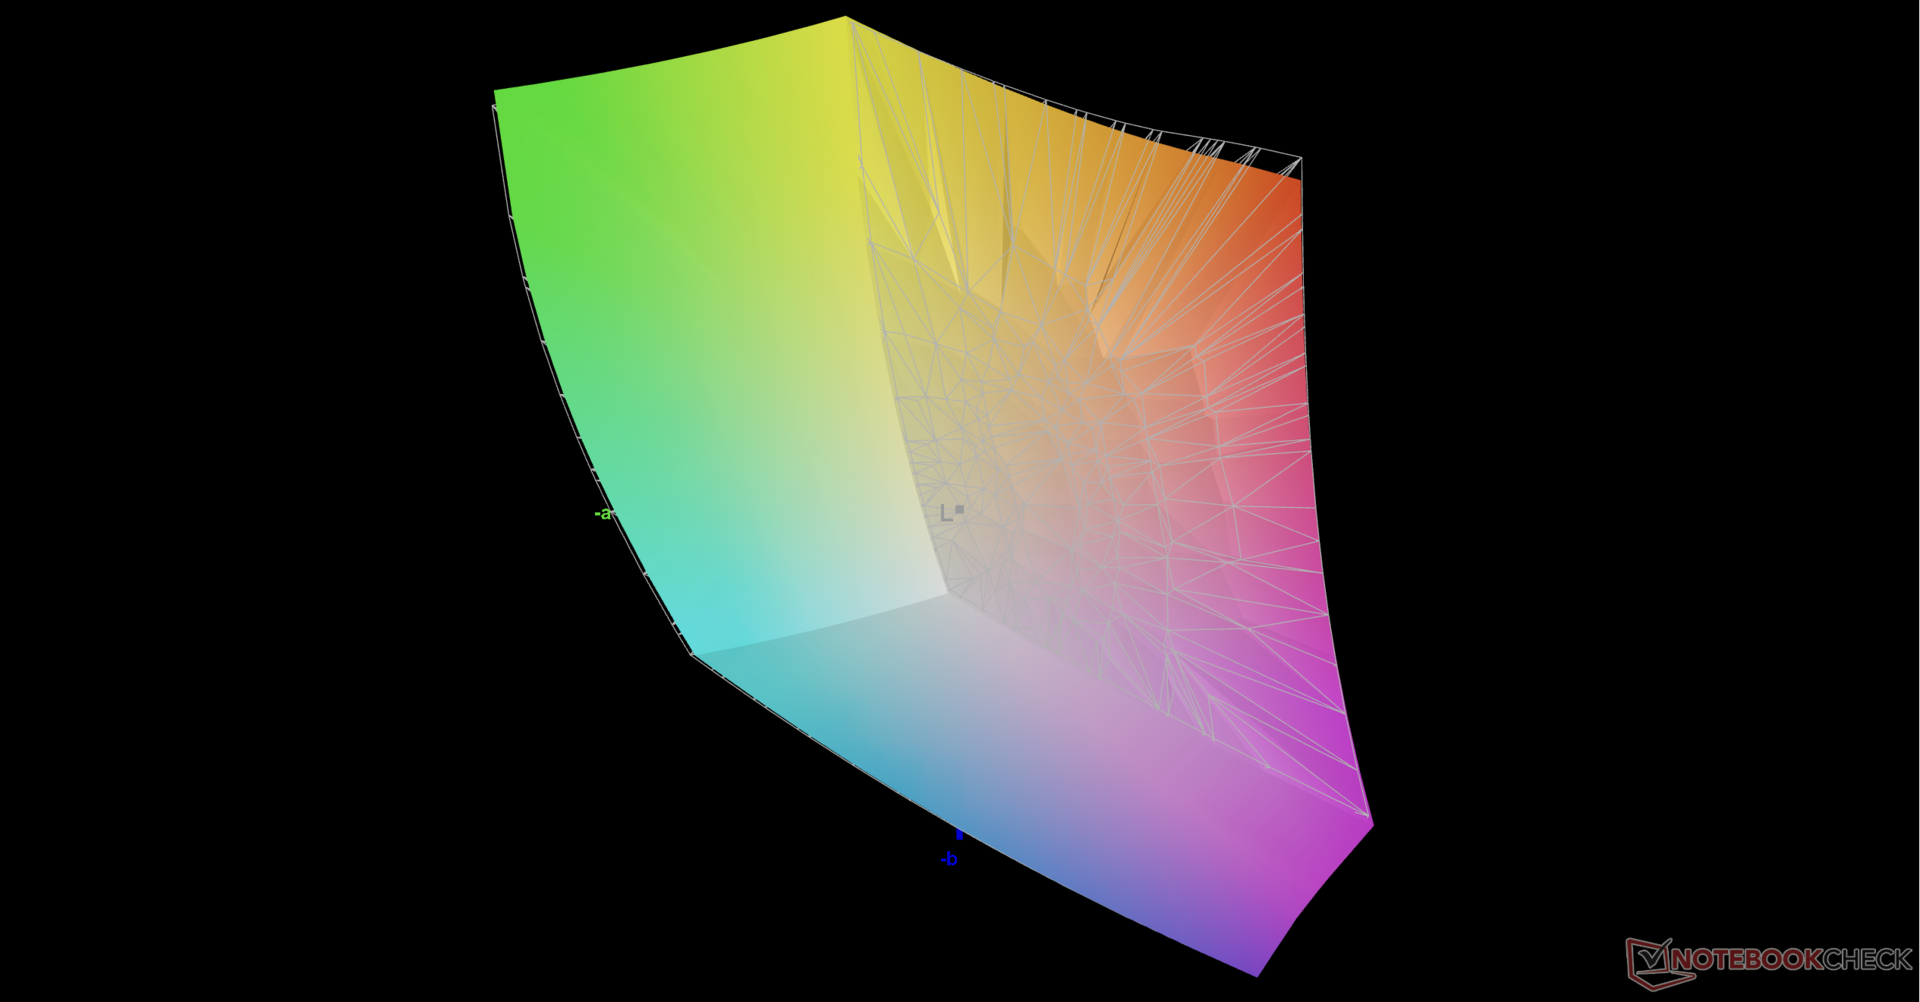
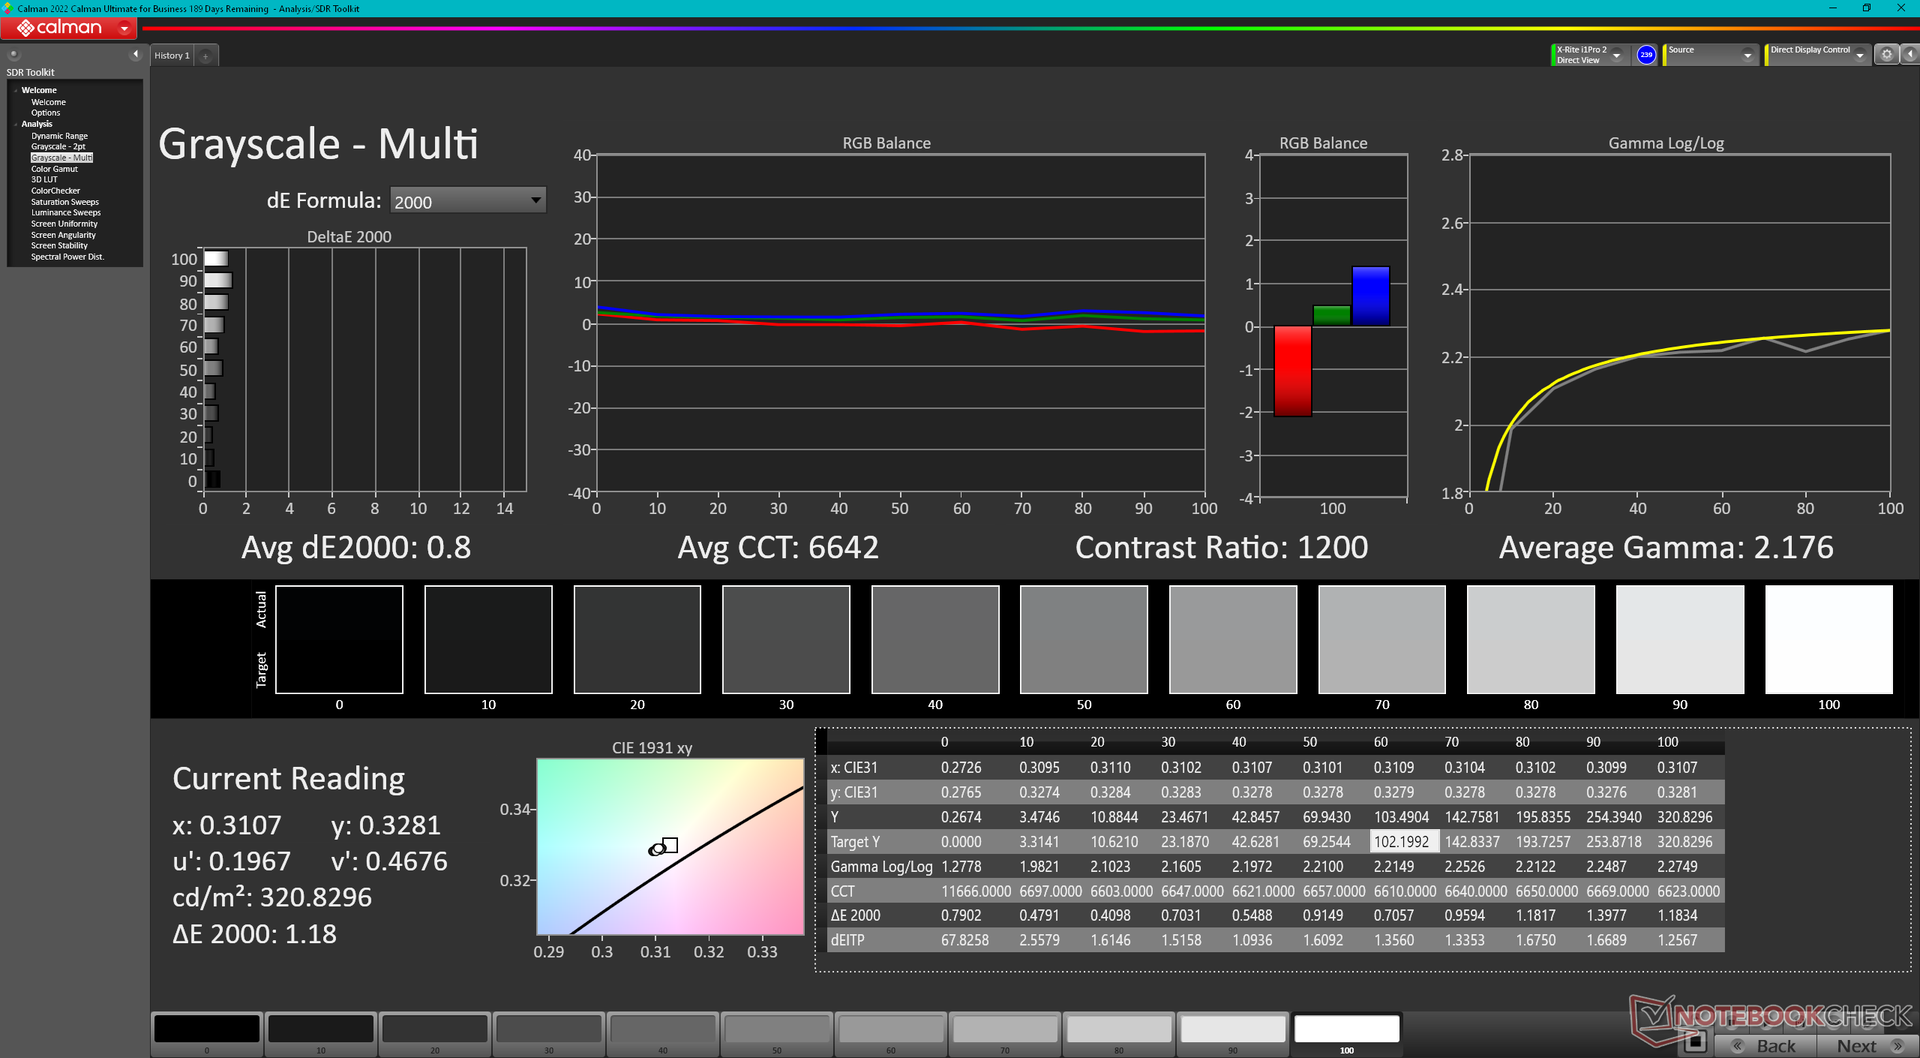
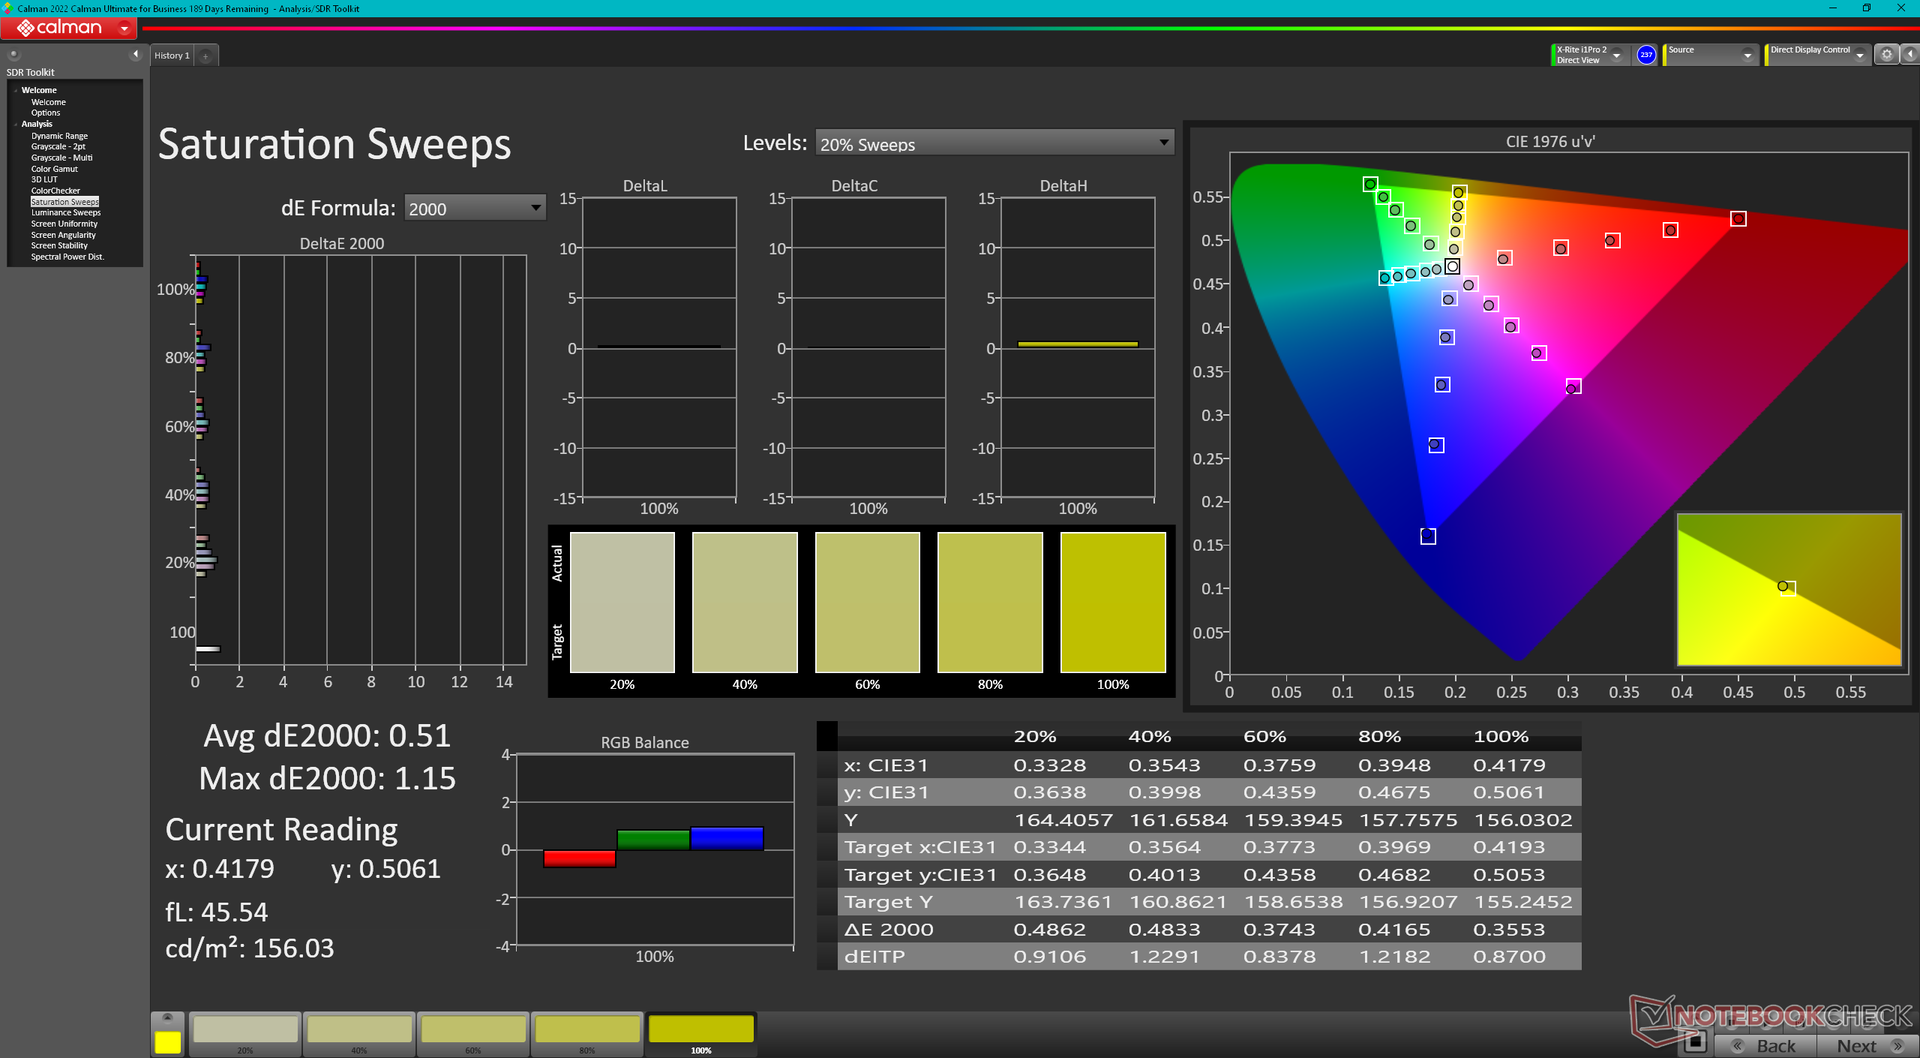
The 2023 model utilizes the same 240 Hz BOE NE173QHM-NZ2 IPS panel as on the 2022 model. Our measurements below are therefore nearly identical year-over-year. This isn't necessarily a bad thing since the panel offers very fast response times, full DCI-P3 colors, and a decent contrast ratio to be fit for both graphics editing and gaming. Users looking for 4K or OLED options, however, are out of luck at the moment.
| |||||||||||||||||||||||||
Brightness Distribution: 86 %
Center on Battery: 322.5 cd/m²
Contrast: 1112:1 (Black: 0.29 cd/m²)
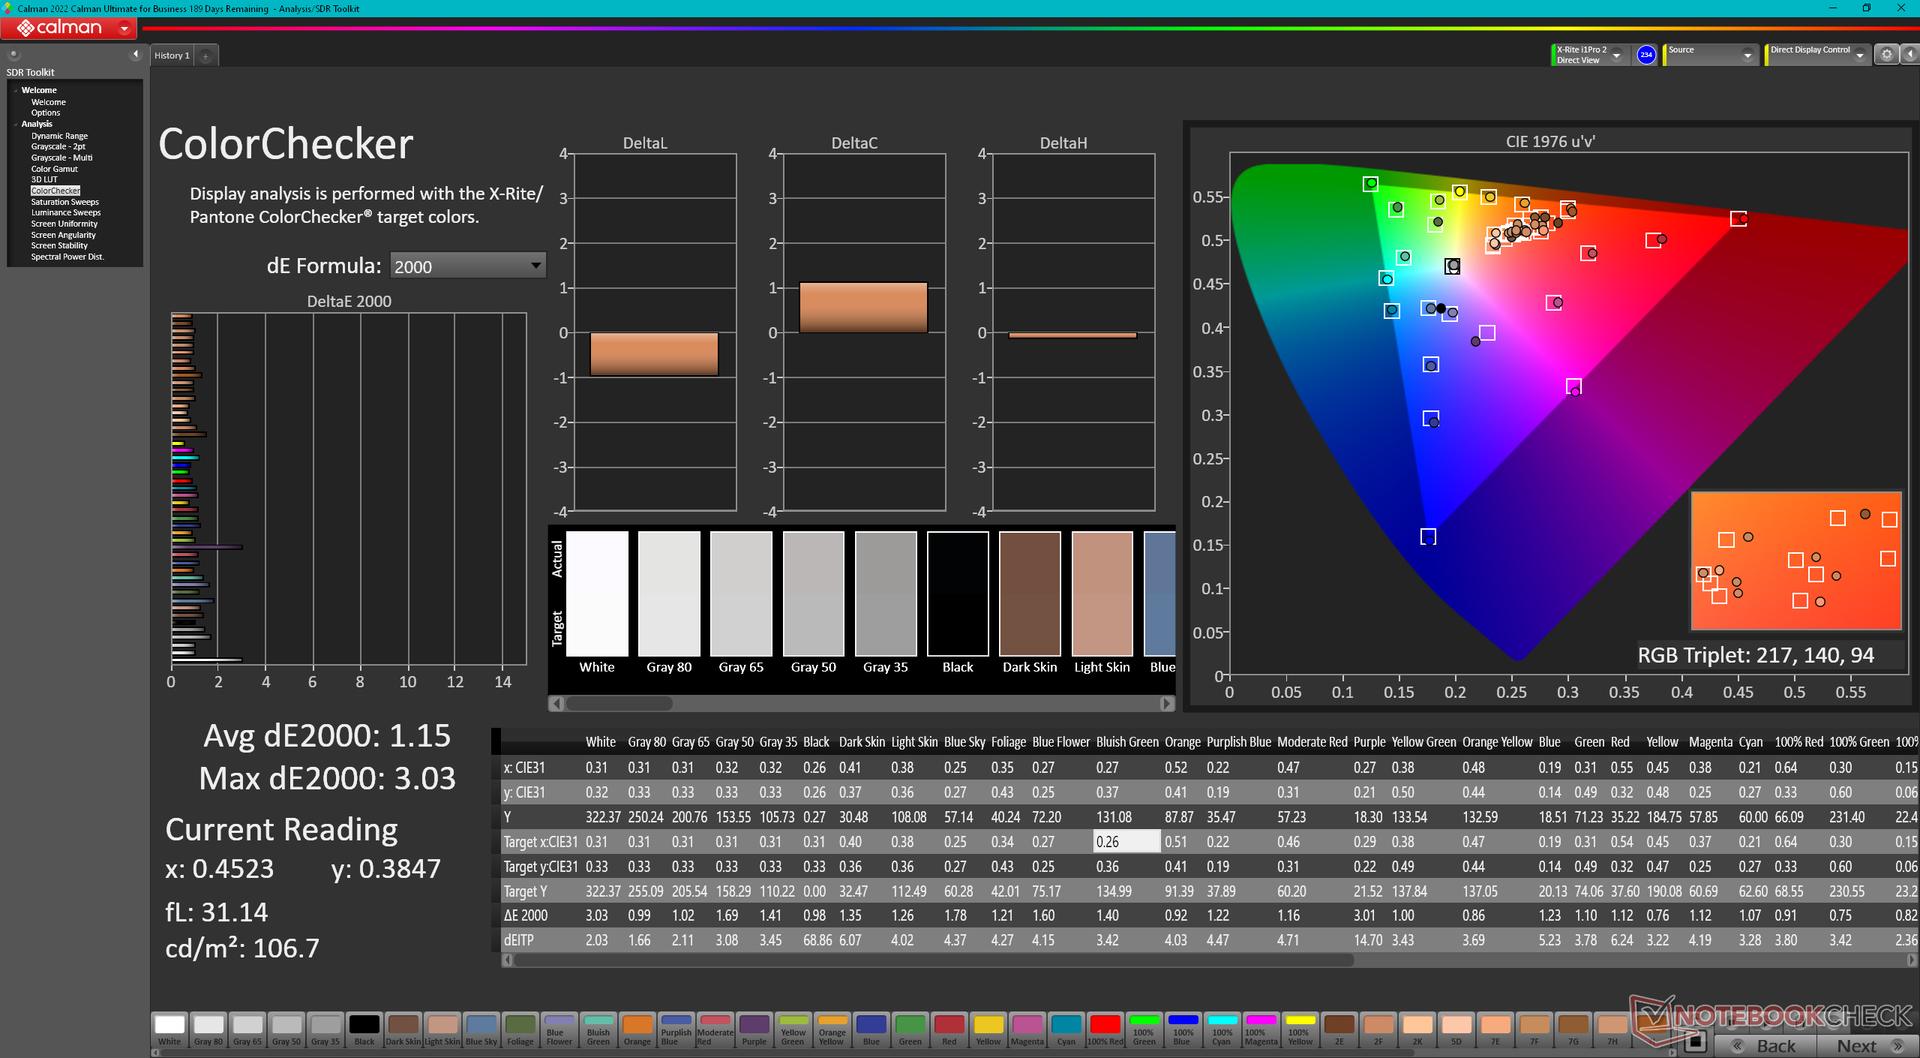
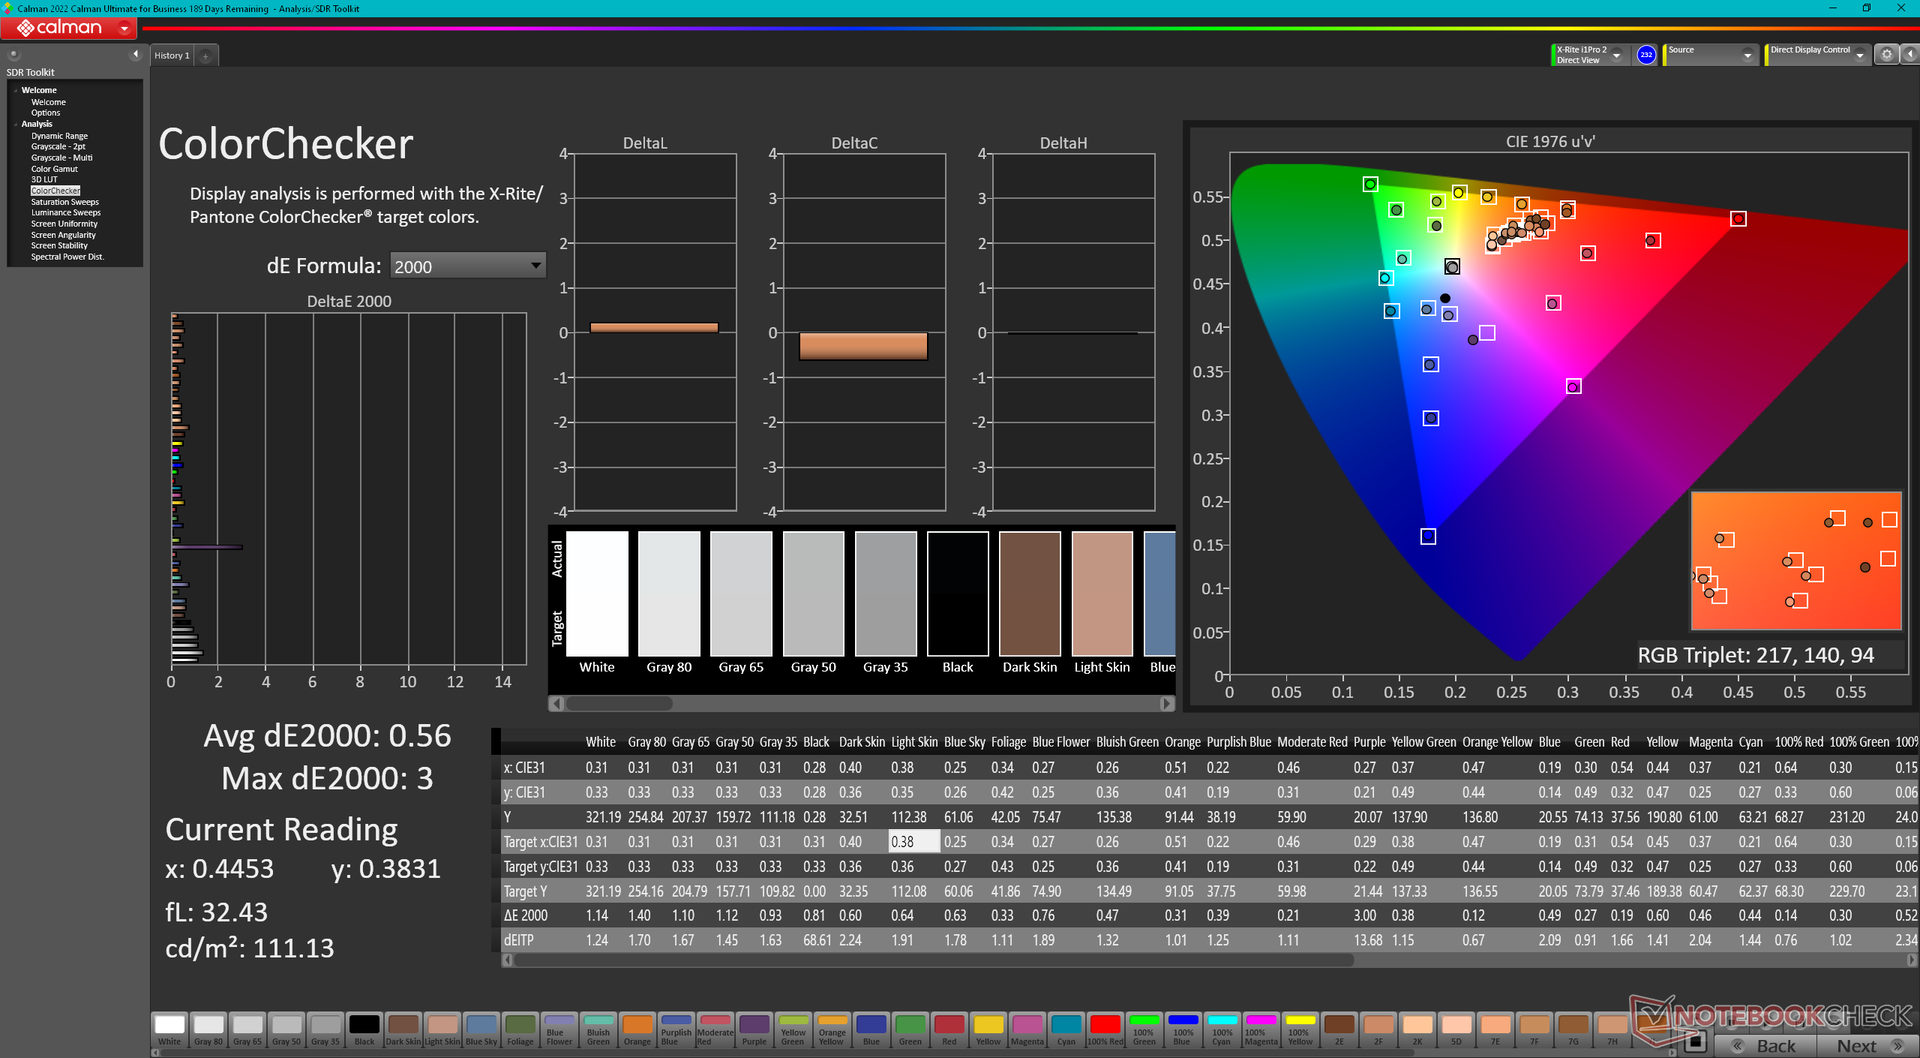
ΔE ColorChecker Calman: 1.15 | ∀{0.5-29.43 Ø4.72}
calibrated: 0.56
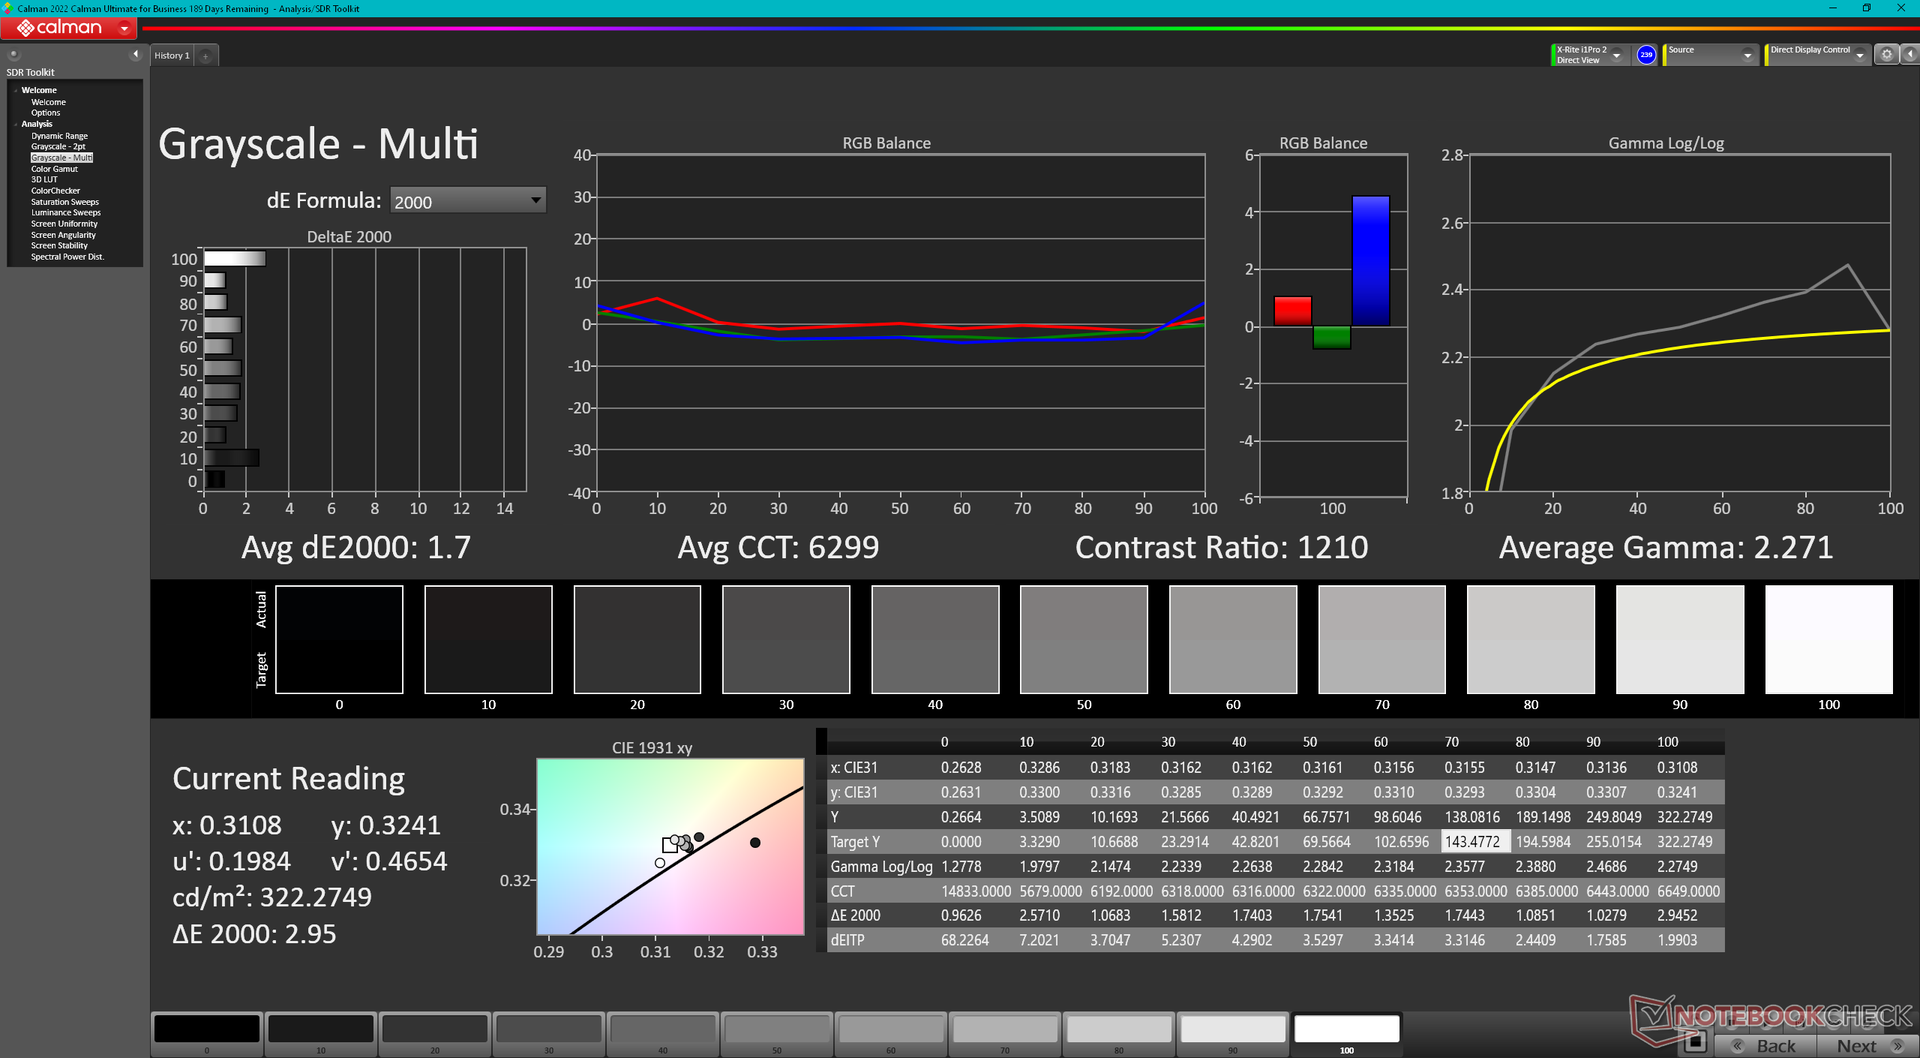
ΔE Greyscale Calman: 1.7 | ∀{0.09-98 Ø4.97}
85.6% AdobeRGB 1998 (Argyll 3D)
100% sRGB (Argyll 3D)
98% Display P3 (Argyll 3D)
Gamma: 2.27
CCT: 6299 K
| Asus ROG Strix Scar 17 G733PY-XS96 NE173QHM-NZ2, IPS, 2560x1440, 17.3" | Asus ROG Strix Scar 17 SE G733CX-LL014W NE173QHM-NZ2, IPS, 2560x1440, 17.3" | MSI GE78HX 13VH-070US AU Optronics B170QAN01.2, IPS, 2560x1600, 17" | Eluktronics Mech-17 GP2 BOE NE170QDM-NZ1, IPS, 2560x1600, 17" | Aorus 17X XES Sharp SHP1563, IPS, 1920x1080, 17.3" | Alienware m17 R5 (R9 6900HX, RX 6850M XT) AU Optronics AUODBA3, IPS, 3840x2160, 17" | |
|---|---|---|---|---|---|---|
| Display | -1% | 0% | -16% | -15% | 1% | |
| Display P3 Coverage (%) | 98 | 97.1 -1% | 97.6 0% | 69.1 -29% | 70.1 -28% | 97.2 -1% |
| sRGB Coverage (%) | 100 | 99.9 0% | 99.9 0% | 99.7 0% | 99.9 0% | 99.6 0% |
| AdobeRGB 1998 Coverage (%) | 85.6 | 84.8 -1% | 86.5 1% | 69.8 -18% | 71.9 -16% | 88.4 3% |
| Response Times | 10% | 38% | -38% | 47% | -84% | |
| Response Time Grey 50% / Grey 80% * (ms) | 6.2 ? | 5.7 ? 8% | 4.2 ? 32% | 12 ? -94% | 3.4 ? 45% | 16.4 ? -165% |
| Response Time Black / White * (ms) | 11.4 ? | 10.1 ? 11% | 6.4 ? 44% | 9.4 ? 18% | 5.8 ? 49% | 11.6 ? -2% |
| PWM Frequency (Hz) | ||||||
| Screen | 5% | -93% | -20% | -102% | -161% | |
| Brightness middle (cd/m²) | 322.5 | 320 -1% | 398.6 24% | 417.3 29% | 278 -14% | 484 50% |
| Brightness (cd/m²) | 317 | 303 -4% | 384 21% | 387 22% | 273 -14% | 449 42% |
| Brightness Distribution (%) | 86 | 87 1% | 89 3% | 87 1% | 79 -8% | 87 1% |
| Black Level * (cd/m²) | 0.29 | 0.3 -3% | 0.46 -59% | 0.42 -45% | 0.26 10% | 0.55 -90% |
| Contrast (:1) | 1112 | 1067 -4% | 867 -22% | 994 -11% | 1069 -4% | 880 -21% |
| Colorchecker dE 2000 * | 1.15 | 1.1 4% | 4.05 -252% | 2.14 -86% | 3.96 -244% | 4.8 -317% |
| Colorchecker dE 2000 max. * | 3.03 | 2.7 11% | 8.68 -186% | 4.09 -35% | 10.78 -256% | 7.48 -147% |
| Colorchecker dE 2000 calibrated * | 0.56 | 1.02 -82% | 0.42 25% | 1.07 -91% | 4.74 -746% | |
| Greyscale dE 2000 * | 1.7 | 1.1 35% | 6.5 -282% | 3.1 -82% | 6.8 -300% | 5.5 -224% |
| Gamma | 2.27 97% | 2.13 103% | 2.11 104% | 2.19 100% | 2.224 99% | 2.42 91% |
| CCT | 6299 103% | 6599 98% | 7518 86% | 6040 108% | 7651 85% | 6148 106% |
| Total Average (Program / Settings) | 5% /
4% | -18% /
-54% | -25% /
-22% | -23% /
-62% | -81% /
-116% |
* ... smaller is better
The display comes pre-calibrated out of the box with very low average grayscale and color deltaE values of only 1.7 and 1.15, respectively. An end-user calibration is therefore not needed.

Display Response Times
| ↔ Response Time Black to White | ||
|---|---|---|
| 11.4 ms ... rise ↗ and fall ↘ combined | ↗ 5.9 ms rise | 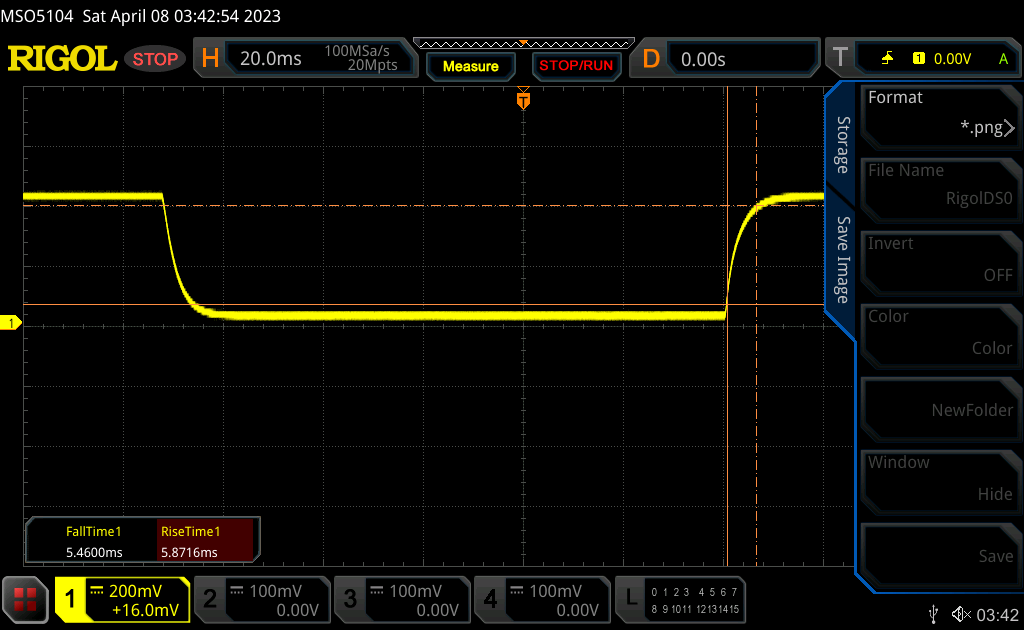 |
| ↘ 5.5 ms fall | ||
| The screen shows good response rates in our tests, but may be too slow for competitive gamers. In comparison, all tested devices range from 0.1 (minimum) to 240 (maximum) ms. » 31 % of all devices are better. This means that the measured response time is better than the average of all tested devices (19.8 ms). | ||
| ↔ Response Time 50% Grey to 80% Grey | ||
| 6.2 ms ... rise ↗ and fall ↘ combined | ↗ 2.8 ms rise | 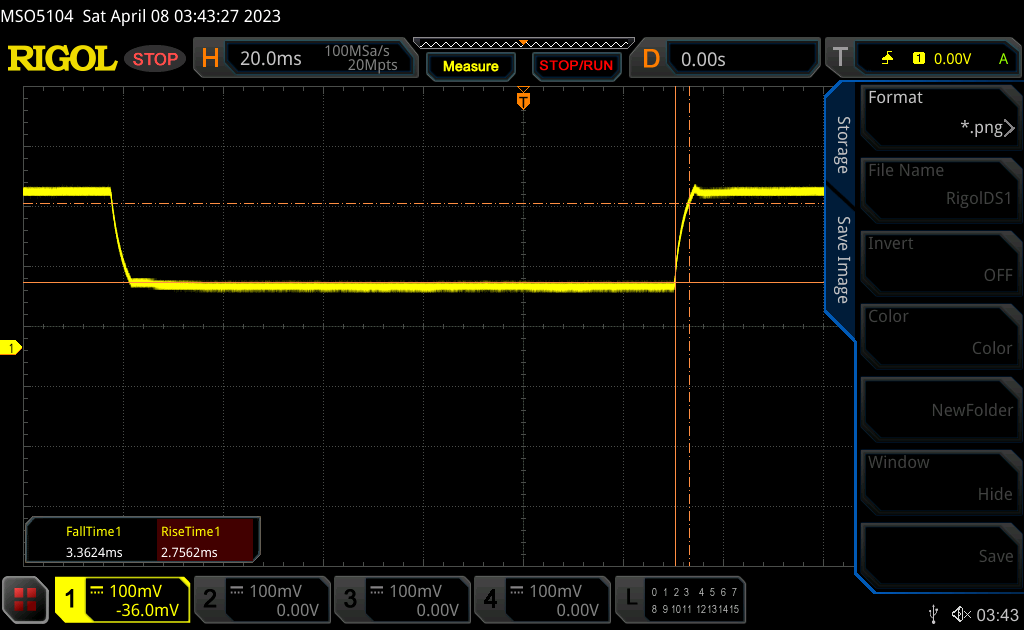 |
| ↘ 3.4 ms fall | ||
| The screen shows very fast response rates in our tests and should be very well suited for fast-paced gaming. In comparison, all tested devices range from 0.165 (minimum) to 636 (maximum) ms. » 19 % of all devices are better. This means that the measured response time is better than the average of all tested devices (31 ms). | ||
Screen Flickering / PWM (Pulse-Width Modulation)
| Screen flickering / PWM not detected | 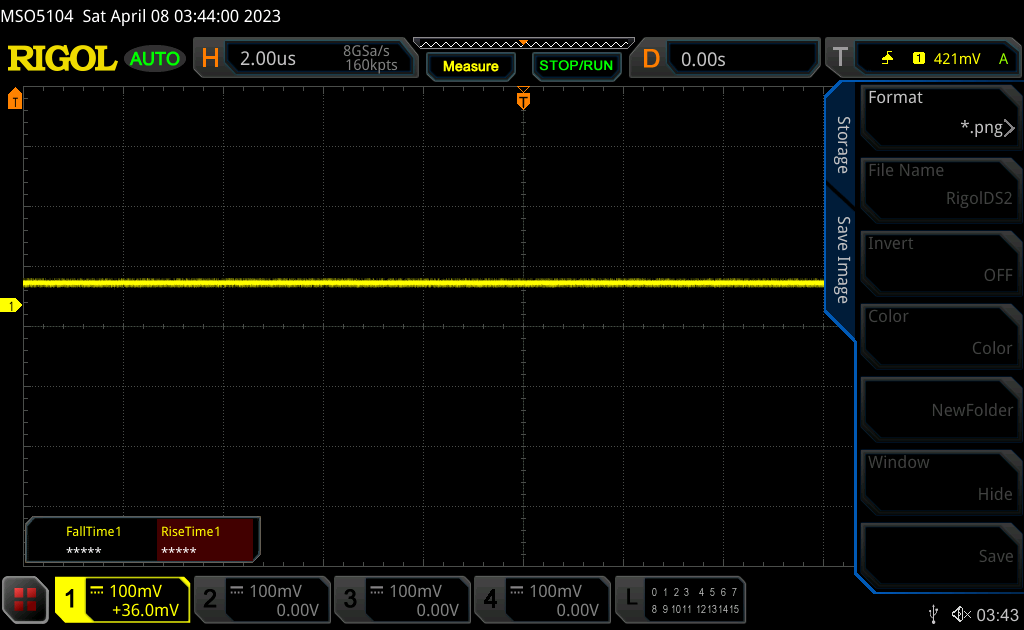 | ||
In comparison: 52 % of all tested devices do not use PWM to dim the display. If PWM was detected, an average of 7763 (minimum: 5 - maximum: 343500) Hz was measured. | |||

Performance — Rising Ryzen
Testing Conditions
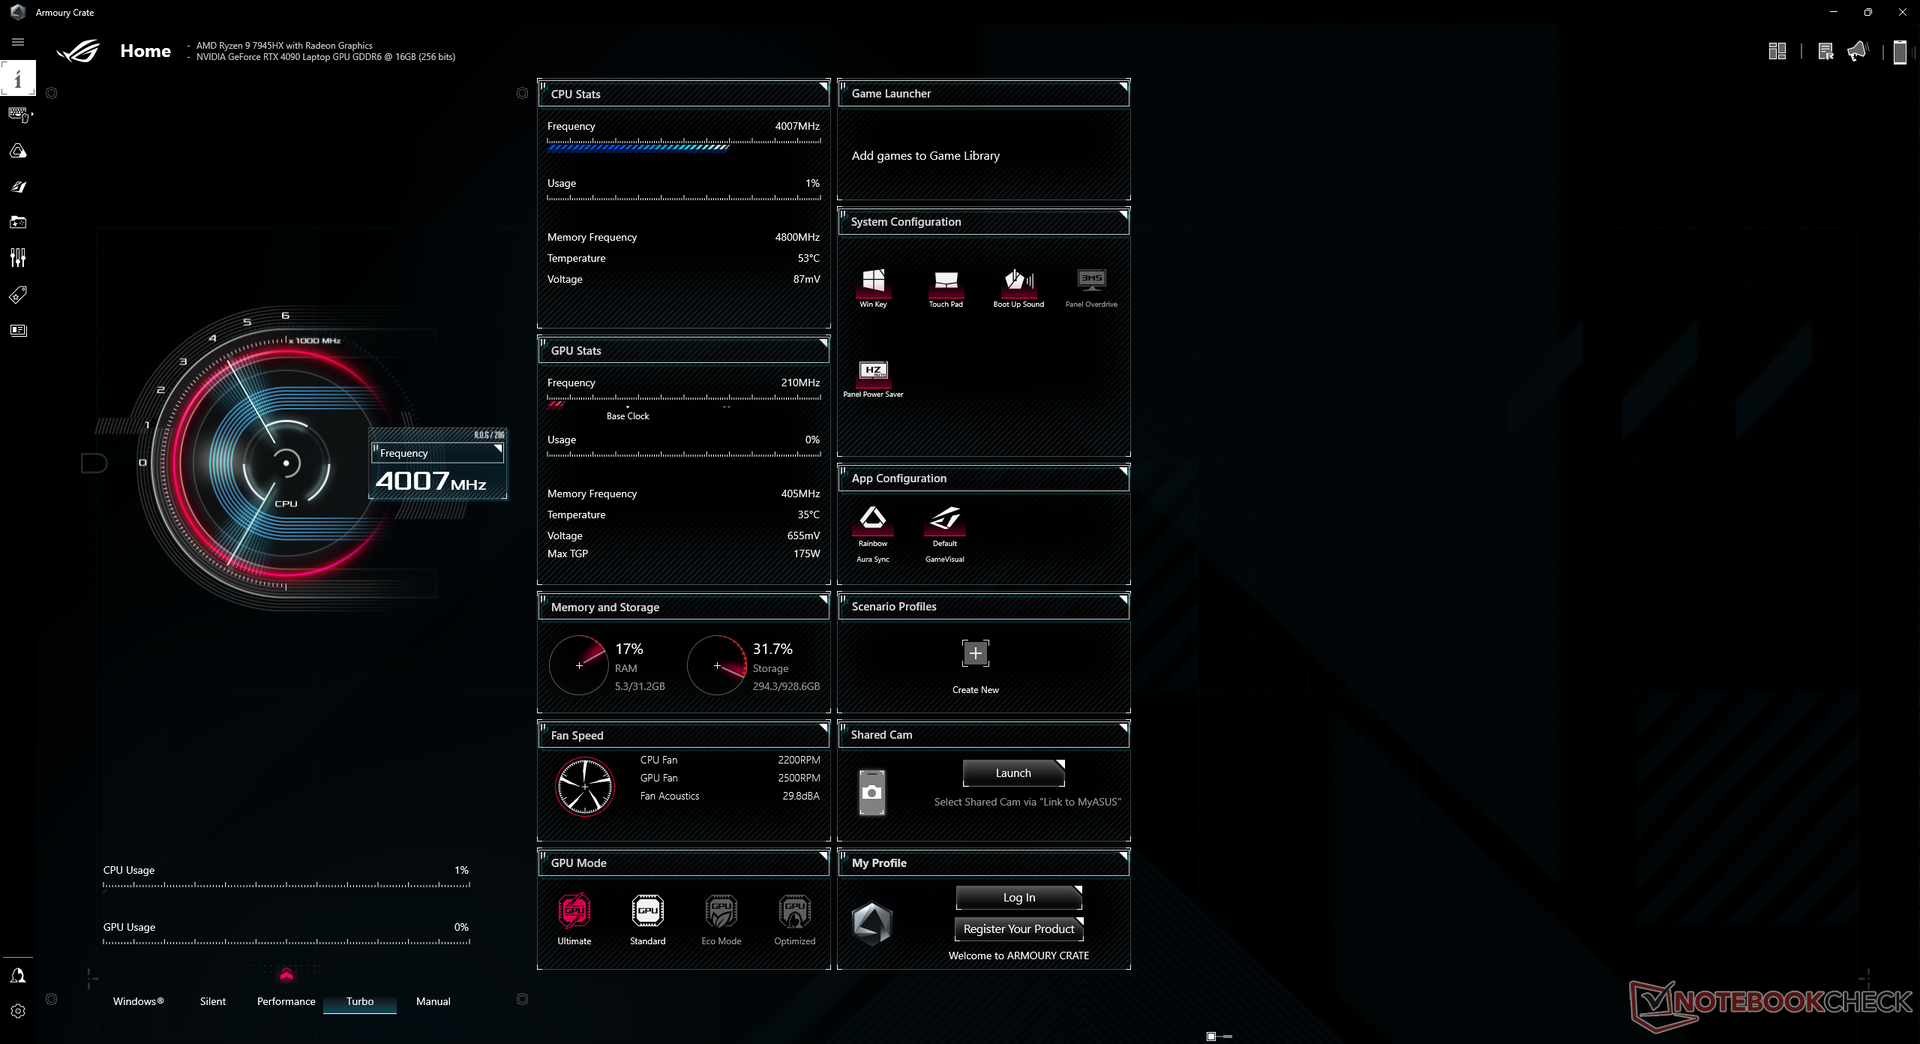
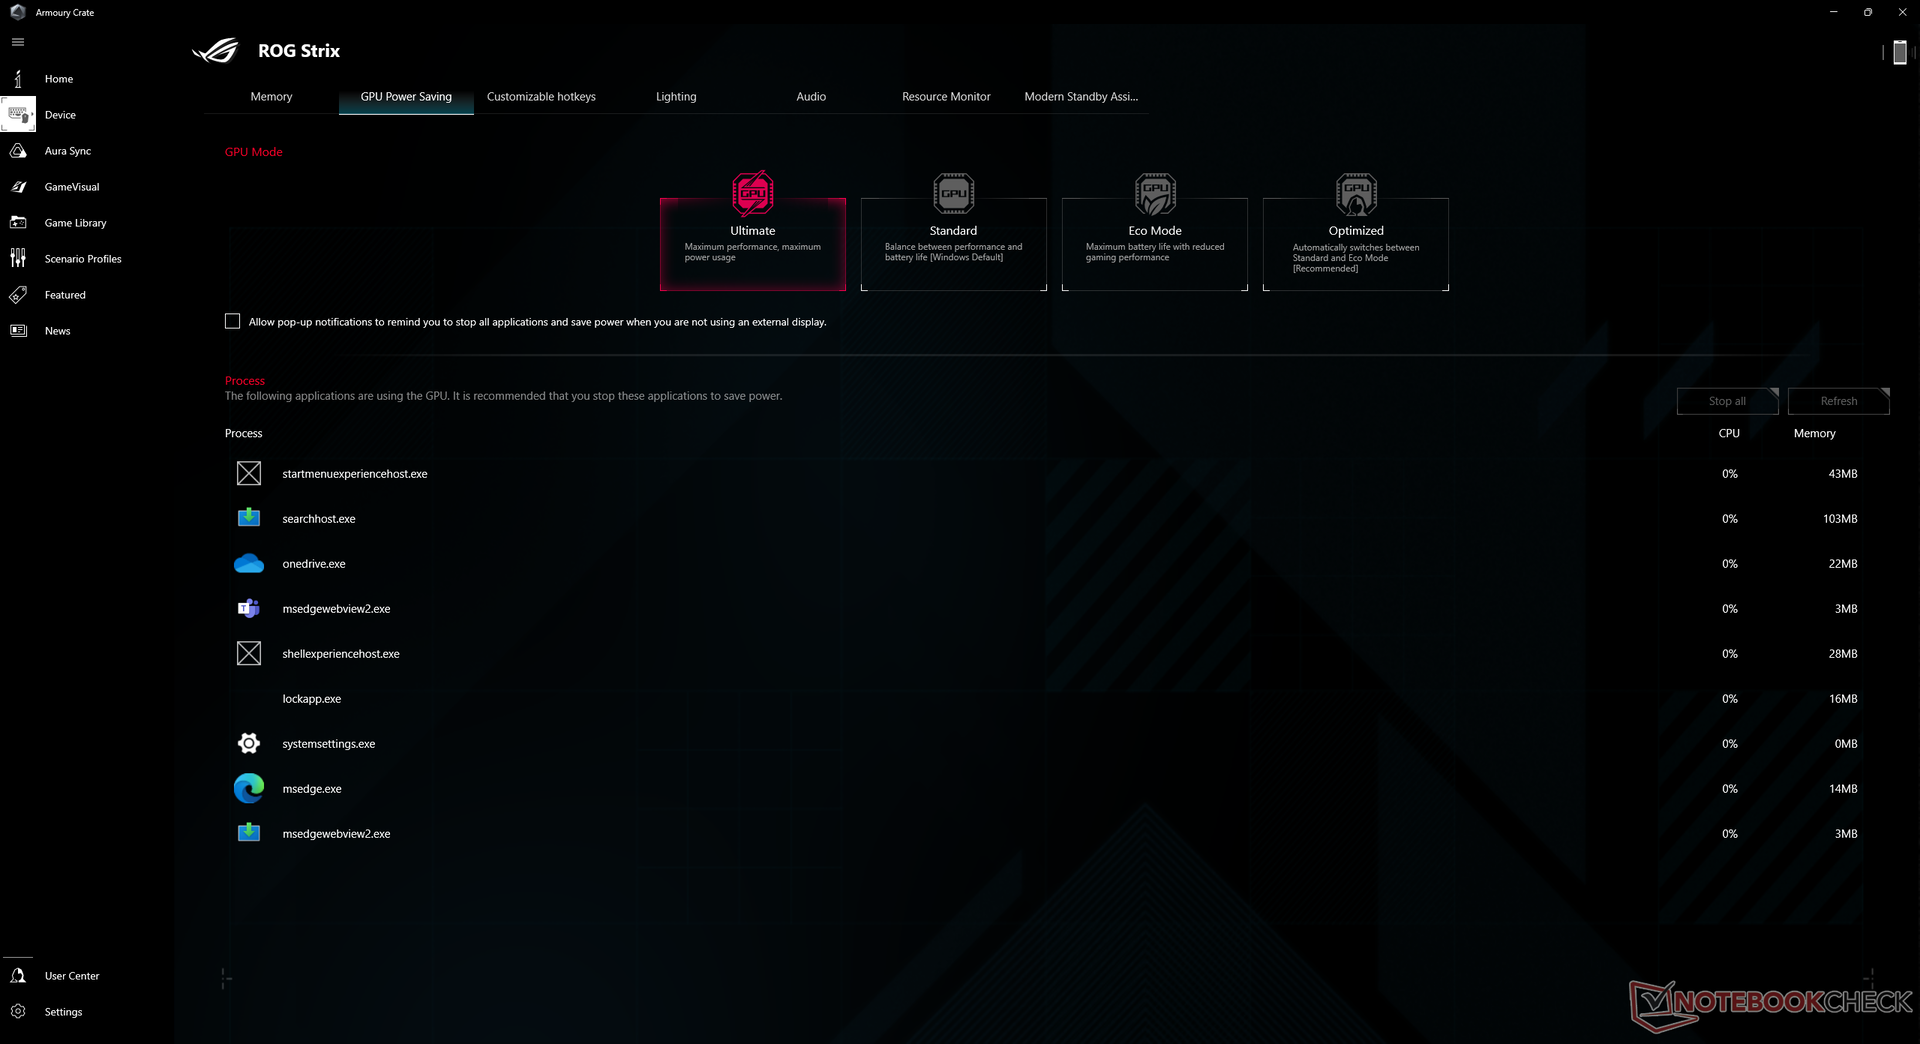
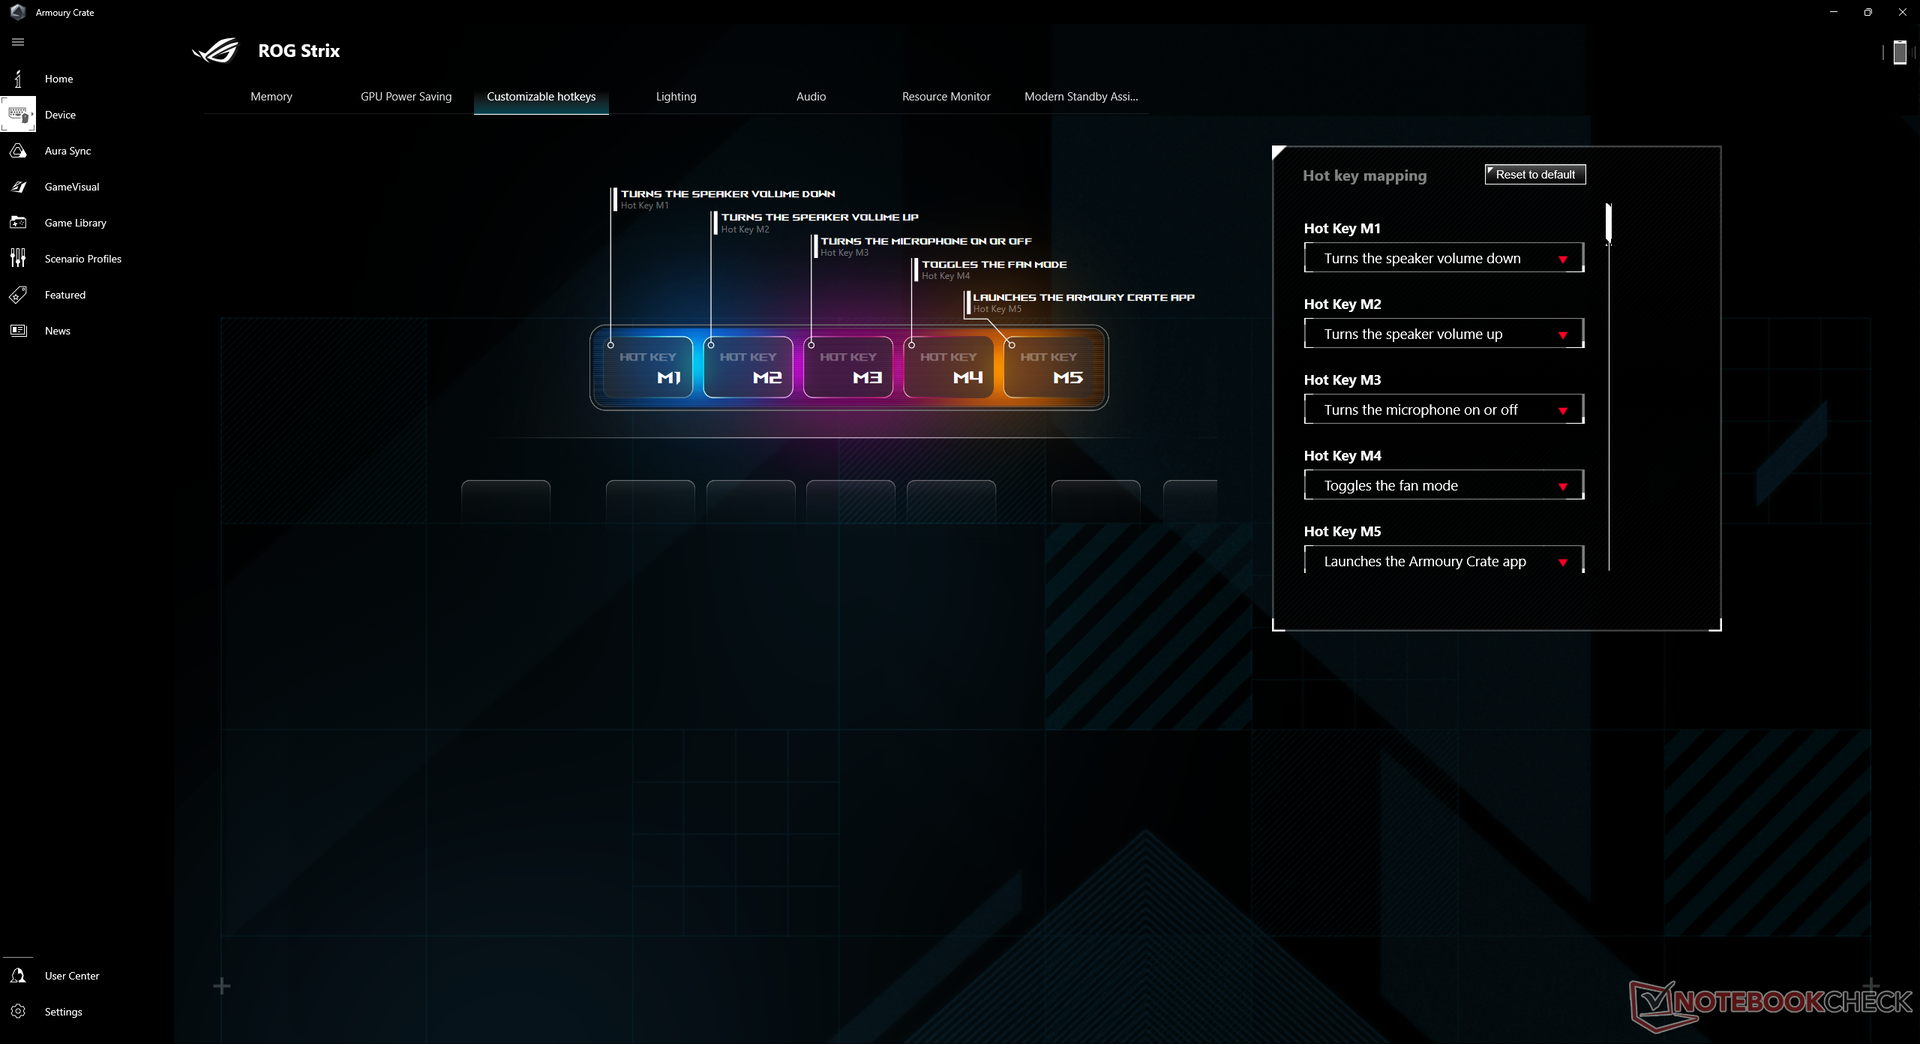
We set our unit to Turbo mode and discrete GPU mode via Asus Armoury Crate prior to running any benchmarks below. Owners are encouraged to become familiar with Armoury Crate as it is the control hub for power modes, MUX, Asus Aura, and other model-specific features and updates.
It's worth noting that we experienced a couple of issues on our test unit. When switching between Optimus and dGPU modes, the system would sometimes fail to load when rebooting. A hard reboot would then be required.

Processor
Processor performance is one of the fastest available on any laptop as detailed in our review of the Ryzen 9 7945HX. Nonetheless, it still trails behind the competing Core i9-13950HX or i9-13900HX just slightly when it comes to single-threaded operations.
Cinebench R15 Multi Loop
Cinebench R23: Multi Core | Single Core
Cinebench R20: CPU (Multi Core) | CPU (Single Core)
Cinebench R15: CPU Multi 64Bit | CPU Single 64Bit
Blender: v2.79 BMW27 CPU
7-Zip 18.03: 7z b 4 | 7z b 4 -mmt1
Geekbench 5.5: Multi-Core | Single-Core
HWBOT x265 Benchmark v2.2: 4k Preset
LibreOffice : 20 Documents To PDF
R Benchmark 2.5: Overall mean
* ... smaller is better
AIDA64: FP32 Ray-Trace | FPU Julia | CPU SHA3 | CPU Queen | FPU SinJulia | FPU Mandel | CPU AES | CPU ZLib | FP64 Ray-Trace | CPU PhotoWorxx
| Performance rating | |
| Asus ROG Strix Scar 17 G733PY-XS96 | |
| Average AMD Ryzen 9 7945HX | |
| Asus ROG Strix G17 G713PI | |
| Eluktronics Mech-17 GP2 | |
| MSI GE78HX 13VH-070US | |
| Aorus 17X XES | |
| Alienware m17 R5 (R9 6900HX, RX 6850M XT) | |
| AIDA64 / FP32 Ray-Trace | |
| Asus ROG Strix Scar 17 G733PY-XS96 | |
| Average AMD Ryzen 9 7945HX (50388 - 60169, n=7) | |
| Asus ROG Strix G17 G713PI | |
| MSI GE78HX 13VH-070US | |
| Eluktronics Mech-17 GP2 | |
| Alienware m17 R5 (R9 6900HX, RX 6850M XT) | |
| Aorus 17X XES | |
| AIDA64 / FPU Julia | |
| Asus ROG Strix Scar 17 G733PY-XS96 | |
| Asus ROG Strix G17 G713PI | |
| Average AMD Ryzen 9 7945HX (201874 - 252486, n=7) | |
| MSI GE78HX 13VH-070US | |
| Eluktronics Mech-17 GP2 | |
| Alienware m17 R5 (R9 6900HX, RX 6850M XT) | |
| Aorus 17X XES | |
| AIDA64 / CPU SHA3 | |
| Asus ROG Strix Scar 17 G733PY-XS96 | |
| Average AMD Ryzen 9 7945HX (8525 - 10389, n=7) | |
| Asus ROG Strix G17 G713PI | |
| Eluktronics Mech-17 GP2 | |
| MSI GE78HX 13VH-070US | |
| Aorus 17X XES | |
| Alienware m17 R5 (R9 6900HX, RX 6850M XT) | |
| AIDA64 / CPU Queen | |
| Asus ROG Strix Scar 17 G733PY-XS96 | |
| Average AMD Ryzen 9 7945HX (175041 - 200651, n=7) | |
| Asus ROG Strix G17 G713PI | |
| Eluktronics Mech-17 GP2 | |
| MSI GE78HX 13VH-070US | |
| Alienware m17 R5 (R9 6900HX, RX 6850M XT) | |
| Aorus 17X XES | |
| AIDA64 / FPU SinJulia | |
| Asus ROG Strix Scar 17 G733PY-XS96 | |
| Average AMD Ryzen 9 7945HX (28794 - 32988, n=7) | |
| Asus ROG Strix G17 G713PI | |
| Eluktronics Mech-17 GP2 | |
| MSI GE78HX 13VH-070US | |
| Alienware m17 R5 (R9 6900HX, RX 6850M XT) | |
| Aorus 17X XES | |
| AIDA64 / FPU Mandel | |
| Asus ROG Strix Scar 17 G733PY-XS96 | |
| Average AMD Ryzen 9 7945HX (105740 - 134044, n=7) | |
| Asus ROG Strix G17 G713PI | |
| MSI GE78HX 13VH-070US | |
| Eluktronics Mech-17 GP2 | |
| Alienware m17 R5 (R9 6900HX, RX 6850M XT) | |
| Aorus 17X XES | |
| AIDA64 / CPU AES | |
| Eluktronics Mech-17 GP2 | |
| Average AMD Ryzen 9 7945HX (126790 - 325960, n=7) | |
| Asus ROG Strix Scar 17 G733PY-XS96 | |
| Asus ROG Strix G17 G713PI | |
| MSI GE78HX 13VH-070US | |
| Aorus 17X XES | |
| Alienware m17 R5 (R9 6900HX, RX 6850M XT) | |
| AIDA64 / CPU ZLib | |
| Asus ROG Strix Scar 17 G733PY-XS96 | |
| Average AMD Ryzen 9 7945HX (2022 - 2409, n=7) | |
| Asus ROG Strix G17 G713PI | |
| MSI GE78HX 13VH-070US | |
| Eluktronics Mech-17 GP2 | |
| Aorus 17X XES | |
| Alienware m17 R5 (R9 6900HX, RX 6850M XT) | |
| AIDA64 / FP64 Ray-Trace | |
| Asus ROG Strix Scar 17 G733PY-XS96 | |
| Average AMD Ryzen 9 7945HX (26875 - 31796, n=7) | |
| Asus ROG Strix G17 G713PI | |
| MSI GE78HX 13VH-070US | |
| Eluktronics Mech-17 GP2 | |
| Alienware m17 R5 (R9 6900HX, RX 6850M XT) | |
| Aorus 17X XES | |
| AIDA64 / CPU PhotoWorxx | |
| MSI GE78HX 13VH-070US | |
| Eluktronics Mech-17 GP2 | |
| Aorus 17X XES | |
| Average AMD Ryzen 9 7945HX (31421 - 40095, n=7) | |
| Asus ROG Strix Scar 17 G733PY-XS96 | |
| Asus ROG Strix G17 G713PI | |
| Alienware m17 R5 (R9 6900HX, RX 6850M XT) | |
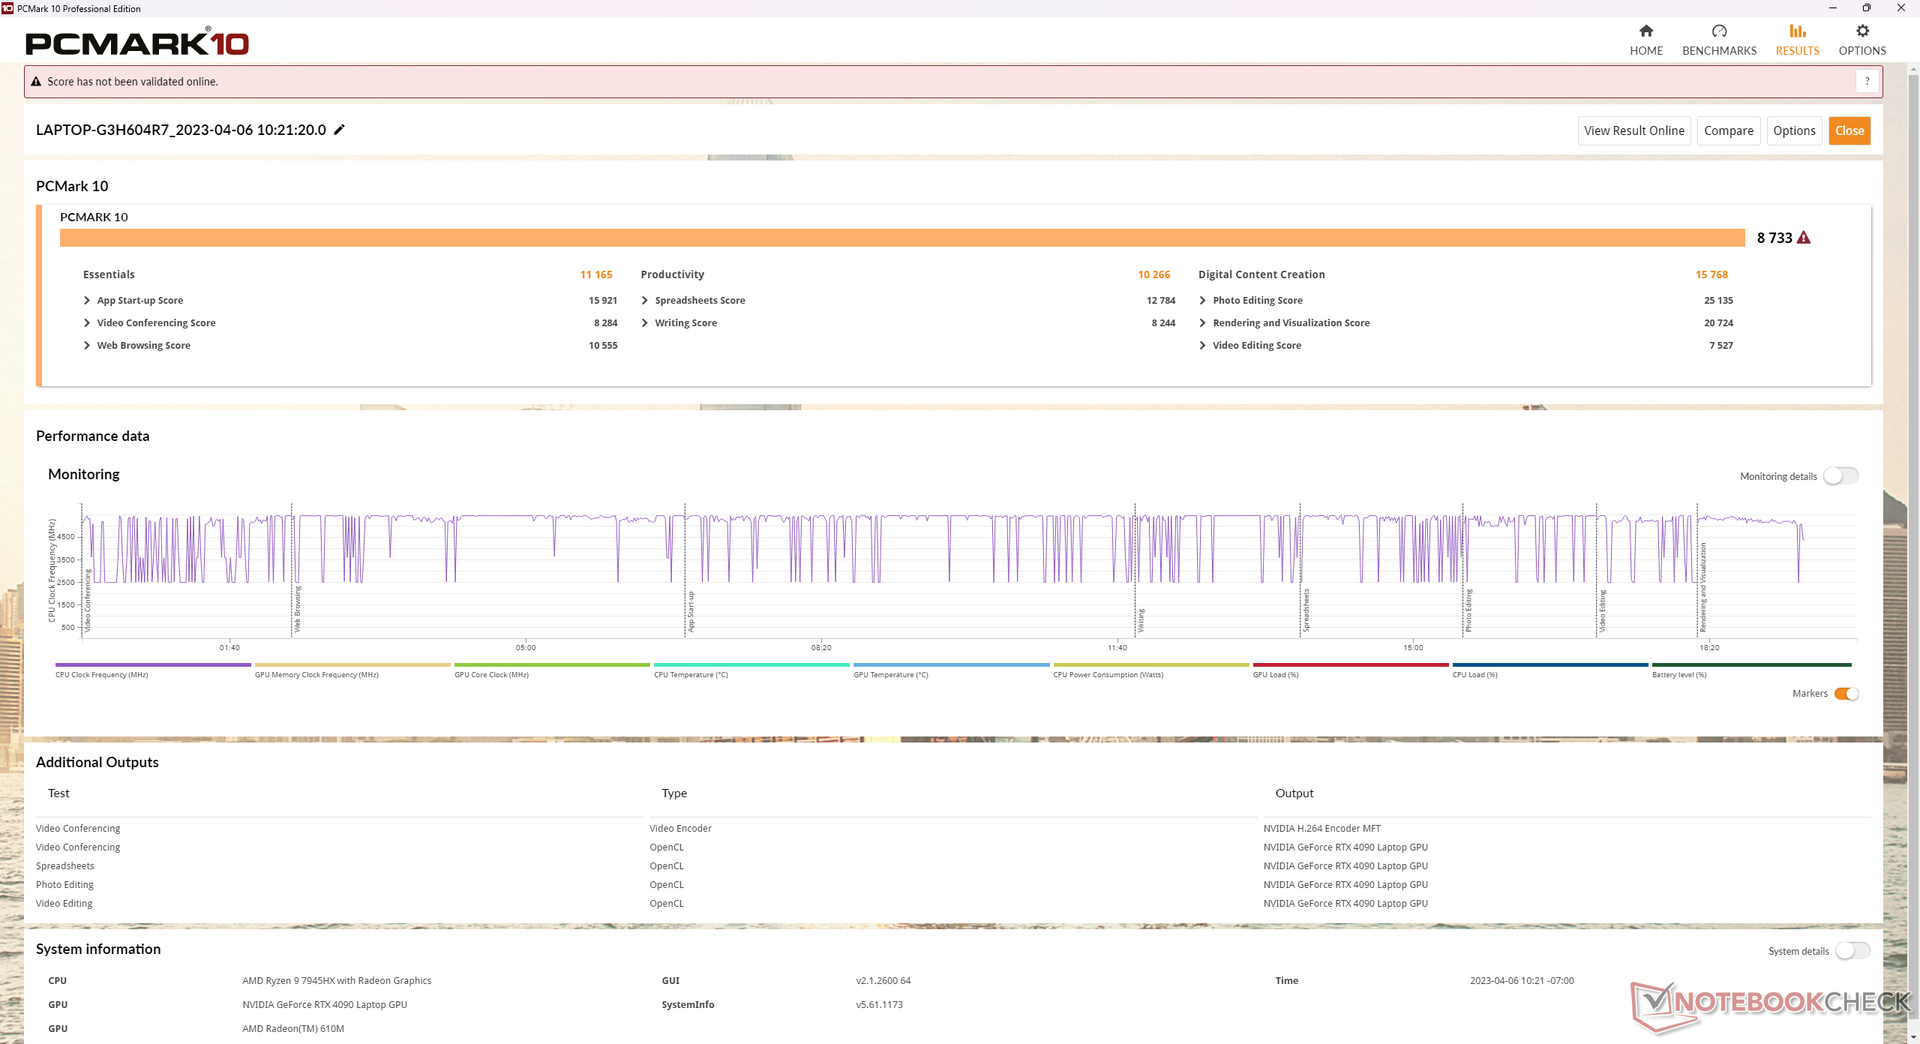
System Performance
CrossMark: Overall | Productivity | Creativity | Responsiveness
| PCMark 10 / Score | |
| Eluktronics Mech-17 GP2 | |
| Average AMD Ryzen 9 7945HX, NVIDIA GeForce RTX 4090 Laptop GPU (8733 - 9151, n=2) | |
| MSI GE78HX 13VH-070US | |
| Asus ROG Strix Scar 17 G733PY-XS96 | |
| Aorus 17X XES | |
| Asus ROG Strix G17 G713PI | |
| Alienware m17 R5 (R9 6900HX, RX 6850M XT) | |
| Asus ROG Strix Scar 17 SE G733CX-LL014W | |
| PCMark 10 / Essentials | |
| Eluktronics Mech-17 GP2 | |
| Average AMD Ryzen 9 7945HX, NVIDIA GeForce RTX 4090 Laptop GPU (11165 - 12176, n=2) | |
| MSI GE78HX 13VH-070US | |
| Asus ROG Strix G17 G713PI | |
| Asus ROG Strix Scar 17 G733PY-XS96 | |
| Aorus 17X XES | |
| Asus ROG Strix Scar 17 SE G733CX-LL014W | |
| Alienware m17 R5 (R9 6900HX, RX 6850M XT) | |
| PCMark 10 / Productivity | |
| Asus ROG Strix G17 G713PI | |
| Average AMD Ryzen 9 7945HX, NVIDIA GeForce RTX 4090 Laptop GPU (10266 - 11833, n=2) | |
| Eluktronics Mech-17 GP2 | |
| MSI GE78HX 13VH-070US | |
| Asus ROG Strix Scar 17 G733PY-XS96 | |
| Aorus 17X XES | |
| Asus ROG Strix Scar 17 SE G733CX-LL014W | |
| Alienware m17 R5 (R9 6900HX, RX 6850M XT) | |
| PCMark 10 / Digital Content Creation | |
| Asus ROG Strix Scar 17 G733PY-XS96 | |
| Eluktronics Mech-17 GP2 | |
| MSI GE78HX 13VH-070US | |
| Average AMD Ryzen 9 7945HX, NVIDIA GeForce RTX 4090 Laptop GPU (14432 - 15768, n=2) | |
| Aorus 17X XES | |
| Alienware m17 R5 (R9 6900HX, RX 6850M XT) | |
| Asus ROG Strix Scar 17 SE G733CX-LL014W | |
| Asus ROG Strix G17 G713PI | |
| CrossMark / Overall | |
| Eluktronics Mech-17 GP2 | |
| Aorus 17X XES | |
| Asus ROG Strix Scar 17 SE G733CX-LL014W | |
| Asus ROG Strix G17 G713PI | |
| Average AMD Ryzen 9 7945HX, NVIDIA GeForce RTX 4090 Laptop GPU (1993 - 2078, n=2) | |
| Asus ROG Strix Scar 17 G733PY-XS96 | |
| MSI GE78HX 13VH-070US | |
| Alienware m17 R5 (R9 6900HX, RX 6850M XT) | |
| CrossMark / Productivity | |
| Eluktronics Mech-17 GP2 | |
| Aorus 17X XES | |
| Asus ROG Strix Scar 17 SE G733CX-LL014W | |
| Asus ROG Strix G17 G713PI | |
| Average AMD Ryzen 9 7945HX, NVIDIA GeForce RTX 4090 Laptop GPU (1838 - 1946, n=2) | |
| MSI GE78HX 13VH-070US | |
| Asus ROG Strix Scar 17 G733PY-XS96 | |
| Alienware m17 R5 (R9 6900HX, RX 6850M XT) | |
| CrossMark / Creativity | |
| Eluktronics Mech-17 GP2 | |
| Average AMD Ryzen 9 7945HX, NVIDIA GeForce RTX 4090 Laptop GPU (2334 - 2377, n=2) | |
| Asus ROG Strix Scar 17 SE G733CX-LL014W | |
| Asus ROG Strix Scar 17 G733PY-XS96 | |
| Asus ROG Strix G17 G713PI | |
| Aorus 17X XES | |
| MSI GE78HX 13VH-070US | |
| Alienware m17 R5 (R9 6900HX, RX 6850M XT) | |
| CrossMark / Responsiveness | |
| Aorus 17X XES | |
| Asus ROG Strix Scar 17 SE G733CX-LL014W | |
| Eluktronics Mech-17 GP2 | |
| MSI GE78HX 13VH-070US | |
| Asus ROG Strix G17 G713PI | |
| Average AMD Ryzen 9 7945HX, NVIDIA GeForce RTX 4090 Laptop GPU (1584 - 1689, n=2) | |
| Asus ROG Strix Scar 17 G733PY-XS96 | |
| Alienware m17 R5 (R9 6900HX, RX 6850M XT) | |
| PCMark 10 Score | 8733 points | |
Help | ||
| AIDA64 / Memory Copy | |
| MSI GE78HX 13VH-070US | |
| Eluktronics Mech-17 GP2 | |
| Aorus 17X XES | |
| Average AMD Ryzen 9 7945HX (48948 - 57953, n=7) | |
| Alienware m17 R5 (R9 6900HX, RX 6850M XT) | |
| Asus ROG Strix Scar 17 G733PY-XS96 | |
| Asus ROG Strix G17 G713PI | |
| AIDA64 / Memory Read | |
| MSI GE78HX 13VH-070US | |
| Eluktronics Mech-17 GP2 | |
| Aorus 17X XES | |
| Average AMD Ryzen 9 7945HX (56910 - 67753, n=7) | |
| Asus ROG Strix G17 G713PI | |
| Asus ROG Strix Scar 17 G733PY-XS96 | |
| Alienware m17 R5 (R9 6900HX, RX 6850M XT) | |
| AIDA64 / Memory Write | |
| MSI GE78HX 13VH-070US | |
| Eluktronics Mech-17 GP2 | |
| Average AMD Ryzen 9 7945HX (58602 - 70063, n=7) | |
| Aorus 17X XES | |
| Asus ROG Strix Scar 17 G733PY-XS96 | |
| Asus ROG Strix G17 G713PI | |
| Alienware m17 R5 (R9 6900HX, RX 6850M XT) | |
| AIDA64 / Memory Latency | |
| Alienware m17 R5 (R9 6900HX, RX 6850M XT) | |
| Eluktronics Mech-17 GP2 | |
| Aorus 17X XES | |
| Asus ROG Strix G17 G713PI | |
| MSI GE78HX 13VH-070US | |
| Average AMD Ryzen 9 7945HX (77.1 - 91.3, n=7) | |
| Asus ROG Strix Scar 17 G733PY-XS96 | |
* ... smaller is better
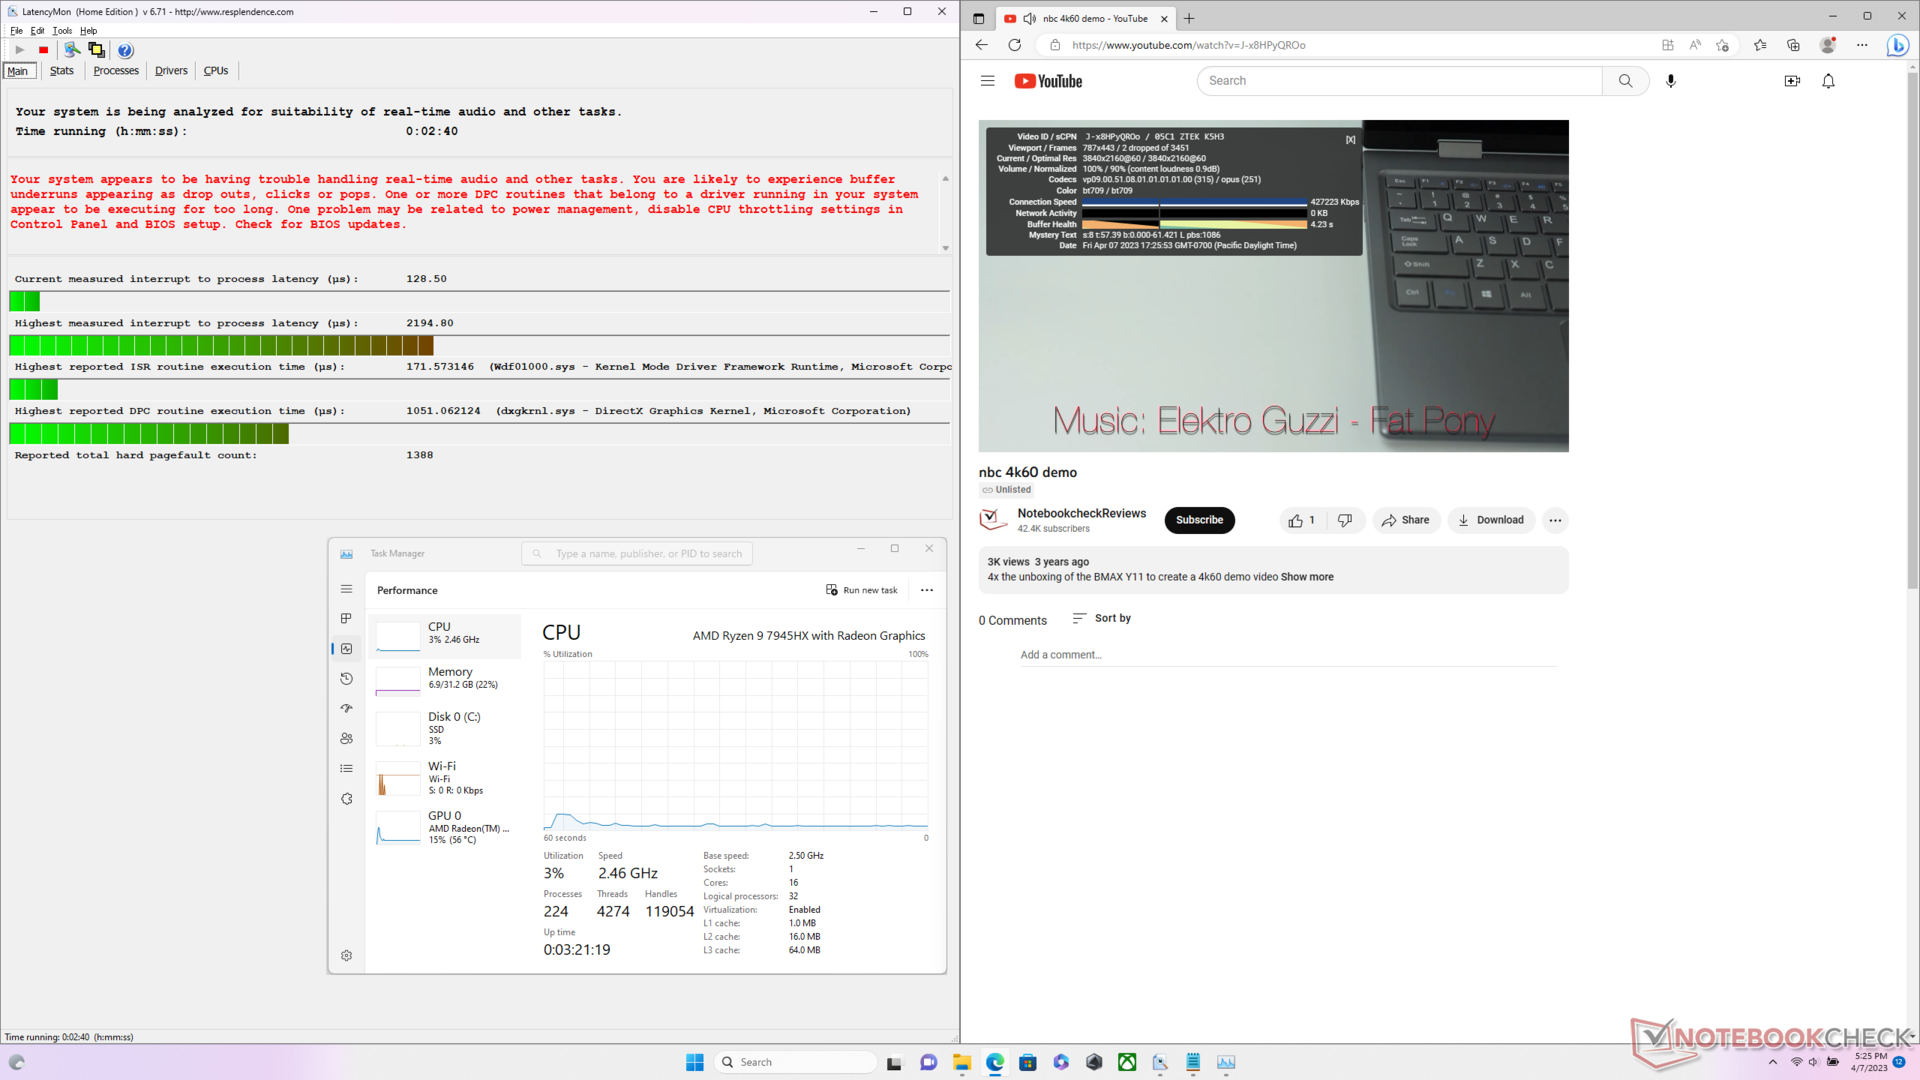
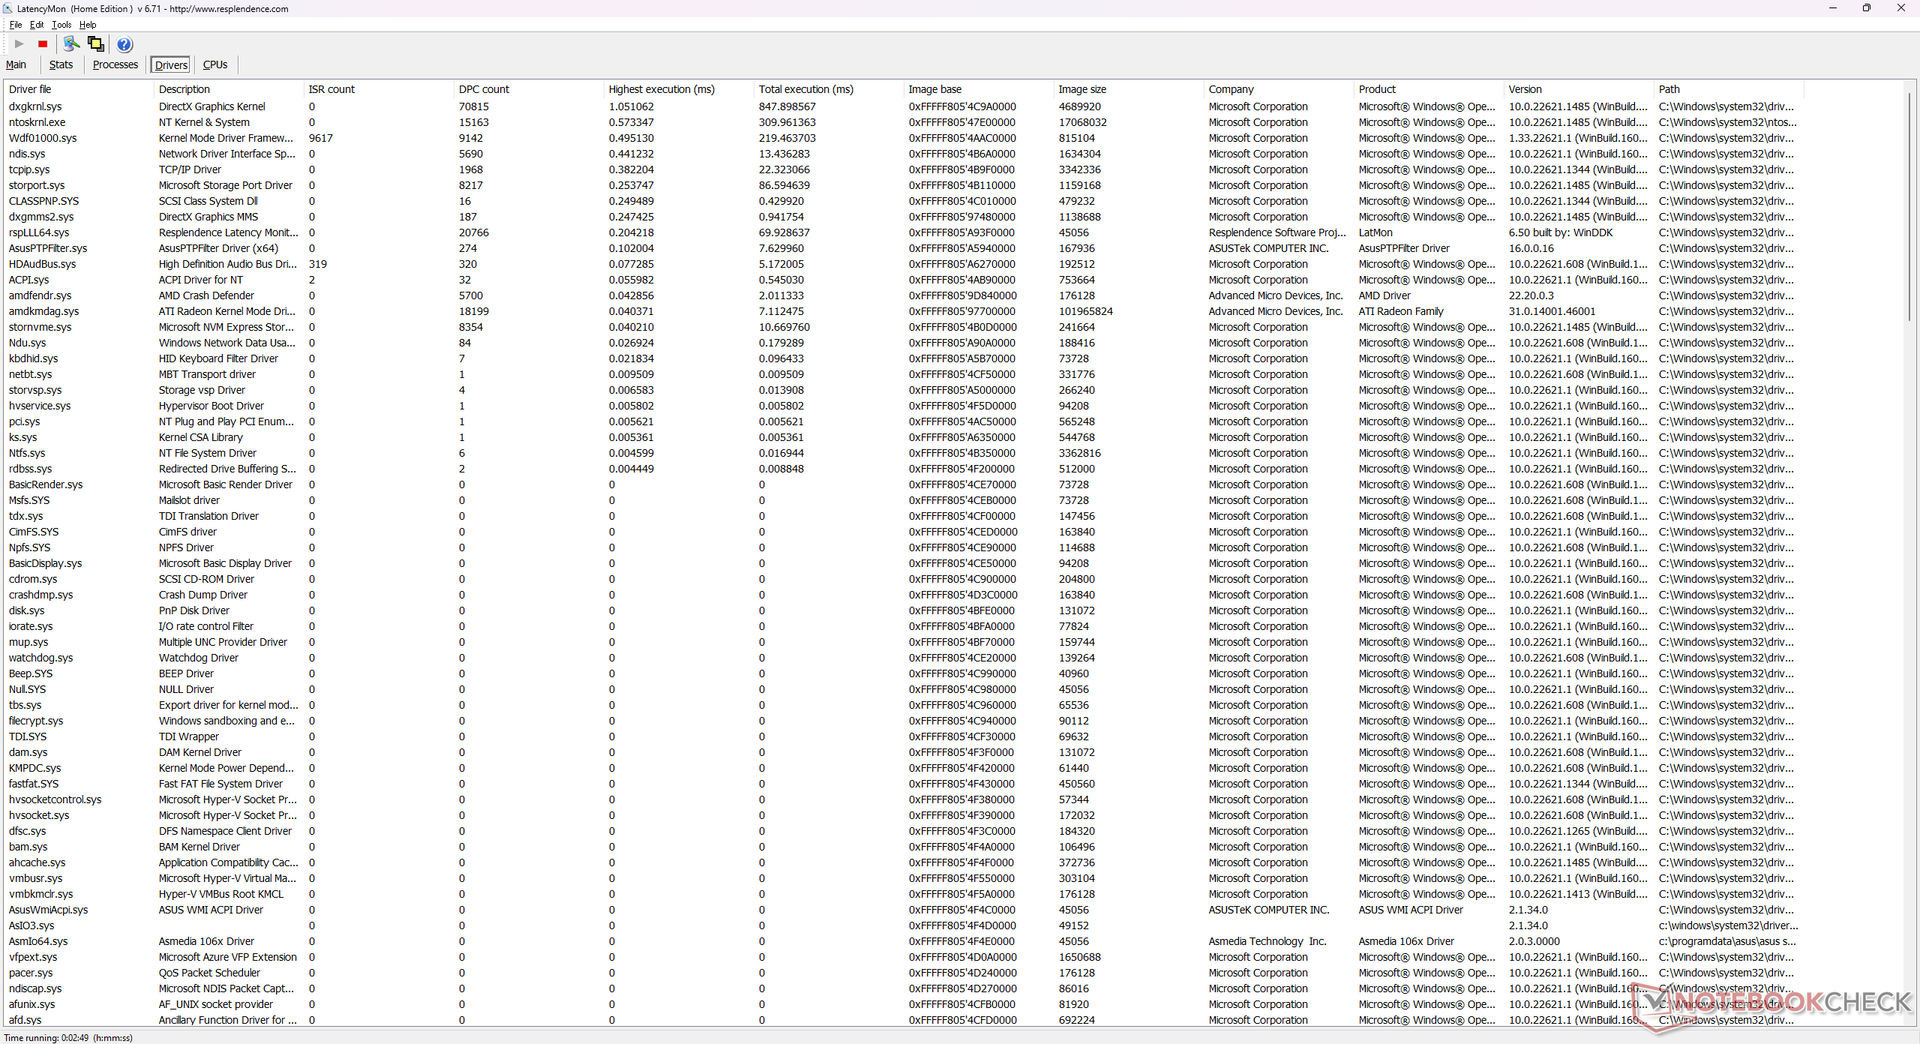
DPC Latency
LatencyMon would reveal no DPC issues when opening multiple browser tabs of our homepage. Running Prime95, however, would induce a high interrupt latency. We're able to record 2 dropped frames when playing back our one-minute 4K60 test video.
| DPC Latencies / LatencyMon - interrupt to process latency (max), Web, Youtube, Prime95 | |
| MSI GE78HX 13VH-070US | |
| Asus ROG Strix Scar 17 SE G733CX-LL014W | |
| Asus ROG Strix Scar 17 G733PY-XS96 | |
| Asus ROG Strix G17 G713PI | |
| Alienware m17 R5 (R9 6900HX, RX 6850M XT) | |
| Eluktronics Mech-17 GP2 | |
* ... smaller is better
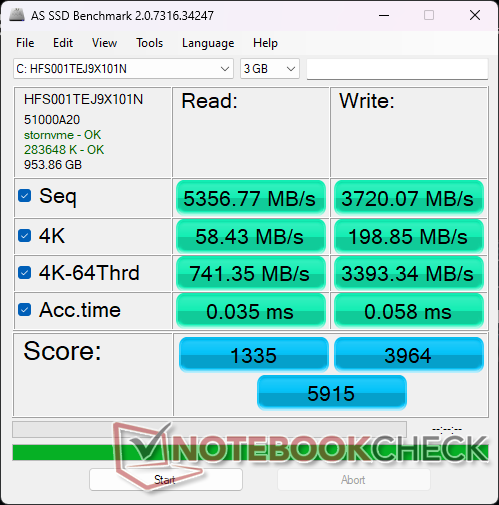
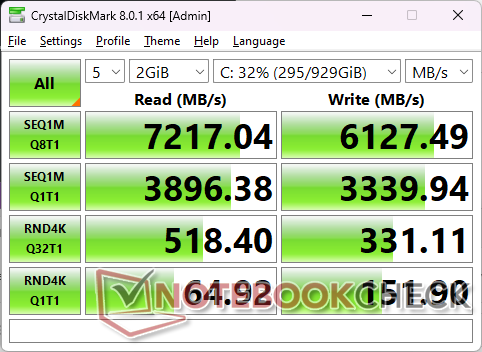
Storage Devices — Performance Throttling Detected
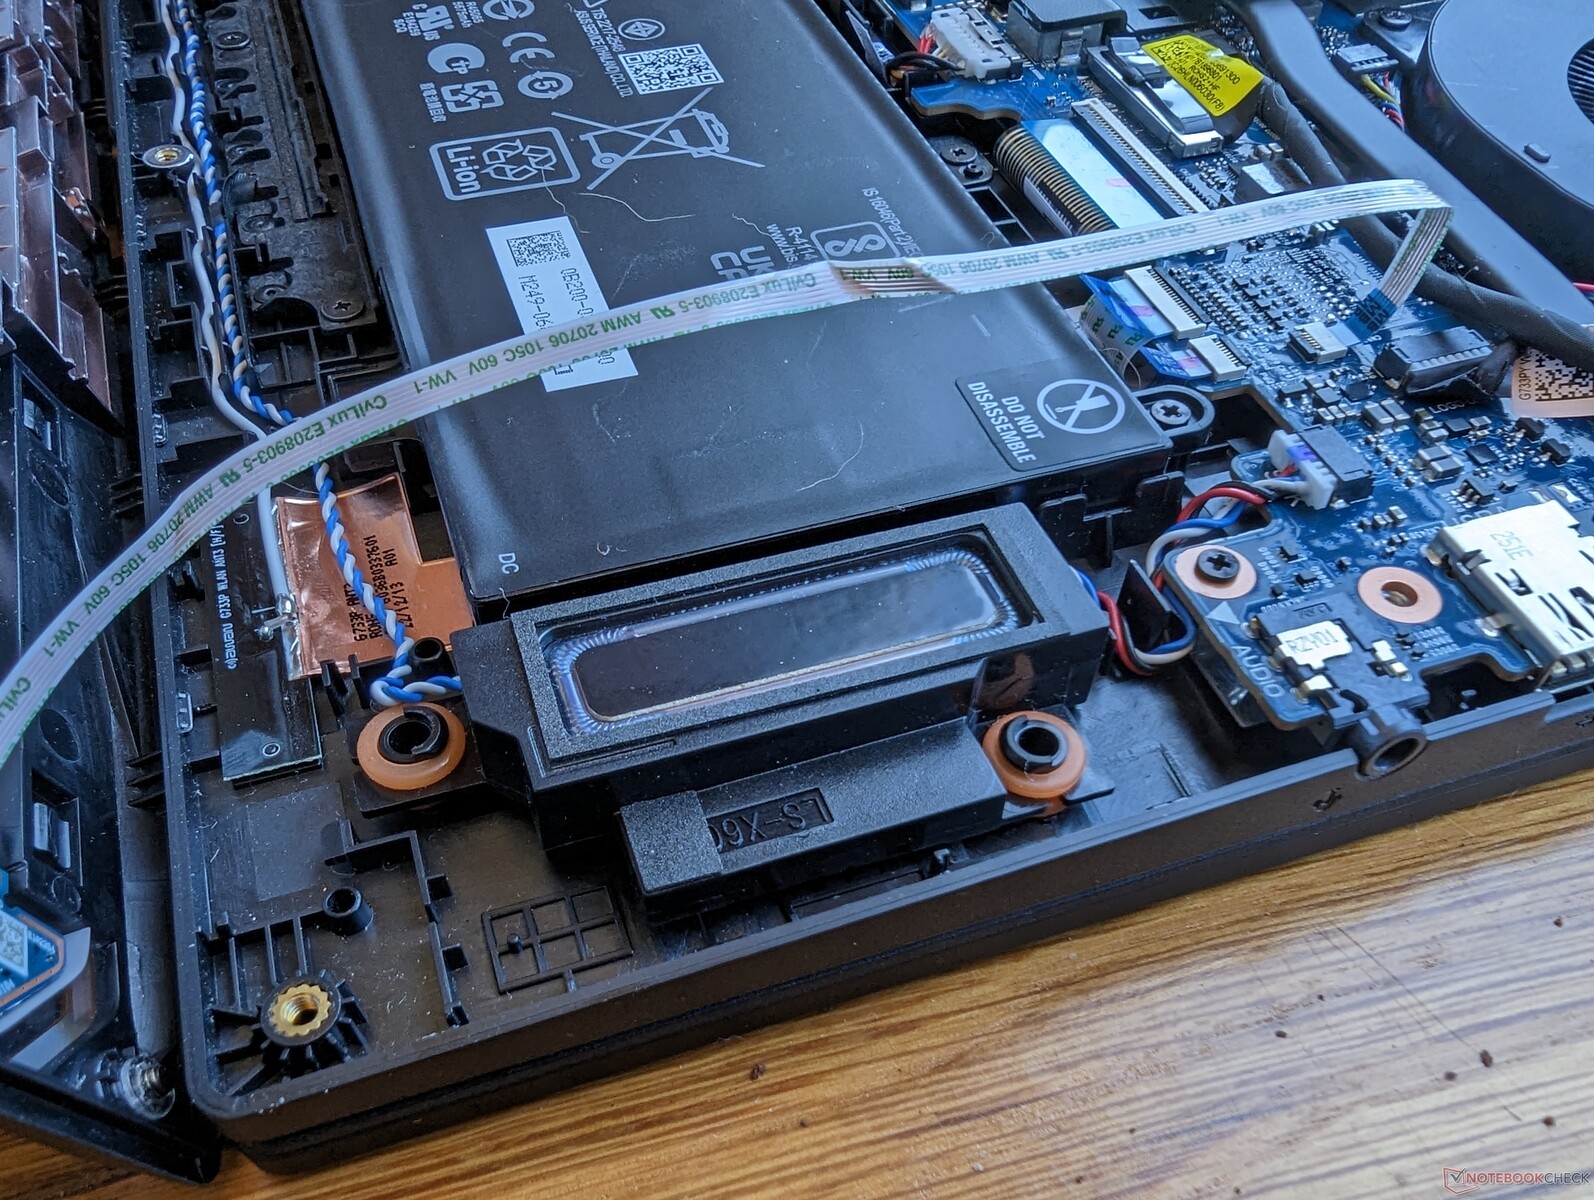
Our unit ships with a 1 TB SK hynix PC801 for sequential read and write rates of about 7200 MB/s and 6200 MB/s, respectively. However, the drive in our unit would exhibit performance throttling issues after about 4 minutes of stress as shown by our graph below. There is no heat spreader or thermal pad on the SSDs to assist in heat dissipation.

| Drive Performance rating - Percent | |
| Aorus 17X XES | |
| MSI GE78HX 13VH-070US | |
| Asus ROG Strix Scar 17 G733PY-XS96 | |
| Eluktronics Mech-17 GP2 | |
| Alienware m17 R5 (R9 6900HX, RX 6850M XT) | |
| Asus ROG Strix G17 G713PI | |
* ... smaller is better
Disk Throttling: DiskSpd Read Loop, Queue Depth 8
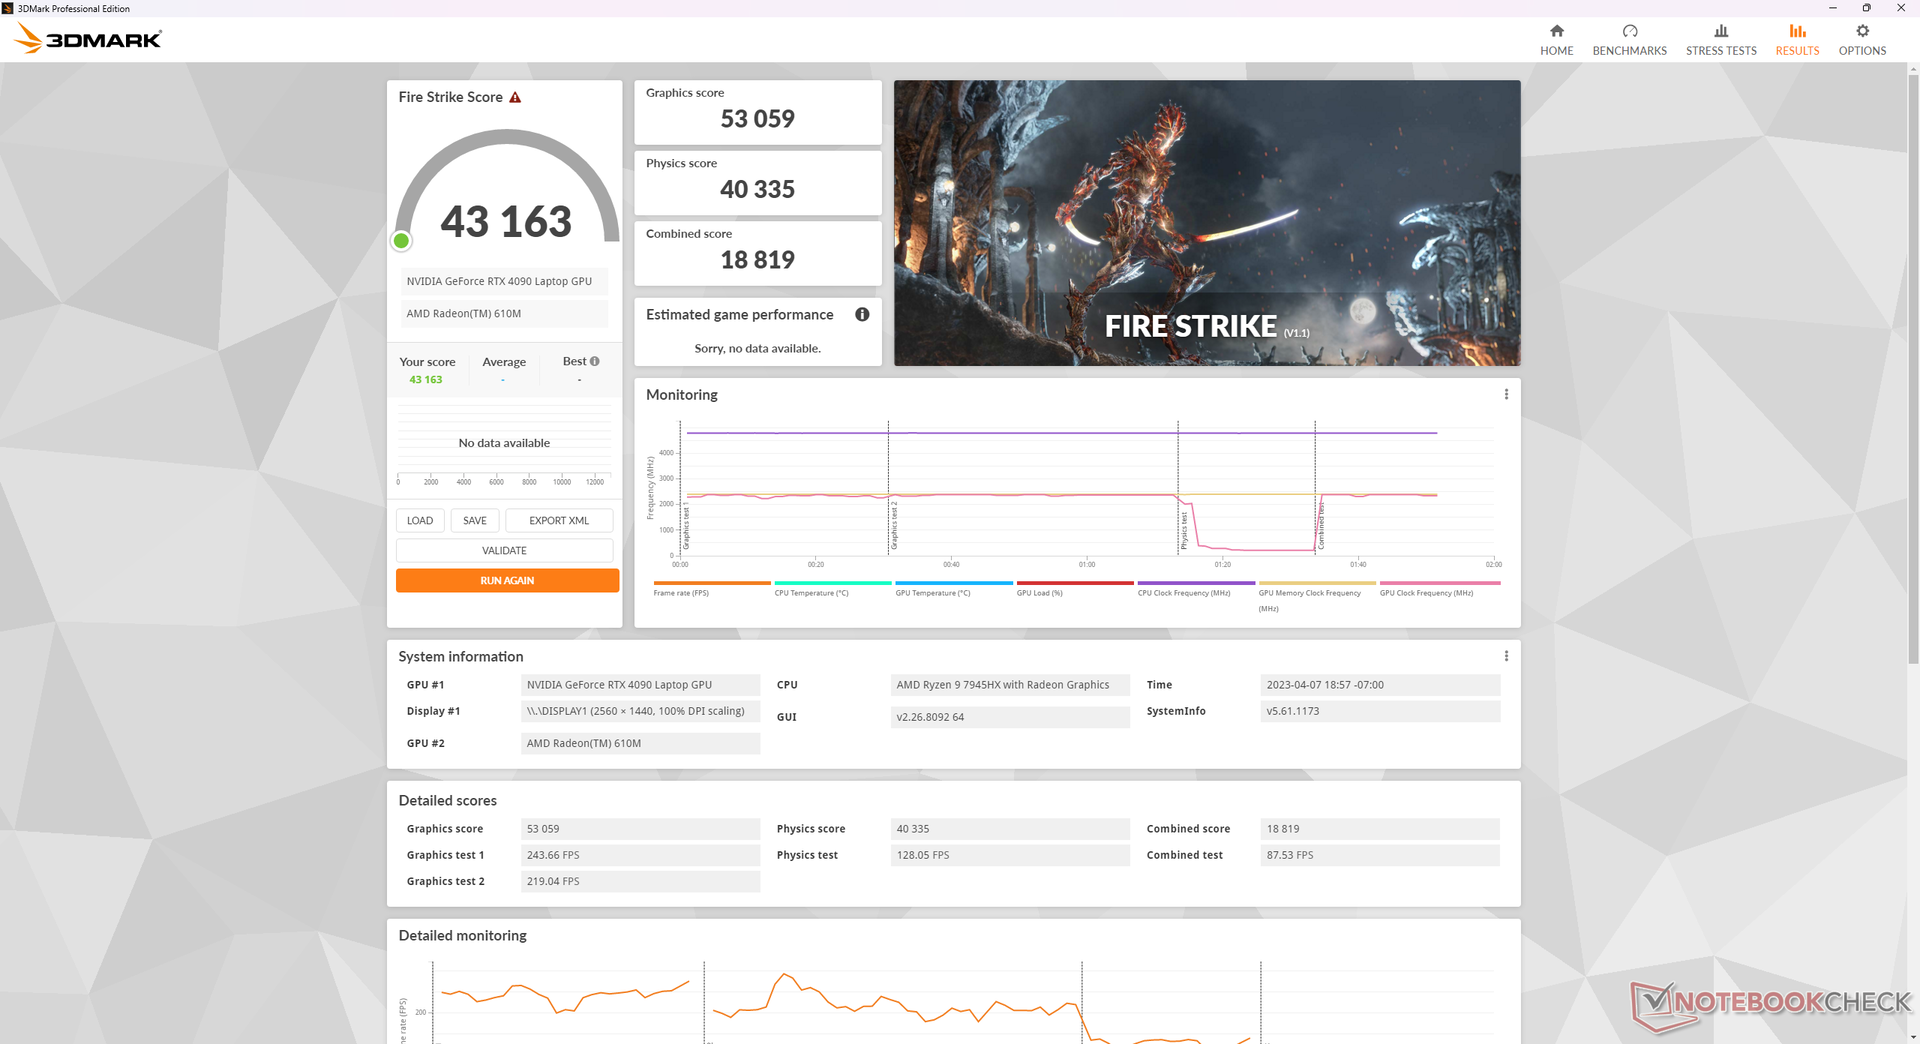
GPU Performance — 175 W GeForce RTX 4090
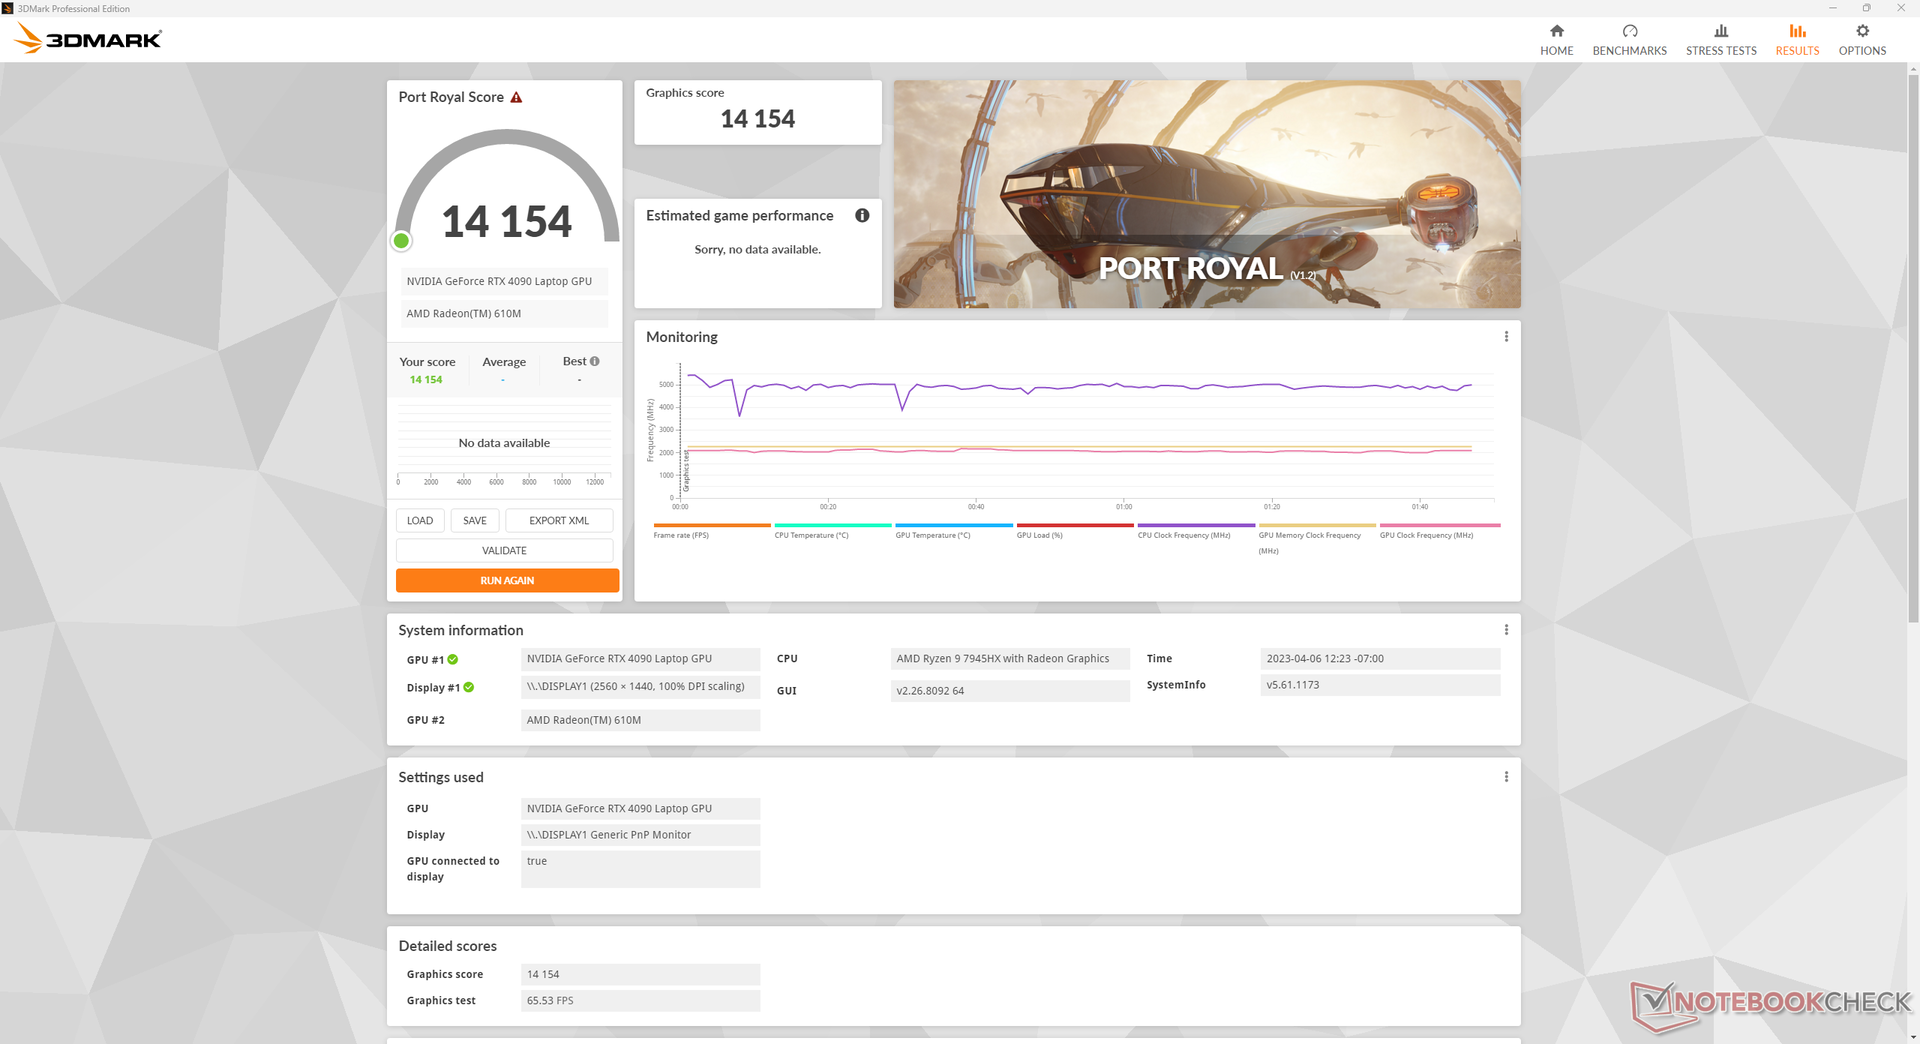
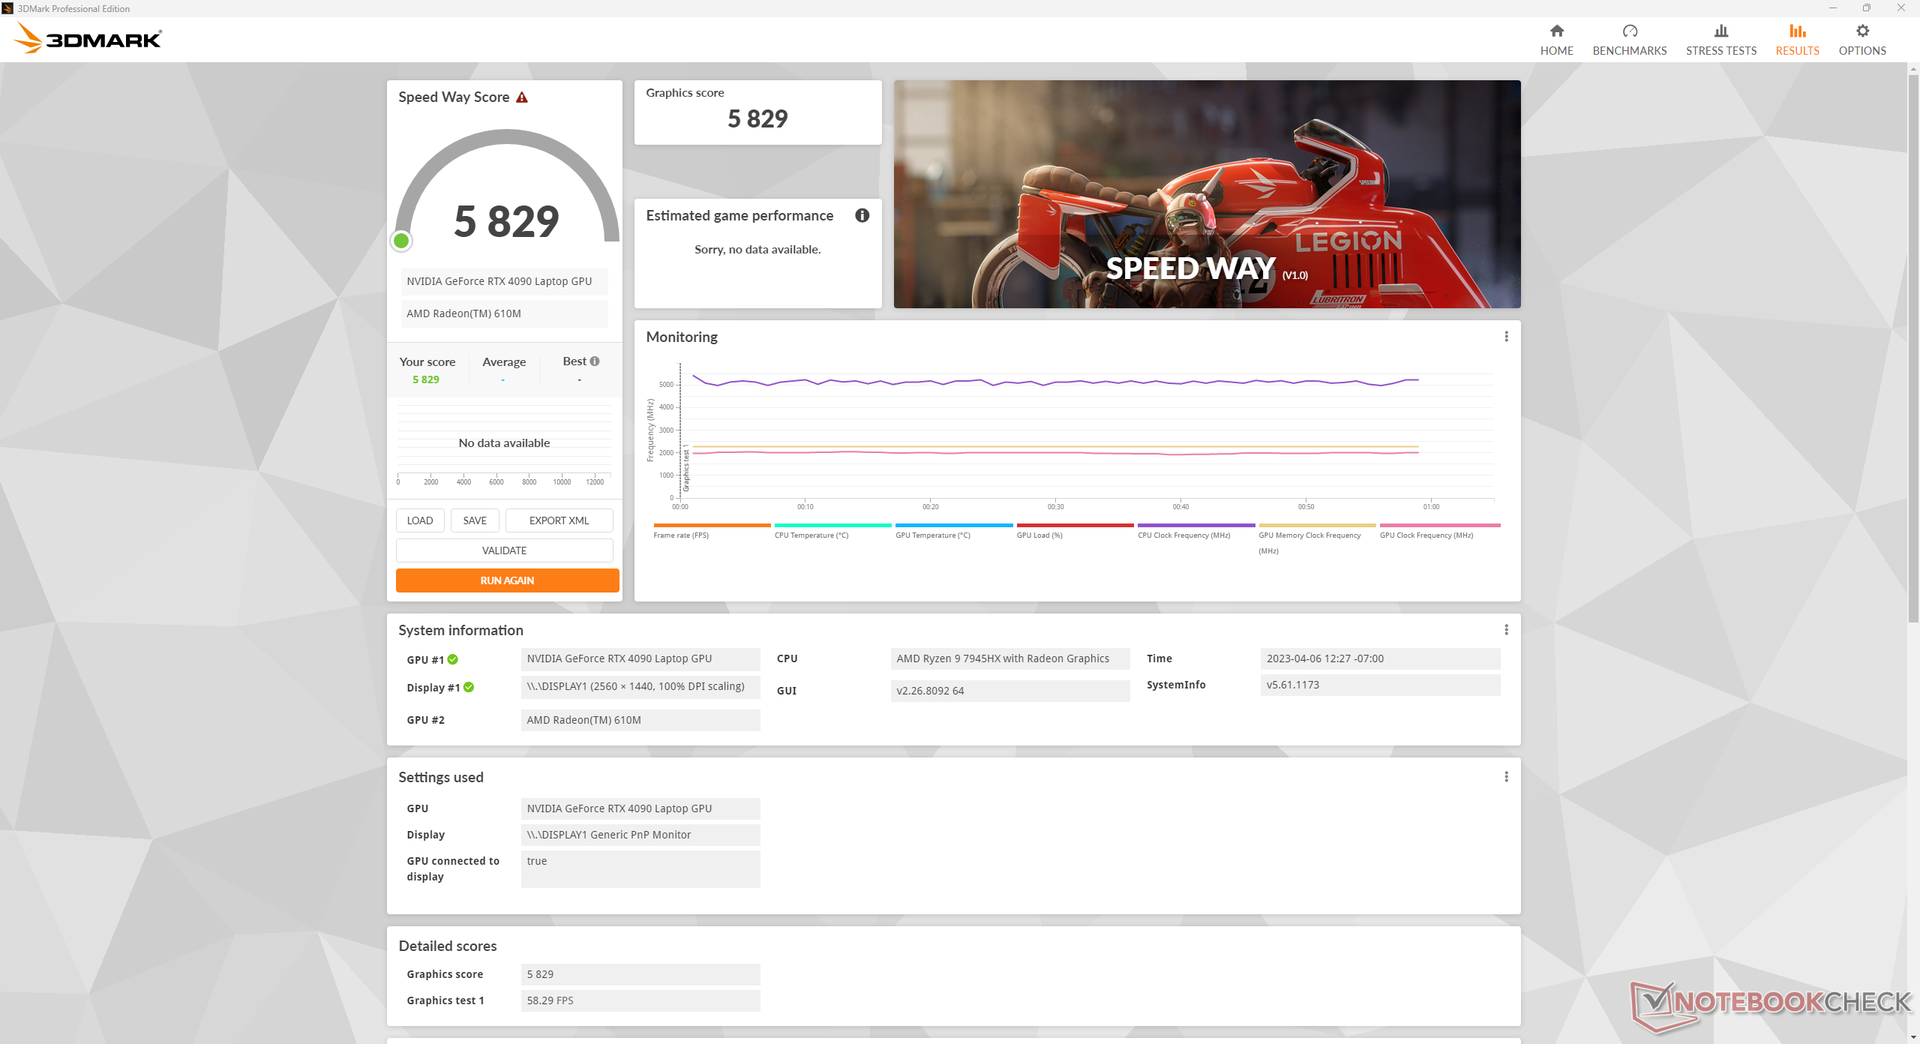
The mobile GeForce RTX 4090 offers 60 to 80 percent faster performance than the mobile RTX 3080 Ti in last year's ROG Strix Scar 17 G733. Thus, the year-over-year performance differential is quite significant. Downgrading to the RTX 4080 or 4070 SKUs is expected to impact GPU performance by 15 to 20 percent and 40 to 50 percent, respectively. Enthusiasts may therefore want to avoid the mobile RTX 4070 since the performance dip from mobile RTX 4080 to mobile RTX 4070 is much greater than the dip from mobile RTX 4090 to mobile RTX 4080.
Running on Performance mode instead of Turbo mode slightly impacts performance. A Fire Strike test on Performance mode would result in a 4 to 5 percent drop in the graphics score. Our Stress Test section below explores these two modes further.

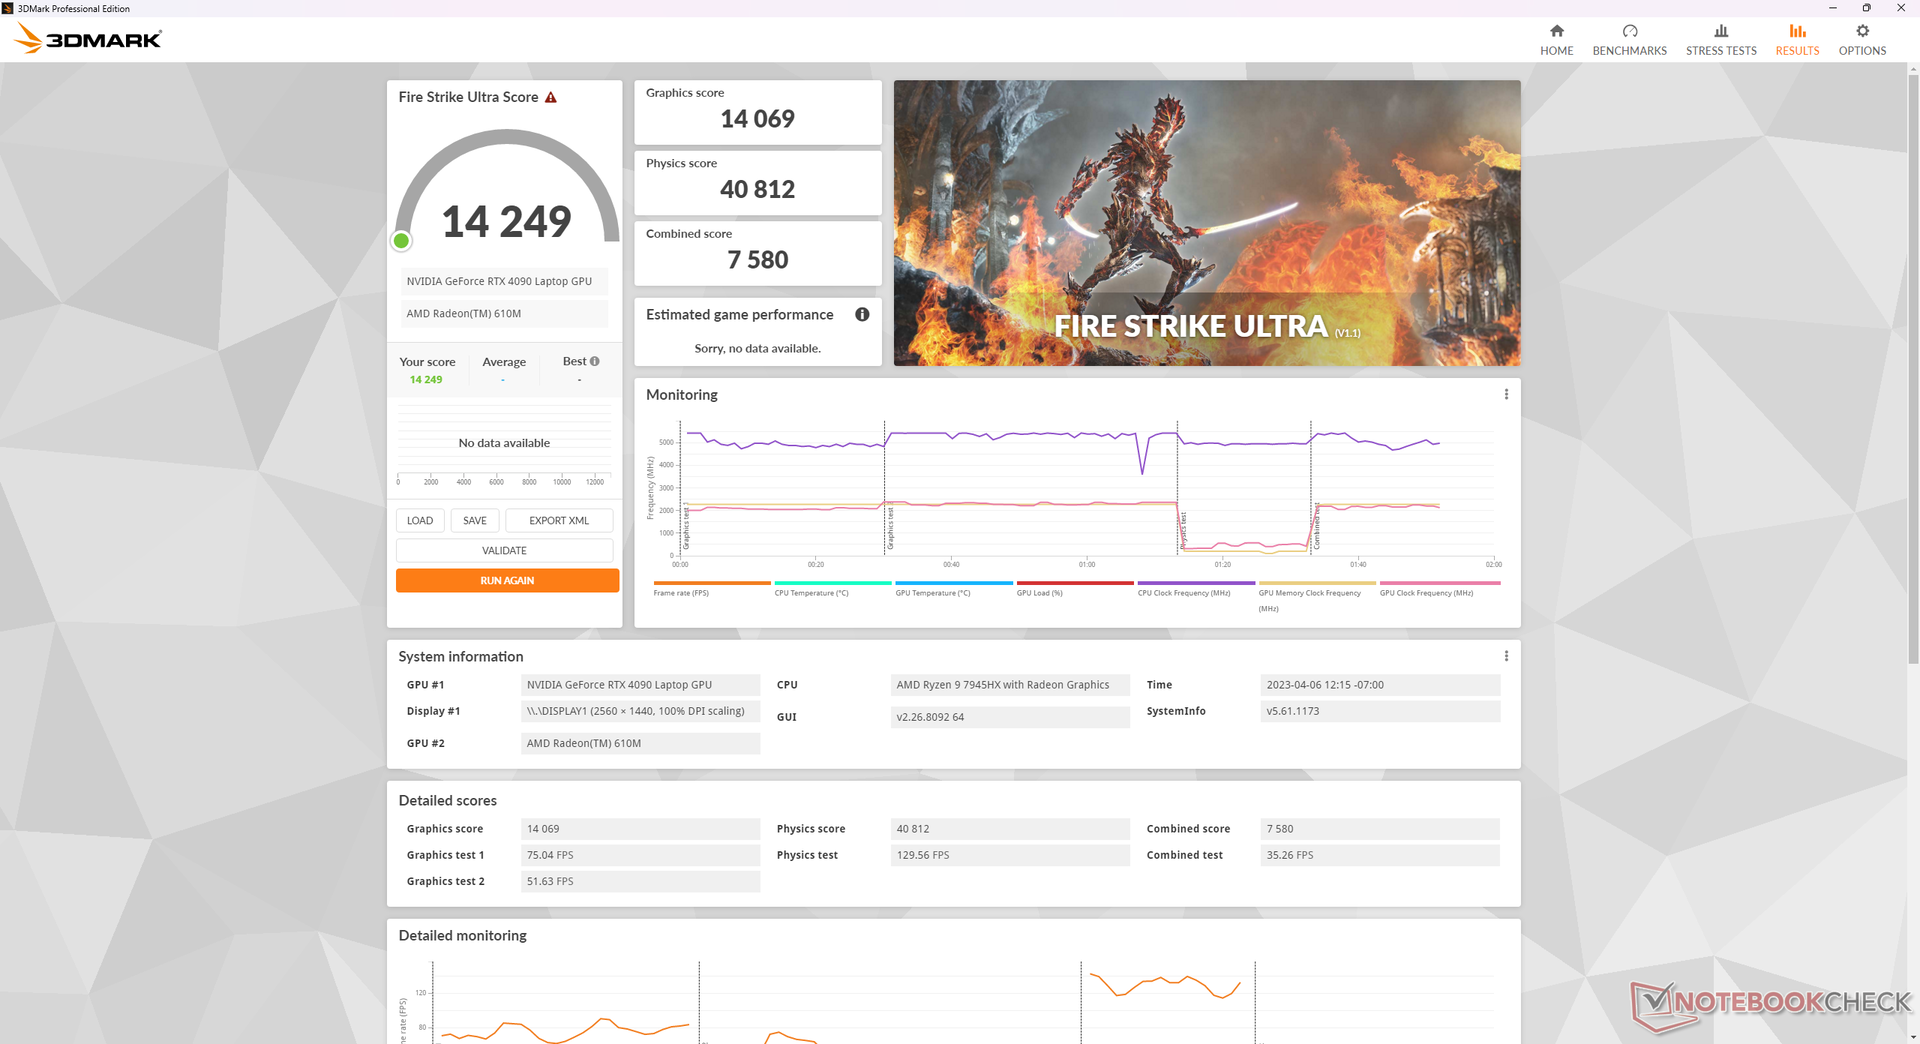
| 3DMark 11 Performance | 46484 points | |
| 3DMark Fire Strike Score | 43163 points | |
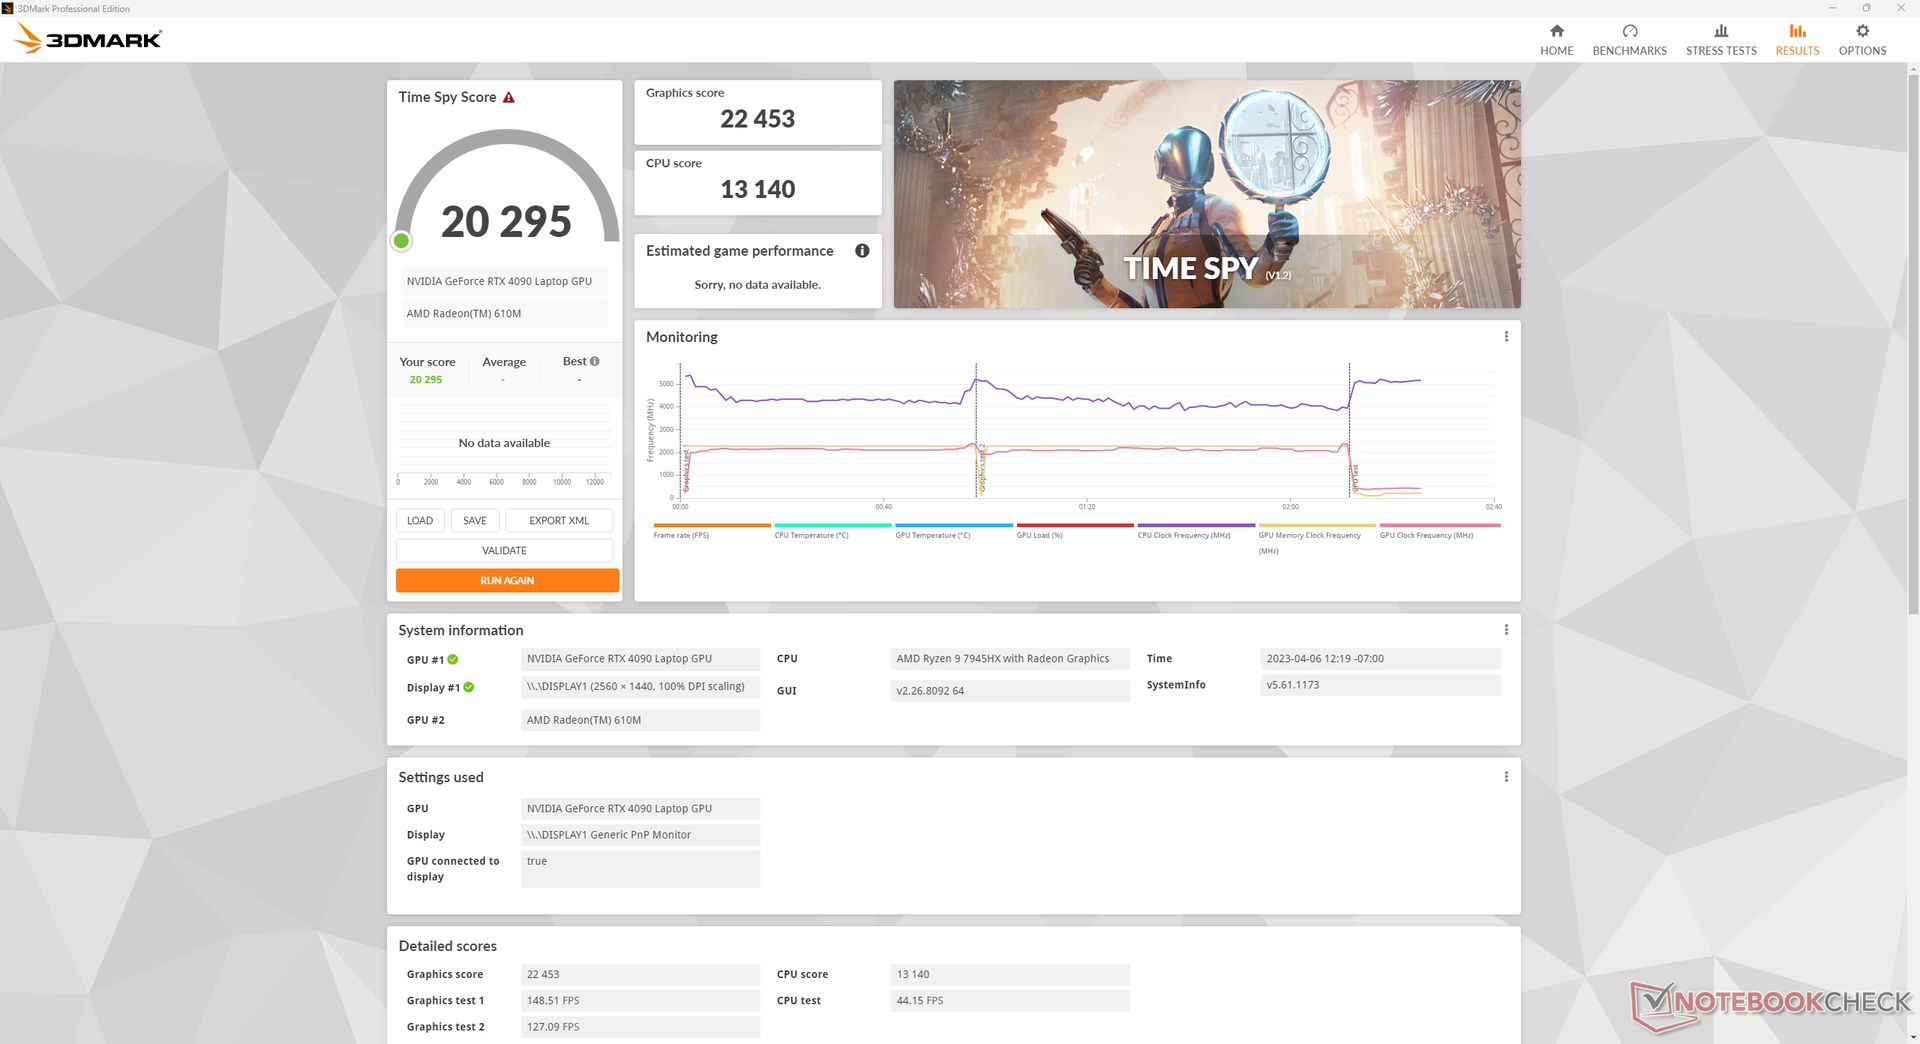
| 3DMark Time Spy Score | 20295 points | |
Help | ||
* ... smaller is better
| Tiny Tina's Wonderlands | |
| 1920x1080 Low Preset (DX12) | |
| KFA2 GeForce RTX 4090 SG | |
| Average NVIDIA GeForce RTX 4090 Laptop GPU (268 - 378, n=8) | |
| Asus ROG Strix Scar 17 G733PY-XS96 | |
| 1920x1080 Medium Preset (DX12) | |
| KFA2 GeForce RTX 4090 SG | |
| Average NVIDIA GeForce RTX 4090 Laptop GPU (230 - 302, n=8) | |
| Asus ROG Strix Scar 17 G733PY-XS96 | |
| 1920x1080 High Preset (DX12) | |
| KFA2 GeForce RTX 4090 SG | |
| Average NVIDIA GeForce RTX 4090 Laptop GPU (168 - 233, n=9) | |
| Asus ROG Strix Scar 17 G733PY-XS96 | |
| 1920x1080 Badass Preset (DX12) | |
| KFA2 GeForce RTX 4090 SG | |
| Asus ROG Strix Scar 17 G733PY-XS96 | |
| Average NVIDIA GeForce RTX 4090 Laptop GPU (141.1 - 189.4, n=14) | |
| 2560x1440 Badass Preset (DX12) | |
| KFA2 GeForce RTX 4090 SG | |
| Asus ROG Strix Scar 17 G733PY-XS96 | |
| Average NVIDIA GeForce RTX 4090 Laptop GPU (103.4 - 137.8, n=14) | |
| 3840x2160 Badass Preset (DX12) | |
| KFA2 GeForce RTX 4090 SG | |
| Asus ROG Strix Scar 17 G733PY-XS96 | |
| Average NVIDIA GeForce RTX 4090 Laptop GPU (53.3 - 73.7, n=12) | |
Witcher 3 FPS Chart
| low | med. | high | ultra | QHD DLSS | QHD FSR | QHD | 4K DLSS | 4K FSR | 4K | |
|---|---|---|---|---|---|---|---|---|---|---|
| GTA V (2015) | 185 | 180.4 | 175.2 | 112.6 | 114.8 | 170.5 | ||||
| The Witcher 3 (2015) | 490.1 | 405.6 | 370.3 | 203.8 | 154.8 | |||||
| Dota 2 Reborn (2015) | 165.6 | 150.5 | 154.2 | 139 | 135.4 | |||||
| Final Fantasy XV Benchmark (2018) | 214 | 205 | 163.9 | 151 | 93.3 | |||||
| X-Plane 11.11 (2018) | 132.2 | 118 | 94.3 | 78.5 | ||||||
| Far Cry 5 (2018) | 157 | 145 | 142 | 108 | ||||||
| Shadow of the Tomb Raider (2018) | 238 | 228 | 190 | 104 | ||||||
| Borderlands 3 (2019) | 121.4 | |||||||||
| Doom Eternal (2020) | 441 | 362 | 200 | |||||||
| Valorant (2020) | 485 | |||||||||
| Assassin´s Creed Valhalla (2020) | 187 | 169 | 135 | 79 | ||||||
| Far Cry 6 (2021) | 117 | 112 | 109 | 82 | ||||||
| Cyberpunk 2077 1.6 (2022) | 146.4 | 140.5 | 132.6 | 133.8 | 104.3 | 48.6 | ||||
| Tiny Tina's Wonderlands (2022) | 267.7 | 230 | 194.6 | 176.2 | 134.2 | 71.9 | ||||
| F1 22 (2022) | 266 | 243 | 221 | 116.3 | 92.1 | 45.8 | ||||
| Call of Duty Modern Warfare 2 2022 (2022) | 188 | 180 | 135 | 82 | ||||||
| Star Wars Jedi Survivor (2023) | 105.6 | 103.1 | 88.4 | 43 | ||||||
| Black Myth: Wukong (2024) | 153 | 117 | 93 | 41 | 43 | 24 | ||||
| Final Fantasy XVI (2024) | 91.6 | 71.2 | 77.5 | |||||||
| God of War Ragnarök (2024) | 138 | 127.1 | 113.9 | 82.8 | ||||||
| Call of Duty Black Ops 6 (2024) | 130 | 126 | 92 | 76 | 72 | 76 | ||||
| Stalker 2 (2024) | 64.2 | 113.2 | 58.6 | 78.2 | 38.9 | |||||
| Marvel Rivals (2024) | 146 | 122 | 101 | 90 | 71 | |||||
| Kingdom Come Deliverance 2 (2025) | 112.5 | 110.4 | 86.7 | 70.8 | 48.4 | |||||
| Monster Hunter Wilds (2025) | 89.2 | 84.7 | 78.1 | 74.7 | 66.6 | 58 | 42.8 | |||
| Civilization 7 (2025) | 161.3 | 155.4 | 154.9 | |||||||
| The Elder Scrolls IV Oblivion Remastered (2025) | 56.8 | 53.7 | 43.1 | 26.4 | ||||||
| Doom: The Dark Ages (2025) | 123.4 | 115 | 105.5 | 95.2 | 95.3 | 73.1 | 57.1 | 39.7 | ||
| F1 25 (2025) | 227 | 216 | 203 | 53.8 | 57.8 | 32.4 | 28.8 | 15 | ||
| Borderlands 4 (2025) | 83.2 | 70 | 54.8 | 37.9 | ||||||
| Battlefield 6 (2025) | 126.8 | 113.7 | 89.9 | 50.9 | ||||||
| The Outer Worlds 2 (2025) | 77.2 | 41.8 | 51.5 | 27.2 | ||||||
| ARC Raiders (2025) | 226 | 205 | 196.7 | 116.5 | 87.7 | 50 | ||||
| Anno 117: Pax Romana (2025) | 96.4 | 59.9 | 59 | 44.4 | 25.9 | |||||
| Call of Duty Black Ops 7 (2025) | 76 | 52 | 27 | |||||||
| Resident Evil Requiem (2026) | 72.4 | 55.6 | 28.3 | |||||||
| Death Stranding 2 (2026) | 88.5 | 82.6 | 68.1 | 63.4 | 42.4 | |||||
| Crimson Desert (2026) | 73.3 | 68.1 | 57.3 | 51.1 | 43.1 | |||||
| Pragmata (2026) | 110.7 | 104.6 | 85.5 | 82.6 | 58.6 | |||||
| War Thunder (2026) | 123 | 85 | 50 | |||||||
| Forza Horizon 6 (2026) | 94 | 61 | 50 | 31 | ||||||
| 007 First Light (2026) | 75.8 | 79.4 | 67.3 | 63.4 | 35.7 |
Emissions — Performance Quieter Than Turbo
System Noise
Fan noise is ever present at 23 to 27 dB(A) against a silent background of 22.7 dB(A) no matter the performance setting. Thankfully, this range is quiet enough to be mostly unnoticeable and the fans do a good job at remaining below 30 dB(A) when running slightly higher loads like web browsing or streaming.
Gaming on Performance mode is quieter than on Turbo mode. Fan noise when running Witcher 3 on Performance mode would be around 46.4 dB(A) vs. 51.4 to 54 dB(A) if on Turbo mode. Thus, users may want to eat the 5 percent graphics performance deficit for the quieter noise levels of Performance mode.
Noise level
| Idle |
| 23.5 / 27.7 / 27.7 dB(A) |
| Load |
| 30.5 / 54.1 dB(A) |
 | ||
30 dB silent 40 dB(A) audible 50 dB(A) loud |
||
min: | ||
| Asus ROG Strix Scar 17 G733PY-XS96 GeForce RTX 4090 Laptop GPU, R9 7945HX, SK hynix PC801 HFS001TEJ9X101N | MSI GE78HX 13VH-070US GeForce RTX 4080 Laptop GPU, i9-13950HX, Samsung PM9A1 MZVL22T0HBLB | Eluktronics Mech-17 GP2 GeForce RTX 4090 Laptop GPU, i9-13900HX, Samsung PM9A1 MZVL21T0HCLR | Asus ROG Strix G17 G713PI GeForce RTX 4070 Laptop GPU, R9 7945HX, WD PC SN560 SDDPNQE-1T00 | Aorus 17X XES GeForce RTX 3070 Ti Laptop GPU, i9-12900HX, Gigabyte AG470S1TB-SI B10 | Alienware m17 R5 (R9 6900HX, RX 6850M XT) Radeon RX 6850M XT, R9 6900HX, SSSTC CA6-8D1024 | |
|---|---|---|---|---|---|---|
| Noise | -10% | -10% | -9% | -24% | 1% | |
| off / environment * (dB) | 22.7 | 23.4 -3% | 25.2 -11% | 25 -10% | 26 -15% | 23 -1% |
| Idle Minimum * (dB) | 23.5 | 24.2 -3% | 28 -19% | 26 -11% | 28 -19% | 23 2% |
| Idle Average * (dB) | 27.7 | 25.6 8% | 28 -1% | 29 -5% | 32 -16% | 28.11 -1% |
| Idle Maximum * (dB) | 27.7 | 31 -12% | 30.4 -10% | 30 -8% | 38 -37% | 28.11 -1% |
| Load Average * (dB) | 30.5 | 43.3 -42% | 41 -34% | 46 -51% | 53 -74% | 30.62 -0% |
| Witcher 3 ultra * (dB) | 51.4 | 56.3 -10% | 50.7 1% | 46 11% | 54 -5% | 49.75 3% |
| Load Maximum * (dB) | 54.1 | 59.1 -9% | 52.6 3% | 47 13% | 55 -2% | 50.17 7% |
* ... smaller is better
Temperature
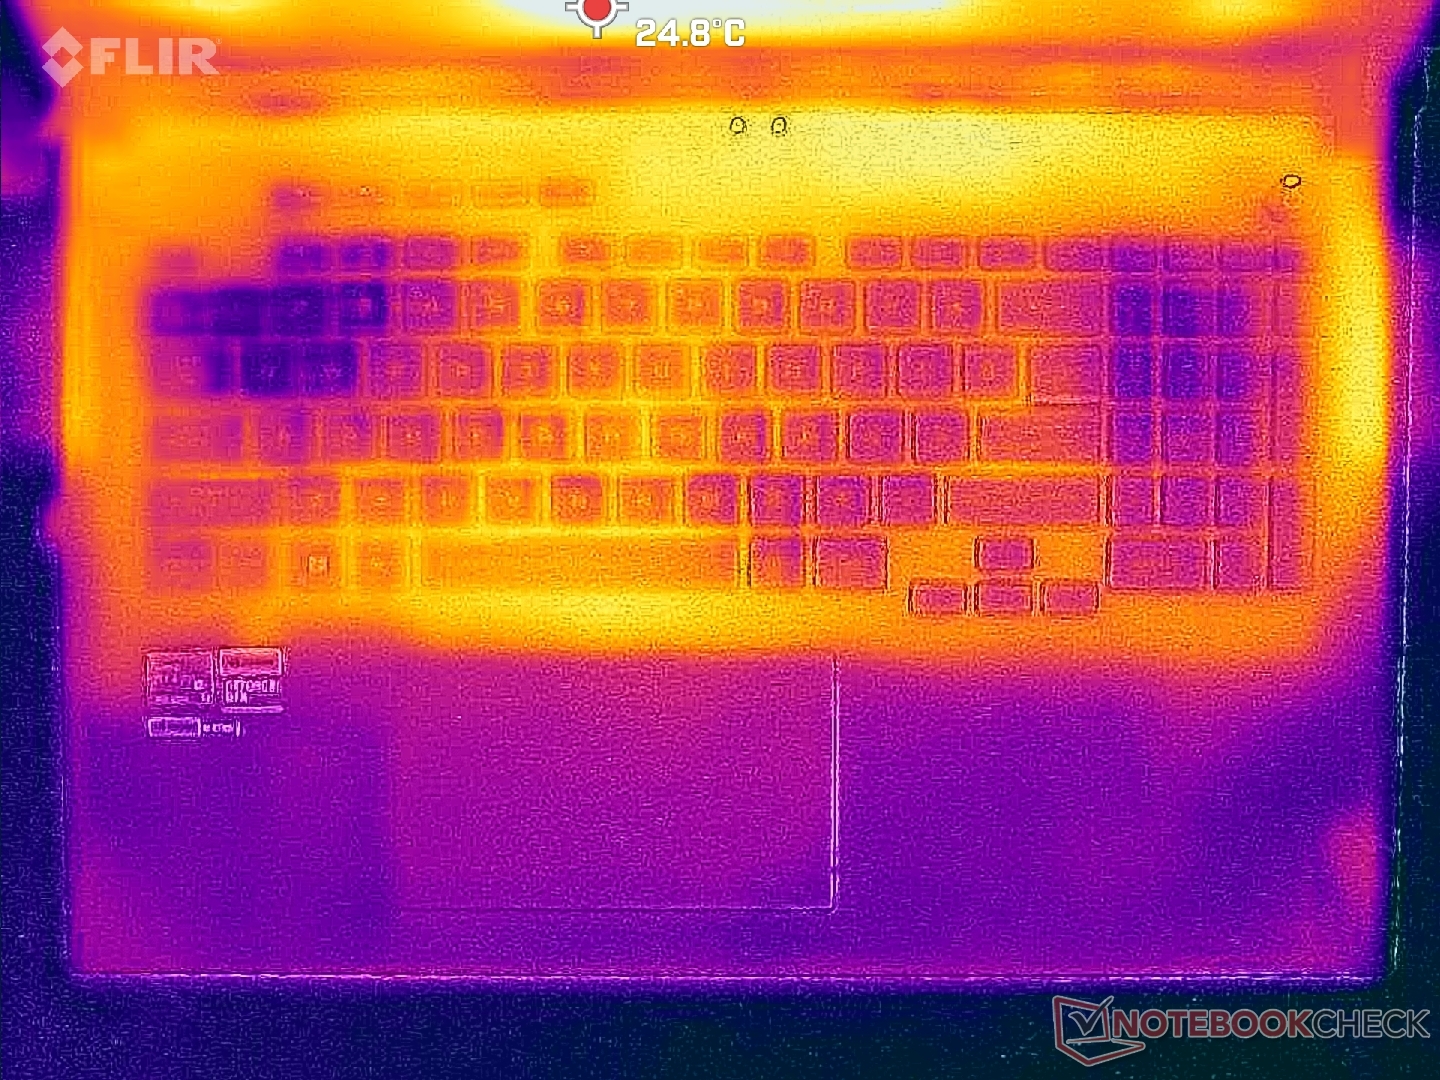
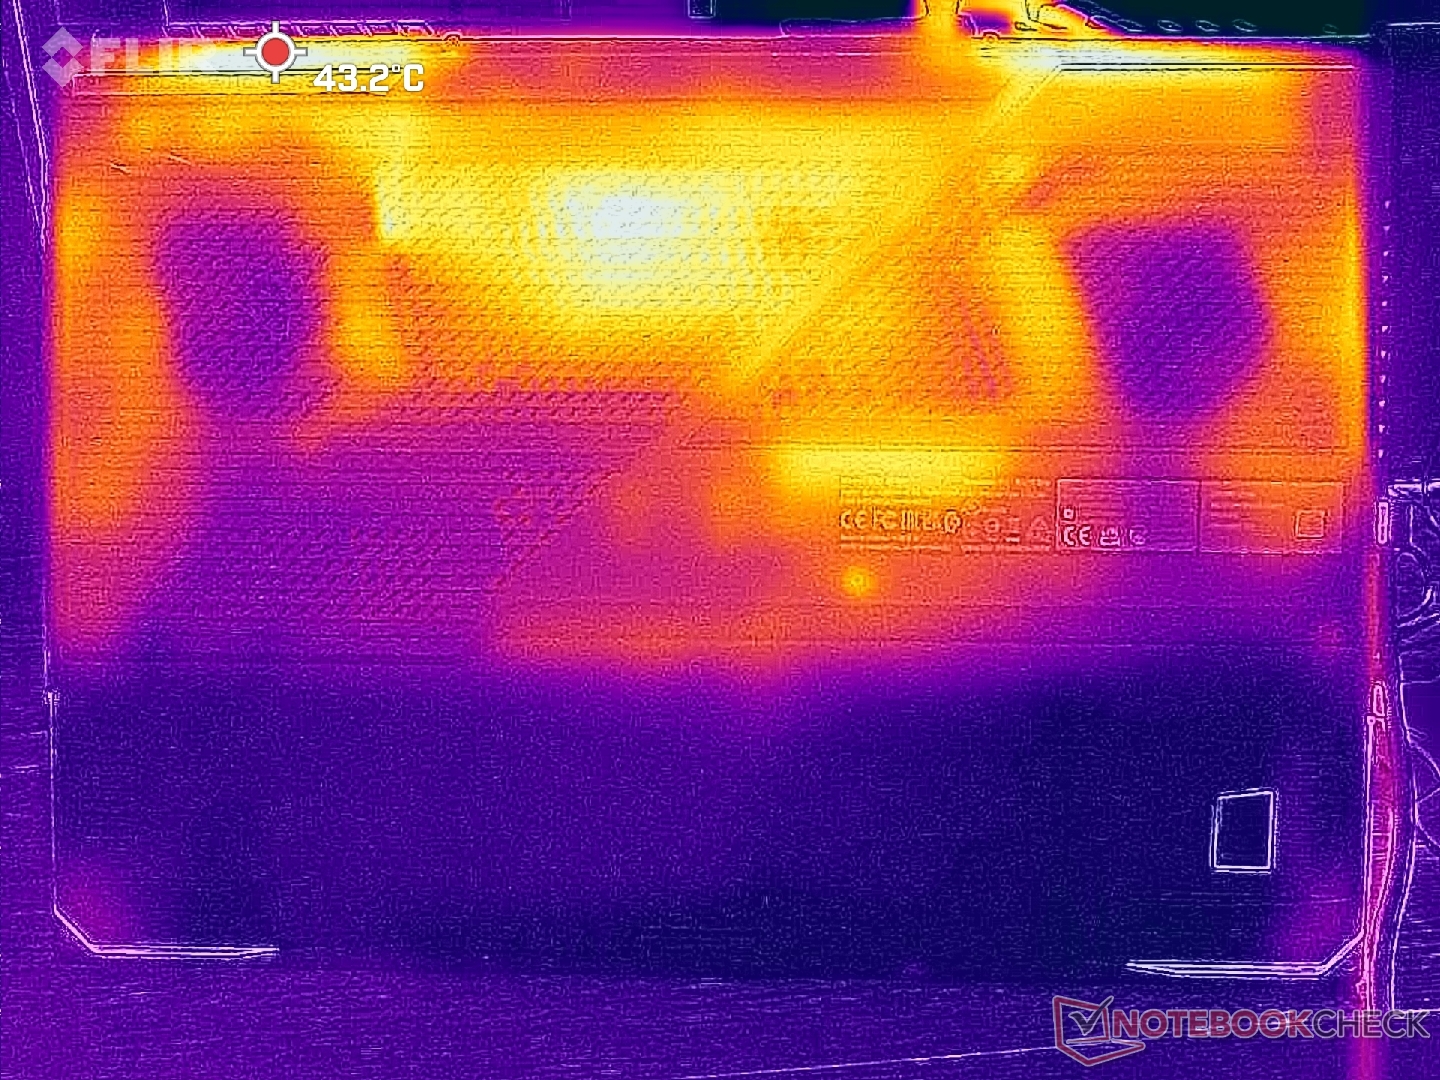
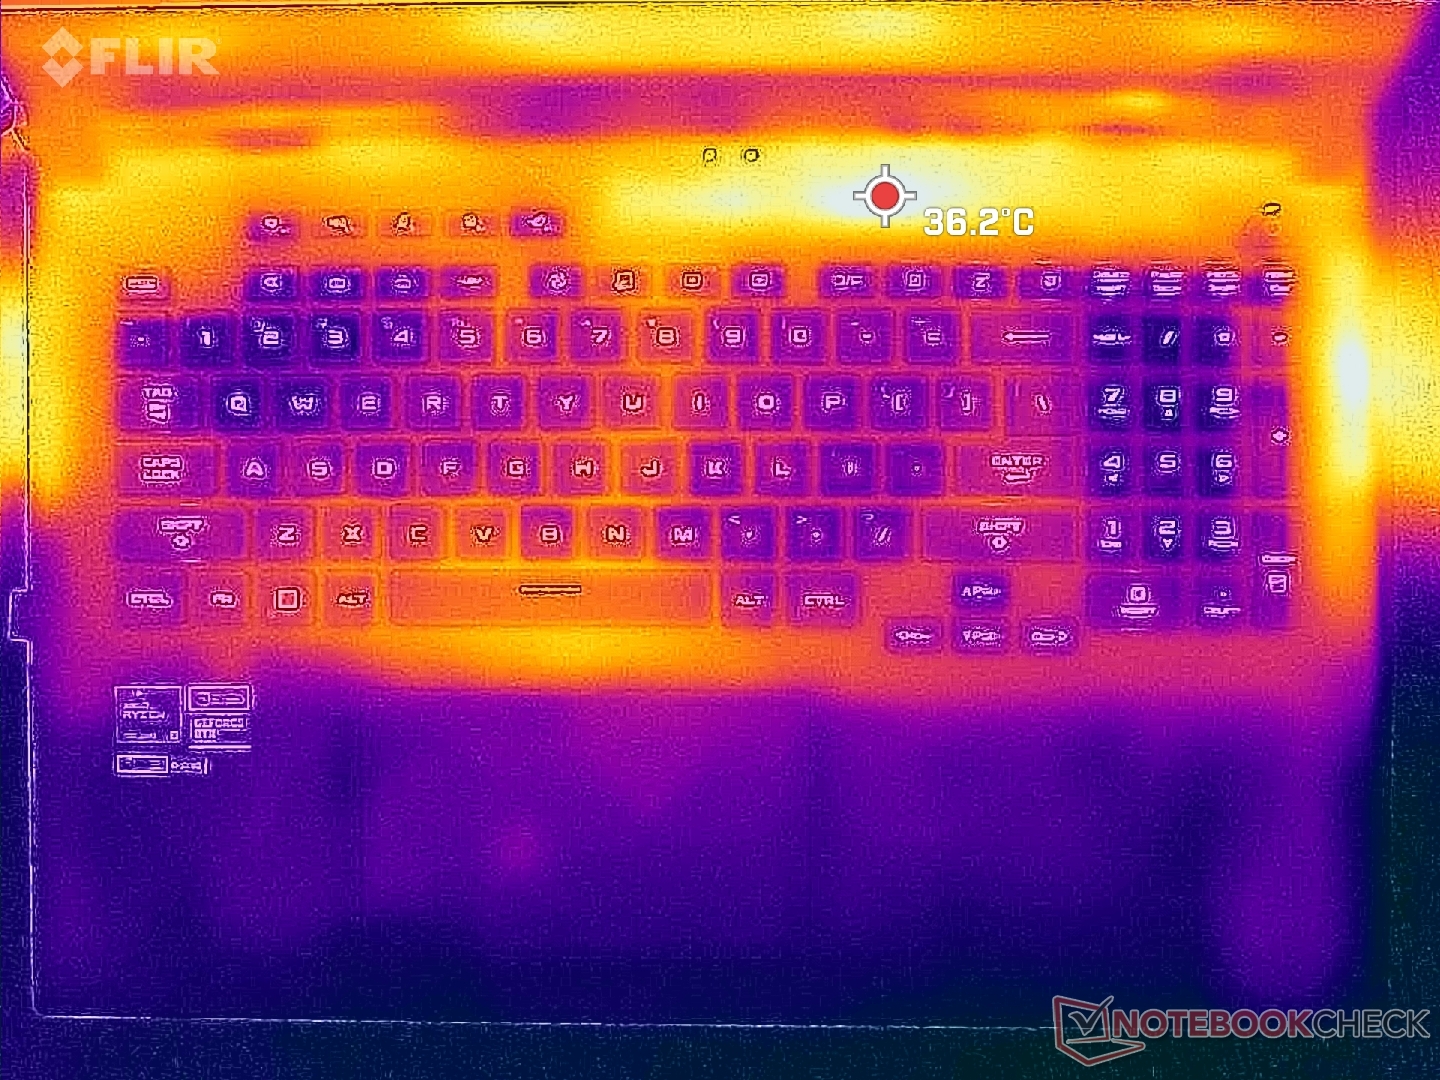
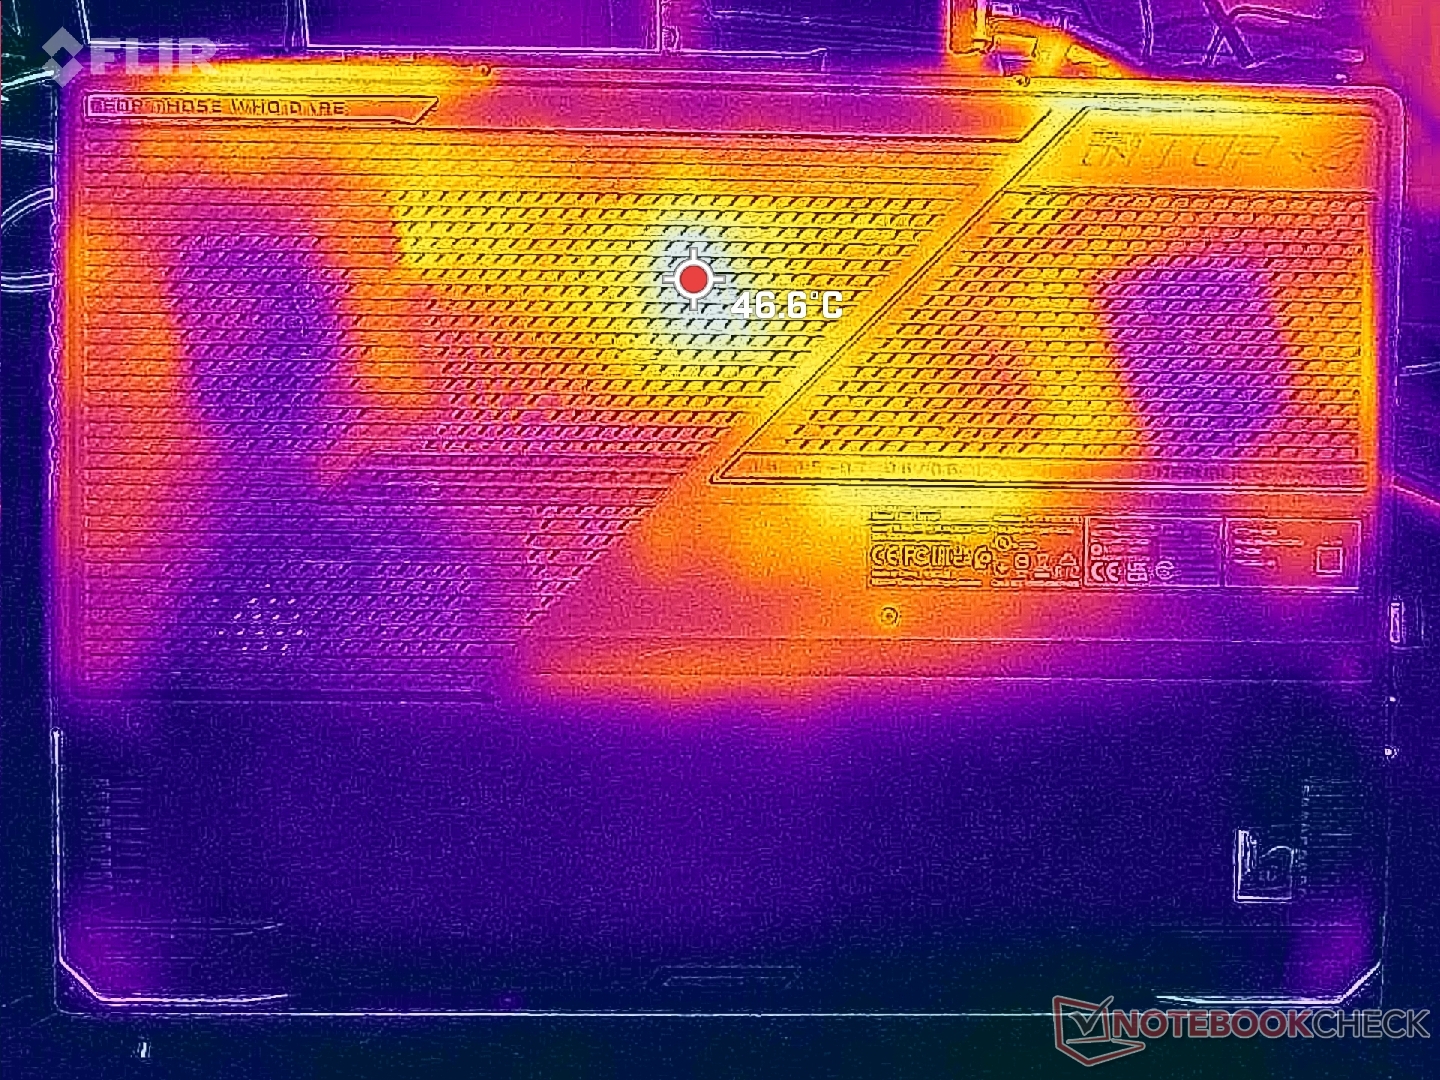
Much of the keyboard and palm rests remain cool when gaming. Hot spots are instead along the edges of the deck where fingers are less likely to touch.
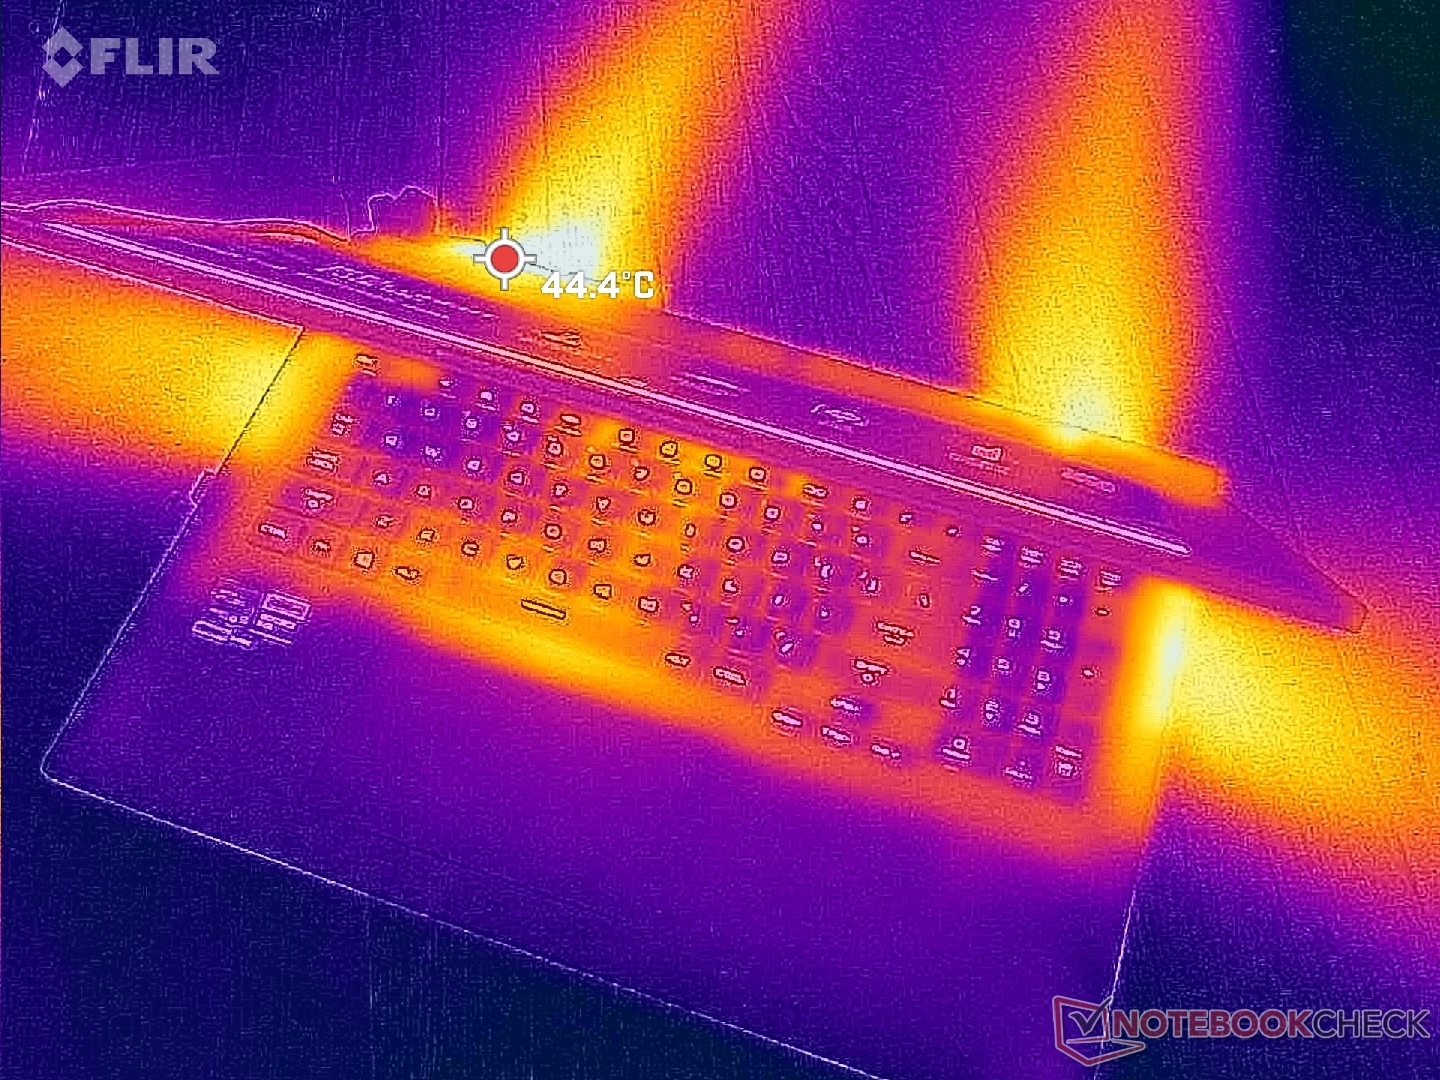
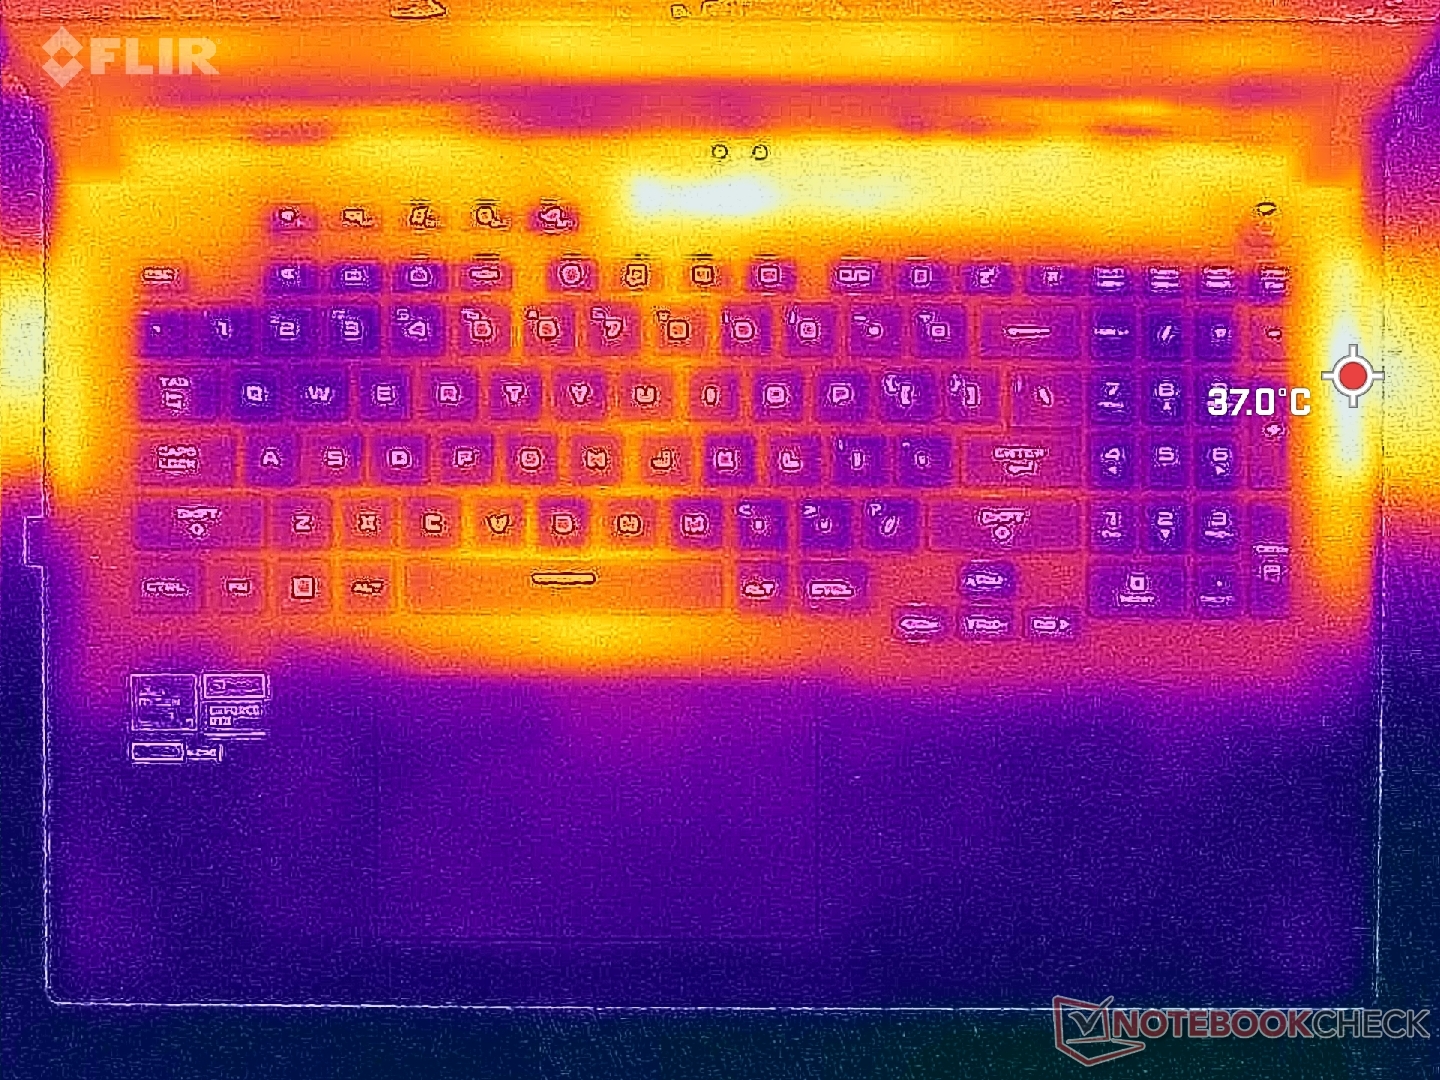
(+) The maximum temperature on the upper side is 34.6 °C / 94 F, compared to the average of 40.4 °C / 105 F, ranging from 21.2 to 68.8 °C for the class Gaming.
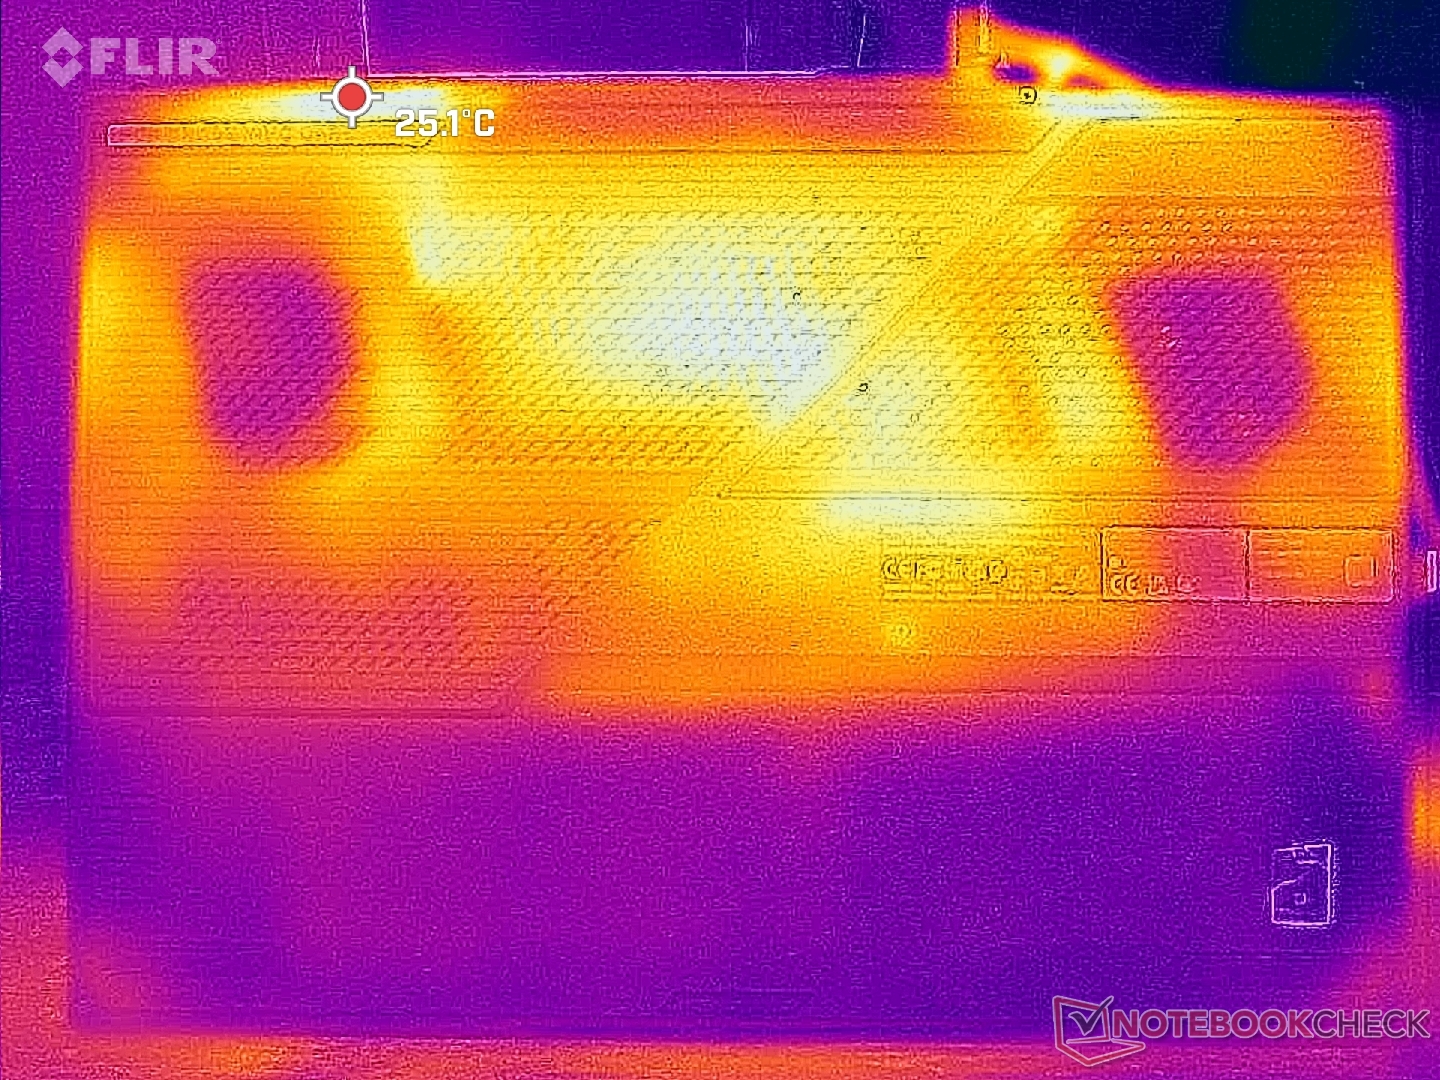
(+) The bottom heats up to a maximum of 35.6 °C / 96 F, compared to the average of 43.2 °C / 110 F
(+) In idle usage, the average temperature for the upper side is 23.2 °C / 74 F, compared to the device average of 33.9 °C / 93 F.
(+) Playing The Witcher 3, the average temperature for the upper side is 27.3 °C / 81 F, compared to the device average of 33.9 °C / 93 F.
(+) The palmrests and touchpad are cooler than skin temperature with a maximum of 20.8 °C / 69.4 F and are therefore cool to the touch.
(+) The average temperature of the palmrest area of similar devices was 28.8 °C / 83.8 F (+8 °C / 14.4 F).
| Asus ROG Strix Scar 17 G733PY-XS96 AMD Ryzen 9 7945HX, NVIDIA GeForce RTX 4090 Laptop GPU | MSI GE78HX 13VH-070US Intel Core i9-13950HX, NVIDIA GeForce RTX 4080 Laptop GPU | Eluktronics Mech-17 GP2 Intel Core i9-13900HX, NVIDIA GeForce RTX 4090 Laptop GPU | Asus ROG Strix G17 G713PI AMD Ryzen 9 7945HX, NVIDIA GeForce RTX 4070 Laptop GPU | Aorus 17X XES Intel Core i9-12900HX, NVIDIA GeForce RTX 3070 Ti Laptop GPU | Alienware m17 R5 (R9 6900HX, RX 6850M XT) AMD Ryzen 9 6900HX, AMD Radeon RX 6850M XT | |
|---|---|---|---|---|---|---|
| Heat | -13% | -13% | -18% | -46% | -29% | |
| Maximum Upper Side * (°C) | 34.6 | 37.4 -8% | 39 -13% | 42 -21% | 54 -56% | 53 -53% |
| Maximum Bottom * (°C) | 35.6 | 45 -26% | 44 -24% | 41 -15% | 58 -63% | 56 -57% |
| Idle Upper Side * (°C) | 27.2 | 29.8 -10% | 31 -14% | 33 -21% | 37 -36% | 30 -10% |
| Idle Bottom * (°C) | 30 | 32.4 -8% | 29.8 1% | 34 -13% | 39 -30% | 29 3% |
* ... smaller is better
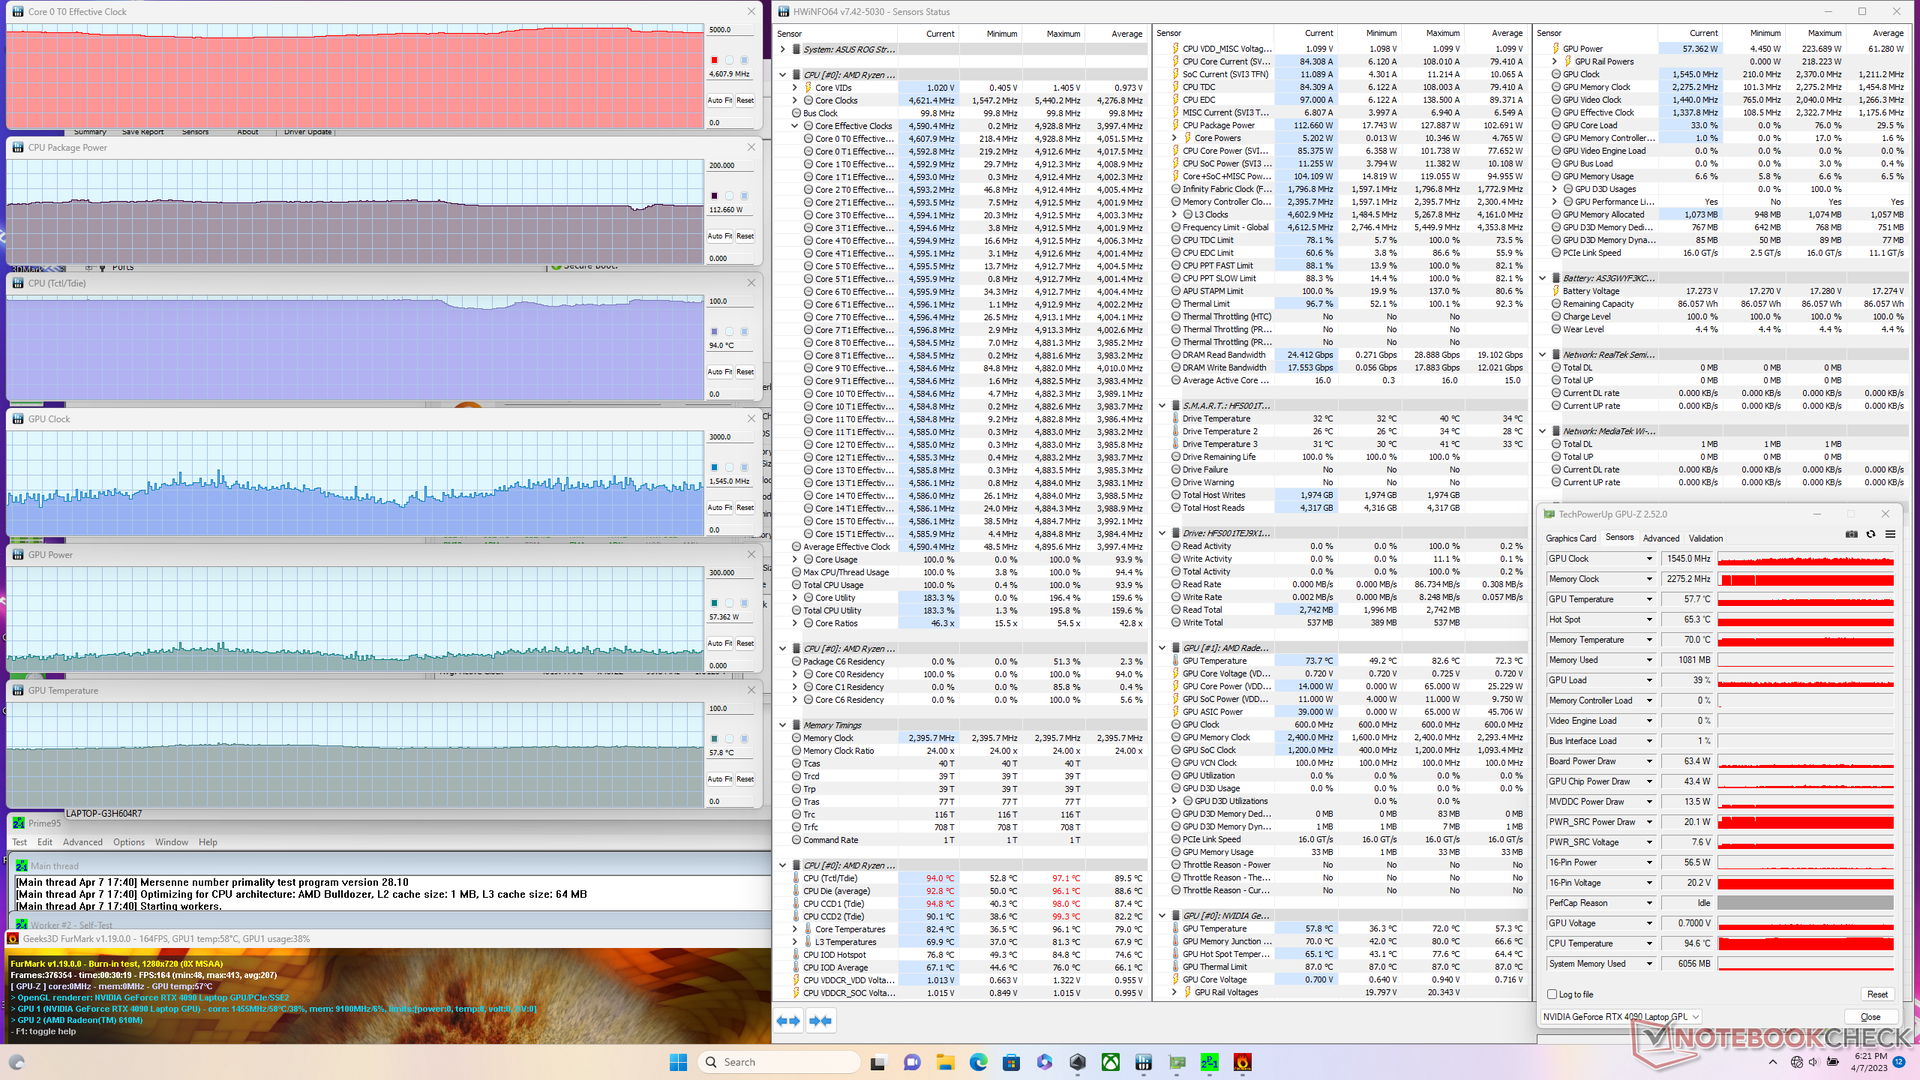
Stress Test — Warm Core Temperature
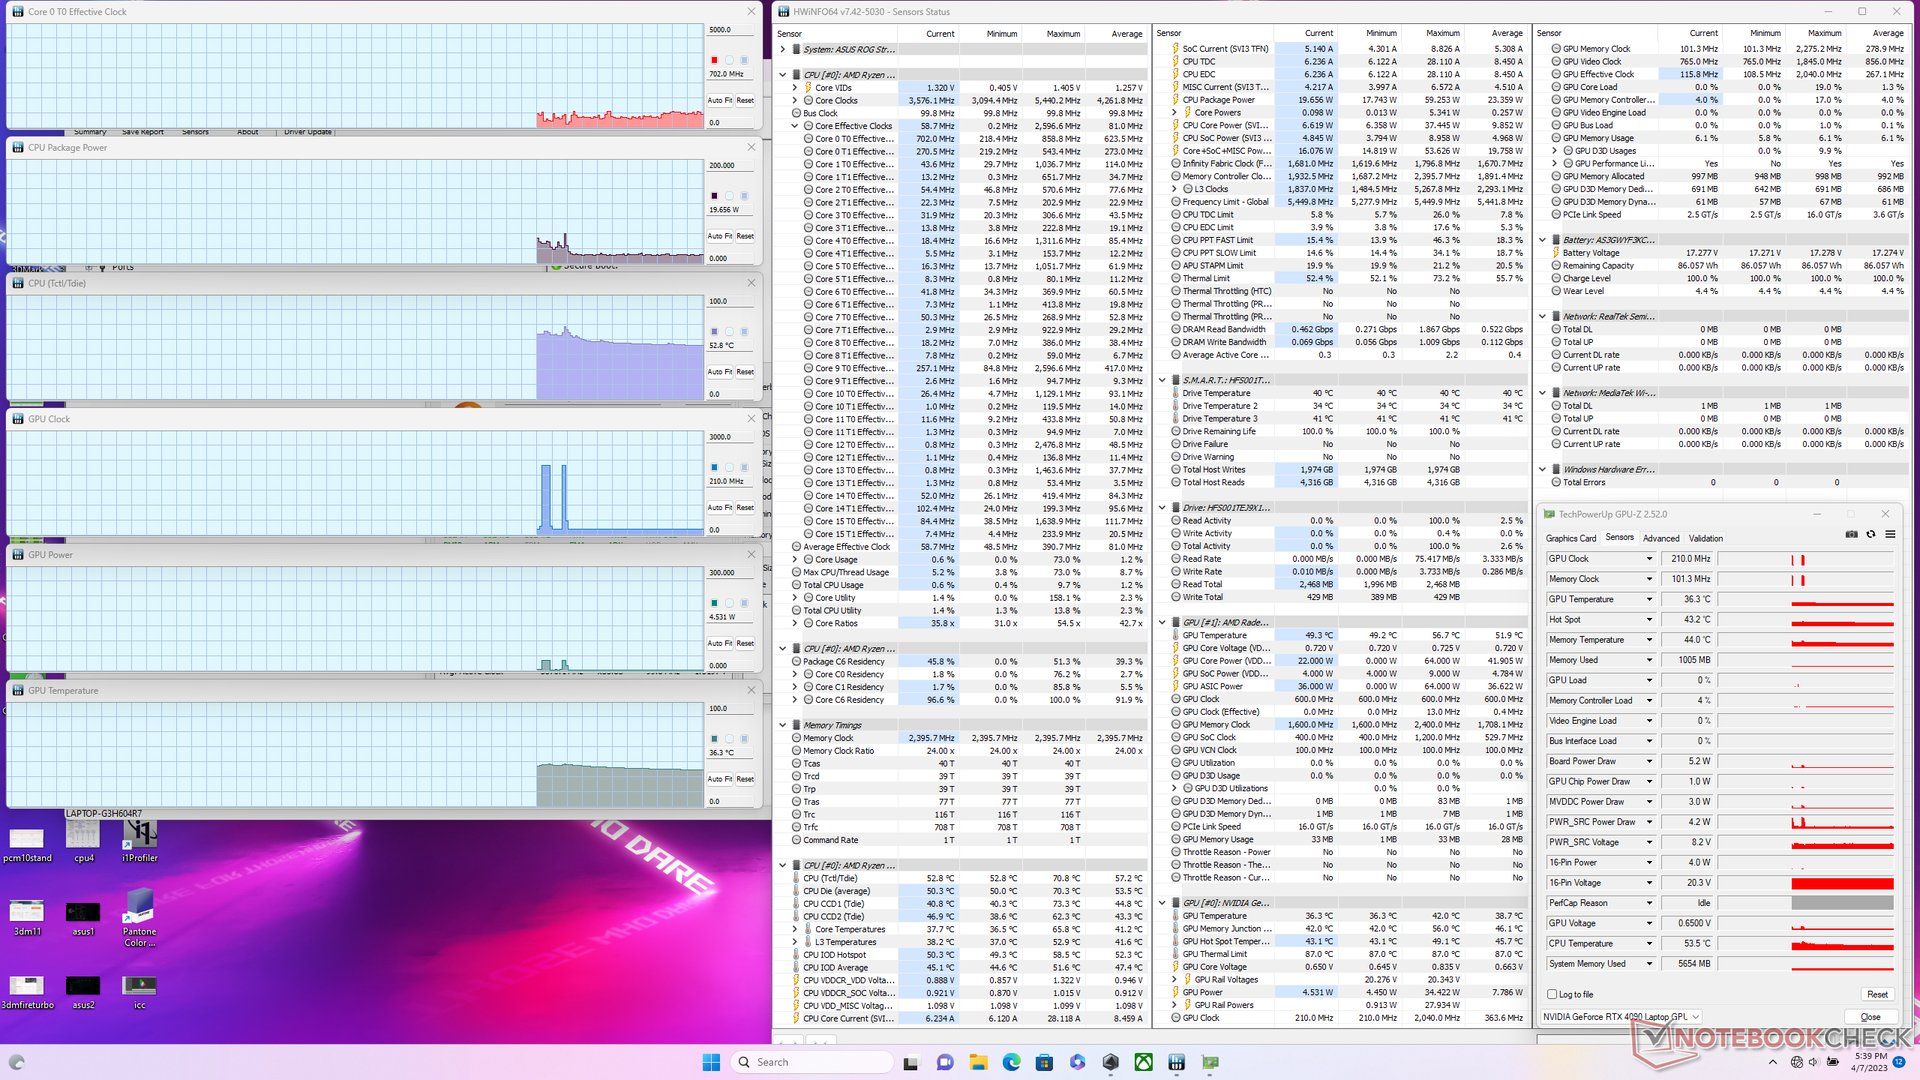
When stressed under Prime95, the CPU would cycle between 4.2 and 4.9 GHz while maintaining a CPU package power between 114 W and 128 W. Core temperature would be very high at over 90 C, however.
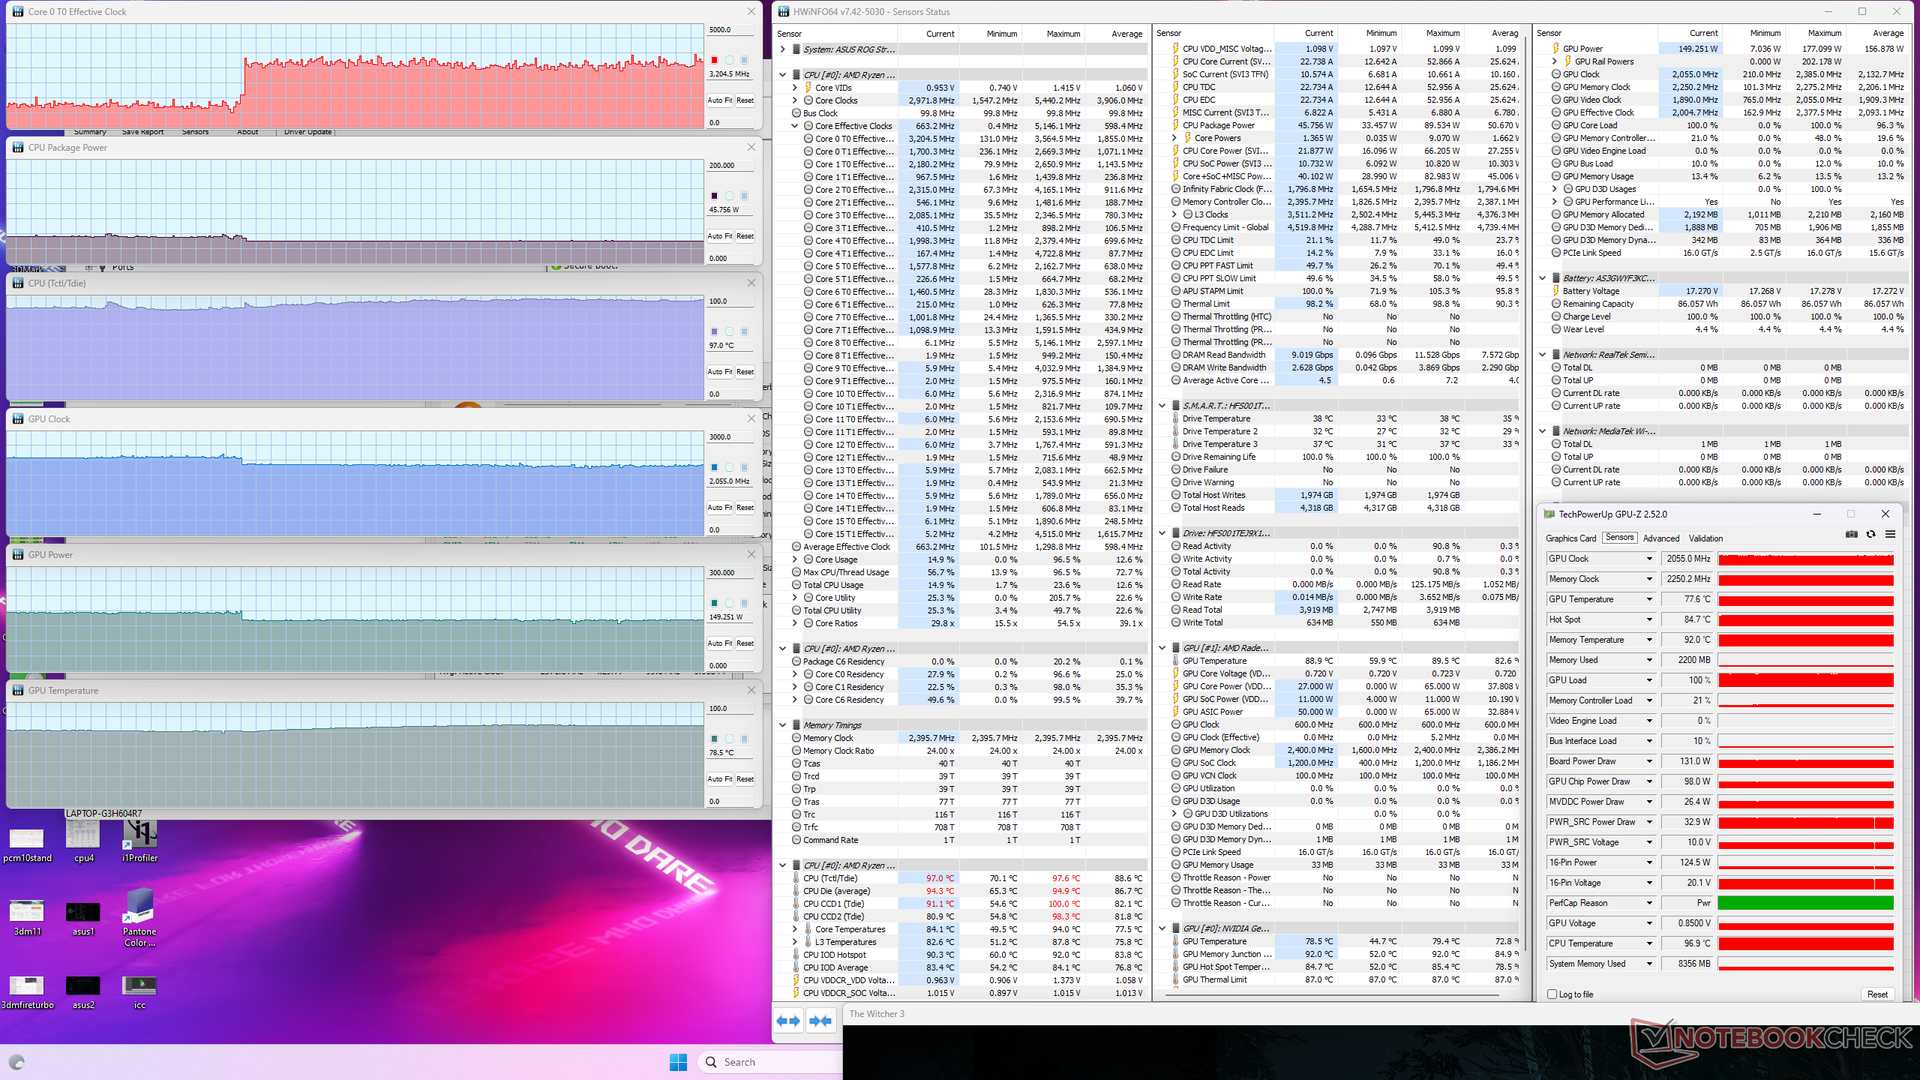
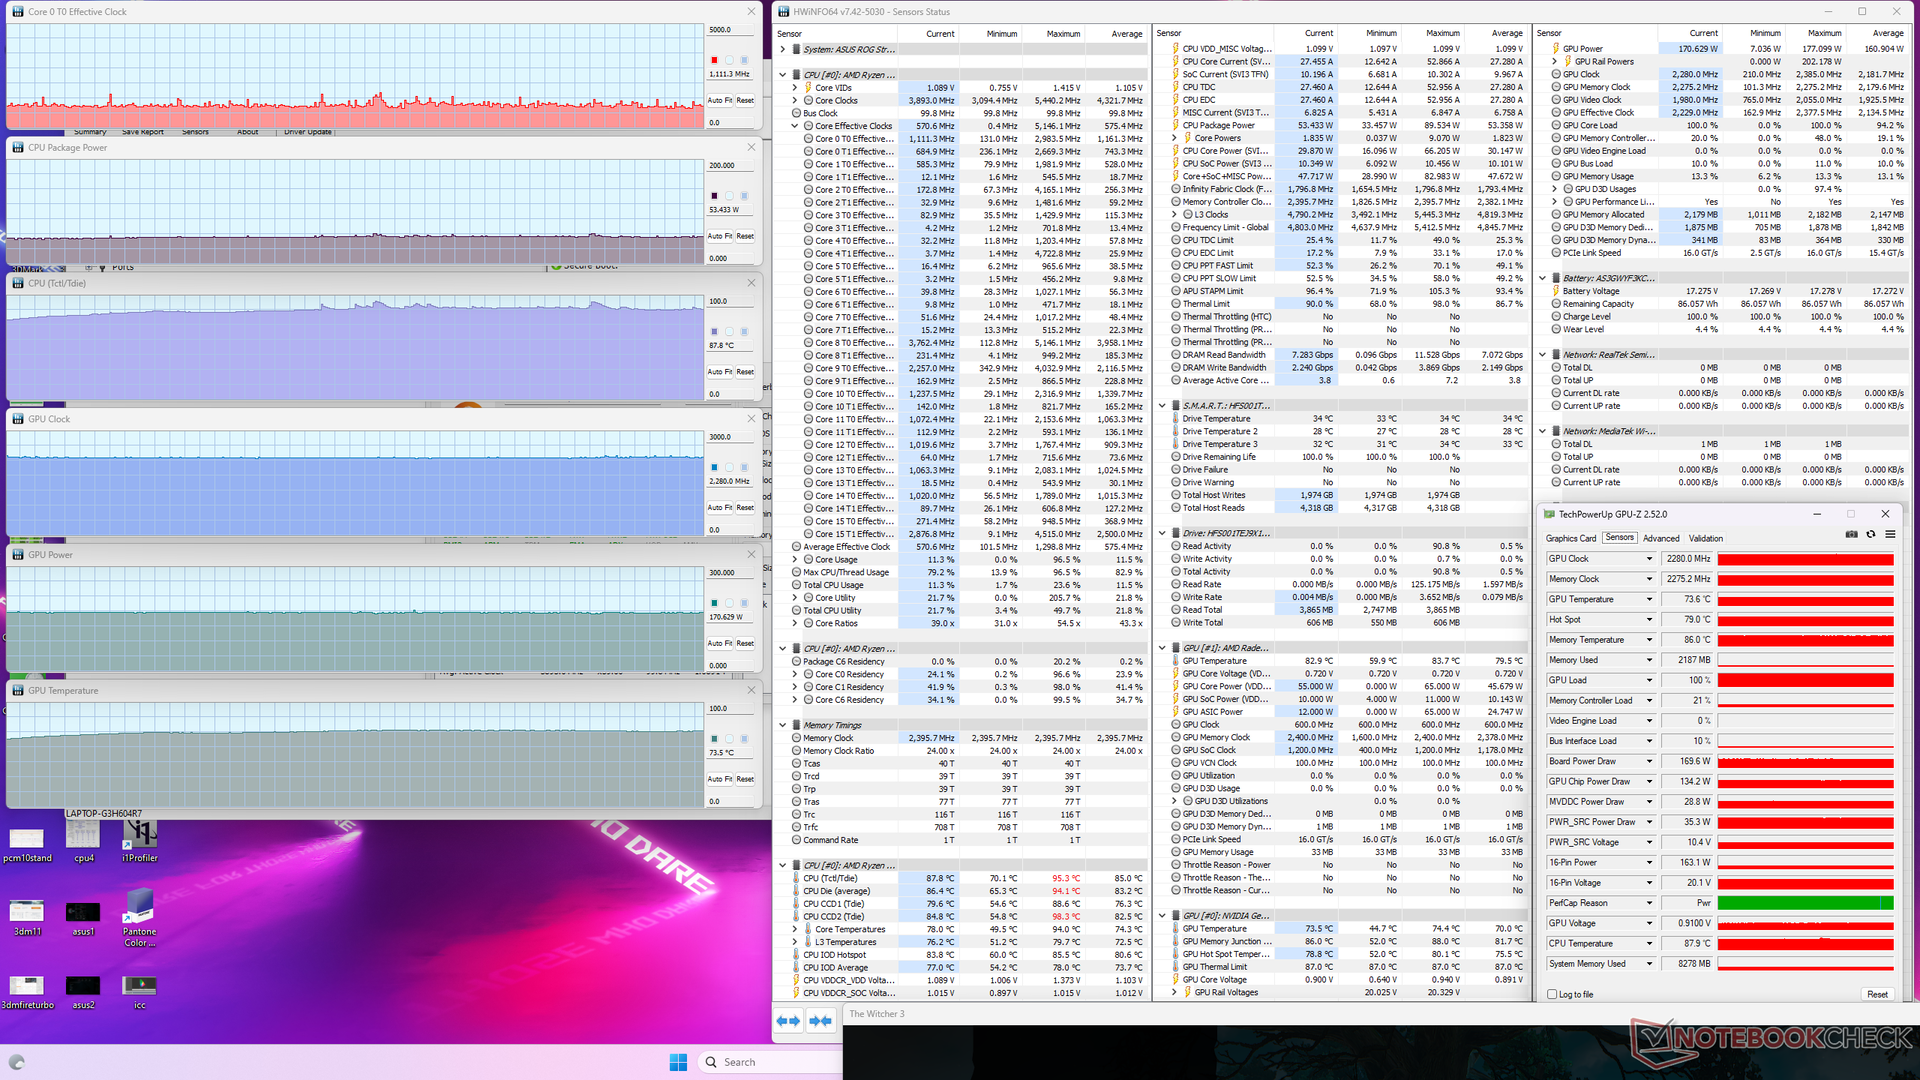
GPU clock rate, memory clock, temperature, and board power draw would stabilize at 2055 MHz, 2250 MHz, 79 C, and 149 W, respectively, when running Witcher 3 on Performance mode. These values would change to 2280 MHz, 2275 MHz, 74 C, and 170 W when set to Turbo mode. Thus, Turbo mode is required is you want to come closer to the advertised 175 W TGP of the mobile RTX 4090.
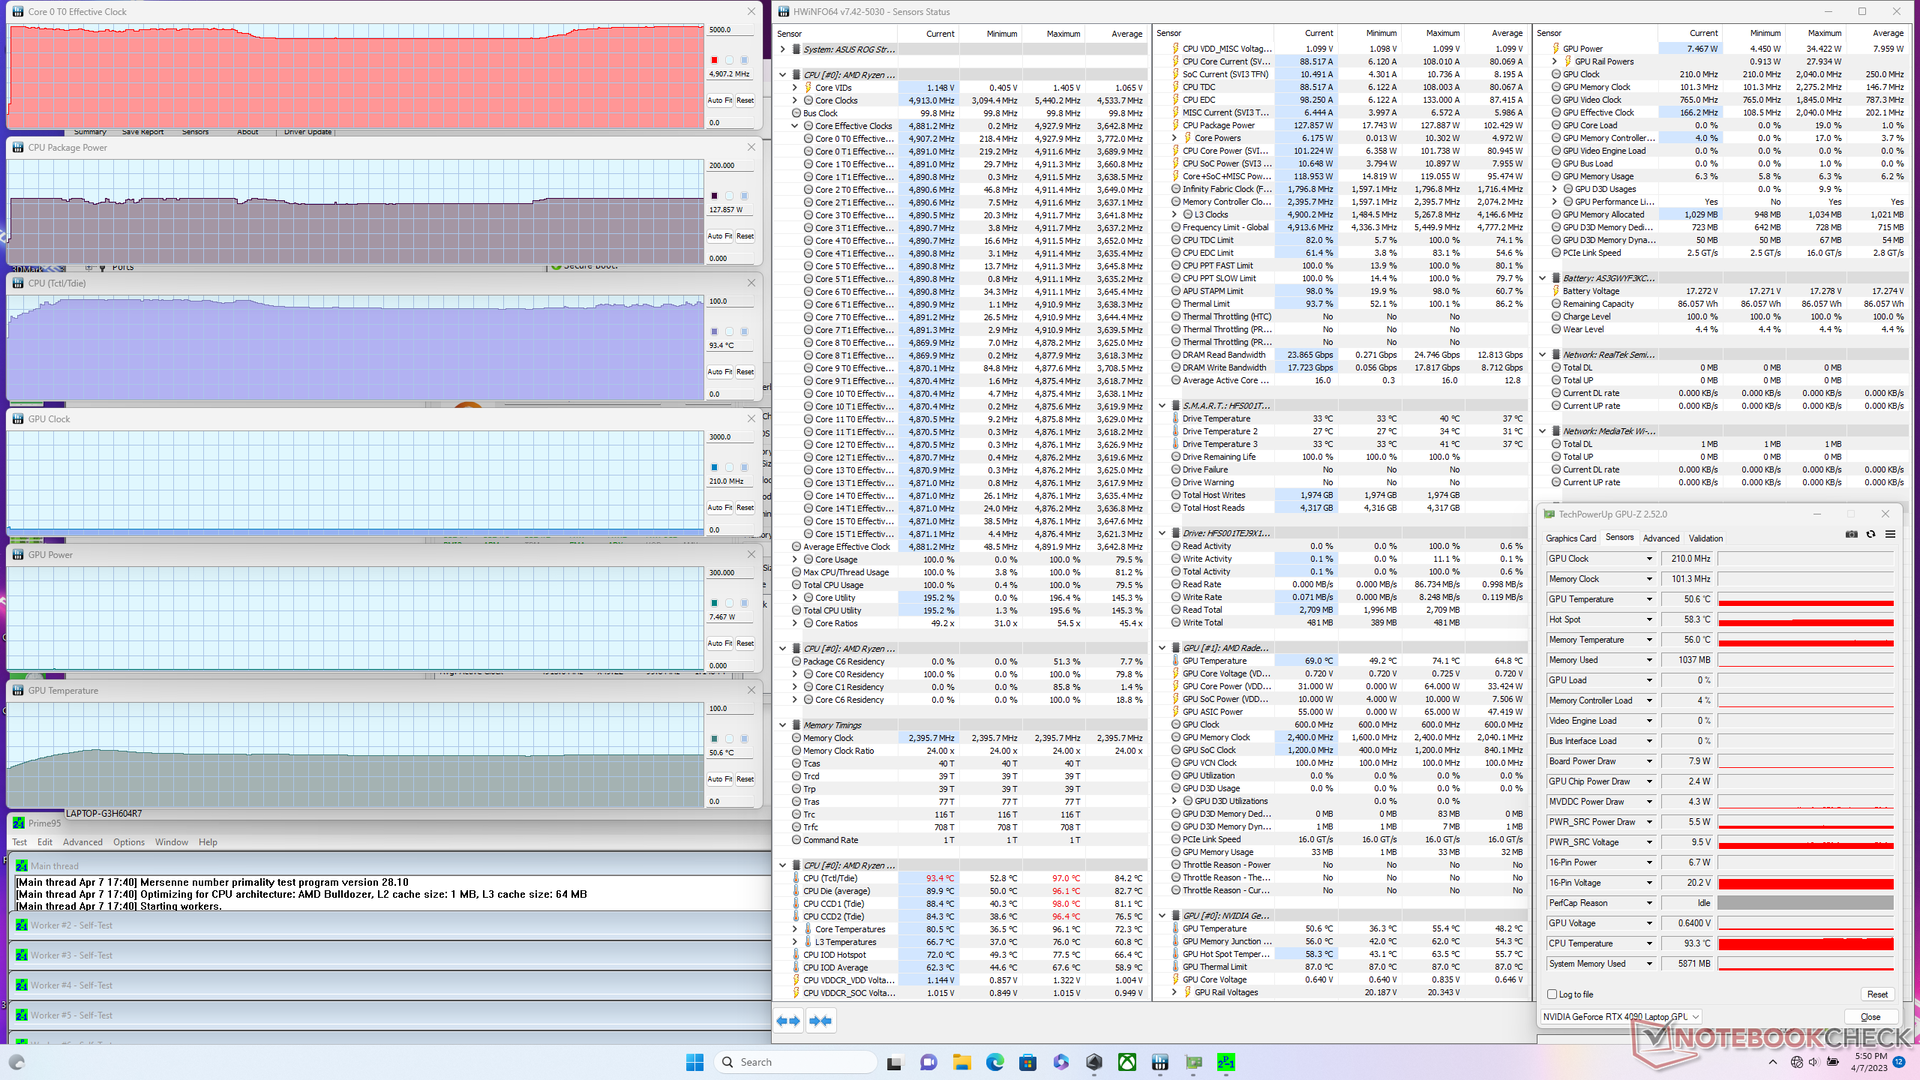
| CPU Clock (GHz) | GPU Clock (MHz) | Average CPU Temperature (°C) | Average GPU Temperature (°C) | |
| System Idle | -- | -- | 53 | 36 |
| Prime95 Stress | 4.2 - 4.9 | -- | 90 - 94 | 51 |
| Prime95 + FurMark Stress | 4.2 - 4.8 | ~850 - 1545 | 94 | 58 |
| Witcher 3 Stress (Performance mode) | ~3.2 | 2055 | 97 | 79 |
| Witcher 3 Stress (Turbo mode) | ~1.1 | 2280 | 88 | 74 |
Speakers
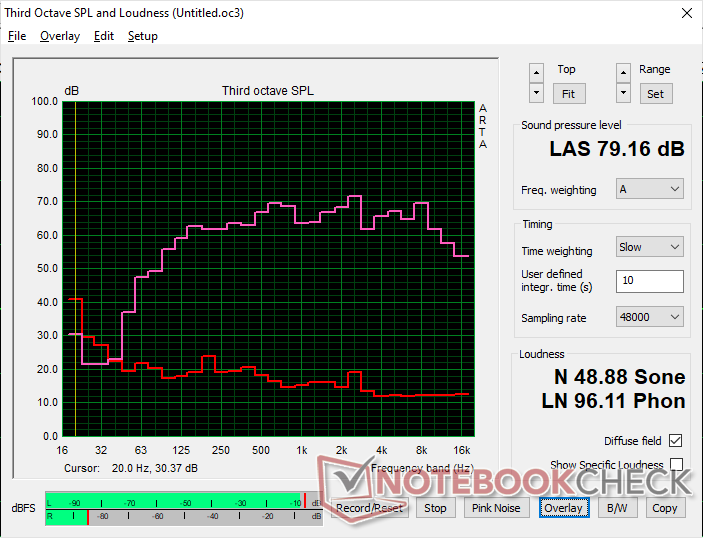
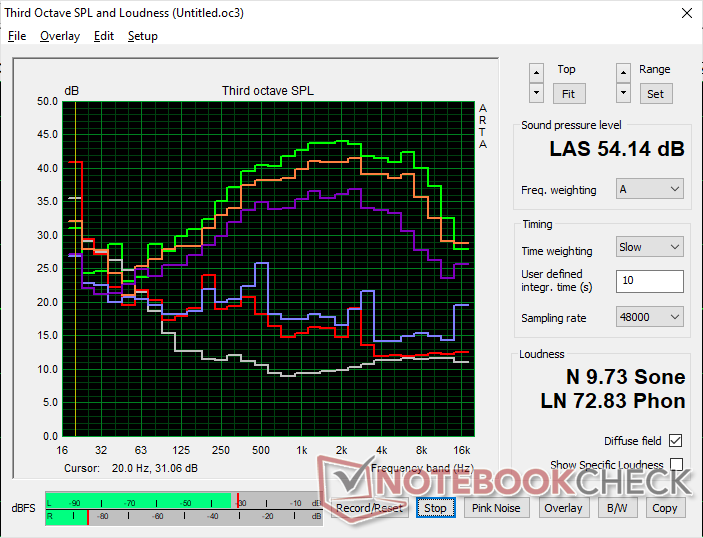
Asus ROG Strix Scar 17 G733PY-XS96 audio analysis
(±) | speaker loudness is average but good (79.2 dB)
Bass 100 - 315 Hz
(+) | good bass - only 2.8% away from median
(+) | bass is linear (5.6% delta to prev. frequency)
Mids 400 - 2000 Hz
(+) | balanced mids - only 2.9% away from median
(+) | mids are linear (4.7% delta to prev. frequency)
Highs 2 - 16 kHz
(+) | balanced highs - only 3.5% away from median
(±) | linearity of highs is average (10% delta to prev. frequency)
Overall 100 - 16.000 Hz
(+) | overall sound is linear (9.3% difference to median)
Compared to same class
» 3% of all tested devices in this class were better, 2% similar, 95% worse
» The best had a delta of 6%, average was 18%, worst was 132%
Compared to all devices tested
» 3% of all tested devices were better, 1% similar, 96% worse
» The best had a delta of 4%, average was 23%, worst was 134%
Apple MacBook Pro 16 2021 M1 Pro audio analysis
(+) | speakers can play relatively loud (84.7 dB)
Bass 100 - 315 Hz
(+) | good bass - only 3.8% away from median
(+) | bass is linear (5.2% delta to prev. frequency)
Mids 400 - 2000 Hz
(+) | balanced mids - only 1.3% away from median
(+) | mids are linear (2.1% delta to prev. frequency)
Highs 2 - 16 kHz
(+) | balanced highs - only 1.9% away from median
(+) | highs are linear (2.7% delta to prev. frequency)
Overall 100 - 16.000 Hz
(+) | overall sound is linear (4.6% difference to median)
Compared to same class
» 0% of all tested devices in this class were better, 0% similar, 100% worse
» The best had a delta of 5%, average was 17%, worst was 45%
Compared to all devices tested
» 0% of all tested devices were better, 0% similar, 100% worse
» The best had a delta of 4%, average was 23%, worst was 134%
Energy Management — Demanding Machine
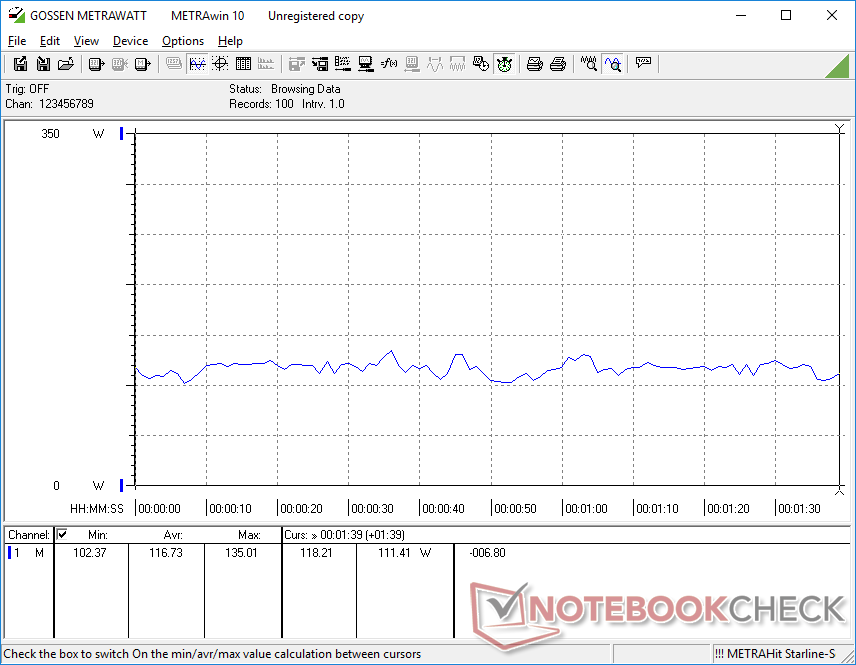
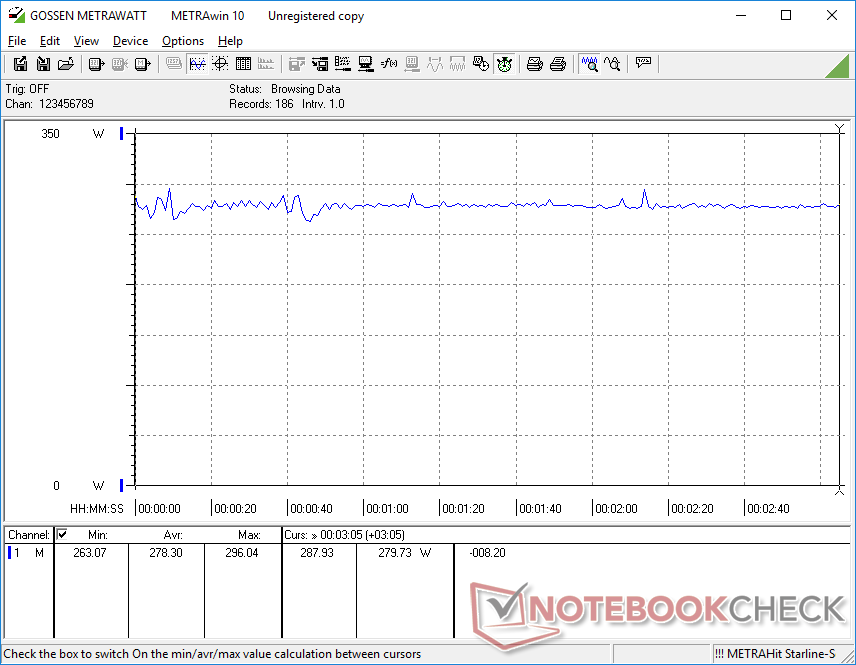
Power Consumption
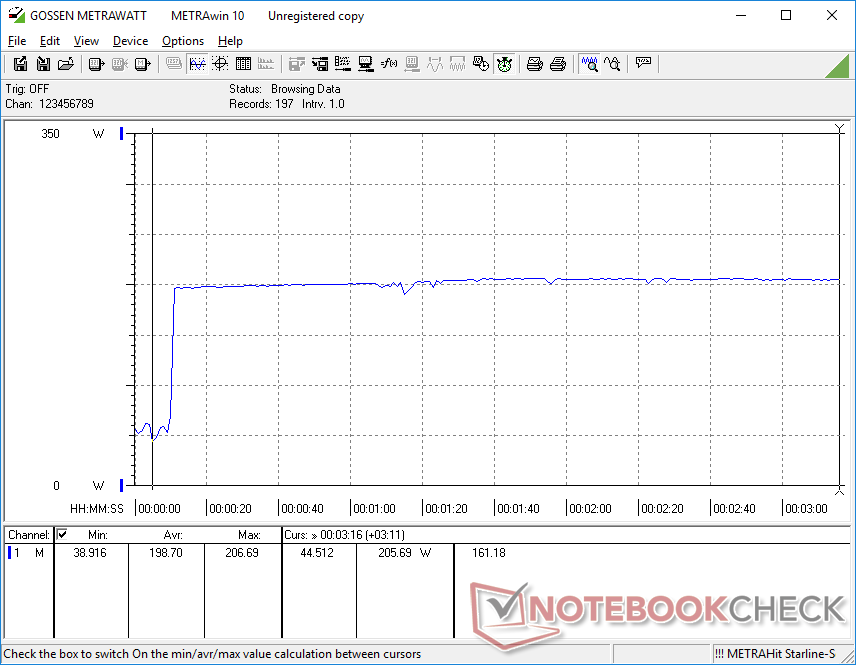
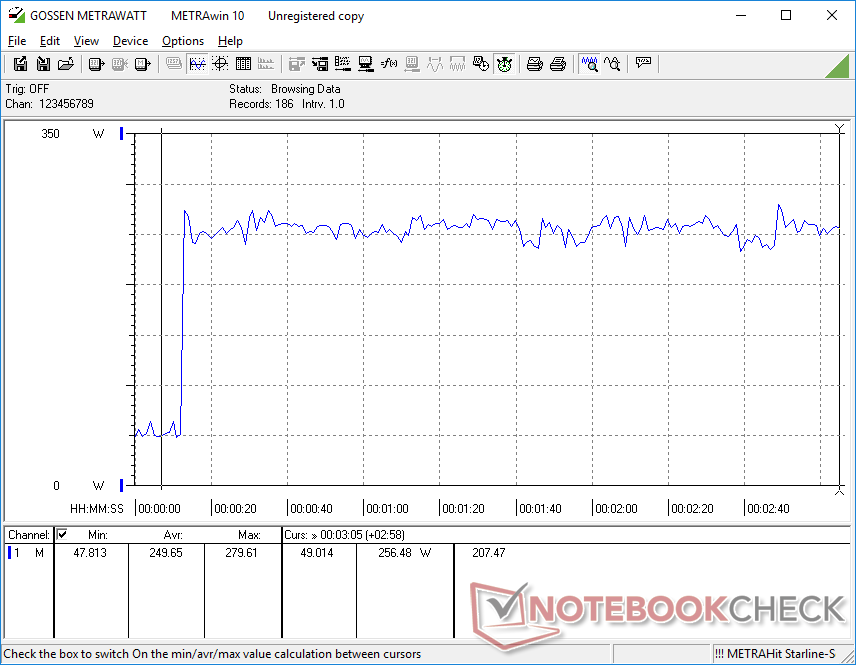
Our 2023 model is generally more power-hungry than the Intel-powered 2022 model. When running Prime95, for example, power consumption would stabilize at 205 W vs. just 117 W on last year's i9-12950HX configuration. Similarly, running Witcher 3 would consume about 24 percent more power over the older RTX 3080 Ti configuration. Performance may be faster gen over gen, but consumption has risen as well.
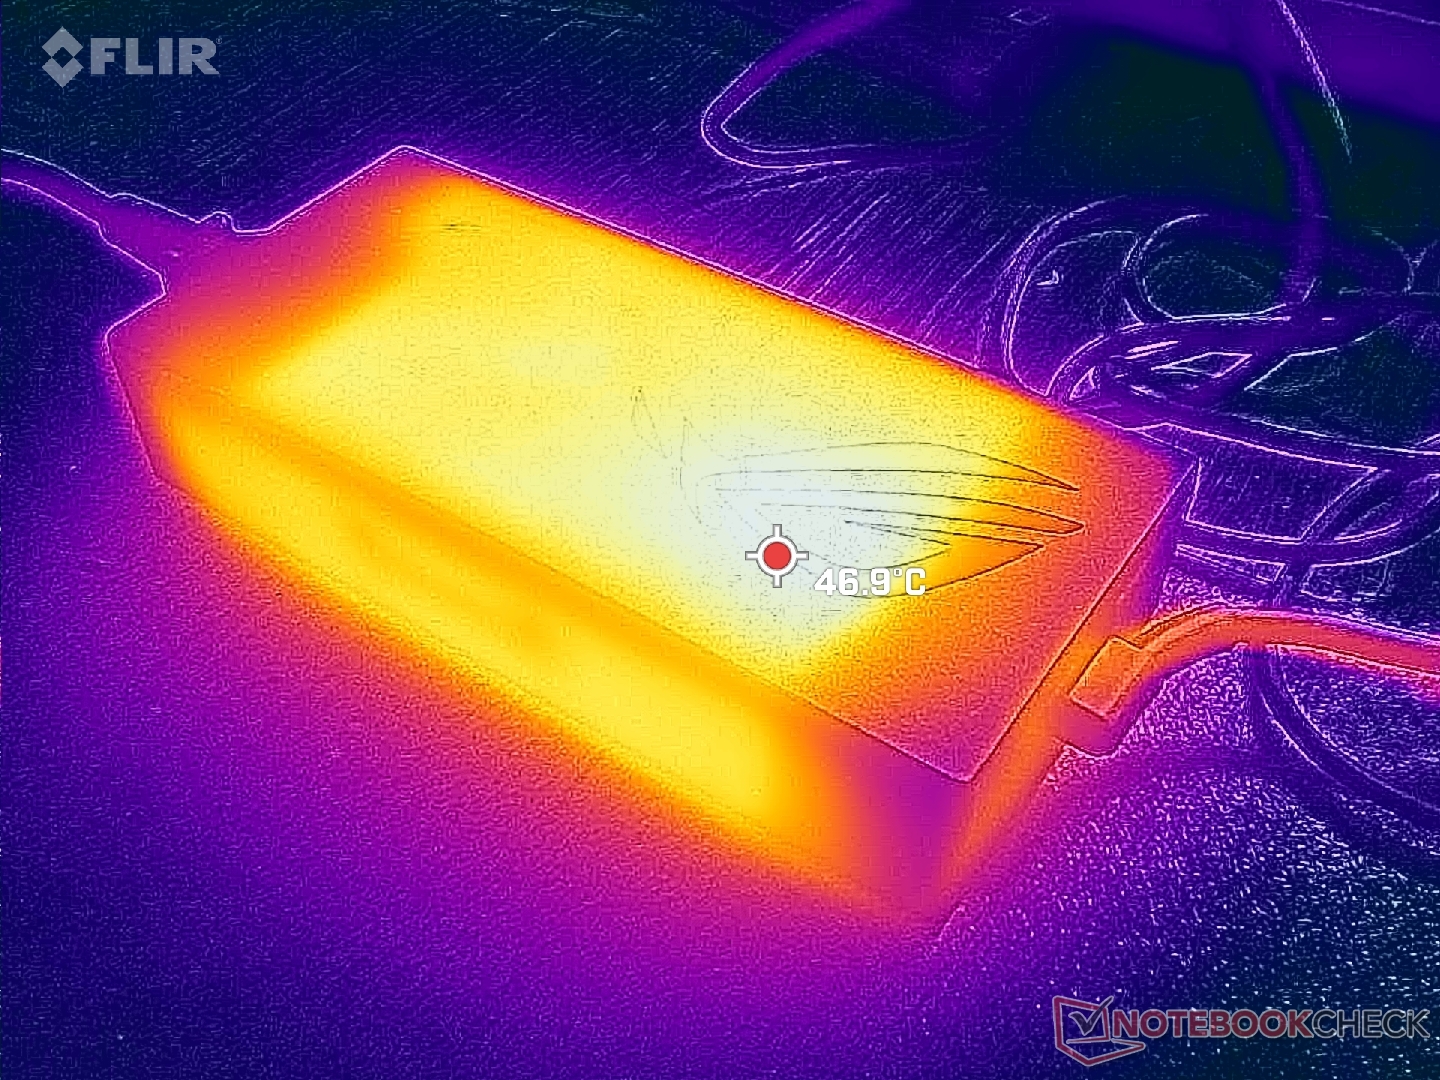
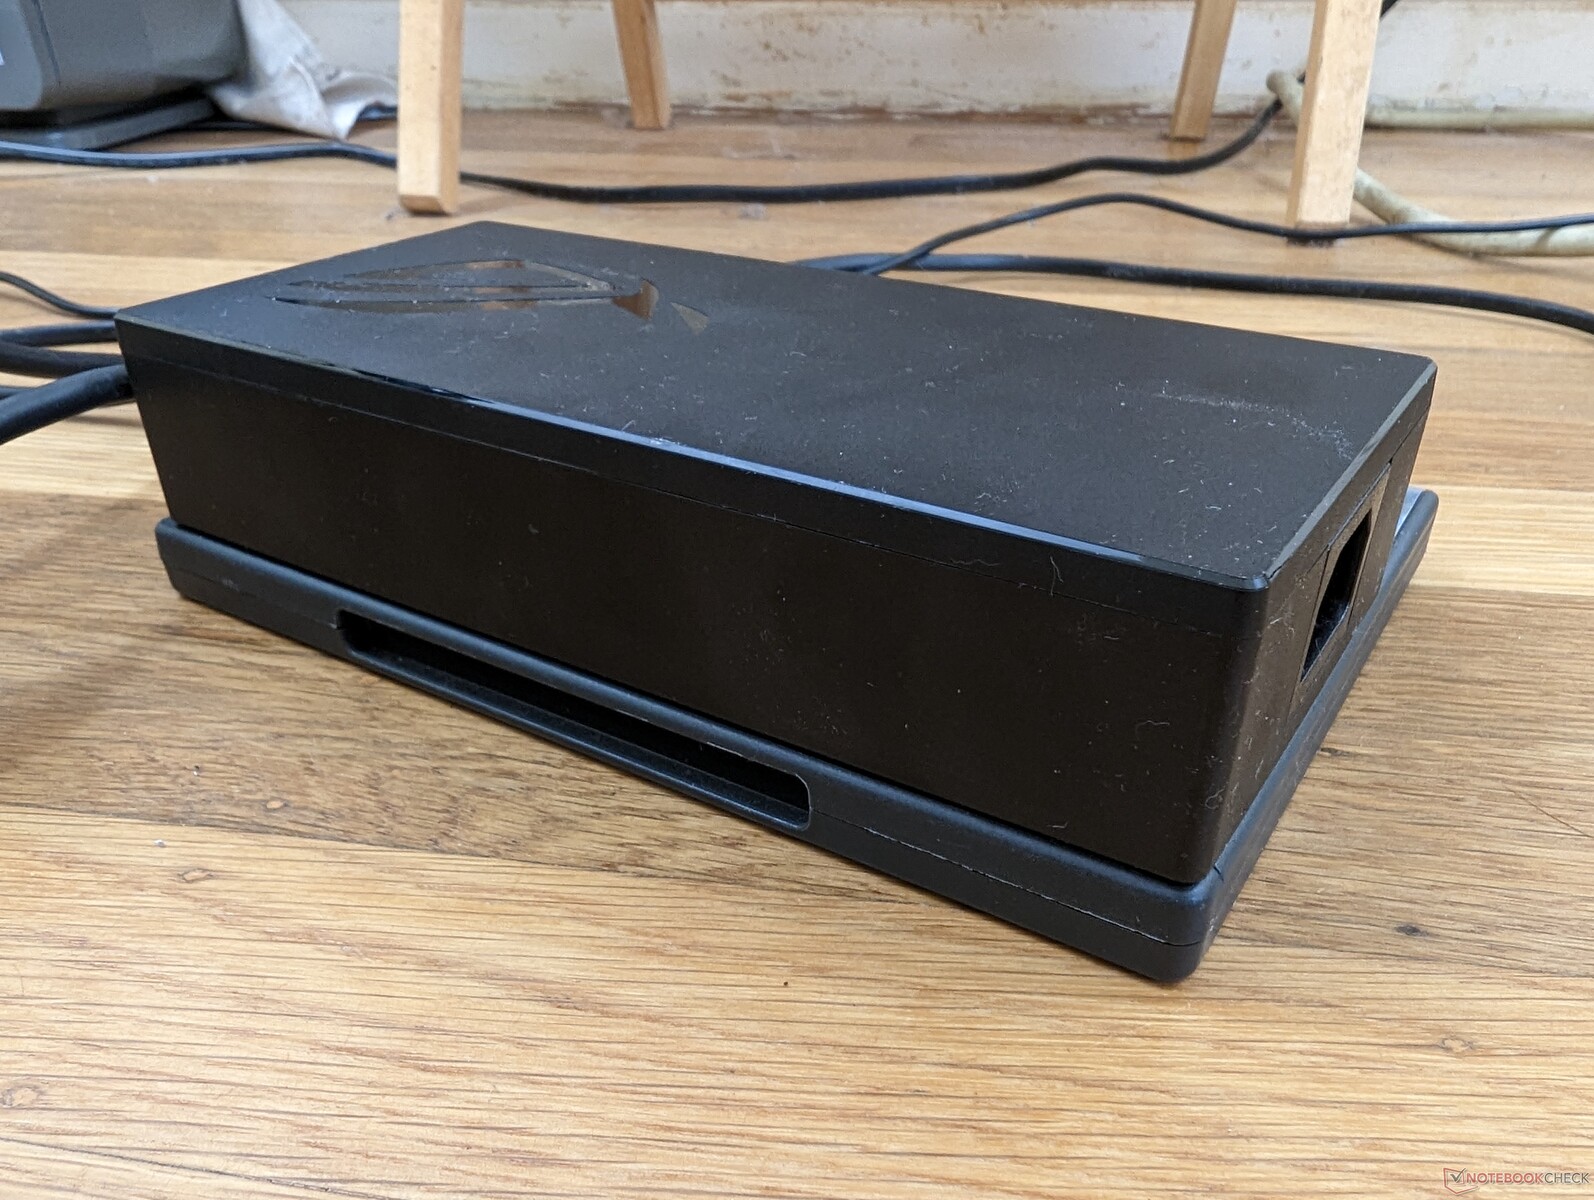
We're able to record a maximum draw of 280 W from the large (~18.4 x 8.4 x 3.6 cm) 330 W AC adapter.
| Off / Standby | |
| Idle | |
| Load |
|
Key:
min: | |
| Asus ROG Strix Scar 17 G733PY-XS96 R9 7945HX, GeForce RTX 4090 Laptop GPU, SK hynix PC801 HFS001TEJ9X101N, IPS, 2560x1440, 17.3" | MSI GE78HX 13VH-070US i9-13950HX, GeForce RTX 4080 Laptop GPU, Samsung PM9A1 MZVL22T0HBLB, IPS, 2560x1600, 17" | Eluktronics Mech-17 GP2 i9-13900HX, GeForce RTX 4090 Laptop GPU, Samsung PM9A1 MZVL21T0HCLR, IPS, 2560x1600, 17" | Asus ROG Strix G17 G713PI R9 7945HX, GeForce RTX 4070 Laptop GPU, WD PC SN560 SDDPNQE-1T00, IPS, 2560x1440, 17.3" | Aorus 17X XES i9-12900HX, GeForce RTX 3070 Ti Laptop GPU, Gigabyte AG470S1TB-SI B10, IPS, 1920x1080, 17.3" | Alienware m17 R5 (R9 6900HX, RX 6850M XT) R9 6900HX, Radeon RX 6850M XT, SSSTC CA6-8D1024, IPS, 3840x2160, 17" | |
|---|---|---|---|---|---|---|
| Power Consumption | -3% | -1% | 13% | -9% | 23% | |
| Idle Minimum * (Watt) | 14.5 | 16.1 -11% | 14 3% | 15 -3% | 18 -24% | 13 10% |
| Idle Average * (Watt) | 21.1 | 24 -14% | 19.3 9% | 20 5% | 28 -33% | 16.5 22% |
| Idle Maximum * (Watt) | 42.8 | 34 21% | 36.8 14% | 29 32% | 36 16% | 17 60% |
| Load Average * (Watt) | 116.7 | 123.6 -6% | 117.2 -0% | 121 -4% | 153 -31% | 93 20% |
| Witcher 3 ultra * (Watt) | 278 | 286 -3% | 304 -9% | 179.8 35% | 221 21% | 239 14% |
| Load Maximum * (Watt) | 279.6 | 285.7 -2% | 342.5 -22% | 246 12% | 290 -4% | 251 10% |
* ... smaller is better
Power Consumption Witcher 3 / Stresstest
Power Consumption external Monitor
Battery Life
WLAN runtime is about average at 4 hours when on the Balanced profile with Optimus and iGPU active. Other 17-inch gaming laptops like the ROG Strix G17 G713PI or Aorus 17X XES would return similar results.
The system can be recharged via third-party USB-C adapters. Some adapters may not work, however; our 135 W Lenovo USB-C charger would work without issues while our 130 W Dell XPS USB-C charger would not recharge at all.
| Asus ROG Strix Scar 17 G733PY-XS96 R9 7945HX, GeForce RTX 4090 Laptop GPU, 90 Wh | MSI GE78HX 13VH-070US i9-13950HX, GeForce RTX 4080 Laptop GPU, 99 Wh | Eluktronics Mech-17 GP2 i9-13900HX, GeForce RTX 4090 Laptop GPU, 99 Wh | Asus ROG Strix G17 G713PI R9 7945HX, GeForce RTX 4070 Laptop GPU, 90 Wh | Aorus 17X XES i9-12900HX, GeForce RTX 3070 Ti Laptop GPU, 99 Wh | Alienware m17 R5 (R9 6900HX, RX 6850M XT) R9 6900HX, Radeon RX 6850M XT, 97 Wh | |
|---|---|---|---|---|---|---|
| Battery runtime | 49% | 24% | 5% | 7% | 17% | |
| WiFi v1.3 (h) | 4.1 | 6.1 49% | 5.1 24% | 4.3 5% | 4.4 7% | 4.8 17% |
| Reader / Idle (h) | 7.3 | |||||
| Load (h) | 1.5 | 1 | 1.4 | 1.8 | ||
| H.264 (h) | 2.8 | 3.8 | 4.9 | |||
| Witcher 3 ultra (h) | 1.1 |
Pros
Cons
Verdict — Excellent Performance With An Aging Look
For 2022, AMD and Nvidia introduced the Zen 3+ and mobile GeForce 30 Ti series to supersede the 2021 Zen 3 and non Ti options, respectively. The upgrades proved to be relatively minor, however, as the newer options brought nothing new at the architectural level. For 2023, the Zen 4 and mobile GeForce RTX 40 series have finally brought the significant performance upgrades laptop gamers have been waiting for. Power consumption may be higher, but the increase in horsepower makes up for it especially since the Ryzen 9 7945HX is both slightly faster and more power efficient than the competing 13th gen Core i9-13950HX.
The 2023 ROG Strix Scar 17 shows the Ryzen 9 7945HX and GeForce RTX 4090 at their best. Some external design features, however, could use an update.
While the processors are impressive this year, the overall external design of the ROG Strix Scar 17 could use a bigger refresh. CPU temperature when gaming is higher than expected, for example, while the PCIe4 x4 SSD throttles after a few minutes of heavy use. The small numpad and arrow keys are still cramped and some secondary labels on the keyboard keys still do not light up when the backlight is active. Some competing models like the thinner MSI GE78 have also moved on to 16:10 whereas the Strix Scar 17 series continues to be 16:9. The model risks looking and feeling stale sooner even though its performance is anything but slow.
Price and Availability
Asus ROG Strix Scar 17 G733PY-XS96
- 04/10/2023 v7 (old)
Allen Ngo
Transparency
The selection of devices to be reviewed is made by our editorial team. The test sample was provided to the author as a loan by the manufacturer or retailer for the purpose of this review. The lender had no influence on this review, nor did the manufacturer receive a copy of this review before publication. There was no obligation to publish this review. As an independent media company, Notebookcheck is not subjected to the authority of manufacturers, retailers or publishers.
This is how Notebookcheck is testing
Every year, Notebookcheck independently reviews hundreds of laptops and smartphones using standardized procedures to ensure that all results are comparable. We have continuously developed our test methods for around 20 years and set industry standards in the process. In our test labs, high-quality measuring equipment is utilized by experienced technicians and editors. These tests involve a multi-stage validation process. Our complex rating system is based on hundreds of well-founded measurements and benchmarks, which maintains objectivity. Further information on our test methods can be found here.
Price comparison
