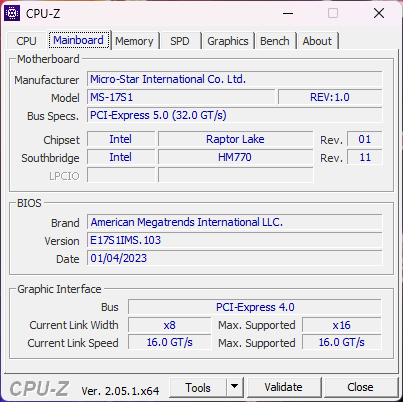
MSI Raider GE78 HX 13VH laptop review: 13th gen Core i9-13950HX and GeForce RTX 4080 upgrades
Unveiled at CES 2023, the 16:10 17.0-inch Raider GE78 succeeds the 16:9 17.3-inch 2022 Raider GE77 with upgraded internals and a brand new chassis design. It ships with some of the most powerful Raptor Lake-H Intel CPUs and mobile GeForce 40 GPUs currently available on any laptop model. The MSI GE series sits just below the even more expensive and larger GT77 Titan series in terms of classification.
SKUs range from the 13th gen Core i9-13950HX CPU, 140 W GeForce RTX 4070 GPU, and 1920 x 1200 165 Hz IPS display up to the Core i9-13980HX, 175 W RTX 4090, and 2560 x 1600 240 Hz IPS display for about $4200 USD. Our specific review unit is an upper midrange configuration with the Core i9-13950HX, 175 W RTX 4080, and 1600p display for about $3700 USD.
Competitors to the GE78 include other high-end 17-inch gaming laptops like the Razer Blade 17, Asus ROG Strix Scar 17, Alienware m17 R5, or the Eluktronics Mech-17 GP2. A 16.0-inch version is also available called the Raider GE68.
More MSI reviews:
Potential Competitors in Comparison
Rating | Date | Model | Weight | Height | Size | Resolution | Price |
|---|---|---|---|---|---|---|---|
| 88.3 % v7 (old) | 03 / 2023 | MSI GE78HX 13VH-070US i9-13950HX, GeForce RTX 4080 Laptop GPU | 3 kg | 23 mm | 17.00" | 2560x1600 | |
| 89.9 % v7 (old) | 03 / 2023 | Eluktronics Mech-17 GP2 i9-13900HX, GeForce RTX 4090 Laptop GPU | 2.9 kg | 27 mm | 17.00" | 2560x1600 | |
| 88.4 % v7 (old) | 04 / 2023 | Asus ROG Strix G17 G713PI R9 7945HX, GeForce RTX 4070 Laptop GPU | 2.8 kg | 30.7 mm | 17.30" | 2560x1440 | |
| 89 % v7 (old) | 02 / 2023 | MSI Titan GT77 HX 13VI i9-13950HX, GeForce RTX 4090 Laptop GPU | 3.5 kg | 23 mm | 17.30" | 3840x2160 | |
| 86.8 % v7 (old) | 07 / 2022 | MSI Raider GE77 HX 12UHS i9-12900HX, GeForce RTX 3080 Ti Laptop GPU | 3.1 kg | 25.9 mm | 17.30" | 3840x2160 | |
| 89.9 % v7 (old) | 07 / 2022 | Razer Blade 17 Early 2022 i9-12900H, GeForce RTX 3080 Ti Laptop GPU | 2.8 kg | 19.9 mm | 17.30" | 3840x2160 |
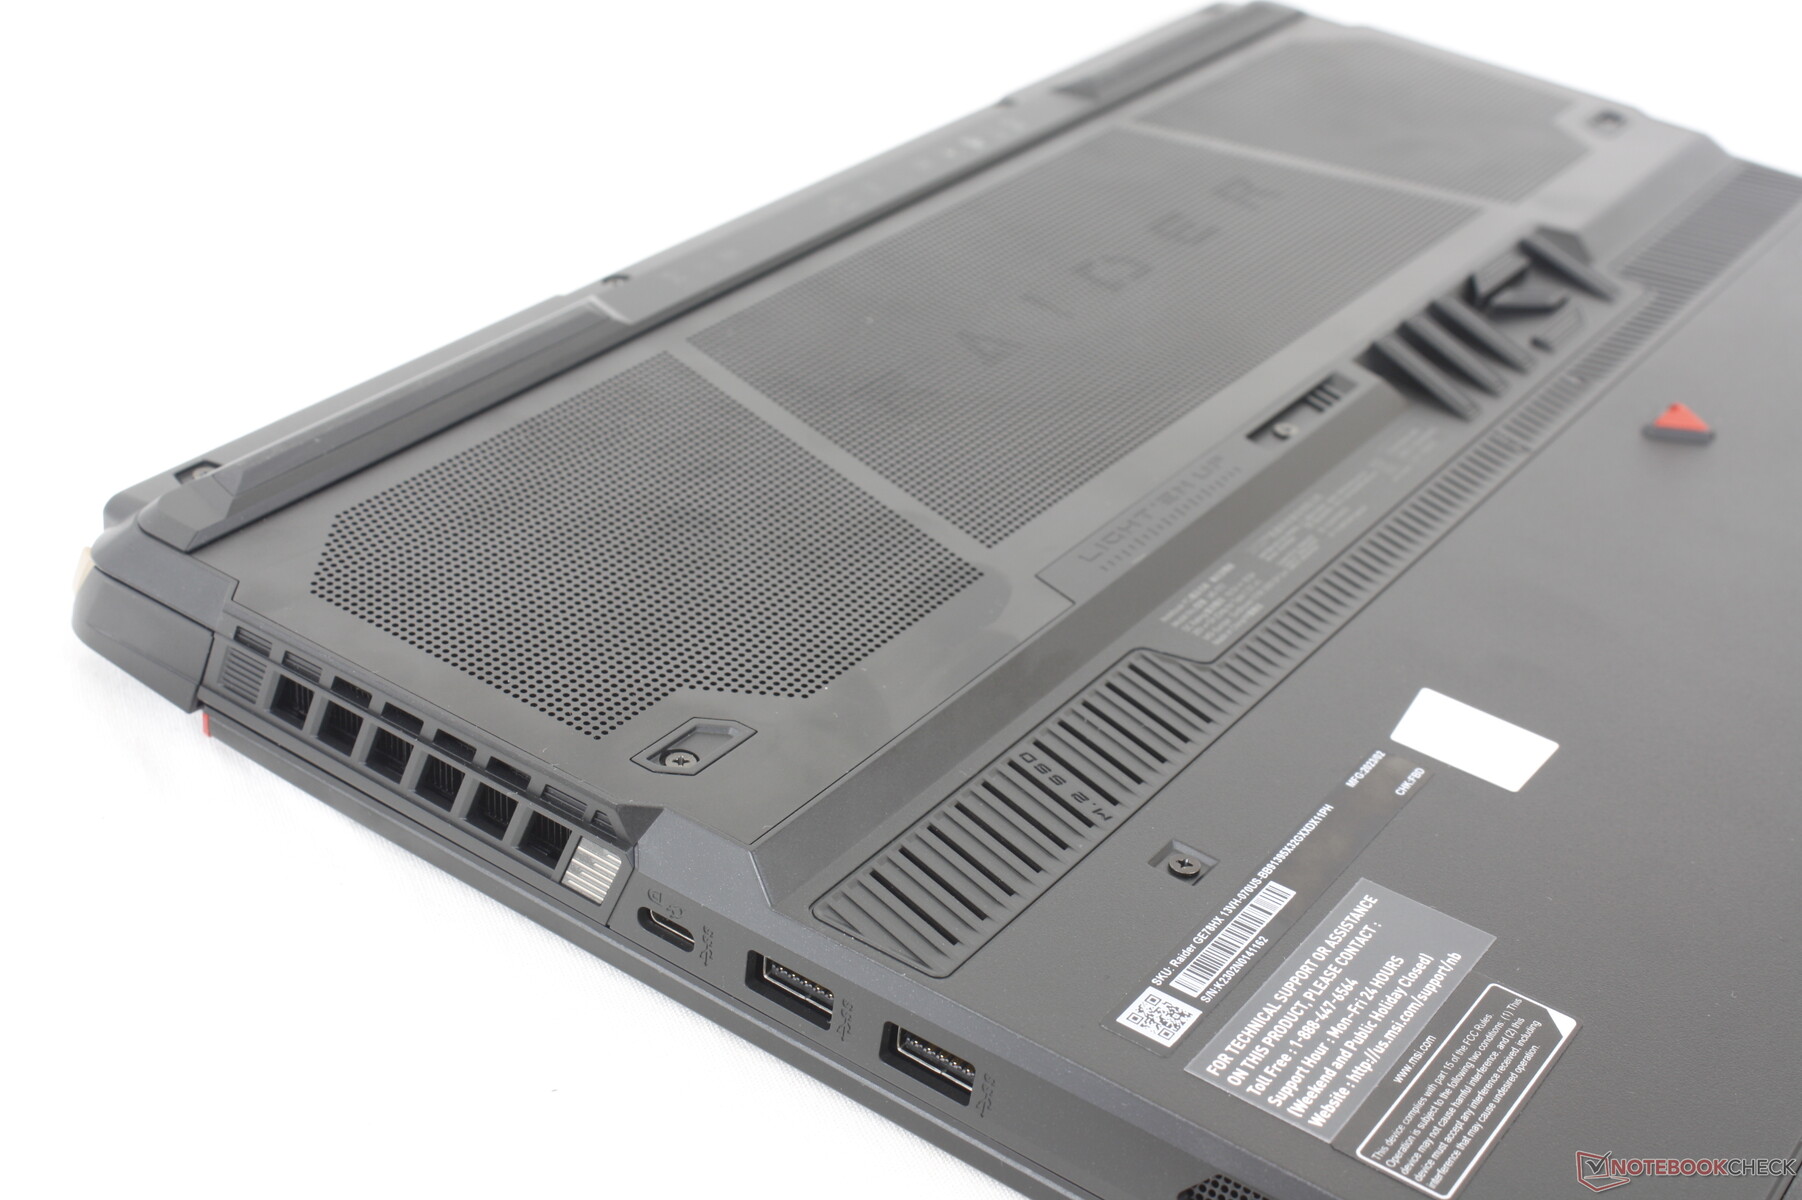
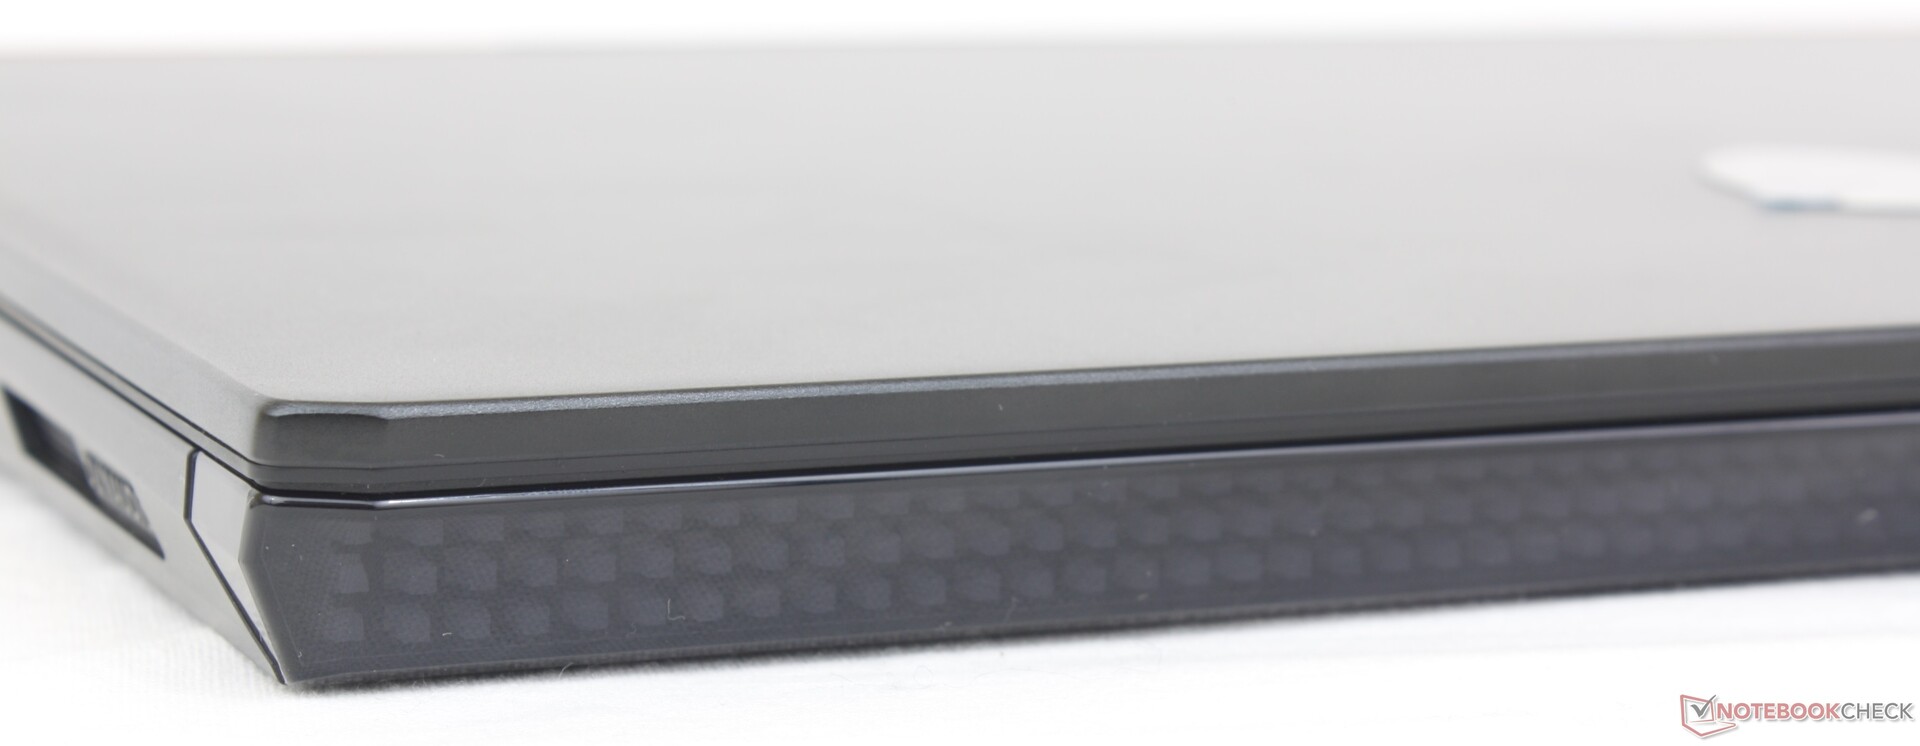
Case — Retro-Futuristic
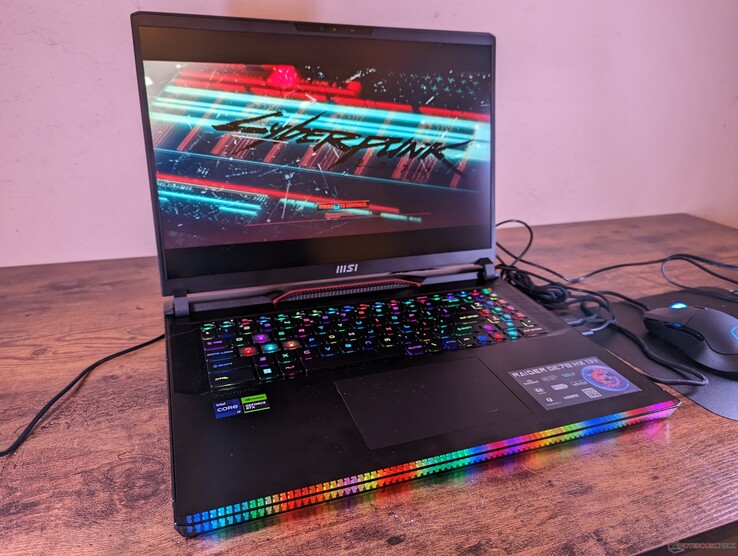
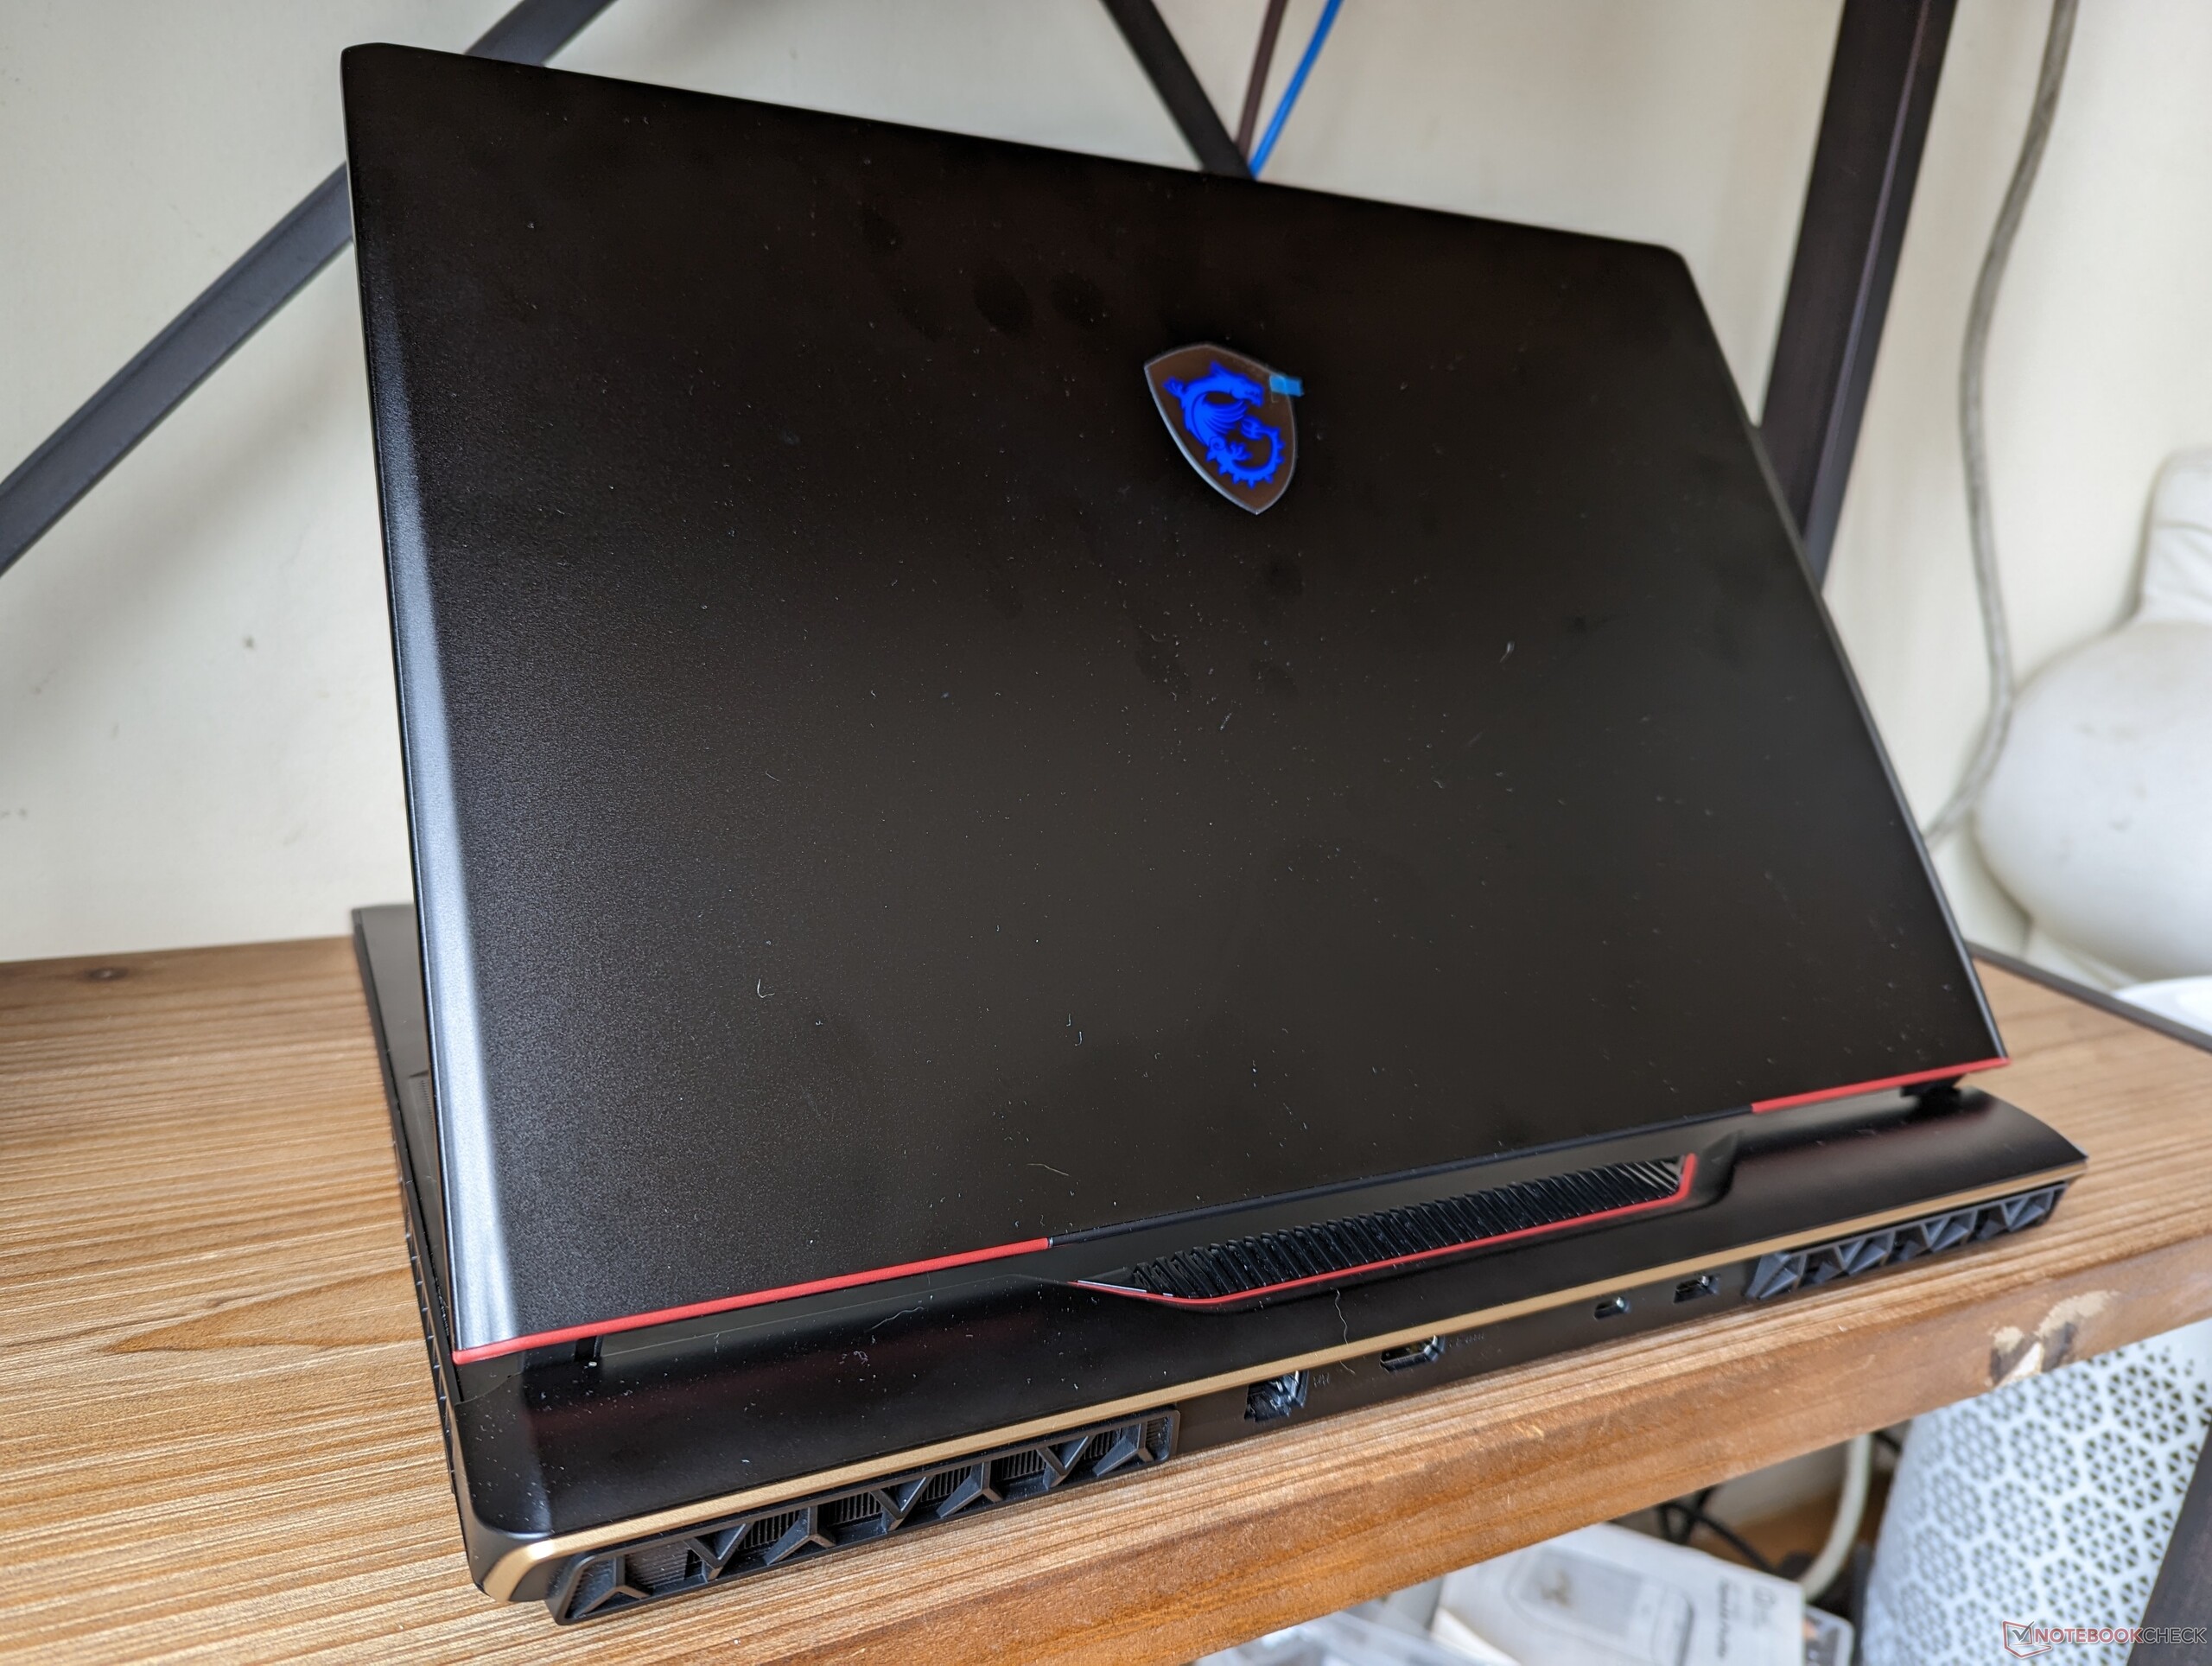
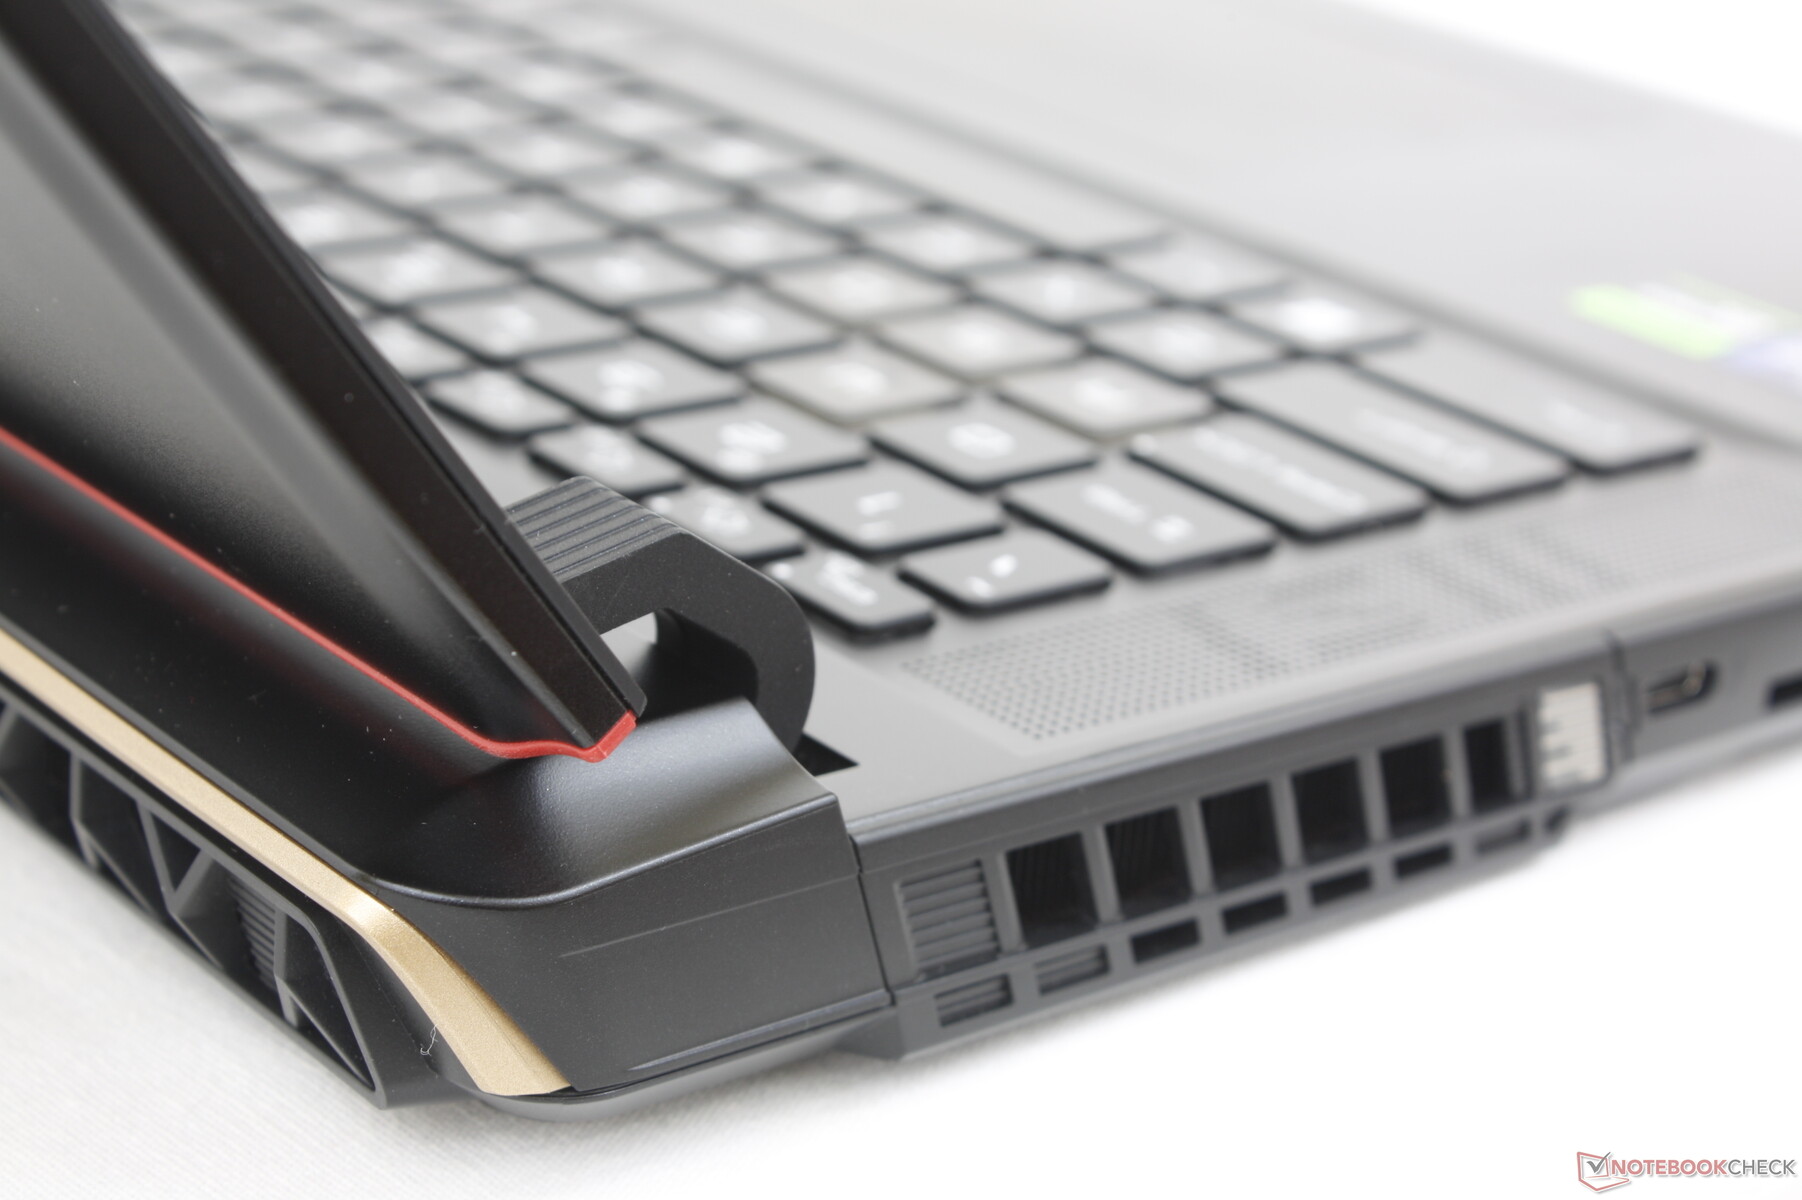
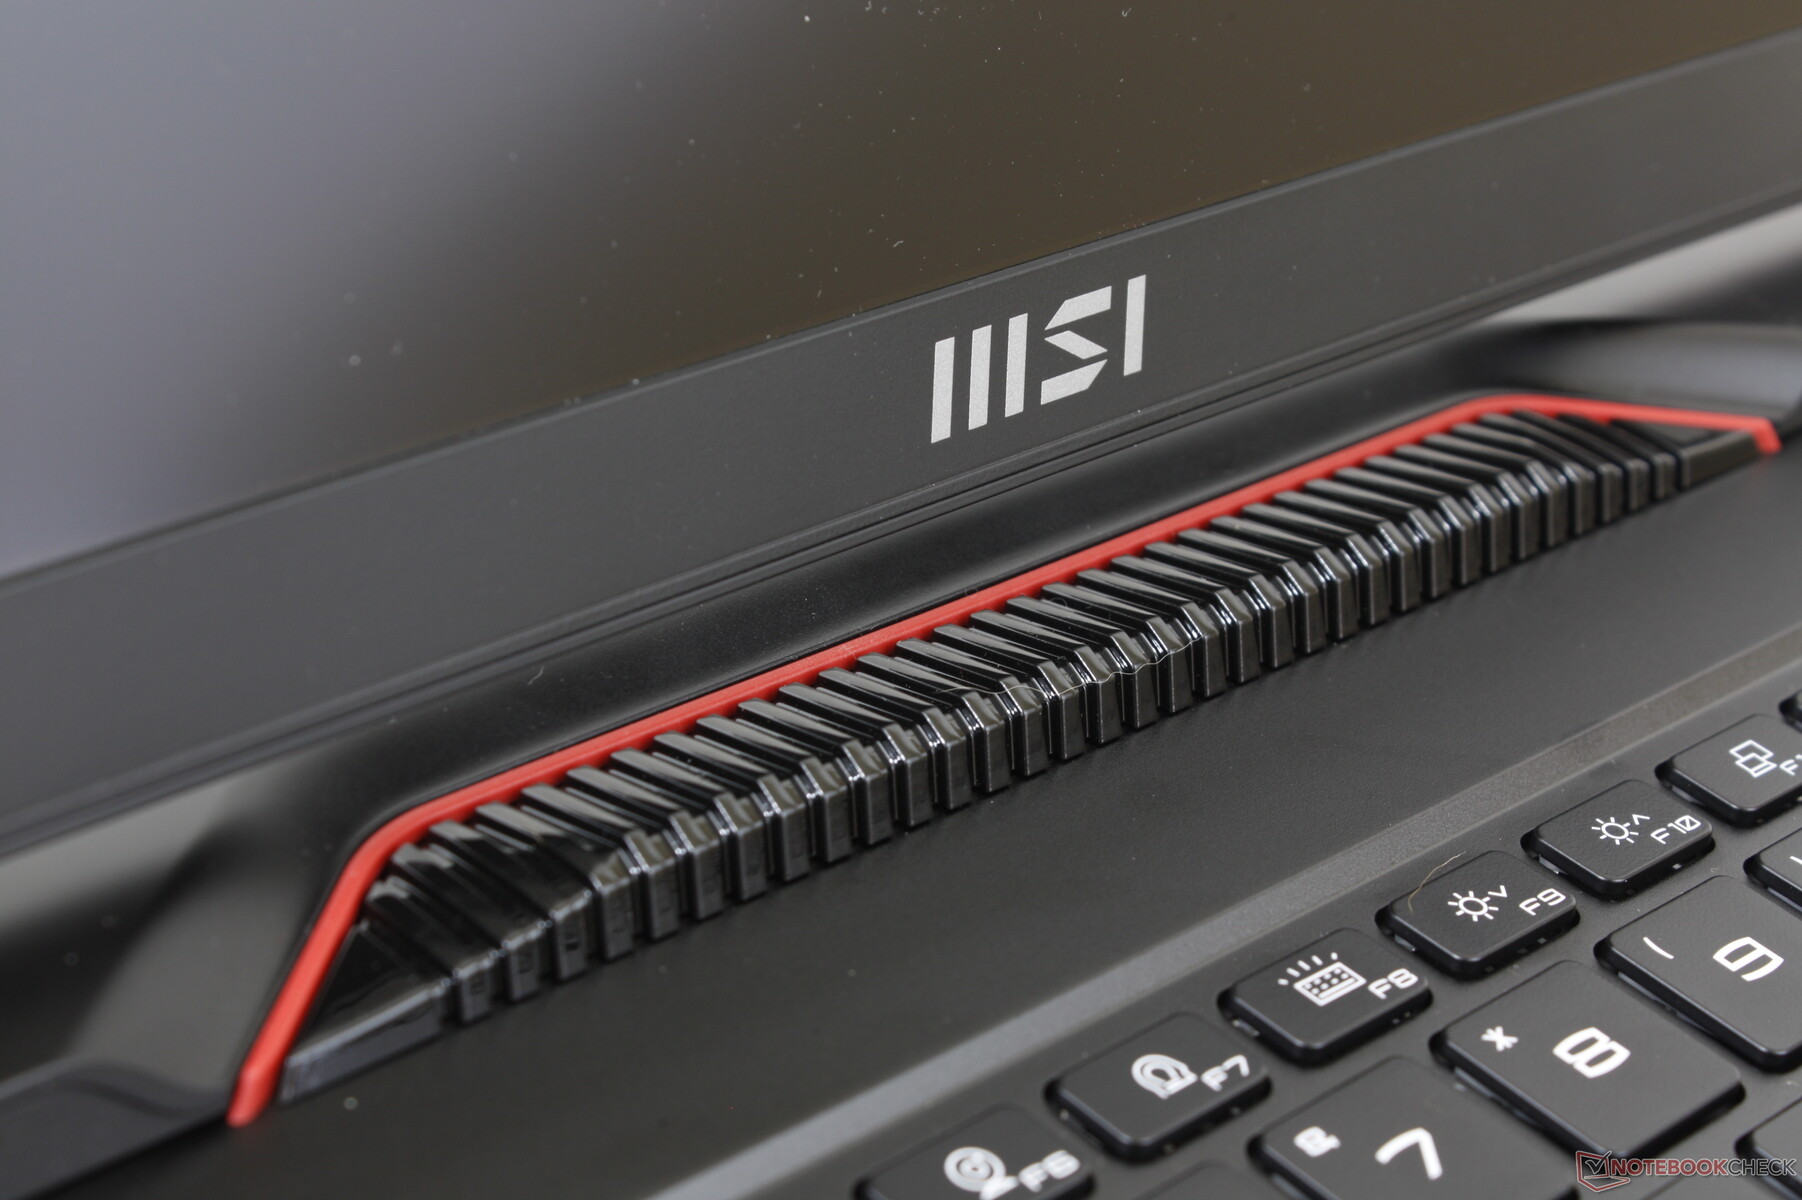
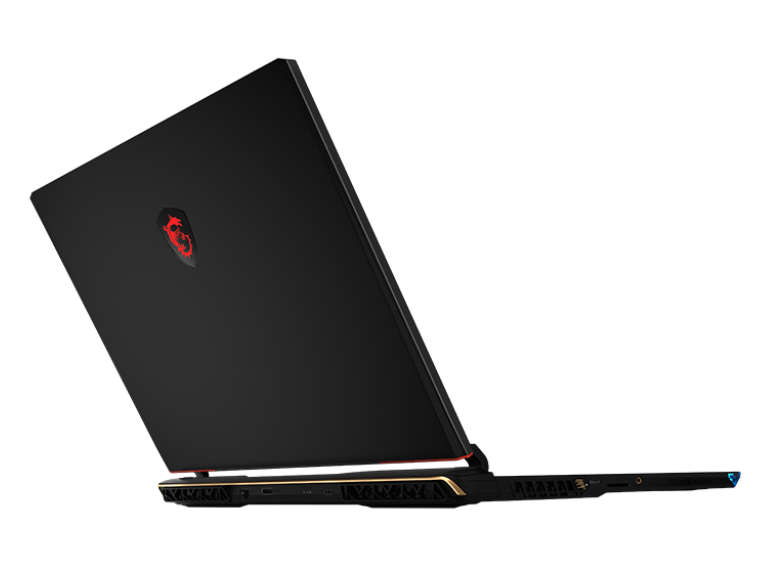
According to MSI, the last GE model design prioritized minimalism with smooth flat surfaces. In an attempt to bring some style back to the series, the design of the GE78 was inspired by 8-bit games and 80s aesthetics. Thus, the latest model incorporates more curves along its rear and a reimagined light bar along the front edge consisting of individual LED RGB "pixels". The pixelated lights are similar in style to the Hyundai Ioniq 6 which itself was also inspired by retro aesthetics. The end result is a unique look that helps to visually distinguish the GE78 from the sea of other gaming laptops in the market. Whether or not the new GE78 looks better than the old GE77, however, is all a matter of taste.
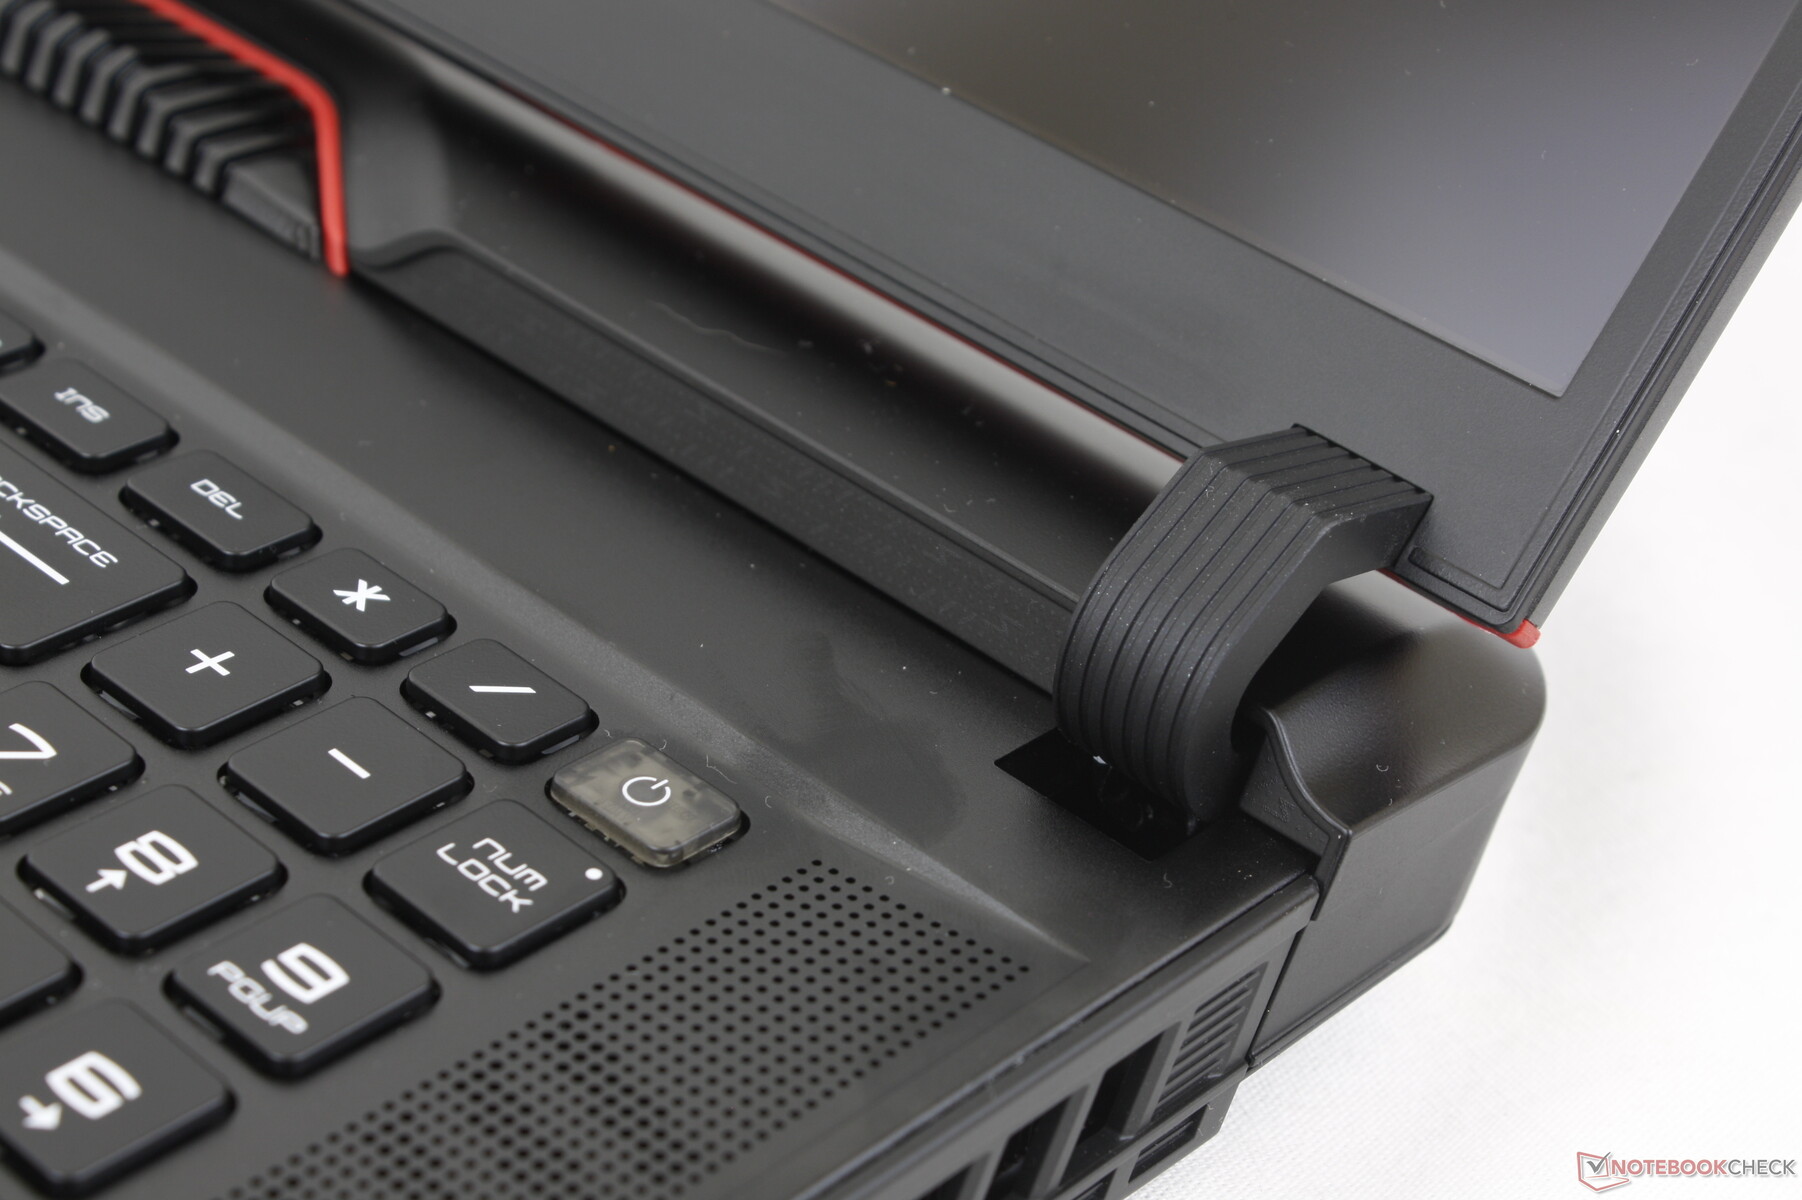
Build quality doesn't take a backseat from all the aesthetic changes. The new hinges, for example, are now larger and firmer than the hinges on the GE77 and so they are likely to last longer. In fact, they look a lot like the hinges on the Asus Strix Scar series. Chassis rigidity is otherwise similar to the GE77 with minimal creaking and just a bit of warping when applying pressure on the outer lid.
There is a higher chance of gaps between materials since the GE78 skeleton consists of more individual parts than a typical unibody design like the Razer Blade. This is especially true of the rear and edges where we can notice a slightly wider gap on one side than the other on our test unit. It's not of any concern, but it's worth checking for nonetheless.
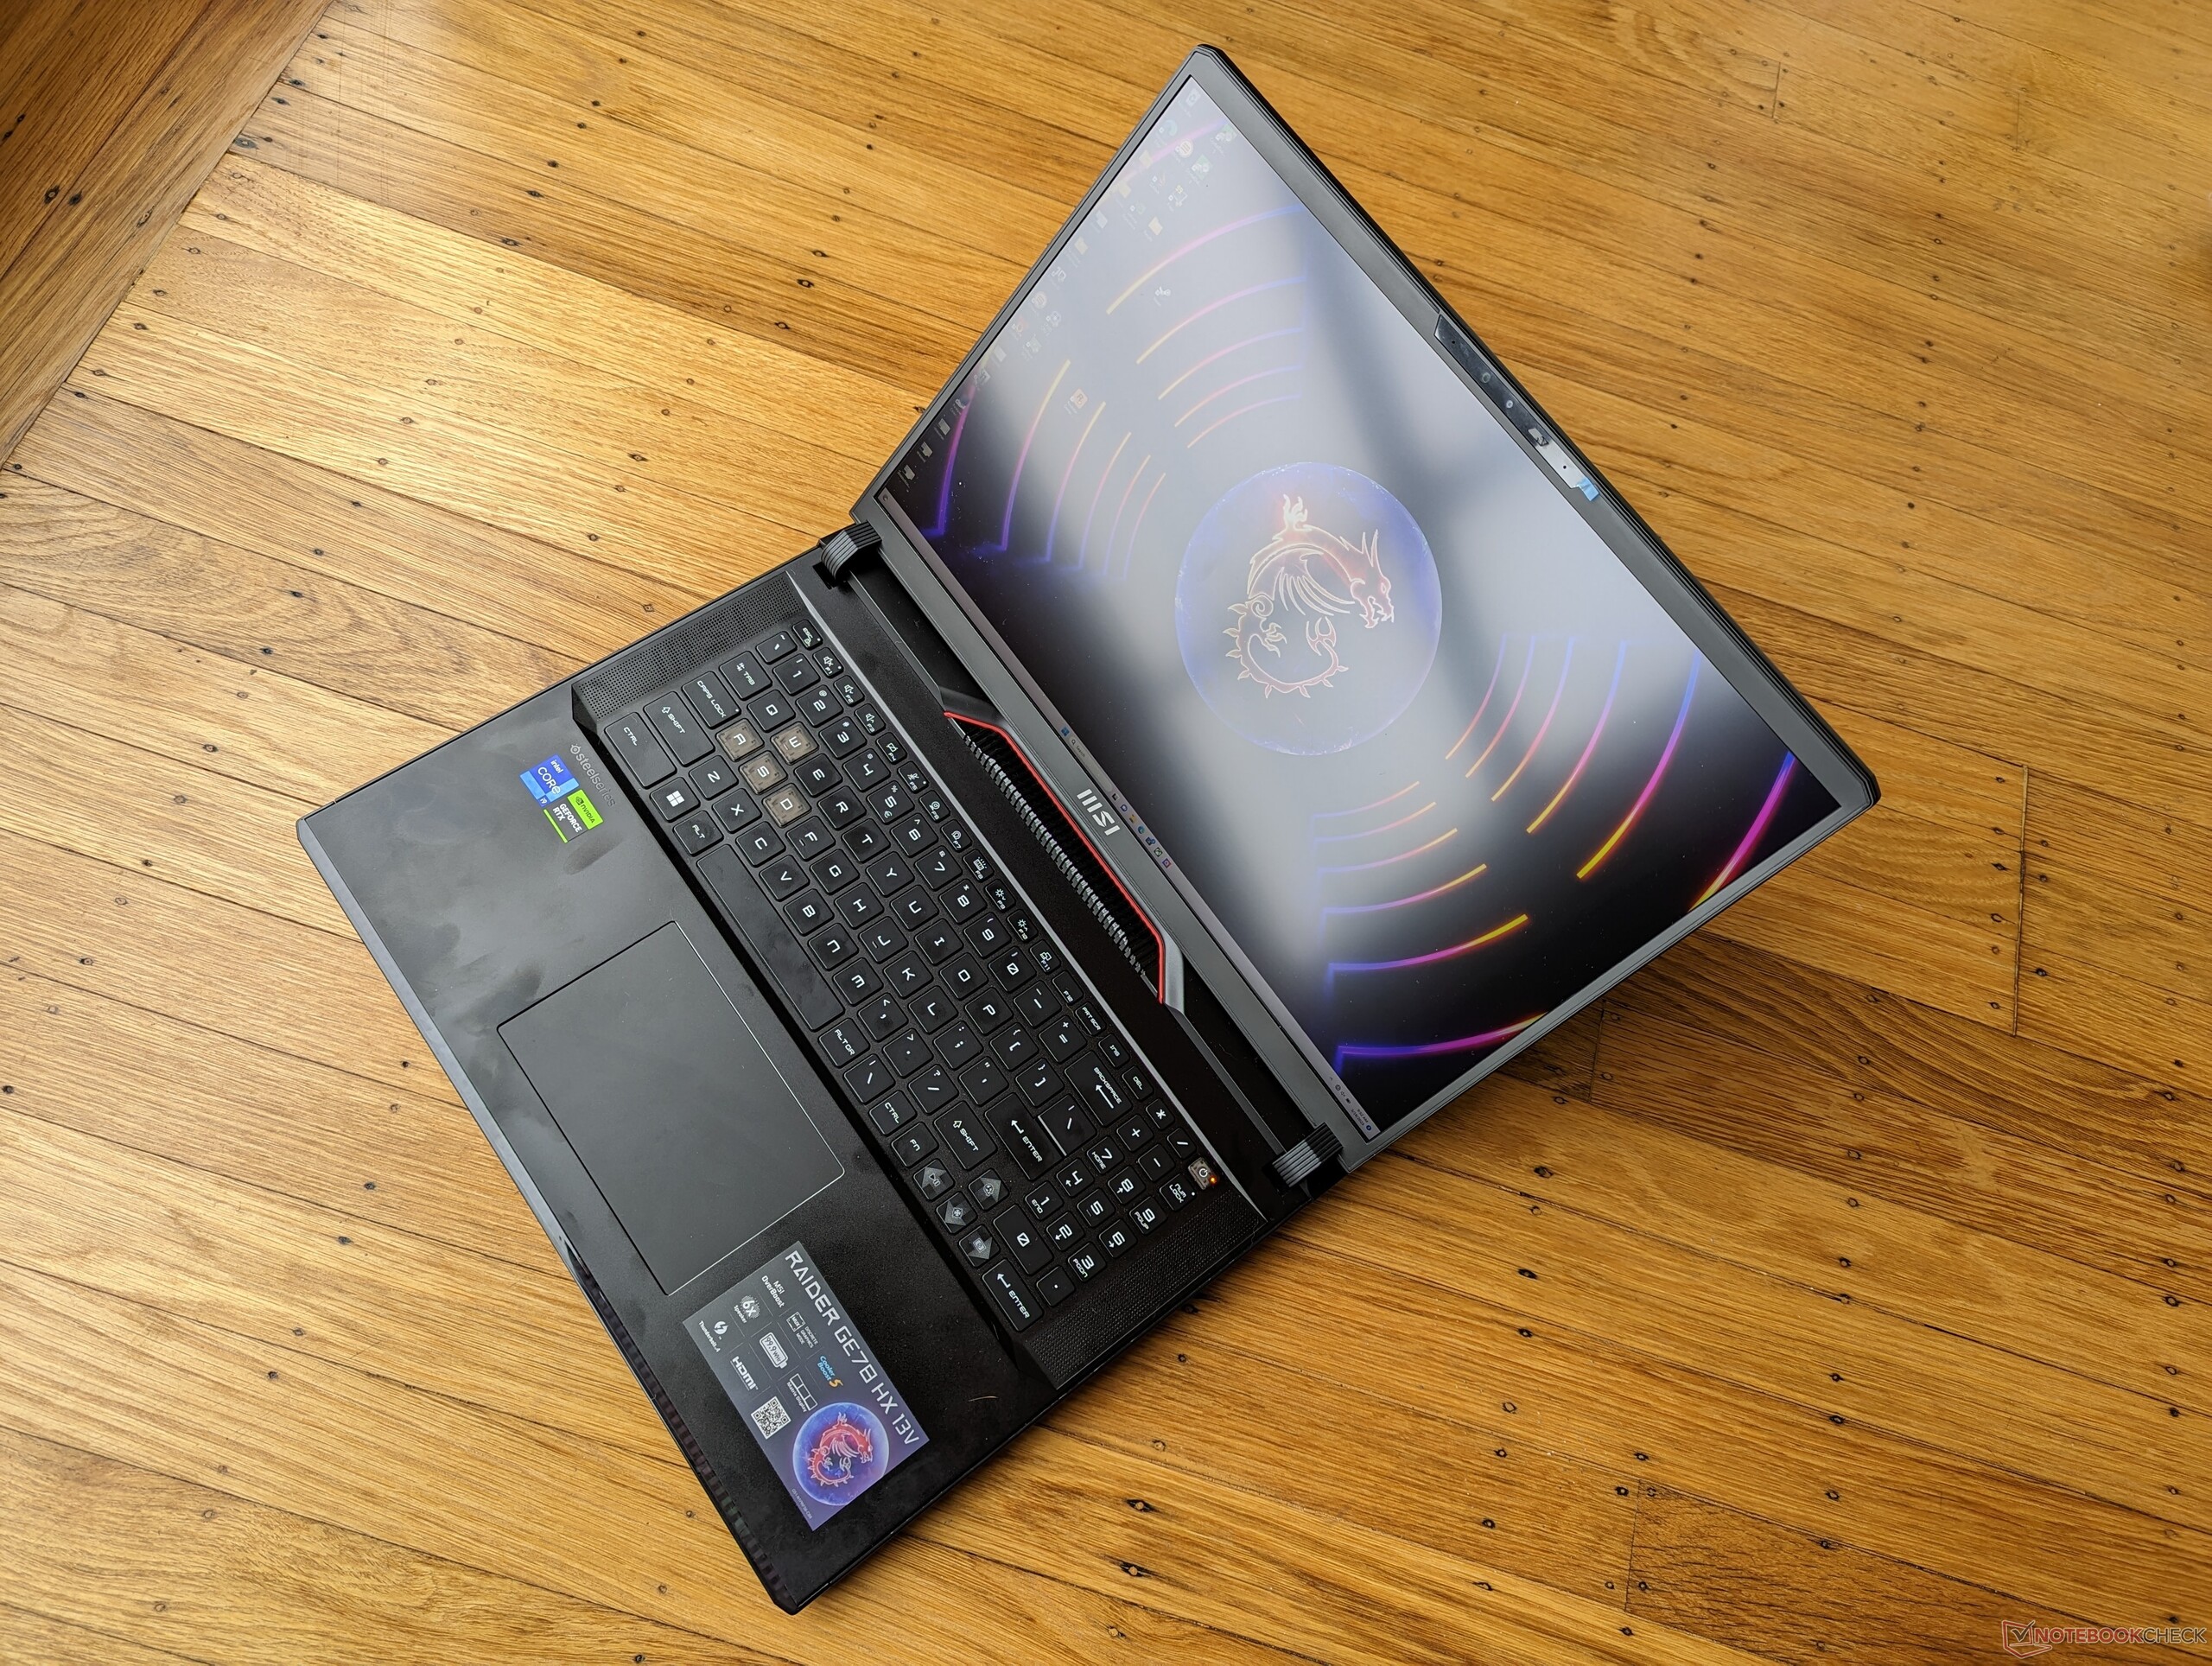
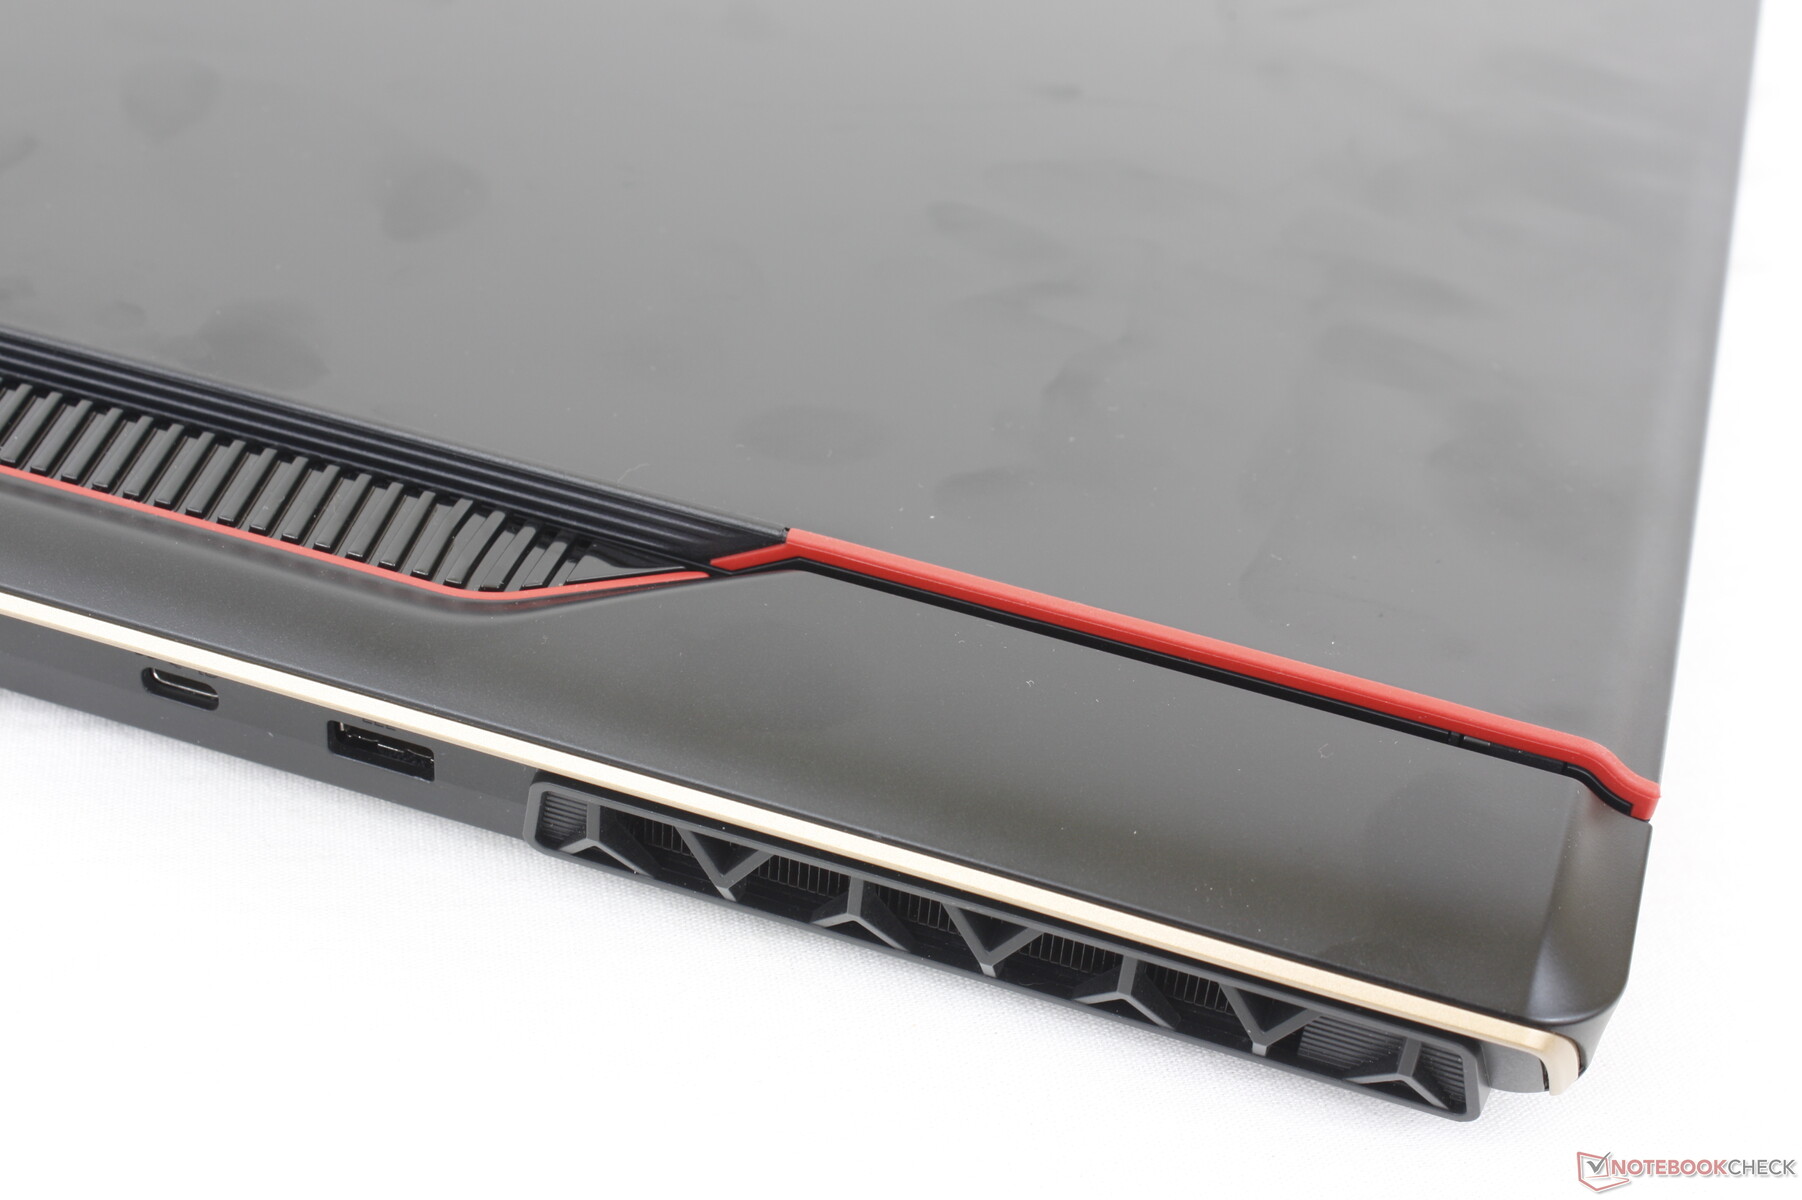
Because of the change in aspect ratio from 16:9 to 16:10, the GE78 is shorter in length but wider in width for a squarer footprint than its predecessor. It's still thinner by a couple of millimeters, however, so don't assume that the GE78 is thicker just because of its retro-inspired aesthetics. Overall weight is about 200 grams heavier than the Razer Blade 17.
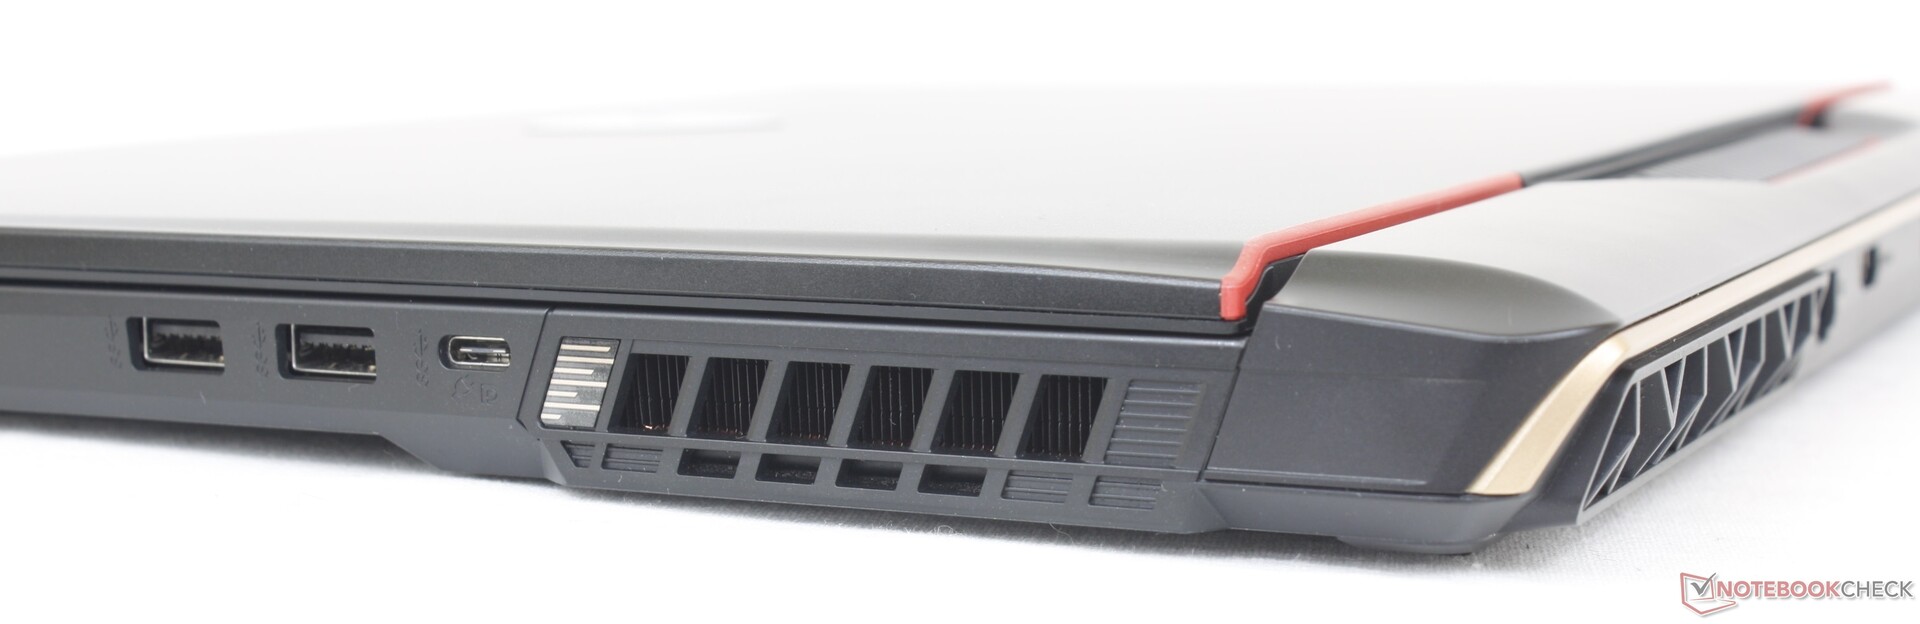
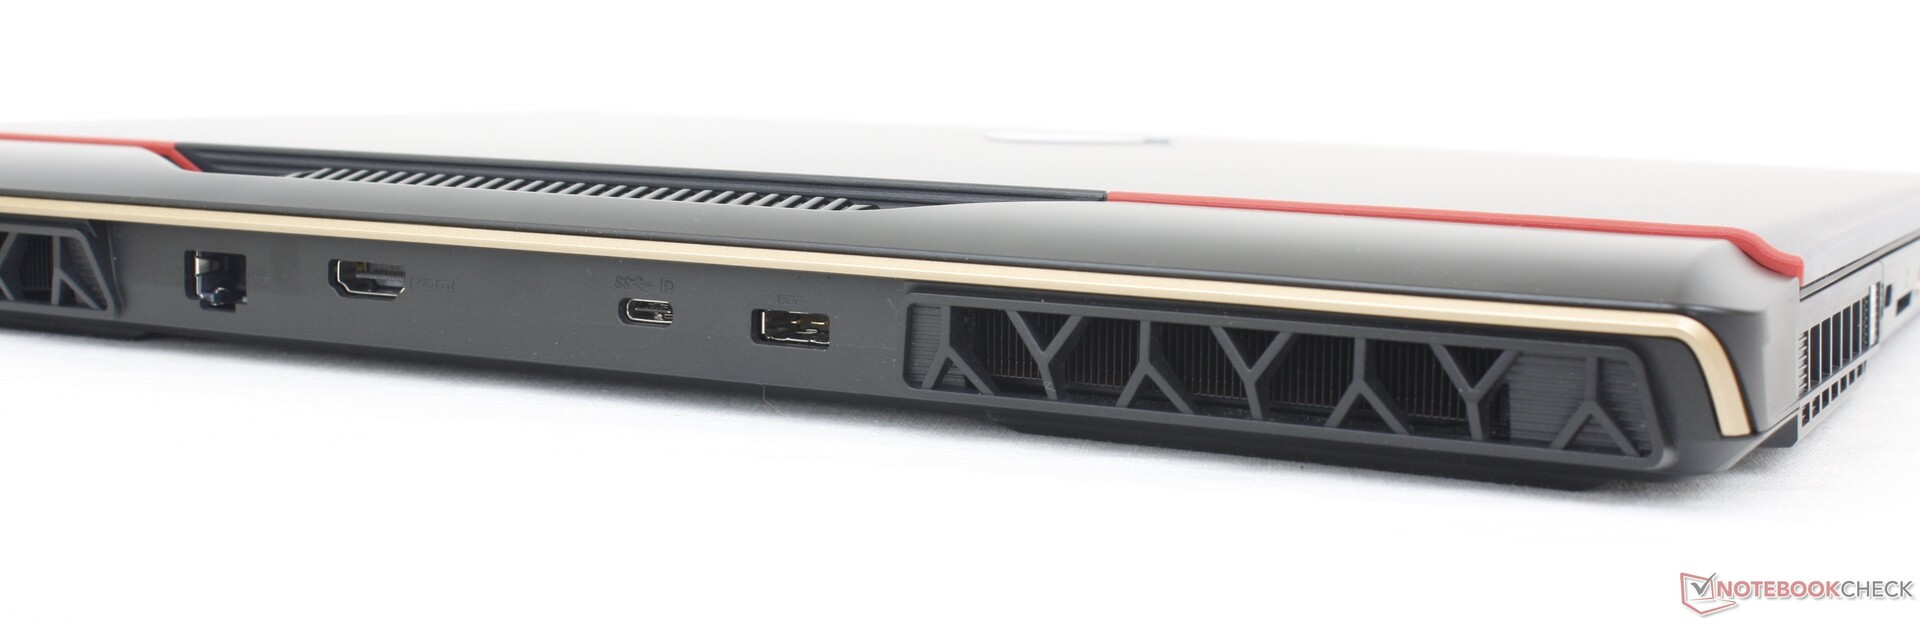
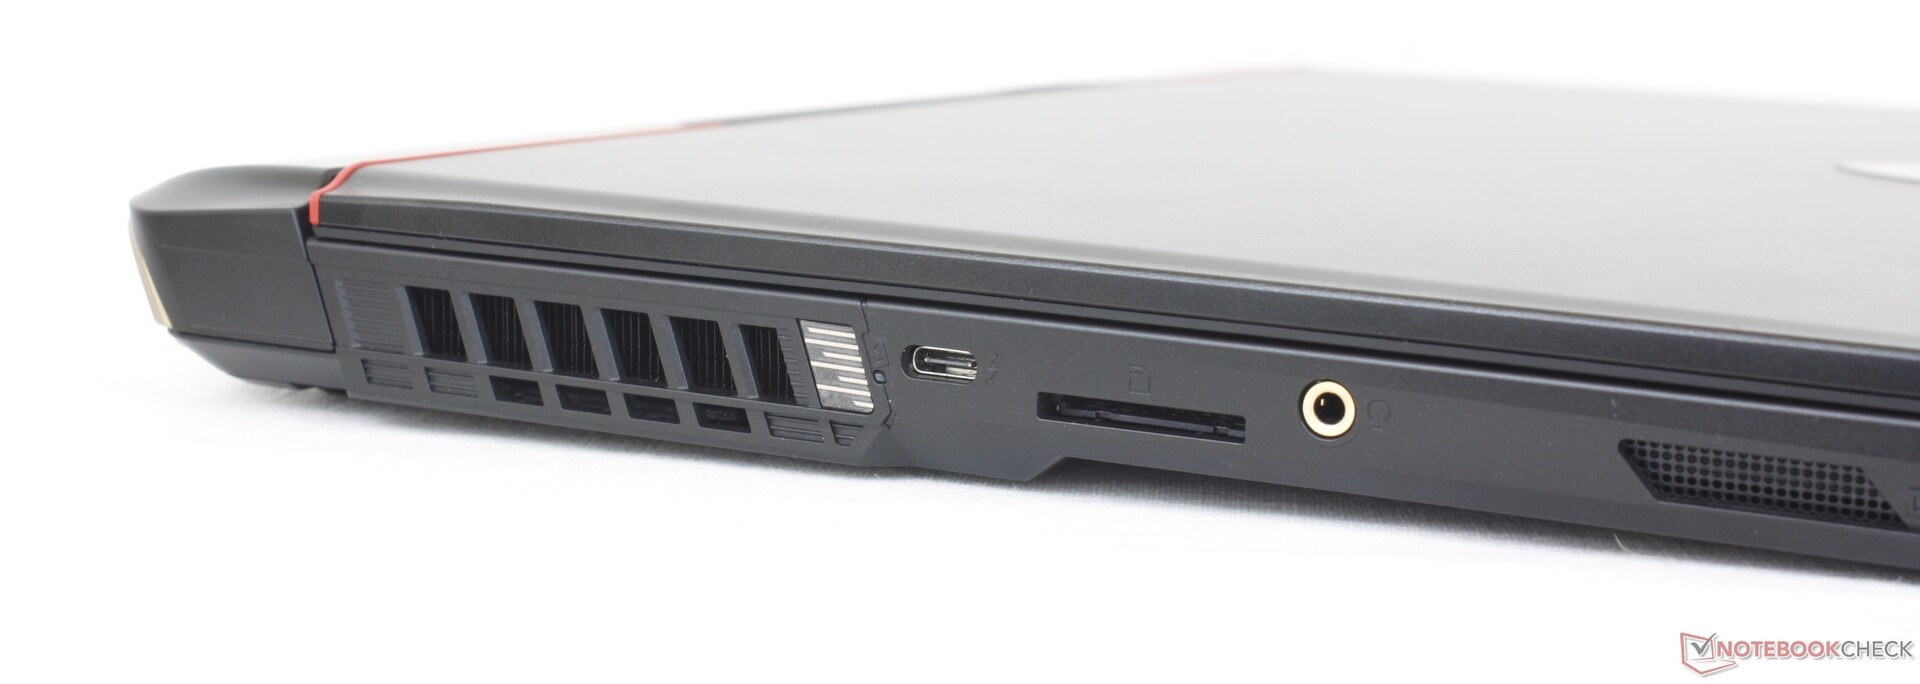
Connectivity — USB-C In Every Direction
Port options and positioning have changed from the GE77. Most notably, the GE78 swaps out one USB-A port for a third USB-C port and so there is now one USB-C port on each side of the chassis.
Unfortunately, the three USB-C ports are not all created equal. Firstly, Thunderbolt devices are only supported via the left USB-C port. And secondly, their DisplayPort functionalities are tied to the MUX setting. When the dGPU is active, for example, our DP external monitor would only work on the USB-C port along the right edge while it would not work on the left or rear USB-C ports. If the iGPU or hybrid GPU mode is active, our DP external monitor would only work on the left edge USB-C port while it would not work on the rear or right edge USB-C ports. We're unable to get DP working at all on the rear USB-C port.
Thirdly, MSI advertises Power Delivery but we are unable to get this working as well. Our unit would not recharge via USB-C no matter which port or how many USB-C adapters we tested.
SD Card Reader
Transfer rates form the integrated SD reader are disappointing considering the high price of the GE78. Moving 1 GB of pictures from our UHS-II test card to desktop takes about 16 seconds compared to half that on the Razer Blade 17.
| SD Card Reader | |
| average JPG Copy Test (av. of 3 runs) | |
| Razer Blade 17 Early 2022 (AV PRO microSD 128 GB V60) | |
| MSI Titan GT77 HX 13VI (Angelibird AV Pro V60) | |
| Eluktronics Mech-17 GP2 (Angelibird AV Pro V60) | |
| MSI GE78HX 13VH-070US (Angelibird AV Pro V60) | |
| MSI Raider GE77 HX 12UHS (AV PRO microSD 128 GB V60) | |
| maximum AS SSD Seq Read Test (1GB) | |
| Eluktronics Mech-17 GP2 (Angelibird AV Pro V60) | |
| MSI GE78HX 13VH-070US (Angelibird AV Pro V60) | |
| MSI Titan GT77 HX 13VI (Angelibird AV Pro V60) | |
Communication
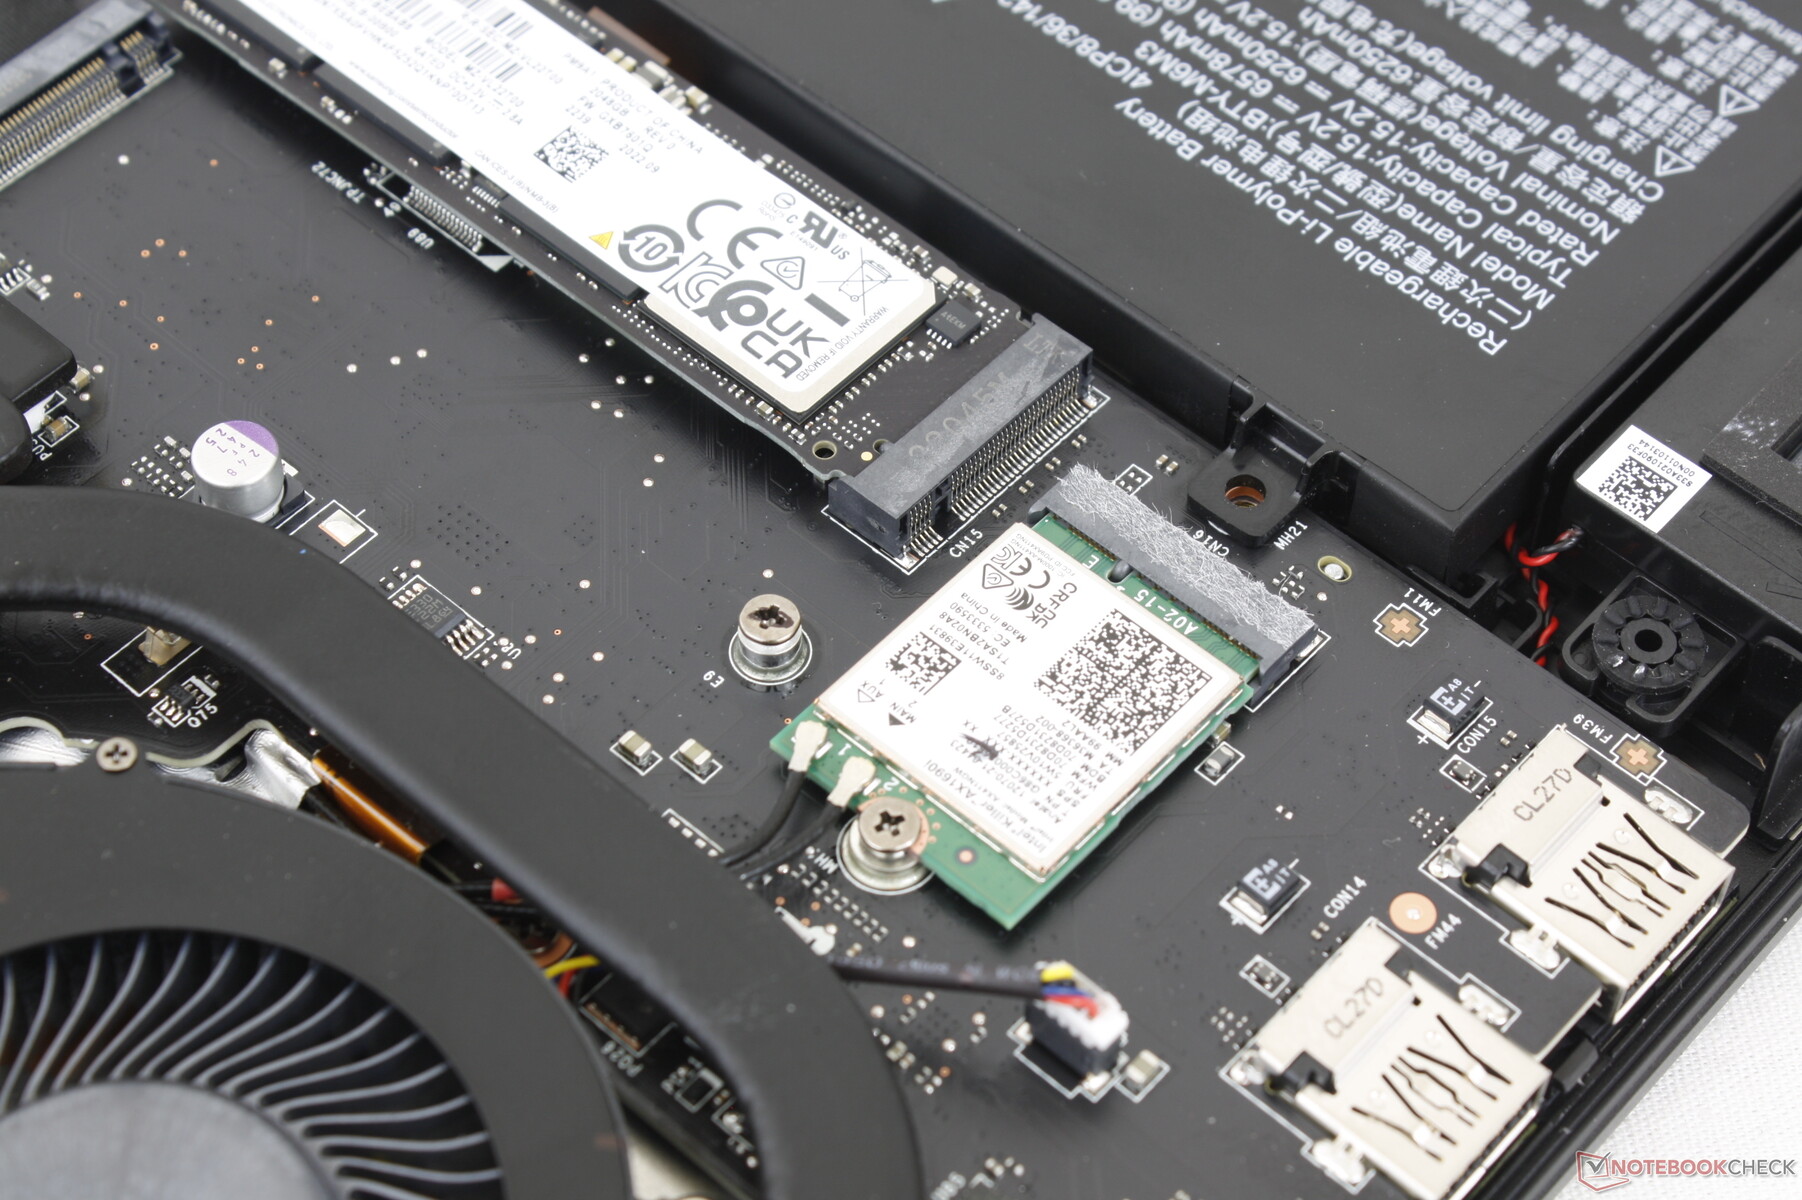
A Killer AX1690i comes standard for Wi-Fi 6E and Bluetooth 5.3 connectivity. The Killer module is essentially a rebranded Intel AX210/211 optimized for gaming laptops. We experienced no issues when paired to our Asus AXE11000 6 GHz test router.
| Networking | |
| iperf3 transmit AXE11000 | |
| Asus ROG Strix G17 G713PI | |
| MSI Titan GT77 HX 13VI | |
| Eluktronics Mech-17 GP2 | |
| MSI GE78HX 13VH-070US | |
| iperf3 receive AXE11000 | |
| Asus ROG Strix G17 G713PI | |
| Razer Blade 17 Early 2022 | |
| MSI Titan GT77 HX 13VI | |
| Eluktronics Mech-17 GP2 | |
| MSI GE78HX 13VH-070US | |
| iperf3 transmit AXE11000 6GHz | |
| MSI GE78HX 13VH-070US | |
| iperf3 receive AXE11000 6GHz | |
| MSI Raider GE77 HX 12UHS | |
| MSI GE78HX 13VH-070US | |
Webcam
The integrated 2 MP webcam on the GE78 remains a standard on most gaming laptops. A few other makers like Razer have upped the ante to 5 MP for a sharper picture.
IR and a physical webcam shutter come standard for Hello support and added privacy, respectively.


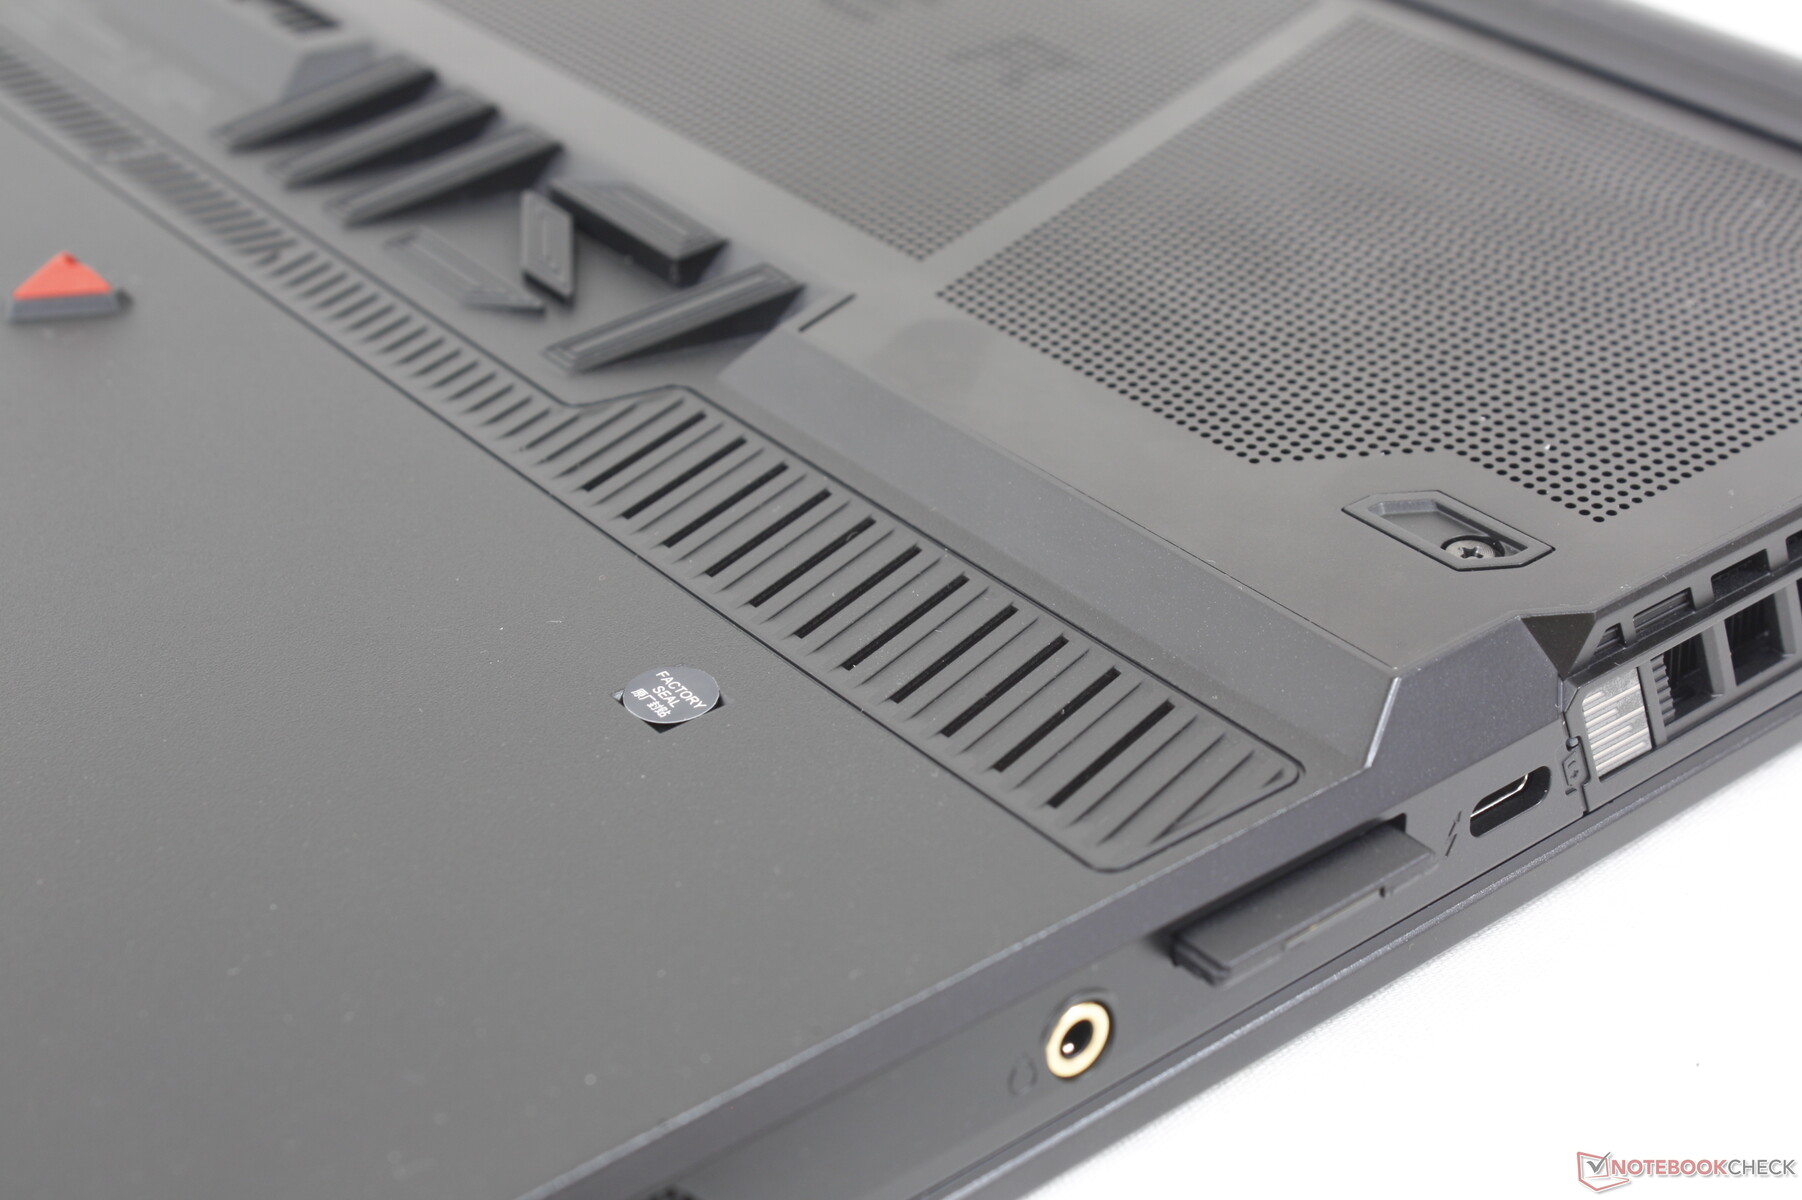
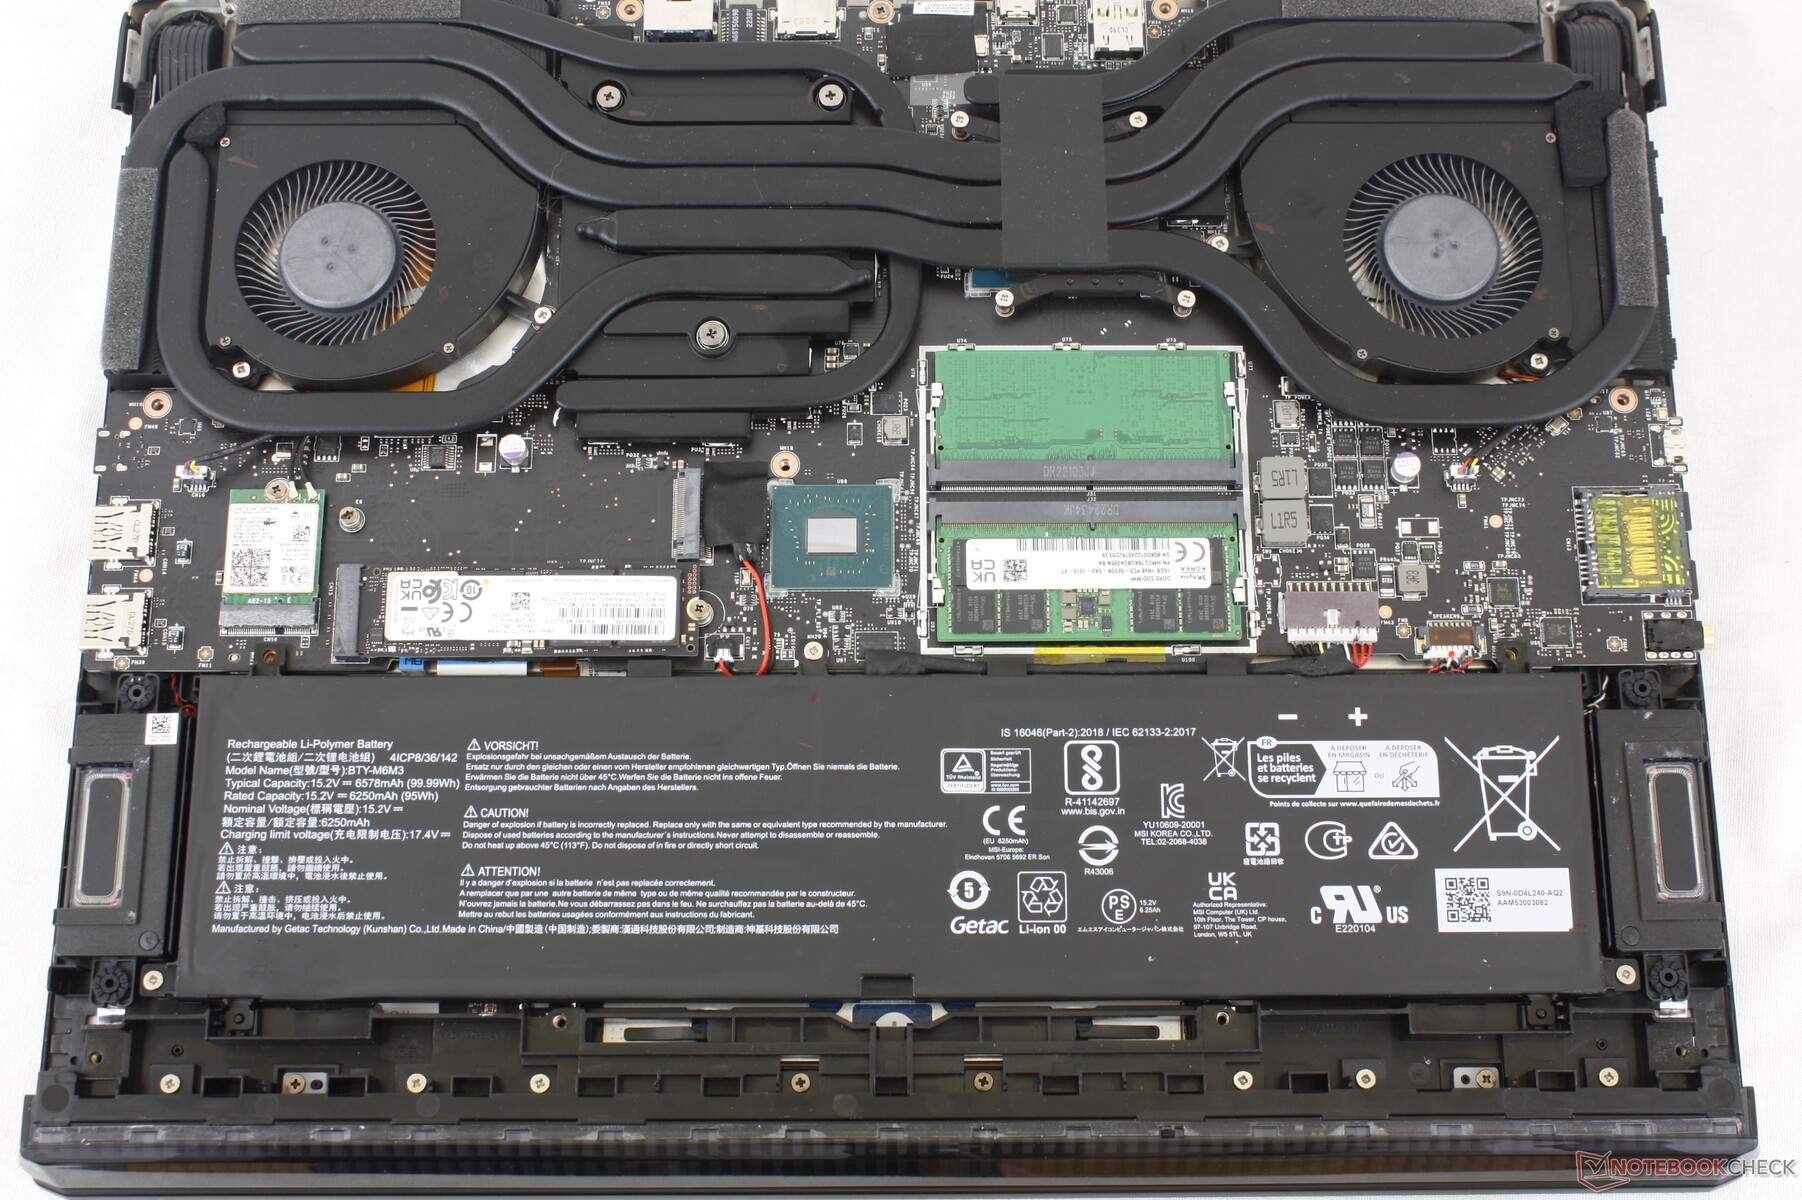
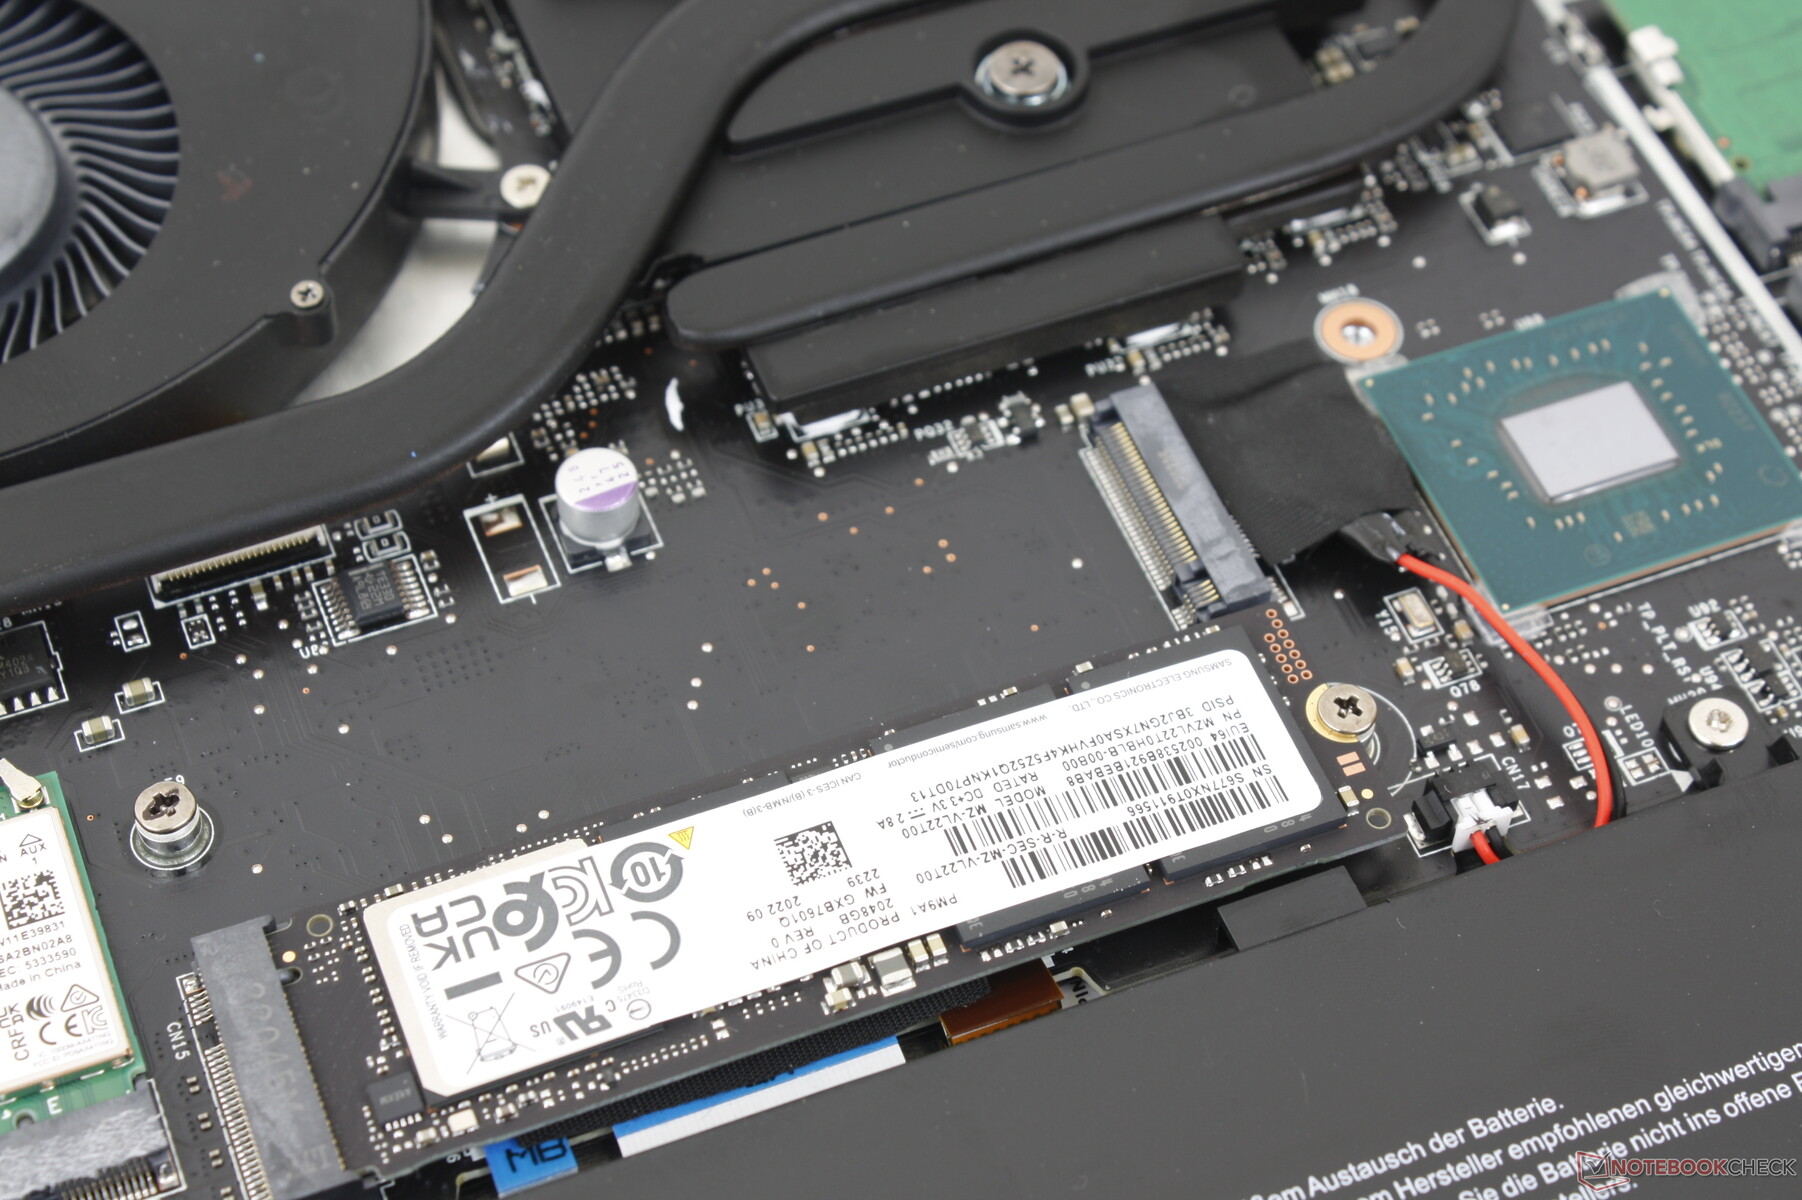
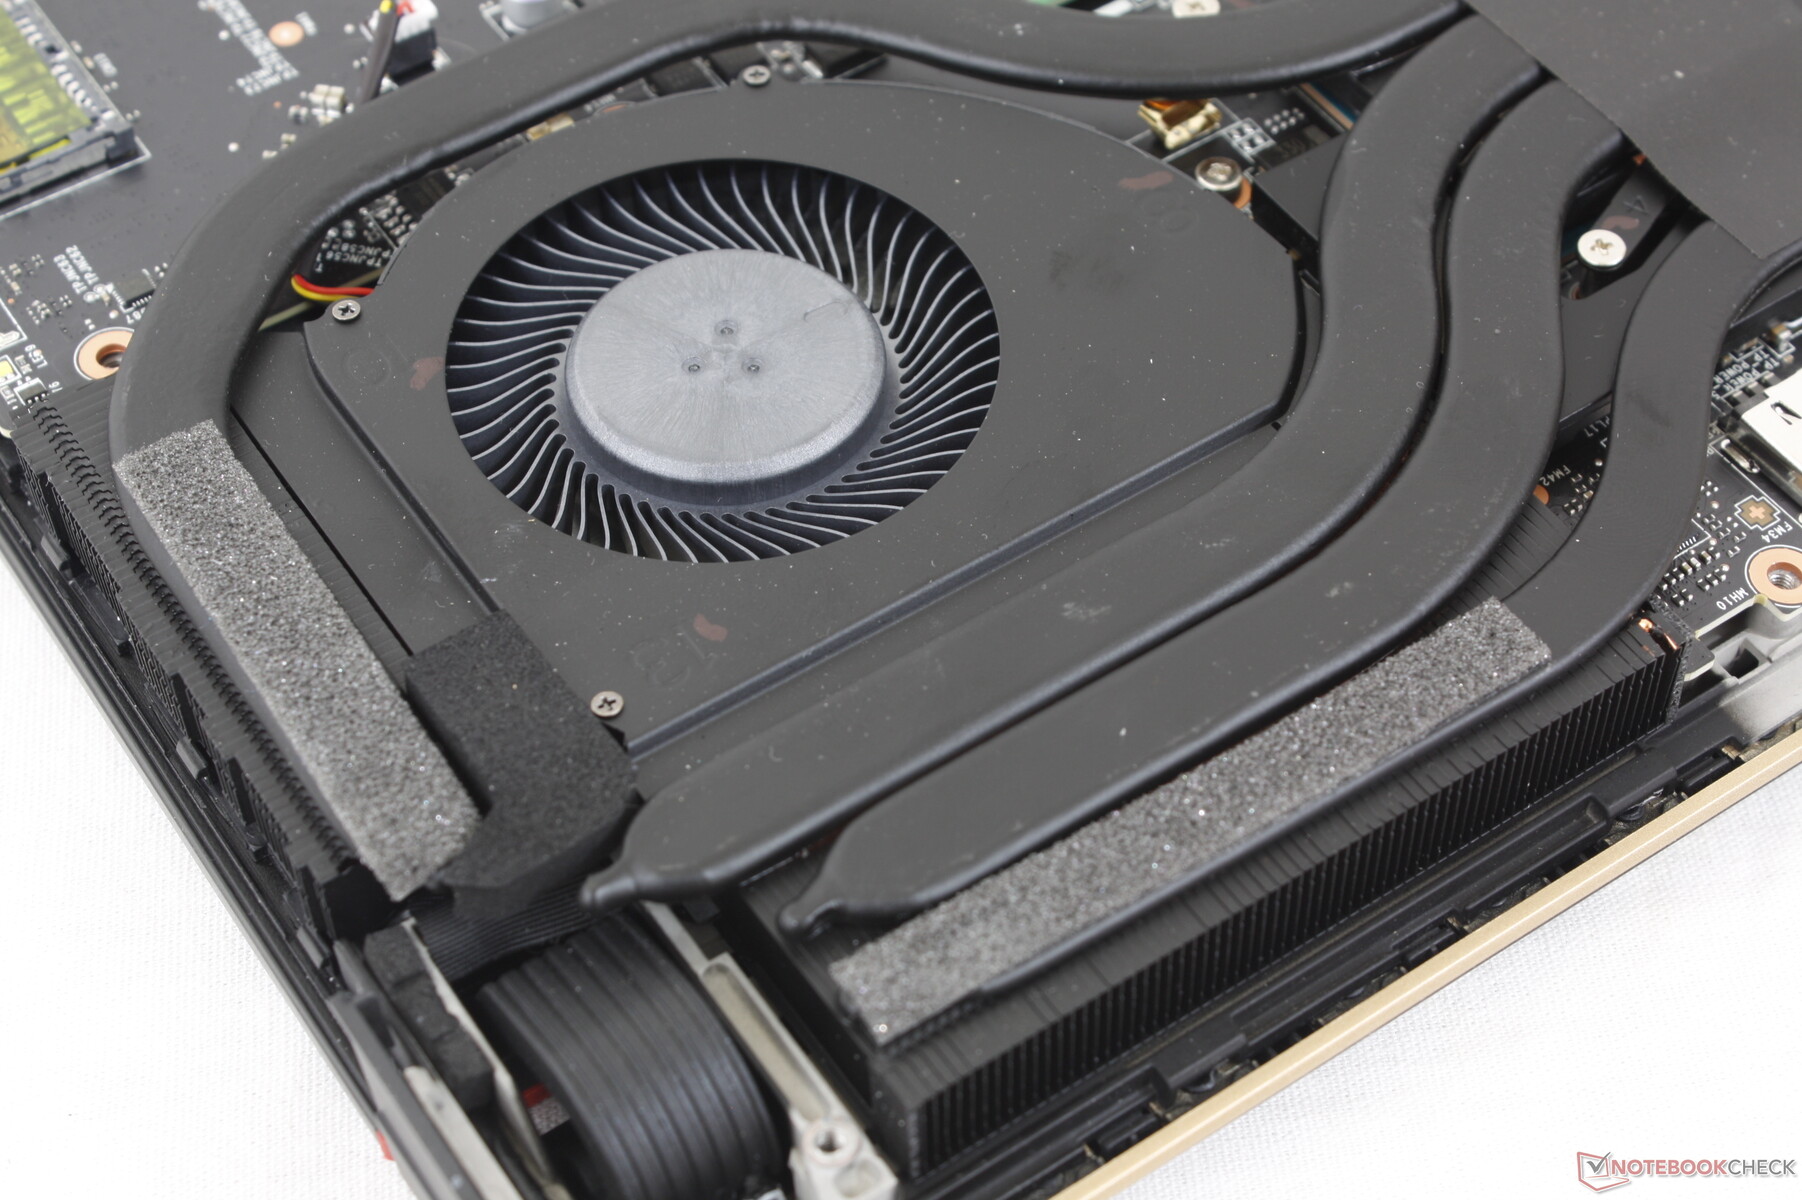
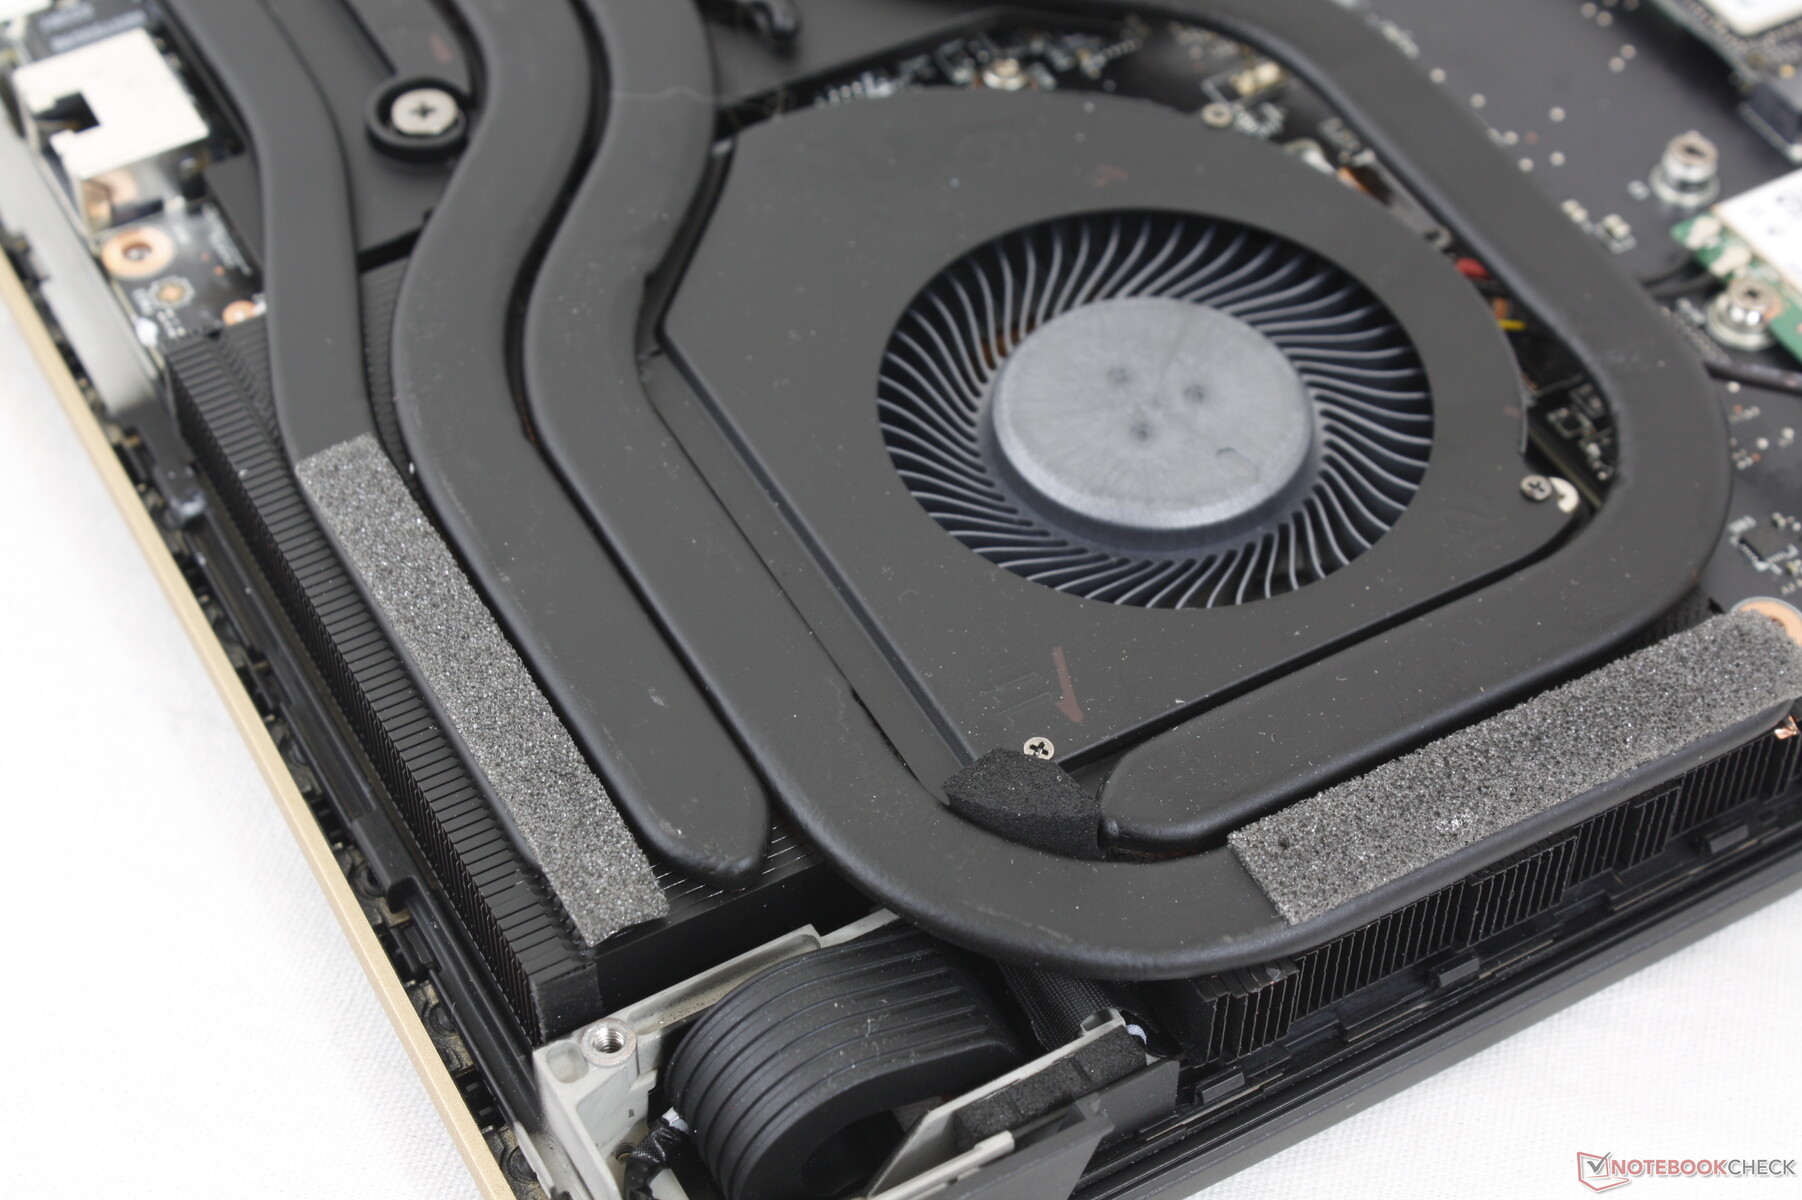
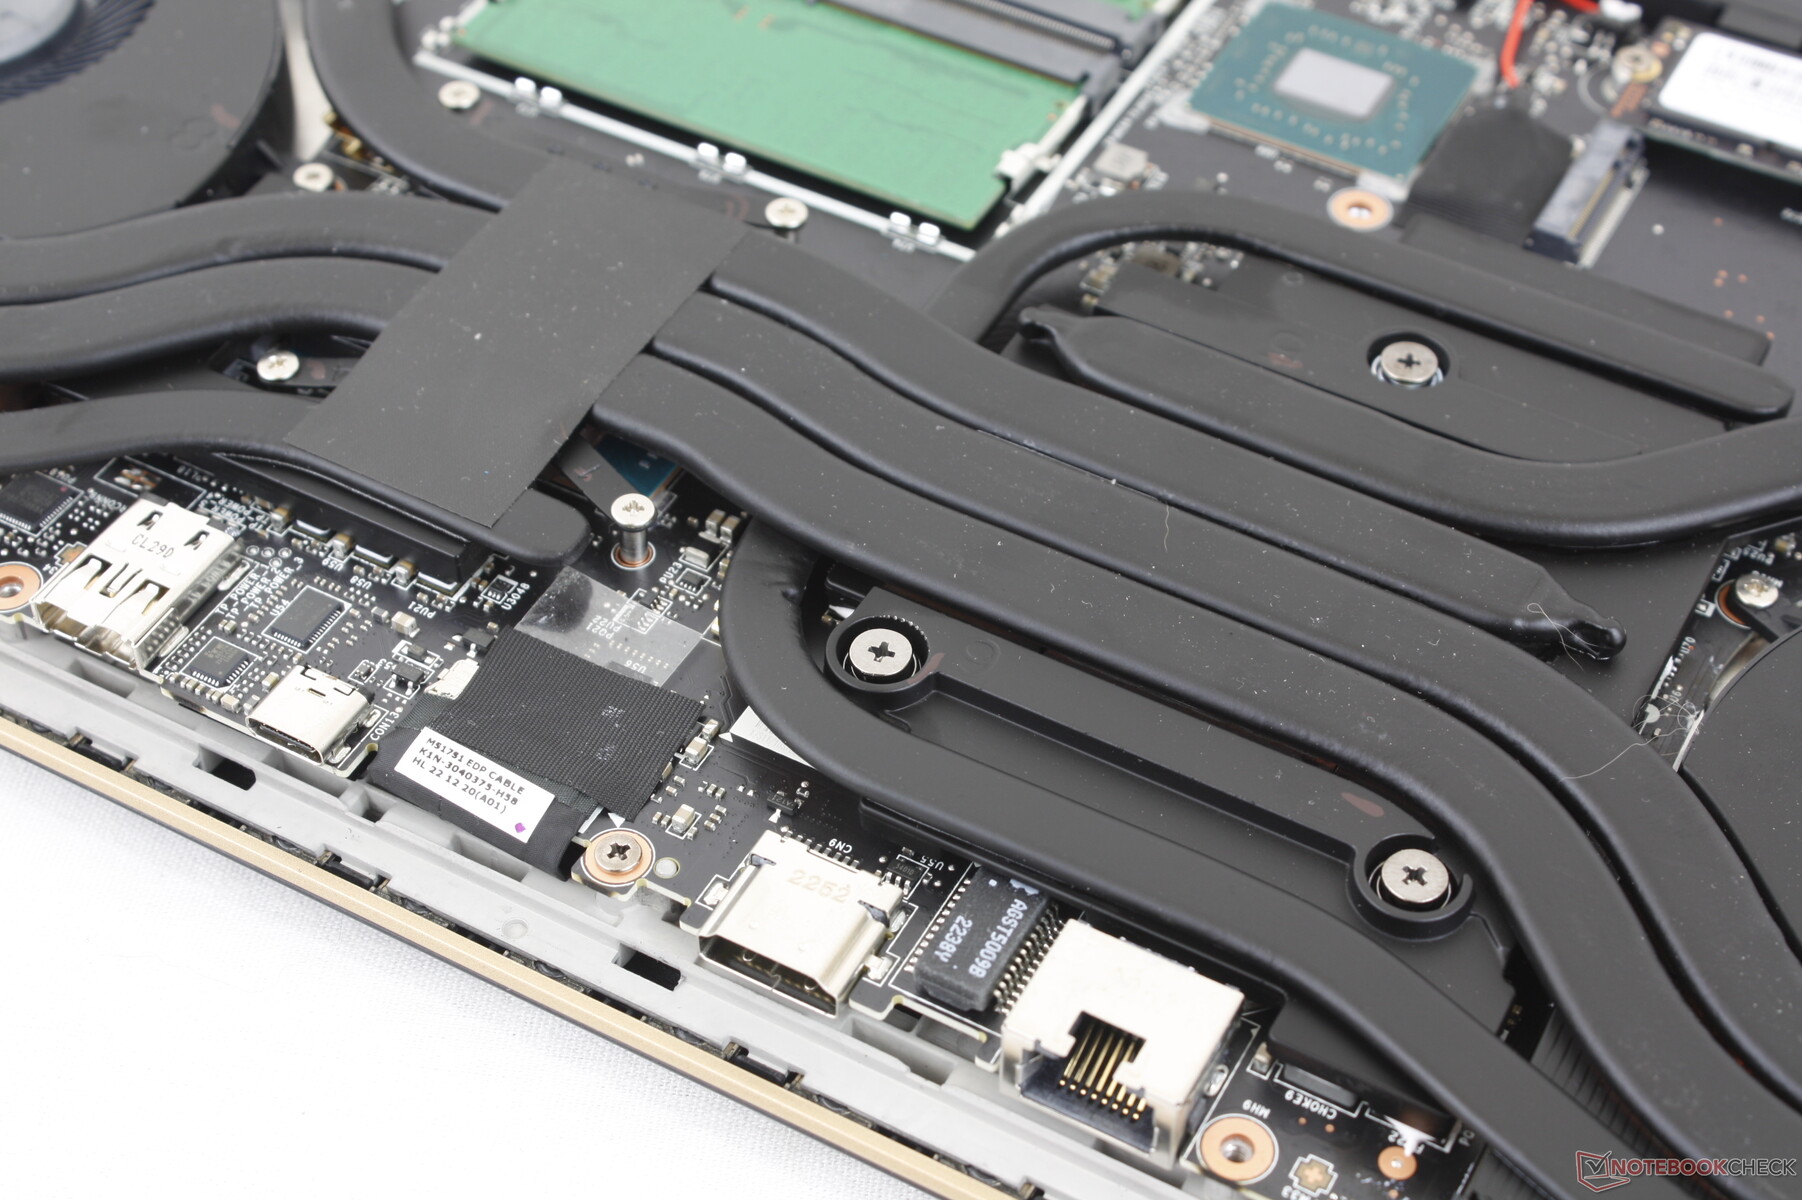
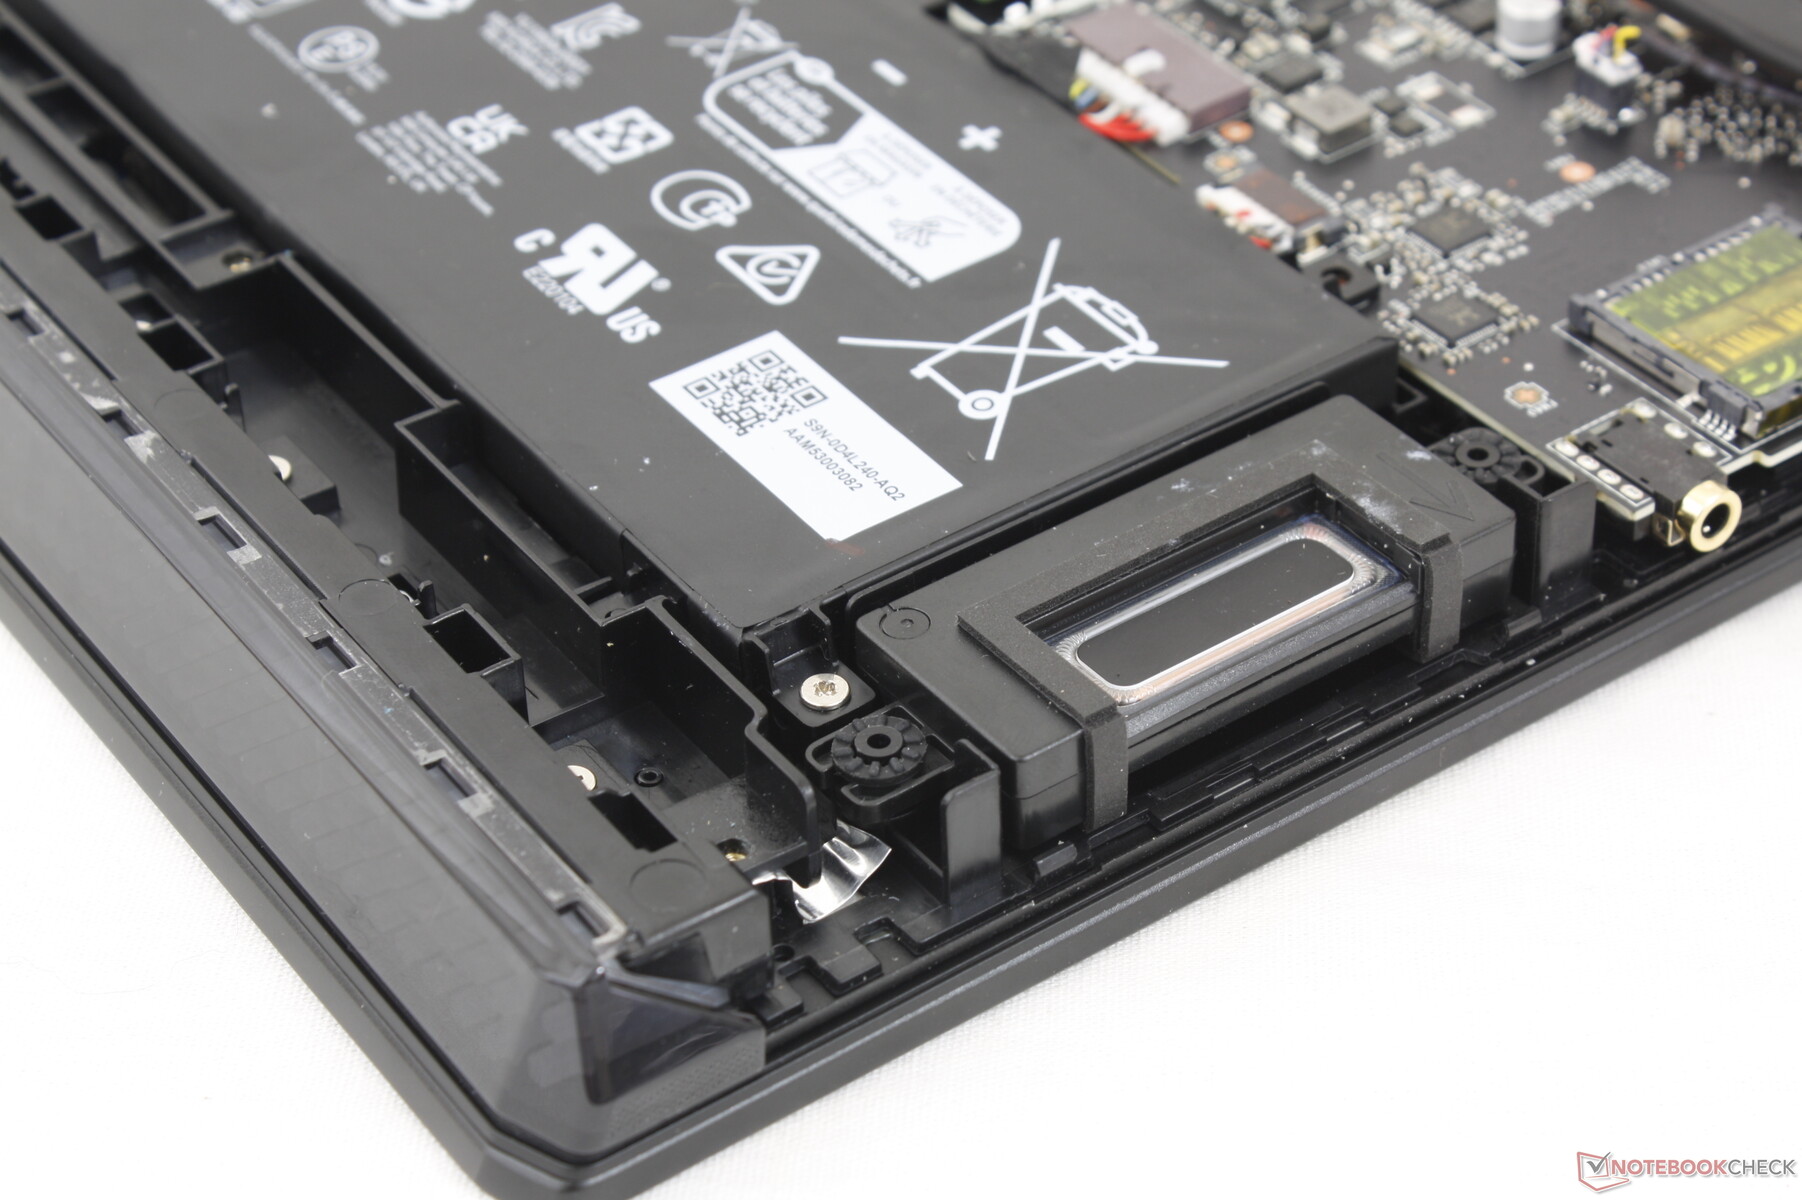
Maintenance — A Bit Harder Than Before
The bottom panel is secured by 12 Philips screws. As per usual for MSI, a 'factory seal' sticker must be broken if owners want to remove the bottom panel for any servicing.
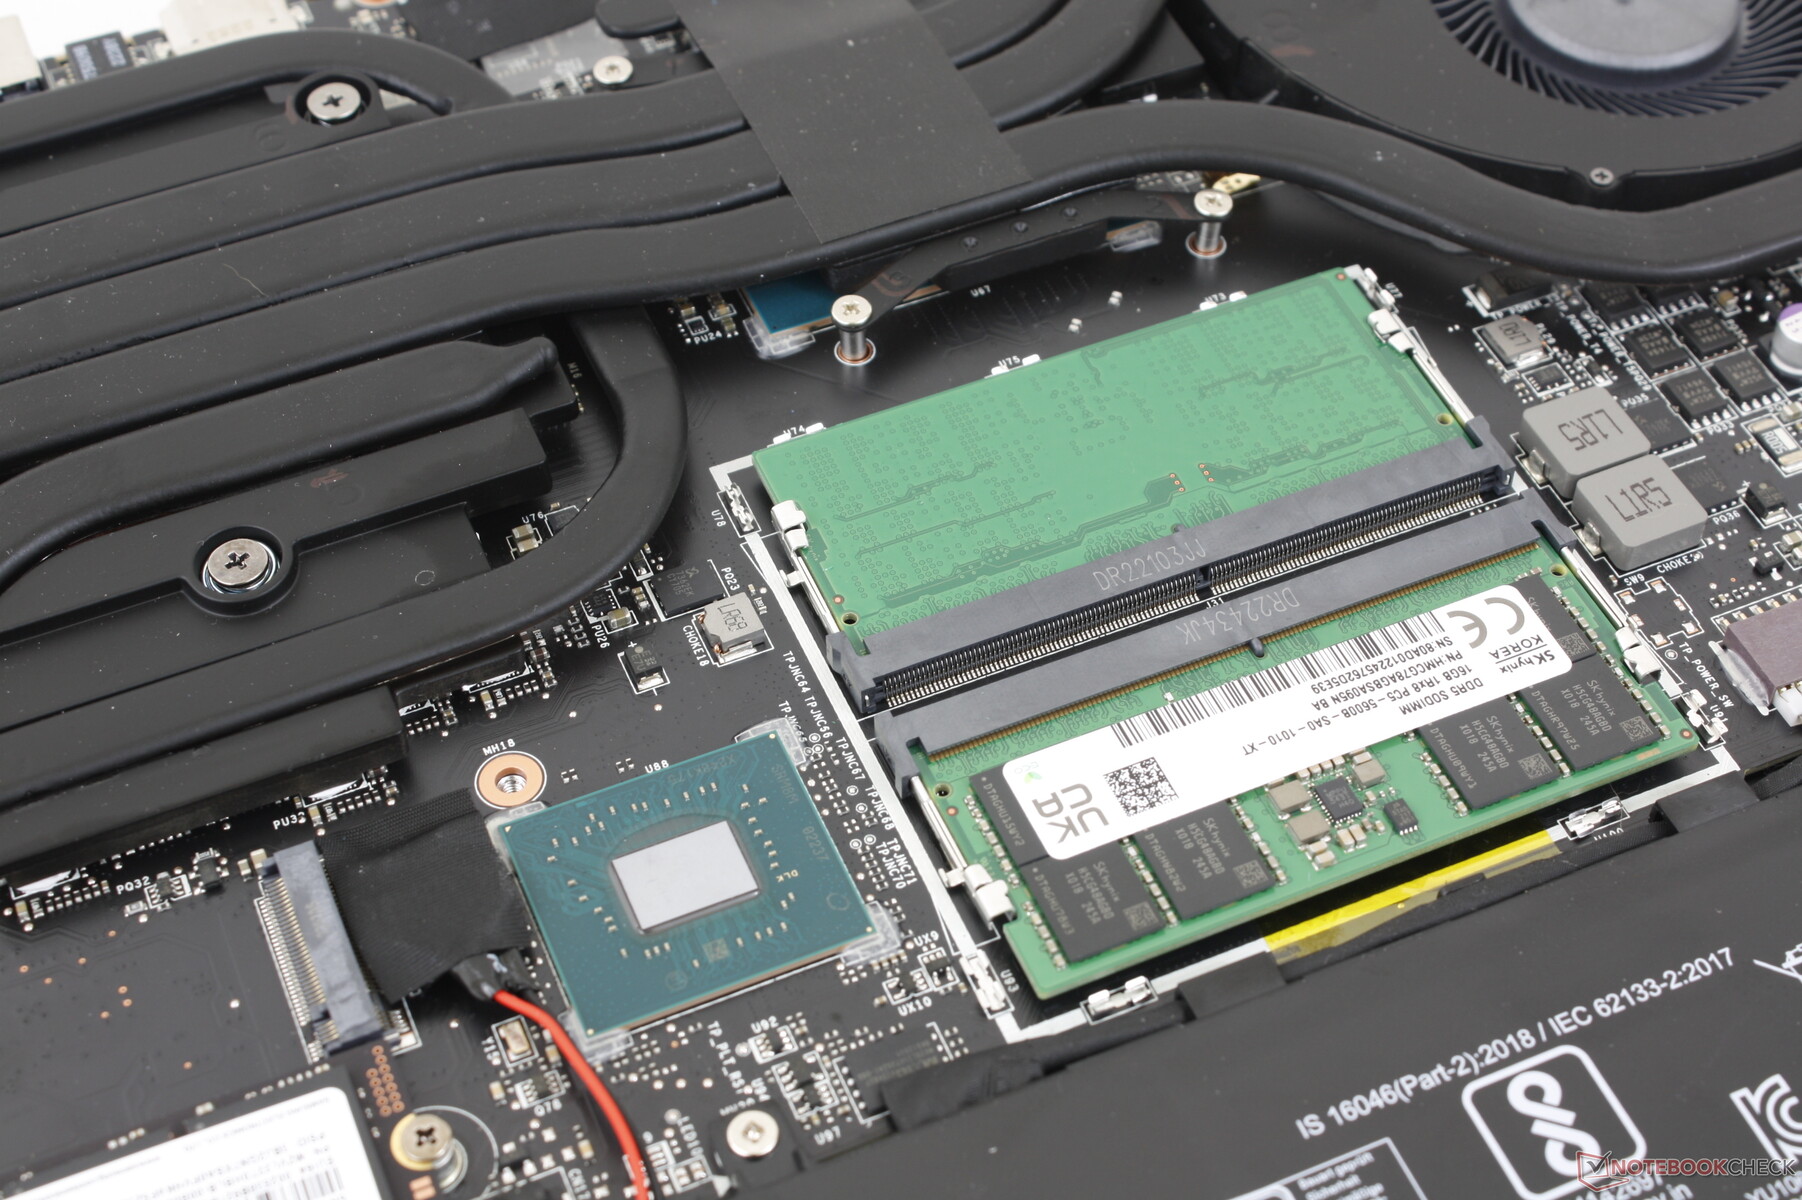
It's recommended to use a sharp plastic edge when removing the bottom panel because the latches around the edges can be quite tight. Once out, users will have direct access to 2x SODIMM slots, 2x M.2 SSD slots, WLAN module, and battery.
Accessories and Warranty
There are no extras in the box other than the AC adapter and paperwork. The standard one-year limited warranty applies if purchased in the US.
Input Devices — Larger and More Refined
Keyboard
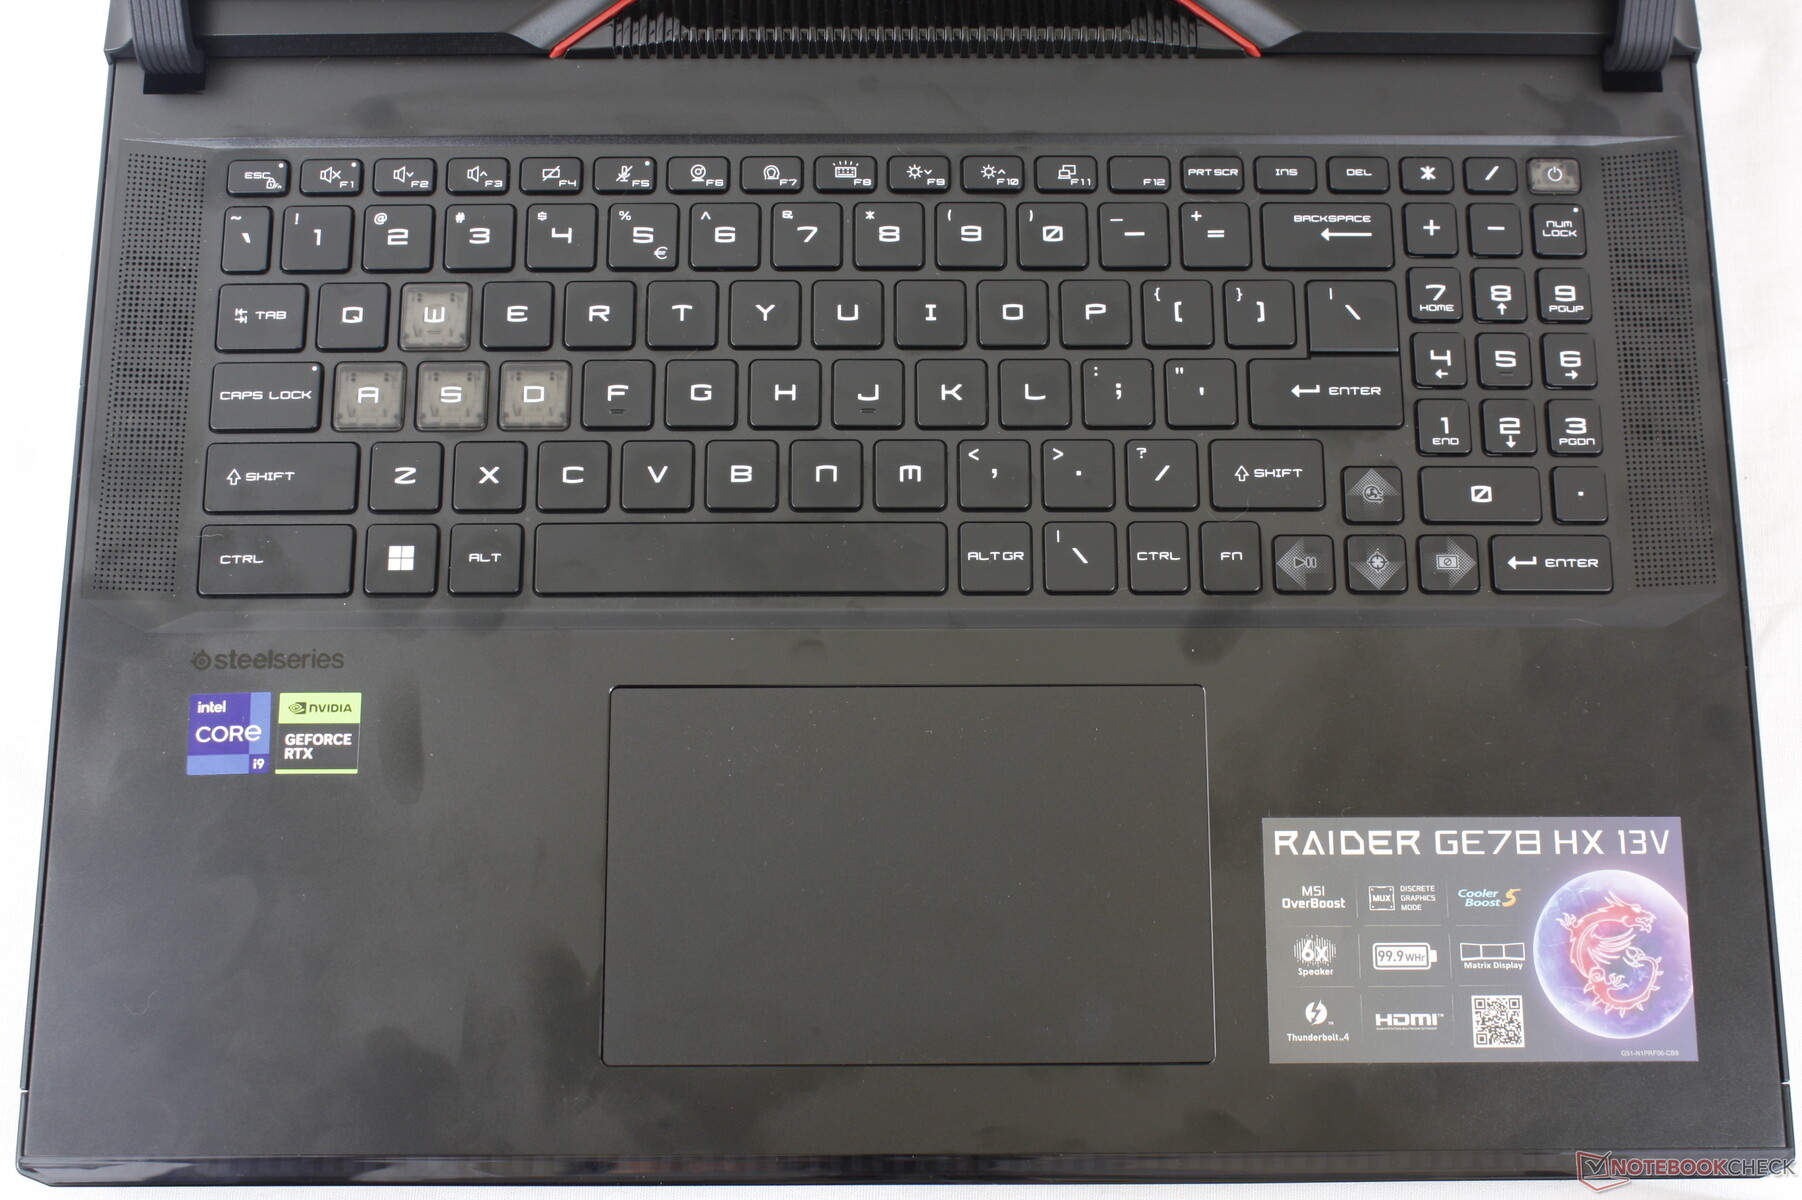
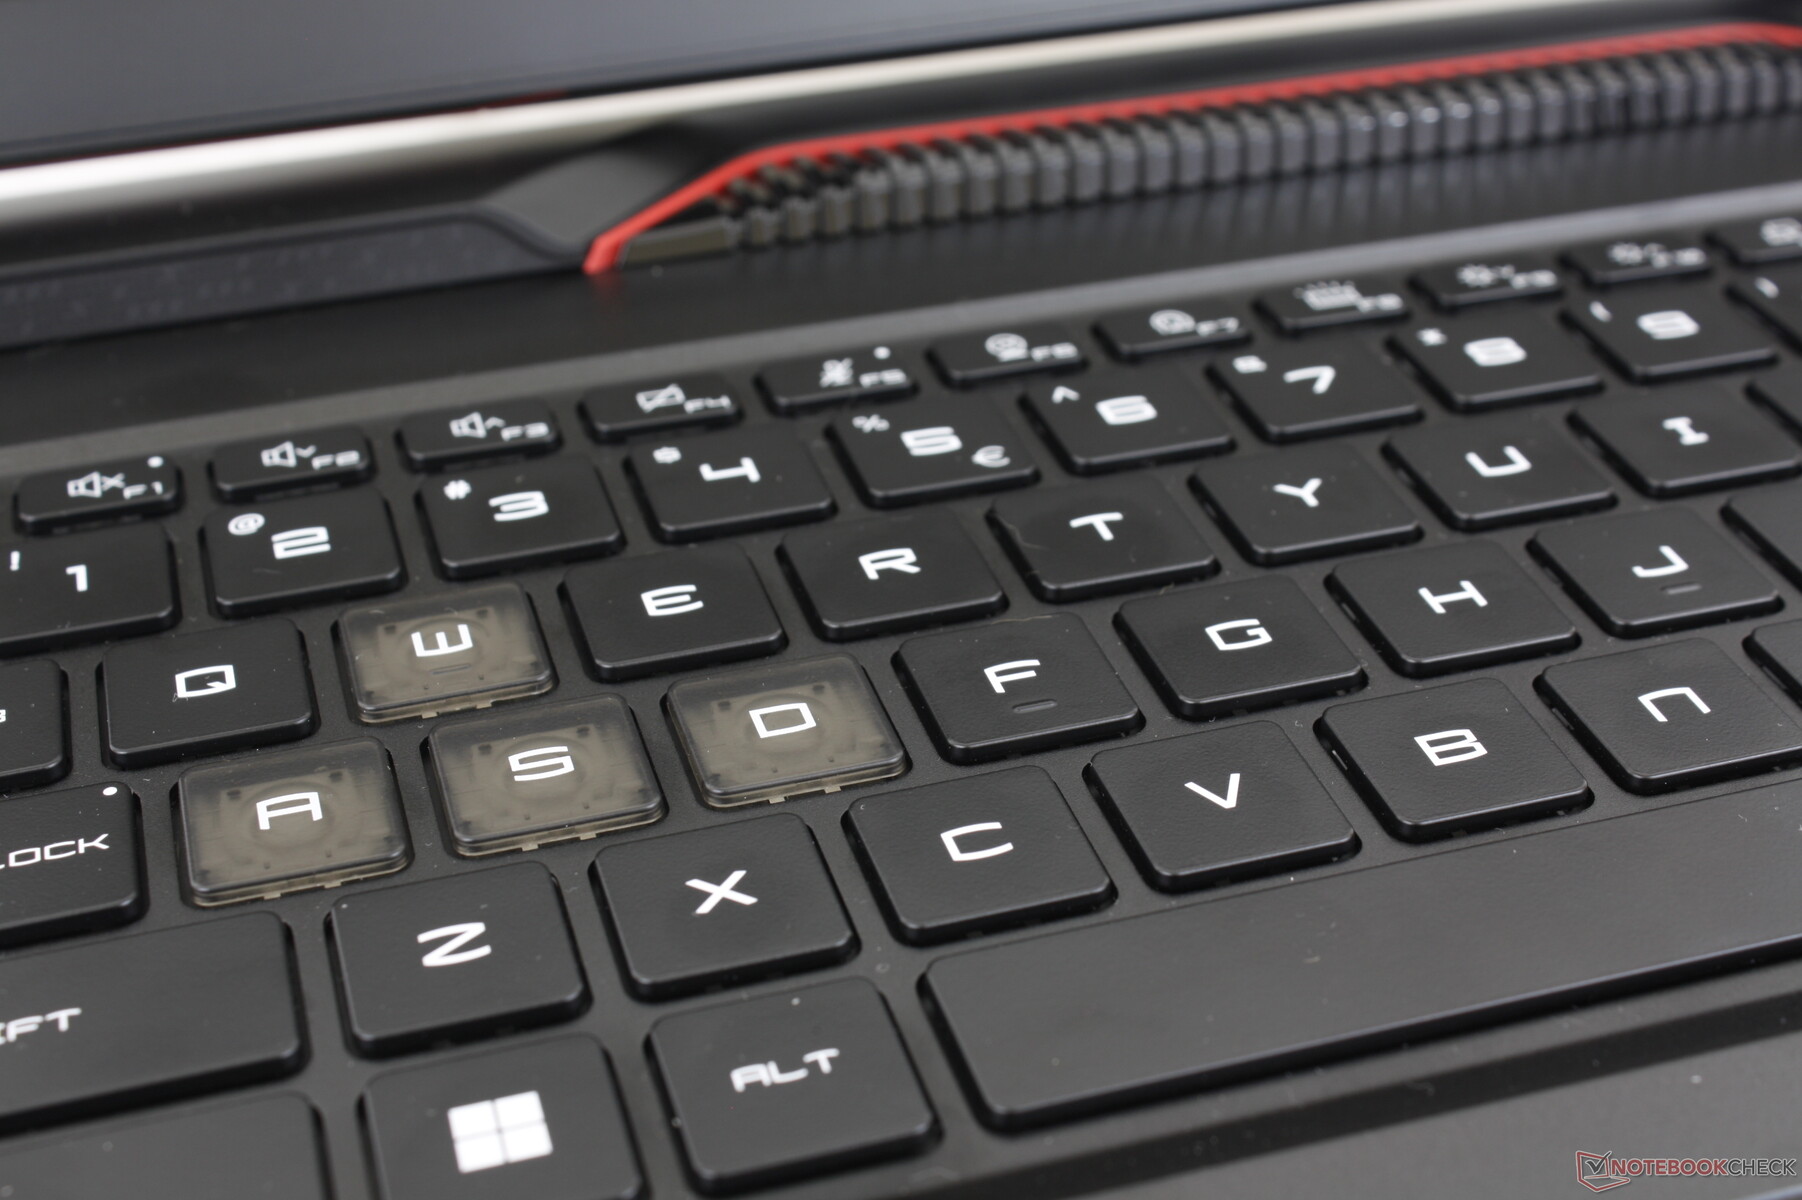
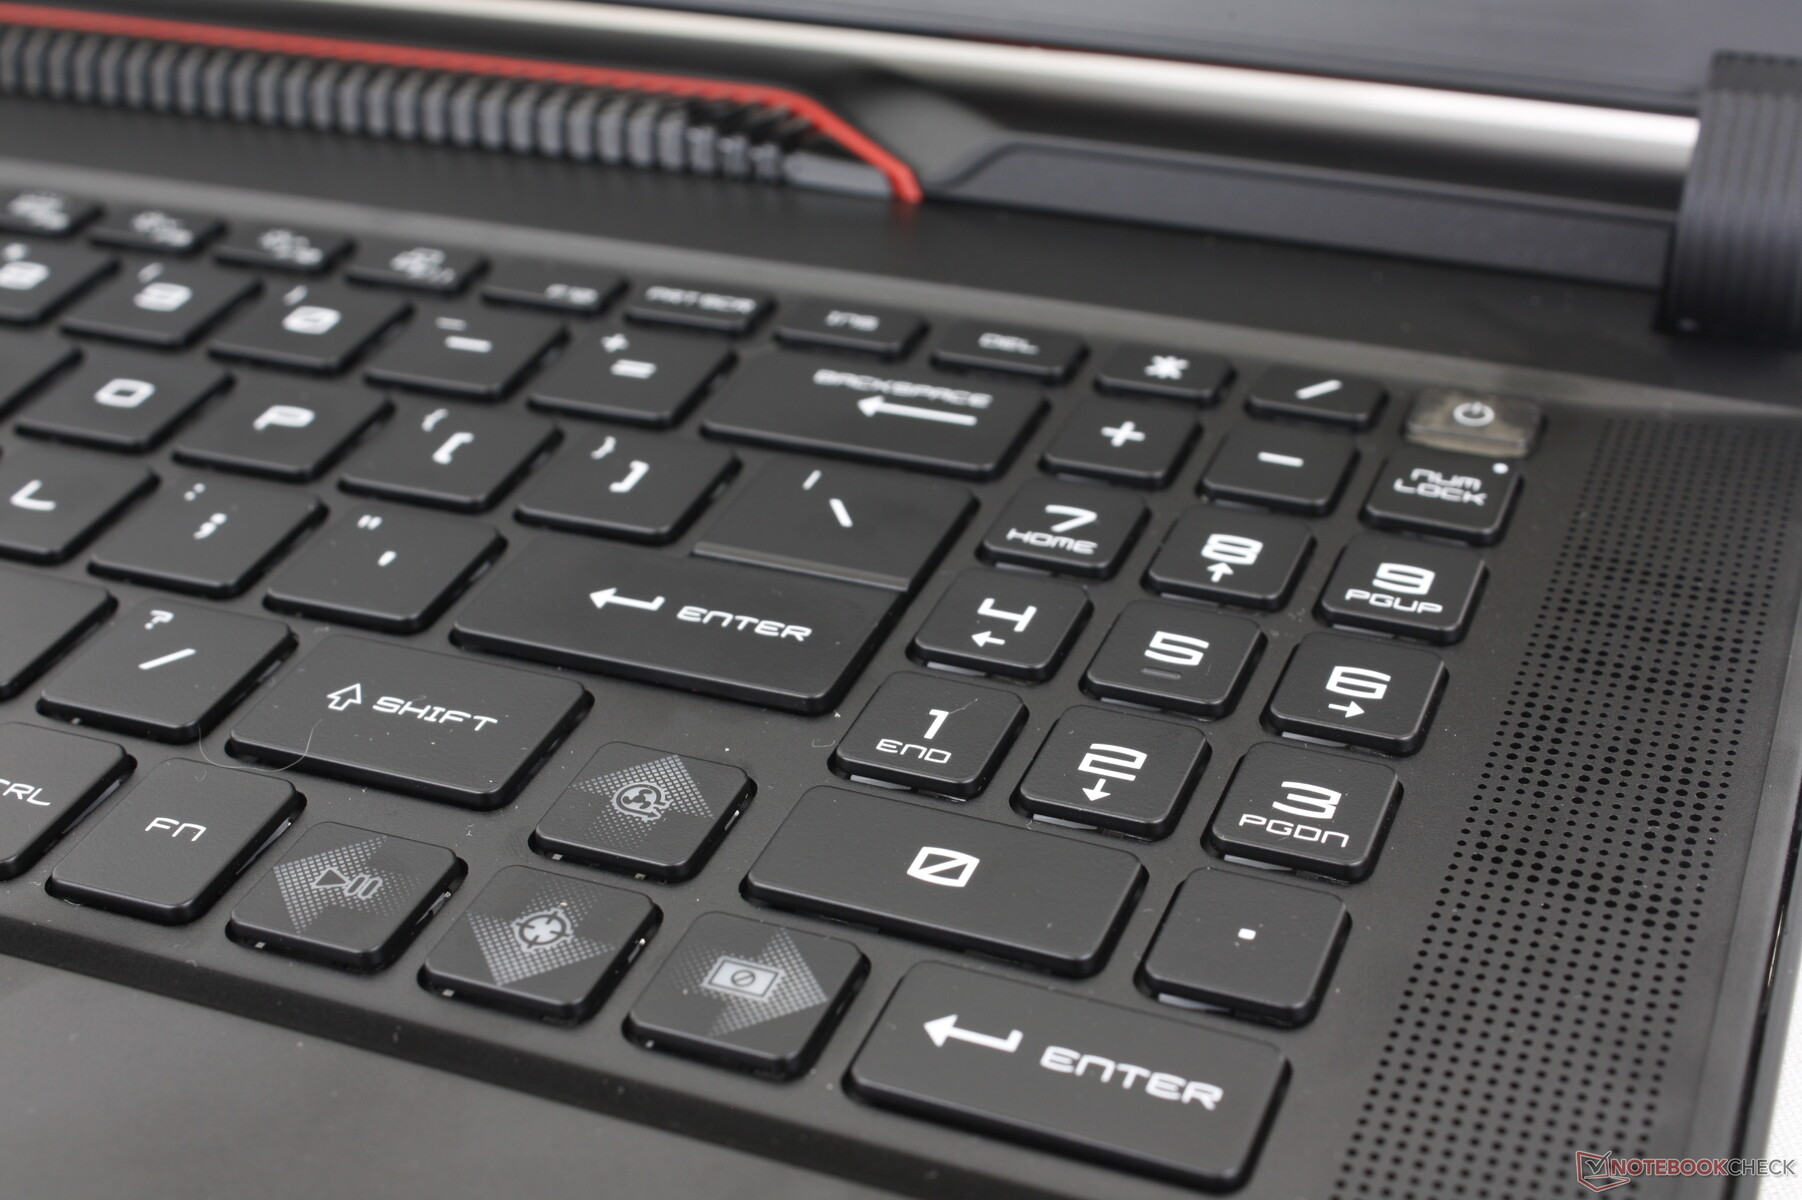
MSI has revamped the keycaps and labeling on the keys when compared to the GE77. Key feedback is still very good if not better than before; the Space and Enter keys in particular are louder and clickier this time around for a more satisfying typing experience.
The arrow keys and numpad could use some work. Despite the large 17-inch form factor, these specific keys are small and cramped. In comparison, the arrow keys and numpad on the Lenovo Legion series are larger and more spacious. Games that often utilize the arrow keys, such as racing titles, can be more difficult to play on the MSI system.
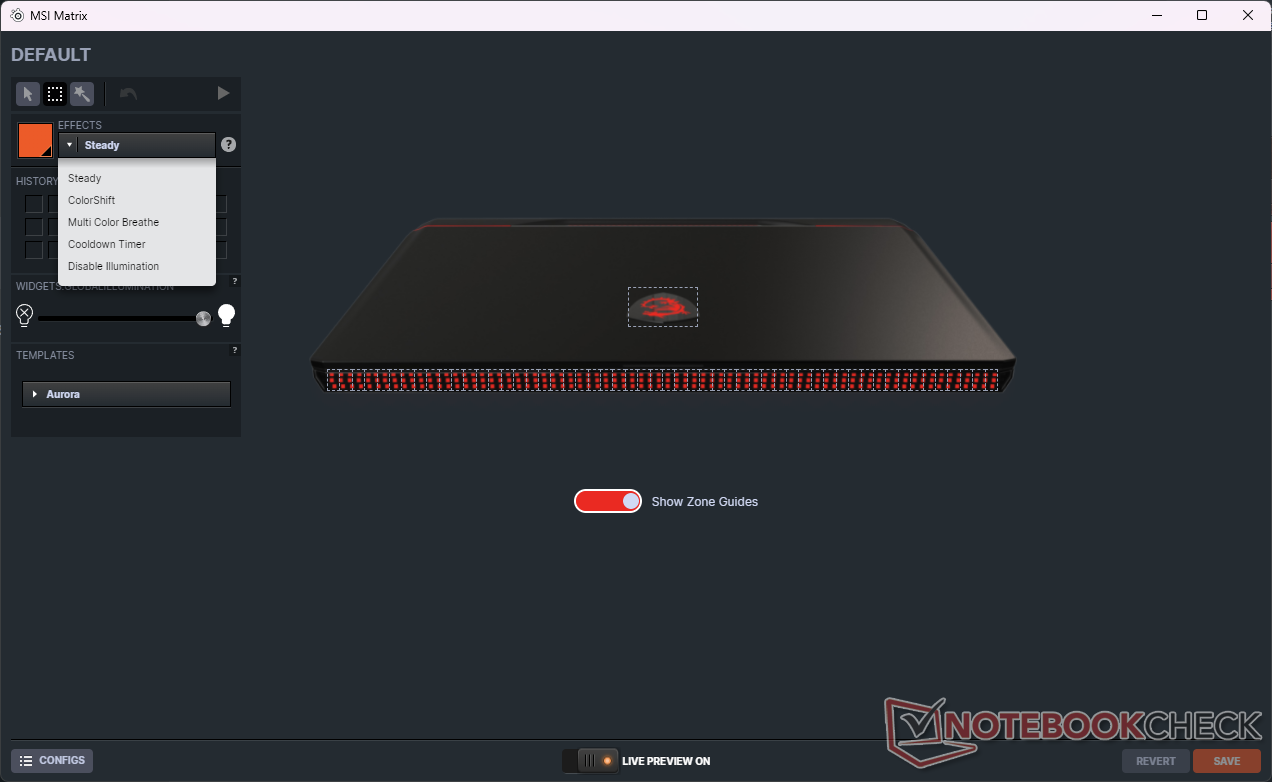
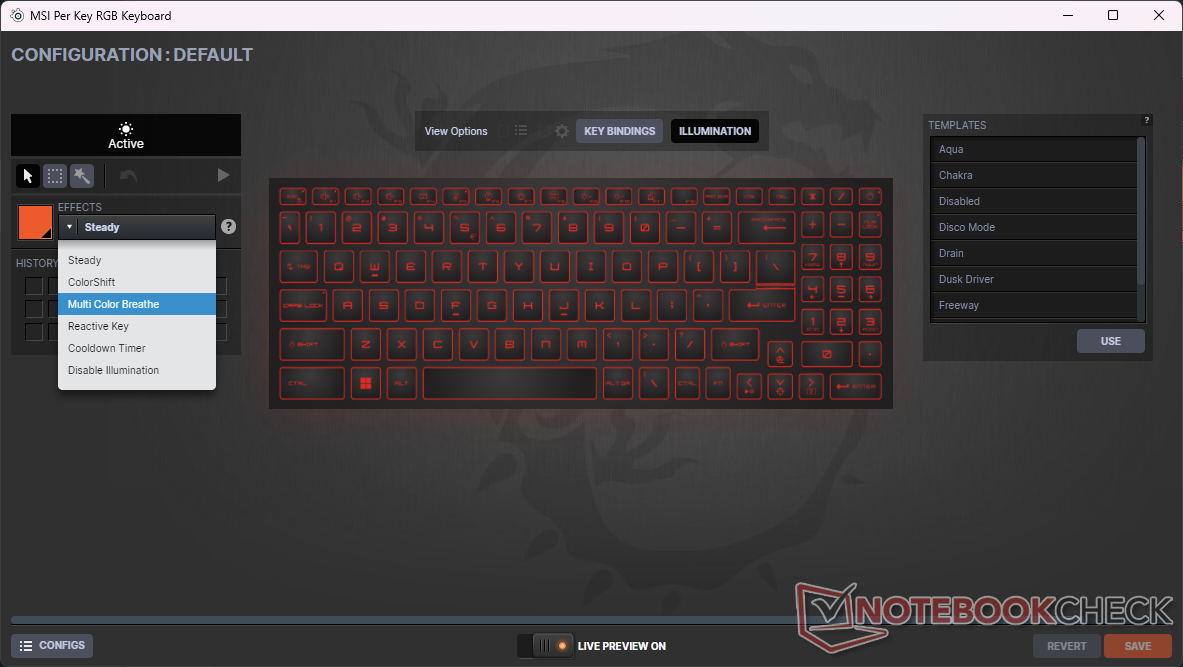
Per-key RGB lighting effects are controlled by the pre-installed SteelSeries GG software as shown by screenshots below. The app controls the pixel "matrix" light bar along the front edge of the chassis as well.
Touchpad
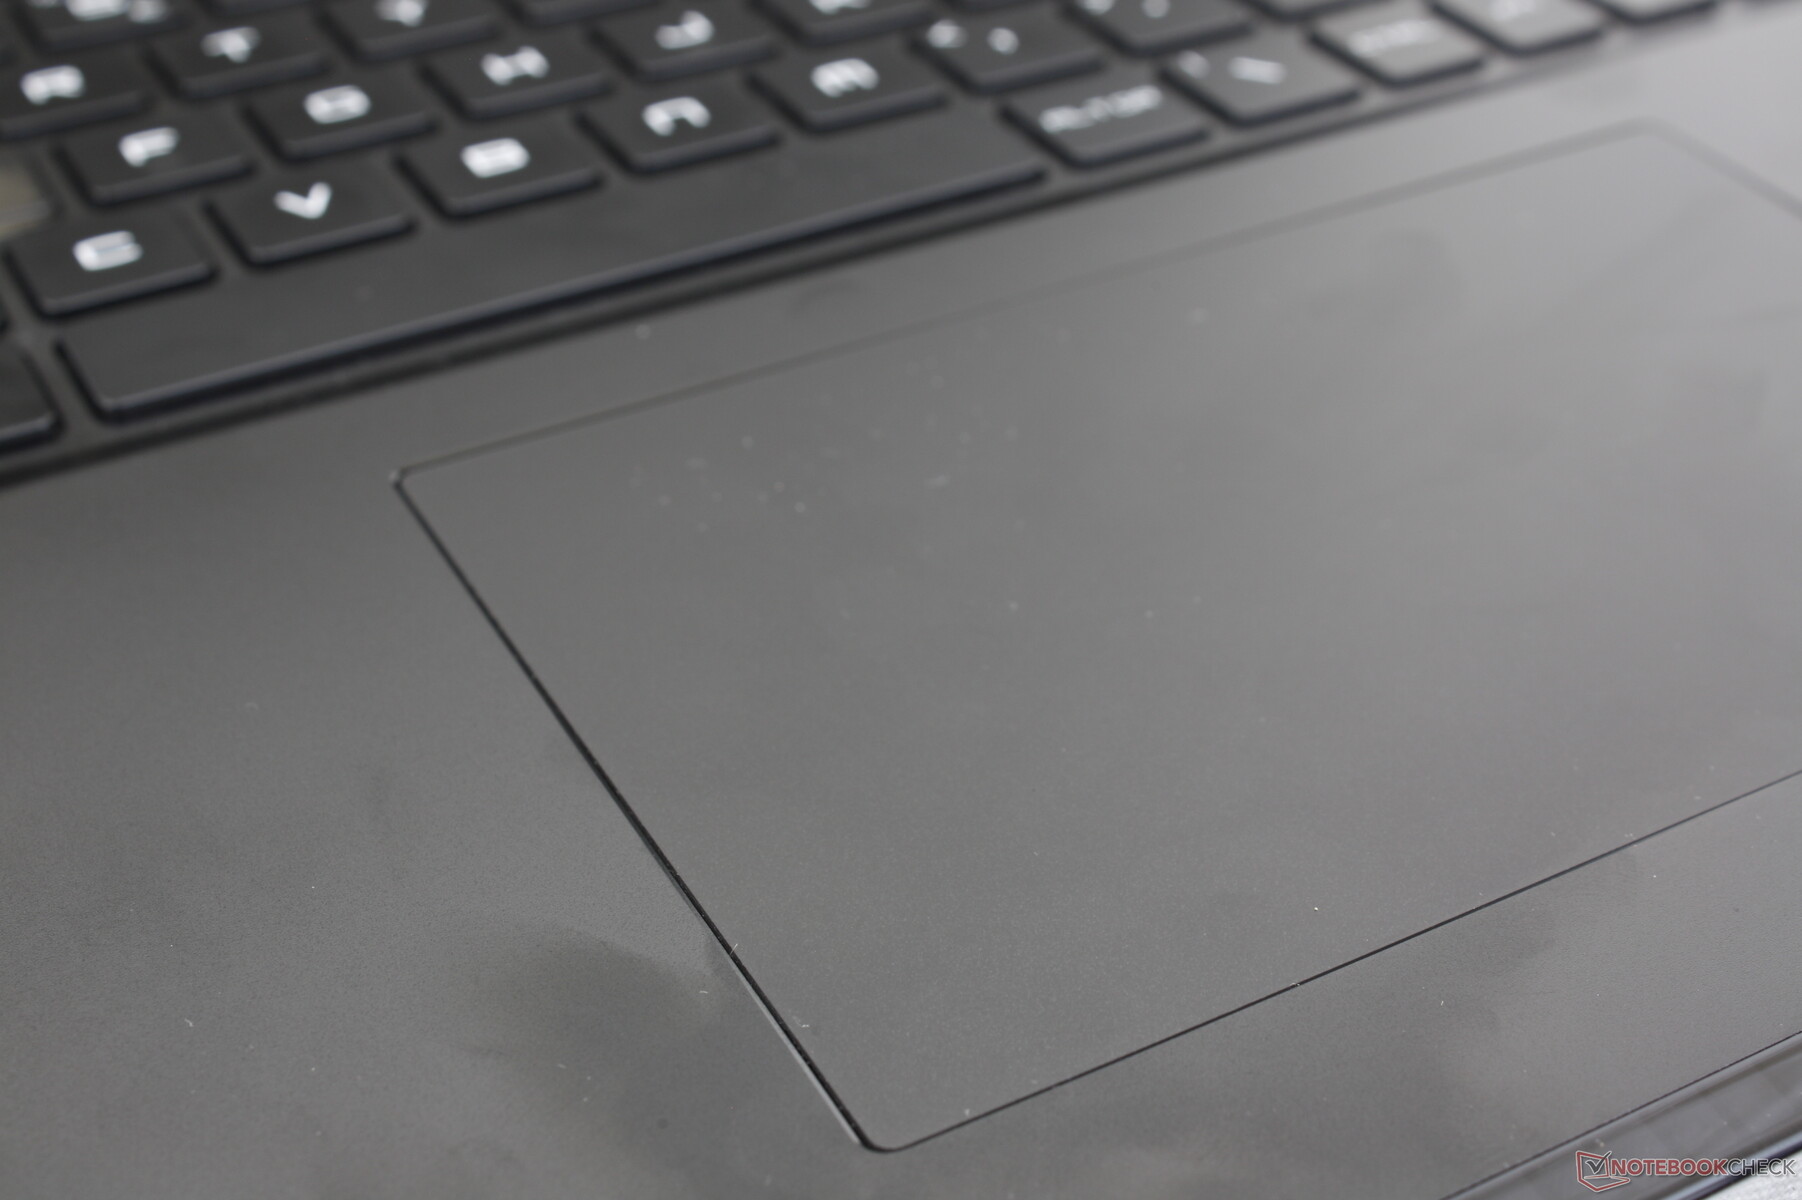
The clickpad has grown in size from the tiny 10.5 x 6.5 cm surface area on the GE77 to a much roomier 13 x 8.2 cm on the GE78. Gliding on the plastic surface is stickier than expected, however, and so there is slightly more resistance when gliding at quicker speeds. Feedback when pressing down is quiet but too shallow and weak for an unsatisfying feel overall.
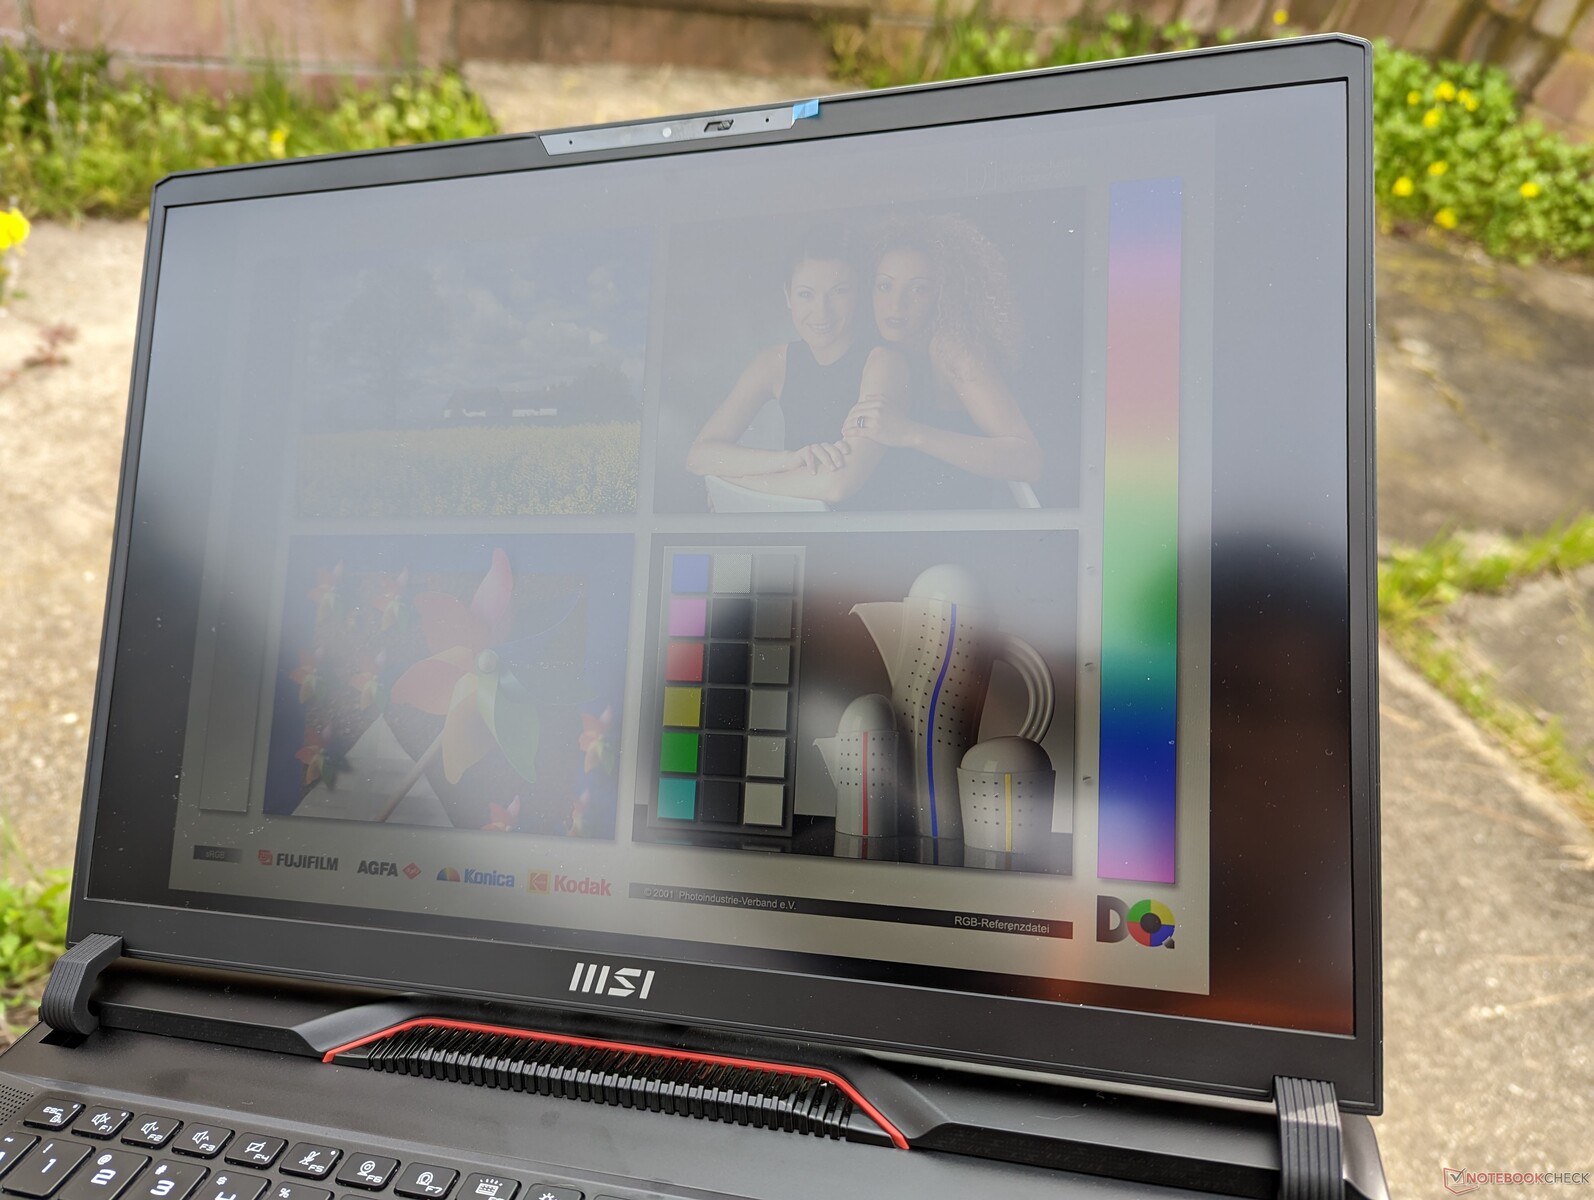
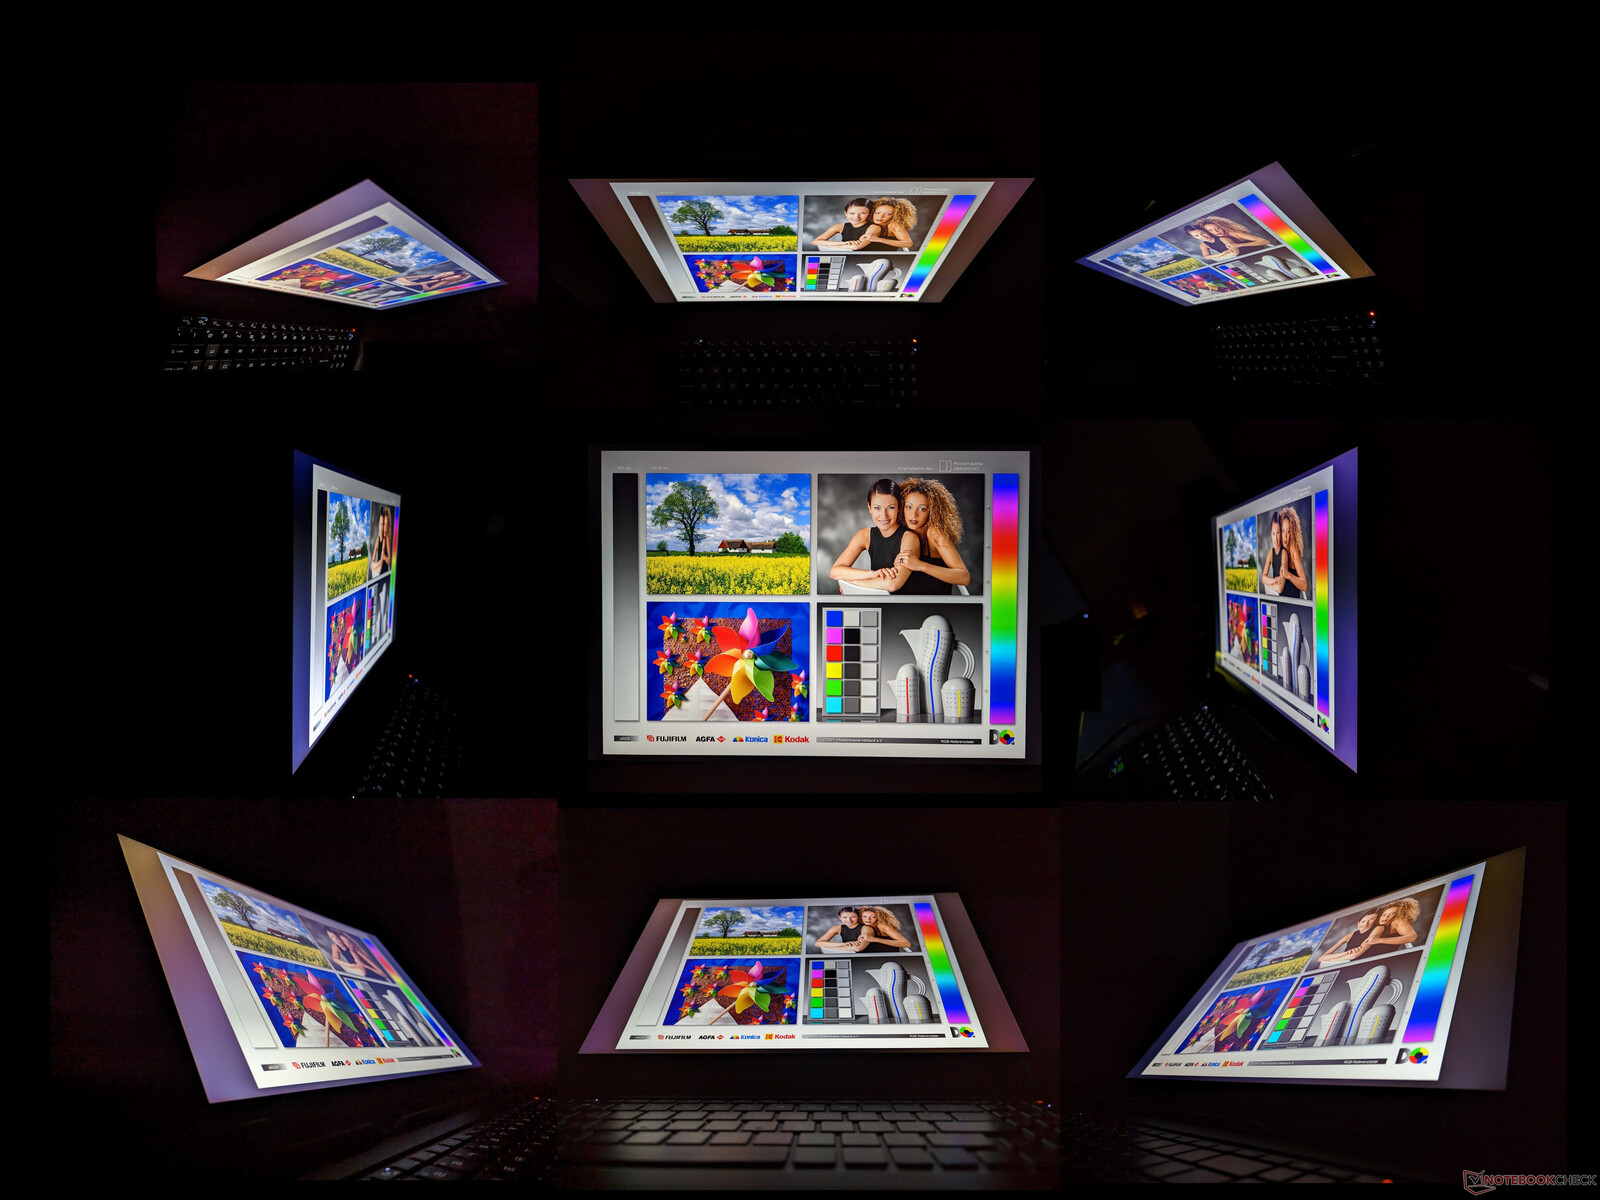
Display — Where's the G-Sync Support?
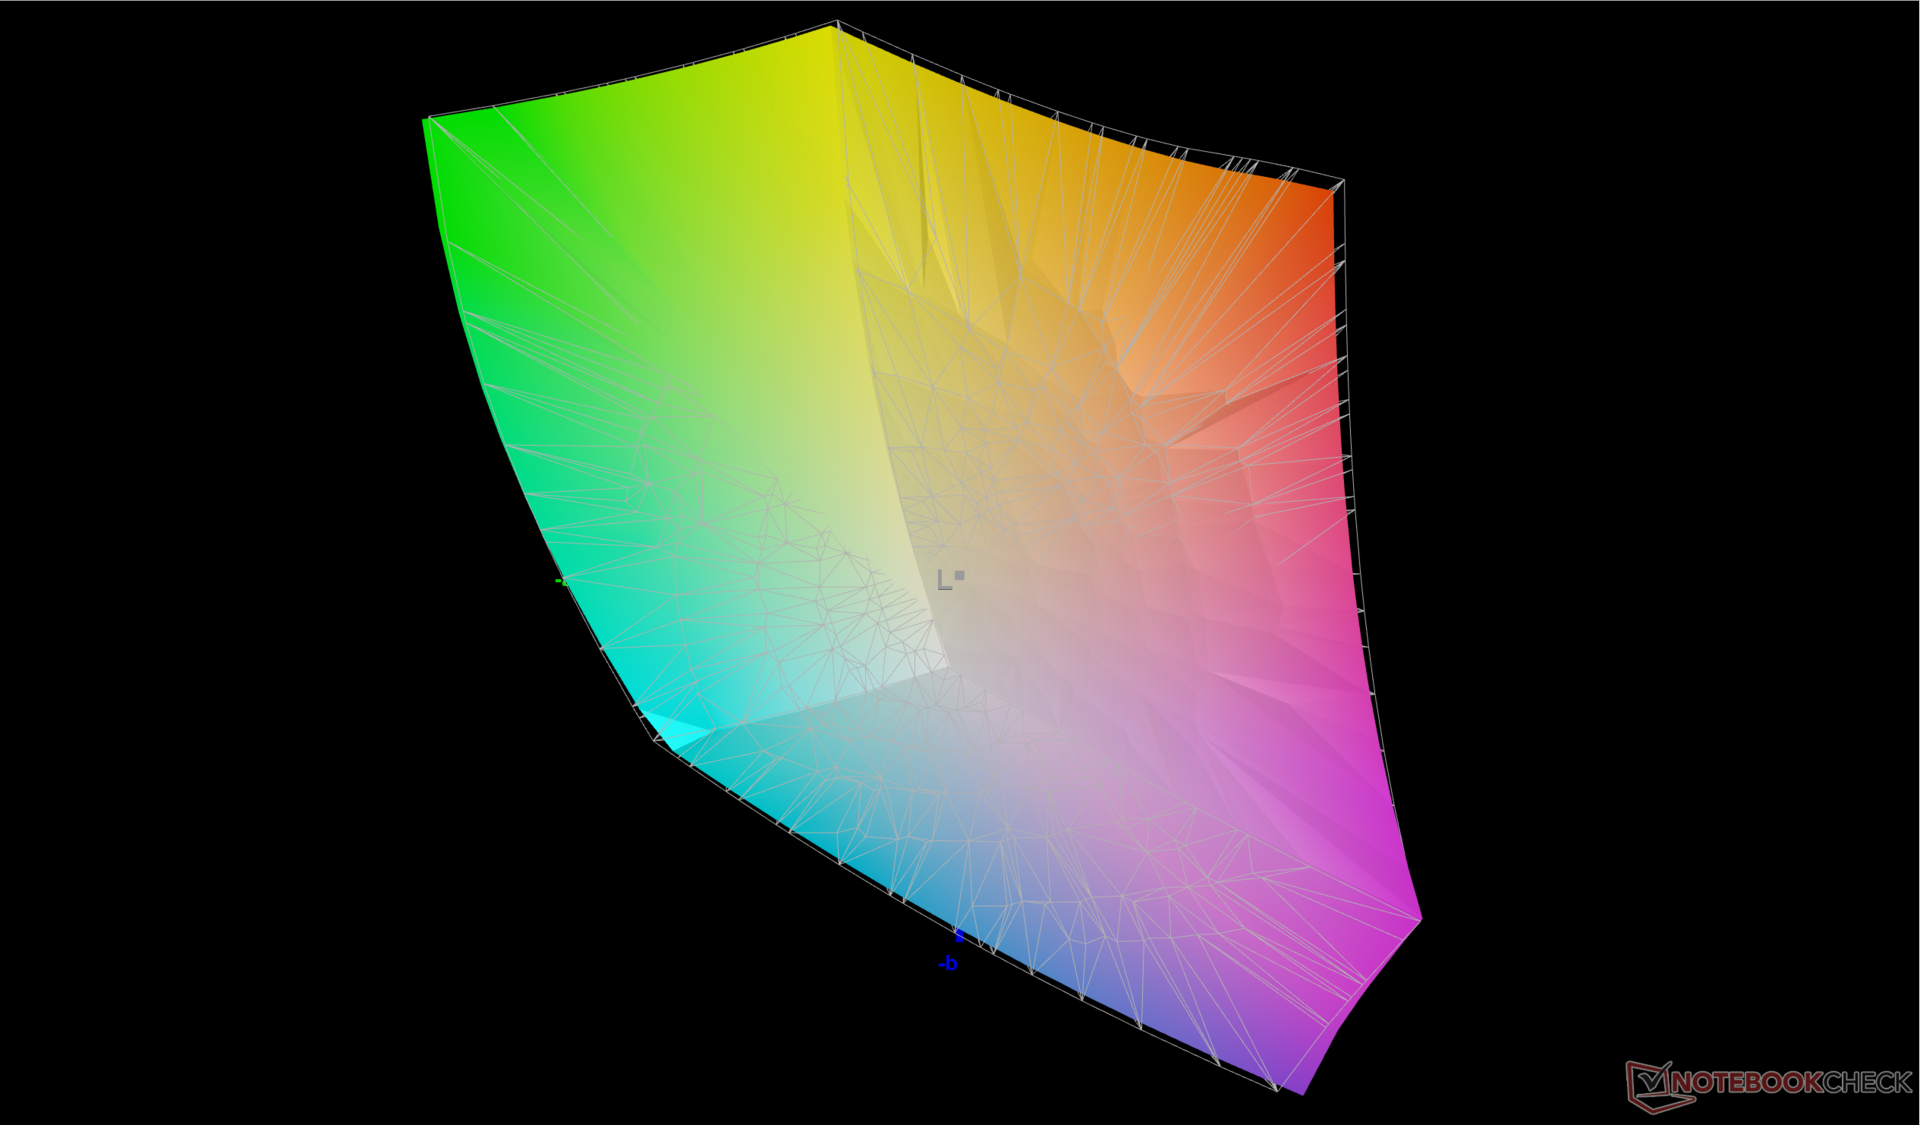
The GE78 is the first laptop in our database to sport the AU Optronics B170QAN01.2 IPS panel. However, all our in-house measurements show it to be essentially identical to the AU Optronics B173ZAN06.1 panel in last year's GE77 except in size (17.0-inch vs. 17.3-inch), aspect ratio (16:10 vs. 16:9), and refresh rate (240 Hz vs. 120 Hz). Core attributes like the wide P3 colors, fast response times, 400-nit brightness, and decent contrast ratio remain about the same for a similar visual experience between them.
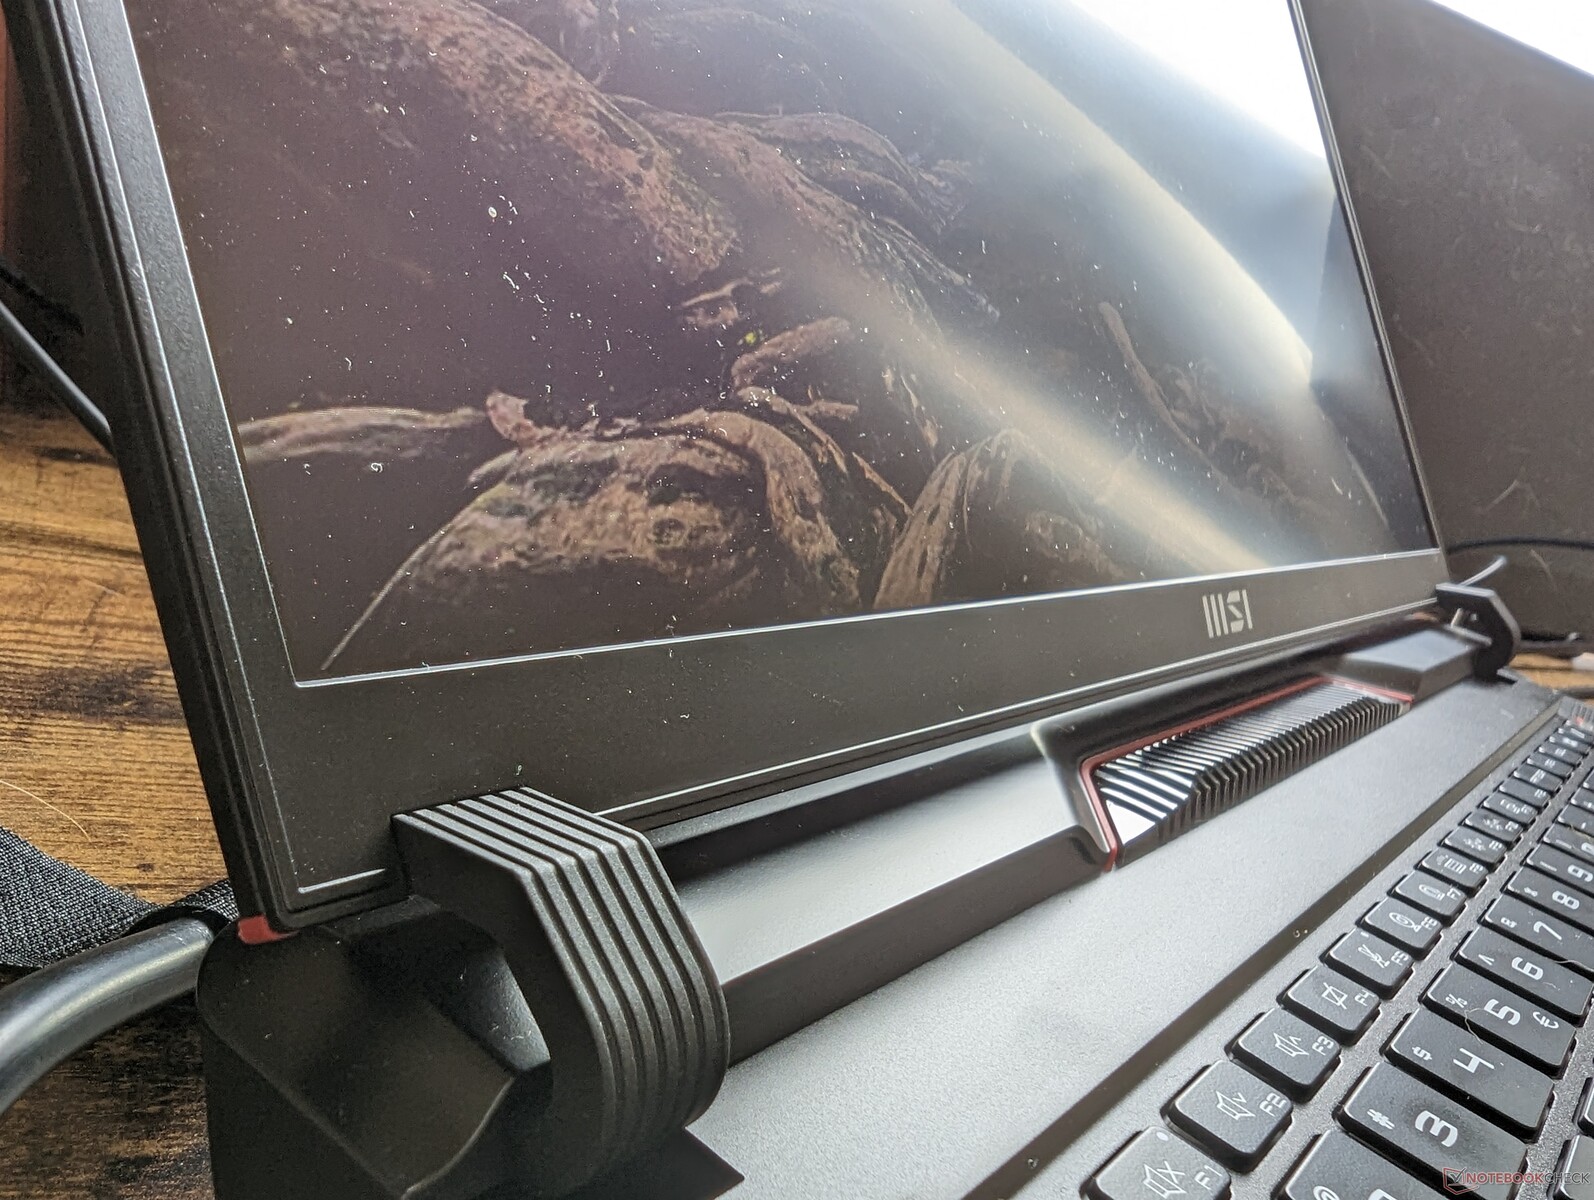
Perhaps the most egregious aspect of the display is its terrible backlight bleeding control on our specific test unit. As shown by the screenshot below, the light bleed is noticeable especially during movie playback with black borders or when playing certain games. Some level of backlight bleeding is to be expected from most IPS panels, but it is far too substantial on a high-end laptop like our GE78.


| |||||||||||||||||||||||||
Brightness Distribution: 89 %
Center on Battery: 398.6 cd/m²
Contrast: 867:1 (Black: 0.46 cd/m²)
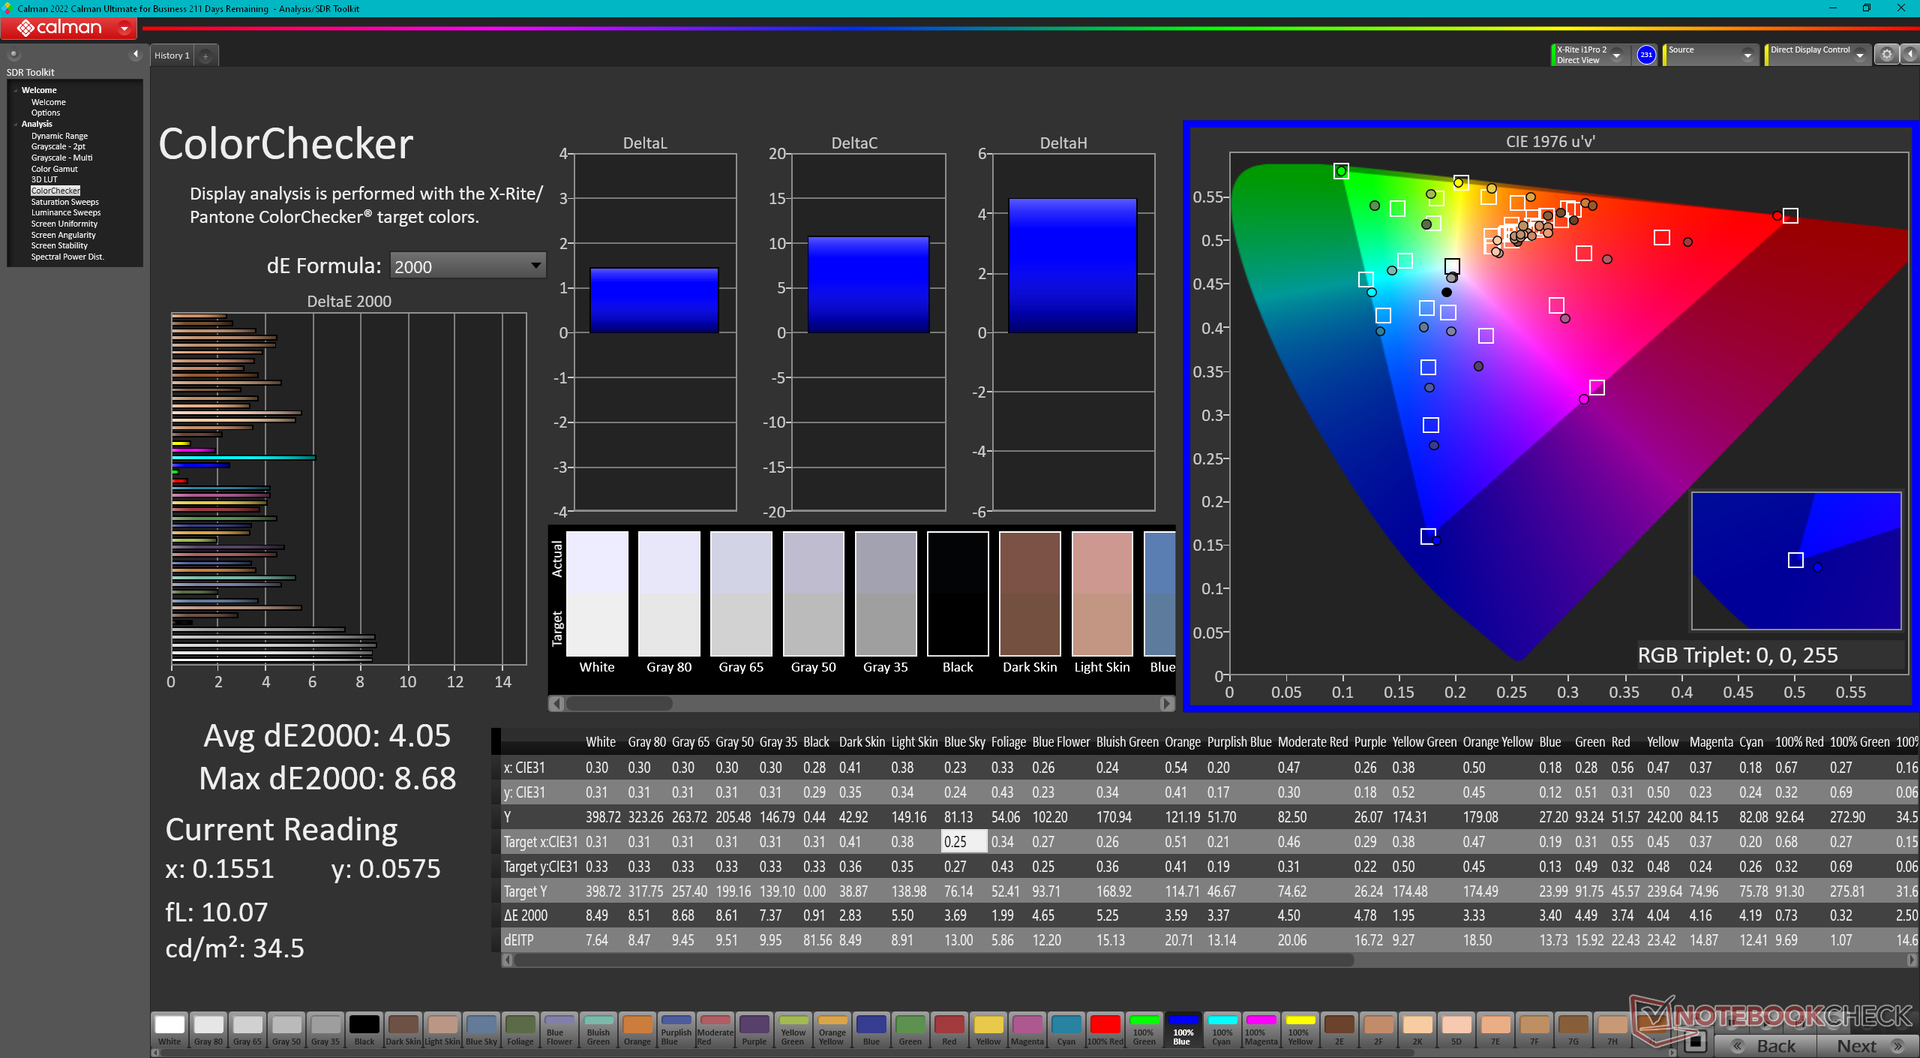
ΔE ColorChecker Calman: 4.05 | ∀{0.5-29.43 Ø4.71}
calibrated: 1.02
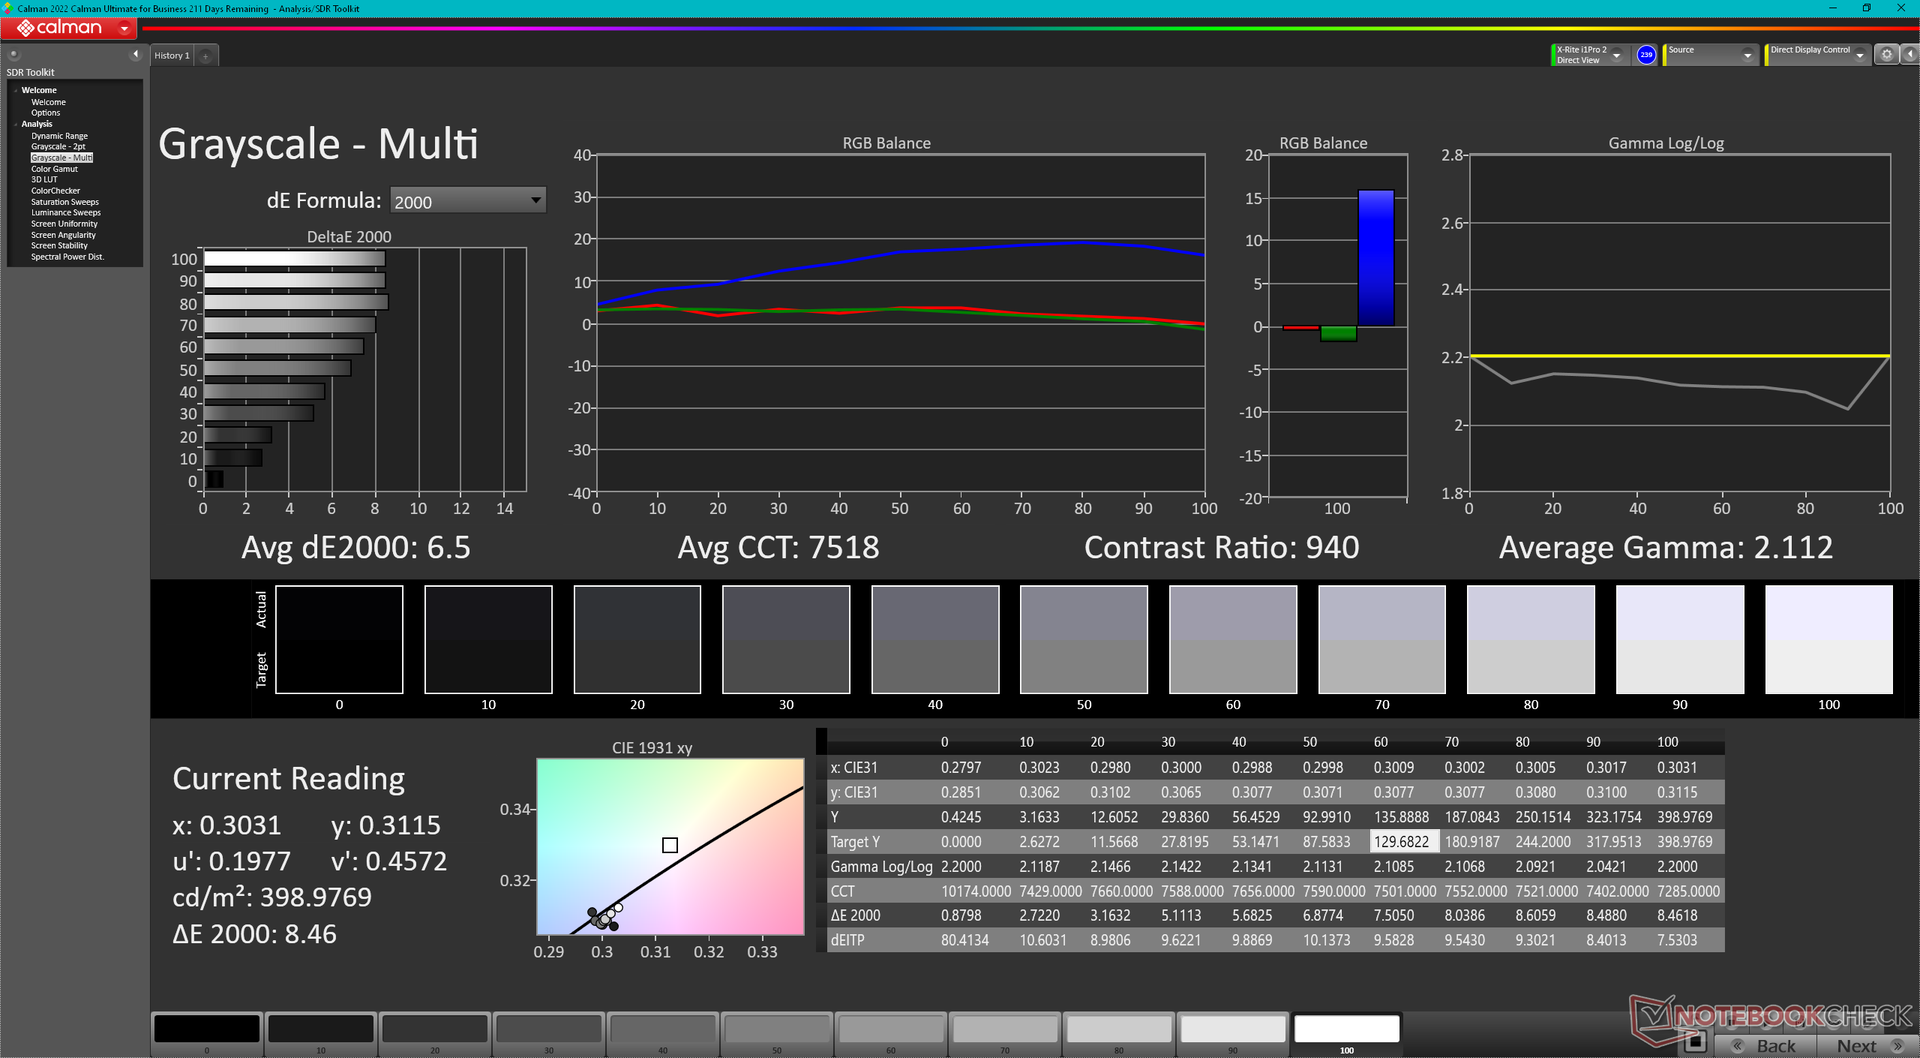
ΔE Greyscale Calman: 6.5 | ∀{0.09-98 Ø4.96}
86.5% AdobeRGB 1998 (Argyll 3D)
99.9% sRGB (Argyll 3D)
97.6% Display P3 (Argyll 3D)
Gamma: 2.11
CCT: 7518 K
| MSI GE78HX 13VH-070US AU Optronics B170QAN01.2, IPS, 2560x1600, 17" | Eluktronics Mech-17 GP2 BOE NE170QDM-NZ1, IPS, 2560x1600, 17" | Asus ROG Strix G17 G713PI BOE0B69, IPS, 2560x1440, 17.3" | MSI Titan GT77 HX 13VI B173ZAN06.C, Mini-LED, 3840x2160, 17.3" | MSI Raider GE77 HX 12UHS AU Optronics B173ZAN06.1, IPS, 3840x2160, 17.3" | Razer Blade 17 Early 2022 AU Optronics B173ZAN06.9, IPS, 3840x2160, 17.3" | |
|---|---|---|---|---|---|---|
| Display | -16% | 0% | 1% | -1% | 1% | |
| Display P3 Coverage (%) | 97.6 | 69.1 -29% | 98.3 1% | 94.9 -3% | 96.6 -1% | 99.4 2% |
| sRGB Coverage (%) | 99.9 | 99.7 0% | 100 0% | 99.9 0% | 99.8 0% | 100 0% |
| AdobeRGB 1998 Coverage (%) | 86.5 | 69.8 -19% | 85.9 -1% | 92.4 7% | 85.8 -1% | 87.3 1% |
| Response Times | -117% | -30% | -565% | -13% | -33% | |
| Response Time Grey 50% / Grey 80% * (ms) | 4.2 ? | 12 ? -186% | 5.3 ? -26% | 38.4 ? -814% | 5.8 ? -38% | 7.5 ? -79% |
| Response Time Black / White * (ms) | 6.4 ? | 9.4 ? -47% | 8.6 ? -34% | 26.6 ? -316% | 5.6 ? 13% | 5.6 ? 13% |
| PWM Frequency (Hz) | 2380 ? | |||||
| Screen | 27% | 27% | 77665% | -32% | 36% | |
| Brightness middle (cd/m²) | 398.6 | 417.3 5% | 327 -18% | 606 52% | 381 -4% | 503 26% |
| Brightness (cd/m²) | 384 | 387 1% | 320 -17% | 602 57% | 371 -3% | 486 27% |
| Brightness Distribution (%) | 89 | 87 -2% | 89 0% | 93 4% | 84 -6% | 84 -6% |
| Black Level * (cd/m²) | 0.46 | 0.42 9% | 0.38 17% | 0.0001 100% | 0.52 -13% | 0.44 4% |
| Contrast (:1) | 867 | 994 15% | 861 -1% | 6060000 698862% | 733 -15% | 1143 32% |
| Colorchecker dE 2000 * | 4.05 | 2.14 47% | 1.01 75% | 4.8 -19% | 1.08 73% | |
| Colorchecker dE 2000 max. * | 8.68 | 4.09 53% | 4.01 54% | 8.2 6% | 4.54 48% | |
| Colorchecker dE 2000 calibrated * | 1.02 | 0.42 59% | 0.41 60% | 1.8 -76% | 2.53 -148% | 0.6 41% |
| Greyscale dE 2000 * | 6.5 | 3.1 52% | 1.6 75% | 6.5 -0% | 1.3 80% | |
| Gamma | 2.11 104% | 2.19 100% | 2.168 101% | 2.63 84% | 2.151 102% | |
| CCT | 7518 86% | 6040 108% | 6659 98% | 6596 99% | 6541 99% | |
| Total Average (Program / Settings) | -35% /
-3% | -1% /
13% | 25700% /
49847% | -15% /
-20% | 1% /
19% |
* ... smaller is better
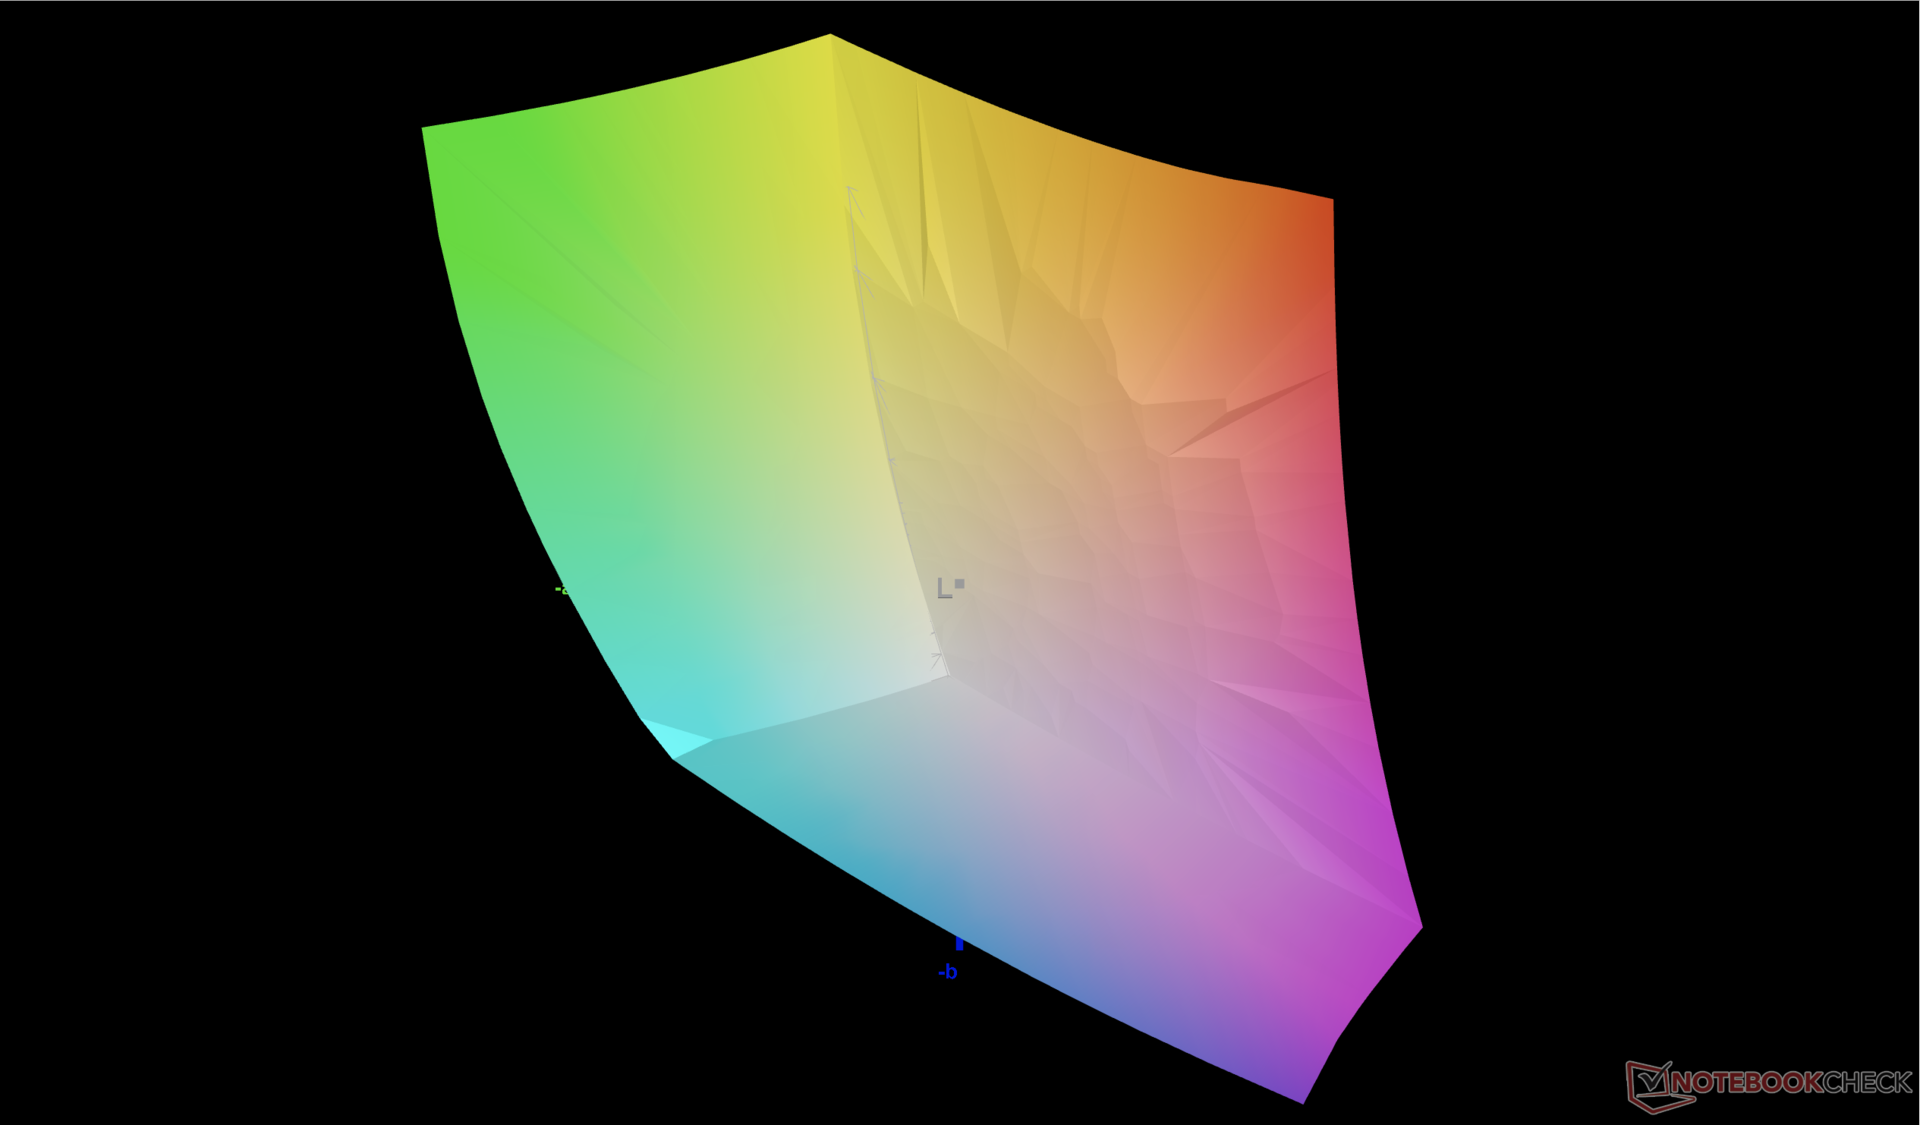
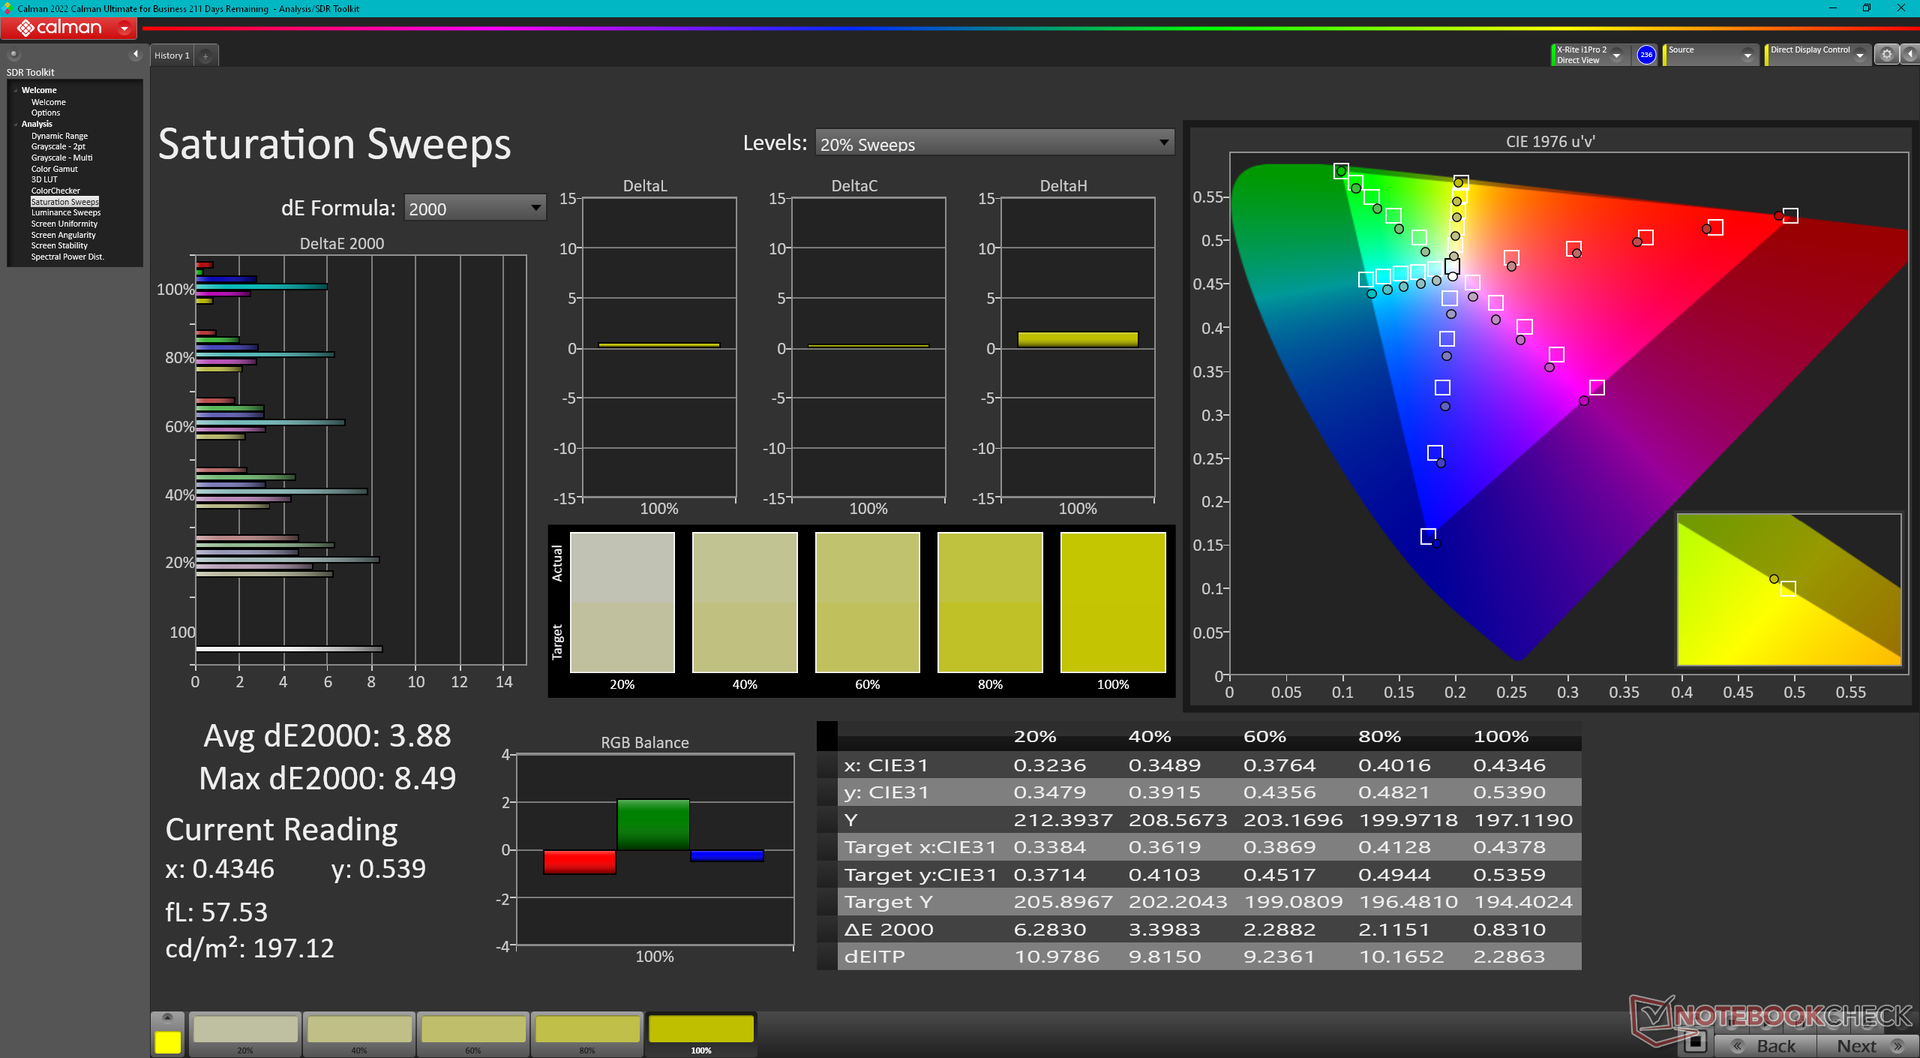
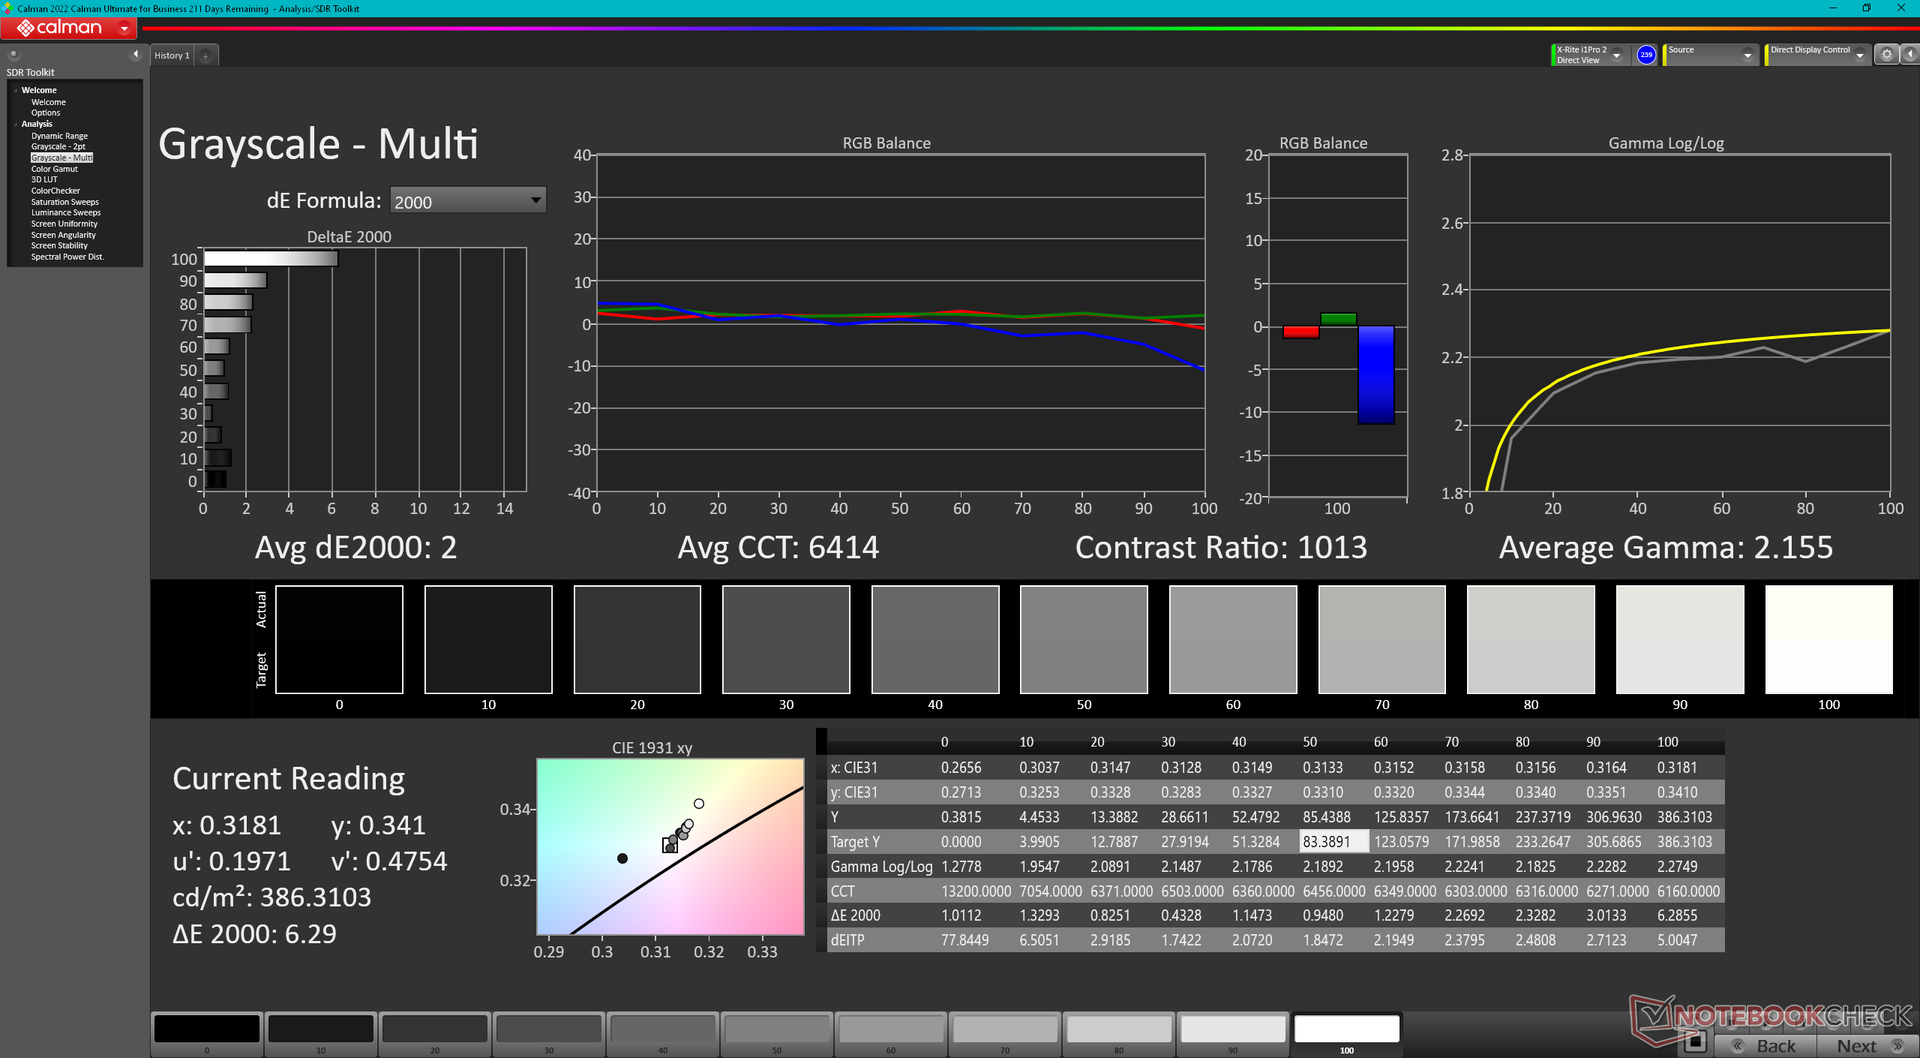
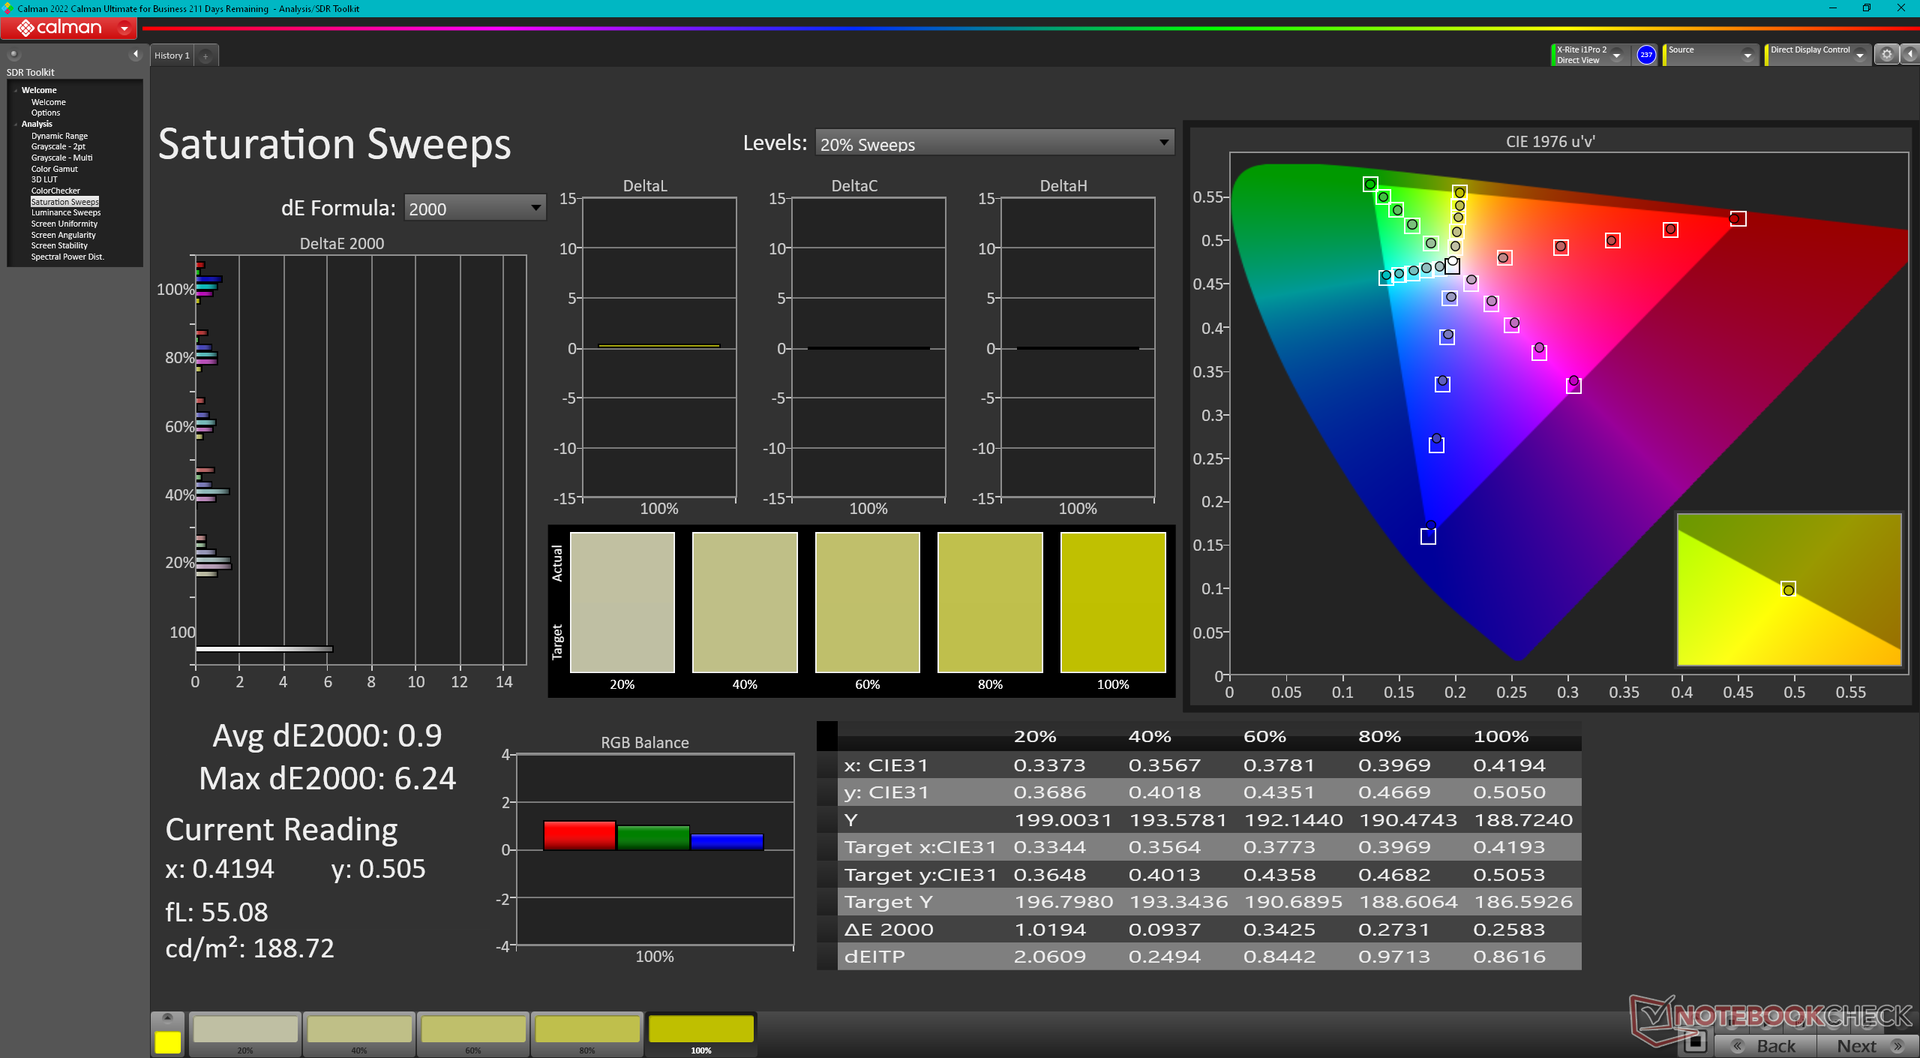
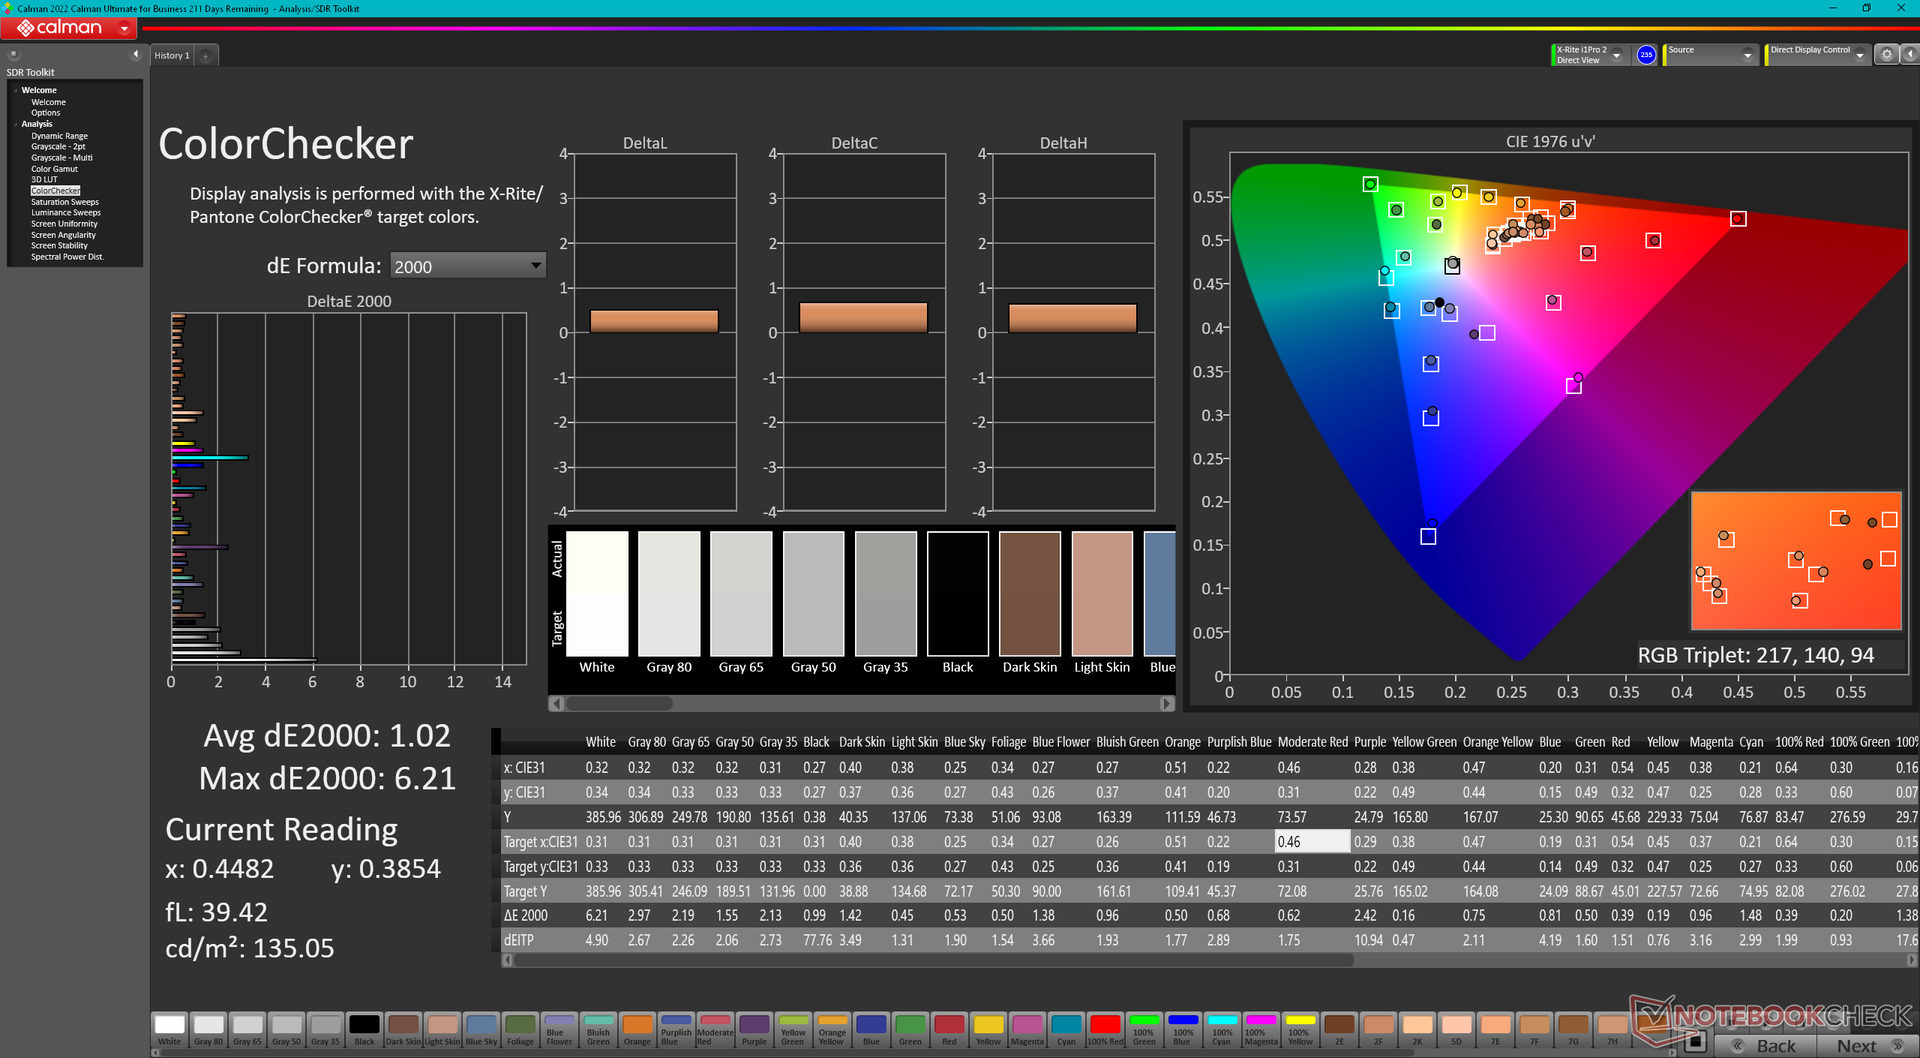
The display is set to P3 colors out of the box by default. While color accuracy isn't bad, the model is not calibrated at factory unlike on the MSI Creator series. We recommend applying our calibrated ICM profile above to get more accurate colors from the panel especially since it covers sRGB and P3 entirely. We're able to bring down the average grayscale and color DeltaE values to just 2 and 1.02, respectively, with our X-Rite colorimeter.
Display Response Times
| ↔ Response Time Black to White | ||
|---|---|---|
| 6.4 ms ... rise ↗ and fall ↘ combined | ↗ 2.8 ms rise | 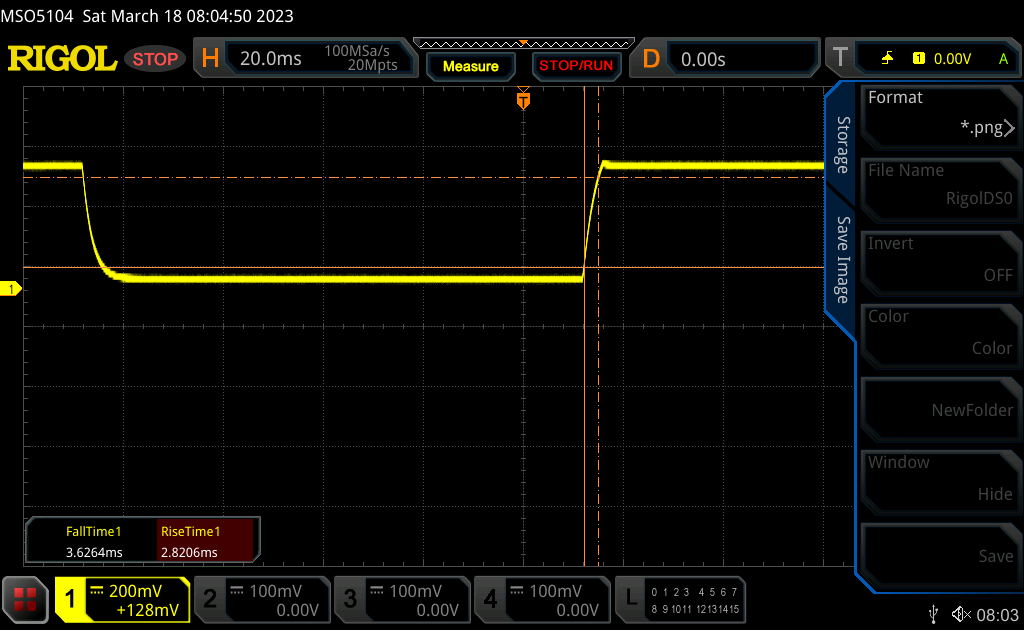 |
| ↘ 3.6 ms fall | ||
| The screen shows very fast response rates in our tests and should be very well suited for fast-paced gaming. In comparison, all tested devices range from 0.1 (minimum) to 240 (maximum) ms. » 20 % of all devices are better. This means that the measured response time is better than the average of all tested devices (19.8 ms). | ||
| ↔ Response Time 50% Grey to 80% Grey | ||
| 4.2 ms ... rise ↗ and fall ↘ combined | ↗ 1.9 ms rise | 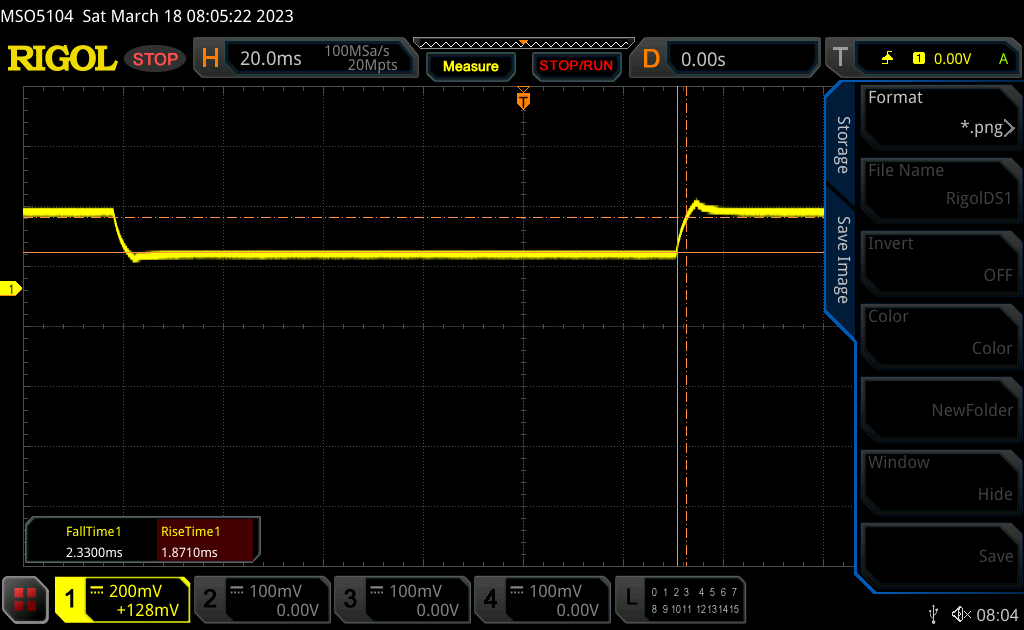 |
| ↘ 2.3 ms fall | ||
| The screen shows very fast response rates in our tests and should be very well suited for fast-paced gaming. In comparison, all tested devices range from 0.165 (minimum) to 636 (maximum) ms. » 16 % of all devices are better. This means that the measured response time is better than the average of all tested devices (31 ms). | ||
Screen Flickering / PWM (Pulse-Width Modulation)
| Screen flickering / PWM not detected | 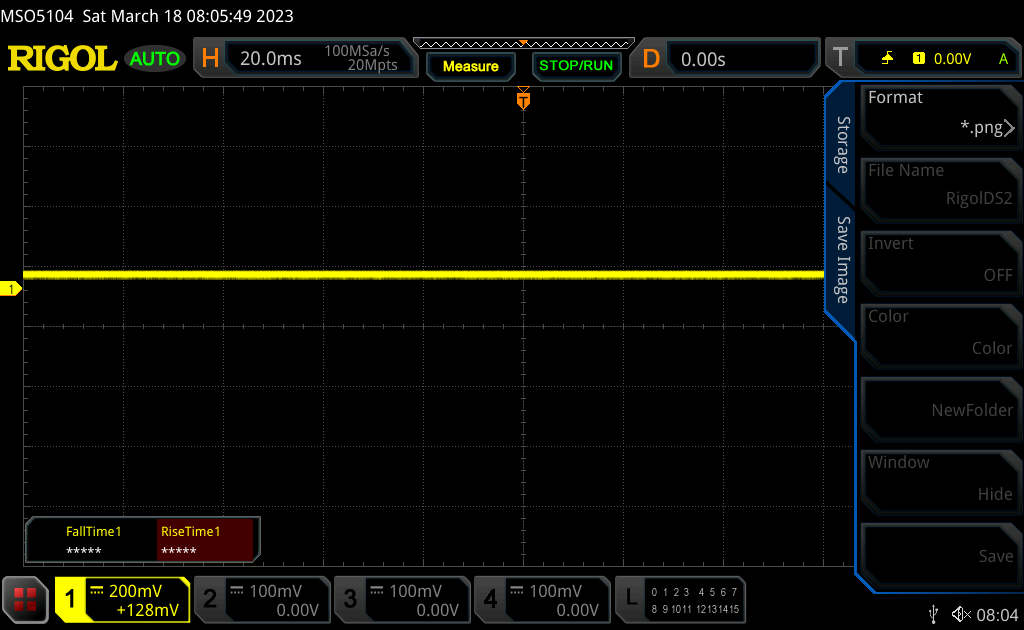 | ||
In comparison: 52 % of all tested devices do not use PWM to dim the display. If PWM was detected, an average of 7757 (minimum: 5 - maximum: 343500) Hz was measured. | |||
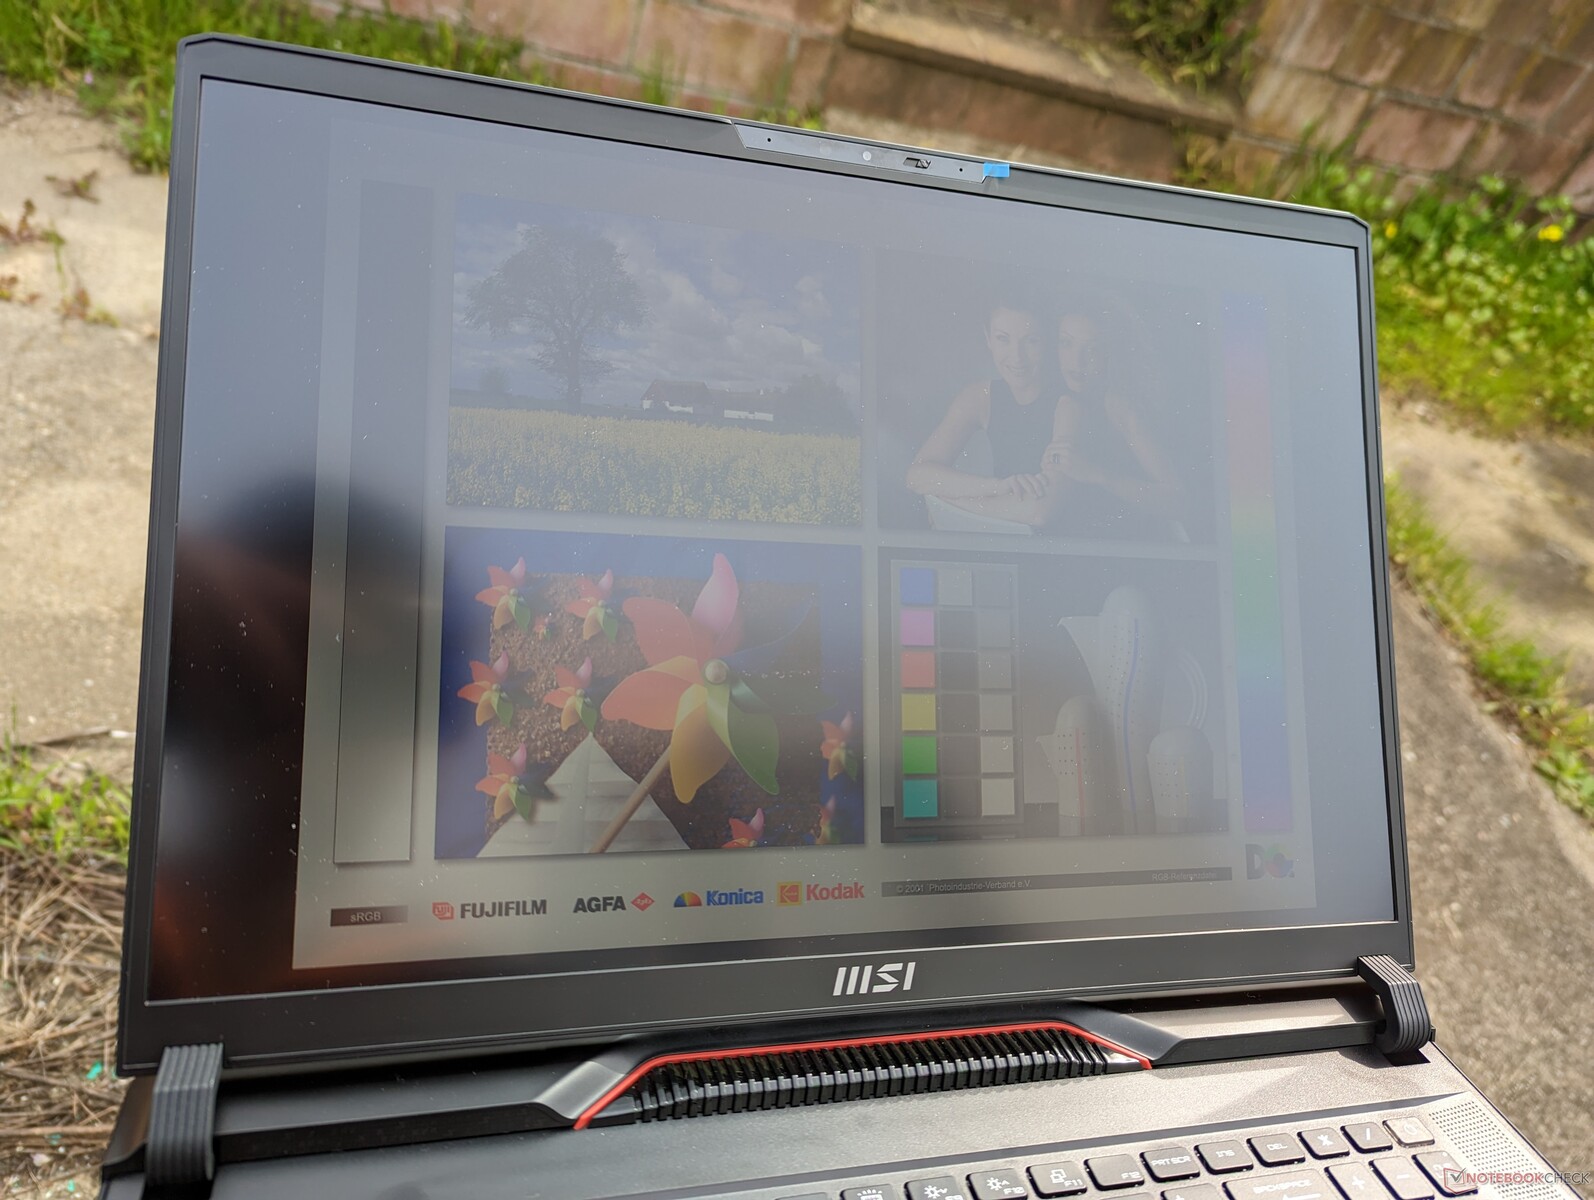
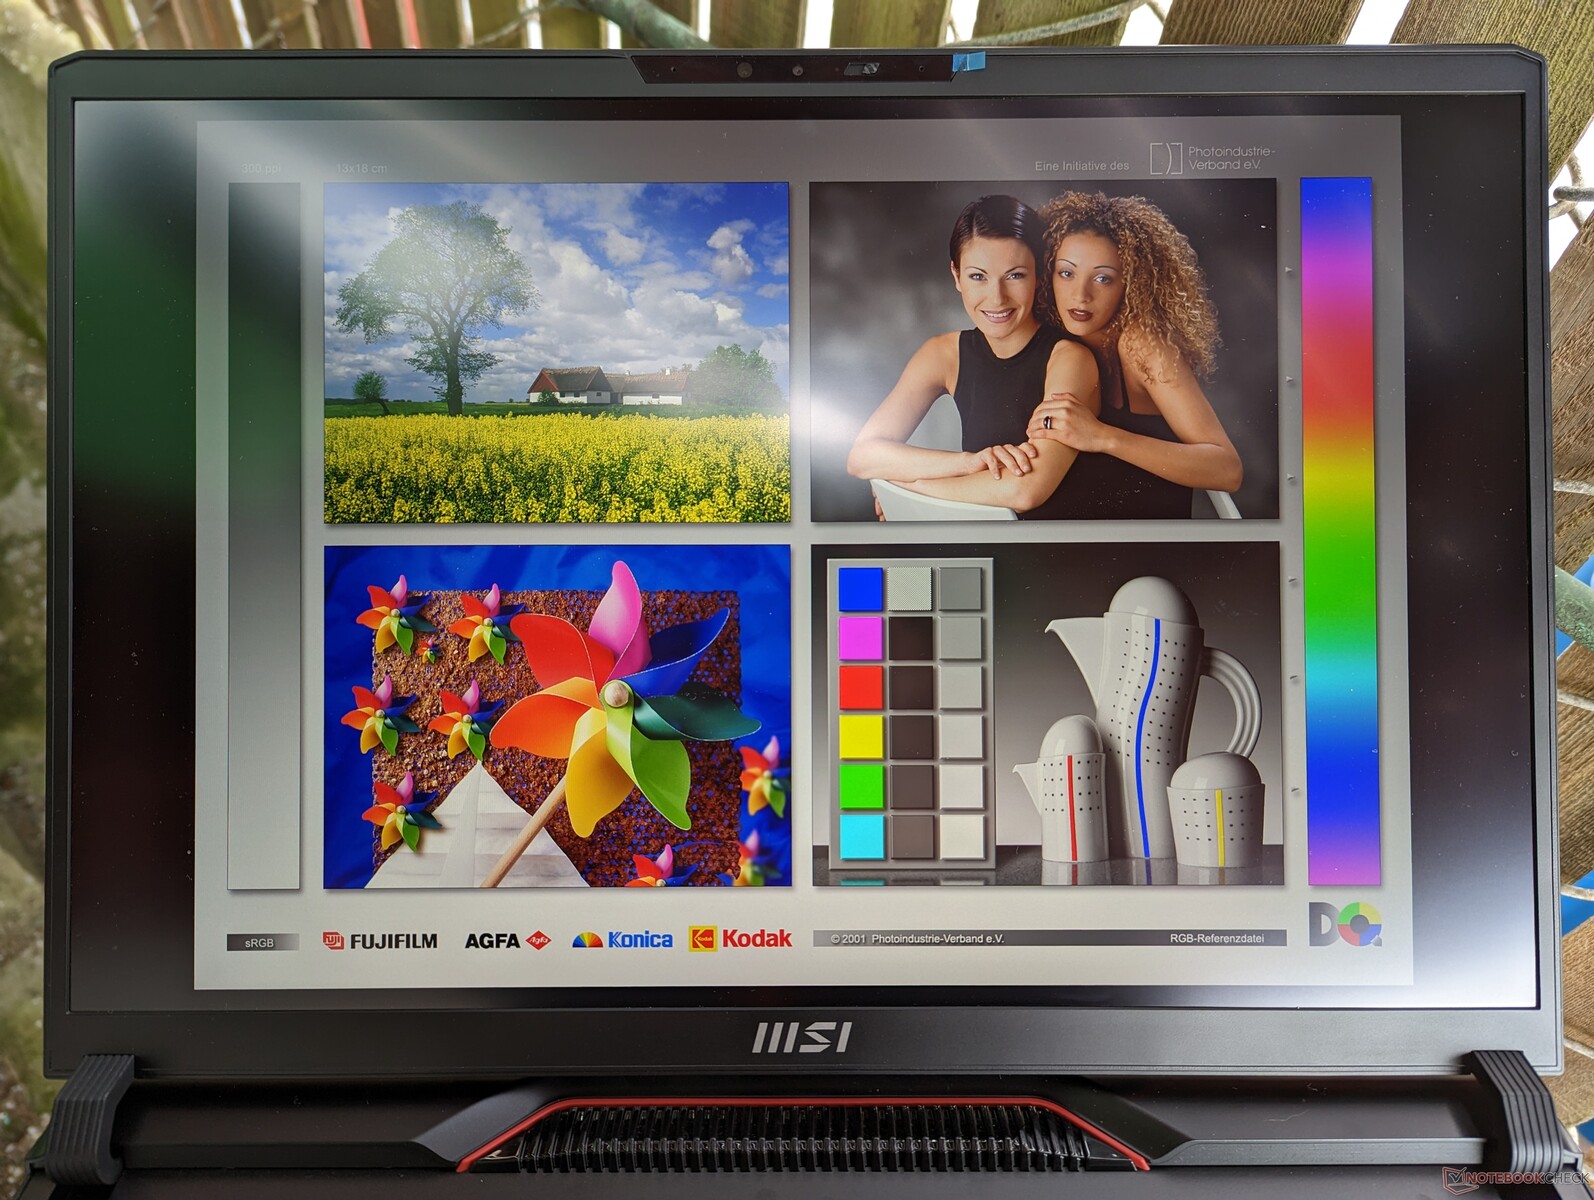
Outdoor visibility remains about the same as on the GE77. The mini-LED panel on the Titan GT77 is even brighter by 1.5x for better outdoor visibility, but the model itself is much larger than our GE78.
Performance — Intel 13th Gen + Mobile GeForce RTX 40
Testing Conditions
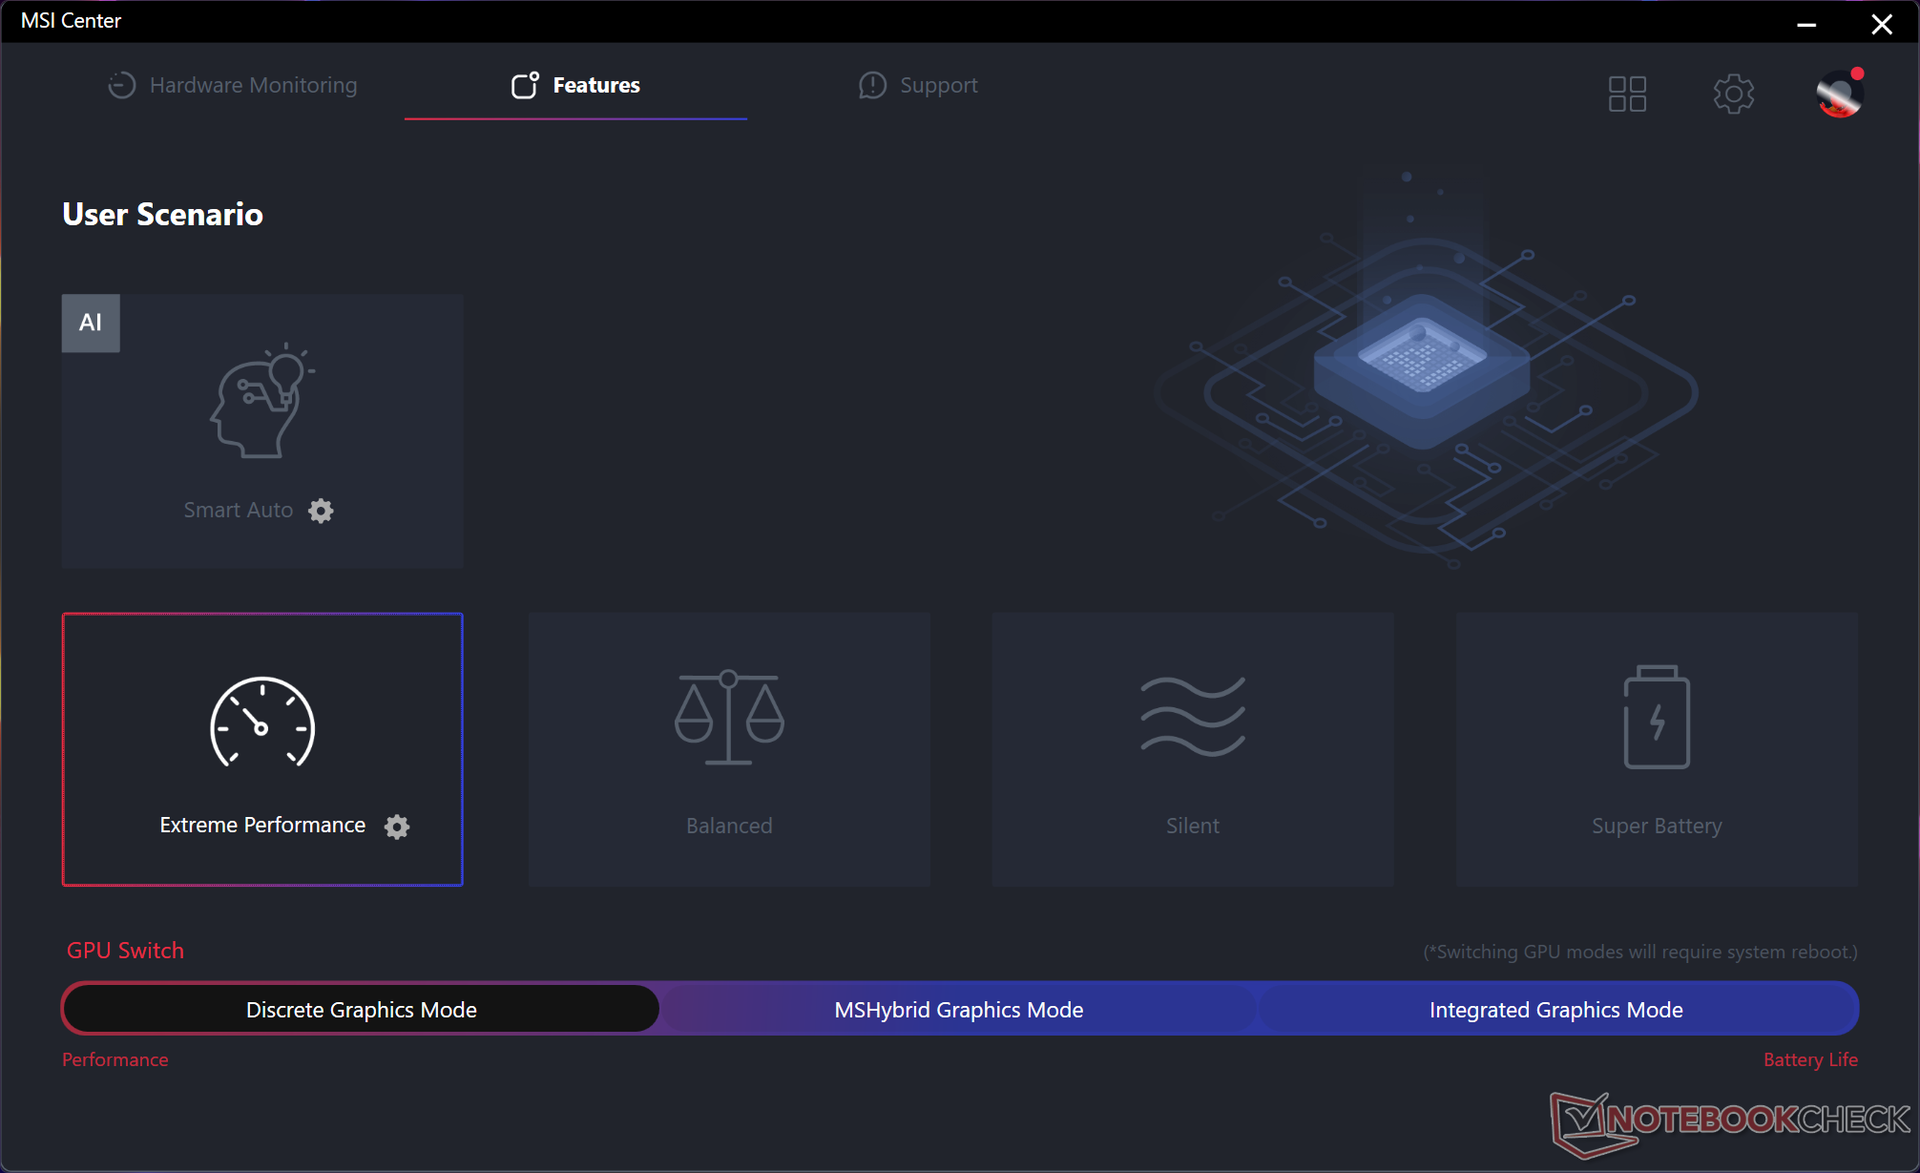
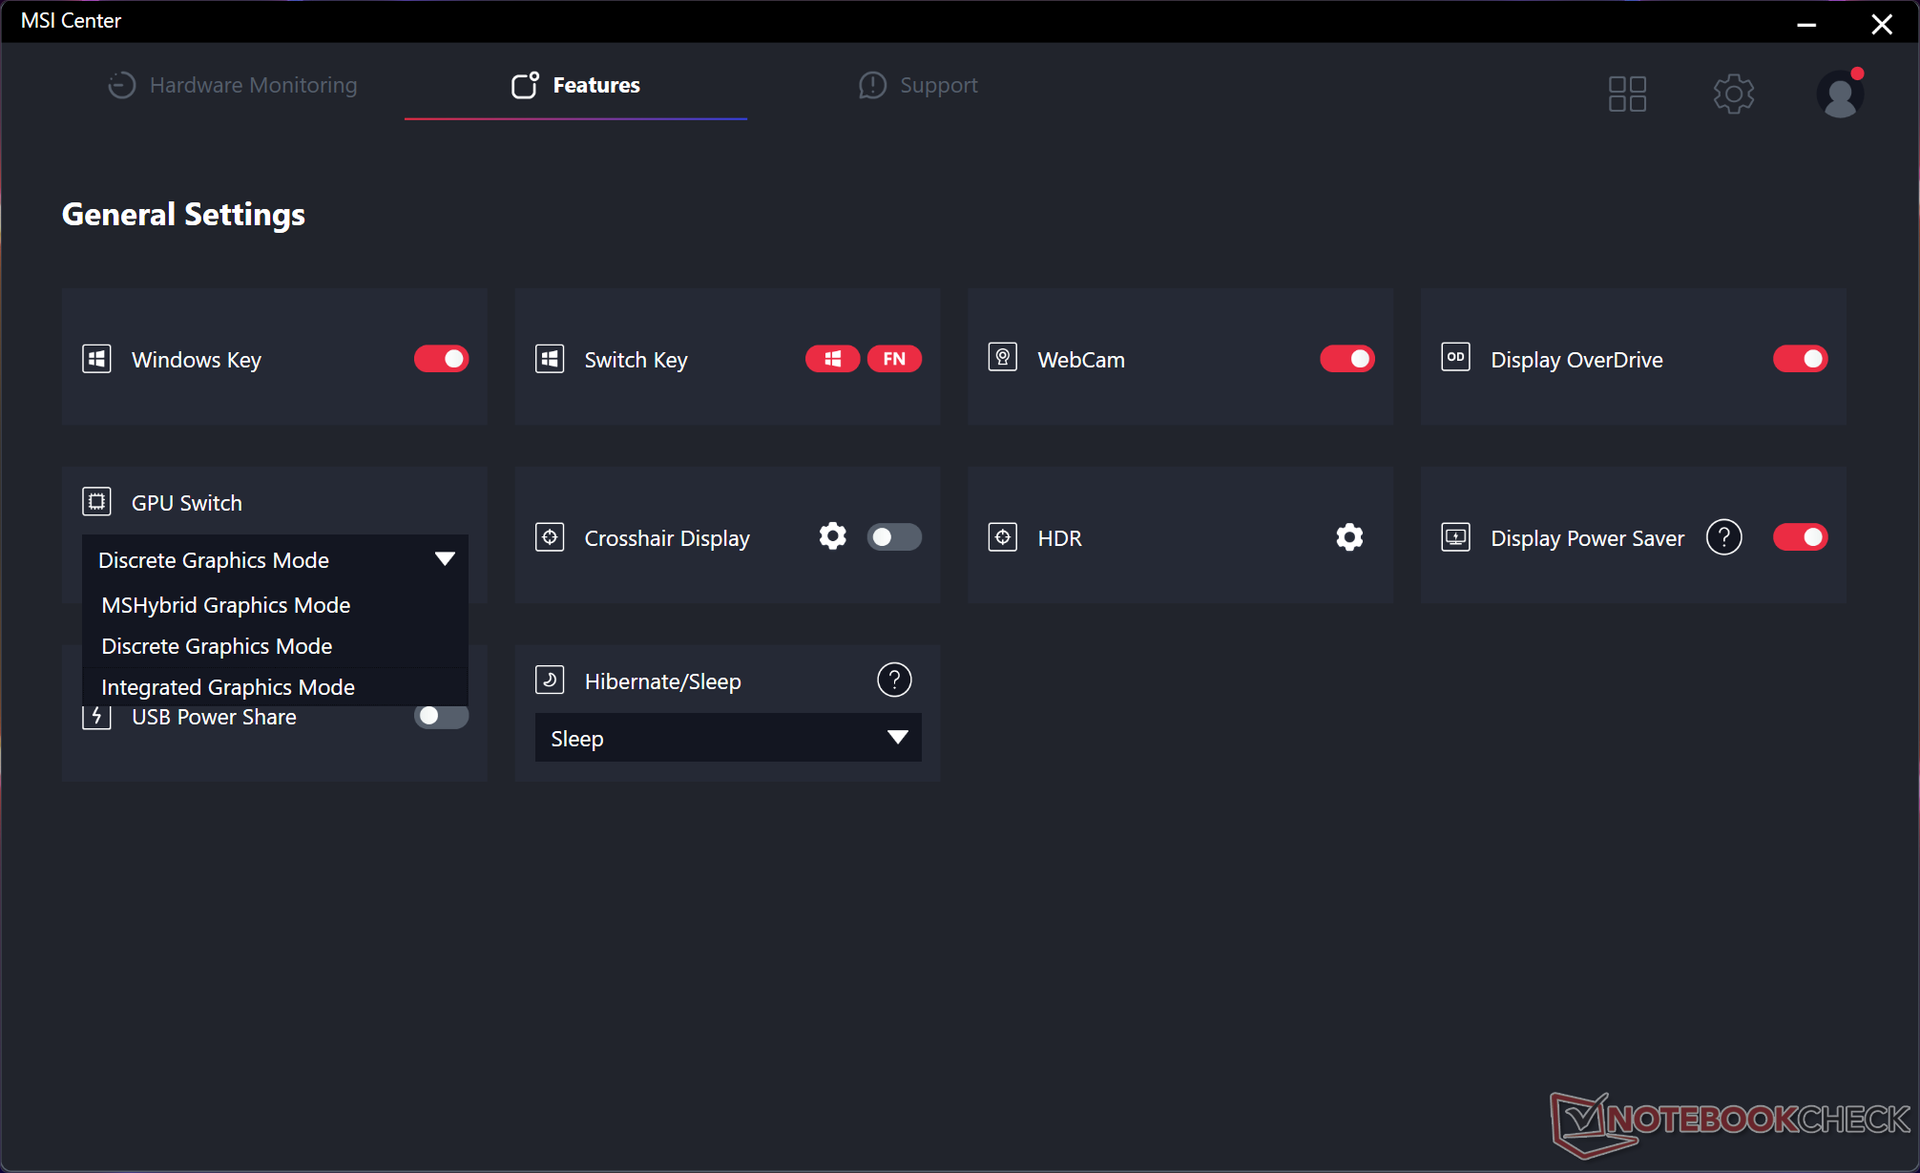
We set our unit to Extreme Performance mode, Auto fan mode, Discrete Graphics mode, and Windows Best Performance mode prior to running any benchmarks below. Annoyingly, the MSI power modes do not sync with Windows and so it is possible to have MSI Center set to Extreme Performance mode and Windows set to Power Saver mode simultaneously.
Another fan mode is available called Cooler Boost mode which raises the fans to their highest RPMs regardless of the onscreen activity. This doesn't necessarily improve performance, however, as our Stress Test section below will show.
Note that MSI Center will automatically set itself to Extreme Performance mode when running on Discrete Graphics mode even when you tell the software to run on Balanced mode. It would be better to simply gray out any performance mode options if they are incompatible with the current GPU selection to avoid confusion.
Advanced Optimus is not supported and so a reboot is required when switching between the discrete GPU (MUX) and MS Hybrid mode. G-Sync is not supported on the internal display.
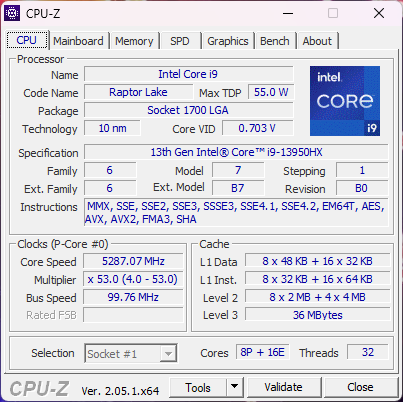
Processor
Raw CPU performance is one of the fastest on any laptop regardless of size or manufacturer. The 13th gen Core i9-13950HX in our MSI would outperform the latest Zen 4 Ryzen 9 7945HX in the competing Asus ROG Strix G17 G713PI by up to 5 percent and 15 percent in multi-threaded and single-threaded tests, respectively. The year-over-year gains over the previous 12th gen Core i9-12900HX in last year's GE77 is also significant at 45 percent.
As impressive as the Core i9-13950HX may be, potential buyers may still want to consider the lesser Core i9-13900HX configuration instead because the performance differences between the two processors are within just 5 percent of one another.
Cinebench R15 Multi Loop
Cinebench R23: Multi Core | Single Core
Cinebench R20: CPU (Multi Core) | CPU (Single Core)
Cinebench R15: CPU Multi 64Bit | CPU Single 64Bit
Blender: v2.79 BMW27 CPU
7-Zip 18.03: 7z b 4 | 7z b 4 -mmt1
Geekbench 5.5: Multi-Core | Single-Core
HWBOT x265 Benchmark v2.2: 4k Preset
LibreOffice : 20 Documents To PDF
R Benchmark 2.5: Overall mean
| HWBOT x265 Benchmark v2.2 / 4k Preset | |
| MSI GE78HX 13VH-070US | |
| Eluktronics Mech-17 GP2 | |
| Asus ROG Strix G17 G713PI | |
| Average Intel Core i9-13950HX (26 - 34.5, n=7) | |
| MSI Raider GE77 HX 12UHS | |
| Asus ROG Strix Scar 17 SE G733CX-LL014W | |
| Schenker XMG Core 15 (M22) | |
| Corsair Voyager a1600 | |
| Alienware m17 R5 (R9 6900HX, RX 6850M XT) | |
| Razer Blade 17 Early 2022 | |
| Schenker Compact 17 | |
* ... smaller is better
AIDA64: FP32 Ray-Trace | FPU Julia | CPU SHA3 | CPU Queen | FPU SinJulia | FPU Mandel | CPU AES | CPU ZLib | FP64 Ray-Trace | CPU PhotoWorxx
| Performance rating | |
| Asus ROG Strix G17 G713PI | |
| Eluktronics Mech-17 GP2 | |
| MSI GE78HX 13VH-070US | |
| MSI Titan GT77 HX 13VI | |
| Average Intel Core i9-13950HX | |
| MSI Raider GE77 HX 12UHS | |
| Razer Blade 17 Early 2022 | |
| AIDA64 / FP32 Ray-Trace | |
| Asus ROG Strix G17 G713PI | |
| MSI Titan GT77 HX 13VI | |
| MSI GE78HX 13VH-070US | |
| Eluktronics Mech-17 GP2 | |
| Average Intel Core i9-13950HX (17993 - 28957, n=9) | |
| MSI Raider GE77 HX 12UHS | |
| Razer Blade 17 Early 2022 | |
| AIDA64 / FPU Julia | |
| Asus ROG Strix G17 G713PI | |
| MSI Titan GT77 HX 13VI | |
| MSI GE78HX 13VH-070US | |
| Eluktronics Mech-17 GP2 | |
| Average Intel Core i9-13950HX (89362 - 144303, n=9) | |
| MSI Raider GE77 HX 12UHS | |
| Razer Blade 17 Early 2022 | |
| AIDA64 / CPU SHA3 | |
| Asus ROG Strix G17 G713PI | |
| MSI Titan GT77 HX 13VI | |
| Eluktronics Mech-17 GP2 | |
| MSI GE78HX 13VH-070US | |
| Average Intel Core i9-13950HX (4518 - 7093, n=9) | |
| MSI Raider GE77 HX 12UHS | |
| Razer Blade 17 Early 2022 | |
| AIDA64 / CPU Queen | |
| Asus ROG Strix G17 G713PI | |
| Eluktronics Mech-17 GP2 | |
| MSI GE78HX 13VH-070US | |
| MSI Titan GT77 HX 13VI | |
| Average Intel Core i9-13950HX (131931 - 140103, n=8) | |
| MSI Raider GE77 HX 12UHS | |
| Razer Blade 17 Early 2022 | |
| AIDA64 / FPU SinJulia | |
| Asus ROG Strix G17 G713PI | |
| Eluktronics Mech-17 GP2 | |
| MSI Titan GT77 HX 13VI | |
| MSI GE78HX 13VH-070US | |
| Average Intel Core i9-13950HX (12318 - 17057, n=9) | |
| MSI Raider GE77 HX 12UHS | |
| Razer Blade 17 Early 2022 | |
| AIDA64 / FPU Mandel | |
| Asus ROG Strix G17 G713PI | |
| MSI Titan GT77 HX 13VI | |
| MSI GE78HX 13VH-070US | |
| Eluktronics Mech-17 GP2 | |
| Average Intel Core i9-13950HX (44372 - 71038, n=9) | |
| MSI Raider GE77 HX 12UHS | |
| Razer Blade 17 Early 2022 | |
| AIDA64 / CPU AES | |
| Eluktronics Mech-17 GP2 | |
| MSI Raider GE77 HX 12UHS | |
| Asus ROG Strix G17 G713PI | |
| Average Intel Core i9-13950HX (99981 - 204491, n=9) | |
| MSI Titan GT77 HX 13VI | |
| MSI GE78HX 13VH-070US | |
| Razer Blade 17 Early 2022 | |
| AIDA64 / CPU ZLib | |
| Asus ROG Strix G17 G713PI | |
| MSI GE78HX 13VH-070US | |
| MSI Titan GT77 HX 13VI | |
| Eluktronics Mech-17 GP2 | |
| Average Intel Core i9-13950HX (1263 - 2069, n=9) | |
| MSI Raider GE77 HX 12UHS | |
| Razer Blade 17 Early 2022 | |
| AIDA64 / FP64 Ray-Trace | |
| Asus ROG Strix G17 G713PI | |
| MSI Titan GT77 HX 13VI | |
| MSI GE78HX 13VH-070US | |
| Eluktronics Mech-17 GP2 | |
| Average Intel Core i9-13950HX (9649 - 15573, n=9) | |
| MSI Raider GE77 HX 12UHS | |
| Razer Blade 17 Early 2022 | |
| AIDA64 / CPU PhotoWorxx | |
| MSI GE78HX 13VH-070US | |
| Average Intel Core i9-13950HX (40233 - 50864, n=9) | |
| MSI Raider GE77 HX 12UHS | |
| Eluktronics Mech-17 GP2 | |
| MSI Titan GT77 HX 13VI | |
| Razer Blade 17 Early 2022 | |
| Asus ROG Strix G17 G713PI | |
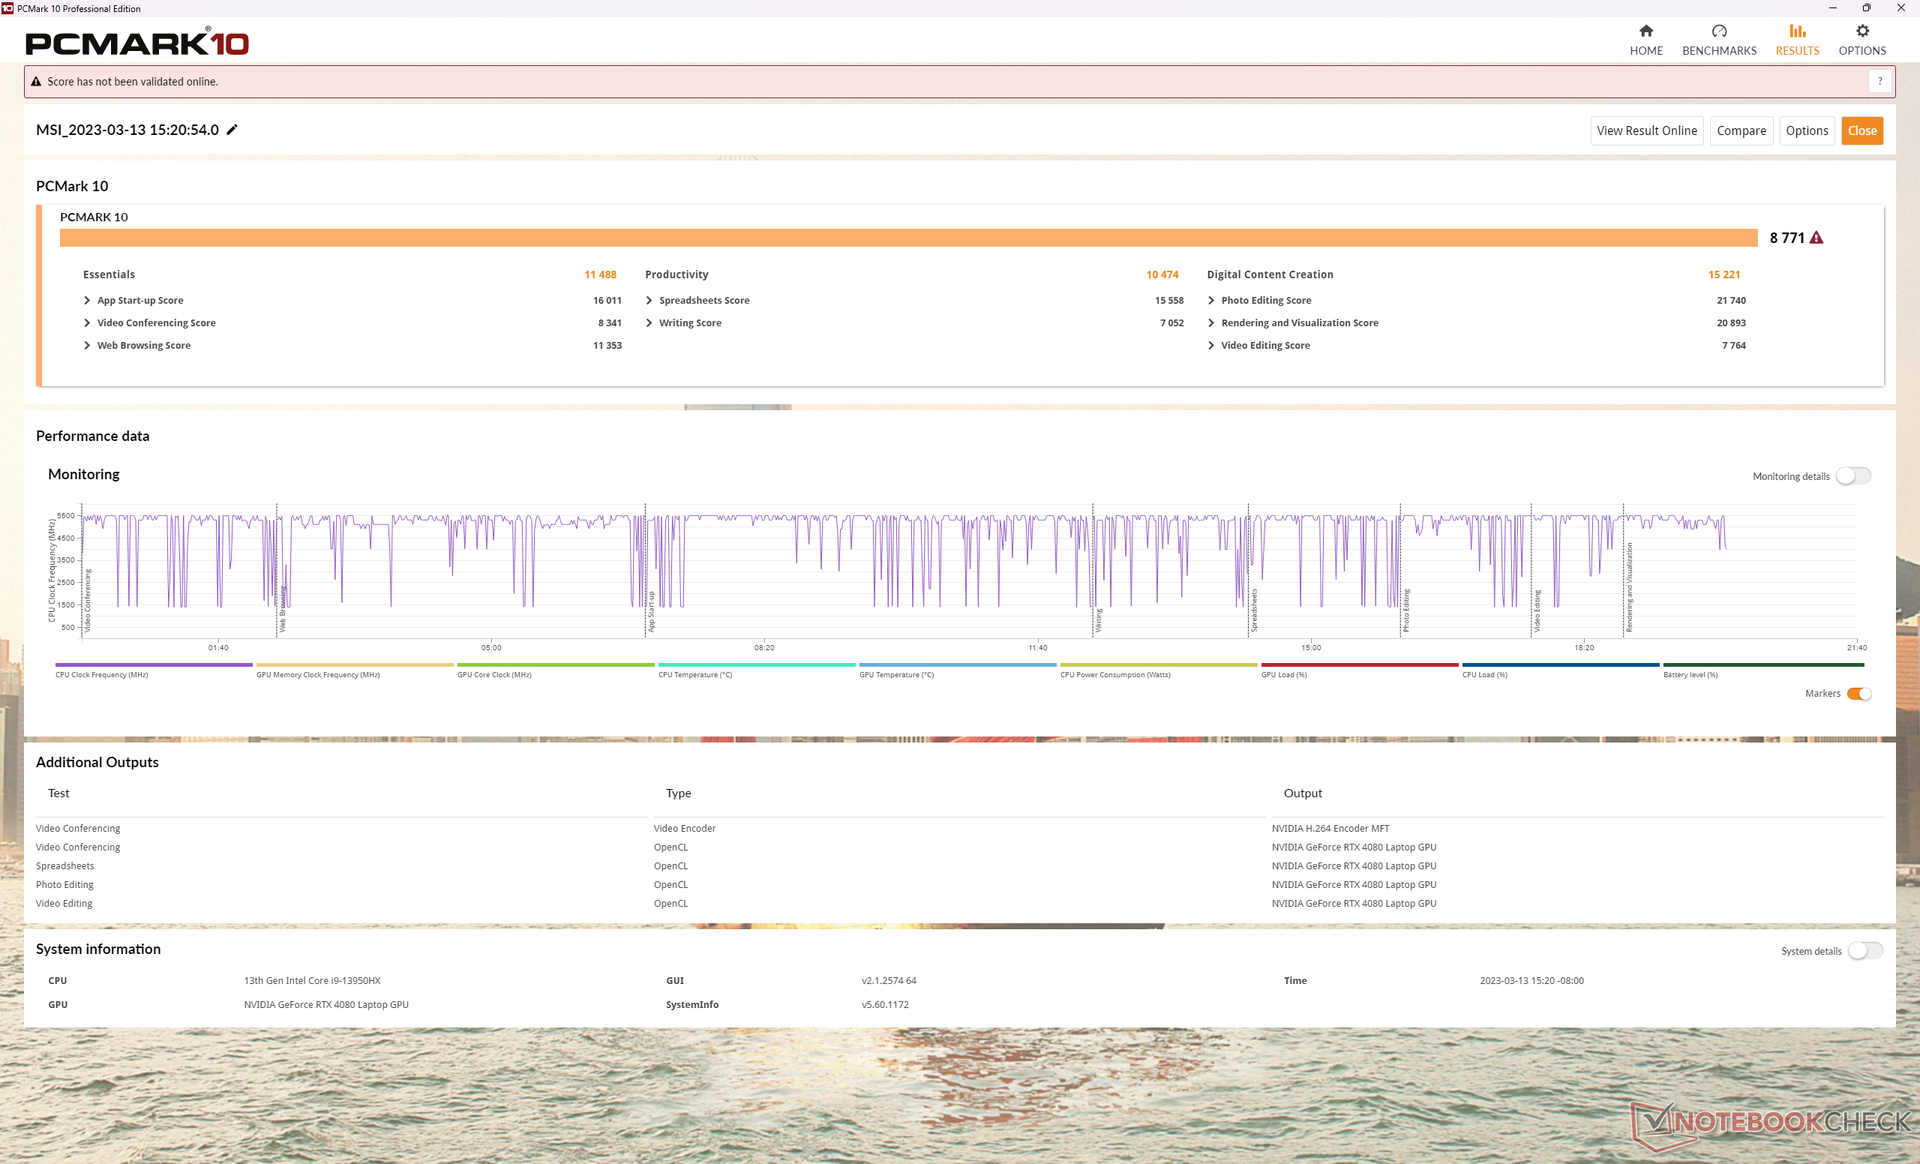
System Performance
PCMark 10 results are consistently ahead of the GE77 running on last generation hardware especially in the Digital Content subtest where GPU performance is favored.
We experienced an issue on our unit would it some sometimes not wake from sleep which would then require a hard reboot each time. The issue would seemingly occur more often in dGPU mode rather than MS Hybrid mode.
CrossMark: Overall | Productivity | Creativity | Responsiveness
| PCMark 10 / Score | |
| Eluktronics Mech-17 GP2 | |
| MSI Titan GT77 HX 13VI | |
| MSI GE78HX 13VH-070US | |
| Average Intel Core i9-13950HX, NVIDIA GeForce RTX 4080 Laptop GPU (7888 - 8771, n=2) | |
| Asus ROG Strix G17 G713PI | |
| Razer Blade 17 Early 2022 | |
| MSI Raider GE77 HX 12UHS | |
| PCMark 10 / Essentials | |
| Eluktronics Mech-17 GP2 | |
| MSI Titan GT77 HX 13VI | |
| MSI GE78HX 13VH-070US | |
| Average Intel Core i9-13950HX, NVIDIA GeForce RTX 4080 Laptop GPU (11078 - 11488, n=2) | |
| Asus ROG Strix G17 G713PI | |
| Razer Blade 17 Early 2022 | |
| MSI Raider GE77 HX 12UHS | |
| PCMark 10 / Productivity | |
| Asus ROG Strix G17 G713PI | |
| Eluktronics Mech-17 GP2 | |
| MSI GE78HX 13VH-070US | |
| MSI Titan GT77 HX 13VI | |
| MSI Raider GE77 HX 12UHS | |
| Average Intel Core i9-13950HX, NVIDIA GeForce RTX 4080 Laptop GPU (8271 - 10474, n=2) | |
| Razer Blade 17 Early 2022 | |
| PCMark 10 / Digital Content Creation | |
| MSI Titan GT77 HX 13VI | |
| Eluktronics Mech-17 GP2 | |
| MSI GE78HX 13VH-070US | |
| Average Intel Core i9-13950HX, NVIDIA GeForce RTX 4080 Laptop GPU (14535 - 15221, n=2) | |
| Razer Blade 17 Early 2022 | |
| MSI Raider GE77 HX 12UHS | |
| Asus ROG Strix G17 G713PI | |
| CrossMark / Overall | |
| Eluktronics Mech-17 GP2 | |
| MSI Raider GE77 HX 12UHS | |
| MSI Titan GT77 HX 13VI | |
| Asus ROG Strix G17 G713PI | |
| MSI GE78HX 13VH-070US | |
| Razer Blade 17 Early 2022 | |
| Average Intel Core i9-13950HX, NVIDIA GeForce RTX 4080 Laptop GPU (1592 - 1899, n=2) | |
| CrossMark / Productivity | |
| MSI Raider GE77 HX 12UHS | |
| Eluktronics Mech-17 GP2 | |
| MSI Titan GT77 HX 13VI | |
| Asus ROG Strix G17 G713PI | |
| MSI GE78HX 13VH-070US | |
| Razer Blade 17 Early 2022 | |
| Average Intel Core i9-13950HX, NVIDIA GeForce RTX 4080 Laptop GPU (1509 - 1846, n=2) | |
| CrossMark / Creativity | |
| Eluktronics Mech-17 GP2 | |
| MSI Titan GT77 HX 13VI | |
| MSI Raider GE77 HX 12UHS | |
| Asus ROG Strix G17 G713PI | |
| MSI GE78HX 13VH-070US | |
| Average Intel Core i9-13950HX, NVIDIA GeForce RTX 4080 Laptop GPU (1780 - 2035, n=2) | |
| Razer Blade 17 Early 2022 | |
| CrossMark / Responsiveness | |
| MSI Raider GE77 HX 12UHS | |
| MSI Titan GT77 HX 13VI | |
| Eluktronics Mech-17 GP2 | |
| MSI GE78HX 13VH-070US | |
| Asus ROG Strix G17 G713PI | |
| Razer Blade 17 Early 2022 | |
| Average Intel Core i9-13950HX, NVIDIA GeForce RTX 4080 Laptop GPU (1342 - 1681, n=2) | |
| PCMark 10 Score | 8771 points | |
Help | ||
| AIDA64 / Memory Copy | |
| MSI GE78HX 13VH-070US | |
| Average Intel Core i9-13950HX (61938 - 78813, n=9) | |
| MSI Raider GE77 HX 12UHS | |
| Eluktronics Mech-17 GP2 | |
| MSI Titan GT77 HX 13VI | |
| Razer Blade 17 Early 2022 | |
| Asus ROG Strix G17 G713PI | |
| AIDA64 / Memory Read | |
| MSI GE78HX 13VH-070US | |
| Average Intel Core i9-13950HX (62368 - 86831, n=9) | |
| Eluktronics Mech-17 GP2 | |
| MSI Raider GE77 HX 12UHS | |
| MSI Titan GT77 HX 13VI | |
| Razer Blade 17 Early 2022 | |
| Asus ROG Strix G17 G713PI | |
| AIDA64 / Memory Write | |
| MSI GE78HX 13VH-070US | |
| Average Intel Core i9-13950HX (59501 - 80441, n=9) | |
| Eluktronics Mech-17 GP2 | |
| MSI Raider GE77 HX 12UHS | |
| MSI Titan GT77 HX 13VI | |
| Asus ROG Strix G17 G713PI | |
| Razer Blade 17 Early 2022 | |
| AIDA64 / Memory Latency | |
| MSI Titan GT77 HX 13VI | |
| Average Intel Core i9-13950HX (84.4 - 99.5, n=9) | |
| Eluktronics Mech-17 GP2 | |
| Asus ROG Strix G17 G713PI | |
| MSI GE78HX 13VH-070US | |
| MSI Raider GE77 HX 12UHS | |
* ... smaller is better
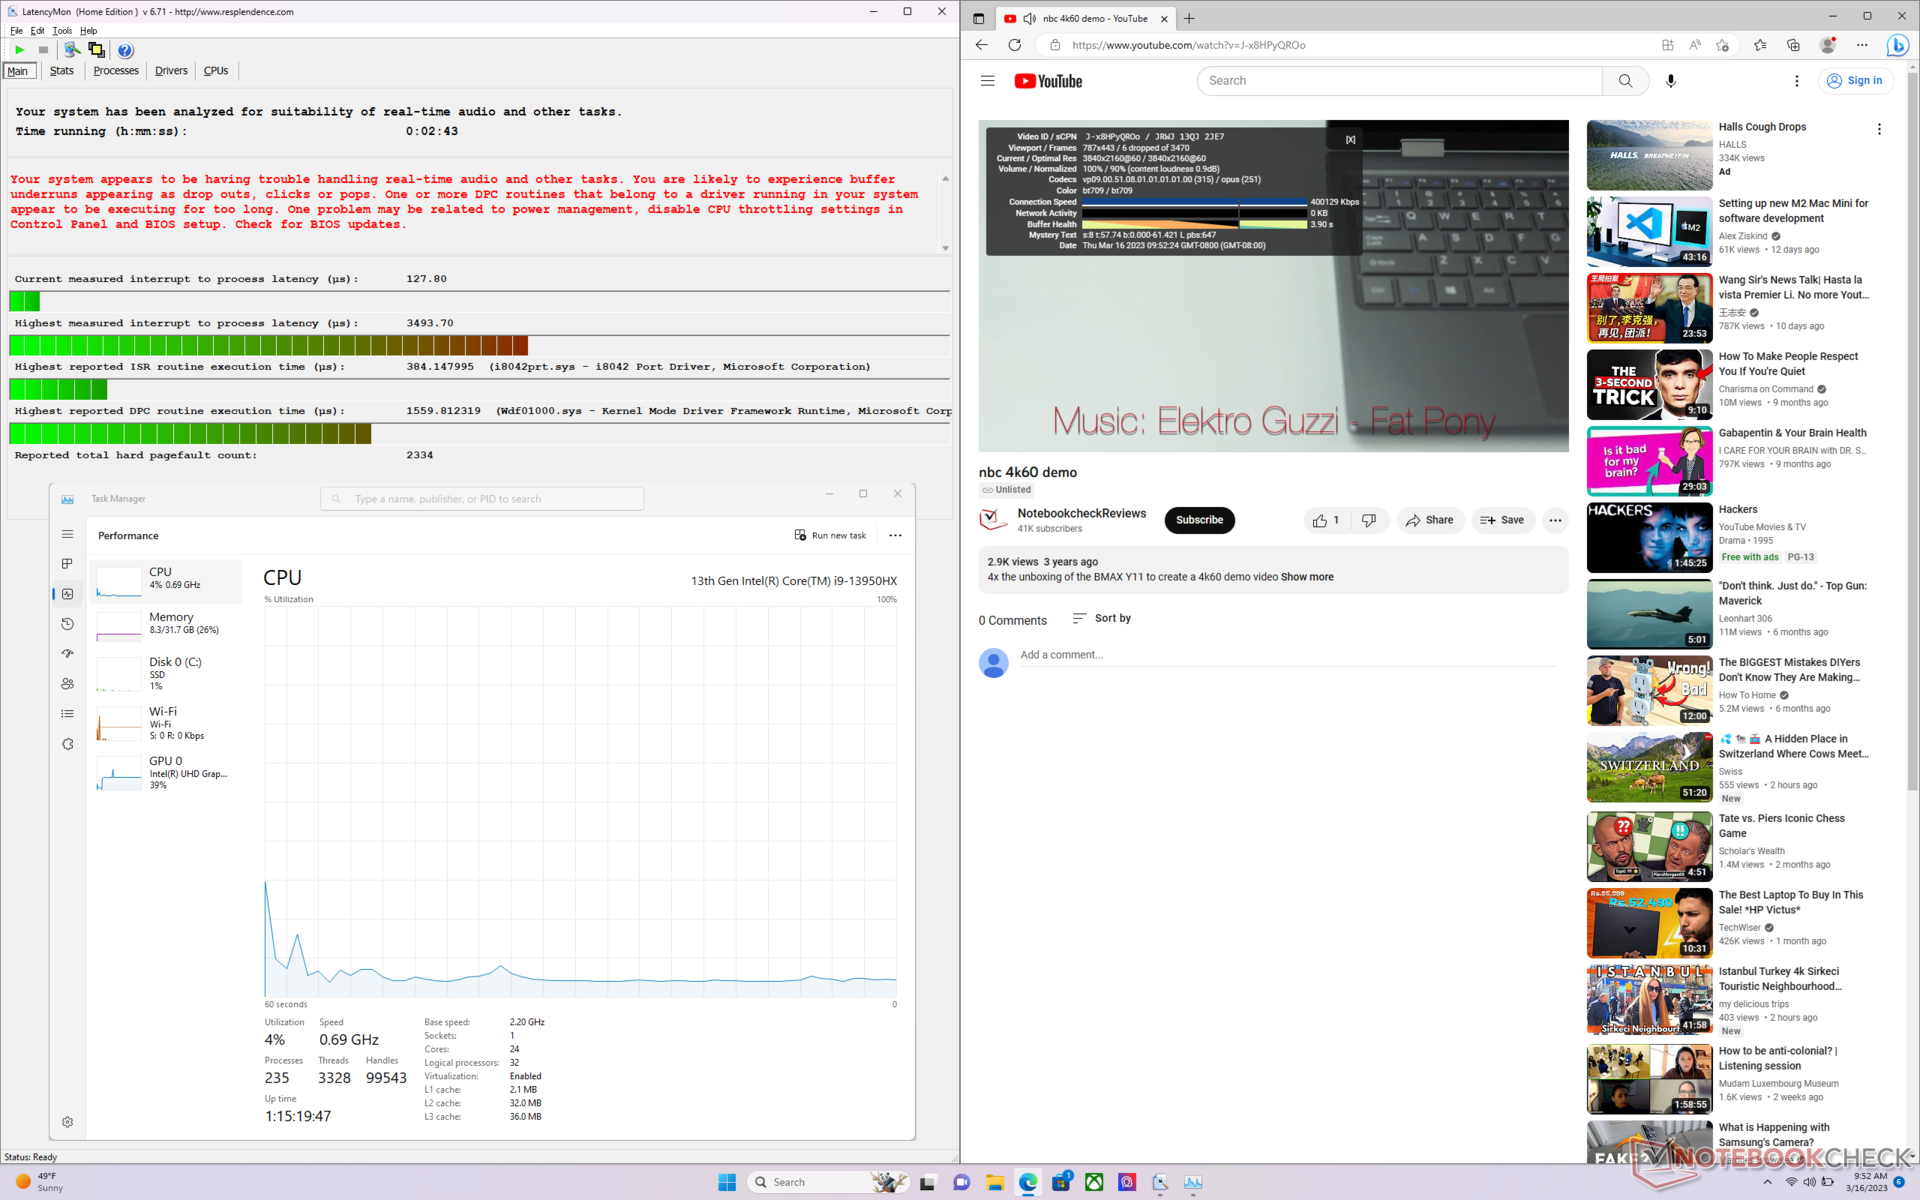
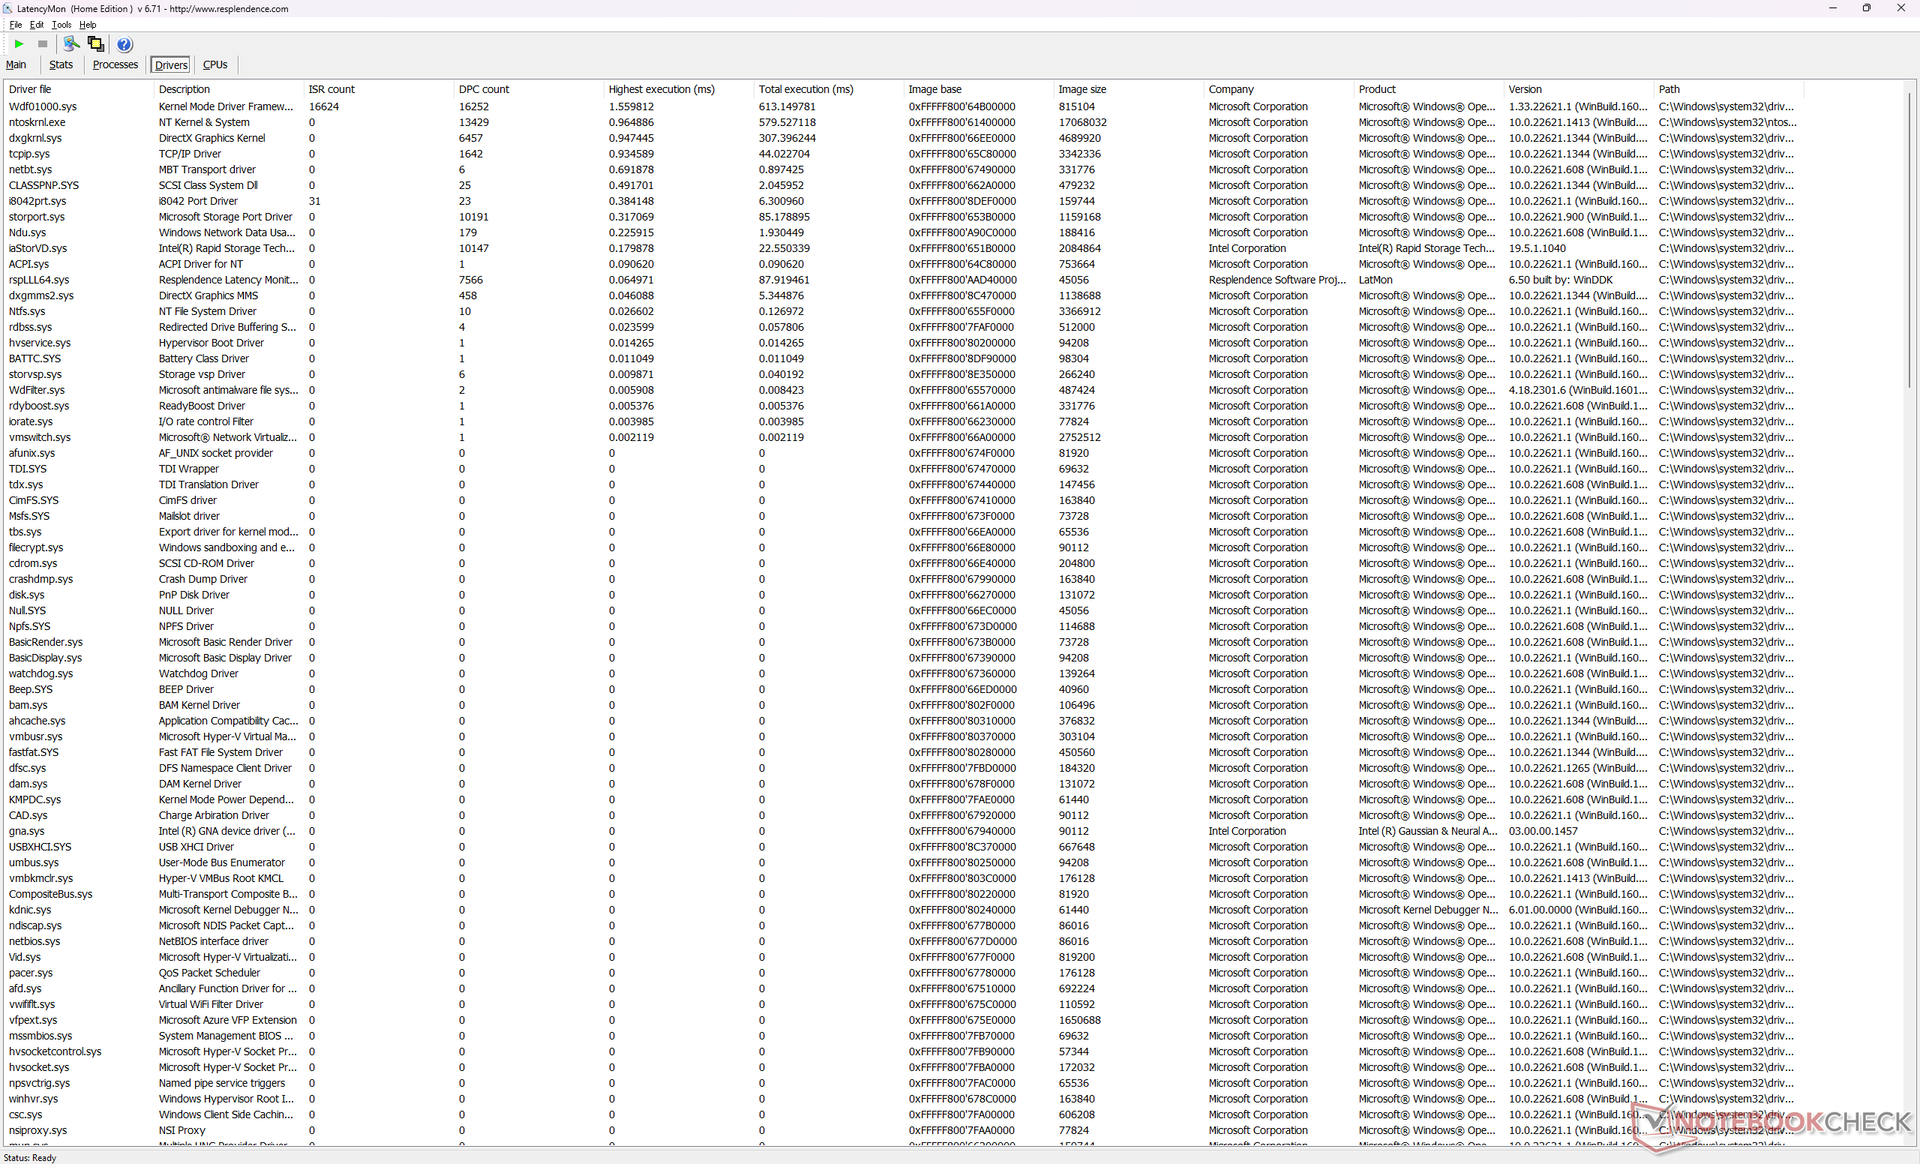
DPC Latency
LatencyMon reveals DPC issues when opening multiple browser tabs of our homepage even when set to the iGPU only. Nvidia has acknowledged a bug with its latest graphics drivers resultingin high DPC latencies as well.
4K video playback at 60 FPS is imperfect with 6 dropped frames during our minute-long test video. Repeating the test would not improve our results.
| DPC Latencies / LatencyMon - interrupt to process latency (max), Web, Youtube, Prime95 | |
| MSI Titan GT77 HX 13VI | |
| MSI GE78HX 13VH-070US | |
| MSI Raider GE77 HX 12UHS | |
| Asus ROG Strix G17 G713PI | |
| Eluktronics Mech-17 GP2 | |
| Razer Blade 17 Early 2022 | |
* ... smaller is better
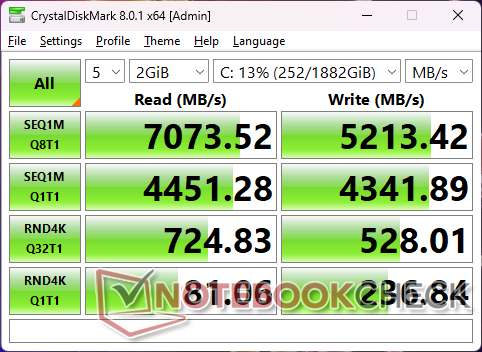
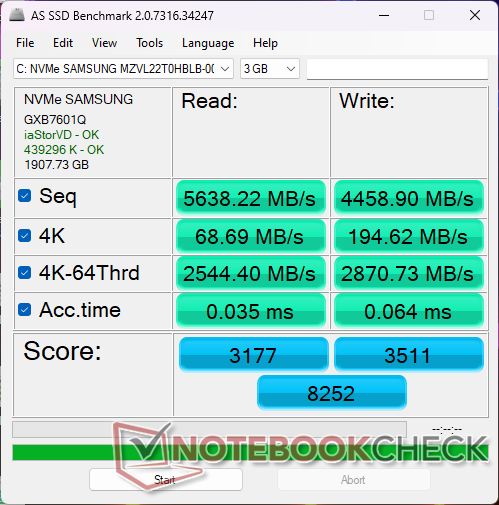
Storage Devices — Ready For PCIe5 SSDs
Our test unit ships with a 2 TB Samsung PM9A1 which is one of the fastest PCIe4 x4 NVMe SSDs available. The drive would have no issues maintaining transfer rates of over 7000 MB/s even when stressed as shown by our DiskSpd loop results below. This is to be expected since the GE78 can support even faster PCIe5 SSDs once they become widely available.

| Drive Performance rating - Percent | |
| MSI Raider GE77 HX 12UHS | |
| Razer Blade 17 Early 2022 | |
| MSI GE78HX 13VH-070US | |
| MSI Titan GT77 HX 13VI | |
| Eluktronics Mech-17 GP2 | |
| Asus ROG Strix G17 G713PI | |
* ... smaller is better
Disk Throttling: DiskSpd Read Loop, Queue Depth 8
GPU Performance — 175 W Graphics
The model currently offers three mobile GPU options: the GeForce RTX 4070, 4080, or 4090. Jumping from the mobile 4070 to the mobile 4080 will boost performance by 40 to 60 percent while jumping from the mobile 4080 to the mobile 4090 will only boost performance by about 10 percent. Knowing how these three mobile GPUs compare to one another should help in deciding which GE78 configuration to buy.
Our RTX 4080 configuration offers 30 to 50 percent faster raw performance than the mobile RTX 3080 Ti in last year's GE77. If the title supports DLSS 3 like Cyberpunk 2077, then performance can be up to 2x to 3x faster. We recommend checking out our dedicated review page on the mobile RTX 4080 for more benchmarks and comparisons related to the mobile GeForce 40 series.
The mobile RTX 4080 should not be directly compared to the desktop RTX 4080 which is significantly more power-hungry and even faster by about 1.5x.
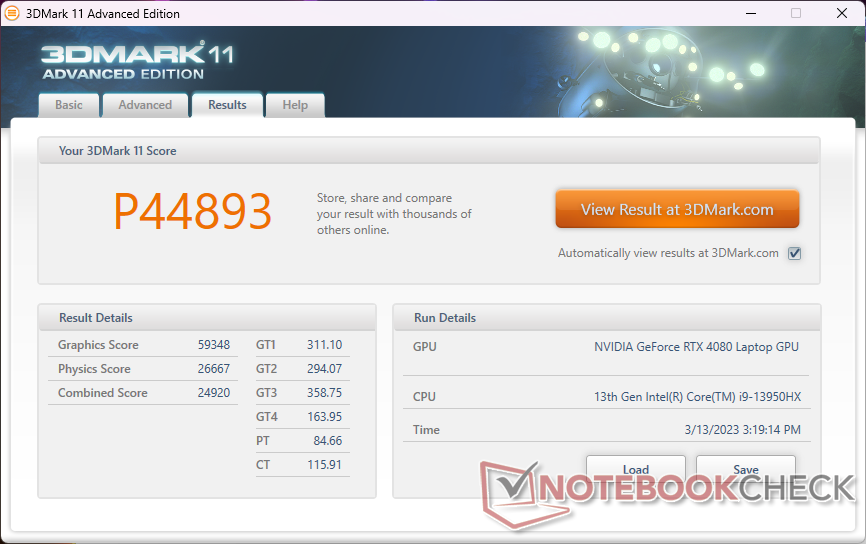
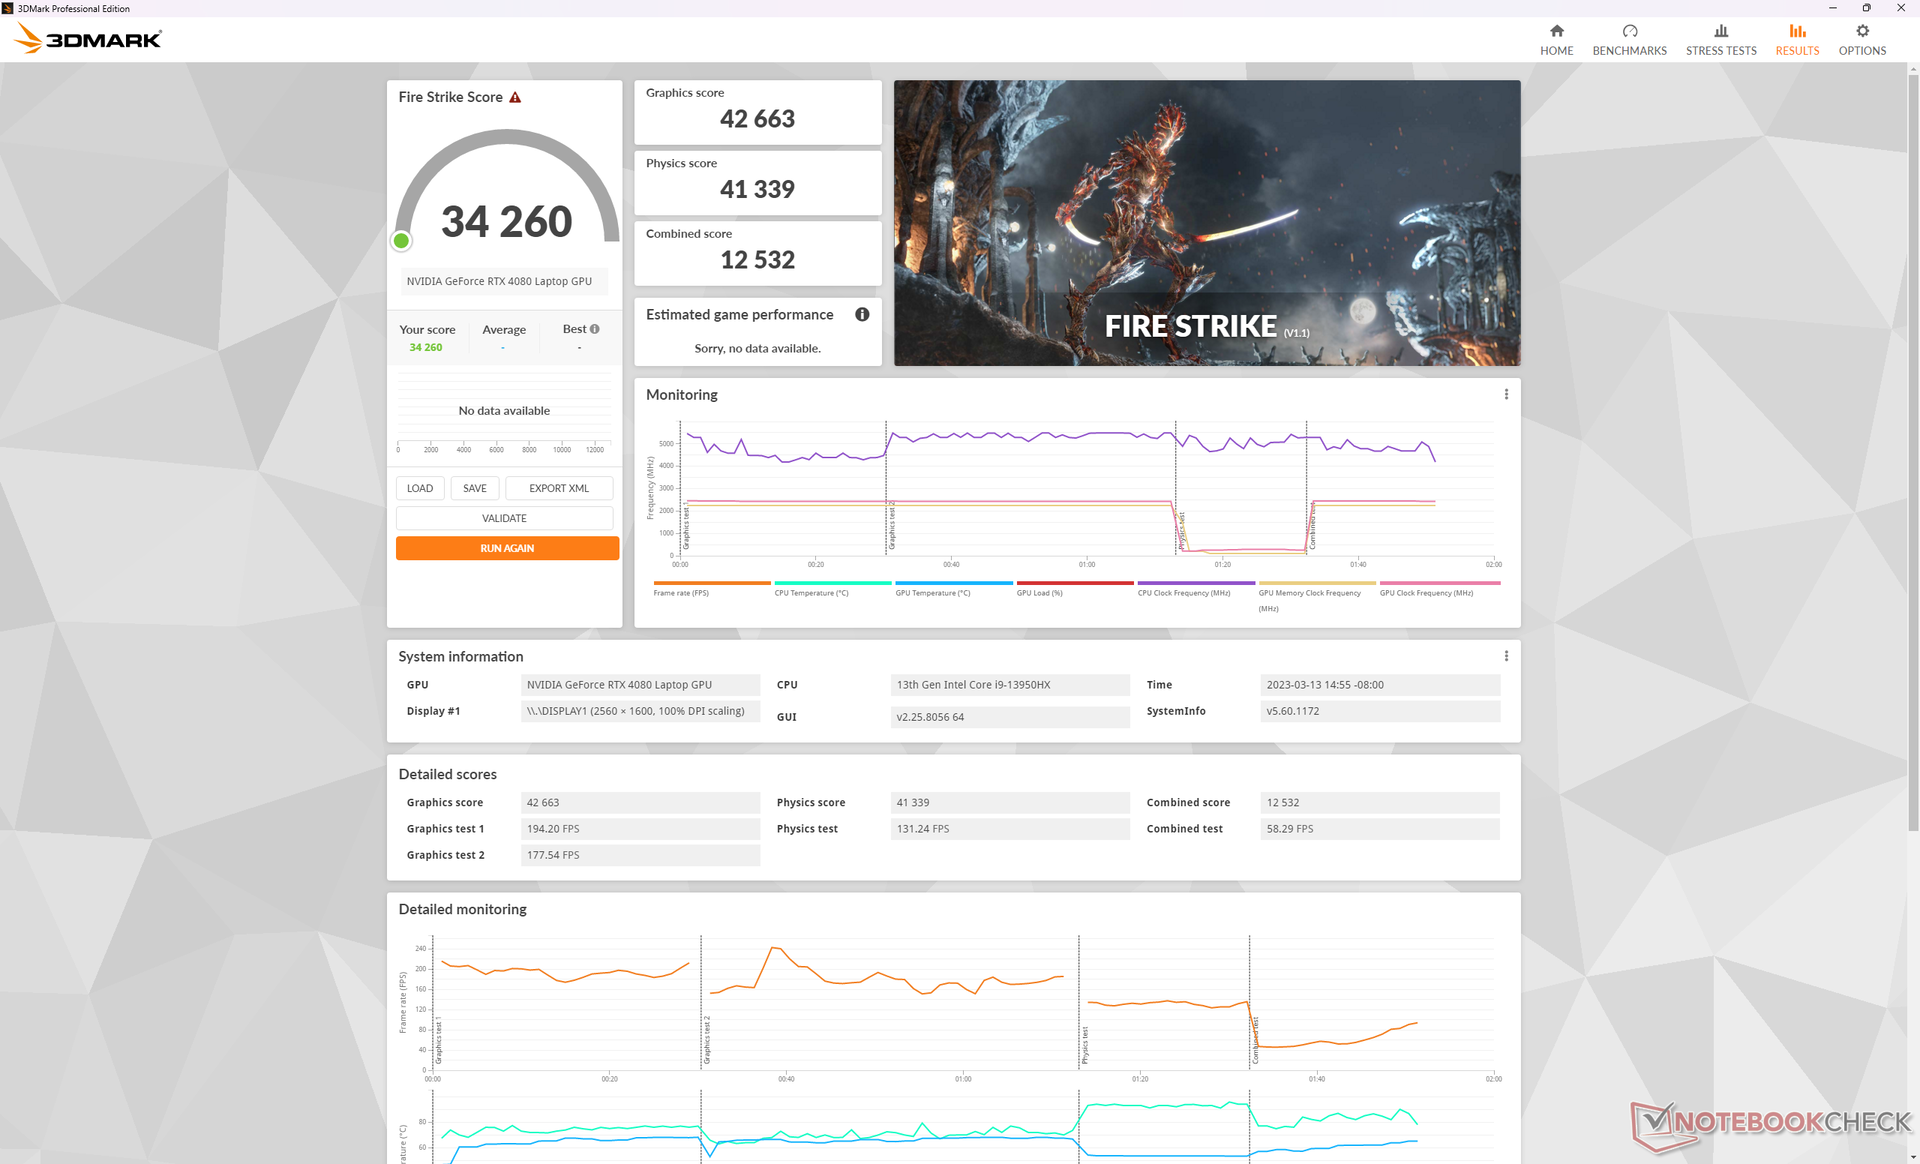
| 3DMark 11 Performance | 44893 points | |
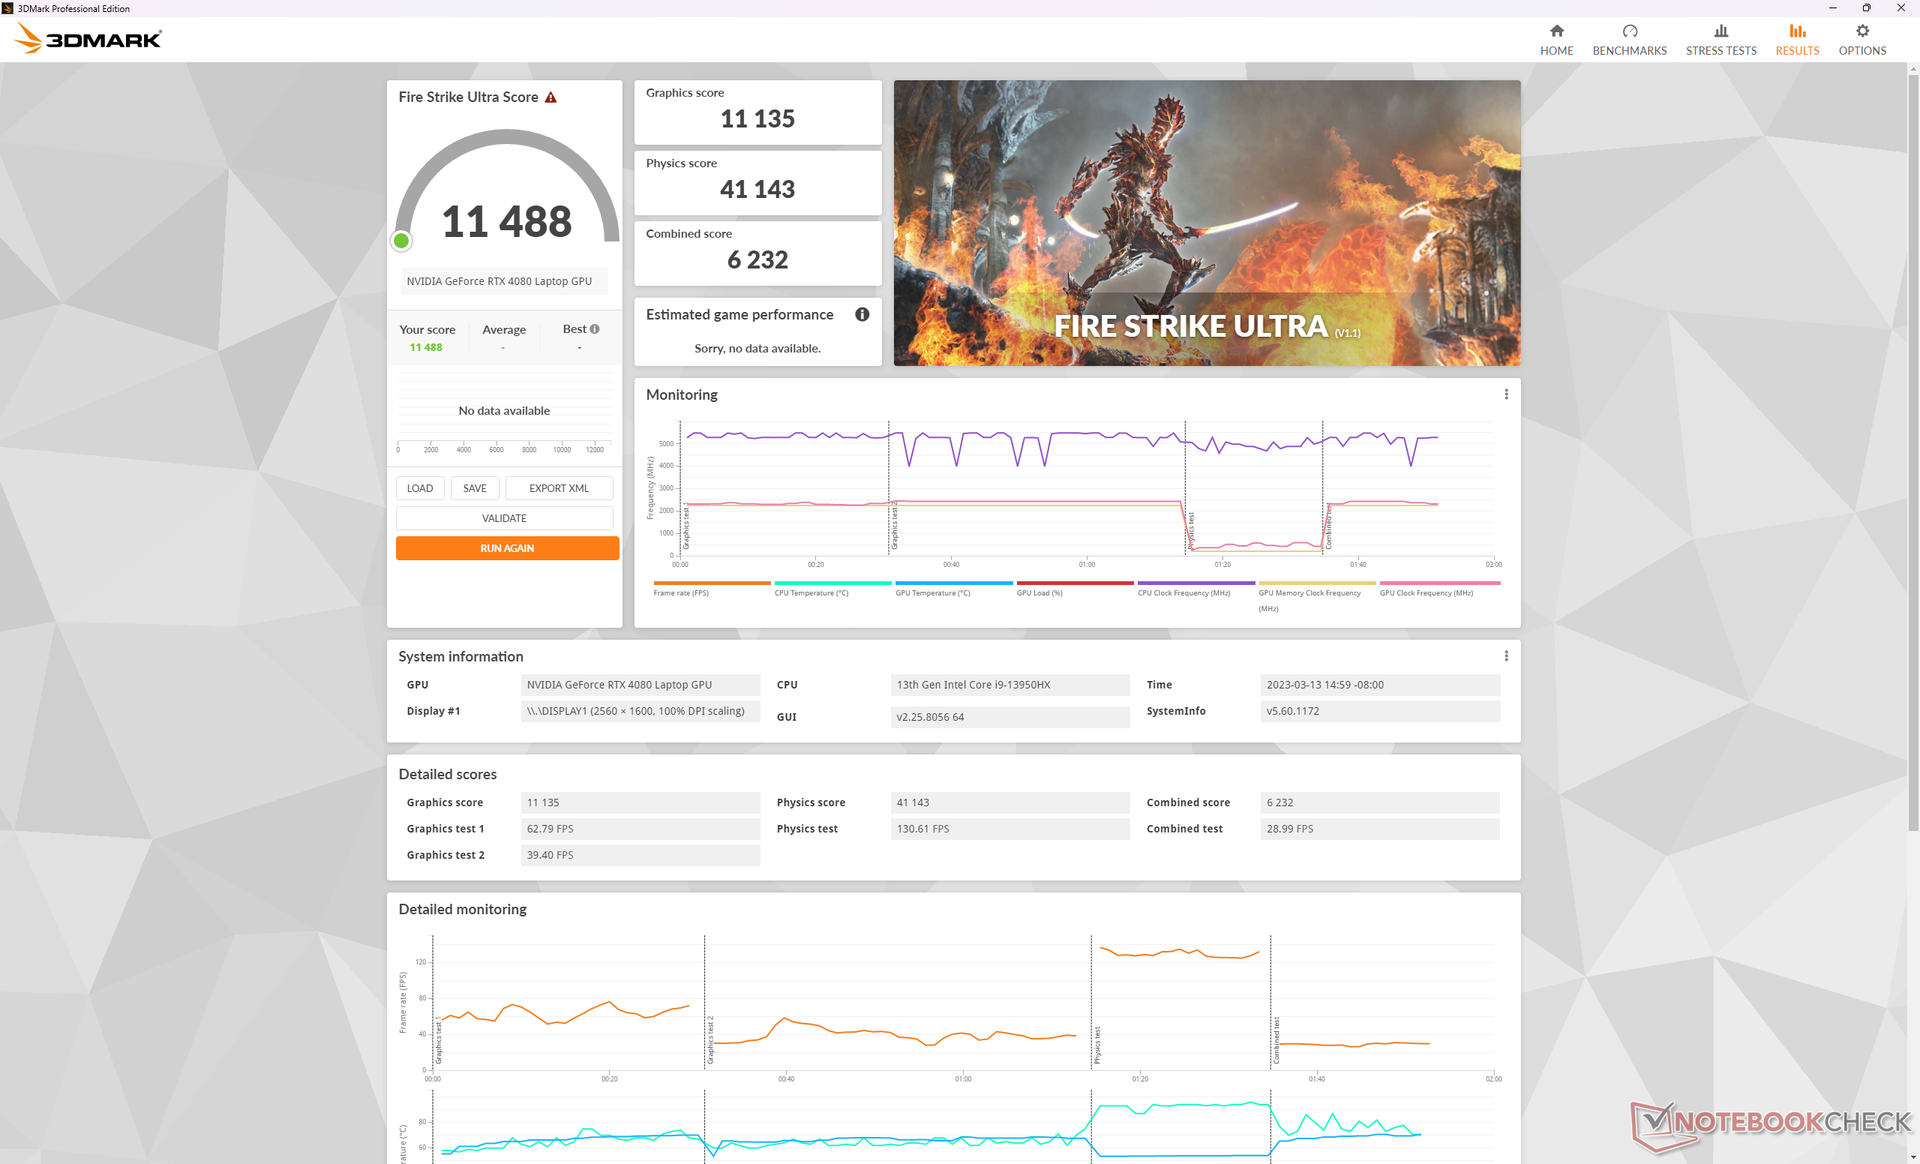
| 3DMark Fire Strike Score | 34260 points | |
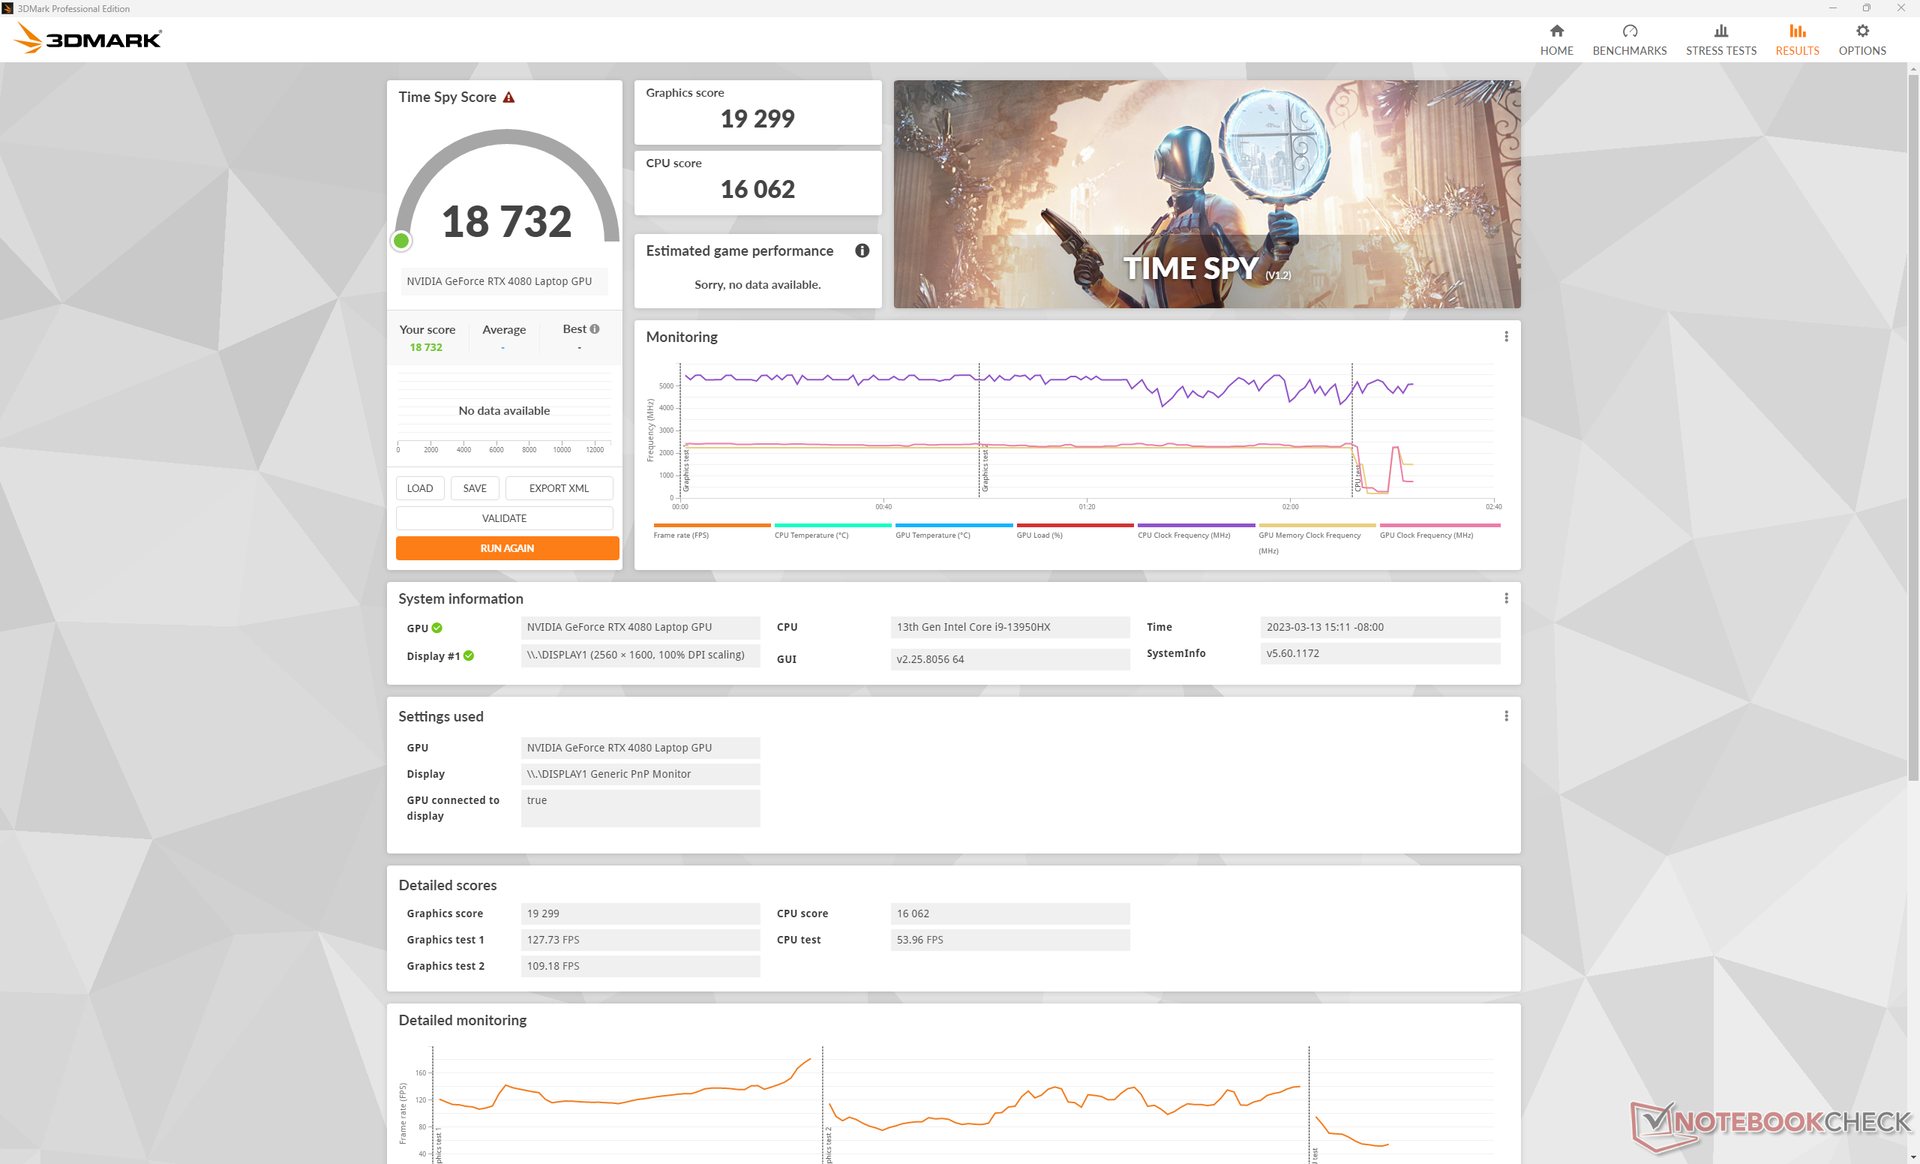
| 3DMark Time Spy Score | 18732 points | |
Help | ||
* ... smaller is better
| The Witcher 3 - 1920x1080 Ultra Graphics & Postprocessing (HBAO+) | |
| KFA2 GeForce RTX 4080 SG | |
| Eluktronics Mech-17 GP2 | |
| MSI GE78HX 13VH-070US | |
| MSI Raider GE77 HX 12UHS | |
| Alienware m17 R5 (R9 6900HX, RX 6850M XT) | |
| Asus ROG Strix G17 G713PI | |
| Corsair Voyager a1600 | |
| MSI Katana 17 B13VFK | |
| Schenker Compact 17 | |
| Schenker XMG Core 15 (M22) | |
| HP Omen 15-en0375ng | |
Witcher 3 FPS Chart
| low | med. | high | ultra | QHD | 4K | |
|---|---|---|---|---|---|---|
| GTA V (2015) | 172.9 | 170 | 164.7 | 102.9 | 103.7 | 144.6 |
| The Witcher 3 (2015) | 605.7 | 539.8 | 382.9 | 175.9 | 129.4 | |
| Dota 2 Reborn (2015) | 180.4 | 161.7 | 154.8 | 145.6 | 142.6 | |
| Final Fantasy XV Benchmark (2018) | 180.4 | 166.9 | 148.5 | 131.6 | 76.2 | |
| X-Plane 11.11 (2018) | 174.1 | 157.4 | 126.8 | 110 | ||
| Strange Brigade (2018) | 324 | 272 | 267 | 258 | 237 | 121.5 |
| Cyberpunk 2077 1.6 (2022) | 149.2 | 142.6 | 136.8 | 135.8 | 88.6 | 40.2 |
| F1 22 (2022) | 237 | 235 | 228 | 115.4 | 77.4 | 39 |
Emissions — One Loud Gamer
System Noise
The internal fans are almost always active no matter the onscreen load. We're able to record a quiet hum of 24.2 dB(A) against a silent background of 23.4 dB(A) when simply idling on Power Saver mode. If web browsing or video streaming, fan noise would typically hover between the 25 and 31 dB(A) range. It's not loud enough to be distracting, but it's noticeable nonetheless. Competing machines like the Eluktronics Mech-17 or Asus ROG Strix G17 G713PI would behave similarly.
Gaming on Performance mode (or Extreme mode) would induce a fan noise of just over 56 dB(A) which is on the higher-end of the spectrum when it comes to gaming laptops. The aforementioned Eluktronics and Asus laptops, for example, would run noticeably quieter at 51 and 46 dB(A), respectively, under similar gaming loads.
Enabling Cooler Boost mode will raise fan RPMs to the absolute limit no matter the onscreen load for a noise level approaching 60 dB(A). Gaming performance, however, is not necessarily any faster and so Cooler Boost mode is more about temperature control than performance control. We've had similar observations on other MSI laptops with the same Cooler Boost feature.
Noise level
| Idle |
| 24.2 / 25.6 / 31 dB(A) |
| Load |
| 43.3 / 59.1 dB(A) |
 | ||
30 dB silent 40 dB(A) audible 50 dB(A) loud |
||
min: | ||
| MSI GE78HX 13VH-070US GeForce RTX 4080 Laptop GPU, i9-13950HX, Samsung PM9A1 MZVL22T0HBLB | Eluktronics Mech-17 GP2 GeForce RTX 4090 Laptop GPU, i9-13900HX, Samsung PM9A1 MZVL21T0HCLR | Asus ROG Strix G17 G713PI GeForce RTX 4070 Laptop GPU, R9 7945HX, WD PC SN560 SDDPNQE-1T00 | MSI Titan GT77 HX 13VI GeForce RTX 4090 Laptop GPU, i9-13950HX, Samsung PM9A1 MZVL22T0HBLB | MSI Raider GE77 HX 12UHS GeForce RTX 3080 Ti Laptop GPU, i9-12900HX, Samsung PM9A1 MZVL22T0HBLB | Razer Blade 17 Early 2022 GeForce RTX 3080 Ti Laptop GPU, i9-12900H, Samsung PM9A1 MZVL21T0HCLR | |
|---|---|---|---|---|---|---|
| Noise | -1% | 1% | -7% | -15% | -3% | |
| off / environment * (dB) | 23.4 | 25.2 -8% | 25 -7% | 24.6 -5% | 26 -11% | 26 -11% |
| Idle Minimum * (dB) | 24.2 | 28 -16% | 26 -7% | 29.2 -21% | 26 -7% | 26 -7% |
| Idle Average * (dB) | 25.6 | 28 -9% | 29 -13% | 29.2 -14% | 34 -33% | 27 -5% |
| Idle Maximum * (dB) | 31 | 30.4 2% | 30 3% | 29.2 6% | 46 -48% | 32 -3% |
| Load Average * (dB) | 43.3 | 41 5% | 46 -6% | 50.7 -17% | 50 -15% | 50 -15% |
| Witcher 3 ultra * (dB) | 56.3 | 50.7 10% | 46 18% | 53.3 5% | 55 2% | 51 9% |
| Load Maximum * (dB) | 59.1 | 52.6 11% | 47 20% | 61 -3% | 57 4% | 51 14% |
* ... smaller is better
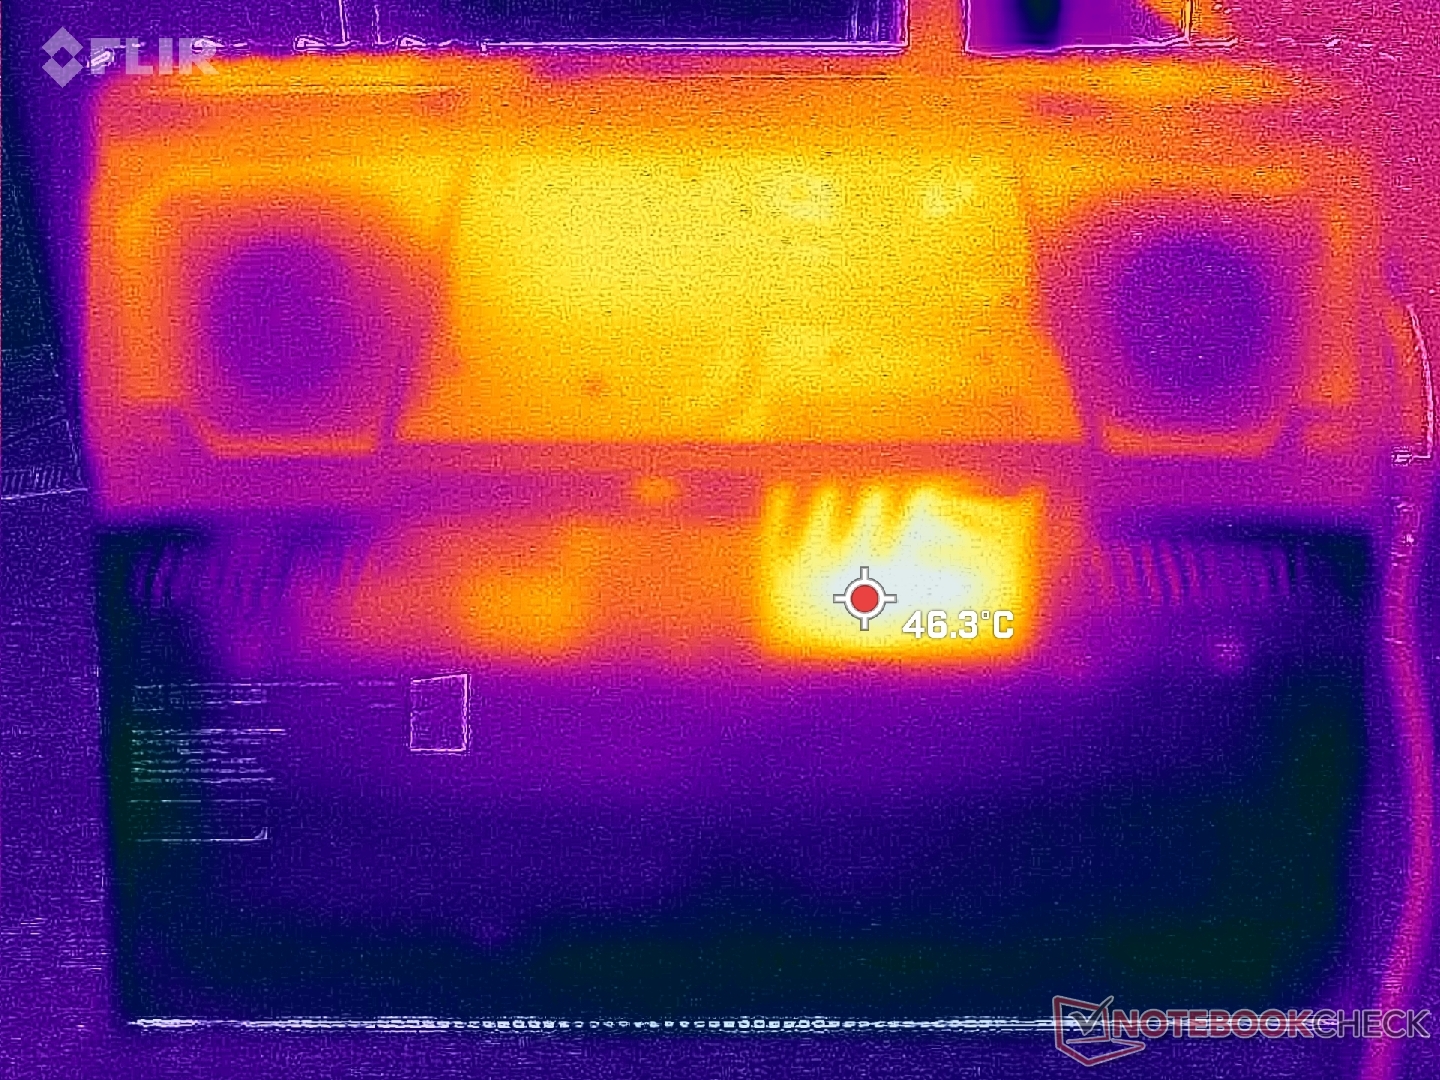
Temperature
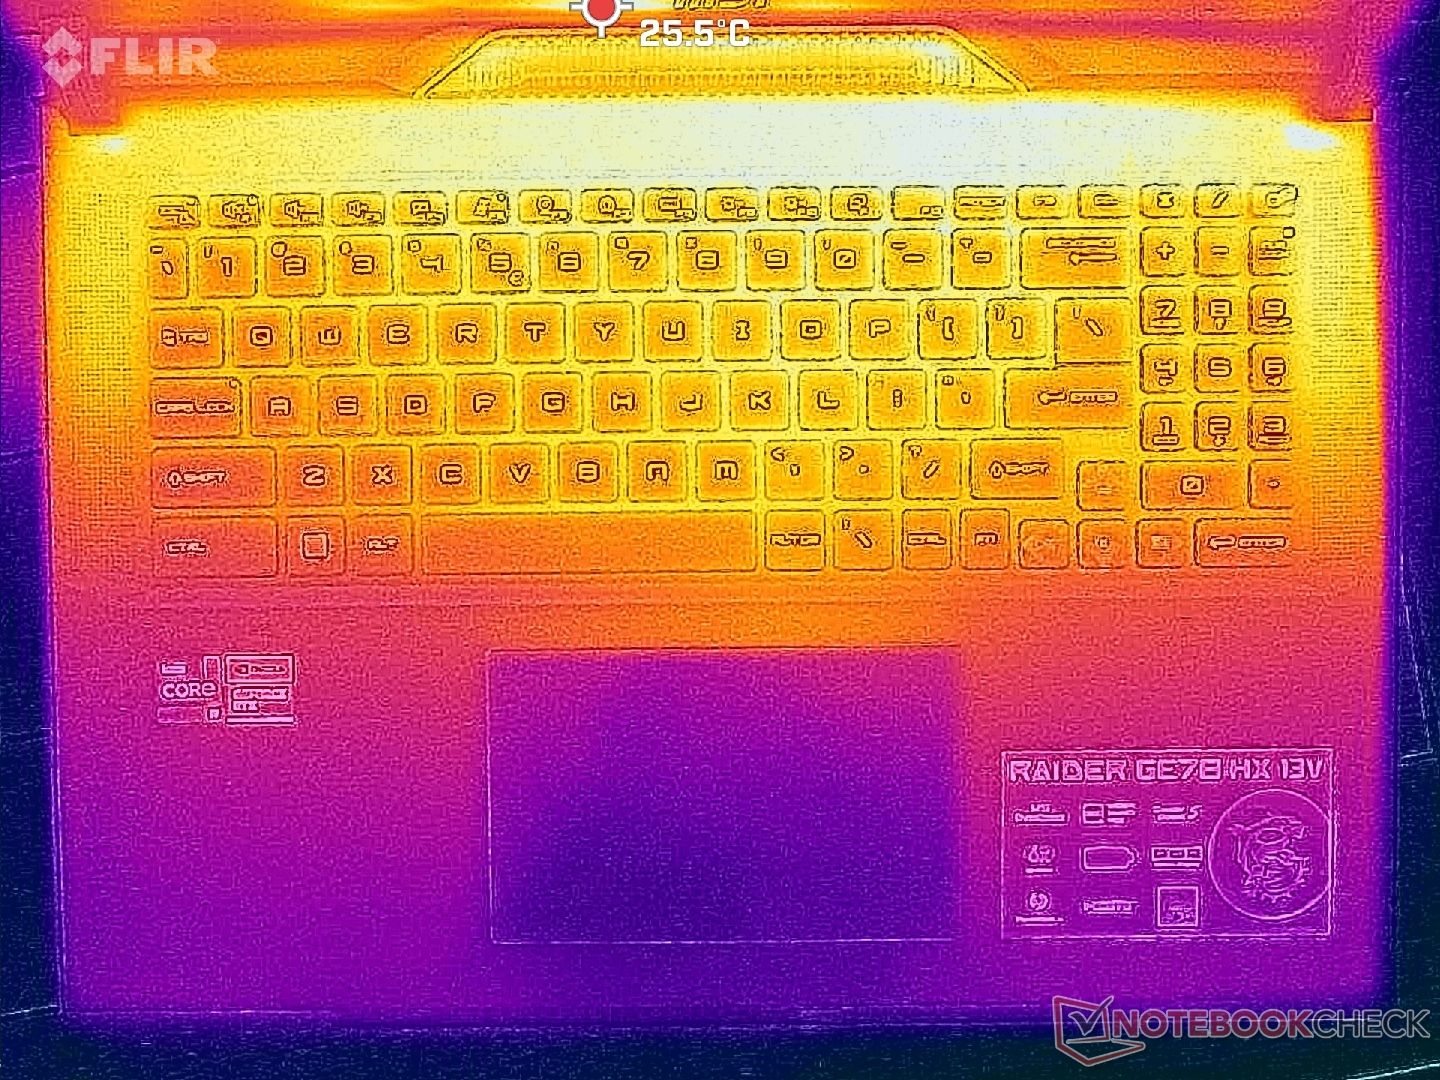
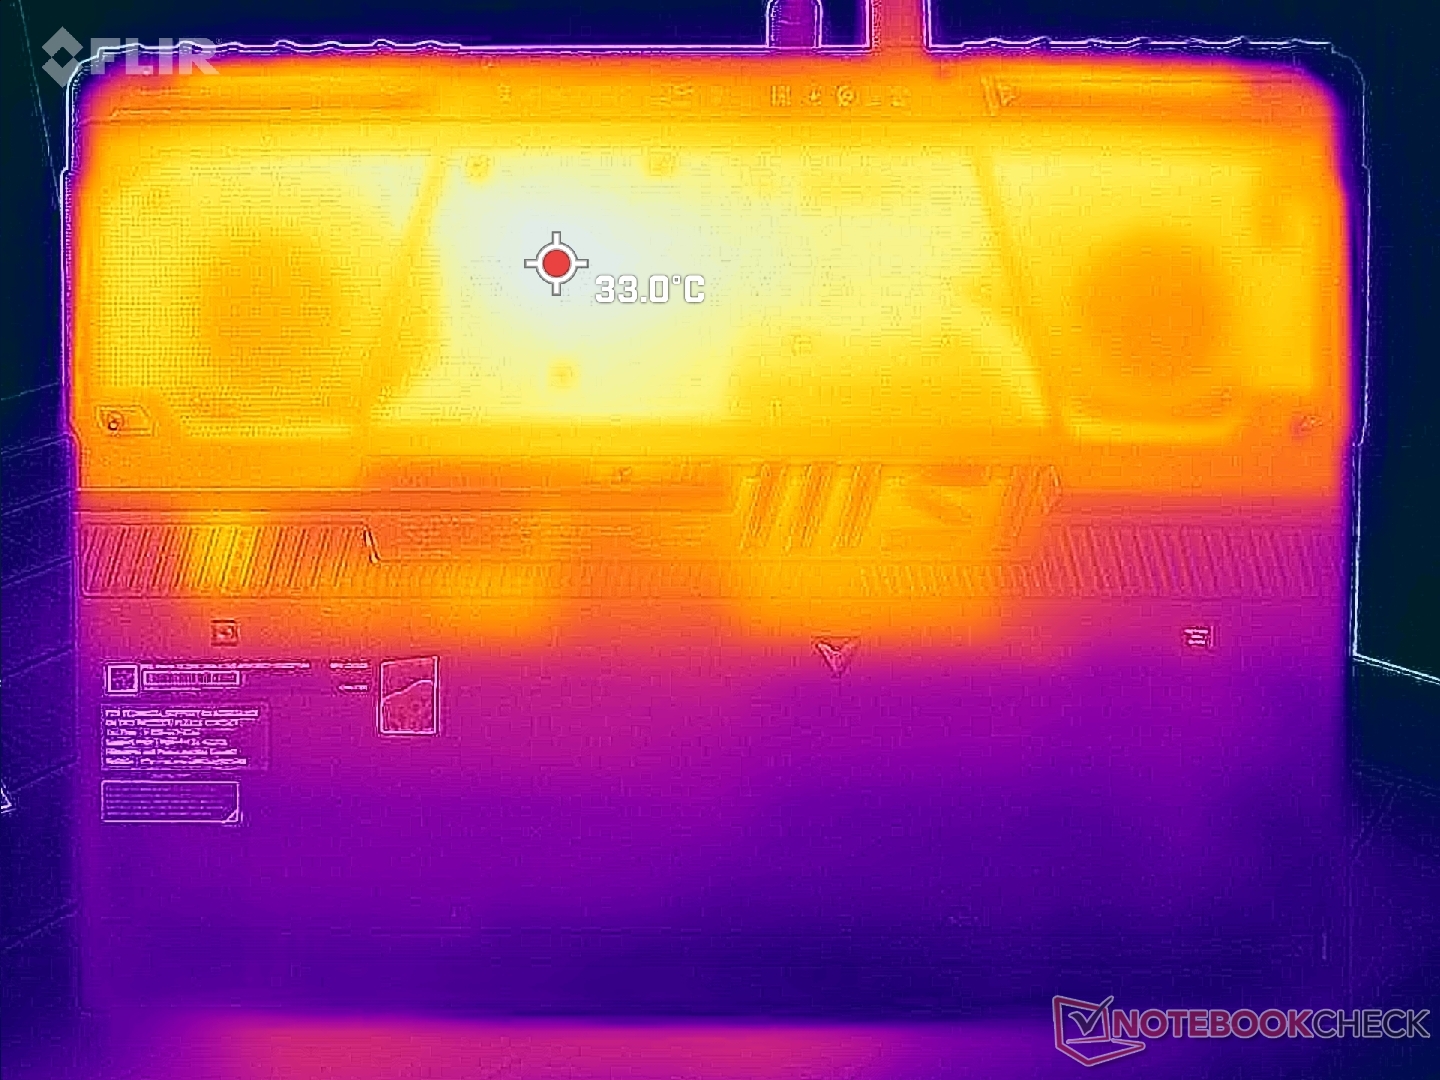
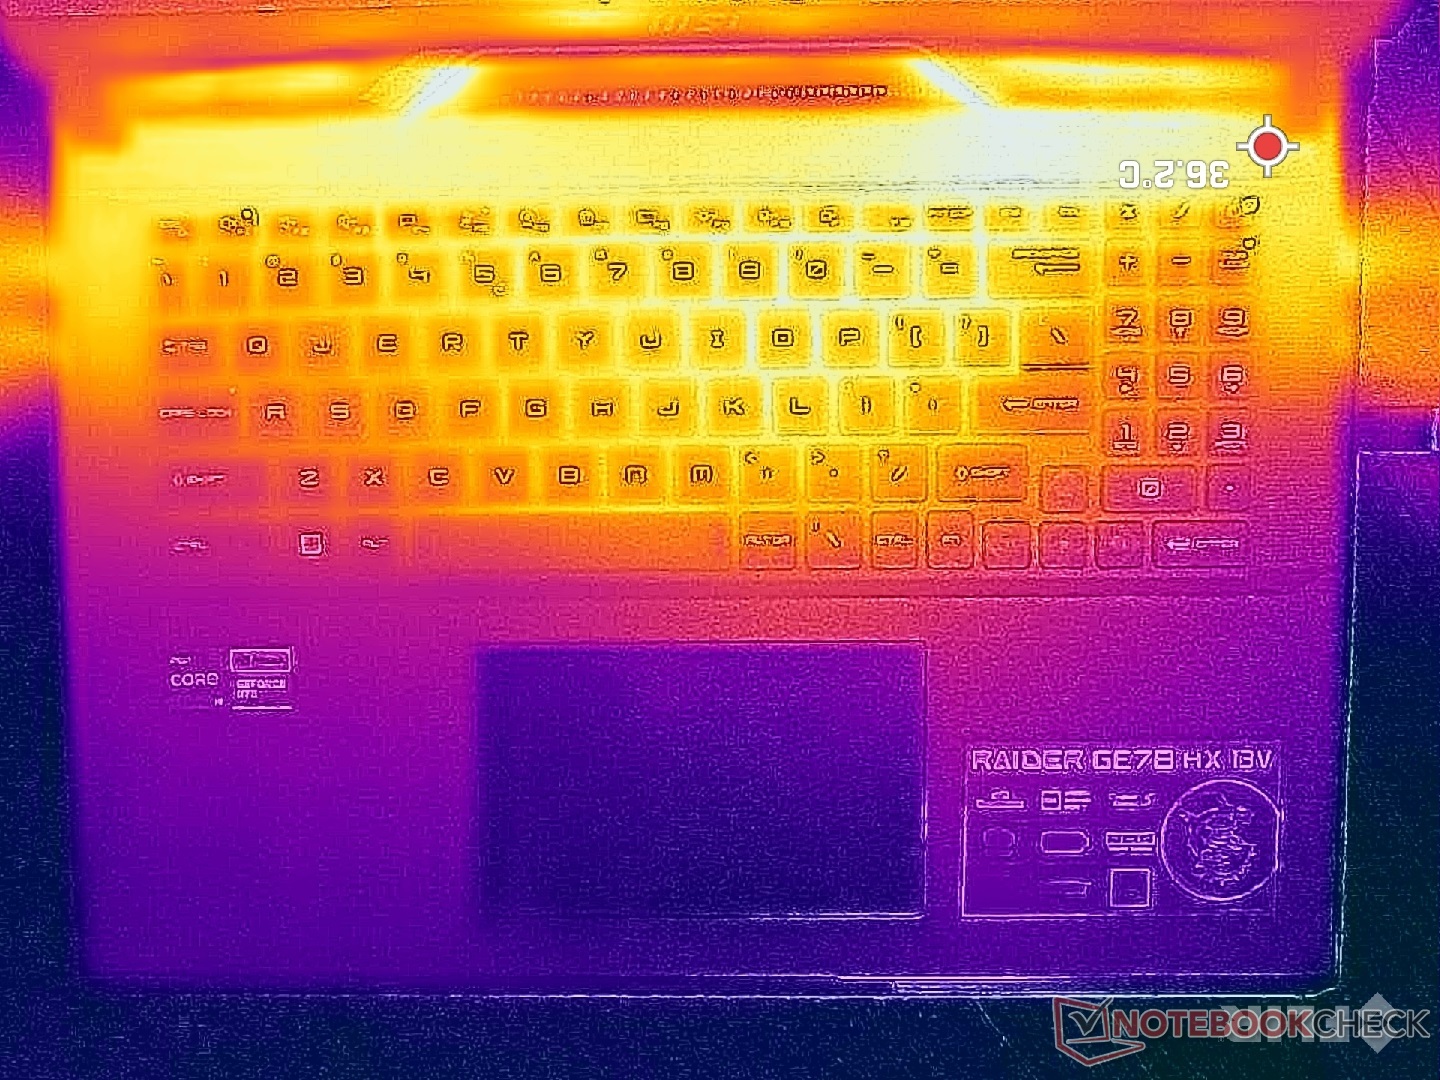
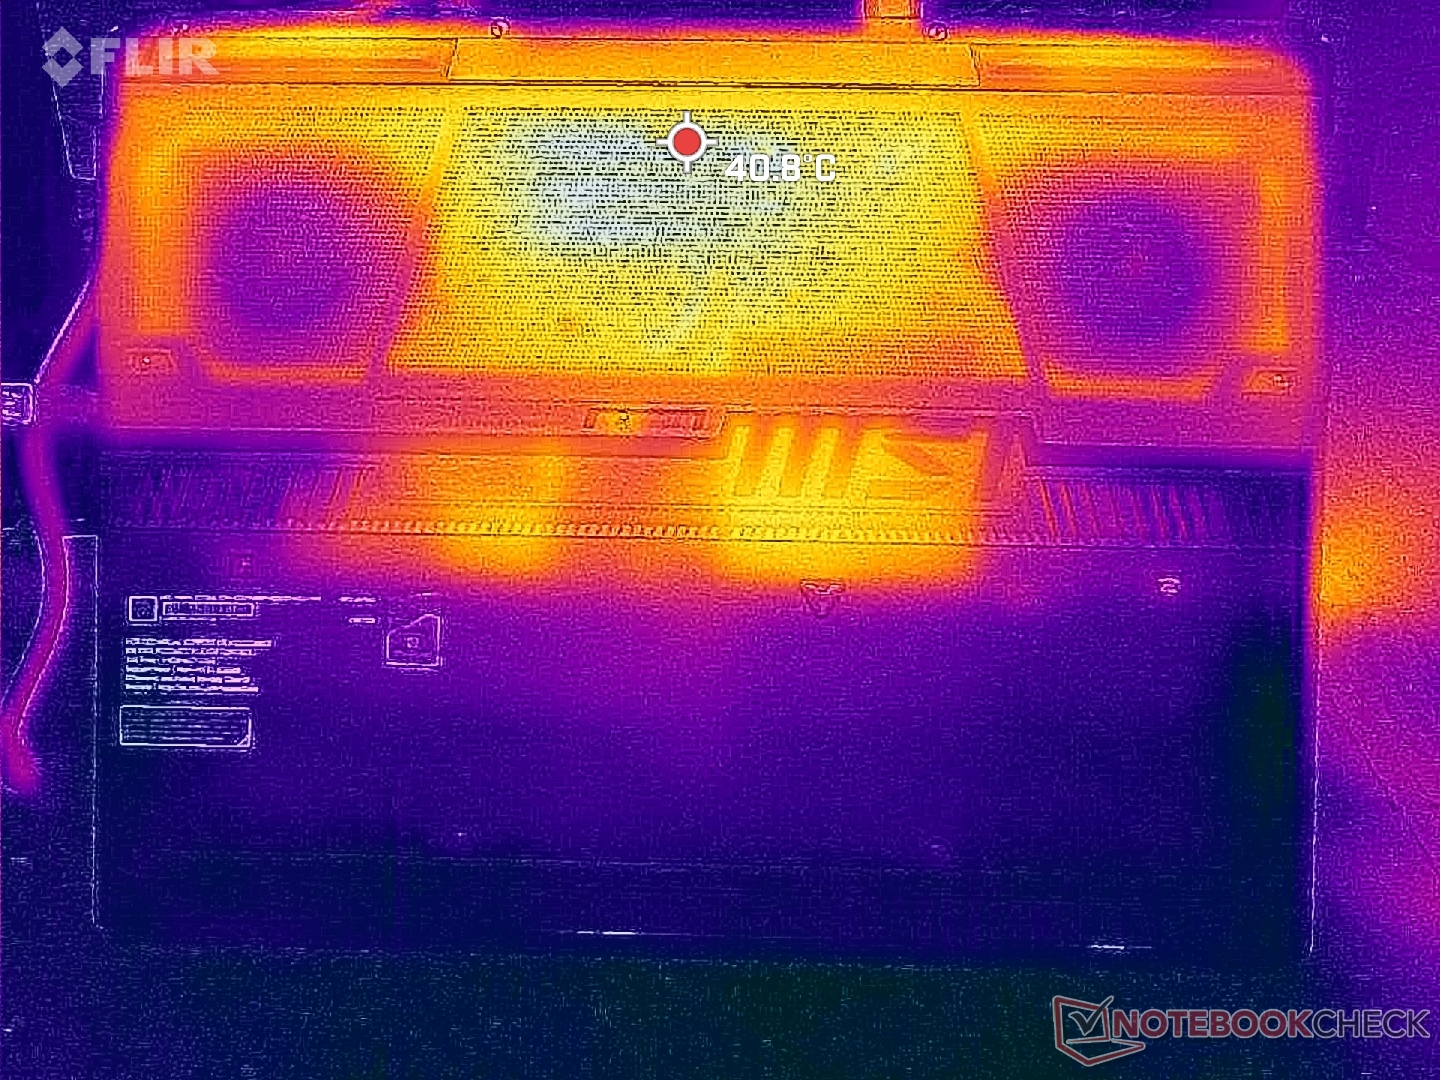
Surface temperatures are usually a non-issue on MSI GE and GT models since they are largely plastic and thicker in design. The average surface temperature when gaming on the GE78, for example, is about 32 C on both the top and bottom compared to 43 C to 44 C on the Razer Blade 17.
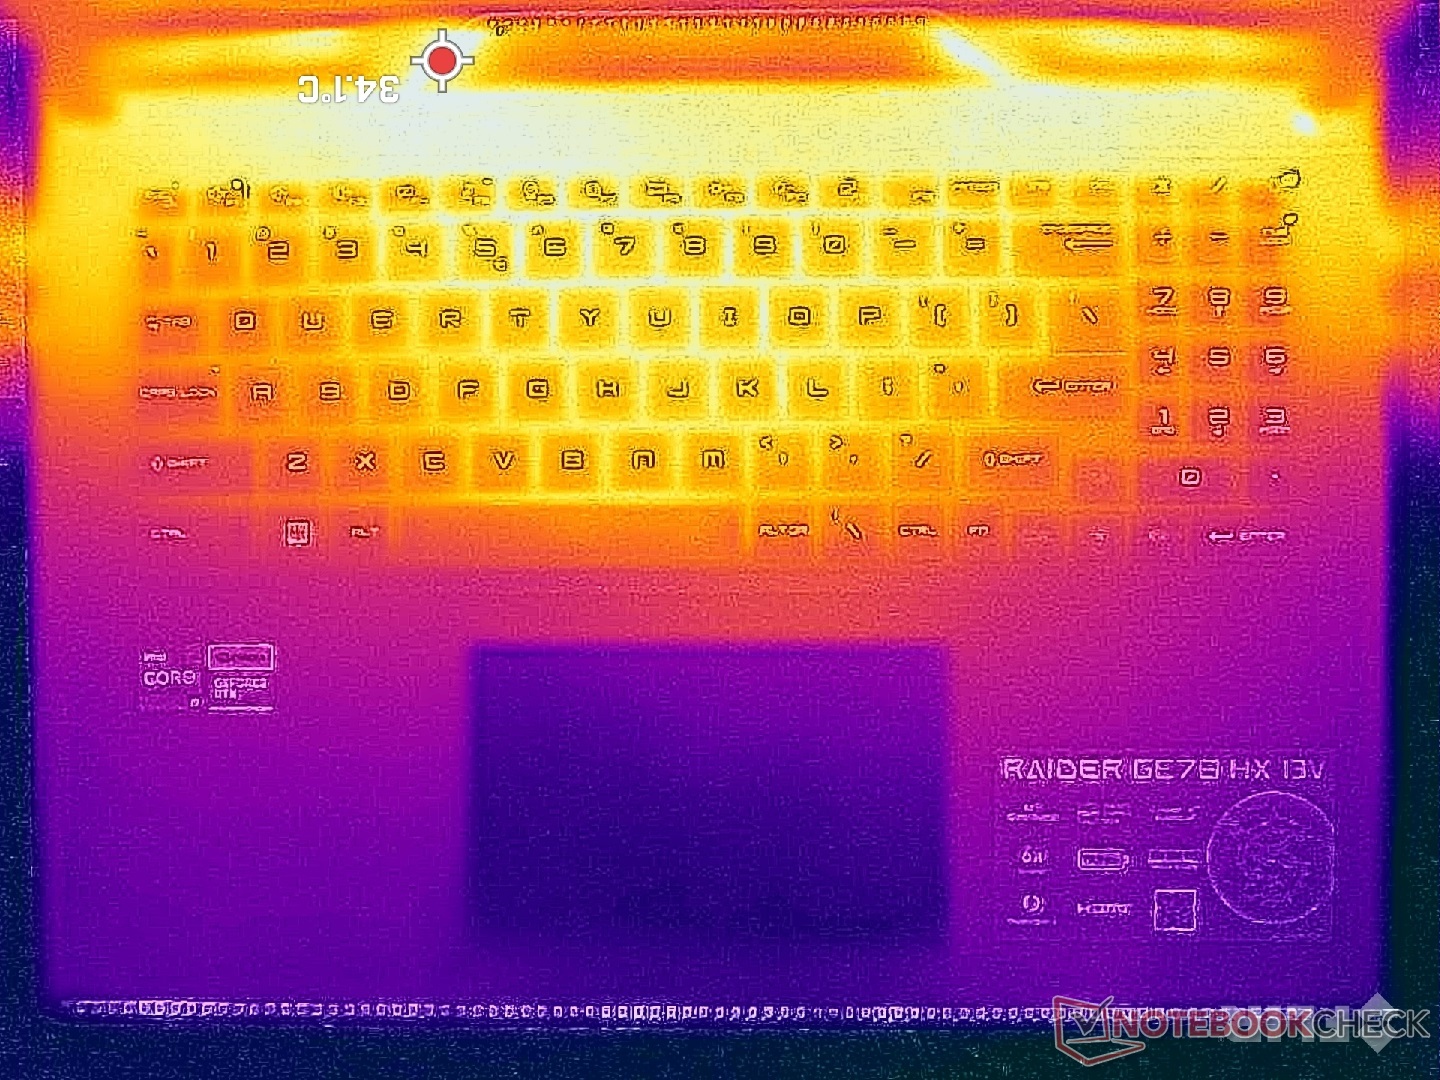
Any hot spots on the system are toward the rear of the chassis and away from the front as shown by the temperature maps below. Palms or fingers should therefore not feel uncomfortably warm whilst typing or gaming.
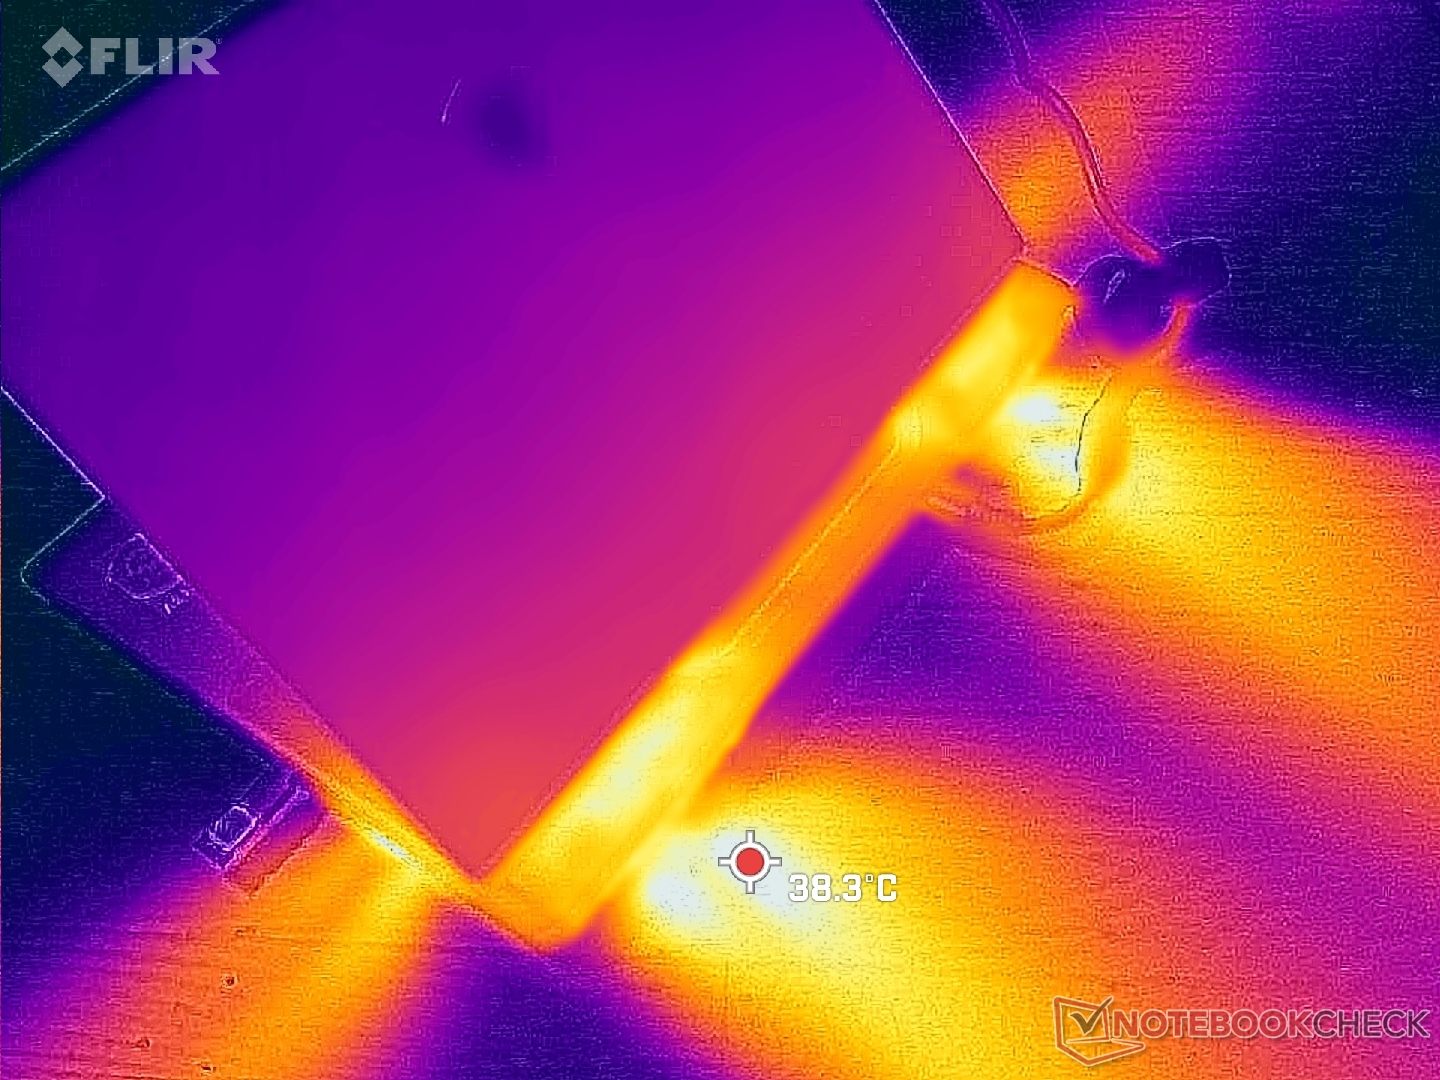
(+) The maximum temperature on the upper side is 37.4 °C / 99 F, compared to the average of 40.4 °C / 105 F, ranging from 21.2 to 68.8 °C for the class Gaming.
(±) The bottom heats up to a maximum of 45 °C / 113 F, compared to the average of 43.2 °C / 110 F
(+) In idle usage, the average temperature for the upper side is 25.7 °C / 78 F, compared to the device average of 33.9 °C / 93 F.
(+) Playing The Witcher 3, the average temperature for the upper side is 30.5 °C / 87 F, compared to the device average of 33.9 °C / 93 F.
(+) The palmrests and touchpad are cooler than skin temperature with a maximum of 24.6 °C / 76.3 F and are therefore cool to the touch.
(+) The average temperature of the palmrest area of similar devices was 28.8 °C / 83.8 F (+4.2 °C / 7.5 F).
| MSI GE78HX 13VH-070US Intel Core i9-13950HX, NVIDIA GeForce RTX 4080 Laptop GPU | Eluktronics Mech-17 GP2 Intel Core i9-13900HX, NVIDIA GeForce RTX 4090 Laptop GPU | Asus ROG Strix G17 G713PI AMD Ryzen 9 7945HX, NVIDIA GeForce RTX 4070 Laptop GPU | MSI Titan GT77 HX 13VI Intel Core i9-13950HX, NVIDIA GeForce RTX 4090 Laptop GPU | MSI Raider GE77 HX 12UHS Intel Core i9-12900HX, NVIDIA GeForce RTX 3080 Ti Laptop GPU | Razer Blade 17 Early 2022 Intel Core i9-12900H, NVIDIA GeForce RTX 3080 Ti Laptop GPU | |
|---|---|---|---|---|---|---|
| Heat | 1% | -5% | 5% | -33% | -24% | |
| Maximum Upper Side * (°C) | 37.4 | 39 -4% | 42 -12% | 40.6 -9% | 53 -42% | 50 -34% |
| Maximum Bottom * (°C) | 45 | 44 2% | 41 9% | 41.1 9% | 58 -29% | 56 -24% |
| Idle Upper Side * (°C) | 29.8 | 31 -4% | 33 -11% | 26.2 12% | 38 -28% | 36 -21% |
| Idle Bottom * (°C) | 32.4 | 29.8 8% | 34 -5% | 30.3 6% | 43 -33% | 38 -17% |
* ... smaller is better
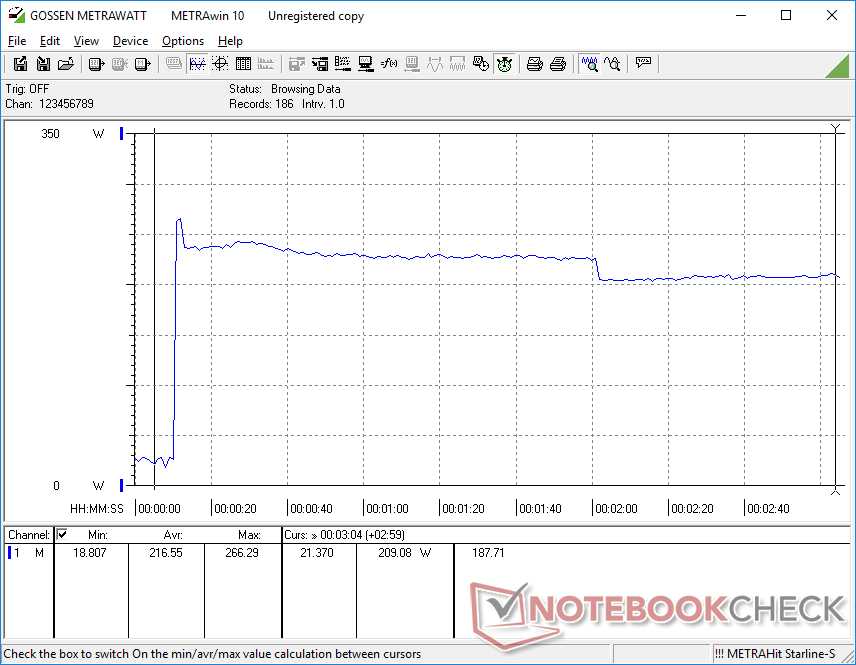
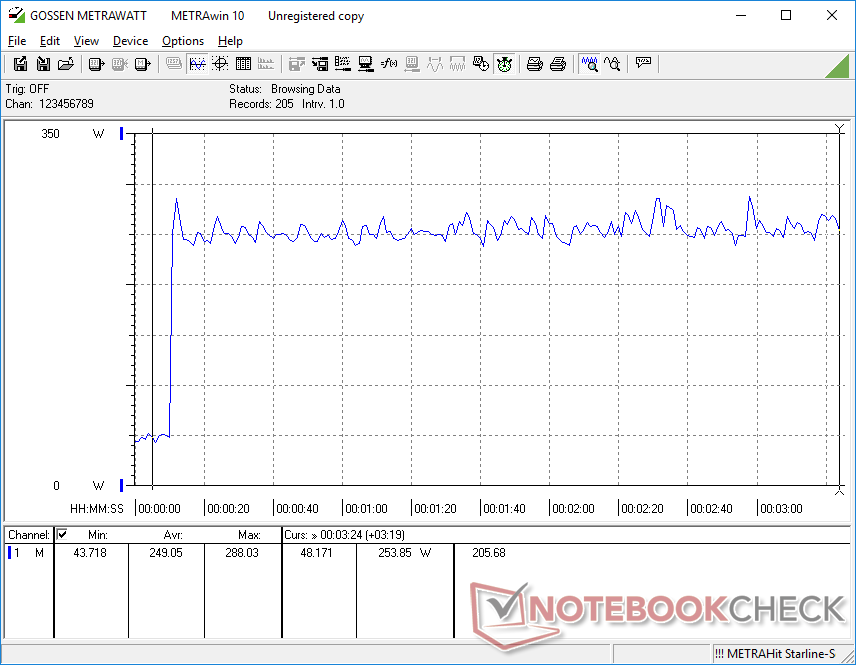
Stress Test
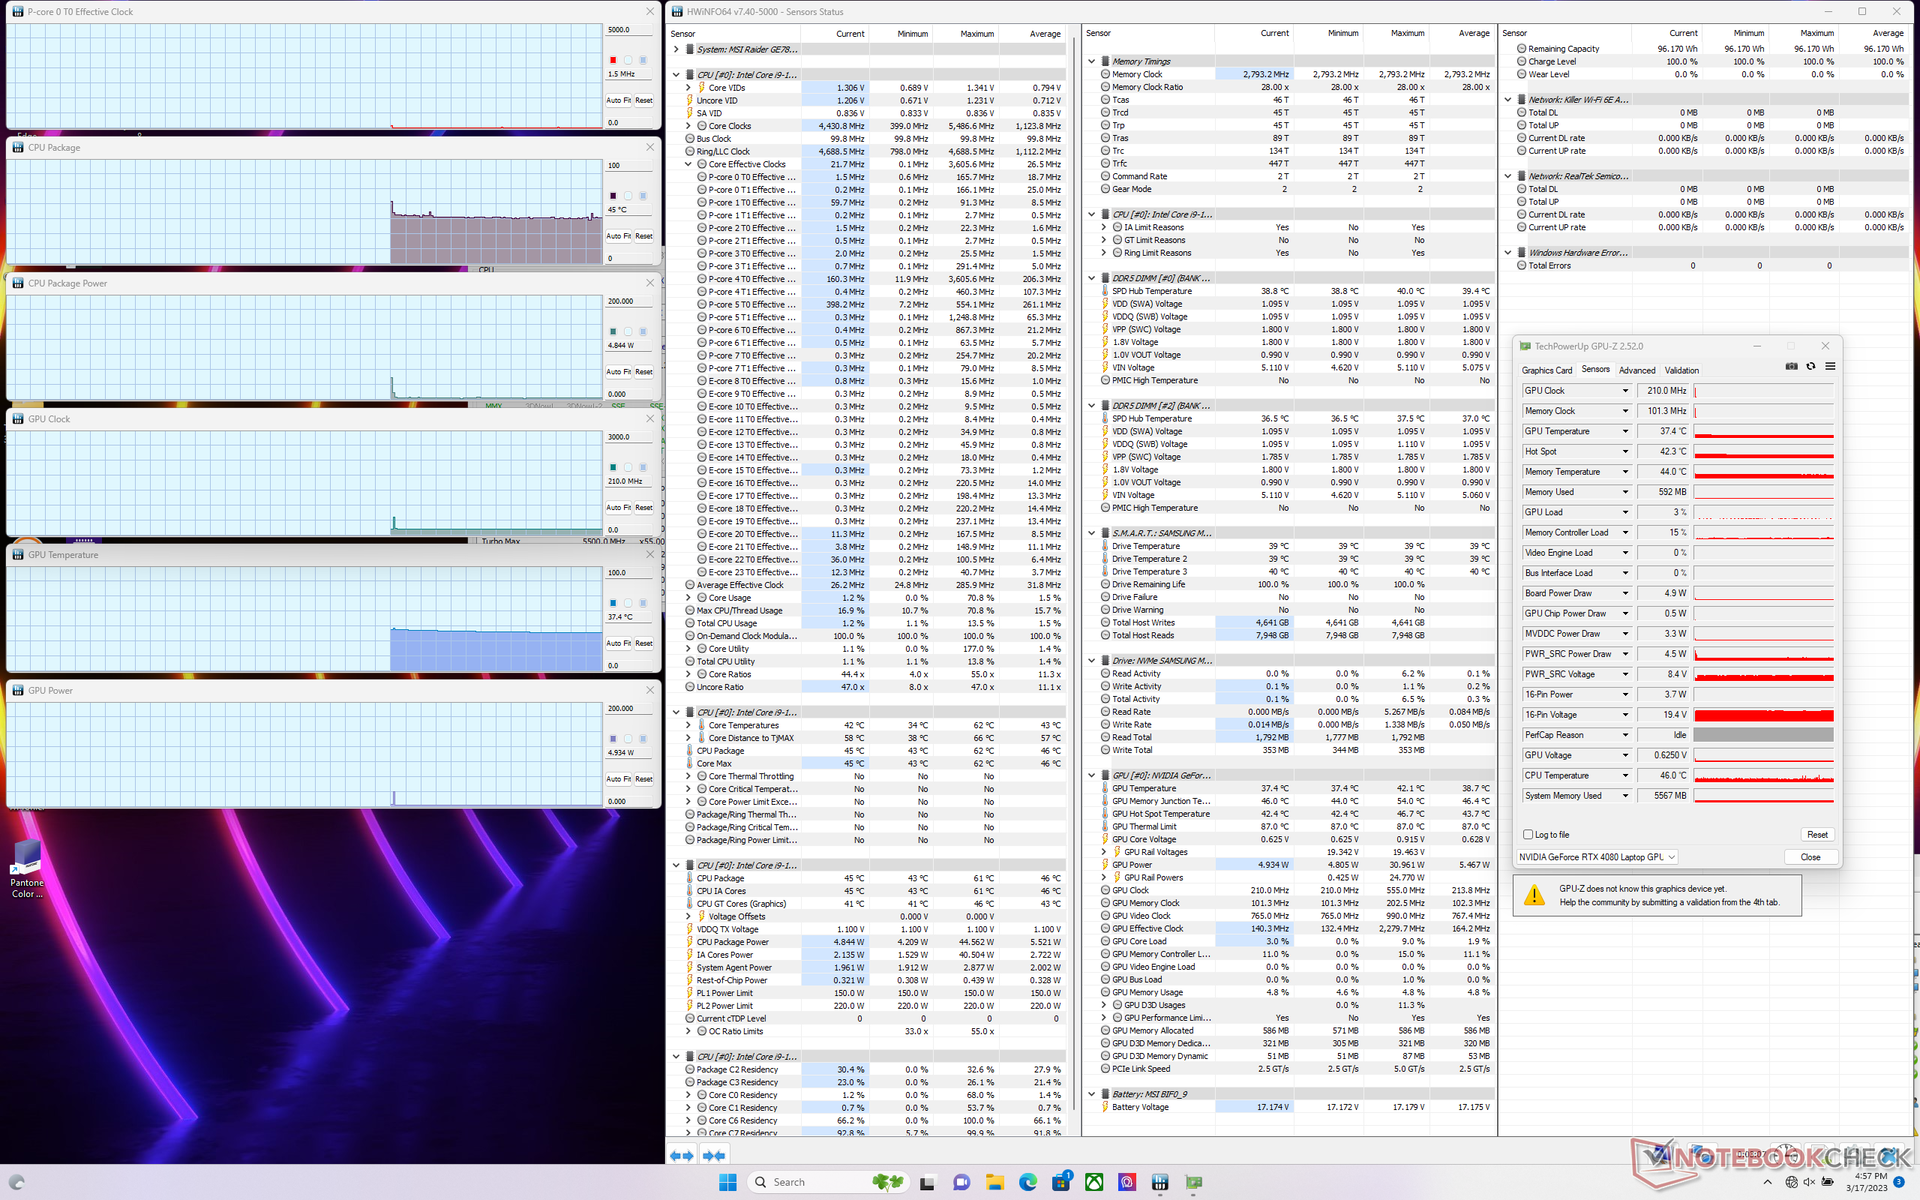
When running Prime95 to stress the CPU, clock rates and board power draw would boost to 4.5 GHz and 173 W, respectively, lasting for just a few seconds or until hitting a core temperature of 95 C. Thereafter, clock rates and board power draw would steadily drop until stabilizing at about 3.7 GHz and 144 W, respectively. Core temperature would remain very high at 91 C meaning there's very little headroom for any additional processor performance. Repeating this same test on the Razer Blade 16 with a similar Core i9 CPU would result in both slower average clock rates and a cooler core temperature of ~3.2 GHz and 82 C, respectively. The Intel 13th gen Core i9 series may be fast, but expect core temperatures to be high across the board.
Running Witcher 3 to represent typical gaming loads would result in a stable GPU clock rate, GPU temperature, and board power draw of 2430 MHz, 73 C, and 156 W, respectively. Results would remain identical if Cooler Boost is enabled. We expect board power draw to be closer to 175 W if configured with the faster RTX 4090 GPU.
Running on battery power limits performance as to be expected. Fire Strike on batteries would return Physics and Graphics scores of only 18881 and 22232 points, respectively, compared to 41339 and 42663 points when on mains.
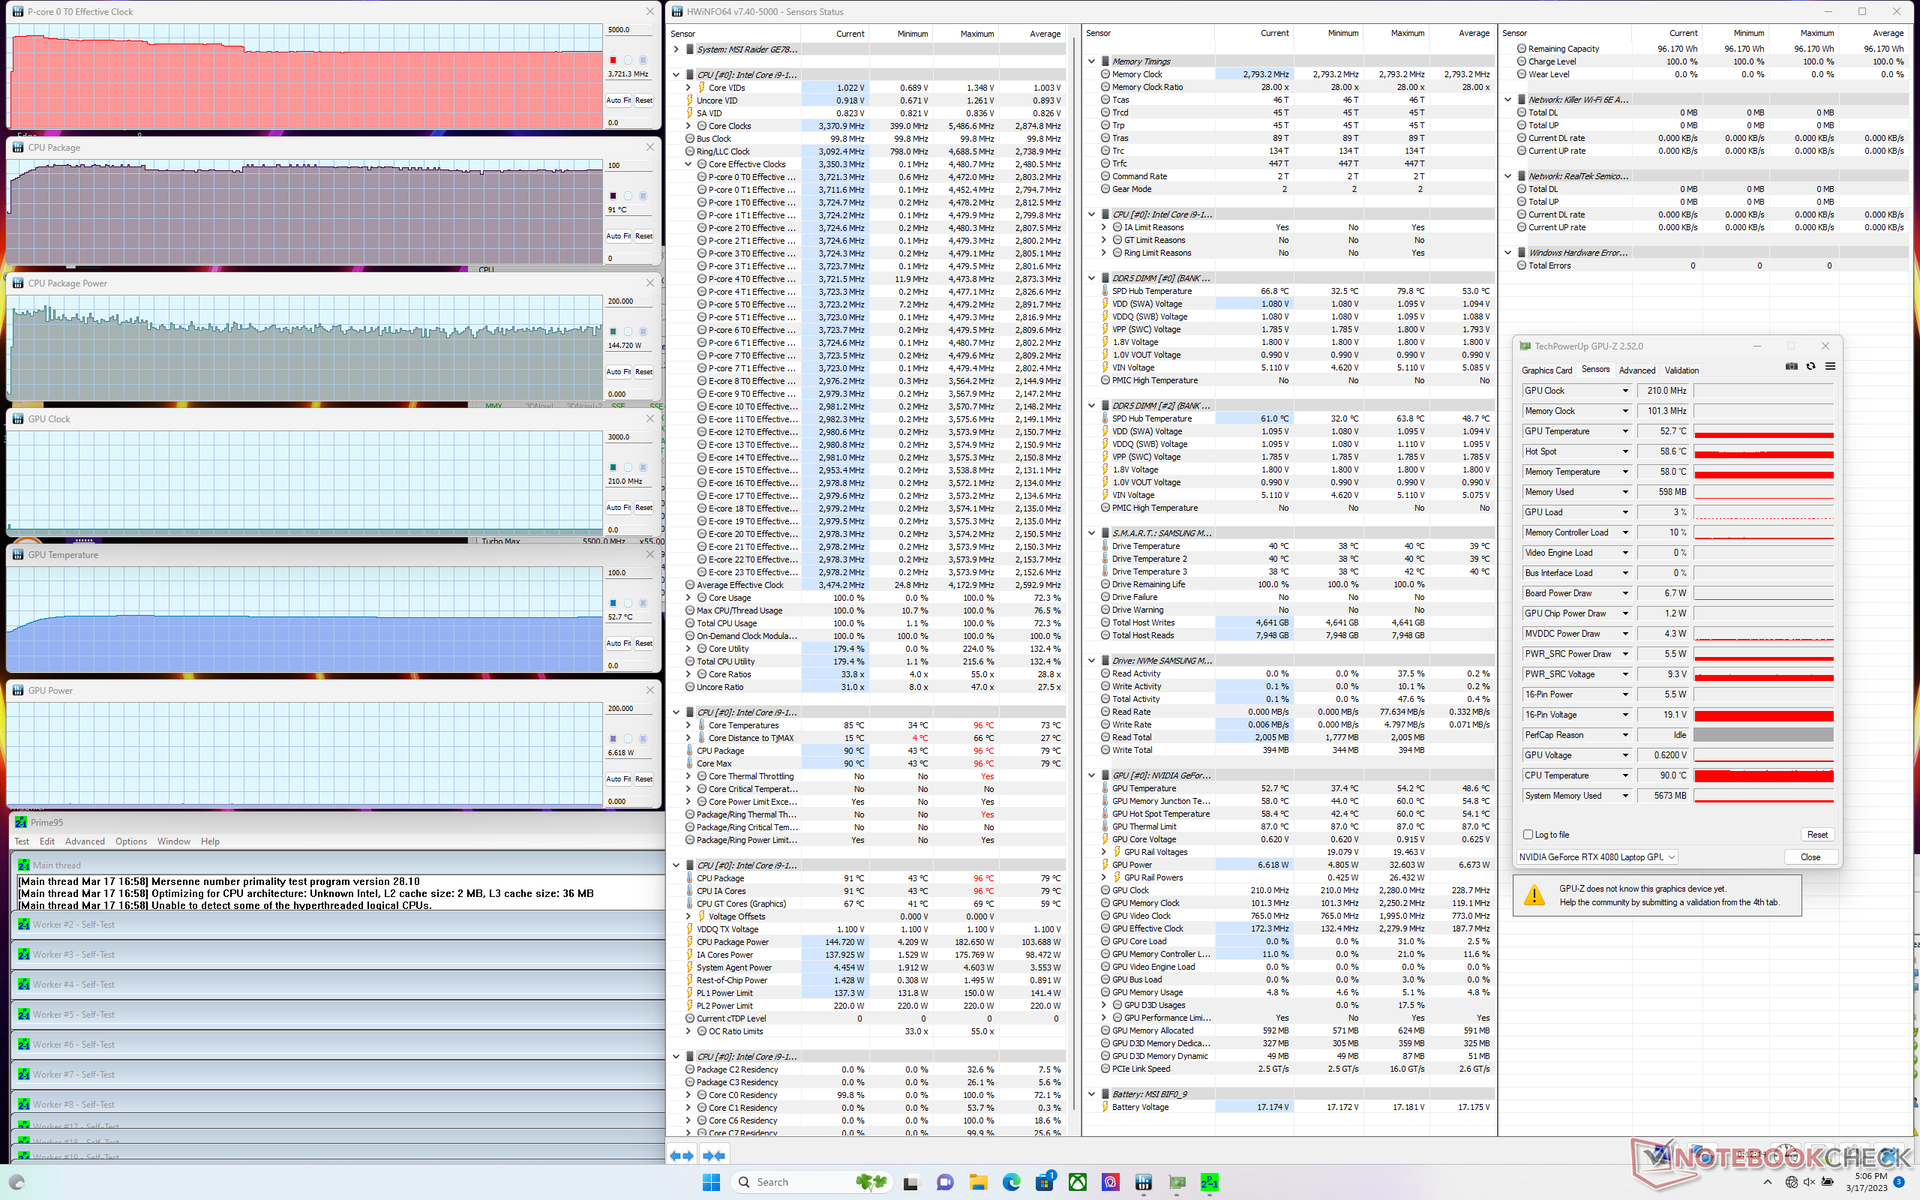
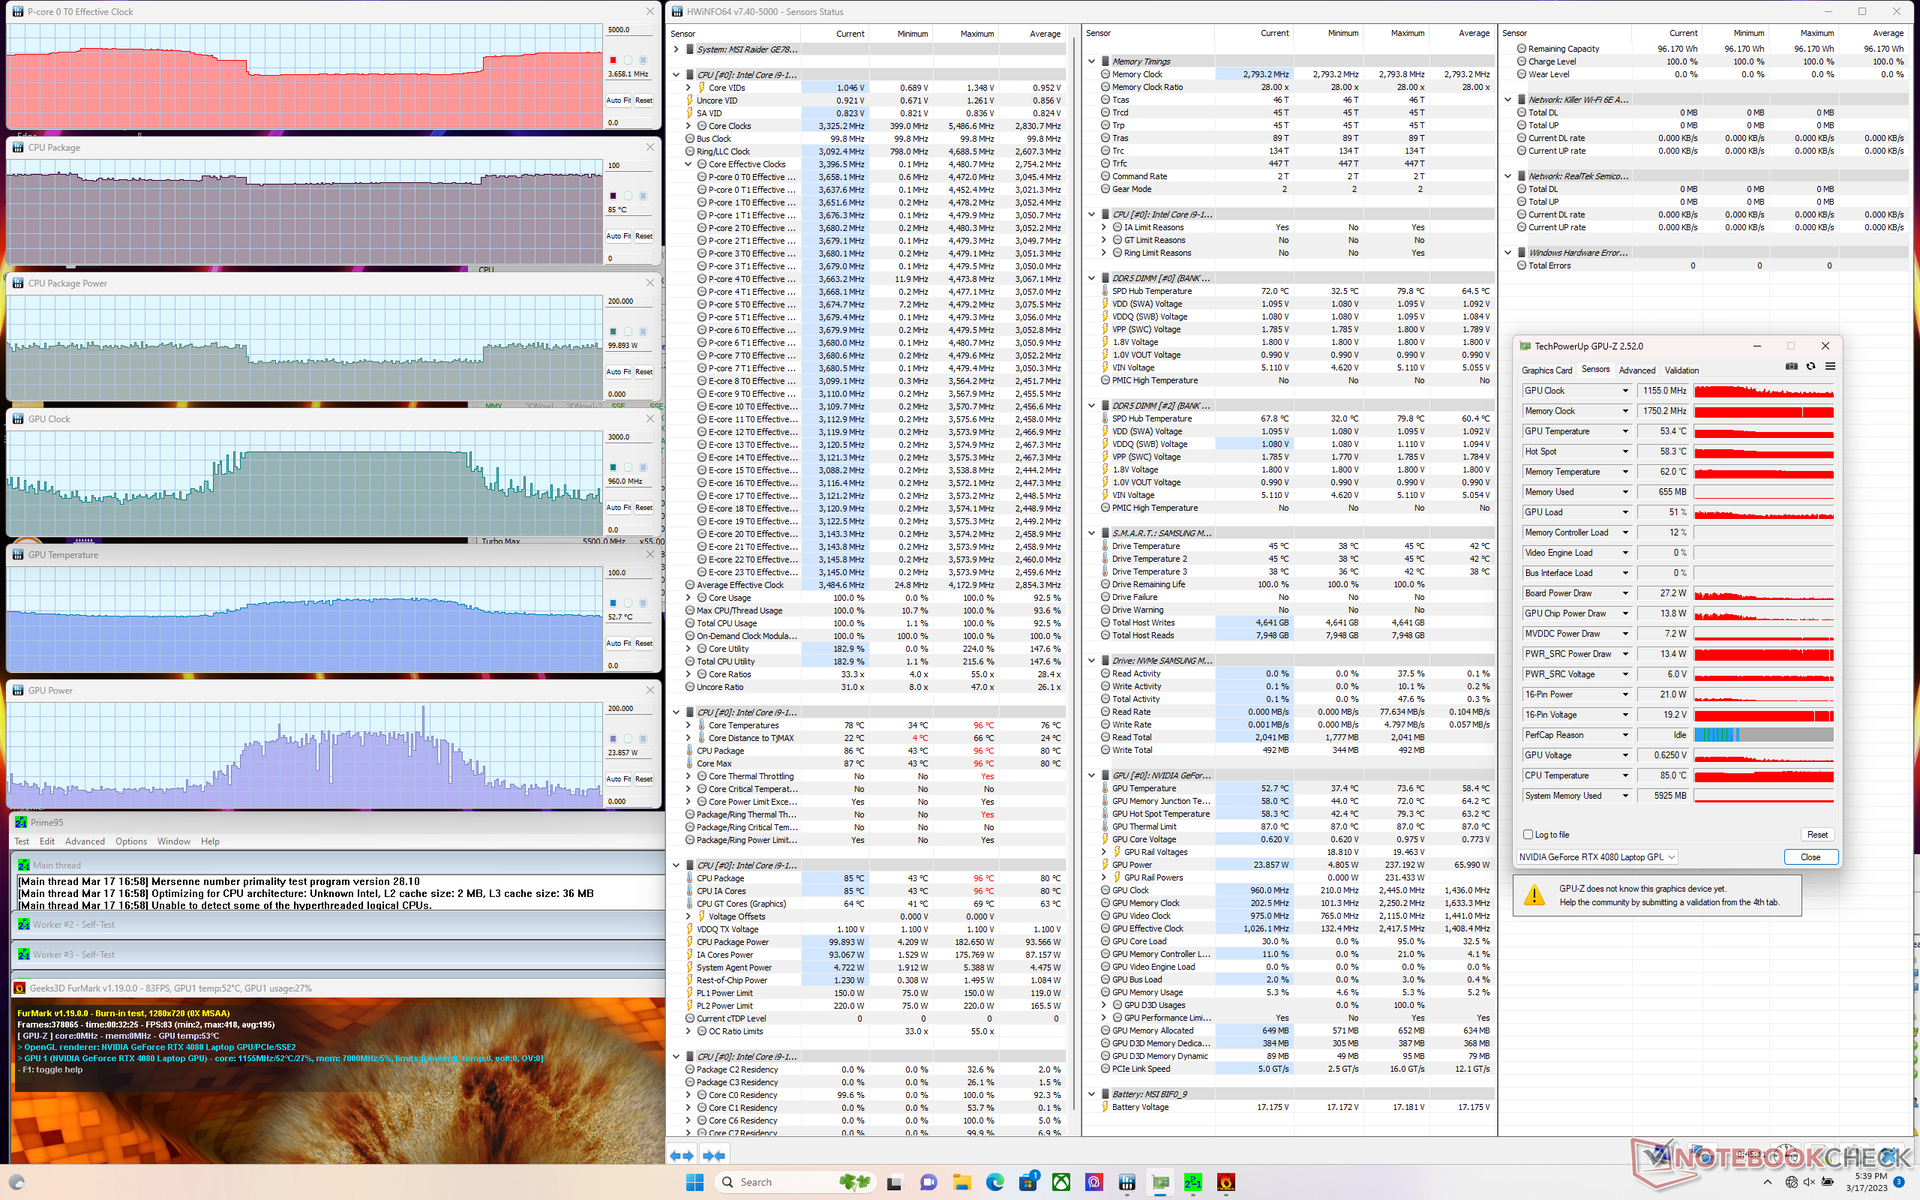
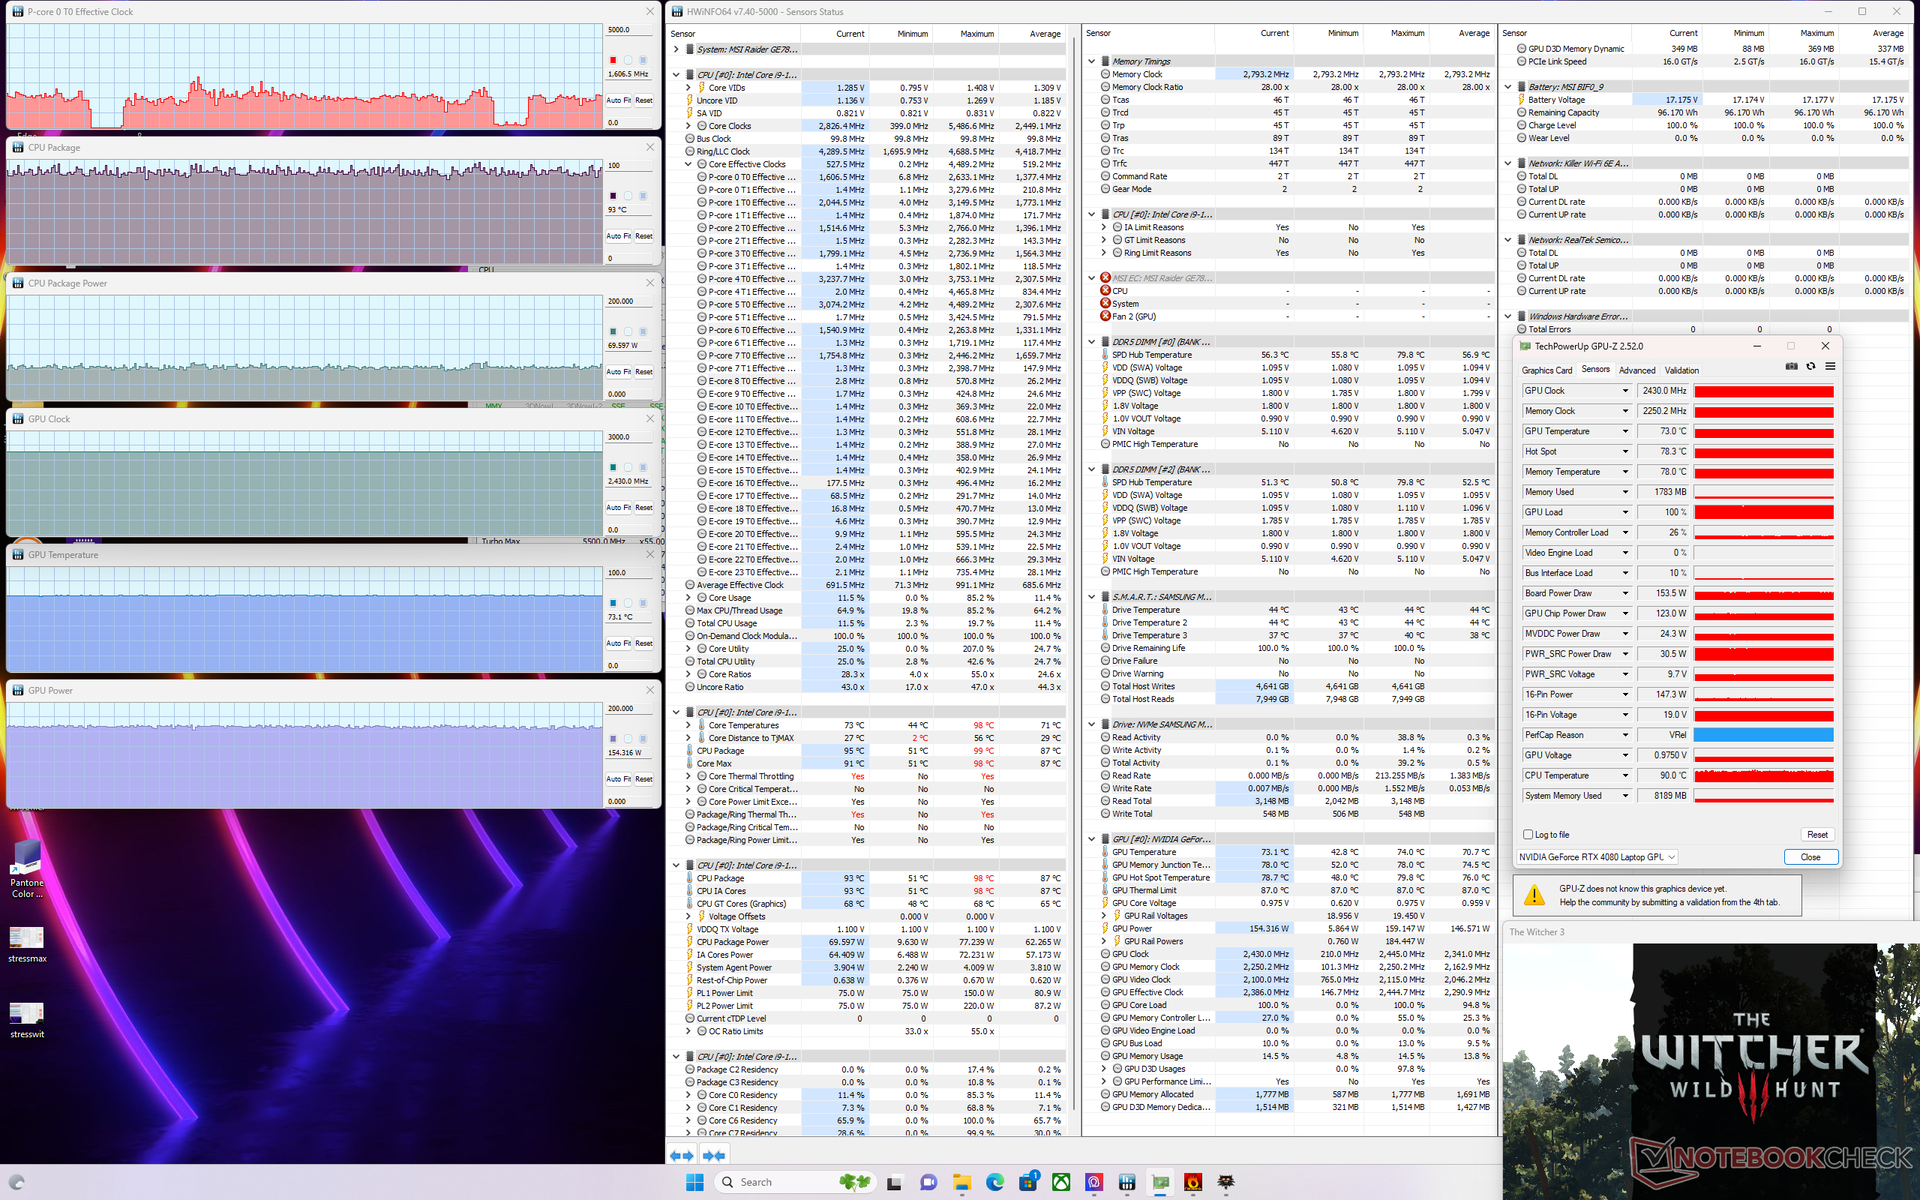
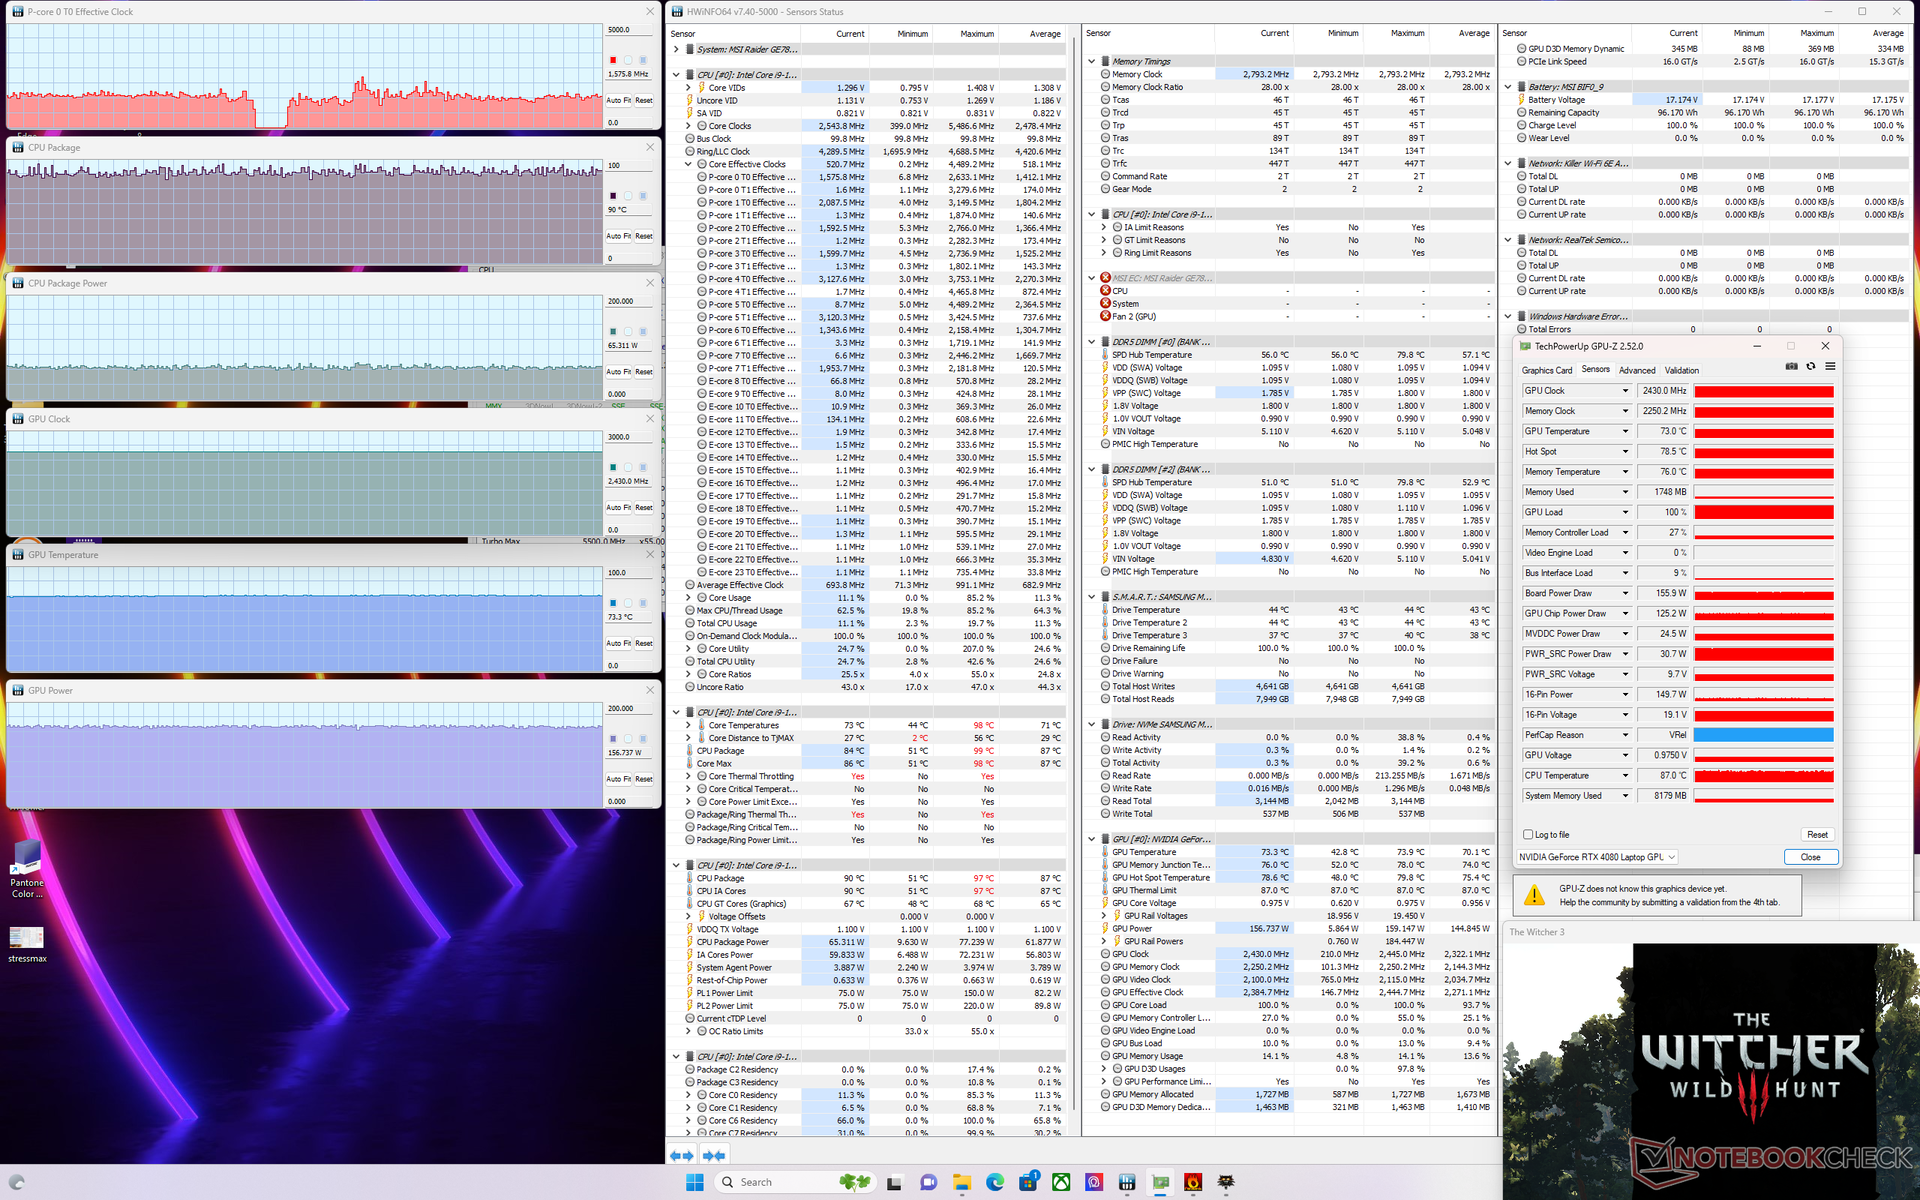
| CPU Clock (GHz) | GPU Clock (MHz) | Average CPU Temperature (°C) | Average GPU Temperature (°C) | |
| System Idle | -- | -- | 45 | 37 |
| Prime95 Stress | 3.7 | -- | 91 | 53 |
| Prime95 + FurMark Stress | 2.4 - 3.7 | 960 - 2360 | 82 - 85 | 53 - 60 |
| Witcher 3 Stress | ~1.6 | 2430 | 93 | 73 |
Speakers
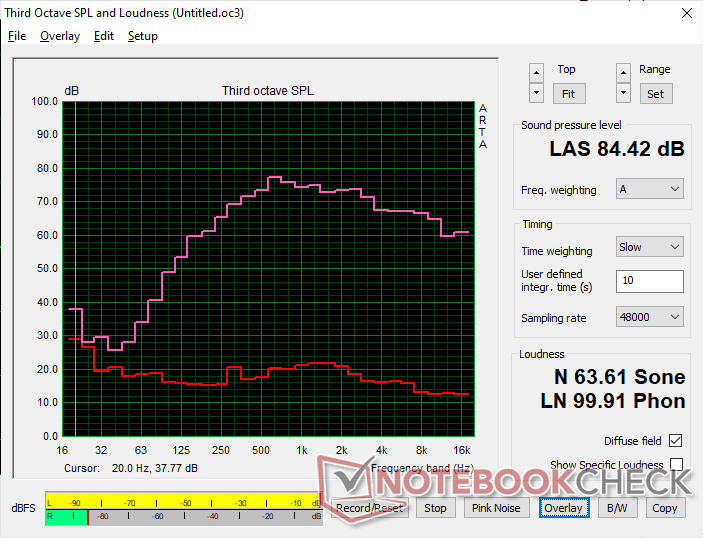
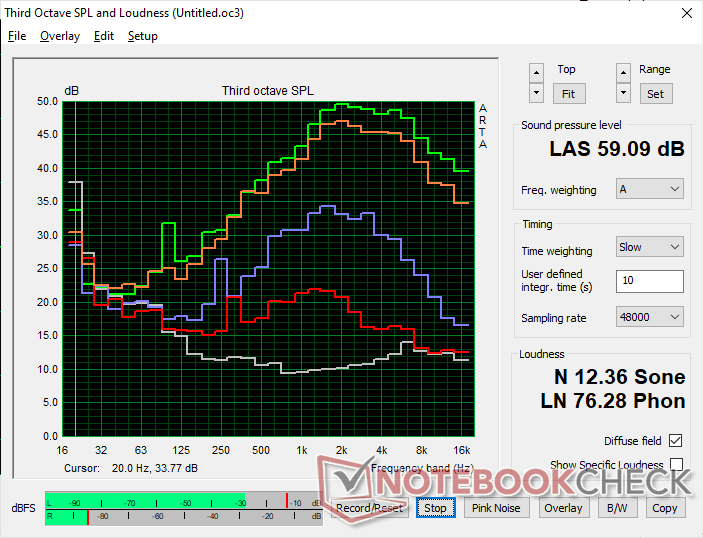
MSI GE78HX 13VH-070US audio analysis
(+) | speakers can play relatively loud (84.4 dB)
Bass 100 - 315 Hz
(±) | reduced bass - on average 8.3% lower than median
(±) | linearity of bass is average (9.3% delta to prev. frequency)
Mids 400 - 2000 Hz
(±) | higher mids - on average 6.8% higher than median
(+) | mids are linear (3.4% delta to prev. frequency)
Highs 2 - 16 kHz
(+) | balanced highs - only 2% away from median
(+) | highs are linear (2.6% delta to prev. frequency)
Overall 100 - 16.000 Hz
(+) | overall sound is linear (12% difference to median)
Compared to same class
» 12% of all tested devices in this class were better, 4% similar, 84% worse
» The best had a delta of 6%, average was 18%, worst was 132%
Compared to all devices tested
» 9% of all tested devices were better, 2% similar, 88% worse
» The best had a delta of 4%, average was 23%, worst was 134%
Apple MacBook Pro 16 2021 M1 Pro audio analysis
(+) | speakers can play relatively loud (84.7 dB)
Bass 100 - 315 Hz
(+) | good bass - only 3.8% away from median
(+) | bass is linear (5.2% delta to prev. frequency)
Mids 400 - 2000 Hz
(+) | balanced mids - only 1.3% away from median
(+) | mids are linear (2.1% delta to prev. frequency)
Highs 2 - 16 kHz
(+) | balanced highs - only 1.9% away from median
(+) | highs are linear (2.7% delta to prev. frequency)
Overall 100 - 16.000 Hz
(+) | overall sound is linear (4.6% difference to median)
Compared to same class
» 0% of all tested devices in this class were better, 0% similar, 100% worse
» The best had a delta of 5%, average was 17%, worst was 45%
Compared to all devices tested
» 0% of all tested devices were better, 0% similar, 100% worse
» The best had a delta of 4%, average was 23%, worst was 134%
Energy Management — Fat Power Brick With High Consumption
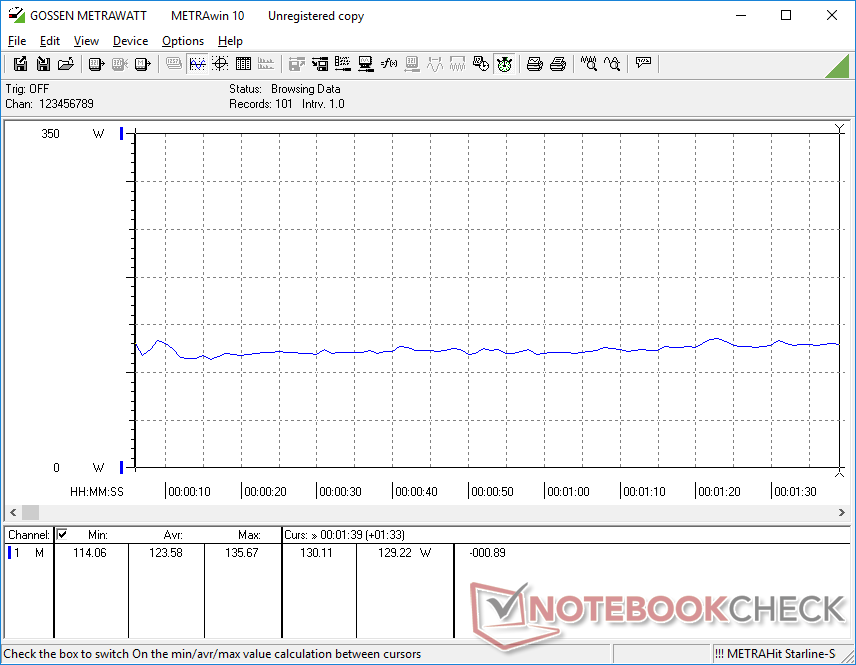
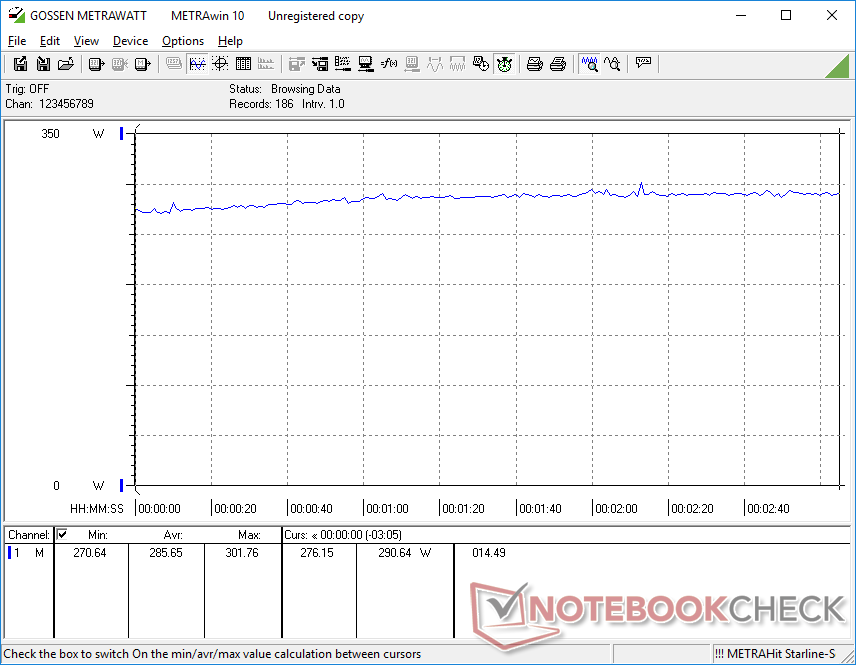
Power Consumption
Power consumption is now even higher than on laptops running on previous generation 12th gen Intel CPUs and GeForce 30 GPUs which were already quite high to begin with. For example, gaming would consume 286 W compared to 247 W on the GE77. GPU performance-per-watt is still better on the GeForce 40 series, however, so at least the uptick in consumption is relatively minor all things considered.
Running Prime95 on an external monitor would consume 32 percent more power than on the GE77 when under similar loads for a 40 to 45 percent boost in raw processor performance. CPU performance-per-watt is therefore just barely higher when jumping between the 12th gen and 13th gen Core-H series.
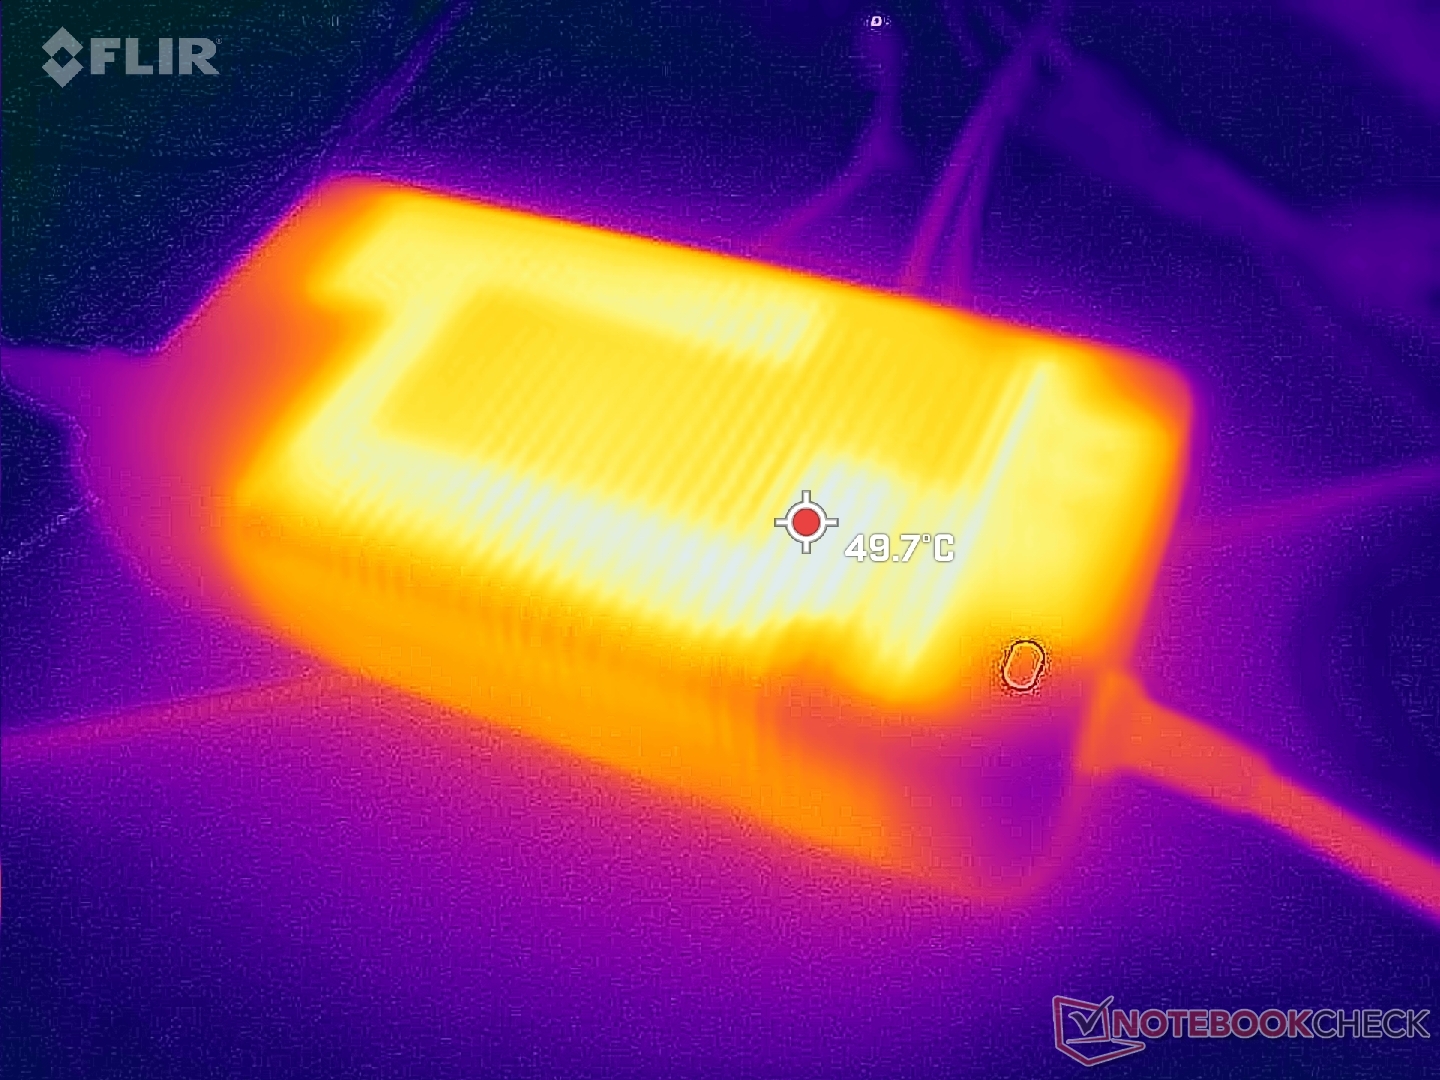
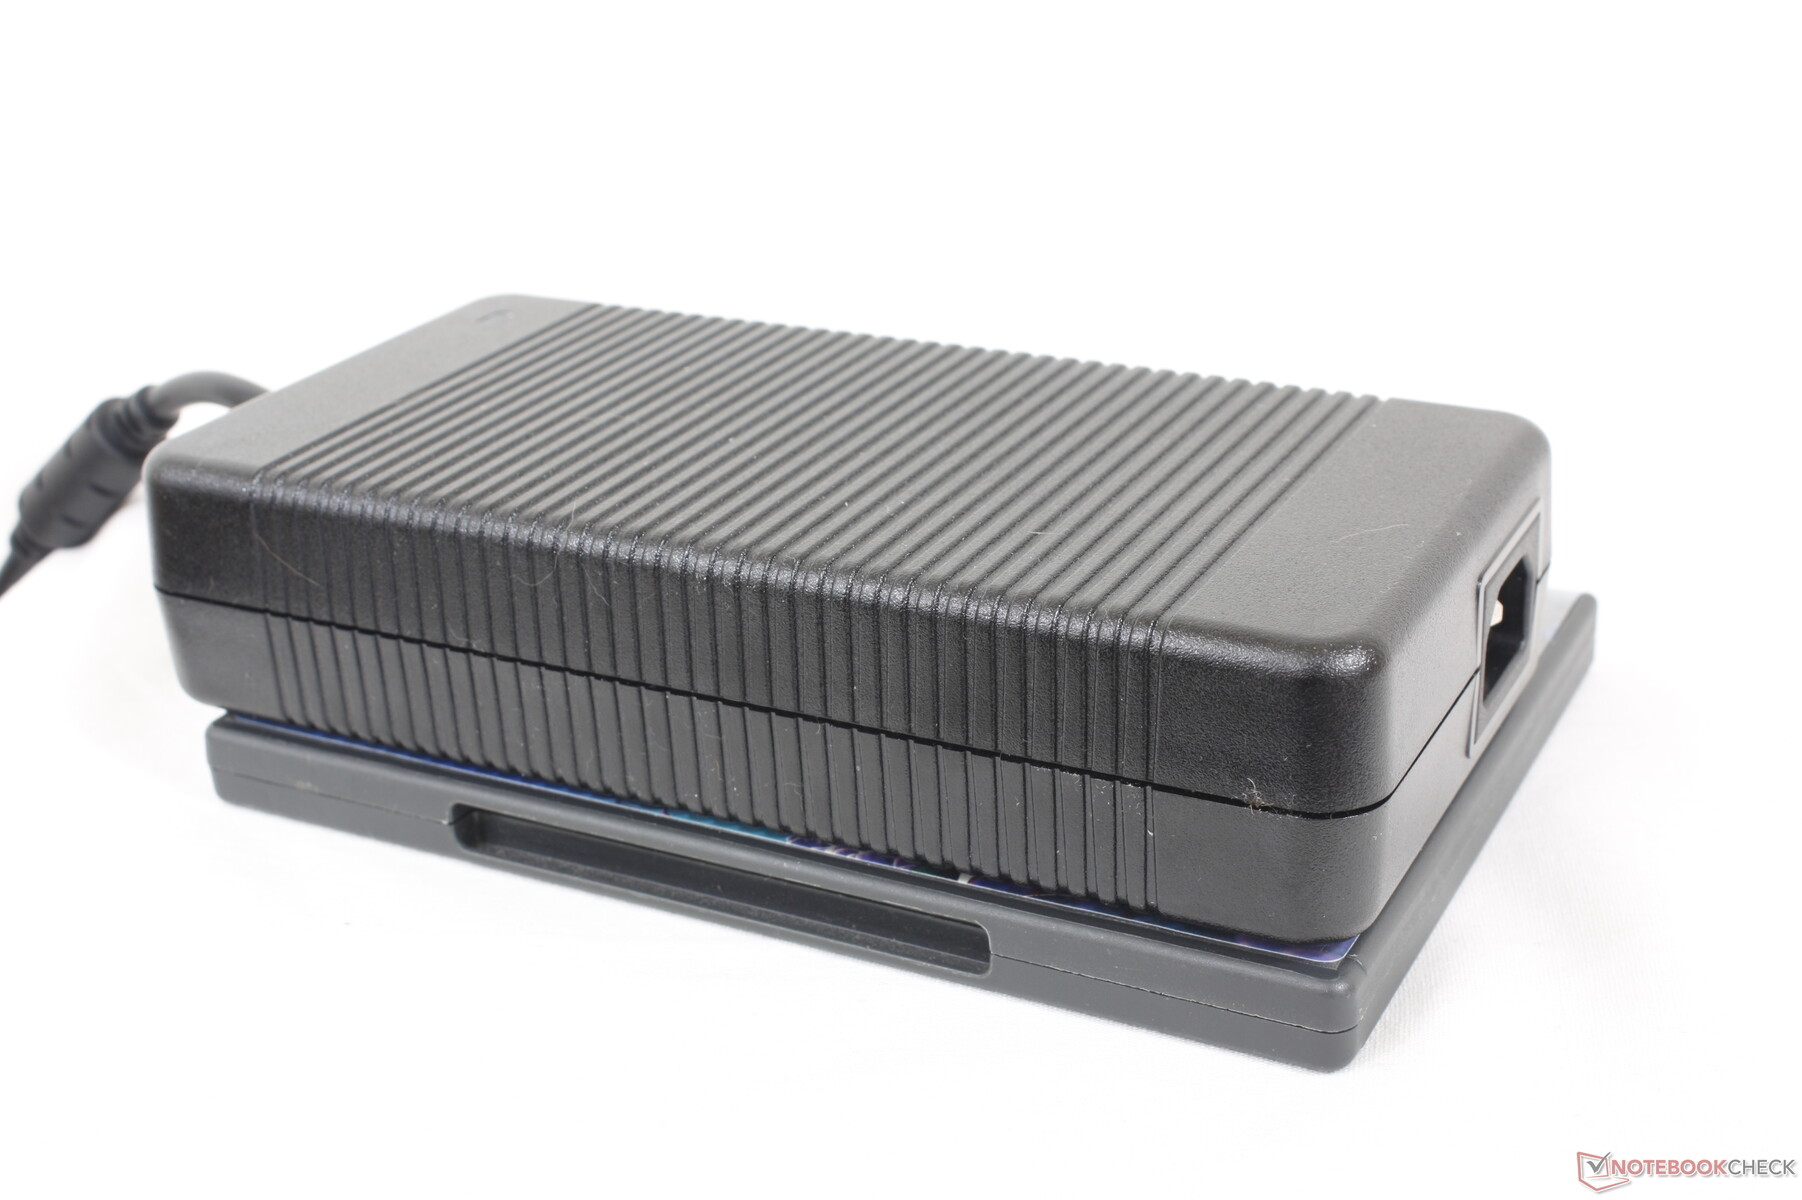
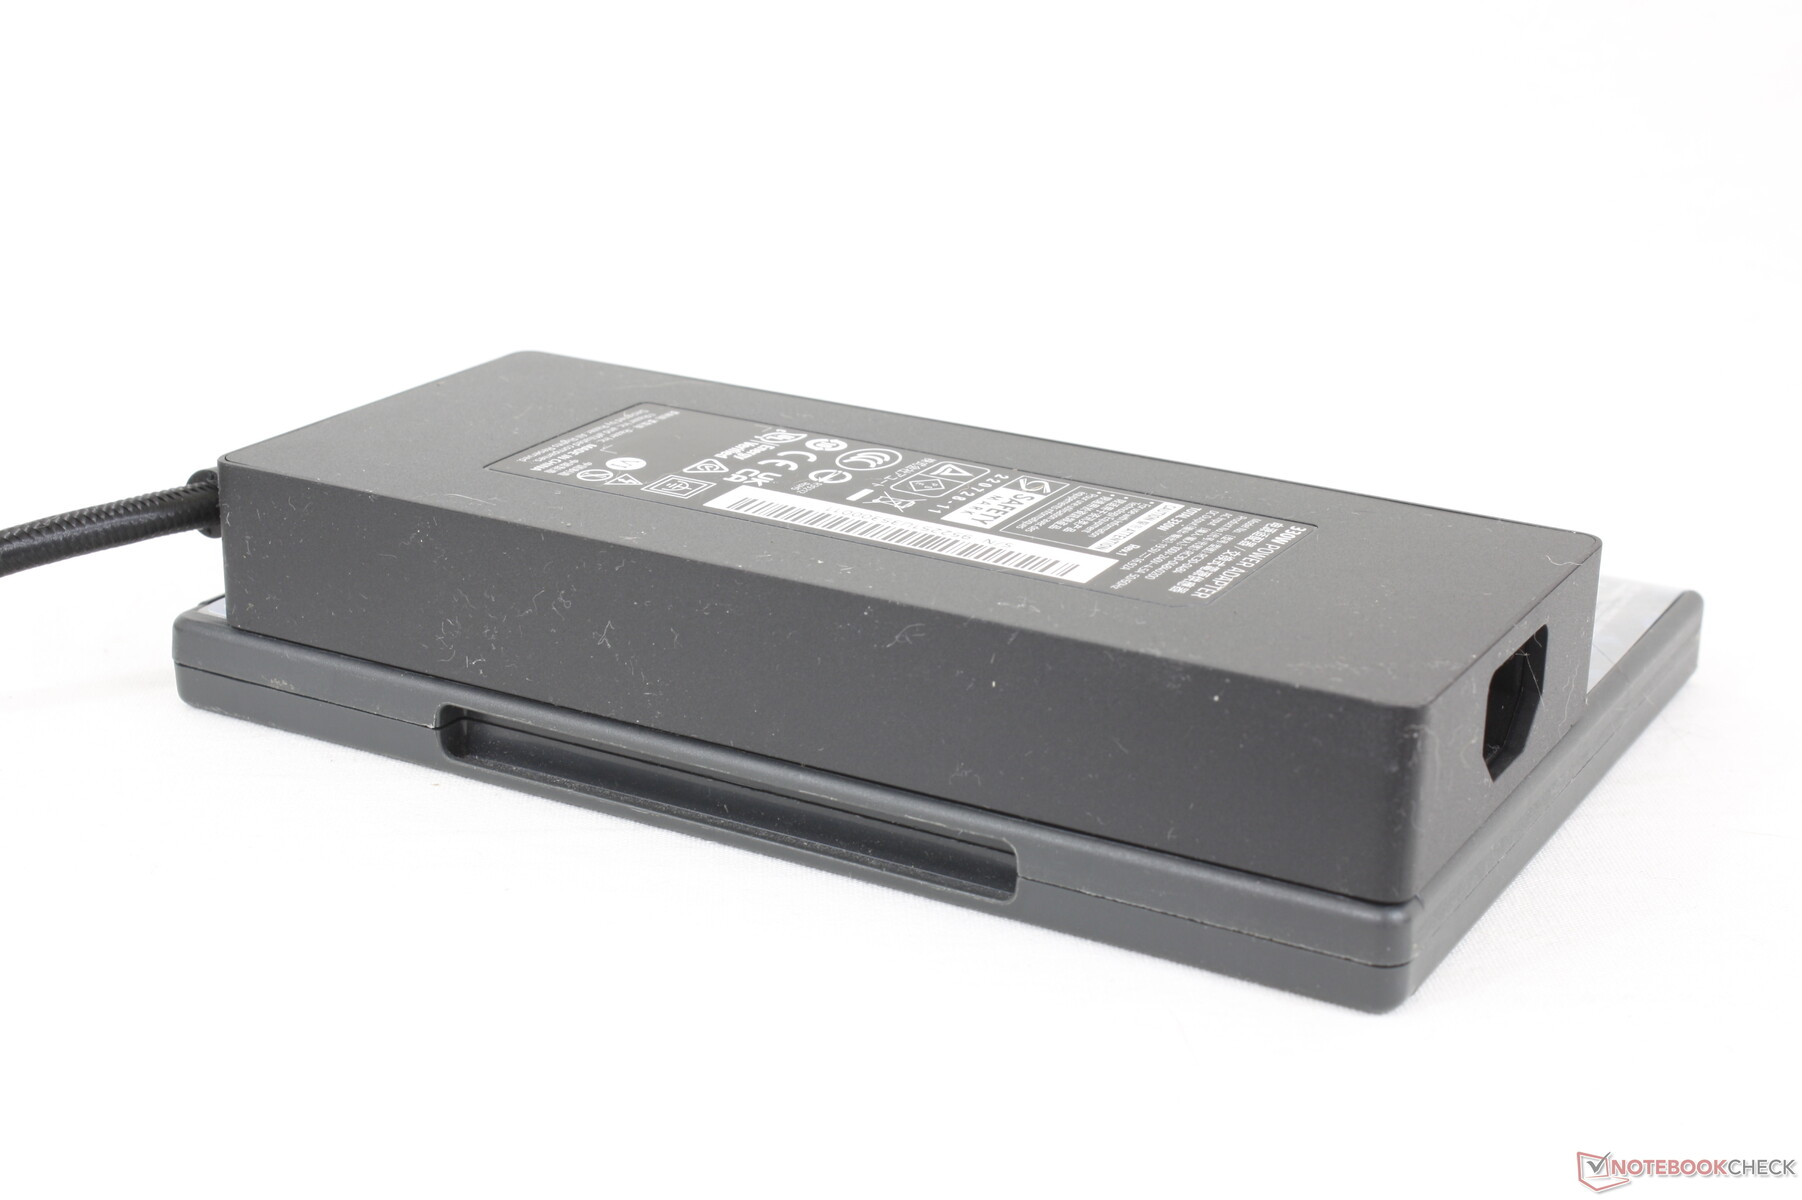
We're able to record a temporary maximum draw of 288 W from the bulky (~19.9 x 9.8 x 4.2 cm) 330 W AC adapter when the CPU and GPU are stressed under Prime95 and FurMark simultaneously. Unlike Razer, MSI has yet to migrate to GaN charging and so its 330 W power brick is noticeably larger and heavier than the 330 W Razer solution.
| Off / Standby | |
| Idle | |
| Load |
|
Key:
min: | |
| MSI GE78HX 13VH-070US i9-13950HX, GeForce RTX 4080 Laptop GPU, Samsung PM9A1 MZVL22T0HBLB, IPS, 2560x1600, 17" | Eluktronics Mech-17 GP2 i9-13900HX, GeForce RTX 4090 Laptop GPU, Samsung PM9A1 MZVL21T0HCLR, IPS, 2560x1600, 17" | Asus ROG Strix G17 G713PI R9 7945HX, GeForce RTX 4070 Laptop GPU, WD PC SN560 SDDPNQE-1T00, IPS, 2560x1440, 17.3" | MSI Titan GT77 HX 13VI i9-13950HX, GeForce RTX 4090 Laptop GPU, Samsung PM9A1 MZVL22T0HBLB, Mini-LED, 3840x2160, 17.3" | MSI Raider GE77 HX 12UHS i9-12900HX, GeForce RTX 3080 Ti Laptop GPU, Samsung PM9A1 MZVL22T0HBLB, IPS, 3840x2160, 17.3" | Razer Blade 17 Early 2022 i9-12900H, GeForce RTX 3080 Ti Laptop GPU, Samsung PM9A1 MZVL21T0HCLR, IPS, 3840x2160, 17.3" | |
|---|---|---|---|---|---|---|
| Power Consumption | 1% | 15% | 2% | 5% | 6% | |
| Idle Minimum * (Watt) | 16.1 | 14 13% | 15 7% | 14 13% | 13 19% | 17 -6% |
| Idle Average * (Watt) | 24 | 19.3 20% | 20 17% | 21.6 10% | 19 21% | 23 4% |
| Idle Maximum * (Watt) | 34 | 36.8 -8% | 29 15% | 24.8 27% | 29 15% | 34 -0% |
| Load Average * (Watt) | 123.6 | 117.2 5% | 121 2% | 122.5 1% | 143 -16% | 120 3% |
| Witcher 3 ultra * (Watt) | 286 | 304 -6% | 179.8 37% | 265 7% | 247 14% | 229 20% |
| Load Maximum * (Watt) | 285.7 | 342.5 -20% | 246 14% | 418 -46% | 352 -23% | 243 15% |
* ... smaller is better
Power Consumption Witcher 3 / Stresstest
Power Consumption external Monitor
Battery Life
Runtimes are pretty good considering the demanding hardware inside. We're able to clock in just over 6 hours of real-world WLAN browsing when on the Balanced power profile with the iGPU active. Competitors like the Eluktronics Mech-17 GP2 or Asus ROG Strix G17 G713PI would last for one to two hours shorter, respectively, when under similar conditions.
Charging from empty to full capacity takes about 2.5 hours which is a full hour longer than on most Ultrabooks. Though MSI says PD charging is supported, we're unable to charge our test unit via any of the three USB-C ports.
| MSI GE78HX 13VH-070US i9-13950HX, GeForce RTX 4080 Laptop GPU, 99 Wh | Eluktronics Mech-17 GP2 i9-13900HX, GeForce RTX 4090 Laptop GPU, 99 Wh | Asus ROG Strix G17 G713PI R9 7945HX, GeForce RTX 4070 Laptop GPU, 90 Wh | MSI Titan GT77 HX 13VI i9-13950HX, GeForce RTX 4090 Laptop GPU, 99.9 Wh | MSI Raider GE77 HX 12UHS i9-12900HX, GeForce RTX 3080 Ti Laptop GPU, 99.99 Wh | Razer Blade 17 Early 2022 i9-12900H, GeForce RTX 3080 Ti Laptop GPU, 82 Wh | |
|---|---|---|---|---|---|---|
| Battery runtime | -16% | -32% | -10% | 19% | -9% | |
| Reader / Idle (h) | 7.3 | 9.8 34% | 7.1 -3% | |||
| WiFi v1.3 (h) | 6.1 | 5.1 -16% | 4.3 -30% | 5.3 -13% | 5.4 -11% | 3.8 -38% |
| Load (h) | 1.5 | 1 -33% | 1.4 -7% | 2 33% | 1.7 13% | |
| H.264 (h) | 2.8 | 6 | 6.5 | 4.8 | ||
| Witcher 3 ultra (h) | 1.1 |
Pros
Cons
Verdict — Excellent Year-Over-Year Performance Boost
Performance-wise, the GE78 offers a significant boost over the GE77 for just slightly higher power consumption. You'll have to get the RTX 4080 or 4090 configurations to see the performance advantages, however, as the RTX 4070 is closer in performance to the older RTX 3080 Ti.
In terms of design, some users might prefer the 16:9 minimalistic look of the older GE77 over the 16:10 retro-inspired GE78 and vice versa. We wouldn't call one better than the other in terms of aesthetics, but we'll give the edge to the GE78 for its stronger hinges and larger keys and clickpad.
The MSI GE78 is a big step forward over the GE77 in terms of performance. Some of its features, however, are lacking against the competition especially when considering the >$3000 USD price range.
Hopefully the issues we experienced on our unit aren't widespread on retail units. The freezing when waking from sleep, heavy light bleeding, and DPC latency issues are problems that shouldn't be present on an expensive model like the GE78. The lack of G-Sync, Advanced Optimus, and slimmer GaN charging are also unfortunate when alternatives like the Razer Blade series now offer them by default.
Price and Availability
MSI GE78HX 13VH-070US
- 03/21/2023 v7 (old)
Allen Ngo
Transparency
The selection of devices to be reviewed is made by our editorial team. The test sample was provided to the author as a loan by the manufacturer or retailer for the purpose of this review. The lender had no influence on this review, nor did the manufacturer receive a copy of this review before publication. There was no obligation to publish this review. As an independent media company, Notebookcheck is not subjected to the authority of manufacturers, retailers or publishers.
This is how Notebookcheck is testing
Every year, Notebookcheck independently reviews hundreds of laptops and smartphones using standardized procedures to ensure that all results are comparable. We have continuously developed our test methods for around 20 years and set industry standards in the process. In our test labs, high-quality measuring equipment is utilized by experienced technicians and editors. These tests involve a multi-stage validation process. Our complex rating system is based on hundreds of well-founded measurements and benchmarks, which maintains objectivity. Further information on our test methods can be found here.
Price comparison
