MSI Crosshair 15 Rainbow Six Extraction Edition Review: Capable QHD 165 Hz midranger beyond the theming

Game-themed laptops are hard to come by these days. Alienware celebrated the launch of Cyberpunk 2077 with a themed m17 R3 back in the day, but that was more of a skin to spruce up the design. With the Crosshair 15, MSI has designed the laptop from the ground up to imbue Ubisoft's Rainbow Six: Extraction vibes in all aspects of the design.
The thing with gaming-themed laptops is that they appeal to only a niche audience invested in the particular game. Rainbow Six: Extraction earned mixed reviews from critics and fans, so a laptop themed on this game may not pique everyone's interest at first glance.
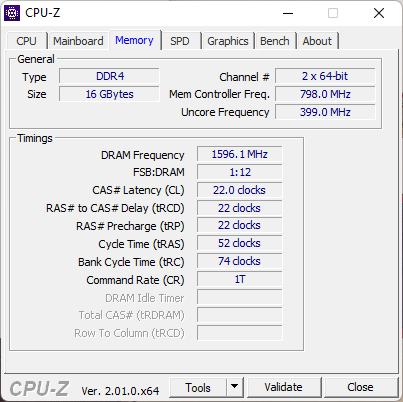
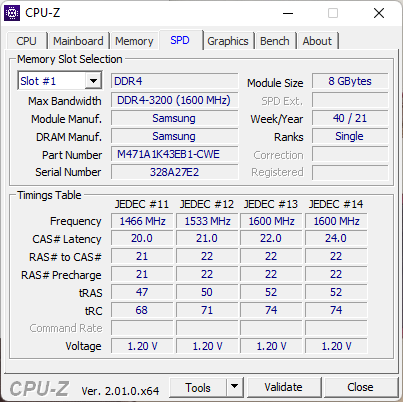
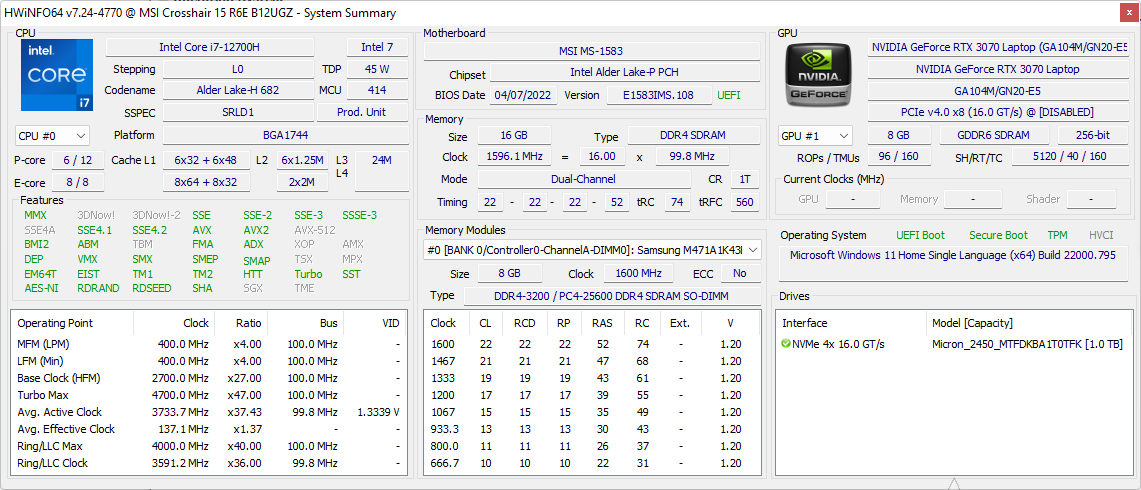
Going beyond the theming, however, we find that MSI has a lot to offer in the package. Our MSI Crosshair 15 Rainbow Six: Extraction Edition (R6E) came equipped with an Intel Core i7-12700H processor, Nvidia GeForce RTX 3070 Laptop GPU, 16 GB DDR4-3200 RAM, a 1 TB NVMe SSD, and a 165 Hz QHD display.
The combination of an Alder Lake-H CPU and the RTX 3070 Laptop GPU is not often seen given that Nvidia has supplanted this GPU with the RTX 3070 Ti Laptop GPU. Nevertheless, this Crosshair 15 configuration will set you back by ₹1,90,990 (US$2,312) in India.
In this review, we evaluate the MSI Crosshair 15 Rainbow Six: Extraction Edition and see how it fares against the competition as an upper midrange gaming laptop.
Potential Competitors in Comparison
Rating | Date | Model | Weight | Height | Size | Resolution | Price |
|---|---|---|---|---|---|---|---|
| 85.8 % v7 (old) | 12 / 2022 | MSI Crosshair 15 R6E B12UGZ-050 i7-12700H, GeForce RTX 3070 Laptop GPU | 2.5 kg | 26.9 mm | 15.60" | 2560x1440 | |
| 84.5 % v7 (old) | 02 / 2022 | MSI Stealth GS66 12UGS i7-12700H, GeForce RTX 3070 Ti Laptop GPU | 2.2 kg | 19.8 mm | 15.60" | 2560x1440 | |
| 88 % v7 (old) | 03 / 2022 | Lenovo Legion 5 Pro 16 G7 i7 RTX 3070Ti i7-12700H, GeForce RTX 3070 Ti Laptop GPU | 2.6 kg | 26.6 mm | 16.00" | 2560x1600 | |
| 80.3 % v7 (old) | 06 / 2022 | MSI Katana GF66 12UGS i7-12700H, GeForce RTX 3070 Ti Laptop GPU | 2.3 kg | 27.5 mm | 15.60" | 1920x1080 | |
| 80.7 % v7 (old) | 04 / 2022 | MSI Pulse GL66 12UEK i9-12900H, GeForce RTX 3060 Laptop GPU | 2.3 kg | 25 mm | 15.60" | 1920x1080 | |
| 84 % v7 (old) | 06 / 2022 | Acer Nitro 5 AN515-58-72QR i7-12700H, GeForce RTX 3070 Ti Laptop GPU | 2.5 kg | 26.8 mm | 15.60" | 2560x1440 | |
| 85.5 % v7 (old) | 12 / 2022 | Aorus 15 XE5 i7-12700H, GeForce RTX 3070 Ti Laptop GPU | 2.3 kg | 24 mm | 15.60" | 2560x1440 | |
| 88.4 % v7 (old) | 07 / 2022 | Schenker XMG Neo 15 (i7-12700H, RTX 3080 Ti) i7-12700H, GeForce RTX 3080 Ti Laptop GPU | 2.3 kg | 26.6 mm | 15.60" | 2560x1440 | |
| 85.8 % v7 (old) | 07 / 2022 | Asus TUF Dash F15 FX517ZR i7-12650H, GeForce RTX 3070 Laptop GPU | 2 kg | 20.7 mm | 15.60" | 2560x1440 | |
| 88 % v7 (old) | 11 / 2022 | Schenker XMG Neo 15 (Ryzen 9 6900HX, RTX 3070 Ti) R9 6900HX, GeForce RTX 3070 Ti Laptop GPU | 2.3 kg | 26.6 mm | 15.60" | 2560x1440 |
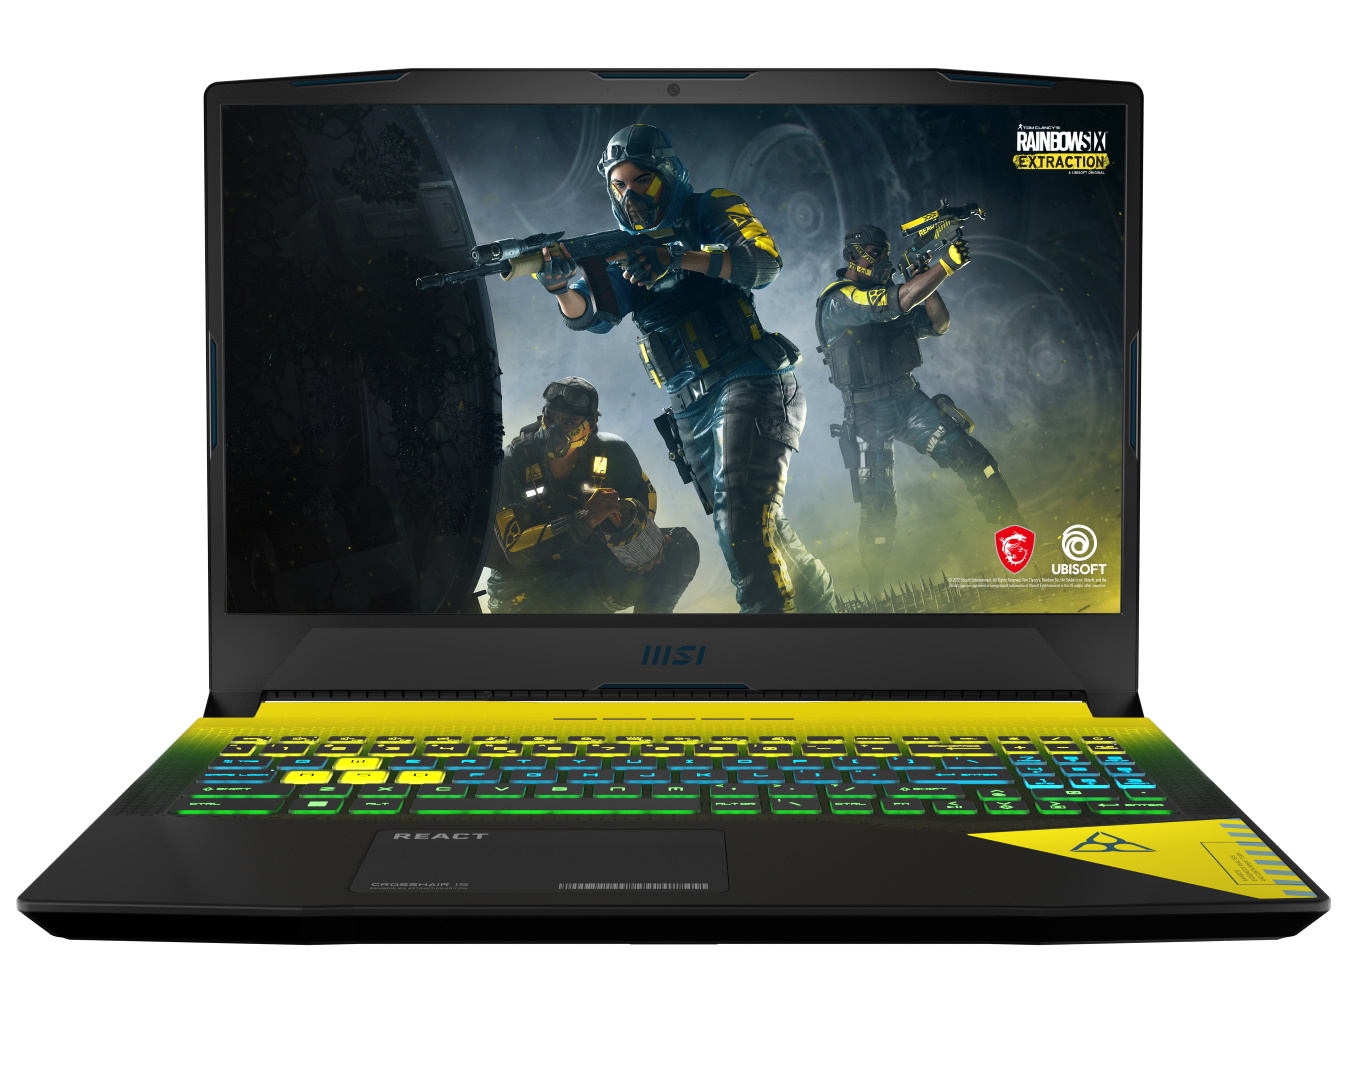
Case: Pulse GL66 painted in Rainbow Six: Extraction colors
The MSI Crosshair 15 R6E's chassis is primarily made of plastic. The build does not really exude any premium vibe but feels sturdy-enough for daily use. There is noticeable flex in the keyboard deck, but it didn't hinder regular usage.
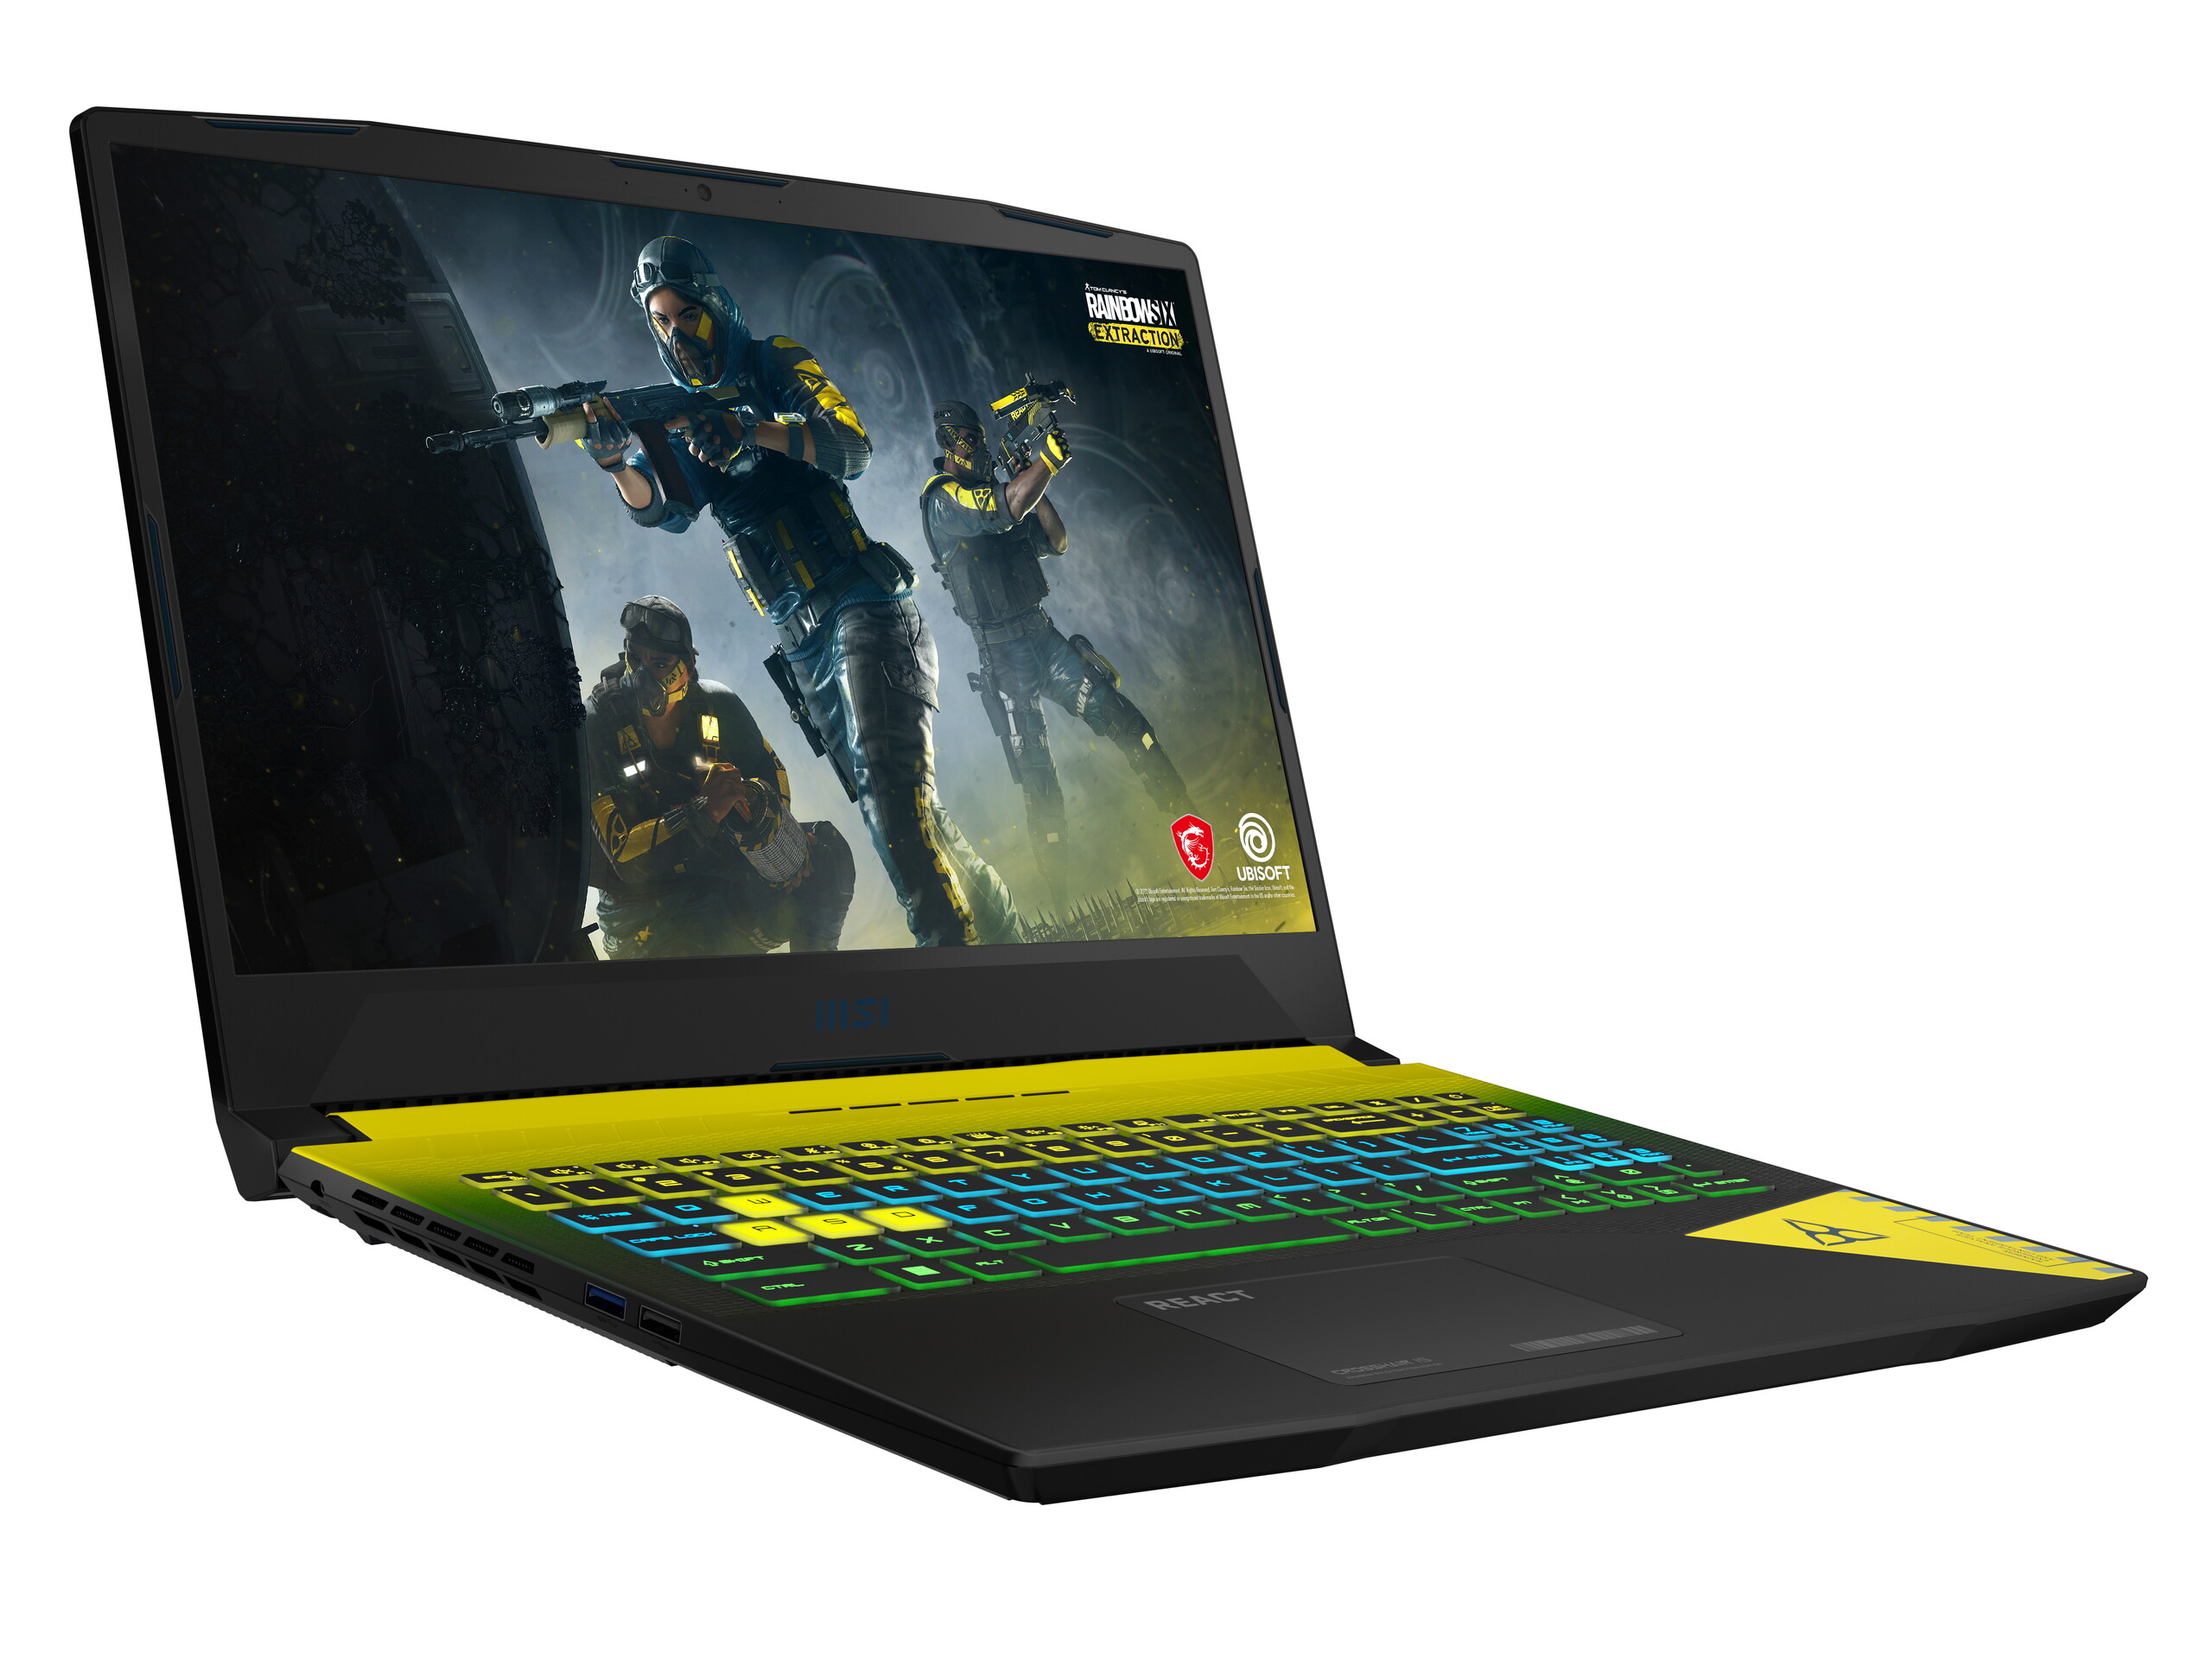
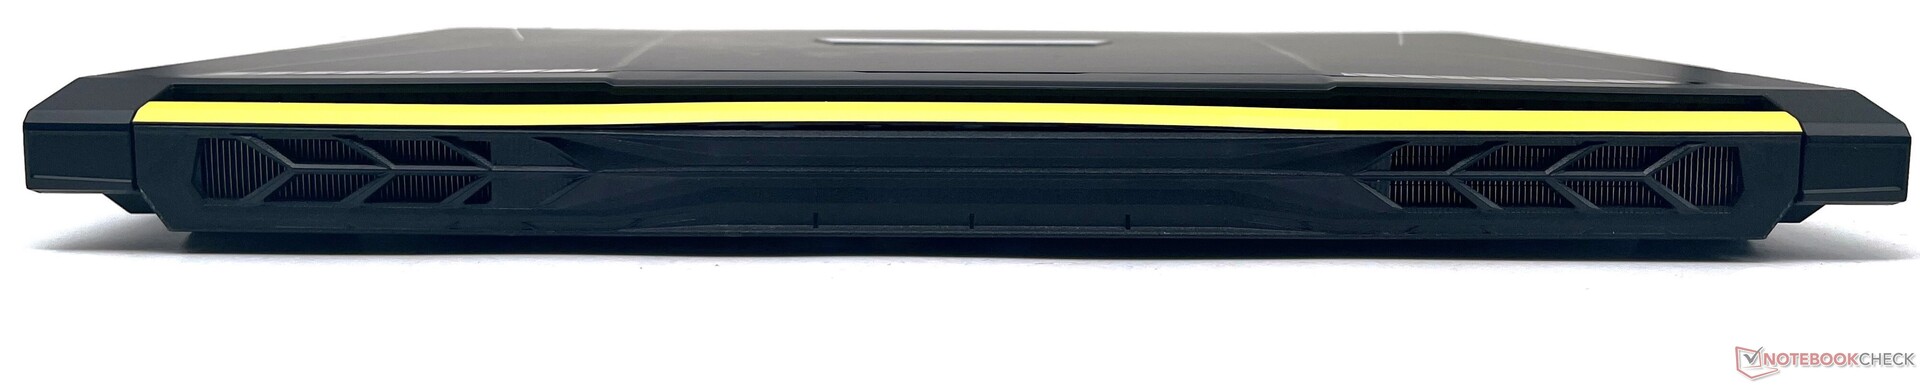
The Crosshair 15 R6E makes extensive use of a yellow-black dual-tone color scheme and the game's REACT design elements right from the packaging to the chassis, thus proclaiming its Rainbow Six: Extraction allegiance.
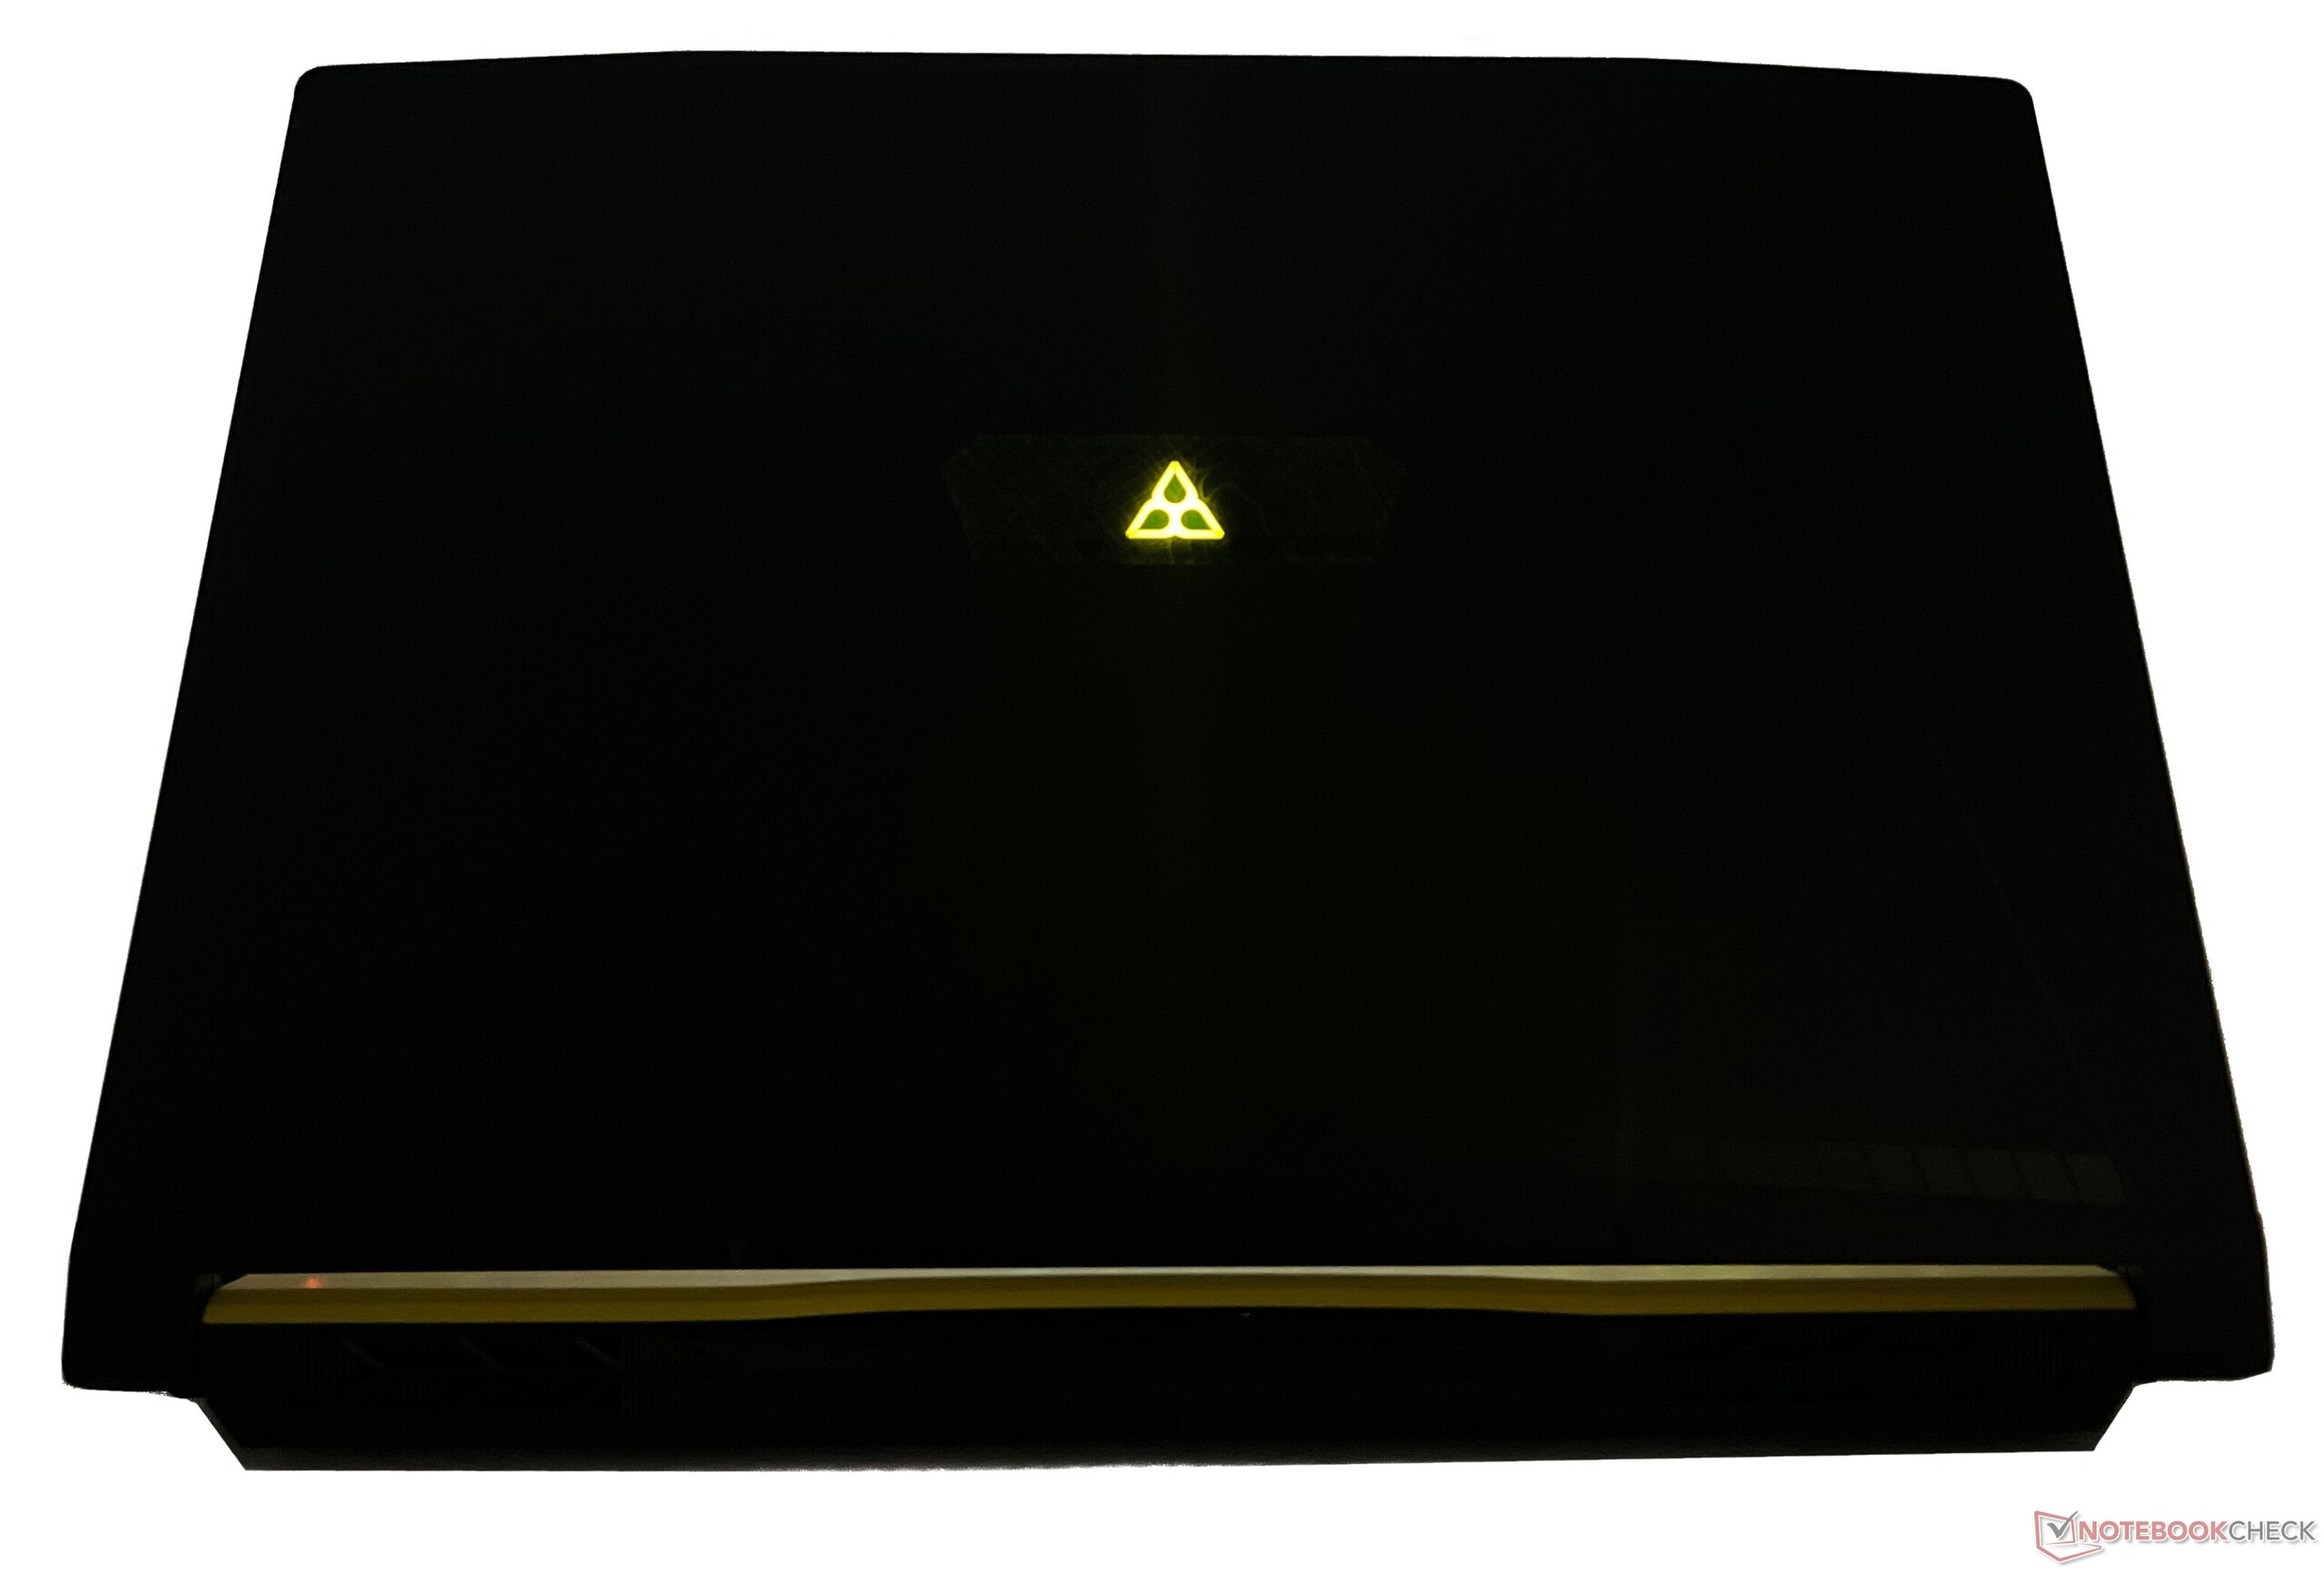
Accordingly, MSI has even replaced its logo with that of the game's at the back of the display. The Rainbow Six: Extraction logo is not too large but is conspicuous enough and glows in bright yellow. There are no RGB lighting patterns, so you will have to contend with the color scheme on offer.
At a thickness of 26.9 mm, it is not the slimmest laptop in its class — that credit goes to the MSI Stealth GS66 and the Razer Blade 15. Still, it is portable enough to slip into a backpack and the 2.5 kg weight does not feel too heavy either.
Overall, the MSI Crosshair 15 Rainbow Six: Extraction Edition's chassis is decently built for the price and essentially comes across as a rehash of the Pulse GL66, and in many ways the Katana GF66, with a fresh coat of paint.
Connectivity: Covers just the essentials
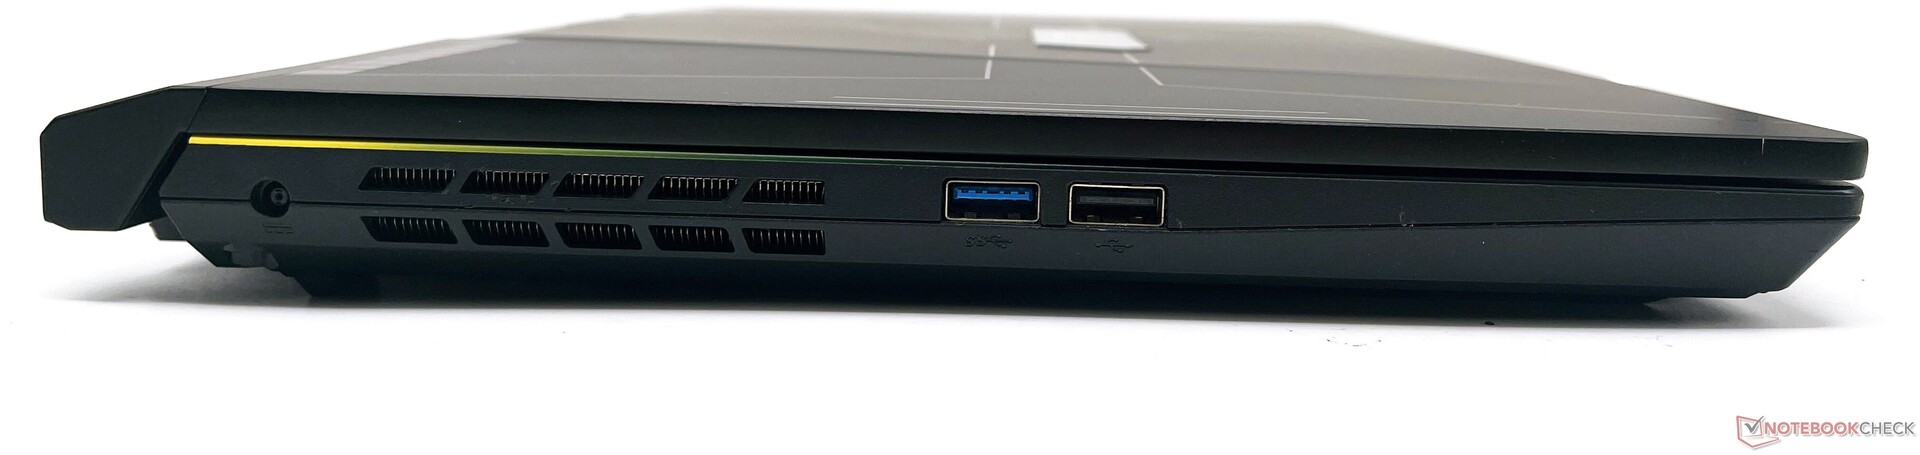
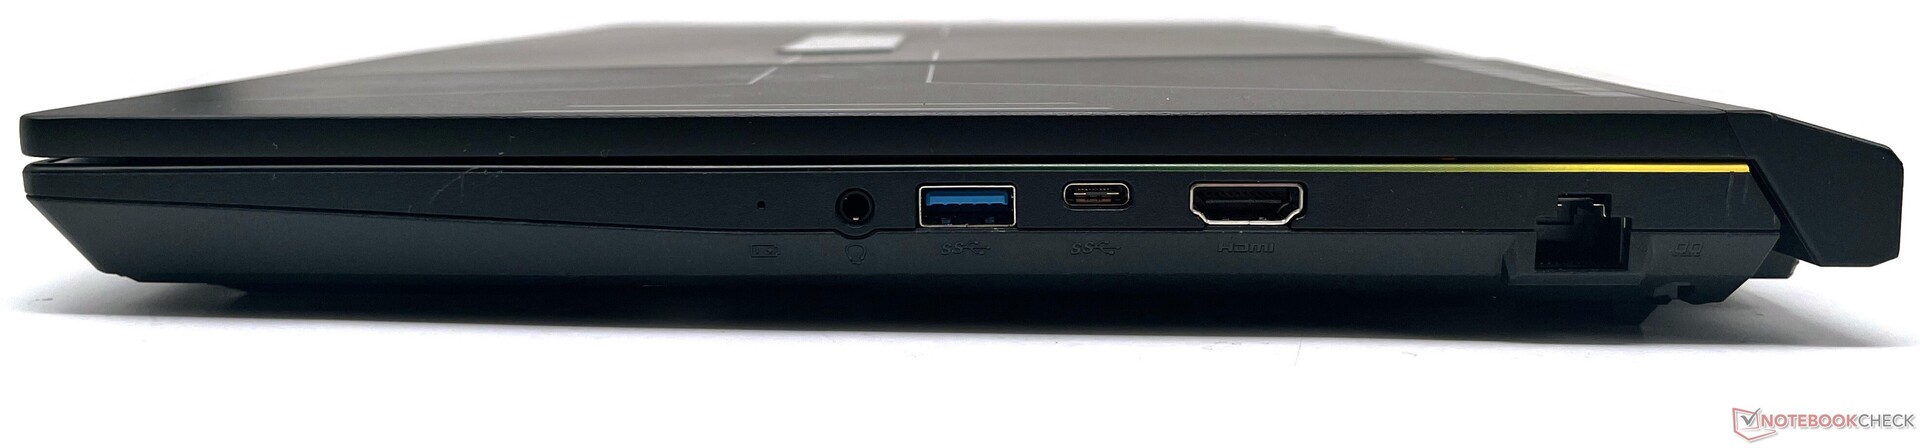
The Crosshair 15 R6E does not offer an extensive port selection, but the essentials are covered. Towards the left, we have USB 3.2 Gen1 Type-A and USB 2.0 Type-A ports. On the right, we get a 3.5 mm combo audio jack, another USB 3.2 Gen1 Type-A, a USB 3.2 Gen1 Type-C port, HDMI-out, and Gigabit Ethernet.
The HDMI port supports only 4K 60 Hz output. There's no card reader, Thunderbolt 4, or Kensington lock slot available.
Port placement is not really ideal, since a majority of them are located towards the right side of the device. The ports on the left could use some additional spacing, given that a good amount of space remains unused. That being said, there are no hindrances while connecting multiple peripherals.
Communication
The Crosshair 15 R6E comes equipped with an Intel Wi-Fi 6 AX201 WLAN module with Bluetooth 5.2. The laptop ranks at the bottom of our Wi-Fi charts with the Asus ROG Rapture GT-AXE11000 reference router.
That being said, its throughput is still better than that of the Pulse GL66. Receive speeds are fairly stable, but we noticed dips during transmit.
| Networking / iperf3 transmit AXE11000 | |
| Schenker XMG Neo 15 (i7-12700H, RTX 3080 Ti) | |
| Acer Nitro 5 AN515-58-72QR | |
| Schenker XMG Neo 15 (Ryzen 9 6900HX, RTX 3070 Ti) | |
| MSI Katana GF66 12UGS | |
| Asus TUF Dash F15 FX517ZR | |
| Average Intel Wi-Fi 6 AX201 (438 - 1715, n=74) | |
| Average of class Gaming (560 - 1862, n=89, last 2 years) | |
| MSI Crosshair 15 R6E B12UGZ-050 | |
| Networking / iperf3 receive AXE11000 | |
| Acer Nitro 5 AN515-58-72QR | |
| MSI Katana GF66 12UGS | |
| Schenker XMG Neo 15 (i7-12700H, RTX 3080 Ti) | |
| Asus TUF Dash F15 FX517ZR | |
| MSI Stealth GS66 12UGS | |
| Schenker XMG Neo 15 (Ryzen 9 6900HX, RTX 3070 Ti) | |
| Average of class Gaming (680 - 1745, n=89, last 2 years) | |
| Average Intel Wi-Fi 6 AX201 (390 - 1734, n=79) | |
| MSI Crosshair 15 R6E B12UGZ-050 | |
| Networking / iperf3 transmit AX12 | |
| Lenovo Legion 5 Pro 16 G7 i7 RTX 3070Ti | |
| Average Intel Wi-Fi 6 AX201 (49.8 - 1775, n=324) | |
| MSI Pulse GL66 12UEK | |
| Networking / iperf3 receive AX12 | |
| Lenovo Legion 5 Pro 16 G7 i7 RTX 3070Ti | |
| Average Intel Wi-Fi 6 AX201 (136 - 1743, n=324) | |
| MSI Pulse GL66 12UEK | |
Webcam
The 720p webcam is just about serviceable for the occasional video call or two. As noticed in our ColorChecker Passport and test chart captures below, the Crosshair 15's webcam shows lots of noise and an overall lack of sharpness.
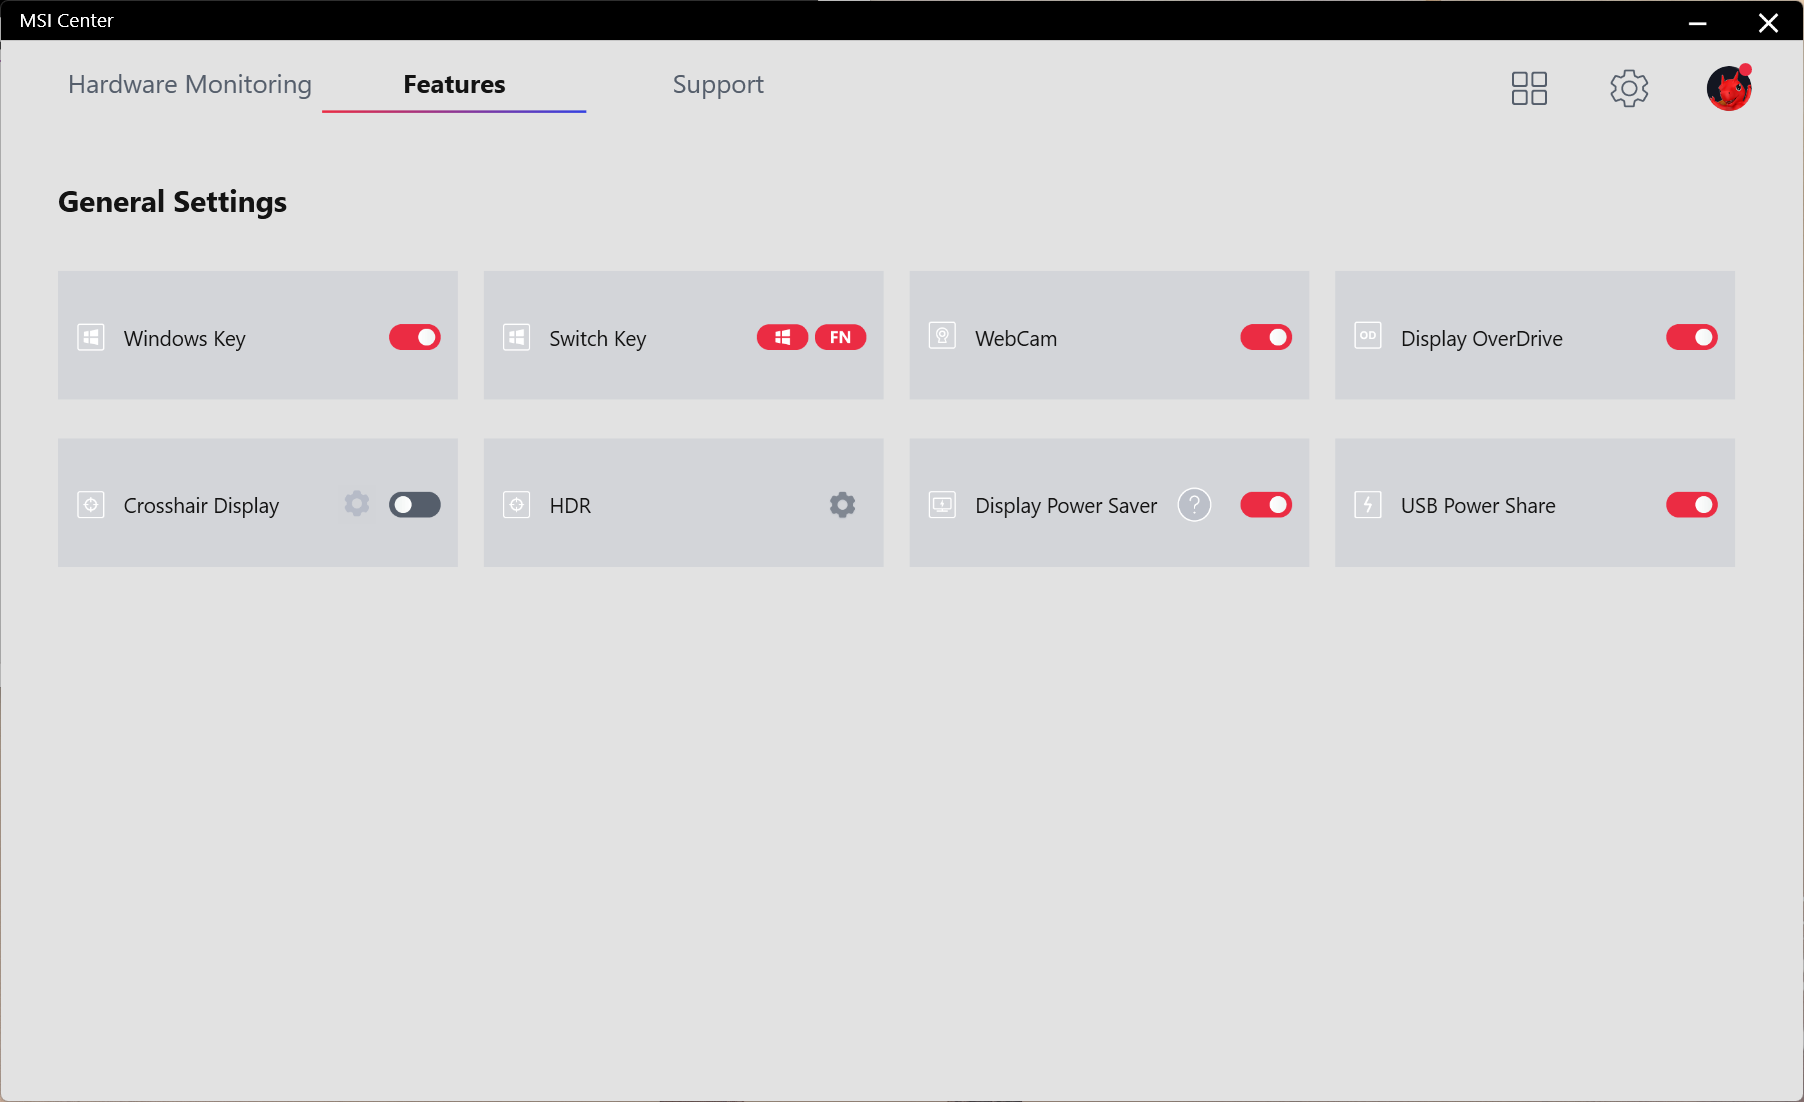
There is no physical privacy shutter available, but it is possible to enable or disable the webcam using the shortcut on the F6 function key or via MSI Center.


Security
There is no biometric login available on the Crosshair 15 R6E. The only major security component onboard is the TPM 2.0 module.
Accessories
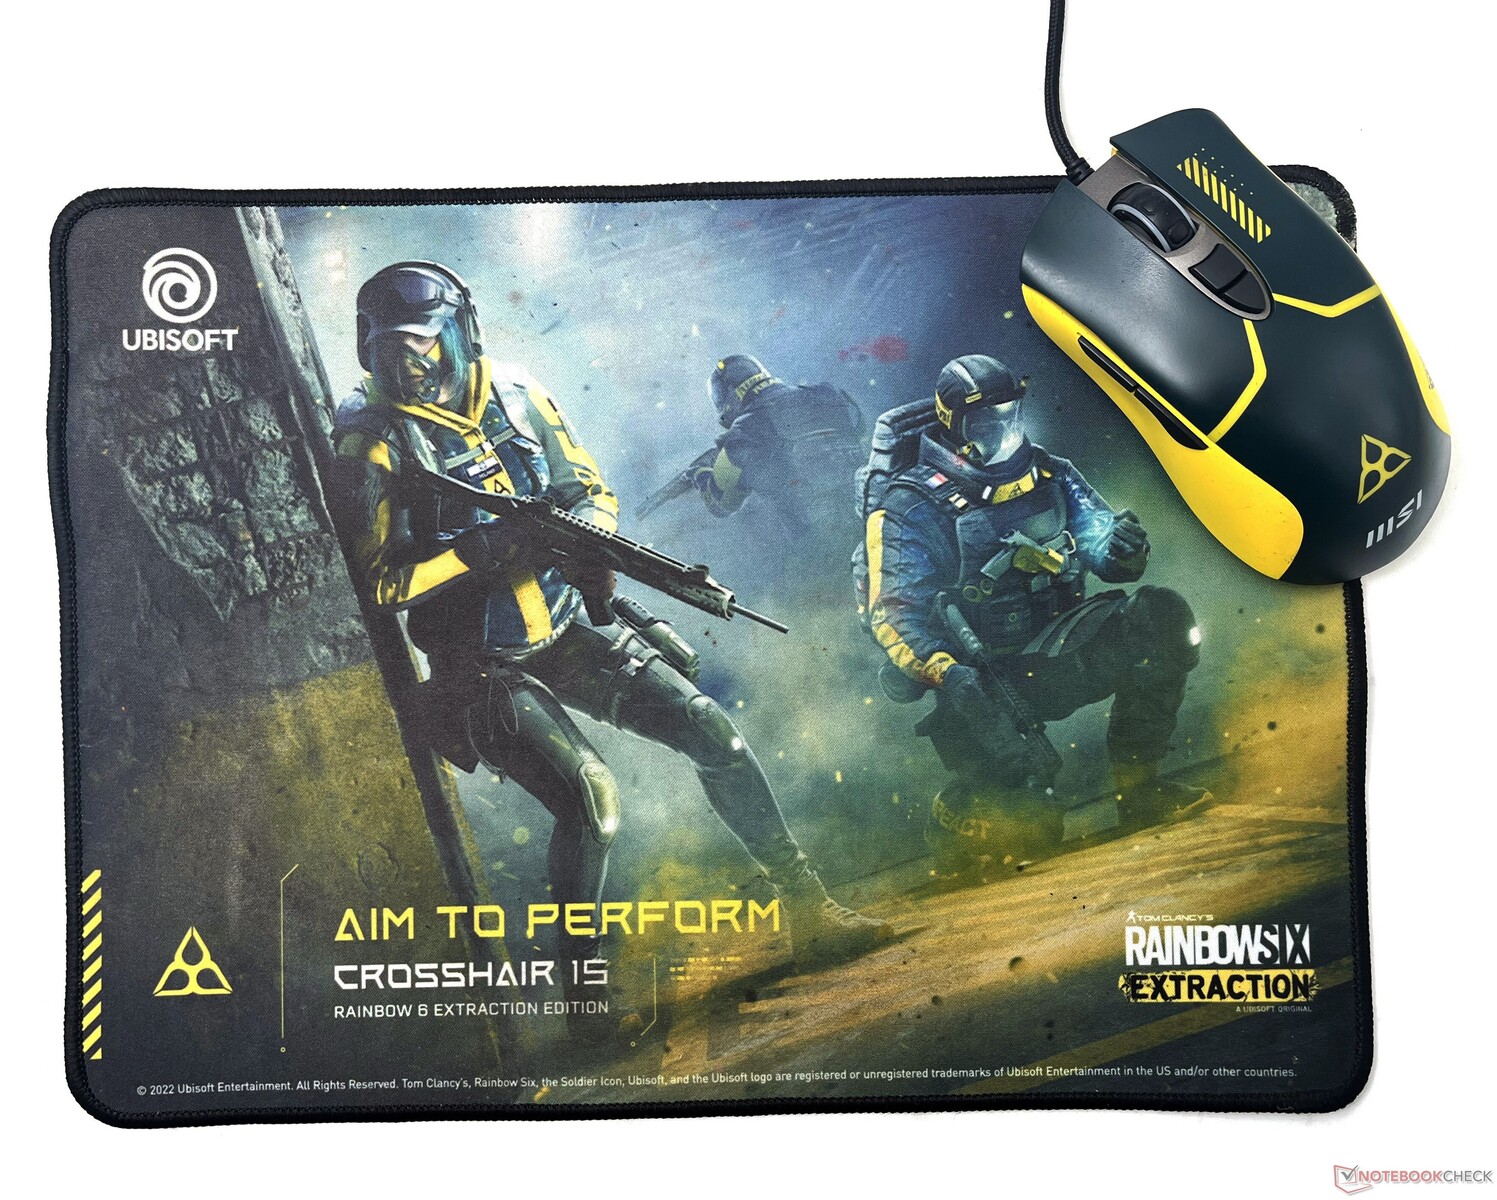
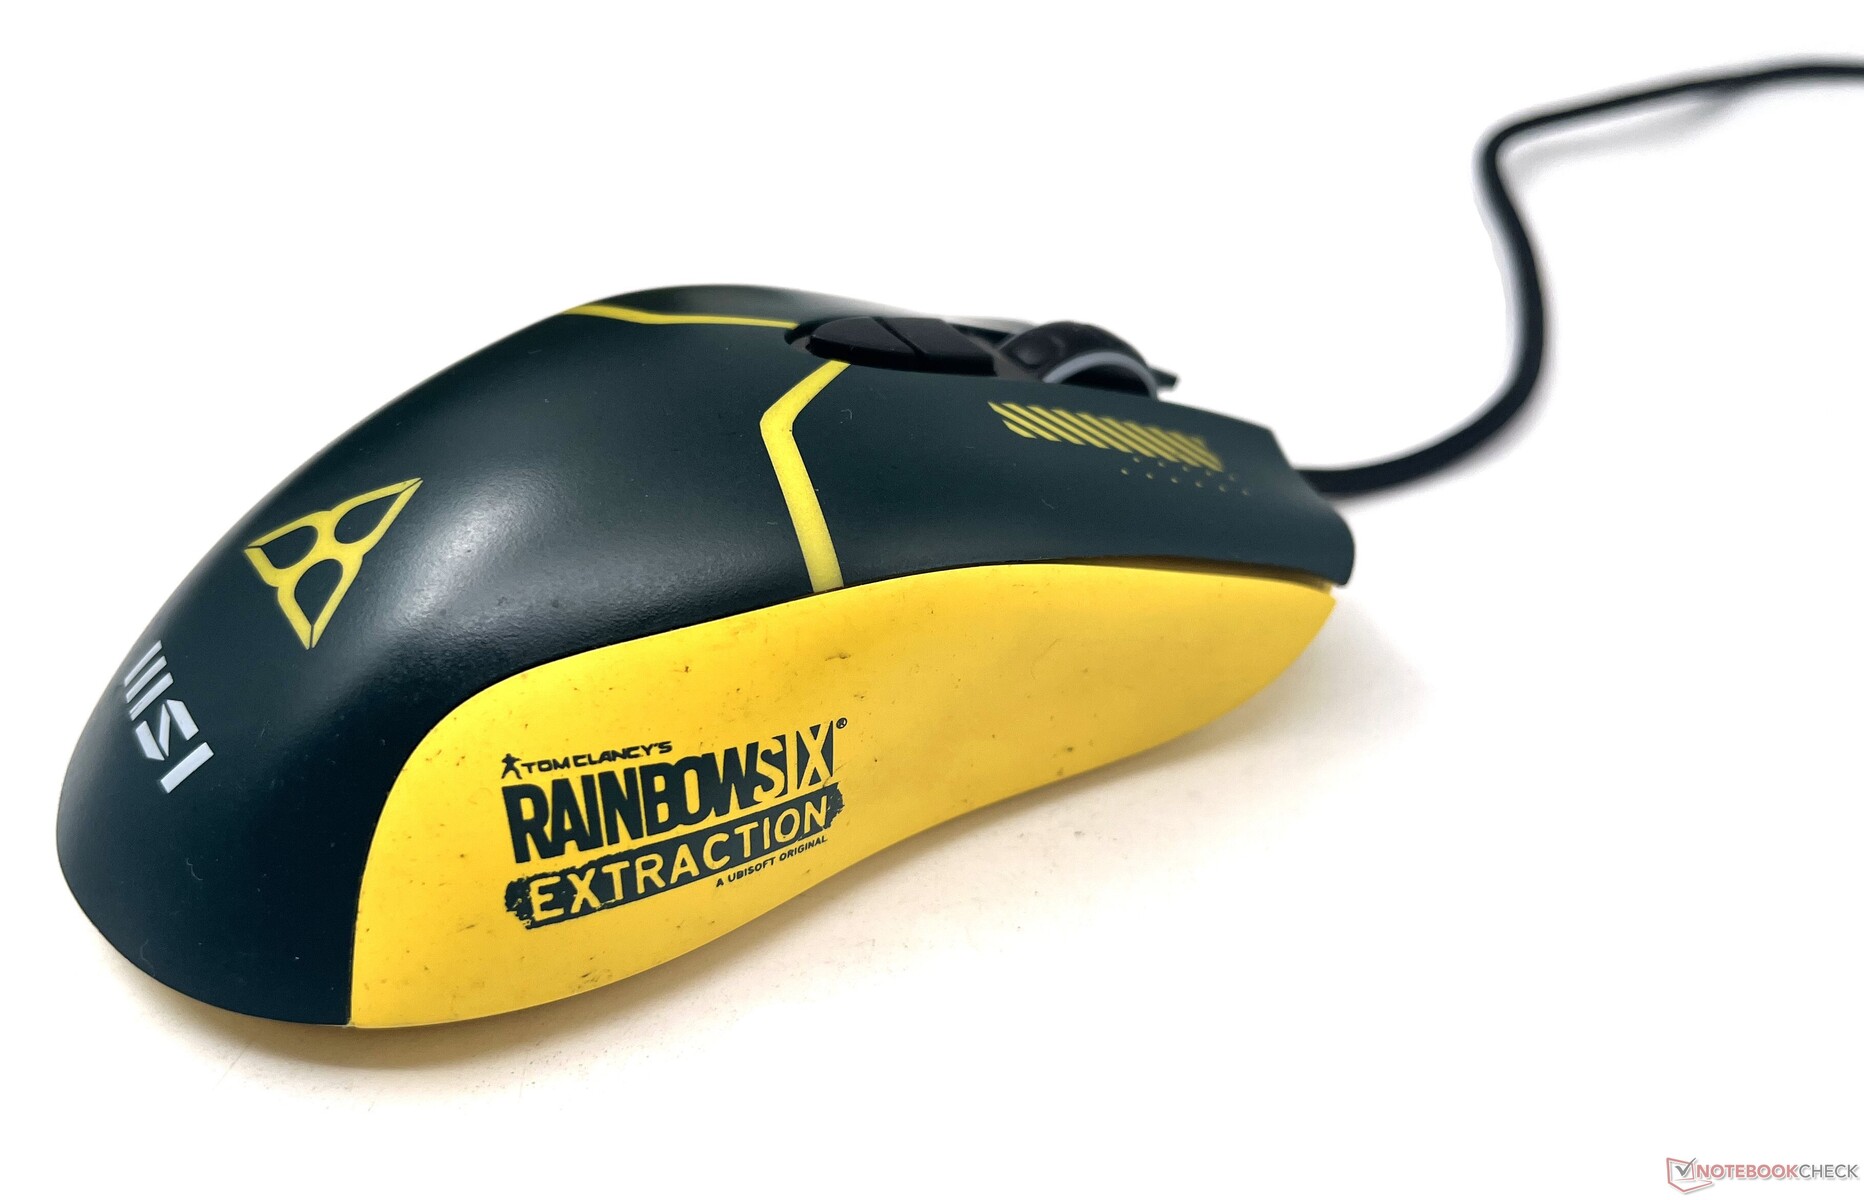
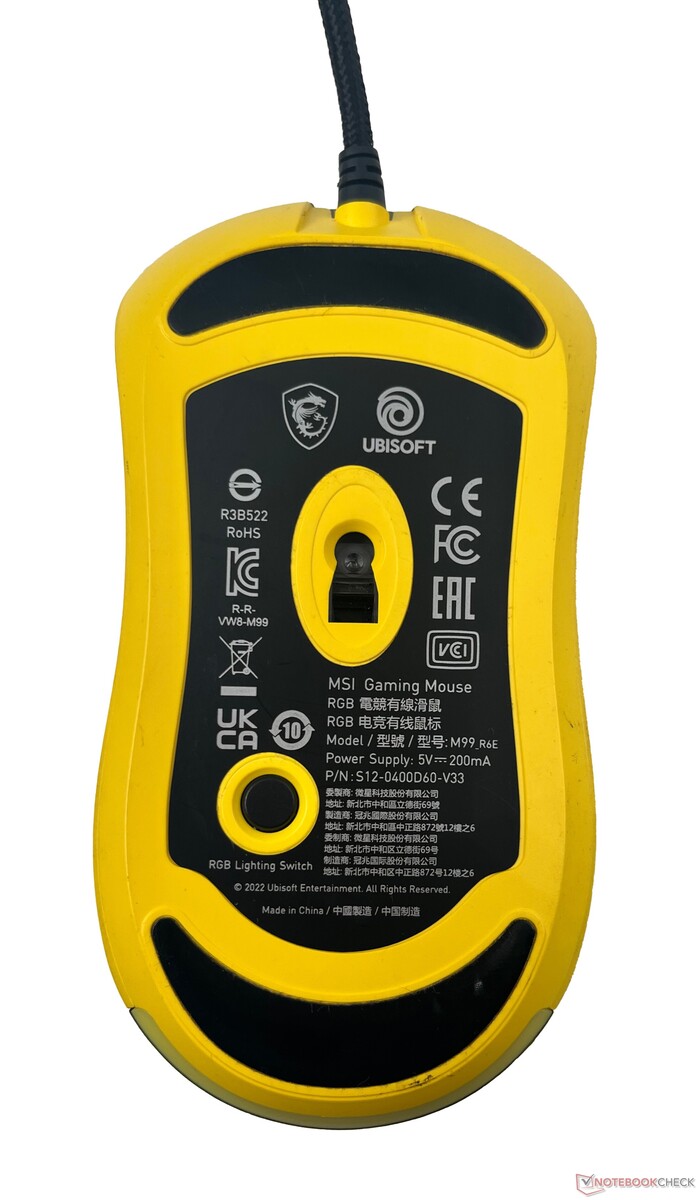
MSI tries to further pull you into the Rainbow Six: Extraction universe with a few additional accessories. A mouse pad and a gaming mouse themed on the game are included in the package. Buyers also get to redeem a free copy of Rainbow Six: Extraction Deluxe Edition via Ubisoft.
The mouse is a custom version of the MSI M99. The mouse uses an Avago 3050 sensor with a 4,000 DPI resolution and a 500 Hz polling rate. It's obviously not in the league of a Corsair IronClaw RGB or even the Mad Catz R.A.T. Air, but it is still a decent free offering.
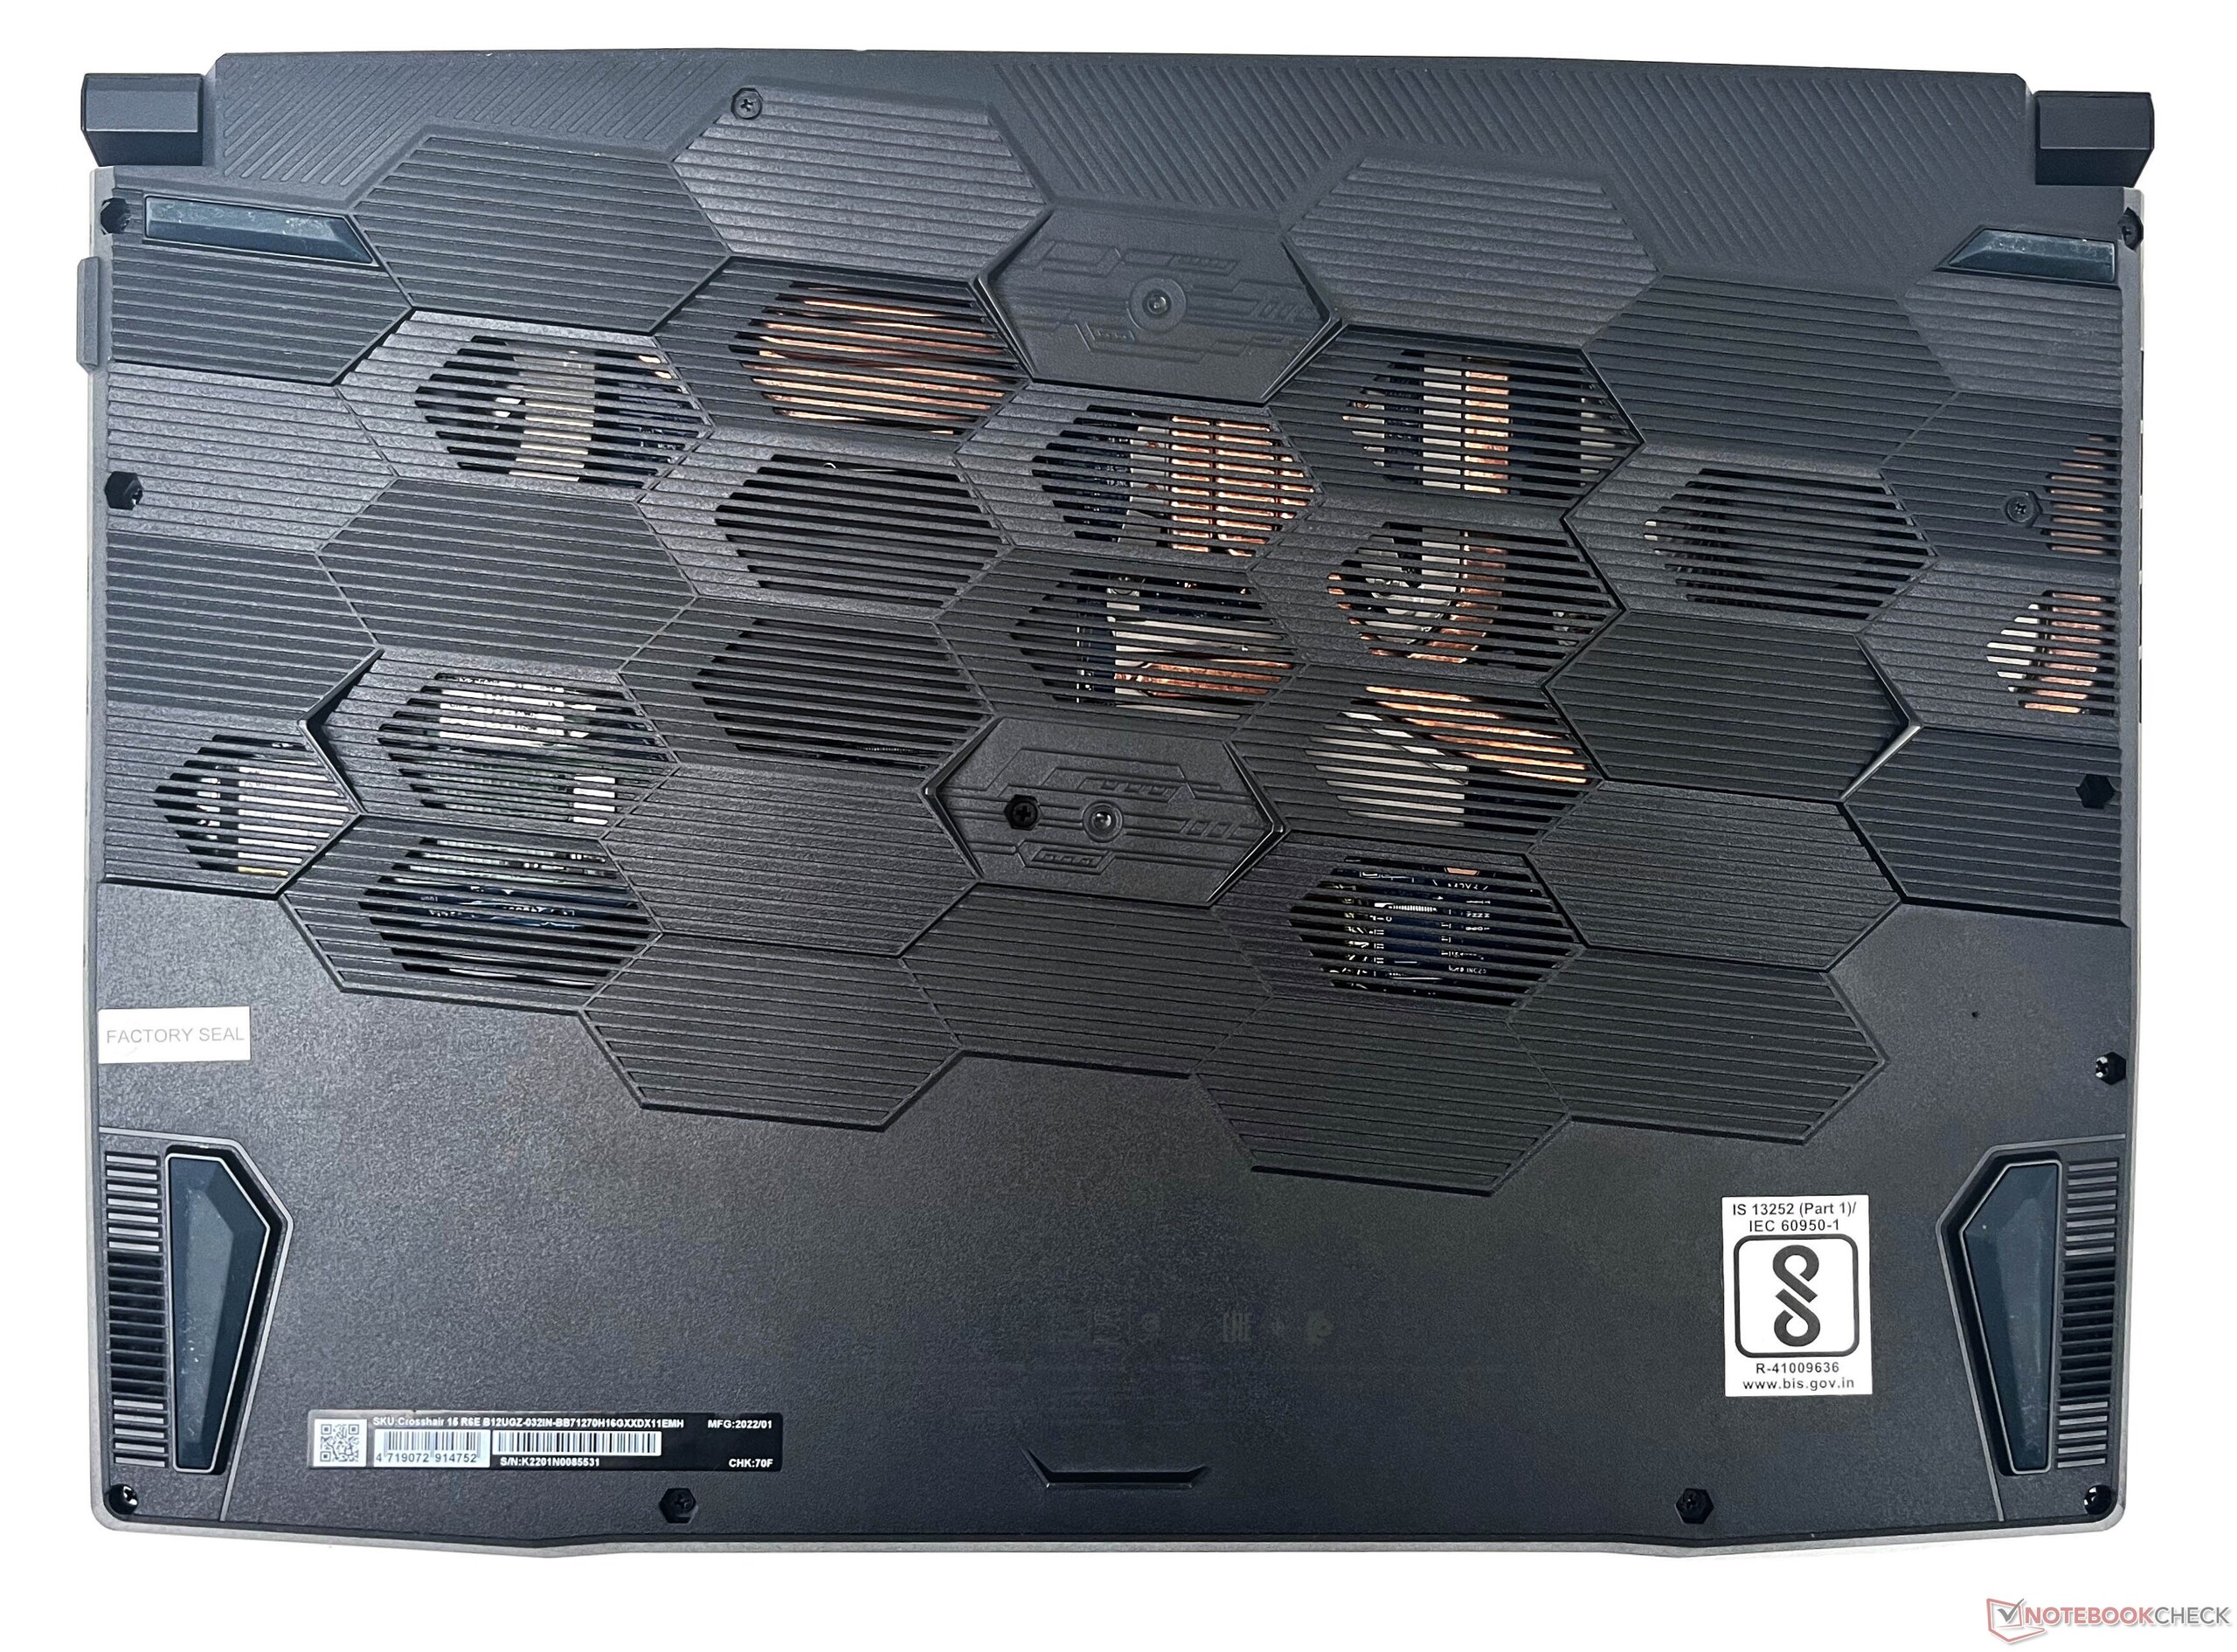
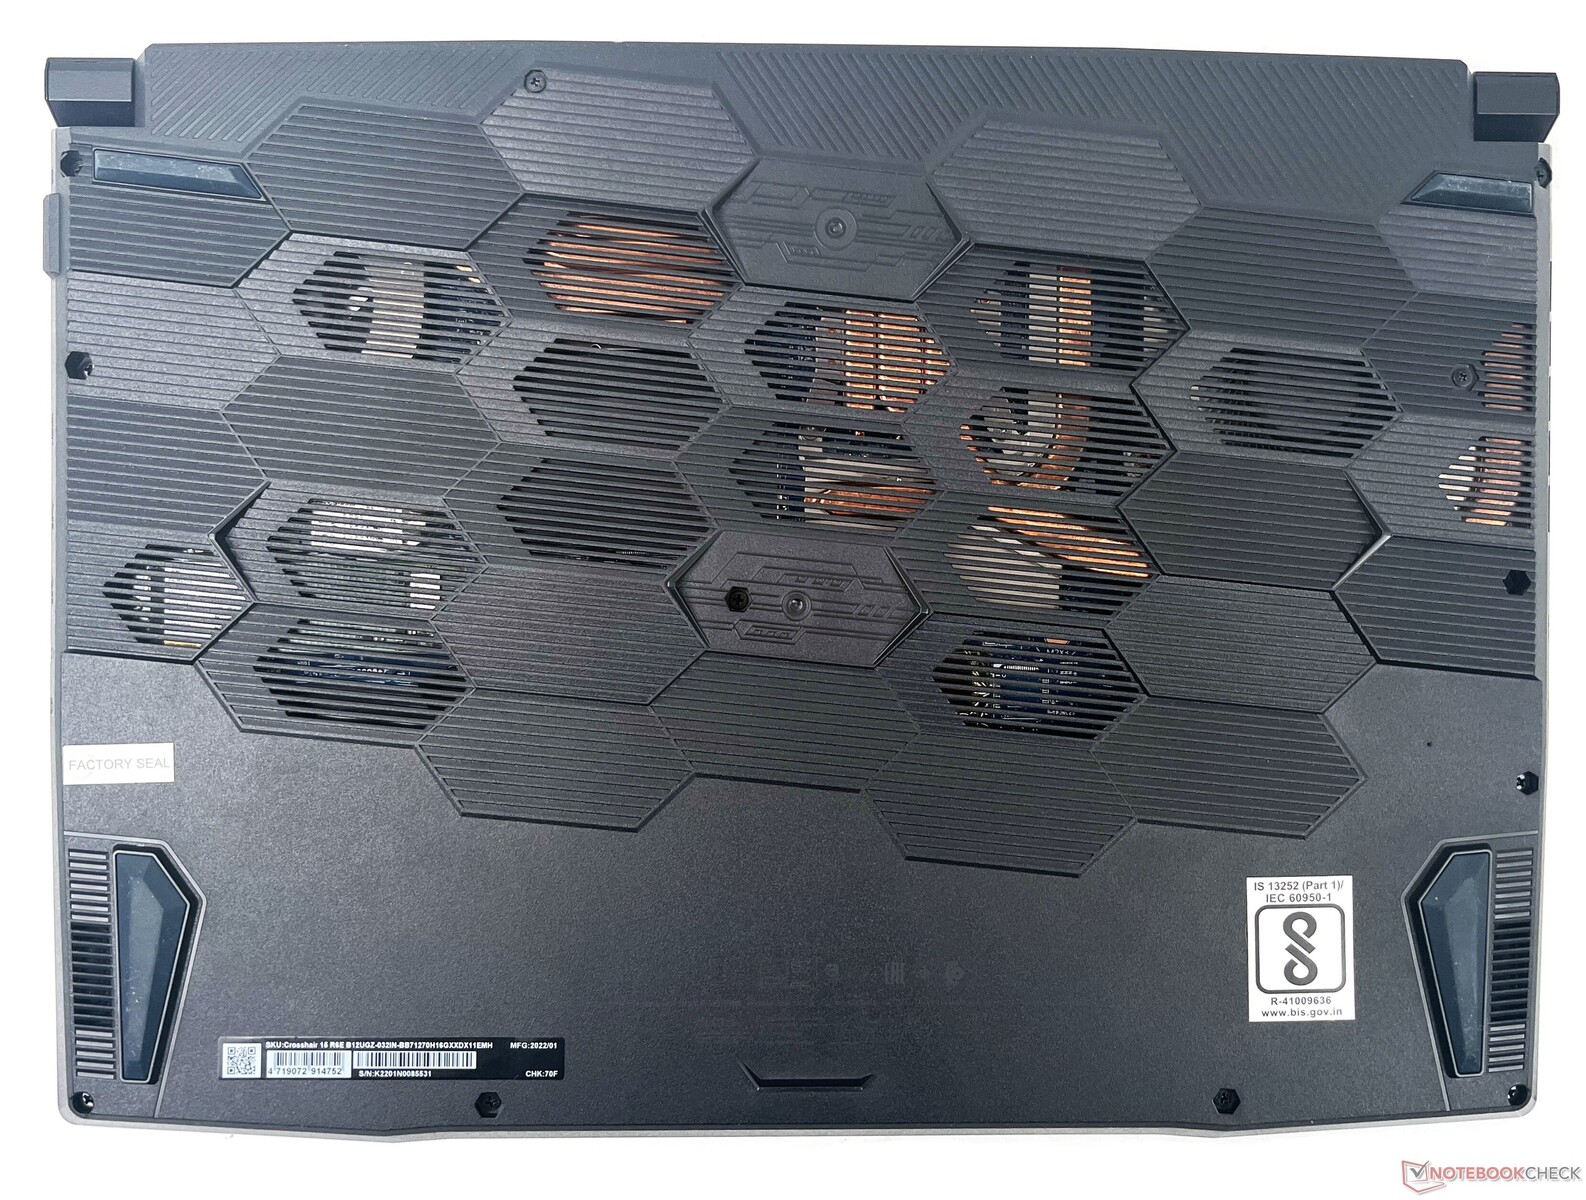
Maintenance
As is the norm with MSI review samples, we were prevented from removing the Factory Seal sticker that hides one of the screws. That being said, opening the back panel is quite straightforward and users should be able to perform upgrades without issues.
Warranty
MSI offers a two-year warranty for the Crosshair 15 R6E that also includes a year of global travel insurance at authorized MSI service centers.
Input Devices: Fixed thematic backlight colors
Keyboard
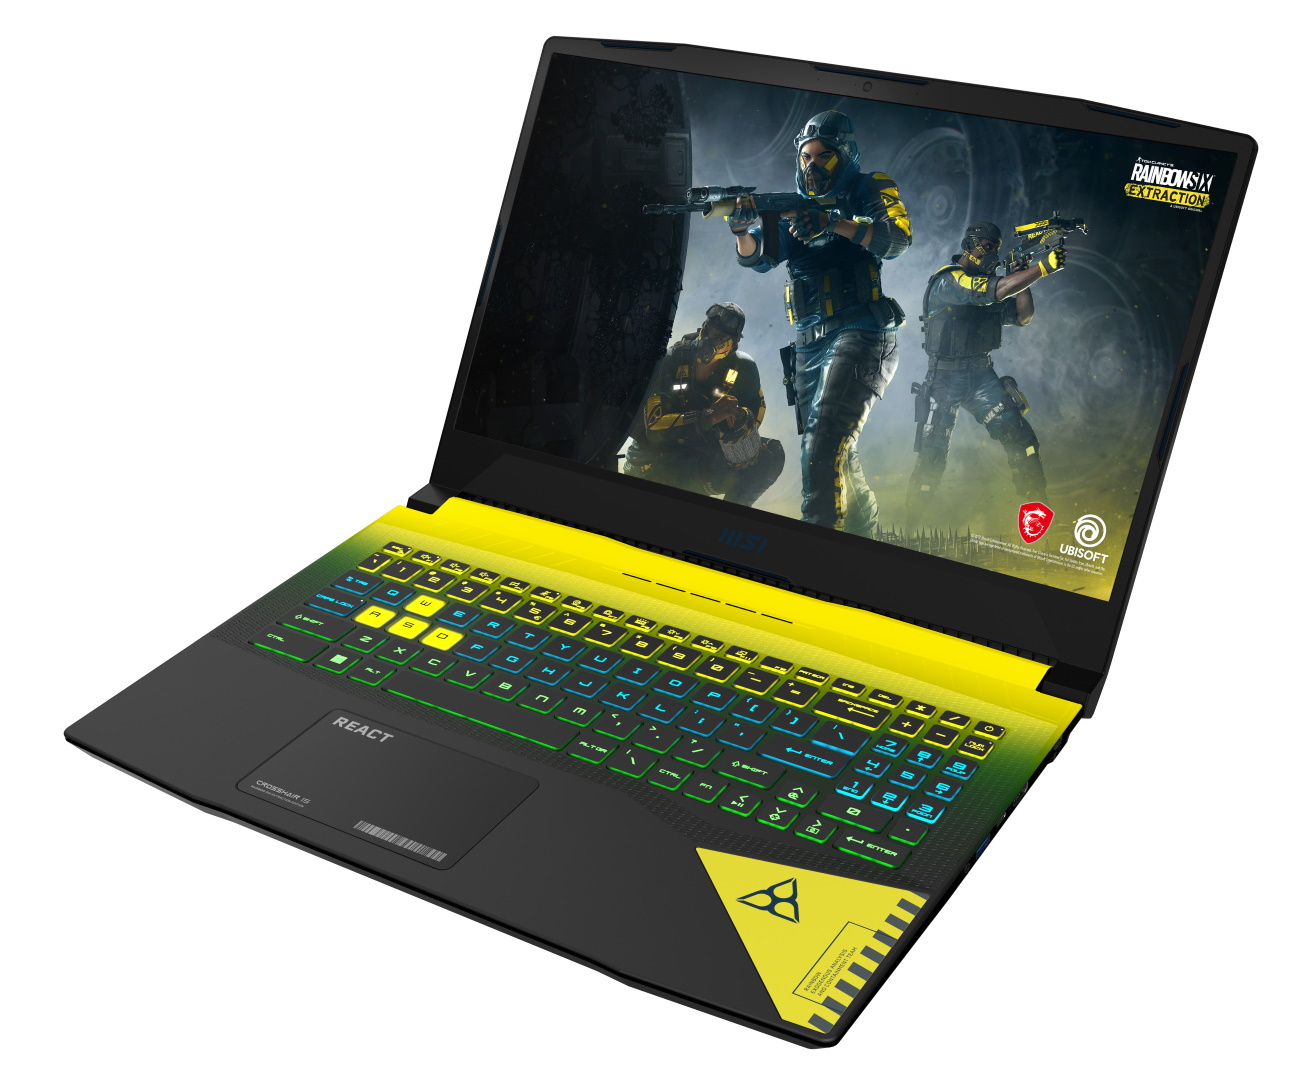
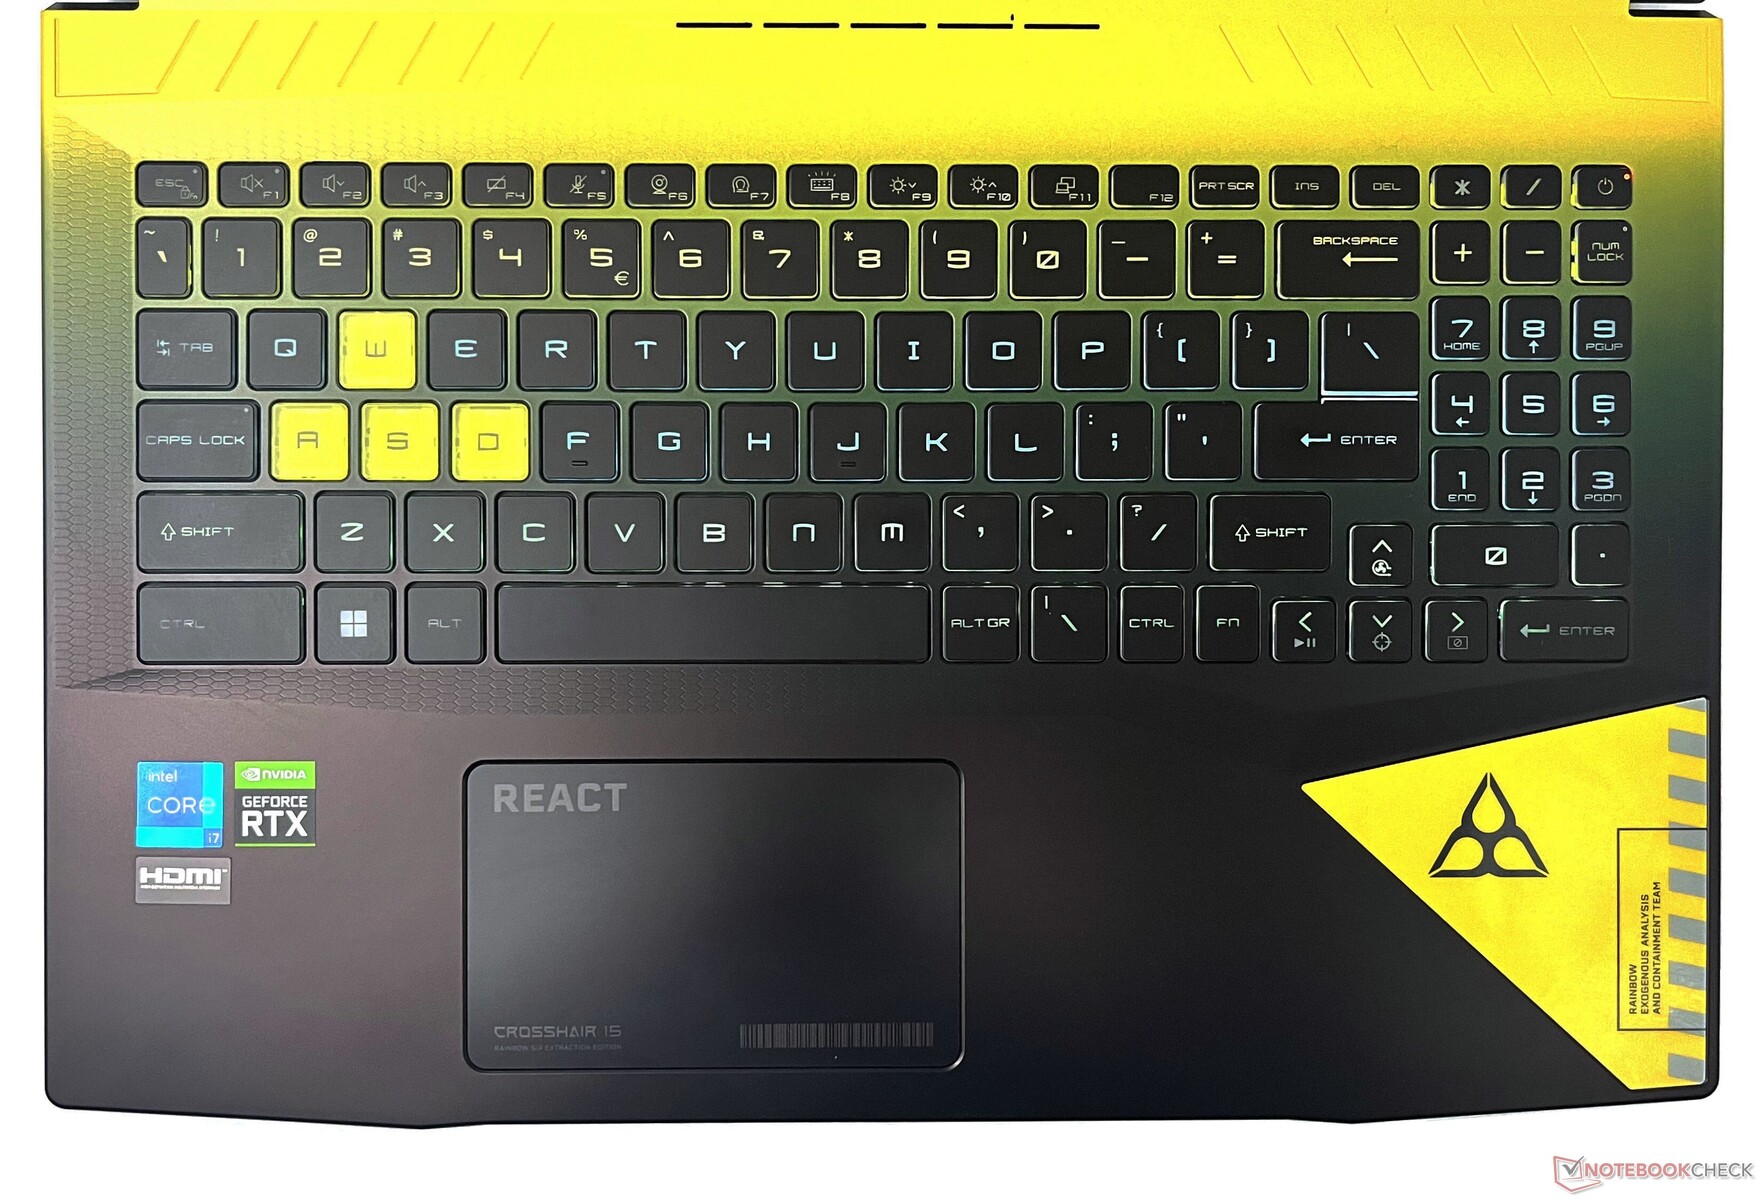
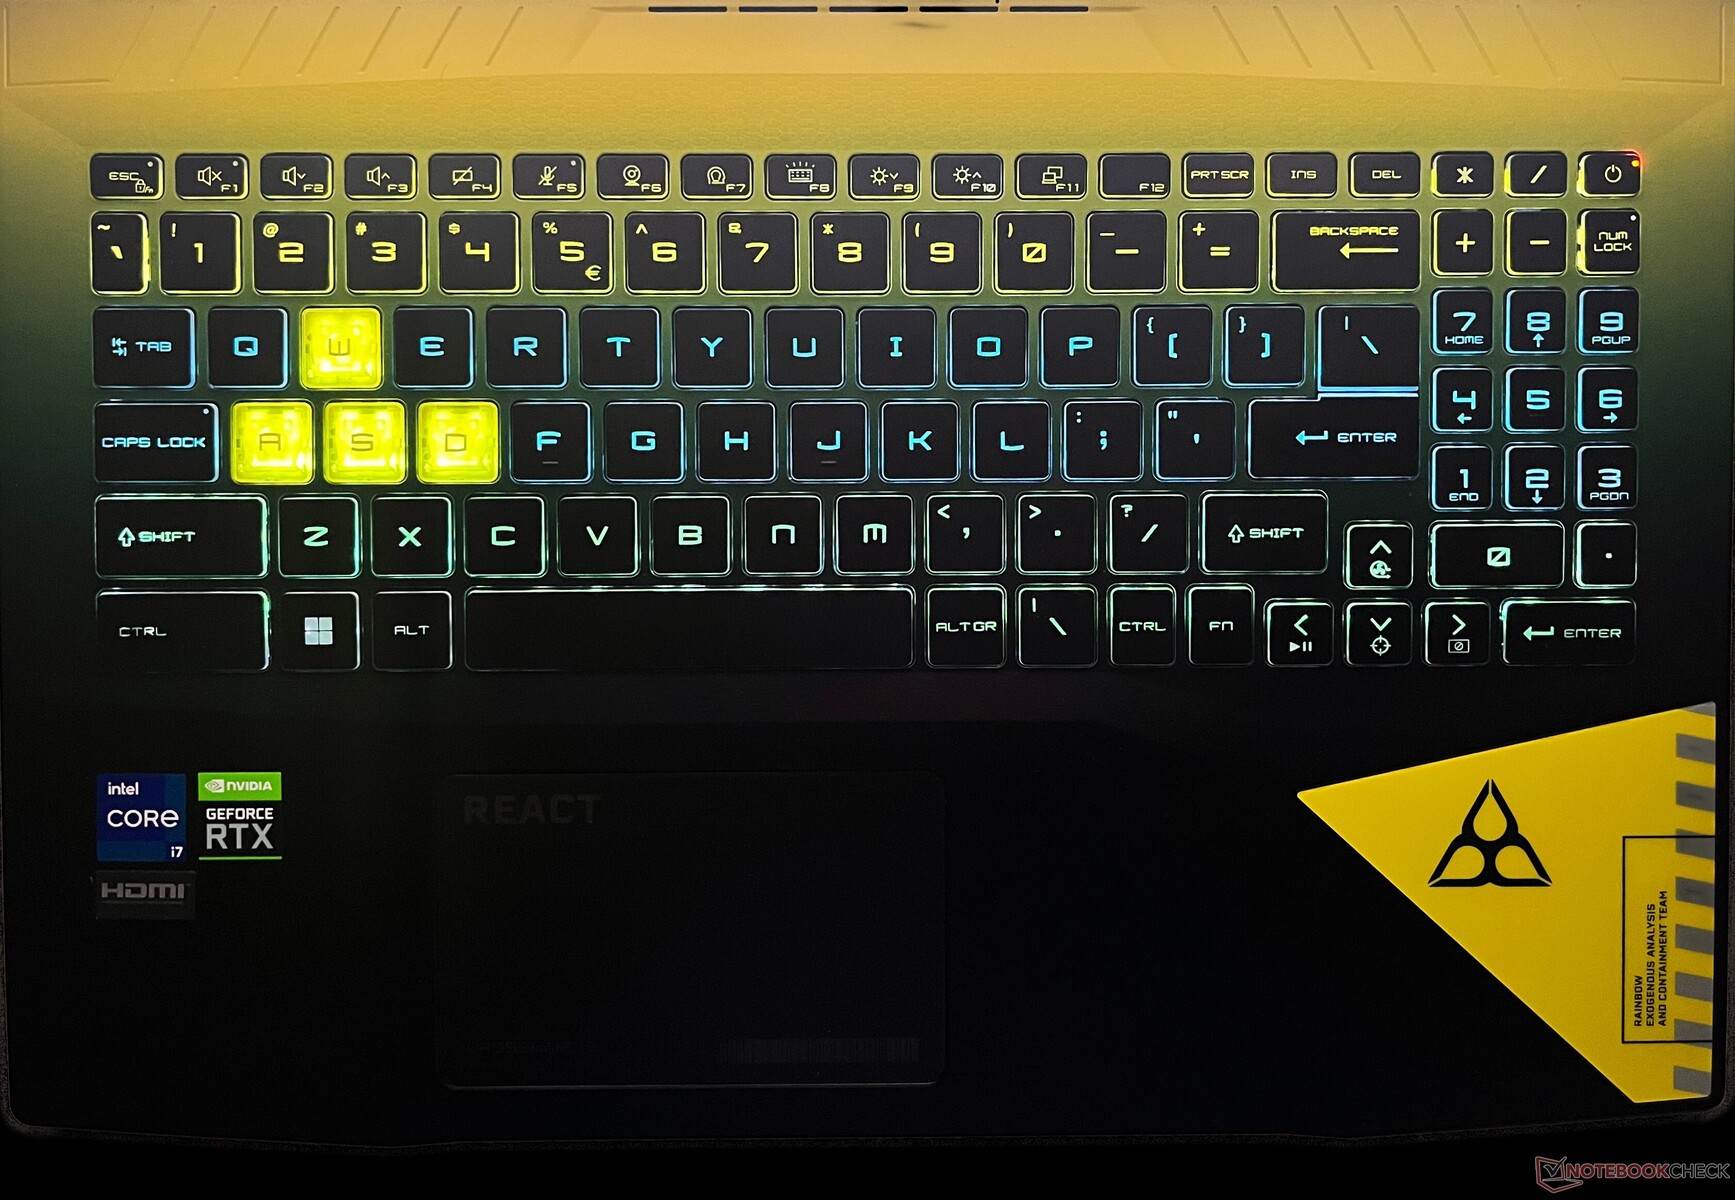
The Crosshair 15 R6E's keyboard does not feature RGB or any of the fancy SteelSeries features, but MSI has incorporated what it calls a Spectrum Backlight keyboard. Essentially, the keyboard lights are inspired by — you guessed it — the Rainbow Six: Extraction game with yellow and blue colors.
Each key has fixed lighting that cannot be customized, although the intensity of the overall backlight itself can be adjusted via a keyboard shortcut. The keys have a good 1.7 mm travel and decent tactile feedback.
The inclusion of the numpad is welcome, and the arrow keys are not squished. The secondary functions are thankfully lit, which makes them easy to recognize in the dark.
If you are new to MSI laptops, you should take note of the awkward Fn key placement on the right instead of its usual position.
Touchpad
The 10.5 cm x 6.5 cm touchpad gets the game's REACT logo and the Crosshair 15 label. In terms of functionality, it's akin to the touchpads we've seen with its Pulse and Katana cousins.
The touchpad response is good and gestures work well thanks to Windows Precision drivers. The left and right mouse buttons are flush with the touchpad and click effortlessly, albeit with some noise.
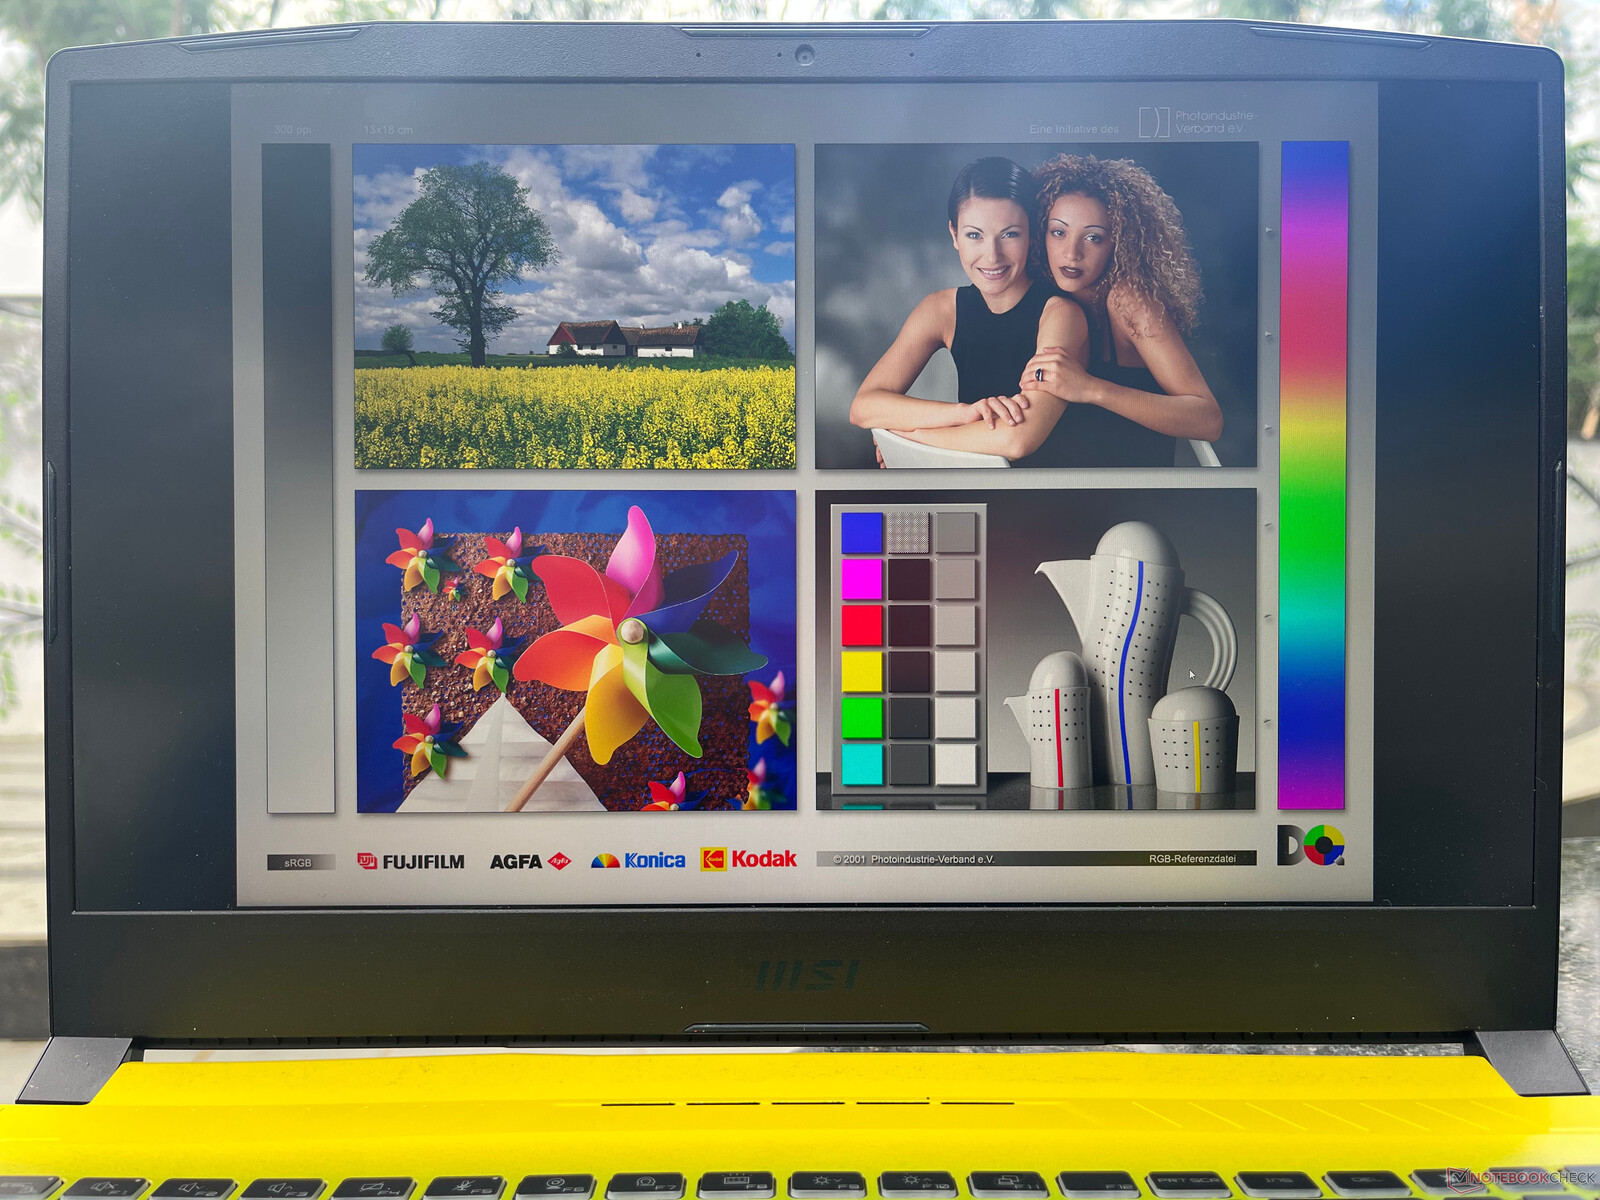
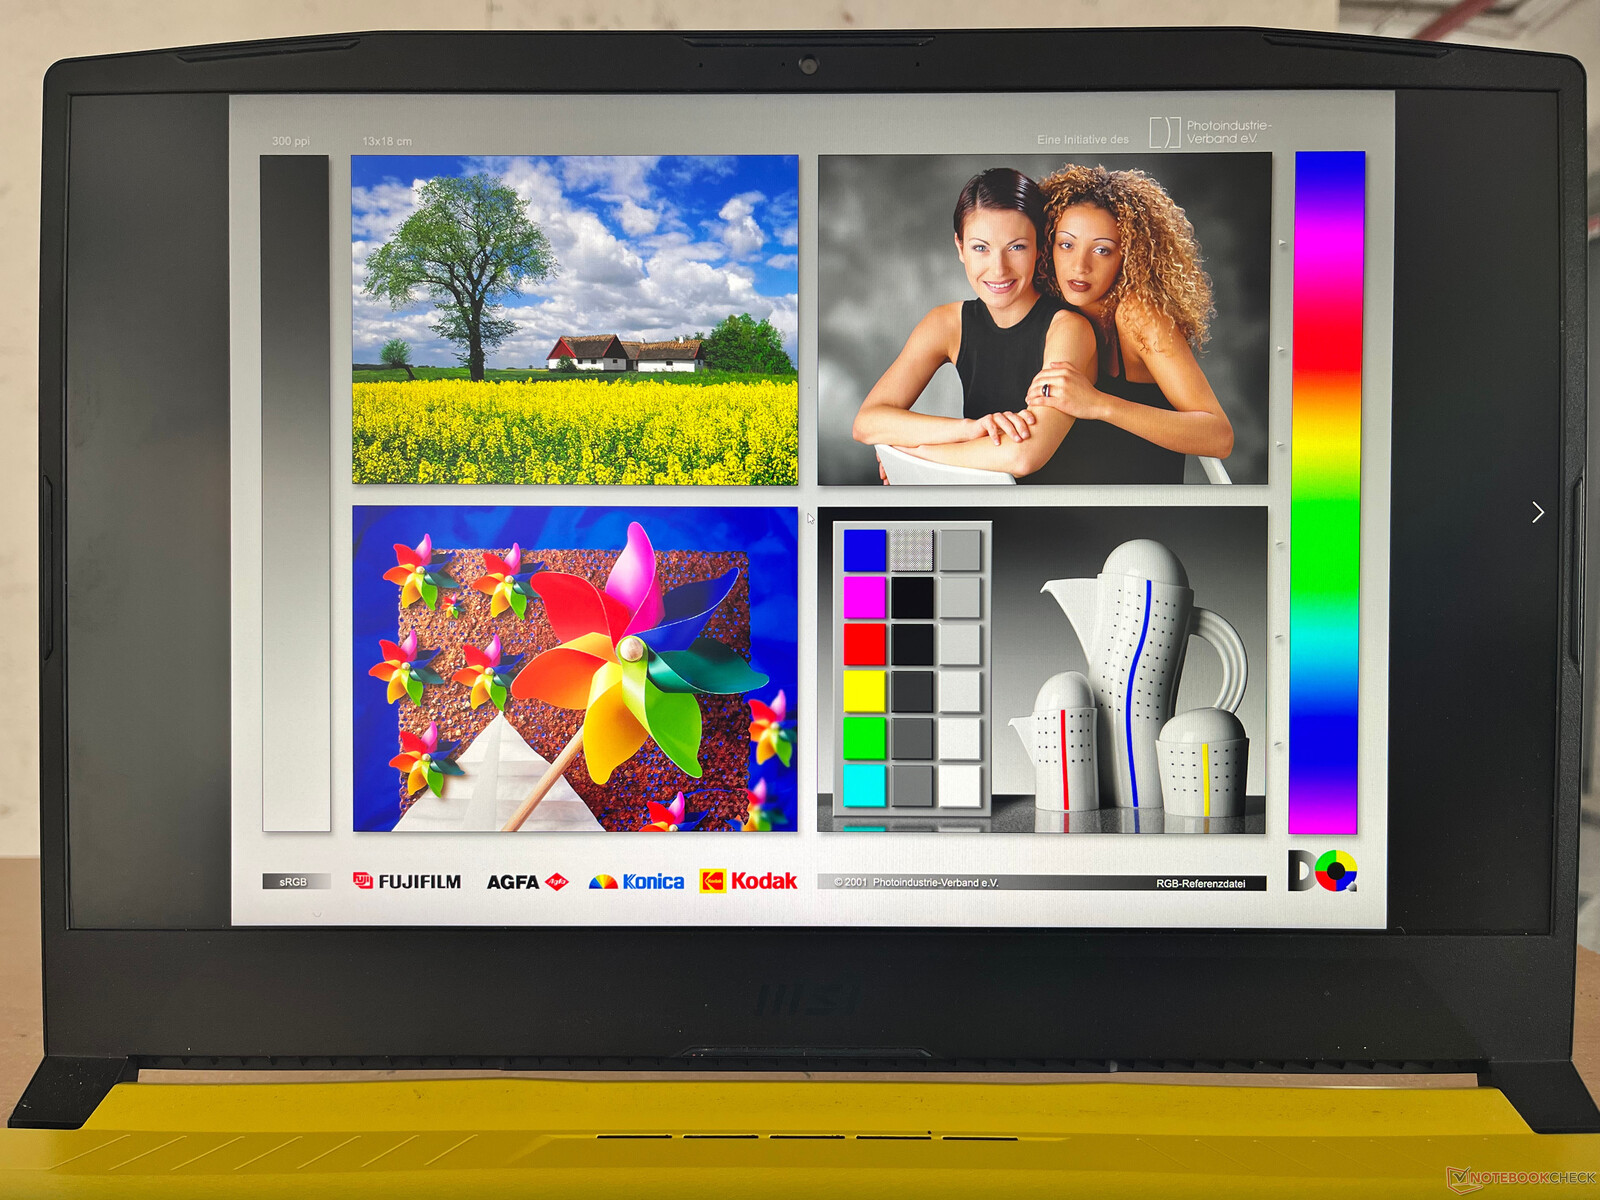
Display: QHD 165 Hz panel with wide color gamut coverage and no PWM
MSI offers a 15.6-inch QHD IPS-level panel with a 165 Hz refresh rate in both Crosshair 15 R6E SKUs. There is no HDR10 or Dolby Vision support. We recorded a maximum brightness of 342 nits, which should be amenable for indoor use.
An 89% brightness distribution and a 1069:1 measured contrast ratio offer a decent viewing experience. This is similar to what we had observed previously with the Asus ROG Zephyrus G15 and the Acer Nitro 5, which use the same panel.
However, we see significant backlight bleeding near the lower corners of the display.


| |||||||||||||||||||||||||
Brightness Distribution: 89 %
Center on Battery: 341 cd/m²
Contrast: 1069:1 (Black: 0.32 cd/m²)
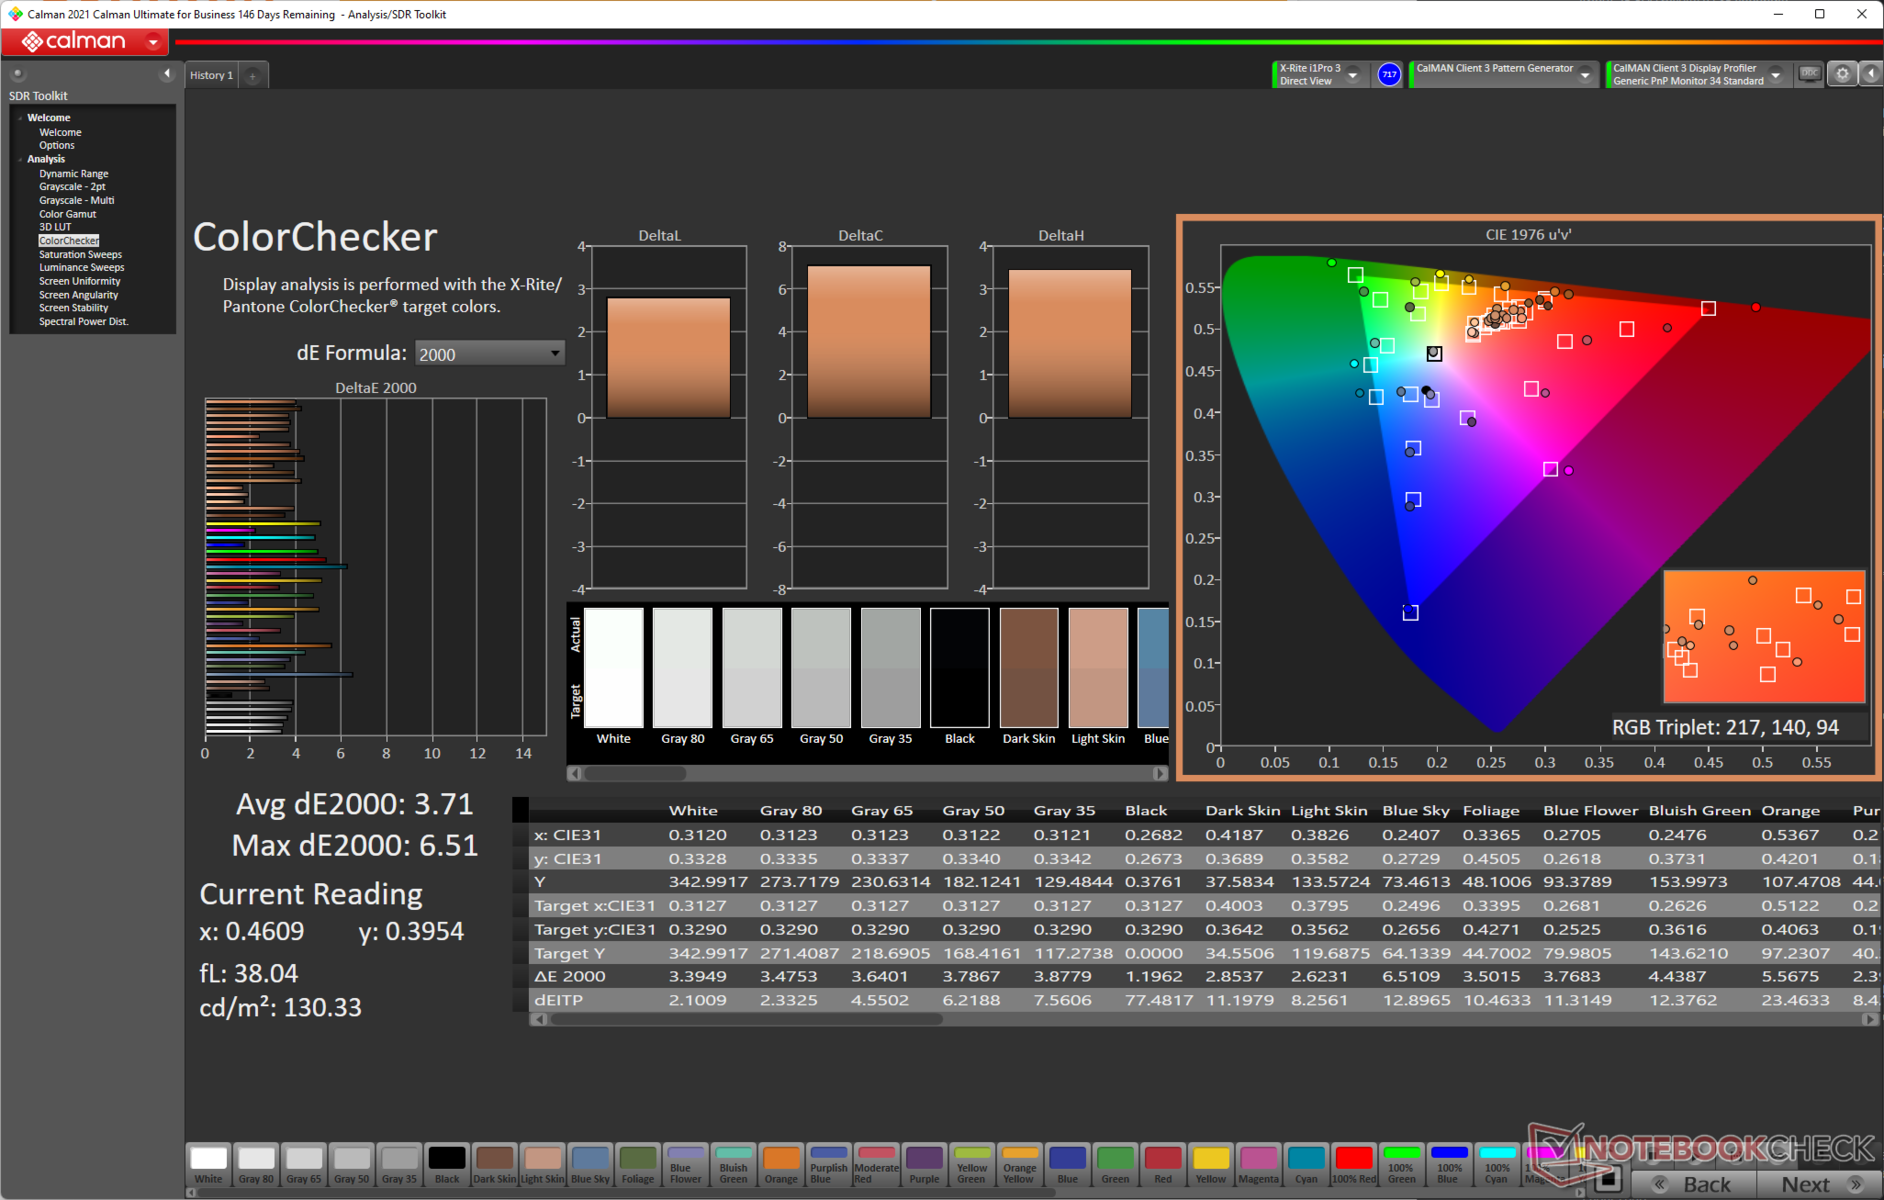
ΔE ColorChecker Calman: 3.71 | ∀{0.5-29.43 Ø4.72}
calibrated: 2.59
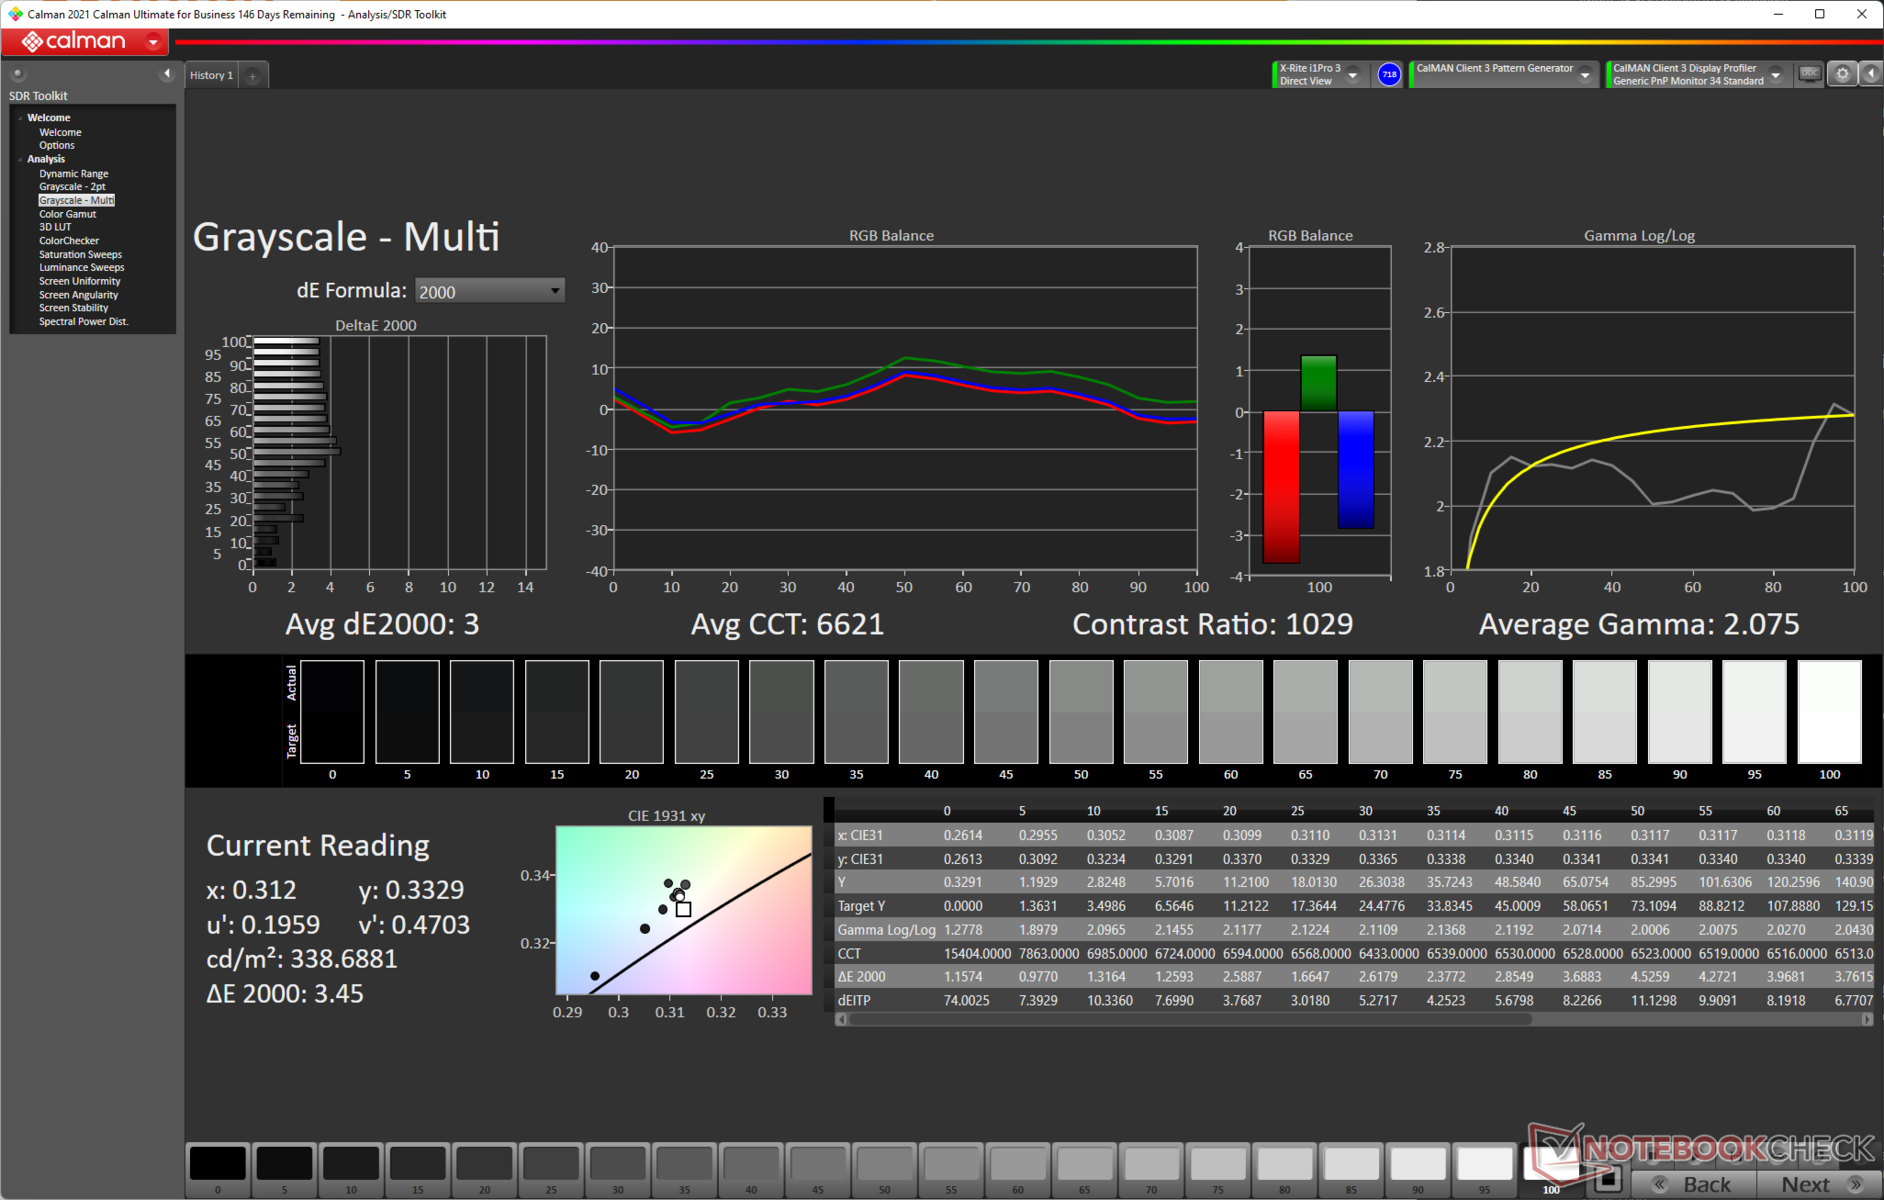
ΔE Greyscale Calman: 3 | ∀{0.09-98 Ø4.97}
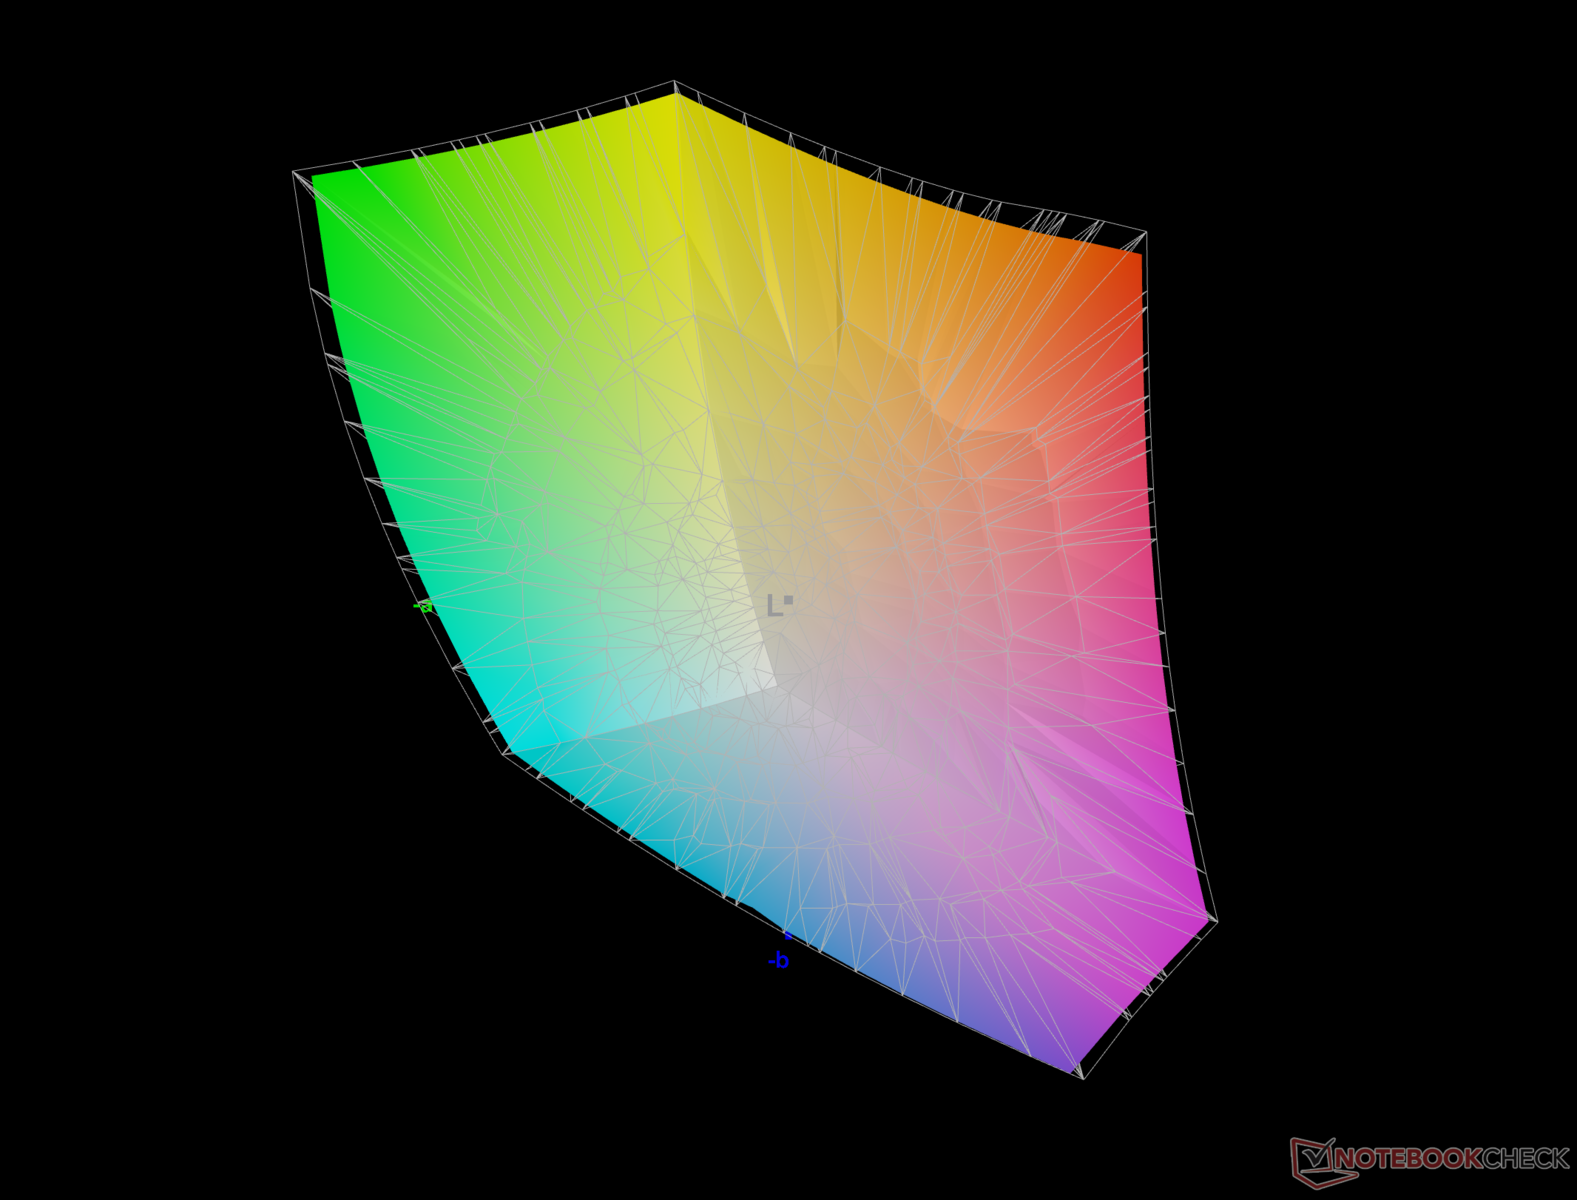
84.7% AdobeRGB 1998 (Argyll 3D)
99.8% sRGB (Argyll 3D)
94.8% Display P3 (Argyll 3D)
Gamma: 2.07
CCT: 6621 K
| MSI Crosshair 15 R6E B12UGZ-050 CMN N156KME-GNA, IPS-Level, 2560x1440, 15.6" | MSI Stealth GS66 12UGS Sharp LQ156T1JW04 (SHP153C), IPS-Level, 2560x1440, 15.6" | Lenovo Legion 5 Pro 16 G7 i7 RTX 3070Ti NE160QDM-NY1, IPS, 2560x1600, 16" | Acer Nitro 5 AN515-58-72QR Chi Mei N156KME-GNA, IPS, 2560x1440, 15.6" | Schenker XMG Neo 15 (Ryzen 9 6900HX, RTX 3070 Ti) BOE0A67, IPS, 2560x1440, 15.6" | |
|---|---|---|---|---|---|
| Display | 1% | -15% | 1% | -15% | |
| Display P3 Coverage (%) | 94.8 | 96.4 2% | 68.7 -28% | 95.6 1% | 68.9 -27% |
| sRGB Coverage (%) | 99.8 | 99.7 0% | 97.6 -2% | 99.8 0% | 97.7 -2% |
| AdobeRGB 1998 Coverage (%) | 84.7 | 85.6 1% | 70.9 -16% | 85.2 1% | 70.4 -17% |
| Response Times | -8% | -112% | -110% | -70% | |
| Response Time Grey 50% / Grey 80% * (ms) | 5.36 ? | 6 ? -12% | 17.6 ? -228% | 15.7 ? -193% | 12.4 ? -131% |
| Response Time Black / White * (ms) | 8.04 ? | 8.4 ? -4% | 7.6 ? 5% | 10.2 ? -27% | 8.8 ? -9% |
| PWM Frequency (Hz) | |||||
| Screen | -13% | 25% | -1% | 14% | |
| Brightness middle (cd/m²) | 342 | 272 -20% | 502 47% | 332 -3% | 370 8% |
| Brightness (cd/m²) | 326 | 253 -22% | 491 51% | 303 -7% | 343 5% |
| Brightness Distribution (%) | 89 | 87 -2% | 91 2% | 86 -3% | 82 -8% |
| Black Level * (cd/m²) | 0.32 | 0.25 22% | 0.37 -16% | 0.29 9% | 0.28 12% |
| Contrast (:1) | 1069 | 1088 2% | 1357 27% | 1145 7% | 1321 24% |
| Colorchecker dE 2000 * | 3.71 | 3.73 -1% | 2.7 27% | 3.61 3% | 2.31 38% |
| Colorchecker dE 2000 max. * | 6.51 | 9.43 -45% | 4.5 31% | 7.71 -18% | 4.03 38% |
| Colorchecker dE 2000 calibrated * | 2.59 | 0.98 62% | 1.4 46% | 0.59 77% | |
| Greyscale dE 2000 * | 3 | 6.5 -117% | 2.7 10% | 5.2 -73% | 3.28 -9% |
| Gamma | 2.07 106% | 2.172 101% | 2.44 90% | 2.155 102% | 2.47 89% |
| CCT | 6621 98% | 6485 100% | 6326 103% | 6724 97% | 6206 105% |
| Total Average (Program / Settings) | -7% /
-10% | -34% /
-3% | -37% /
-16% | -24% /
-6% |
* ... smaller is better
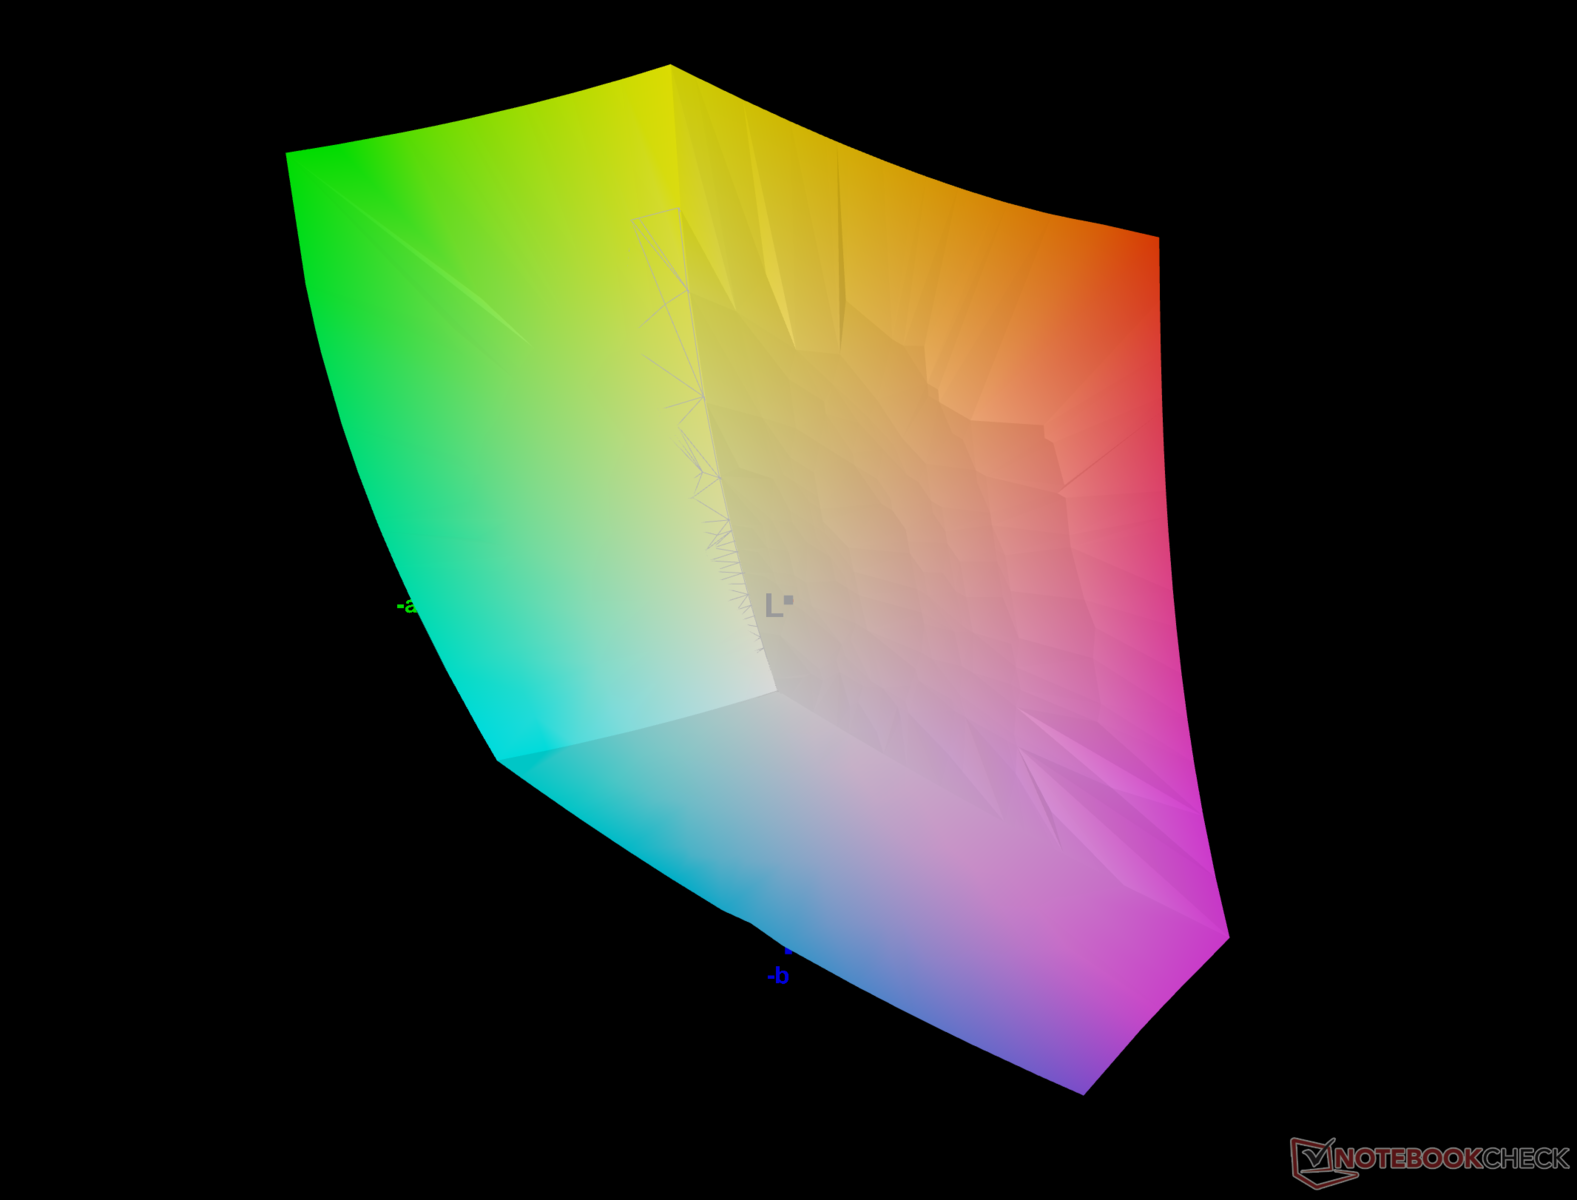
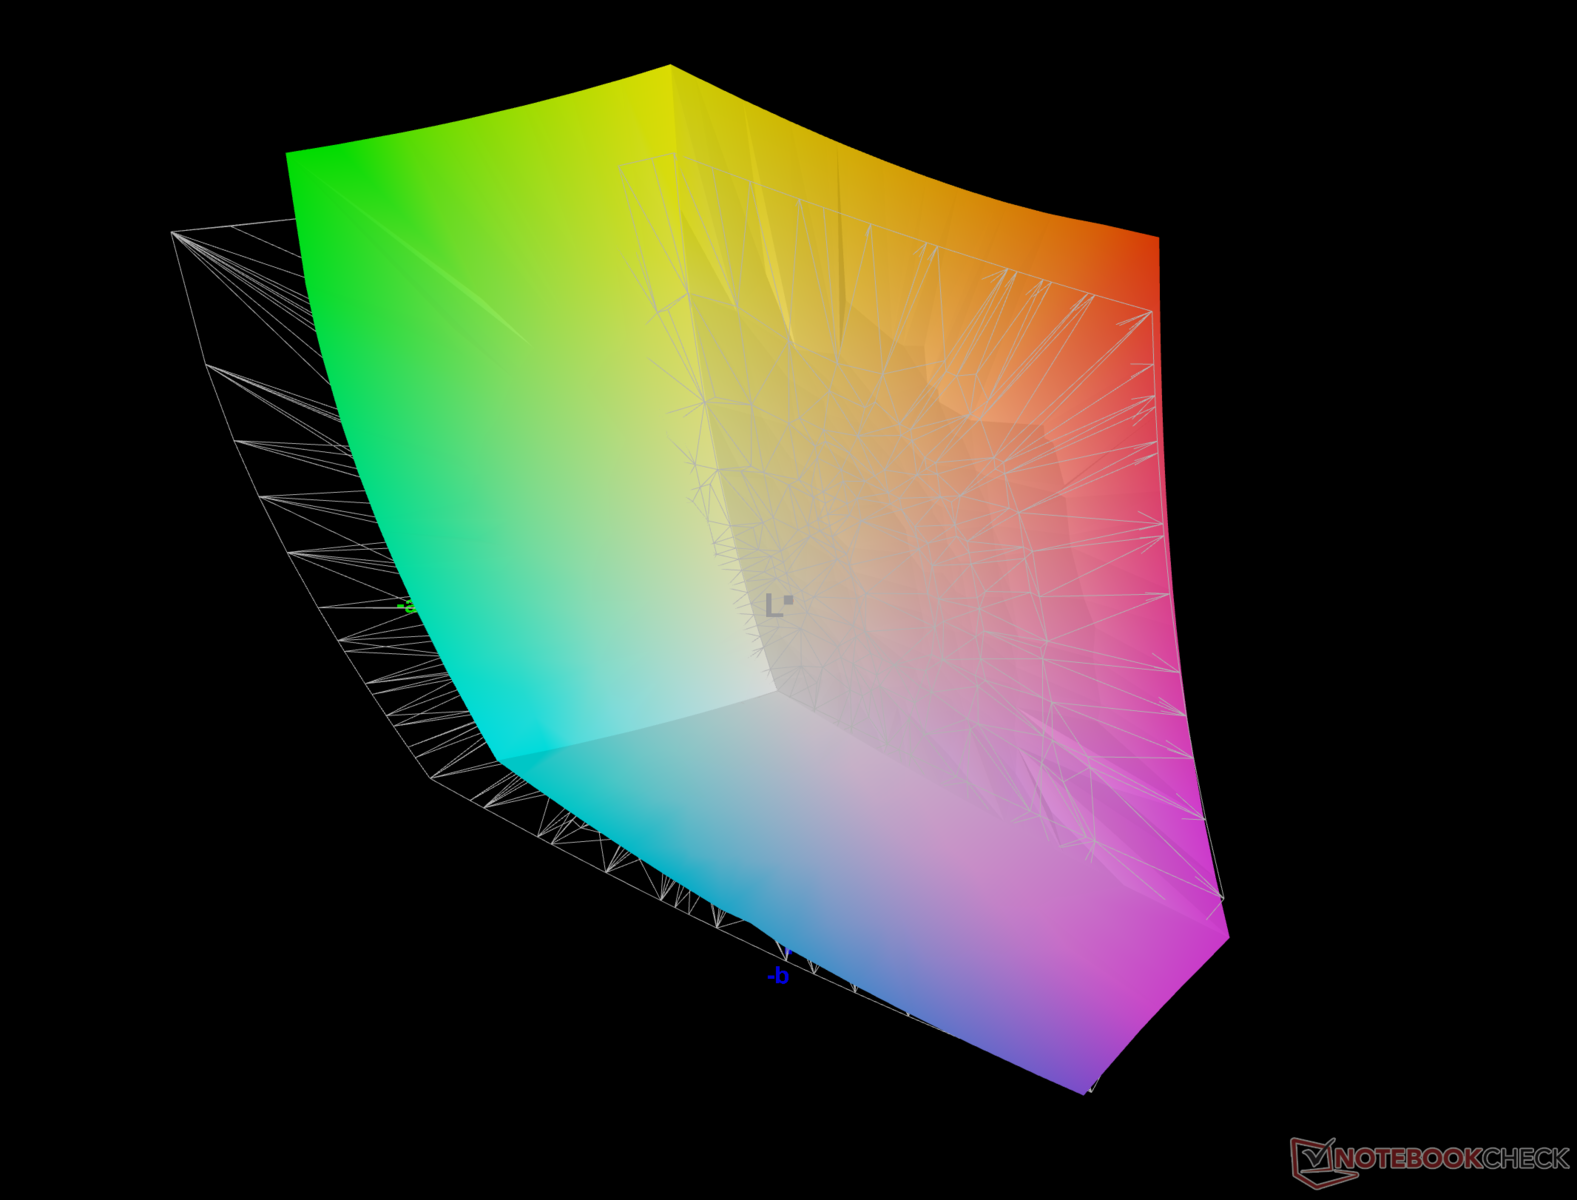
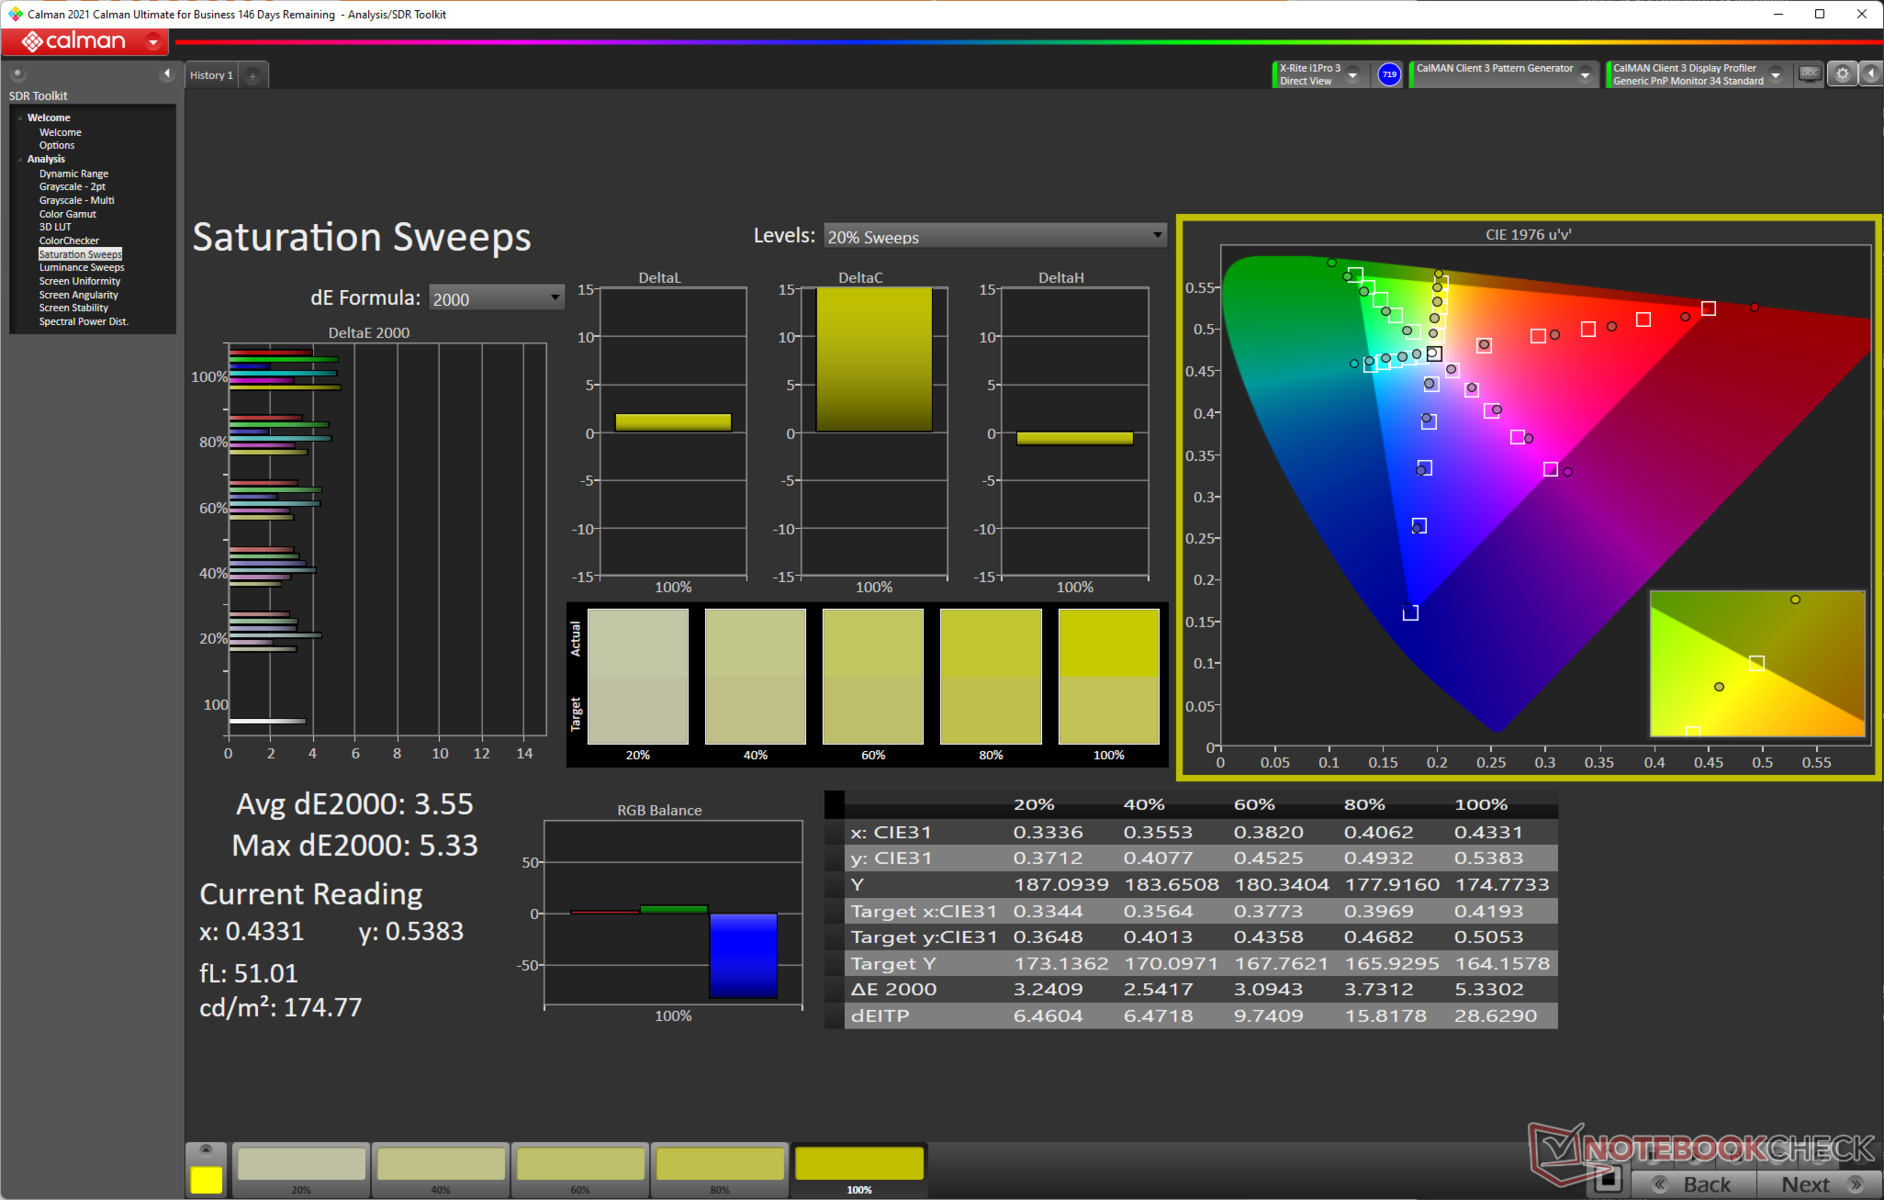
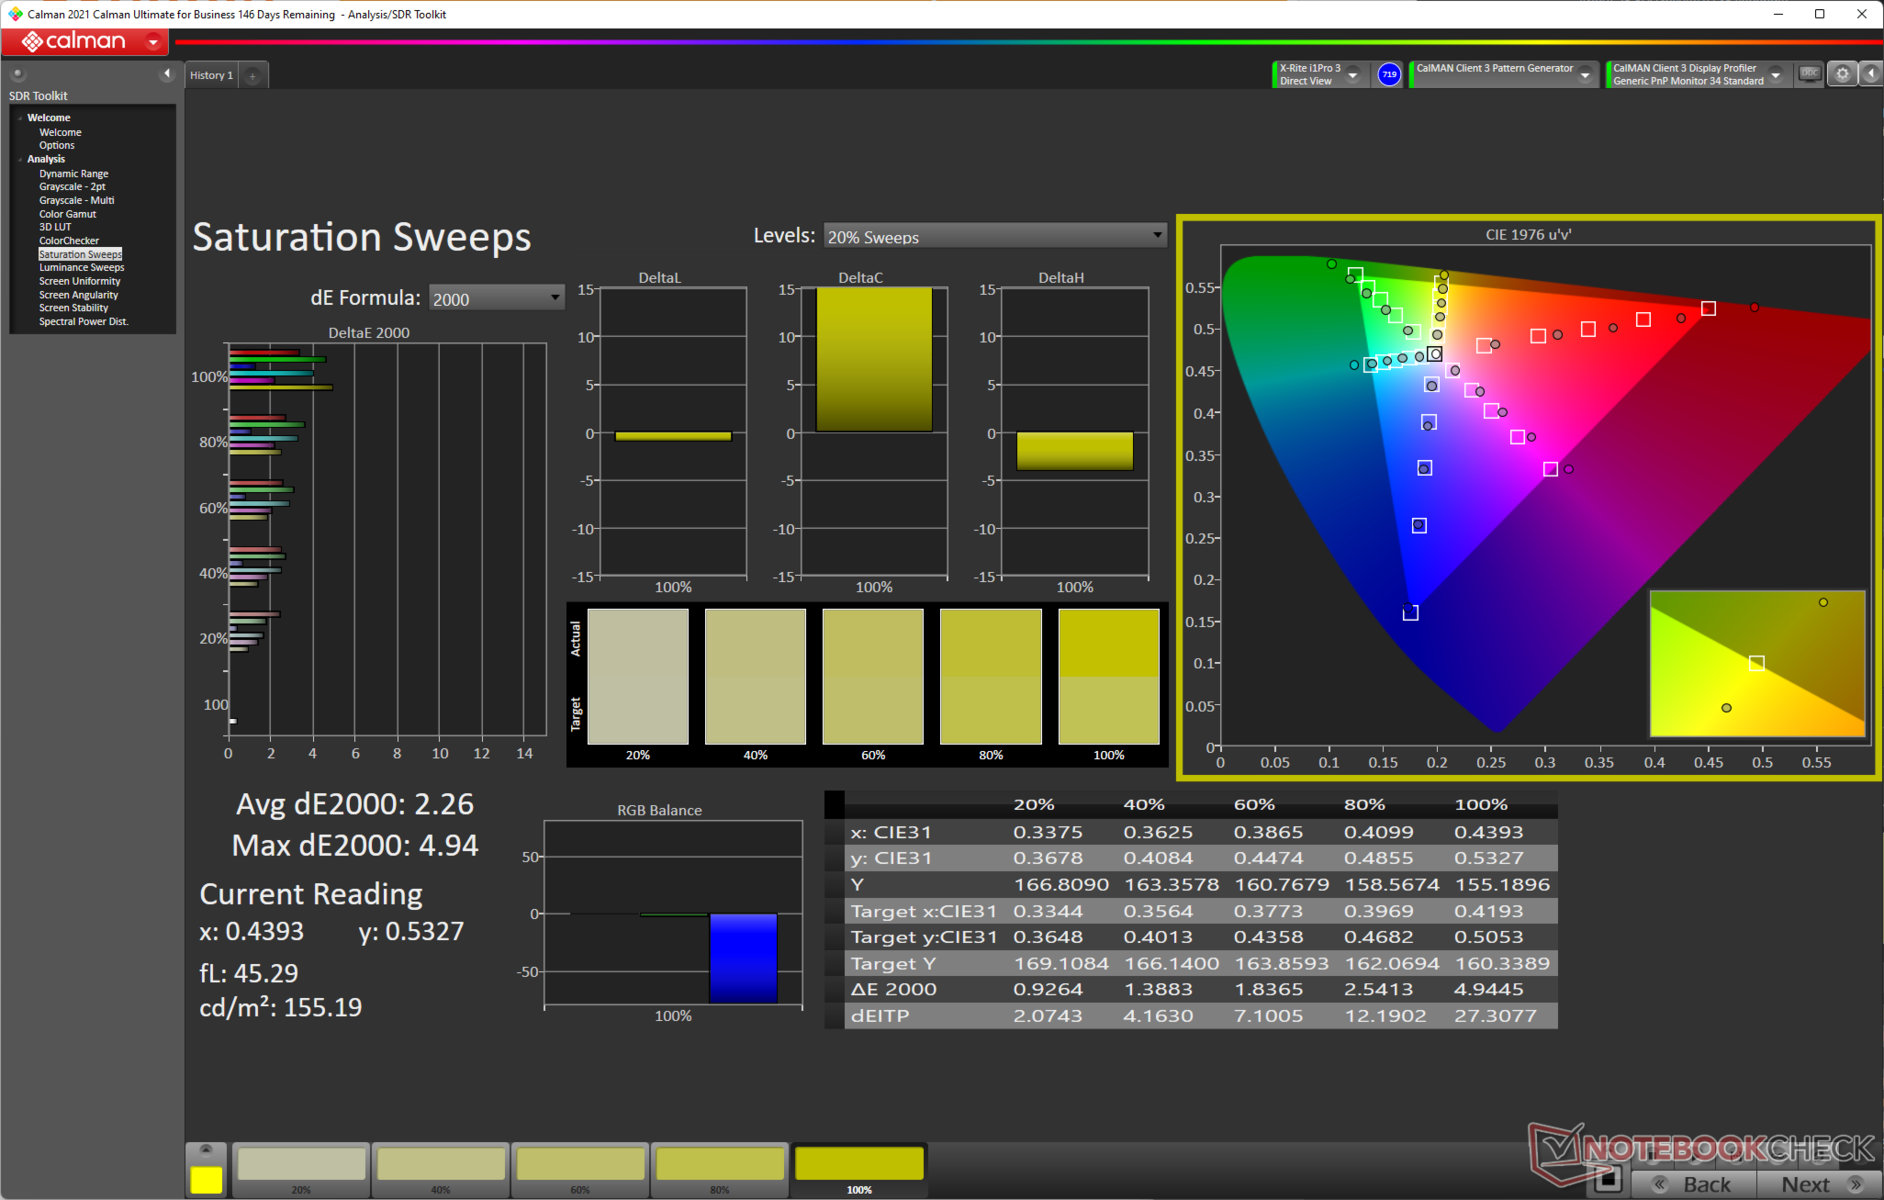
MSI claims that the Crosshair 15's panel can cover 100% DCI-P3 color space. In our tests, we found that it can do nearly 95% Display P3, which should pique the interest of content creators. The panel covers the complete sRGB color gamut. Adobe RGB coverage is pretty decent as well at nearly 85%.
We observe that the color gamut coverage is comparable to the Acer Nitro 5 and Aorus 15 XE5, which also sport the same Chi Mei N156KME-GNA panel. It is good to see manufacturers finally considering good color performance at these prices.
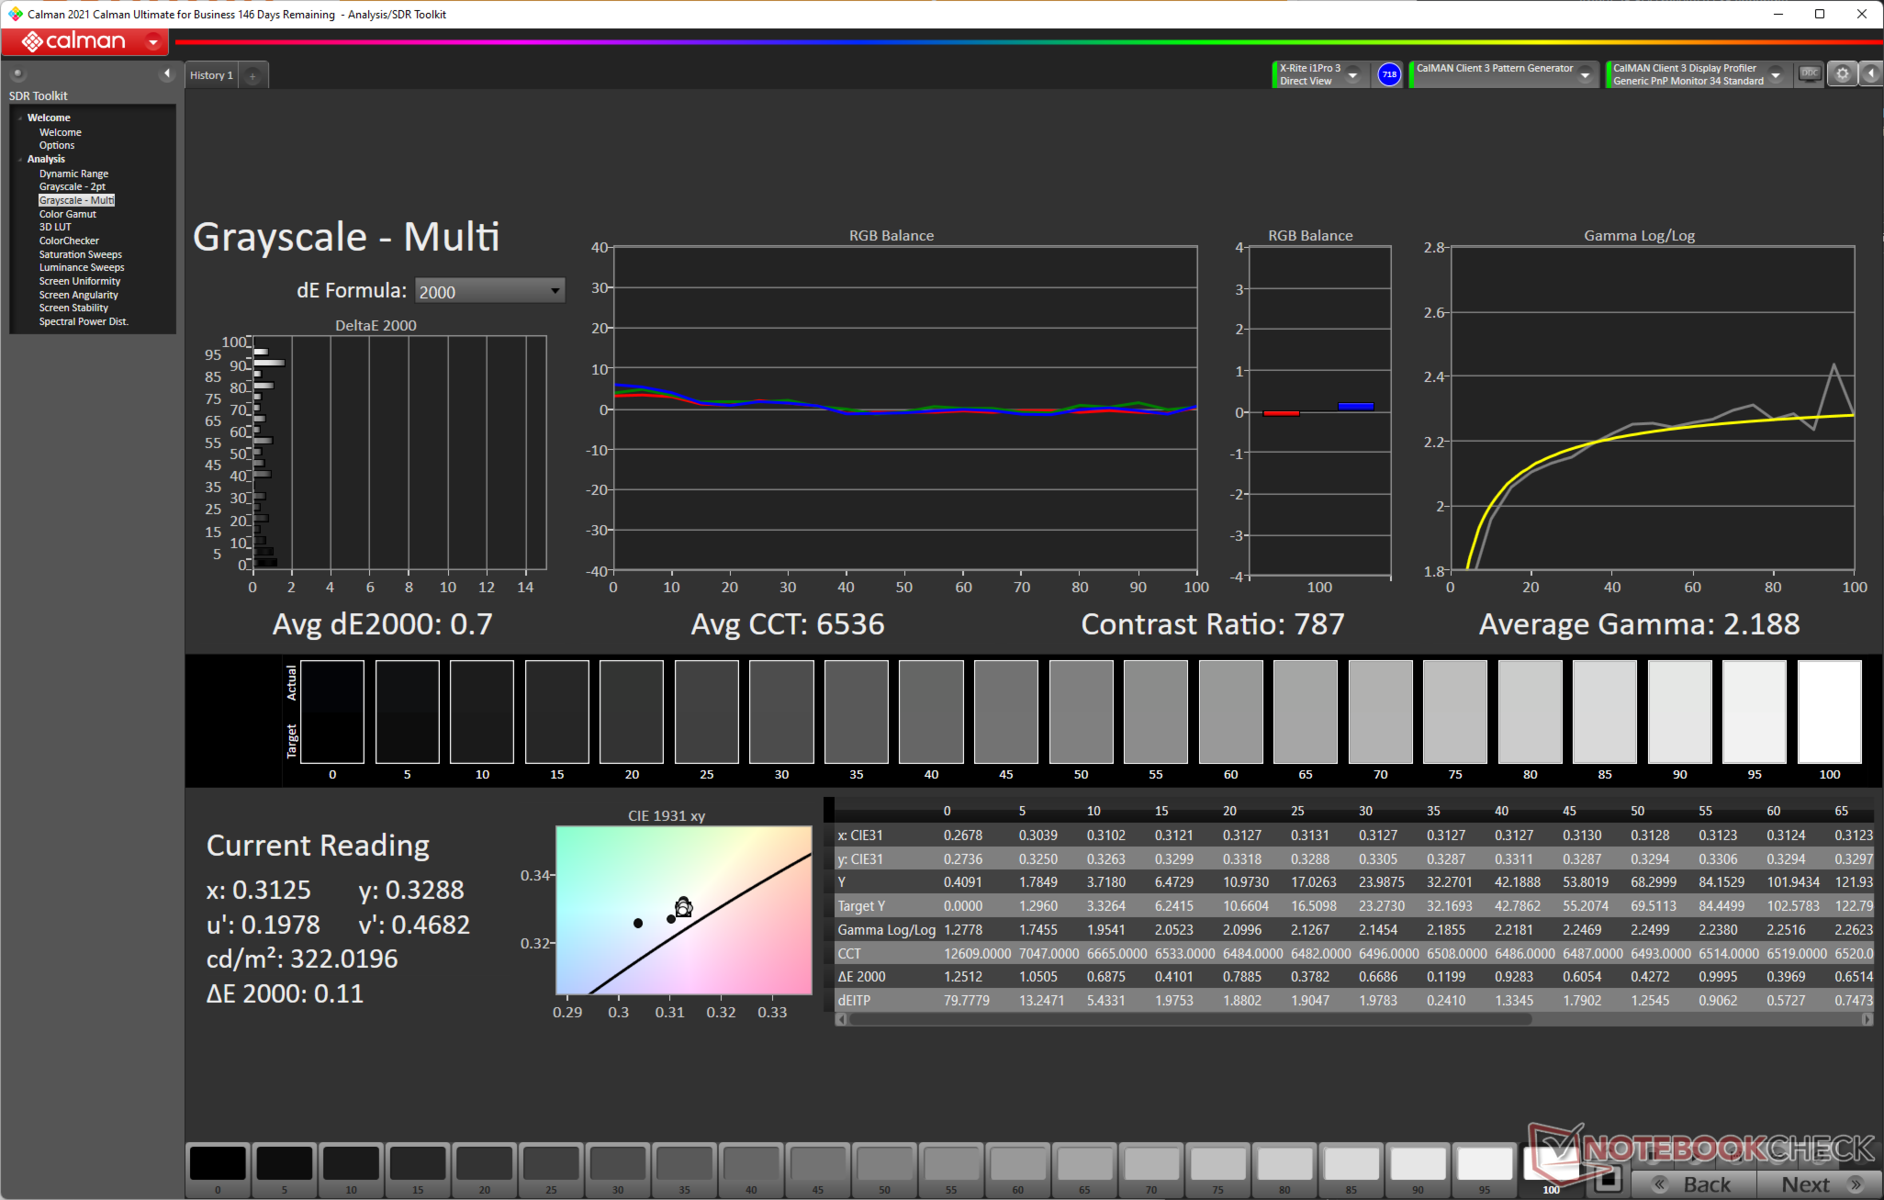
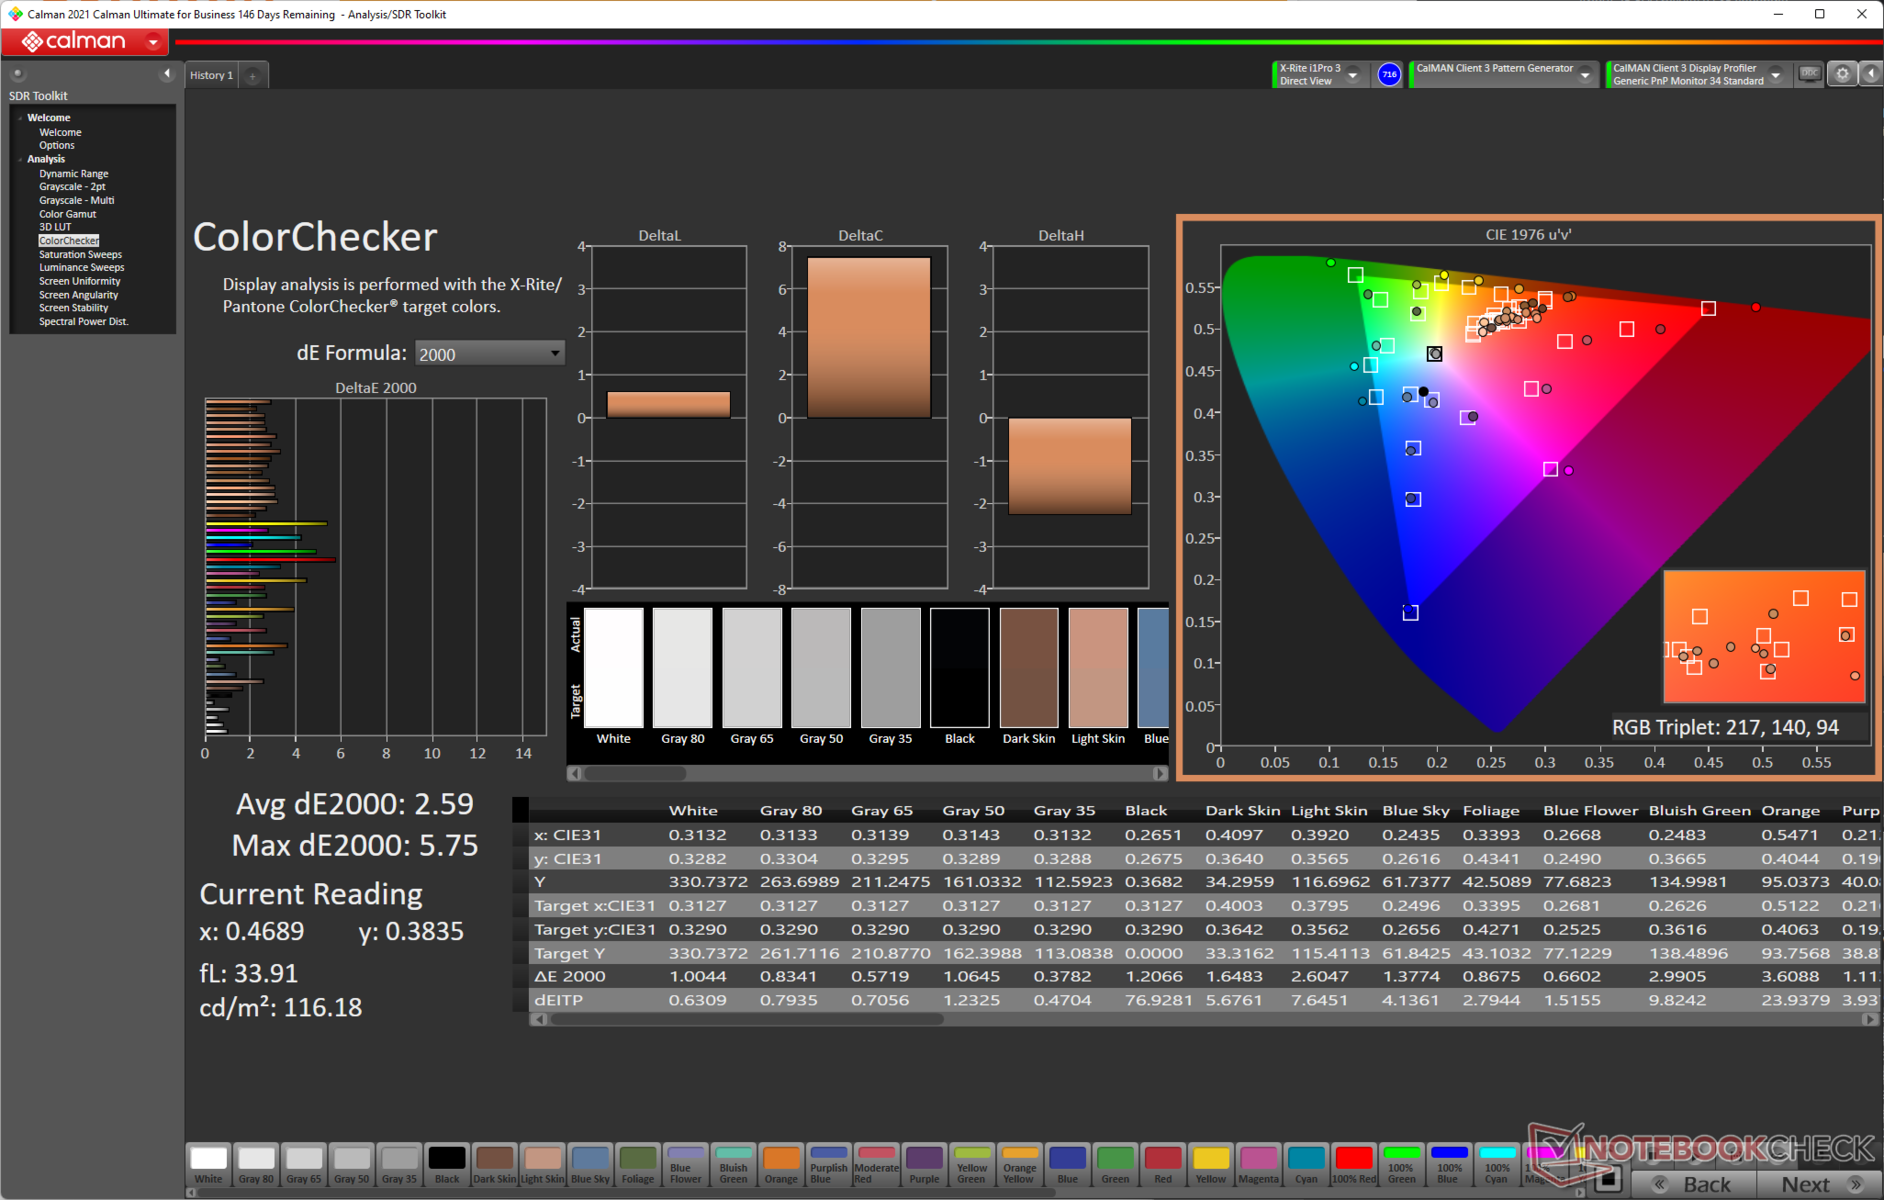
Color accuracy out-of-the-box is definitely serviceable with a grayscale Delta E of 3 and an average ColorChecker Delta E of 3.71.
Our calibration routine with the X-rite i1Basic Pro 3 spectrophotometer and Calman Ultimate color calibration software from Portrait Displays results in a significantly reduced grayscale Delta E of 0.7 and a perceivable average Delta E improvement to 2.59 in ColorChecker. Higher deviations are seen with the red color.
The calibrated ICC file can be downloaded from the link above.
Display Response Times
| ↔ Response Time Black to White | ||
|---|---|---|
| 8.04 ms ... rise ↗ and fall ↘ combined | ↗ 4.72 ms rise | 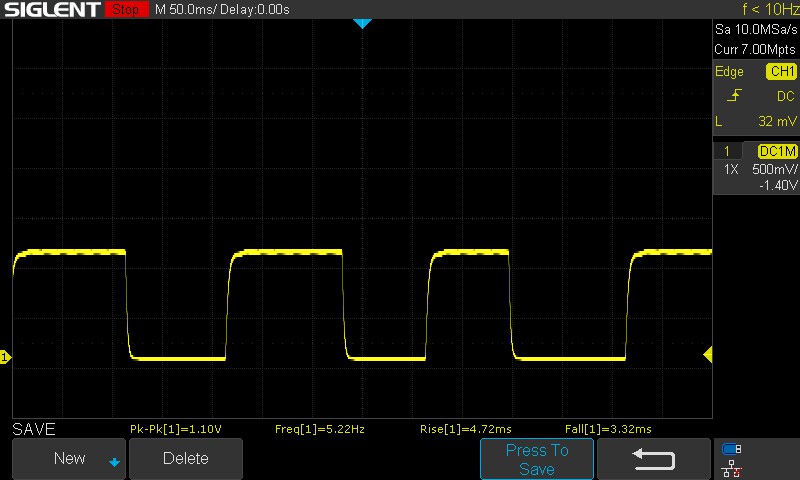 |
| ↘ 3.32 ms fall | ||
| The screen shows fast response rates in our tests and should be suited for gaming. In comparison, all tested devices range from 0.1 (minimum) to 240 (maximum) ms. » 24 % of all devices are better. This means that the measured response time is better than the average of all tested devices (19.8 ms). | ||
| ↔ Response Time 50% Grey to 80% Grey | ||
| 5.36 ms ... rise ↗ and fall ↘ combined | ↗ 2.71 ms rise | 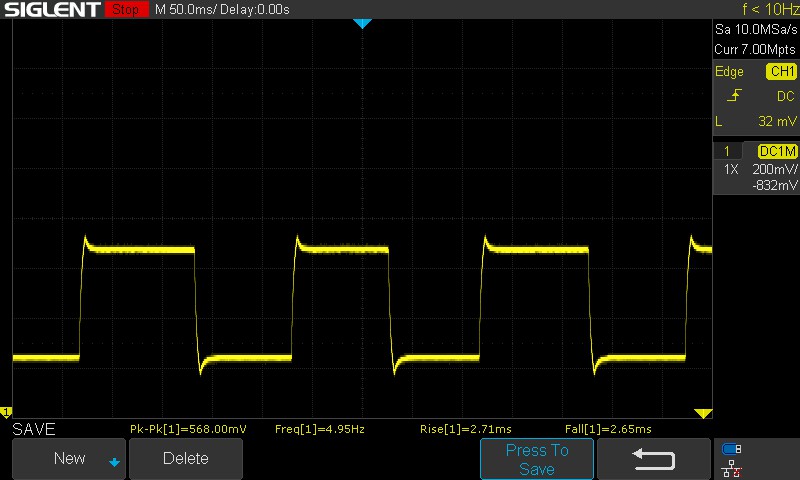 |
| ↘ 2.65 ms fall | ||
| The screen shows very fast response rates in our tests and should be very well suited for fast-paced gaming. In comparison, all tested devices range from 0.165 (minimum) to 636 (maximum) ms. » 18 % of all devices are better. This means that the measured response time is better than the average of all tested devices (31 ms). | ||
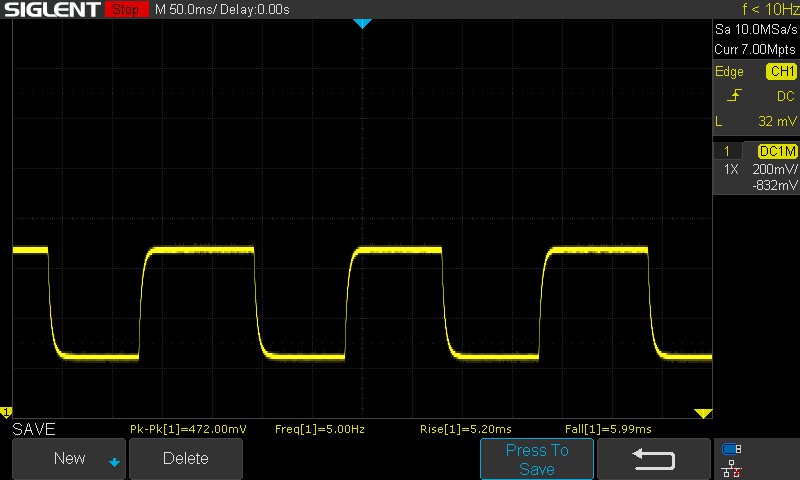
Response times are decent, although we would have liked to see lower values for the 100% black to 100% white transition.
The panel uses overdrive by default, which is seen as a “horn” in the 50% grey to 80% grey oscilloscope pattern.
Without overdrive enabled, this value can increase to 11.19 ms.
Screen Flickering / PWM (Pulse-Width Modulation)
| Screen flickering / PWM not detected | ≤ 100 % brightness setting | 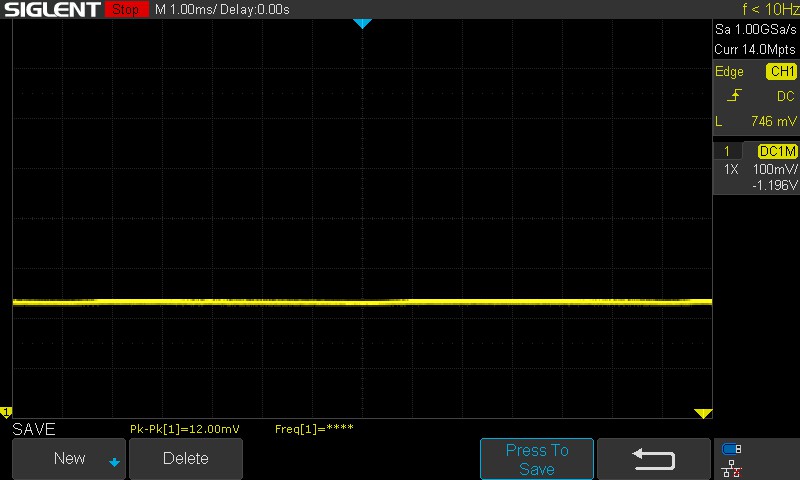 | |
In comparison: 52 % of all tested devices do not use PWM to dim the display. If PWM was detected, an average of 7750 (minimum: 5 - maximum: 343500) Hz was measured. | |||
We did not observe PWM flickering at all tested brightness levels, so that's one less thing to worry about during long working hours or gaming sessions.
Check out our article on “Why Pulse Width Modulation (PWM) is such a headache”, and also our PWM Ranking Table for comparisons across all reviewed devices.
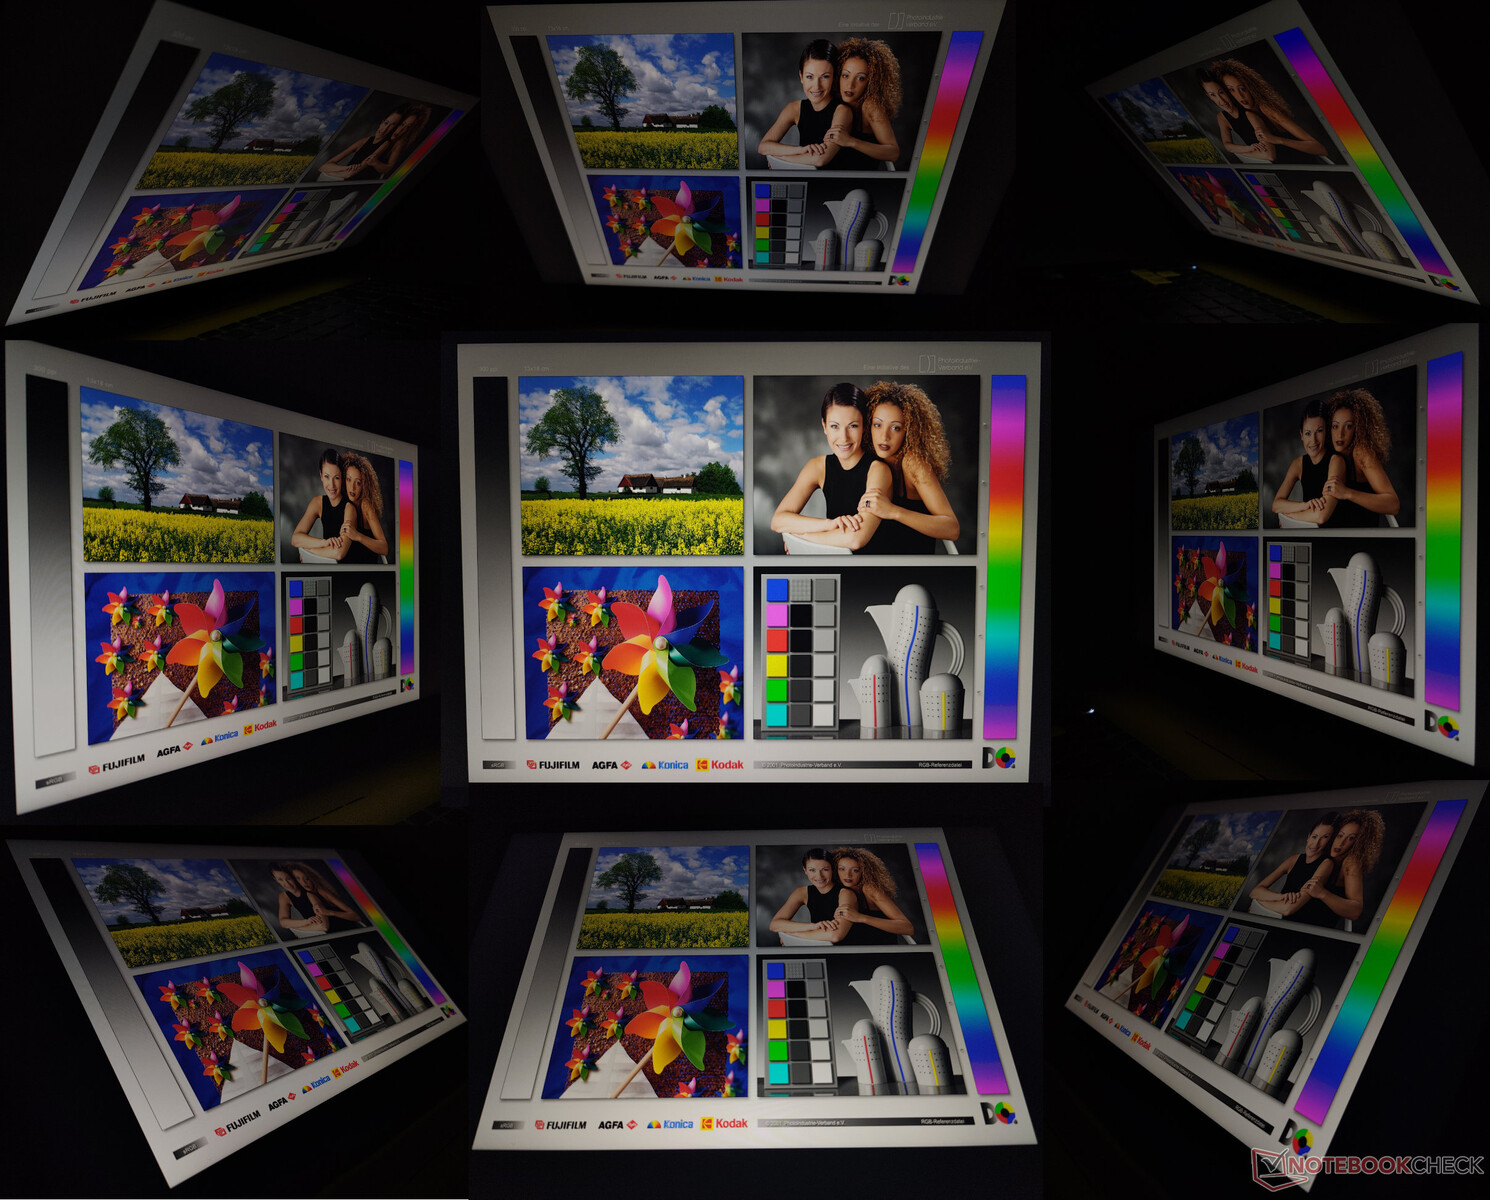
Outdoor viewing is legible as long as there's no sunlight directly falling on the display. Viewing angles are not particularly impressive, however. We observed loss of brightness and color at extreme viewing angles.
Performance: Not the fastest Core i7-12700H we've seen
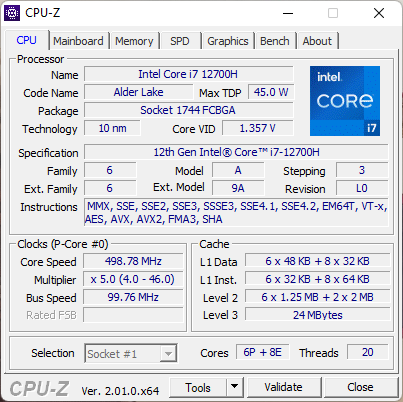
Our Crosshair 15 R6E unit is powered by an Intel Core i7-12700H processor and a 140 W Nvidia GeForce RTX 3070 Laptop GPU. Buyers also have the option of configuring the laptop with an RTX 3060 Laptop GPU or CPU options up to the Alder Lake Core i9.
Testing Conditions
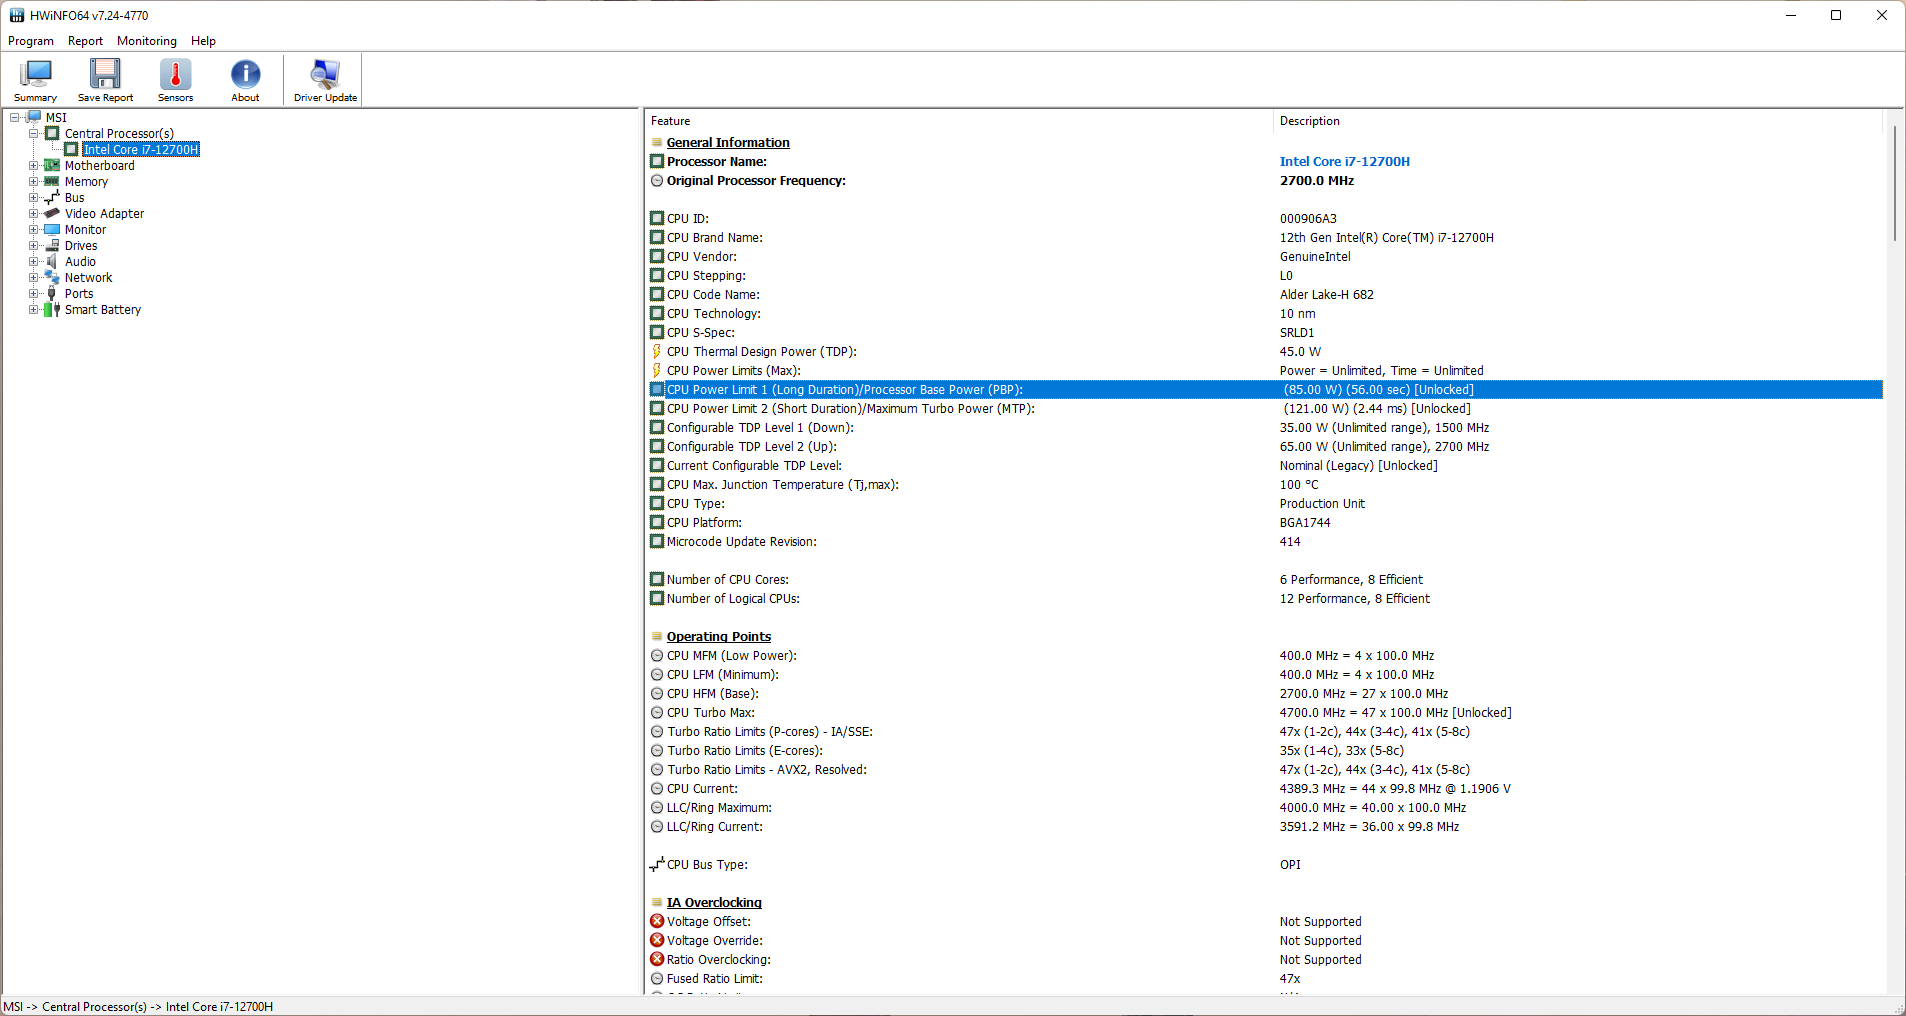
MSI Center offers a one-stop shop for adjusting various performance parameters of the Crosshair 15 R6E. We used the Extreme Performance preset to let the Core i7-12700H fully flex its muscles. This allows the processor to operate at a sustained PL1 of 85 W and short-term PL2 of 121 W. There is no MUX switching option available for the dGPU.
All tests were performed in the Extreme Performance profile unless otherwise specified.
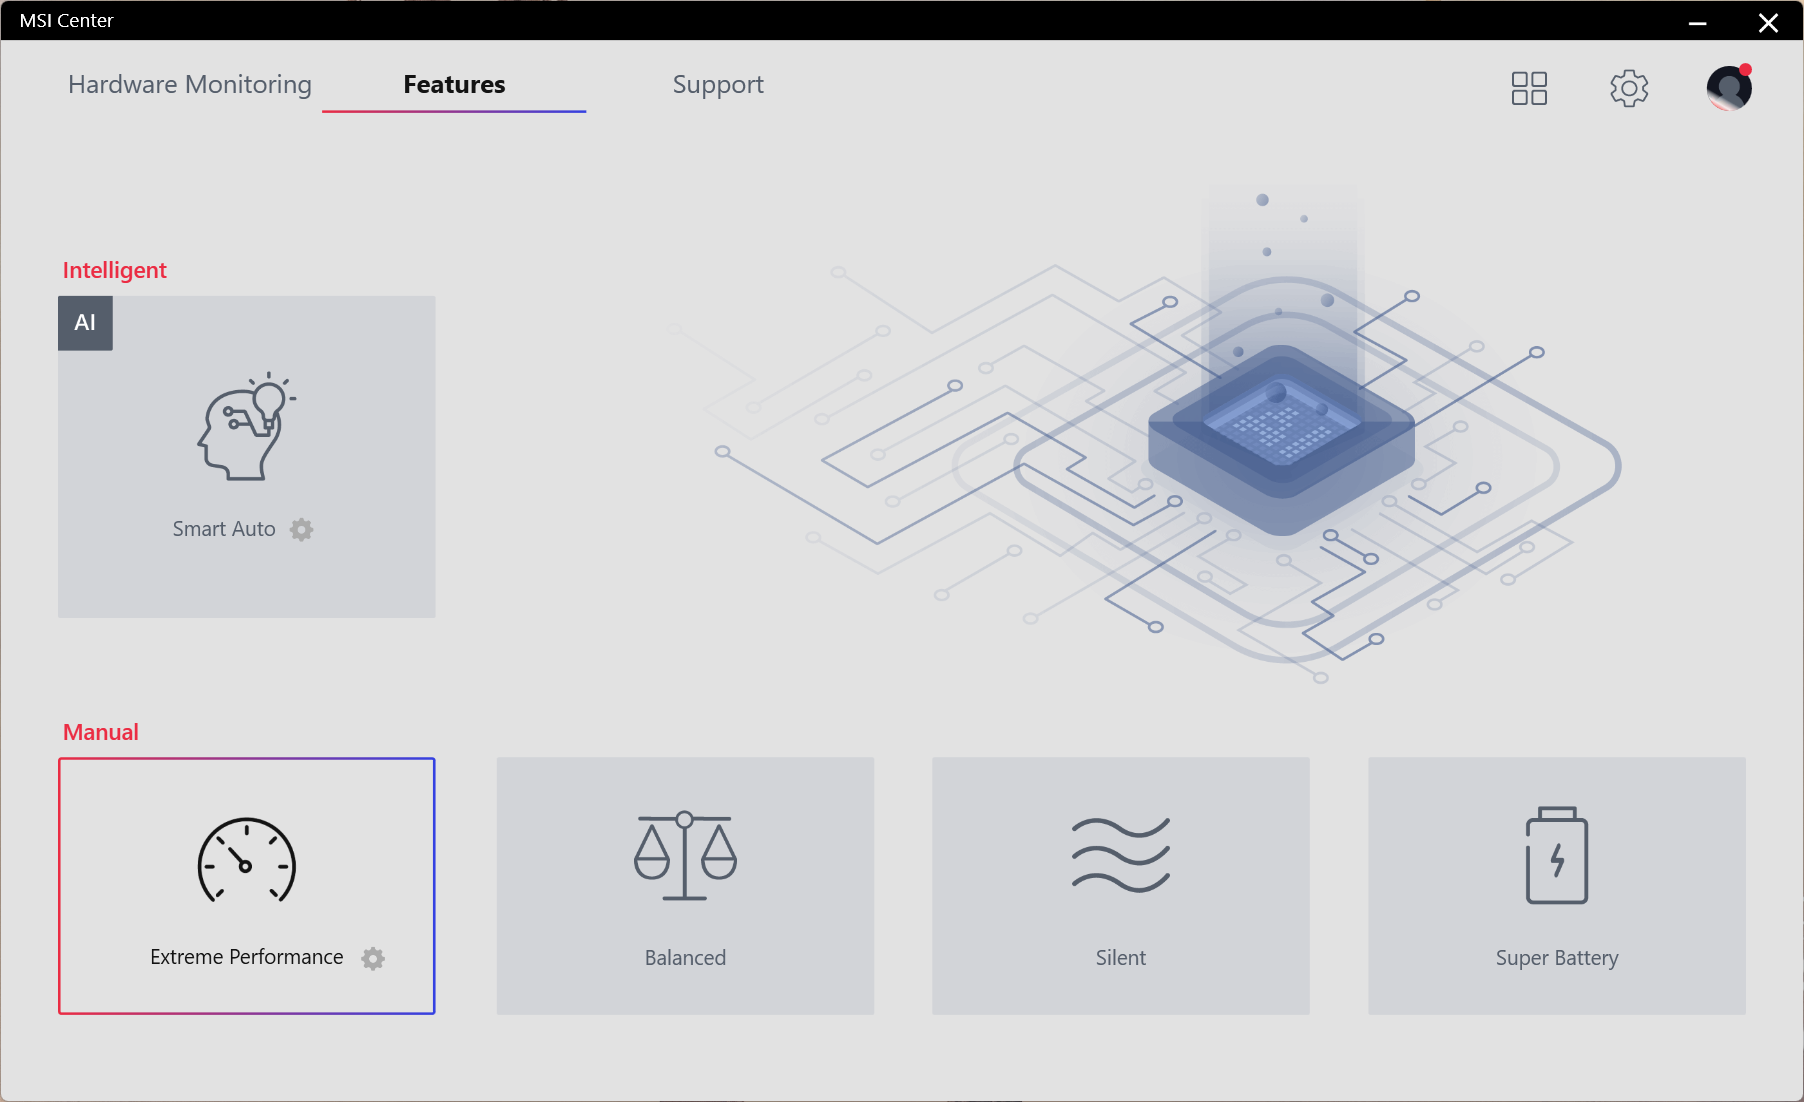
The table below shows how processor base power (PBP, PL1) and maximum turbo power (MTP, PL2) change with each performance mode. The Balanced profile should cater to most needs. Those who wish to extract the maximum possible performance from the Core i7-12700H can opt for the Extreme Performance mode.
| Performance Mode | PL1 (PBP) / Tau | PL2 (MTP) / Tau |
|---|---|---|
| Super Battery | 13 W / 56 s | 121 W / 2.44 ms |
| Silent | 23 W / 56 s | 121 W / 2.44 ms |
| Balanced | 38 W / 56 s | 121 W / 2.44 ms |
| Extreme Performance | 85 W / 56 s | 121 W / 2.44 ms |
Processor
The Core i7-12700H is an Alder Lake-H processor with six P-cores and eight E-cores. The Crosshair 15 R6E is able to allow a decent sustained performance for this processor in our Cinebench R15 multi-core loop test, matching that of the AMD Ryzen 9 6900HX in the Schenker XMG Neo 15.
This is not the fastest Core i7-12700H we've seen, though. The processor's implementation in the MSI Stealth GS66 and Lenovo Legion 5i Pro 16 G7 gets better scores due to higher PL1 and PL2 values.
Cinebench R15 Multi Loop
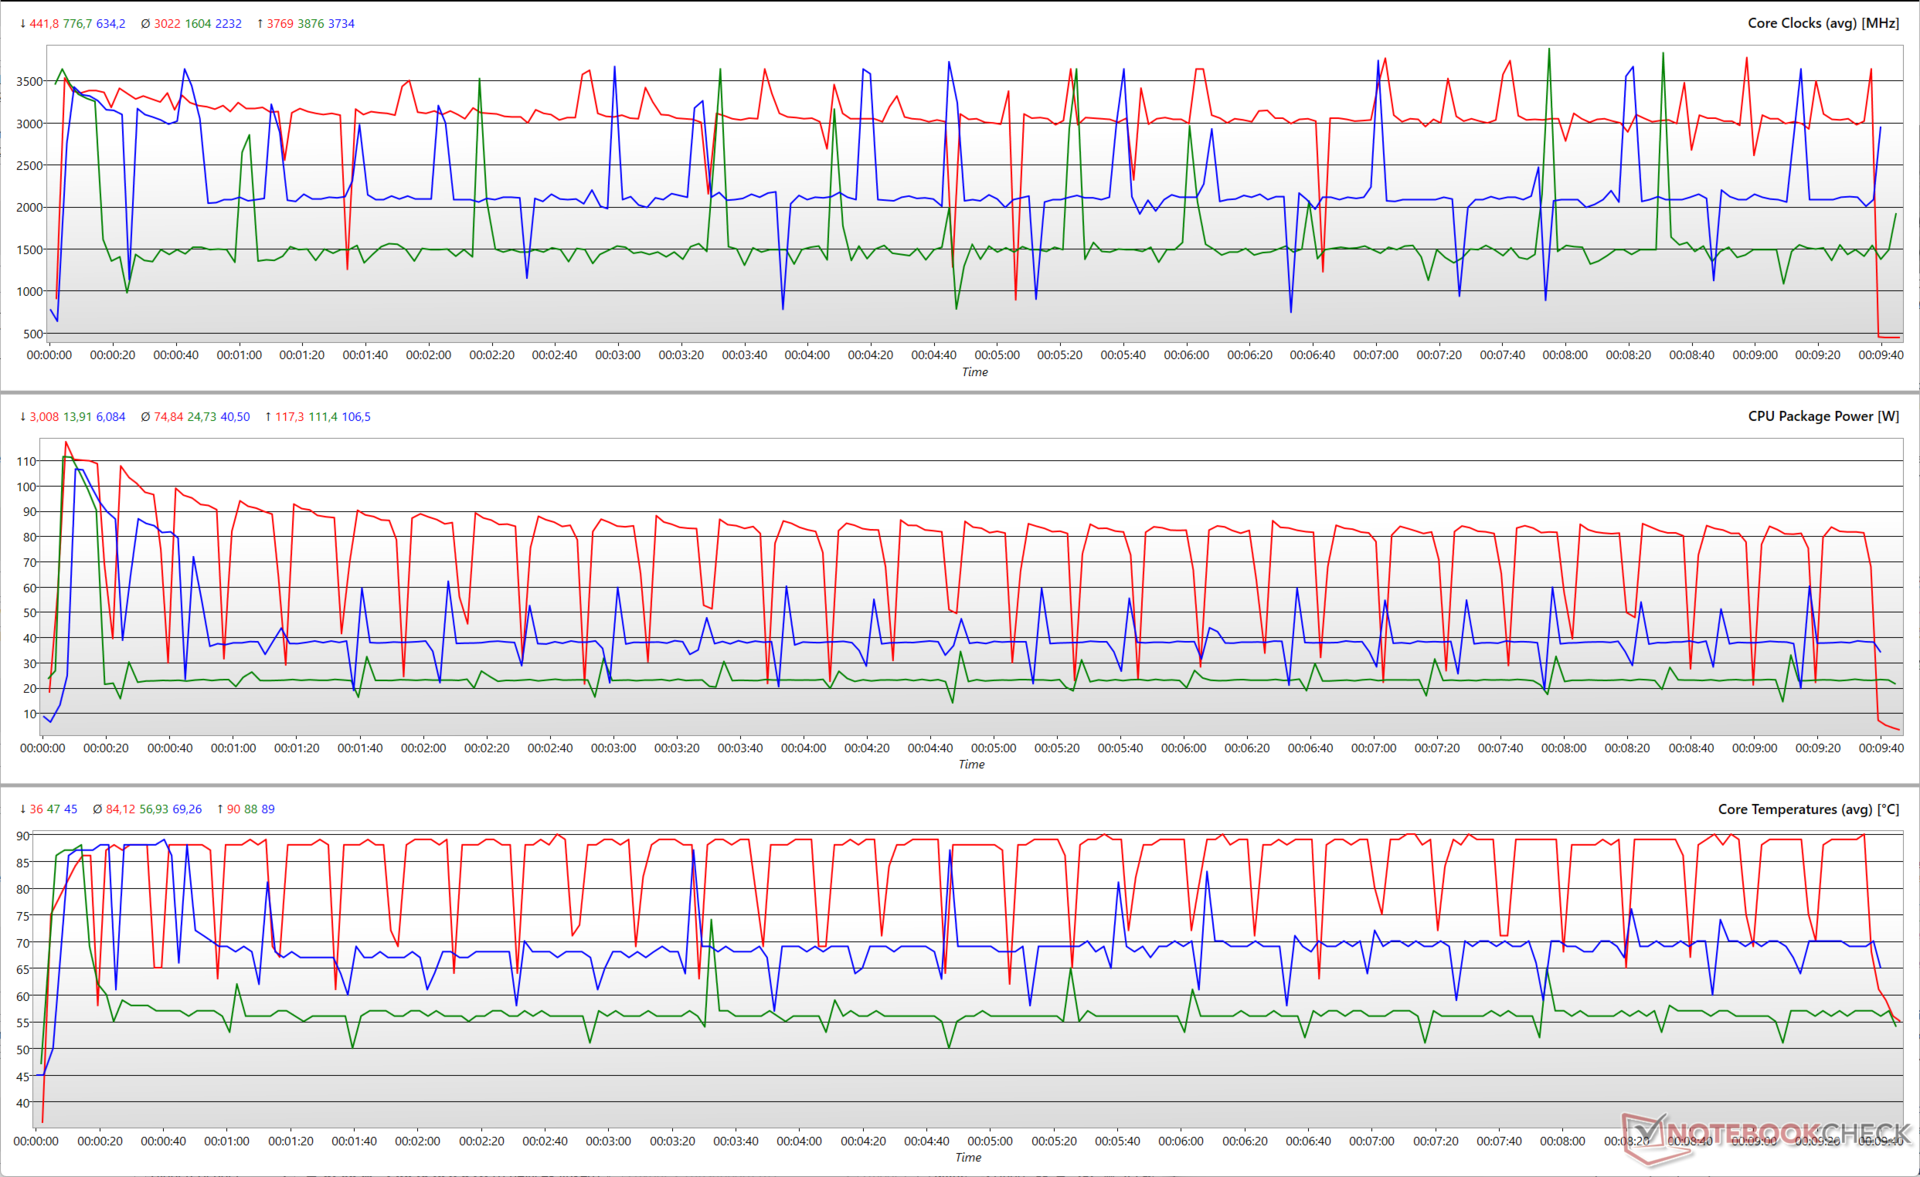
The following graph illustrates how CPU parameters vary during a Cinebench R15 multi-core loop test. Since the 121 W PL2 remains unaltered in all three performance modes, the Core i7-12700H is able to boost up close to 3.8 GHz taking both P and E cores into consideration. The P-cores and E-cores can individually boost up to 4.6 GHz and 3.5 GHz, respectively.
While peak package power and core temperatures are more or less similar across the tested performance modes, the average values show marked differences. The average package power during the run is close to 75 W in the Extreme Performance mode with temperatures around the 84 °C mark. The Balanced setting has average temperatures around 69 °C for an average package power of 40.5 W.
Silent mode has the least emissions in the comparison with an average package power just close to 25 W and average core temperatures near to 57 °C.
Although multi-core performance takes a 15% hit when compared to the Core i7-12700H in the Lenovo Legion 5i Pro 16 G7, the Crosshair 15 R6E is only about 8% behind in overall CPU performance.
The Crosshair 15 R6E is 13% faster than the Ryzen 9 6900HX-powered XMG Neo 15, but the latter scores a 32% higher performance rating in AIDA64 tests.
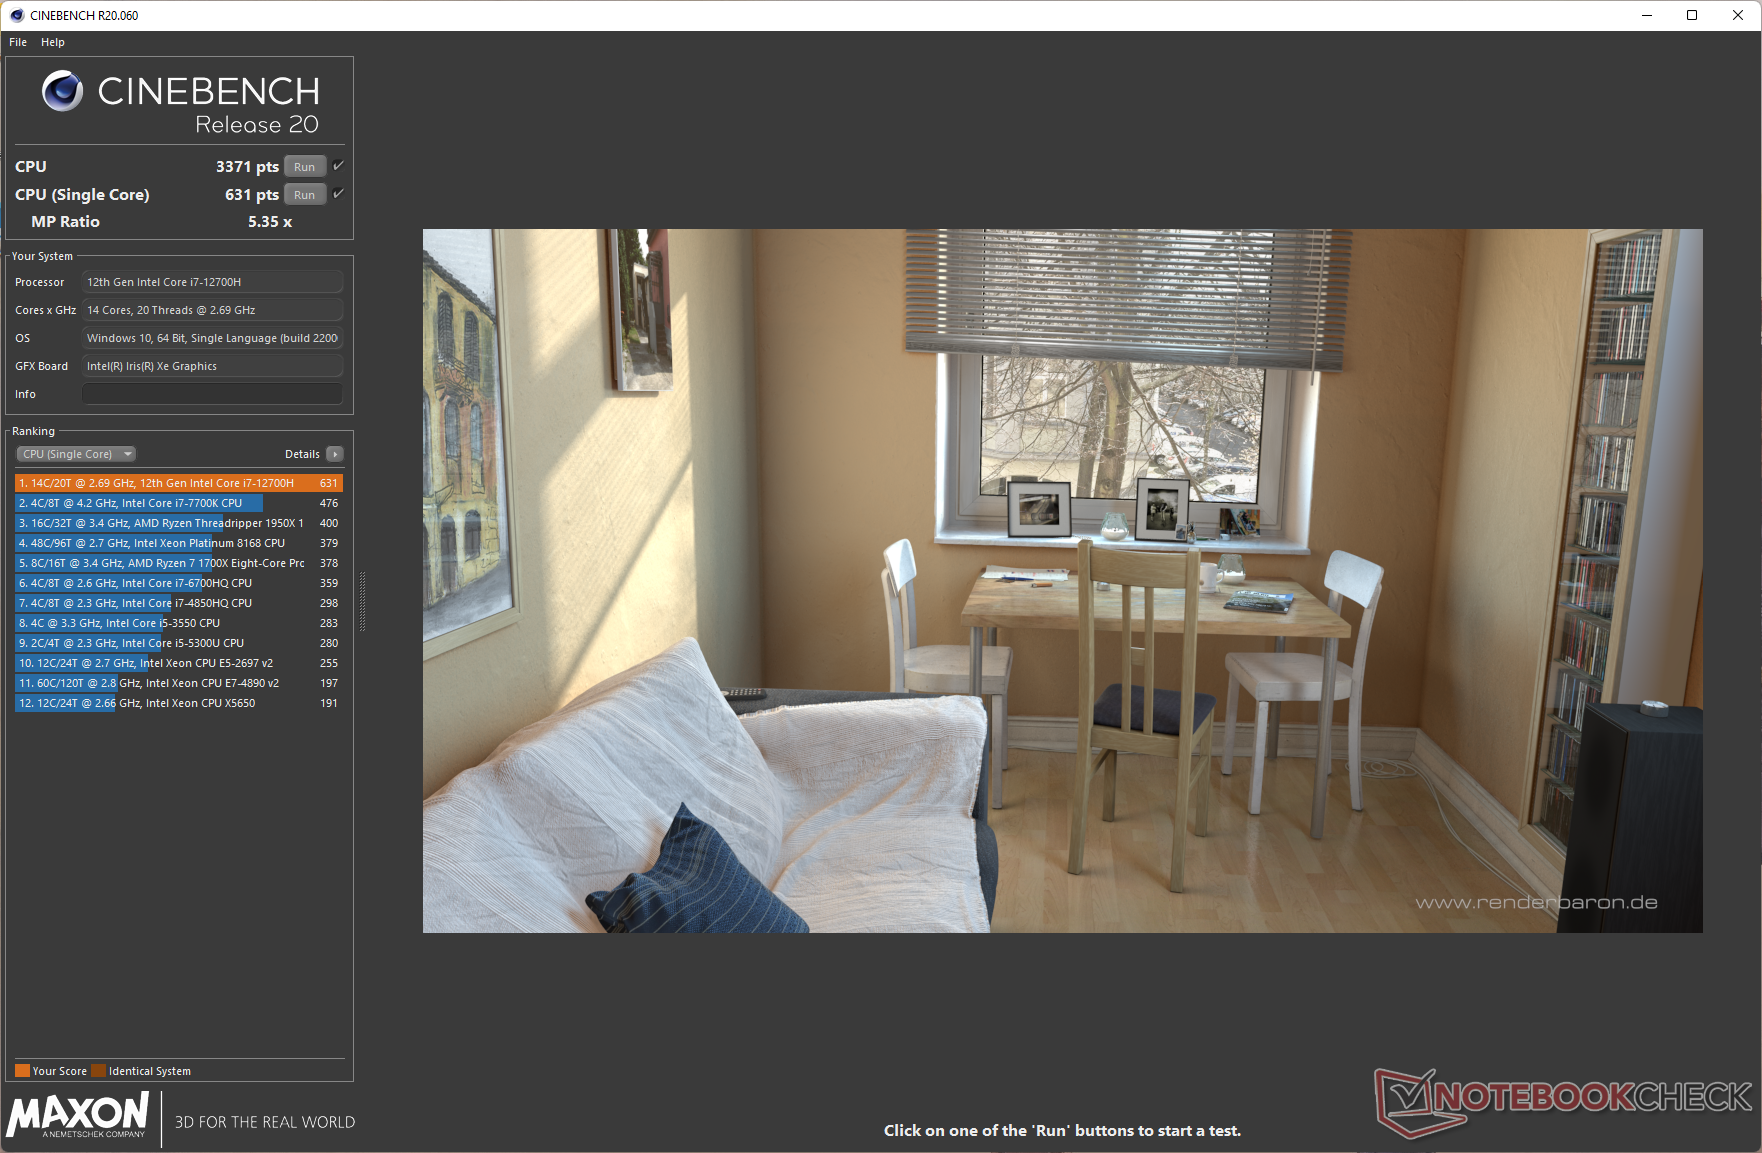
Cinebench R20 multi-core performance drops by a massive 45% on battery power, though single-core scores are only reduced by 10%.
Cinebench R23: Multi Core | Single Core
Cinebench R20: CPU (Multi Core) | CPU (Single Core)
Cinebench R15: CPU Multi 64Bit | CPU Single 64Bit
Blender: v2.79 BMW27 CPU
7-Zip 18.03: 7z b 4 | 7z b 4 -mmt1
Geekbench 5.5: Multi-Core | Single-Core
HWBOT x265 Benchmark v2.2: 4k Preset
LibreOffice : 20 Documents To PDF
R Benchmark 2.5: Overall mean
| CPU Performance rating | |
| Average of class Gaming | |
| Lenovo Legion 5 Pro 16 G7 i7 RTX 3070Ti | |
| MSI Pulse GL66 12UEK | |
| MSI Stealth GS66 12UGS | |
| Schenker XMG Neo 15 (i7-12700H, RTX 3080 Ti) | |
| MSI Crosshair 15 R6E B12UGZ-050 | |
| Acer Nitro 5 AN515-58-72QR | |
| Aorus 15 XE5 | |
| MSI Katana GF66 12UGS | |
| Average Intel Core i7-12700H | |
| Asus TUF Dash F15 FX517ZR | |
| Schenker XMG Neo 15 (Ryzen 9 6900HX, RTX 3070 Ti) | |
| Cinebench R23 / Single Core | |
| Average of class Gaming (1166 - 2356, n=106, last 2 years) | |
| MSI Pulse GL66 12UEK | |
| MSI Katana GF66 12UGS | |
| Lenovo Legion 5 Pro 16 G7 i7 RTX 3070Ti | |
| Acer Nitro 5 AN515-58-72QR | |
| Schenker XMG Neo 15 (i7-12700H, RTX 3080 Ti) | |
| Asus TUF Dash F15 FX517ZR | |
| MSI Stealth GS66 12UGS | |
| MSI Crosshair 15 R6E B12UGZ-050 | |
| Aorus 15 XE5 | |
| Average Intel Core i7-12700H (778 - 1826, n=63) | |
| Schenker XMG Neo 15 (Ryzen 9 6900HX, RTX 3070 Ti) | |
| Cinebench R20 / CPU (Multi Core) | |
| Average of class Gaming (4029 - 16108, n=105, last 2 years) | |
| Lenovo Legion 5 Pro 16 G7 i7 RTX 3070Ti | |
| Schenker XMG Neo 15 (i7-12700H, RTX 3080 Ti) | |
| MSI Pulse GL66 12UEK | |
| MSI Stealth GS66 12UGS | |
| Acer Nitro 5 AN515-58-72QR | |
| MSI Katana GF66 12UGS | |
| MSI Crosshair 15 R6E B12UGZ-050 | |
| Aorus 15 XE5 | |
| Average Intel Core i7-12700H (1576 - 7407, n=64) | |
| Schenker XMG Neo 15 (Ryzen 9 6900HX, RTX 3070 Ti) | |
| Asus TUF Dash F15 FX517ZR | |
| Cinebench R20 / CPU (Single Core) | |
| Average of class Gaming (442 - 895, n=105, last 2 years) | |
| MSI Pulse GL66 12UEK | |
| MSI Katana GF66 12UGS | |
| Lenovo Legion 5 Pro 16 G7 i7 RTX 3070Ti | |
| Asus TUF Dash F15 FX517ZR | |
| MSI Crosshair 15 R6E B12UGZ-050 | |
| Acer Nitro 5 AN515-58-72QR | |
| MSI Stealth GS66 12UGS | |
| Schenker XMG Neo 15 (i7-12700H, RTX 3080 Ti) | |
| Aorus 15 XE5 | |
| Average Intel Core i7-12700H (300 - 704, n=64) | |
| Schenker XMG Neo 15 (Ryzen 9 6900HX, RTX 3070 Ti) | |
| Cinebench R15 / CPU Single 64Bit | |
| Average of class Gaming (188.8 - 343, n=105, last 2 years) | |
| MSI Pulse GL66 12UEK | |
| Lenovo Legion 5 Pro 16 G7 i7 RTX 3070Ti | |
| MSI Katana GF66 12UGS | |
| MSI Katana GF66 12UGS | |
| Acer Nitro 5 AN515-58-72QR | |
| Schenker XMG Neo 15 (i7-12700H, RTX 3080 Ti) | |
| MSI Crosshair 15 R6E B12UGZ-050 | |
| Asus TUF Dash F15 FX517ZR | |
| MSI Stealth GS66 12UGS | |
| Aorus 15 XE5 | |
| Average Intel Core i7-12700H (113 - 263, n=65) | |
| Schenker XMG Neo 15 (Ryzen 9 6900HX, RTX 3070 Ti) | |
| Geekbench 5.5 / Single-Core | |
| Average of class Gaming (986 - 2474, n=104, last 2 years) | |
| MSI Pulse GL66 12UEK | |
| MSI Crosshair 15 R6E B12UGZ-050 | |
| Asus TUF Dash F15 FX517ZR | |
| Acer Nitro 5 AN515-58-72QR | |
| MSI Katana GF66 12UGS | |
| Schenker XMG Neo 15 (i7-12700H, RTX 3080 Ti) | |
| Lenovo Legion 5 Pro 16 G7 i7 RTX 3070Ti | |
| Average Intel Core i7-12700H (803 - 1851, n=64) | |
| Aorus 15 XE5 | |
| MSI Stealth GS66 12UGS | |
| Schenker XMG Neo 15 (Ryzen 9 6900HX, RTX 3070 Ti) | |
| HWBOT x265 Benchmark v2.2 / 4k Preset | |
| Average of class Gaming (11.5 - 44.3, n=104, last 2 years) | |
| Lenovo Legion 5 Pro 16 G7 i7 RTX 3070Ti | |
| Schenker XMG Neo 15 (i7-12700H, RTX 3080 Ti) | |
| MSI Stealth GS66 12UGS | |
| MSI Pulse GL66 12UEK | |
| Acer Nitro 5 AN515-58-72QR | |
| MSI Crosshair 15 R6E B12UGZ-050 | |
| Schenker XMG Neo 15 (Ryzen 9 6900HX, RTX 3070 Ti) | |
| Asus TUF Dash F15 FX517ZR | |
| Average Intel Core i7-12700H (4.67 - 21.8, n=64) | |
| Aorus 15 XE5 | |
| MSI Katana GF66 12UGS | |
| LibreOffice / 20 Documents To PDF | |
| Schenker XMG Neo 15 (Ryzen 9 6900HX, RTX 3070 Ti) | |
| Average of class Gaming (33.2 - 88.8, n=104, last 2 years) | |
| Schenker XMG Neo 15 (i7-12700H, RTX 3080 Ti) | |
| Average Intel Core i7-12700H (34.2 - 95.3, n=63) | |
| MSI Crosshair 15 R6E B12UGZ-050 | |
| Lenovo Legion 5 Pro 16 G7 i7 RTX 3070Ti | |
| MSI Pulse GL66 12UEK | |
| Acer Nitro 5 AN515-58-72QR | |
| MSI Stealth GS66 12UGS | |
| Asus TUF Dash F15 FX517ZR | |
| Aorus 15 XE5 | |
| MSI Katana GF66 12UGS | |
| R Benchmark 2.5 / Overall mean | |
| Schenker XMG Neo 15 (Ryzen 9 6900HX, RTX 3070 Ti) | |
| Average Intel Core i7-12700H (0.4441 - 1.052, n=63) | |
| Aorus 15 XE5 | |
| Asus TUF Dash F15 FX517ZR | |
| Schenker XMG Neo 15 (i7-12700H, RTX 3080 Ti) | |
| Acer Nitro 5 AN515-58-72QR | |
| MSI Katana GF66 12UGS | |
| Lenovo Legion 5 Pro 16 G7 i7 RTX 3070Ti | |
| MSI Stealth GS66 12UGS | |
| MSI Crosshair 15 R6E B12UGZ-050 | |
| Average of class Gaming (0.3439 - 0.759, n=105, last 2 years) | |
| MSI Pulse GL66 12UEK | |
* ... smaller is better
AIDA64: FP32 Ray-Trace | FPU Julia | CPU SHA3 | CPU Queen | FPU SinJulia | FPU Mandel | CPU AES | CPU ZLib | FP64 Ray-Trace | CPU PhotoWorxx
Check out our dedicated Intel Core i7-12700H page for more information and performance comparisons.
System Performance
Competing devices are able to edge-out the Crosshair 15 R6E in PCMark 10 scores but not by much. CrossMark sees the Crosshair 15 R6E put out a much improved performance.
AIDA64 tests see the Crosshair 15 R6E trail behind other Core i7-12700H-powered laptops. We did not experience any particular performance concerns with daily productivity tasks or web browsing.
CrossMark: Overall | Productivity | Creativity | Responsiveness
| PCMark 10 / Score | |
| Average of class Gaming (5828 - 11574, n=92, last 2 years) | |
| Aorus 15 XE5 | |
| MSI Stealth GS66 12UGS | |
| Schenker XMG Neo 15 (i7-12700H, RTX 3080 Ti) | |
| Lenovo Legion 5 Pro 16 G7 i7 RTX 3070Ti | |
| MSI Katana GF66 12UGS | |
| Average Intel Core i7-12700H, NVIDIA GeForce RTX 3070 Laptop GPU (7082 - 7647, n=2) | |
| Schenker XMG Neo 15 (Ryzen 9 6900HX, RTX 3070 Ti) | |
| MSI Pulse GL66 12UEK | |
| MSI Crosshair 15 R6E B12UGZ-050 | |
| Acer Nitro 5 AN515-58-72QR | |
| Asus TUF Dash F15 FX517ZR | |
| PCMark 10 / Essentials | |
| MSI Stealth GS66 12UGS | |
| Aorus 15 XE5 | |
| Average of class Gaming (8810 - 11935, n=96, last 2 years) | |
| Schenker XMG Neo 15 (i7-12700H, RTX 3080 Ti) | |
| Average Intel Core i7-12700H, NVIDIA GeForce RTX 3070 Laptop GPU (10076 - 10926, n=2) | |
| Schenker XMG Neo 15 (Ryzen 9 6900HX, RTX 3070 Ti) | |
| MSI Pulse GL66 12UEK | |
| MSI Katana GF66 12UGS | |
| MSI Crosshair 15 R6E B12UGZ-050 | |
| Asus TUF Dash F15 FX517ZR | |
| Lenovo Legion 5 Pro 16 G7 i7 RTX 3070Ti | |
| Acer Nitro 5 AN515-58-72QR | |
| PCMark 10 / Productivity | |
| Average of class Gaming (6845 - 21327, n=94, last 2 years) | |
| Aorus 15 XE5 | |
| MSI Katana GF66 12UGS | |
| Lenovo Legion 5 Pro 16 G7 i7 RTX 3070Ti | |
| MSI Pulse GL66 12UEK | |
| Average Intel Core i7-12700H, NVIDIA GeForce RTX 3070 Laptop GPU (9460 - 9877, n=2) | |
| Schenker XMG Neo 15 (Ryzen 9 6900HX, RTX 3070 Ti) | |
| Asus TUF Dash F15 FX517ZR | |
| MSI Stealth GS66 12UGS | |
| MSI Crosshair 15 R6E B12UGZ-050 | |
| Schenker XMG Neo 15 (i7-12700H, RTX 3080 Ti) | |
| Acer Nitro 5 AN515-58-72QR | |
| PCMark 10 / Digital Content Creation | |
| Average of class Gaming (7602 - 19657, n=94, last 2 years) | |
| Schenker XMG Neo 15 (i7-12700H, RTX 3080 Ti) | |
| Lenovo Legion 5 Pro 16 G7 i7 RTX 3070Ti | |
| MSI Stealth GS66 12UGS | |
| Aorus 15 XE5 | |
| MSI Katana GF66 12UGS | |
| Average Intel Core i7-12700H, NVIDIA GeForce RTX 3070 Laptop GPU (10113 - 11245, n=2) | |
| Acer Nitro 5 AN515-58-72QR | |
| MSI Crosshair 15 R6E B12UGZ-050 | |
| Schenker XMG Neo 15 (Ryzen 9 6900HX, RTX 3070 Ti) | |
| MSI Pulse GL66 12UEK | |
| Asus TUF Dash F15 FX517ZR | |
| CrossMark / Overall | |
| MSI Pulse GL66 12UEK | |
| MSI Crosshair 15 R6E B12UGZ-050 | |
| Average of class Gaming (1366 - 2409, n=93, last 2 years) | |
| Lenovo Legion 5 Pro 16 G7 i7 RTX 3070Ti | |
| Aorus 15 XE5 | |
| MSI Katana GF66 12UGS | |
| Average Intel Core i7-12700H, NVIDIA GeForce RTX 3070 Laptop GPU (1844 - 2003, n=2) | |
| Asus TUF Dash F15 FX517ZR | |
| Schenker XMG Neo 15 (i7-12700H, RTX 3080 Ti) | |
| Acer Nitro 5 AN515-58-72QR | |
| Schenker XMG Neo 15 (Ryzen 9 6900HX, RTX 3070 Ti) | |
| CrossMark / Productivity | |
| MSI Pulse GL66 12UEK | |
| MSI Crosshair 15 R6E B12UGZ-050 | |
| MSI Katana GF66 12UGS | |
| Aorus 15 XE5 | |
| Average Intel Core i7-12700H, NVIDIA GeForce RTX 3070 Laptop GPU (1785 - 1971, n=2) | |
| Lenovo Legion 5 Pro 16 G7 i7 RTX 3070Ti | |
| Average of class Gaming (1386 - 2254, n=93, last 2 years) | |
| Acer Nitro 5 AN515-58-72QR | |
| Asus TUF Dash F15 FX517ZR | |
| Schenker XMG Neo 15 (i7-12700H, RTX 3080 Ti) | |
| Schenker XMG Neo 15 (Ryzen 9 6900HX, RTX 3070 Ti) | |
| CrossMark / Creativity | |
| Average of class Gaming (1343 - 2729, n=93, last 2 years) | |
| MSI Pulse GL66 12UEK | |
| Lenovo Legion 5 Pro 16 G7 i7 RTX 3070Ti | |
| Schenker XMG Neo 15 (i7-12700H, RTX 3080 Ti) | |
| Asus TUF Dash F15 FX517ZR | |
| Aorus 15 XE5 | |
| MSI Crosshair 15 R6E B12UGZ-050 | |
| Average Intel Core i7-12700H, NVIDIA GeForce RTX 3070 Laptop GPU (1912 - 1979, n=2) | |
| MSI Katana GF66 12UGS | |
| Acer Nitro 5 AN515-58-72QR | |
| Schenker XMG Neo 15 (Ryzen 9 6900HX, RTX 3070 Ti) | |
| CrossMark / Responsiveness | |
| MSI Pulse GL66 12UEK | |
| MSI Crosshair 15 R6E B12UGZ-050 | |
| MSI Katana GF66 12UGS | |
| Aorus 15 XE5 | |
| Average Intel Core i7-12700H, NVIDIA GeForce RTX 3070 Laptop GPU (1824 - 2182, n=2) | |
| Lenovo Legion 5 Pro 16 G7 i7 RTX 3070Ti | |
| Average of class Gaming (1226 - 2334, n=93, last 2 years) | |
| Acer Nitro 5 AN515-58-72QR | |
| Asus TUF Dash F15 FX517ZR | |
| Schenker XMG Neo 15 (i7-12700H, RTX 3080 Ti) | |
| Schenker XMG Neo 15 (Ryzen 9 6900HX, RTX 3070 Ti) | |
| PCMark 8 Home Score Accelerated v2 | 6083 points | |
| PCMark 8 Creative Score Accelerated v2 | 9960 points | |
| PCMark 8 Work Score Accelerated v2 | 6346 points | |
| PCMark 10 Score | 7082 points | |
Help | ||
| AIDA64 / Memory Latency | |
| Average of class Gaming (75.3 - 259, n=103, last 2 years) | |
| Lenovo Legion 5 Pro 16 G7 i7 RTX 3070Ti | |
| MSI Katana GF66 12UGS | |
| Asus TUF Dash F15 FX517ZR | |
| Aorus 15 XE5 | |
| MSI Stealth GS66 12UGS | |
| MSI Crosshair 15 R6E B12UGZ-050 | |
| MSI Pulse GL66 12UEK | |
| Schenker XMG Neo 15 (Ryzen 9 6900HX, RTX 3070 Ti) | |
| Average Intel Core i7-12700H (76.2 - 133.9, n=62) | |
| Acer Nitro 5 AN515-58-72QR | |
| Acer Nitro 5 AN515-58-72QR | |
* ... smaller is better
DPC Latency
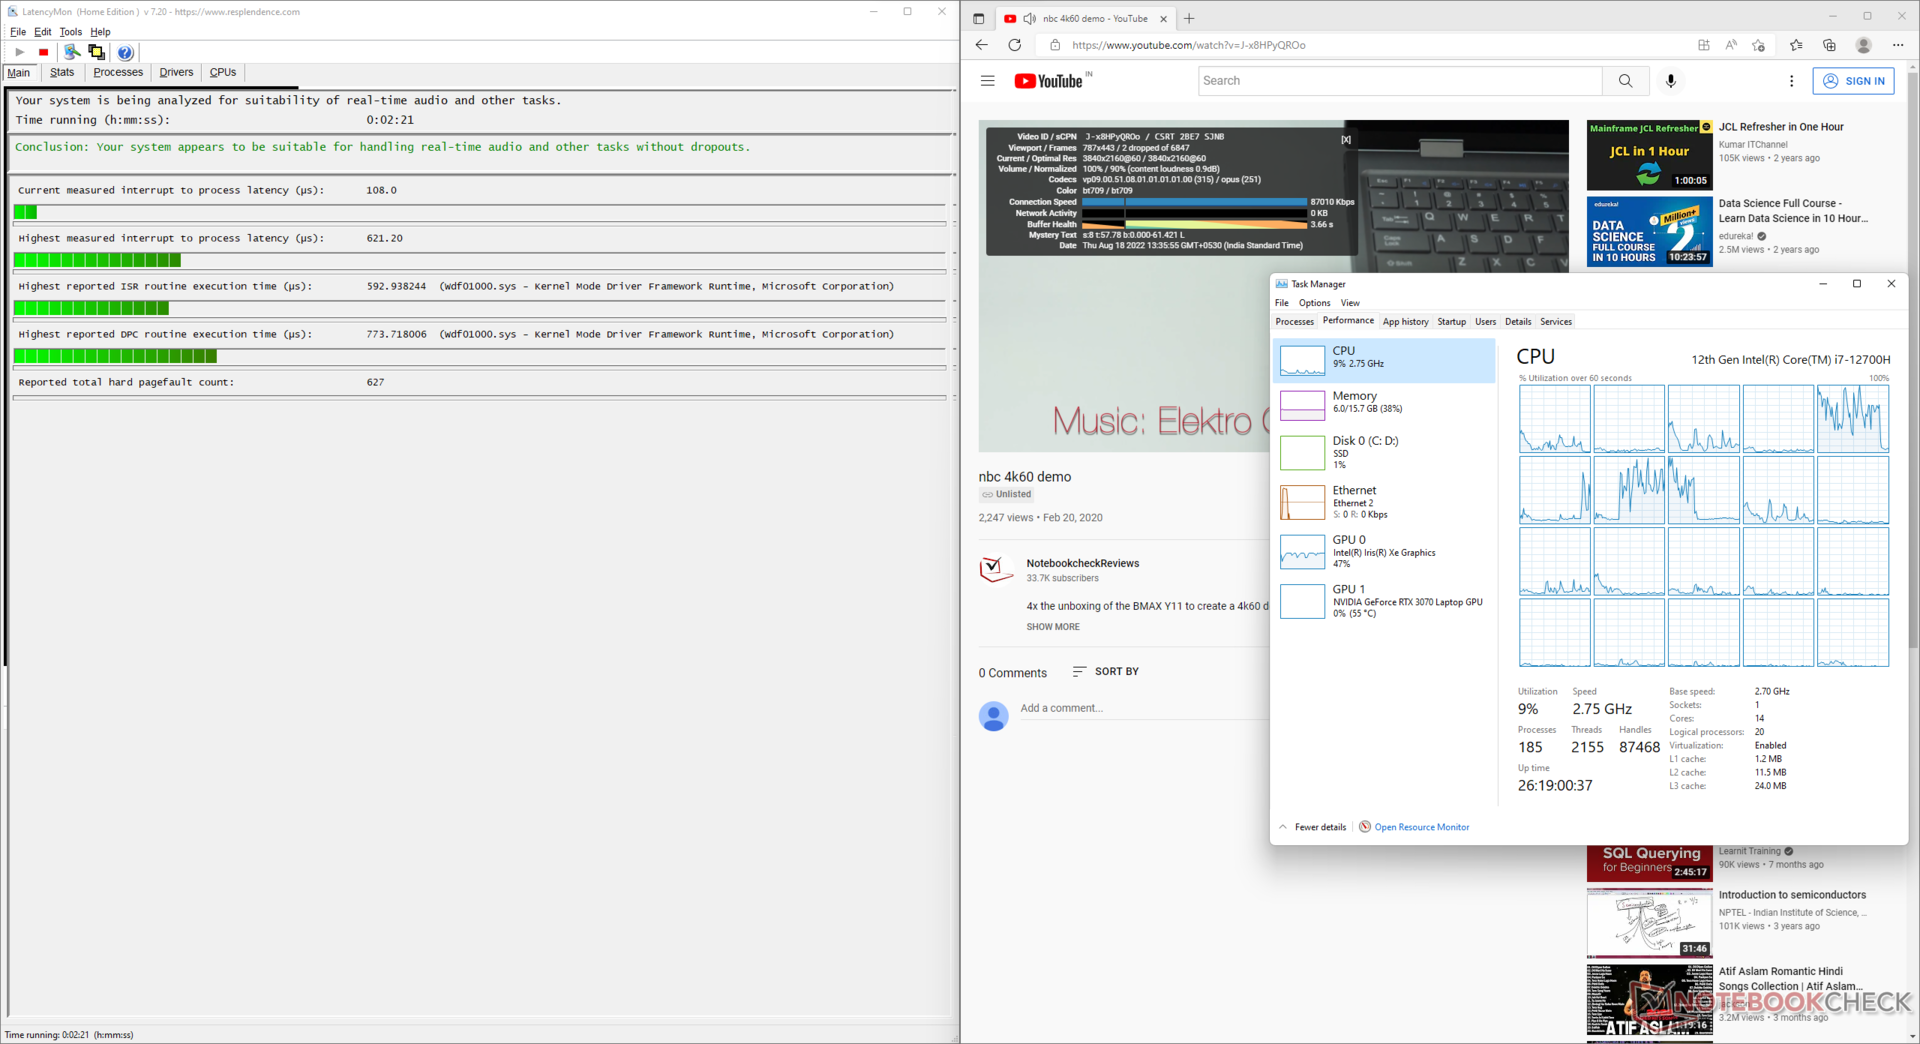
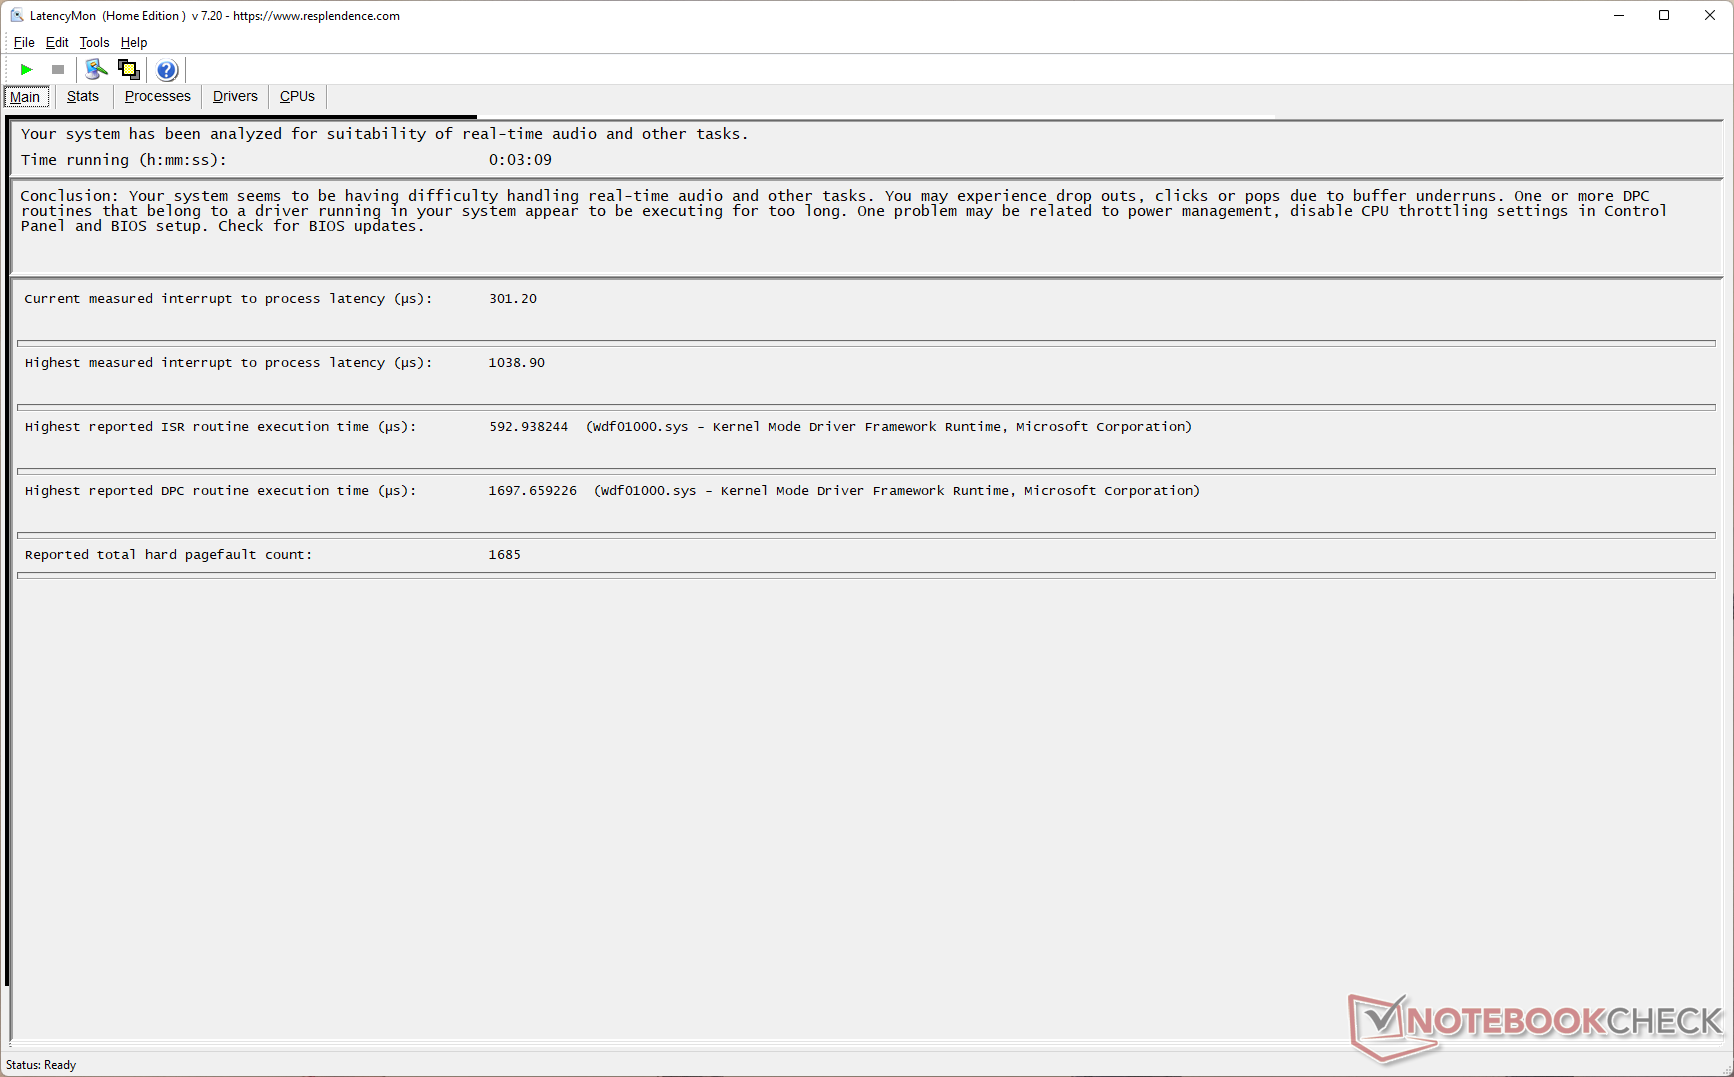
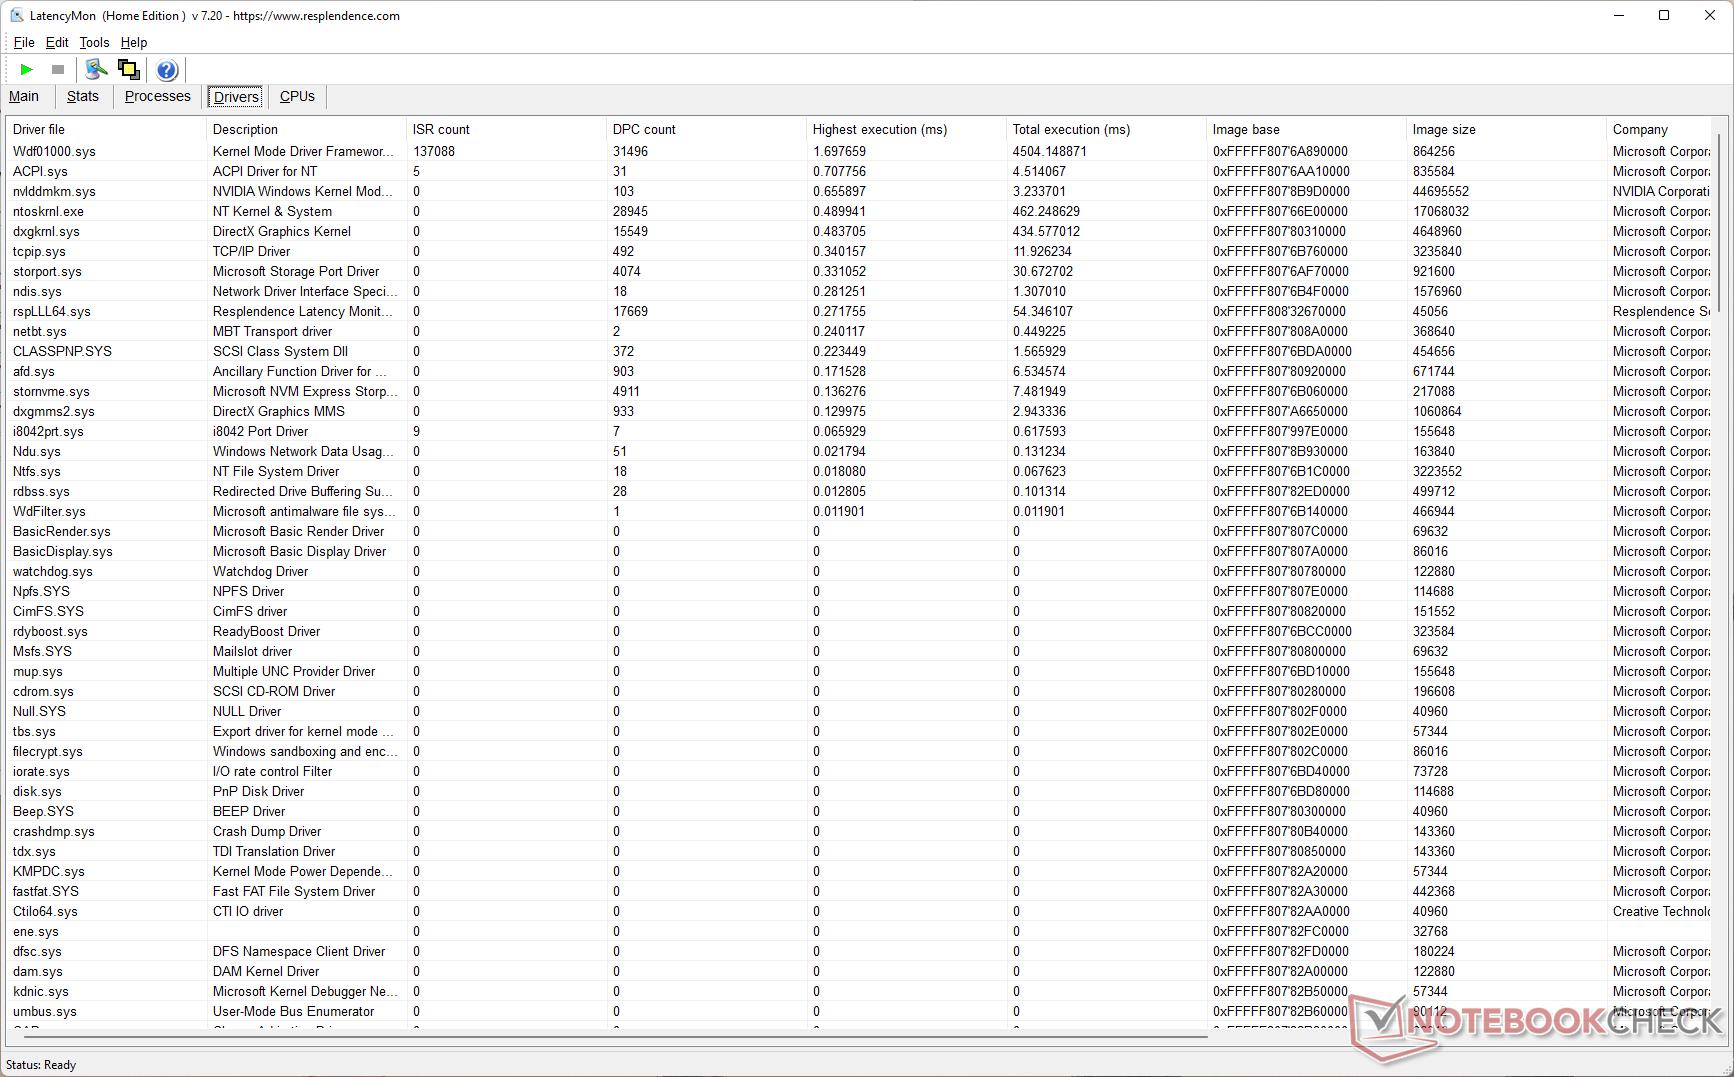
Our standardized LatencyMon test sees the Crosshair 15 R6E having somewhat of a higher DPC latency than other Core i7-12700H-powered laptops. We observed increased latency after running the Prime95 in-place large FFTs test following our YouTube benchmark.
The Windows Kernel Mode Driver Framework seems to be the reason for increased latency values.
| DPC Latencies / LatencyMon - interrupt to process latency (max), Web, Youtube, Prime95 | |
| Schenker XMG Neo 15 (i7-12700H, RTX 3080 Ti) | |
| MSI Stealth GS66 12UGS | |
| Schenker XMG Neo 15 (Ryzen 9 6900HX, RTX 3070 Ti) | |
| Aorus 15 XE5 | |
| MSI Crosshair 15 R6E B12UGZ-050 | |
| MSI Pulse GL66 12UEK | |
| Acer Nitro 5 AN515-58-72QR | |
| Lenovo Legion 5 Pro 16 G7 i7 RTX 3070Ti | |
| MSI Katana GF66 12UGS | |
| Asus TUF Dash F15 FX517ZR | |
* ... smaller is better
More latency comparisons across reviewed devices can be found in our DPC Latency Ranking page.
Storage Devices
The Micron 2450 1 TB NVMe PCIe SSD does not break any speed records. The Crosshair 15 R6E's two NVMe M.2 slots and the Micron drive itself support PCIe Gen 4, but the performance is more in line with PCIe Gen 3 speeds. That being said, the drive is able to come close to its rated I/O specifications for the most part.
The drive exhibits no throttling in our DiskSpd read loop test at a queue depth of 8. There is no scope for adding a 2.5-inch SATA storage expansion.

* ... smaller is better
Disk Throttling: DiskSpd Read Loop, Queue Depth 8
GPU Performance
Our Crosshair 15 R6E test unit uses a 140 W RTX 3070 Laptop GPU with 8 GB GDDR6 VRAM. MSI does not specify the exact Dynamic Boost for this GPU.
3DMark performance is behind some RTX 3070 Ti-powered laptops but not by much. The Crosshair 15 R6E trails the RTX 3080 Ti-powered XMG Neo 15 by 11% and 13% in 3DMark Fire Strike Graphics and Time Spy Graphics tests, respectively.
The Asus TUF Dash F15 with the same GPU is 19% slower than the one in the Crosshair 15 R6E owing to a lower 105 W TGP.
| 3DMark 11 Performance | 30240 points | |
| 3DMark Ice Storm Standard Score | 158460 points | |
| 3DMark Cloud Gate Standard Score | 56797 points | |
| 3DMark Fire Strike Score | 24233 points | |
| 3DMark Fire Strike Extreme Score | 12959 points | |
| 3DMark Time Spy Score | 10496 points | |
Help | ||
The Crosshair 15 R6E takes 42% and 33% lesser times in Blender Classroom Optix and Classroom CUDA, respectively when compared to the average times recorded for the RTX 3070 Laptop GPU.
| Blender / v3.3 Classroom OPTIX/RTX | |
| Asus TUF Dash F15 FX517ZR | |
| Average NVIDIA GeForce RTX 3070 Laptop GPU (26 - 30, n=8) | |
| MSI Crosshair 15 R6E B12UGZ-050 | |
| Aorus 15 XE5 | |
| Schenker XMG Neo 15 (Ryzen 9 6900HX, RTX 3070 Ti) | |
| Average of class Gaming (9 - 32, n=105, last 2 years) | |
| Blender / v3.3 Classroom CUDA | |
| Asus TUF Dash F15 FX517ZR | |
| Average NVIDIA GeForce RTX 3070 Laptop GPU (43 - 51, n=9) | |
| MSI Crosshair 15 R6E B12UGZ-050 | |
| Aorus 15 XE5 | |
| Schenker XMG Neo 15 (Ryzen 9 6900HX, RTX 3070 Ti) | |
| Average of class Gaming (15 - 233, n=106, last 2 years) | |
| Blender / v3.3 Classroom CPU | |
| Average NVIDIA GeForce RTX 3070 Laptop GPU (329 - 698, n=12) | |
| Asus TUF Dash F15 FX517ZR | |
| Aorus 15 XE5 | |
| MSI Crosshair 15 R6E B12UGZ-050 | |
| Schenker XMG Neo 15 (Ryzen 9 6900HX, RTX 3070 Ti) | |
| Average of class Gaming (122 - 565, n=101, last 2 years) | |
* ... smaller is better
Gaming Performance
Gaming performance in tested games at 1080p Ultra settings is only about 8% behind that of the RTX 3080 Ti-powered XMG Neo 15. The Lenovo Legion 5i Pro 16 G7 with an RTX 3070 Ti shows perceivable leads over the Crosshair 15 R6E in most games, particularly at QHD Ultra.
The RTX 3080 Ti-powered XMG Neo 15 can be up to 17% in Far Cry 5 QHD Ultra, but this delta increases to 45% in The Witcher 3 at 1080p High. In Rainbow Six: Extraction, the Crosshair 15 R6E shows good leads in 1080p and QHD Ultra settings over the Stealth GS66 with an RTX 3070 Ti Laptop GPU.
| F1 2021 | |
| 1920x1080 High Preset AA:T AF:16x | |
| Lenovo Legion 5 Pro 16 G7 i7 RTX 3070Ti | |
| MSI Stealth GS66 12UGS | |
| MSI Crosshair 15 R6E B12UGZ-050 | |
| Average NVIDIA GeForce RTX 3070 Laptop GPU (66.1 - 256, n=16) | |
| Asus TUF Dash F15 FX517ZR | |
| Acer Nitro 5 AN515-58-72QR | |
| 1920x1080 Ultra High Preset + Raytracing AA:T AF:16x | |
| Lenovo Legion 5 Pro 16 G7 i7 RTX 3070Ti | |
| MSI Crosshair 15 R6E B12UGZ-050 | |
| MSI Stealth GS66 12UGS | |
| Acer Nitro 5 AN515-58-72QR | |
| Average NVIDIA GeForce RTX 3070 Laptop GPU (33.1 - 123.1, n=23) | |
| Asus TUF Dash F15 FX517ZR | |
| 2560x1440 Ultra High Preset + Raytracing AA:T AF:16x | |
| Lenovo Legion 5 Pro 16 G7 i7 RTX 3070Ti | |
| MSI Crosshair 15 R6E B12UGZ-050 | |
| Average NVIDIA GeForce RTX 3070 Laptop GPU (67.1 - 90.2, n=11) | |
| Acer Nitro 5 AN515-58-72QR | |
| MSI Stealth GS66 12UGS | |
| Asus TUF Dash F15 FX517ZR | |
| Rainbow Six Extraction | |
| 1920x1080 High Preset (with Fixed Resolution Quality) | |
| Average NVIDIA GeForce RTX 3070 Laptop GPU (171 - 202, n=4) | |
| MSI Stealth GS66 12UGS | |
| MSI Crosshair 15 R6E B12UGZ-050 | |
| 1920x1080 Ultra Preset (with Fixed Resolution Quality) | |
| MSI Crosshair 15 R6E B12UGZ-050 | |
| Average NVIDIA GeForce RTX 3070 Laptop GPU (149 - 157, n=4) | |
| MSI Stealth GS66 12UGS | |
| 2560x1440 Ultra Preset (with Fixed Resolution Quality) | |
| MSI Crosshair 15 R6E B12UGZ-050 | |
| Average NVIDIA GeForce RTX 3070 Laptop GPU (97 - 103, n=3) | |
| MSI Stealth GS66 12UGS | |
The Witcher 3 FPS Chart
The RTX 3070 Laptop GPU shows good sustained performance in The Witcher 3 at 1080p Ultra with the character remaining stationary for the duration of the test. We do see frame rate fluctuations, but they are not very drastic.
| low | med. | high | ultra | QHD | 4K | |
|---|---|---|---|---|---|---|
| GTA V (2015) | 184.2 | 182 | 173.8 | 113.7 | 97.1 | |
| The Witcher 3 (2015) | 368 | 294 | 168 | 105.7 | ||
| Dota 2 Reborn (2015) | 177.7 | 161.4 | 150.4 | 142.7 | 127.2 | |
| Final Fantasy XV Benchmark (2018) | 166.6 | 127.5 | 98 | 79 | 46.9 | |
| X-Plane 11.11 (2018) | 150.1 | 133.1 | 106.3 | 98.7 | ||
| Far Cry 5 (2018) | 137 | 125 | 122 | 118 | 99 | |
| Strange Brigade (2018) | 444 | 251 | 211 | 185.5 | 140.5 | |
| F1 2021 (2021) | 319 | 228 | 192.6 | 115.4 | 86.3 | |
| Rainbow Six Extraction (2022) | 225 | 189 | 171 | 155 | 103 | |
| Cyberpunk 2077 1.6 (2022) | 123 | 111.6 | 90.8 | 76.9 | 49.5 |
Check out our dedicated Nvidia GeForce RTX 3070 Laptop GPU page for more information and performance comparisons.
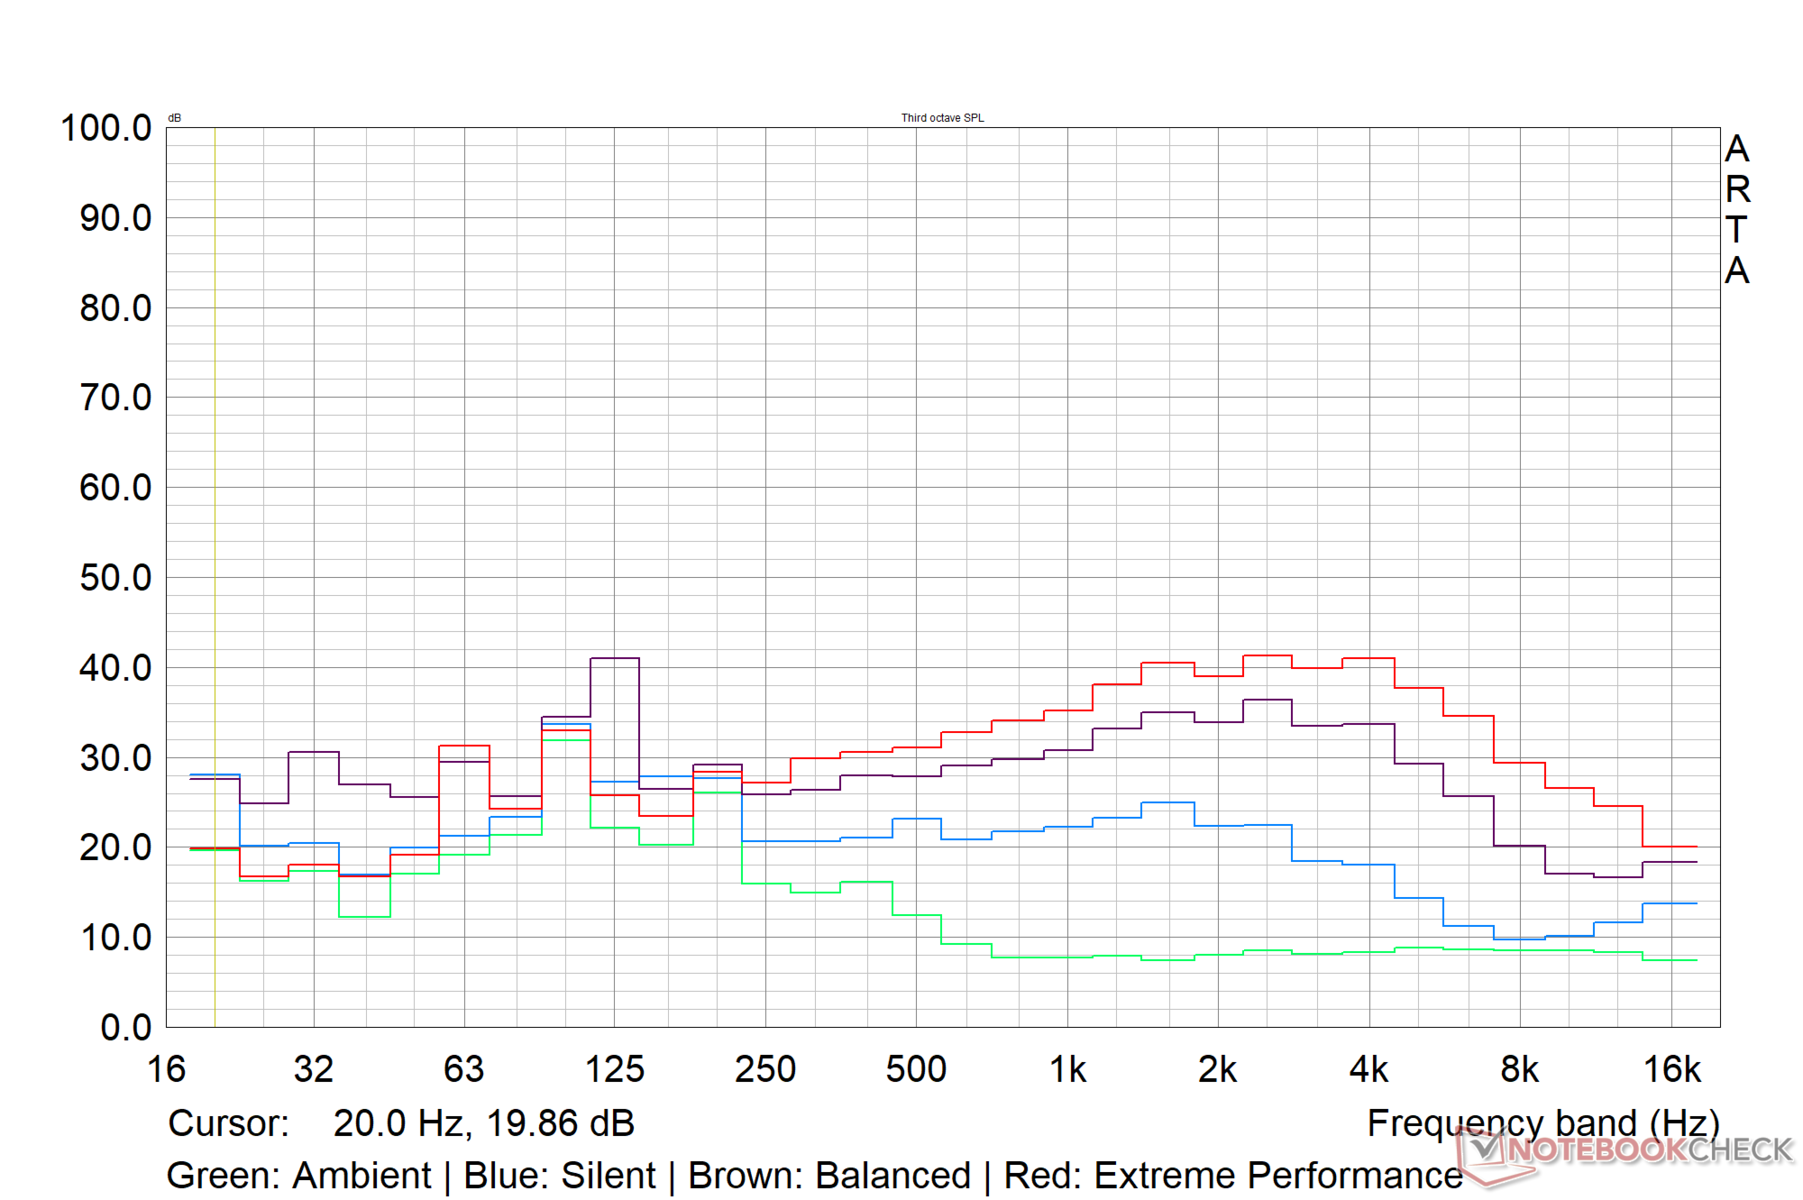
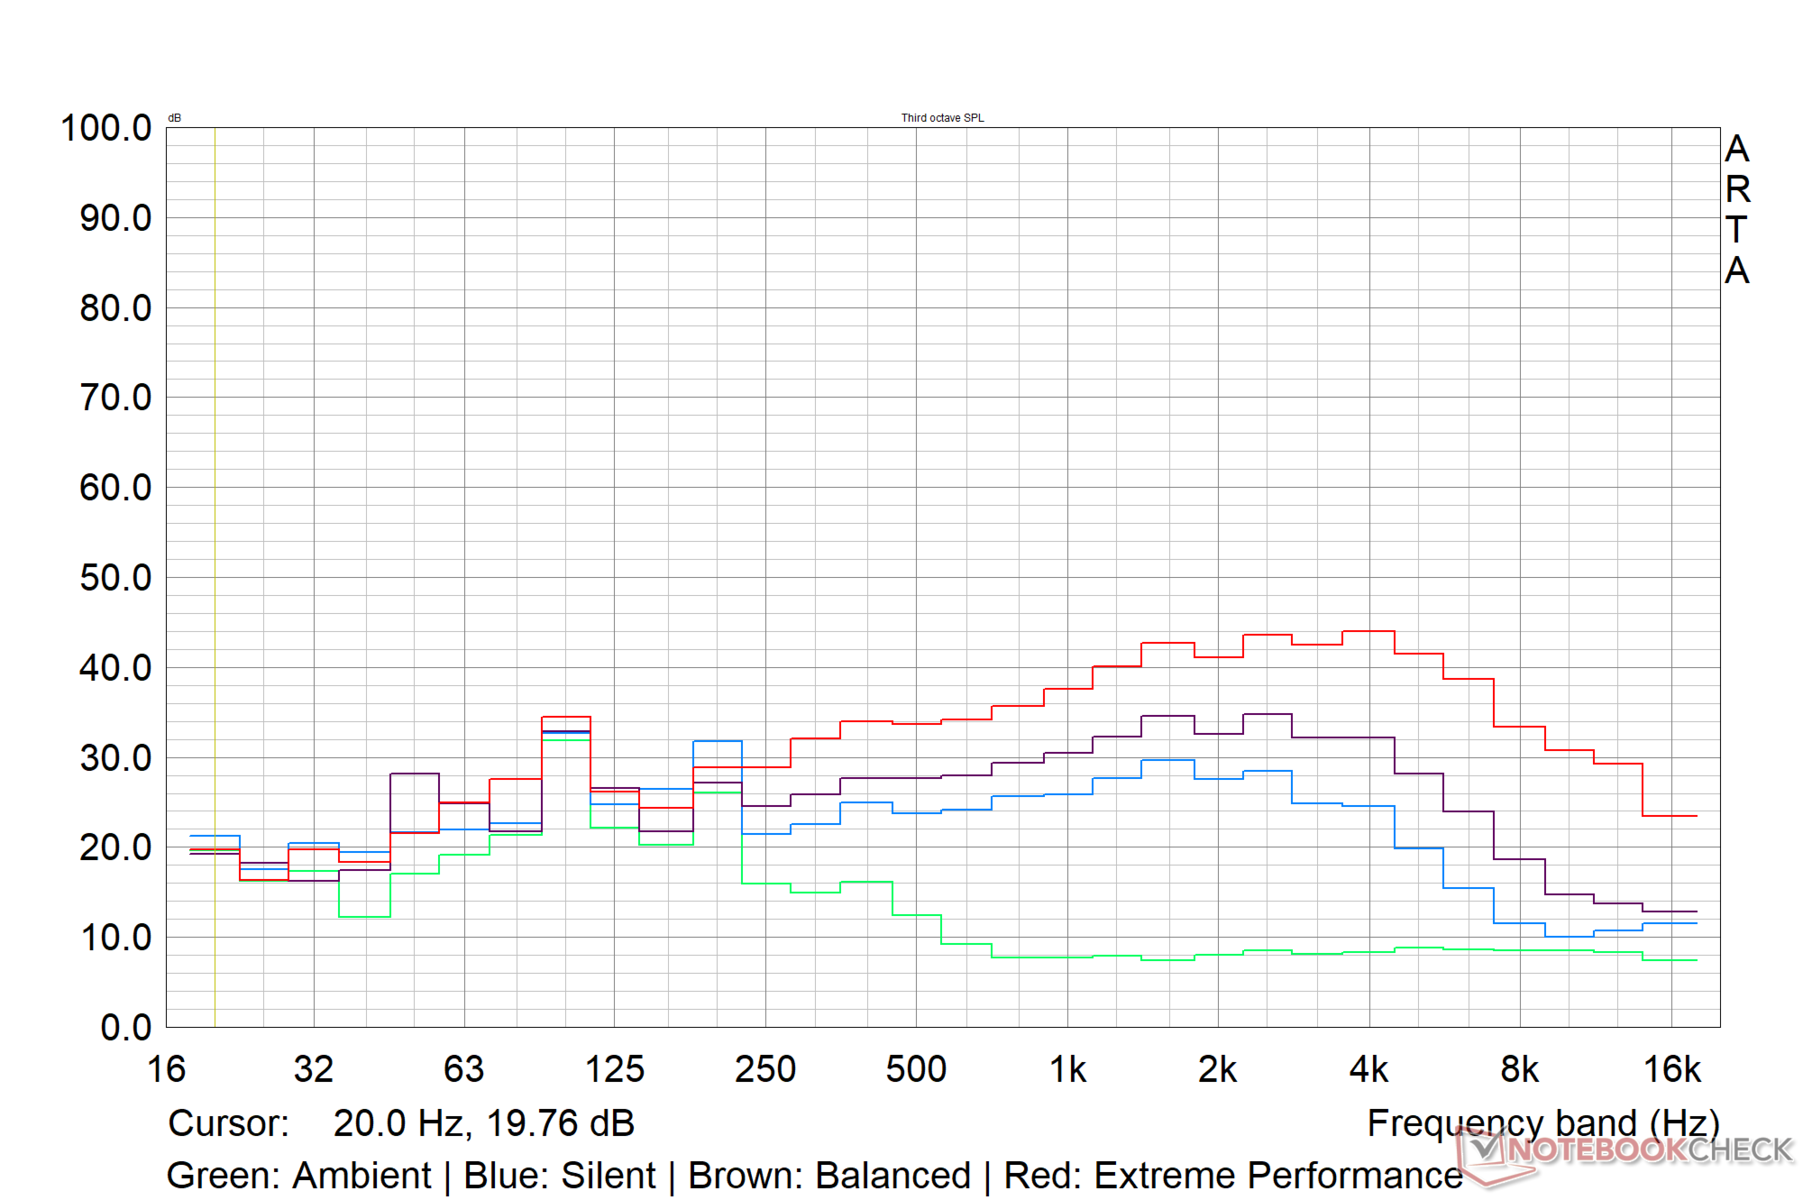
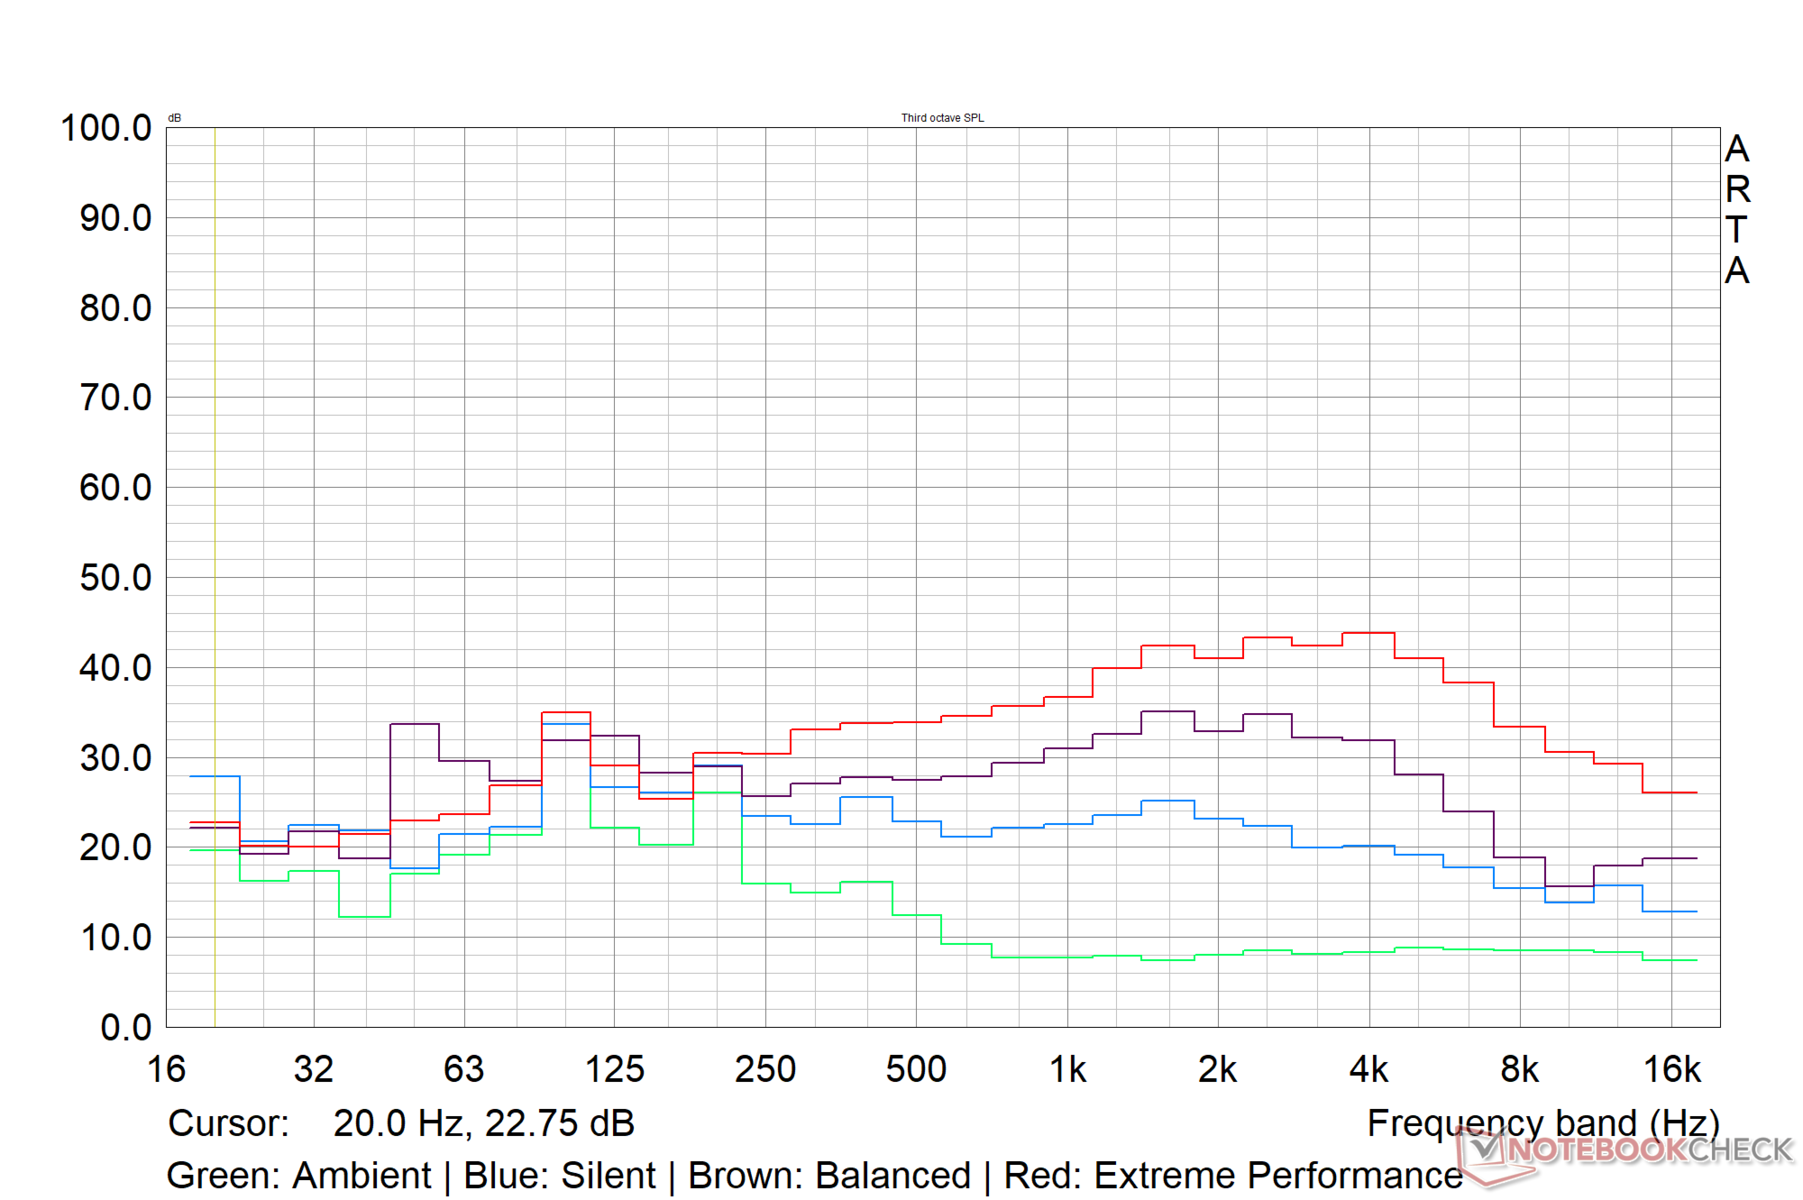
Emissions: Tolerable noise levels in the Balanced profile
System Noise
Fan noise in the default Balanced setting is quite tolerable even under load. MSI seems to have capped the Crosshair 15 R6E's maximum fan noise to about 45 db(A) in this mode.
The Extreme Performance setting sees the sound pressure level (SPL) increasing to the 52 dB(A) mark. The SPL is limited to under 40 dB(A) in the Silent profile.
| Performance Setting | Idle dB(A) | Load Average dB(A) | Load Maximum dB(A) | The Witcher 3 dB(A) |
|---|---|---|---|---|
| Silent | 25.98 | 33.09 | 37.69 | 34 |
| Balanced | 26.14 | 44.33 | 43.20 | 43.34 |
| Extreme Performance | 26.14 | 50.07 | 52.66 | 52.43 |
Noise level
| Idle |
| 26.14 / 26.14 / 26.14 dB(A) |
| Load |
| 44.33 / 43.2 dB(A) |
 | ||
30 dB silent 40 dB(A) audible 50 dB(A) loud |
||
min: | ||
| MSI Crosshair 15 R6E B12UGZ-050 Intel Core i7-12700H, NVIDIA GeForce RTX 3070 Laptop GPU | MSI Stealth GS66 12UGS Intel Core i7-12700H, NVIDIA GeForce RTX 3070 Ti Laptop GPU | Lenovo Legion 5 Pro 16 G7 i7 RTX 3070Ti Intel Core i7-12700H, NVIDIA GeForce RTX 3070 Ti Laptop GPU | Asus TUF Dash F15 FX517ZR Intel Core i7-12650H, NVIDIA GeForce RTX 3070 Laptop GPU | Schenker XMG Neo 15 (Ryzen 9 6900HX, RTX 3070 Ti) AMD Ryzen 9 6900HX, NVIDIA GeForce RTX 3070 Ti Laptop GPU | |
|---|---|---|---|---|---|
| Noise | -14% | -12% | -13% | -7% | |
| off / environment * (dB) | 22.82 | 24 -5% | 24.6 -8% | 26 -14% | 23 -1% |
| Idle Minimum * (dB) | 26.14 | 31 -19% | 28.4 -9% | 26 1% | 23 12% |
| Idle Average * (dB) | 26.14 | 32 -22% | 28.4 -9% | 32 -22% | 25.82 1% |
| Idle Maximum * (dB) | 26.14 | 35 -34% | 28.4 -9% | 33 -26% | 27.3 -4% |
| Load Average * (dB) | 44.33 | 48 -8% | 49.4 -11% | 48 -8% | 42.7 4% |
| Witcher 3 ultra * (dB) | 43.3 | 43 1% | 49.4 -14% | 47 -9% | 56 -29% |
| Load Maximum * (dB) | 43.2 | 48 -11% | 54.7 -27% | 49 -13% | 56 -30% |
* ... smaller is better
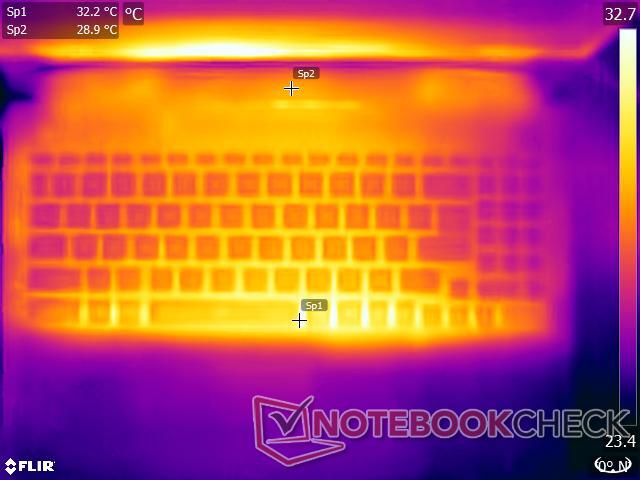
Temperature
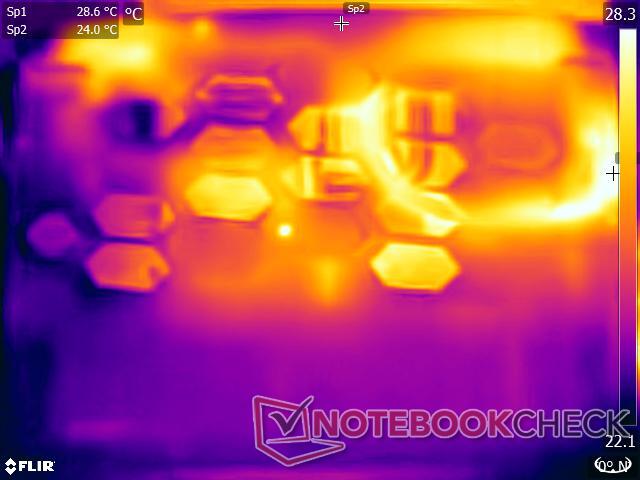
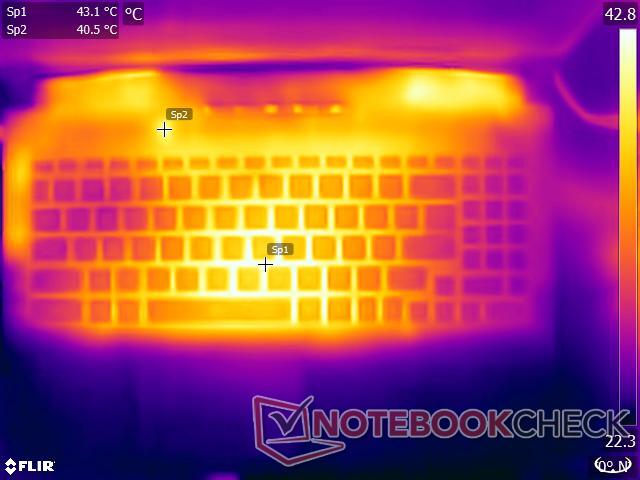
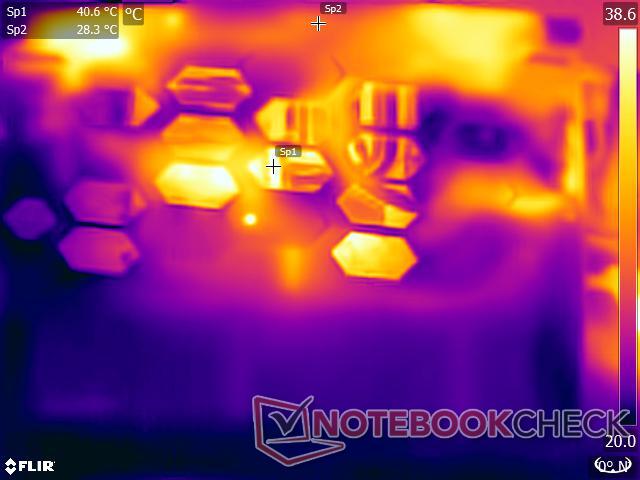
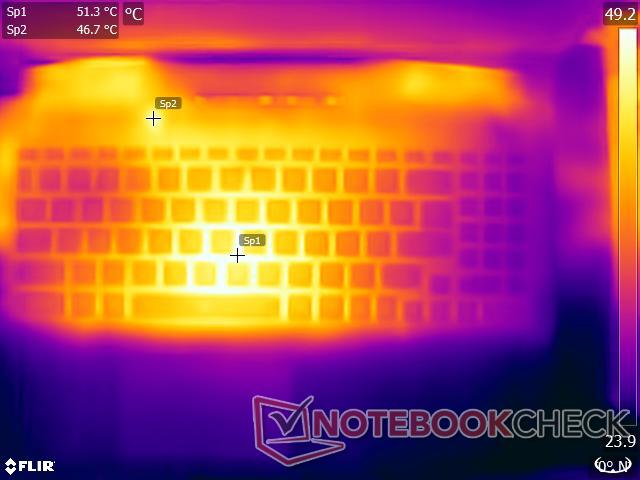
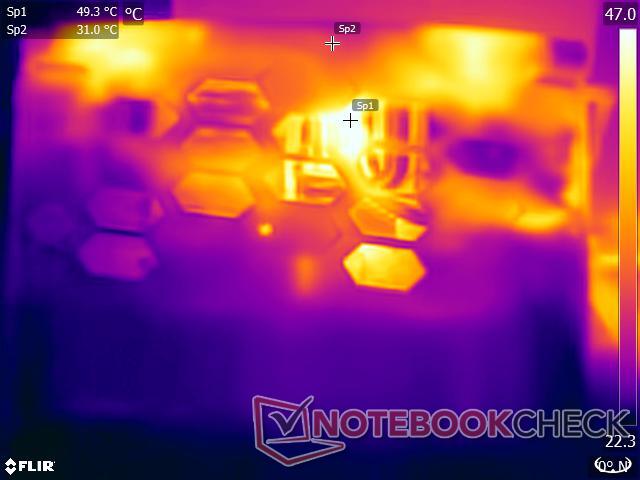
Surface temperatures are tolerable during most productivity tasks that don't push the CPU and GPU to their limits. Under a combined Prime95 and FurMark load, we recorded surface temperatures up to the 48 °C mark on both sides of the unit. This increases to nearly 55 °C while stressing with The Witcher 3 at 1080p Ultra.
The touchpad and palm rest areas remain relatively cool throughout the test.
(-) The maximum temperature on the upper side is 48.4 °C / 119 F, compared to the average of 40.4 °C / 105 F, ranging from 21.2 to 68.8 °C for the class Gaming.
(-) The bottom heats up to a maximum of 48.2 °C / 119 F, compared to the average of 43.2 °C / 110 F
(+) In idle usage, the average temperature for the upper side is 30.6 °C / 87 F, compared to the device average of 33.9 °C / 93 F.
(-) Playing The Witcher 3, the average temperature for the upper side is 43.5 °C / 110 F, compared to the device average of 33.9 °C / 93 F.
(+) The palmrests and touchpad are reaching skin temperature as a maximum (32.8 °C / 91 F) and are therefore not hot.
(-) The average temperature of the palmrest area of similar devices was 28.8 °C / 83.8 F (-4 °C / -7.2 F).
Although our stress tests represent extreme scenarios, we recommend opting for the Silent or Balanced performance modes should you wish to use the device on the lap.
| MSI Crosshair 15 R6E B12UGZ-050 Intel Core i7-12700H, NVIDIA GeForce RTX 3070 Laptop GPU | MSI Stealth GS66 12UGS Intel Core i7-12700H, NVIDIA GeForce RTX 3070 Ti Laptop GPU | Lenovo Legion 5 Pro 16 G7 i7 RTX 3070Ti Intel Core i7-12700H, NVIDIA GeForce RTX 3070 Ti Laptop GPU | Asus TUF Dash F15 FX517ZR Intel Core i7-12650H, NVIDIA GeForce RTX 3070 Laptop GPU | Schenker XMG Neo 15 (Ryzen 9 6900HX, RTX 3070 Ti) AMD Ryzen 9 6900HX, NVIDIA GeForce RTX 3070 Ti Laptop GPU | |
|---|---|---|---|---|---|
| Heat | 2% | -1% | -6% | 6% | |
| Maximum Upper Side * (°C) | 48.4 | 54 -12% | 45.3 6% | 52 -7% | 41 15% |
| Maximum Bottom * (°C) | 48.2 | 59 -22% | 61.2 -27% | 52 -8% | 57 -18% |
| Idle Upper Side * (°C) | 34 | 26 24% | 28.6 16% | 33 3% | 28 18% |
| Idle Bottom * (°C) | 32.4 | 27 17% | 31.4 3% | 36 -11% | 30 7% |
* ... smaller is better
Stress Test
During Prime95 stress, we see that the Core i7-12700H is able to boost up to 3.8 GHz while consuming 111 W. However, the average core clocks are more in the 2.9 GHz range with average package power being around 80 W. The processor can reach up to 93 °C during this stress.
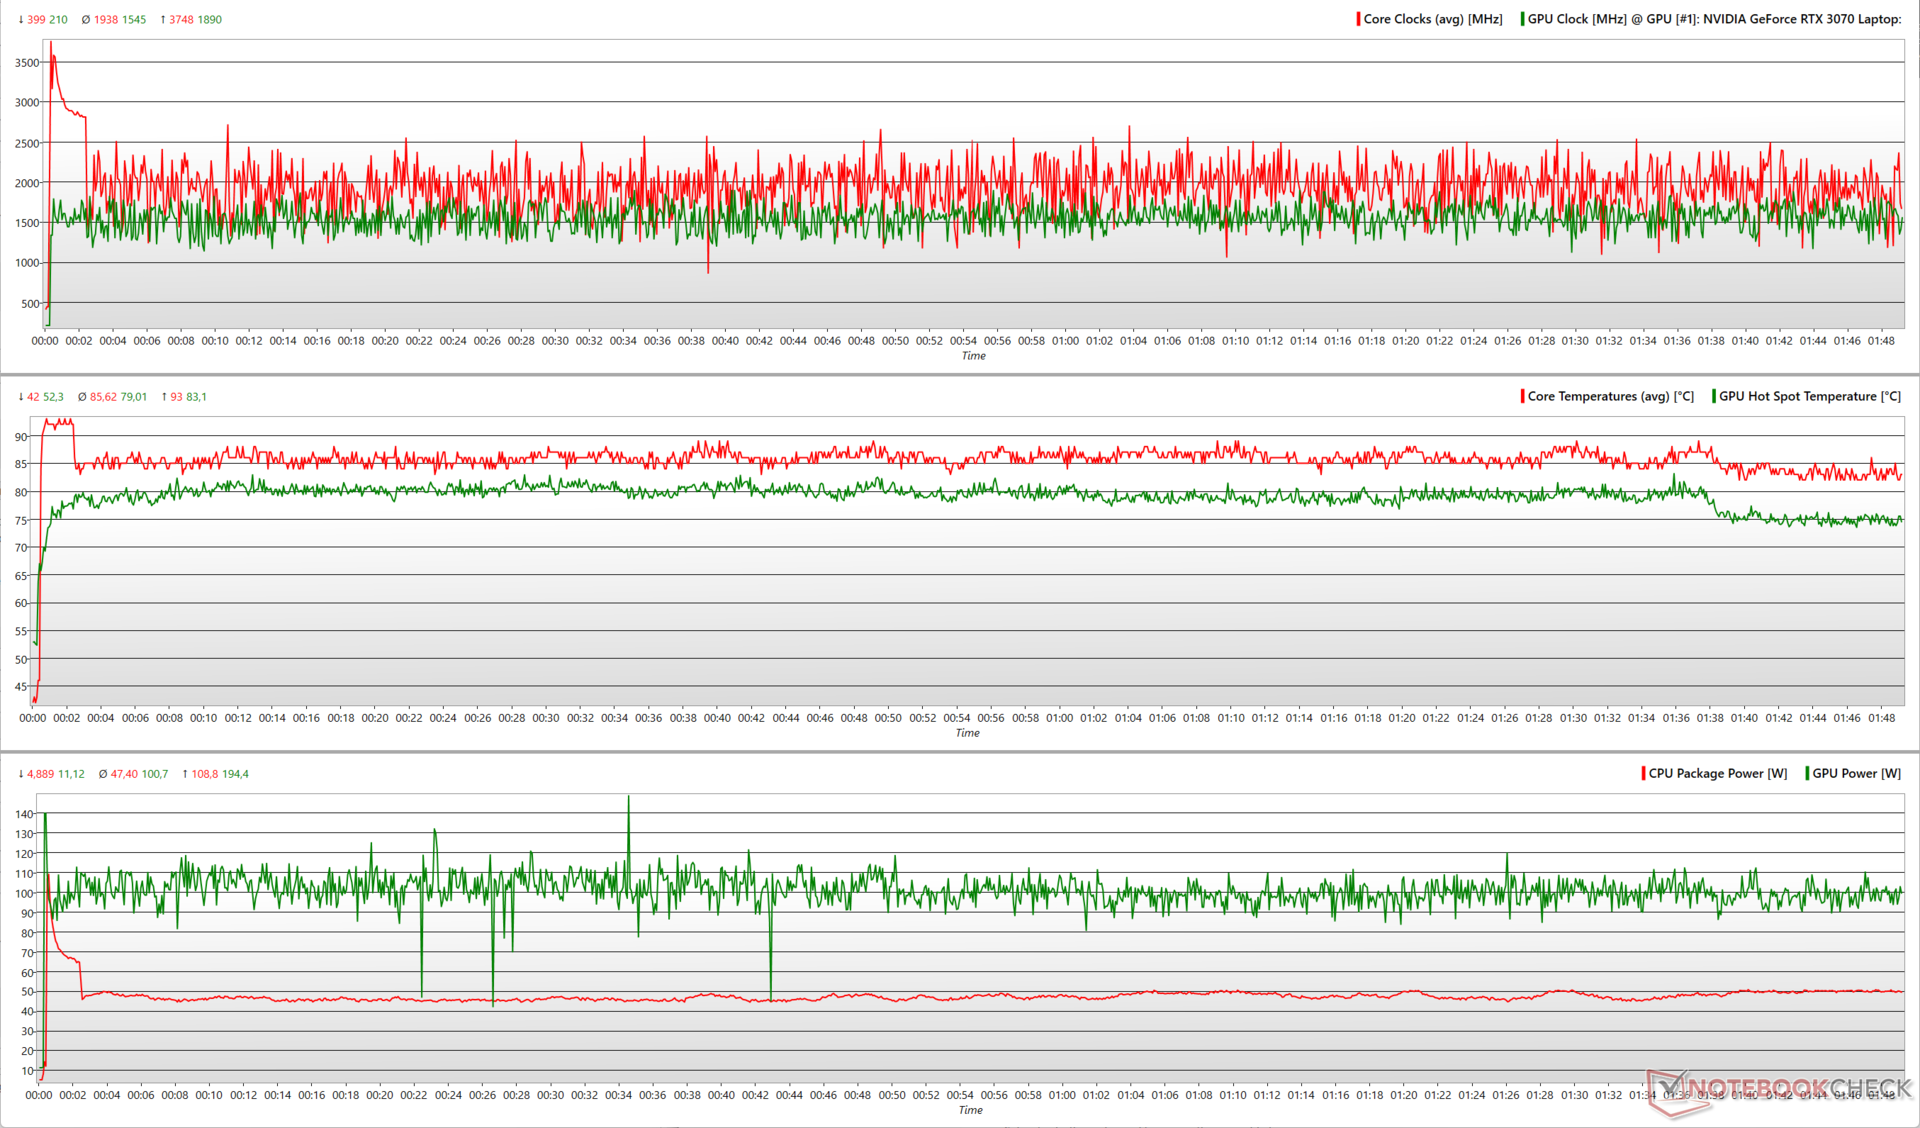
Adding FurMark causes the Crosshair 15 R6E to shift a portion of the total power budget to the RTX 3070. This results in reduced average CPU core clocks to 1.9 GHz with the drop in average package power to 47.4 W. The RTX 3070 is able to attain near its peak 1.9 GHz clock and sustain at 1.54 GHz. In doing so, the GPU consumes close to 195 W peak power and an average of about 101 W. Average CPU and GPU temperatures hover around 85.6 °C and 79 °C, respectively.
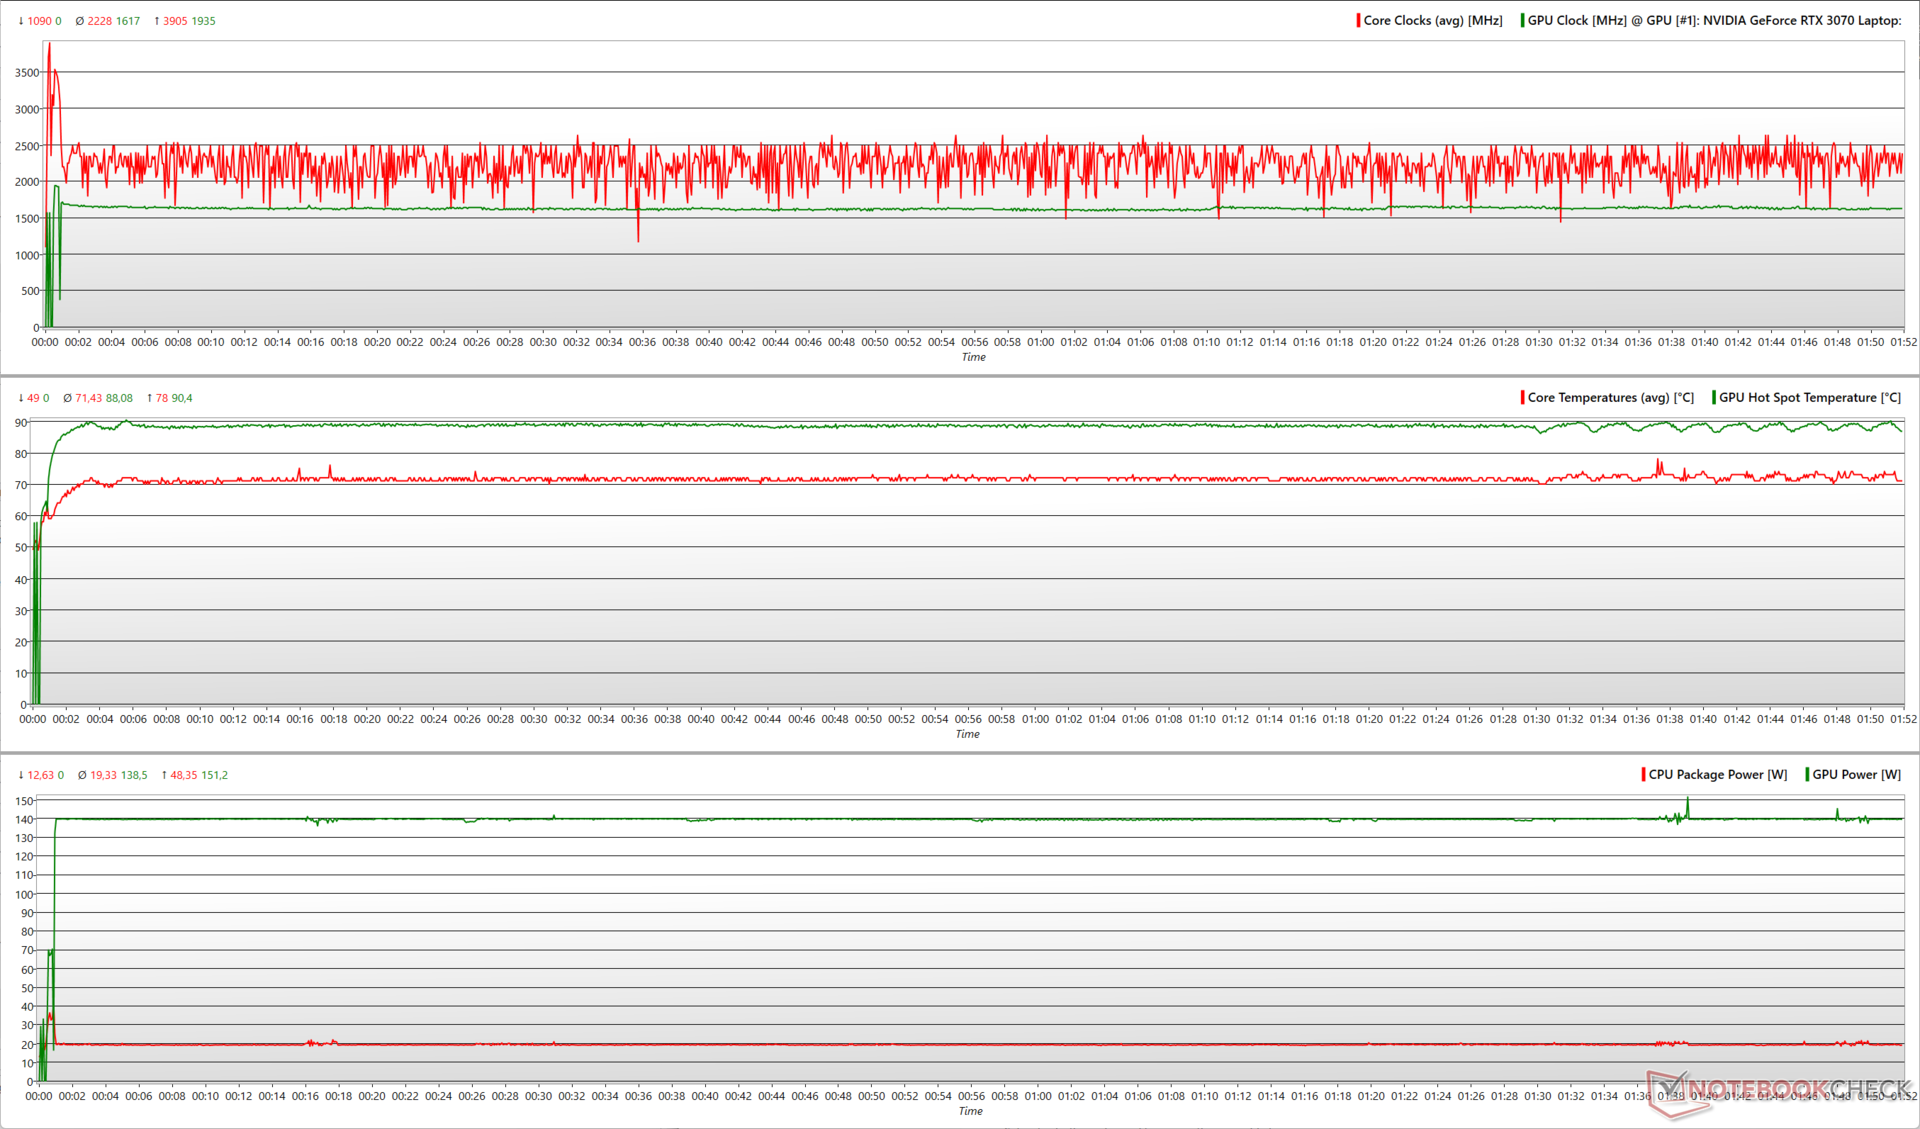
The Witcher 3 stress at 1080p Ultra sees a more equitable distribution of power, with the Core i7-12700H now being able to work at average speeds of 2.2 GHz and the RTX 3070 also boosting slightly higher to 1.6 GHz. The higher average GPU clock comes at the expense of higher average power consumption at 138.5 W.
Interestingly, we observe that the Core i7-12700H is able to attain a higher clock with just under 20 W of average package power. Average temperatures during The Witcher 3 stress coast around the 71.4 °C and 88 °C for the CPU and GPU, respectively.
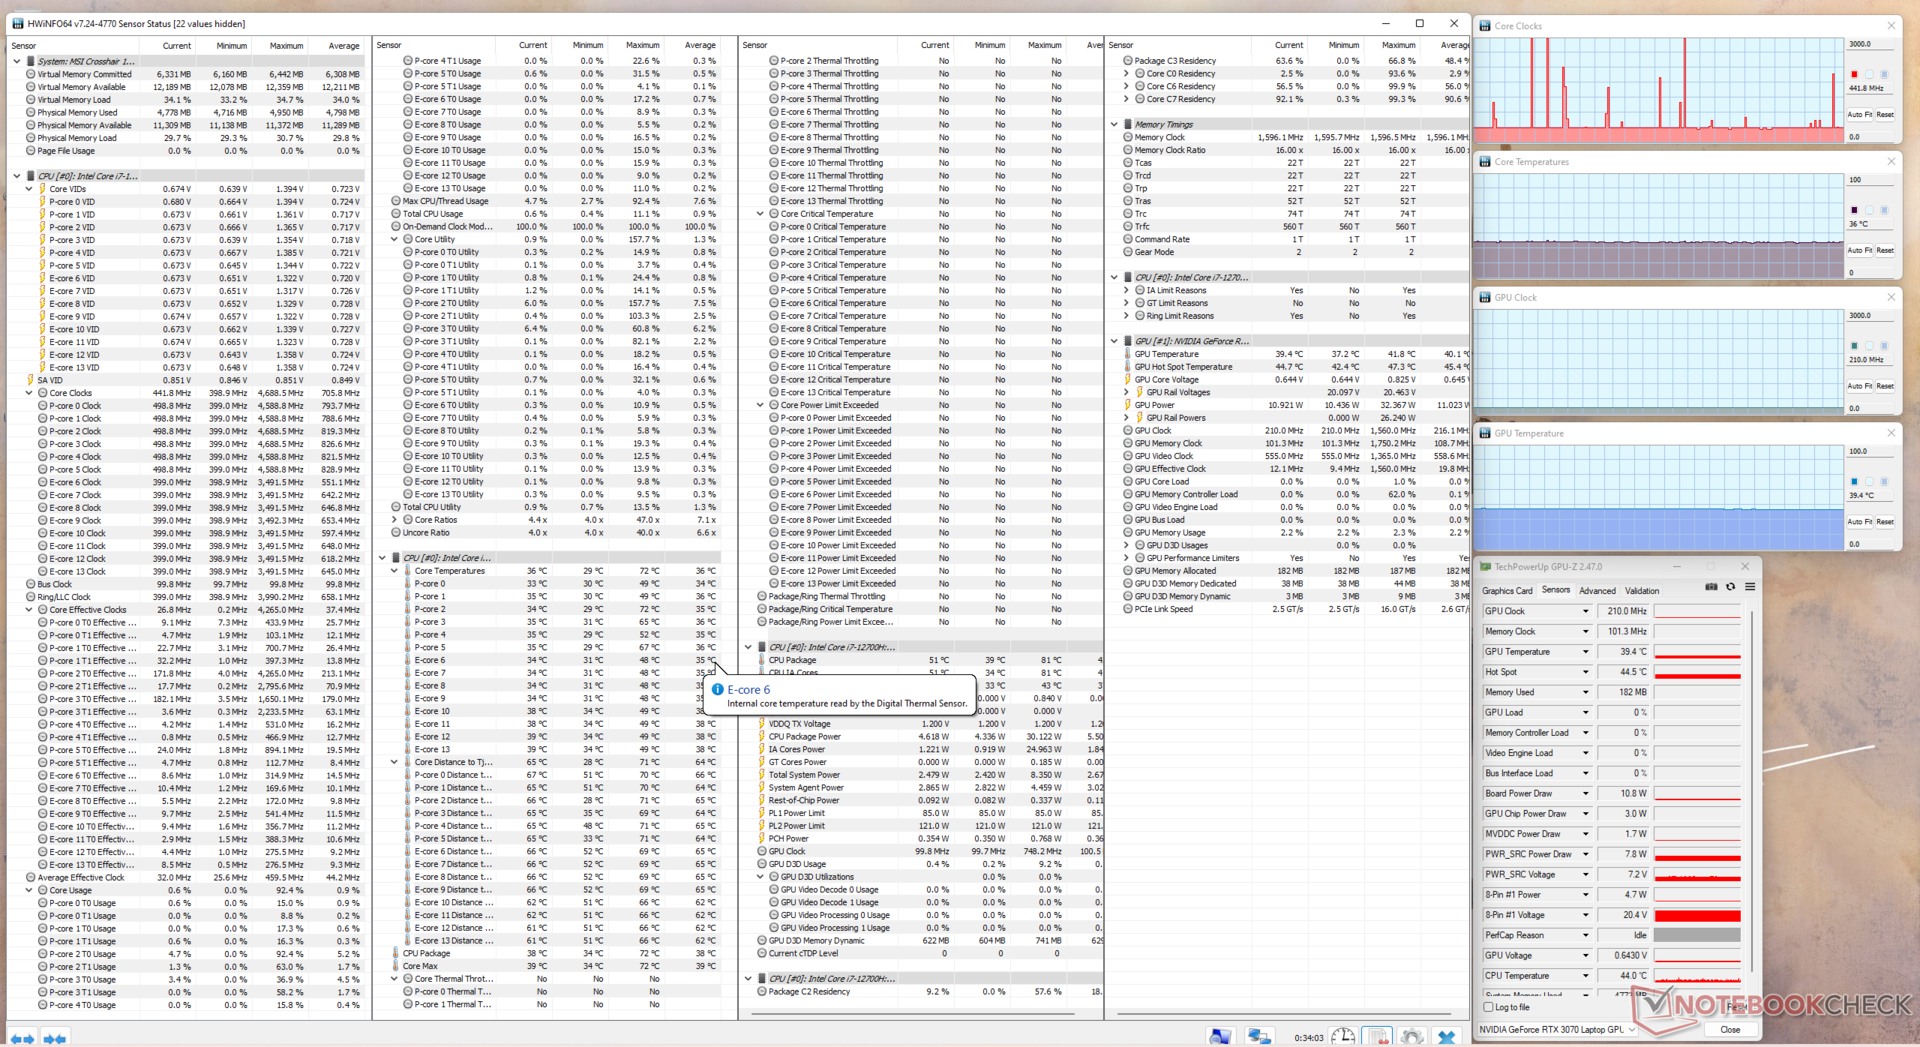
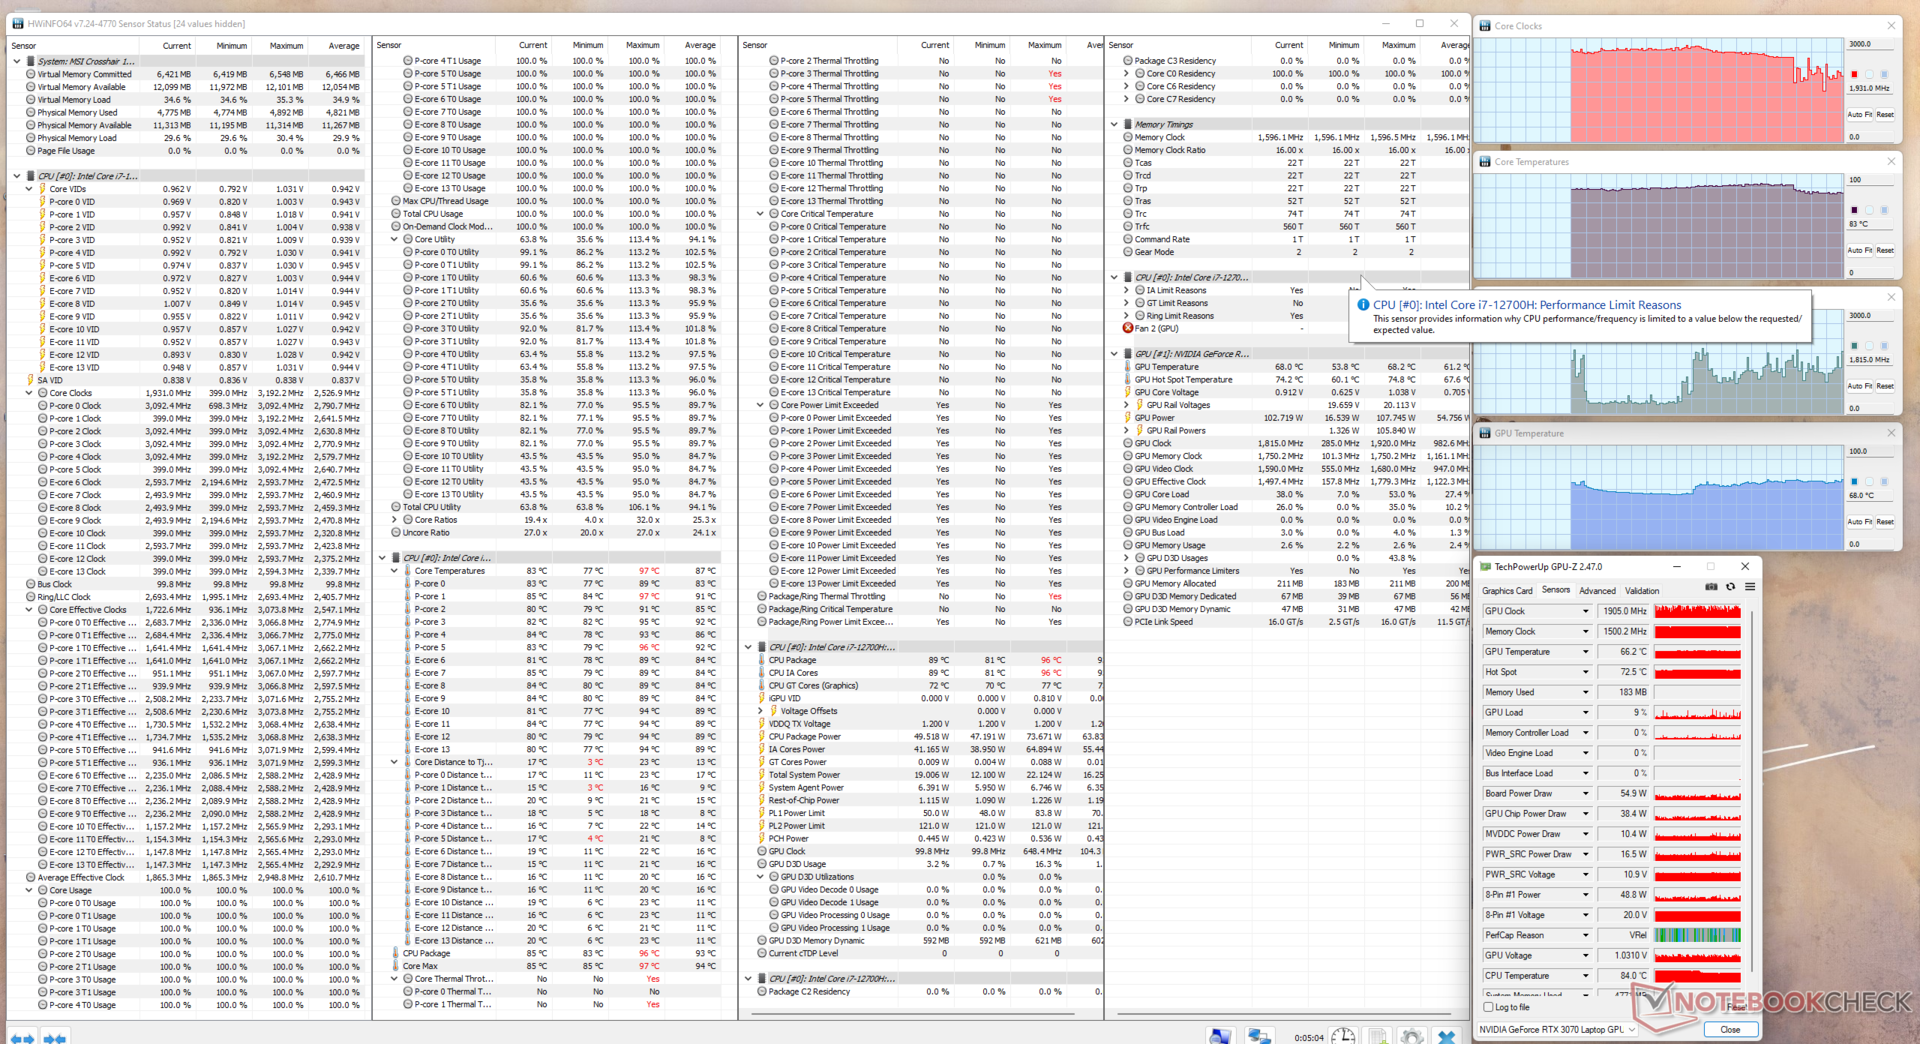
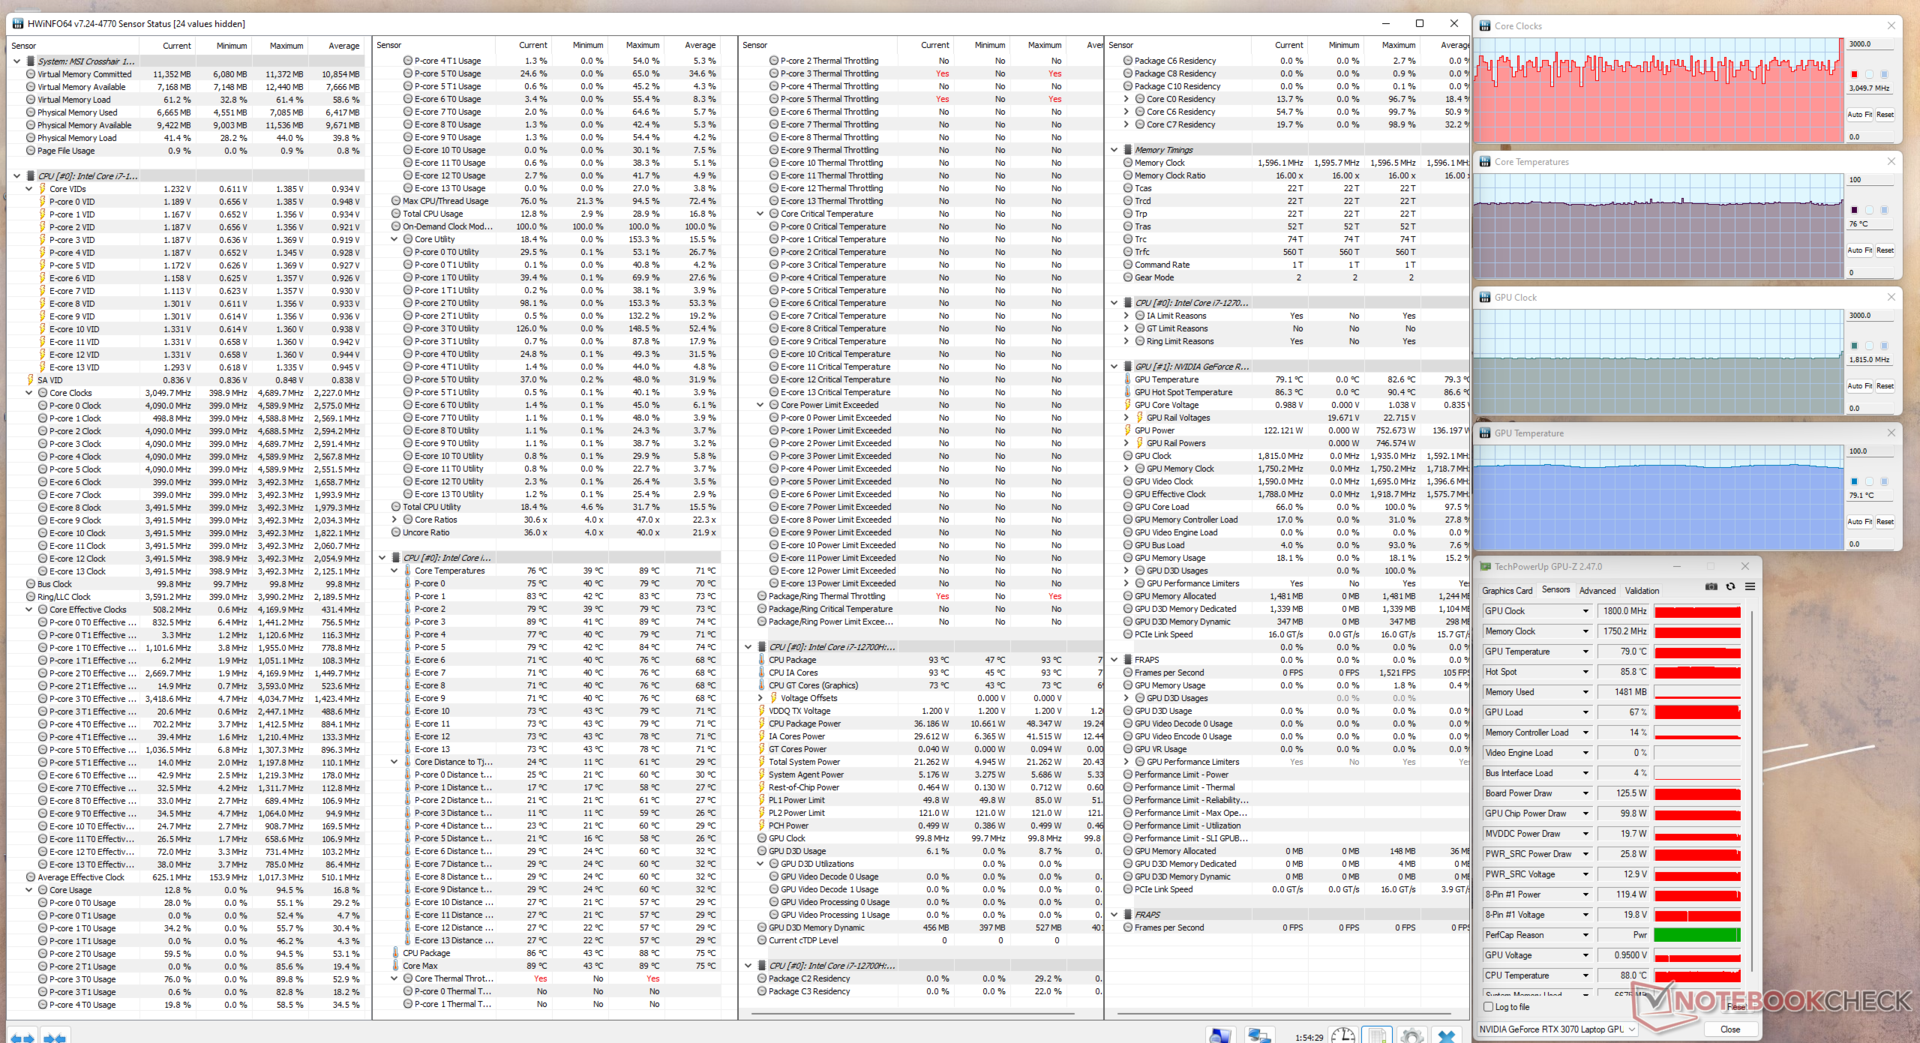
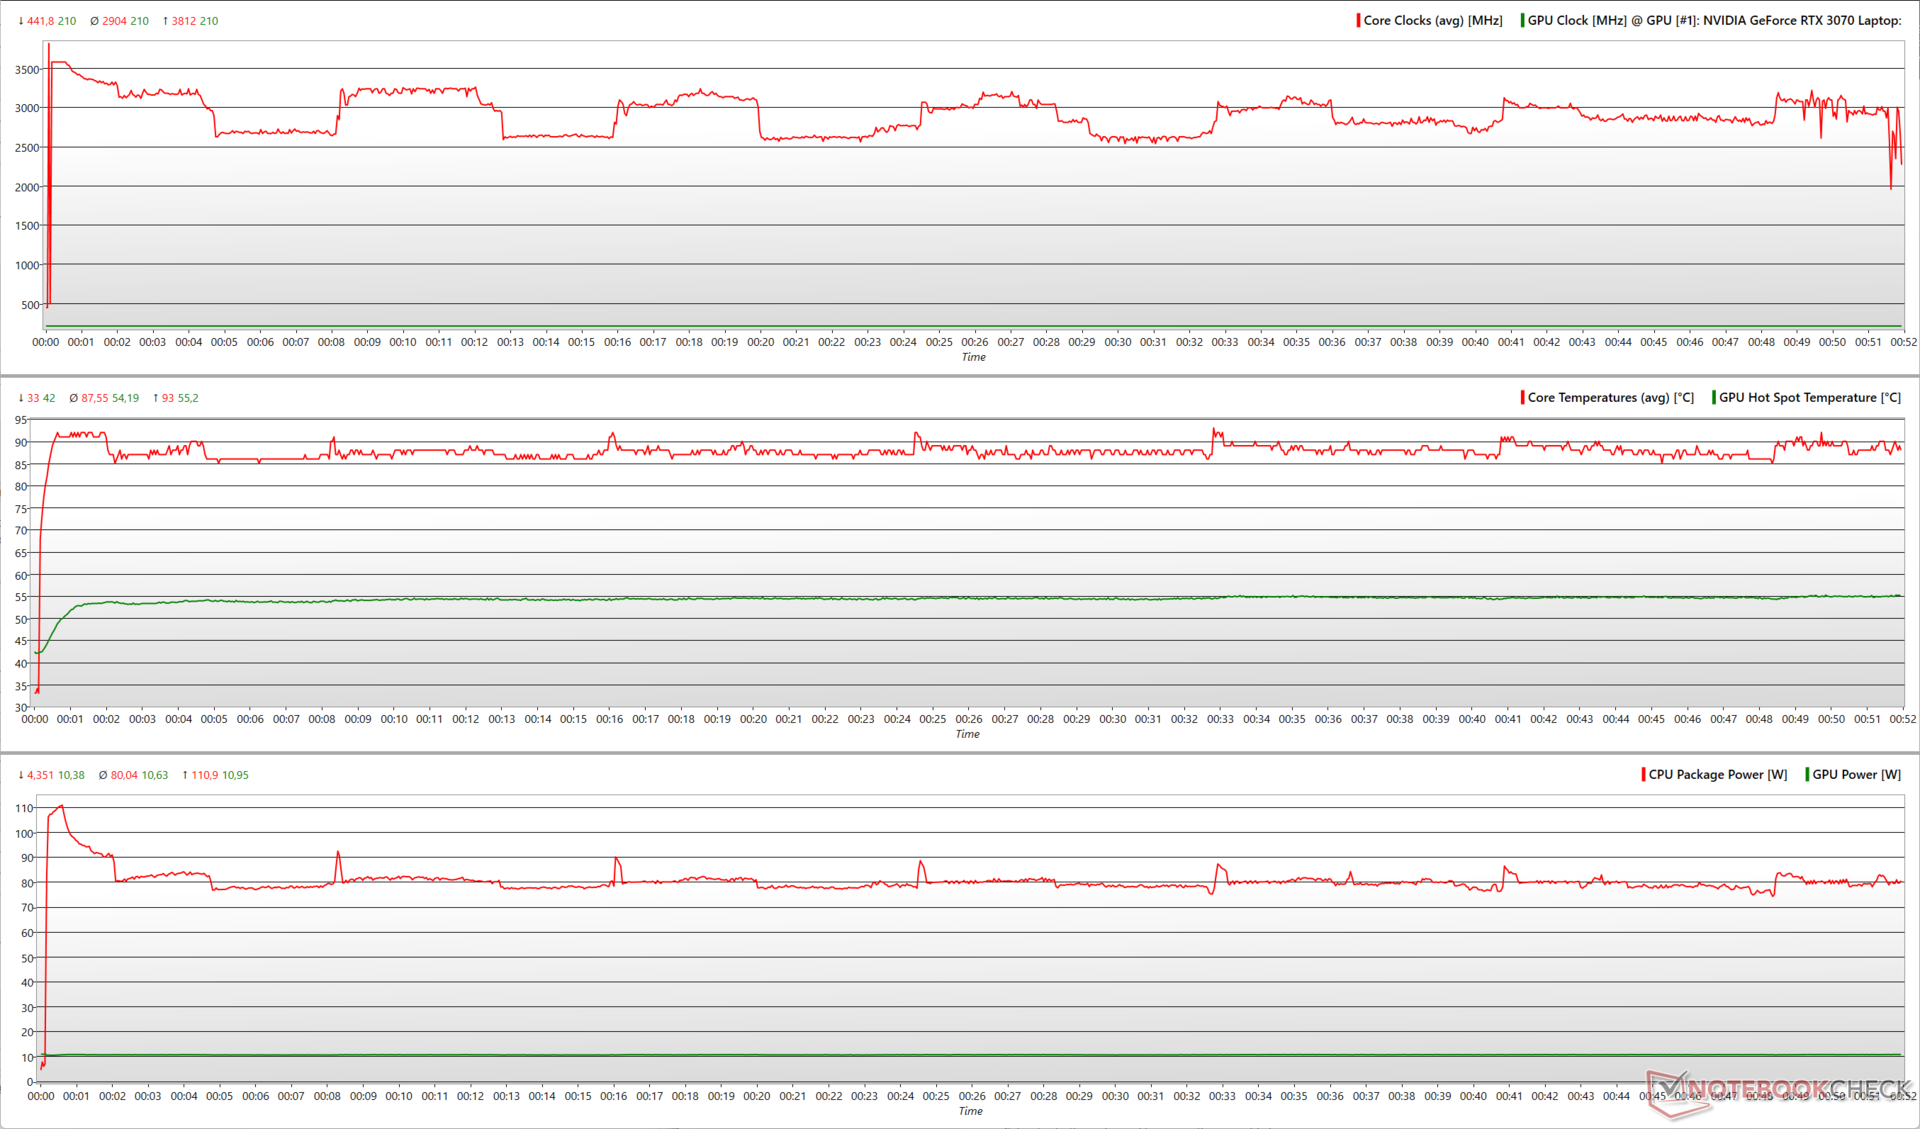
| Stress Test | CPU Clock (GHz) | GPU Clock (MHz) | Average CPU Temperature (°C) | Average GPU Temperature (°C) |
| System Idle | 0.4 | 210 | 36 | 40.1 |
| Prime95 | 2.53 | 210 | 51 | 41.3 |
| Prime95 + FurMark | 1.93 | 1.81 | 87 | 61.2 |
| The Witcher 3 | 3.04 | 1.81 | 71 | 79.3 |
Speakers
The Crosshair 15 R6E features 2x 2W speakers that produce 74.6 dB(A) loudness. The bass response is passable, but the mids and highs are clearly discernible without distortion. The sound quality is just about serviceable for basic multimedia consumption across an average-sized room.
External audio can be connected via Bluetooth 5.2 or the 3.5 mm combo audio jack.
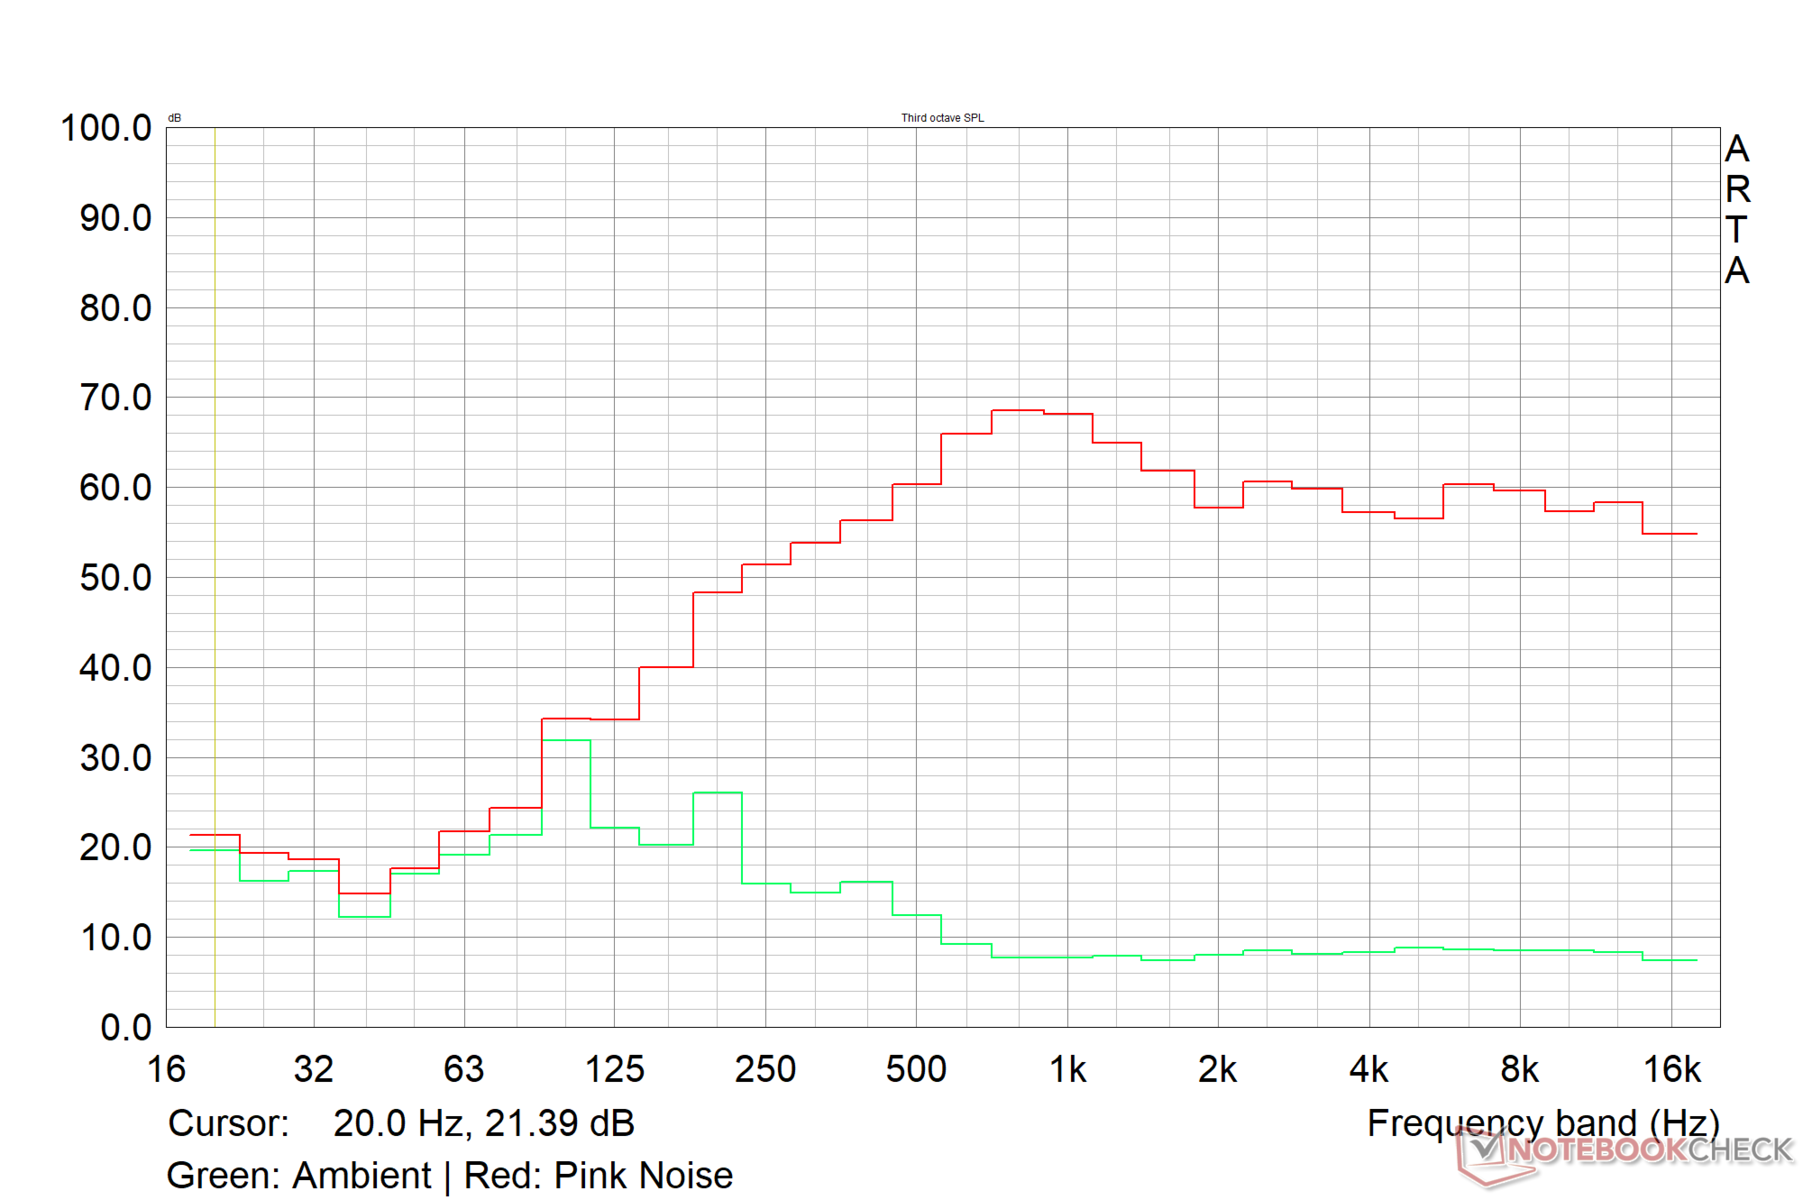
MSI Crosshair 15 R6E B12UGZ-050 audio analysis
(±) | speaker loudness is average but good (74.6 dB)
Bass 100 - 315 Hz
(±) | reduced bass - on average 14.1% lower than median
(±) | linearity of bass is average (10% delta to prev. frequency)
Mids 400 - 2000 Hz
(±) | higher mids - on average 5.6% higher than median
(+) | mids are linear (6.5% delta to prev. frequency)
Highs 2 - 16 kHz
(+) | balanced highs - only 1.7% away from median
(+) | highs are linear (4% delta to prev. frequency)
Overall 100 - 16.000 Hz
(±) | linearity of overall sound is average (15.1% difference to median)
Compared to same class
» 32% of all tested devices in this class were better, 6% similar, 62% worse
» The best had a delta of 6%, average was 18%, worst was 132%
Compared to all devices tested
» 21% of all tested devices were better, 4% similar, 75% worse
» The best had a delta of 4%, average was 23%, worst was 134%
Apple MacBook Pro 16 2021 M1 Pro audio analysis
(+) | speakers can play relatively loud (84.7 dB)
Bass 100 - 315 Hz
(+) | good bass - only 3.8% away from median
(+) | bass is linear (5.2% delta to prev. frequency)
Mids 400 - 2000 Hz
(+) | balanced mids - only 1.3% away from median
(+) | mids are linear (2.1% delta to prev. frequency)
Highs 2 - 16 kHz
(+) | balanced highs - only 1.9% away from median
(+) | highs are linear (2.7% delta to prev. frequency)
Overall 100 - 16.000 Hz
(+) | overall sound is linear (4.6% difference to median)
Compared to same class
» 0% of all tested devices in this class were better, 0% similar, 100% worse
» The best had a delta of 5%, average was 17%, worst was 45%
Compared to all devices tested
» 0% of all tested devices were better, 0% similar, 100% worse
» The best had a delta of 4%, average was 23%, worst was 134%
Energy Management: High power draws at max. load
Power Consumption
Even in the Extreme Performance profile, power consumption seems relatively economical for the hardware on offer. The Asus TUF Dash F15 is 30% more economical than the Crosshair 15 R6E in load max. and The Witcher 3 tests due to its lower wattage CPU and GPU.
The power supply is rated at 240 W, but we observed power draws up to 290 W during a combined Prime95 and FurMark load. The fluctuating power consumption during this run is in line with fluctuating CPU and GPU clocks we had observed during the stress test above.
| Off / Standby | |
| Idle | |
| Load |
|
Key:
min: | |
| MSI Crosshair 15 R6E B12UGZ-050 i7-12700H, GeForce RTX 3070 Laptop GPU, IPS-Level, 2560x1440, 15.6" | MSI Stealth GS66 12UGS i7-12700H, GeForce RTX 3070 Ti Laptop GPU, IPS-Level, 2560x1440, 15.6" | Lenovo Legion 5 Pro 16 G7 i7 RTX 3070Ti i7-12700H, GeForce RTX 3070 Ti Laptop GPU, IPS, 2560x1600, 16" | Asus TUF Dash F15 FX517ZR i7-12650H, GeForce RTX 3070 Laptop GPU, IPS, 2560x1440, 15.6" | Schenker XMG Neo 15 (Ryzen 9 6900HX, RTX 3070 Ti) R9 6900HX, GeForce RTX 3070 Ti Laptop GPU, IPS, 2560x1440, 15.6" | Average NVIDIA GeForce RTX 3070 Laptop GPU | Average of class Gaming | |
|---|---|---|---|---|---|---|---|
| Power Consumption | -7% | -10% | 2% | -11% | -36% | -24% | |
| Idle Minimum * (Watt) | 9.6 | 11 -15% | 8.6 10% | 10 -4% | 13 -35% | 15.6 ? -63% | 13 ? -35% |
| Idle Average * (Watt) | 14.1 | 16 -13% | 17.6 -25% | 14 1% | 17 -21% | 20.1 ? -43% | 18.7 ? -33% |
| Idle Maximum * (Watt) | 14.96 | 23 -54% | 18.5 -24% | 20 -34% | 20 -34% | 29.4 ? -97% | 24.3 ? -62% |
| Load Average * (Watt) | 107.3 | 110 -3% | 110 -3% | 122 -14% | 89 17% | 110.8 ? -3% | 109.7 ? -2% |
| Witcher 3 ultra * (Watt) | 197 | 151 23% | 227 -15% | 138.6 30% | 200 -2% | ||
| Load Maximum * (Watt) | 289.93 | 230 21% | 294.6 -2% | 189 35% | 260 10% | 214 ? 26% | 257 ? 11% |
* ... smaller is better
Power Consumption - The Witcher 3 / Stress test
Power Consumption - External monitor
Battery Life
Battery tests were performed in the Balanced profile with the display refresh rate set to 60 Hz. Our Crosshair 15 R6E B12UGZ came equipped with a 4-cell 90 WHr battery that offers decent run times in our standardized Wi-Fi browsing test at 150 nits. Video playback backup is just short of the 9-hour mark at 150 nits with all radios turned off.
MSI also offers the Crosshair R6E B12UEZ variant that comes with a 3-cell 56.5 WHr battery.
| MSI Crosshair 15 R6E B12UGZ-050 i7-12700H, GeForce RTX 3070 Laptop GPU, 90 Wh | MSI Stealth GS66 12UGS i7-12700H, GeForce RTX 3070 Ti Laptop GPU, 99.9 Wh | Lenovo Legion 5 Pro 16 G7 i7 RTX 3070Ti i7-12700H, GeForce RTX 3070 Ti Laptop GPU, 80 Wh | Asus TUF Dash F15 FX517ZR i7-12650H, GeForce RTX 3070 Laptop GPU, 76 Wh | Schenker XMG Neo 15 (Ryzen 9 6900HX, RTX 3070 Ti) R9 6900HX, GeForce RTX 3070 Ti Laptop GPU, 93 Wh | Average of class Gaming | |
|---|---|---|---|---|---|---|
| Battery runtime | 4% | -35% | 18% | 34% | 6% | |
| H.264 (h) | 8.9 | 6.3 -29% | 5.8 -35% | 10.7 20% | 8.64 ? -3% | |
| WiFi v1.3 (h) | 7.3 | 5.4 -26% | 5.4 -26% | 7 -4% | 10.9 49% | 7.11 ? -3% |
| Witcher 3 ultra (h) | 1.6 | |||||
| Load (h) | 1.2 | 1.6 33% | 0.6 -50% | 2.3 92% | 1.6 33% | 1.502 ? 25% |
| Reader / Idle (h) | 7.8 | 10.8 | 8.71 ? |
Pros
Cons
Verdict: Pulse GL66 reskin that gets a lot of things right
Laptops themed on specific games generally have limited appeal beyond the fans of the said game. The MSI Crosshair 15 Rainbow Six: Extraction Edition, eponymously named after Ubisoft's popular co-op FPS franchise, is the only Crosshair 15 offering this year.
The chassis is essentially a rehash of the Pulse GL66 with heavily borrowed design elements from the game. MSI has even gone to the extent of replacing its own logo on the display lid with that of Rainbow Six: Extraction's. You also get a few goodies in the box including a game-themed mouse, a mouse pad, and a Deluxe copy of the game itself.
As such, the Crosshair 15 R6E inherits some deficiencies of the Pulse GL66's design such as flex in the keyboard deck and a non-ideal port distribution. However, the laptop comes with a highly functional QHD 165 Hz display that should augur well for both gaming and content creation.
The MSI Crosshair 15 Rainbow Six: Extraction's design may find limited appeal, but beneath the skin you get a highly capable midranger with good display characteristics and tolerable emissions.”
The Crosshair 15 R6E's implementation of the Core i7-12700H is not the fastest we've seen. The MSI Stealth GS66 and the Lenovo Legion 5i Pro 16 G7 featuring the same processor perform perceivably better in multi-core tests. The Crosshair 15 R6E's overall performance in gaming can be better or equal to some RTX 3070 Ti-powered laptops such as the Schenker XMG Neo 15, Acer Nitro 5, and MSI Katana GF66.
Thermal and noise emissions are largely tolerable as long as you are fine with the Balanced performance profile. However, power consumption is on the higher side especially with power draws under max. load and gaming.
Even if you are not a fan of the game, the MSI Crosshair 15 Rainbow Six: Extraction Edition does merit a consideration taking into account the performance on offer and pricing relative to the competition.
Price and Availability
The MSI Crosshair 15 Rainbow Six: Extraction Edition is available on Amazon US for US$2,149. In India, the laptop retails around the ₹1,90,990 mark but is currently listed as out-of-stock on Amazon India and Flipkart.
MSI Crosshair 15 R6E B12UGZ-050
- 12/19/2022 v7 (old)
Vaidyanathan Subramaniam
Price comparison
