MSI Katana GF66 12UGS laptop review: The update to Alder Lake brings significantly more performance
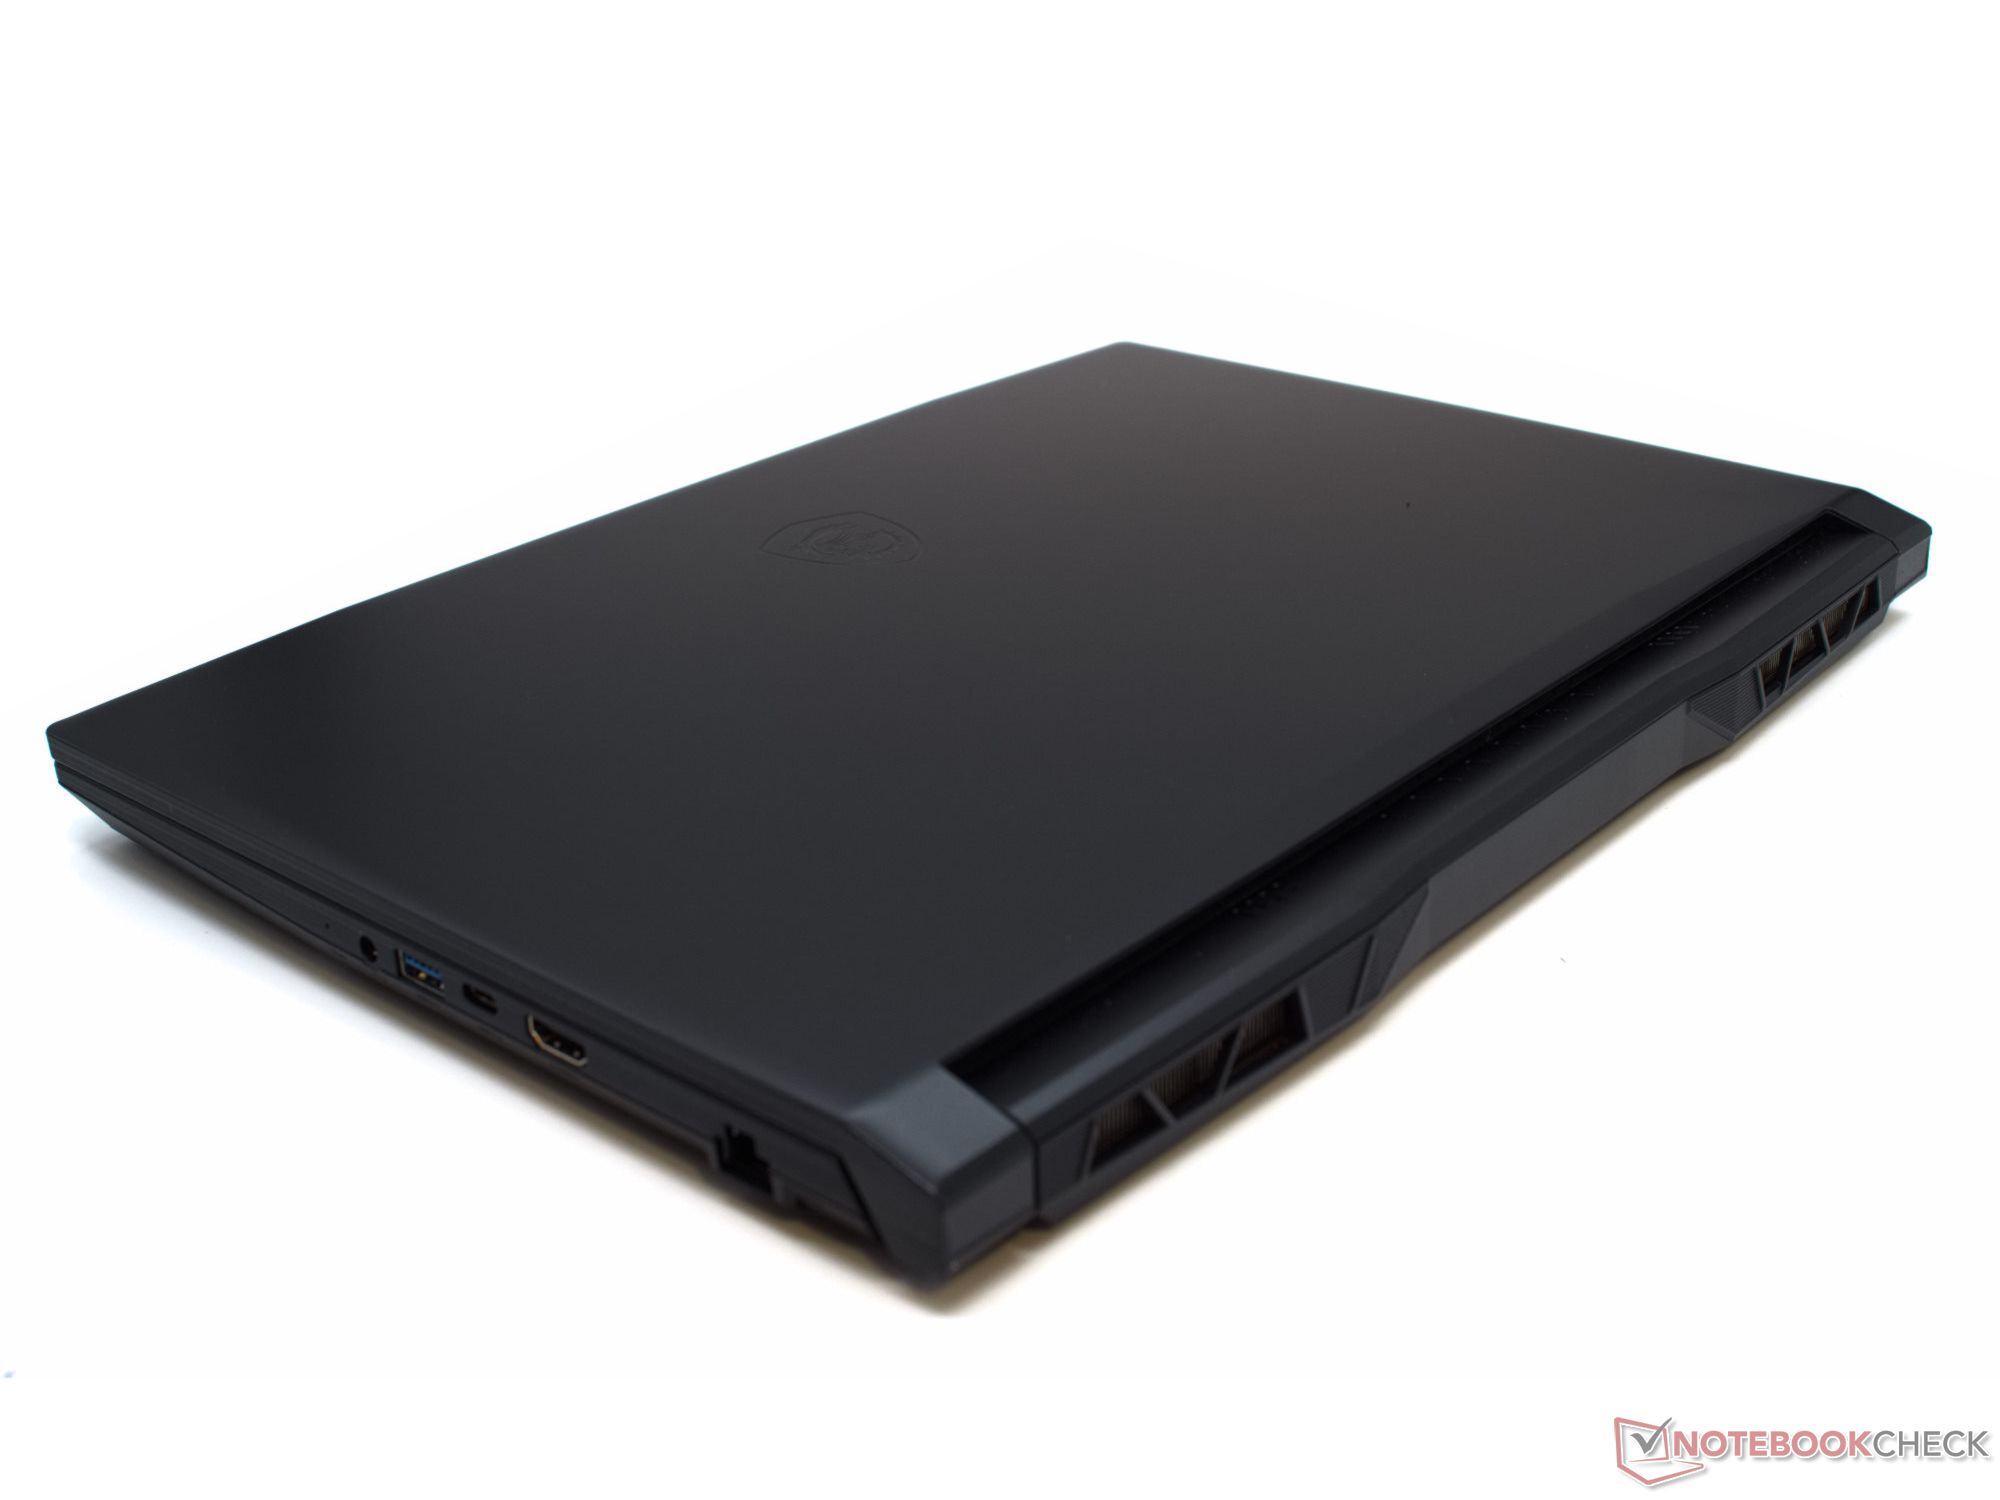
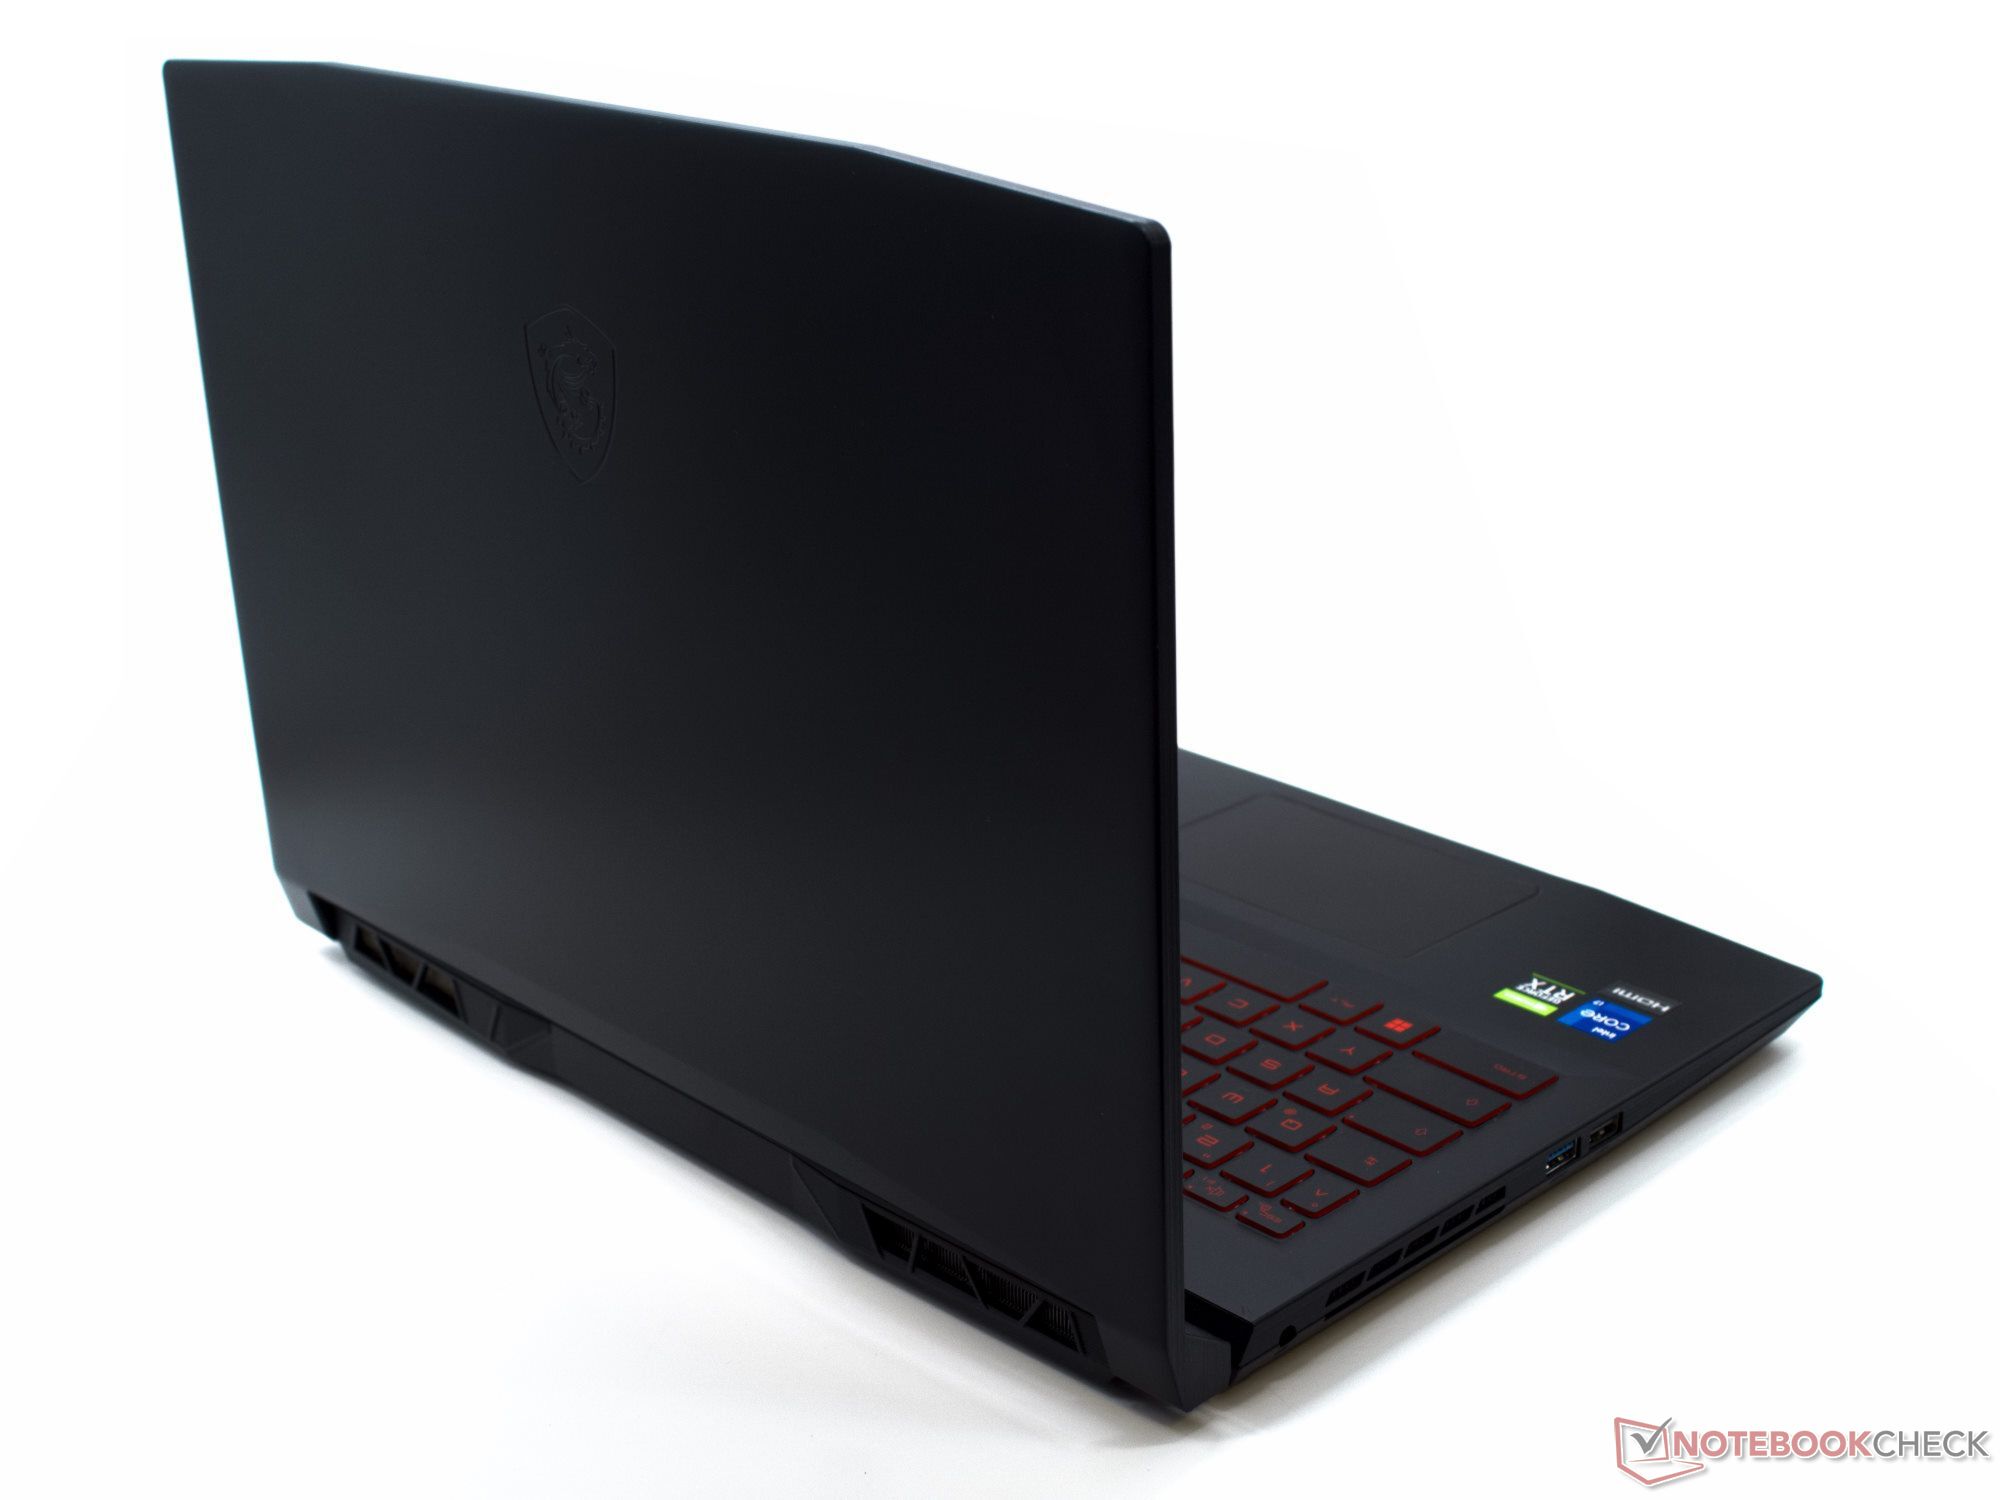
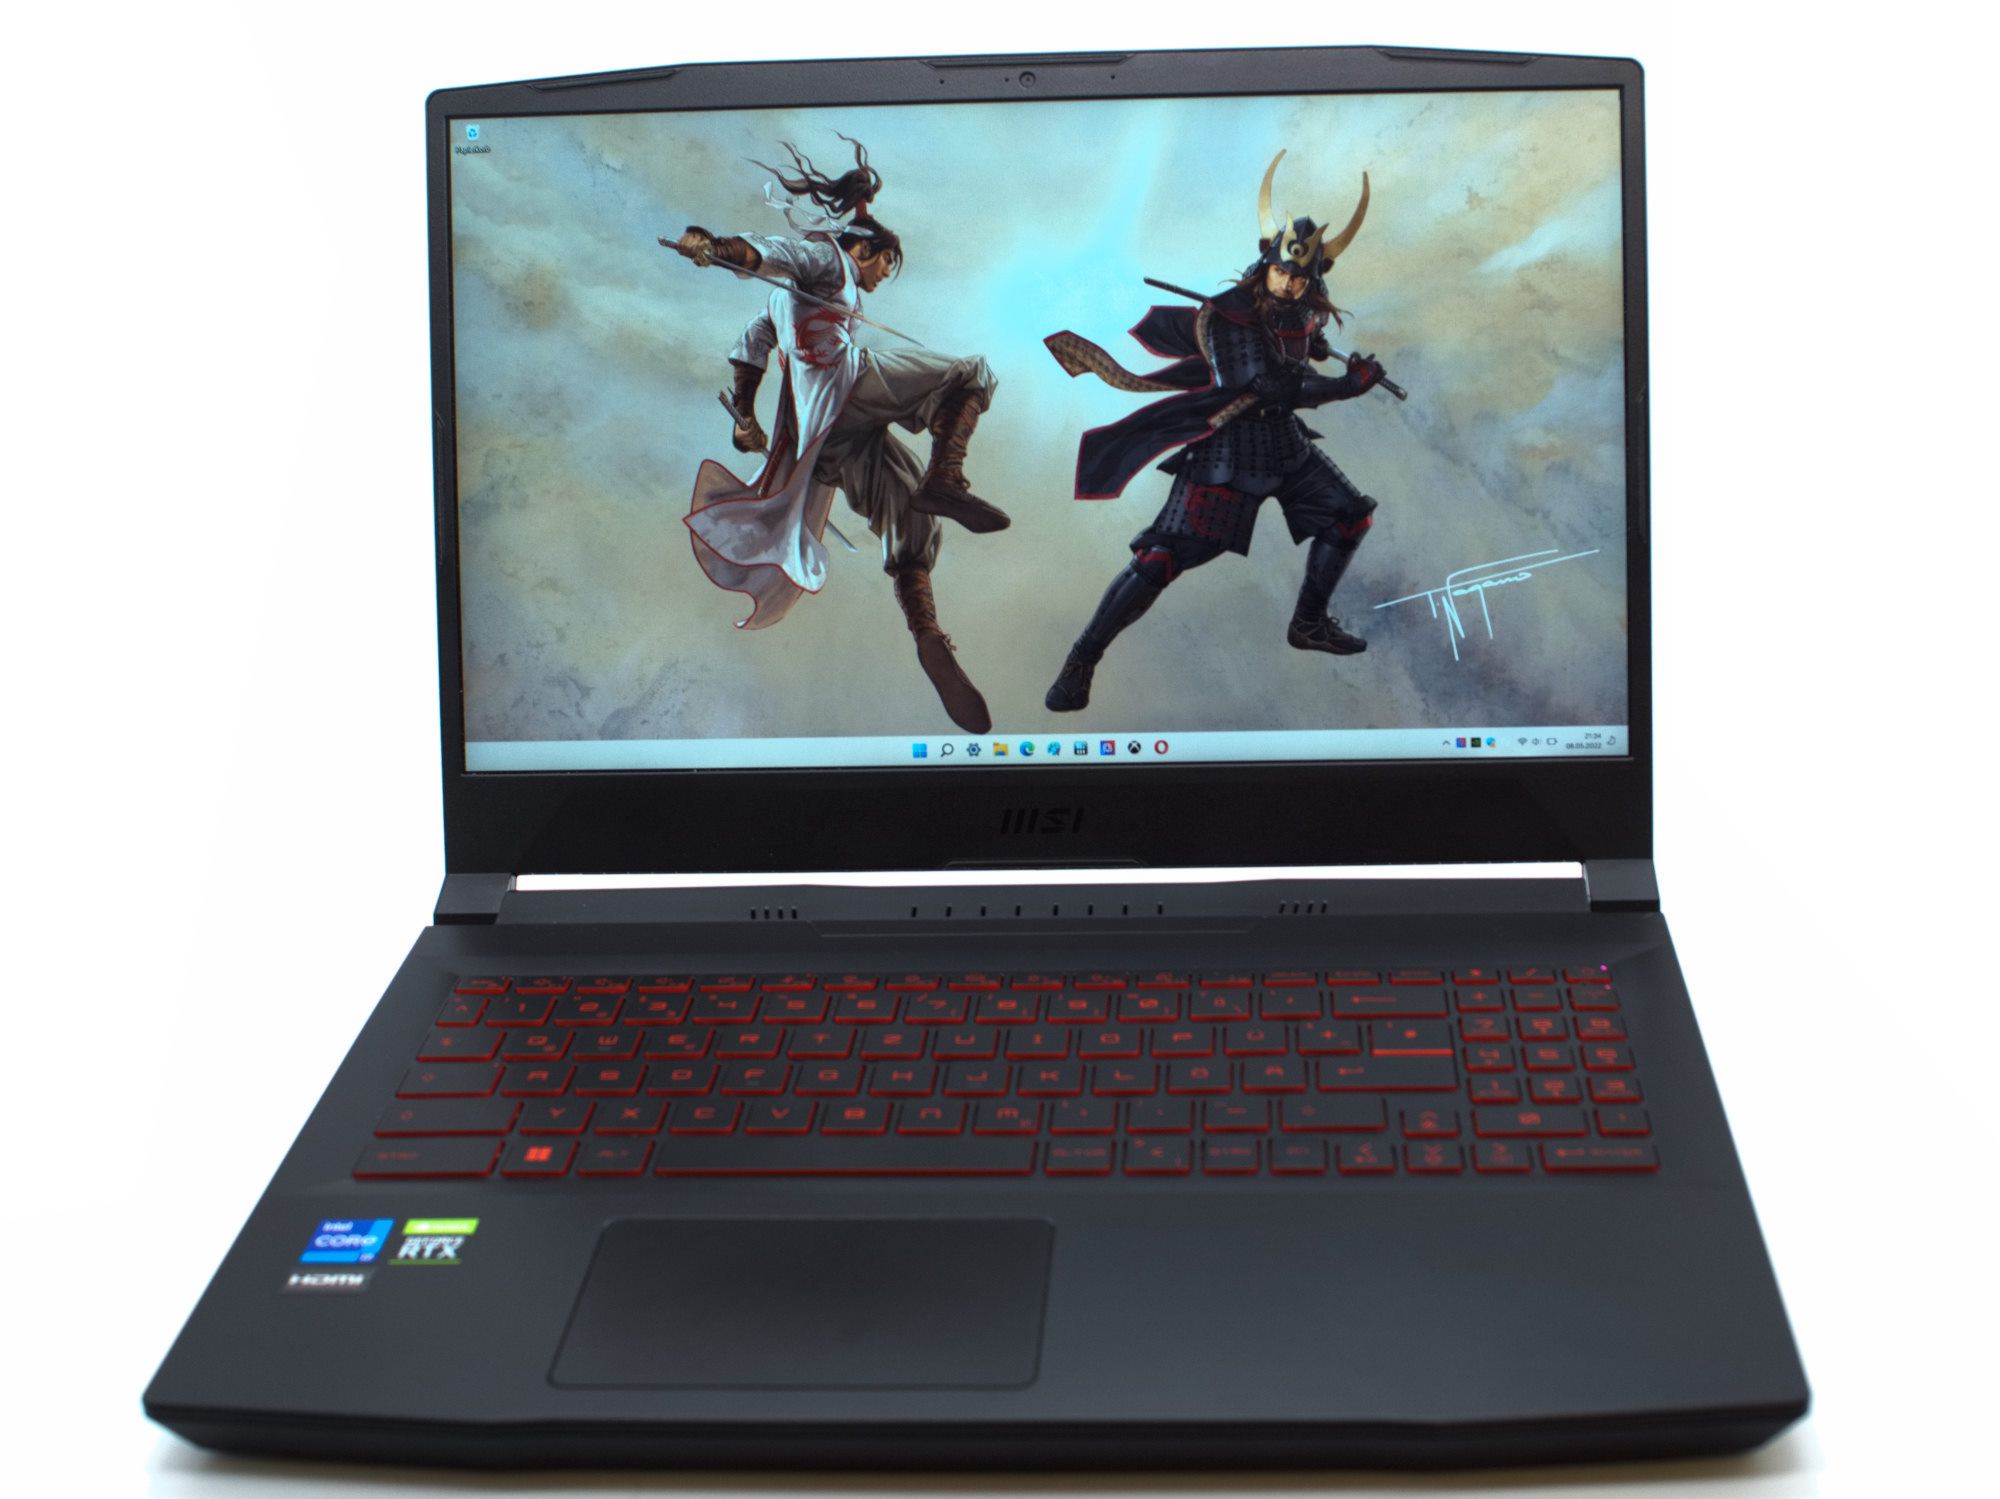
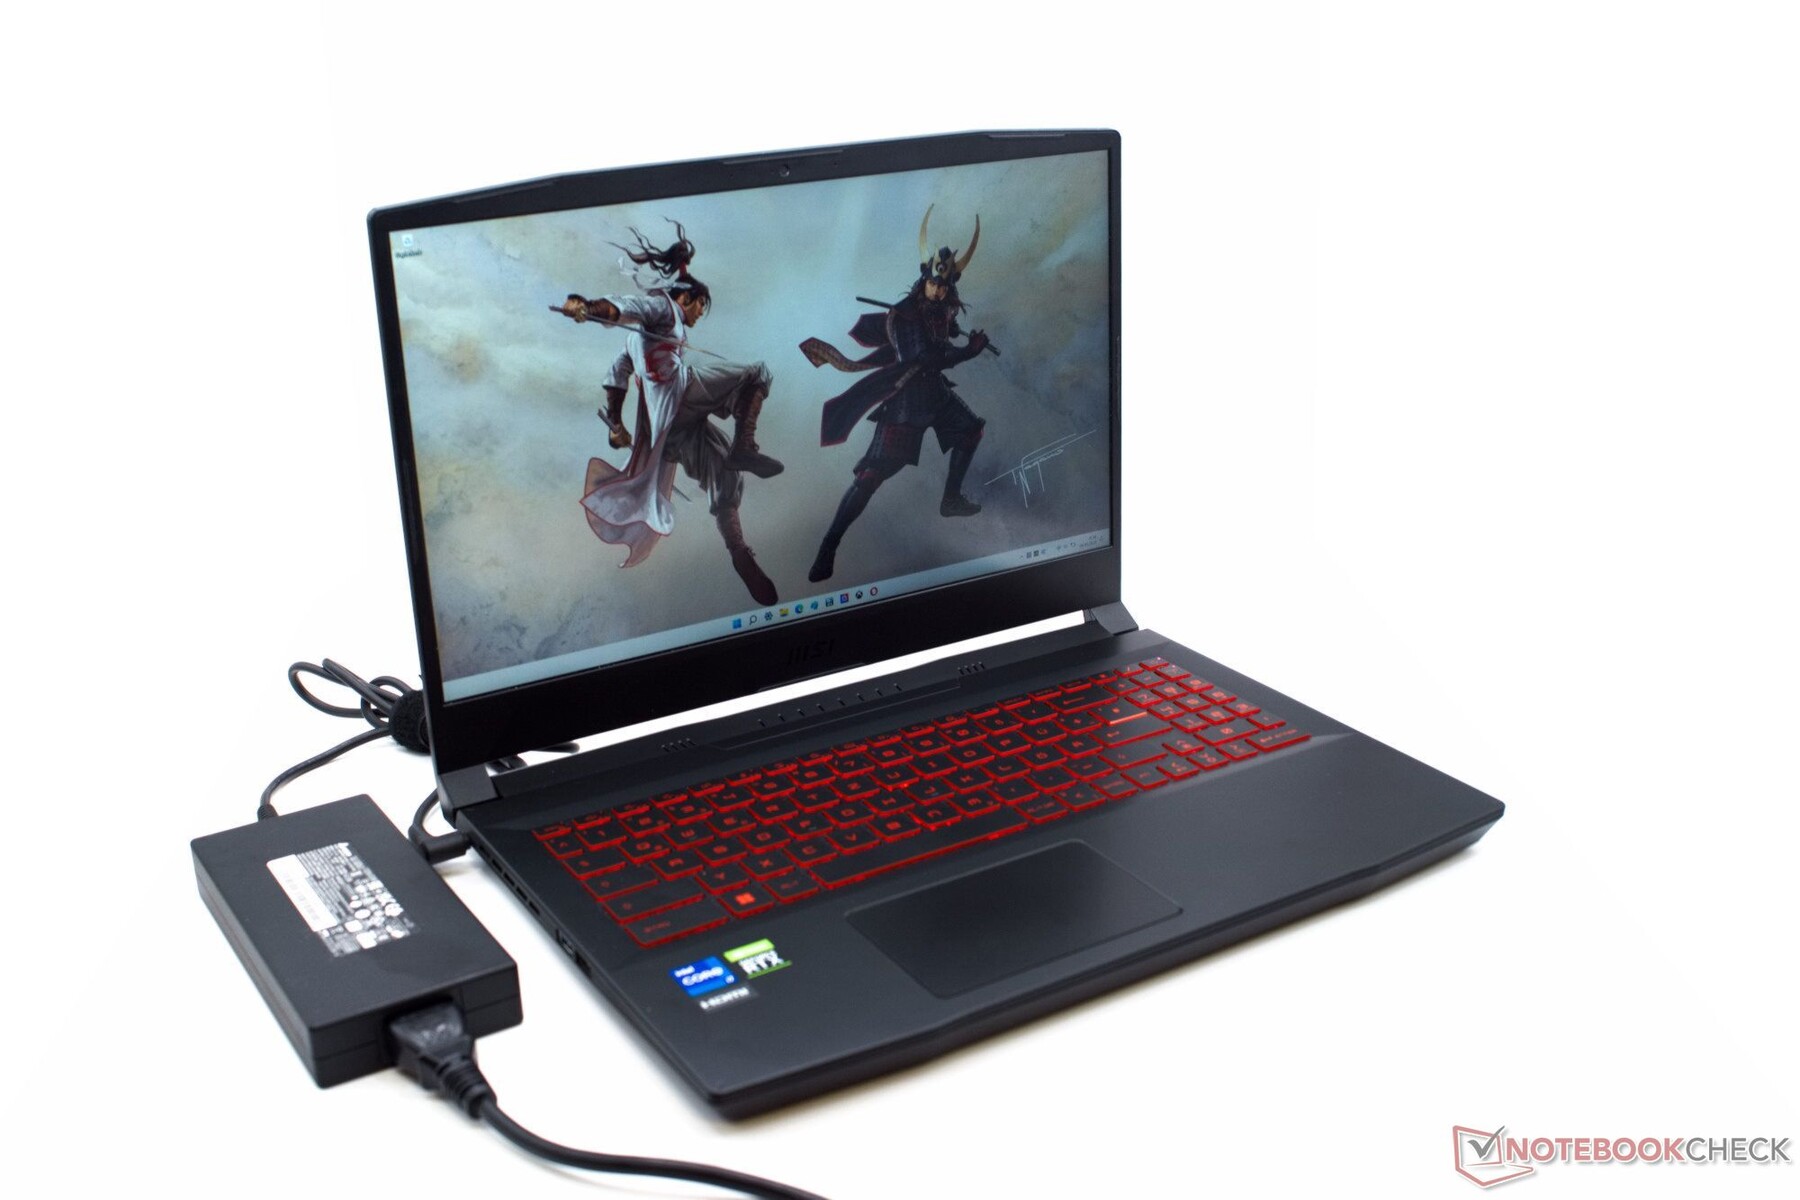
In terms of the computing performance, MSI has significantly upgraded the Katana GF66 we tested last year. The Intel Core i7-11800H and Nvidia GeForce RTX 3070 were replaced by the more current chips, and at this point a Core i7-12700H and RTX 3070 Ti make up the computing performance. Nothing has changed in the exterior of the elegant gaming laptop, and the design by Nagano Tsuyoshi was kept without any changes.
In addition to the upgrades of the hardware, the display was also replaced by another panel. However, this appears to be more of a downgrade than upgrade, and the display evaluation of the GF66 12UGS turns out significantly worse than that of the GF66 11UG.
For a laptop with the powerful Nvidia GeForce RTX 3070 Ti, the Katana is relatively affordable at around 2000 Euros (~$2142). At that price, we also see several gaming laptops with supposedly weaker configurations among our comparison devices. However, once again we see the powerful influence of the TDP and TGP values on the computing performance. In several benchmarks, some laptops such as the Asus TUF Gaming F15 or the Lenovo Legion 5 are able to significantly surpass the current Katana GF66 and its large sibling, the GF76.
Possible Competitors in Comparison
Rating | Date | Model | Weight | Height | Size | Resolution | Price |
|---|---|---|---|---|---|---|---|
| 80.3 % v7 (old) | 06 / 2022 | MSI Katana GF66 12UGS i7-12700H, GeForce RTX 3070 Ti Laptop GPU | 2.3 kg | 27.5 mm | 15.60" | 1920x1080 | |
| 79.2 % v7 (old) | 09 / 2021 | MSI Katana GF66 11UG-220 i7-11800H, GeForce RTX 3070 Laptop GPU | 2.3 kg | 25 mm | 15.60" | 1920x1080 | |
| 82.6 % v7 (old) | 05 / 2022 | MSI Katana GF76 12UGS i7-12700H, GeForce RTX 3070 Ti Laptop GPU | 2.7 kg | 25.2 mm | 17.30" | 1920x1080 | |
| 87.2 % v7 (old) | 03 / 2022 | Asus TUF Gaming F15 FX507ZM i7-12700H, GeForce RTX 3060 Laptop GPU | 2.1 kg | 24.95 mm | 15.60" | 1920x1080 | |
| 85 % v7 (old) | 07 / 2021 | Asus TUF Gaming A15 FA506QR-AZ061T R7 5800H, GeForce RTX 3070 Laptop GPU | 2.3 kg | 24 mm | 15.60" | 1920x1080 | |
| 84 % v7 (old) | 06 / 2022 | Acer Nitro 5 AN515-58-72QR i7-12700H, GeForce RTX 3070 Ti Laptop GPU | 2.5 kg | 26.8 mm | 15.60" | 2560x1440 | |
| 82.6 % v7 (old) | 05 / 2022 | Lenovo Legion 5 15ACH6A-82NW0010GE R5 5600H, Radeon RX 6600M | 2.5 kg | 25.75 mm | 15.60" | 1920x1080 |
Case and Equipment - Upgrades are lacking here
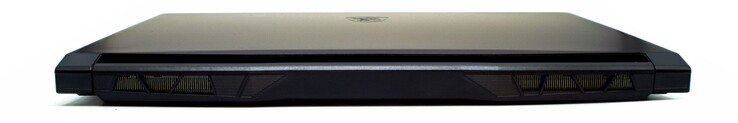
Compared to the GF66 11UG, there are no changes in the case or connection equipment. The design is still elegant and inconspicuous, and the amount, positioning, and types of the connections also remain the same. This means that we continue to miss Thunderbolt and DisplayPort in the USB-C connection of the gaming laptop. You can find a more detailed description of the case and connection equipment in our review of the MSI Katana GF66 11UG.
There are some slight improvements in the better webcam and stability of the display hinges, which now offer more resistance than those of the predecessor, holding the display better in place.

In terms of the size and weight, the Katana GF66 12UGS places in the middle of the field of competitors. As typical for gaming laptops, the weight is more than 2 kilograms (~4.4 lb).
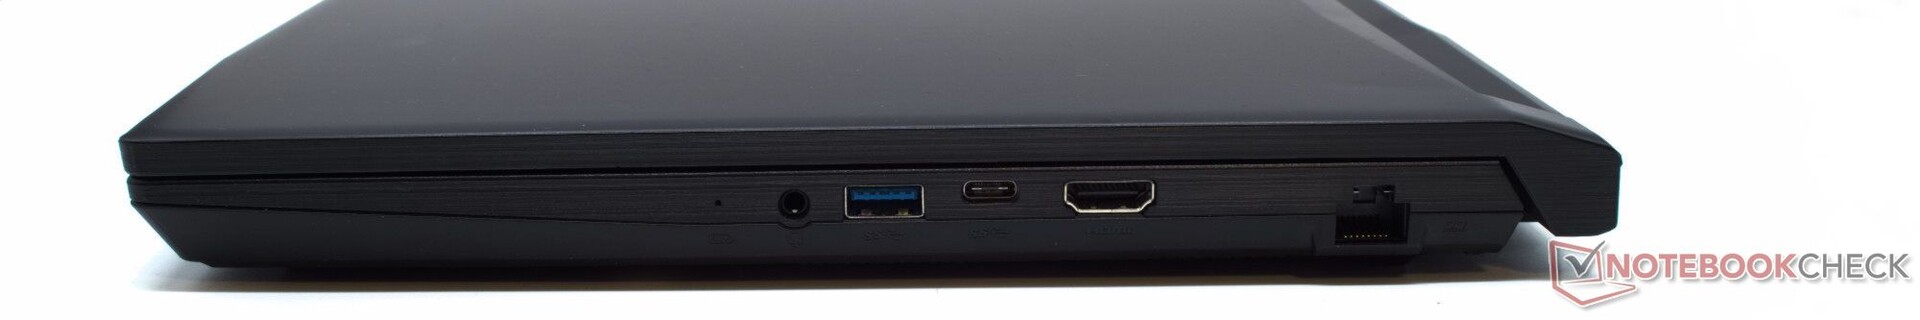
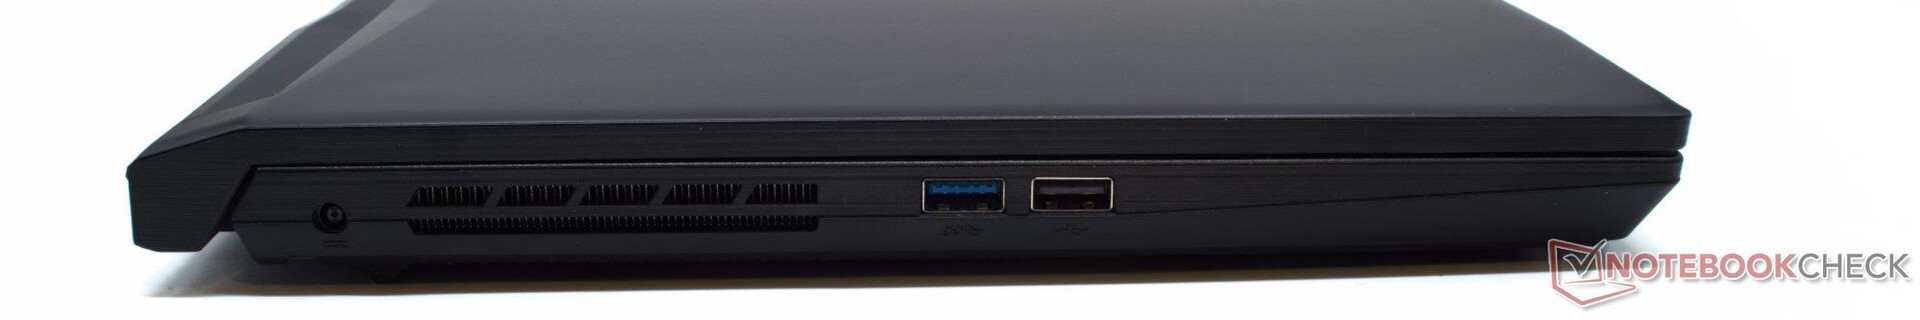
Connection Equipment
The MSI Katana doesn't really offer a lot in terms of connections. The USB-2.0 port on the left side clearly shows that MSI cut some corners in the connections. Other equipment it lacks is a card reader or a fully equipped USB-C port.
Communication
The Intel AX201 module continues to offer the WLAN-ax and Bluetooth 5.2 functionalities. The high transfer rates that we measure in our test with the ROG Rapture GT-AXE11000 point to powerful antennas in the gaming laptop.
Webcam
Even if the quality of the webcam continues to leave something to be desired, the camera of the GF66 has slightly improved compared to last year. For example, the color deviations are now slightly lower, and the contrast and sharpness have slightly improved.


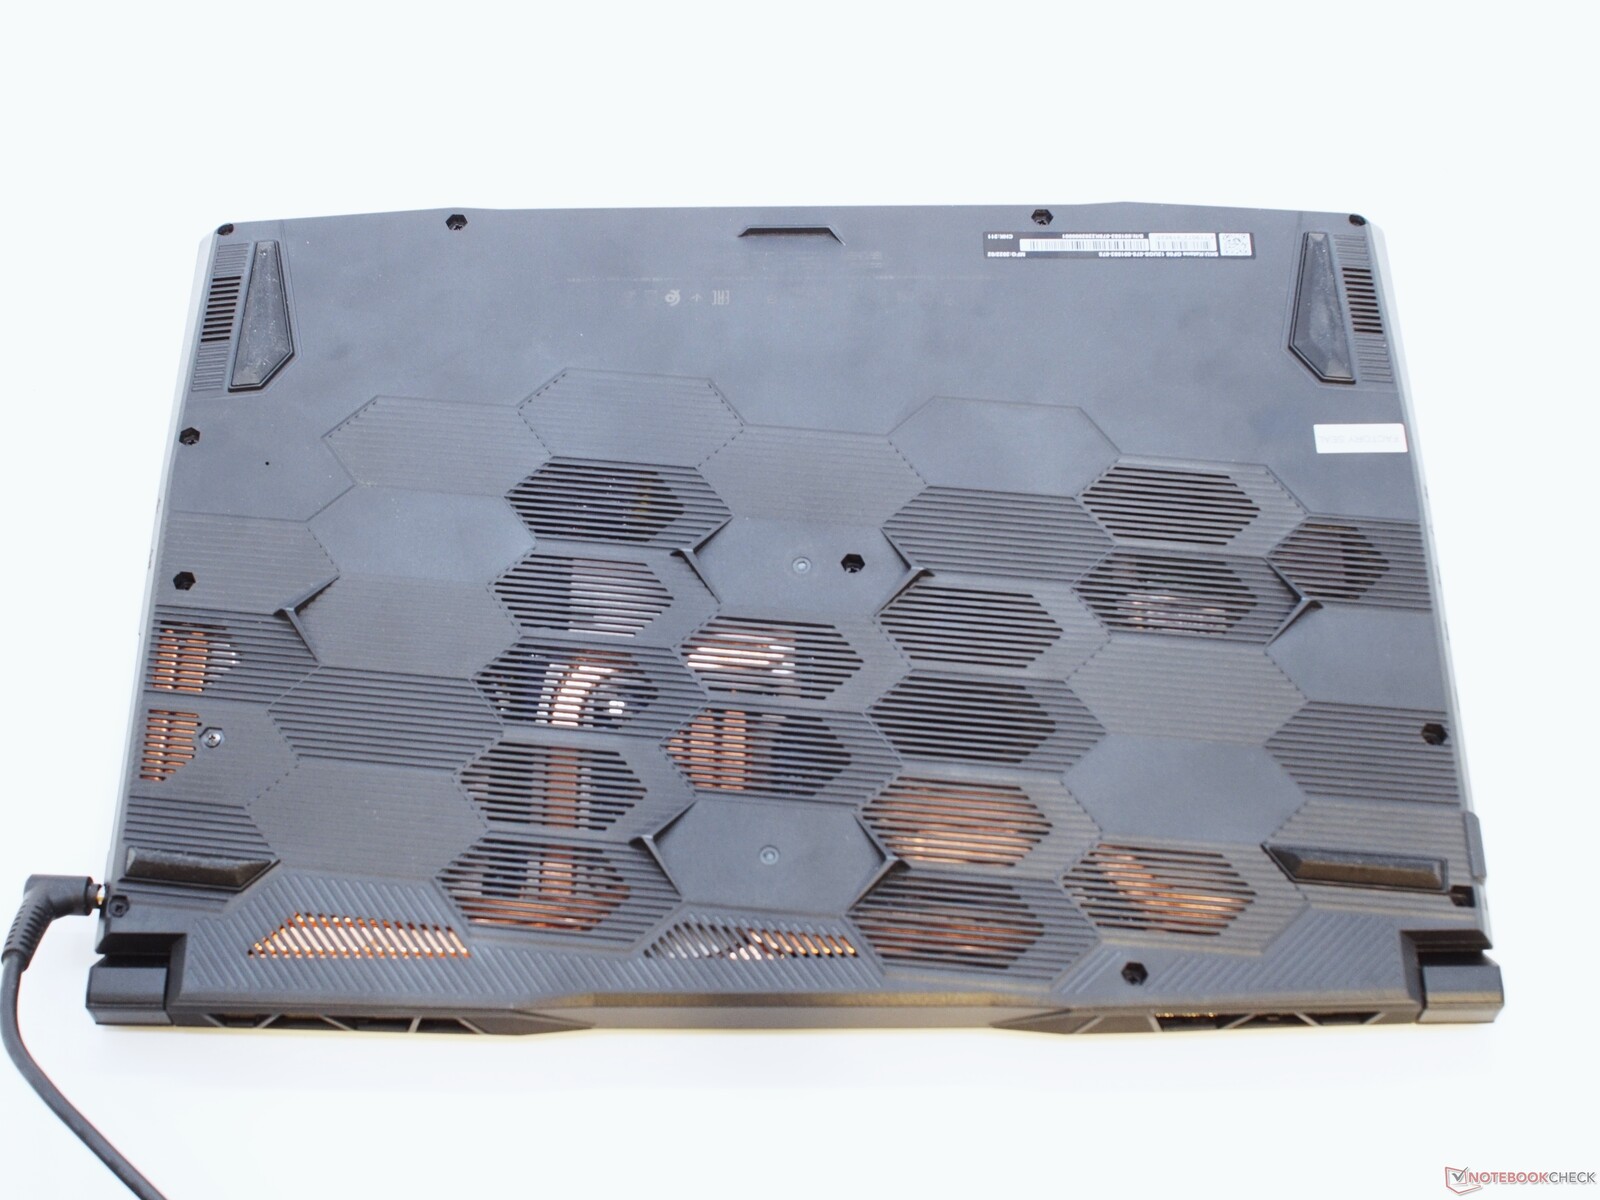
Maintenance
While the MSI Katana GF66 should really be easy to open, MSI hides at least one of the screws underneath a seal sticker most of the time. Even though this seal should be easy to remove, we did not do this, since our test unit is a loaner. Underneath the base cover, the working memory, WLAN module, and M.2-NVMe SSDs can be replaced or expanded, since the gaming laptop also offers a free M.2 slot.
Warranty
MSI offers the GF66 in Europe with a 24-month manufacturer warranty. Defective devices will be picked up and repaired at a central location, from where they are shipped back to the customer. By the way, removing the seal sticker will not impact the warranty on the device. The seal is only meant to show the customer whether the devices is in its original condition.
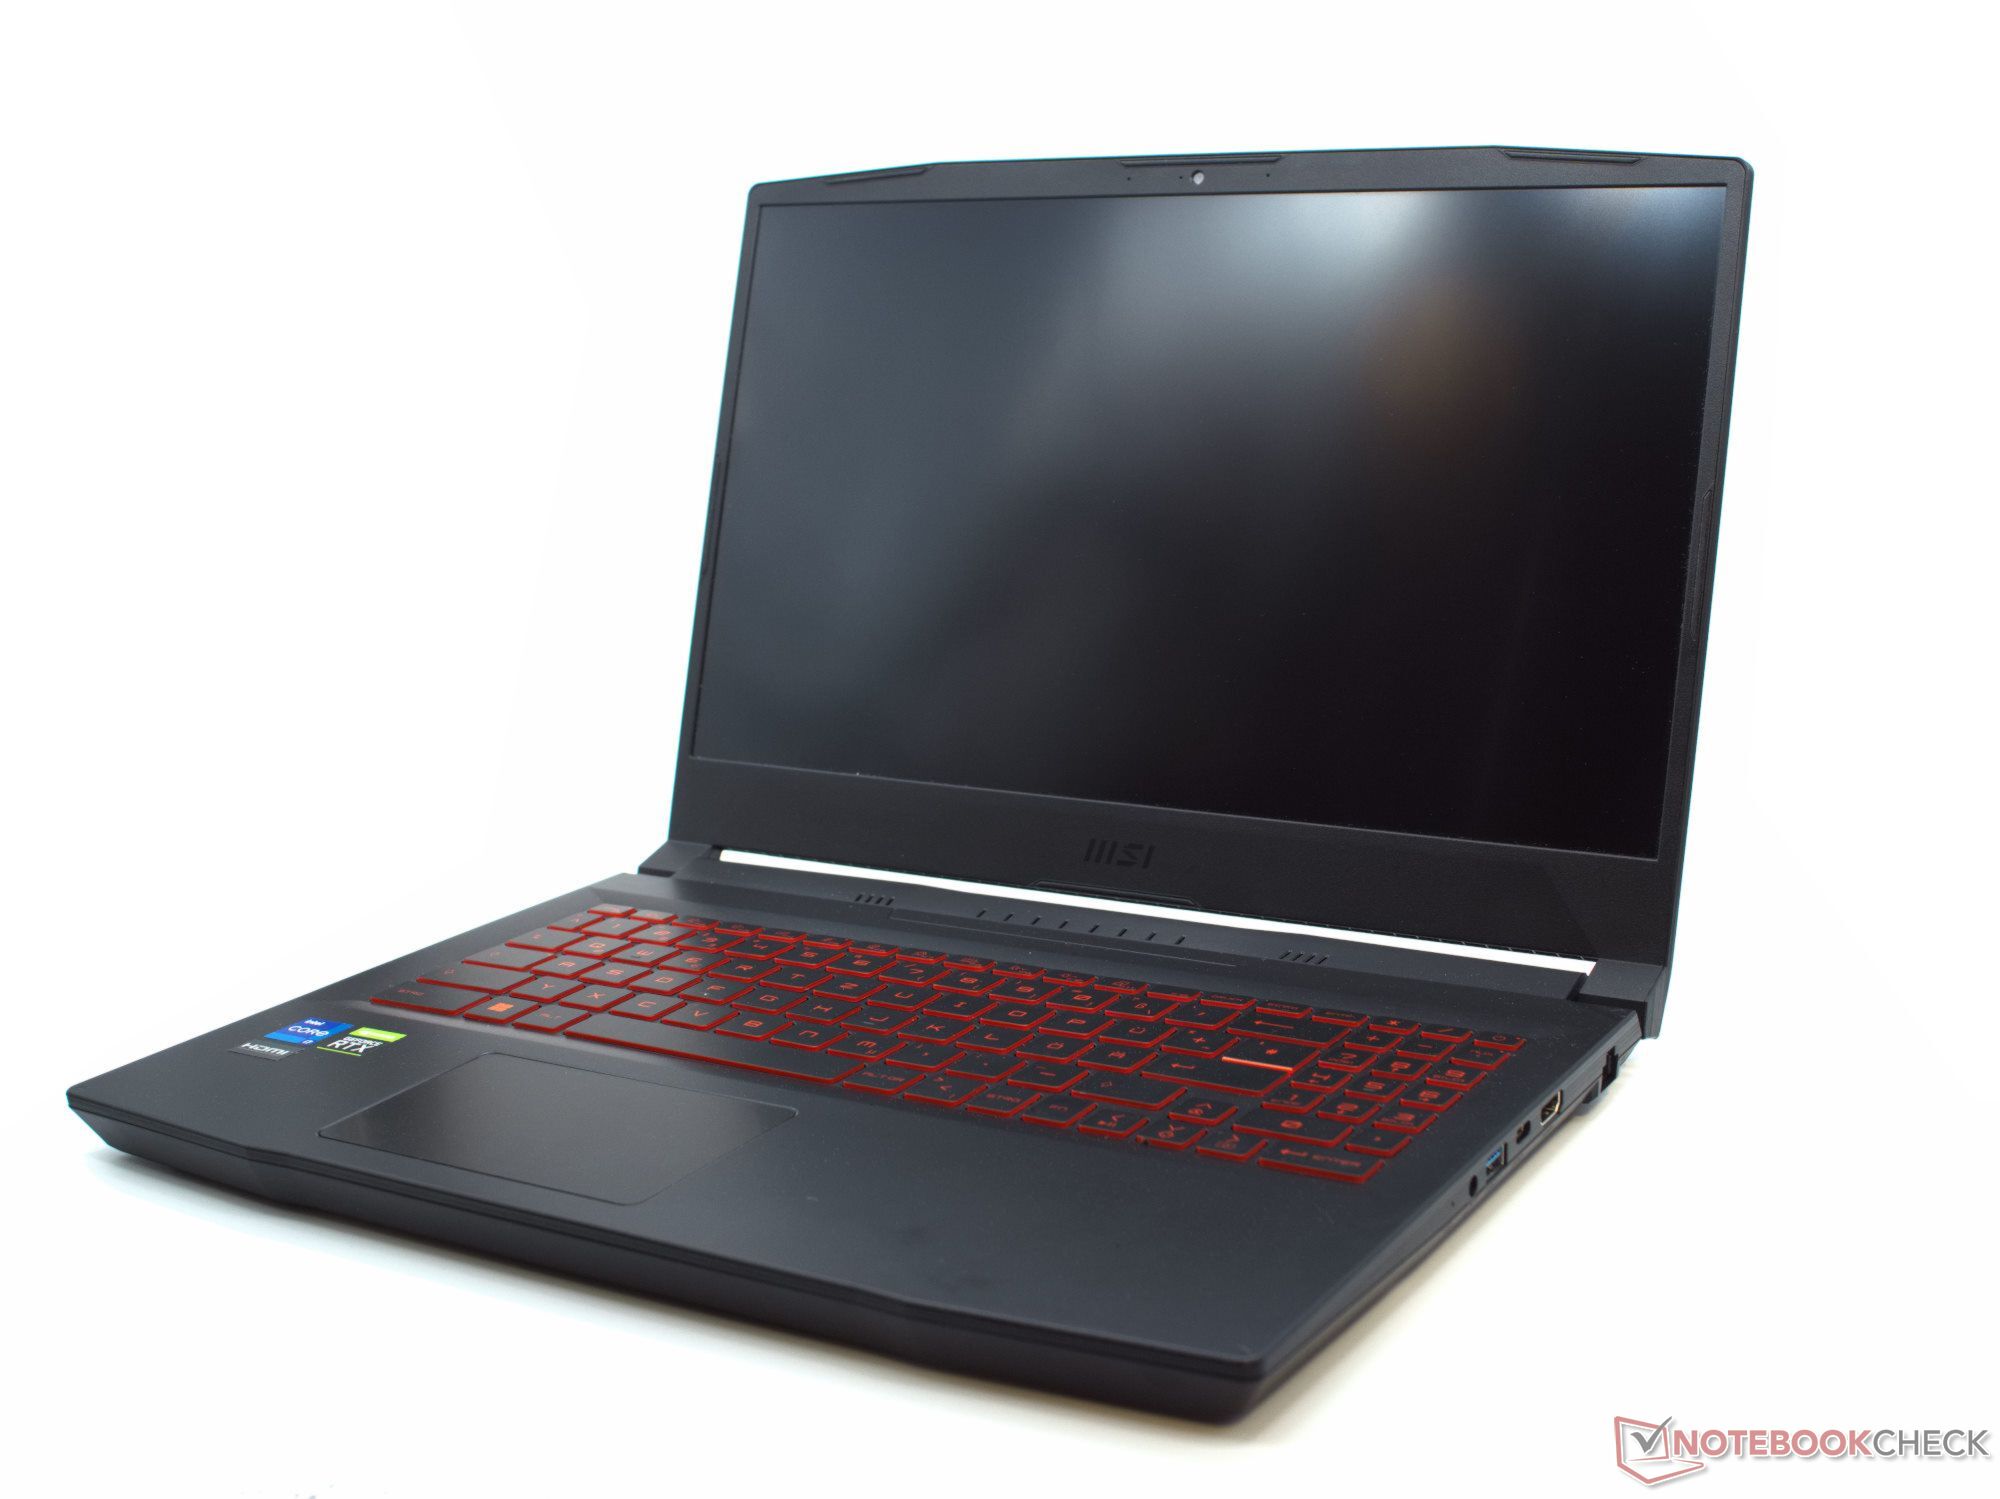
Input Devices - Nothing new here
The keyboard and touchpad of the gaming laptop show no changes compared to the competitor. The keys have a comfortable size, and the red background illumination of the keyboard can be adjusted without glare. Unfortunately, the size of the fairly small touchpad was not increased, but the touchpad responds to inputs flawlessly.
At this point, there are working drivers for all the function keys, so you can control the webcam, microphone, and MSI Center via key press, and the target cross overlay also works now, facilitating aiming in many games.
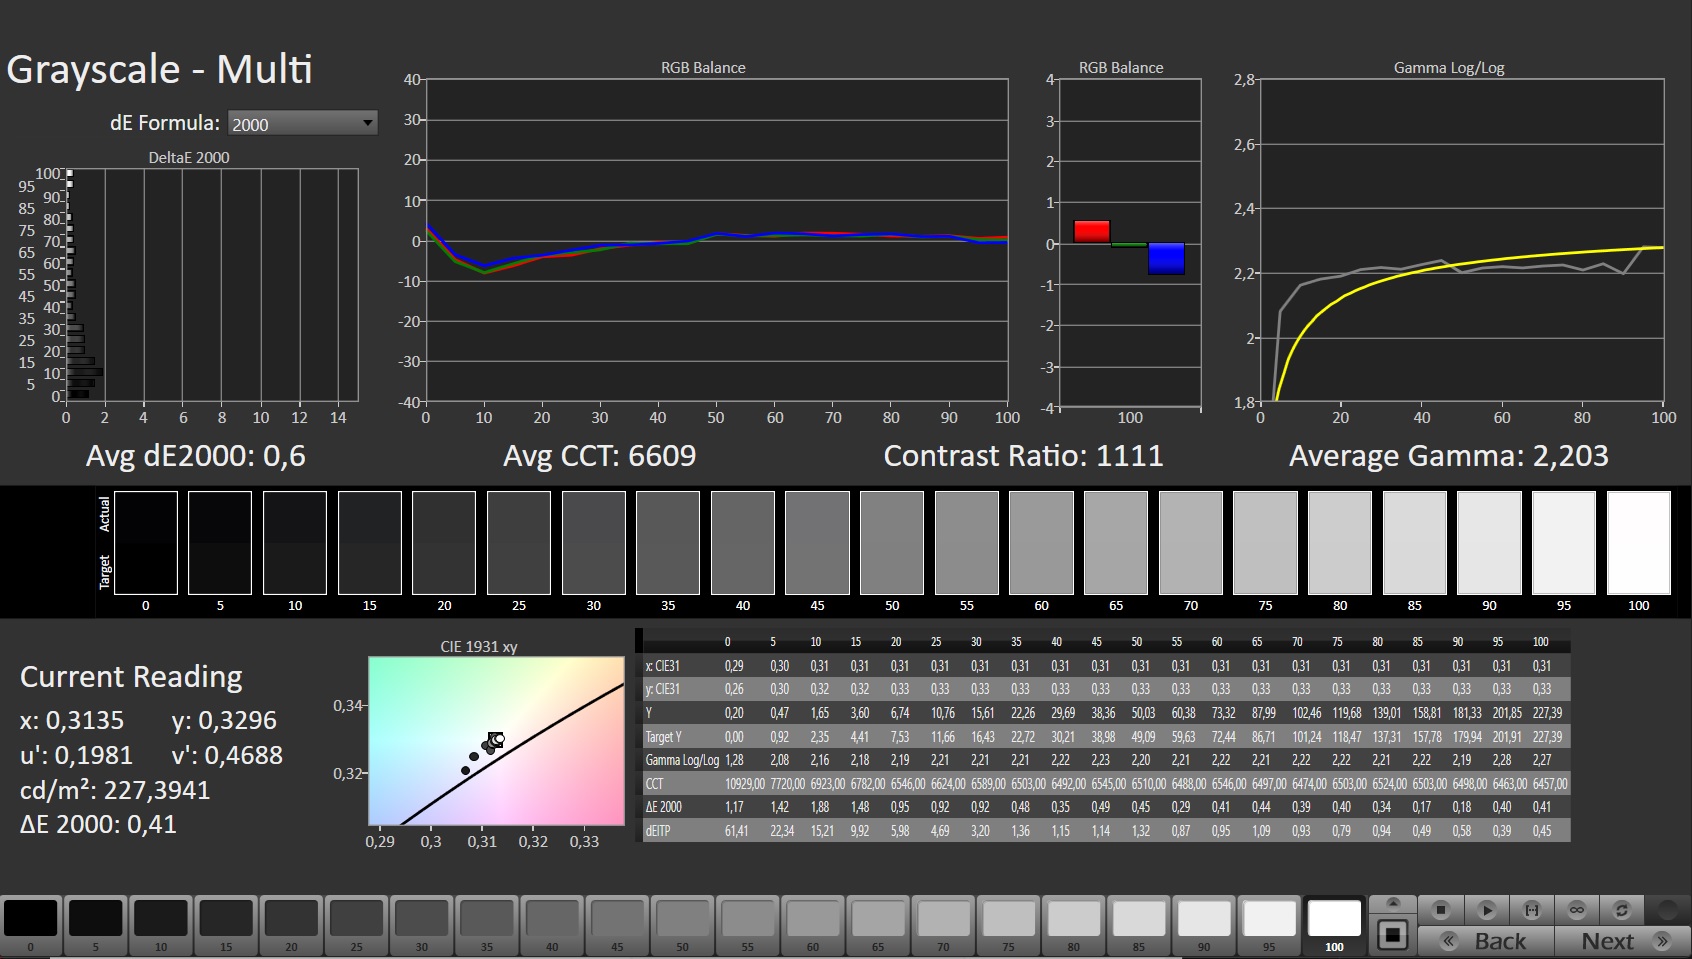
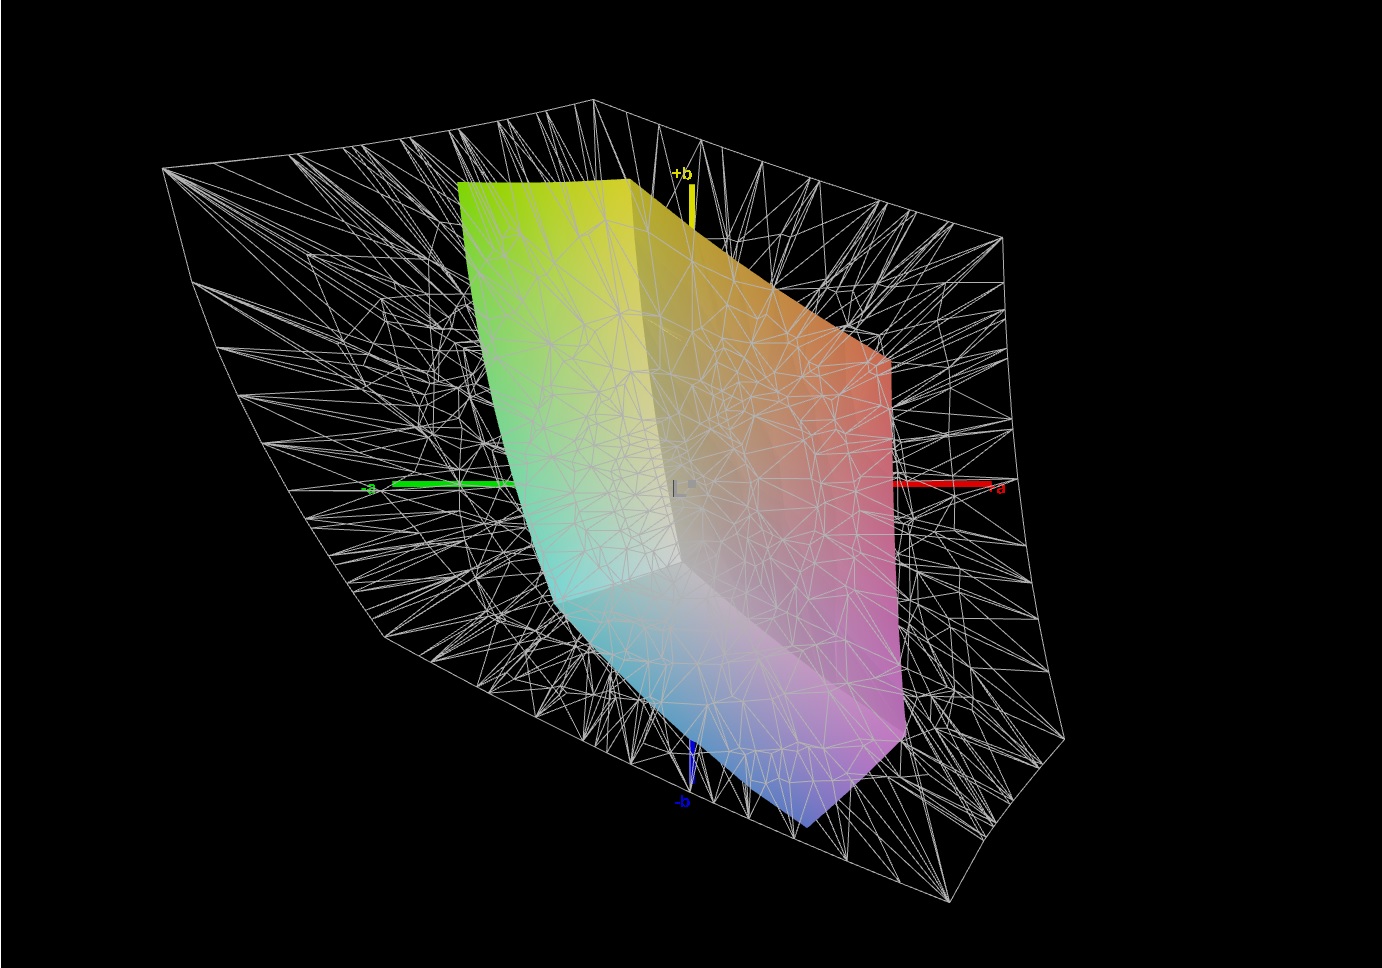
Display - MSI performs a clear downgrade here

The display of the GF66 12UGS is significantly worse than that of the GF66 11UG. While 144 Hz and a Full-HD resolution are adequate for a gaming laptop with the GeForce RTX 3070 Ti, the rest of the values of the panel don't support using it as a gaming monitor. At 58.3%, the sRGB color space coverage of the new AU Optronics panel is worse than that of the panel in the predecessor model; at an average of 225 cd/m², the brightness is worse; and the response times are also worse. MSI performed a clear downgrade here.
The contrast ratio of 1081:1 is good, but only the Asus TUF Gaming A15 has a lower value in our comparison field. Apart from the 144 Hz, the display of the gaming laptop offers values that are more appropriate for an office laptop.
| |||||||||||||||||||||||||
Brightness Distribution: 90 %
Center on Battery: 227 cd/m²
Contrast: 1081:1 (Black: 0.21 cd/m²)
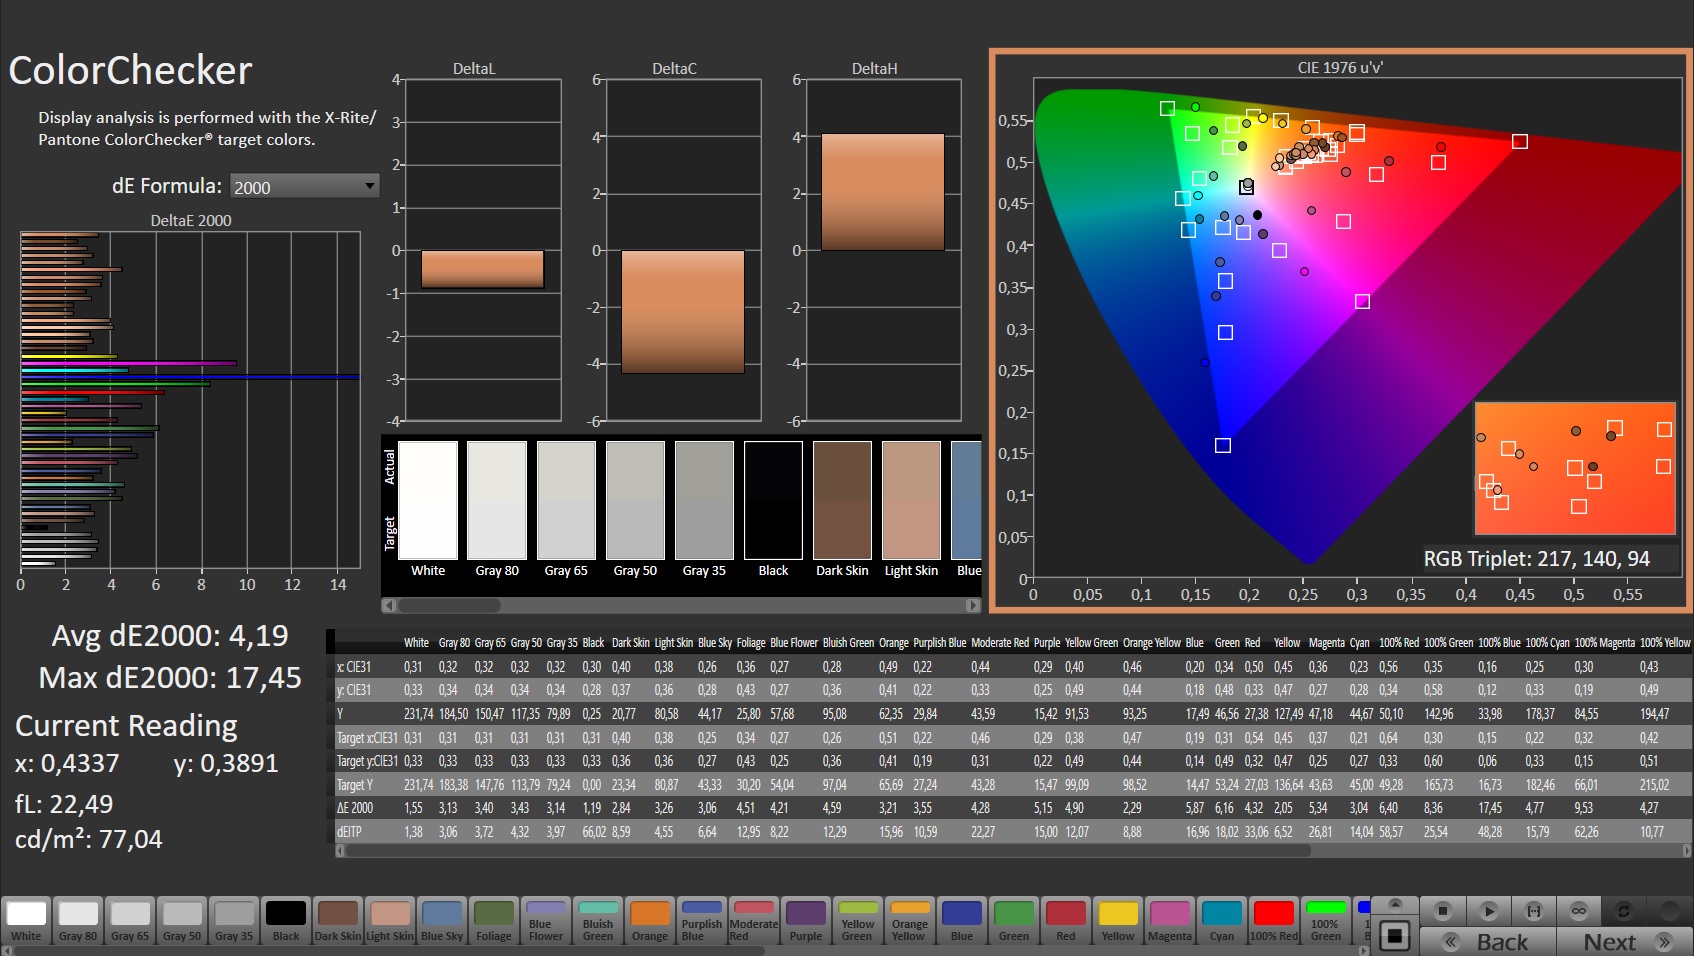
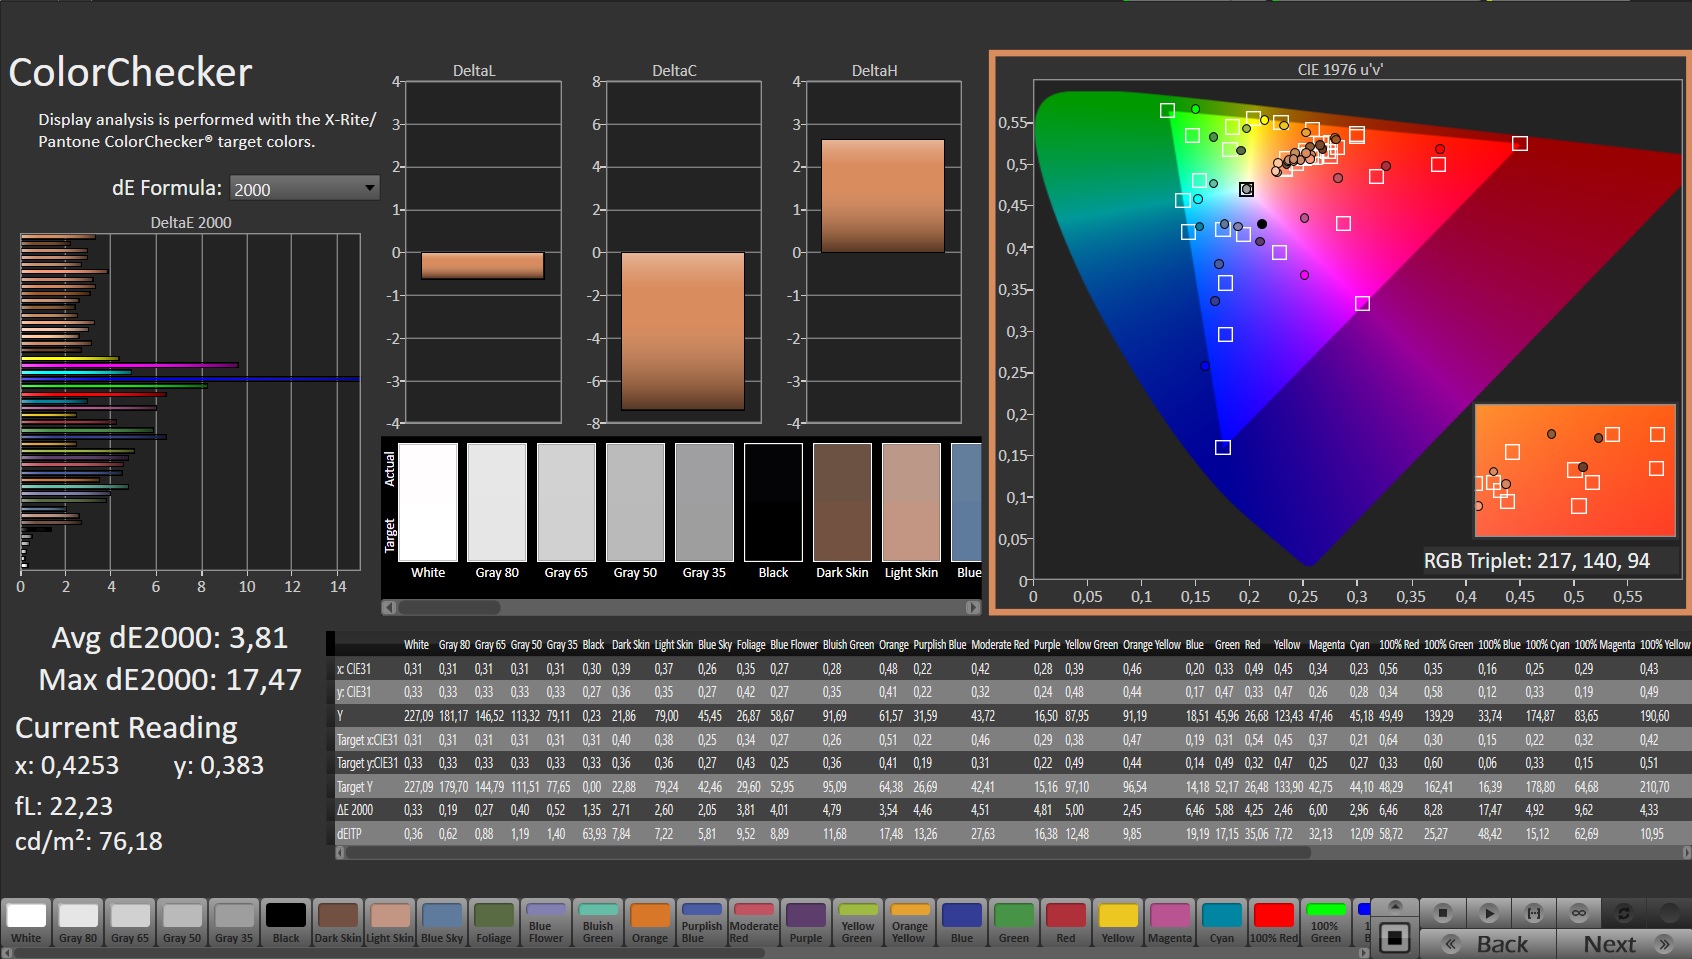
ΔE ColorChecker Calman: 4.19 | ∀{0.5-29.43 Ø4.73}
calibrated: 3.81
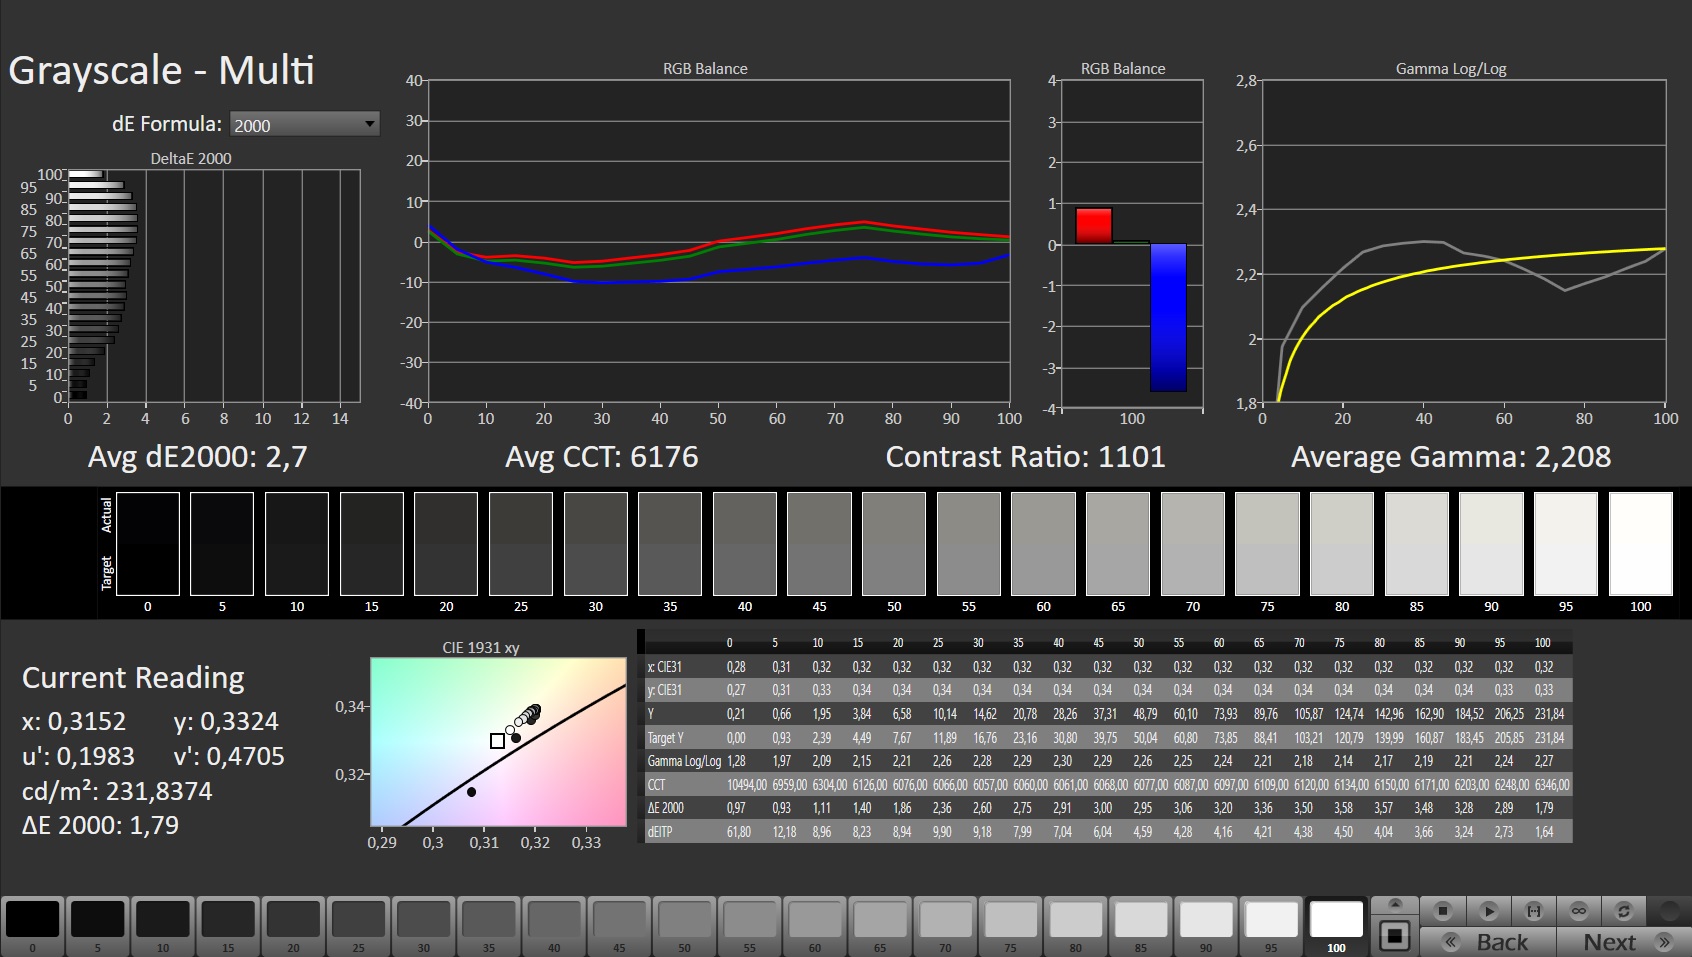
ΔE Greyscale Calman: 2.7 | ∀{0.09-98 Ø4.97}
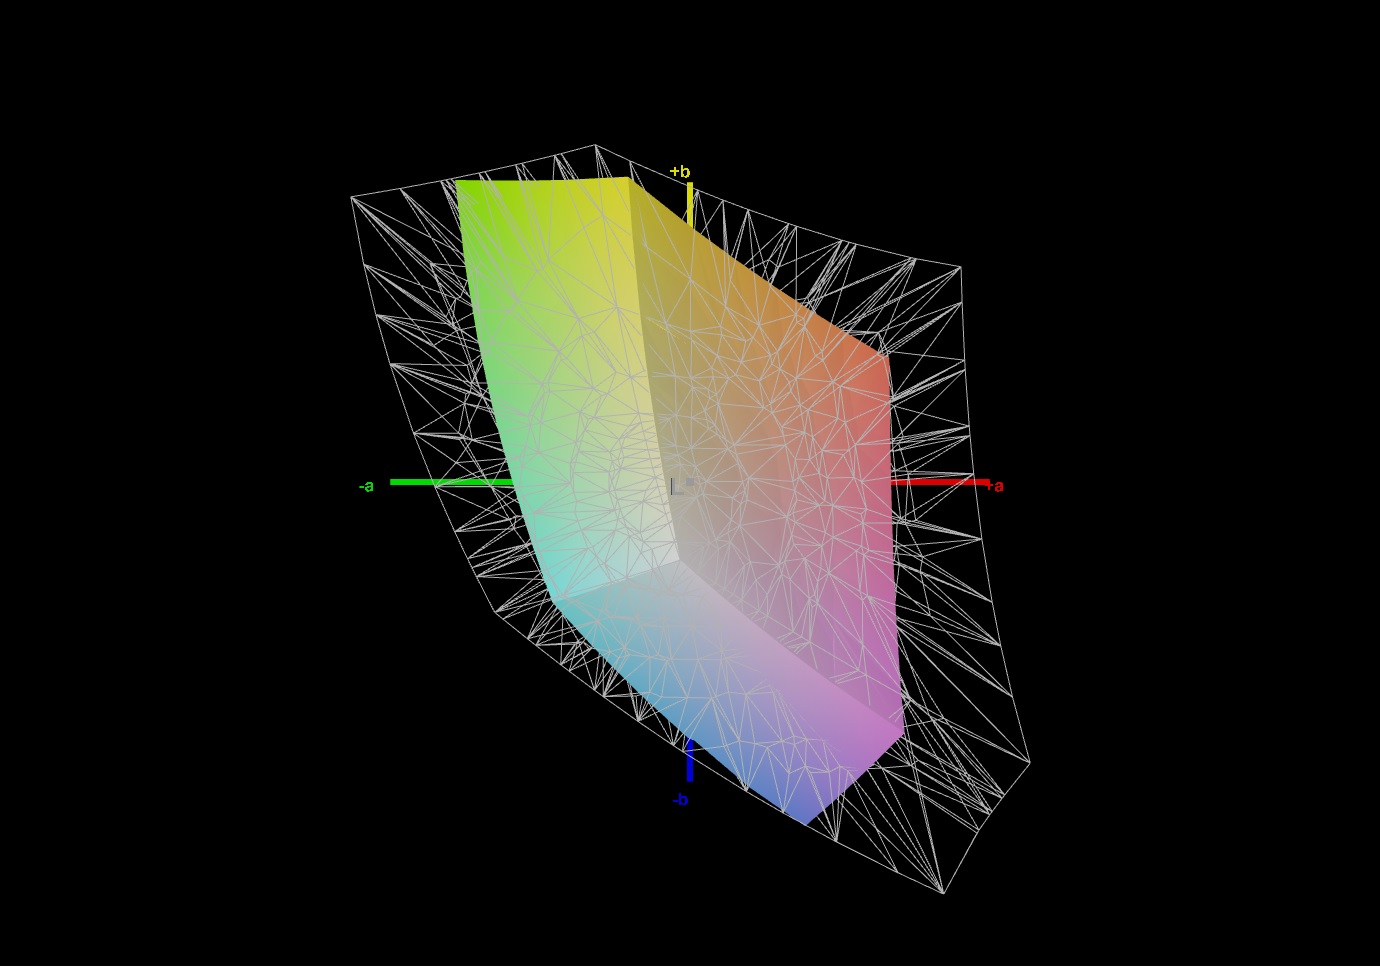
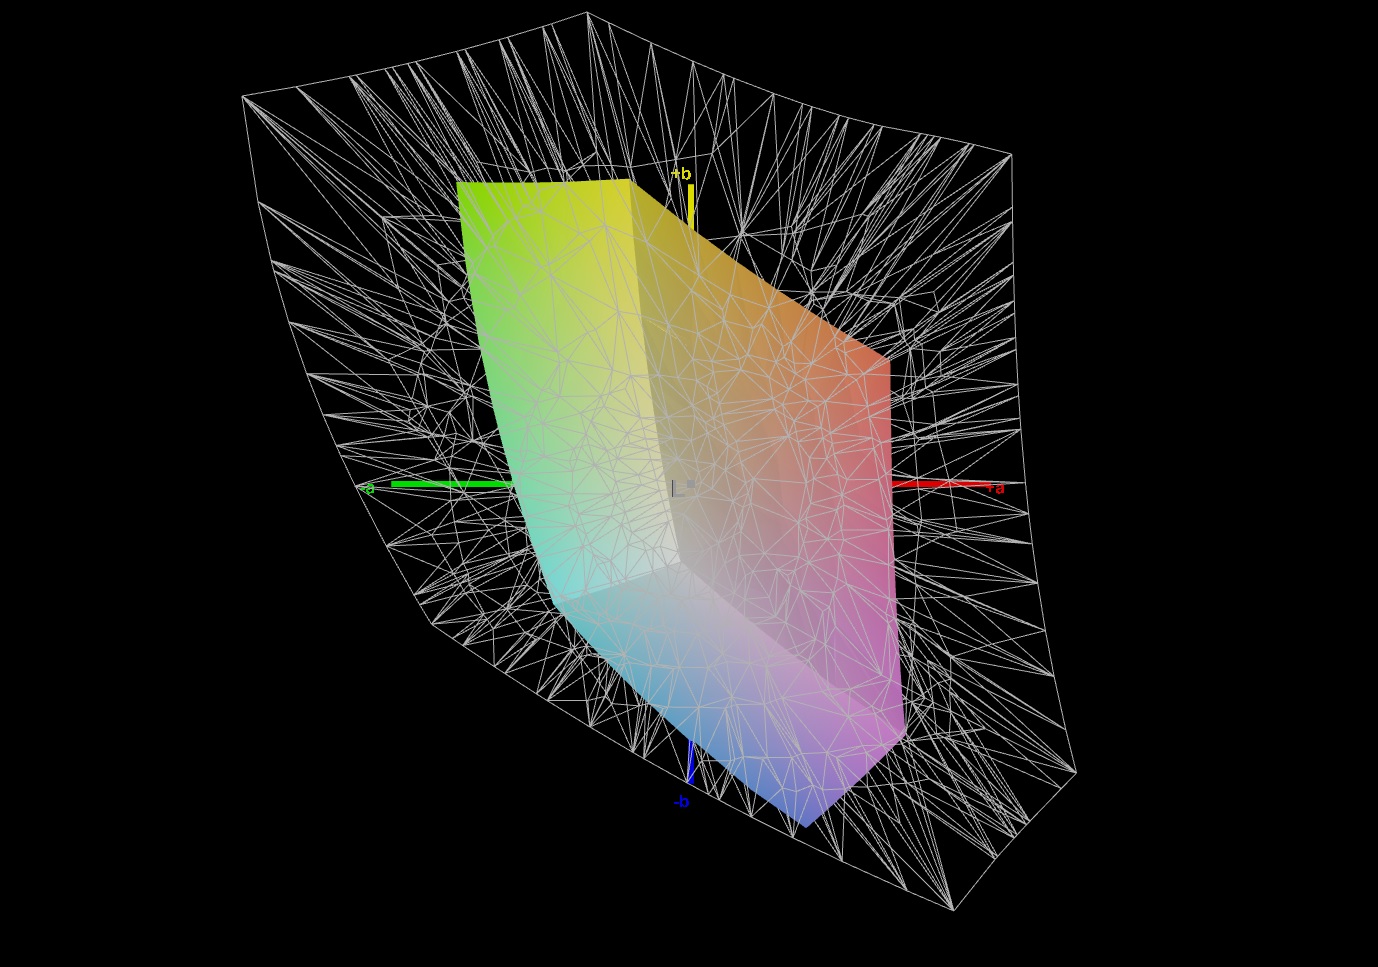
40.4% AdobeRGB 1998 (Argyll 3D)
58.3% sRGB (Argyll 3D)
39.1% Display P3 (Argyll 3D)
Gamma: 2.208
CCT: 6176 K
| MSI Katana GF66 12UGS AU Optronics AUOAF90, IPS, 1920x1080, 15.6" | MSI Katana GF66 11UG-220 AU Optronics B156HAN08.0, IPS, 1920x1080, 15.6" | MSI Katana GF76 12UGS AU Optronics B173HAN04.9, IPS, 1920x1080, 17.3" | Asus TUF Gaming F15 FX507ZM TL156VDXP0101, IPS, 1920x1080, 15.6" | Asus TUF Gaming A15 FA506QR-AZ061T Sharp SHP1532, IPS, 1920x1080, 15.6" | Acer Nitro 5 AN515-58-72QR Chi Mei N156KME-GNA, IPS, 2560x1440, 15.6" | Lenovo Legion 5 15ACH6A-82NW0010GE LGD06A5, IPS, 1920x1080, 15.6" | |
|---|---|---|---|---|---|---|---|
| Display | 63% | -1% | 69% | 109% | 77% | ||
| Display P3 Coverage (%) | 39.1 | 65.4 67% | 38.5 -2% | 66.4 70% | 95.6 145% | 71.1 82% | |
| sRGB Coverage (%) | 58.3 | 91.3 57% | 57.8 -1% | 97 66% | 99.8 71% | 99.1 70% | |
| AdobeRGB 1998 Coverage (%) | 40.4 | 66.7 65% | 39.8 -1% | 68.5 70% | 85.2 111% | 72.3 79% | |
| Response Times | 71% | 3% | 71% | 71% | 63% | 71% | |
| Response Time Grey 50% / Grey 80% * (ms) | 40 ? | 7.4 ? 81% | 40.6 ? -2% | 5.6 ? 86% | 12 ? 70% | 15.7 ? 61% | 15 ? 62% |
| Response Time Black / White * (ms) | 28.4 ? | 11.2 ? 61% | 26.4 ? 7% | 12.8 ? 55% | 8 ? 72% | 10.2 ? 64% | 6 ? 79% |
| PWM Frequency (Hz) | 1250 ? | ||||||
| Screen | 7% | 23% | 32% | 30% | 12% | 15% | |
| Brightness middle (cd/m²) | 227 | 307 35% | 281 24% | 353.7 56% | 297 31% | 332 46% | 371 63% |
| Brightness (cd/m²) | 225 | 321 43% | 264 17% | 340 51% | 268 19% | 303 35% | 328 46% |
| Brightness Distribution (%) | 90 | 83 -8% | 88 -2% | 89 -1% | 84 -7% | 86 -4% | 85 -6% |
| Black Level * (cd/m²) | 0.21 | 0.27 -29% | 0.2 5% | 0.34 -62% | 0.22 -5% | 0.29 -38% | 0.32 -52% |
| Contrast (:1) | 1081 | 1137 5% | 1405 30% | 1040 -4% | 1350 25% | 1145 6% | 1159 7% |
| Colorchecker dE 2000 * | 4.19 | 4.67 -11% | 3.69 12% | 1.74 58% | 1.36 68% | 3.61 14% | 3.25 22% |
| Colorchecker dE 2000 max. * | 17.45 | 7.53 57% | 8.46 52% | 3.63 79% | 3.82 78% | 7.71 56% | 6.33 64% |
| Colorchecker dE 2000 calibrated * | 3.81 | 2.41 37% | 3.61 5% | 0.5 87% | 0.59 85% | 1.11 71% | |
| Greyscale dE 2000 * | 2.7 | 4.5 -67% | 0.94 65% | 2.1 22% | 1.88 30% | 5.2 -93% | 4.94 -83% |
| Gamma | 2.208 100% | 2.276 97% | 2.42 91% | 2.3 96% | 2.48 89% | 2.155 102% | 2.45 90% |
| CCT | 6176 105% | 6824 95% | 6443 101% | 6257 104% | 6768 96% | 6724 97% | 6064 107% |
| Color Space (Percent of AdobeRGB 1998) (%) | 63 | ||||||
| Color Space (Percent of sRGB) (%) | 99 | ||||||
| Total Average (Program / Settings) | 47% /
28% | 8% /
15% | 57% /
45% | 51% /
38% | 61% /
40% | 54% /
36% |
* ... smaller is better
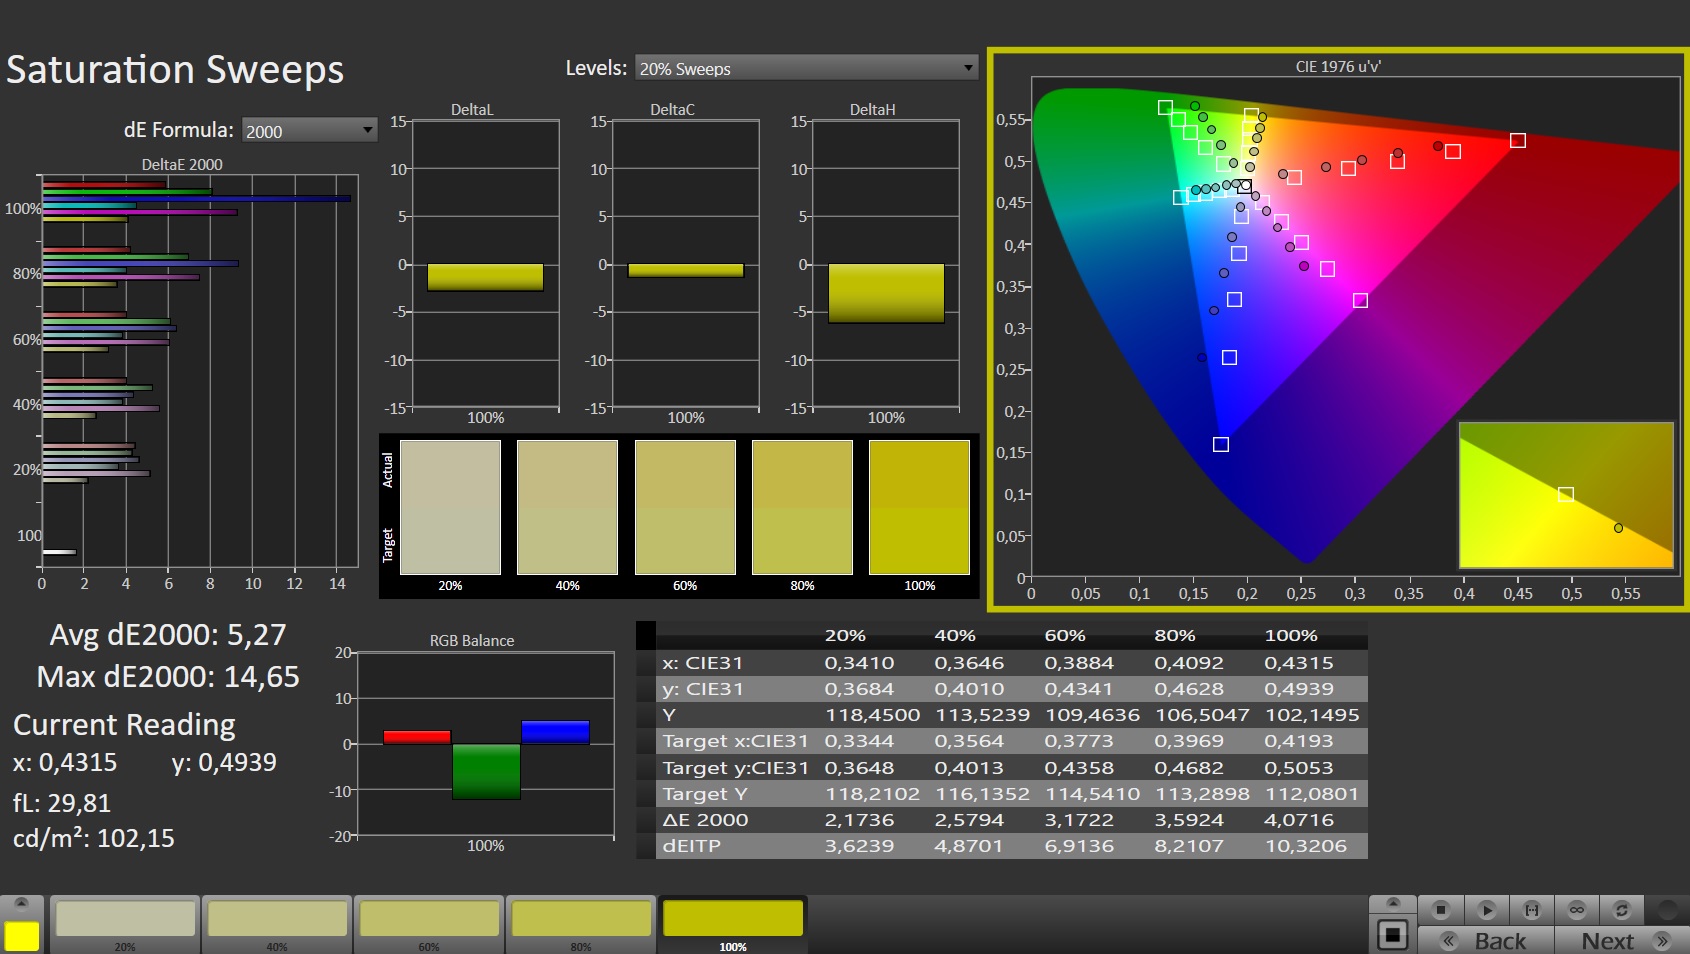
The color space coverage and color reproduction of the MSI Katana GF66 12UGS is unconvincing. Almost all the colors are outside the range for natural color reproduction, and you can even notice color deviations with your bare eyes. Due to the low color space coverage, even a calibration with CalMan and the X-Rite i1 Colorimeter will hardly bring any improvements.

Display Response Times
| ↔ Response Time Black to White | ||
|---|---|---|
| 28.4 ms ... rise ↗ and fall ↘ combined | ↗ 15.2 ms rise | 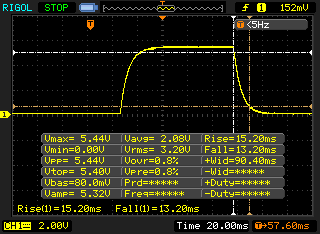 |
| ↘ 13.2 ms fall | ||
| The screen shows relatively slow response rates in our tests and may be too slow for gamers. In comparison, all tested devices range from 0.1 (minimum) to 240 (maximum) ms. » 75 % of all devices are better. This means that the measured response time is worse than the average of all tested devices (19.9 ms). | ||
| ↔ Response Time 50% Grey to 80% Grey | ||
| 40 ms ... rise ↗ and fall ↘ combined | ↗ 18.8 ms rise | 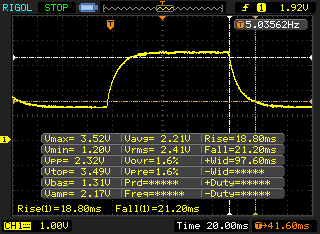 |
| ↘ 21.2 ms fall | ||
| The screen shows slow response rates in our tests and will be unsatisfactory for gamers. In comparison, all tested devices range from 0.165 (minimum) to 636 (maximum) ms. » 61 % of all devices are better. This means that the measured response time is worse than the average of all tested devices (31.1 ms). | ||
Screen Flickering / PWM (Pulse-Width Modulation)
| Screen flickering / PWM not detected | 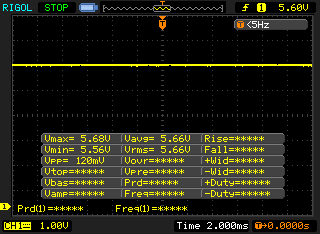 | ||
In comparison: 52 % of all tested devices do not use PWM to dim the display. If PWM was detected, an average of 7798 (minimum: 5 - maximum: 343500) Hz was measured. | |||
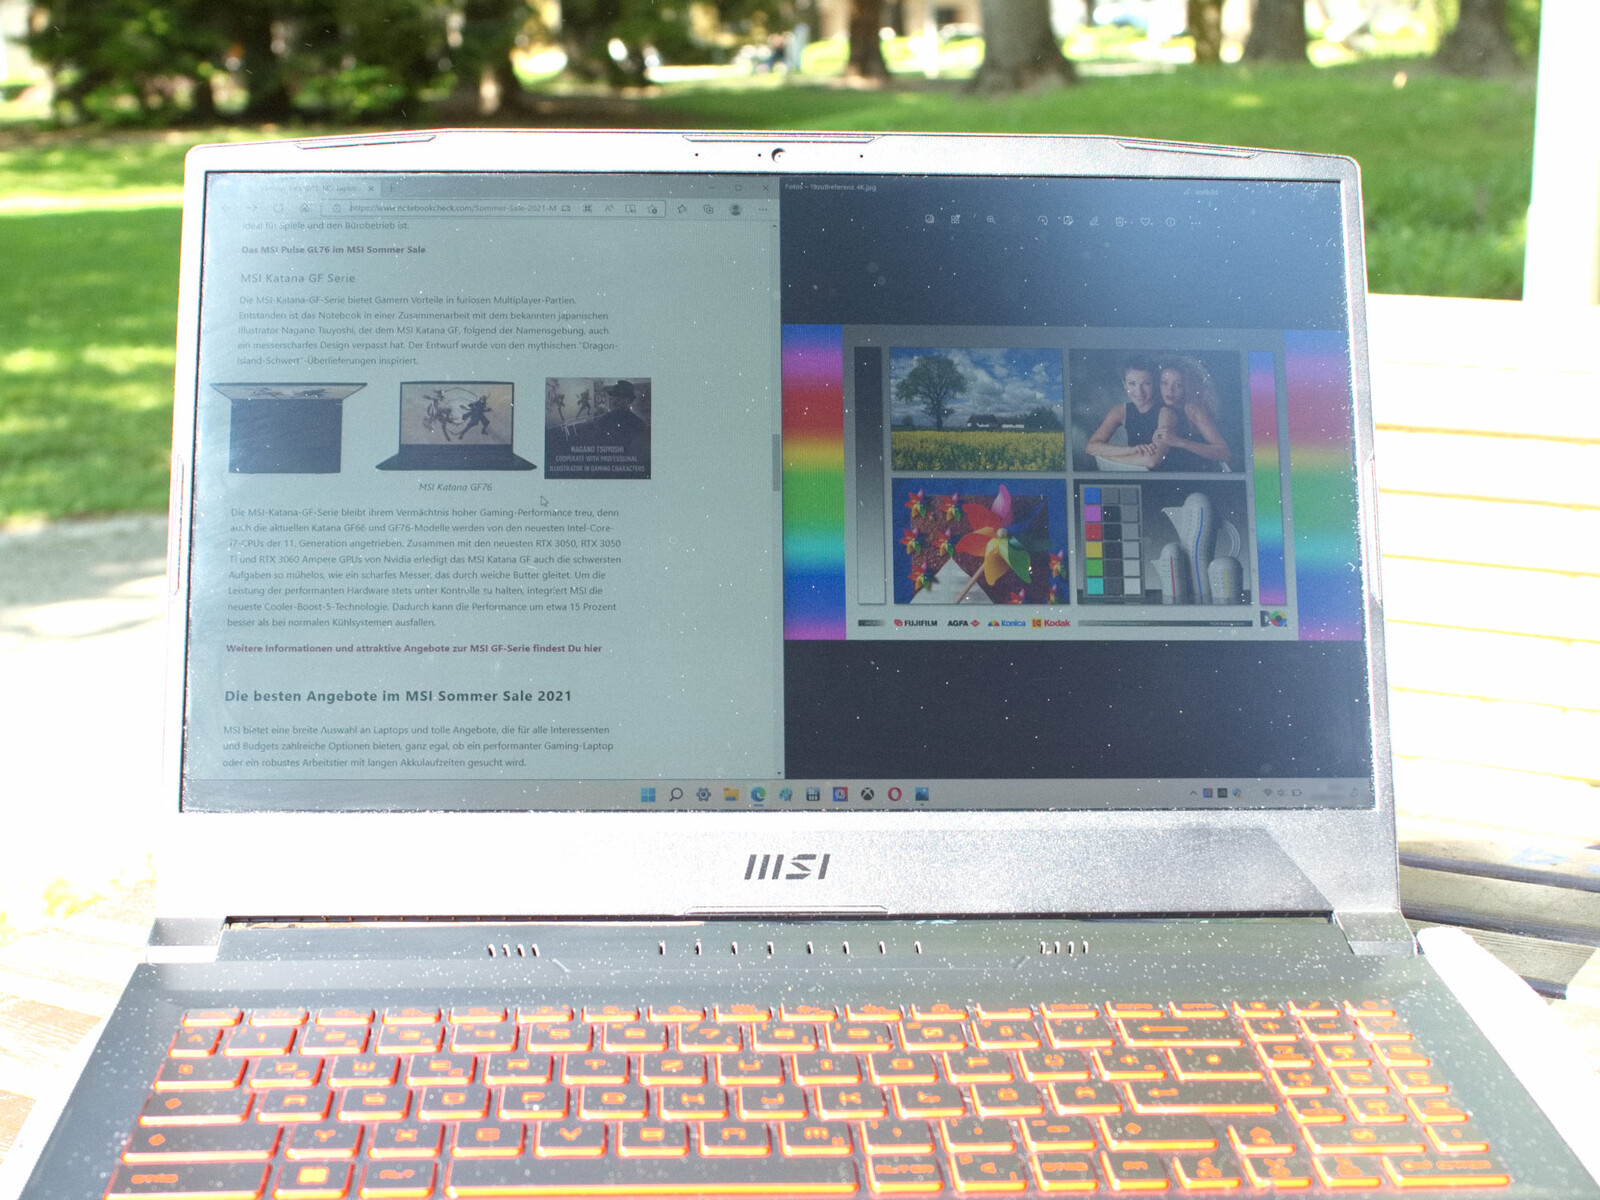
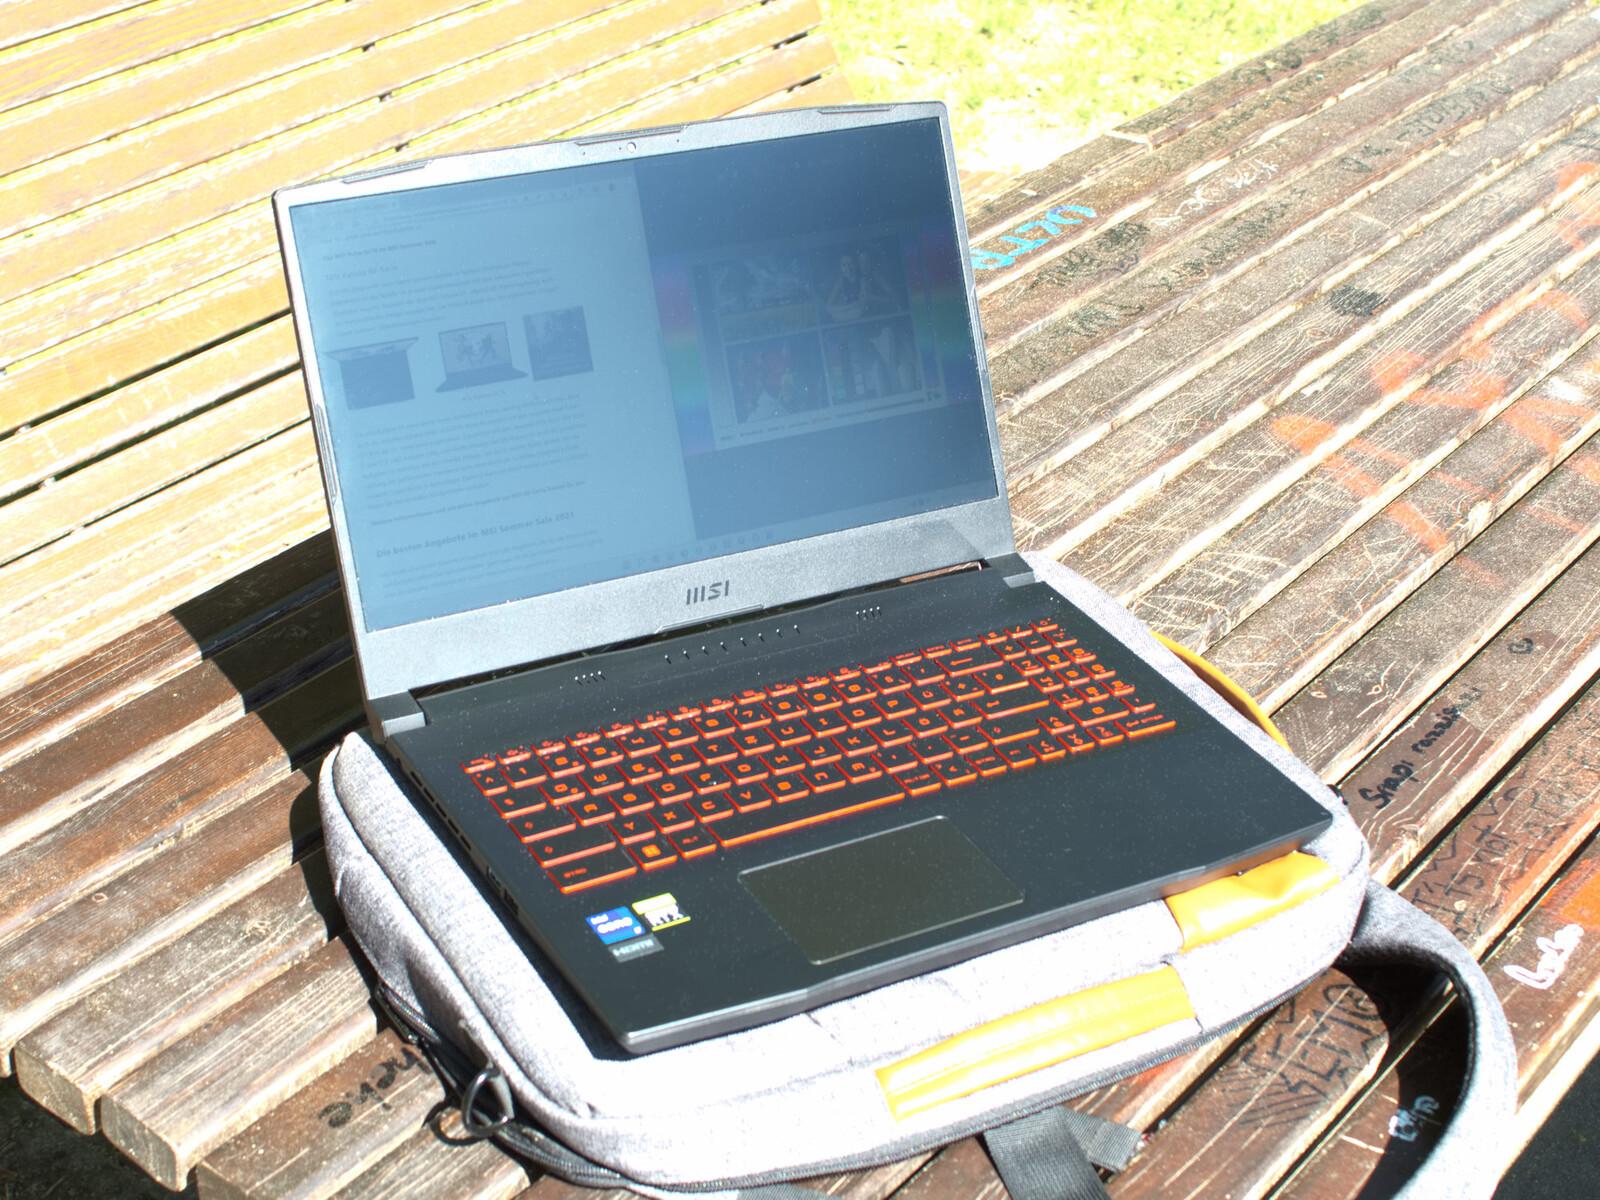
In bright sunlight, the image contents can only be read to a limited extent. To be able to read it easily, the display would have to offer a higher brightness.
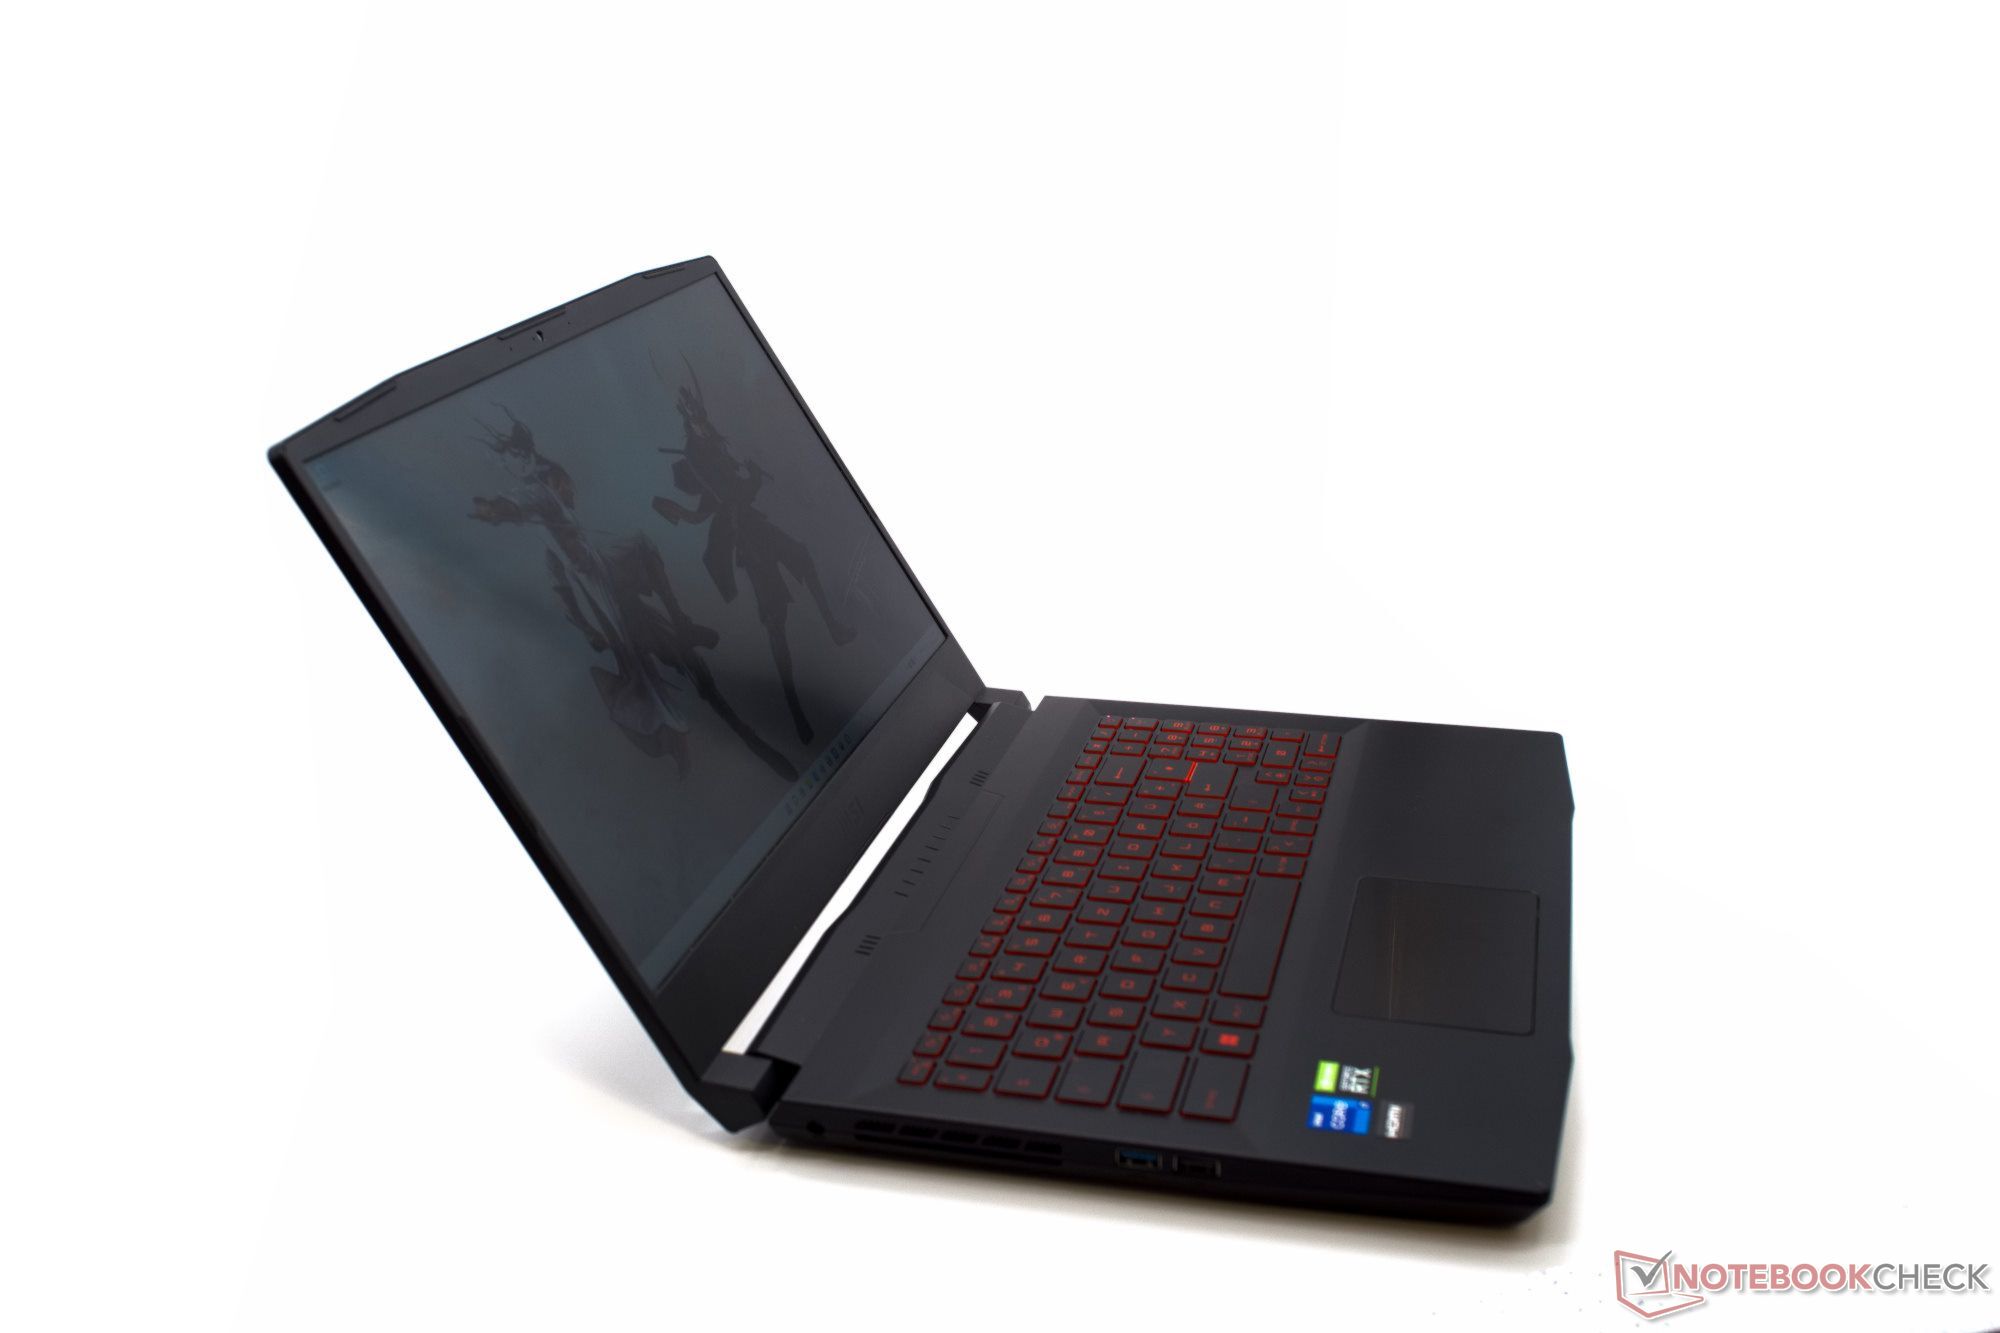
In the analysis of the viewing angles, the MSI GF66 12UGS does justice to the Wide View (IPS level) specification on the data sheet. There are only minimal deviations in the colors and contrast from all viewing angles. On the other hand, the perceived brightness drops relatively fast, but that this looks exaggerated in the camera image, though.

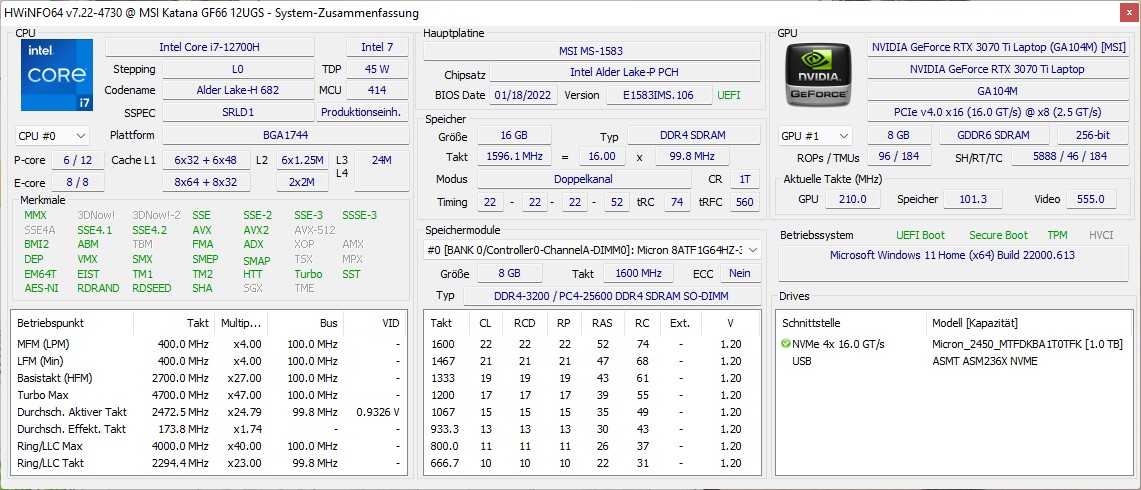
Performance - The current CPU generation
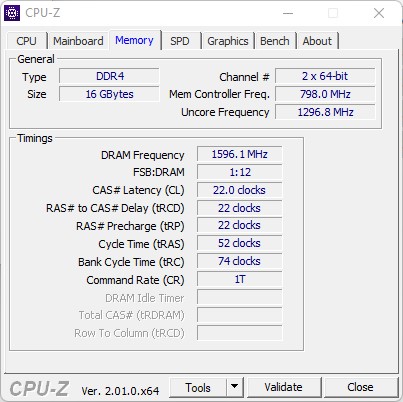
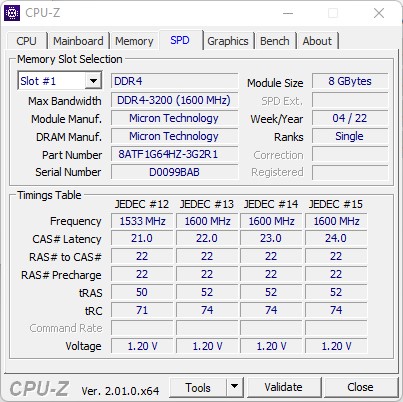
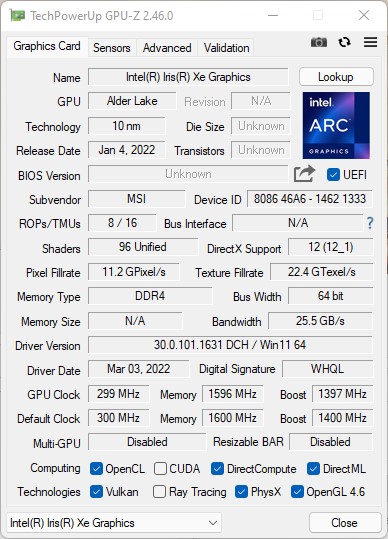
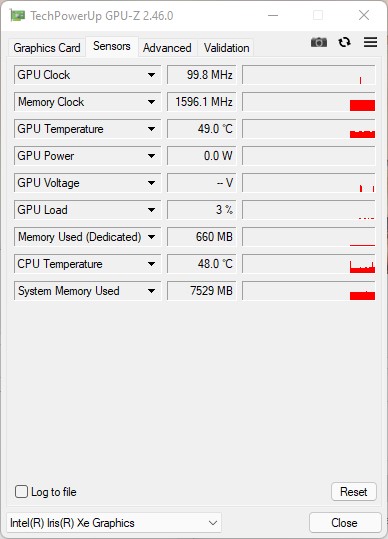
The MSI Katana GF66 12U gaming laptops are available in a wide variety of configurations. Either the Intel Core i5-12500H or the i7-12700H are available, as well as either 8 or 16 GB of DDR4-3200 working memory. MSI also offers various configurations of graphics chips starting from the Nvidia GeForce RTX 3050 up to the RTX 3070 Ti. In the preinstalled operating system, you also have the choice between FreeDos or Windows 11 Home.
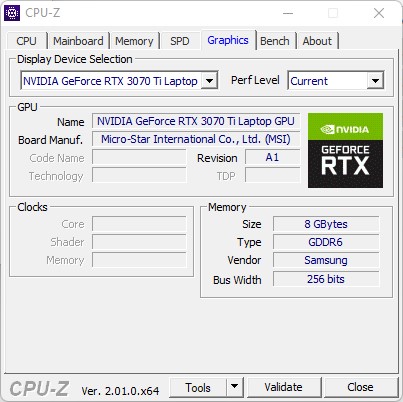
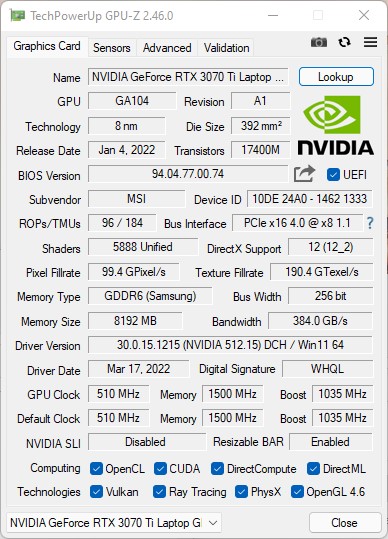
Our test unit offers a powerful configuration with the Nvidia GeForce RTX 3070 Ti, Intel Core i7-12700H, and 16 GB of RAM. With this, the laptop is clearly targeted towards gaming. Thanks to the powerful graphics card, even graphically demanding games can be played at high frame rates.
Test Conditions
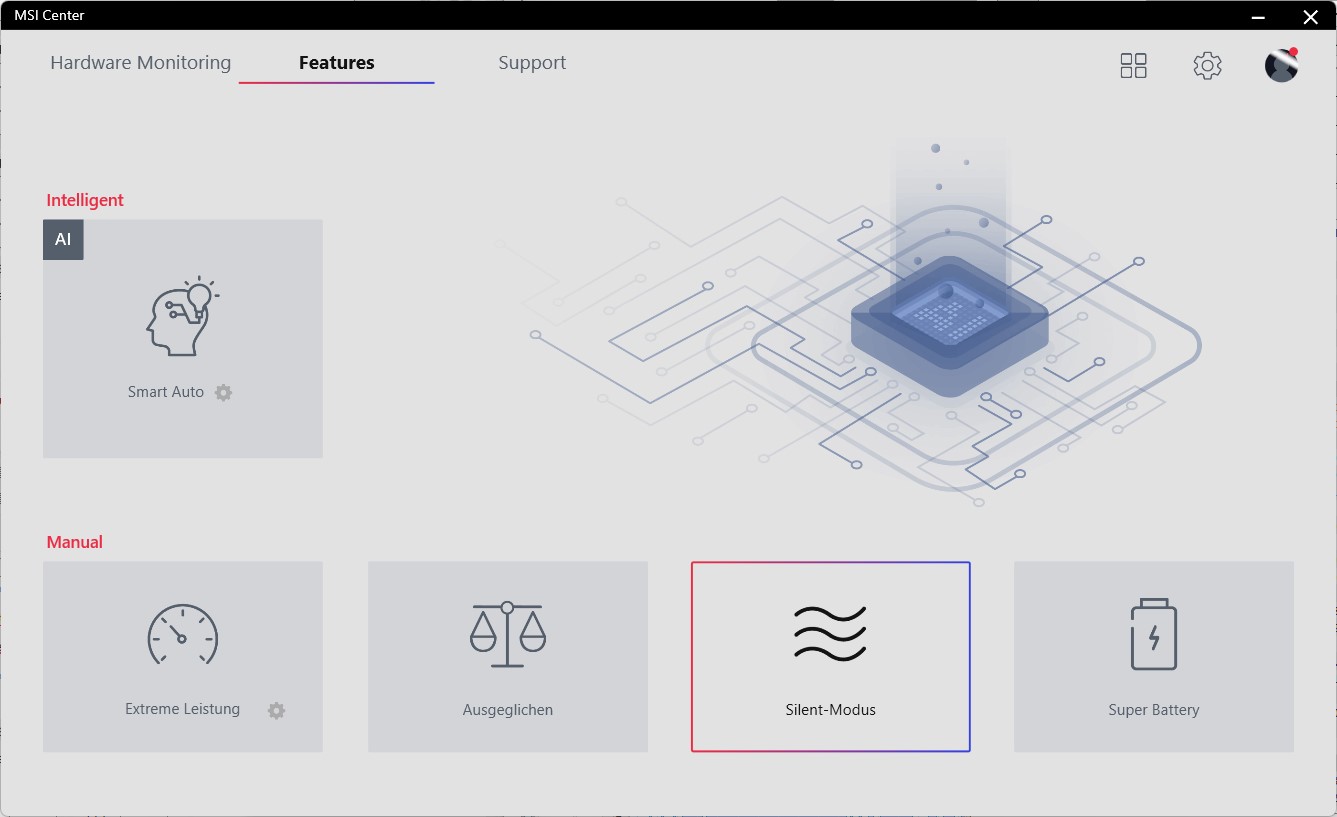
Thanks to the smart performance control, you basically don't really need to configure anything manually in the MSI Katana GF66. In this performance mode, the laptop automatically switches to one of the preinstalled modes between Silent and Extreme Performance.
The PL1 performance limits are between 85 and 23 watts. In battery operation, the PL1 can also be lowered to 13 watts in the Super Battery mode.
All the tests were performed in the Smart Auto performance mode. The long-term processor consumption lies at about 38 watts here, but the laptop is also able to increase this performance significantly during games or in other scenarios.
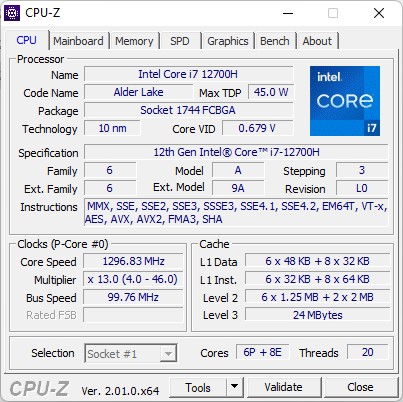
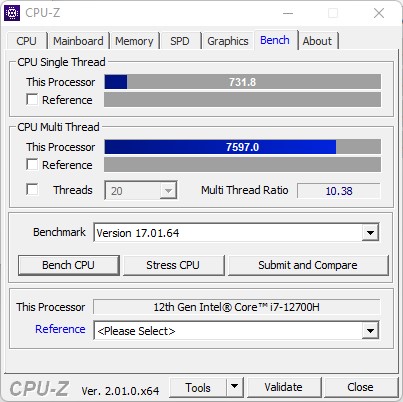
Processor
The Intel Core i7-12700H belongs to the high-end CPUs from the new Alder Lake generation. The processor offers six performance and eight efficiency cores. In this way, the CPU is able to operate on 20 threads. With a TDP configurable up to 45 watts in PL1, the processor is suitable for larger laptops with a powerful cooling system.
In our test, the Katana GF66 is able to show a significantly higher performance in some areas than its predecessor. Even in the AI performance mode, it surpasses its older sibling in most of the generic processor benchmarks. We tested the MSI Katana GF76, which is equipped with the same hardware, in the Extreme Performance mode. While that laptop shows a higher performance under longer load in this way, it performs at eye level in benchmarks with short-term loads. The comparison between the GF66 11U and GF66 12UGS is more interesting. In the fairly balanced AI mode, the Intel Core i7-12700H in the GF66 reaches about the same performance as its predecessor in the Extreme Performance mode.
Cinebench R15 Multi Constant Load Test
* ... smaller is better
AIDA64: FP32 Ray-Trace | FPU Julia | CPU SHA3 | CPU Queen | FPU SinJulia | FPU Mandel | CPU AES | CPU ZLib | FP64 Ray-Trace | CPU PhotoWorxx
| Performance rating | |
| Average of class Gaming | |
| Average Intel Core i7-12700H | |
| MSI Katana GF76 12UGS | |
| Asus TUF Gaming A15 FA506QR-AZ061T | |
| MSI Katana GF66 12UGS | |
| Lenovo Legion 5 15ACH6A-82NW0010GE | |
| Acer Nitro 5 AN515-58-72QR | |
| MSI Katana GF66 11UG-220 -9! | |
| AIDA64 / FP32 Ray-Trace | |
| Average of class Gaming (10227 - 85542, n=110, last 2 years) | |
| Asus TUF Gaming A15 FA506QR-AZ061T | |
| Lenovo Legion 5 15ACH6A-82NW0010GE | |
| Average Intel Core i7-12700H (2585 - 17957, n=64) | |
| MSI Katana GF66 12UGS | |
| MSI Katana GF76 12UGS | |
| Acer Nitro 5 AN515-58-72QR | |
| AIDA64 / FPU Julia | |
| Average of class Gaming (51376 - 238426, n=110, last 2 years) | |
| Lenovo Legion 5 15ACH6A-82NW0010GE | |
| Asus TUF Gaming A15 FA506QR-AZ061T | |
| Average Intel Core i7-12700H (12439 - 90760, n=64) | |
| Acer Nitro 5 AN515-58-72QR | |
| MSI Katana GF66 12UGS | |
| MSI Katana GF76 12UGS | |
| AIDA64 / CPU SHA3 | |
| Average of class Gaming (2180 - 9817, n=110, last 2 years) | |
| MSI Katana GF76 12UGS | |
| Average Intel Core i7-12700H (833 - 4242, n=64) | |
| MSI Katana GF66 12UGS | |
| Acer Nitro 5 AN515-58-72QR | |
| Lenovo Legion 5 15ACH6A-82NW0010GE | |
| Asus TUF Gaming A15 FA506QR-AZ061T | |
| AIDA64 / CPU Queen | |
| Average of class Gaming (49785 - 173351, n=101, last 2 years) | |
| MSI Katana GF76 12UGS | |
| MSI Katana GF66 12UGS | |
| Acer Nitro 5 AN515-58-72QR | |
| Average Intel Core i7-12700H (57923 - 103202, n=63) | |
| Asus TUF Gaming A15 FA506QR-AZ061T | |
| Lenovo Legion 5 15ACH6A-82NW0010GE | |
| AIDA64 / FPU SinJulia | |
| Average of class Gaming (4424 - 33636, n=110, last 2 years) | |
| Asus TUF Gaming A15 FA506QR-AZ061T | |
| Acer Nitro 5 AN515-58-72QR | |
| MSI Katana GF66 12UGS | |
| MSI Katana GF76 12UGS | |
| Average Intel Core i7-12700H (3249 - 9939, n=64) | |
| Lenovo Legion 5 15ACH6A-82NW0010GE | |
| AIDA64 / FPU Mandel | |
| Average of class Gaming (25115 - 128721, n=110, last 2 years) | |
| Lenovo Legion 5 15ACH6A-82NW0010GE | |
| Asus TUF Gaming A15 FA506QR-AZ061T | |
| Average Intel Core i7-12700H (7135 - 44760, n=64) | |
| Acer Nitro 5 AN515-58-72QR | |
| MSI Katana GF66 12UGS | |
| MSI Katana GF76 12UGS | |
| AIDA64 / CPU AES | |
| Average of class Gaming (39258 - 247074, n=110, last 2 years) | |
| Lenovo Legion 5 15ACH6A-82NW0010GE | |
| MSI Katana GF76 12UGS | |
| MSI Katana GF66 12UGS | |
| Average Intel Core i7-12700H (31839 - 144360, n=64) | |
| Asus TUF Gaming A15 FA506QR-AZ061T | |
| Acer Nitro 5 AN515-58-72QR | |
| AIDA64 / CPU ZLib | |
| Average of class Gaming (574 - 2531, n=110, last 2 years) | |
| Acer Nitro 5 AN515-58-72QR | |
| MSI Katana GF76 12UGS | |
| MSI Katana GF66 12UGS | |
| Average Intel Core i7-12700H (305 - 1171, n=64) | |
| Asus TUF Gaming A15 FA506QR-AZ061T | |
| Lenovo Legion 5 15ACH6A-82NW0010GE | |
| MSI Katana GF66 11UG-220 | |
| AIDA64 / FP64 Ray-Trace | |
| Average of class Gaming (5509 - 45446, n=110, last 2 years) | |
| Asus TUF Gaming A15 FA506QR-AZ061T | |
| Lenovo Legion 5 15ACH6A-82NW0010GE | |
| Average Intel Core i7-12700H (1437 - 9692, n=64) | |
| Acer Nitro 5 AN515-58-72QR | |
| MSI Katana GF76 12UGS | |
| MSI Katana GF66 12UGS | |
| AIDA64 / CPU PhotoWorxx | |
| Average of class Gaming (12271 - 89891, n=110, last 2 years) | |
| Average Intel Core i7-12700H (12863 - 52207, n=64) | |
| MSI Katana GF66 12UGS | |
| MSI Katana GF76 12UGS | |
| Acer Nitro 5 AN515-58-72QR | |
| Asus TUF Gaming A15 FA506QR-AZ061T | |
| Lenovo Legion 5 15ACH6A-82NW0010GE | |
System Performance
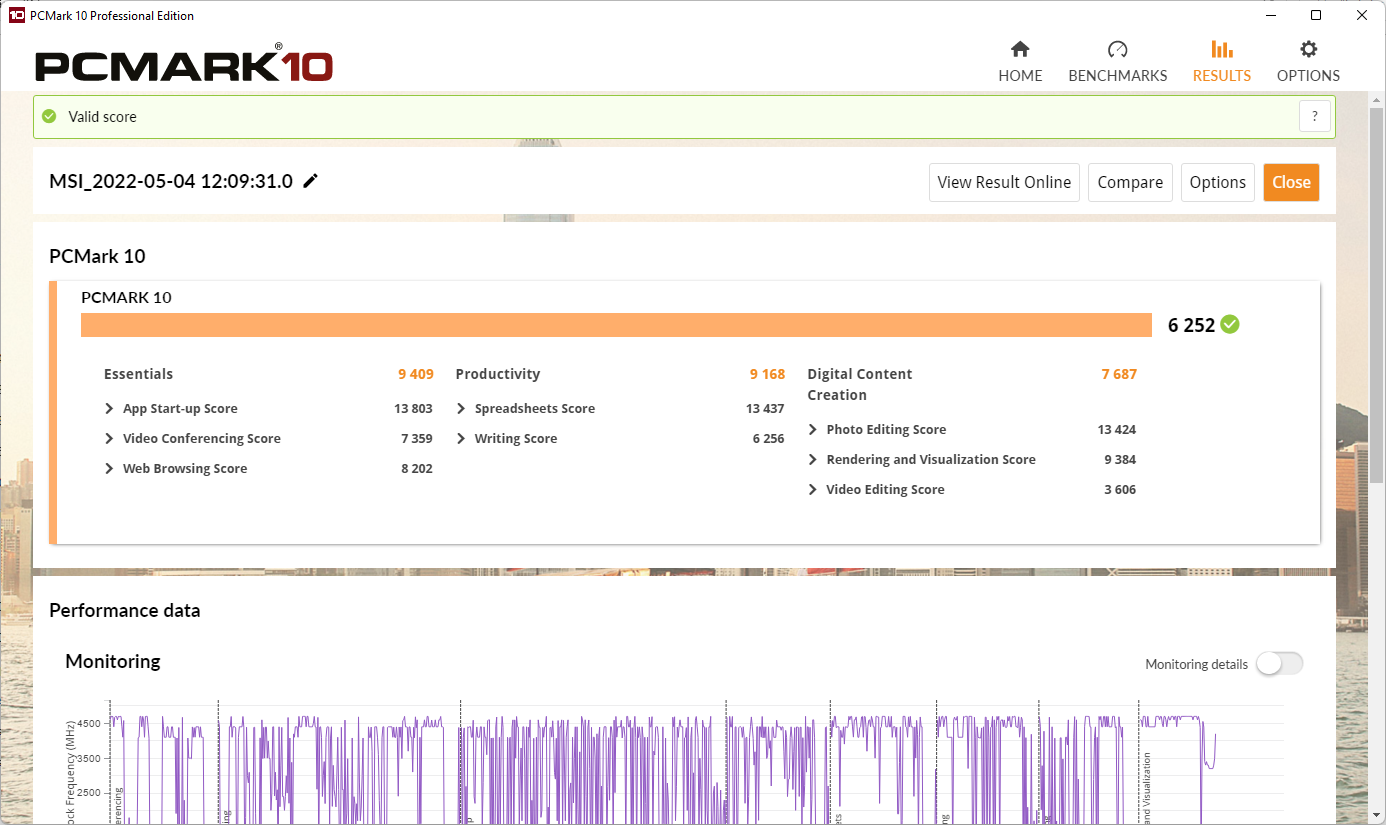
Even though the Katana GF66 is able to offer a solid performance in the PCMark10 and CrossMark benchmarks, it is unable to surpass all the competitors. The responsibility for this should lie mainly in the relatively slow working memory and the slightly limited TDP/TGP. The measured latency of the working memory turns out extremely high at 95.7 ns.
Despite battery operation, the MSI Katana GF66 is able to reach a relatively good value in PCMark 10, as an additional benchmark test shows. At 9409 and 9168 points in the Essentials and Productivity segments respectively, the gaming laptop achieves a high number of points even in battery operation.
CrossMark: Overall | Productivity | Creativity | Responsiveness
| PCMark 10 / Score | |
| Average of class Gaming (5828 - 11574, n=96, last 2 years) | |
| MSI Katana GF76 12UGS | |
| Average Intel Core i7-12700H, NVIDIA GeForce RTX 3070 Ti Laptop GPU (6941 - 7947, n=11) | |
| MSI Katana GF66 12UGS | |
| Asus TUF Gaming F15 FX507ZM | |
| Lenovo Legion 5 15ACH6A-82NW0010GE | |
| Acer Nitro 5 AN515-58-72QR | |
| Asus TUF Gaming A15 FA506QR-AZ061T | |
| MSI Katana GF66 11UG-220 | |
| PCMark 10 / Essentials | |
| MSI Katana GF76 12UGS | |
| Average of class Gaming (8810 - 12600, n=100, last 2 years) | |
| Average Intel Core i7-12700H, NVIDIA GeForce RTX 3070 Ti Laptop GPU (9892 - 10935, n=11) | |
| Lenovo Legion 5 15ACH6A-82NW0010GE | |
| Asus TUF Gaming F15 FX507ZM | |
| MSI Katana GF66 12UGS | |
| Asus TUF Gaming A15 FA506QR-AZ061T | |
| Acer Nitro 5 AN515-58-72QR | |
| MSI Katana GF66 11UG-220 | |
| PCMark 10 / Productivity | |
| Average of class Gaming (6845 - 18766, n=98, last 2 years) | |
| MSI Katana GF76 12UGS | |
| MSI Katana GF66 12UGS | |
| Average Intel Core i7-12700H, NVIDIA GeForce RTX 3070 Ti Laptop GPU (9024 - 10638, n=11) | |
| Asus TUF Gaming A15 FA506QR-AZ061T | |
| Lenovo Legion 5 15ACH6A-82NW0010GE | |
| MSI Katana GF66 11UG-220 | |
| Asus TUF Gaming F15 FX507ZM | |
| Acer Nitro 5 AN515-58-72QR | |
| PCMark 10 / Digital Content Creation | |
| Average of class Gaming (7602 - 19657, n=98, last 2 years) | |
| Asus TUF Gaming F15 FX507ZM | |
| Average Intel Core i7-12700H, NVIDIA GeForce RTX 3070 Ti Laptop GPU (10165 - 12546, n=11) | |
| MSI Katana GF66 12UGS | |
| MSI Katana GF76 12UGS | |
| Acer Nitro 5 AN515-58-72QR | |
| Lenovo Legion 5 15ACH6A-82NW0010GE | |
| MSI Katana GF66 11UG-220 | |
| Asus TUF Gaming A15 FA506QR-AZ061T | |
| CrossMark / Overall | |
| Average of class Gaming (1366 - 2409, n=98, last 2 years) | |
| MSI Katana GF66 12UGS | |
| MSI Katana GF76 12UGS | |
| Average Intel Core i7-12700H, NVIDIA GeForce RTX 3070 Ti Laptop GPU (974 - 2000, n=12) | |
| Acer Nitro 5 AN515-58-72QR | |
| CrossMark / Productivity | |
| MSI Katana GF66 12UGS | |
| MSI Katana GF76 12UGS | |
| Average of class Gaming (1386 - 2254, n=98, last 2 years) | |
| Average Intel Core i7-12700H, NVIDIA GeForce RTX 3070 Ti Laptop GPU (907 - 1962, n=12) | |
| Acer Nitro 5 AN515-58-72QR | |
| CrossMark / Creativity | |
| Average of class Gaming (1343 - 2729, n=98, last 2 years) | |
| MSI Katana GF66 12UGS | |
| Average Intel Core i7-12700H, NVIDIA GeForce RTX 3070 Ti Laptop GPU (1027 - 2057, n=12) | |
| Acer Nitro 5 AN515-58-72QR | |
| MSI Katana GF76 12UGS | |
| CrossMark / Responsiveness | |
| MSI Katana GF66 12UGS | |
| MSI Katana GF76 12UGS | |
| Average Intel Core i7-12700H, NVIDIA GeForce RTX 3070 Ti Laptop GPU (1029 - 2142, n=12) | |
| Average of class Gaming (1226 - 2334, n=98, last 2 years) | |
| Acer Nitro 5 AN515-58-72QR | |
| PCMark 10 Score | 7458 points | |
Help | ||
| AIDA64 / Memory Copy | |
| Average of class Gaming (21750 - 129946, n=110, last 2 years) | |
| Average Intel Core i7-12700H (25615 - 80511, n=64) | |
| Asus TUF Gaming F15 FX507ZM | |
| MSI Katana GF76 12UGS | |
| MSI Katana GF66 12UGS | |
| Acer Nitro 5 AN515-58-72QR | |
| Asus TUF Gaming A15 FA506QR-AZ061T | |
| Lenovo Legion 5 15ACH6A-82NW0010GE | |
| AIDA64 / Memory Read | |
| Average of class Gaming (22956 - 118858, n=110, last 2 years) | |
| Asus TUF Gaming F15 FX507ZM | |
| Average Intel Core i7-12700H (25586 - 79442, n=64) | |
| MSI Katana GF76 12UGS | |
| MSI Katana GF66 12UGS | |
| Asus TUF Gaming A15 FA506QR-AZ061T | |
| Acer Nitro 5 AN515-58-72QR | |
| Lenovo Legion 5 15ACH6A-82NW0010GE | |
| AIDA64 / Memory Write | |
| Average of class Gaming (22297 - 135096, n=110, last 2 years) | |
| Asus TUF Gaming F15 FX507ZM | |
| Average Intel Core i7-12700H (23679 - 88660, n=64) | |
| MSI Katana GF76 12UGS | |
| MSI Katana GF66 12UGS | |
| Acer Nitro 5 AN515-58-72QR | |
| Asus TUF Gaming A15 FA506QR-AZ061T | |
| Lenovo Legion 5 15ACH6A-82NW0010GE | |
| AIDA64 / Memory Latency | |
| Average of class Gaming (75.3 - 259, n=110, last 2 years) | |
| MSI Katana GF66 12UGS | |
| MSI Katana GF76 12UGS | |
| Lenovo Legion 5 15ACH6A-82NW0010GE | |
| Asus TUF Gaming A15 FA506QR-AZ061T | |
| Average Intel Core i7-12700H (76.2 - 133.9, n=62) | |
| MSI Katana GF66 11UG-220 | |
| MSI Katana GF66 11UG-220 | |
| Asus TUF Gaming F15 FX507ZM | |
| Acer Nitro 5 AN515-58-72QR | |
| Acer Nitro 5 AN515-58-72QR | |
* ... smaller is better
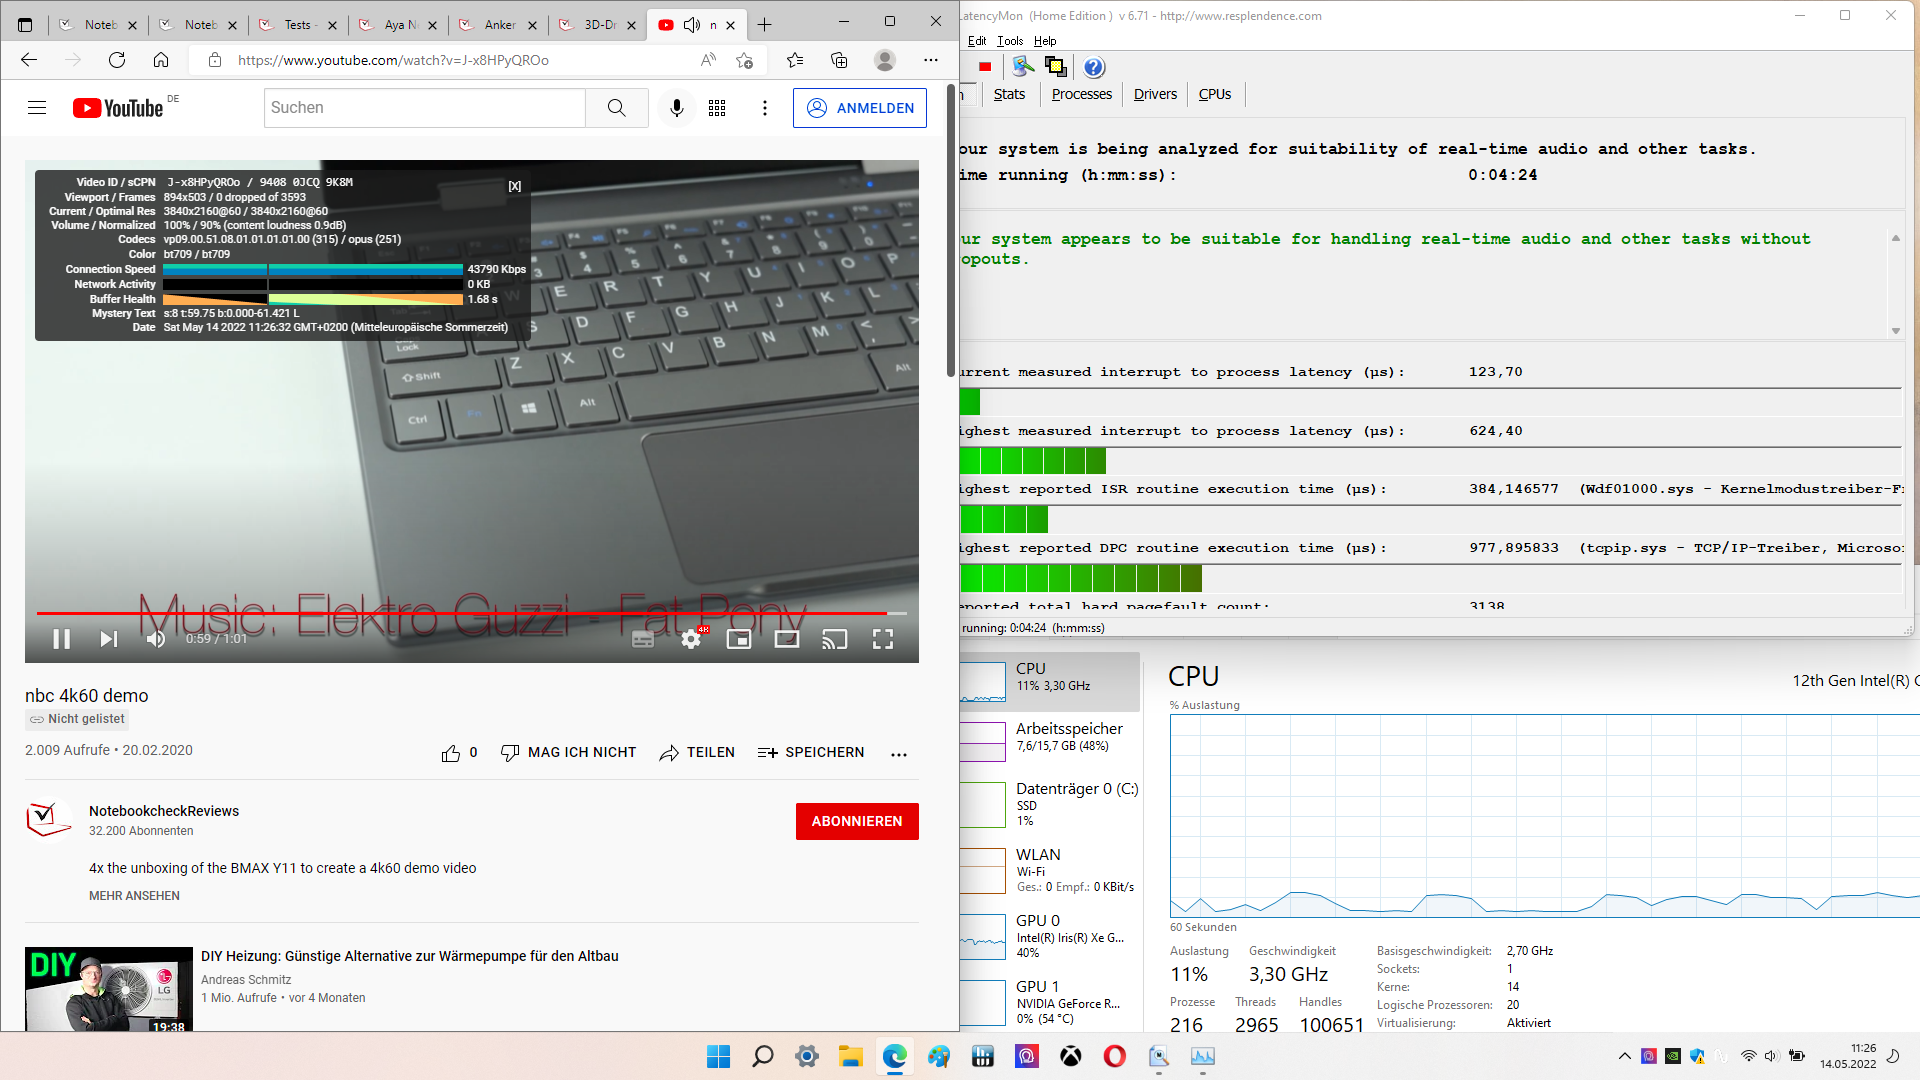
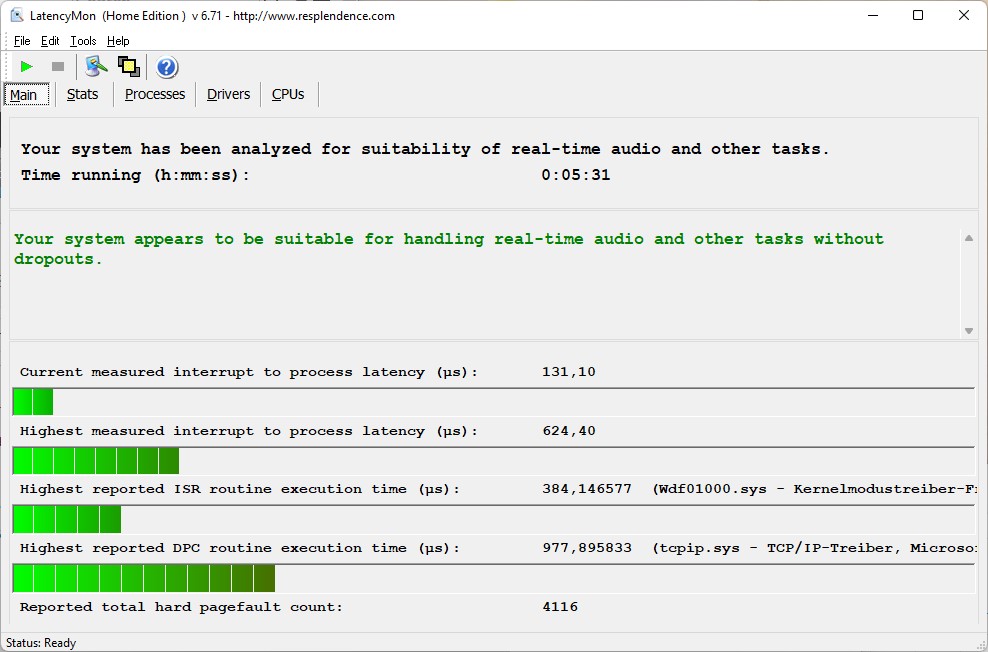
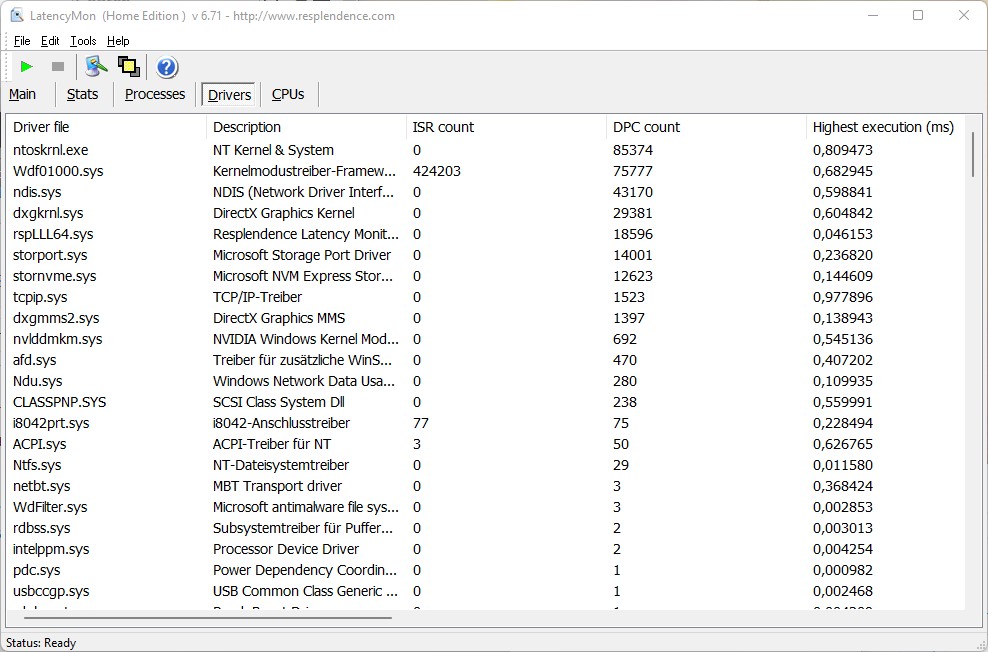
DPC Latencies
The latencies when running time-critical procedures are relatively low, so that the Katana GF66 in the configuration of our test unit should also be suited for real-time applications. In the 4K 60Hz Youtube test video, there were no dropped frames. Driver updates and other factors may influence the values significantly here.
| DPC Latencies / LatencyMon - interrupt to process latency (max), Web, Youtube, Prime95 | |
| MSI Katana GF76 12UGS | |
| Asus TUF Gaming A15 FA506QR-AZ061T | |
| MSI Katana GF66 11UG-220 | |
| Lenovo Legion 5 15ACH6A-82NW0010GE | |
| Acer Nitro 5 AN515-58-72QR | |
| MSI Katana GF66 12UGS | |
* ... smaller is better
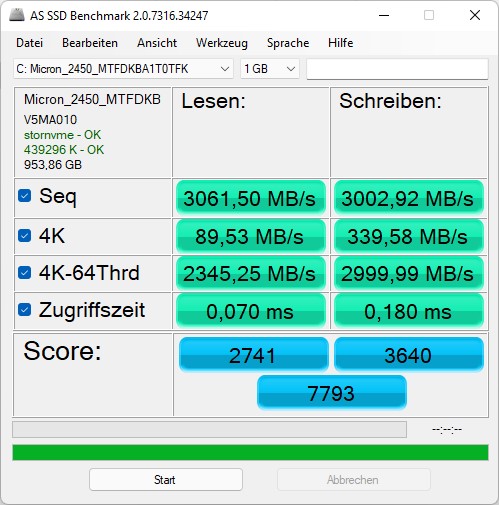
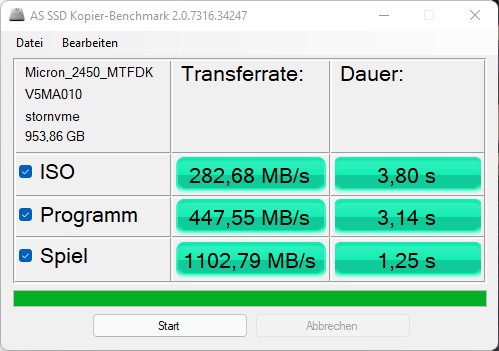
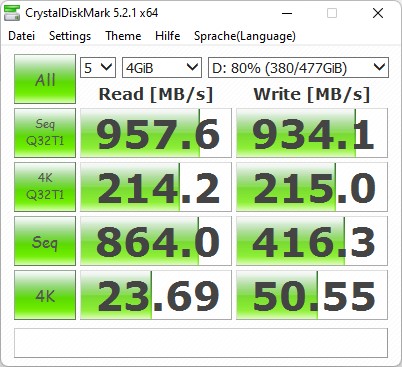
Storage Solution
Even though the Micron 2450 NVMe SSD with 1 TB of storage used here is able to achieve one of the top places in our comparison field, it places more in the middle of the field in our table of SSDs and HDDs. While the results in the single storage benchmarks are good, they are not outstanding.

* ... smaller is better
Constant Performance Reading: DiskSpd Read Loop, Queue Depth 8
Graphics Card
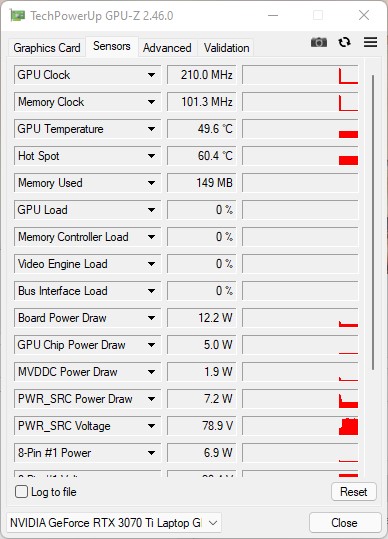
As one of the most powerful laptop graphics cards, the Nvidia Geforce RTX 3070 Ti is able to achieve high frame rates in many games. However, in our test unit, the performance of the graphics card is heavily limited, since the RTX 3070 Ti only runs at around 90 watts over a longer time period. This becomes particularly clear in the Time Spy benchmark, where the performance is about 600 points below the average of all devices with similar hardware. But in our comparison to the competitors from the same price segment, the MSI gaming laptop still delivers powerful results.
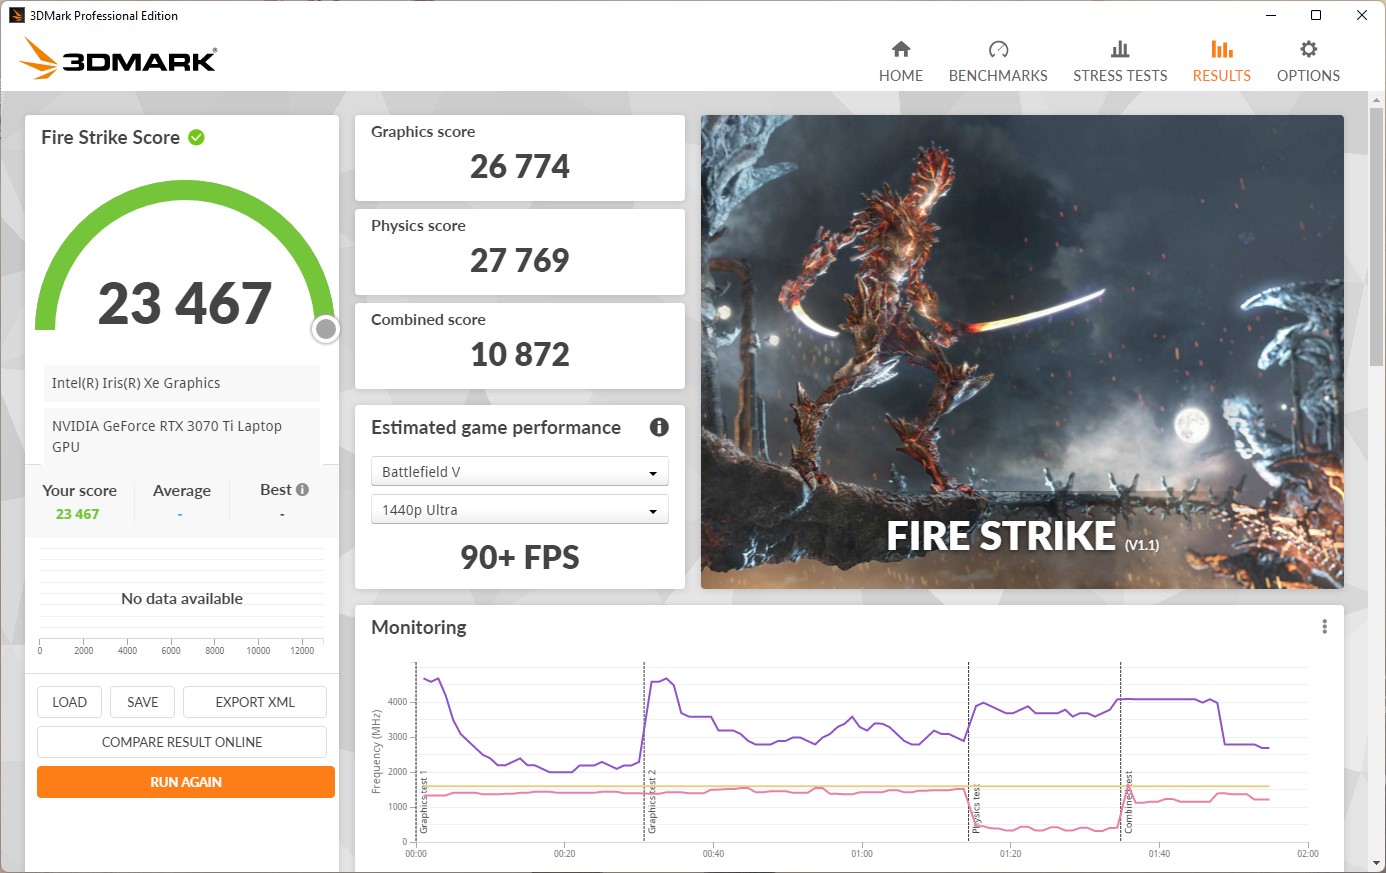


| 3DMark 11 Performance | 29386 points | |
| 3DMark Fire Strike Score | 23467 points | |
| 3DMark Time Spy Score | 10242 points | |
Help | ||
Gaming Performance
The MSI Katana GF66 11UGS is able to bring almost all the games we tested in all the quality levels and Full-HD resolution at more than 100 FPS to the screen. This makes it a very versatile gaming laptop.
| Far Cry 6 | |
| 1920x1080 High Graphics Quality AA:T | |
| Average of class Gaming (120.8 - 136, n=2, last 2 years) | |
| Average NVIDIA GeForce RTX 3070 Ti Laptop GPU (89 - 108, n=3) | |
| MSI Katana GF66 12UGS | |
| Lenovo Legion 5 15ACH6A-82NW0010GE | |
| Lenovo Legion 5 15ACH6A-82NW0010GE | |
| 1920x1080 Ultra Graphics Quality + HD Textures AA:T | |
| Average of class Gaming (96.3 - 135.7, n=3, last 2 years) | |
| Average NVIDIA GeForce RTX 3070 Ti Laptop GPU (82 - 95.3, n=4) | |
| MSI Katana GF66 12UGS | |
| Lenovo Legion 5 15ACH6A-82NW0010GE | |
| Lenovo Legion 5 15ACH6A-82NW0010GE | |
| Ghostwire Tokyo | |
| 1920x1080 High Settings | |
| Average NVIDIA GeForce RTX 3070 Ti Laptop GPU (123.9 - 152, n=4) | |
| MSI Katana GF66 12UGS | |
| 1920x1080 Highest Settings | |
| Average NVIDIA GeForce RTX 3070 Ti Laptop GPU (115.4 - 145.1, n=4) | |
| MSI Katana GF66 12UGS | |
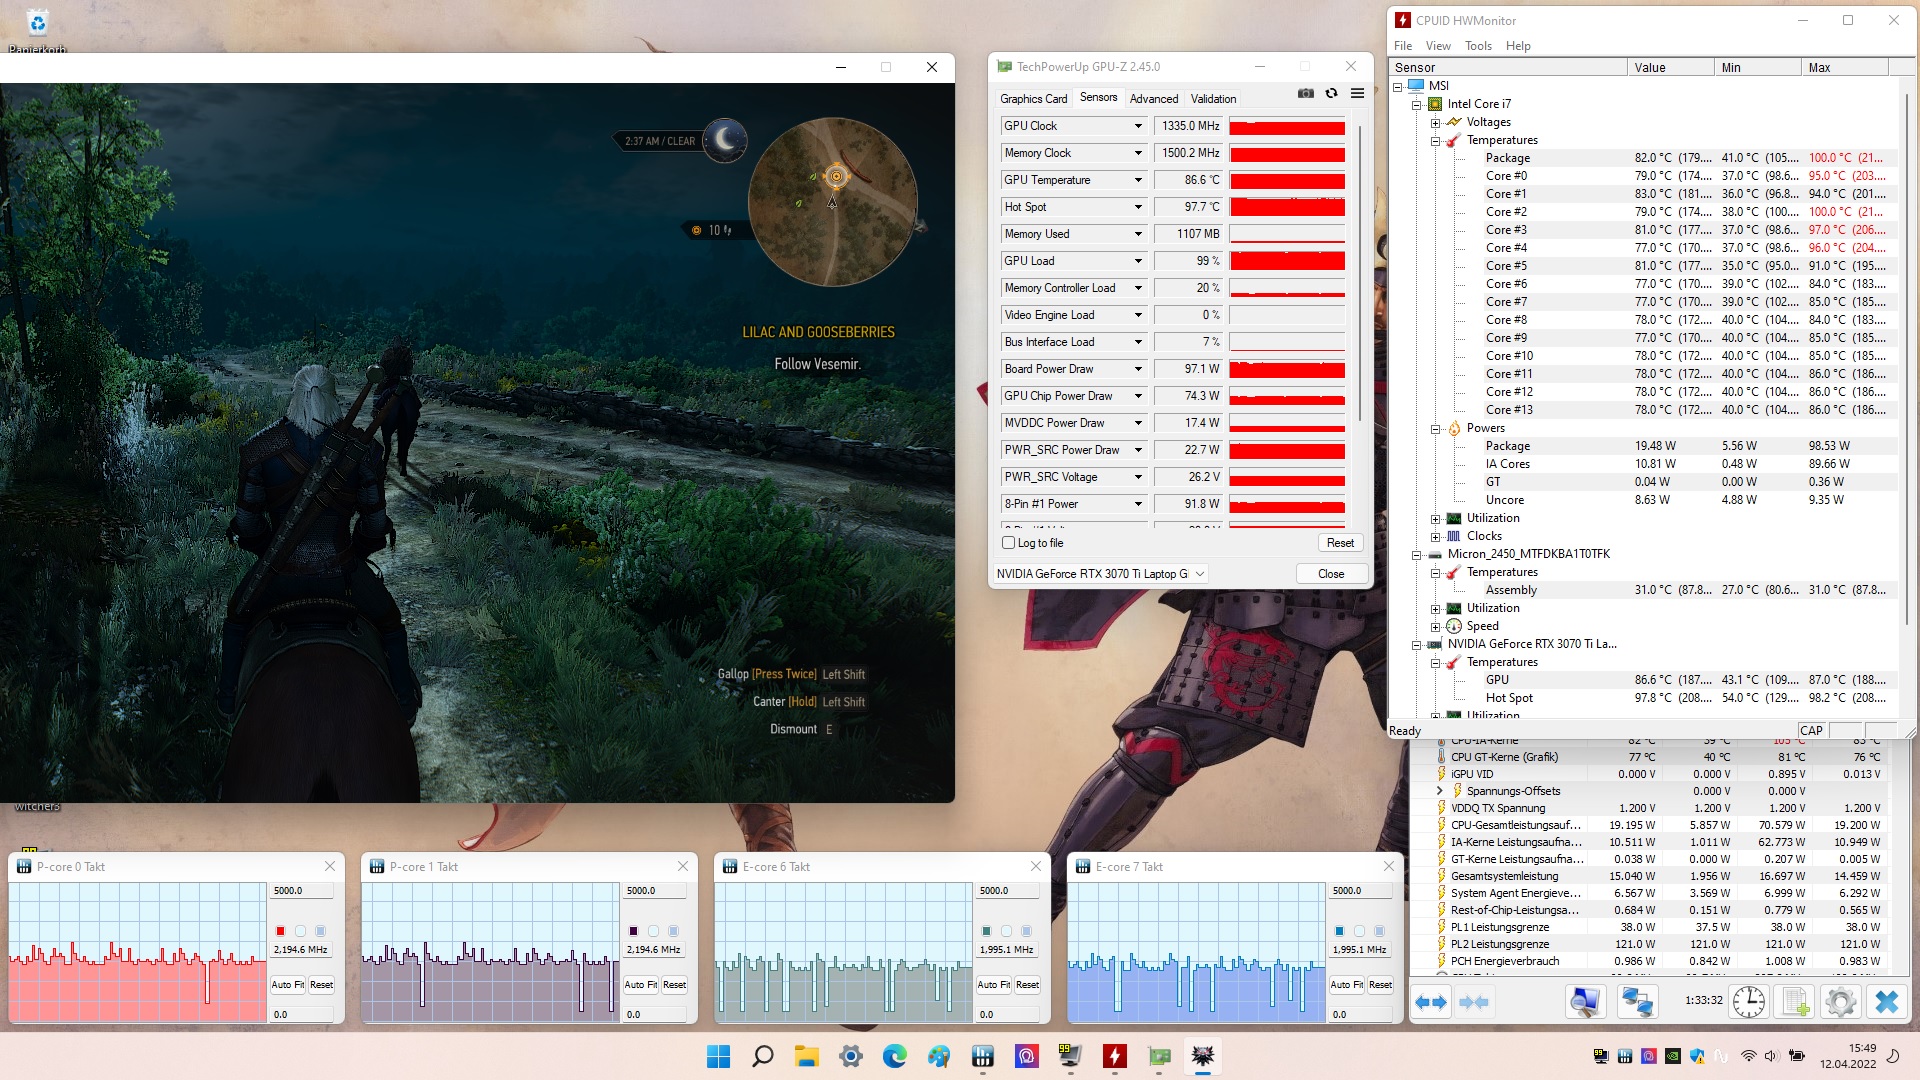
Even though the frame rate drops slightly after a while in the constant load test with "The Witcher 3" (FHD/Ultra), it then remains fairly constant at a relatively high 80 to 90 FPS.
The Witcher 3 FPS Chart
| low | med. | high | ultra | QHD | 4K | |
|---|---|---|---|---|---|---|
| GTA V (2015) | 180.7 | 175.2 | 168 | 102.5 | ||
| The Witcher 3 (2015) | 403 | 139.7 | 96.8 | |||
| Dota 2 Reborn (2015) | 180.4 | 165.1 | 148.1 | 138.1 | ||
| Final Fantasy XV Benchmark (2018) | 174.3 | 120.6 | 89.5 | 68.2 | 39.6 | |
| X-Plane 11.11 (2018) | 139 | 126.4 | 102.5 | |||
| Far Cry 5 (2018) | 131 | 124 | 117 | |||
| Strange Brigade (2018) | 435 | 232 | 193.4 | 171.2 | ||
| Far Cry 6 (2021) | 99 | 89 | 82 | |||
| Ghostwire Tokyo (2022) | 127 | 124 | 123.9 | 115.4 |
Emissions - A fairly quiet gaming laptop
Noise Emissions
In the AI mode, the Katana GF66 stays significantly quieter than you would expect from a gaming laptop. At a maximum of 45 dB(A), the noise level of the laptop is hardly annoying.
Noise level
| Idle |
| 27 / 28 / 31 dB(A) |
| Load |
| 44 / 45 dB(A) |
 | ||
30 dB silent 40 dB(A) audible 50 dB(A) loud |
||
min: | ||
| MSI Katana GF66 12UGS i7-12700H, GeForce RTX 3070 Ti Laptop GPU | MSI Katana GF76 12UGS i7-12700H, GeForce RTX 3070 Ti Laptop GPU | Asus TUF Gaming F15 FX507ZM i7-12700H, GeForce RTX 3060 Laptop GPU | Asus TUF Gaming A15 FA506QR-AZ061T R7 5800H, GeForce RTX 3070 Laptop GPU | Acer Nitro 5 AN515-58-72QR i7-12700H, GeForce RTX 3070 Ti Laptop GPU | Lenovo Legion 5 15ACH6A-82NW0010GE R5 5600H, Radeon RX 6600M | |
|---|---|---|---|---|---|---|
| Noise | -11% | 3% | 1% | -7% | -3% | |
| off / environment * (dB) | 26 | 23 12% | 23.2 11% | 26 -0% | 26 -0% | 25 4% |
| Idle Minimum * (dB) | 27 | 28.41 -5% | 23.6 13% | 26 4% | 26 4% | 25 7% |
| Idle Average * (dB) | 28 | 28.41 -1% | 23.6 16% | 26 7% | 29 -4% | 25 11% |
| Idle Maximum * (dB) | 31 | 36.71 -18% | 25.4 18% | 27.4 12% | 33 -6% | 34.5 -11% |
| Load Average * (dB) | 44 | 53.04 -21% | 38 14% | 46.6 -6% | 47 -7% | 51.1 -16% |
| Witcher 3 ultra * (dB) | 44 | 54.22 -23% | 54.1 -23% | 53 -20% | ||
| Load Maximum * (dB) | 45 | 54.38 -21% | 57.2 -27% | 49.3 -10% | 53 -18% | 51.3 -14% |
* ... smaller is better
Temperatures
At least, the WASD keys don't reach the highest temperatures in the device during the stress test, even if the more than 50 °C (122 °F) that we measured here aren't very inviting for long gaming sessions. On the other hand, high surface temperatures are a problem of many gaming laptops. So for the MSI Katana GF66 as well, using an external keyboard is recommended.
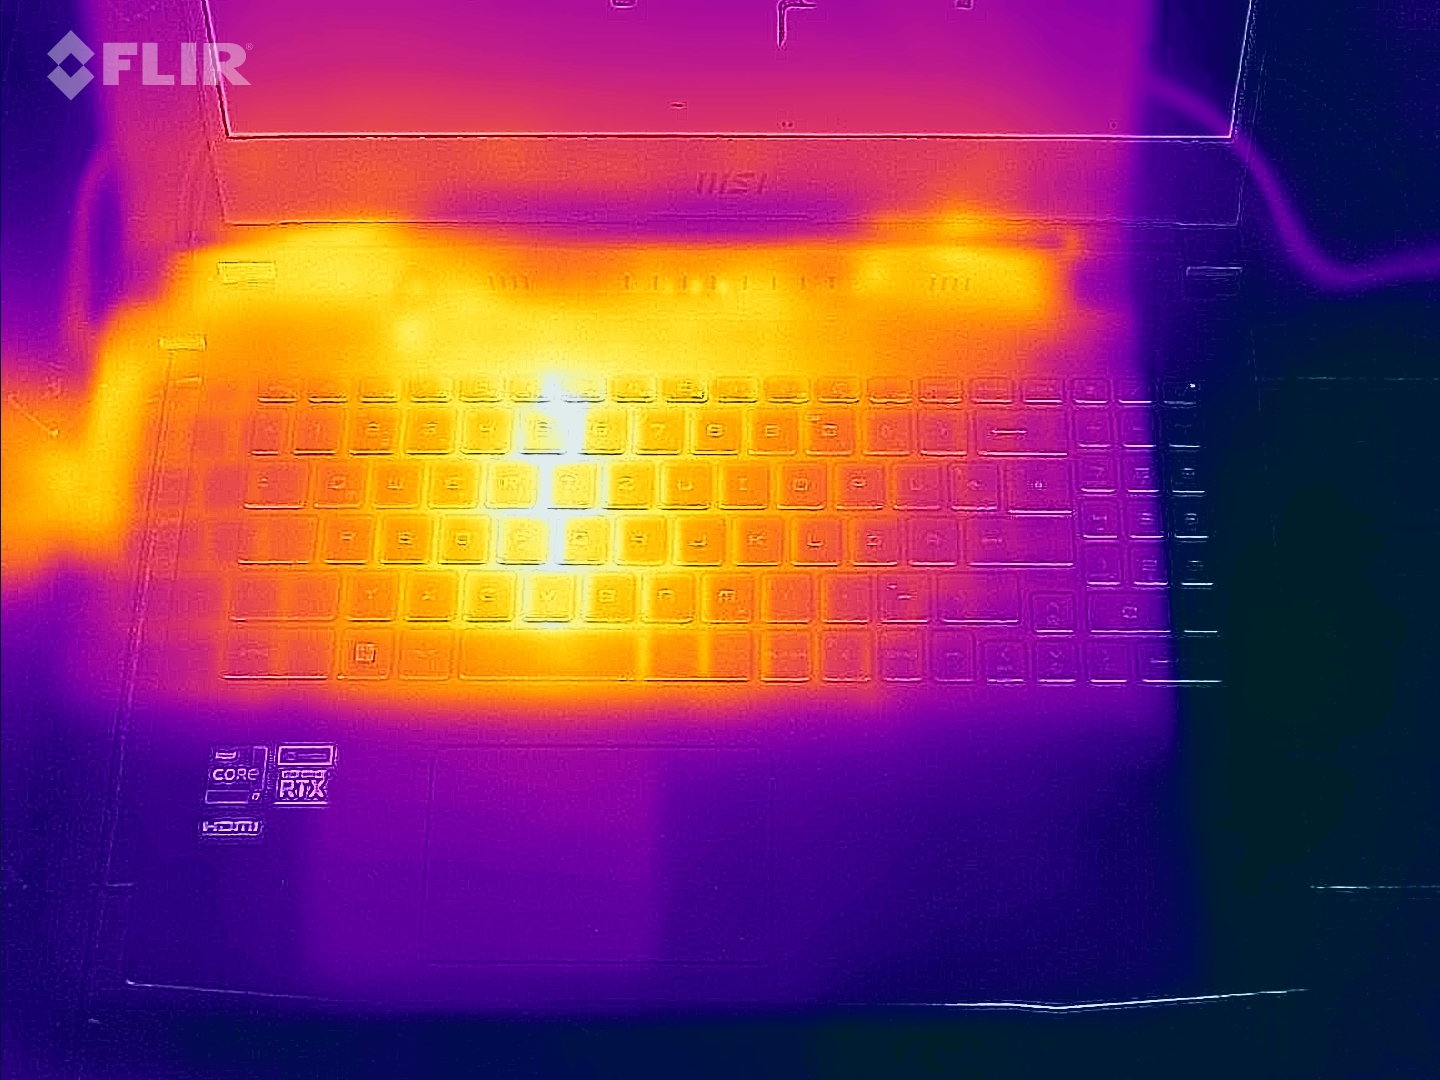
(-) The maximum temperature on the upper side is 61 °C / 142 F, compared to the average of 40.4 °C / 105 F, ranging from 21.2 to 68.8 °C for the class Gaming.
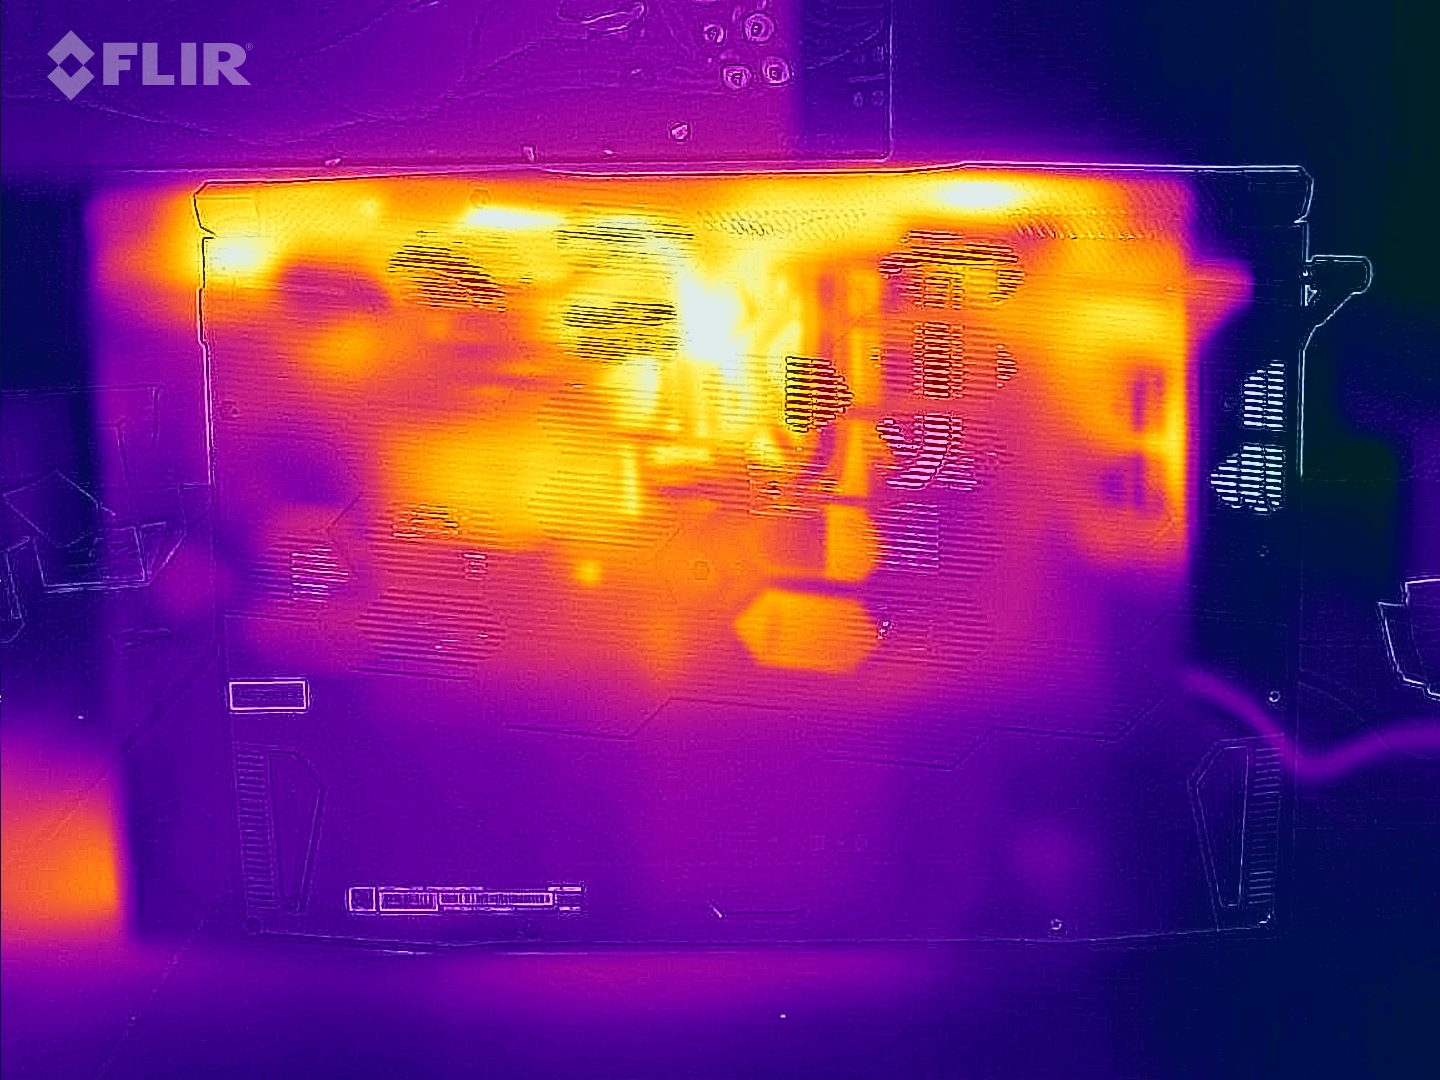
(-) The bottom heats up to a maximum of 55 °C / 131 F, compared to the average of 43.2 °C / 110 F
(±) In idle usage, the average temperature for the upper side is 33.9 °C / 93 F, compared to the device average of 33.9 °C / 93 F.
(-) Playing The Witcher 3, the average temperature for the upper side is 46.8 °C / 116 F, compared to the device average of 33.9 °C / 93 F.
(-) The palmrests and touchpad can get very hot to the touch with a maximum of 43 °C / 109.4 F.
(-) The average temperature of the palmrest area of similar devices was 28.8 °C / 83.8 F (-14.2 °C / -25.6 F).
| MSI Katana GF66 12UGS i7-12700H, GeForce RTX 3070 Ti Laptop GPU | MSI Katana GF66 11UG-220 i7-11800H, GeForce RTX 3070 Laptop GPU | MSI Katana GF76 12UGS i7-12700H, GeForce RTX 3070 Ti Laptop GPU | Asus TUF Gaming F15 FX507ZM i7-12700H, GeForce RTX 3060 Laptop GPU | Asus TUF Gaming A15 FA506QR-AZ061T R7 5800H, GeForce RTX 3070 Laptop GPU | Acer Nitro 5 AN515-58-72QR i7-12700H, GeForce RTX 3070 Ti Laptop GPU | Lenovo Legion 5 15ACH6A-82NW0010GE R5 5600H, Radeon RX 6600M | |
|---|---|---|---|---|---|---|---|
| Heat | 15% | 8% | 12% | 9% | 16% | 23% | |
| Maximum Upper Side * (°C) | 61 | 56 8% | 51 16% | 44.4 27% | 46.7 23% | 48 21% | 39.9 35% |
| Maximum Bottom * (°C) | 55 | 49 11% | 55 -0% | 48.8 11% | 55.9 -2% | 51 7% | 43.8 20% |
| Idle Upper Side * (°C) | 43 | 36 16% | 37 14% | 37.8 12% | 37.1 14% | 34 21% | 34.1 21% |
| Idle Bottom * (°C) | 38 | 28 26% | 38 -0% | 39.6 -4% | 38.1 -0% | 33 13% | 31.7 17% |
* ... smaller is better
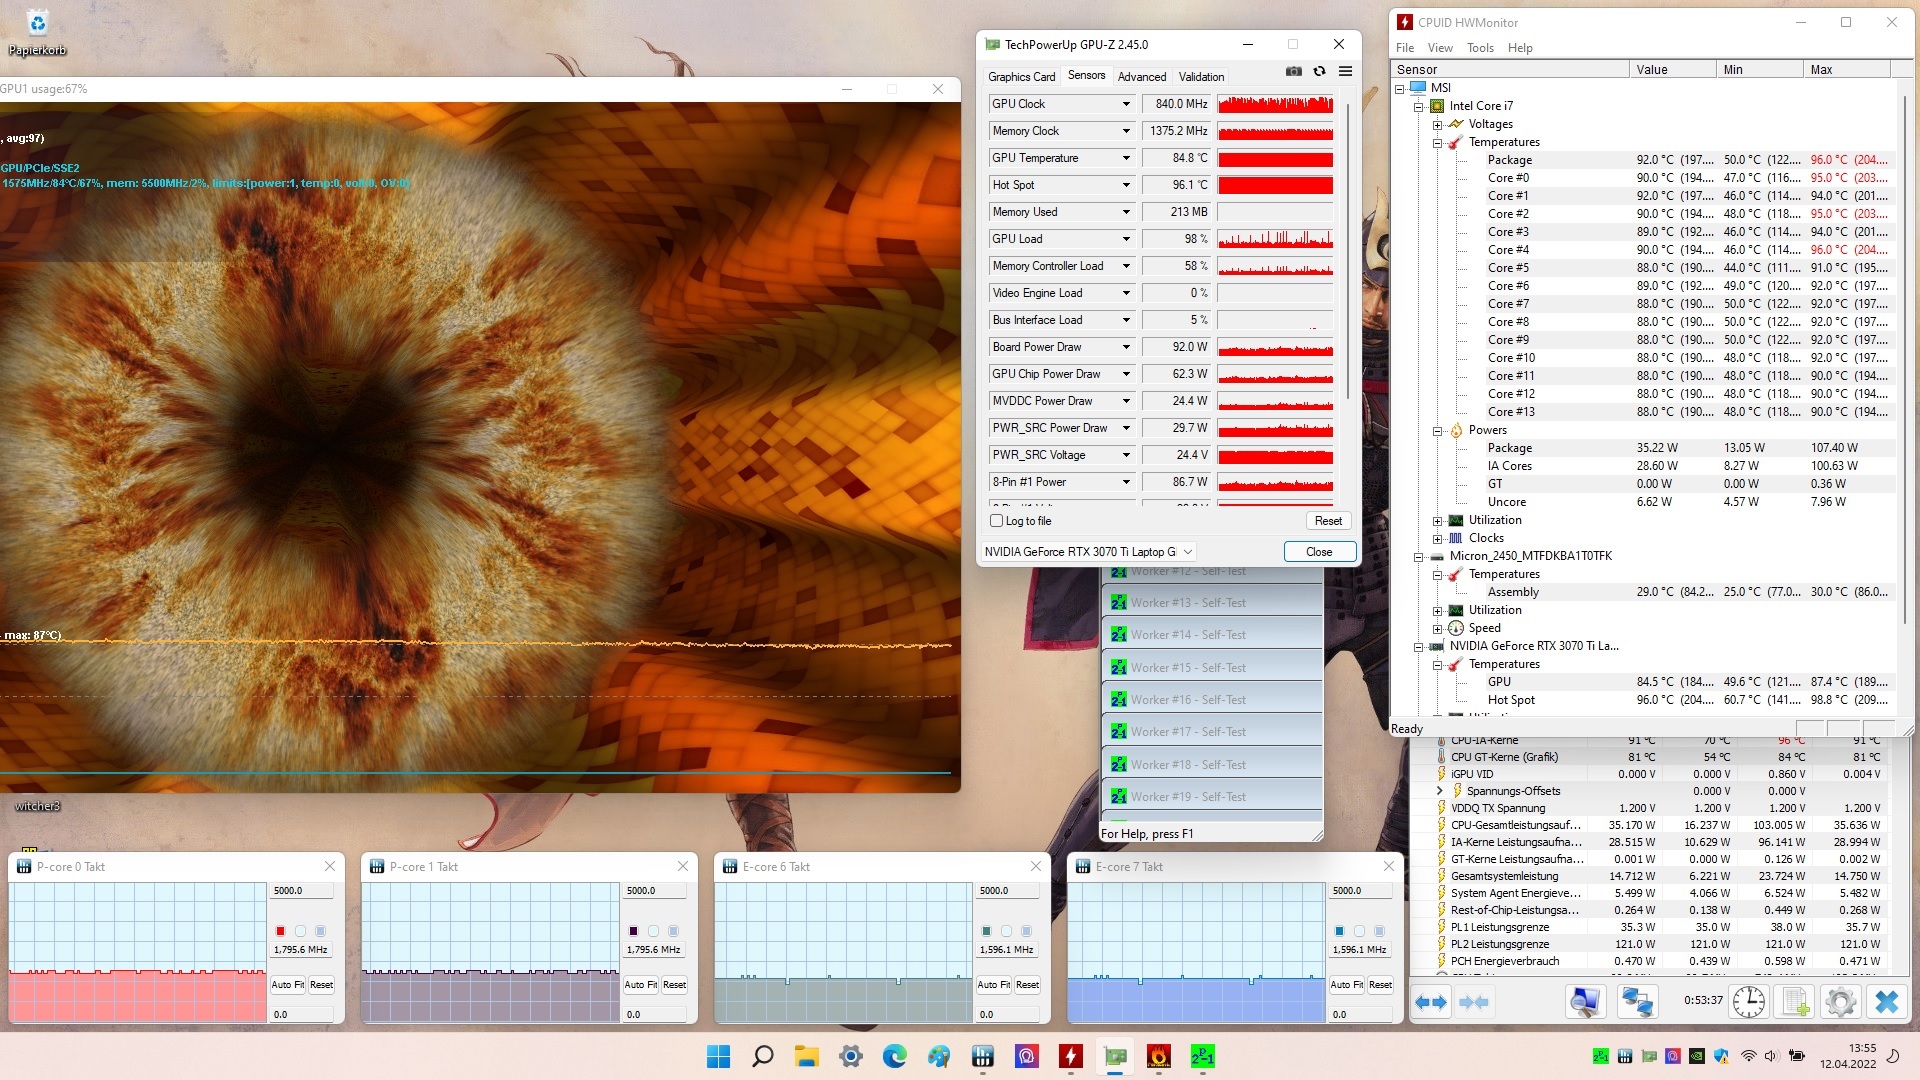
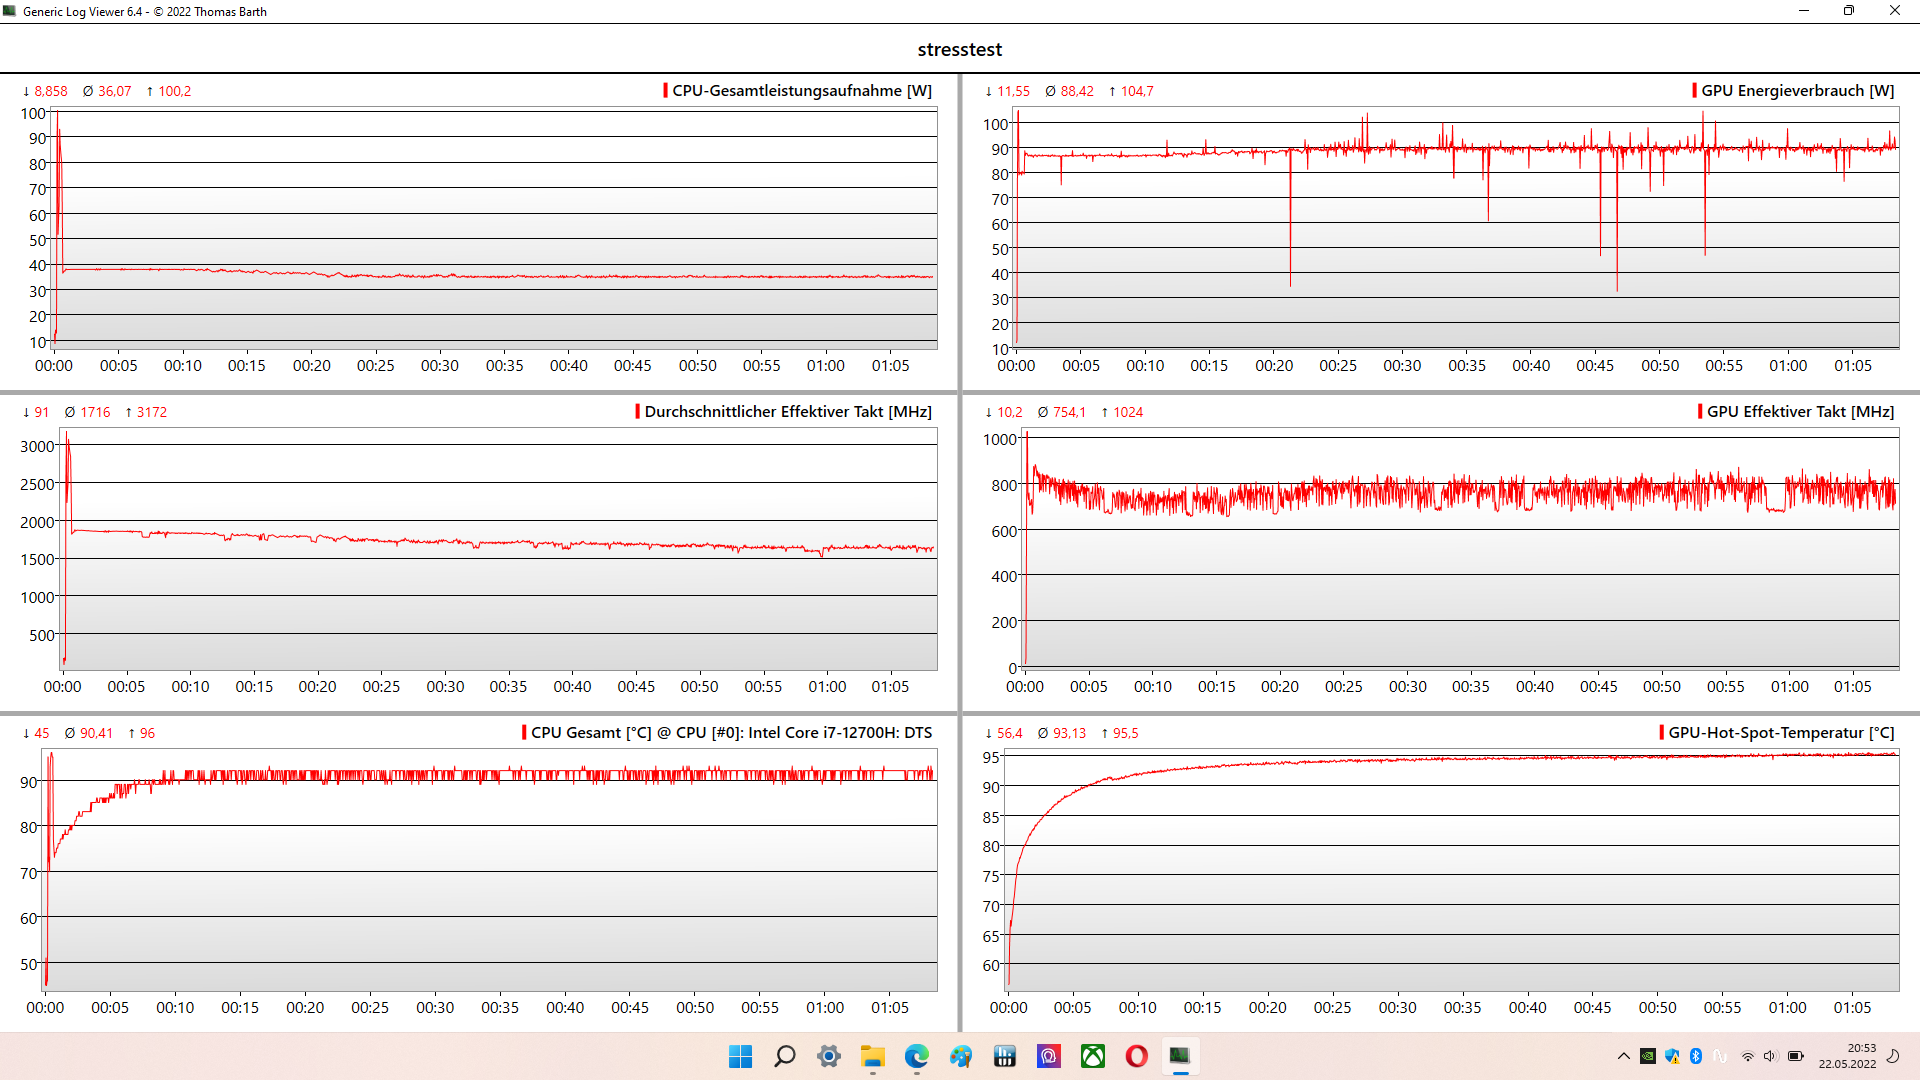
Stress test
Over a longer time period, the consumption of the CPU during the stress test is 33 watts, while in the first 10 minutes of the stress test, it is still able to use 45 watts. However, the CPU and GPU simply switch around a bit of the shared common consumption, which lies at around 120 watts. We do not notice any significant problems in the temperatures of both chips. At 90 and 95 °C respectively (194 and 203 °F), both fall into a high but still non-critical range and can be maintained stably.
Speakers
A high maximum volume and a good general reproduction of music and voice ensure a solid sound image. We can forgive the slight weakness in the bass of the laptop. A reduction in the volume ensures a more balanced sound.
MSI Katana GF66 12UGS audio analysis
(±) | speaker loudness is average but good (80 dB)
Bass 100 - 315 Hz
(-) | nearly no bass - on average 17.3% lower than median
(±) | linearity of bass is average (9.9% delta to prev. frequency)
Mids 400 - 2000 Hz
(±) | higher mids - on average 6.8% higher than median
(±) | linearity of mids is average (8.3% delta to prev. frequency)
Highs 2 - 16 kHz
(+) | balanced highs - only 1.1% away from median
(+) | highs are linear (4.2% delta to prev. frequency)
Overall 100 - 16.000 Hz
(±) | linearity of overall sound is average (16.5% difference to median)
Compared to same class
» 42% of all tested devices in this class were better, 7% similar, 51% worse
» The best had a delta of 6%, average was 18%, worst was 132%
Compared to all devices tested
» 28% of all tested devices were better, 6% similar, 66% worse
» The best had a delta of 4%, average was 24%, worst was 134%
Apple MacBook Pro 16 2021 M1 Pro audio analysis
(+) | speakers can play relatively loud (84.7 dB)
Bass 100 - 315 Hz
(+) | good bass - only 3.8% away from median
(+) | bass is linear (5.2% delta to prev. frequency)
Mids 400 - 2000 Hz
(+) | balanced mids - only 1.3% away from median
(+) | mids are linear (2.1% delta to prev. frequency)
Highs 2 - 16 kHz
(+) | balanced highs - only 1.9% away from median
(+) | highs are linear (2.7% delta to prev. frequency)
Overall 100 - 16.000 Hz
(+) | overall sound is linear (4.6% difference to median)
Compared to same class
» 0% of all tested devices in this class were better, 0% similar, 100% worse
» The best had a delta of 5%, average was 17%, worst was 45%
Compared to all devices tested
» 0% of all tested devices were better, 0% similar, 100% worse
» The best had a delta of 4%, average was 24%, worst was 134%
Power Management - A meager battery life
Power Consumption
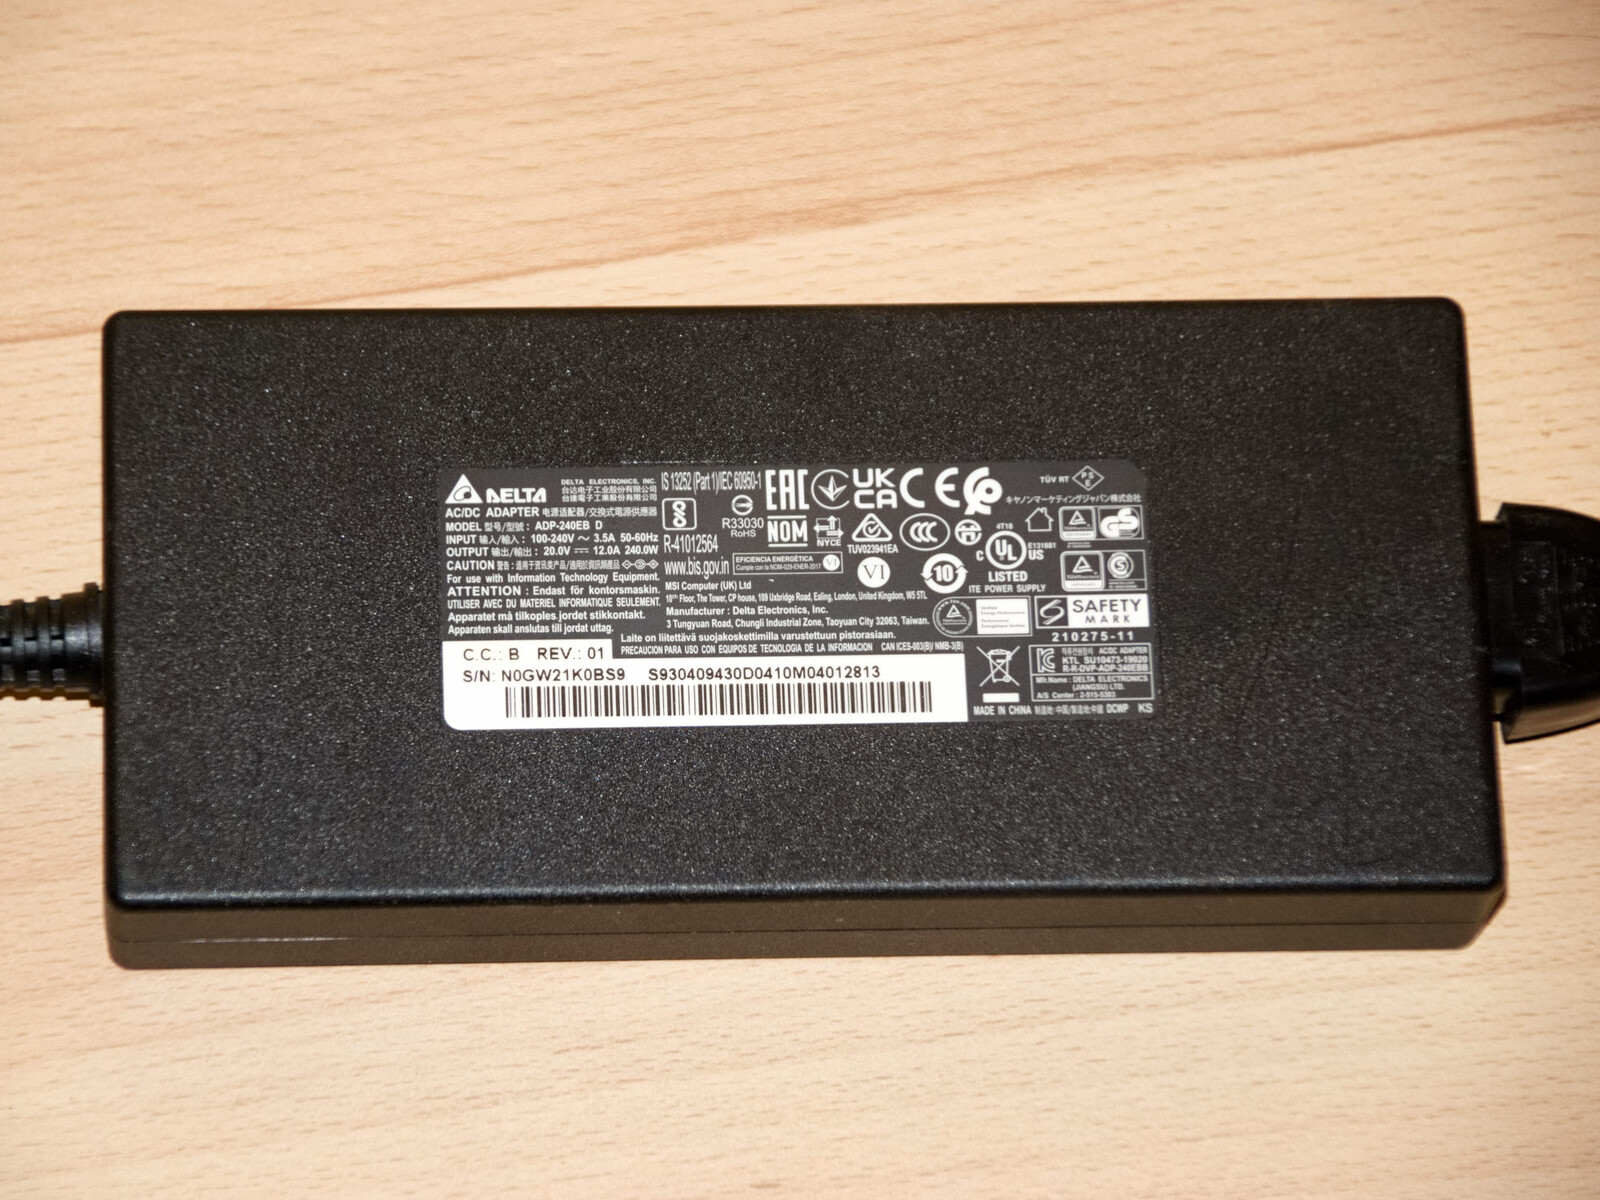
While the power supply was still sized very tightly in the predecessor, MSI has significantly increased this here and included a power supply with an appropriate performance of 240 watts. This means that the gaming laptop won't hit the limits of the power supply even under maximum load.
In terms of the power consumption, the laptop lies at a level that is below the average of gaming laptops.
| Off / Standby | |
| Idle | |
| Load |
|
Key:
min: | |
| MSI Katana GF66 12UGS i7-12700H, GeForce RTX 3070 Ti Laptop GPU | MSI Katana GF76 12UGS i7-12700H, GeForce RTX 3070 Ti Laptop GPU | Asus TUF Gaming F15 FX507ZM i7-12700H, GeForce RTX 3060 Laptop GPU | Asus TUF Gaming A15 FA506QR-AZ061T R7 5800H, GeForce RTX 3070 Laptop GPU | Acer Nitro 5 AN515-58-72QR i7-12700H, GeForce RTX 3070 Ti Laptop GPU | Lenovo Legion 5 15ACH6A-82NW0010GE R5 5600H, Radeon RX 6600M | Average of class Gaming | |
|---|---|---|---|---|---|---|---|
| Power Consumption | -19% | -4% | 1% | -12% | -13% | -29% | |
| Idle Minimum * (Watt) | 9 | 14.2 -58% | 6.3 30% | 10.2 -13% | 7 22% | 10 -11% | 13.3 ? -48% |
| Idle Average * (Watt) | 13 | 18 -38% | 9.8 25% | 12.8 2% | 15 -15% | 13.2 -2% | 19 ? -46% |
| Idle Maximum * (Watt) | 20 | 22 -10% | 26.5 -33% | 15 25% | 24 -20% | 15.6 22% | 24.5 ? -23% |
| Load Average * (Watt) | 100 | 98 2% | 103.8 -4% | 130 -30% | 124 -24% | 178 -78% | 108.1 ? -8% |
| Witcher 3 ultra * (Watt) | 149 | 159 -7% | 189 -27% | 137 8% | 195.1 -31% | 181 -21% | |
| Load Maximum * (Watt) | 212 | 219 -3% | 241.9 -14% | 184 13% | 220 -4% | 180 15% | 254 ? -20% |
* ... smaller is better
Power Consumption The Witcher 3 / Stress Test
{
Battery Life
On the other hand, the MSI Katana GF66 12UGS isn't really efficient either. So it is hardly surprising that the gaming laptop only offers a short battery life. However, the battery life still remains within a range that is normal for the gaming laptop competitors.
| MSI Katana GF66 12UGS i7-12700H, GeForce RTX 3070 Ti Laptop GPU, 52 Wh | MSI Katana GF76 12UGS i7-12700H, GeForce RTX 3070 Ti Laptop GPU, 53.5 Wh | Asus TUF Gaming F15 FX507ZM i7-12700H, GeForce RTX 3060 Laptop GPU, 90 Wh | Asus TUF Gaming A15 FA506QR-AZ061T R7 5800H, GeForce RTX 3070 Laptop GPU, 90 Wh | Acer Nitro 5 AN515-58-72QR i7-12700H, GeForce RTX 3070 Ti Laptop GPU, 57.5 Wh | Lenovo Legion 5 15ACH6A-82NW0010GE R5 5600H, Radeon RX 6600M, 80 Wh | Average of class Gaming | |
|---|---|---|---|---|---|---|---|
| Battery runtime | 34% | 40% | 223% | 25% | 163% | 99% | |
| Reader / Idle (h) | 15.8 | 17.4 | 5.7 | 12.8 | 8.71 ? | ||
| WiFi v1.3 (h) | 2.4 | 3.7 54% | 4.8 100% | 11.4 375% | 3.9 63% | 9.2 283% | 7.01 ? 192% |
| Load (h) | 1.4 | 1.6 14% | 1.1 -21% | 2.4 71% | 1.2 -14% | 2 43% | 1.47 ? 5% |
| H.264 (h) | 3.3 | 4.7 | 8.26 ? |
Pros
Cons
Verdict
MSI made improvements in many areas in the Katana GF66, showing even without top values in the configured TDP limits that gaming can also be done relatively affordable. However, the Nvidia RTX 3070 Ti and the Intel Core i7-12700H are still a bit of a sham. This is another case where we would have really liked more clear specifications on the TDP from the manufacturer. But the real problem for demanding gamers is the bad display. With its slow response times and bad color reproduction, the display isn't really 100% suitable for gaming.
The MSI Katana GF66 12UGS is a laptop with a balanced price-performance ratio, delivering a fairly affordable entry into the top class of mobile gaming.
Even though the "plastic sword" is unable to shine with the best equipment, it is basically solid. Those who don't have too high demands on a gaming laptop will find a good companion in this device. Despite the slightly limited TGP/TDP, the graphics card and processor are very powerful, allowing the Katana GF66 12UGS to fulfill its main task as a gaming laptop.
Price and Availability
The MSI Katana GF66 is available in many configurations in the US, most of them still with 11th generation processors. A configuration with a 12th gen i7 processor and the RTX 3050 Ti is currently available from Amazon for $1150 and with an i5 processor for $1130. A higher-end configuration of the GF76 is available from Amazon for example for $1960.
MSI Katana GF66 12UGS
- 05/31/2022 v7 (old)
Marc Herter
Price comparison

