Lenovo Legion 5 15 review: AMD's new Radeon RX 6600M meets Ryzen 5 5600H

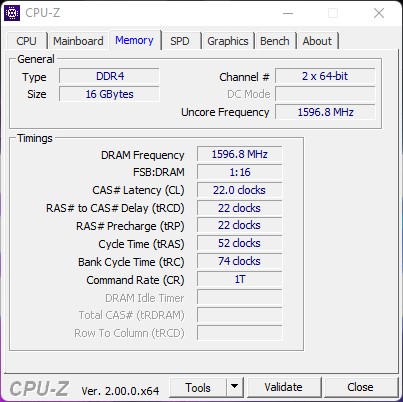
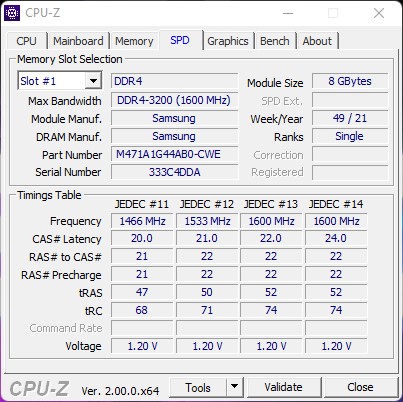
Lenovo's Legion series is a household name in the field of gaming laptops. Lenovo has been establishing this brand for several years now and continues to build upon it. This is also the case with the current Lenovo Legion 5 15ACH6A, which comes equipped with an AMD Ryzen 5 5600H based on the current Zen3 architecture. The GPU is the AMD Radeon RX 6600M, a new mobile graphics card in the mid-range segment that offers 8GB of VRAM, which is appropriate for this price range. The remaining hardware includes 16 GB RAM and a 512 GB SSD, as well as a 165 Hz display which reinforces the laptop's intended purpose.
The machine is currently selling for just under 1,000 Euros, a highly competitive price for what is on offer. Whether performance meets expectations will be uncovered later in this review.
Similarly equipped devices are used for comparison. A list of these can be found in the table below.
Possible competitors in comparison
Rating | Date | Model | Weight | Height | Size | Resolution | Price |
|---|---|---|---|---|---|---|---|
| 82.6 % v7 (old) | 05 / 2022 | Lenovo Legion 5 15ACH6A-82NW0010GE R5 5600H, Radeon RX 6600M | 2.5 kg | 25.75 mm | 15.60" | 1920x1080 | |
| 80.7 % v7 (old) | 09 / 2021 | Gigabyte G5 KC i5-10500H, GeForce RTX 3060 Laptop GPU | 2.1 kg | 28 mm | 15.60" | 1920x1080 | |
| 85.9 % v7 (old) | 06 / 2021 | Asus TUF Gaming F15 FX506HM i7-11800H, GeForce RTX 3060 Laptop GPU | 2.3 kg | 24.9 mm | 15.60" | 1920x1080 | |
| 84.3 % v7 (old) | 09 / 2021 | HP Victus 16-e0179ng R7 5800H, GeForce RTX 3060 Laptop GPU | 2.5 kg | 23.5 mm | 16.10" | 1920x1080 | |
| 81.4 % v7 (old) | 12 / 2021 | Medion Erazer Deputy P25 R7 5800H, GeForce RTX 3060 Laptop GPU | 2.3 kg | 26 mm | 15.60" | 1920x1080 | |
| 82.7 % v7 (old) | 10 / 2021 | Dell G15 5515 R7 5800H, GeForce RTX 3050 Ti Laptop GPU | 2.4 kg | 24.9 mm | 15.60" | 1920x1080 |
Case
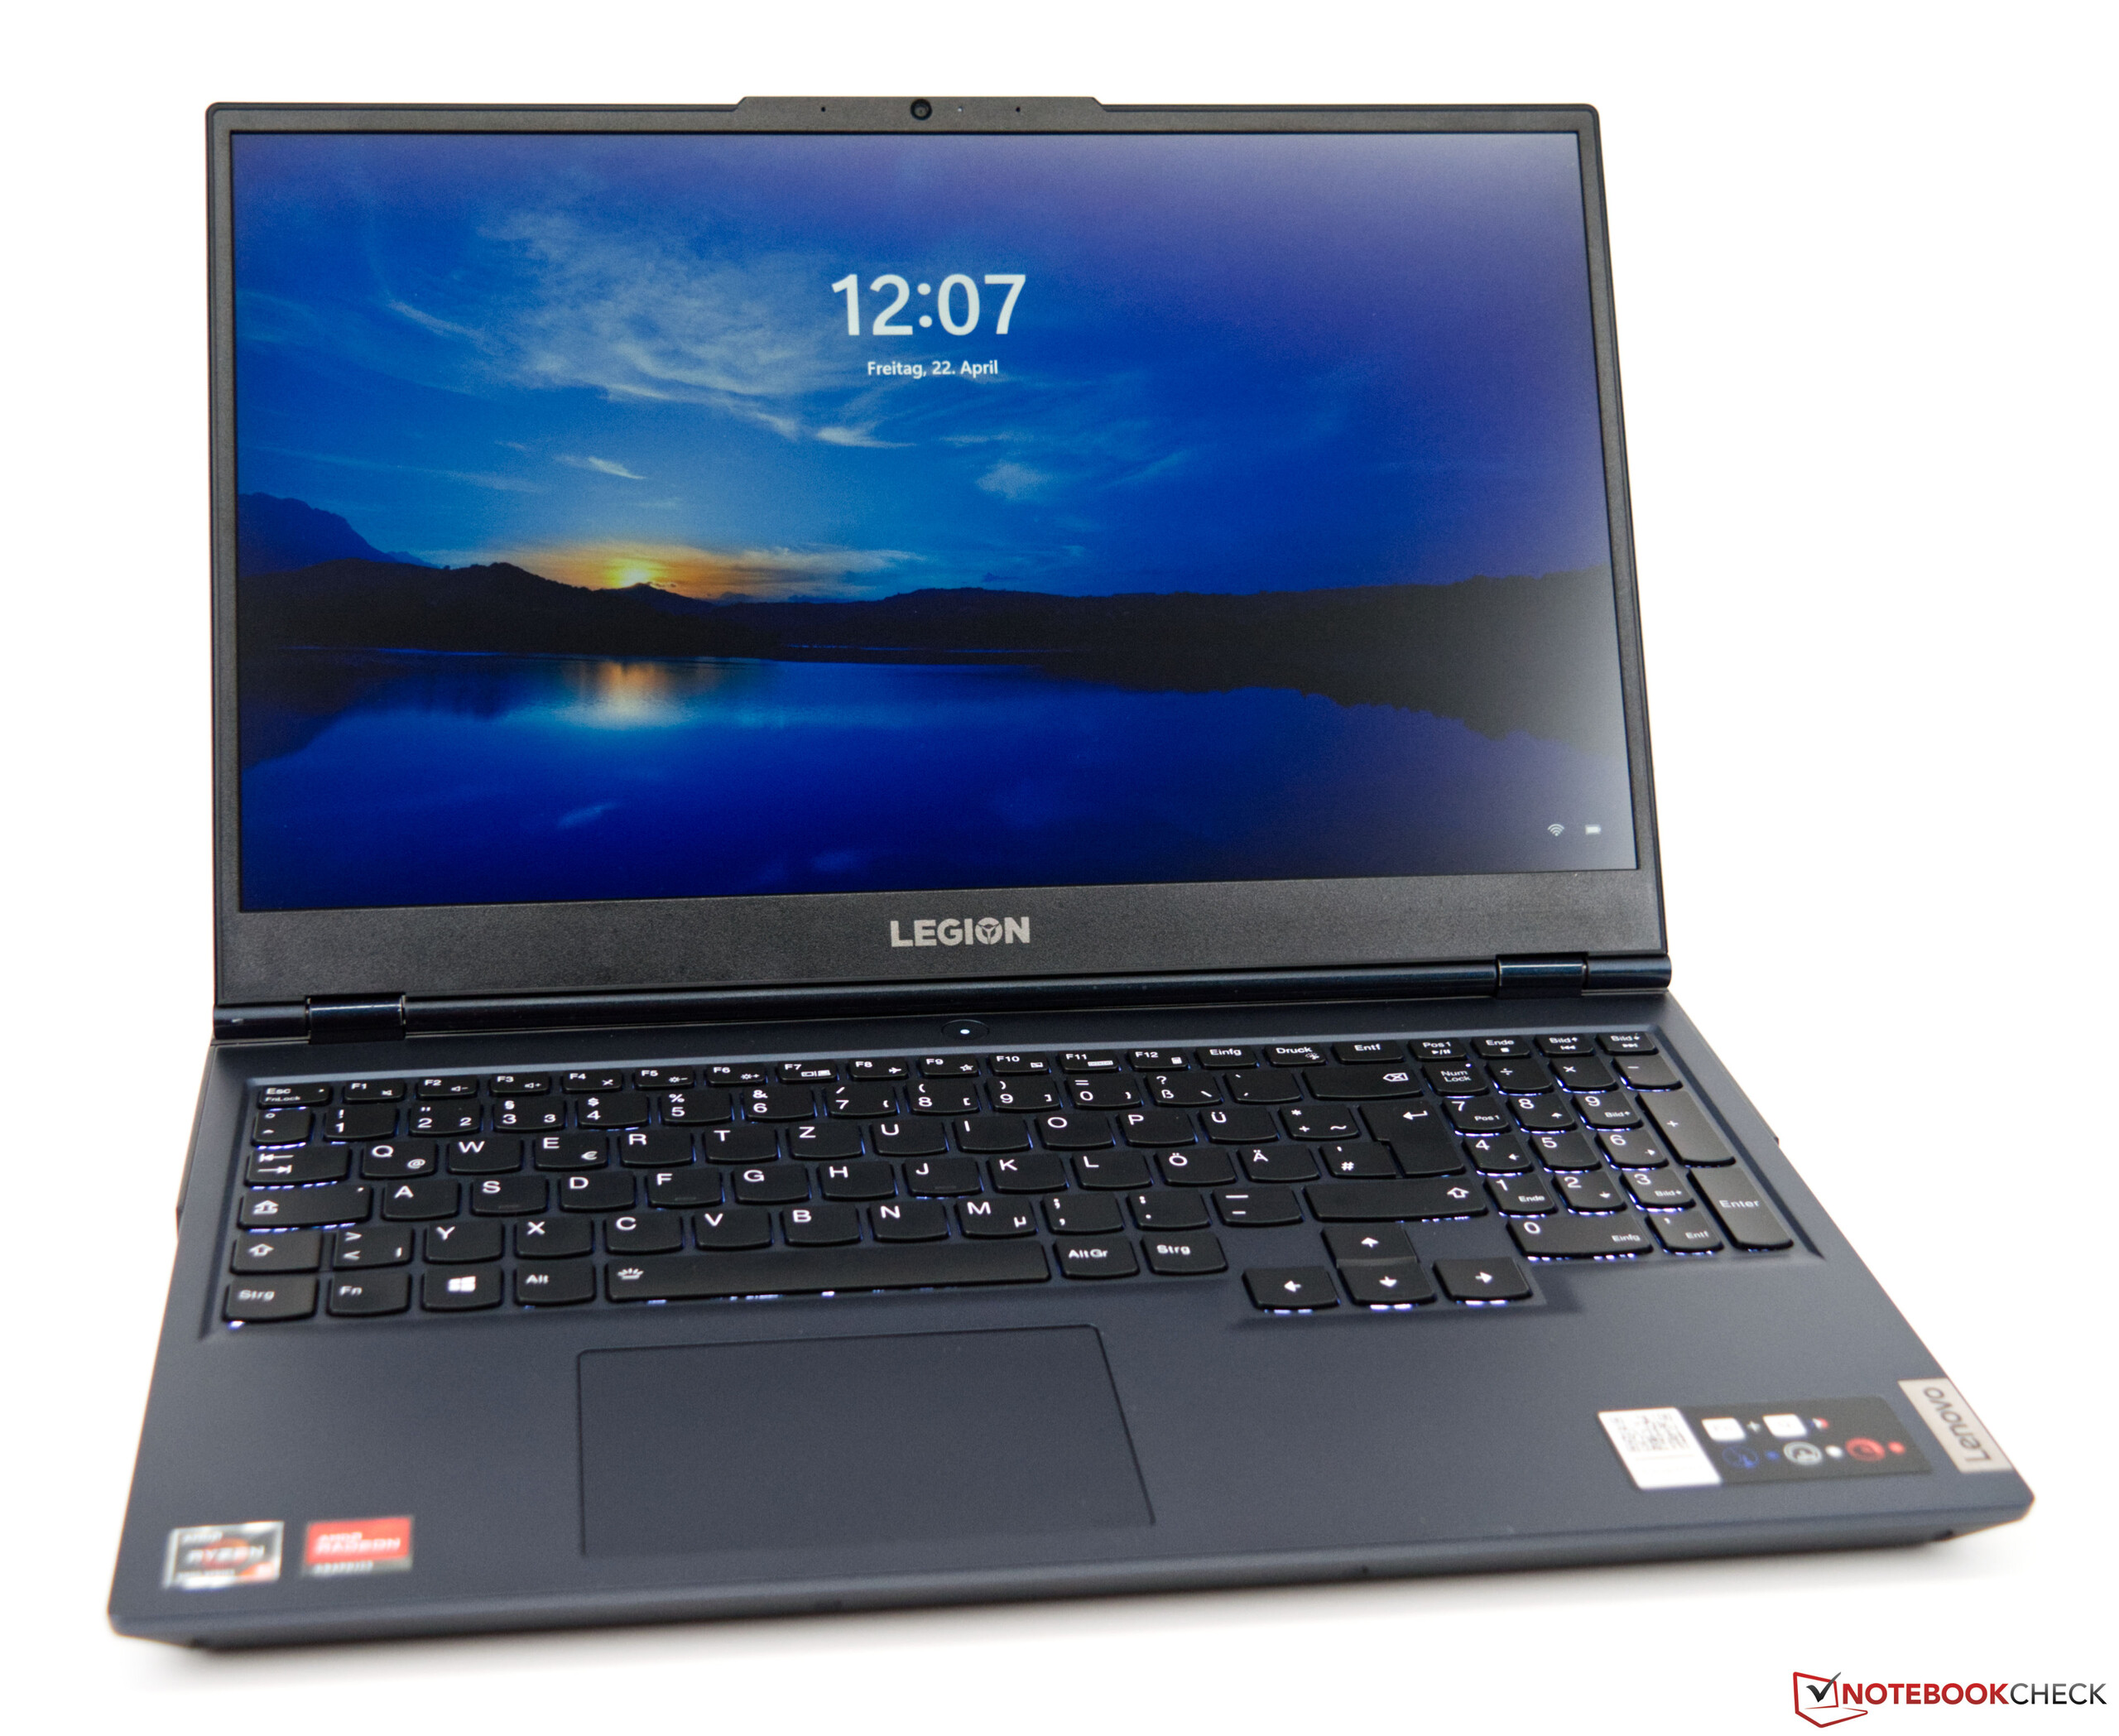
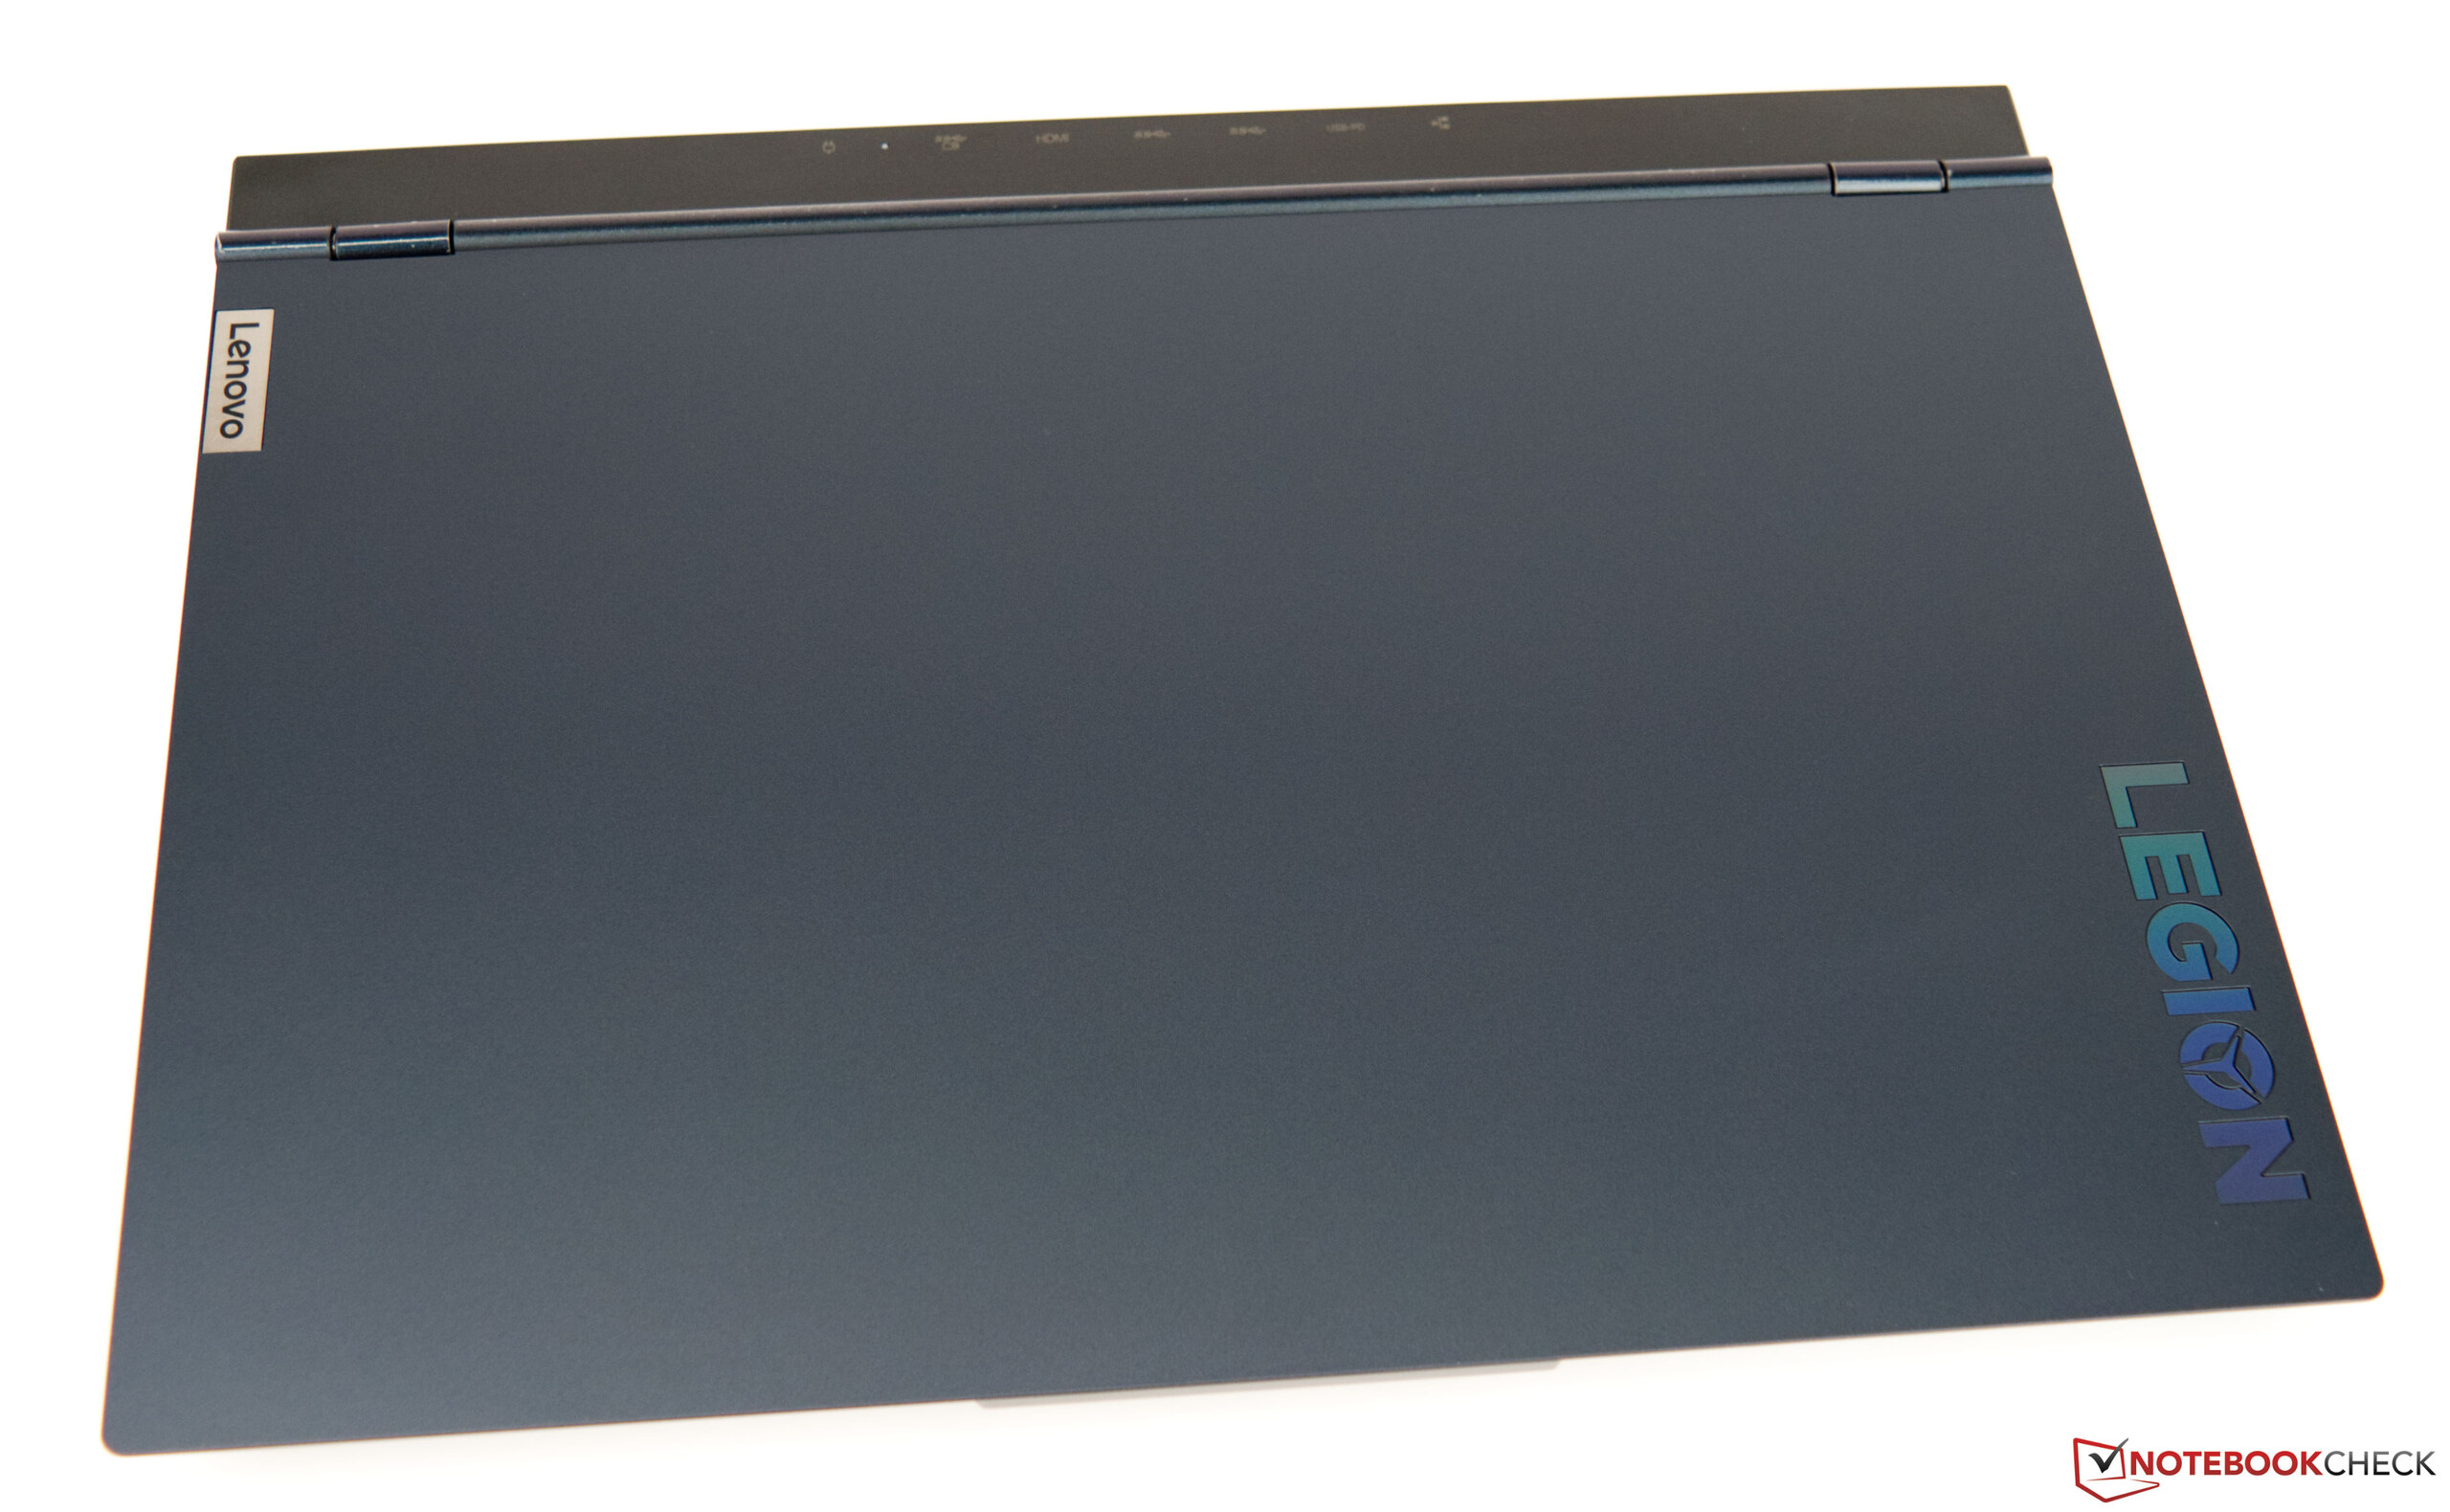
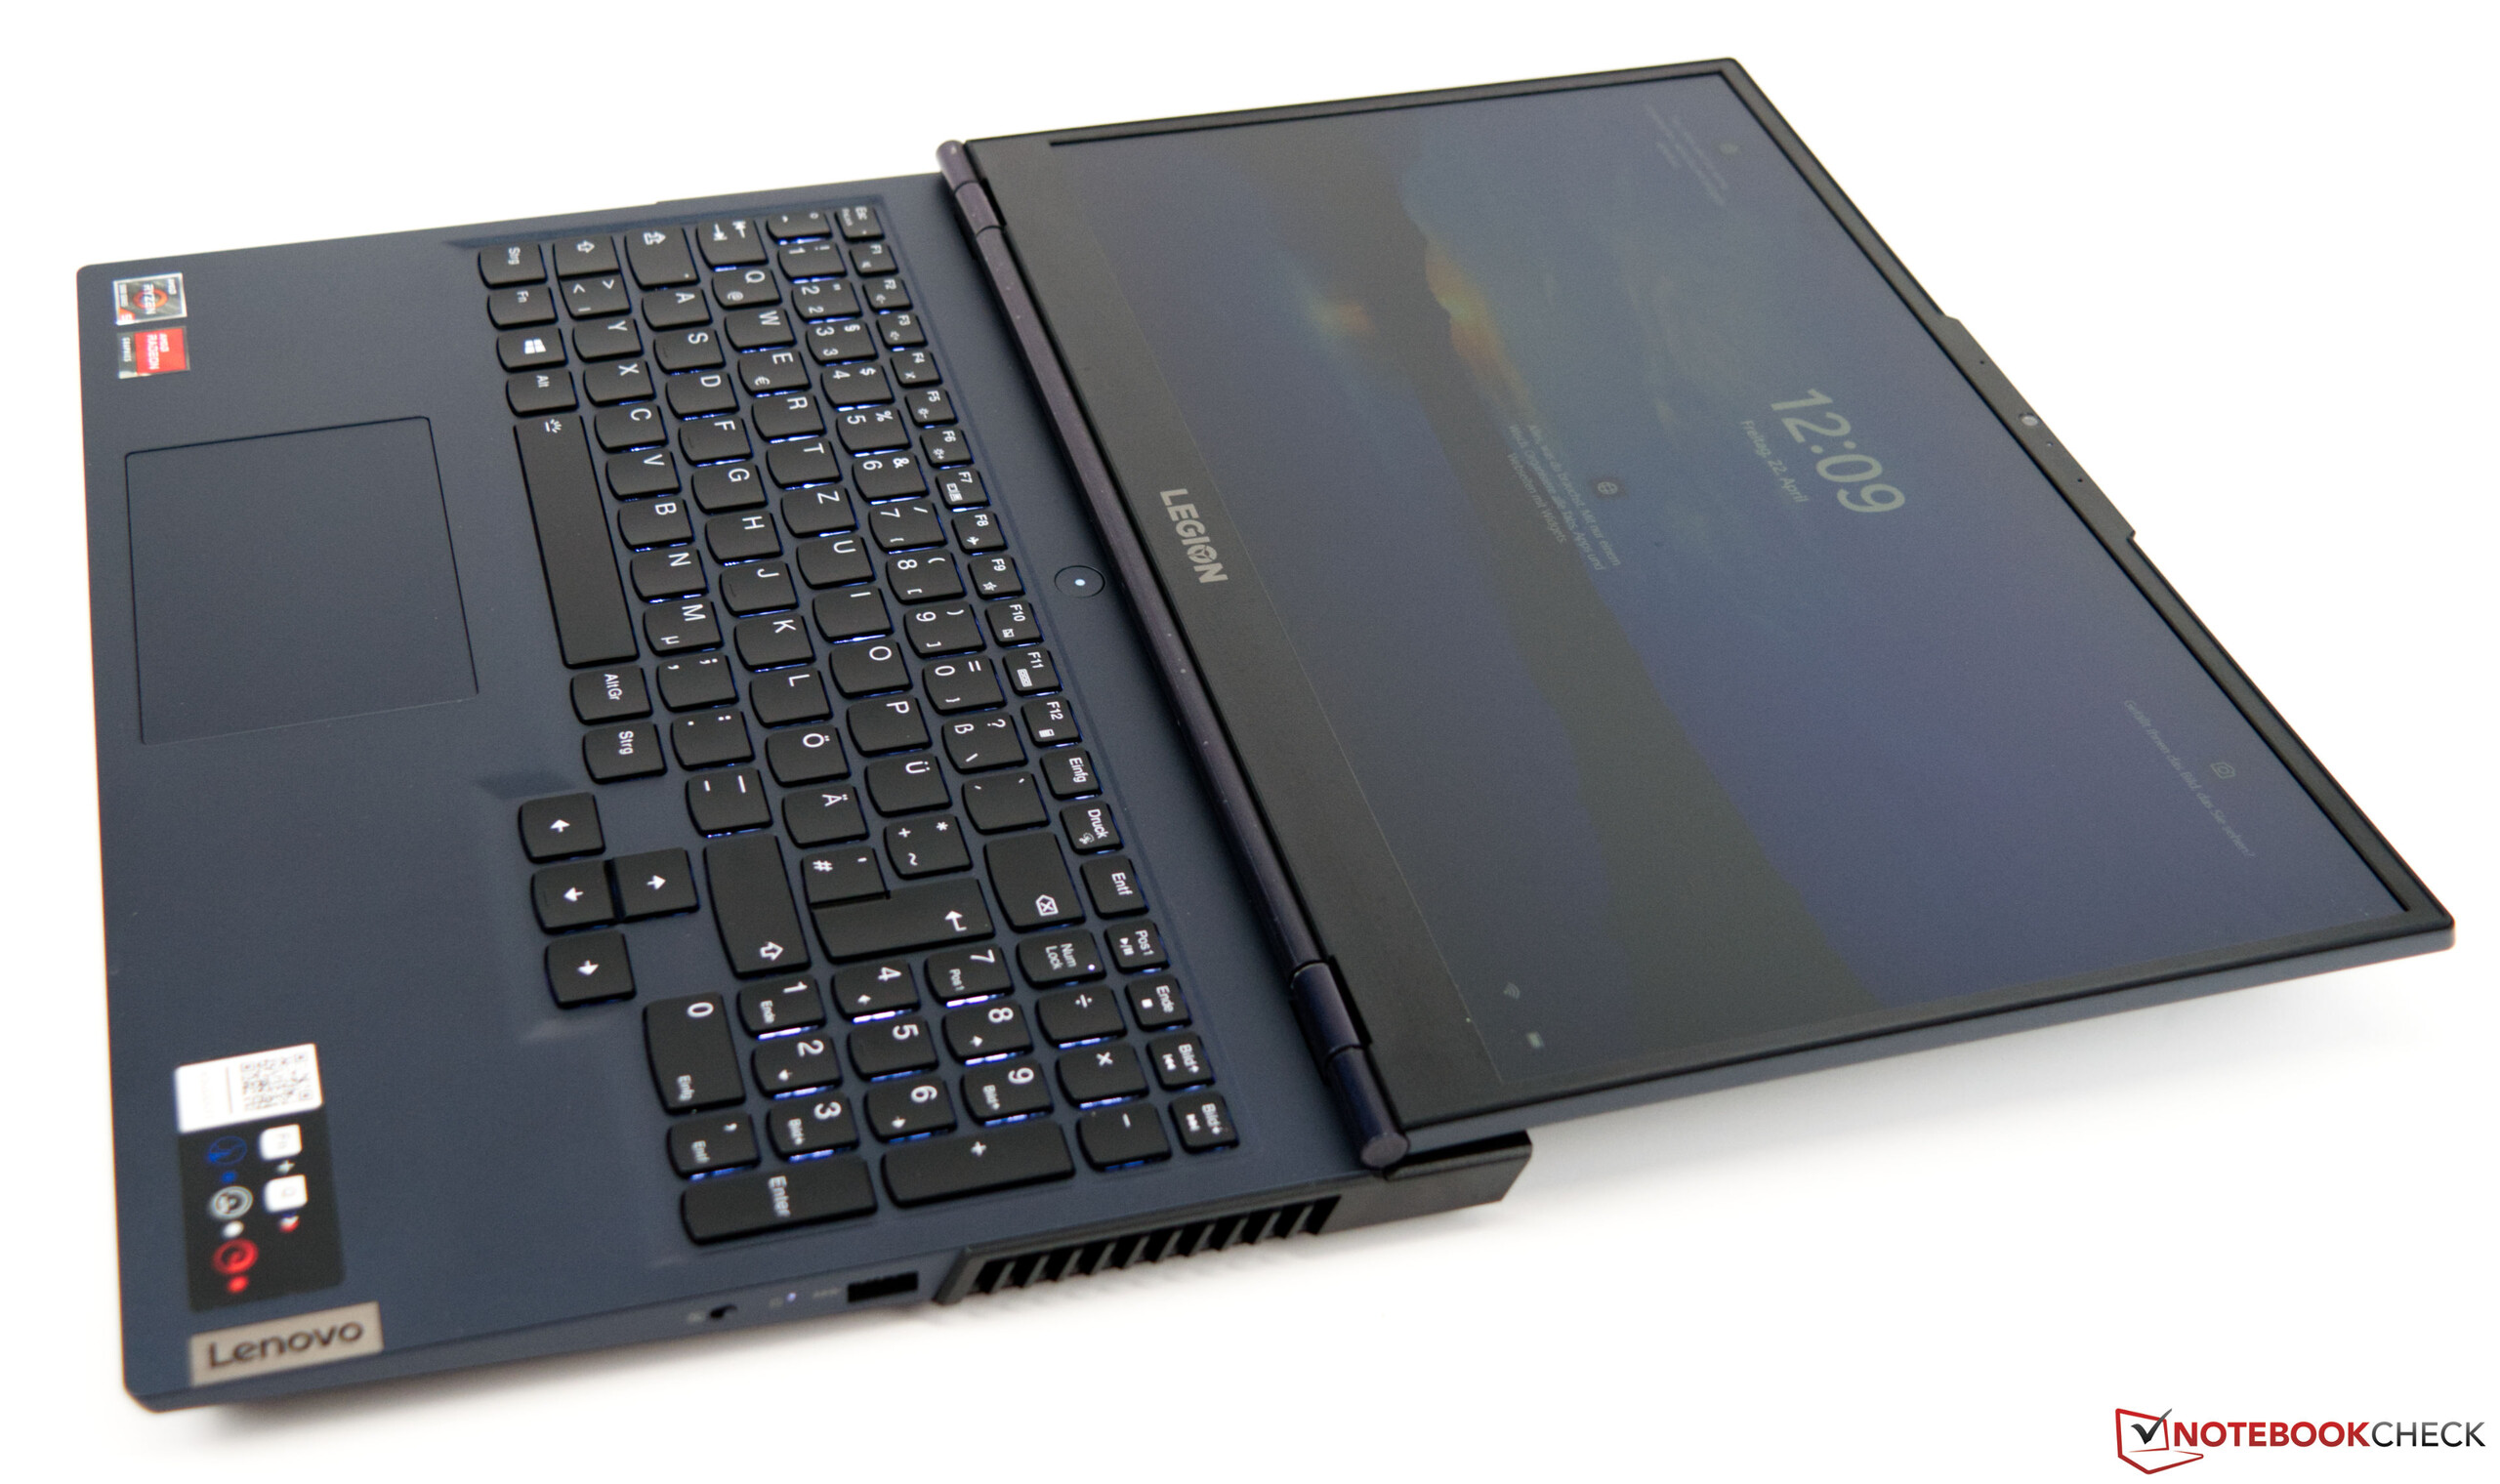
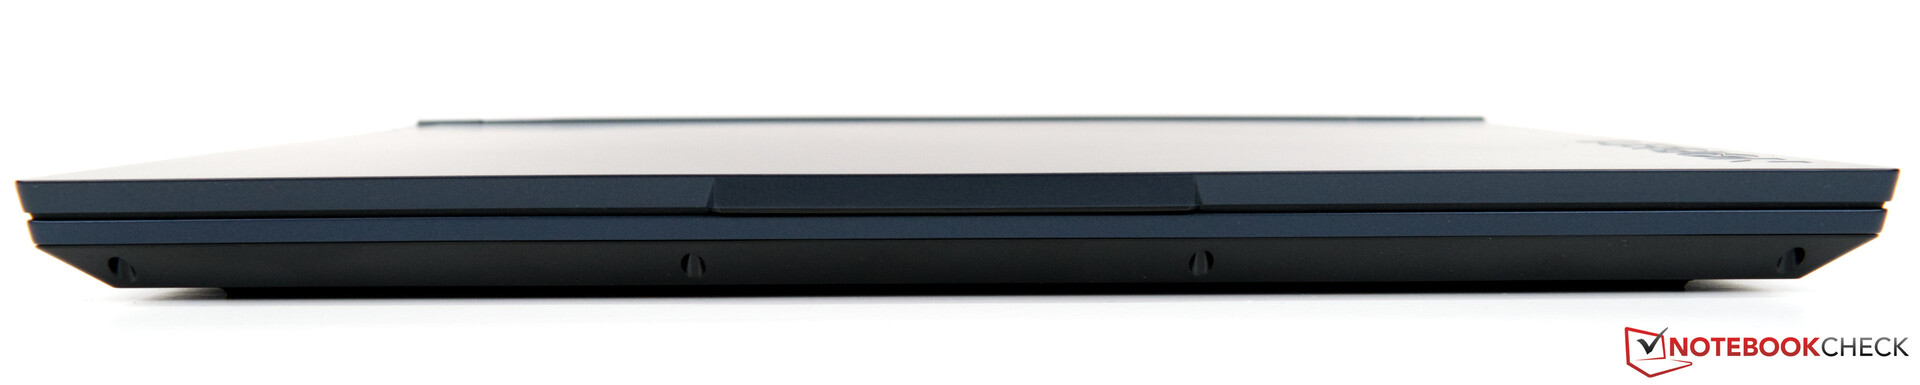
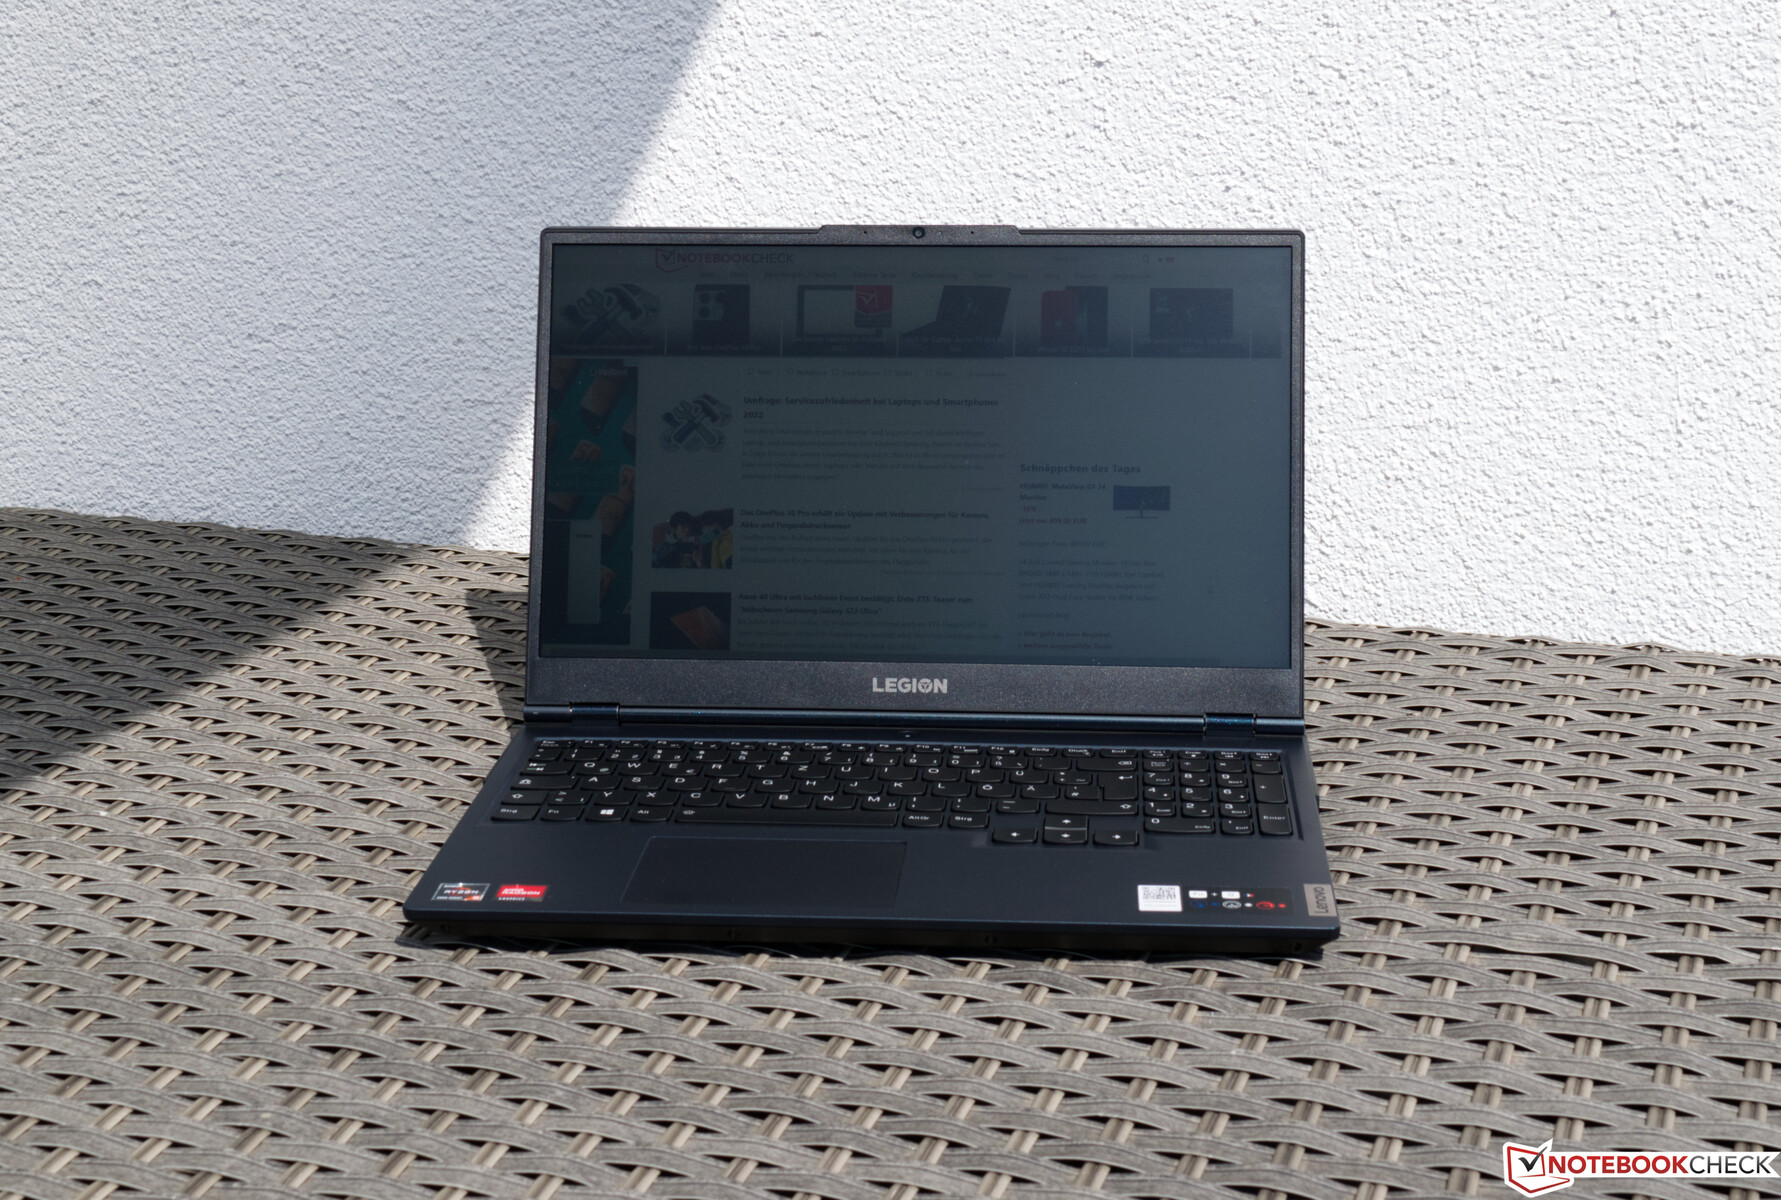
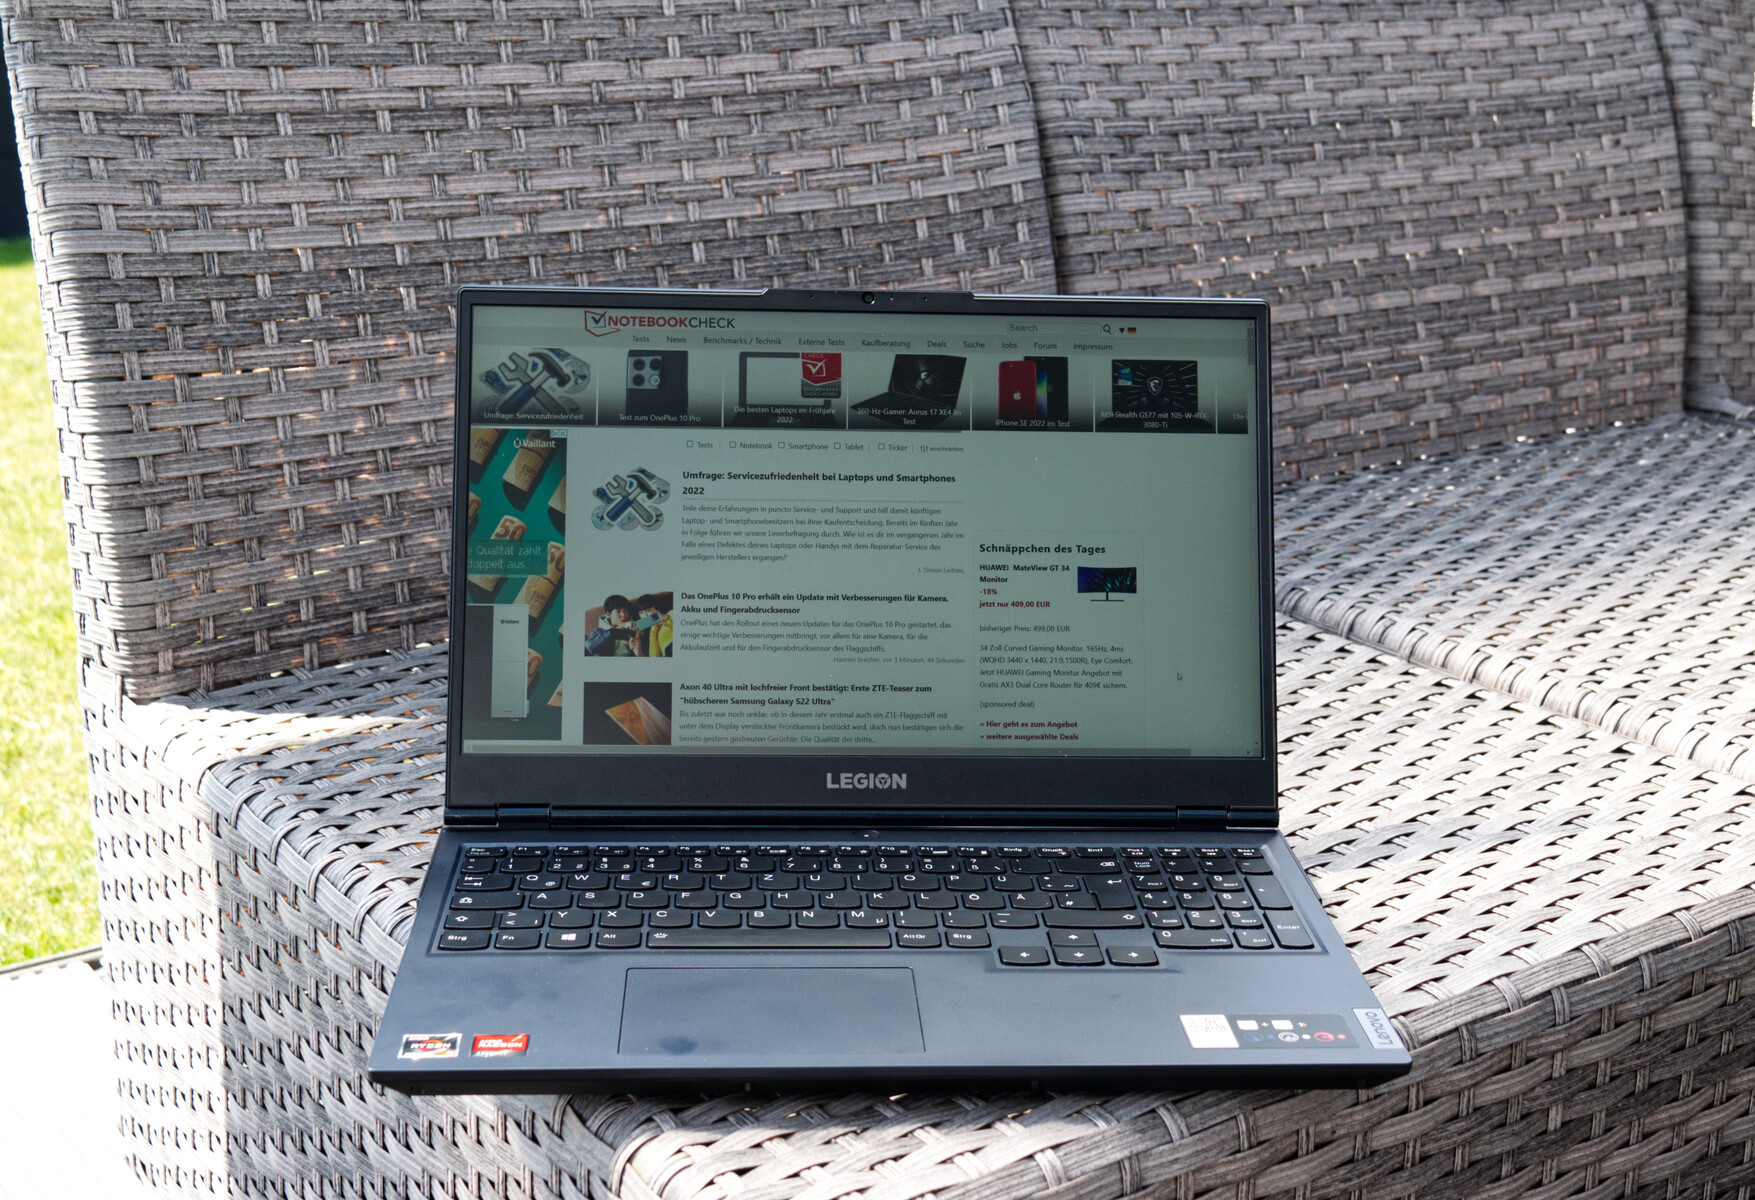
The Lenovo Legion 5 15ACH6A is clearly recognizable as a gaming laptop. Optically, Lenovo remains true to its Legion series: the rather inconspicuous device offers subtle highlights in the form of lettering that indicates the device class. In terms of color, the phantom blue suits the device well and is not obtrusive. Lenovo continues to employ tried-and-tested materials, primarily using plastic for the case. The Legion 5 15ACH6A nevertheless appears to be of high quality and the base offers good rigidity. The center of the keyboard, however, yielded slightly during the pressure test. Despite its smaller size, the display lid offers similar torsional stiffness to the Lenovo Legion 5 17 - it can be twisted without much effort. Selective impacts of force do not pose a problem and are well absorbed. The opening angle of the display is very large at 180°. The hinges make a high-quality and stable impression, but cannot completely prevent teetering. The base's weight is heavy enough to open the display with one hand.

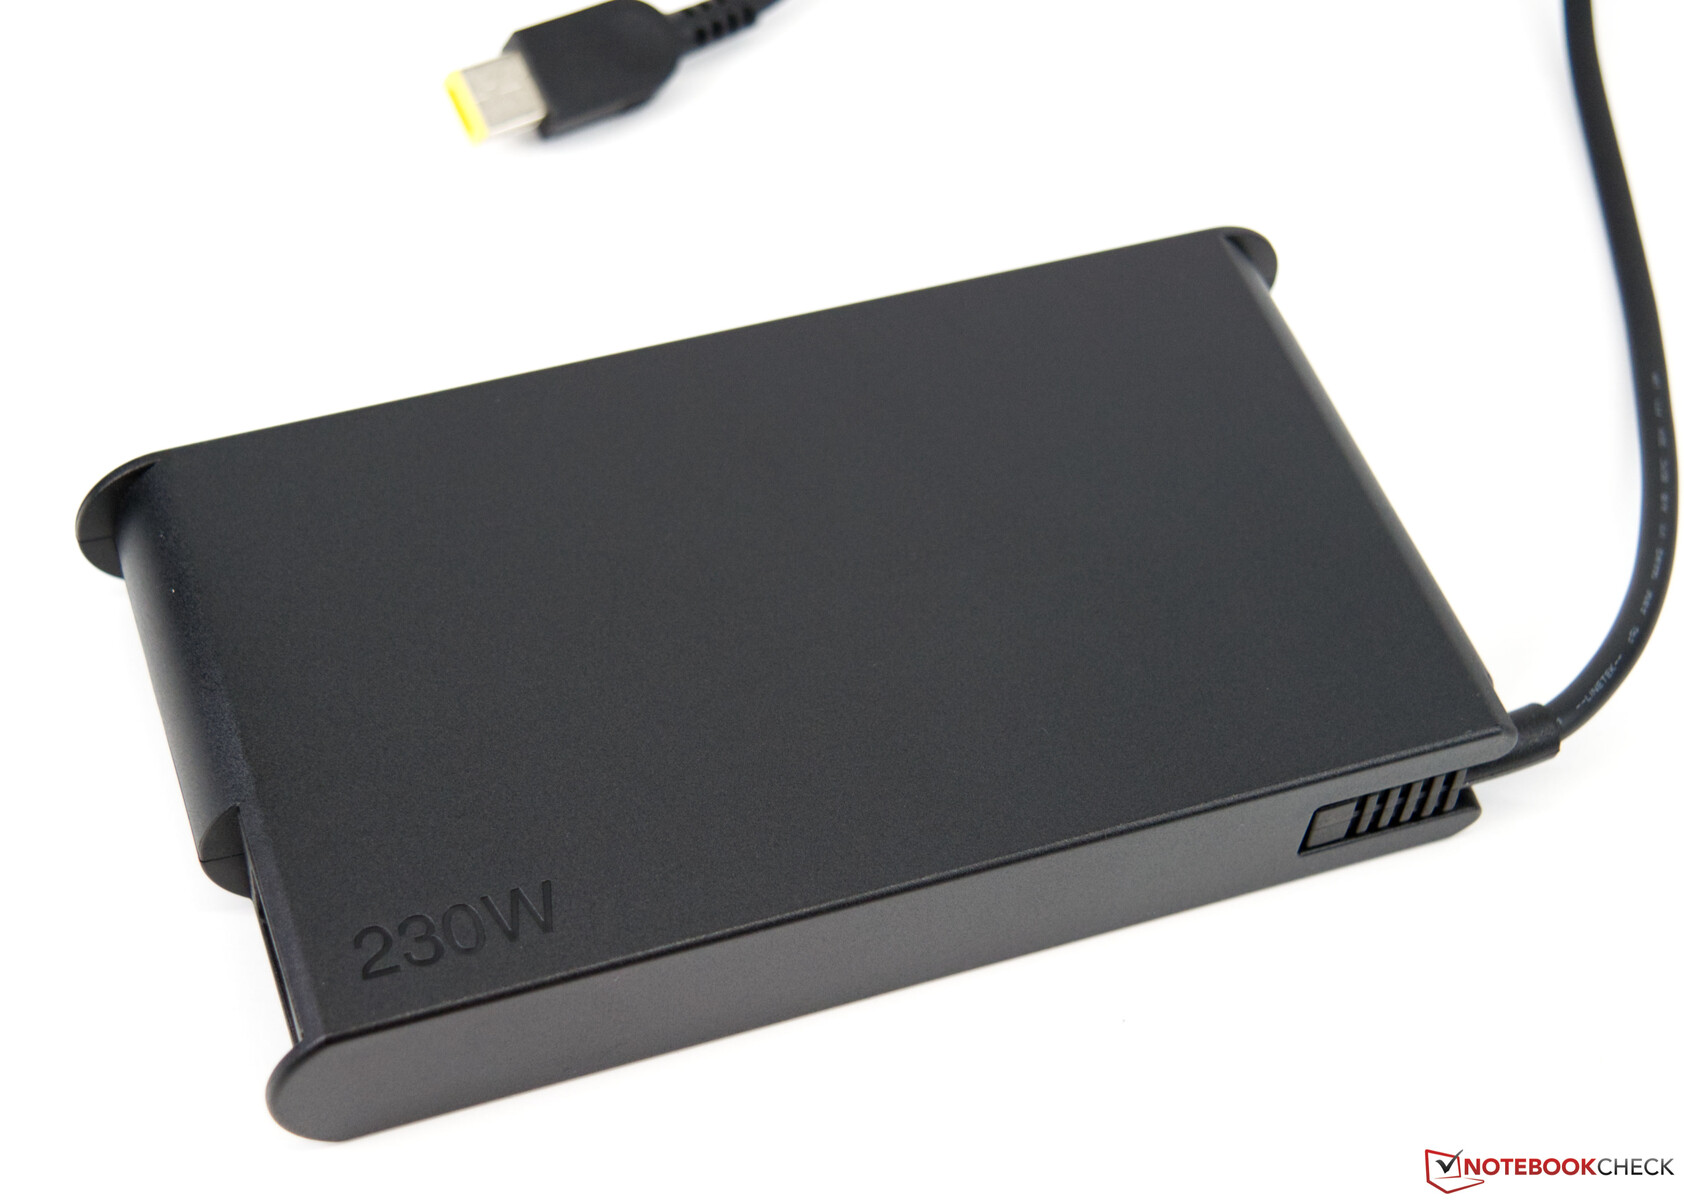
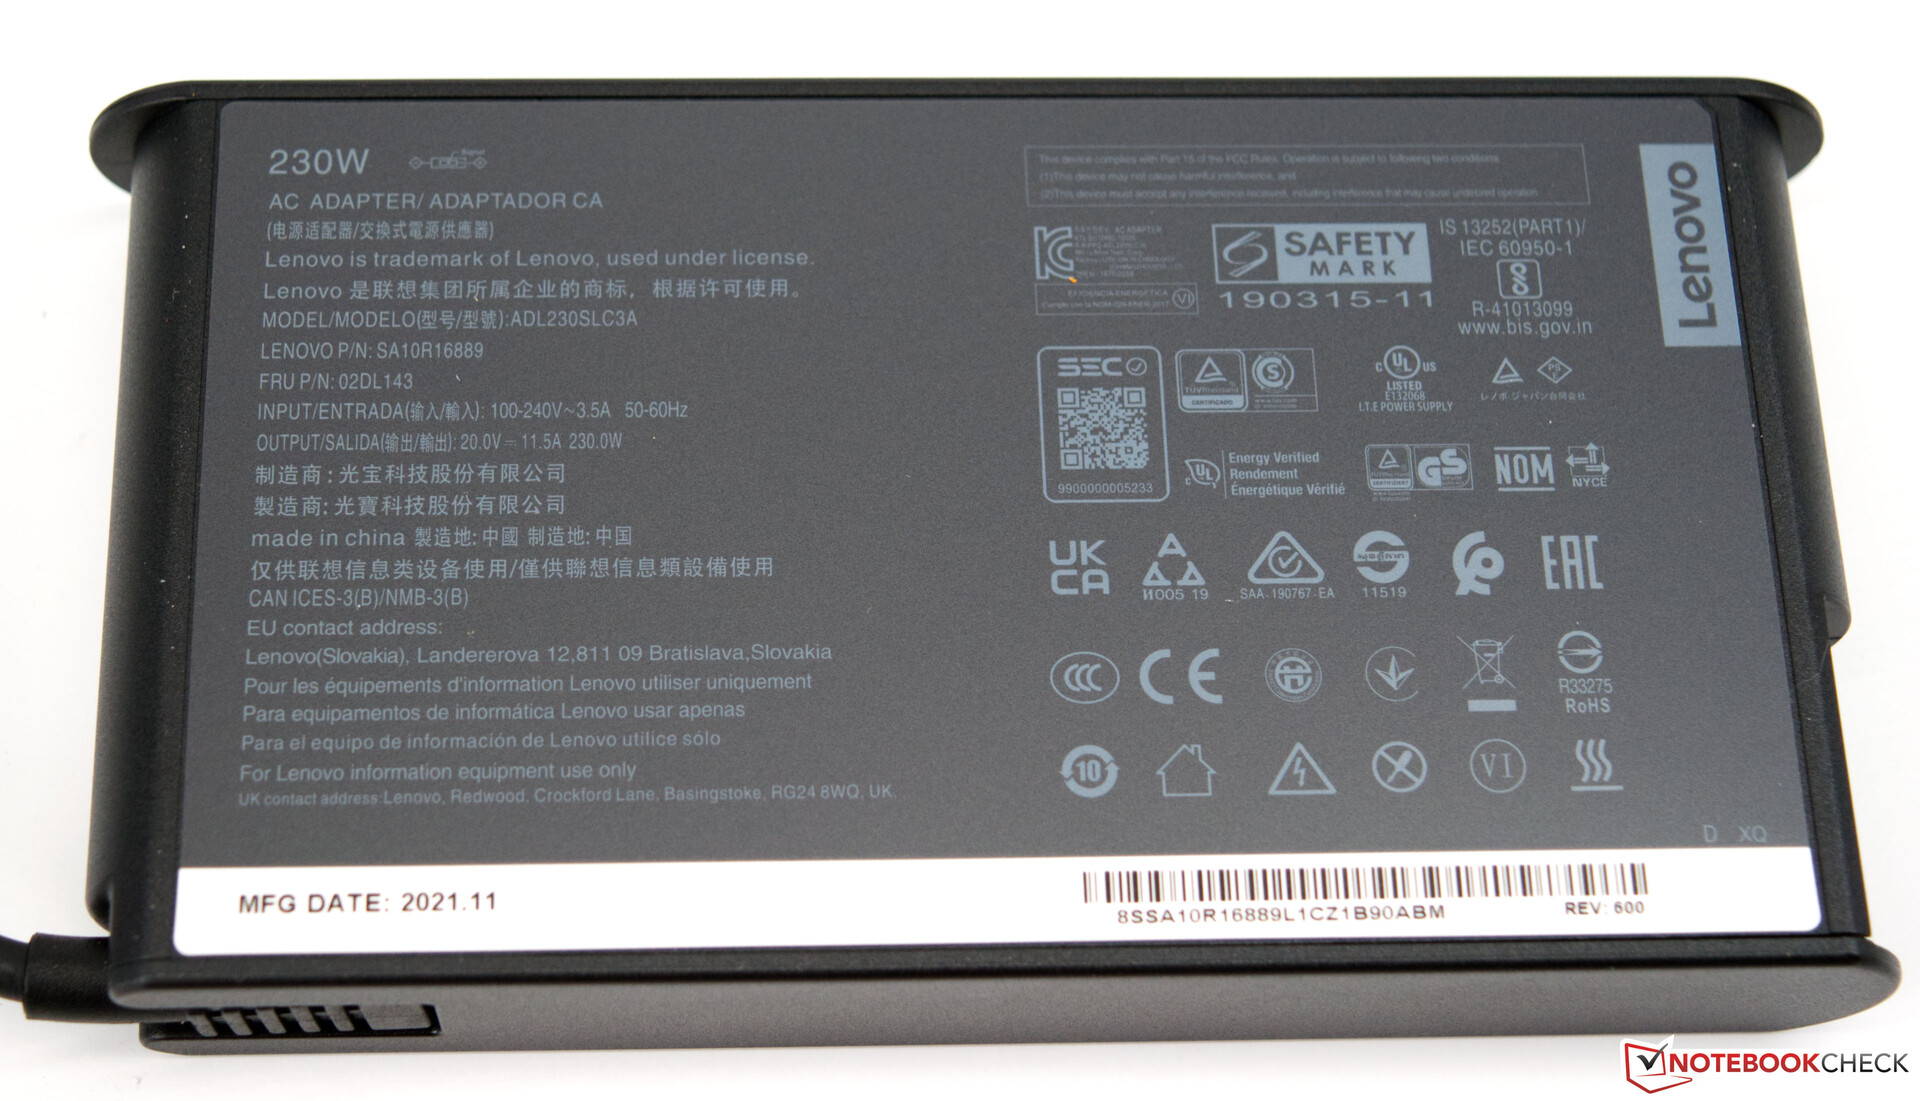
At 2.5 kilograms, the Lenovo Legion 5 15 is not a lightweight at all in the 15-inch class. Excluding the HP Victus 16, all comparison devices weigh a little less. In terms of size, there are no notable differences. The slim but powerful 230-watt power adapter adds another 866 grams.
Hardware
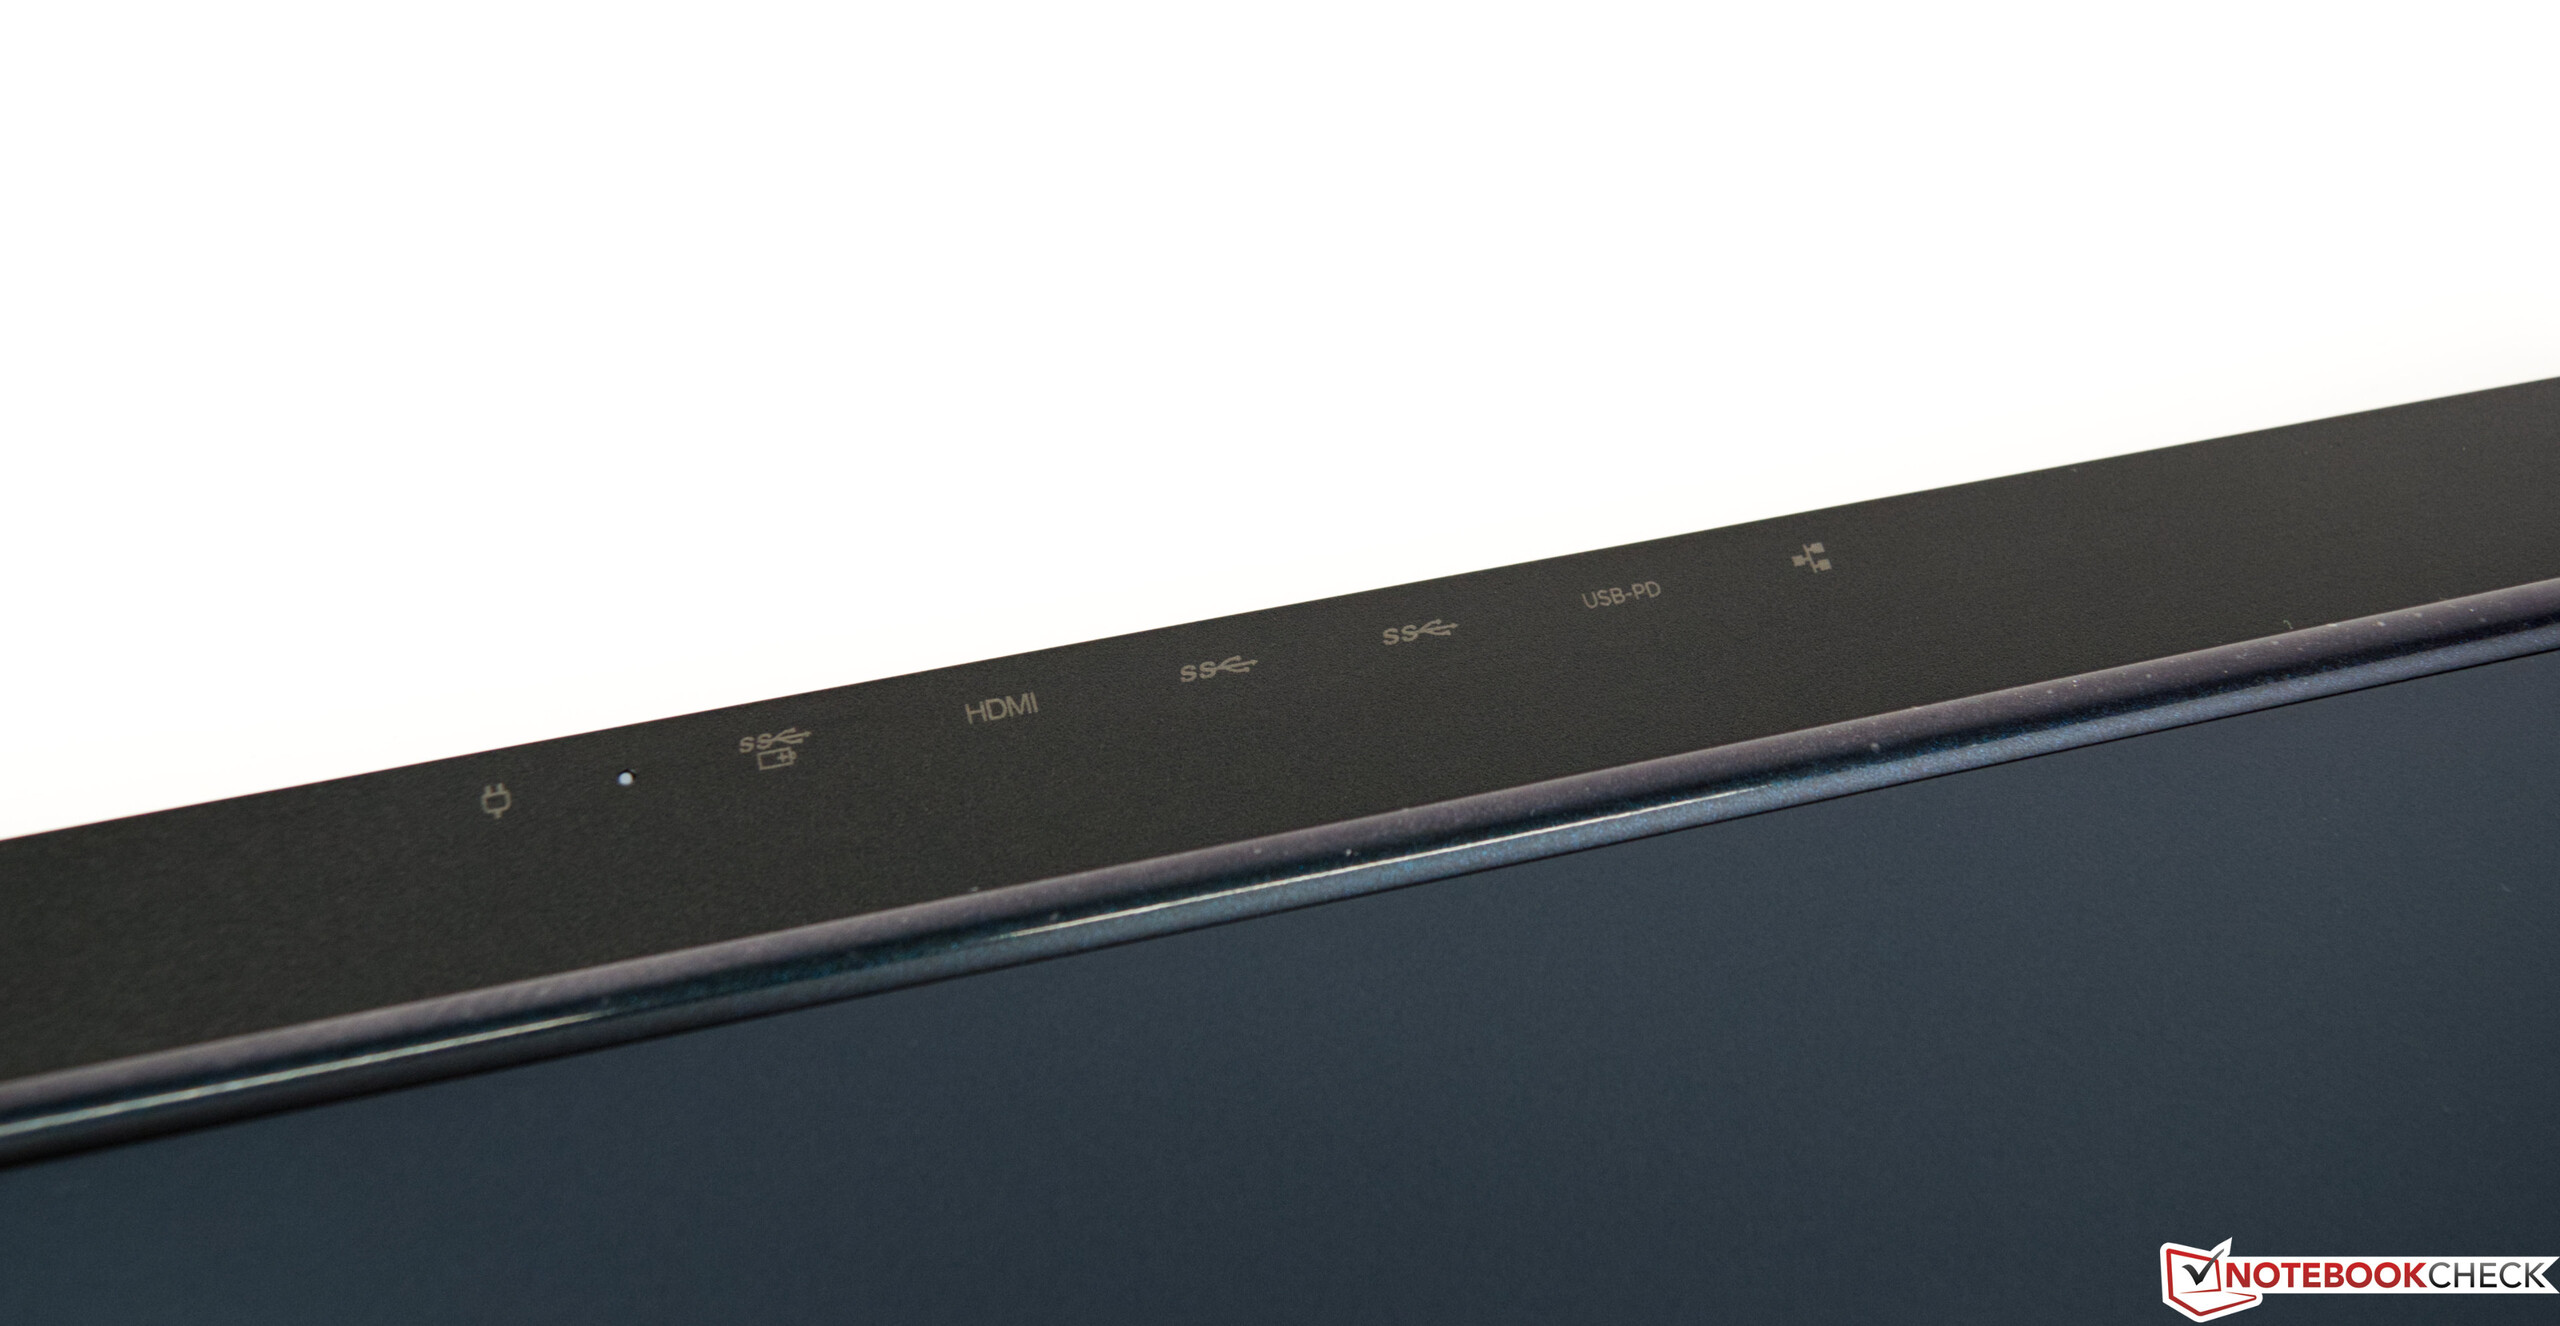
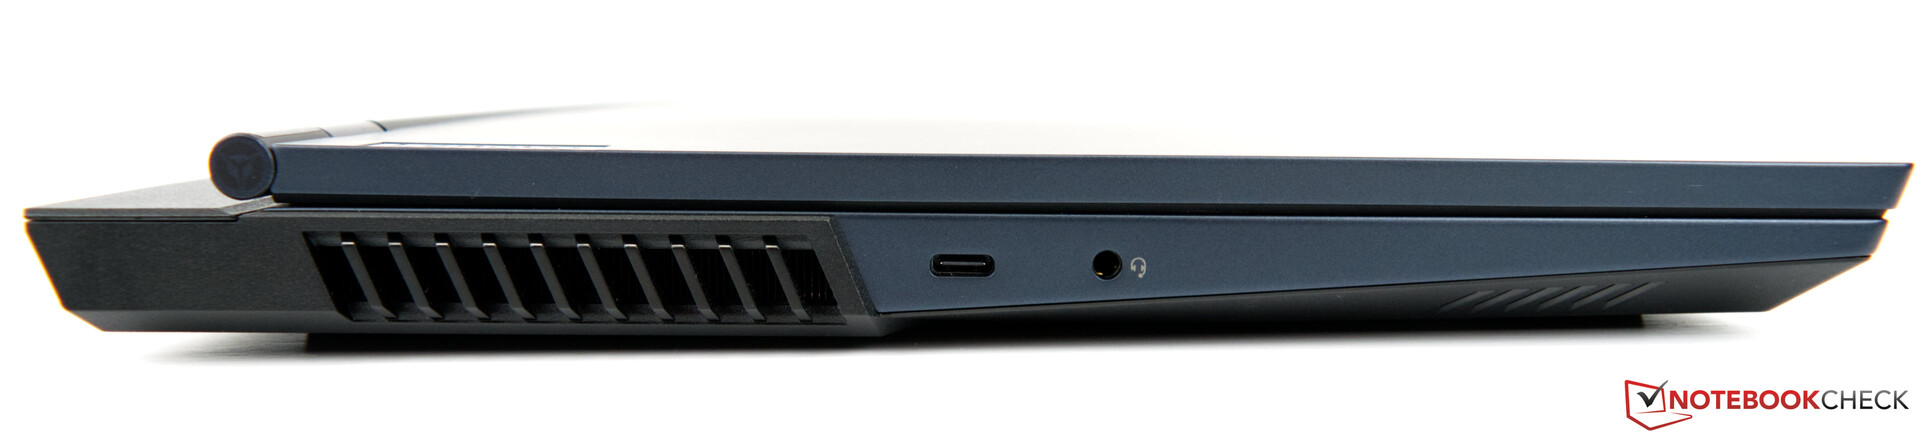
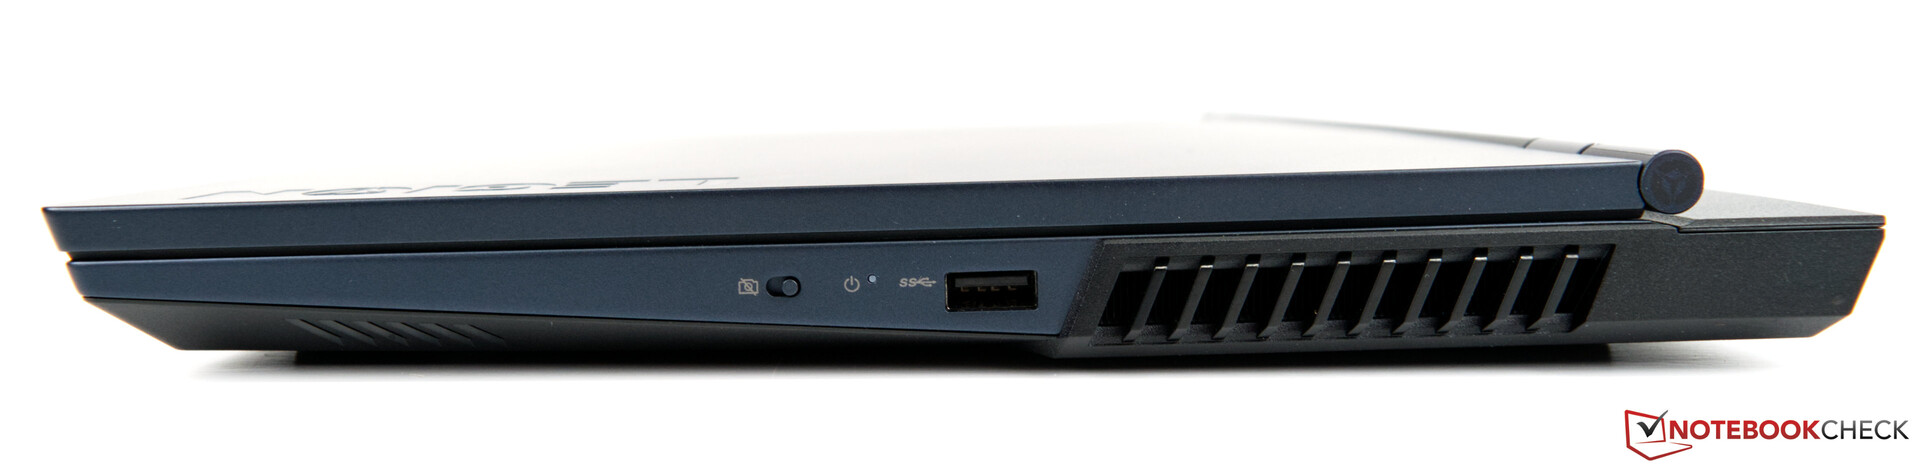
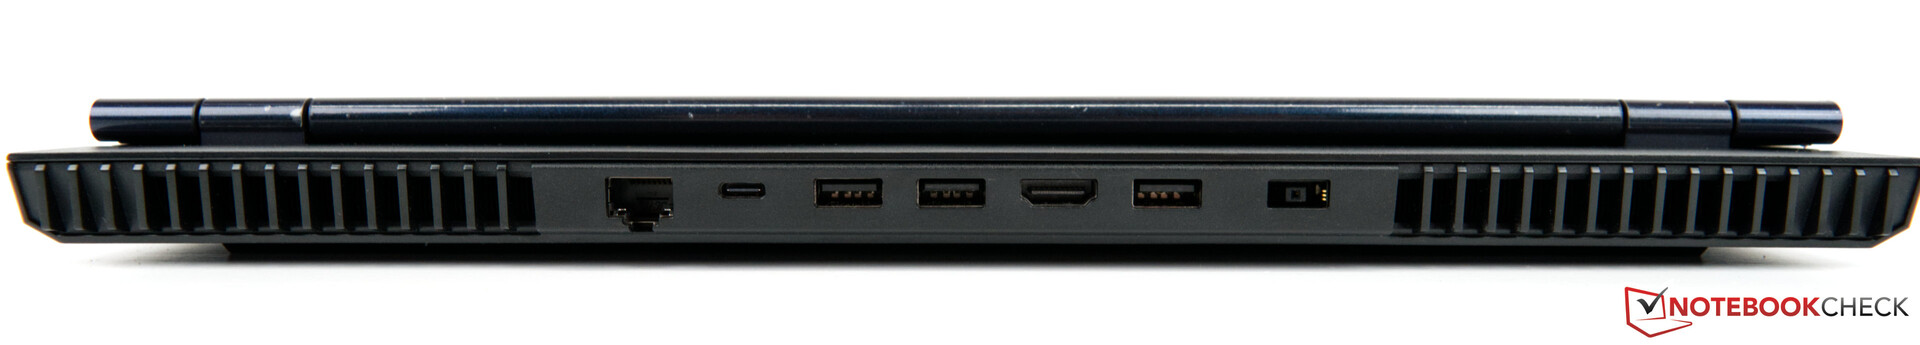
The Lenovo Legion 5 15 offers a wide selection of external ports. Four USB ports are on offer, a number that is not usually standard in laptops. There is also an HDMI output and a network connection. Up to two external displays in total can be operated via the Lenovo Legion 5 15, made possible by a rear USB-C port. However, an SD card reader is absent.
Communication
The Lenovo Legion 5 15 is equipped with the latest Realtek WLAN module. In our tests, the WLAN module delivered solid performance, which, however, is well below the class average. In comparison, the competition, excluding the Asus TUF Gaming F15, delivers consistently better results. But the performance measured is still sufficient for everyday use.
Webcam
Hardly any gaming laptop offers good webcam quality. The Lenovo Legion 5 15 is no exception: it lacks color fidelity and image sharpness, as you can see in our photos.


Accessories
Delivery includes a 230-watt slim power supply weighing just under 850g and several information booklets.
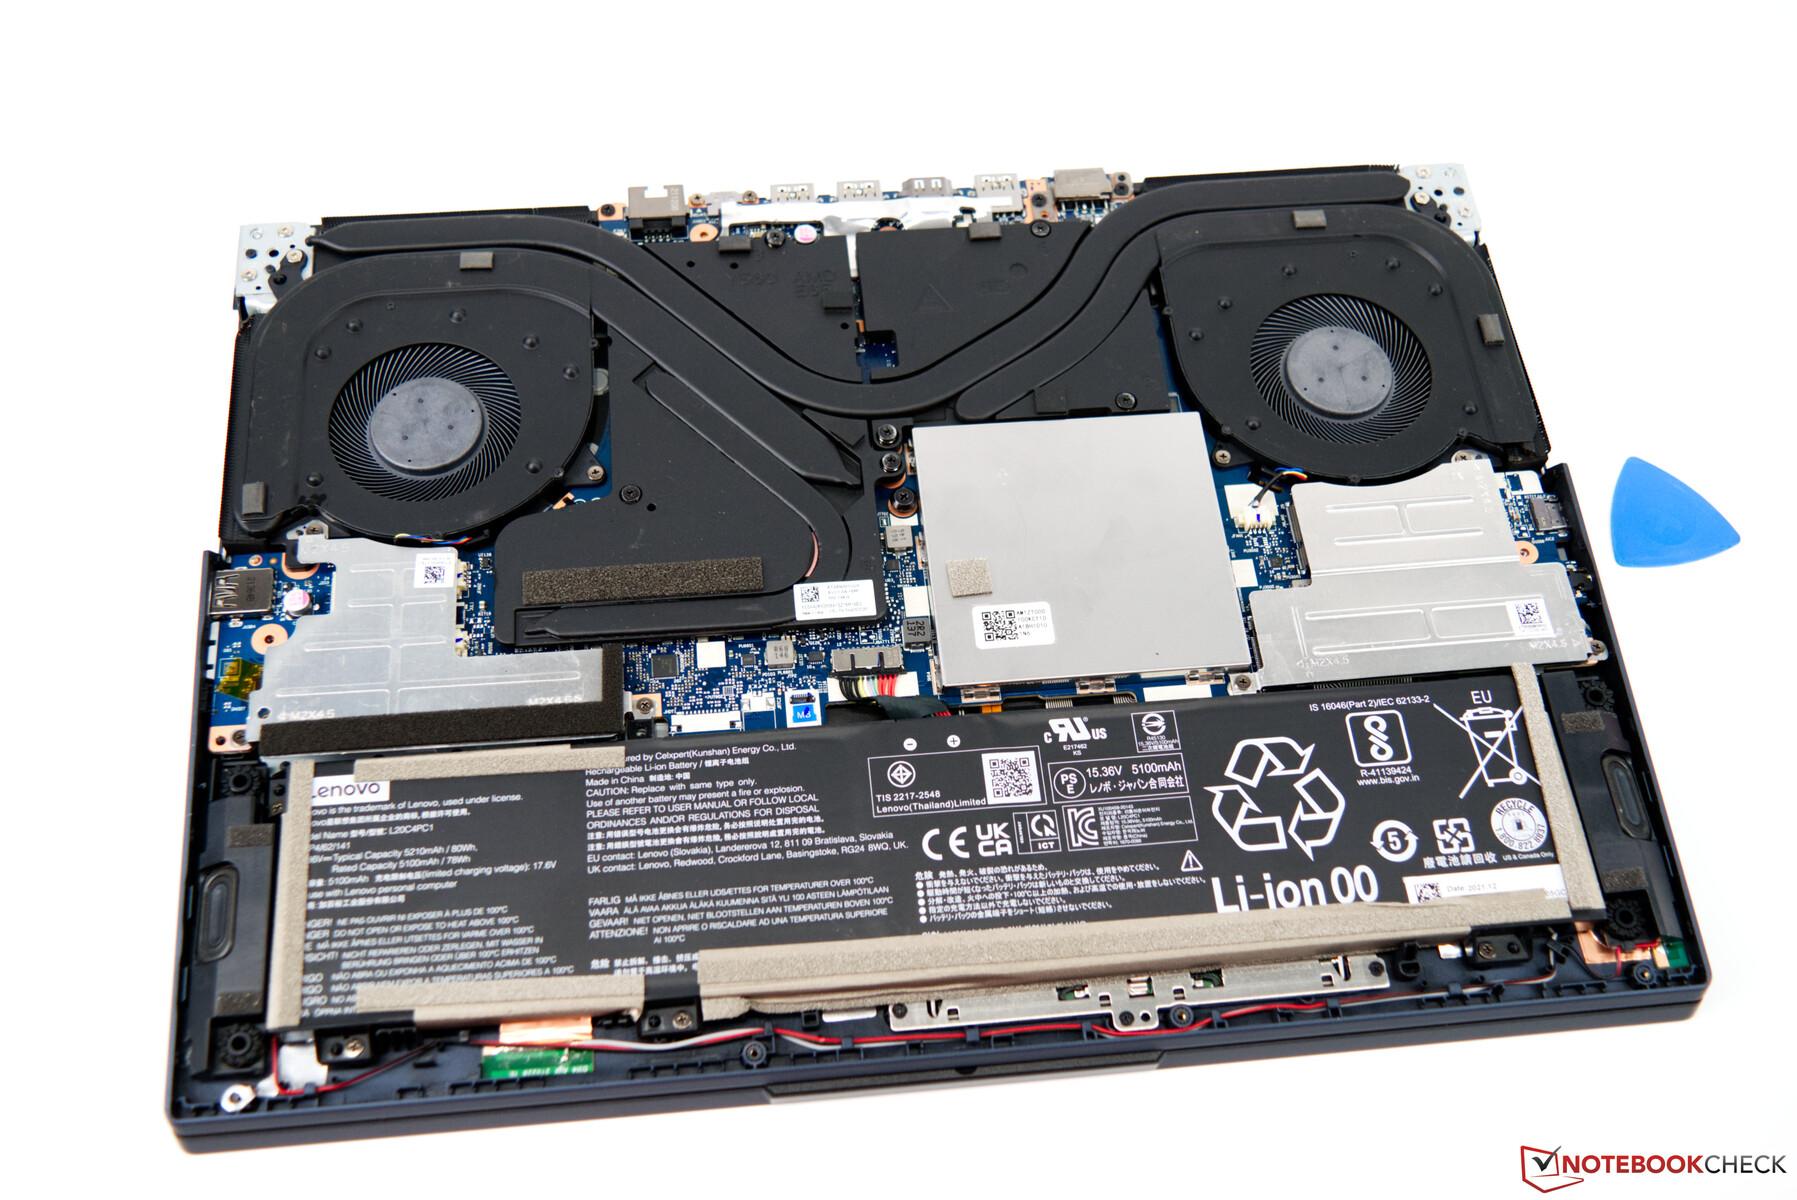
Maintenance
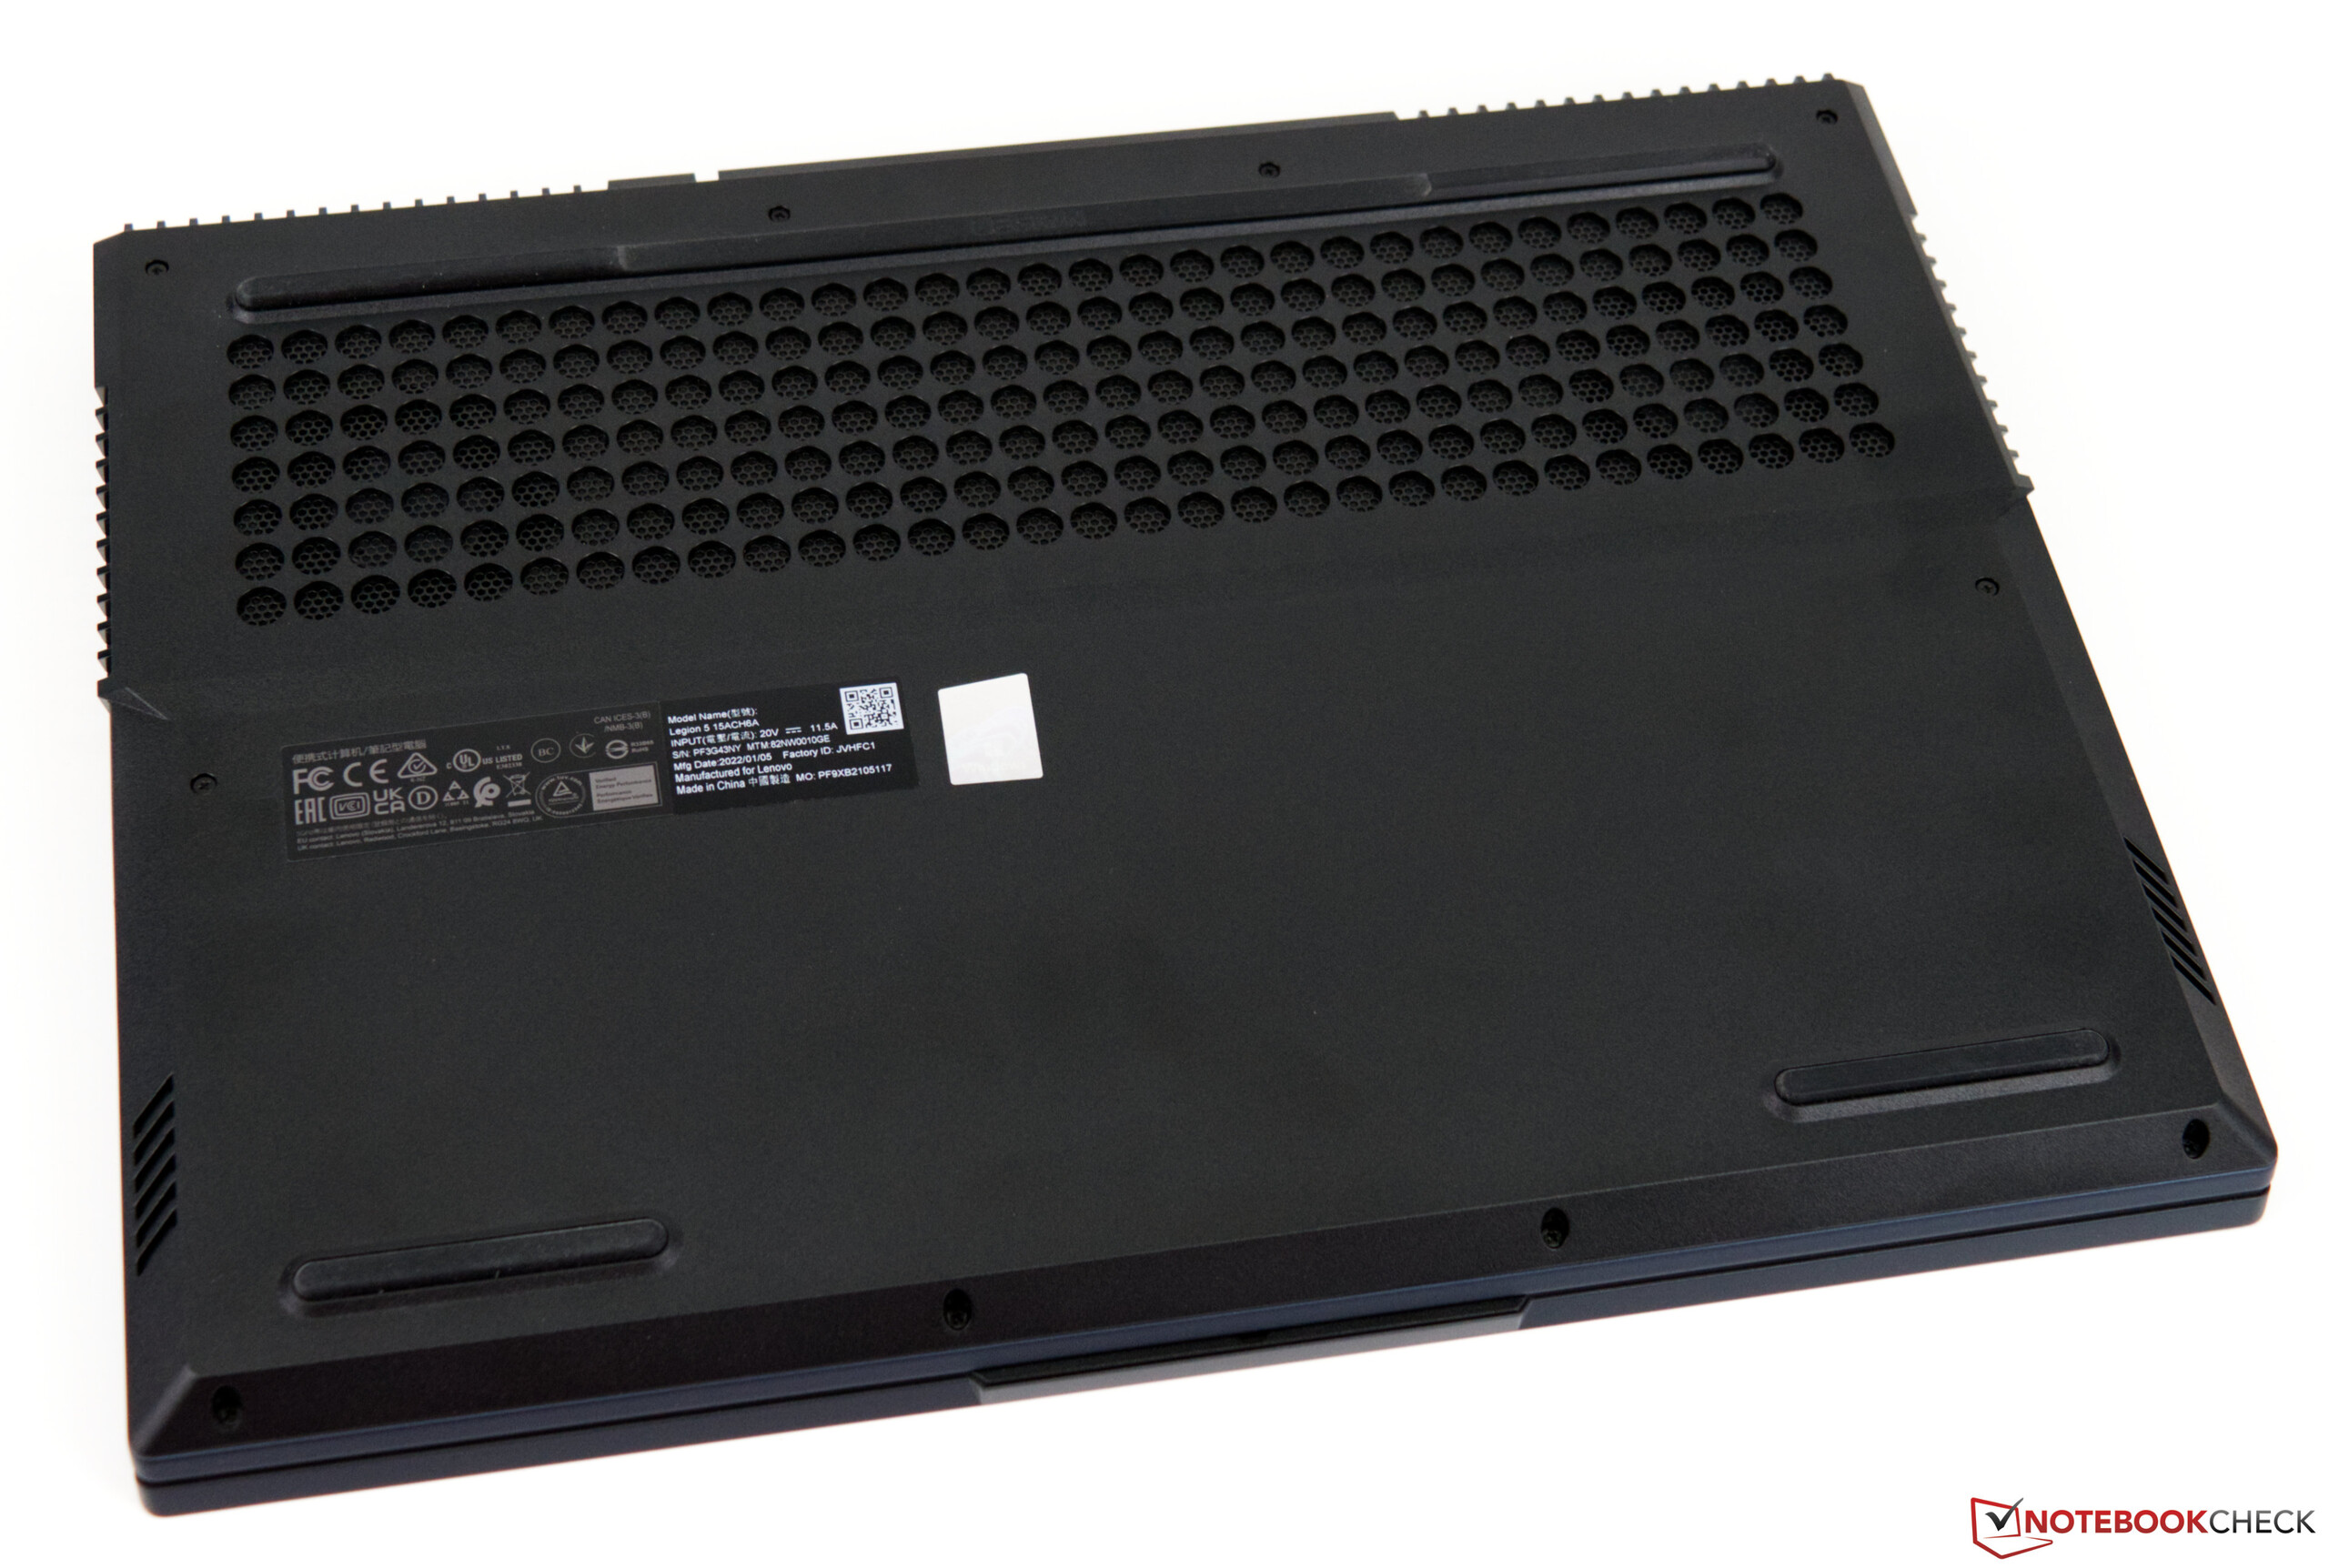
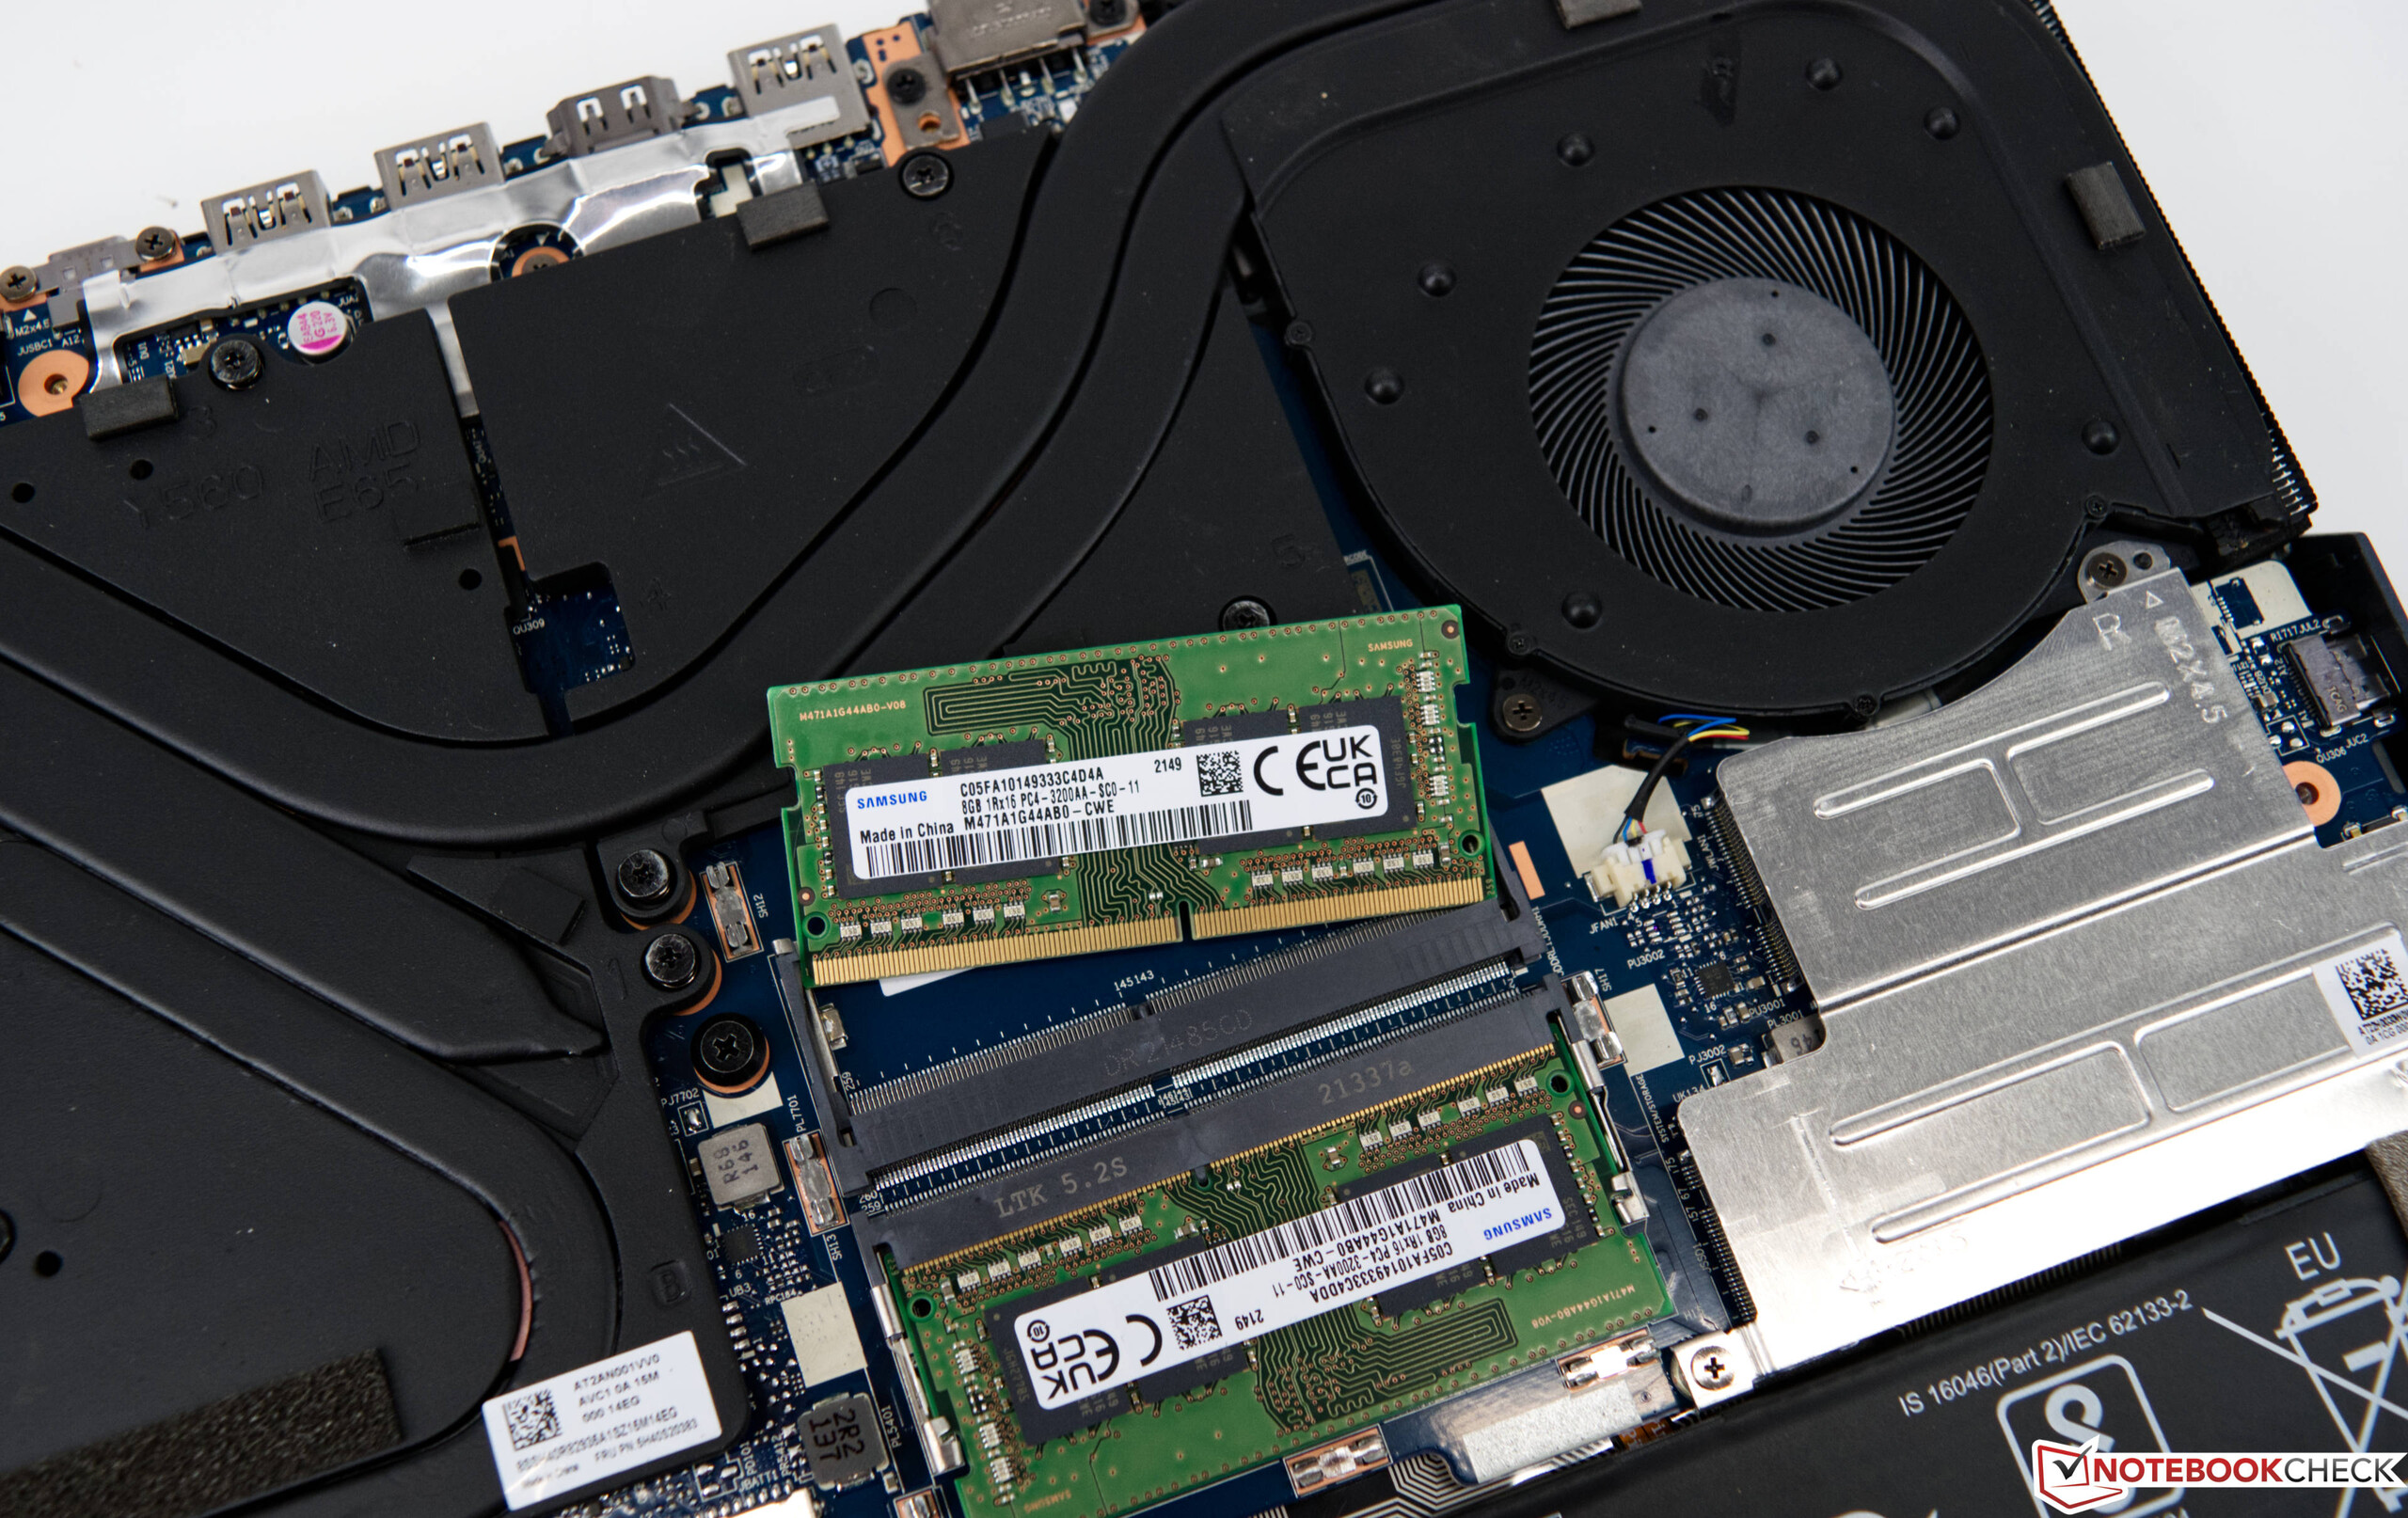
For maintenance, the bottom panel must be removed due to the lack of a maintenance cap. Removal is only possible with suitable tools. Otherwise, there is a risk of damage, as the bottom panel remains fixed in place by a large number of plastic clips even after all screws have been removed. The installed components, such as RAM, SSD, or the WiFi module, are located under a separate cover that can be easily removed. In our case, the Lenovo Legion 5 15 still offers space for another storage device.
Warranty
Those who buy the laptop directly from Lenovo receive a 36-month warranty (PremiumCare).
Input Devices
Keyboard
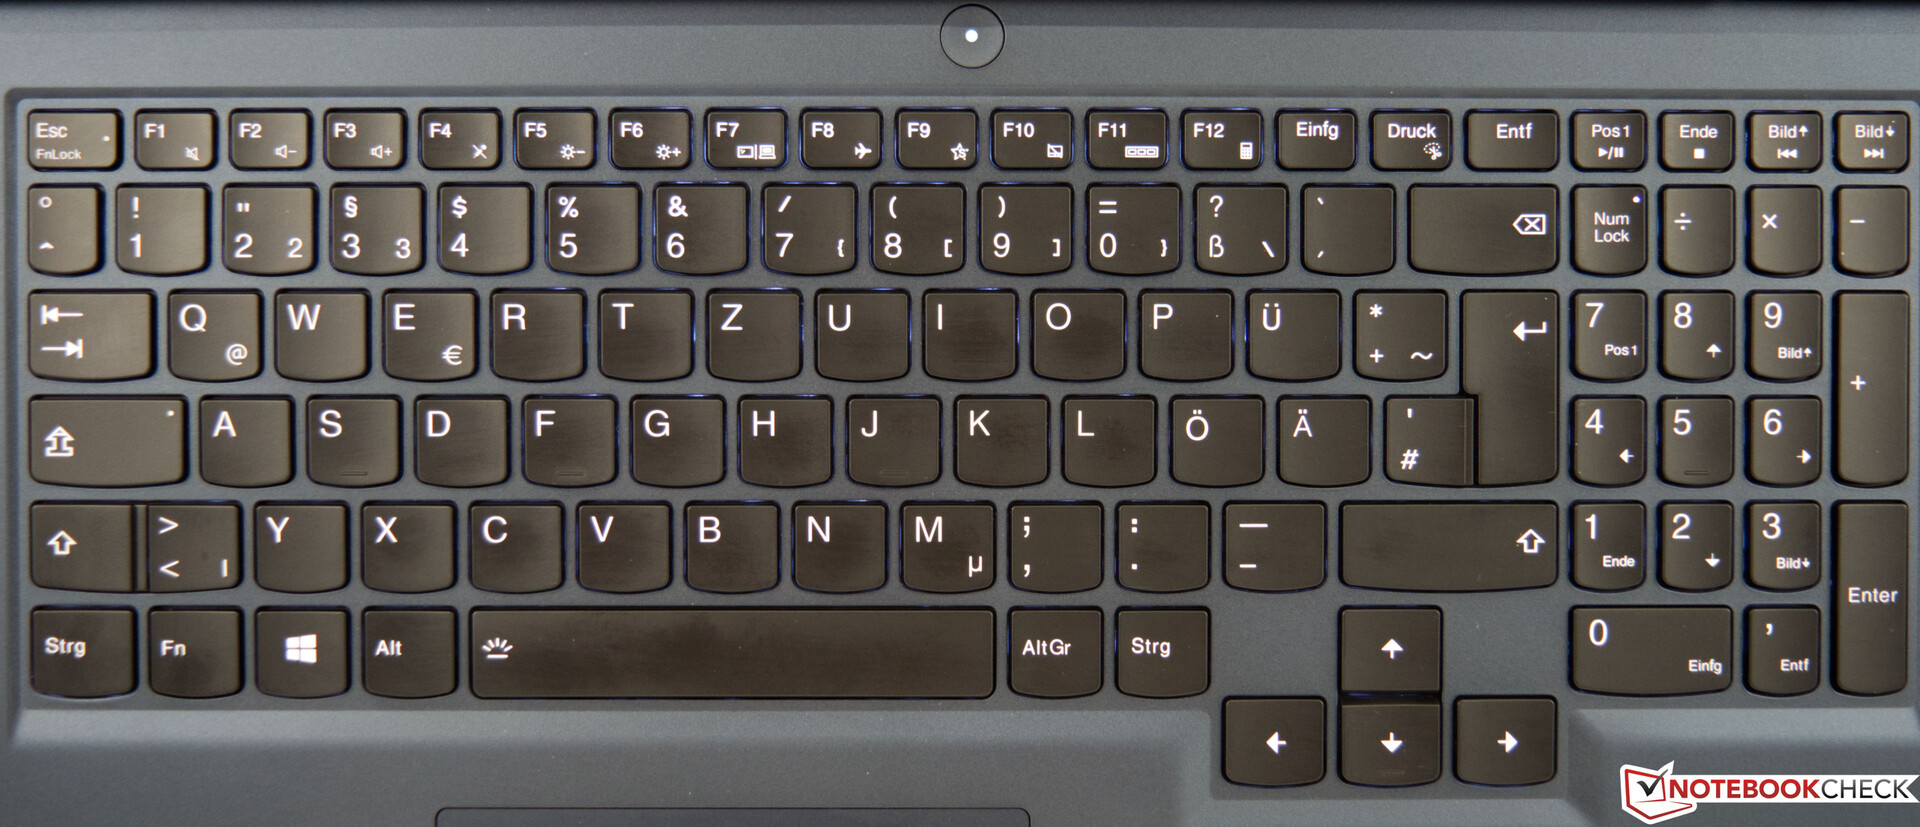
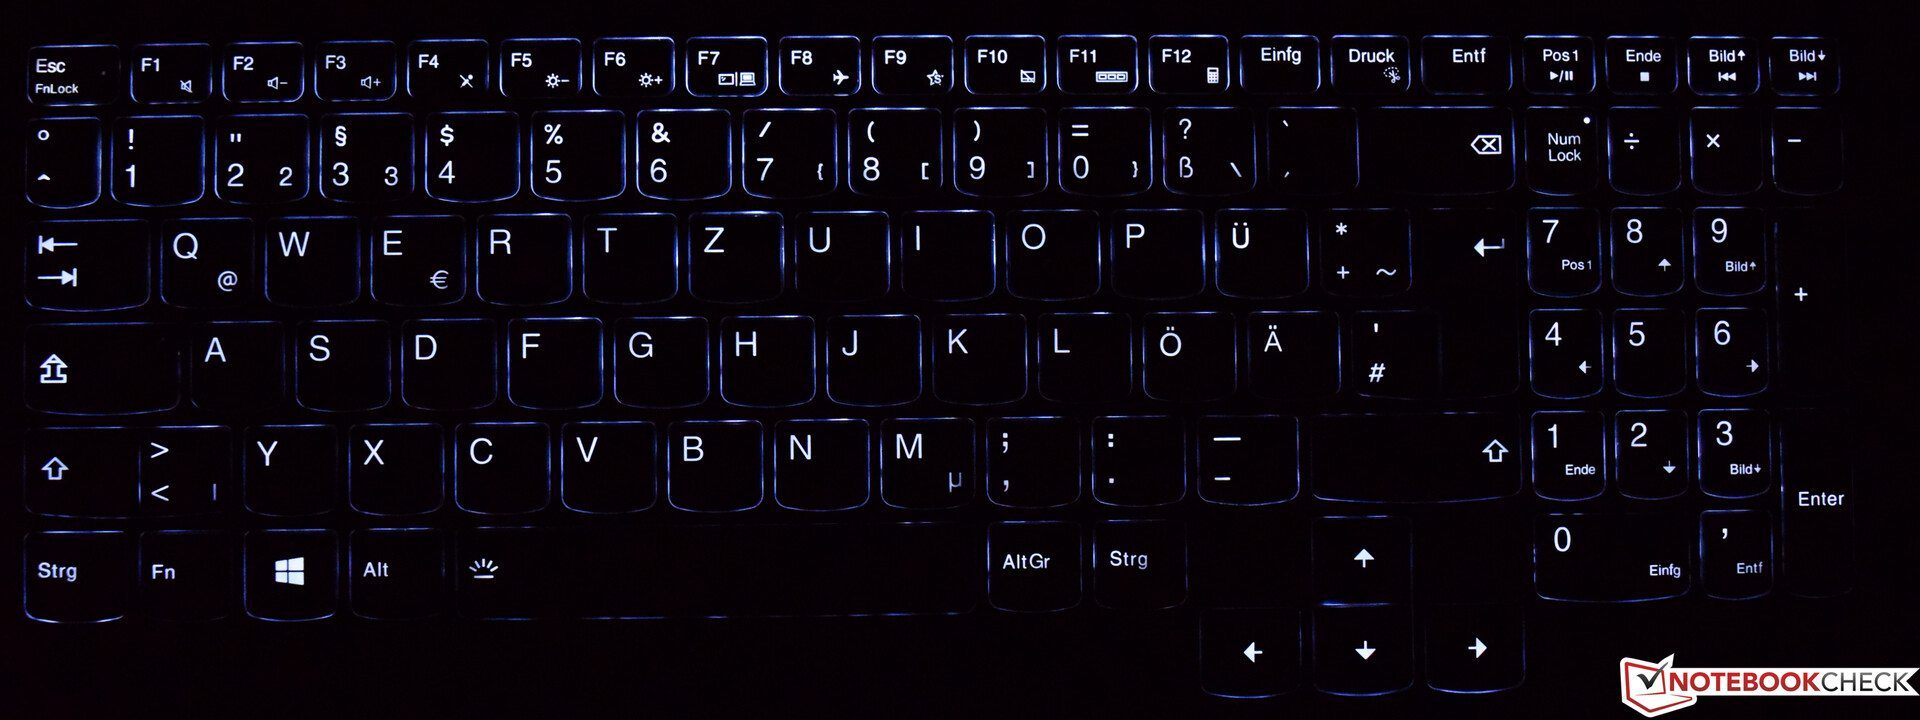
Lenovo uses a 6-line chiclet keyboard for the Legion 5 15, which we already know from the 17-inch variant. The accompanying lighting has two adjustable levels. The keys are pleasantly large and the arrow keys are adequately sized. The short travel of only 1.5 millimeters is accompanied by a slightly muffled stroke and a clearly noticeable pressure point. Hence, there is no spongy typing feeling.
Touchpad
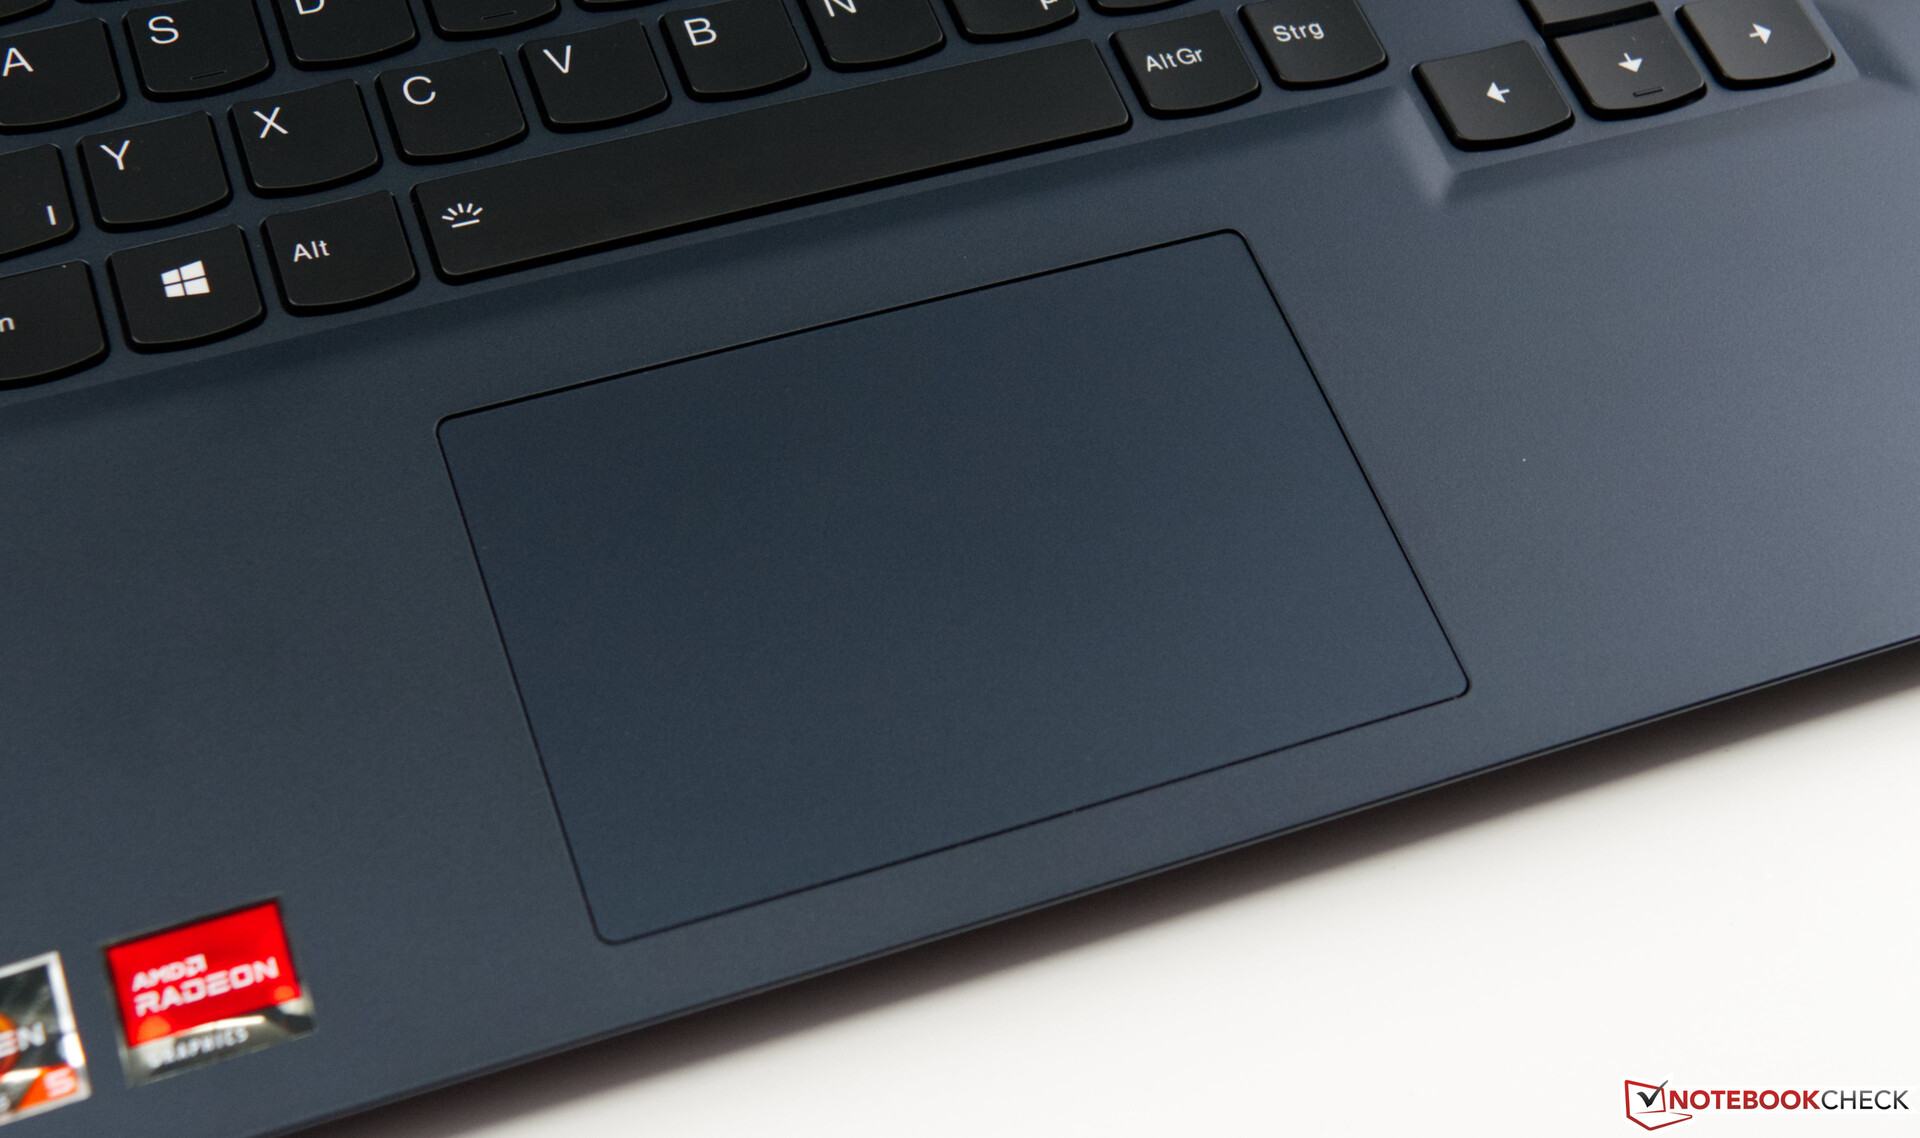
At 7 x 10.5 centimeters, the built-in touchpad is the same size as in the Lenovo Legion 5 17. But compared to its bigger brother, it doesn't appear so insignificant here. The input surface is very sensitive and reacts promptly to finger movements. We could not detect any inaccuracies while using our test sample. As usual, the two input keys are located at the bottom area, which emits a clearly audible click when pressed.
Display


The Legion 5 15 under review here is equipped with a matte FHD display with a 165 Hz refresh rate. Alternatively, this model is also available with a WQHD option. Additionally, Lenovo offers the Legion 5 15 with FHD panels that have 60 and 120 Hz refresh rates. The 15-inch IPS display of our test device offers a native resolution of 1920x1080 pixels, which corresponds to a calculated pixel density of 141 PPI.
In our measurements, the built-in display achieved the specified brightness. With an average of 328 cd/m², the default value (300 cd/m²) is clearly exceeded. The contrast ratio is 1,159:1, which is a typical value for an IPS panel. Competitors deliver partly better values here due to better black levels.
Eye fatigue due to PWM should not occur with the Lenovo Legion 5 15. PWM is not used to regulate brightness on the built-in display. There is a small drawback in terms of clouding: light bleeding is visible in the two lower corners, but this is only noticeable in very dark scenes.
| |||||||||||||||||||||||||
Brightness Distribution: 85 %
Center on Battery: 371 cd/m²
Contrast: 1159:1 (Black: 0.32 cd/m²)
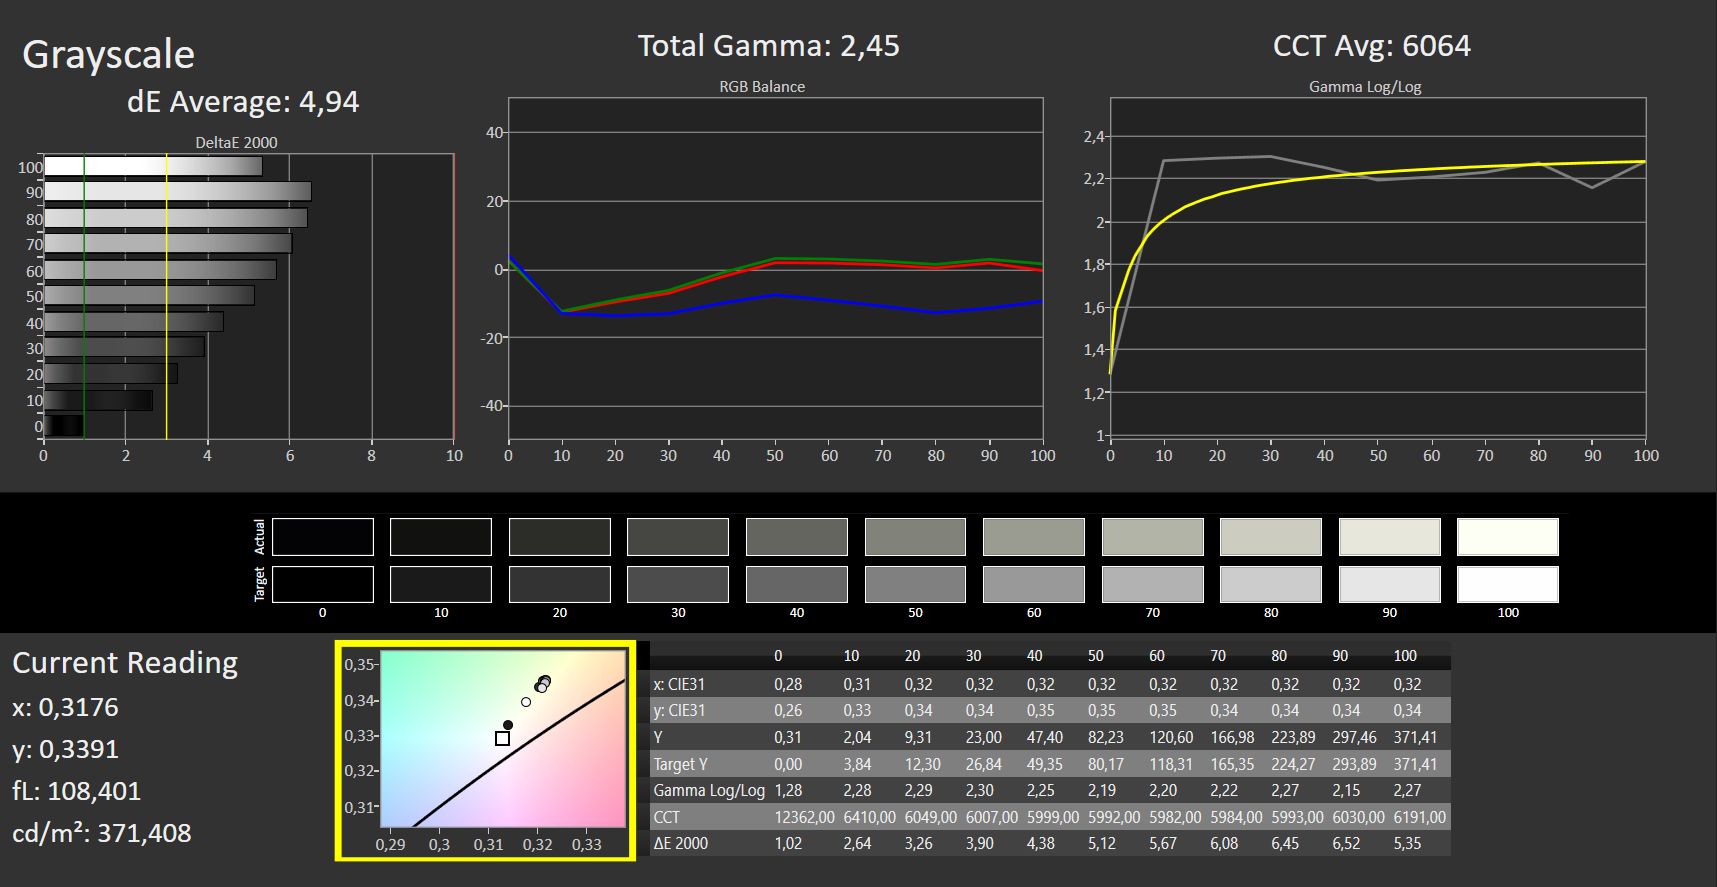
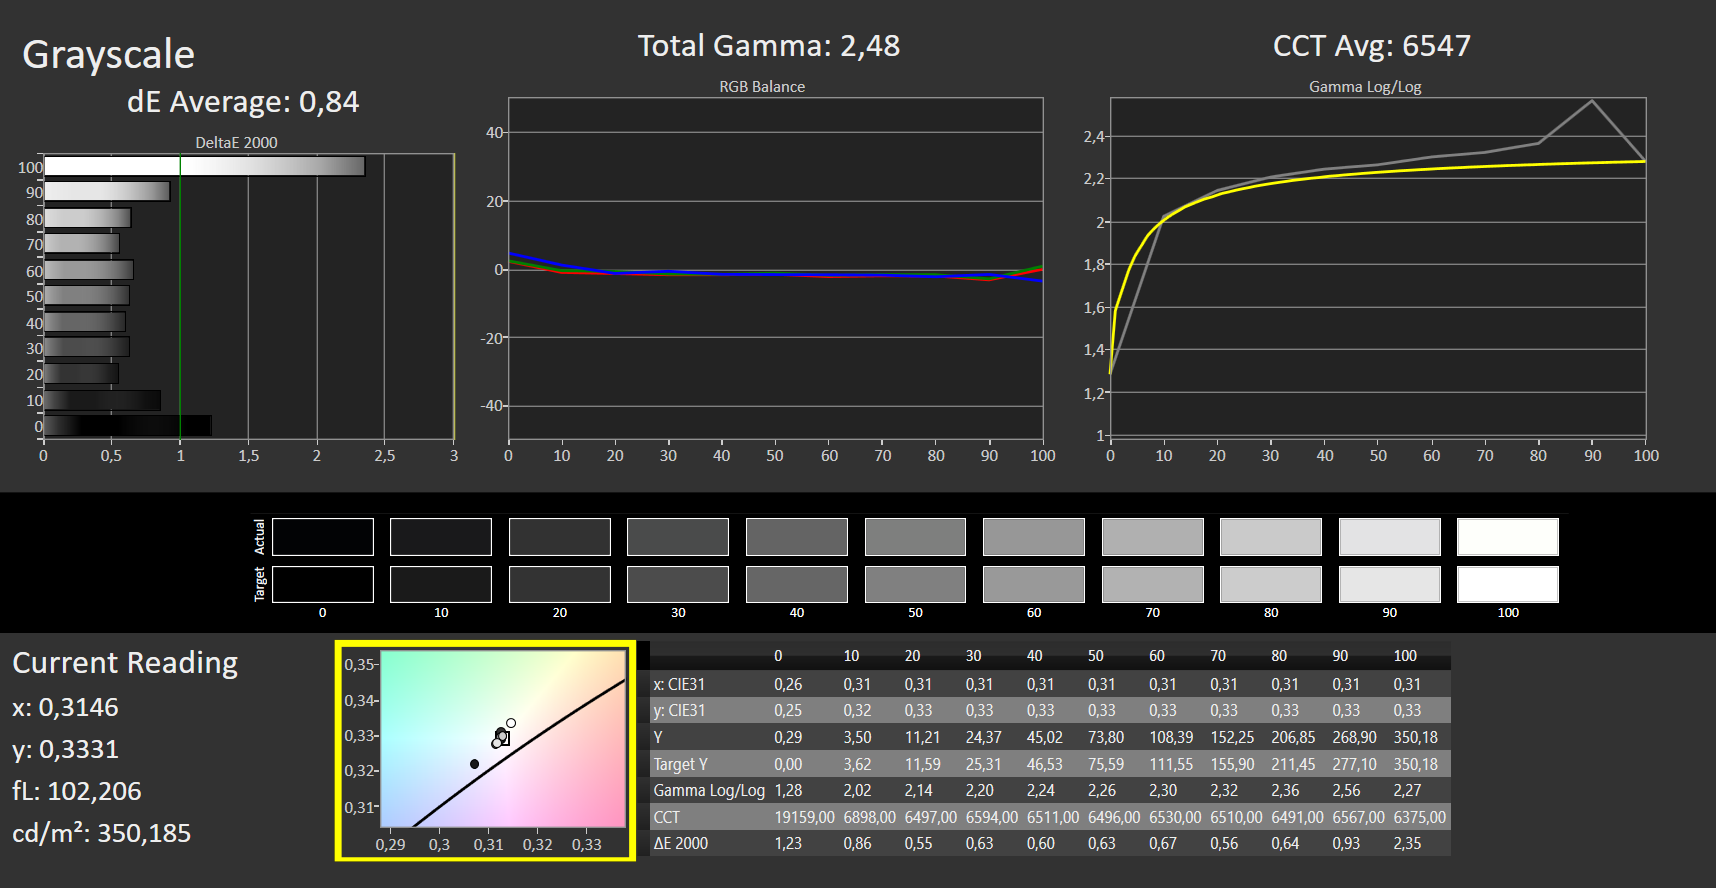
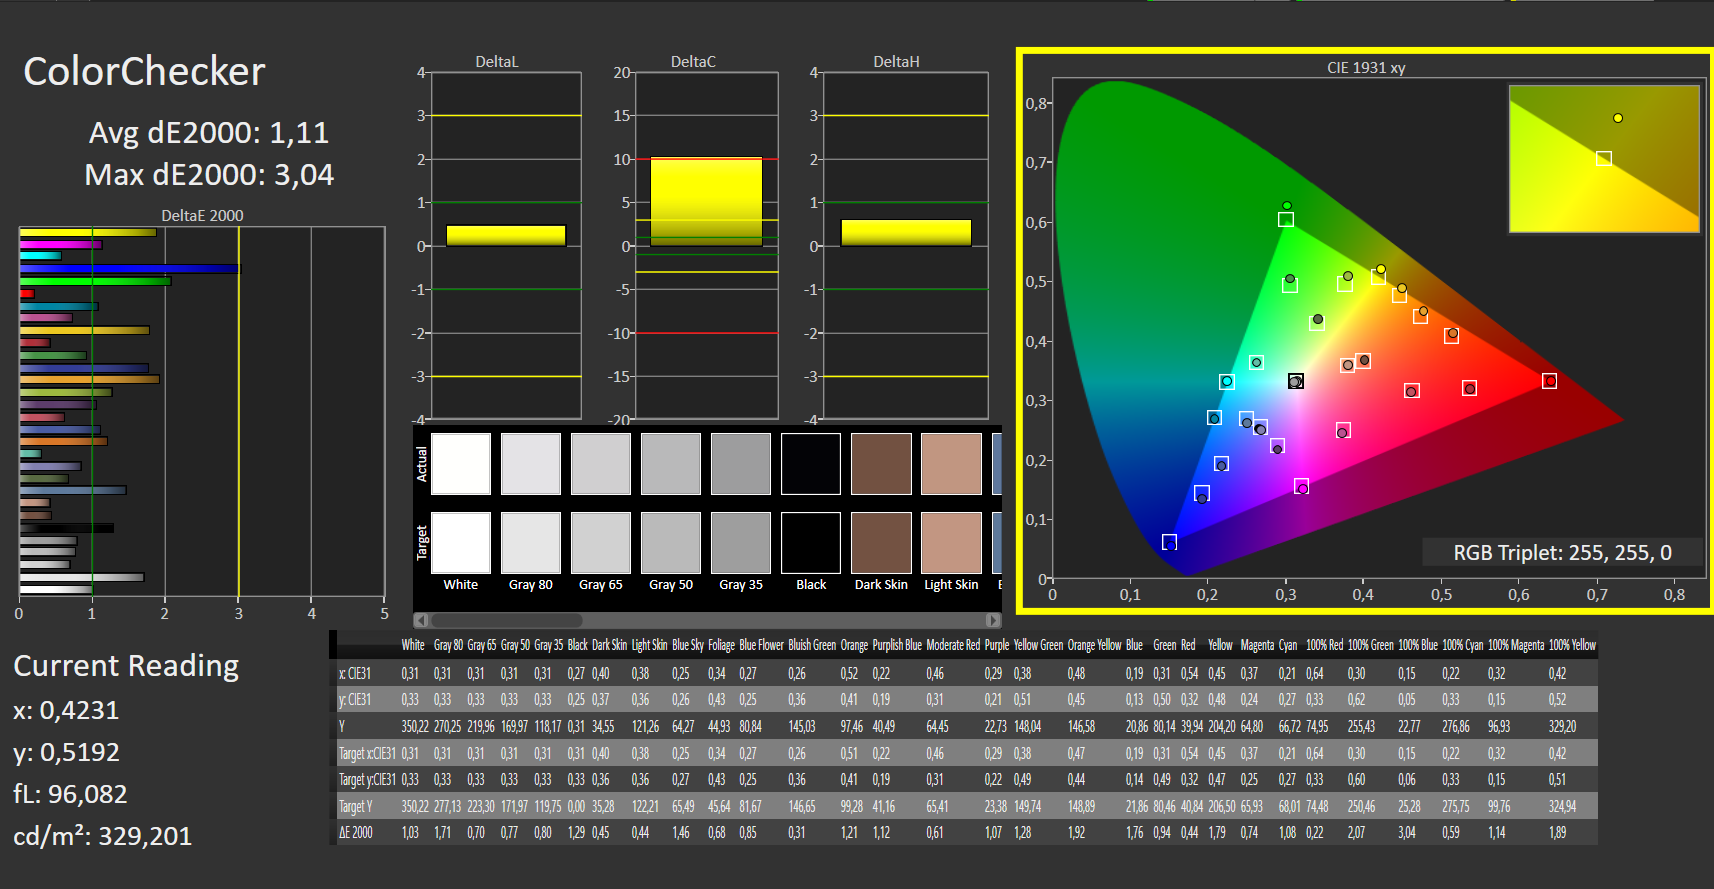
ΔE ColorChecker Calman: 3.25 | ∀{0.5-29.43 Ø4.71}
calibrated: 1.11
ΔE Greyscale Calman: 4.94 | ∀{0.09-98 Ø4.96}
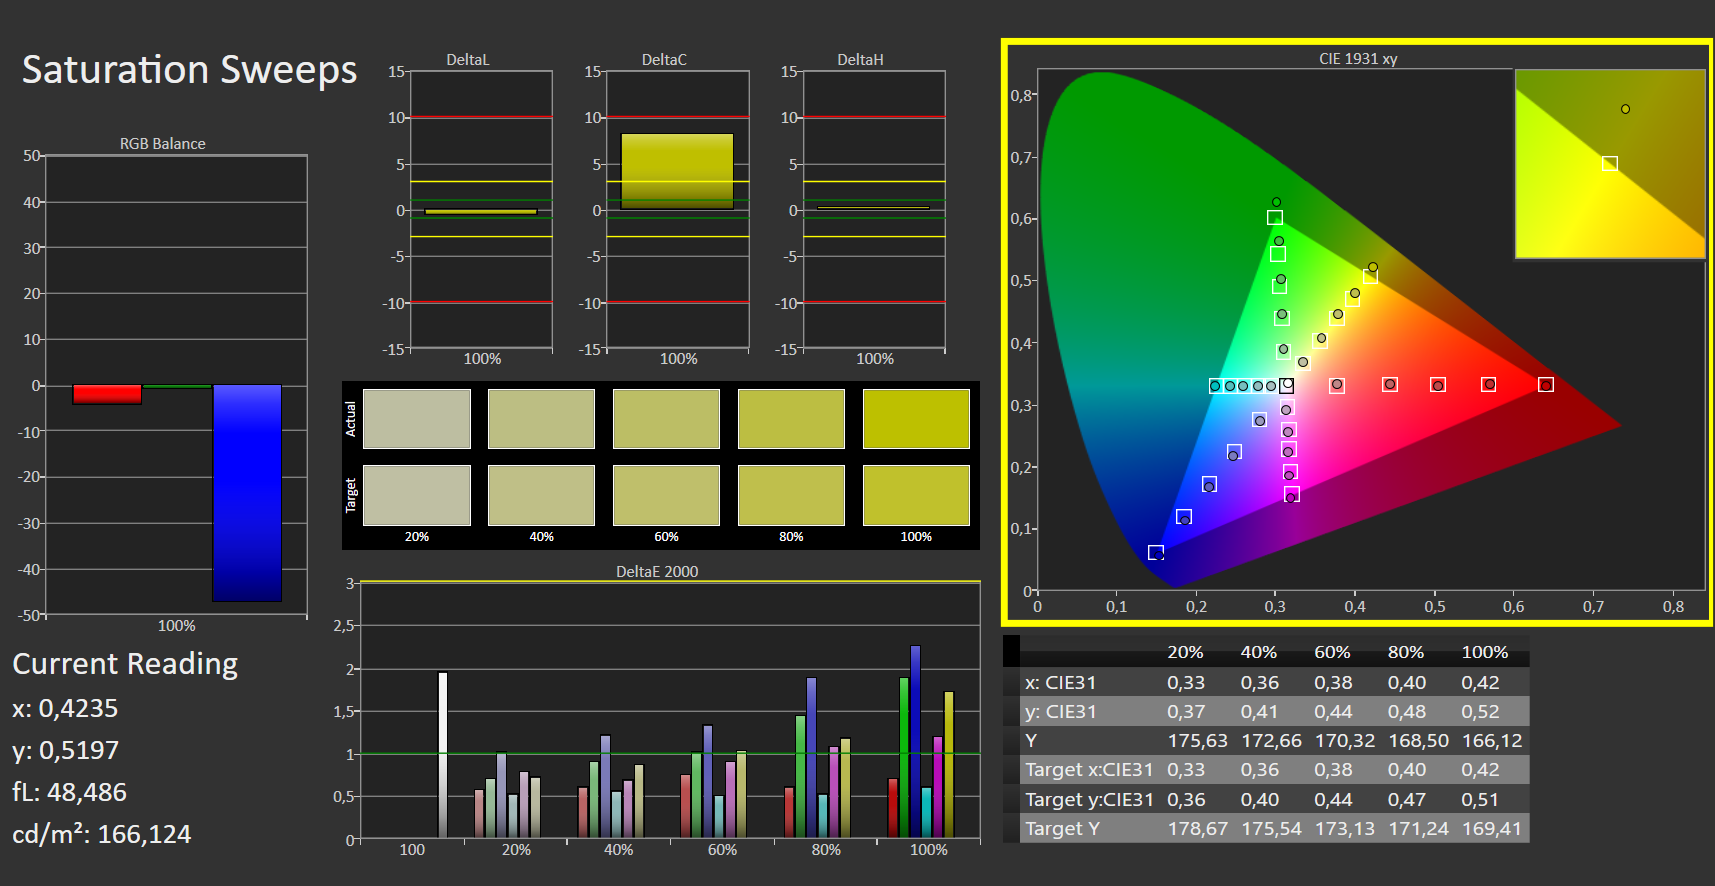
72.3% AdobeRGB 1998 (Argyll 3D)
99.1% sRGB (Argyll 3D)
71.1% Display P3 (Argyll 3D)
Gamma: 2.45
CCT: 6064 K
| Lenovo Legion 5 15ACH6A-82NW0010GE LGD06A5, IPS, 1920x1080, 15.6" | Gigabyte G5 KC LM156LF-1F02, IPS, 1920x1080, 15.6" | Asus TUF Gaming F15 FX506HM Chi Mei N156HRA-EA1, IPS, 1920x1080, 15.6" | HP Victus 16-e0179ng BOE09BE, IPS, 1920x1080, 16.1" | Medion Erazer Deputy P25 Panda LM156LF-2F03, IPS, 1920x1080, 15.6" | Dell G15 5515 BOE092A, IPS, 1920x1080, 15.6" | |
|---|---|---|---|---|---|---|
| Display | -3% | -39% | 2% | -42% | -44% | |
| Display P3 Coverage (%) | 71.1 | 68.2 -4% | 41.9 -41% | 72.6 2% | 39.7 -44% | 39.1 -45% |
| sRGB Coverage (%) | 99.1 | 96.7 -2% | 62.9 -37% | 100 1% | 59.7 -40% | 56.9 -43% |
| AdobeRGB 1998 Coverage (%) | 72.3 | 69.6 -4% | 43.3 -40% | 73.5 2% | 41.1 -43% | 40.4 -44% |
| Response Times | -20% | -175% | -52% | -288% | -124% | |
| Response Time Grey 50% / Grey 80% * (ms) | 15 ? | 10 ? 33% | 28.4 ? -89% | 9.6 ? 36% | 40.4 ? -169% | 25.2 ? -68% |
| Response Time Black / White * (ms) | 6 ? | 10.4 ? -73% | 21.6 ? -260% | 14.4 ? -140% | 30.4 ? -407% | 16.8 ? -180% |
| PWM Frequency (Hz) | 200 ? | |||||
| Screen | -36% | -54% | 4% | -49% | -74% | |
| Brightness middle (cd/m²) | 371 | 295 -20% | 268.3 -28% | 361 -3% | 283 -24% | 278 -25% |
| Brightness (cd/m²) | 328 | 275 -16% | 257 -22% | 341 4% | 266 -19% | 262 -20% |
| Brightness Distribution (%) | 85 | 86 1% | 84 -1% | 88 4% | 85 0% | 83 -2% |
| Black Level * (cd/m²) | 0.32 | 0.23 28% | 0.34 -6% | 0.3 6% | 0.2 37% | 0.36 -13% |
| Contrast (:1) | 1159 | 1283 11% | 789 -32% | 1203 4% | 1415 22% | 772 -33% |
| Colorchecker dE 2000 * | 3.25 | 5.21 -60% | 5.05 -55% | 2.44 25% | 5.32 -64% | 5.74 -77% |
| Colorchecker dE 2000 max. * | 6.33 | 14.03 -122% | 15.43 -144% | 6.37 -1% | 17.68 -179% | 19.63 -210% |
| Colorchecker dE 2000 calibrated * | 1.11 | 1.73 -56% | 3.21 -189% | 1.26 -14% | 3.94 -255% | 4.7 -323% |
| Greyscale dE 2000 * | 4.94 | 9.4 -90% | 5.5 -11% | 4.6 7% | 2.9 41% | 3.1 37% |
| Gamma | 2.45 90% | 2.046 108% | 2.35 94% | 2.268 97% | 2.062 107% | 2.011 109% |
| CCT | 6064 107% | 8002 81% | 7392 88% | 6609 98% | 7167 91% | 6207 105% |
| Total Average (Program / Settings) | -20% /
-27% | -89% /
-68% | -15% /
-5% | -126% /
-82% | -81% /
-75% |
* ... smaller is better
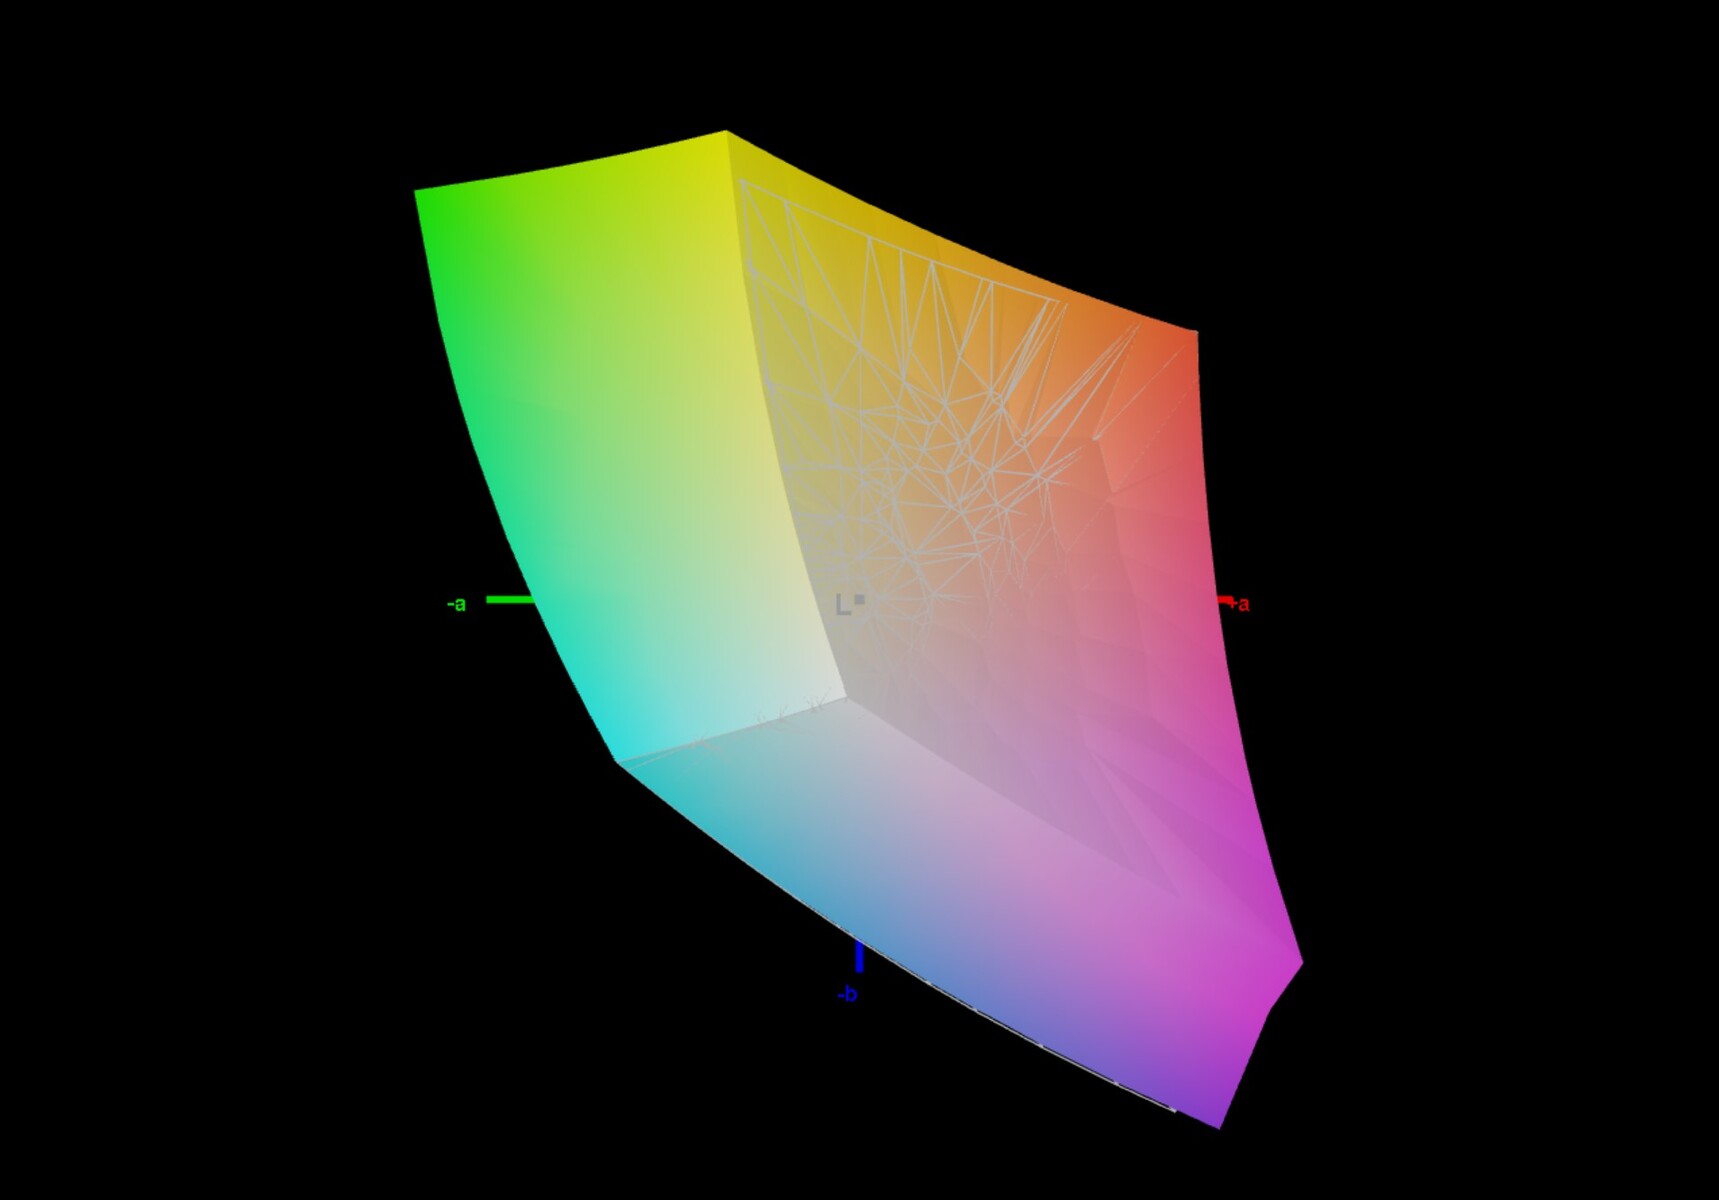
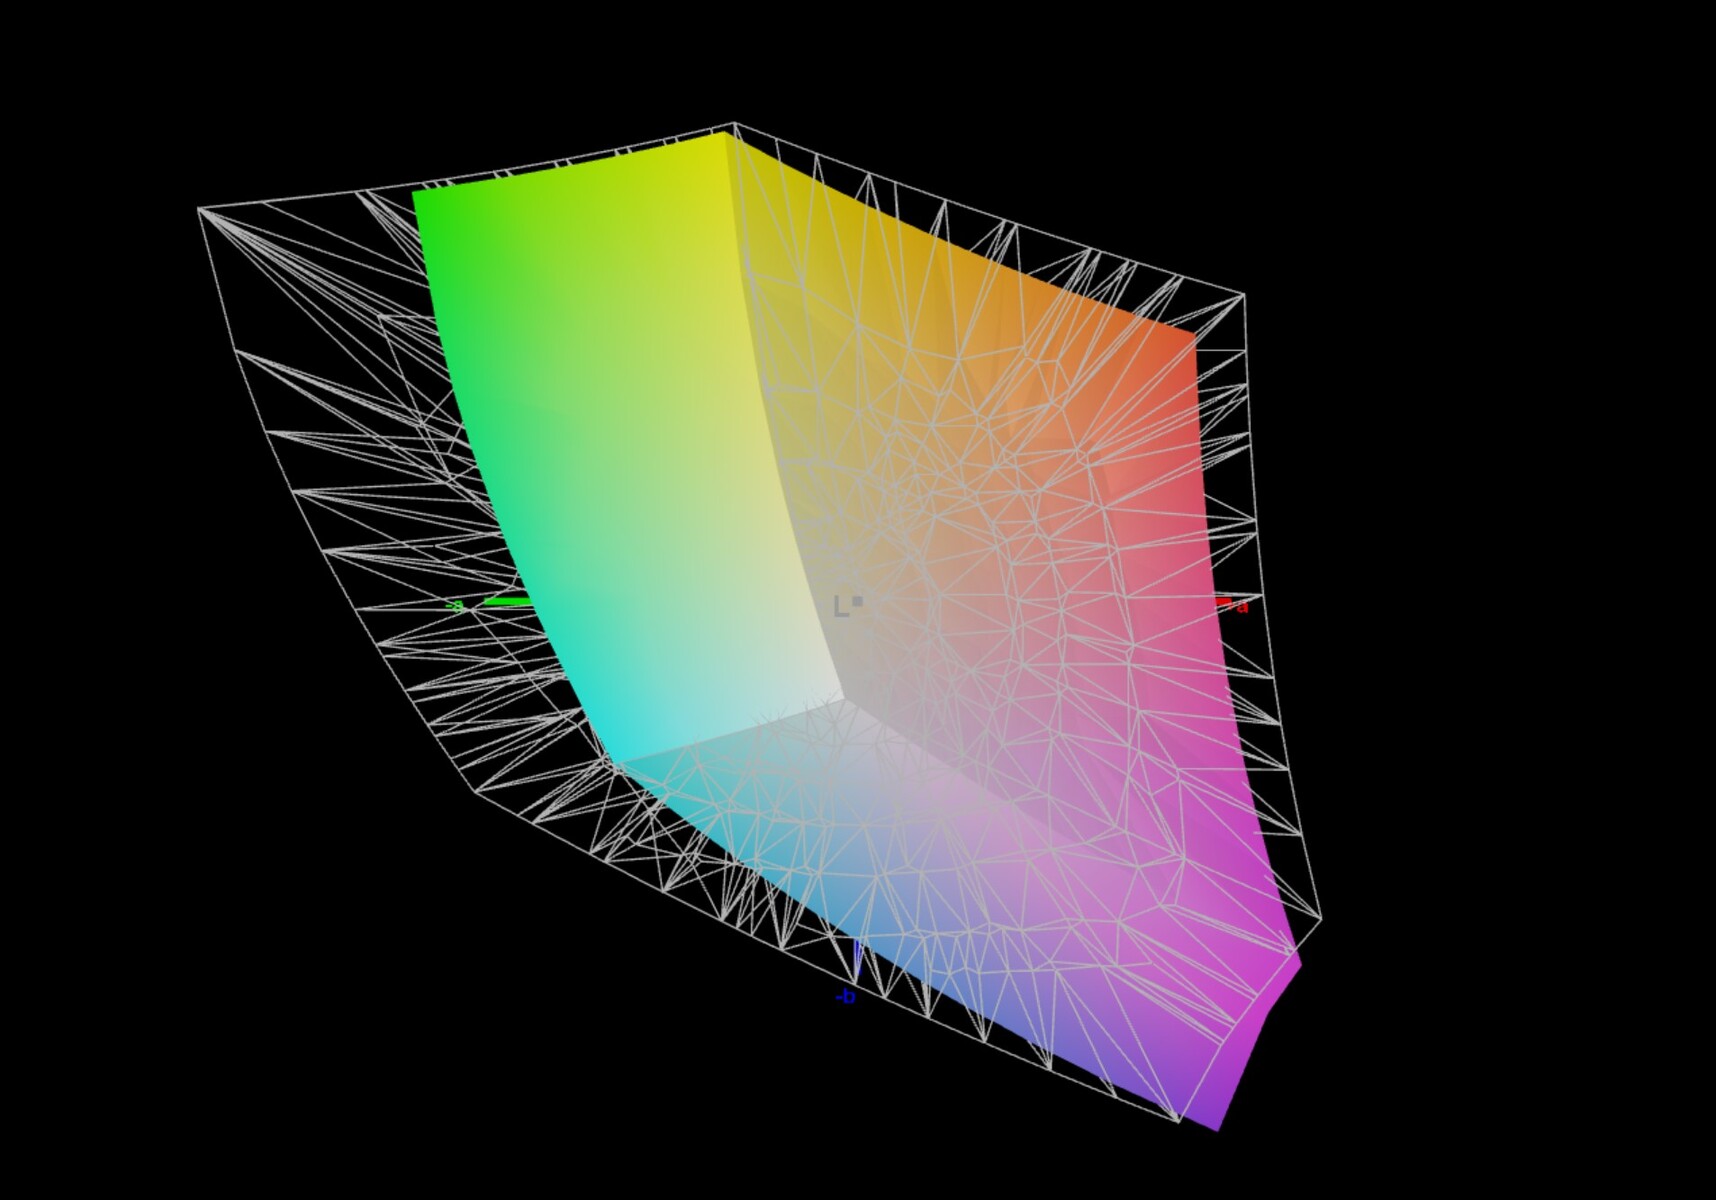
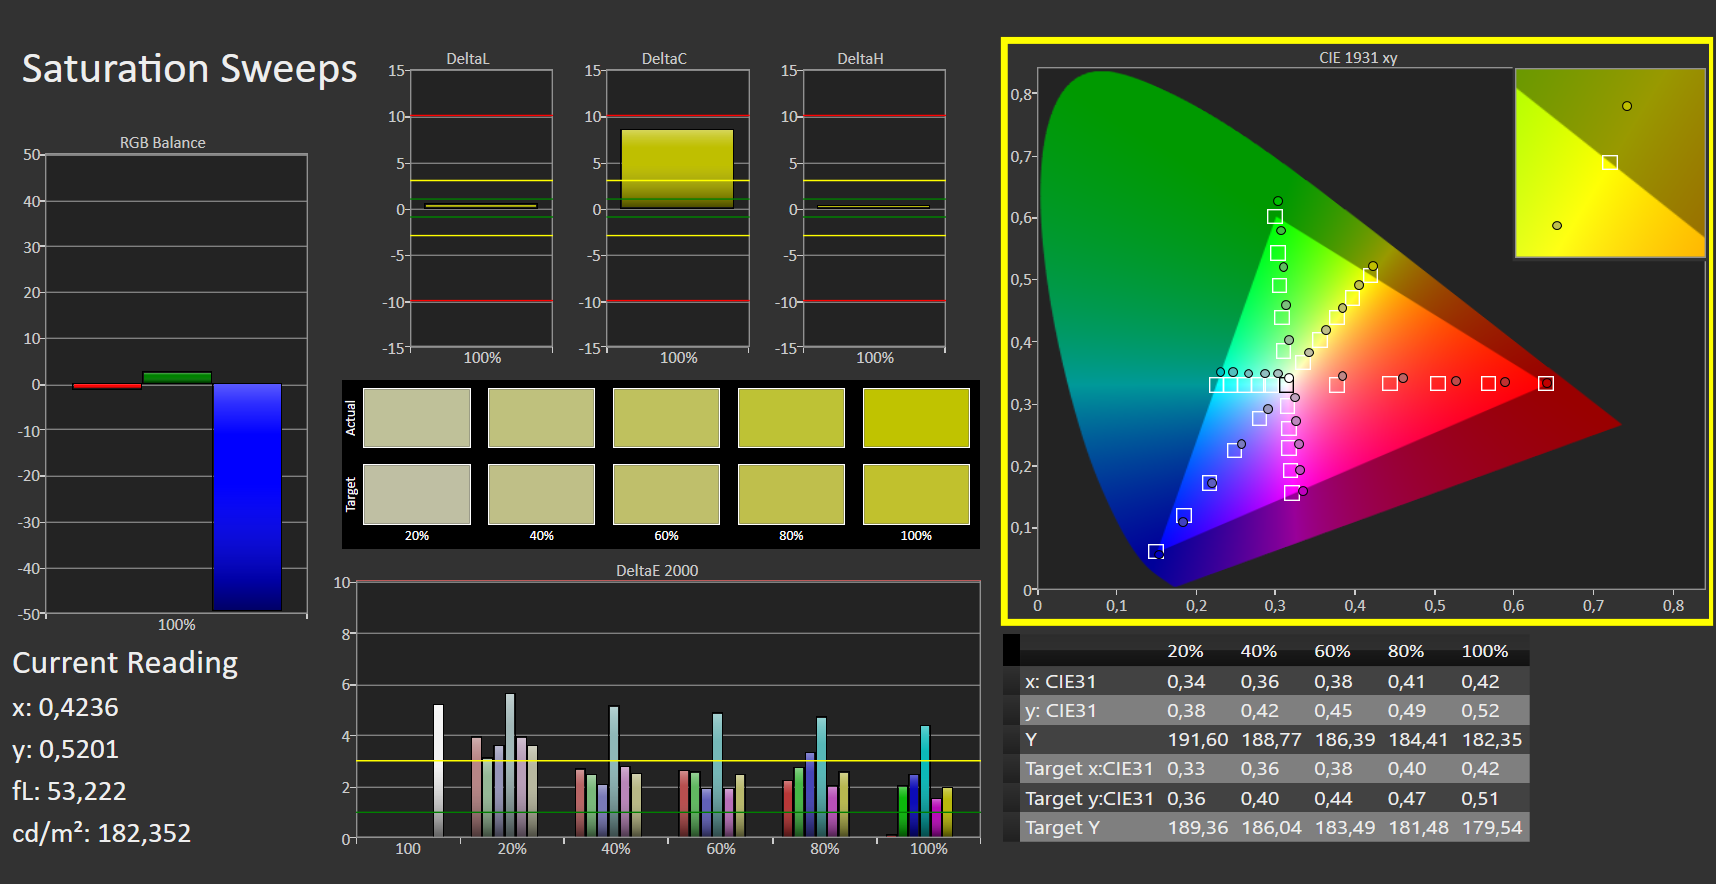
Image quality is consistently good. Despite the matte surface, no graininess was detected. The measured Delta E-2000 values for the greyscale and colors compared to the sRGB color space are good, although the target value of 3 is not quite reached. Compared to our comparison devices, the Legion 5 15 is the best one here. After manual calibration, we were able to improve the values significantly.

Display Response Times
| ↔ Response Time Black to White | ||
|---|---|---|
| 6 ms ... rise ↗ and fall ↘ combined | ↗ 2 ms rise |  |
| ↘ 4 ms fall | ||
| The screen shows very fast response rates in our tests and should be very well suited for fast-paced gaming. In comparison, all tested devices range from 0.1 (minimum) to 240 (maximum) ms. » 19 % of all devices are better. This means that the measured response time is better than the average of all tested devices (19.8 ms). | ||
| ↔ Response Time 50% Grey to 80% Grey | ||
| 15 ms ... rise ↗ and fall ↘ combined | ↗ 7 ms rise |  |
| ↘ 8 ms fall | ||
| The screen shows good response rates in our tests, but may be too slow for competitive gamers. In comparison, all tested devices range from 0.165 (minimum) to 636 (maximum) ms. » 29 % of all devices are better. This means that the measured response time is better than the average of all tested devices (30.9 ms). | ||
Screen Flickering / PWM (Pulse-Width Modulation)
| Screen flickering / PWM not detected |  | ||
In comparison: 52 % of all tested devices do not use PWM to dim the display. If PWM was detected, an average of 7741 (minimum: 5 - maximum: 343500) Hz was measured. | |||
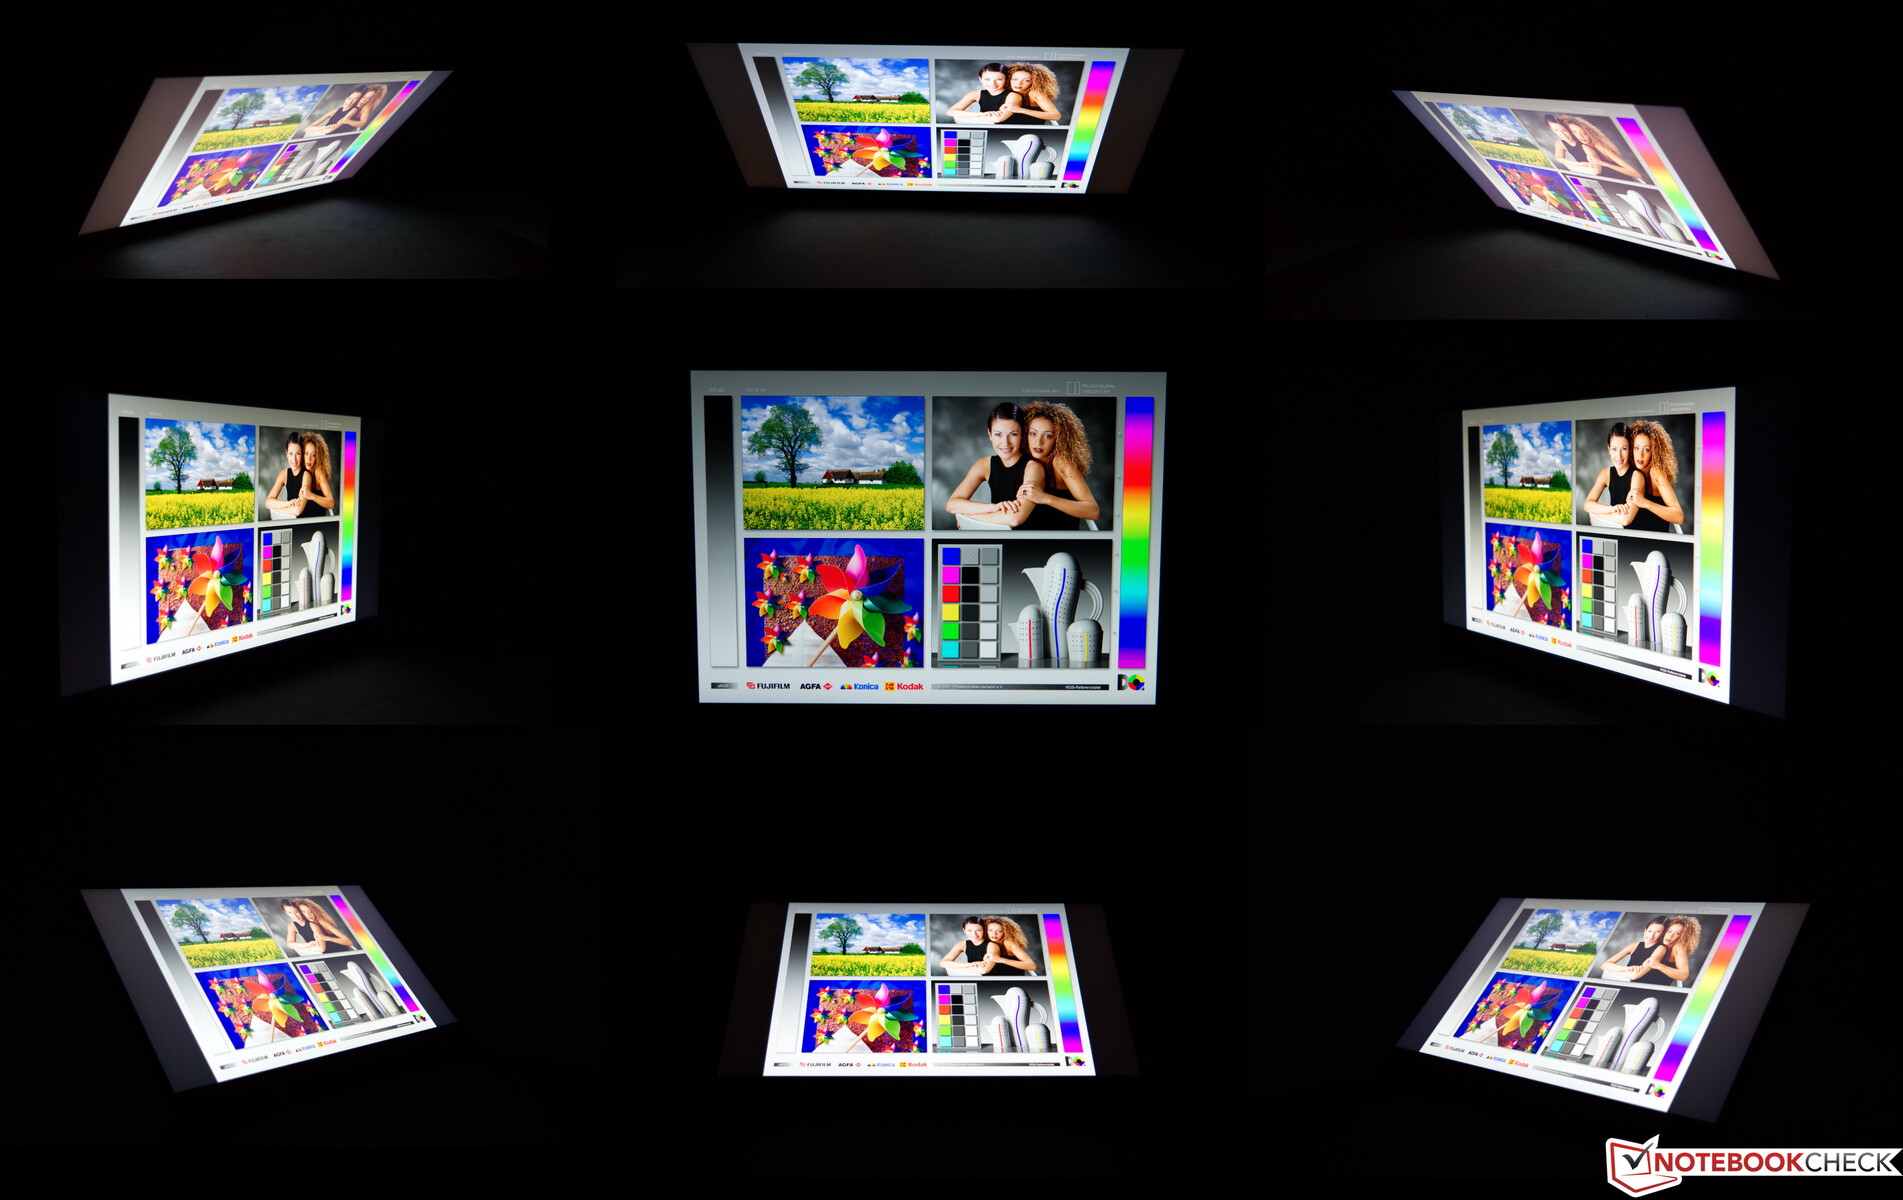
Those wanting to use the Lenovo Legion 5 15 on the terrace should find a place in the shade. No unusual anomalies were detected in the viewing angle test. Here, we have a typical IPS display with minimal fogging in the four images at the corners. But this is absent during normal use and is only noticeable at very flat viewing angles.
Performance
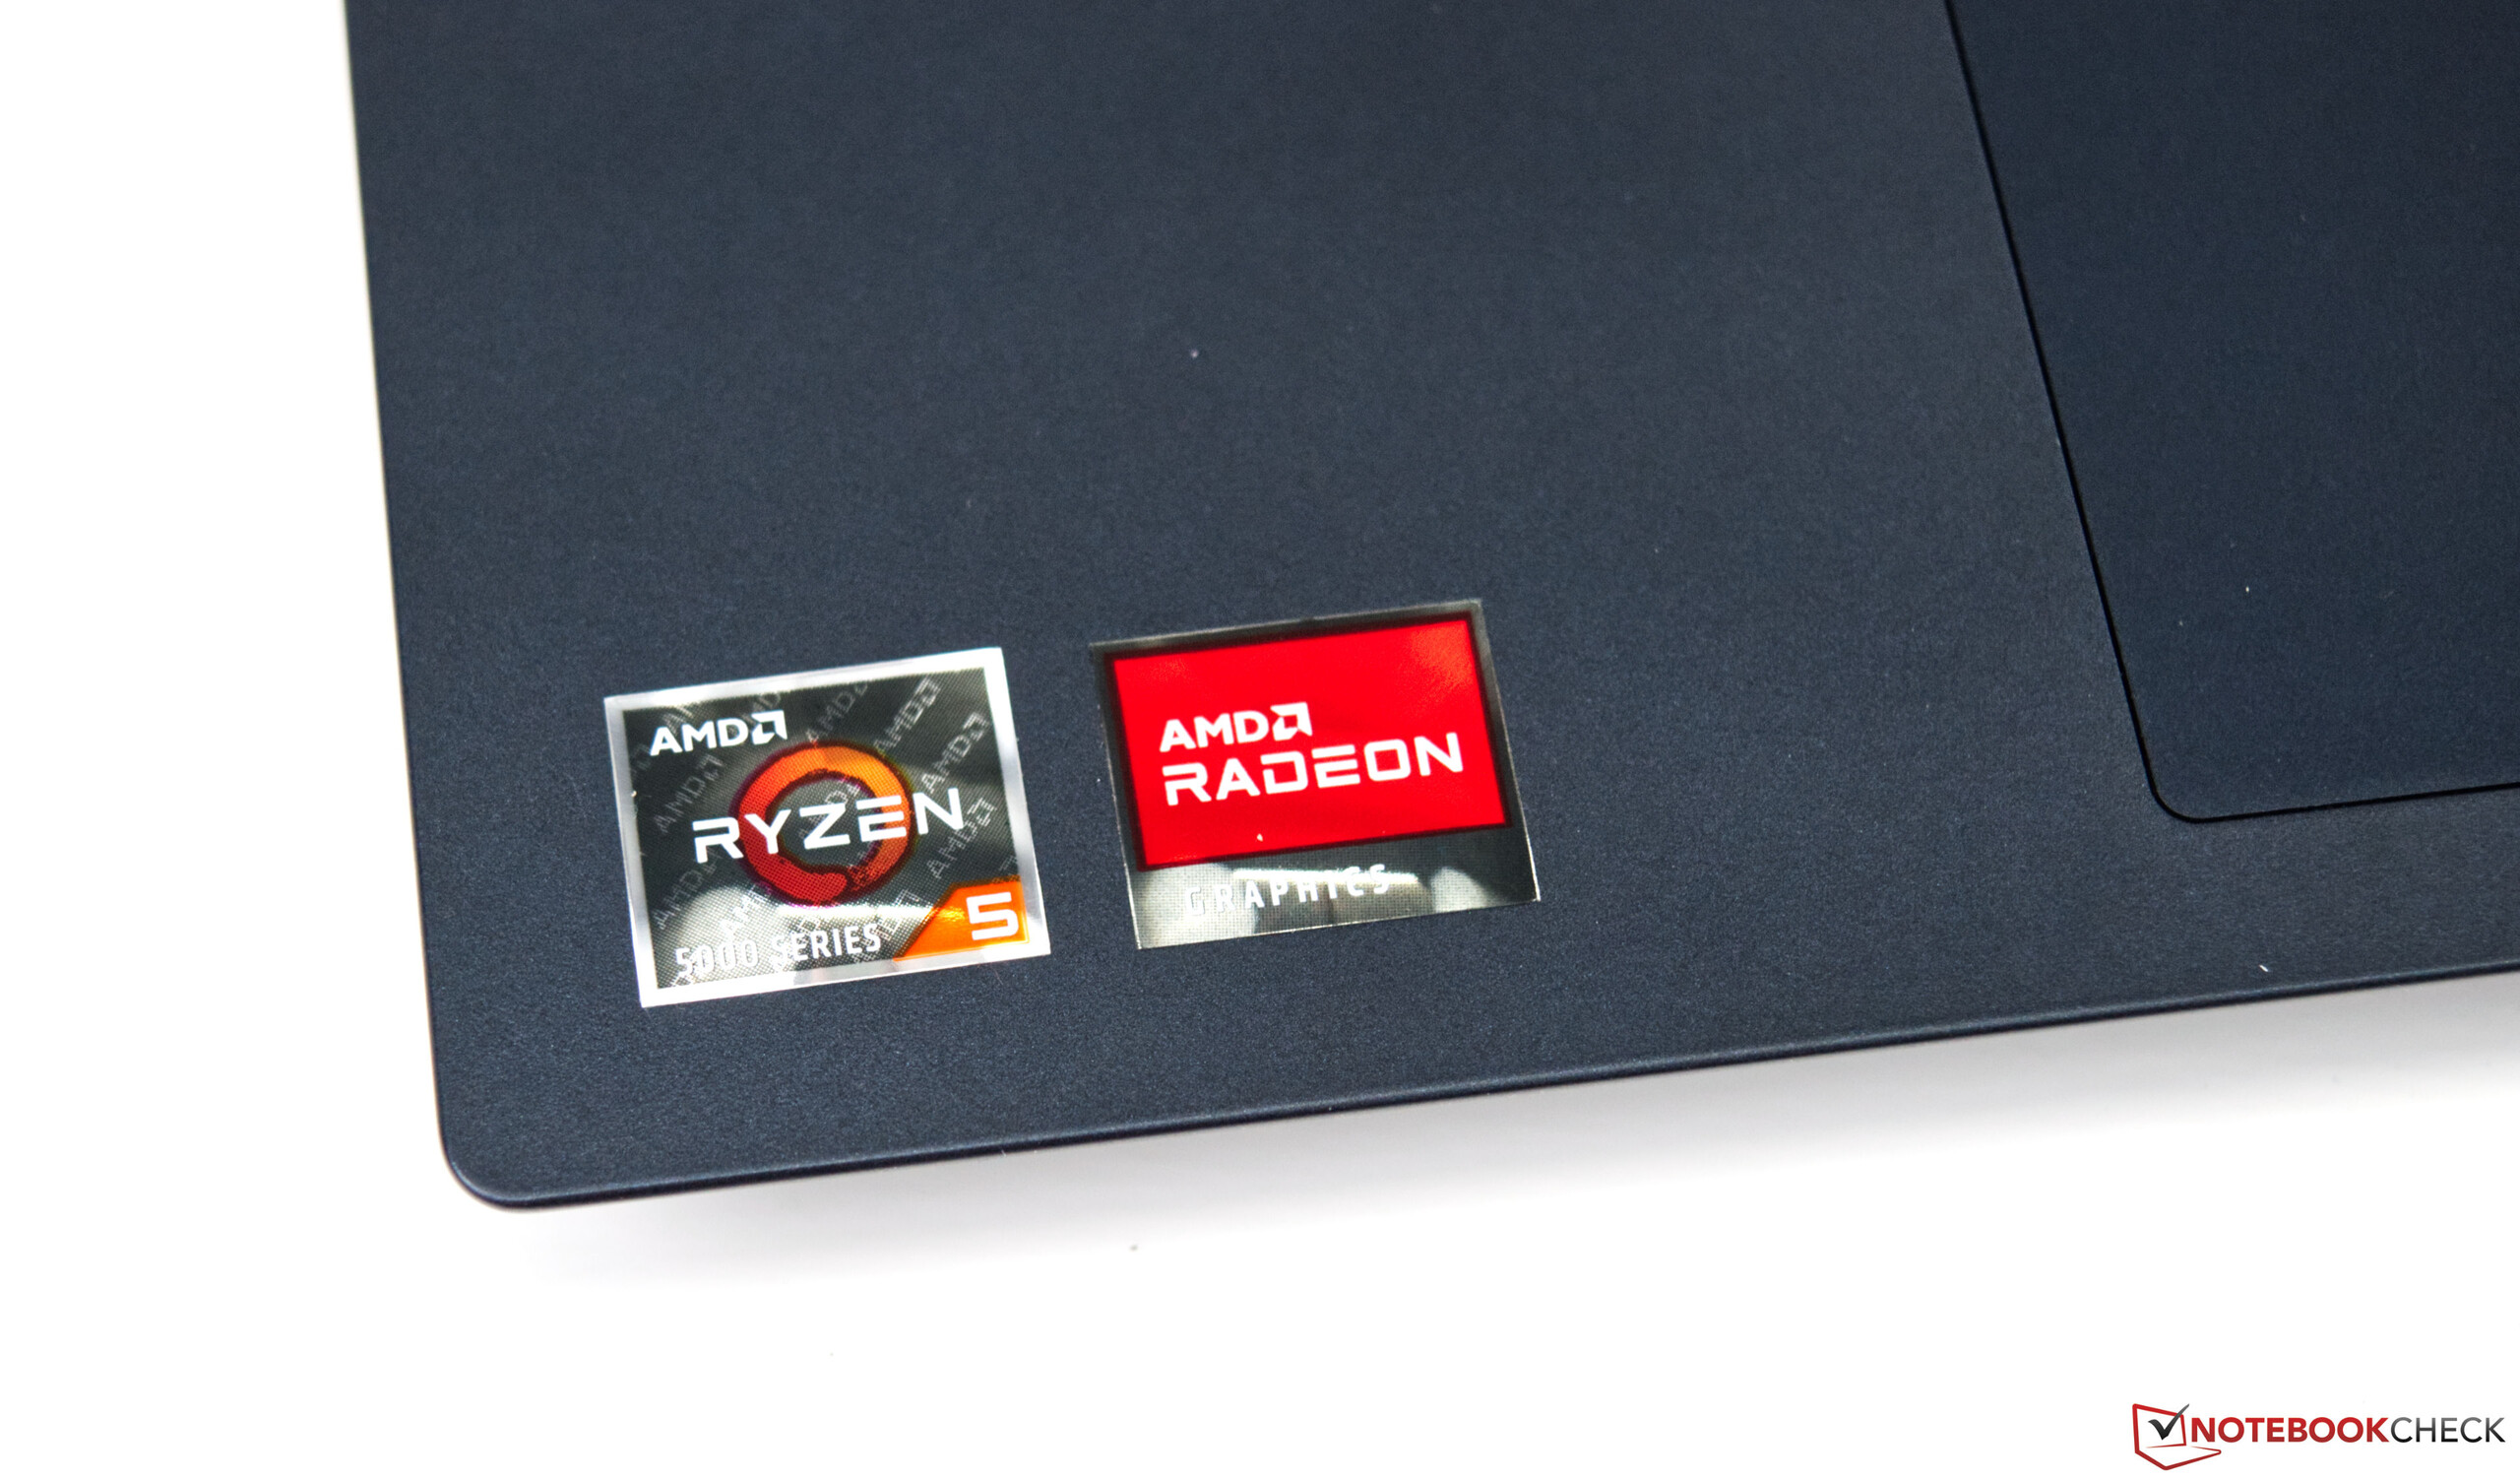
Those looking for a gaming notebook should first look at the performance and the price. Lenovo places its faith entirely in AMD for the performance of the test device provided. Both the CPU and GPU come from AMD and together make for a decent package with solid performance. Alternatively, you can also obtain a variant with an Nvidia GPU. For this, however, you have to dig a little deeper into your wallet.
Test Conditions
In the preinstalled Lenovo Vantage Center, users can make various changes to the system settings. For example, the performance of certain components can be adjusted according to predefined power options. All benchmarks were carried out with the Power Mode profile. Note: Power Mode can only be used when the power supply is connected.
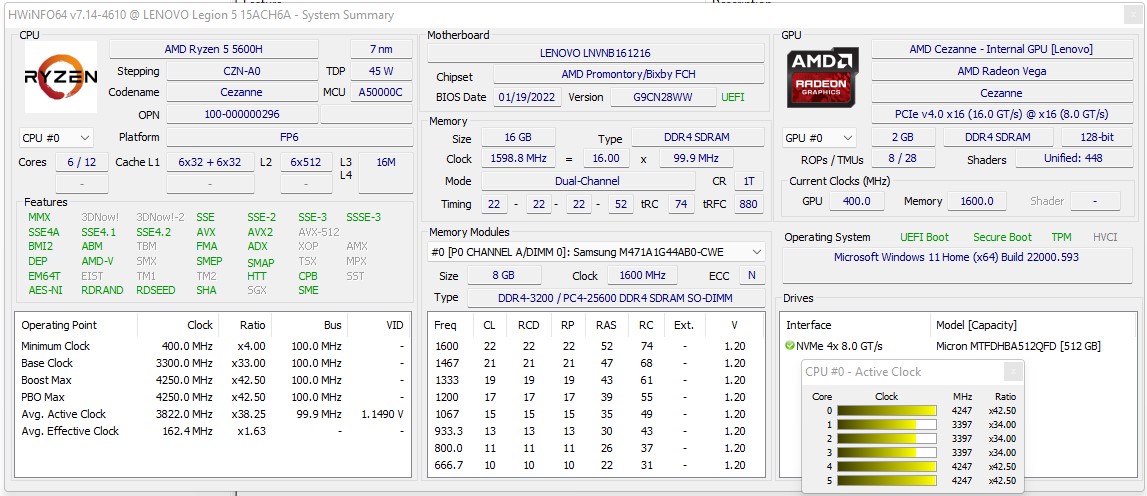
Processor
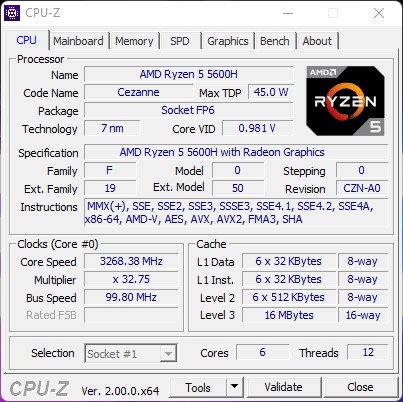
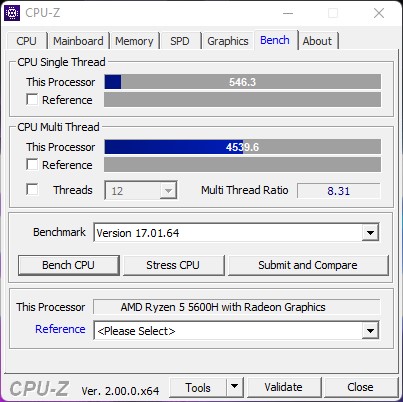
The Lenovo Legion 5 15 is equipped with an AMD Ryzen 5 5600H. With six cores and twelve threads, it offers solid performance for everyday use. However, the performance yield of our test device is slightly below average.
Our Lenovo Legion 5 15 performed comparatively well in the load test, which we carried out with the Cinebench R15 multi-loop. Performance remained stable throughout and a drop in performance was not observed.
Further comparisons and benchmarks can be seen in our CPU comparison table below.
CineBench R15 Multi Sustained Load
Cinebench R23: Multi Core | Single Core
Cinebench R20: CPU (Multi Core) | CPU (Single Core)
Cinebench R15: CPU Multi 64Bit | CPU Single 64Bit
Blender: v2.79 BMW27 CPU
7-Zip 18.03: 7z b 4 | 7z b 4 -mmt1
Geekbench 5.5: Multi-Core | Single-Core
HWBOT x265 Benchmark v2.2: 4k Preset
LibreOffice : 20 Documents To PDF
R Benchmark 2.5: Overall mean
| CPU Performance rating | |
| Average of class Gaming | |
| Asus TUF Gaming F15 FX506HM -2! | |
| Medion Erazer Deputy P25 | |
| HP Victus 16-e0179ng | |
| Dell G15 5515 | |
| Lenovo Legion 5 15ACH6A-82NW0010GE | |
| Average AMD Ryzen 5 5600H | |
| Gigabyte G5 KC | |
| Cinebench R23 / Multi Core | |
| Average of class Gaming (10488 - 42661, n=104, last 2 years) | |
| Asus TUF Gaming F15 FX506HM | |
| Medion Erazer Deputy P25 | |
| Dell G15 5515 | |
| Lenovo Legion 5 15ACH6A-82NW0010GE | |
| HP Victus 16-e0179ng | |
| Average AMD Ryzen 5 5600H (7945 - 10416, n=13) | |
| Gigabyte G5 KC | |
| Cinebench R23 / Single Core | |
| Average of class Gaming (1601 - 2415, n=104, last 2 years) | |
| Asus TUF Gaming F15 FX506HM | |
| Medion Erazer Deputy P25 | |
| Dell G15 5515 | |
| HP Victus 16-e0179ng | |
| Lenovo Legion 5 15ACH6A-82NW0010GE | |
| Average AMD Ryzen 5 5600H (1316 - 1381, n=13) | |
| Gigabyte G5 KC | |
| Cinebench R20 / CPU (Multi Core) | |
| Average of class Gaming (4029 - 16433, n=103, last 2 years) | |
| Asus TUF Gaming F15 FX506HM | |
| Medion Erazer Deputy P25 | |
| Dell G15 5515 | |
| HP Victus 16-e0179ng | |
| Lenovo Legion 5 15ACH6A-82NW0010GE | |
| Average AMD Ryzen 5 5600H (3074 - 4059, n=16) | |
| Gigabyte G5 KC | |
| Cinebench R20 / CPU (Single Core) | |
| Average of class Gaming (622 - 913, n=103, last 2 years) | |
| Asus TUF Gaming F15 FX506HM | |
| Medion Erazer Deputy P25 | |
| Dell G15 5515 | |
| HP Victus 16-e0179ng | |
| Lenovo Legion 5 15ACH6A-82NW0010GE | |
| Average AMD Ryzen 5 5600H (527 - 538, n=15) | |
| Gigabyte G5 KC | |
| Cinebench R15 / CPU Multi 64Bit | |
| Average of class Gaming (1578 - 6330, n=102, last 2 years) | |
| Asus TUF Gaming F15 FX506HM | |
| Medion Erazer Deputy P25 | |
| HP Victus 16-e0179ng | |
| Dell G15 5515 | |
| Lenovo Legion 5 15ACH6A-82NW0010GE | |
| Average AMD Ryzen 5 5600H (1319 - 1723, n=16) | |
| Gigabyte G5 KC | |
| Cinebench R15 / CPU Single 64Bit | |
| Average of class Gaming (188.8 - 350, n=103, last 2 years) | |
| HP Victus 16-e0179ng | |
| Medion Erazer Deputy P25 | |
| Asus TUF Gaming F15 FX506HM | |
| Dell G15 5515 | |
| Lenovo Legion 5 15ACH6A-82NW0010GE | |
| Average AMD Ryzen 5 5600H (218 - 225, n=14) | |
| Gigabyte G5 KC | |
| Blender / v2.79 BMW27 CPU | |
| Gigabyte G5 KC | |
| Average AMD Ryzen 5 5600H (300 - 384, n=14) | |
| Lenovo Legion 5 15ACH6A-82NW0010GE | |
| Dell G15 5515 | |
| HP Victus 16-e0179ng | |
| Medion Erazer Deputy P25 | |
| Asus TUF Gaming F15 FX506HM | |
| Average of class Gaming (79 - 330, n=101, last 2 years) | |
| 7-Zip 18.03 / 7z b 4 | |
| Average of class Gaming (33491 - 148086, n=102, last 2 years) | |
| HP Victus 16-e0179ng | |
| Medion Erazer Deputy P25 | |
| Dell G15 5515 | |
| Asus TUF Gaming F15 FX506HM | |
| Lenovo Legion 5 15ACH6A-82NW0010GE | |
| Average AMD Ryzen 5 5600H (36315 - 46562, n=14) | |
| Gigabyte G5 KC | |
| 7-Zip 18.03 / 7z b 4 -mmt1 | |
| Average of class Gaming (4824 - 7436, n=102, last 2 years) | |
| Asus TUF Gaming F15 FX506HM | |
| HP Victus 16-e0179ng | |
| Dell G15 5515 | |
| Medion Erazer Deputy P25 | |
| Average AMD Ryzen 5 5600H (5213 - 5446, n=14) | |
| Lenovo Legion 5 15ACH6A-82NW0010GE | |
| Gigabyte G5 KC | |
| Geekbench 5.5 / Multi-Core | |
| Average of class Gaming (6460 - 28263, n=102, last 2 years) | |
| HP Victus 16-e0179ng | |
| Dell G15 5515 | |
| Medion Erazer Deputy P25 | |
| Lenovo Legion 5 15ACH6A-82NW0010GE | |
| Average AMD Ryzen 5 5600H (4990 - 7253, n=14) | |
| Gigabyte G5 KC | |
| Gigabyte G5 KC | |
| Geekbench 5.5 / Single-Core | |
| Average of class Gaming (1403 - 2474, n=102, last 2 years) | |
| Medion Erazer Deputy P25 | |
| Dell G15 5515 | |
| HP Victus 16-e0179ng | |
| Lenovo Legion 5 15ACH6A-82NW0010GE | |
| Average AMD Ryzen 5 5600H (1365 - 1445, n=14) | |
| Gigabyte G5 KC | |
| Gigabyte G5 KC | |
| HWBOT x265 Benchmark v2.2 / 4k Preset | |
| Average of class Gaming (11.5 - 44.4, n=102, last 2 years) | |
| Asus TUF Gaming F15 FX506HM | |
| HP Victus 16-e0179ng | |
| Medion Erazer Deputy P25 | |
| Dell G15 5515 | |
| Lenovo Legion 5 15ACH6A-82NW0010GE | |
| Average AMD Ryzen 5 5600H (9.92 - 13.3, n=14) | |
| Gigabyte G5 KC | |
| LibreOffice / 20 Documents To PDF | |
| Dell G15 5515 | |
| Average AMD Ryzen 5 5600H (52.2 - 81.5, n=14) | |
| Medion Erazer Deputy P25 | |
| HP Victus 16-e0179ng | |
| Lenovo Legion 5 15ACH6A-82NW0010GE | |
| Gigabyte G5 KC | |
| Average of class Gaming (33.2 - 88.8, n=102, last 2 years) | |
| Asus TUF Gaming F15 FX506HM | |
| R Benchmark 2.5 / Overall mean | |
| Gigabyte G5 KC | |
| Asus TUF Gaming F15 FX506HM | |
| Average AMD Ryzen 5 5600H (0.526 - 0.596, n=14) | |
| Lenovo Legion 5 15ACH6A-82NW0010GE | |
| Medion Erazer Deputy P25 | |
| HP Victus 16-e0179ng | |
| Dell G15 5515 | |
| Average of class Gaming (0.3439 - 0.59, n=102, last 2 years) | |
* ... smaller is better
AIDA64: FP32 Ray-Trace | FPU Julia | CPU SHA3 | CPU Queen | FPU SinJulia | FPU Mandel | CPU AES | CPU ZLib | FP64 Ray-Trace | CPU PhotoWorxx
| Performance rating | |
| Average of class Gaming | |
| HP Victus 16-e0179ng | |
| Dell G15 5515 | |
| Medion Erazer Deputy P25 | |
| Lenovo Legion 5 15ACH6A-82NW0010GE | |
| Average AMD Ryzen 5 5600H | |
| Gigabyte G5 KC | |
| Asus TUF Gaming F15 FX506HM -9! | |
| AIDA64 / FP32 Ray-Trace | |
| Average of class Gaming (10227 - 85542, n=102, last 2 years) | |
| Medion Erazer Deputy P25 | |
| HP Victus 16-e0179ng | |
| Dell G15 5515 | |
| Lenovo Legion 5 15ACH6A-82NW0010GE | |
| Average AMD Ryzen 5 5600H (9181 - 12636, n=14) | |
| Gigabyte G5 KC | |
| AIDA64 / FPU Julia | |
| Average of class Gaming (51376 - 372155, n=102, last 2 years) | |
| Medion Erazer Deputy P25 | |
| HP Victus 16-e0179ng | |
| Dell G15 5515 | |
| Lenovo Legion 5 15ACH6A-82NW0010GE | |
| Average AMD Ryzen 5 5600H (51994 - 78250, n=14) | |
| Gigabyte G5 KC | |
| AIDA64 / CPU SHA3 | |
| Average of class Gaming (2180 - 10115, n=102, last 2 years) | |
| Medion Erazer Deputy P25 | |
| HP Victus 16-e0179ng | |
| Dell G15 5515 | |
| Lenovo Legion 5 15ACH6A-82NW0010GE | |
| Average AMD Ryzen 5 5600H (1587 - 2675, n=14) | |
| Gigabyte G5 KC | |
| AIDA64 / CPU Queen | |
| Average of class Gaming (49785 - 173351, n=86, last 2 years) | |
| Medion Erazer Deputy P25 | |
| HP Victus 16-e0179ng | |
| Dell G15 5515 | |
| Lenovo Legion 5 15ACH6A-82NW0010GE | |
| Average AMD Ryzen 5 5600H (66699 - 77213, n=14) | |
| Gigabyte G5 KC | |
| AIDA64 / FPU SinJulia | |
| Average of class Gaming (4424 - 33636, n=102, last 2 years) | |
| Medion Erazer Deputy P25 | |
| Dell G15 5515 | |
| HP Victus 16-e0179ng | |
| Lenovo Legion 5 15ACH6A-82NW0010GE | |
| Average AMD Ryzen 5 5600H (8340 - 9159, n=14) | |
| Gigabyte G5 KC | |
| AIDA64 / FPU Mandel | |
| Average of class Gaming (25115 - 196829, n=102, last 2 years) | |
| Medion Erazer Deputy P25 | |
| HP Victus 16-e0179ng | |
| Dell G15 5515 | |
| Lenovo Legion 5 15ACH6A-82NW0010GE | |
| Average AMD Ryzen 5 5600H (28268 - 43274, n=14) | |
| Gigabyte G5 KC | |
| AIDA64 / CPU AES | |
| HP Victus 16-e0179ng | |
| Dell G15 5515 | |
| Average of class Gaming (39258 - 247074, n=102, last 2 years) | |
| Lenovo Legion 5 15ACH6A-82NW0010GE | |
| Average AMD Ryzen 5 5600H (39852 - 98939, n=14) | |
| Medion Erazer Deputy P25 | |
| Gigabyte G5 KC | |
| AIDA64 / CPU ZLib | |
| Average of class Gaming (574 - 2531, n=102, last 2 years) | |
| Medion Erazer Deputy P25 | |
| HP Victus 16-e0179ng | |
| Dell G15 5515 | |
| Lenovo Legion 5 15ACH6A-82NW0010GE | |
| Average AMD Ryzen 5 5600H (507 - 649, n=14) | |
| Gigabyte G5 KC | |
| Asus TUF Gaming F15 FX506HM | |
| AIDA64 / FP64 Ray-Trace | |
| Average of class Gaming (5509 - 45446, n=102, last 2 years) | |
| Medion Erazer Deputy P25 | |
| HP Victus 16-e0179ng | |
| Dell G15 5515 | |
| Lenovo Legion 5 15ACH6A-82NW0010GE | |
| Average AMD Ryzen 5 5600H (4811 - 6652, n=14) | |
| Gigabyte G5 KC | |
| AIDA64 / CPU PhotoWorxx | |
| Average of class Gaming (12271 - 89891, n=102, last 2 years) | |
| Gigabyte G5 KC | |
| HP Victus 16-e0179ng | |
| Average AMD Ryzen 5 5600H (7419 - 24746, n=14) | |
| Lenovo Legion 5 15ACH6A-82NW0010GE | |
| Dell G15 5515 | |
| Medion Erazer Deputy P25 | |
System Performance
Unlike the previous CPU benchmarks, the Lenovo Legion 5 15 leaves a very good impression in terms of raw system performance. Our test device is almost always on top in comparison to competitors, but the lead over close competitors is only marginal. Nevertheless, our test device rises above the class average in this discipline.
| PCMark 10 / Score | |
| Average of class Gaming (5828 - 12414, n=93, last 2 years) | |
| Lenovo Legion 5 15ACH6A-82NW0010GE | |
| Average AMD Ryzen 5 5600H, AMD Radeon RX 6600M (n=1) | |
| Asus TUF Gaming F15 FX506HM | |
| Medion Erazer Deputy P25 | |
| HP Victus 16-e0179ng | |
| Dell G15 5515 | |
| Gigabyte G5 KC | |
| PCMark 10 / Essentials | |
| Average of class Gaming (8810 - 11935, n=97, last 2 years) | |
| Asus TUF Gaming F15 FX506HM | |
| Lenovo Legion 5 15ACH6A-82NW0010GE | |
| Average AMD Ryzen 5 5600H, AMD Radeon RX 6600M (n=1) | |
| HP Victus 16-e0179ng | |
| Medion Erazer Deputy P25 | |
| Dell G15 5515 | |
| Gigabyte G5 KC | |
| PCMark 10 / Productivity | |
| Average of class Gaming (6845 - 25323, n=95, last 2 years) | |
| Lenovo Legion 5 15ACH6A-82NW0010GE | |
| Average AMD Ryzen 5 5600H, AMD Radeon RX 6600M (n=1) | |
| HP Victus 16-e0179ng | |
| Medion Erazer Deputy P25 | |
| Asus TUF Gaming F15 FX506HM | |
| Dell G15 5515 | |
| Gigabyte G5 KC | |
| PCMark 10 / Digital Content Creation | |
| Average of class Gaming (7602 - 19954, n=95, last 2 years) | |
| Lenovo Legion 5 15ACH6A-82NW0010GE | |
| Average AMD Ryzen 5 5600H, AMD Radeon RX 6600M (n=1) | |
| Asus TUF Gaming F15 FX506HM | |
| Medion Erazer Deputy P25 | |
| HP Victus 16-e0179ng | |
| Gigabyte G5 KC | |
| Dell G15 5515 | |
| PCMark 10 Score | 7091 points | |
Help | ||
| AIDA64 / Memory Copy | |
| Average of class Gaming (21750 - 129946, n=102, last 2 years) | |
| HP Victus 16-e0179ng | |
| Dell G15 5515 | |
| Medion Erazer Deputy P25 | |
| Average AMD Ryzen 5 5600H (20549 - 42141, n=14) | |
| Lenovo Legion 5 15ACH6A-82NW0010GE | |
| Gigabyte G5 KC | |
| AIDA64 / Memory Read | |
| Average of class Gaming (22956 - 118858, n=102, last 2 years) | |
| HP Victus 16-e0179ng | |
| Dell G15 5515 | |
| Average AMD Ryzen 5 5600H (22917 - 47595, n=14) | |
| Lenovo Legion 5 15ACH6A-82NW0010GE | |
| Medion Erazer Deputy P25 | |
| Gigabyte G5 KC | |
| AIDA64 / Memory Write | |
| Average of class Gaming (22297 - 135096, n=102, last 2 years) | |
| Gigabyte G5 KC | |
| Medion Erazer Deputy P25 | |
| HP Victus 16-e0179ng | |
| Average AMD Ryzen 5 5600H (20226 - 44872, n=14) | |
| Dell G15 5515 | |
| Lenovo Legion 5 15ACH6A-82NW0010GE | |
| AIDA64 / Memory Latency | |
| Average of class Gaming (75.3 - 165.4, n=102, last 2 years) | |
| Lenovo Legion 5 15ACH6A-82NW0010GE | |
| HP Victus 16-e0179ng | |
| Medion Erazer Deputy P25 | |
| Average AMD Ryzen 5 5600H (75 - 89.1, n=14) | |
| Dell G15 5515 | |
| Gigabyte G5 KC | |
| Asus TUF Gaming F15 FX506HM | |
* ... smaller is better
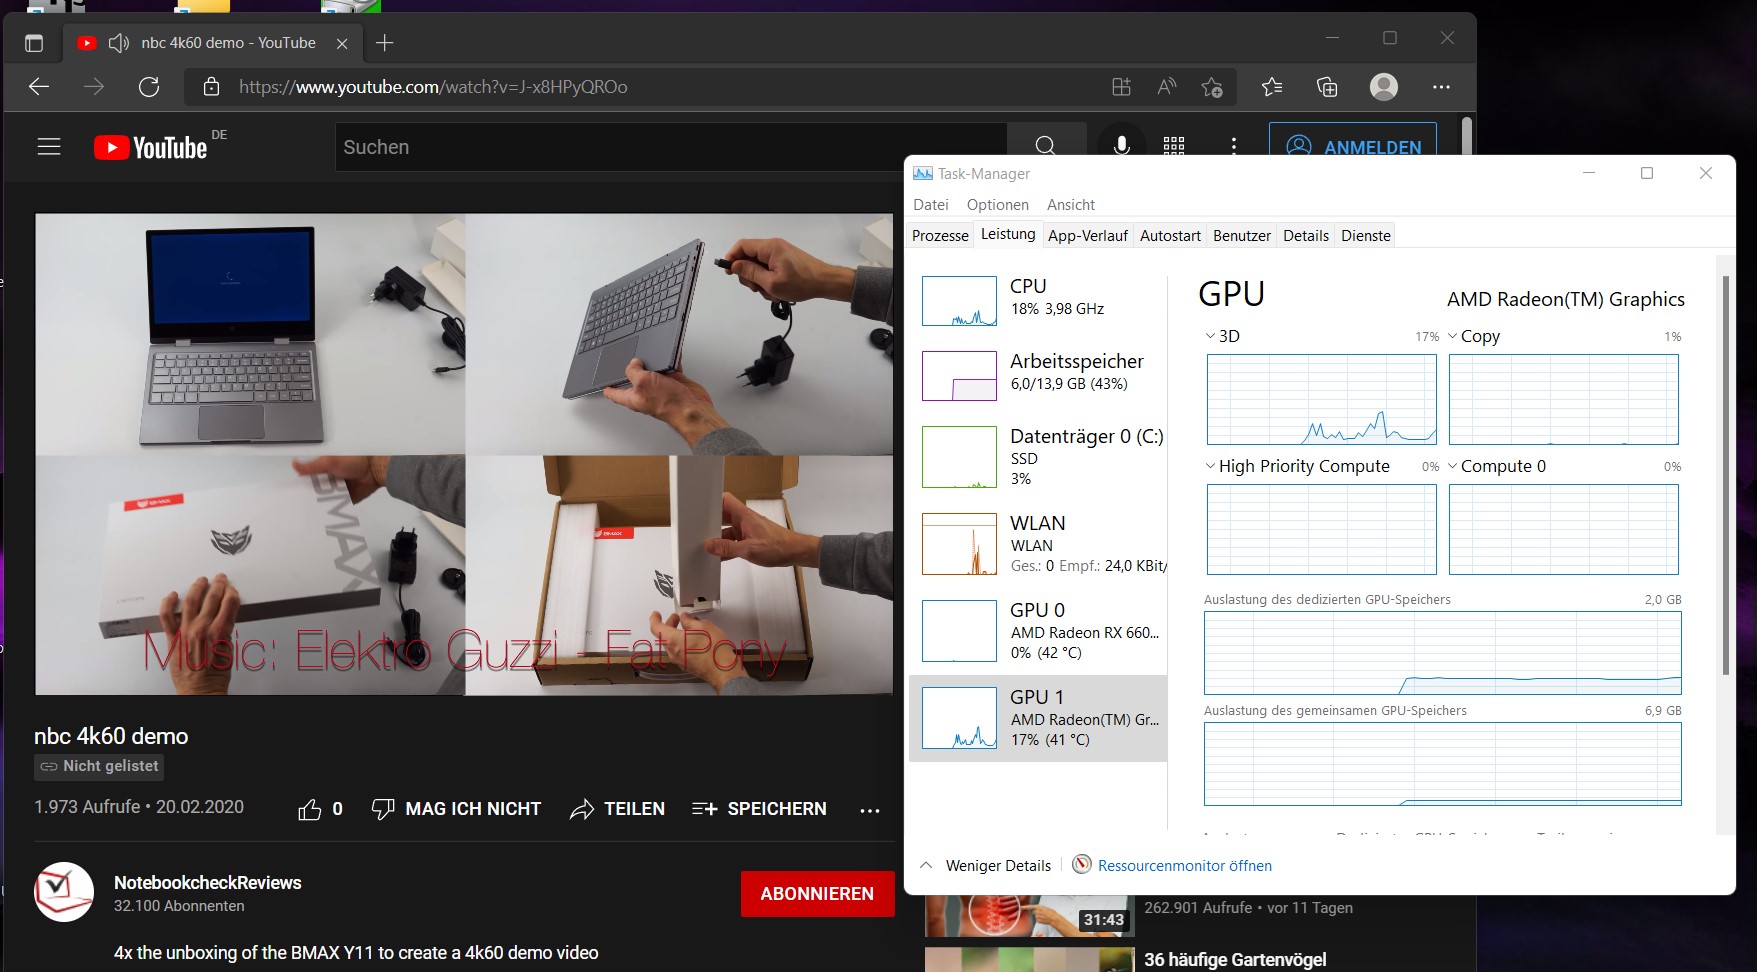
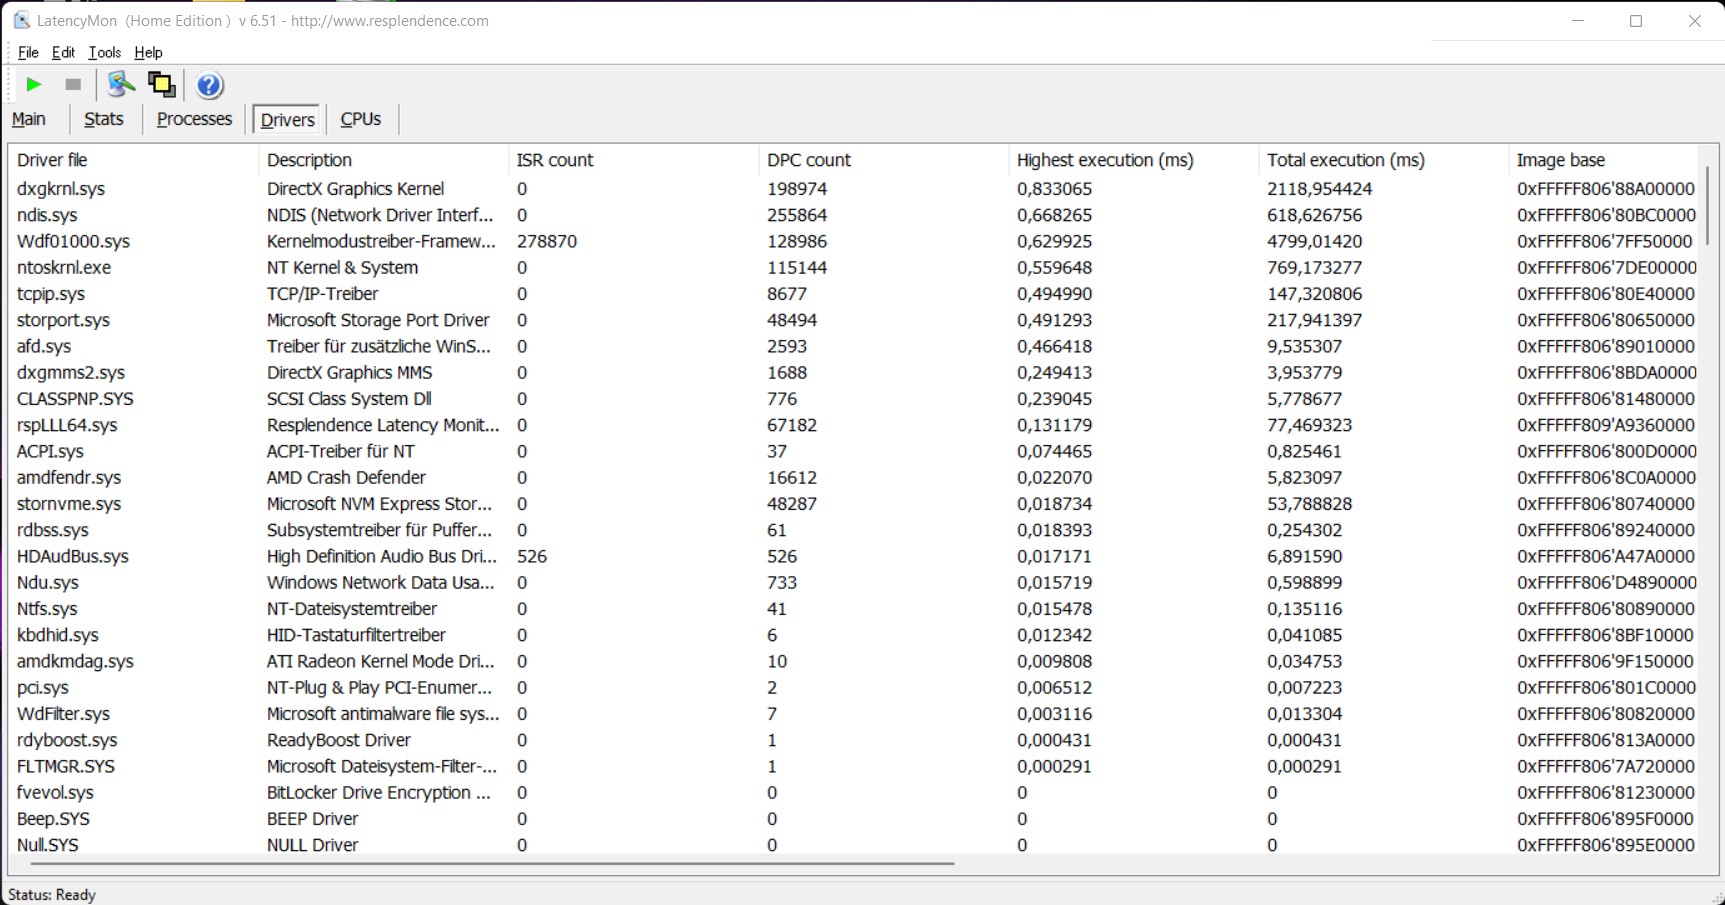
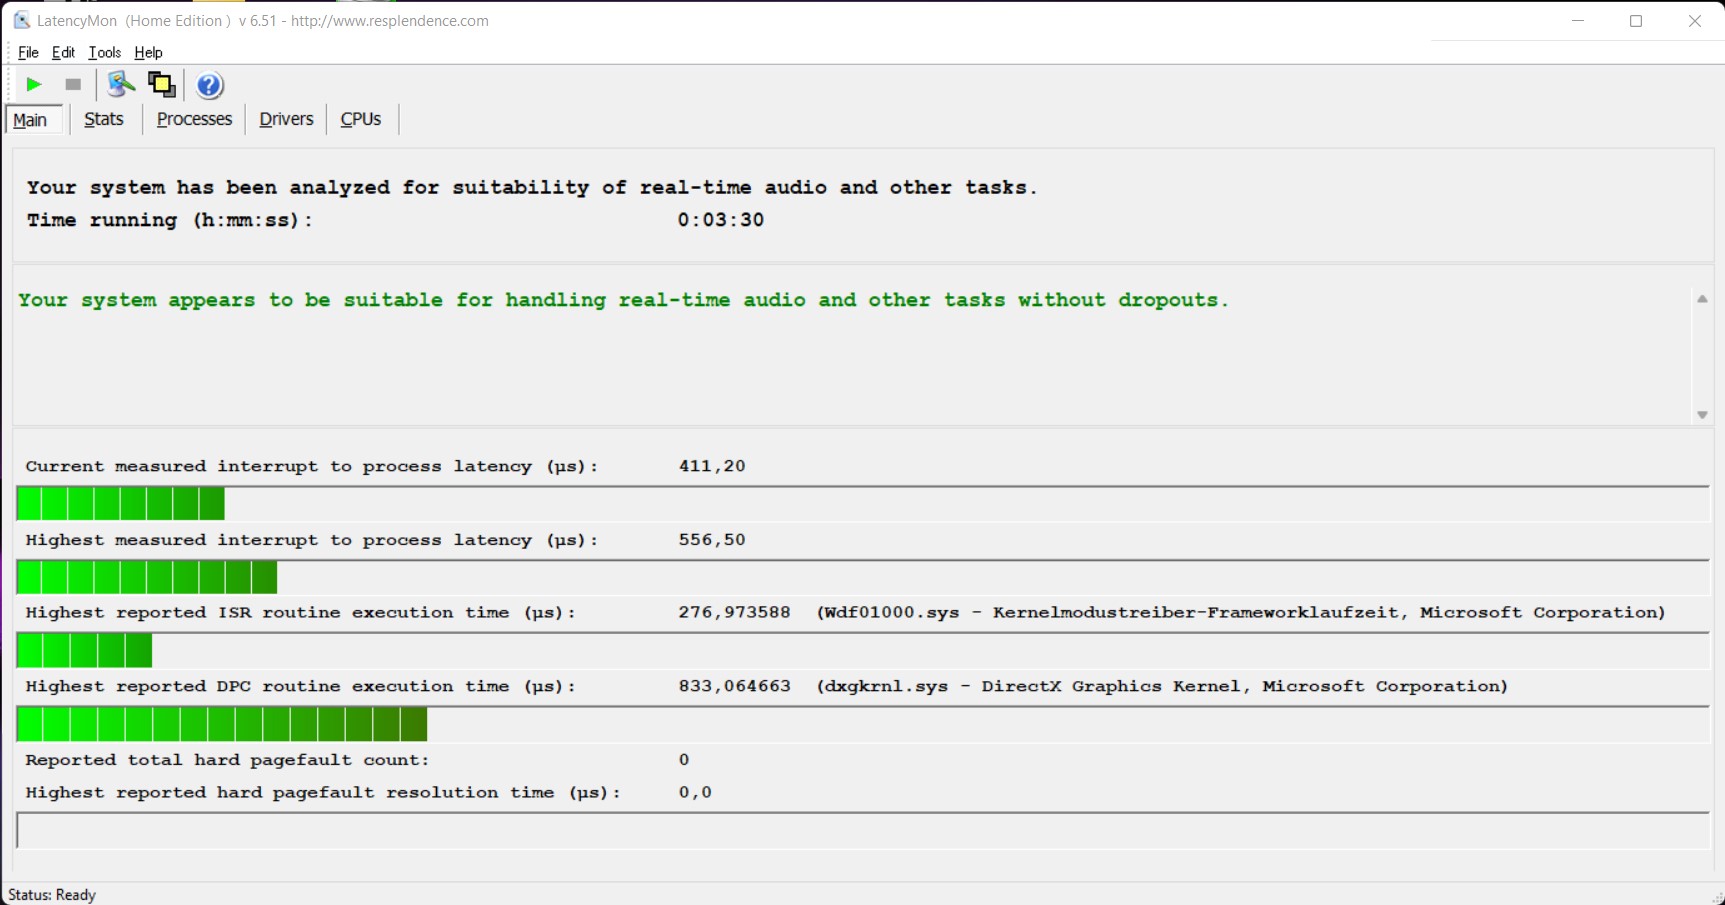
DPC Latencies
The Lenovo Legion 5 15 has no issues opening multiple browser tabs in Edge and playing 4K YouTube video. LatencyMon did not register any increased latencies. An iGPU load is minimal at around 20 percent.
| DPC Latencies / LatencyMon - interrupt to process latency (max), Web, Youtube, Prime95 | |
| Medion Erazer Deputy P25 | |
| Asus TUF Gaming F15 FX506HM | |
| HP Victus 16-e0179ng | |
| Lenovo Legion 5 15ACH6A-82NW0010GE | |
| Dell G15 5515 | |
| Gigabyte G5 KC | |
* ... smaller is better
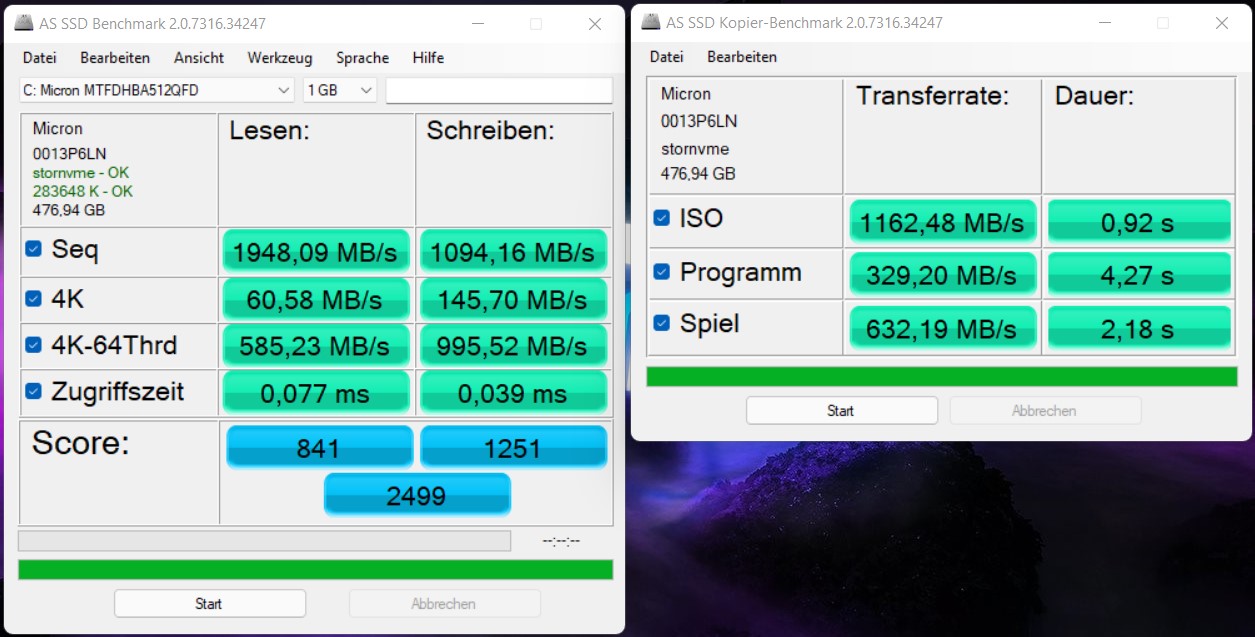
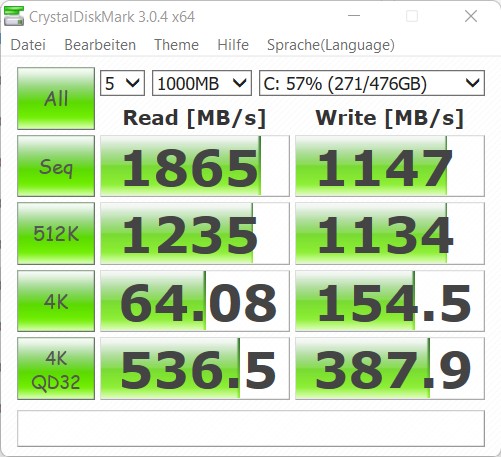
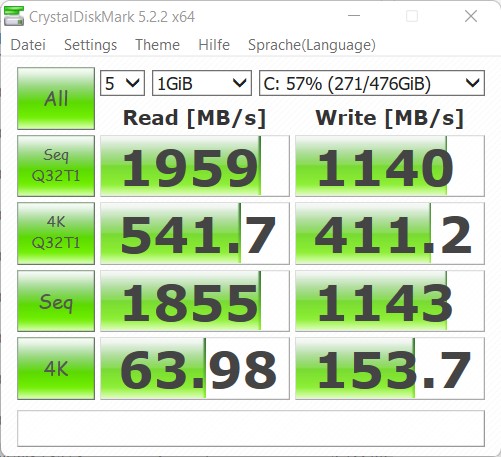
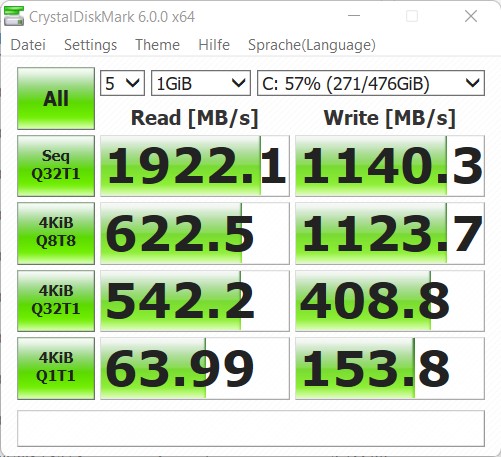
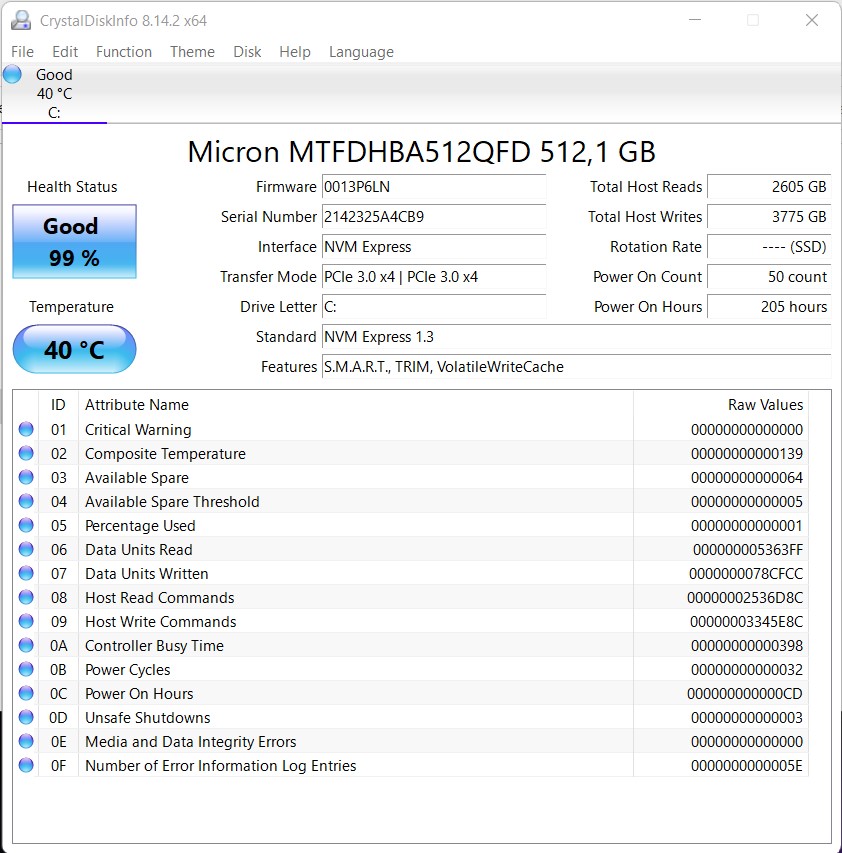
Storage Devices
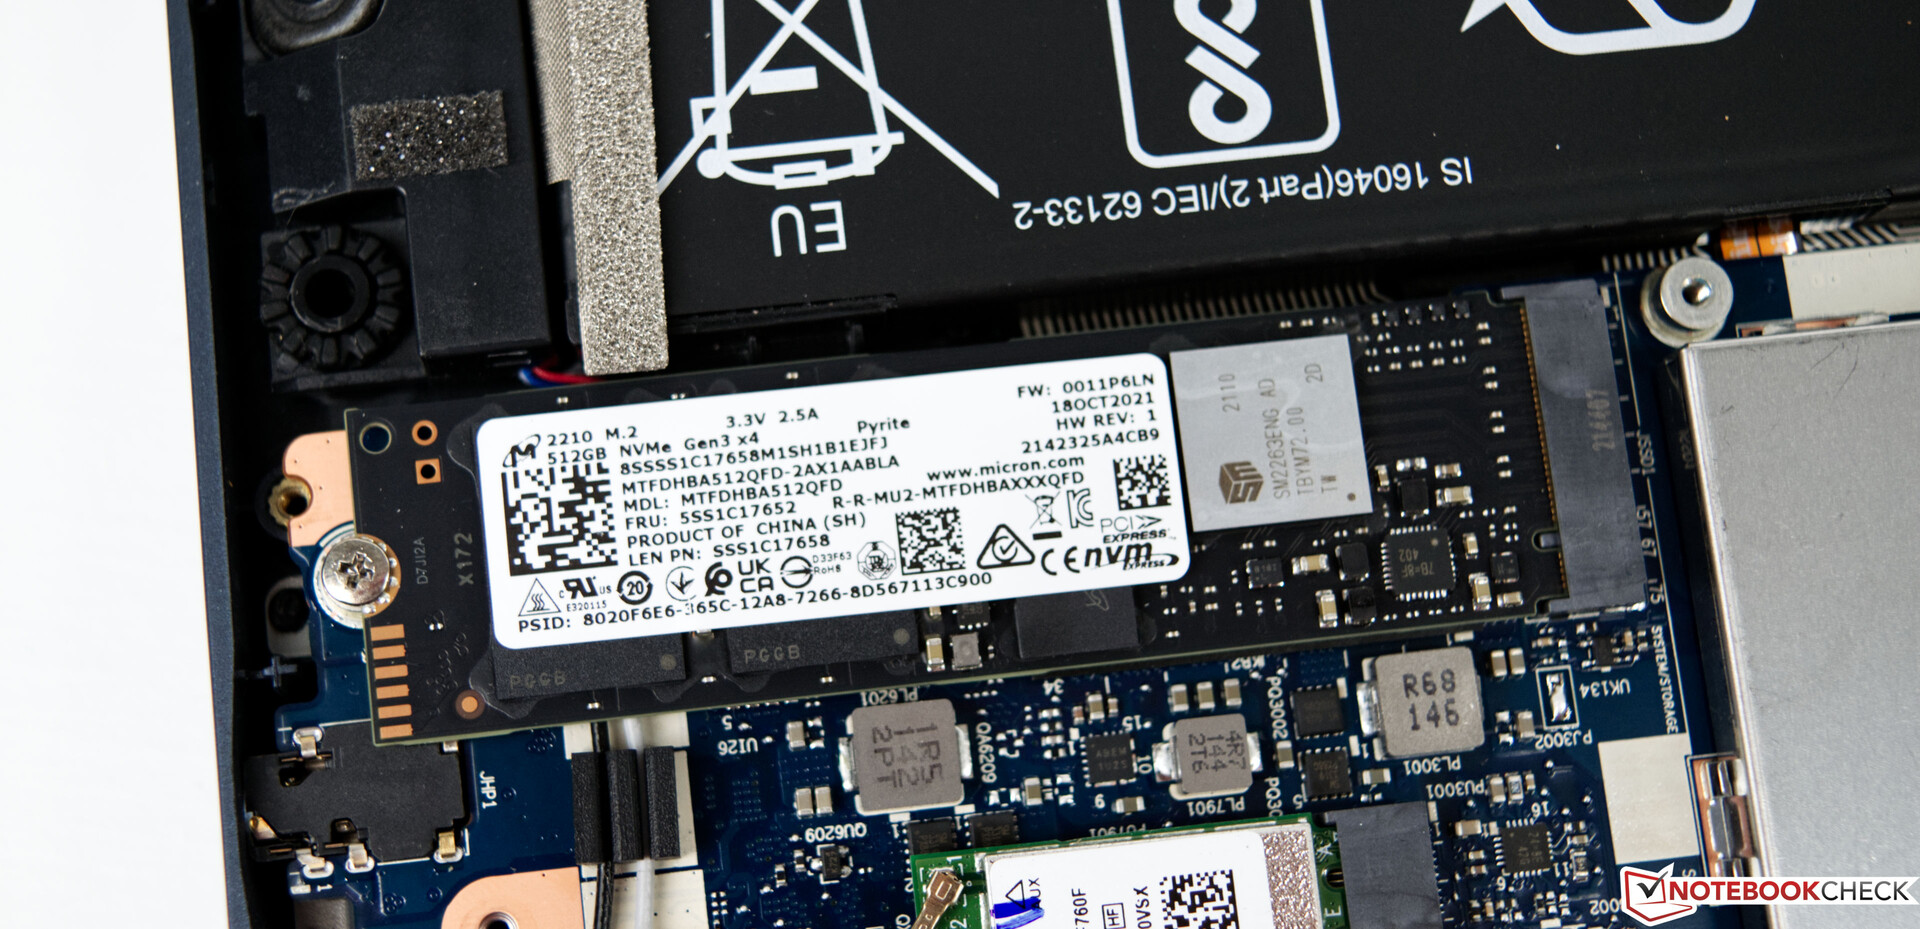
Lenovo has installed a 512 GB SSD from Micron in our test device. However, 512 GB of storage space is not very generous for a gaming laptop, where we expect at least 1 TB. The Lenovo Legion 5 15, therefore, poses no threat to other competitors here and even falls behind in the device class.
Further comparisons and benchmarks can be seen in our comparison table below.

* ... smaller is better
Sustained Read: DiskSpd Read Loop, Queue Depth 8
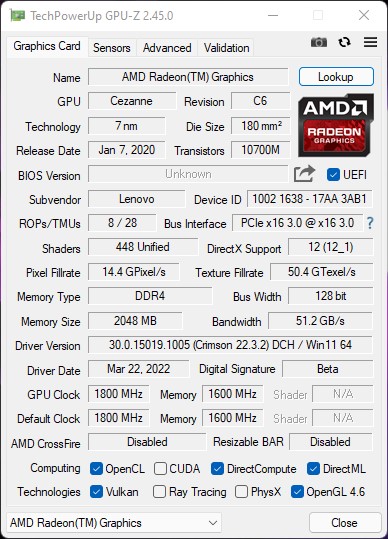
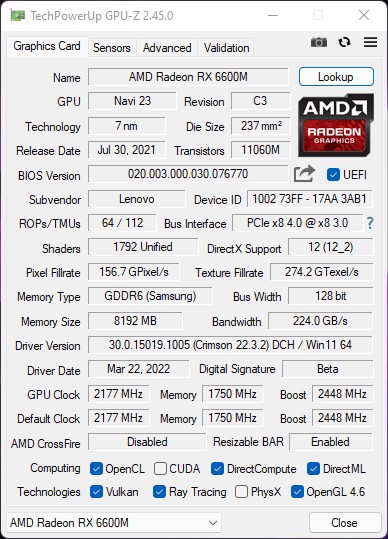
GPU
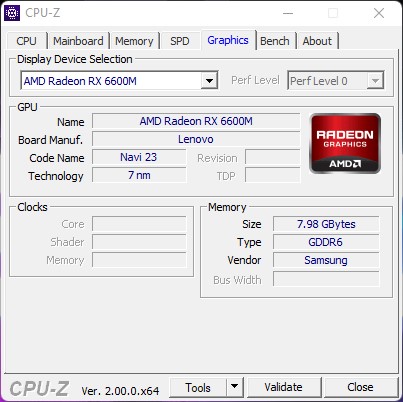
In addition to the CPU, the GPU is crucial for 3D performance, which is a decisive criterion for gaming laptops. The Lenovo Legion 5 15ACH6A features AMD's new mid-range graphics card, the AMD Radeon RX 6600M. This is based on the current RDNA 2 architecture and has a TDP of up to 100 watts. Under load, however, we often registered consumption values that leveled off at around 90 watts. For less demanding tasks, there is also iGPU in the form of the Radeon RX Vega 8.
In the first performance comparison chart, our Lenovo Legion 5 15 takes first place. The comparison devices using an Nvidia GeForce RTX 3060 laptop are almost always outperformed. Compared to the AMD Radeon RX 6700M, a performance deficit of around 9 percent is to be expected. On the whole, the performance of the AMD Radeon RX 6600M lies between an Nvidia GeForce RTX 3060 laptop and an Nvidia GeForce RTX 3070 laptop.
For further comparisons and benchmarks, please refer to our GPU comparison table below.
| 3DMark 05 Standard | 44004 points | |
| 3DMark 06 Standard Score | 43447 points | |
| 3DMark Vantage P Result | 68792 points | |
| 3DMark 11 Performance | 23141 points | |
| 3DMark Ice Storm Standard Score | 148265 points | |
| 3DMark Cloud Gate Standard Score | 44854 points | |
| 3DMark Fire Strike Score | 20992 points | |
| 3DMark Fire Strike Extreme Score | 10383 points | |
| 3DMark Time Spy Score | 8013 points | |
Help | ||
Gaming Performance
In terms of raw gaming performance, the Lenovo Legion 5 15 with its AMD Radeon RX 6600M is unable to utilize its maximum potential due to limitations in CPU performance. Nevertheless, all current games can be played on the Lenovo Legion 5 15 without issue. Only in FarCry 6 did the average FPS slip well below the 60 mark at maximum details.
In the stress test, in which we played Witcher 3 at Ultra settings, performance was relatively stable. Performance drops and unplayable frame rates are not to be expected even after long periods of playing time.
Witcher 3 FPS diagram
| low | med. | high | ultra | |
|---|---|---|---|---|
| GTA V (2015) | 167.4 | 158.4 | 130.2 | 73.8 |
| The Witcher 3 (2015) | 255 | 194 | 141 | 81.3 |
| Dota 2 Reborn (2015) | 132.7 | 118 | 110.2 | 104 |
| Rise of the Tomb Raider (2016) | 205 | 161.2 | 121.4 | 95.9 |
| Final Fantasy XV Benchmark (2018) | 138.5 | 104.5 | 78.4 | |
| X-Plane 11.11 (2018) | 64.7 | 50.7 | 45.1 | |
| Far Cry 5 (2018) | 110 | 97 | 93 | 86 |
| Strange Brigade (2018) | 309 | 188.1 | 170 | 151 |
| Shadow of the Tomb Raider (2018) | 135.7 | 117.5 | 114.2 | 105.4 |
| Far Cry New Dawn (2019) | 86 | 76 | 73 | 67 |
| Metro Exodus (2019) | 151.2 | 104.3 | 79.8 | 62.3 |
| Control (2019) | 204 | 93.6 | 69.7 | |
| Borderlands 3 (2019) | 98.8 | 87.7 | 78.8 | 64.5 |
| F1 2020 (2020) | 247 | 188 | 173.5 | 128 |
| Death Stranding (2020) | 126.9 | 122.4 | 115.1 | 111.2 |
| Mafia Definitive Edition (2020) | 96.9 | 85.4 | 79.2 | |
| F1 2021 (2021) | 268 | 194.2 | 174.4 | 95.9 |
| Alan Wake Remastered (2021) | 124.5 | 121.4 | ||
| Far Cry 6 (2021) | 105.6 | 88.1 | 80.5 | 51.6 |
| Guardians of the Galaxy (2021) | 88 | 87 | 86 | 86 |
| Riders Republic (2021) | 89 | 83 | 77 | 76 |
| Forza Horizon 5 (2021) | 154 | 116 | 110 | 89 |
| Farming Simulator 22 (2021) | 170.1 | 134.5 | 119.4 | 112.8 |
| God of War (2022) | 69.7 | 68.1 | 63.6 | 54.2 |
| Rainbow Six Extraction (2022) | 141 | 126 | 120 | 94 |
| Dying Light 2 (2022) | 104.7 | 77.6 | 61.5 | |
| GRID Legends (2022) | 166 | 155 | 133 | 105 |
| Cyberpunk 2077 1.6 (2022) | 111.8 | 98.1 | 75.1 | 60.7 |
| Elex 2 (2022) | 70.8 | 71.4 | 67.6 | 66.1 |
Emissions
Noise
Those who opt for a gaming laptop need to be somewhat more accommodating in regard to noise levels than in the case of less powerful office notebooks. The Lenovo Legion 5 15 is no exception here: with a maximum of 51.3 dB(A), the device is very clearly audible under full load. In addition, the two compact axial fans generate a high-frequency noise, which makes the subjective sound level seem even louder. On the upside, the laptop operates very quietly and often in complete silence when idle and under low load.
Noise level
| Idle |
| 25 / 25 / 34.5 dB(A) |
| Load |
| 51.1 / 51.3 dB(A) |
 | ||
30 dB silent 40 dB(A) audible 50 dB(A) loud |
||
min: | ||
| Lenovo Legion 5 15ACH6A-82NW0010GE Radeon RX 6600M, R5 5600H, Micron 2210 MTFDHBA512QFD | Gigabyte G5 KC GeForce RTX 3060 Laptop GPU, i5-10500H, ESR512GTLCG-EAC-4 | Asus TUF Gaming F15 FX506HM GeForce RTX 3060 Laptop GPU, i7-11800H, SK Hynix HFM001TD3JX013N | HP Victus 16-e0179ng GeForce RTX 3060 Laptop GPU, R7 5800H, WDC PC SN730 SDBPNTY-1T00 | Medion Erazer Deputy P25 GeForce RTX 3060 Laptop GPU, R7 5800H, Phison E12S-512GB-Phison-SSD-BICS4 | Dell G15 5515 GeForce RTX 3050 Ti Laptop GPU, R7 5800H, Samsung PM991a MZ9LQ512HBLU-00BD1 | |
|---|---|---|---|---|---|---|
| Noise | -22% | 14% | 4% | -7% | 6% | |
| off / environment * (dB) | 25 | 27 -8% | 24.8 1% | 24 4% | 25 -0% | 24 4% |
| Idle Minimum * (dB) | 25 | 31 -24% | 24.6 2% | 24 4% | 27 -8% | 25 -0% |
| Idle Average * (dB) | 25 | 32 -28% | 24.9 -0% | 25 -0% | 29 -16% | 26 -4% |
| Idle Maximum * (dB) | 34.5 | 51 -48% | 24.9 28% | 34 1% | 31 10% | 30 13% |
| Load Average * (dB) | 51.1 | 57 -12% | 27.1 47% | 44 14% | 57 -12% | 44 14% |
| Load Maximum * (dB) | 51.3 | 58 -13% | 49 4% | 52 -1% | 58 -13% | 48 6% |
| Witcher 3 ultra * (dB) | 56 | 46.4 | 50 | 56 | 44 |
* ... smaller is better
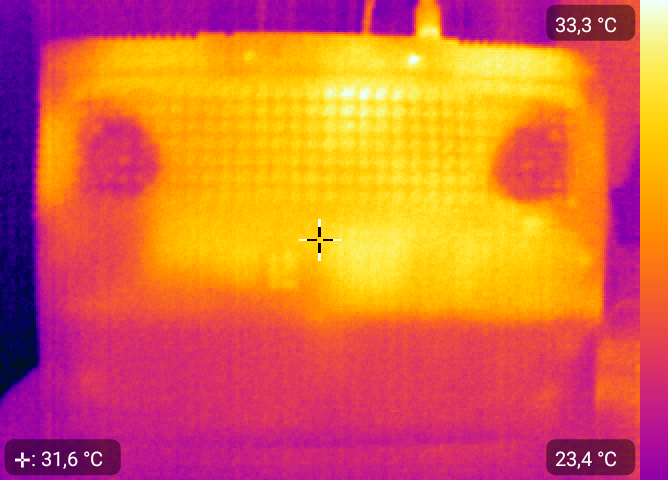
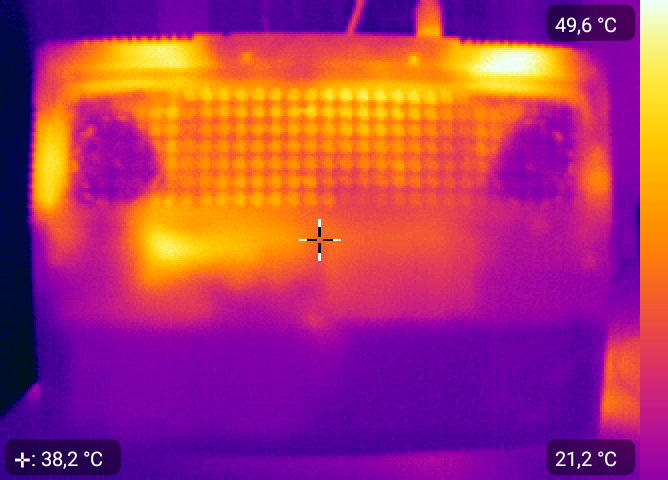
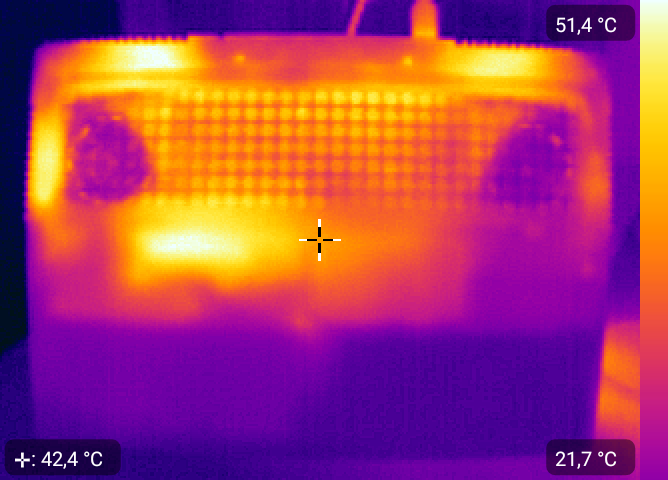
Temperature
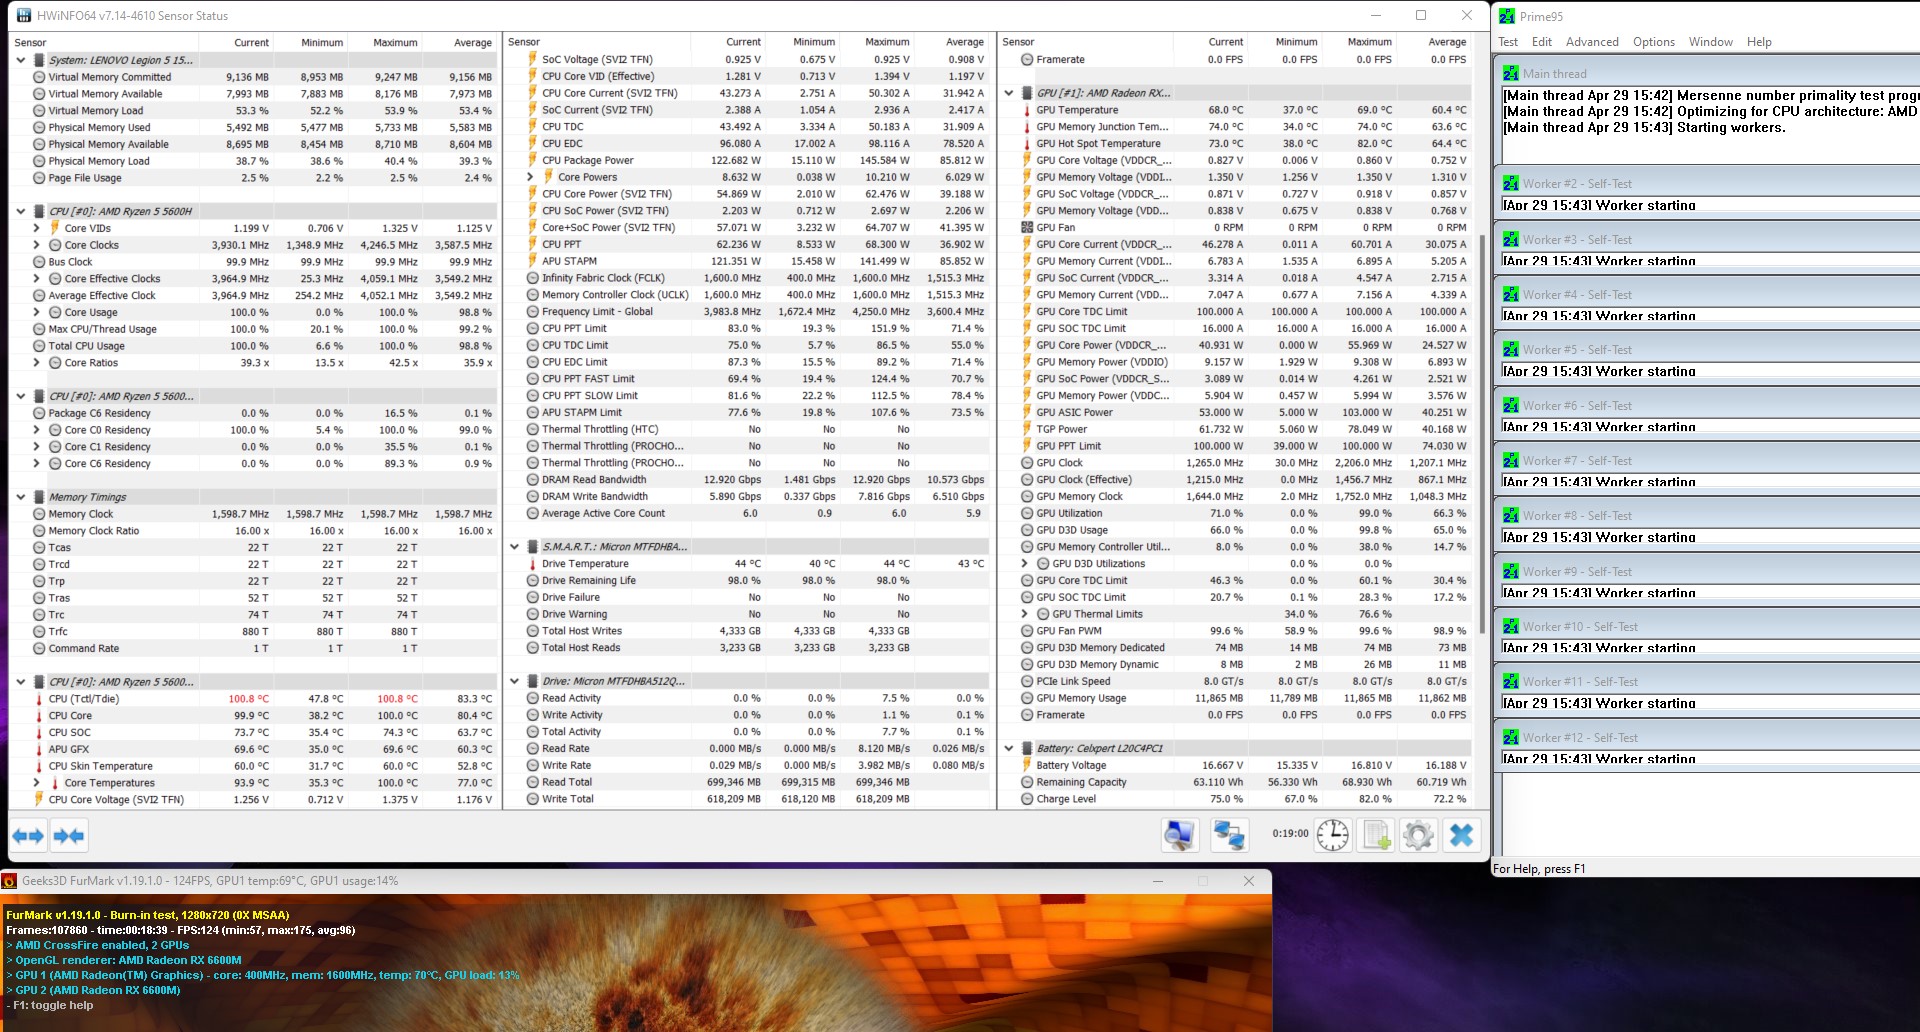
Lenovo does not shy away from high temperatures, allowing the SoC to function without throttling until just over 100 °C, where the ripcord is pulled to prevent damage. The SoC nevertheless had a stable clock rate of 3.6 GHz, above the base clock of 3.3 GHz. Subsequently, the CPU temperature settled at around 83 °C. The graphics card, on the other hand, did not reach such high temperatures during the stress test. GPU temperatures were 60 °C on average, although a maximum of just under 70 °C was reached. The permanent load did not have a negative impact. A subsequent 3D benchmark displayed an identical result compared to the cold start.
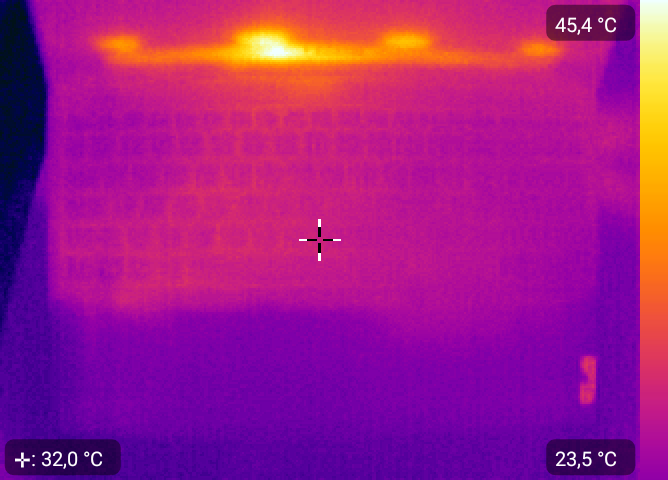
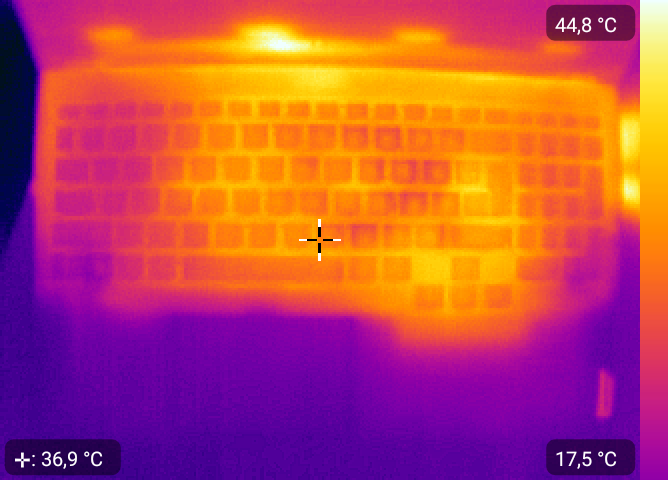
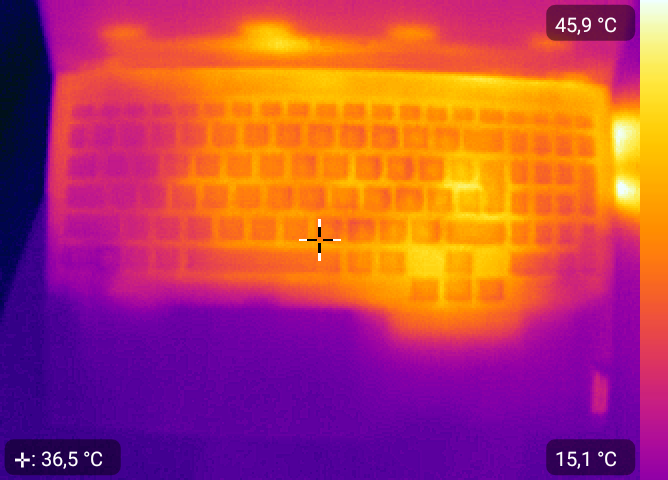
(+) The maximum temperature on the upper side is 39.9 °C / 104 F, compared to the average of 40.4 °C / 105 F, ranging from 21.2 to 68.8 °C for the class Gaming.
(±) The bottom heats up to a maximum of 43.8 °C / 111 F, compared to the average of 43.2 °C / 110 F
(+) In idle usage, the average temperature for the upper side is 27.9 °C / 82 F, compared to the device average of 33.9 °C / 93 F.
(+) The palmrests and touchpad are cooler than skin temperature with a maximum of 27.2 °C / 81 F and are therefore cool to the touch.
(±) The average temperature of the palmrest area of similar devices was 28.8 °C / 83.8 F (+1.6 °C / 2.8 F).
| Lenovo Legion 5 15ACH6A-82NW0010GE AMD Ryzen 5 5600H, AMD Radeon RX 6600M | Gigabyte G5 KC Intel Core i5-10500H, NVIDIA GeForce RTX 3060 Laptop GPU | Asus TUF Gaming F15 FX506HM Intel Core i7-11800H, NVIDIA GeForce RTX 3060 Laptop GPU | HP Victus 16-e0179ng AMD Ryzen 7 5800H, NVIDIA GeForce RTX 3060 Laptop GPU | Medion Erazer Deputy P25 AMD Ryzen 7 5800H, NVIDIA GeForce RTX 3060 Laptop GPU | Dell G15 5515 AMD Ryzen 7 5800H, NVIDIA GeForce RTX 3050 Ti Laptop GPU | |
|---|---|---|---|---|---|---|
| Heat | -10% | 5% | -28% | 12% | 1% | |
| Maximum Upper Side * (°C) | 39.9 | 50 -25% | 46.4 -16% | 51 -28% | 37 7% | 50 -25% |
| Maximum Bottom * (°C) | 43.8 | 49 -12% | 45.4 -4% | 52 -19% | 40 9% | 49 -12% |
| Idle Upper Side * (°C) | 34.1 | 33 3% | 26 24% | 46 -35% | 27 21% | 26 24% |
| Idle Bottom * (°C) | 31.7 | 34 -7% | 27.4 14% | 41 -29% | 29 9% | 26 18% |
* ... smaller is better
Speakers
The sound system only has two stereo speakers. Highs and mids stand out clearly and can reproduce speech clearly. Owing to weak volume, however, the bass is lacking. Due to the noise of the laptop, it is advisable to use a headset anyway, which can be connected via the 3.5 mm jack or USB.
Lenovo Legion 5 15ACH6A-82NW0010GE audio analysis
(±) | speaker loudness is average but good (73.8 dB)
Bass 100 - 315 Hz
(-) | nearly no bass - on average 25% lower than median
(±) | linearity of bass is average (13.1% delta to prev. frequency)
Mids 400 - 2000 Hz
(±) | higher mids - on average 6.1% higher than median
(+) | mids are linear (6.9% delta to prev. frequency)
Highs 2 - 16 kHz
(+) | balanced highs - only 3.7% away from median
(±) | linearity of highs is average (9.2% delta to prev. frequency)
Overall 100 - 16.000 Hz
(±) | linearity of overall sound is average (23.3% difference to median)
Compared to same class
» 85% of all tested devices in this class were better, 4% similar, 11% worse
» The best had a delta of 6%, average was 18%, worst was 132%
Compared to all devices tested
» 70% of all tested devices were better, 5% similar, 25% worse
» The best had a delta of 4%, average was 23%, worst was 134%
Dell G15 5515 audio analysis
(±) | speaker loudness is average but good (76 dB)
Bass 100 - 315 Hz
(-) | nearly no bass - on average 22% lower than median
(±) | linearity of bass is average (14.9% delta to prev. frequency)
Mids 400 - 2000 Hz
(+) | balanced mids - only 2.8% away from median
(+) | mids are linear (3% delta to prev. frequency)
Highs 2 - 16 kHz
(+) | balanced highs - only 1.4% away from median
(+) | highs are linear (3.7% delta to prev. frequency)
Overall 100 - 16.000 Hz
(±) | linearity of overall sound is average (16.8% difference to median)
Compared to same class
» 44% of all tested devices in this class were better, 11% similar, 45% worse
» The best had a delta of 6%, average was 18%, worst was 132%
Compared to all devices tested
» 30% of all tested devices were better, 7% similar, 63% worse
» The best had a delta of 4%, average was 23%, worst was 134%
Energy Management
Power Consumption
In terms of power consumption, the Lenovo Legion 5 15 cannot keep up with the comparison devices chosen here. When idle, the Lenovo Legion 5 15 is still relatively good. Nevertheless, the power consumption increases significantly under load and we recorded an average of 178 watts, which is rather dismal compared to the competition. With a maximum of 181 watts, the 230-watt slim power supply adequately powerful.
| Off / Standby | |
| Idle | |
| Load |
|
Key:
min: | |
| Lenovo Legion 5 15ACH6A-82NW0010GE R5 5600H, Radeon RX 6600M, Micron 2210 MTFDHBA512QFD, IPS, 1920x1080, 15.6" | Gigabyte G5 KC i5-10500H, GeForce RTX 3060 Laptop GPU, ESR512GTLCG-EAC-4, IPS, 1920x1080, 15.6" | Asus TUF Gaming F15 FX506HM i7-11800H, GeForce RTX 3060 Laptop GPU, SK Hynix HFM001TD3JX013N, IPS, 1920x1080, 15.6" | HP Victus 16-e0179ng R7 5800H, GeForce RTX 3060 Laptop GPU, WDC PC SN730 SDBPNTY-1T00, IPS, 1920x1080, 16.1" | Medion Erazer Deputy P25 R7 5800H, GeForce RTX 3060 Laptop GPU, Phison E12S-512GB-Phison-SSD-BICS4, IPS, 1920x1080, 15.6" | Dell G15 5515 R7 5800H, GeForce RTX 3050 Ti Laptop GPU, Samsung PM991a MZ9LQ512HBLU-00BD1, IPS, 1920x1080, 15.6" | Average AMD Radeon RX 6600M | Average of class Gaming | |
|---|---|---|---|---|---|---|---|---|
| Power Consumption | 2% | 5% | 17% | 9% | 23% | -12% | -28% | |
| Idle Minimum * (Watt) | 10 | 8 20% | 9.5 5% | 5 50% | 8 20% | 5 50% | 13.7 ? -37% | 13.1 ? -31% |
| Idle Average * (Watt) | 13.2 | 13 2% | 12.1 8% | 10 24% | 11 17% | 9 32% | 16.6 ? -26% | 19 ? -44% |
| Idle Maximum * (Watt) | 15.6 | 20 -28% | 22.5 -44% | 20 -28% | 16 -3% | 20 -28% | 19.1 ? -22% | 24.6 ? -58% |
| Load Average * (Watt) | 178 | 98 45% | 99.5 44% | 108 39% | 109 39% | 94 47% | 114.4 ? 36% | 111.3 ? 37% |
| Witcher 3 ultra * (Watt) | 181 | 166 8% | 157 13% | 145 20% | 183 -1% | 123 32% | ||
| Load Maximum * (Watt) | 180 | 242 -34% | 173.5 4% | 189 -5% | 211 -17% | 172 4% | 197.8 ? -10% | 260 ? -44% |
* ... smaller is better
Power Consumption Witcher 3 / Stress test
Power Consumption with an external monitor
Battery Life
Regarding battery life, Lenovo has done well with the Legion 5 15. All comparison devices fall behind in testing. The inbuilt 80 Wh battery was able to power the Lenovo Legion 5 15 for a good 9 hours in the Wi-Fi test.
Regarding battery power, it should be noted that GPU performance is significantly throttled. But the same is also true of almost all modern gaming laptops.


| Lenovo Legion 5 15ACH6A-82NW0010GE R5 5600H, Radeon RX 6600M, 80 Wh | Gigabyte G5 KC i5-10500H, GeForce RTX 3060 Laptop GPU, 48.96 Wh | Asus TUF Gaming F15 FX506HM i7-11800H, GeForce RTX 3060 Laptop GPU, 90 Wh | HP Victus 16-e0179ng R7 5800H, GeForce RTX 3060 Laptop GPU, 70 Wh | Medion Erazer Deputy P25 R7 5800H, GeForce RTX 3060 Laptop GPU, 49 Wh | Dell G15 5515 R7 5800H, GeForce RTX 3050 Ti Laptop GPU, 56 Wh | Average of class Gaming | |
|---|---|---|---|---|---|---|---|
| Battery runtime | -55% | -9% | -35% | -30% | -11% | -29% | |
| Reader / Idle (h) | 12.8 | 5.2 -59% | 11 -14% | 8.5 -34% | 10.5 -18% | 13.5 5% | 7.84 ? -39% |
| WiFi v1.3 (h) | 9.2 | 3.6 -61% | 7.9 -14% | 5.9 -36% | 6.7 -27% | 8 -13% | 7.08 ? -23% |
| Load (h) | 2 | 1.1 -45% | 2 0% | 1.3 -35% | 1.1 -45% | 1.5 -25% | 1.496 ? -25% |
| H.264 (h) | 8.8 | 8.27 ? |
Pros
Cons
Verdict - Solid gaming notebook with long battery life


The Lenovo Legion 5 15 is a brand new 15-inch gaming notebook with the latest AMD GPU and a CPU. The AMD Ryzen 5 5600H does its job well, even if two additional cores would also come in handy for CPU-heavy workloads. For this, you can purchase a Lenovo Legion 5 15 with the AMD Ryzen 7 5800H. As for the built-in AMD Radeon RX 6600M, it uses the current RDNA 2 architecture, which we have known for quite some time. This GPU is aimed at gamers who primarily want to play in FHD - the built-in display of our test device cannot offer much more than this. At least a 165 Hz option is included and the color space coverage is better than in some other devices. In a direct performance comparison with Nvidia, the AMD Radeon RX 6600M falls between the Nvidia GeForce RTX 3060 laptop and an Nvidia GeForce RTX 3070 laptop.
The Lenovo Legion 5 15 is a well-rounded gaming notebook without any fancy additions, offering solid gaming performance thanks to the latest AMD Ryzen CPU together with an AMD Radeon GPU.
The Lenovo Legion 5 15 is a fundamentally solid gaming laptop. Due to its relatively strong battery life, the notebook could also function as an excellent multimedia device. External ports are available in good numbers. At the same time, the lack of an SD card reader is not a big deal-breaker. But the built-in mass storage device does fall short - there should be at least a 1 TB SSD here. Fortunately, a second mass storage device can be installed quickly and easily.
Price and Availability
The laptop is currently available in various configurations via Lenovo's US website, starting at $879.99.
Lenovo Legion 5 15ACH6A-82NW0010GE
- 04/29/2022 v7 (old)
Sebastian Bade
Price comparison

