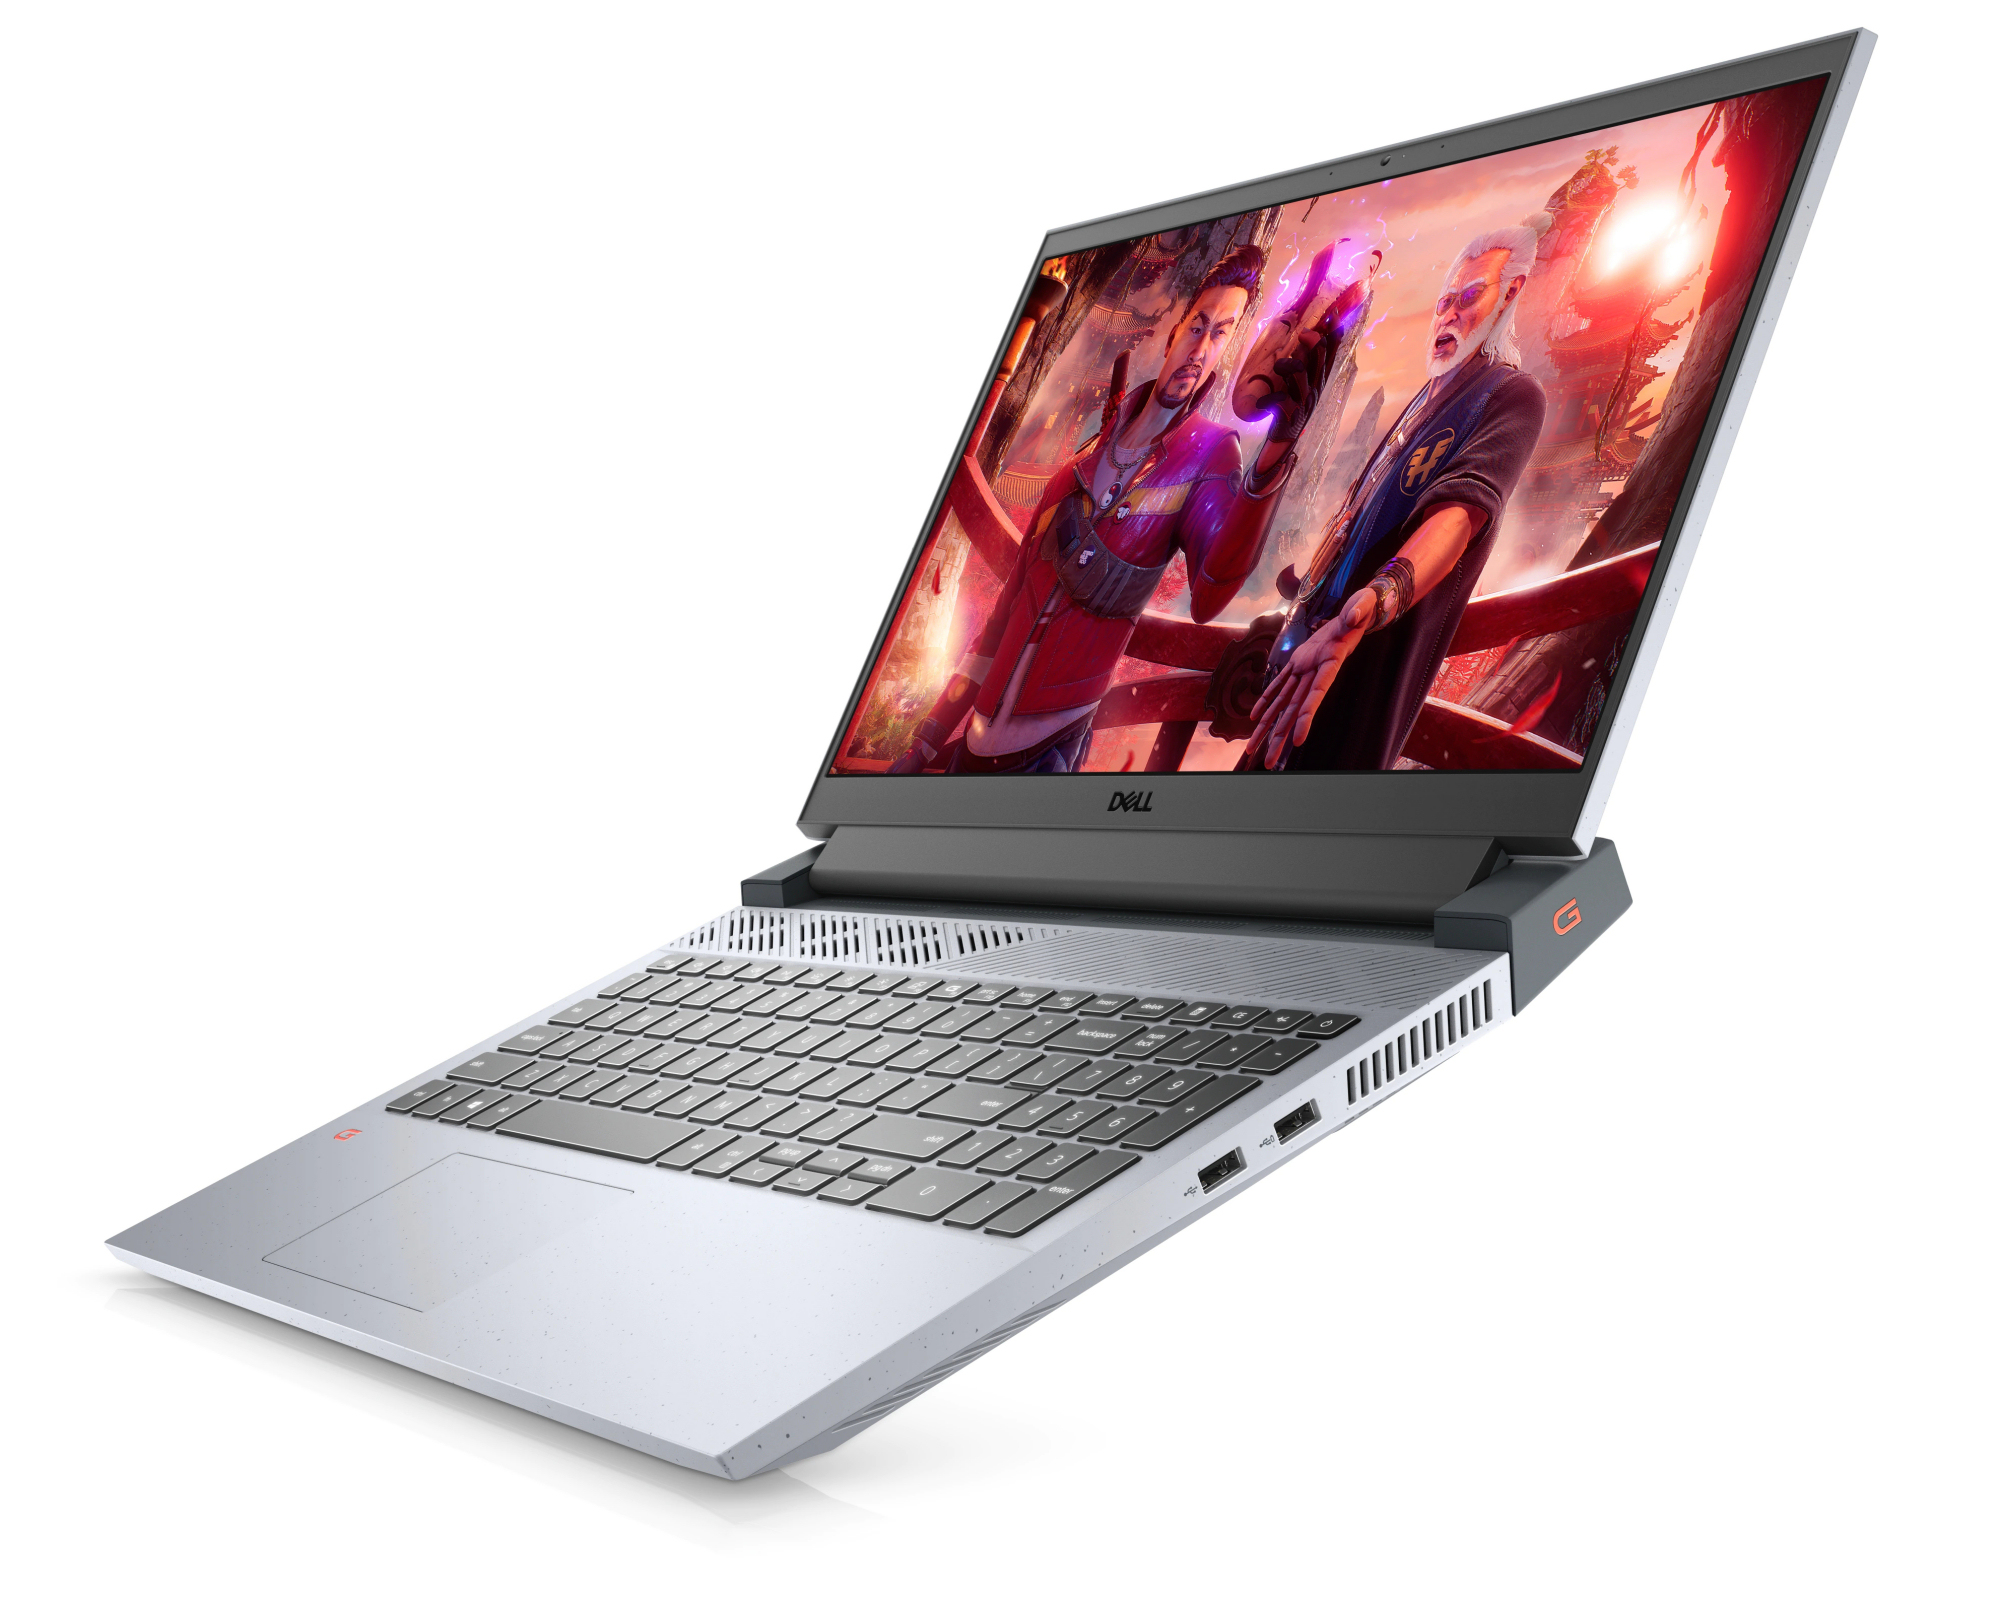
Dell G15 5515 Ryzen Edition review: An affordable FHD gaming laptop

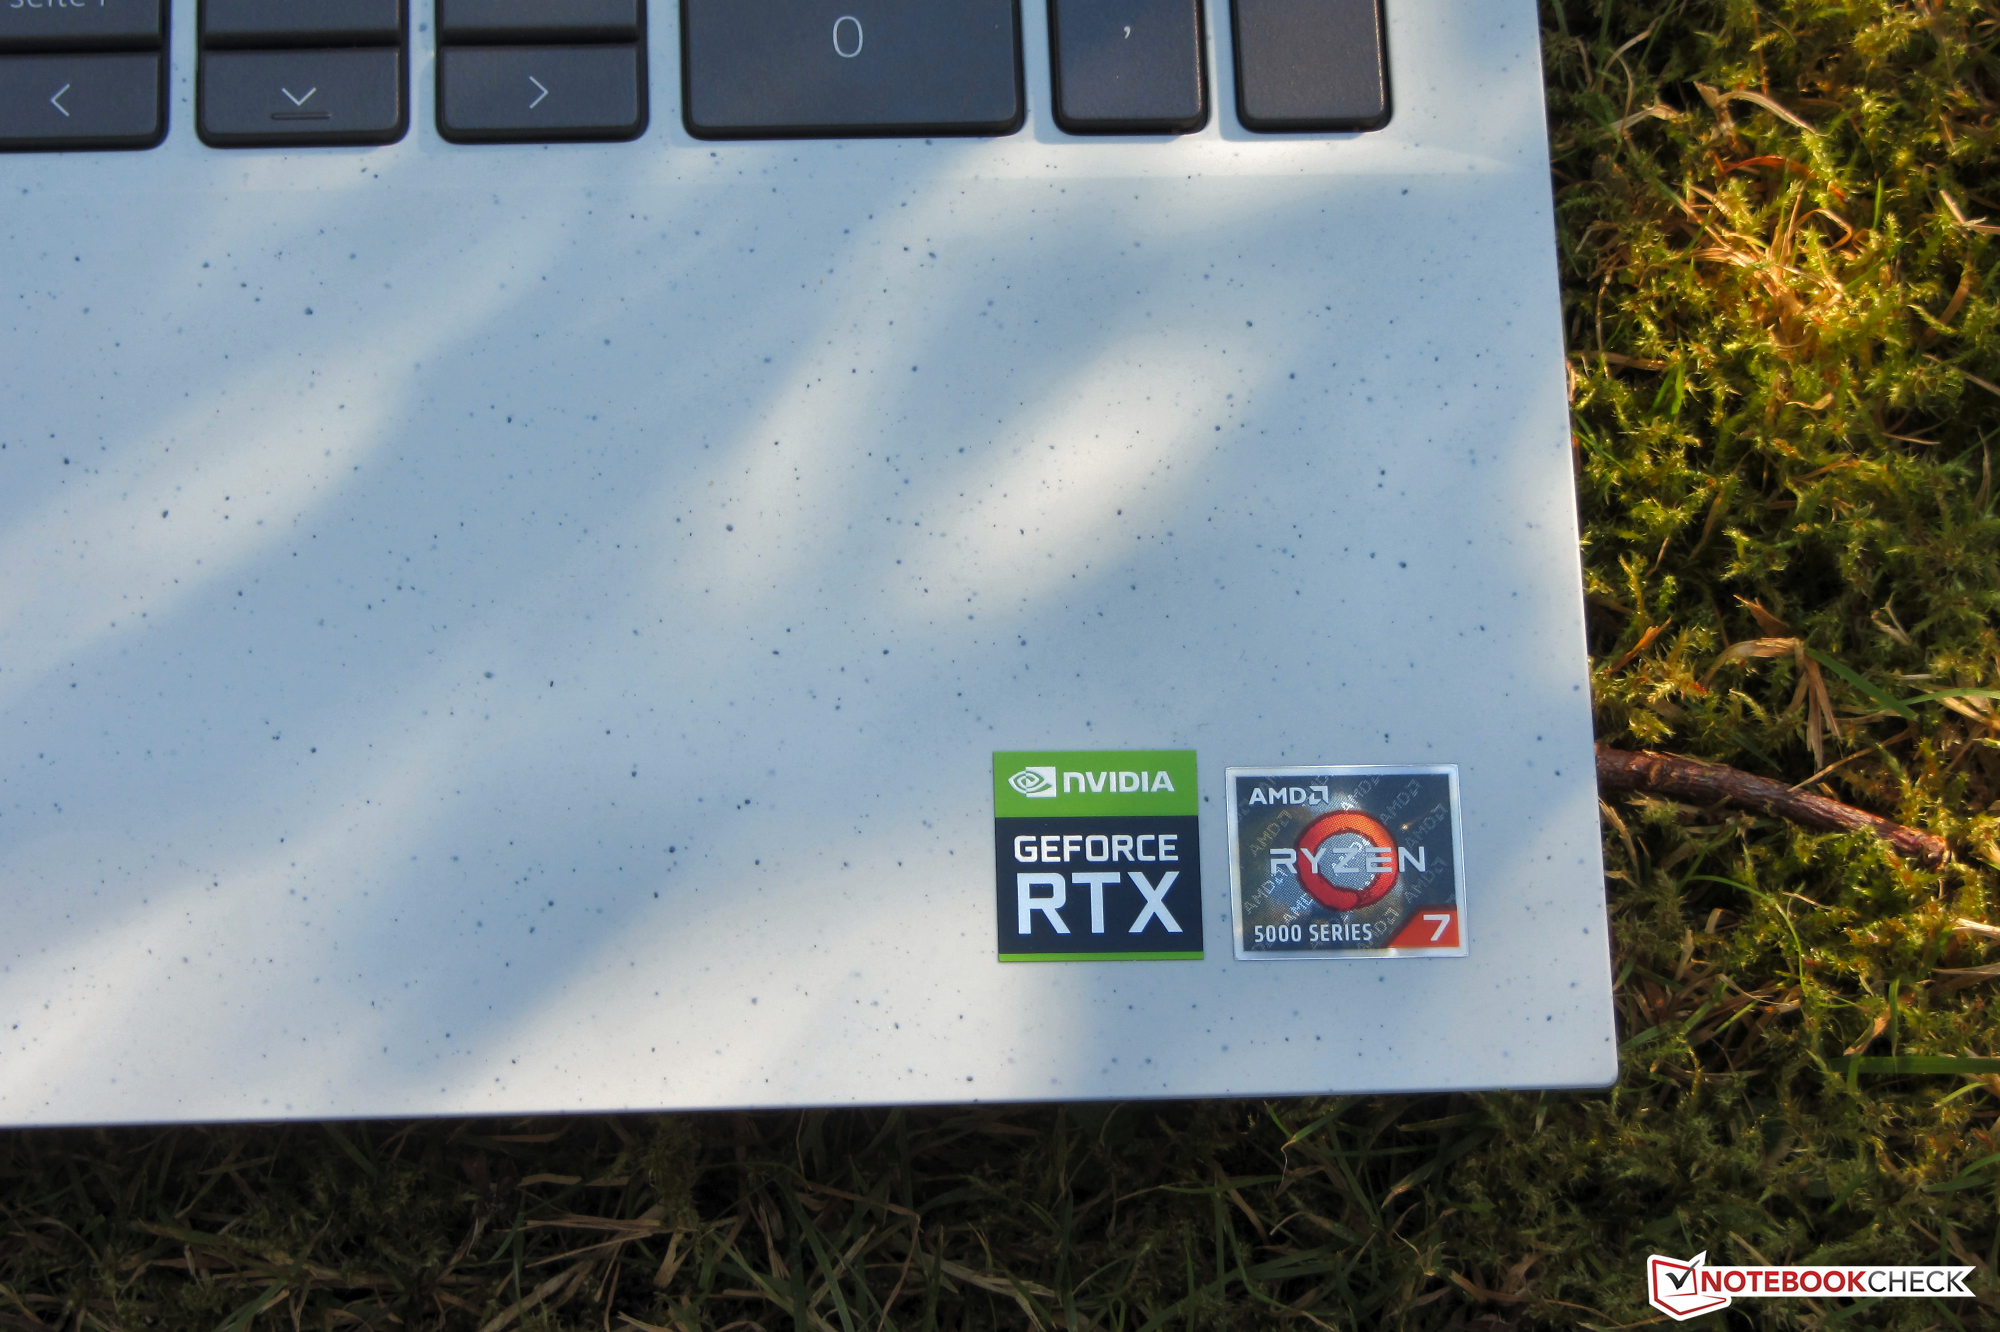
With the G15 5515, Dell adds a gaming laptop from the entry level segment into its portfolio. The equipment configuration we are testing here is run by a Ryzen 7 5800H APU and a GeForce RTX 3050 Ti laptop GPU. The competitors include devices such as the Schenker XMG Focus 15, the Gigabyte G5 KC, and the Lenovo Legion 5 15ACH.
Possible Competitors in Comparison
Rating | Date | Model | Weight | Height | Size | Resolution | Price |
|---|---|---|---|---|---|---|---|
| 82.7 % v7 (old) | 10 / 2021 | Dell G15 5515 R7 5800H, GeForce RTX 3050 Ti Laptop GPU | 2.4 kg | 24.9 mm | 15.60" | 1920x1080 | |
| 83.4 % v7 (old) | 09 / 2021 | Lenovo Legion 5 15ACH-82JU00C6GE-FL R7 5800H, GeForce RTX 3060 Laptop GPU | 2.5 kg | 26 mm | 15.60" | 1920x1080 | |
| 83.2 % v7 (old) | 09 / 2021 | Schenker XMG Focus 15 i7-11800H, GeForce RTX 3050 Ti Laptop GPU | 1.9 kg | 22 mm | 15.60" | 1920x1080 | |
| 80.7 % v7 (old) | 09 / 2021 | Gigabyte G5 KC i5-10500H, GeForce RTX 3060 Laptop GPU | 2.1 kg | 28 mm | 15.60" | 1920x1080 |
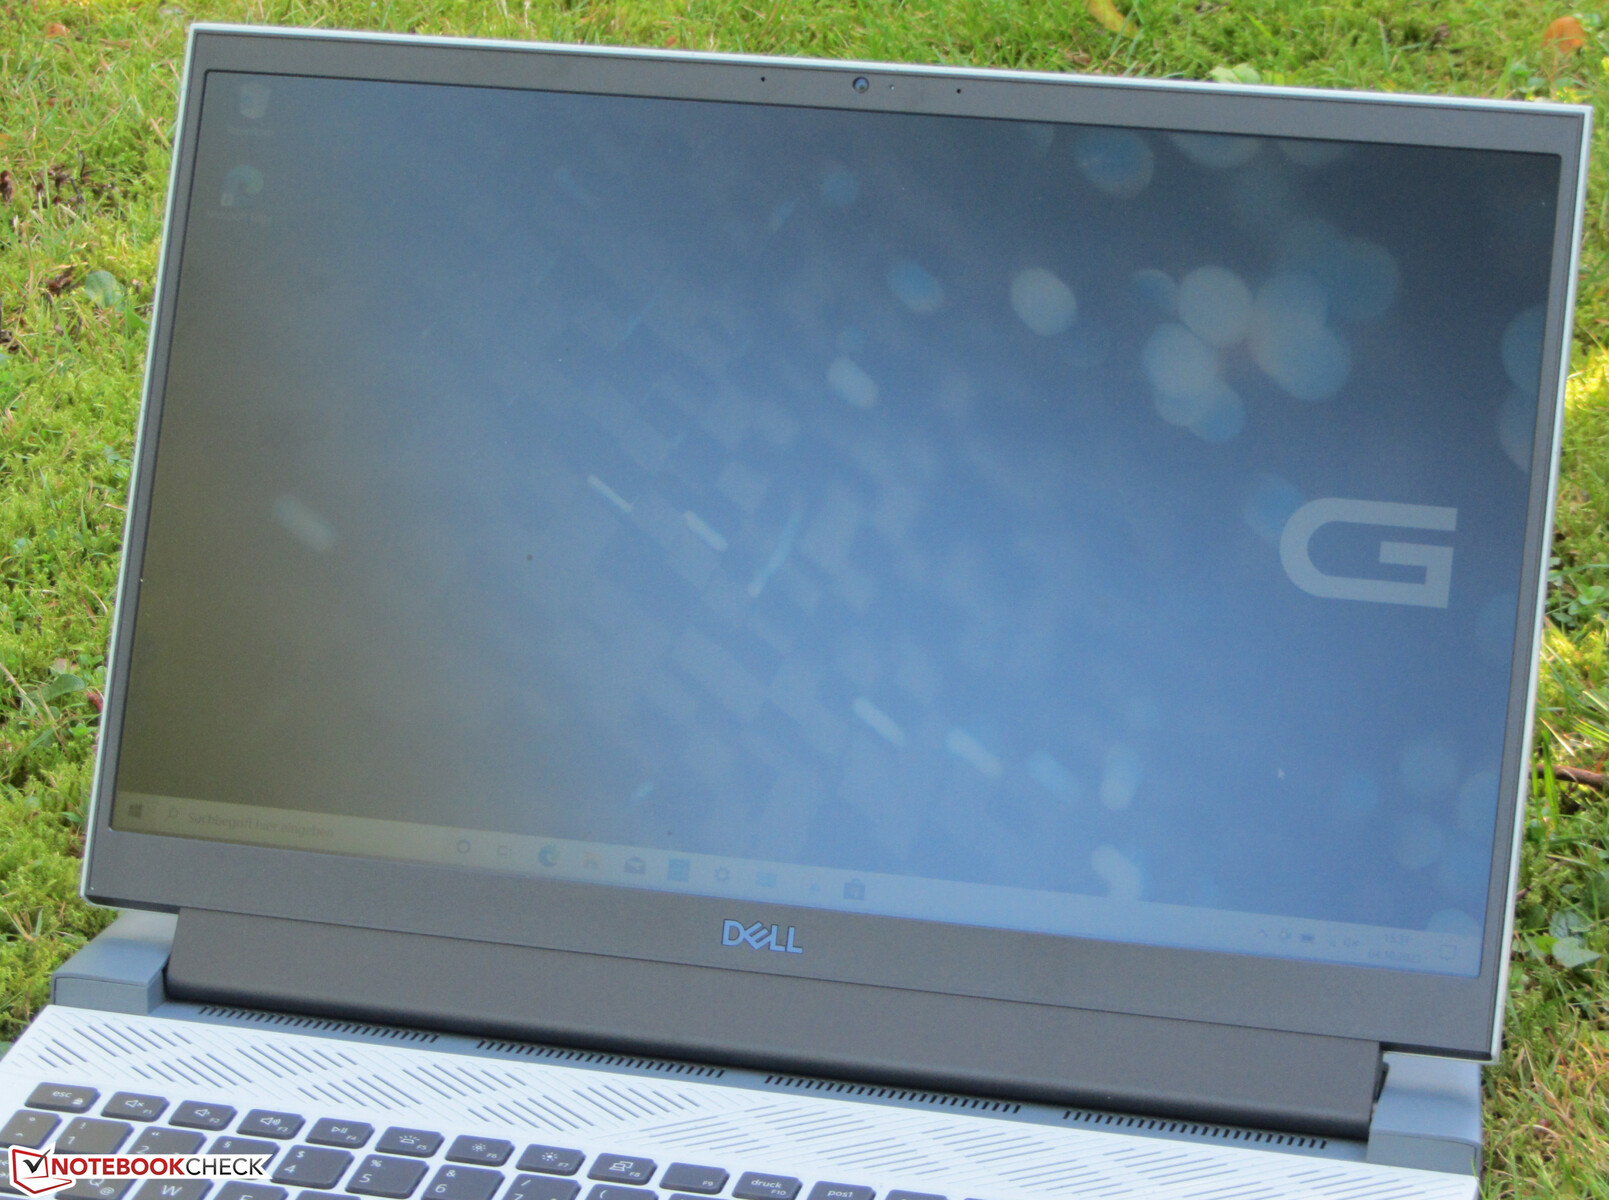
Case - The G15 has a plastic case
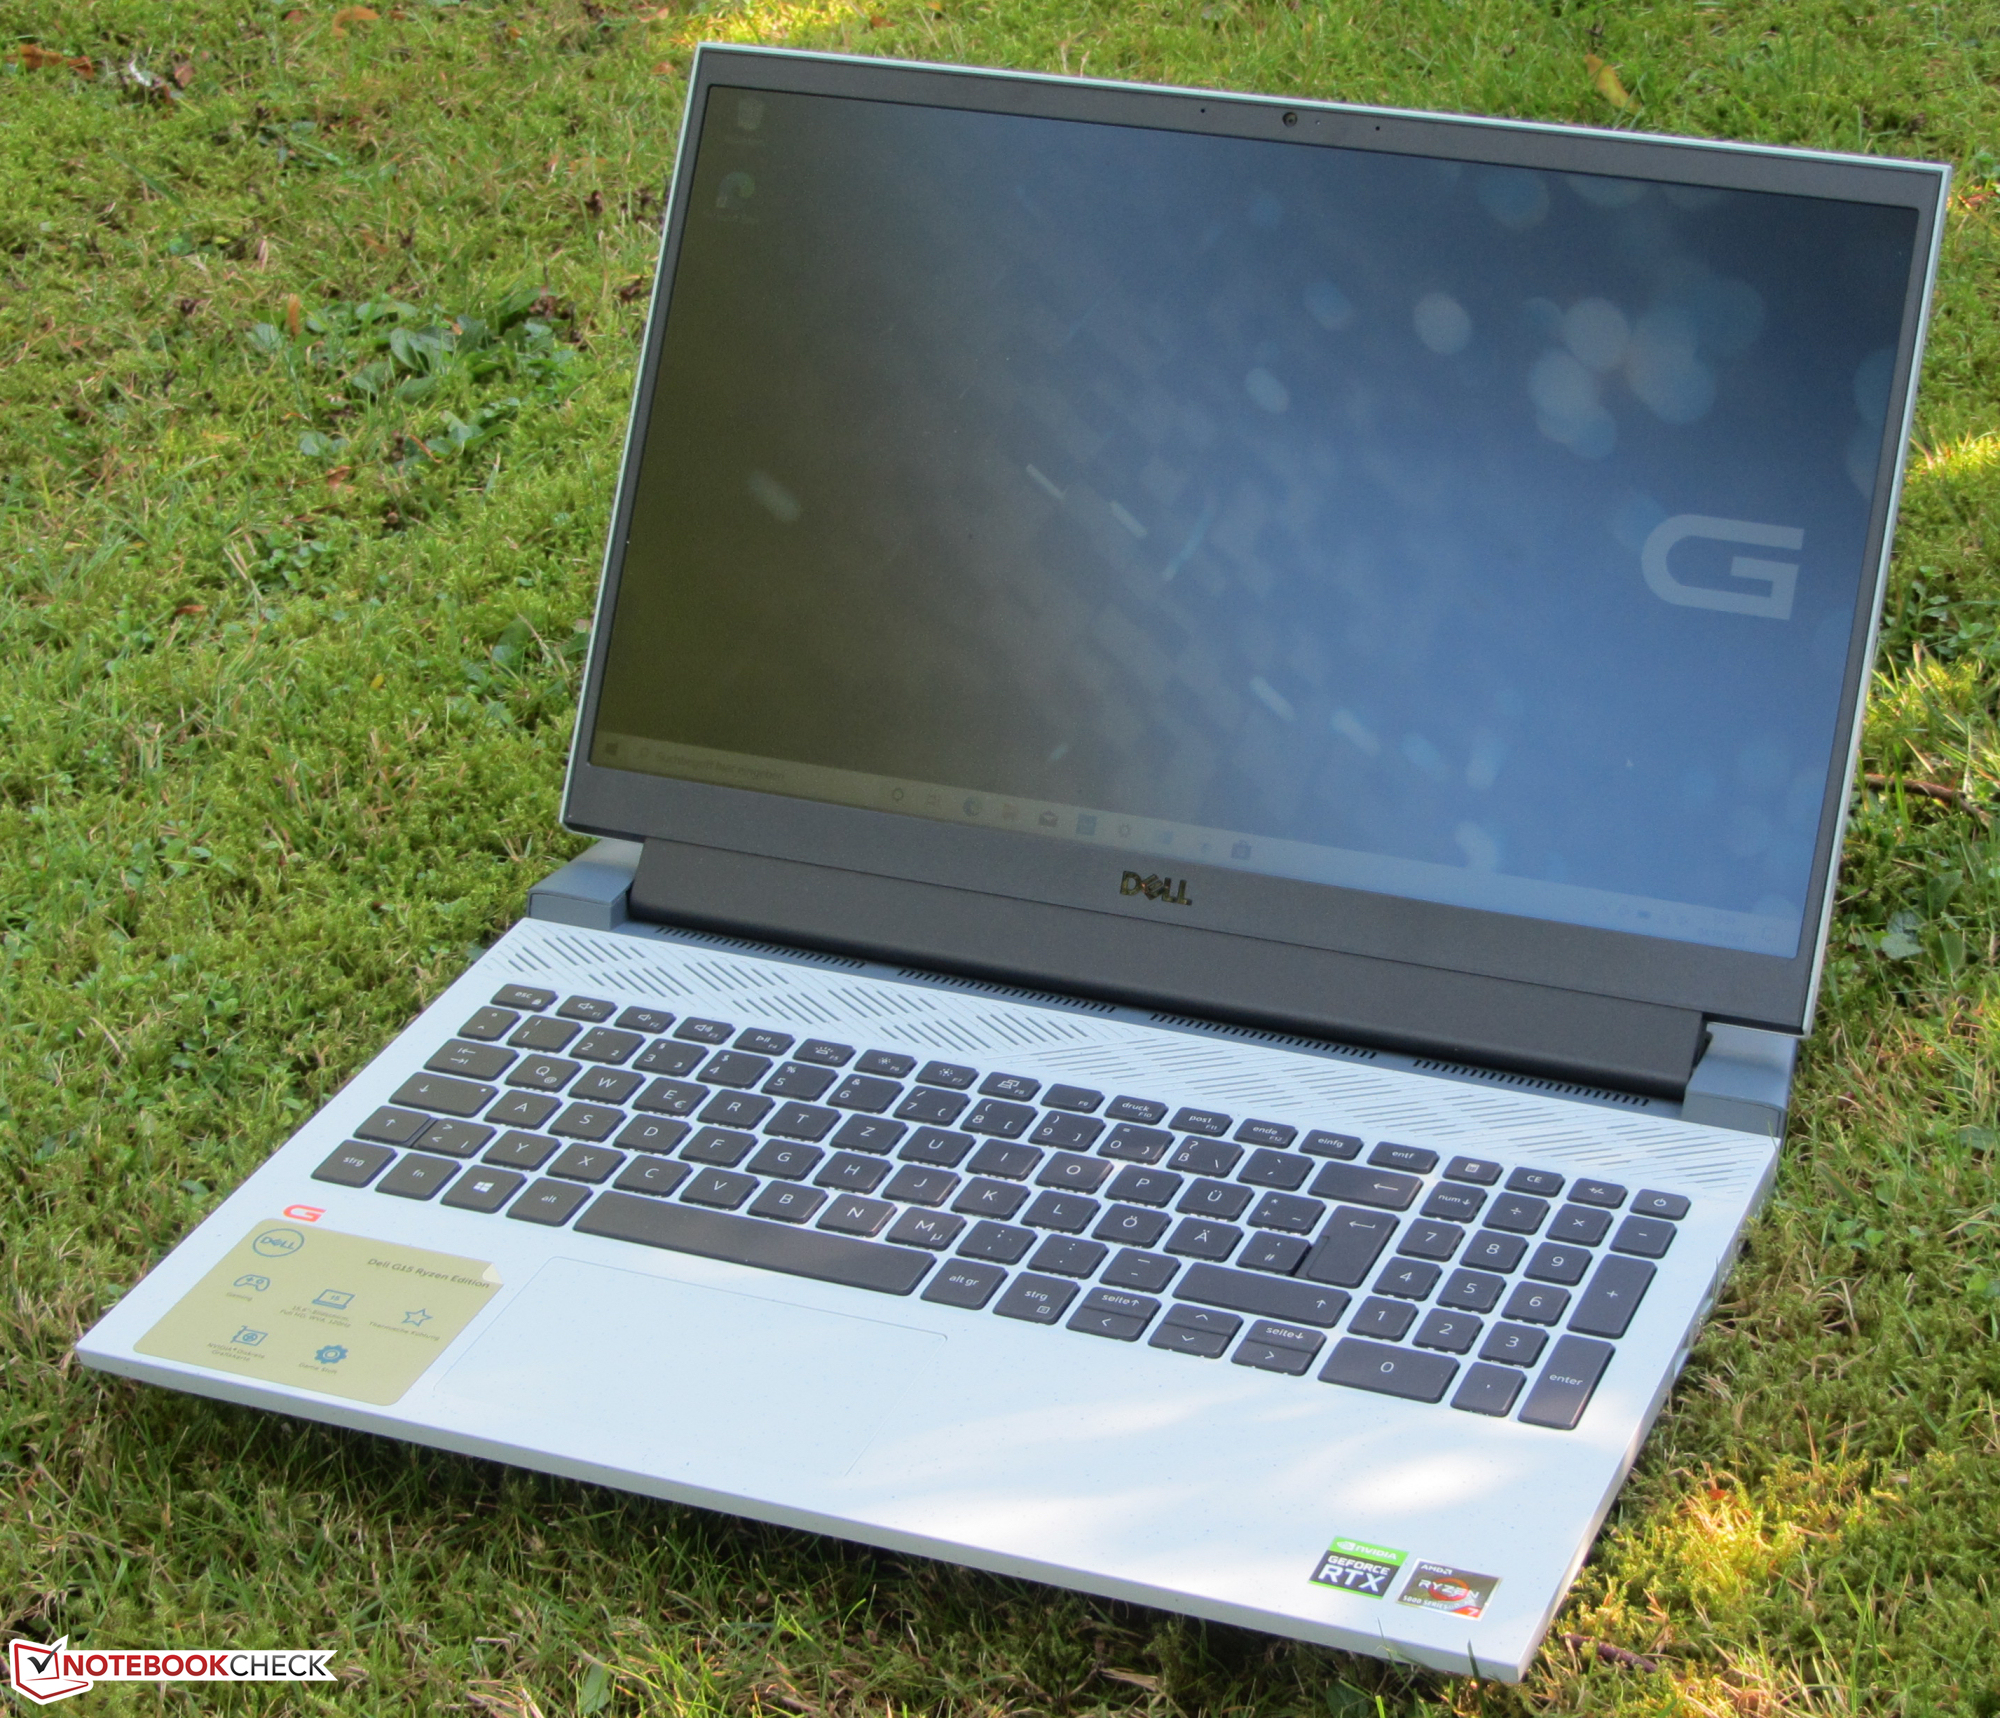
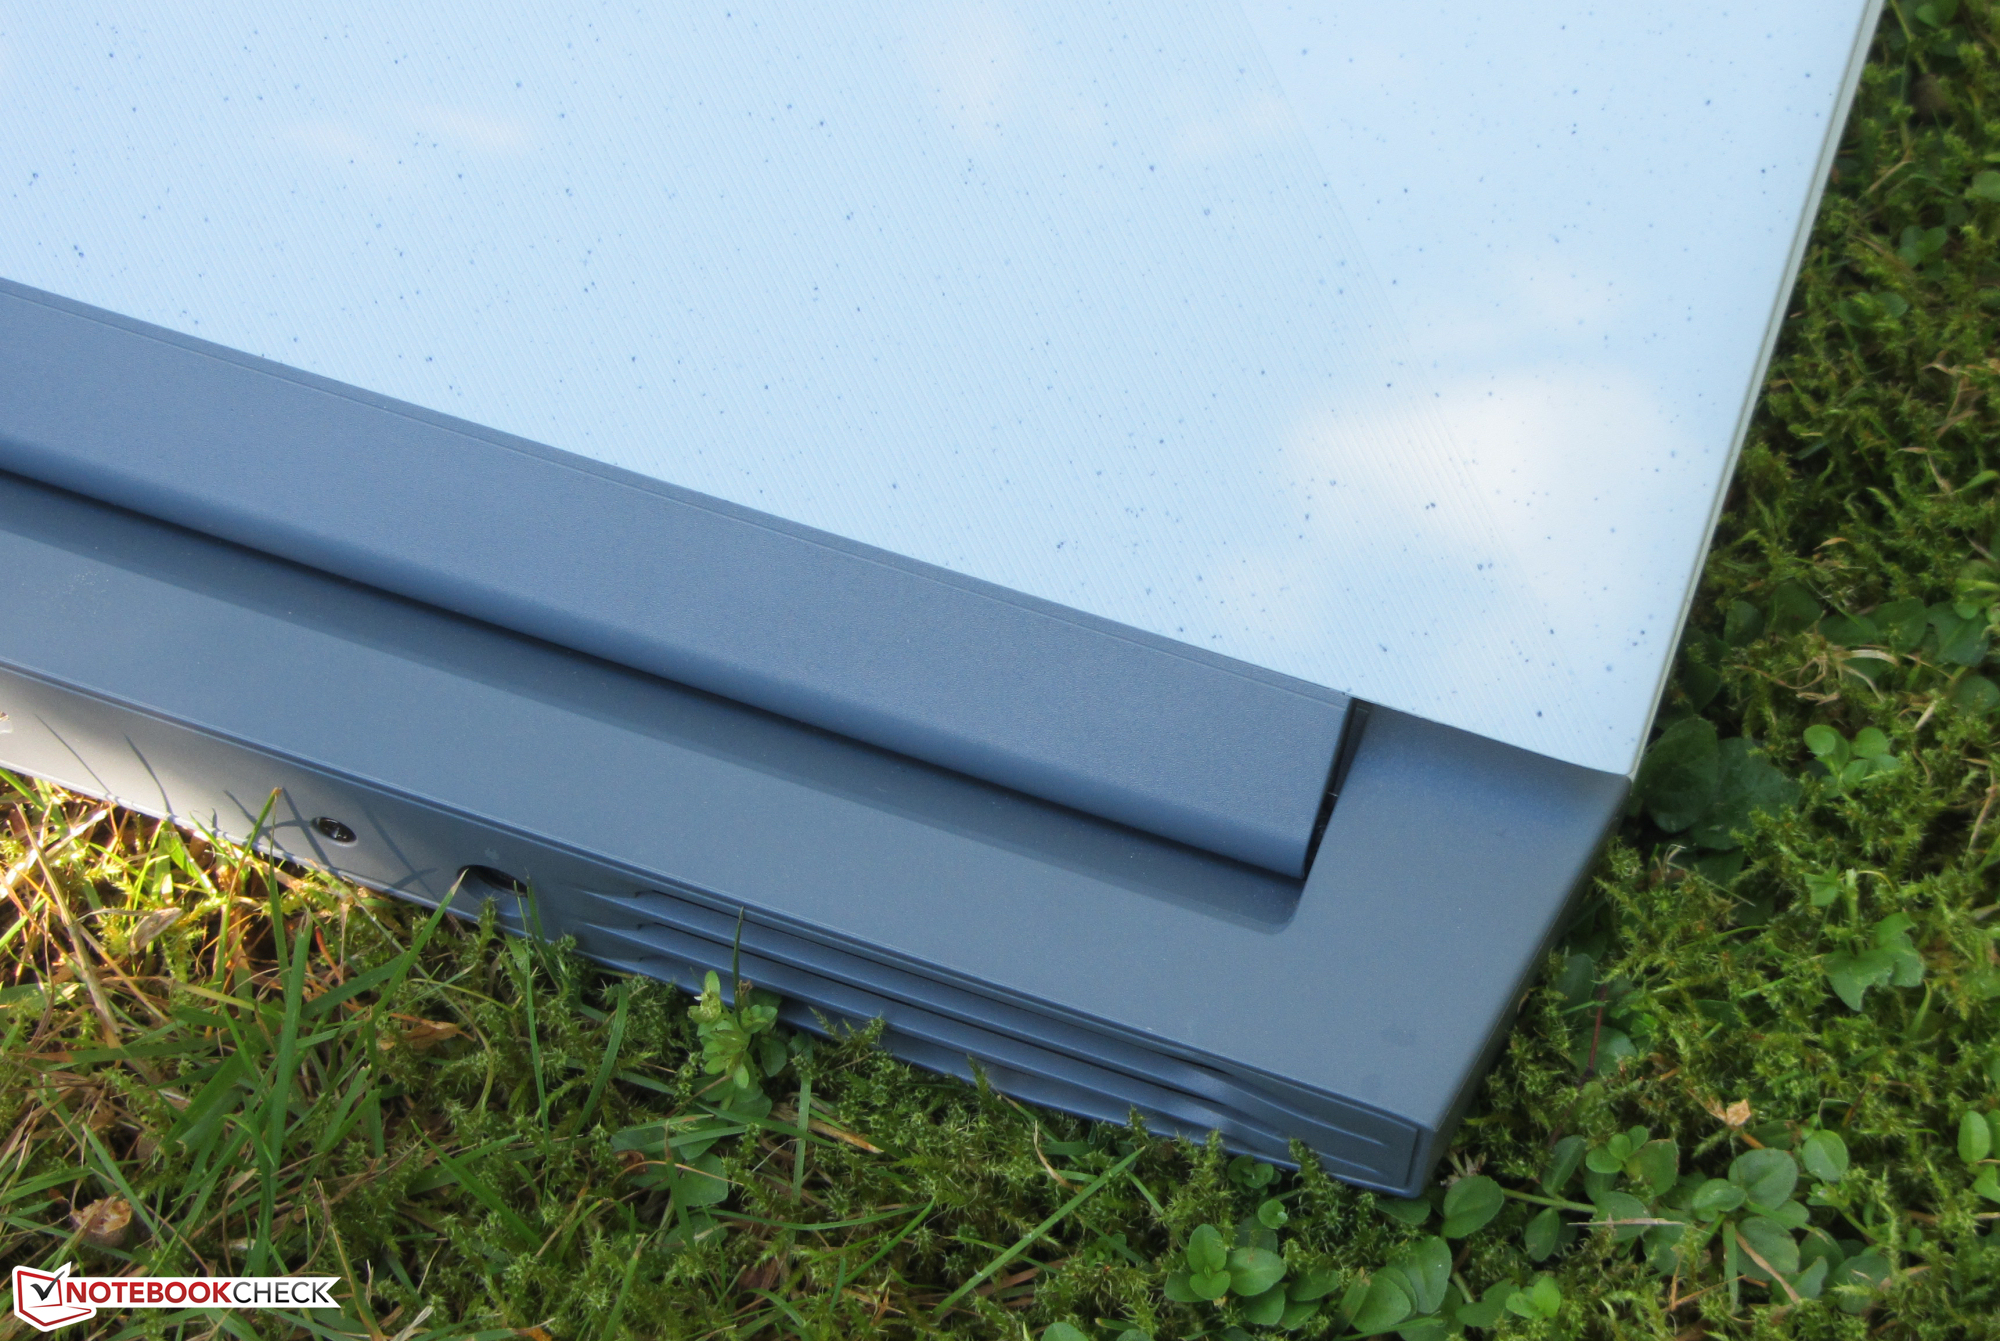
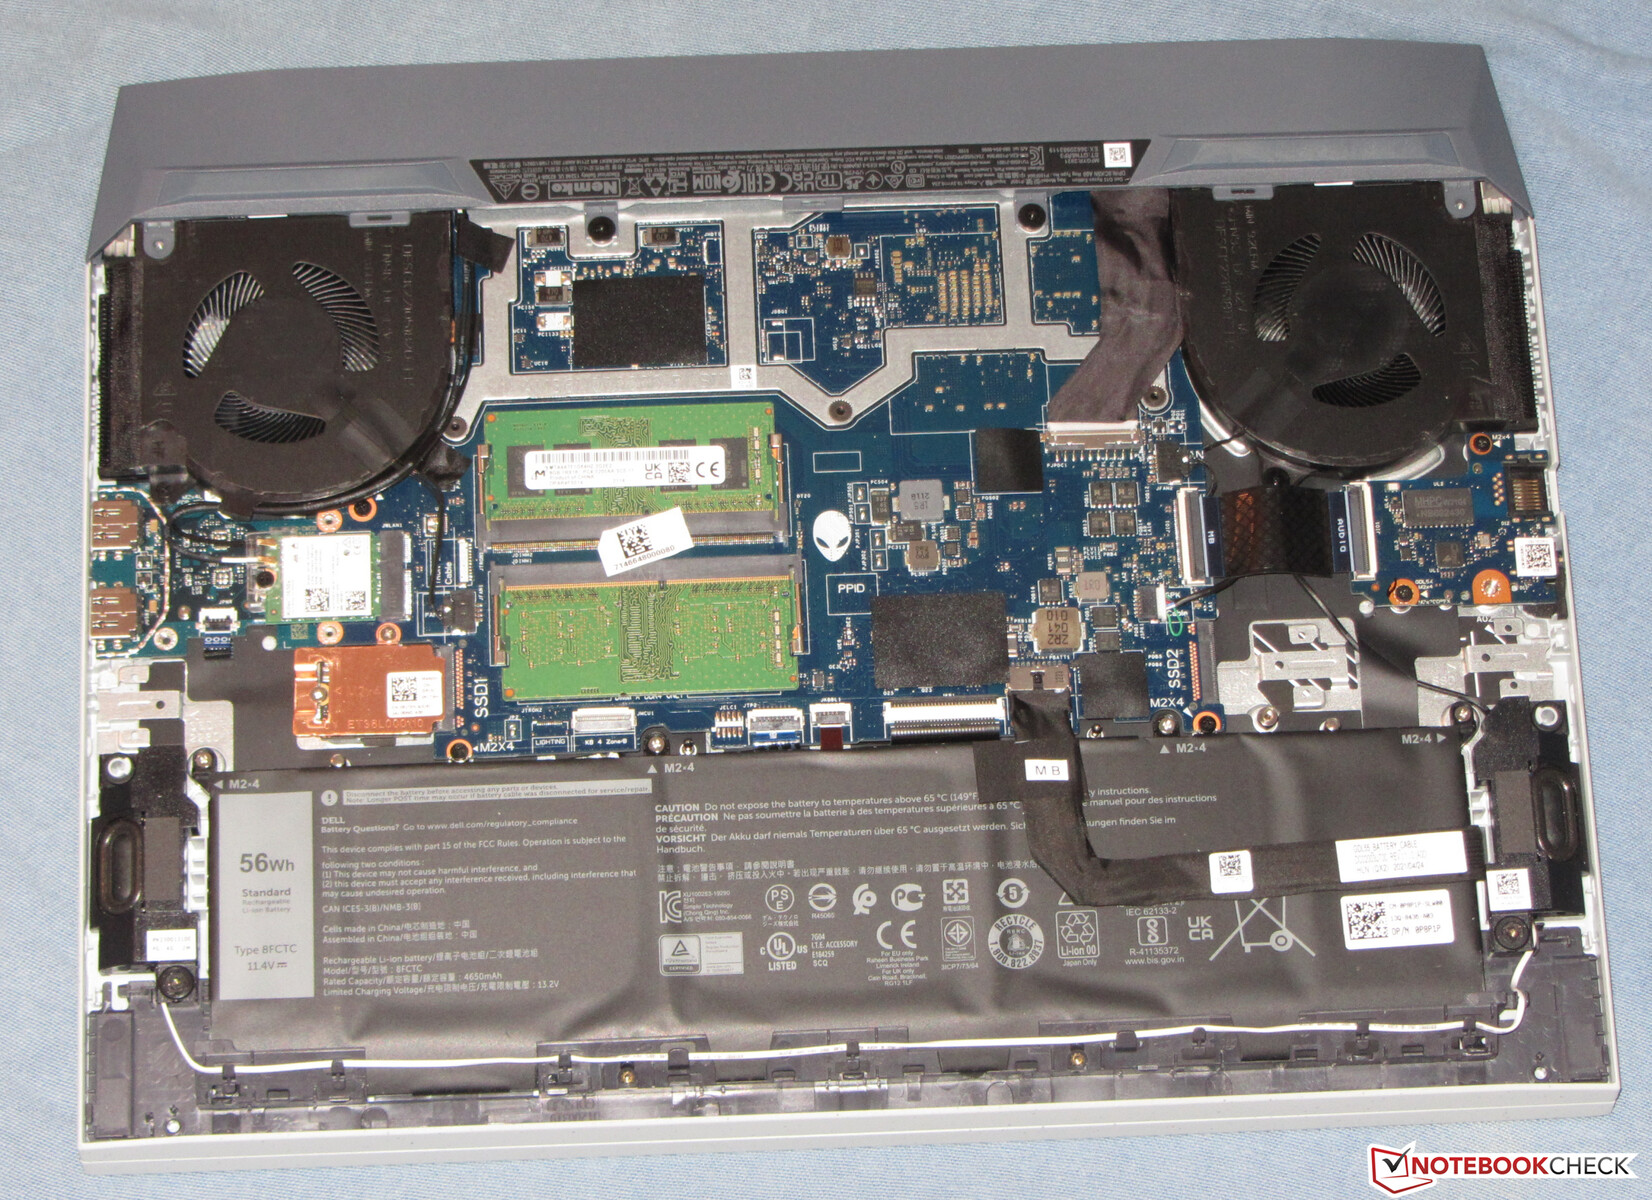
The case of the G15 does not offer any high-quality materials but is made from plastic. While a fifth of the base unit in the back is kept in a dark gray color tone, the rest four fifth and the lid cover have a light gray color. The light gray areas have some dark gray color spots ("Phantom Grey Sprinkled"). The battery is built in. You can access the insides after removing the bottom of the case.
The case shows some good workmanship. The gaps are right and we do not feel any material protrusions or sharp edges. The base unit and lid can be warped to an extent that is just barely acceptable. Pressure on the back of the lid does not lead to any changes in the image. The hinges hold the lid tightly in position, but it is still possible to open the lid with one hand. The maximum opening angle is about 135 degrees.

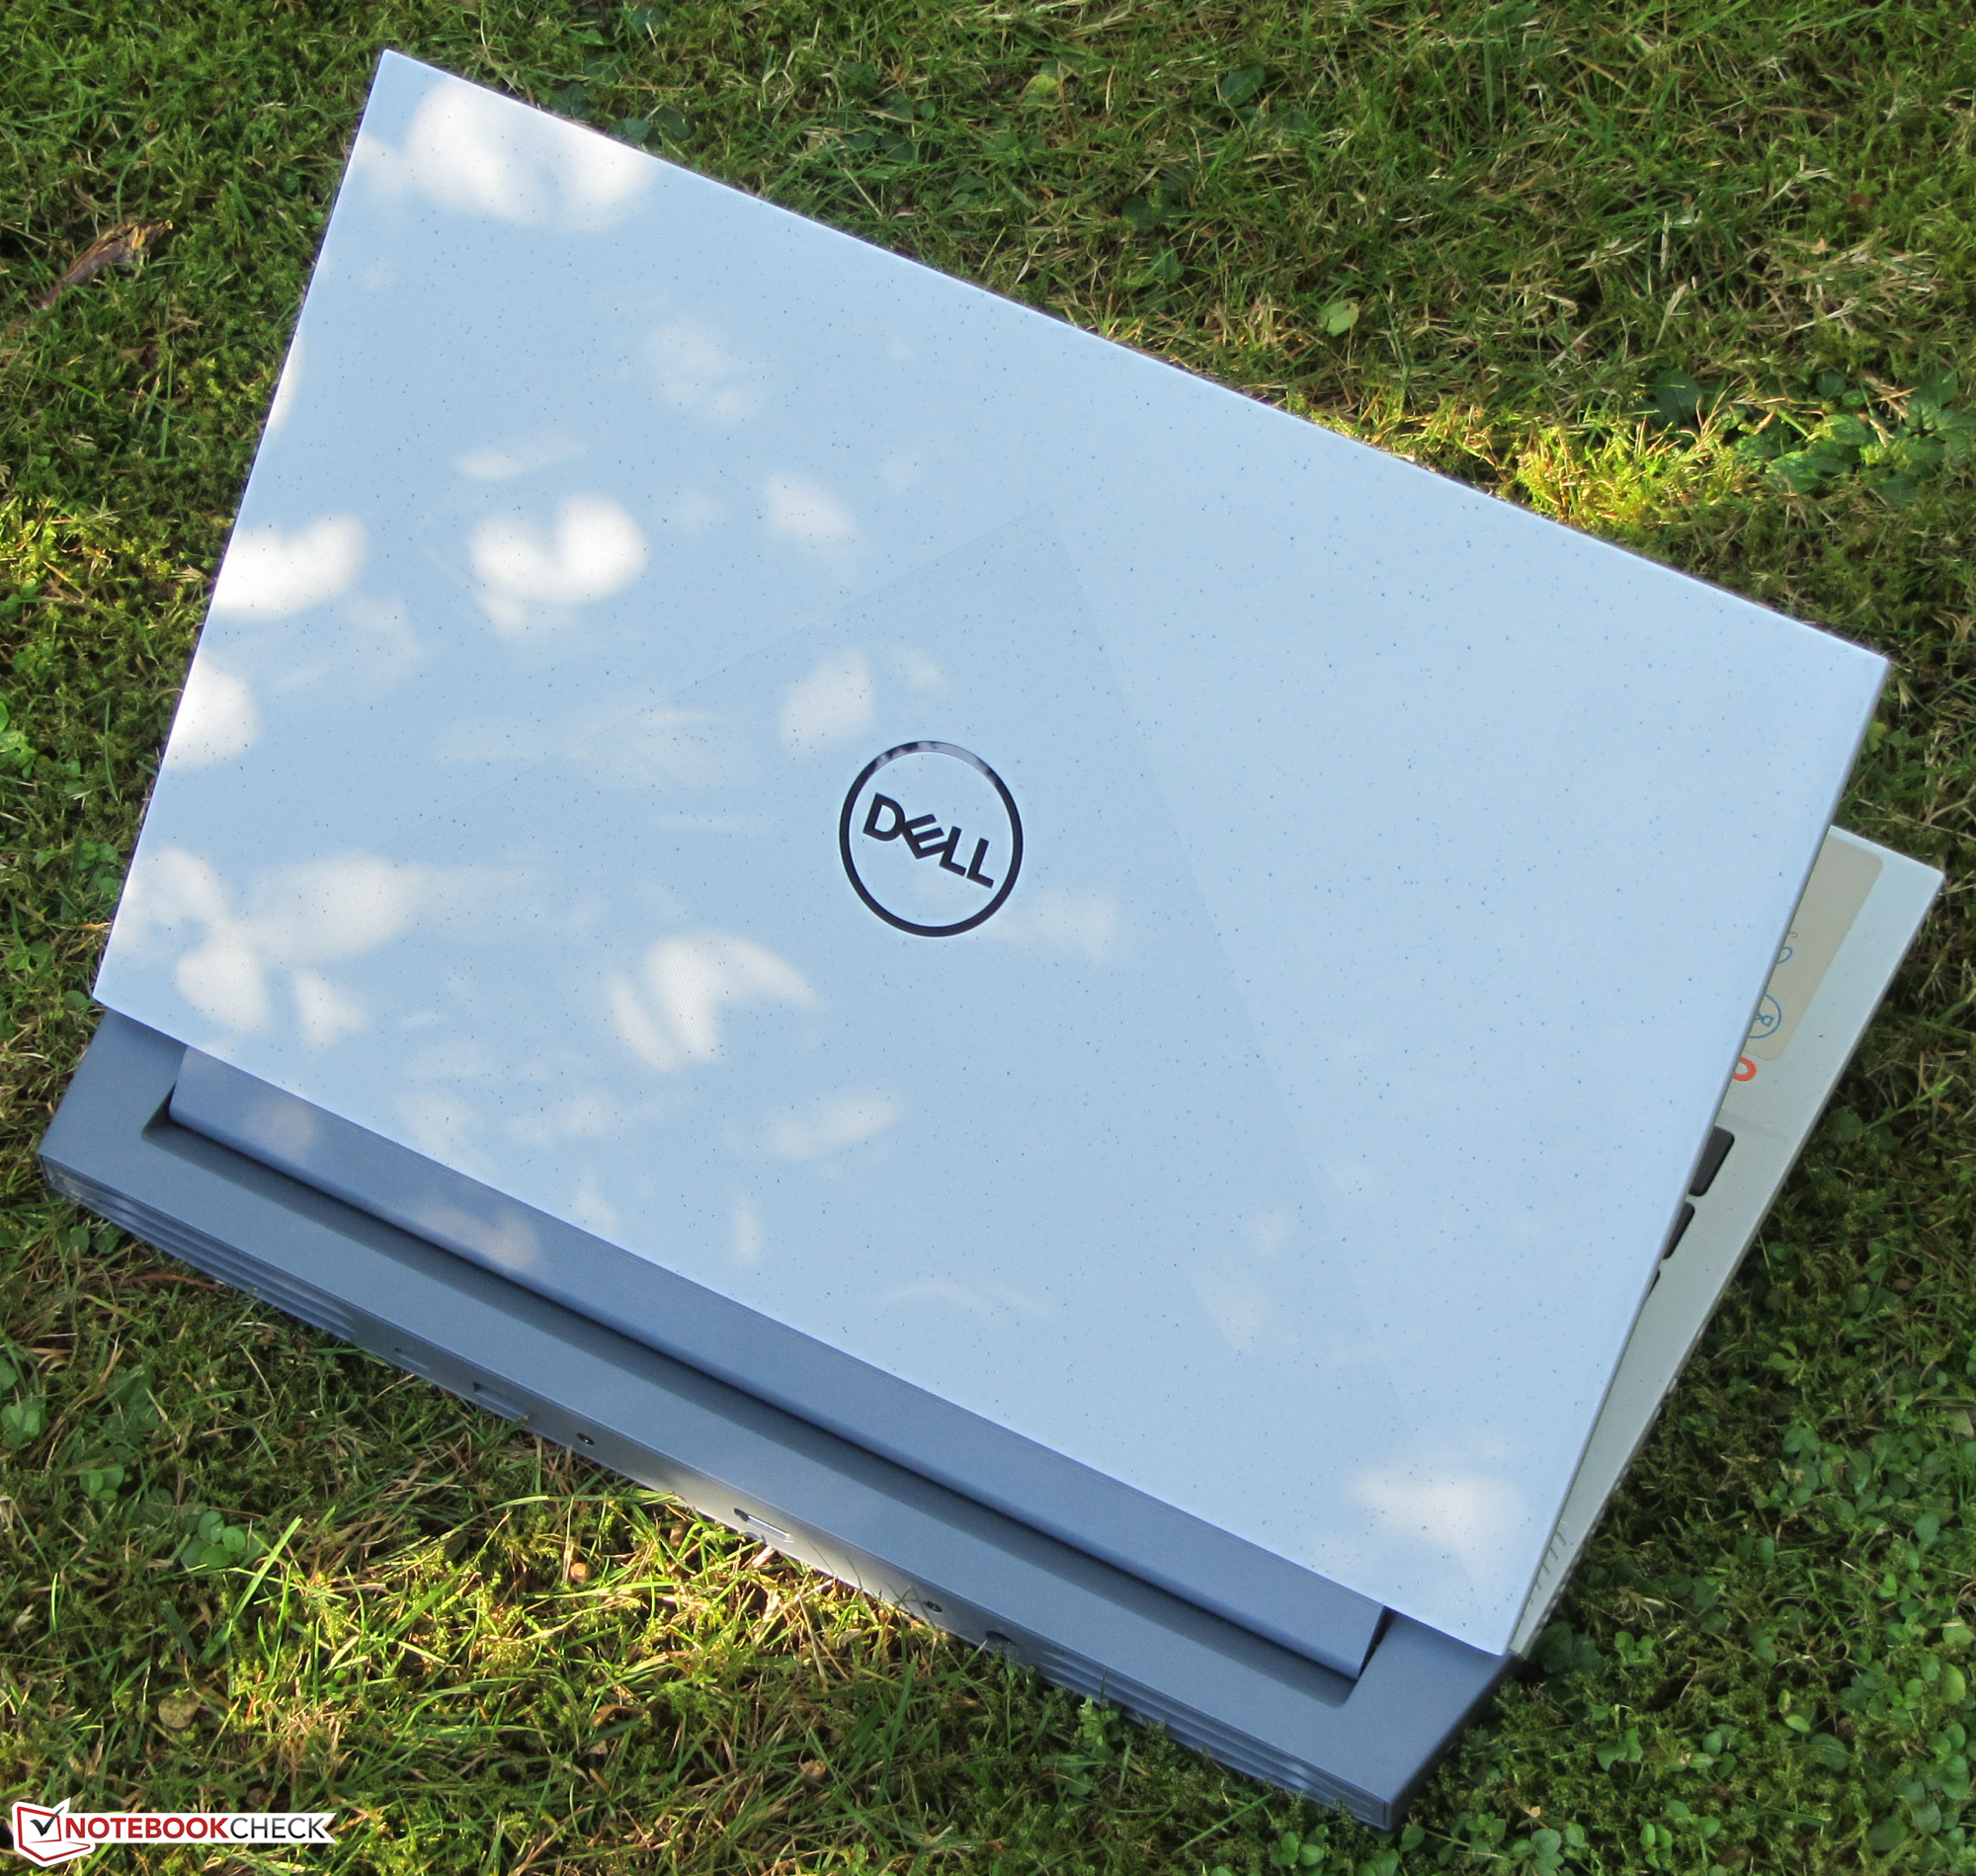
The footprint of the G15 is the largest in our comparison field and the laptop is also one of the heavier devices. The Schenker XMG Focus 15 turns out significantly more compact and brings 500 grams (~17.6 oz) less weight to the scale.
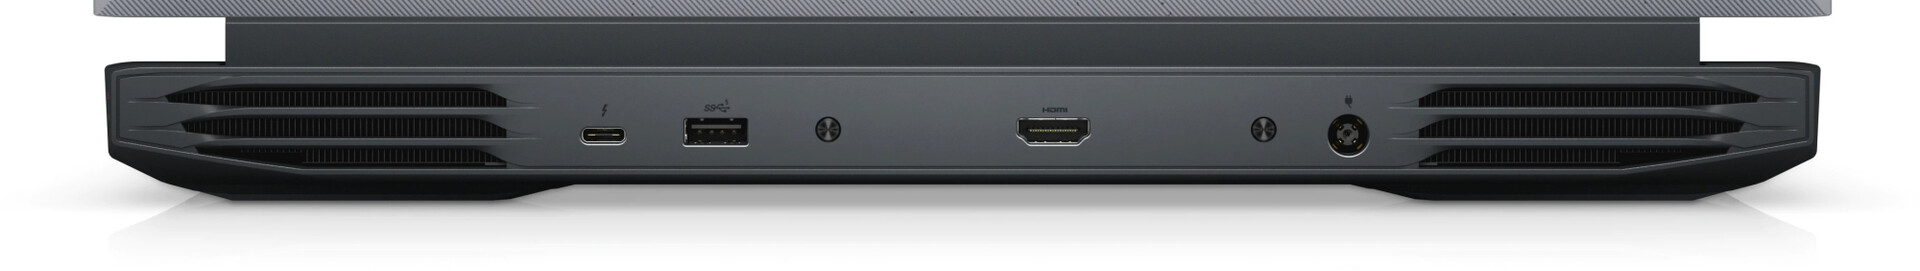
Equipment - The Dell G15 does not offer Thunderbolt
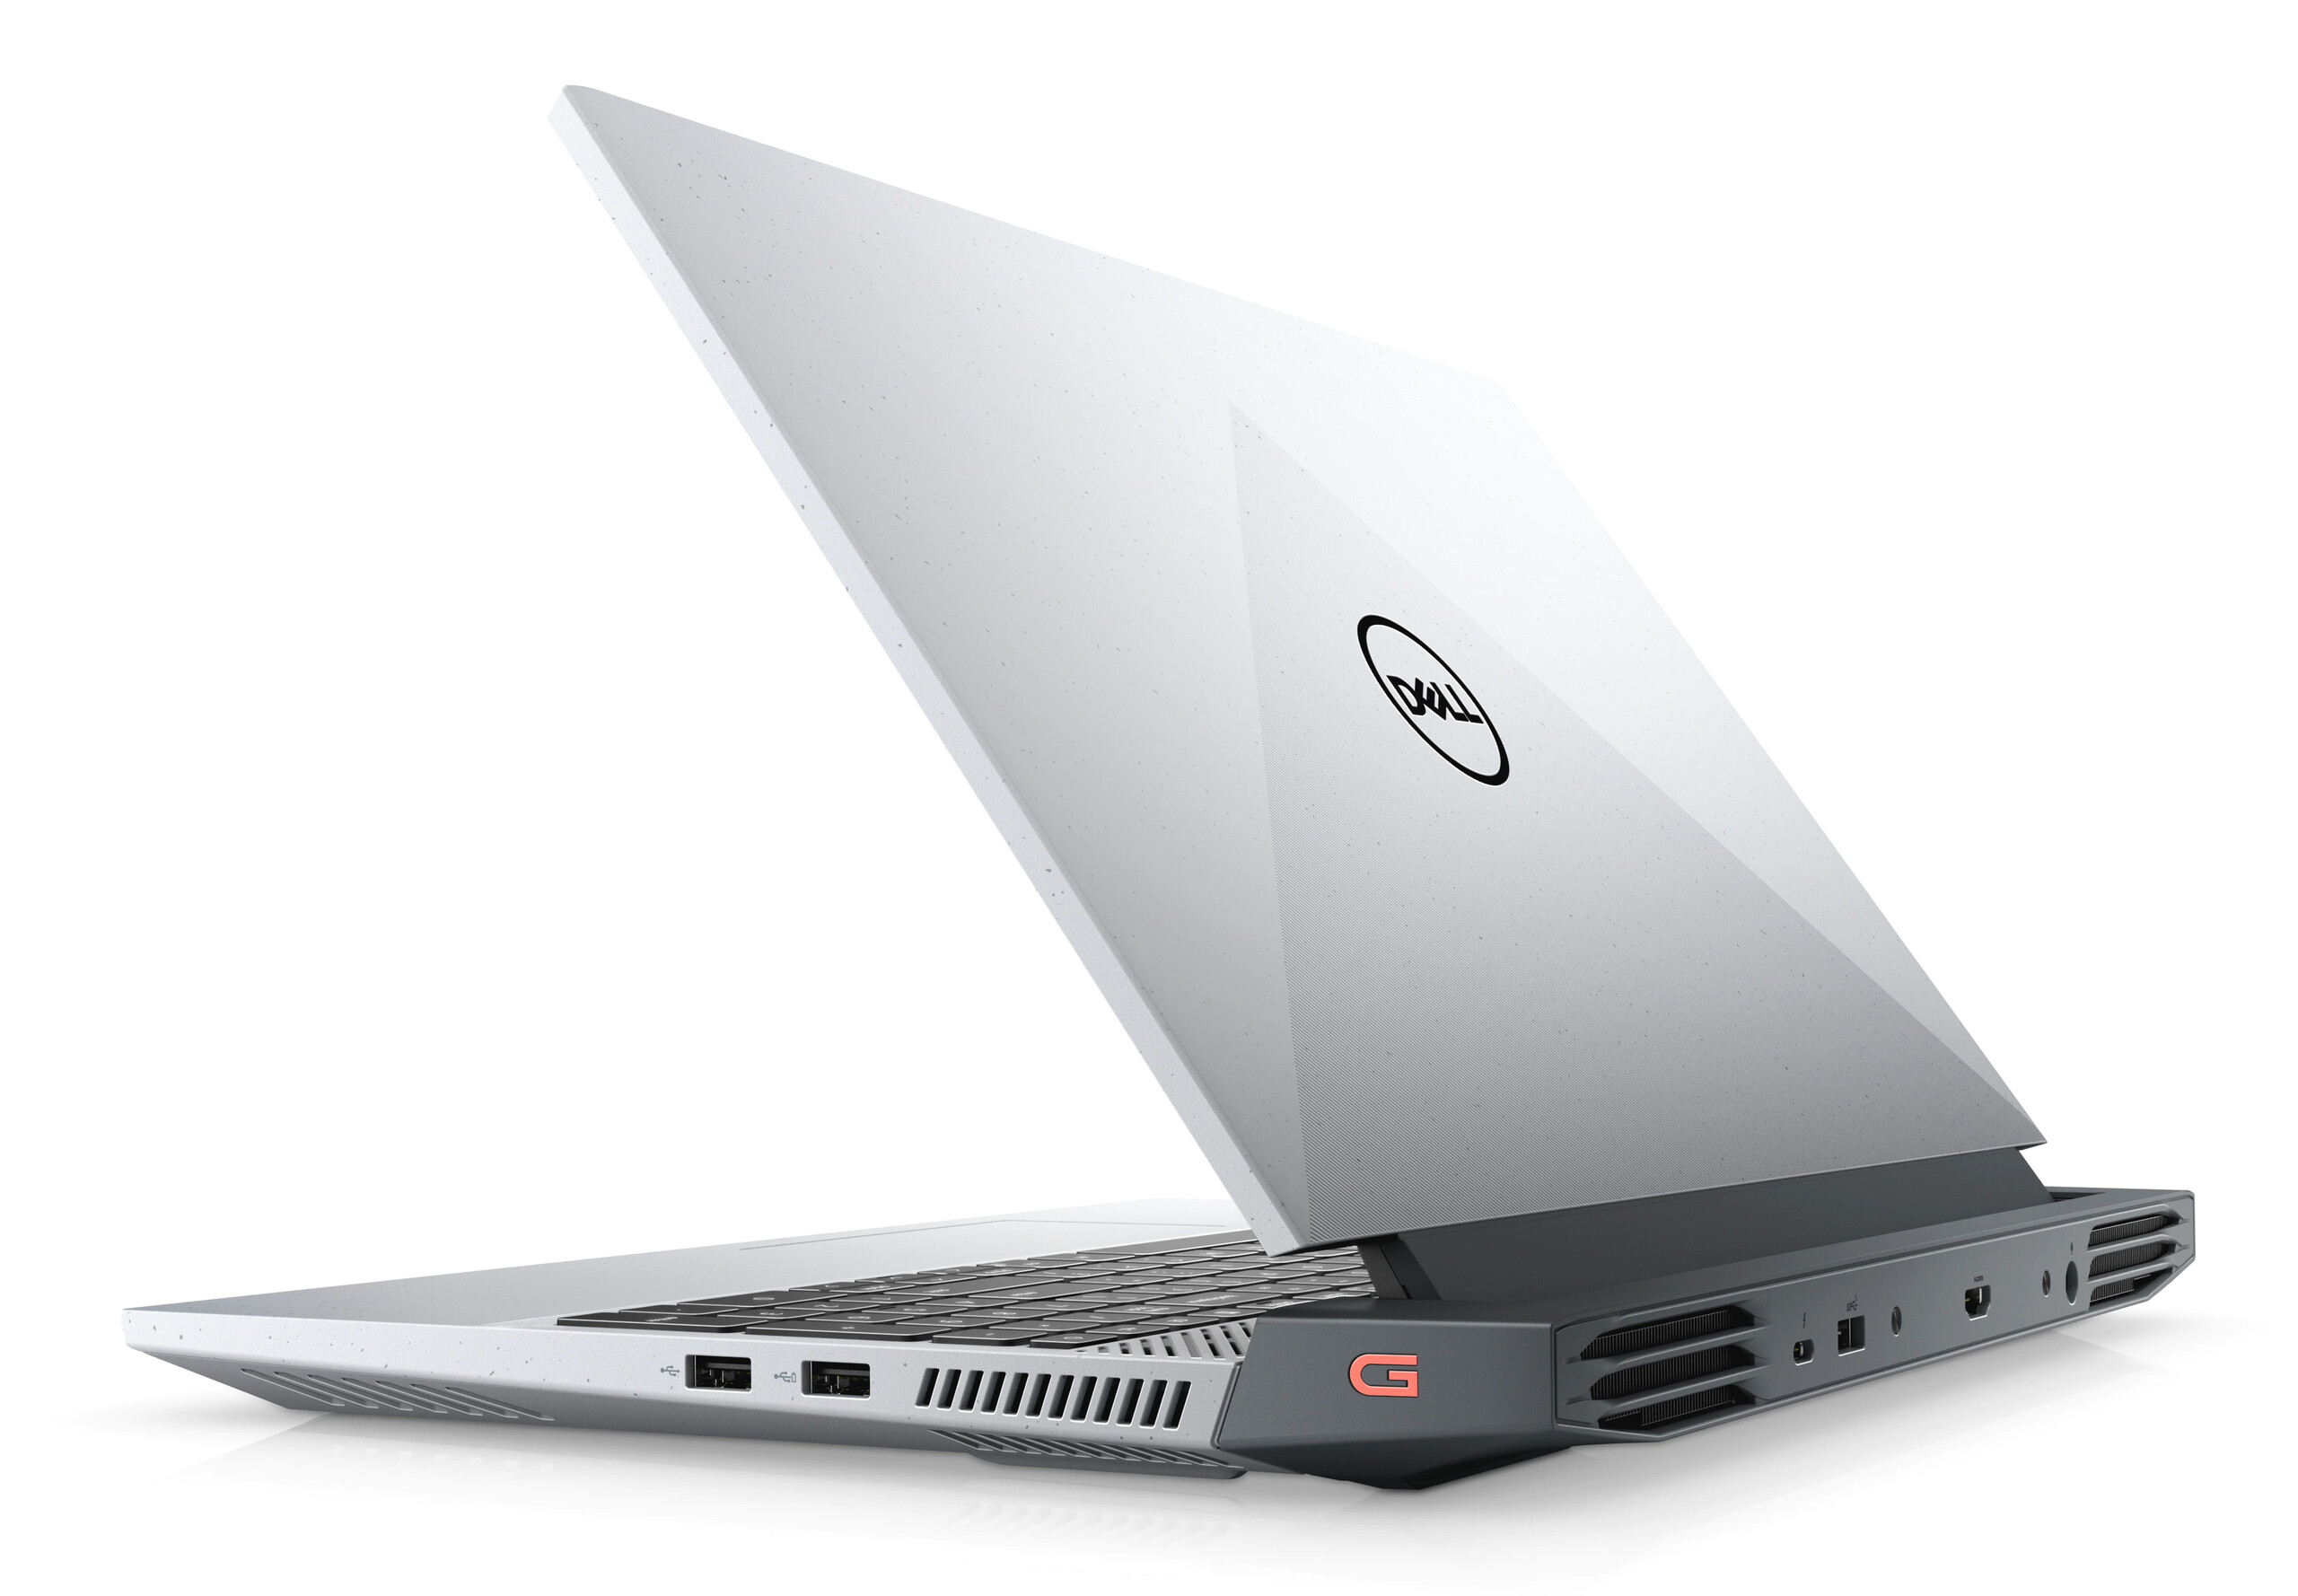
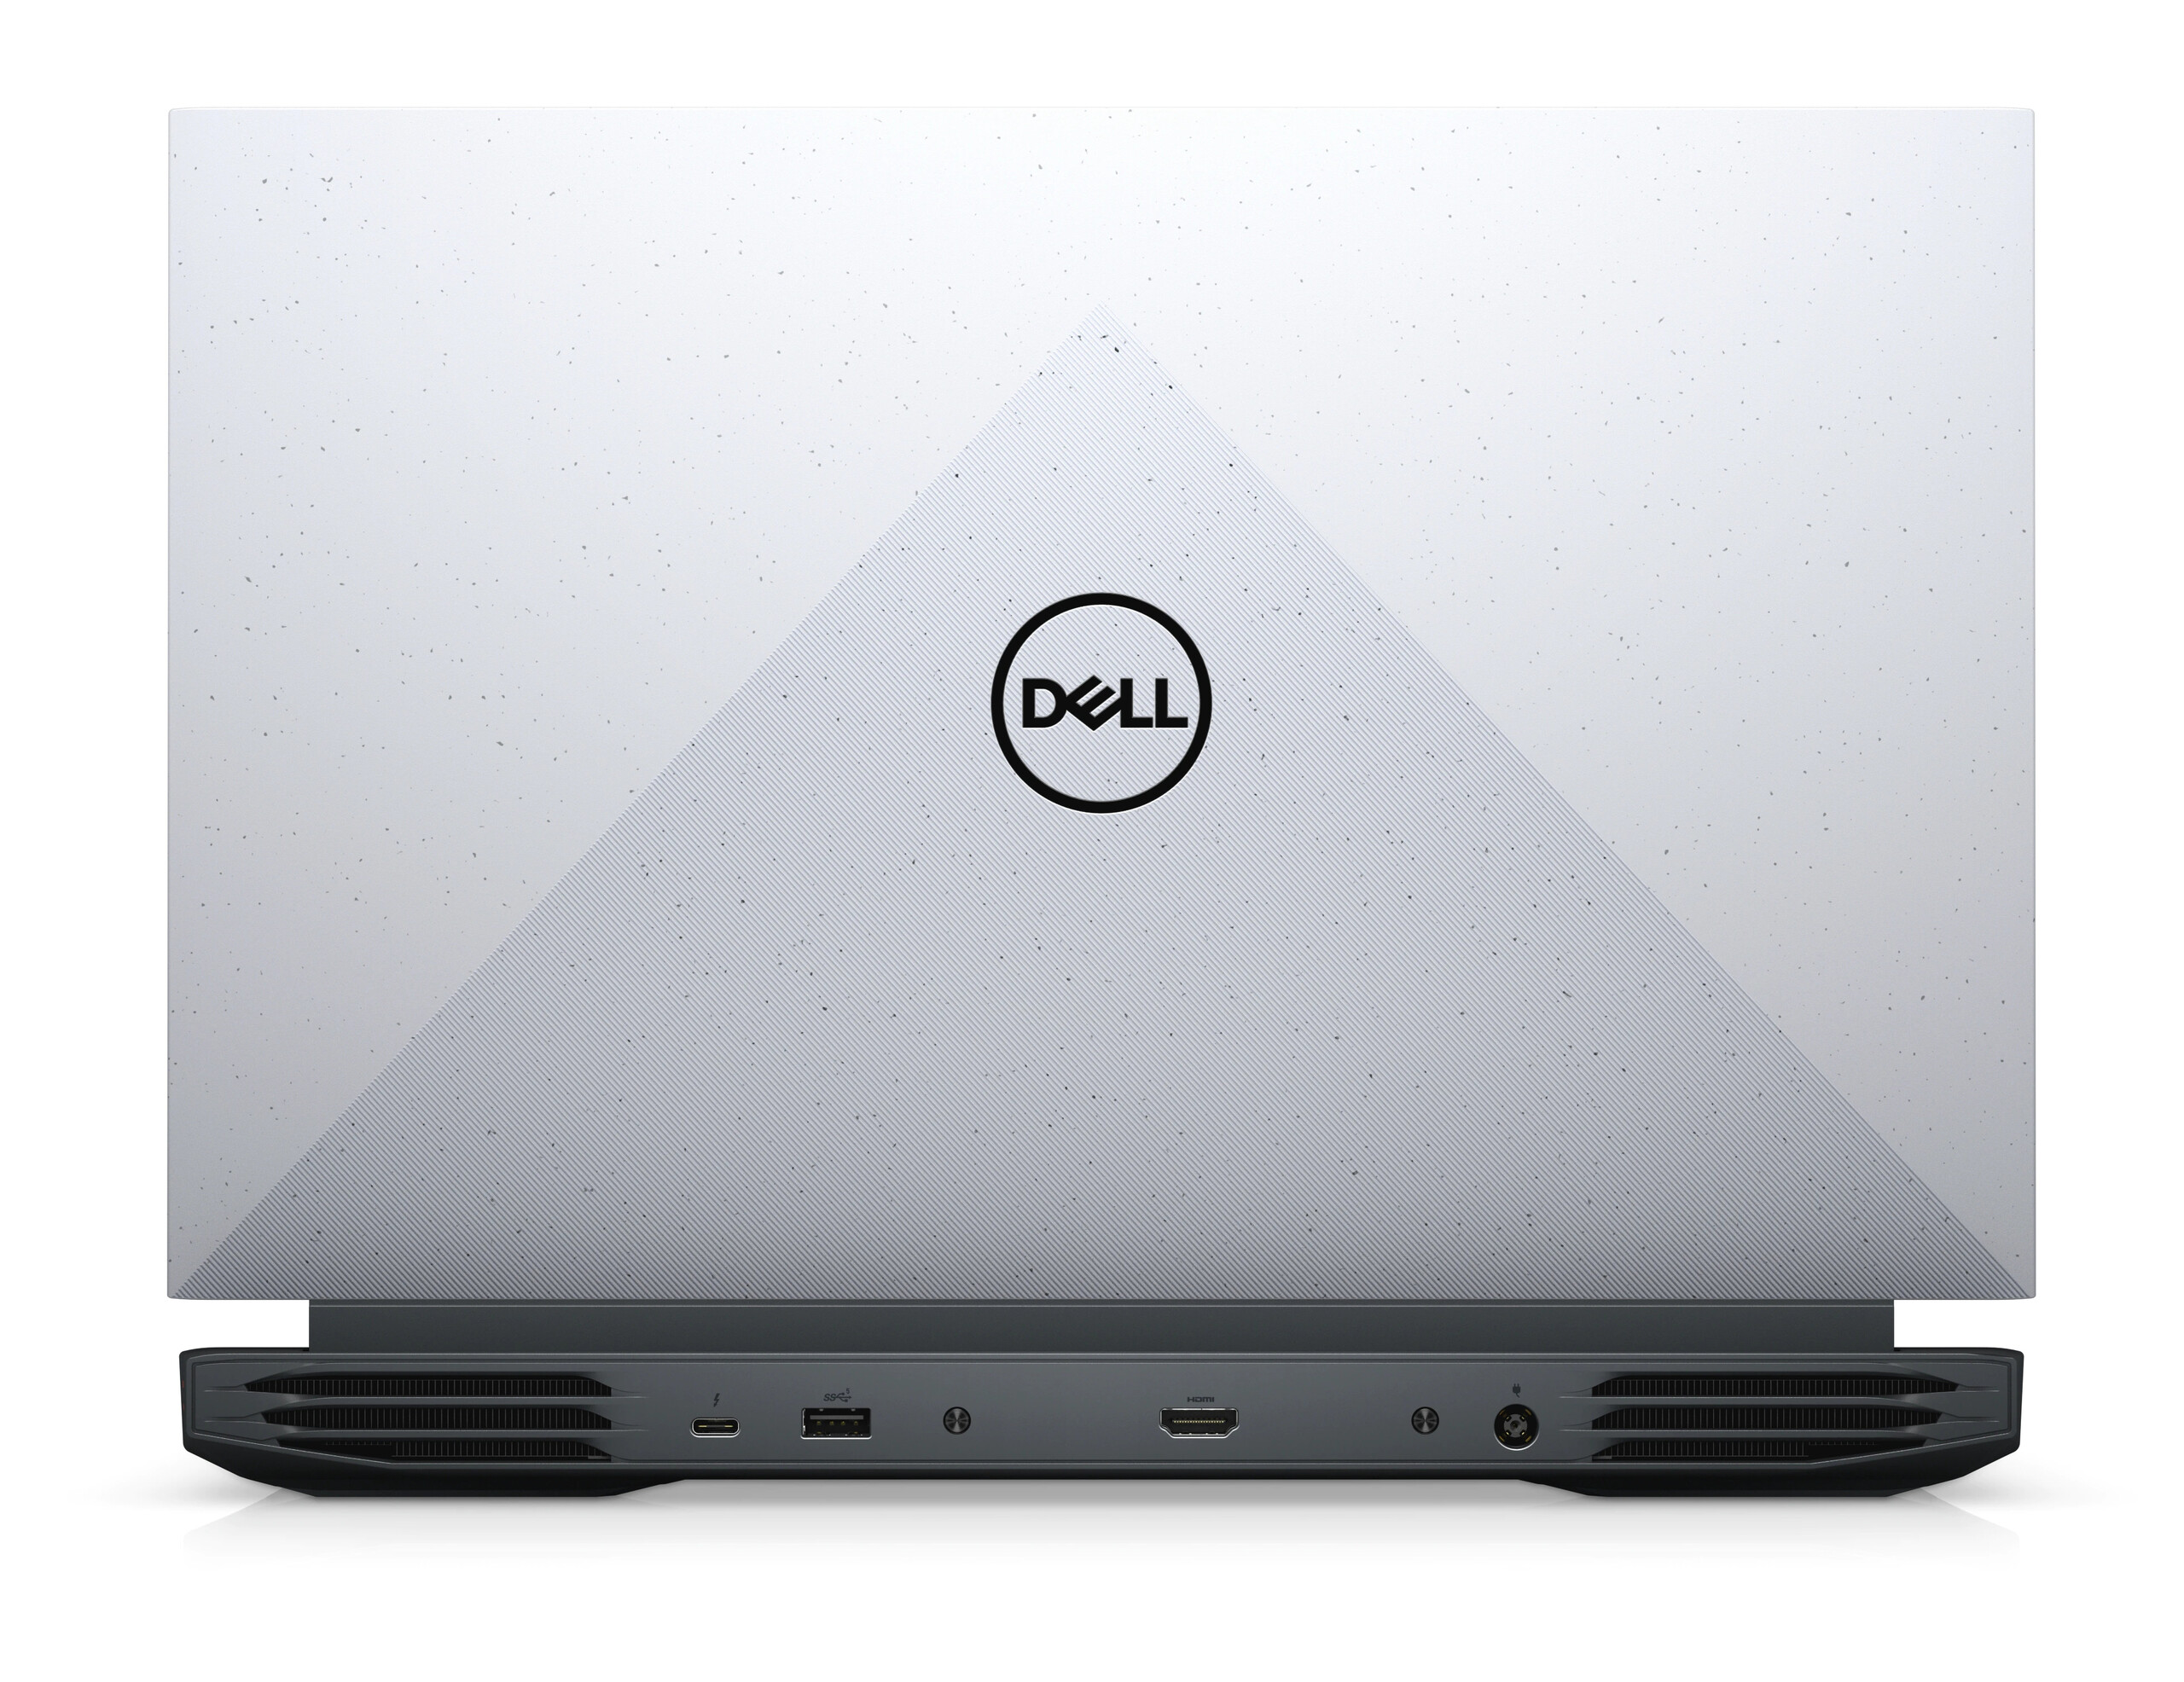
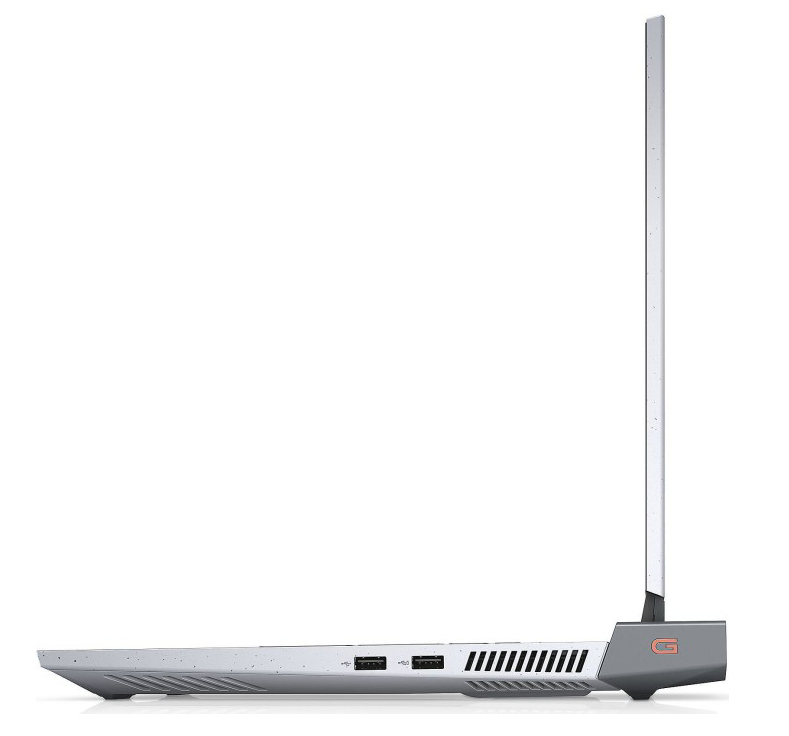
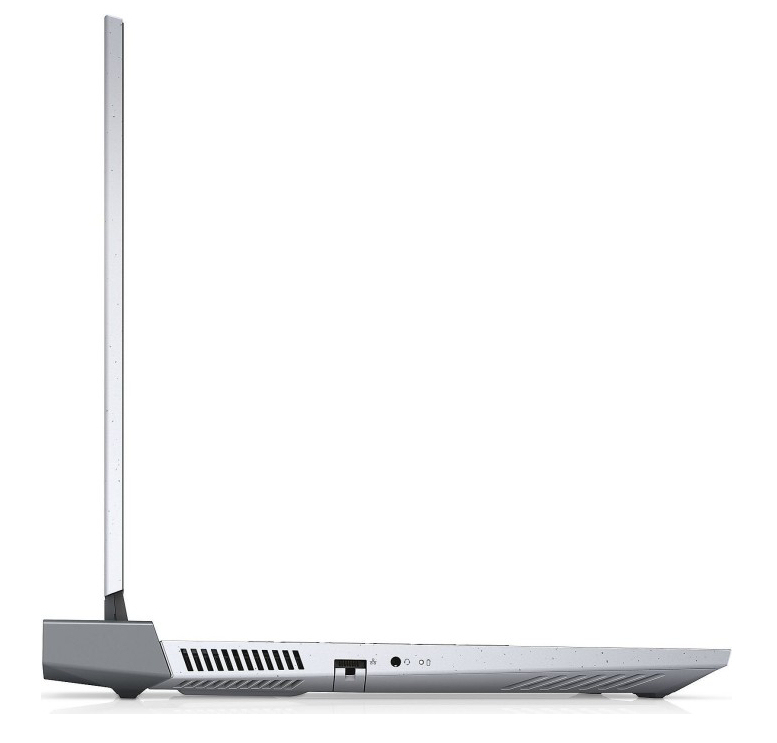
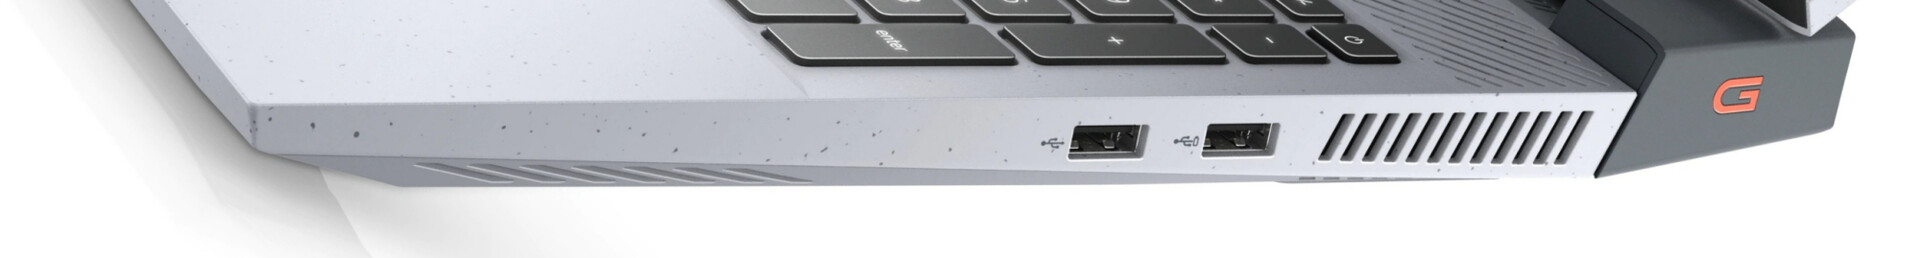
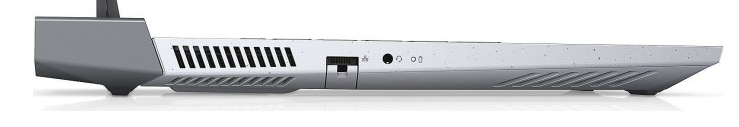
The G15 offers three USB-A connections (2x USB 2.0, 1x USB 3.2 Gen 1; models with the RTX 3060 GPU: 3x USB 3.2 Gen 1) and a single USB-C connection (USB 3.2 Gen 2), which supports DisplayPort via USB-C. So together with the HDMI connection, there are two video outputs. You will look for a storage card reader in vain.
The connections are distributed over three sides of the laptop. Since the video connections and the power port are positioned in the back, the corresponding cables will run towards the back and not be in the way.
Communication
The Killer WLAN module contains an Intel chip (AX200) and supports the 802.11a/b/g/n/ac/ax standards. The transfer rates determined under optimal conditions (no other WLAN devices in close proximity and close distance between the laptop and server PC) turn out very good. Wired network connections are handled by Realtek's RTL8125 Gigabit Ethernet controller, which completes its tasks without any problems.
Webcam
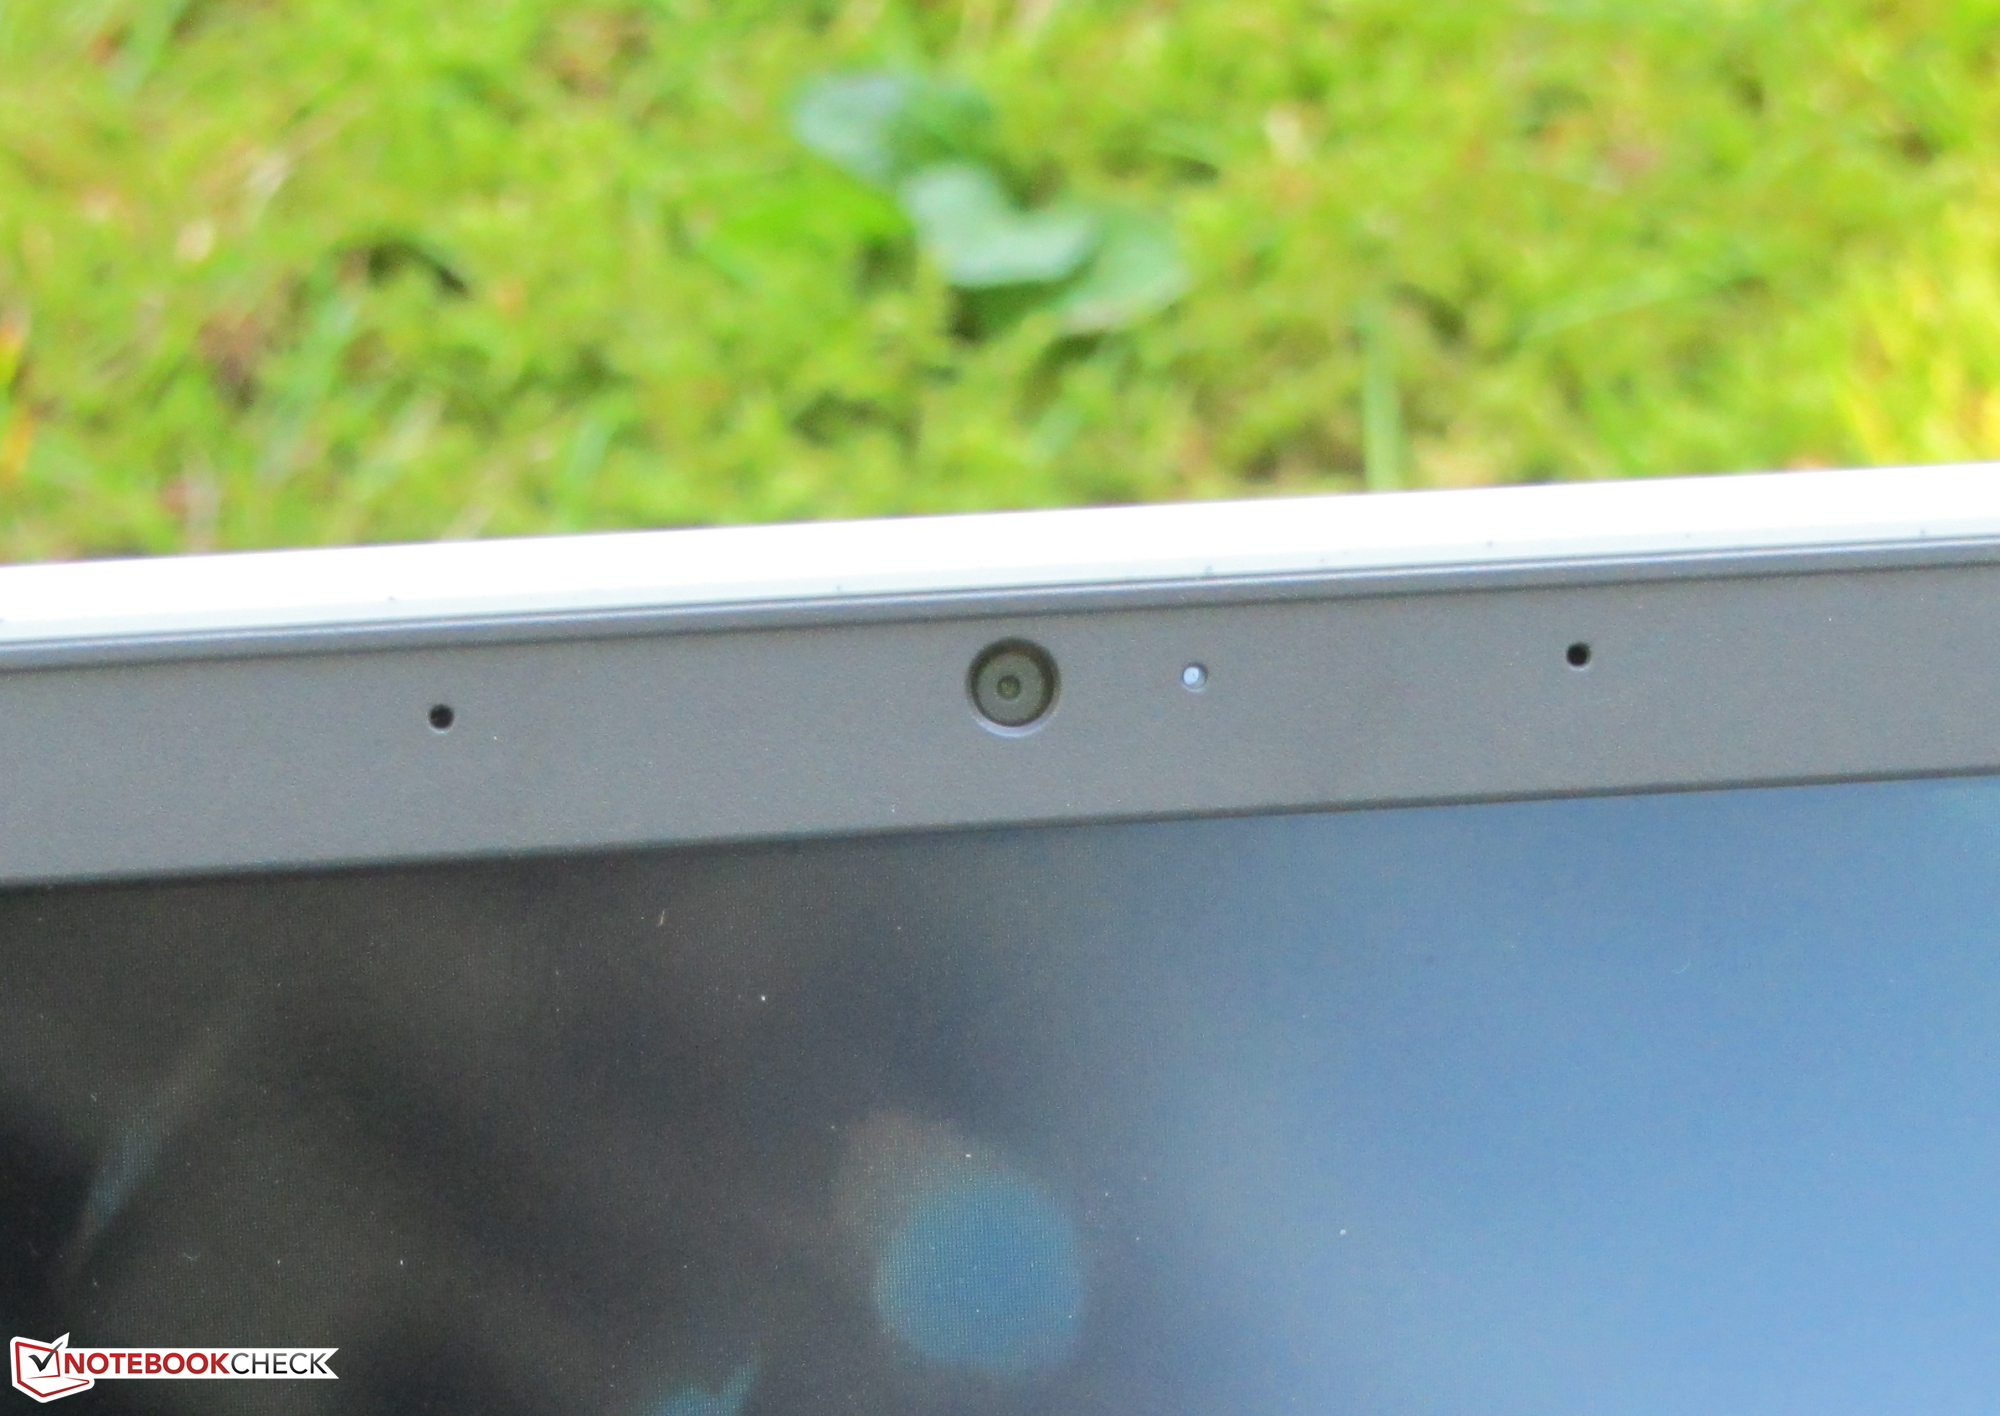
The 0.9-MP webcam creates images with a resolution of 1280 x 720 pixels. The color accuracy is lacking, and colors deviate significantly from the target.


Accessories
The laptop includes the usual documentation: a quick-start manual and warranty information.
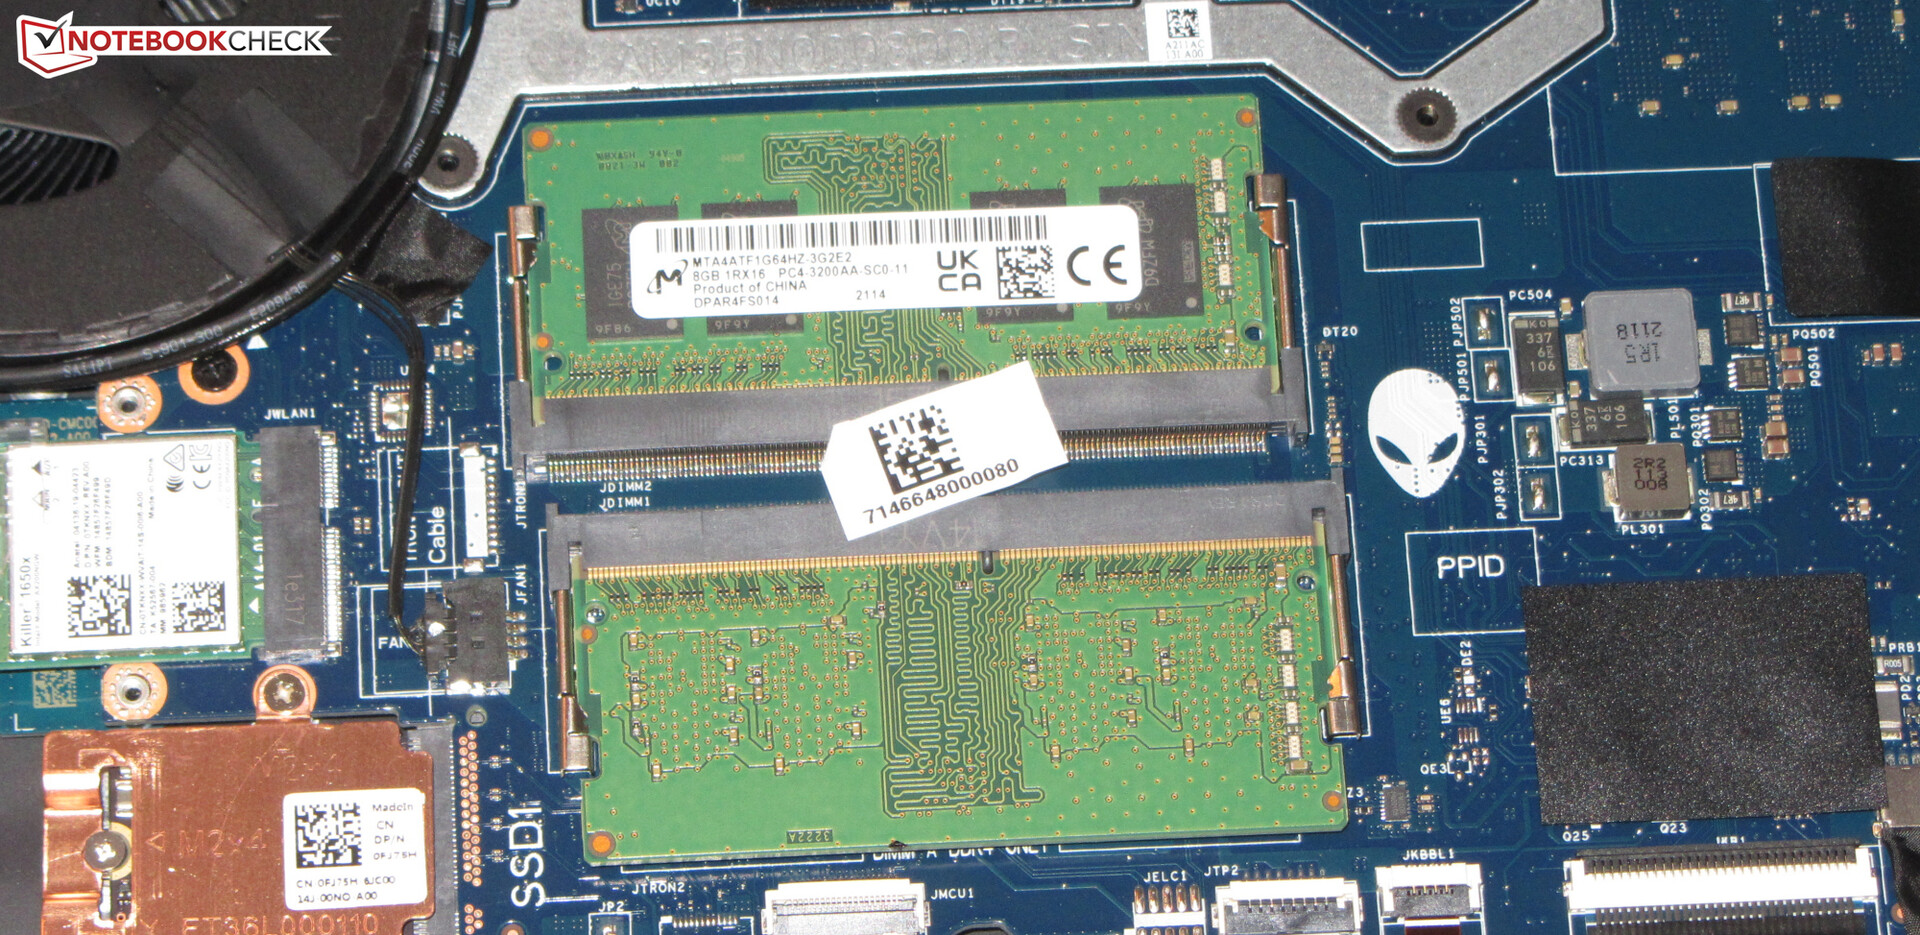
Maintenance
After you have removed all the screws from the case bottom, you can loosen it with the help of a prying tool, but some sections are fixed quite tightly. Removing the case bottom will provide access to the SSD, WLAN module, working memory, battery, and fans.
Warranty
Dell only offers a one-year warranty for the 15.6-inch laptop. To extend it to three-year premium support will cost about 150 Euros (~$174).
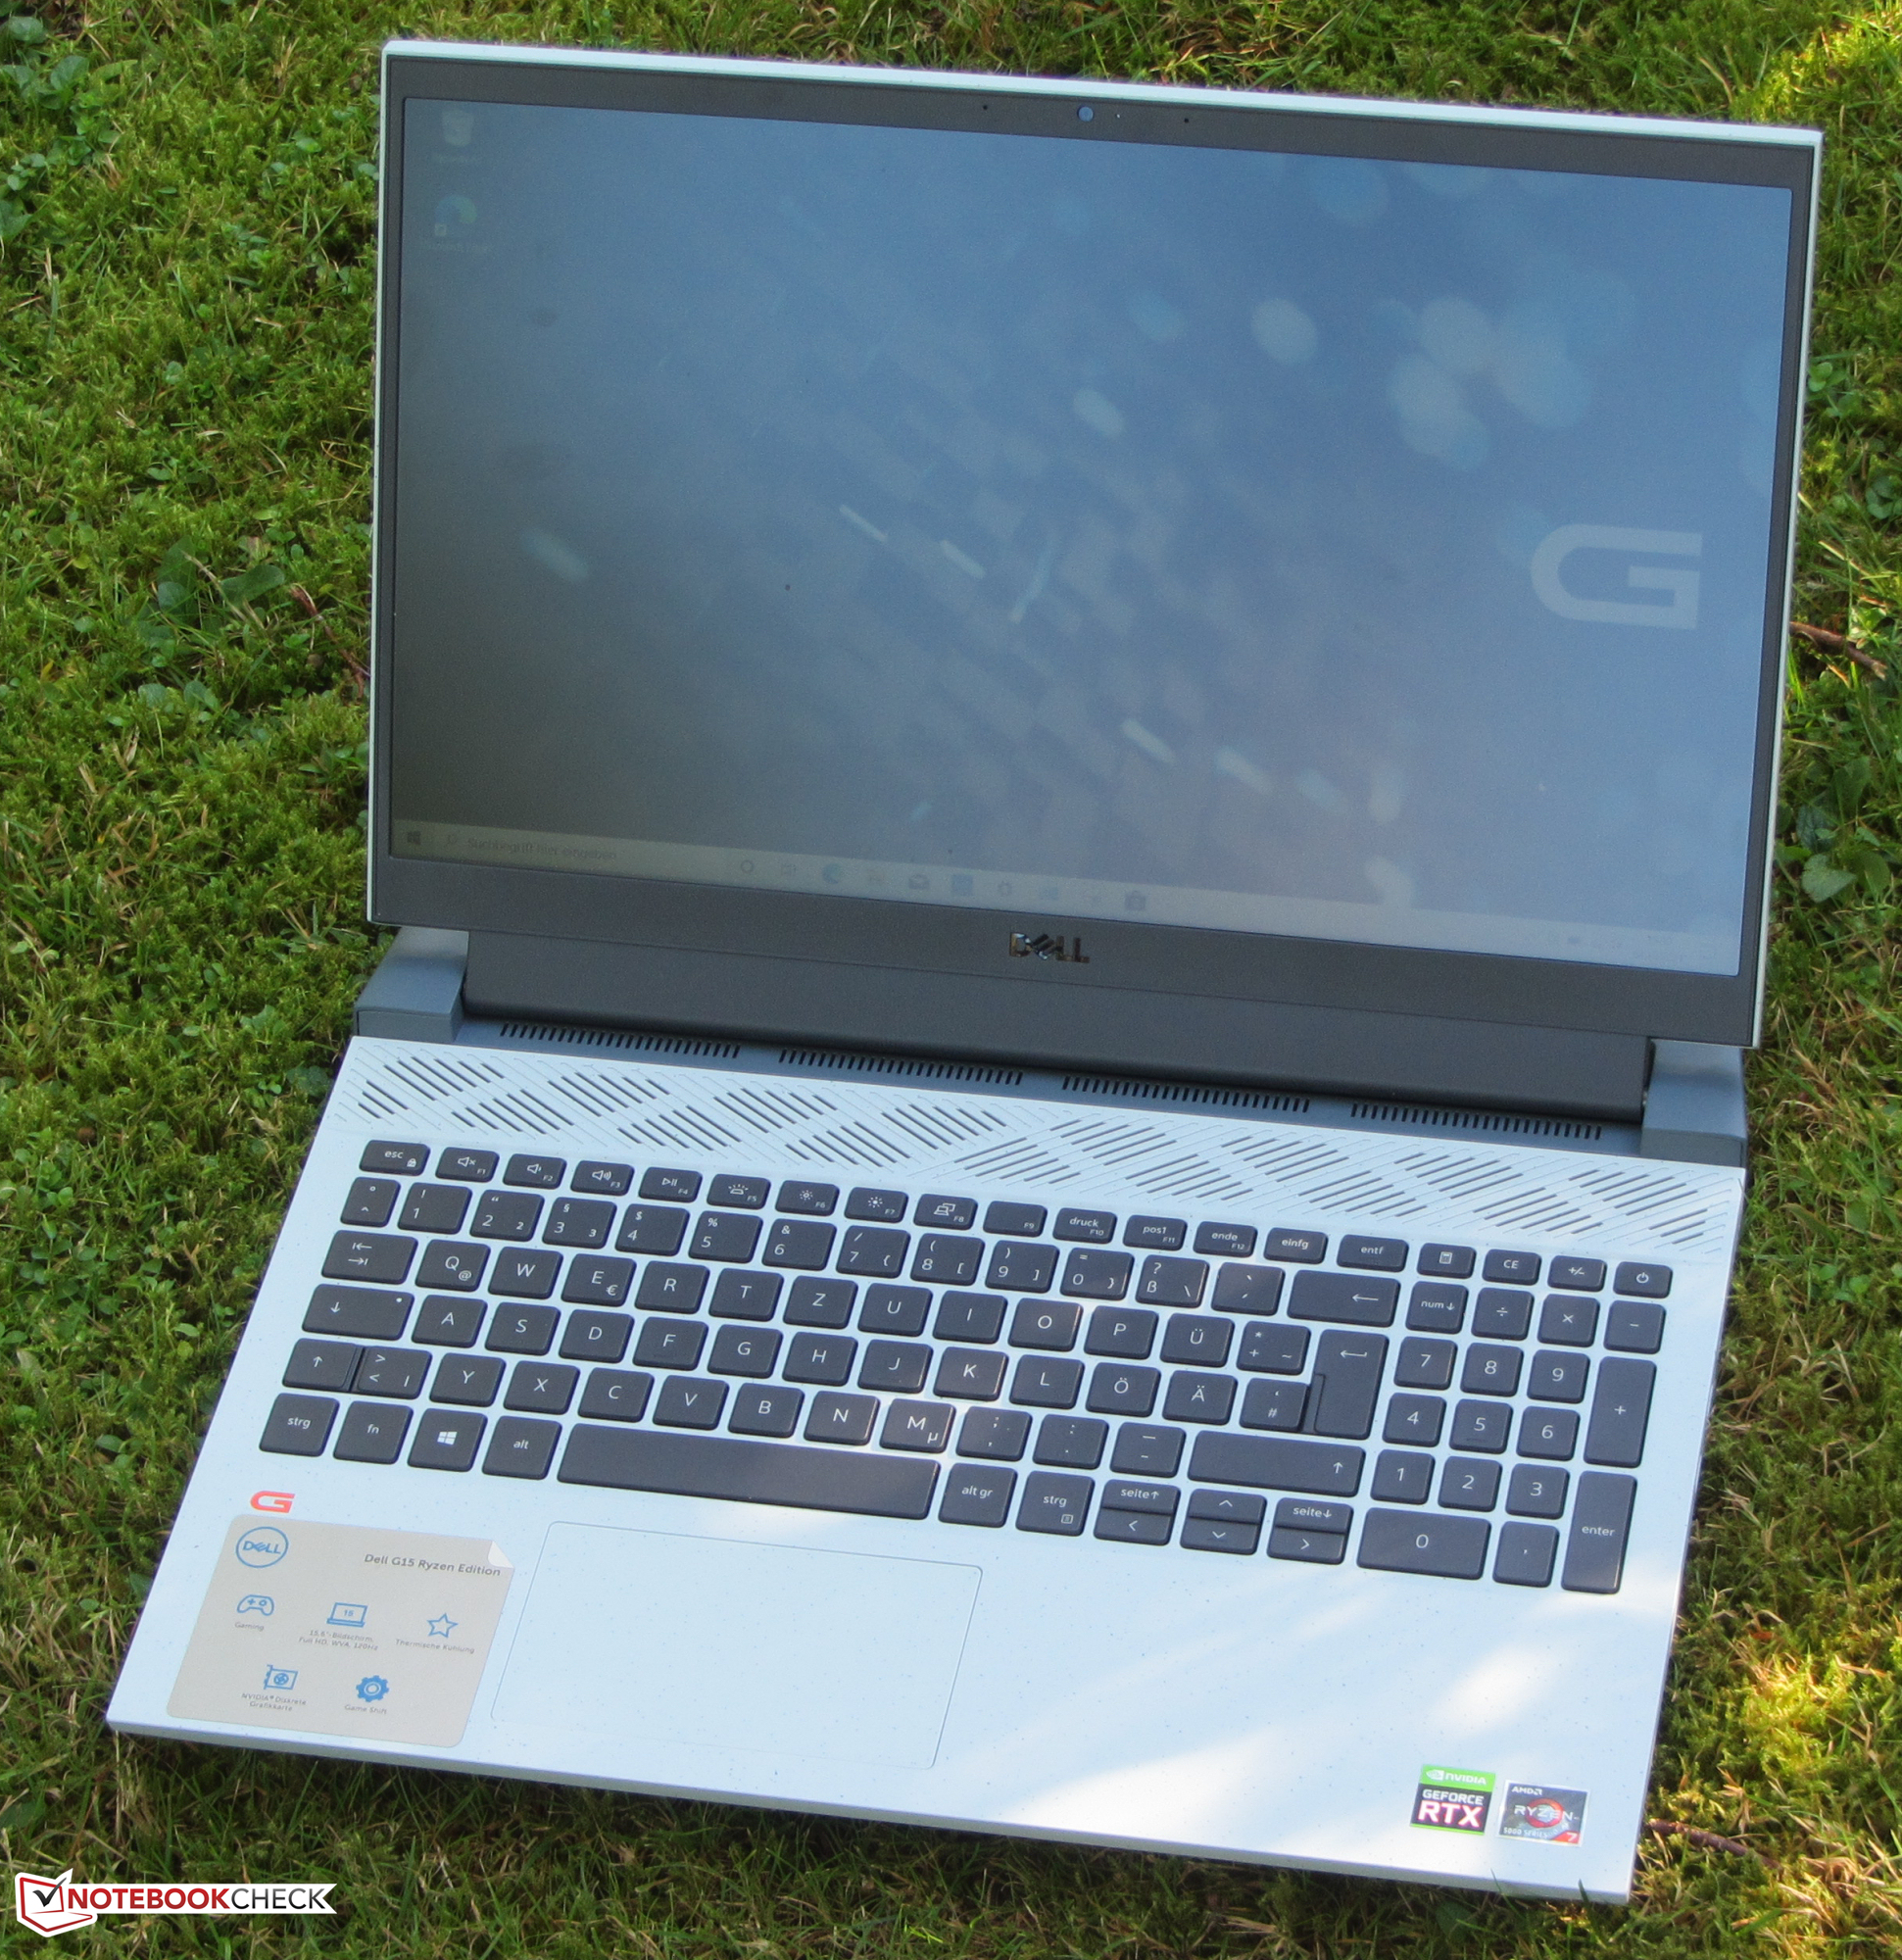
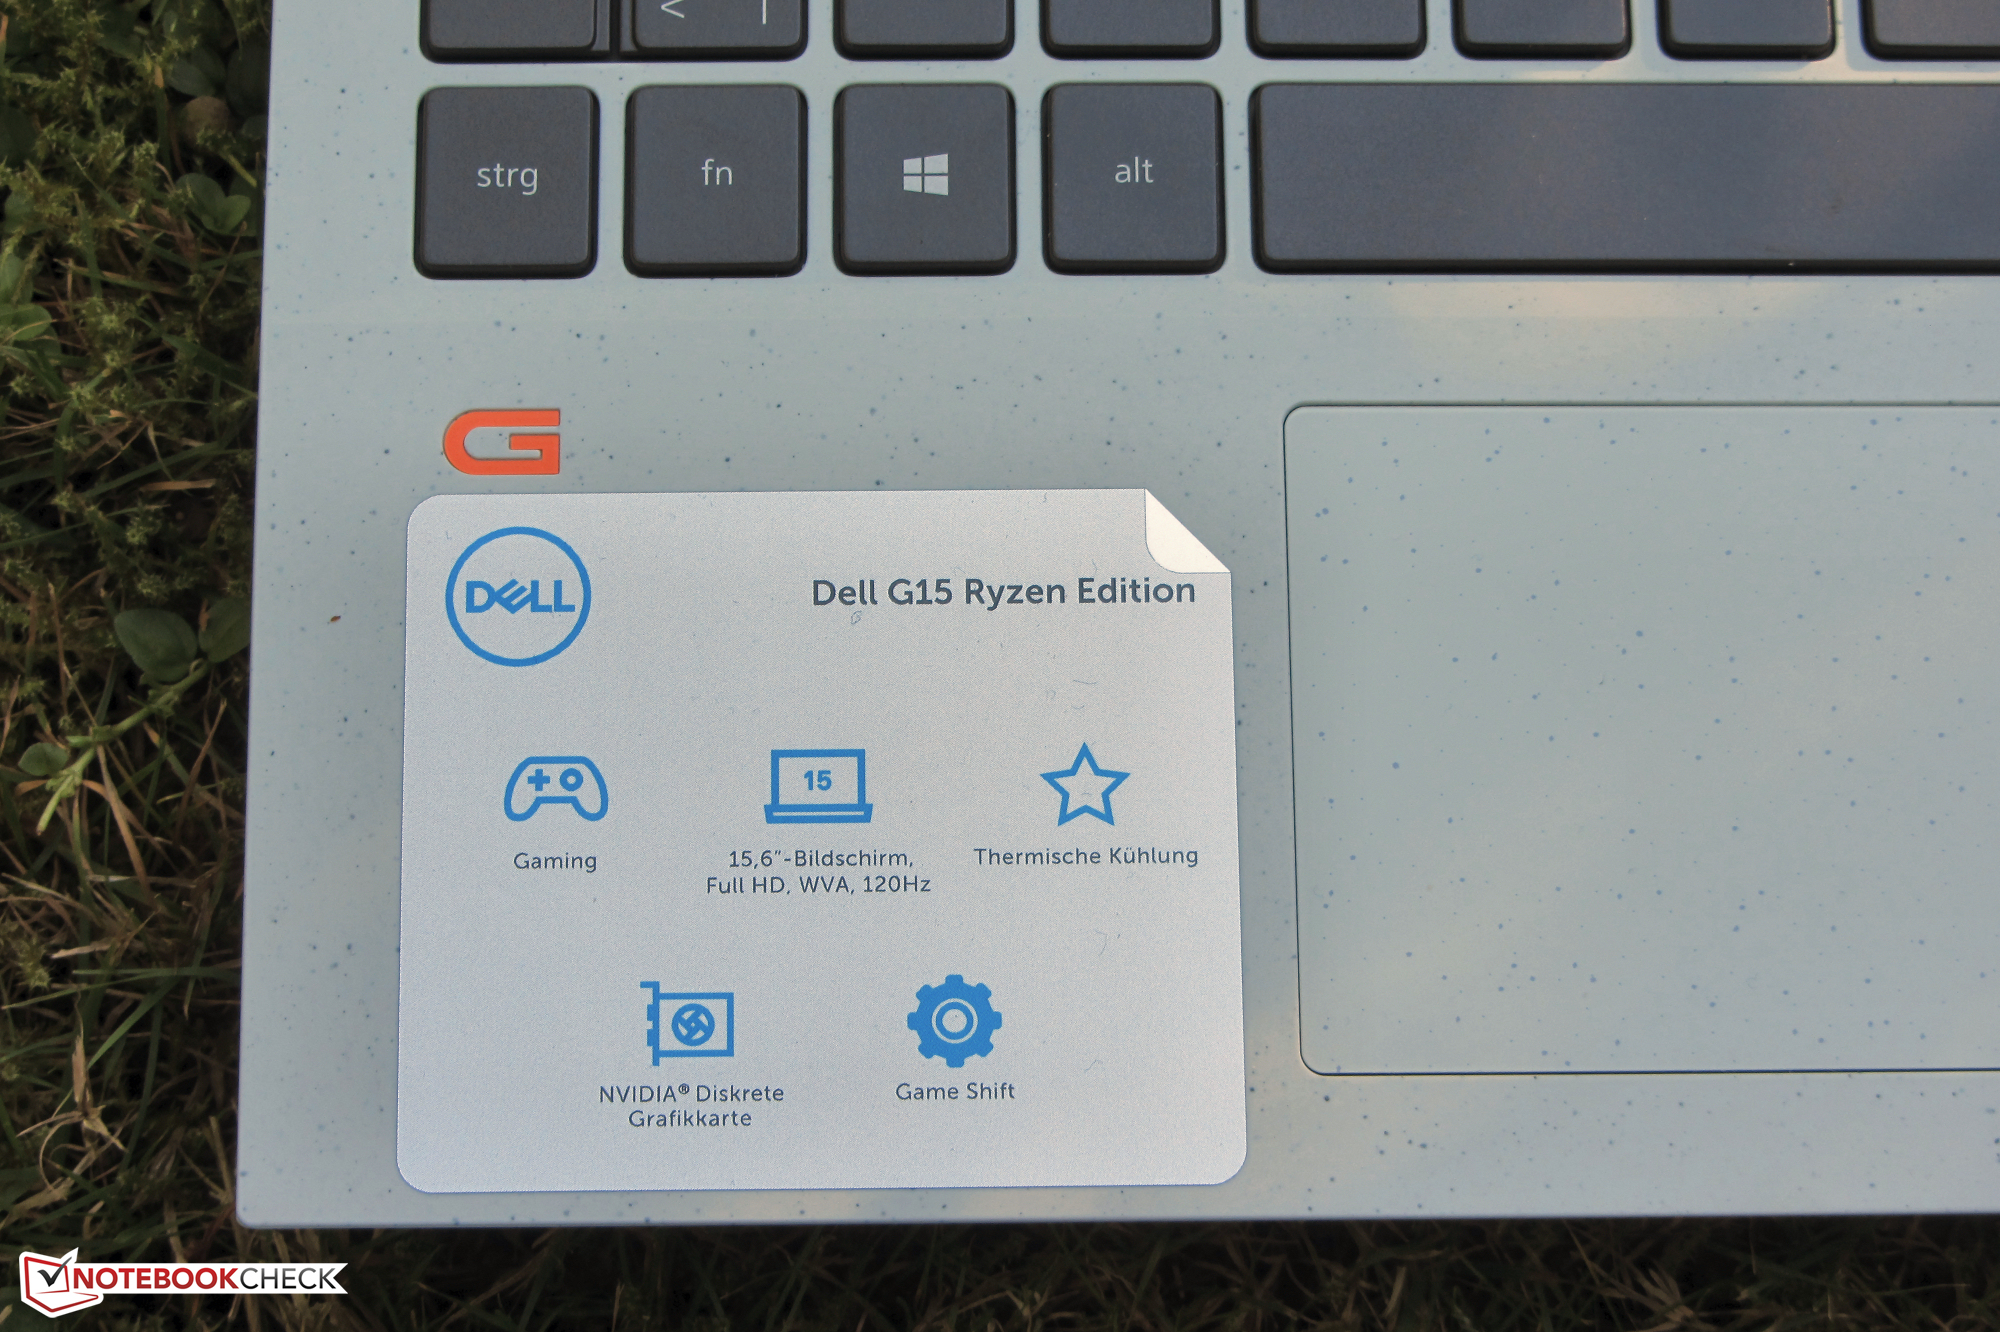
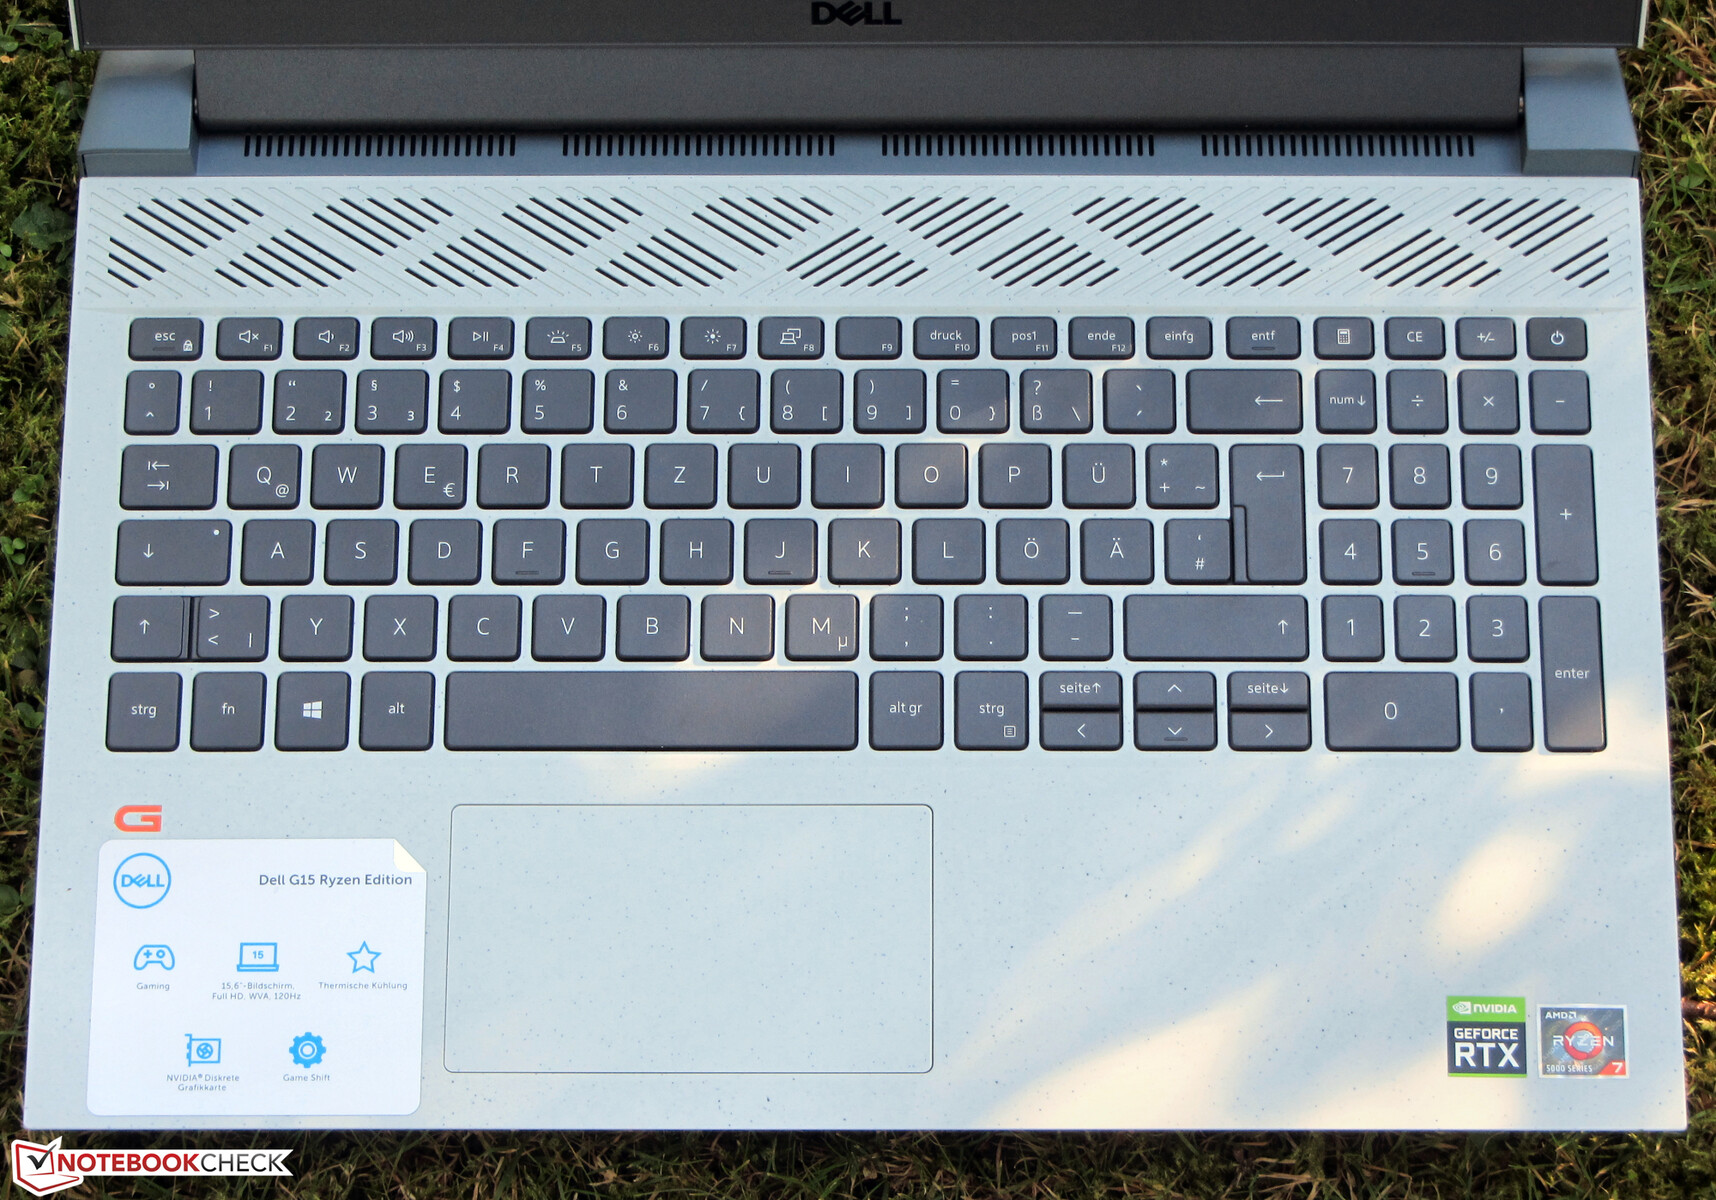
Input Devices - The Dell laptop includes keyboard illumination
Keyboard
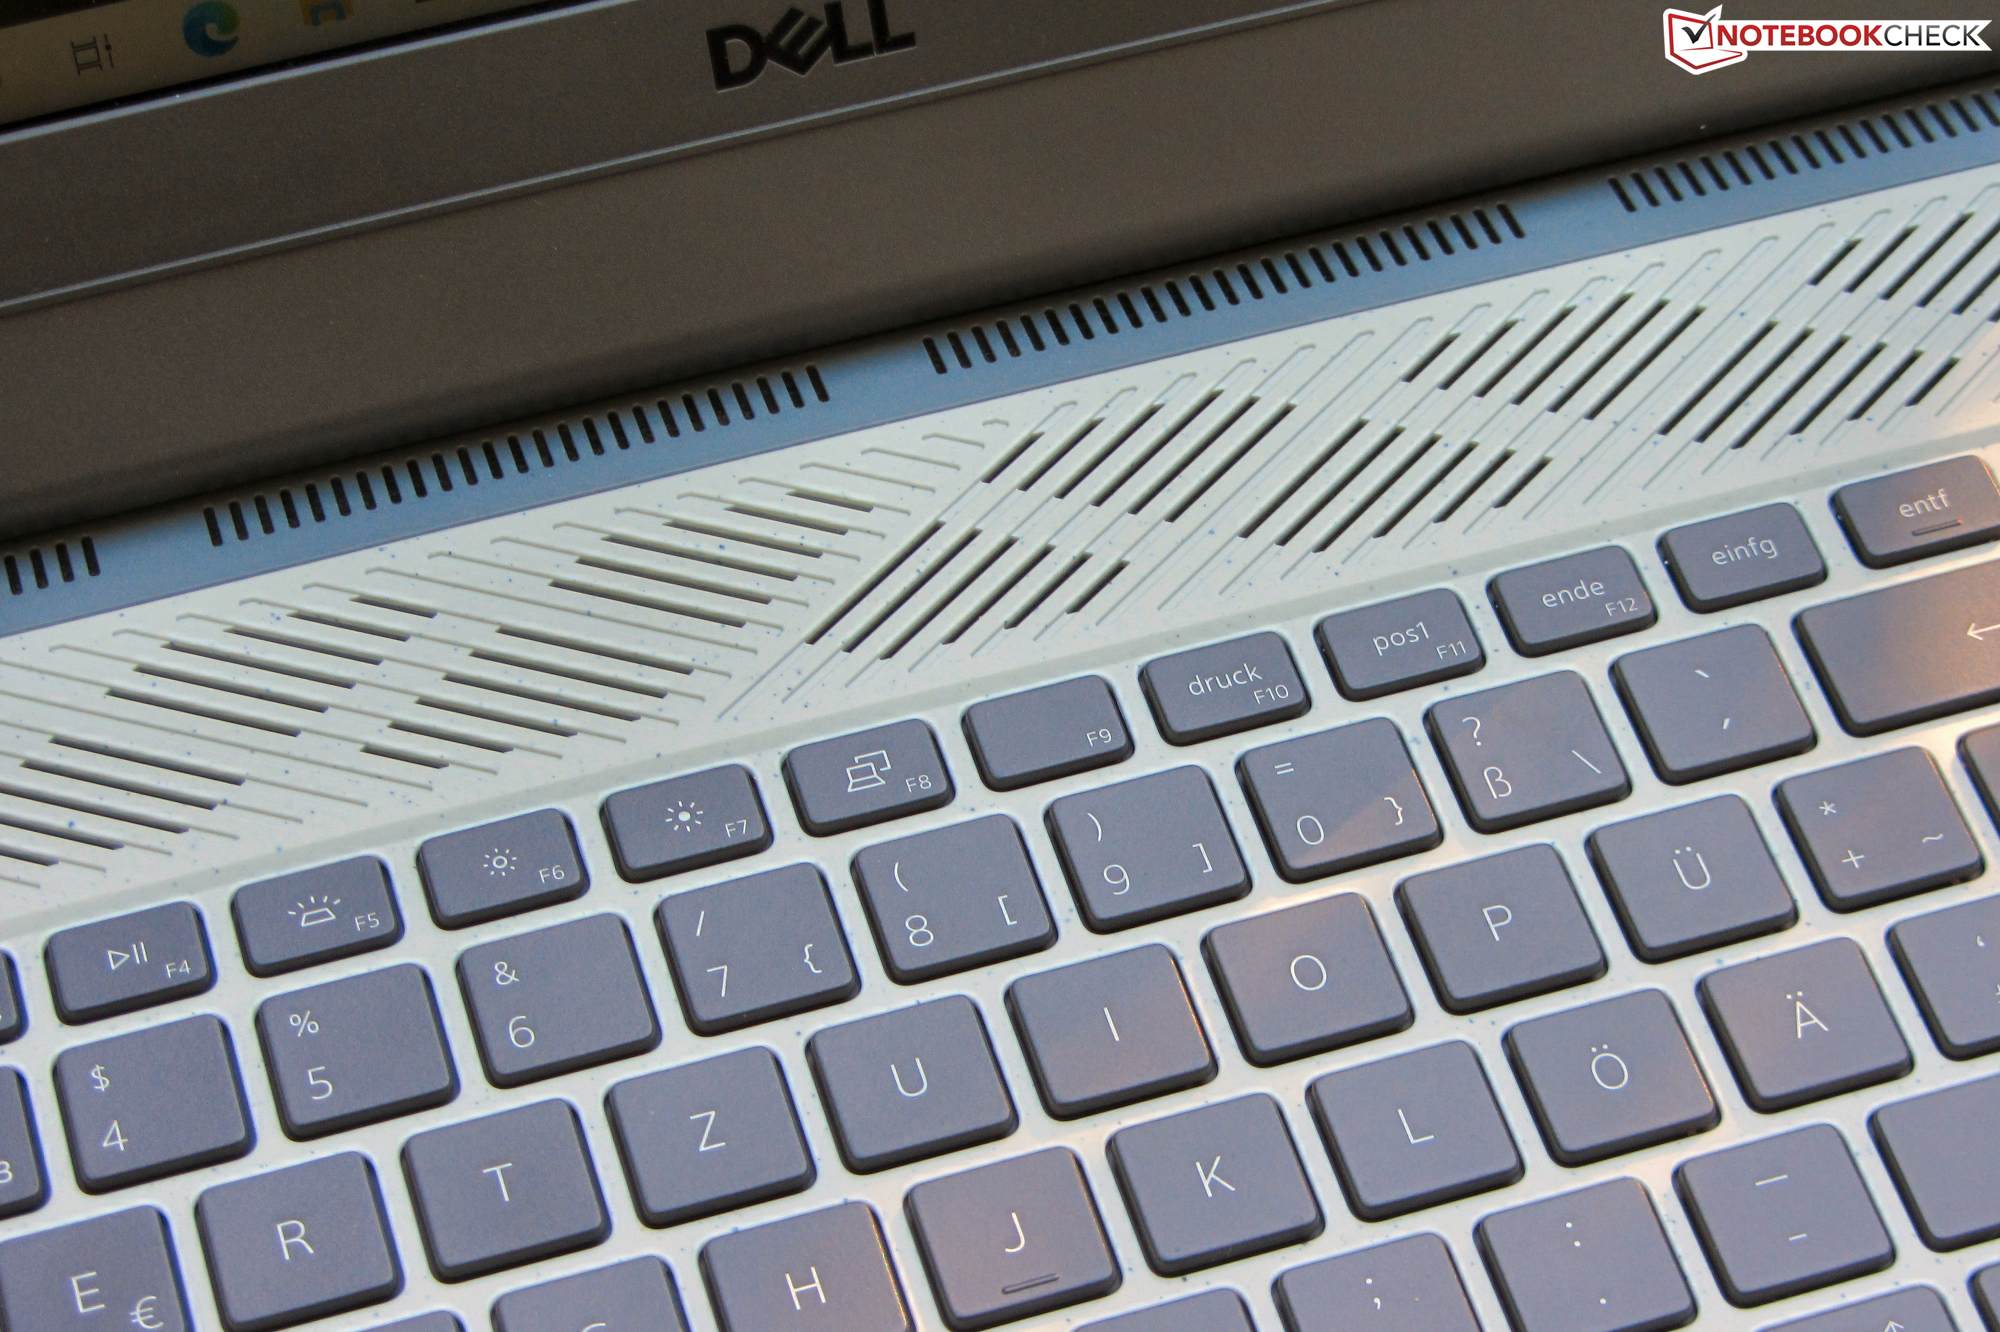
Dell has equipped the G15 with an illuminated chiclet keyboard including a number block. The flat keys offer a medium stroke and a clear pressure point. The resistance of the keys is okay. While typing, the keyboard has some minimal give, which does not create any annoyance. The "Enter" and arrow keys turn out slightly small. The two-step keyboard illumination is controlled using a function key. Overall, the keyboard is suitable for everyday tasks.
Touchpad
A multitouch-capable ClickPad measuring 10.5 x 6 cm (~4.1 x 2.4 in) serves as the mouse replacement. Its smooth surface makes it easy to slide the fingers, and it also responds to inputs in the corners. The pad offers a short stroke and clear pressure point.
Display - A 120-Hz IPS panel
The low brightness (261.7 cd/m²) and contrast (772:1) of the 15.6-inch display (1920 x 1080 pixels) are unable to impress. We consider brightness values higher than 300 cd/m² and a contrast higher than 1.000:1 as good. While the 120-Hz panel offers quick response times, it is unable to keep up with the values from the competitors, which are equipped with 144 or 165-Hz panels.
At brightness levels of 99% and lower, the display flickers with a frequency of 200 Hz. Due to this fairly low frequency, this could cause headaches or eye problems for some sensitive users.
| |||||||||||||||||||||||||
Brightness Distribution: 83 %
Center on Battery: 278 cd/m²
Contrast: 772:1 (Black: 0.36 cd/m²)
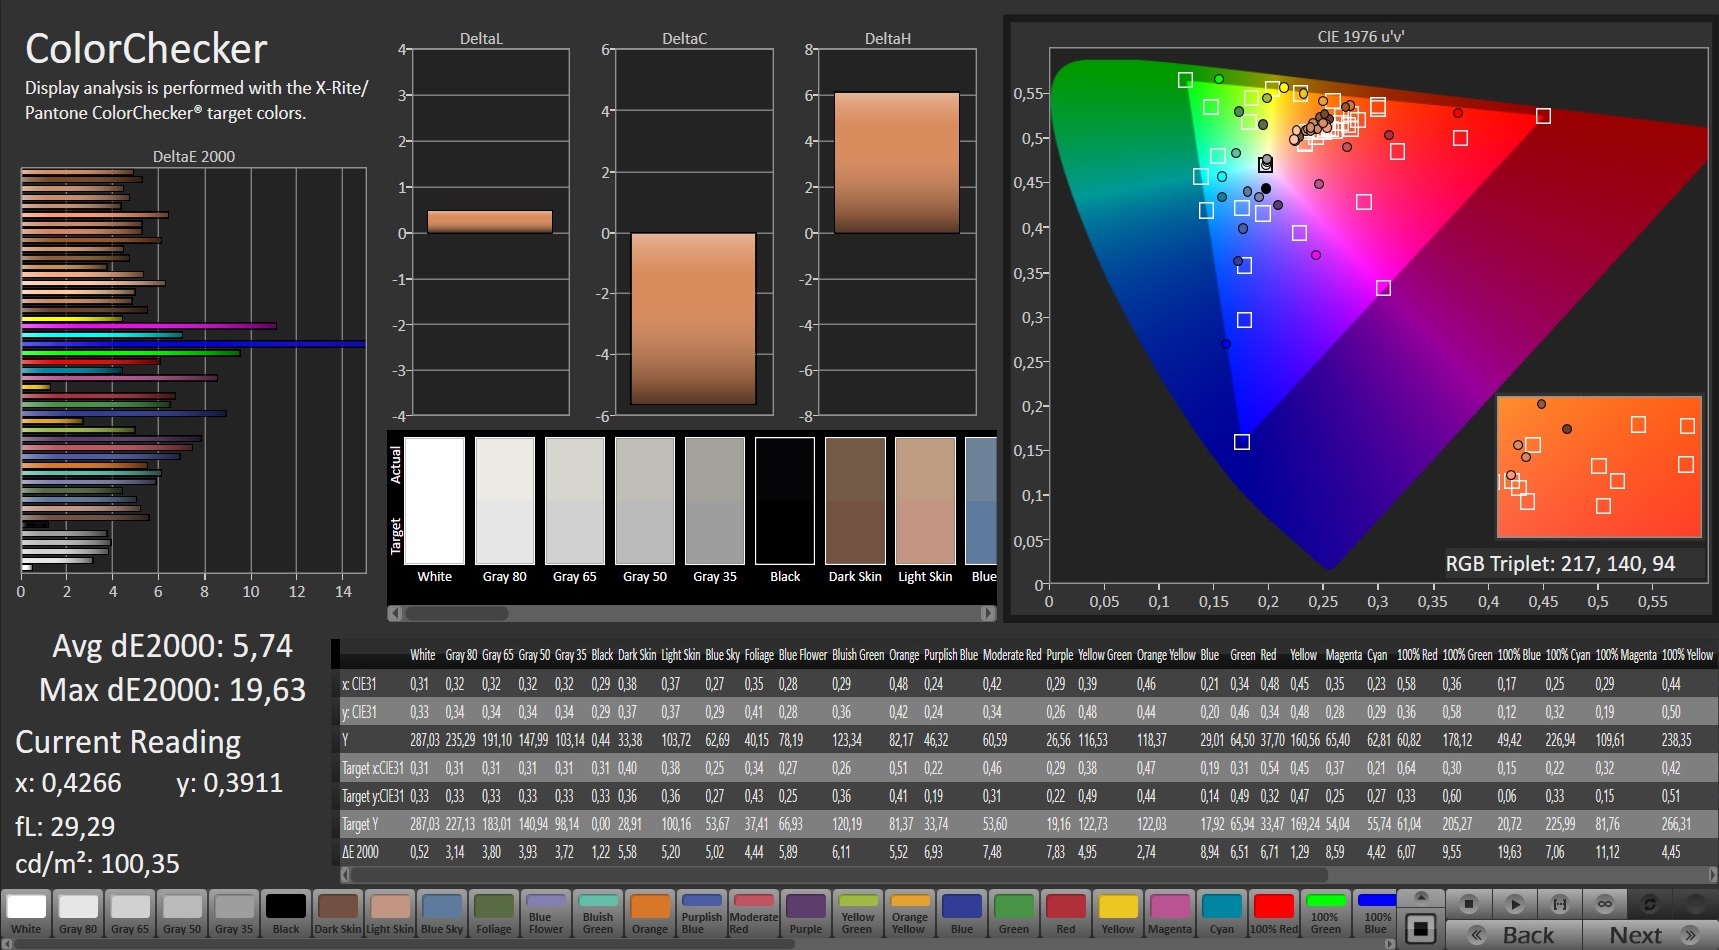
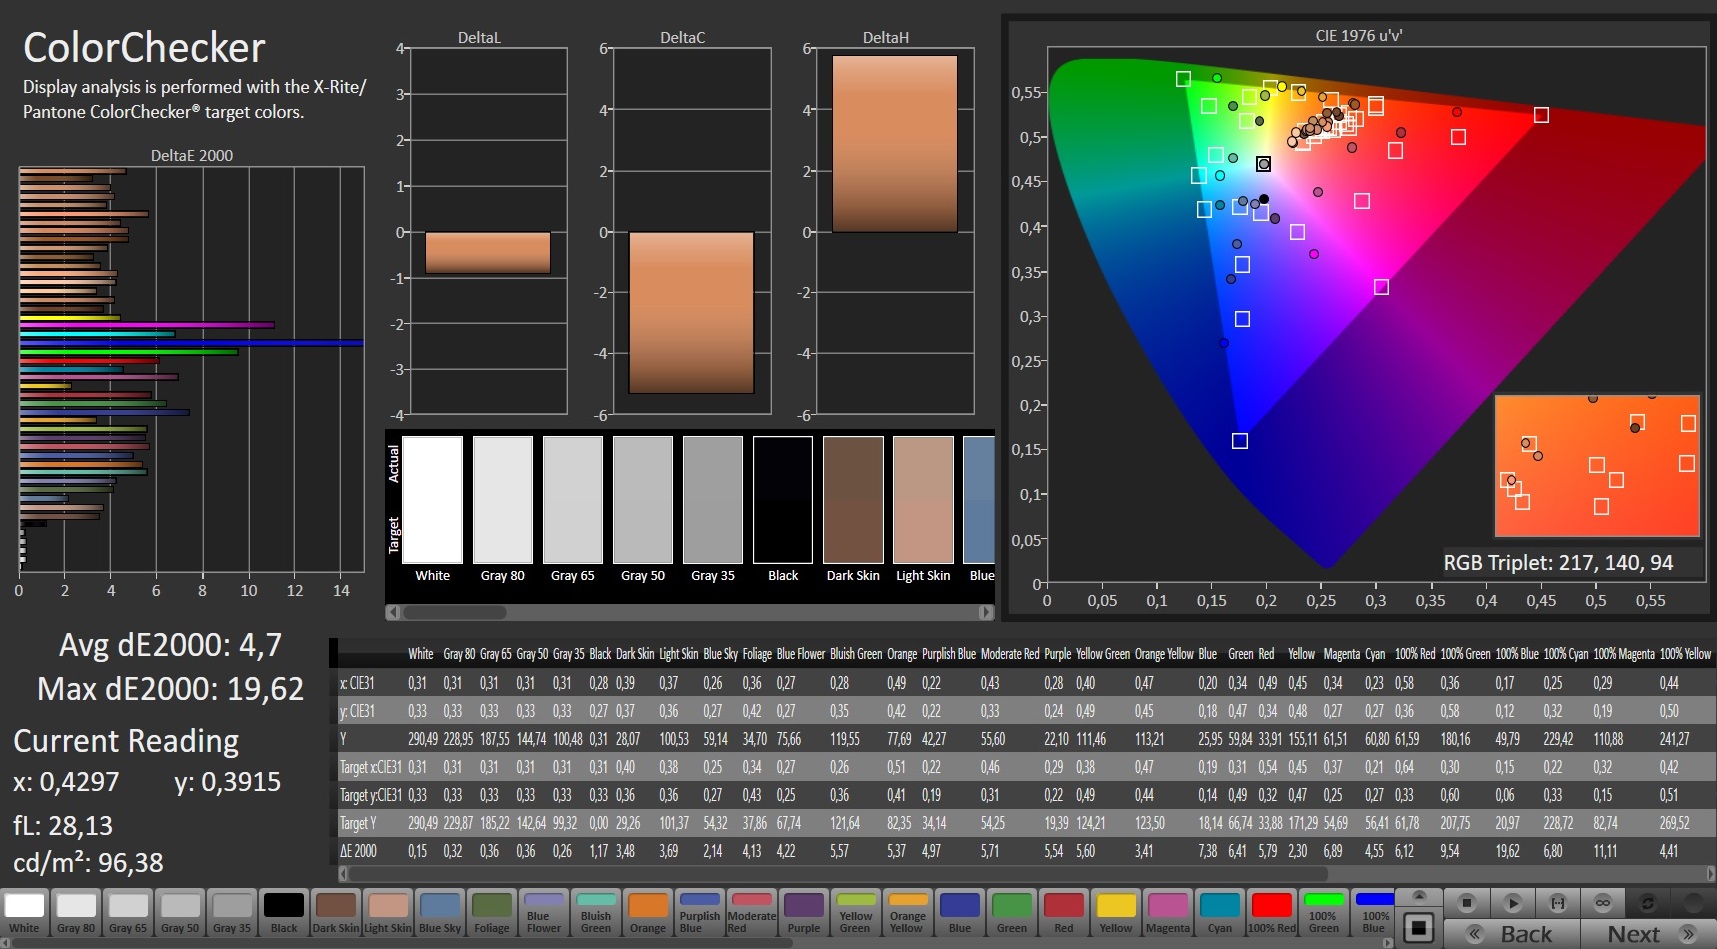
ΔE ColorChecker Calman: 5.74 | ∀{0.5-29.43 Ø4.73}
calibrated: 4.7
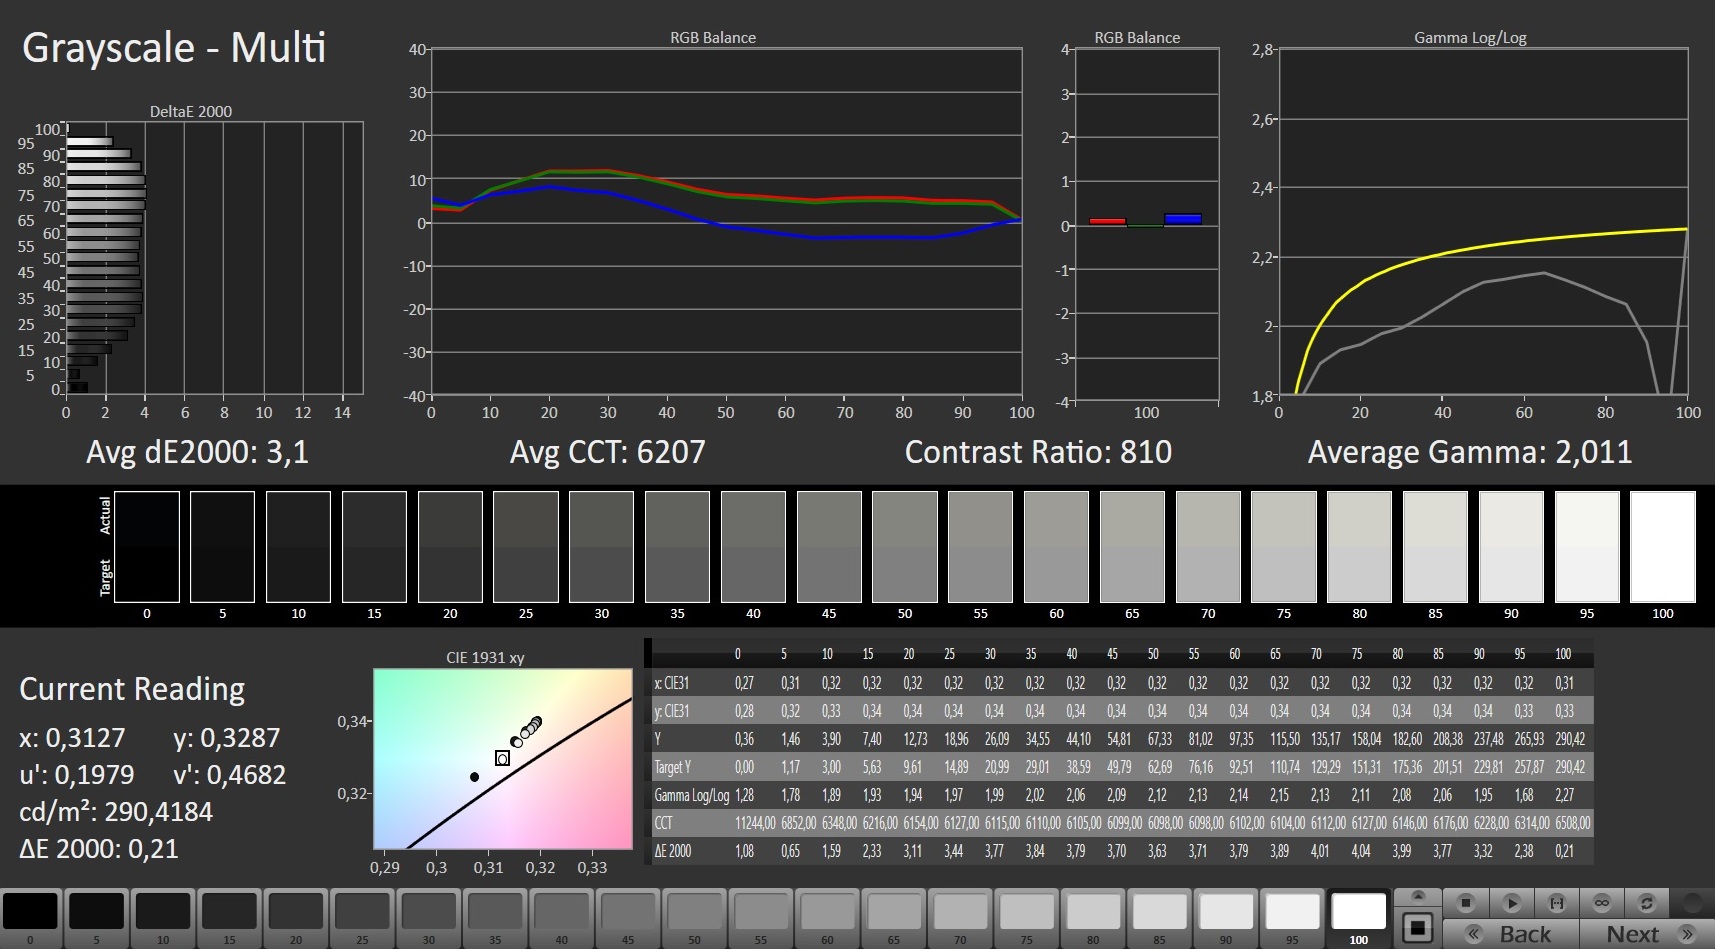
ΔE Greyscale Calman: 3.1 | ∀{0.09-98 Ø4.97}
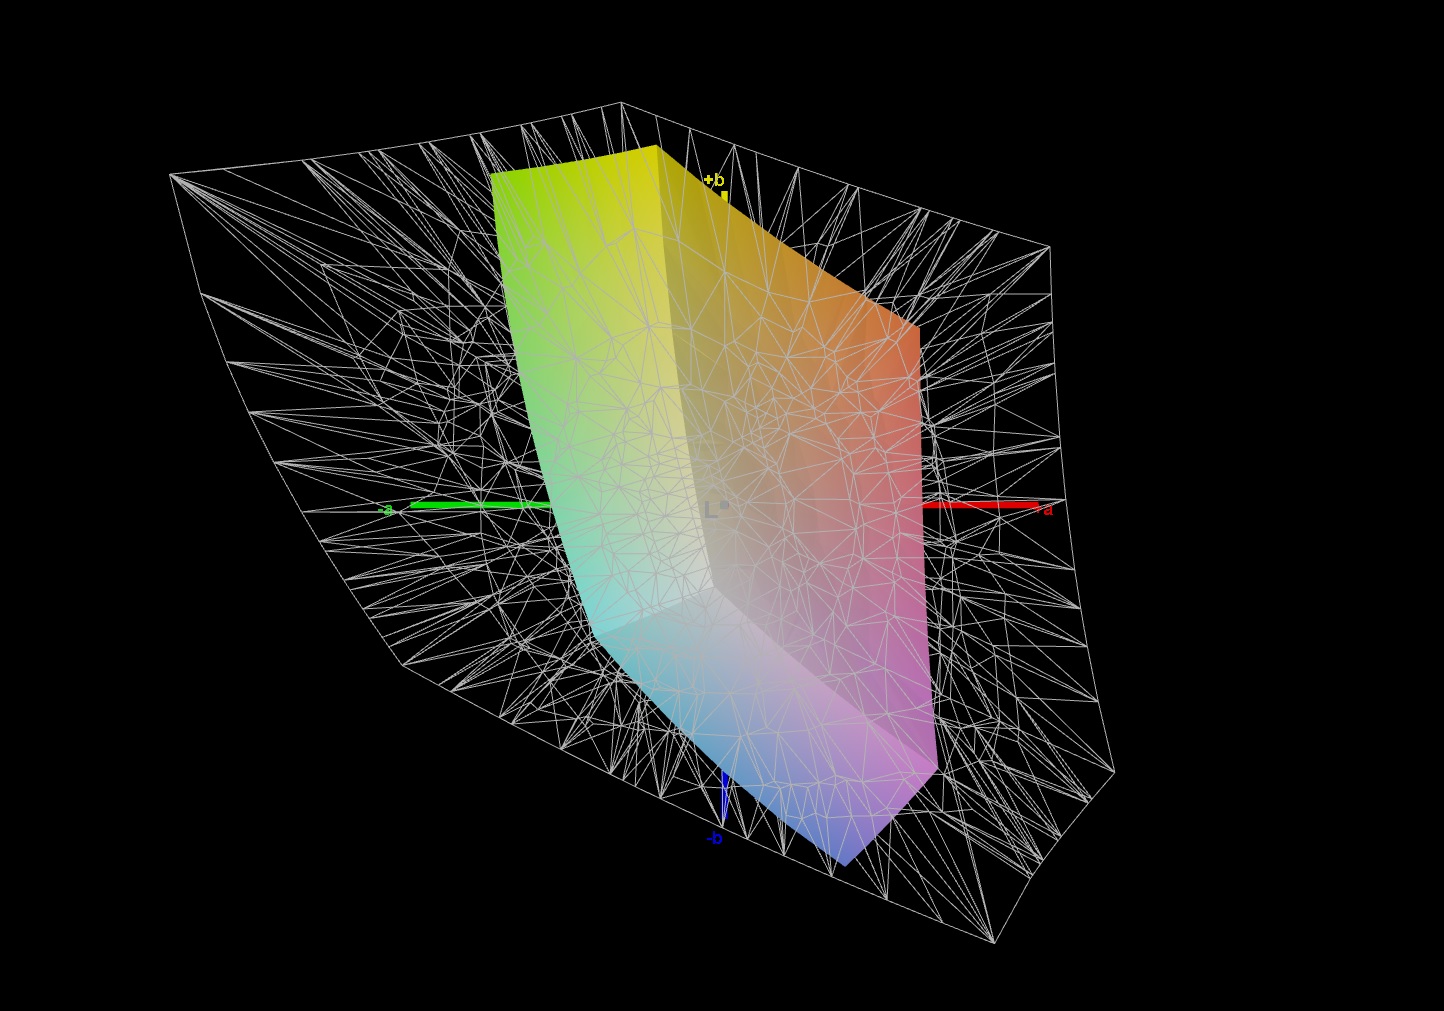
40.4% AdobeRGB 1998 (Argyll 3D)
56.9% sRGB (Argyll 3D)
39.1% Display P3 (Argyll 3D)
Gamma: 2.011
CCT: 6207 K
| Dell G15 5515 BOE092A, IPS, 1920x1080, 15.6" | Lenovo Legion 5 15ACH-82JU00C6GE-FL B156HAN12.H, , 1920x1080, 15.6" | Schenker XMG Focus 15 LG Philips LP156WFG-SPB5, IPS, 1920x1080, 15.6" | Gigabyte G5 KC LM156LF-1F02, IPS, 1920x1080, 15.6" | |
|---|---|---|---|---|
| Display | 68% | 66% | 72% | |
| Display P3 Coverage (%) | 39.1 | 65.4 67% | 64.6 65% | 68.2 74% |
| sRGB Coverage (%) | 56.9 | 96.3 69% | 95.3 67% | 96.7 70% |
| AdobeRGB 1998 Coverage (%) | 40.4 | 67.5 67% | 66.5 65% | 69.6 72% |
| Response Times | 46% | 39% | 49% | |
| Response Time Grey 50% / Grey 80% * (ms) | 25.2 ? | 13.6 ? 46% | 18 ? 29% | 10 ? 60% |
| Response Time Black / White * (ms) | 16.8 ? | 9.2 ? 45% | 8.8 ? 48% | 10.4 ? 38% |
| PWM Frequency (Hz) | 200 ? | |||
| Screen | 25% | 39% | 2% | |
| Brightness middle (cd/m²) | 278 | 350 26% | 418 50% | 295 6% |
| Brightness (cd/m²) | 262 | 350 34% | 376 44% | 275 5% |
| Brightness Distribution (%) | 83 | 96 16% | 83 0% | 86 4% |
| Black Level * (cd/m²) | 0.36 | 0.3 17% | 0.41 -14% | 0.23 36% |
| Contrast (:1) | 772 | 1167 51% | 1020 32% | 1283 66% |
| Colorchecker dE 2000 * | 5.74 | 3.9 32% | 1.67 71% | 5.21 9% |
| Colorchecker dE 2000 max. * | 19.63 | 8.2 58% | 3.88 80% | 14.03 29% |
| Colorchecker dE 2000 calibrated * | 4.7 | 1.6 66% | 0.98 79% | 1.73 63% |
| Greyscale dE 2000 * | 3.1 | 5.5 -77% | 2.9 6% | 9.4 -203% |
| Gamma | 2.011 109% | 2.15 102% | 2.26 97% | 2.046 108% |
| CCT | 6207 105% | 7414 88% | 6209 105% | 8002 81% |
| Total Average (Program / Settings) | 46% /
37% | 48% /
44% | 41% /
24% |
* ... smaller is better
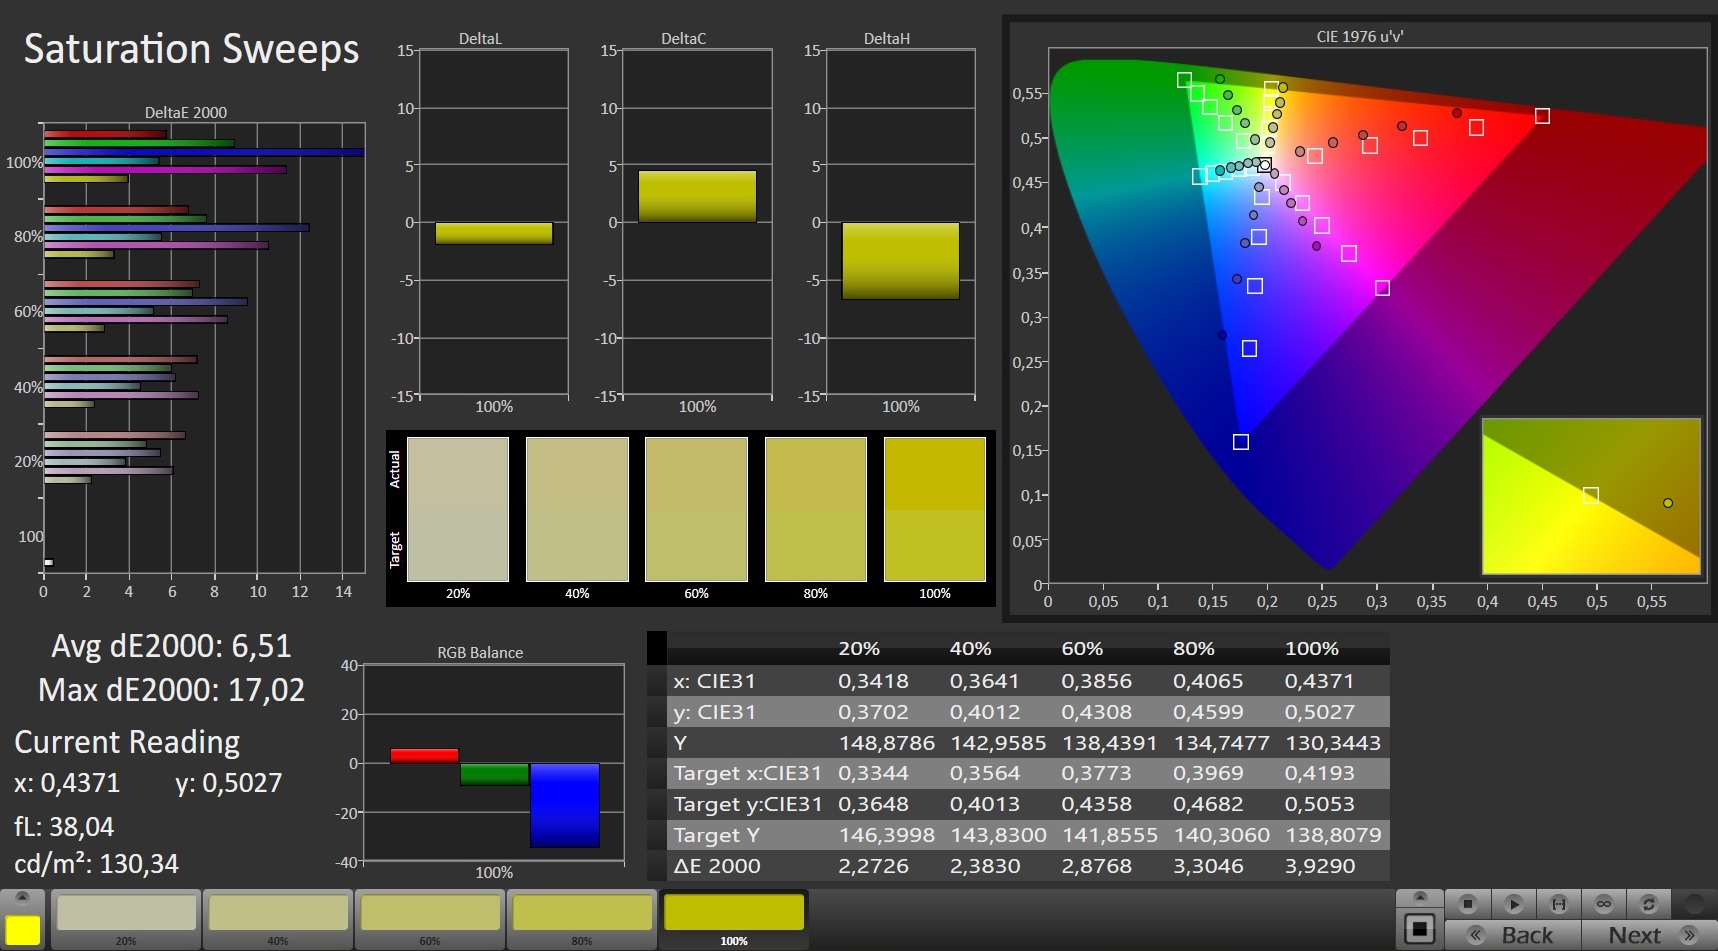
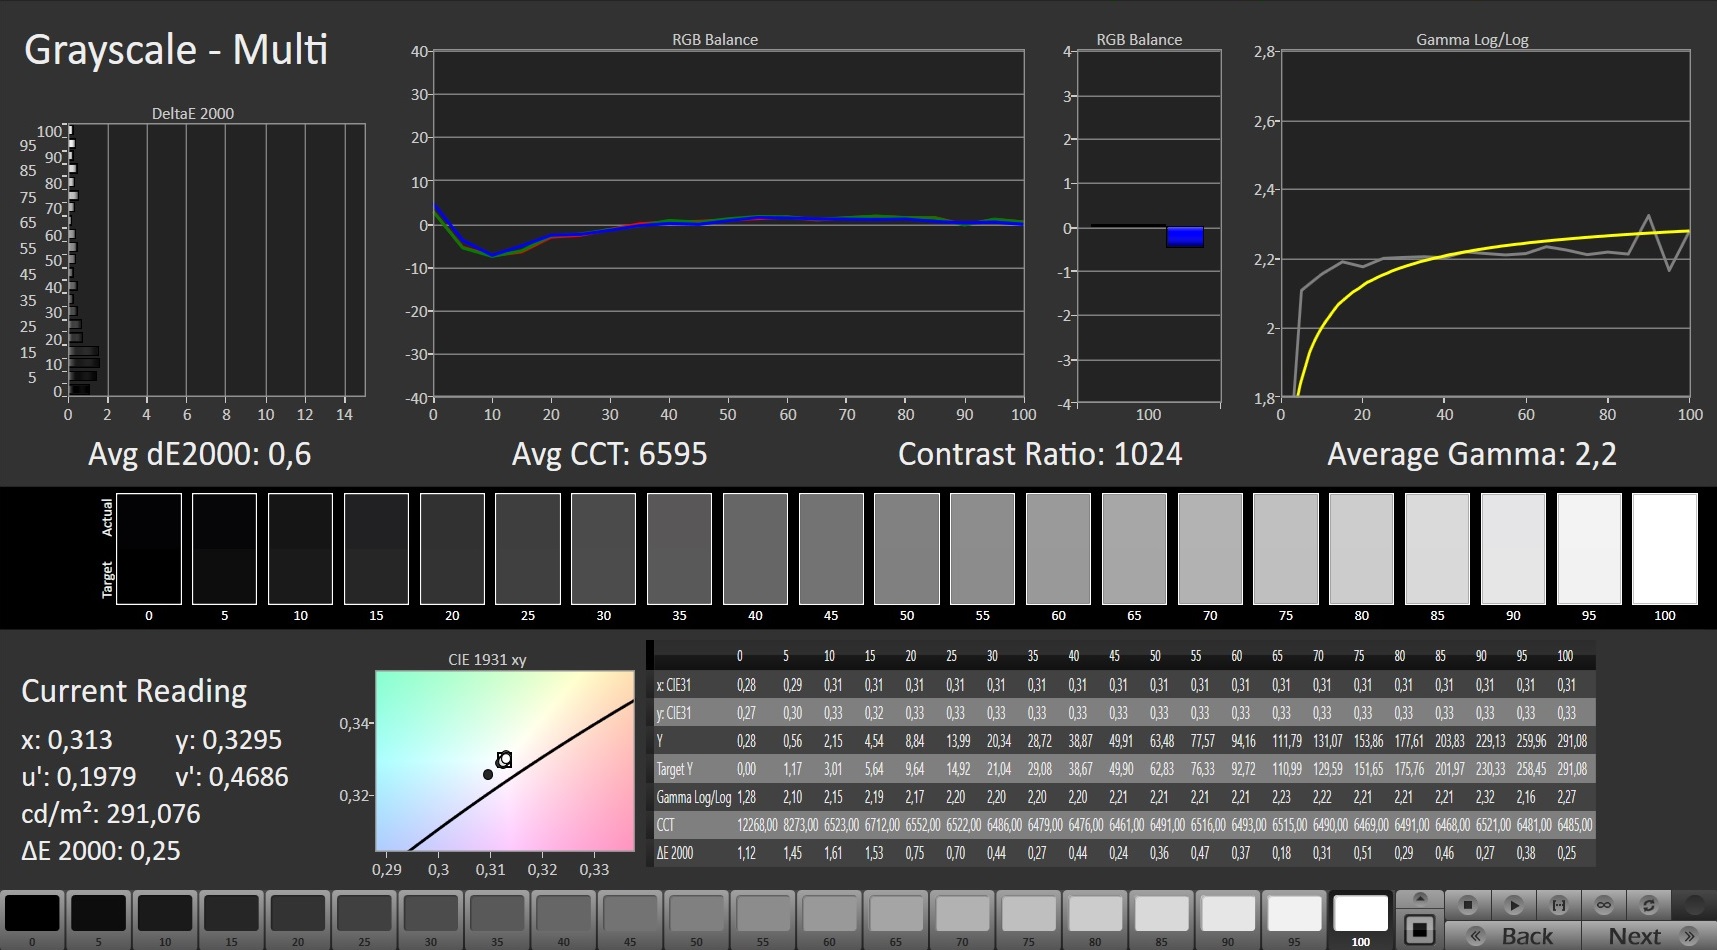
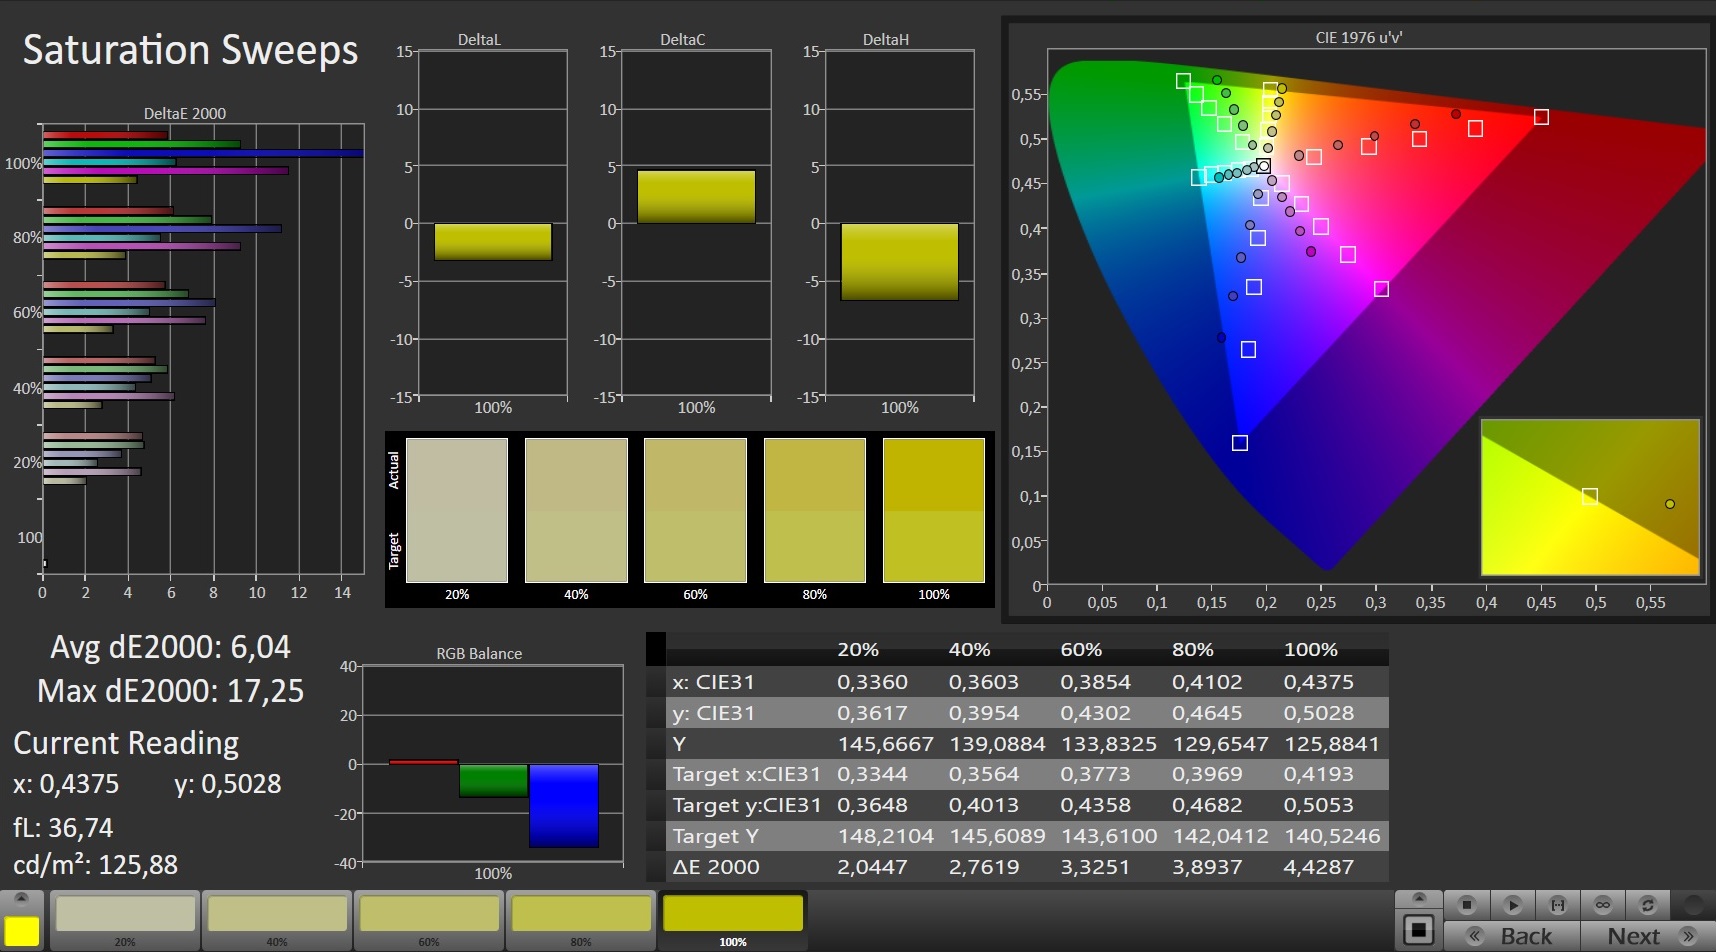
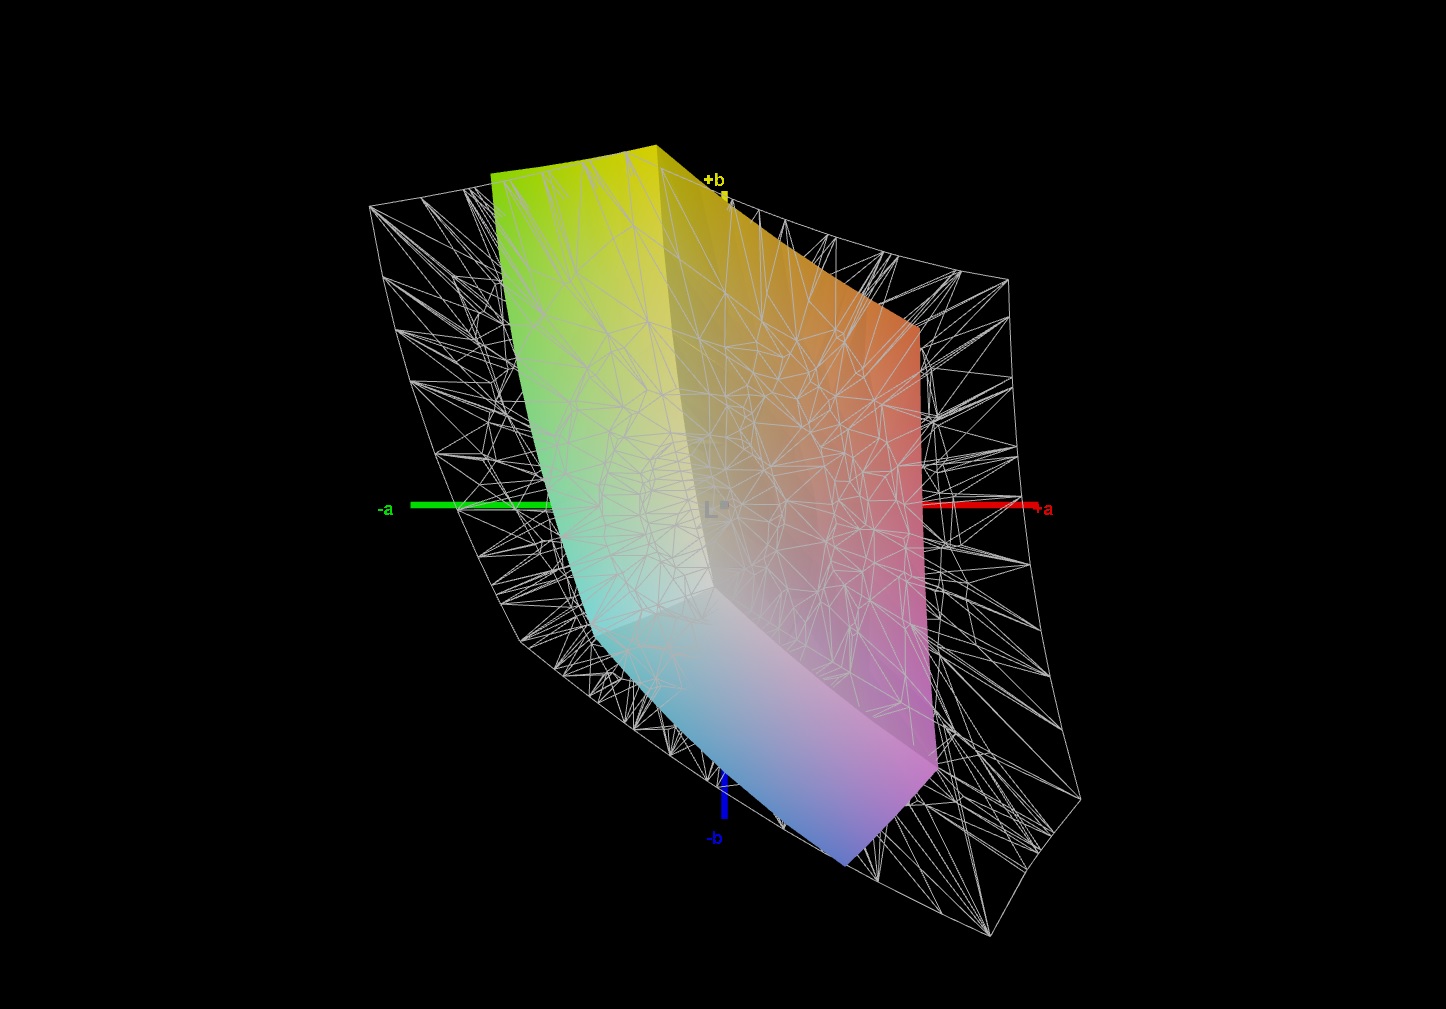
In the state of delivery, the display presents a decent color reproduction, even though the colors deviate slightly from the target. It does not suffer from a blue tint. A calibration will only bring a slight improvement of the color accuracy. The display is unable to cover the AdobeRGB (40%), sRGB (57%), and DCI-P3 (39%) color spaces.
Display Response Times
| ↔ Response Time Black to White | ||
|---|---|---|
| 16.8 ms ... rise ↗ and fall ↘ combined | ↗ 9.2 ms rise | 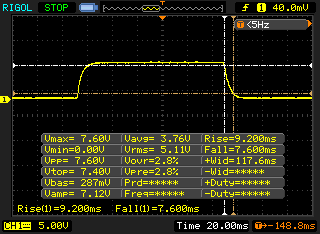 |
| ↘ 7.6 ms fall | ||
| The screen shows good response rates in our tests, but may be too slow for competitive gamers. In comparison, all tested devices range from 0.1 (minimum) to 240 (maximum) ms. » 38 % of all devices are better. This means that the measured response time is better than the average of all tested devices (19.9 ms). | ||
| ↔ Response Time 50% Grey to 80% Grey | ||
| 25.2 ms ... rise ↗ and fall ↘ combined | ↗ 12.4 ms rise | 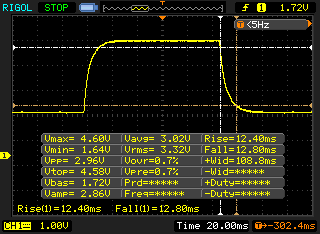 |
| ↘ 12.8 ms fall | ||
| The screen shows relatively slow response rates in our tests and may be too slow for gamers. In comparison, all tested devices range from 0.165 (minimum) to 636 (maximum) ms. » 35 % of all devices are better. This means that the measured response time is better than the average of all tested devices (31.1 ms). | ||
Screen Flickering / PWM (Pulse-Width Modulation)
| Screen flickering / PWM detected | 200 Hz | ≤ 99 % brightness setting | 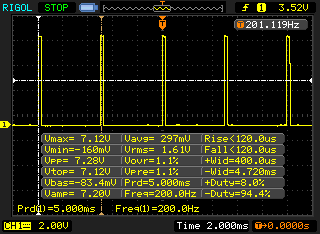 |
The display backlight flickers at 200 Hz (worst case, e.g., utilizing PWM) Flickering detected at a brightness setting of 99 % and below. There should be no flickering or PWM above this brightness setting. The frequency of 200 Hz is relatively low, so sensitive users will likely notice flickering and experience eyestrain at the stated brightness setting and below. In comparison: 52 % of all tested devices do not use PWM to dim the display. If PWM was detected, an average of 7798 (minimum: 5 - maximum: 343500) Hz was measured. | |||
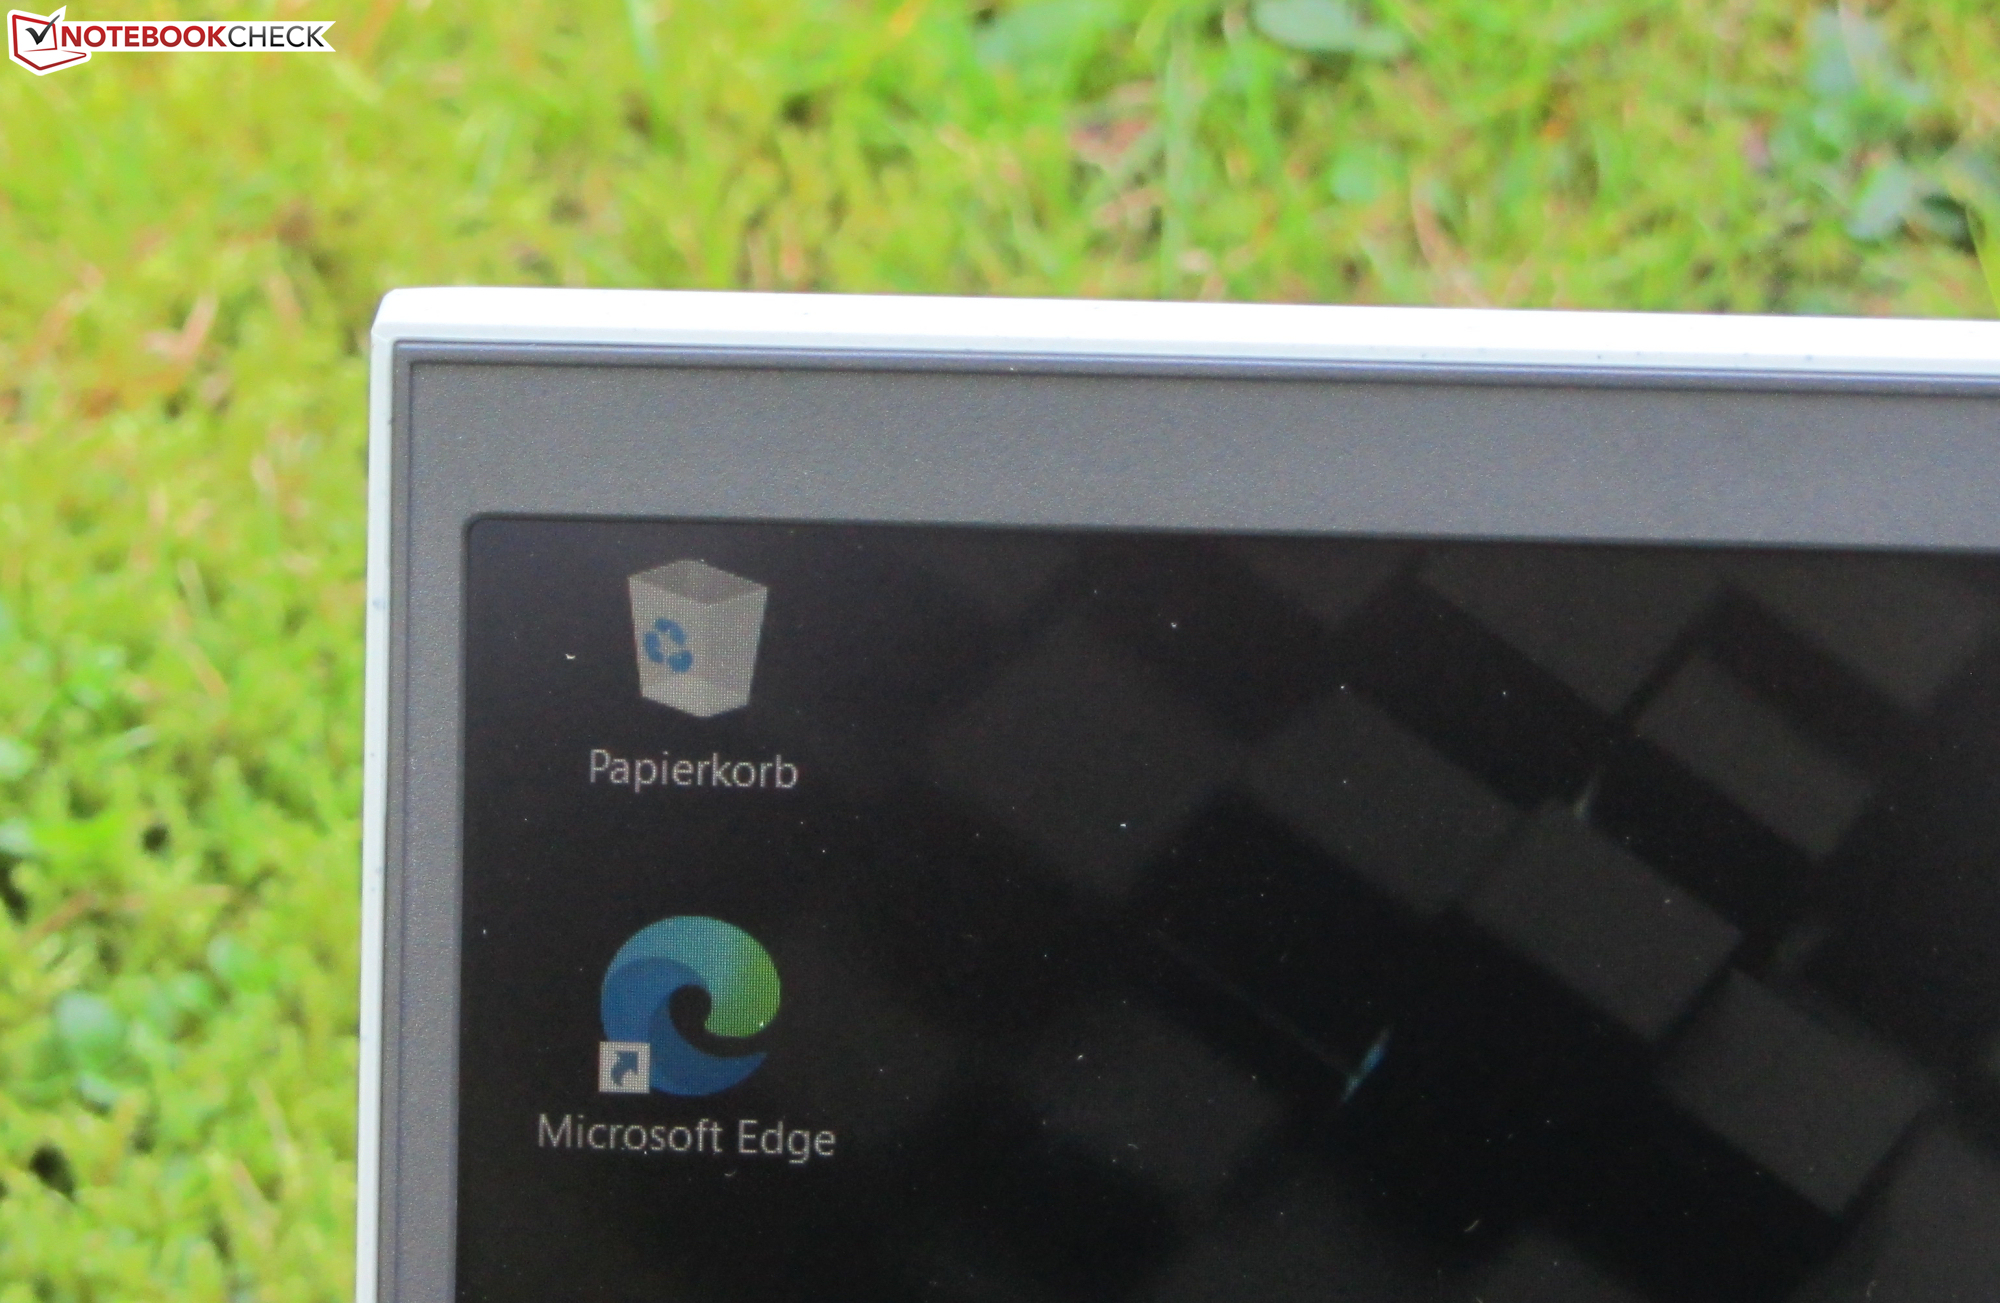
The IPS panel has stable viewing angles and can be read from any position. Outdoors, you can only read the display when the sun light isn't too bright.

Performance - Ryzen power
With the G15 5515, Dell offers a 15.6-inch gaming laptop that allows playing all the current games smoothly.
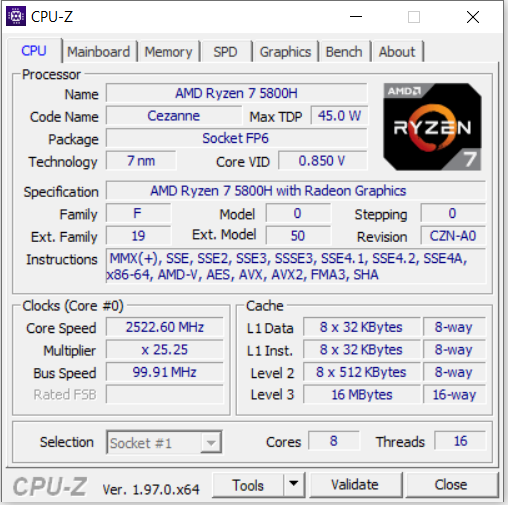
Processor
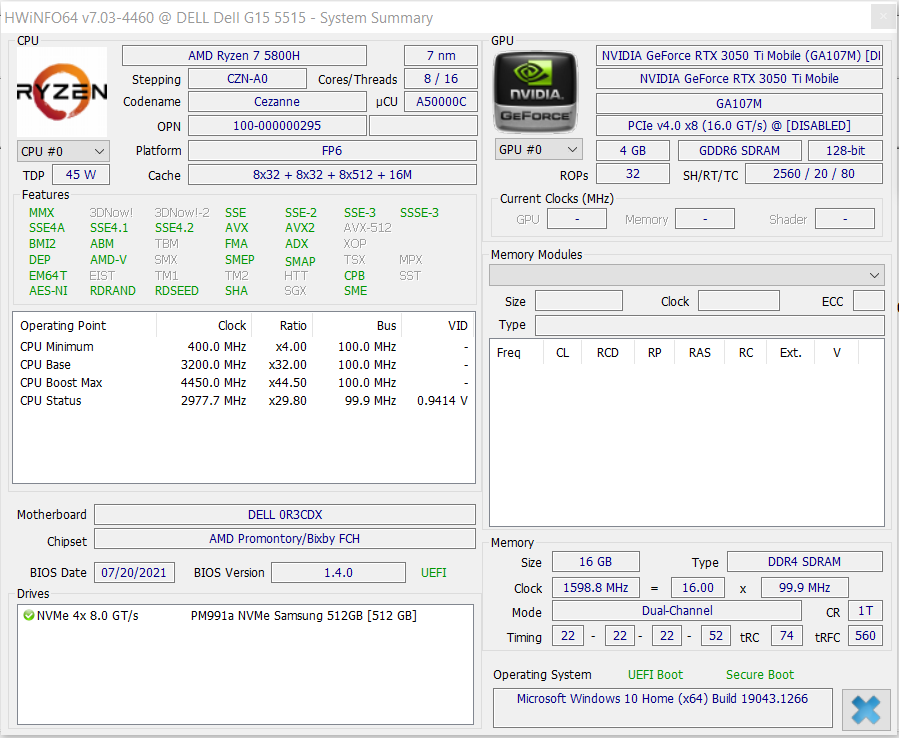
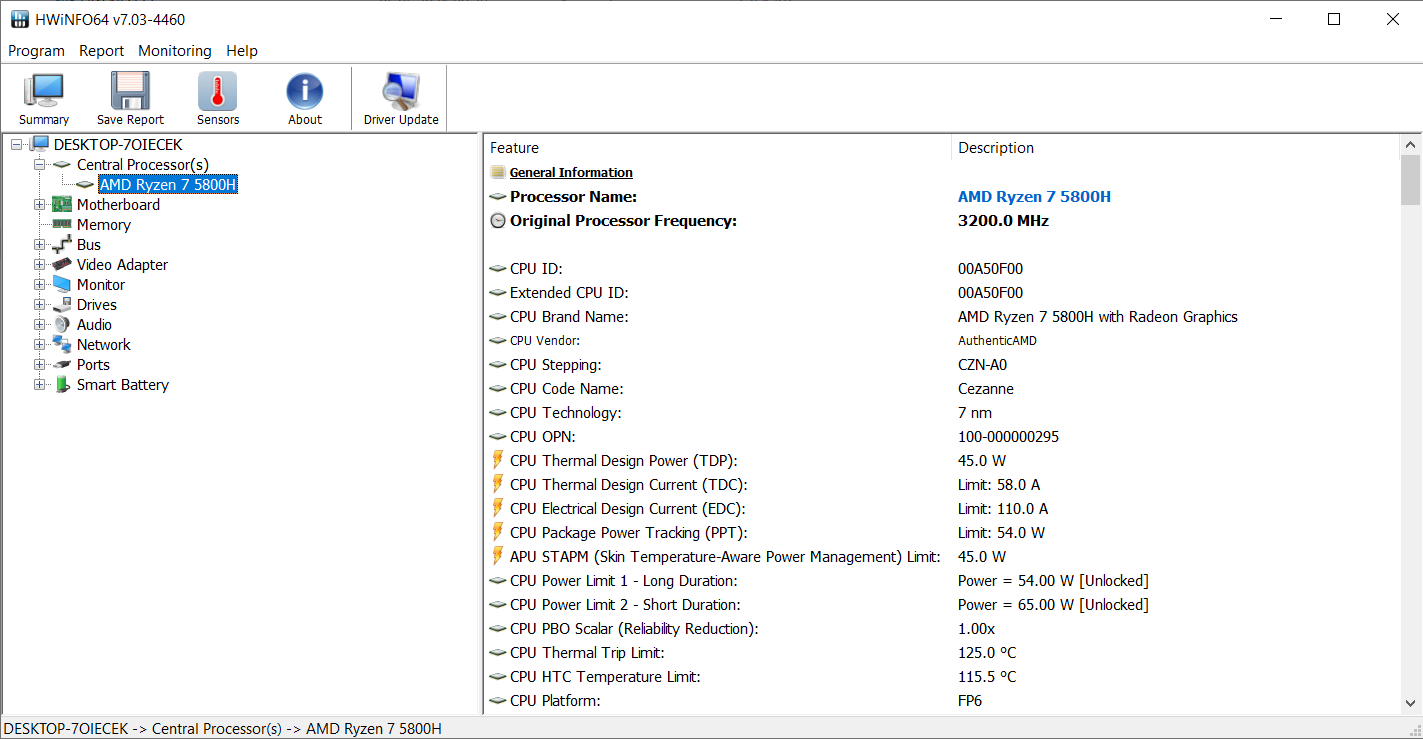
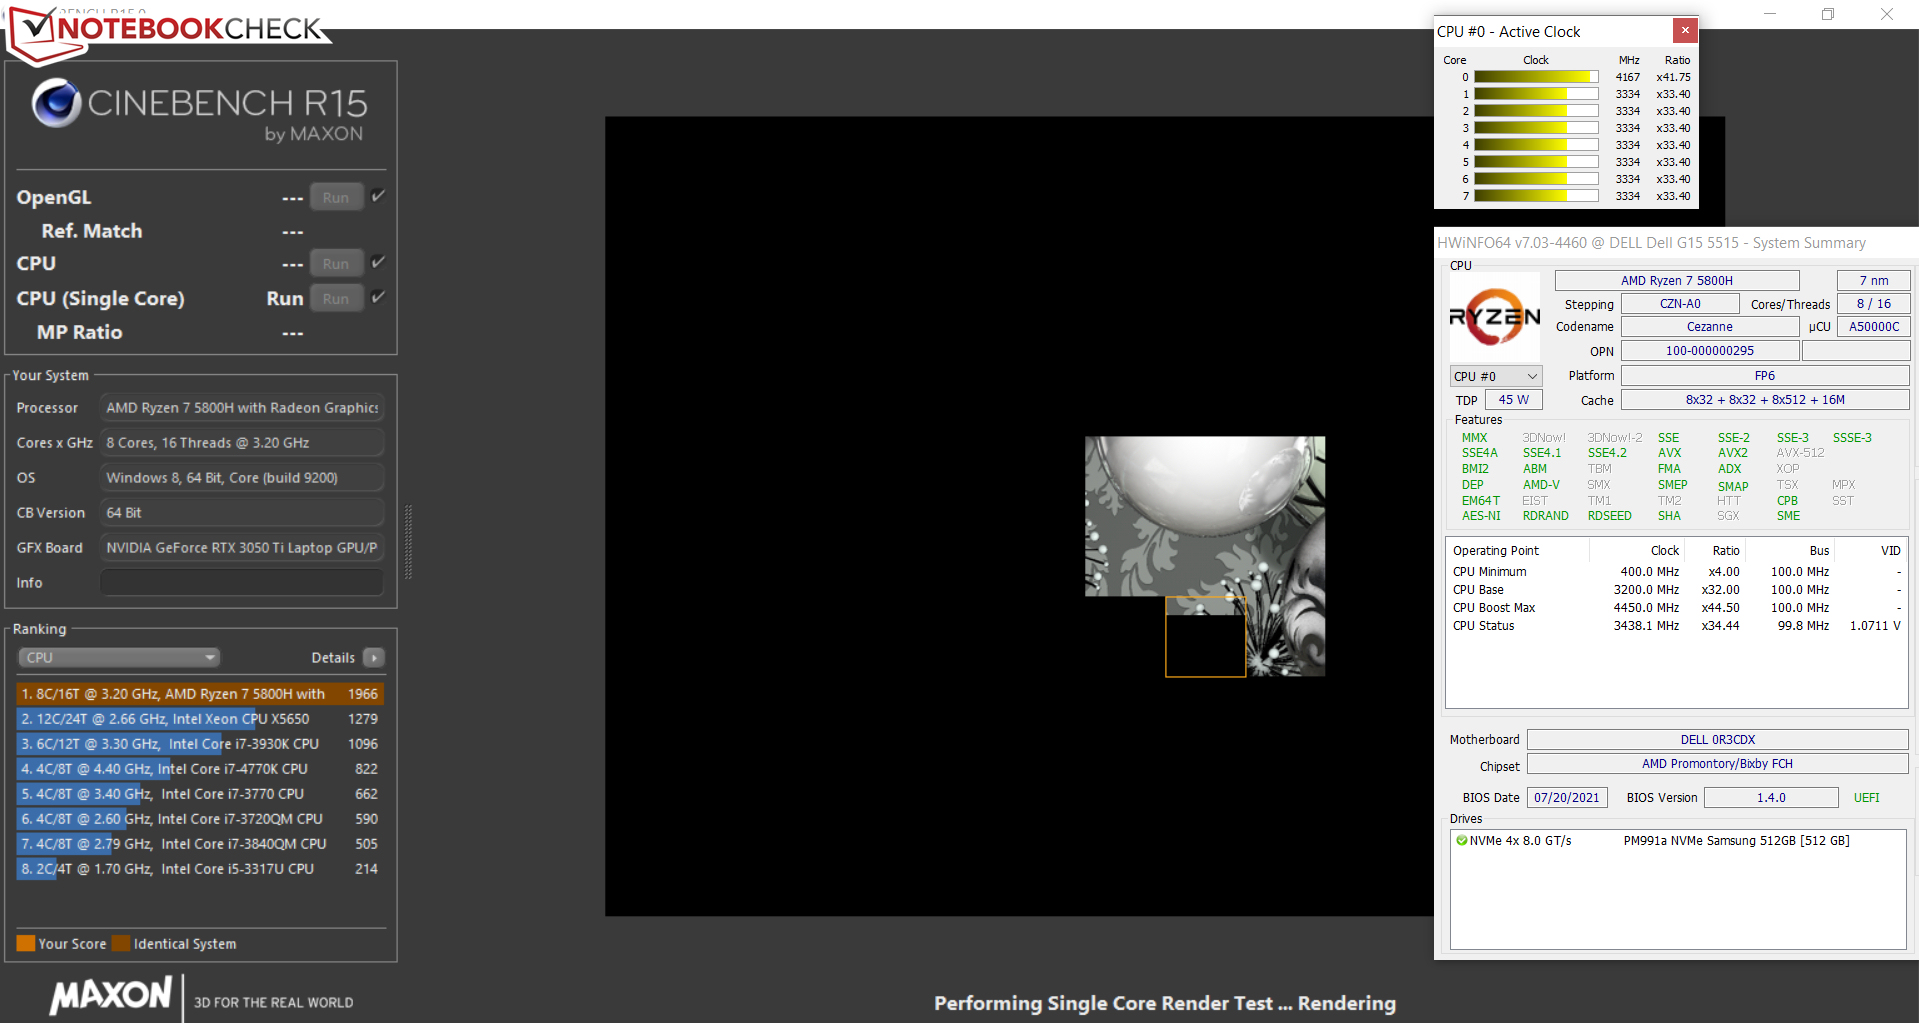
The CPU part of the Ryzen 7 5800H APU (Cezanne) consists of an octa-core processor that runs at a basic clock speed of 3.2 GHz. The speed can be increased via Turbo up to 4.3 GHz. Simultaneous multithreading (two threads running per core) is supported.
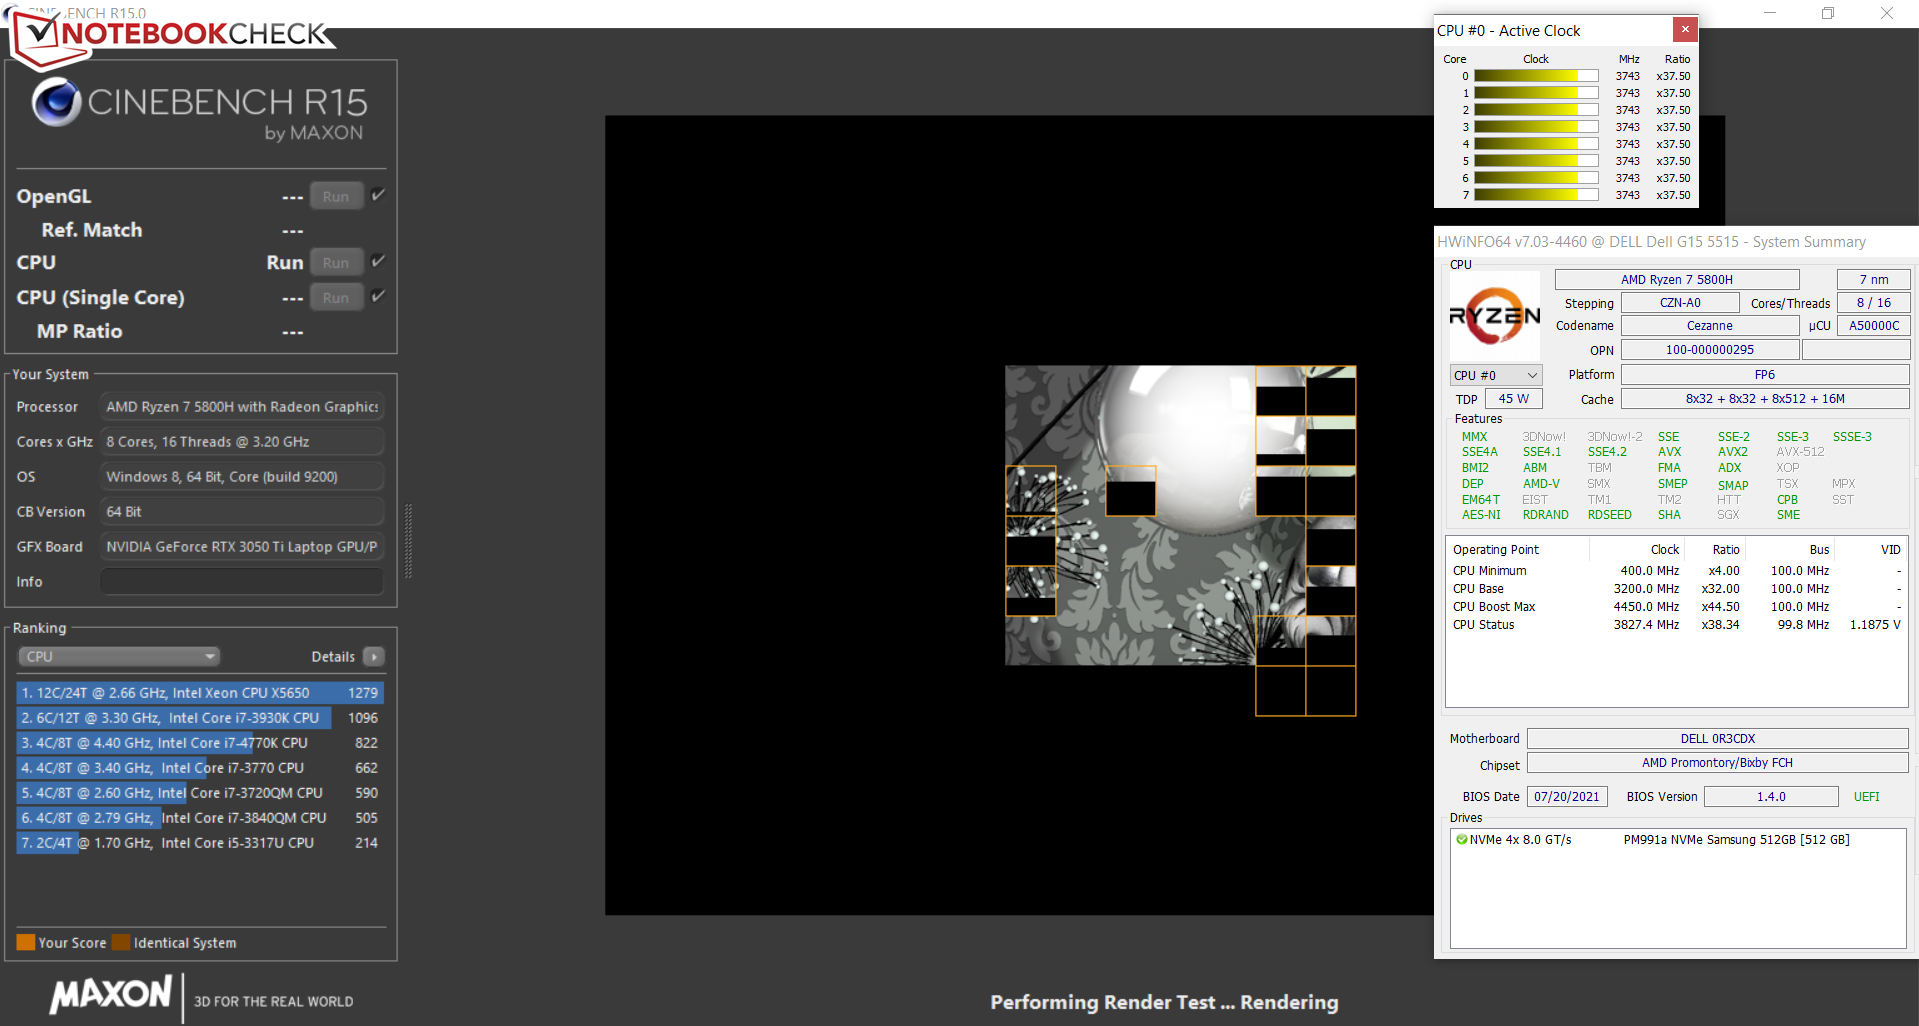
For a short time, the multithread test of Cinebench R15 benchmark runs at 3.8 GHz, before the clock speed drops to between 3.5 and 3.6 GHz. The single-thread test runs at 3.3 to 4.2 GHz. In battery operation, the CPU runs at 2.1 to 2.3 GHz in the multithread test and 2.1 to 3.4 GHz in the single-thread test.
The Lenovo Legion 5 15ACH, which is also equipped with the Ryzen 7 5800H APU, does slightly better in the multithread applications than the G15. The reason for this lies in the higher power limits Lenovo is allowing for the APU.
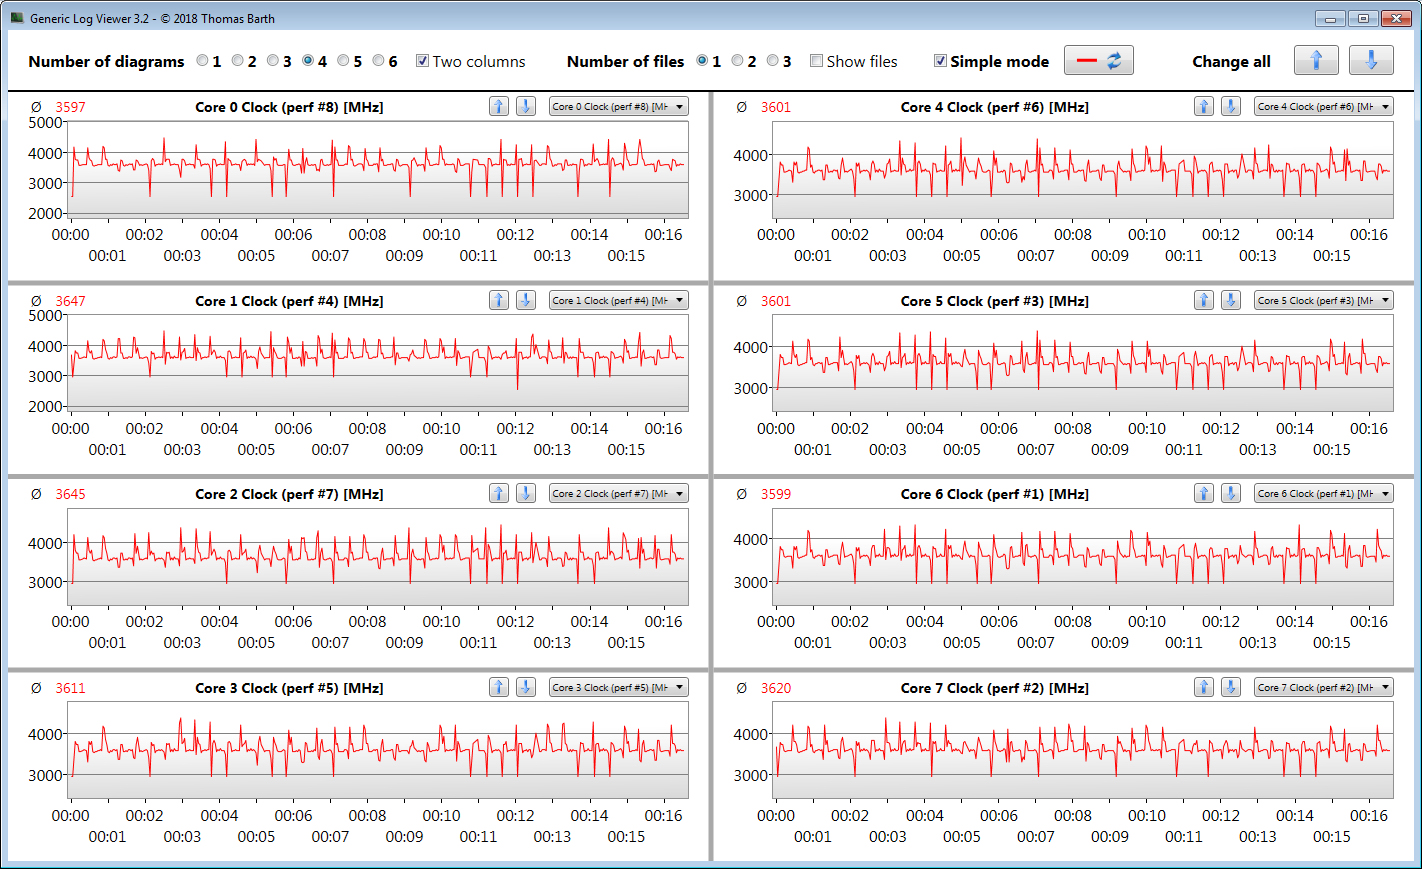
We evaluate whether the CPU Turbo is also used constantly in mains operation by running the multithread test of the Cinebench R15 benchmark for at least 30 minutes in a constant loop. The Turbo is used at a medium level.
Cinebench R15 Multi Constant Load Test
| CPU Performance rating - Percent | |
| Average of class Gaming | |
| Average AMD Ryzen 7 5800H | |
| Schenker XMG Focus 15 | |
| Lenovo Legion 5 15ACH-82JU00C6GE-FL | |
| Dell G15 5515 | |
| Gigabyte G5 KC | |
* ... smaller is better
System Performance
The system runs smoothly and quickly, offering more than sufficient computing power for all the usual application areas. The dedicated GPU allows using computer games and other GPU-heavy applications. This is also accompanied by very good PC Mark results.
| PCMark 8 Home Score Accelerated v2 | 4870 points | |
| PCMark 8 Creative Score Accelerated v2 | 5361 points | |
| PCMark 8 Work Score Accelerated v2 | 5713 points | |
| PCMark 10 Score | 6098 points | |
Help | ||
| PCMark 10 / Score | |
| Average of class Gaming (5828 - 11574, n=95, last 2 years) | |
| Lenovo Legion 5 15ACH-82JU00C6GE-FL | |
| Schenker XMG Focus 15 | |
| Average AMD Ryzen 7 5800H, NVIDIA GeForce RTX 3050 Ti Laptop GPU (6098 - 6493, n=2) | |
| Dell G15 5515 | |
| Gigabyte G5 KC | |
| PCMark 10 / Essentials | |
| Average of class Gaming (8810 - 12600, n=99, last 2 years) | |
| Lenovo Legion 5 15ACH-82JU00C6GE-FL | |
| Schenker XMG Focus 15 | |
| Average AMD Ryzen 7 5800H, NVIDIA GeForce RTX 3050 Ti Laptop GPU (9631 - 10213, n=2) | |
| Dell G15 5515 | |
| Gigabyte G5 KC | |
| PCMark 10 / Productivity | |
| Average of class Gaming (6845 - 18766, n=97, last 2 years) | |
| Lenovo Legion 5 15ACH-82JU00C6GE-FL | |
| Average AMD Ryzen 7 5800H, NVIDIA GeForce RTX 3050 Ti Laptop GPU (8625 - 9199, n=2) | |
| Schenker XMG Focus 15 | |
| Dell G15 5515 | |
| Gigabyte G5 KC | |
| PCMark 10 / Digital Content Creation | |
| Average of class Gaming (7602 - 19657, n=97, last 2 years) | |
| Schenker XMG Focus 15 | |
| Gigabyte G5 KC | |
| Lenovo Legion 5 15ACH-82JU00C6GE-FL | |
| Average AMD Ryzen 7 5800H, NVIDIA GeForce RTX 3050 Ti Laptop GPU (7408 - 7907, n=2) | |
| Dell G15 5515 | |
| Dell G15 5515 R7 5800H, GeForce RTX 3050 Ti Laptop GPU | Lenovo Legion 5 15ACH-82JU00C6GE-FL R7 5800H, GeForce RTX 3060 Laptop GPU | Gigabyte G5 KC i5-10500H, GeForce RTX 3060 Laptop GPU | Average AMD Ryzen 7 5800H, NVIDIA GeForce RTX 3050 Ti Laptop GPU | Average of class Gaming | |
|---|---|---|---|---|---|
| AIDA64 / Memory Write | |||||
| Memory Write (MB/s) | 34820 | 32860 -6% | 39449 13% | 34405 ? -1% | 76158 ? 119% |
| AIDA64 / Memory Read | |||||
| Memory Read (MB/s) | 43850 | 42436 -3% | 40220 -8% | 43746 ? 0% | 73891 ? 69% |
| AIDA64 / Memory Latency | |||||
| Memory Latency * (ns) | 78.3 | 81.1 -4% | 57.5 27% | 79 ? -1% | 106.3 ? -36% |
| AIDA64 / Memory Copy | |||||
| Memory Copy (MB/s) | 38595 | 36925 -4% | 35357 -8% | 38305 ? -1% | 72064 ? 87% |
| Total Average (Program / Settings) | -4% /
-4% | 6% /
6% | -1% /
-1% | 60% /
60% |
* ... smaller is better
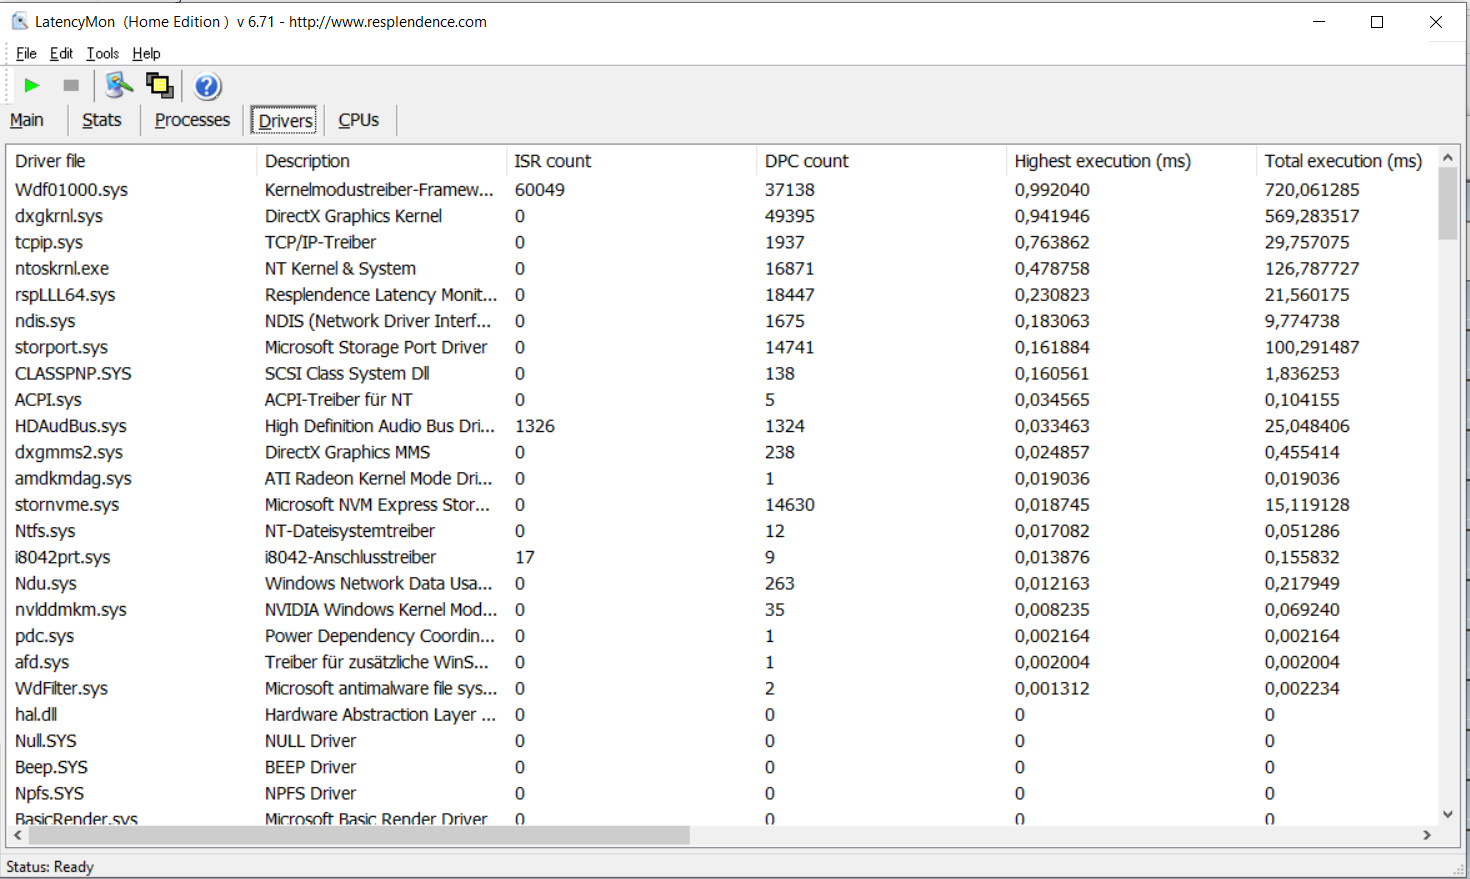
DPC Latencies
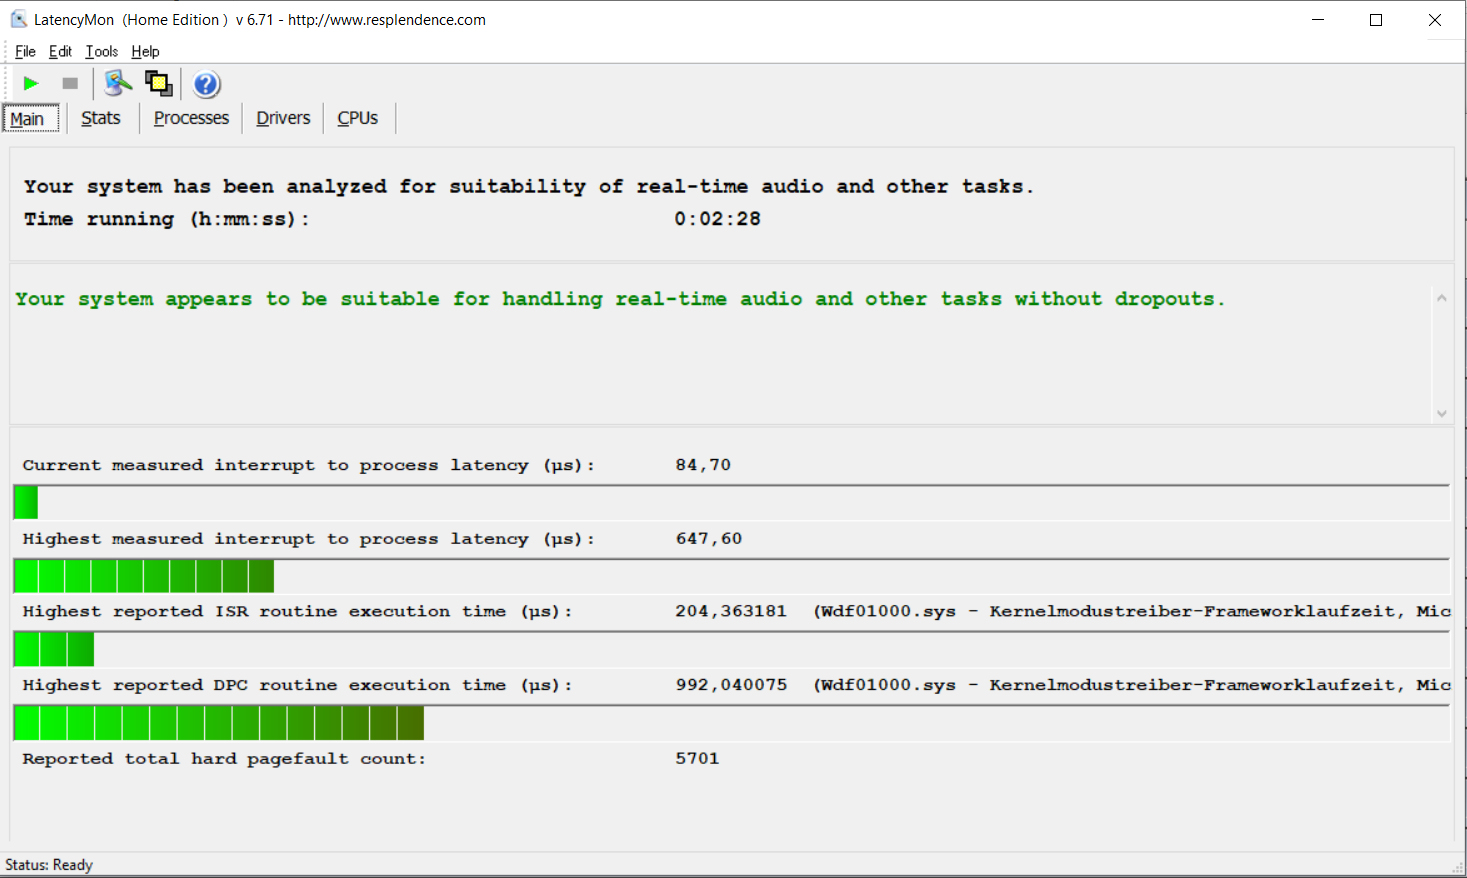
The standardized Latency Monitor test (web surfing, 4k video reproduction, Prime95 high load) does not reveal anything conspicuous in terms of the DPC latencies. The system appears to be suitable for video and audio real-time processing. This statement concerns our test unit with the software that is current at the time of our testing. Future updates might lead to some improvements or make things worse.
| DPC Latencies / LatencyMon - interrupt to process latency (max), Web, Youtube, Prime95 | |
| Lenovo Legion 5 15ACH-82JU00C6GE-FL | |
| Dell G15 5515 | |
| Schenker XMG Focus 15 | |
| Gigabyte G5 KC | |
* ... smaller is better
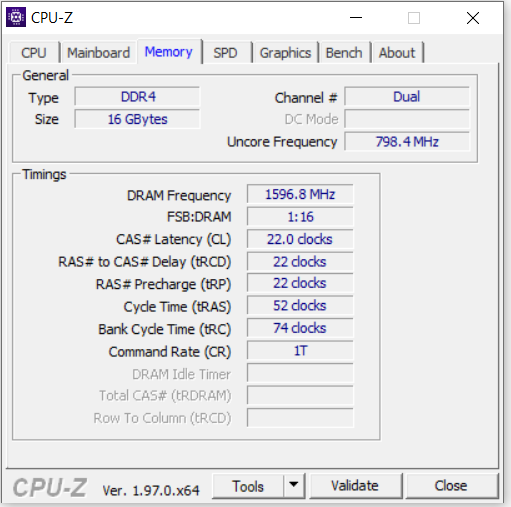
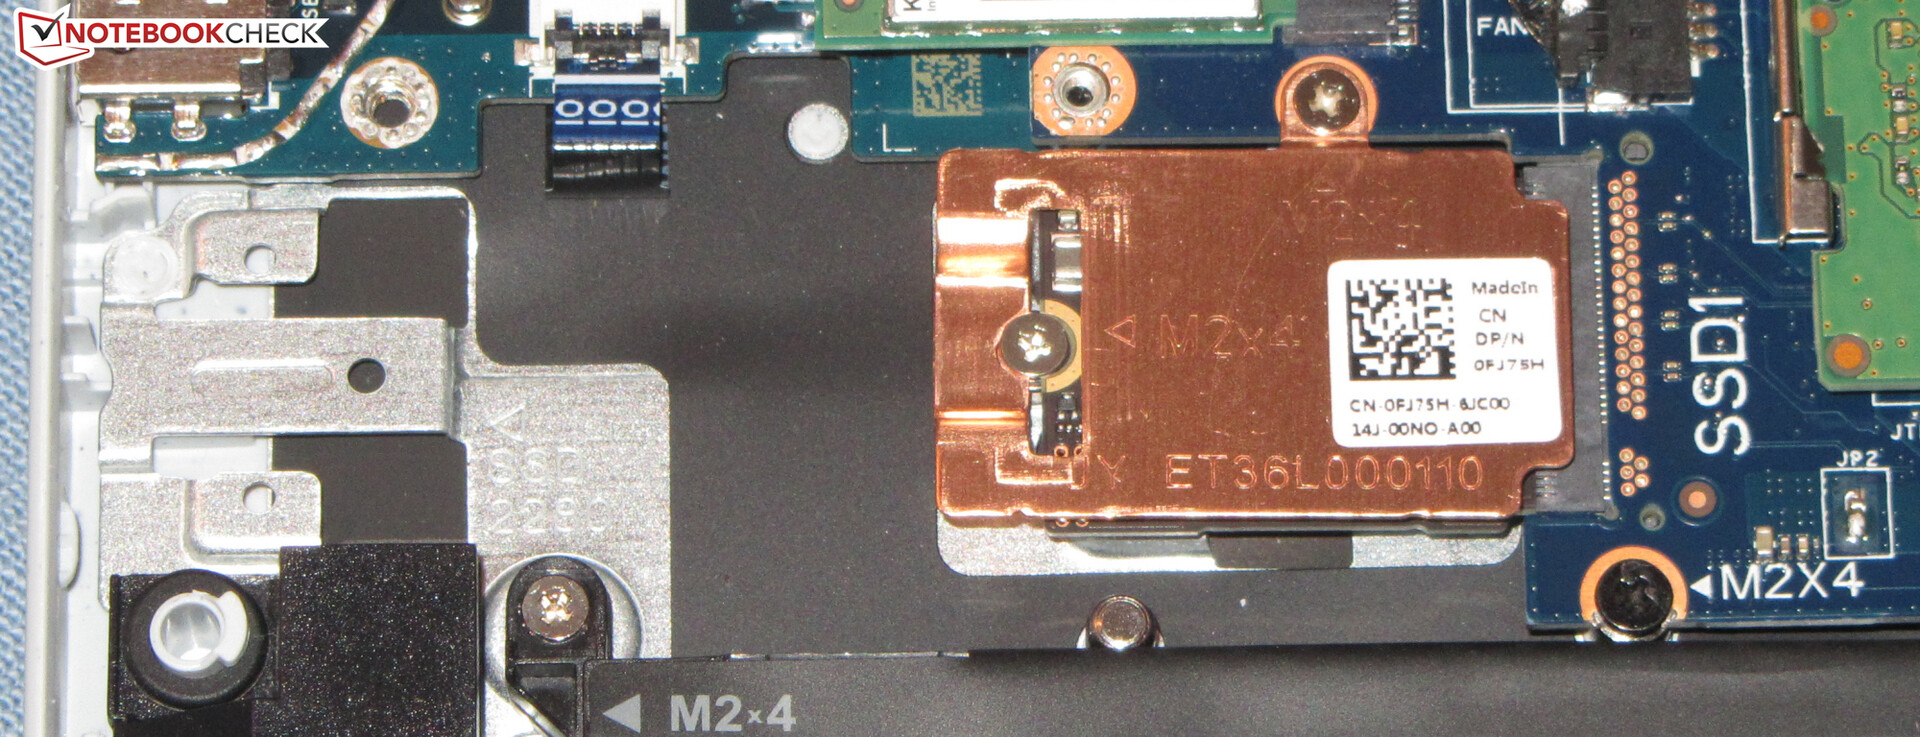
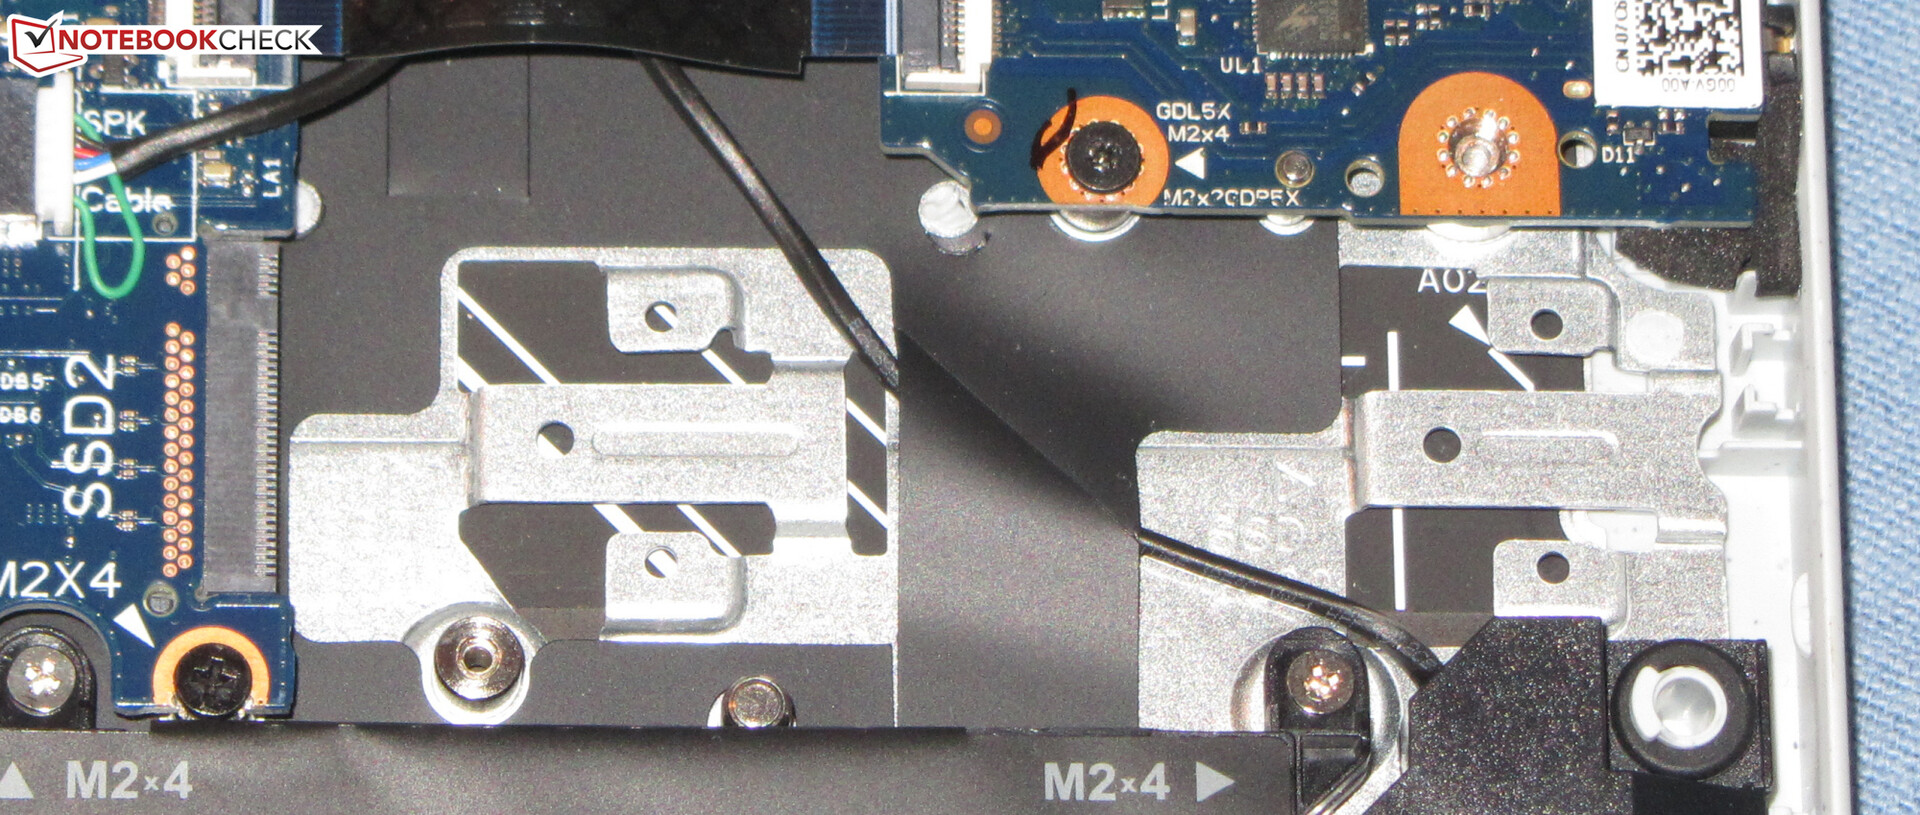
Storage Solution
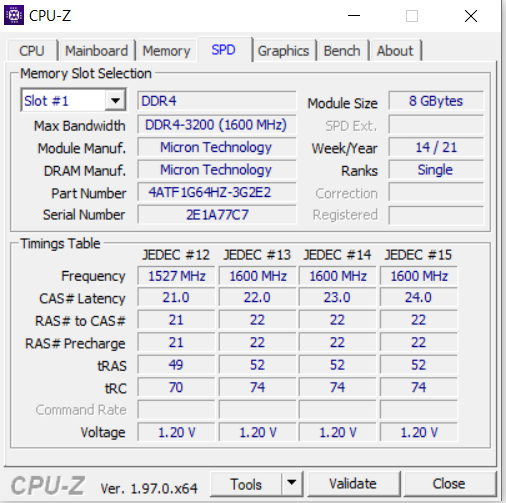
An NVMe SSD (M.2 2230; M.2 2280 models will also fit) from Samsung serves as the system drive. It offers 512 GB of storage and delivers good transfer rates. The laptop is also able to accept a second NVMe SSD (M.2 2230 or M.2 2280).
However, our test unit lacks the fixture that is necessary to insert a second SSD (model number: 0X8MY9). This is the movable thread that allows you to anchor and screw down the back of an M.2 SSD. If you need the thread, you either need to find out from Dell support whether this is available, or alternatively we were also able to locate the part from other vendors such as Amazon, Ebay, and AliExpress.


| Dell G15 5515 Samsung PM991a MZ9LQ512HBLU-00BD1 | Lenovo Legion 5 15ACH-82JU00C6GE-FL Micron 2300 512GB MTFDHBA512TDV | Schenker XMG Focus 15 Samsung SSD 970 EVO Plus 1TB | Gigabyte G5 KC ESR512GTLCG-EAC-4 | Average Samsung PM991a MZ9LQ512HBLU-00BD1 | |
|---|---|---|---|---|---|
| CrystalDiskMark 5.2 / 6 | 41% | 69% | 28% | 12% | |
| Write 4K (MB/s) | 119.9 | 124.6 4% | 238.3 99% | 133.7 12% | 158.3 ? 32% |
| Read 4K (MB/s) | 45.3 | 54.2 20% | 55.6 23% | 46.88 3% | 50.5 ? 11% |
| Write Seq (MB/s) | 1235 | 2706 119% | 3013 144% | 2509 103% | 1528 ? 24% |
| Read Seq (MB/s) | 1765 | 2298 30% | 2879 63% | 2209 25% | 1820 ? 3% |
| Write 4K Q32T1 (MB/s) | 374.3 | 499.7 34% | 569 52% | 373.7 0% | 459 ? 23% |
| Read 4K Q32T1 (MB/s) | 503 | 570 13% | 715 42% | 528 5% | 574 ? 14% |
| Write Seq Q32T1 (MB/s) | 1553 | 2999 93% | 3287 112% | 2511 62% | 1557 ? 0% |
| Read Seq Q32T1 (MB/s) | 3113 | 3461 11% | 3561 14% | 3440 11% | 2815 ? -10% |
| AS SSD | 38% | 58% | 53% | 8% | |
| Seq Read (MB/s) | 2555 | 2960 16% | 2988 17% | 2972 16% | 2593 ? 1% |
| Seq Write (MB/s) | 1791 | 2586 44% | 2541 42% | 2276 27% | 1782 ? -1% |
| 4K Read (MB/s) | 37.8 | 46.84 24% | 42.82 13% | 55.7 47% | 44.2 ? 17% |
| 4K Write (MB/s) | 86.7 | 96.1 11% | 87 0% | 131.2 51% | 131.6 ? 52% |
| 4K-64 Read (MB/s) | 1273 | 854 -33% | 2096 65% | 1775 39% | 1117 ? -12% |
| 4K-64 Write (MB/s) | 926 | 2015 118% | 2455 165% | 2051 121% | 899 ? -3% |
| Access Time Read * (ms) | 0.164 | 0.048 71% | 0.068 59% | 0.091 45% | 0.1287 ? 22% |
| Access Time Write * (ms) | 0.044 | 0.094 -114% | 0.043 2% | 0.028 36% | 0.03133 ? 29% |
| Score Read (Points) | 1566 | 1197 -24% | 2437 56% | 2128 36% | 1421 ? -9% |
| Score Write (Points) | 1192 | 2370 99% | 2797 135% | 2410 102% | 1209 ? 1% |
| Score Total (Points) | 3522 | 4170 18% | 6452 83% | 5595 59% | 3323 ? -6% |
| Copy ISO MB/s (MB/s) | 1899 | 2064 9% | 1667 ? -12% | ||
| Copy Program MB/s (MB/s) | 281.6 | 873 210% | 376 ? 34% | ||
| Copy Game MB/s (MB/s) | 854 | 1503 76% | 894 ? 5% | ||
| Total Average (Program / Settings) | 40% /
39% | 64% /
62% | 41% /
42% | 10% /
10% |
* ... smaller is better
| Drive Performance rating - Percent | |
| Average of class Gaming | |
| Schenker XMG Focus 15 | |
| Gigabyte G5 KC | |
| Lenovo Legion 5 15ACH-82JU00C6GE-FL | |
| Average Samsung PM991a MZ9LQ512HBLU-00BD1 | |
| Dell G15 5515 | |
* ... smaller is better
Dauerleistung Lesen: DiskSpd Read Loop, Queue Depth 8
Graphics Card
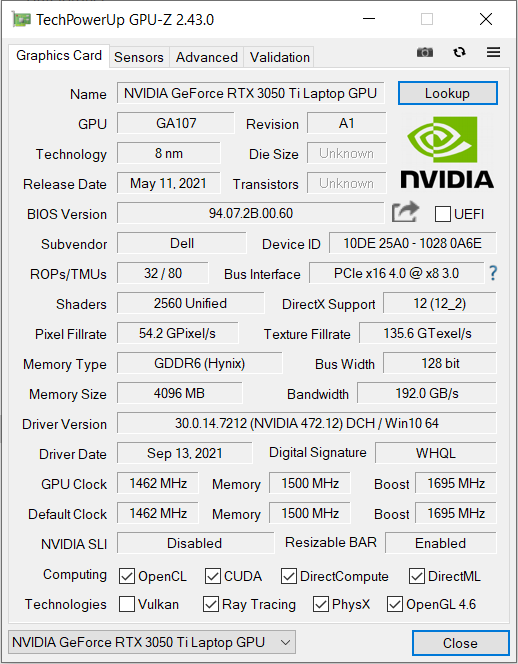
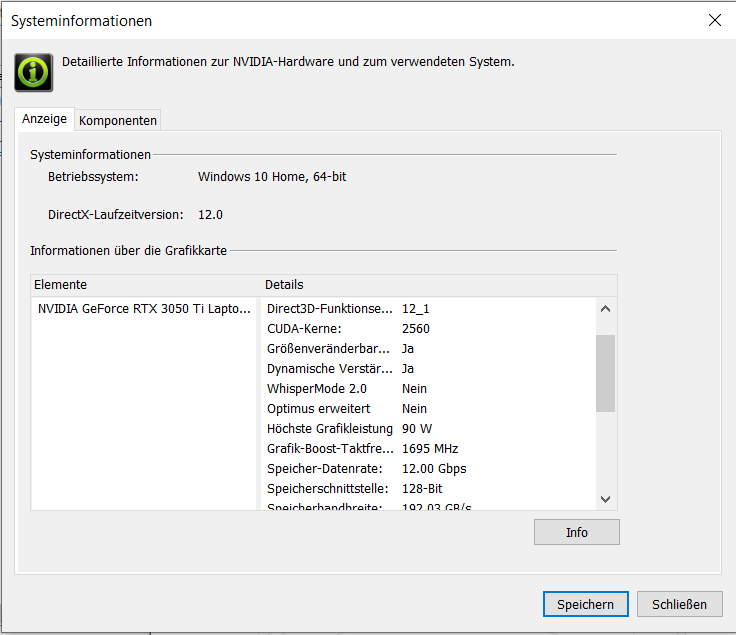
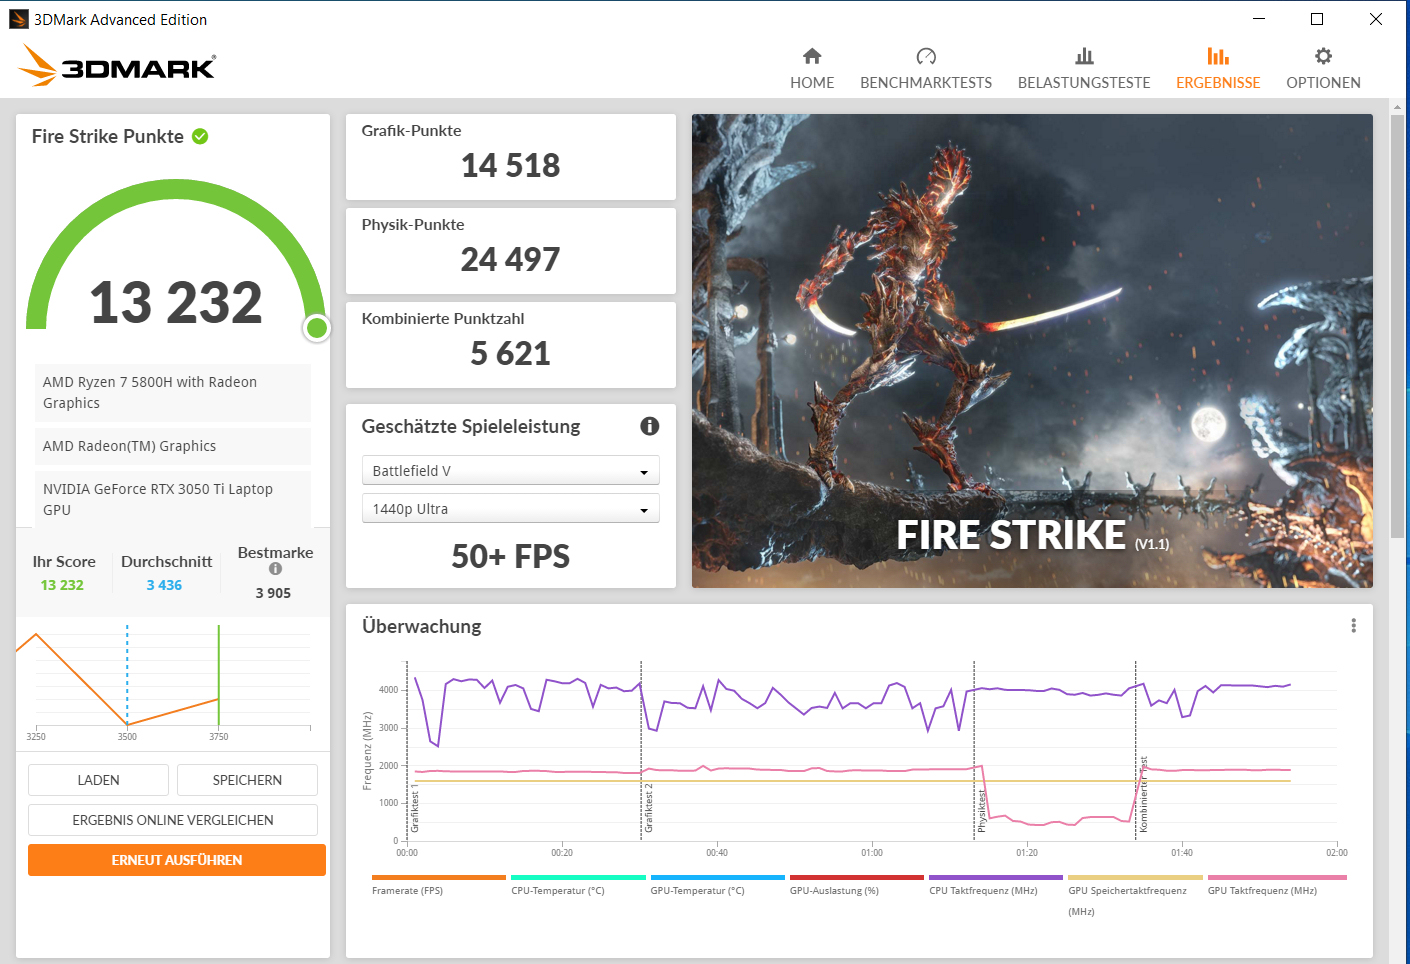
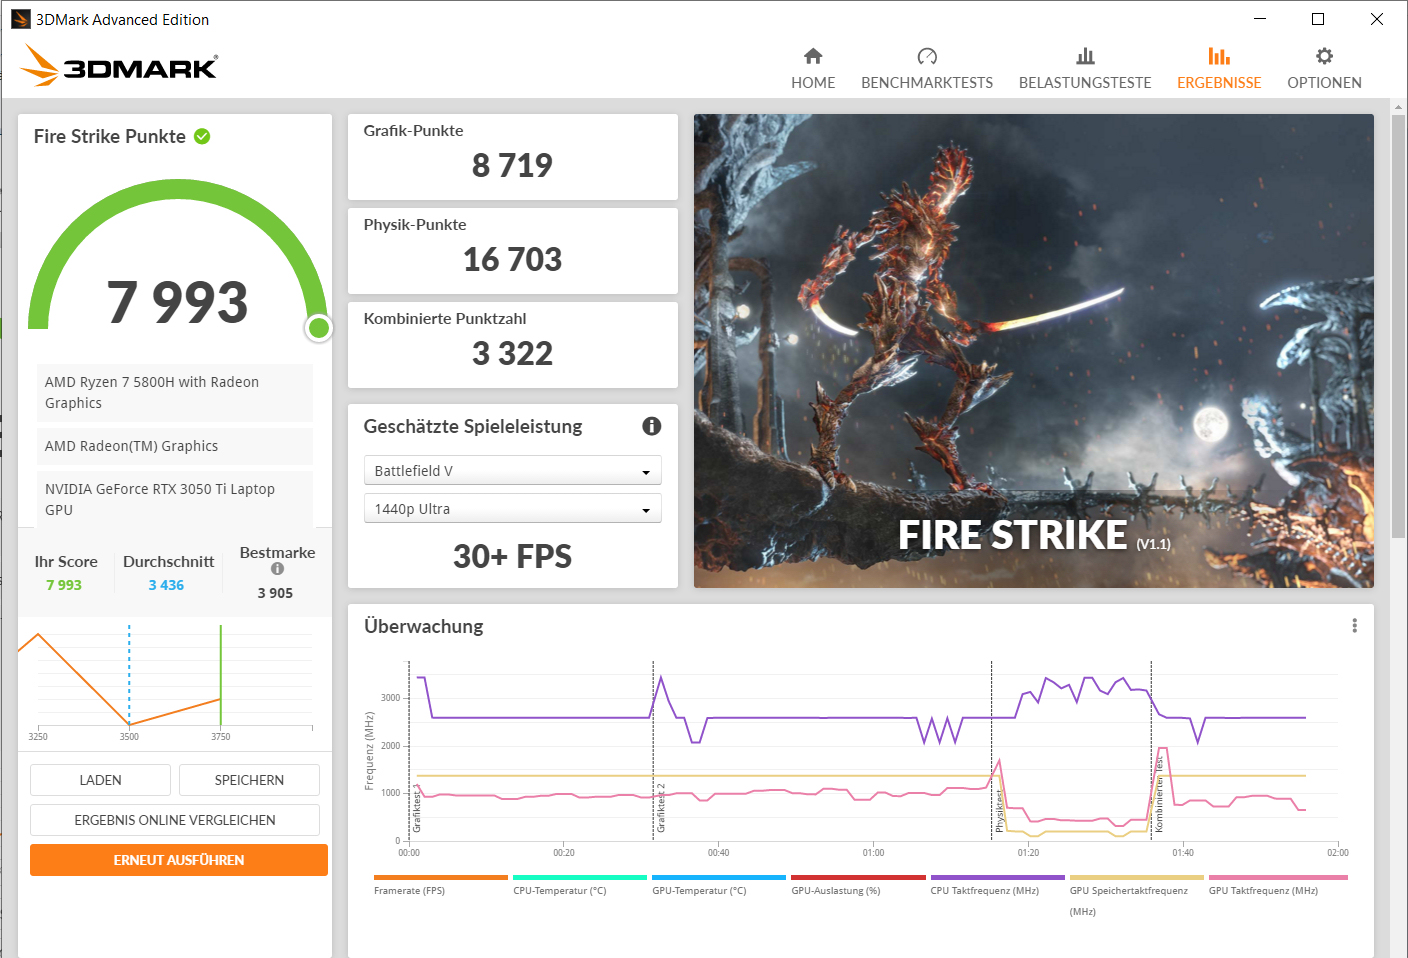
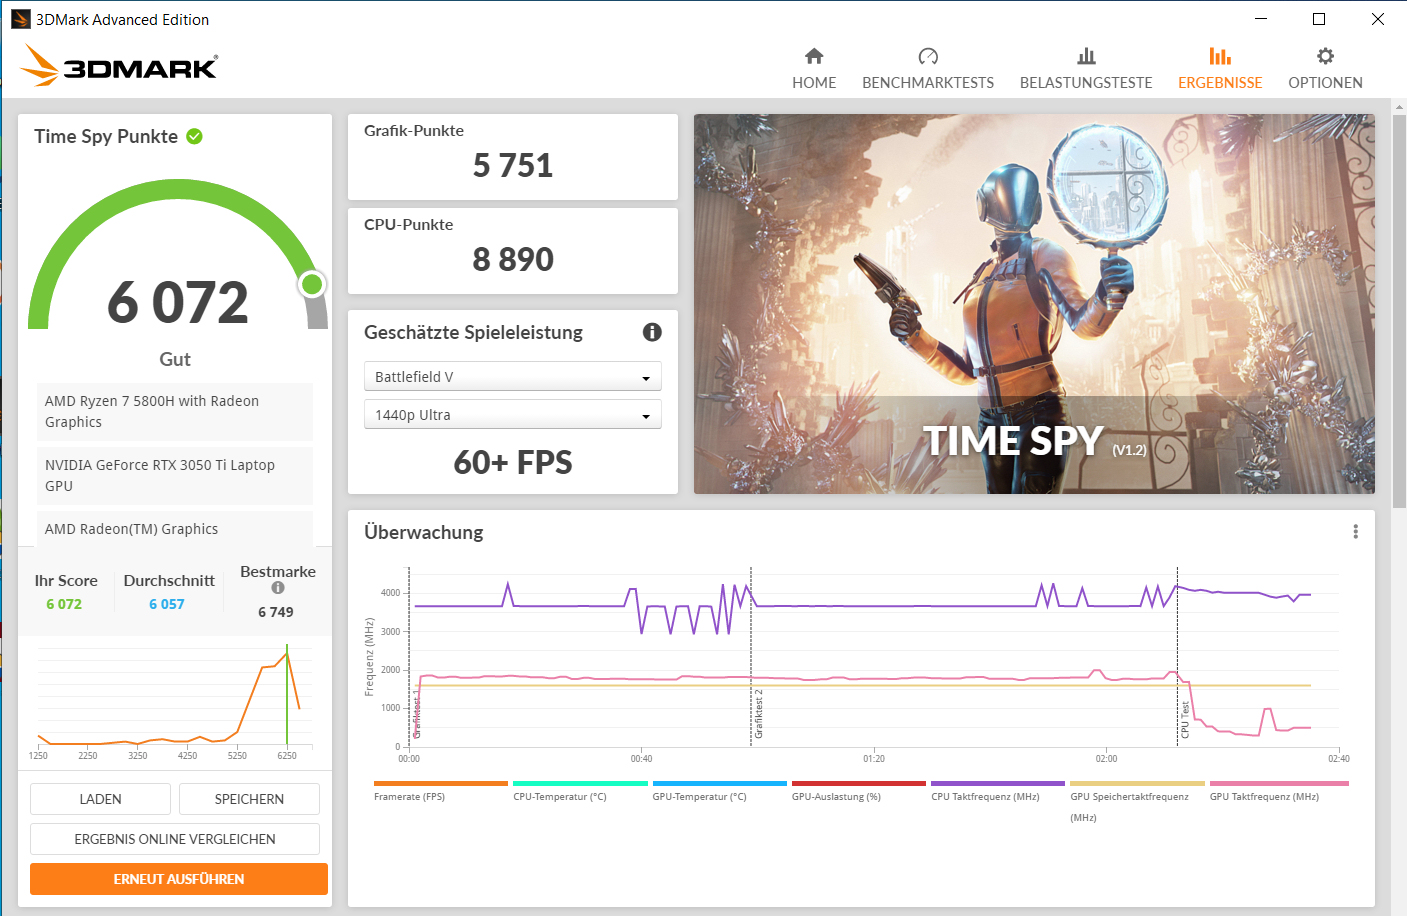
The actual performance of an RTX 3000 GPU depends on several factors: the cooling, the storage equipment, and the maximum TGP configured by the laptop manufacturer within the limits defined by Nvidia. Dell has configured the GeForce RTX 3050 Ti laptop GPU (overview of all RTX 3050 Ti laptops including TGPs) with a maximum TGP of 90 watts (80 watts + 10 watts dynamic boost). However, the dynamic boost appears to be used very little or not at all - at least this is what the Witcher 3 test shows.
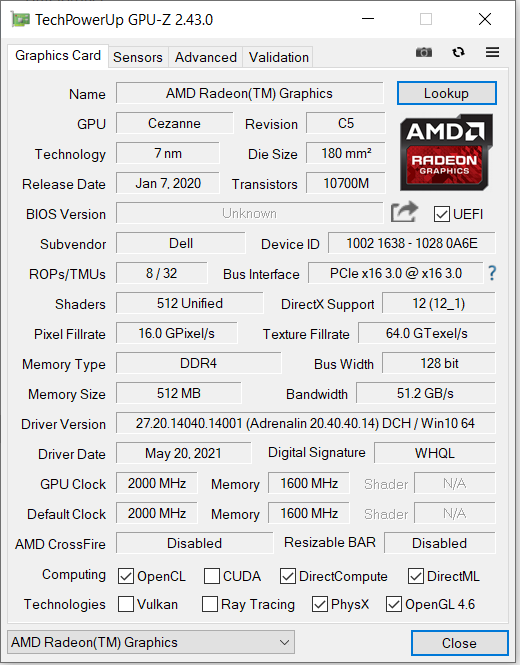
The 3DMark results are at the same level as those of the Schenker XMG Focus 15. The results of both devices are slightly above the RTX 3050 Ti average. The RTX 3050 Ti is able to use fast GDDR6 graphics storage (4096 MB). The Vega 8 graphics core integrated into the processor is active, and the laptop uses Nvidia's Optimus graphics switching solution.
| 3DMark 11 Performance | 18252 points | |
| 3DMark Ice Storm Standard Score | 123089 points | |
| 3DMark Cloud Gate Standard Score | 43639 points | |
| 3DMark Fire Strike Score | 13232 points | |
| 3DMark Time Spy Score | 6072 points | |
Help | ||
| 3DMark Performance rating - Percent | |
| Average of class Gaming | |
| Lenovo Legion 5 15ACH-82JU00C6GE-FL | |
| Gigabyte G5 KC | |
| Schenker XMG Focus 15 | |
| Dell G15 5515 | |
| Average NVIDIA GeForce RTX 3050 Ti Laptop GPU | |
Gaming Performance
The laptop brings all the current games to the screen smoothly. Generally you can select the full display resolution (1920 x 1080 pixels) and high to maximum quality settings. A performance-hungry game such as Cyberpunk 2077 demands some compromise in the quality level. The frame rates turn out slightly below average in the RTX 3050 Ti comparison. The values of the direct competitor, the Schenker XMG Focus 15, range at the same level.
| The Witcher 3 - 1920x1080 Ultra Graphics & Postprocessing (HBAO+) | |
| Average of class Gaming (95 - 240, n=8, last 2 years) | |
| Gigabyte G5 KC | |
| Lenovo Legion 5 15ACH-82JU00C6GE-FL (Ultra Performance) | |
| Lenovo Legion 5 15ACH-82JU00C6GE-FL (Auto) | |
| Lenovo Legion 5 15ACH-82JU00C6GE-FL (Eco) | |
| Dell G15 5515 | |
| Schenker XMG Focus 15 | |
| Average NVIDIA GeForce RTX 3050 Ti Laptop GPU (19 - 58.5, n=29) | |
| Dota 2 Reborn - 1920x1080 ultra (3/3) best looking | |
| Average of class Gaming (84.8 - 248, n=112, last 2 years) | |
| Schenker XMG Focus 15 | |
| Gigabyte G5 KC | |
| Average NVIDIA GeForce RTX 3050 Ti Laptop GPU (67.3 - 145, n=27) | |
| Dell G15 5515 | |
| Lenovo Legion 5 15ACH-82JU00C6GE-FL | |
| Final Fantasy XV Benchmark - 1920x1080 High Quality | |
| Average of class Gaming (41 - 215, n=103, last 2 years) | |
| Lenovo Legion 5 15ACH-82JU00C6GE-FL (1.3) | |
| Gigabyte G5 KC (1.3) | |
| Schenker XMG Focus 15 | |
| Dell G15 5515 (1.3) | |
| Average NVIDIA GeForce RTX 3050 Ti Laptop GPU (23.5 - 106, n=24) | |
| GTA V - 1920x1080 Highest AA:4xMSAA + FX AF:16x | |
| Average of class Gaming (48.3 - 186.9, n=102, last 2 years) | |
| Gigabyte G5 KC | |
| Lenovo Legion 5 15ACH-82JU00C6GE-FL | |
| Schenker XMG Focus 15 | |
| Dell G15 5515 | |
| Average NVIDIA GeForce RTX 3050 Ti Laptop GPU (27.8 - 75.6, n=26) | |
| Strange Brigade - 1920x1080 ultra AA:ultra AF:16 | |
| Average of class Gaming (76.3 - 456, n=93, last 2 years) | |
| Gigabyte G5 KC (1.47.22.14 D3D12) | |
| Dell G15 5515 (1.47.22.14 D3D12) | |
| Schenker XMG Focus 15 (1.47.22.14 D3D12) | |
| Average NVIDIA GeForce RTX 3050 Ti Laptop GPU (34.8 - 101.3, n=25) | |
| Red Dead Redemption 2 - 1920x1080 High Settings | |
| Dell G15 5515 | |
| Average NVIDIA GeForce RTX 3050 Ti Laptop GPU (n=1) | |
| F1 2021 - 1920x1080 Ultra High Preset + Raytracing AA:T AF:16x | |
| Gigabyte G5 KC (803111) | |
| Lenovo Legion 5 15ACH-82JU00C6GE-FL | |
| Dell G15 5515 (807588) | |
| Average NVIDIA GeForce RTX 3050 Ti Laptop GPU (44.4 - 69, n=11) | |
| Dirt 5 - 1920x1080 Ultra High Preset | |
| Dell G15 5515 | |
| Average NVIDIA GeForce RTX 3050 Ti Laptop GPU (40.5 - 54.3, n=5) | |
| Cyberpunk 2077 1.0 - 1920x1080 Medium Preset | |
| Lenovo Legion 5 15ACH-82JU00C6GE-FL | |
| Gigabyte G5 KC | |
| Dell G15 5515 | |
| Average NVIDIA GeForce RTX 3050 Ti Laptop GPU (39 - 45.6, n=4) | |
| New World - 1920x1080 Very High Video Quality | |
| Dell G15 5515 | |
| Average NVIDIA GeForce RTX 3050 Ti Laptop GPU (24.9 - 52.2, n=4) | |
| Far Cry 6 - 1920x1080 Ultra Graphics Quality + HD Textures AA:T | |
| Average of class Gaming (96.3 - 135.7, n=3, last 2 years) | |
| Average NVIDIA GeForce RTX 3050 Ti Laptop GPU (53 - 62, n=2) | |
| Dell G15 5515 | |
In order to evaluate whether the frame rates remain mostly constant over a longer time period, we run the game "The Witcher 3" for about 60 minutes in Full-HD resolution and at maximum quality settings without moving the gaming character. We do not notice any drop in the frame rates.
The Witcher 3 FPS Chart
| low | med. | high | ultra | |
|---|---|---|---|---|
| GTA V (2015) | 174 | 164 | 125 | 71.8 |
| The Witcher 3 (2015) | 252 | 163 | 102 | 56.6 |
| Dota 2 Reborn (2015) | 138 | 124 | 116 | 110 |
| Final Fantasy XV Benchmark (2018) | 132 | 77.4 | 55 | |
| X-Plane 11.11 (2018) | 98 | 85.2 | 70.5 | |
| Far Cry 5 (2018) | 125 | 98 | 92 | 86 |
| Strange Brigade (2018) | 245 | 138 | 112 | 97 |
| Red Dead Redemption 2 (2019) | 118.4 | 75.8 | 50.8 | 27 |
| Dirt 5 (2020) | 162 | 84.3 | 69.1 | 53.6 |
| Cyberpunk 2077 1.0 (2020) | 90.9 | 45.6 | 35.6 | 29.8 |
| F1 2021 (2021) | 221 | 150 | 131 | 66.8 |
| New World (2021) | 99.3 | 73.6 | 68.9 | 52.2 |
| Far Cry 6 (2021) | 107 | 81 | 74 | 53 |
Emissions - The G15 5515 is able to run quietly
Noise Emissions
In everyday operation with Office and Internet, the two fans run at low speeds and are hardly audible. Occasionally they are turned off. Under load, the G15 remains significantly below the noise levels of the competitors, with maximum levels of 48 dB(A) during the stress test and 44 dB(A) during the Witcher 3 test.
Noise level
| Idle |
| 25 / 26 / 30 dB(A) |
| Load |
| 44 / 48 dB(A) |
 | ||
30 dB silent 40 dB(A) audible 50 dB(A) loud |
||
min: | ||
| Dell G15 5515 R7 5800H, GeForce RTX 3050 Ti Laptop GPU | Lenovo Legion 5 15ACH-82JU00C6GE-FL R7 5800H, GeForce RTX 3060 Laptop GPU | Schenker XMG Focus 15 i7-11800H, GeForce RTX 3050 Ti Laptop GPU | Gigabyte G5 KC i5-10500H, GeForce RTX 3060 Laptop GPU | Average NVIDIA GeForce RTX 3050 Ti Laptop GPU | Average of class Gaming | |
|---|---|---|---|---|---|---|
| Noise | -12% | -19% | -30% | -0% | -3% | |
| off / environment * (dB) | 24 | 24.2 -1% | 24 -0% | 27 -13% | 24.8 ? -3% | 24.1 ? -0% |
| Idle Minimum * (dB) | 25 | 29 -16% | 25 -0% | 31 -24% | 25.5 ? -2% | 25.8 ? -3% |
| Idle Average * (dB) | 26 | 29 -12% | 30 -15% | 32 -23% | 26.5 ? -2% | 27.4 ? -5% |
| Idle Maximum * (dB) | 30 | 29 3% | 43 -43% | 51 -70% | 28.7 ? 4% | 30 ? -0% |
| Load Average * (dB) | 44 | 53.5 -22% | 56 -27% | 57 -30% | 41.9 ? 5% | 43 ? 2% |
| Witcher 3 ultra * (dB) | 44 | 53.5 -22% | 56 -27% | 56 -27% | ||
| Load Maximum * (dB) | 48 | 53.5 -11% | 58 -21% | 58 -21% | 49.3 ? -3% | 54 ? -13% |
* ... smaller is better
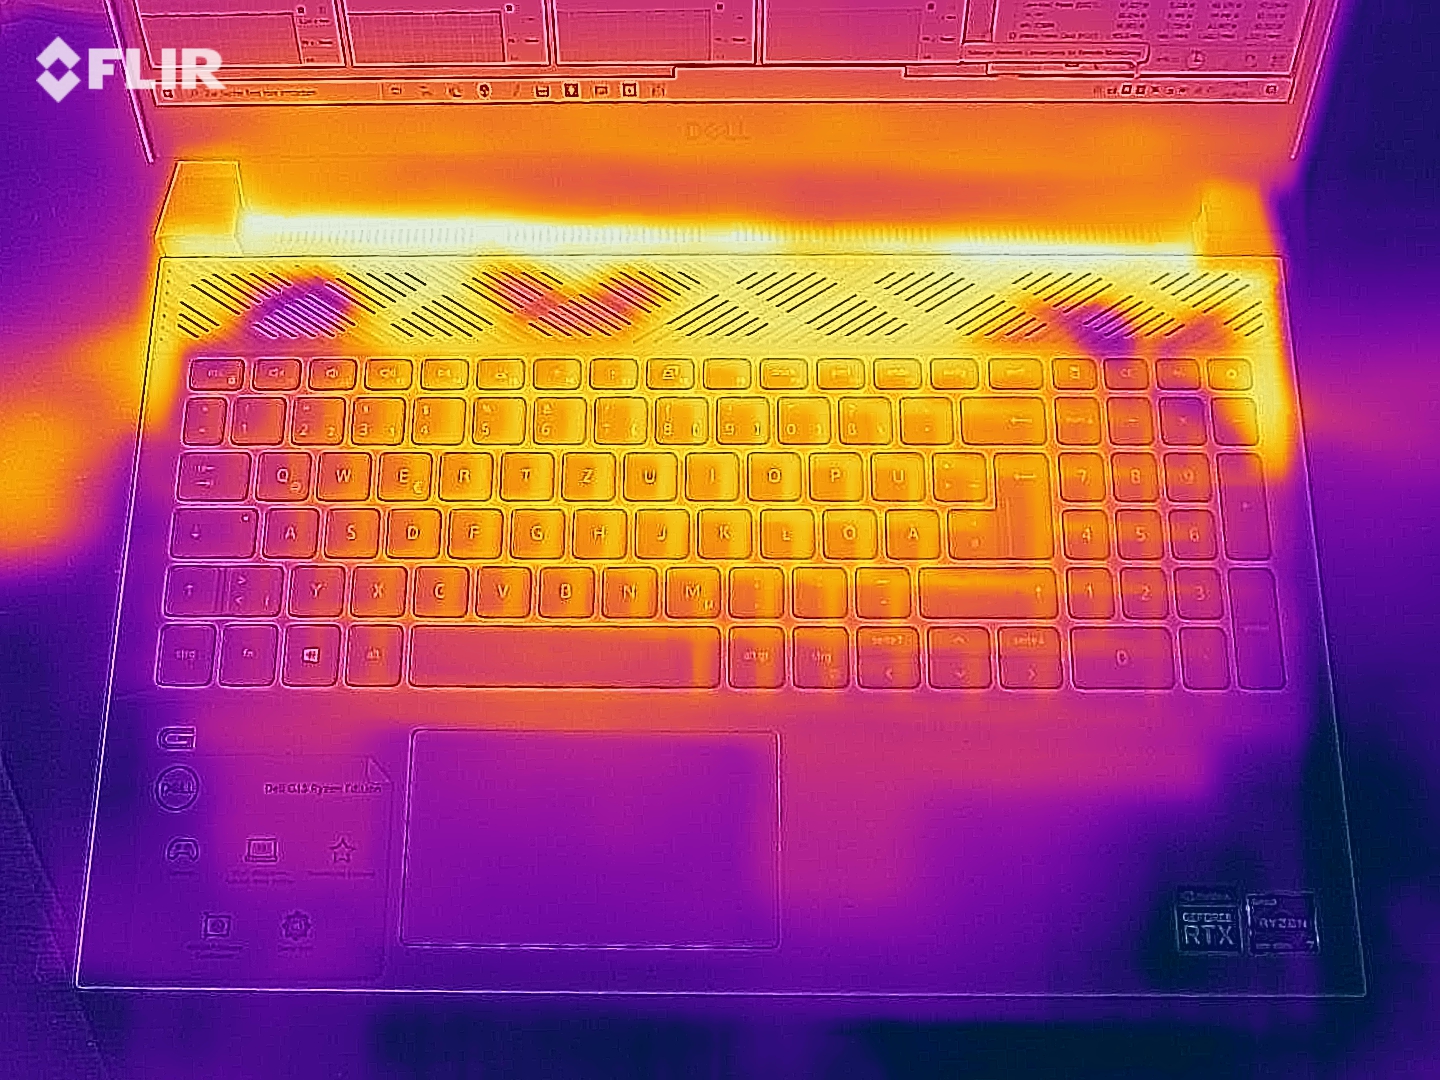
Temperature
In everyday operation (Office, Internet), the case temperatures of the G15 remain clearly within the green range. Under load (stress test, Witcher 3 test), the laptop warms up noticeably but not excessively. While some of the competitors reach temperatures that are in parts higher or lower, overall there are not many differences between them.
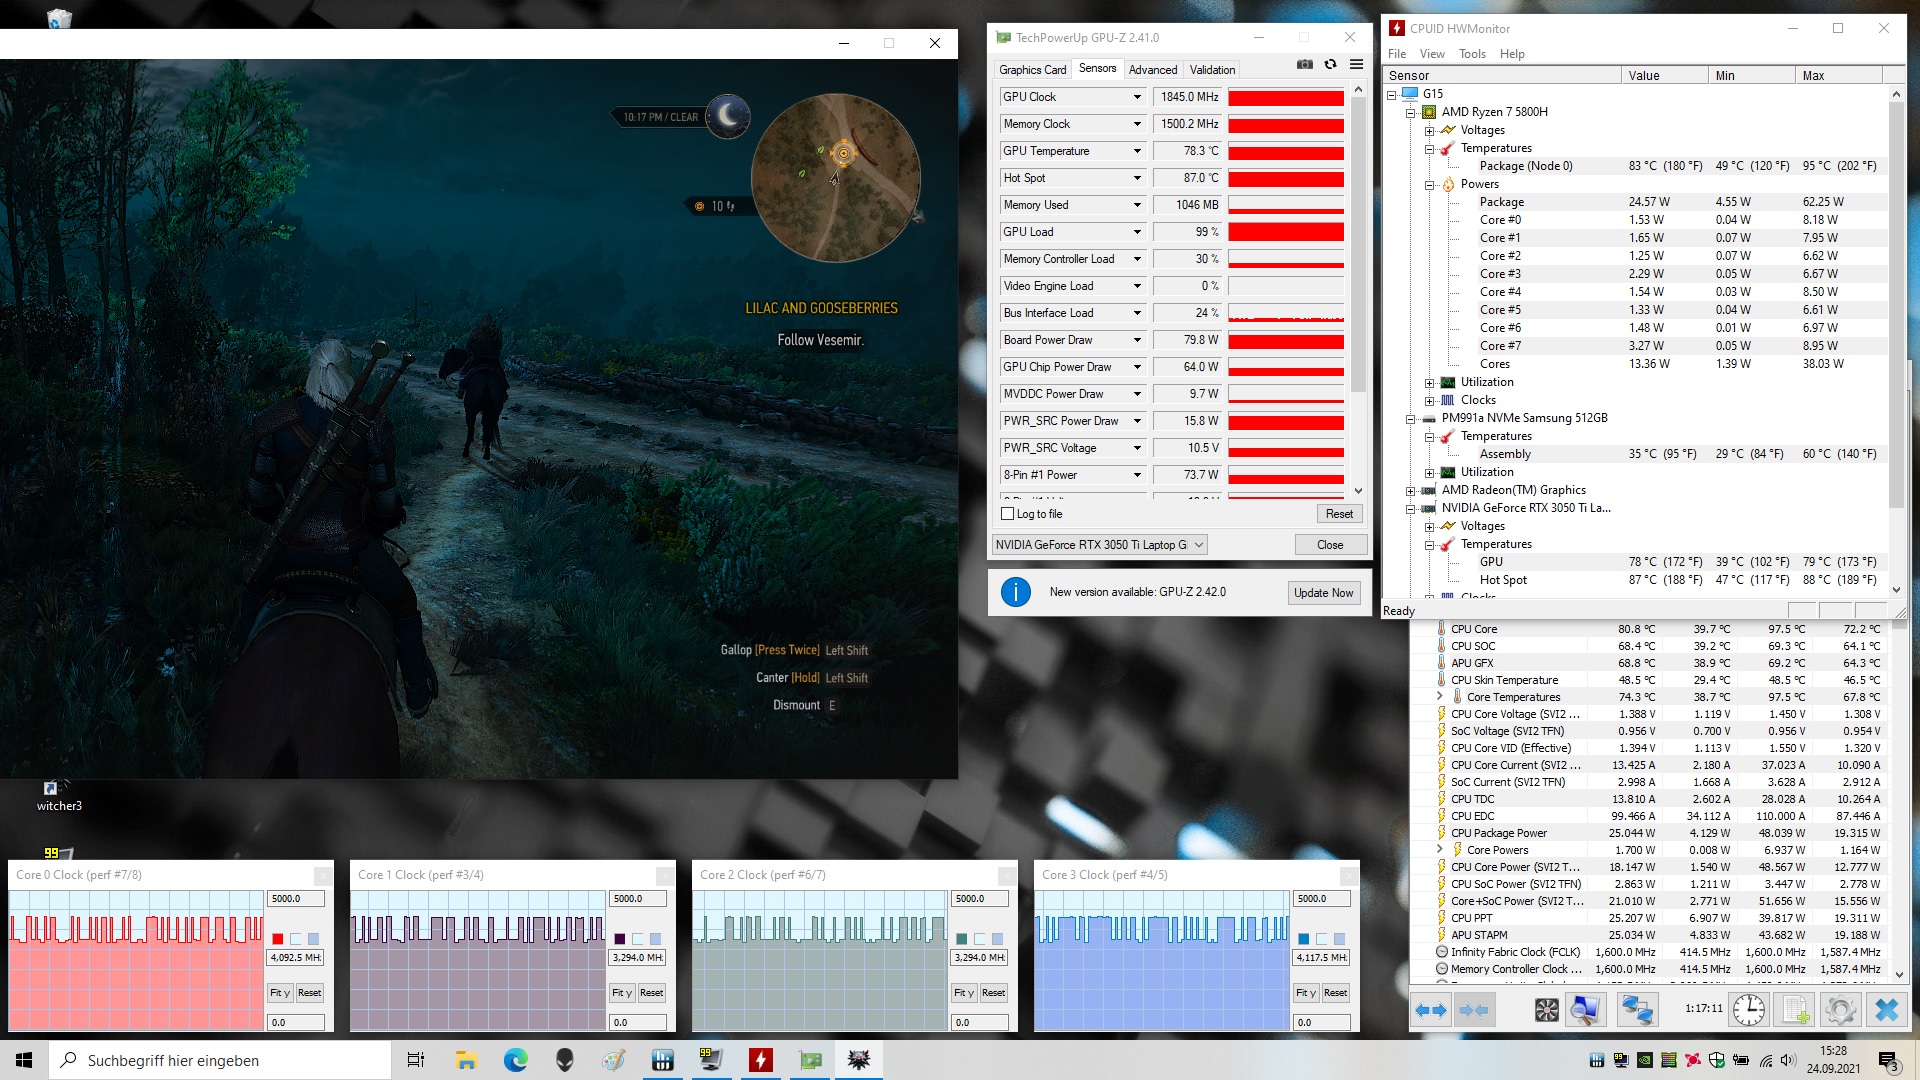
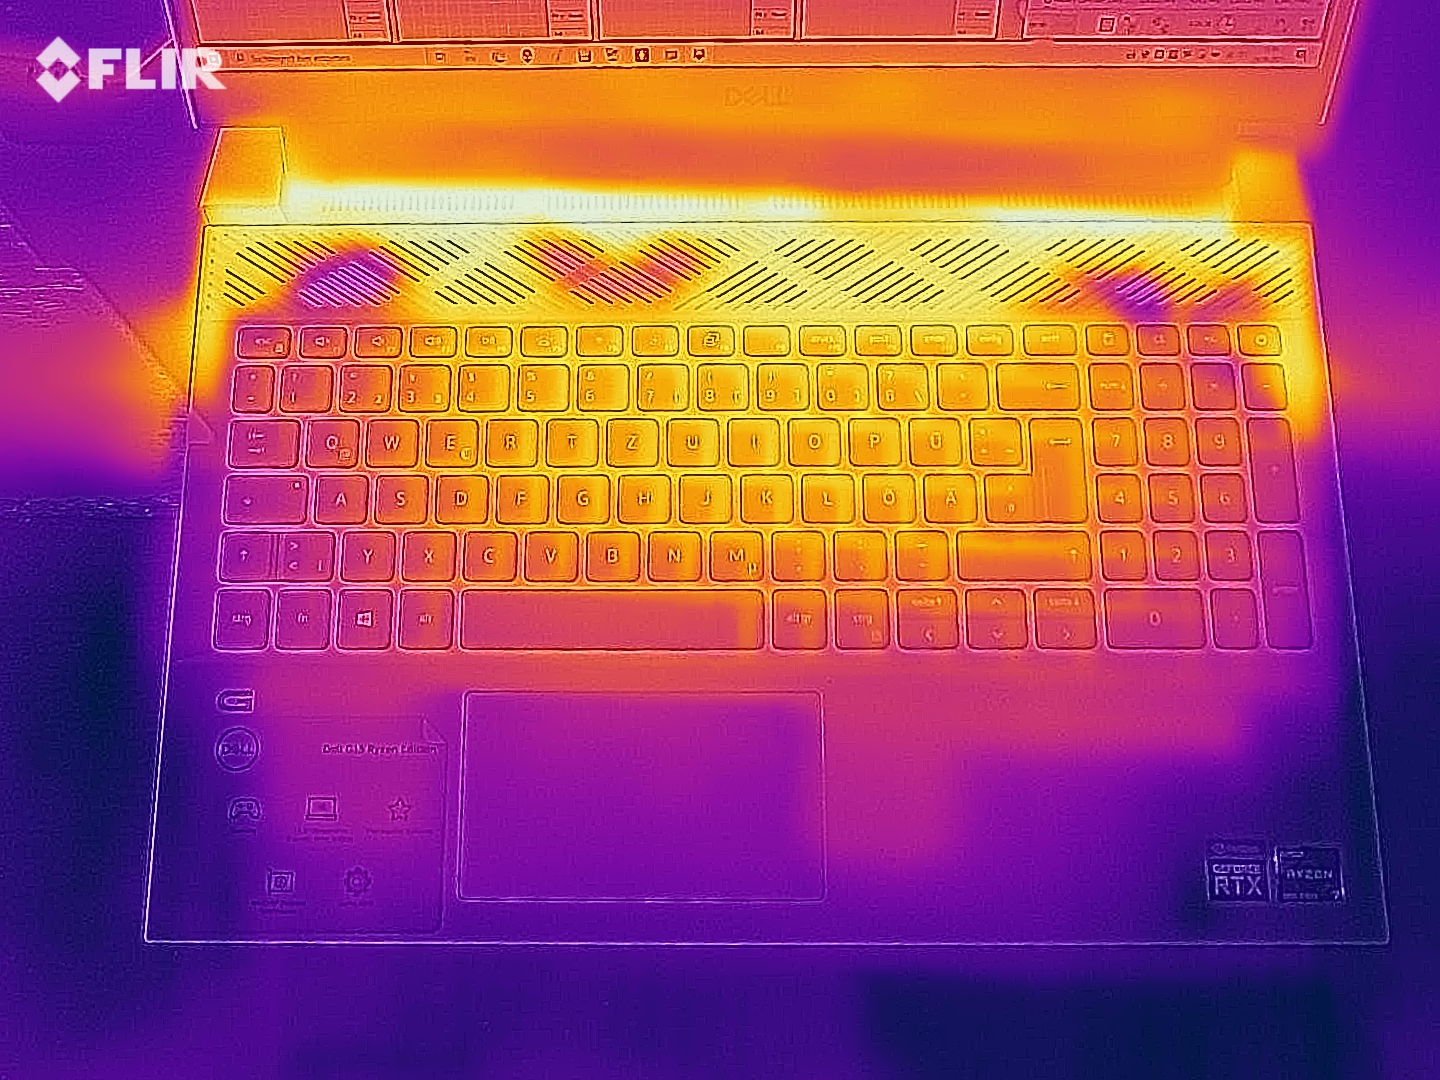
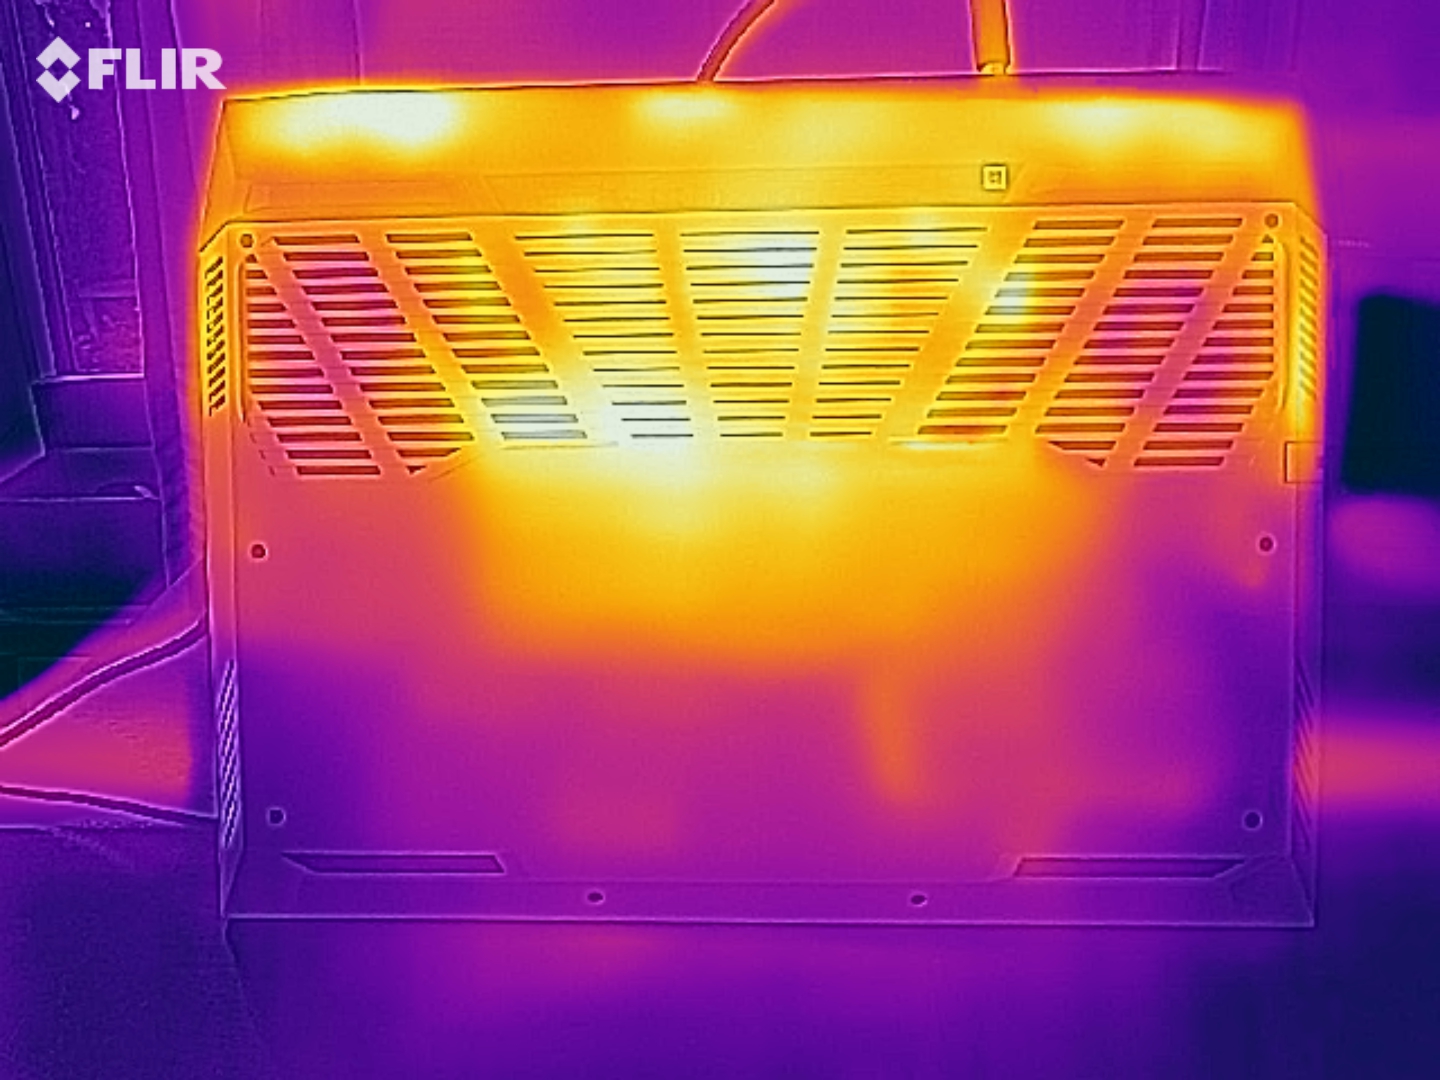
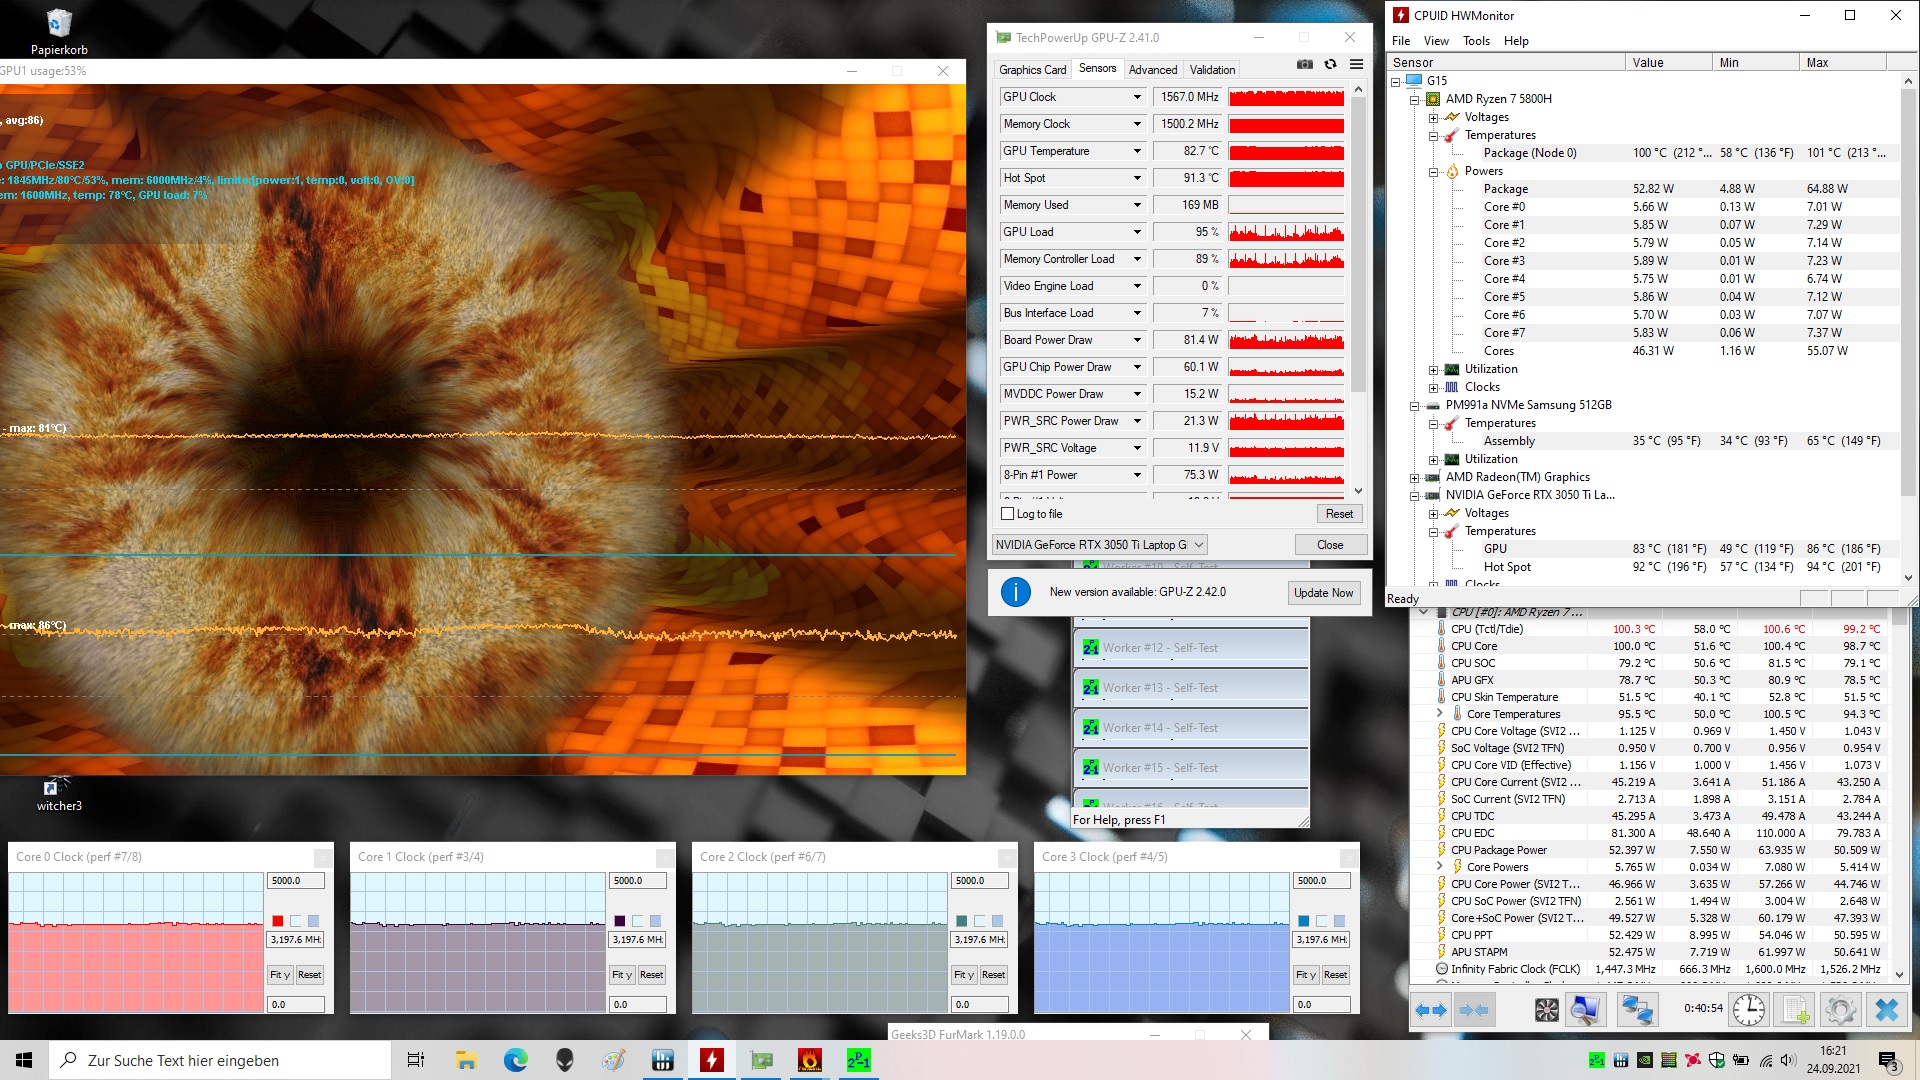
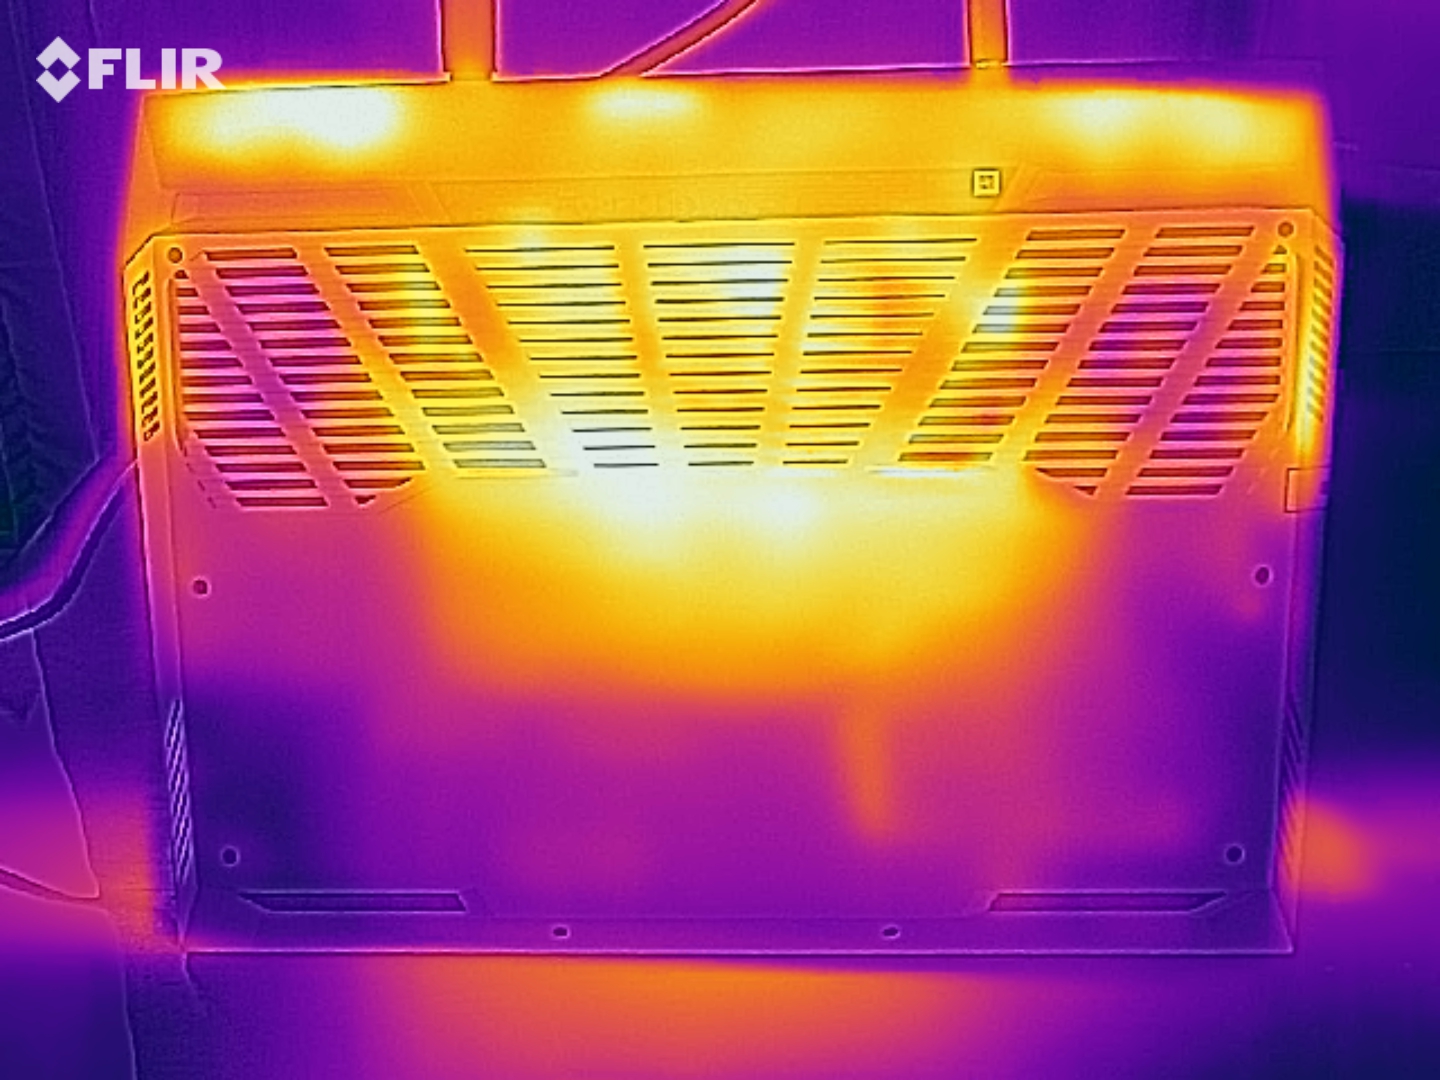
During the stress test with Prime95 and Furmark running for at least one hour, the CPU and GPU run at 3.2 GHz and 1500 to 1600 MHz respectively. The stress test represents an extreme scenario that we use to evaluate whether the system also remains stable during full load.
(-) The maximum temperature on the upper side is 50 °C / 122 F, compared to the average of 40.4 °C / 105 F, ranging from 21.2 to 68.8 °C for the class Gaming.
(-) The bottom heats up to a maximum of 49 °C / 120 F, compared to the average of 43.2 °C / 110 F
(+) In idle usage, the average temperature for the upper side is 24.6 °C / 76 F, compared to the device average of 33.9 °C / 93 F.
(-) Playing The Witcher 3, the average temperature for the upper side is 39.2 °C / 103 F, compared to the device average of 33.9 °C / 93 F.
(+) The palmrests and touchpad are reaching skin temperature as a maximum (34 °C / 93.2 F) and are therefore not hot.
(-) The average temperature of the palmrest area of similar devices was 28.8 °C / 83.8 F (-5.2 °C / -9.4 F).
| Dell G15 5515 R7 5800H, GeForce RTX 3050 Ti Laptop GPU | Lenovo Legion 5 15ACH-82JU00C6GE-FL R7 5800H, GeForce RTX 3060 Laptop GPU | Schenker XMG Focus 15 i7-11800H, GeForce RTX 3050 Ti Laptop GPU | Gigabyte G5 KC i5-10500H, GeForce RTX 3060 Laptop GPU | Average NVIDIA GeForce RTX 3050 Ti Laptop GPU | Average of class Gaming | |
|---|---|---|---|---|---|---|
| Heat | 4% | -21% | -15% | -7% | -10% | |
| Maximum Upper Side * (°C) | 50 | 42.6 15% | 43 14% | 50 -0% | 46 ? 8% | 45.2 ? 10% |
| Maximum Bottom * (°C) | 49 | 52.2 -7% | 46 6% | 49 -0% | 48.6 ? 1% | 48 ? 2% |
| Idle Upper Side * (°C) | 26 | 24.9 4% | 39 -50% | 33 -27% | 30.8 ? -18% | 31.1 ? -20% |
| Idle Bottom * (°C) | 26 | 25.3 3% | 40 -54% | 34 -31% | 31.2 ? -20% | 34.2 ? -32% |
* ... smaller is better
Speakers
The stereo speakers produce a decent sound that lacks bass. For a better listening experience, headphones or external speakers are recommended.
Dell G15 5515 audio analysis
(±) | speaker loudness is average but good (76 dB)
Bass 100 - 315 Hz
(-) | nearly no bass - on average 22% lower than median
(±) | linearity of bass is average (14.9% delta to prev. frequency)
Mids 400 - 2000 Hz
(+) | balanced mids - only 2.8% away from median
(+) | mids are linear (3% delta to prev. frequency)
Highs 2 - 16 kHz
(+) | balanced highs - only 1.4% away from median
(+) | highs are linear (3.7% delta to prev. frequency)
Overall 100 - 16.000 Hz
(±) | linearity of overall sound is average (16.8% difference to median)
Compared to same class
» 44% of all tested devices in this class were better, 11% similar, 46% worse
» The best had a delta of 6%, average was 18%, worst was 132%
Compared to all devices tested
» 29% of all tested devices were better, 8% similar, 63% worse
» The best had a delta of 4%, average was 24%, worst was 134%
Lenovo Legion 5 15ACH-82JU00C6GE-FL audio analysis
(±) | speaker loudness is average but good (81 dB)
Bass 100 - 315 Hz
(-) | nearly no bass - on average 22.1% lower than median
(±) | linearity of bass is average (11.4% delta to prev. frequency)
Mids 400 - 2000 Hz
(+) | balanced mids - only 4.5% away from median
(+) | mids are linear (5% delta to prev. frequency)
Highs 2 - 16 kHz
(+) | balanced highs - only 2.9% away from median
(+) | highs are linear (4.5% delta to prev. frequency)
Overall 100 - 16.000 Hz
(±) | linearity of overall sound is average (17.8% difference to median)
Compared to same class
» 53% of all tested devices in this class were better, 10% similar, 37% worse
» The best had a delta of 6%, average was 18%, worst was 132%
Compared to all devices tested
» 36% of all tested devices were better, 8% similar, 56% worse
» The best had a delta of 4%, average was 24%, worst was 134%
Power Management - A gaming laptop with an excellent battery life
Power Consumption
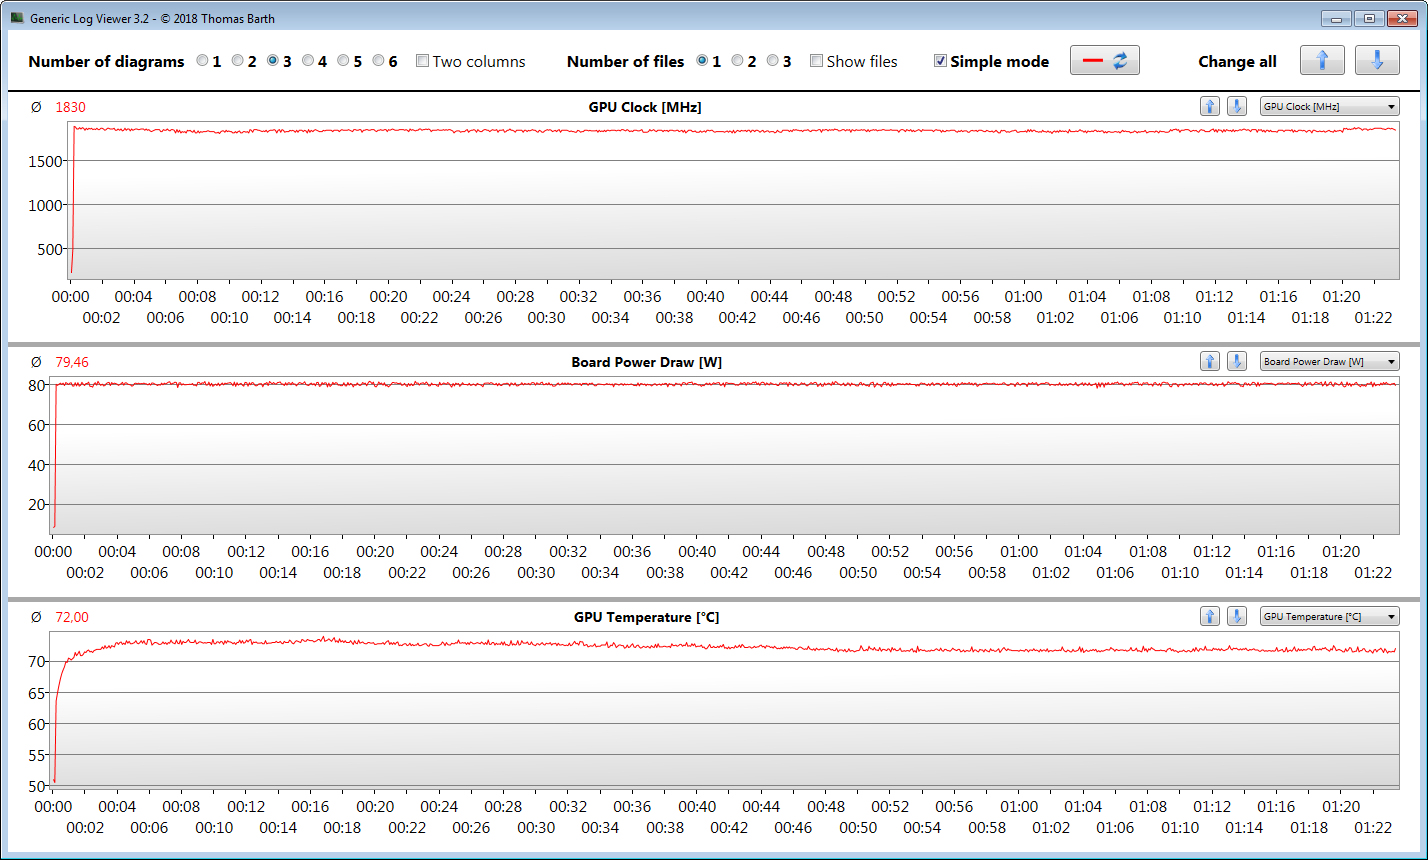
Overall, the power consumption ranges at normal levels for the hardware used here across the whole load range. A positive point is that the laptop consumes significantly less power during idle operation than the Schenker XMG Focus 15. The power supply is rated at 180 watts. The chart below shows the constant power consumption of the laptop during the Witcher 3 test.
| Off / Standby | |
| Idle | |
| Load |
|
Key:
min: | |
The Witcher 3 Power Consumption
| Dell G15 5515 R7 5800H, GeForce RTX 3050 Ti Laptop GPU | Lenovo Legion 5 15ACH-82JU00C6GE-FL R7 5800H, GeForce RTX 3060 Laptop GPU | Schenker XMG Focus 15 i7-11800H, GeForce RTX 3050 Ti Laptop GPU | Gigabyte G5 KC i5-10500H, GeForce RTX 3060 Laptop GPU | Average NVIDIA GeForce RTX 3050 Ti Laptop GPU | Average of class Gaming | |
|---|---|---|---|---|---|---|
| Power Consumption | -22% | -99% | -31% | -14% | -72% | |
| Idle Minimum * (Watt) | 5 | 7.3 -46% | 23 -360% | 8 -60% | 8.2 ? -64% | 13.2 ? -164% |
| Idle Average * (Watt) | 9 | 10.5 -17% | 25 -178% | 13 -44% | 12.6 ? -40% | 18.9 ? -110% |
| Idle Maximum * (Watt) | 20 | 15.7 22% | 29 -45% | 20 -0% | 17.2 ? 14% | 24.3 ? -22% |
| Load Average * (Watt) | 94 | 108 -15% | 106 -13% | 98 -4% | 92 ? 2% | 108 ? -15% |
| Witcher 3 ultra * (Watt) | 123 | 175 -42% | 128 -4% | 166 -35% | ||
| Load Maximum * (Watt) | 172 | 228 -33% | 156 9% | 242 -41% | 139.1 ? 19% | 254 ? -48% |
* ... smaller is better
Battery Life
In the WLAN test, which calls up websites via script, and the video test with the short film Big Buck Bunny (H.264-coding, FHD) running in a loop, the 15.6-inch laptop achieves runtimes of 7:58 h and 8:49 h respectively. During both tests, the power saving functions of the laptop are deactivated and the display brightness is adjusted to about 150 cd/m². In addition, the communication modules are turned off while running the video test.
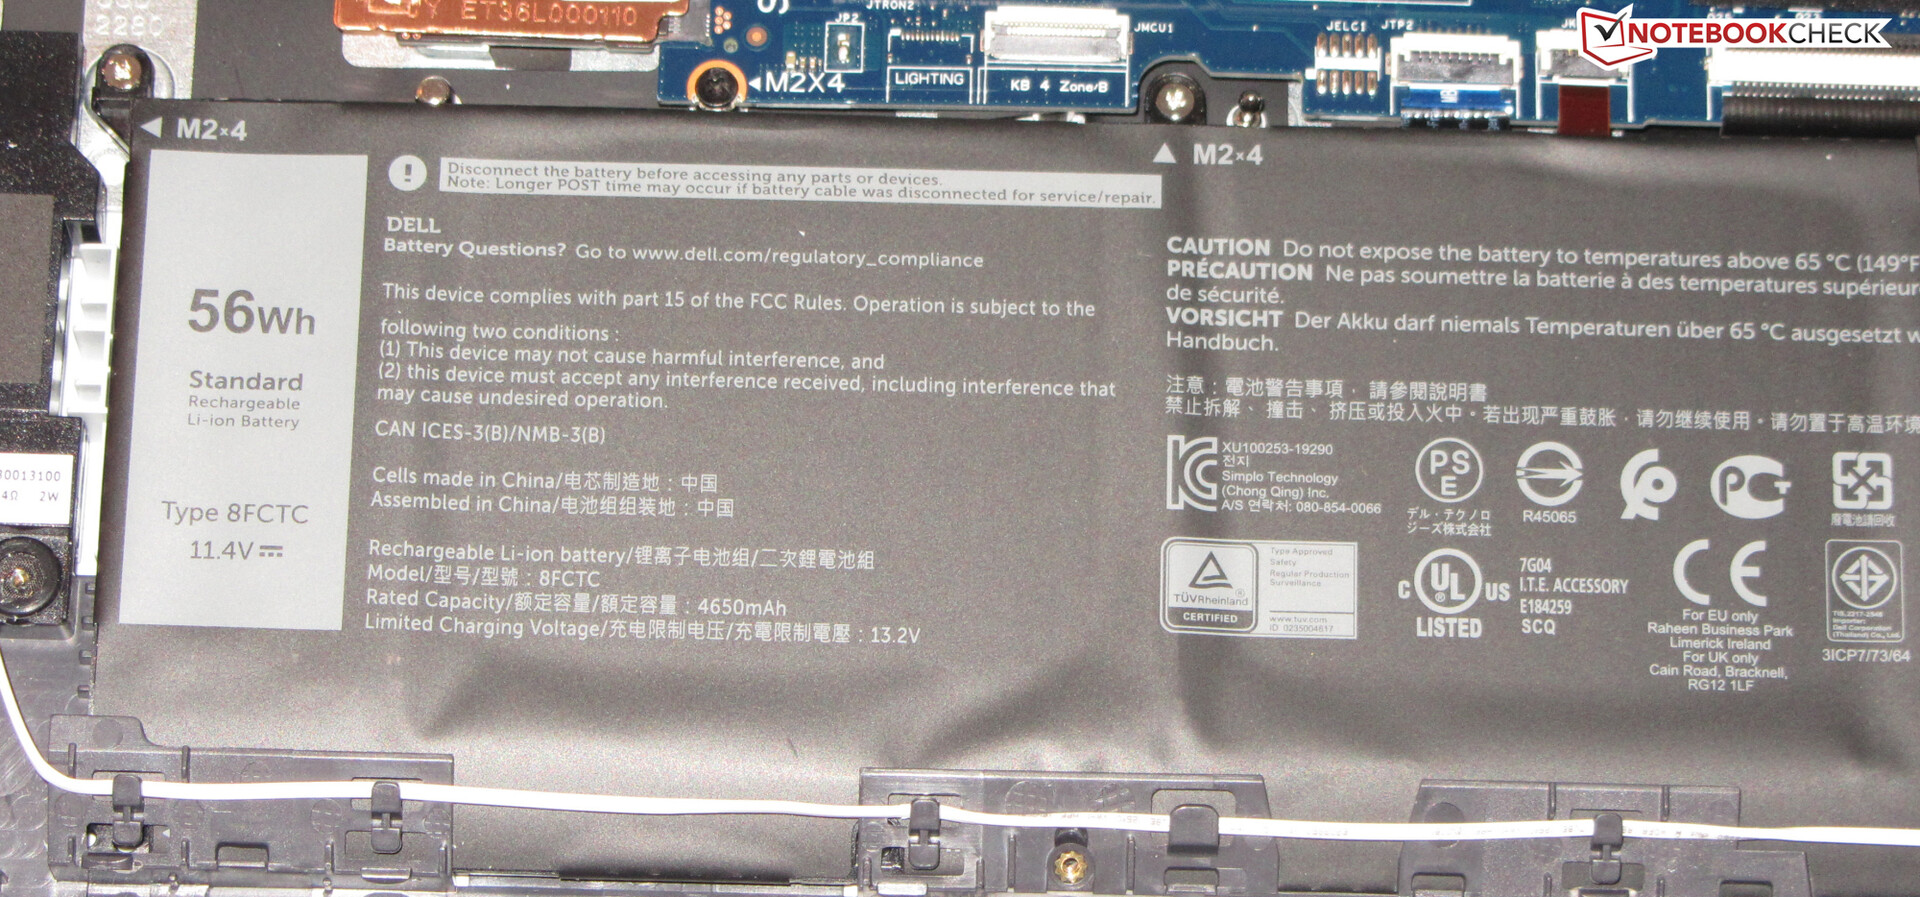
| Dell G15 5515 R7 5800H, GeForce RTX 3050 Ti Laptop GPU, 56 Wh | Lenovo Legion 5 15ACH-82JU00C6GE-FL R7 5800H, GeForce RTX 3060 Laptop GPU, 80 Wh | Schenker XMG Focus 15 i7-11800H, GeForce RTX 3050 Ti Laptop GPU, 49 Wh | Gigabyte G5 KC i5-10500H, GeForce RTX 3060 Laptop GPU, 48.96 Wh | Average of class Gaming | |
|---|---|---|---|---|---|
| Battery runtime | -24% | -48% | -48% | -14% | |
| Reader / Idle (h) | 13.5 | 6.5 -52% | 5.2 -61% | 8.71 ? -35% | |
| H.264 (h) | 8.8 | 4.3 -51% | 8.26 ? -6% | ||
| WiFi v1.3 (h) | 8 | 4.8 -40% | 3.9 -51% | 3.6 -55% | 7.02 ? -12% |
| Load (h) | 1.5 | 1.8 20% | 0.9 -40% | 1.1 -27% | 1.47 ? -2% |
Pros
Cons
Verdict - A well-rounded entry-level gamer

For barely 1050 Euros (~$1217) for our test configuration of the Dell G15 5515, you get a well-rounded and well-equipped entry-level gaming laptop. However, at only 512 GB, the amount of storage is quite meager for a gaming laptop - but you can also upgrade this.
The Dell G15 5515 did not show any grave weaknesses.
The Ryzen 7 5800H APU and GeForce RTX 3050 Ti GPU allow it to run all the current games smoothly - generally in FHD resolution and at high to maximum quality settings. There are no problems in terms of the performance development, and the APU and GPU are able to run constantly at high clock speeds.
While the laptop warms up noticeably under load, this is not excessive. The noise development is at the usual level of the class. In everyday operation, the device runs quietly or even silently. Dell deserves some praise for the battery life. With realistic values of 8 to 9 hours, the G15 outlasts even some office laptops. A point that deserves some complaint is the one-year warranty. At a purchase price of about 1050 Euros (~$1217), it deserves at least a two-year warranty period.
The display (FHD, IPS, 120 Hz) represents the largest weakness of the G15 5515. The brightness and contrast are lower than they should be, and the color space coverage also turns out too low. In addition, the panel shows some PWM flickering. On the positive side are the matte display surface and a decent color reproduction.
An alternative to the G15 could be the Lenovo Legion 5 15ACH, which has a more powerful graphics core and an overall better display on board. In addition, Lenovo offers a two-year warranty for the laptop.
Price and Availability
At the time of the test, the Dell G15 with a Ryzen 7 5800H, GeForce RTX 3050 Ti, 8 GB of RAM, and 512 GB SSD is available for $1090 from Dell, with other configurations also being available.
Dell G15 5515
- 10/12/2021 v7 (old)
Sascha Mölck
Price comparison

