Dell G15 5530 Review: A viable Alienware alternative now with Raptor Lake-HX

The Dell G series is aimed at bringing Alienware prowess to those who prefer not to pay through the teeth for a capable gaming laptop. Back during MWC 2023, Dell introduced the refreshed G15 and G16 series with Intel Raptor Lake-HX and Nvidia GeForce RTX 40 series GPU options.
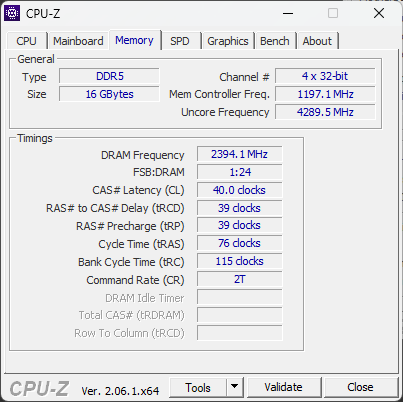
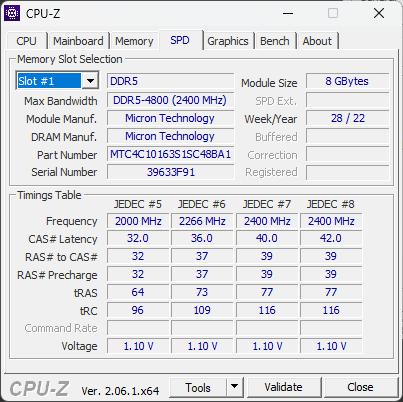
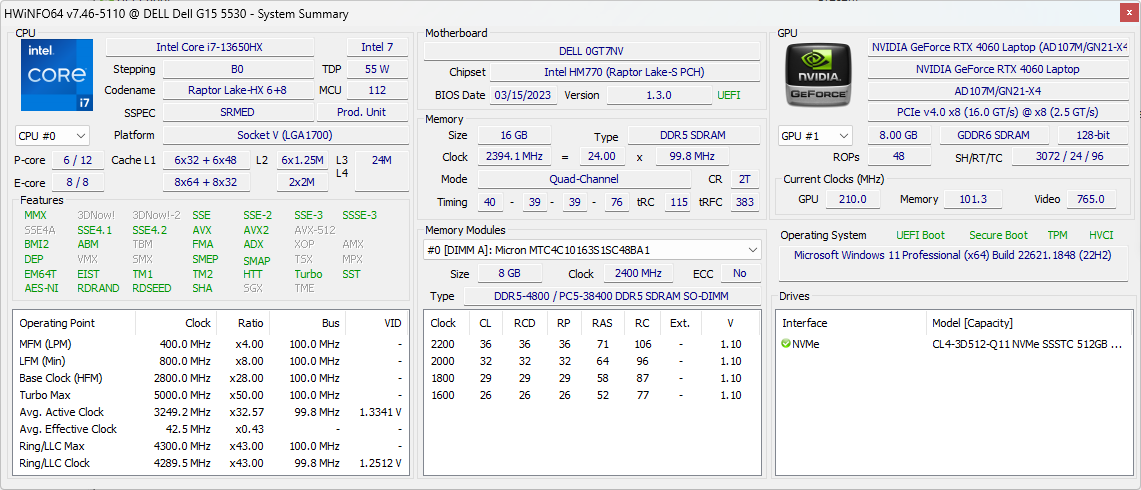
We now have with us the Dell G15 5530 with a top-end configuration featuring the Intel Core i7-13650HX, Nvidia GeForce RTX 4060 Laptop GPU, 16 GB DDR5-4800 RAM, 512 GB NVMe SSD, and a 15.6-inch 165 Hz FHD G-Sync display.
In this review, we take the Dell G15 5530 for a spin and see how well it fares vis-à-vis the competition for the ₹1,58,990 (€1,449 or US$1659.99) asking price.
Potential competitors in comparison
Rating | Date | Model | Weight | Height | Size | Resolution | Price |
|---|---|---|---|---|---|---|---|
| 84.2 % v7 (old) | 06 / 2023 | Dell G15 5530 i7-13650HX, GeForce RTX 4060 Laptop GPU | 3 kg | 26.95 mm | 15.60" | 1920x1080 | |
| 87.4 % v7 (old) | 03 / 2023 | Asus ROG Strix G18 G814JI i7-13650HX, GeForce RTX 4070 Laptop GPU | 3 kg | 31 mm | 18.00" | 2560x1600 | |
| 87.9 % v7 (old) | 05 / 2023 | Lenovo Legion Pro 5 16IRX8 i7-13700HX, GeForce RTX 4060 Laptop GPU | 2.5 kg | 26.8 mm | 16.00" | 2560x1600 | |
| 89.7 % v7 (old) | 06 / 2023 | Asus ROG Flow X16 GV601V i9-13900H, GeForce RTX 4060 Laptop GPU | 2.1 kg | 19.4 mm | 16.00" | 2560x1600 | |
| 82.1 % v7 (old) | 02 / 2023 | MSI Katana 17 B13VFK i7-13620H, GeForce RTX 4060 Laptop GPU | 2.8 kg | 25.2 mm | 17.30" | 1920x1080 | |
| 86.9 % v7 (old) | 06 / 2023 | Asus TUF Gaming A16 FA617XS R9 7940HS, Radeon RX 7600S | 2.2 kg | 22.1 mm | 16.00" | 1920x1200 | |
| 88.4 % v7 (old) | 04 / 2023 | Asus ROG Strix G17 G713PI R9 7945HX, GeForce RTX 4070 Laptop GPU | 2.8 kg | 30.7 mm | 17.30" | 2560x1440 | |
| 89 % v7 (old) | 04 / 2023 | Medion Erazer Major X20 i9-13900HX, GeForce RTX 4070 Laptop GPU | 2.4 kg | 29 mm | 16.00" | 2560x1600 |
Chassis: Plastic heavyweight complemented by a bulky power brick
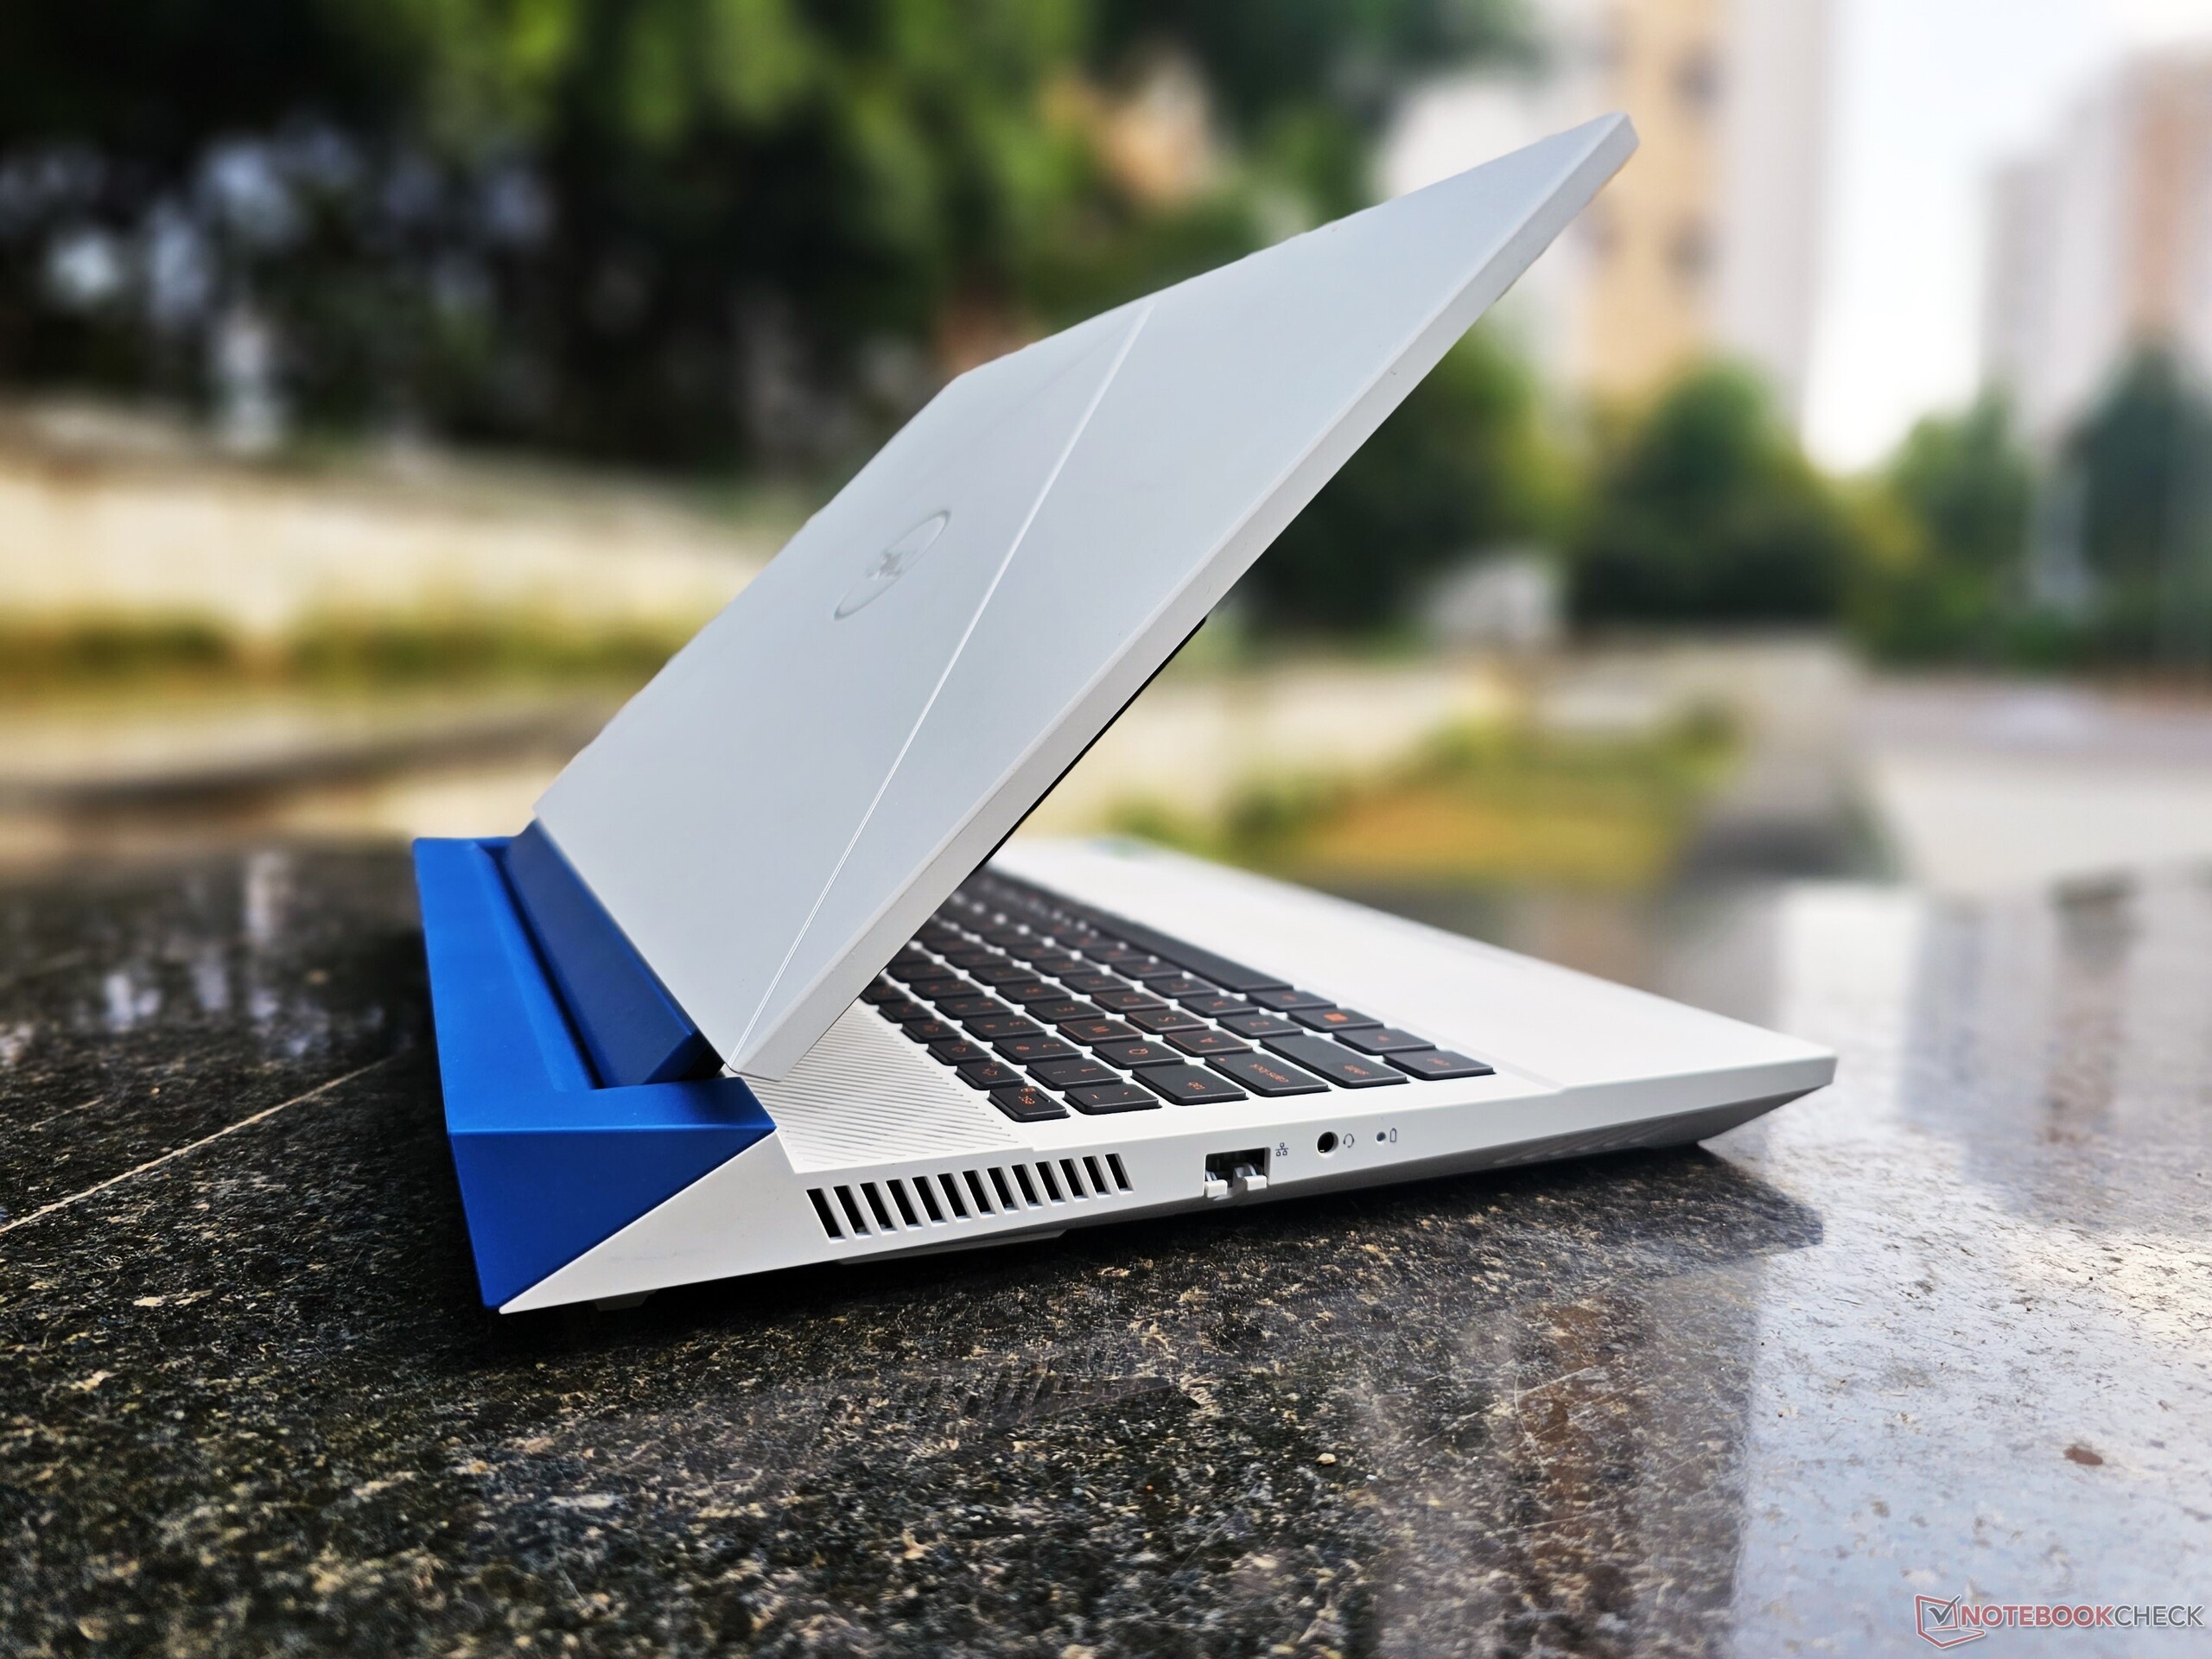
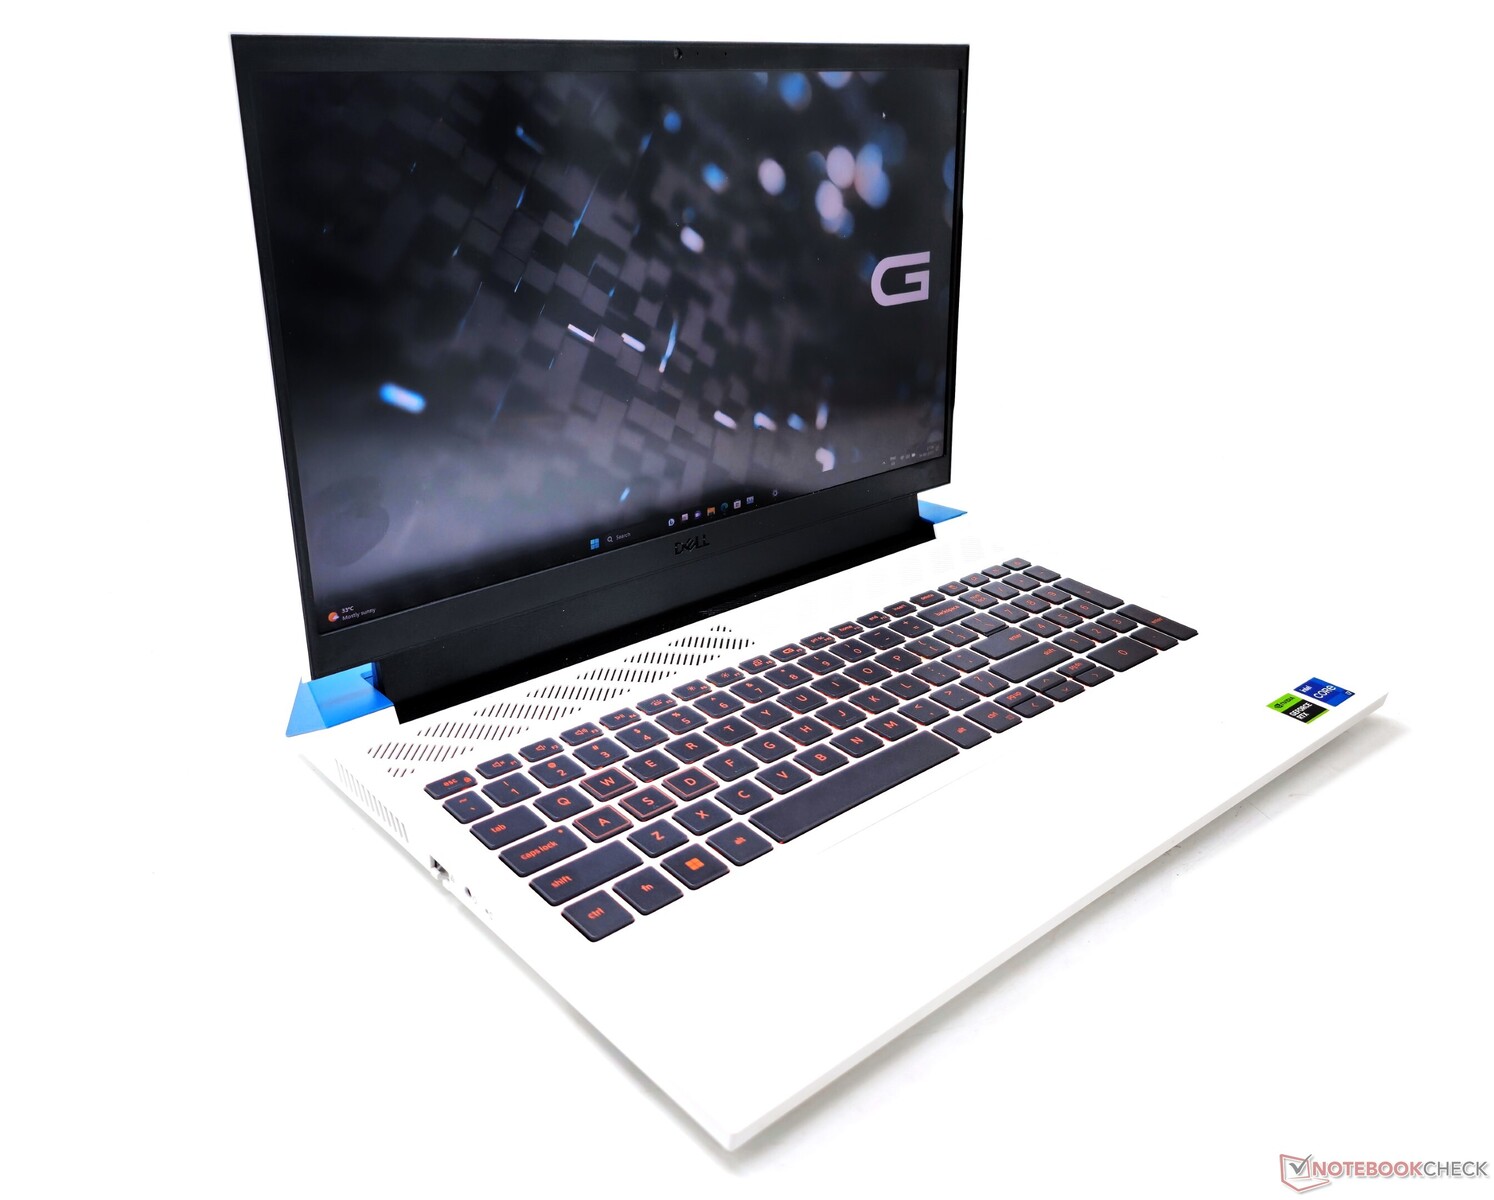
Dell seems to have cut-down on RGB pizzazz this time, unlike what we've seen previously with the G15 5520 and G15 5521 Special Edition. The 5530's chassis is more or less identical to that of the G15 5510.
Our G15 5530 unit is the Quantum White variant with a Deep Space Blue thermal shelf. Additionally, Dell offers two alternative color choices for this model: Dark Shadow Gray with a Black thermal shelf and Pop Purple with a Neo Mint thermal shelf.
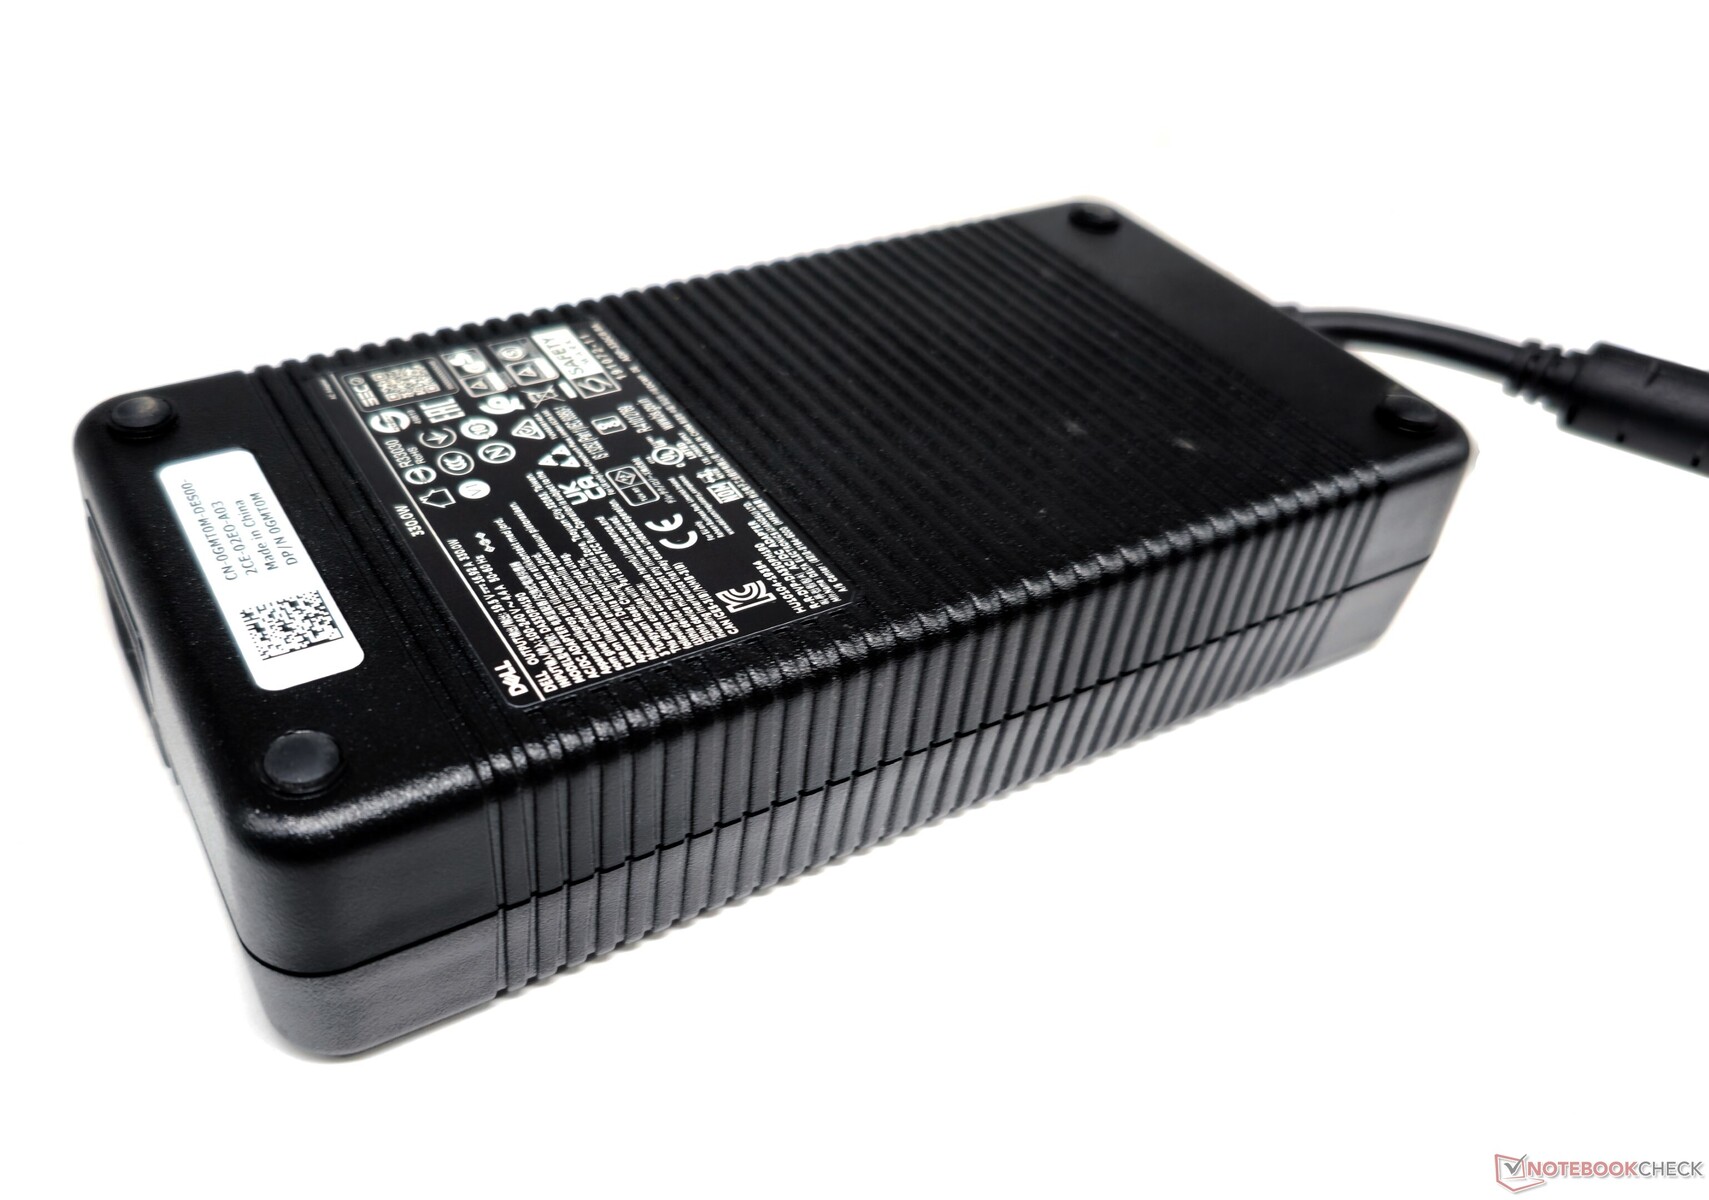
The G15 5530 laptop features a plastic chassis that weighs nearly 3 kg, which is its main drawback. Adding to the heft is also a 1.34 kg 330 W power adapter, so gamers can expect quite the workout while lugging around this laptop.
The hinges in our unit felt somewhat stiff, but the lid can be opened with a single finger with some effort. Although the lid easily flexes with minimal force, it remains stable without wobbling in normal use.
There are no surprises in the overall chassis design, but the sharp corners and heavy weight may not be to everyone's liking.

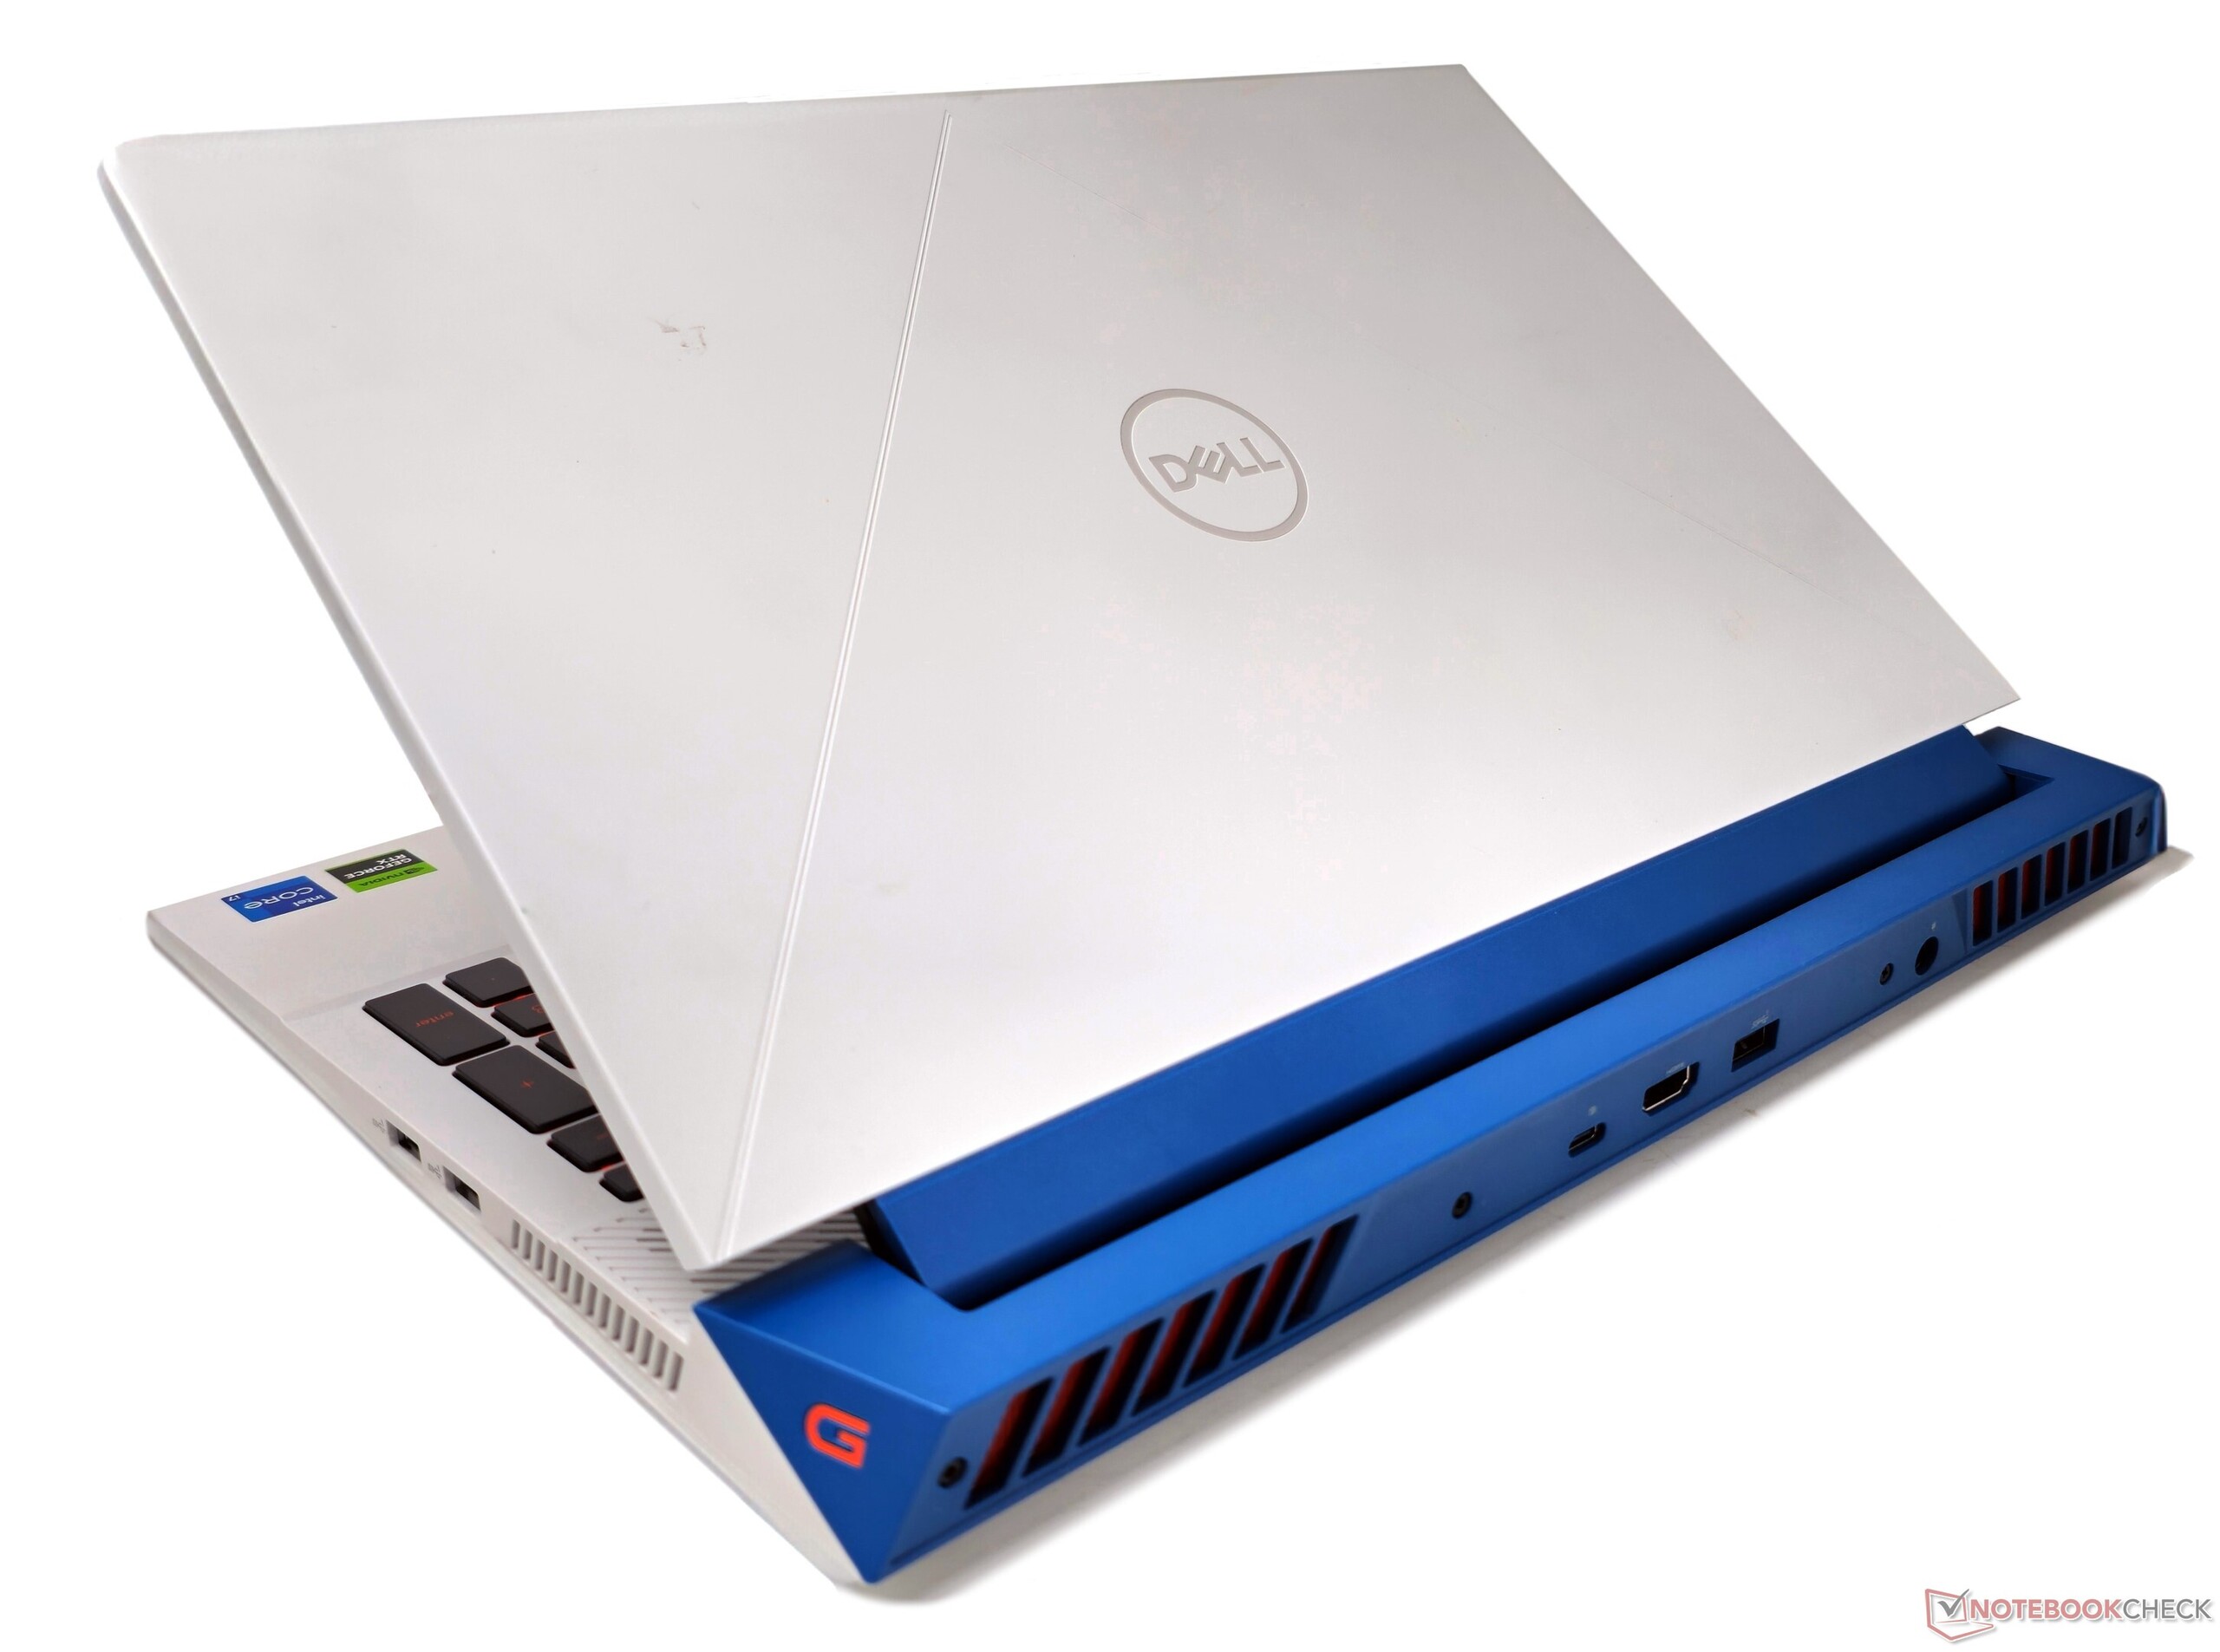

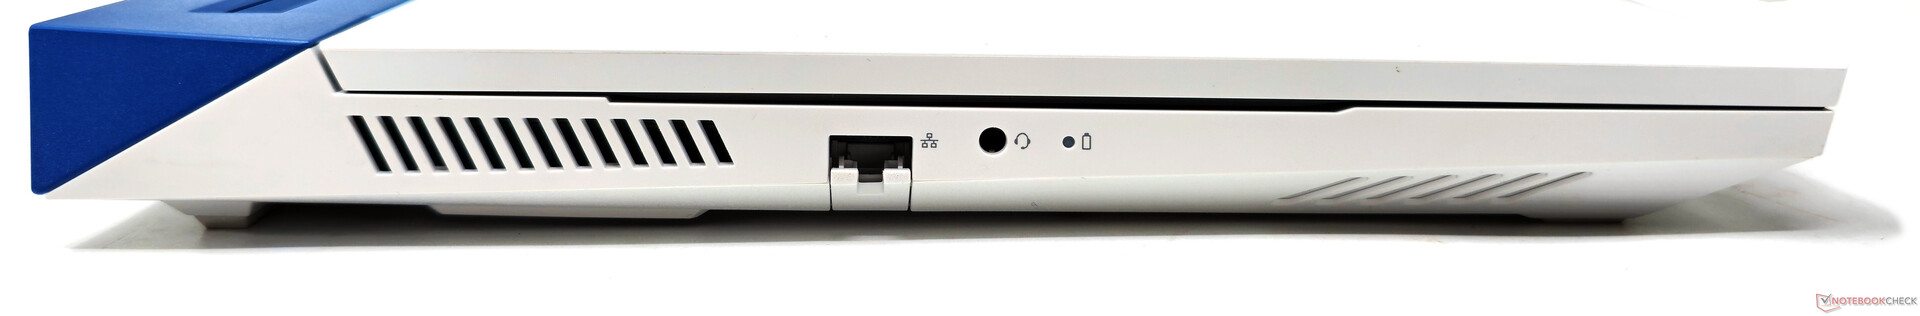
Connectivity: Non-ideal port distribution for gamers
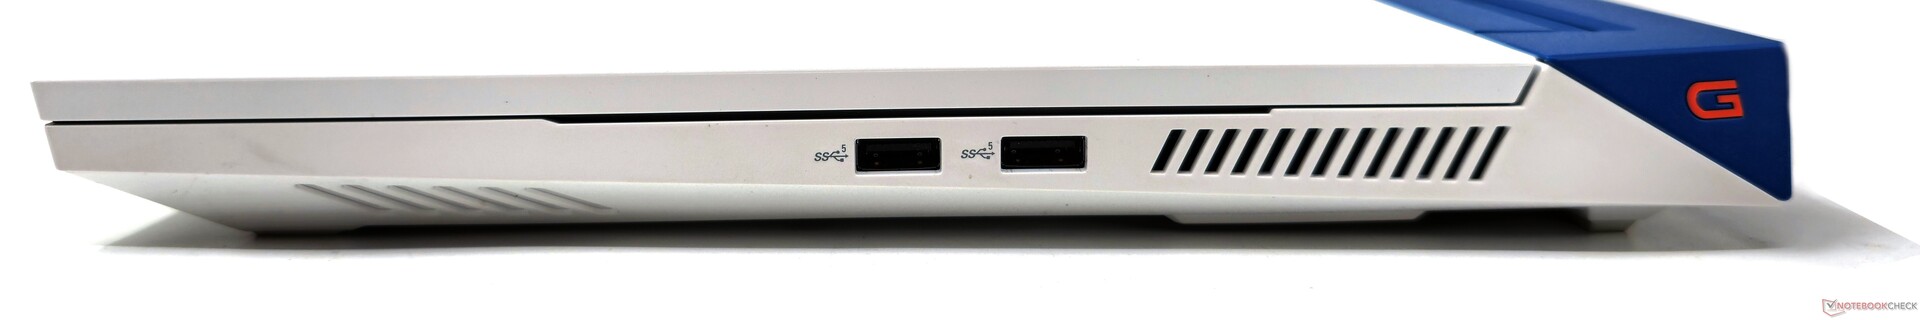
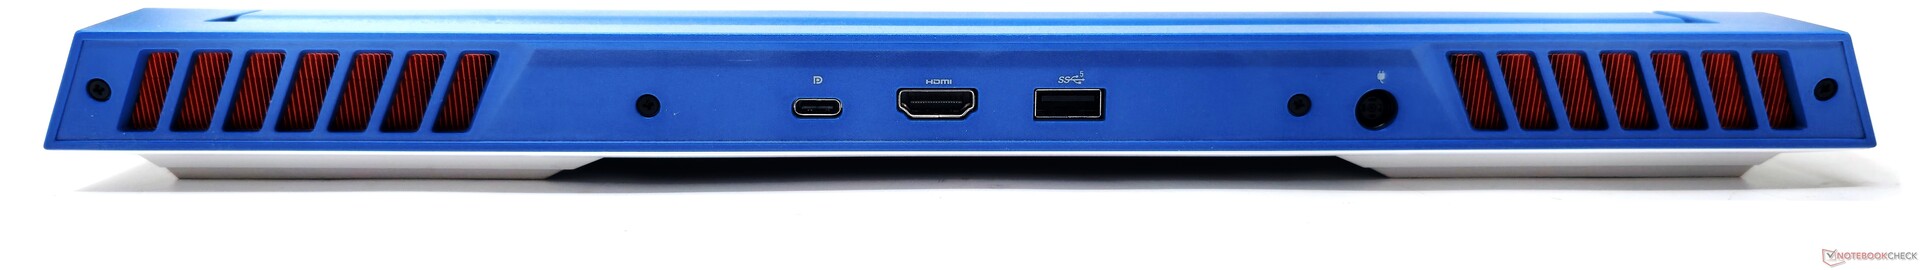
The port placement on the G15 5530 is less than ideal. Only the LAN port and a headphone jack are present on the left while the right side features two USB 3.2 Gen1 Type-A ports. The remaining ports are located at the rear.
The absence of USB ports on the left side can be irksome for peripheral connectivity, especially for gamers who use a wired mouse.
Furthermore, the sole USB Type-C port offers DisplayPort-out functionality but lacks Power Delivery. As a result, the laptop cannot be charged without utilizing the bulky power brick.
Communication
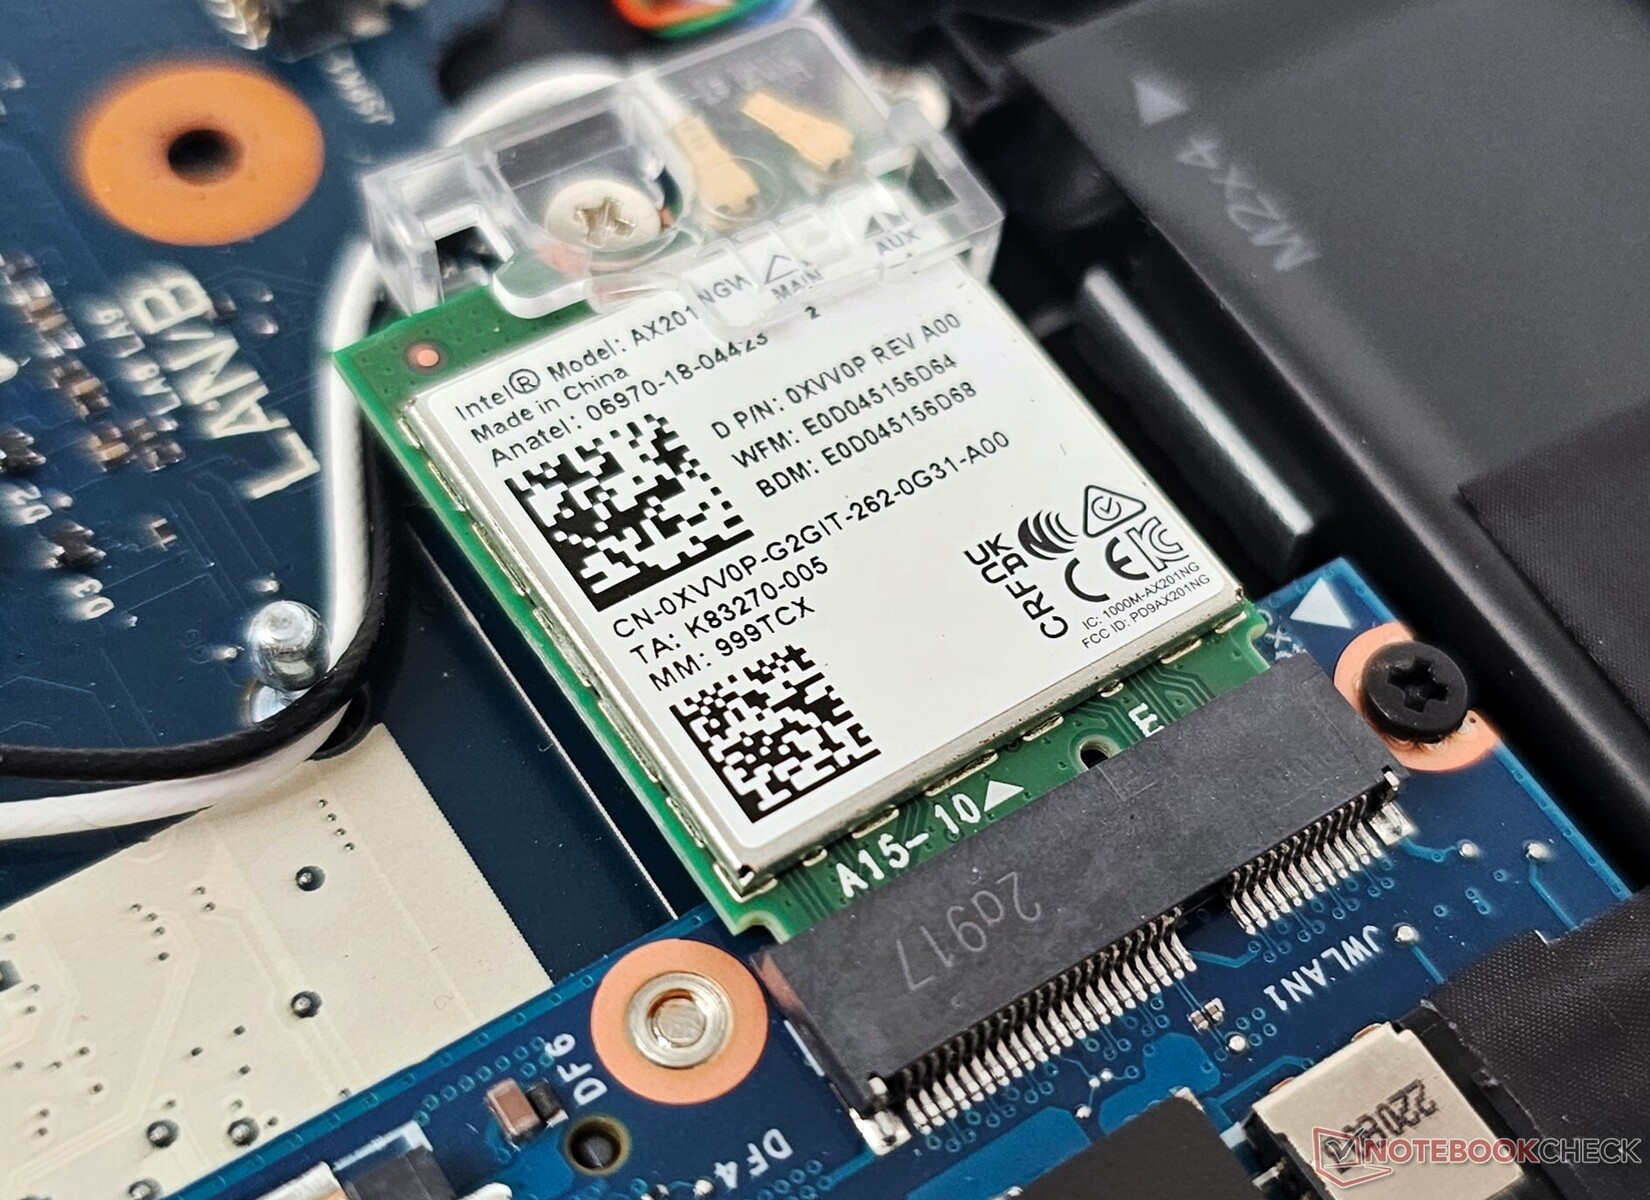
Although the Intel AX201 WLAN card in the G15 5530 lacks support for Wi-Fi 6E, we found that its implementation in the G15 5530 still delivers excellent throughput.
Our testing, conducted with the reference Asus ROG Rapture GT-AXE11000 router, showed relatively stable performance when the laptop was positioned 1 m away from the router with a clear line of sight and no external interference.
Webcam
Image quality from the 720p webcam is nothing to write home about with large color deviations (particularly with blue shades) and a lack of overall sharpness and clarity.


Security
Apart from the TPM 2.0 module, the G15 5530 does not offer any additional security features or biometric logins.
Accessories and Warranty
There are no accessories in the box other than the 330 W power adapter and the usual paperwork.
In India, Dell provides a one-year premium onsite hardware and software support as standard.
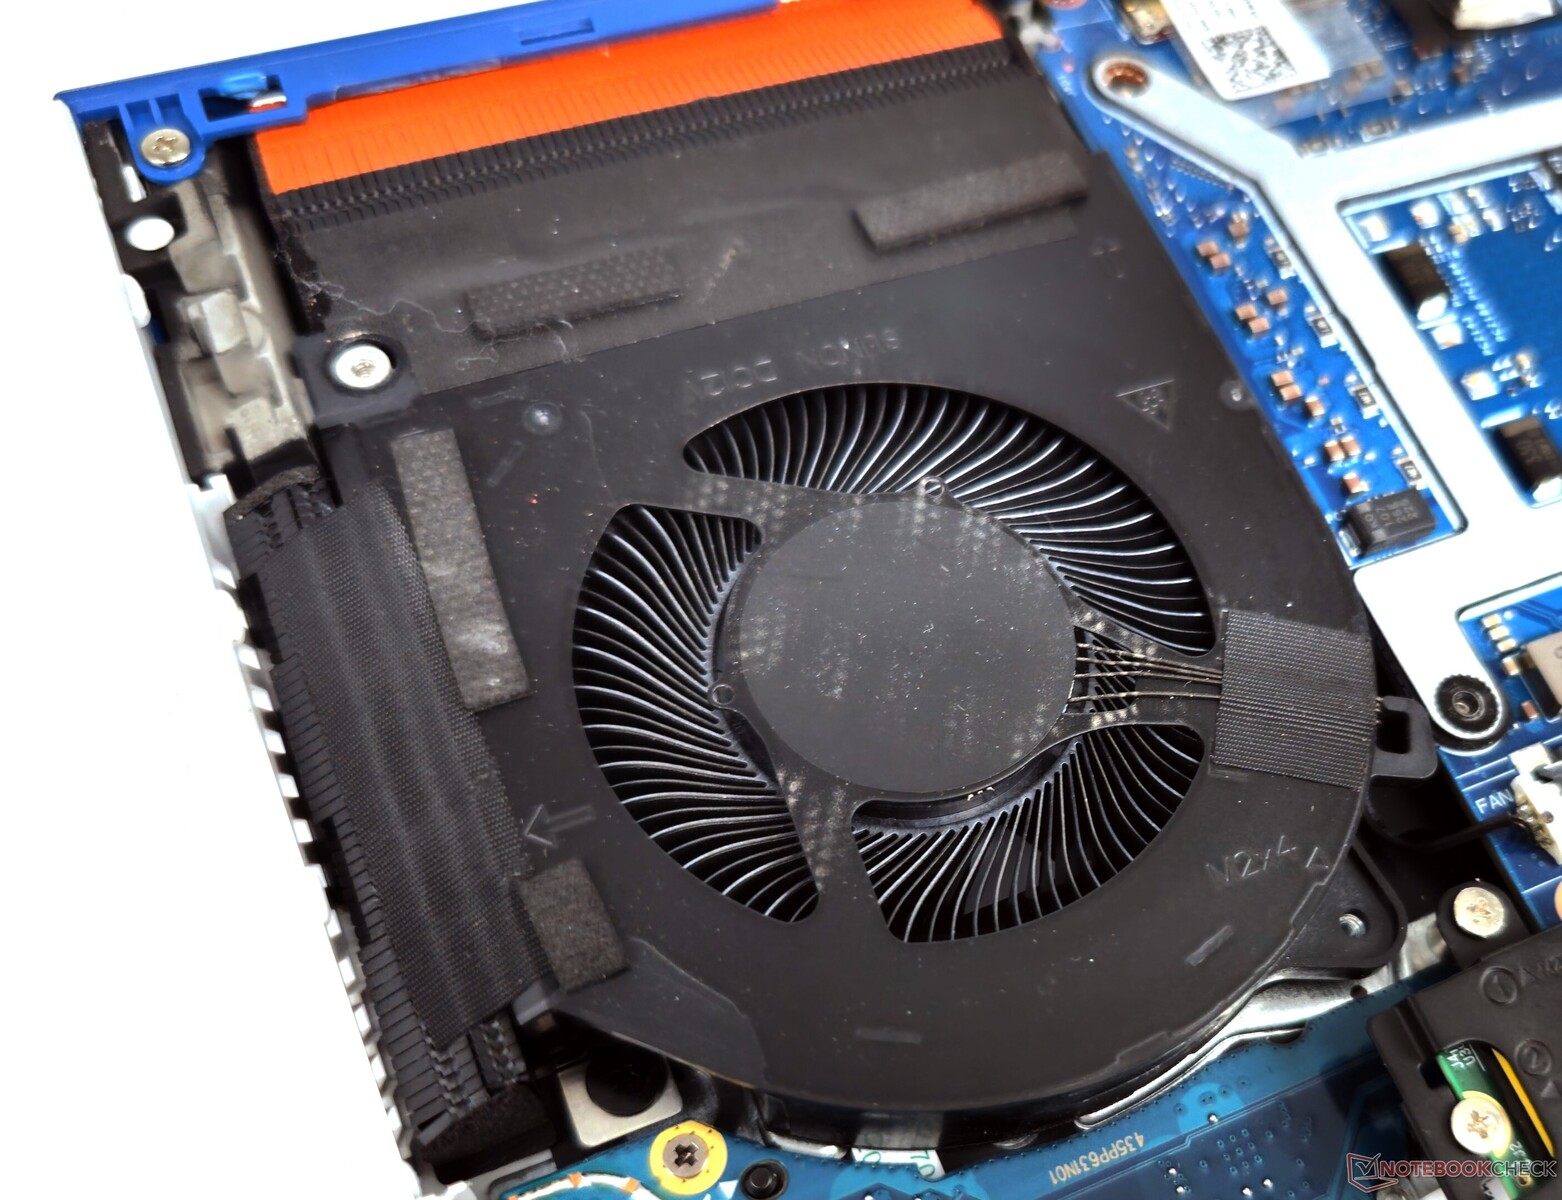
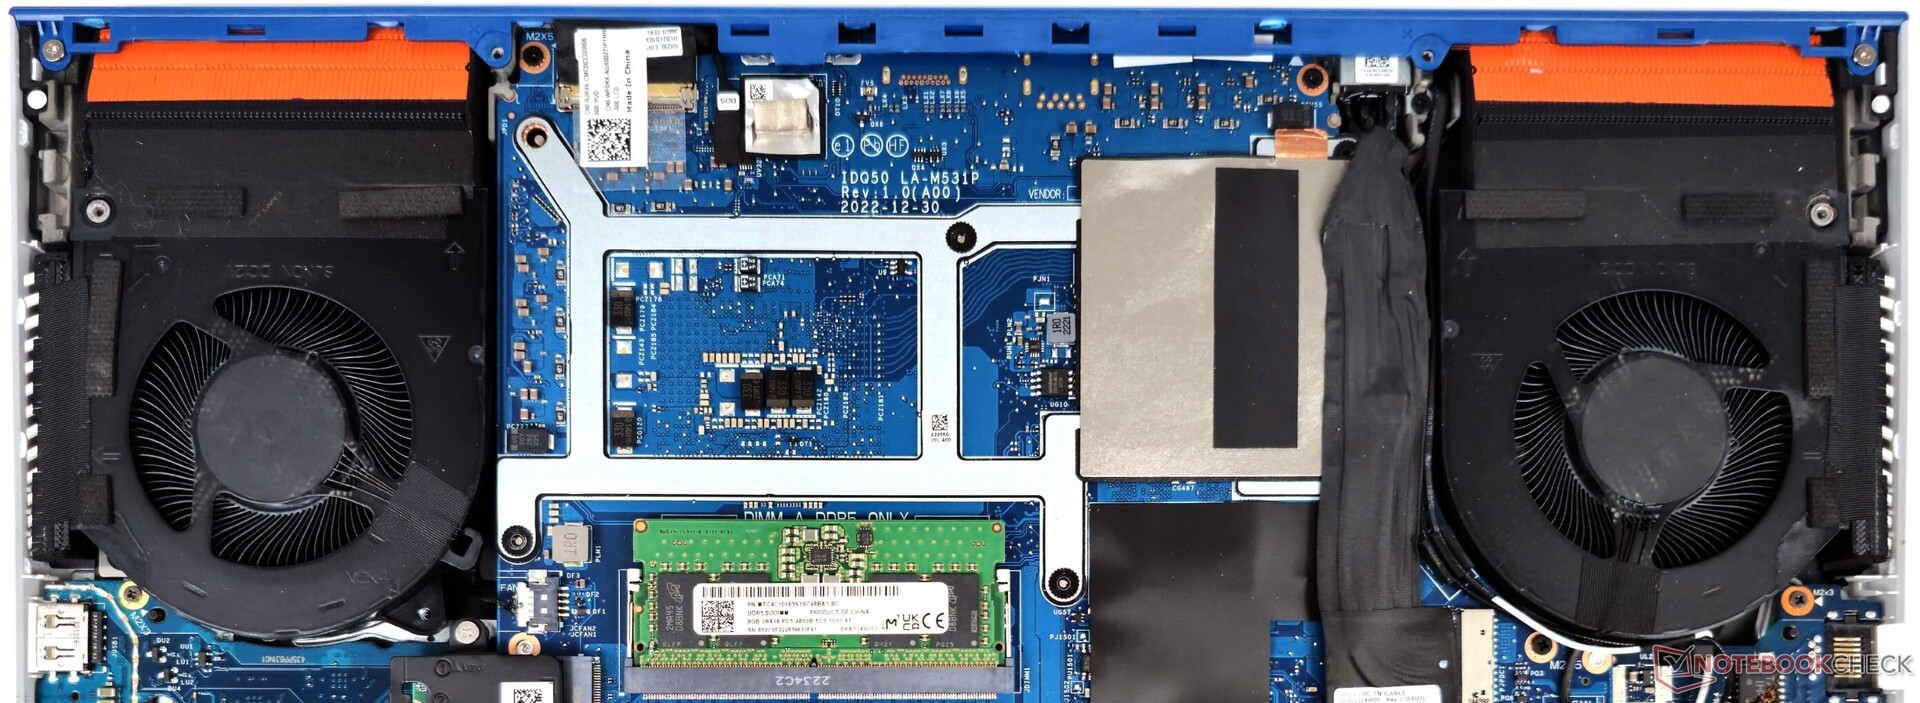
Maintenance
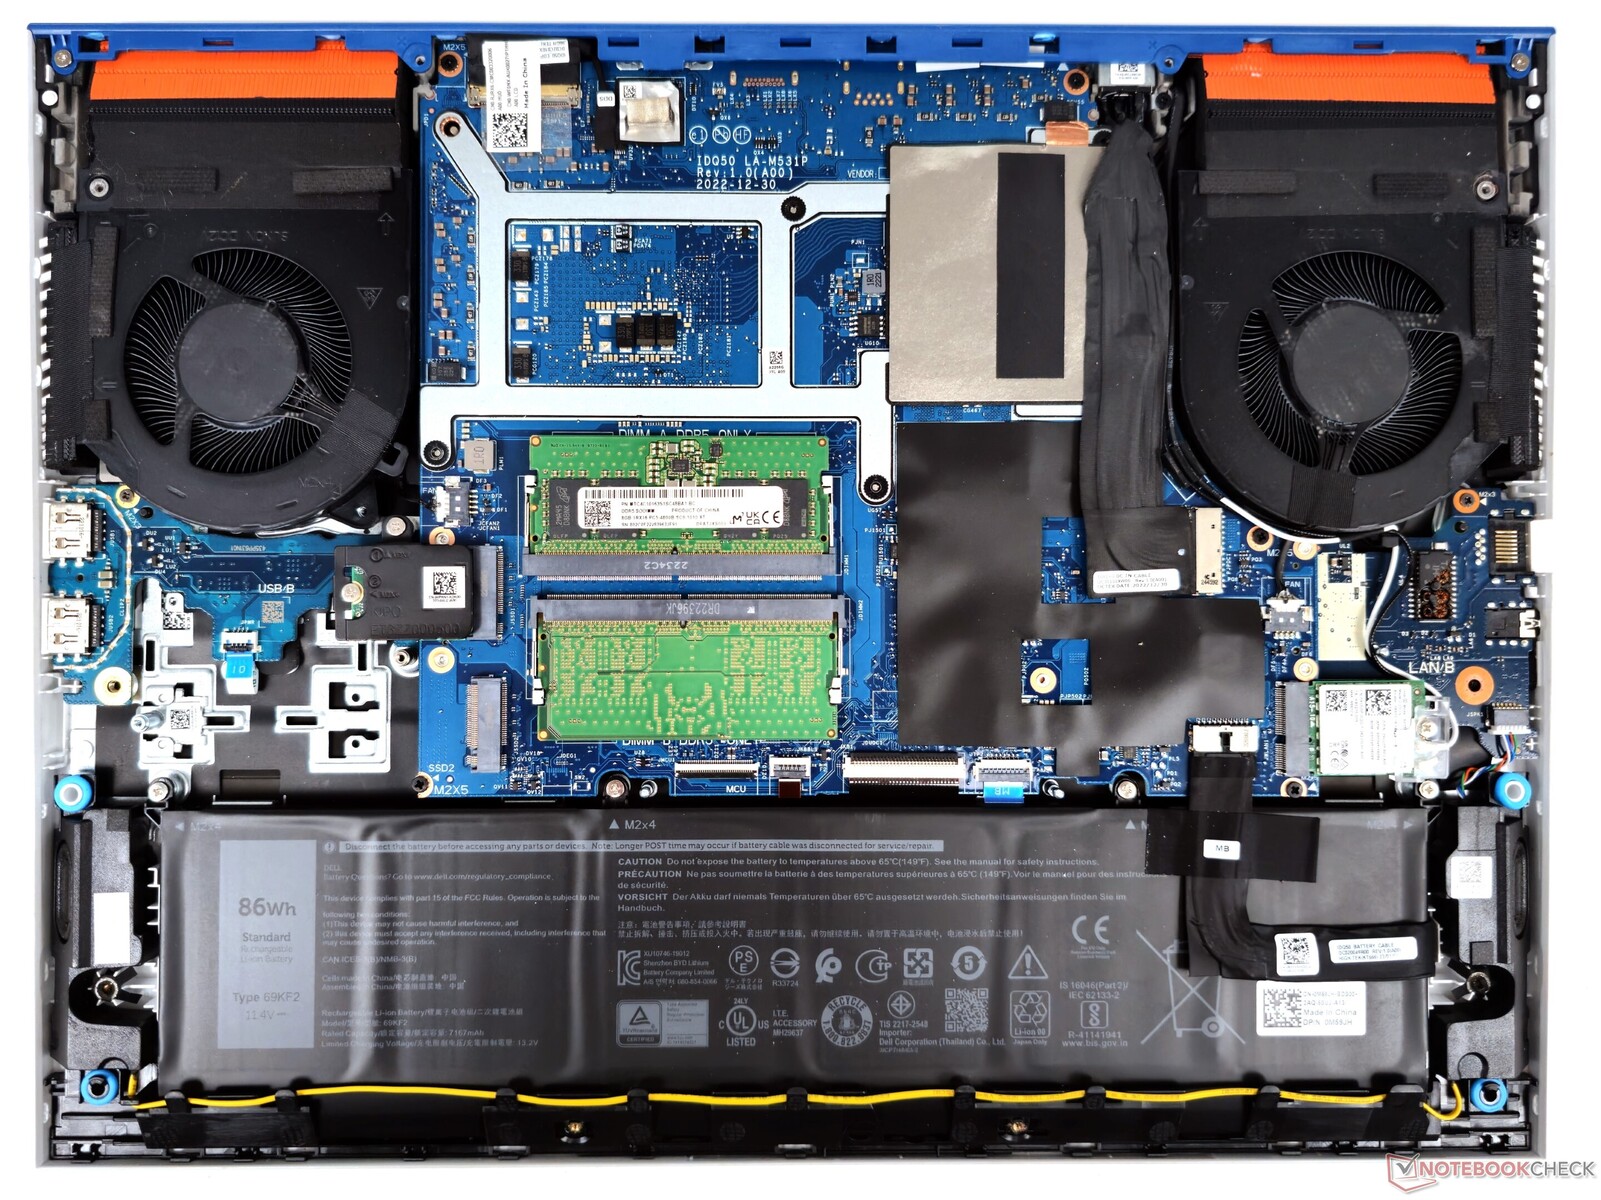
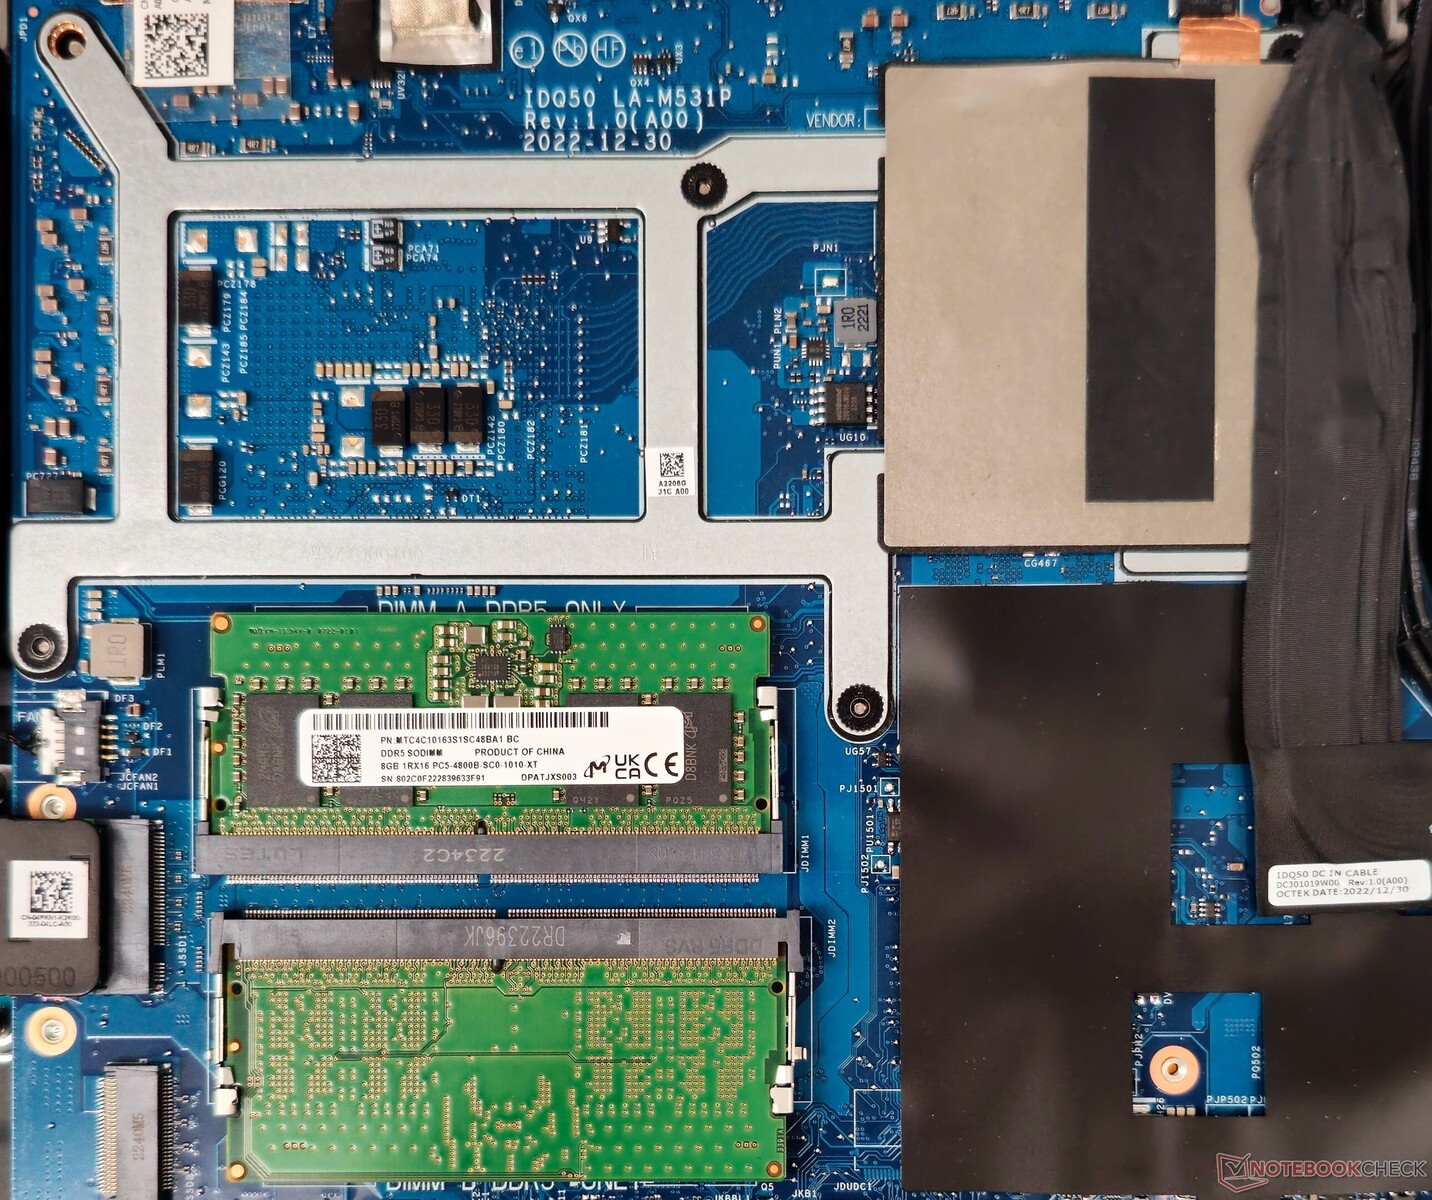
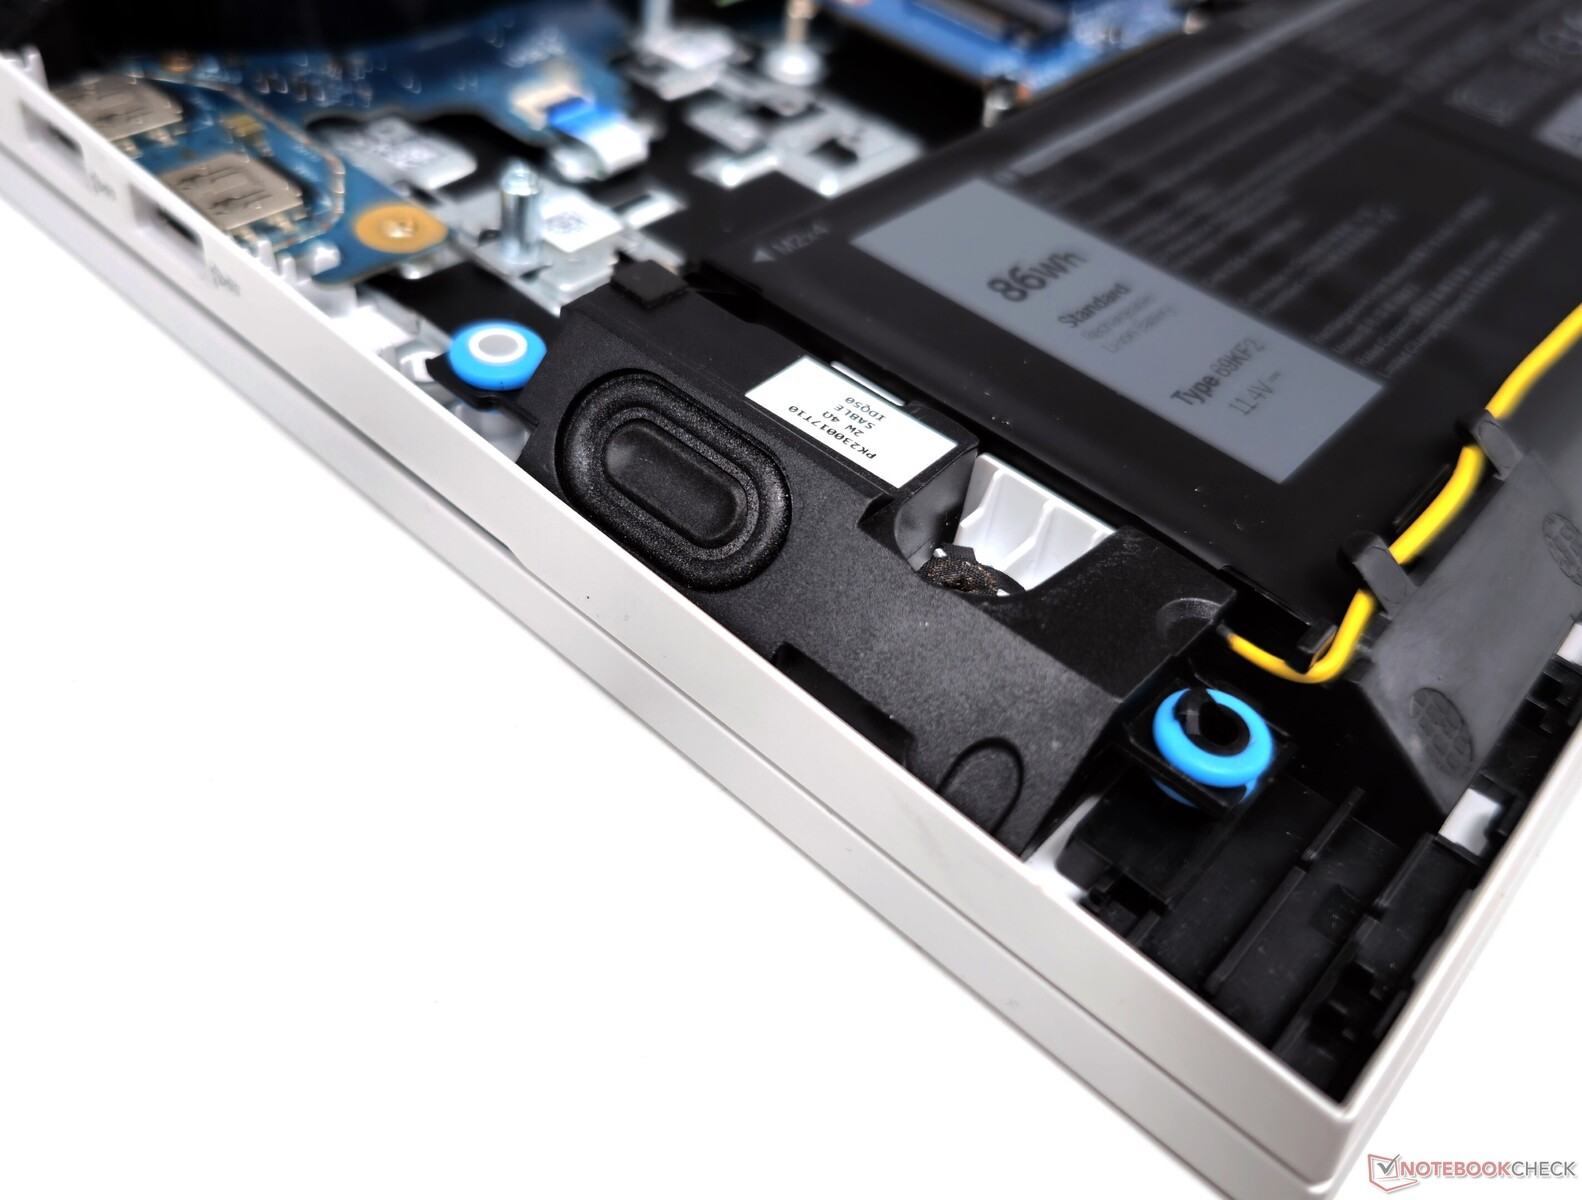
The G15 5530's back panel can be easily pried open after removing 10 PH00 screws. The cooling system is located on the underside of the board. The WLAN, SSD, and DDR5 RAM are all upgradable.
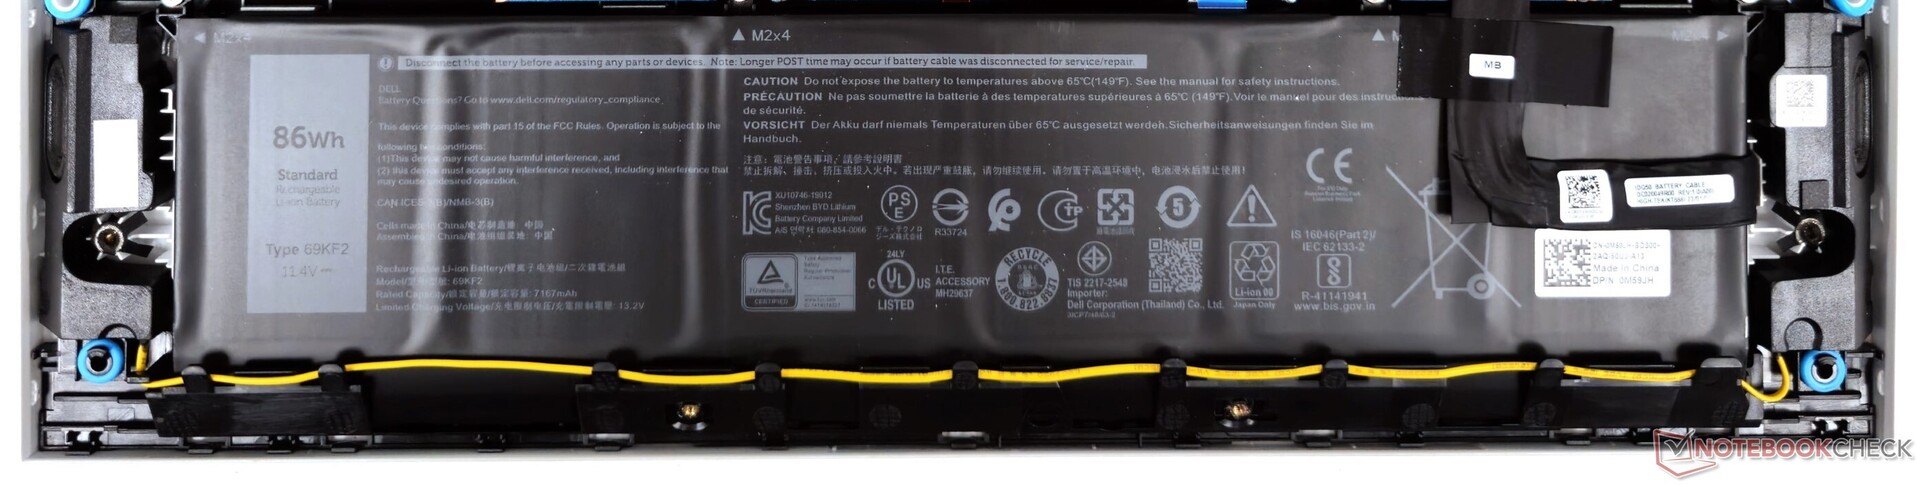
Dell utilizes non-conventional M.2 2242 slots (M-key) for storage. Users should take this into consideration when adding or replacing NVMe drives. The battery can be unscrewed and replaced if necessary.
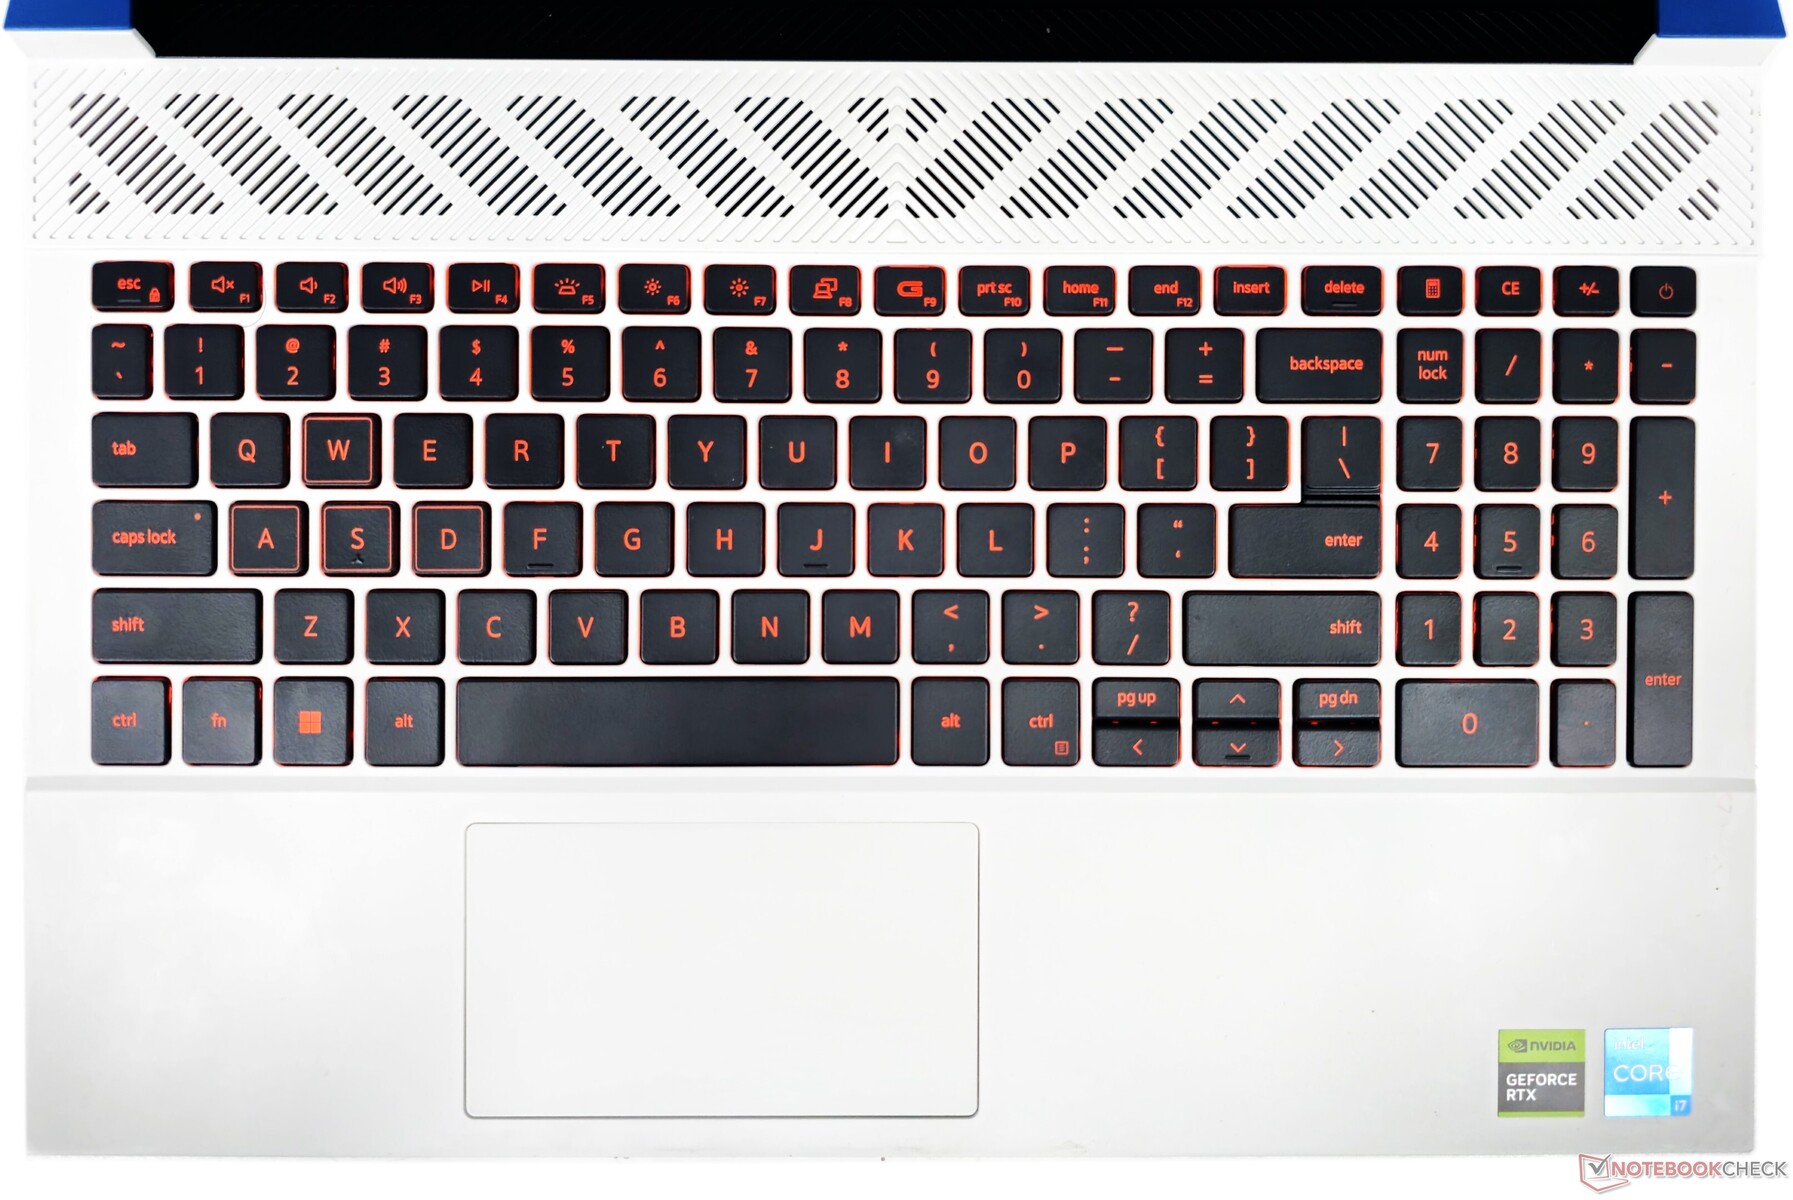
Input Devices: Flat keys with shallow travel and a cramped touchpad
Keyboard
The keyboard on the G15 5530 has minimal flex and features flat, evenly spaced keys that offer a somewhat shallow travel. It includes a numpad along with calculator shortcuts for convenience. However, this layout results in the Page Up and Page Down keys being crammed together with the tiny arrow keys.
According to Dell, the G15 5530's keyboard is equipped with 4-zone RGB backlighting. However, in our unit, only orange LEDs were present with a two-stage brightness adjustment. Additionally, the keyboard was not recognized in the Alienware Command Center, limiting customization options.
The F9 key includes a Game Shift shortcut, allowing for instant switching to maximum performance and fan speed whenever needed.
Touchpad
The 6 cm x 10.5 cm touchpad feels cramped compared to other 2023 laptops. That being said, it offers smooth gliding, supports Windows Precision gestures, and is responsive even at the corners.
The clicks can get loud at times, which could be a minor annoyance for those who prefer quieter input.
The G15's input devices aren't bad per se, but users can surely benefit from an external keyboard and mouse.
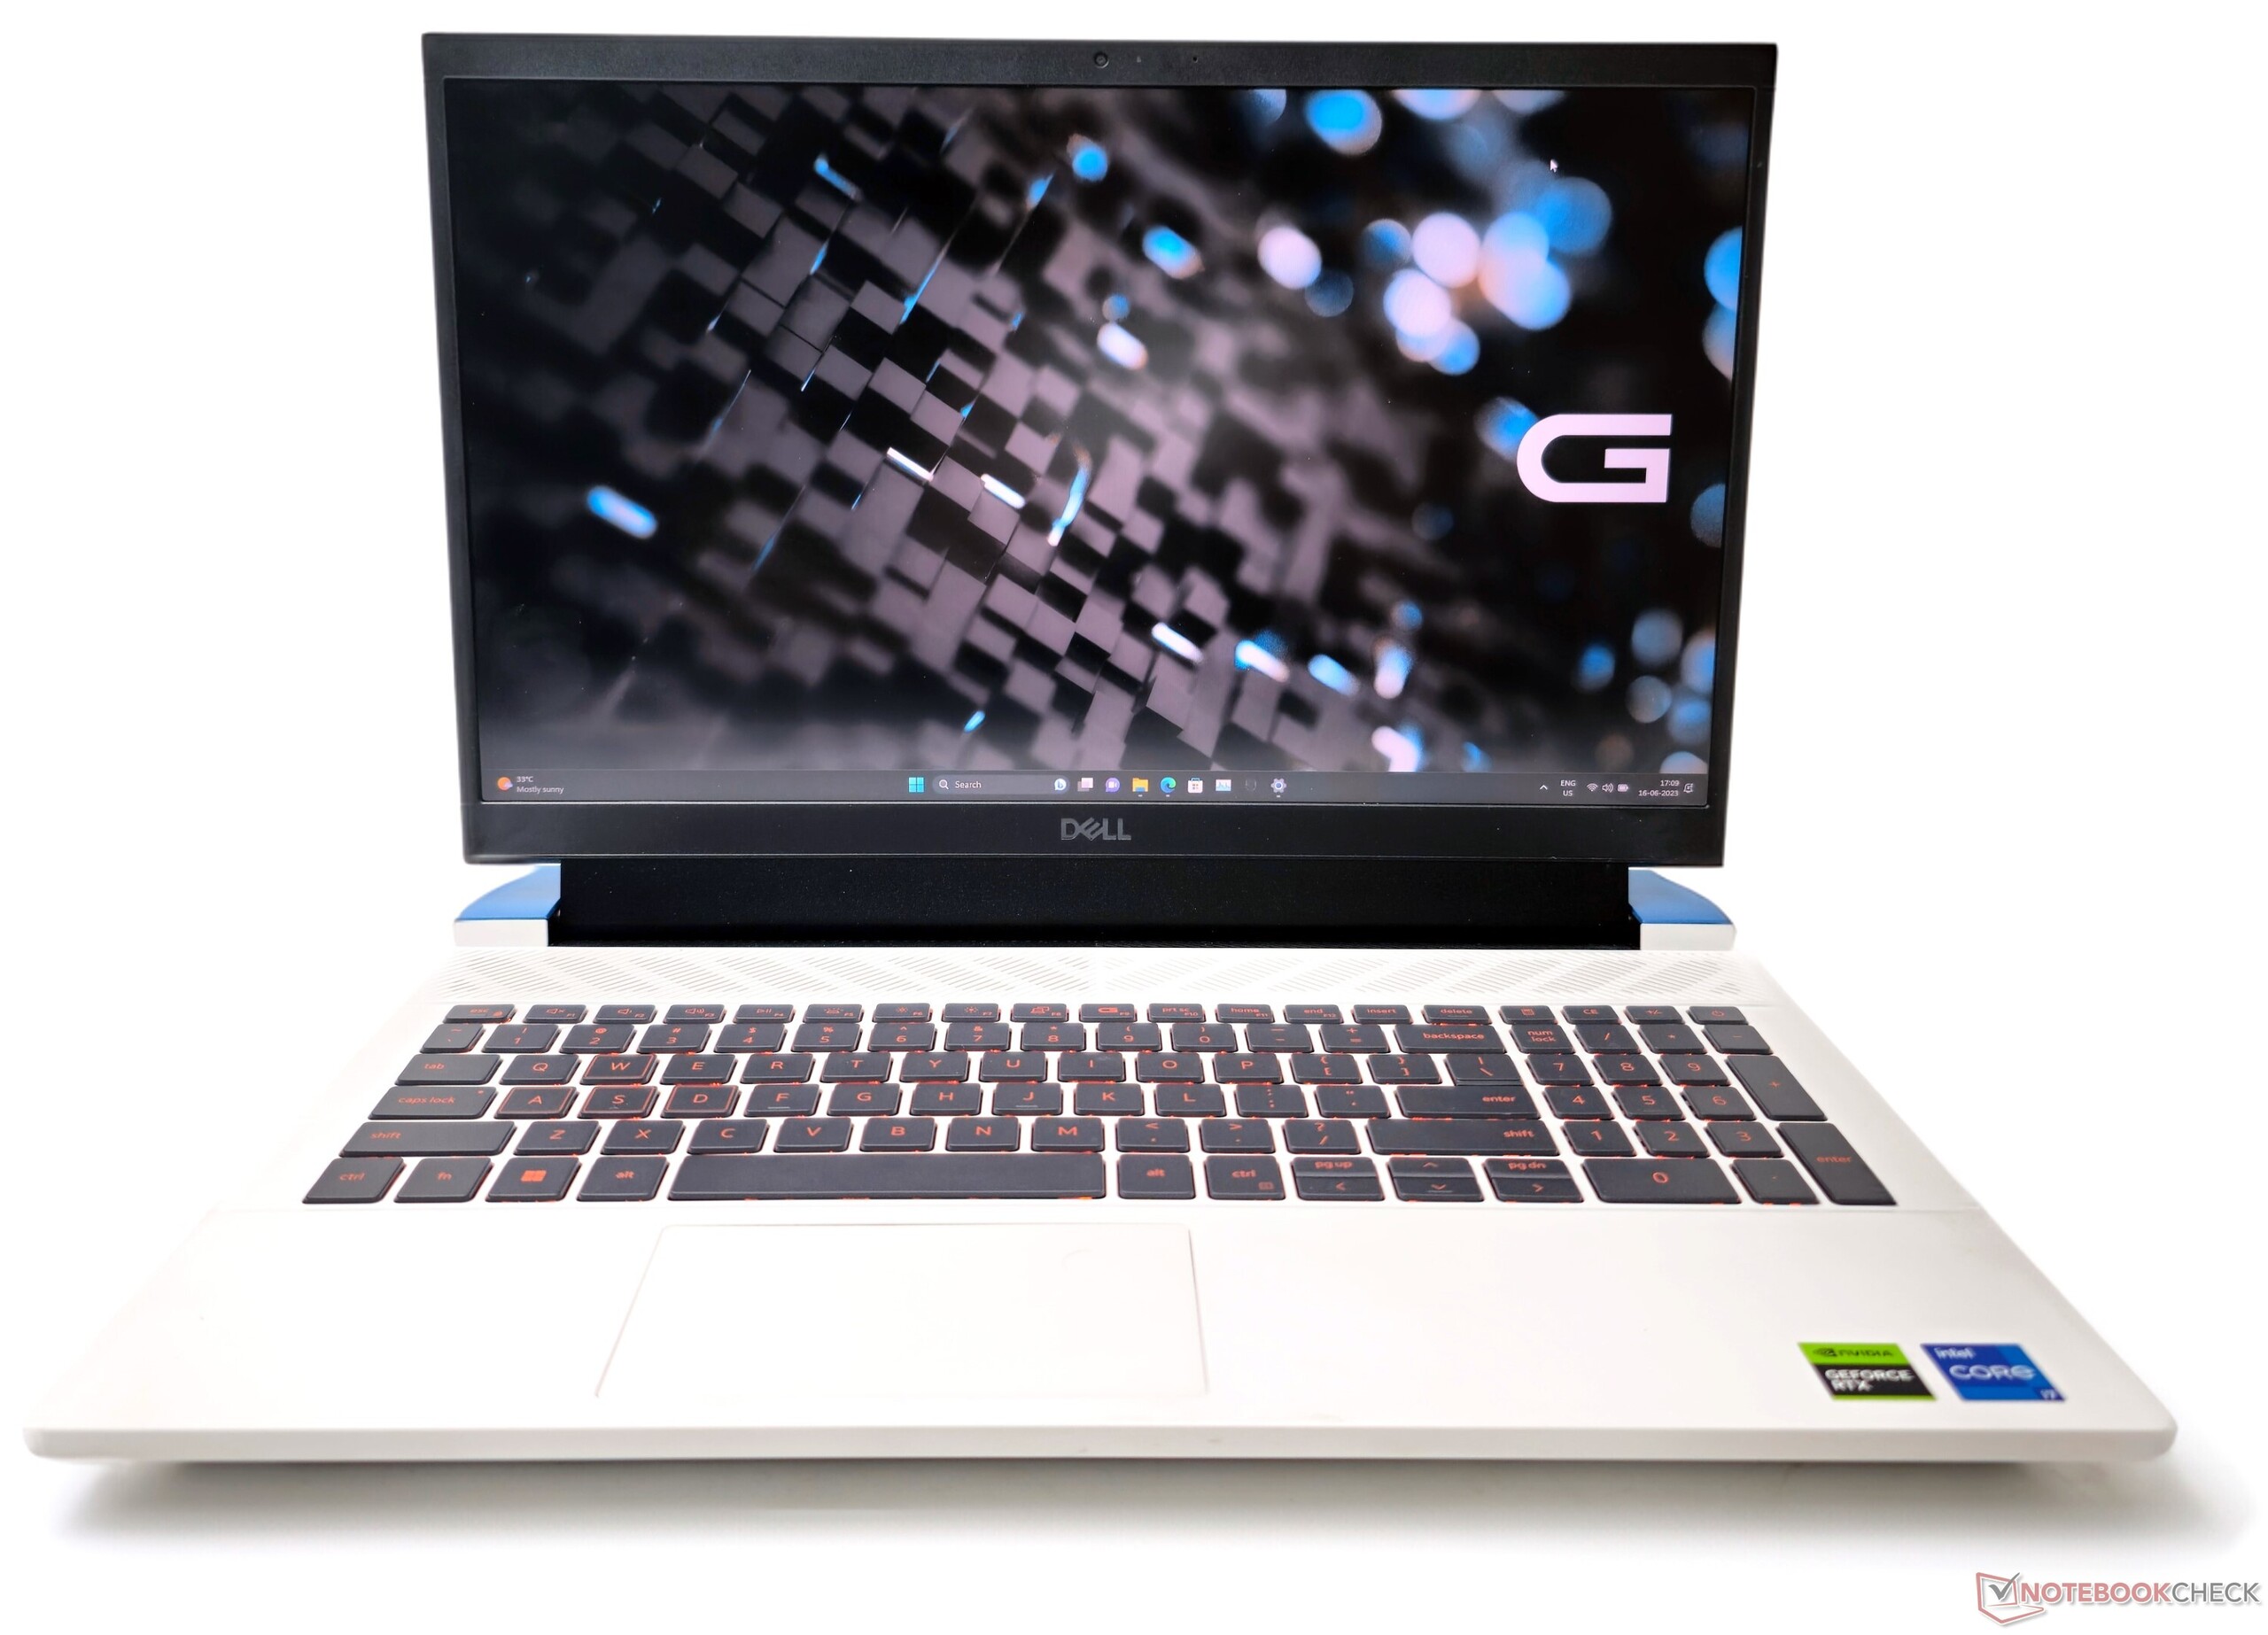
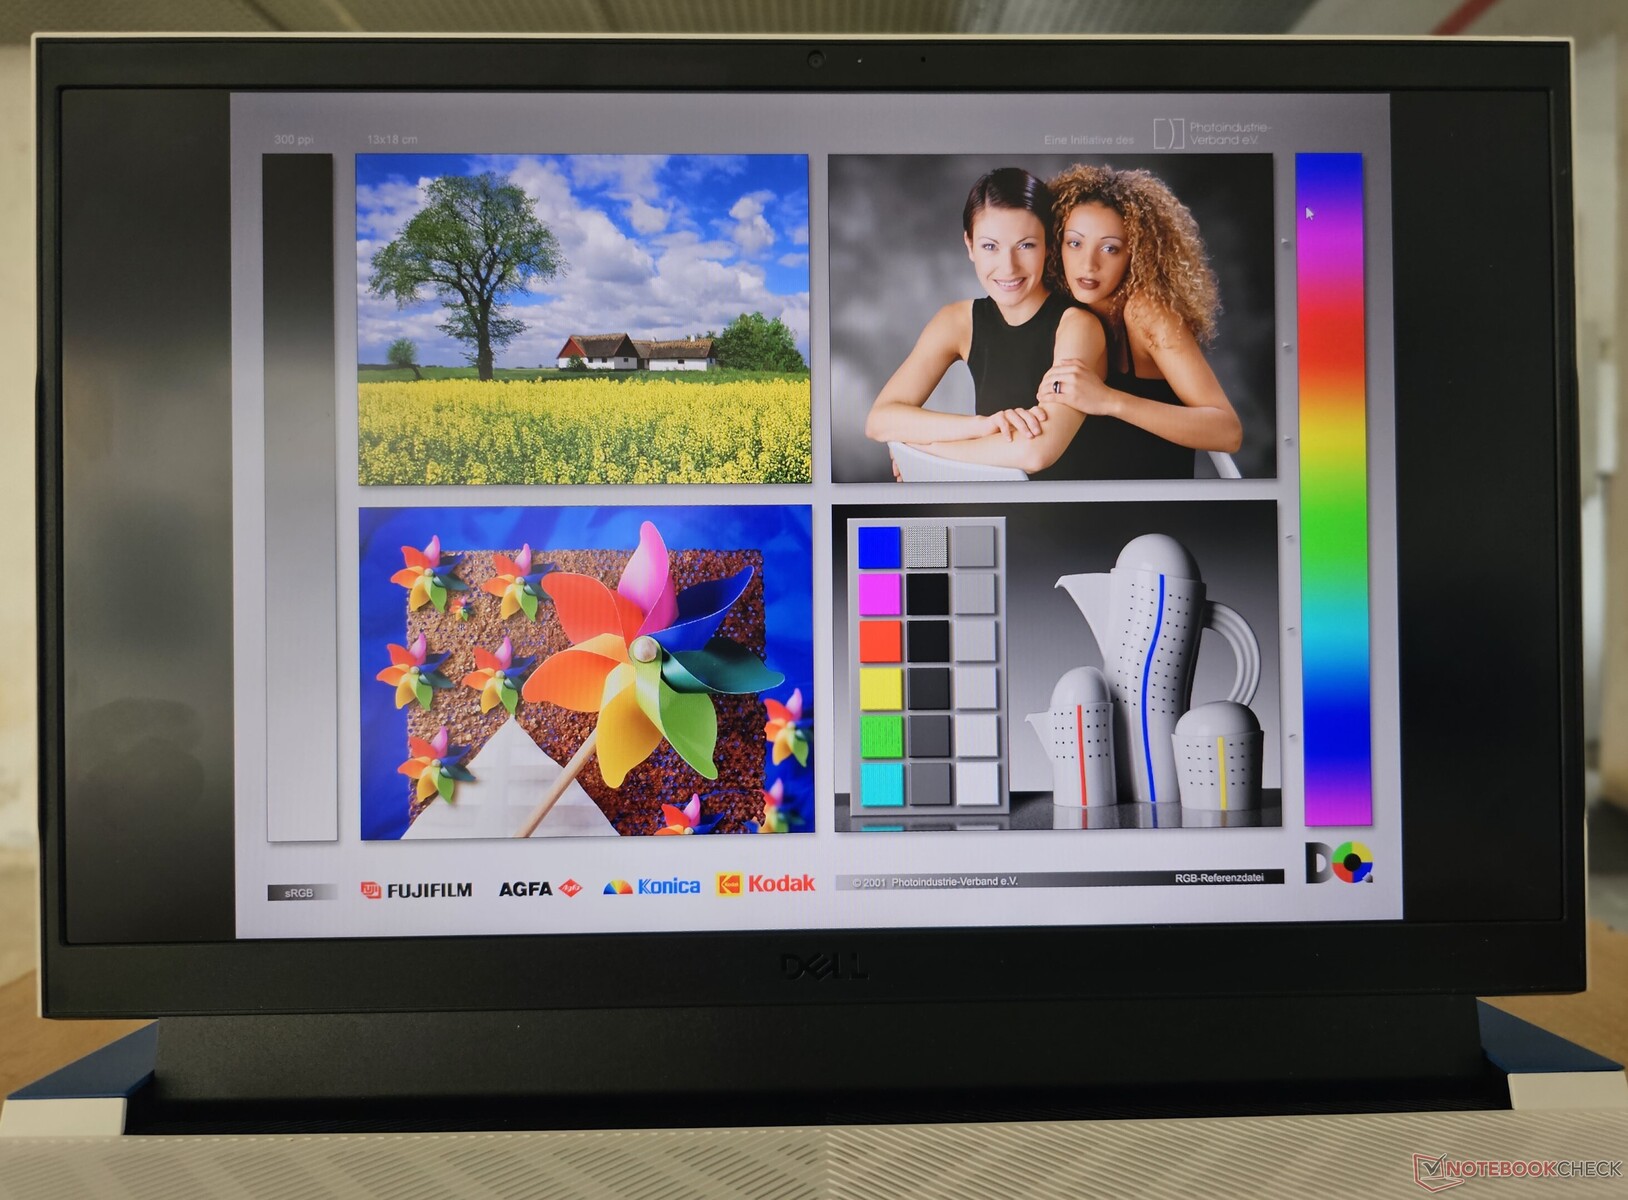
Display: 165 Hz 1080p panel with overdrive
Dell equips the G15 with a 1080p AUO IPS panel that offers a 165 Hz refresh rate with G-Sync. We see significant blacklight bleeding at the corners, as is typical with IPS screens.
The brightness distribution is quite even at 94% and the contrast ratio is a respectable 1524:1, which should offer a good viewing experience for gaming.


| |||||||||||||||||||||||||
Brightness Distribution: 94 %
Center on Battery: 321 cd/m²
Contrast: 1524:1 (Black: 0.21 cd/m²)
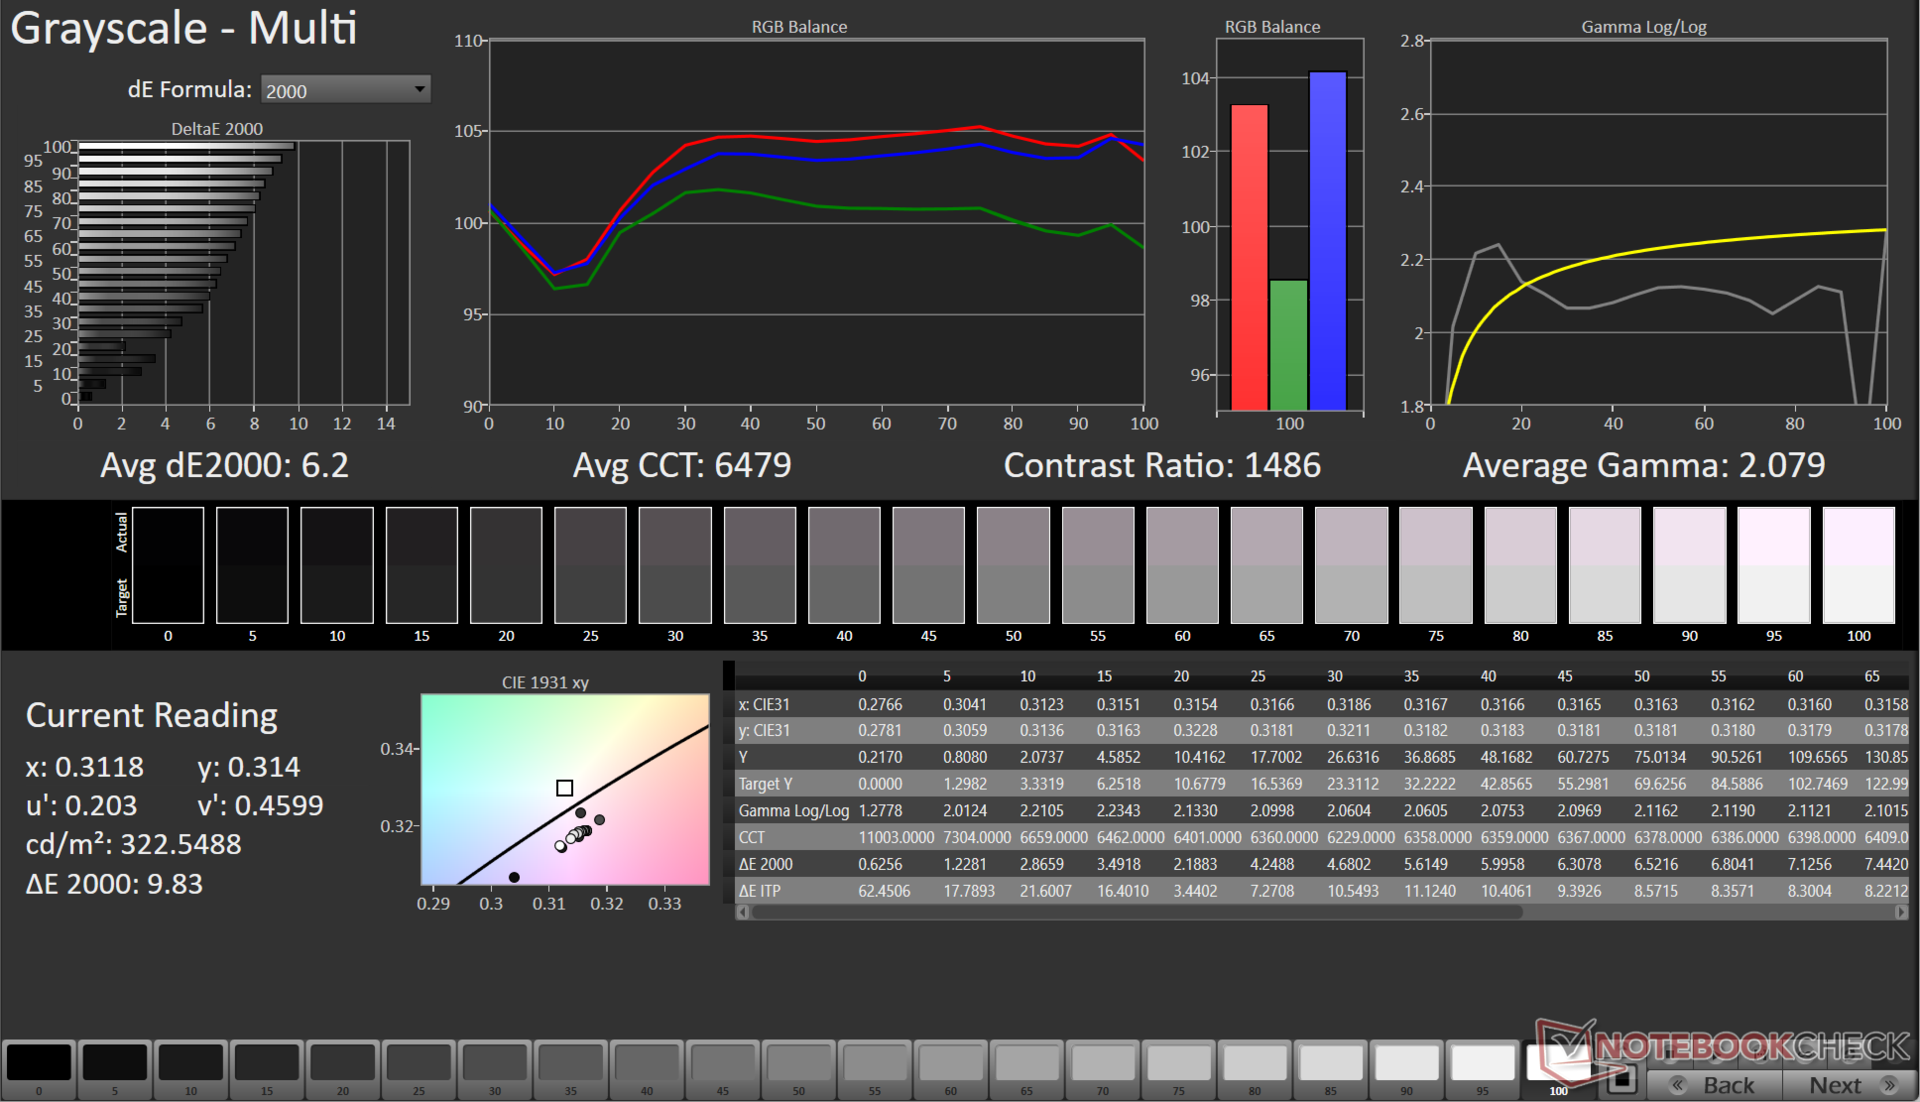
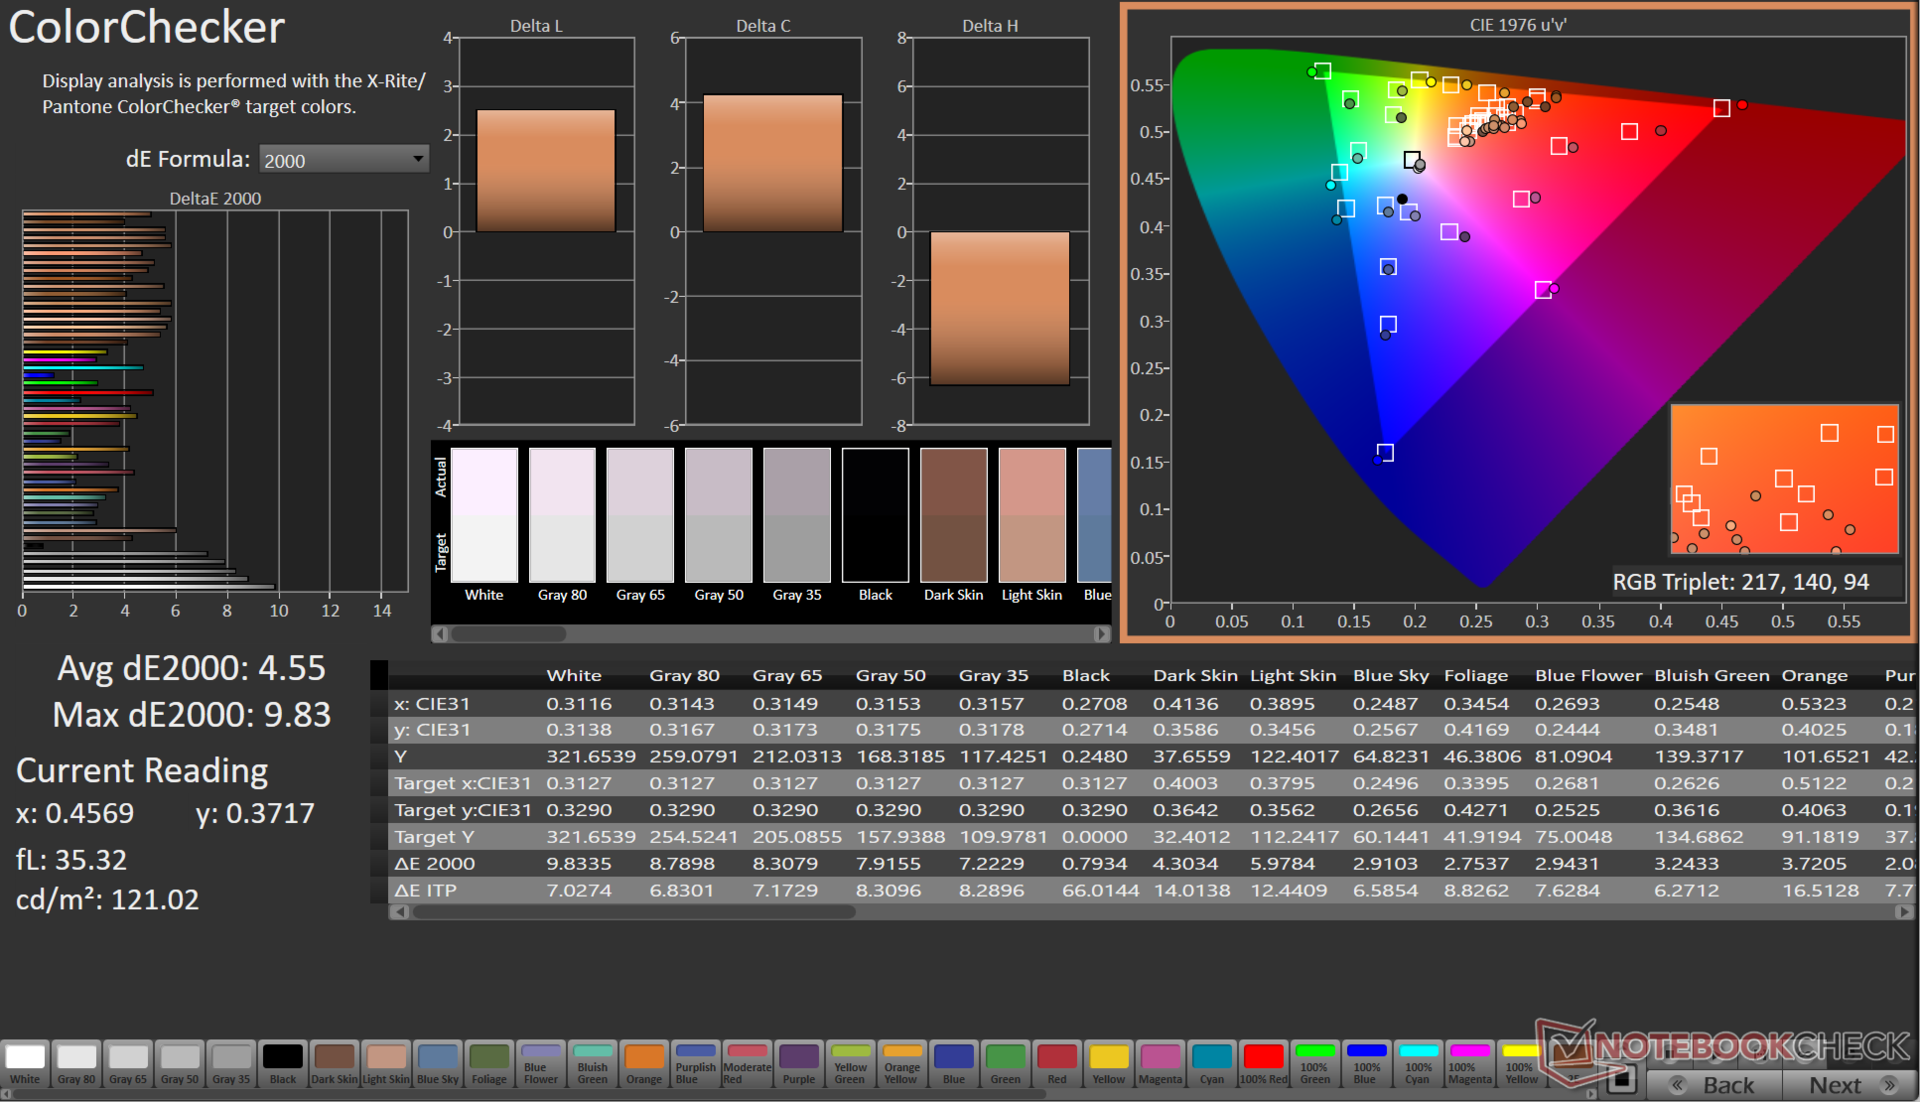
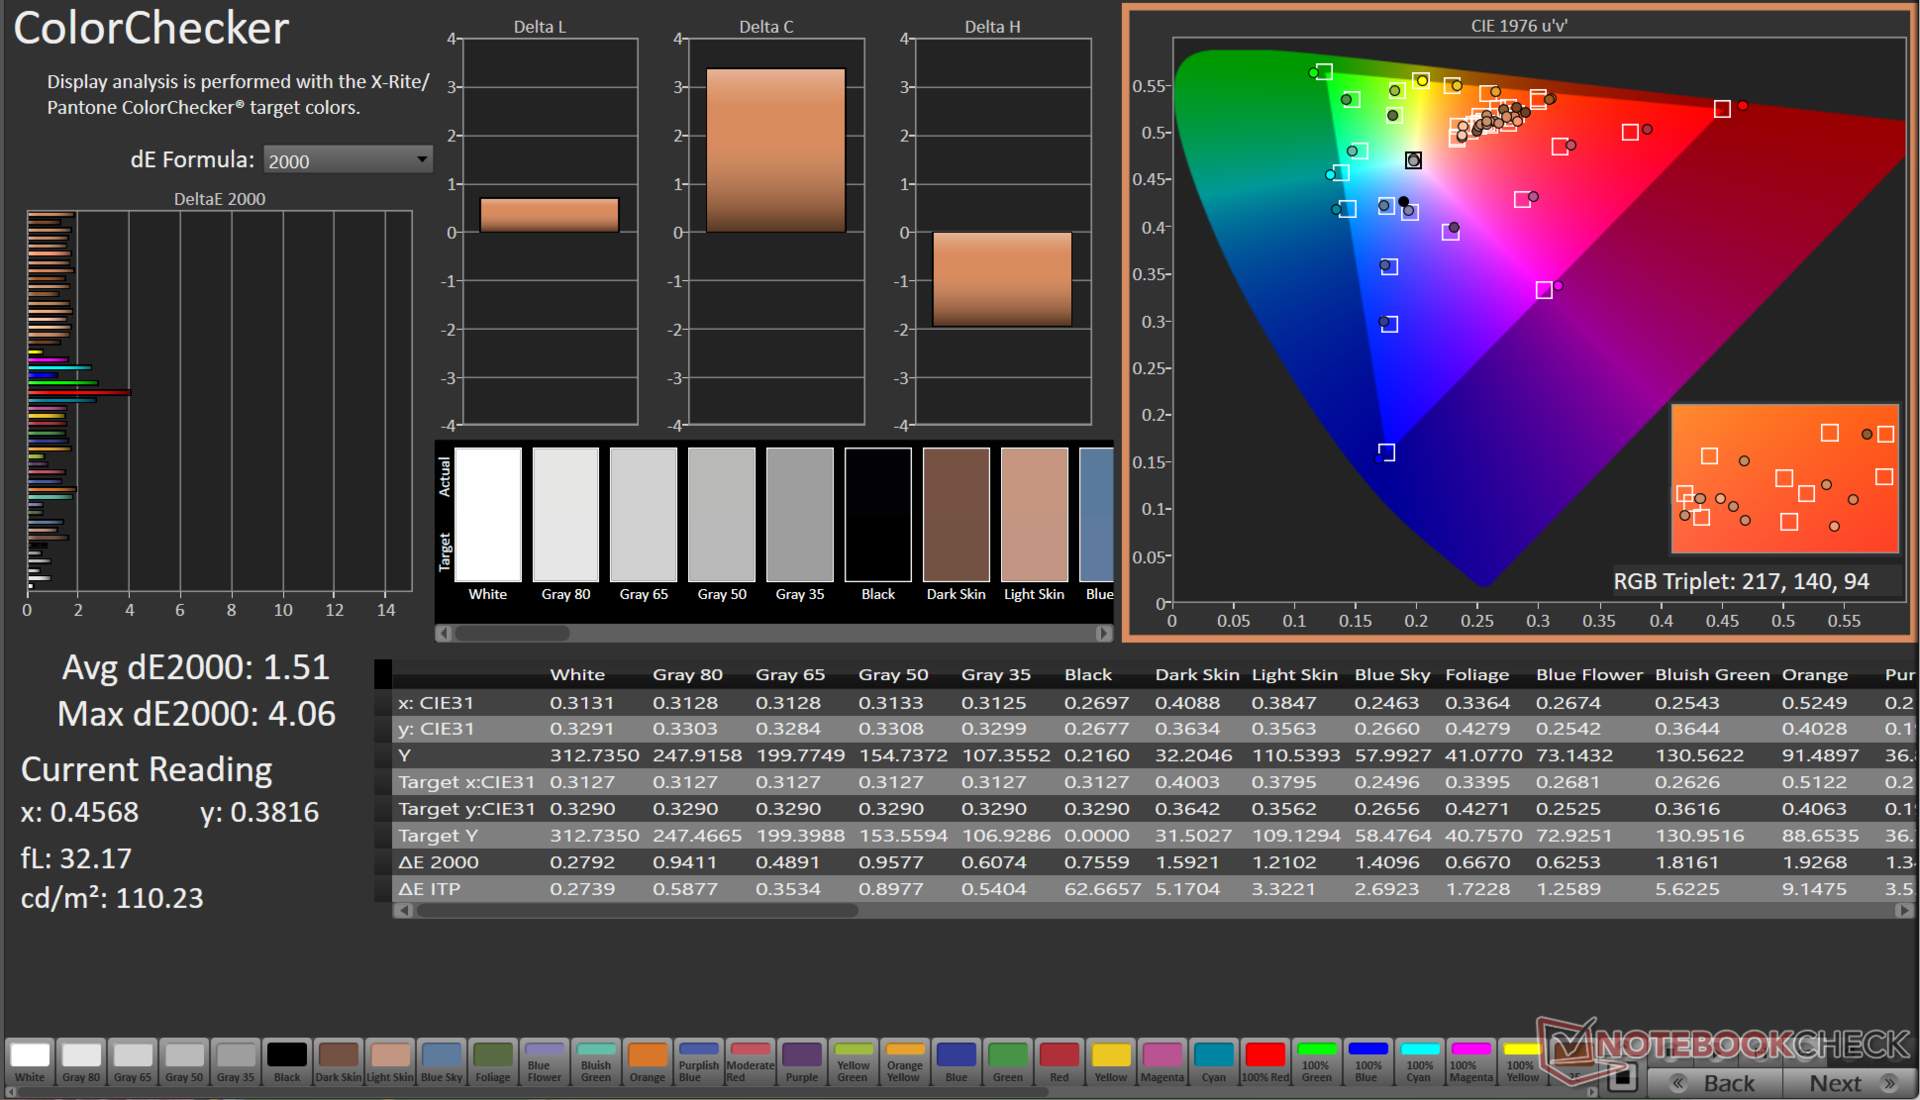
ΔE ColorChecker Calman: 4.55 | ∀{0.5-29.43 Ø4.71}
calibrated: 1.51
ΔE Greyscale Calman: 6.2 | ∀{0.09-98 Ø4.96}
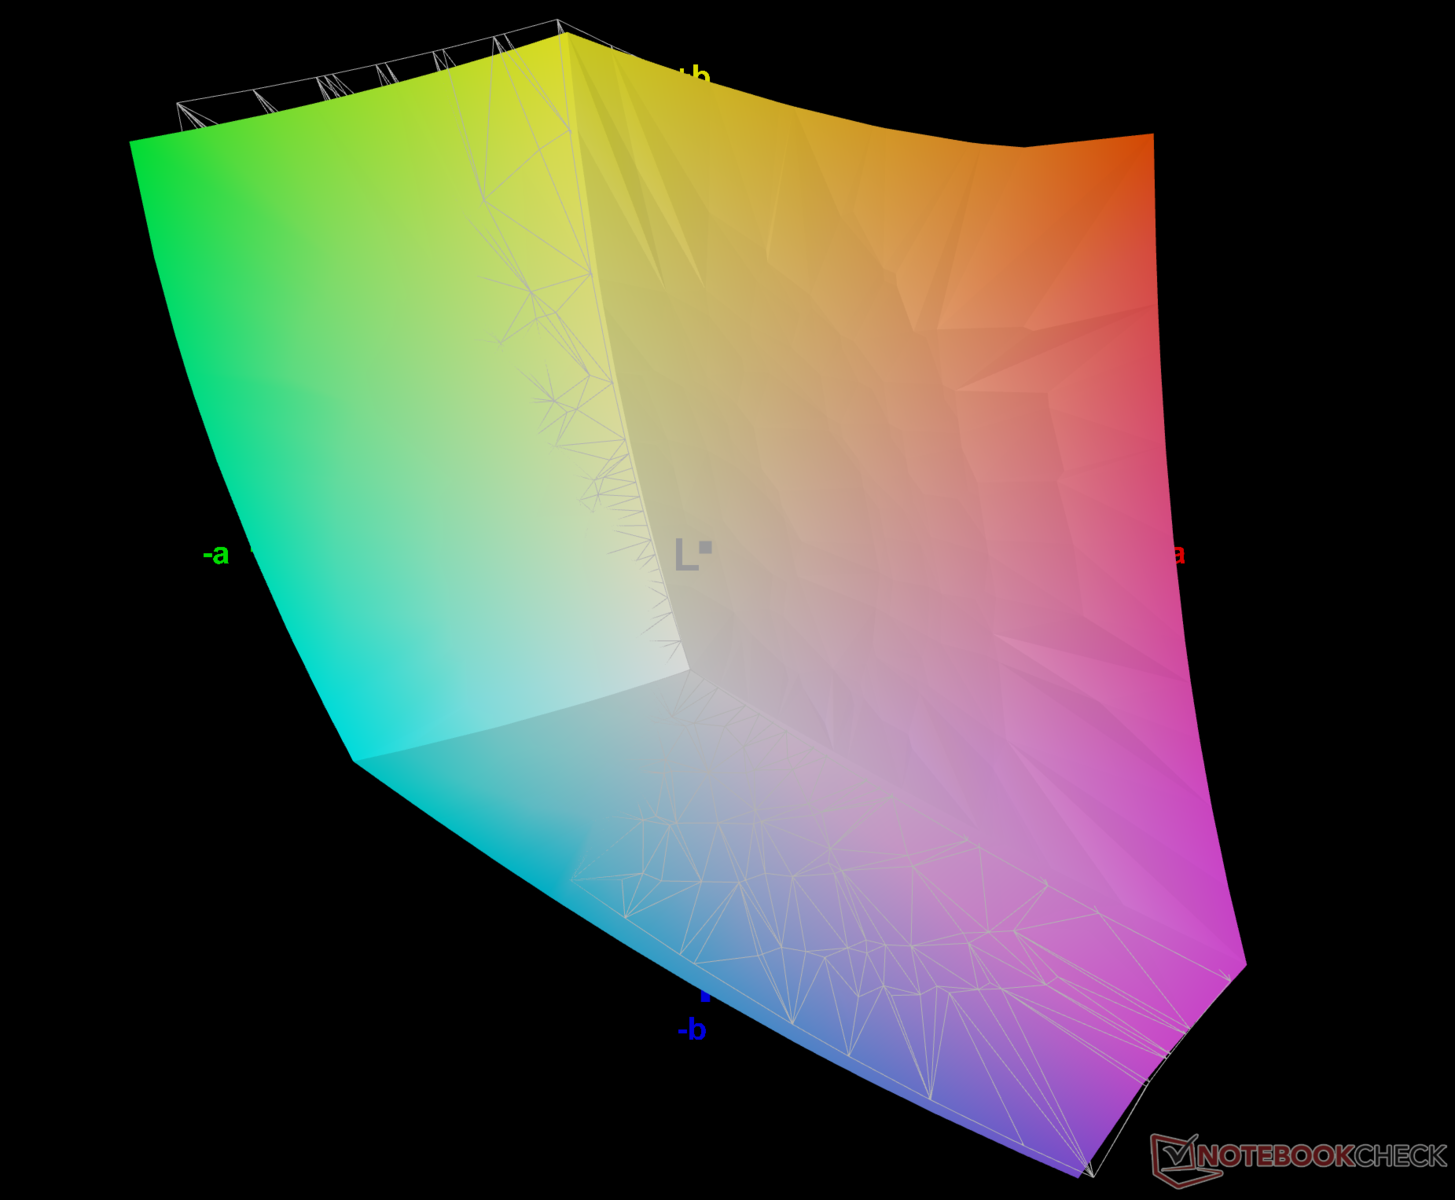
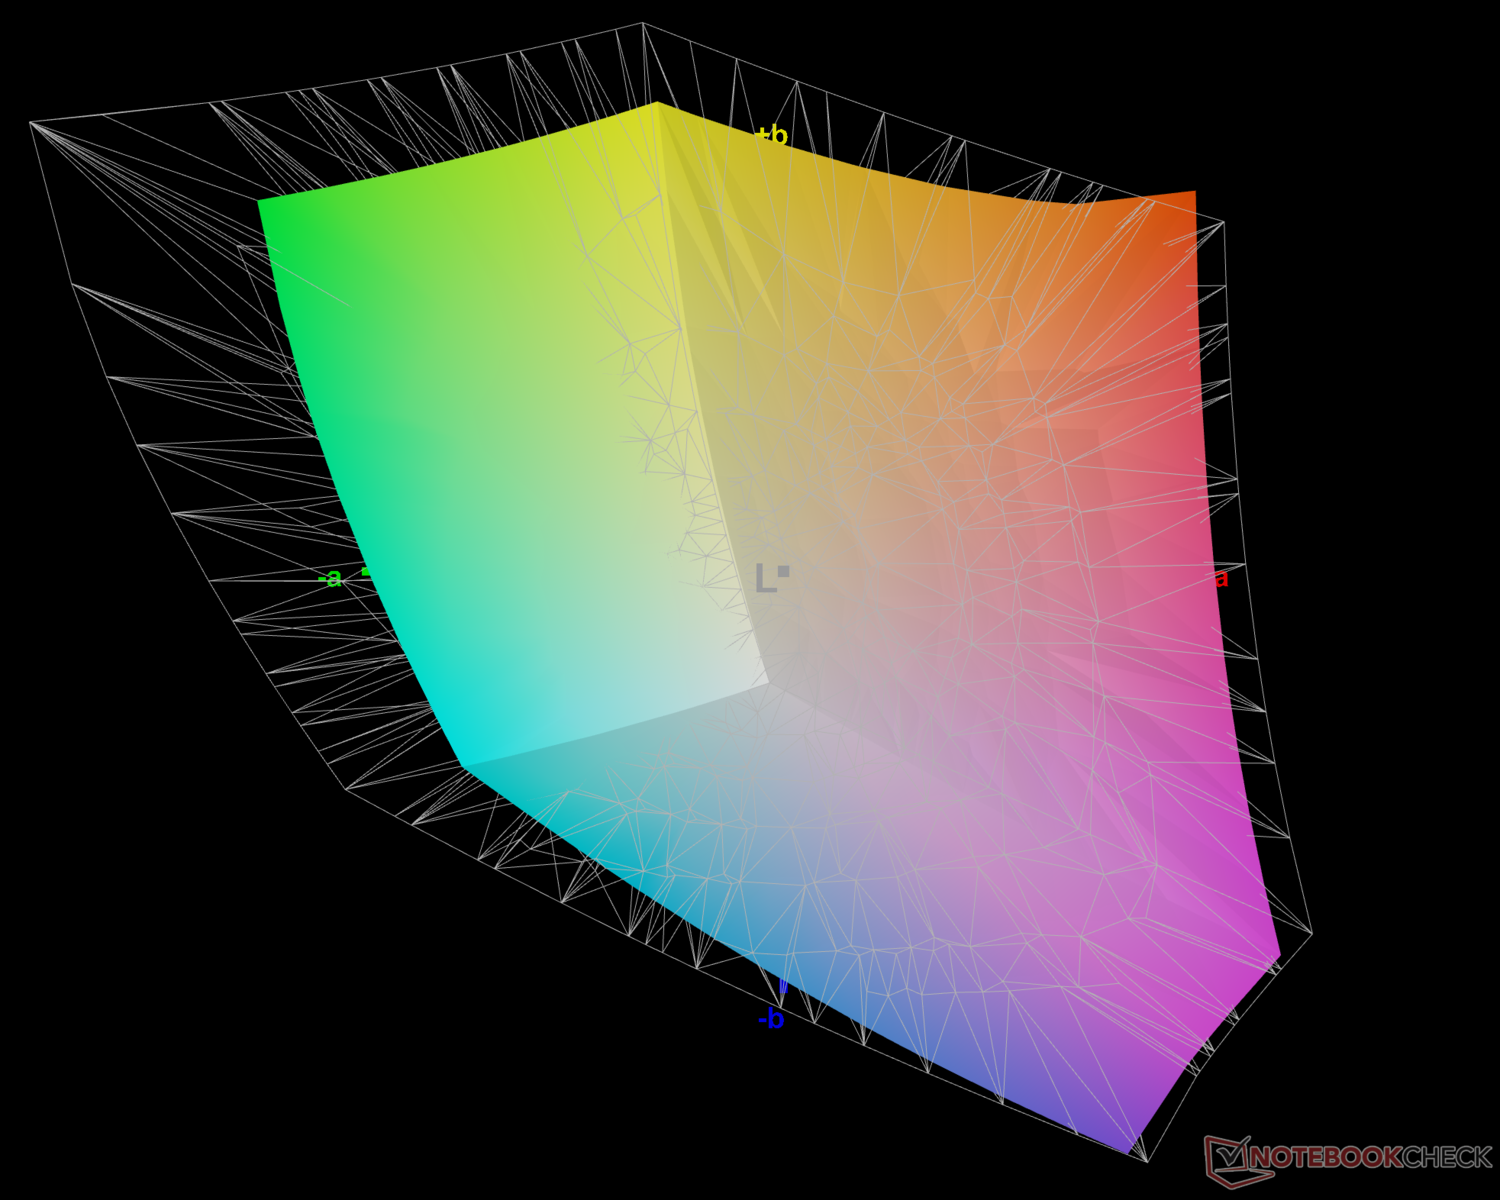
74.4% AdobeRGB 1998 (Argyll 3D)
98.4% sRGB (Argyll 3D)
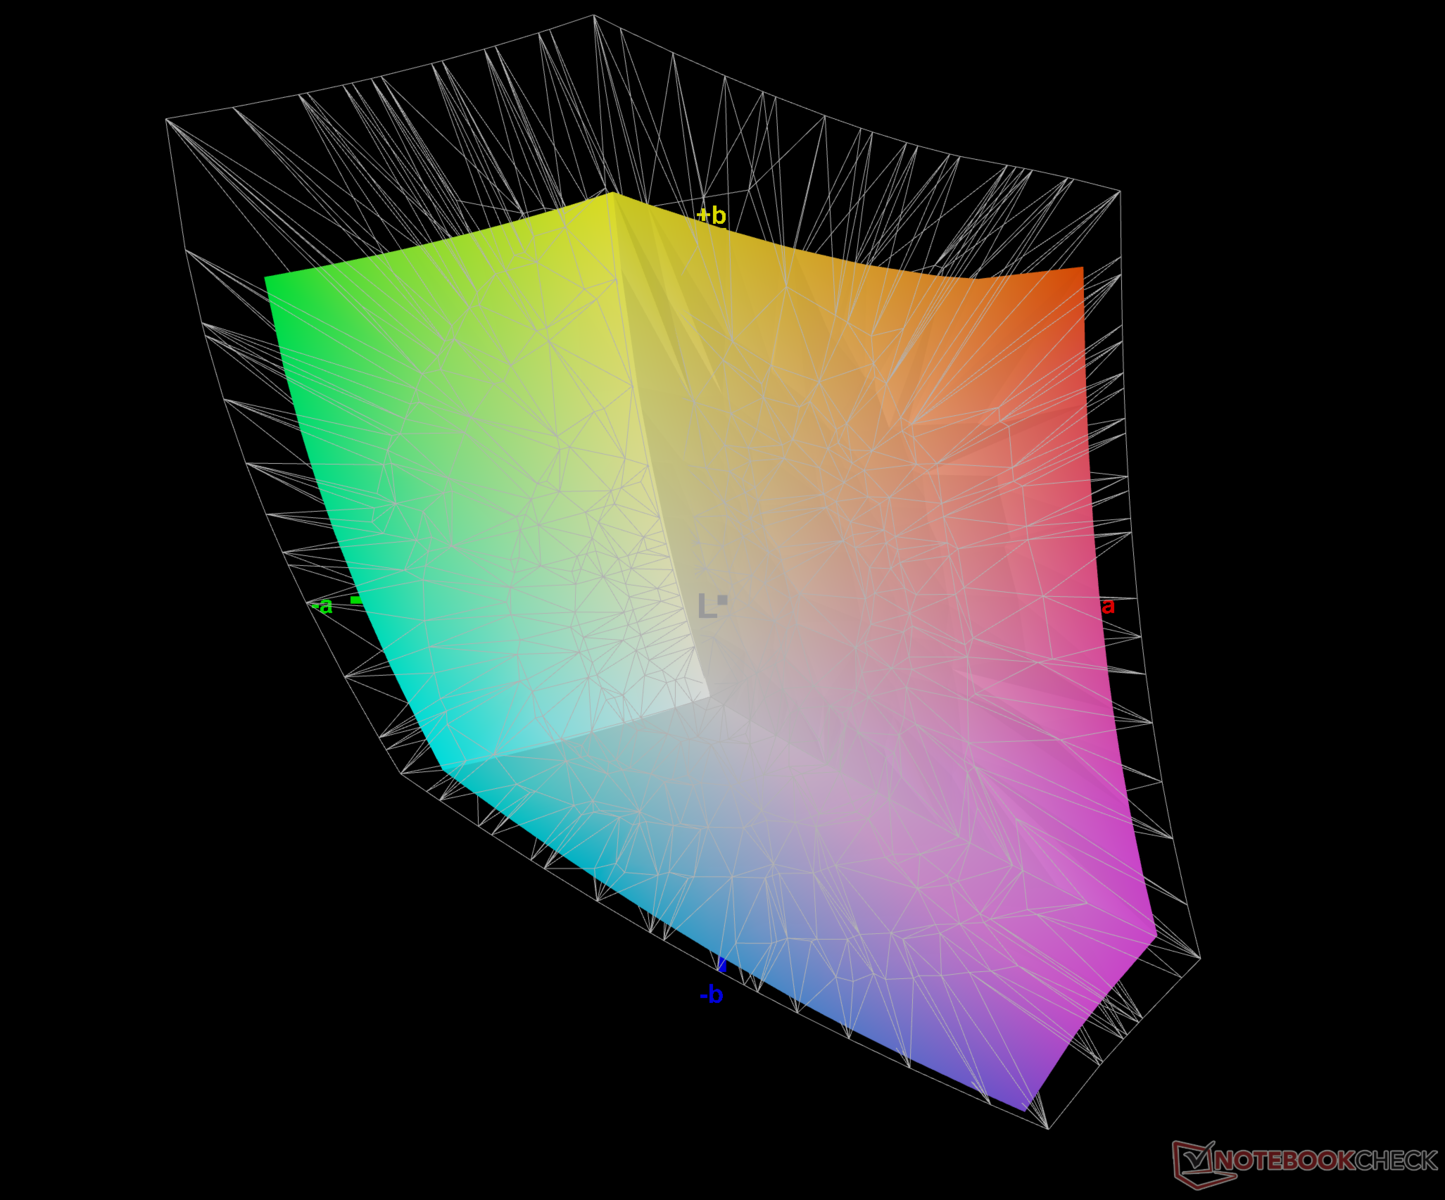
73.1% Display P3 (Argyll 3D)
Gamma: 2.07
CCT: 6479 K
| Dell G15 5530 AUO B156HAN, IPS, 1920x1080, 15.6" | Asus ROG Strix G18 G814JI NE180QDM-NZ2 (BOE0B35), IPS, 2560x1600, 18" | Lenovo Legion Pro 5 16IRX8 AU Optronics B160QAN03.1, IPS, 2560x1600, 16" | Asus ROG Flow X16 GV601V TMX1603 (TL160ADMP03-0), IPS, 2560x1600, 16" | MSI Katana 17 B13VFK B173HAN04.9, IPS LED, 1920x1080, 17.3" | Asus TUF Gaming A16 FA617XS BOE NE160WUM-NX2, IPS, 1920x1200, 16" | Asus ROG Strix G17 G713PI BOE0B69, IPS, 2560x1440, 17.3" | Medion Erazer Major X20 BOE CQ NE160QDM-NZ1, IPS, 2560x1600, 16" | |
|---|---|---|---|---|---|---|---|---|
| Display | 17% | -1% | 16% | -42% | -4% | 17% | -3% | |
| Display P3 Coverage (%) | 73.1 | 98.1 34% | 71.2 -3% | 96.61 32% | 40.8 -44% | 69.3 -5% | 98.3 34% | 69.4 -5% |
| sRGB Coverage (%) | 98.4 | 99.9 2% | 98.8 0% | 99.92 2% | 61 -38% | 97.3 -1% | 100 2% | 98 0% |
| AdobeRGB 1998 Coverage (%) | 74.4 | 85.6 15% | 73.3 -1% | 84.63 14% | 42.2 -43% | 70.7 -5% | 85.9 15% | 70.9 -5% |
| Response Times | -67% | -211% | -27% | -630% | -224% | -59% | -161% | |
| Response Time Grey 50% / Grey 80% * (ms) | 3.39 ? | 5.6 ? -65% | 14.5 ? -328% | 3.8 ? -12% | 33 ? -873% | 15.6 ? -360% | 5.3 ? -56% | 13.1 ? -286% |
| Response Time Black / White * (ms) | 5.35 ? | 9 ? -68% | 10.4 ? -94% | 7.6 ? -42% | 26 ? -386% | 10 ? -87% | 8.6 ? -61% | 7.3 ? -36% |
| PWM Frequency (Hz) | 21620 ? | |||||||
| Screen | 14% | 21% | 21% | -32% | 21% | 17% | 12% | |
| Brightness middle (cd/m²) | 320 | 471 47% | 405.7 27% | 486 52% | 267 -17% | 301 -6% | 327 2% | 374 17% |
| Brightness (cd/m²) | 316 | 422 34% | 368 16% | 469 48% | 256 -19% | 294 -7% | 320 1% | 357 13% |
| Brightness Distribution (%) | 94 | 83 -12% | 87 -7% | 91 -3% | 93 -1% | 94 0% | 89 -5% | 92 -2% |
| Black Level * (cd/m²) | 0.21 | 0.47 -124% | 0.38 -81% | 0.39 -86% | 0.21 -0% | 0.21 -0% | 0.38 -81% | 0.33 -57% |
| Contrast (:1) | 1524 | 1002 -34% | 1068 -30% | 1246 -18% | 1271 -17% | 1433 -6% | 861 -44% | 1133 -26% |
| Colorchecker dE 2000 * | 4.55 | 2.05 55% | 1.65 64% | 2.27 50% | 4.7 -3% | 1.79 61% | 1.01 78% | 2.43 47% |
| Colorchecker dE 2000 max. * | 9.83 | 4.15 58% | 4.2 57% | 5.73 42% | 20.4 -108% | 3.48 65% | 4.01 59% | 3.97 60% |
| Colorchecker dE 2000 calibrated * | 1.51 | 0.8 47% | 0.53 65% | 0.6 60% | 4.5 -198% | 1.2 21% | 0.41 73% | 1.4 7% |
| Greyscale dE 2000 * | 6.2 | 2.8 55% | 1.2 81% | 3.36 46% | 1.5 76% | 2.5 60% | 1.6 74% | 3.1 50% |
| Gamma | 2.07 106% | 2.204 100% | 2.3 96% | 2.46 89% | 2.12 104% | 2.265 97% | 2.168 101% | 2.191 100% |
| CCT | 6479 100% | 7122 91% | 6453 101% | 6625 98% | 6552 99% | 6157 106% | 6659 98% | 6194 105% |
| Total Average (Program / Settings) | -12% /
3% | -64% /
-17% | 3% /
13% | -235% /
-119% | -69% /
-19% | -8% /
7% | -51% /
-16% |
* ... smaller is better
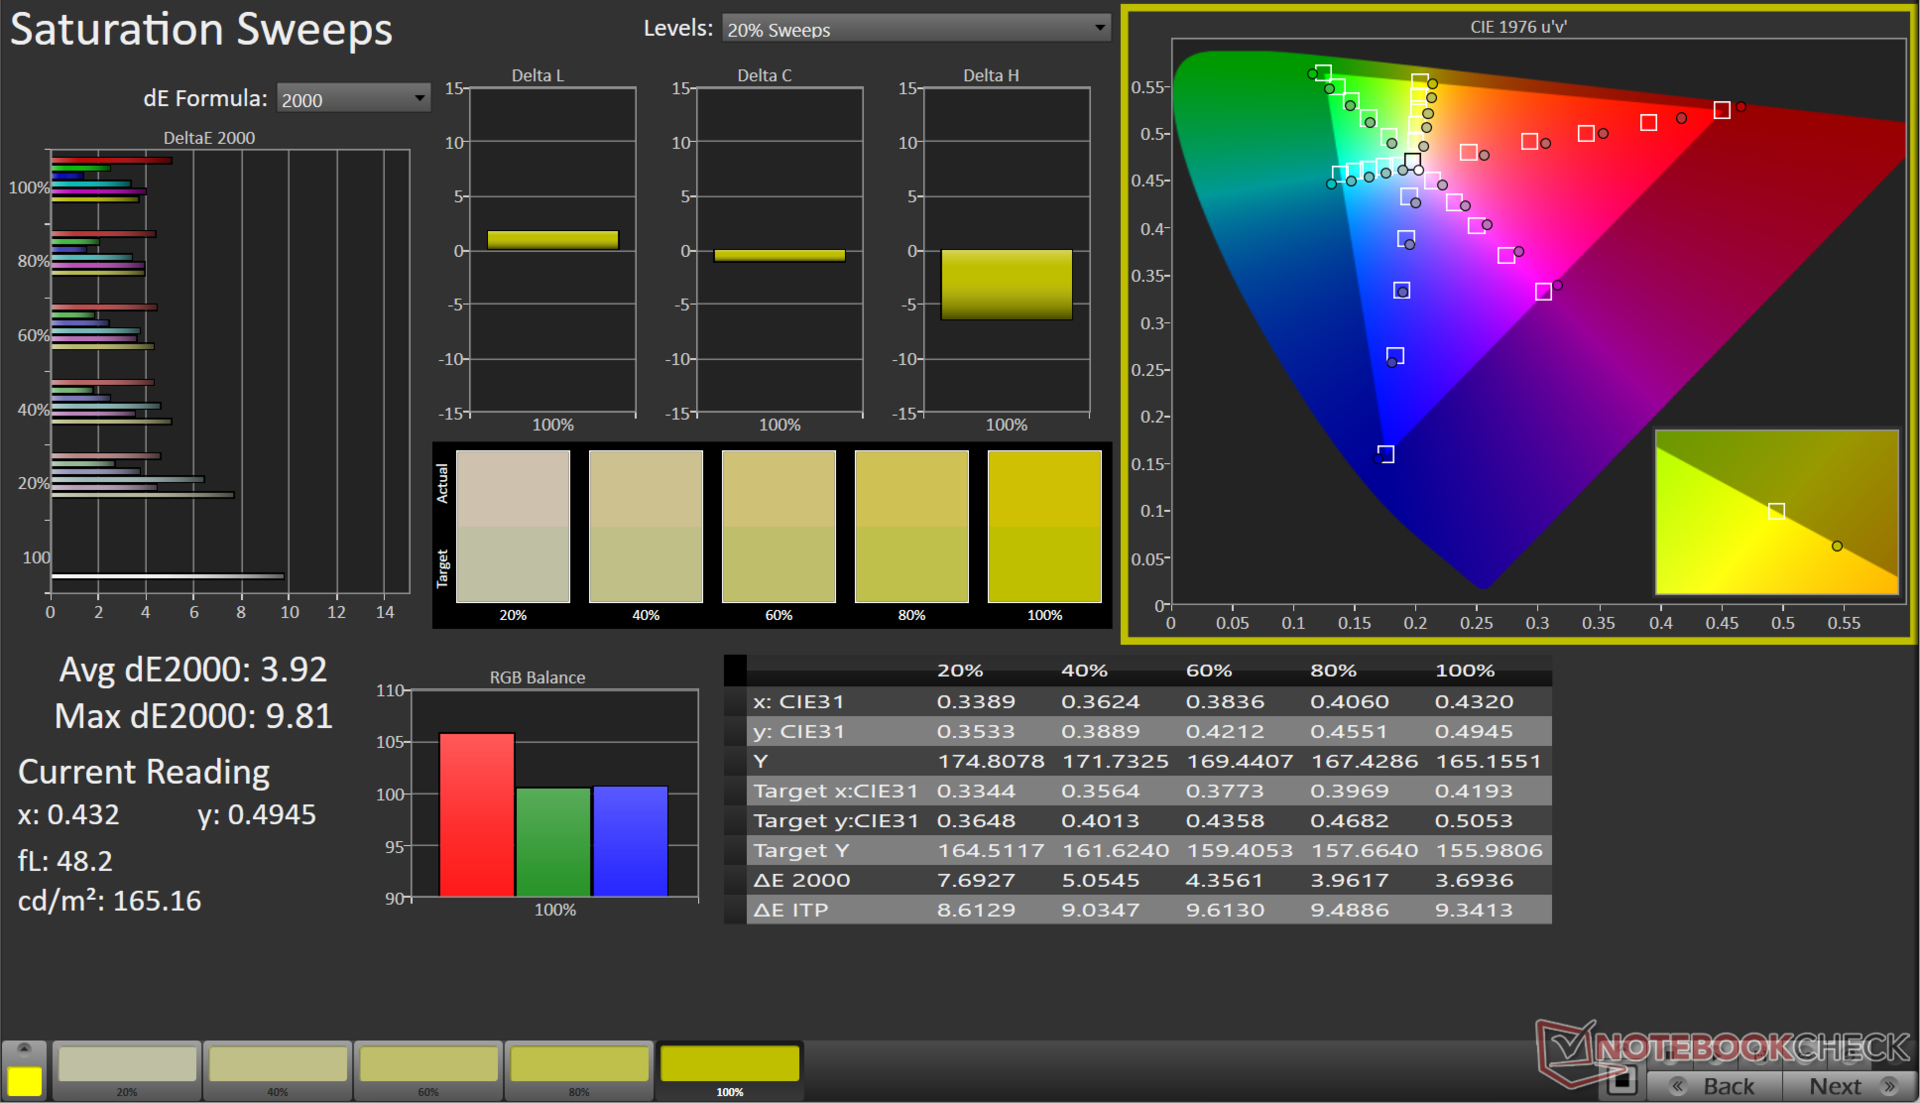
The display covers nearly the entire sRGB color gamut with decent performance in Adobe RGB and Display P3 color spaces as well, which should be amenable for gaming and to get basic edits done.
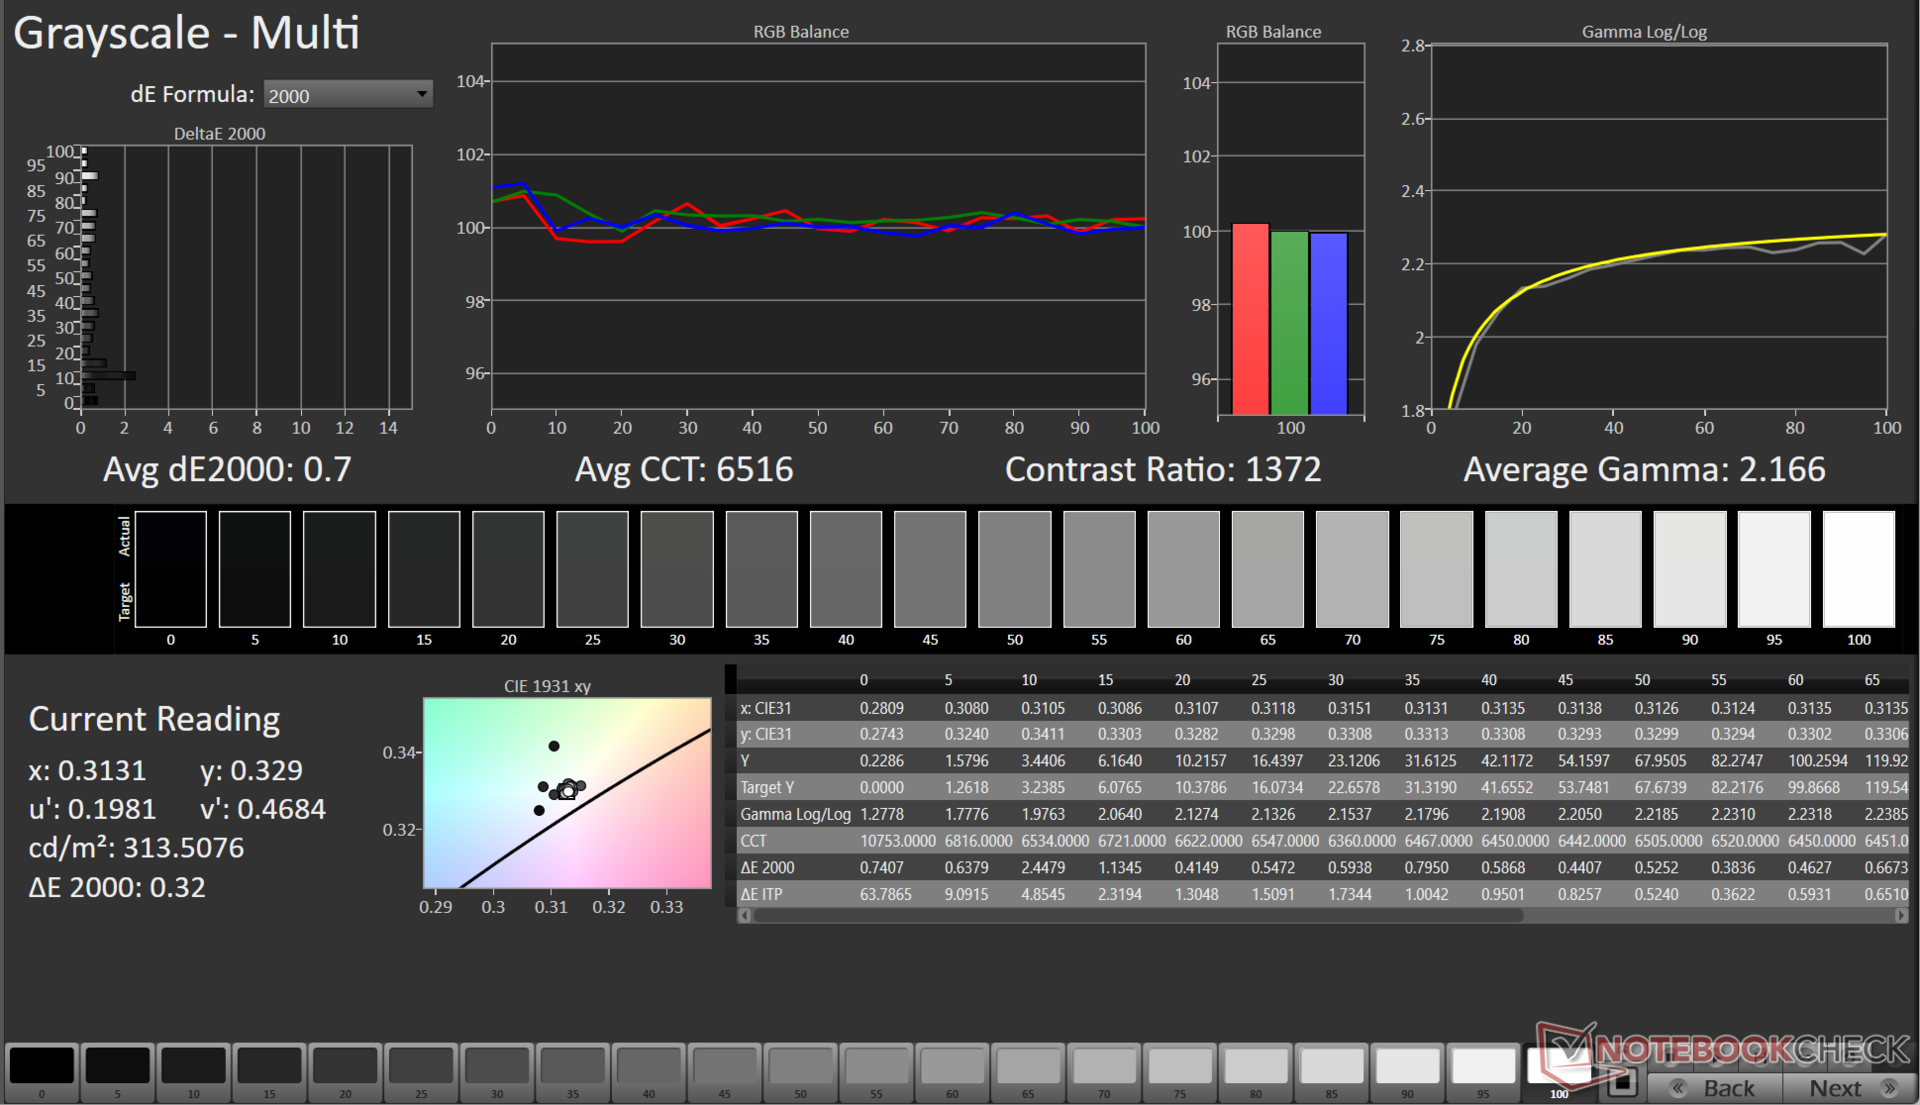
The G15's out-of-the-box color accuracy exhibits noticeable deviations. However, we were able to achieve dramatic improvements with our calibration routine using the X-Rite i1Basic Pro 3 spectrophotometer and Portrait Display's Calman Ultimate color calibration software.
The Grayscale average Delta E 2000 could be reduced to 0.7, while the ColorChecker average Delta E 2000 improved to 1.51.
The calibrated ICC file can be downloaded from the link above.

Display Response Times
| ↔ Response Time Black to White | ||
|---|---|---|
| 5.35 ms ... rise ↗ and fall ↘ combined | ↗ 2.34 ms rise | 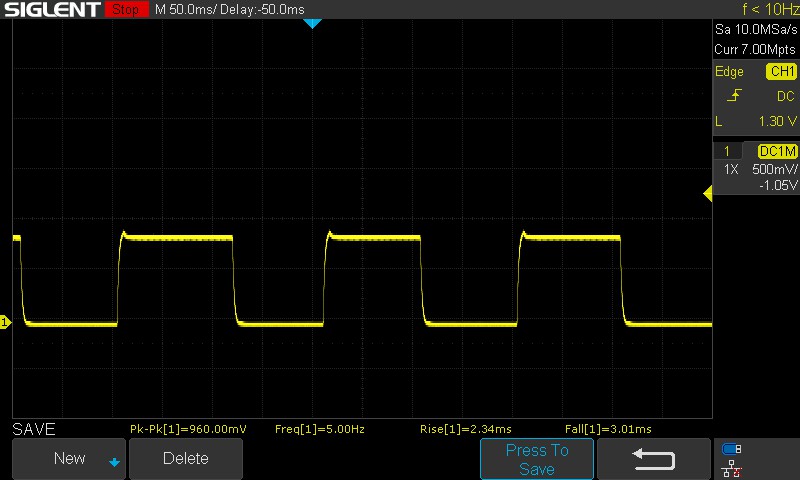 |
| ↘ 3.01 ms fall | ||
| The screen shows very fast response rates in our tests and should be very well suited for fast-paced gaming. In comparison, all tested devices range from 0.1 (minimum) to 240 (maximum) ms. » 18 % of all devices are better. This means that the measured response time is better than the average of all tested devices (19.8 ms). | ||
| ↔ Response Time 50% Grey to 80% Grey | ||
| 3.39 ms ... rise ↗ and fall ↘ combined | ↗ 1.4 ms rise | 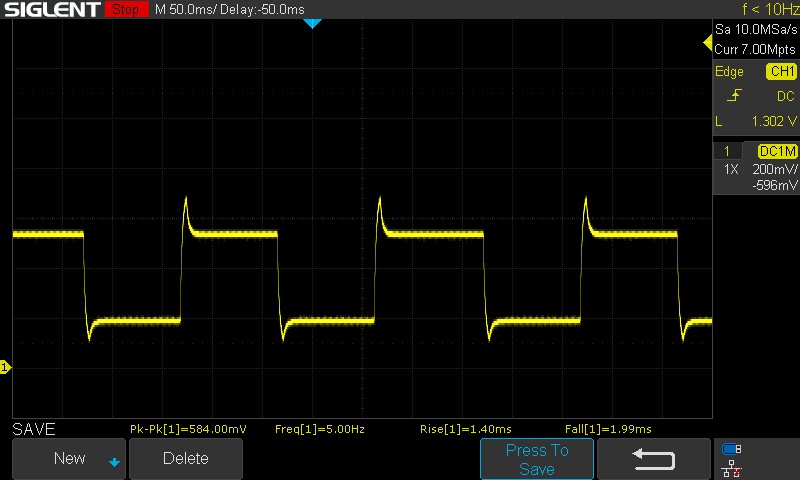 |
| ↘ 1.99 ms fall | ||
| The screen shows very fast response rates in our tests and should be very well suited for fast-paced gaming. In comparison, all tested devices range from 0.165 (minimum) to 636 (maximum) ms. » 14 % of all devices are better. This means that the measured response time is better than the average of all tested devices (30.9 ms). | ||
Screen Flickering / PWM (Pulse-Width Modulation)
| Screen flickering / PWM detected | 21620 Hz | ≤ 100 % brightness setting | 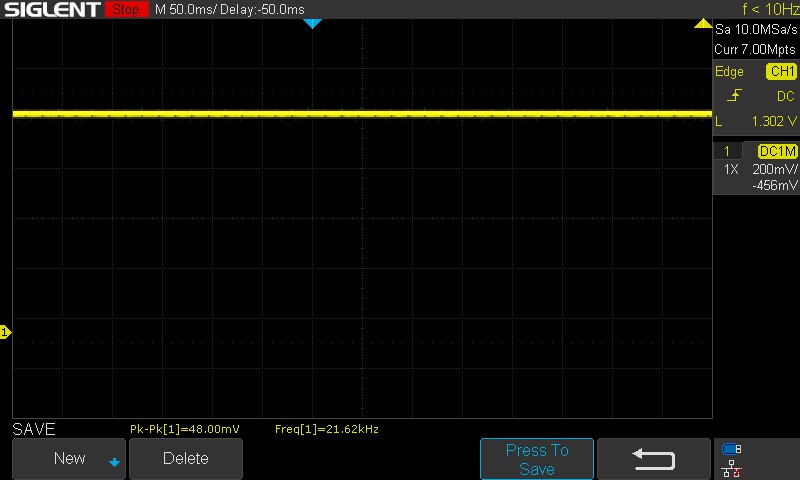 |
The display backlight flickers at 21620 Hz (worst case, e.g., utilizing PWM) Flickering detected at a brightness setting of 100 % and below. There should be no flickering or PWM above this brightness setting. The frequency of 21620 Hz is quite high, so most users sensitive to PWM should not notice any flickering. In comparison: 52 % of all tested devices do not use PWM to dim the display. If PWM was detected, an average of 7744 (minimum: 5 - maximum: 343500) Hz was measured. | |||
The G15's panel employs overdrive to achieve lower response times. It is worth noting that there is no option to deactivate panel overdrive through the Alienware Command Center.
Although the panel does not utilize PWM for brightness adjustment, it still exhibits flickering. However, this is unlikely to cause significant eye strain or discomfort for most users due to its high frequency.
For more information, check out our article, "Why PWM is such a headache". Also, the PWM Ranking table provides an overview of measured PWM frequencies across all reviewed devices to date.
Outdoor viewing does not pose major issues as long there's no direct sunlight falling on the screen. Viewing angles are wide and are relatively stable save for some perceivable loss of brightness at the extremes.


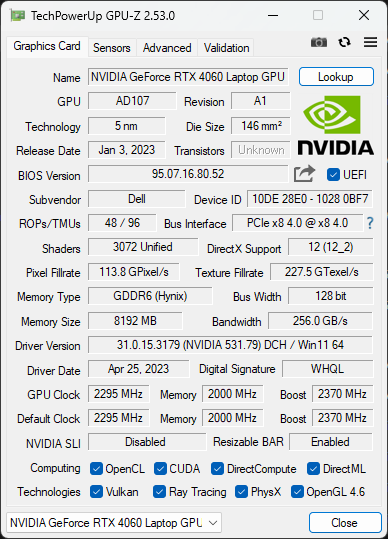
Performance: On expected lines for a Core i7-13650HX and RTX 4060 combo
Our Dell G15 5530 unit is powered by the Intel Core i7-13650HX and the Nvidia GeForce RTX 4060 Laptop GPU. Depending on the region, buyers can also configure this laptop with a Core i5-13450HX and an RTX 3050 6 GB or RTX 4050 Laptop GPU.
Note that the RTX 3050 option is only available in combination with the Core i5-13450HX.
Testing Conditions
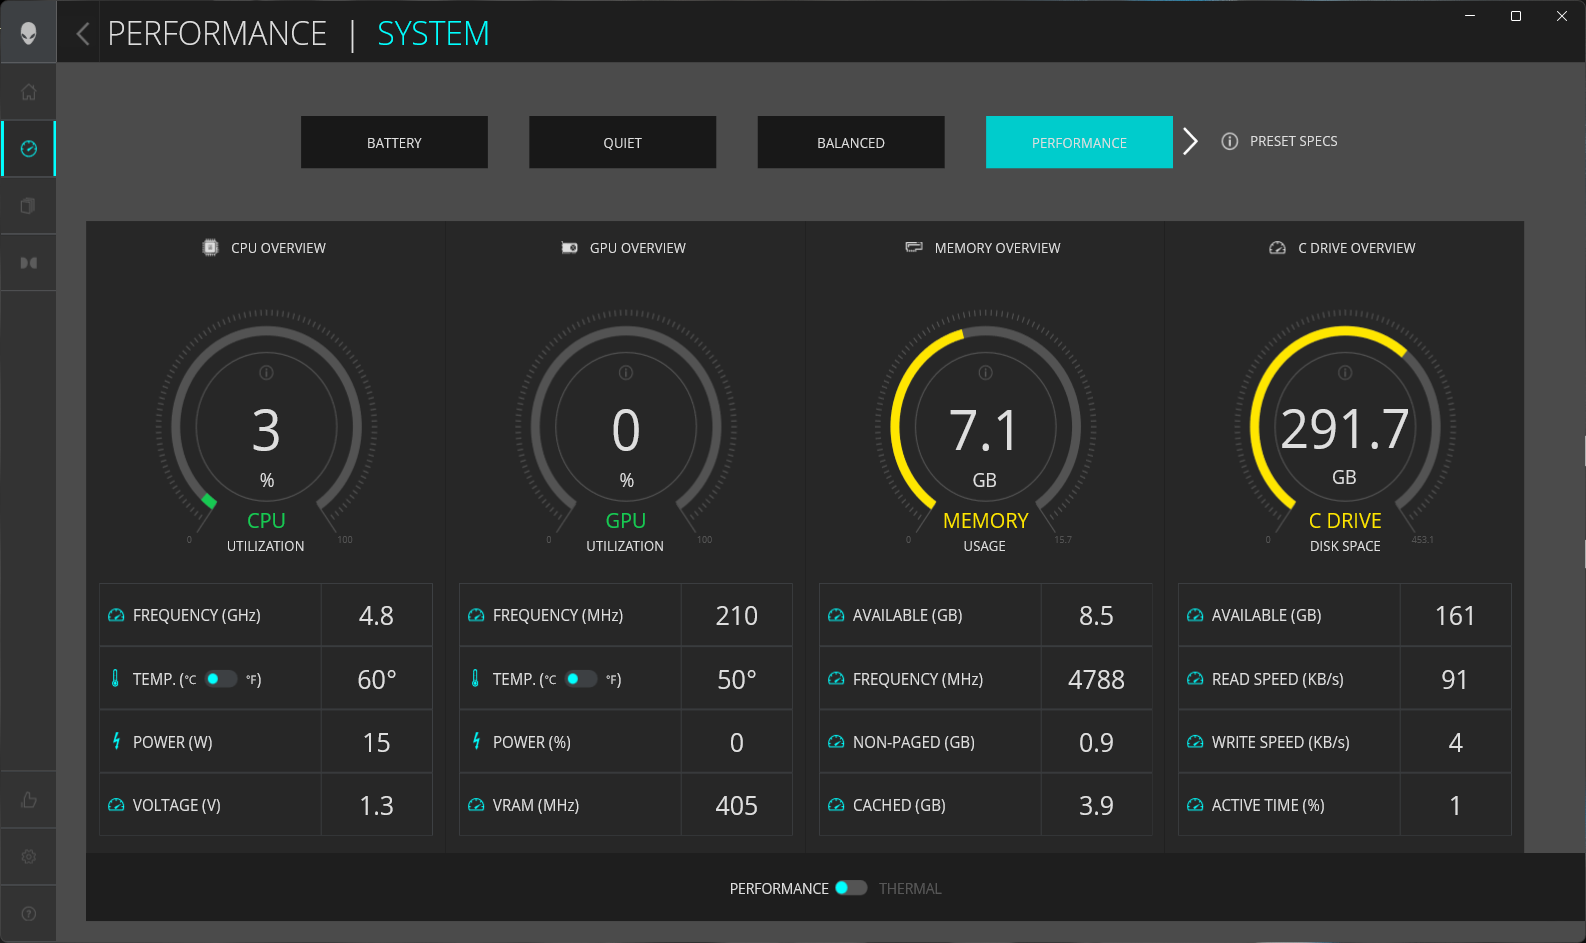
The Alienware Command Center provides four predefined performance presets to choose from, but it also allows users to create and customize their own profiles.
We utilized the Performance mode for all benchmarks and tests, except for assessing battery life for which we used the Battery profile.
The table below illustrates the variations in Processor Base Power (PBP) and Maximum Turbo Power (MTP) for each scenario:
| Performance mode | PL1 (PBP) / Tau | PL2 (MTP) / Tau | PL4 |
|---|---|---|---|
| Battery | 55 W / 56 s | 157 W / 2.44 ms | 242 W |
| Quiet | 55 W / 56 s | 157 W / 2.44 ms | 242 W |
| Balanced | 157 W / 56 s | 157 W / 2.44 ms | 242 W |
| Performance | 191 W / 56 s | 191 W / 2.44 ms | 242 W |
Processor
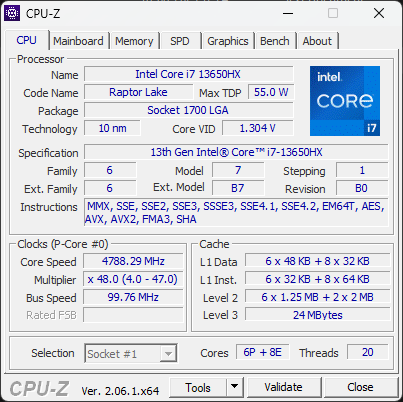
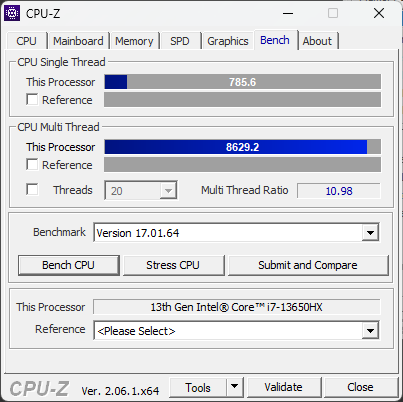
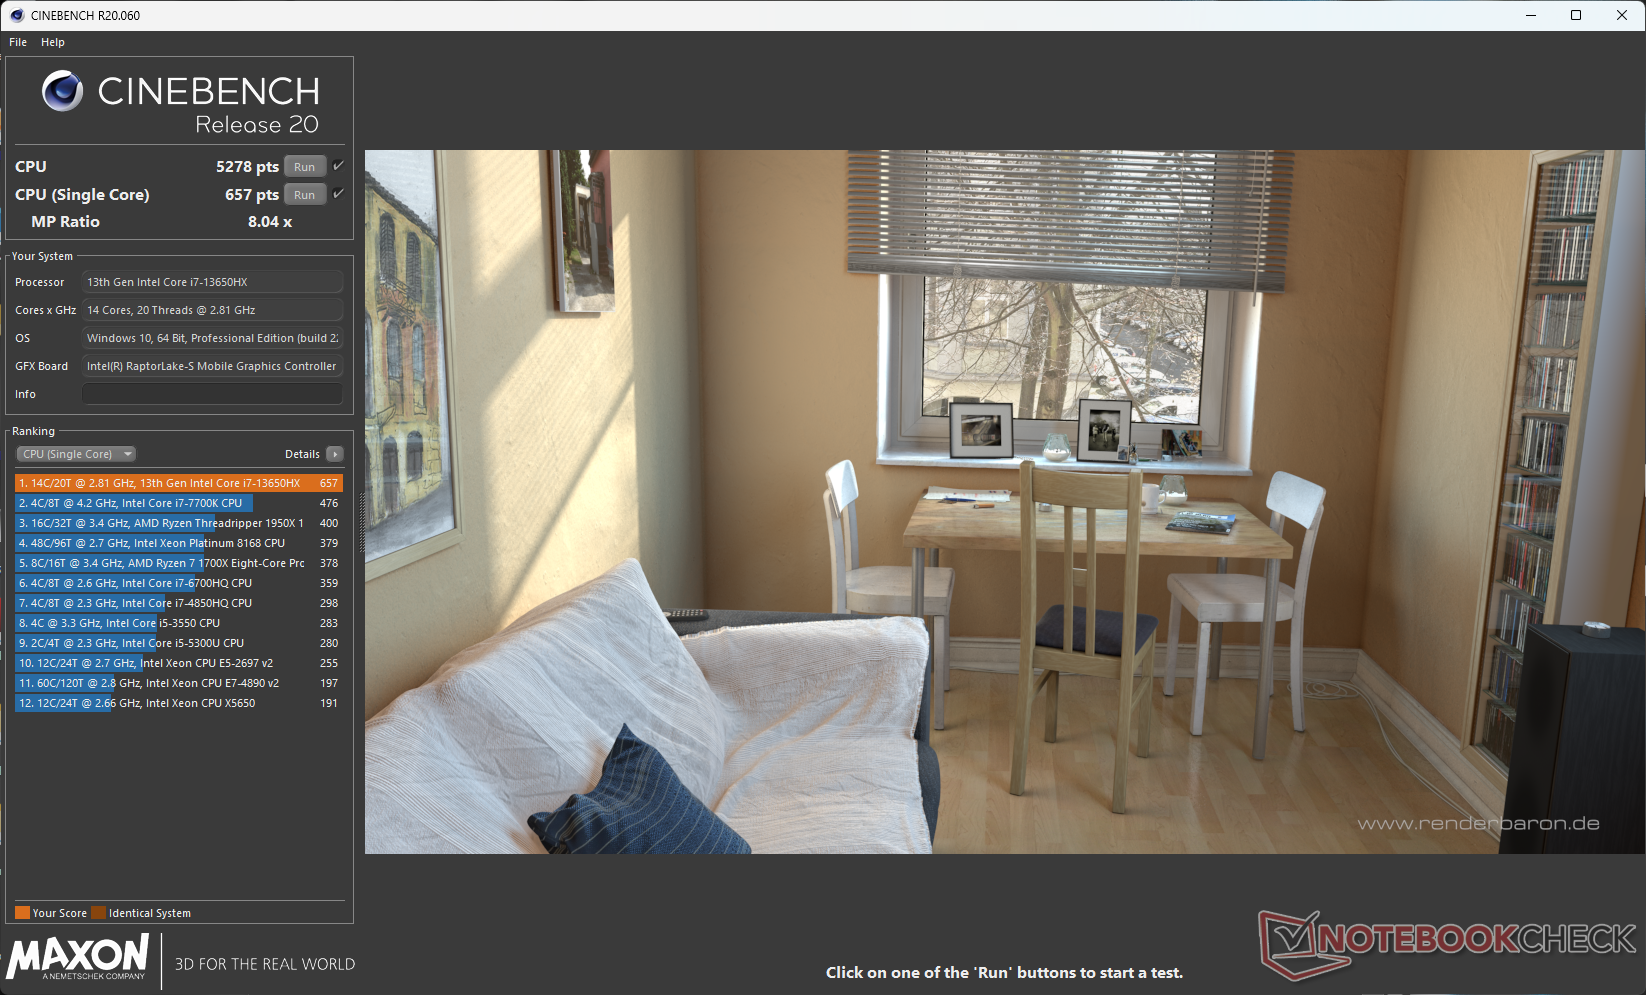
The Intel Core i7-13650HX is a 14-core 20-thread Raptor Lake-HX part that offers a single-core boost up to 4.9 GHz on its P-cores.
In the Cinebench R15 multi-core loop test, the G15 5530 starts off on par with the Asus ROG Strix G18, which utilizes the same CPU. However, we observe slight throttling midway through the test. The overall CPU performance is otherwise nearly identical in both models.
The G15 5530's Core i7-13650HX offers good leads in multi-core tests over the Ryzen 9 7940HS in the Asus TUF Gaming A16, but the latter manages to stay within striking distance in cumulative performance due to its high single-core gains.
Cinebench R15 Multi Loop
Cinebench R23: Multi Core | Single Core
Cinebench R20: CPU (Multi Core) | CPU (Single Core)
Cinebench R15: CPU Multi 64Bit | CPU Single 64Bit
Blender: v2.79 BMW27 CPU
7-Zip 18.03: 7z b 4 | 7z b 4 -mmt1
Geekbench 5.5: Multi-Core | Single-Core
HWBOT x265 Benchmark v2.2: 4k Preset
LibreOffice : 20 Documents To PDF
R Benchmark 2.5: Overall mean
| CPU Performance rating | |
| Asus ROG Strix G17 G713PI | |
| Medion Erazer Major X20 | |
| Average of class Gaming | |
| Asus ROG Flow X16 GV601V | |
| Dell G15 5530 | |
| Asus ROG Strix G18 G814JI | |
| Lenovo Legion Pro 5 16IRX8 | |
| Average Intel Core i7-13650HX | |
| Asus TUF Gaming A16 FA617XS | |
| MSI Katana 17 B13VFK | |
| Cinebench R23 / Multi Core | |
| Asus ROG Strix G17 G713PI | |
| Medion Erazer Major X20 | |
| Average of class Gaming (10488 - 42661, n=104, last 2 years) | |
| Asus ROG Strix G18 G814JI | |
| Dell G15 5530 | |
| Average Intel Core i7-13650HX (18744 - 21006, n=6) | |
| Lenovo Legion Pro 5 16IRX8 | |
| Asus ROG Flow X16 GV601V | |
| Asus TUF Gaming A16 FA617XS | |
| MSI Katana 17 B13VFK | |
| Cinebench R23 / Single Core | |
| Medion Erazer Major X20 | |
| Average of class Gaming (1601 - 2415, n=104, last 2 years) | |
| Asus ROG Flow X16 GV601V | |
| Asus ROG Strix G18 G814JI | |
| Asus ROG Strix G17 G713PI | |
| Dell G15 5530 | |
| Average Intel Core i7-13650HX (1693 - 1903, n=6) | |
| MSI Katana 17 B13VFK | |
| Asus TUF Gaming A16 FA617XS | |
| Lenovo Legion Pro 5 16IRX8 | |
| Cinebench R20 / CPU (Multi Core) | |
| Medion Erazer Major X20 | |
| Average of class Gaming (4029 - 16433, n=103, last 2 years) | |
| Asus ROG Strix G17 G713PI | |
| Dell G15 5530 | |
| Asus ROG Strix G18 G814JI | |
| Average Intel Core i7-13650HX (7197 - 8021, n=5) | |
| Asus ROG Flow X16 GV601V | |
| Lenovo Legion Pro 5 16IRX8 | |
| Asus TUF Gaming A16 FA617XS | |
| MSI Katana 17 B13VFK | |
| Cinebench R20 / CPU (Single Core) | |
| Average of class Gaming (622 - 913, n=103, last 2 years) | |
| Medion Erazer Major X20 | |
| Asus ROG Flow X16 GV601V | |
| Asus ROG Strix G18 G814JI | |
| Average Intel Core i7-13650HX (700 - 728, n=5) | |
| Asus ROG Strix G17 G713PI | |
| Dell G15 5530 | |
| Asus TUF Gaming A16 FA617XS | |
| MSI Katana 17 B13VFK | |
| Lenovo Legion Pro 5 16IRX8 | |
| Cinebench R15 / CPU Multi 64Bit | |
| Asus ROG Strix G17 G713PI | |
| Medion Erazer Major X20 | |
| Average of class Gaming (1578 - 6330, n=102, last 2 years) | |
| Lenovo Legion Pro 5 16IRX8 | |
| Dell G15 5530 | |
| Asus ROG Strix G18 G814JI | |
| Asus ROG Flow X16 GV601V | |
| Average Intel Core i7-13650HX (2864 - 3147, n=5) | |
| Asus TUF Gaming A16 FA617XS | |
| MSI Katana 17 B13VFK | |
| Cinebench R15 / CPU Single 64Bit | |
| Average of class Gaming (188.8 - 350, n=103, last 2 years) | |
| Medion Erazer Major X20 | |
| Asus ROG Strix G17 G713PI | |
| Asus ROG Flow X16 GV601V | |
| Asus TUF Gaming A16 FA617XS | |
| Asus ROG Strix G18 G814JI | |
| Dell G15 5530 | |
| Average Intel Core i7-13650HX (256 - 275, n=5) | |
| Lenovo Legion Pro 5 16IRX8 | |
| MSI Katana 17 B13VFK | |
| Blender / v2.79 BMW27 CPU | |
| MSI Katana 17 B13VFK | |
| Asus TUF Gaming A16 FA617XS | |
| Asus ROG Flow X16 GV601V | |
| Average Intel Core i7-13650HX (158 - 226, n=5) | |
| Dell G15 5530 | |
| Asus ROG Strix G18 G814JI | |
| Lenovo Legion Pro 5 16IRX8 | |
| Average of class Gaming (79 - 330, n=101, last 2 years) | |
| Medion Erazer Major X20 | |
| Asus ROG Strix G17 G713PI | |
| 7-Zip 18.03 / 7z b 4 | |
| Asus ROG Strix G17 G713PI | |
| Medion Erazer Major X20 | |
| Average of class Gaming (33491 - 148086, n=102, last 2 years) | |
| Asus ROG Strix G18 G814JI | |
| Lenovo Legion Pro 5 16IRX8 | |
| Dell G15 5530 | |
| Average Intel Core i7-13650HX (73927 - 80057, n=5) | |
| Asus ROG Flow X16 GV601V | |
| Asus TUF Gaming A16 FA617XS | |
| MSI Katana 17 B13VFK | |
| 7-Zip 18.03 / 7z b 4 -mmt1 | |
| Asus ROG Strix G17 G713PI | |
| Medion Erazer Major X20 | |
| Asus TUF Gaming A16 FA617XS | |
| Average of class Gaming (4824 - 7436, n=102, last 2 years) | |
| Asus ROG Flow X16 GV601V | |
| Asus ROG Strix G18 G814JI | |
| Average Intel Core i7-13650HX (5828 - 6125, n=5) | |
| Dell G15 5530 | |
| MSI Katana 17 B13VFK | |
| Lenovo Legion Pro 5 16IRX8 | |
| Geekbench 5.5 / Multi-Core | |
| Medion Erazer Major X20 | |
| Asus ROG Strix G17 G713PI | |
| Average of class Gaming (6460 - 28263, n=102, last 2 years) | |
| Asus ROG Strix G18 G814JI | |
| Lenovo Legion Pro 5 16IRX8 | |
| Dell G15 5530 | |
| Asus ROG Flow X16 GV601V | |
| Average Intel Core i7-13650HX (12509 - 14778, n=5) | |
| Asus TUF Gaming A16 FA617XS | |
| MSI Katana 17 B13VFK | |
| Geekbench 5.5 / Single-Core | |
| Average of class Gaming (1403 - 2474, n=102, last 2 years) | |
| Asus ROG Strix G17 G713PI | |
| Medion Erazer Major X20 | |
| Asus TUF Gaming A16 FA617XS | |
| Asus ROG Flow X16 GV601V | |
| Dell G15 5530 | |
| Average Intel Core i7-13650HX (1810 - 1866, n=5) | |
| Asus ROG Strix G18 G814JI | |
| MSI Katana 17 B13VFK | |
| Lenovo Legion Pro 5 16IRX8 | |
| HWBOT x265 Benchmark v2.2 / 4k Preset | |
| Asus ROG Strix G17 G713PI | |
| Average of class Gaming (11.5 - 44.4, n=102, last 2 years) | |
| Medion Erazer Major X20 | |
| Lenovo Legion Pro 5 16IRX8 | |
| Asus ROG Strix G18 G814JI | |
| Dell G15 5530 | |
| Asus ROG Flow X16 GV601V | |
| Average Intel Core i7-13650HX (18.9 - 23.6, n=5) | |
| Asus TUF Gaming A16 FA617XS | |
| MSI Katana 17 B13VFK | |
| LibreOffice / 20 Documents To PDF | |
| Asus ROG Strix G18 G814JI | |
| MSI Katana 17 B13VFK | |
| Average of class Gaming (33.2 - 88.8, n=102, last 2 years) | |
| Average Intel Core i7-13650HX (38.9 - 58.8, n=5) | |
| Dell G15 5530 | |
| Asus ROG Strix G17 G713PI | |
| Medion Erazer Major X20 | |
| Asus TUF Gaming A16 FA617XS | |
| Asus ROG Flow X16 GV601V | |
| Lenovo Legion Pro 5 16IRX8 | |
| R Benchmark 2.5 / Overall mean | |
| Lenovo Legion Pro 5 16IRX8 | |
| MSI Katana 17 B13VFK | |
| Asus ROG Strix G18 G814JI | |
| Average Intel Core i7-13650HX (0.4217 - 0.4461, n=6) | |
| Dell G15 5530 | |
| Asus TUF Gaming A16 FA617XS | |
| Average of class Gaming (0.3439 - 0.59, n=102, last 2 years) | |
| Asus ROG Flow X16 GV601V | |
| Asus ROG Strix G17 G713PI | |
| Medion Erazer Major X20 | |
* ... smaller is better
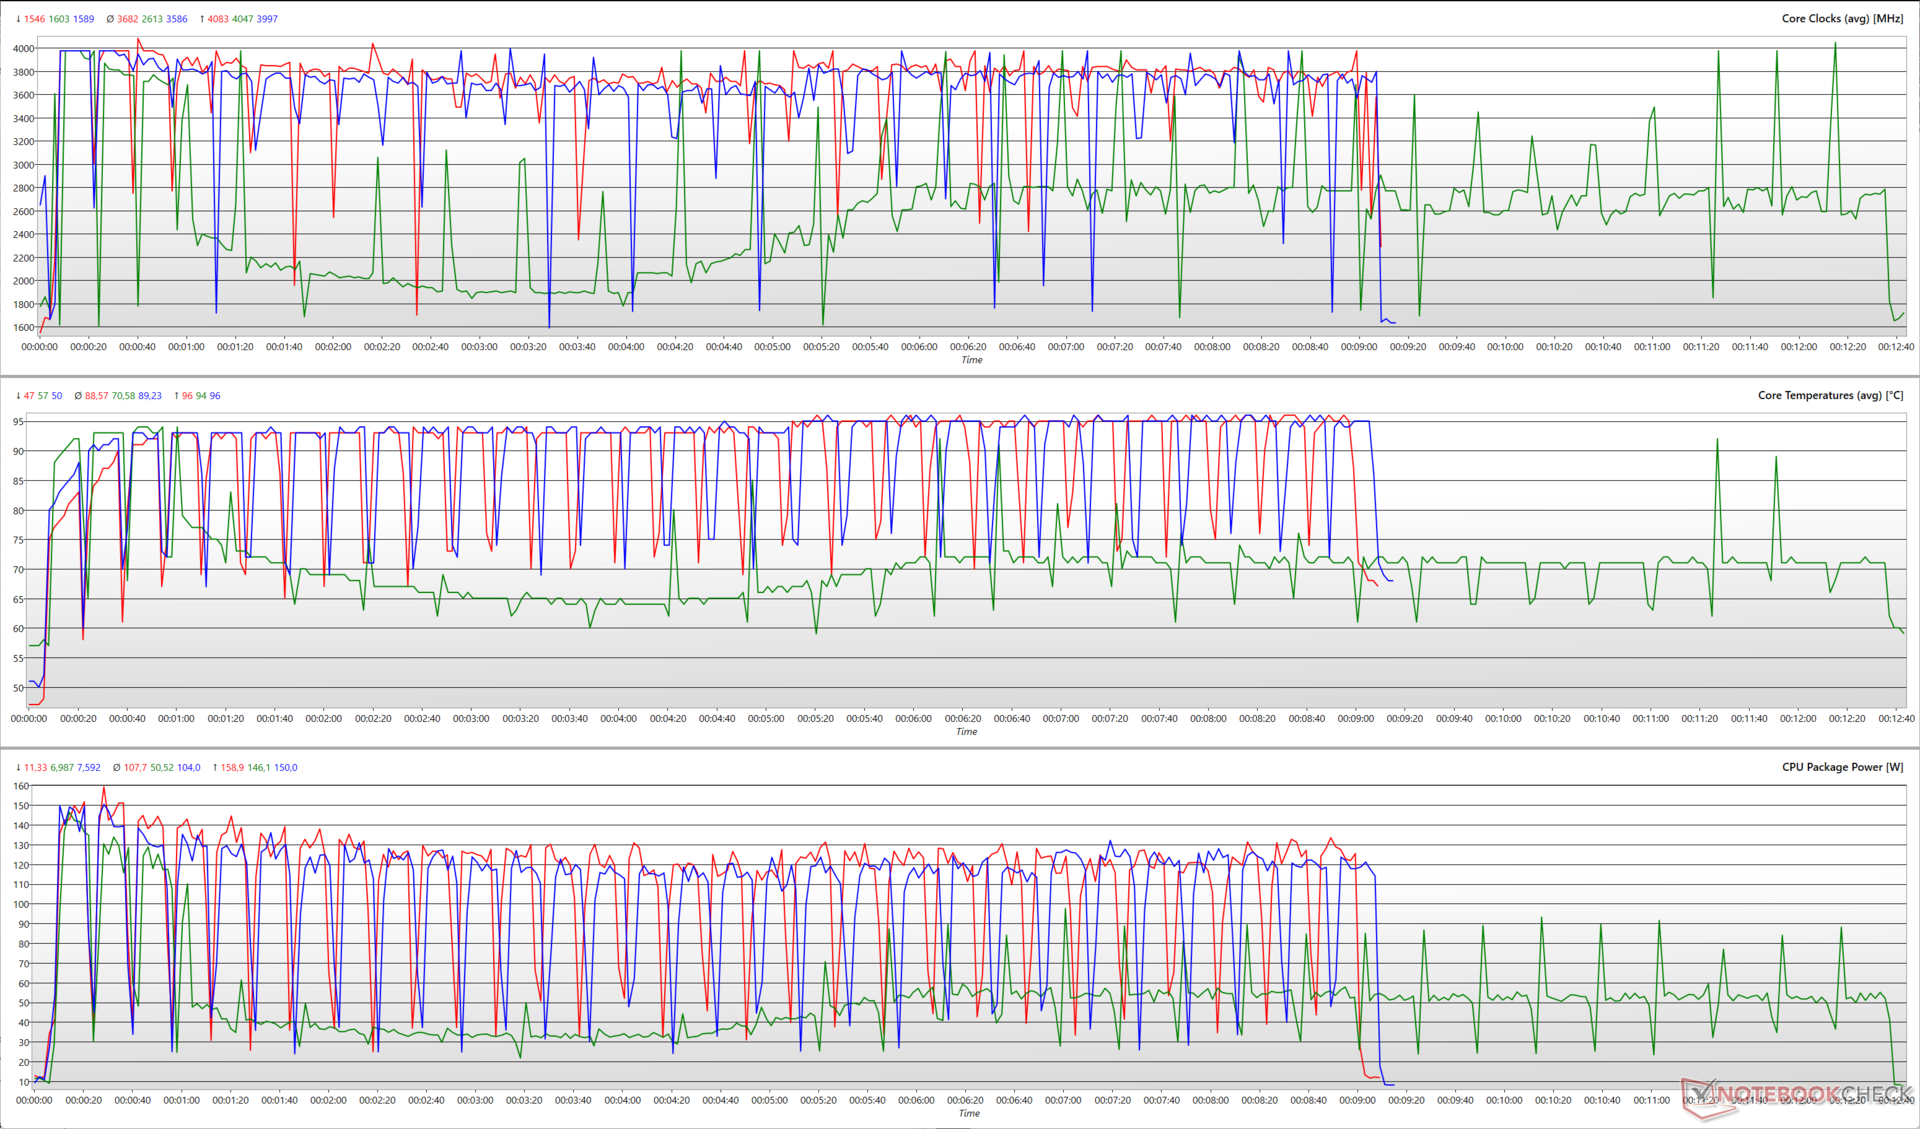
The graph below illustrates how various CPU parameters vary in each performance mode during a Cinebench R15 multi-core loop.
Performance and Balanced modes show similar average boost clocks around the 3.6 GHz mark while Quiet mode makes do with just a 2.6 GHz average boost.
Balanced mode is about 9 W more economical than Performance in terms of peak CPU package power draw. The core temperatures are more or less identical in both presets, however.
It's worth noting that while Quiet mode consumes just about 50.5 W package power on average, it also results in a 23% performance loss.
On battery power, Cinebench R20 single-core performance takes only a 7% hit. However, the multi-core score drops by 34%.
AIDA64: FP32 Ray-Trace | FPU Julia | CPU SHA3 | CPU Queen | FPU SinJulia | FPU Mandel | CPU AES | CPU ZLib | FP64 Ray-Trace | CPU PhotoWorxx
| Performance rating | |
| Asus ROG Strix G17 G713PI | |
| Average of class Gaming | |
| Medion Erazer Major X20 | |
| Asus TUF Gaming A16 FA617XS | |
| Lenovo Legion Pro 5 16IRX8 | |
| Asus ROG Strix G18 G814JI | |
| Dell G15 5530 | |
| Average Intel Core i7-13650HX | |
| Asus ROG Flow X16 GV601V | |
| MSI Katana 17 B13VFK | |
| AIDA64 / FP32 Ray-Trace | |
| Asus ROG Strix G17 G713PI | |
| Average of class Gaming (10227 - 85542, n=102, last 2 years) | |
| Asus TUF Gaming A16 FA617XS | |
| Medion Erazer Major X20 | |
| Lenovo Legion Pro 5 16IRX8 | |
| Asus ROG Strix G18 G814JI | |
| Dell G15 5530 | |
| Average Intel Core i7-13650HX (13404 - 20012, n=5) | |
| MSI Katana 17 B13VFK | |
| Asus ROG Flow X16 GV601V | |
| AIDA64 / FPU Julia | |
| Asus ROG Strix G17 G713PI | |
| Average of class Gaming (51376 - 372155, n=102, last 2 years) | |
| Medion Erazer Major X20 | |
| Asus TUF Gaming A16 FA617XS | |
| Lenovo Legion Pro 5 16IRX8 | |
| Asus ROG Strix G18 G814JI | |
| Dell G15 5530 | |
| Average Intel Core i7-13650HX (68241 - 97317, n=5) | |
| Asus ROG Flow X16 GV601V | |
| MSI Katana 17 B13VFK | |
| AIDA64 / CPU SHA3 | |
| Asus ROG Strix G17 G713PI | |
| Average of class Gaming (2180 - 10115, n=102, last 2 years) | |
| Medion Erazer Major X20 | |
| Lenovo Legion Pro 5 16IRX8 | |
| Asus TUF Gaming A16 FA617XS | |
| Asus ROG Strix G18 G814JI | |
| Dell G15 5530 | |
| Asus ROG Flow X16 GV601V | |
| Average Intel Core i7-13650HX (3127 - 4487, n=5) | |
| MSI Katana 17 B13VFK | |
| AIDA64 / CPU Queen | |
| Asus ROG Strix G17 G713PI | |
| Medion Erazer Major X20 | |
| Asus TUF Gaming A16 FA617XS | |
| Average of class Gaming (49785 - 173351, n=86, last 2 years) | |
| Lenovo Legion Pro 5 16IRX8 | |
| Asus ROG Flow X16 GV601V | |
| Asus ROG Strix G18 G814JI | |
| Average Intel Core i7-13650HX (108627 - 110589, n=5) | |
| Dell G15 5530 | |
| MSI Katana 17 B13VFK | |
| AIDA64 / FPU SinJulia | |
| Asus ROG Strix G17 G713PI | |
| Asus TUF Gaming A16 FA617XS | |
| Medion Erazer Major X20 | |
| Average of class Gaming (4424 - 33636, n=102, last 2 years) | |
| Lenovo Legion Pro 5 16IRX8 | |
| Asus ROG Flow X16 GV601V | |
| Dell G15 5530 | |
| Asus ROG Strix G18 G814JI | |
| Average Intel Core i7-13650HX (9134 - 10887, n=5) | |
| MSI Katana 17 B13VFK | |
| AIDA64 / FPU Mandel | |
| Asus ROG Strix G17 G713PI | |
| Average of class Gaming (25115 - 196829, n=102, last 2 years) | |
| Asus TUF Gaming A16 FA617XS | |
| Medion Erazer Major X20 | |
| Lenovo Legion Pro 5 16IRX8 | |
| Asus ROG Strix G18 G814JI | |
| Dell G15 5530 | |
| Average Intel Core i7-13650HX (33391 - 48323, n=5) | |
| Asus ROG Flow X16 GV601V | |
| MSI Katana 17 B13VFK | |
| AIDA64 / CPU AES | |
| Asus ROG Strix G17 G713PI | |
| Medion Erazer Major X20 | |
| Average of class Gaming (39258 - 247074, n=102, last 2 years) | |
| Lenovo Legion Pro 5 16IRX8 | |
| Asus TUF Gaming A16 FA617XS | |
| Dell G15 5530 | |
| Asus ROG Strix G18 G814JI | |
| Asus ROG Flow X16 GV601V | |
| Average Intel Core i7-13650HX (64436 - 85343, n=5) | |
| MSI Katana 17 B13VFK | |
| AIDA64 / CPU ZLib | |
| Asus ROG Strix G17 G713PI | |
| Medion Erazer Major X20 | |
| Average of class Gaming (574 - 2531, n=102, last 2 years) | |
| Lenovo Legion Pro 5 16IRX8 | |
| Dell G15 5530 | |
| Asus ROG Strix G18 G814JI | |
| Average Intel Core i7-13650HX (1136 - 1285, n=5) | |
| Asus ROG Flow X16 GV601V | |
| Asus TUF Gaming A16 FA617XS | |
| MSI Katana 17 B13VFK | |
| AIDA64 / FP64 Ray-Trace | |
| Asus ROG Strix G17 G713PI | |
| Average of class Gaming (5509 - 45446, n=102, last 2 years) | |
| Asus TUF Gaming A16 FA617XS | |
| Medion Erazer Major X20 | |
| Lenovo Legion Pro 5 16IRX8 | |
| Asus ROG Strix G18 G814JI | |
| Dell G15 5530 | |
| Average Intel Core i7-13650HX (7270 - 10900, n=5) | |
| Asus ROG Flow X16 GV601V | |
| MSI Katana 17 B13VFK | |
| AIDA64 / CPU PhotoWorxx | |
| Average of class Gaming (12271 - 89891, n=102, last 2 years) | |
| Medion Erazer Major X20 | |
| Asus ROG Strix G18 G814JI | |
| Average Intel Core i7-13650HX (36170 - 43289, n=5) | |
| Asus ROG Flow X16 GV601V | |
| Dell G15 5530 | |
| Lenovo Legion Pro 5 16IRX8 | |
| MSI Katana 17 B13VFK | |
| Asus ROG Strix G17 G713PI | |
| Asus TUF Gaming A16 FA617XS | |
Our dedicated Intel Core i7-13650HX page offers more information and performance comparisons.
System Performance
The G15 5530 achieves a lower PCMark 10 overall score relative to the competition, but we didn't face any hiccups in general purpose computing.
The MSI Katana 17 with a Core i7-13620H manages to slightly edge out the G15 5530 in PCMark 10 and CrossMark overall scores.
CrossMark: Overall | Productivity | Creativity | Responsiveness
AIDA64: Memory Copy | Memory Read | Memory Write | Memory Latency
| PCMark 10 / Score | |
| Average of class Gaming (5828 - 12414, n=93, last 2 years) | |
| Asus TUF Gaming A16 FA617XS | |
| Asus ROG Flow X16 GV601V | |
| Lenovo Legion Pro 5 16IRX8 | |
| Medion Erazer Major X20 | |
| Asus ROG Strix G17 G713PI | |
| Average Intel Core i7-13650HX, NVIDIA GeForce RTX 4060 Laptop GPU (6984 - 7613, n=3) | |
| MSI Katana 17 B13VFK | |
| Dell G15 5530 | |
| Asus ROG Strix G18 G814JI | |
| PCMark 10 / Essentials | |
| Medion Erazer Major X20 | |
| Asus ROG Flow X16 GV601V | |
| Asus ROG Strix G17 G713PI | |
| Dell G15 5530 | |
| Lenovo Legion Pro 5 16IRX8 | |
| Asus TUF Gaming A16 FA617XS | |
| MSI Katana 17 B13VFK | |
| Average of class Gaming (8810 - 11935, n=97, last 2 years) | |
| Average Intel Core i7-13650HX, NVIDIA GeForce RTX 4060 Laptop GPU (9532 - 11151, n=3) | |
| Asus ROG Strix G18 G814JI | |
| PCMark 10 / Productivity | |
| Average of class Gaming (6845 - 25323, n=95, last 2 years) | |
| Asus ROG Strix G17 G713PI | |
| Asus TUF Gaming A16 FA617XS | |
| Asus ROG Flow X16 GV601V | |
| Average Intel Core i7-13650HX, NVIDIA GeForce RTX 4060 Laptop GPU (9961 - 10204, n=3) | |
| Dell G15 5530 | |
| Medion Erazer Major X20 | |
| MSI Katana 17 B13VFK | |
| Lenovo Legion Pro 5 16IRX8 | |
| Asus ROG Strix G18 G814JI | |
| PCMark 10 / Digital Content Creation | |
| Average of class Gaming (7602 - 19954, n=95, last 2 years) | |
| Lenovo Legion Pro 5 16IRX8 | |
| Asus TUF Gaming A16 FA617XS | |
| Asus ROG Flow X16 GV601V | |
| Average Intel Core i7-13650HX, NVIDIA GeForce RTX 4060 Laptop GPU (8323 - 11686, n=3) | |
| Medion Erazer Major X20 | |
| MSI Katana 17 B13VFK | |
| Asus ROG Strix G17 G713PI | |
| Dell G15 5530 | |
| Asus ROG Strix G18 G814JI | |
| CrossMark / Overall | |
| Asus ROG Strix G17 G713PI | |
| Average of class Gaming (1366 - 2409, n=94, last 2 years) | |
| Asus ROG Flow X16 GV601V | |
| Average Intel Core i7-13650HX, NVIDIA GeForce RTX 4060 Laptop GPU (1839 - 1951, n=3) | |
| MSI Katana 17 B13VFK | |
| Medion Erazer Major X20 | |
| Dell G15 5530 | |
| Asus TUF Gaming A16 FA617XS | |
| Lenovo Legion Pro 5 16IRX8 | |
| CrossMark / Productivity | |
| Asus ROG Strix G17 G713PI | |
| Asus ROG Flow X16 GV601V | |
| Average of class Gaming (1386 - 2254, n=94, last 2 years) | |
| Average Intel Core i7-13650HX, NVIDIA GeForce RTX 4060 Laptop GPU (1730 - 1864, n=3) | |
| MSI Katana 17 B13VFK | |
| Dell G15 5530 | |
| Asus TUF Gaming A16 FA617XS | |
| Medion Erazer Major X20 | |
| Lenovo Legion Pro 5 16IRX8 | |
| CrossMark / Creativity | |
| Asus ROG Strix G17 G713PI | |
| Average of class Gaming (1343 - 2786, n=94, last 2 years) | |
| Asus ROG Flow X16 GV601V | |
| Medion Erazer Major X20 | |
| Dell G15 5530 | |
| Average Intel Core i7-13650HX, NVIDIA GeForce RTX 4060 Laptop GPU (2020 - 2063, n=3) | |
| MSI Katana 17 B13VFK | |
| Asus TUF Gaming A16 FA617XS | |
| Lenovo Legion Pro 5 16IRX8 | |
| CrossMark / Responsiveness | |
| MSI Katana 17 B13VFK | |
| Average Intel Core i7-13650HX, NVIDIA GeForce RTX 4060 Laptop GPU (1544 - 1907, n=3) | |
| Average of class Gaming (1226 - 2334, n=94, last 2 years) | |
| Asus ROG Flow X16 GV601V | |
| Asus ROG Strix G17 G713PI | |
| Lenovo Legion Pro 5 16IRX8 | |
| Medion Erazer Major X20 | |
| Dell G15 5530 | |
| Asus TUF Gaming A16 FA617XS | |
| AIDA64 / Memory Copy | |
| Average of class Gaming (21750 - 129946, n=102, last 2 years) | |
| Medion Erazer Major X20 | |
| Asus ROG Strix G18 G814JI | |
| Asus ROG Flow X16 GV601V | |
| Asus TUF Gaming A16 FA617XS | |
| Average Intel Core i7-13650HX, NVIDIA GeForce RTX 4060 Laptop GPU (59266 - 59896, n=3) | |
| Dell G15 5530 | |
| Lenovo Legion Pro 5 16IRX8 | |
| MSI Katana 17 B13VFK | |
| Asus ROG Strix G17 G713PI | |
| AIDA64 / Memory Read | |
| Average of class Gaming (22956 - 118858, n=102, last 2 years) | |
| Medion Erazer Major X20 | |
| Asus ROG Strix G18 G814JI | |
| Asus ROG Flow X16 GV601V | |
| Average Intel Core i7-13650HX, NVIDIA GeForce RTX 4060 Laptop GPU (67305 - 68612, n=3) | |
| Dell G15 5530 | |
| Lenovo Legion Pro 5 16IRX8 | |
| MSI Katana 17 B13VFK | |
| Asus TUF Gaming A16 FA617XS | |
| Asus ROG Strix G17 G713PI | |
| AIDA64 / Memory Write | |
| Average of class Gaming (22297 - 135096, n=102, last 2 years) | |
| Asus TUF Gaming A16 FA617XS | |
| Lenovo Legion Pro 5 16IRX8 | |
| Medion Erazer Major X20 | |
| Asus ROG Flow X16 GV601V | |
| Asus ROG Strix G18 G814JI | |
| Dell G15 5530 | |
| Average Intel Core i7-13650HX, NVIDIA GeForce RTX 4060 Laptop GPU (58028 - 60298, n=3) | |
| Asus ROG Strix G17 G713PI | |
| MSI Katana 17 B13VFK | |
| AIDA64 / Memory Latency | |
| Average of class Gaming (75.3 - 165.4, n=102, last 2 years) | |
| MSI Katana 17 B13VFK | |
| Asus ROG Flow X16 GV601V | |
| Dell G15 5530 | |
| Medion Erazer Major X20 | |
| Average Intel Core i7-13650HX, NVIDIA GeForce RTX 4060 Laptop GPU (90.4 - 90.8, n=3) | |
| Asus TUF Gaming A16 FA617XS | |
| Asus ROG Strix G17 G713PI | |
| Asus ROG Strix G18 G814JI | |
| Lenovo Legion Pro 5 16IRX8 | |
* ... smaller is better
| PCMark 8 Home Score Accelerated v2 | 4748 points | |
| PCMark 8 Work Score Accelerated v2 | 6712 points | |
| PCMark 10 Score | 6984 points | |
Help | ||
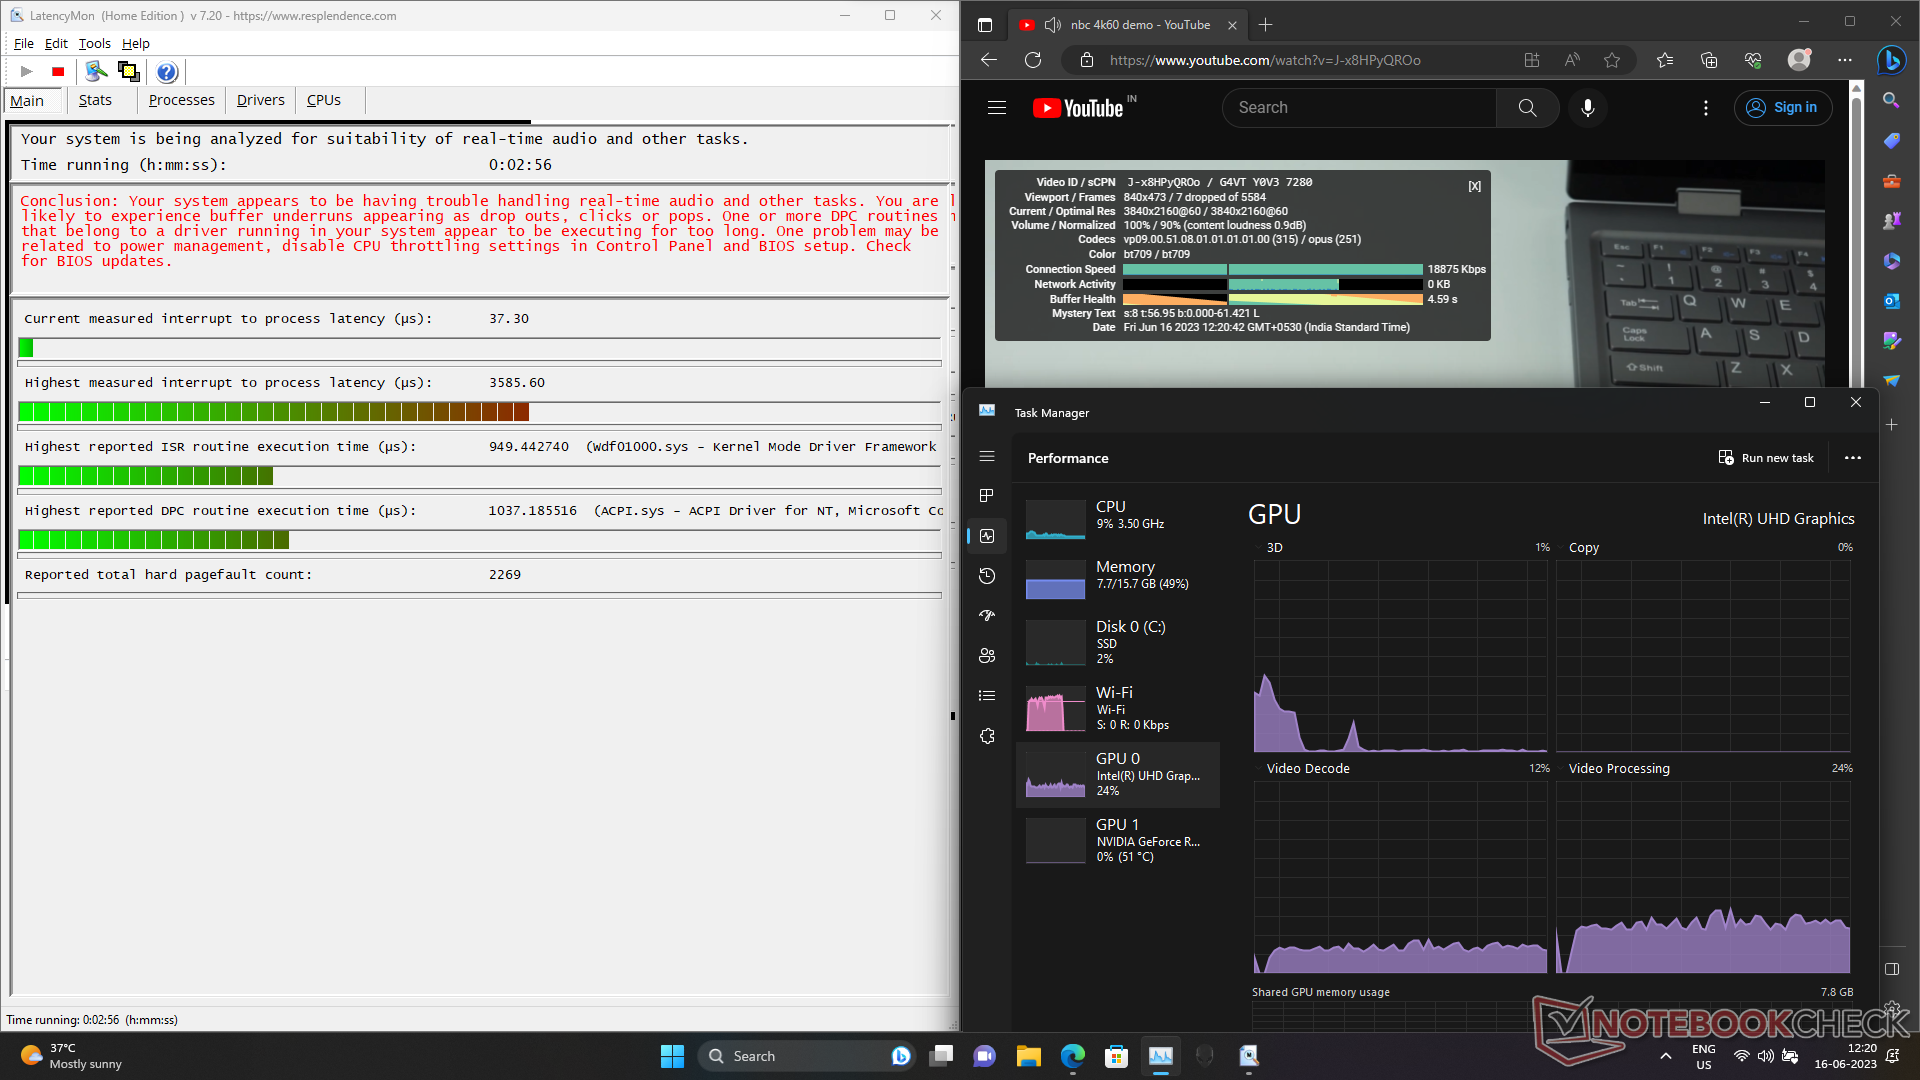
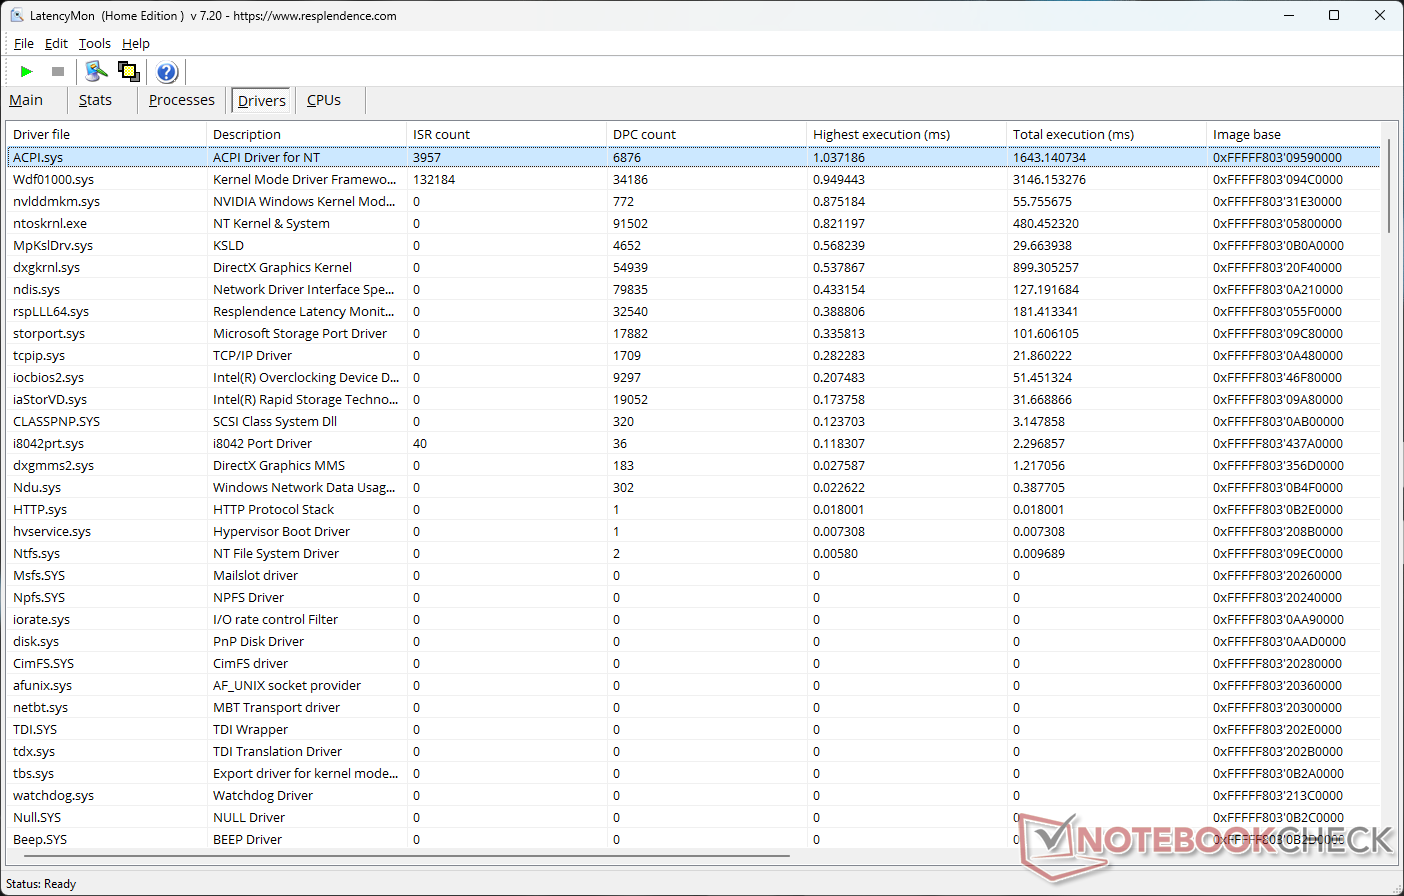
DPC Latency
The G15 5530 suffers from a high interrupt-to-process latency of 3585.6 µs due to high execution times of the ACPI.sys driver.
| DPC Latencies / LatencyMon - interrupt to process latency (max), Web, Youtube, Prime95 | |
| Dell G15 5530 | |
| MSI Katana 17 B13VFK | |
| Medion Erazer Major X20 | |
| Asus ROG Strix G17 G713PI | |
| Asus ROG Flow X16 GV601V | |
| Asus TUF Gaming A16 FA617XS | |
| Asus ROG Strix G18 G814JI | |
| Lenovo Legion Pro 5 16IRX8 | |
* ... smaller is better
Storage Devices
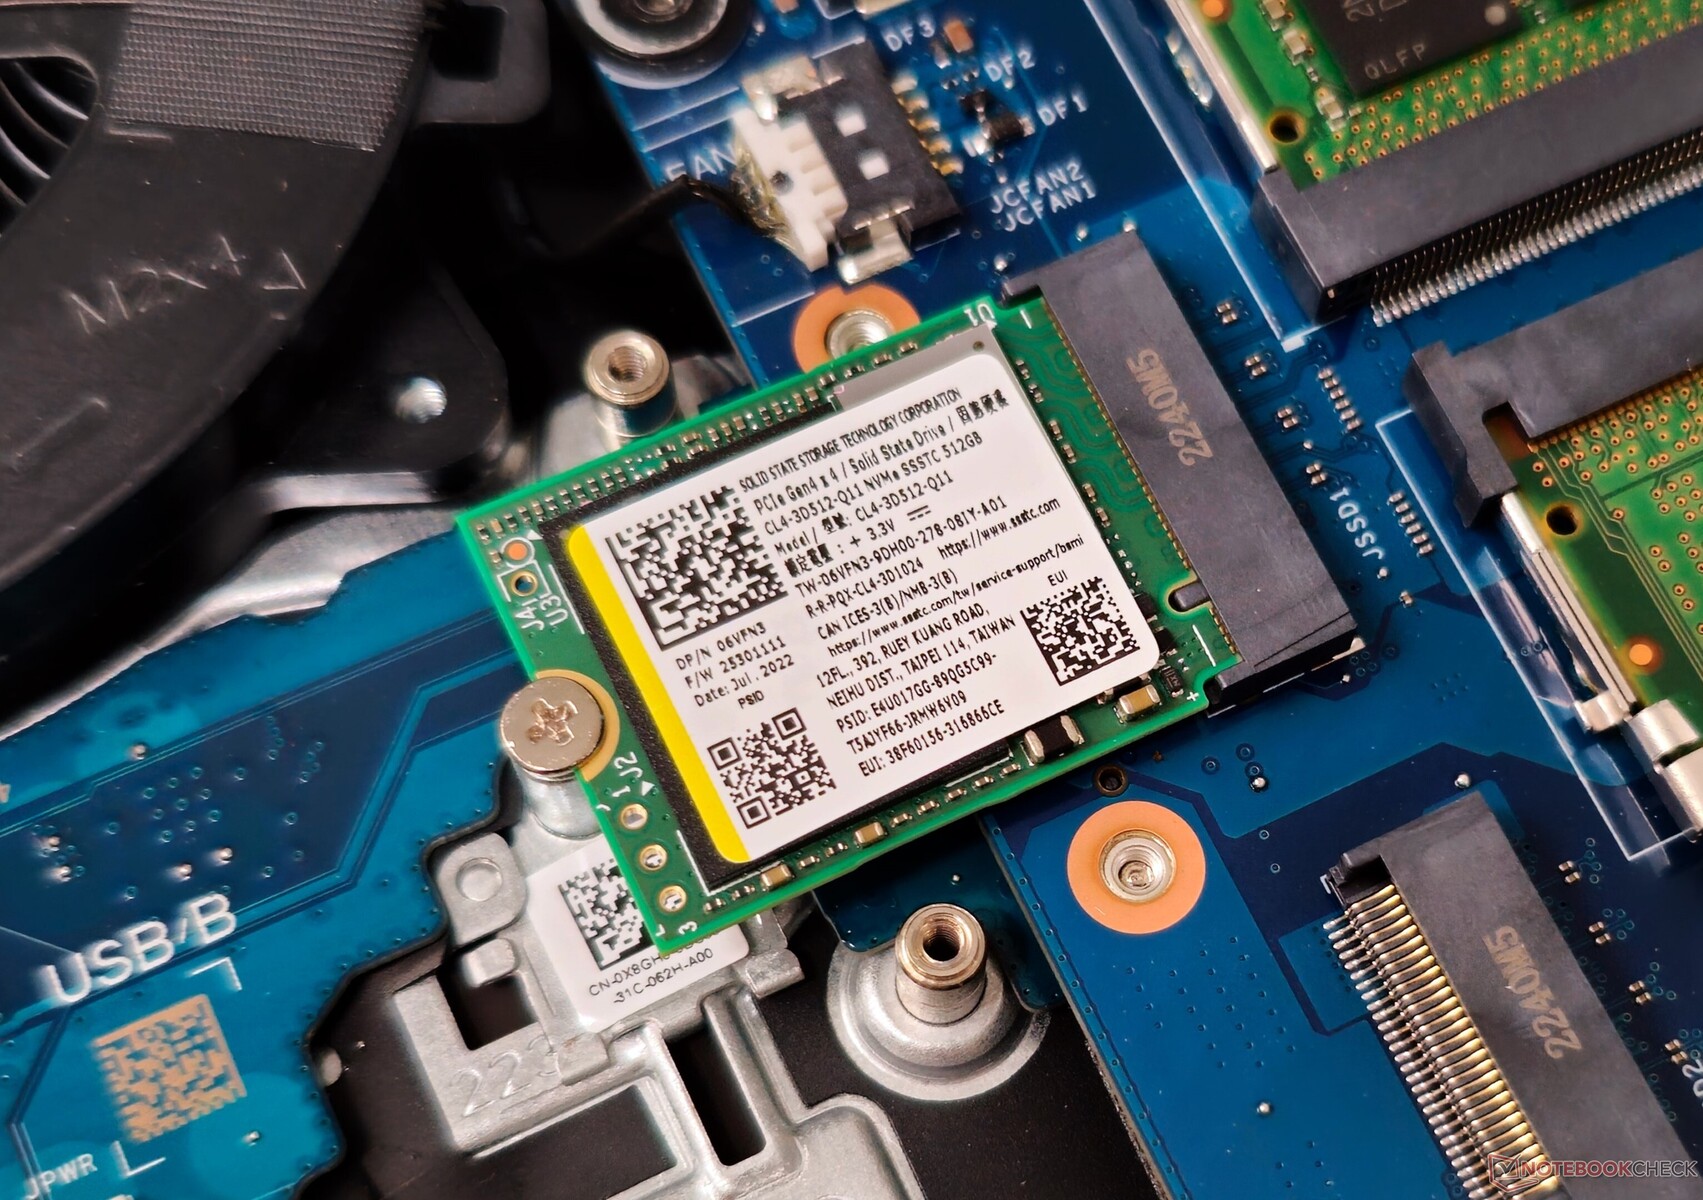
Dell offers two M.2 2242 slots for storage drives instead of the more ubiquitous M.2 2280 variety.
Users should upgrade the drive if they intend to install a large number of games, as the factory image only provides 398 GB free of the 512 GB capacity.
With sequential reads of less than 3,000 MB/s and sequential writes around the 500 MB/s mark, the SSTC CL4's performance is far from impressive.
There is no scope for storage expansion via 2.5-inch SATA drives.

* ... smaller is better
The SSD offers sustained reads at a queue depth of 8 but only after the performance drops drastically in the 10th run.
Disk Throttling: DiskSpd Read Loop, Queue Depth 8
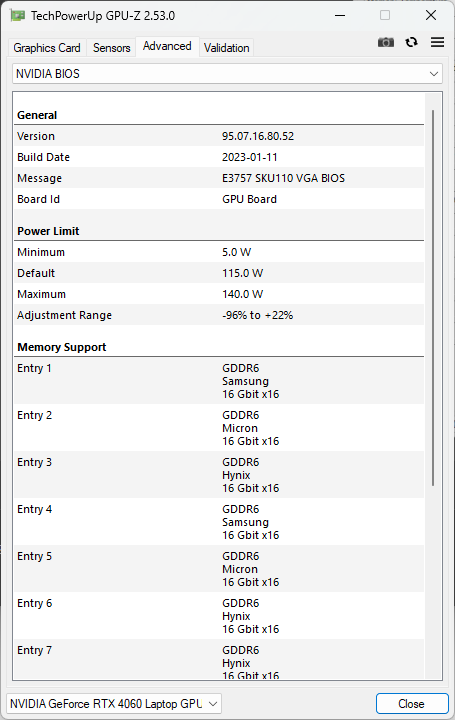
GPU Performance
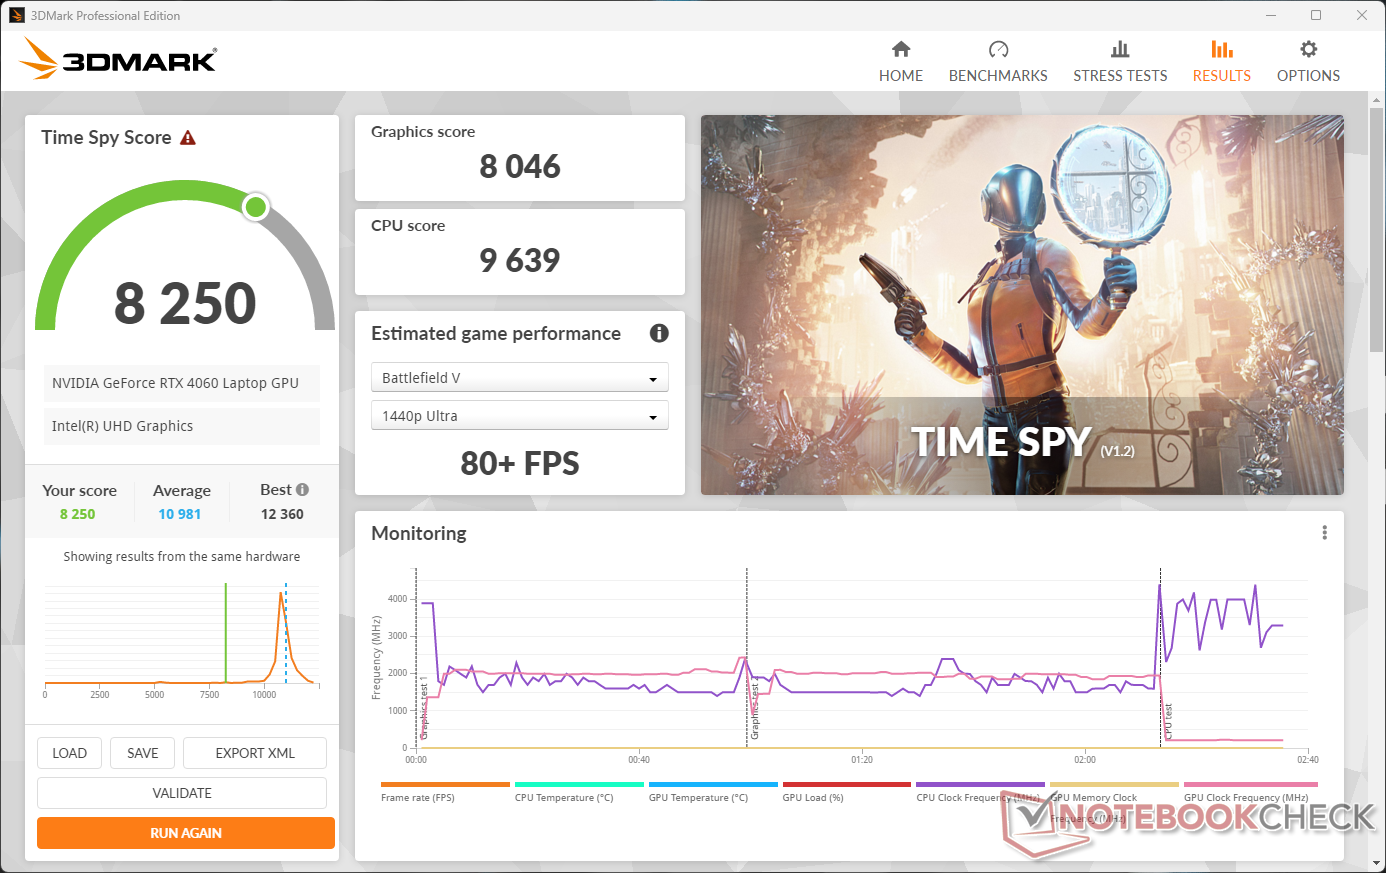
The 140 W Nvidia GeForce RTX 4060 Laptop GPU performs on expected lines in cumulative 3DMark tests. Interestingly, the MSI Katana 17 with a 105 W RTX 4060 has a slight performance edge over other RTX 4060-powered laptops in the comparison.
On the other hand, the G15 5530 compensates for this performance difference in Blender tests.
3DMark Time Spy score Graphics score dips by 24% on battery power.
| 3DMark 11 Performance | 32321 points | |
| 3DMark Ice Storm Standard Score | 242288 points | |
| 3DMark Cloud Gate Standard Score | 66116 points | |
| 3DMark Fire Strike Score | 24323 points | |
| 3DMark Fire Strike Extreme Score | 12237 points | |
| 3DMark Time Spy Score | 11007 points | |
Help | ||
| Blender / v3.3 Classroom OPTIX/RTX | |
| MSI Katana 17 B13VFK | |
| Asus ROG Strix G18 G814JI | |
| Average NVIDIA GeForce RTX 4060 Laptop GPU (19 - 28, n=53) | |
| Asus ROG Flow X16 GV601V | |
| Lenovo Legion Pro 5 16IRX8 | |
| Dell G15 5530 | |
| Asus ROG Strix G17 G713PI | |
| Medion Erazer Major X20 | |
| Average of class Gaming (9 - 32, n=103, last 2 years) | |
| Blender / v3.3 Classroom CUDA | |
| MSI Katana 17 B13VFK | |
| Average NVIDIA GeForce RTX 4060 Laptop GPU (39 - 53, n=53) | |
| Asus ROG Flow X16 GV601V | |
| Dell G15 5530 | |
| Lenovo Legion Pro 5 16IRX8 | |
| Asus ROG Strix G18 G814JI | |
| Asus ROG Strix G17 G713PI | |
| Medion Erazer Major X20 | |
| Average of class Gaming (15 - 228, n=103, last 2 years) | |
| Blender / v3.3 Classroom CPU | |
| MSI Katana 17 B13VFK | |
| Asus ROG Flow X16 GV601V | |
| Average NVIDIA GeForce RTX 4060 Laptop GPU (189 - 452, n=53) | |
| Asus TUF Gaming A16 FA617XS | |
| Dell G15 5530 | |
| Asus ROG Strix G18 G814JI | |
| Lenovo Legion Pro 5 16IRX8 | |
| Average of class Gaming (122 - 565, n=99, last 2 years) | |
| Medion Erazer Major X20 | |
| Asus ROG Strix G17 G713PI | |
* ... smaller is better
Gaming Performance
The RTX 4060 Laptop GPU is capable of achieving triple-digit frames per second (fps) in relatively older games at 1080p Ultra settings. Even in newer games, it can consistently deliver frame rates well above 60 fps at 1080p Ultra.
For users interested in gaming at higher resolutions using an external monitor, enabling Nvidia DLSS (Deep Learning Super Sampling) or AMD FSR (FidelityFX Super Resolution) in supported titles can provide good fps boosts.
| The Witcher 3 - 1920x1080 Ultra Graphics & Postprocessing (HBAO+) | |
| Average of class Gaming (104.7 - 240, n=7, last 2 years) | |
| Medion Erazer Major X20 | |
| Asus ROG Strix G17 G713PI | |
| Asus ROG Strix G18 G814JI | |
| Lenovo Legion Pro 5 16IRX8 | |
| Asus ROG Flow X16 GV601V | |
| MSI Katana 17 B13VFK | |
| Dell G15 5530 | |
| Asus TUF Gaming A16 FA617XS | |
| Cyberpunk 2077 1.6 | |
| 1920x1080 High Preset | |
| Lenovo Legion Pro 5 16IRX8 | |
| Dell G15 5530 | |
| Asus ROG Strix G17 G713PI | |
| Asus ROG Flow X16 GV601V | |
| Average NVIDIA GeForce RTX 4060 Laptop GPU (63.5 - 114.9, n=16) | |
| 1920x1080 Ultra Preset | |
| Lenovo Legion Pro 5 16IRX8 | |
| Asus ROG Strix G17 G713PI | |
| Dell G15 5530 | |
| Asus ROG Flow X16 GV601V | |
| Average NVIDIA GeForce RTX 4060 Laptop GPU (57.9 - 93.2, n=18) | |
| MSI Katana 17 B13VFK | |
| 1920x1080 Ray Tracing Ultra Preset (DLSS off) | |
| Average NVIDIA GeForce RTX 4060 Laptop GPU (25.6 - 60, n=6) | |
| Dell G15 5530 | |
| Asus ROG Flow X16 GV601V | |
| MSI Katana 17 B13VFK | |
The Witcher 3 FPS Chart
The G15 5530's cooling system seems to be quite effective as evident from the relatively stable frame rates seen below in The Witcher 3 stress test.
| low | med. | high | ultra | |
|---|---|---|---|---|
| GTA V (2015) | 182.6 | 175.3 | 172.8 | 111.8 |
| The Witcher 3 (2015) | 407 | 335 | 205 | 104.6 |
| Dota 2 Reborn (2015) | 179.9 | 163.8 | 154.9 | 144.8 |
| Final Fantasy XV Benchmark (2018) | 212 | 137.3 | 100.1 | |
| X-Plane 11.11 (2018) | 160.1 | 146.8 | 115.6 | |
| Far Cry 5 (2018) | 168 | 152 | 146 | 139 |
| Strange Brigade (2018) | 467 | 281 | 222 | 189.6 |
| Cyberpunk 2077 1.6 (2022) | 123.2 | 99.4 | 86.1 | 80 |
| F1 22 (2022) | 244 | 235 | 177.7 | 66.1 |
Check out our dedicated Nvidia GeForce RTX 4060 Laptop GPU page for more performance comparisons.
Emissions: Gets toasty when stressed
System Noise
Under load, the G15 can generate noise emissions just below the 50 dB(A) mark. Interestingly, the Quiet mode produces a higher sound pressure level (SPL) compared to the Balanced and Performance modes even in a light 3DMark 06 load. That being said, the maximum fan noise remains below 40 dB(A) in this profile.
No major performance regressions were observed across the different profiles when tested with The Witcher 3 at 1080p Ultra.
Noise level
| Idle |
| 26.85 / 26.85 / 26.85 dB(A) |
| Load |
| 27.65 / 47.86 dB(A) |
 | ||
30 dB silent 40 dB(A) audible 50 dB(A) loud |
||
min: | ||
As mentioned earlier, the Quiet mode may exhibit some limitations in CPU performance, but it should still enable satisfactory frame rates while keeping fan noise at an acceptable level.
| Performance mode | Idle dB(A) | Load average dB(A) | Load maximum dB(A) | The Witcher 3 1080p Ultra dB(A) |
|---|---|---|---|---|
| Battery | 20.90 | 32.60 | 33.21 | 44.36 / 104 fps |
| Quiet | 20.74 | 32.95 | 37.68 | 37.63 / 99 fps |
| Balanced | 20.80 | 26.40 | 45.97 | 45.92 / 104 fps |
| Performance | 26.85 | 27.65 | 47.86 | 47.86 / 105 fps |
| Dell G15 5530 Intel Core i7-13650HX, GeForce RTX 4060 Laptop GPU | Asus ROG Strix G18 G814JI Intel Core i7-13650HX, GeForce RTX 4070 Laptop GPU | Lenovo Legion Pro 5 16IRX8 Intel Core i7-13700HX, GeForce RTX 4060 Laptop GPU | Asus ROG Flow X16 GV601V Intel Core i9-13900H, GeForce RTX 4060 Laptop GPU | MSI Katana 17 B13VFK Intel Core i7-13620H, GeForce RTX 4060 Laptop GPU | Asus TUF Gaming A16 FA617XS AMD Ryzen 9 7940HS, Radeon RX 7600S | Asus ROG Strix G17 G713PI AMD Ryzen 9 7945HX, GeForce RTX 4070 Laptop GPU | Medion Erazer Major X20 Intel Core i9-13900HX, GeForce RTX 4070 Laptop GPU | |
|---|---|---|---|---|---|---|---|---|
| Noise | -10% | -3% | -4% | -24% | -13% | -14% | -21% | |
| off / environment * (dB) | 20.41 | 25 -22% | 23 -13% | 24 -18% | 24.5 -20% | 25 -22% | 25 -22% | 24 -18% |
| Idle Minimum * (dB) | 26.85 | 26 3% | 23.1 14% | 24 11% | 24.5 9% | 25 7% | 26 3% | 25 7% |
| Idle Average * (dB) | 26.85 | 28 -4% | 23.1 14% | 24 11% | 24.5 9% | 26 3% | 29 -8% | 29 -8% |
| Idle Maximum * (dB) | 26.85 | 29 -8% | 26.6 1% | 24 11% | 40 -49% | 28 -4% | 30 -12% | 31 -15% |
| Load Average * (dB) | 27.65 | 41 -48% | 34.7 -25% | 36.71 -33% | 48.3 -75% | 43 -56% | 46 -66% | 50 -81% |
| Witcher 3 ultra * (dB) | 47.9 | 44 8% | 47.6 1% | 50.92 -6% | 56 -17% | 51 -6% | 46 4% | 53 -11% |
| Load Maximum * (dB) | 47.86 | 46 4% | 54.8 -15% | 50.92 -6% | 59.1 -23% | 53 -11% | 47 2% | 57 -19% |
* ... smaller is better
Temperature
According to Dell, G15 5530 SKUs equipped with an RTX 4050 and above utilize a vapor chamber cooling system, along with Element 31 thermal interface material, similar to their Alienware cousins.
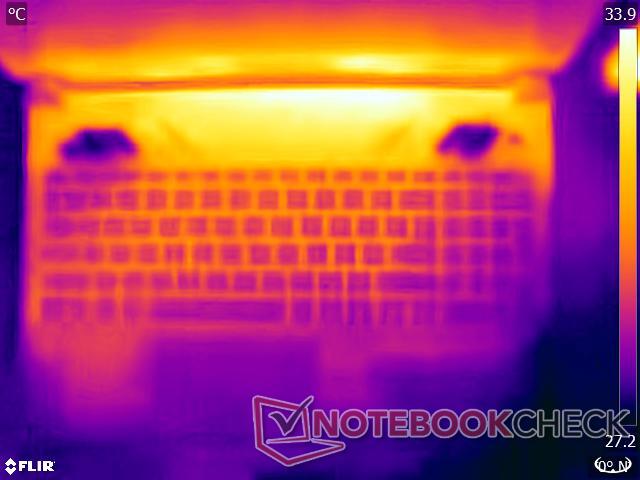
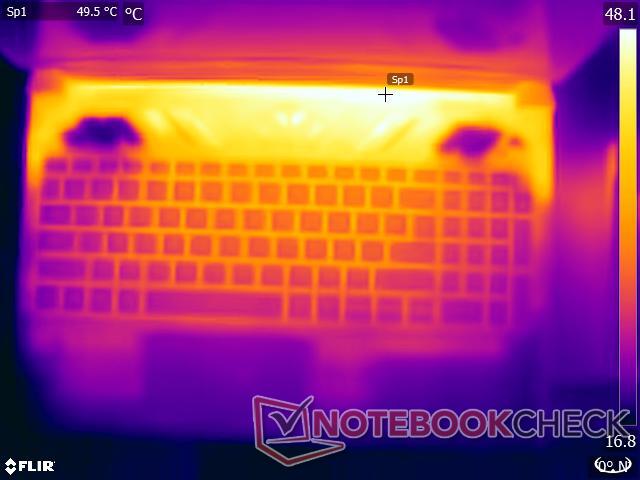
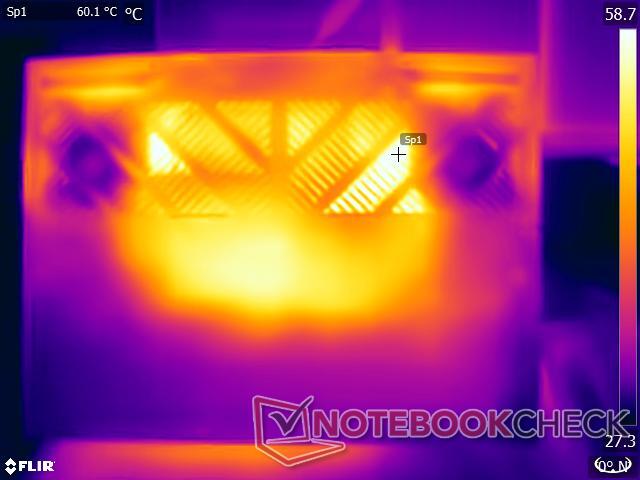
Despite the presence of a vapor chamber, we do observe high surface temperatures under load. The palm rests and touchpad areas remain relatively cool, nevertheless.
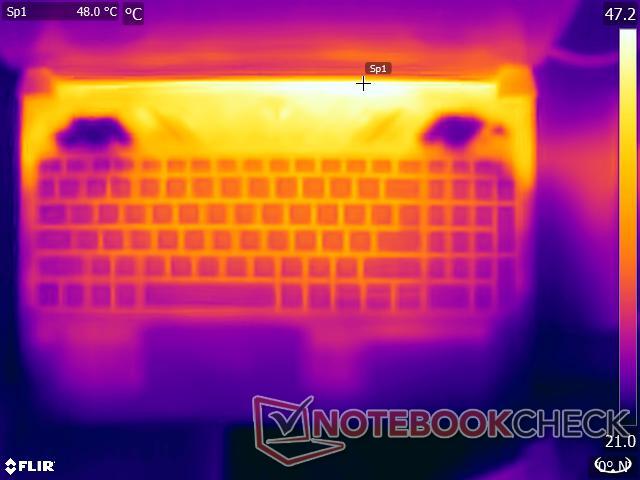
(-) The maximum temperature on the upper side is 54 °C / 129 F, compared to the average of 40.4 °C / 105 F, ranging from 21.2 to 68.8 °C for the class Gaming.
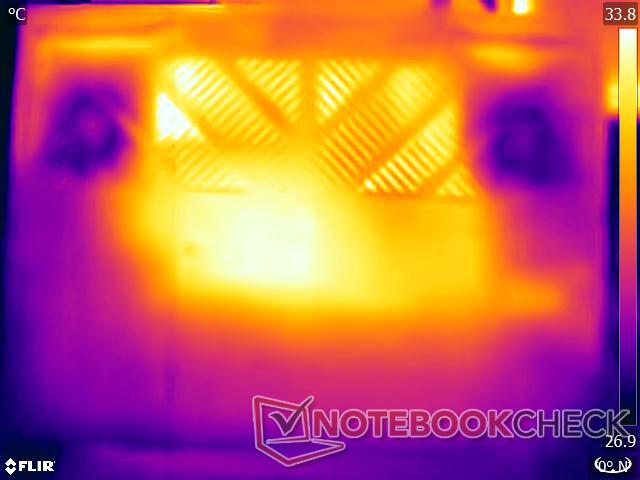
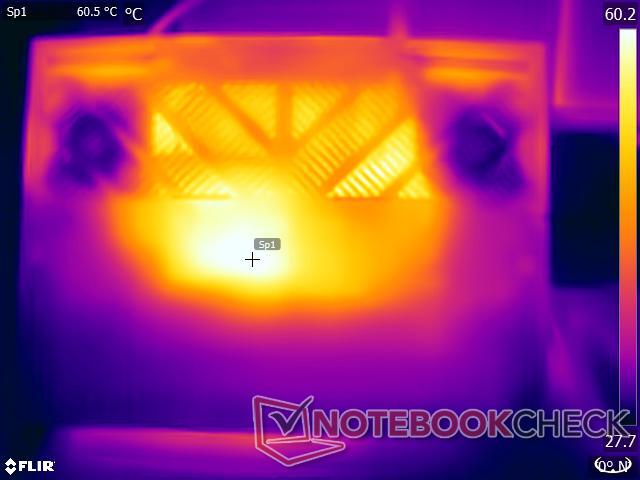
(-) The bottom heats up to a maximum of 62.2 °C / 144 F, compared to the average of 43.2 °C / 110 F
(+) In idle usage, the average temperature for the upper side is 31 °C / 88 F, compared to the device average of 33.9 °C / 93 F.
(-) Playing The Witcher 3, the average temperature for the upper side is 41.9 °C / 107 F, compared to the device average of 33.9 °C / 93 F.
(+) The palmrests and touchpad are reaching skin temperature as a maximum (34.4 °C / 93.9 F) and are therefore not hot.
(-) The average temperature of the palmrest area of similar devices was 28.8 °C / 83.8 F (-5.6 °C / -10.1 F).
| Dell G15 5530 Intel Core i7-13650HX, NVIDIA GeForce RTX 4060 Laptop GPU | Asus ROG Strix G18 G814JI Intel Core i7-13650HX, NVIDIA GeForce RTX 4070 Laptop GPU | Lenovo Legion Pro 5 16IRX8 Intel Core i7-13700HX, NVIDIA GeForce RTX 4060 Laptop GPU | Asus ROG Flow X16 GV601V Intel Core i9-13900H, NVIDIA GeForce RTX 4060 Laptop GPU | MSI Katana 17 B13VFK Intel Core i7-13620H, NVIDIA GeForce RTX 4060 Laptop GPU | Asus TUF Gaming A16 FA617XS AMD Ryzen 9 7940HS, AMD Radeon RX 7600S | Asus ROG Strix G17 G713PI AMD Ryzen 9 7945HX, NVIDIA GeForce RTX 4070 Laptop GPU | Medion Erazer Major X20 Intel Core i9-13900HX, NVIDIA GeForce RTX 4070 Laptop GPU | |
|---|---|---|---|---|---|---|---|---|
| Heat | 16% | 13% | 11% | 13% | 11% | 14% | 3% | |
| Maximum Upper Side * (°C) | 54 | 45 17% | 42.8 21% | 46 15% | 41.6 23% | 53 2% | 42 22% | 46 15% |
| Maximum Bottom * (°C) | 62.2 | 47 24% | 50 20% | 41 34% | 43.1 31% | 48 23% | 41 34% | 49 21% |
| Idle Upper Side * (°C) | 33.4 | 28 16% | 29.6 11% | 36 -8% | 32 4% | 30 10% | 33 1% | 37 -11% |
| Idle Bottom * (°C) | 33.4 | 31 7% | 34 -2% | 33 1% | 35.8 -7% | 30 10% | 34 -2% | 38 -14% |
* ... smaller is better
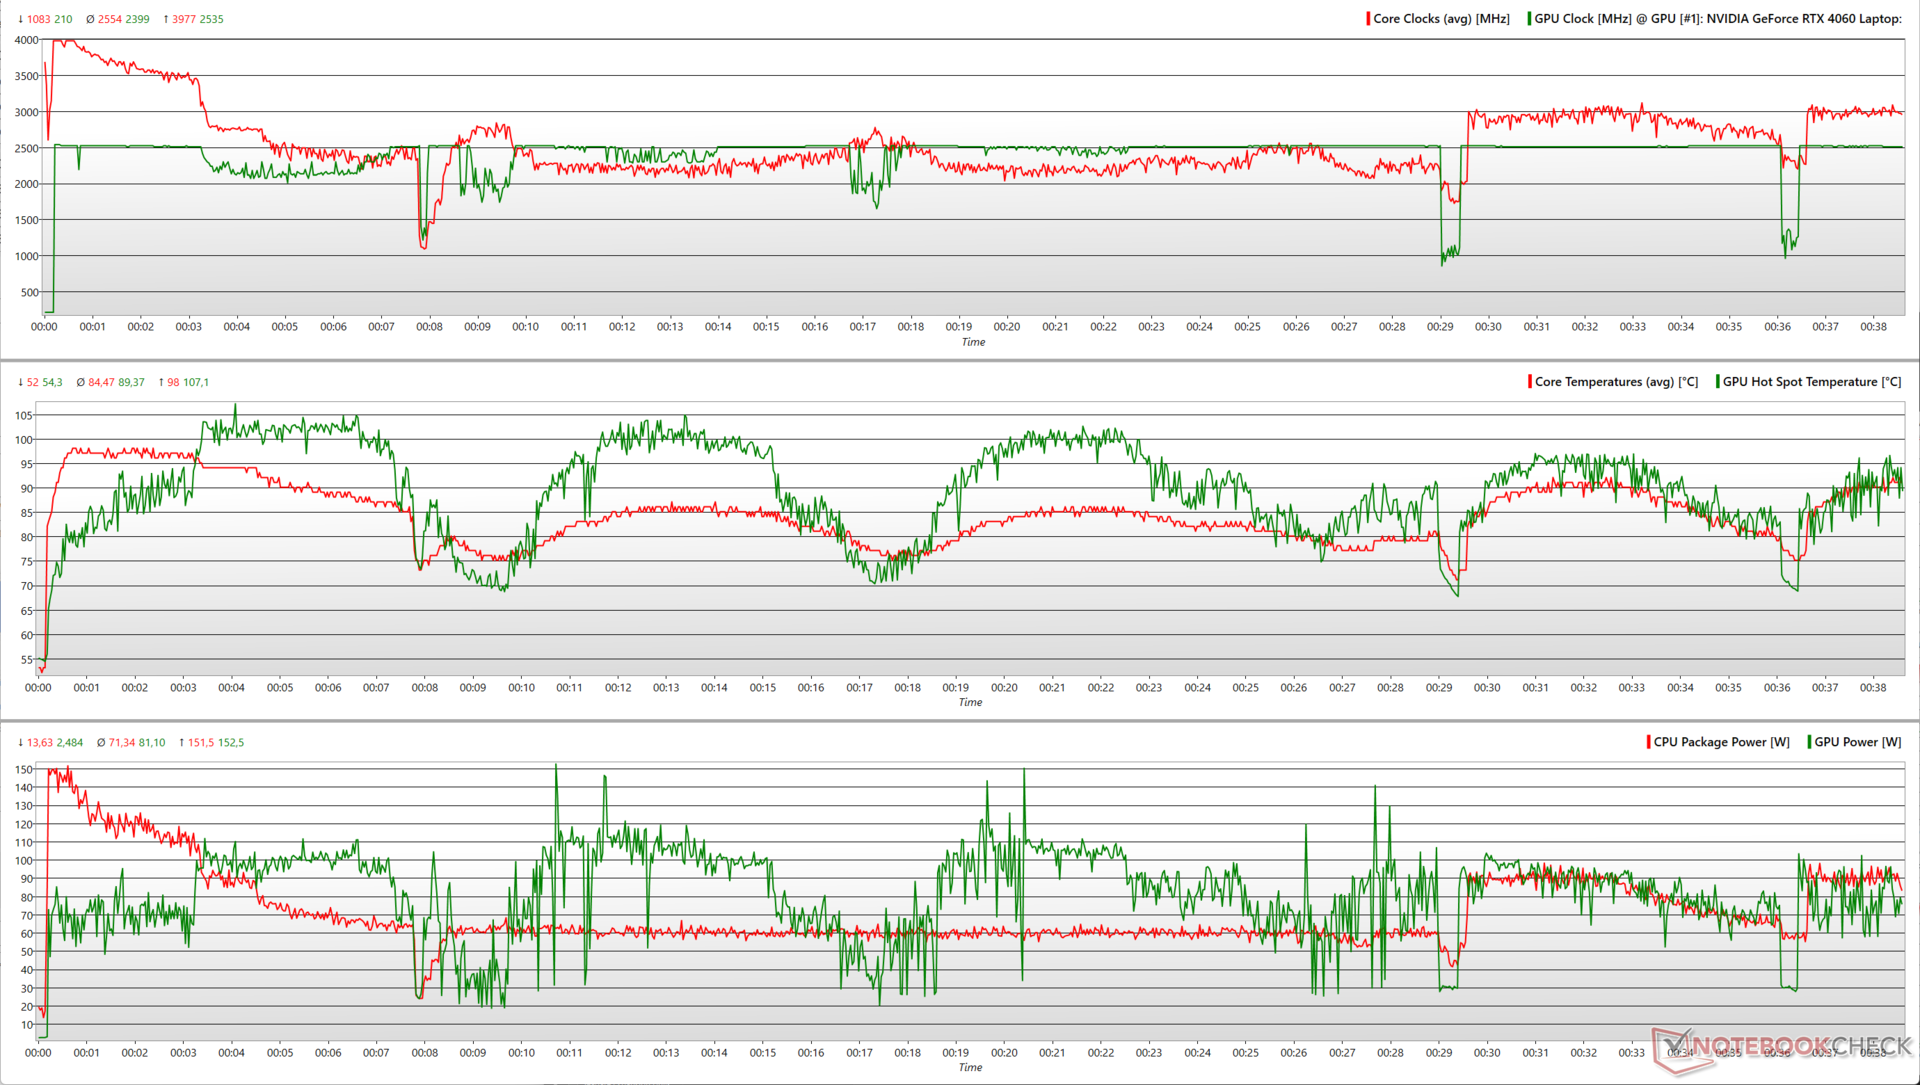
Stress Test
During stress testing using Prime95's in-place large FFTs, the Core i7-13650HX reaches a peak package power of 162 W and achieves a maximum boost frequency of nearly 4 GHz. However, this high power consumption and frequency are not sustained, and the CPU settles at an average package power of 124 W throughout the stress test.
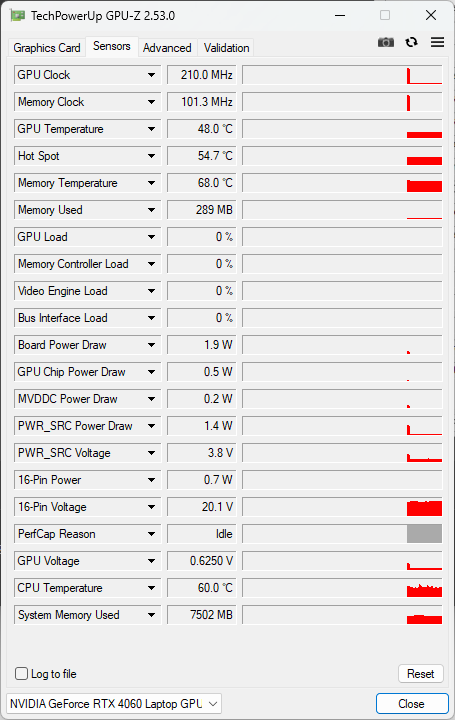
When FurMark is introduced, the RTX 4060 GPU reaches a peak power consumption of 152.5 W with a clock speed of 2,535 MHz. Eventually, both the CPU and GPU settle at an average power consumption of 71 W (clocked at 2.5 GHz) and 81 W (clocked at 2,399 MHz), respectively.
| Stress Test | CPU Clock (GHz) | GPU Clock (MHz) | Average CPU Temperature (°C) | Average GPU Temperature (°C) |
| System Idle | 1.6 | 210 | 39 | 36.3 |
| Prime95 | 3.7 | 210 | 92 | 61.3 |
| Prime95 + FurMark | 3.05 | 2,505 | 84.5 | 89.3 |
| The Witcher 3 1080p Ultra | 4 | 1,485 | 79 | 94 |
The CPU and GPU demonstrate a more predictable response during stress testing with The Witcher 3 at 1080p Ultra. They reach peak clocks of 4.1 GHz and 2,535 MHz, respectively, with the CPU consuming a maximum of 70 W and the GPU consuming a maximum of 118 W. There is a brief drop in CPU and GPU metrics around the 30-minute mark of the test, but they quickly recover to their original clock speeds.


Speakers
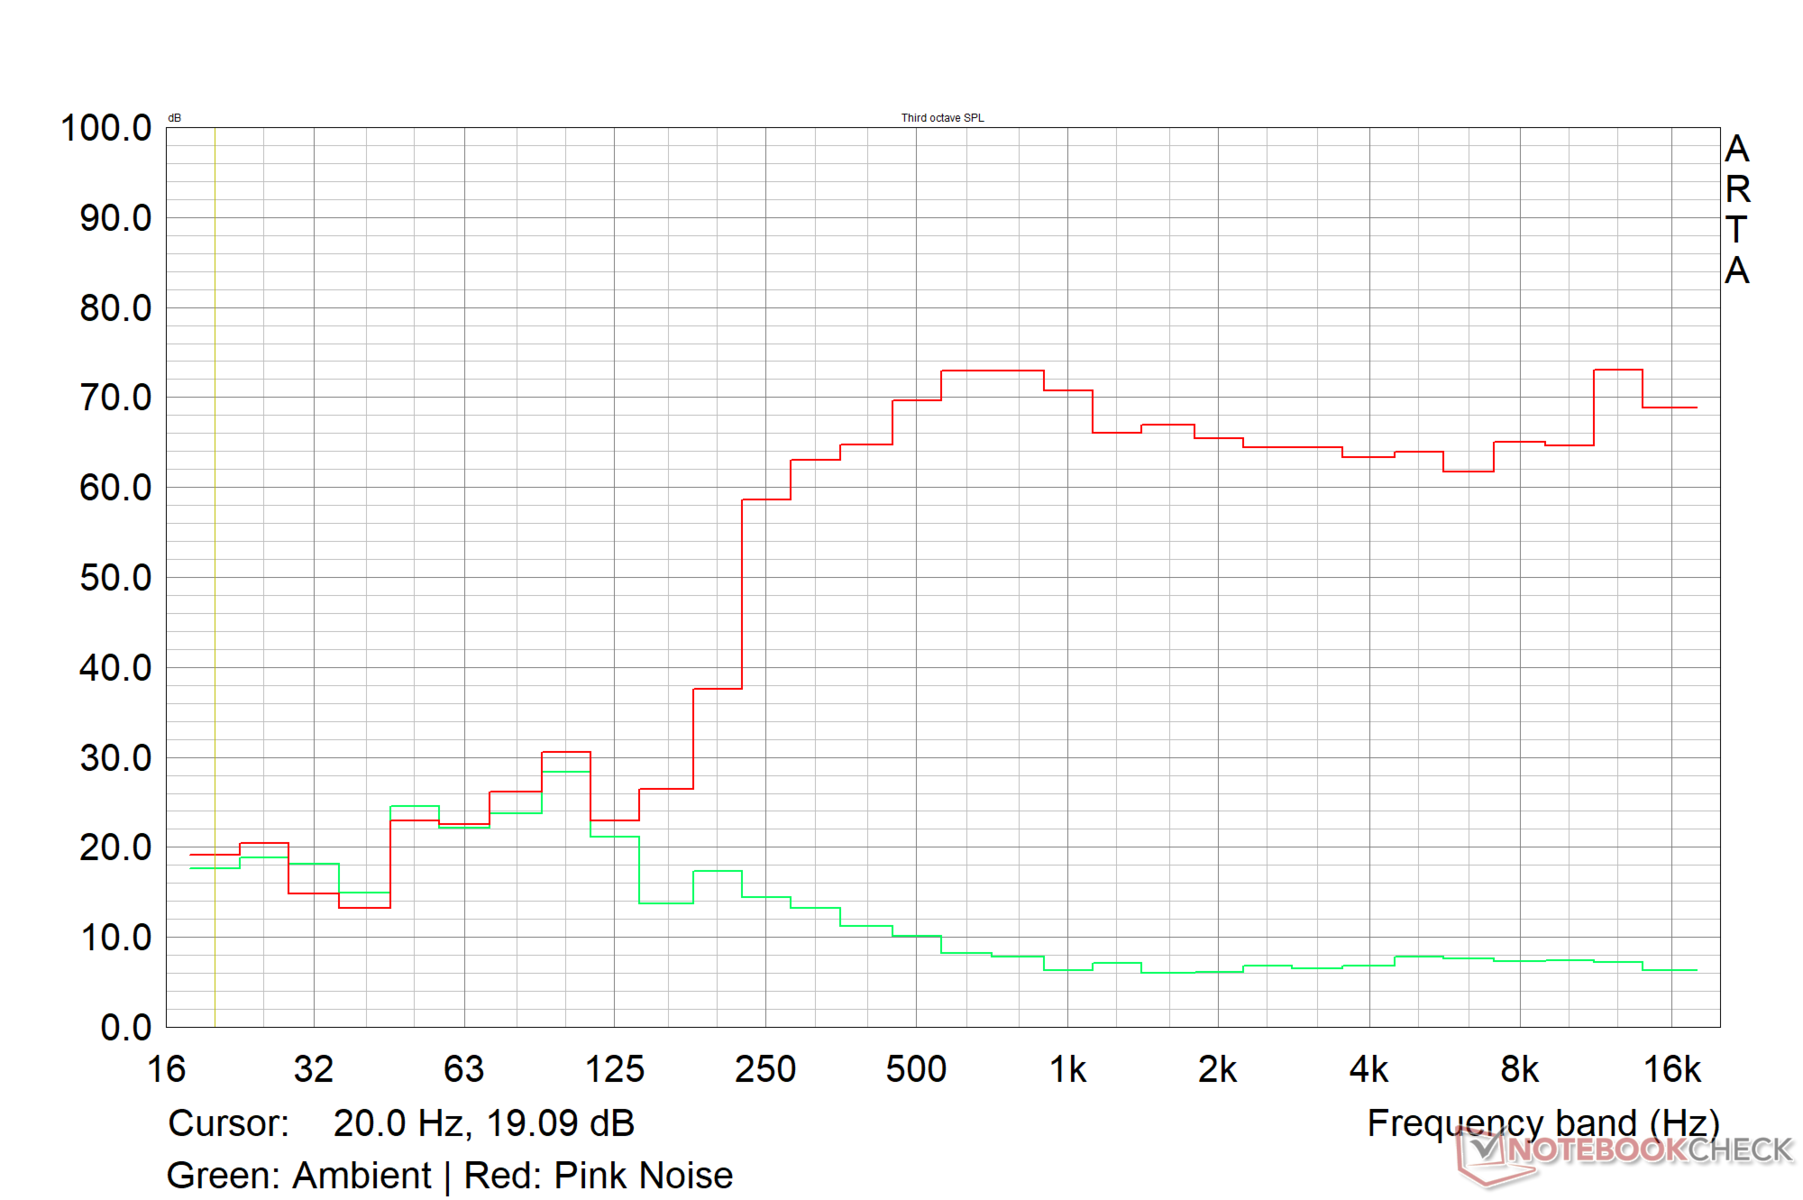
The G15's speakers are reasonably loud at 79.6 dB(A). However, it appears that Dell could have utilized the large chassis more effectively to provide a stronger bass response. On the positive side, the mids and highs are reproduced well.
The audio quality is serviceable, but users can get a better audio experience by connecting external audio devices through the 3.5 mm audio jack or via Bluetooth.
Dell G15 5530 audio analysis
(±) | speaker loudness is average but good (79.6 dB)
Bass 100 - 315 Hz
(-) | nearly no bass - on average 24.7% lower than median
(-) | bass is not linear (15.2% delta to prev. frequency)
Mids 400 - 2000 Hz
(+) | balanced mids - only 4.1% away from median
(+) | mids are linear (4.2% delta to prev. frequency)
Highs 2 - 16 kHz
(+) | balanced highs - only 0.8% away from median
(+) | highs are linear (2.2% delta to prev. frequency)
Overall 100 - 16.000 Hz
(±) | linearity of overall sound is average (16.3% difference to median)
Compared to same class
» 41% of all tested devices in this class were better, 6% similar, 53% worse
» The best had a delta of 6%, average was 18%, worst was 132%
Compared to all devices tested
» 27% of all tested devices were better, 6% similar, 67% worse
» The best had a delta of 4%, average was 23%, worst was 134%
Apple MacBook Pro 16 2021 M1 Pro audio analysis
(+) | speakers can play relatively loud (84.7 dB)
Bass 100 - 315 Hz
(+) | good bass - only 3.8% away from median
(+) | bass is linear (5.2% delta to prev. frequency)
Mids 400 - 2000 Hz
(+) | balanced mids - only 1.3% away from median
(+) | mids are linear (2.1% delta to prev. frequency)
Highs 2 - 16 kHz
(+) | balanced highs - only 1.9% away from median
(+) | highs are linear (2.7% delta to prev. frequency)
Overall 100 - 16.000 Hz
(+) | overall sound is linear (4.6% difference to median)
Compared to same class
» 0% of all tested devices in this class were better, 0% similar, 100% worse
» The best had a delta of 5%, average was 17%, worst was 45%
Compared to all devices tested
» 0% of all tested devices were better, 0% similar, 100% worse
» The best had a delta of 4%, average was 23%, worst was 134%
Energy Management: Not very economical under load
Power Consumption
While the G15 5530 demonstrates reasonably efficient power consumption when idle, it consumes more power under load compared to the ROG Strix G18 equipped with an RTX 4070.
The Lenovo Legion Pro 5 16, featuring a Core i7-13700HX and RTX 4060, shows a reversal of roles with slightly lower power consumption under load than the G15 5530 but higher power draws when idle.
The supplied massive 330 W power adapter is able to keep the G15 adequately fed even under stress.
| Off / Standby | |
| Idle | |
| Load |
|
Key:
min: | |
| Dell G15 5530 i7-13650HX, GeForce RTX 4060 Laptop GPU, IPS, 1920x1080, 15.6" | Asus ROG Strix G18 G814JI i7-13650HX, GeForce RTX 4070 Laptop GPU, IPS, 2560x1600, 18" | Lenovo Legion Pro 5 16IRX8 i7-13700HX, GeForce RTX 4060 Laptop GPU, IPS, 2560x1600, 16" | Asus ROG Flow X16 GV601V i9-13900H, GeForce RTX 4060 Laptop GPU, IPS, 2560x1600, 16" | MSI Katana 17 B13VFK i7-13620H, GeForce RTX 4060 Laptop GPU, IPS LED, 1920x1080, 17.3" | Asus TUF Gaming A16 FA617XS R9 7940HS, Radeon RX 7600S, IPS, 1920x1200, 16" | Asus ROG Strix G17 G713PI R9 7945HX, GeForce RTX 4070 Laptop GPU, IPS, 2560x1440, 17.3" | Medion Erazer Major X20 i9-13900HX, GeForce RTX 4070 Laptop GPU, IPS, 2560x1600, 16" | Average NVIDIA GeForce RTX 4060 Laptop GPU | Average of class Gaming | |
|---|---|---|---|---|---|---|---|---|---|---|
| Power Consumption | -10% | -66% | 1% | 1% | 19% | -35% | -26% | -9% | -30% | |
| Idle Minimum * (Watt) | 8.4 | 8 5% | 24.5 -192% | 9.6 -14% | 12.2 -45% | 7 17% | 15 -79% | 12 -43% | 11.5 ? -37% | 13.1 ? -56% |
| Idle Average * (Watt) | 14.98 | 15 -0% | 29.2 -95% | 16 -7% | 14.9 1% | 10 33% | 20 -34% | 16 -7% | 16 ? -7% | 19 ? -27% |
| Idle Maximum * (Watt) | 15.56 | 26 -67% | 34.3 -120% | 16.9 -9% | 15.8 -2% | 15 4% | 29 -86% | 26 -67% | 20.3 ? -30% | 24.6 ? -58% |
| Load Average * (Watt) | 96.8 | 102 -5% | 98.7 -2% | 104 -7% | 85.22 12% | 86 11% | 121 -25% | 115 -19% | 92.9 ? 4% | 111.3 ? -15% |
| Witcher 3 ultra * (Watt) | 186 | 178.6 4% | 178.6 4% | 142 24% | 151.1 19% | 160.6 14% | 179.8 3% | 191.6 -3% | ||
| Load Maximum * (Watt) | 271.42 | 267 2% | 249.6 8% | 214 21% | 212.8 22% | 172 37% | 246 9% | 319 -18% | 210 ? 23% | 260 ? 4% |
* ... smaller is better
Power Consumption: The Witcher 3 / Stress test
Power Consumption: External monitor
Battery Life
The G15 switches to the Battery power profile when unplugged. However, the refresh rate does not automatically reduce to 60 Hz.
The 86 WHr battery provides decent run times as long as the laptop is not under heavy stress. For instance, during 1080p video playback at 150 nits, the battery can last nearly 7 hours. However, when gaming at the same brightness level, the battery barely lasts an hour.
| Dell G15 5530 Intel Core i7-13650HX, GeForce RTX 4060 Laptop GPU, 86 Wh | Asus ROG Strix G18 G814JI Intel Core i7-13650HX, GeForce RTX 4070 Laptop GPU, 90 Wh | Lenovo Legion Pro 5 16IRX8 Intel Core i7-13700HX, GeForce RTX 4060 Laptop GPU, 80 Wh | Asus ROG Flow X16 GV601V Intel Core i9-13900H, GeForce RTX 4060 Laptop GPU, 90 Wh | MSI Katana 17 B13VFK Intel Core i7-13620H, GeForce RTX 4060 Laptop GPU, 53.5 Wh | Asus TUF Gaming A16 FA617XS AMD Ryzen 9 7940HS, Radeon RX 7600S, 90 Wh | Asus ROG Strix G17 G713PI AMD Ryzen 9 7945HX, GeForce RTX 4070 Laptop GPU, 90 Wh | Medion Erazer Major X20 Intel Core i9-13900HX, GeForce RTX 4070 Laptop GPU, 62.3 Wh | Average of class Gaming | |
|---|---|---|---|---|---|---|---|---|---|
| Battery runtime | 38% | -31% | 47% | -15% | 62% | -8% | 7% | 39% | |
| H.264 (h) | 6.8 | 8.9 31% | 12.4 82% | 2.8 -59% | 4.2 -38% | 8.27 ? 22% | |||
| WiFi v1.3 (h) | 6.5 | 8.1 25% | 3.4 -48% | 7.9 22% | 2.9 -55% | 12.4 91% | 4.3 -34% | 3.9 -40% | 7.08 ? 9% |
| Witcher 3 ultra (h) | 0.8 | 1.1 38% | |||||||
| Load (h) | 0.8 | 1.2 50% | 0.7 -13% | 1.5 88% | 1 25% | 0.9 13% | 1 25% | 1.6 100% | 1.496 ? 87% |
| Reader / Idle (h) | 11.7 | 6.7 | 20.3 | 5.8 | 7.84 ? |
Pros
Cons
Verdict: Tries to get it right without breaking the bank
Dell's refreshed G15 5530 brings the power of desktop-class Intel Raptor Lake-HX to a heavy yet trendy chassis complemented by a bulky power adapter.
The G15 5530 has a lot of good things going for it. You get good Wi-Fi throughput and a fast 1080p IPS panel with decent color reproduction. Maintenance and upgrades are easy, provided you don't mind the unconventional M.2 2242 SSD slot.
On the performance front, the Core i7-13650HX and 140 W Nvidia GeForce RTX 4060 Laptop GPU combination deliver strong performance for 1080p Ultra gaming, with potential for higher resolutions using DLSS or FSR. For the most part, the G15 5530 performs on par with the Lenovo Legion Pro 5 16 with a Core i7-13700HX.
The Dell G15 5530 delivers strong performance, easy upgrades, and is an affordable alternative to its Alienware brethren as long as you can overlook its bulk and live with some of its compromises."
There are few inevitable trade-offs that need to be made, however. The port placement is not very ideal, the storage is slow, there's no USB power delivery, and the webcam disappoints for a 2023 device. Surface temperatures and power consumption under load are on the higher side as well for this configuration. Even an Asus ROG Strix G17 with an AMD Ryzen 9 7945HX and RTX 4070 guzzles lesser power under load.
All in all, the Dell G15 5530 tries its best to balance power and pricing, and definitely merits a consideration if you are looking for a gaming laptop around the ₹1,50,000 (US$1,400) mark.
Price and Availability
The Dell G15 5530 can be configured and purchased directly from Dell India and Dell US online stores. The G15 5530 with the RTX 4060 is also listed on Amazon US.
Amazon India has an RTX 4050 version with unknown availability. The Dell G15 5530 with Core i7-13650HX, RTX 4050, and a 1 TB SSD can be had from Best Buy for US$1,150.
Dell G15 5530
- 06/25/2023 v7 (old)
Vaidyanathan Subramaniam
Transparency
The selection of devices to be reviewed is made by our editorial team. The test sample was provided to the author as a loan by the manufacturer or retailer for the purpose of this review. The lender had no influence on this review, nor did the manufacturer receive a copy of this review before publication. There was no obligation to publish this review. As an independent media company, Notebookcheck is not subjected to the authority of manufacturers, retailers or publishers.
This is how Notebookcheck is testing
Every year, Notebookcheck independently reviews hundreds of laptops and smartphones using standardized procedures to ensure that all results are comparable. We have continuously developed our test methods for around 20 years and set industry standards in the process. In our test labs, high-quality measuring equipment is utilized by experienced technicians and editors. These tests involve a multi-stage validation process. Our complex rating system is based on hundreds of well-founded measurements and benchmarks, which maintains objectivity. Further information on our test methods can be found here.
Price comparison
