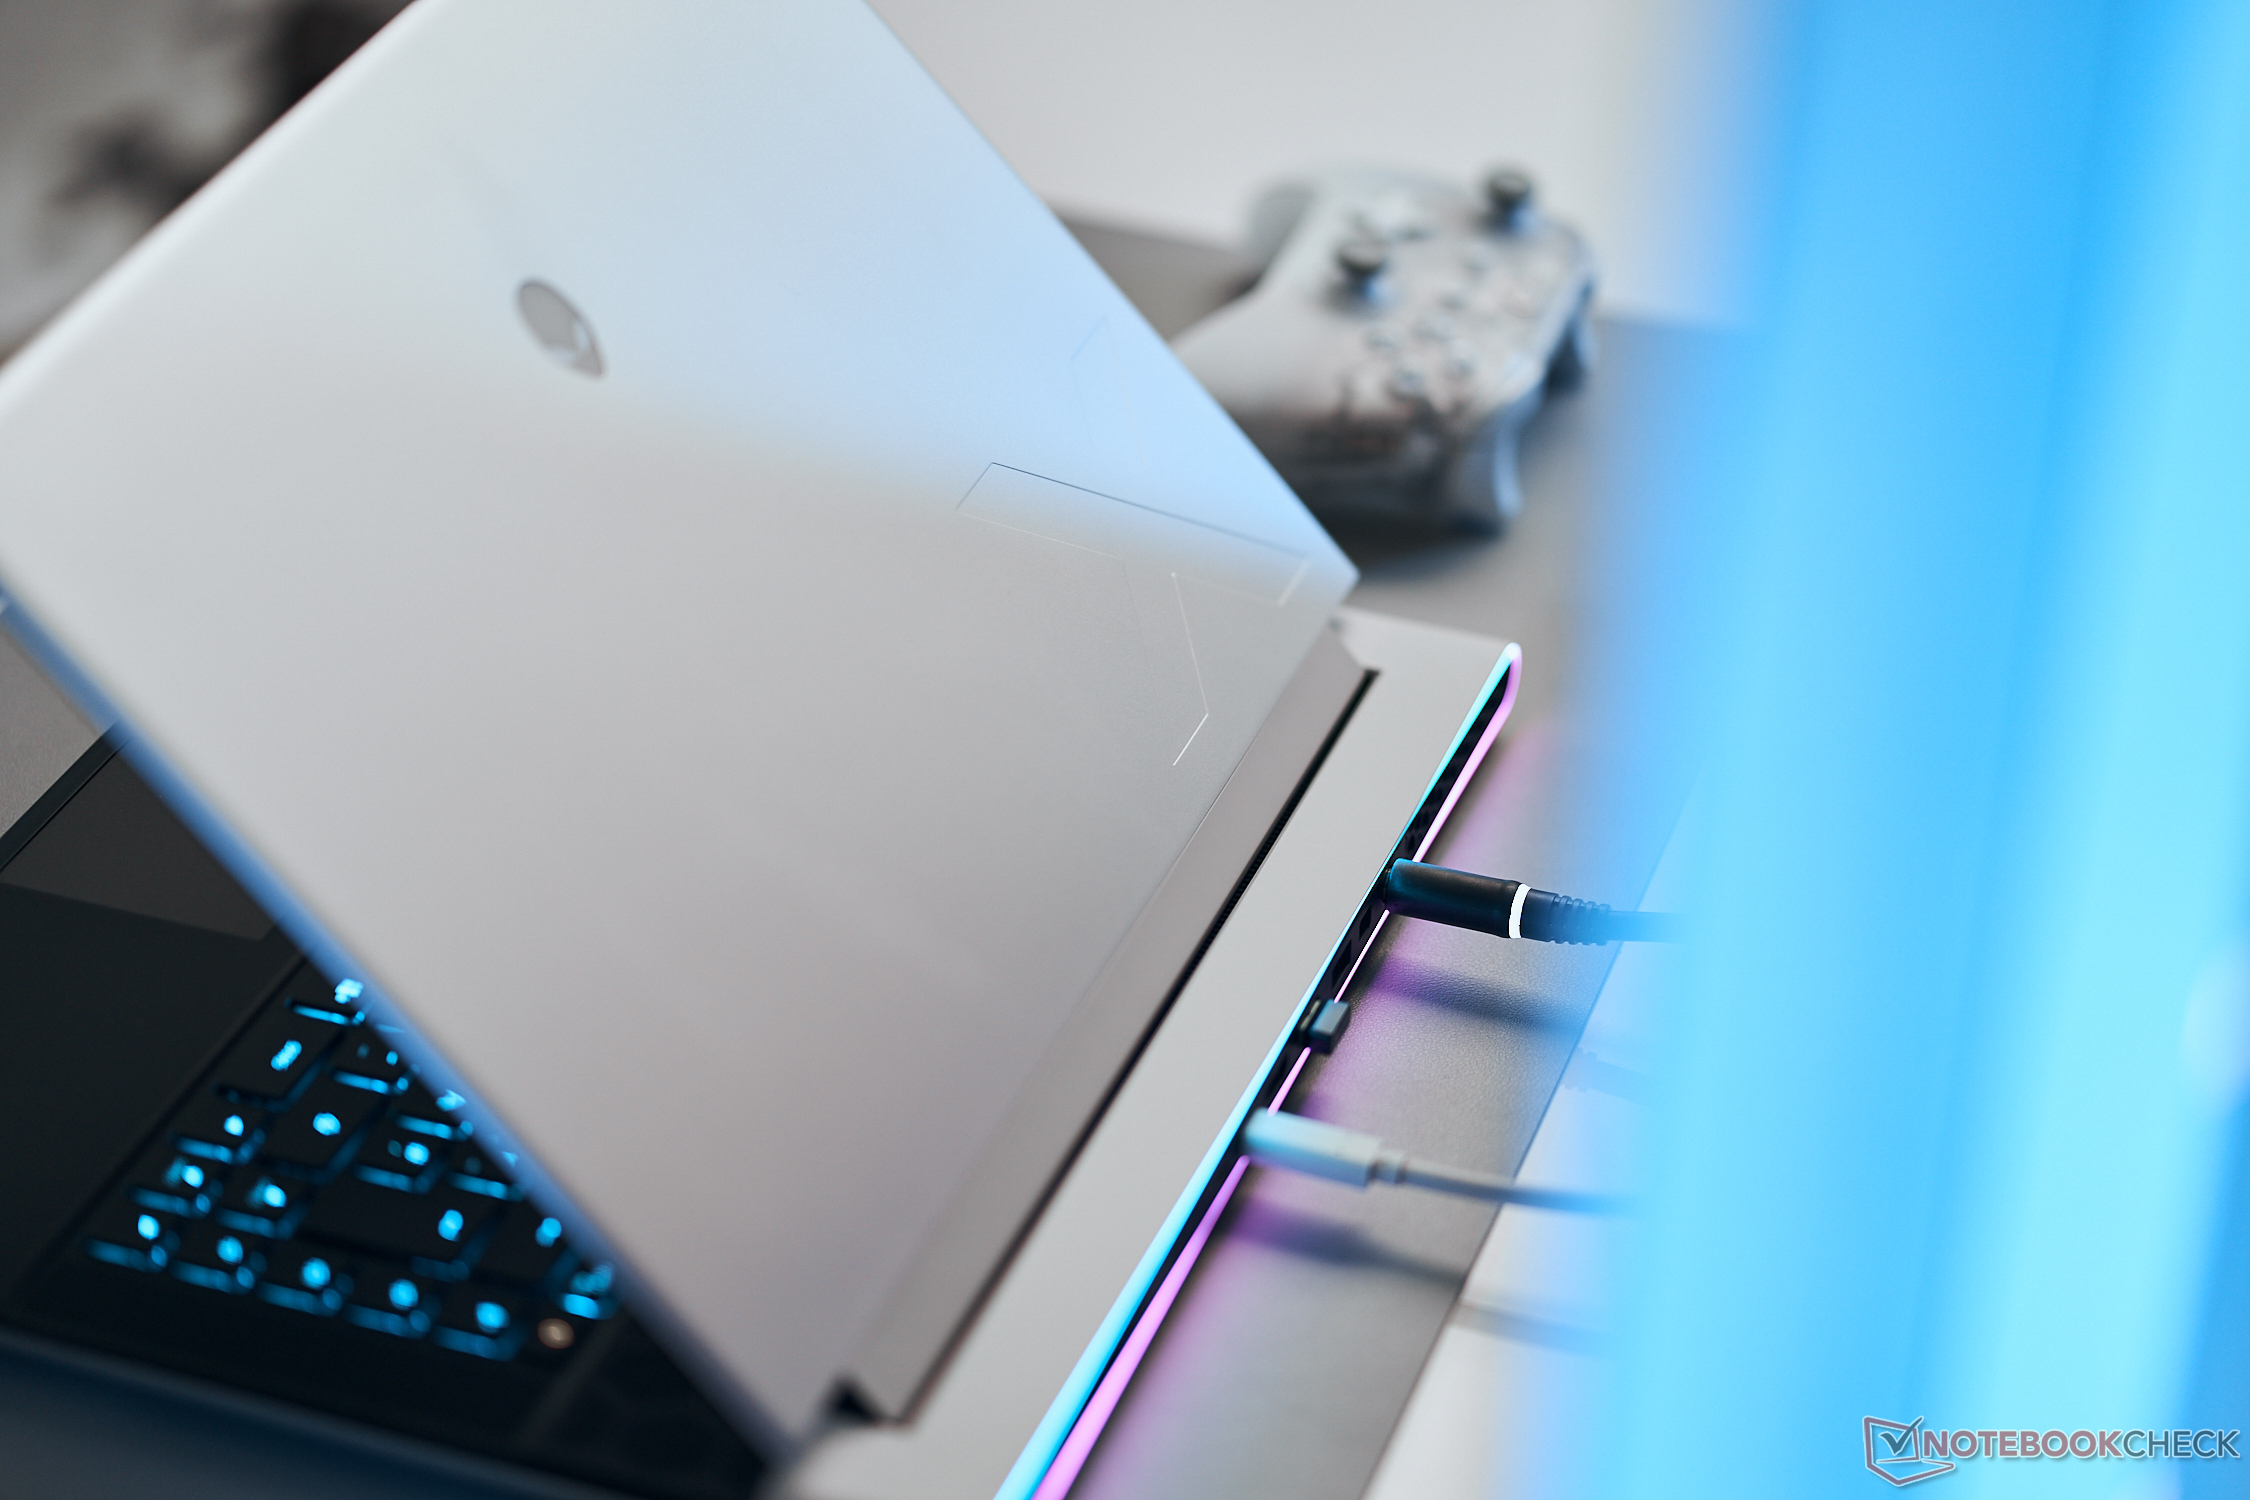
Alienware x16 R2 laptop review: A step sideways from the x16 R1

The ultra-thin Alienware x16 series launched late last year with the debut of the Alienware x16 R1. For 2024, the series has been refreshed with the x16 R2. The newer model swaps out the older Raptor Lake-H processor options with AI-ready Meteor Lake-H options while everything else remains essentially the same as the original x16 R1 design. We therefore recommend checking out our review on the x16 R1 as most of our existing comments still apply for the visually identical x16 R2. Any notable differences will be noted in this review.
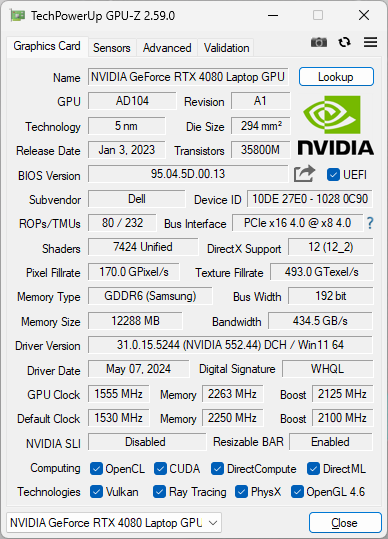
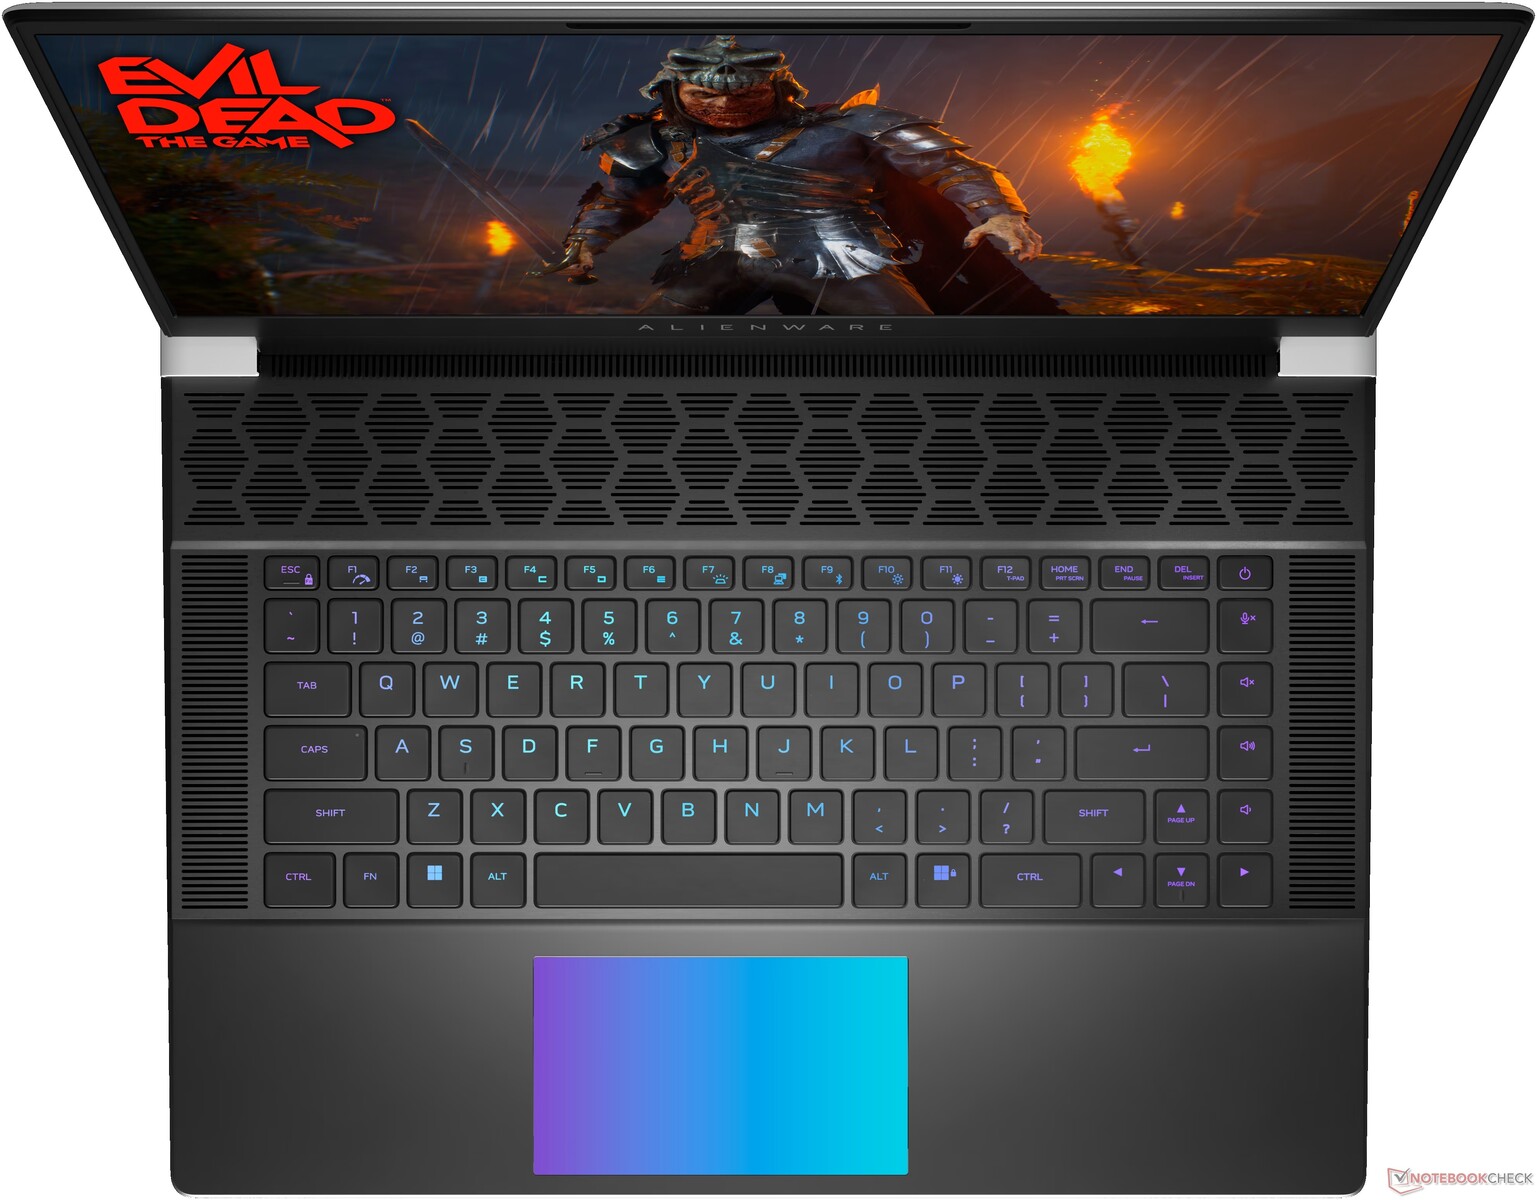
Our unit in review is a higher-end configuration with the Core Ultra 9 185H CPU, 175 W GeForce RTX 4080 GPU, 1600p 240 Hz display, and ultra-low profile CherryMX mechanical keys for approximately $3200 USD. Other SKUs include regular membrane-based keys and the Core Ultra 7 155H with GeForce RTX 4060, 4070, or 4090 graphics and 1200p 480 Hz IPS display instead.
Alternatives to the Alienware x16 R2 include other high-end 16-inch gaming laptops like the Razer Blade 16, Asus ROG Strix Scar 16, Lenovo Legion Pro 7 16, or MSI Vector 16 HX.
More Dell reviews:
Potential Competitors in Comparison
Rating | Date | Model | Weight | Height | Size | Resolution | Price |
|---|---|---|---|---|---|---|---|
| 88.4 % v7 (old) | 05 / 2024 | Alienware x16 R2 P120F Ultra 9 185H, GeForce RTX 4080 Laptop GPU | 2.7 kg | 18.57 mm | 16.00" | 2560x1600 | |
| 88.4 % v7 (old) | 06 / 2023 | Alienware x16 R1 i9-13900HK, GeForce RTX 4080 Laptop GPU | 2.6 kg | 18.57 mm | 16.00" | 2560x1600 | |
| 90.2 % v7 (old) | 03 / 2024 | Alienware m16 R2 Ultra 7 155H, GeForce RTX 4070 Laptop GPU | 2.5 kg | 23.5 mm | 16.00" | 2560x1600 | |
| 87.6 % v7 (old) | 04 / 2024 | Asus ROG Strix Scar 16 G634JZR i9-14900HX, GeForce RTX 4080 Laptop GPU | 2.7 kg | 30.4 mm | 16.00" | 2560x1600 | |
| 89.5 % v7 (old) | 03 / 2024 | Lenovo Legion Pro 7 16IRX9H i9-14900HX, GeForce RTX 4080 Laptop GPU | 2.7 kg | 21.95 mm | 16.00" | 2560x1600 | |
| 88 % v7 (old) | 02 / 2024 | MSI Vector 16 HX A14V i9-14900HX, GeForce RTX 4080 Laptop GPU | 2.7 kg | 28.55 mm | 16.00" | 2560x1600 |
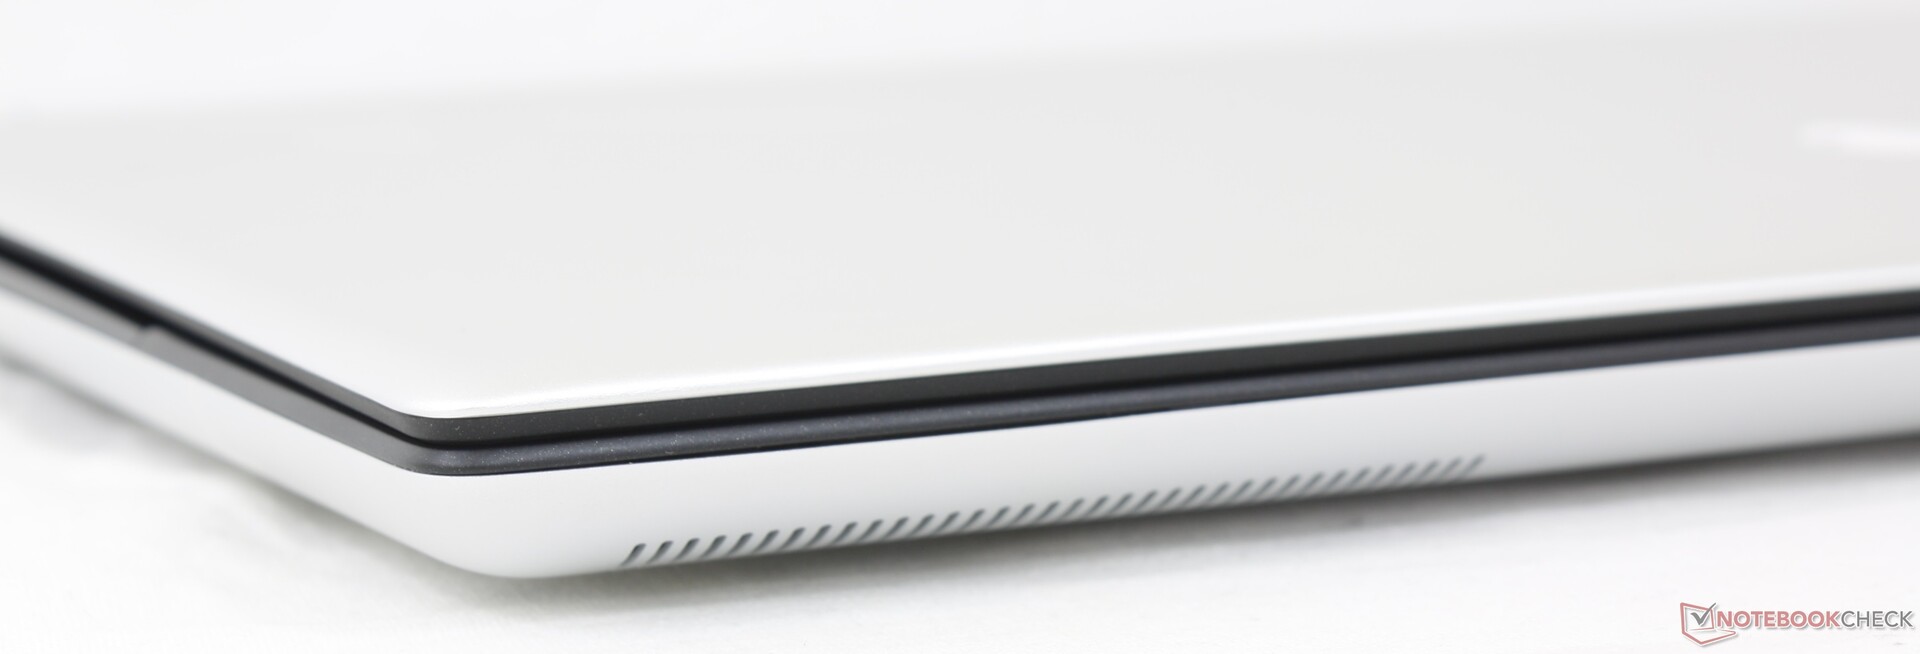
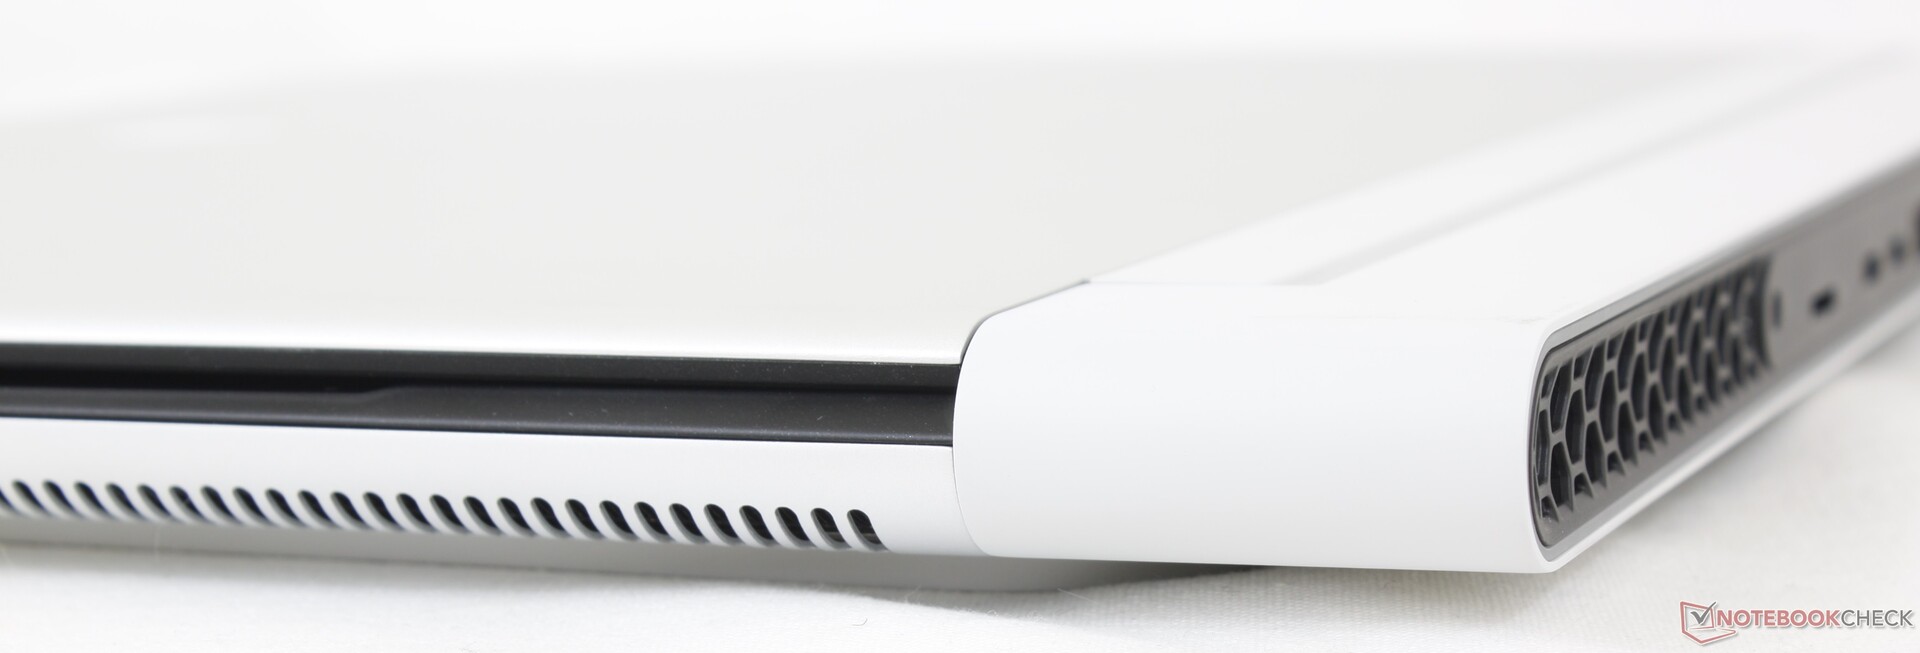
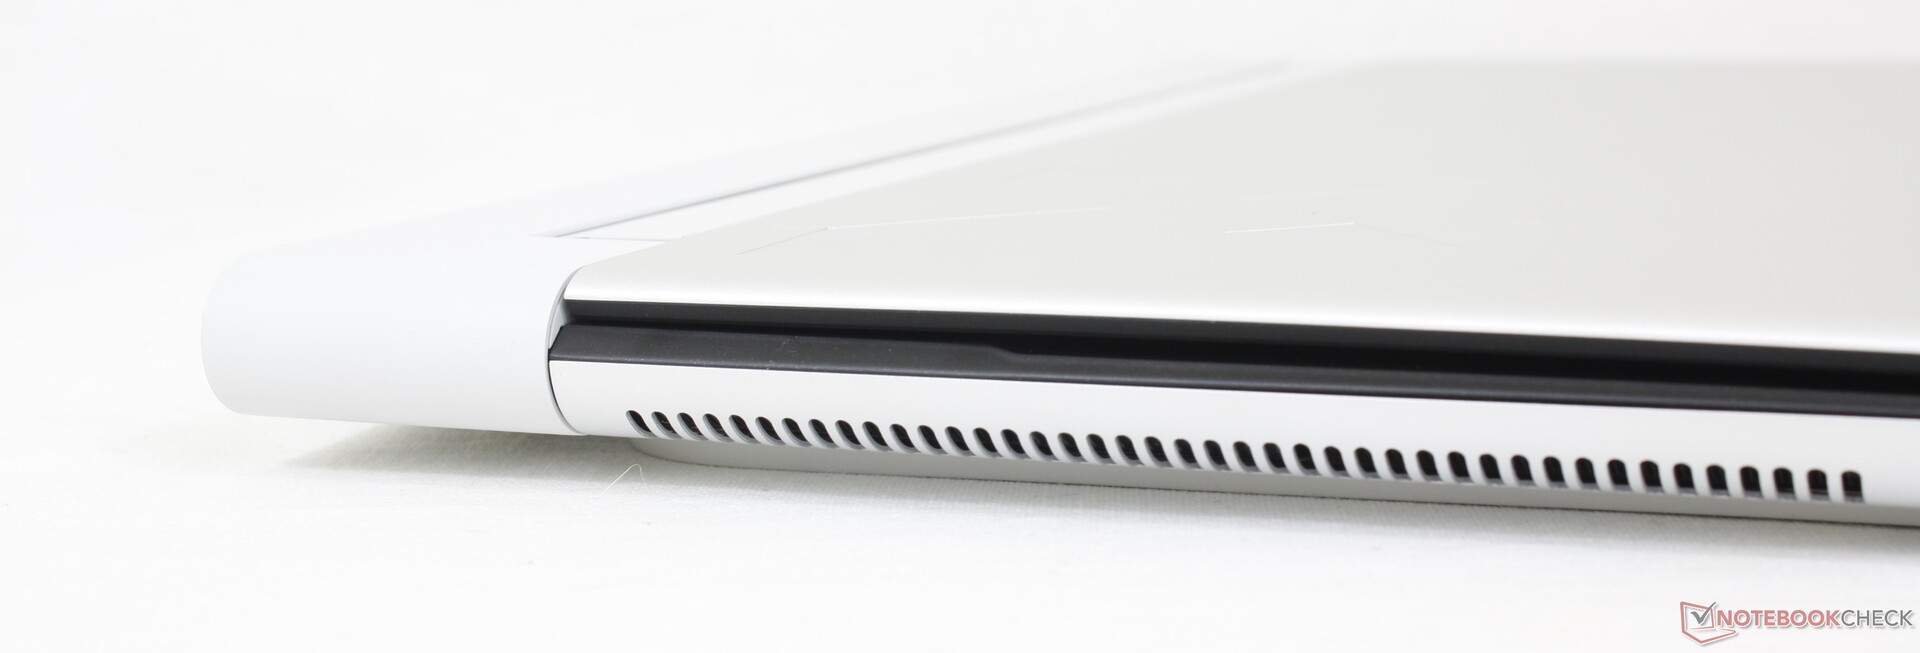
Case — No External Changes
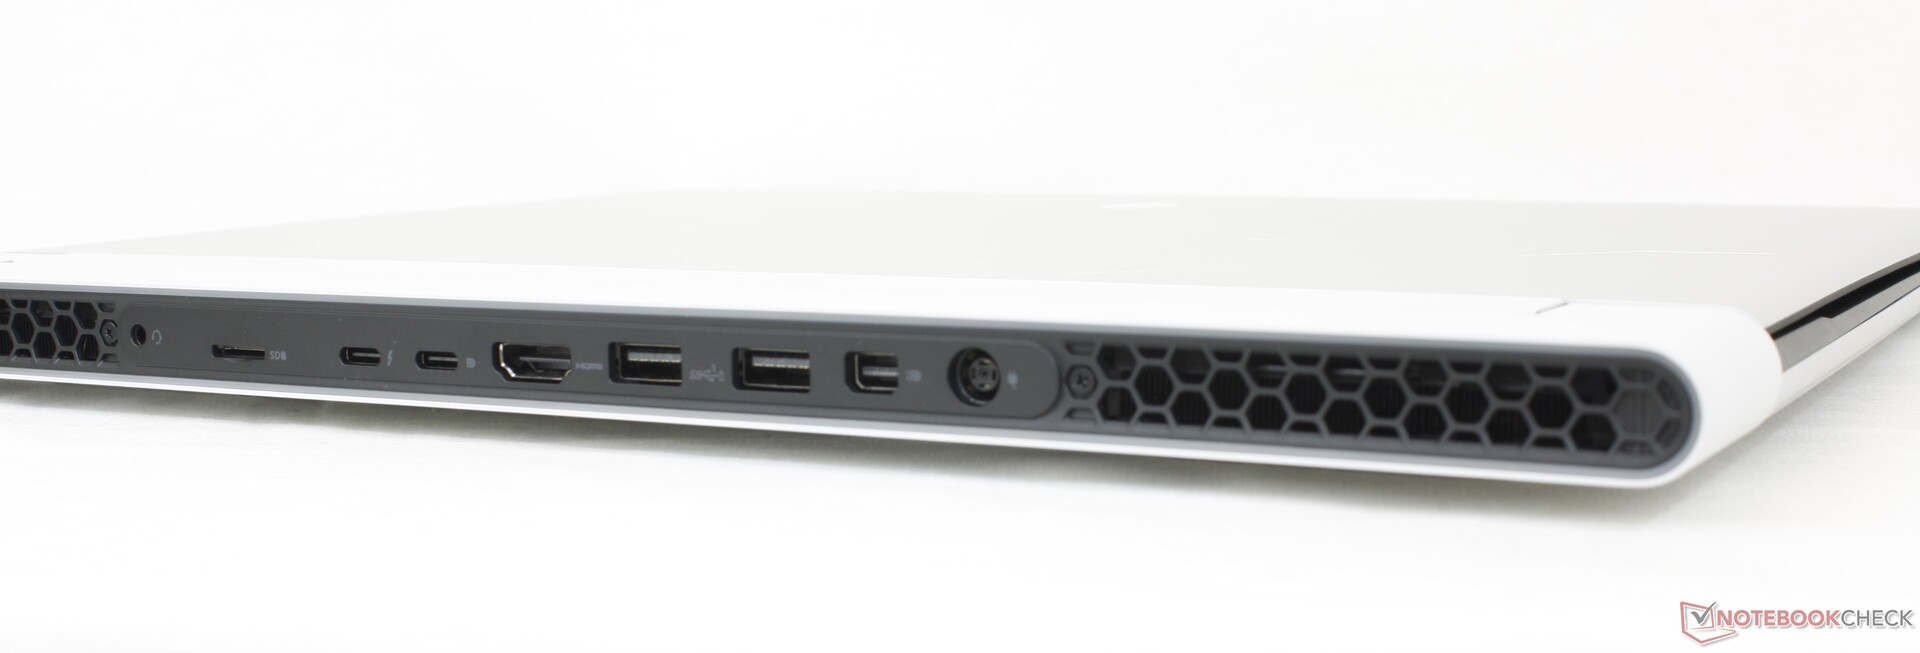
Connectivity
SD Card Reader
Interestingly, the MicroSD reader on our x16 R2 would exhibit none of the transfer rate issues we experienced on last year's x16 R1.
| SD Card Reader | |
| average JPG Copy Test (av. of 3 runs) | |
| Alienware x16 R2 P120F (AV PRO microSD 128 GB V60) | |
| MSI Vector 16 HX A14V (Toshiba Exceria Pro SDXC 64 GB UHS-II) | |
| Alienware m16 R2 (AV PRO microSD 128 GB V60) | |
| Alienware x16 R1 (AV PRO microSD 128 GB V60) | |
| maximum AS SSD Seq Read Test (1GB) | |
| Alienware x16 R2 P120F (AV PRO microSD 128 GB V60) | |
| Alienware x16 R1 (AV PRO microSD 128 GB V60) | |
| Alienware m16 R2 (AV PRO microSD 128 GB V60) | |
| MSI Vector 16 HX A14V (Toshiba Exceria Pro SDXC 64 GB UHS-II) | |
Communication
Dell has upgraded the WLAN module for this year's refresh to support Wi-Fi 7.
Webcam


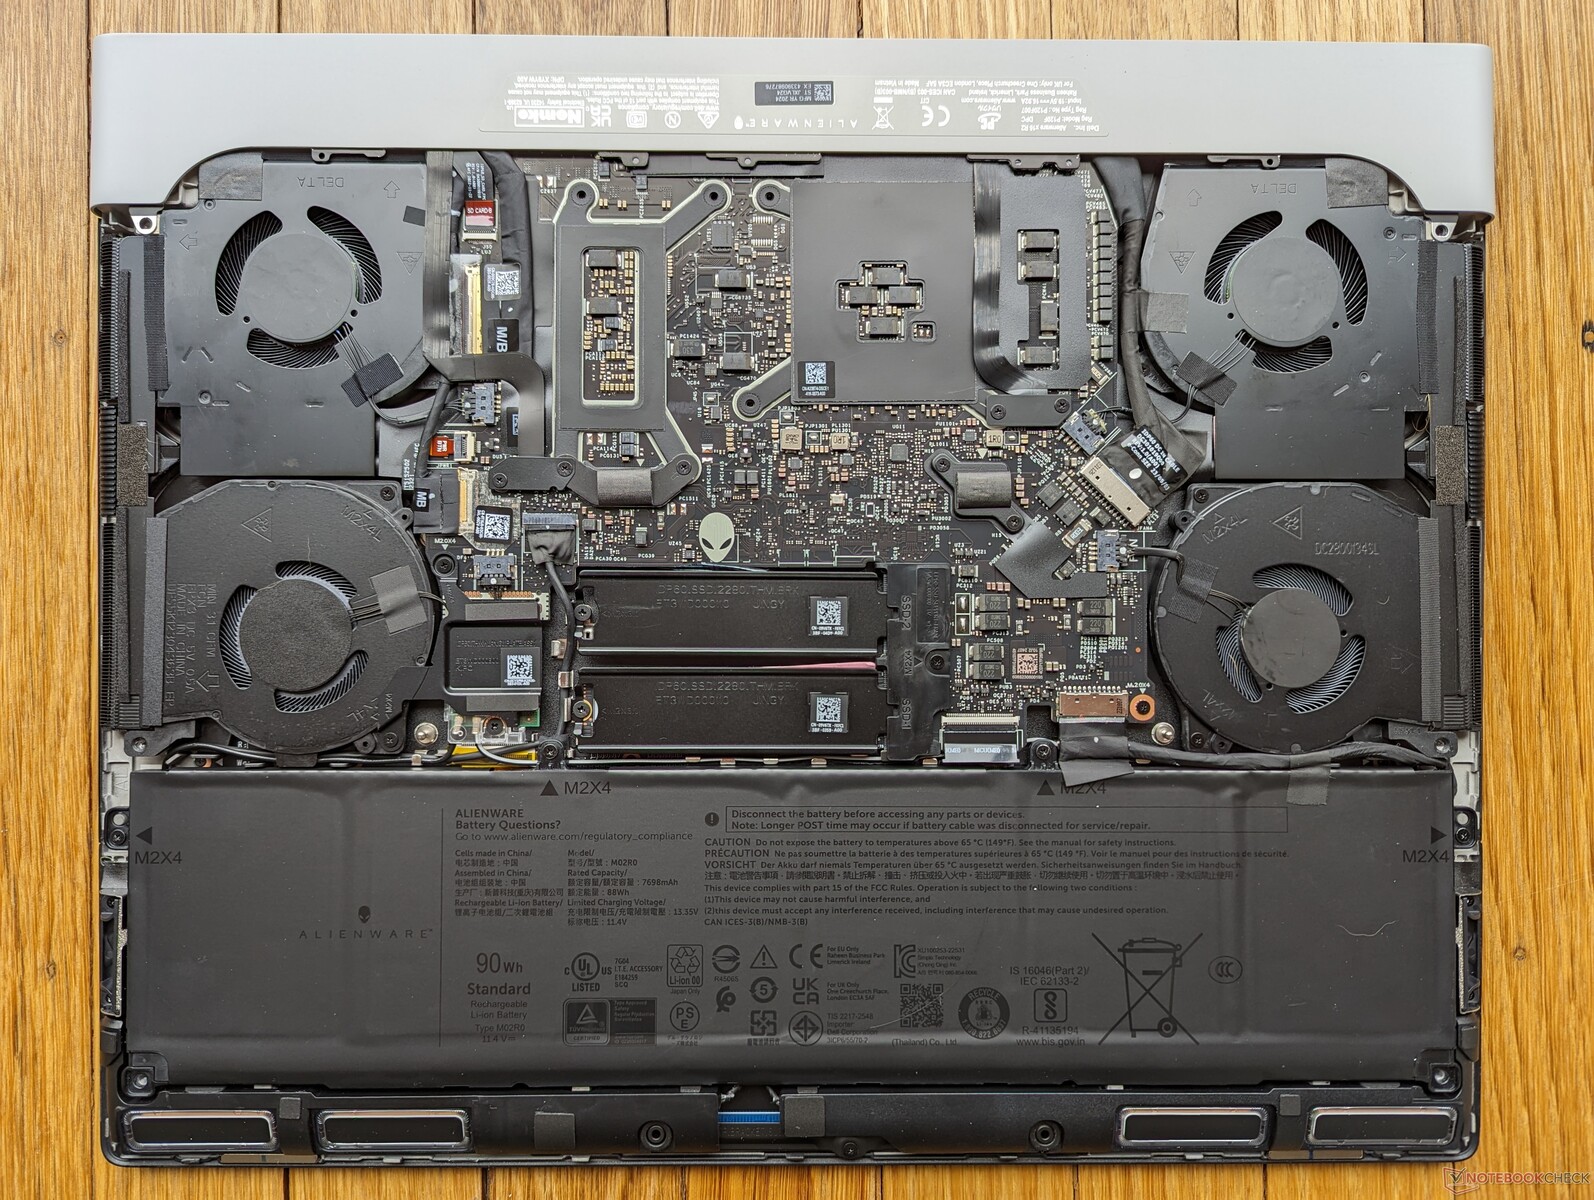
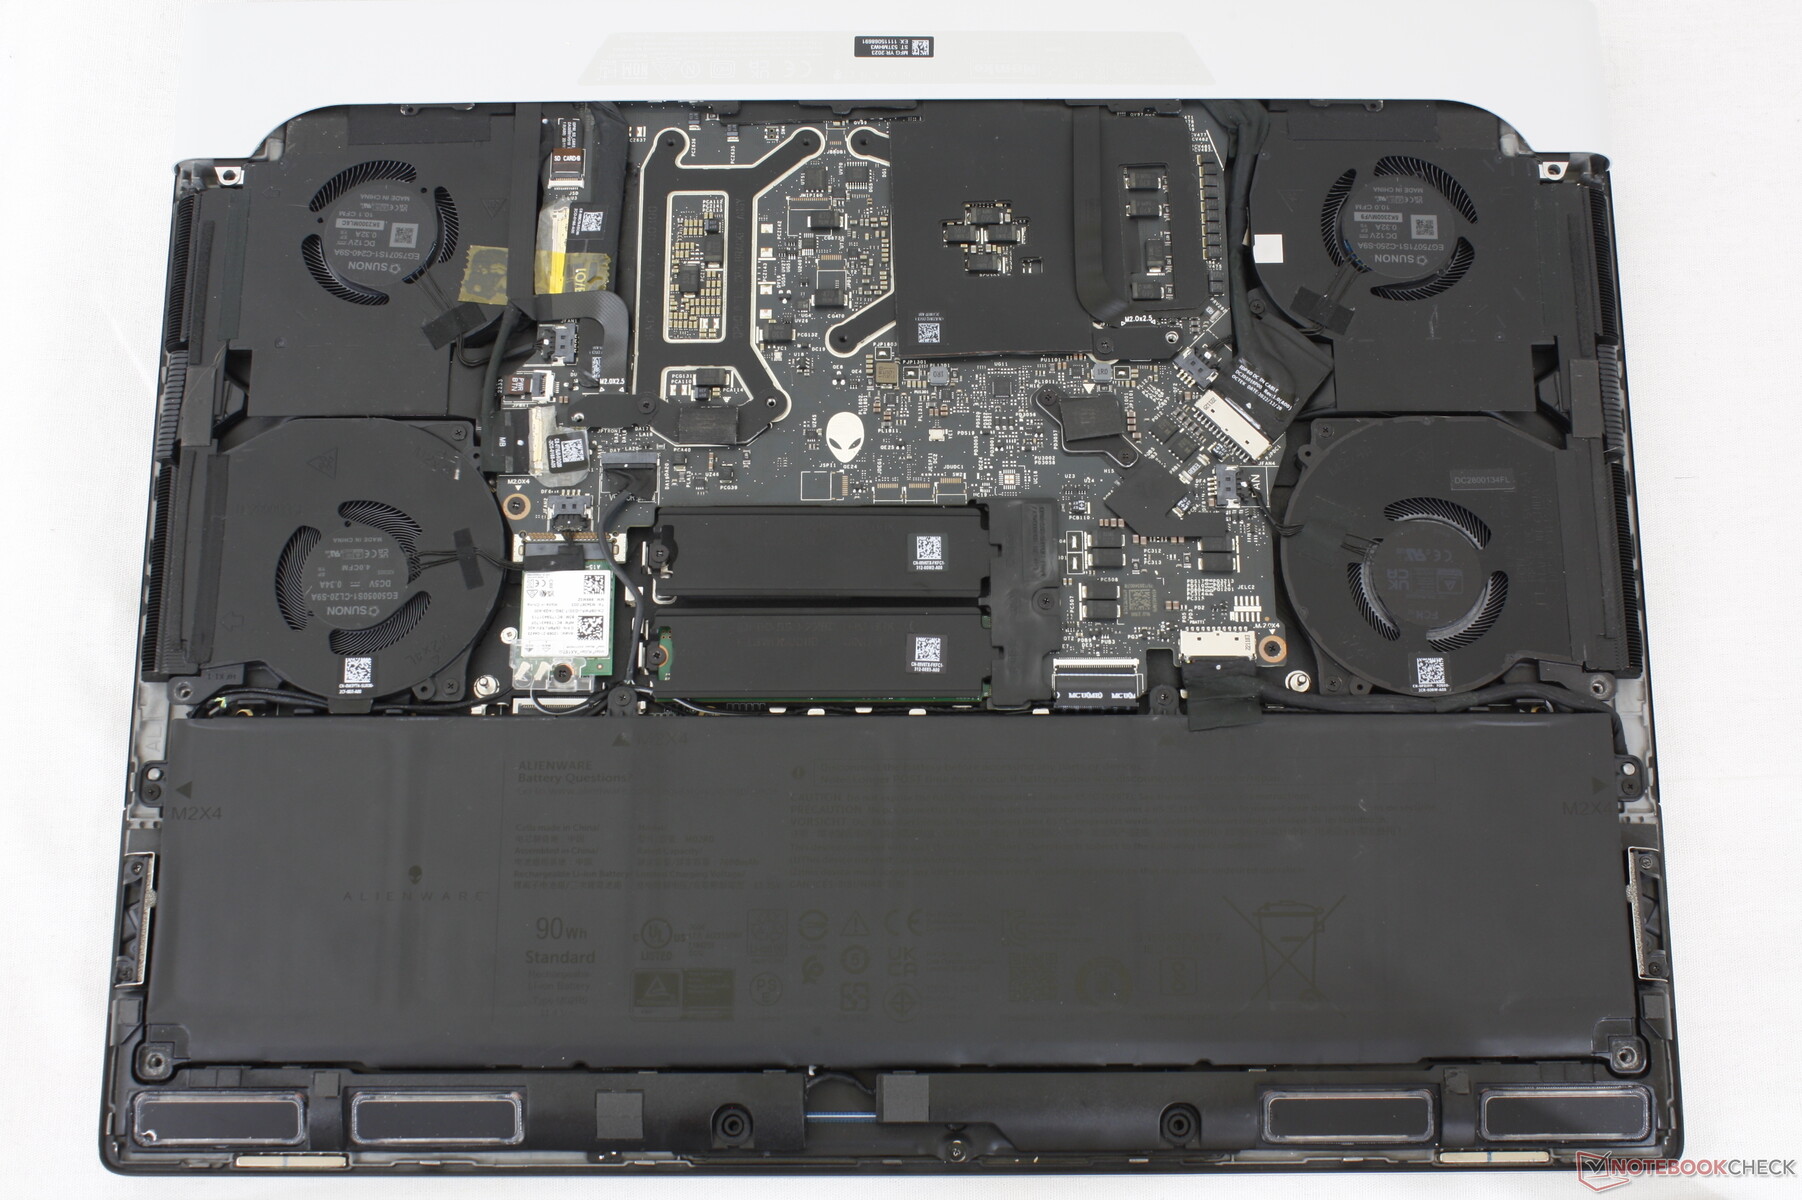
Maintenance
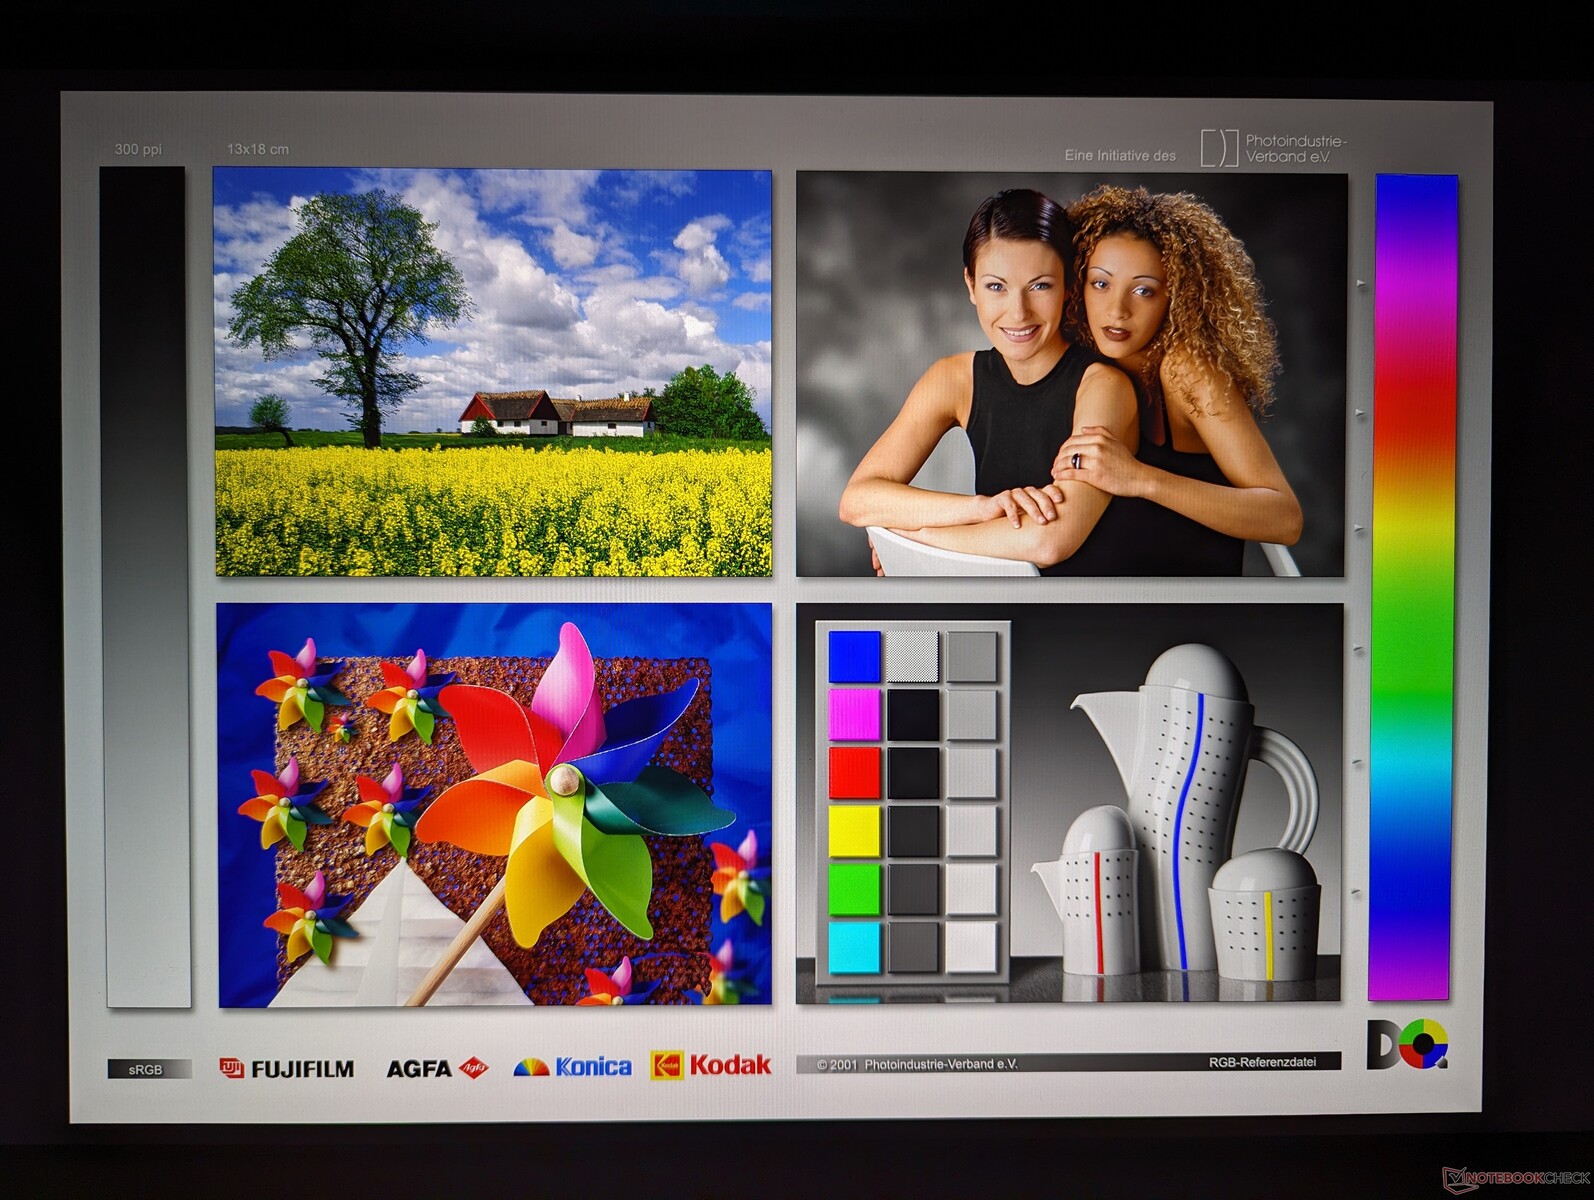
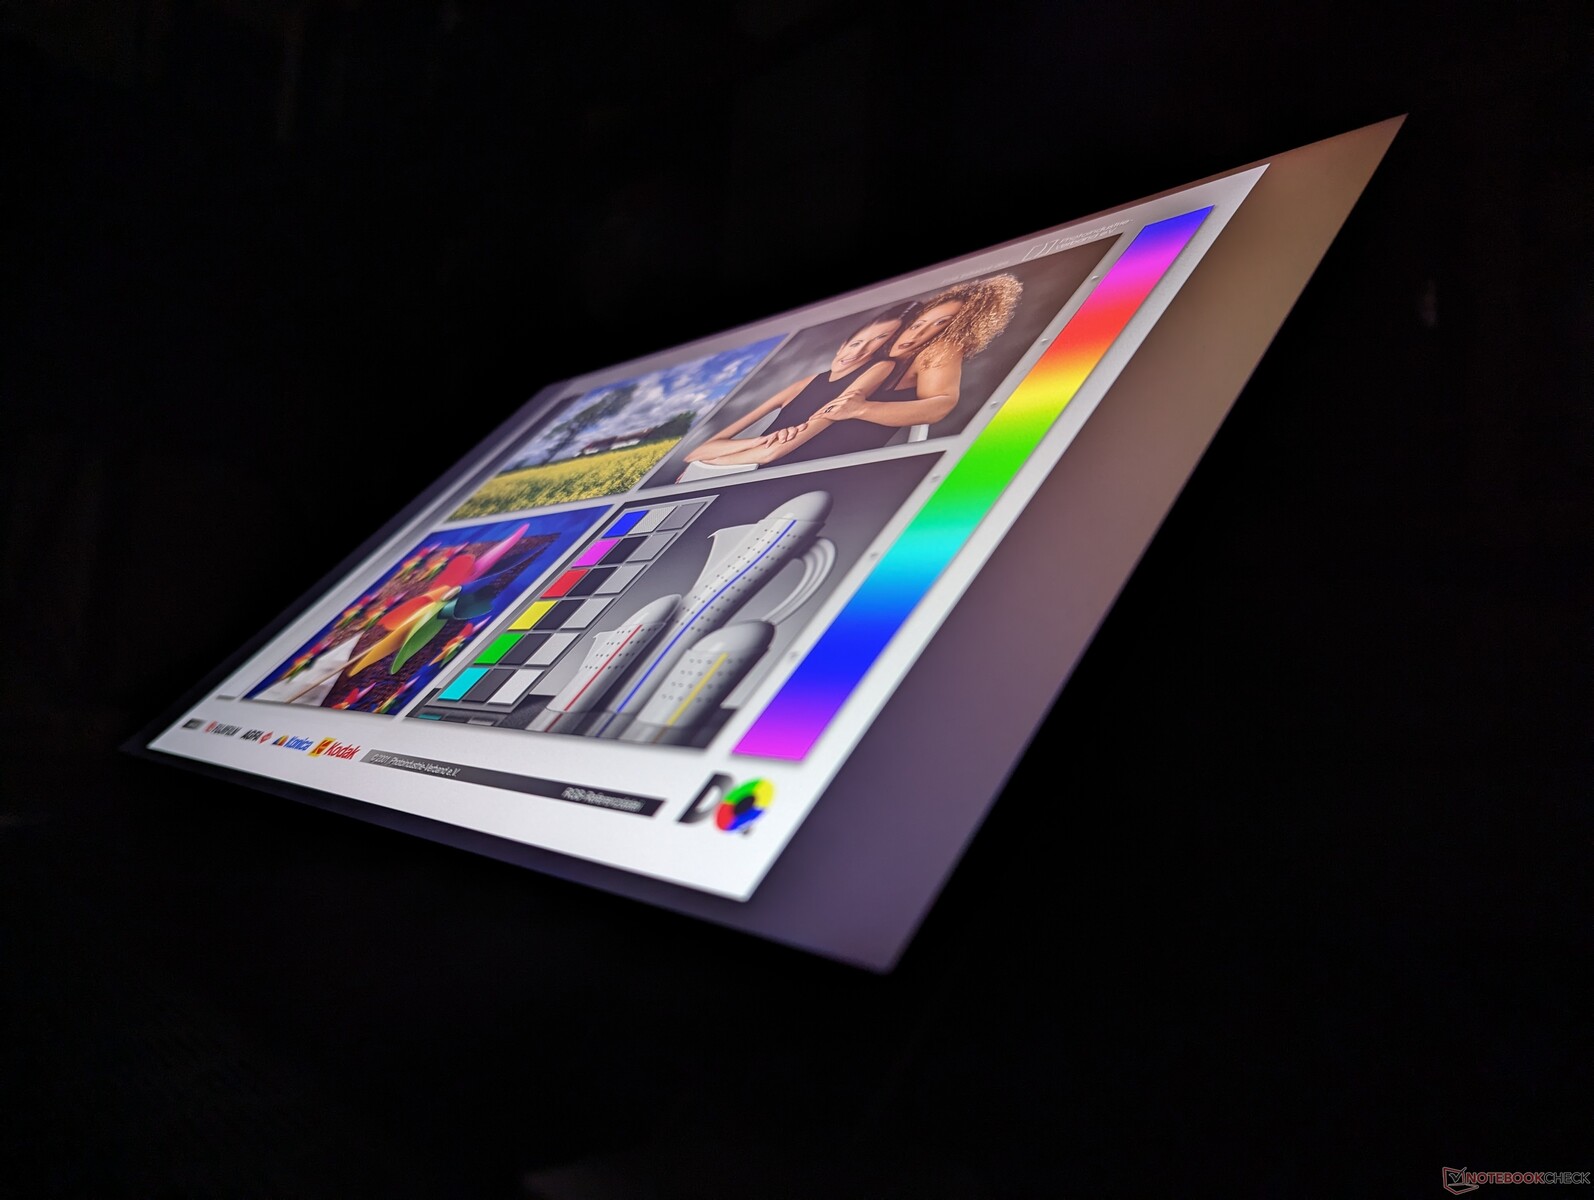
Display — No More 165 Hz Option
Dell has swapped out the BOE NE16NZ4 panel on last year's x16 R1 for the BOE B160QAN on this year's x16 R2. However, the two panels are otherwise almost identical in terms of color reproduction, response times, brightness levels, and contrast for an essentially identical viewing experience.
The native refresh rate can be set to 240 Hz or 60 Hz with no variable options. G-Sync is supported only when set to dGPU mode and not Optimus mode.
Users can configure between two displays as shown below whereas the x16 R1 had three:
- 2560 x 1600, 240 Hz, 100% DCI-P3, G-Sync, Advanced Optimus
- 1920 x 1200, 480 Hz, 100% DCI-P3, G-Sync, Advanced Optimus


| |||||||||||||||||||||||||
Brightness Distribution: 90 %
Center on Battery: 348.4 cd/m²
Contrast: 1056:1 (Black: 0.33 cd/m²)
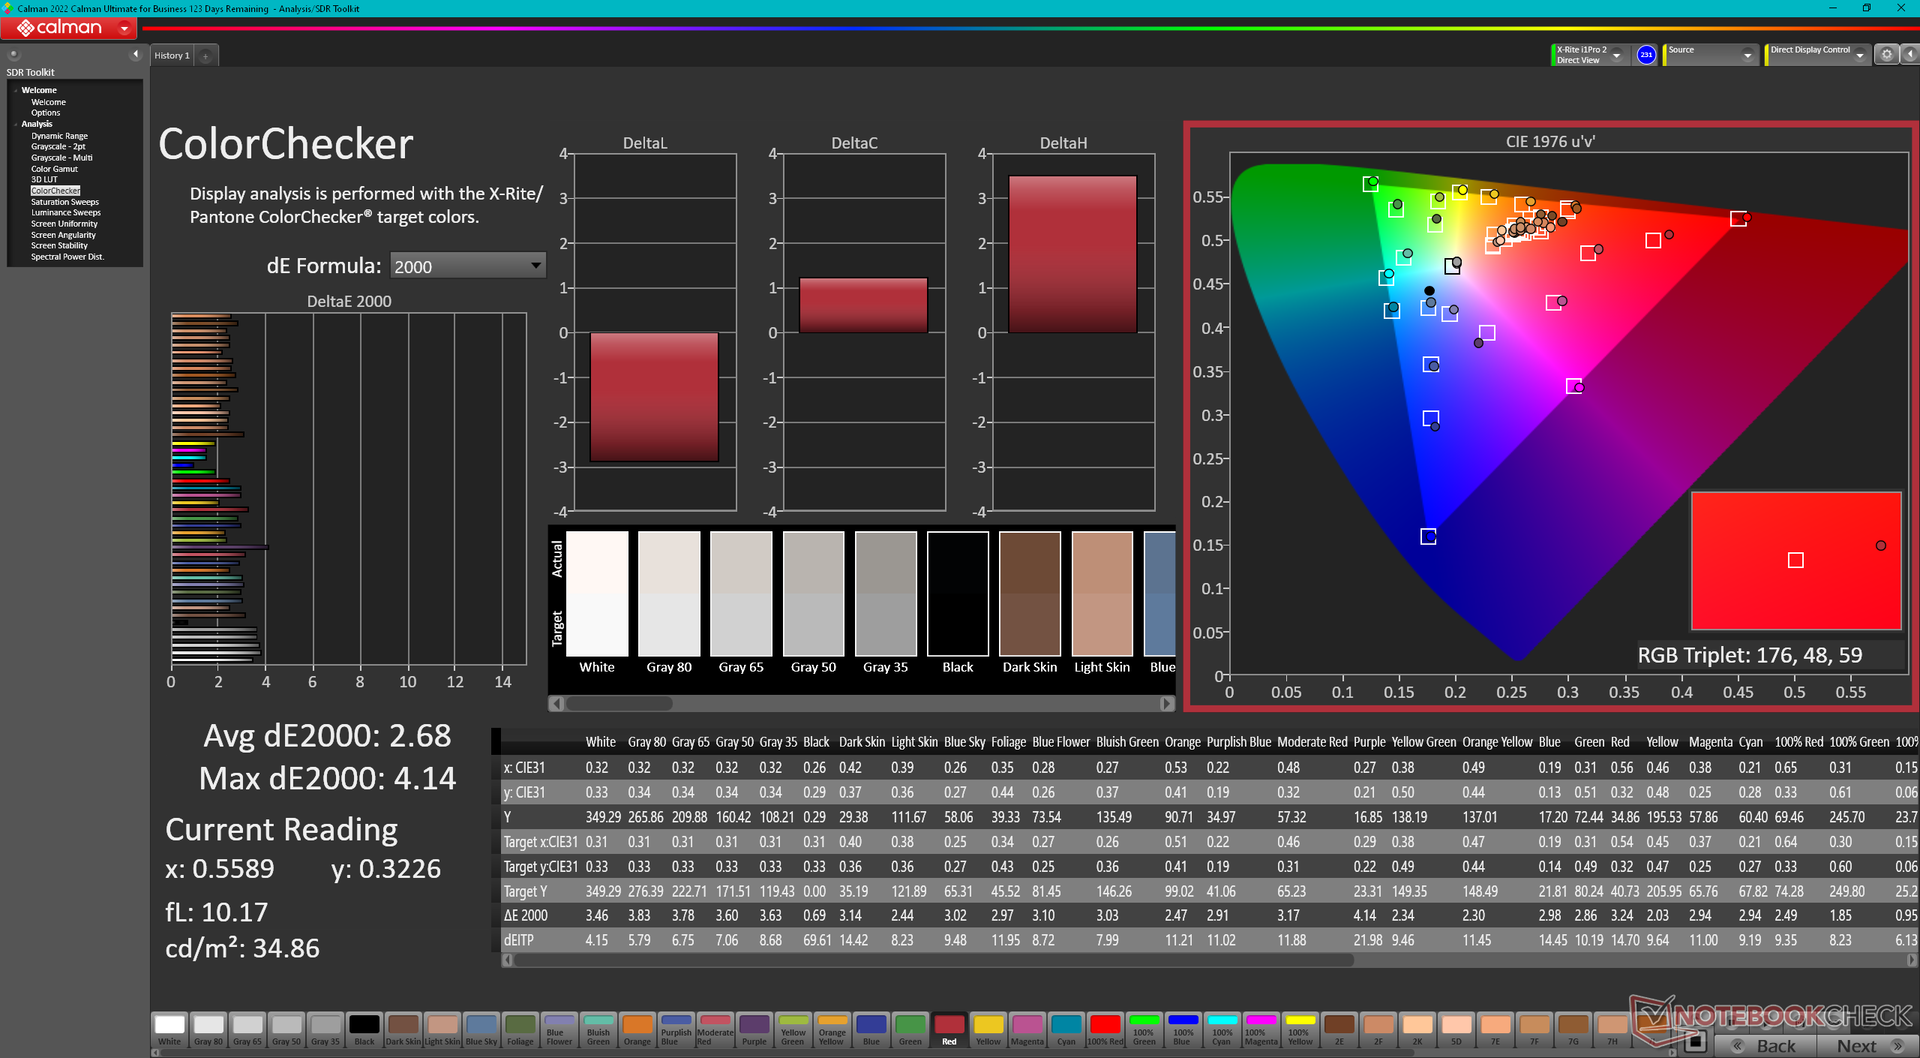
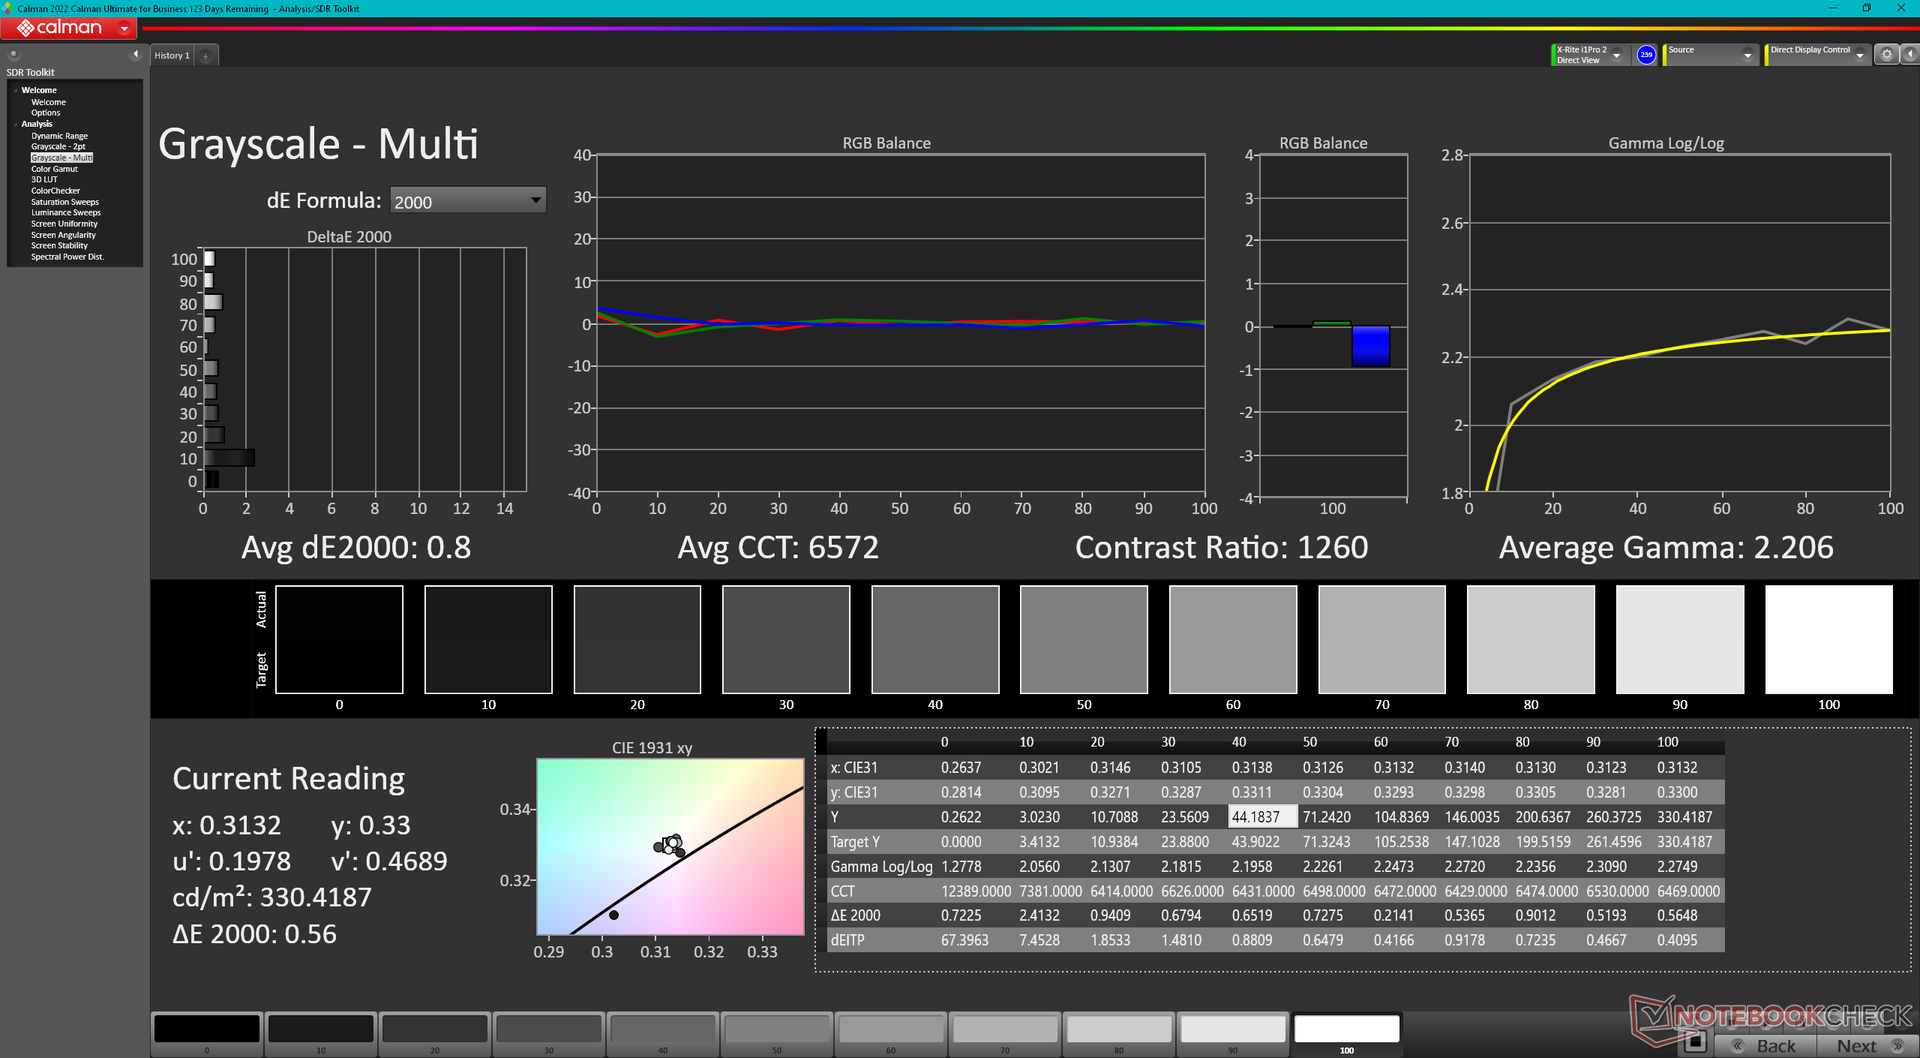
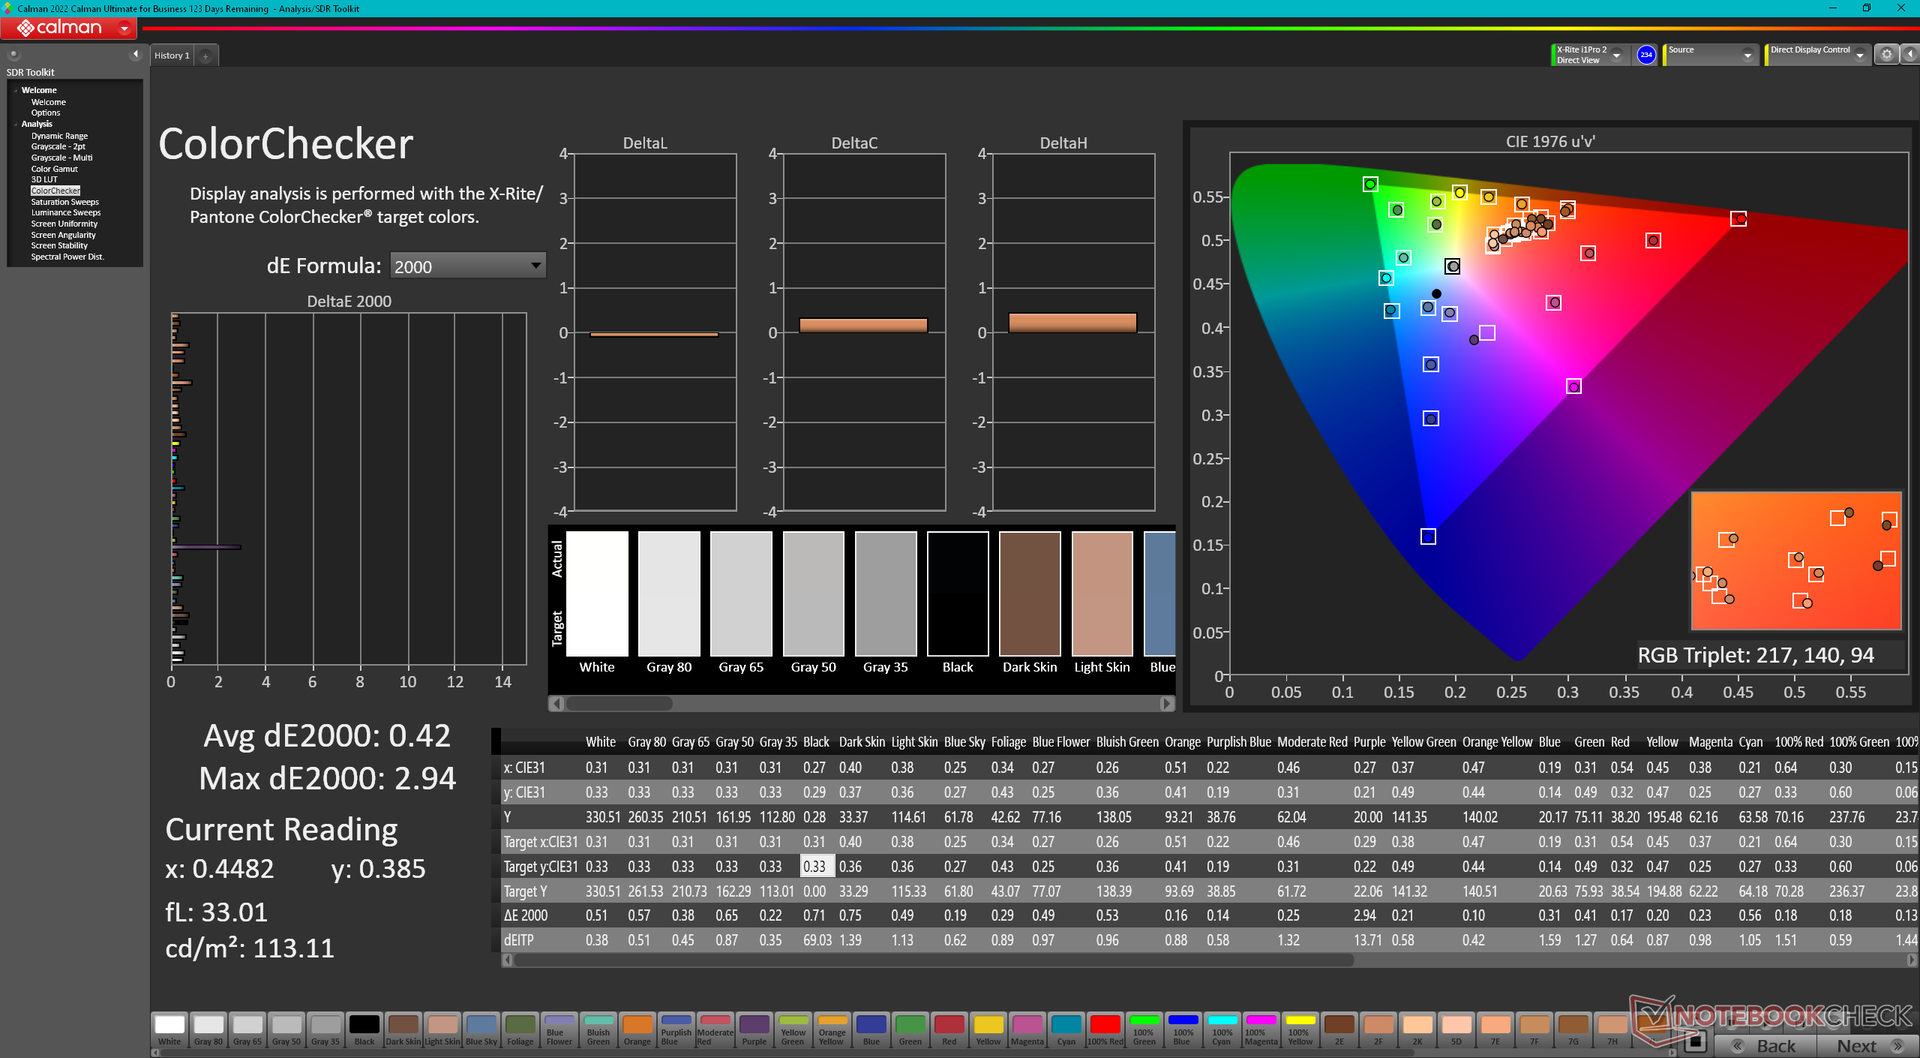
ΔE ColorChecker Calman: 2.68 | ∀{0.5-29.43 Ø4.75}
calibrated: 0.42
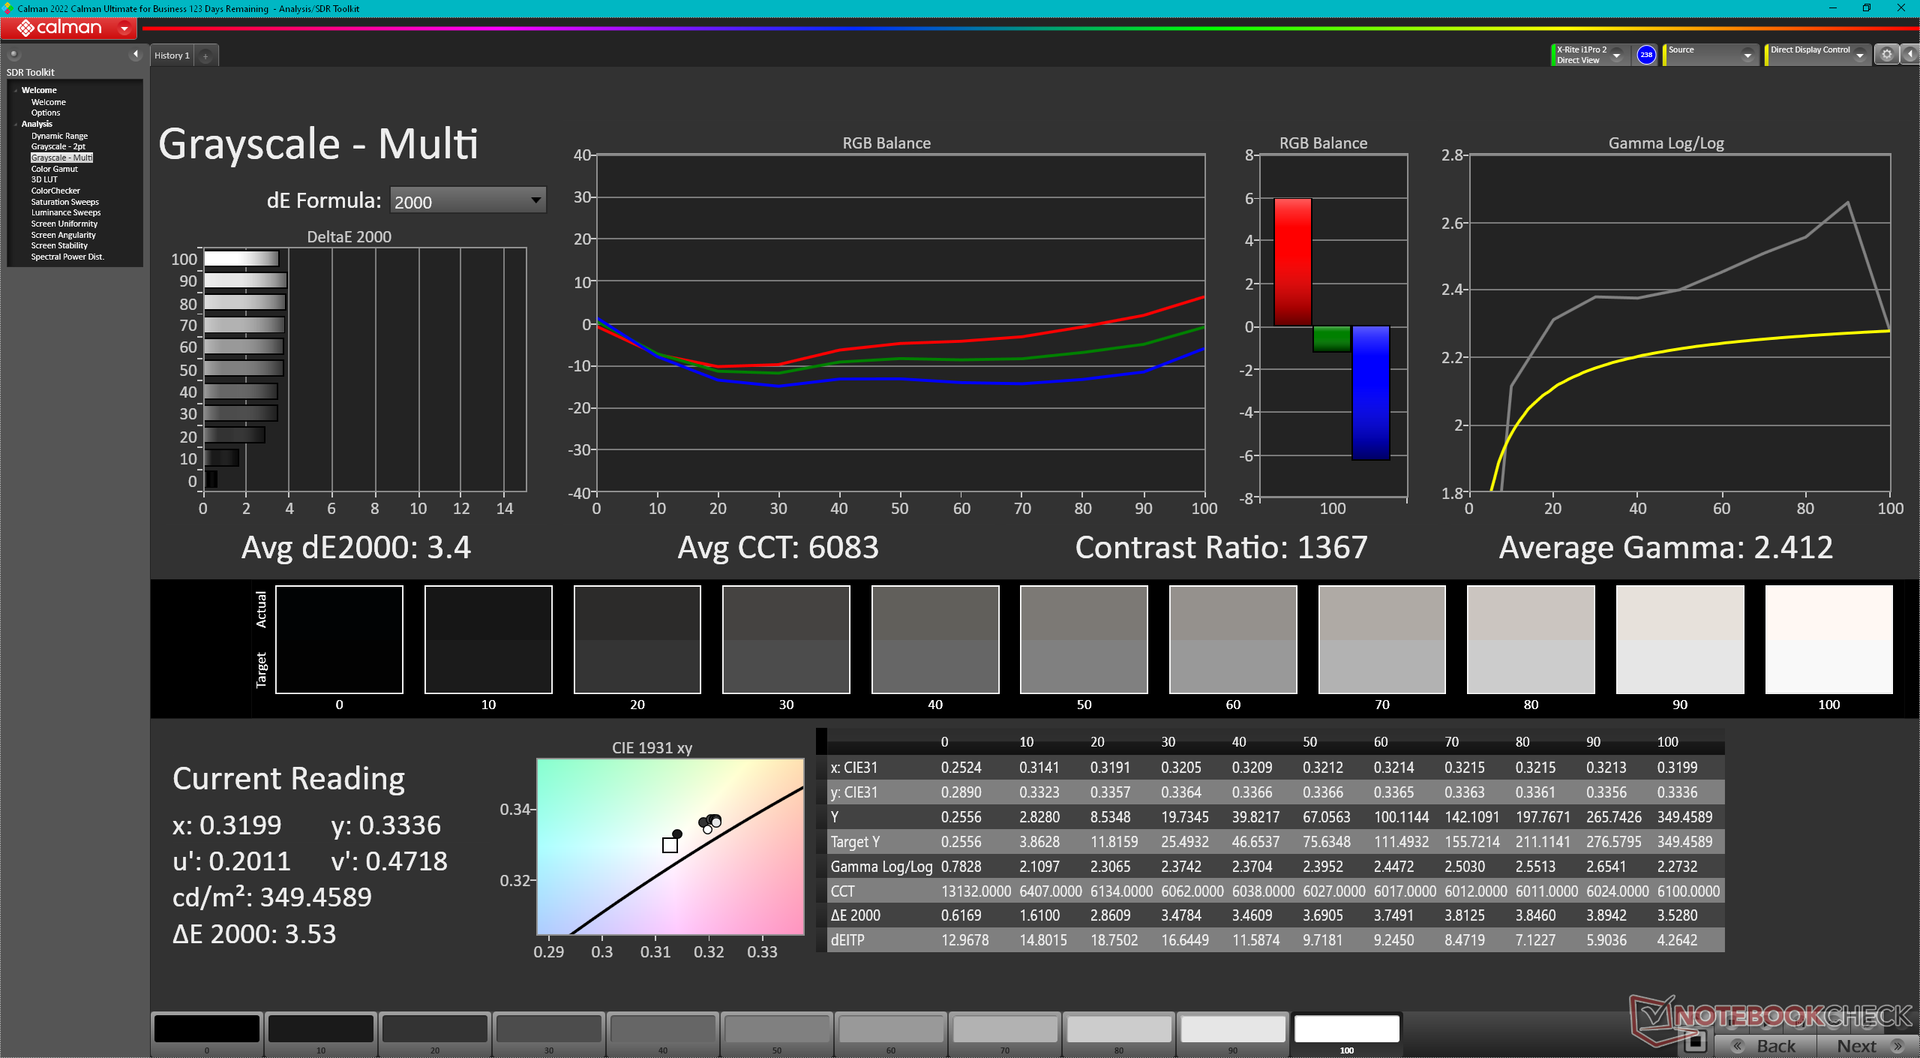
ΔE Greyscale Calman: 3.4 | ∀{0.09-98 Ø5}
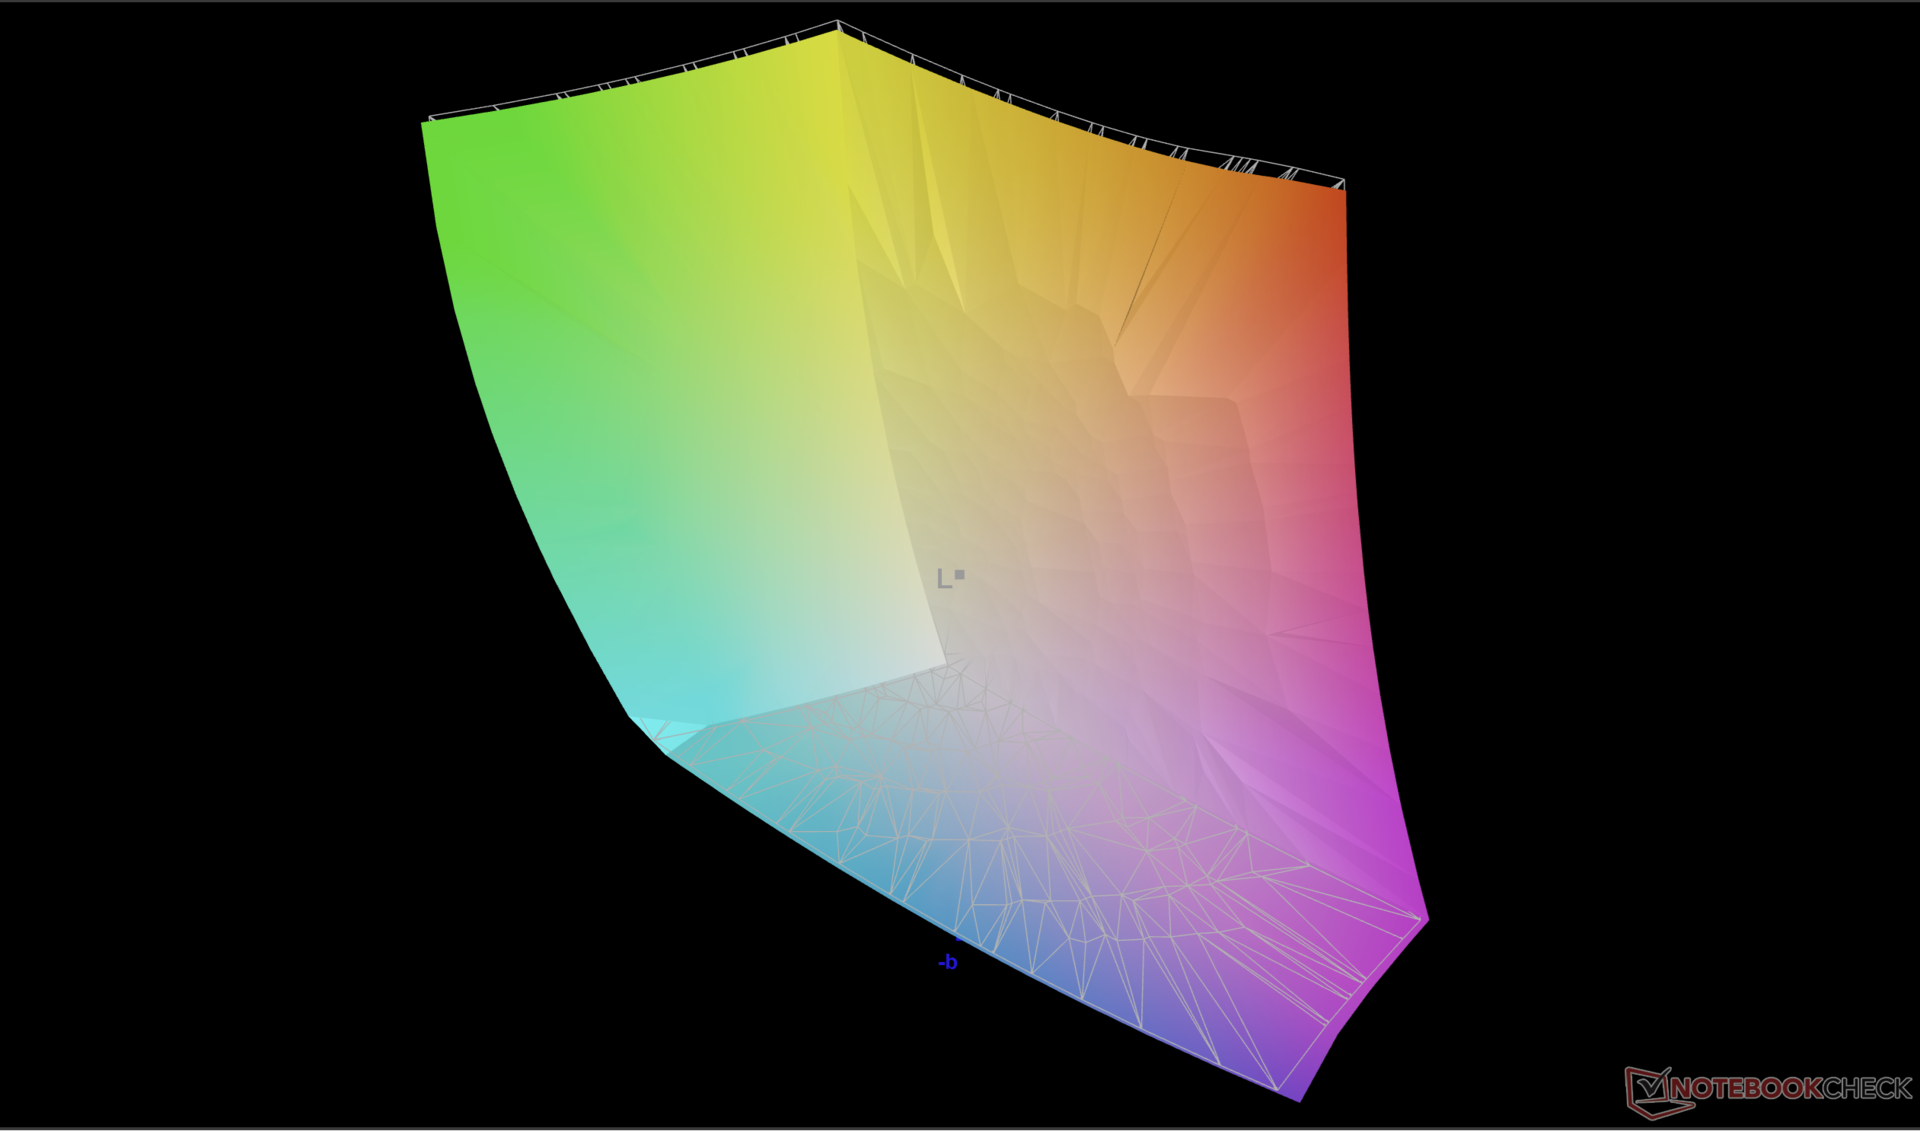
88.8% AdobeRGB 1998 (Argyll 3D)
100% sRGB (Argyll 3D)
98.3% Display P3 (Argyll 3D)
Gamma: 2.41
CCT: 6083 K
| Alienware x16 R2 P120F BOE B160QAN, IPS, 2560x1600, 16" | Alienware x16 R1 BOE NE16NZ4, IPS, 2560x1600, 16" | Alienware m16 R2 BOE NE16NYH, IPS, 2560x1600, 16" | Asus ROG Strix Scar 16 G634JZR BOE NE160QDM-NM7, Mini LED, 2560x1600, 16" | Lenovo Legion Pro 7 16IRX9H BOE CQ NE16QDM-NZB, IPS, 2560x1600, 16" | MSI Vector 16 HX A14V Chi Mei N160GME-GTB, IPS, 2560x1600, 16" | |
|---|---|---|---|---|---|---|
| Display | 0% | -16% | 1% | -1% | -2% | |
| Display P3 Coverage (%) | 98.3 | 99.2 1% | 71 -28% | 99.8 2% | 98.5 0% | 95.4 -3% |
| sRGB Coverage (%) | 100 | 100 0% | 100 0% | 100 0% | 99.9 0% | 99.7 0% |
| AdobeRGB 1998 Coverage (%) | 88.8 | 88.6 0% | 71.4 -20% | 90.8 2% | 86.7 -2% | 85.4 -4% |
| Response Times | -32% | -29% | -31% | -99% | -46% | |
| Response Time Grey 50% / Grey 80% * (ms) | 3.9 ? | 5.1 ? -31% | 5.7 ? -46% | 5 ? -28% | 12.6 ? -223% | 5.7 ? -46% |
| Response Time Black / White * (ms) | 7.8 ? | 10.3 ? -32% | 8.7 ? -12% | 10.4 ? -33% | 5.8 ? 26% | 11.4 ? -46% |
| PWM Frequency (Hz) | 2040 ? | |||||
| Screen | -13% | 5% | 16% | 21% | -27% | |
| Brightness middle (cd/m²) | 348.4 | 302.2 -13% | 345.8 -1% | 490 41% | 487 40% | 557.2 60% |
| Brightness (cd/m²) | 340 | 285 -16% | 337 -1% | 487 43% | 460 35% | 506 49% |
| Brightness Distribution (%) | 90 | 89 -1% | 87 -3% | 94 4% | 88 -2% | 83 -8% |
| Black Level * (cd/m²) | 0.33 | 0.26 21% | 0.3 9% | 0.4 -21% | 0.42 -27% | 0.41 -24% |
| Contrast (:1) | 1056 | 1162 10% | 1153 9% | 1225 16% | 1160 10% | 1359 29% |
| Colorchecker dE 2000 * | 2.68 | 1.63 39% | 1.99 26% | 1.08 60% | 1.12 58% | 2.91 -9% |
| Colorchecker dE 2000 max. * | 4.14 | 4.13 -0% | 3.52 15% | 2.38 43% | 2.26 45% | 5.94 -43% |
| Colorchecker dE 2000 calibrated * | 0.42 | 1.17 -179% | 0.62 -48% | 0.9 -114% | 0.54 -29% | 1.63 -288% |
| Greyscale dE 2000 * | 3.4 | 2.5 26% | 2.1 38% | 1.1 68% | 1.4 59% | 3.8 -12% |
| Gamma | 2.41 91% | 2.23 99% | 2.32 95% | 2.13 103% | 2.242 98% | 2.23 99% |
| CCT | 6083 107% | 6590 99% | 6369 102% | 6724 97% | 6809 95% | 6408 101% |
| Total Average (Program / Settings) | -15% /
-13% | -13% /
-4% | -5% /
6% | -26% /
-1% | -25% /
-25% |
* ... smaller is better
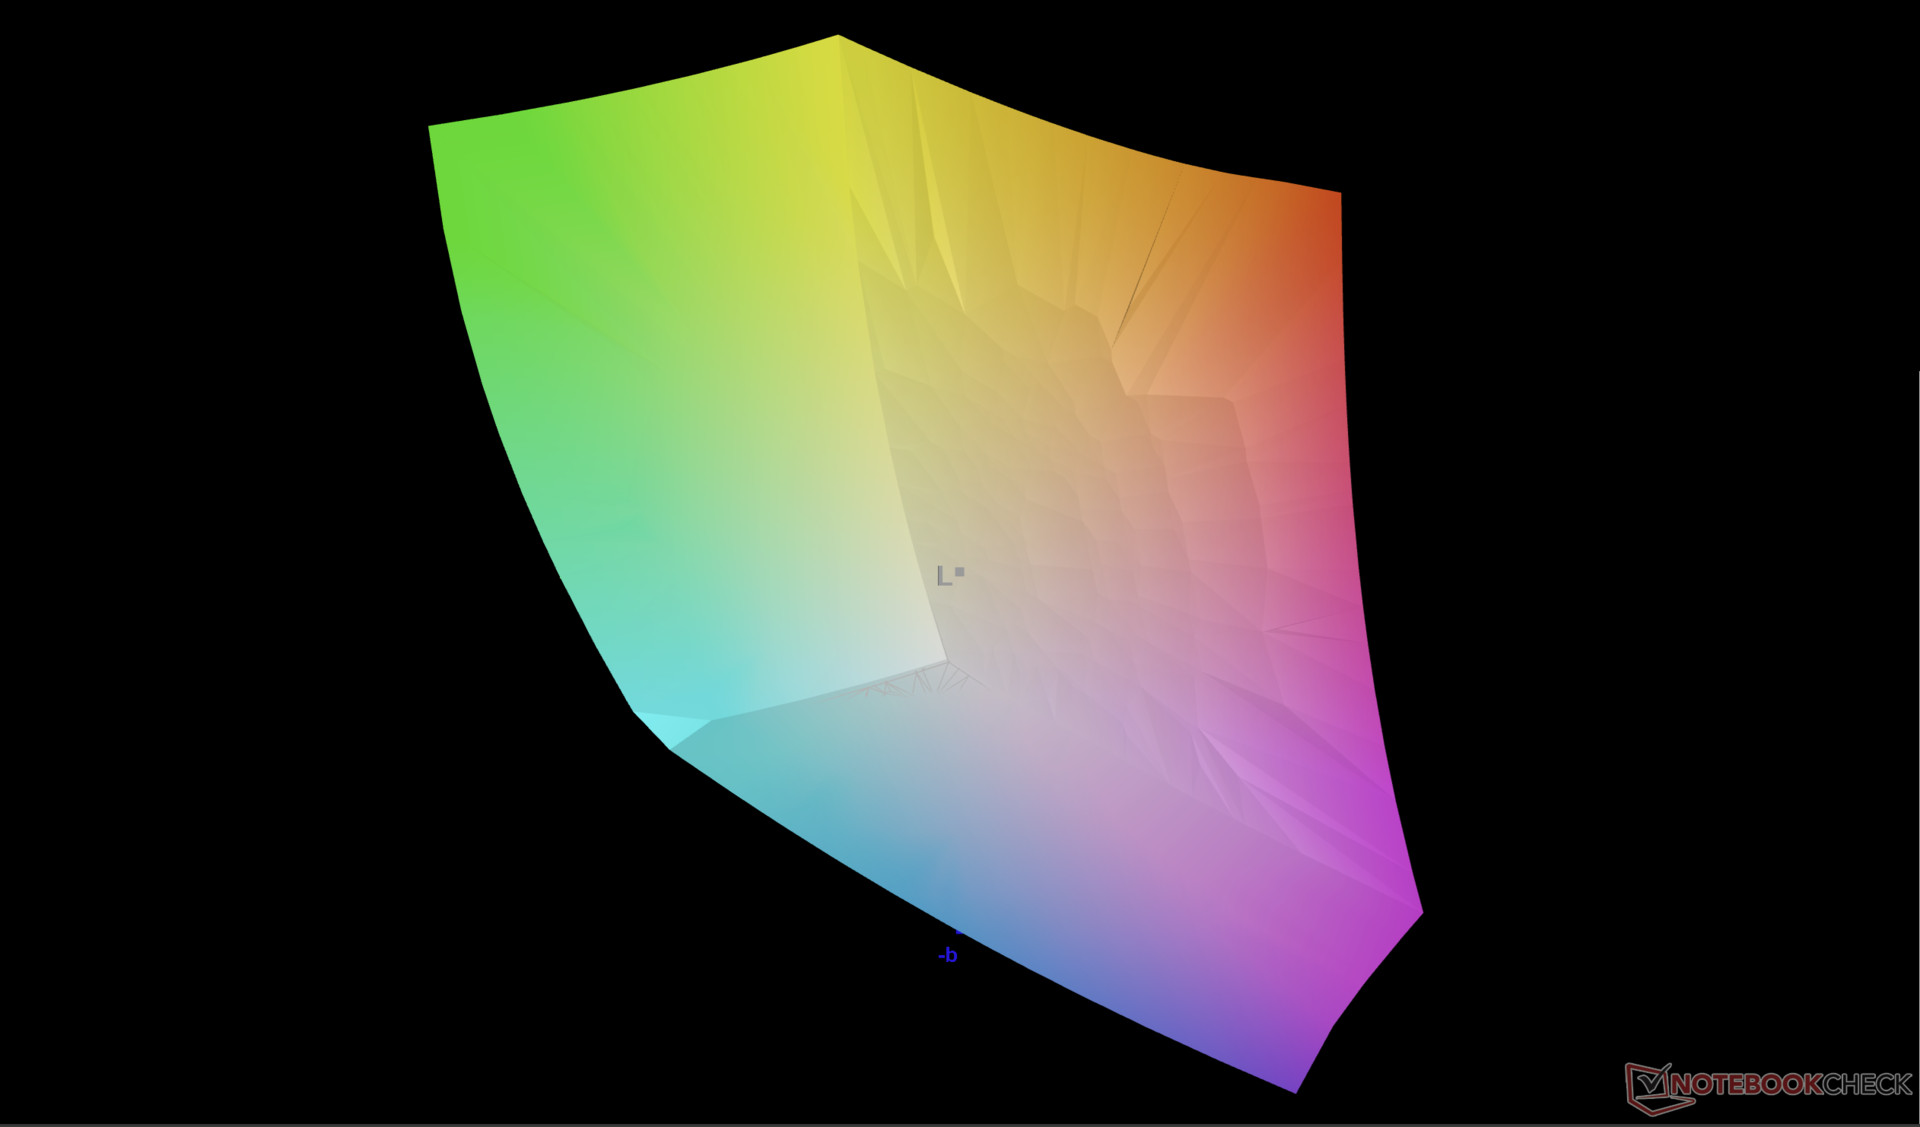
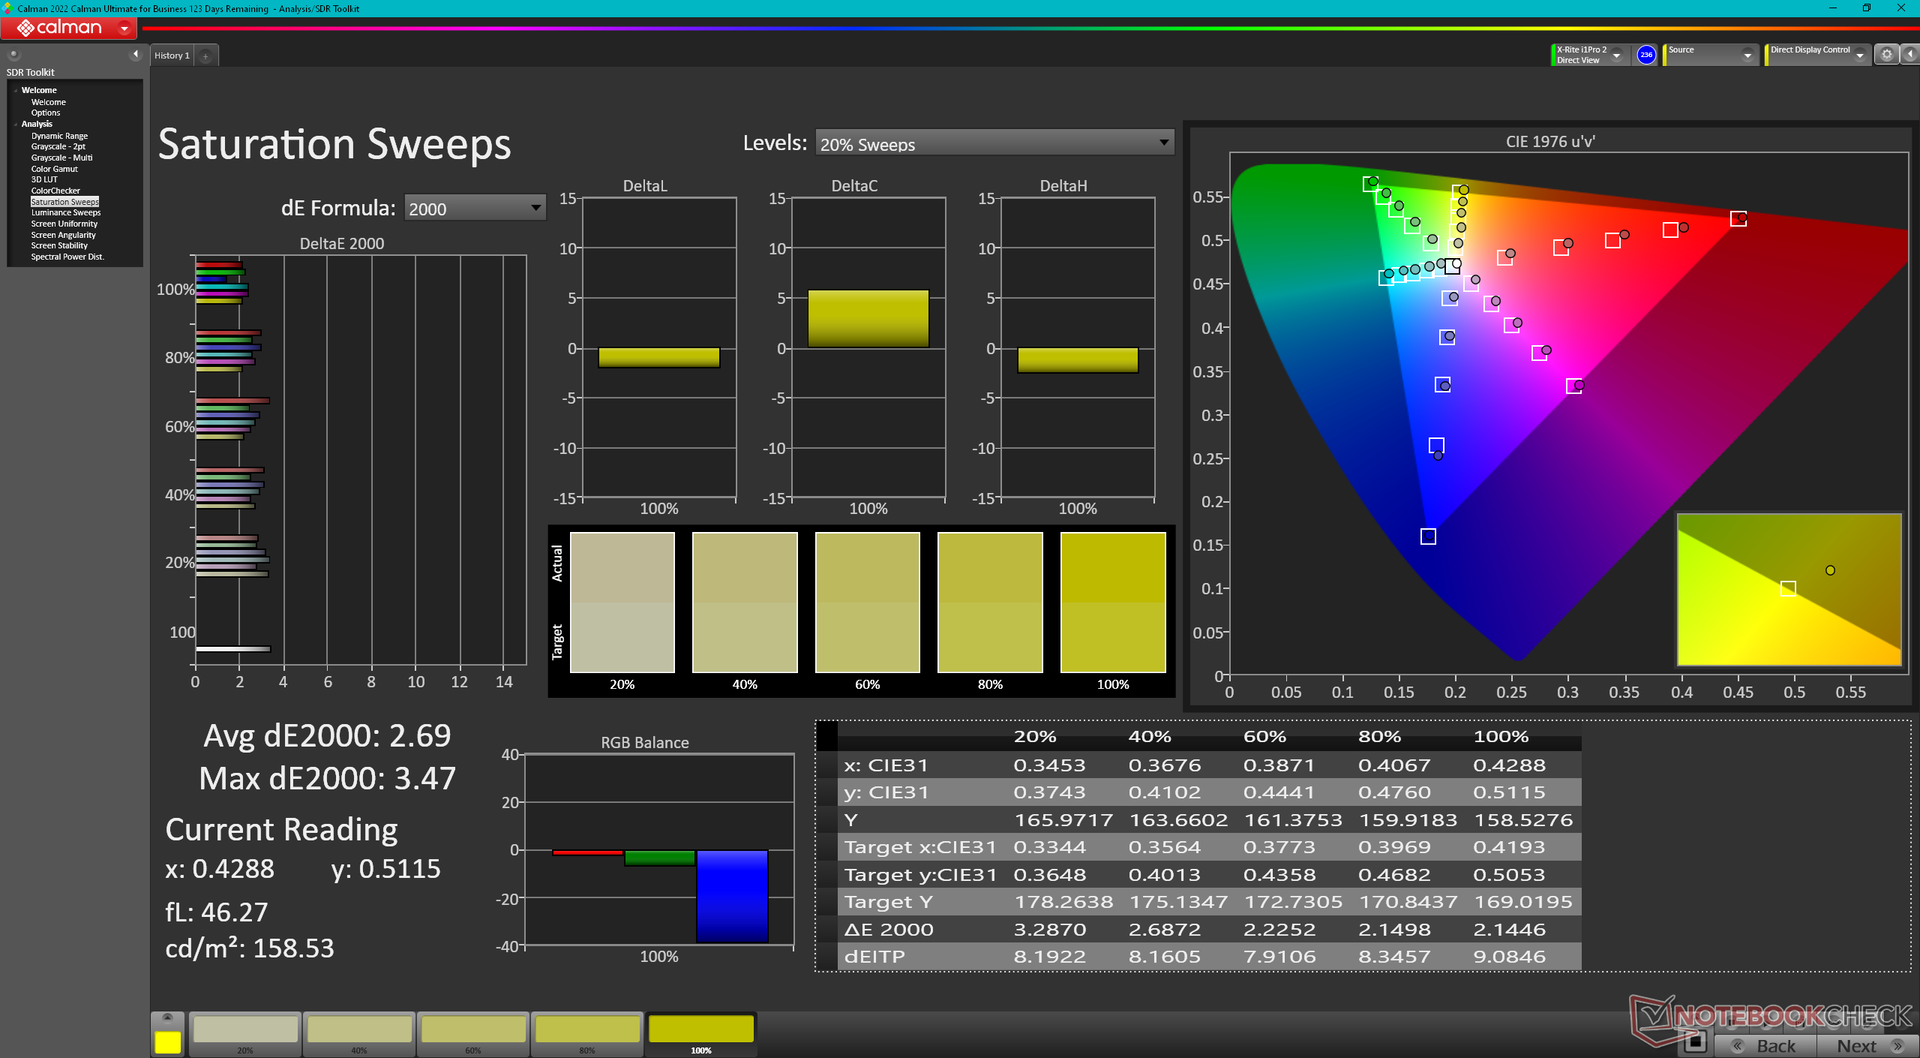
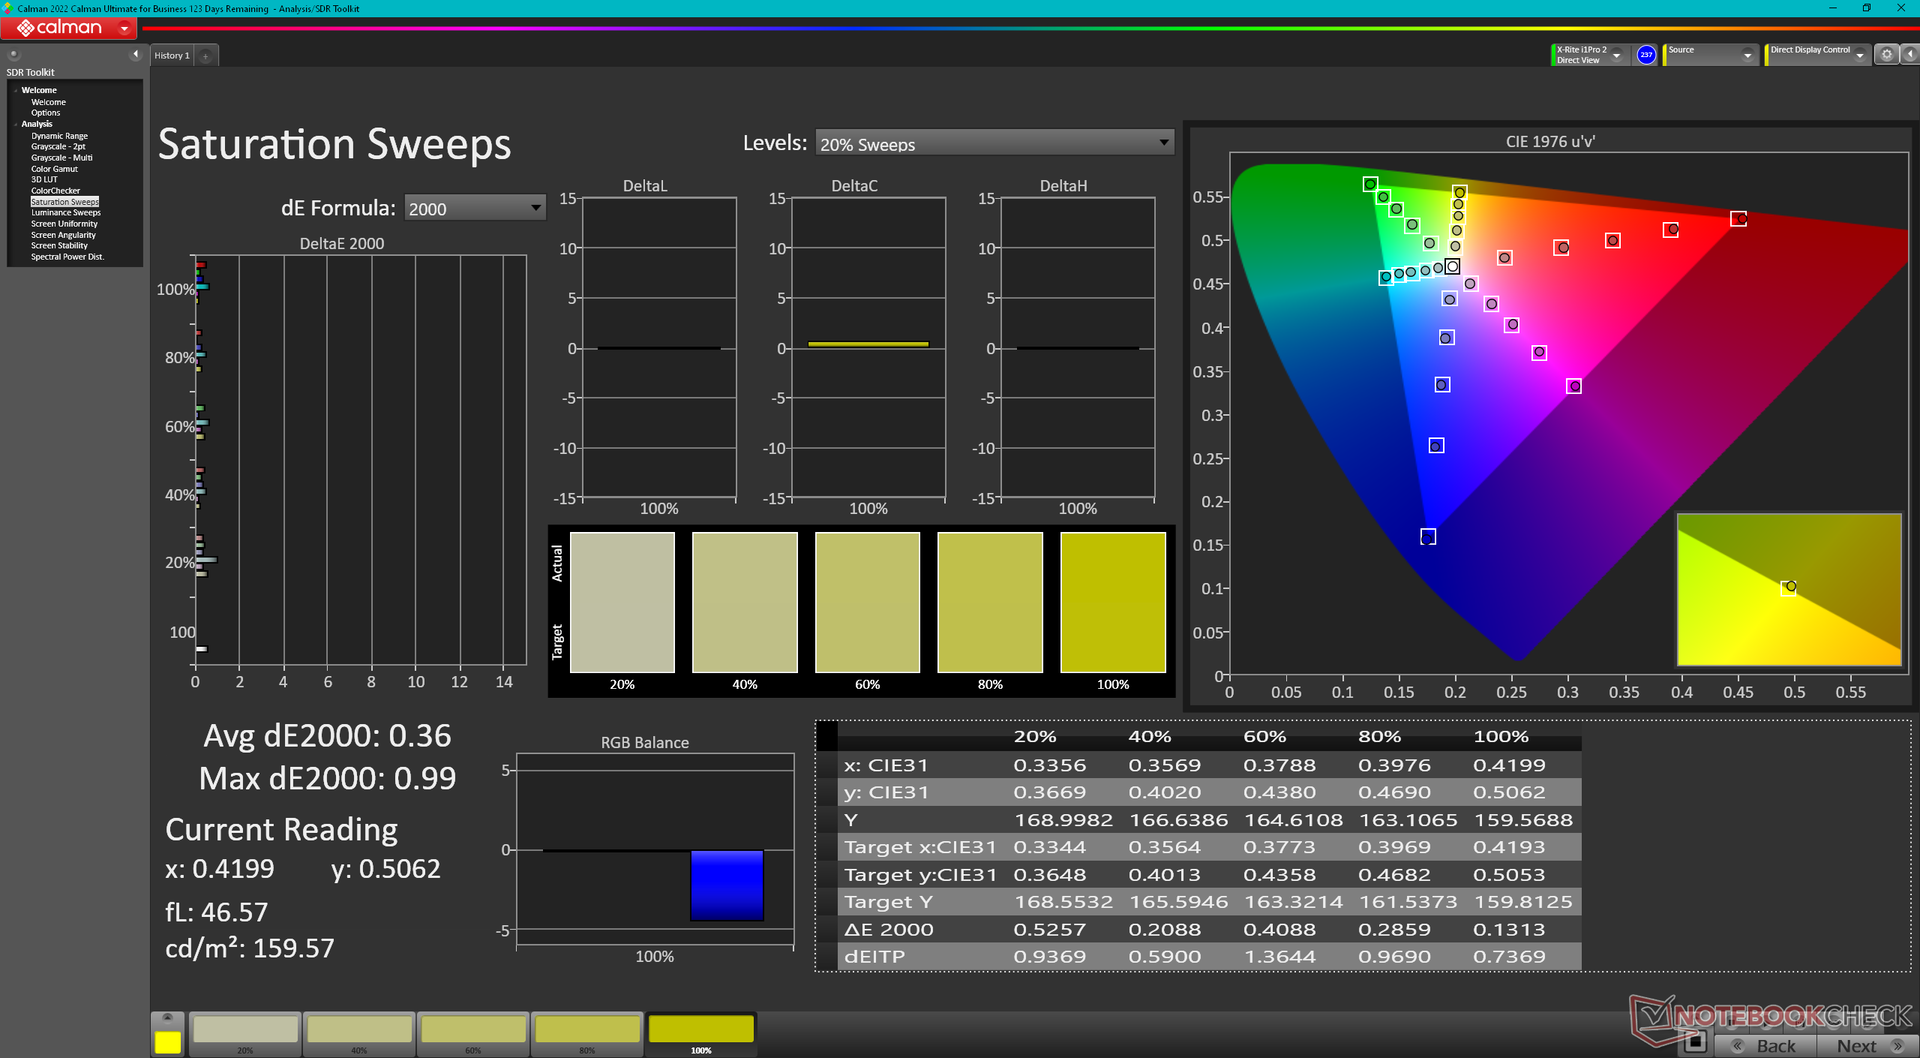
The display is set to sRGB by default even though it supports full P3 colors. It is nonetheless decently calibrated albeit with the color temperature leaning slightly too warm.
Display Response Times
| ↔ Response Time Black to White | ||
|---|---|---|
| 7.8 ms ... rise ↗ and fall ↘ combined | ↗ 3.9 ms rise | 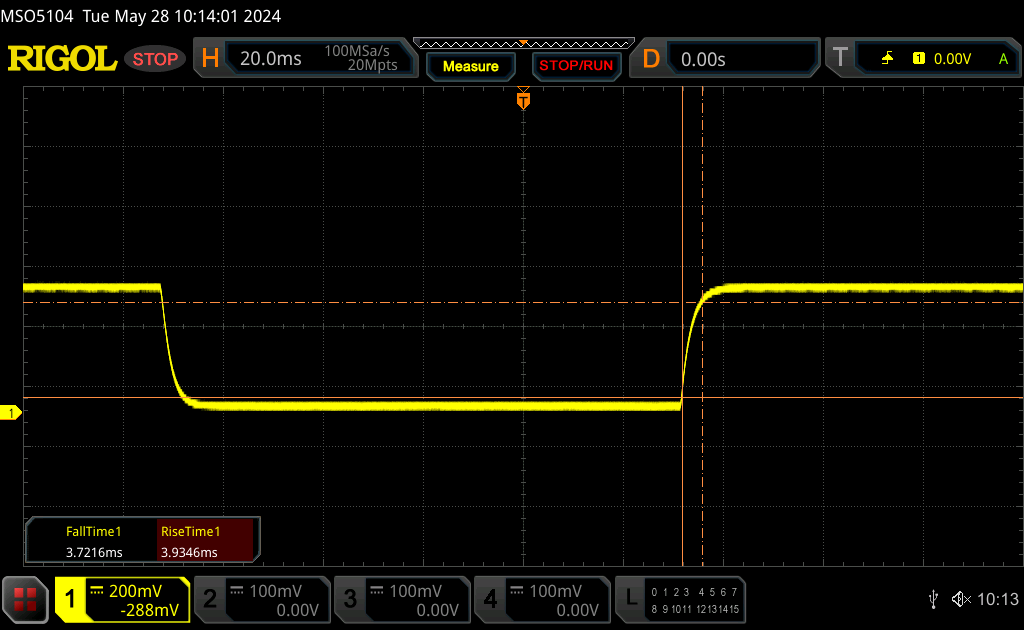 |
| ↘ 3.7 ms fall | ||
| The screen shows very fast response rates in our tests and should be very well suited for fast-paced gaming. In comparison, all tested devices range from 0.1 (minimum) to 240 (maximum) ms. » 21 % of all devices are better. This means that the measured response time is better than the average of all tested devices (20 ms). | ||
| ↔ Response Time 50% Grey to 80% Grey | ||
| 3.9 ms ... rise ↗ and fall ↘ combined | ↗ 1.7 ms rise | 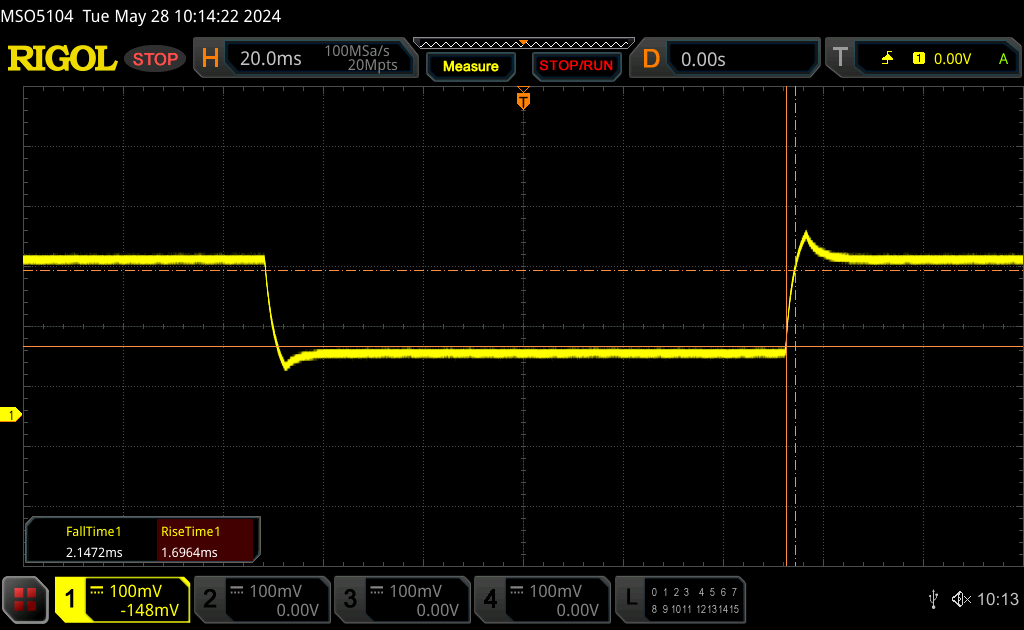 |
| ↘ 2.2 ms fall | ||
| The screen shows very fast response rates in our tests and should be very well suited for fast-paced gaming. In comparison, all tested devices range from 0.165 (minimum) to 636 (maximum) ms. » 14 % of all devices are better. This means that the measured response time is better than the average of all tested devices (31.4 ms). | ||
Screen Flickering / PWM (Pulse-Width Modulation)
| Screen flickering / PWM not detected | 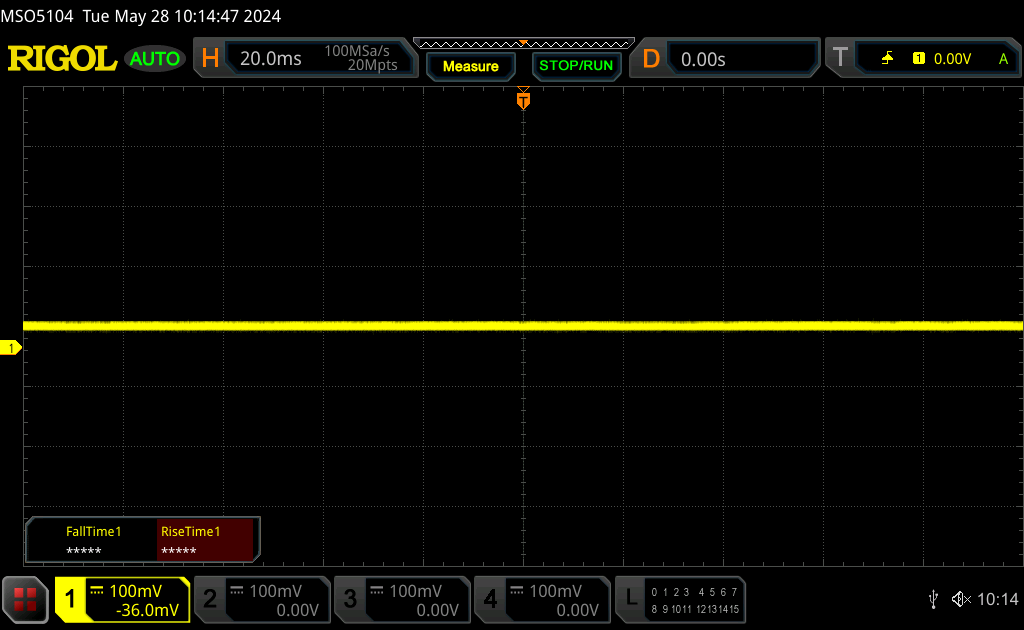 | ||
In comparison: 53 % of all tested devices do not use PWM to dim the display. If PWM was detected, an average of 7979 (minimum: 5 - maximum: 343500) Hz was measured. | |||


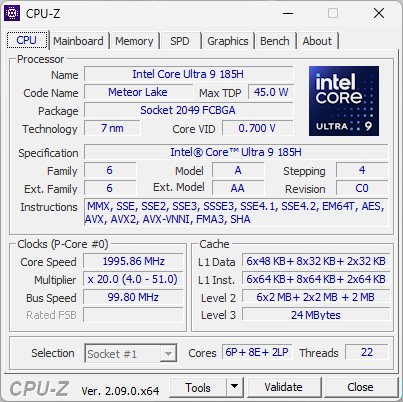
Performance — Core Ultra 9 185H vs. Core i9-13900HK


Testing Conditions
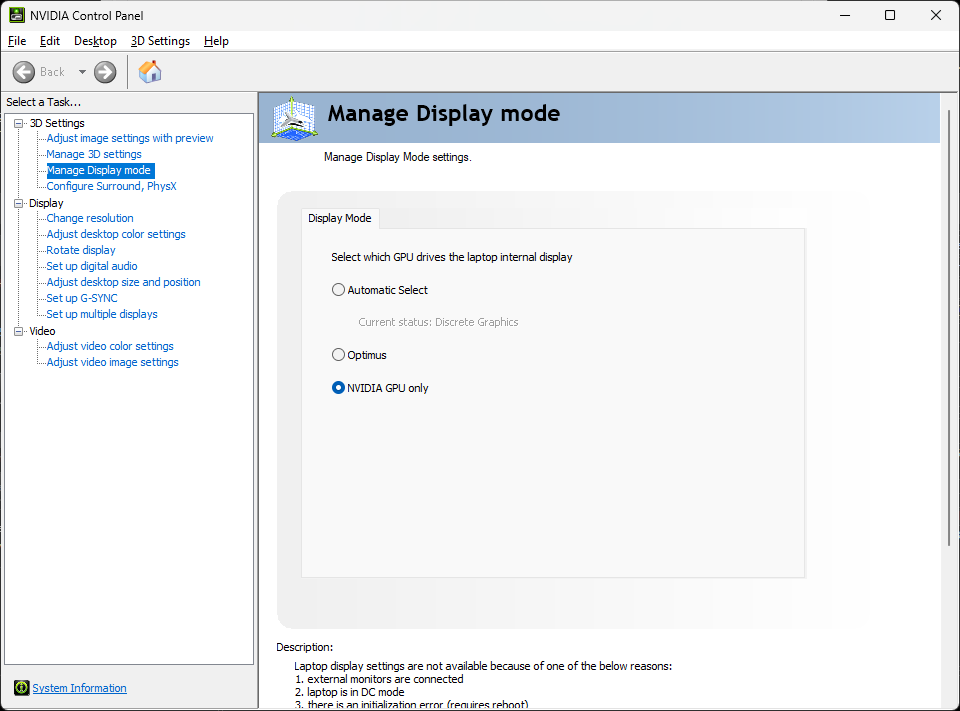
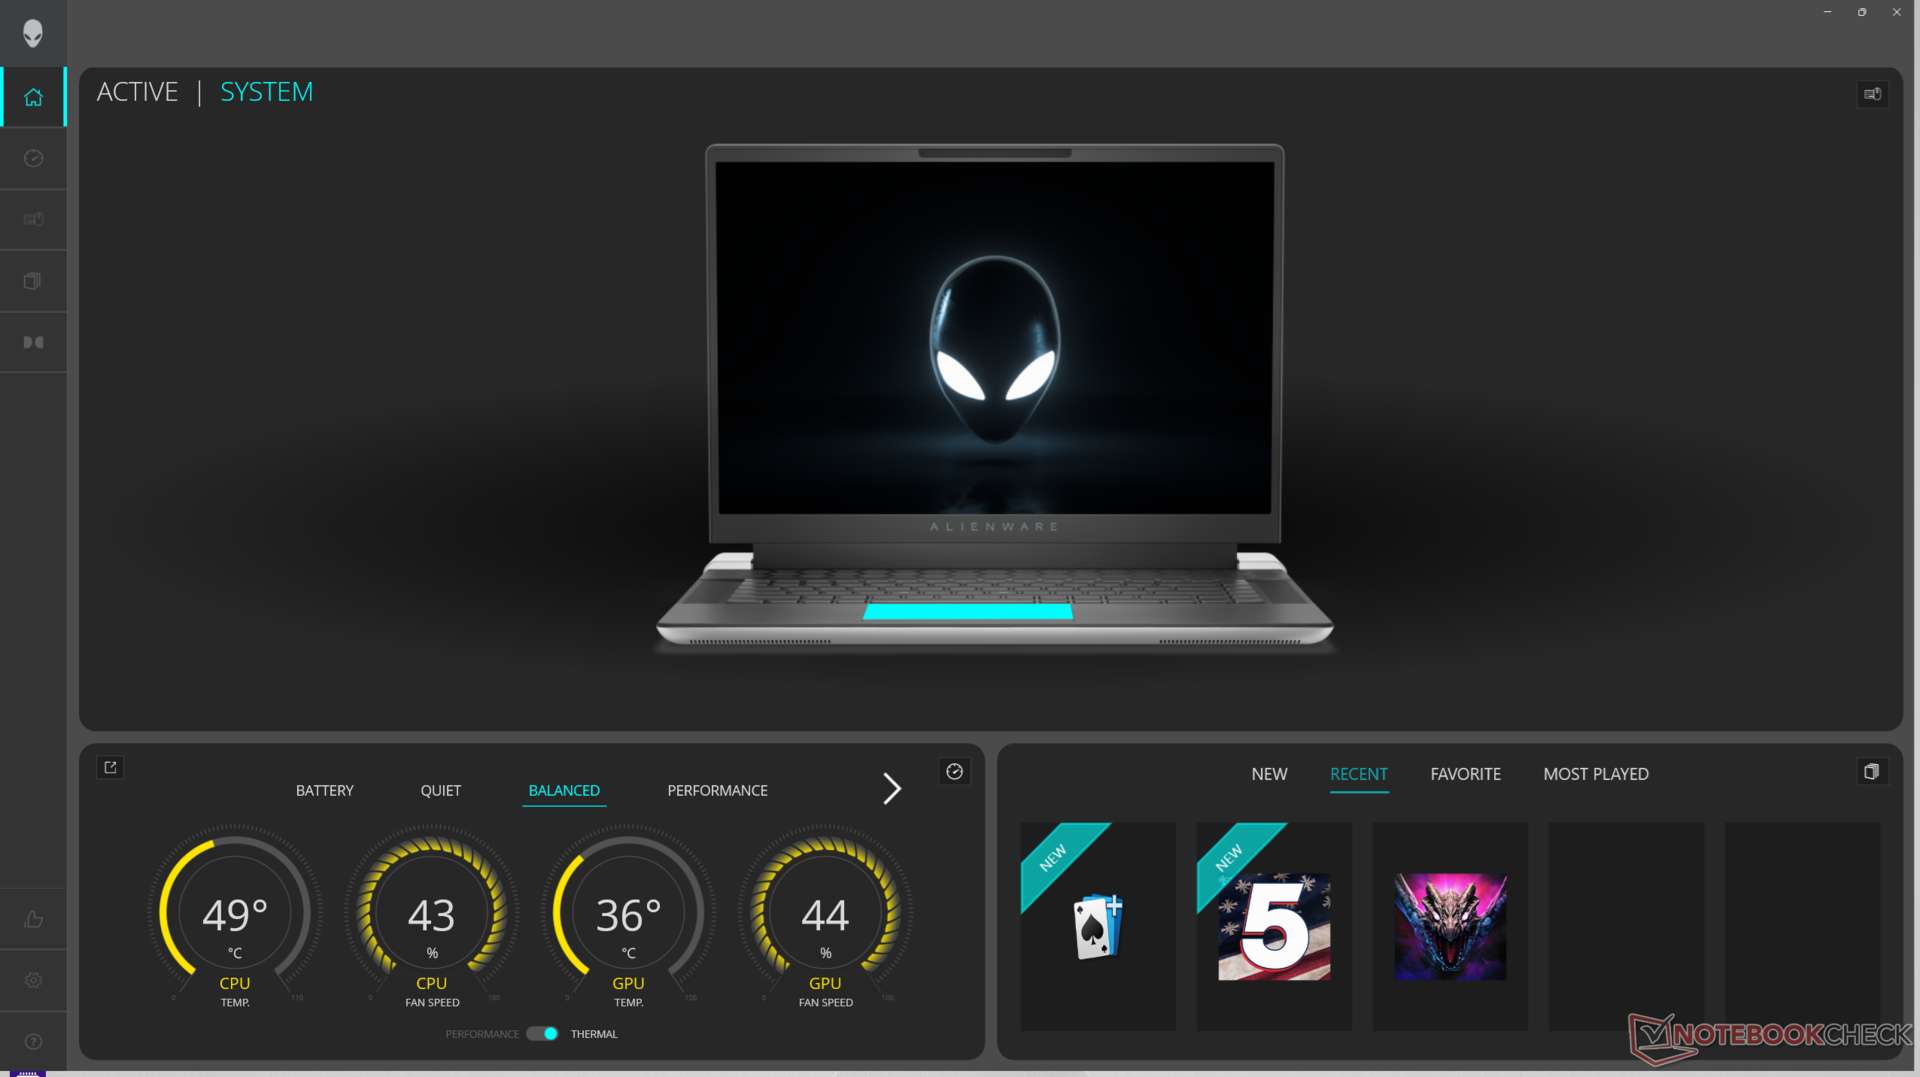
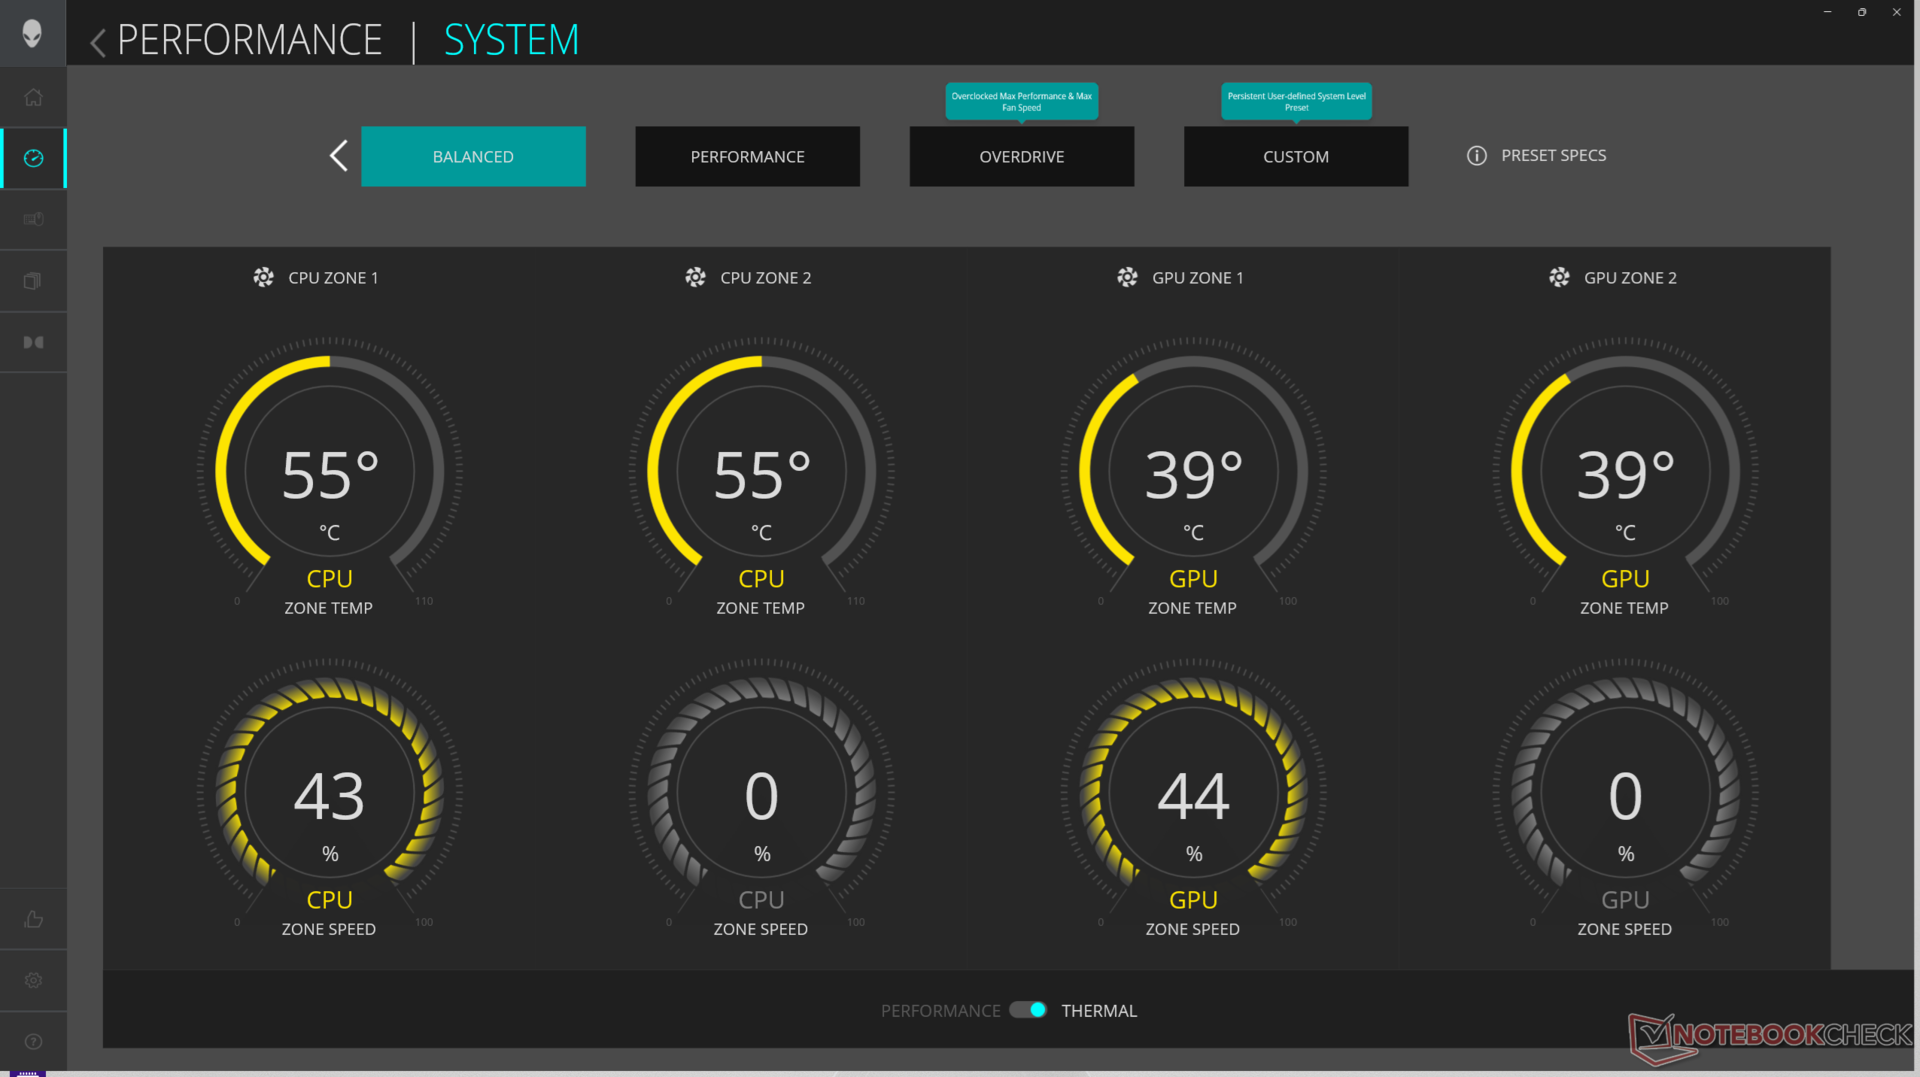
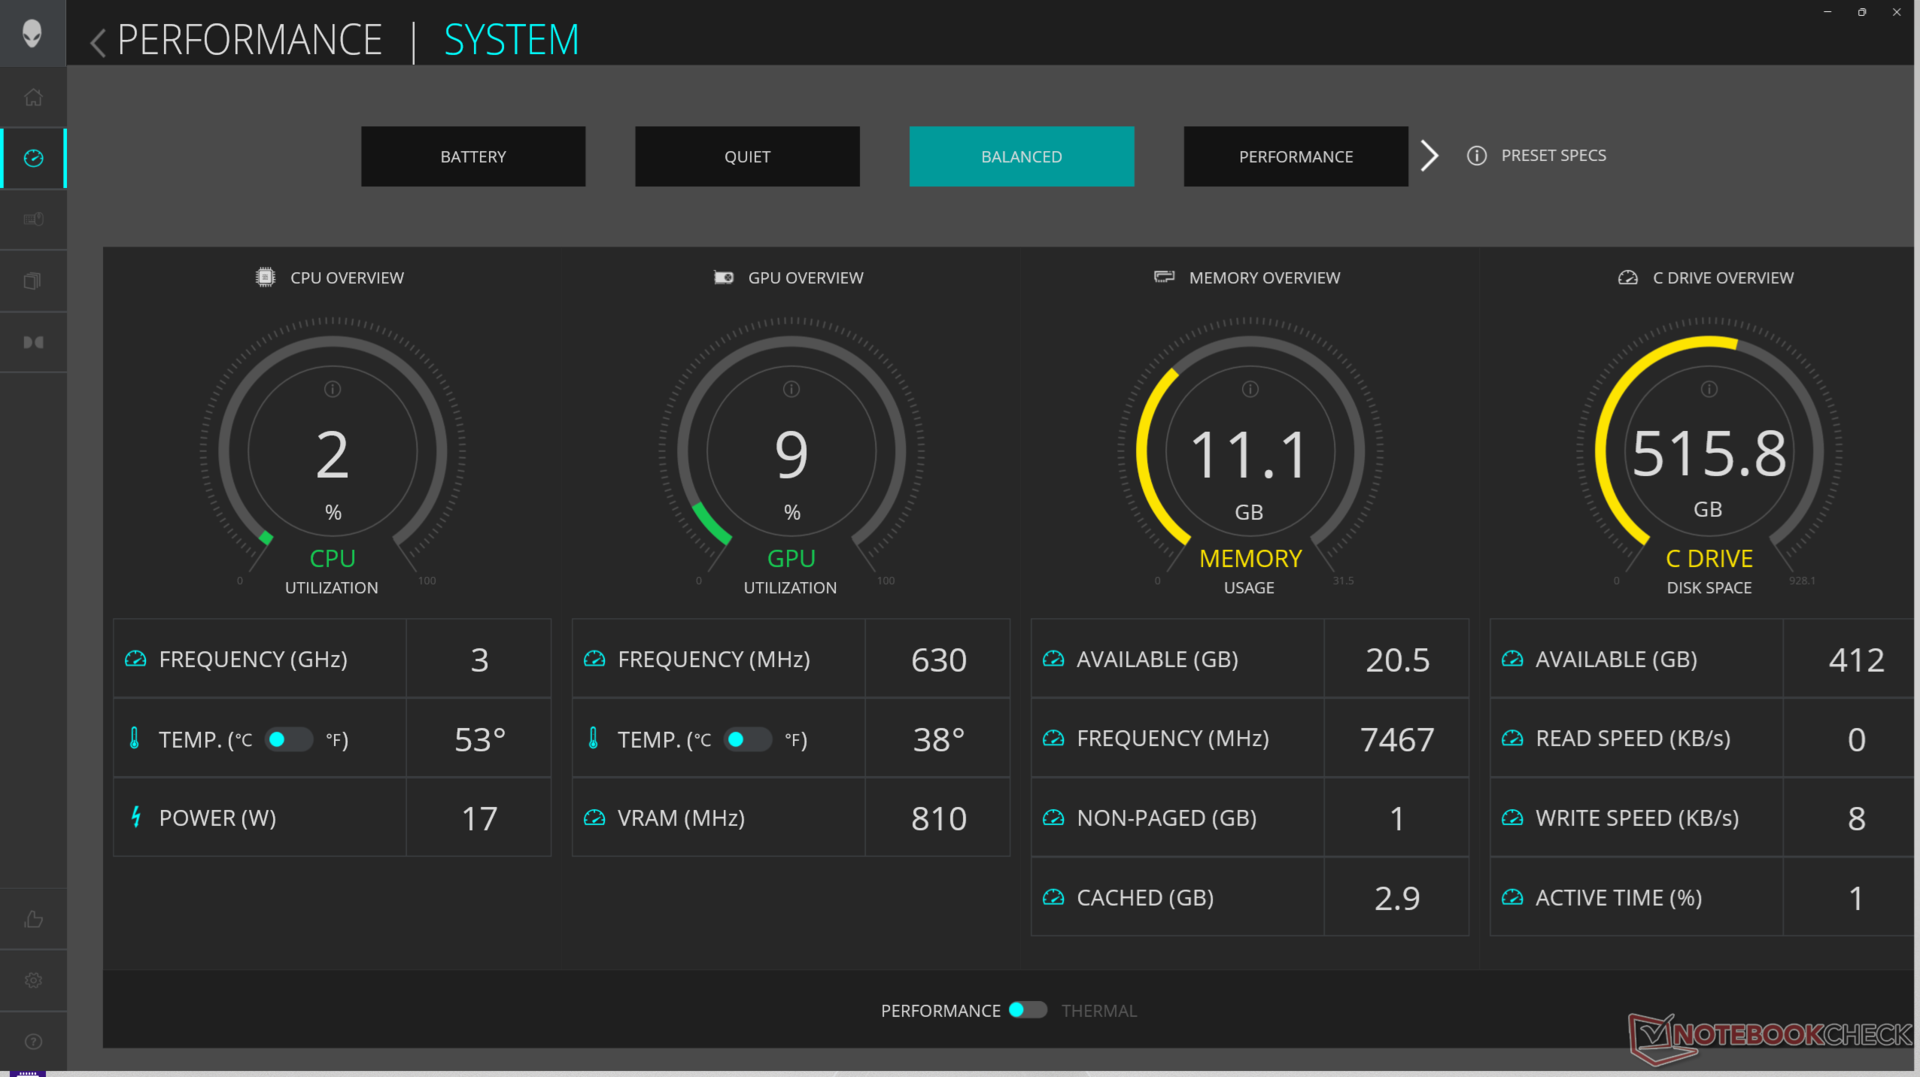
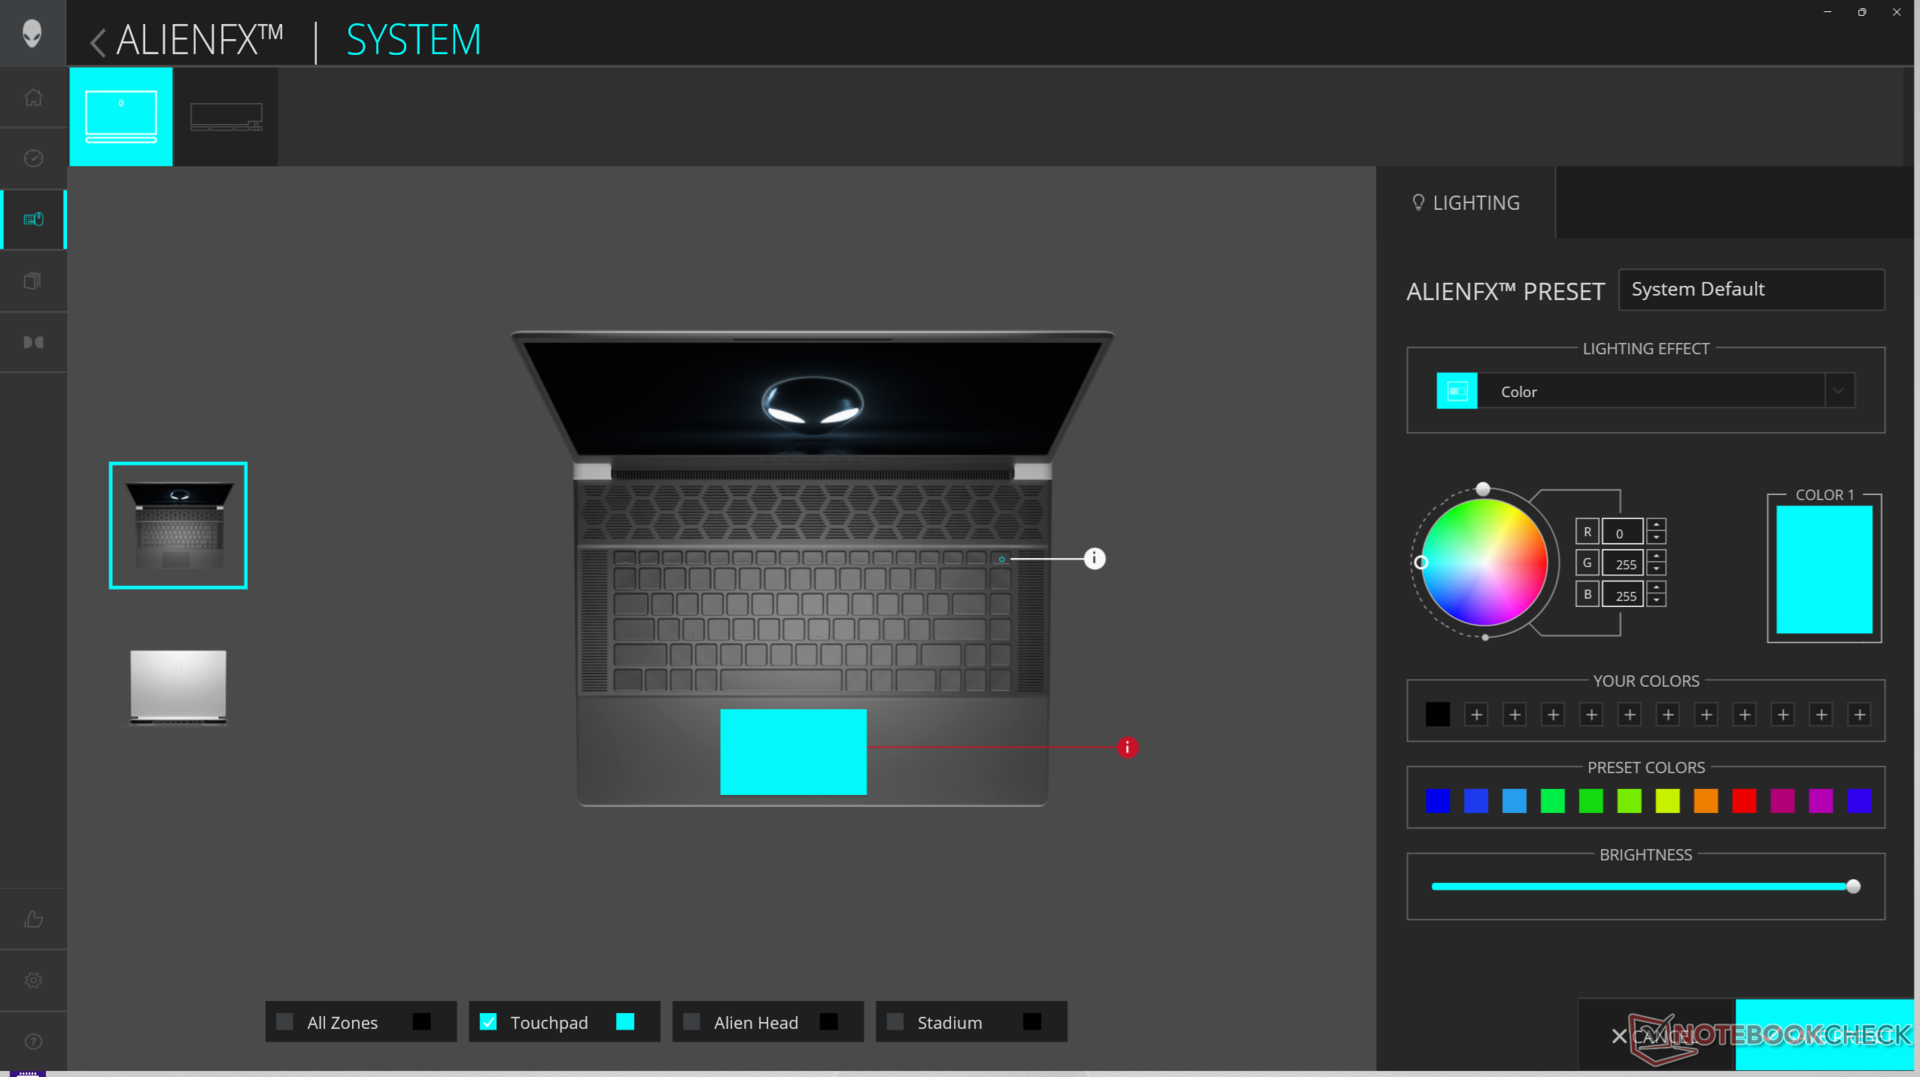
We set Alienware Command Center to Overdrive mode and the graphics to dGPU mode for the best possible benchmark results. Owners are encouraged to become familiar with Command Center as it is the hub for adjusting RGB lighting effects and performance profiles.
Nvidia Control Panel offers no "iGPU only" mode as shown by the screenshot above.
Processor
The Core Ultra 9 185H is approximately 5 to 10 percent and 15 to 20 percent slower than the Core i9-13900HK in last year's x16 R1 when it comes to multi-threaded and single-threaded applications, respectively. Interestingly, downgrading to the Core Ultra 7 155H configuration is not expected to impact performance by any significant margins on our time with the Alienware m16 R2 as shown by the comparison chart below.
Raptor Lake-HX options such as the Core i9-14900HX are not available on the Alienware x16 series likely due to thermal limitations since these processors require more power than the Meteor Lake-H series. Such options would have offered significantly faster performance than both the Core i9-13900HK or Core Ultra 9 185H.
Cinebench R15 Multi Loop
Cinebench R23: Multi Core | Single Core
Cinebench R20: CPU (Multi Core) | CPU (Single Core)
Cinebench R15: CPU Multi 64Bit | CPU Single 64Bit
Blender: v2.79 BMW27 CPU
7-Zip 18.03: 7z b 4 | 7z b 4 -mmt1
Geekbench 6.5: Multi-Core | Single-Core
Geekbench 5.5: Multi-Core | Single-Core
HWBOT x265 Benchmark v2.2: 4k Preset
LibreOffice : 20 Documents To PDF
R Benchmark 2.5: Overall mean
* ... smaller is better
AIDA64: FP32 Ray-Trace | FPU Julia | CPU SHA3 | CPU Queen | FPU SinJulia | FPU Mandel | CPU AES | CPU ZLib | FP64 Ray-Trace | CPU PhotoWorxx
| Performance rating | |
| MSI Vector 16 HX A14V | |
| Lenovo Legion Pro 7 16IRX9H | |
| Asus ROG Strix Scar 16 G634JZR | |
| Alienware x16 R2 P120F | |
| Alienware x16 R1 | |
| Alienware m16 R2 | |
| Average Intel Core Ultra 9 185H | |
| AIDA64 / FP32 Ray-Trace | |
| MSI Vector 16 HX A14V | |
| Lenovo Legion Pro 7 16IRX9H | |
| Asus ROG Strix Scar 16 G634JZR | |
| Alienware x16 R2 P120F | |
| Alienware m16 R2 | |
| Alienware x16 R1 | |
| Average Intel Core Ultra 9 185H (9220 - 18676, n=20) | |
| AIDA64 / FPU Julia | |
| MSI Vector 16 HX A14V | |
| Lenovo Legion Pro 7 16IRX9H | |
| Asus ROG Strix Scar 16 G634JZR | |
| Alienware x16 R2 P120F | |
| Alienware m16 R2 | |
| Alienware x16 R1 | |
| Average Intel Core Ultra 9 185H (48865 - 96463, n=20) | |
| AIDA64 / CPU SHA3 | |
| Lenovo Legion Pro 7 16IRX9H | |
| MSI Vector 16 HX A14V | |
| Asus ROG Strix Scar 16 G634JZR | |
| Alienware x16 R2 P120F | |
| Alienware m16 R2 | |
| Alienware x16 R1 | |
| Average Intel Core Ultra 9 185H (2394 - 4534, n=20) | |
| AIDA64 / CPU Queen | |
| Asus ROG Strix Scar 16 G634JZR | |
| Lenovo Legion Pro 7 16IRX9H | |
| MSI Vector 16 HX A14V | |
| Alienware x16 R1 | |
| Alienware x16 R2 P120F | |
| Average Intel Core Ultra 9 185H (66785 - 95241, n=20) | |
| Alienware m16 R2 | |
| AIDA64 / FPU SinJulia | |
| Lenovo Legion Pro 7 16IRX9H | |
| MSI Vector 16 HX A14V | |
| Asus ROG Strix Scar 16 G634JZR | |
| Alienware x16 R1 | |
| Alienware x16 R2 P120F | |
| Alienware m16 R2 | |
| Average Intel Core Ultra 9 185H (7255 - 11392, n=20) | |
| AIDA64 / FPU Mandel | |
| MSI Vector 16 HX A14V | |
| Lenovo Legion Pro 7 16IRX9H | |
| Asus ROG Strix Scar 16 G634JZR | |
| Alienware x16 R2 P120F | |
| Alienware m16 R2 | |
| Alienware x16 R1 | |
| Average Intel Core Ultra 9 185H (24004 - 48020, n=20) | |
| AIDA64 / CPU AES | |
| Asus ROG Strix Scar 16 G634JZR | |
| Lenovo Legion Pro 7 16IRX9H | |
| MSI Vector 16 HX A14V | |
| Average Intel Core Ultra 9 185H (53116 - 154066, n=20) | |
| Alienware x16 R2 P120F | |
| Alienware m16 R2 | |
| Alienware x16 R1 | |
| AIDA64 / CPU ZLib | |
| Lenovo Legion Pro 7 16IRX9H | |
| MSI Vector 16 HX A14V | |
| Asus ROG Strix Scar 16 G634JZR | |
| Alienware x16 R2 P120F | |
| Alienware x16 R1 | |
| Alienware m16 R2 | |
| Average Intel Core Ultra 9 185H (678 - 1341, n=20) | |
| AIDA64 / FP64 Ray-Trace | |
| MSI Vector 16 HX A14V | |
| Lenovo Legion Pro 7 16IRX9H | |
| Asus ROG Strix Scar 16 G634JZR | |
| Alienware x16 R2 P120F | |
| Alienware x16 R1 | |
| Alienware m16 R2 | |
| Average Intel Core Ultra 9 185H (4428 - 10078, n=20) | |
| AIDA64 / CPU PhotoWorxx | |
| Alienware x16 R2 P120F | |
| Asus ROG Strix Scar 16 G634JZR | |
| Alienware x16 R1 | |
| MSI Vector 16 HX A14V | |
| Average Intel Core Ultra 9 185H (44547 - 53918, n=20) | |
| Lenovo Legion Pro 7 16IRX9H | |
| Alienware m16 R2 | |
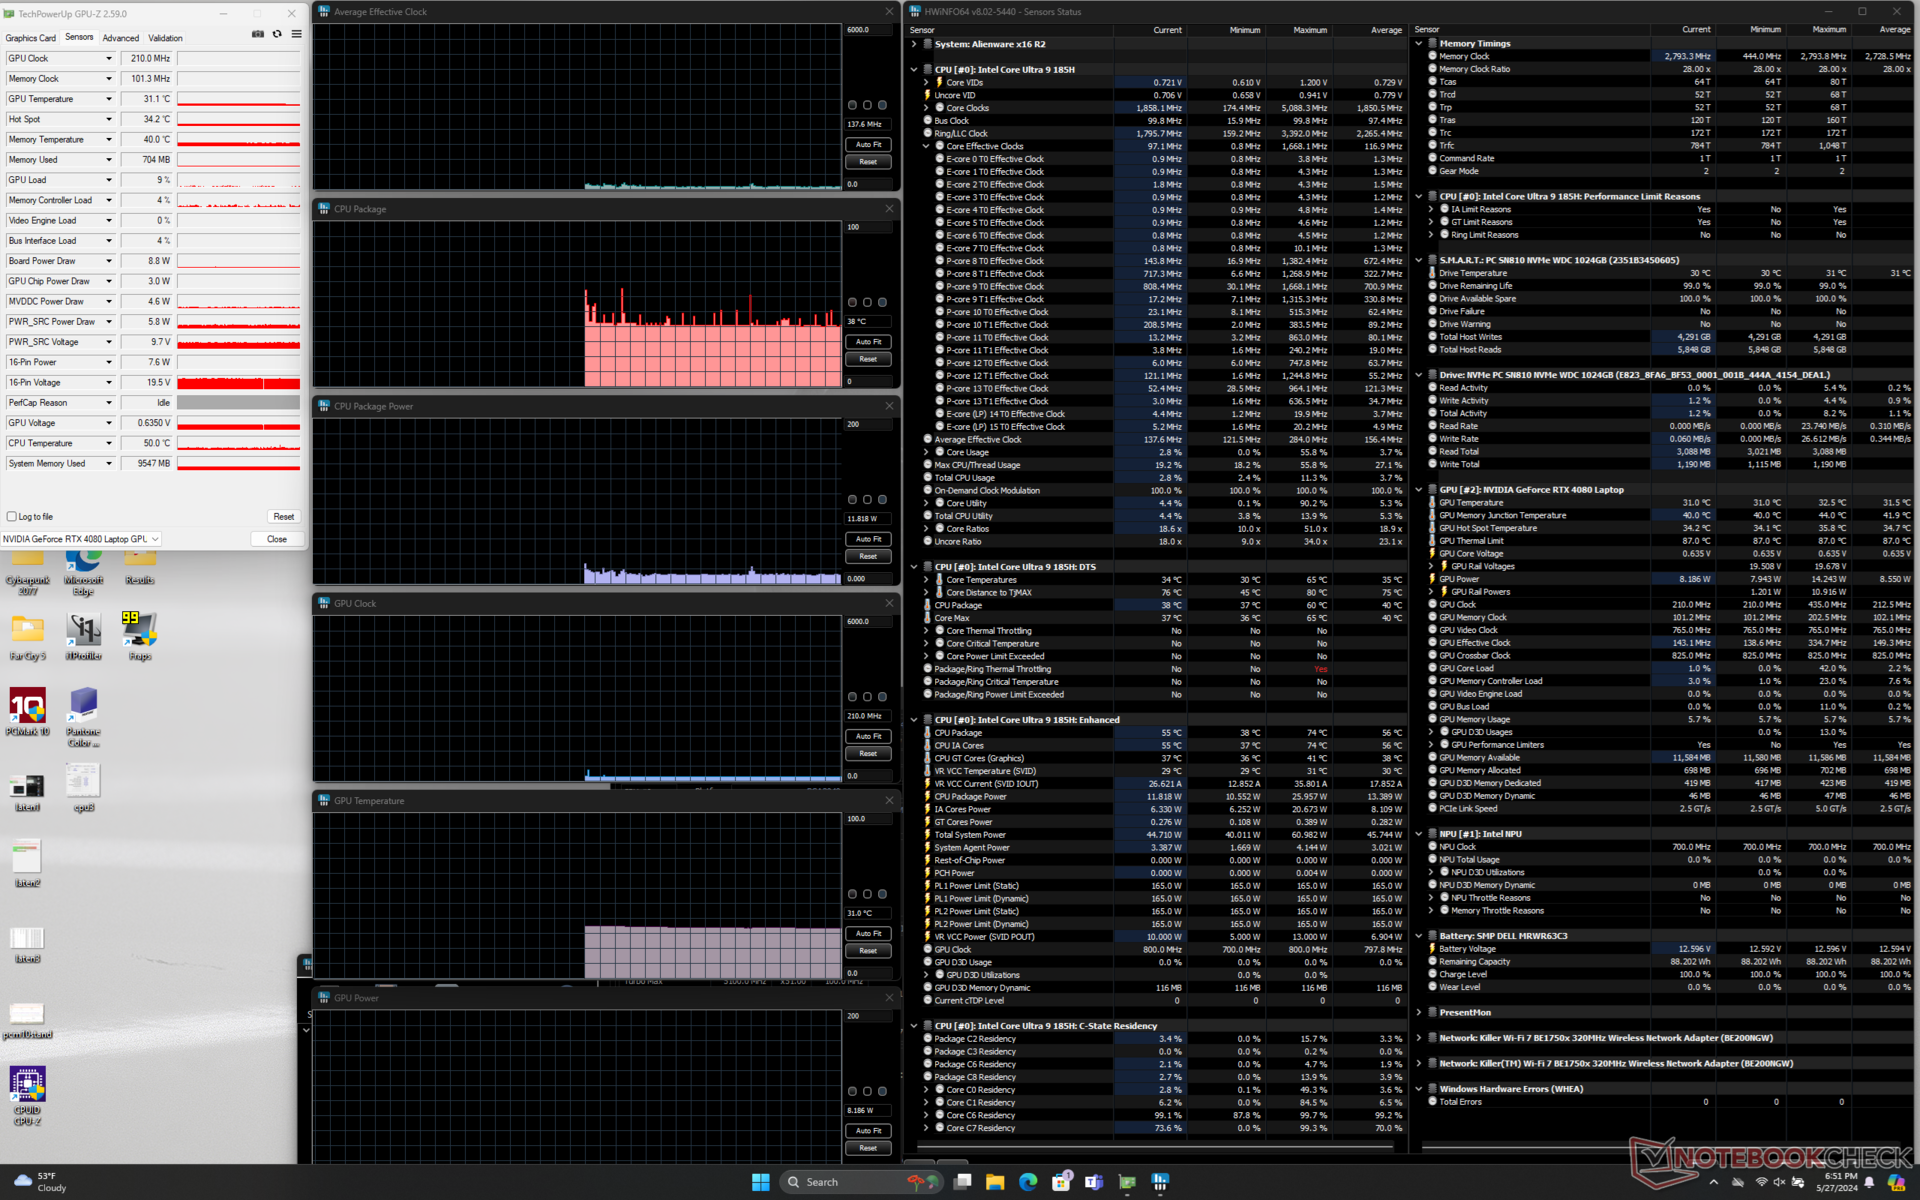
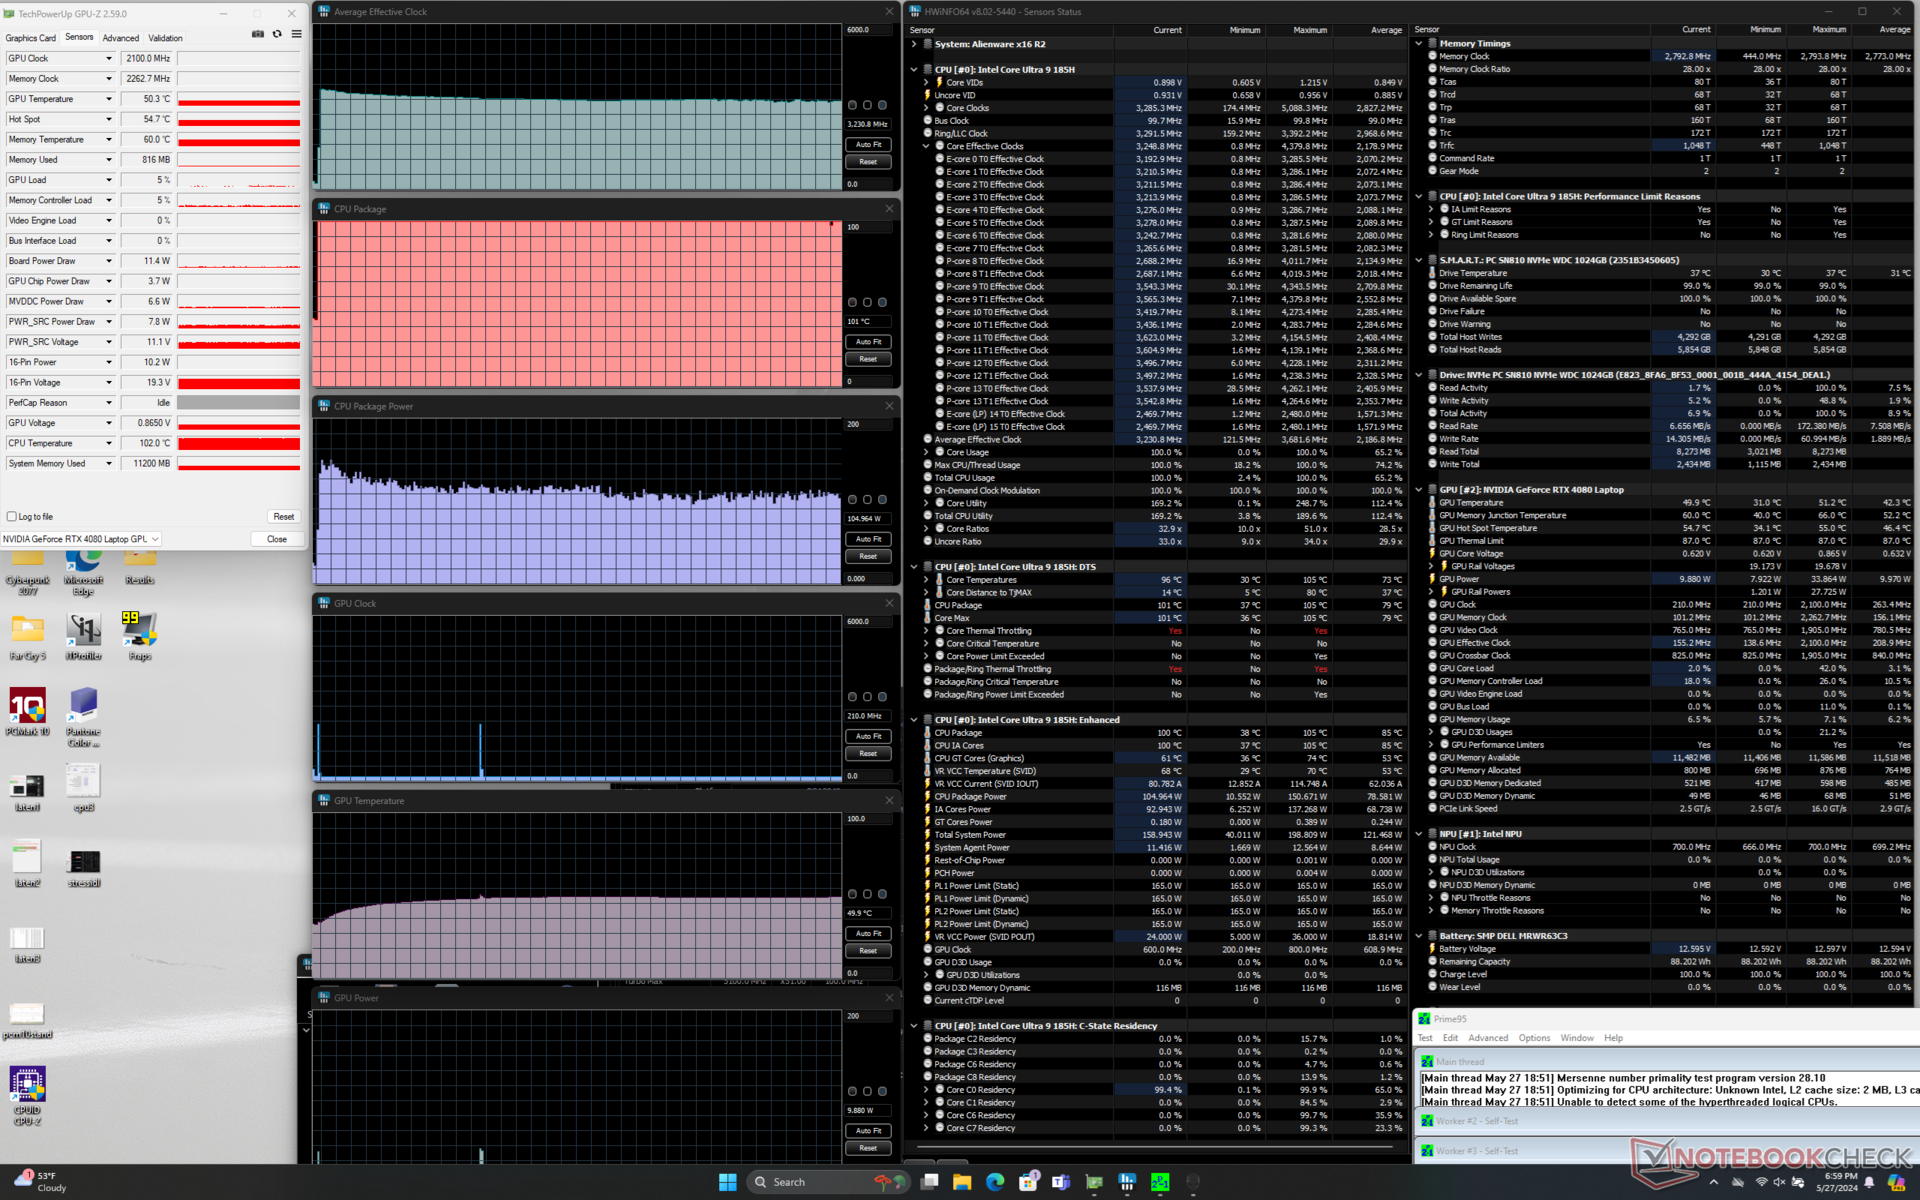
Stress Test
Core temperatures between the CPU and GPU are just as warm as what we recorded on the x16 R1. The CPU in particular still stabilizes at almost 100 C (!) when running Prime95 while the GPU stabilizes in the mid 80 C range when running Witcher 3. Interestingly, GPU clock rate is down across the board when compared to the x16 R1. The GPU would range between 2100 to 2325 MHz depending on the power profile compared to 2460 MHz on the original x16 R1. Board power draw would also be lower on the newer x16 R2 model (150 W vs. 165 W). These findings correlate with the generally slower graphics performance in the GPU Performance section below.
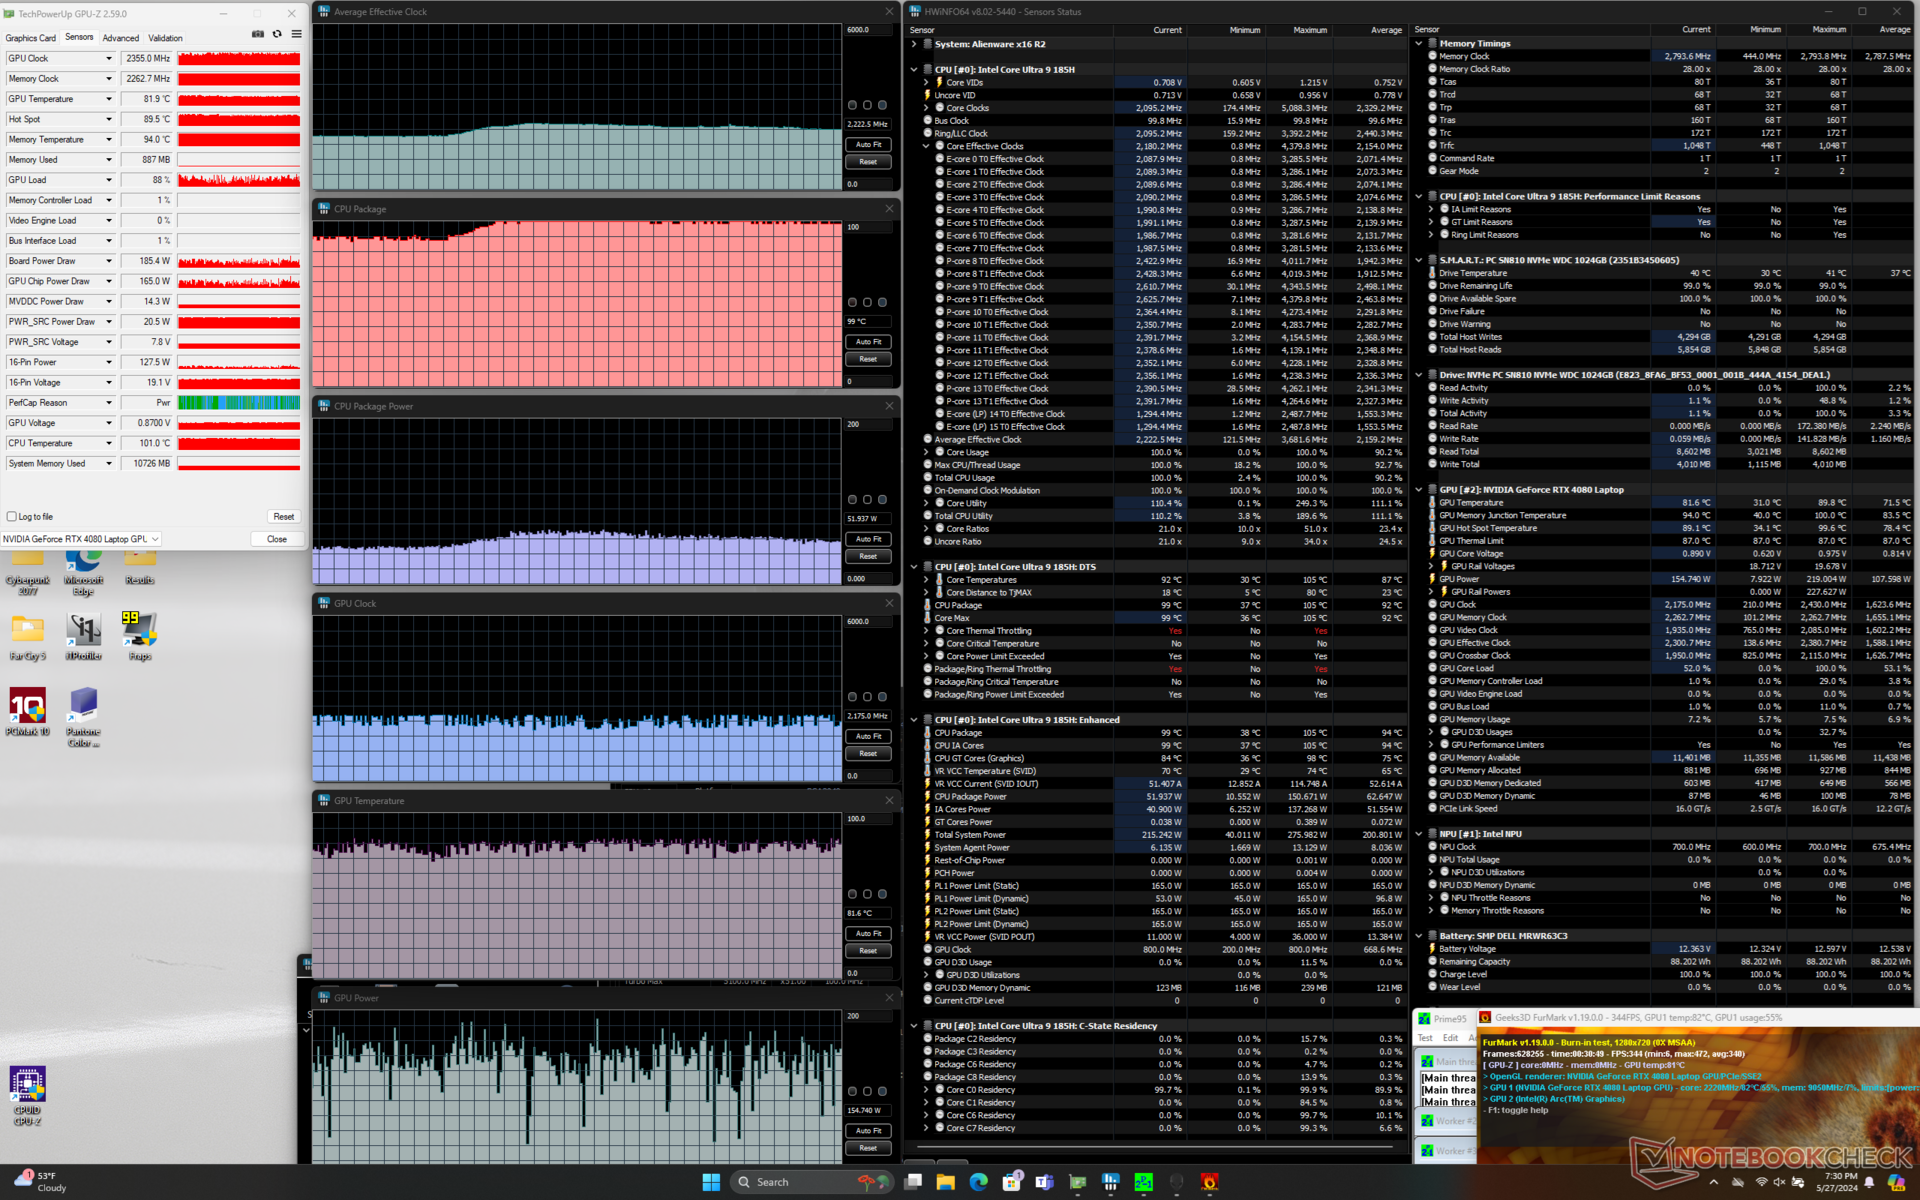
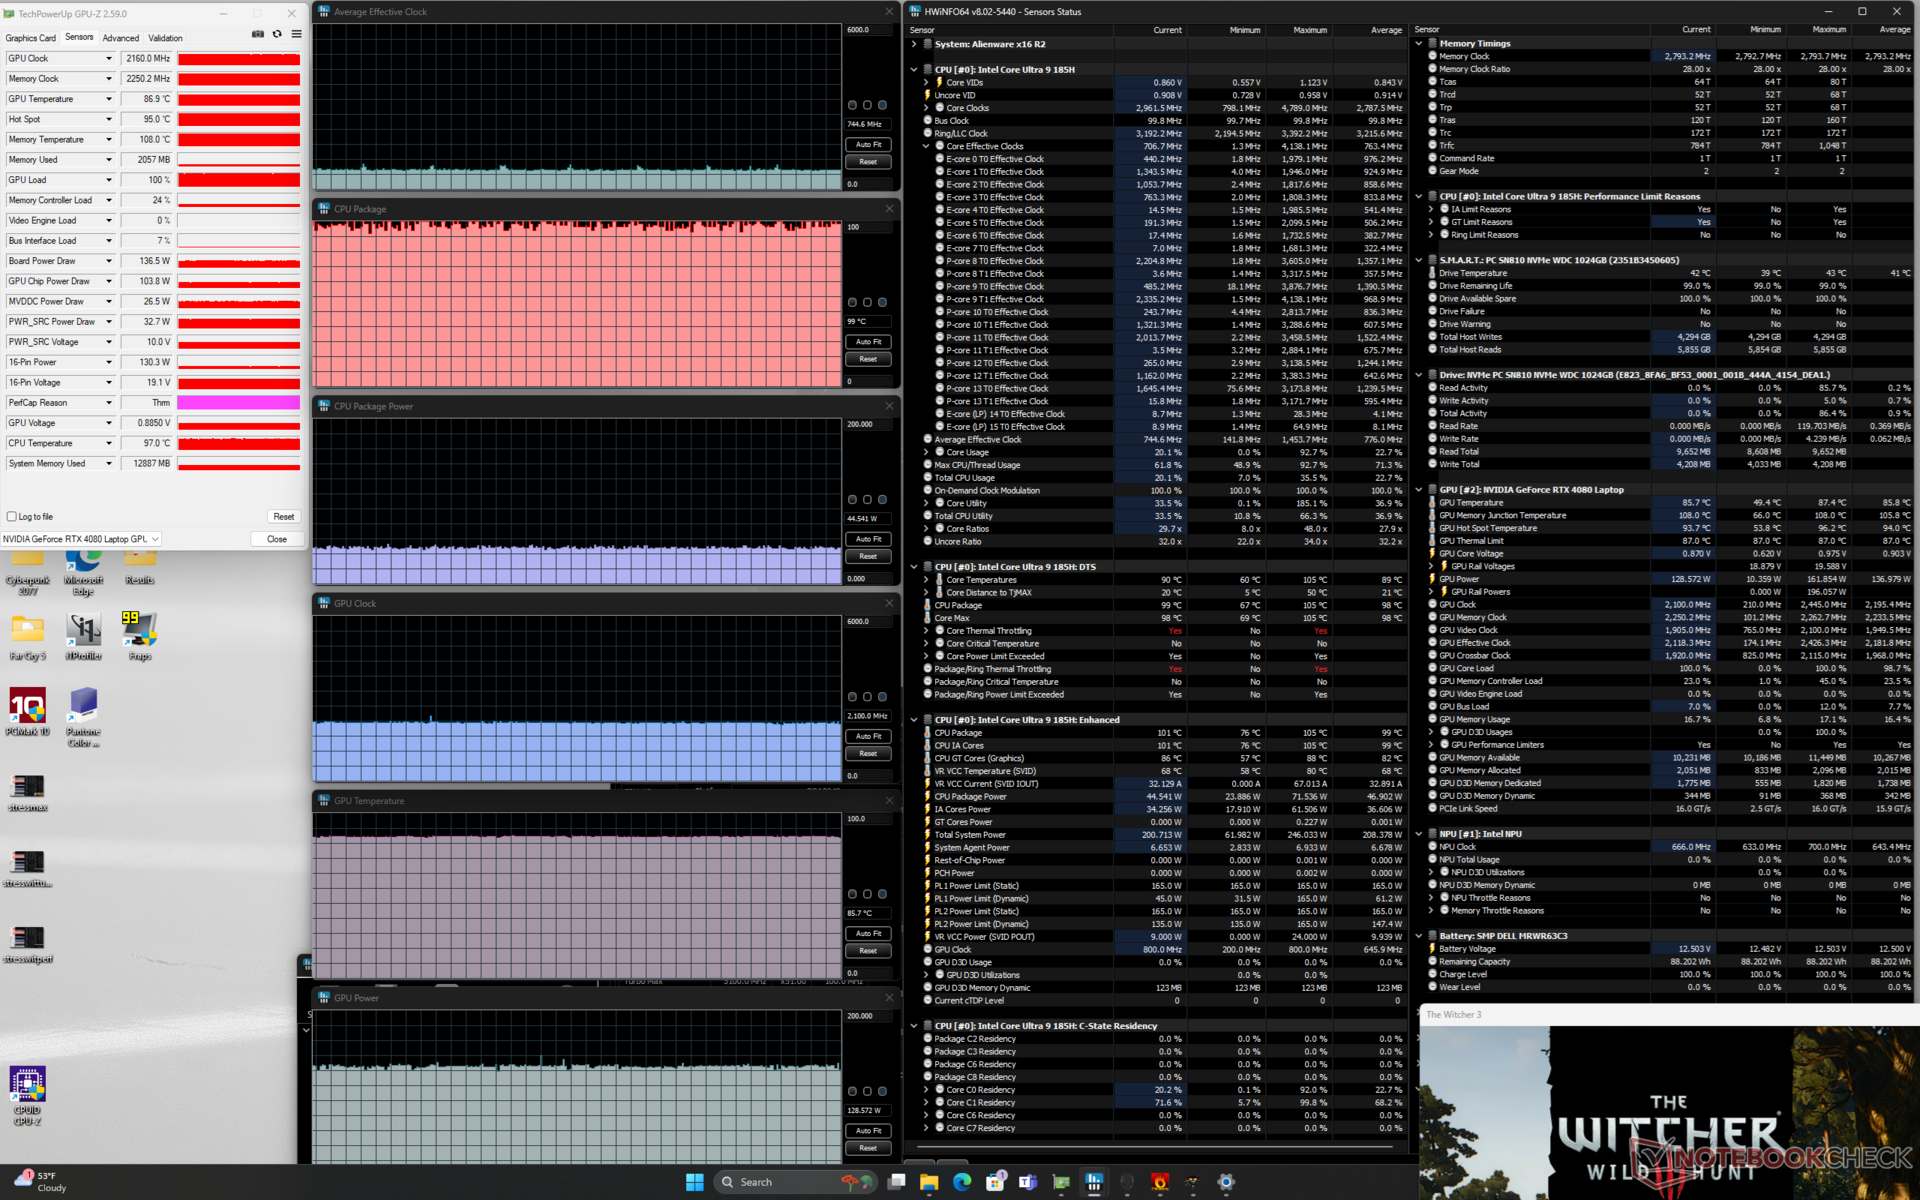
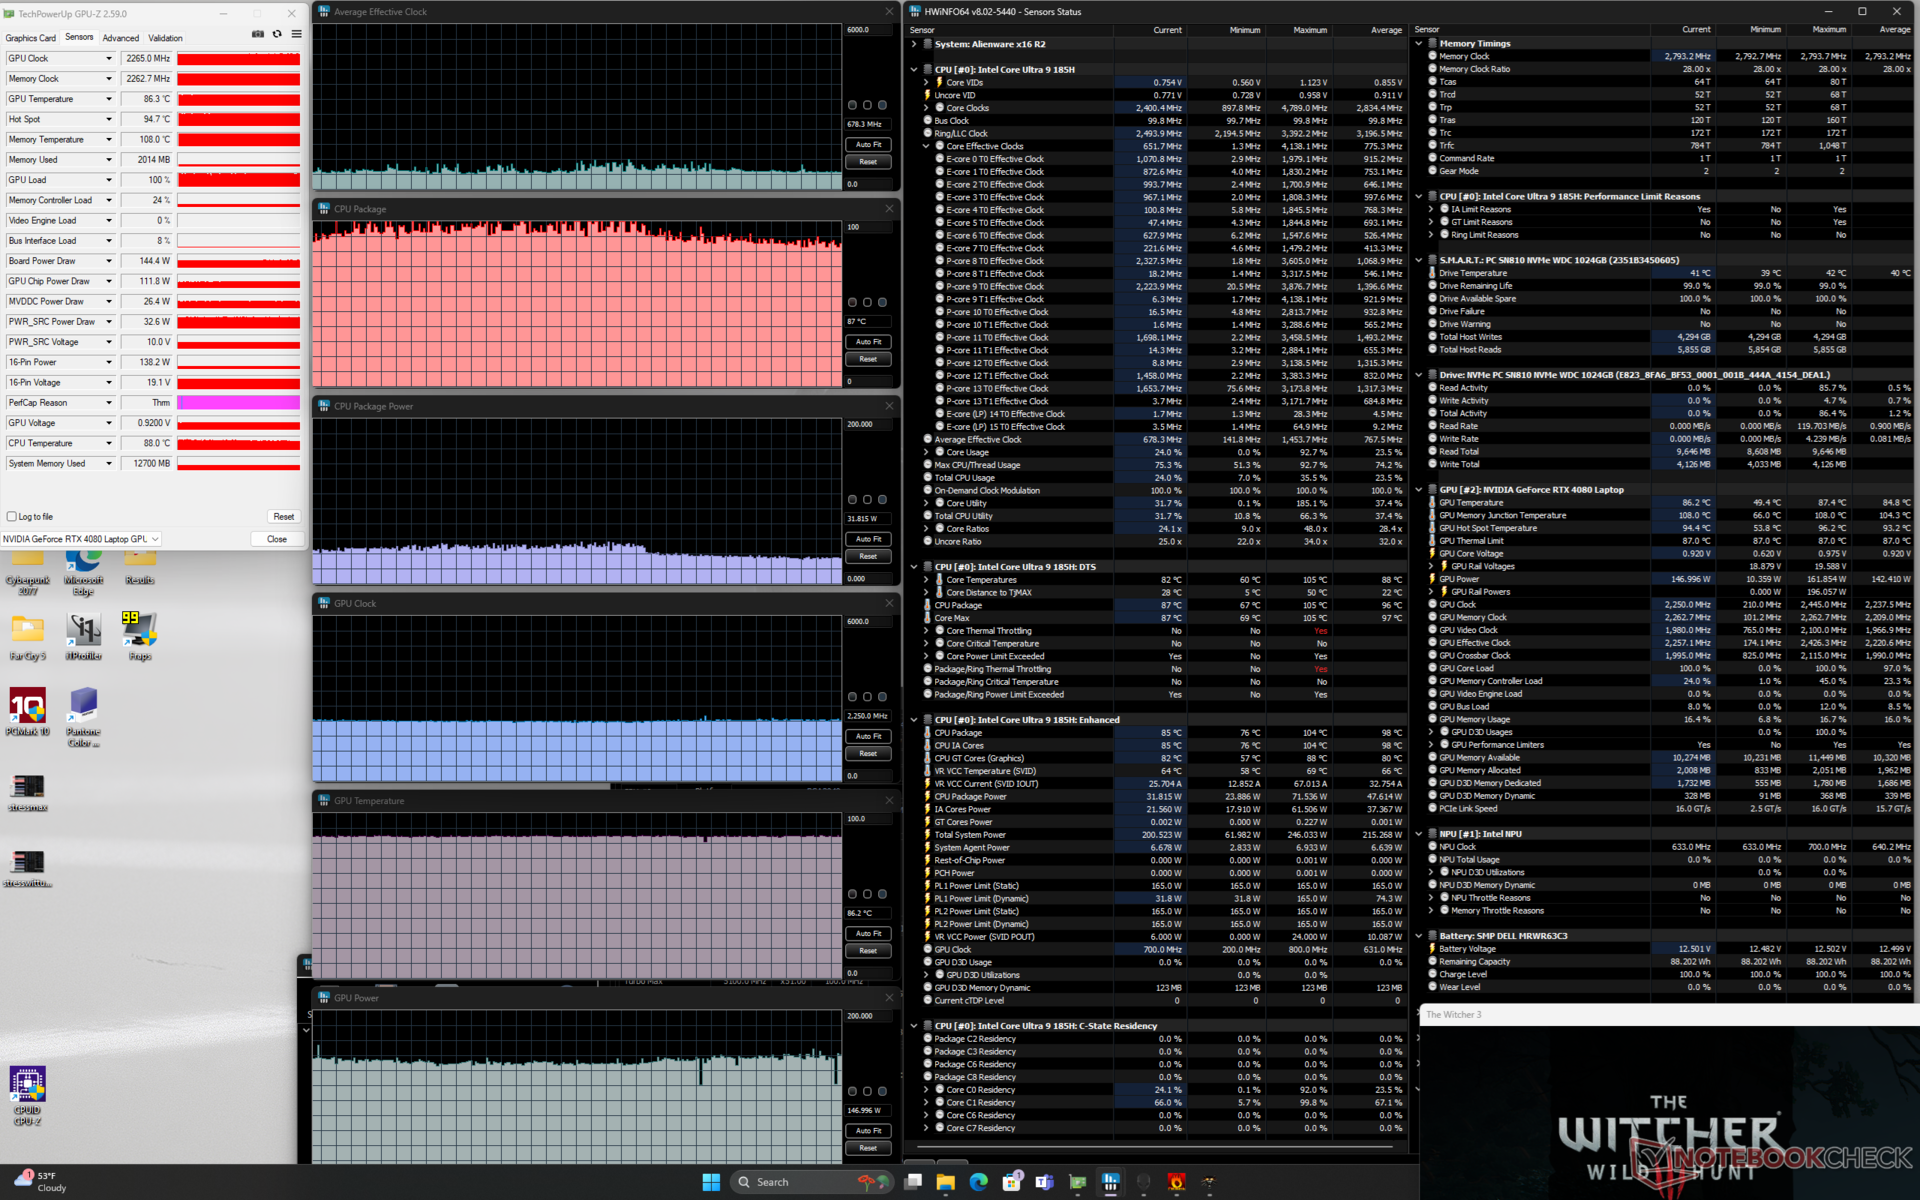
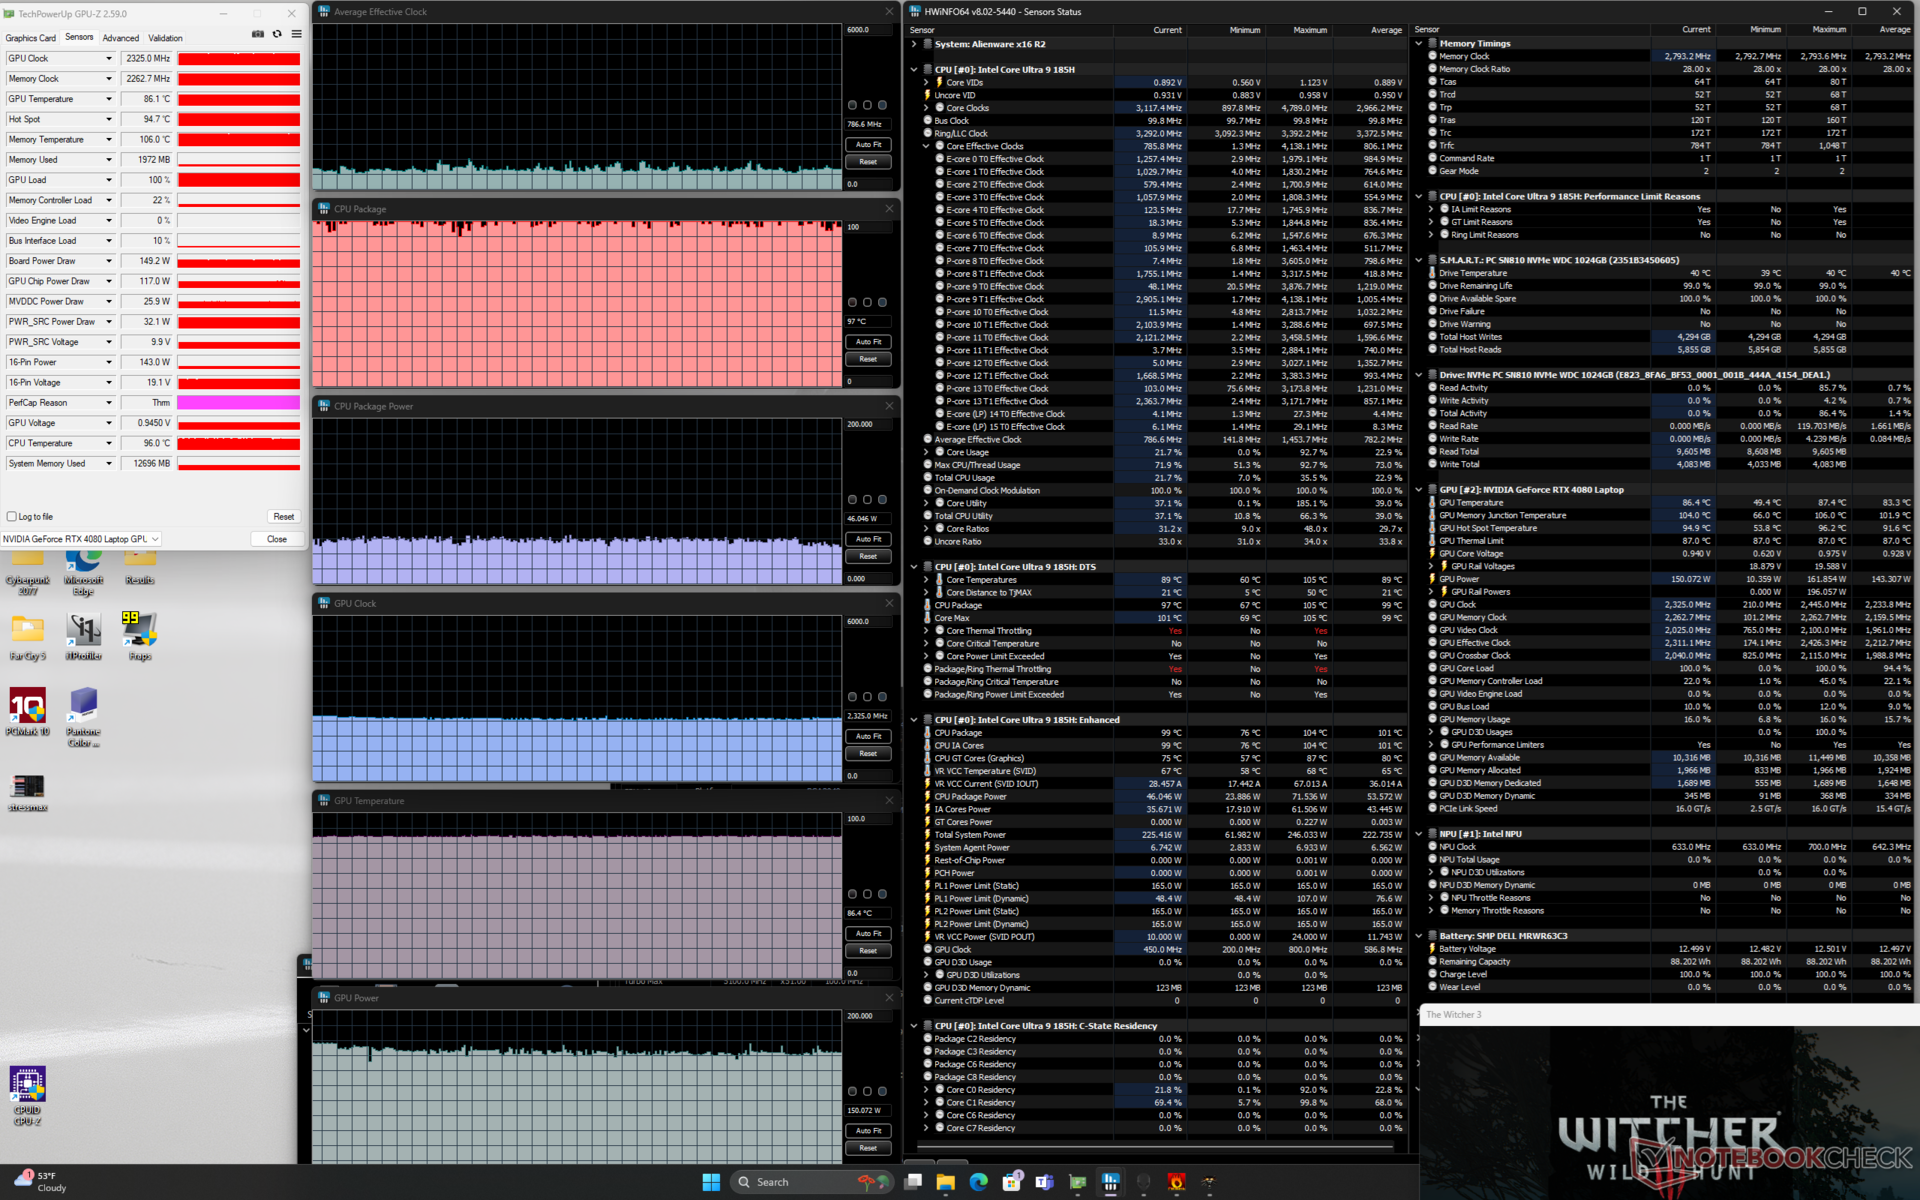
| Average CPU Clock (GHz) | GPU Clock (MHz) | Average CPU Temperature (°C) | Average GPU Temperature (°C) | |
| System Idle | -- | -- | 38 | 31 |
| Prime95 Stress | 3.2 | -- | 101 | 50 |
| Prime95 + FurMark Stress | 2.2 | 2175 | 99 | 82 |
| Witcher 3 Stress (Balanced mode) | 0.7 | 2100 | 99 | 86 |
| Witcher 3 Stress (Performance mode) | 0.7 | 2250 | 87 | 86 |
| Witcher 3 Stress (Overdrive mode) | 0.8 | 2325 | 97 | 86 |
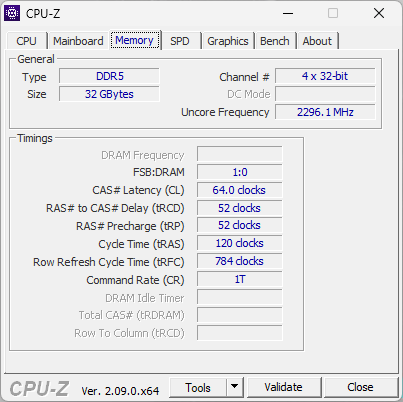
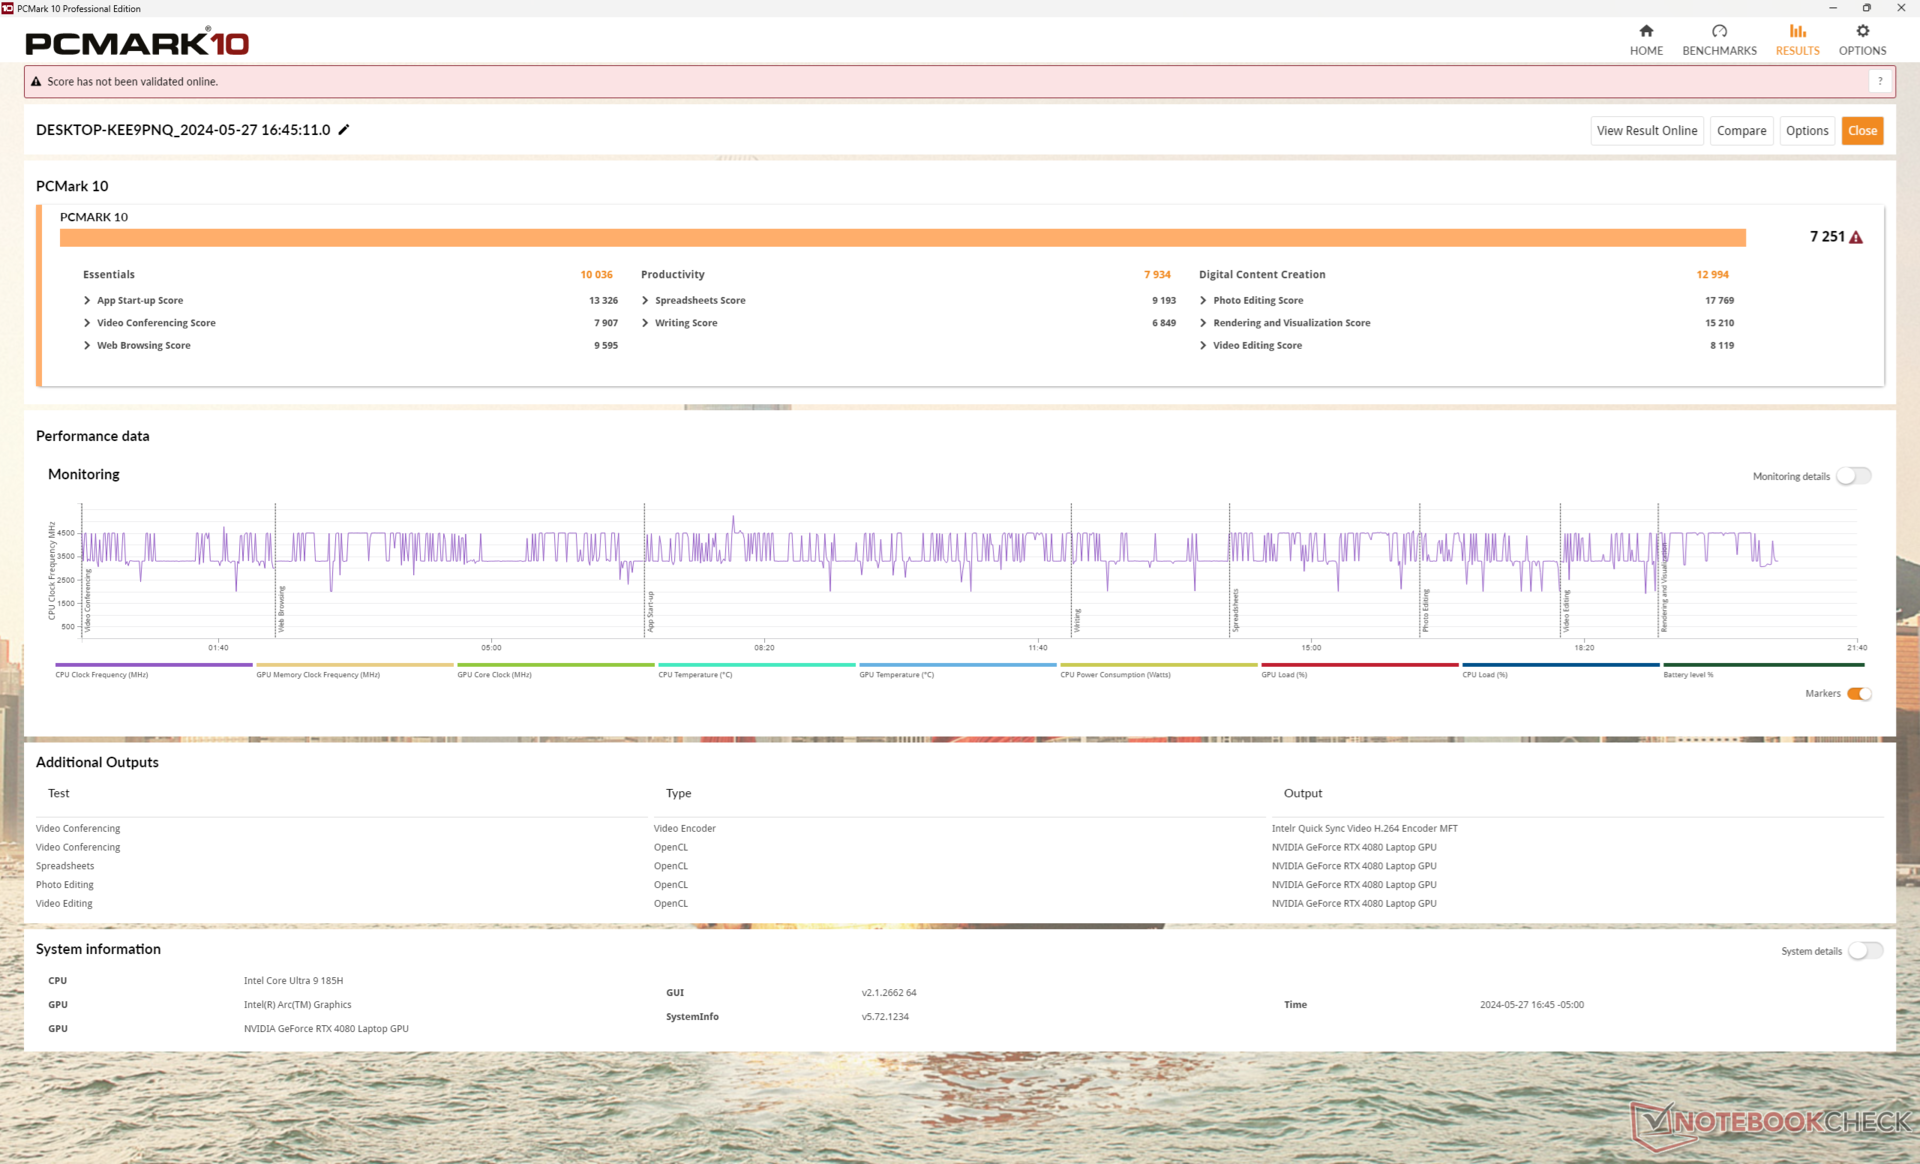
System Performance
PCMark results are about the same if not lower than before. Meanwhile, RAM is slightly faster this year (7467 MT/s vs. 6000 MT/s) for slightly higher AIDA64 copy/read results but slower write and latency results.
CrossMark: Overall | Productivity | Creativity | Responsiveness
WebXPRT 3: Overall
WebXPRT 4: Overall
Mozilla Kraken 1.1: Total
| PCMark 10 / Score | |
| Lenovo Legion Pro 7 16IRX9H | |
| MSI Vector 16 HX A14V | |
| Alienware x16 R1 | |
| Alienware m16 R2 | |
| Asus ROG Strix Scar 16 G634JZR | |
| Alienware x16 R2 P120F | |
| Average Intel Core Ultra 9 185H, NVIDIA GeForce RTX 4080 Laptop GPU (n=1) | |
| PCMark 10 / Essentials | |
| Lenovo Legion Pro 7 16IRX9H | |
| Asus ROG Strix Scar 16 G634JZR | |
| MSI Vector 16 HX A14V | |
| Alienware x16 R1 | |
| Alienware m16 R2 | |
| Alienware x16 R2 P120F | |
| Average Intel Core Ultra 9 185H, NVIDIA GeForce RTX 4080 Laptop GPU (n=1) | |
| PCMark 10 / Productivity | |
| Lenovo Legion Pro 7 16IRX9H | |
| Alienware x16 R1 | |
| MSI Vector 16 HX A14V | |
| Alienware m16 R2 | |
| Alienware x16 R2 P120F | |
| Average Intel Core Ultra 9 185H, NVIDIA GeForce RTX 4080 Laptop GPU (n=1) | |
| Asus ROG Strix Scar 16 G634JZR | |
| PCMark 10 / Digital Content Creation | |
| Asus ROG Strix Scar 16 G634JZR | |
| MSI Vector 16 HX A14V | |
| Lenovo Legion Pro 7 16IRX9H | |
| Alienware x16 R1 | |
| Alienware m16 R2 | |
| Alienware x16 R2 P120F | |
| Average Intel Core Ultra 9 185H, NVIDIA GeForce RTX 4080 Laptop GPU (n=1) | |
| CrossMark / Overall | |
| Lenovo Legion Pro 7 16IRX9H | |
| MSI Vector 16 HX A14V | |
| Asus ROG Strix Scar 16 G634JZR | |
| Alienware x16 R1 | |
| Alienware m16 R2 | |
| Alienware x16 R2 P120F | |
| Average Intel Core Ultra 9 185H, NVIDIA GeForce RTX 4080 Laptop GPU (n=1) | |
| CrossMark / Productivity | |
| Lenovo Legion Pro 7 16IRX9H | |
| MSI Vector 16 HX A14V | |
| Asus ROG Strix Scar 16 G634JZR | |
| Alienware x16 R1 | |
| Alienware m16 R2 | |
| Alienware x16 R2 P120F | |
| Average Intel Core Ultra 9 185H, NVIDIA GeForce RTX 4080 Laptop GPU (n=1) | |
| CrossMark / Creativity | |
| Lenovo Legion Pro 7 16IRX9H | |
| MSI Vector 16 HX A14V | |
| Asus ROG Strix Scar 16 G634JZR | |
| Alienware x16 R1 | |
| Alienware m16 R2 | |
| Alienware x16 R2 P120F | |
| Average Intel Core Ultra 9 185H, NVIDIA GeForce RTX 4080 Laptop GPU (n=1) | |
| CrossMark / Responsiveness | |
| Lenovo Legion Pro 7 16IRX9H | |
| MSI Vector 16 HX A14V | |
| Alienware x16 R1 | |
| Asus ROG Strix Scar 16 G634JZR | |
| Alienware x16 R2 P120F | |
| Average Intel Core Ultra 9 185H, NVIDIA GeForce RTX 4080 Laptop GPU (n=1) | |
| Alienware m16 R2 | |
| WebXPRT 3 / Overall | |
| Lenovo Legion Pro 7 16IRX9H | |
| MSI Vector 16 HX A14V | |
| Asus ROG Strix Scar 16 G634JZR | |
| Alienware x16 R1 | |
| Alienware m16 R2 | |
| Alienware x16 R2 P120F | |
| Average Intel Core Ultra 9 185H, NVIDIA GeForce RTX 4080 Laptop GPU (n=1) | |
| WebXPRT 4 / Overall | |
| Lenovo Legion Pro 7 16IRX9H | |
| Asus ROG Strix Scar 16 G634JZR | |
| MSI Vector 16 HX A14V | |
| Alienware x16 R1 | |
| Alienware m16 R2 | |
| Alienware x16 R2 P120F | |
| Average Intel Core Ultra 9 185H, NVIDIA GeForce RTX 4080 Laptop GPU (n=1) | |
| Mozilla Kraken 1.1 / Total | |
| Alienware x16 R2 P120F | |
| Average Intel Core Ultra 9 185H, NVIDIA GeForce RTX 4080 Laptop GPU (n=1) | |
| Alienware m16 R2 | |
| Alienware x16 R1 | |
| MSI Vector 16 HX A14V | |
| Asus ROG Strix Scar 16 G634JZR | |
| Lenovo Legion Pro 7 16IRX9H | |
* ... smaller is better
| PCMark 10 Score | 7251 points | |
Help | ||
| AIDA64 / Memory Copy | |
| Alienware x16 R2 P120F | |
| Average Intel Core Ultra 9 185H (69929 - 95718, n=20) | |
| Asus ROG Strix Scar 16 G634JZR | |
| Lenovo Legion Pro 7 16IRX9H | |
| MSI Vector 16 HX A14V | |
| Alienware x16 R1 | |
| Alienware m16 R2 | |
| AIDA64 / Memory Read | |
| Asus ROG Strix Scar 16 G634JZR | |
| Lenovo Legion Pro 7 16IRX9H | |
| MSI Vector 16 HX A14V | |
| Alienware x16 R2 P120F | |
| Average Intel Core Ultra 9 185H (64619 - 87768, n=20) | |
| Alienware m16 R2 | |
| Alienware x16 R1 | |
| AIDA64 / Memory Write | |
| Alienware x16 R1 | |
| Asus ROG Strix Scar 16 G634JZR | |
| MSI Vector 16 HX A14V | |
| Alienware x16 R2 P120F | |
| Average Intel Core Ultra 9 185H (51114 - 93871, n=20) | |
| Lenovo Legion Pro 7 16IRX9H | |
| Alienware m16 R2 | |
| AIDA64 / Memory Latency | |
| Average Intel Core Ultra 9 185H (121.4 - 259, n=20) | |
| Alienware x16 R2 P120F | |
| Alienware m16 R2 | |
| Alienware x16 R1 | |
| MSI Vector 16 HX A14V | |
| Asus ROG Strix Scar 16 G634JZR | |
| Lenovo Legion Pro 7 16IRX9H | |
* ... smaller is better
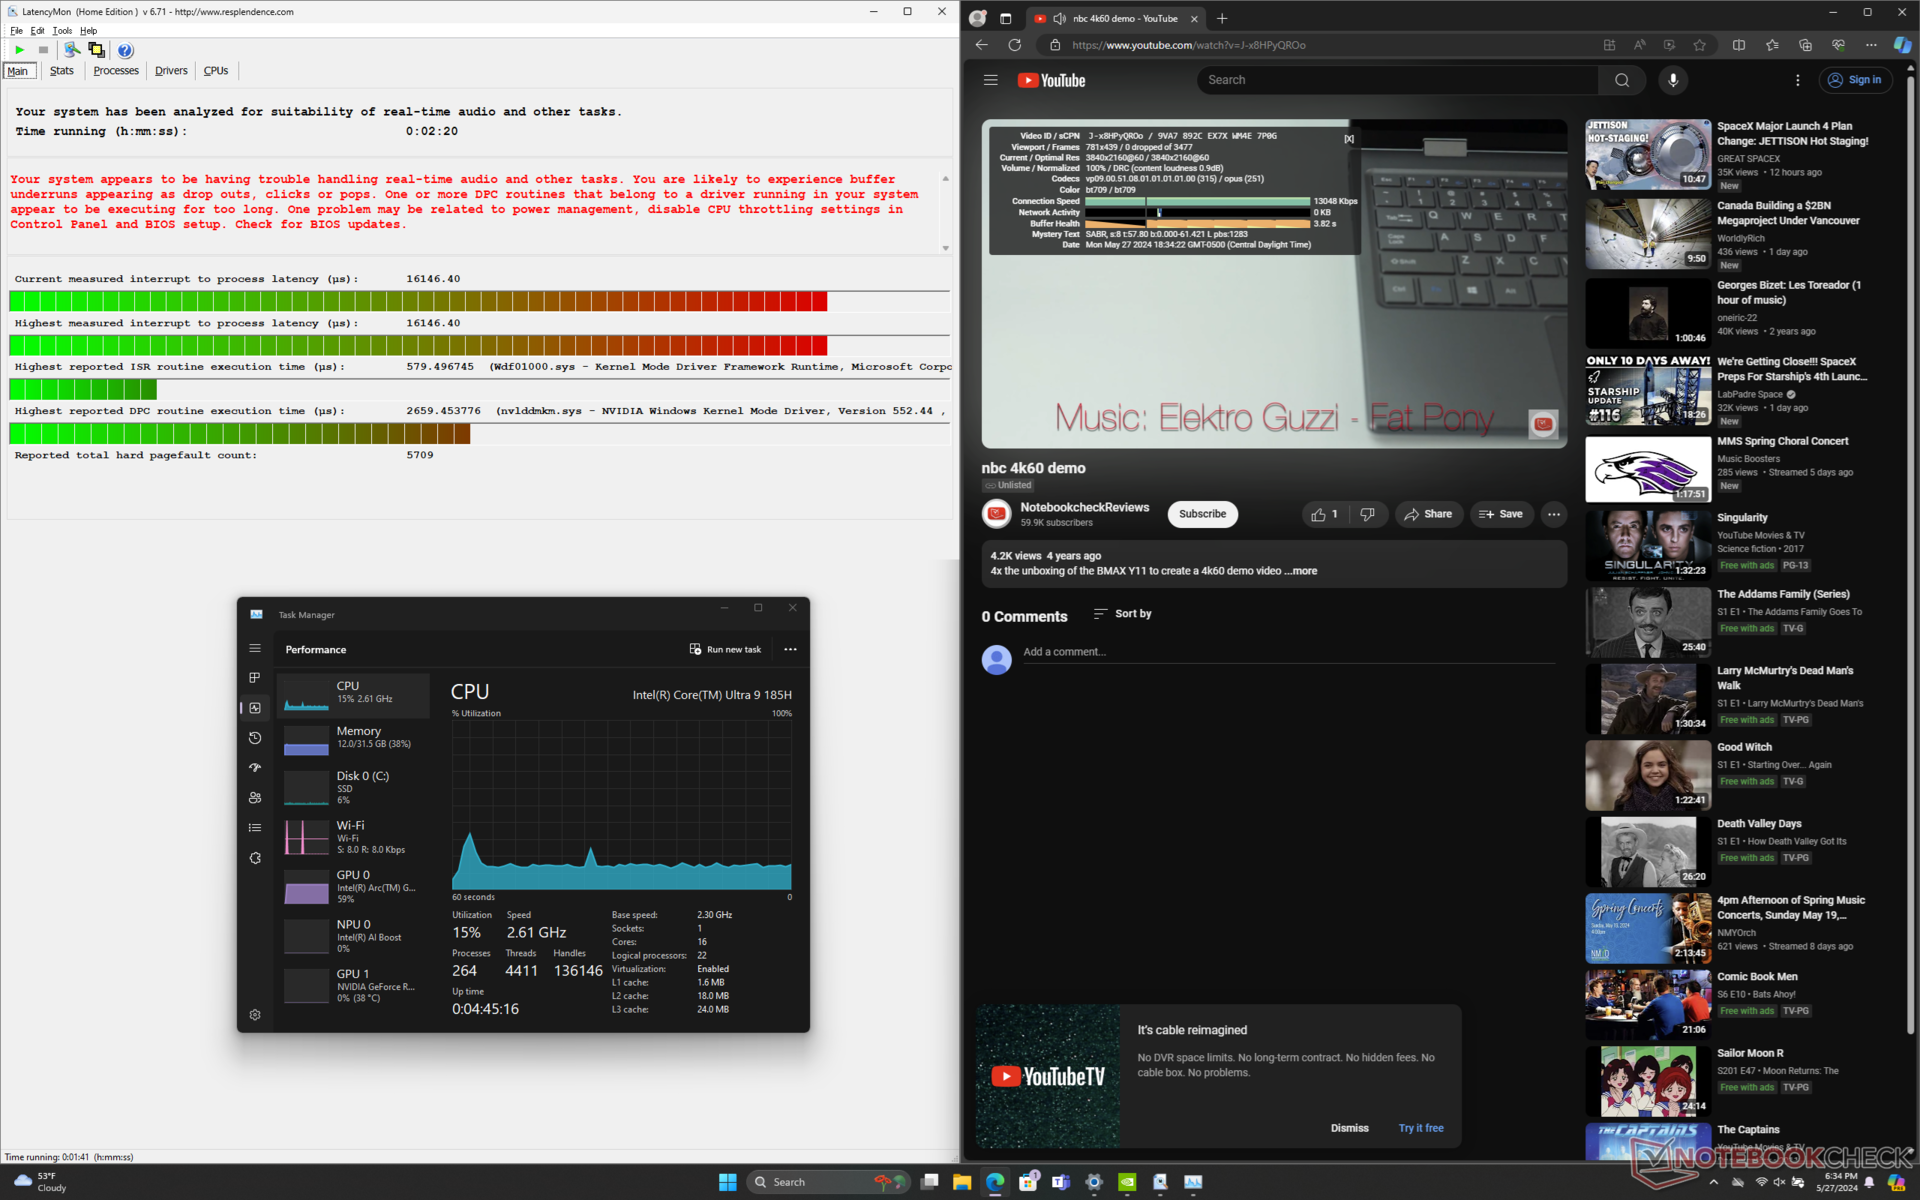
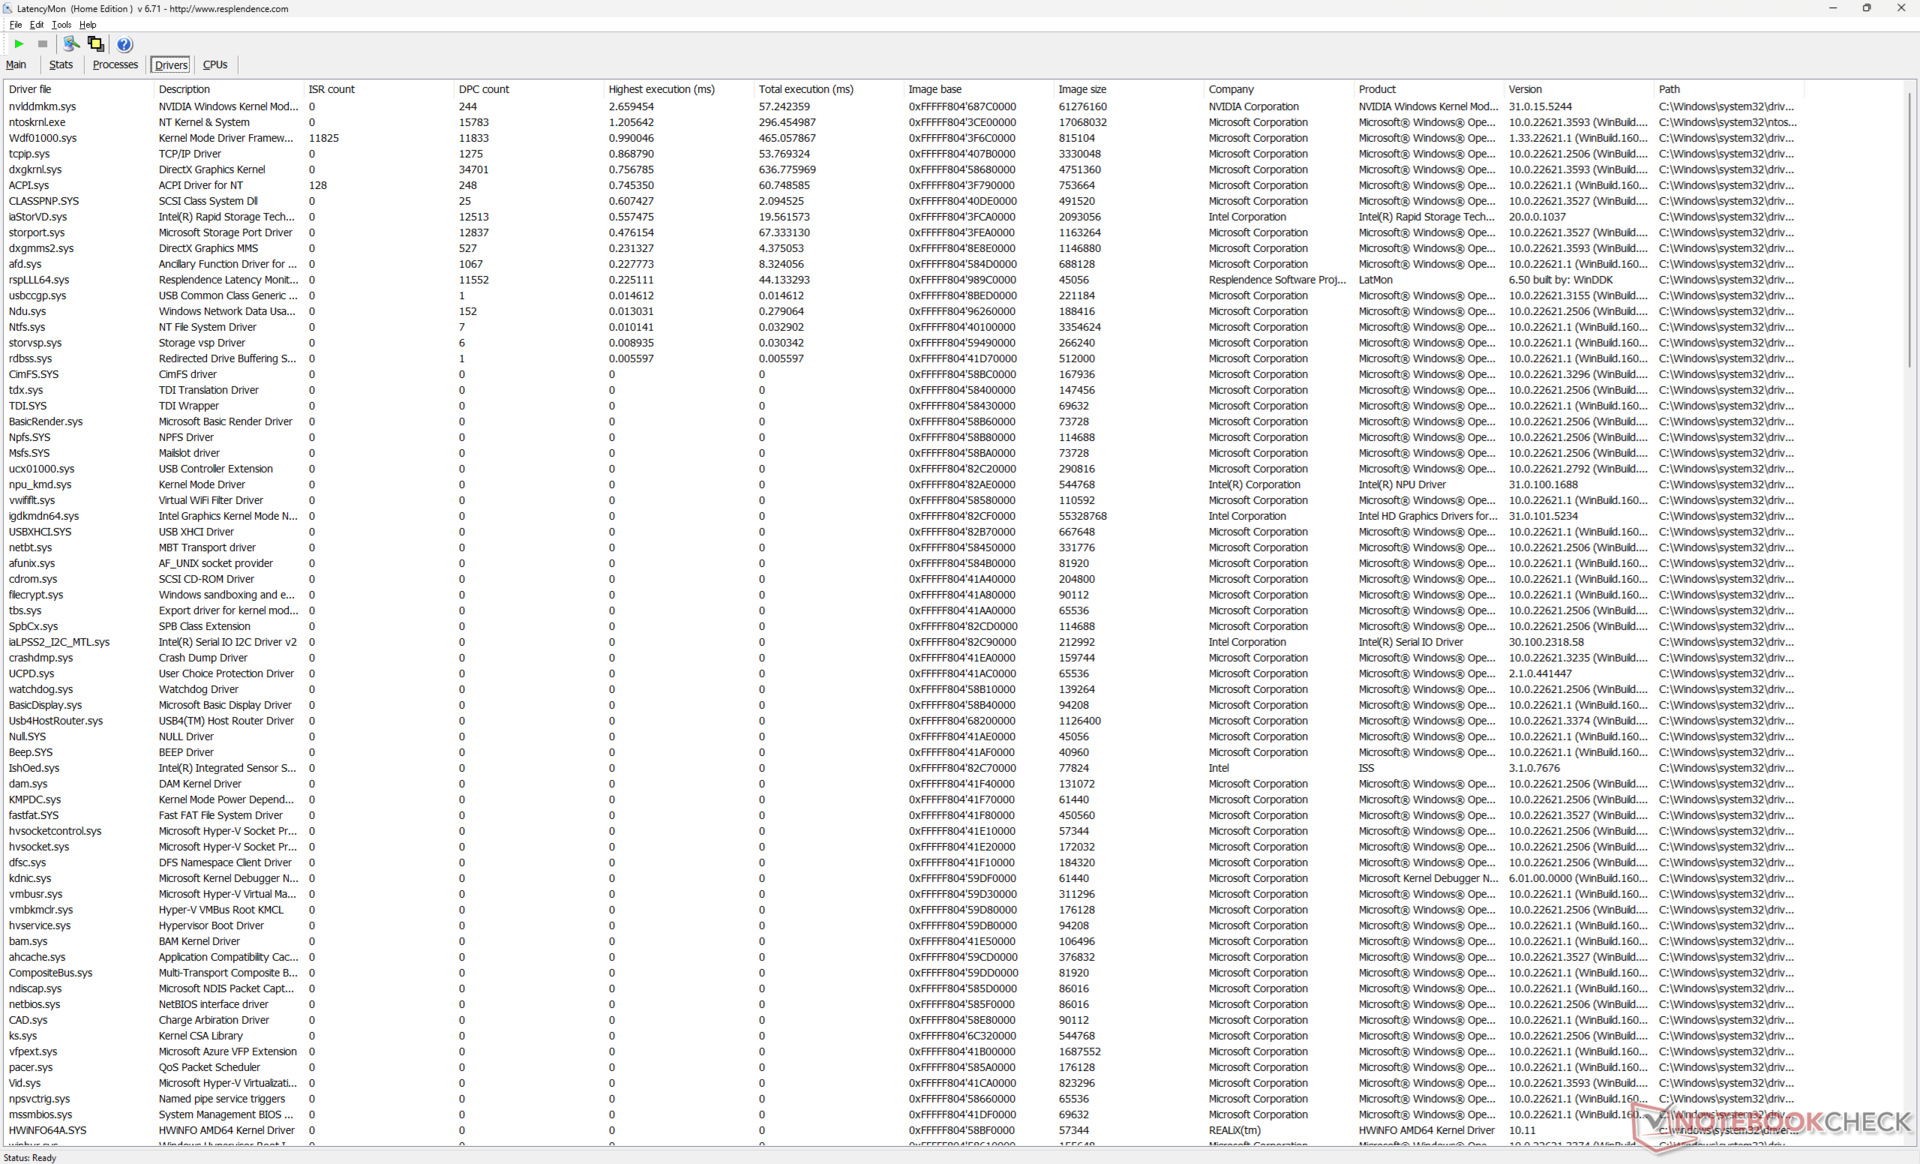
DPC Latency
LatencyMon reveals notable DPC issues when opening multiple browser tabs of our homepage even after multiple retries on Optimus mode. We experienced no such issues on the original x16 R1. 4K video playback at 60 FPS is otherwise perfect with no dropped frames recorded.
| DPC Latencies / LatencyMon - interrupt to process latency (max), Web, Youtube, Prime95 | |
| Alienware x16 R2 P120F | |
| Asus ROG Strix Scar 16 G634JZR | |
| Alienware m16 R2 | |
| MSI Vector 16 HX A14V | |
| Alienware x16 R1 | |
| Lenovo Legion Pro 7 16IRX9H | |
* ... smaller is better
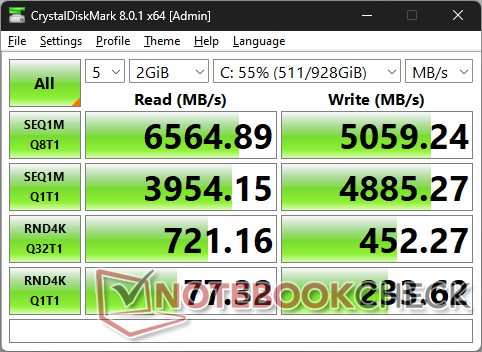
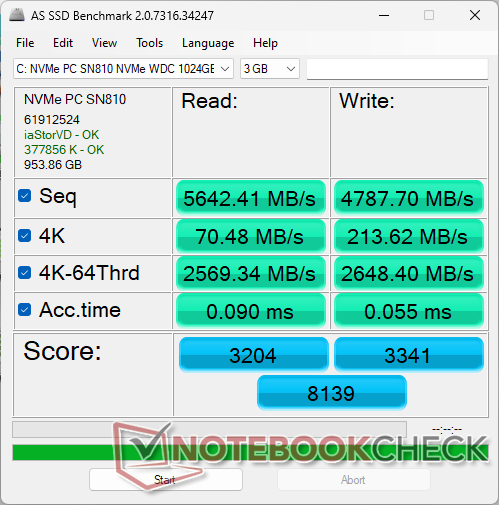
Storage Devices
Our test unit ships with the WDC PC SN810 instead of the SK Hynix PC801 on last year's model. The Western Digital drive can sustain maximum transfer rates for longer than the SK Hynix as shown by our DiskSpd loop graph below, but write rates are generally slower.

| Drive Performance rating - Percent | |
| Lenovo Legion Pro 7 16IRX9H | |
| Alienware x16 R1 | |
| Alienware x16 R2 P120F | |
| Alienware m16 R2 | |
| Asus ROG Strix Scar 16 G634JZR | |
| MSI Vector 16 HX A14V | |
* ... smaller is better
Disk Throttling: DiskSpd Read Loop, Queue Depth 8
GPU Performance
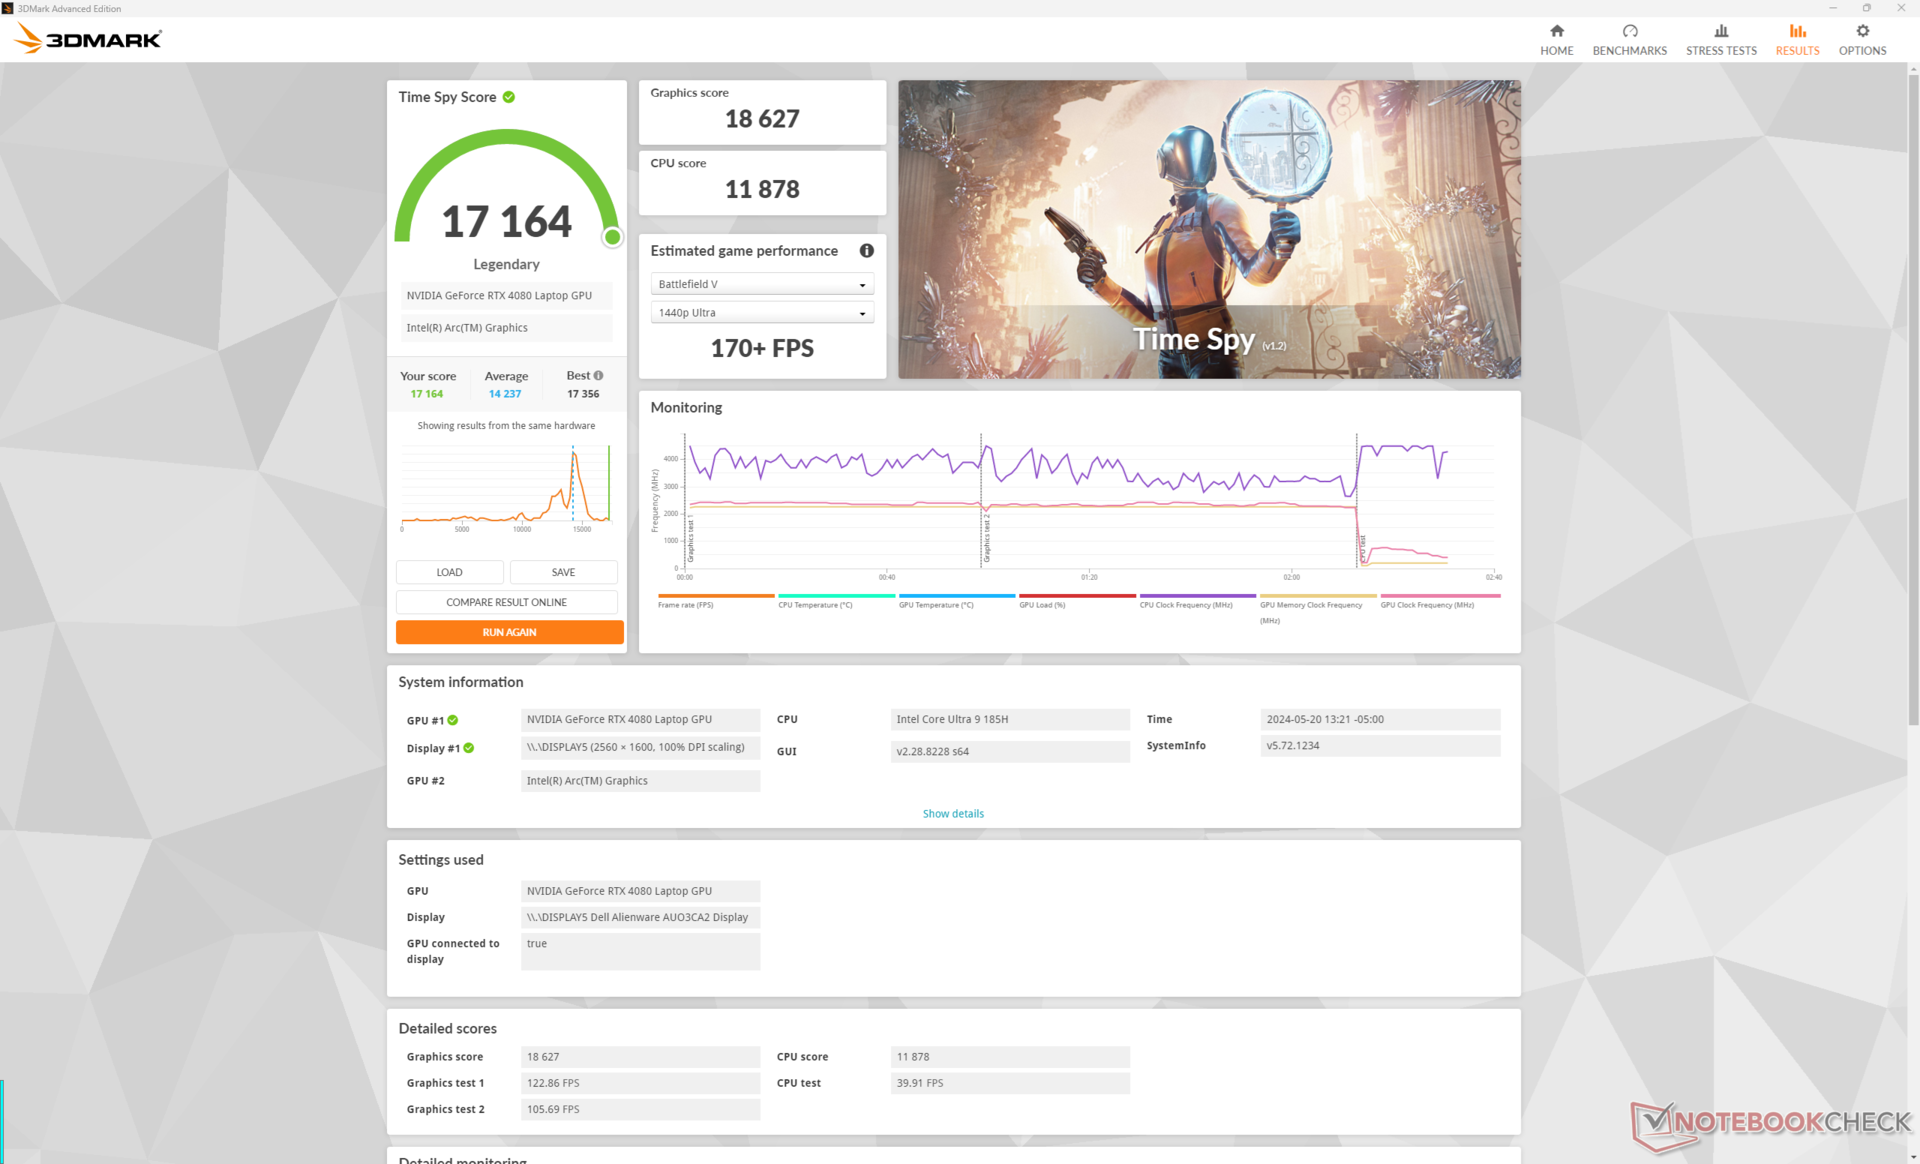
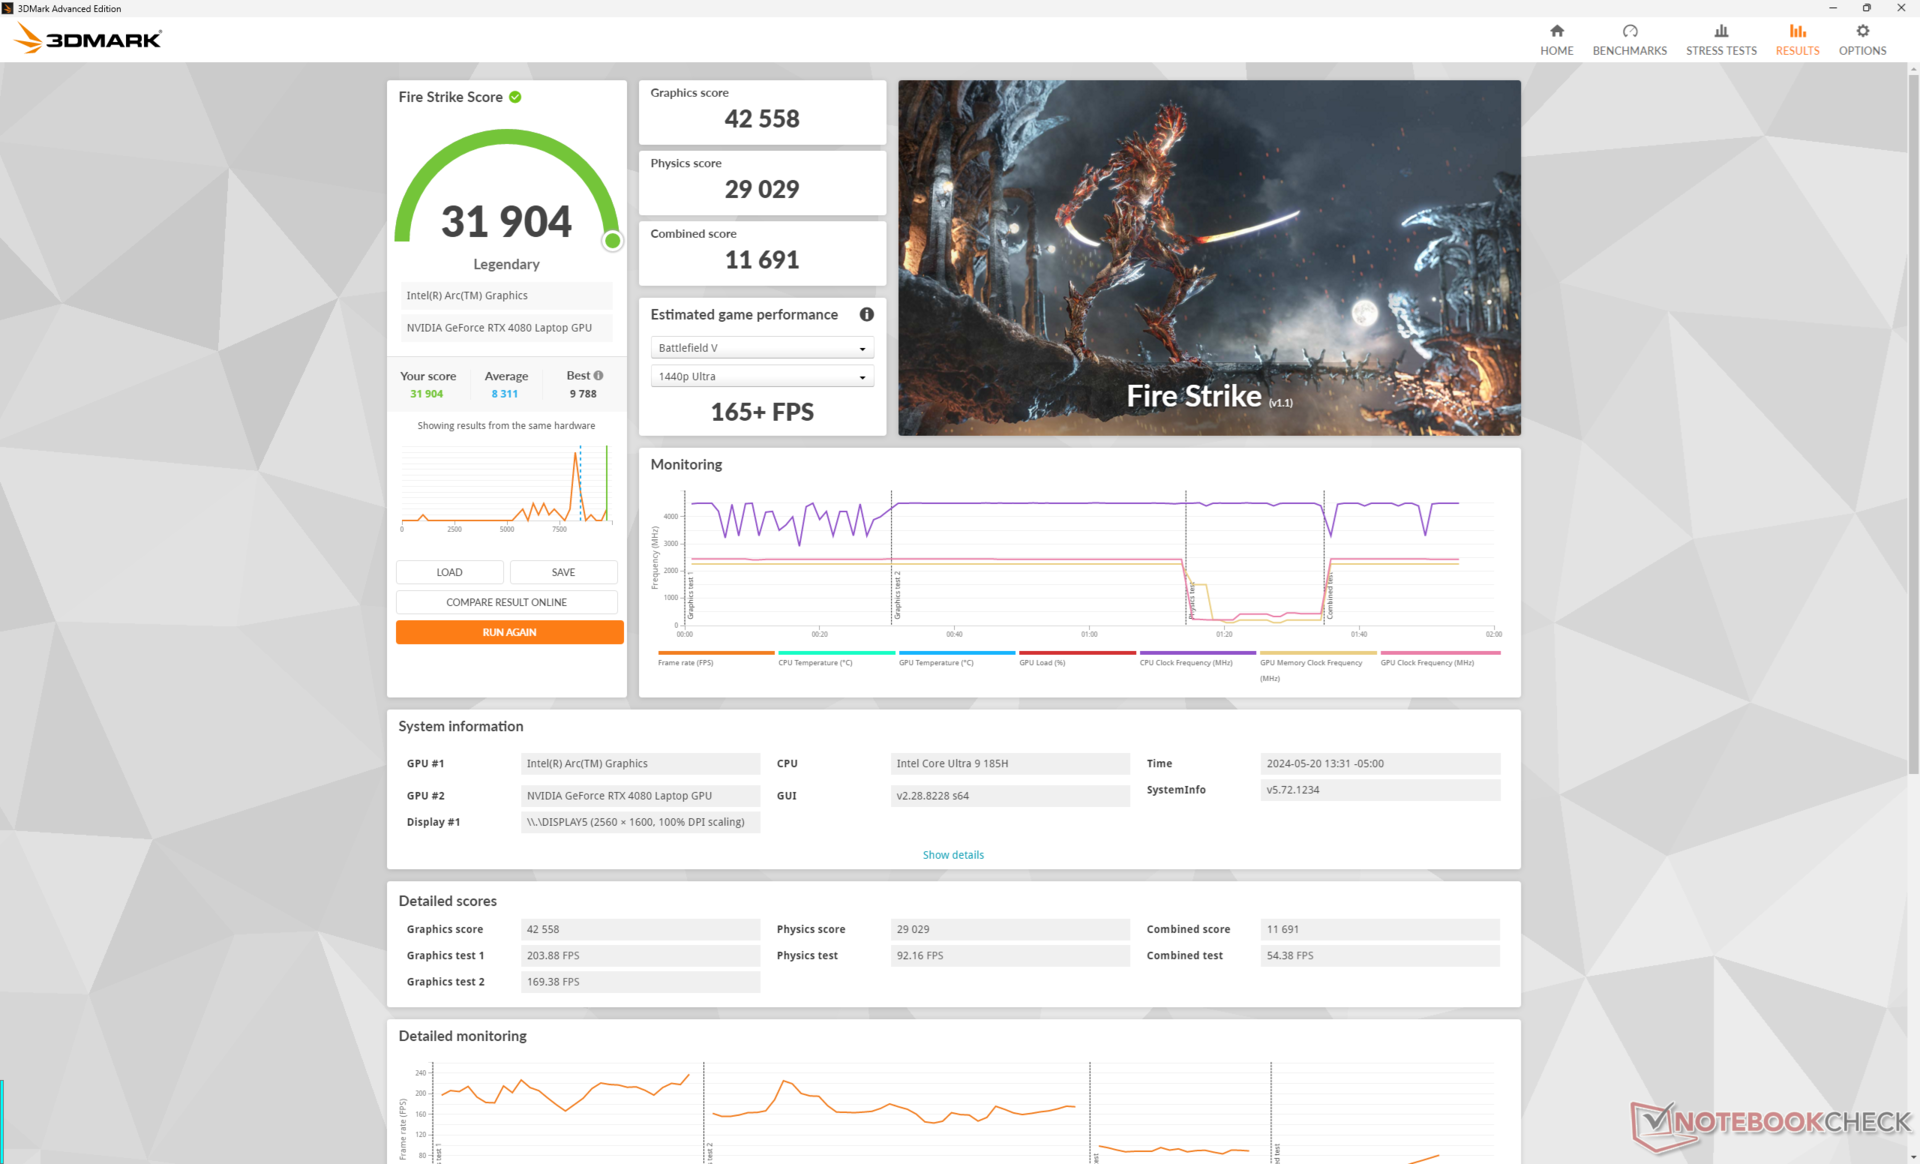
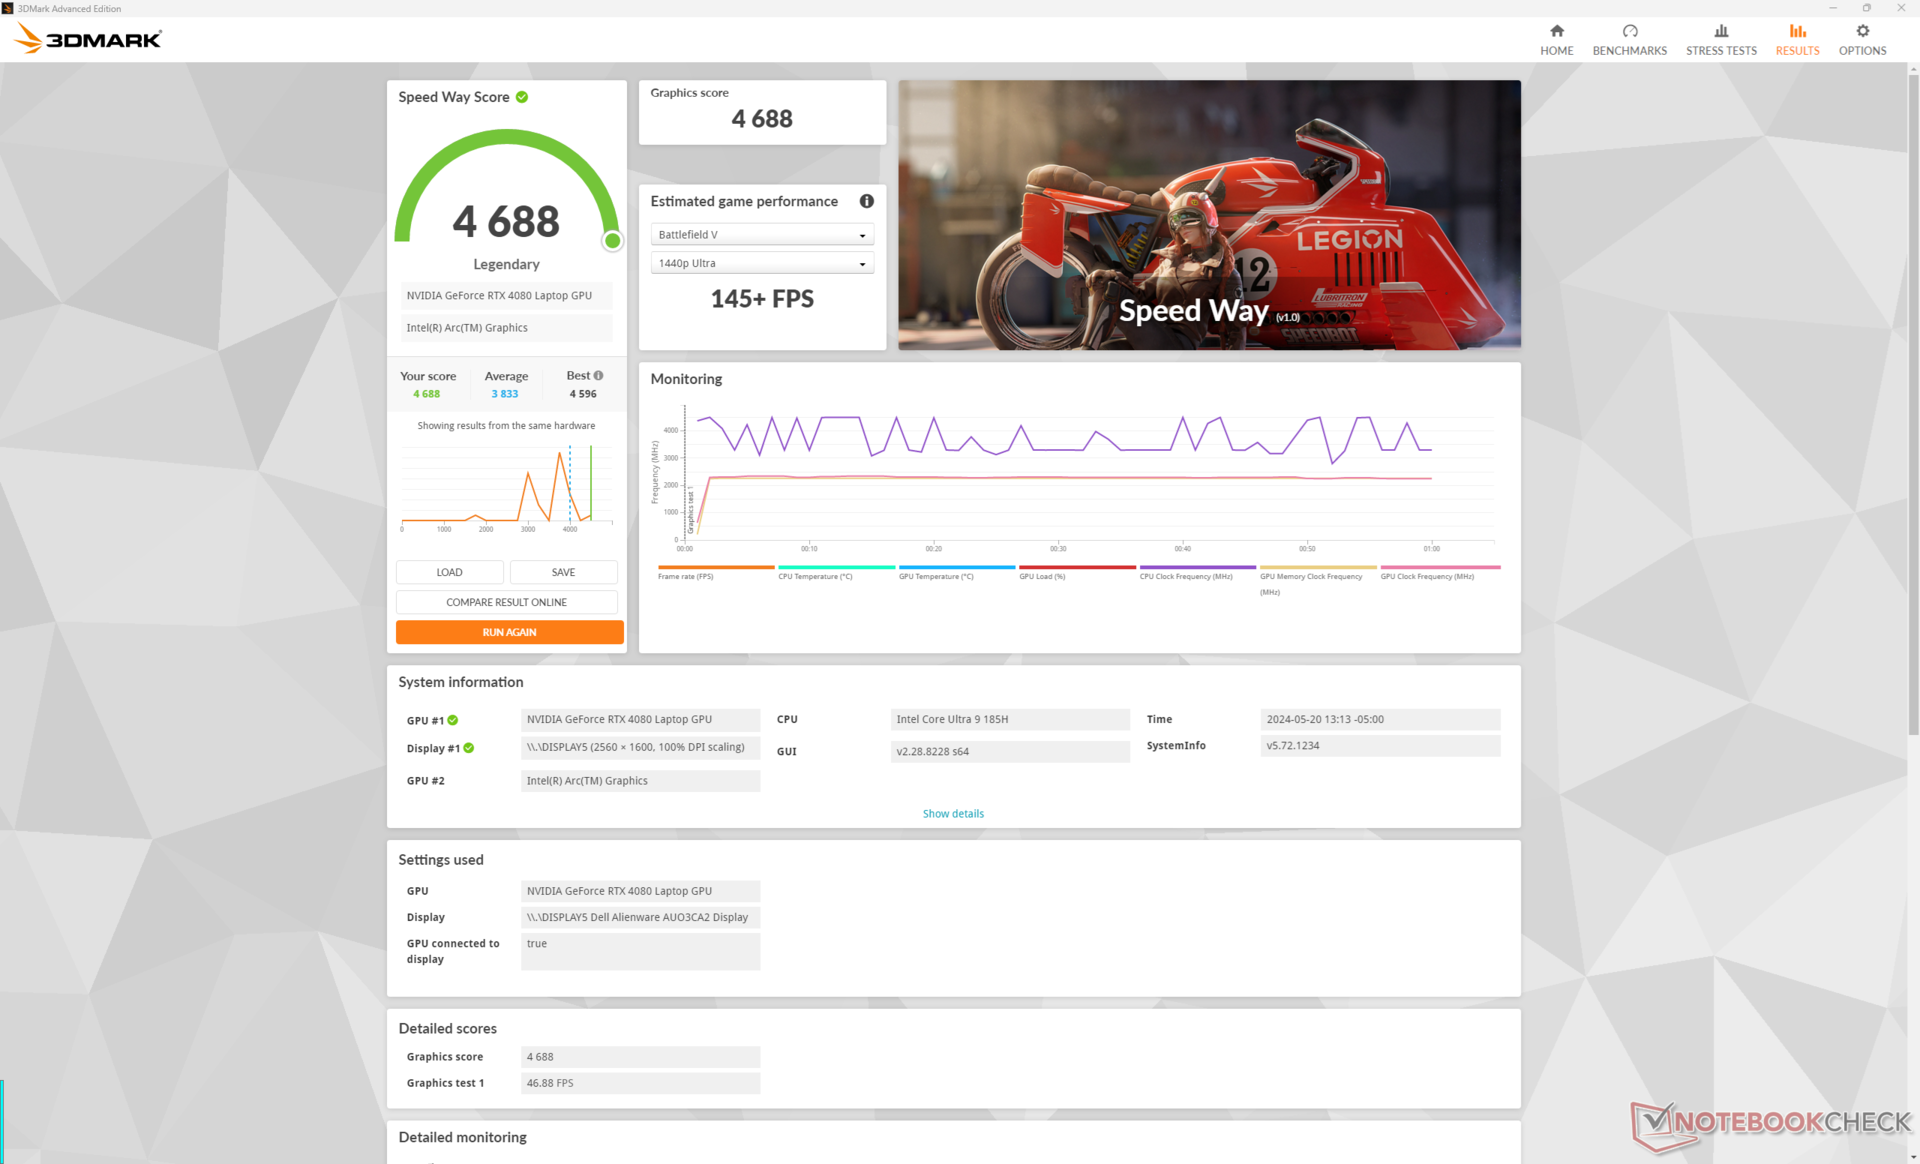
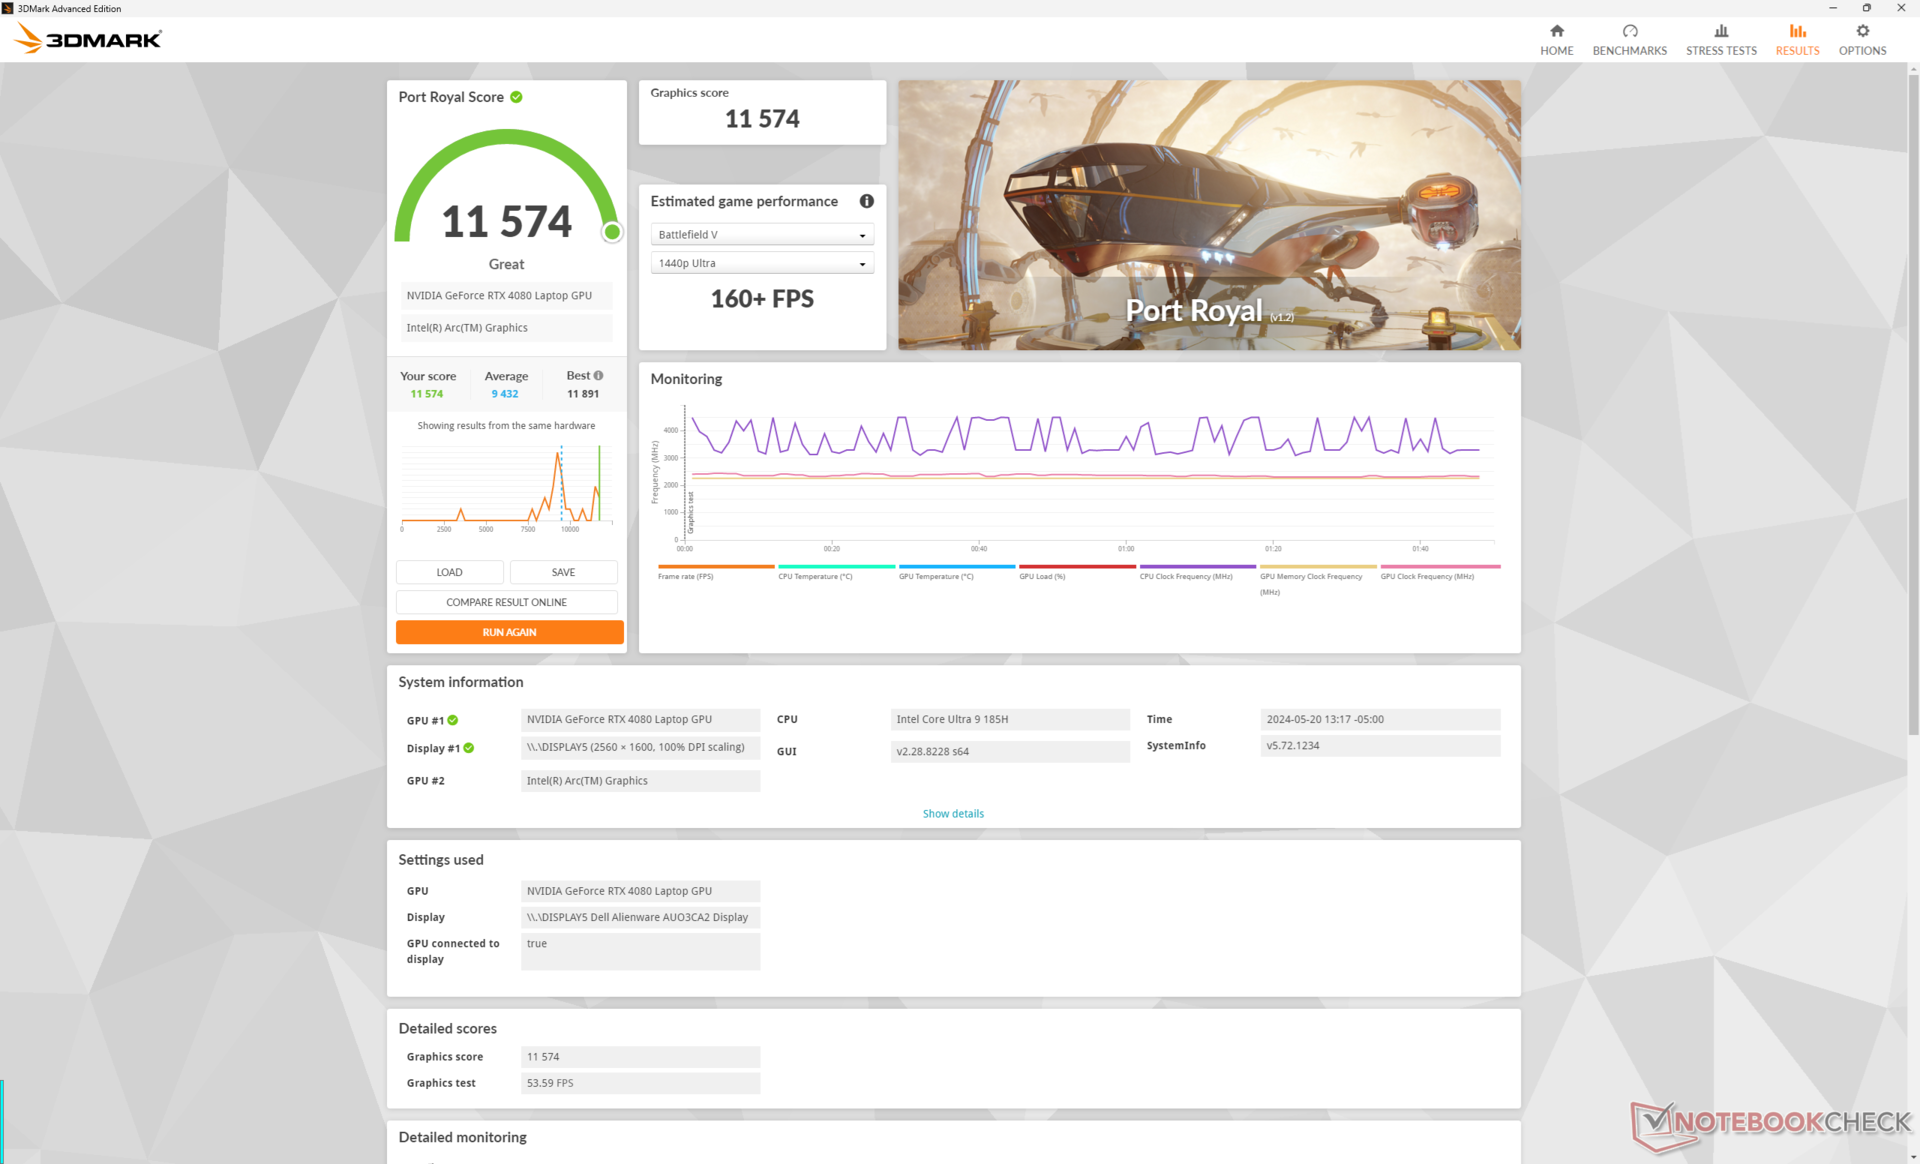
The 175 W mobile GeForce RTX 4080 GPU remains the same albeit with 3DMark scores that are about 5 percent slower than what we recorded on the x16 R1. Upgrading to the RTX 4090 configuration is expected to improve performance by just 5 to 15 percent while downgrading to the RTX 4070 or 4060 will reduce performance by as much as 30 percent and 45 percent, respectively.
| Power Profile | Graphics Score | Physics Score | Combined Score |
| Overdrive Mode | 42558 | 29029 | 11691 |
| Performance Mode | 40773 (-4%) | 26070 (-10%) | 12450 (-7%) |
| Balanced Mode | 40593 (-5%) | 26746 (-8%) | 12237 (-5%) |
| Battery Power | 21754 (-49%) | 25880 (-11%) | 9863 (-16%) |
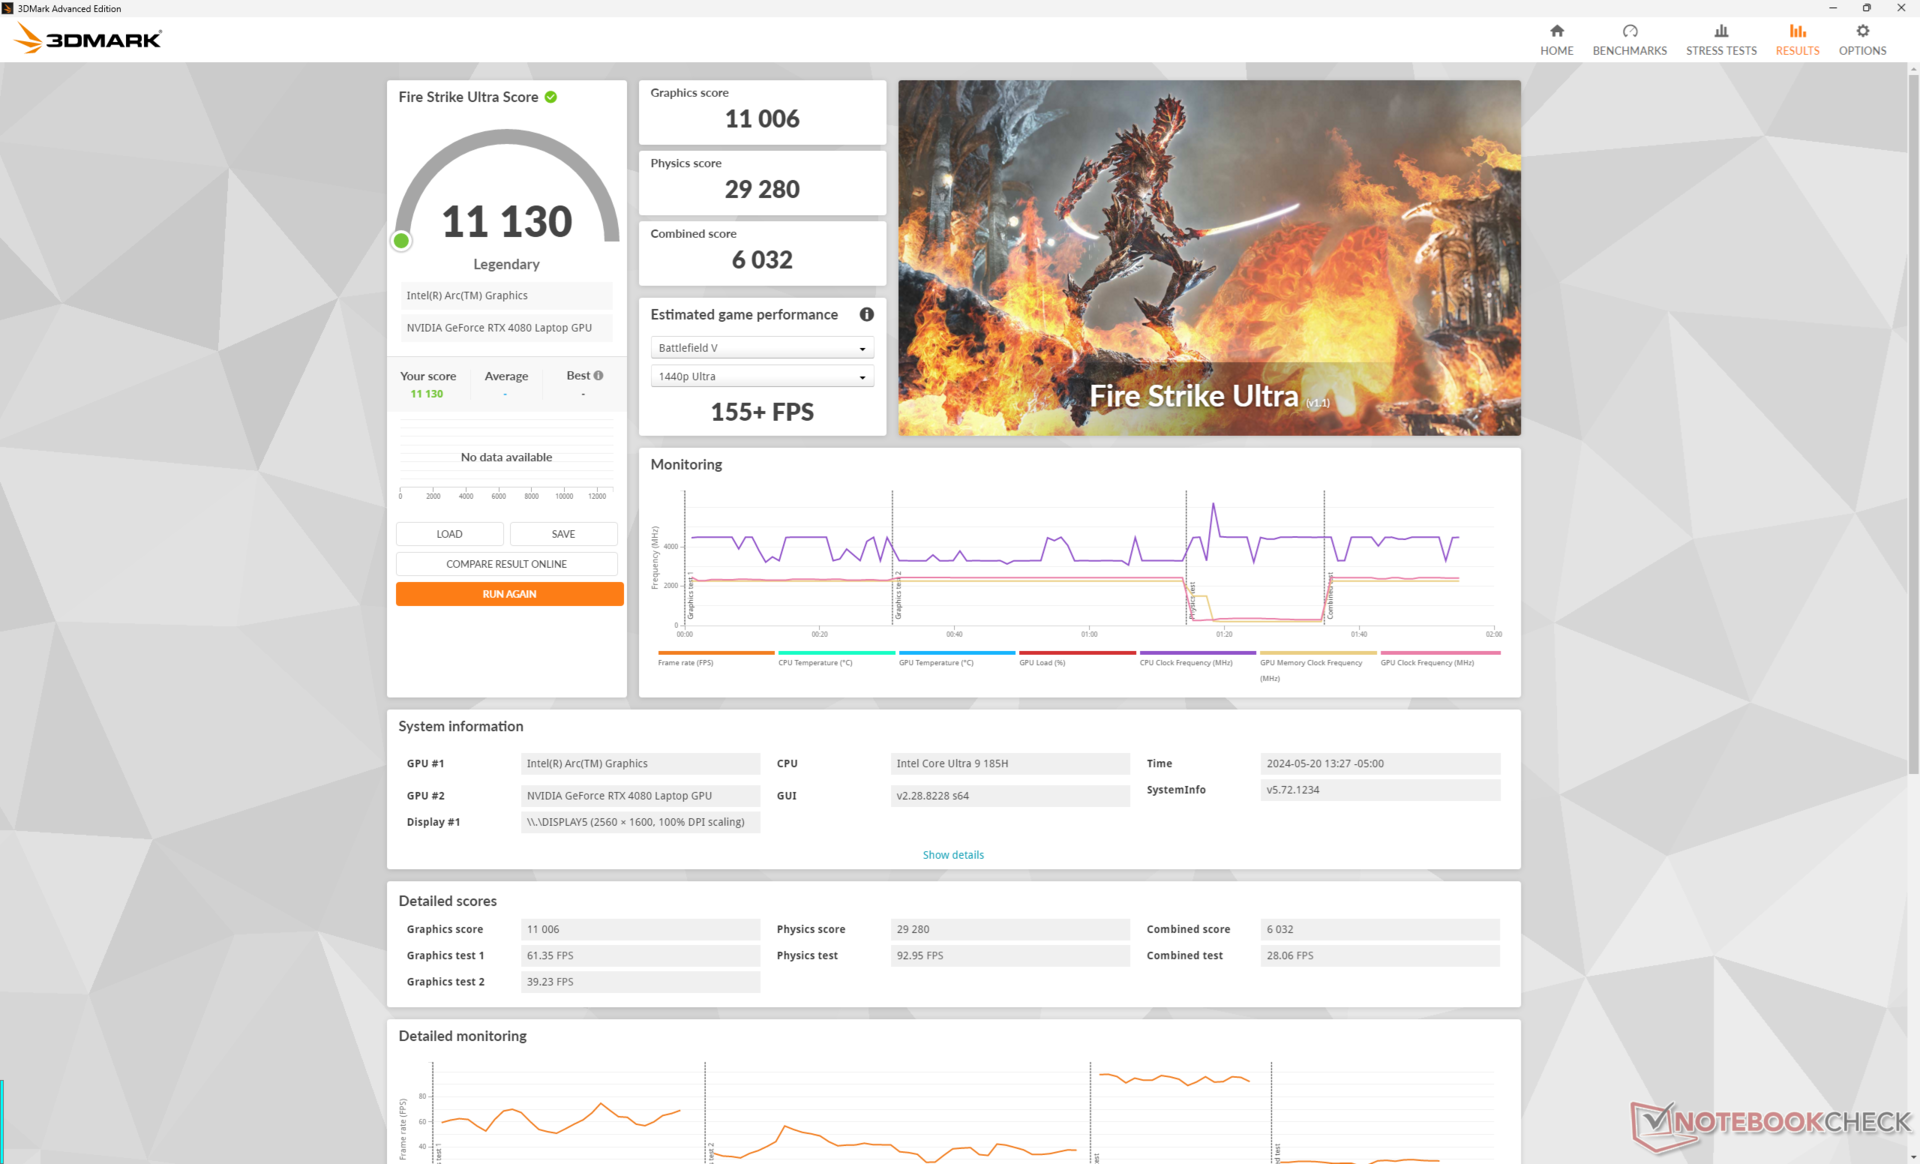
Running the system on Performance mode instead of Overdrive mode will impact overall performance slightly as shown by our Fire Strike results table above. Interestingly, the difference between Performance and Balanced modes is comparatively much smaller.
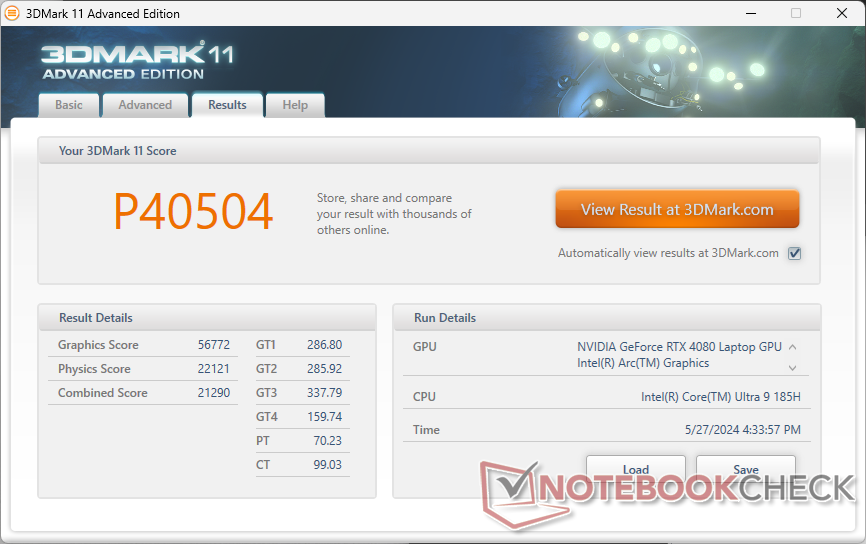
| 3DMark 11 Performance | 40504 points | |
| 3DMark Fire Strike Score | 31904 points | |
| 3DMark Time Spy Score | 17164 points | |
Help | ||
* ... smaller is better
Gaming Performance
Disappointingly, performance in games would be consistently slower than what we recorded on the x16 R1 by about 5 to 15 percent. The wider deltas would occur at lower resolutions while the smaller deltas would occur at higher resolutions which is consistent with the slower raw CPU performance results when compared to the Core i9-14900HK noted above.
| Baldur's Gate 3 | |
| 1920x1080 Ultra Preset AA:T | |
| Alienware x16 R2 P120F | |
| Average NVIDIA GeForce RTX 4080 Laptop GPU (111.8 - 181.2, n=7) | |
| Alienware m16 R2 | |
| Framework Laptop 16 | |
| 2560x1440 Ultra Preset AA:T | |
| Alienware x16 R2 P120F | |
| Average NVIDIA GeForce RTX 4080 Laptop GPU (88.3 - 129.3, n=7) | |
| Alienware m16 R2 | |
| Framework Laptop 16 | |
| 3840x2160 Ultra Preset AA:T | |
| Alienware x16 R2 P120F | |
| Average NVIDIA GeForce RTX 4080 Laptop GPU (48.8 - 68.4, n=5) | |
| Alienware m16 R2 | |
| Framework Laptop 16 | |
| 3840x2160 Ultra Preset + Quality DLSS | |
| Average NVIDIA GeForce RTX 4080 Laptop GPU (90.9 - 120.5, n=3) | |
| Alienware x16 R2 P120F | |
| Cyberpunk 2077 | |
| 1920x1080 Ultra Preset (FSR off) | |
| Average NVIDIA GeForce RTX 4080 Laptop GPU (83.9 - 127.1, n=15) | |
| Alienware x16 R2 P120F | |
| Alienware m16 R2 | |
| Framework Laptop 16 | |
| 2560x1440 Ultra Preset (FSR off) | |
| Average NVIDIA GeForce RTX 4080 Laptop GPU (56.2 - 86.3, n=15) | |
| Alienware x16 R2 P120F | |
| Alienware m16 R2 | |
| Framework Laptop 16 | |
| 3840x2160 Ultra Preset (FSR off) | |
| Average NVIDIA GeForce RTX 4080 Laptop GPU (25.8 - 39.8, n=8) | |
| Alienware x16 R2 P120F | |
| Alienware m16 R2 | |
| Framework Laptop 16 | |
| 1920x1080 Ray Tracing Ultra Preset (DLSS off) | |
| Alienware x16 R2 P120F | |
| Average NVIDIA GeForce RTX 4080 Laptop GPU (43.8 - 67.2, n=12) | |
| Alienware m16 R2 | |
| Framework Laptop 16 | |
| 3840x2160 Ray Tracing Ultra Preset (DLSS off, no Path Tracing) | |
| Average NVIDIA GeForce RTX 4080 Laptop GPU (16 - 20, n=5) | |
| Alienware x16 R2 P120F | |
| Alienware m16 R2 | |
Witcher 3 FPS Chart
| low | med. | high | ultra | QHD | 4K DLSS | 4K | |
|---|---|---|---|---|---|---|---|
| The Witcher 3 (2015) | 364.4 | 340.7 | 292.1 | 166.3 | 118.5 | ||
| Dota 2 Reborn (2015) | 155.7 | 142 | 139.2 | 133 | 127.9 | ||
| Final Fantasy XV Benchmark (2018) | 188 | 169.3 | 139.8 | 120.8 | 70.2 | ||
| X-Plane 11.11 (2018) | 134 | 117.4 | 89.3 | 78 | |||
| Far Cry 5 (2018) | 137 | 127 | 122 | 114 | 114 | 91 | |
| Strange Brigade (2018) | 427 | 336 | 317 | 293 | 226 | 112.9 | |
| Tiny Tina's Wonderlands (2022) | 220.8 | 199.6 | 166.7 | 144.5 | 99 | 50.1 | |
| F1 22 (2022) | 219 | 211 | 185.7 | 108.5 | 65.6 | 36.6 | |
| Baldur's Gate 3 (2023) | 186.8 | 172.9 | 161.2 | 159.4 | 124.3 | 104.4 | 65 |
| Cyberpunk 2077 (2023) | 121.5 | 118.7 | 109 | 99.7 | 75.4 | 32.5 |
Emissions
System Noise
The fans in the x16 R2 are able to remain quieter for longer periods before needing to ramp up in speed and noise. Otherwise, the noise ceiling is similar to what we recorded on the x16 R1 at about 50 dB(A) and 54 dB(A) when gaming on Performance mode and Overdrive mode, respectively. Note that fan noise when gaming on Balanced mode would be exactly the same as Performance mode which aligns with our 3DMark results above.
Noise level
| Idle |
| 23.8 / 28.5 / 28.5 dB(A) |
| Load |
| 28.8 / 54.2 dB(A) |
 | ||
30 dB silent 40 dB(A) audible 50 dB(A) loud |
||
min: | ||
| Alienware x16 R2 P120F GeForce RTX 4080 Laptop GPU, Ultra 9 185H, WDC PC SN810 1TB | Alienware x16 R1 GeForce RTX 4080 Laptop GPU, i9-13900HK, SK hynix PC801 HFS001TEJ9X101N | Alienware m16 R2 GeForce RTX 4070 Laptop GPU, Ultra 7 155H, Samsung PM9A1 MZVL21T0HCLR | Asus ROG Strix Scar 16 G634JZR GeForce RTX 4080 Laptop GPU, i9-14900HX, SK hynix PC801 HFS002TEJ9X101N | Lenovo Legion Pro 7 16IRX9H GeForce RTX 4080 Laptop GPU, i9-14900HX, SK Hynix HFS001TEJ9X115N | MSI Vector 16 HX A14V GeForce RTX 4080 Laptop GPU, i9-14900HX, WD PC SN560 SDDPNQE-1T00 | |
|---|---|---|---|---|---|---|
| Noise | -2% | -3% | -20% | -22% | -28% | |
| off / environment * (dB) | 23.4 | 22.7 3% | 24.7 -6% | 21.07 10% | 24 -3% | 23.2 1% |
| Idle Minimum * (dB) | 23.8 | 23.1 3% | 25.3 -6% | 29.75 -25% | 25 -5% | 33.5 -41% |
| Idle Average * (dB) | 28.5 | 25.8 9% | 25.3 11% | 29.75 -4% | 30 -5% | 33.5 -18% |
| Idle Maximum * (dB) | 28.5 | 25.8 9% | 25.3 11% | 29.75 -4% | 45 -58% | 33.5 -18% |
| Load Average * (dB) | 28.8 | 39.3 -36% | 31.7 -10% | 54.85 -90% | 50 -74% | 52.1 -81% |
| Witcher 3 ultra * (dB) | 49.5 | 49.9 -1% | 53.8 -9% | 57.8 -17% | 54 -9% | 62 -25% |
| Load Maximum * (dB) | 54.2 | 54.8 -1% | 62 -14% | 58 -7% | 56 -3% | 62 -14% |
* ... smaller is better
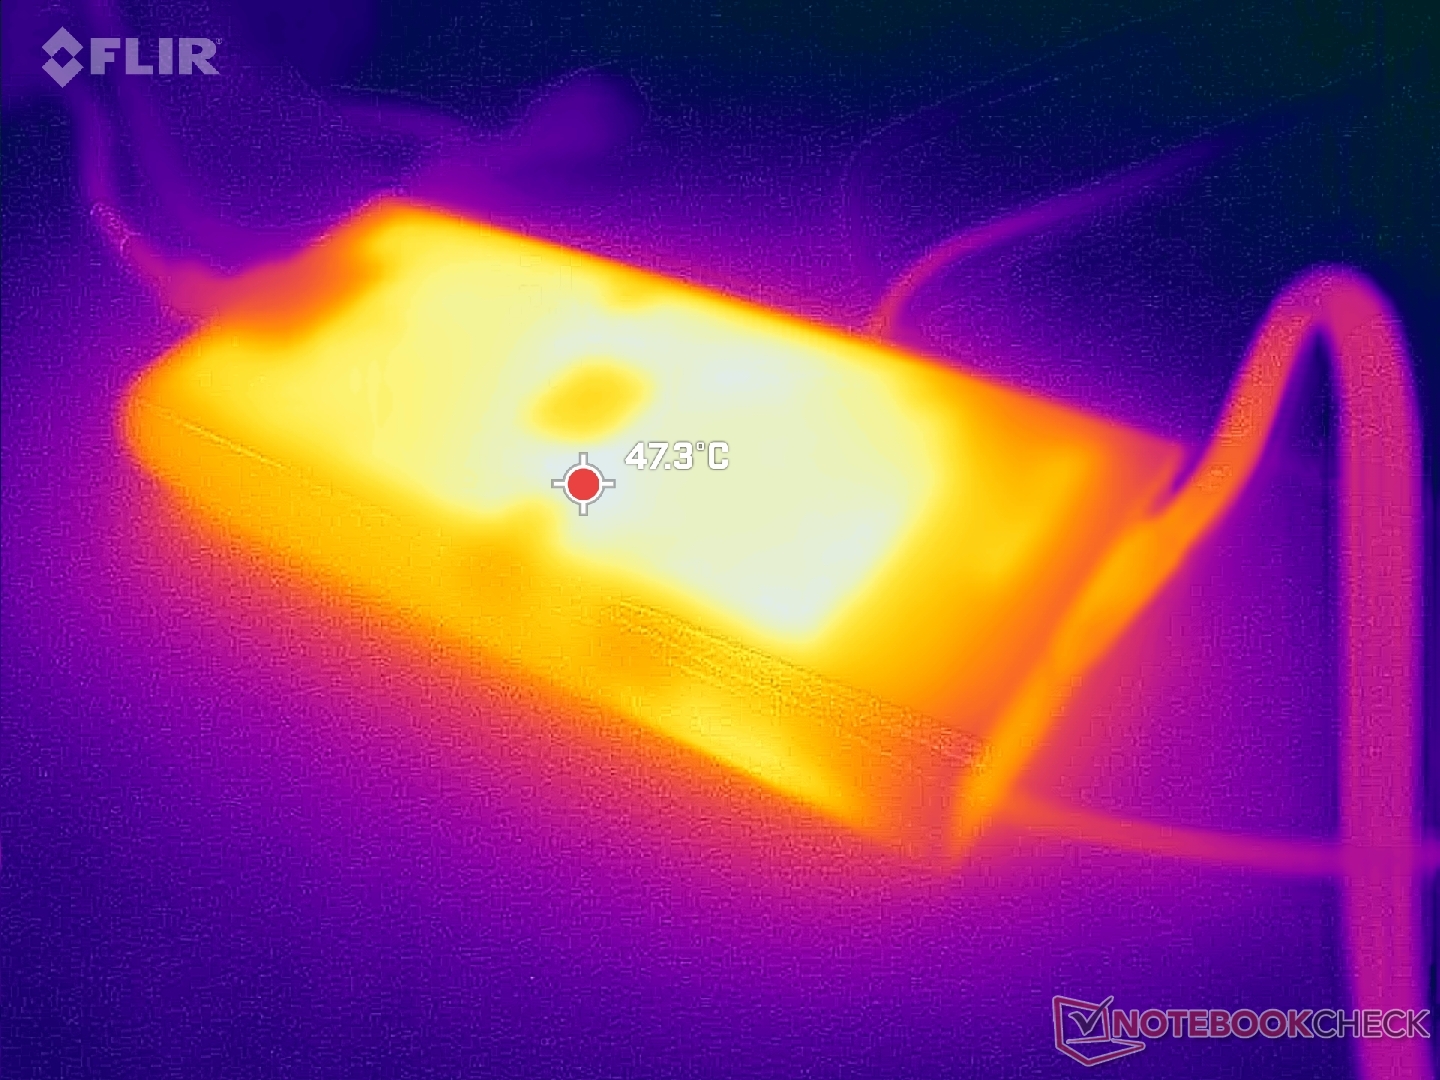
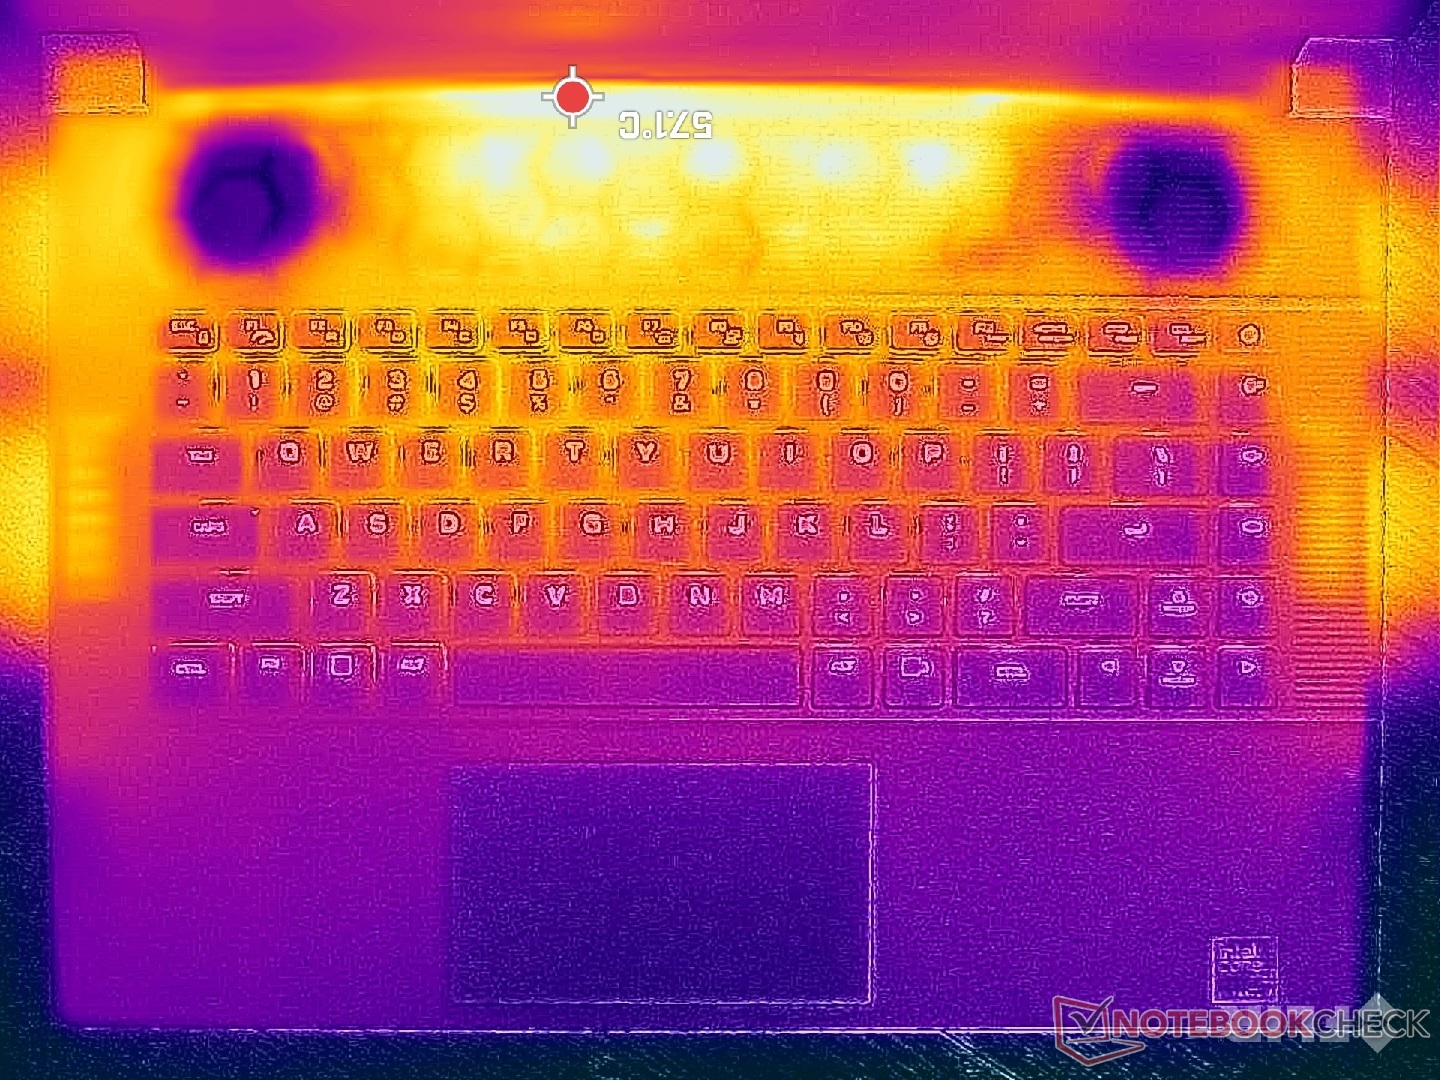
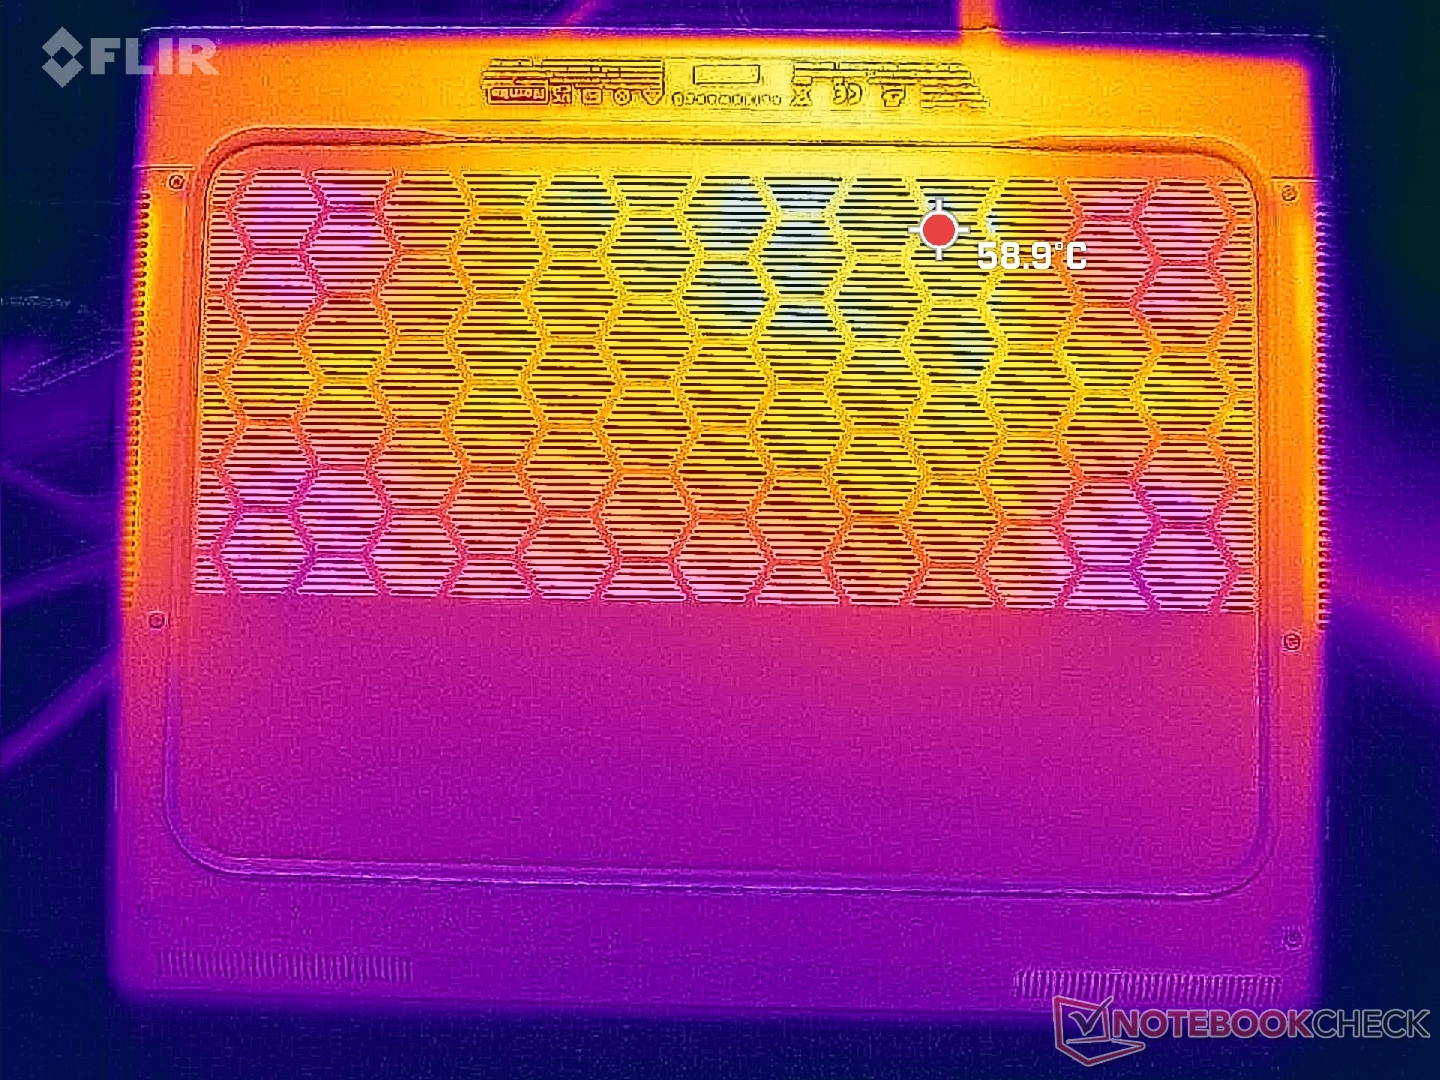
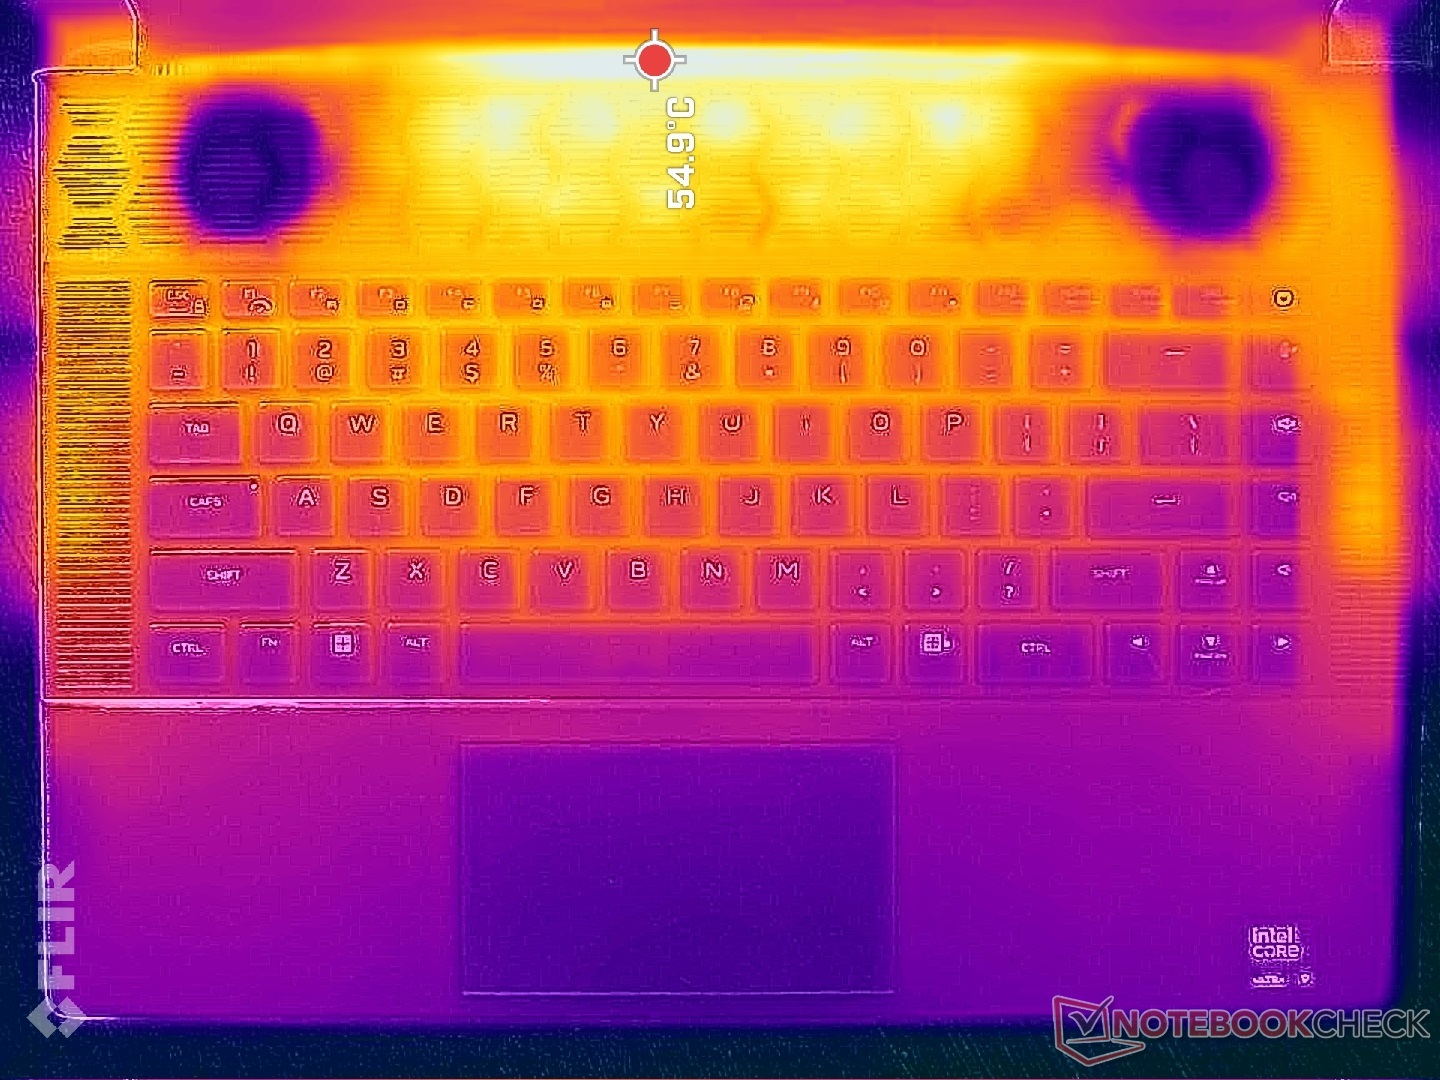
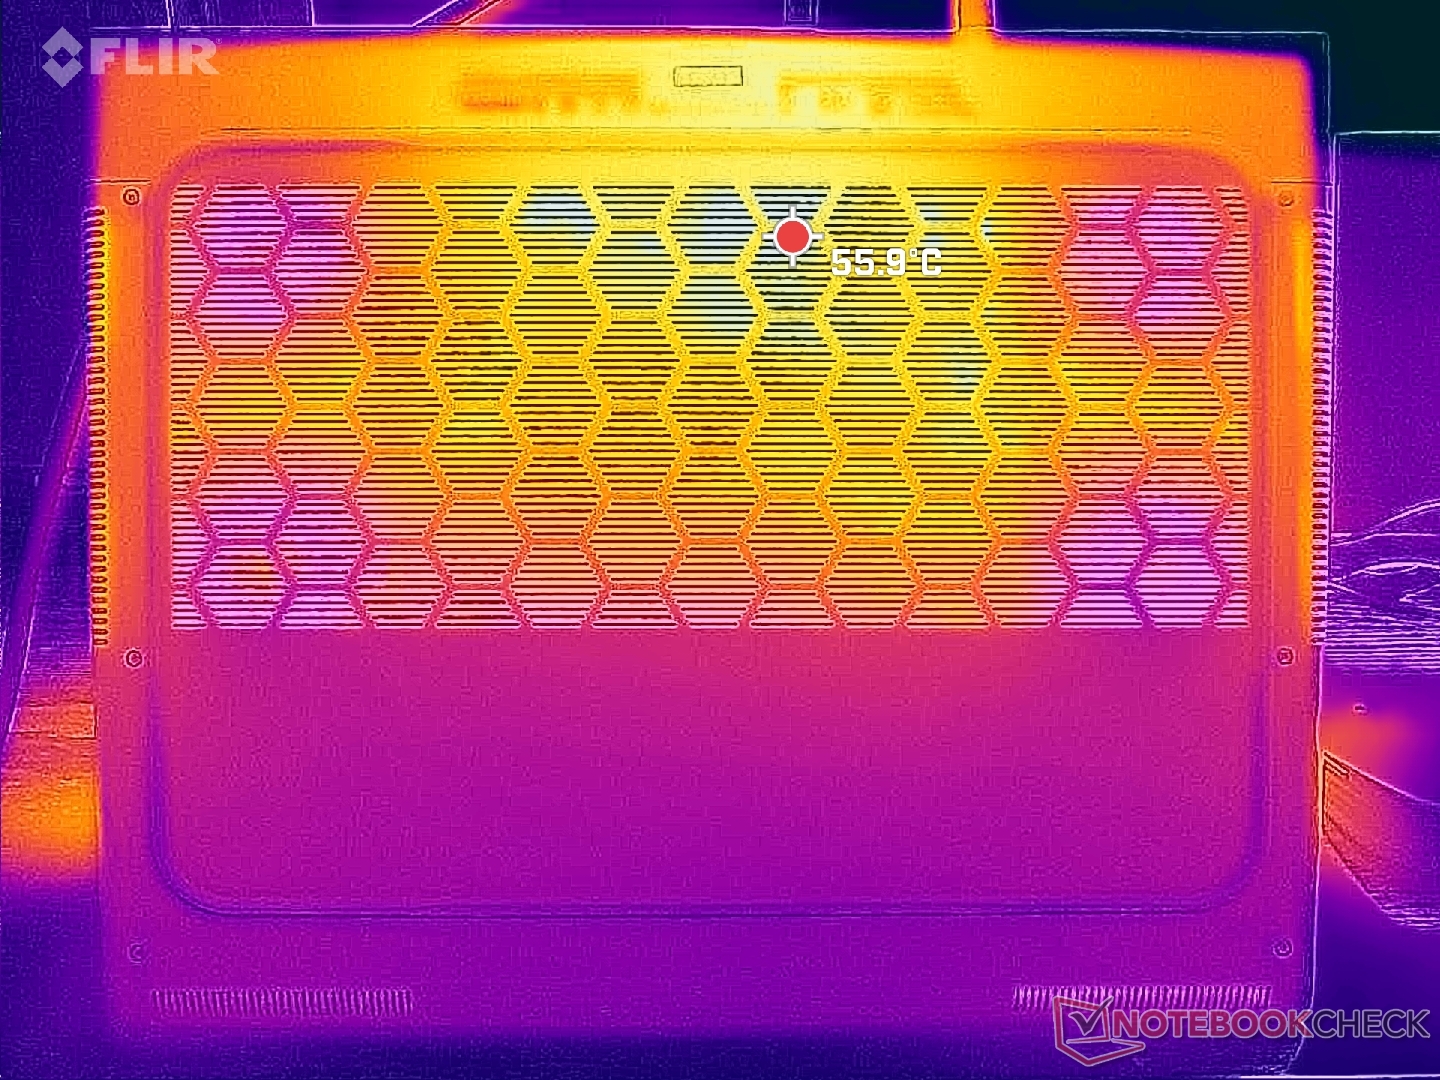
Temperature
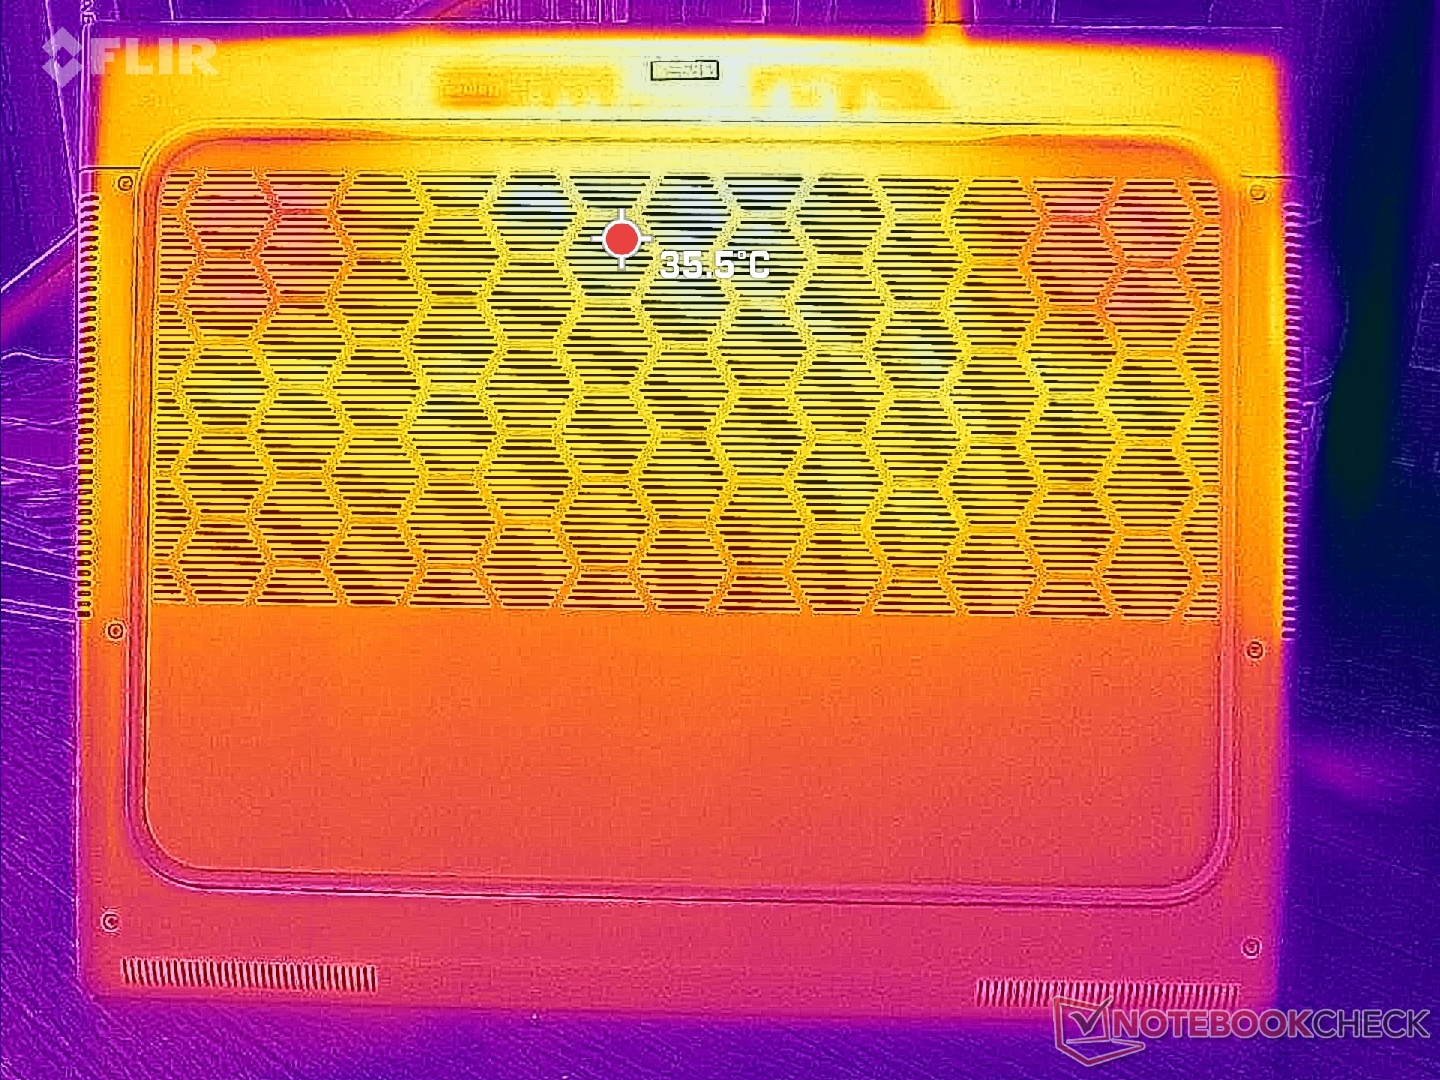
Surface temperatures are very warm towards the back half of the chassis while the front half is noticeably cooler for palms and fingers. The Alienware x16 series utilizes more ventilation grilles than the m16 series by necessity since the x16 design is defined by its thinness.
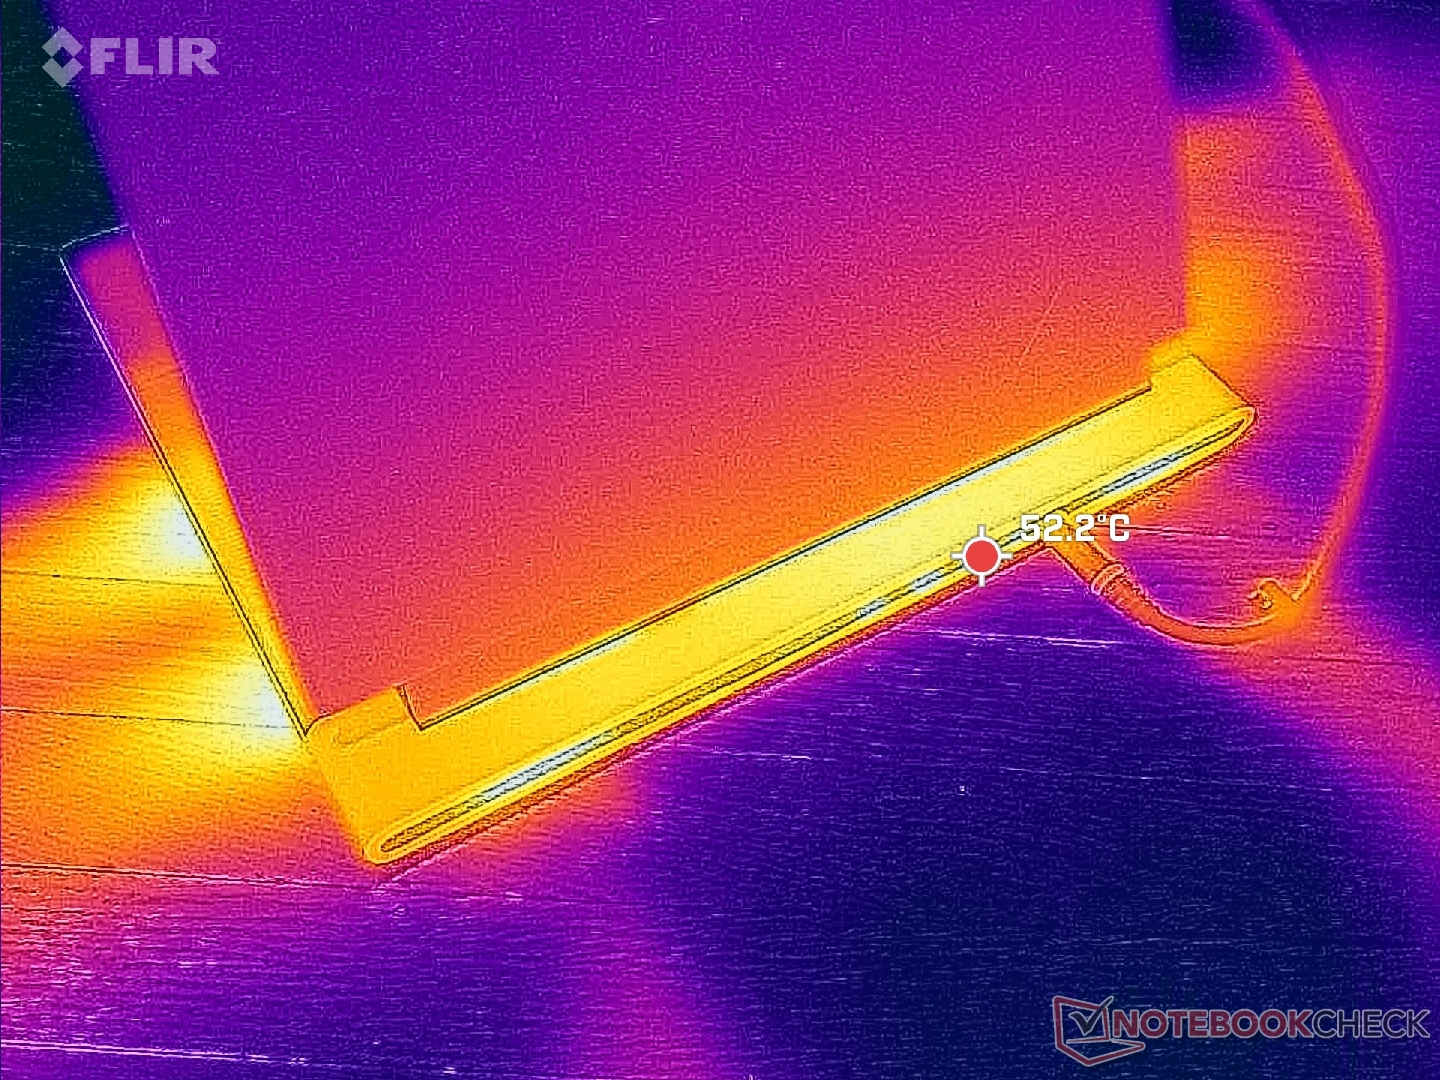
(-) The maximum temperature on the upper side is 51 °C / 124 F, compared to the average of 40.4 °C / 105 F, ranging from 21.2 to 68.8 °C for the class Gaming.
(-) The bottom heats up to a maximum of 50.8 °C / 123 F, compared to the average of 43.3 °C / 110 F
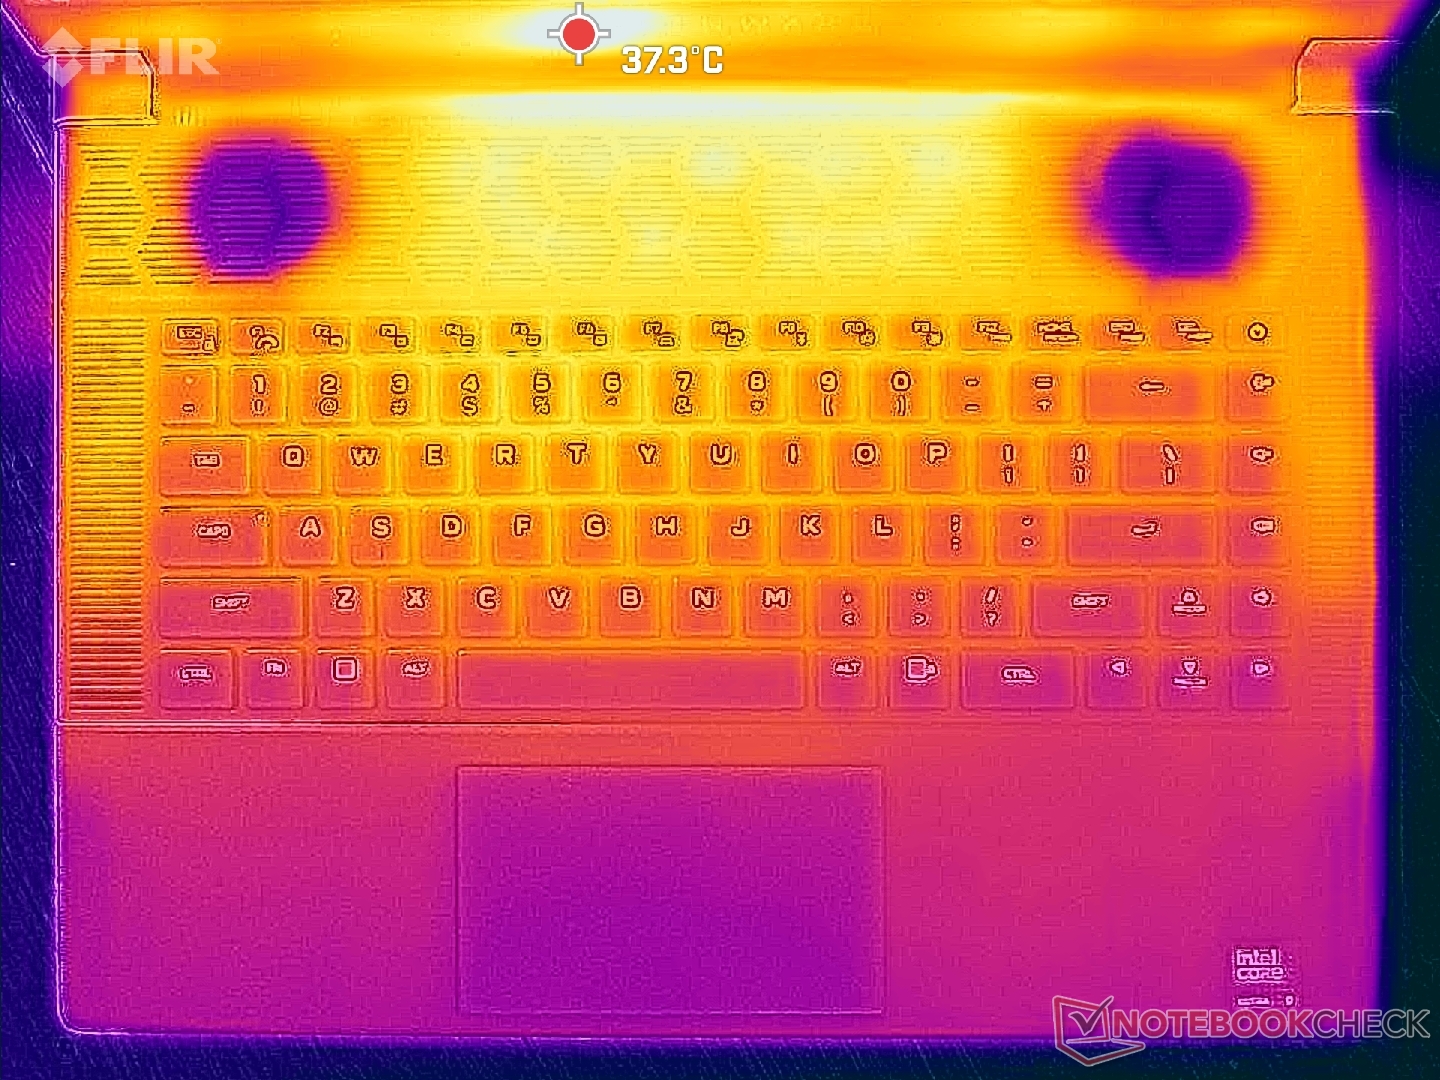
(+) In idle usage, the average temperature for the upper side is 31.3 °C / 88 F, compared to the device average of 33.9 °C / 93 F.
(-) Playing The Witcher 3, the average temperature for the upper side is 42.4 °C / 108 F, compared to the device average of 33.9 °C / 93 F.
(+) The palmrests and touchpad are reaching skin temperature as a maximum (33.2 °C / 91.8 F) and are therefore not hot.
(-) The average temperature of the palmrest area of similar devices was 28.8 °C / 83.8 F (-4.4 °C / -8 F).
| Alienware x16 R2 P120F Intel Core Ultra 9 185H, NVIDIA GeForce RTX 4080 Laptop GPU | Alienware x16 R1 Intel Core i9-13900HK, NVIDIA GeForce RTX 4080 Laptop GPU | Alienware m16 R2 Intel Core Ultra 7 155H, NVIDIA GeForce RTX 4070 Laptop GPU | Asus ROG Strix Scar 16 G634JZR Intel Core i9-14900HX, NVIDIA GeForce RTX 4080 Laptop GPU | Lenovo Legion Pro 7 16IRX9H Intel Core i9-14900HX, NVIDIA GeForce RTX 4080 Laptop GPU | MSI Vector 16 HX A14V Intel Core i9-14900HX, NVIDIA GeForce RTX 4080 Laptop GPU | |
|---|---|---|---|---|---|---|
| Heat | 3% | -1% | 5% | 1% | 27% | |
| Maximum Upper Side * (°C) | 51 | 47.2 7% | 44.8 12% | 47.8 6% | 46 10% | 36.4 29% |
| Maximum Bottom * (°C) | 50.8 | 47.8 6% | 48 6% | 52.2 -3% | 49 4% | 35.6 30% |
| Idle Upper Side * (°C) | 36.6 | 36.8 -1% | 37.2 -2% | 32.4 11% | 38 -4% | 26.6 27% |
| Idle Bottom * (°C) | 35.2 | 35.8 -2% | 42 -19% | 33 6% | 37 -5% | 27 23% |
* ... smaller is better
Speakers
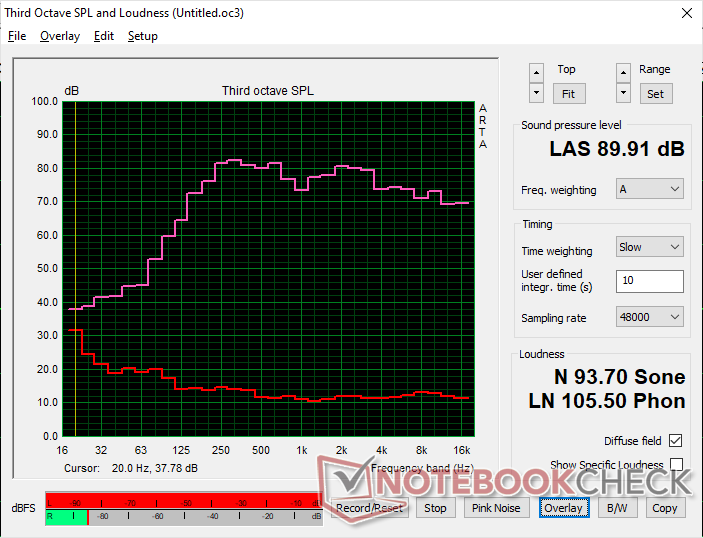
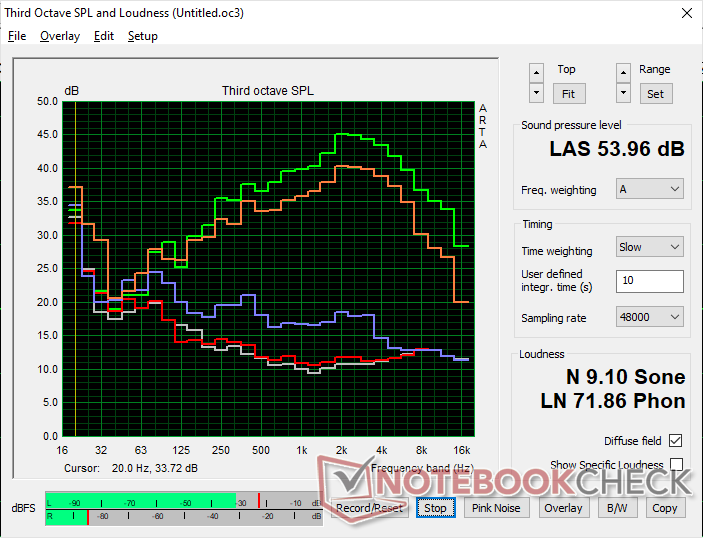
Alienware x16 R2 P120F audio analysis
(+) | speakers can play relatively loud (89.9 dB)
Bass 100 - 315 Hz
(±) | reduced bass - on average 7.4% lower than median
(±) | linearity of bass is average (7.6% delta to prev. frequency)
Mids 400 - 2000 Hz
(+) | balanced mids - only 2.6% away from median
(+) | mids are linear (3.6% delta to prev. frequency)
Highs 2 - 16 kHz
(+) | balanced highs - only 3.4% away from median
(+) | highs are linear (2.8% delta to prev. frequency)
Overall 100 - 16.000 Hz
(+) | overall sound is linear (8.2% difference to median)
Compared to same class
» 1% of all tested devices in this class were better, 1% similar, 98% worse
» The best had a delta of 6%, average was 18%, worst was 132%
Compared to all devices tested
» 2% of all tested devices were better, 1% similar, 98% worse
» The best had a delta of 4%, average was 24%, worst was 134%
Apple MacBook Pro 16 2021 M1 Pro audio analysis
(+) | speakers can play relatively loud (84.7 dB)
Bass 100 - 315 Hz
(+) | good bass - only 3.8% away from median
(+) | bass is linear (5.2% delta to prev. frequency)
Mids 400 - 2000 Hz
(+) | balanced mids - only 1.3% away from median
(+) | mids are linear (2.1% delta to prev. frequency)
Highs 2 - 16 kHz
(+) | balanced highs - only 1.9% away from median
(+) | highs are linear (2.7% delta to prev. frequency)
Overall 100 - 16.000 Hz
(+) | overall sound is linear (4.6% difference to median)
Compared to same class
» 0% of all tested devices in this class were better, 0% similar, 100% worse
» The best had a delta of 5%, average was 17%, worst was 45%
Compared to all devices tested
» 0% of all tested devices were better, 0% similar, 100% worse
» The best had a delta of 4%, average was 24%, worst was 134%
Energy Management
Power Consumption
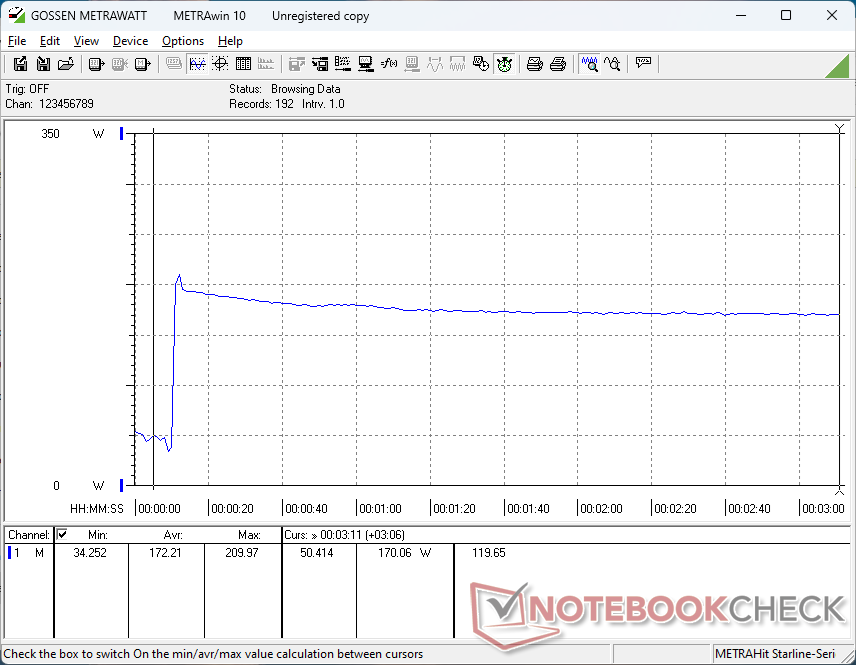
Overall consumption is generally lower than what we recorded on the x16 R1 by about 10 to 15 percent when running demanding loads like games or Prime95 stress. However, this deficit accompanies the slower CPU and GPU results noted above. Performance-per-watt is therefore about the same year-over-year despite the CPU change.
We encountered a bug when on Standby mode. If set to Optimus, Standby mode would operate normally with a low <1 watt power draw. If set to dGPU mode and Overdrive, however, Standby mode would demand as much as 39 W resulting in an unnecessarily warm laptop and high battery draw.

| Off / Standby | |
| Idle | |
| Load |
|
Key:
min: | |
| Alienware x16 R2 P120F Ultra 9 185H, GeForce RTX 4080 Laptop GPU, WDC PC SN810 1TB, IPS, 2560x1600, 16" | Alienware x16 R1 i9-13900HK, GeForce RTX 4080 Laptop GPU, SK hynix PC801 HFS001TEJ9X101N, IPS, 2560x1600, 16" | Alienware m16 R2 Ultra 7 155H, GeForce RTX 4070 Laptop GPU, Samsung PM9A1 MZVL21T0HCLR, IPS, 2560x1600, 16" | Asus ROG Strix Scar 16 G634JZR i9-14900HX, GeForce RTX 4080 Laptop GPU, SK hynix PC801 HFS002TEJ9X101N, Mini LED, 2560x1600, 16" | Lenovo Legion Pro 7 16IRX9H i9-14900HX, GeForce RTX 4080 Laptop GPU, SK Hynix HFS001TEJ9X115N, IPS, 2560x1600, 16" | MSI Vector 16 HX A14V i9-14900HX, GeForce RTX 4080 Laptop GPU, WD PC SN560 SDDPNQE-1T00, IPS, 2560x1600, 16" | |
|---|---|---|---|---|---|---|
| Power Consumption | -55% | 11% | -10% | -30% | -27% | |
| Idle Minimum * (Watt) | 9.9 | 25.2 -155% | 8.1 18% | 10.71 -8% | 16 -62% | 15.8 -60% |
| Idle Average * (Watt) | 14.5 | 29.9 -106% | 13 10% | 14.75 -2% | 21 -45% | 23.3 -61% |
| Idle Maximum * (Watt) | 33.5 | 49.8 -49% | 40.3 -20% | 30 10% | 36 -7% | 30 10% |
| Load Average * (Watt) | 97.5 | 105.4 -8% | 79 19% | 135 -38% | 132 -35% | 123.9 -27% |
| Witcher 3 ultra * (Watt) | 230 | 263 -14% | 188.1 18% | 286 -24% | 267 -16% | 285 -24% |
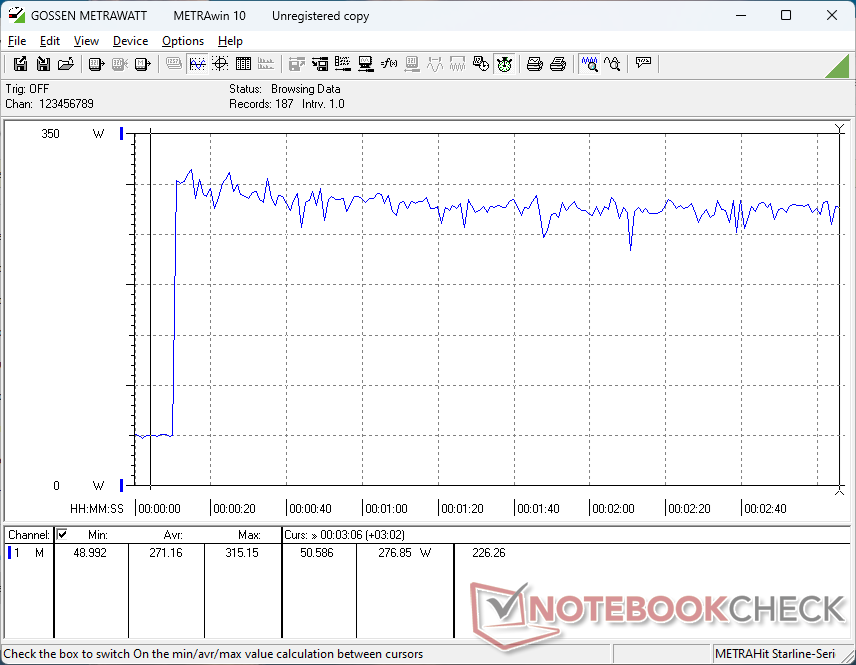
| Load Maximum * (Watt) | 315.2 | 313.8 -0% | 254.9 19% | 307 3% | 360 -14% | 306 3% |
* ... smaller is better
Power Consumption Witcher 3 / Stresstest
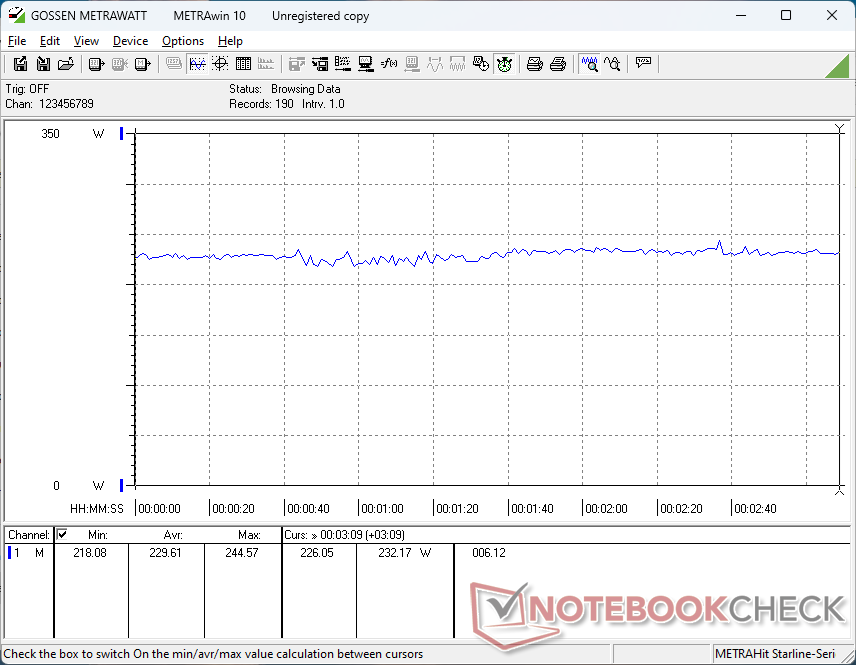
Power Consumption external Monitor
Battery Life
Runtimes are a bit longer this time around likely due to the overall lower power consumption noted above. We're able to record a WLAN runtime of over 40 minutes longer than on the x16 R1, but most other gaming laptops are still able to last much longer including Dell's own Alienware m16 R2.
| Alienware x16 R2 P120F Ultra 9 185H, GeForce RTX 4080 Laptop GPU, 90 Wh | Alienware x16 R1 i9-13900HK, GeForce RTX 4080 Laptop GPU, 90 Wh | Alienware m16 R2 Ultra 7 155H, GeForce RTX 4070 Laptop GPU, 90 Wh | Asus ROG Strix Scar 16 G634JZR i9-14900HX, GeForce RTX 4080 Laptop GPU, 90 Wh | Lenovo Legion Pro 7 16IRX9H i9-14900HX, GeForce RTX 4080 Laptop GPU, 99.9 Wh | MSI Vector 16 HX A14V i9-14900HX, GeForce RTX 4080 Laptop GPU, 90 Wh | |
|---|---|---|---|---|---|---|
| Battery runtime | -22% | 153% | 125% | 94% | 72% | |
| WiFi v1.3 (h) | 3.2 | 2.5 -22% | 8.1 153% | 7.2 125% | 6.2 94% | 5.5 72% |
| Reader / Idle (h) | 7.3 | 12.6 | 10.7 | |||
| Load (h) | 0.7 | 1 | 0.9 | 1.4 | ||
| H.264 (h) | 7.5 | |||||
| Witcher 3 ultra (h) | 1 |
Pros
Cons
Verdict — Alienware x16 R1 Is Faster For Pure Gaming
The big advantage that the Alienware x16 R2 has over the x16 R1 is its integrated NPU for accelerating Windows AI tasks. Such features are expected to become commonplace in the next year or so via Microsoft Co-Pilot and other upcoming Ai-driven applications. For gaming purposes, however, the NPU brings nothing to the table to improve the experience as of 2024. If anything, it's arguably detrimental as raw CPU performance has dropped when compared to the Core i9-13900HK in last year's x16 R1 since precious die space has been reserved for the new neural processor.
The Alienware x16 R2 introduces new Meteor Lake-H CPUs with an integrated NPU for compatibility with future Windows AI features. Unfortunately, raw gaming performance has suffered as a result.
The generally slower performance has also led to lower power consumption and longer runtimes than the original launch model. However, the target gaming enthusiasts who like to buy Alienware are probably not very excited about trading in performance for battery life. Such a move would have been more acceptable on the lower-end Dell G series instead.
We recommend considering the original Alienware x16 R1 since the x16 R2 doesn't offer any new GPU options, display options, or even chassis colors or external changes. The CPU update is only desirable for those who want to "future-proof" their workspace with the integrated NPU.
Price and Availability
Dell is now shipping the Alienware x16 R2 starting at $2100 for the Core Ultra 7, GeForce RTX 4060, standard keyboard, and 1600p240 IPS configuration or up to $3500 if configured with the Core Ultra 9, RTX 4090, and mechanical keyboard.
Alienware x16 R2 P120F
- 05/29/2024 v7 (old)
Allen Ngo
Transparency
The selection of devices to be reviewed is made by our editorial team. The test sample was provided to the author as a loan by the manufacturer or retailer for the purpose of this review. The lender had no influence on this review, nor did the manufacturer receive a copy of this review before publication. There was no obligation to publish this review. As an independent media company, Notebookcheck is not subjected to the authority of manufacturers, retailers or publishers.
This is how Notebookcheck is testing
Every year, Notebookcheck independently reviews hundreds of laptops and smartphones using standardized procedures to ensure that all results are comparable. We have continuously developed our test methods for around 20 years and set industry standards in the process. In our test labs, high-quality measuring equipment is utilized by experienced technicians and editors. These tests involve a multi-stage validation process. Our complex rating system is based on hundreds of well-founded measurements and benchmarks, which maintains objectivity. Further information on our test methods can be found here.
Price comparison
