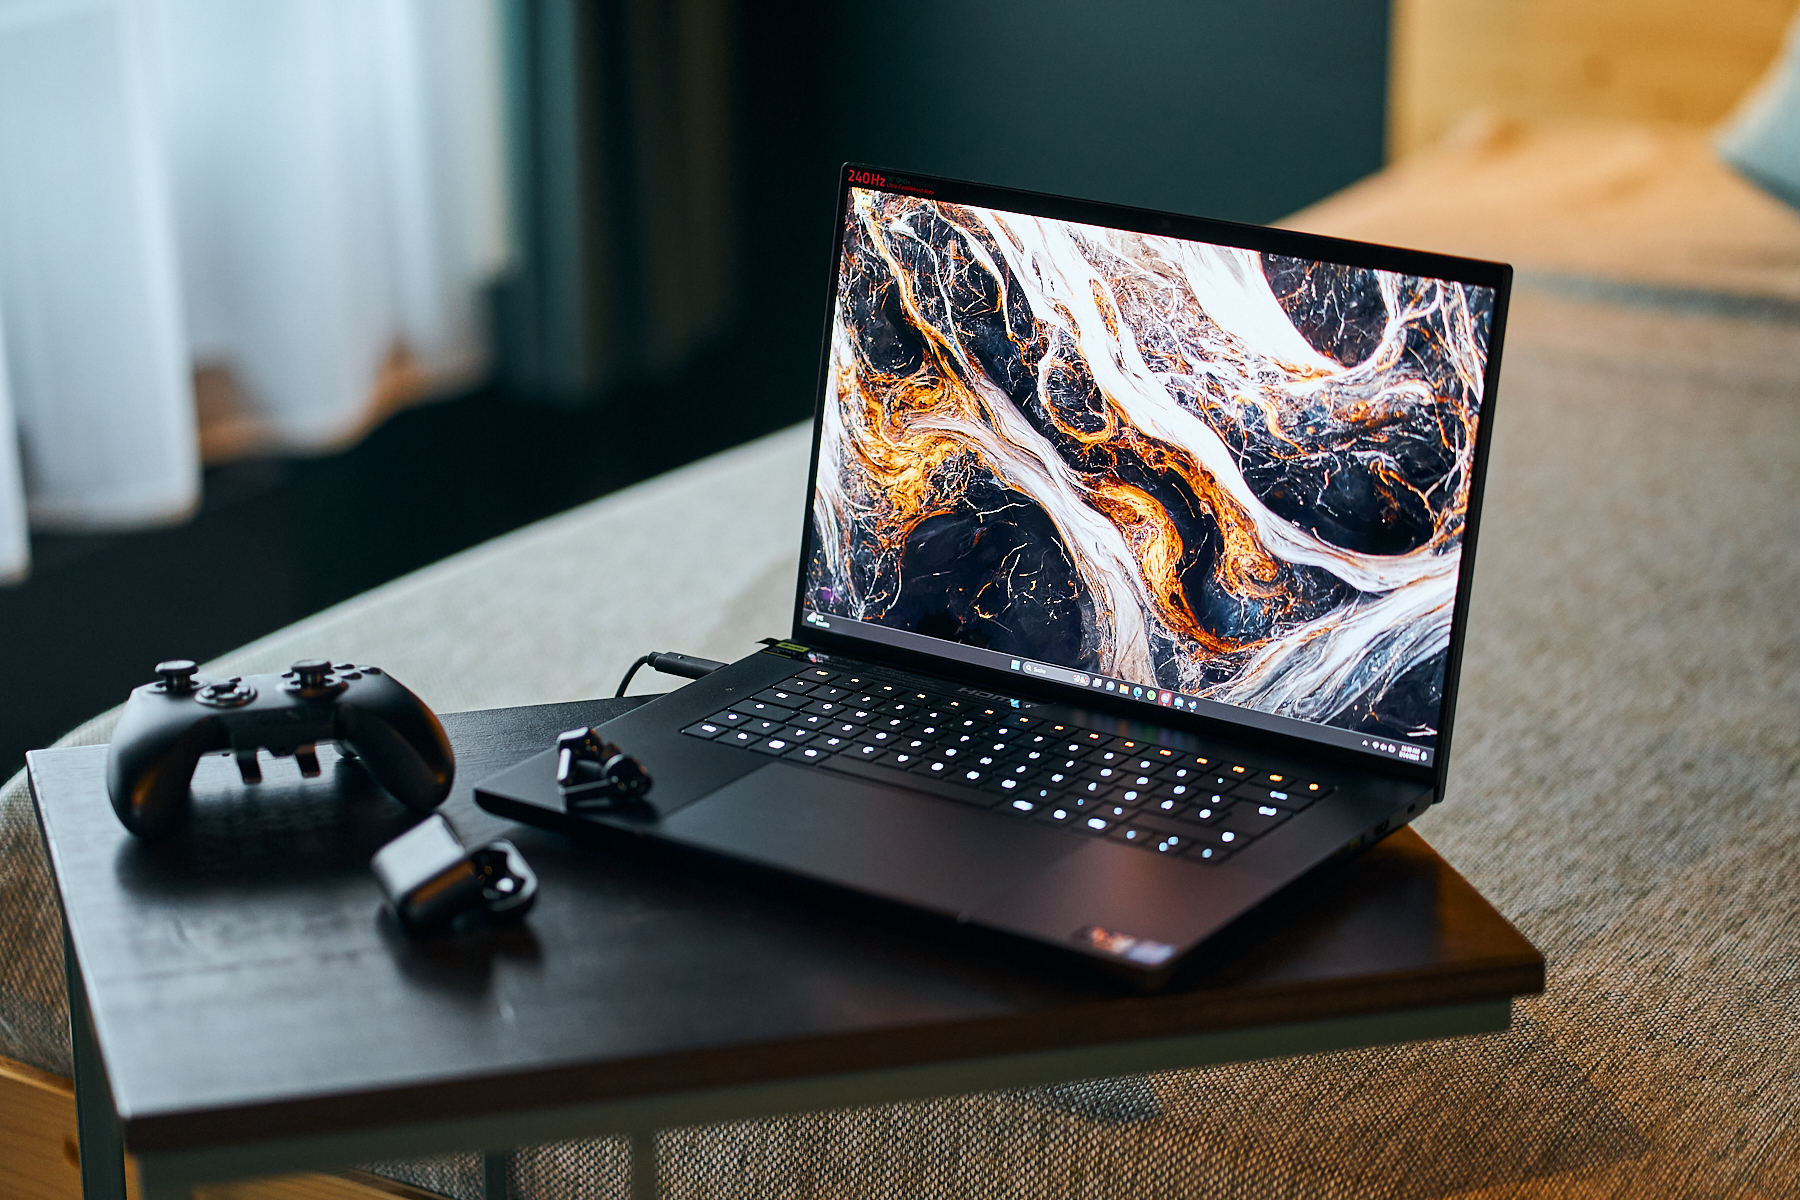
Razer Blade 16 (2024) laptop review: Now with super-fast Samsung OLED

What's new about the Razer Blade compared to its predecessor from last year? In short: WiFi 7, Intel Gen 14 and an OLED display. The latter is what Razer advertizes as its big new feature. Even so, the predecessor model's already excellent Mini-LED options have been kept, meaning you can now choose between OLED and Mini-LED. So, in this review, we will be taking a very close look at the laptop's display in particular. Furthermore, we will check what performance Intel Gen 14 can deliver inside the Blade 16 compared to Gen 13.
Our 2024 Razer Blade 16 will compete against other 16-inch gamers with an RTX 4090, first and foremost the Lenovo flagship Legion 9i Gen 8 16IRX8—but also the Schenker XMG Neo 16 E23 and the Asus ROG Zephyrus M16. And, of course, we will also be comparing it to its predecessor with the Gen-13-HX CPU and the RTX 4090. In order to at least have one laptop with a new Gen-14 CPU in the comparison field, we will also be pitting it against the Lenovo Legion 5i 16 G9 with the i7-14650HX.
Possible competitors compared
Rating | Date | Model | Weight | Height | Size | Resolution | Price |
|---|---|---|---|---|---|---|---|
| 91.1 % v7 (old) | 02 / 2024 | Razer Blade 16 2024, RTX 4090 i9-14900HX, GeForce RTX 4090 Laptop GPU | 2.5 kg | 22 mm | 16.00" | 2560x1600 | |
| 89.8 % v7 (old) | 03 / 2023 | Razer Blade 16 Early 2023 RTX 4090 i9-13950HX, GeForce RTX 4090 Laptop GPU | 2.5 kg | 21.99 mm | 16.00" | 3840x2400 | |
| 90.2 % v7 (old) | 10 / 2023 | Lenovo Legion 9 16IRX8 i9-13980HX, GeForce RTX 4090 Laptop GPU | 2.6 kg | 22.7 mm | 16.00" | 3200x2000 | |
| 87.7 % v7 (old) | 04 / 2023 | Schenker XMG Neo 16 E23 i9-13900HX, GeForce RTX 4090 Laptop GPU | 2.5 kg | 29.9 mm | 16.00" | 2560x1600 | |
| 89.1 % v7 (old) | 01 / 2024 | Lenovo Legion 5 16IRX G9 i7-14650HX, GeForce RTX 4060 Laptop GPU | 2.4 kg | 25.2 mm | 16.00" | 2560x1600 |
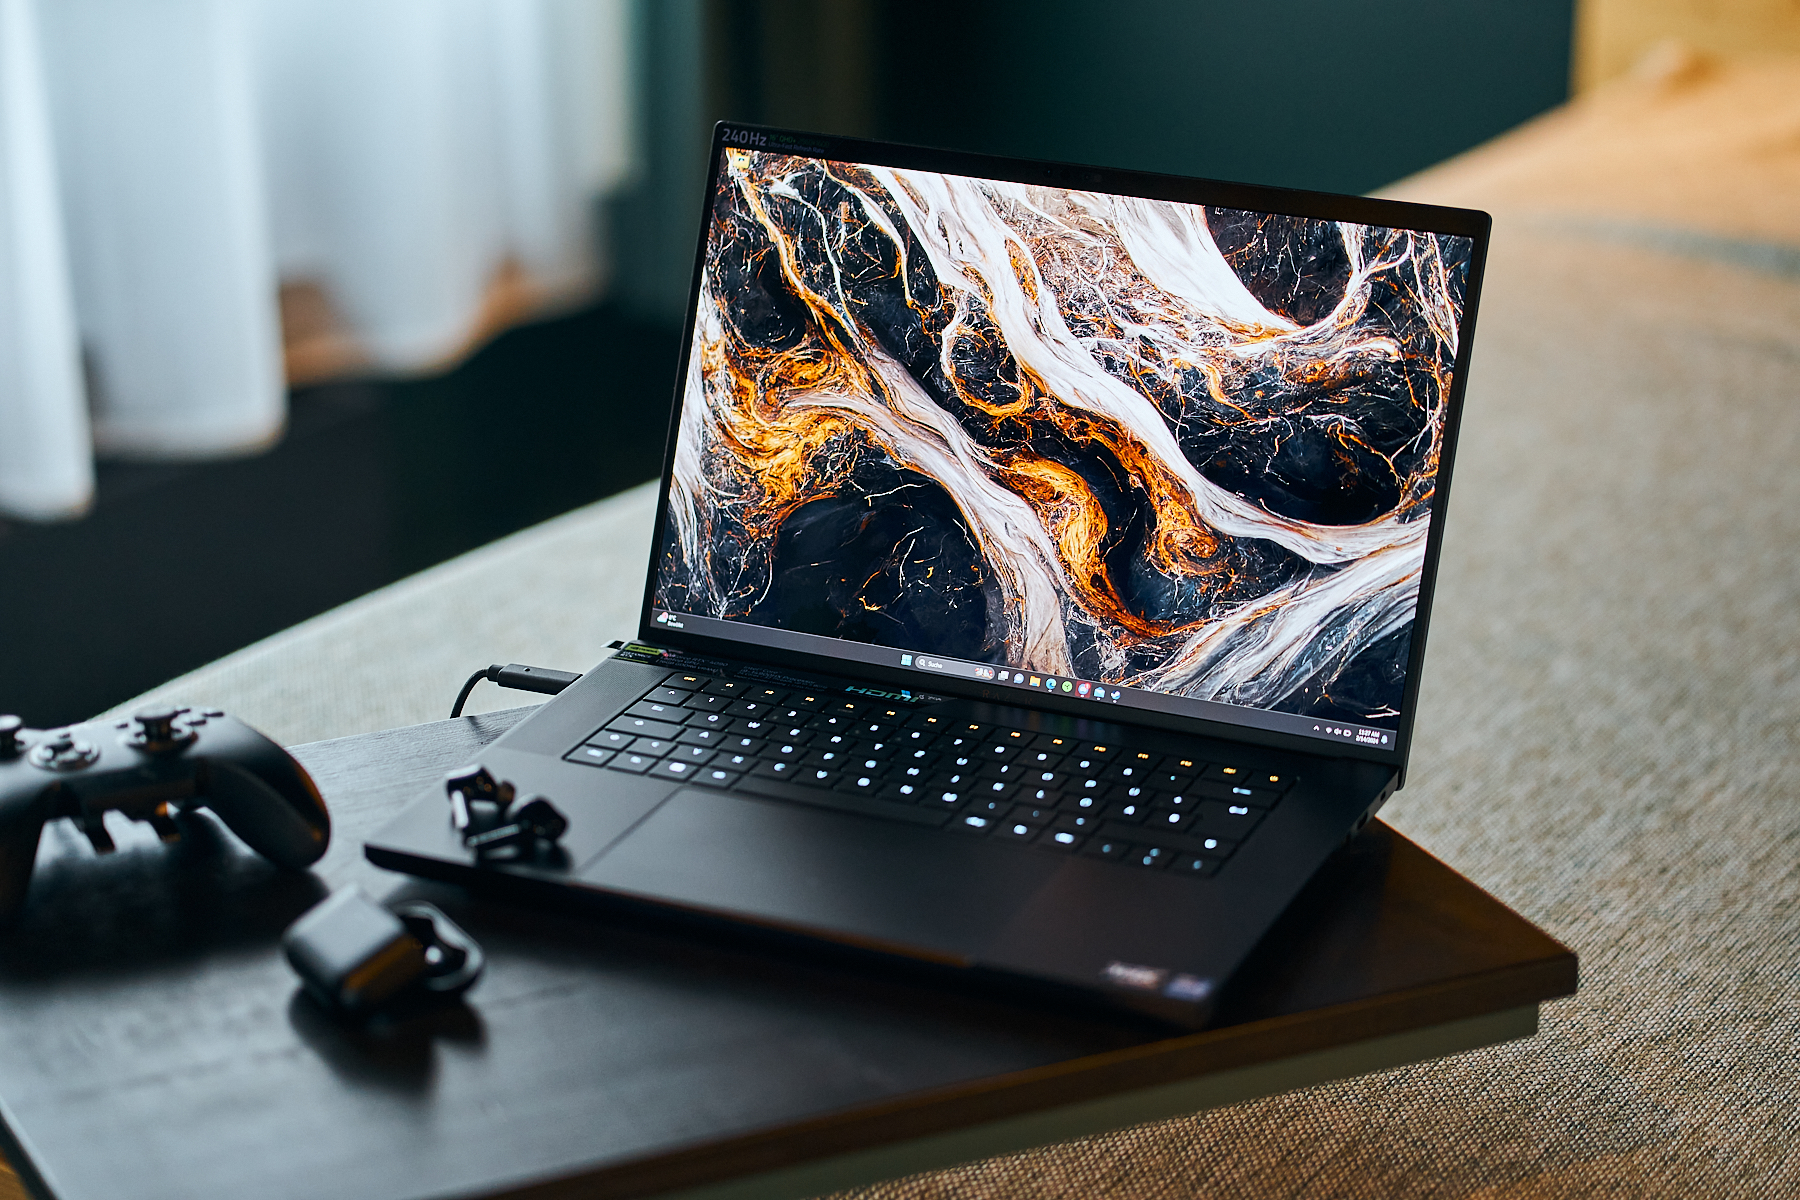
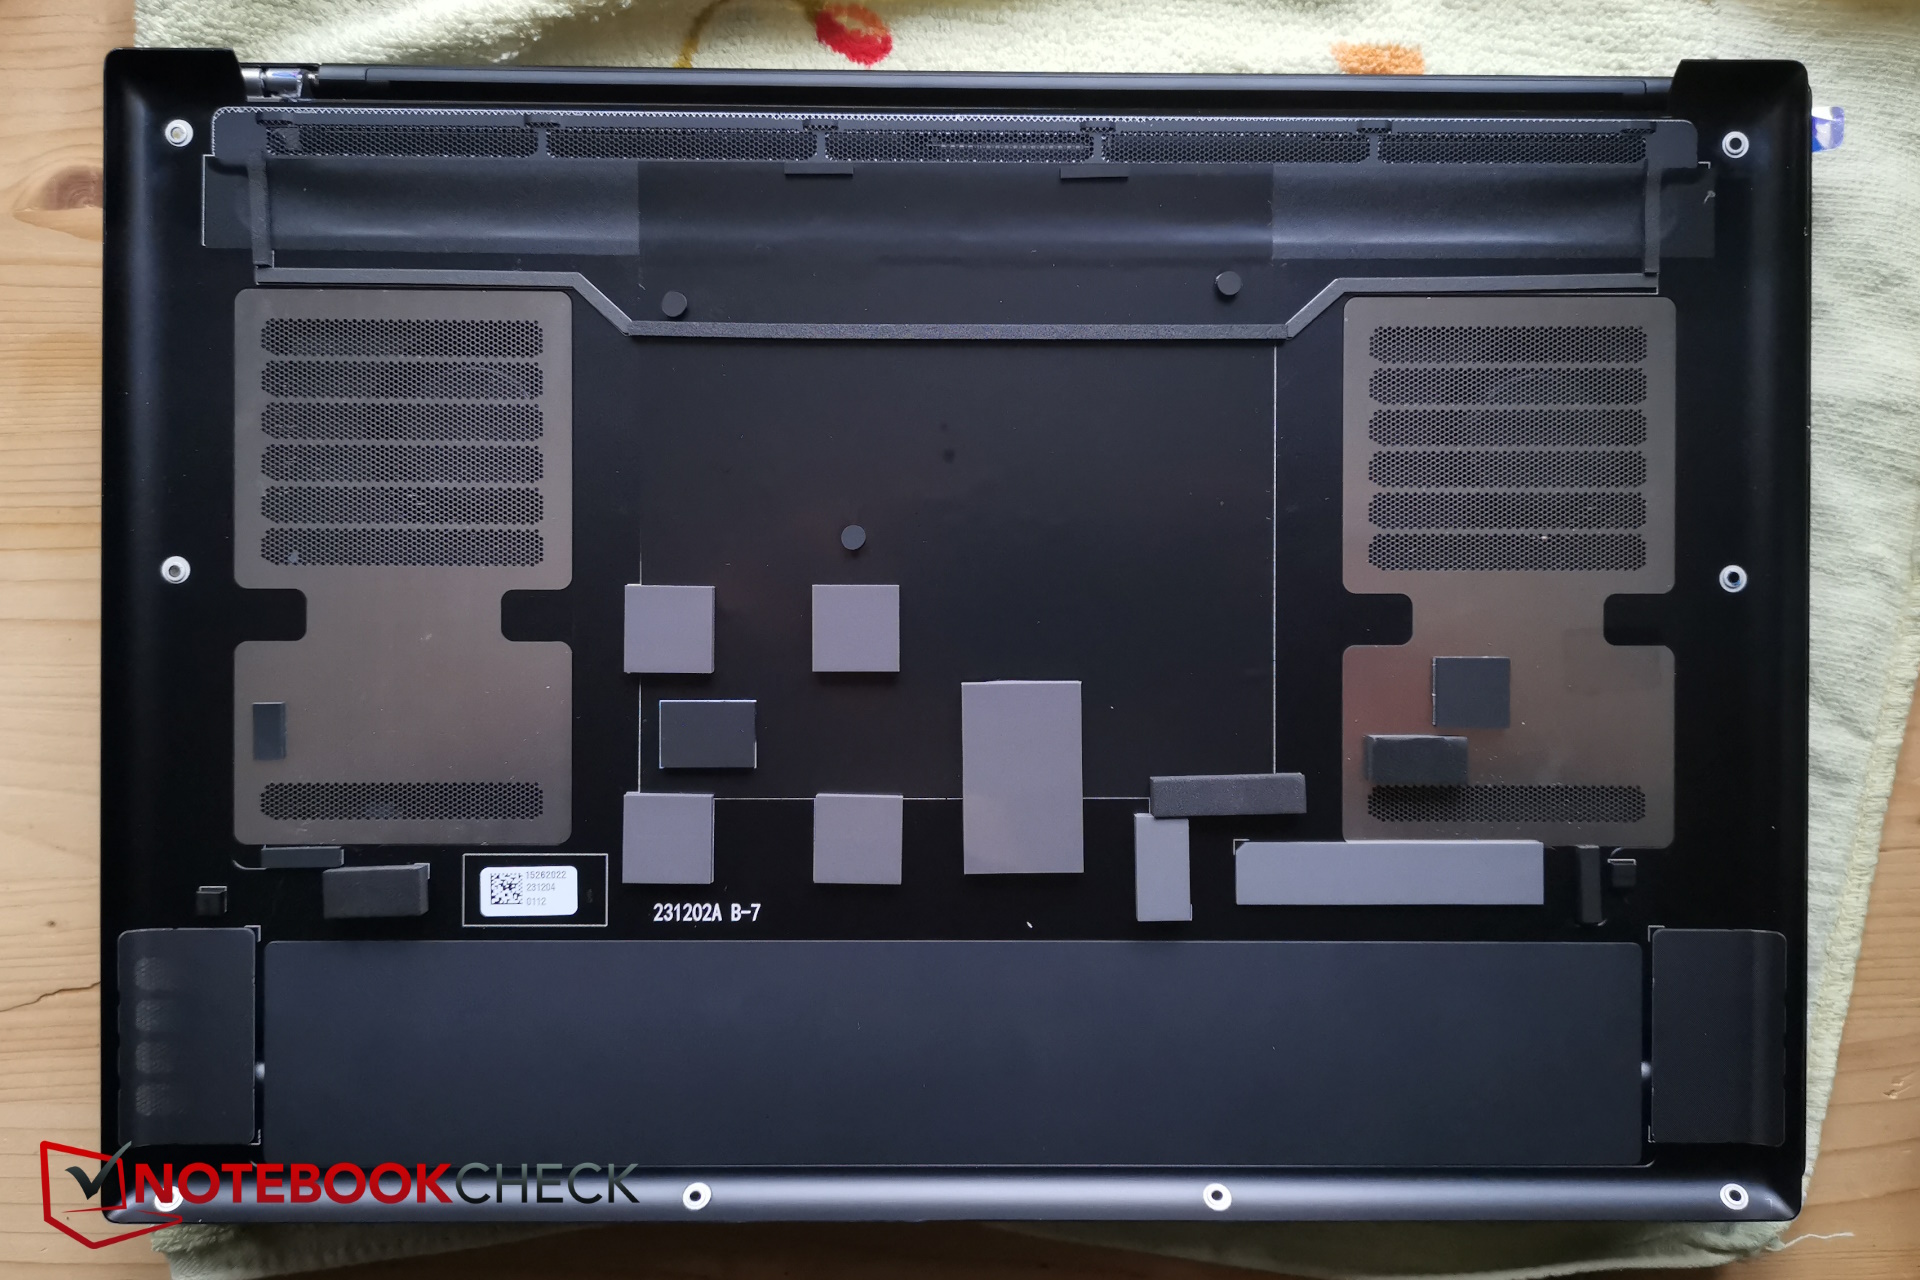
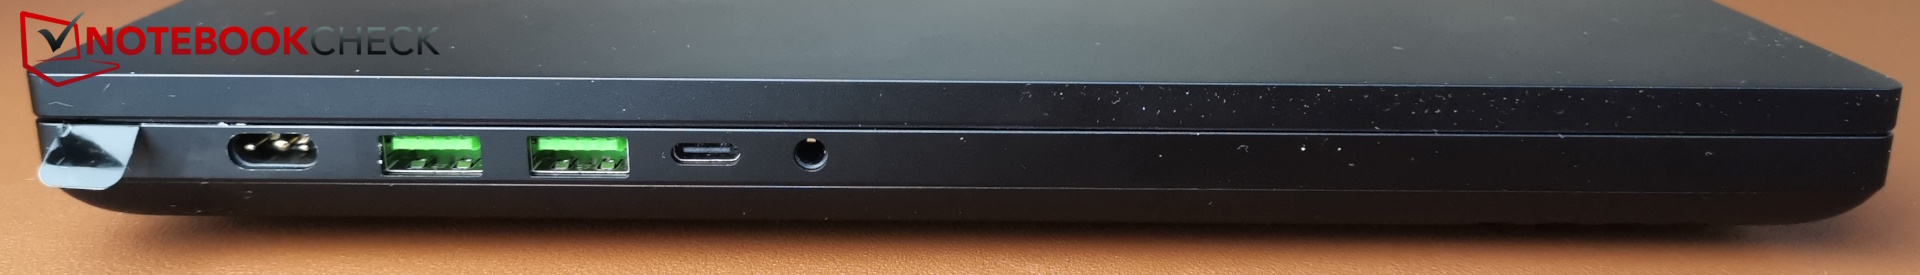
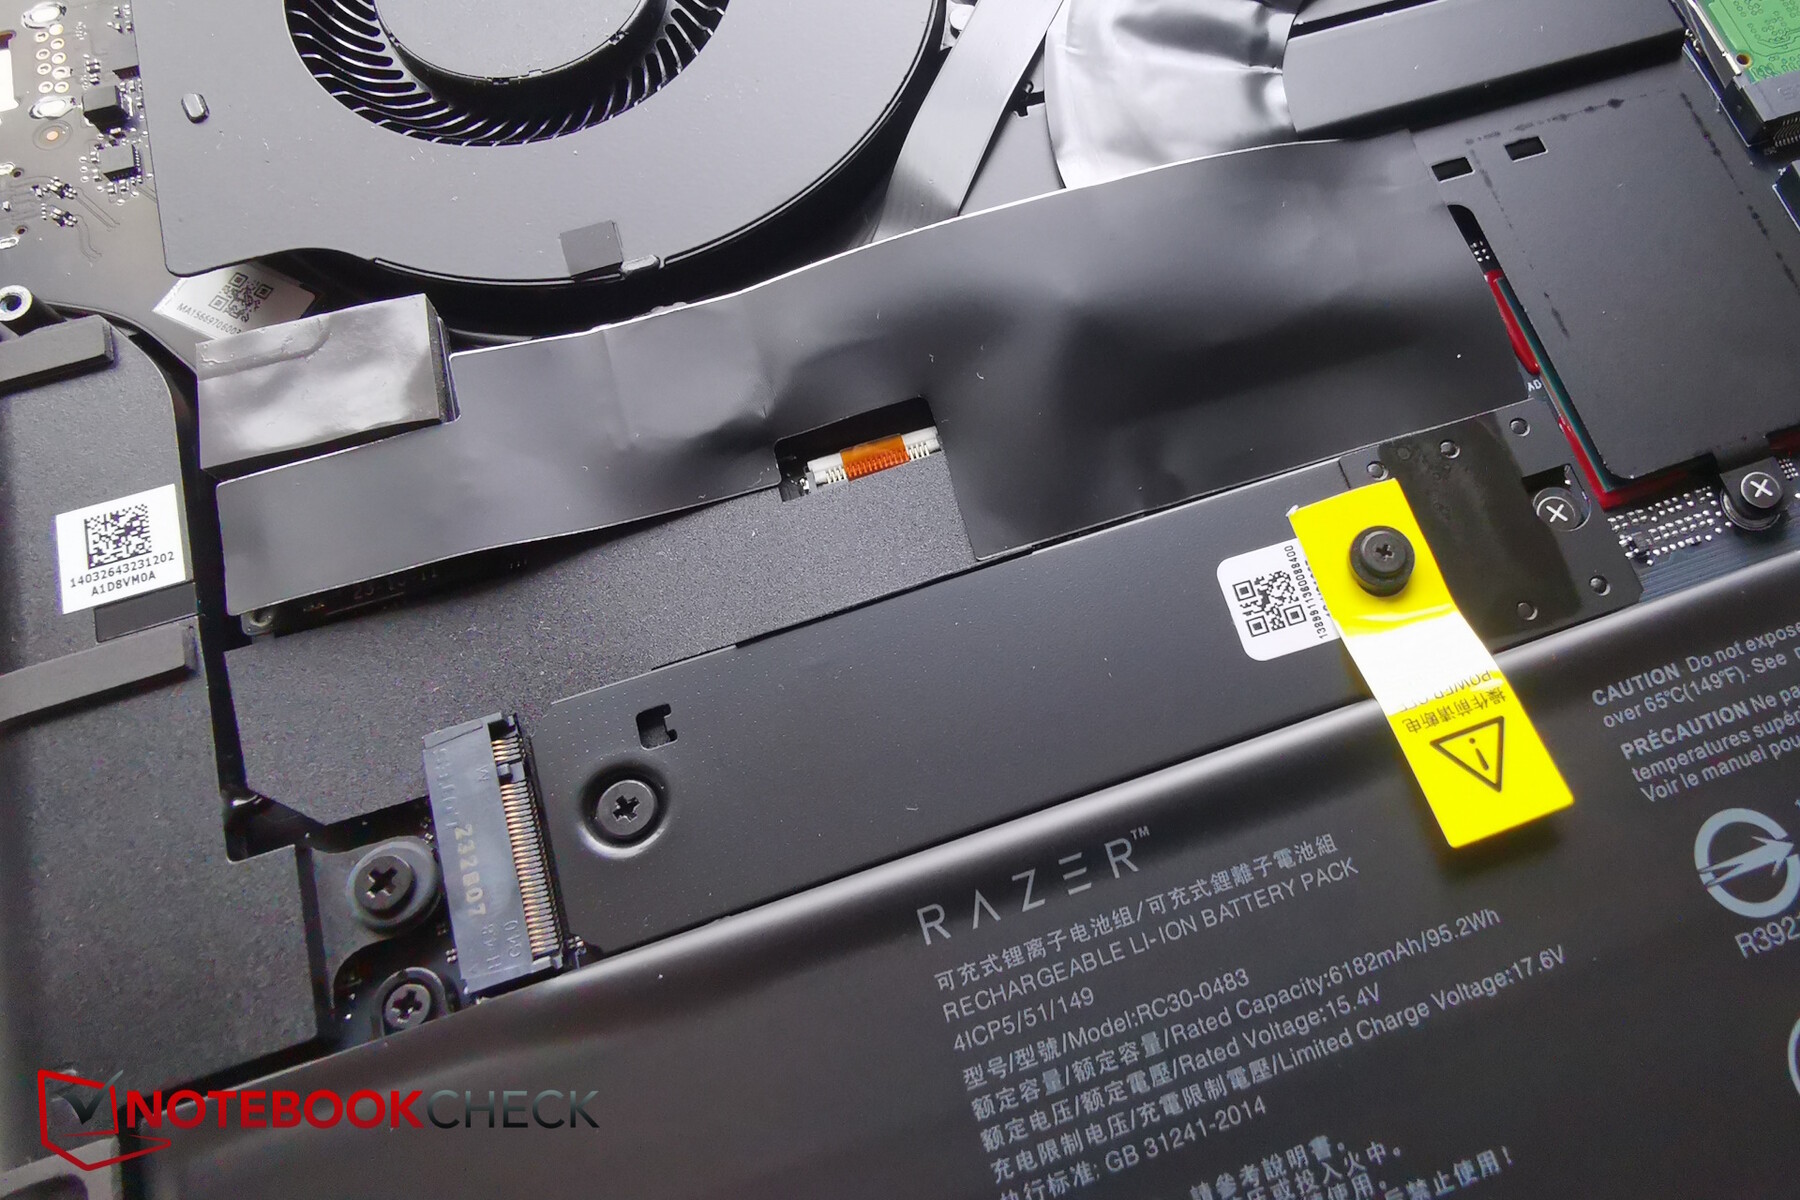
Case & connectivity - Metal unibody with a titanium plate
Practically nothing has changed about the laptop's case—the hardware continues to be housed within an aluminum unibody case and a titanium plate sits in the front of the base to improve its sturdiness. The case as well as the keyboard continue to be real fingerprint magnets.
One change has been made, however: You now have the choice to go for the "Mercury" edition of the Blade which features a light design.
More information on the device's case, connectivity and input devices can be found in our reviews of the 2023 models.


| SD Card Reader | |
| average JPG Copy Test (av. of 3 runs) | |
| Razer Blade 16 Early 2023 RTX 4090 (Angelbird AV PRO 128 GB V60) | |
| Razer Blade 16 2024, RTX 4090 | |
| Average of class Gaming (20.9 - 210, n=54, last 2 years) | |
| Lenovo Legion 9 16IRX8 (Toshiba Exceria Pro SDXC 64 GB UHS-II) | |
| Schenker XMG Neo 16 E23 (AV PRO microSD 128 GB V60) | |
| Lenovo Legion 5 16IRX G9 | |
| maximum AS SSD Seq Read Test (1GB) | |
| Razer Blade 16 Early 2023 RTX 4090 (Angelbird AV PRO 128 GB V60) | |
| Razer Blade 16 2024, RTX 4090 | |
| Average of class Gaming (25.5 - 261, n=51, last 2 years) | |
| Lenovo Legion 9 16IRX8 (Toshiba Exceria Pro SDXC 64 GB UHS-II) | |
| Schenker XMG Neo 16 E23 (AV PRO microSD 128 GB V60) | |
| Lenovo Legion 5 16IRX G9 | |


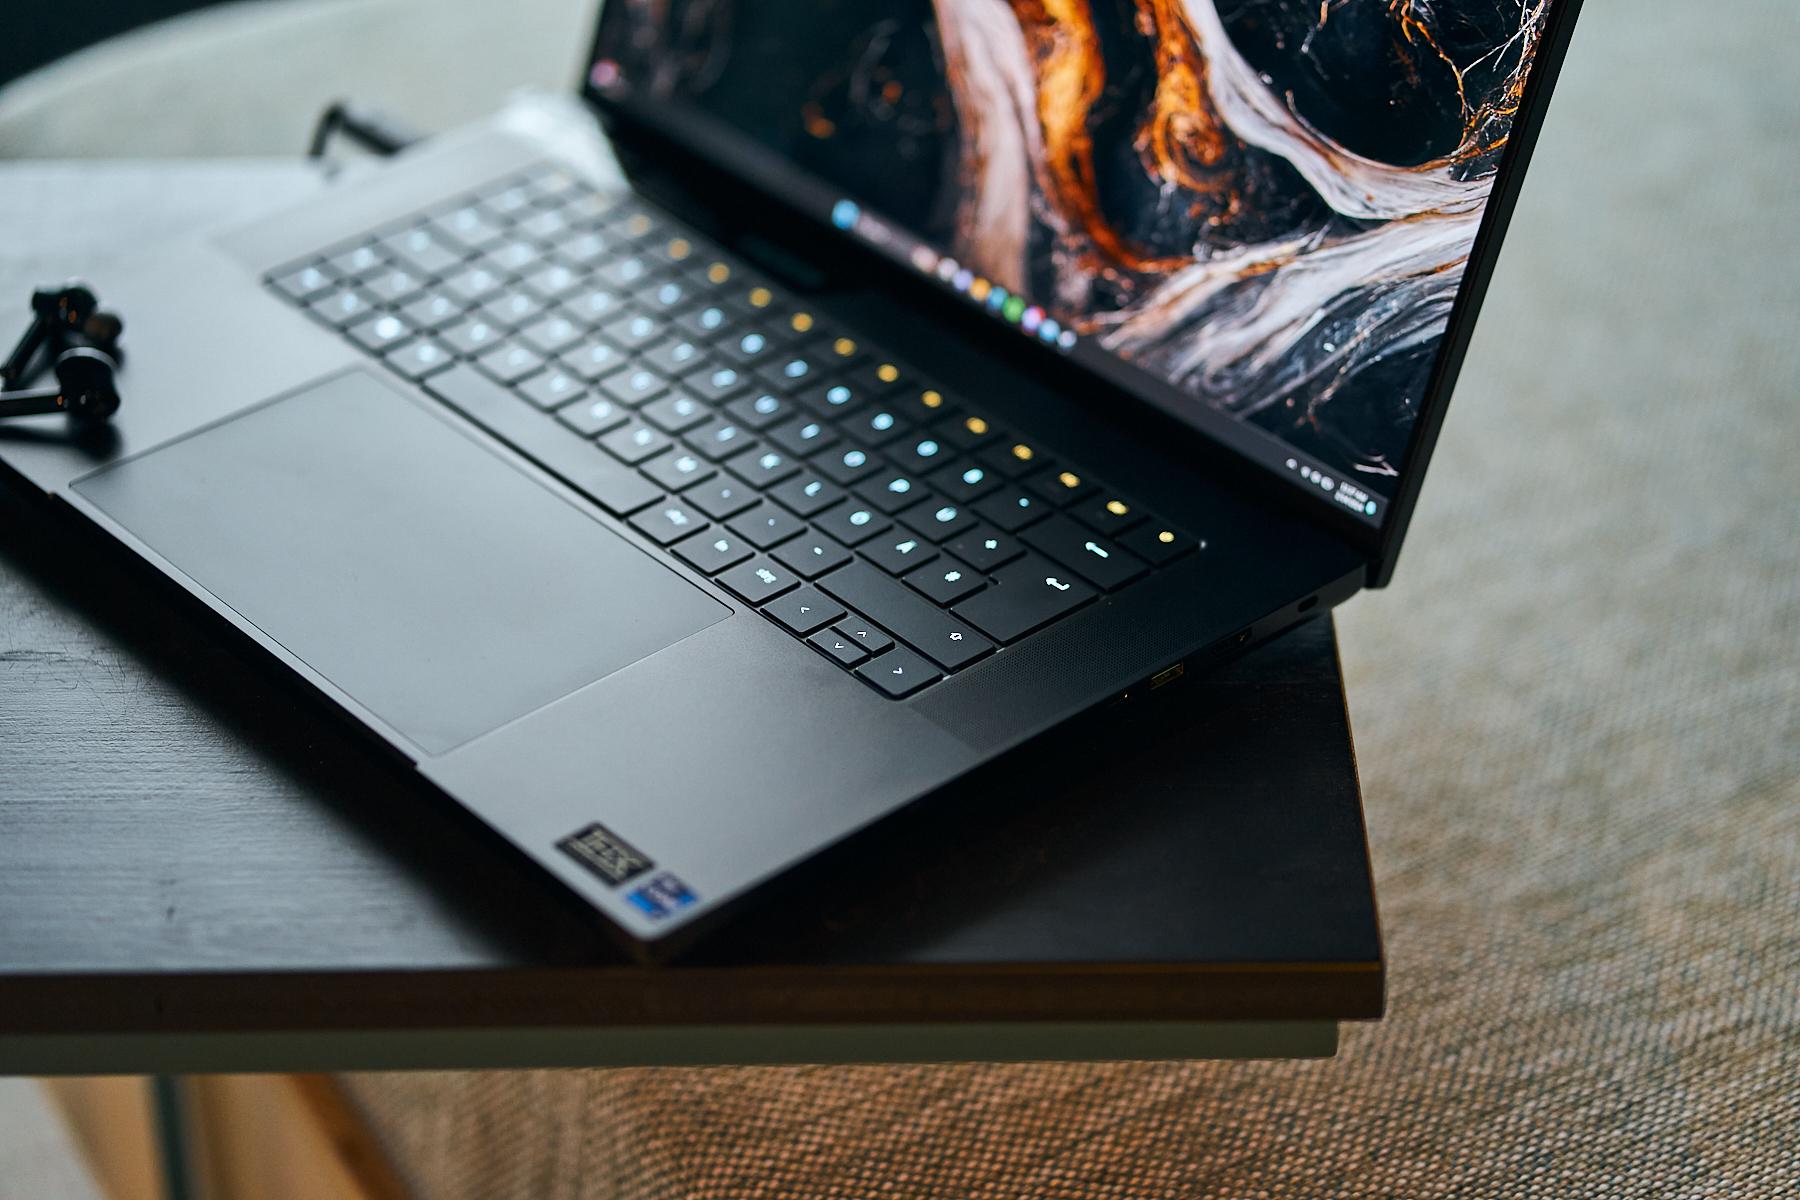
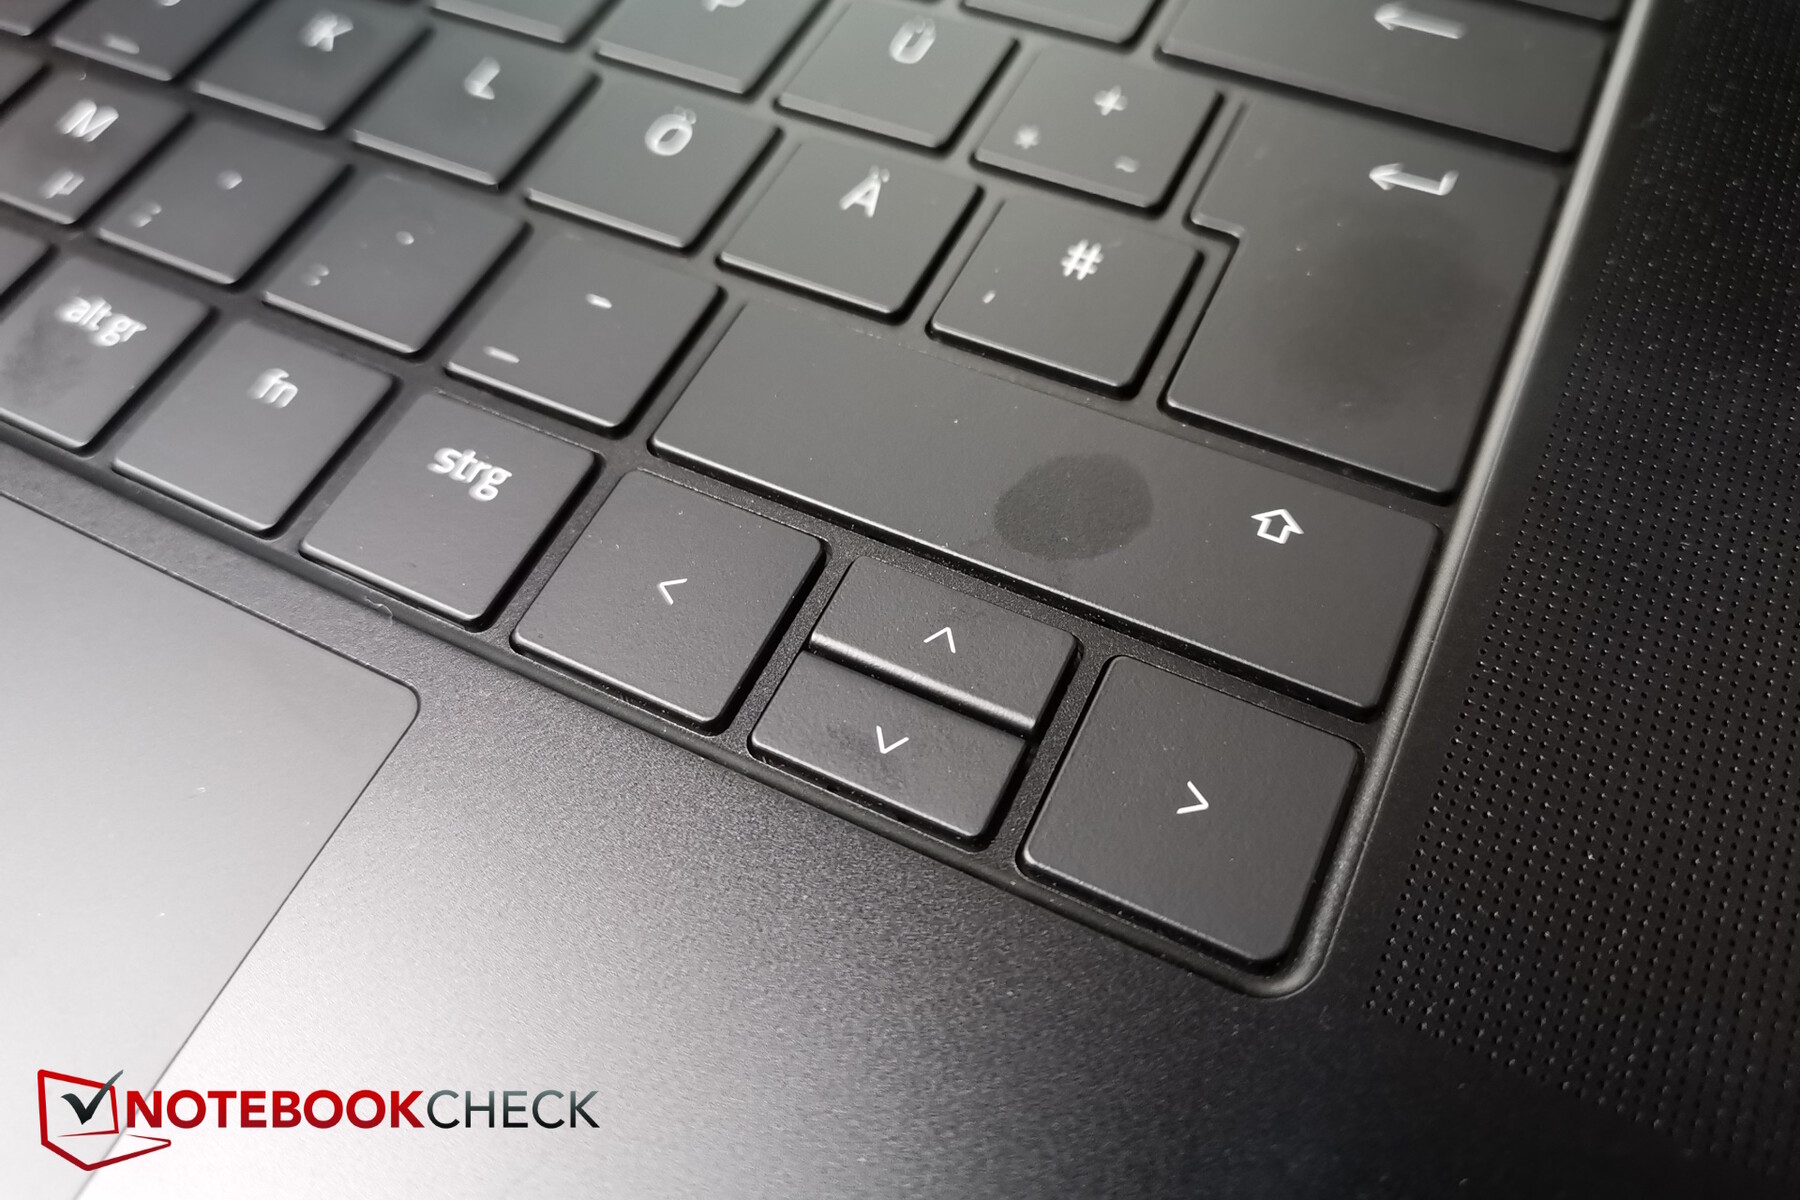
Input devices - The touchpad is almost too big?
The laptop's membrane-switch keys are quite big and have a little space between them. In turn, Razer has decided against installing a numerical keypad.
The keys' lift is short to average and their feedback is decent. Unfortunately, the up/down arrow keys are halved in height but apart from this, the layout feels nice and spacious.
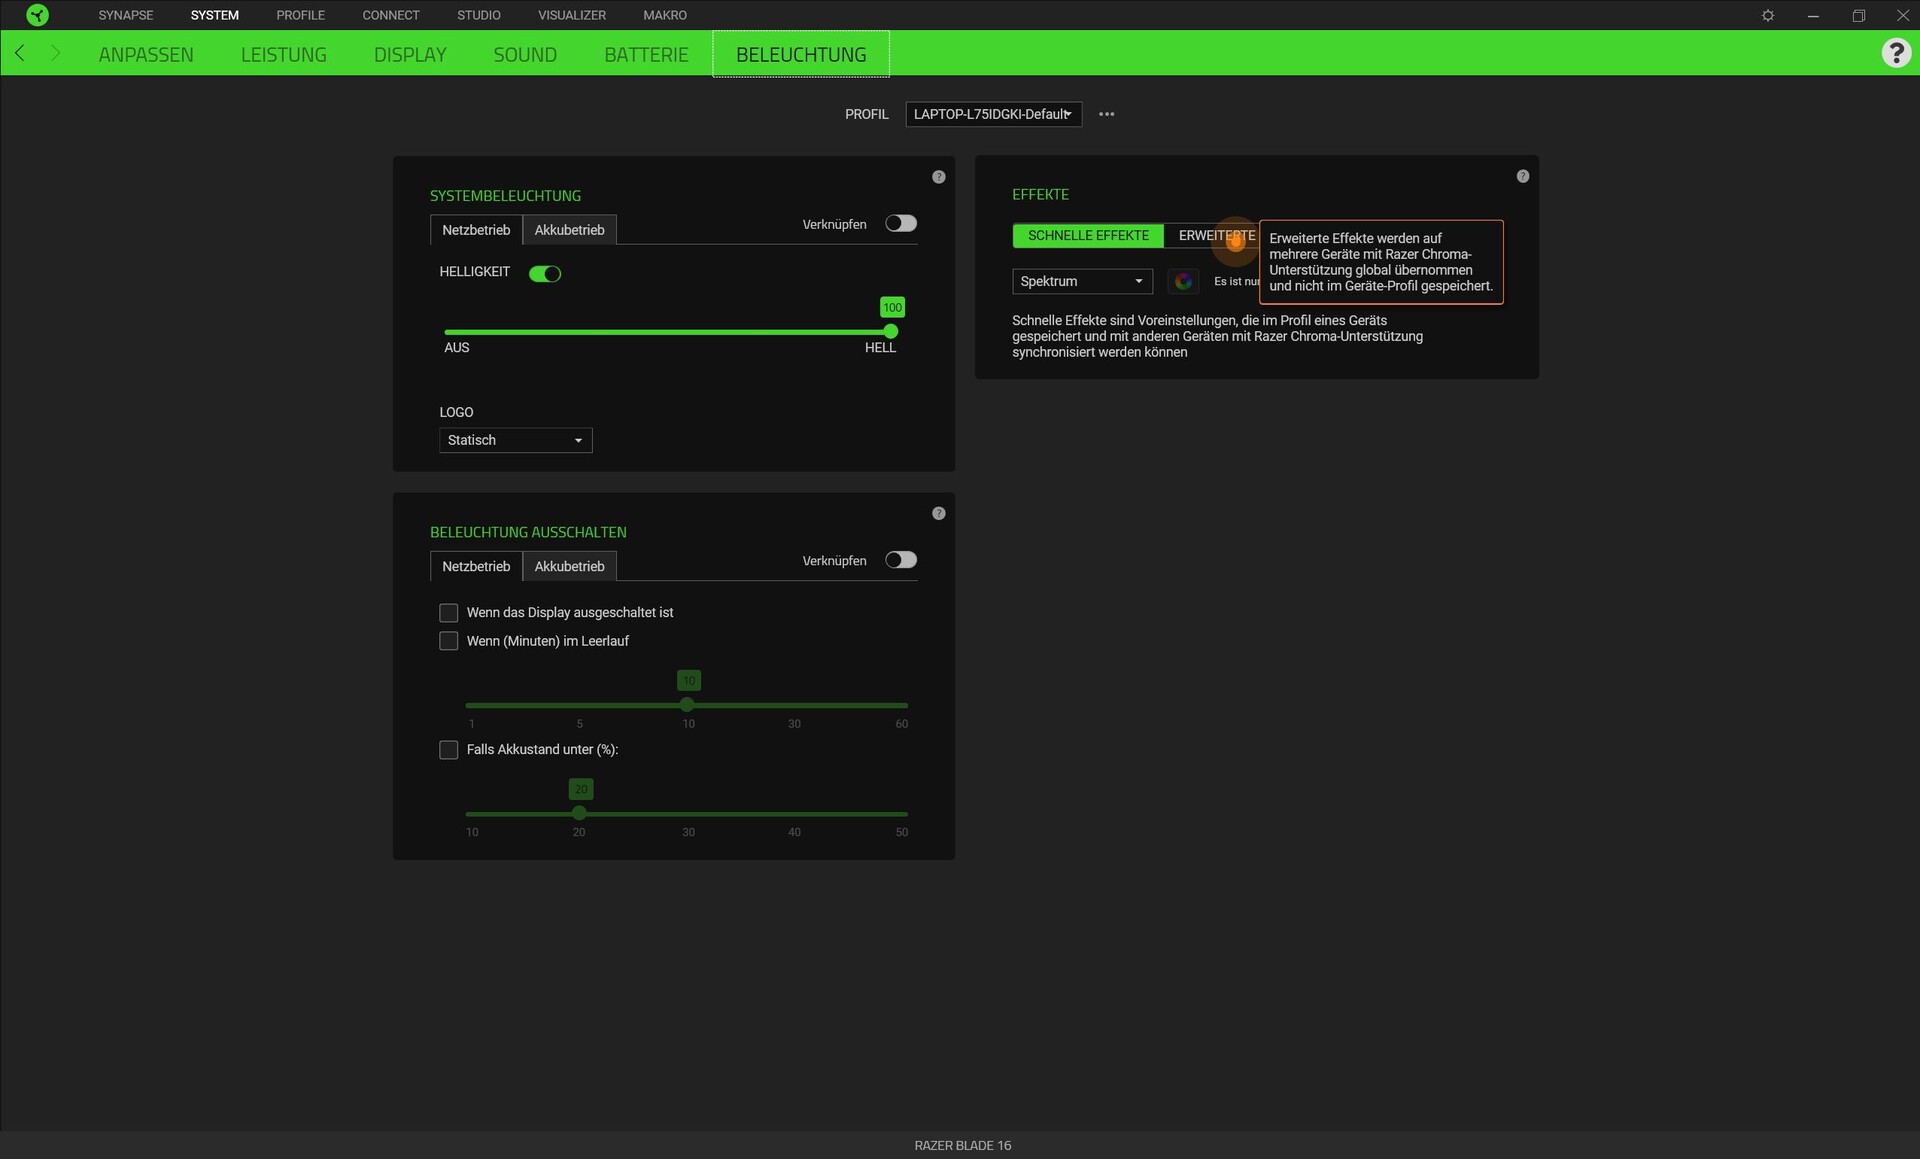
The per-button RGB backlighting (Razer Chroma) can be extensively configured via the Synapse app, as is typical for Razer.
The touchpad is massive! So big that the palm rests next to it almost seem too small. This sometimes leads to touchpad inputs failing because your hand has accidentally touched the pad when you were simply resting it on the side. Less would've been more in this aspect.


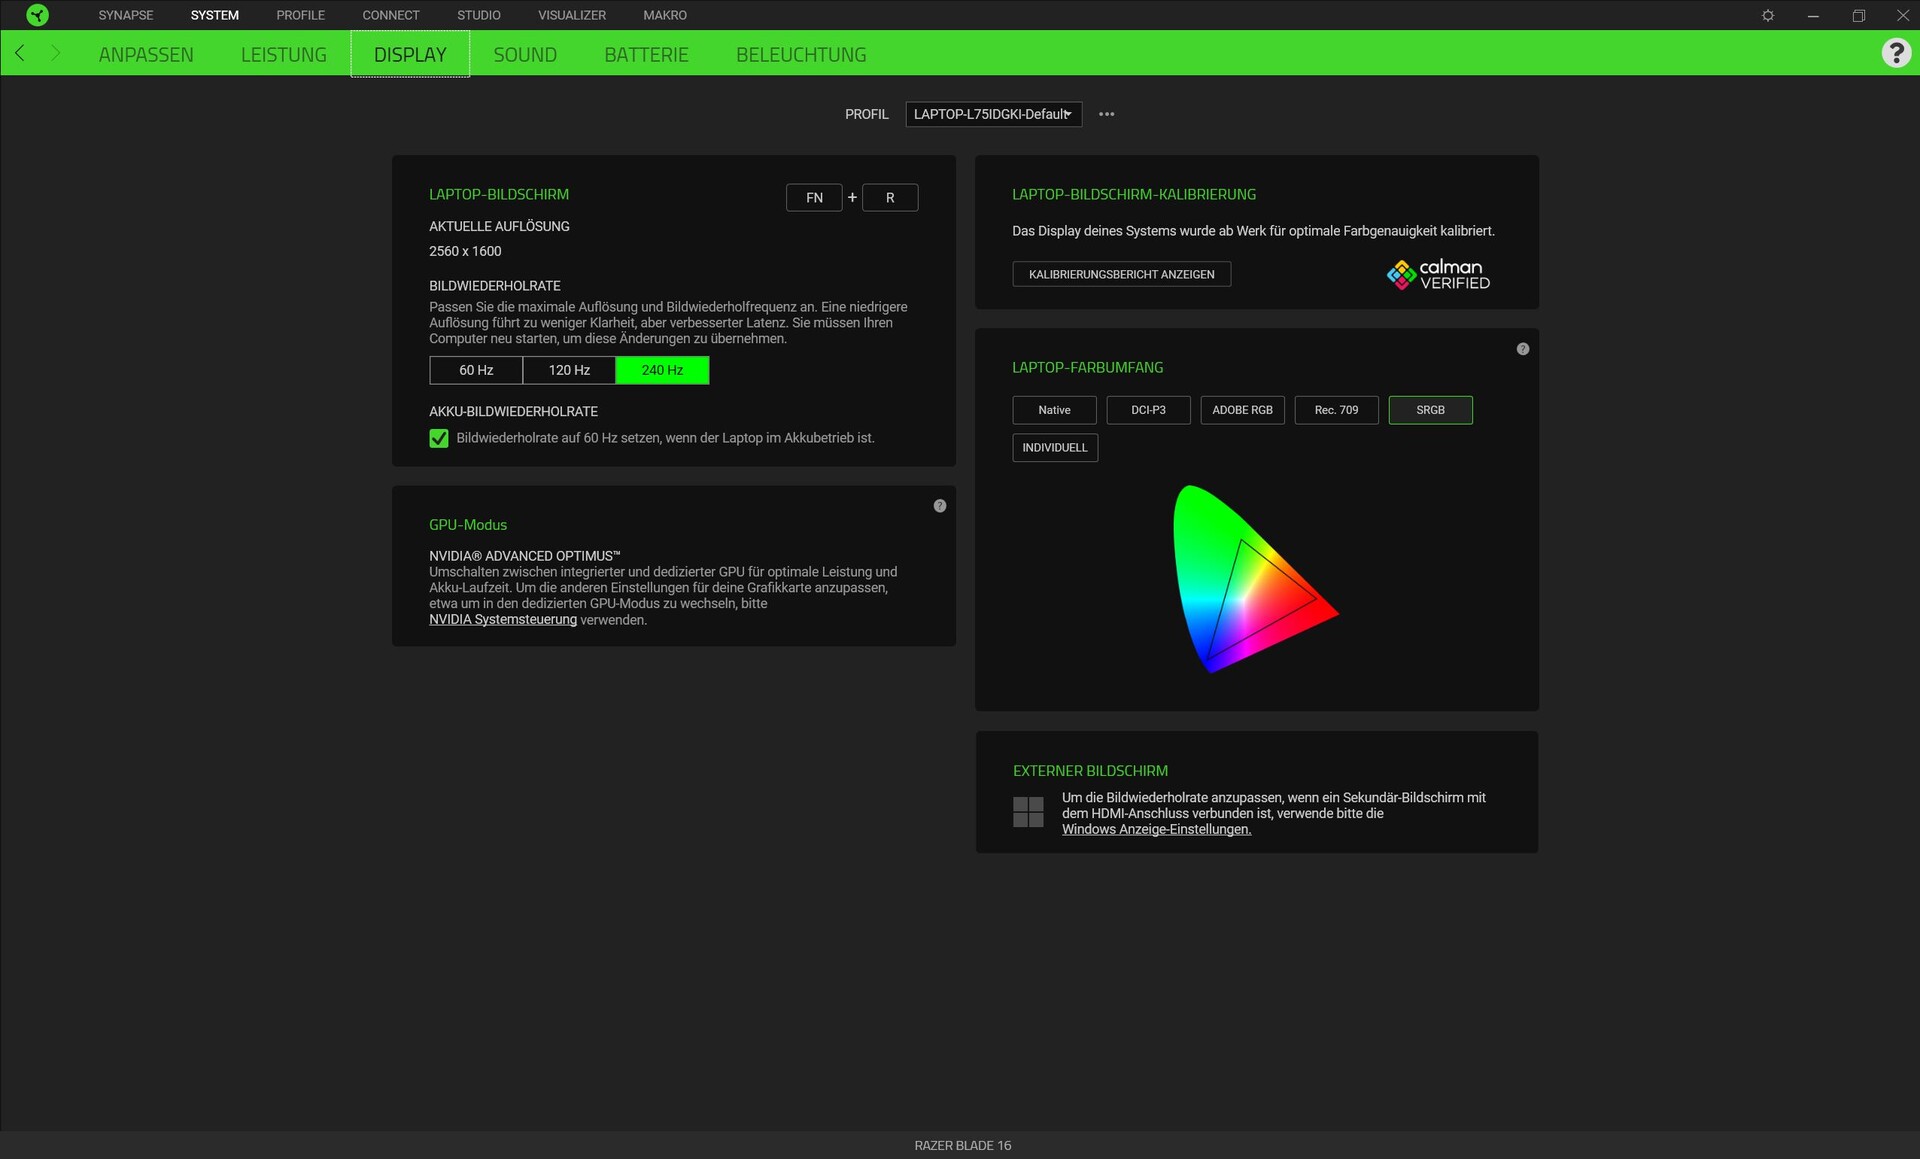
Display - The Blade 16 with OLED or Mini-LED?
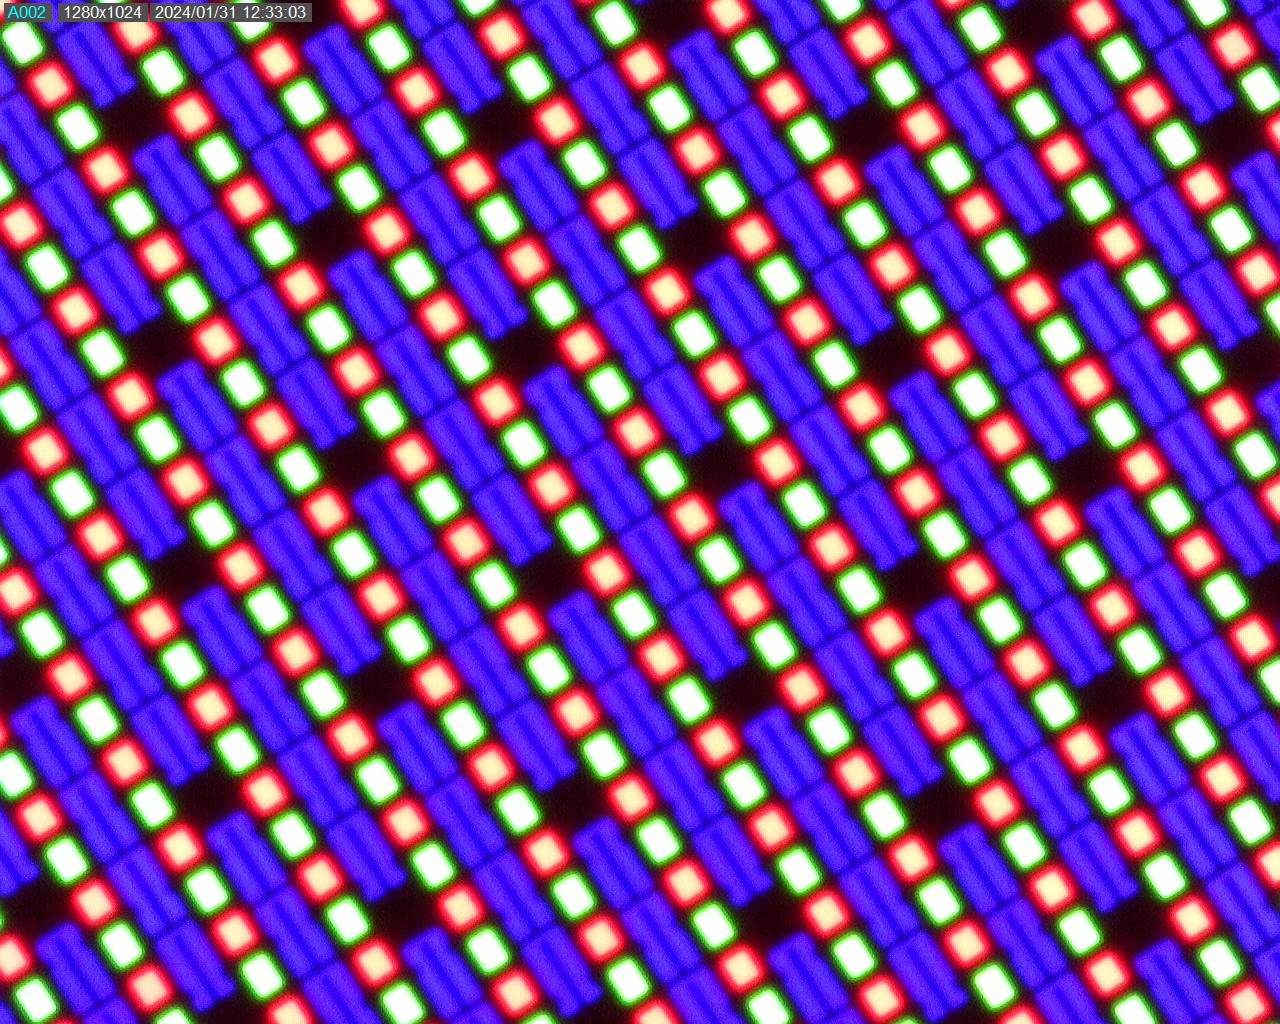
The new Samsung OLED is installed into our test model, which is the one Razer speaks so highly of. You can also still choose to get the laptop with the good Mini-LED displays, however. The customer is faced with a difficult decision, as both panel types have their own advantages and disadvantages.
The Mini-LEDs can achieve up to 1,000 nits (HDR) and the predecessor model still managed over 700 nits in SDR mode. Our OLED "only" achieved an average of 420 nits but in turn, it features a perfect black value and, as a result, high contrasts. It can perfectly darken individual areas on the display.
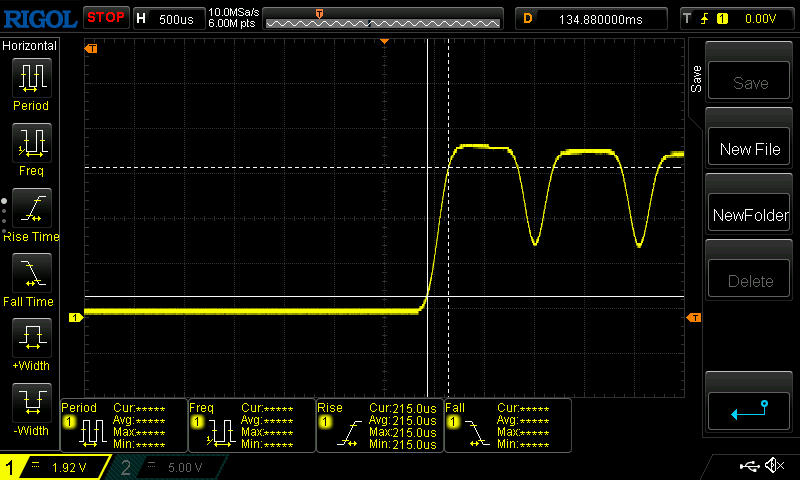
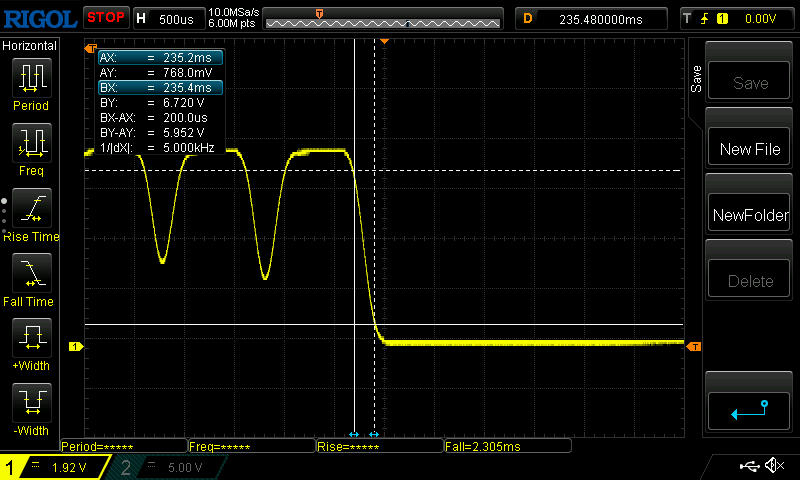
The Mini-LED display features two native resolution modes, namely FHD+ and UHD+. The OLED is "limited" to 1,600p (QHD+) but it does have extremely fast response times between 0.2 (gray-to-gray) and 0.4 milliseconds (black-to-white). No matter which display you end up choosing, you certainly won't get a bad one with Razer.
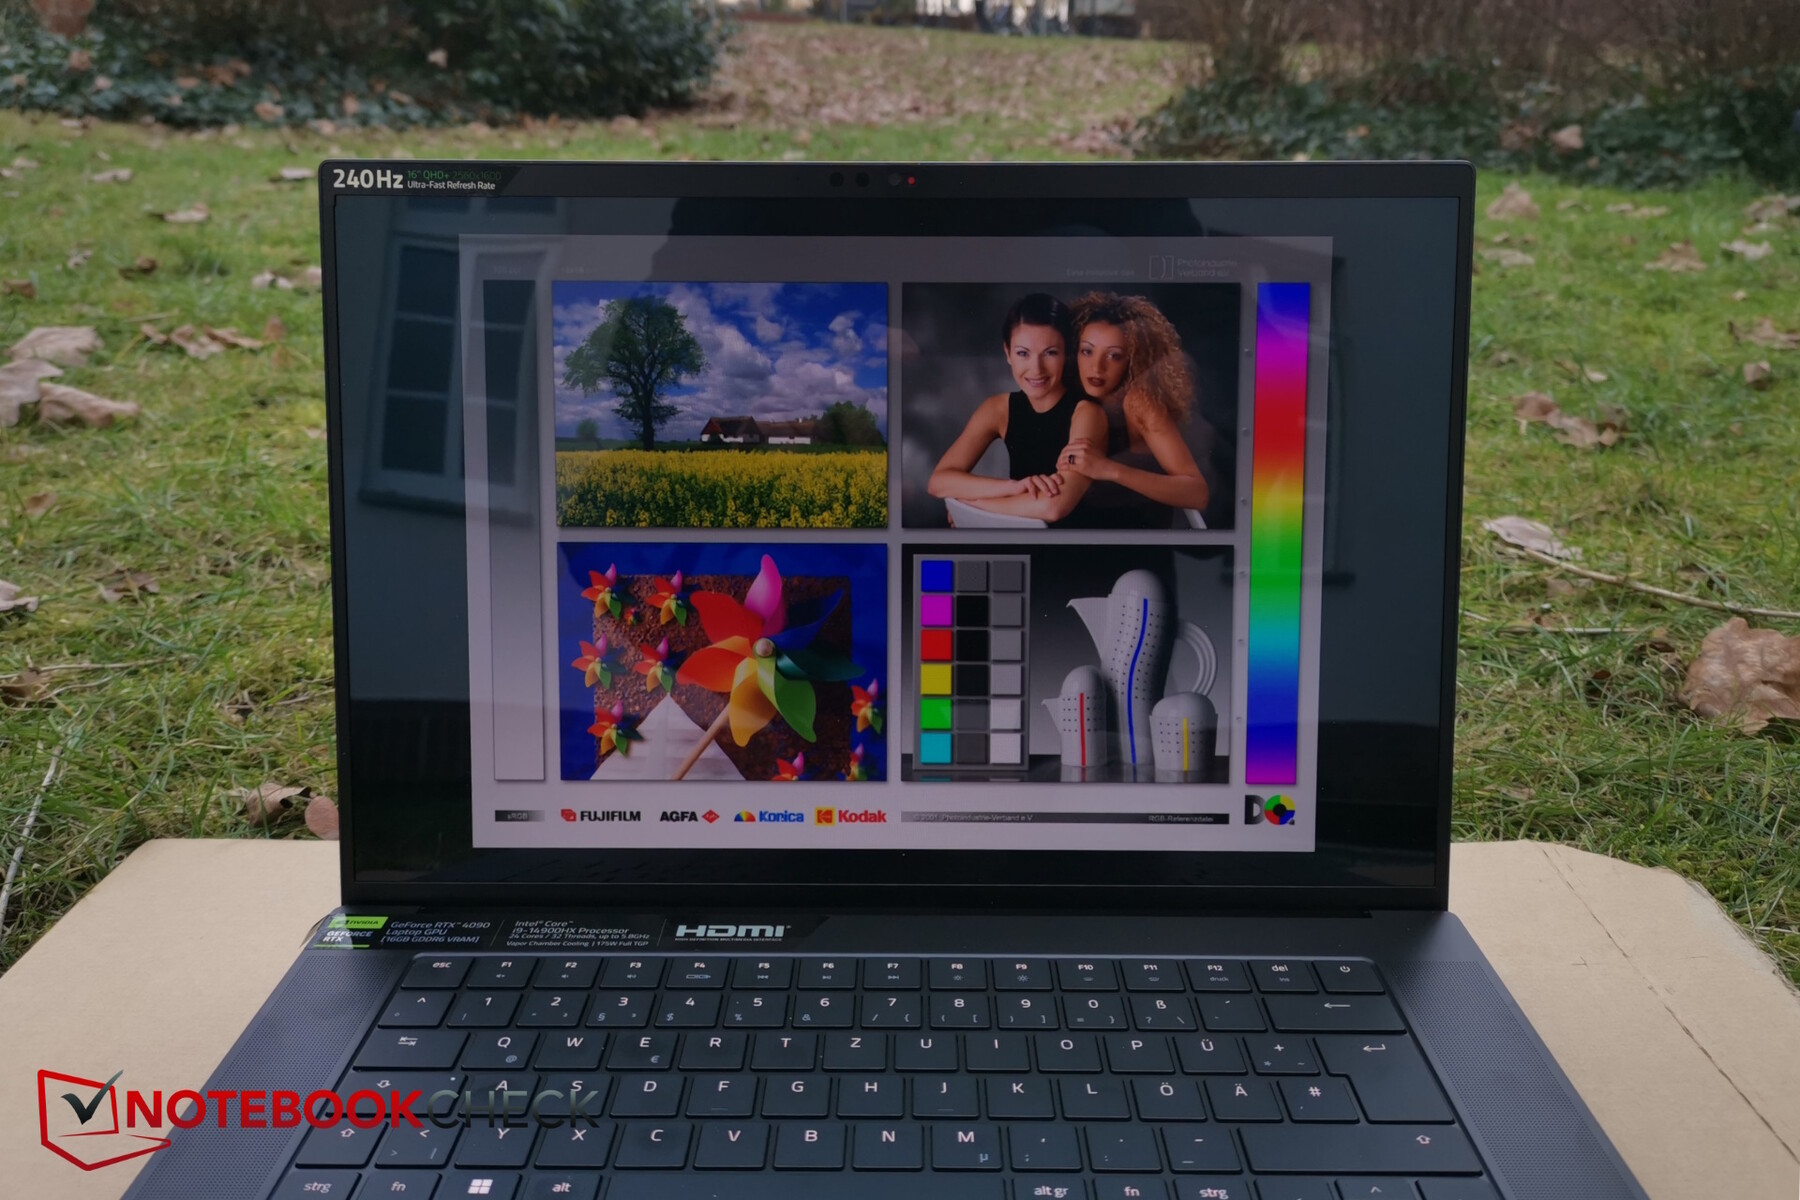
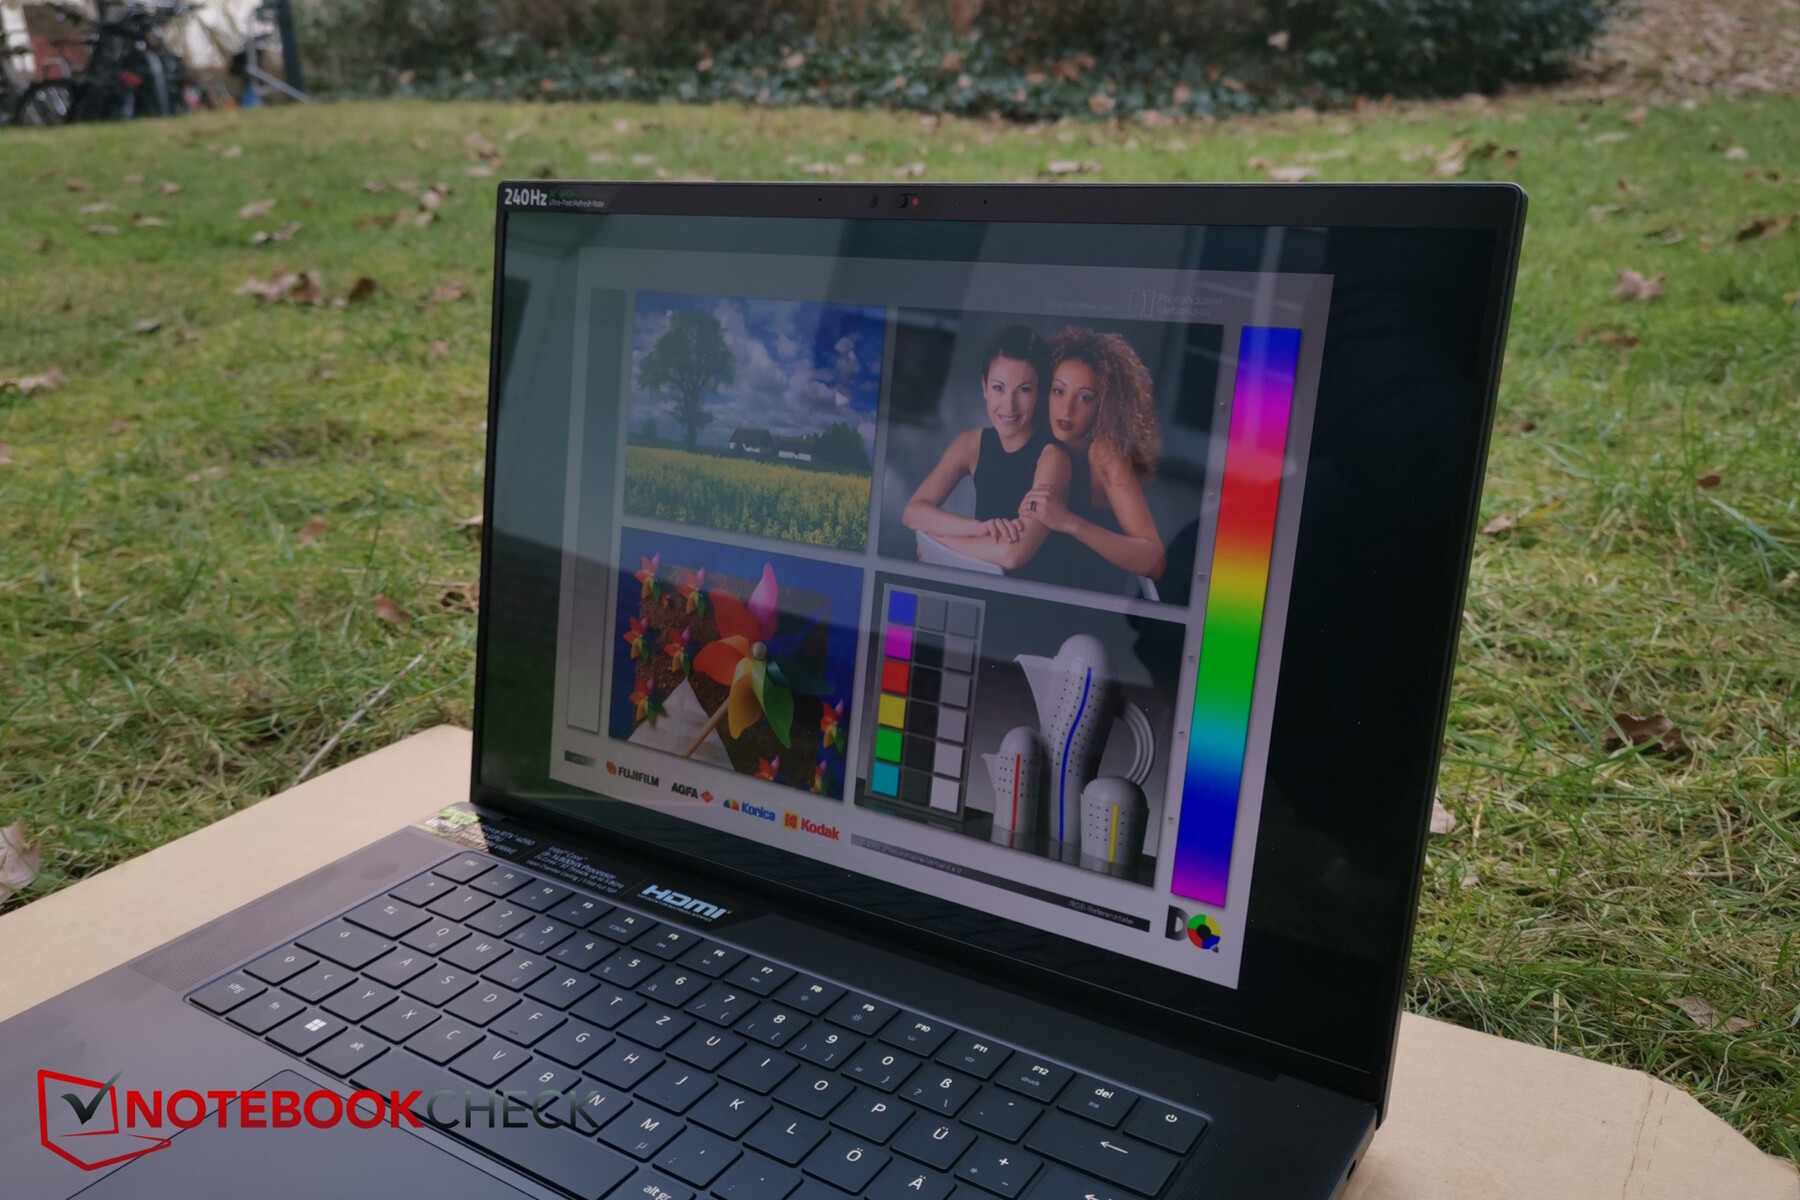
The Samsung OLED in our Blade test model has a reflective, clear surface. Razer advertizes the model with all kinds of certificates, including VESA ClearMR 11000 (highest display clarity with moving objects on the screen at 240 Hz), Calman Verified (color-calibrated) and VESA DisplayHDR True Black 500.
In addition to the numerous certificates, the 16:10 OLED with a resolution of 2,560 x 1,600 pixels is G-Sync ready and comes pre-calibrated. There is no backlight bleeding with OLEDs.
| |||||||||||||||||||||||||
Brightness Distribution: 98 %
Center on Battery: 416 cd/m²
Contrast: 20900:1 (Black: 0.02 cd/m²)
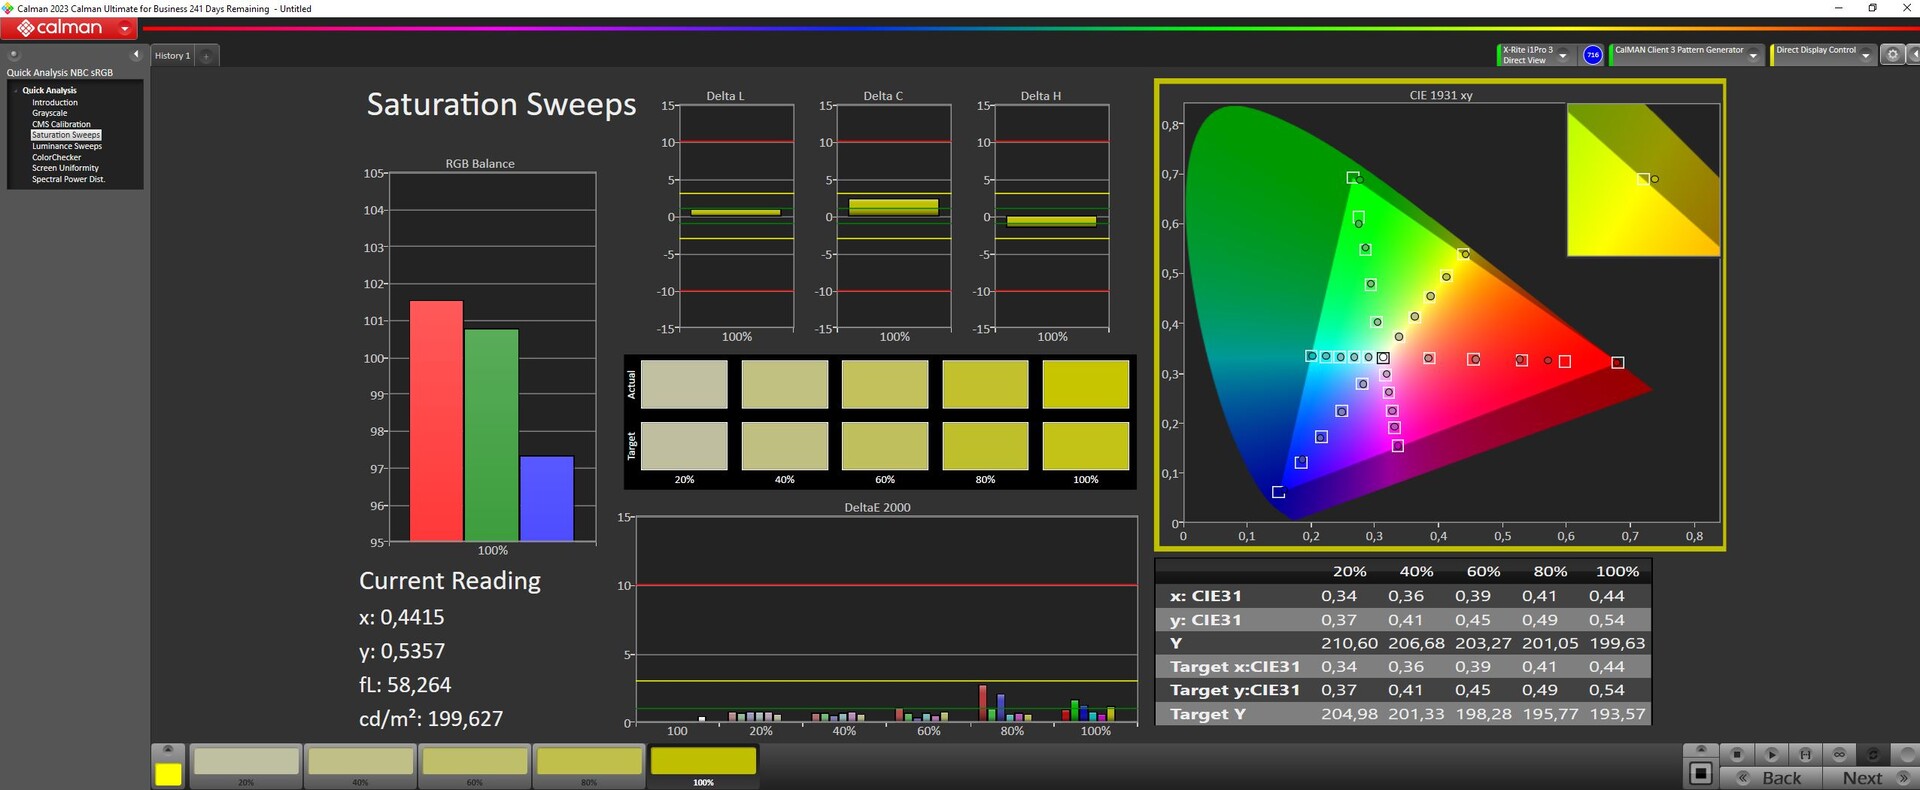
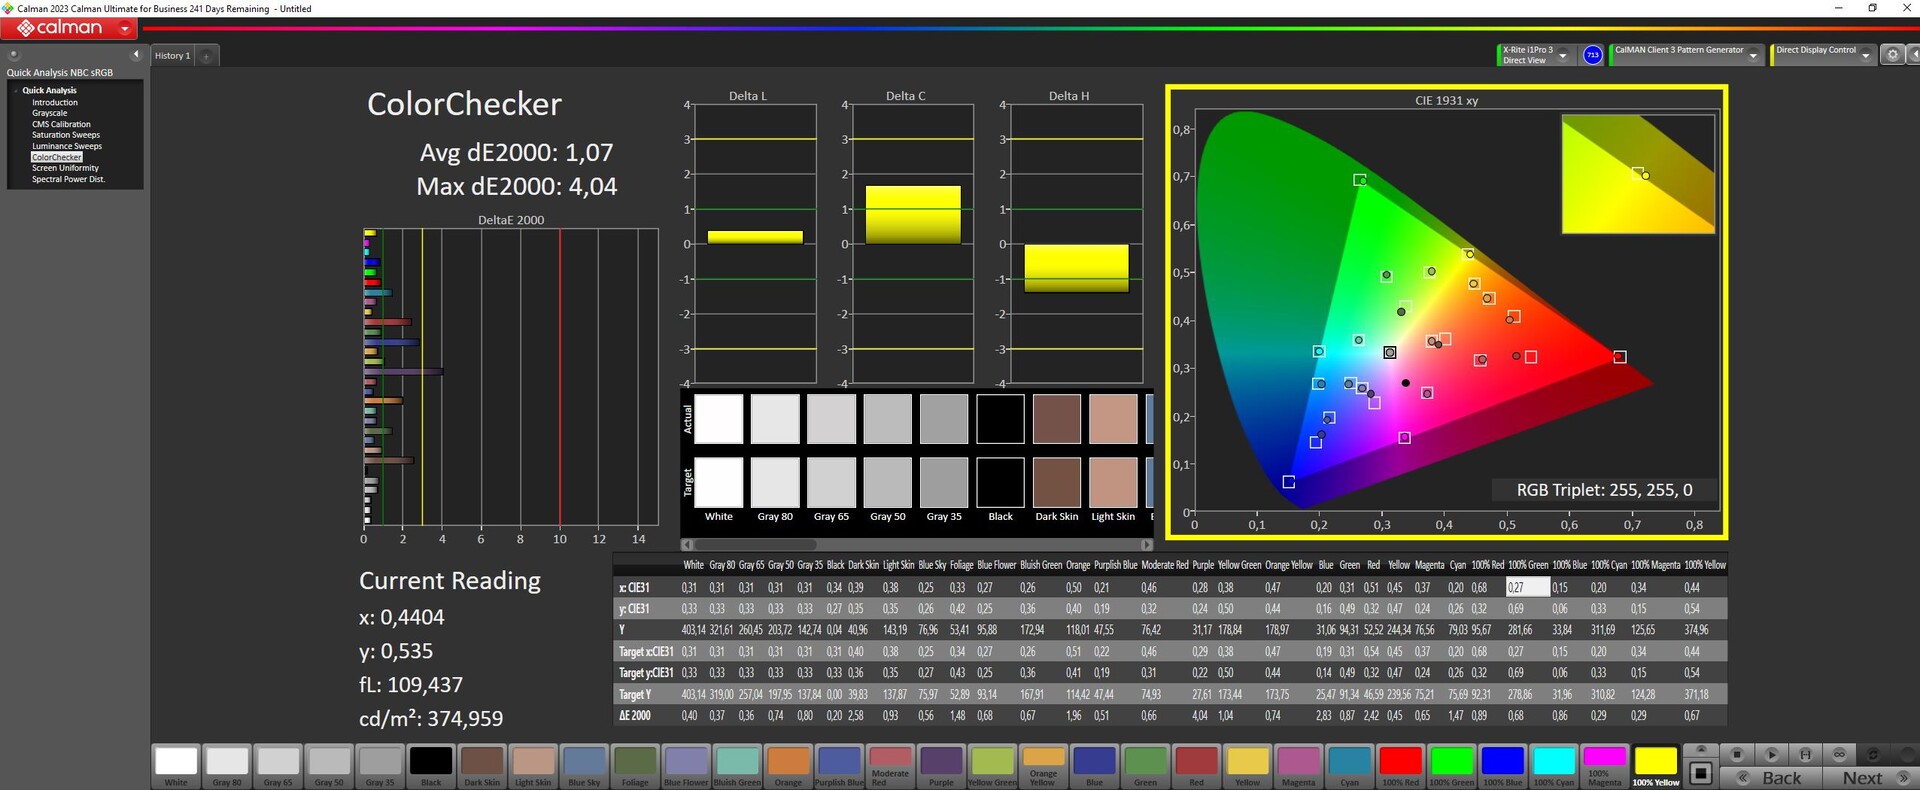
ΔE ColorChecker Calman: 1.07 | ∀{0.5-29.43 Ø4.71}
calibrated: 1.07
ΔE Greyscale Calman: 1.12 | ∀{0.09-98 Ø4.96}
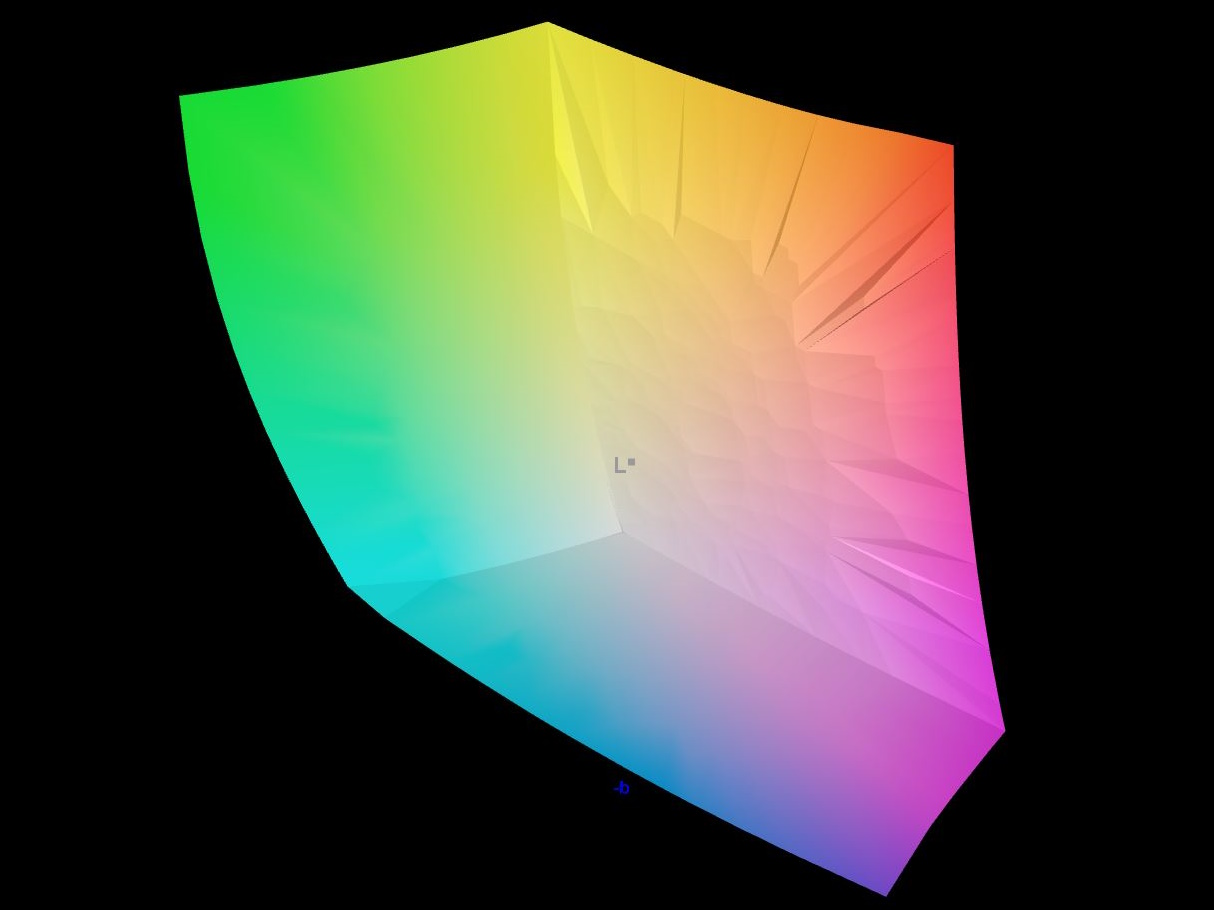
95.6% AdobeRGB 1998 (Argyll 3D)
99.9% sRGB (Argyll 3D)
99.1% Display P3 (Argyll 3D)
Gamma: 2.29
CCT: 6417 K
| Razer Blade 16 2024, RTX 4090 Samsung SDC41AB (ATNA60DL03-0), OLED, 2560x1600, 16" | Razer Blade 16 Early 2023 RTX 4090 AUO B160ZAN01.U, mini-LED, 3840x2400, 16" | Lenovo Legion 9 16IRX8 CSOT T3 MNG007ZA2-2, Mini-LED, 3200x2000, 16" | Schenker XMG Neo 16 E23 BOE0AF0 NE160QDM-NZ1, IPS, 2560x1600, 16" | Lenovo Legion 5 16IRX G9 NE160QDM-NZ3, IPS, 2560x1600, 16" | |
|---|---|---|---|---|---|
| Display | -1% | -4% | -21% | -16% | |
| Display P3 Coverage (%) | 99.1 | 99.9 1% | 97.2 -2% | 67.3 -32% | 72.4 -27% |
| sRGB Coverage (%) | 99.9 | 100 0% | 99.9 0% | 96.7 -3% | 100 0% |
| AdobeRGB 1998 Coverage (%) | 95.6 | 90.9 -5% | 87 -9% | 68.9 -28% | 74.1 -22% |
| Response Times | -9780% | -4121% | -3996% | -3592% | |
| Response Time Grey 50% / Grey 80% * (ms) | 0.24 ? | 10.2 ? -4150% | 13.3 ? -5442% | 14.5 ? -5942% | 12.5 ? -5108% |
| Response Time Black / White * (ms) | 0.4 ? | 62.04 ? -15410% | 11.6 ? -2800% | 8.6 ? -2050% | 8.7 ? -2075% |
| PWM Frequency (Hz) | 960 | 2420 ? | 4742 | ||
| Screen | -42% | -49% | -201% | -176% | |
| Brightness middle (cd/m²) | 418 | 730 75% | 674.9 61% | 372 -11% | 526 26% |
| Brightness (cd/m²) | 420 | 729 74% | 682 62% | 349 -17% | 500 19% |
| Brightness Distribution (%) | 98 | 94 -4% | 96 -2% | 88 -10% | 87 -11% |
| Black Level * (cd/m²) | 0.02 | 0.0045 78% | 0.04 -100% | 0.32 -1500% | 0.33 -1550% |
| Contrast (:1) | 20900 | 162222 676% | 16873 -19% | 1163 -94% | 1594 -92% |
| Colorchecker dE 2000 * | 1.07 | 5.65 -428% | 2.56 -139% | 2.06 -93% | 1.2 -12% |
| Colorchecker dE 2000 max. * | 4.04 | 10.11 -150% | 4.16 -3% | 3 26% | 2.1 48% |
| Colorchecker dE 2000 calibrated * | 1.07 | 1.85 -73% | 2.47 -131% | 1.5 -40% | 1 7% |
| Greyscale dE 2000 * | 1.12 | 8.1 -623% | 3 -168% | 1.9 -70% | 1.3 -16% |
| Gamma | 2.29 96% | 1.98 111% | 2.38 92% | 2.312 95% | 2.23 99% |
| CCT | 6417 101% | 5874 111% | 6799 96% | 6747 96% | 6391 102% |
| Total Average (Program / Settings) | -3274% /
-1424% | -1391% /
-621% | -1406% /
-705% | -1261% /
-630% |
* ... smaller is better
As promised, the panel covers DisplayP3 practically in its entirety and, of course, sRGB too. In addition, AdobeRGB is covered by about 96 per cent.


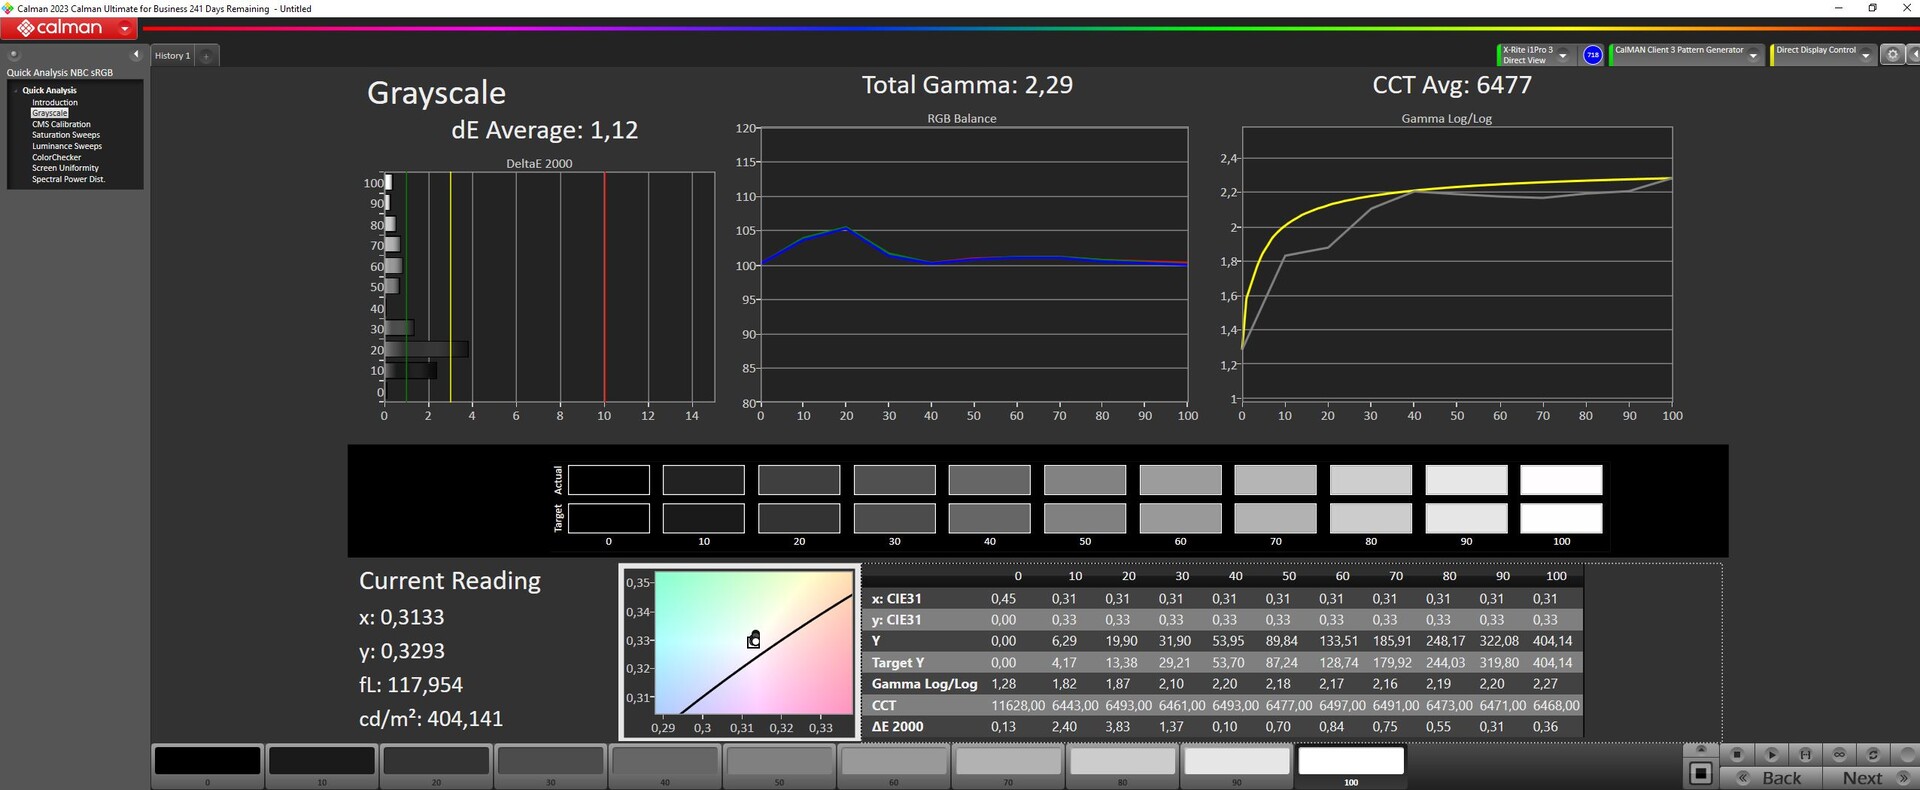
According to Razer, every 16-inch Blade model comes pre-calibrated and our measurements confirmed this. Its grayscale and color deviations are very low—only around 1. This means the Blade 16 is perfect for editing photos and videos.
The manufacturer also sets up several color profiles for this in its Synapse software, namely DCI-P3, Adobe RGB, Rec. 709 and sRGB. There is also the option to adjust the color mode individually and there is a native color mode. We selected DCI-P3 for our measurements.
In total, we would class the OLED panel to be ever-so-slightly superior to the Mini-LED display, which is especially to do with its excellent color space coverage, color accuracy, deep blacks, high contrasts and speedy response times.
Display Response Times
| ↔ Response Time Black to White | ||
|---|---|---|
| 0.4 ms ... rise ↗ and fall ↘ combined | ↗ 0.2 ms rise | 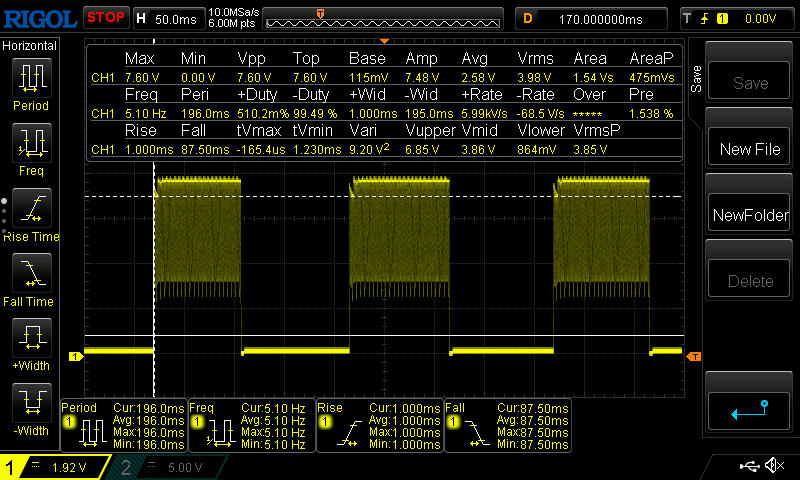 |
| ↘ 0.2 ms fall | ||
| The screen shows very fast response rates in our tests and should be very well suited for fast-paced gaming. In comparison, all tested devices range from 0.1 (minimum) to 240 (maximum) ms. » 0 % of all devices are better. This means that the measured response time is better than the average of all tested devices (19.8 ms). | ||
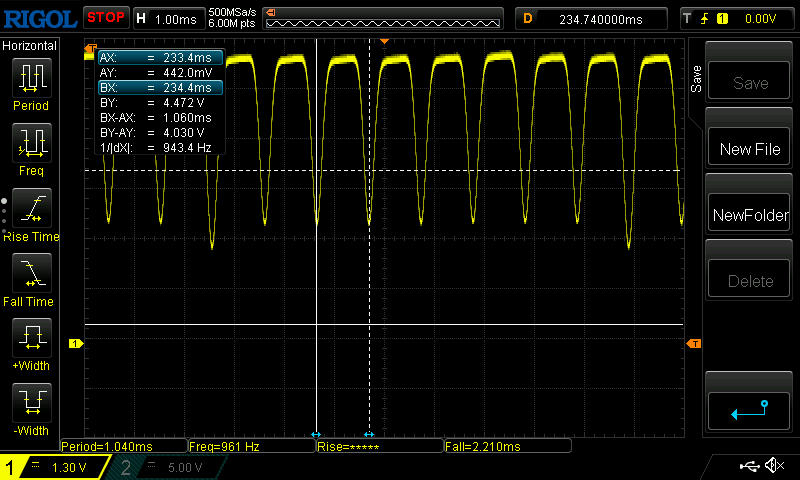
| ↔ Response Time 50% Grey to 80% Grey | ||
| 0.24 ms ... rise ↗ and fall ↘ combined | ↗ 0.15 ms rise | 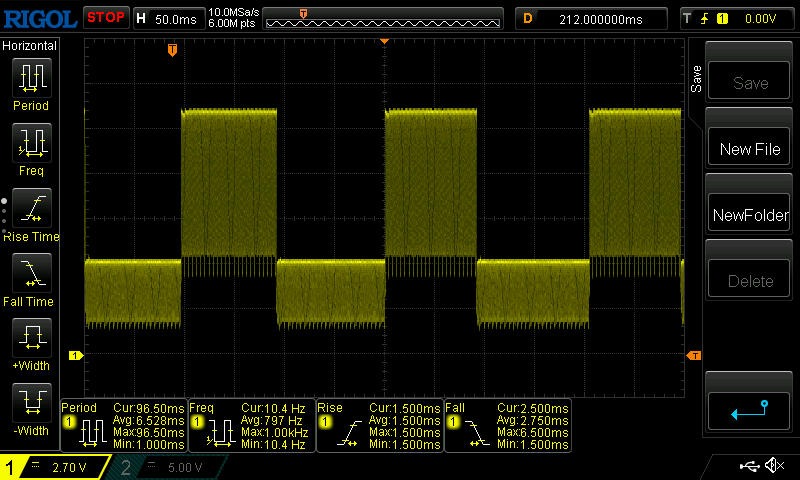 |
| ↘ 0.09 ms fall | ||
| The screen shows very fast response rates in our tests and should be very well suited for fast-paced gaming. In comparison, all tested devices range from 0.165 (minimum) to 636 (maximum) ms. » 0 % of all devices are better. This means that the measured response time is better than the average of all tested devices (31 ms). | ||
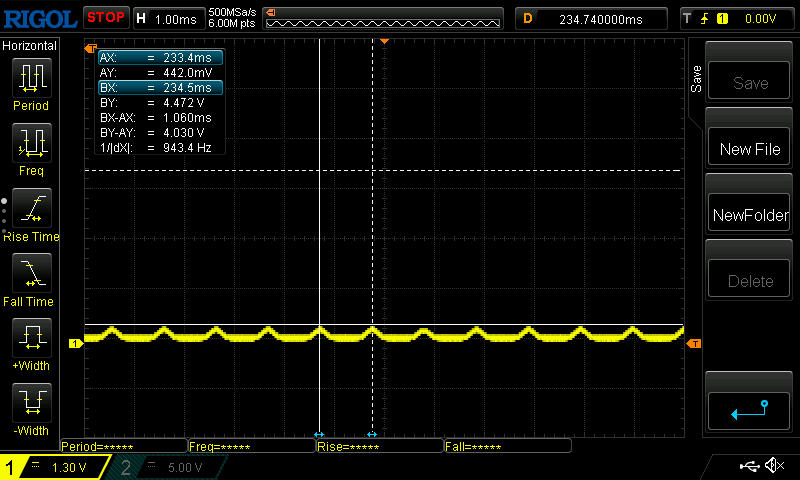
Screen Flickering / PWM (Pulse-Width Modulation)
| Screen flickering / PWM detected | 960 Hz | 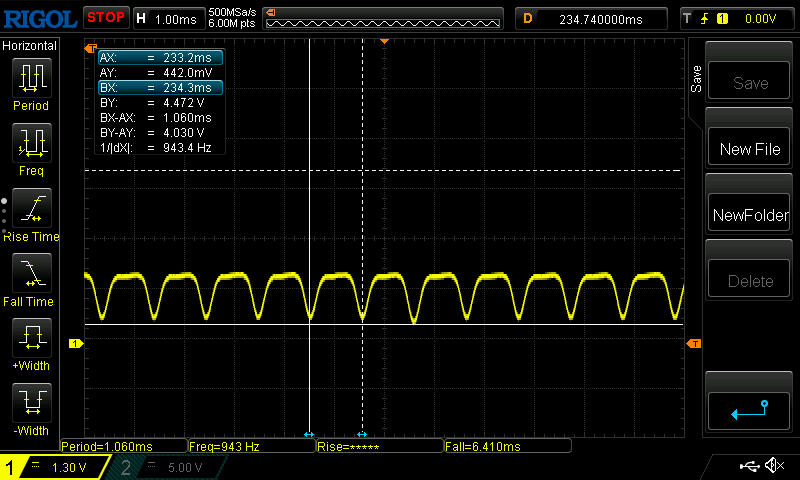 | |
The display backlight flickers at 960 Hz (worst case, e.g., utilizing PWM) . The frequency of 960 Hz is quite high, so most users sensitive to PWM should not notice any flickering. In comparison: 52 % of all tested devices do not use PWM to dim the display. If PWM was detected, an average of 7747 (minimum: 5 - maximum: 343500) Hz was measured. | |||
The laptop's response times of 0.2 and 0.4 ms are very fast—too fast for our test device's automatic recording mode. Below is our manual recording of its rise and fall times.
Outside, it might get a little difficult to use the Blade 16 due to its reflective surface. Even so, its strong contrast makes up for this a little. In the shade, it should be fine to work outdoors.

Performance - Stagnation despite new CPU generation
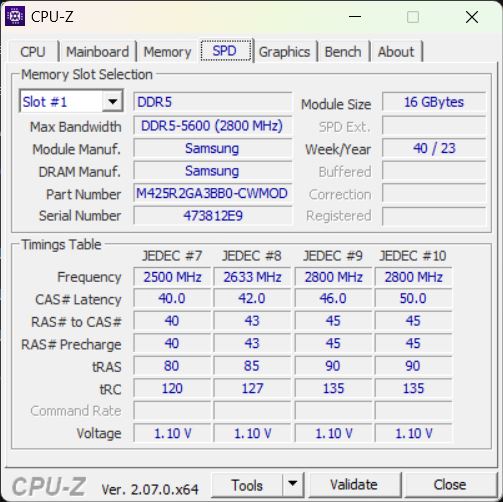
With its powerful RTX 4090 and no less powerful Intel Core i9-14900HX, the Blade 16 is of course primarily aimed at gamers. But with its good screen and elegant, thin design, Razer has always deliberately targeted creative professionals as well. 32 GB RAM, WiFi 7 and a 2-TB SSD complete our test sample's features.


Testing conditions
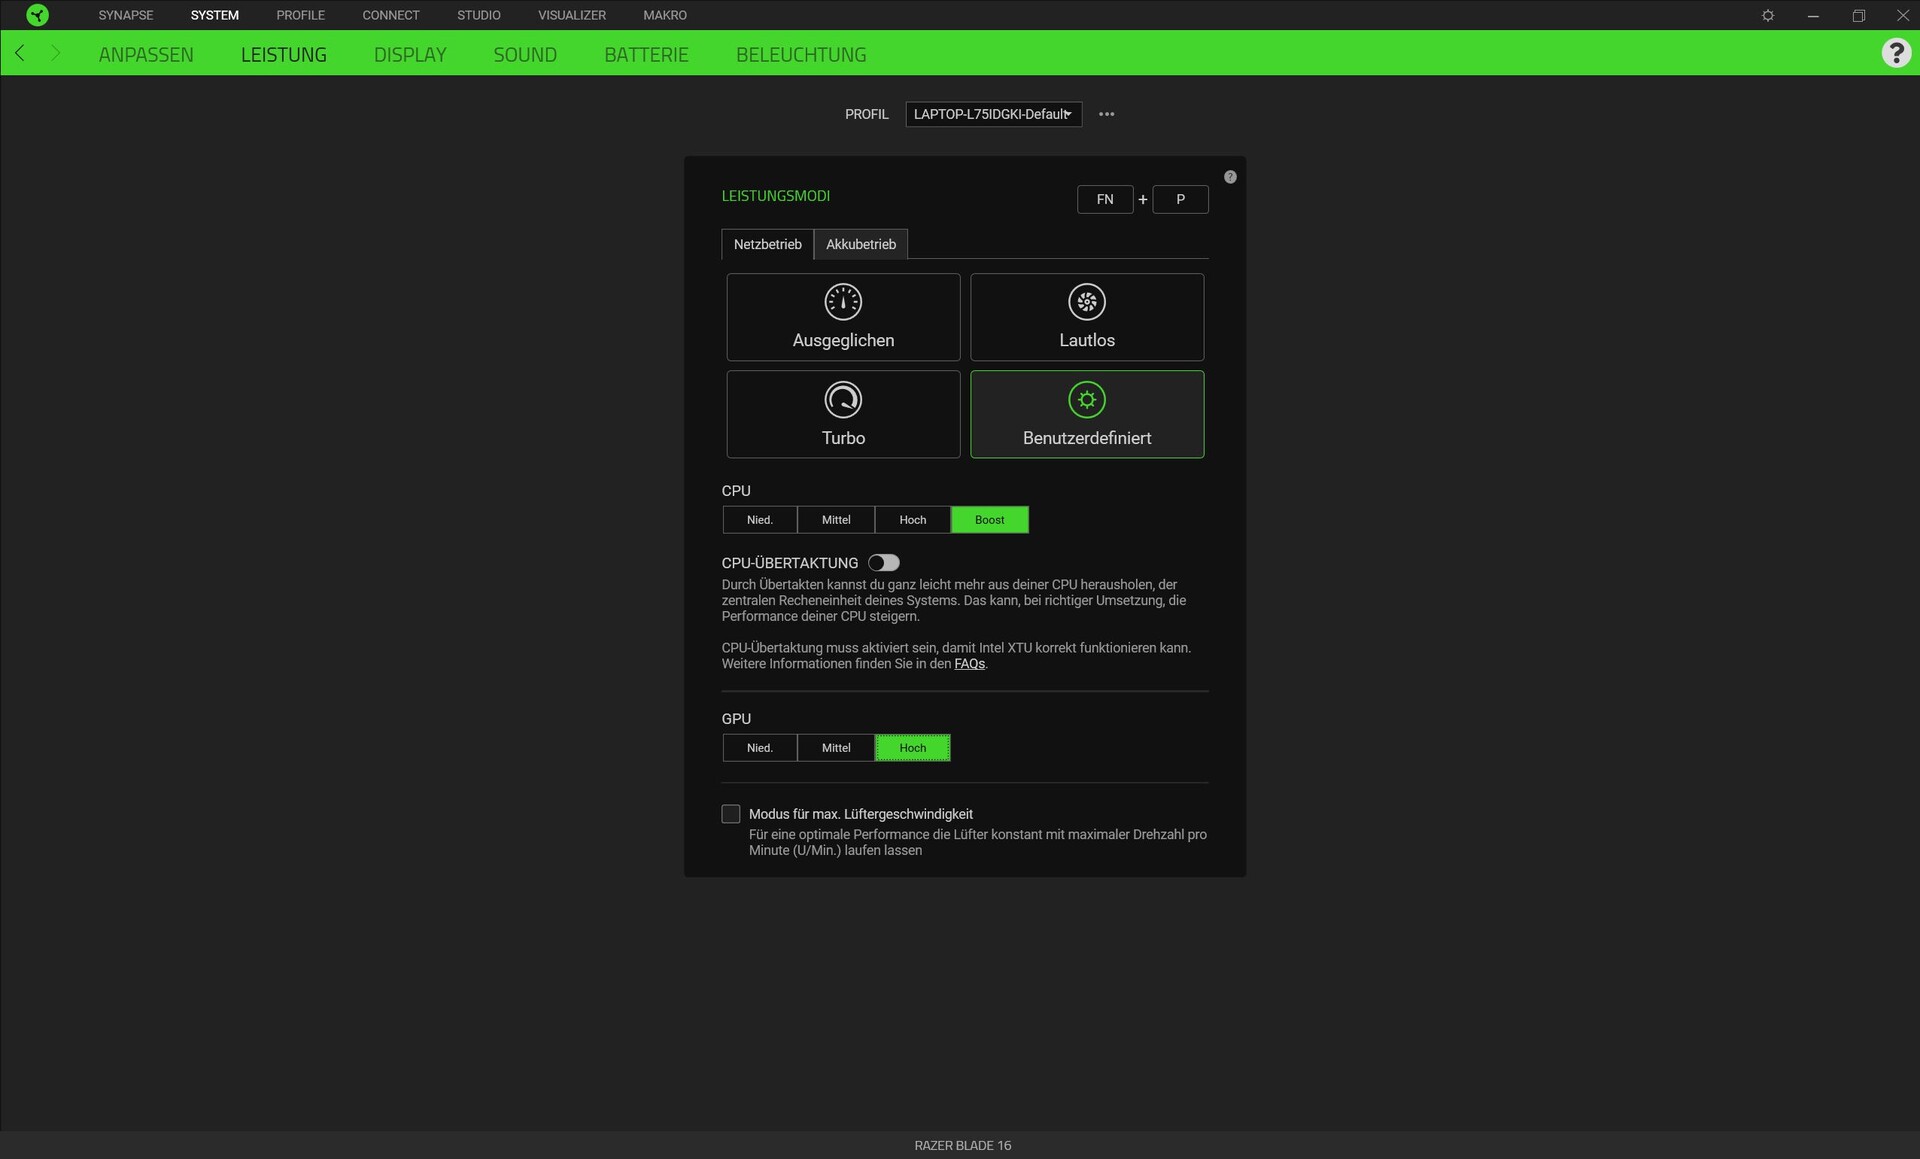
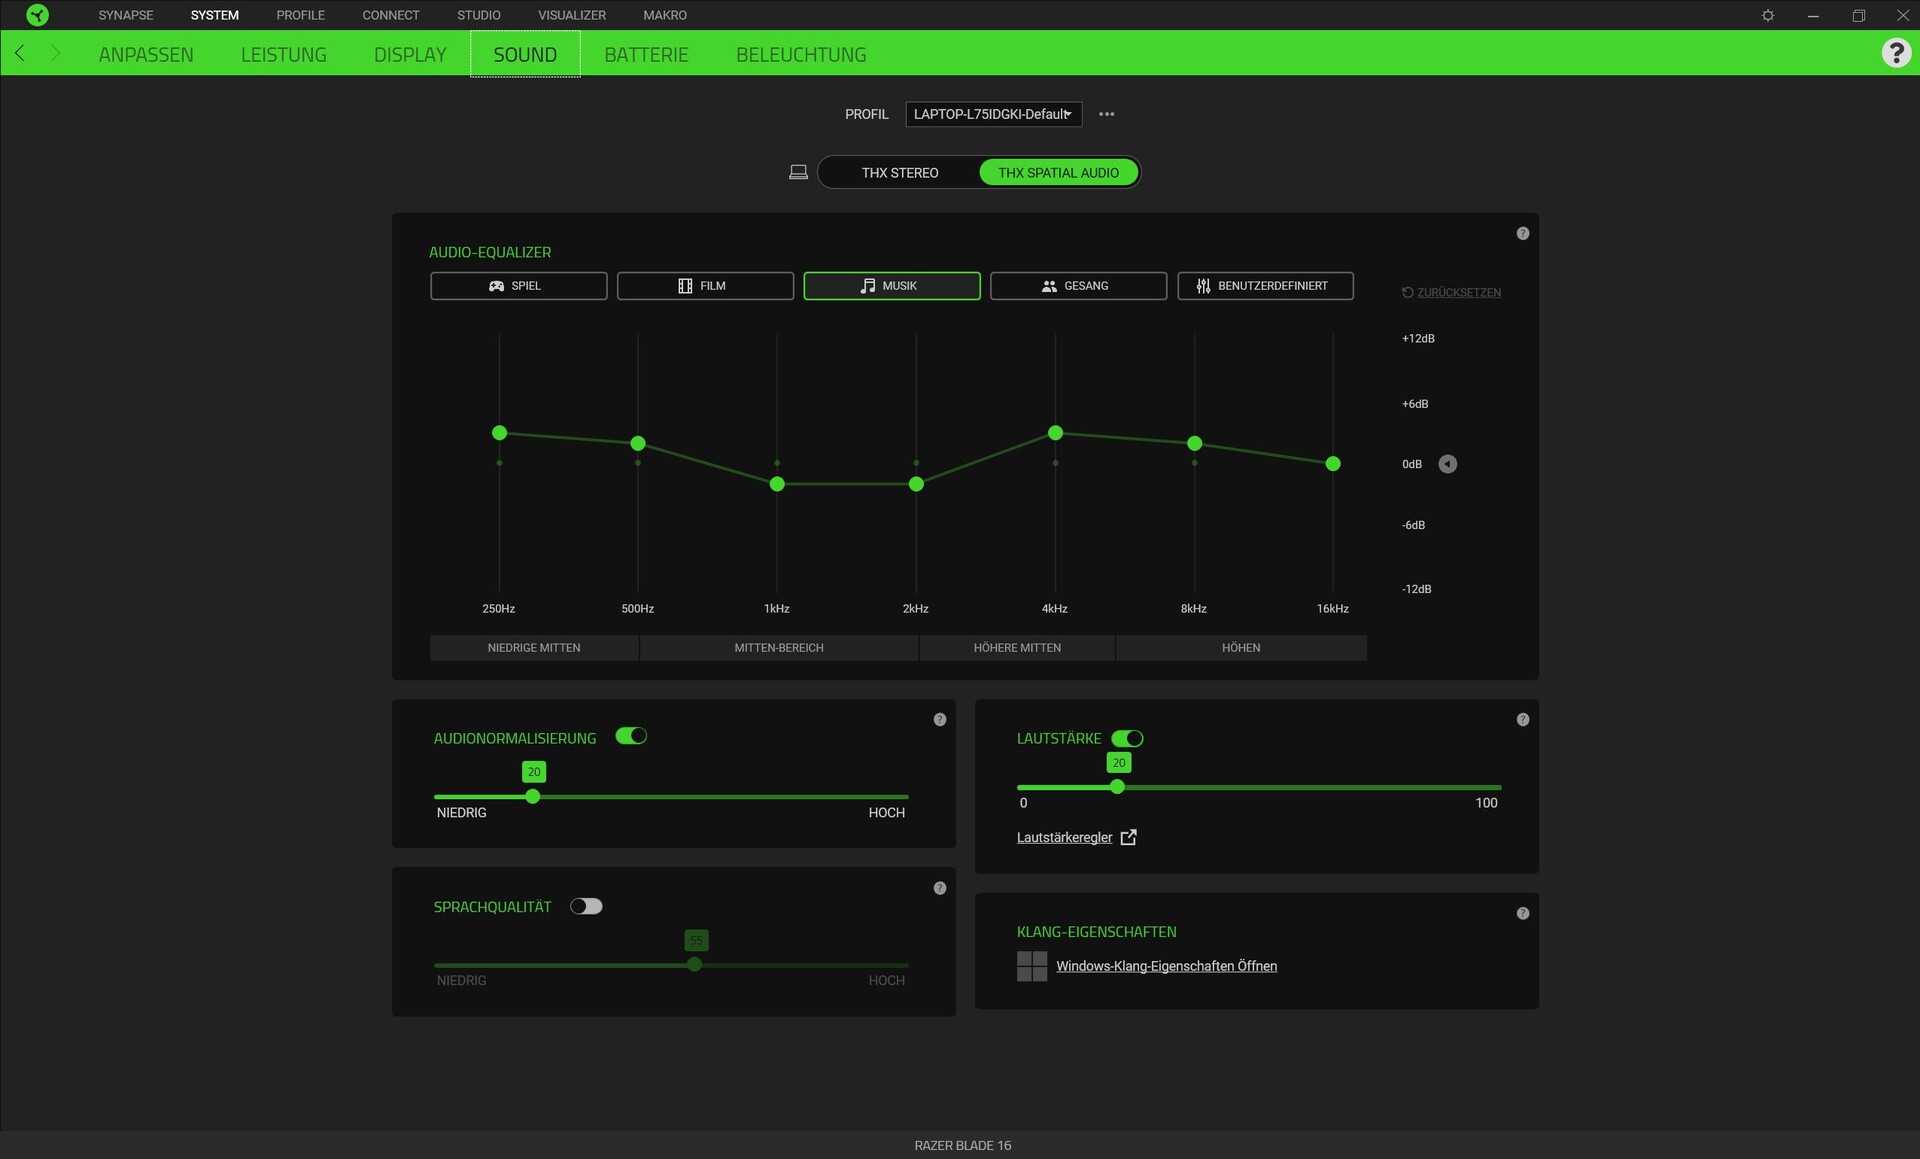
Razer Synapse serves as the command and control center in the Blade models. It lets you set one of the four performance modes (silent, balanced, turbo, custom) as well as lighting effects and make further adjustments.
Sometimes the software has to update itself, which takes an unusually long time; we even had to restart the device afterwards, which was a bit annoying. The options cannot be accessed during the long, unsolicited update. The home screen also isn't the best. Although the software remembers the last tab opened during a Windows session (e.g. performance), we always have to restart before we can access the home screen. Here, we first have to select our device (even if it is our only Razer device) and then click on the correct tab; "customize" is selected by default (set function keys)—a tab that is probably rarely used.
For our benchmarks, we used the custom mode to maximize the CPU and GPU's performance. However, we left the fans on automatic, otherwise they would always turn up to maximum volume. Sometimes there were some problems with graphics switching, which failed for certain apps. For example, 3DMark 06 only started in dGPU mode.


Processor
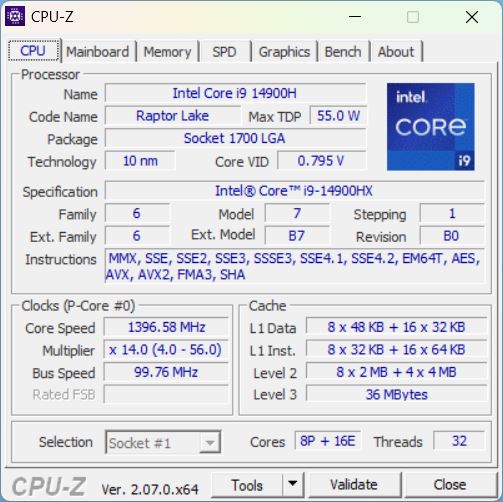
The Core i9-14900HX is the current top dog within the Raptor-Lake-Refresh series for laptops. Compared to last year's Raptor Lake, however, the architecture has remained the same—only its turbo clock rate is now slightly higher. It now clocks at up to 5.8 GHz and apart from this, Intel's flagship CPU features 24 cores (8 P cores, 16 E cores; 32 threads).
During the Cinebench R15 loop, the CPU delivered very high and constant performance without the usual drop in performance after the first 1 to 3 runs. Even so, the Legion 9 with last year's top model, the Core i9-13980HX, was just as fast and the other top-of-the-range CPUs from Intel's Gen 13 only came in just behind. The weaker i7-14650HX within the current Legion 5 trailed a little more behind. Compared to its predecessor, the current CPU's results were about 8 per cent better. Despite this excellent performance, there aren't all too many arguments that speak for spending lots of money on Intel Gen 14, as Gen 13 is nearly identically fast. Take a look at our analysis of the new Gen-14 CPUs for more information.
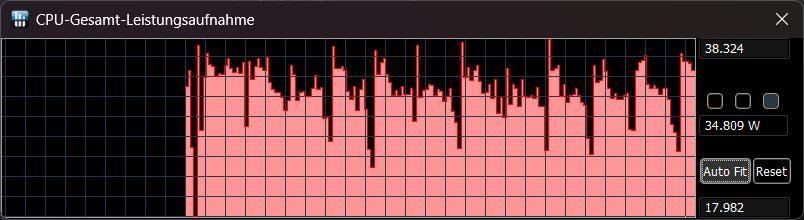
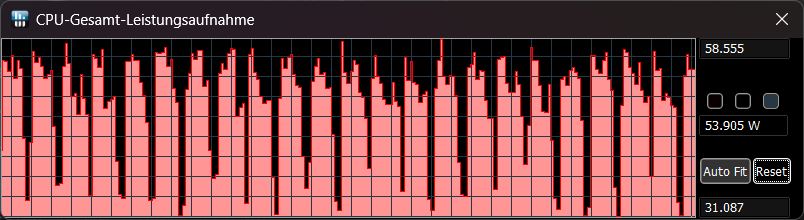
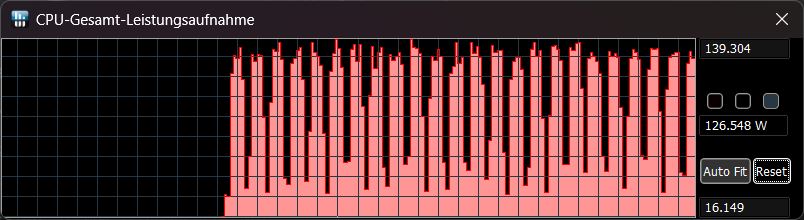
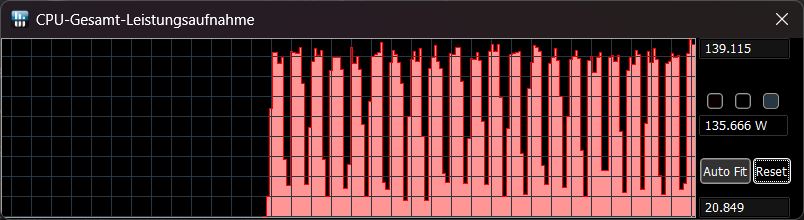
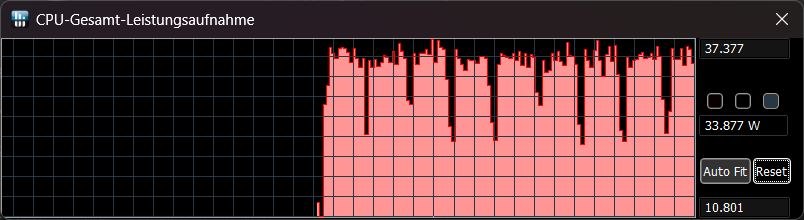
In the table below, we have listed the power consumption during Cinebench R15 using the different performance modes and the screenshots on the right illustrate these values. If we disconnected the power, Synapse automatically switched to balanced mode, which couldn't be changed. However, the TDP values were even lower than in the same mode when plugged in—they are rather more similar to the silent-mode values.
| Performance mode/value | Cinebench R15 score, first run | TDP at beginning of run | TDP at end of run |
|---|---|---|---|
| User-defined (boost/high) | 4,456 | 139 | 135 |
| Turbo | 4,305 | 139 | 126 |
| Balanced | 2,678 | 58 | 54 |
| Silent | 1,888 | 38 | 35 |
| Battery | 1,835 | 37 | 34 |
Cinebench R15 Multi continuous test
Cinebench R23: Multi Core | Single Core
Cinebench R20: CPU (Multi Core) | CPU (Single Core)
Cinebench R15: CPU Multi 64Bit | CPU Single 64Bit
Blender: v2.79 BMW27 CPU
7-Zip 18.03: 7z b 4 | 7z b 4 -mmt1
Geekbench 6.7: Multi-Core | Single-Core
Geekbench 5.5: Multi-Core | Single-Core
HWBOT x265 Benchmark v2.2: 4k Preset
LibreOffice : 20 Documents To PDF
R Benchmark 2.5: Overall mean
| CPU Performance rating | |
| Lenovo Legion 9 16IRX8 | |
| Razer Blade 16 2024, RTX 4090 | |
| Average Intel Core i9-14900HX | |
| Schenker XMG Neo 16 E23 -2! | |
| Razer Blade 16 Early 2023 RTX 4090 -2! | |
| Average of class Gaming | |
| Lenovo Legion 5 16IRX G9 | |
| Cinebench R23 / Multi Core | |
| Lenovo Legion 9 16IRX8 | |
| Schenker XMG Neo 16 E23 | |
| Razer Blade 16 2024, RTX 4090 | |
| Average Intel Core i9-14900HX (17078 - 36249, n=37) | |
| Razer Blade 16 Early 2023 RTX 4090 | |
| Average of class Gaming (10488 - 42661, n=107, last 2 years) | |
| Lenovo Legion 5 16IRX G9 | |
| Cinebench R23 / Single Core | |
| Average Intel Core i9-14900HX (1720 - 2245, n=37) | |
| Lenovo Legion 9 16IRX8 | |
| Razer Blade 16 2024, RTX 4090 | |
| Schenker XMG Neo 16 E23 | |
| Average of class Gaming (1166 - 2415, n=107, last 2 years) | |
| Lenovo Legion 5 16IRX G9 | |
| Razer Blade 16 Early 2023 RTX 4090 | |
| Cinebench R20 / CPU (Multi Core) | |
| Lenovo Legion 9 16IRX8 | |
| Schenker XMG Neo 16 E23 | |
| Average Intel Core i9-14900HX (6579 - 13832, n=37) | |
| Razer Blade 16 2024, RTX 4090 | |
| Razer Blade 16 Early 2023 RTX 4090 | |
| Average of class Gaming (4029 - 16433, n=106, last 2 years) | |
| Lenovo Legion 5 16IRX G9 | |
| Cinebench R20 / CPU (Single Core) | |
| Average Intel Core i9-14900HX (657 - 859, n=37) | |
| Razer Blade 16 2024, RTX 4090 | |
| Schenker XMG Neo 16 E23 | |
| Average of class Gaming (442 - 913, n=106, last 2 years) | |
| Razer Blade 16 Early 2023 RTX 4090 | |
| Lenovo Legion 5 16IRX G9 | |
| Lenovo Legion 9 16IRX8 | |
| Cinebench R15 / CPU Multi 64Bit | |
| Schenker XMG Neo 16 E23 | |
| Lenovo Legion 9 16IRX8 | |
| Razer Blade 16 2024, RTX 4090 | |
| Average Intel Core i9-14900HX (3263 - 5589, n=38) | |
| Razer Blade 16 Early 2023 RTX 4090 | |
| Average of class Gaming (1578 - 6330, n=105, last 2 years) | |
| Lenovo Legion 5 16IRX G9 | |
| Cinebench R15 / CPU Single 64Bit | |
| Razer Blade 16 2024, RTX 4090 | |
| Average Intel Core i9-14900HX (247 - 323, n=37) | |
| Lenovo Legion 9 16IRX8 | |
| Schenker XMG Neo 16 E23 | |
| Average of class Gaming (188.8 - 350, n=106, last 2 years) | |
| Lenovo Legion 5 16IRX G9 | |
| Razer Blade 16 Early 2023 RTX 4090 | |
| Blender / v2.79 BMW27 CPU | |
| Average of class Gaming (79 - 330, n=104, last 2 years) | |
| Lenovo Legion 5 16IRX G9 | |
| Average Intel Core i9-14900HX (91 - 206, n=37) | |
| Razer Blade 16 Early 2023 RTX 4090 | |
| Schenker XMG Neo 16 E23 | |
| Razer Blade 16 2024, RTX 4090 | |
| Lenovo Legion 9 16IRX8 | |
| 7-Zip 18.03 / 7z b 4 | |
| Lenovo Legion 9 16IRX8 | |
| Razer Blade 16 2024, RTX 4090 | |
| Schenker XMG Neo 16 E23 | |
| Average Intel Core i9-14900HX (66769 - 136645, n=37) | |
| Razer Blade 16 Early 2023 RTX 4090 | |
| Lenovo Legion 5 16IRX G9 | |
| Average of class Gaming (33491 - 148086, n=105, last 2 years) | |
| 7-Zip 18.03 / 7z b 4 -mmt1 | |
| Schenker XMG Neo 16 E23 | |
| Average Intel Core i9-14900HX (5452 - 7545, n=37) | |
| Razer Blade 16 2024, RTX 4090 | |
| Lenovo Legion 9 16IRX8 | |
| Razer Blade 16 Early 2023 RTX 4090 | |
| Lenovo Legion 5 16IRX G9 | |
| Average of class Gaming (4199 - 7436, n=105, last 2 years) | |
| Geekbench 6.7 / Multi-Core | |
| Razer Blade 16 2024, RTX 4090 | |
| Lenovo Legion 9 16IRX8 | |
| Average Intel Core i9-14900HX (13158 - 19665, n=37) | |
| Lenovo Legion 5 16IRX G9 | |
| Average of class Gaming (6625 - 22850, n=106, last 2 years) | |
| Geekbench 6.7 / Single-Core | |
| Average Intel Core i9-14900HX (2419 - 3129, n=37) | |
| Razer Blade 16 2024, RTX 4090 | |
| Lenovo Legion 9 16IRX8 | |
| Average of class Gaming (1490 - 3259, n=106, last 2 years) | |
| Lenovo Legion 5 16IRX G9 | |
| Geekbench 5.5 / Multi-Core | |
| Schenker XMG Neo 16 E23 | |
| Lenovo Legion 9 16IRX8 | |
| Average Intel Core i9-14900HX (8618 - 23194, n=37) | |
| Razer Blade 16 2024, RTX 4090 | |
| Average of class Gaming (6460 - 28263, n=105, last 2 years) | |
| Lenovo Legion 5 16IRX G9 | |
| Razer Blade 16 Early 2023 RTX 4090 | |
| Geekbench 5.5 / Single-Core | |
| Lenovo Legion 9 16IRX8 | |
| Razer Blade 16 2024, RTX 4090 | |
| Average Intel Core i9-14900HX (1669 - 2210, n=37) | |
| Average of class Gaming (986 - 2474, n=105, last 2 years) | |
| Schenker XMG Neo 16 E23 | |
| Razer Blade 16 Early 2023 RTX 4090 | |
| Lenovo Legion 5 16IRX G9 | |
| HWBOT x265 Benchmark v2.2 / 4k Preset | |
| Lenovo Legion 9 16IRX8 | |
| Schenker XMG Neo 16 E23 | |
| Razer Blade 16 Early 2023 RTX 4090 | |
| Razer Blade 16 2024, RTX 4090 | |
| Average Intel Core i9-14900HX (16.8 - 38.9, n=37) | |
| Average of class Gaming (11.5 - 44.4, n=105, last 2 years) | |
| Lenovo Legion 5 16IRX G9 | |
| LibreOffice / 20 Documents To PDF | |
| Razer Blade 16 Early 2023 RTX 4090 | |
| Average of class Gaming (33.2 - 88.8, n=105, last 2 years) | |
| Razer Blade 16 2024, RTX 4090 | |
| Lenovo Legion 5 16IRX G9 | |
| Average Intel Core i9-14900HX (19 - 85.1, n=37) | |
| Schenker XMG Neo 16 E23 | |
| Lenovo Legion 9 16IRX8 | |
| R Benchmark 2.5 / Overall mean | |
| Average of class Gaming (0.3439 - 0.759, n=106, last 2 years) | |
| Lenovo Legion 5 16IRX G9 | |
| Razer Blade 16 Early 2023 RTX 4090 | |
| Average Intel Core i9-14900HX (0.3604 - 0.4859, n=37) | |
| Lenovo Legion 9 16IRX8 | |
| Razer Blade 16 2024, RTX 4090 | |
| Schenker XMG Neo 16 E23 | |
* ... smaller is better
AIDA64: FP32 Ray-Trace | FPU Julia | CPU SHA3 | CPU Queen | FPU SinJulia | FPU Mandel | CPU AES | CPU ZLib | FP64 Ray-Trace | CPU PhotoWorxx
| Performance rating | |
| Lenovo Legion 9 16IRX8 | |
| Average of class Gaming | |
| Razer Blade 16 2024, RTX 4090 | |
| Schenker XMG Neo 16 E23 | |
| Average Intel Core i9-14900HX | |
| Razer Blade 16 Early 2023 RTX 4090 | |
| Lenovo Legion 5 16IRX G9 | |
| AIDA64 / FP32 Ray-Trace | |
| Average of class Gaming (10227 - 85542, n=105, last 2 years) | |
| Lenovo Legion 9 16IRX8 | |
| Razer Blade 16 2024, RTX 4090 | |
| Average Intel Core i9-14900HX (13098 - 33474, n=36) | |
| Schenker XMG Neo 16 E23 | |
| Lenovo Legion 5 16IRX G9 | |
| Razer Blade 16 Early 2023 RTX 4090 | |
| AIDA64 / FPU Julia | |
| Average of class Gaming (51376 - 238426, n=105, last 2 years) | |
| Lenovo Legion 9 16IRX8 | |
| Razer Blade 16 2024, RTX 4090 | |
| Average Intel Core i9-14900HX (67573 - 166040, n=36) | |
| Schenker XMG Neo 16 E23 | |
| Razer Blade 16 Early 2023 RTX 4090 | |
| Lenovo Legion 5 16IRX G9 | |
| AIDA64 / CPU SHA3 | |
| Lenovo Legion 9 16IRX8 | |
| Average of class Gaming (2180 - 10115, n=105, last 2 years) | |
| Razer Blade 16 2024, RTX 4090 | |
| Average Intel Core i9-14900HX (3589 - 7979, n=36) | |
| Schenker XMG Neo 16 E23 | |
| Razer Blade 16 Early 2023 RTX 4090 | |
| Lenovo Legion 5 16IRX G9 | |
| AIDA64 / CPU Queen | |
| Razer Blade 16 2024, RTX 4090 | |
| Average Intel Core i9-14900HX (118405 - 148966, n=36) | |
| Razer Blade 16 Early 2023 RTX 4090 | |
| Schenker XMG Neo 16 E23 | |
| Lenovo Legion 9 16IRX8 | |
| Average of class Gaming (49785 - 173351, n=90, last 2 years) | |
| Lenovo Legion 5 16IRX G9 | |
| AIDA64 / FPU SinJulia | |
| Razer Blade 16 2024, RTX 4090 | |
| Lenovo Legion 9 16IRX8 | |
| Average Intel Core i9-14900HX (10475 - 18517, n=36) | |
| Schenker XMG Neo 16 E23 | |
| Average of class Gaming (4424 - 33636, n=105, last 2 years) | |
| Razer Blade 16 Early 2023 RTX 4090 | |
| Lenovo Legion 5 16IRX G9 | |
| AIDA64 / FPU Mandel | |
| Average of class Gaming (25115 - 128721, n=105, last 2 years) | |
| Lenovo Legion 9 16IRX8 | |
| Razer Blade 16 2024, RTX 4090 | |
| Average Intel Core i9-14900HX (32543 - 83662, n=36) | |
| Schenker XMG Neo 16 E23 | |
| Lenovo Legion 5 16IRX G9 | |
| Razer Blade 16 Early 2023 RTX 4090 | |
| AIDA64 / CPU AES | |
| Schenker XMG Neo 16 E23 | |
| Razer Blade 16 Early 2023 RTX 4090 | |
| Average Intel Core i9-14900HX (86964 - 241777, n=36) | |
| Lenovo Legion 9 16IRX8 | |
| Razer Blade 16 2024, RTX 4090 | |
| Average of class Gaming (39258 - 247074, n=105, last 2 years) | |
| Lenovo Legion 5 16IRX G9 | |
| AIDA64 / CPU ZLib | |
| Lenovo Legion 9 16IRX8 | |
| Razer Blade 16 2024, RTX 4090 | |
| Average Intel Core i9-14900HX (1054 - 2292, n=36) | |
| Schenker XMG Neo 16 E23 | |
| Razer Blade 16 Early 2023 RTX 4090 | |
| Average of class Gaming (574 - 2531, n=105, last 2 years) | |
| Lenovo Legion 5 16IRX G9 | |
| AIDA64 / FP64 Ray-Trace | |
| Average of class Gaming (5509 - 45446, n=105, last 2 years) | |
| Lenovo Legion 9 16IRX8 | |
| Razer Blade 16 2024, RTX 4090 | |
| Average Intel Core i9-14900HX (6809 - 18349, n=36) | |
| Schenker XMG Neo 16 E23 | |
| Lenovo Legion 5 16IRX G9 | |
| Razer Blade 16 Early 2023 RTX 4090 | |
| AIDA64 / CPU PhotoWorxx | |
| Razer Blade 16 Early 2023 RTX 4090 | |
| Lenovo Legion 9 16IRX8 | |
| Razer Blade 16 2024, RTX 4090 | |
| Schenker XMG Neo 16 E23 | |
| Average Intel Core i9-14900HX (23903 - 54702, n=36) | |
| Average of class Gaming (12271 - 89891, n=105, last 2 years) | |
| Lenovo Legion 5 16IRX G9 | |
System performance
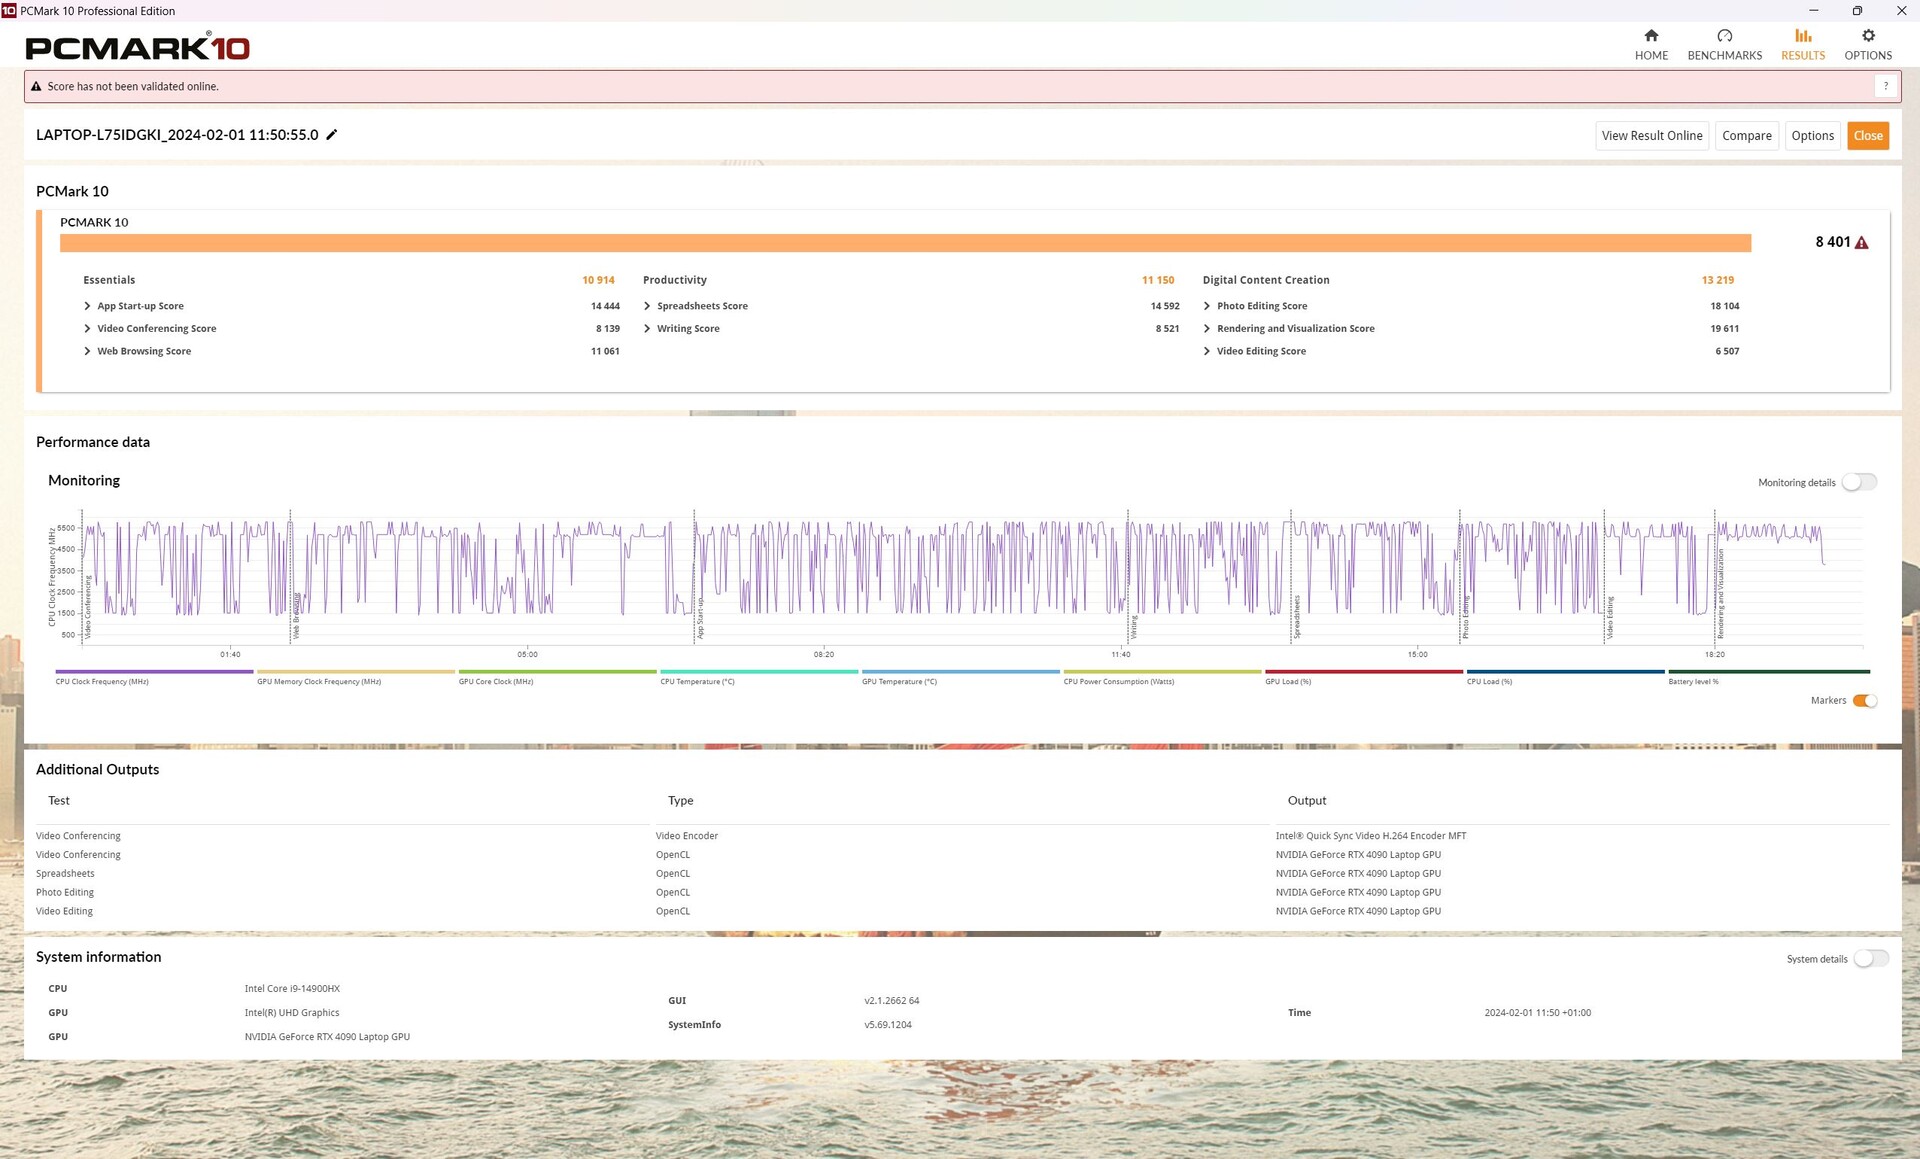
During CrossMark, the Blade 16 took the lead over the comparison devices, while in PCMark 10, the gamer came around 3 per cent behind the average laptop with the same CPU/GPU combination. In total, all the comparison devices achieved similar values.
Subjectively, the system runs smoothly—only graphics switching causes it to freeze for a few seconds when starting apps, but this is also the case on a lot of other gamers with dGPUs.
CrossMark: Overall | Productivity | Creativity | Responsiveness
WebXPRT 3: Overall
WebXPRT 4: Overall
Mozilla Kraken 1.1: Total
| PCMark 10 / Score | |
| Lenovo Legion 9 16IRX8 | |
| Average Intel Core i9-14900HX, NVIDIA GeForce RTX 4090 Laptop GPU (8230 - 9234, n=13) | |
| Average of class Gaming (5828 - 12414, n=93, last 2 years) | |
| Razer Blade 16 2024, RTX 4090 | |
| Schenker XMG Neo 16 E23 | |
| Lenovo Legion 5 16IRX G9 | |
| Razer Blade 16 Early 2023 RTX 4090 | |
| PCMark 10 / Essentials | |
| Lenovo Legion 9 16IRX8 | |
| Average Intel Core i9-14900HX, NVIDIA GeForce RTX 4090 Laptop GPU (10778 - 11628, n=13) | |
| Schenker XMG Neo 16 E23 | |
| Razer Blade 16 2024, RTX 4090 | |
| Razer Blade 16 Early 2023 RTX 4090 | |
| Lenovo Legion 5 16IRX G9 | |
| Average of class Gaming (8810 - 11935, n=97, last 2 years) | |
| PCMark 10 / Productivity | |
| Average of class Gaming (6845 - 25323, n=95, last 2 years) | |
| Razer Blade 16 2024, RTX 4090 | |
| Lenovo Legion 9 16IRX8 | |
| Average Intel Core i9-14900HX, NVIDIA GeForce RTX 4090 Laptop GPU (9458 - 11759, n=13) | |
| Schenker XMG Neo 16 E23 | |
| Lenovo Legion 5 16IRX G9 | |
| Razer Blade 16 Early 2023 RTX 4090 | |
| PCMark 10 / Digital Content Creation | |
| Lenovo Legion 9 16IRX8 | |
| Average Intel Core i9-14900HX, NVIDIA GeForce RTX 4090 Laptop GPU (13219 - 16462, n=13) | |
| Schenker XMG Neo 16 E23 | |
| Average of class Gaming (7602 - 19954, n=95, last 2 years) | |
| Razer Blade 16 2024, RTX 4090 | |
| Razer Blade 16 Early 2023 RTX 4090 | |
| Lenovo Legion 5 16IRX G9 | |
| CrossMark / Overall | |
| Razer Blade 16 2024, RTX 4090 | |
| Average Intel Core i9-14900HX, NVIDIA GeForce RTX 4090 Laptop GPU (1877 - 2344, n=10) | |
| Schenker XMG Neo 16 E23 | |
| Lenovo Legion 5 16IRX G9 | |
| Razer Blade 16 Early 2023 RTX 4090 | |
| Average of class Gaming (1366 - 2409, n=94, last 2 years) | |
| Lenovo Legion 9 16IRX8 | |
| CrossMark / Productivity | |
| Razer Blade 16 2024, RTX 4090 | |
| Average Intel Core i9-14900HX, NVIDIA GeForce RTX 4090 Laptop GPU (1738 - 2162, n=10) | |
| Schenker XMG Neo 16 E23 | |
| Lenovo Legion 5 16IRX G9 | |
| Razer Blade 16 Early 2023 RTX 4090 | |
| Average of class Gaming (1386 - 2254, n=94, last 2 years) | |
| Lenovo Legion 9 16IRX8 | |
| CrossMark / Creativity | |
| Schenker XMG Neo 16 E23 | |
| Razer Blade 16 2024, RTX 4090 | |
| Average Intel Core i9-14900HX, NVIDIA GeForce RTX 4090 Laptop GPU (2195 - 2660, n=10) | |
| Lenovo Legion 5 16IRX G9 | |
| Lenovo Legion 9 16IRX8 | |
| Average of class Gaming (1343 - 2786, n=94, last 2 years) | |
| Razer Blade 16 Early 2023 RTX 4090 | |
| CrossMark / Responsiveness | |
| Lenovo Legion 5 16IRX G9 | |
| Average Intel Core i9-14900HX, NVIDIA GeForce RTX 4090 Laptop GPU (1478 - 2327, n=10) | |
| Razer Blade 16 2024, RTX 4090 | |
| Razer Blade 16 Early 2023 RTX 4090 | |
| Schenker XMG Neo 16 E23 | |
| Average of class Gaming (1226 - 2334, n=94, last 2 years) | |
| Lenovo Legion 9 16IRX8 | |
| WebXPRT 3 / Overall | |
| Lenovo Legion 9 16IRX8 | |
| Schenker XMG Neo 16 E23 | |
| Razer Blade 16 2024, RTX 4090 | |
| Average Intel Core i9-14900HX, NVIDIA GeForce RTX 4090 Laptop GPU (279 - 339, n=10) | |
| Average of class Gaming (220 - 532, n=98, last 2 years) | |
| Lenovo Legion 5 16IRX G9 | |
| Razer Blade 16 Early 2023 RTX 4090 | |
| Razer Blade 16 Early 2023 RTX 4090 | |
| WebXPRT 4 / Overall | |
| Lenovo Legion 9 16IRX8 | |
| Schenker XMG Neo 16 E23 | |
| Average Intel Core i9-14900HX, NVIDIA GeForce RTX 4090 Laptop GPU (246 - 309, n=8) | |
| Average of class Gaming (165 - 354, n=98, last 2 years) | |
| Razer Blade 16 Early 2023 RTX 4090 | |
| Razer Blade 16 Early 2023 RTX 4090 | |
| Razer Blade 16 Early 2023 RTX 4090 | |
| Lenovo Legion 5 16IRX G9 | |
| Mozilla Kraken 1.1 / Total | |
| Lenovo Legion 5 16IRX G9 | |
| Razer Blade 16 Early 2023 RTX 4090 | |
| Razer Blade 16 Early 2023 RTX 4090 | |
| Average of class Gaming (391 - 590, n=100, last 2 years) | |
| Average Intel Core i9-14900HX, NVIDIA GeForce RTX 4090 Laptop GPU (428 - 535, n=11) | |
| Schenker XMG Neo 16 E23 | |
| Razer Blade 16 2024, RTX 4090 | |
| Lenovo Legion 9 16IRX8 | |
* ... smaller is better
| PCMark 10 Score | 8401 points | |
Help | ||
| AIDA64 / Memory Copy | |
| Razer Blade 16 2024, RTX 4090 | |
| Razer Blade 16 Early 2023 RTX 4090 | |
| Lenovo Legion 9 16IRX8 | |
| Schenker XMG Neo 16 E23 | |
| Average Intel Core i9-14900HX (38028 - 83392, n=36) | |
| Average of class Gaming (21750 - 129946, n=105, last 2 years) | |
| Lenovo Legion 5 16IRX G9 | |
| AIDA64 / Memory Read | |
| Razer Blade 16 2024, RTX 4090 | |
| Lenovo Legion 9 16IRX8 | |
| Razer Blade 16 Early 2023 RTX 4090 | |
| Schenker XMG Neo 16 E23 | |
| Average Intel Core i9-14900HX (43306 - 87568, n=36) | |
| Average of class Gaming (22956 - 118858, n=105, last 2 years) | |
| Lenovo Legion 5 16IRX G9 | |
| AIDA64 / Memory Write | |
| Razer Blade 16 Early 2023 RTX 4090 | |
| Lenovo Legion 9 16IRX8 | |
| Average of class Gaming (22297 - 135096, n=105, last 2 years) | |
| Razer Blade 16 2024, RTX 4090 | |
| Average Intel Core i9-14900HX (37146 - 80589, n=36) | |
| Schenker XMG Neo 16 E23 | |
| Lenovo Legion 5 16IRX G9 | |
| AIDA64 / Memory Latency | |
| Average of class Gaming (75.3 - 259, n=105, last 2 years) | |
| Lenovo Legion 5 16IRX G9 | |
| Razer Blade 16 Early 2023 RTX 4090 | |
| Schenker XMG Neo 16 E23 | |
| Average Intel Core i9-14900HX (76.1 - 105, n=36) | |
| Lenovo Legion 9 16IRX8 | |
| Razer Blade 16 2024, RTX 4090 | |
* ... smaller is better
DPC latency
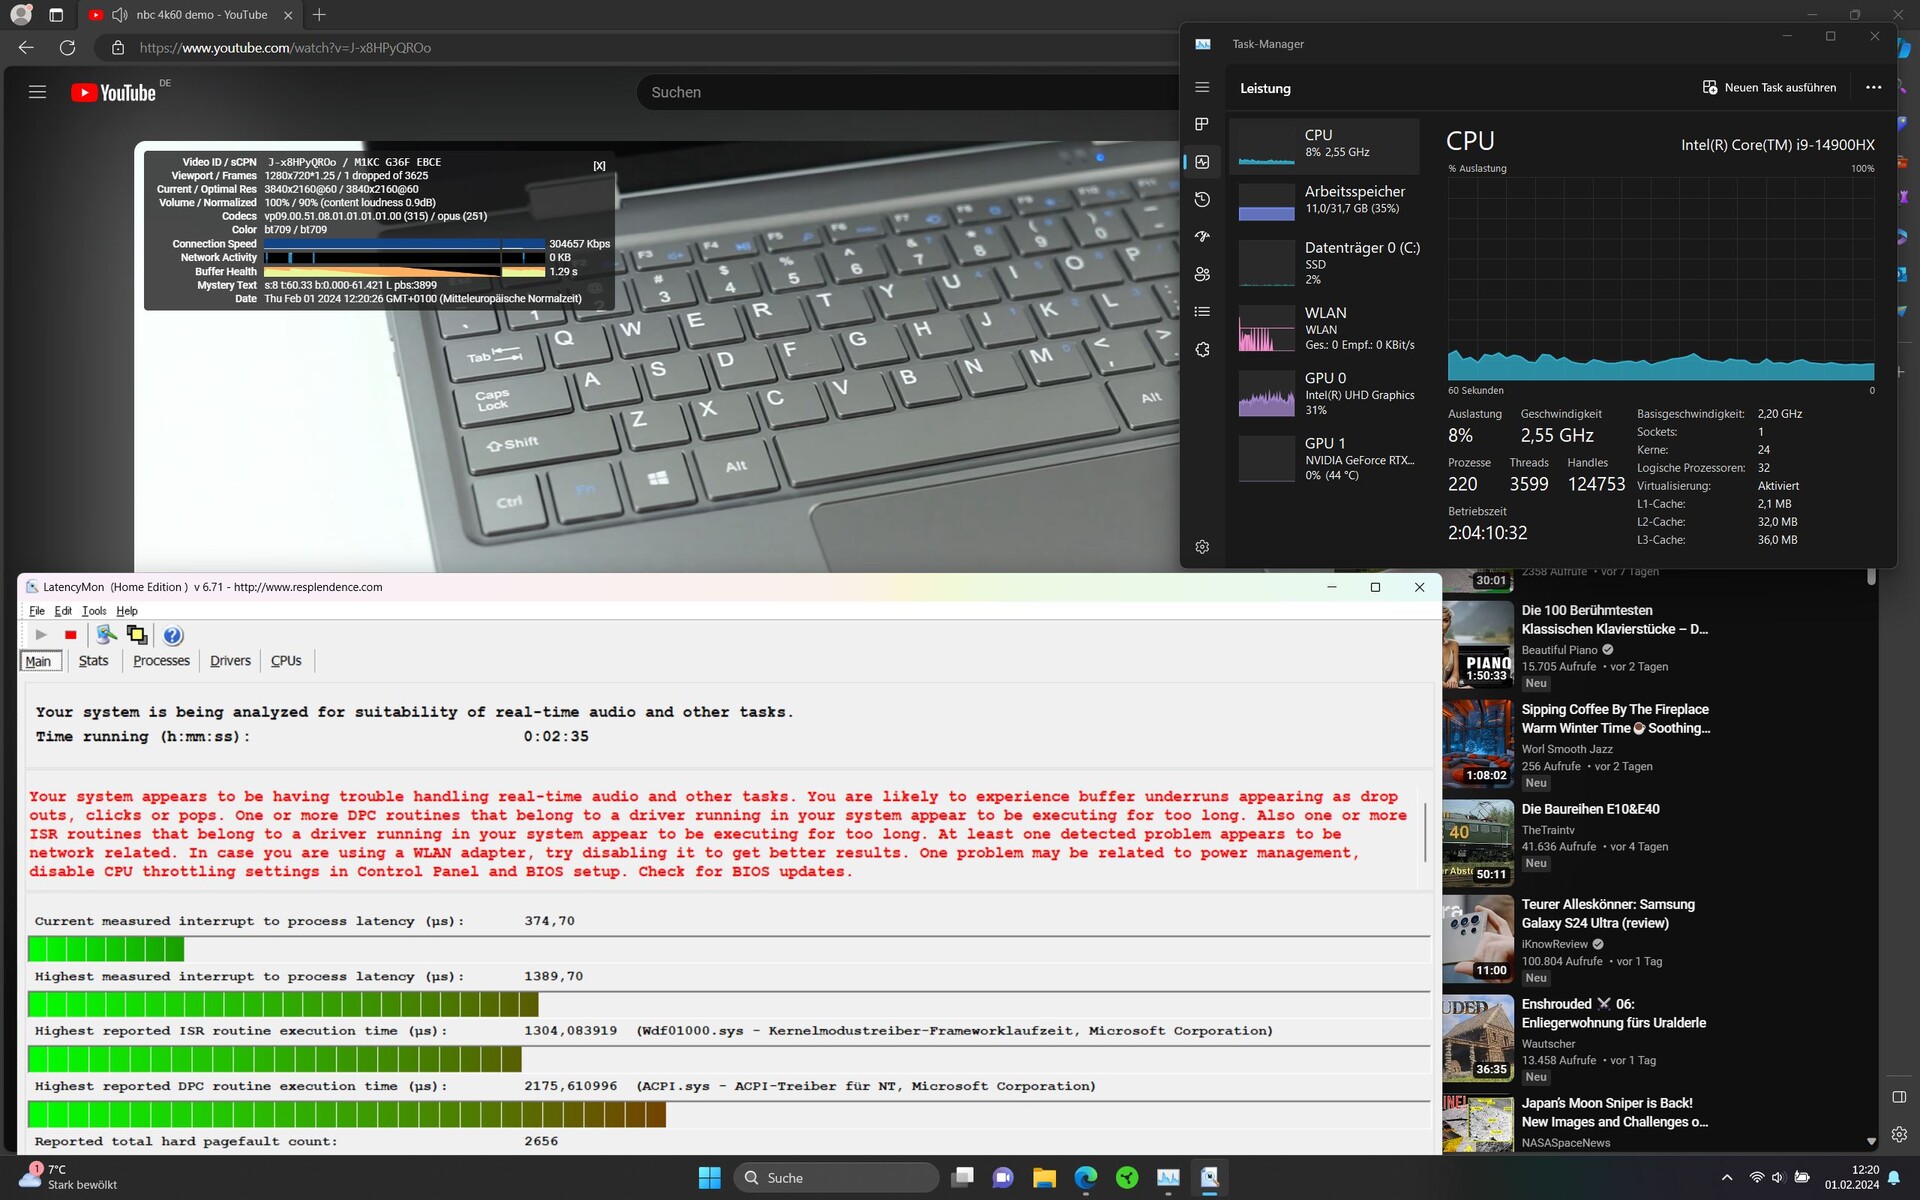
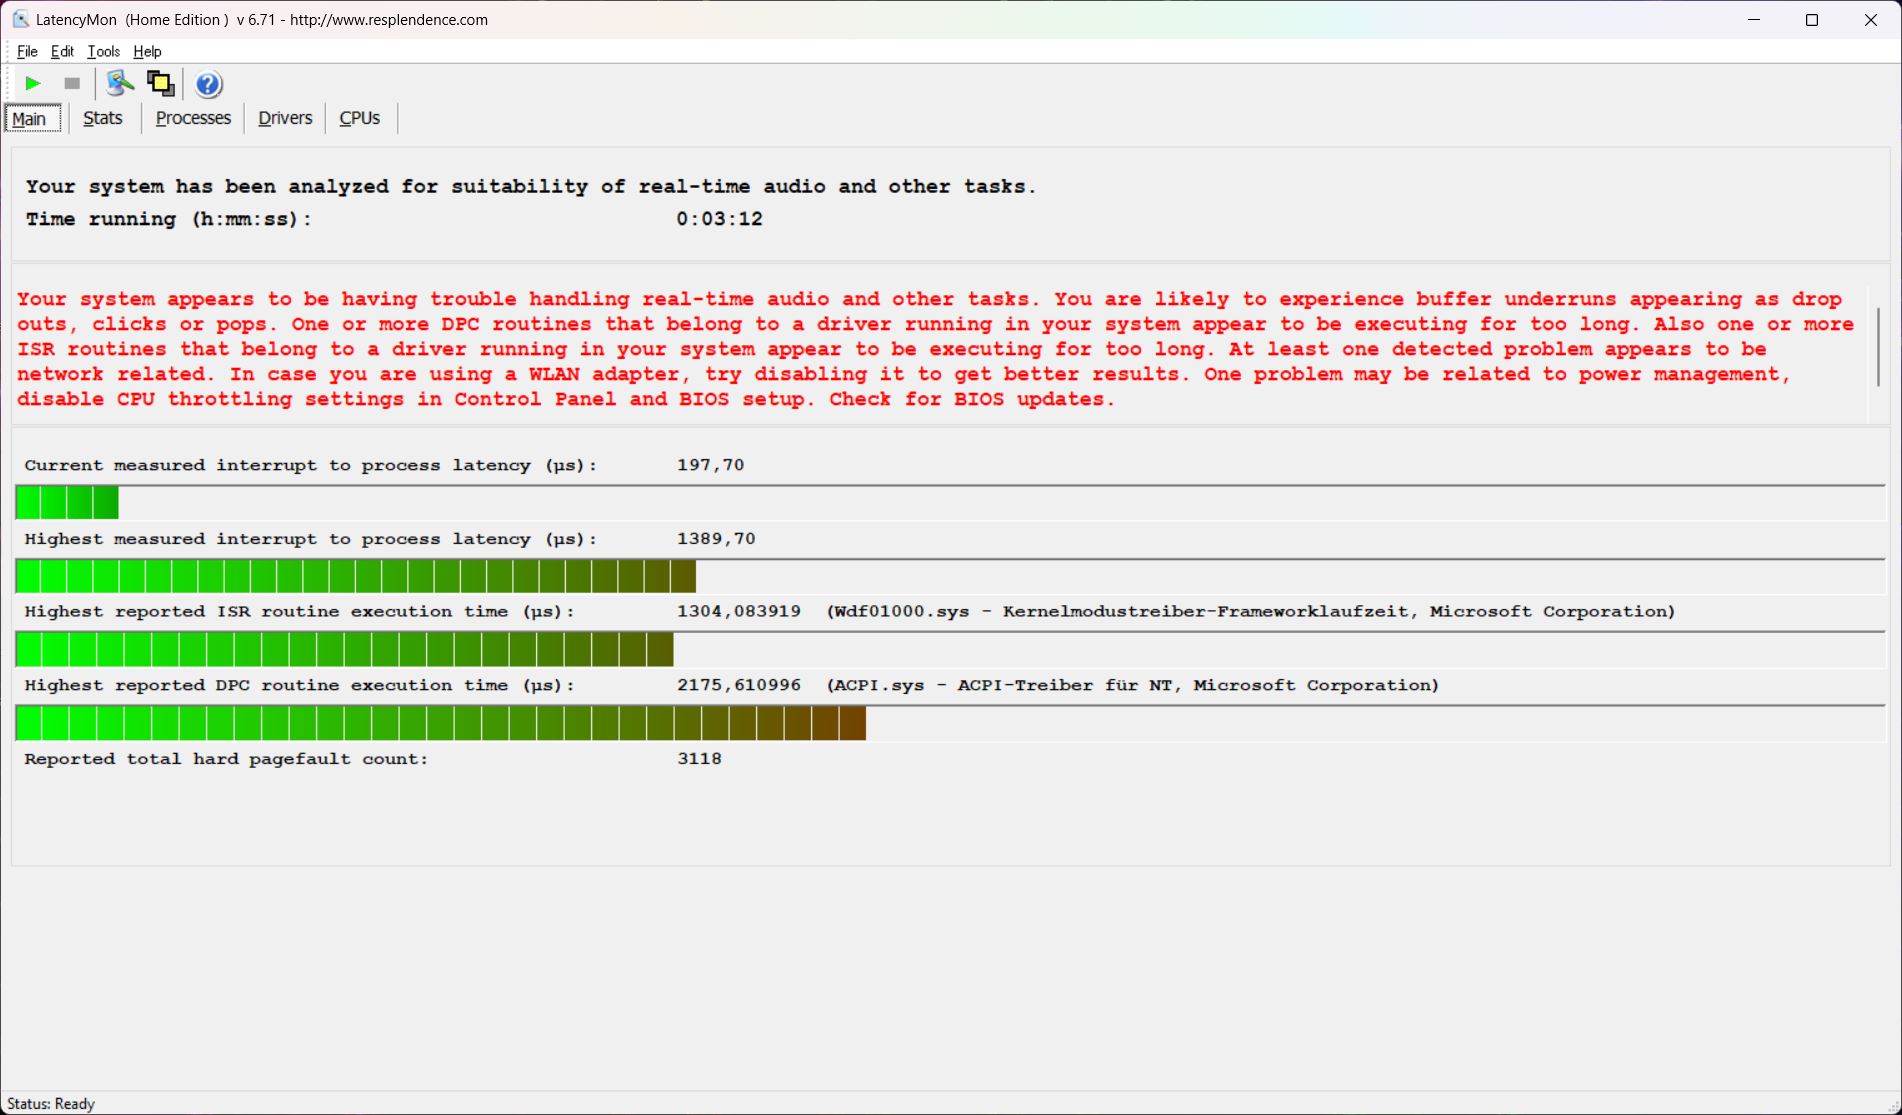
The LatencyMon software detected slight latencies as soon as the browser was opened. These increased when opening several tabs on our website. Our 4K/60 fps YouTube video was played smoothly but with one dropped frame.

| DPC Latencies / LatencyMon - interrupt to process latency (max), Web, Youtube, Prime95 | |
| Razer Blade 16 Early 2023 RTX 4090 | |
| Razer Blade 16 Early 2023 RTX 4090 | |
| Schenker XMG Neo 16 E23 | |
| Lenovo Legion 9 16IRX8 | |
| Lenovo Legion 5 16IRX G9 | |
| Razer Blade 16 2024, RTX 4090 | |
* ... smaller is better
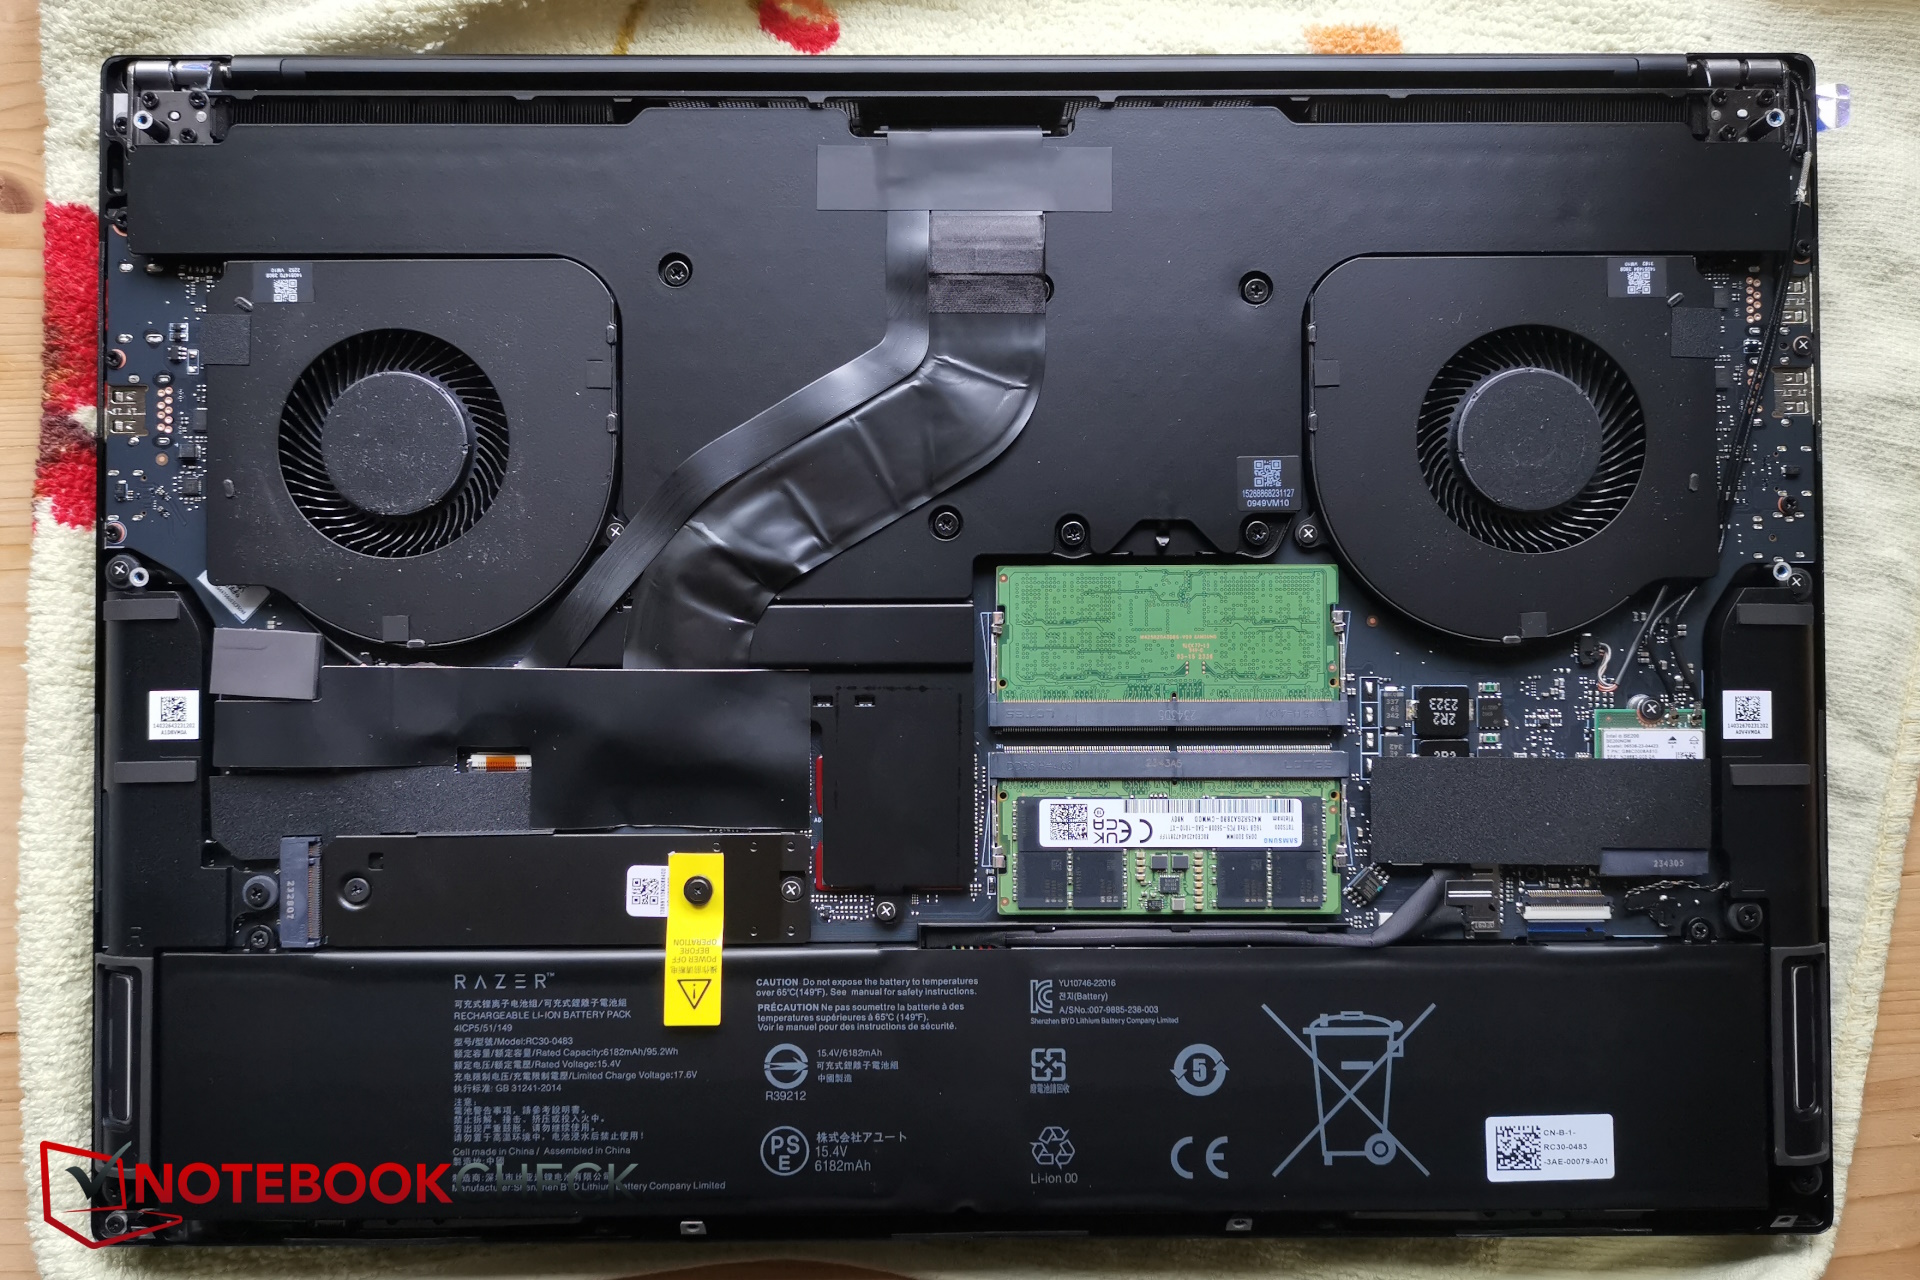
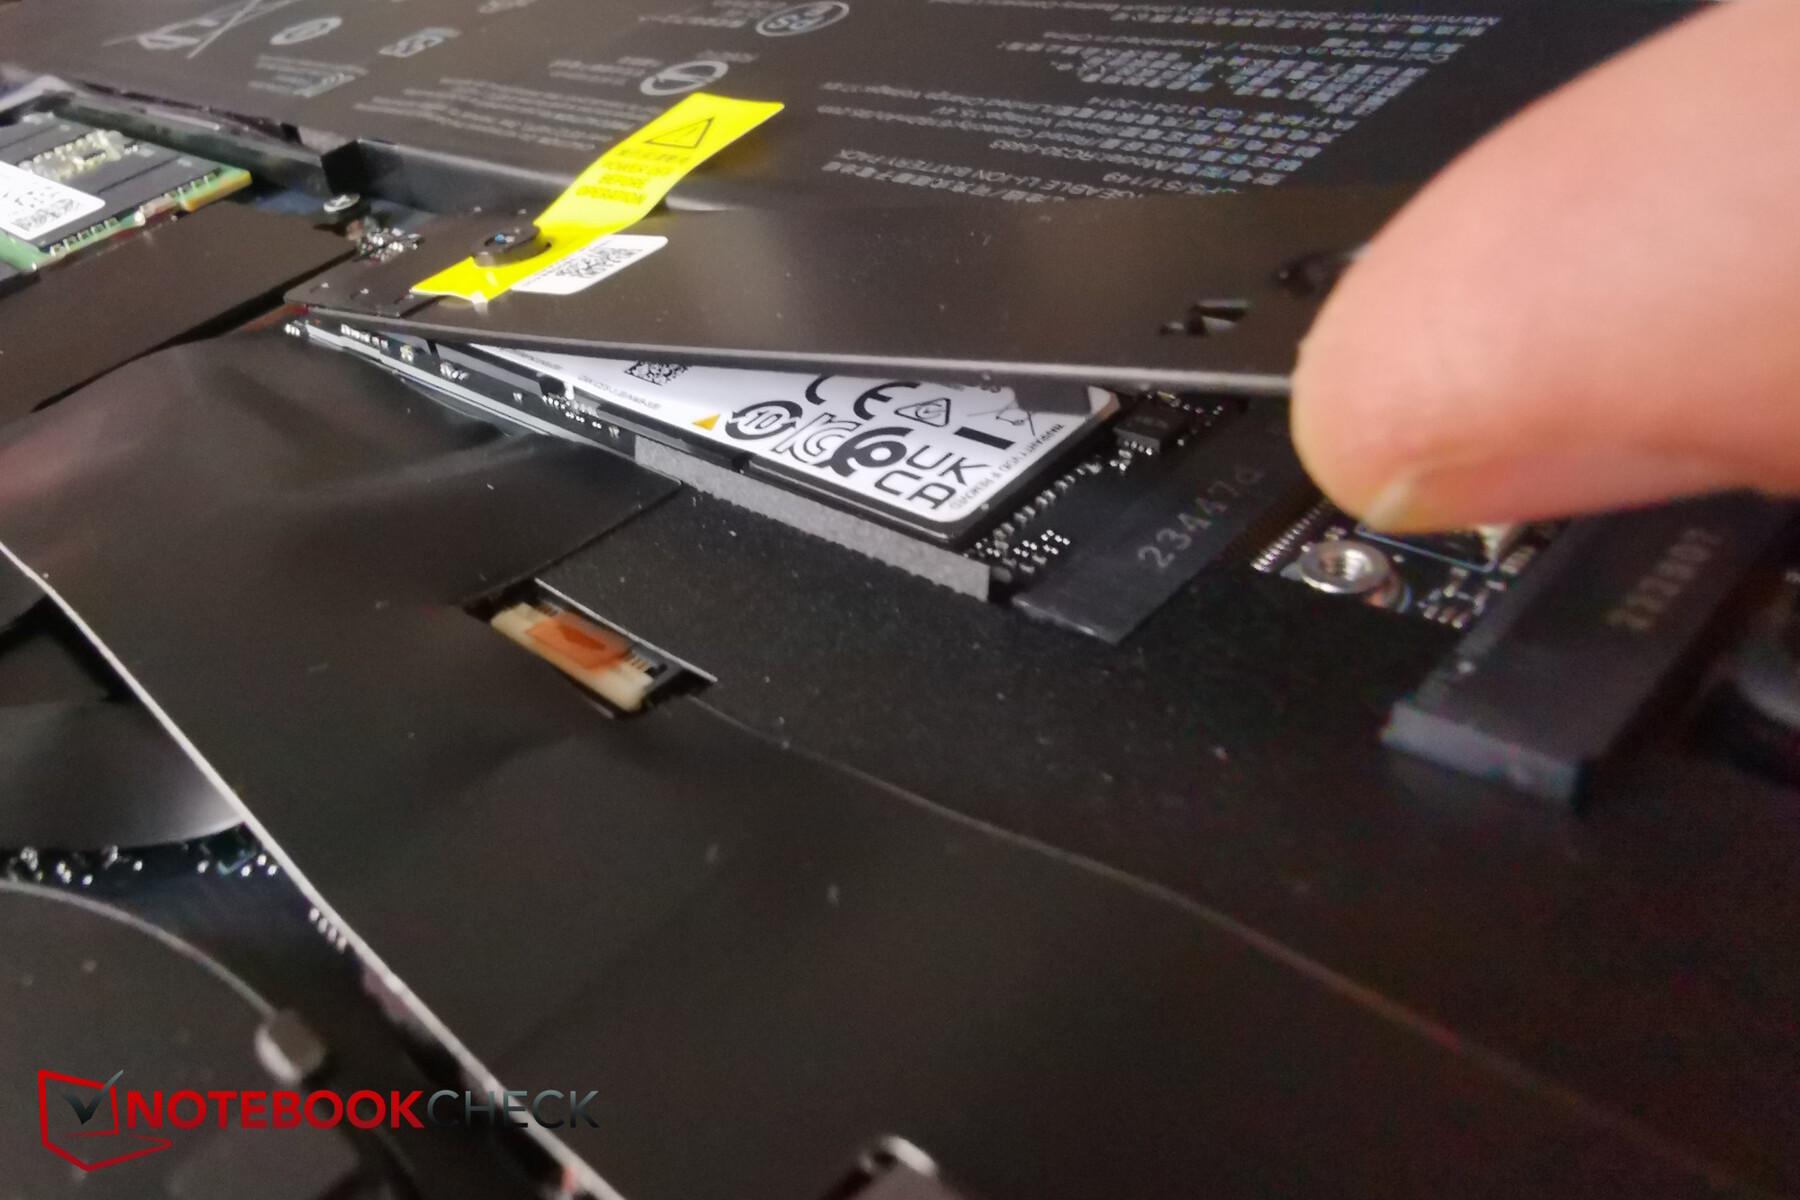
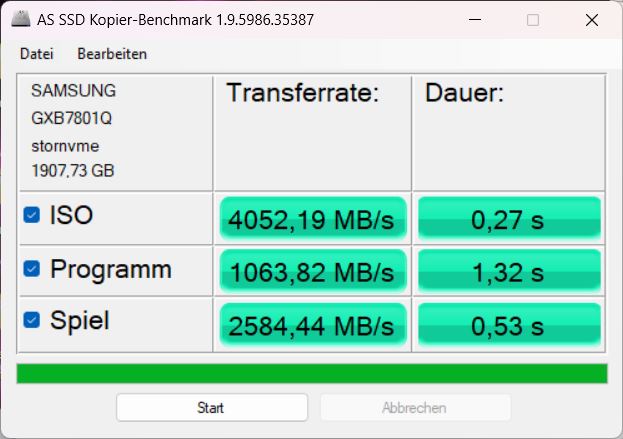
Storage devices
Razer has installed a 2-TB PCIe-4-NVMe SSD from Samsung into our test device. The relatively fast storage device achieved position 13 in our best list. Within the Blade, the SSD first ran at optimum speeds but it couldn't keep these steady over longer periods—its transfer rates fell by around 30 per cent after a while due to thermal throttling. Subsequently, it still remained a fast model, however, Razer should really take steps to ensure thermal throttling doesn't happen to begin with.


* ... smaller is better
Reading continuous performance: DiskSpd Read Loop, Queue Depth 8
Graphics card
The RTX 4090 is currently the most powerful GPU for laptops. Inside the Blade 16, it is even allowed to make use of the maximum 175 watts (150 watts + 25 watts Dynamic Boost, depending on the mode). It also features 16 GB RAM.
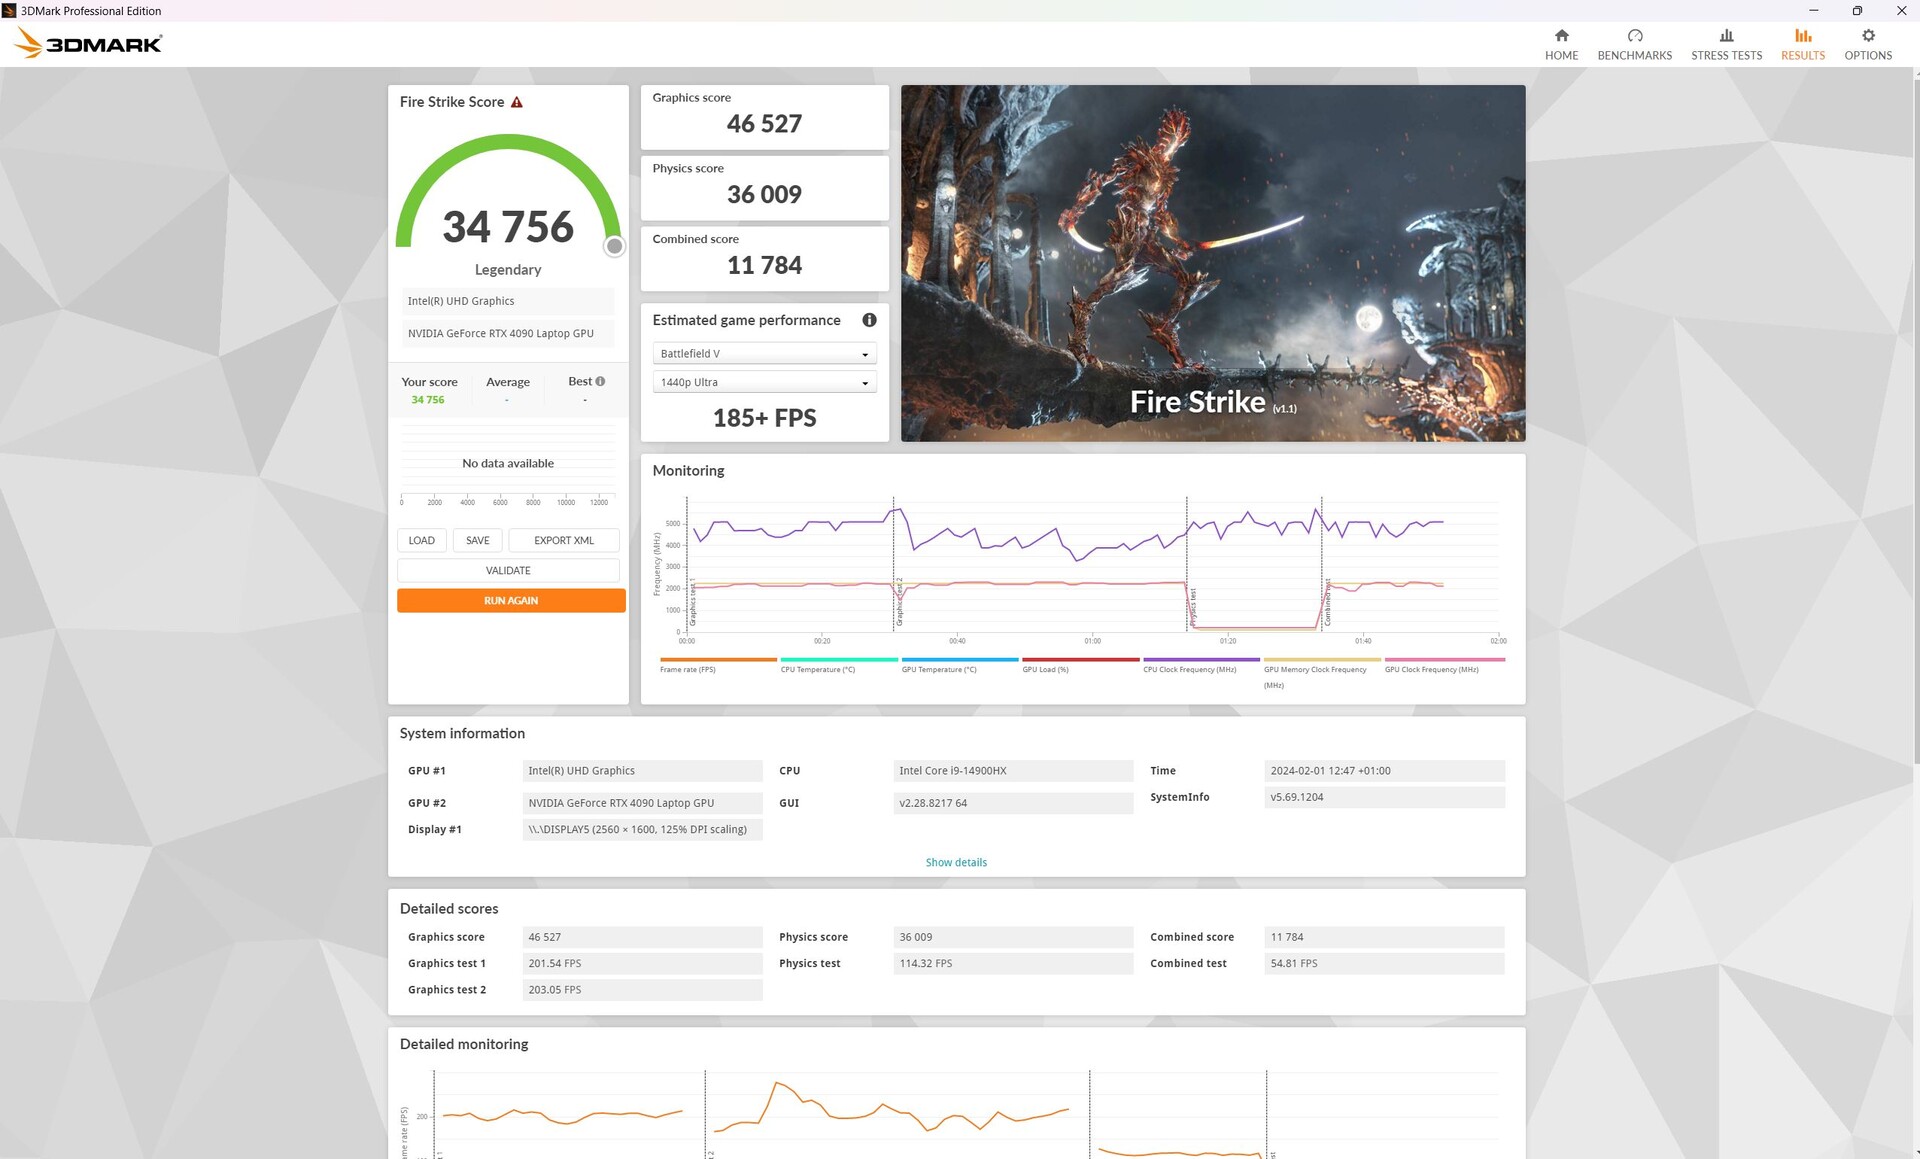
During the synthetic 3DMark benchmarks, the RTX-4090 competitors all did similarly well—only the XMG Neo 16 E23 was about 7 per cent faster. All-in-all, the RTX 4090 within the Blade 16 achieved results comparable with the average of all laptops in our database that feature an RTX 4090. Compared to the 2023 Blade 16, it only did 5 per cent better.
Repeating another Fire-Strike run in battery mode led to the laptop's graphics score dropping by a whopping 85 per cent!

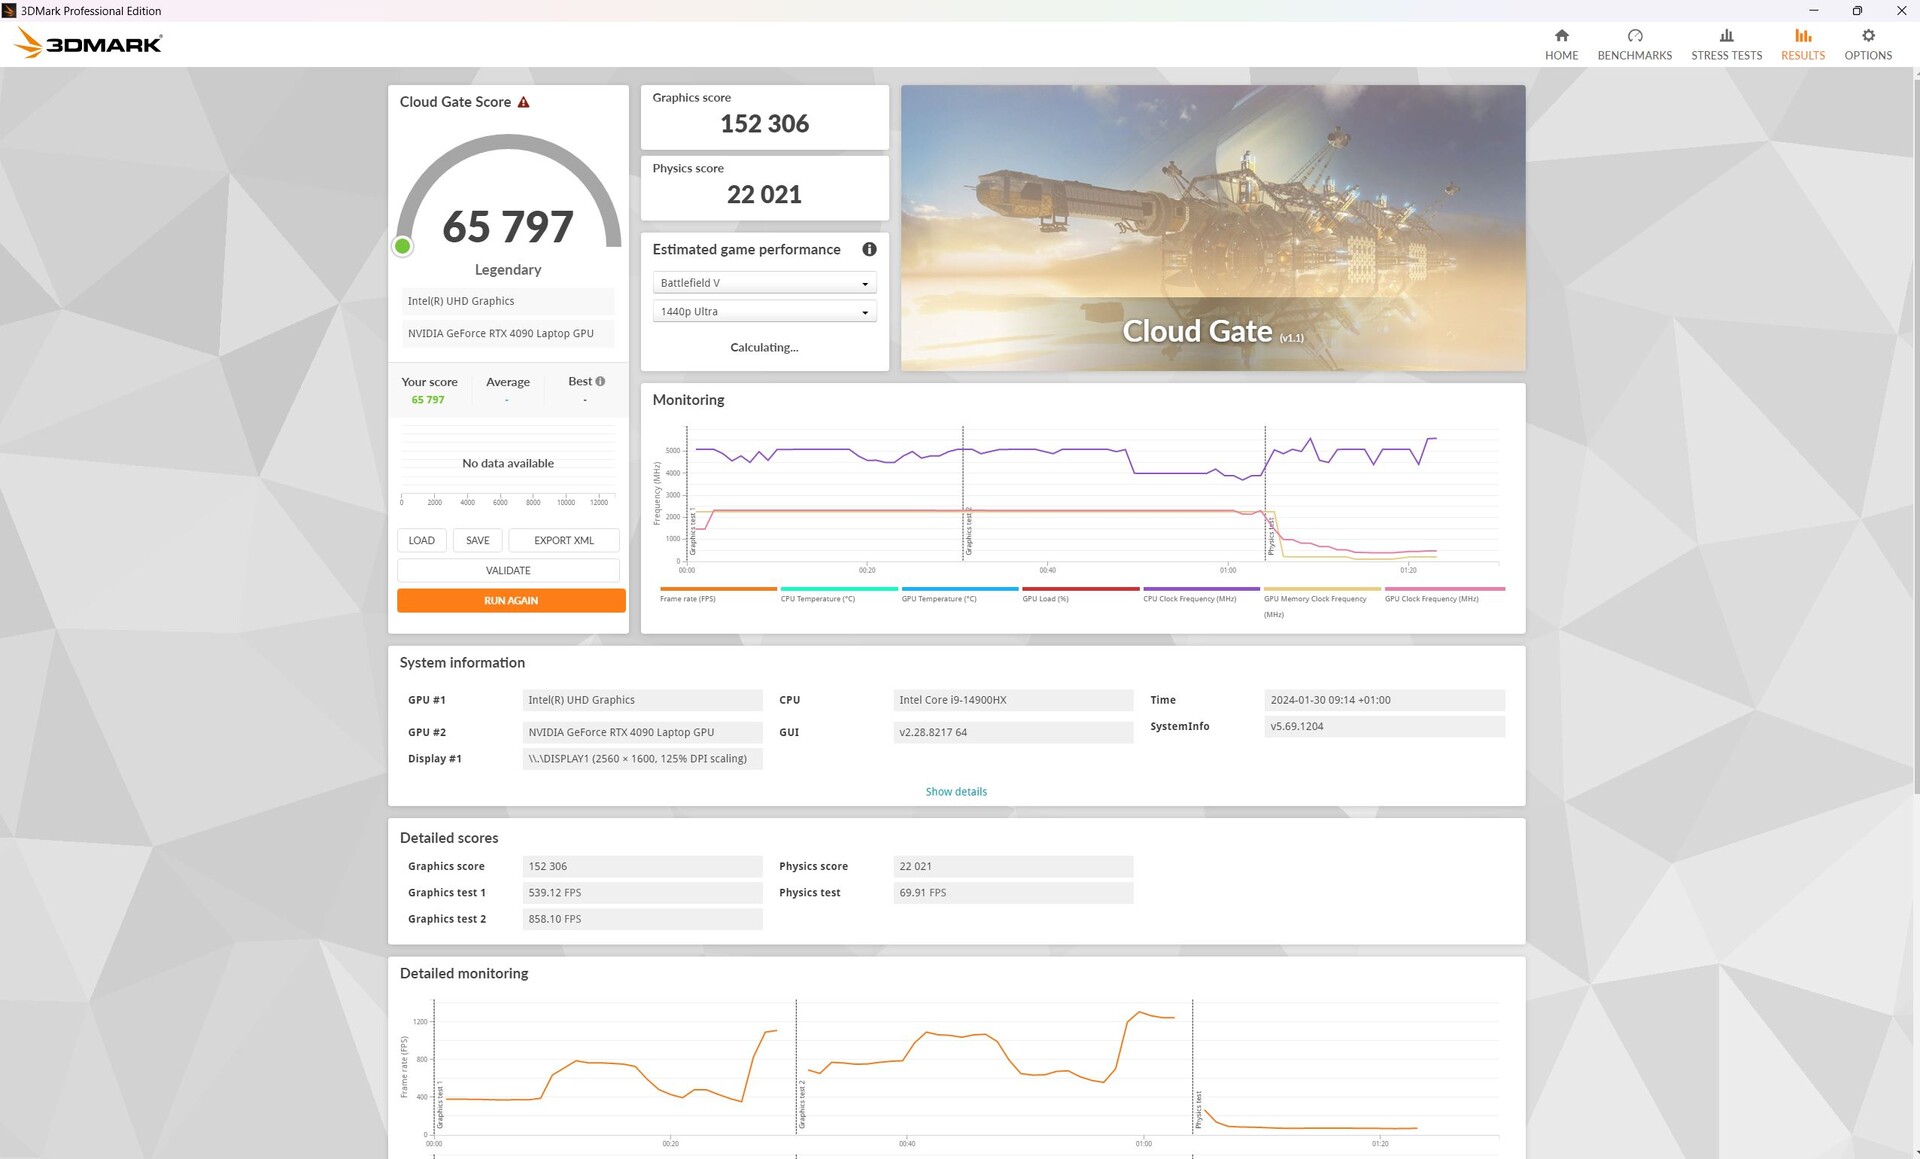

| 3DMark 11 Performance | 44454 points | |
| 3DMark Cloud Gate Standard Score | 65797 points | |
| 3DMark Fire Strike Score | 34756 points | |
| 3DMark Time Spy Score | 18732 points | |
Help | ||
* ... smaller is better
Gaming
When gaming, the laptop painted a similar picture. Again, the Blade achieved a lead of around 7 per cent compared to its predecessor. Other last-gen competitors such as the XMG Neo 16 or the Legion 9 actually even came ahead of the Blade when gaming.
All-in-all, the Blade 16 features enough power to depict all games in 4K. However, its frame rate sometimes dropped to below the 60-fps mark when running Dying Light.
When playing Cyberpunk 2077 1.6, the new Blade 16 managed around 52 fps in 4K Ultra. In 4K, its frame rates dropped to unplayable values at maximum RT quality, best GPU or not.
Even with DLSS or Frame Generation (FG), you can't match the display's refresh rate—at least in its native 1,600p resolution. In Cyberpunk, we measured 53.42fps (DLSS) and around 85fps (FG). In Call of Duty: Modern Warfare III, the system achieved 161fps (DLSS) and 183 fps (FG) and in Alan Wake II we measured 73.5 (DLSS) and 112.6 fps (FG).
The table below shows the FPS, consumption and volume values for The Witcher 3 FHD Ultra using the various performance modes.
| Performance mode/value | Witcher 3 fps (Max / Avg) | noise emissions in dB | power consumption in watts |
|---|---|---|---|
| User-defined (boost/high) | 211 / 193 | 46.81 | 243 |
| Turbo | 203 / 191 | 46.81 | 242 |
| Balanced | 177 / 169 | 42.99 | 196 |
| Silent | 141 / 132 | 32.16 | 141 |
| Performance rating - Percent | |
| Lenovo Legion 9 16IRX8 | |
| Schenker XMG Neo 16 E23 | |
| Razer Blade 16 2024, RTX 4090 | |
| Razer Blade 16 Early 2023 RTX 4090 | |
| Average of class Gaming | |
| Lenovo Legion 5 16IRX G9 | |
| The Witcher 3 - 1920x1080 Ultra Graphics & Postprocessing (HBAO+) | |
| Schenker XMG Neo 16 E23 | |
| Lenovo Legion 9 16IRX8 | |
| Razer Blade 16 2024, RTX 4090 | |
| Average of class Gaming (104.7 - 240, n=6, last 2 years) | |
| Razer Blade 16 Early 2023 RTX 4090 | |
| Lenovo Legion 5 16IRX G9 | |
| GTA V - 1920x1080 Highest AA:4xMSAA + FX AF:16x | |
| Lenovo Legion 9 16IRX8 | |
| Schenker XMG Neo 16 E23 | |
| Razer Blade 16 2024, RTX 4090 | |
| Average of class Gaming (48.3 - 186.9, n=93, last 2 years) | |
| Razer Blade 16 Early 2023 RTX 4090 | |
| Lenovo Legion 5 16IRX G9 | |
| Final Fantasy XV Benchmark - 1920x1080 High Quality | |
| Schenker XMG Neo 16 E23 | |
| Lenovo Legion 9 16IRX8 | |
| Average of class Gaming (41 - 215, n=95, last 2 years) | |
| Razer Blade 16 2024, RTX 4090 | |
| Razer Blade 16 Early 2023 RTX 4090 | |
| Lenovo Legion 5 16IRX G9 | |
| Strange Brigade - 1920x1080 ultra AA:ultra AF:16 | |
| Lenovo Legion 9 16IRX8 | |
| Schenker XMG Neo 16 E23 | |
| Razer Blade 16 2024, RTX 4090 | |
| Razer Blade 16 Early 2023 RTX 4090 | |
| Average of class Gaming (76.3 - 456, n=86, last 2 years) | |
| Lenovo Legion 5 16IRX G9 | |
| Dota 2 Reborn - 1920x1080 ultra (3/3) best looking | |
| Lenovo Legion 9 16IRX8 | |
| Razer Blade 16 2024, RTX 4090 | |
| Razer Blade 16 Early 2023 RTX 4090 | |
| Schenker XMG Neo 16 E23 | |
| Lenovo Legion 5 16IRX G9 | |
| Average of class Gaming (84.8 - 248, n=107, last 2 years) | |
| X-Plane 11.11 - 1920x1080 high (fps_test=3) | |
| Razer Blade 16 2024, RTX 4090 | |
| Lenovo Legion 9 16IRX8 | |
| Razer Blade 16 Early 2023 RTX 4090 | |
| Schenker XMG Neo 16 E23 | |
| Lenovo Legion 5 16IRX G9 | |
| Average of class Gaming (55.5 - 143.5, n=109, last 2 years) | |
| Cyberpunk 2077 1.6 | |
| 1920x1080 Ultra Preset | |
| Schenker XMG Neo 16 E23 | |
| Lenovo Legion 9 16IRX8 | |
| Average NVIDIA GeForce RTX 4090 Laptop GPU (91 - 159.7, n=20) | |
| Razer Blade 16 2024, RTX 4090 | |
| Razer Blade 16 Early 2023 RTX 4090 | |
| 2560x1440 Ultra Preset | |
| Schenker XMG Neo 16 E23 | |
| Lenovo Legion 9 16IRX8 | |
| Average NVIDIA GeForce RTX 4090 Laptop GPU (75.7 - 116, n=21) | |
| Razer Blade 16 Early 2023 RTX 4090 | |
| Razer Blade 16 2024, RTX 4090 | |
| 3840x2160 Ultra Preset | |
| Average NVIDIA GeForce RTX 4090 Laptop GPU (38.8 - 56, n=16) | |
| Razer Blade 16 2024, RTX 4090 | |
| Razer Blade 16 Early 2023 RTX 4090 | |
| 1920x1080 Ray Tracing Ultra Preset (DLSS off) | |
| Average NVIDIA GeForce RTX 4090 Laptop GPU (56.5 - 74, n=8) | |
| Razer Blade 16 Early 2023 RTX 4090 | |
| Razer Blade 16 2024, RTX 4090 | |
| 3840x2160 Ray Tracing Ultra Preset (DLSS off) | |
| Razer Blade 16 Early 2023 RTX 4090 | |
| Average NVIDIA GeForce RTX 4090 Laptop GPU (16.5 - 22.4, n=7) | |
| Razer Blade 16 2024, RTX 4090 | |
Witcher 3 FPS diagram
| low | med. | high | ultra | QHD DLSS | QHD | 4K DLSS | 4K | |
|---|---|---|---|---|---|---|---|---|
| GTA V (2015) | 184 | 181.9 | 181.6 | 138.1 | 126.9 | 168 | ||
| The Witcher 3 (2015) | 567 | 425 | 354 | 200 | 164 | |||
| Dota 2 Reborn (2015) | 233 | 210 | 201 | 188.1 | 187.3 | |||
| Final Fantasy XV Benchmark (2018) | 171.7 | 155.7 | 137.5 | 126.8 | ||||
| X-Plane 11.11 (2018) | 204 | 182.3 | 146.2 | 145.5 | ||||
| Far Cry 5 (2018) | 173 | 140 | 134 | 127 | 125 | 103 | ||
| Strange Brigade (2018) | 487 | 372 | 368 | 359.8 | 279 | 157 | ||
| Dying Light 2 (2022) | 223.1 | 196.6 | 155.6 | 117.3 | 59.8 | |||
| Cyberpunk 2077 1.6 (2022) | 146.7 | 138.51 | 123.6 | 103.58 | 86.59 | 46.1 | ||
| F1 23 (2023) | 113.2 | 72.4 | 36.9 | |||||
| Baldur's Gate 3 (2023) | 175.8 | 134 | 74 | |||||
| Cyberpunk 2077 (2023) | 95.35 | 83.39 | 39.61 | |||||
| Assassin's Creed Mirage (2023) | 130 | 117 | 74 | |||||
| Alan Wake 2 (2023) | 108.6 | 78.4 | 41.6 | |||||
| Call of Duty Modern Warfare 3 2023 (2023) | 179 | 138 | 91 | |||||
| Avatar Frontiers of Pandora (2023) | 98 | 67 | 34 | |||||
| Black Myth: Wukong (2024) | 53 | 58 | 39 | 23 | ||||
| Call of Duty Black Ops 6 (2024) | 124 | 111 | 103 | 71 | 68 | |||
| Indiana Jones and the Great Circle (2024) | 122.4 | 109.3 | 95.4 | 58 | ||||
| Monster Hunter Wilds (2025) | 70.56 | 70.41 | 63.11 | 40.46 | ||||
| Assassin's Creed Shadows (2025) | 64 | 58 | 52 | 34 |
Emissions & power - The Razer Blade offers lots of customization options
Noise emissions
In custom mode with maximized CPU and GPU performance, the fans sometimes stood still, but mostly they hummed along at around 27 dB—even when idle.
In the average load scenario (3DMark 06), they sped up in two steps. In the first 30 seconds, they slowly ramped up and maintained this average noise level for about a minute before they ramped up again to over 43 dB. Here, for example, the significantly cheaper Dell G16 remained much quieter, not changing its output volume of 27 dB over the entire test run. The laptop's predecessor also remained quieter in this scenario.
Turbo mode didn't bring any advantages in terms of performance or noise emissions when you look at the Witcher 3 results, but the Blade is cooled better.
Despite almost the same performance, the new Blade is minimally louder than its predecessor even under maximum stress. However, the competition is even louder when gaming.
Noise level
| Idle |
| 23 / 23 / 27.66 dB(A) |
| Load |
| 43.76 / 50.37 dB(A) |
 | ||
30 dB silent 40 dB(A) audible 50 dB(A) loud |
||
min: | ||
| Razer Blade 16 2024, RTX 4090 GeForce RTX 4090 Laptop GPU, i9-14900HX, Samsung PM9A1 MZVL22T0HBLB | Razer Blade 16 Early 2023 RTX 4090 GeForce RTX 4090 Laptop GPU, i9-13950HX, SSSTC CA6-8D1024 | Lenovo Legion 9 16IRX8 GeForce RTX 4090 Laptop GPU, i9-13980HX, 2x SK Hynix HFS001TEJ9X115N (RAID 0) | Schenker XMG Neo 16 E23 GeForce RTX 4090 Laptop GPU, i9-13900HX, Crucial P5 Plus 1TB CT1000P5PSSD8 | Lenovo Legion 5 16IRX G9 GeForce RTX 4060 Laptop GPU, i7-14650HX, Samsung PM9A1 MZVL21T0HCLR | |
|---|---|---|---|---|---|
| Noise | 4% | -2% | -30% | -11% | |
| off / environment * (dB) | 23 | 20.84 9% | 23.7 -3% | 25 -9% | 24 -4% |
| Idle Minimum * (dB) | 23 | 23.65 -3% | 24 -4% | 31 -35% | 24 -4% |
| Idle Average * (dB) | 23 | 23.65 -3% | 24 -4% | 33 -43% | 28.8 -25% |
| Idle Maximum * (dB) | 27.66 | 23.65 14% | 30.4 -10% | 42 -52% | 32 -16% |
| Load Average * (dB) | 43.76 | 43.35 1% | 30.4 31% | 58 -33% | 45.5 -4% |
| Witcher 3 ultra * (dB) | 46.81 | 46.7 -0% | 52.2 -12% | 57 -22% | 53.1 -13% |
| Load Maximum * (dB) | 50.37 | 46.72 7% | 54.9 -9% | 59 -17% | 55.7 -11% |
* ... smaller is better
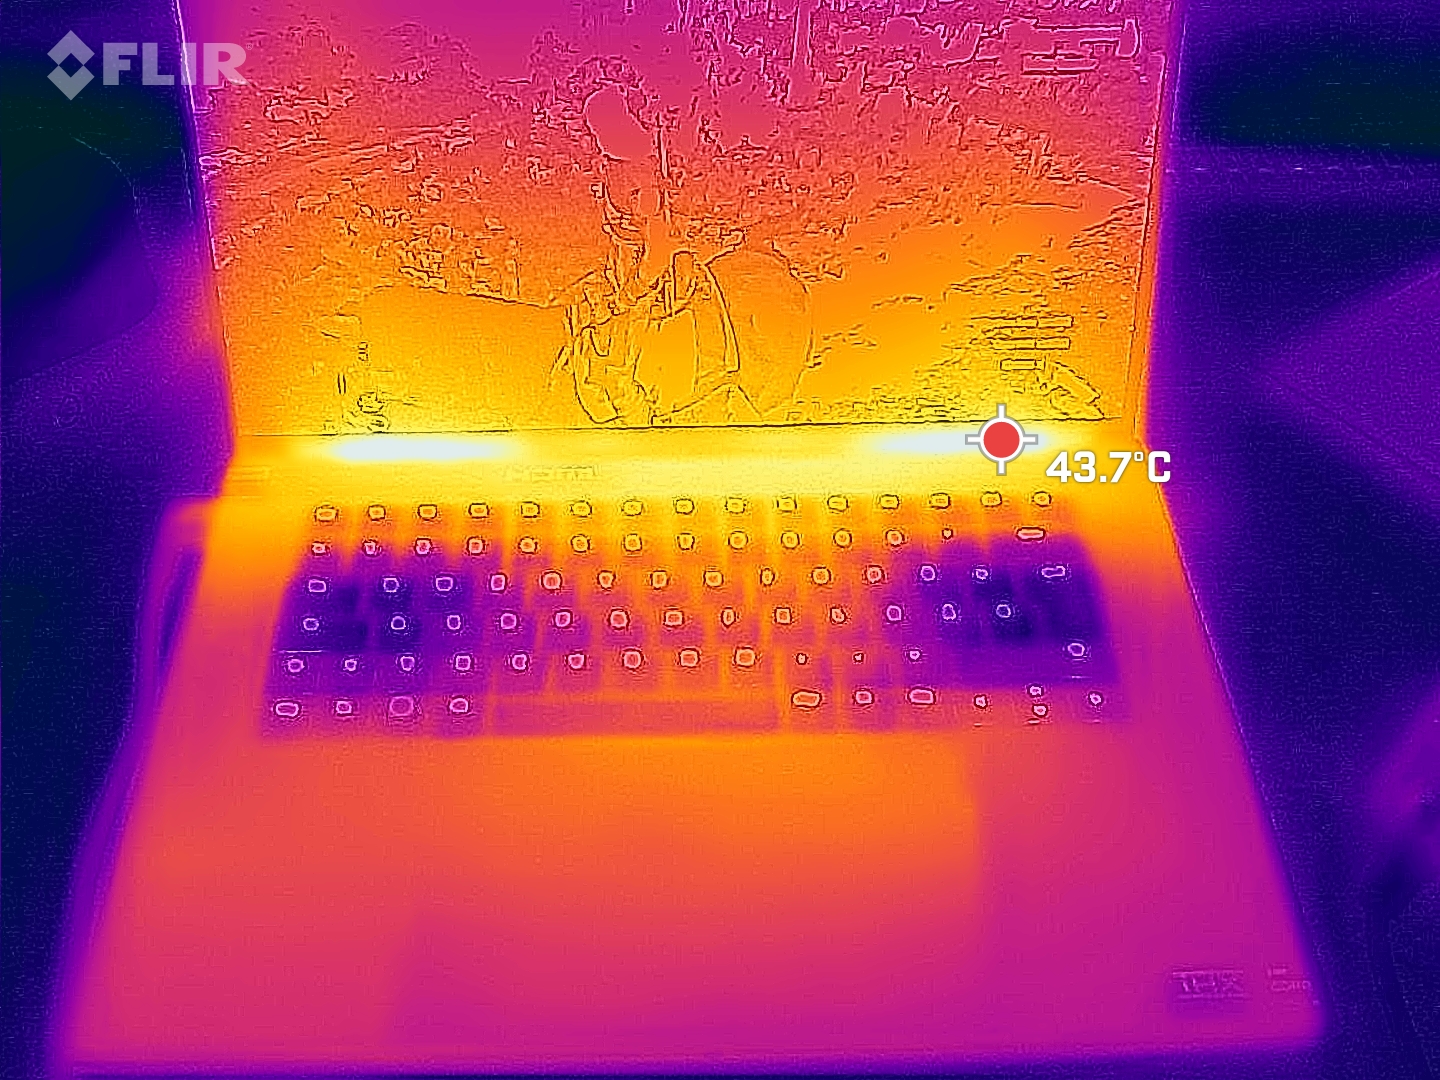
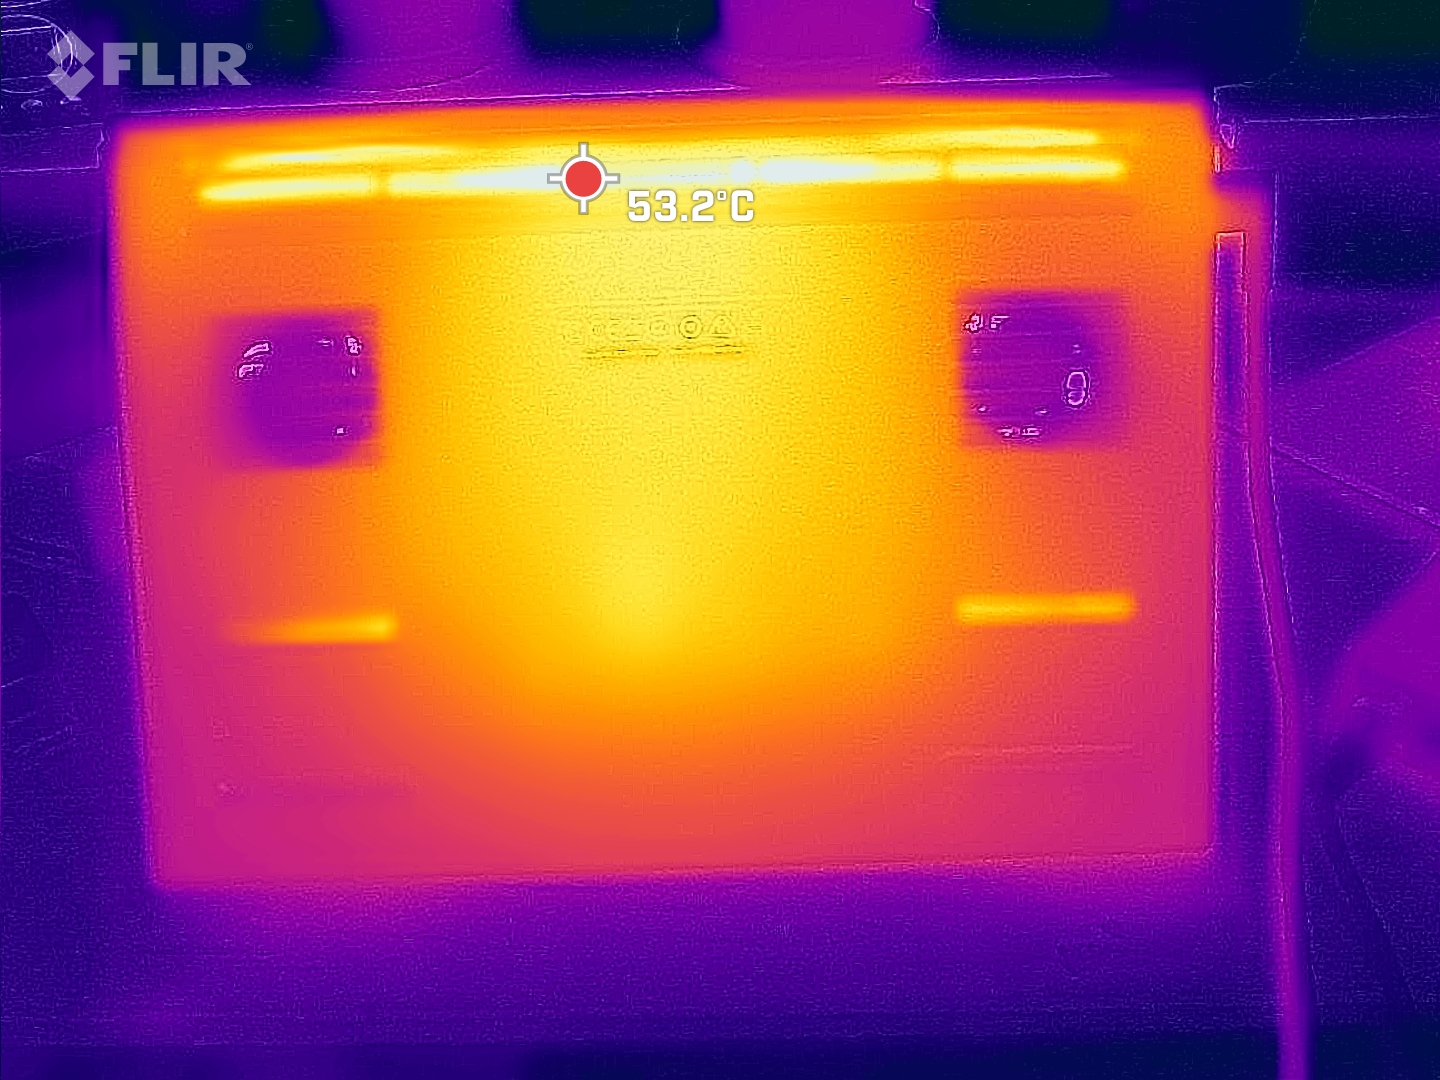
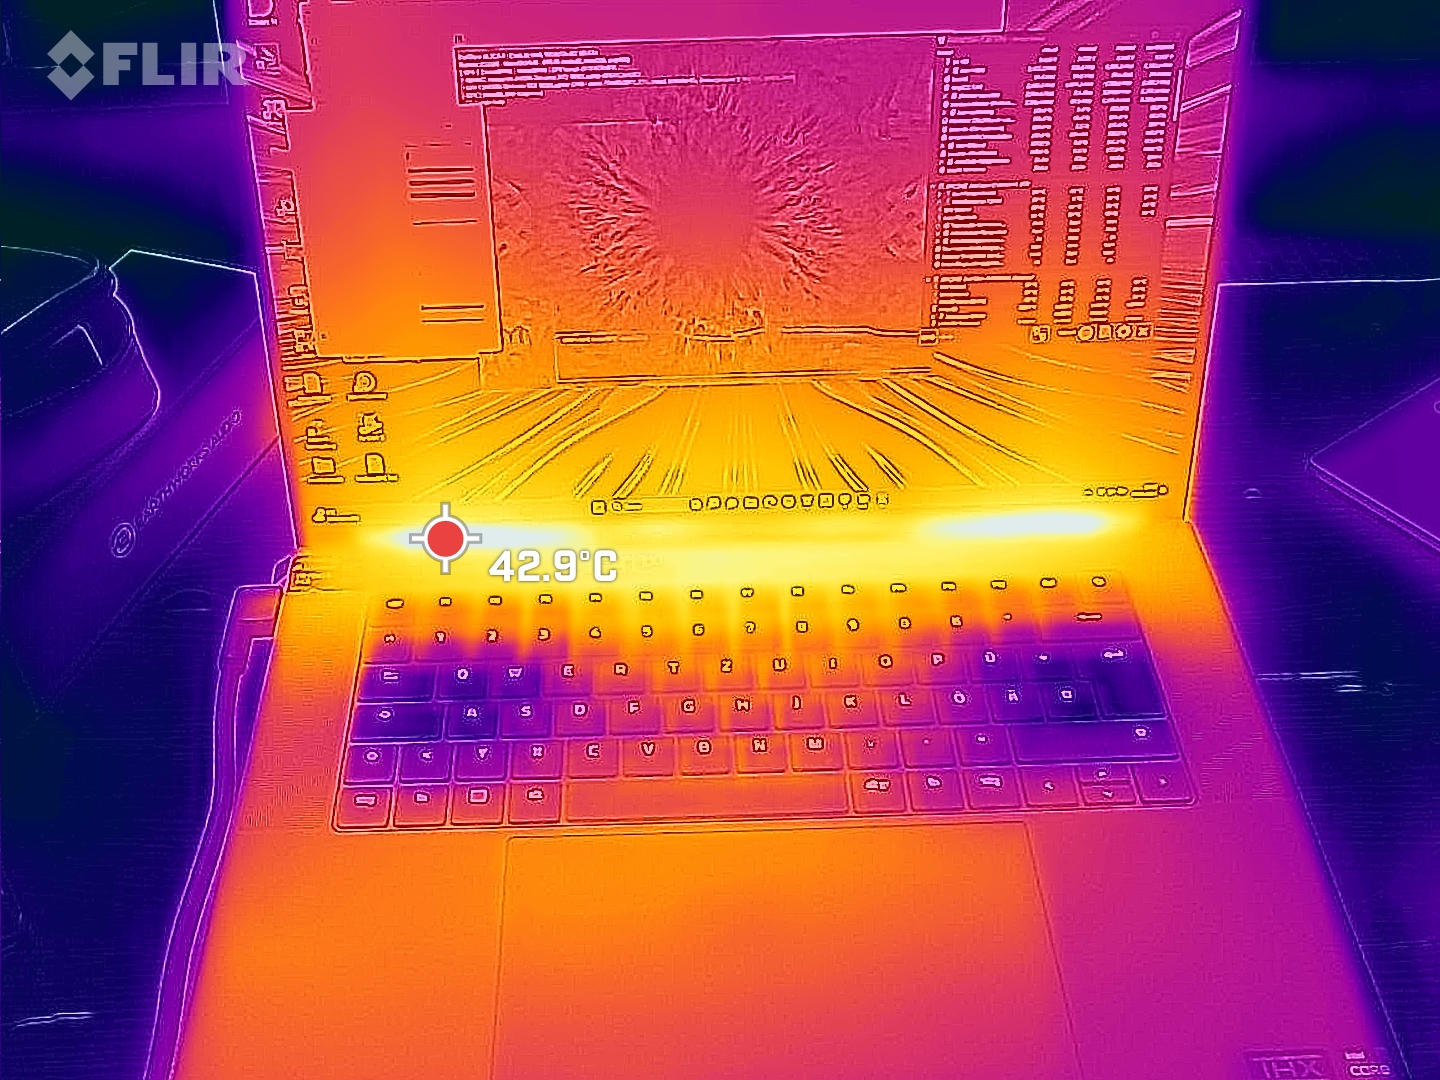
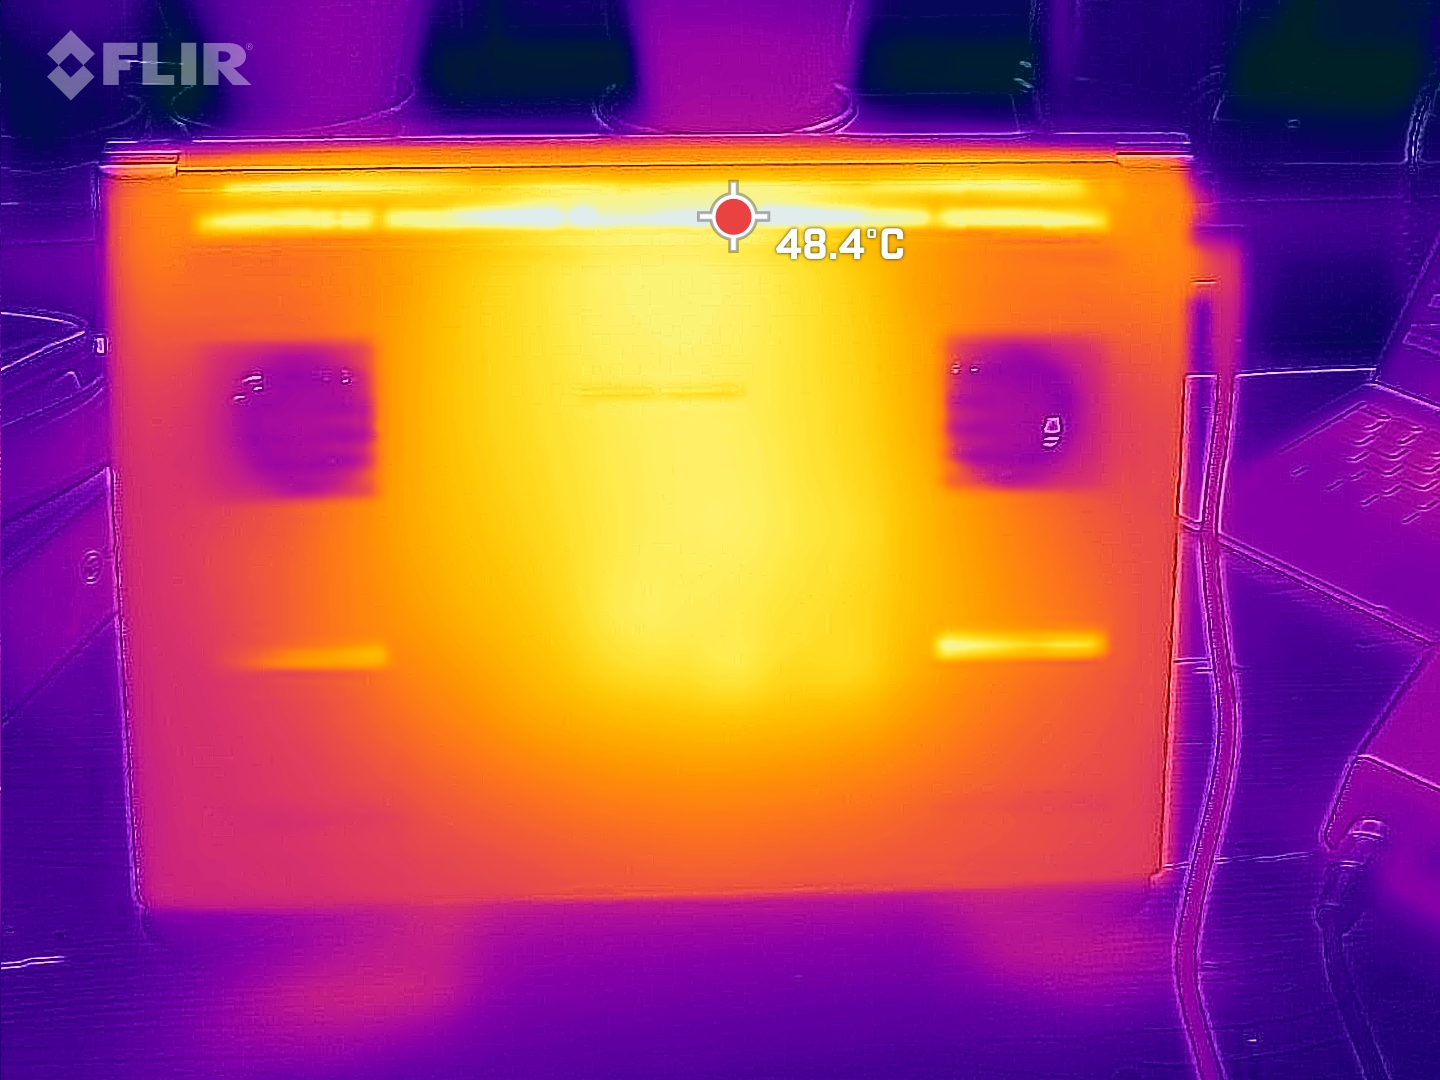
Temperature
Under maximum stress, we measured hot spots of up to 47 °C. This is too hot to set the device on your lap, but still comparatively cool compared to the competition.
(±) The maximum temperature on the upper side is 45 °C / 113 F, compared to the average of 40.4 °C / 105 F, ranging from 21.2 to 68.8 °C for the class Gaming.
(±) The bottom heats up to a maximum of 45 °C / 113 F, compared to the average of 43.2 °C / 110 F
(+) In idle usage, the average temperature for the upper side is 26.8 °C / 80 F, compared to the device average of 33.9 °C / 93 F.
(±) Playing The Witcher 3, the average temperature for the upper side is 35.9 °C / 97 F, compared to the device average of 33.9 °C / 93 F.
(+) The palmrests and touchpad are reaching skin temperature as a maximum (34 °C / 93.2 F) and are therefore not hot.
(-) The average temperature of the palmrest area of similar devices was 28.8 °C / 83.8 F (-5.2 °C / -9.4 F).
| Razer Blade 16 2024, RTX 4090 Intel Core i9-14900HX, NVIDIA GeForce RTX 4090 Laptop GPU | Razer Blade 16 Early 2023 RTX 4090 Intel Core i9-13950HX, NVIDIA GeForce RTX 4090 Laptop GPU | Lenovo Legion 9 16IRX8 Intel Core i9-13980HX, NVIDIA GeForce RTX 4090 Laptop GPU | Schenker XMG Neo 16 E23 Intel Core i9-13900HX, NVIDIA GeForce RTX 4090 Laptop GPU | Lenovo Legion 5 16IRX G9 Intel Core i7-14650HX, NVIDIA GeForce RTX 4060 Laptop GPU | |
|---|---|---|---|---|---|
| Heat | -10% | -12% | -2% | -2% | |
| Maximum Upper Side * (°C) | 45 | 52 -16% | 49.6 -10% | 50 -11% | 40.4 10% |
| Maximum Bottom * (°C) | 45 | 47.6 -6% | 48.6 -8% | 51 -13% | 43.8 3% |
| Idle Upper Side * (°C) | 29 | 33 -14% | 33.2 -14% | 28 3% | 30.3 -4% |
| Idle Bottom * (°C) | 30 | 30.6 -2% | 34.2 -14% | 26 13% | 35.3 -18% |
* ... smaller is better
Speakers
In contrast to many other gaming laptops, the Blade 16 has four speakers, two tweeters and two woofers. This provides the listener with balanced highs and mids and—unlike many competitors—even bass is noticeable.
However, this does have its limits and the speakers are still not excessively loud. Only a 3.5 mm jack connection is available for connecting analogue devices.
Razer Blade 16 2024, RTX 4090 audio analysis
(±) | speaker loudness is average but good (81.16 dB)
Bass 100 - 315 Hz
(±) | reduced bass - on average 8.2% lower than median
(±) | linearity of bass is average (7.4% delta to prev. frequency)
Mids 400 - 2000 Hz
(+) | balanced mids - only 3.3% away from median
(+) | mids are linear (5.9% delta to prev. frequency)
Highs 2 - 16 kHz
(+) | balanced highs - only 1.6% away from median
(+) | highs are linear (3.1% delta to prev. frequency)
Overall 100 - 16.000 Hz
(+) | overall sound is linear (9.2% difference to median)
Compared to same class
» 3% of all tested devices in this class were better, 1% similar, 96% worse
» The best had a delta of 6%, average was 18%, worst was 132%
Compared to all devices tested
» 3% of all tested devices were better, 1% similar, 96% worse
» The best had a delta of 4%, average was 23%, worst was 134%
Lenovo Legion 9 16IRX8 audio analysis
(+) | speakers can play relatively loud (82.8 dB)
Bass 100 - 315 Hz
(±) | reduced bass - on average 13.5% lower than median
(±) | linearity of bass is average (9% delta to prev. frequency)
Mids 400 - 2000 Hz
(+) | balanced mids - only 1.5% away from median
(+) | mids are linear (5.7% delta to prev. frequency)
Highs 2 - 16 kHz
(+) | balanced highs - only 2.4% away from median
(+) | highs are linear (3.7% delta to prev. frequency)
Overall 100 - 16.000 Hz
(+) | overall sound is linear (11% difference to median)
Compared to same class
» 7% of all tested devices in this class were better, 3% similar, 89% worse
» The best had a delta of 6%, average was 18%, worst was 132%
Compared to all devices tested
» 6% of all tested devices were better, 2% similar, 92% worse
» The best had a delta of 4%, average was 23%, worst was 134%
Power consumption
The new Blade has made great progress in terms of its power consumption. Especially when idling, its consumption now drops to an expected level; the predecessor model was extremely power-hungry in this scenario.
Even when playing The Witcher, its consumption dropped slightly despite the same if not slightly better performance. Only its theoretical, temporary maximum consumption of 328 watts is now higher.
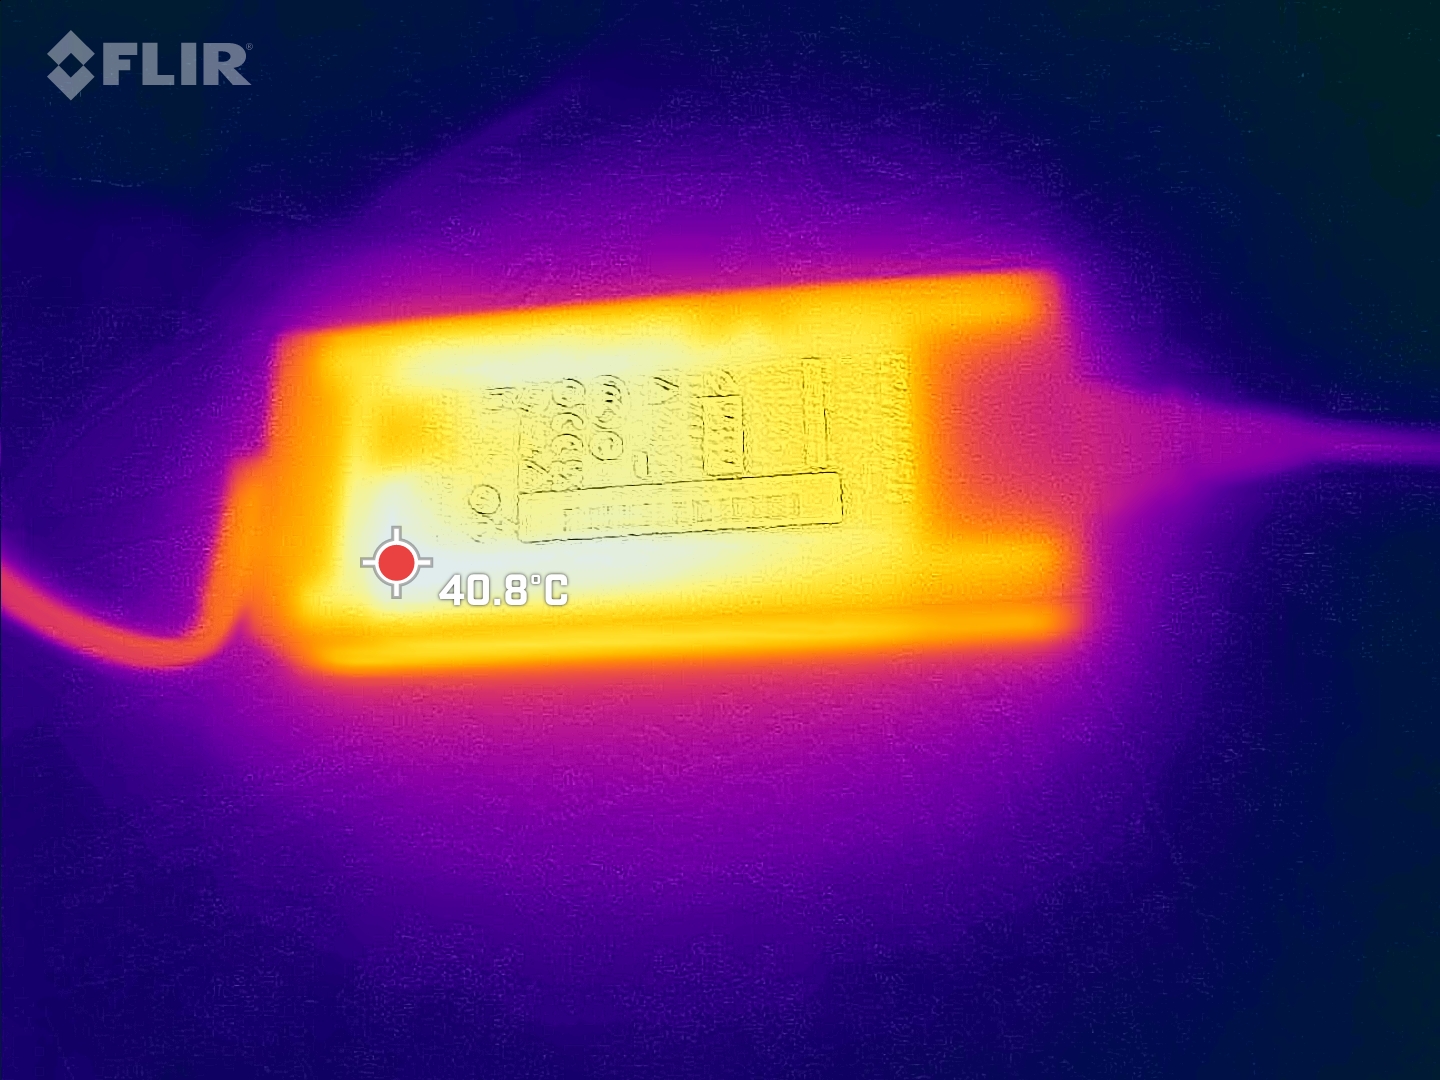
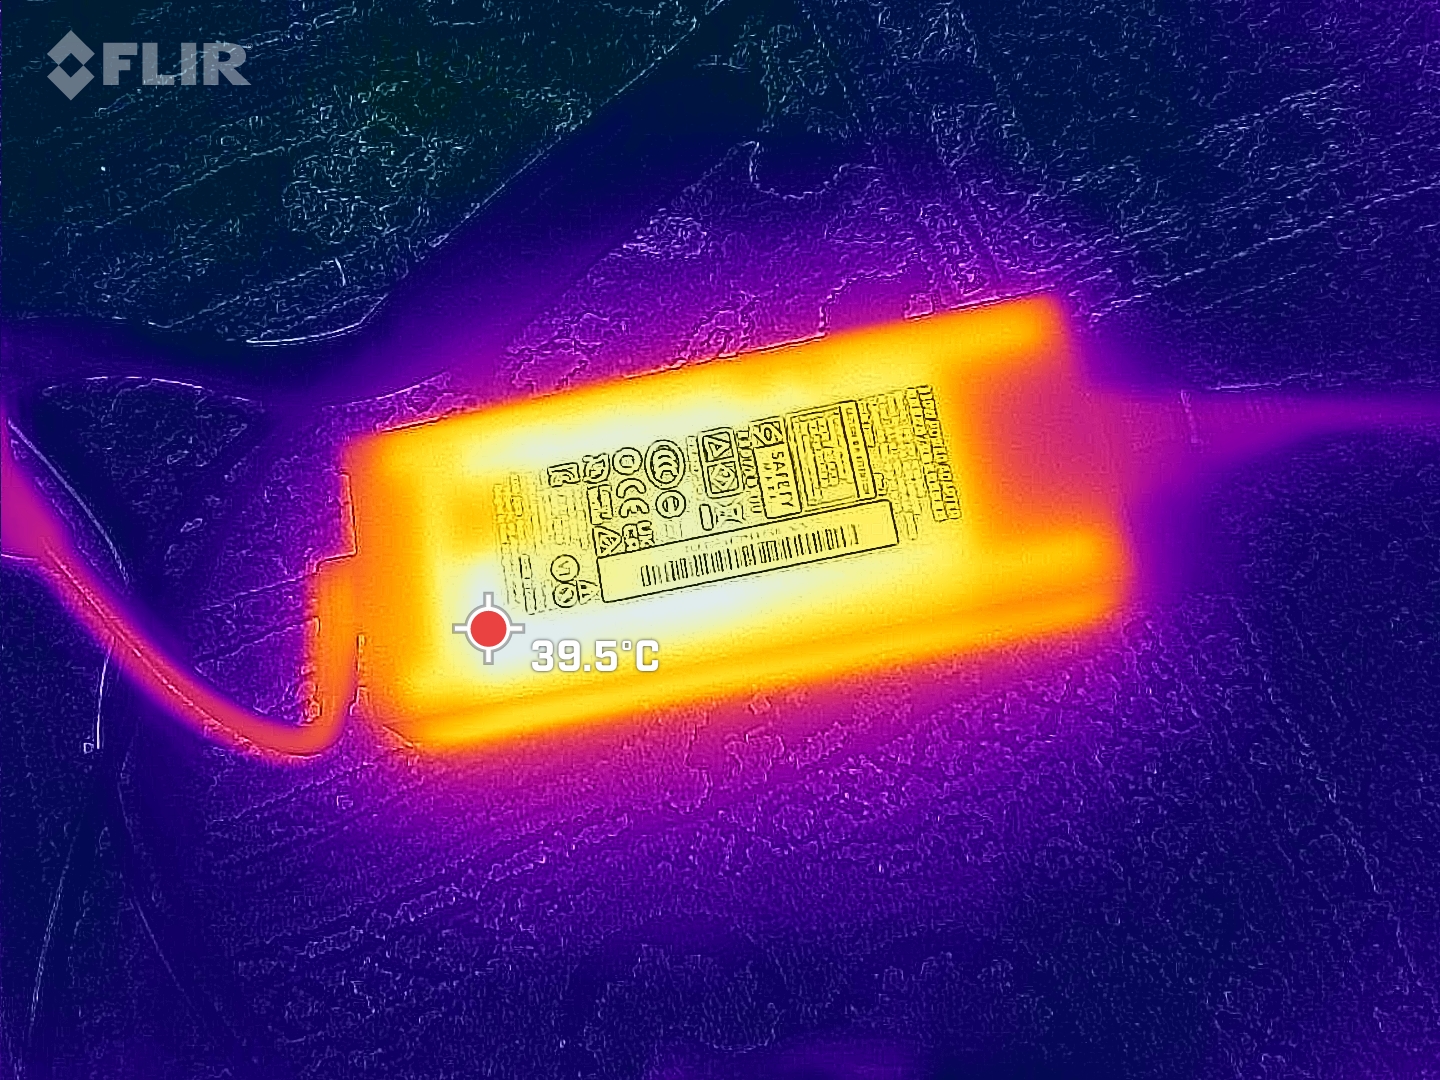
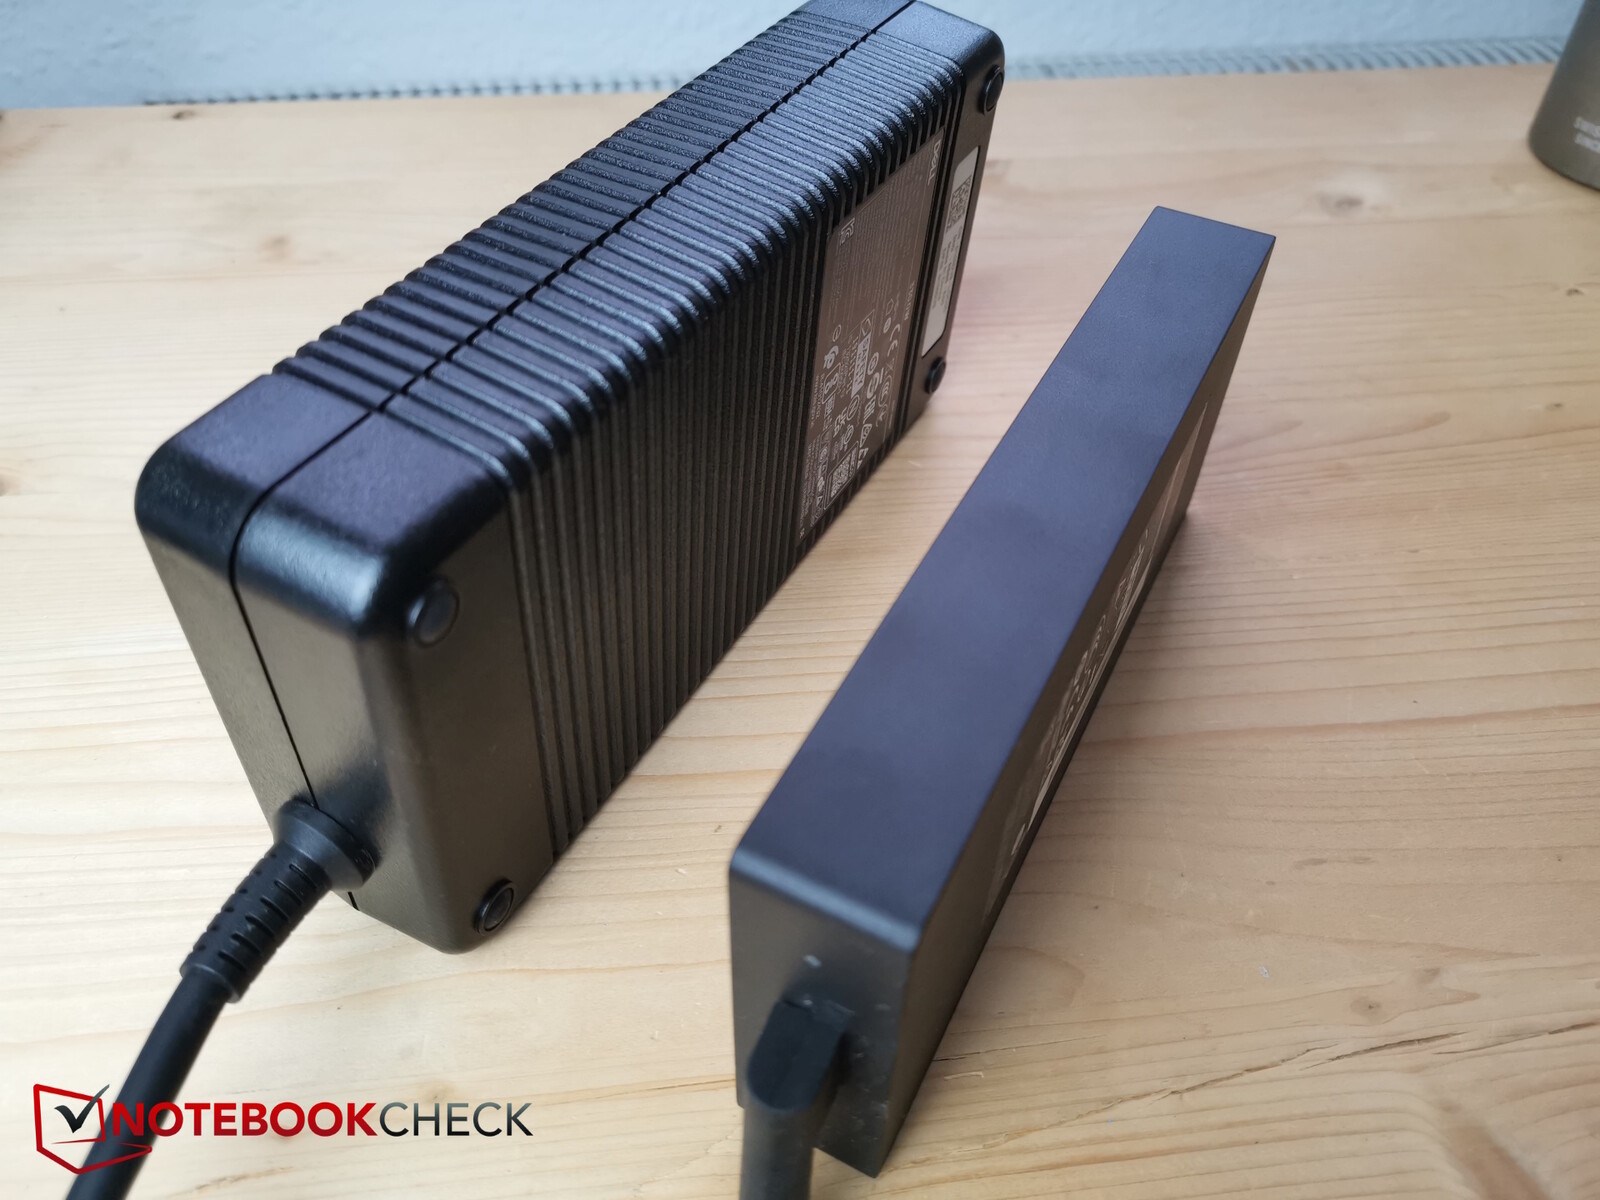
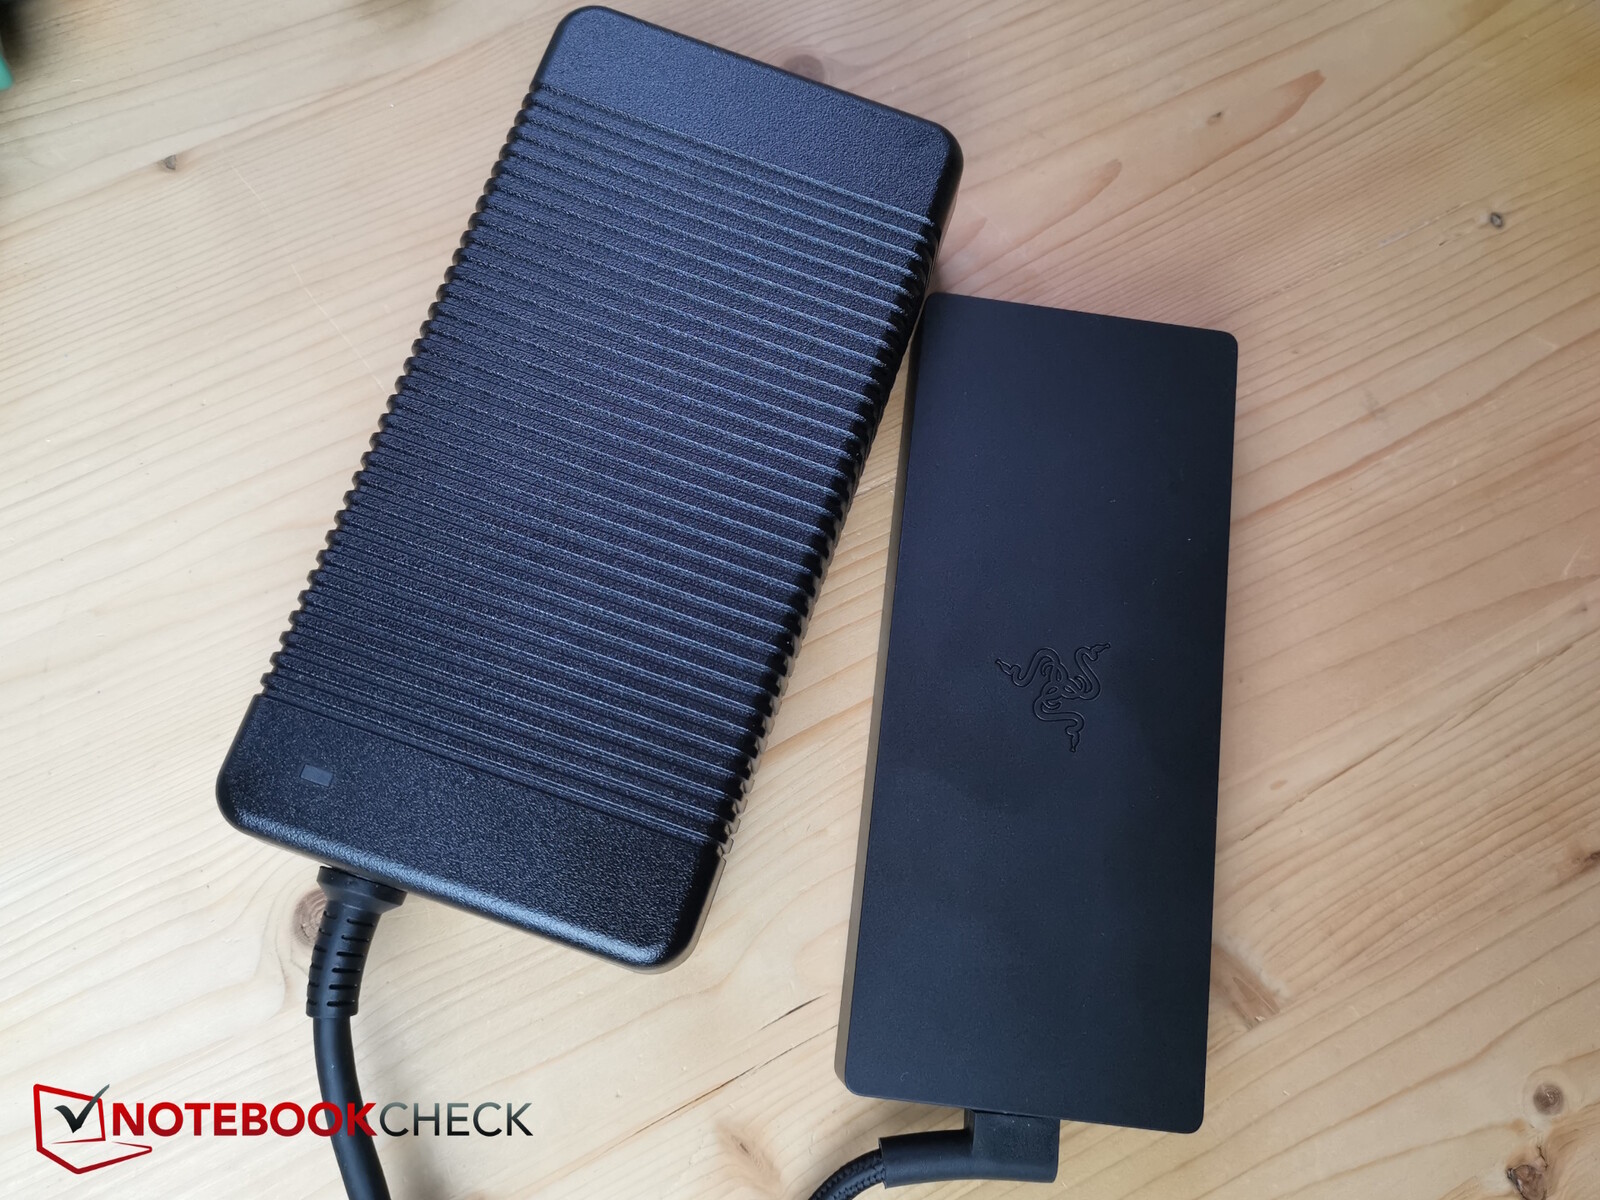
Razer is rightly proud of its power supply units, which are often smaller than comparable solutions from generic third-party manufacturers while delivering the same performance. The included 330-watt power supply is just the right size to absorb peak loads and, according to Razer, has saved around 60 per cent in size compared to comparable solutions. In fact, the Razer power supply is significantly smaller than the 330-watt one delivered with the Dell G16 (2024), for example.
| Off / Standby | |
| Idle | |
| Load |
|
Key:
min: | |
| Razer Blade 16 2024, RTX 4090 i9-14900HX, GeForce RTX 4090 Laptop GPU, Samsung PM9A1 MZVL22T0HBLB, OLED, 2560x1600, 16" | Razer Blade 16 Early 2023 RTX 4090 i9-13950HX, GeForce RTX 4090 Laptop GPU, SSSTC CA6-8D1024, mini-LED, 3840x2400, 16" | Lenovo Legion 9 16IRX8 i9-13980HX, GeForce RTX 4090 Laptop GPU, 2x SK Hynix HFS001TEJ9X115N (RAID 0), Mini-LED, 3200x2000, 16" | Schenker XMG Neo 16 E23 i9-13900HX, GeForce RTX 4090 Laptop GPU, Crucial P5 Plus 1TB CT1000P5PSSD8, IPS, 2560x1600, 16" | Lenovo Legion 5 16IRX G9 i7-14650HX, GeForce RTX 4060 Laptop GPU, Samsung PM9A1 MZVL21T0HCLR, IPS, 2560x1600, 16" | Average NVIDIA GeForce RTX 4090 Laptop GPU | Average of class Gaming | |
|---|---|---|---|---|---|---|---|
| Power Consumption | -41% | -69% | -6% | 10% | -20% | 6% | |
| Idle Minimum * (Watt) | 16.9 | 27.5 -63% | 32.3 -91% | 8 53% | 15.4 9% | 16.2 ? 4% | 13 ? 23% |
| Idle Average * (Watt) | 17.8 | 34.4 -93% | 42.6 -139% | 18 -1% | 19.7 -11% | 23.1 ? -30% | 18.7 ? -5% |
| Idle Maximum * (Watt) | 19.6 | 35.4 -81% | 57.9 -195% | 28 -43% | 20.7 -6% | 34.2 ? -74% | 24.3 ? -24% |
| Load Average * (Watt) | 128 | 147.8 -15% | 121 5% | 133 -4% | 102.6 20% | 130.5 ? -2% | 110.2 ? 14% |
| Witcher 3 ultra * (Watt) | 243 | 256 -5% | 254 -5% | 294 -21% | 191.3 21% | ||
| Load Maximum * (Watt) | 328 | 286.7 13% | 297.7 9% | 399 -22% | 246.6 25% | 324 ? 1% | 258 ? 21% |
* ... smaller is better
Power consumption Witcher 3 / stress test
Power consumption with external monitor
Runtimes
The laptop's battery capacity has remained the same at 95.2 Ah. The same can also be said for its runtimes. We measured around 5.5 hours of surfing and 6.5 hours of video watching.
| Razer Blade 16 2024, RTX 4090 i9-14900HX, GeForce RTX 4090 Laptop GPU, 95.2 Wh | Razer Blade 16 Early 2023 RTX 4090 i9-13950HX, GeForce RTX 4090 Laptop GPU, 95.2 Wh | Lenovo Legion 9 16IRX8 i9-13980HX, GeForce RTX 4090 Laptop GPU, 99.9 Wh | Schenker XMG Neo 16 E23 i9-13900HX, GeForce RTX 4090 Laptop GPU, 99 Wh | Lenovo Legion 5 16IRX G9 i7-14650HX, GeForce RTX 4060 Laptop GPU, 80 Wh | Average of class Gaming | |
|---|---|---|---|---|---|---|
| Battery runtime | 8% | -37% | -1% | 8% | 20% | |
| H.264 (h) | 7.6 | 8.4 11% | 5.8 -24% | 9.6 26% | 8.64 ? 14% | |
| WiFi v1.3 (h) | 5.5 | 5.8 5% | 2.7 -51% | 6.7 22% | 7.4 35% | 7.11 ? 29% |
| Load (h) | 1.3 | 1.4 8% | 1 -23% | 0.8 -38% | 1.502 ? 16% | |
| Witcher 3 ultra (h) | 1.6 | 1.4 | ||||
| Reader / Idle (h) | 6.7 | 8.71 ? |
Pros
Cons
Verdict - Few arguments that speak for upgrading from the 2023 model

The Razer Blade 16 is once again a very successful gaming laptop. It is compact, slim, yet powerful and has a high-quality finish. With its fast and beautiful OLED display, the configurations have been enriched with a beautiful screen alternative.
However, owners of the 2023 models which also feature very good Mini-LED displays don't really have any reason to upgrade—its performance has barely been improved through Raptor Lake Refresh and no must-have features have been added to this model.
Just like its predecessor, the 2024 version of the Razer Blade 16 is a very successful high-end gamer. However, there are hardly any reasons to upgrade from its almost equivalent predecessor.
Price and availability
The new Blade 16 can currently be found on Amazon for US$4,699.99.
Razer Blade 16 2024, RTX 4090
- 02/19/2024 v7 (old)
Christian Hintze
Transparency
The selection of devices to be reviewed is made by our editorial team. The test sample was provided to the author as a loan by the manufacturer or retailer for the purpose of this review. The lender had no influence on this review, nor did the manufacturer receive a copy of this review before publication. There was no obligation to publish this review. As an independent media company, Notebookcheck is not subjected to the authority of manufacturers, retailers or publishers.
This is how Notebookcheck is testing
Every year, Notebookcheck independently reviews hundreds of laptops and smartphones using standardized procedures to ensure that all results are comparable. We have continuously developed our test methods for around 20 years and set industry standards in the process. In our test labs, high-quality measuring equipment is utilized by experienced technicians and editors. These tests involve a multi-stage validation process. Our complex rating system is based on hundreds of well-founded measurements and benchmarks, which maintains objectivity. Further information on our test methods can be found here.
Price comparison

