Notebookcheck Logo

Intel Raptor Lake-HX Refresh analysis - Core i9-14900HX with more single-core performance

Performance before efficiency. Intel's Raptor Lake-HX Refresh is an update of its fastest mobile processors which are used in powerful multimedia and gaming laptops, promising better performance while gaming and in single-core scenarios. We have tested the new Core i9-14900HX and have compared it with the old Core i9-13900HX as well as the AMD Ryzen 9 7945HX. Update: Additional gaming benchmarks including Modern Warfare 3, Avatar & Assassin's Creed Mirage

This past December, Intel unveiled its brand new Meteor Lake gen Core Ultra mobile processors (reviewed here) which, for the first time, rely on a tile/chiplet design and run within an area between 28 and 115 watts. For its more powerful HX mobile processors, Intel continues to use its well-known Raptor-Lake gen and has named the new chips "Raptor Lake Refresh", whereby their old labelling "Core i9-14xxxHX" remains the same. In general, nothing has changed about the cores' architecture and configuration, but their maximum turbo clock rate has been increased. Aside from more single-core performance, Intel promises that the new processors will deliver better performance under mixed single/multi-core load—this is needed for gaming in particular. Of course, we want to check this and will be comparing the new Core i9-14900HX with the old 13th gen processors (Core i9-13900HXCore i9-13950HXCore i9-13980HX) as well as both of the AMD flagships, namely the Ryzen 9 7945HX and the Ryzen 9 7945HX3D.

Update 01/13/2024: More gaming benchmarks added

Overview 14th gen Raptor Lake-HX

Intel has revised its 14th gen Raptor-Lake-HX model lineup ever so slightly, as the Core i9-14900HX is now the new mobile processor flagship. Currently, it is also the only HX chip featuring a total of 24 cores (32 threads), since there are no successors to the Core i9-13950HX and the Core i9-13980HX at the moment. We also have no information on whether there will even be any successors for these models. Its clock rate has changed, as its eight P-cores can now achieve up to 5.8 GHz (with one or two active cores, otherwise max. 5.2 GHz), even outperforming the Core i9-13980HX by 200 MHz—and the Core i9-13900HX by 400 MHz. The 16 E-cores' maximum clock rate is now up to 4.1 GHz (as opposed to 4.0 GHz). The cache's size remains to be 36 MB and Intel still states a base power of 55 watts and a maximum consumption of 157 watts. Although, we know from the past that the 13th HX gen models can consume even more.

Raptor Lake-HX SKUs (source: Intel)
Raptor Lake-HX platform features (source: Intel)

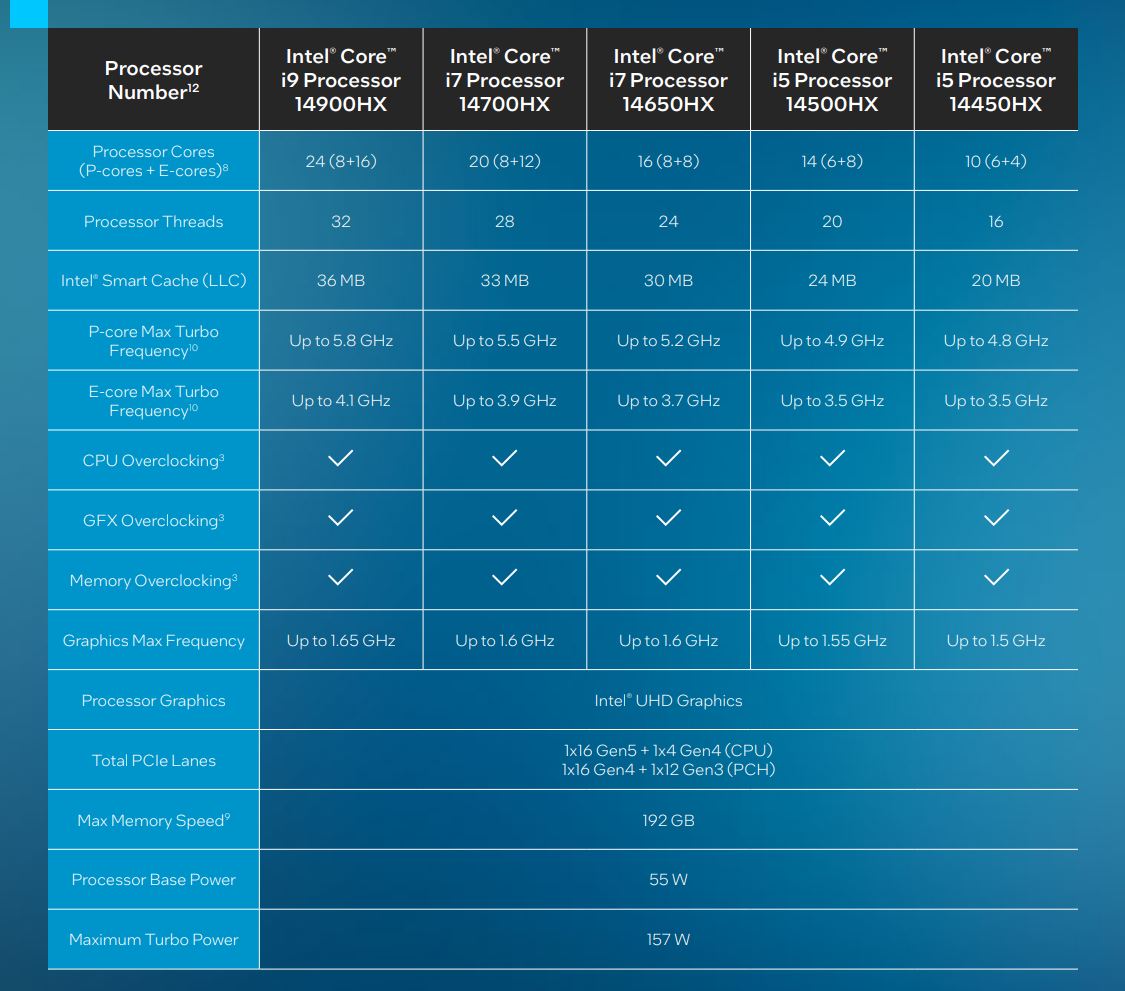
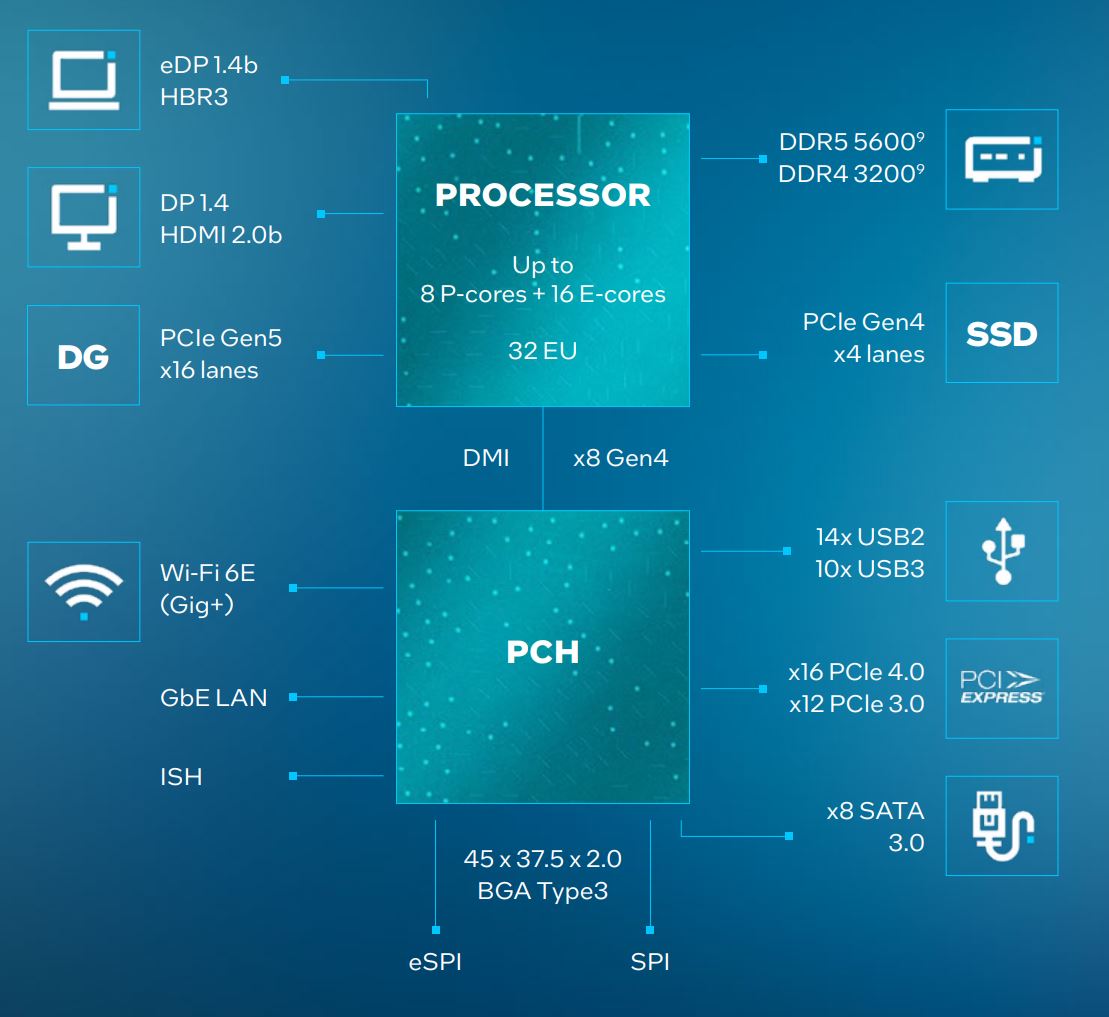
The Core i7-14700HX has been given four additional E-cores, raising the number of total cores from 16 to 20 (28 threads). Furthermore, their clock rates have been increased as well. The lineup is completed by the Core i7-14650HX, the Core i5-14500HX and the Core i5-14450HX. In total, the number of HX processors has been reduced from nine to five. The new HX models support a maximum of 192 GB RAM (DDR5-5600).

Raptor Lake-HX optionally with Wi-Fi 7
Thunderbolt 5 with 240-watt charging via USB-C is optionally compatible.

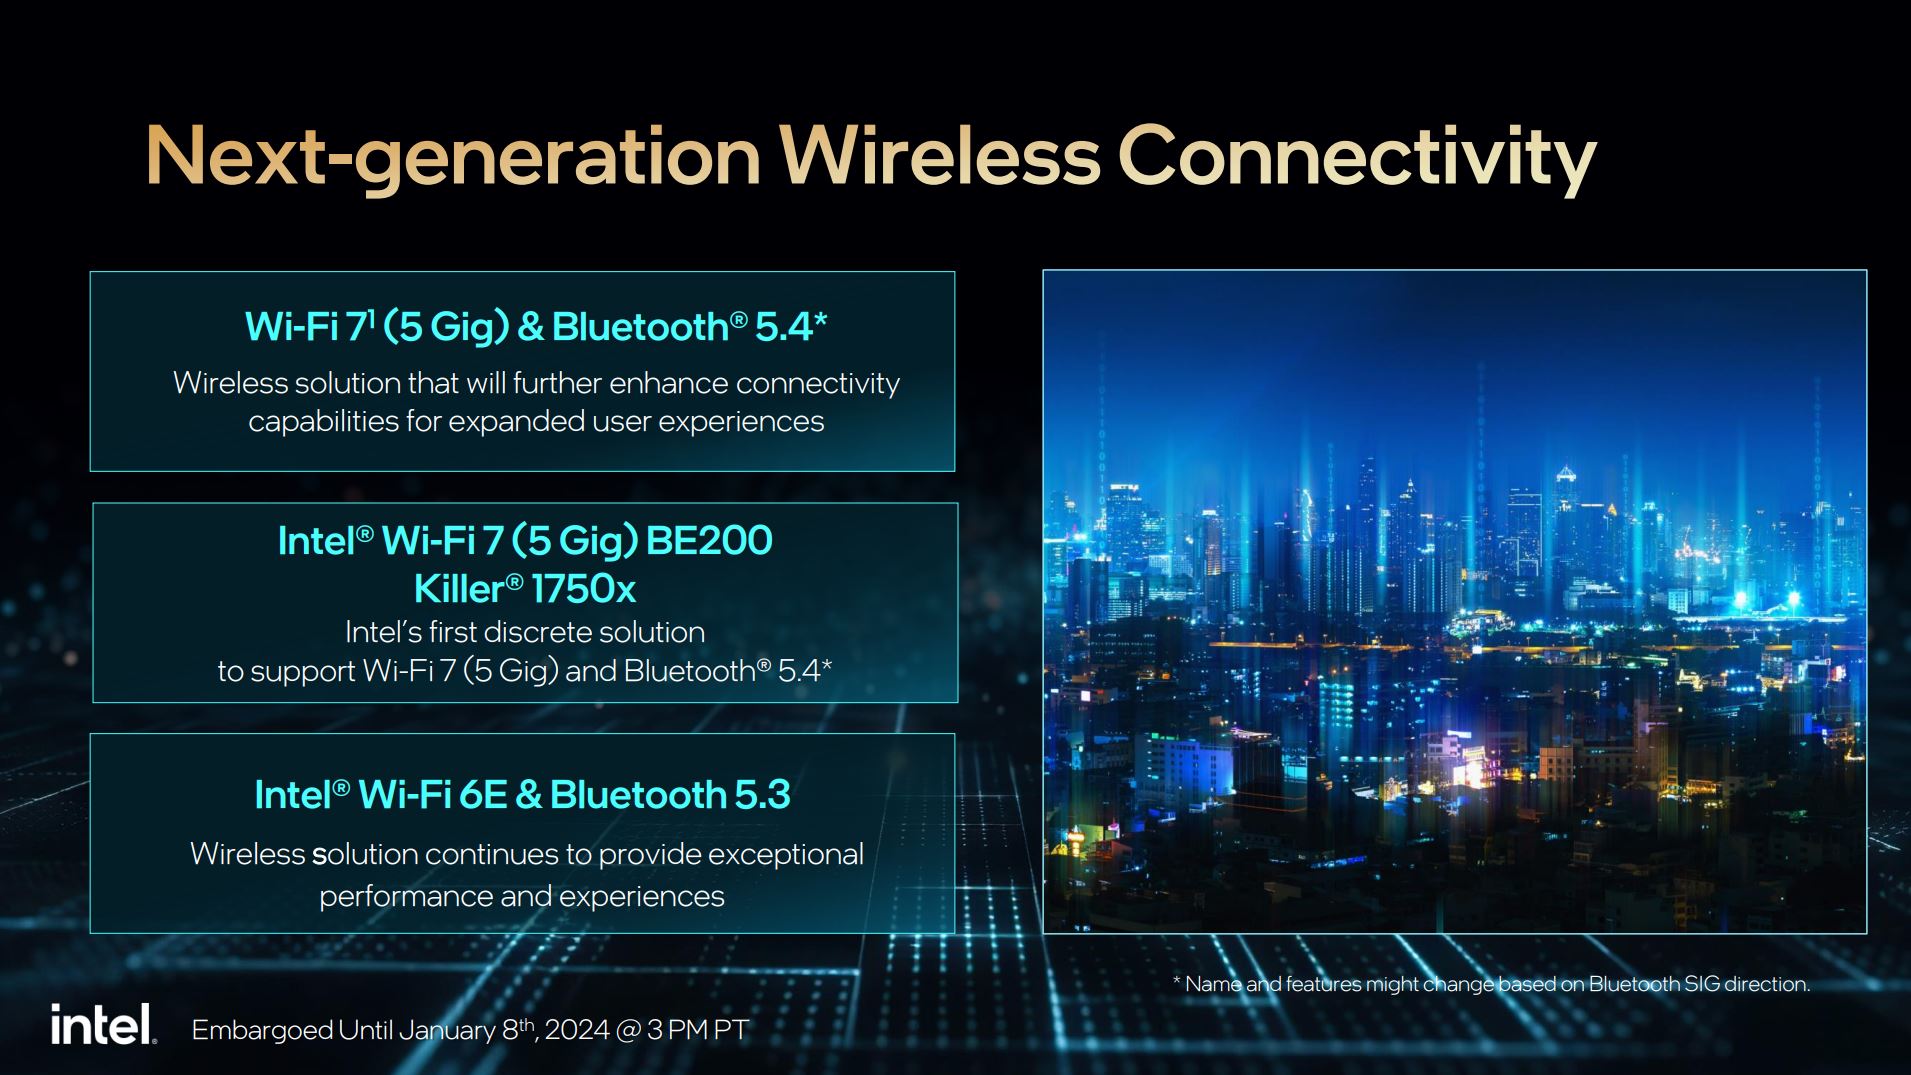
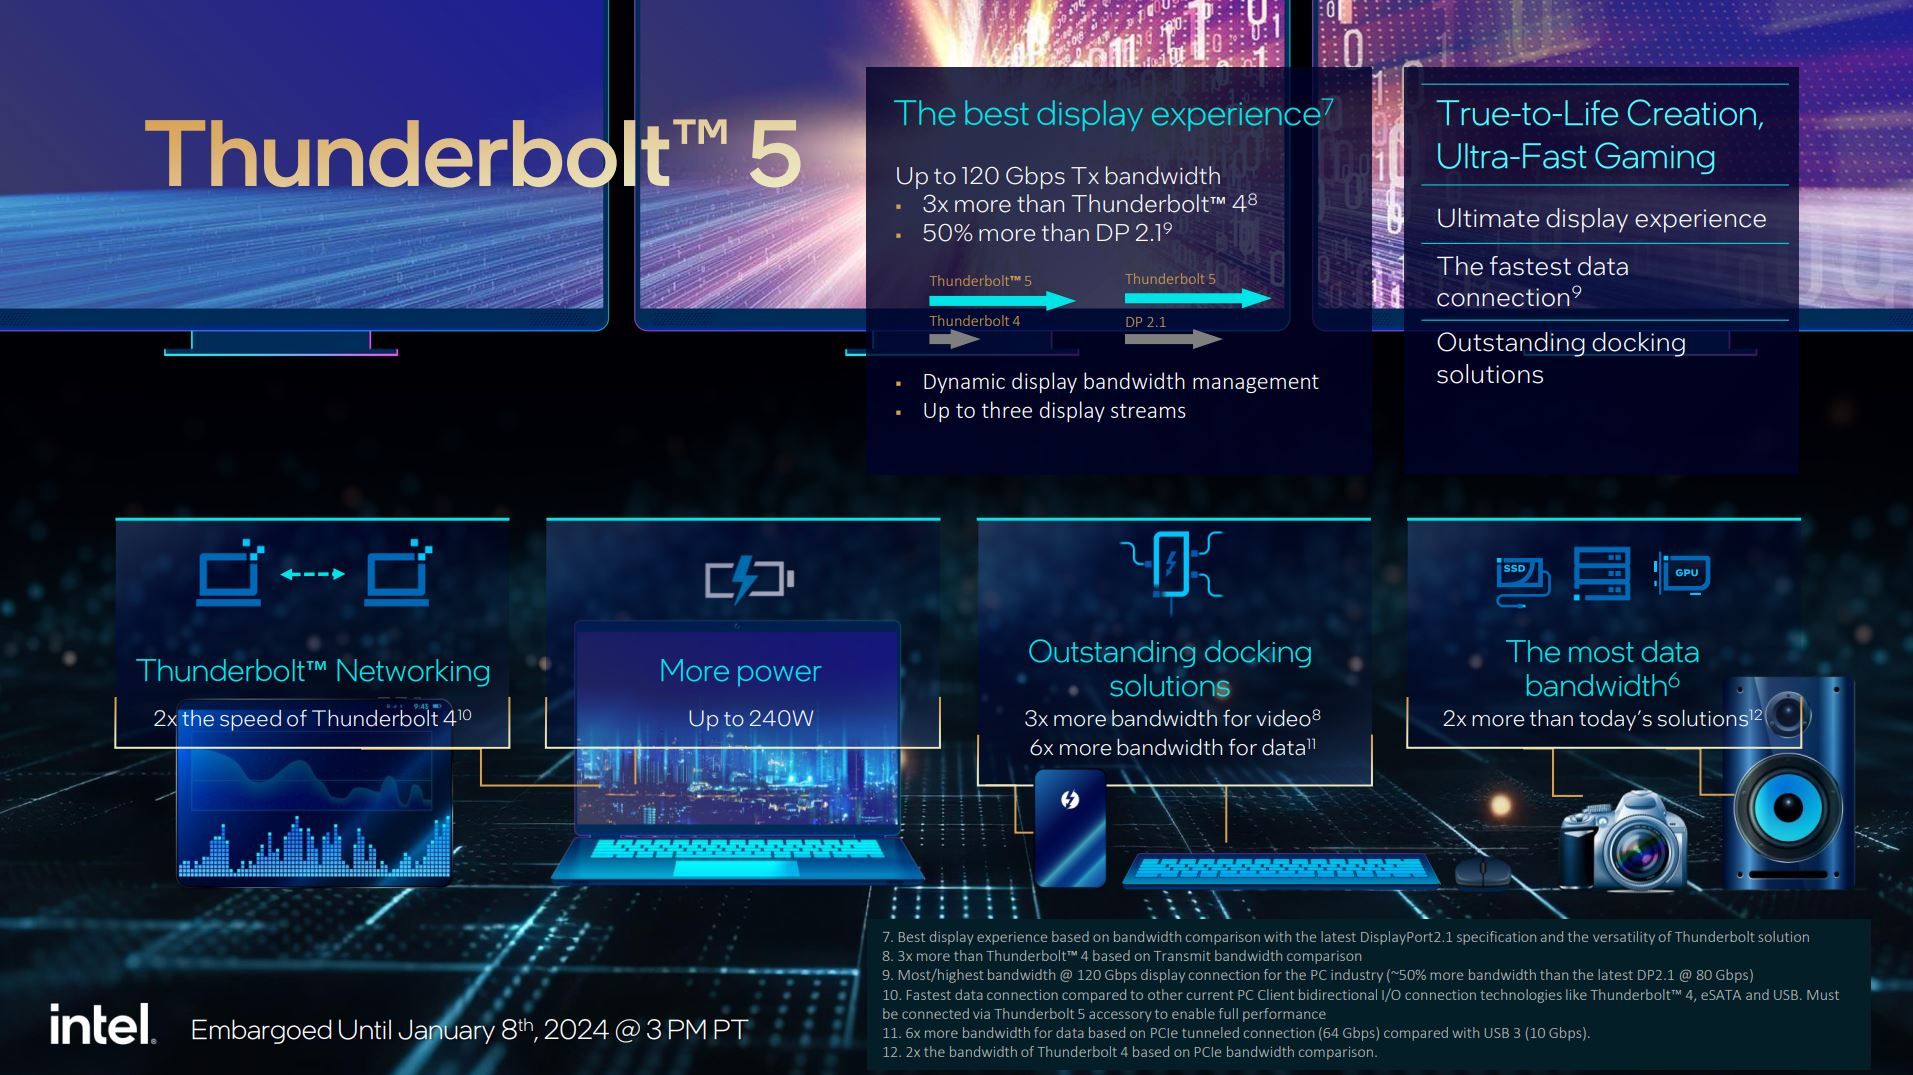
In terms of their connectivity, the newest features such as Wi-Fi 7 or Thunderbolt 5 are supported—however, only optionally. In this case, it all comes down to what functions individual manufacturers decide will be available for users. Moreover, all HX models can be overclocked and thanks to Intel's own XTU software, this is done quite comfortably.

Test system - XMG Neo 17 (E24)

XMG Neo 17 (E24)
XMG Neo 17 (E24)

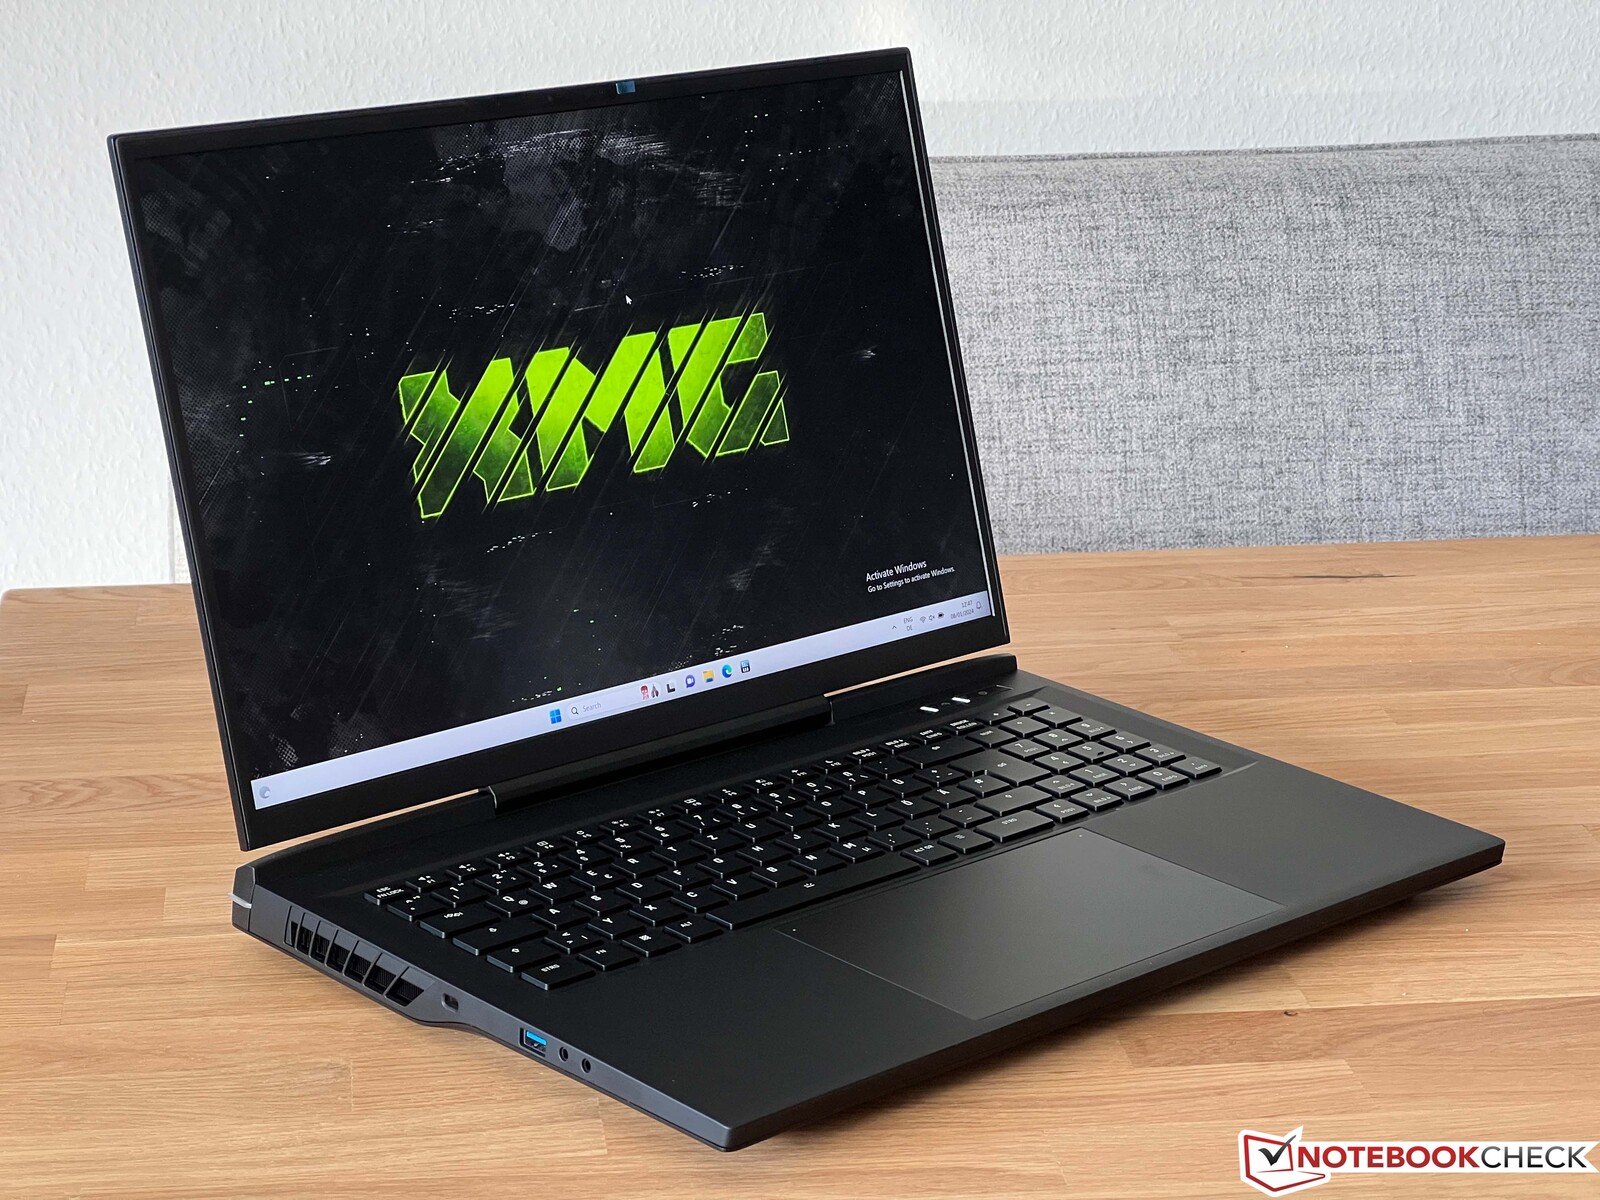
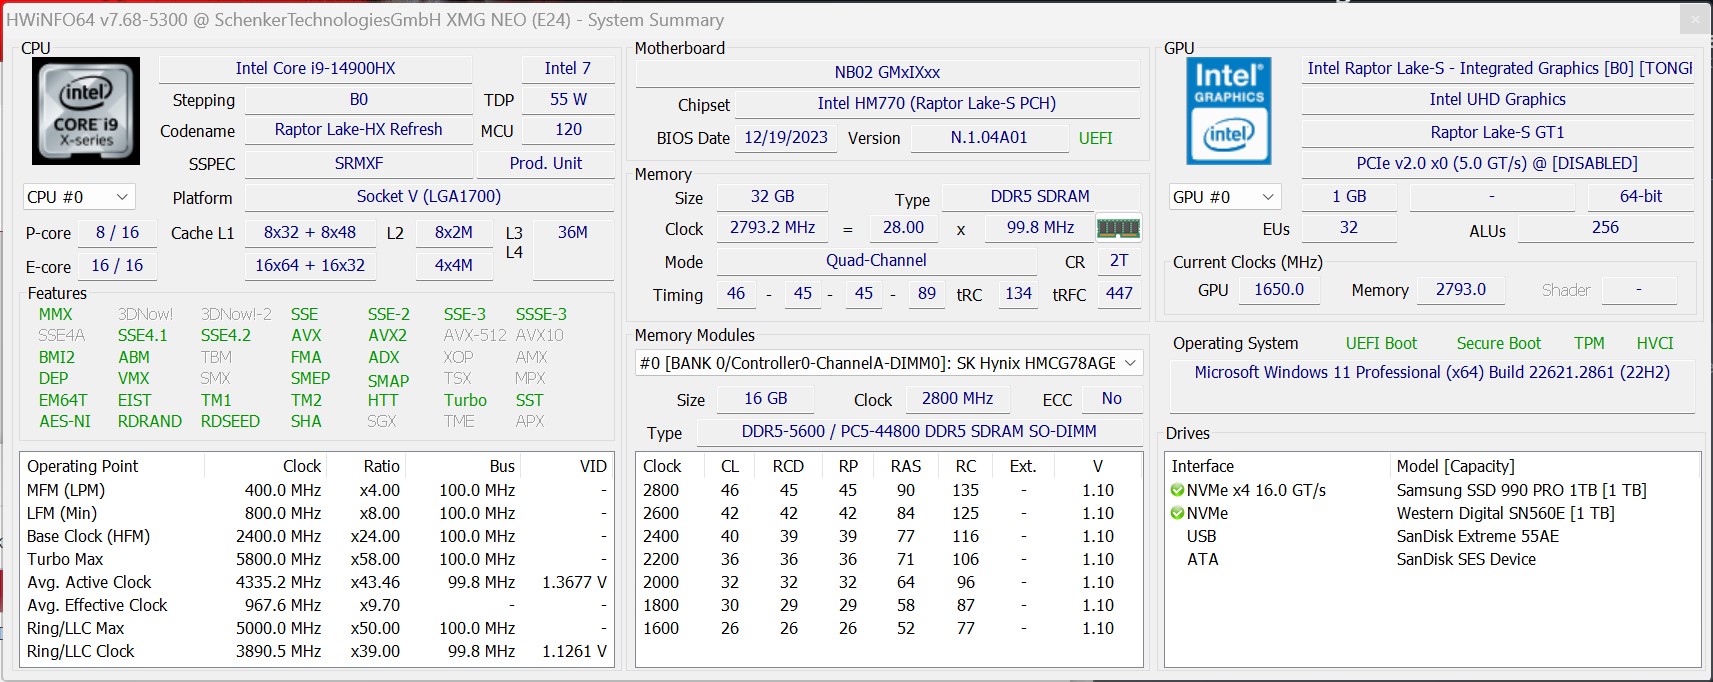
As a test system, we have received an early sample of the new XMG Neo 17 (E24), fitted with the Core i9-14900HX, a dedicated Nvidia GeForce RTX 4090 Laptop as well as 32 GB DDR5-5600 RAM. The new XMG Neo 17 (E24) makes use of the same case as the 2023 version, but there are quite a few differences on the inside. This includes a new pure-iGPU mode, the battery can be charged via USB-C (100 watts), and the heat pipe for the Oasis water cooling now covers the CPU area better. The Neo 17 also lets you reduce the CPU's voltage (undervolting) within the BIOS.

The device continues to use a G-Sync-compatible 17-inch IPS panel with a resolution of 2,560 x 1,600 pixels, an aspect ratio of 16:10 and a refresh rate of 240 Hz. You have the choice between a quiet membrane keyboard and an optional mechanical keyboard (Cherry MX Ultra Low Profile Tactile Switches).

HWiNFO XMG Neo 17 (E24)

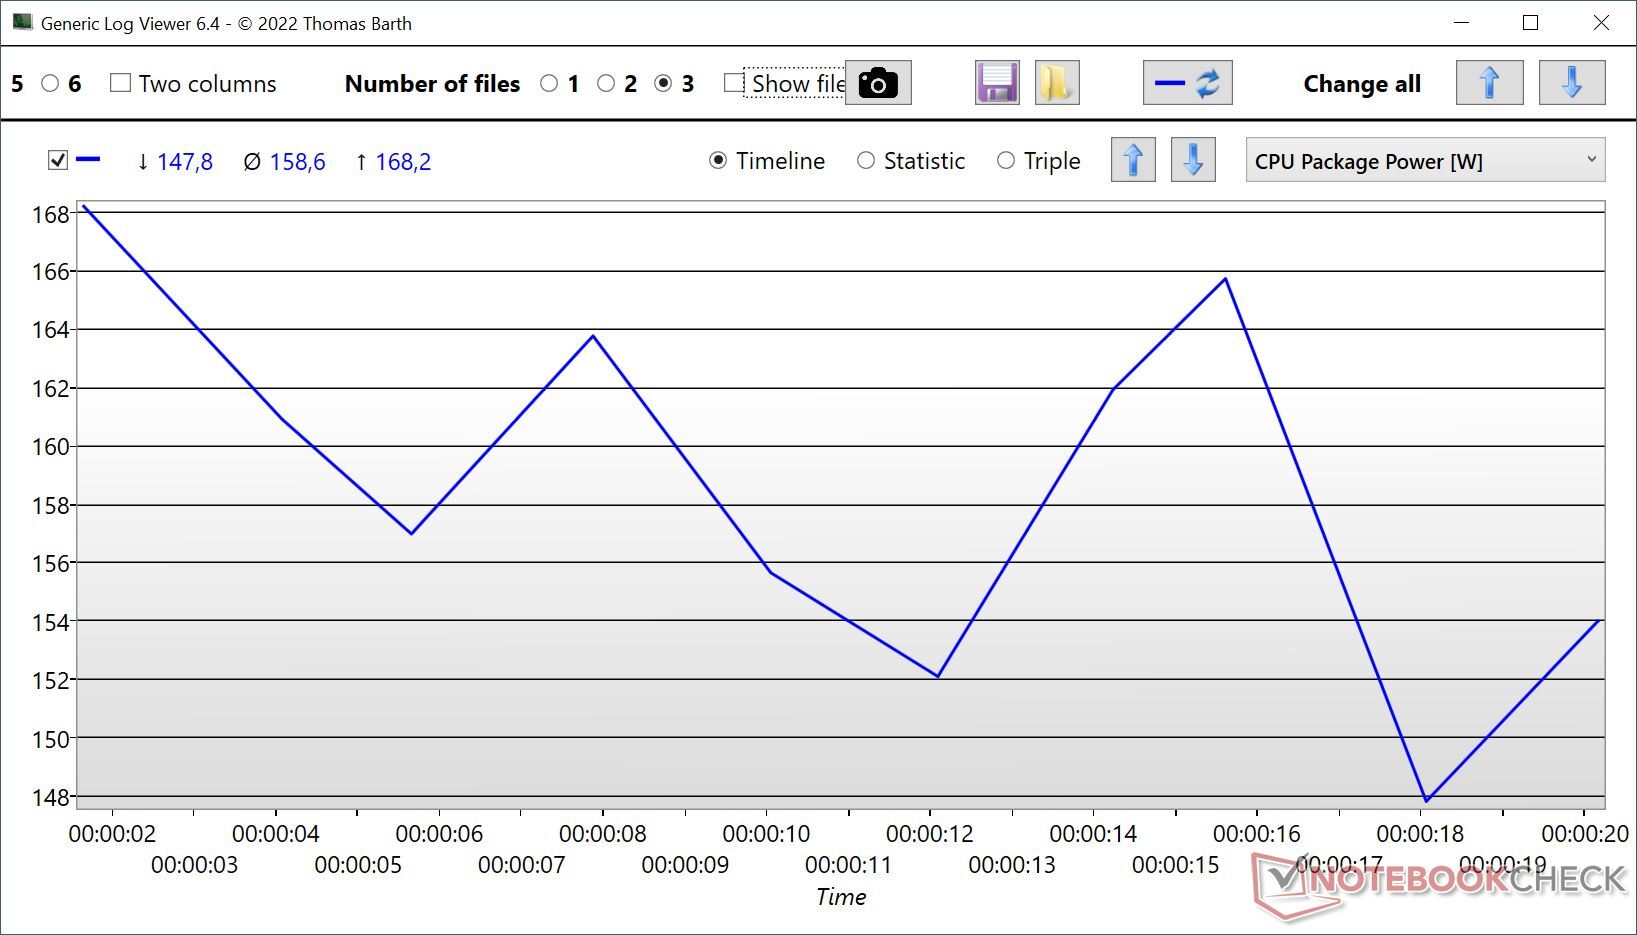
The GPU can again use a maximum of 150 watts (+25 watts Dynamic Boost), while the processor is permanently run at a maximum of 160 watts (PL4: 250 watts)—although, we measured 170 watts during our tests. We completed the following benchmarks without using the additional Oasis water cooling. We will publish a full review of the XMG Neo 17 E24 soon.

Please note: During our power measurements using an external display, the dedicated graphics card was active—this was also the case on quite a few of the comparison systems. The video output's configuration largely depends on the laptop manufacturer's configuration, the XMG Neo 17 (E24)'s HDMI output and its USB-C port are connected directly to the dGPU.

Single-core performance & efficiency

Thanks to its higher turbo clock of up to 5.8 GHz, Intel has improved its single-core performance even more, leading to the new Core i9-14900HX coming 3 % ahead of the Core i9-13980HX and 9 % ahead of the fastest  Core i9-13900HX during Cinebench R23. Apple's new M3 Max (16 CPU cores) was beaten by 13 %, however, it came ahead of the new Core i9-14900HX in Geekbench 6.2 and the new Cinebench 2024. AMD's Ryzen 9 7945HX was beaten by 15 %.

Cinebench R23: Single Core
Cinebench R20: CPU (Single Core)
Cinebench R15: CPU Single 64Bit
7-Zip 18.03: 7z b 4 -mmt1
Geekbench 5.5: Single-Core
Geekbench 6.2: Single-Core
Cinebench 2024: CPU Single Core
Cinebench R23 / Single Core
Intel Core i9-14900HX
SCHENKER XMG Neo 17 2024 Engineering Sample
2232 Points
Intel Core i9-13980HX
MSI Titan GT77 HX 13VI
2169 Points -3%
Intel Core i9-13950HX
MSI Titan GT77 HX 13VI
2100 Points -6%
Intel Core i9-13900HX
SCHENKER XMG Neo 16 Raptor Lake
2055 Points -8%
Intel Core i9-13900HX
Lenovo Legion Pro 7 16IRX8H
2043 Points -8%
Intel Core i9-13950HX
Razer Blade 16 Early 2023
2029 Points -9%
Apple M3 Max 16-Core
Apple MacBook Pro 16 2023 M3 Max
1968 Points -12%
AMD Ryzen 9 7945HX
Asus Zephyrus Duo 16 GX650PY-NM006W
1940 Points -13%
AMD Ryzen 9 7945HX
Asus ROG Strix G17 G713PI (Turbo Mode)
1936 Points -13%
AMD Ryzen 9 7945HX3D
Asus ROG Strix Scar 17 G733PYV-LL053X
1935 Points -13%
Intel Core i9-12900HX
MSI Titan GT77 12UHS
1913 Points -14%
AMD Ryzen 9 7945HX
Asus ROG Strix G17 G713PI
1863 Points -17%
AMD Ryzen 9 6900HX
Asus ROG Zephyrus Duo 16 GX650RX
1566 Points -30%
AMD Ryzen 9 6900HX
SCHENKER XMG Neo 17 M22
1557 Points -30%
Cinebench R20 / CPU (Single Core)
Intel Core i9-14900HX
SCHENKER XMG Neo 17 2024 Engineering Sample
859 Points
Intel Core i9-13980HX
MSI Titan GT77 HX 13VI
825 Points -4%
Intel Core i9-13950HX
MSI Titan GT77 HX 13VI
803 Points -7%
Intel Core i9-13900HX
Lenovo Legion Pro 7 16IRX8H
788 Points -8%
Intel Core i9-13900HX
SCHENKER XMG Neo 16 Raptor Lake
756 Points -12%
AMD Ryzen 9 7945HX
Asus Zephyrus Duo 16 GX650PY-NM006W
756 Points -12%
AMD Ryzen 9 7945HX3D
Asus ROG Strix Scar 17 G733PYV-LL053X
755 Points -12%
AMD Ryzen 9 7945HX
Asus ROG Strix G17 G713PI (Turbo Mode)
753 Points -12%
Intel Core i9-13950HX
Razer Blade 16 Early 2023
742 Points -14%
Intel Core i9-12900HX
MSI Titan GT77 12UHS
738 Points -14%
AMD Ryzen 9 7945HX
Asus ROG Strix G17 G713PI
712 Points -17%
AMD Ryzen 9 6900HX
SCHENKER XMG Neo 17 M22
605 Points -30%
AMD Ryzen 9 6900HX
Asus ROG Zephyrus Duo 16 GX650RX
595 Points -31%
Apple M3 Max 16-Core
Apple MacBook Pro 16 2023 M3 Max
497 Points -42%
Cinebench R15 / CPU Single 64Bit
Intel Core i9-14900HX
SCHENKER XMG Neo 17 2024 Engineering Sample
320 Points
Intel Core i9-13980HX
MSI Titan GT77 HX 13VI
312 Points -2%
AMD Ryzen 9 7945HX3D
Asus ROG Strix Scar 17 G733PYV-LL053X
311 Points -3%
AMD Ryzen 9 7945HX
Asus Zephyrus Duo 16 GX650PY-NM006W
307 Points -4%
Intel Core i9-13900HX
Lenovo Legion Pro 7 16IRX8H
301 Points -6%
AMD Ryzen 9 7945HX
Asus ROG Strix G17 G713PI (Turbo Mode)
301 Points -6%
Intel Core i9-13950HX
MSI Titan GT77 HX 13VI
300 Points -6%
Intel Core i9-13900HX
SCHENKER XMG Neo 16 Raptor Lake
295 Points -8%
Intel Core i9-13900HX
SCHENKER XMG Neo 16 Raptor Lake
294 Points -8%
AMD Ryzen 9 7945HX
Asus ROG Strix G17 G713PI
294 Points -8%
Intel Core i9-12900HX
MSI Titan GT77 12UHS
278 Points -13%
Intel Core i9-13950HX
Razer Blade 16 Early 2023
274 Points -14%
Apple M3 Max 16-Core
Apple MacBook Pro 16 2023 M3 Max
269 Points -16%
AMD Ryzen 9 6900HX
Asus ROG Zephyrus Duo 16 GX650RX
249 Points -22%
AMD Ryzen 9 6900HX
SCHENKER XMG Neo 17 M22
248 Points -22%
7-Zip 18.03 / 7z b 4 -mmt1
AMD Ryzen 9 7945HX3D
Asus ROG Strix Scar 17 G733PYV-LL053X
7573 MIPS +2%
Intel Core i9-14900HX
SCHENKER XMG Neo 17 2024 Engineering Sample
7405 MIPS
AMD Ryzen 9 7945HX
Asus ROG Strix G17 G713PI (Turbo Mode)
7379 MIPS 0%
AMD Ryzen 9 7945HX
Asus ROG Strix G17 G713PI
7332 MIPS -1%
AMD Ryzen 9 7945HX
Asus Zephyrus Duo 16 GX650PY-NM006W
7319 MIPS -1%
Intel Core i9-13900HX
Lenovo Legion Pro 7 16IRX8H
7035 MIPS -5%
Intel Core i9-13980HX
MSI Titan GT77 HX 13VI
7018 MIPS -5%
Intel Core i9-13950HX
MSI Titan GT77 HX 13VI
6897 MIPS -7%
Intel Core i9-13900HX
SCHENKER XMG Neo 16 Raptor Lake
6800 MIPS -8%
Intel Core i9-13950HX
Razer Blade 16 Early 2023
6445 MIPS -13%
Intel Core i9-12900HX
MSI Titan GT77 12UHS
6256 MIPS -16%
AMD Ryzen 9 6900HX
SCHENKER XMG Neo 17 M22
5872 MIPS -21%
AMD Ryzen 9 6900HX
Asus ROG Zephyrus Duo 16 GX650RX
5727 MIPS -23%
Geekbench 5.5 / Single-Core
Apple M3 Max 16-Core
Apple MacBook Pro 16 2023 M3 Max
2331 Points +7%
Intel Core i9-14900HX
SCHENKER XMG Neo 17 2024 Engineering Sample
2184 Points
Intel Core i9-13980HX
MSI Titan GT77 HX 13VI
2139 Points -2%
AMD Ryzen 9 7945HX3D
Asus ROG Strix Scar 17 G733PYV-LL053X
2133 Points -2%
AMD Ryzen 9 7945HX
Asus Zephyrus Duo 16 GX650PY-NM006W
2132 Points -2%
AMD Ryzen 9 7945HX
Asus ROG Strix G17 G713PI (Turbo Mode)
2103 Points -4%
AMD Ryzen 9 7945HX
Asus ROG Strix G17 G713PI
2053 Points -6%
Intel Core i9-13950HX
MSI Titan GT77 HX 13VI
2043 Points -6%
Intel Core i9-13900HX
Lenovo Legion Pro 7 16IRX8H
2025 Points -7%
Intel Core i9-13900HX
SCHENKER XMG Neo 16 Raptor Lake
2023 Points -7%
Intel Core i9-12900HX
MSI Titan GT77 12UHS
1923 Points -12%
Intel Core i9-13950HX
Razer Blade 16 Early 2023
1805 Points -17%
AMD Ryzen 9 6900HX
Asus ROG Zephyrus Duo 16 GX650RX
1594 Points -27%
AMD Ryzen 9 6900HX
SCHENKER XMG Neo 17 M22
1590 Points -27%
Geekbench 6.2 / Single-Core
Apple M3 Max 16-Core
Apple MacBook Pro 16 2023 M3 Max
3096 Points +2%
Intel Core i9-14900HX
SCHENKER XMG Neo 17 2024 Engineering Sample (6.2.1)
3045 Points
AMD Ryzen 9 7945HX3D
Asus ROG Strix Scar 17 G733PYV-LL053X
2916 Points -4%
Cinebench 2024 / CPU Single Core
Apple M3 Max 16-Core
Apple MacBook Pro 16 2023 M3 Max
139 Points +7%
Intel Core i9-14900HX
SCHENKER XMG Neo 17 2024 Engineering Sample
130 Points
AMD Ryzen 9 7945HX3D
Asus ROG Strix Scar 17 G733PYV-LL053X
115 Points -12%
Cinebench R23: Single Core
Cinebench R20: CPU (Single Core)
Cinebench R15: CPU Single 64Bit
7-Zip 18.03: 7z b 4 -mmt1
Geekbench 5.5: Single-Core
Geekbench 6.2: Single-Core
Cinebench 2024: CPU Single Core
Package power Core i9-14900HX Cinebench R23 Single

The picture changes slightly when we take a look at power consumption. While the performance core in last year's Raptor-Lake CPUs consumed around 34-36 watts, the new Core i9-14900HX's consumes 38 watts under pure single-core load due to its higher turbo clock of 5.8 GHz (IA cores, package power is even higher). Thus, AMD's CPU efficiency is a lot better, however, the test results of the AMD models and the new Core i9-14900HX were somewhat distorted, as the dedicated GPU was active during our power measurements and we measured the consumption of the entire system. On the old Raptor-Lake-HX models, on the other hand, only the iGPU was active. Neither Intel nor AMD stand a chance against the efficiency of Apple's current M3 Max (~5.5 watts under single-core load).

Power Consumption / Cinebench R23 Single Power Efficiency - external Monitor
Apple M3 Max 16-Core
Apple MacBook Pro 16 2023 M3 Max
113.8 Points per Watt +338%
Intel Core i9-13950HX
MSI Titan GT77 HX 13VI
28.5 Points per Watt +10%
AMD Ryzen 9 7945HX
Asus ROG Strix G17 G713PI
28.2 Points per Watt +8%
Intel Core i9-12900HX
MSI Titan GT77 12UHS
27.8 Points per Watt +7%
AMD Ryzen 9 7945HX3D
Asus ROG Strix Scar 17 G733PYV-LL053X
26.9 Points per Watt +3%
AMD Ryzen 9 7945HX
Asus ROG Strix G17 G713PI
26.8 Points per Watt +3%
AMD Ryzen 9 7945HX
Asus Zephyrus Duo 16 GX650PY-NM006W
26.4 Points per Watt +2%
Intel Core i9-14900HX
SCHENKER XMG Neo 17 2024 Engineering Sample
26 Points per Watt
Power Consumption / Cinebench R23 Single (external Monitor)
Intel Core i9-14900HX
SCHENKER XMG Neo 17 2024 Engineering Sample
85.8 (78.3min, 81.4P1 - 168.8max) Watt *
Intel Core i9-13950HX
MSI Titan GT77 HX 13VI
73.8 (69.8min, 70.2P1 - 100.2max) Watt * +14%
AMD Ryzen 9 7945HX
Asus Zephyrus Duo 16 GX650PY-NM006W
73.4 (69.8min, 69.9P1 - 99.9max) Watt * +14%
AMD Ryzen 9 7945HX
Asus ROG Strix G17 G713PI (Turbo Mode)
72.2 (62.6min, 63.8P1 - 92.5max) Watt * +16%
AMD Ryzen 9 7945HX3D
Asus ROG Strix Scar 17 G733PYV-LL053X
71.9 (70.8min, 71P1 - 86max) Watt * +16%
Intel Core i9-12900HX
MSI Titan GT77 12UHS
68.7 (63.7min, 64.8P1 - 87.6max) Watt * +20%
AMD Ryzen 9 7945HX
Asus ROG Strix G17 G713PI
66.1 (57.7min, 58.2P1 - 93.6max) Watt * +23%
Apple M3 Max 16-Core
Apple MacBook Pro 16 2023 M3 Max
17.3 (16.2min, 16.2P1 - 21.4max) Watt * +80%

* ... smaller is better

Multi-core performance

The Raptor Lake-HX Refresh's multi-core performance basically hasn't changed at all and the Core i9-14900HX's actual performance depends on each individual laptop's power limits. The XMG Neo 17 (E24) showed a package power of 160 watts on average during the benchmarks, which explains its slight advantage over the Core i9-13900HX. Both the Core i9-13950HX and the Core i9-13980HX inside the MSI Titan GT77 HX had an advantage, as they were allowed to consume more than 200 watts at the beginning of the benchmarks. The AMD models Ryzen 9 7945HX and Ryzen 9 7945HX3D were also a little faster.

Cinebench R23: Multi Core
Cinebench R20: CPU (Multi Core)
Cinebench R15: CPU Multi 64Bit
Blender: v2.79 BMW27 CPU | v3.3 Classroom CPU
7-Zip 18.03: 7z b 4
Geekbench 5.5: Multi-Core
Cinebench 2024: CPU Multi Core
Geekbench 6.2: Multi-Core
Cinebench R23 / Multi Core
AMD Ryzen 9 7945HX
Asus Zephyrus Duo 16 GX650PY-NM006W
34521 (32987.6min - 34521.3max) Points +7%
AMD Ryzen 9 7945HX
Asus ROG Strix G17 G713PI (Turbo Mode)
34202 Points +6%
Intel Core i9-13950HX
MSI Titan GT77 HX 13VI
33277 Points +3%
Intel Core i9-13980HX
MSI Titan GT77 HX 13VI
33052 Points +2%
AMD Ryzen 9 7945HX3D
Asus ROG Strix Scar 17 G733PYV-LL053X
32782 Points +1%
AMD Ryzen 9 7945HX
Asus ROG Strix G17 G713PI
32379 Points 0%
Intel Core i9-14900HX
SCHENKER XMG Neo 17 2024 Engineering Sample
32336 Points
Intel Core i9-13900HX
Lenovo Legion Pro 7 16IRX8H
30162 Points -7%
Intel Core i9-13900HX
SCHENKER XMG Neo 16 Raptor Lake
28707 (26191.7min - 28706.8max) Points -11%
Intel Core i9-13900HX
SCHENKER XMG Neo 16 Raptor Lake
28010 (26406.1min - 28009.8max) Points -13%
Intel Core i9-13900HX
SCHENKER XMG Neo 16 Raptor Lake
26703 Points -17%
Intel Core i9-13950HX
Razer Blade 16 Early 2023
26736 (22394.1min - 26736.1max) Points -17%
Apple M3 Max 16-Core
Apple MacBook Pro 16 2023 M3 Max
24024 Points -26%
Intel Core i9-12900HX
MSI Titan GT77 12UHS
22982 Points -29%
AMD Ryzen 9 6900HX
Asus ROG Zephyrus Duo 16 GX650RX
14085 Points -56%
Cinebench R20 / CPU (Multi Core)
AMD Ryzen 9 7945HX
Asus ROG Strix G17 G713PI (Turbo Mode)
13769 Points +13%
AMD Ryzen 9 7945HX
Asus Zephyrus Duo 16 GX650PY-NM006W
13457 Points +10%
AMD Ryzen 9 7945HX3D
Asus ROG Strix Scar 17 G733PYV-LL053X
13033 Points +7%
Intel Core i9-13950HX
MSI Titan GT77 HX 13VI
12648 Points +3%
Intel Core i9-13980HX
MSI Titan GT77 HX 13VI
12437 Points +2%
Intel Core i9-14900HX
SCHENKER XMG Neo 17 2024 Engineering Sample
12233 Points
Intel Core i9-13900HX
Lenovo Legion Pro 7 16IRX8H
11500 Points -6%
Intel Core i9-13900HX
SCHENKER XMG Neo 16 Raptor Lake
11289 Points -8%
AMD Ryzen 9 7945HX
Asus ROG Strix G17 G713PI
10025 Points -18%
Intel Core i9-13950HX
Razer Blade 16 Early 2023
8697 Points -29%
Intel Core i9-12900HX
MSI Titan GT77 12UHS
8667 Points -29%
Apple M3 Max 16-Core
Apple MacBook Pro 16 2023 M3 Max
6327 Points -48%
AMD Ryzen 9 6900HX
Asus ROG Zephyrus Duo 16 GX650RX
5489 Points -55%
Cinebench R15 / CPU Multi 64Bit
AMD Ryzen 9 7945HX
Asus ROG Strix G17 G713PI (Turbo Mode)
5663 Points +16%
AMD Ryzen 9 7945HX3D
Asus ROG Strix Scar 17 G733PYV-LL053X
5600 (5177.32min - 5599.89max) Points +15%
AMD Ryzen 9 7945HX
Asus Zephyrus Duo 16 GX650PY-NM006W
5554 (5255.55min - 5554.01max) Points +14%
Intel Core i9-13950HX
MSI Titan GT77 HX 13VI
5227 (4889.98min - 5226.71max) Points +7%
AMD Ryzen 9 7945HX
Asus ROG Strix G17 G713PI
5205 (4749.47min - 5204.94max) Points +7%
Intel Core i9-13980HX
MSI Titan GT77 HX 13VI
5172 (4917.63min - 5171.97max) Points +6%
Intel Core i9-13900HX
SCHENKER XMG Neo 16 Raptor Lake
4913 Points +1%
Intel Core i9-13900HX
SCHENKER XMG Neo 16 Raptor Lake
4875 (4298.3min - 4875.08max) Points 0%
Intel Core i9-14900HX
SCHENKER XMG Neo 17 2024 Engineering Sample
4875 (4783.54min - 4875.08max) Points
Intel Core i9-13900HX
Lenovo Legion Pro 7 16IRX8H
4819 (4429.68min - 4819.28max) Points -1%
Intel Core i9-13950HX
Razer Blade 16 Early 2023
4529 (4463.29min - 4528.99max) Points -7%
Intel Core i9-12900HX
MSI Titan GT77 12UHS
3570 (3259.45min - 3569.52max) Points -27%
Apple M3 Max 16-Core
Apple MacBook Pro 16 2023 M3 Max
3401 (3260min - 3401max) Points -30%
AMD Ryzen 9 6900HX
Asus ROG Zephyrus Duo 16 GX650RX
2292 Points -53%
Blender / v2.79 BMW27 CPU
AMD Ryzen 9 6900HX
Asus ROG Zephyrus Duo 16 GX650RX
220 Seconds * -116%
Apple M3 Max 16-Core
Apple MacBook Pro 16 2023 M3 Max
215 Seconds * -111%
Intel Core i9-12900HX
MSI Titan GT77 12UHS
147 Seconds * -44%
Intel Core i9-13950HX
Razer Blade 16 Early 2023
114 Seconds * -12%
Intel Core i9-13900HX
SCHENKER XMG Neo 16 Raptor Lake
111 Seconds * -9%
Intel Core i9-13900HX
Lenovo Legion Pro 7 16IRX8H
105 Seconds * -3%
Intel Core i9-14900HX
SCHENKER XMG Neo 17 2024 Engineering Sample
102 Seconds *
Intel Core i9-13980HX
MSI Titan GT77 HX 13VI
101 Seconds * +1%
Intel Core i9-13950HX
MSI Titan GT77 HX 13VI
100 Seconds * +2%
AMD Ryzen 9 7945HX
Asus ROG Strix G17 G713PI
100 Seconds * +2%
AMD Ryzen 9 7945HX
Asus ROG Strix G17 G713PI (Turbo Mode)
95 Seconds * +7%
AMD Ryzen 9 7945HX3D
Asus ROG Strix Scar 17 G733PYV-LL053X
95 Seconds * +7%
AMD Ryzen 9 7945HX
Asus Zephyrus Duo 16 GX650PY-NM006W
93 Seconds * +9%
Blender / v3.3 Classroom CPU
Intel Core i9-12900HX
MSI Titan GT77 12UHS
263 Seconds * -47%
Intel Core i9-13950HX
Razer Blade 16 Early 2023 (3.3.3)
207 Seconds * -16%
Intel Core i9-13900HX
SCHENKER XMG Neo 16 Raptor Lake (3.3.3)
200 Seconds * -12%
Apple M3 Max 16-Core
Apple MacBook Pro 16 2023 M3 Max
194 Seconds * -8%
Intel Core i9-13900HX
Lenovo Legion Pro 7 16IRX8H (3.3.3)
192 Seconds * -7%
Intel Core i9-14900HX
SCHENKER XMG Neo 17 2024 Engineering Sample (3.3.3)
179 Seconds *
Intel Core i9-13980HX
MSI Titan GT77 HX 13VI (3.3.3)
176 Seconds * +2%
Intel Core i9-13950HX
MSI Titan GT77 HX 13VI (3.3.3)
175 Seconds * +2%
AMD Ryzen 9 7945HX
Asus ROG Strix G17 G713PI
158 Seconds * +12%
AMD Ryzen 9 7945HX3D
Asus ROG Strix Scar 17 G733PYV-LL053X (3.3.3)
150 Seconds * +16%
AMD Ryzen 9 7945HX
Asus Zephyrus Duo 16 GX650PY-NM006W (3.3.3)
147 Seconds * +18%
7-Zip 18.03 / 7z b 4
AMD Ryzen 9 7945HX
Asus ROG Strix G17 G713PI (Turbo Mode)
140471 MIPS +11%
AMD Ryzen 9 7945HX3D
Asus ROG Strix Scar 17 G733PYV-LL053X
136201 MIPS +7%
AMD Ryzen 9 7945HX
Asus Zephyrus Duo 16 GX650PY-NM006W
135927 MIPS +7%
Intel Core i9-13950HX
MSI Titan GT77 HX 13VI
127295 MIPS 0%
Intel Core i9-14900HX
SCHENKER XMG Neo 17 2024 Engineering Sample
127108 MIPS
Intel Core i9-13980HX
MSI Titan GT77 HX 13VI
125720 MIPS -1%
AMD Ryzen 9 7945HX
Asus ROG Strix G17 G713PI
123364 MIPS -3%
Intel Core i9-13900HX
Lenovo Legion Pro 7 16IRX8H
122254 MIPS -4%
Intel Core i9-13900HX
SCHENKER XMG Neo 16 Raptor Lake
118715 MIPS -7%
Intel Core i9-13950HX
Razer Blade 16 Early 2023
109330 MIPS -14%
Intel Core i9-12900HX
MSI Titan GT77 12UHS
86234 MIPS -32%
AMD Ryzen 9 6900HX
Asus ROG Zephyrus Duo 16 GX650RX
64457 MIPS -49%
Geekbench 5.5 / Multi-Core
Apple M3 Max 16-Core
Apple MacBook Pro 16 2023 M3 Max
22816 Points +6%
Intel Core i9-14900HX
SCHENKER XMG Neo 17 2024 Engineering Sample
21606 Points
Intel Core i9-13900HX
Lenovo Legion Pro 7 16IRX8H
21058 Points -3%
Intel Core i9-13900HX
SCHENKER XMG Neo 16 Raptor Lake
20784 Points -4%
Intel Core i9-13950HX
MSI Titan GT77 HX 13VI
20634 Points -4%
Intel Core i9-13980HX
MSI Titan GT77 HX 13VI
20329 Points -6%
AMD Ryzen 9 7945HX
Asus ROG Strix G17 G713PI (Turbo Mode)
19954 Points -8%
AMD Ryzen 9 7945HX3D
Asus ROG Strix Scar 17 G733PYV-LL053X
19875 Points -8%
AMD Ryzen 9 7945HX
Asus Zephyrus Duo 16 GX650PY-NM006W
19583 Points -9%
AMD Ryzen 9 7945HX
Asus ROG Strix G17 G713PI
18372 Points -15%
Intel Core i9-13950HX
Razer Blade 16 Early 2023
18152 Points -16%
Intel Core i9-12900HX
MSI Titan GT77 12UHS
16250 Points -25%
AMD Ryzen 9 6900HX
Asus ROG Zephyrus Duo 16 GX650RX
10167 Points -53%
Cinebench 2024 / CPU Multi Core
Intel Core i9-14900HX
SCHENKER XMG Neo 17 2024 Engineering Sample
1780 Points
AMD Ryzen 9 7945HX3D
Asus ROG Strix Scar 17 G733PYV-LL053X
1772 Points 0%
Apple M3 Max 16-Core
Apple MacBook Pro 16 2023 M3 Max
1612 Points -9%
Geekbench 6.2 / Multi-Core
Apple M3 Max 16-Core
Apple MacBook Pro 16 2023 M3 Max
21243 Points +14%
Intel Core i9-14900HX
SCHENKER XMG Neo 17 2024 Engineering Sample (6.2.1)
18643 Points
AMD Ryzen 9 7945HX3D
Asus ROG Strix Scar 17 G733PYV-LL053X
16957 Points -9%
Cinebench R23: Multi Core
Cinebench R20: CPU (Multi Core)
Cinebench R15: CPU Multi 64Bit
Blender: v2.79 BMW27 CPU | v3.3 Classroom CPU
7-Zip 18.03: 7z b 4
Geekbench 5.5: Multi-Core
Cinebench 2024: CPU Multi Core
Geekbench 6.2: Multi-Core

* ... smaller is better

Package power Core i9-14900HX Cinebench R23 Multi

When taking a look at efficiency, you have to keep in mind that the dedicated GPU was active. Due to the higher total consumption values, the influence is less here than during the single-core tests. The Core i9-14900HX may have come ahead of most of its Intel siblings, however, AMD's Dragon Range Ryzen 9 7945HX came quite a bit ahead when it came to efficiency. It is no surprise that Apple's efficiency came out on top but for the first time, the new M3 Max is able to hit performance levels close to the smaller HX processors (Core i7).

Power Consumption / Cinebench R23 Multi Power Efficiency - external Monitor
Apple M3 Max 16-Core
Apple MacBook Pro 16 2023 M3 Max
306 Points per Watt +111%
AMD Ryzen 9 7945HX3D
Asus ROG Strix Scar 17 G733PYV-LL053X
207 Points per Watt +43%
AMD Ryzen 9 7945HX
Asus Zephyrus Duo 16 GX650PY-NM006W
194.4 Points per Watt +34%
AMD Ryzen 9 7945HX
Asus ROG Strix G17 G713PI
191.1 Points per Watt +32%
Intel Core i9-13980HX
Asus ROG Strix Scar 18 2023 G834JY-N6005W
160.9 Points per Watt +11%
Intel Core i9-14900HX
SCHENKER XMG Neo 17 2024 Engineering Sample
145 Points per Watt
Intel Core i9-13950HX
Razer Blade 16 Early 2023 RTX 4090
144.1 Points per Watt -1%
Intel Core i9-13900HX
Lenovo Legion Pro 7 RTX4090
141.4 Points per Watt -2%
Intel Core i9-13950HX
MSI Titan GT77 HX 13VI
135.3 Points per Watt -7%
Intel Core i9-12900HX
MSI Titan GT77 12UHS
122.6 Points per Watt -15%
Power Consumption / Cinebench R23 Multi (external Monitor)
Intel Core i9-13950HX
MSI Titan GT77 HX 13VI
246 (227min, 227P1 - 264max) Watt * -10%
Intel Core i9-14900HX
SCHENKER XMG Neo 17 2024 Engineering Sample
223 (216min, 216P1 - 229max) Watt *
Intel Core i9-13900HX
Lenovo Legion Pro 7 RTX4090
220 (215min, 215P1 - 224max) Watt * +1%
Intel Core i9-13950HX
Razer Blade 16 Early 2023 RTX 4090
197.3 (191.9min, 192.7P1 - 200max) Watt * +12%
Intel Core i9-12900HX
MSI Titan GT77 12UHS
187.5 (166.8min, 167.1P1 - 230max) Watt * +16%
Intel Core i9-13900HX
SCHENKER XMG Neo 16 E23
182.4 (172.3min, 172.3P1 - 207max) Watt * +18%
AMD Ryzen 9 7945HX
Asus ROG Strix G17 G713PI (Turbo Mode)
179 (171.5min, 171.8P1 - 181.3max) Watt * +20%
AMD Ryzen 9 7945HX
Asus Zephyrus Duo 16 GX650PY-NM006W
177.6 (166.7min, 166.8P1 - 187.3max) Watt * +20%
Intel Core i9-13980HX
Asus ROG Strix Scar 18 2023 G834JY-N6005W
175.9 (93.7min, 95.8P1 - 193.7max) Watt * +21%
AMD Ryzen 9 7945HX3D
Asus ROG Strix Scar 17 G733PYV-LL053X
158.5 (149.9min, 150.4P1 - 171.1max) Watt * +29%
Intel Core i7-13700HX
Aorus 15X ASF
148.3 (116.3min, 116.3P1 - 185.2max) Watt * +33%
Apple M3 Max 16-Core
Apple MacBook Pro 16 2023 M3 Max
78.6 (71.7min, 73.3P1 - 80.2max) Watt * +65%

* ... smaller is better

Performance with low power limits

As was already the case in previous analysis articles, we also took at look at its performance with lower power limits and we have put together our findings in the following table. Quickly, two things become clear. Firstly, at the end of the day, the Core i9-14900HX is basically just a Core i9-13900HX with a higher turbo clock, and with lower power limits, the two chips don't differ that much. Secondly, you can clearly see that AMD can deliver the same multi-core performance using considerably less power. The Apple M3 Max is impressive, too—with a comparable power limit, it performed about 32 % faster than the Core i9-14900HX.

Cinebench R23 Multi
Power Limit Core i9-14900HX Core i9-13900HX Core i9-13950HX Core i9-13980HX Ryzen 9 7945HX Ryzen 9 7945HX3D M3 Max 16-Core
170 watts 31,958 31,903
150 watts 30,308 30,655 30,623
130 watts 28,933 28,239 29,141 29,281 34,202
115 watts 27,750 27,369 28,199 28,073 33,361
100 watts 26,323 25,942 26,653 26,507 32,947 32,977
80 watts 23,334 23,216 23,950 23,766 30,907 30,804
55 watts 18,258 18,843 19,772 19,478 26,045 24,024

Power consumption when idle

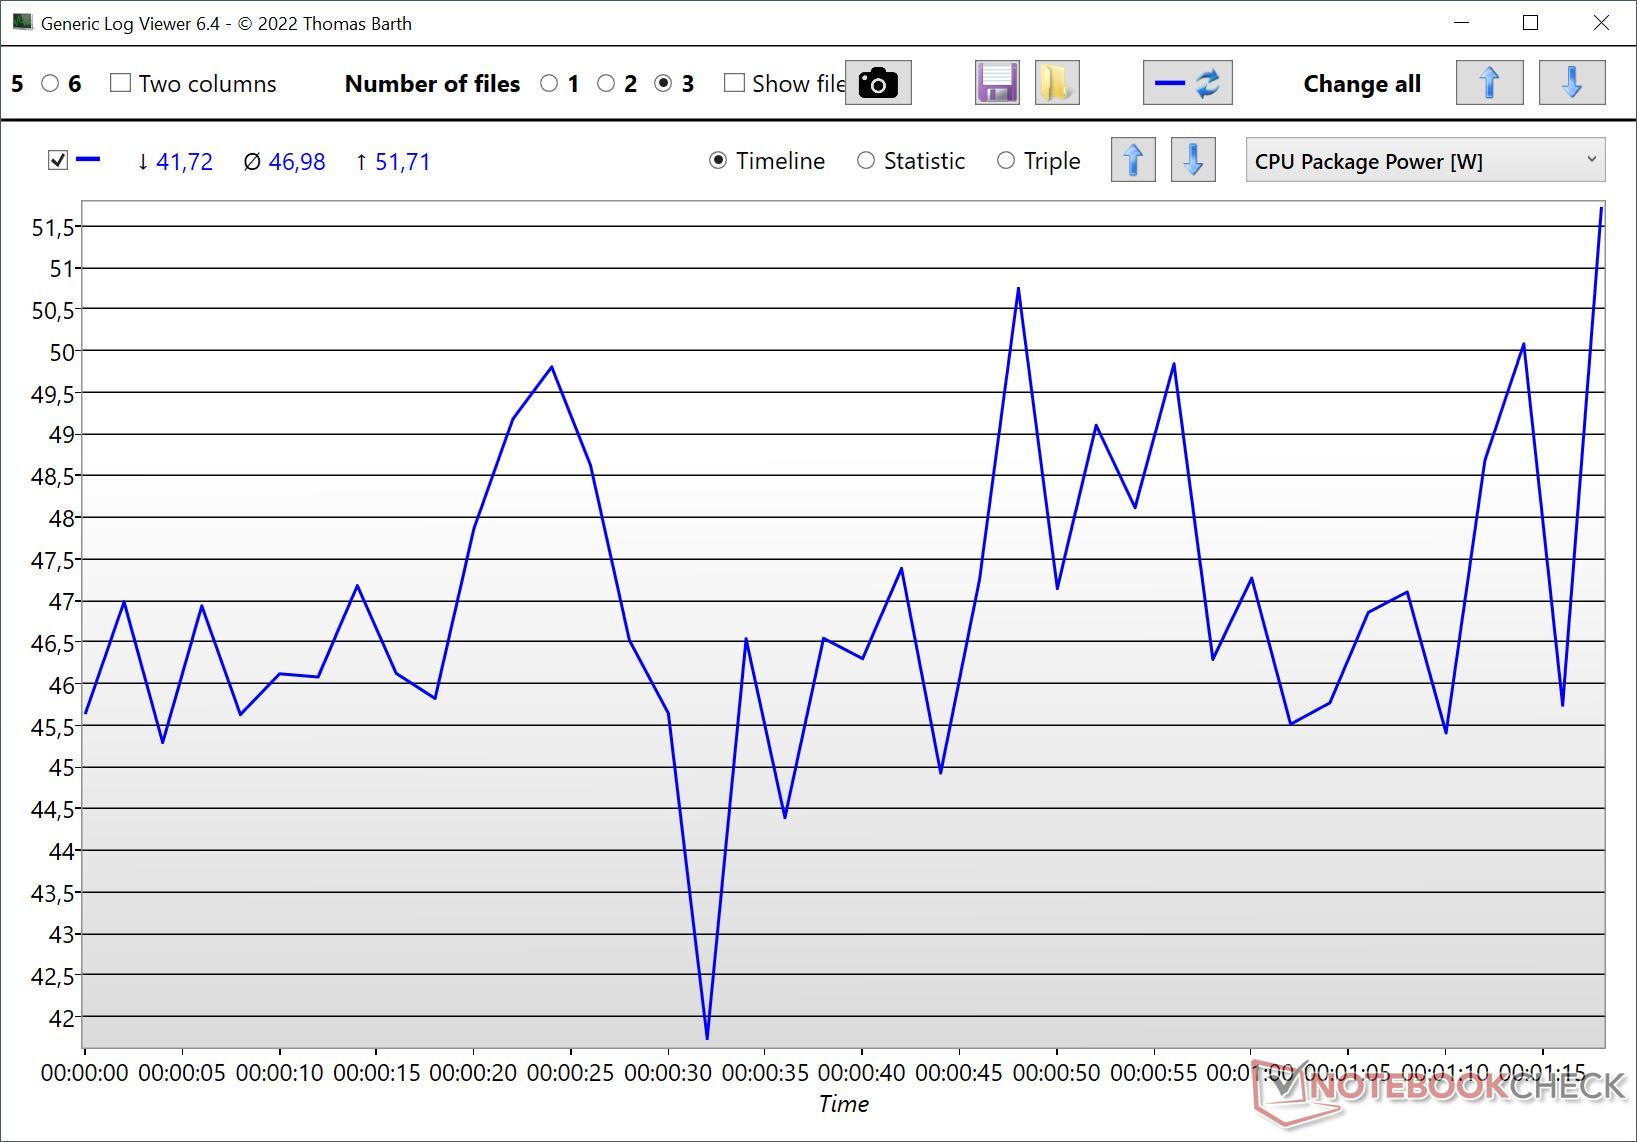
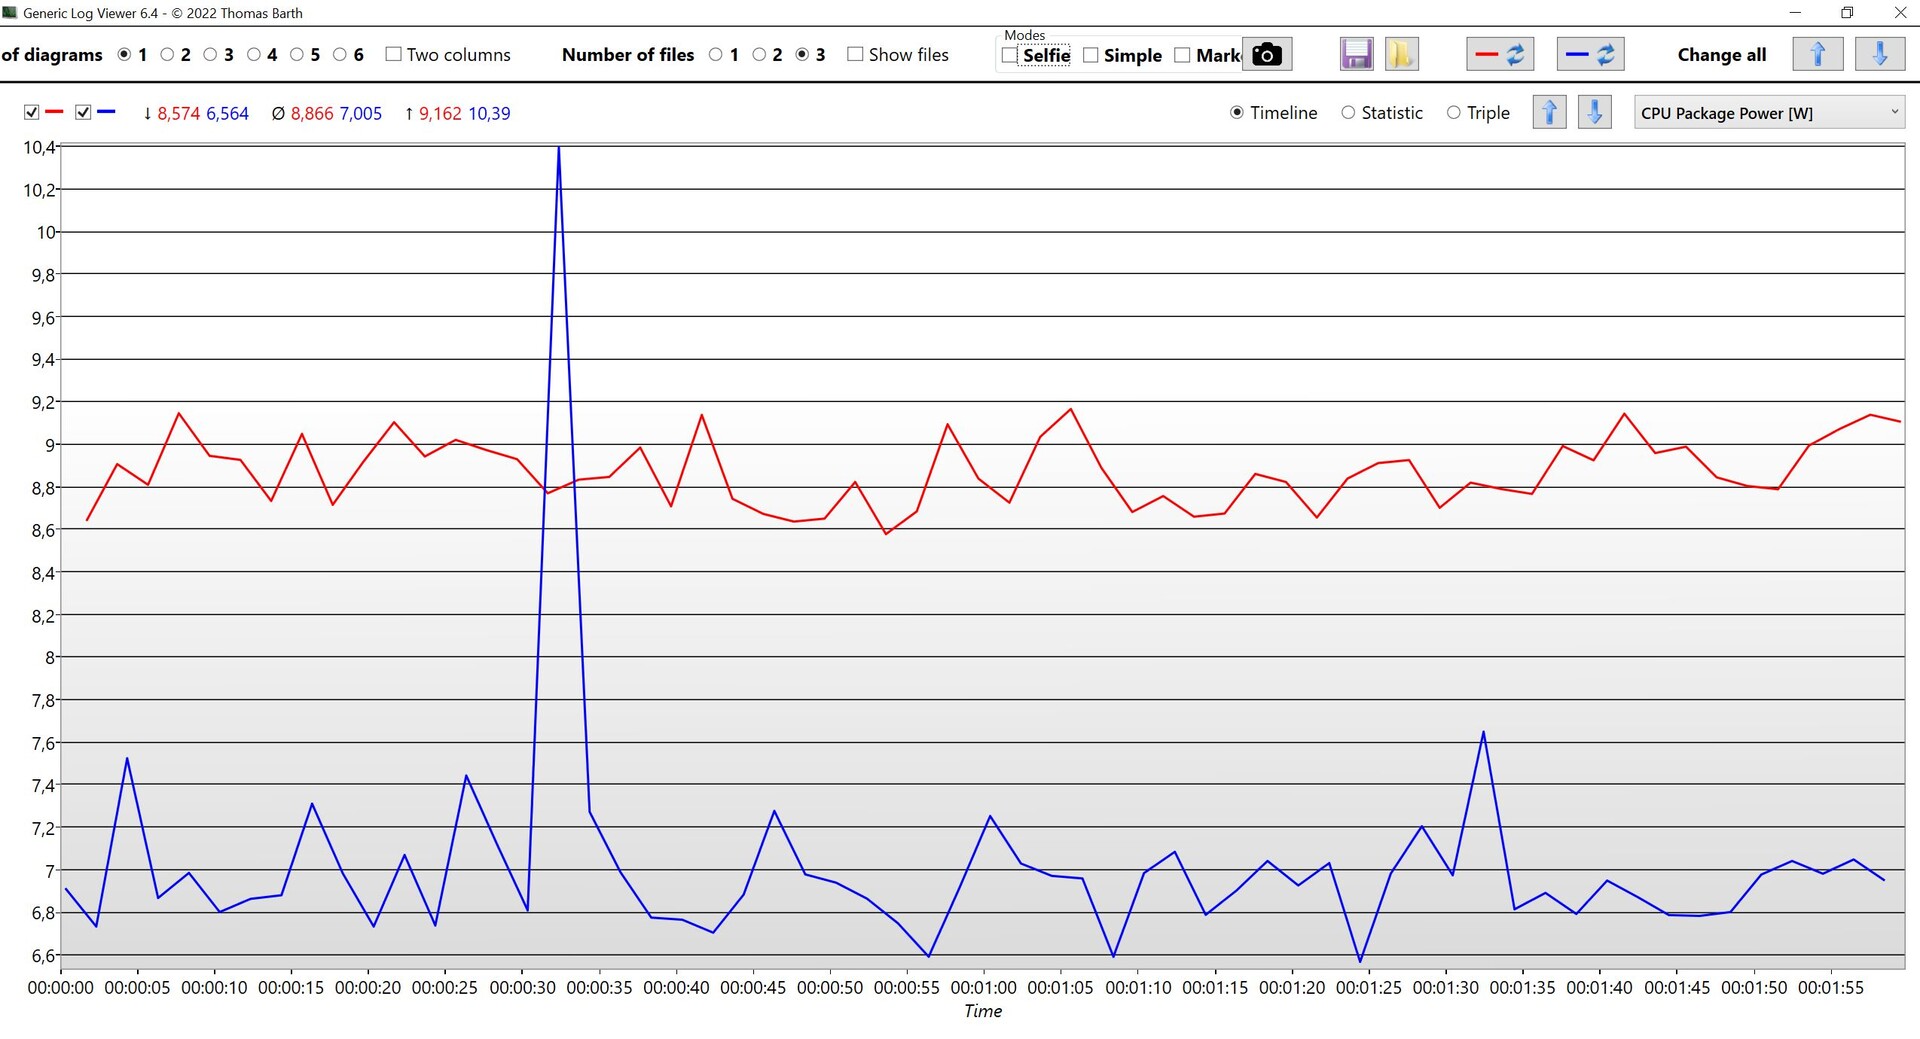
We also compared the new Core i9-14900HX's power consumption in idle mode to that of the AMD Ryzen 9 7945HX3D, whereby the performance settings were kept as close as possible on both models. Here, we noted that the Core i9-14900HX had a slight advantage, balancing out at around 7 watts in an ideal scenario. The Ryzen 9 7945HX3D with its chiplet design, on the other hand, required an average of 8.9 watts when idle.

CPU package power in idle mode (blue: Core i9-14900HX, red: Ryzen 9 7945HX3D)

Gaming performance

In contrast to the CPU benchmarks, the processor of course isn't always fully loaded when gaming—instead, there will likely be a mix of single/multi-core load. One indicator of this is its CPU score during the 3DMark tests and when comparing the Time Spy results, we noted a 10 % advantage over the Core i9-13900HX and the new Core i9-14900HX is on the same level as last year's Core i9-13980HX.

3DMark - 2560x1440 Time Spy CPU
Lenovo Legion 9 16IRX8
Intel Core i9-13980HX, NVIDIA GeForce RTX 4090 Laptop GPU
17712 Points +4%
Alienware m18 R1
Intel Core i9-13980HX, NVIDIA GeForce RTX 4090 Laptop GPU
17525 Points +3%
MSI Raider GE78 HX 13VI
Intel Core i9-13980HX, NVIDIA GeForce RTX 4090 Laptop GPU
17026 Points 0%
SCHENKER XMG Neo 17 2024 Engineering Sample
Intel Core i9-14900HX, NVIDIA GeForce RTX 4090 Laptop GPU
16982 Points
Asus ROG Strix Scar 18 2023 G834JY-N6005W
Intel Core i9-13980HX, NVIDIA GeForce RTX 4090 Laptop GPU
15908 Points -6%
MSI Titan GT77 HX 13VI
Intel Core i9-13950HX, NVIDIA GeForce RTX 4090 Laptop GPU
15403 Points -9%
Lenovo Legion Pro 7 RTX4090
Intel Core i9-13900HX, NVIDIA GeForce RTX 4090 Laptop GPU
15066 Points -11%
Asus ROG Strix Scar 17 G733PYV-LL053X
AMD Ryzen 9 7945HX3D, NVIDIA GeForce RTX 4090 Laptop GPU
14131 Points -17%
SCHENKER Key 17 Pro (Early 23)
Intel Core i9-13900HX, NVIDIA GeForce RTX 4090 Laptop GPU
14048 Points -17%
Asus ROG Strix Scar 17 G733PY-XS96
AMD Ryzen 9 7945HX, NVIDIA GeForce RTX 4090 Laptop GPU
13140 Points -23%
Lenovo Legion Pro 5 16ARX8
AMD Ryzen 7 7745HX, NVIDIA GeForce RTX 4070 Laptop GPU
11477 Points -32%
Average of class
  (353 - 23721, n=2294)
7399 Points -56%

Gaming performance 1080p

Naturally, it isn't ideal to compare a processor's gaming performance using various laptops, as there will always be slight differences in how their power limits are configured—when it comes to the processor as well as the graphics cards. In its press documents, Intel has shown its results with high details at 1080p which, in our opinion, isn't terribly realistic. If you're going to show 1080p resolution, then you'll at least want the maximum details, as no HX processor is offered without a powerful dedicated graphics card. In general, the Core i9-14900HX's performance is good but not that much better than the predecessor models. Upgrading from a previous-gen Core i9 HX processor is certainly not worth it. In certain games, the AMD Ryzen 9 7945HX3D with its 3D cache has quite an advantage, again making it the best mobile gaming CPU in total.

The Witcher 3 - 1920x1080 Ultra Graphics & Postprocessing (HBAO+)
Alienware m18 R1
Intel Core i9-13980HX, NVIDIA GeForce RTX 4090 Laptop GPU
213.9 (205min) fps +9%
MSI Raider GE78 HX 13VI
Intel Core i9-13980HX, NVIDIA GeForce RTX 4090 Laptop GPU
213.4 (72.4P0.1, 144.6P1) fps +9%
Lenovo Legion 9 16IRX8
Intel Core i9-13980HX, NVIDIA GeForce RTX 4090 Laptop GPU
208.7 (191min) fps +7%
Asus ROG Strix Scar 17 G733PYV-LL053X
AMD Ryzen 9 7945HX3D, NVIDIA GeForce RTX 4090 Laptop GPU
207 fps +6%
SCHENKER Key 17 Pro (Early 23)
Intel Core i9-13900HX, NVIDIA GeForce RTX 4090 Laptop GPU
206 (176min) fps +5%
Asus ROG Strix Scar 17 G733PY-XS96
AMD Ryzen 9 7945HX, NVIDIA GeForce RTX 4090 Laptop GPU
203.8 (186min) fps +4%
Lenovo Legion Pro 7 RTX4090
Intel Core i9-13900HX, NVIDIA GeForce RTX 4090 Laptop GPU
200 (174min) fps +2%
MSI Titan GT77 HX 13VI
Intel Core i9-13950HX, NVIDIA GeForce RTX 4090 Laptop GPU
198.9 (190min, 191P1) fps +2%
SCHENKER XMG Neo 17 2024 Engineering Sample
Intel Core i9-14900HX, NVIDIA GeForce RTX 4090 Laptop GPU
195.8 (176min, 187P1) fps
Lenovo Legion Pro 5 16ARX8
AMD Ryzen 7 7745HX, NVIDIA GeForce RTX 4070 Laptop GPU
119.8 (114min) fps -39%
Average of class
  (1.2 - 328, n=2209)
59.1 fps -70%
GTA V - 1920x1080 Highest Settings possible AA:4xMSAA + FX AF:16x
Asus ROG Strix Scar 17 G733PYV-LL053X
AMD Ryzen 9 7945HX3D, NVIDIA GeForce RTX 4090 Laptop GPU
167.7 (1.87min, 111.1P1) fps +10%
SCHENKER XMG Neo 17 2024 Engineering Sample
Intel Core i9-14900HX, NVIDIA GeForce RTX 4090 Laptop GPU
151.8 (3.32min, 111.1P1) fps
Lenovo Legion 9 16IRX8
Intel Core i9-13980HX, NVIDIA GeForce RTX 4090 Laptop GPU
150.7 (3min, 111.1P1) fps -1%
Alienware m18 R1
Intel Core i9-13980HX, NVIDIA GeForce RTX 4090 Laptop GPU
149 (3.13min, 111.1P1) fps -2%
Lenovo Legion Pro 7 RTX4090
Intel Core i9-13900HX, NVIDIA GeForce RTX 4090 Laptop GPU
143.6 (4.39min, 100P1) fps -5%
SCHENKER Key 17 Pro (Early 23)
Intel Core i9-13900HX, NVIDIA GeForce RTX 4090 Laptop GPU
142.3 (4.44min, 100P1) fps -6%
MSI Raider GE78 HX 13VI
Intel Core i9-13980HX, NVIDIA GeForce RTX 4090 Laptop GPU
142 (2.92min, 90.9P1) fps -6%
Asus ROG Strix Scar 18 2023 G834JY-N6005W
Intel Core i9-13980HX, NVIDIA GeForce RTX 4090 Laptop GPU
141.3 (4.69min, 100P1) fps -7%
MSI Titan GT77 HX 13VI
Intel Core i9-13950HX, NVIDIA GeForce RTX 4090 Laptop GPU
140.9 (3.54min, 83.3P1) fps -7%
Lenovo Legion Pro 5 16ARX8
AMD Ryzen 7 7745HX, NVIDIA GeForce RTX 4070 Laptop GPU
119.9 (3.81min, 76.9P1) fps -21%
Asus ROG Strix Scar 17 G733PY-XS96
AMD Ryzen 9 7945HX, NVIDIA GeForce RTX 4090 Laptop GPU
112.6 (4.54min, 71.4P1) fps -26%
Average of class
  (2.1 - 182, n=1316)
62.6 fps -59%
Final Fantasy XV Benchmark - 1920x1080 High Quality
Alienware m18 R1
Intel Core i9-13980HX, NVIDIA GeForce RTX 4090 Laptop GPU
194.8 fps +7%
MSI Titan GT77 HX 13VI
Intel Core i9-13950HX, NVIDIA GeForce RTX 4090 Laptop GPU
187.4 fps +2%
MSI Raider GE78 HX 13VI
Intel Core i9-13980HX, NVIDIA GeForce RTX 4090 Laptop GPU
183.3 fps 0%
SCHENKER Key 17 Pro (Early 23)
Intel Core i9-13900HX, NVIDIA GeForce RTX 4090 Laptop GPU
183.1 fps 0%
SCHENKER XMG Neo 17 2024 Engineering Sample
Intel Core i9-14900HX, NVIDIA GeForce RTX 4090 Laptop GPU
182.9 fps
Lenovo Legion 9 16IRX8
Intel Core i9-13980HX, NVIDIA GeForce RTX 4090 Laptop GPU
181.3 fps -1%
Lenovo Legion Pro 7 RTX4090
Intel Core i9-13900HX, NVIDIA GeForce RTX 4090 Laptop GPU
181.2 fps -1%
Asus ROG Strix Scar 17 G733PYV-LL053X
AMD Ryzen 9 7945HX3D, NVIDIA GeForce RTX 4090 Laptop GPU
180 fps -2%
Asus ROG Strix Scar 18 2023 G834JY-N6005W
Intel Core i9-13980HX, NVIDIA GeForce RTX 4090 Laptop GPU
177.6 fps -3%
Asus ROG Strix Scar 17 G733PY-XS96
AMD Ryzen 9 7945HX, NVIDIA GeForce RTX 4090 Laptop GPU
163.9 fps -10%
Lenovo Legion Pro 5 16ARX8
AMD Ryzen 7 7745HX, NVIDIA GeForce RTX 4070 Laptop GPU
119.9 fps -34%
Average of class
  (0.84 - 237, n=1449)
63.8 fps -65%
Strange Brigade - 1920x1080 ultra AA:ultra AF:16
Asus ROG Strix Scar 17 G733PYV-LL053X
AMD Ryzen 9 7945HX3D, NVIDIA GeForce RTX 4090 Laptop GPU
420 (64.7min, 302P1) fps +12%
Lenovo Legion 9 16IRX8
Intel Core i9-13980HX, NVIDIA GeForce RTX 4090 Laptop GPU
387 (23.7min, 277P1) fps +3%
SCHENKER Key 17 Pro (Early 23)
Intel Core i9-13900HX, NVIDIA GeForce RTX 4090 Laptop GPU
378 (20.6min, 257P1) fps +1%
MSI Raider GE78 HX 13VI
Intel Core i9-13980HX, NVIDIA GeForce RTX 4090 Laptop GPU
378 (54.7min, 251P1) fps +1%
SCHENKER XMG Neo 17 2024 Engineering Sample
Intel Core i9-14900HX, NVIDIA GeForce RTX 4090 Laptop GPU
376 (106.6min, 279P1) fps
MSI Titan GT77 HX 13VI
Intel Core i9-13950HX, NVIDIA GeForce RTX 4090 Laptop GPU
373 (29.9min, 272P1) fps -1%
Alienware m18 R1
Intel Core i9-13980HX, NVIDIA GeForce RTX 4090 Laptop GPU
373 (73.3min, 273P1) fps -1%
Asus ROG Strix Scar 18 2023 G834JY-N6005W
Intel Core i9-13980HX, NVIDIA GeForce RTX 4090 Laptop GPU
366 (29.1min, 263P1) fps -3%
Lenovo Legion Pro 7 RTX4090
Intel Core i9-13900HX, NVIDIA GeForce RTX 4090 Laptop GPU
347 (87.7min, 252P1) fps -8%
Lenovo Legion Pro 5 16ARX8
AMD Ryzen 7 7745HX, NVIDIA GeForce RTX 4070 Laptop GPU
223 (89min, 167.8P1) fps -41%
Average of class
  (9.7 - 602, n=1189)
123.3 fps -67%
Dota 2 Reborn - 1920x1080 ultra (3/3) best looking
Asus ROG Strix Scar 17 G733PYV-LL053X
AMD Ryzen 9 7945HX3D, NVIDIA GeForce RTX 4090 Laptop GPU
220 (175min) fps +23%
Alienware m18 R1
Intel Core i9-13980HX, NVIDIA GeForce RTX 4090 Laptop GPU
194.2 (157.6min) fps +9%
Lenovo Legion 9 16IRX8
Intel Core i9-13980HX, NVIDIA GeForce RTX 4090 Laptop GPU
193.1 (162.4min) fps +8%
Asus ROG Strix Scar 18 2023 G834JY-N6005W
Intel Core i9-13980HX, NVIDIA GeForce RTX 4090 Laptop GPU
190.2 (160.9min) fps +6%
MSI Titan GT77 HX 13VI
Intel Core i9-13950HX, NVIDIA GeForce RTX 4090 Laptop GPU
185.9 (157.5min) fps +4%
SCHENKER Key 17 Pro (Early 23)
Intel Core i9-13900HX, NVIDIA GeForce RTX 4090 Laptop GPU
182.5 (149.3min) fps +2%
Lenovo Legion Pro 7 RTX4090
Intel Core i9-13900HX, NVIDIA GeForce RTX 4090 Laptop GPU
182.1 (154.2min) fps +2%
Lenovo Legion Pro 5 16ARX8
AMD Ryzen 7 7745HX, NVIDIA GeForce RTX 4070 Laptop GPU
182 (152.8min) fps +2%
MSI Raider GE78 HX 13VI
Intel Core i9-13980HX, NVIDIA GeForce RTX 4090 Laptop GPU
178.8 (148.8min) fps 0%
SCHENKER XMG Neo 17 2024 Engineering Sample
Intel Core i9-14900HX, NVIDIA GeForce RTX 4090 Laptop GPU
178.8 (152.1min) fps
Asus ROG Strix Scar 17 G733PY-XS96
AMD Ryzen 9 7945HX, NVIDIA GeForce RTX 4090 Laptop GPU
139 (118.5min) fps -22%
Average of class
  (4.6 - 268, n=1993)
86.1 fps -52%
X-Plane 11.11 - 1920x1080 high (fps_test=3)
Asus ROG Strix Scar 17 G733PYV-LL053X
AMD Ryzen 9 7945HX3D, NVIDIA GeForce RTX 4090 Laptop GPU
166.2 fps +23%
Alienware m18 R1
Intel Core i9-13980HX, NVIDIA GeForce RTX 4090 Laptop GPU
143.5 fps +6%
Asus ROG Strix Scar 18 2023 G834JY-N6005W
Intel Core i9-13980HX, NVIDIA GeForce RTX 4090 Laptop GPU
142.8 fps +6%
Lenovo Legion 9 16IRX8
Intel Core i9-13980HX, NVIDIA GeForce RTX 4090 Laptop GPU
140.1 fps +4%
SCHENKER Key 17 Pro (Early 23)
Intel Core i9-13900HX, NVIDIA GeForce RTX 4090 Laptop GPU
136.6 fps +1%
Lenovo Legion Pro 7 RTX4090
Intel Core i9-13900HX, NVIDIA GeForce RTX 4090 Laptop GPU
136.4 fps +1%
SCHENKER XMG Neo 17 2024 Engineering Sample
Intel Core i9-14900HX, NVIDIA GeForce RTX 4090 Laptop GPU
135.3 fps
MSI Titan GT77 HX 13VI
Intel Core i9-13950HX, NVIDIA GeForce RTX 4090 Laptop GPU
134.2 fps -1%
MSI Titan GT77 HX 13VI
Intel Core i9-13950HX, NVIDIA GeForce RTX 4090 Laptop GPU
134.1 fps -1%
MSI Raider GE78 HX 13VI
Intel Core i9-13980HX, NVIDIA GeForce RTX 4090 Laptop GPU
126.4 fps -7%
Lenovo Legion Pro 5 16ARX8
AMD Ryzen 7 7745HX, NVIDIA GeForce RTX 4070 Laptop GPU
117.8 fps -13%
Asus ROG Strix Scar 17 G733PY-XS96
AMD Ryzen 9 7945HX, NVIDIA GeForce RTX 4090 Laptop GPU
94.3 fps -30%
Average of class
  (2.65 - 188.1, n=1904)
58.6 fps -57%
Shadow of the Tomb Raider - 1920x1080 Highest Preset AA:T
Asus ROG Strix Scar 17 G733PYV-LL053X
AMD Ryzen 9 7945HX3D, NVIDIA GeForce RTX 4090 Laptop GPU
271 fps +28%
Asus ROG Strix Scar 17 G733PY-XS96
AMD Ryzen 9 7945HX, NVIDIA GeForce RTX 4090 Laptop GPU
228 fps +8%
MSI Raider GE78 HX 13VI
Intel Core i9-13980HX, NVIDIA GeForce RTX 4090 Laptop GPU
219 fps +3%
MSI Titan GT77 HX 13VI
Intel Core i9-13950HX, NVIDIA GeForce RTX 4090 Laptop GPU
214 fps +1%
SCHENKER XMG Neo 17 2024 Engineering Sample
Intel Core i9-14900HX, NVIDIA GeForce RTX 4090 Laptop GPU
212 fps
Lenovo Legion Pro 5 16ARX8
AMD Ryzen 7 7745HX, NVIDIA GeForce RTX 4070 Laptop GPU
168 fps -21%
Asus ROG Strix Scar 18 2023 G834JY-N6005W
Intel Core i9-13980HX, NVIDIA GeForce RTX 4090 Laptop GPU
143.7 fps -32%
Average of class
  (6 - 375, n=612)
100.8 fps -52%
F1 22 - 1920x1080 Ultra High Preset AA:T AF:16x
Alienware m18 R1
Intel Core i9-13980HX, NVIDIA GeForce RTX 4090 Laptop GPU
144.7 (124min, 94P1) fps +15%
MSI Titan GT77 HX 13VI
Intel Core i9-13950HX, NVIDIA GeForce RTX 4090 Laptop GPU
138.2 (118min, 84P1) fps +9%
MSI Raider GE78 HX 13VI
Intel Core i9-13980HX, NVIDIA GeForce RTX 4090 Laptop GPU
137.1 (115min, 79P1) fps +9%
Asus ROG Strix Scar 17 G733PYV-LL053X
AMD Ryzen 9 7945HX3D, NVIDIA GeForce RTX 4090 Laptop GPU
135.9 (118min, 98P1) fps +8%
Lenovo Legion 9 16IRX8
Intel Core i9-13980HX, NVIDIA GeForce RTX 4090 Laptop GPU
130.8 (95min, 78P1) fps +4%
Lenovo Legion Pro 7 RTX4090
Intel Core i9-13900HX, NVIDIA GeForce RTX 4090 Laptop GPU
129.2 (105min, 83P1) fps +2%
SCHENKER XMG Neo 17 2024 Engineering Sample
Intel Core i9-14900HX, NVIDIA GeForce RTX 4090 Laptop GPU
126.3 (109min, 83P1) fps
Asus ROG Strix Scar 18 2023 G834JY-N6005W
Intel Core i9-13980HX, NVIDIA GeForce RTX 4090 Laptop GPU
124.5 (107min, 87P1) fps -1%
Asus ROG Strix Scar 17 G733PY-XS96
AMD Ryzen 9 7945HX, NVIDIA GeForce RTX 4090 Laptop GPU
116.3 (86min, 73P1) fps -8%
Lenovo Legion Pro 5 16ARX8
AMD Ryzen 7 7745HX, NVIDIA GeForce RTX 4070 Laptop GPU
84.1 (71min, 59P1) fps -33%
Average of class
  (5.09 - 221, n=483)
60.8 fps -52%
F1 23 - 1920x1080 Ultra High Preset AA:T AF:16x
Asus ROG Strix Scar 17 G733PYV-LL053X
AMD Ryzen 9 7945HX3D, NVIDIA GeForce RTX 4090 Laptop GPU
132 (107min, 102P1) fps +11%
MSI Raider GE78 HX 13VI
Intel Core i9-13980HX, NVIDIA GeForce RTX 4090 Laptop GPU
129.8 (104min, 98P1) fps +9%
SCHENKER XMG Neo 17 2024 Engineering Sample
Intel Core i9-14900HX, NVIDIA GeForce RTX 4090 Laptop GPU
119.3 (95min, 90P1) fps
Average of class
  (5 - 226, n=200)
57.3 fps -52%
Far Cry 5 - 1920x1080 Ultra Preset AA:T
Asus ROG Strix Scar 17 G733PYV-LL053X
AMD Ryzen 9 7945HX3D, NVIDIA GeForce RTX 4090 Laptop GPU
218 fps +35%
SCHENKER XMG Neo 17 2024 Engineering Sample
Intel Core i9-14900HX, NVIDIA GeForce RTX 4090 Laptop GPU
162 fps
MSI Titan GT77 HX 13VI
Intel Core i9-13950HX, NVIDIA GeForce RTX 4090 Laptop GPU
160 fps -1%
Asus ROG Strix Scar 18 2023 G834JY-N6005W
Intel Core i9-13980HX, NVIDIA GeForce RTX 4090 Laptop GPU
158 (117min) fps -2%
Lenovo Legion 9 16IRX8
Intel Core i9-13980HX, NVIDIA GeForce RTX 4090 Laptop GPU
158 (102min) fps -2%
Asus ROG Strix Scar 17 G733PY-XS96
AMD Ryzen 9 7945HX, NVIDIA GeForce RTX 4090 Laptop GPU
145 (106min) fps -10%
Average of class
  (1 - 278, n=1015)
83.7 fps -48%
Far Cry 6 - 1920x1080 Ultra Graphics Quality + HD Textures AA:T
Asus ROG Strix Scar 17 G733PYV-LL053X
AMD Ryzen 9 7945HX3D, NVIDIA GeForce RTX 4090 Laptop GPU
167 fps +7%
SCHENKER XMG Neo 17 2024 Engineering Sample
Intel Core i9-14900HX, NVIDIA GeForce RTX 4090 Laptop GPU
156 fps
MSI Titan GT77 HX 13VI
Intel Core i9-13950HX, NVIDIA GeForce RTX 4090 Laptop GPU
144 fps -8%
Asus ROG Strix Scar 17 G733PY-XS96
AMD Ryzen 9 7945HX, NVIDIA GeForce RTX 4090 Laptop GPU
112 (91min) fps -28%
Lenovo Legion Pro 5 16ARX8
AMD Ryzen 7 7745HX, NVIDIA GeForce RTX 4070 Laptop GPU
110 (74min) fps -29%
Average of class
  (4.67 - 223, n=284)
95.4 fps -39%
Call of Duty Modern Warfare 2 2022 - 1920x1080 Extreme Quality Preset AA:T2X Filmic SM
Asus ROG Strix Scar 17 G733PYV-LL053X
AMD Ryzen 9 7945HX3D, NVIDIA GeForce RTX 4090 Laptop GPU
182 fps +8%
Asus ROG Strix Scar 17 G733PY-XS96
AMD Ryzen 9 7945HX, NVIDIA GeForce RTX 4090 Laptop GPU
180 (103min) fps +7%
MSI Raider GE78 HX 13VI
Intel Core i9-13980HX, NVIDIA GeForce RTX 4090 Laptop GPU
177 (102min) fps +5%
MSI Titan GT77 HX 13VI
Intel Core i9-13950HX, NVIDIA GeForce RTX 4090 Laptop GPU
176 fps +5%
Asus ROG Strix Scar 18 2023 G834JY-N6005W
Intel Core i9-13980HX, NVIDIA GeForce RTX 4090 Laptop GPU
170 (98P1) fps +1%
SCHENKER XMG Neo 17 2024 Engineering Sample
Intel Core i9-14900HX, NVIDIA GeForce RTX 4090 Laptop GPU
168 fps
Lenovo Legion Pro 5 16ARX8
AMD Ryzen 7 7745HX, NVIDIA GeForce RTX 4070 Laptop GPU
108 (61min) fps -36%
Average of class
  (12 - 285, n=120)
105.1 fps -37%
Cyberpunk 2077 1.6 - 1920x1080 Ultra Preset
Asus ROG Strix Scar 17 G733PYV-LL053X
AMD Ryzen 9 7945HX3D, NVIDIA GeForce RTX 4090 Laptop GPU
157 fps +21%
MSI Raider GE78 HX 13VI
Intel Core i9-13980HX, NVIDIA GeForce RTX 4090 Laptop GPU
135.14 (44.88min) fps +4%
MSI Titan GT77 HX 13VI
Intel Core i9-13950HX, NVIDIA GeForce RTX 4090 Laptop GPU
135 fps +4%
Asus ROG Strix Scar 17 G733PY-XS96
AMD Ryzen 9 7945HX, NVIDIA GeForce RTX 4090 Laptop GPU
133.8 (57.7min) fps +3%
Lenovo Legion 9 16IRX8
Intel Core i9-13980HX, NVIDIA GeForce RTX 4090 Laptop GPU
131.4 (23.8min) fps +1%
SCHENKER XMG Neo 17 2024 Engineering Sample
Intel Core i9-14900HX, NVIDIA GeForce RTX 4090 Laptop GPU
130 fps
Alienware m18 R1
Intel Core i9-13980HX, NVIDIA GeForce RTX 4090 Laptop GPU
127.92 (32.4min) fps -2%
Asus ROG Strix Scar 18 2023 G834JY-N6005W
Intel Core i9-13980HX, NVIDIA GeForce RTX 4090 Laptop GPU
119.7 (69min) fps -8%
Lenovo Legion Pro 5 16ARX8
AMD Ryzen 7 7745HX, NVIDIA GeForce RTX 4070 Laptop GPU
98.9 (35.5min) fps -24%
Average of class
  (5 - 241, n=374)
73.2 fps -44%
Cyberpunk 2077 2.0 Phantom Liberty - 1920x1080 Ultra Preset (FSR off)
Asus ROG Strix Scar 17 G733PYV-LL053X
AMD Ryzen 9 7945HX3D, NVIDIA GeForce RTX 4090 Laptop GPU
142.8 fps +16%
Lenovo Legion 9 16IRX8
Intel Core i9-13980HX, NVIDIA GeForce RTX 4090 Laptop GPU
131.22 (31.65min) fps +7%
MSI Raider GE78 HX 13VI
Intel Core i9-13980HX, NVIDIA GeForce RTX 4090 Laptop GPU
127 (36.47min) fps +4%
SCHENKER XMG Neo 17 2024 Engineering Sample
Intel Core i9-14900HX, NVIDIA GeForce RTX 4090 Laptop GPU
122.7 (16.4min) fps
Average of class
  (2.3 - 216, n=183)
72.5 fps -41%
Assassin's Creed Mirage - 1920x1080 Ultra High Preset (Adaptive Quality Off)
SCHENKER XMG Neo 17 2024 Engineering Sample
Intel Core i9-14900HX, NVIDIA GeForce RTX 4090 Laptop GPU
153 fps
MSI Raider GE78 HX 13VI
Intel Core i9-13980HX, NVIDIA GeForce RTX 4090 Laptop GPU
149 (5min) fps -3%
Average of class
  (14 - 202, n=90)
92.6 fps -39%
Avatar Frontiers of Pandora - 1920x1080 Ultra Preset AA:T
Lenovo Legion 9 16IRX8
Intel Core i9-13980HX, NVIDIA GeForce RTX 4090 Laptop GPU
100 (65min) fps +3%
SCHENKER XMG Neo 17 2024 Engineering Sample
Intel Core i9-14900HX, NVIDIA GeForce RTX 4090 Laptop GPU
97 fps
Average of class
  (8 - 170, n=86)
57.9 fps -40%
Call of Duty Modern Warfare 3 2023 - 1920x1080 Extreme Preset
SCHENKER XMG Neo 17 2024 Engineering Sample
Intel Core i9-14900HX, NVIDIA GeForce RTX 4090 Laptop GPU
171 fps
Average of class
  (27 - 276, n=70)
116.7 fps -32%
Total War Pharaoh - 1920x1080 Ultra Preset
SCHENKER XMG Neo 17 2024 Engineering Sample
Intel Core i9-14900HX, NVIDIA GeForce RTX 4090 Laptop GPU
178 fps
Average of class
  (11 - 234, n=104)
92.5 fps -48%

Gaming performance QHD

At QHD resolution, the processor's influence becomes even smaller and the GPU is much more of a deciding factor. Again, the HX processors from Intel all did similarly and all i9 models are well suited for gaming. The Ryzen 9 7945HX3D still offers considerably more performance when running quite a few games, for example Far Cry 5, GTA V or F1 2023.

Shadow of the Tomb Raider - 2560x1440 Highest Preset AA:T
Asus ROG Strix Scar 17 G733PYV-LL053X
NVIDIA GeForce RTX 4090 Laptop GPU, R9 7945HX3D, SK hynix PC801 HFS001TEJ9X101N
199 fps +13%
Asus ROG Strix Scar 17 G733PY-XS96
NVIDIA GeForce RTX 4090 Laptop GPU, R9 7945HX, SK hynix PC801 HFS001TEJ9X101N
190 fps +8%
MSI Titan GT77 HX 13VI
NVIDIA GeForce RTX 4090 Laptop GPU, i9-13950HX, Samsung PM9A1 MZVL22T0HBLB
187 fps +6%
Lenovo Legion Pro 7 RTX4090
NVIDIA GeForce RTX 4090 Laptop GPU, i9-13900HX, Samsung PM9A1 MZVL21T0HCLR
185 fps +5%
SCHENKER XMG Neo 17 2024 Engineering Sample
NVIDIA GeForce RTX 4090 Laptop GPU, i9-14900HX
176 fps
Alienware M18 R1 QHD
NVIDIA GeForce RTX 4090 Laptop GPU, i9-13900HX
175 fps -1%
Asus ROG Strix Scar 18 2023 G834JY-N6005W
NVIDIA GeForce RTX 4090 Laptop GPU, i9-13980HX, 2x Samsung PM9A1 MZVL21T0HCLR (RAID 0)
121.2 fps -31%
Lenovo Legion Pro 5 16ARX8
NVIDIA GeForce RTX 4070 Laptop GPU, R7 7745HX, Samsung PM9A1 MZVL21T0HCLR
110 fps -37%
Far Cry 5 - 2560x1440 Ultra Preset AA:T
Asus ROG Strix Scar 17 G733PYV-LL053X
NVIDIA GeForce RTX 4090 Laptop GPU, R9 7945HX3D, SK hynix PC801 HFS001TEJ9X101N
194 fps +24%
MSI Titan GT77 HX 13VI
NVIDIA GeForce RTX 4090 Laptop GPU, i9-13950HX, Samsung PM9A1 MZVL22T0HBLB
159 fps +1%
Lenovo Legion 9 16IRX8
NVIDIA GeForce RTX 4090 Laptop GPU, i9-13980HX, 2x SK Hynix HFS001TEJ9X115N (RAID 0)
157 (111min - 208max) fps 0%
SCHENKER XMG Neo 17 2024 Engineering Sample
NVIDIA GeForce RTX 4090 Laptop GPU, i9-14900HX
157 fps
Asus ROG Strix Scar 18 2023 G834JY-N6005W
NVIDIA GeForce RTX 4090 Laptop GPU, i9-13980HX, 2x Samsung PM9A1 MZVL21T0HCLR (RAID 0)
153 (107min - 197max) fps -3%
Asus ROG Strix Scar 17 G733PY-XS96
NVIDIA GeForce RTX 4090 Laptop GPU, R9 7945HX, SK hynix PC801 HFS001TEJ9X101N
142 (104min - 189max) fps -10%
Far Cry 6 - 2560x1440 Ultra Graphics Quality + HD Textures AA:T
Asus ROG Strix Scar 17 G733PYV-LL053X
NVIDIA GeForce RTX 4090 Laptop GPU, R9 7945HX3D, SK hynix PC801 HFS001TEJ9X101N
146 fps +4%
SCHENKER XMG Neo 17 2024 Engineering Sample
NVIDIA GeForce RTX 4090 Laptop GPU, i9-14900HX
141 fps
MSI Titan GT77 HX 13VI
NVIDIA GeForce RTX 4090 Laptop GPU, i9-13950HX, Samsung PM9A1 MZVL22T0HBLB
135 fps -4%
Alienware M18 R1 QHD
NVIDIA GeForce RTX 4090 Laptop GPU, i9-13900HX
128 (104min - 155max) fps -9%
Asus ROG Strix Scar 17 G733PY-XS96
NVIDIA GeForce RTX 4090 Laptop GPU, R9 7945HX, SK hynix PC801 HFS001TEJ9X101N
109 (88min - 120max) fps -23%
Lenovo Legion Pro 5 16ARX8
NVIDIA GeForce RTX 4070 Laptop GPU, R7 7745HX, Samsung PM9A1 MZVL21T0HCLR
88 (57min - 99max) fps -38%
Final Fantasy XV Benchmark - 2560x1440 High Quality
MSI Titan GT77 HX 13VI
NVIDIA GeForce RTX 4090 Laptop GPU, i9-13950HX, Samsung PM9A1 MZVL22T0HBLB
162.9 fps +6%
Alienware m18 R1
NVIDIA GeForce RTX 4090 Laptop GPU, i9-13980HX, SK hynix PC801 HFS001TEJ9X101N
159.5 fps +4%
Lenovo Legion 9 16IRX8
NVIDIA GeForce RTX 4090 Laptop GPU, i9-13980HX, 2x SK Hynix HFS001TEJ9X115N (RAID 0)
158.4 fps +3%
SCHENKER Key 17 Pro (Early 23)
NVIDIA GeForce RTX 4090 Laptop GPU, i9-13900HX, Samsung 990 Pro 2 TB MZVL72T0HDLB
156.4 fps +2%
Lenovo Legion Pro 7 RTX4090
NVIDIA GeForce RTX 4090 Laptop GPU, i9-13900HX, Samsung PM9A1 MZVL21T0HCLR
154 fps 0%
SCHENKER XMG Neo 17 2024 Engineering Sample
NVIDIA GeForce RTX 4090 Laptop GPU, i9-14900HX
153.5 fps
Asus ROG Strix Scar 17 G733PYV-LL053X
NVIDIA GeForce RTX 4090 Laptop GPU, R9 7945HX3D, SK hynix PC801 HFS001TEJ9X101N
151.2 fps -1%
Asus ROG Strix Scar 17 G733PY-XS96
NVIDIA GeForce RTX 4090 Laptop GPU, R9 7945HX, SK hynix PC801 HFS001TEJ9X101N
151 fps -2%
Asus ROG Strix Scar 18 2023 G834JY-N6005W
NVIDIA GeForce RTX 4090 Laptop GPU, i9-13980HX, 2x Samsung PM9A1 MZVL21T0HCLR (RAID 0)
146.7 fps -4%
Lenovo Legion Pro 5 16ARX8
NVIDIA GeForce RTX 4070 Laptop GPU, R7 7745HX, Samsung PM9A1 MZVL21T0HCLR
119.9 fps -22%
GTA V - 2560x1440 Highest Settings possible AA:4xMSAA + FX AF:16x
Asus ROG Strix Scar 17 G733PYV-LL053X
NVIDIA GeForce RTX 4090 Laptop GPU, R9 7945HX3D, SK hynix PC801 HFS001TEJ9X101N
160.6 (2.82min, 111.1P1 - 363max) fps +11%
Alienware m18 R1
NVIDIA GeForce RTX 4090 Laptop GPU, i9-13980HX, SK hynix PC801 HFS001TEJ9X101N
145.5 (2.46min, 111.1P1 - 281max) fps 0%
Lenovo Legion 9 16IRX8
NVIDIA GeForce RTX 4090 Laptop GPU, i9-13980HX, 2x SK Hynix HFS001TEJ9X115N (RAID 0)
145.3 (4.06min, 100P1 - 332max) fps 0%
SCHENKER XMG Neo 17 2024 Engineering Sample
NVIDIA GeForce RTX 4090 Laptop GPU, i9-14900HX
145.2 (2.65min, 100P1 - 265max) fps
SCHENKER Key 17 Pro (Early 23)
NVIDIA GeForce RTX 4090 Laptop GPU, i9-13900HX, Samsung 990 Pro 2 TB MZVL72T0HDLB
141.5 (28.6min, 100P1 - 268max) fps -3%
Asus ROG Strix Scar 18 2023 G834JY-N6005W
NVIDIA GeForce RTX 4090 Laptop GPU, i9-13980HX, 2x Samsung PM9A1 MZVL21T0HCLR (RAID 0)
139.1 (3.59min, 90.9P1 - 238max) fps -4%
MSI Titan GT77 HX 13VI
NVIDIA GeForce RTX 4090 Laptop GPU, i9-13950HX, Samsung PM9A1 MZVL22T0HBLB
138.5 (3.45min, 76.9P1 - 256max) fps -5%
Lenovo Legion Pro 7 RTX4090
NVIDIA GeForce RTX 4090 Laptop GPU, i9-13900HX, Samsung PM9A1 MZVL21T0HCLR
137.7 (3.84min, 90.9P1 - 304max) fps -5%
Asus ROG Strix Scar 17 G733PY-XS96
NVIDIA GeForce RTX 4090 Laptop GPU, R9 7945HX, SK hynix PC801 HFS001TEJ9X101N
114.8 (5.12min, 71.4P1 - 204max) fps -21%
Lenovo Legion Pro 5 16ARX8
NVIDIA GeForce RTX 4070 Laptop GPU, R7 7745HX, Samsung PM9A1 MZVL21T0HCLR
93.2 (3.72min, 62.5P1 - 175.2max) fps -36%
F1 22 - 2560x1440 Ultra High Preset AA:T AF:16x
Alienware m18 R1
NVIDIA GeForce RTX 4090 Laptop GPU, i9-13980HX, SK hynix PC801 HFS001TEJ9X101N
92.2 (79min, 74P1 - 106max) fps +4%
Asus ROG Strix Scar 17 G733PY-XS96
NVIDIA GeForce RTX 4090 Laptop GPU, R9 7945HX, SK hynix PC801 HFS001TEJ9X101N
92.1 (75min, 60P1 - 107max) fps +4%
Asus ROG Strix Scar 17 G733PYV-LL053X
NVIDIA GeForce RTX 4090 Laptop GPU, R9 7945HX3D, SK hynix PC801 HFS001TEJ9X101N
91.8 (78min, 76P1 - 105max) fps +3%
Lenovo Legion 9 16IRX8
NVIDIA GeForce RTX 4090 Laptop GPU, i9-13980HX, 2x SK Hynix HFS001TEJ9X115N (RAID 0)
90.9 (76min, 56P1 - 105max) fps +2%
Alienware M18 R1 QHD
NVIDIA GeForce RTX 4090 Laptop GPU, i9-13900HX
90.6 (77min, 72P1 - 106max) fps +2%
MSI Titan GT77 HX 13VI
NVIDIA GeForce RTX 4090 Laptop GPU, i9-13950HX, Samsung PM9A1 MZVL22T0HBLB
90.1 (78min, 71P1 - 104max) fps +2%
SCHENKER XMG Neo 17 2024 Engineering Sample
NVIDIA GeForce RTX 4090 Laptop GPU, i9-14900HX
88.7 (77min, 67P1 - 104max) fps
Lenovo Legion Pro 7 RTX4090
NVIDIA GeForce RTX 4090 Laptop GPU, i9-13900HX, Samsung PM9A1 MZVL21T0HCLR
85.2 (72min, 40P1 - 96max) fps -4%
Asus ROG Strix Scar 18 2023 G834JY-N6005W
NVIDIA GeForce RTX 4090 Laptop GPU, i9-13980HX, 2x Samsung PM9A1 MZVL21T0HCLR (RAID 0)
75 (23min, 32P1 - 96max) fps -15%
Lenovo Legion Pro 5 16ARX8
NVIDIA GeForce RTX 4070 Laptop GPU, R7 7745HX, Samsung PM9A1 MZVL21T0HCLR
54.8 (47min, 45P1 - 65max) fps -38%
F1 23 - 2560x1440 Ultra High Preset AA:T AF:16x
Asus ROG Strix Scar 17 G733PYV-LL053X
NVIDIA GeForce RTX 4090 Laptop GPU, R9 7945HX3D, SK hynix PC801 HFS001TEJ9X101N
85.1 (67min, 67P1 - 100max) fps +11%
SCHENKER XMG Neo 17 2024 Engineering Sample
NVIDIA GeForce RTX 4090 Laptop GPU, i9-14900HX
76.9 (59min, 61P1 - 94max) fps
Call of Duty Modern Warfare 2 2022 - 2560x1440 Extreme Quality Preset AA:T2X Filmic SM
Asus ROG Strix Scar 17 G733PYV-LL053X
NVIDIA GeForce RTX 4090 Laptop GPU, R9 7945HX3D, SK hynix PC801 HFS001TEJ9X101N
136 fps +10%
MSI Titan GT77 HX 13VI
NVIDIA GeForce RTX 4090 Laptop GPU, i9-13950HX, Samsung PM9A1 MZVL22T0HBLB
135 fps +9%
Asus ROG Strix Scar 17 G733PY-XS96
NVIDIA GeForce RTX 4090 Laptop GPU, R9 7945HX, SK hynix PC801 HFS001TEJ9X101N
135 (69min) fps +9%
Lenovo Legion Pro 7 RTX4090
NVIDIA GeForce RTX 4090 Laptop GPU, i9-13900HX, Samsung PM9A1 MZVL21T0HCLR
132 (67min) fps +6%
Alienware M18 R1 QHD
NVIDIA GeForce RTX 4090 Laptop GPU, i9-13900HX
132 (69min) fps +6%
Asus ROG Strix Scar 18 2023 G834JY-N6005W
NVIDIA GeForce RTX 4090 Laptop GPU, i9-13980HX, 2x Samsung PM9A1 MZVL21T0HCLR (RAID 0)
127 (65P1) fps +2%
SCHENKER XMG Neo 17 2024 Engineering Sample
NVIDIA GeForce RTX 4090 Laptop GPU, i9-14900HX
124 fps
Lenovo Legion Pro 5 16ARX8
NVIDIA GeForce RTX 4070 Laptop GPU, R7 7745HX, Samsung PM9A1 MZVL21T0HCLR
77 (39min) fps -38%
Cyberpunk 2077 1.6 - 2560x1440 Ultra Preset
Asus ROG Strix Scar 17 G733PYV-LL053X
NVIDIA GeForce RTX 4090 Laptop GPU, R9 7945HX3D, SK hynix PC801 HFS001TEJ9X101N
116 fps +22%
Asus ROG Strix Scar 17 G733PY-XS96
NVIDIA GeForce RTX 4090 Laptop GPU, R9 7945HX, SK hynix PC801 HFS001TEJ9X101N
104.3 (34.5min - 159.2max) fps +9%
Alienware m18 R1
NVIDIA GeForce RTX 4090 Laptop GPU, i9-13980HX, SK hynix PC801 HFS001TEJ9X101N
102.16 (48.9min - 193.9max) fps +7%
Alienware M18 R1 QHD
NVIDIA GeForce RTX 4090 Laptop GPU, i9-13900HX
102.16 (41.4min - 165.62max) fps +7%
Lenovo Legion Pro 7 RTX4090
NVIDIA GeForce RTX 4090 Laptop GPU, i9-13900HX, Samsung PM9A1 MZVL21T0HCLR
100.93 (30.73min - 162.33max) fps +6%
Lenovo Legion 9 16IRX8
NVIDIA GeForce RTX 4090 Laptop GPU, i9-13980HX, 2x SK Hynix HFS001TEJ9X115N (RAID 0)
98.8 (28.3min - 147.2max) fps +4%
MSI Titan GT77 HX 13VI
NVIDIA GeForce RTX 4090 Laptop GPU, i9-13950HX, Samsung PM9A1 MZVL22T0HBLB
98 fps +3%
SCHENKER XMG Neo 17 2024 Engineering Sample
NVIDIA GeForce RTX 4090 Laptop GPU, i9-14900HX
95.3 fps
Asus ROG Strix Scar 18 2023 G834JY-N6005W
NVIDIA GeForce RTX 4090 Laptop GPU, i9-13980HX, 2x Samsung PM9A1 MZVL21T0HCLR (RAID 0)
94.5 (72min - 127max) fps -1%
Lenovo Legion Pro 5 16ARX8
NVIDIA GeForce RTX 4070 Laptop GPU, R7 7745HX, Samsung PM9A1 MZVL21T0HCLR
58.1 (37.8min - 93.4max) fps -39%
Cyberpunk 2077 2.0 Phantom Liberty - 2560x1440 Ultra Preset (FSR off)
Asus ROG Strix Scar 17 G733PYV-LL053X
NVIDIA GeForce RTX 4090 Laptop GPU, R9 7945HX3D, SK hynix PC801 HFS001TEJ9X101N
93.4 fps +6%
Lenovo Legion 9 16IRX8
NVIDIA GeForce RTX 4090 Laptop GPU, i9-13980HX, 2x SK Hynix HFS001TEJ9X115N (RAID 0)
89.55 (28.01min - 139.33max) fps +2%
SCHENKER XMG Neo 17 2024 Engineering Sample
NVIDIA GeForce RTX 4090 Laptop GPU, i9-14900HX
88.2 (17.8min - 124.4max) fps
Call of Duty Modern Warfare 3 2023 - 2560x1440 Extreme Preset
SCHENKER XMG Neo 17 2024 Engineering Sample
NVIDIA GeForce RTX 4090 Laptop GPU, i9-14900HX
123 fps
Assassin's Creed Mirage - 1920x1080 Ultra High Preset (Adaptive Quality Off)
SCHENKER XMG Neo 17 2024 Engineering Sample
NVIDIA GeForce RTX 4090 Laptop GPU, i9-14900HX
153 fps
Avatar Frontiers of Pandora - 2560x1440 Ultra Preset AA:T
Lenovo Legion 9 16IRX8
NVIDIA GeForce RTX 4090 Laptop GPU, i9-13980HX, 2x SK Hynix HFS001TEJ9X115N (RAID 0)
69 (53min - 87max) fps +5%
SCHENKER XMG Neo 17 2024 Engineering Sample
NVIDIA GeForce RTX 4090 Laptop GPU, i9-14900HX
66 fps
Total War Pharaoh - 2560x1440 Ultra Preset
SCHENKER XMG Neo 17 2024 Engineering Sample
NVIDIA GeForce RTX 4090 Laptop GPU, i9-14900HX
160 fps
low med. high ultraQHD
GTA V (2015) 184.1 151.8 145.2
The Witcher 3 (2015) 195.8
Dota 2 Reborn (2015) 230 204 192.4 178.8
Final Fantasy XV Benchmark (2018) 216 182.9 153.5
X-Plane 11.11 (2018) 192 171 135.3
Far Cry 5 (2018) 179 162 157
Strange Brigade (2018) 398 376 294
Shadow of the Tomb Raider (2018) 212 176
F1 2021 (2021) 374 208 176.7
Far Cry 6 (2021) 156 141
Cyberpunk 2077 1.6 (2022) 130 95.3
F1 22 (2022) 309 126.3 88.7
Call of Duty Modern Warfare 2 2022 (2022) 168 124
F1 23 (2023) 313 119.3 76.9
Cyberpunk 2077 2.0 Phantom Liberty (2023) 132.4 122.7 88.2
Assassin's Creed Mirage (2023) 197 153 129
Total War Pharaoh (2023) 235 178 160
Call of Duty Modern Warfare 3 2023 (2023) 180 171 123
Avatar Frontiers of Pandora (2023) 125 97 66

Verdict - The Core i9-14900HX is only a small update

The Intel Core i9-14900HX inside the Schenker XMG Neo 17 (E24) reviewed. Test device provided by Schenker Technologies.

Intel has given its HX mobile processors a small update for 2024—but big changes or improvements can't be seen on the new Raptor-Lake-HX-Refresh models. In general, the lineup has been slimmed down a bit, as the manufacturer has now reduced the number of 13th-gen HX models from nine to five. The Core i9-14900HX is now the only top model, with 24 cores and 32 threads. Its maximum turbo boost has been increased to 5.8 GHz, leading to improved single-core performance. Intel managed to take back the performance crown from Apple in quite a few tests. However, its higher performance is quite simply the result of higher consumption, meaning its efficiency again isn't the greatest.

When it comes to multi-core performance, it mostly depends on each individual laptop's set power limits—in general, not much sets the new Core i9-14900HX apart from the old 13th gen Core-i9-HX models. When gaming, the new Raptor Lake-HX Refresh also benefits from the improved single-core performance in quite a few games but at the end of the day, you can barely notice a difference—especially at maximum quality settings and high resolutions. The processor and graphics cards' power limits again play a big role in this. AMD's Ryzen 9 7945HX3D with its 3D V-Cache remains quite a bit faster in some games and as a result, it continues to be the best mobile HX CPU when it comes to efficiency and gaming performance.

Intel has raised the new Core i9-14900HX's maximum turbo clock, improving its single-core performance in particular. The Raptor Lake-HX Refresh cannot benefit from any other improvements, however, due to the catastrophical availability of HX CPUs from AMD, it doesn't have to.  

At least, this is the theory, as there are practically no laptops currently on the market that are fitted with the Ryzen 9 7945HX3D. The Core i9-14900HX, on the other hand, will soon be available in every high-end gaming/multimedia laptop—making it an easy job to dominate the market in 2024. The processor is by no means bad but Intel doesn't really have to make a huge effort in this field or offer any big advancements. Upgrading from a 13th-gen Core-i9-HX model makes absolutely no sense, whereas switching from an Alder-Lake chip such as the Core i9-12900HX might make more sense, as it still uses the old RTX-3000 gen from Nvidia.

Read all 7 comments / answer
static version load dynamic
Loading comments
Comment on this article
Please share our article, every link counts!
> Expert Reviews and News on Laptops, Smartphones and Tech Innovations > Reviews > Intel Raptor Lake-HX Refresh analysis - Core i9-14900HX with more single-core performance
Andreas Osthoff, 2024-01- 9 (Update: 2024-01-16)