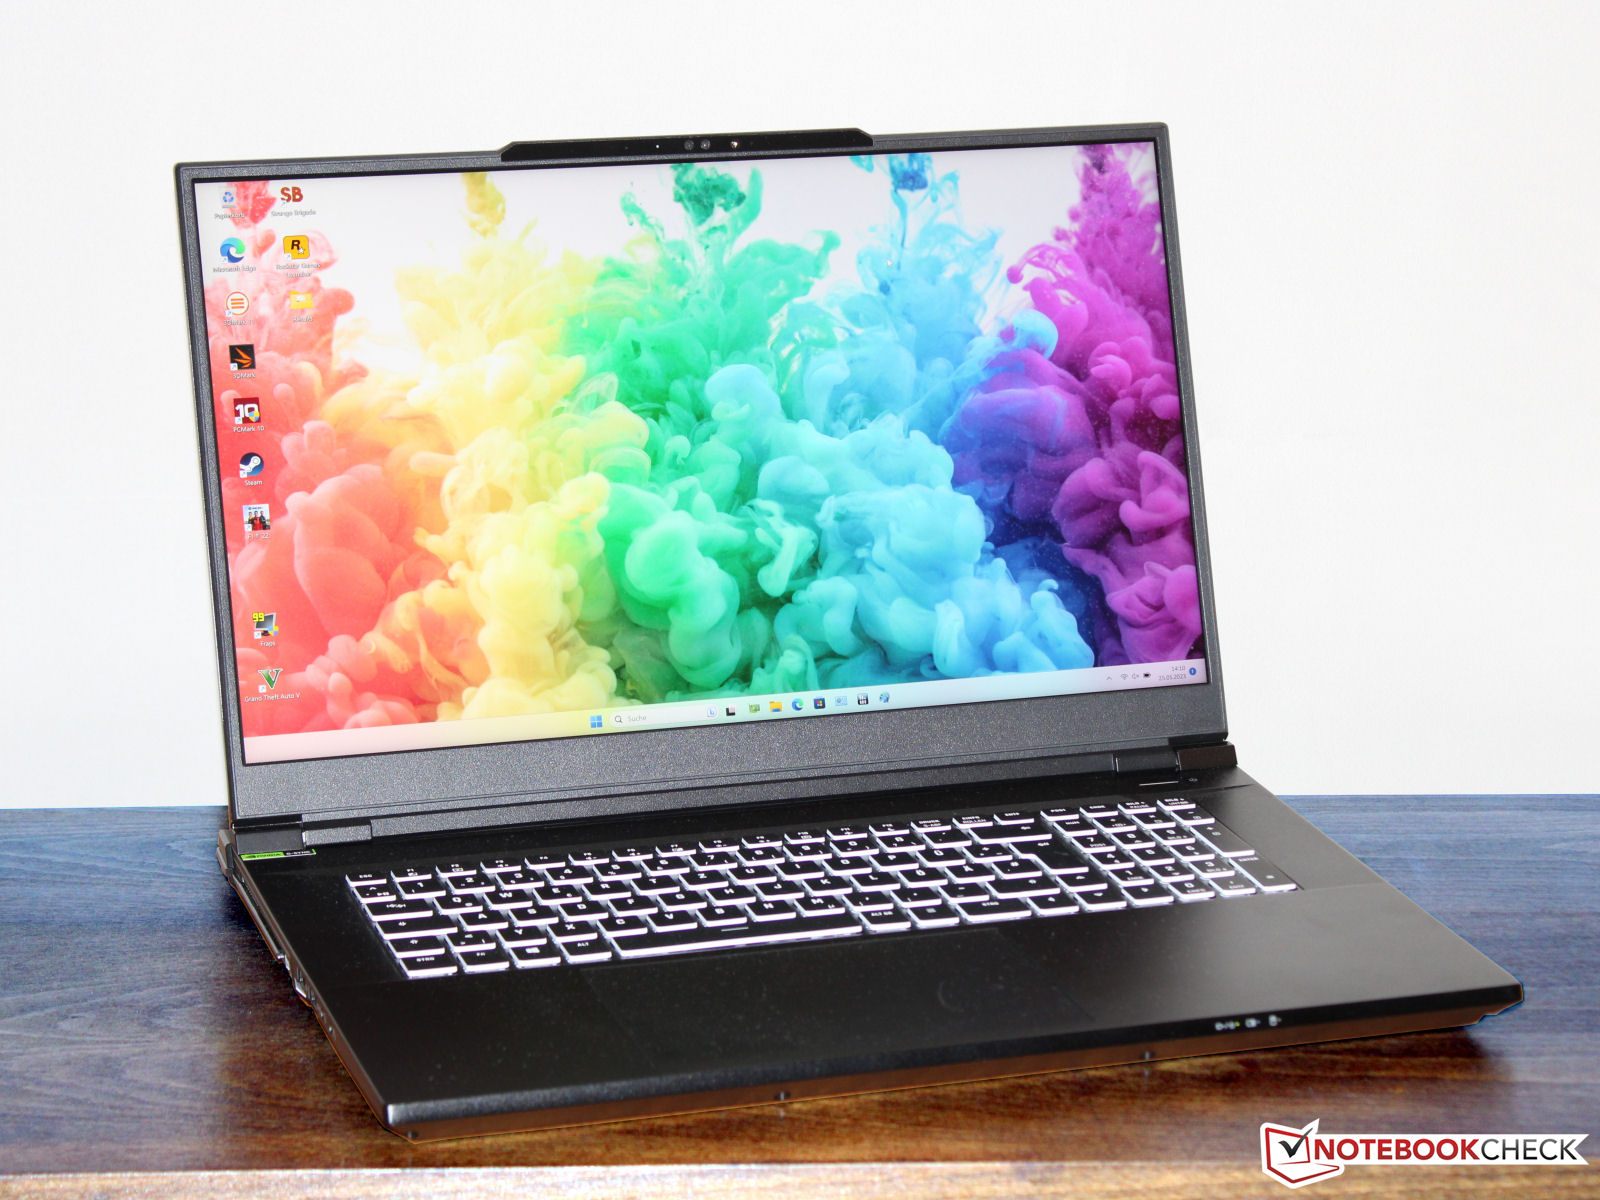
Schenker Key 17 Pro (Early 23) review: 4k gaming notebook with Core i9 and RTX 4090
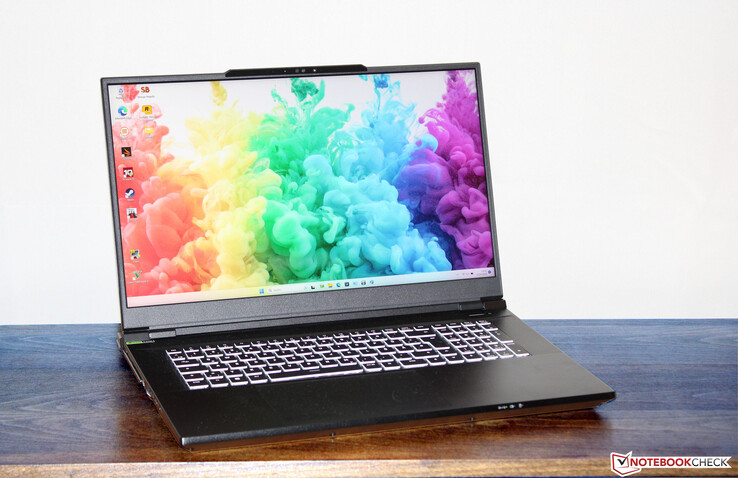
The powerful Key 17 Pro is targeted at creatives and gamers. Raptor Lake and Ada Lovelace provide the necessary computing power in the laptop, which features a Core i9-13900HX and a GeForce RTX 4090 and is based on a Clevo barebone (X370SNW-G). It is competing against devices such as the MSI Stealth 17 Studio A13VH, the Asus ROG Strix Scar 17 G733PY, the Aorus 17X AZF and the Medion Erazer Beast X40.
Comparison with possible competitors
Rating | Date | Model | Weight | Height | Size | Resolution | Price |
|---|---|---|---|---|---|---|---|
| 85.5 % v7 (old) | 06 / 2023 | Schenker Key 17 Pro (Early 23) i9-13900HX, GeForce RTX 4090 Laptop GPU | 3.4 kg | 24.9 mm | 17.30" | 3840x2160 | |
| 89.2 % v7 (old) | 04 / 2023 | MSI Stealth 17 Studio A13VH-014 i9-13900H, GeForce RTX 4080 Laptop GPU | 3 kg | 21.3 mm | 17.30" | 3840x2160 | |
| 88.3 % v7 (old) | 04 / 2023 | Asus ROG Strix Scar 17 G733PY-XS96 R9 7945HX, GeForce RTX 4090 Laptop GPU | 2.9 kg | 28.3 mm | 17.30" | 2560x1440 | |
| 86 % v7 (old) | 04 / 2023 | Aorus 17X AZF i9-13900HX, GeForce RTX 4090 Laptop GPU | 2.9 kg | 21.8 mm | 17.30" | 2560x1440 | |
| 88.4 % v7 (old) | 03 / 2023 | Medion Erazer Beast X40 i9-13900HX, GeForce RTX 4090 Laptop GPU | 2.9 kg | 33 mm | 17.00" | 2560x1600 |
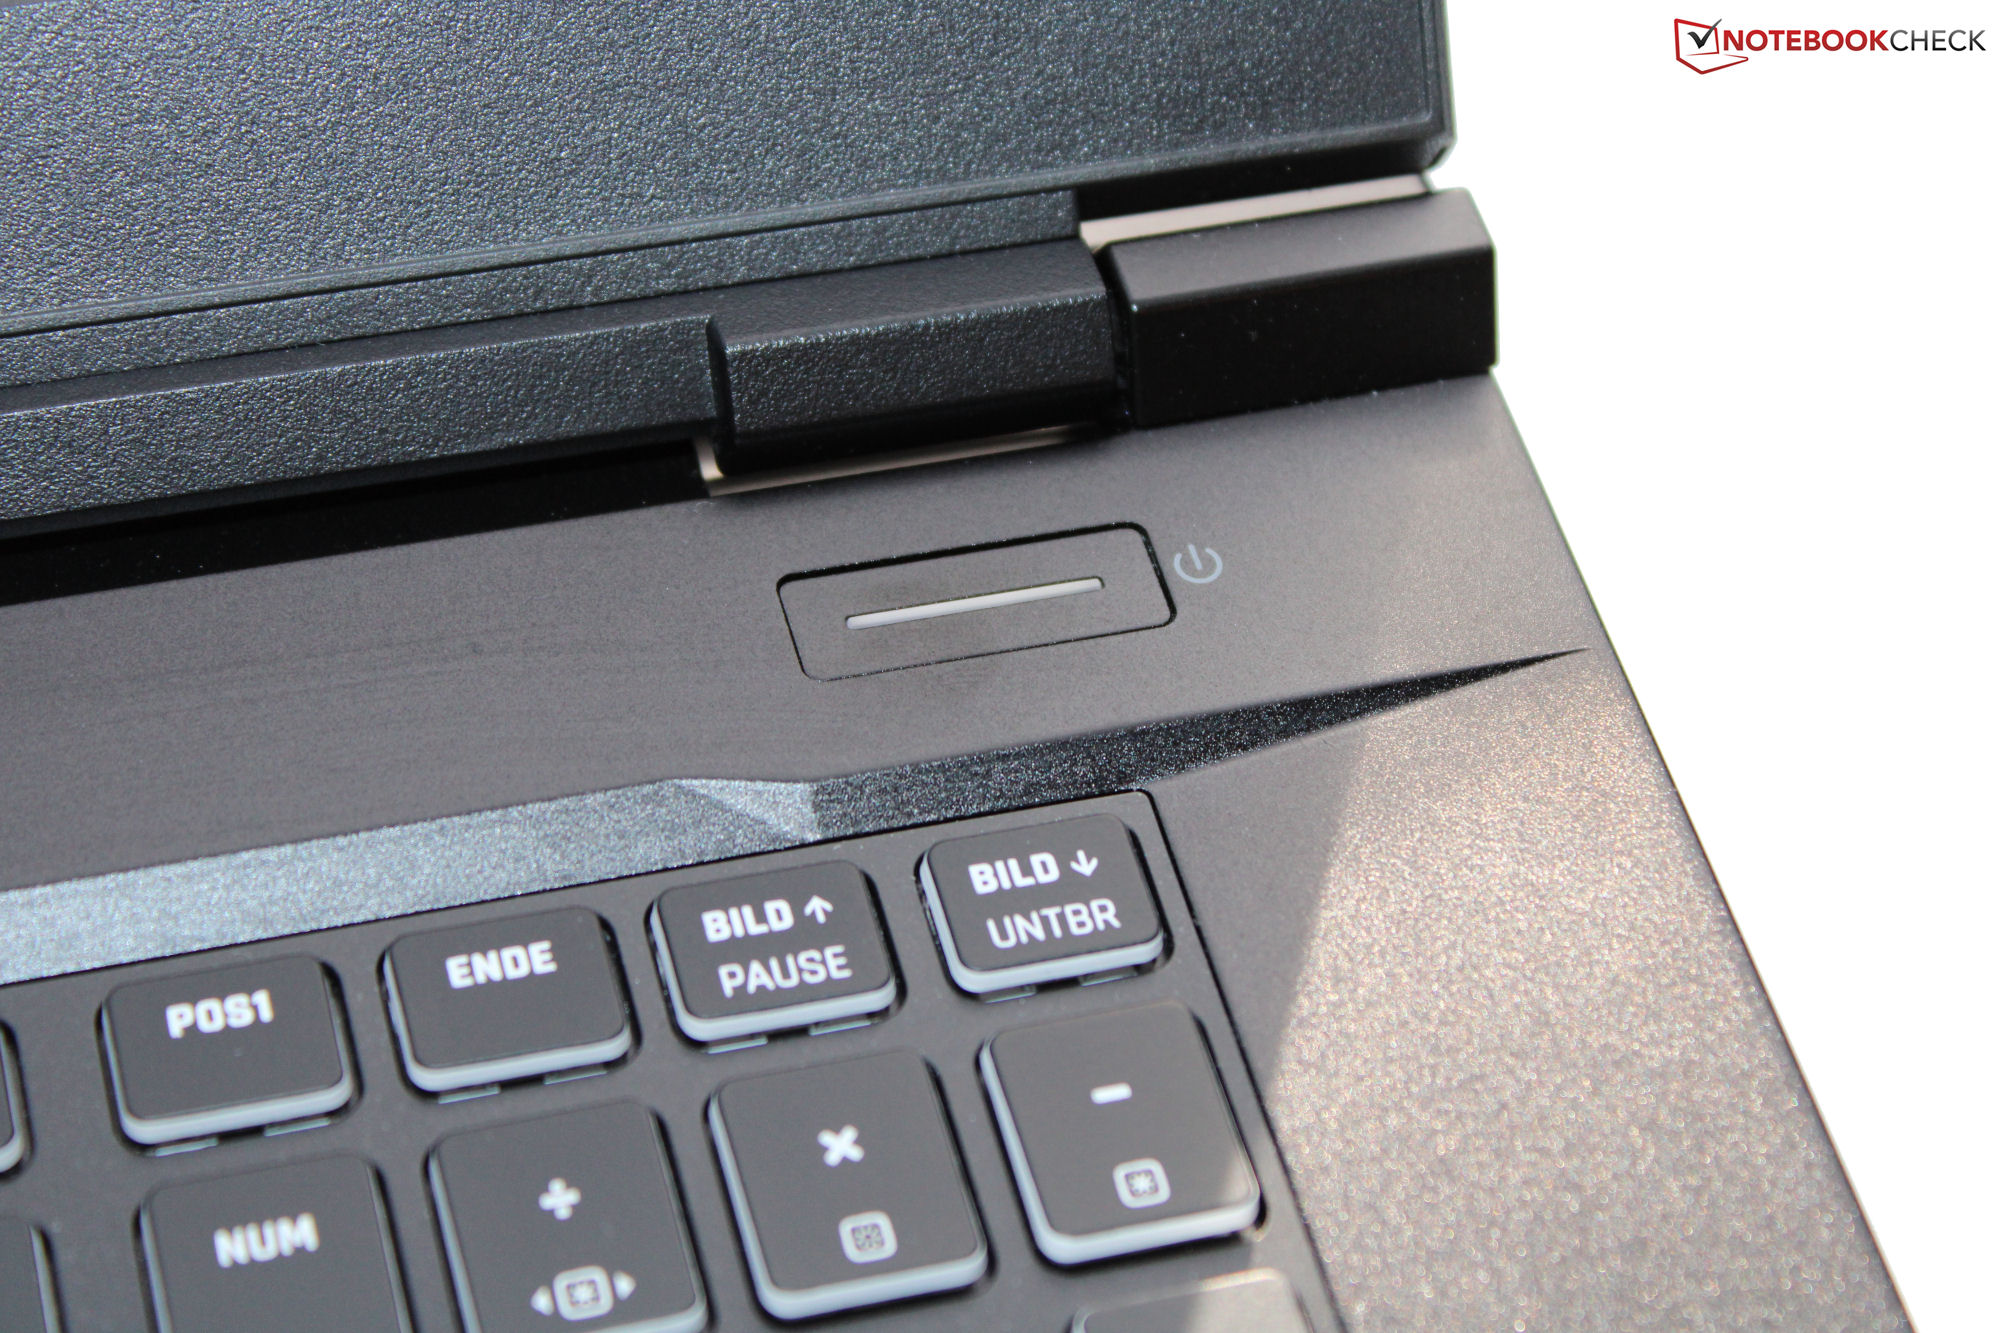
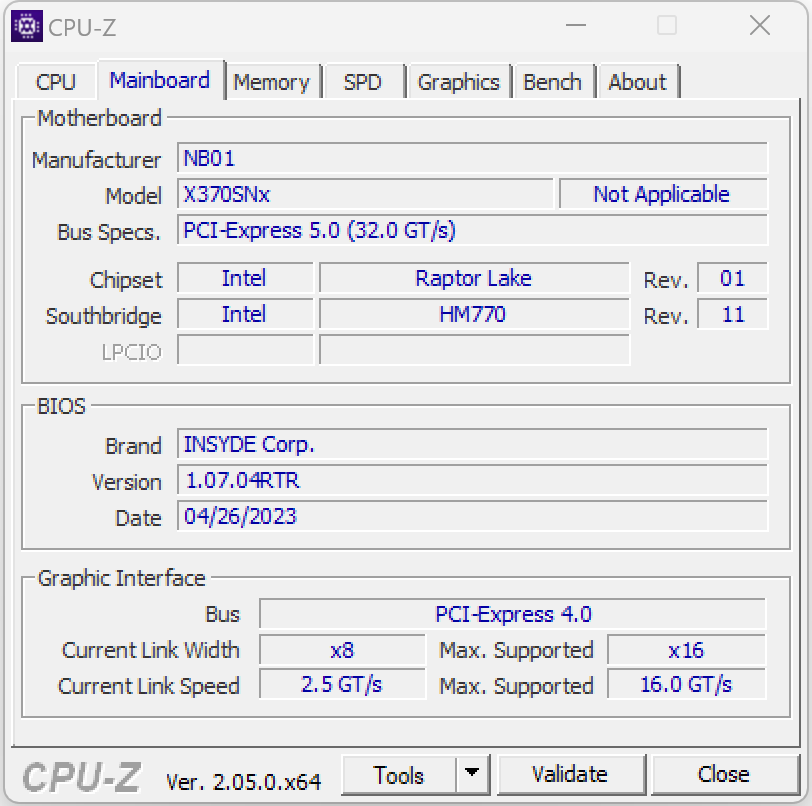
Case and specifications - Clevo barebone offering Thunderbolt 4
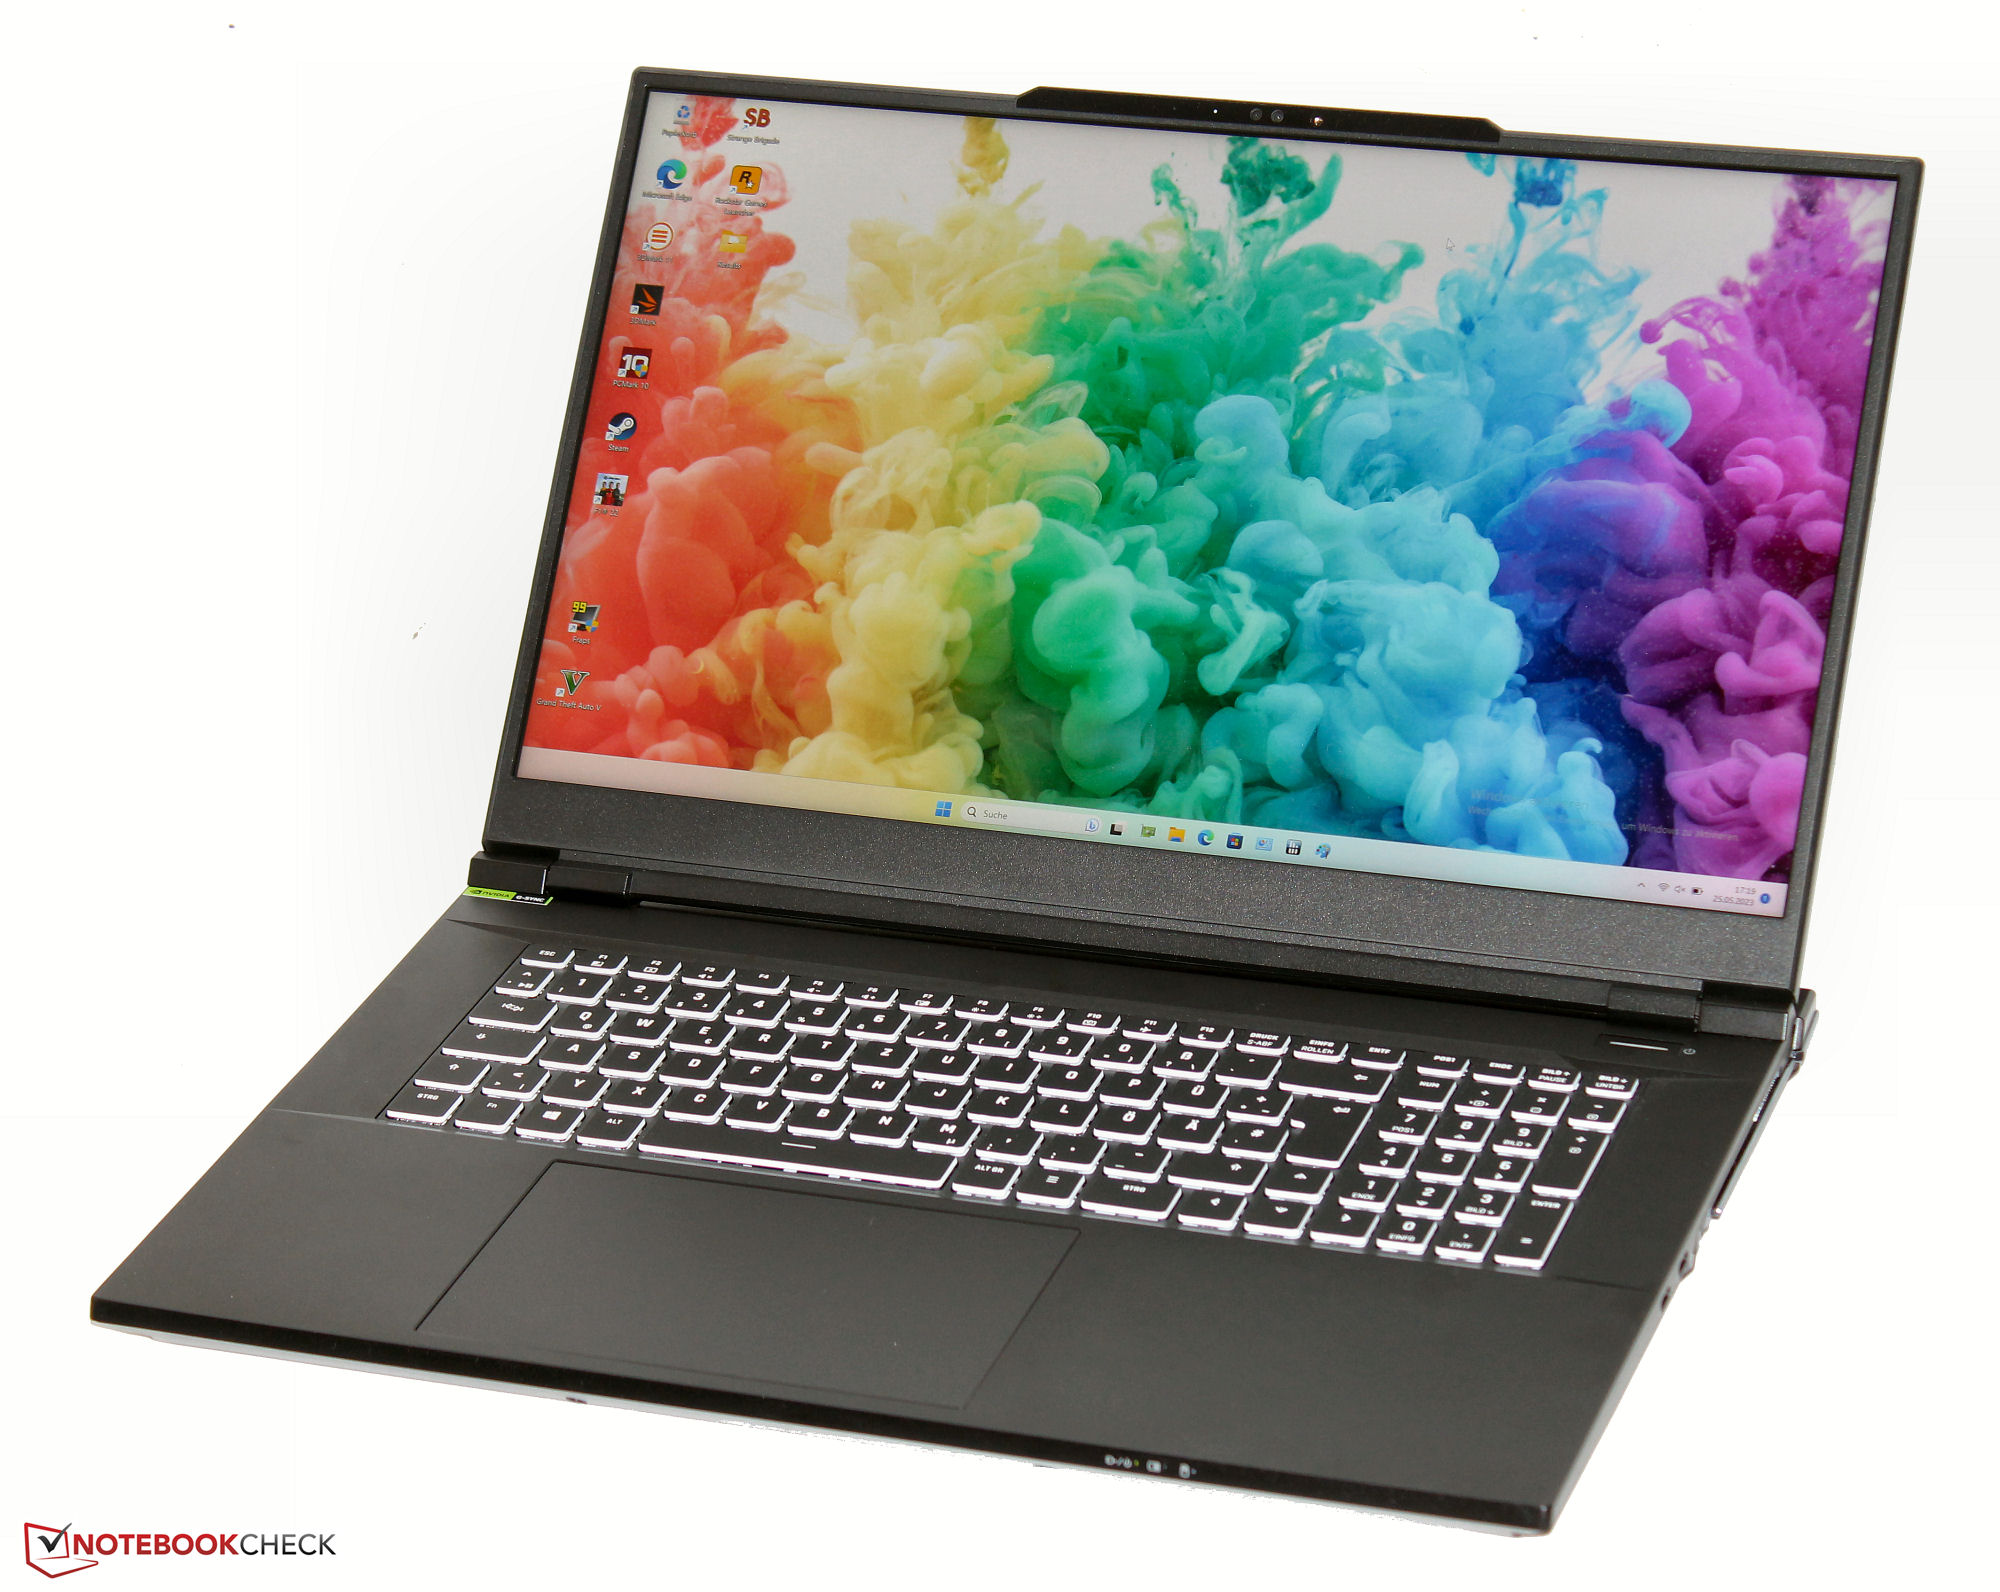
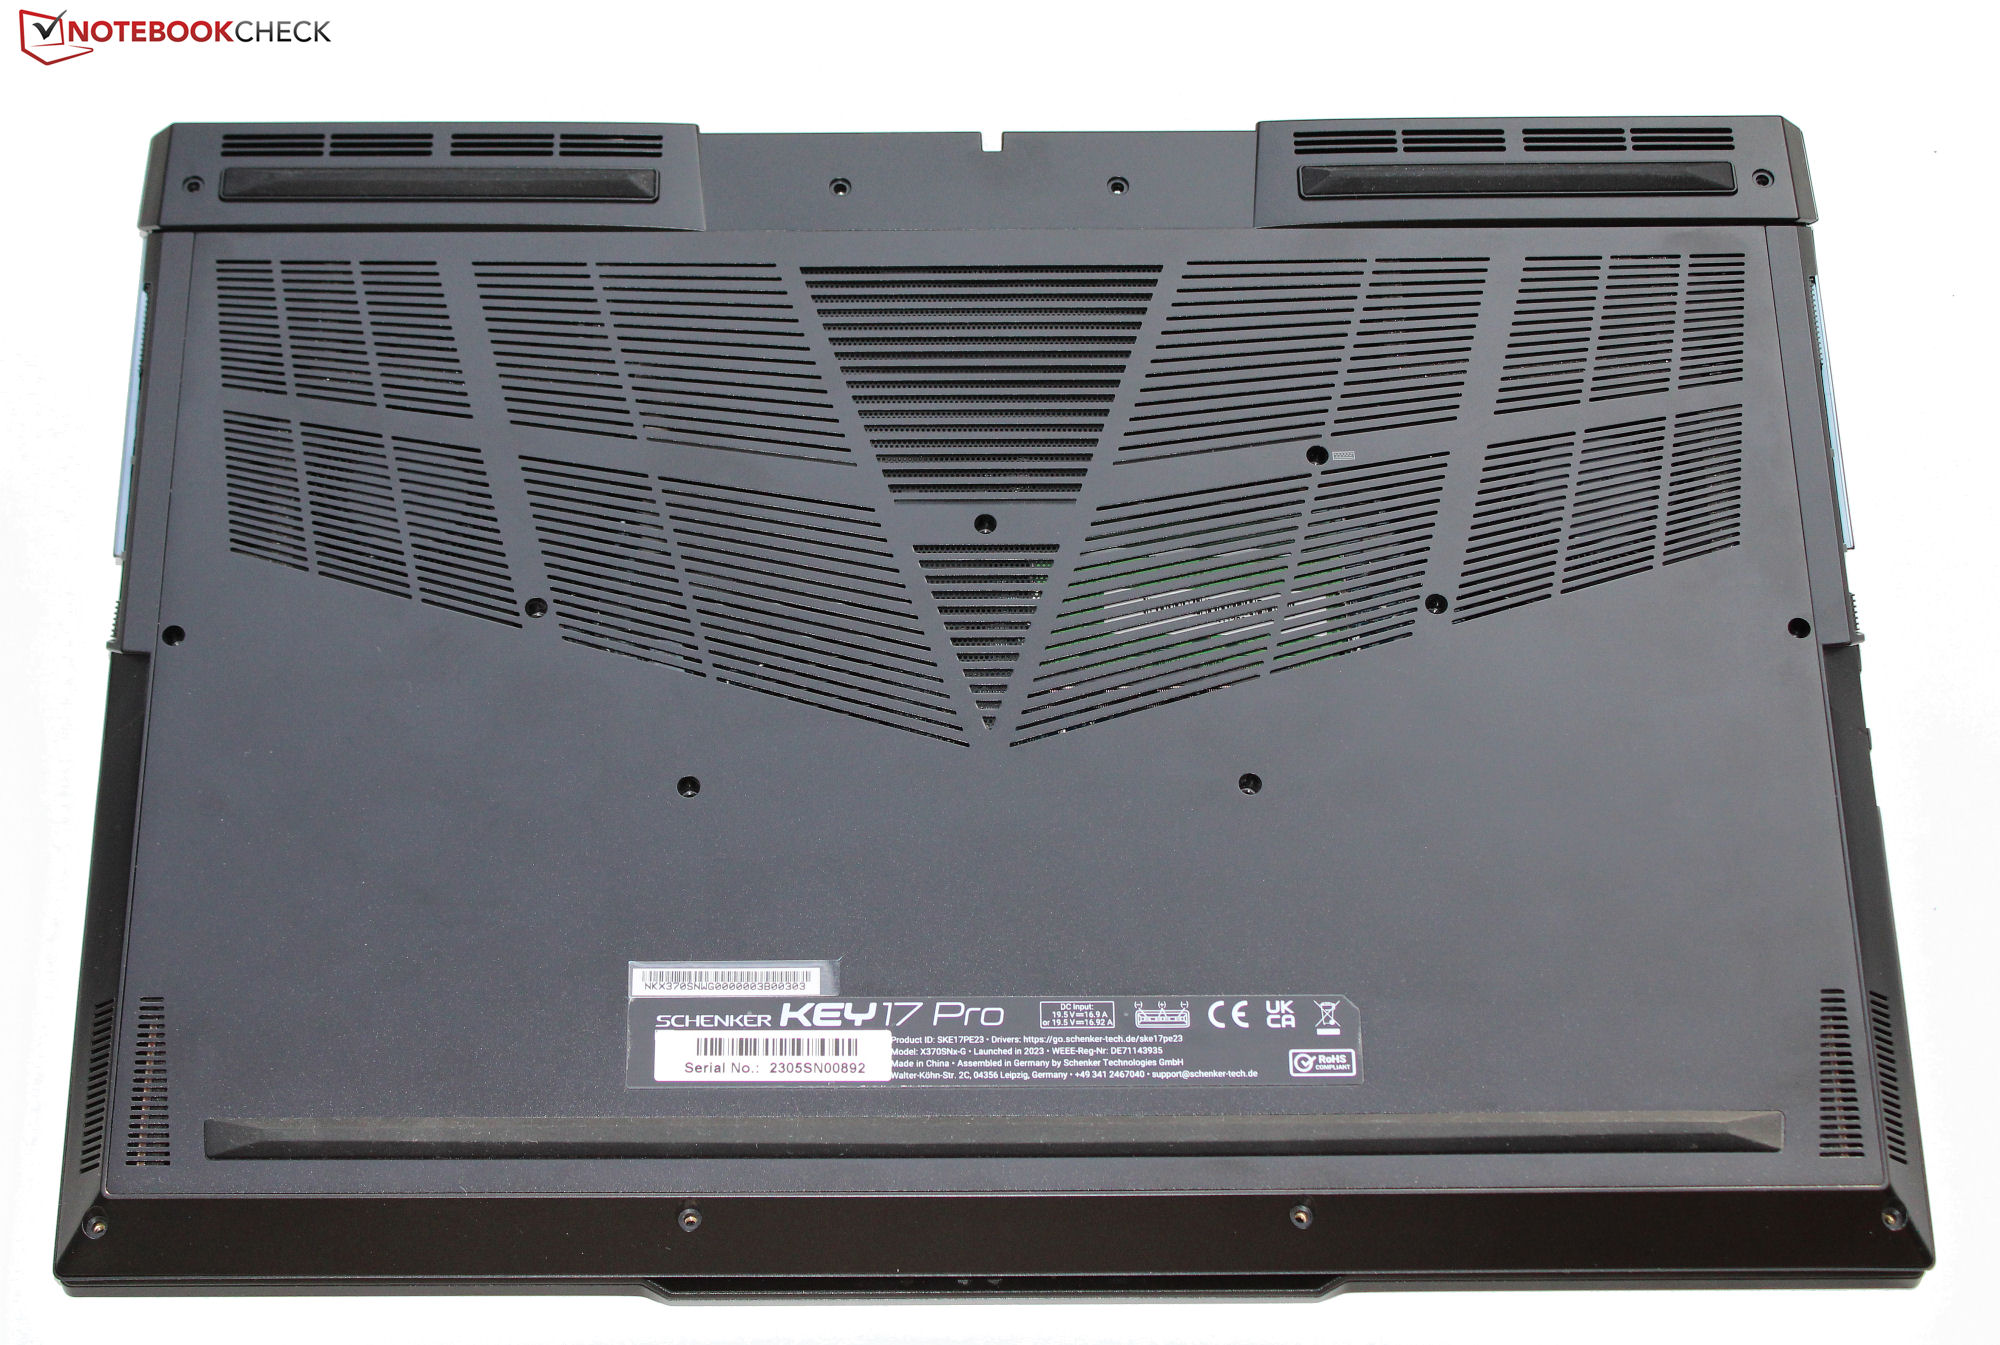
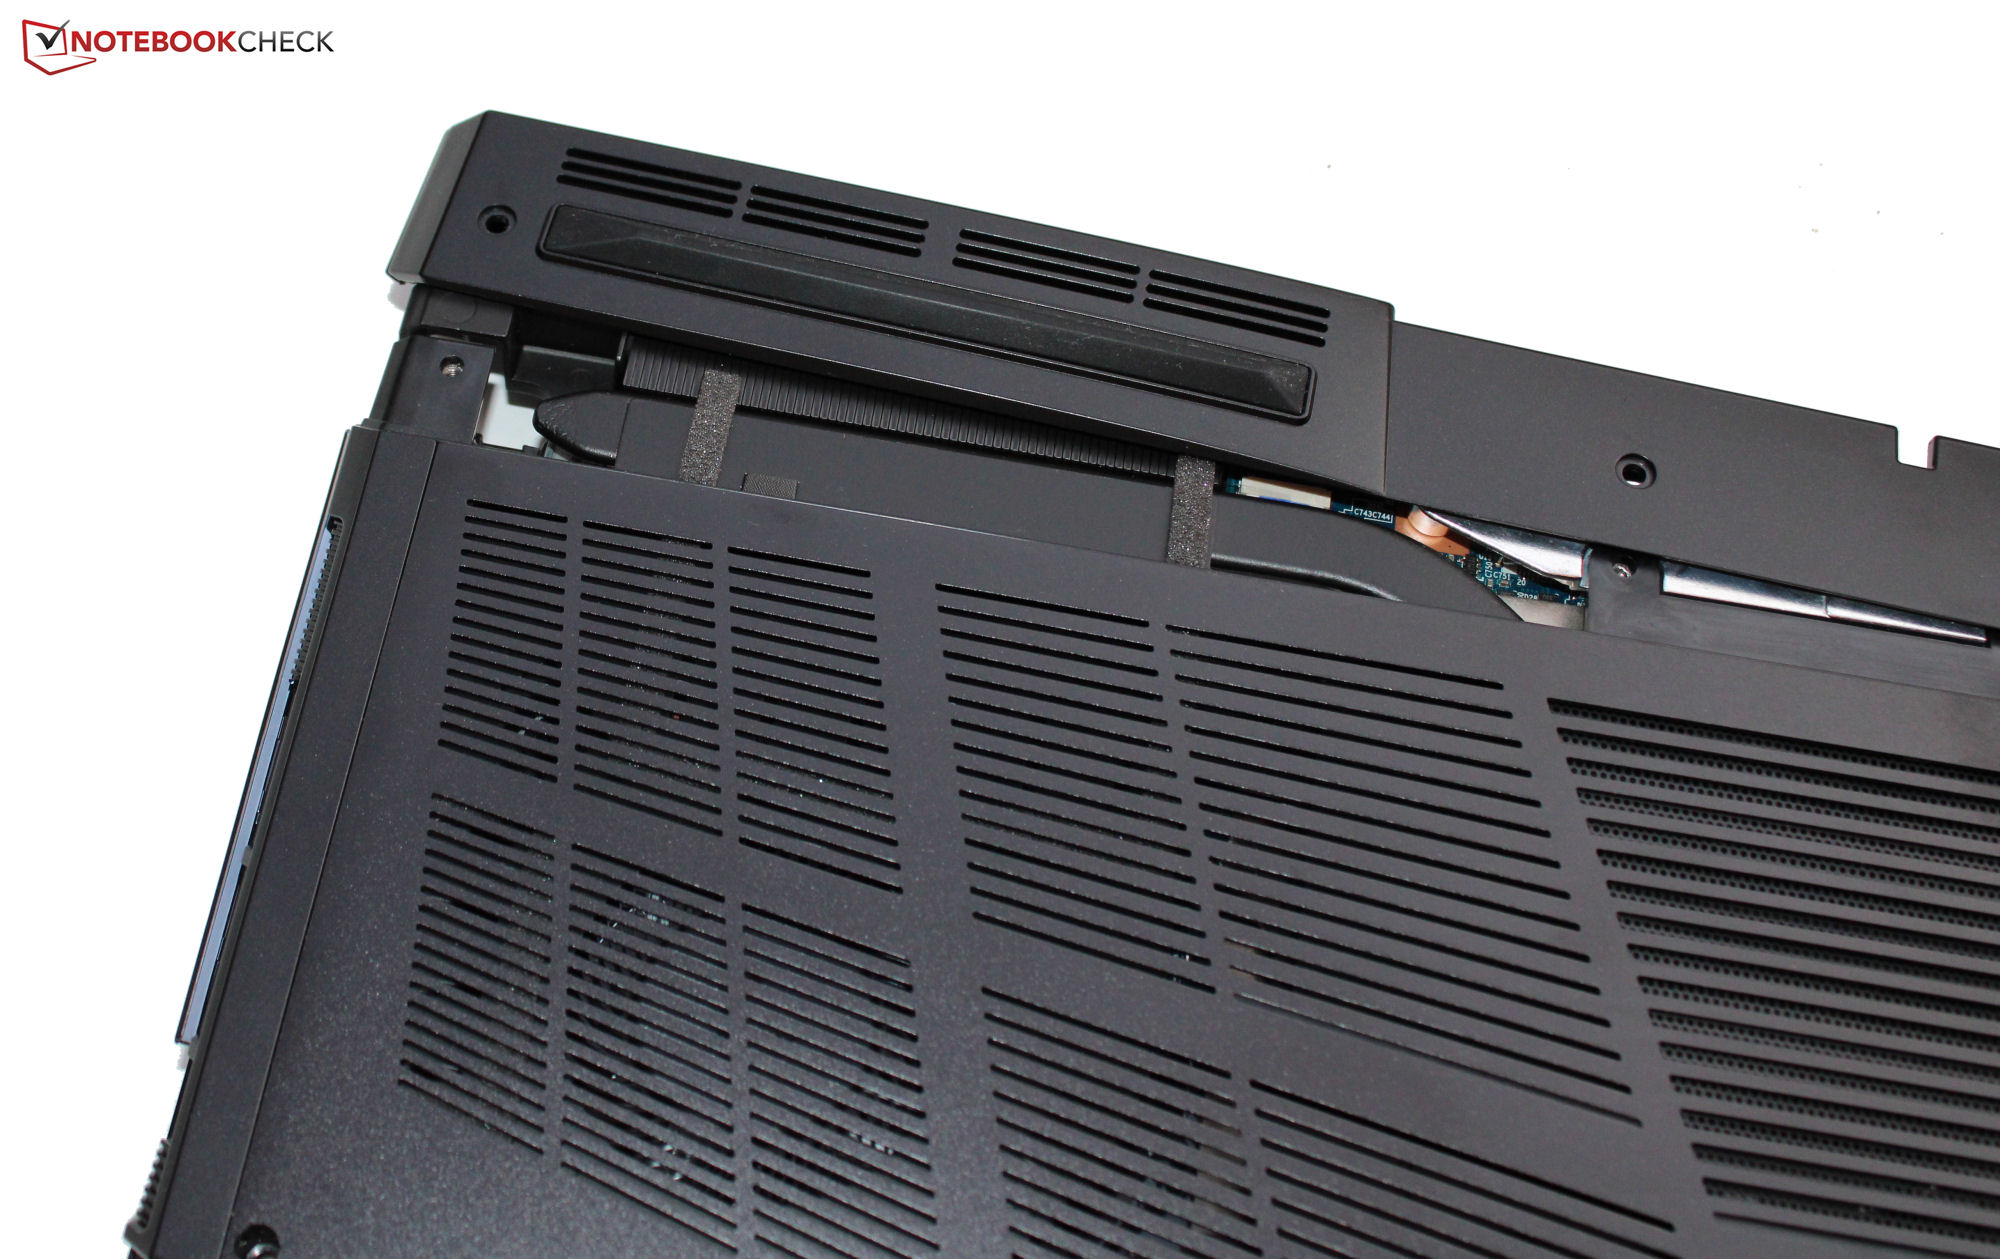
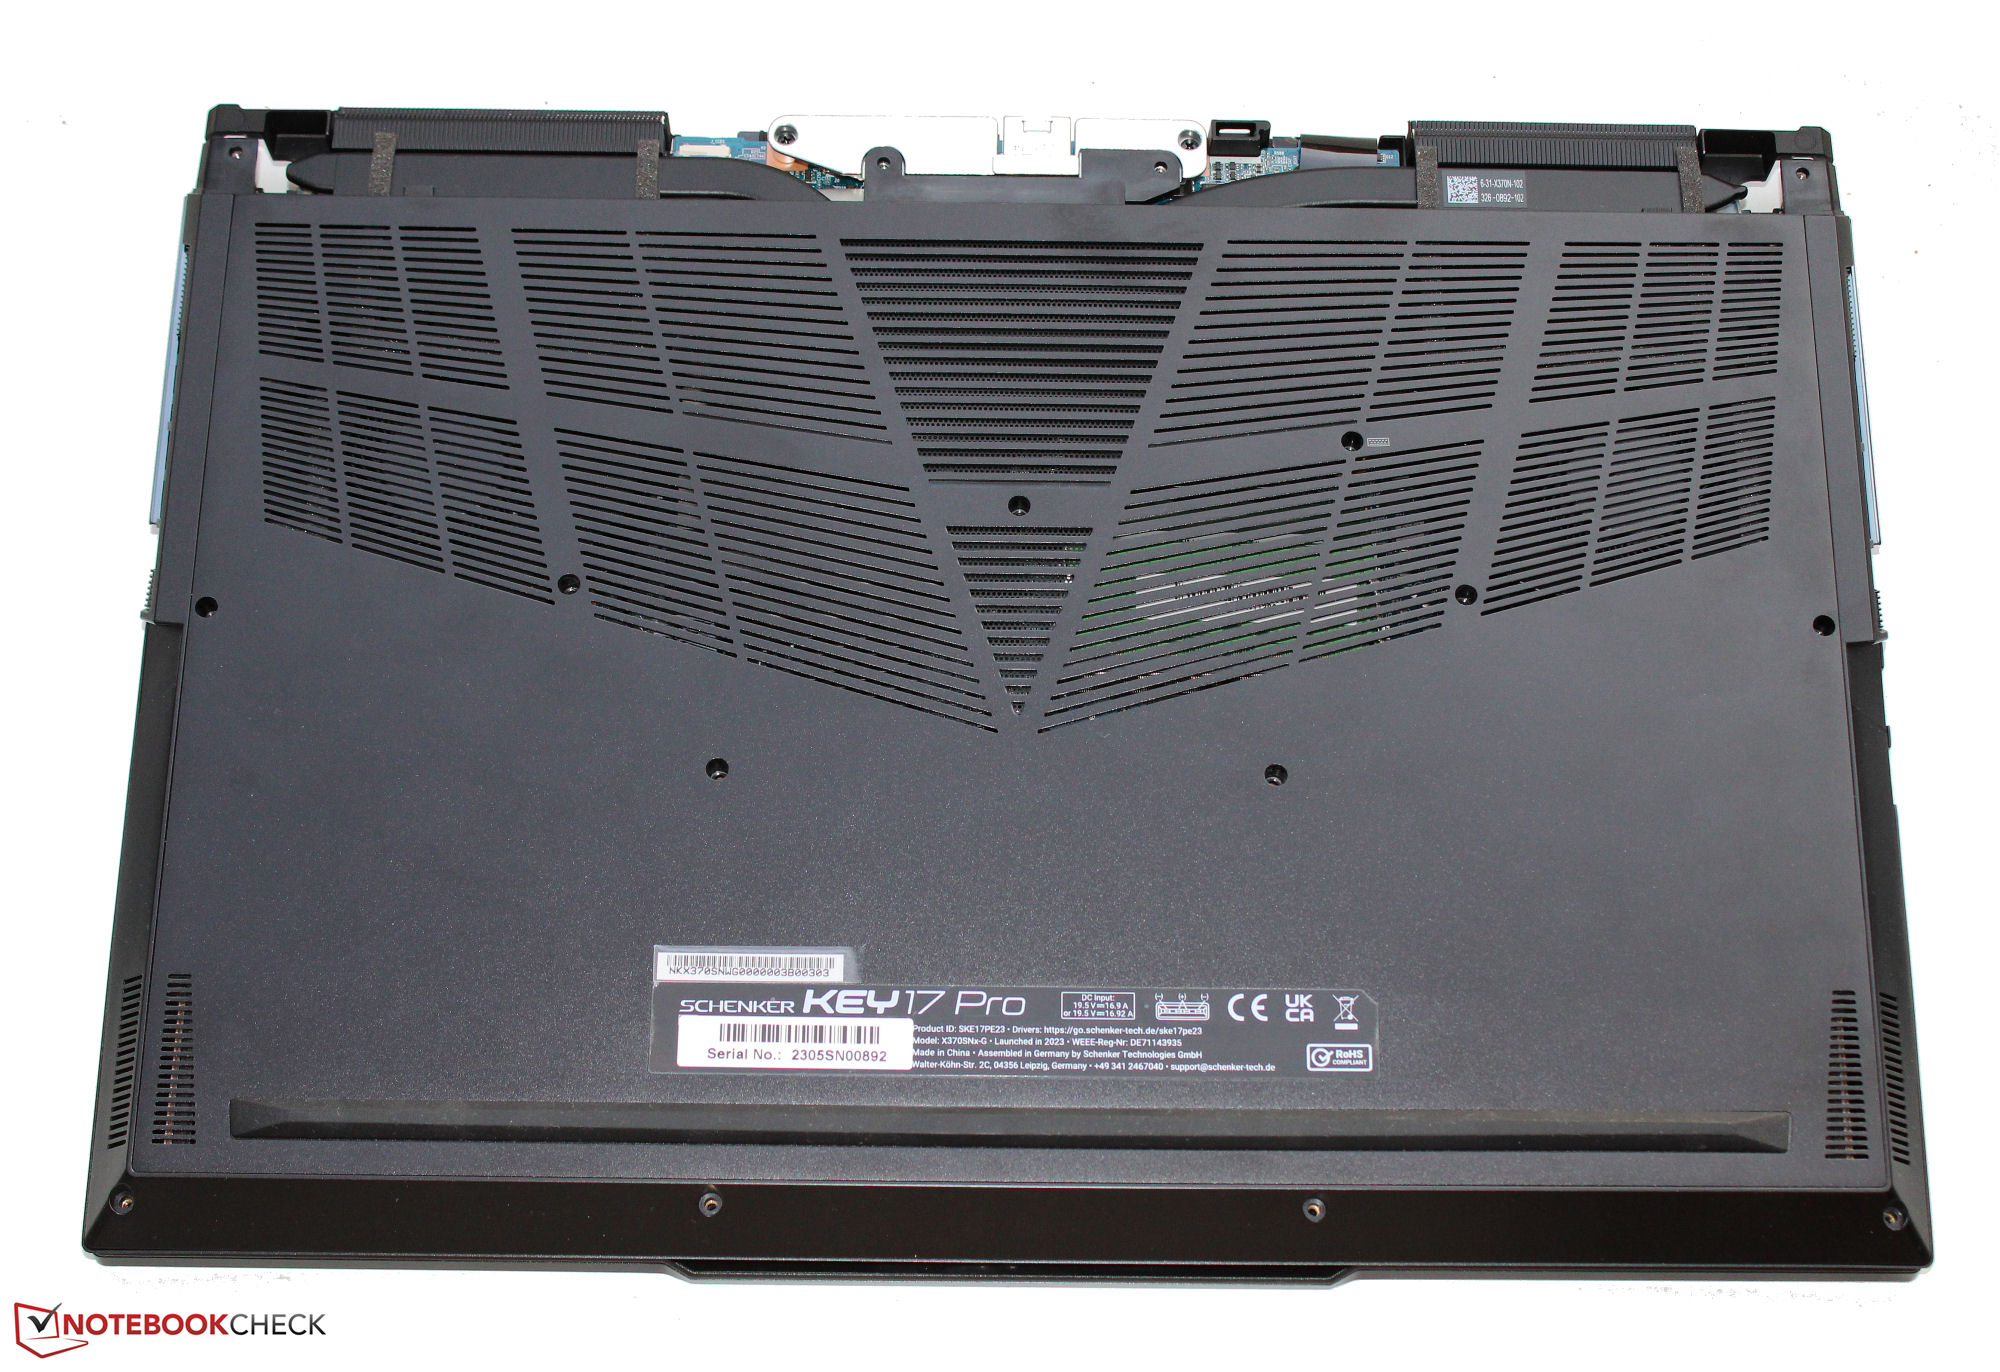
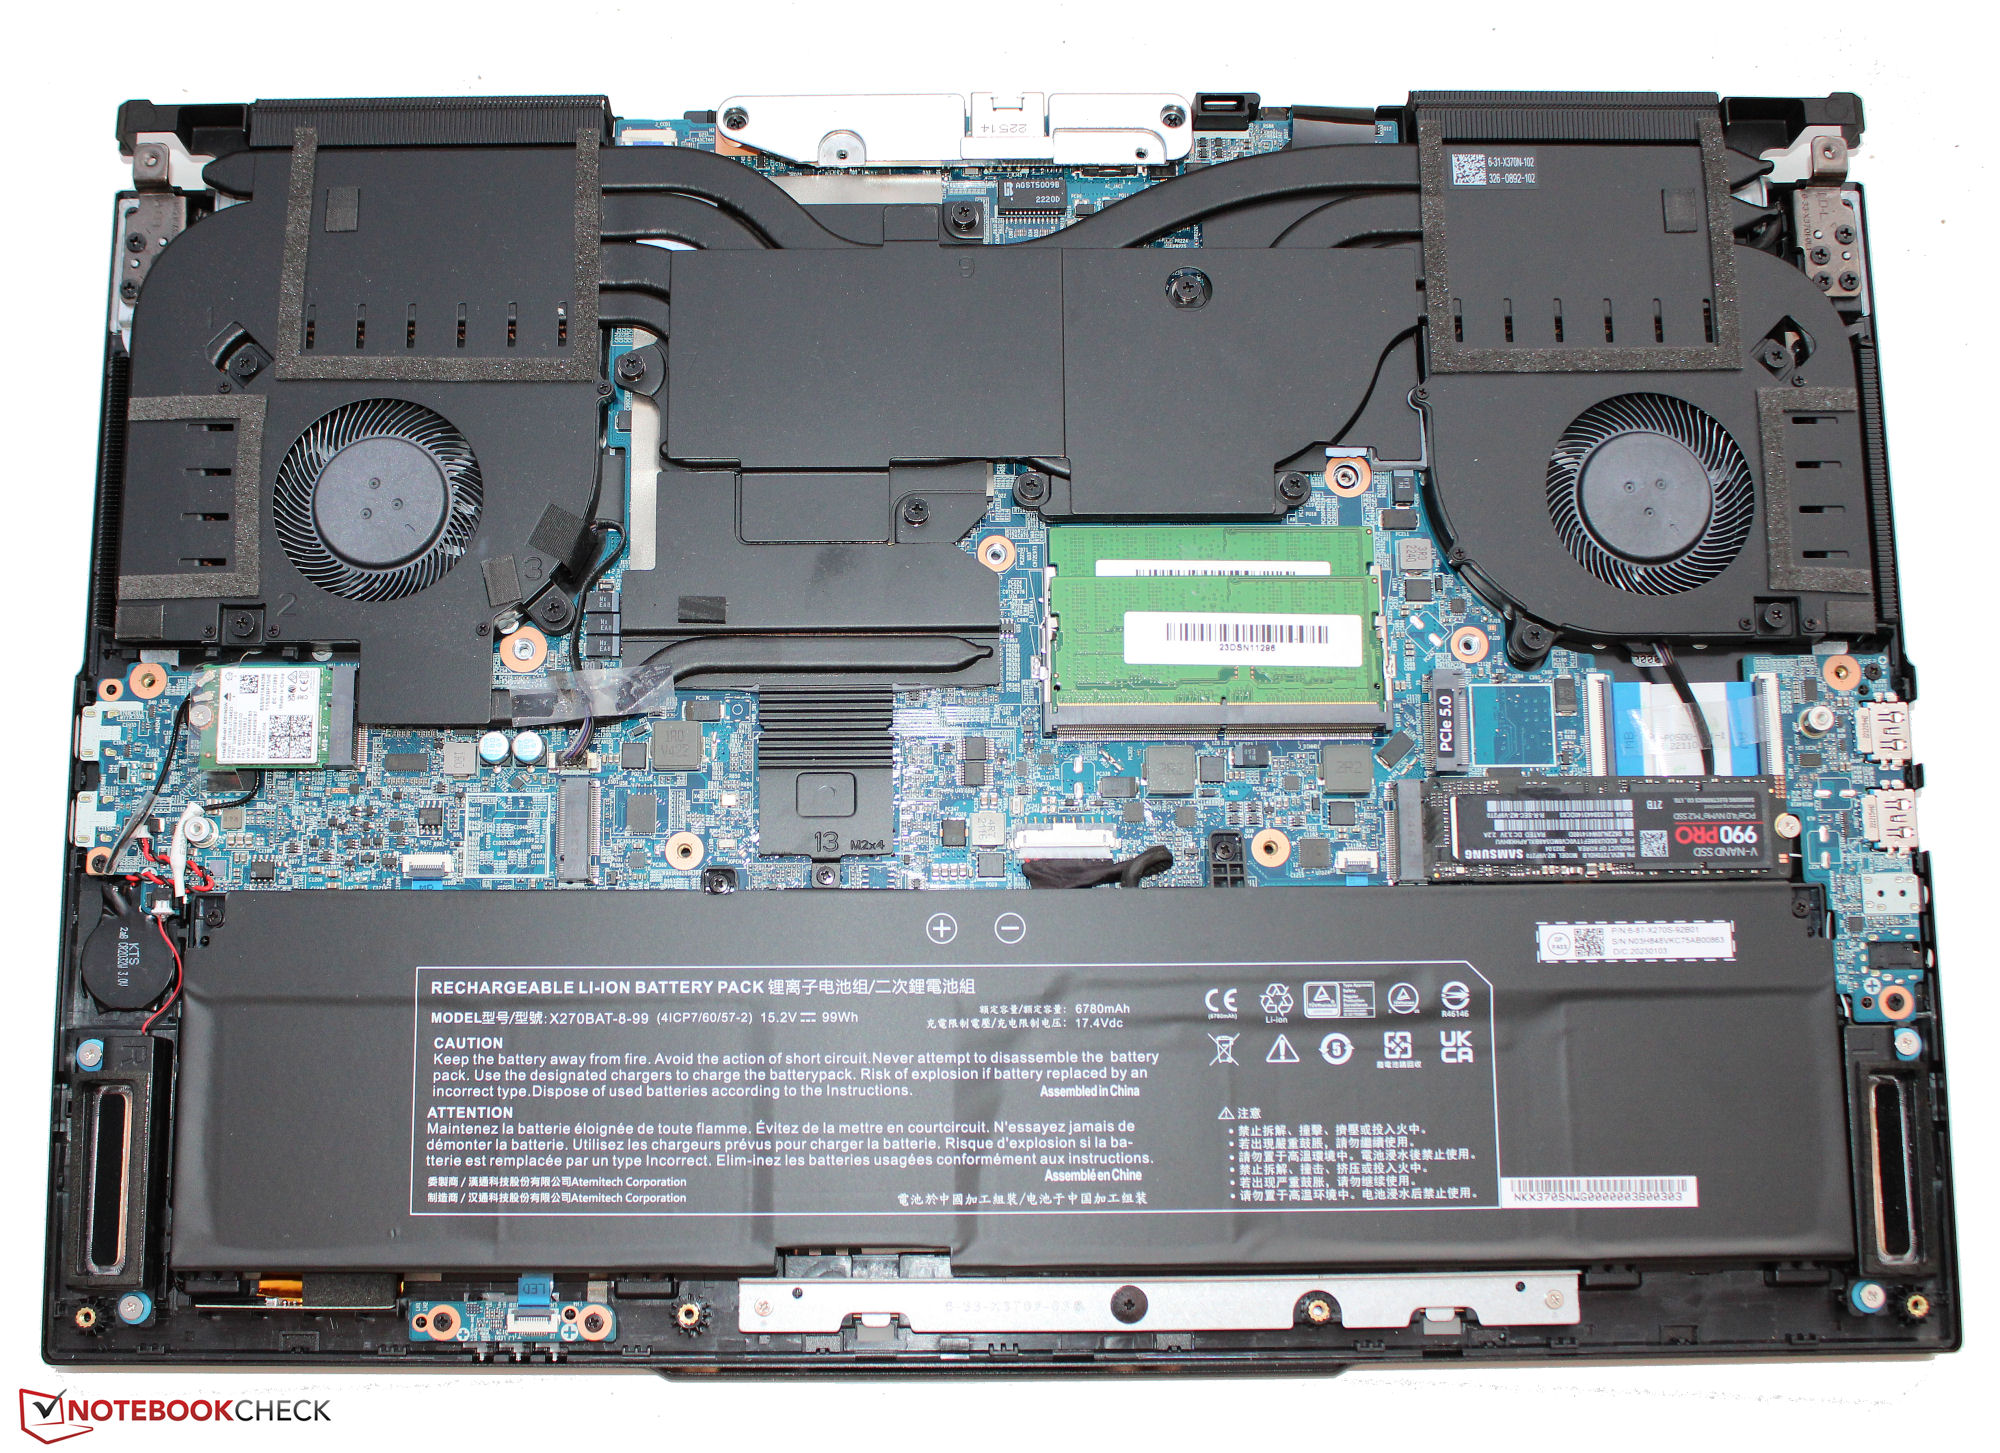
The subtle, matt-black metal chassis on our review unit doesn’t exhibit any workmanship issues. The base hardly flexes at all, and the lid has a small but very much acceptable amount of give. The laptop's battery (screwed down, not glued in) and other internals are accessible once you remove the two-piece bottom cover.
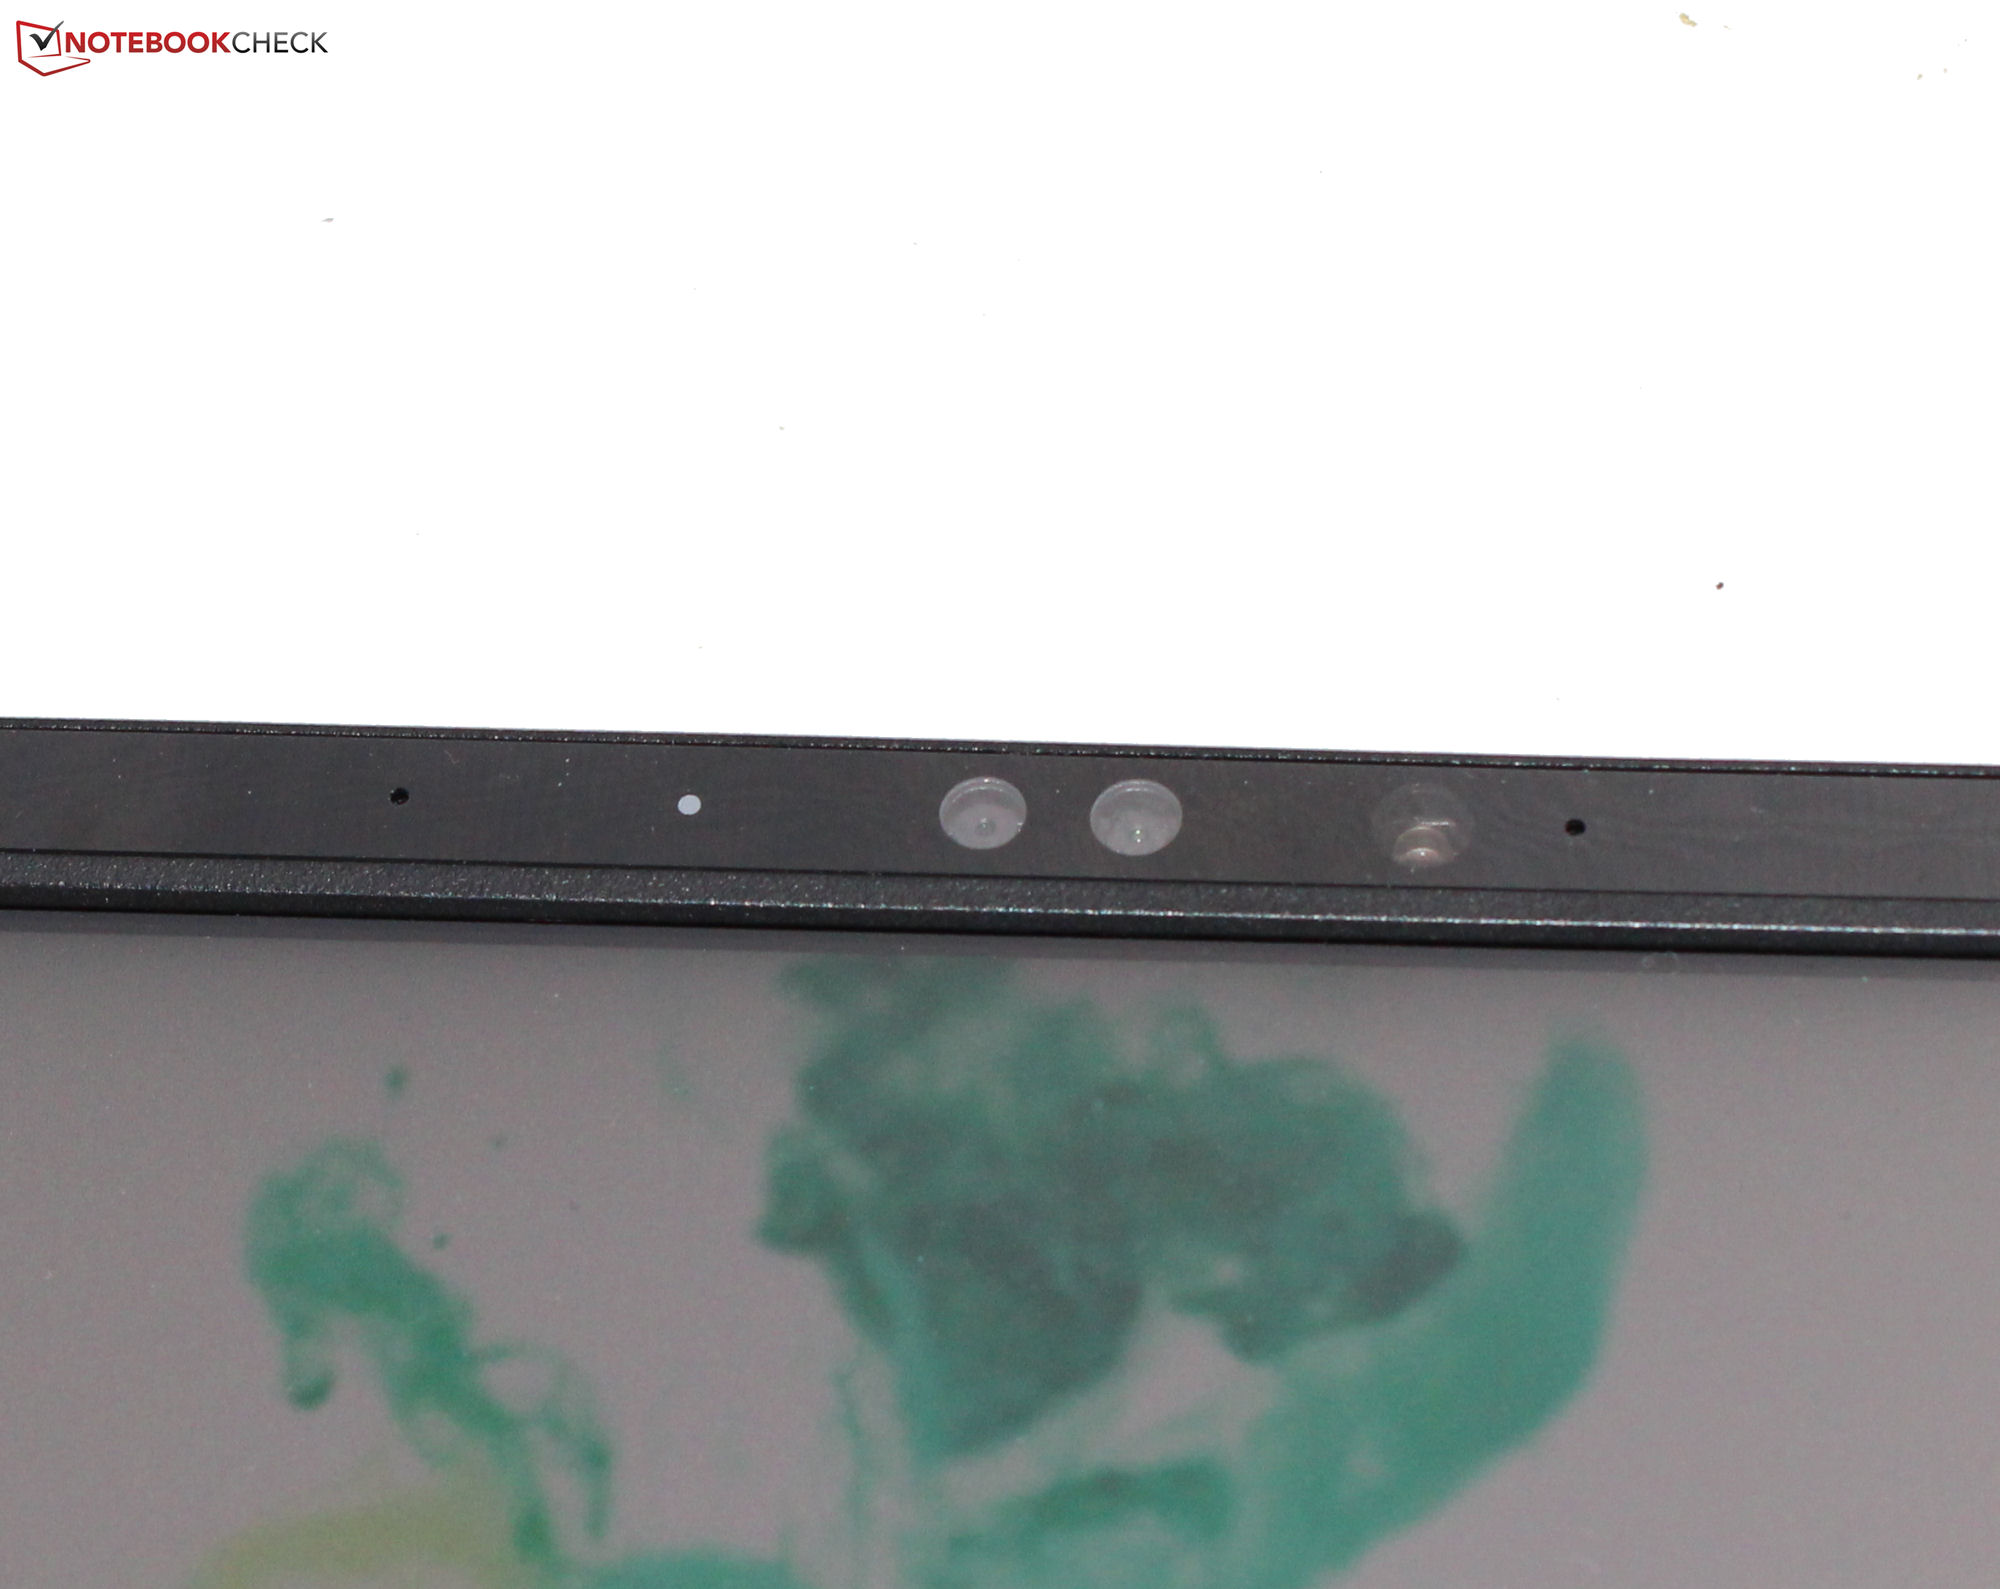
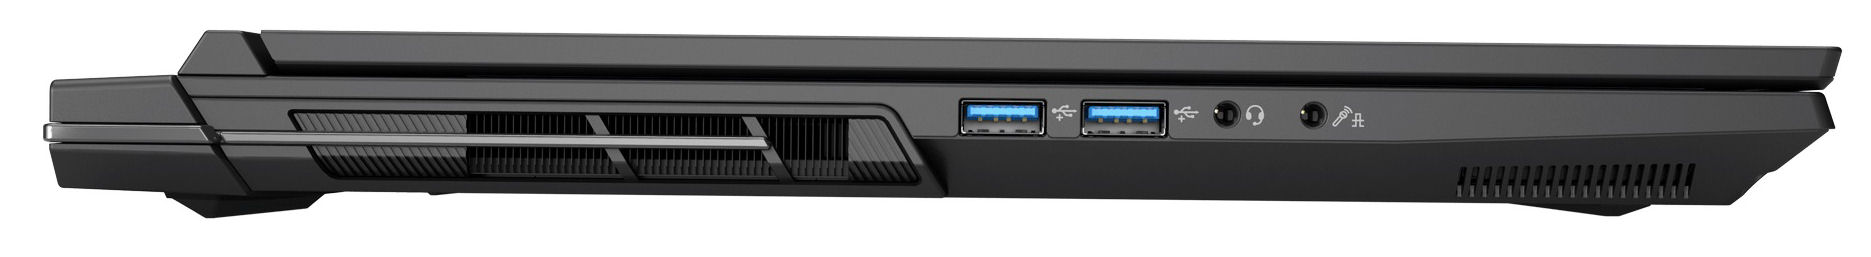
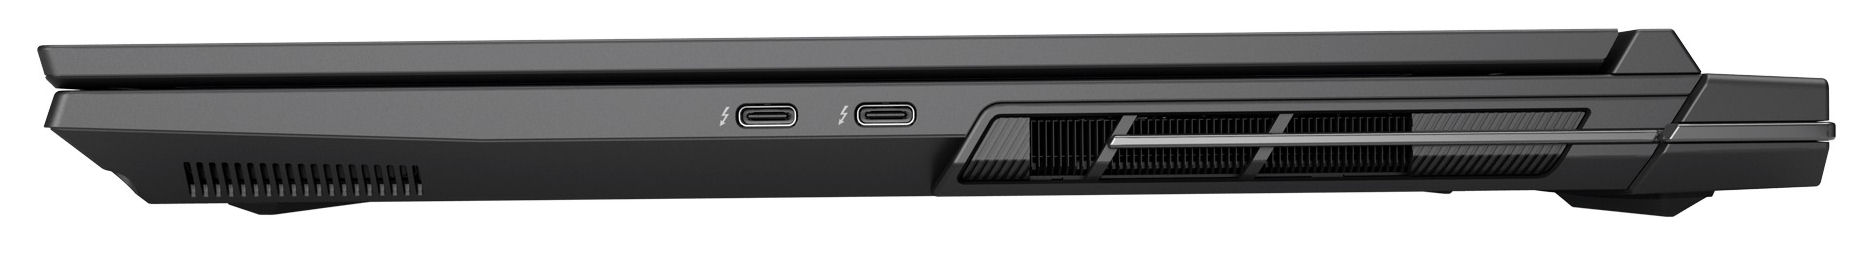
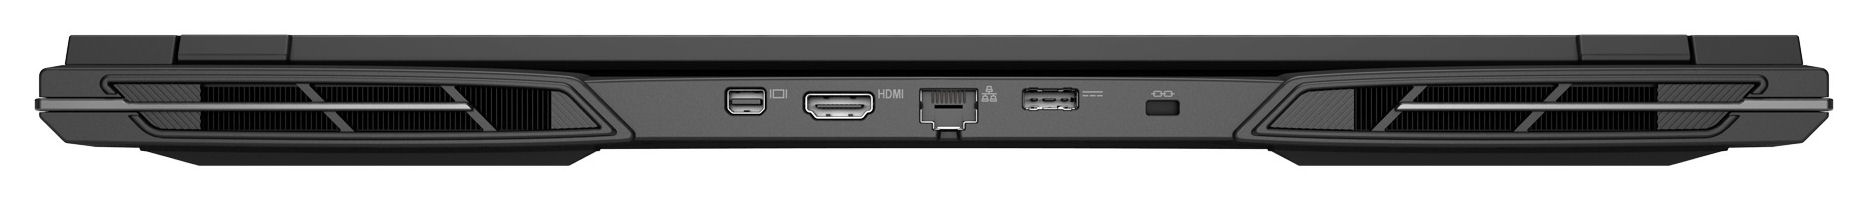
The Key has two USB-A (USB 3.2 Gen 2) and two USB-C ports (Thunderbolt 4). Only one of the Thunderbolt 4 ports supports Power Delivery, but both are capable of outputting a DisplayPort signal. The laptop offers a total of four video outputs (1x HDMI, 3x DP). Unfortunately, the device doesn’t come with a card reader, and the webcam (2.1MP, max resolution of 1,920 x 1,080, no privacy shutter) is nothing to write home about.
Thanks to its Wi-Fi 6E card (Intel AX211), the Key 17 Pro is able to reach excellent Wi-Fi data rates under ideal conditions (i.e. no other Wi-Fi devices in close proximity, short distance between laptop and server PC). Wired connections are handled by a Killer E3100X controller (2.5 Gbit/s).

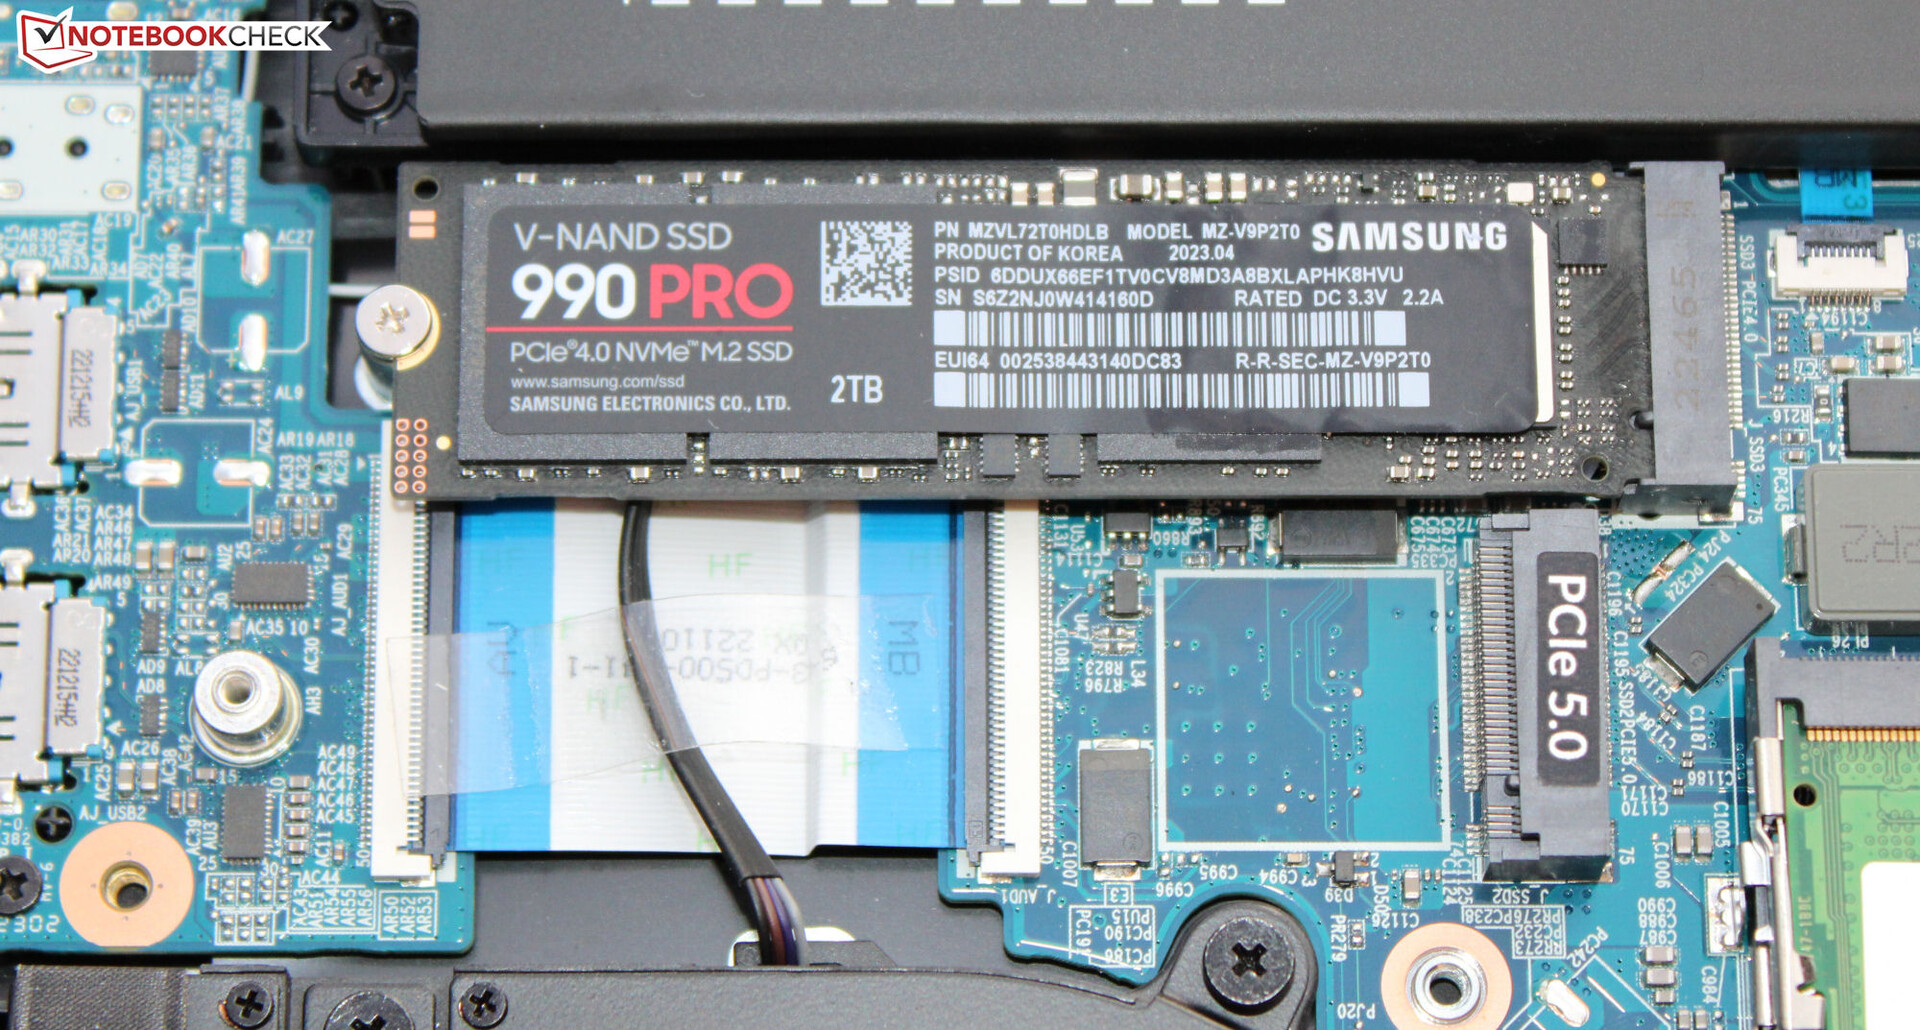
 GeForce RTX 4090 Laptop GPU, i9-13900HX, Samsung 990 Pro 2 TB MZVL72T0HDLB")
 GeForce RTX 4090 Laptop GPU, i9-13900HX, Samsung 990 Pro 2 TB MZVL72T0HDLB")
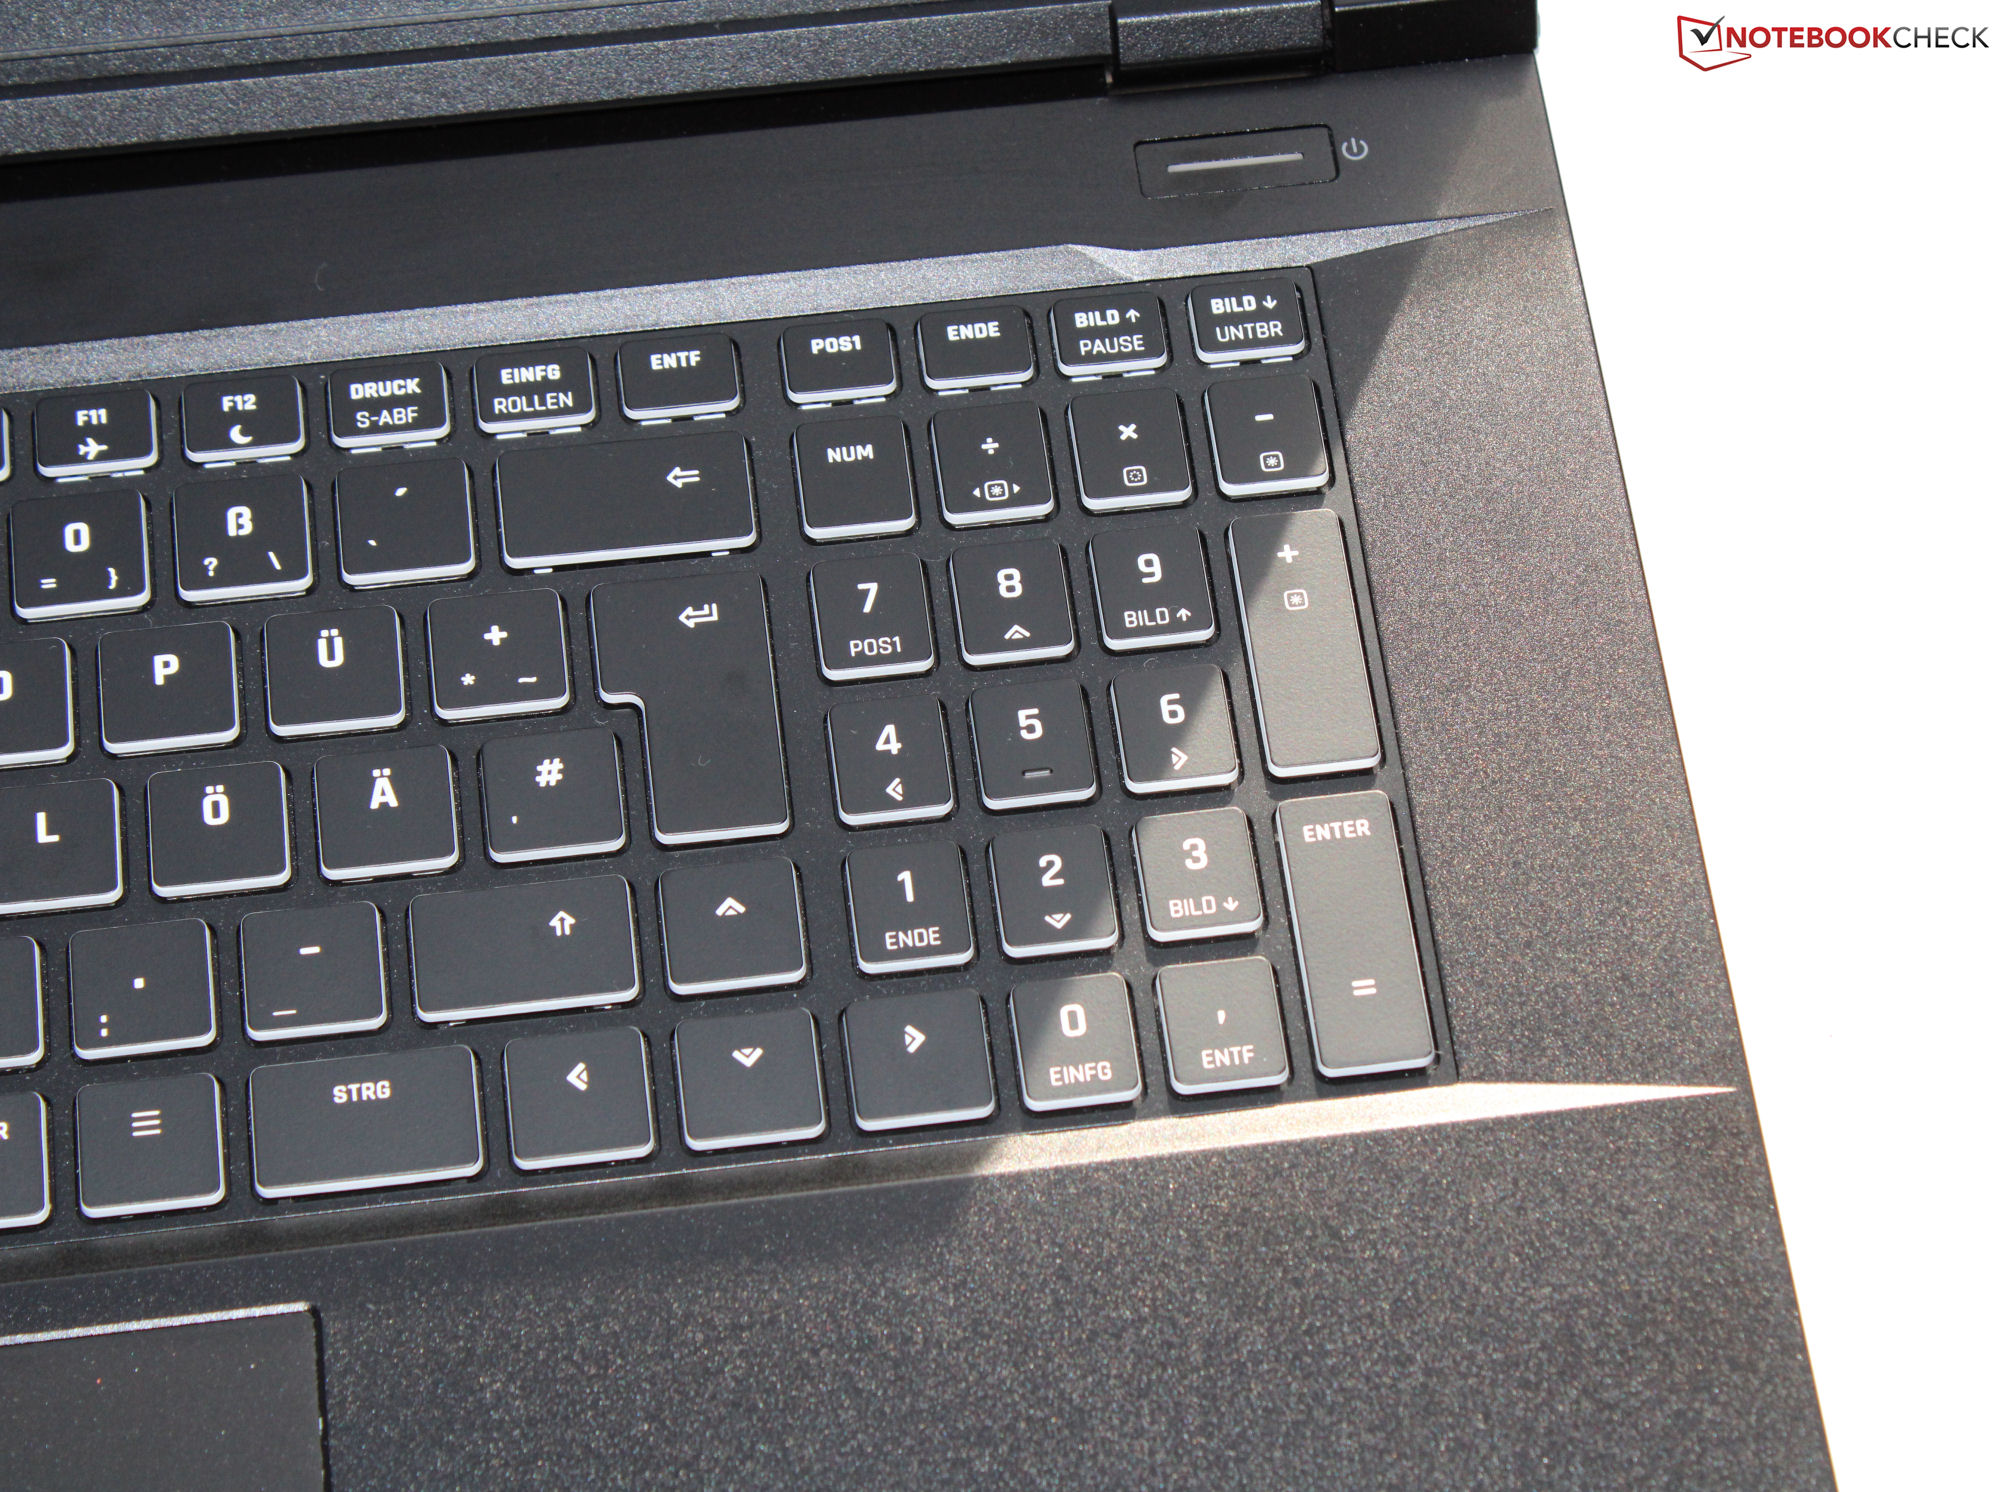
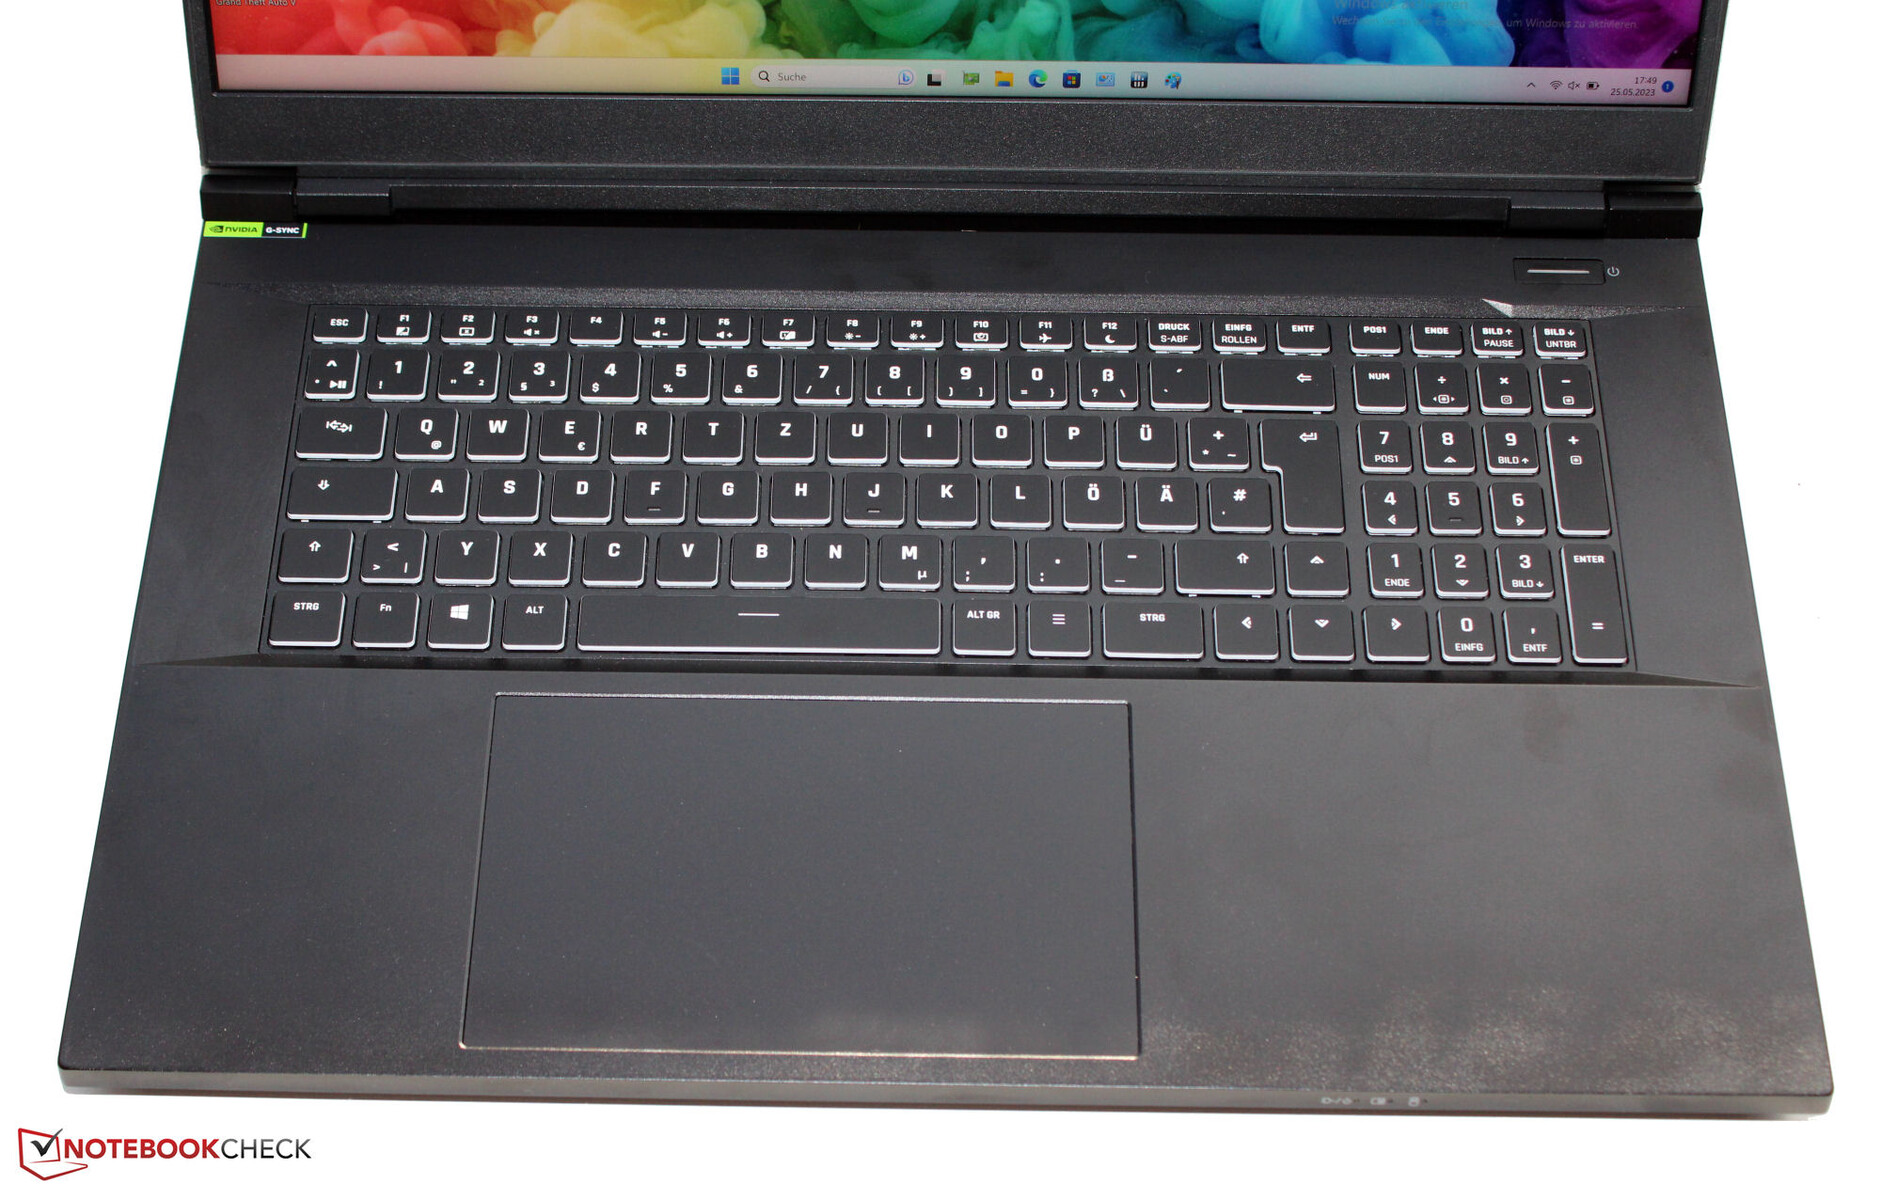
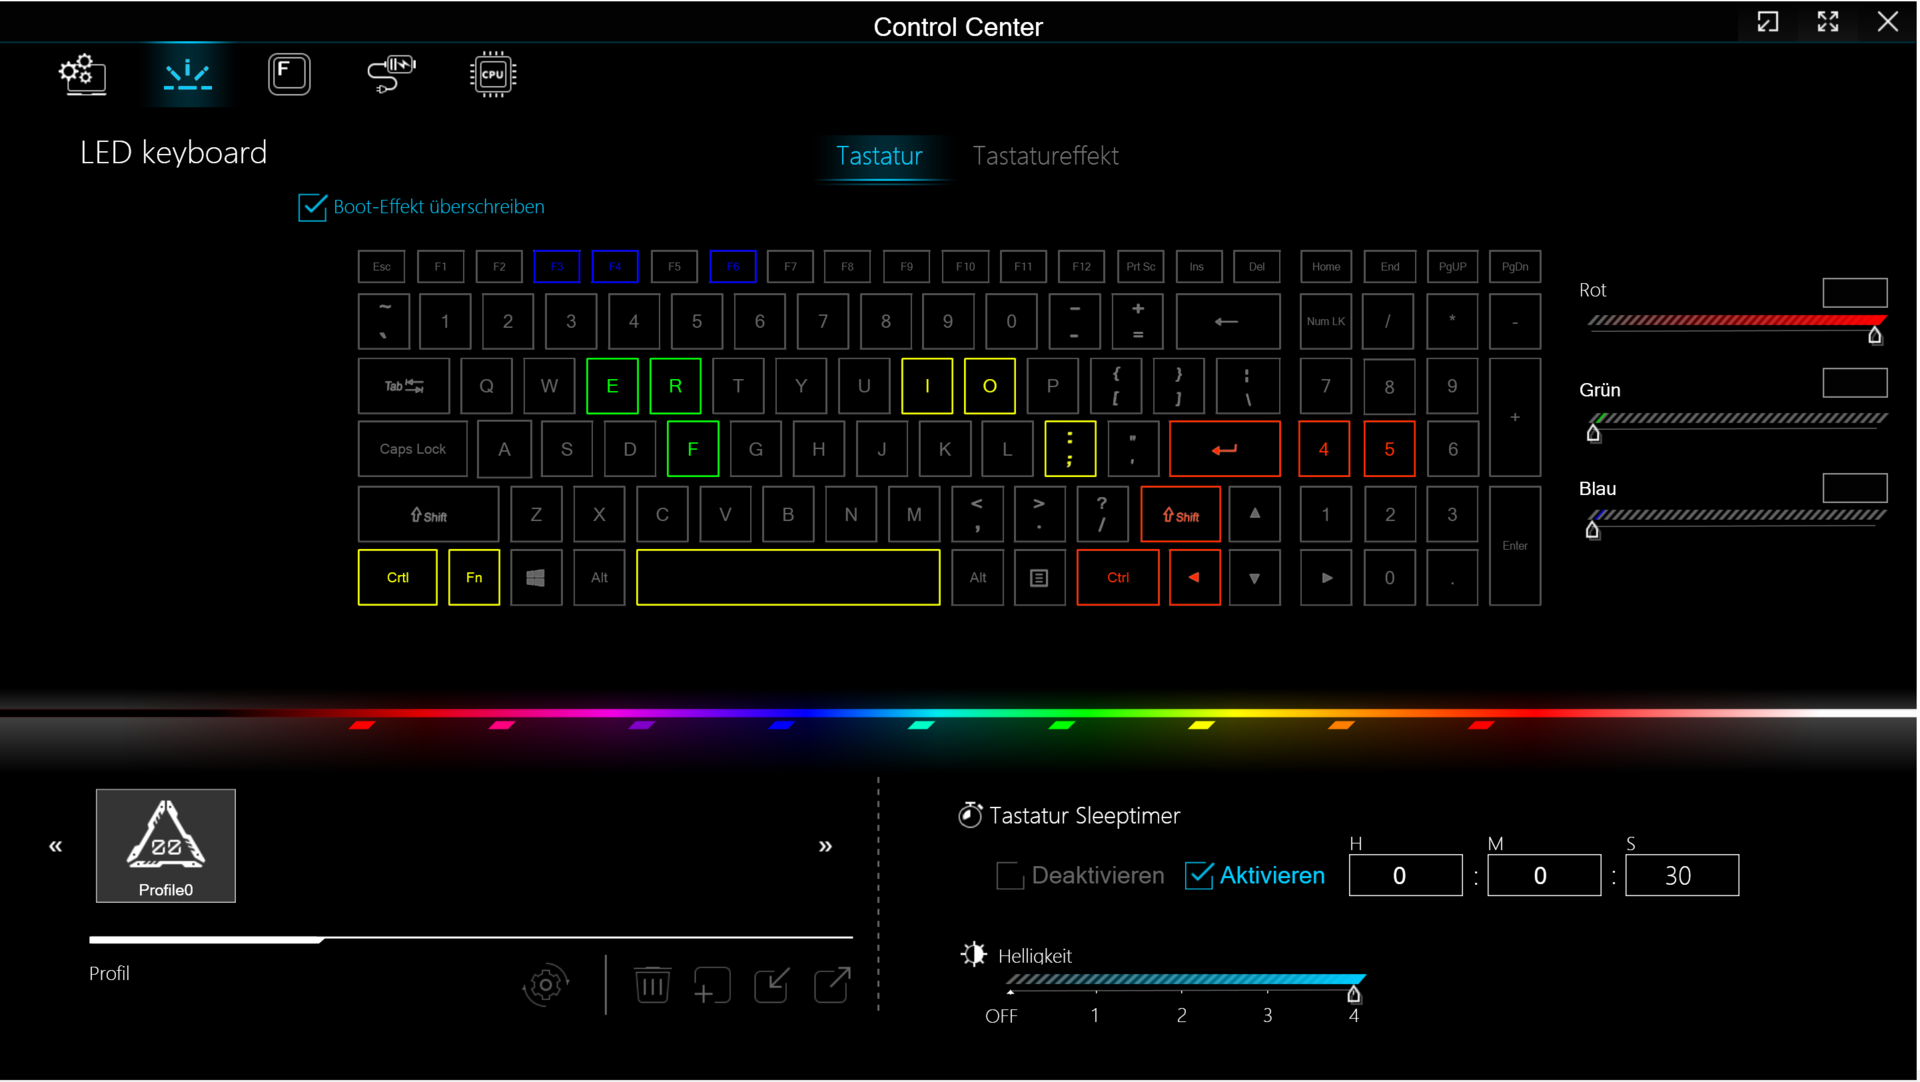
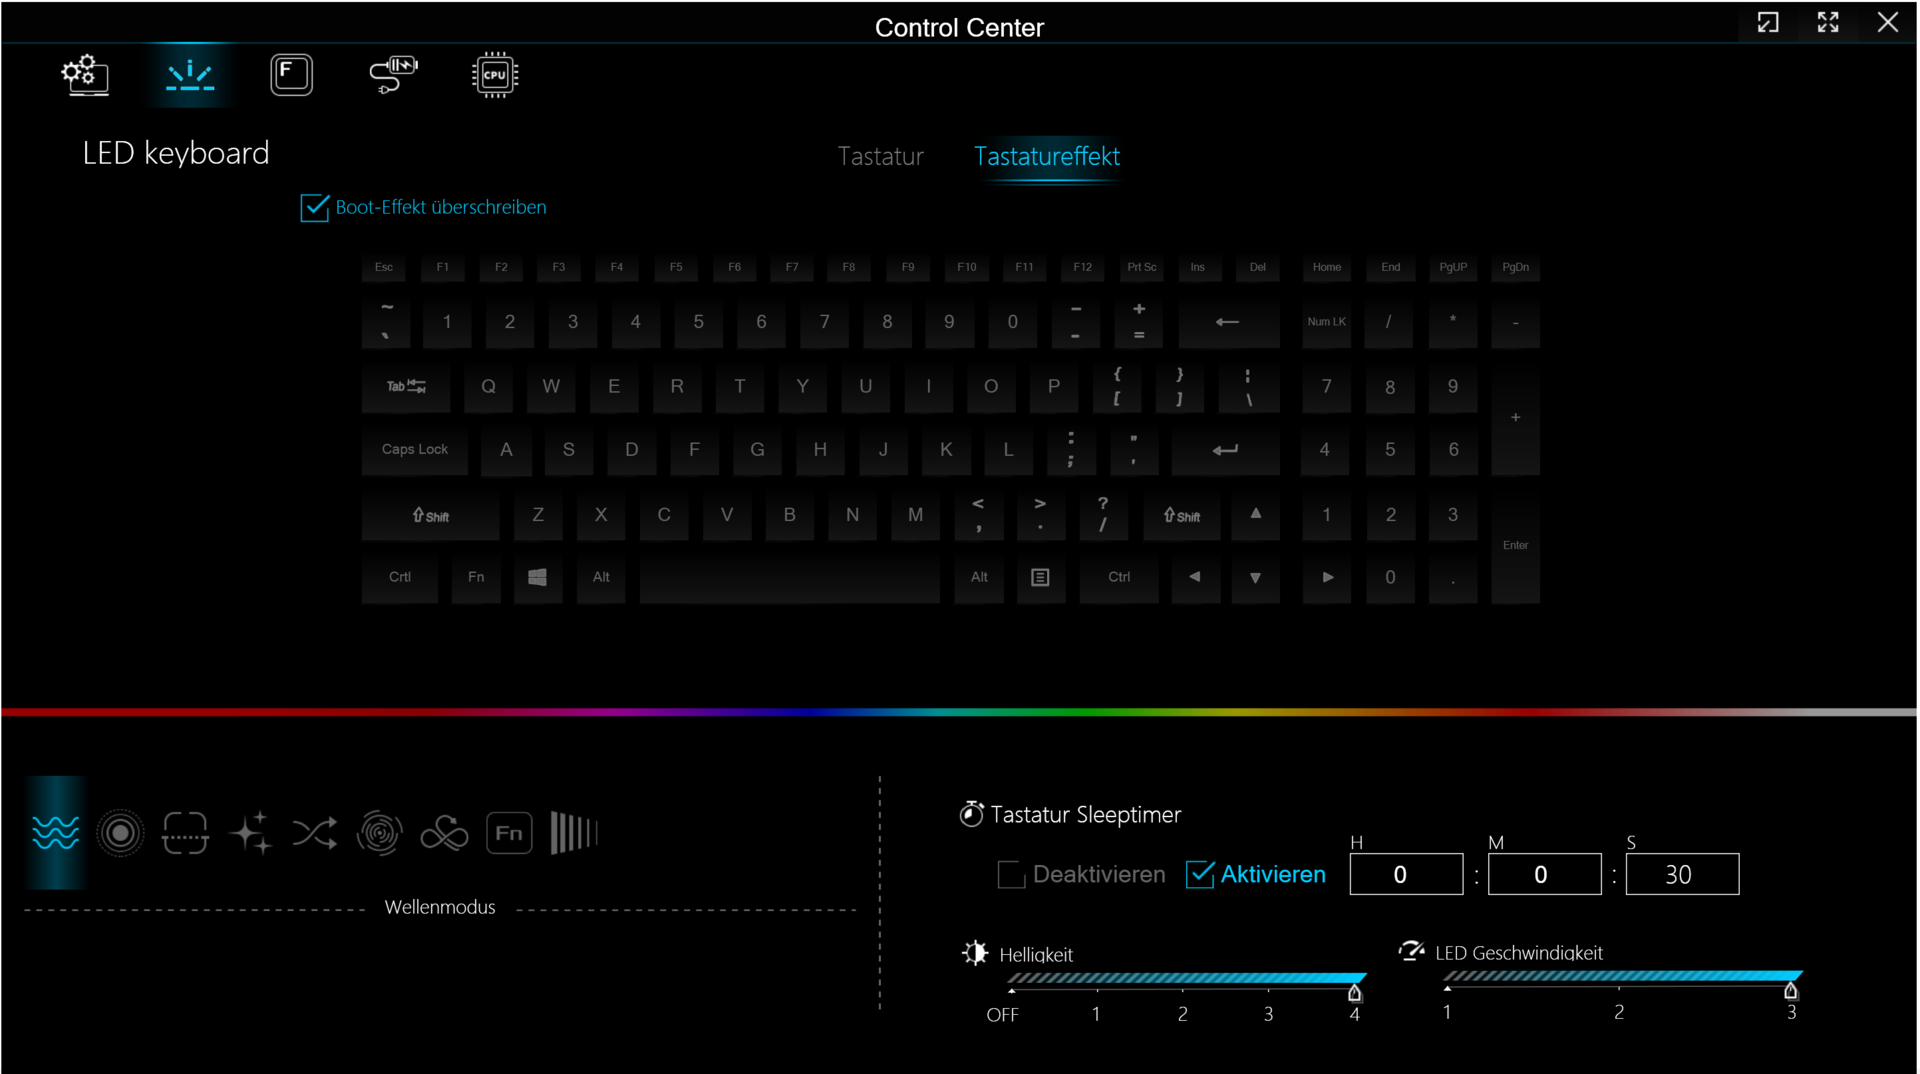
Input devices - Schenker laptop with per-key RGB
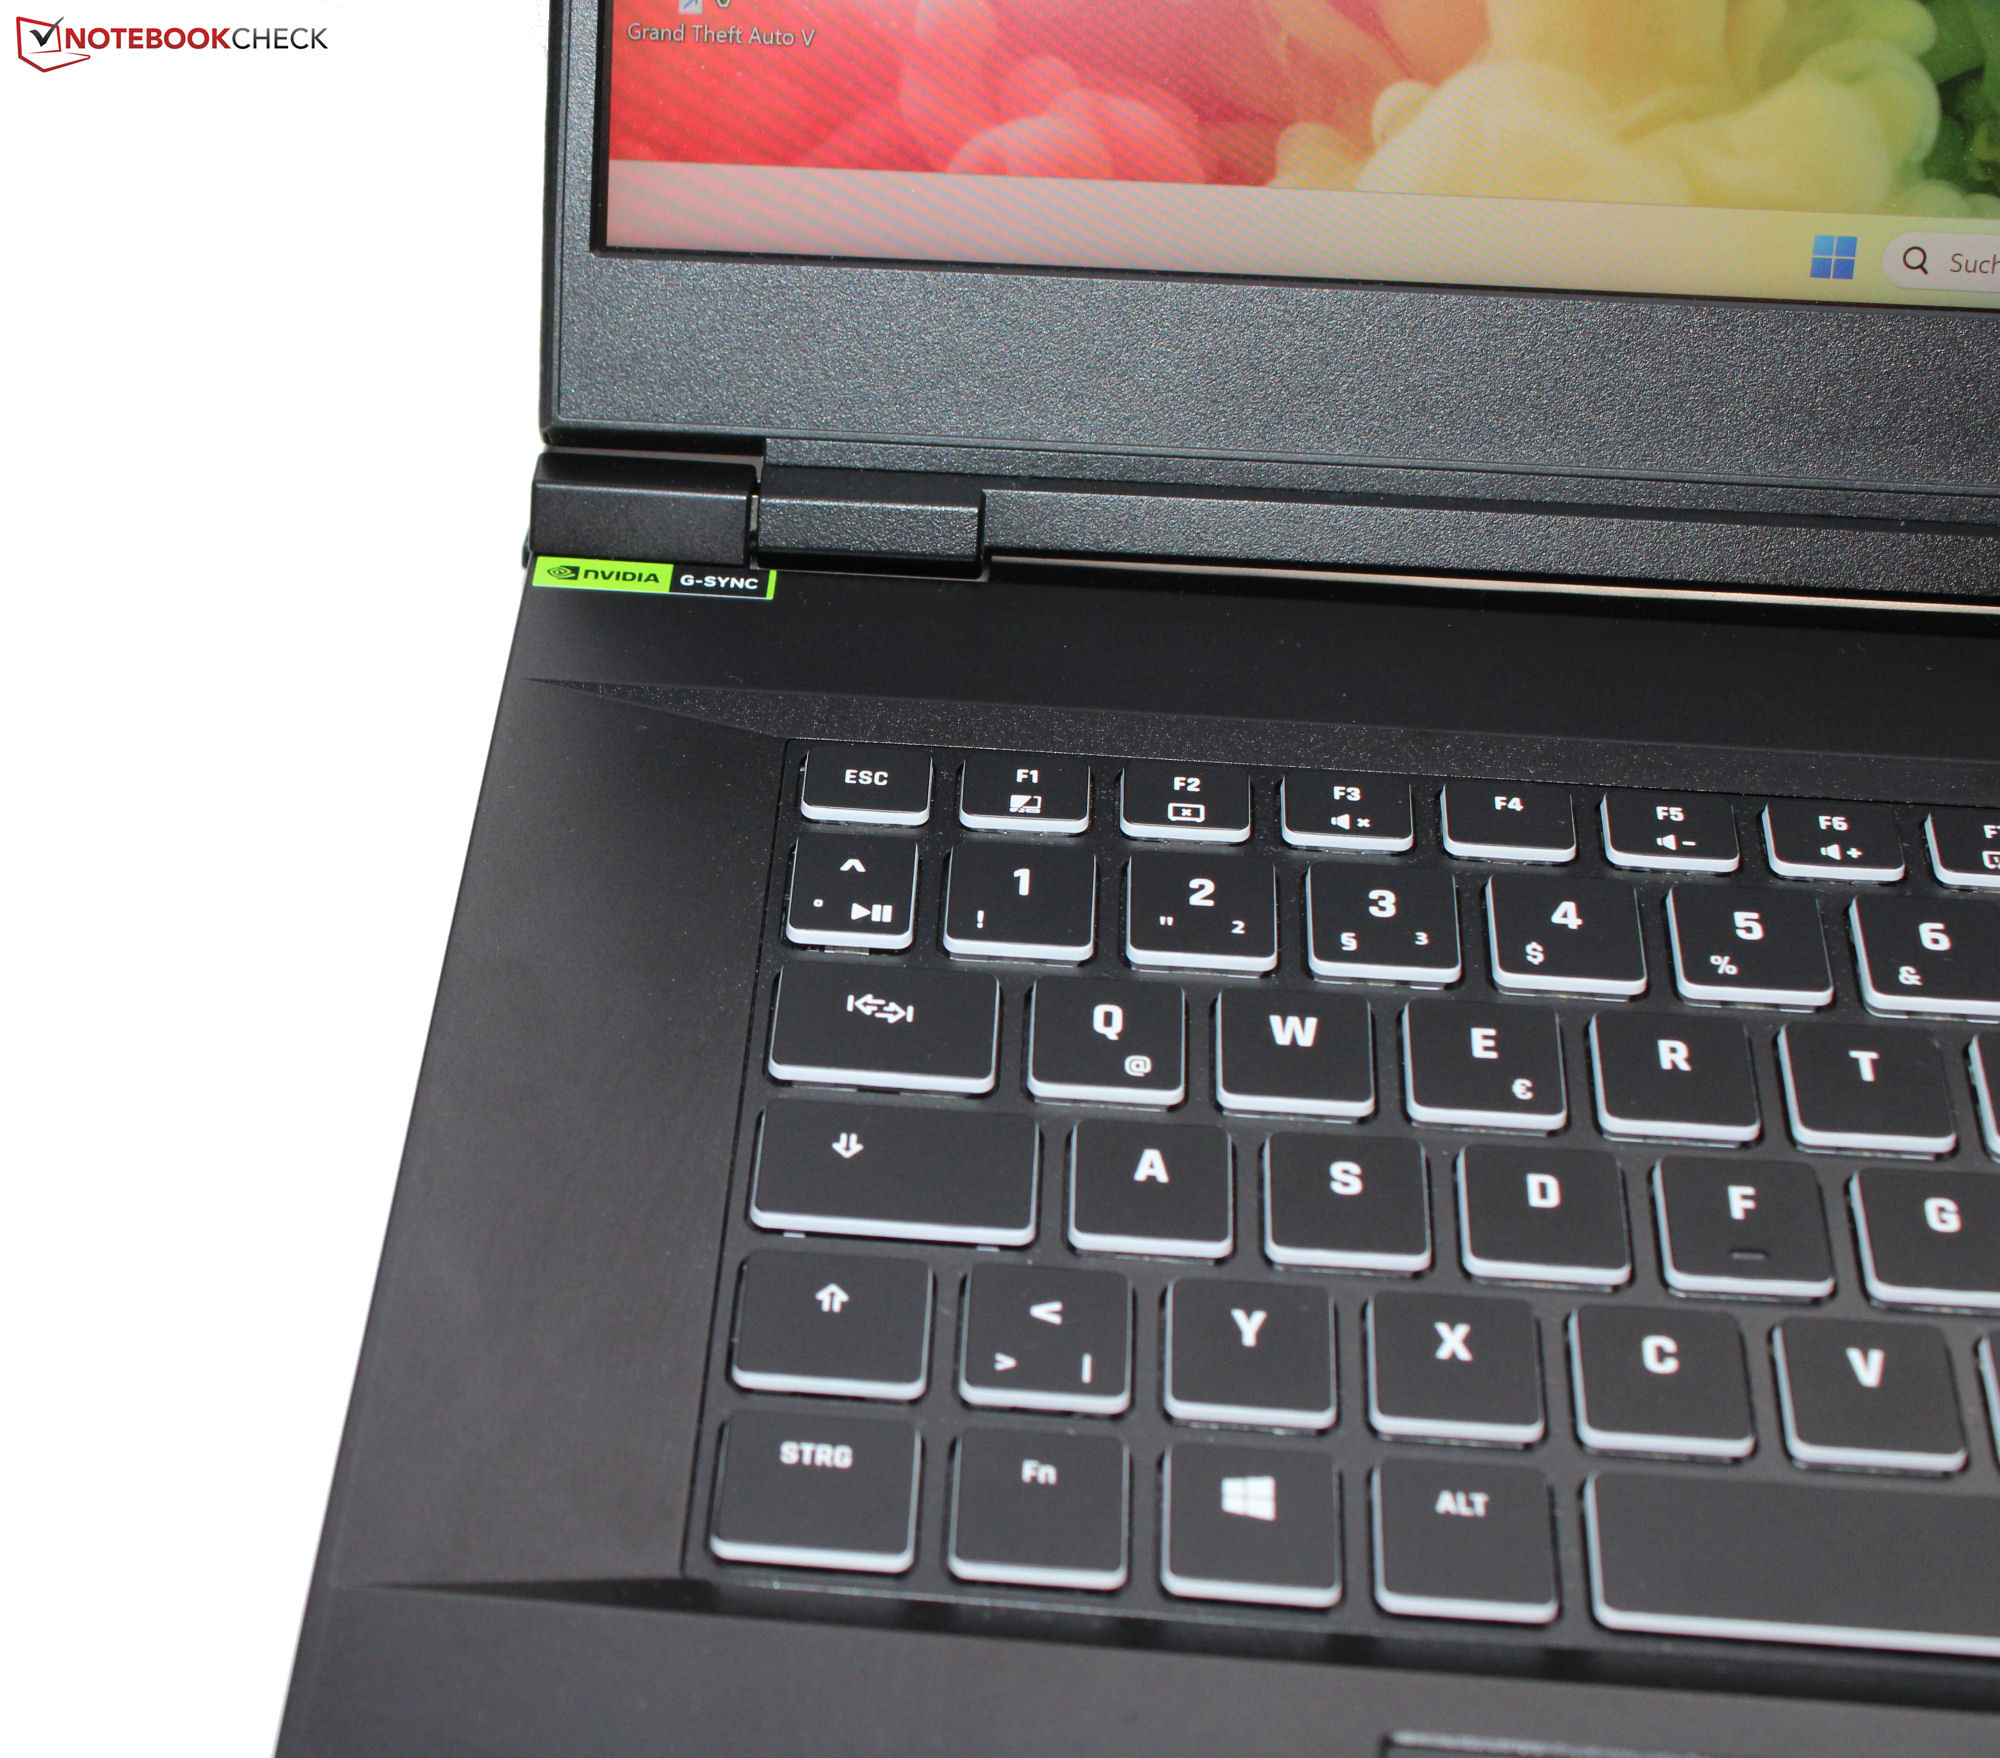
The flat, smooth keys on the chiclet keyboard (with per-key RGB lighting) have a moderate travel and a distinctive actuation point. Though the key resistance could be crisper in our opinion. The keyboard deck flexes a little during typing, but Schenker has overall delivered an adequate keyboard for everyday use. The Key 17 Pro also features a touchpad (measuring approx. 15 x 9.1 cm, or 5.9 x 3.6") with a short travel distance and clear click point.
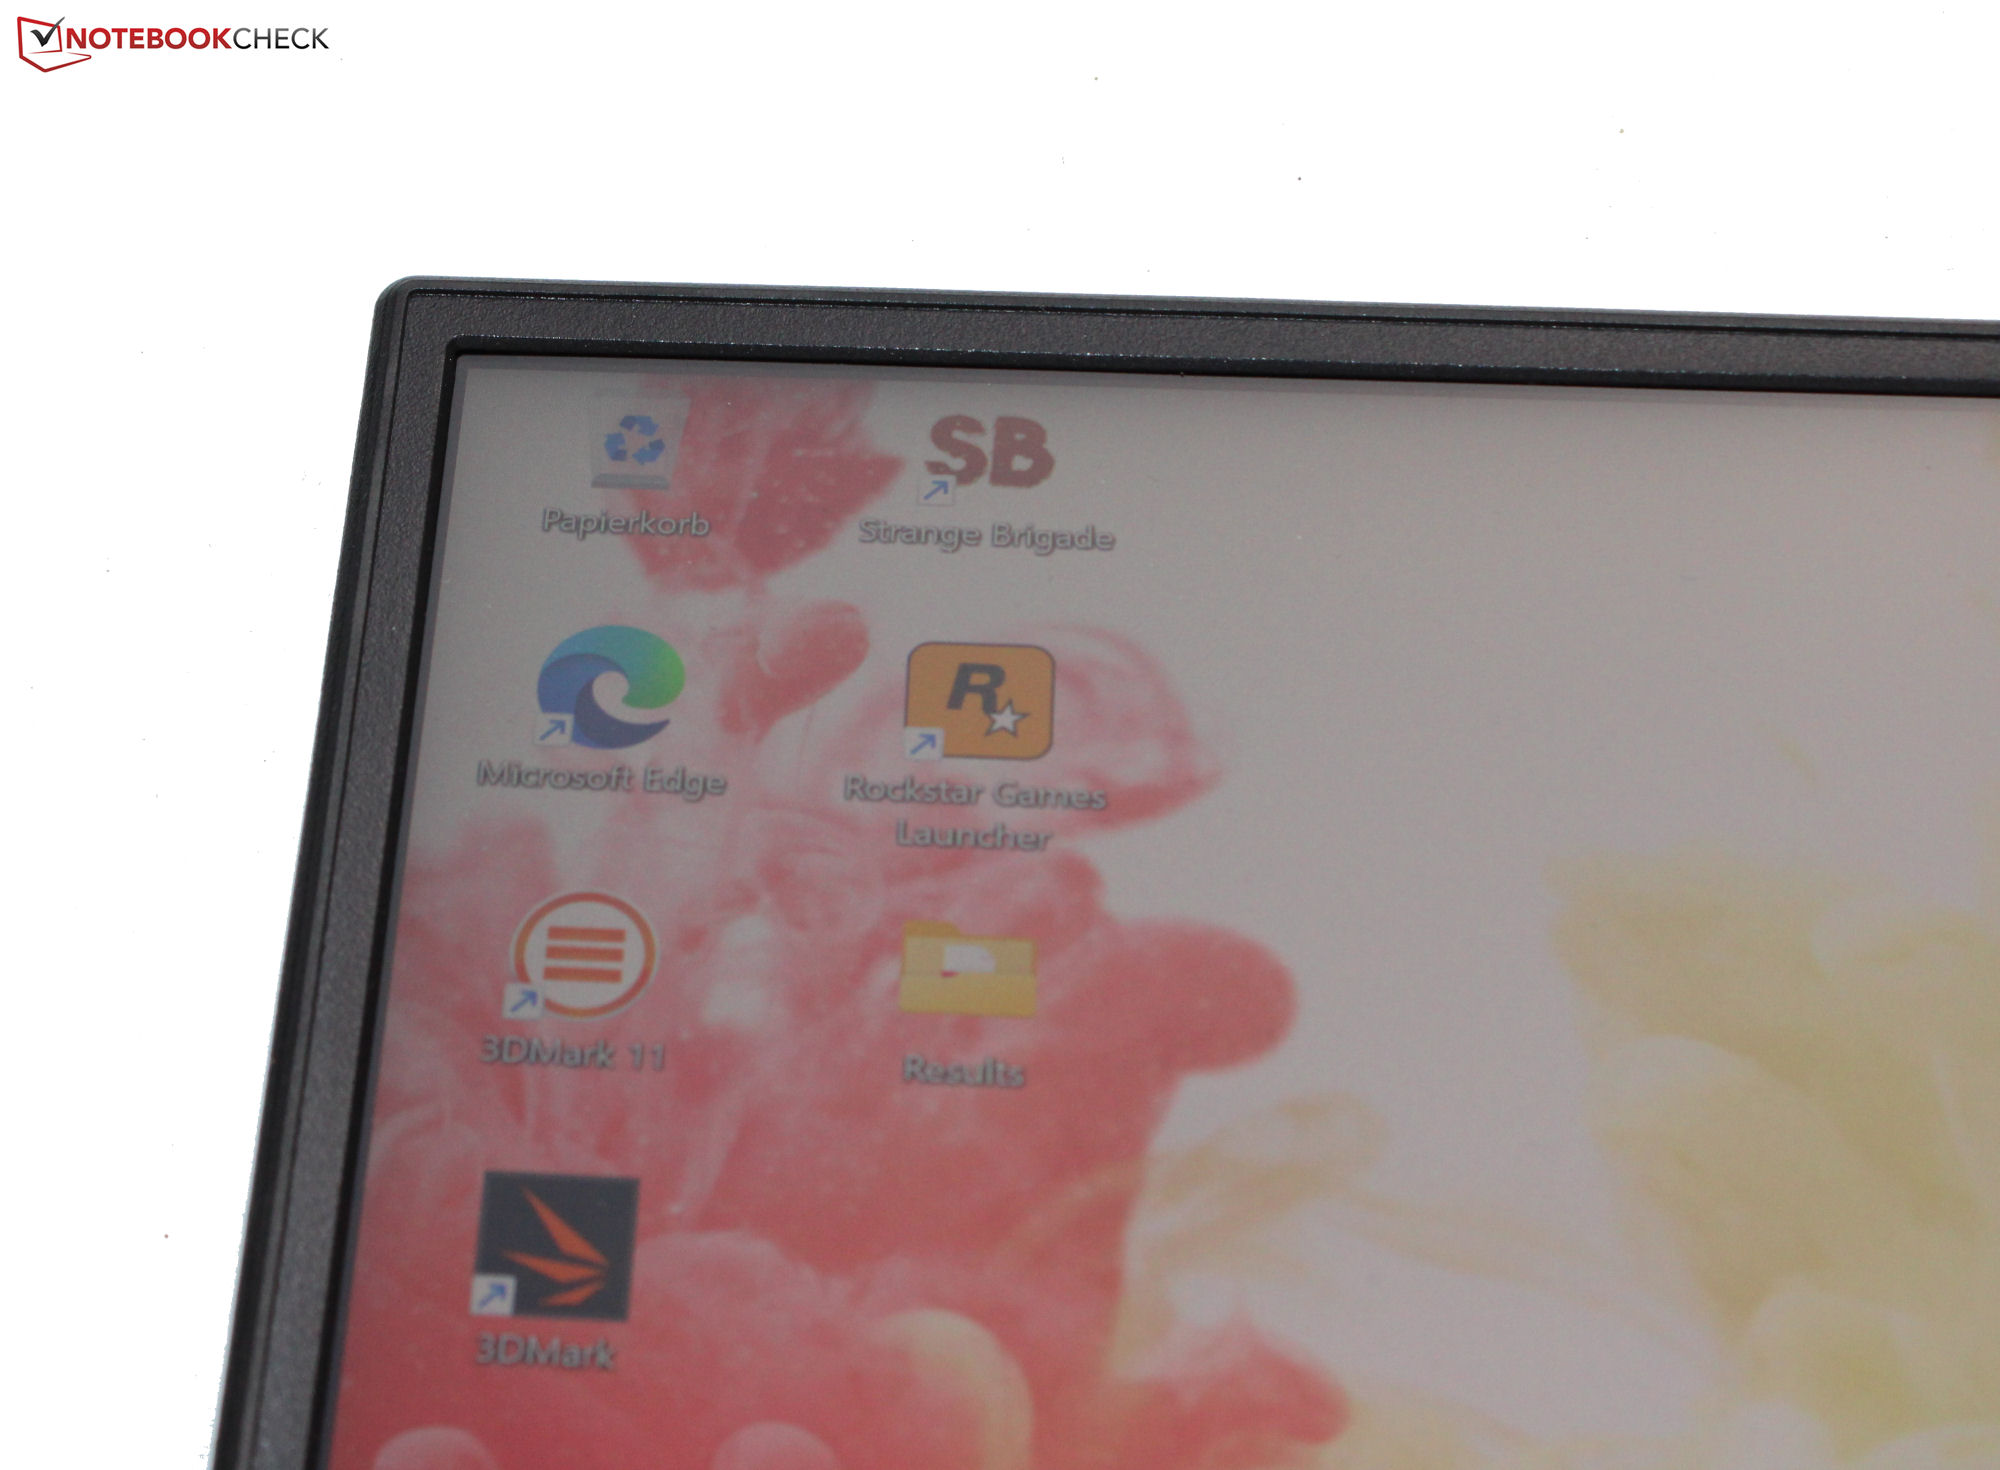
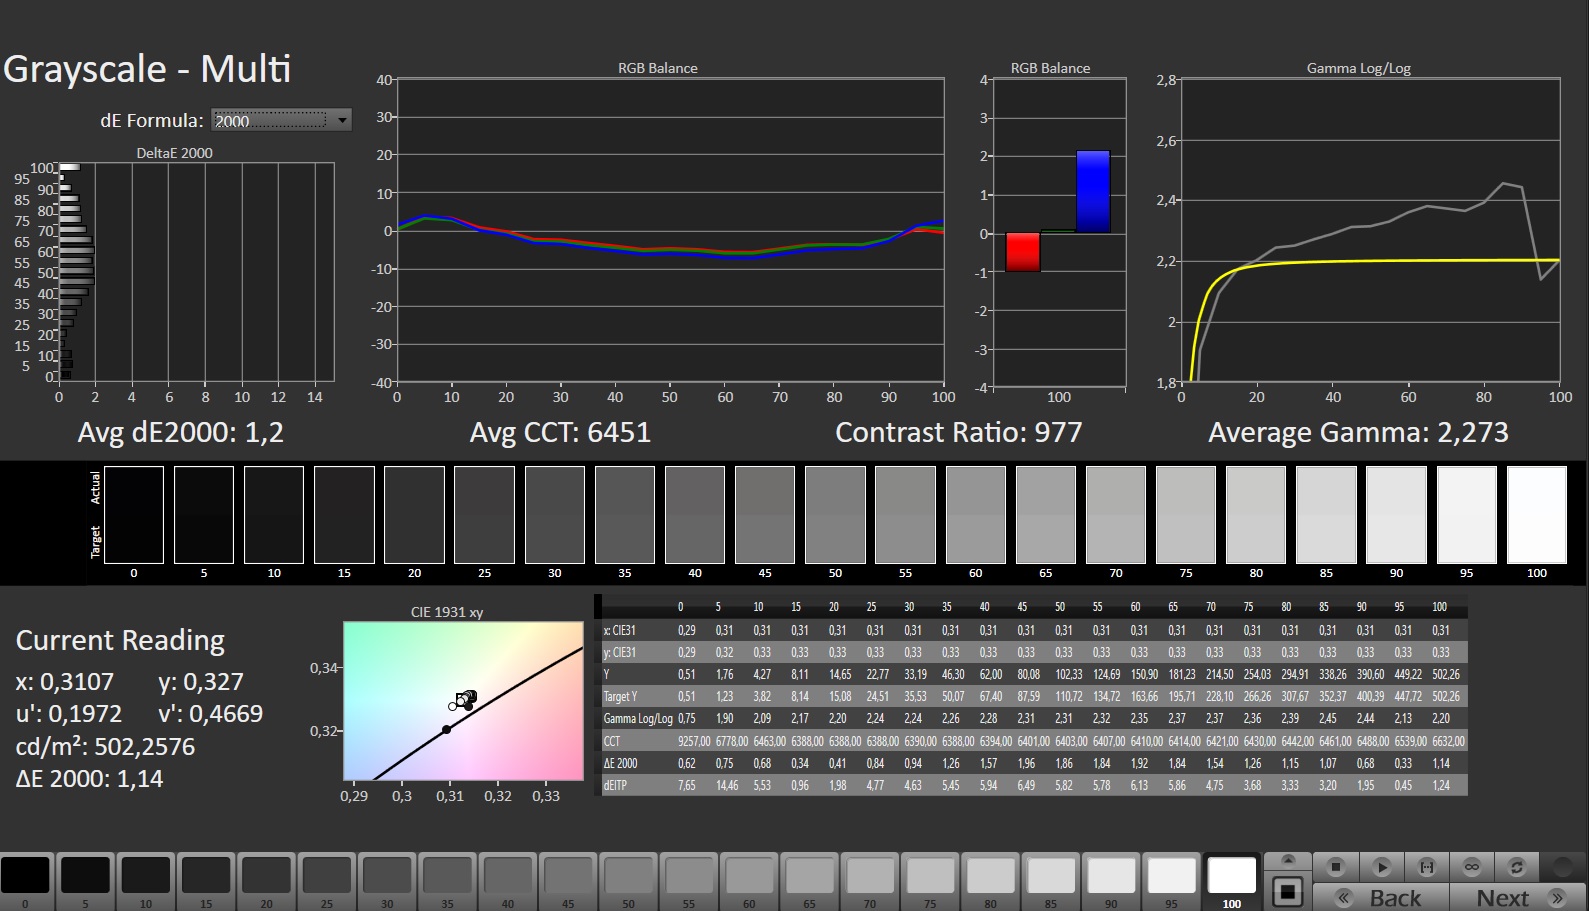
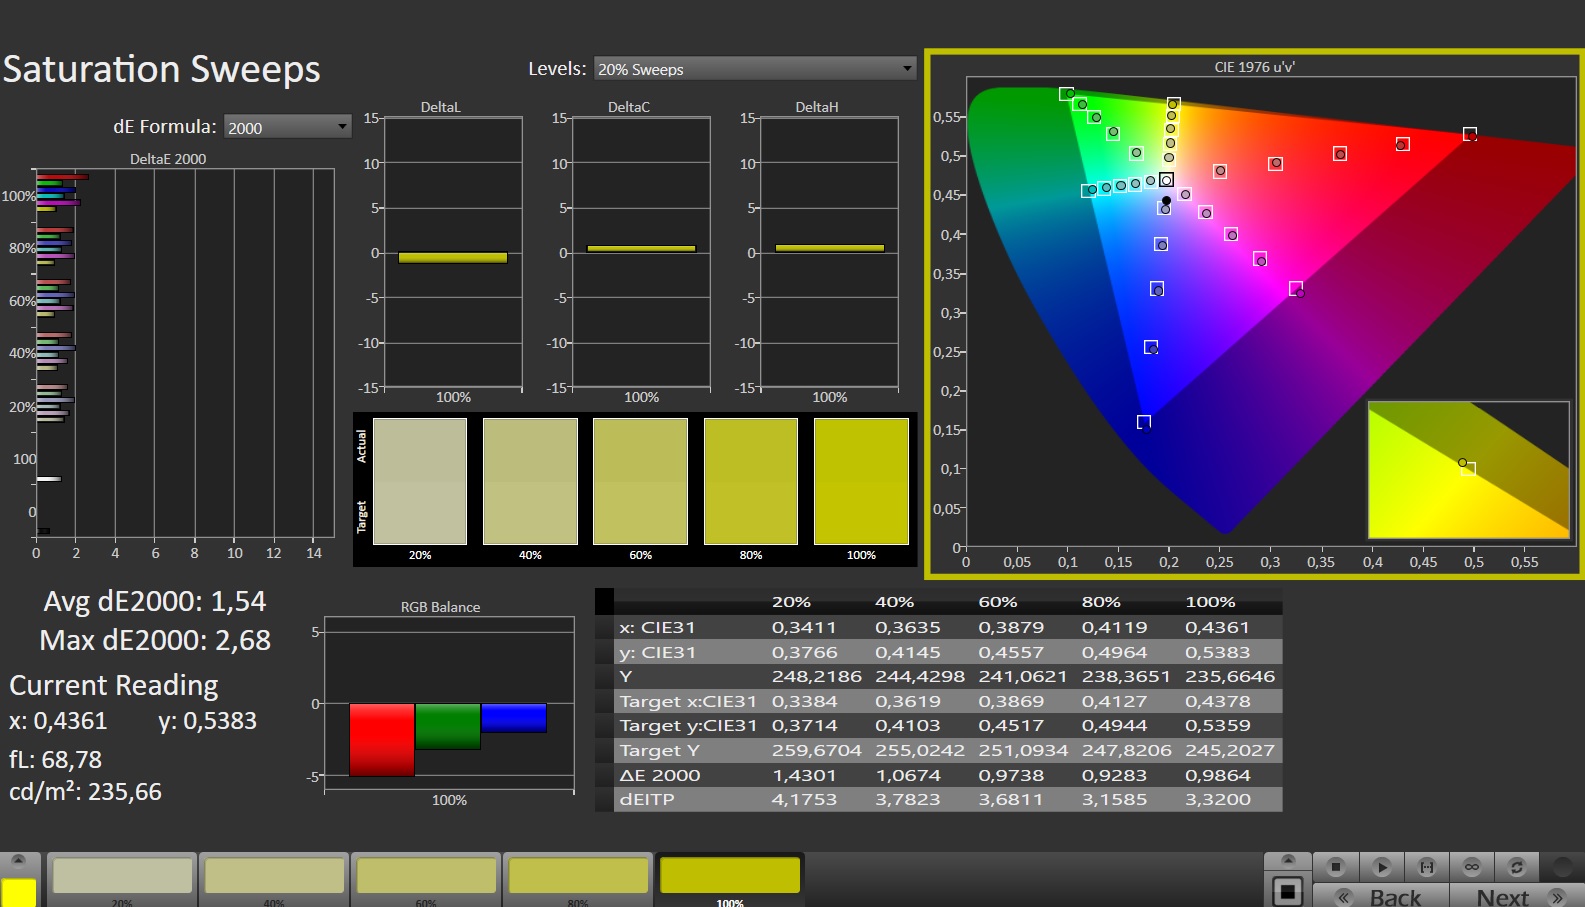
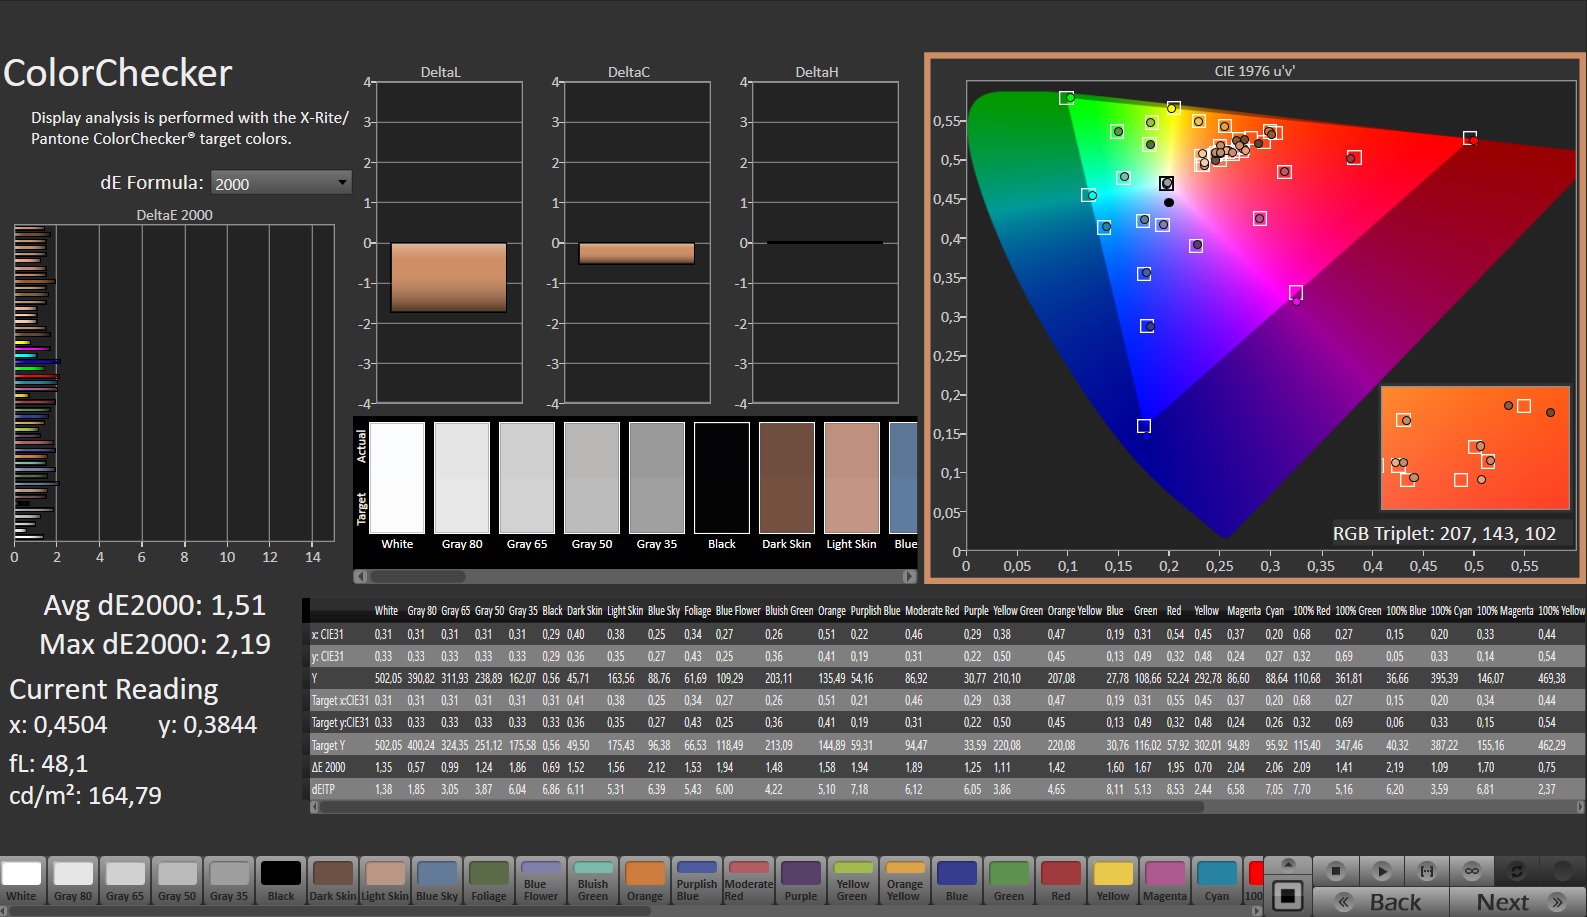
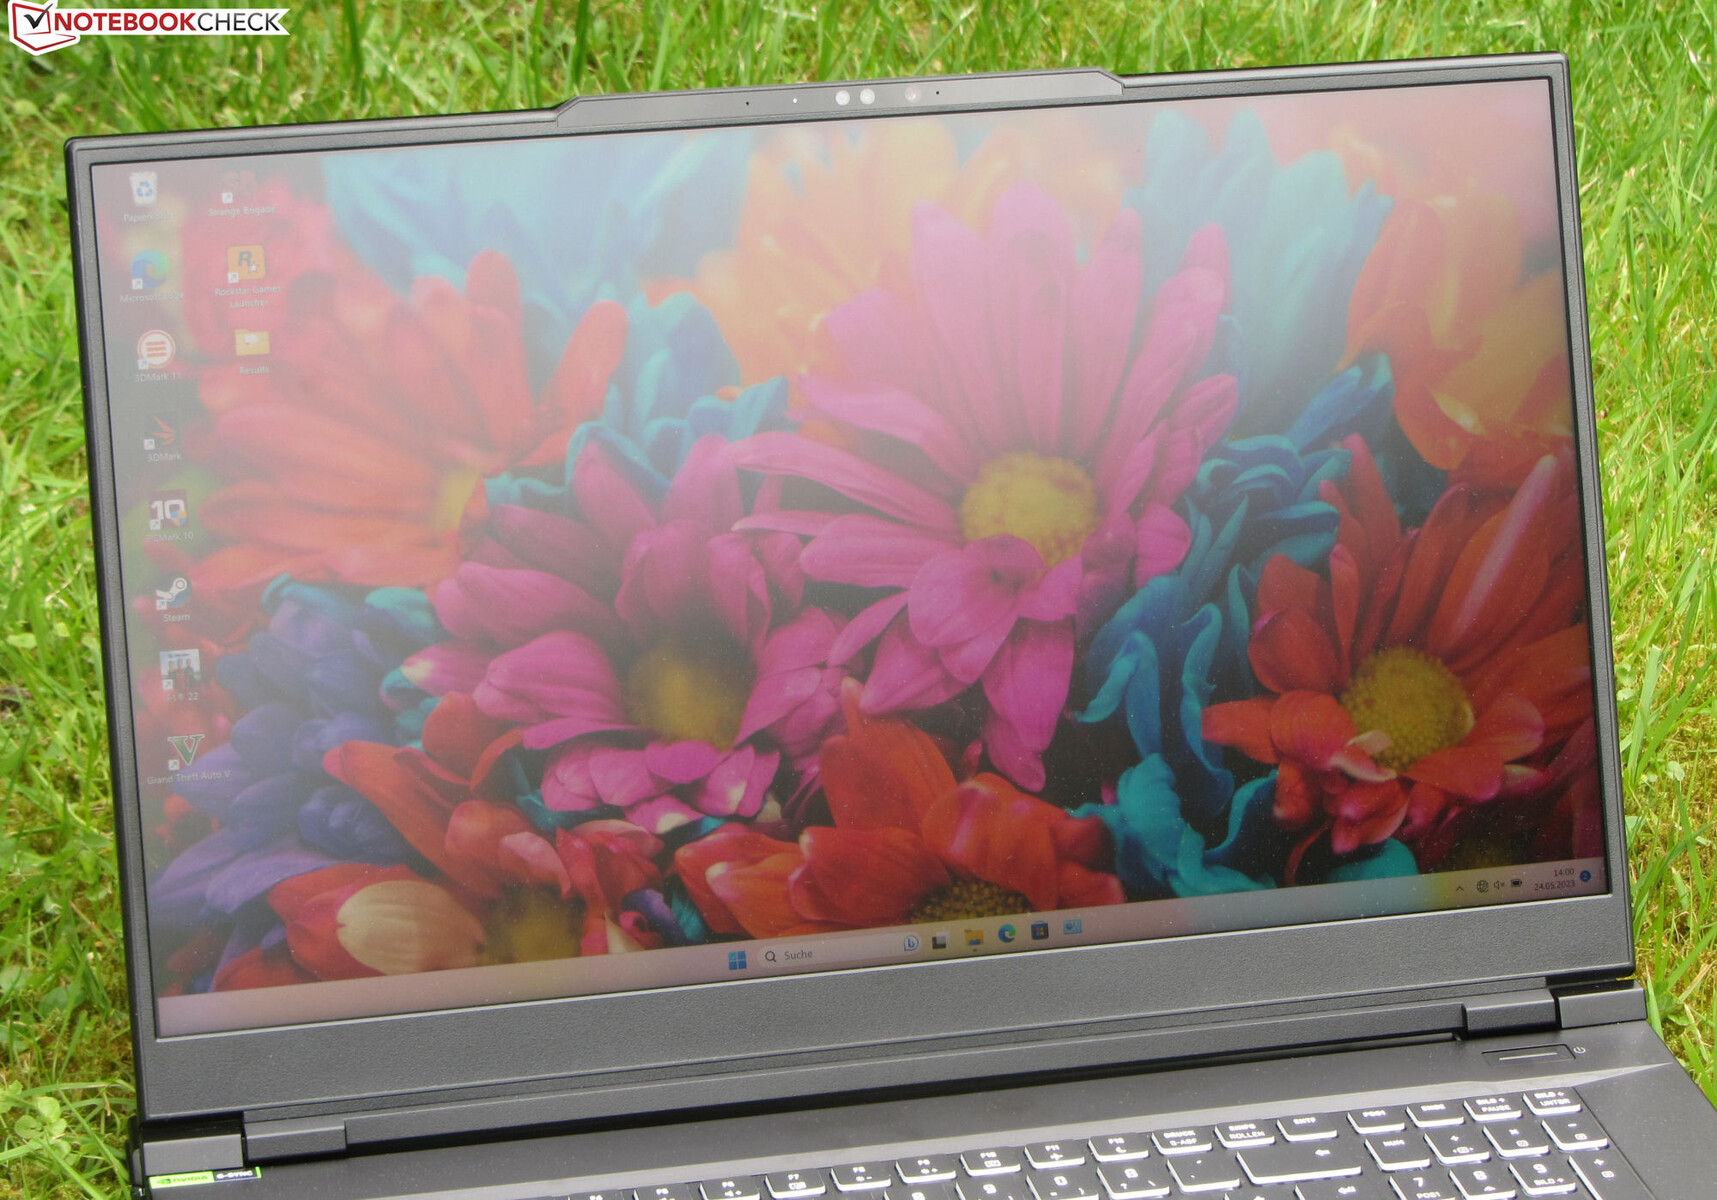
Display - UHD panel with DCI-P3 coverage
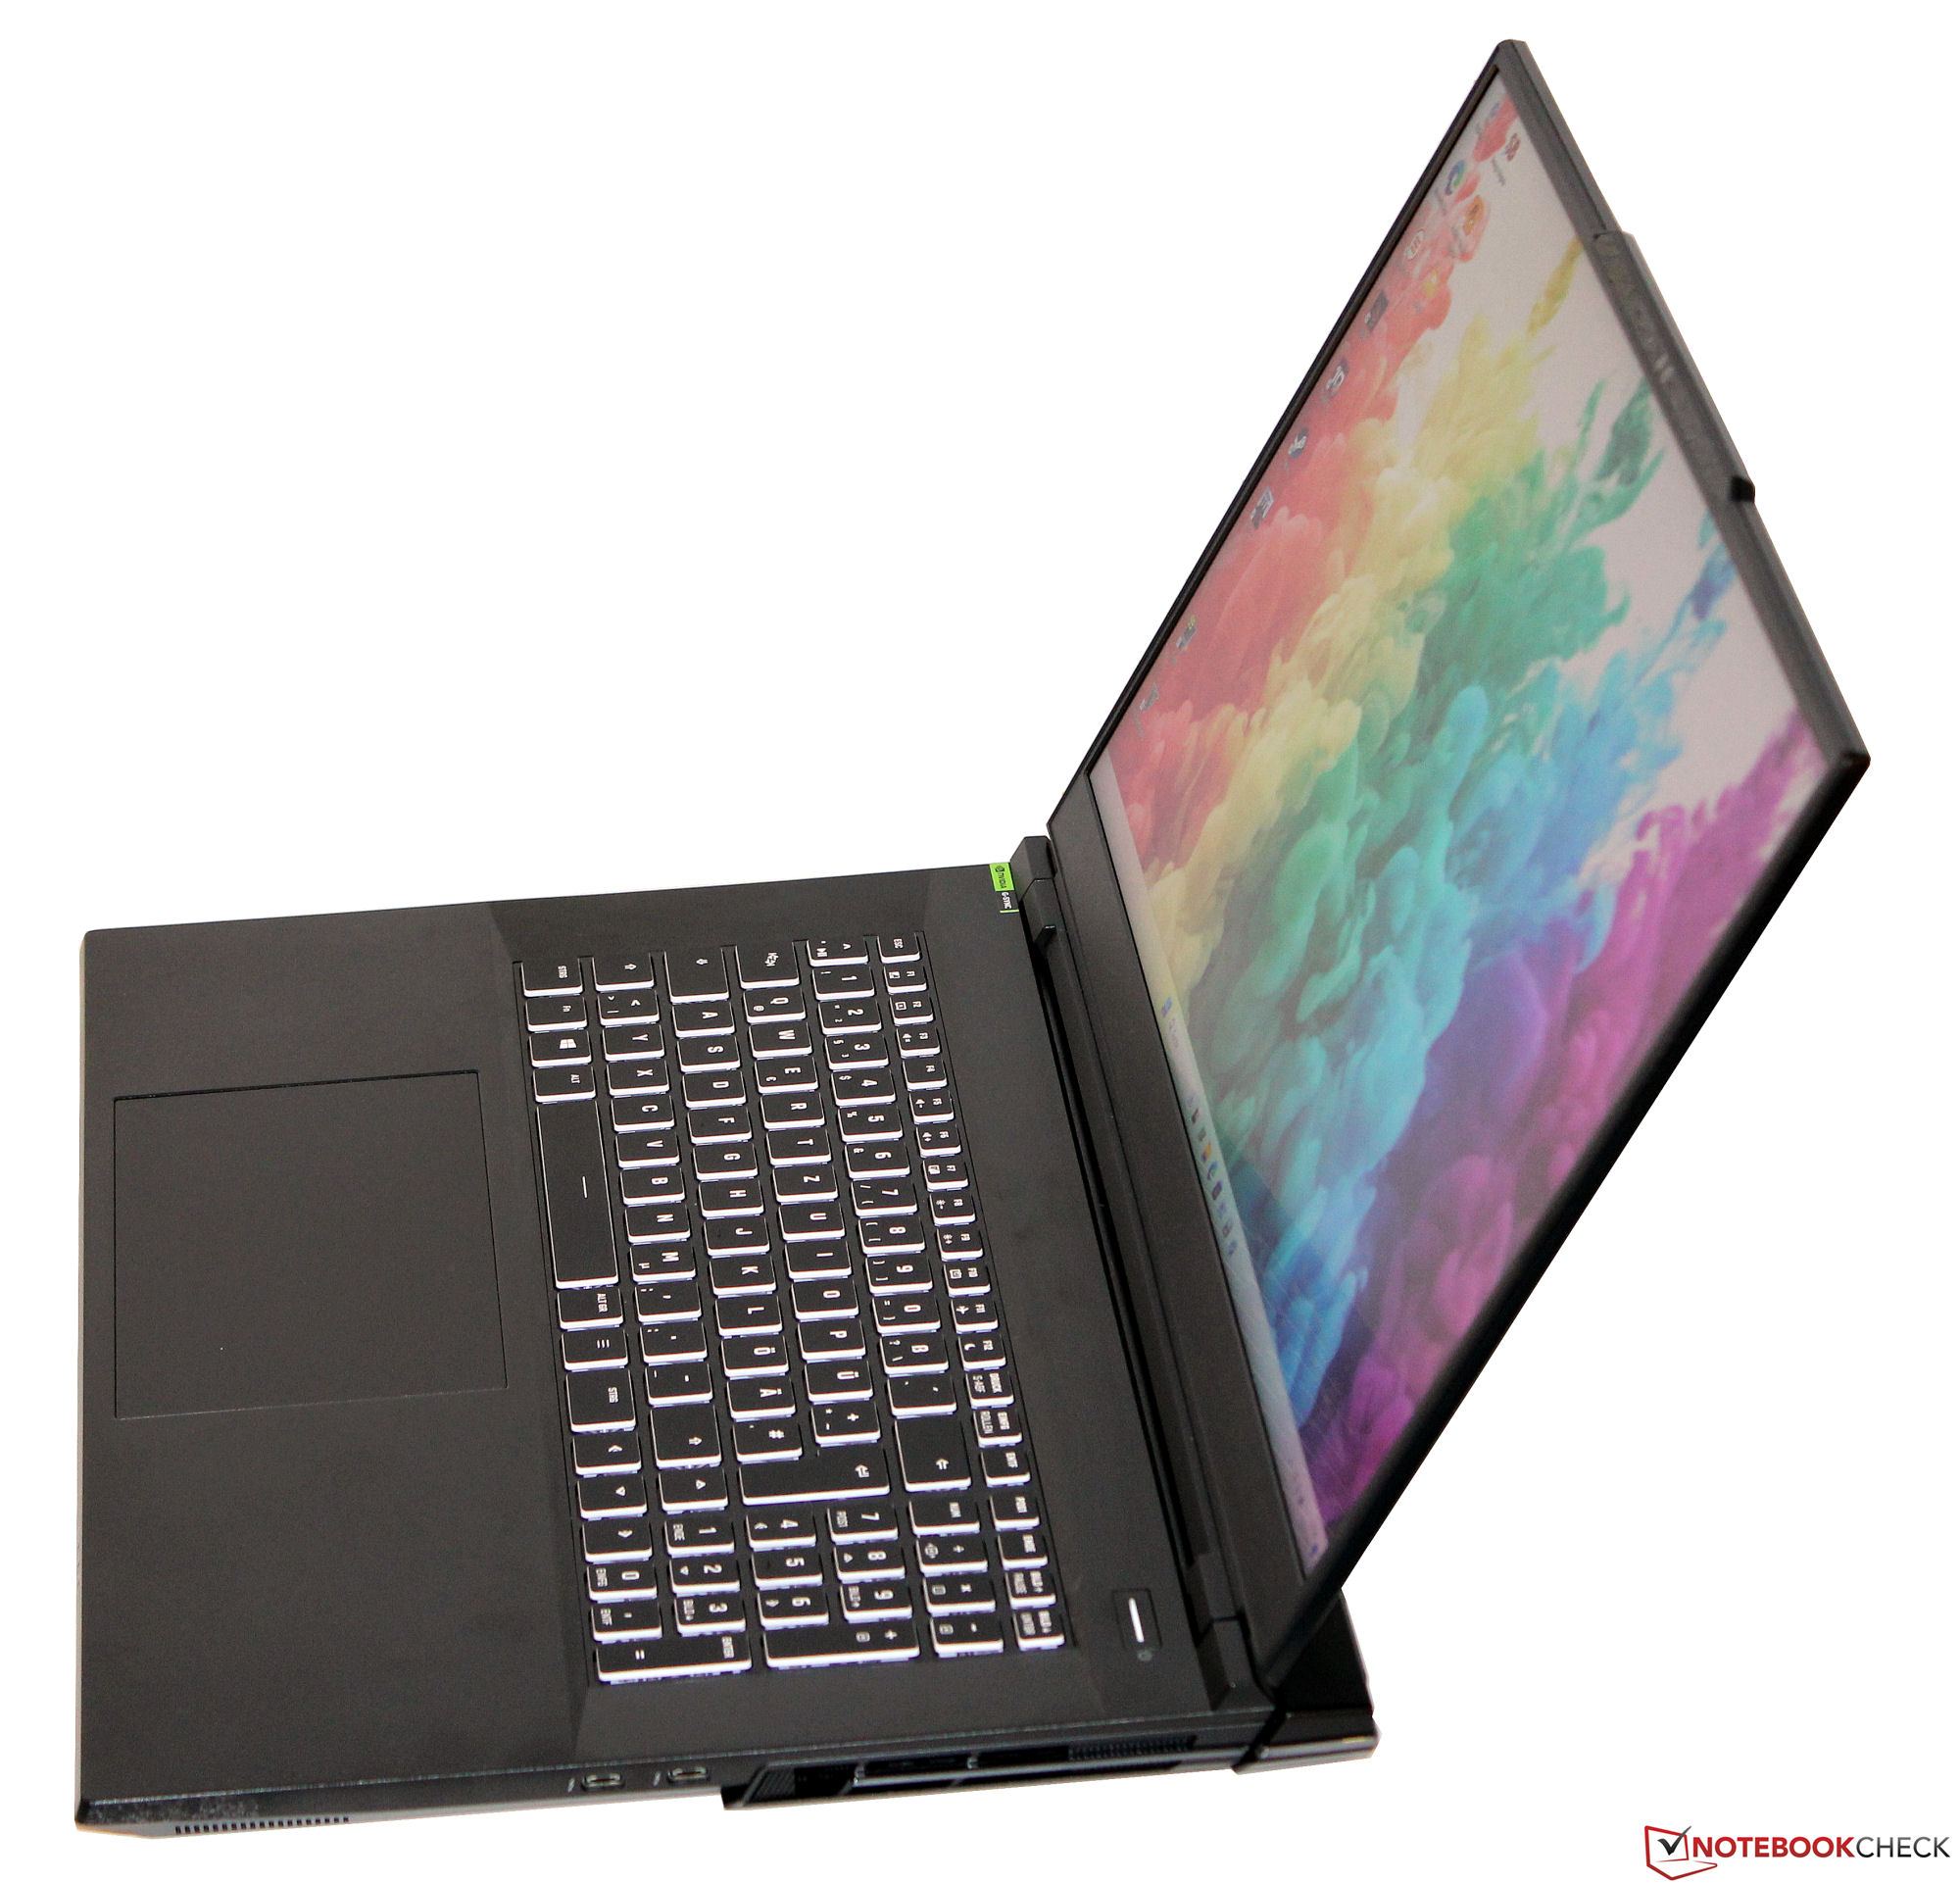
Besides the 4K IPS display (3,840 x 2,150 pixels, 144Hz) on the review unit, Schenker also offers the Key 17 Pro with a QHD IPS panel (2,560 x 1,440 pixels, 240Hz) – both 17.3-inch screens support G-Sync.
The 4K panel is characterised by its high brightness and the absence of PWM flicker and also offers a high refresh rate (144Hz) and fast response times. That said, it misses the mark (> 1,000:1) when it comes to contrast ratio.
| |||||||||||||||||||||||||
Brightness Distribution: 87 %
Center on Battery: 487 cd/m²
Contrast: 955:1 (Black: 0.51 cd/m²)
ΔE ColorChecker Calman: 1.51 | ∀{0.5-29.43 Ø4.73}
ΔE Greyscale Calman: 1.2 | ∀{0.09-98 Ø4.97}
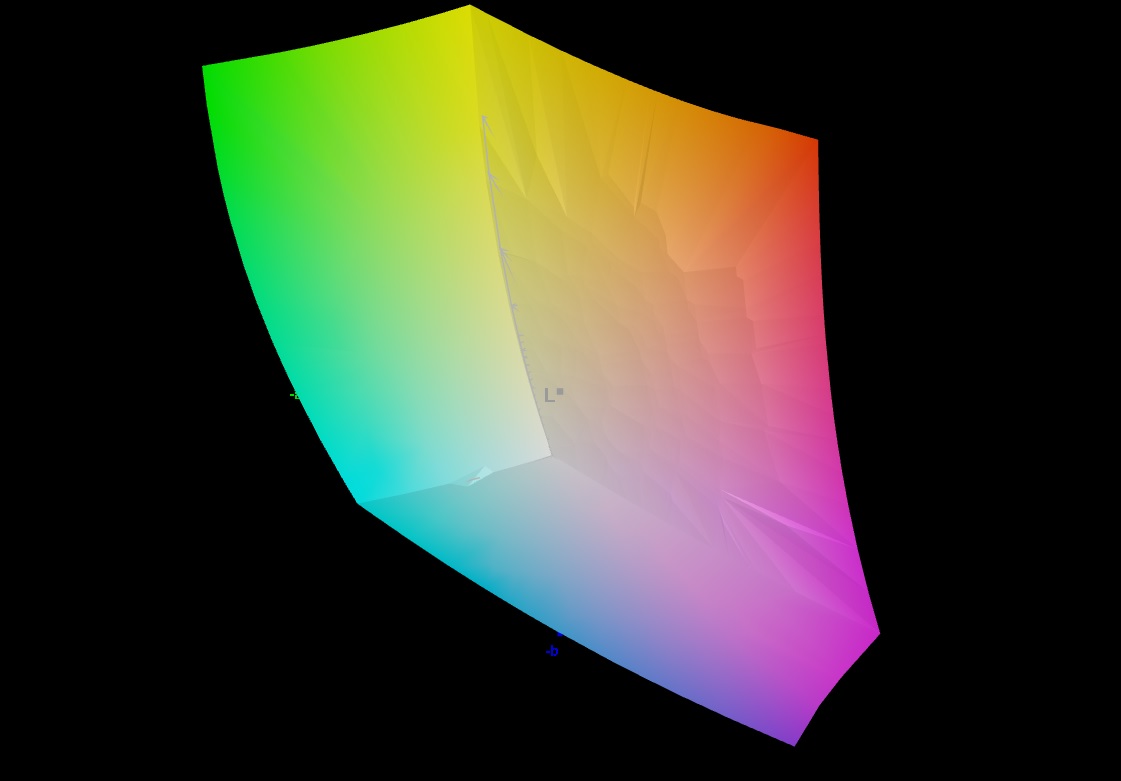
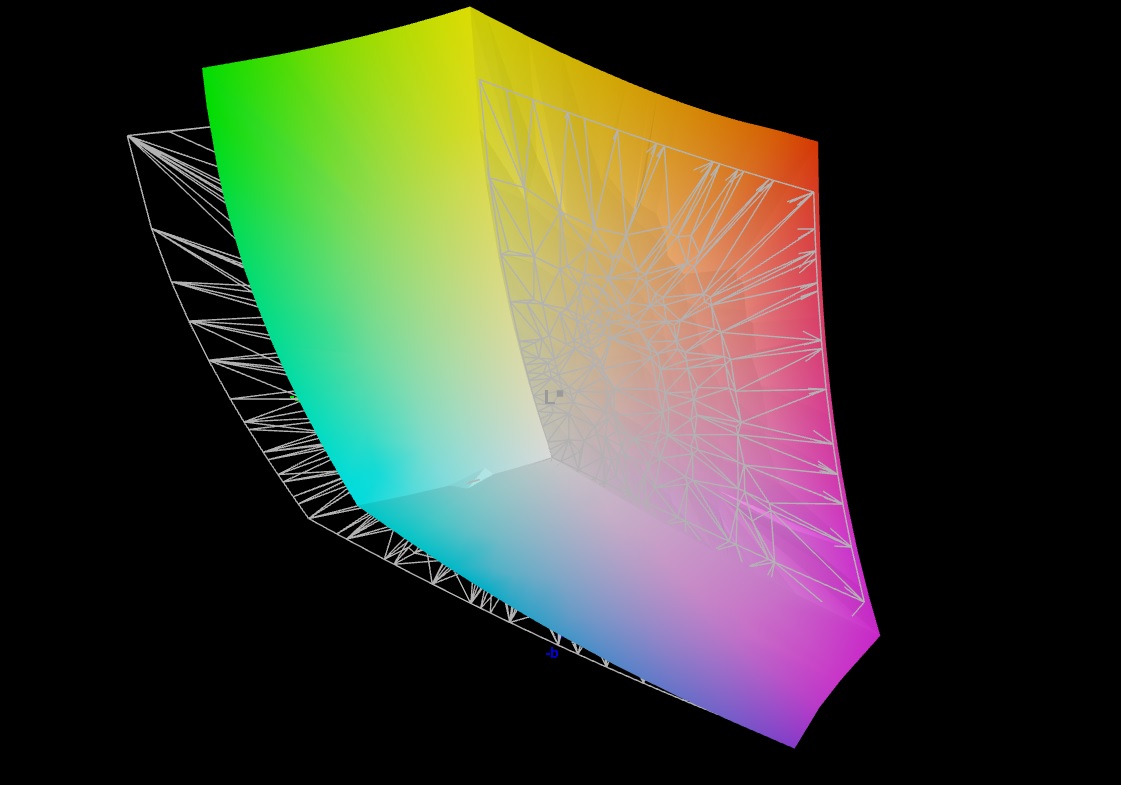
84.3% AdobeRGB 1998 (Argyll 3D)
99.9% sRGB (Argyll 3D)
96.4% Display P3 (Argyll 3D)
Gamma: 2.273
CCT: 6451 K
| Schenker Key 17 Pro (Early 23) BOE CQ NE173QUM-NY1, IPS, 3840x2160, 17.3" | MSI Stealth 17 Studio A13VH-014 AUO41A2 B173ZAN06.C, Mini LED, 3840x2160, 17.3" | Asus ROG Strix Scar 17 G733PY-XS96 NE173QHM-NZ2, IPS, 2560x1440, 17.3" | Aorus 17X AZF BOE09F9, IPS, 2560x1440, 17.3" | Medion Erazer Beast X40 BOE NE170QDM-NZ1, IPS, 2560x1600, 17" | |
|---|---|---|---|---|---|
| Display | 2% | 1% | 0% | -16% | |
| Display P3 Coverage (%) | 96.4 | 92 -5% | 98 2% | 96.7 0% | 68.6 -29% |
| sRGB Coverage (%) | 99.9 | 99.1 -1% | 100 0% | 99.9 0% | 99.8 0% |
| AdobeRGB 1998 Coverage (%) | 84.3 | 94.07 12% | 85.6 2% | 84.5 0% | 69.4 -18% |
| Response Times | -62% | 0% | -18% | 10% | |
| Response Time Grey 50% / Grey 80% * (ms) | 14.8 ? | 46.4 ? -214% | 6.2 ? 58% | 14 ? 5% | 11.3 ? 24% |
| Response Time Black / White * (ms) | 7.2 ? | 0.62 ? 91% | 11.4 ? -58% | 10.1 ? -40% | 7.5 ? -4% |
| PWM Frequency (Hz) | 2400 | ||||
| Screen | 221% | -8% | -57% | -29% | |
| Brightness middle (cd/m²) | 487 | 397.29 -18% | 322.5 -34% | 294 -40% | 384 -21% |
| Brightness (cd/m²) | 485 | 392 -19% | 317 -35% | 276 -43% | 377 -22% |
| Brightness Distribution (%) | 87 | 93 7% | 86 -1% | 90 3% | 90 3% |
| Black Level * (cd/m²) | 0.51 | 0.02 96% | 0.29 43% | 0.28 45% | 0.45 12% |
| Contrast (:1) | 955 | 19865 1980% | 1112 16% | 1050 10% | 853 -11% |
| Colorchecker dE 2000 * | 1.51 | 2.52 -67% | 1.15 24% | 2.81 -86% | 2.05 -36% |
| Colorchecker dE 2000 max. * | 2.19 | 3.91 -79% | 3.03 -38% | 5.7 -160% | 3.64 -66% |
| Greyscale dE 2000 * | 1.2 | 2.78 -132% | 1.7 -42% | 3.4 -183% | 2.3 -92% |
| Gamma | 2.273 97% | 2.63 84% | 2.27 97% | 2.301 96% | 2.017 109% |
| CCT | 6451 101% | 6412 101% | 6299 103% | 7389 88% | 6546 99% |
| Colorchecker dE 2000 calibrated * | 2.52 | 0.56 | 0.86 | 0.74 | |
| Total Average (Program / Settings) | 54% /
127% | -2% /
-5% | -25% /
-38% | -12% /
-20% |
* ... smaller is better
The display already had excellent colour reproduction right out of the box. At roughly 1.5, its average colour difference certainly falls within what we consider good (Delta E < 3). Colour accuracy is a given: the panel has full sRGB coverage and can cover almost the entire DCI-P3 space; it is also capable of reproducing up to 84% of the AdobeRGB gamut.

Display Response Times
| ↔ Response Time Black to White | ||
|---|---|---|
| 7.2 ms ... rise ↗ and fall ↘ combined | ↗ 2.2 ms rise | 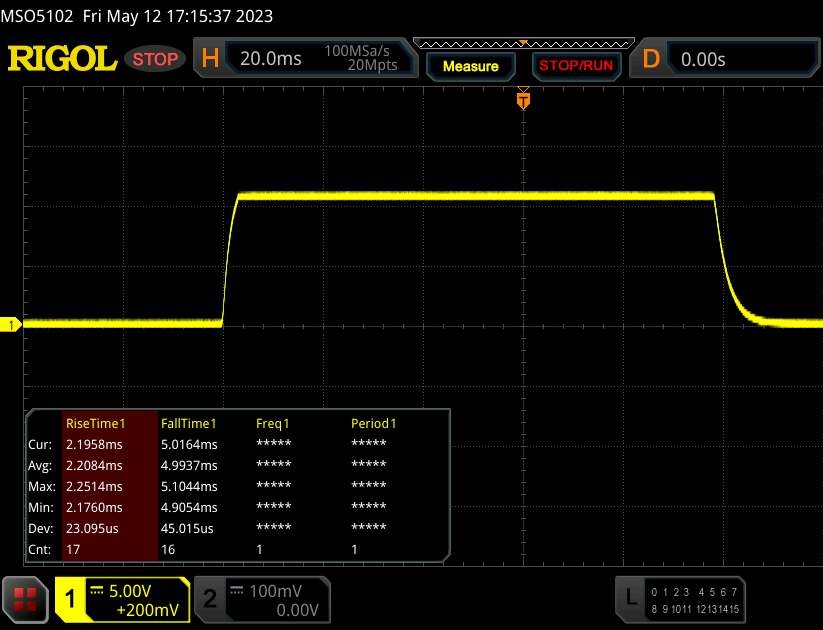 |
| ↘ 5 ms fall | ||
| The screen shows very fast response rates in our tests and should be very well suited for fast-paced gaming. In comparison, all tested devices range from 0.1 (minimum) to 240 (maximum) ms. » 21 % of all devices are better. This means that the measured response time is better than the average of all tested devices (19.9 ms). | ||
| ↔ Response Time 50% Grey to 80% Grey | ||
| 14.8 ms ... rise ↗ and fall ↘ combined | ↗ 7.2 ms rise | 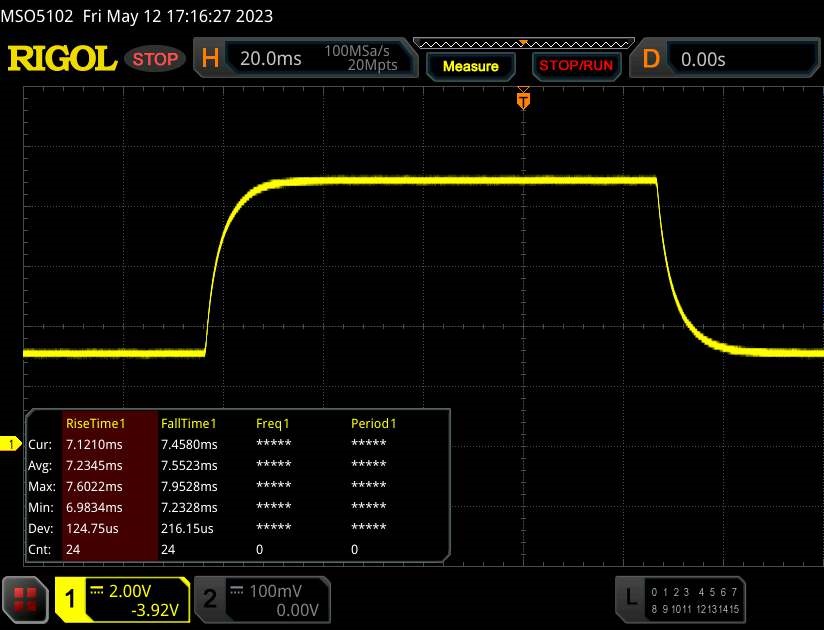 |
| ↘ 7.6 ms fall | ||
| The screen shows good response rates in our tests, but may be too slow for competitive gamers. In comparison, all tested devices range from 0.165 (minimum) to 636 (maximum) ms. » 29 % of all devices are better. This means that the measured response time is better than the average of all tested devices (31.1 ms). | ||
Screen Flickering / PWM (Pulse-Width Modulation)
| Screen flickering / PWM not detected | 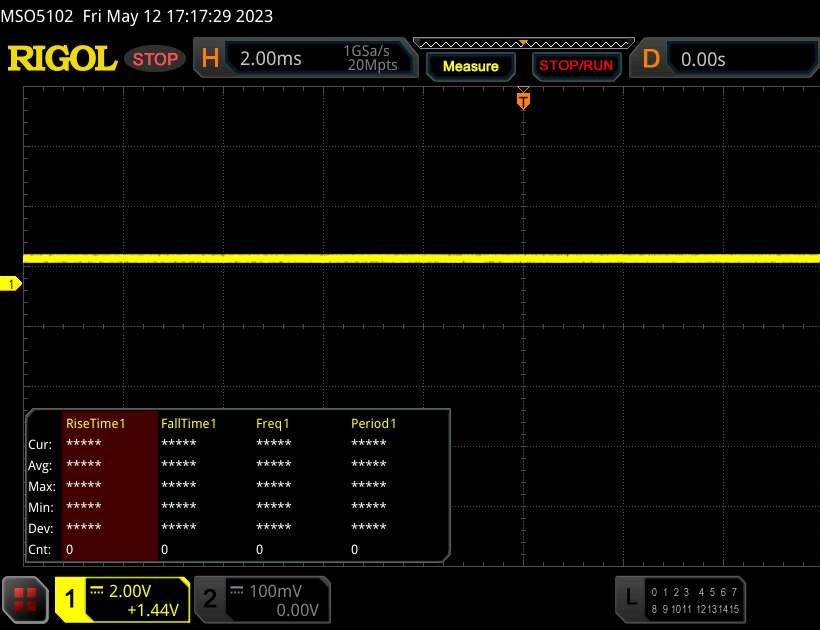 | ||
In comparison: 52 % of all tested devices do not use PWM to dim the display. If PWM was detected, an average of 7784 (minimum: 5 - maximum: 343500) Hz was measured. | |||
The IPS display is readable from any position thanks to its wide viewing angle. You can certainly make out contents on the screen even when outdoors, provided the sun isn't shining too brightly.
Performance - The Key 17 features high-end hardware
The Schenker Key 17 Pro is a high-end 17.3-inch laptop that harnesses the power of Raptor Lake and Ada Lovelace. You can configure the laptop to your needs in Schenker's online shop. Our review unit costs around €4,500 (US$4,820). And prices start at €3,200 (US$3,427).
Test conditions
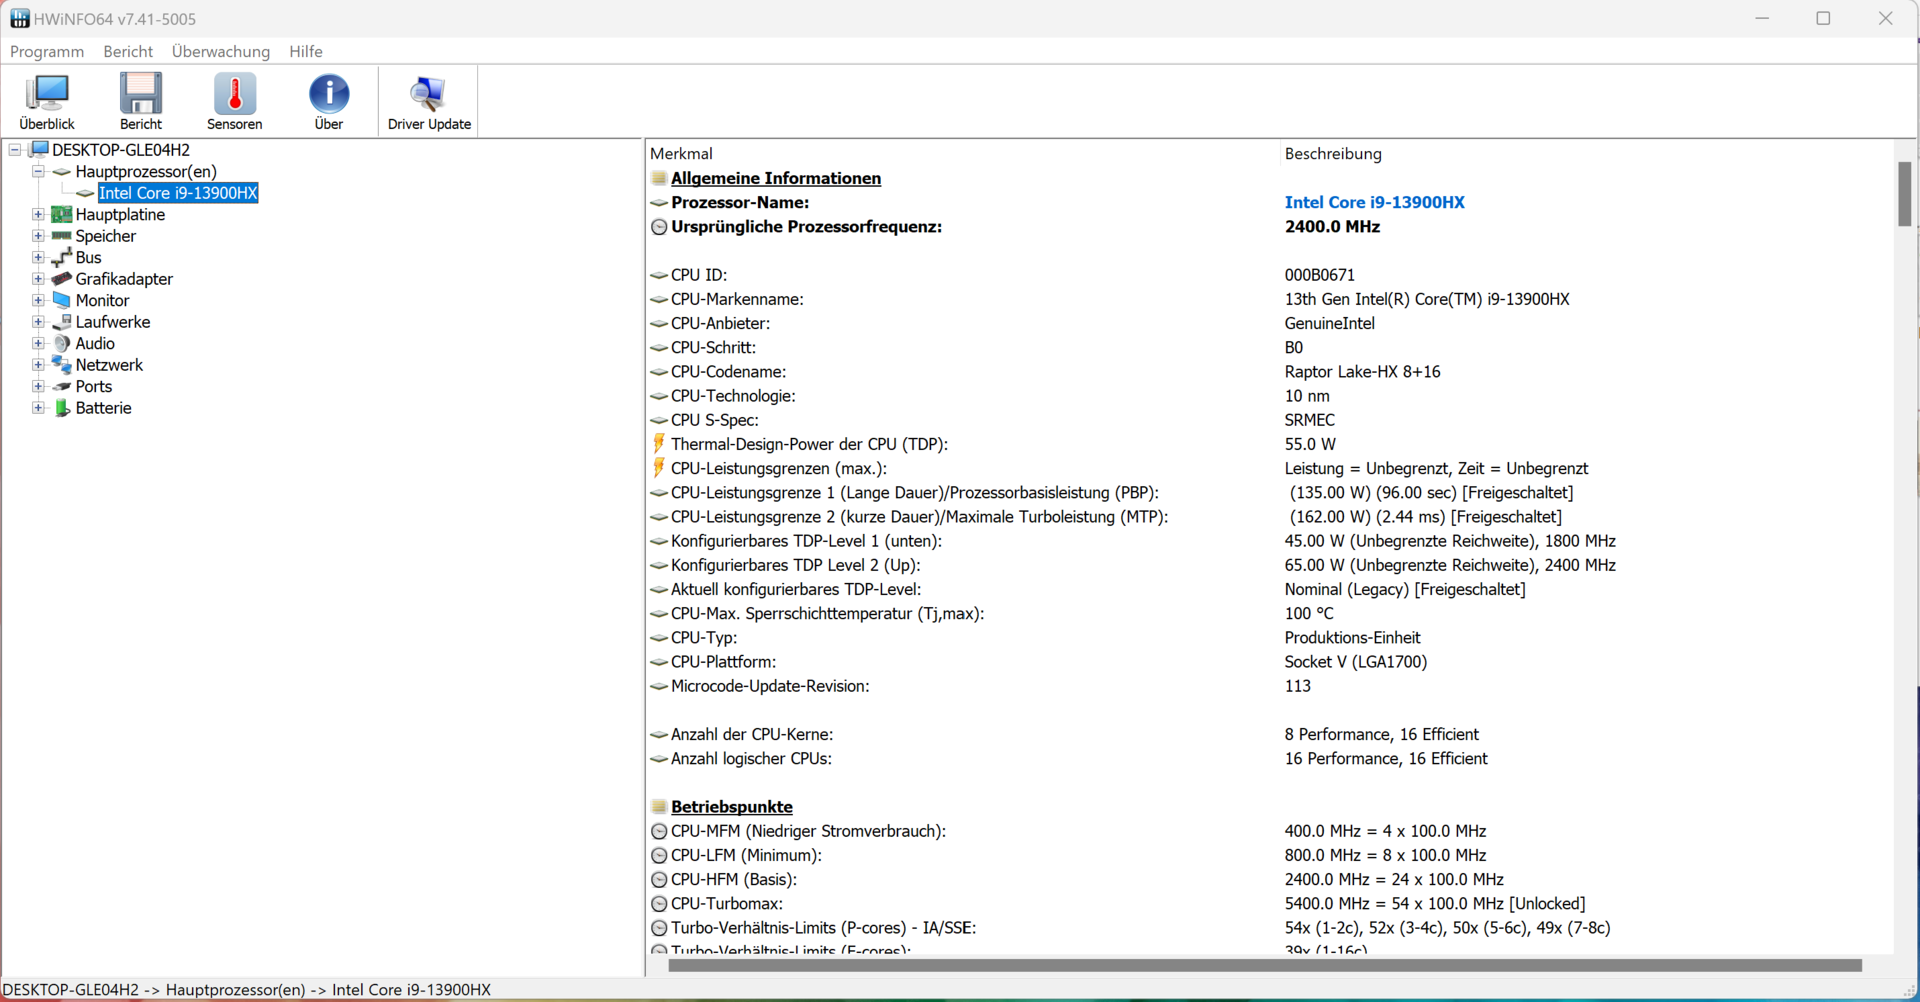
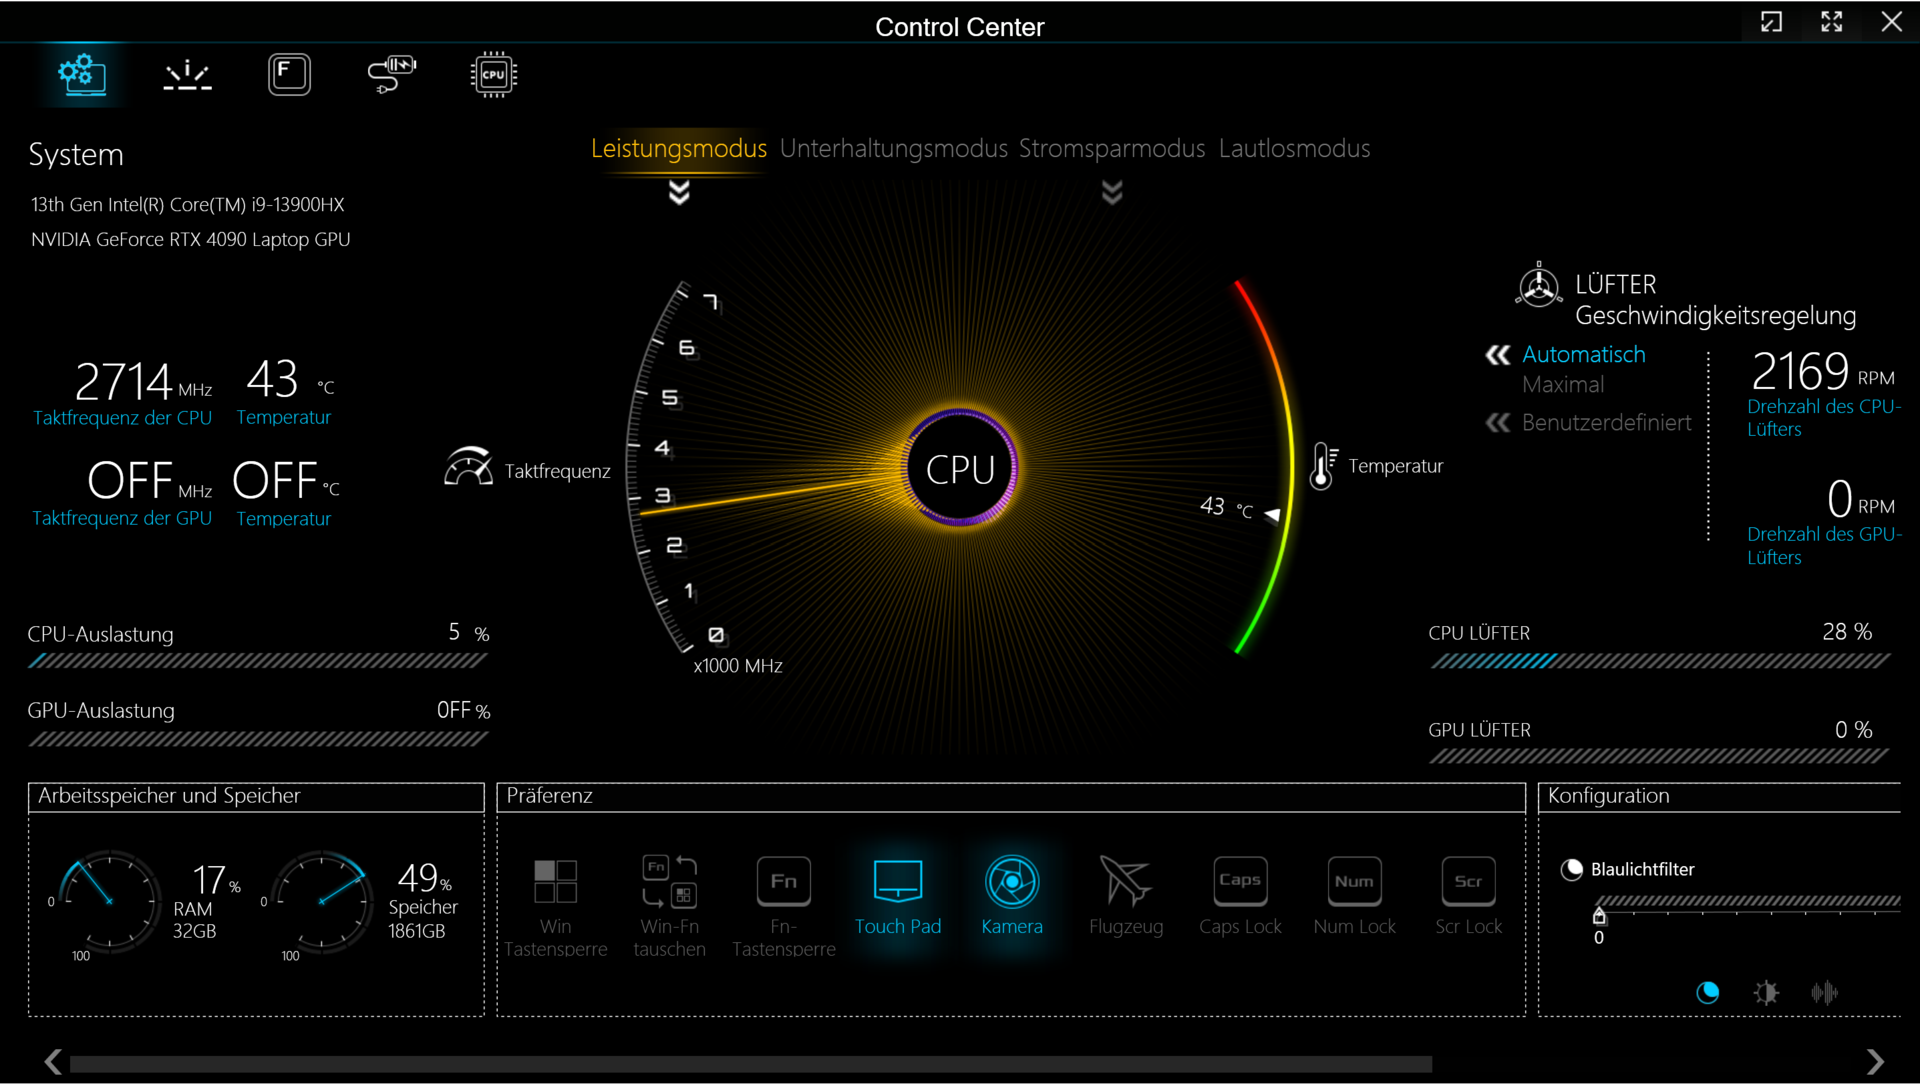
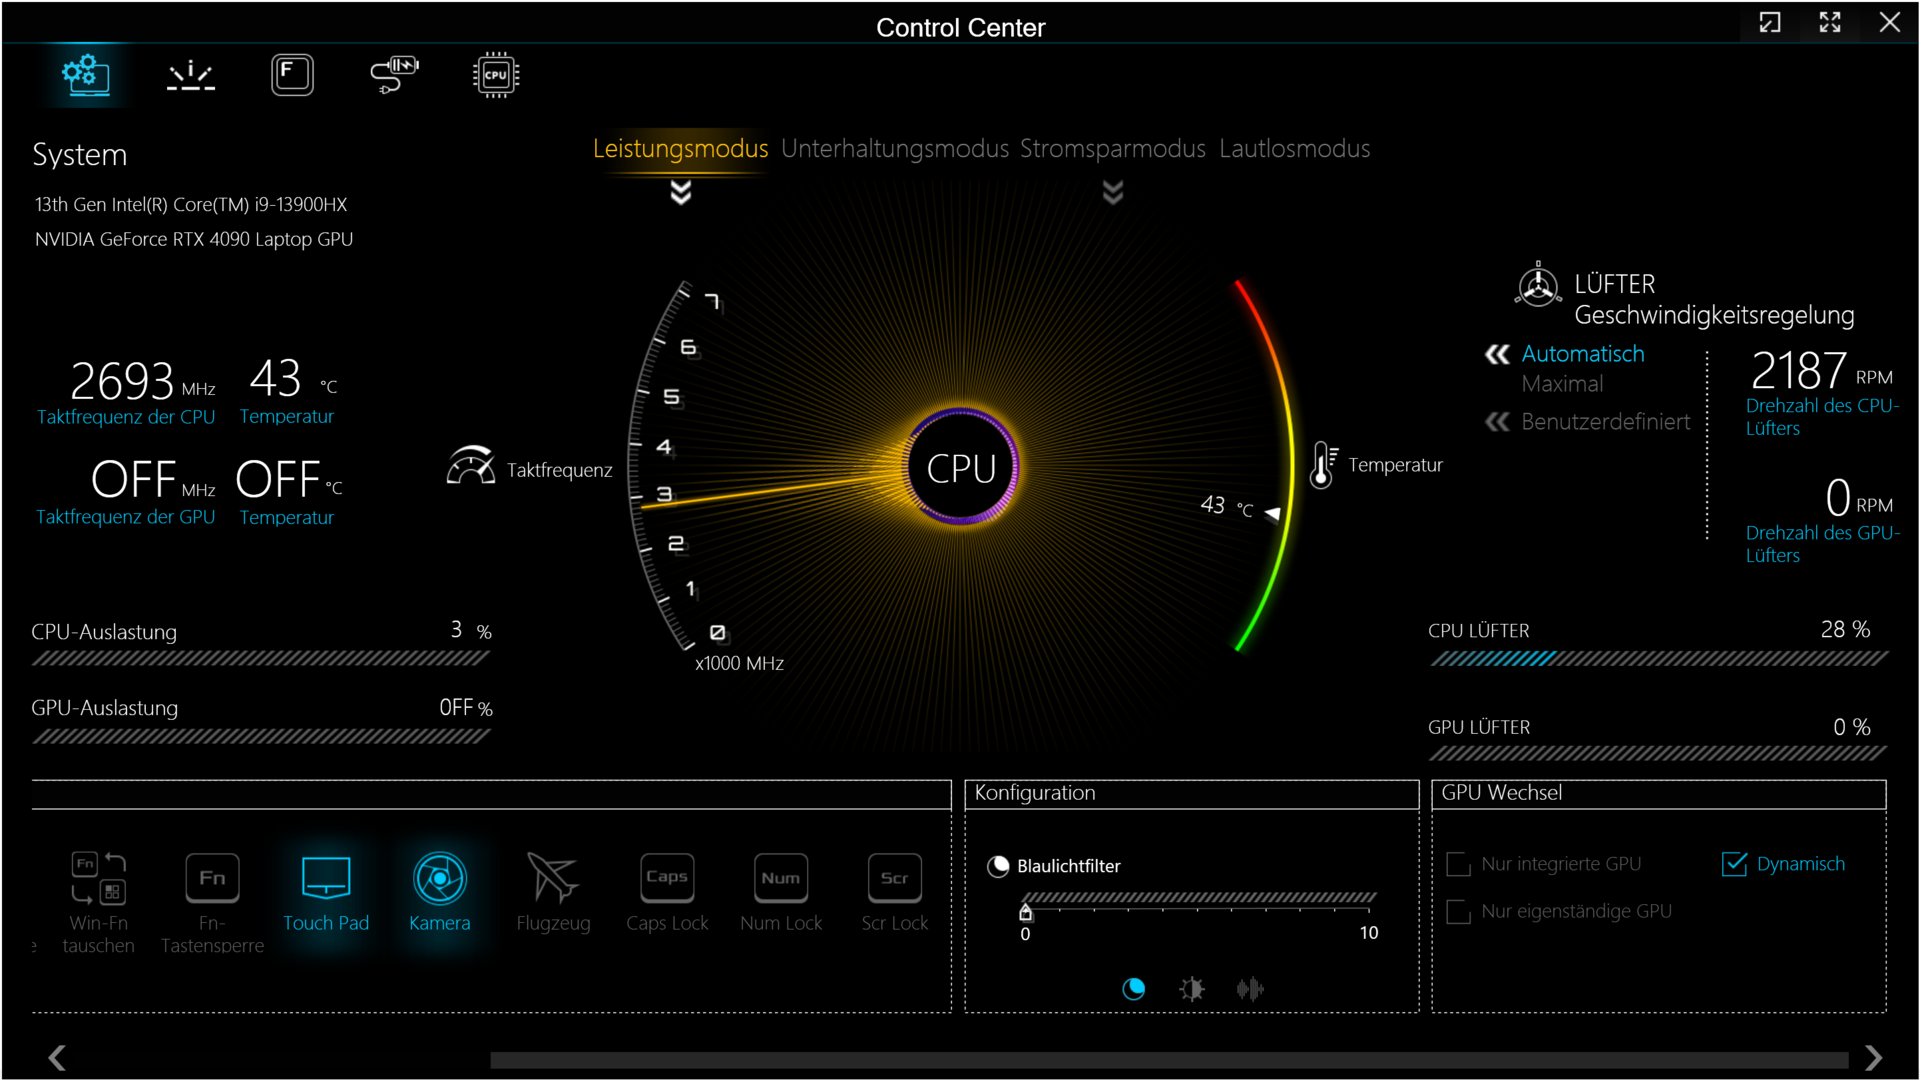
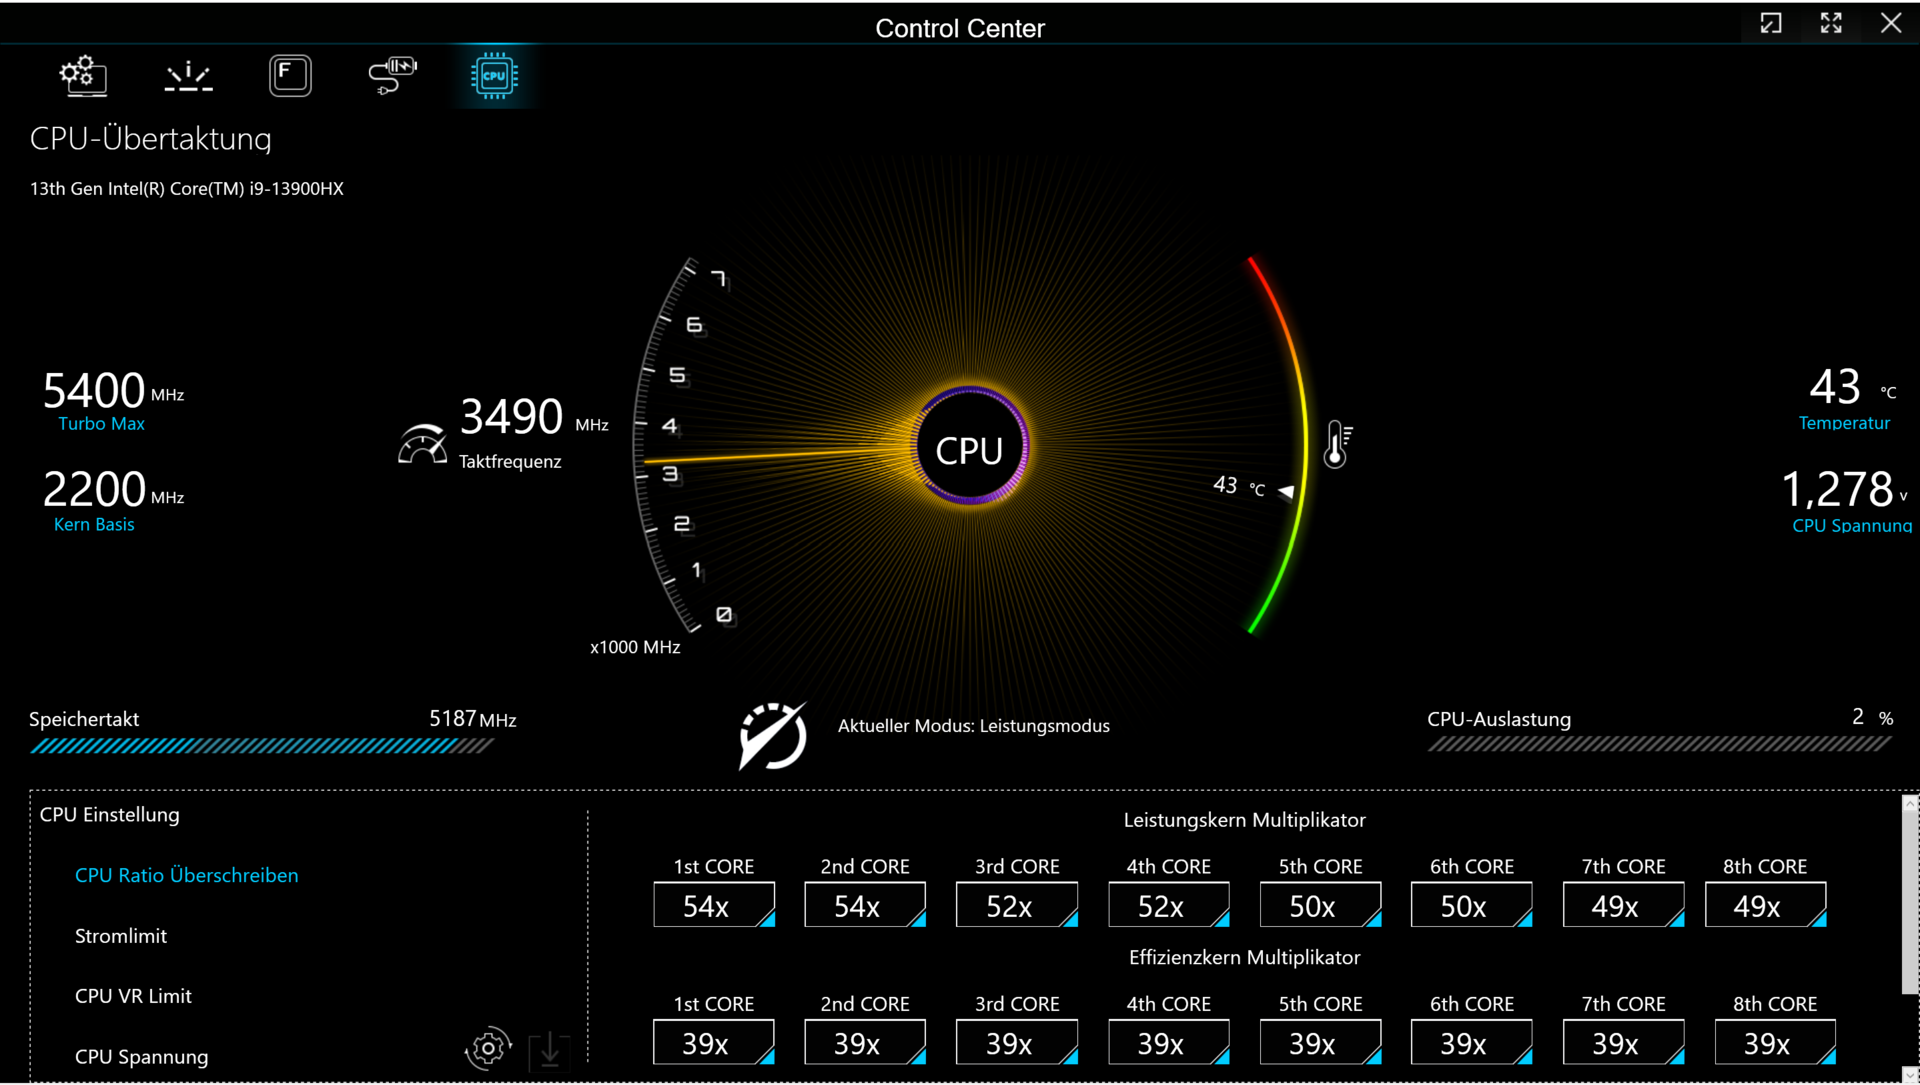
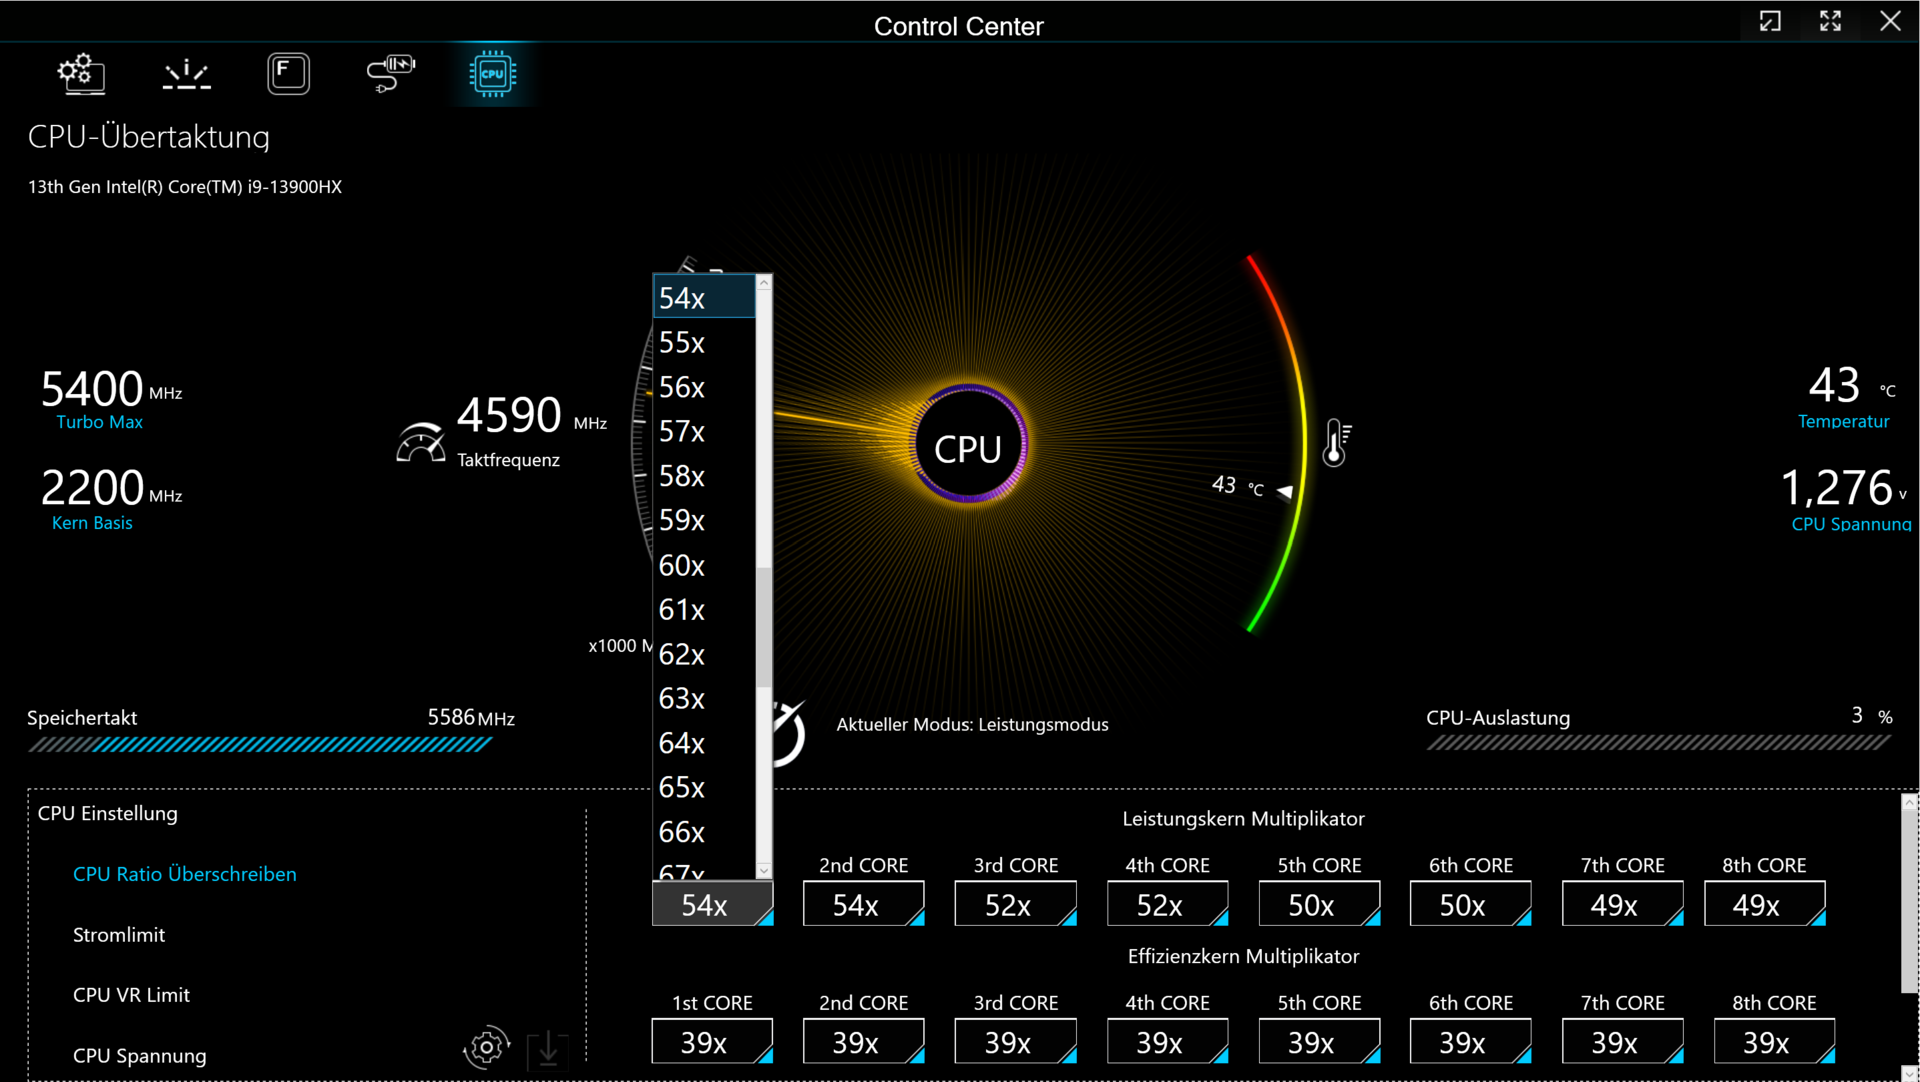
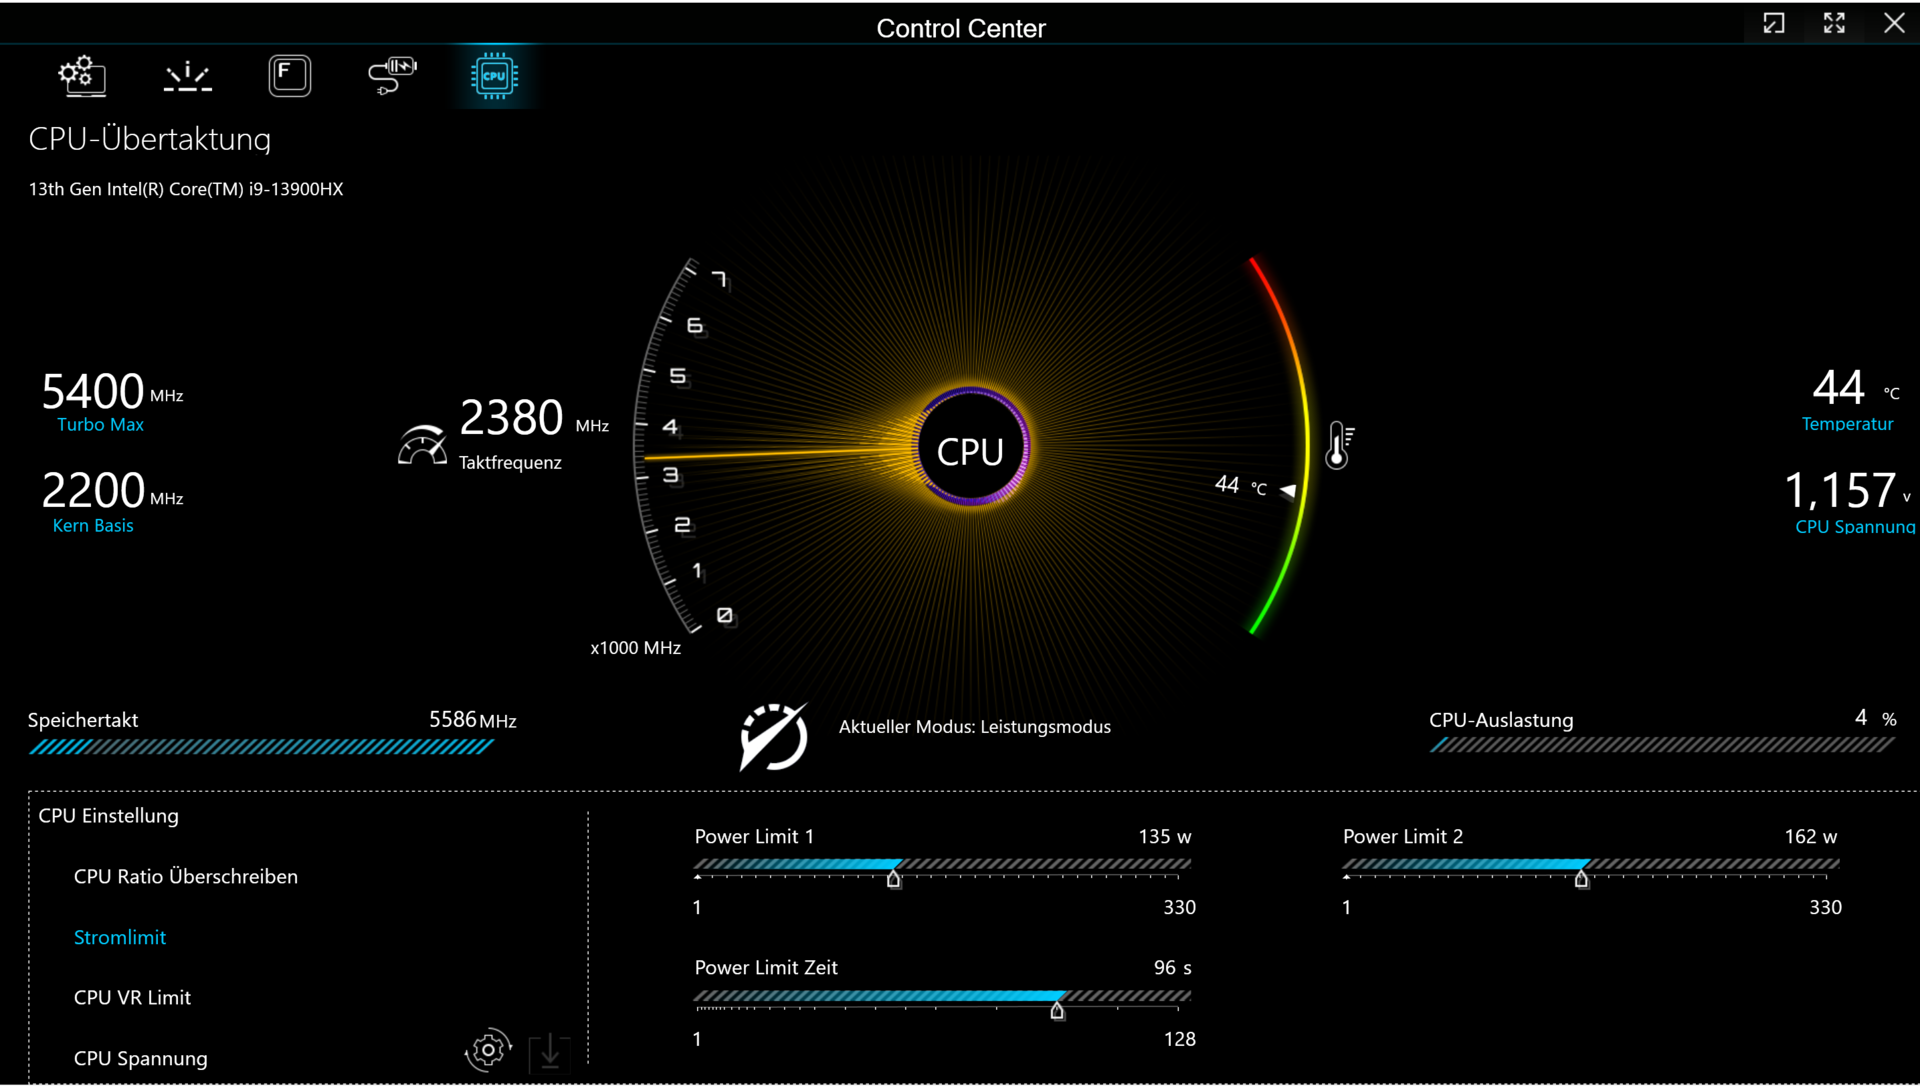
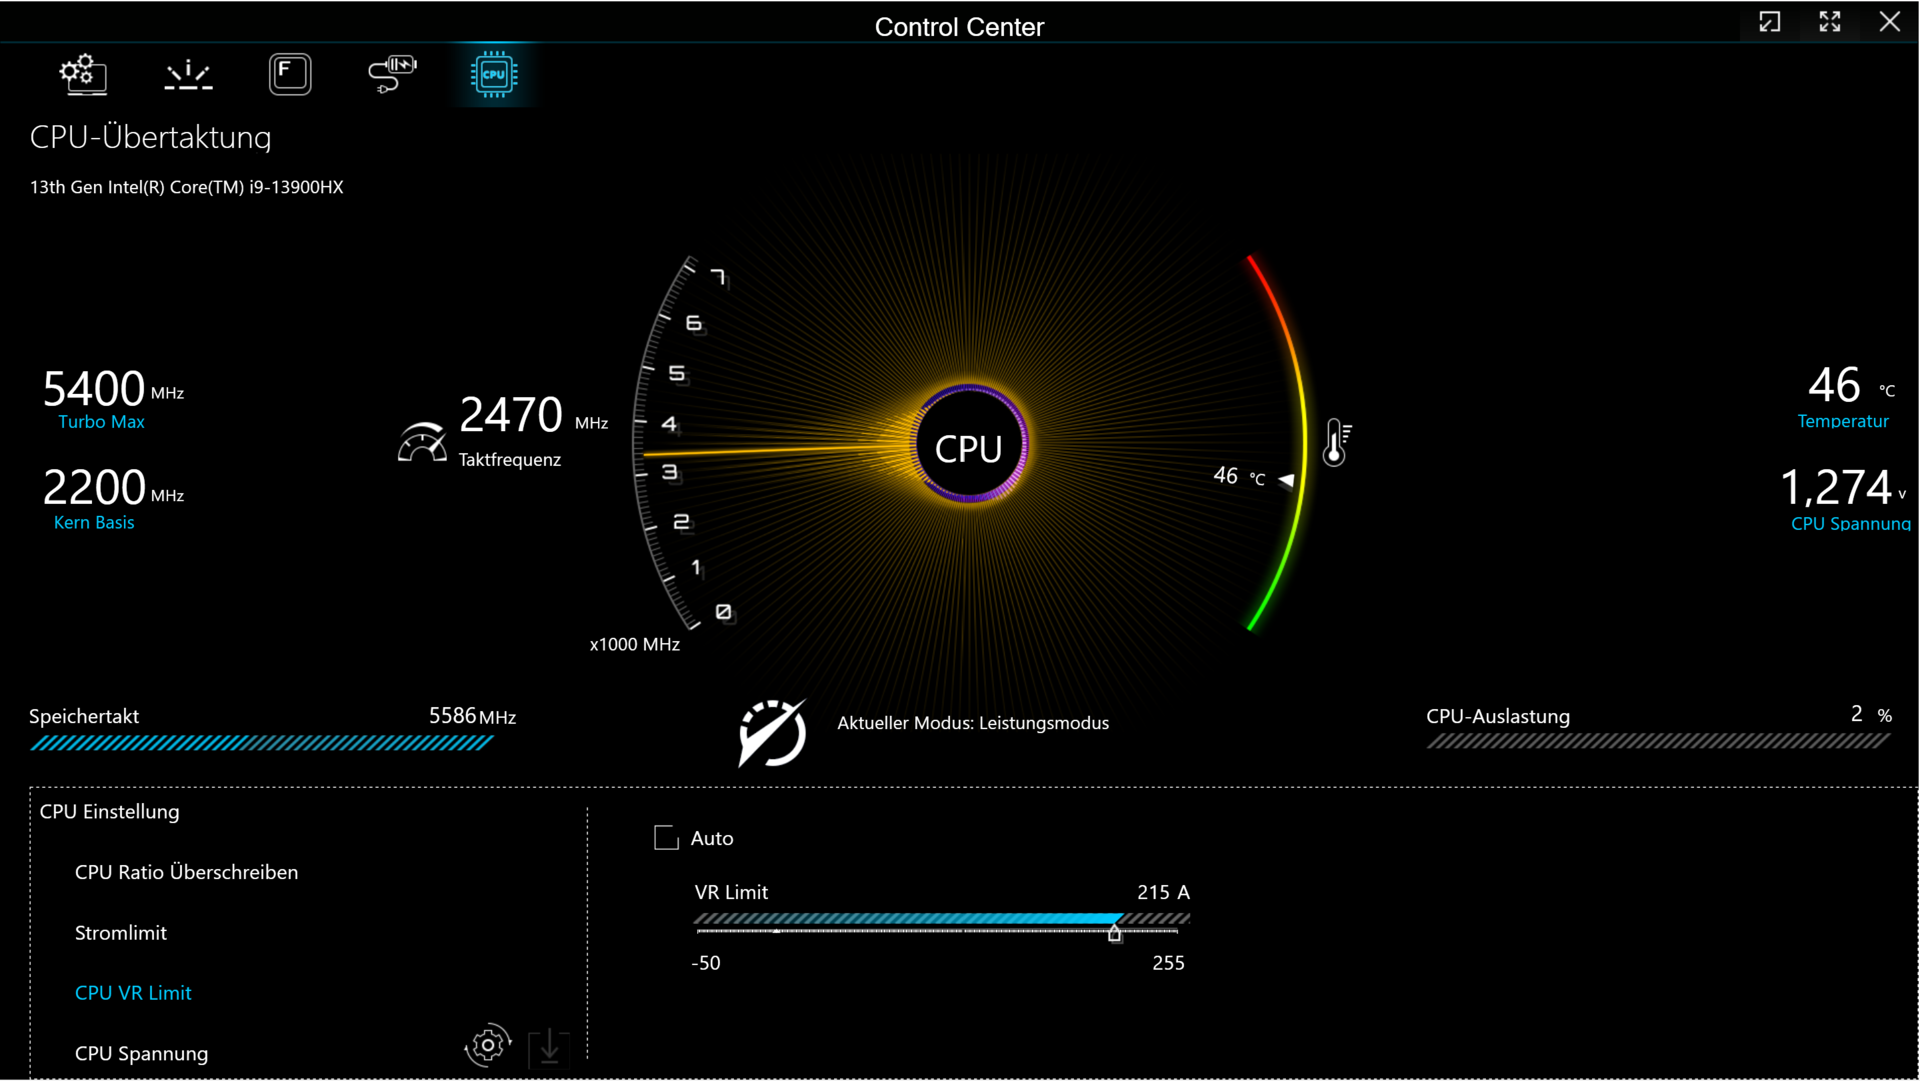
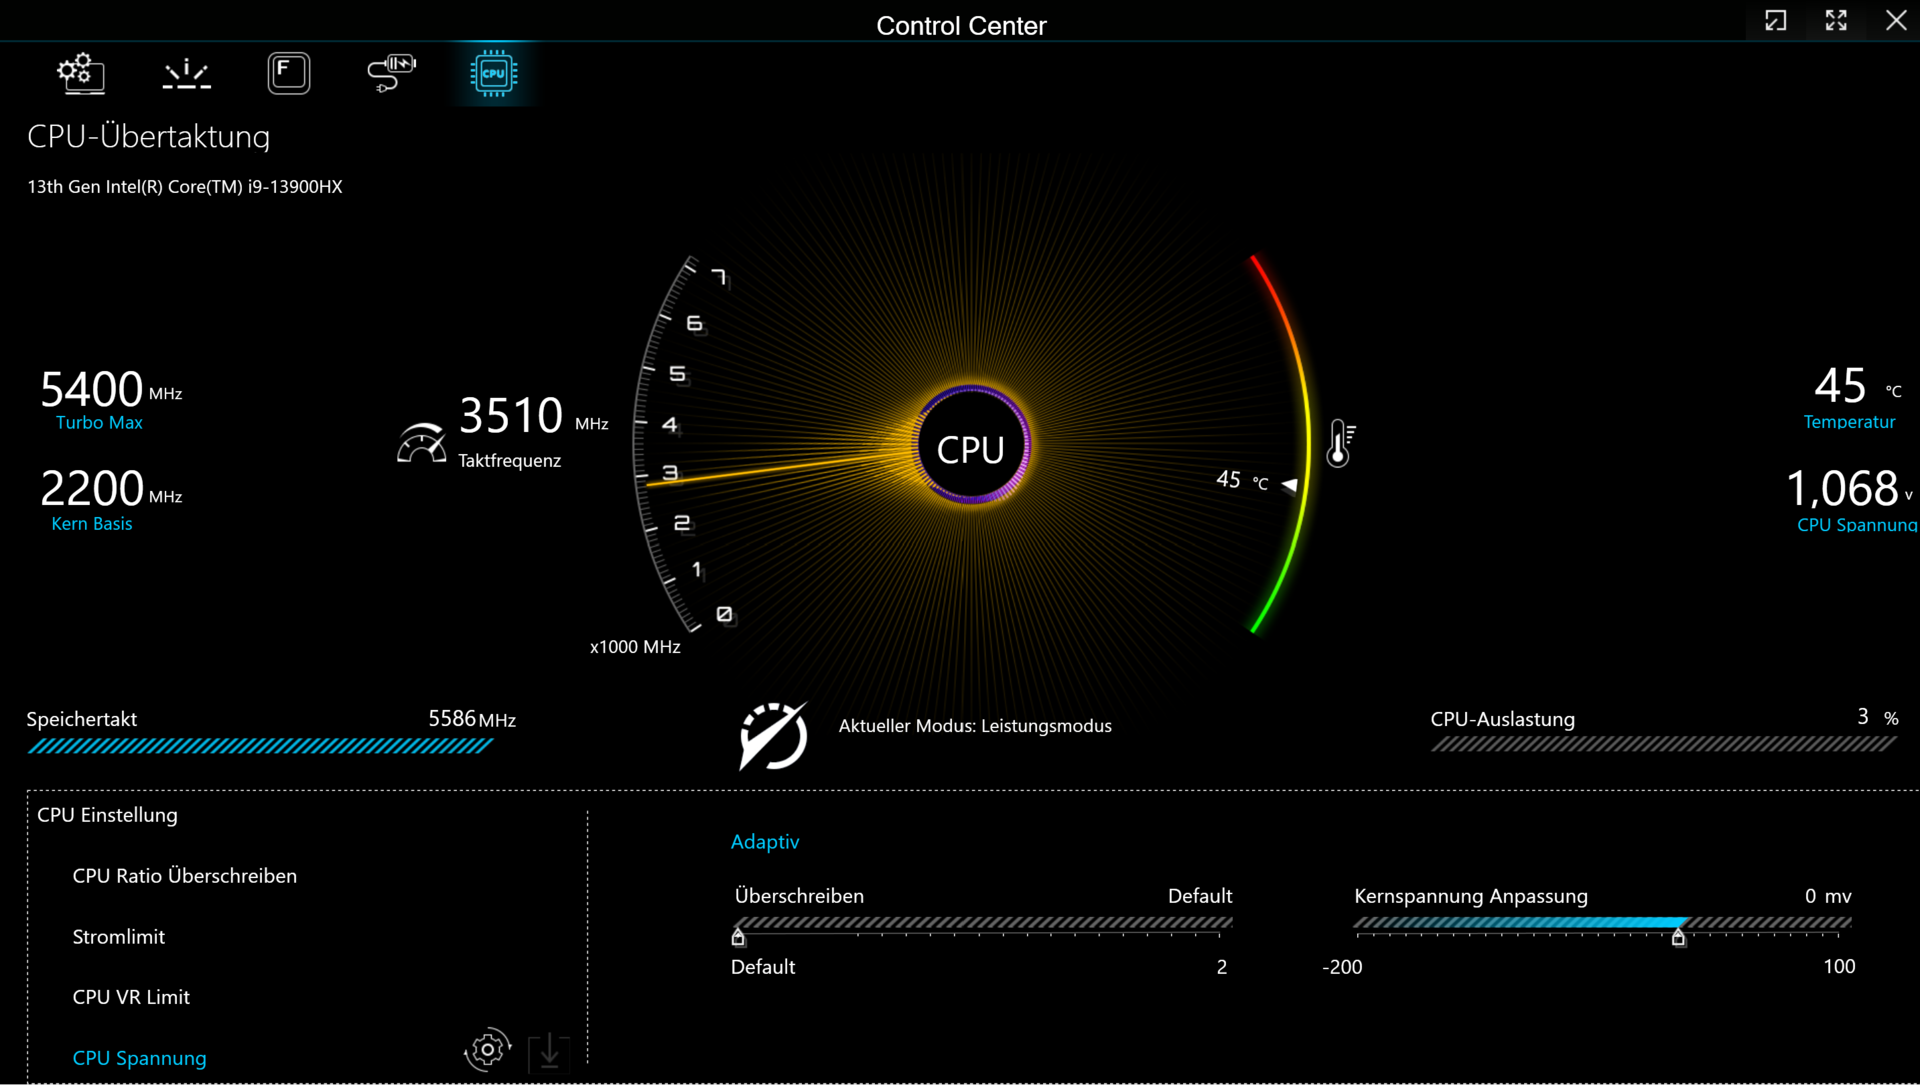
The Key 17 Pro offers four manufacturer-specified power modes (see table). You can switch between them using the Control Center software installed on the laptop. We ran our benchmarks in "Performance mode" and our battery life test in "Power Saver mode" (with the RTX 4090 disabled. Optimus was enabled during our testing.
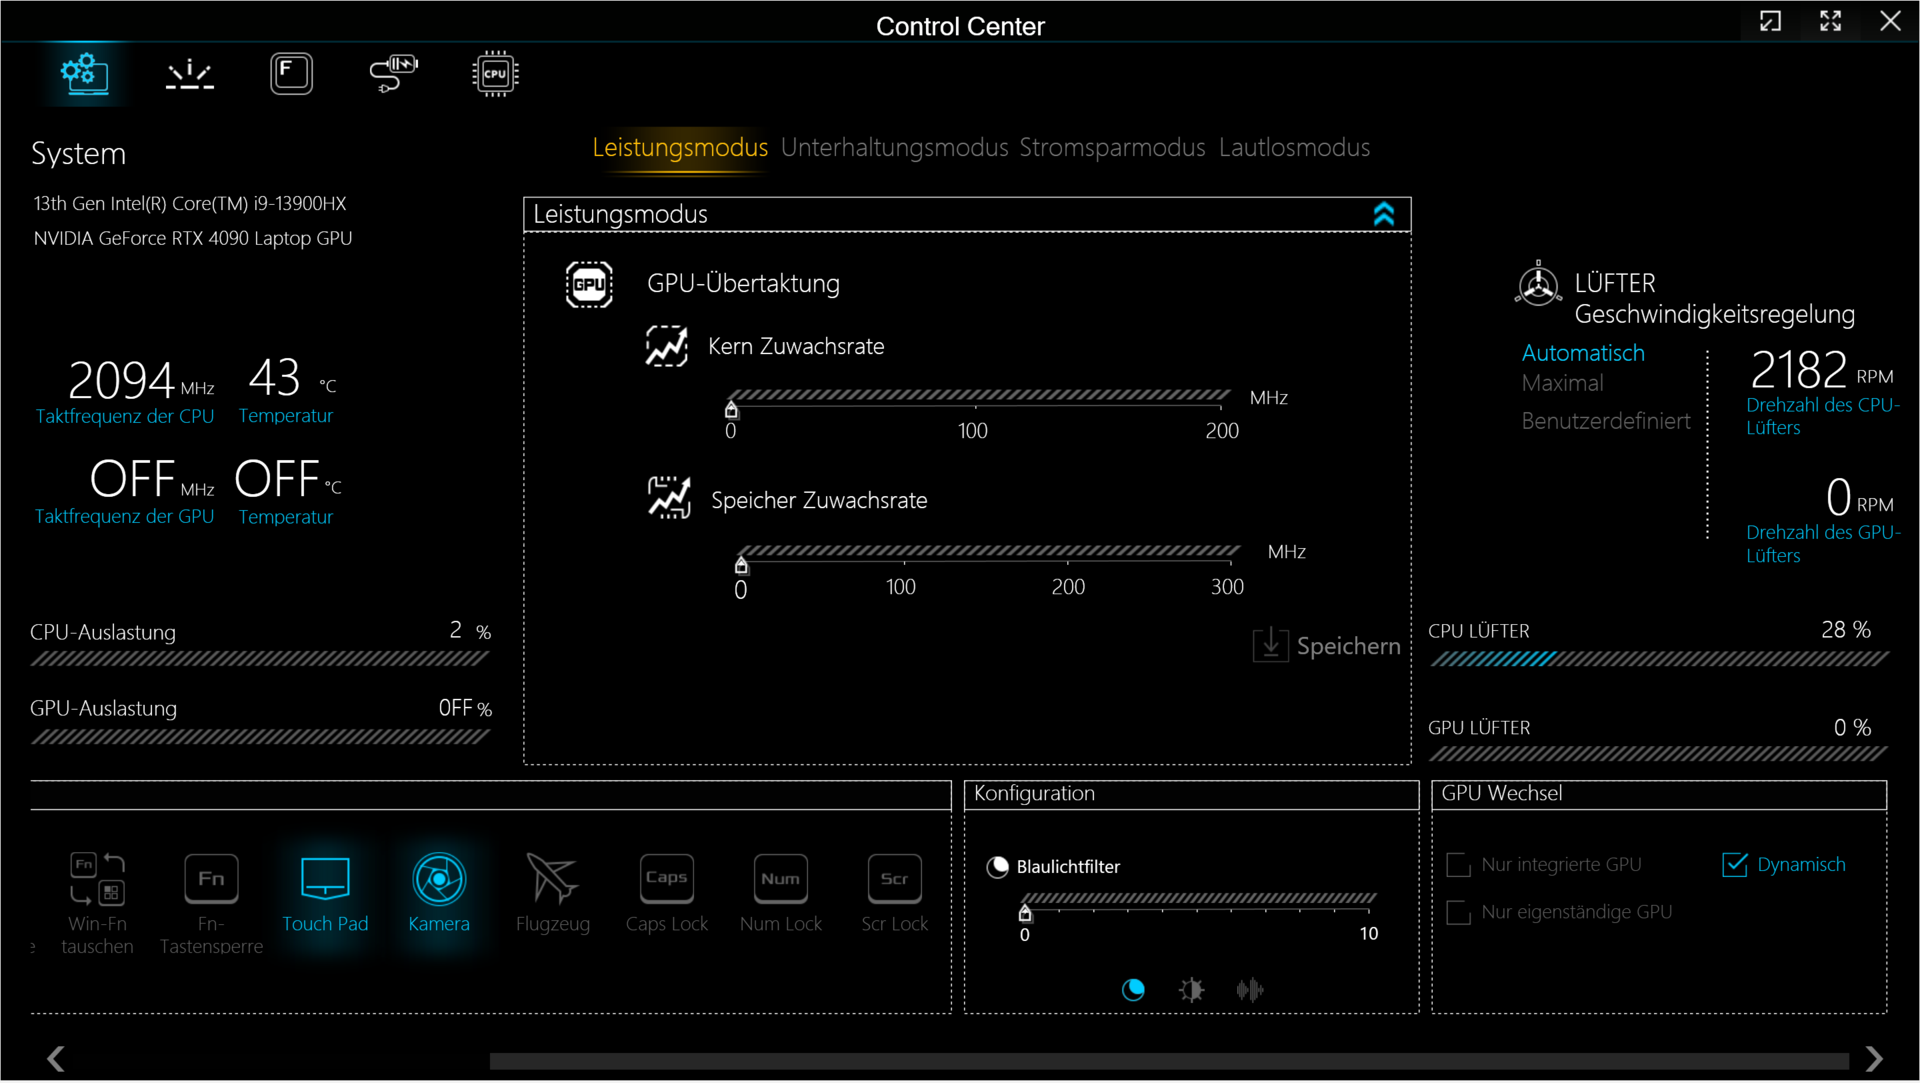
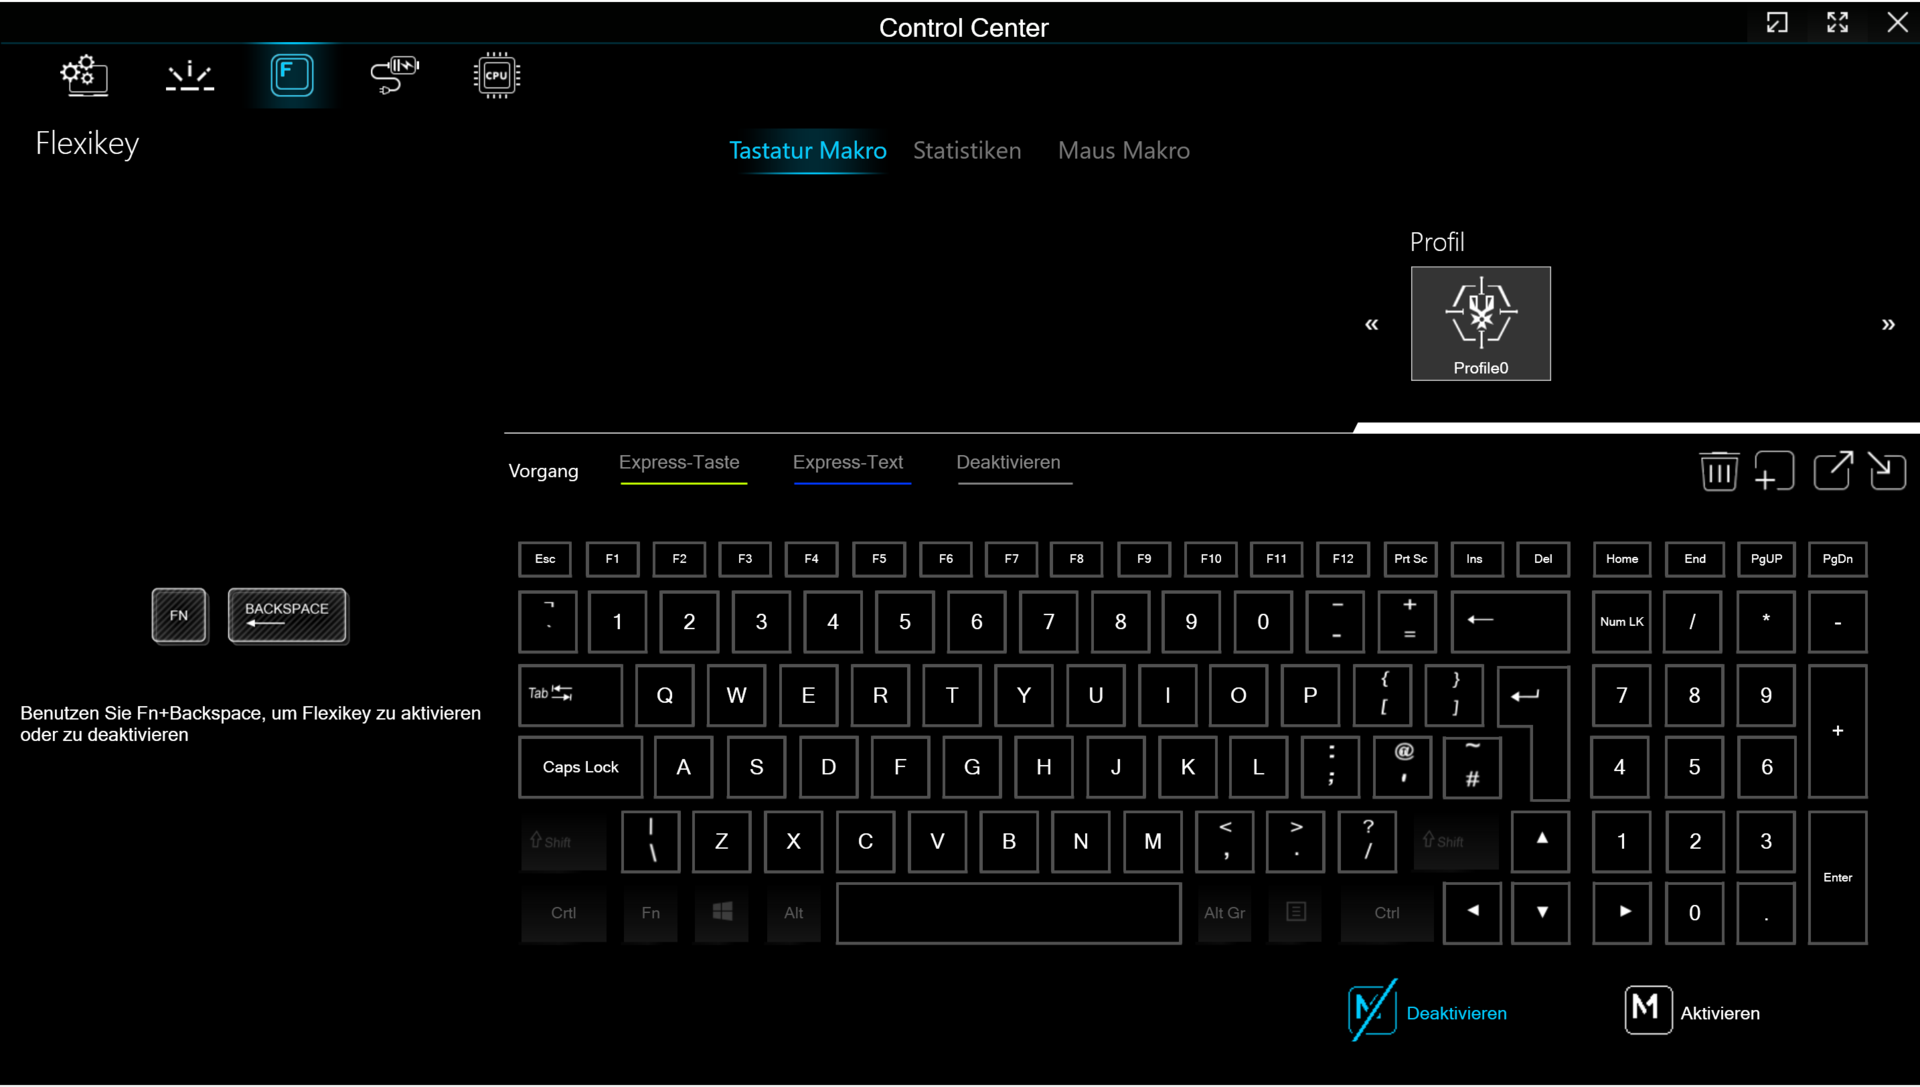
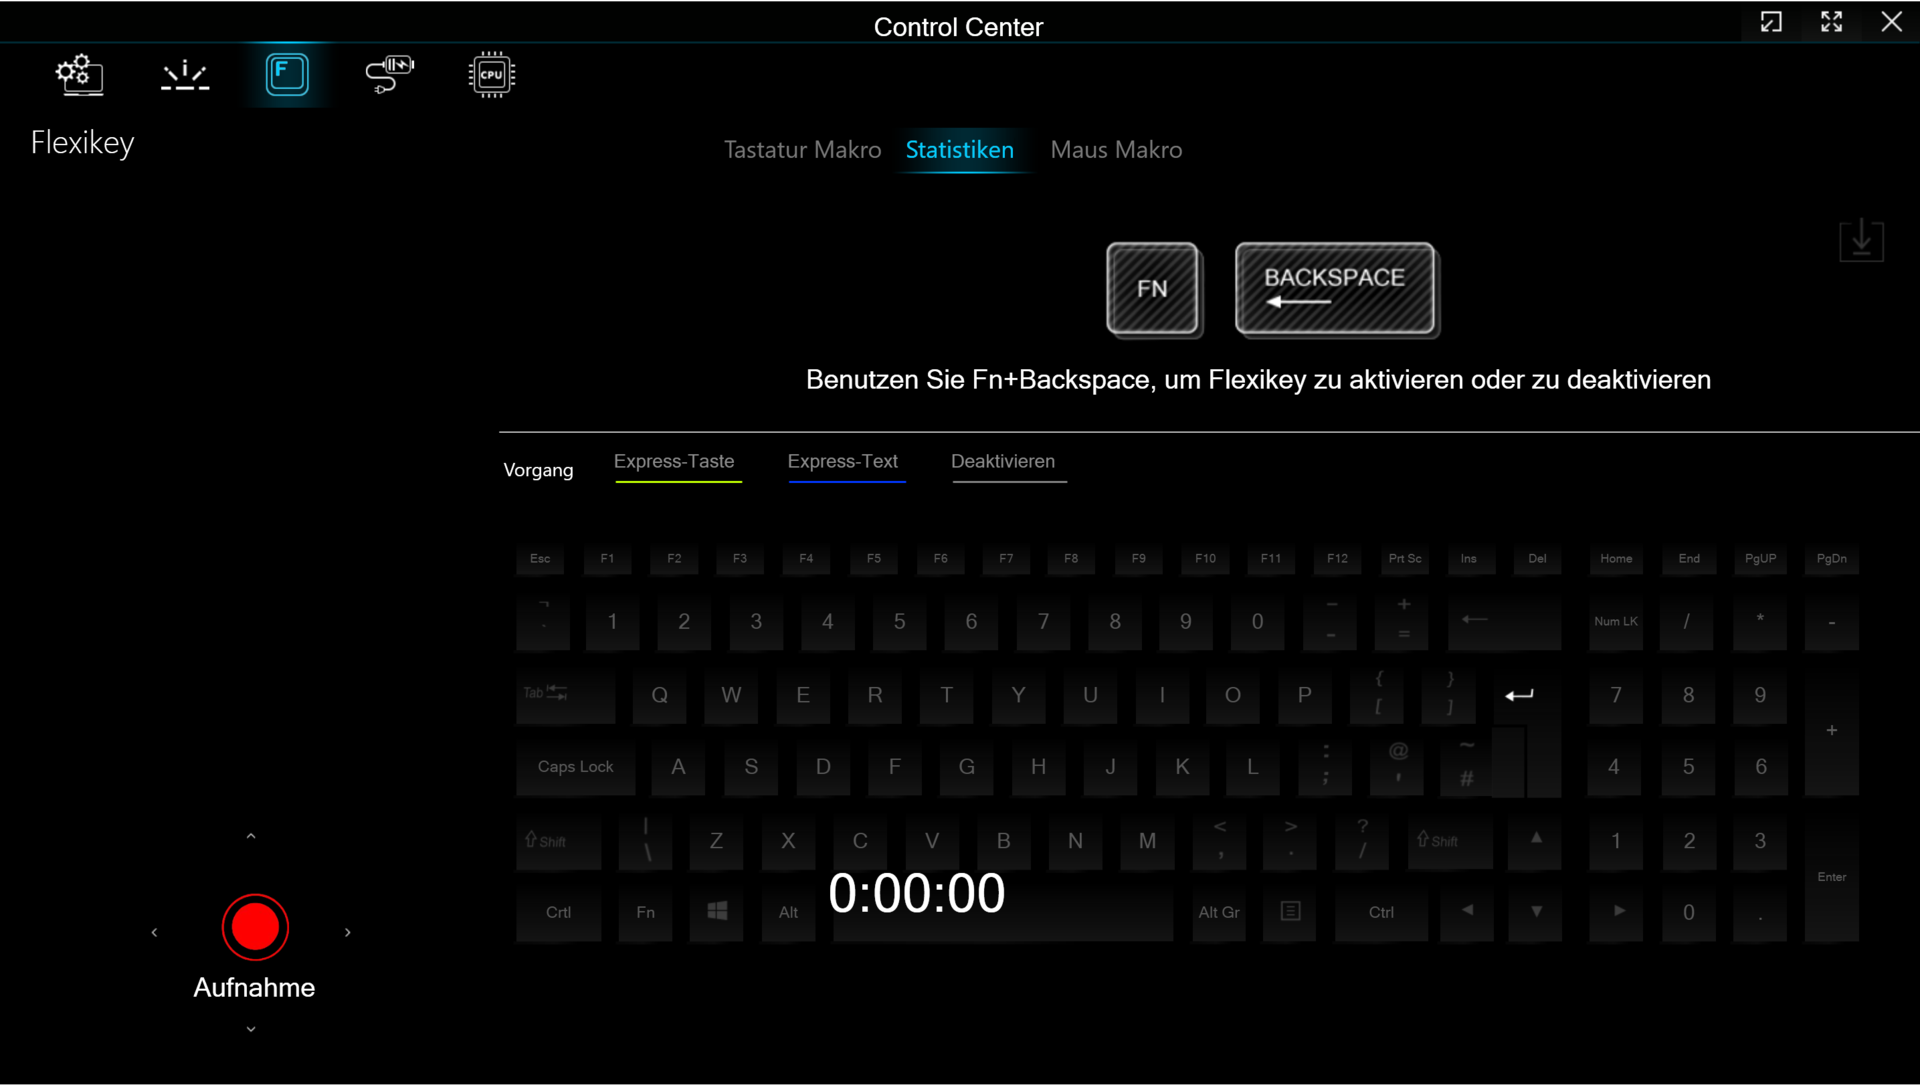
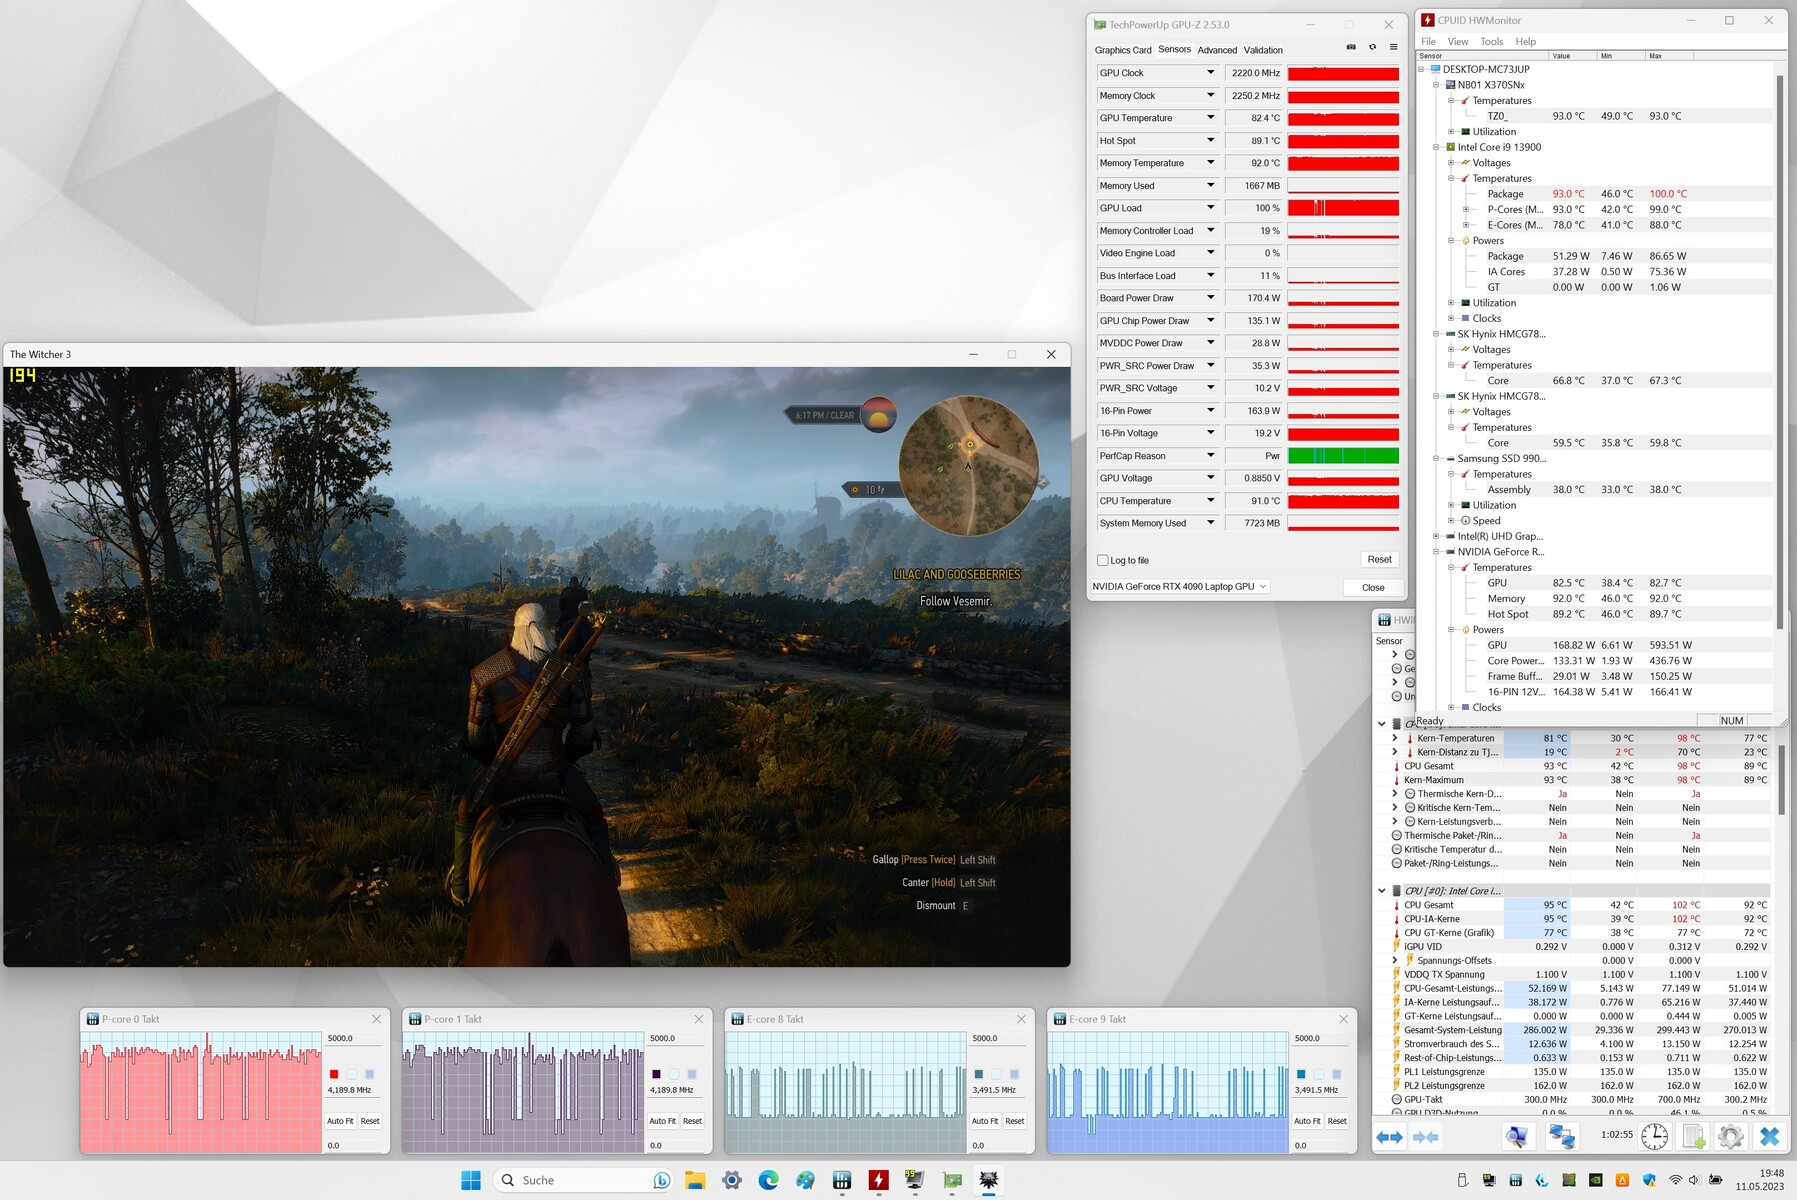
"Performance mode" lets users overclock the GPU and VRAM in Control Center. Clicking on the two downward arrows will open the corresponding menu (figure 3). You'll need to enable CPU overclocking in the BIOS before a new tab shows up in Control Center (see figure 12 to 16). But beware: overclock the hardware at your own risk – you are responsible for any damage arising from it.
| Performance mode | Entertainment mode | Power Saver mode | Silent mode | |
|---|---|---|---|---|
| CPU PL1 (HWInfo) | 135 Watt | 75 Watt | 15 Watt | 15 Watt |
| CPU PL2 (HWInfo) | 162 Watt | 130 Watt | 30 Watt | 30 Watt |
| Noise (Witcher 3) | 62 dB(A) | 54 dB(A) | - | 42 dB(A) |
| Performance (Witcher 3) | ~204 fps | ~188 fps | - | 50 bis 60 fps |
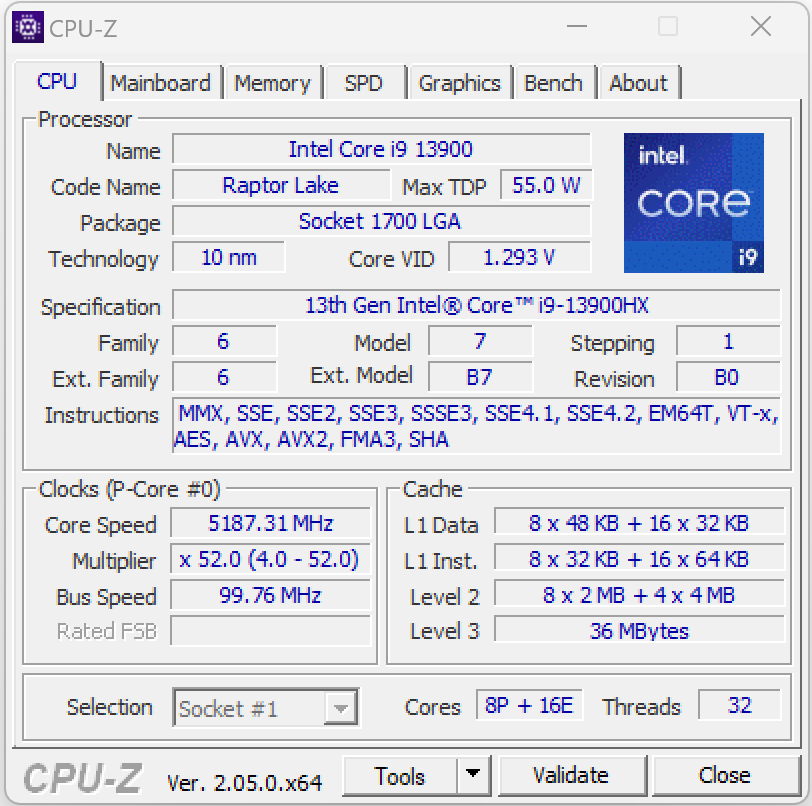
Processor
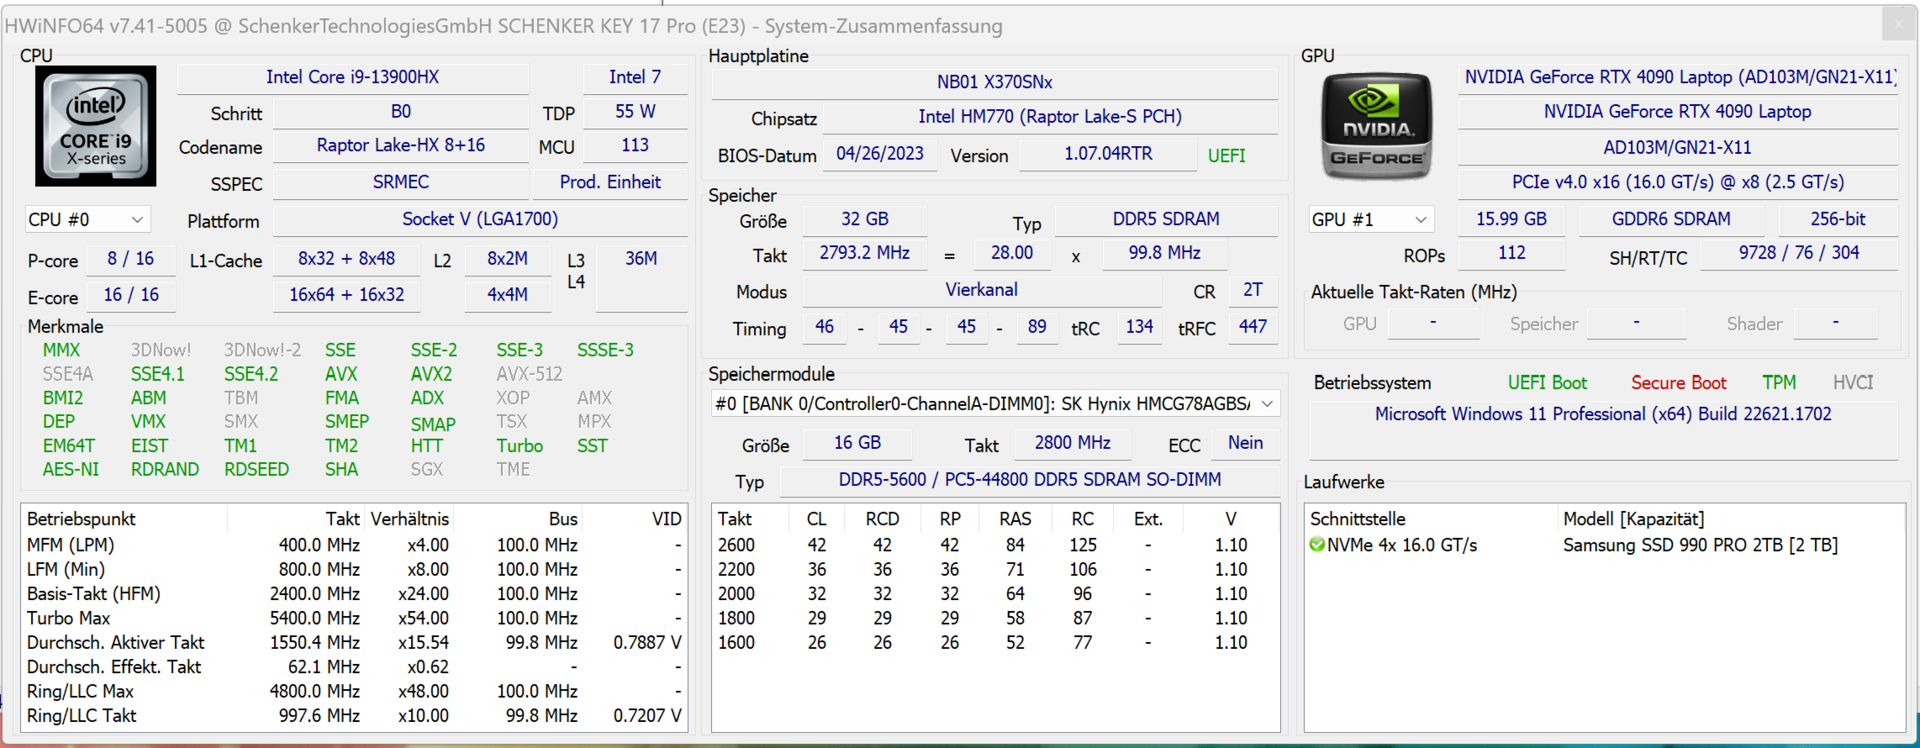
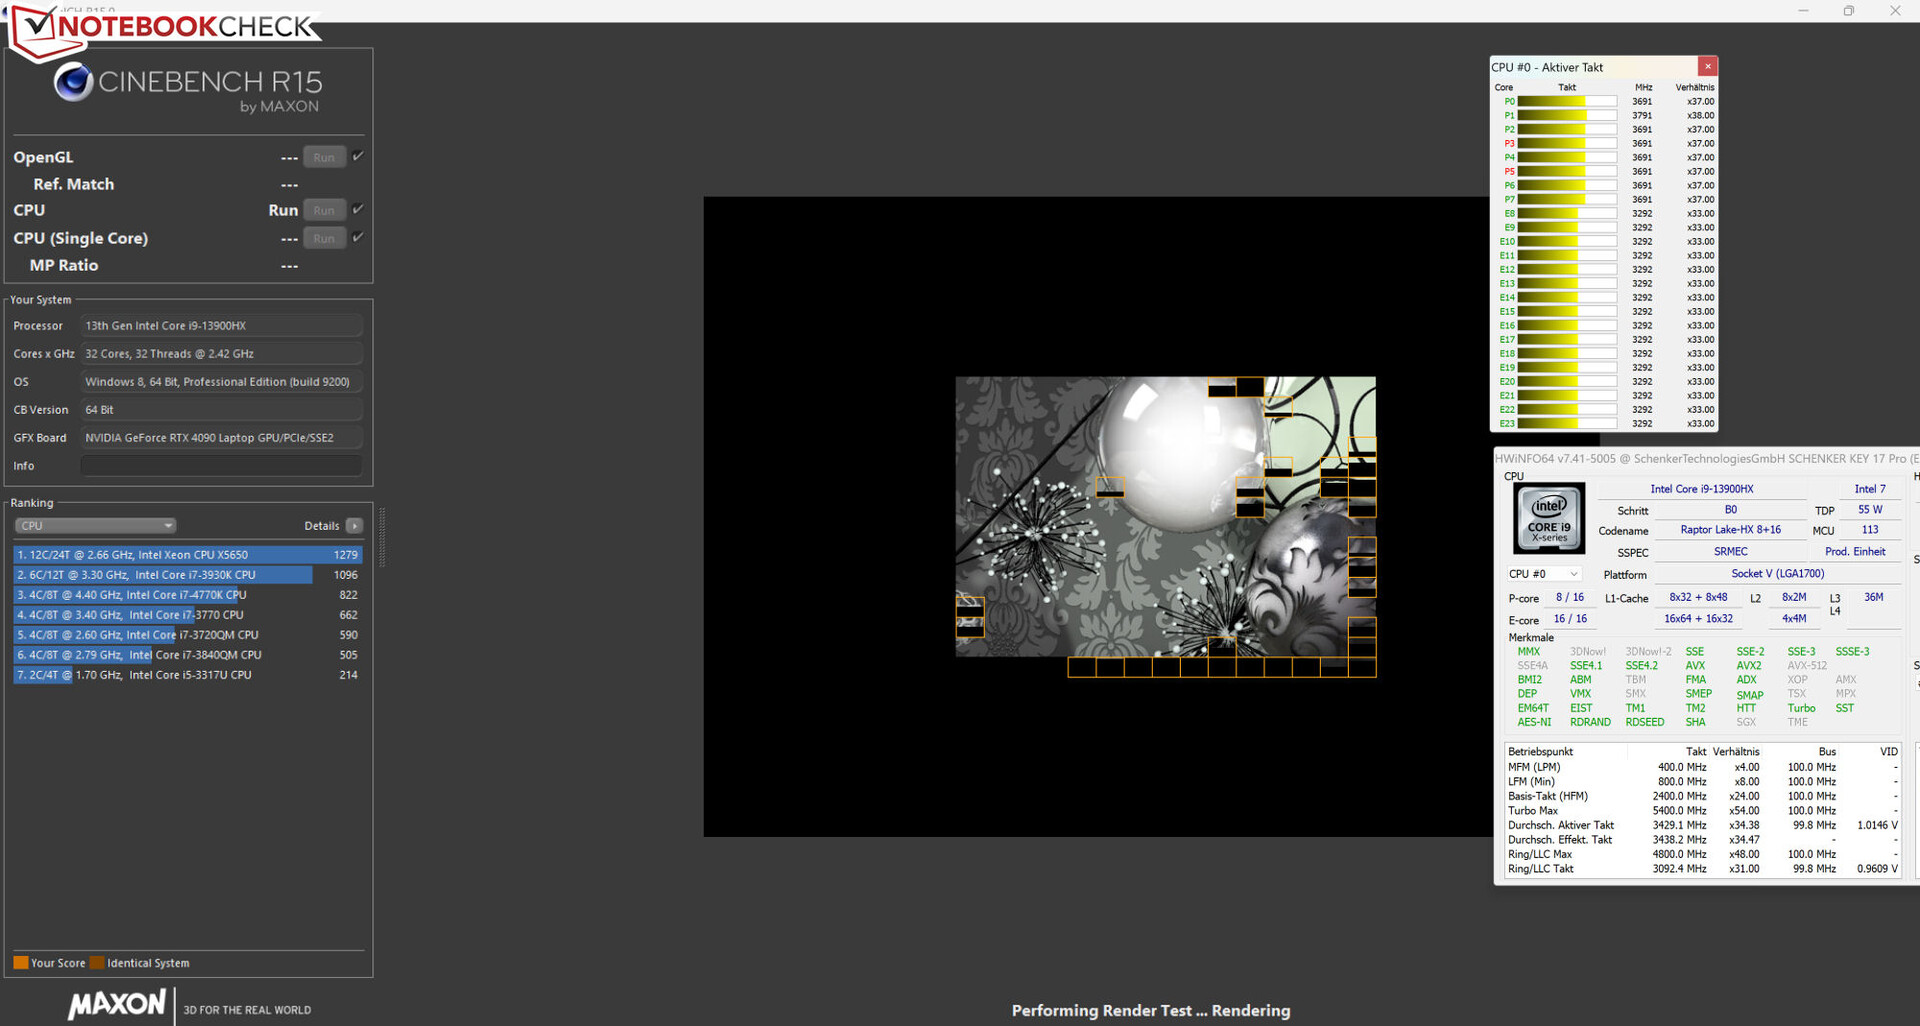
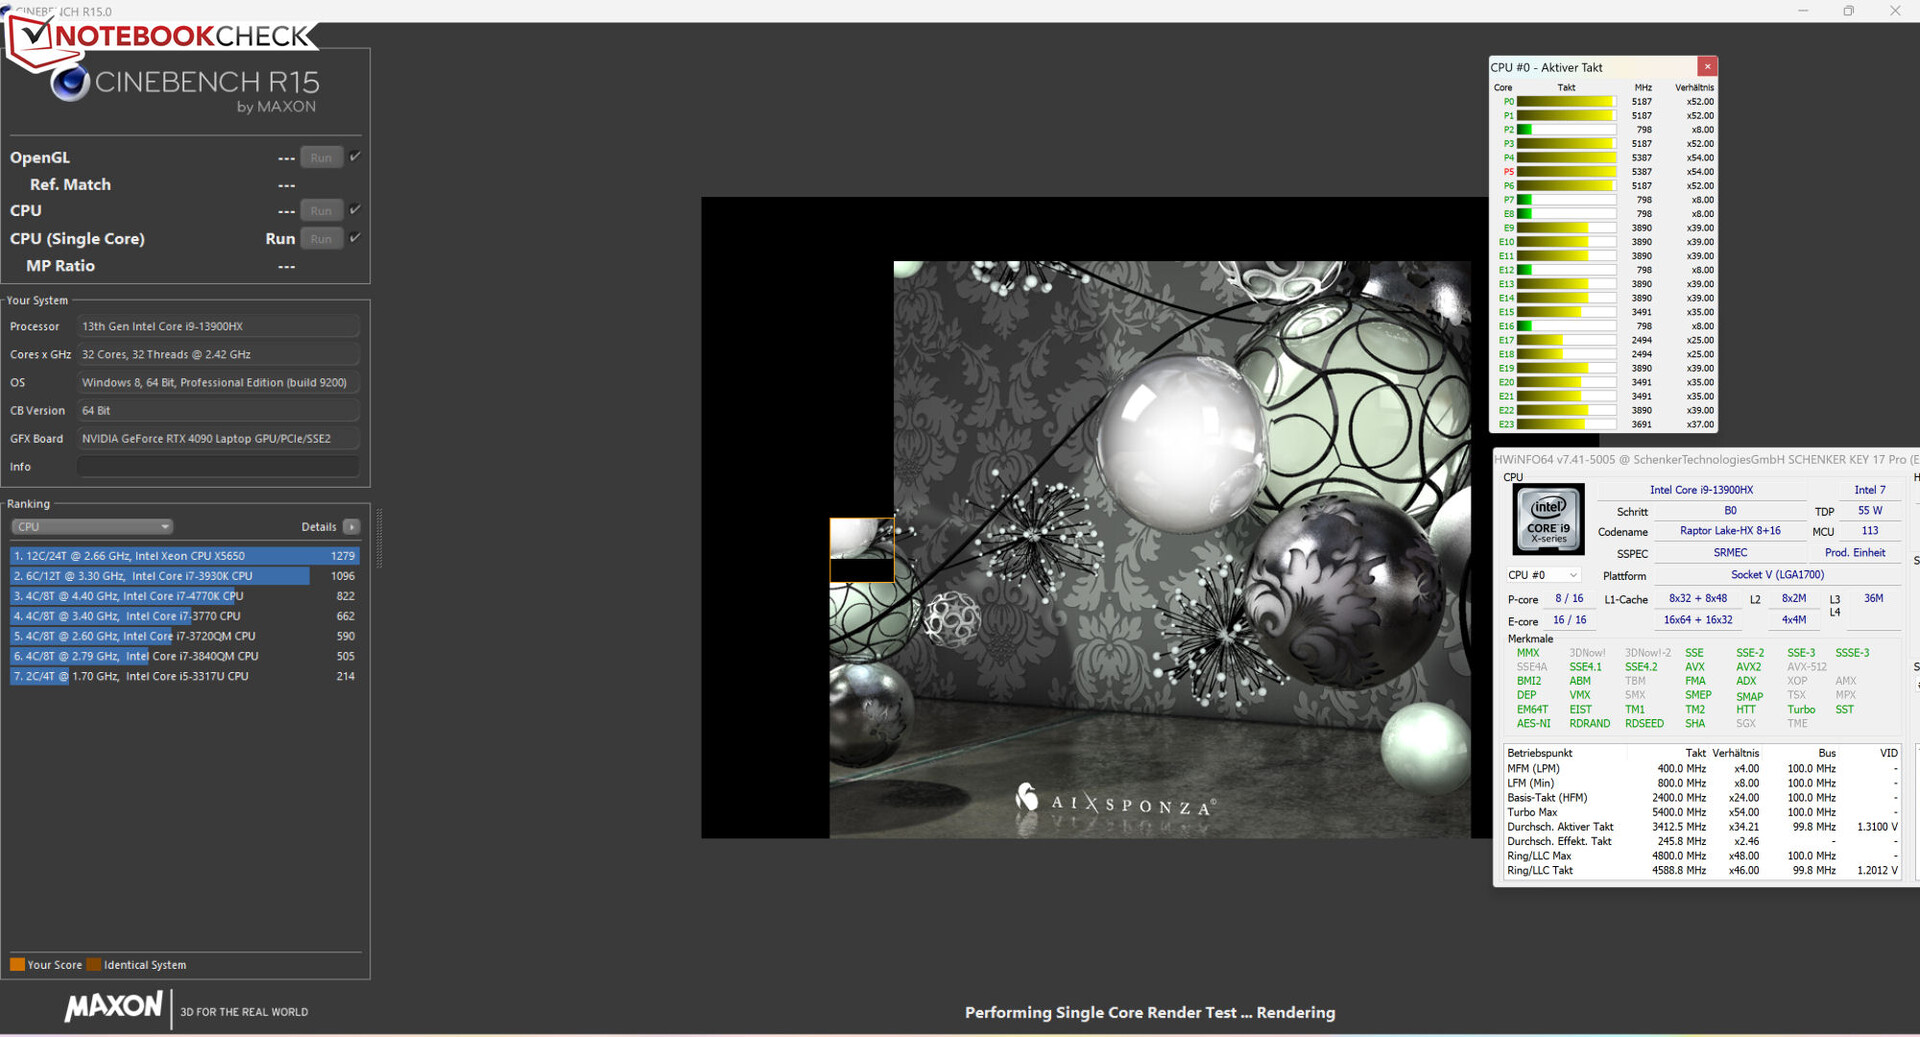
The Core i9-13900HX Raptor Lake processor consists of eight performance cores (Hyperthreading, 2.2 to 5.4GHz) and sixteen efficiency cores (no Hyperthreading, 1.6 to 3.9GHz), giving a total of 32 logical CPU cores.
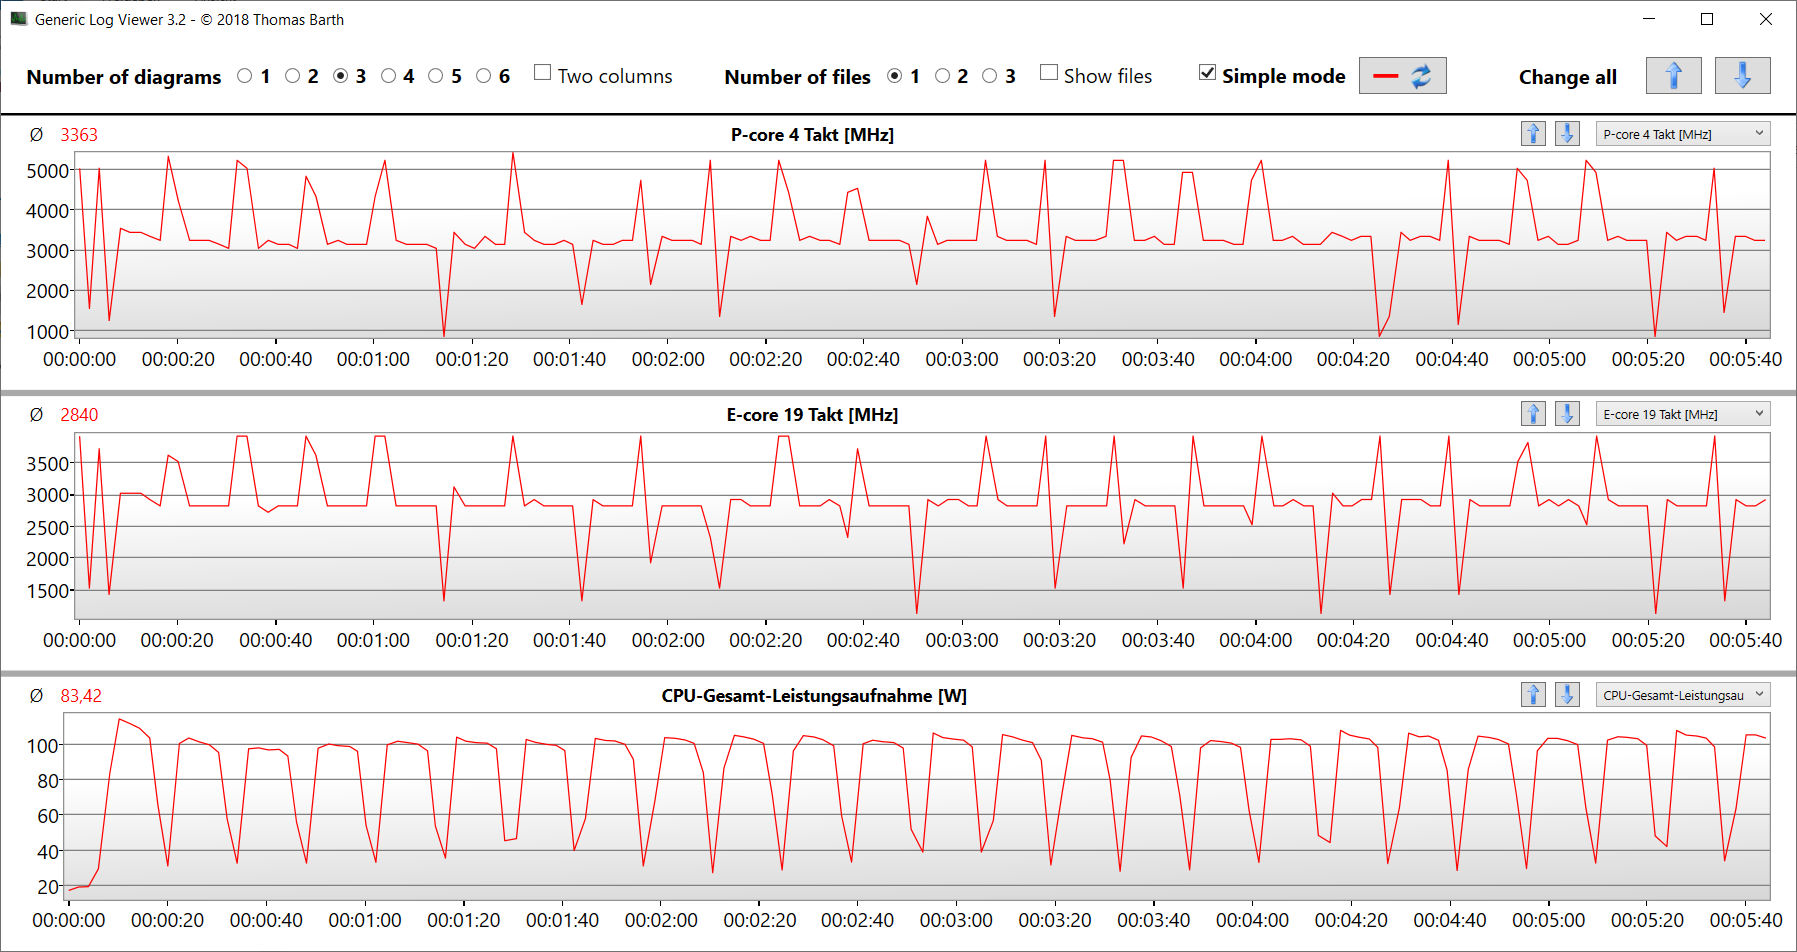
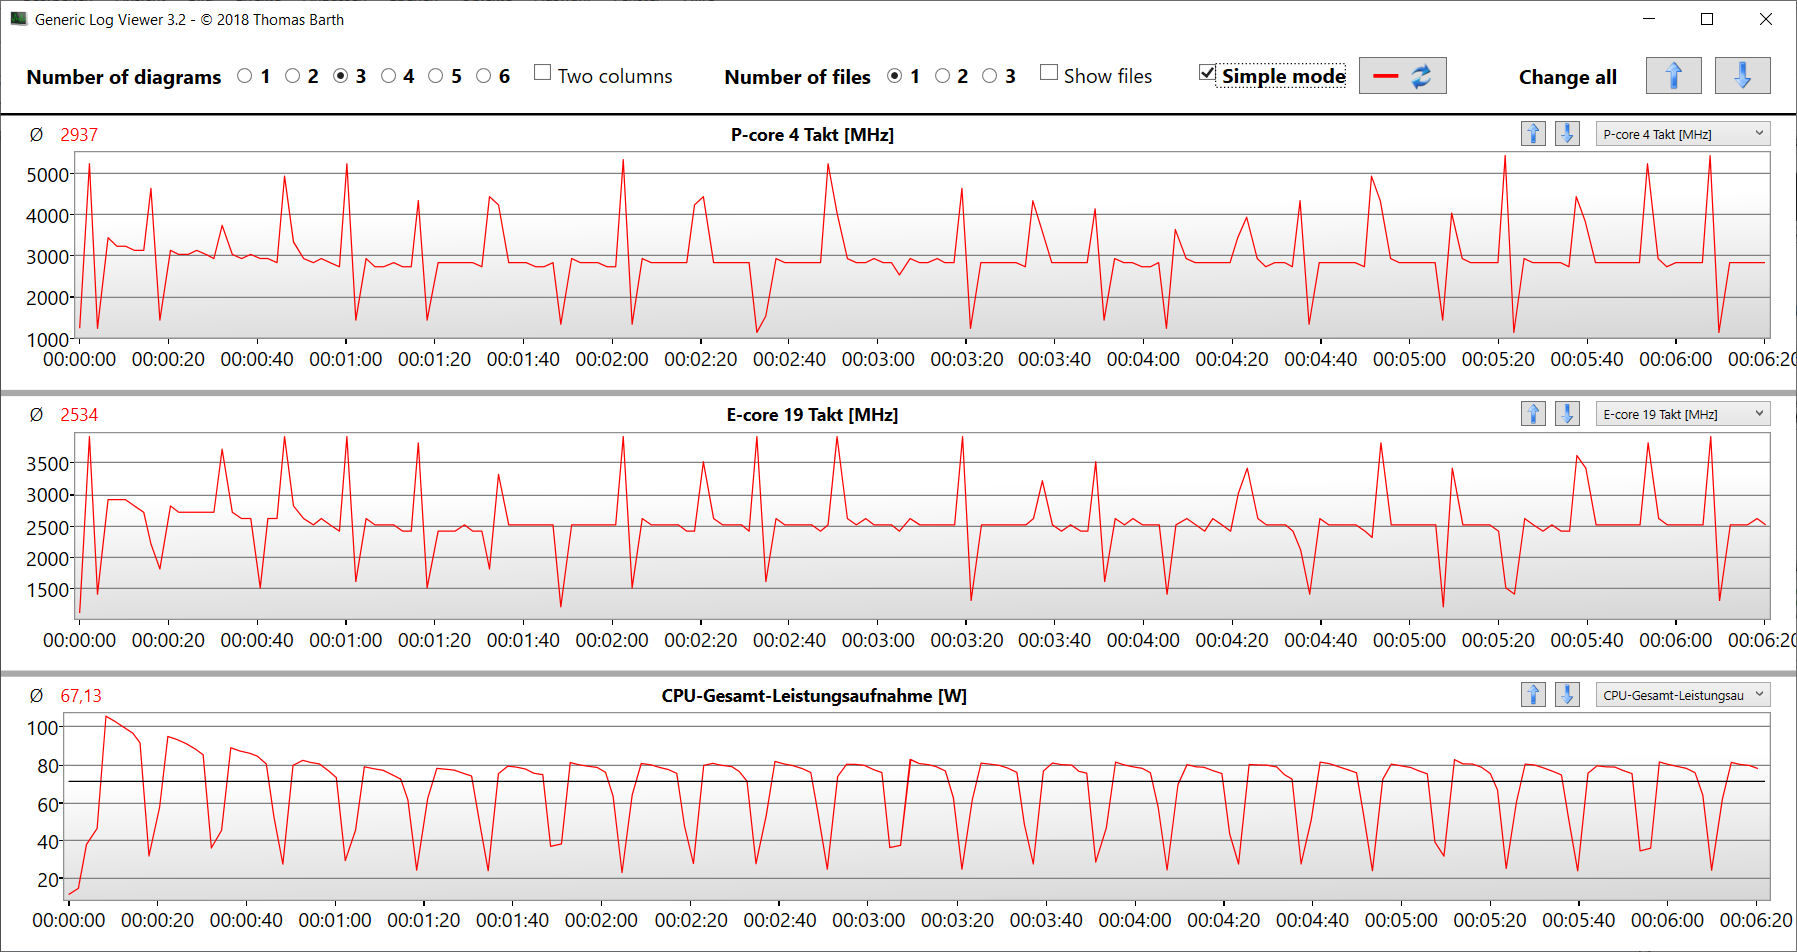
The benchmark results obtained from the Key 17 Pro are roughly in the same ballpark as what we have seen from this CPU on average. During our Cinebench 15 loop test, the sustained multi-thread load caused the CPU's turbo clock speed to drop slightly over the first two runs before eventually stabilising at a constant level.
Cinebench R15 Multi sustained load
* ... smaller is better
AIDA64: FP32 Ray-Trace | FPU Julia | CPU SHA3 | CPU Queen | FPU SinJulia | FPU Mandel | CPU AES | CPU ZLib | FP64 Ray-Trace | CPU PhotoWorxx
| Performance rating | |
| Asus ROG Strix Scar 17 G733PY-XS96 | |
| Schenker Key 17 Pro (Early 23) | |
| Medion Erazer Beast X40 | |
| Average Intel Core i9-13900HX | |
| Average of class Gaming | |
| Aorus 17X AZF | |
| MSI Stealth 17 Studio A13VH-014 | |
| AIDA64 / FP32 Ray-Trace | |
| Asus ROG Strix Scar 17 G733PY-XS96 | |
| Average of class Gaming (10227 - 85542, n=107, last 2 years) | |
| Medion Erazer Beast X40 | |
| Average Intel Core i9-13900HX (17589 - 27615, n=22) | |
| Schenker Key 17 Pro (Early 23) | |
| MSI Stealth 17 Studio A13VH-014 | |
| Aorus 17X AZF | |
| AIDA64 / FPU Julia | |
| Asus ROG Strix Scar 17 G733PY-XS96 | |
| Average of class Gaming (51376 - 238426, n=107, last 2 years) | |
| Medion Erazer Beast X40 | |
| Average Intel Core i9-13900HX (88686 - 137015, n=22) | |
| Schenker Key 17 Pro (Early 23) | |
| MSI Stealth 17 Studio A13VH-014 | |
| Aorus 17X AZF | |
| AIDA64 / CPU SHA3 | |
| Asus ROG Strix Scar 17 G733PY-XS96 | |
| Medion Erazer Beast X40 | |
| Average of class Gaming (2180 - 9817, n=107, last 2 years) | |
| Average Intel Core i9-13900HX (4362 - 7029, n=22) | |
| Schenker Key 17 Pro (Early 23) | |
| Aorus 17X AZF | |
| MSI Stealth 17 Studio A13VH-014 | |
| AIDA64 / CPU Queen | |
| Asus ROG Strix Scar 17 G733PY-XS96 | |
| Schenker Key 17 Pro (Early 23) | |
| Average Intel Core i9-13900HX (125644 - 141385, n=22) | |
| Medion Erazer Beast X40 | |
| Aorus 17X AZF | |
| Average of class Gaming (49785 - 173351, n=98, last 2 years) | |
| MSI Stealth 17 Studio A13VH-014 | |
| AIDA64 / FPU SinJulia | |
| Asus ROG Strix Scar 17 G733PY-XS96 | |
| Medion Erazer Beast X40 | |
| Average Intel Core i9-13900HX (12334 - 17179, n=22) | |
| Schenker Key 17 Pro (Early 23) | |
| Average of class Gaming (4424 - 33636, n=107, last 2 years) | |
| Aorus 17X AZF | |
| MSI Stealth 17 Studio A13VH-014 | |
| AIDA64 / FPU Mandel | |
| Asus ROG Strix Scar 17 G733PY-XS96 | |
| Average of class Gaming (25115 - 128721, n=107, last 2 years) | |
| Medion Erazer Beast X40 | |
| Average Intel Core i9-13900HX (43850 - 69202, n=22) | |
| Schenker Key 17 Pro (Early 23) | |
| MSI Stealth 17 Studio A13VH-014 | |
| Aorus 17X AZF | |
| AIDA64 / CPU AES | |
| Schenker Key 17 Pro (Early 23) | |
| Asus ROG Strix Scar 17 G733PY-XS96 | |
| Aorus 17X AZF | |
| Average Intel Core i9-13900HX (89413 - 237881, n=22) | |
| Medion Erazer Beast X40 | |
| Average of class Gaming (39258 - 247074, n=107, last 2 years) | |
| MSI Stealth 17 Studio A13VH-014 | |
| AIDA64 / CPU ZLib | |
| Asus ROG Strix Scar 17 G733PY-XS96 | |
| Medion Erazer Beast X40 | |
| Average Intel Core i9-13900HX (1284 - 1958, n=22) | |
| Schenker Key 17 Pro (Early 23) | |
| Average of class Gaming (574 - 2531, n=107, last 2 years) | |
| Aorus 17X AZF | |
| MSI Stealth 17 Studio A13VH-014 | |
| AIDA64 / FP64 Ray-Trace | |
| Asus ROG Strix Scar 17 G733PY-XS96 | |
| Average of class Gaming (5509 - 45446, n=107, last 2 years) | |
| Medion Erazer Beast X40 | |
| Average Intel Core i9-13900HX (9481 - 15279, n=22) | |
| Schenker Key 17 Pro (Early 23) | |
| MSI Stealth 17 Studio A13VH-014 | |
| Aorus 17X AZF | |
| AIDA64 / CPU PhotoWorxx | |
| Schenker Key 17 Pro (Early 23) | |
| MSI Stealth 17 Studio A13VH-014 | |
| Aorus 17X AZF | |
| Average Intel Core i9-13900HX (42994 - 51994, n=22) | |
| Average of class Gaming (12271 - 89891, n=107, last 2 years) | |
| Medion Erazer Beast X40 | |
| Asus ROG Strix Scar 17 G733PY-XS96 | |
System performance
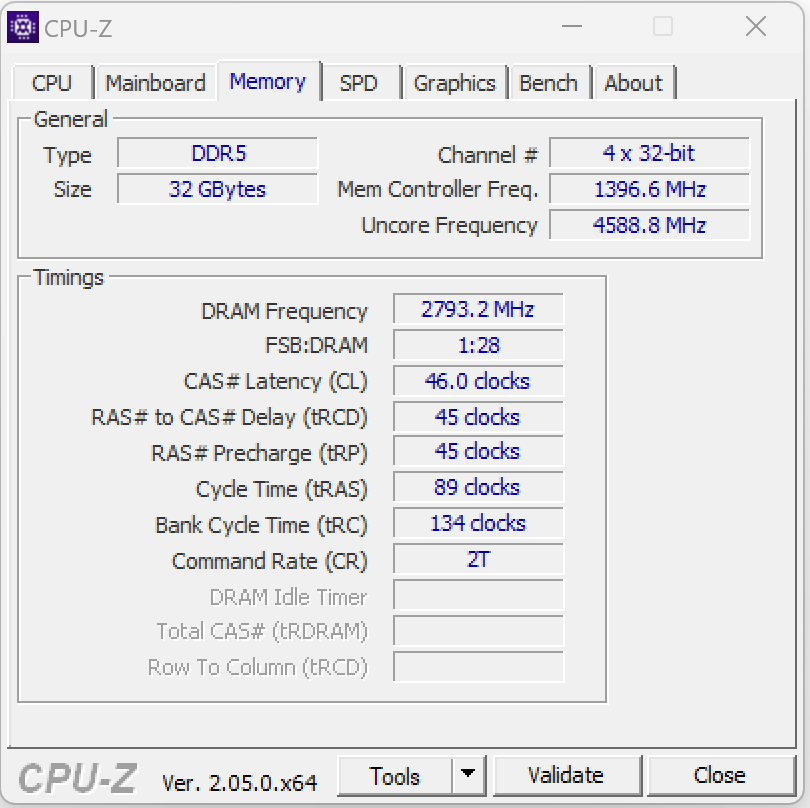
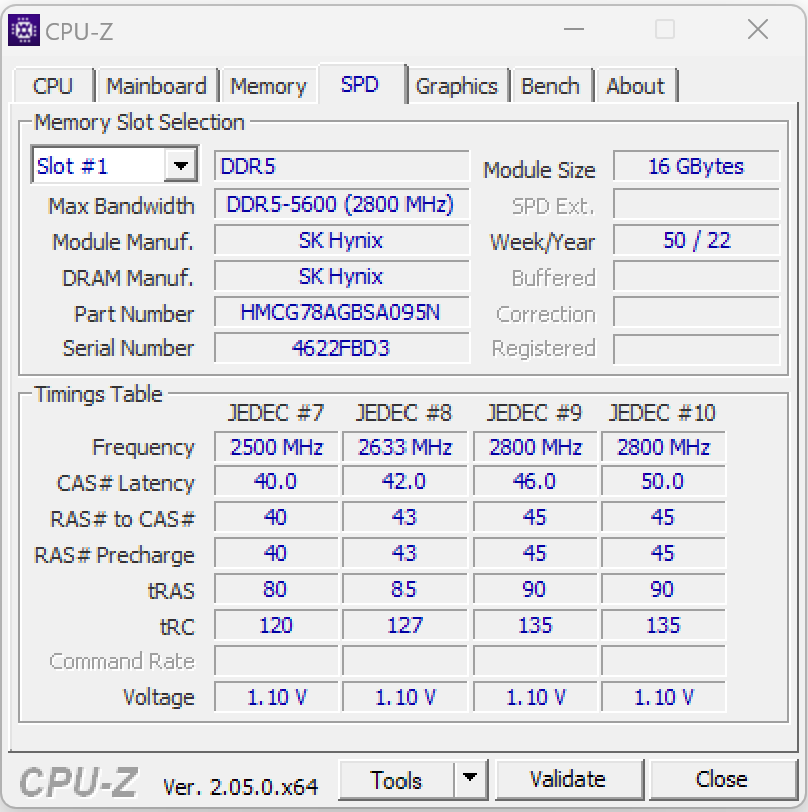
The system runs smoothly and has enough computing muscle to comfortably handle rendering, video editing and gaming. The RAM's transfer rates are fairly standard for DDR5-5600 memory.
CrossMark: Overall | Productivity | Creativity | Responsiveness
| PCMark 10 / Score | |
| Schenker Key 17 Pro (Early 23) | |
| Asus ROG Strix Scar 17 G733PY-XS96 | |
| Average Intel Core i9-13900HX, NVIDIA GeForce RTX 4090 Laptop GPU (7690 - 9331, n=8) | |
| Average of class Gaming (5828 - 11574, n=94, last 2 years) | |
| Medion Erazer Beast X40 | |
| Aorus 17X AZF | |
| MSI Stealth 17 Studio A13VH-014 | |
| PCMark 10 / Essentials | |
| Schenker Key 17 Pro (Early 23) | |
| Average Intel Core i9-13900HX, NVIDIA GeForce RTX 4090 Laptop GPU (10972 - 11983, n=8) | |
| Medion Erazer Beast X40 | |
| Aorus 17X AZF | |
| Asus ROG Strix Scar 17 G733PY-XS96 | |
| Average of class Gaming (8810 - 12600, n=98, last 2 years) | |
| MSI Stealth 17 Studio A13VH-014 | |
| PCMark 10 / Productivity | |
| Medion Erazer Beast X40 | |
| Schenker Key 17 Pro (Early 23) | |
| Average of class Gaming (6845 - 18766, n=96, last 2 years) | |
| Average Intel Core i9-13900HX, NVIDIA GeForce RTX 4090 Laptop GPU (9038 - 11680, n=8) | |
| Aorus 17X AZF | |
| Asus ROG Strix Scar 17 G733PY-XS96 | |
| MSI Stealth 17 Studio A13VH-014 | |
| PCMark 10 / Digital Content Creation | |
| Asus ROG Strix Scar 17 G733PY-XS96 | |
| Schenker Key 17 Pro (Early 23) | |
| Average Intel Core i9-13900HX, NVIDIA GeForce RTX 4090 Laptop GPU (10605 - 16395, n=8) | |
| Average of class Gaming (7602 - 19657, n=96, last 2 years) | |
| MSI Stealth 17 Studio A13VH-014 | |
| Medion Erazer Beast X40 | |
| Aorus 17X AZF | |
| CrossMark / Overall | |
| Schenker Key 17 Pro (Early 23) | |
| Aorus 17X AZF | |
| Medion Erazer Beast X40 | |
| Average Intel Core i9-13900HX, NVIDIA GeForce RTX 4090 Laptop GPU (1825 - 2295, n=8) | |
| Asus ROG Strix Scar 17 G733PY-XS96 | |
| Average of class Gaming (1366 - 2409, n=96, last 2 years) | |
| MSI Stealth 17 Studio A13VH-014 | |
| CrossMark / Productivity | |
| Schenker Key 17 Pro (Early 23) | |
| Aorus 17X AZF | |
| Medion Erazer Beast X40 | |
| Average Intel Core i9-13900HX, NVIDIA GeForce RTX 4090 Laptop GPU (1666 - 2166, n=8) | |
| Average of class Gaming (1386 - 2254, n=96, last 2 years) | |
| Asus ROG Strix Scar 17 G733PY-XS96 | |
| MSI Stealth 17 Studio A13VH-014 | |
| CrossMark / Creativity | |
| Schenker Key 17 Pro (Early 23) | |
| Medion Erazer Beast X40 | |
| Average Intel Core i9-13900HX, NVIDIA GeForce RTX 4090 Laptop GPU (2162 - 2514, n=8) | |
| Asus ROG Strix Scar 17 G733PY-XS96 | |
| Aorus 17X AZF | |
| Average of class Gaming (1343 - 2729, n=96, last 2 years) | |
| MSI Stealth 17 Studio A13VH-014 | |
| CrossMark / Responsiveness | |
| Schenker Key 17 Pro (Early 23) | |
| Aorus 17X AZF | |
| Medion Erazer Beast X40 | |
| Average Intel Core i9-13900HX, NVIDIA GeForce RTX 4090 Laptop GPU (1441 - 2275, n=8) | |
| Average of class Gaming (1226 - 2334, n=96, last 2 years) | |
| Asus ROG Strix Scar 17 G733PY-XS96 | |
| MSI Stealth 17 Studio A13VH-014 | |
| PCMark 10 Score | 8913 points | |
Help | ||
| AIDA64 / Memory Copy | |
| Schenker Key 17 Pro (Early 23) | |
| Aorus 17X AZF | |
| Average Intel Core i9-13900HX (67716 - 79193, n=22) | |
| MSI Stealth 17 Studio A13VH-014 | |
| Average of class Gaming (21750 - 129946, n=107, last 2 years) | |
| Medion Erazer Beast X40 | |
| Asus ROG Strix Scar 17 G733PY-XS96 | |
| AIDA64 / Memory Read | |
| Aorus 17X AZF | |
| Schenker Key 17 Pro (Early 23) | |
| Average Intel Core i9-13900HX (73998 - 88462, n=22) | |
| MSI Stealth 17 Studio A13VH-014 | |
| Medion Erazer Beast X40 | |
| Average of class Gaming (22956 - 118858, n=107, last 2 years) | |
| Asus ROG Strix Scar 17 G733PY-XS96 | |
| AIDA64 / Memory Write | |
| Schenker Key 17 Pro (Early 23) | |
| Aorus 17X AZF | |
| Average of class Gaming (22297 - 135096, n=107, last 2 years) | |
| MSI Stealth 17 Studio A13VH-014 | |
| Average Intel Core i9-13900HX (65472 - 77045, n=22) | |
| Medion Erazer Beast X40 | |
| Asus ROG Strix Scar 17 G733PY-XS96 | |
| AIDA64 / Memory Latency | |
| Average of class Gaming (75.3 - 259, n=107, last 2 years) | |
| MSI Stealth 17 Studio A13VH-014 | |
| Schenker Key 17 Pro (Early 23) | |
| Medion Erazer Beast X40 | |
| Average Intel Core i9-13900HX (75.3 - 91.1, n=22) | |
| Asus ROG Strix Scar 17 G733PY-XS96 | |
| Aorus 17X AZF | |
* ... smaller is better
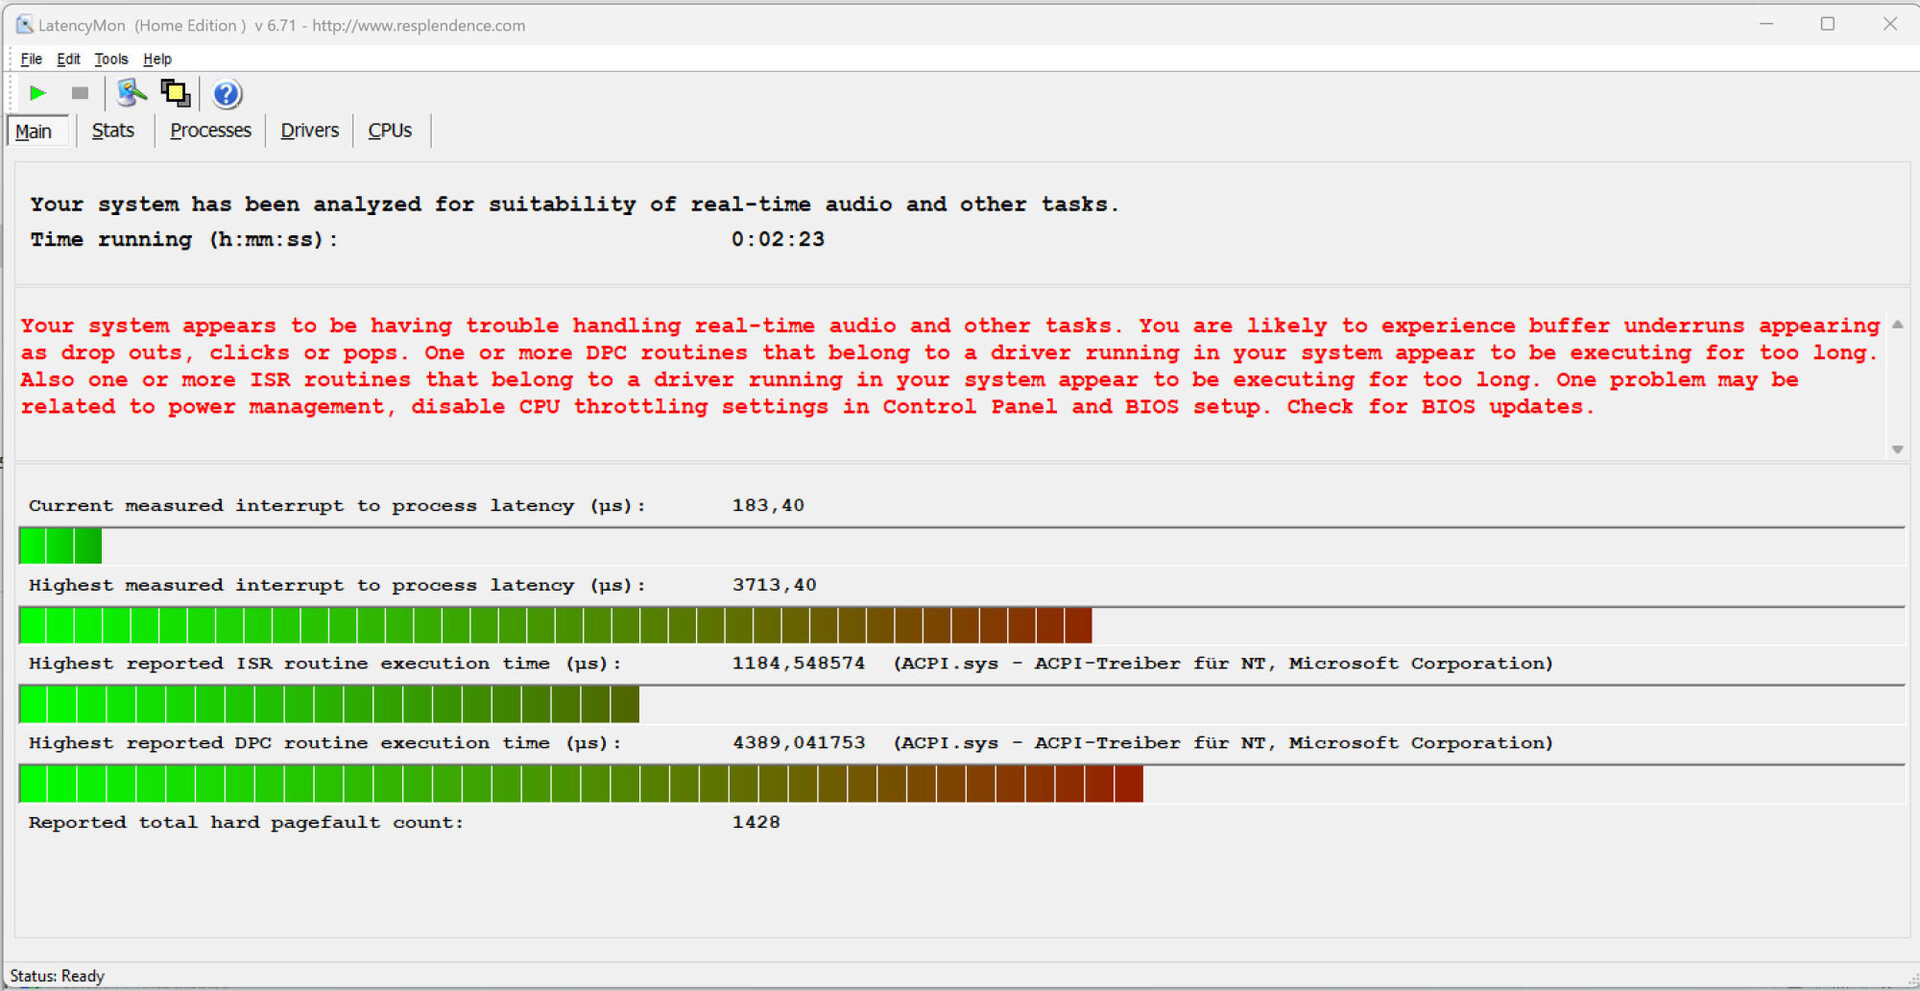
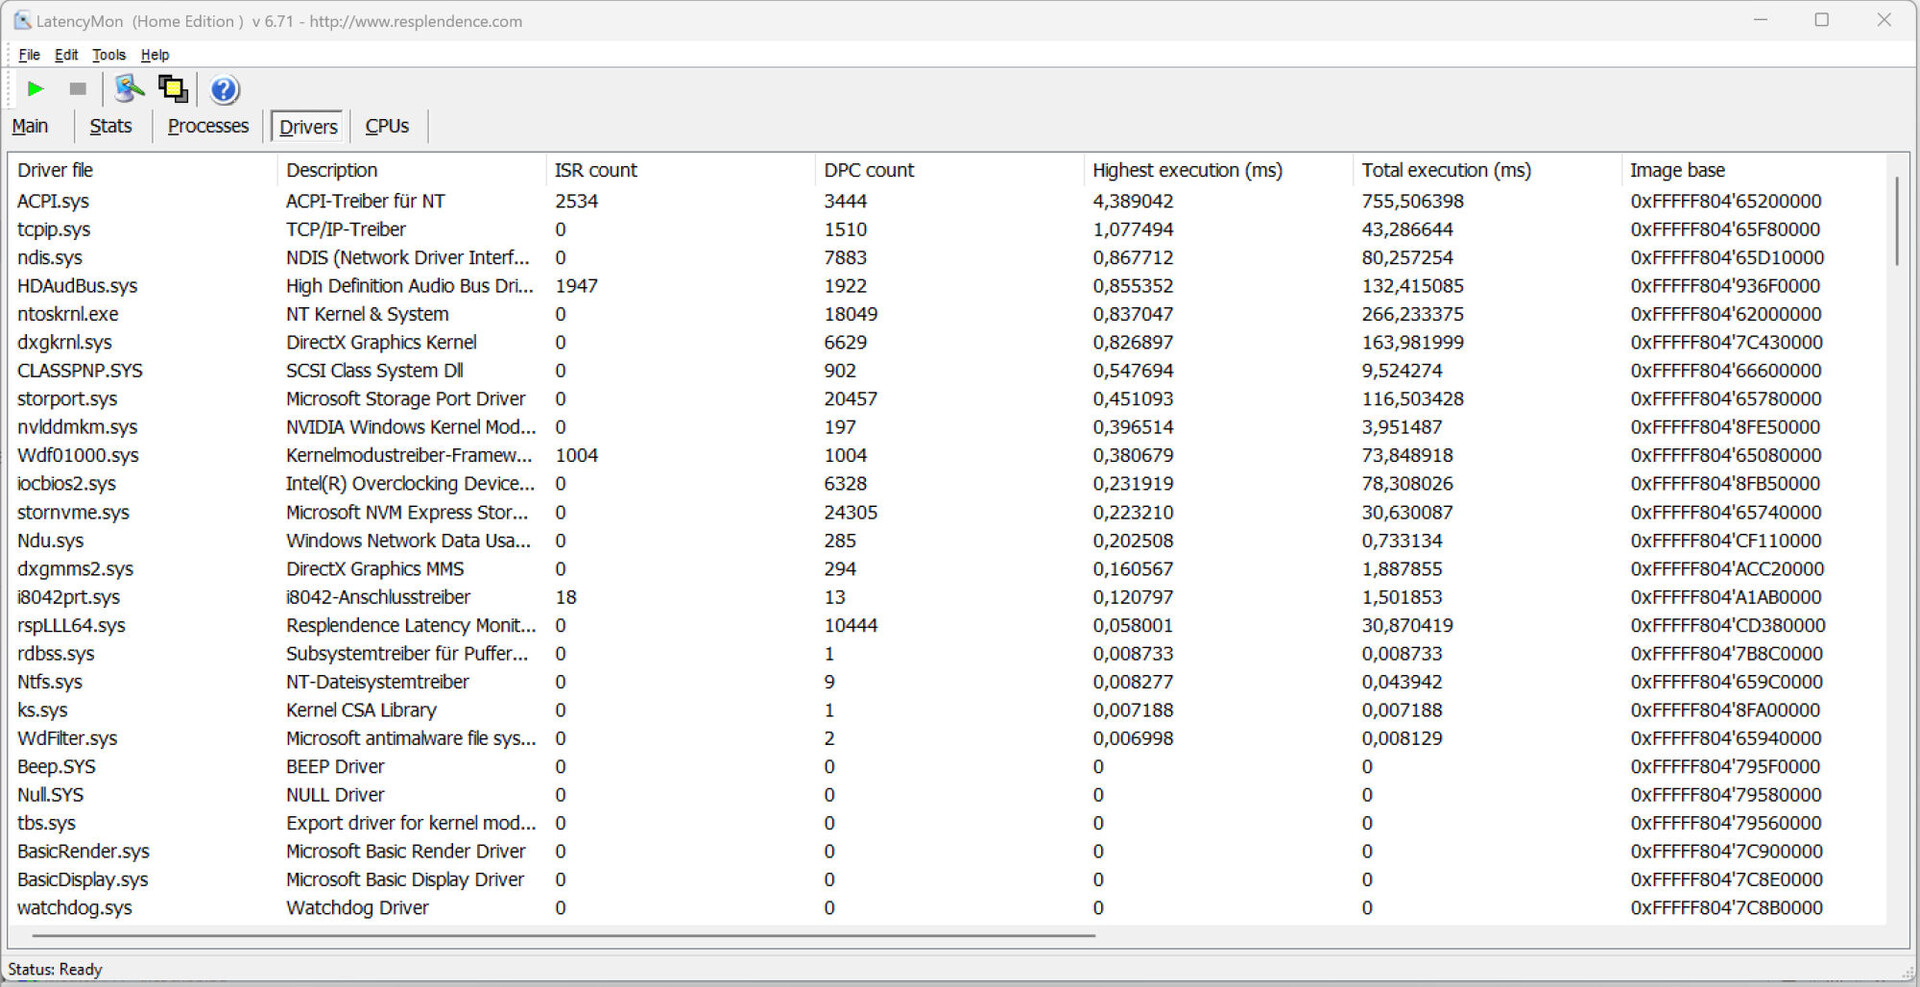
DPC latency
Our standardised latency monitor test (Internet browsing, 4K video playback, Prime95 high load) revealed some latency issues. The system doesn't seem to be suitable for handling real-time video and audio tasks. Hopefully, these issues will be ironed out in future software updates.
| DPC Latencies / LatencyMon - interrupt to process latency (max), Web, Youtube, Prime95 | |
| Aorus 17X AZF | |
| Schenker Key 17 Pro (Early 23) | |
| MSI Stealth 17 Studio A13VH-014 | |
| Medion Erazer Beast X40 | |
| Asus ROG Strix Scar 17 G733PY-XS96 | |
* ... smaller is better
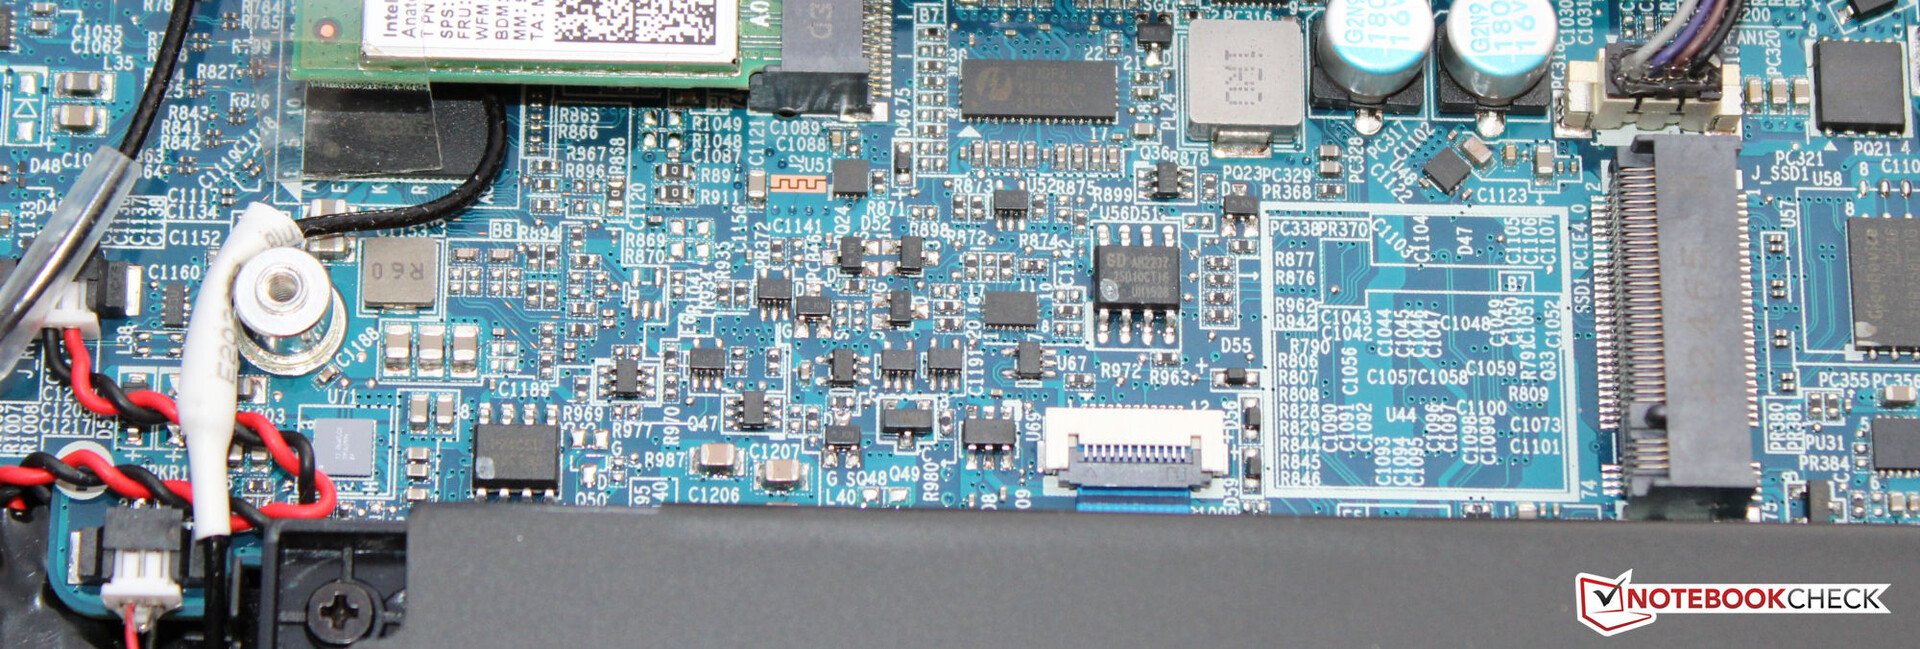
Mass storage
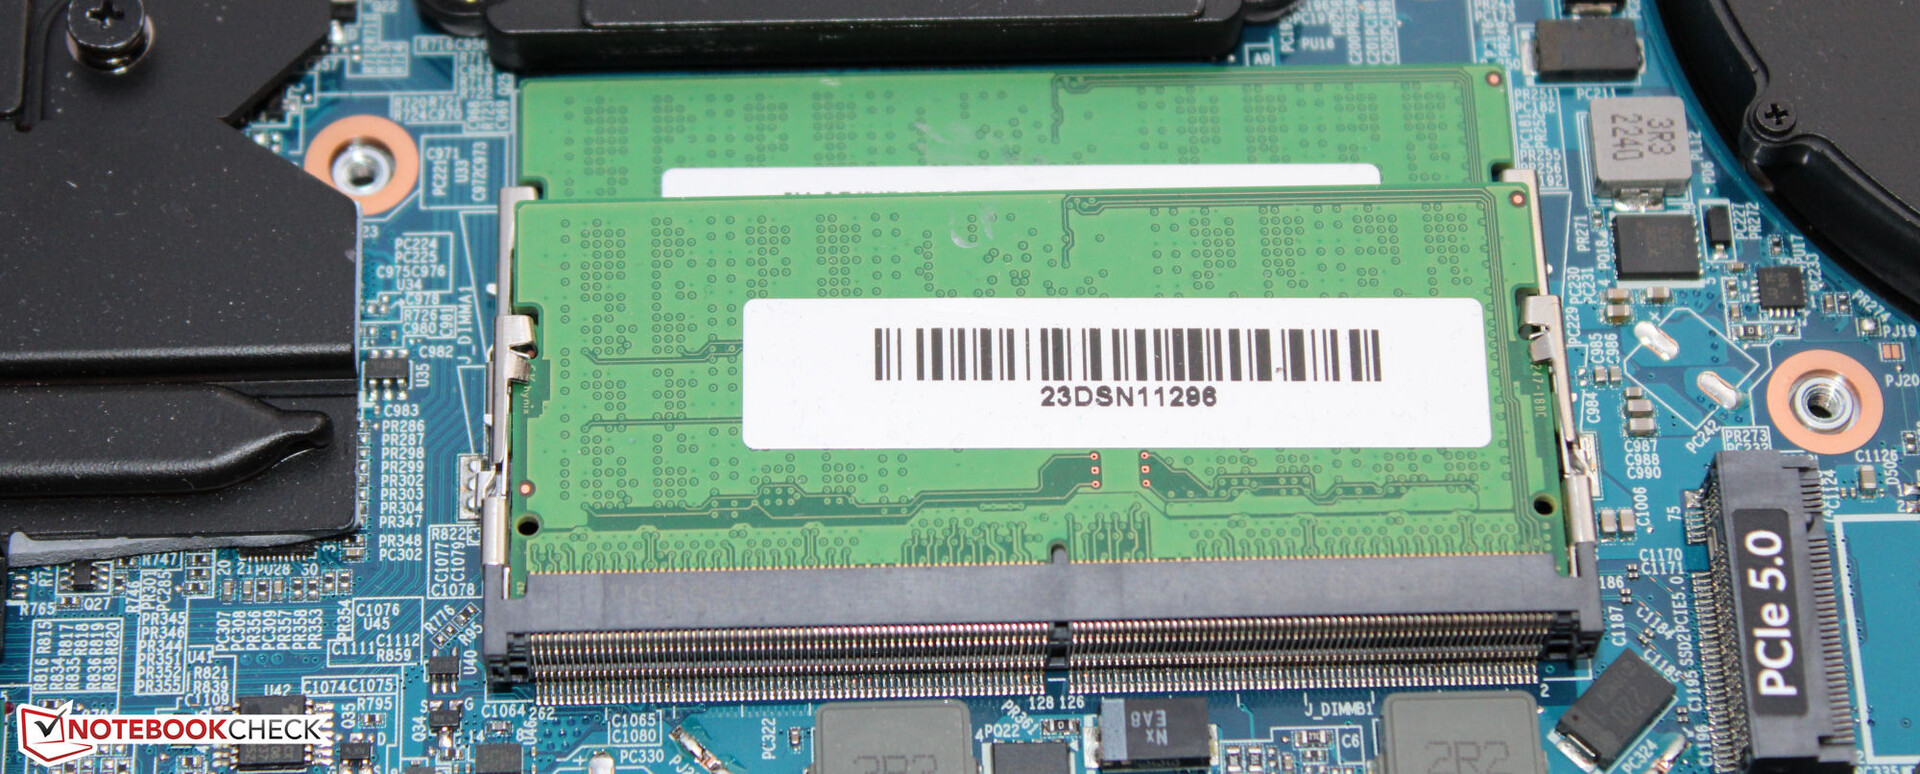
The Schenker Key 17 Pro is able to accommodate up to three M.2-2280 SSDs (2x PCIe 4.0, 1x PCIe 5.0). The preinstalled PCIe 4.0 Samsung drive offers plenty of storage (2 TB) and delivers fantastic transfer rates. We didn't notice any performance dips caused by thermal throttling.

* ... smaller is better
Sustained load Read: DiskSpd Read Loop, Queue Depth 8
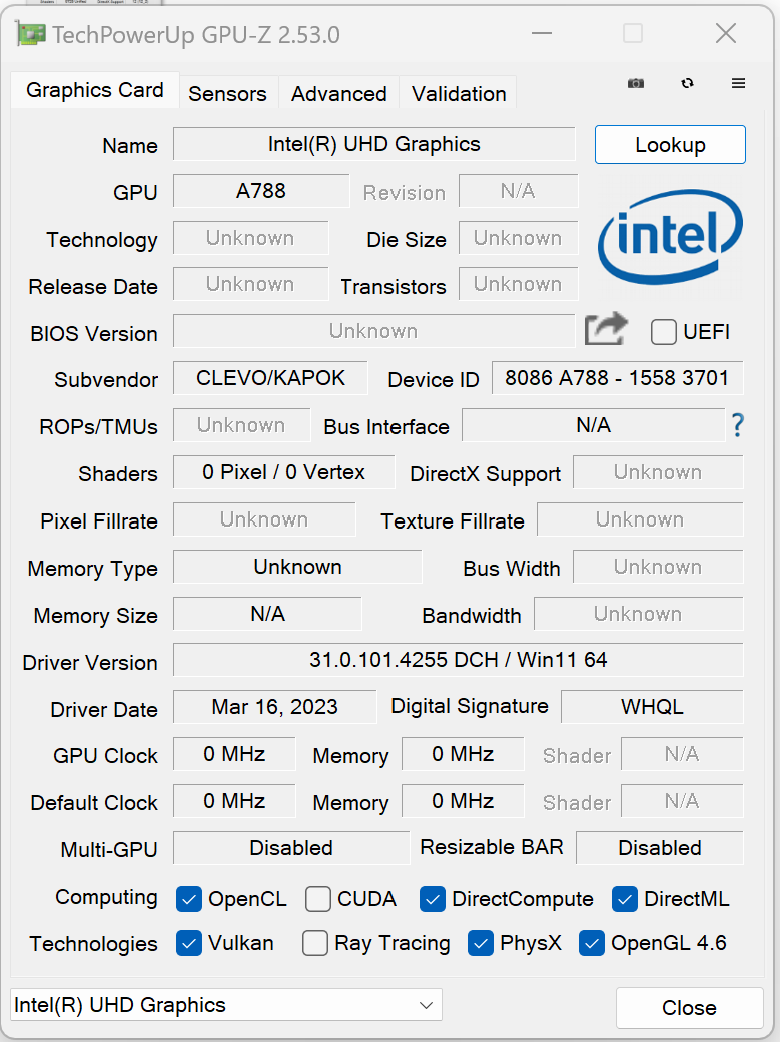
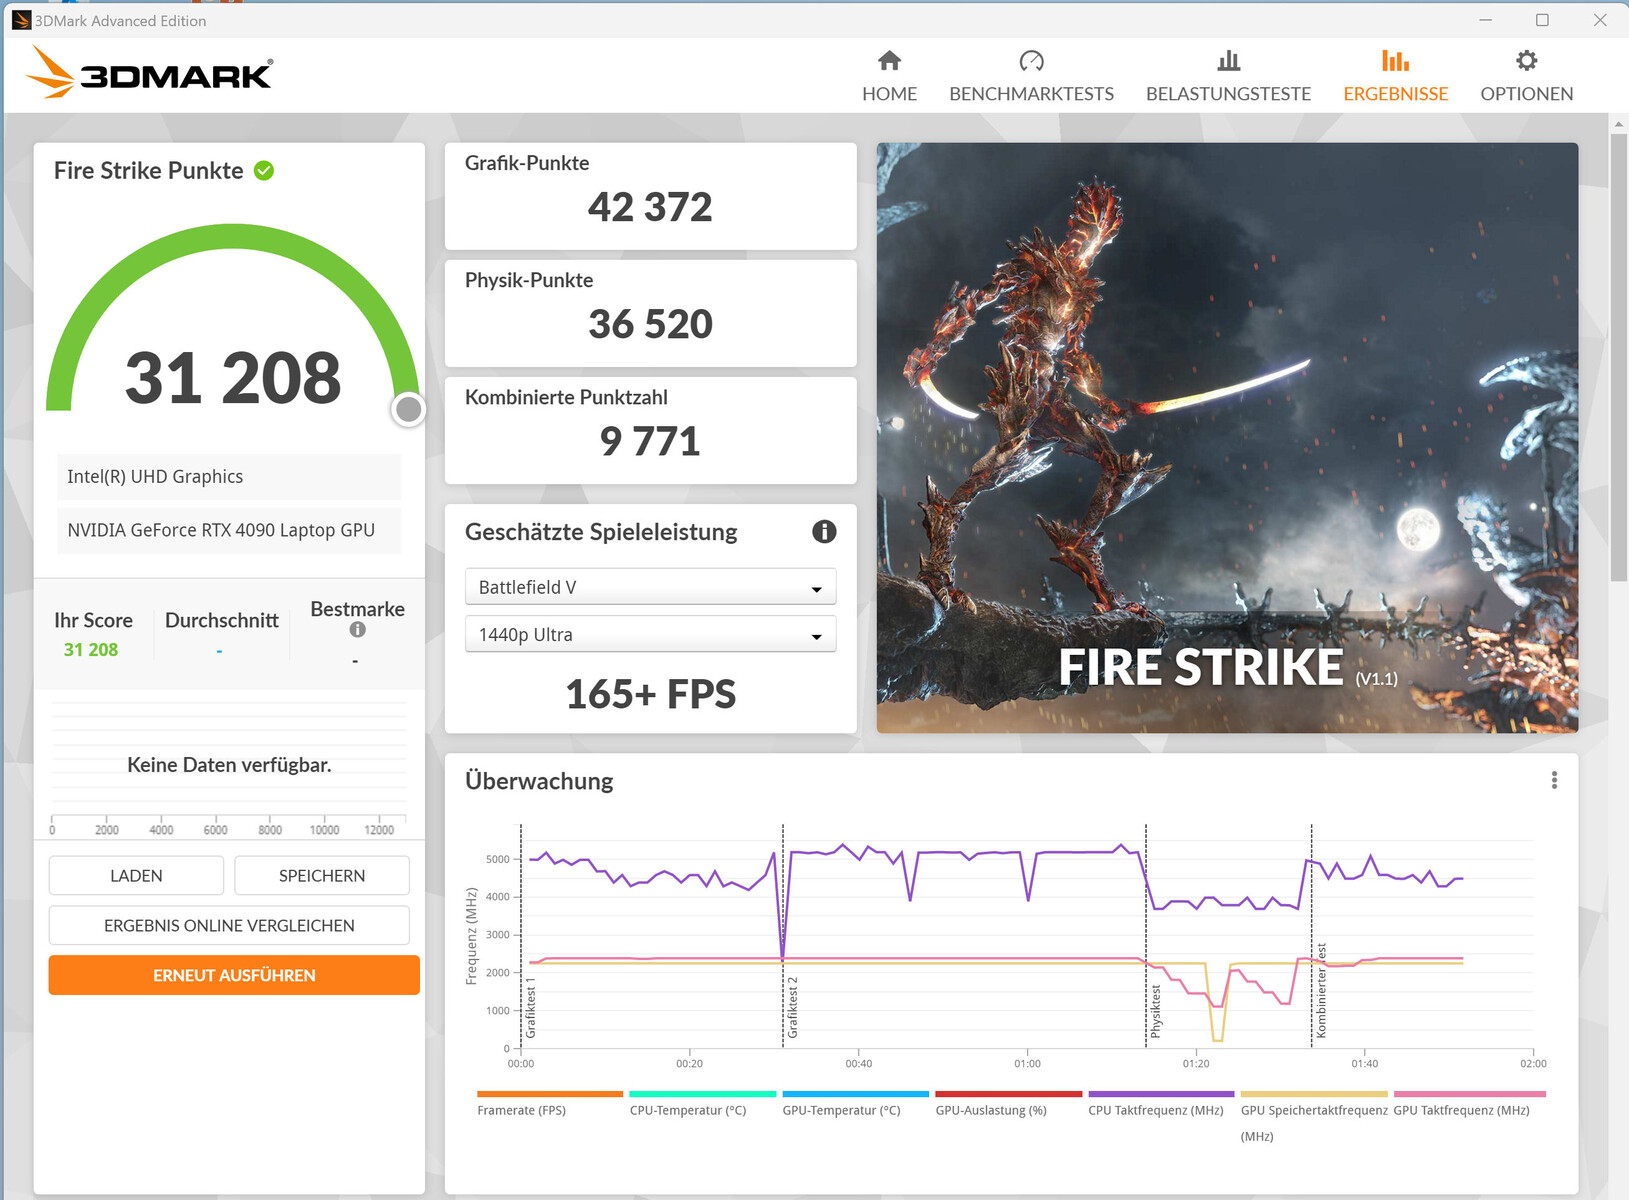
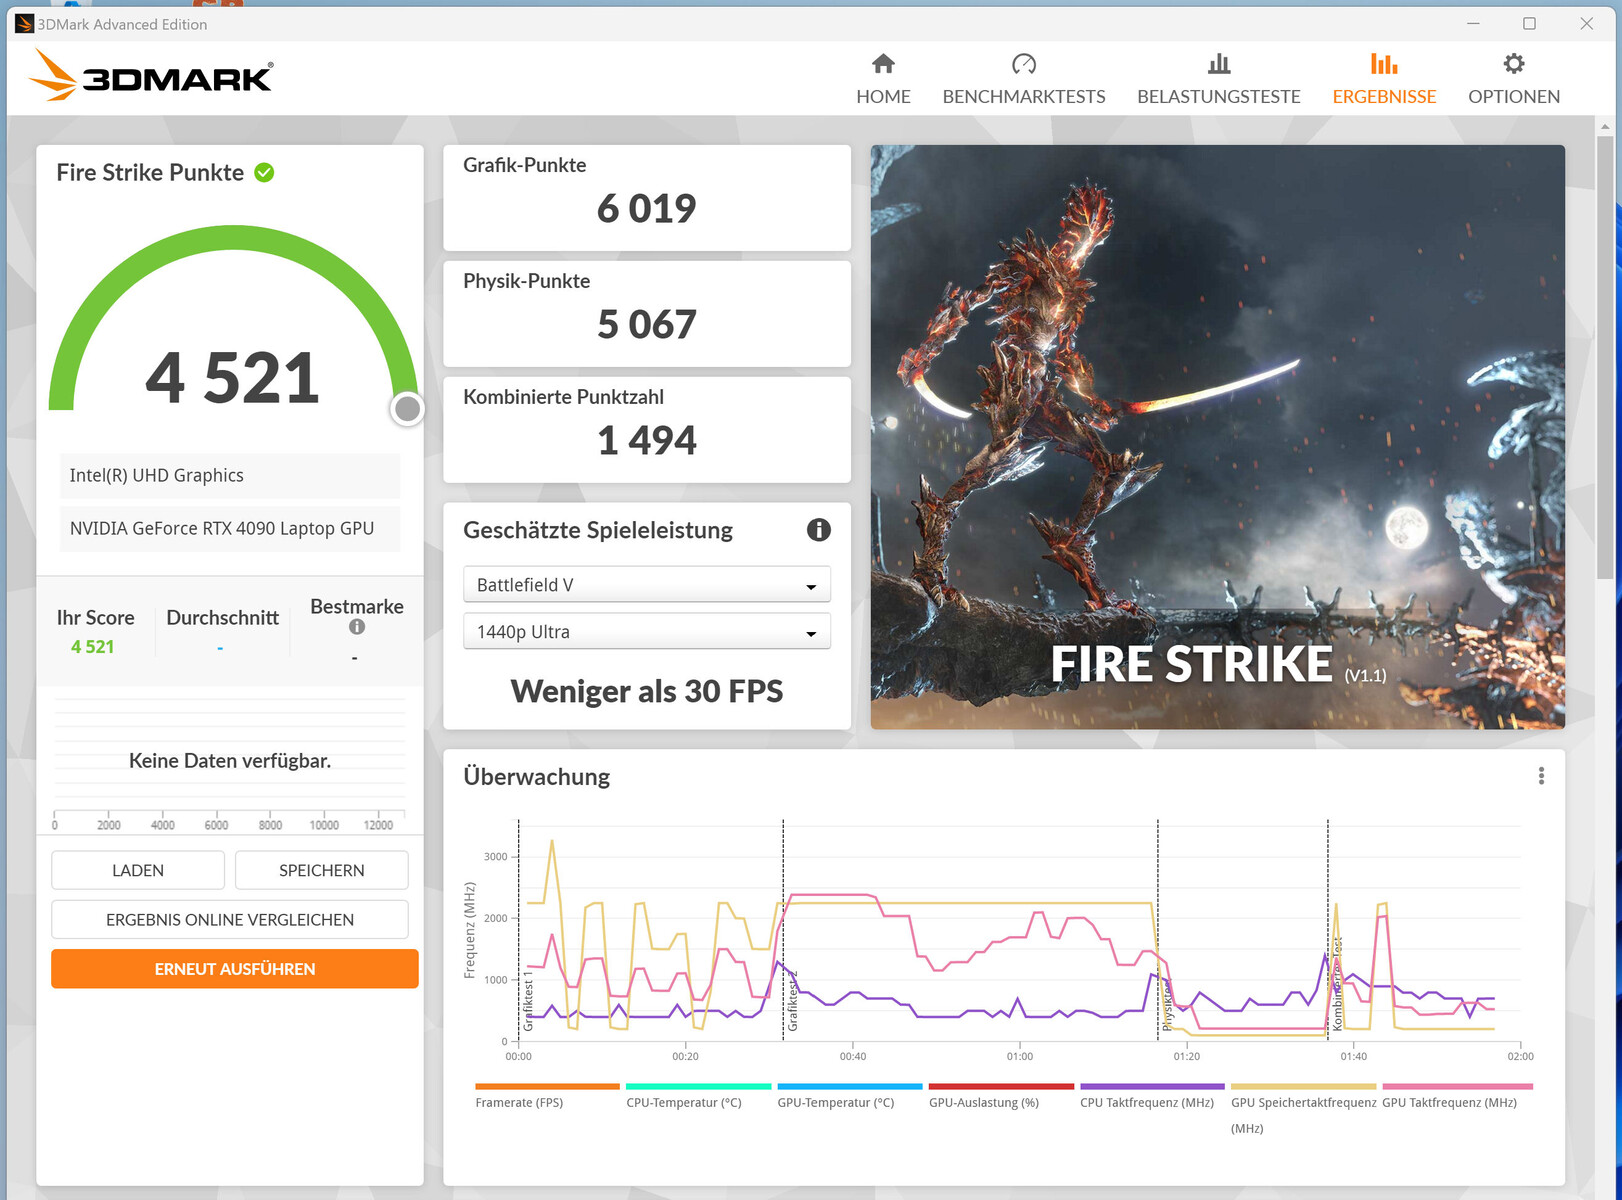
Graphics card
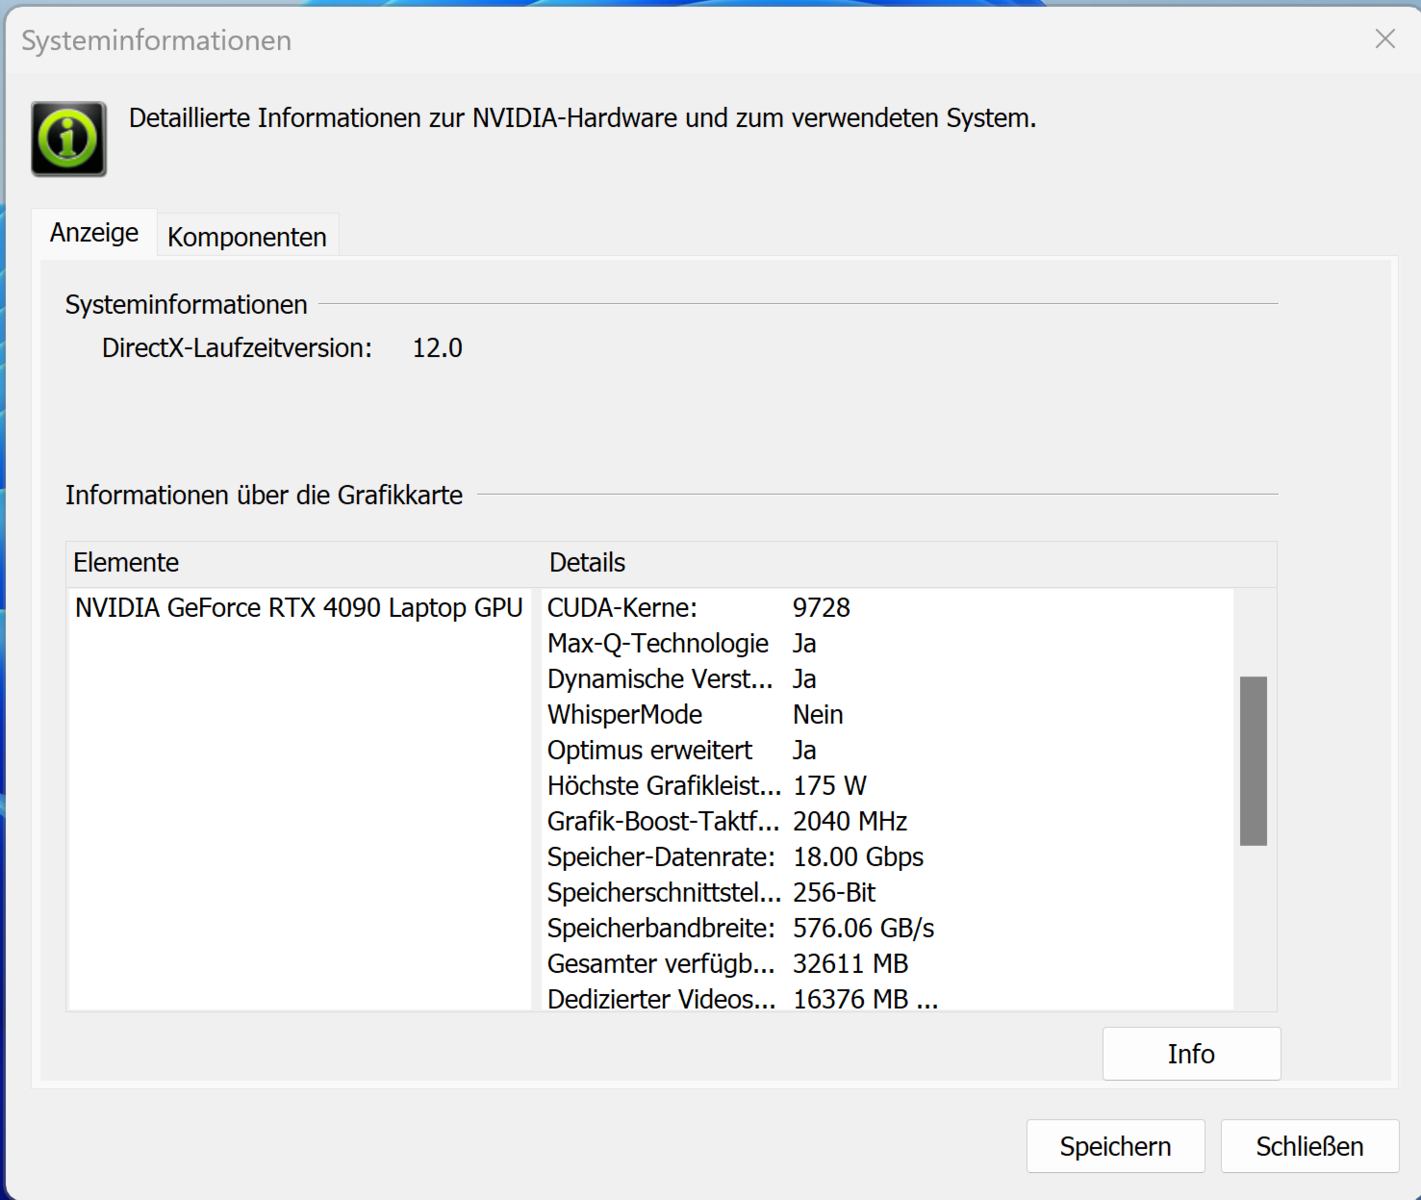
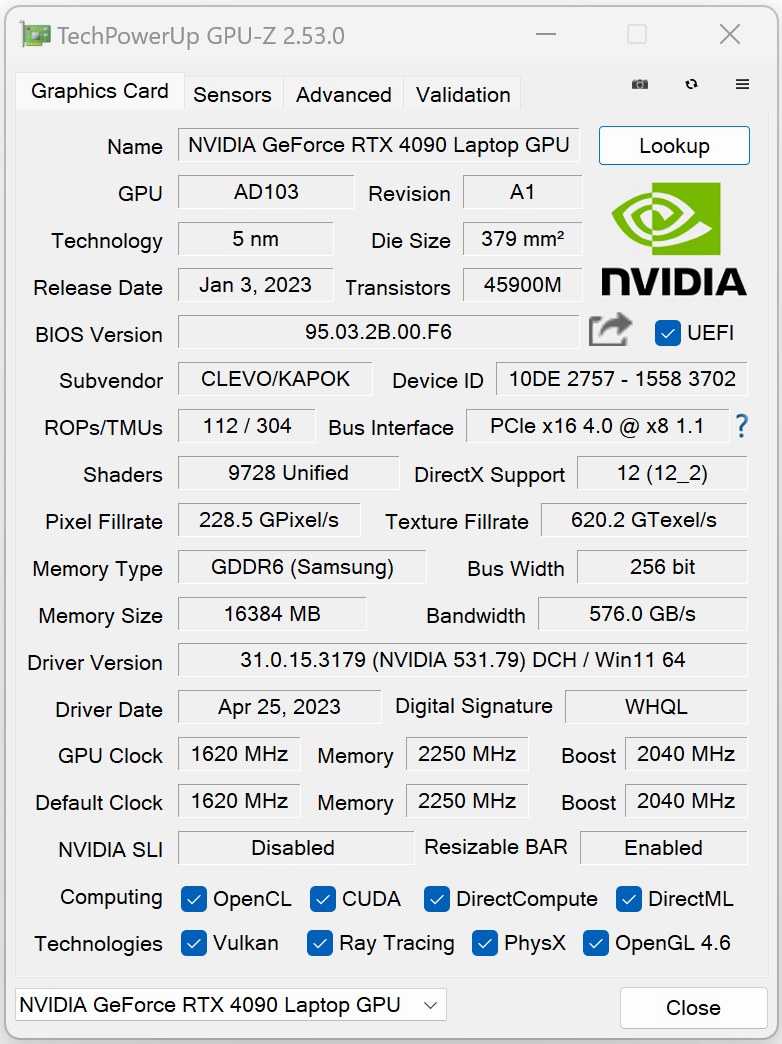
The GeForce RTX 4090 Laptop is Nvidia's current top-of-the-line mobile GPU. It is equipped with 9,728 shader units, a 256-bit memory bus and 16 GB of speedy GDDR6 RAM. The graphics card has a max TGP of 175 watts (150 watt + 25 watt Dynamic Boost) – this is as high as it gets. The TGP wasn't fully utilised during our Witcher 3 test.
Even though the GPU delivered below-average results in synthetic GPU benchmarks, its performance in actual games was above average. Switching to dGPU mode (via Control Center) also provided a performance boost. With such powerful hardware, the laptop is definitely capable of 4K gaming at high to max settings.


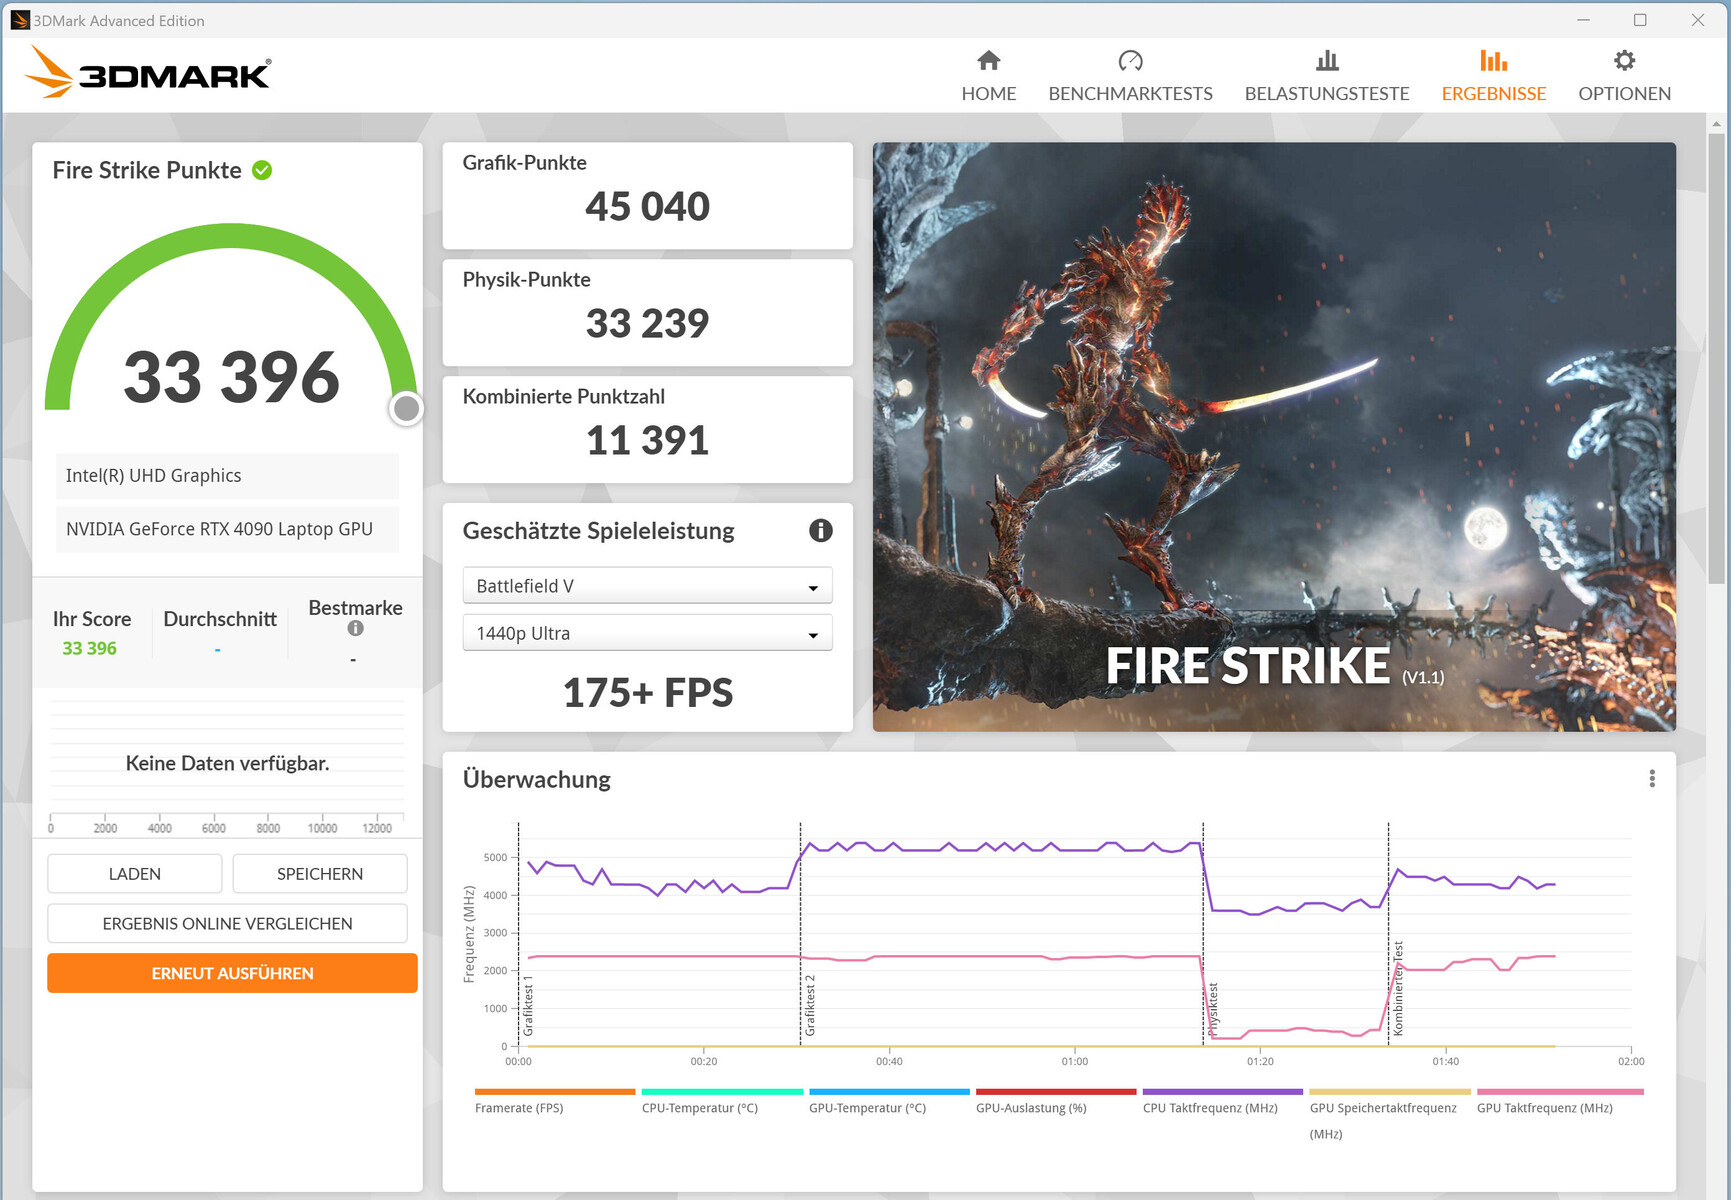
| 3DMark 11 Performance | 44742 points | |
| 3DMark Cloud Gate Standard Score | 54257 points | |
| 3DMark Fire Strike Score | 31208 points | |
| 3DMark Time Spy Score | 19893 points | |
Help | ||
* ... smaller is better
| The Witcher 3 - 1920x1080 Ultra Graphics & Postprocessing (HBAO+) | |
| Schenker Key 17 Pro (Early 23) | |
| Asus ROG Strix Scar 17 G733PY-XS96 | |
| Aorus 17X AZF | |
| Average NVIDIA GeForce RTX 4090 Laptop GPU (139.2 - 216, n=35) | |
| Medion Erazer Beast X40 | |
| Average of class Gaming (95 - 240, n=8, last 2 years) | |
| MSI Stealth 17 Studio A13VH-014 | |
| Strange Brigade - 1920x1080 ultra AA:ultra AF:16 | |
| Aorus 17X AZF | |
| Schenker Key 17 Pro (Early 23) | |
| Medion Erazer Beast X40 | |
| Average NVIDIA GeForce RTX 4090 Laptop GPU (233 - 421, n=39) | |
| Average of class Gaming (76.3 - 456, n=91, last 2 years) | |
| MSI Stealth 17 Studio A13VH-014 | |
| Sons of the Forest | |
| 1920x1080 Ultra Preset AA:T | |
| Schenker Key 17 Pro (Early 23) | |
| Average NVIDIA GeForce RTX 4090 Laptop GPU (85.7 - 93.9, n=2) | |
| Medion Erazer Beast X40 | |
| 3840x2160 Ultra Preset AA:T | |
| Schenker Key 17 Pro (Early 23) | |
| Average NVIDIA GeForce RTX 4090 Laptop GPU (n=1) | |
| Star Wars Jedi Survivor | |
| 1920x1080 Epic Preset | |
| Schenker Key 17 Pro (Early 23) | |
| Average NVIDIA GeForce RTX 4090 Laptop GPU (103 - 148, n=6) | |
| Asus ROG Strix Scar 17 G733PY-XS96 | |
| 3840x2160 Epic Preset | |
| Average NVIDIA GeForce RTX 4090 Laptop GPU (39 - 59, n=6) | |
| Asus ROG Strix Scar 17 G733PY-XS96 | |
| Schenker Key 17 Pro (Early 23) | |
| Resident Evil 4 Remake | |
| 1920x1080 Max Preset | |
| Schenker Key 17 Pro (Early 23) | |
| Average NVIDIA GeForce RTX 4090 Laptop GPU (136.3 - 143.2, n=2) | |
| Aorus 17X AZF | |
| 3840x2160 Max Preset | |
| Schenker Key 17 Pro (Early 23) | |
| Average NVIDIA GeForce RTX 4090 Laptop GPU (63.4 - 64.9, n=2) | |
| Aorus 17X AZF | |
| Dead Island 2 | |
| 1920x1080 Ultra Preset AA:High T | |
| Average NVIDIA GeForce RTX 4090 Laptop GPU (181.7 - 206, n=2) | |
| Schenker Key 17 Pro (Early 23) | |
| 3840x2160 Ultra Preset AA:High T | |
| Average NVIDIA GeForce RTX 4090 Laptop GPU (94.8 - 101.2, n=2) | |
| Schenker Key 17 Pro (Early 23) | |
| The Callisto Protocol | |
| 1920x1080 Ultra Preset (without FSR Upscaling) | |
| Schenker Key 17 Pro (Early 23) | |
| Aorus 17X AZF | |
| Average NVIDIA GeForce RTX 4090 Laptop GPU (102.6 - 150.7, n=6) | |
| 3840x2160 Ultra Preset (without FSR Upscaling) | |
| Schenker Key 17 Pro (Early 23) | |
| Average NVIDIA GeForce RTX 4090 Laptop GPU (48.1 - 81.4, n=6) | |
| Aorus 17X AZF | |
Witcher 3 FPS chart
| low | med. | high | ultra | QHD | 4K | |
|---|---|---|---|---|---|---|
| GTA V (2015) | 187.7 | 186.4 | 184.8 | 142.3 | 141.5 | 167.9 |
| The Witcher 3 (2015) | 474.4 | 382.6 | 299.2 | 206 | 96.3 | |
| Dota 2 Reborn (2015) | 231 | 207 | 195.3 | 182.5 | 141.9 | |
| Final Fantasy XV Benchmark (2018) | 230 | 217 | 183.1 | 156.4 | 91.9 | |
| X-Plane 11.11 (2018) | 180.8 | 171.7 | 136.6 | 109.7 | ||
| Strange Brigade (2018) | 558 | 437 | 410 | 378 | 291 | 153.4 |
| The Callisto Protocol (2022) | 194.5 | 182.6 | 175.5 | 150.7 | 126.7 | 81.4 |
| Sons of the Forest (2023) | 103.2 | 97.5 | 93.9 | 93.9 | 89.6 | 72.5 |
| Resident Evil 4 Remake (2023) | 203 | 194.6 | 173.1 | 143.2 | 113.2 | 64.9 |
| Dead Island 2 (2023) | 226 | 212 | 190.3 | 181.7 | 178.5 | 94.8 |
| Star Wars Jedi Survivor (2023) | 131.2 | 127.6 | 122.1 | 117.4 | 84.4 | 41.8 |
Emissions & Power management - The Schenker laptop can get pretty noisy
Noise emissions
A powerful notebook like the Key 17 Pro can produce a huge amount of noise under load: noise level peaked at 62 dB(A) when the laptop was running games in "Performance mode". Even in "Entertainment mode", the device still managed to reach an extremely loud 54 dB(A). The other two power modes help the Key 17 Pro run quietly for the most part with significantly reduced performance.
The notebook is generally quiet, sometimes even silent, at idle or in everyday use (e.g. office software, Internet browsing). However, the fans occasionally spin up for no reason (a phenomenon that typically happens with Clevo barebones).
Noise level
| Idle |
| 26 / 33 / 46 dB(A) |
| Load |
| 56 / 64 dB(A) |
 | ||
30 dB silent 40 dB(A) audible 50 dB(A) loud |
||
min: | ||
| Schenker Key 17 Pro (Early 23) i9-13900HX, GeForce RTX 4090 Laptop GPU | MSI Stealth 17 Studio A13VH-014 i9-13900H, GeForce RTX 4080 Laptop GPU | Asus ROG Strix Scar 17 G733PY-XS96 R9 7945HX, GeForce RTX 4090 Laptop GPU | Aorus 17X AZF i9-13900HX, GeForce RTX 4090 Laptop GPU | Medion Erazer Beast X40 i9-13900HX, GeForce RTX 4090 Laptop GPU | |
|---|---|---|---|---|---|
| Noise | 25% | 22% | 10% | 13% | |
| off / environment * (dB) | 26 | 24 8% | 22.7 13% | 25 4% | 24 8% |
| Idle Minimum * (dB) | 26 | 24 8% | 23.5 10% | 28 -8% | 25 4% |
| Idle Average * (dB) | 33 | 24 27% | 27.7 16% | 29 12% | 29 12% |
| Idle Maximum * (dB) | 46 | 24 48% | 27.7 40% | 34 26% | 35 24% |
| Load Average * (dB) | 56 | 34.49 38% | 30.5 46% | 51 9% | 51 9% |
| Witcher 3 ultra * (dB) | 62 | 48.29 22% | 51.4 17% | 57 8% | 51 18% |
| Load Maximum * (dB) | 64 | 49.66 22% | 54.1 15% | 54 16% | 53 17% |
* ... smaller is better
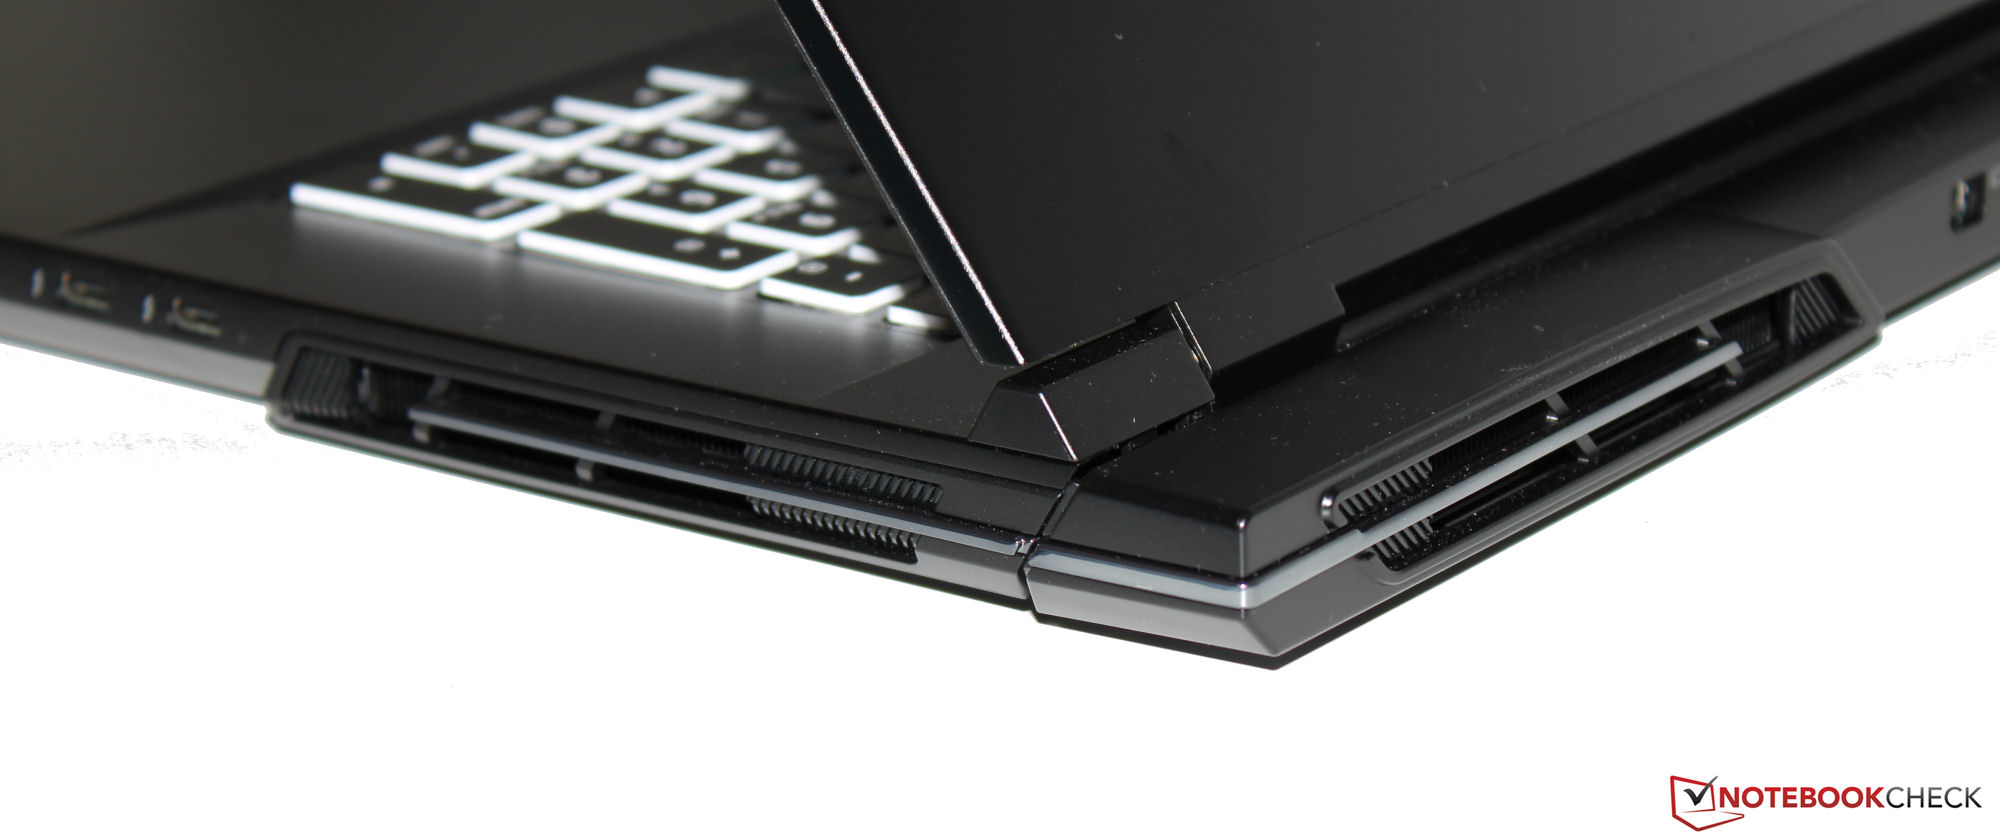
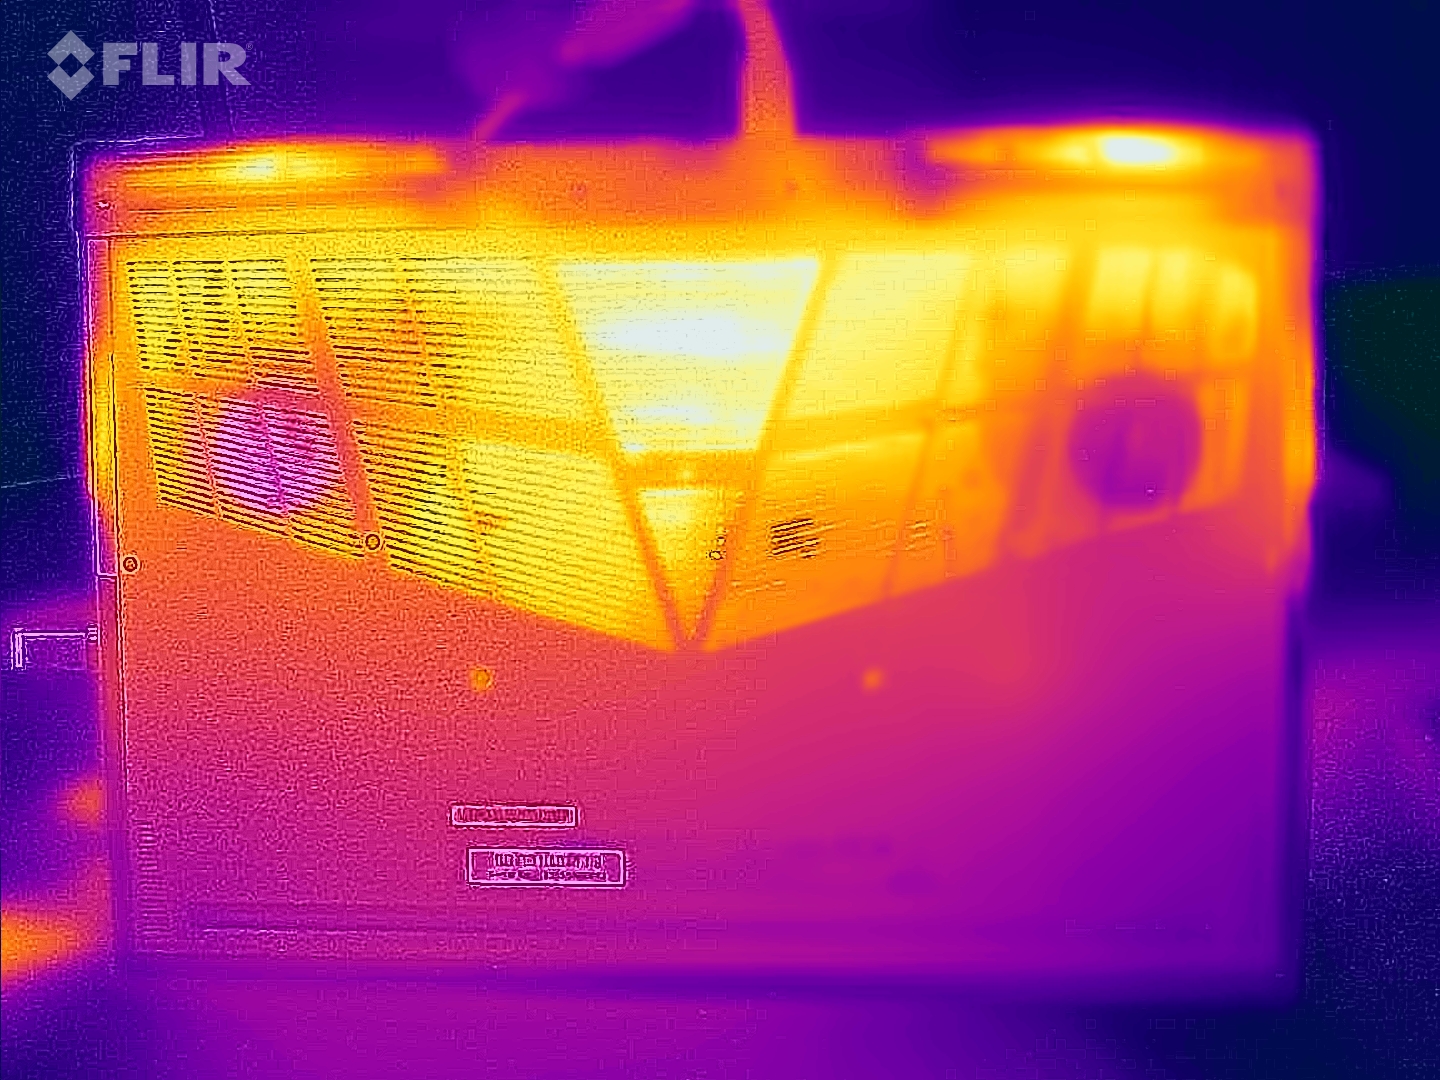
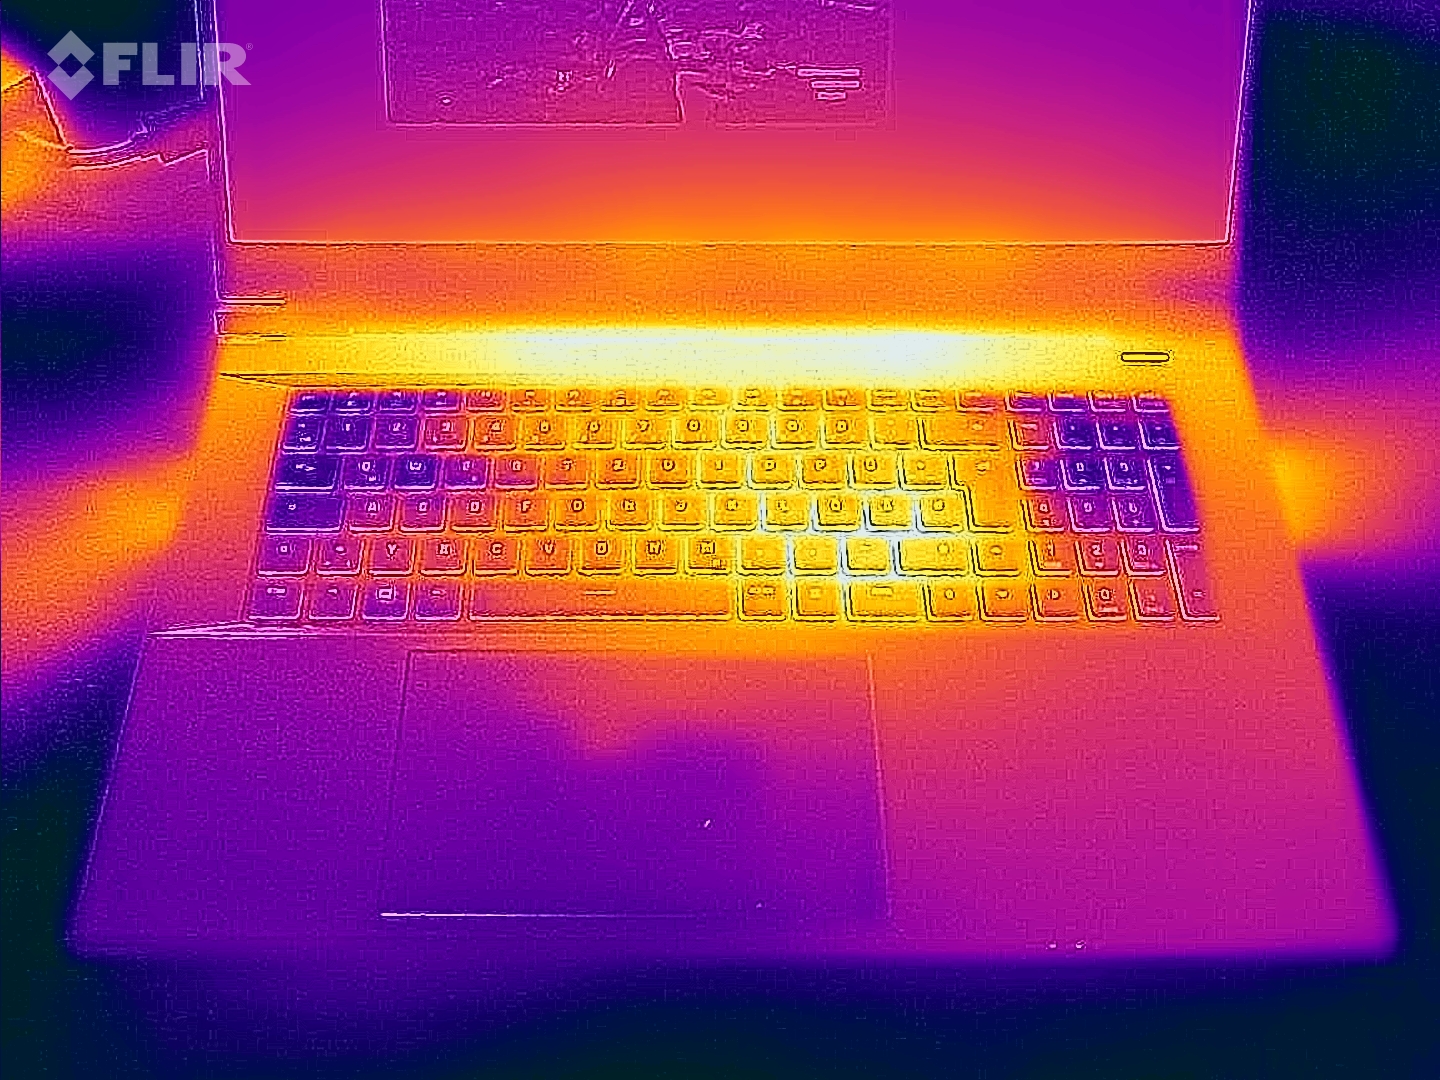
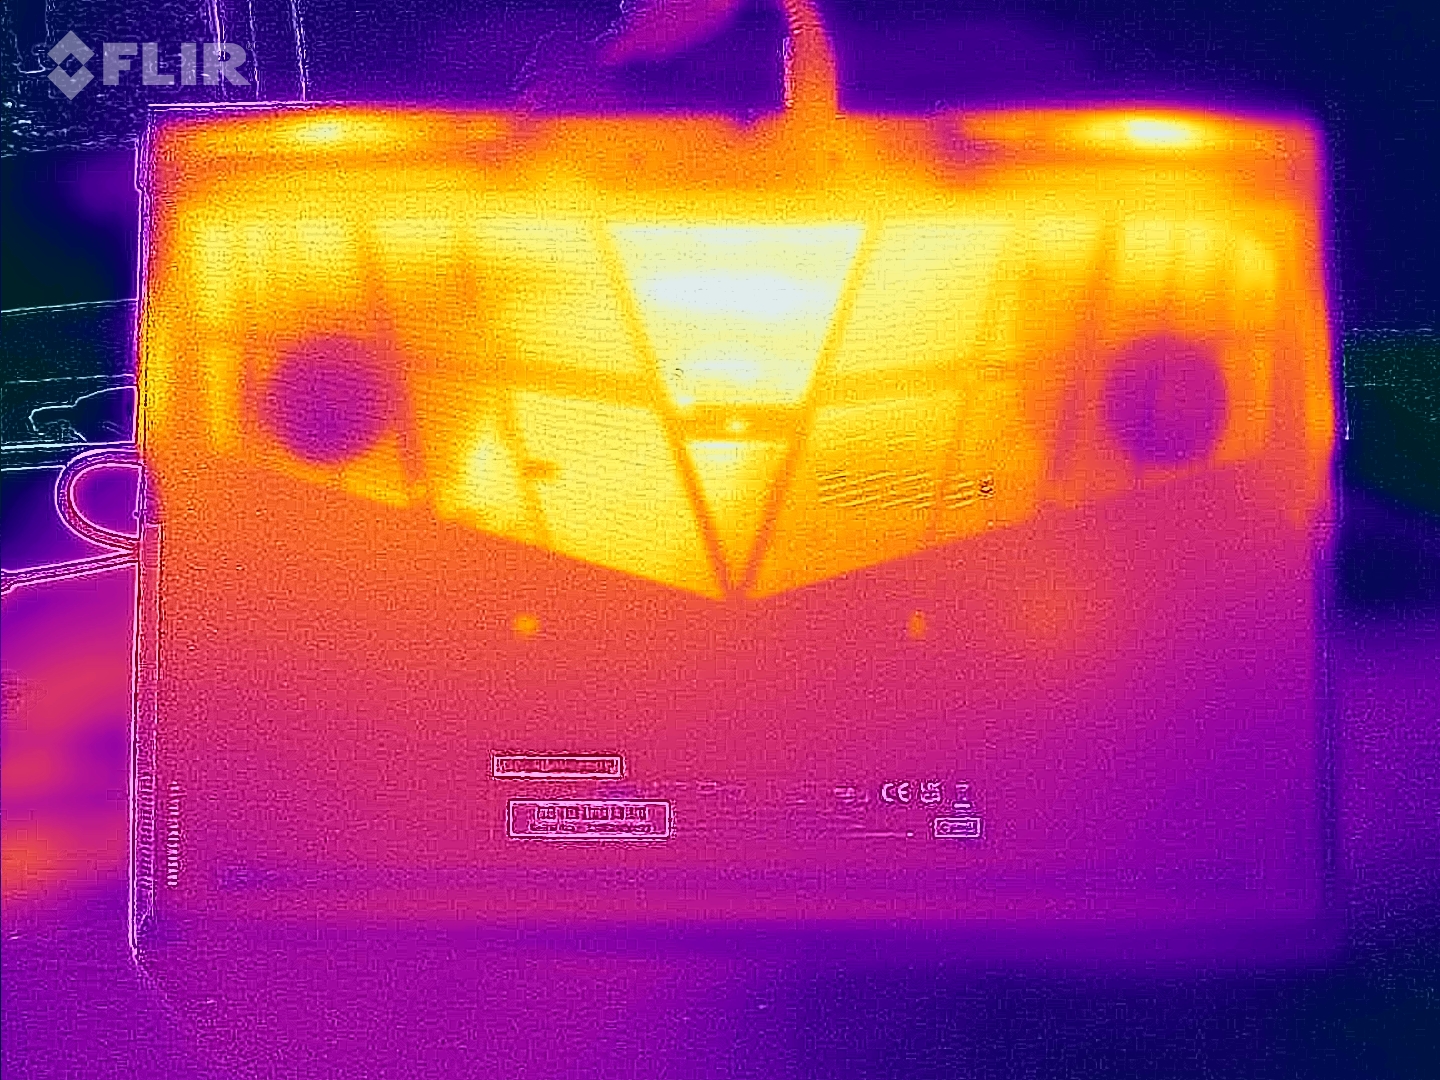
Temperature
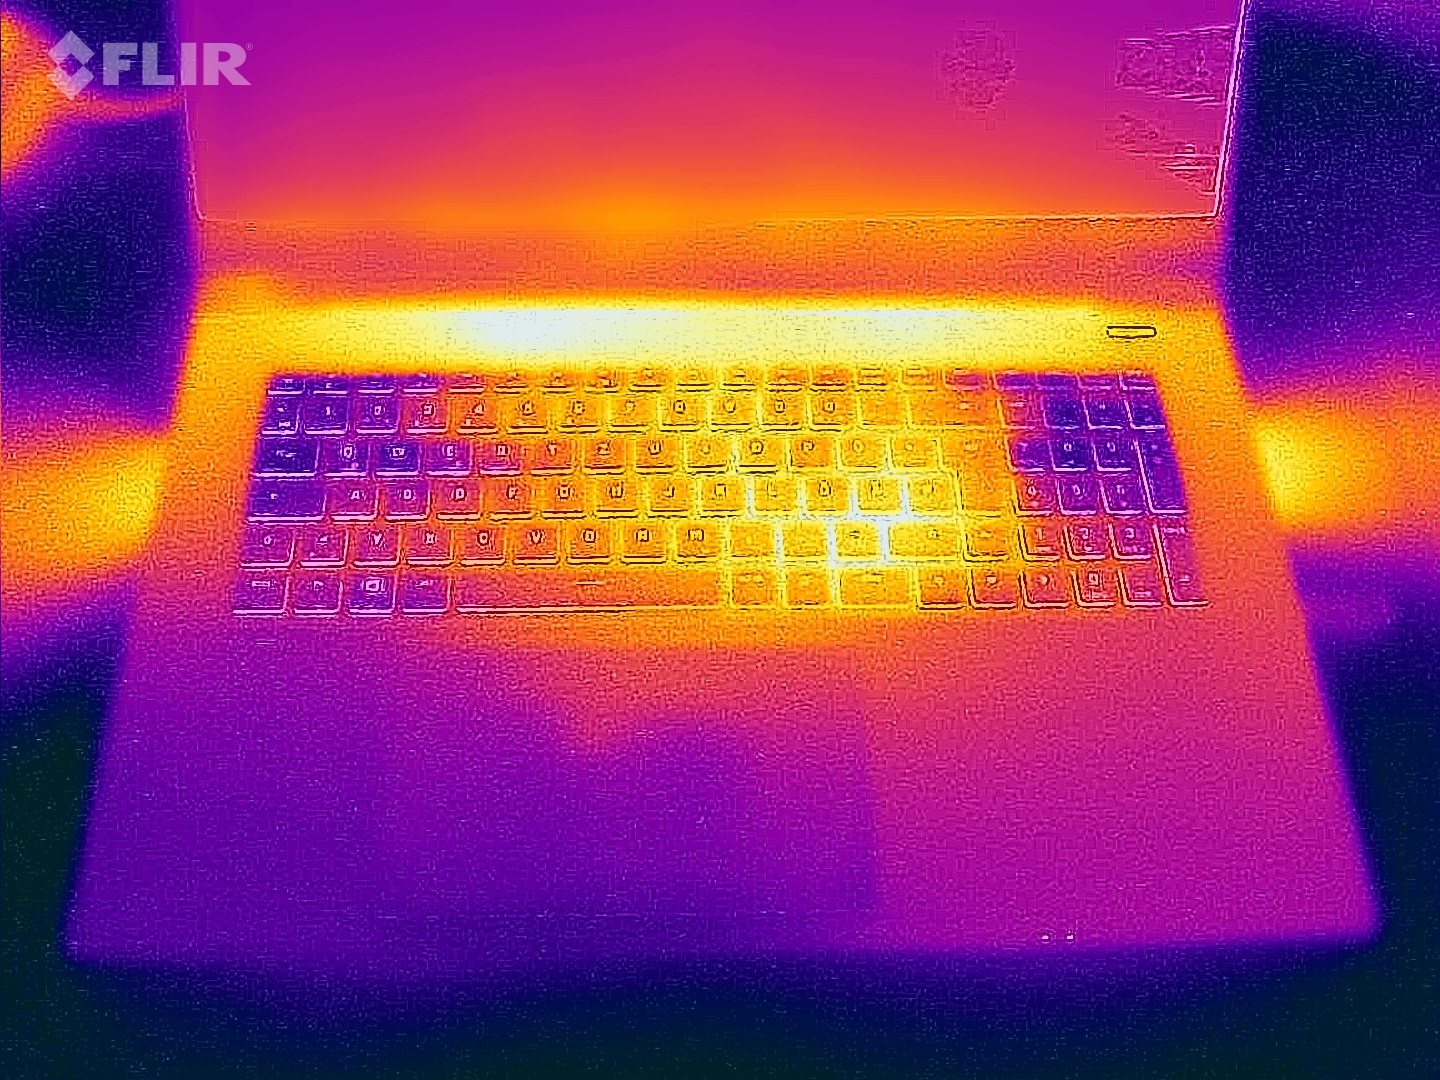
The laptop becomes noticeably warm under load: we measured temperatures between 55 and 60°C (131 and 140°F) at certain spots on the chassis. In normal use, though, chassis temperatures stayed within a comfortable range
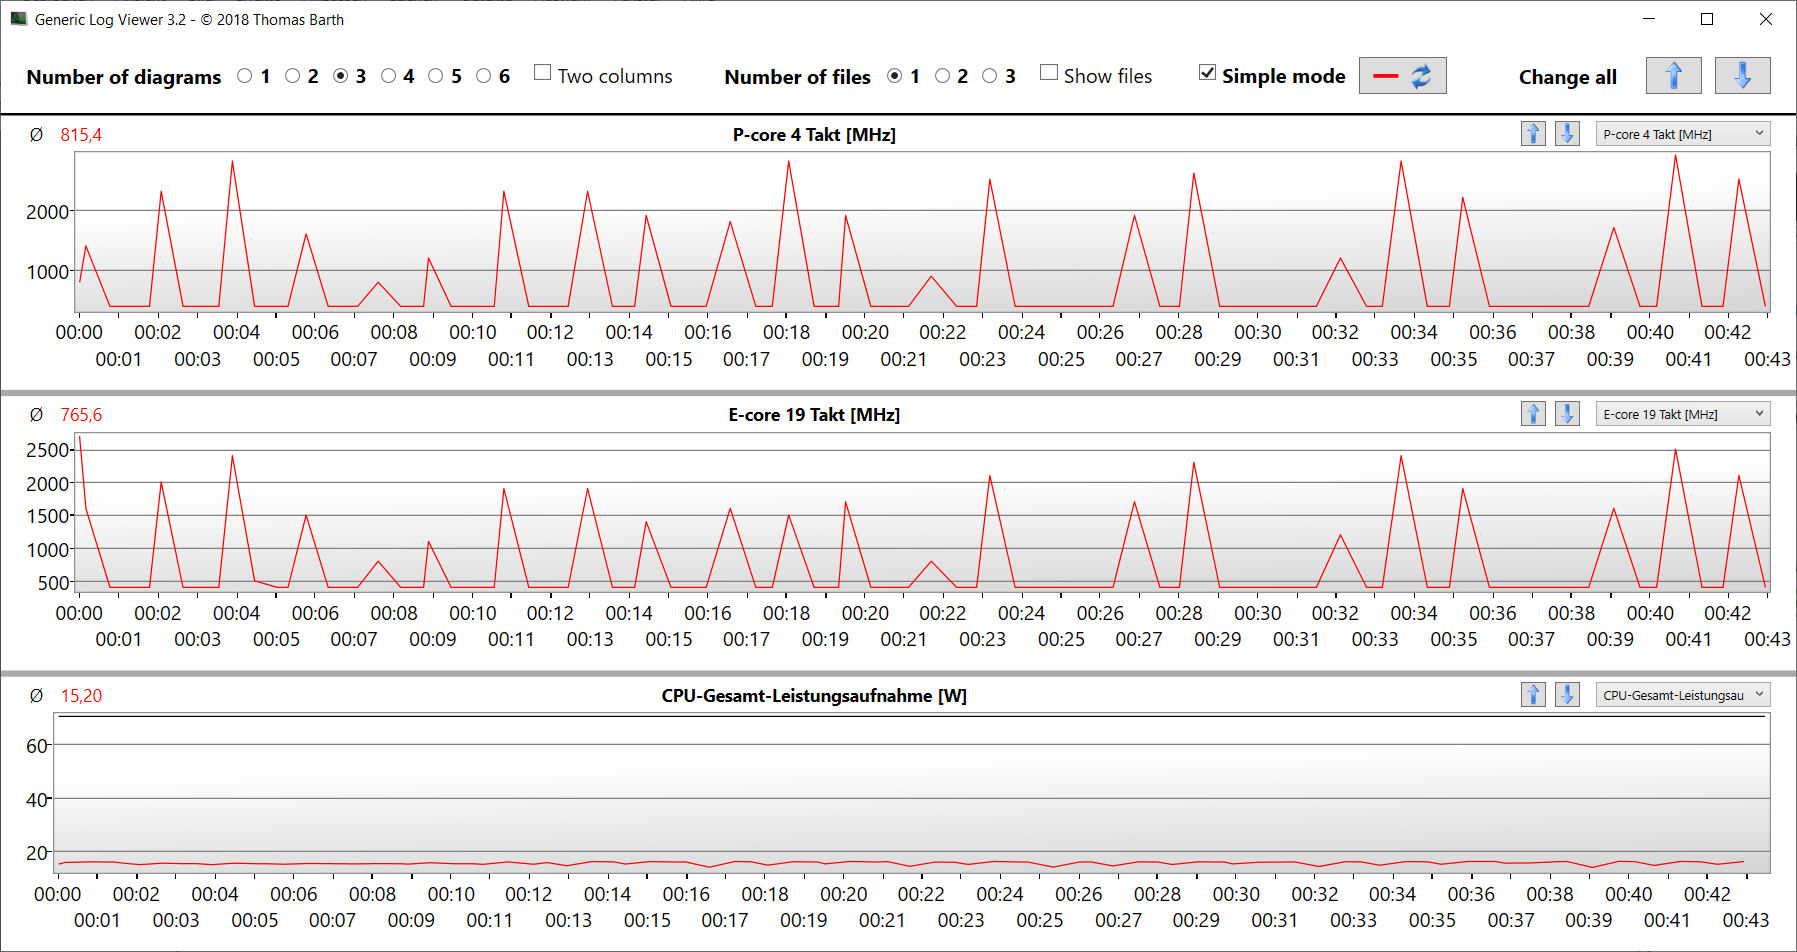
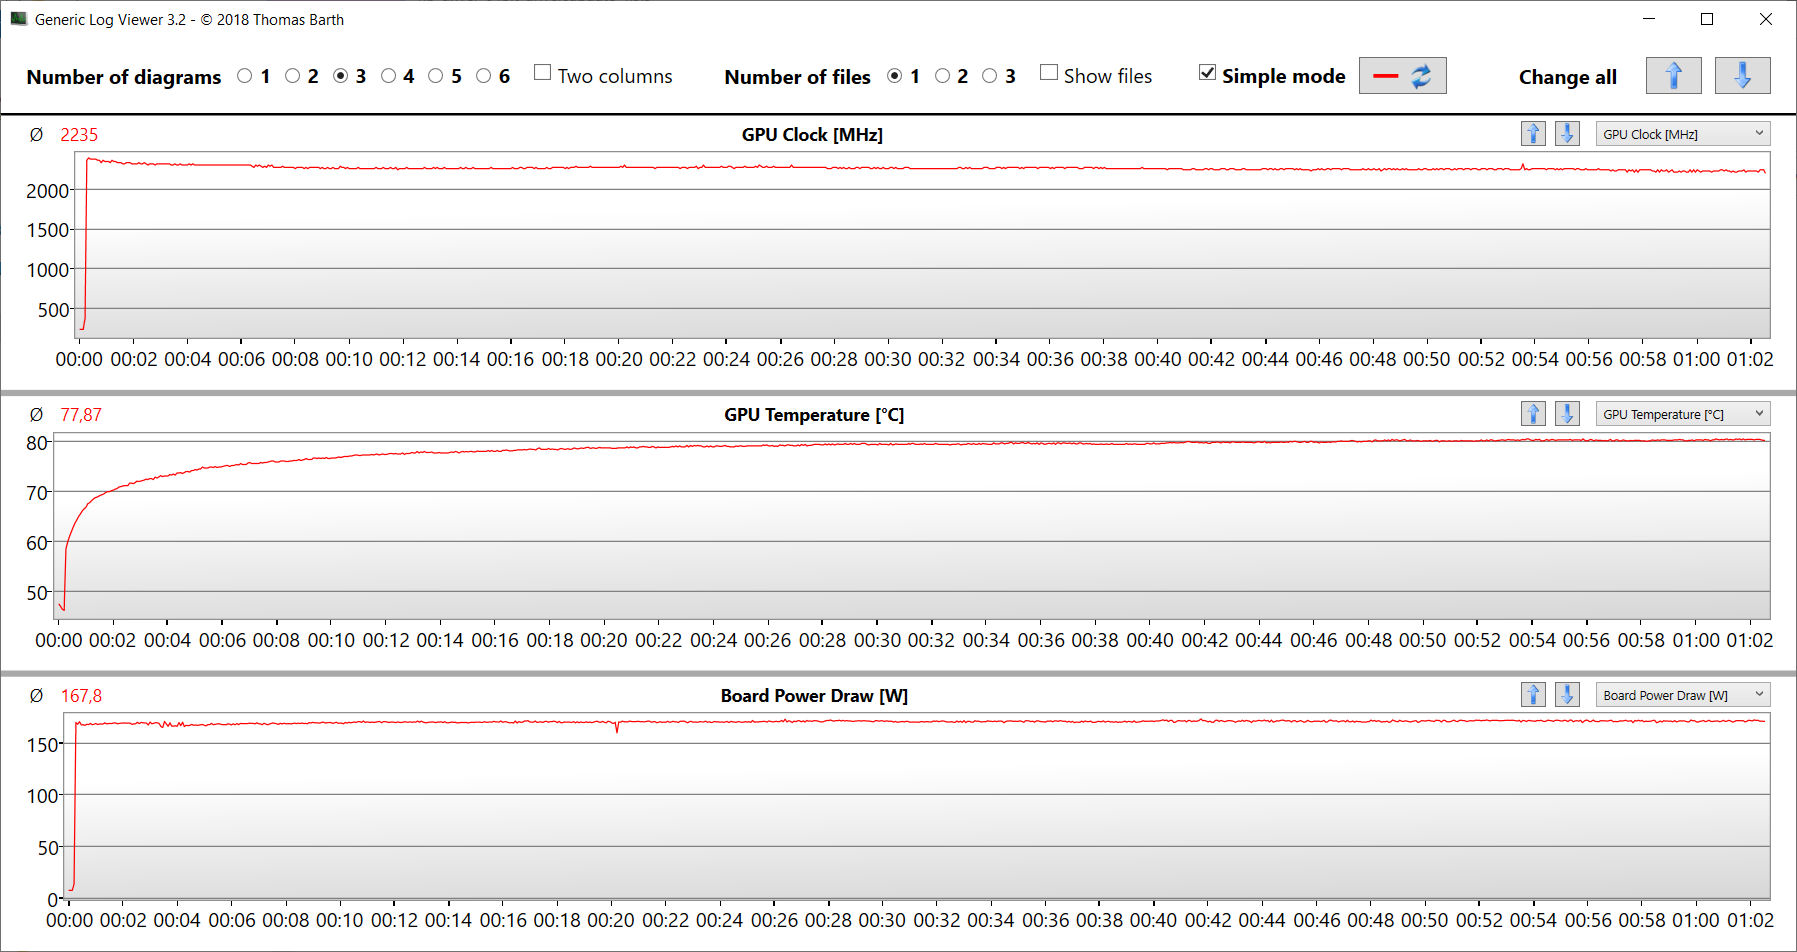
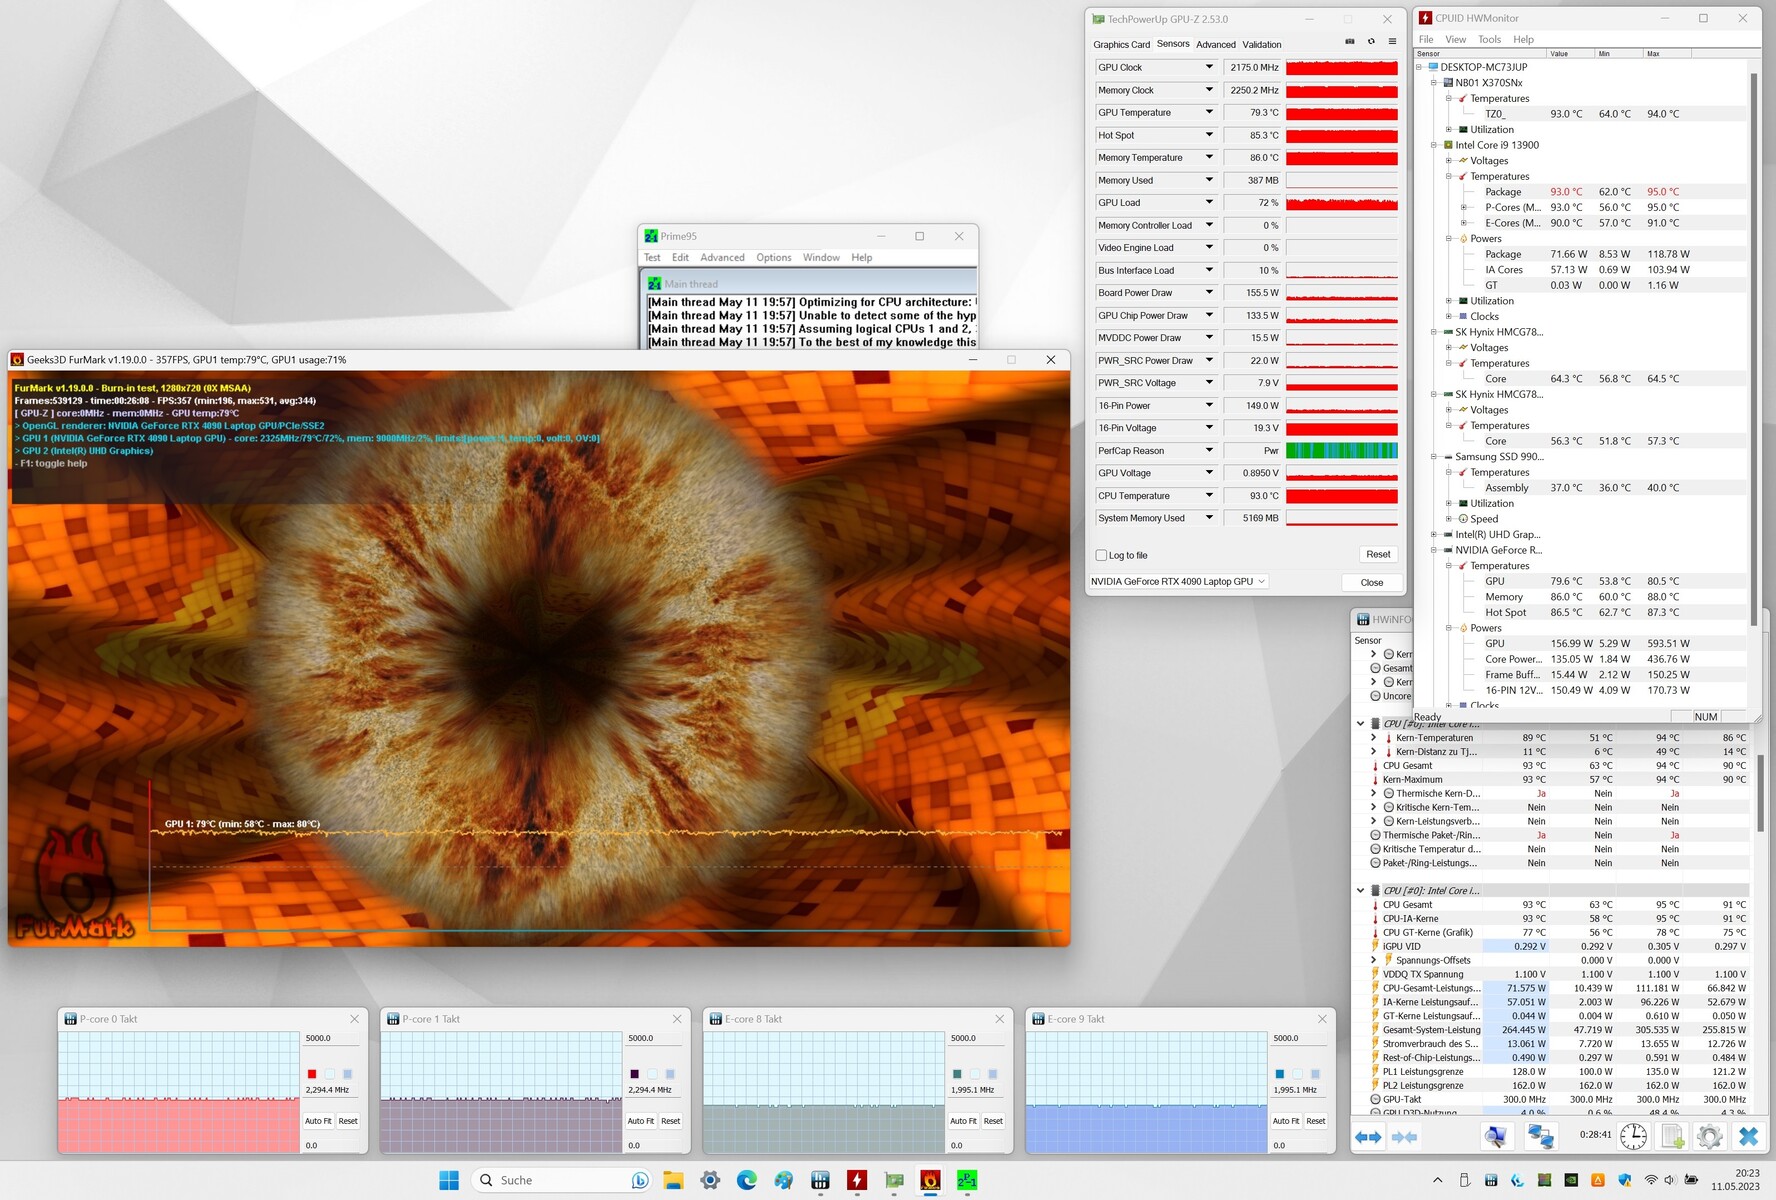
Our stress test (running Prime95 and FurMark over a prolonged period) represents an extreme scenario designed to check a system's stability under full load. The CPU ran at high clock speeds (P-cores: 3.4 to 3.5GHz, E-cores: 3.1 to 3.2GHz) right out of the gate, and the GPU ticked along at 1.0 to 1.6GHz. Subsequently, the CPU clock dropped relatively rapidly whilst the GPU clock climbed above 2GHz.
(-) The maximum temperature on the upper side is 57 °C / 135 F, compared to the average of 40.4 °C / 105 F, ranging from 21.2 to 68.8 °C for the class Gaming.
(-) The bottom heats up to a maximum of 60 °C / 140 F, compared to the average of 43.2 °C / 110 F
(+) In idle usage, the average temperature for the upper side is 28.7 °C / 84 F, compared to the device average of 33.9 °C / 93 F.
(-) Playing The Witcher 3, the average temperature for the upper side is 47.3 °C / 117 F, compared to the device average of 33.9 °C / 93 F.
(±) The palmrests and touchpad can get very hot to the touch with a maximum of 38 °C / 100.4 F.
(-) The average temperature of the palmrest area of similar devices was 28.8 °C / 83.8 F (-9.2 °C / -16.6 F).
| Schenker Key 17 Pro (Early 23) Intel Core i9-13900HX, NVIDIA GeForce RTX 4090 Laptop GPU | MSI Stealth 17 Studio A13VH-014 Intel Core i9-13900H, NVIDIA GeForce RTX 4080 Laptop GPU | Asus ROG Strix Scar 17 G733PY-XS96 AMD Ryzen 9 7945HX, NVIDIA GeForce RTX 4090 Laptop GPU | Aorus 17X AZF Intel Core i9-13900HX, NVIDIA GeForce RTX 4090 Laptop GPU | Medion Erazer Beast X40 Intel Core i9-13900HX, NVIDIA GeForce RTX 4090 Laptop GPU | |
|---|---|---|---|---|---|
| Heat | 10% | 27% | 12% | 11% | |
| Maximum Upper Side * (°C) | 57 | 47 18% | 34.6 39% | 47 18% | 48 16% |
| Maximum Bottom * (°C) | 60 | 54 10% | 35.6 41% | 51 15% | 52 13% |
| Idle Upper Side * (°C) | 32 | 30 6% | 27.2 15% | 30 6% | 30 6% |
| Idle Bottom * (°C) | 34 | 32 6% | 30 12% | 31 9% | 31 9% |
* ... smaller is better
Speakers
The stereo speakers sound pretty decent overall.
Schenker Key 17 Pro (Early 23) audio analysis
(±) | speaker loudness is average but good (78 dB)
Bass 100 - 315 Hz
(±) | reduced bass - on average 11.7% lower than median
(±) | linearity of bass is average (7.1% delta to prev. frequency)
Mids 400 - 2000 Hz
(+) | balanced mids - only 2.1% away from median
(+) | mids are linear (3.5% delta to prev. frequency)
Highs 2 - 16 kHz
(+) | balanced highs - only 1.8% away from median
(+) | highs are linear (6.4% delta to prev. frequency)
Overall 100 - 16.000 Hz
(+) | overall sound is linear (11.9% difference to median)
Compared to same class
» 12% of all tested devices in this class were better, 4% similar, 84% worse
» The best had a delta of 6%, average was 18%, worst was 132%
Compared to all devices tested
» 9% of all tested devices were better, 2% similar, 89% worse
» The best had a delta of 4%, average was 24%, worst was 134%
MSI Stealth 17 Studio A13VH-014 audio analysis
(+) | speakers can play relatively loud (82.44 dB)
Bass 100 - 315 Hz
(±) | reduced bass - on average 8% lower than median
(±) | linearity of bass is average (8.8% delta to prev. frequency)
Mids 400 - 2000 Hz
(±) | higher mids - on average 8.2% higher than median
(+) | mids are linear (6.8% delta to prev. frequency)
Highs 2 - 16 kHz
(+) | balanced highs - only 1% away from median
(+) | highs are linear (4% delta to prev. frequency)
Overall 100 - 16.000 Hz
(+) | overall sound is linear (11.6% difference to median)
Compared to same class
» 10% of all tested devices in this class were better, 3% similar, 87% worse
» The best had a delta of 6%, average was 18%, worst was 132%
Compared to all devices tested
» 8% of all tested devices were better, 2% similar, 90% worse
» The best had a delta of 4%, average was 24%, worst was 134%
Power consumption
The Key 17 Pro didn't show any power usage issues. It maintained a consistent power consumption whilst undergoing the stress test and Witcher 3 test. The included adapter (330 watts) is powerful enough for the device.
| Off / Standby | |
| Idle | |
| Load |
|
Key:
min: | |
Power consumption Witcher 3 / Stresstest
Power consumption with external monitor
Battery life
Our Wi-Fi test is designed to simulate real-life use and involves accessing various websites using a script. The 17.3-inch laptop managed to last 6h 51m during the test – a very respectable result for such a powerful 4K notebook.
Pros
Cons
Verdict - Customisable powerhouse
The Key 17 Pro is made for usage scenarios that require a lot of computing power, such as video editing, gaming and rendering. The GeForce RTX 4090 Laptop and Core i9-13900HX inside deliver the necessary muscle to handle these tasks – both components are able to run constantly at high speeds. The laptop generates a normal amount of heat and noise for this class of device.
Schenker has delivered a powerful high-end notebook with the Key 17 Pro (Early 23).
The Key 17 Pro features three SSD slots (1x PCIe 5.0, 2x PCIe 4.0; M.2-2280), meaning you can quickly add more drives if you ever run low on storage. The two PCIe 4.0 slots support RAID 0/1. Installing additional SSDs isn’t an overly complicated affair. The bottom panel can be removed without using any tools after you undo all the screws.
The two USB-C ports (Thunderbolt 4) let you effortlessly integrate the laptop into an existing desk setup and open up expansion options (e.g. external GPU). One of the ports also supports Power Delivery. Battery life is very decent on the device. The matt 17.3-inch display (4K, IPS, 144Hz, G-Sync and DCI-P3) left a mostly positive impression during our testing, though it would benefit from having higher contrast.
One alternative to the Key 17 Pro is the MSI Stealth 17 Studio. It comes with a mini-LED screen and produces much less noise at full throttle. At the time of this review, the almost identically spec’d Aorus 17X AZF (albeit with a QHD rather than a 4K panel) can be had for considerably less than the Key and is thus a more wallet-friendly option.
Price and availabilty
The Schenker Key 17 Pro (Early 23) as spec'd in this review will set you back roughly €4,479 (US$4,820). Alternatively, you can also configure the device based on your needs in the Schenker online shop. Prices start at €3,199 (US$3,445).
Schenker Key 17 Pro (Early 23)
- 05/30/2023 v7 (old)
Sascha Mölck
Transparency
The selection of devices to be reviewed is made by our editorial team. The test sample was provided to the author as a loan by the manufacturer or retailer for the purpose of this review. The lender had no influence on this review, nor did the manufacturer receive a copy of this review before publication. There was no obligation to publish this review. As an independent media company, Notebookcheck is not subjected to the authority of manufacturers, retailers or publishers.
This is how Notebookcheck is testing
Every year, Notebookcheck independently reviews hundreds of laptops and smartphones using standardized procedures to ensure that all results are comparable. We have continuously developed our test methods for around 20 years and set industry standards in the process. In our test labs, high-quality measuring equipment is utilized by experienced technicians and editors. These tests involve a multi-stage validation process. Our complex rating system is based on hundreds of well-founded measurements and benchmarks, which maintains objectivity. Further information on our test methods can be found here.
Price comparison

