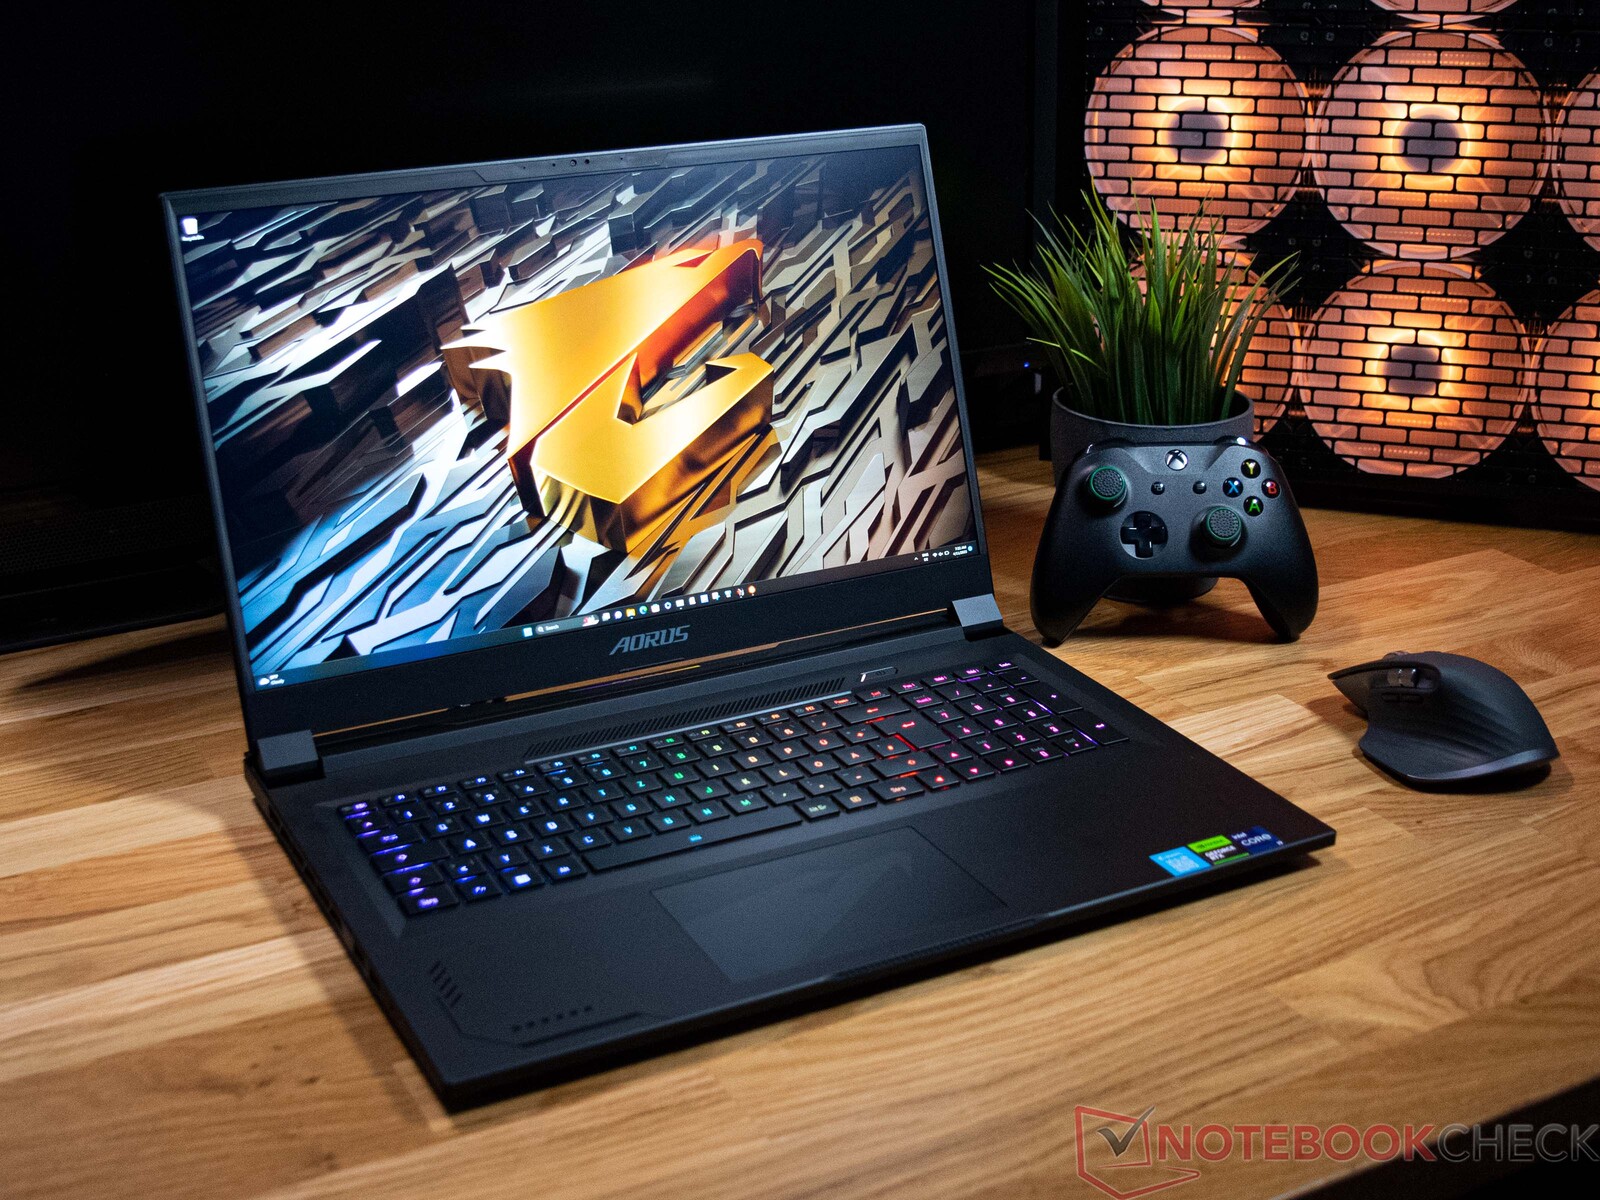
Aorus 17X AZF review: High-end gaming laptop with i9-13900HX and RTX 4090 in a slim case
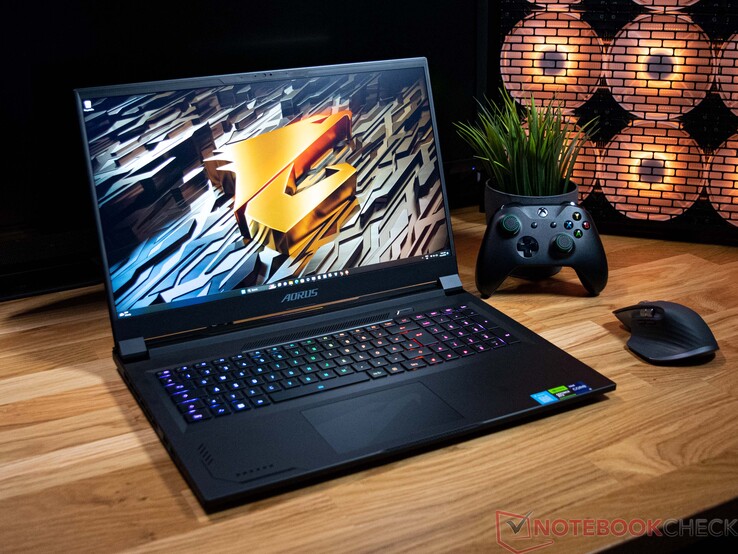
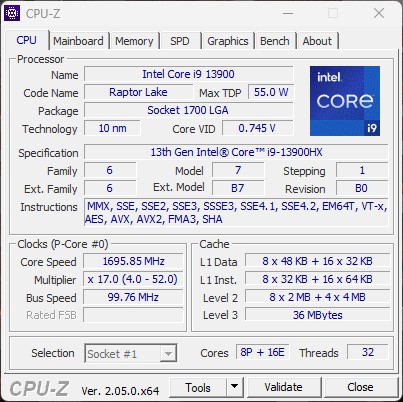
The new Aorus 17X AZF is built upon an Intel Raptor Lake H processor and the latest mobile GPU flagship from Nvidia. An Intel Core i9 13900HX works together with a Nvidia GeForce RTX 4090 laptop GPU under the hood. These two components alone give an idea of the laptop's intended purpose. But how well does the hardware perform in the slim case? We took at look at this and will go into more detail later. But the CPU and GPU alone do not make a good gaming laptop - these are accompanied by a 240 Hz, 17-inch screen in the Aorus 17X AZF, as well as a total of 2 TB SSD storage that can easily store a large number of games and other programs. Such a configuration amounts to US$3,499.00.
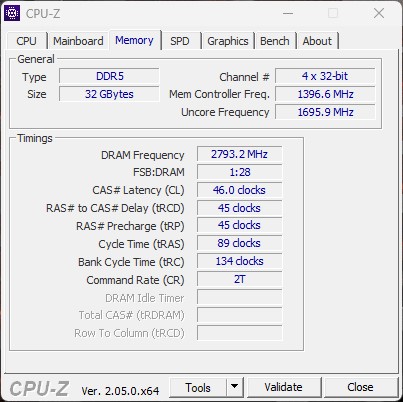
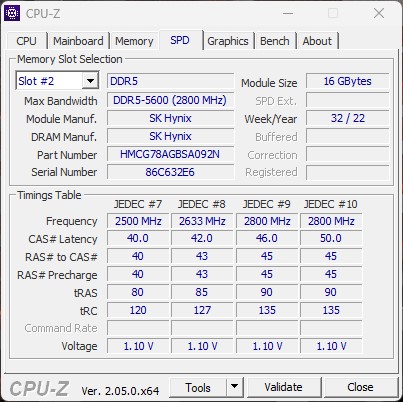
Alternatively, the Aorus 17X is available with an Intel Core Intel Core i7 13700HX. While there are no other choices in terms of the graphics card, the speed of the DDR5 RAM can vary. The Core i7 is technically limited to a maximum of 4800 MT/s, while the Core i9 model has a maximum of 5600 MT/s at its disposal.
Competing laptops in this class also offer similar levels of performance when you look at the technical specifications, since they are also equipped with Intel Raptor-Lake H processors and mobile Ada-Lovelace GPUs. A detailed overview of the comparison devices can be found in the following table.
Possible competitors in comparison
Rating | Date | Model | Weight | Height | Size | Resolution | Price |
|---|---|---|---|---|---|---|---|
| 86 % v7 (old) | 04 / 2023 | Aorus 17X AZF i9-13900HX, GeForce RTX 4090 Laptop GPU | 2.9 kg | 21.8 mm | 17.30" | 2560x1440 | |
| 88.4 % v7 (old) | 03 / 2023 | Medion Erazer Beast X40 i9-13900HX, GeForce RTX 4090 Laptop GPU | 2.9 kg | 33 mm | 17.00" | 2560x1600 | |
| 88.3 % v7 (old) | 03 / 2023 | MSI GE78HX 13VH-070US i9-13950HX, GeForce RTX 4080 Laptop GPU | 3 kg | 23 mm | 17.00" | 2560x1600 | |
| 85.4 % v7 (old) | 03 / 2023 | HP Omen 17-ck2097ng i9-13900HX, GeForce RTX 4080 Laptop GPU | 2.8 kg | 27 mm | 17.30" | 2560x1440 | |
| 90.7 % v7 (old) | 04 / 2023 | Alienware m18 R1 i9-13980HX, GeForce RTX 4090 Laptop GPU | 3.9 kg | 26.7 mm | 18.00" | 1920x1200 | |
| 89 % v7 (old) | 02 / 2023 | MSI Titan GT77 HX 13VI i9-13950HX, GeForce RTX 4090 Laptop GPU | 3.5 kg | 23 mm | 17.30" | 3840x2160 |
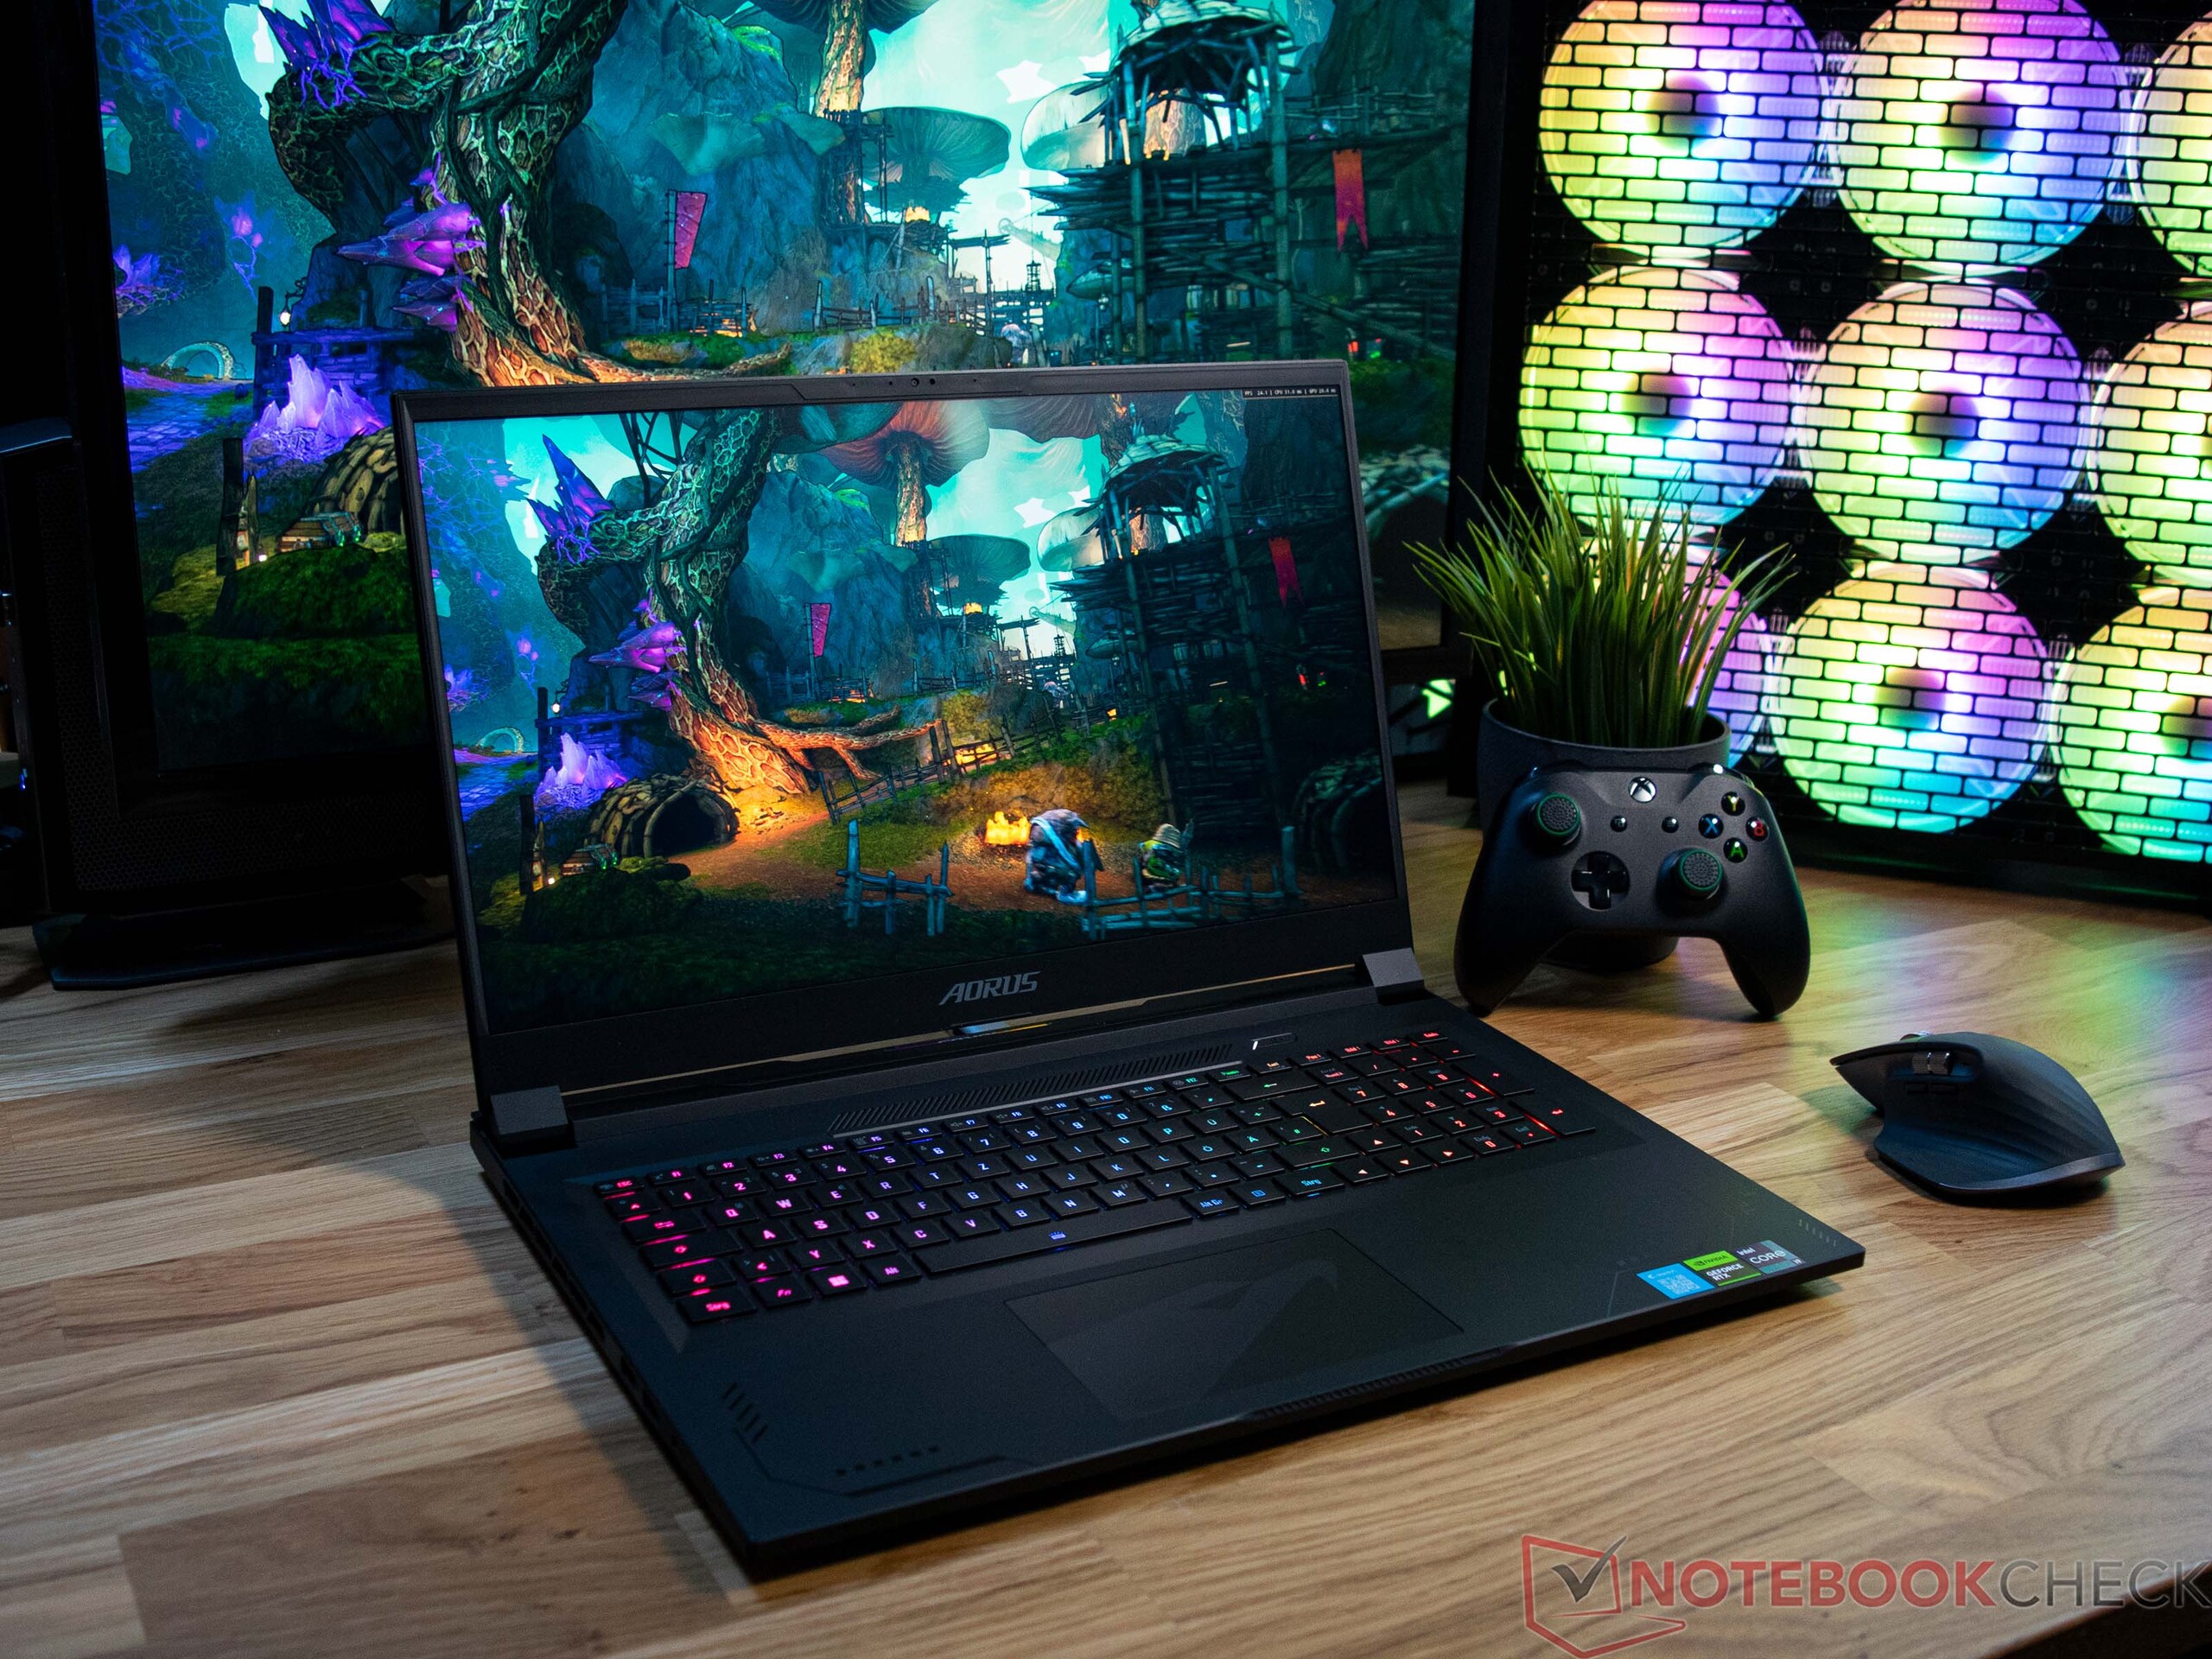
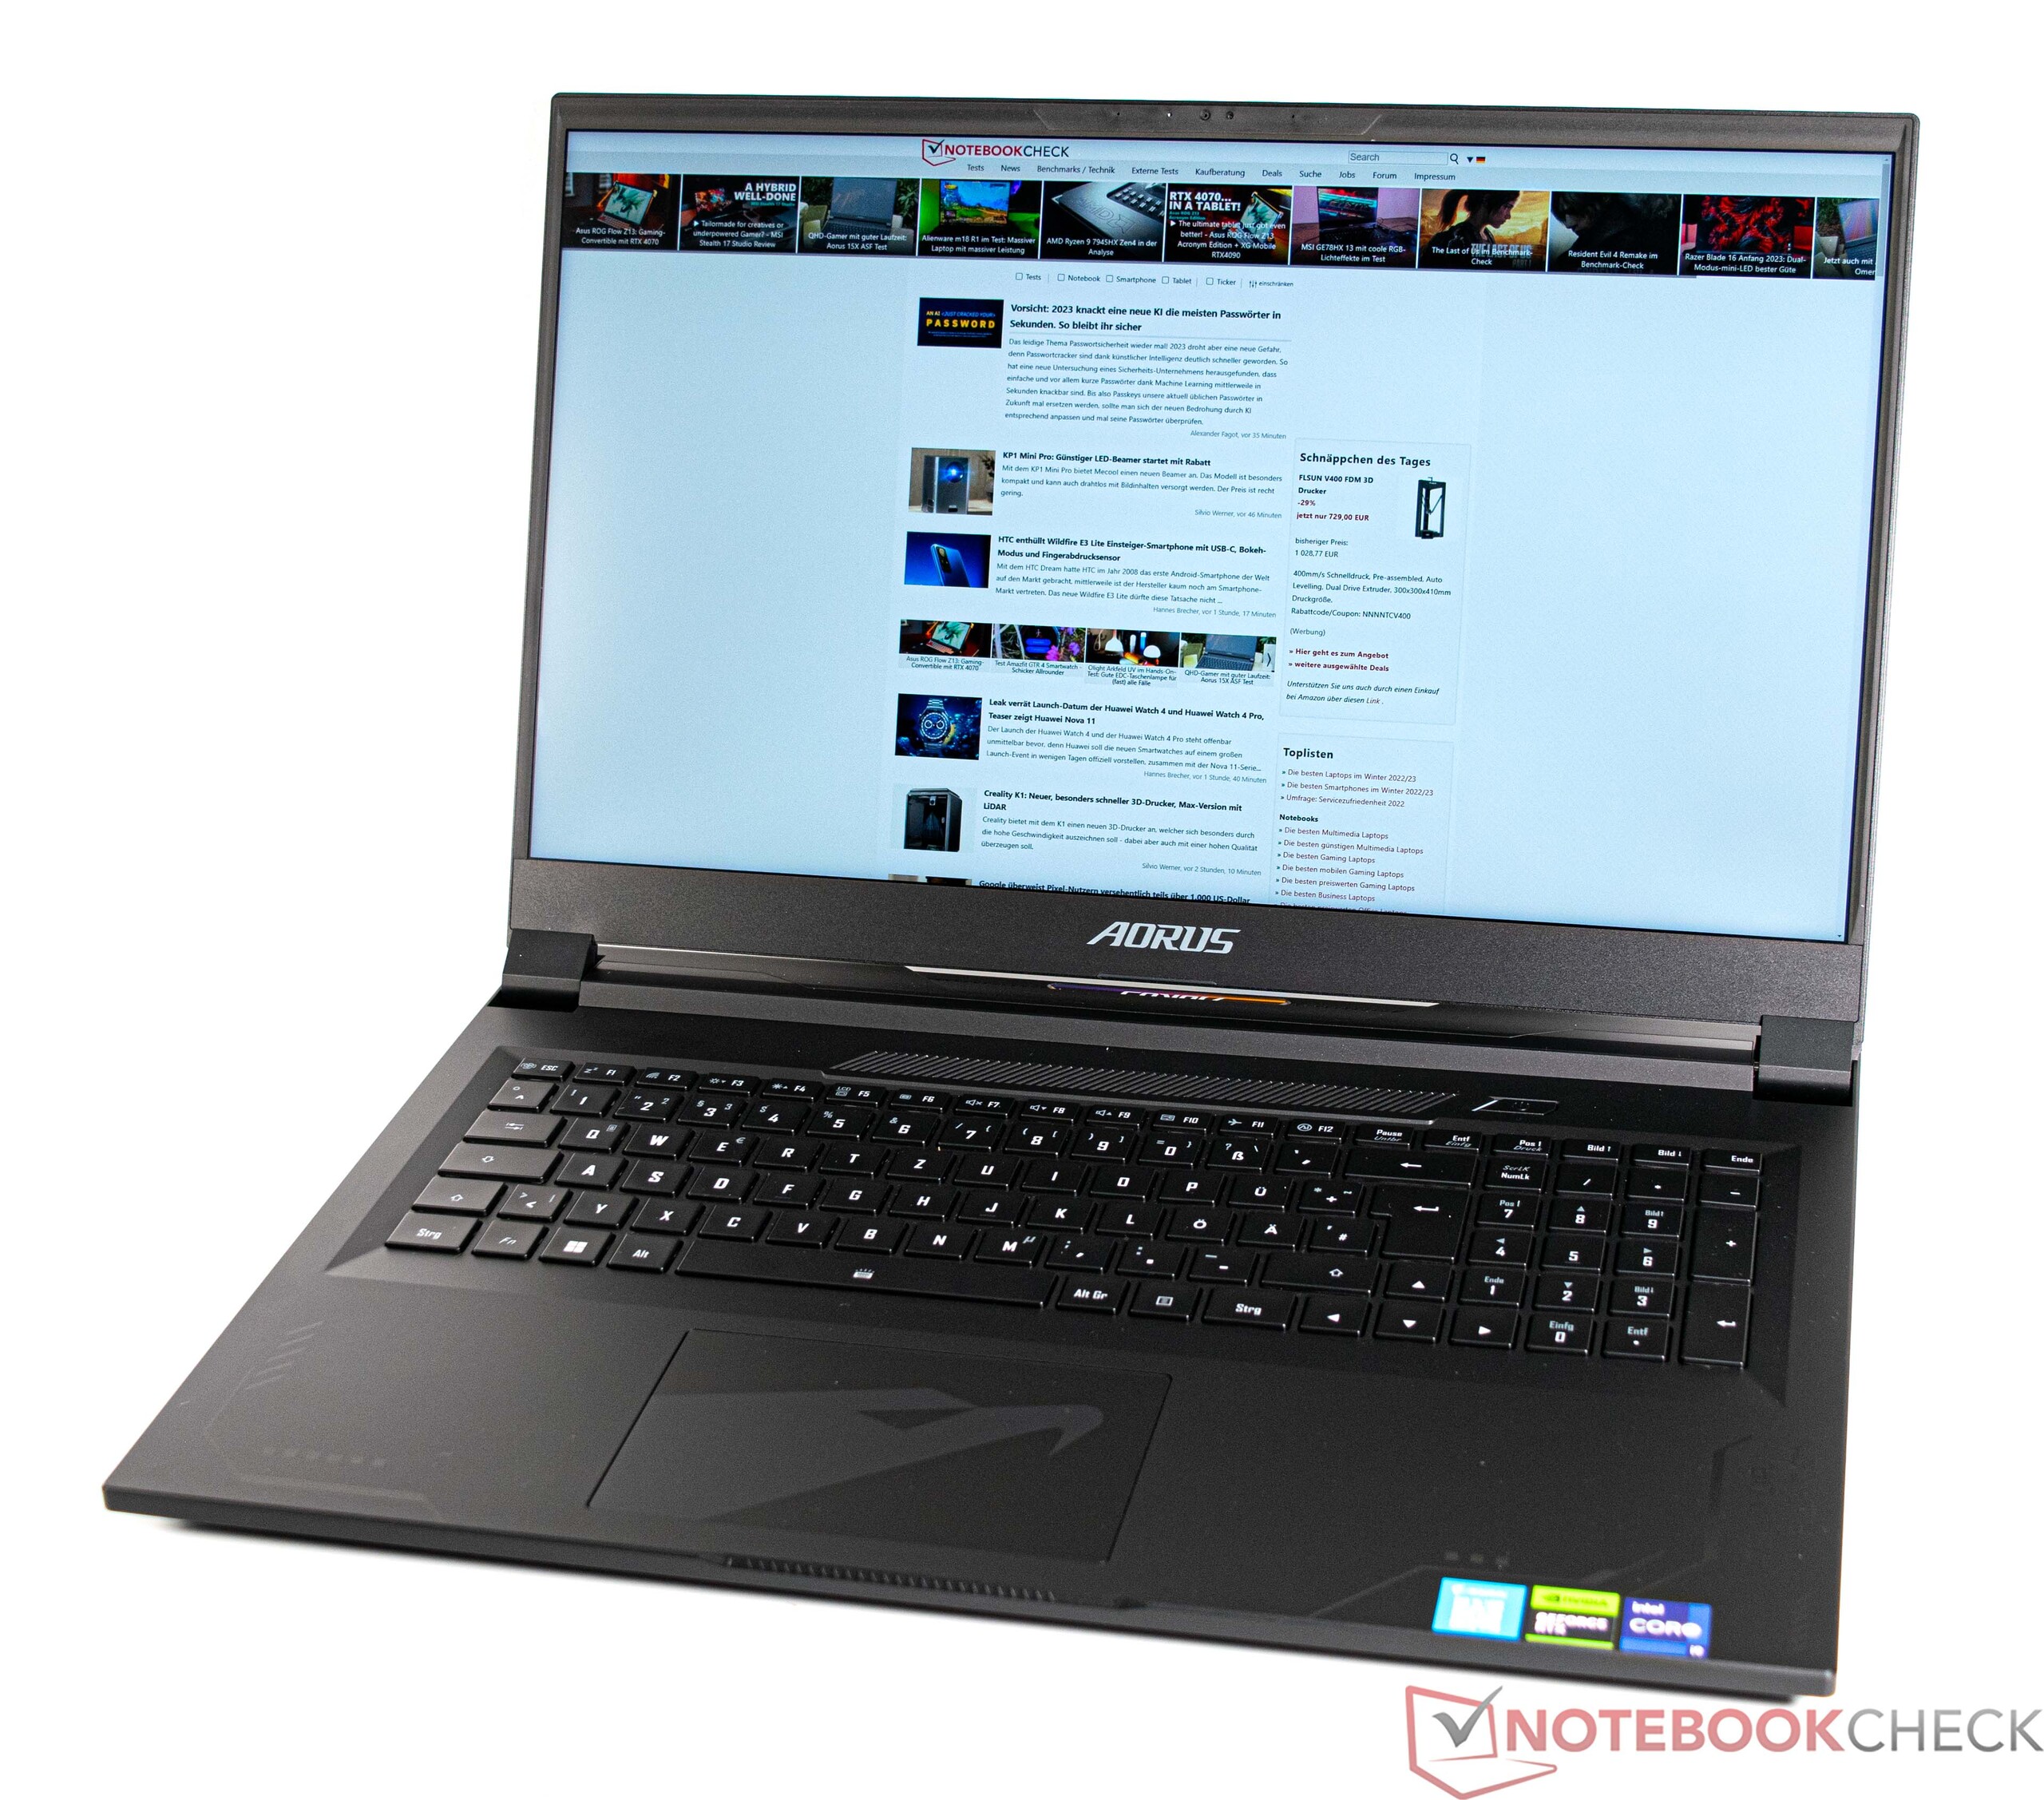
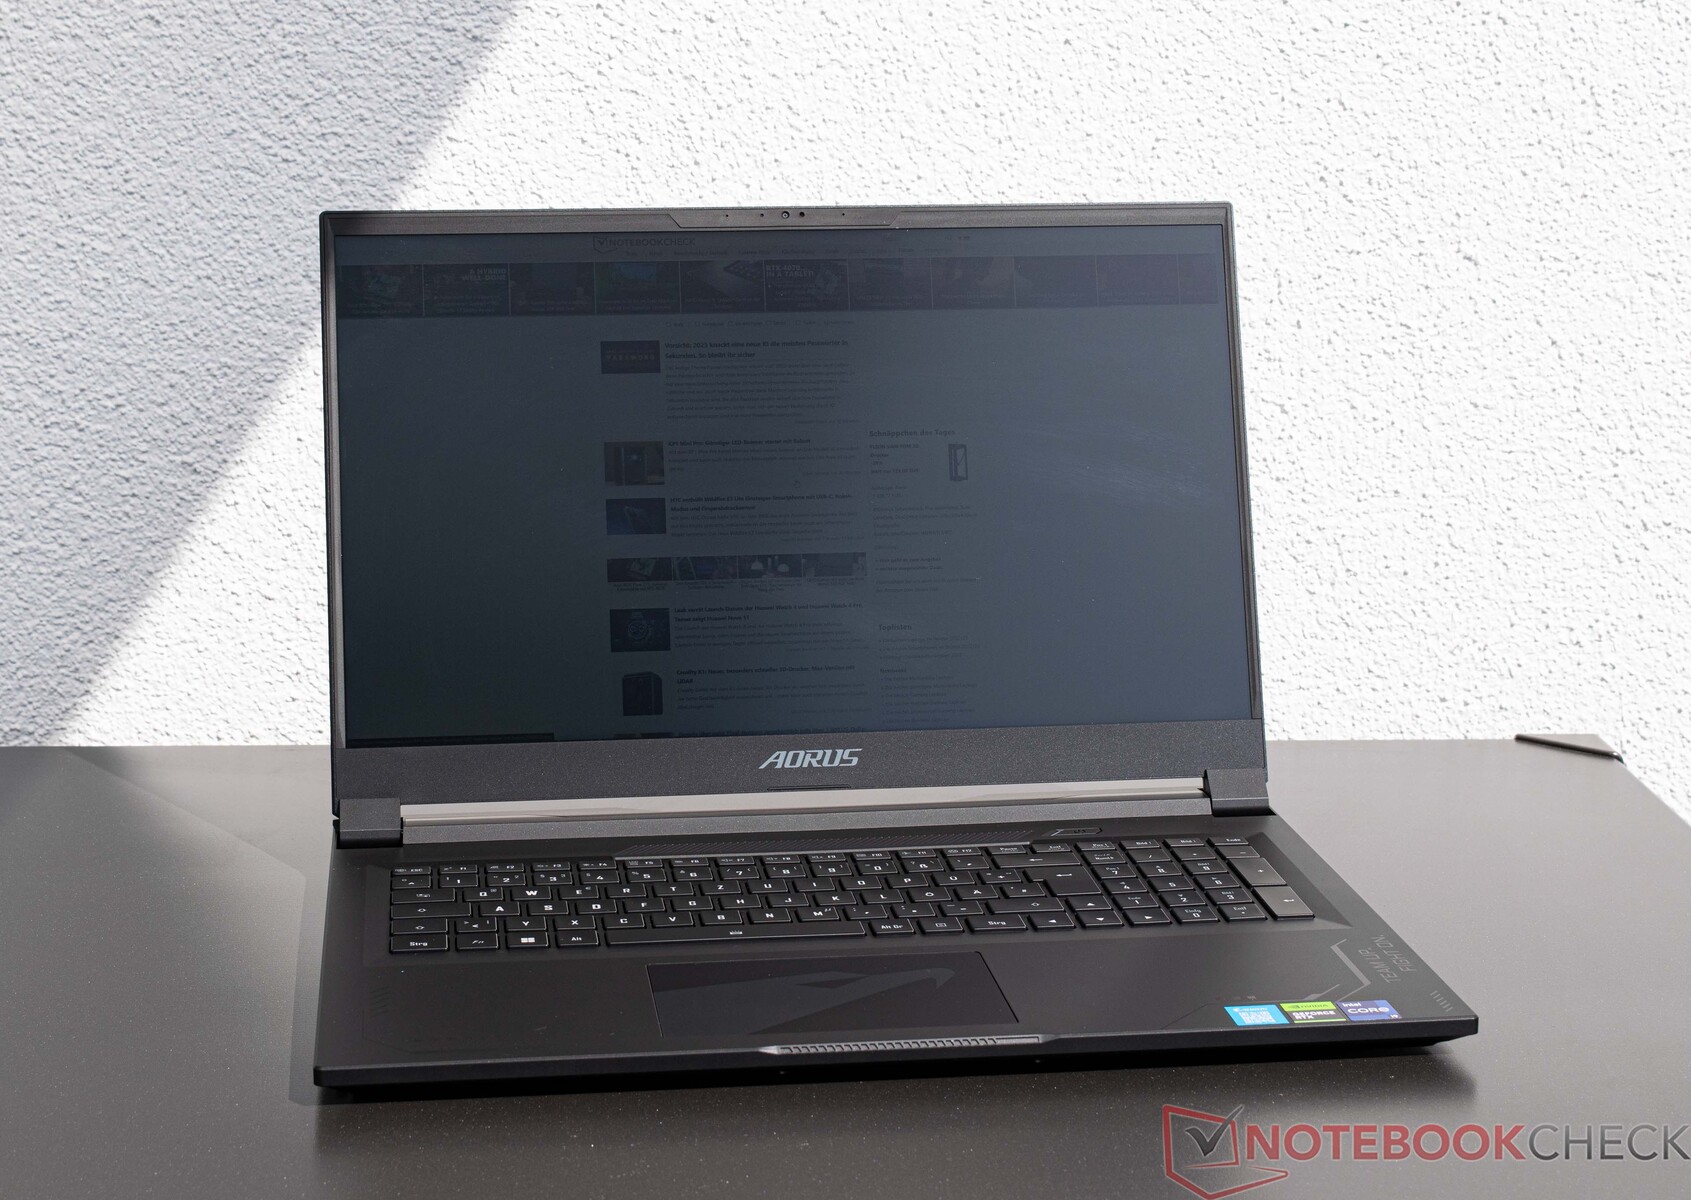
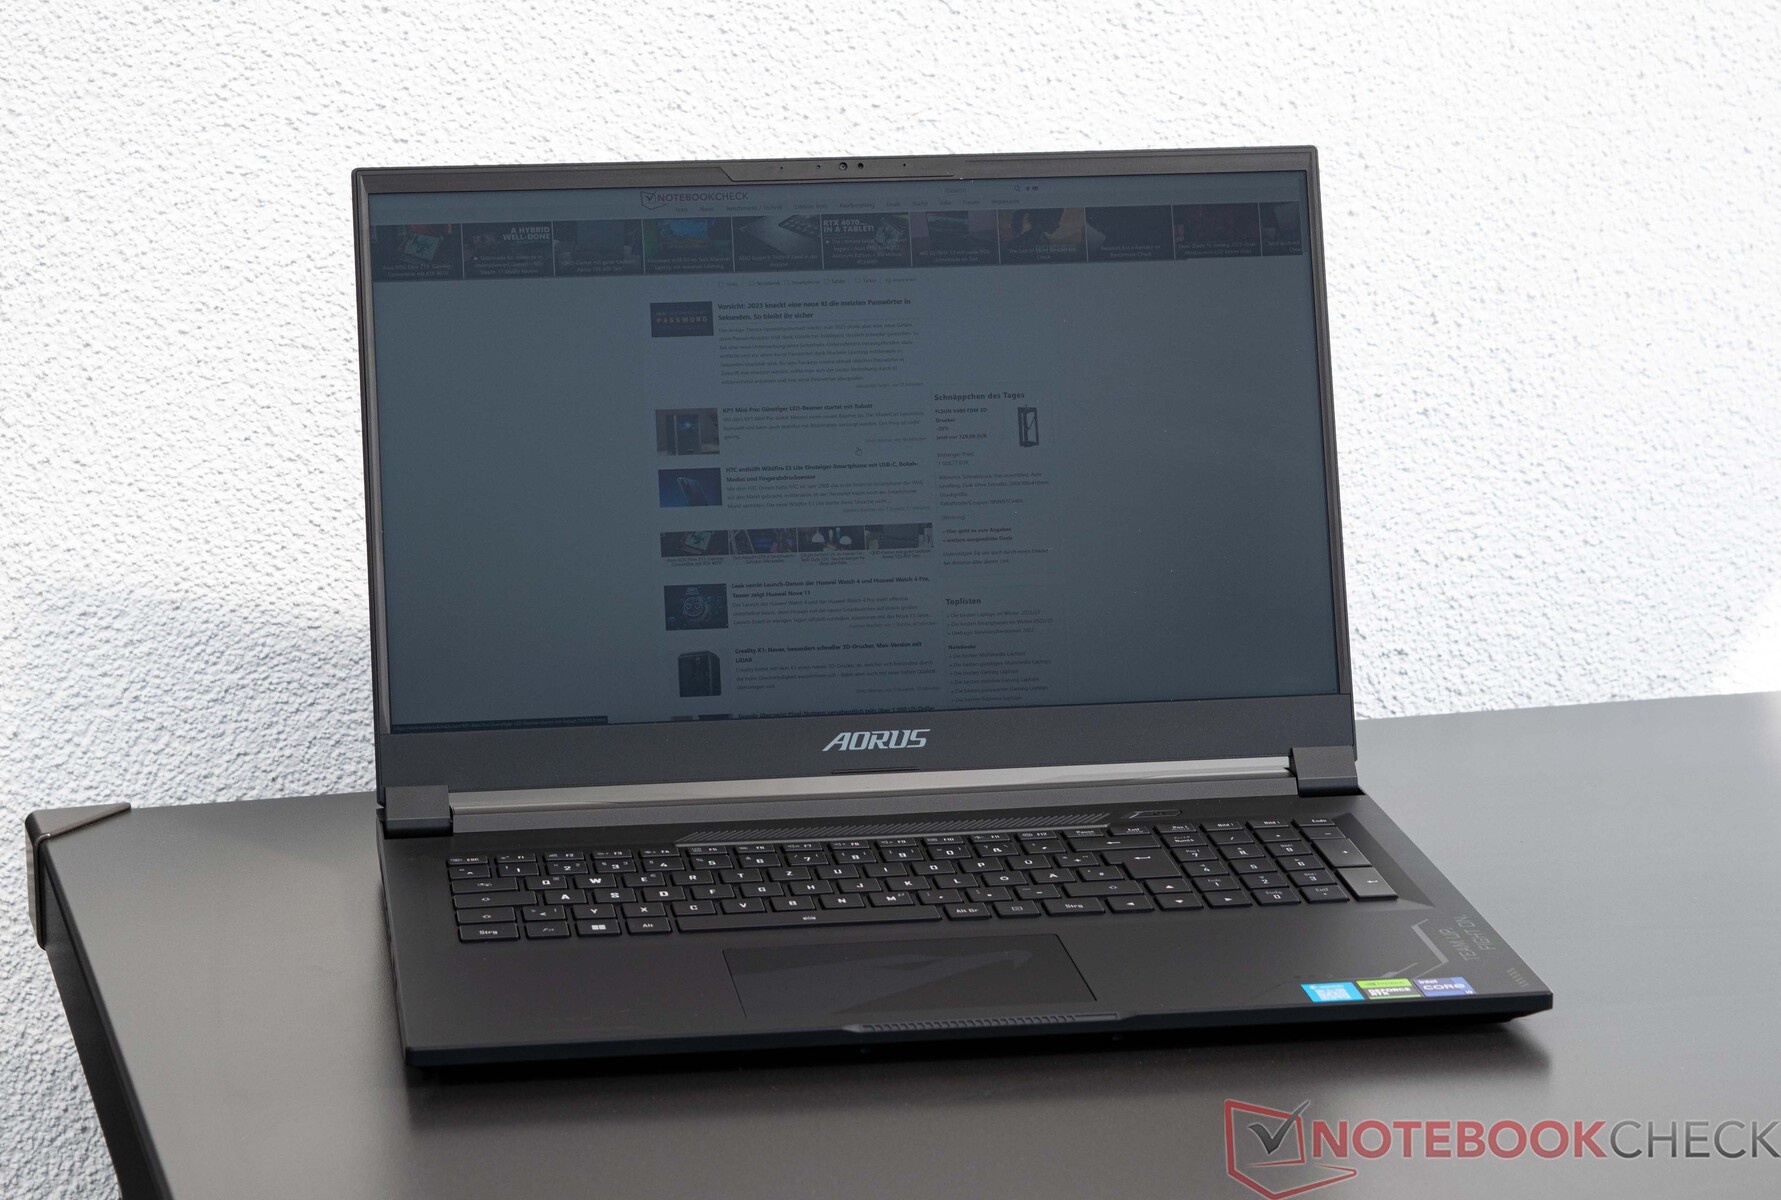
Case - Aluminum and plastic on the Aorus 17X
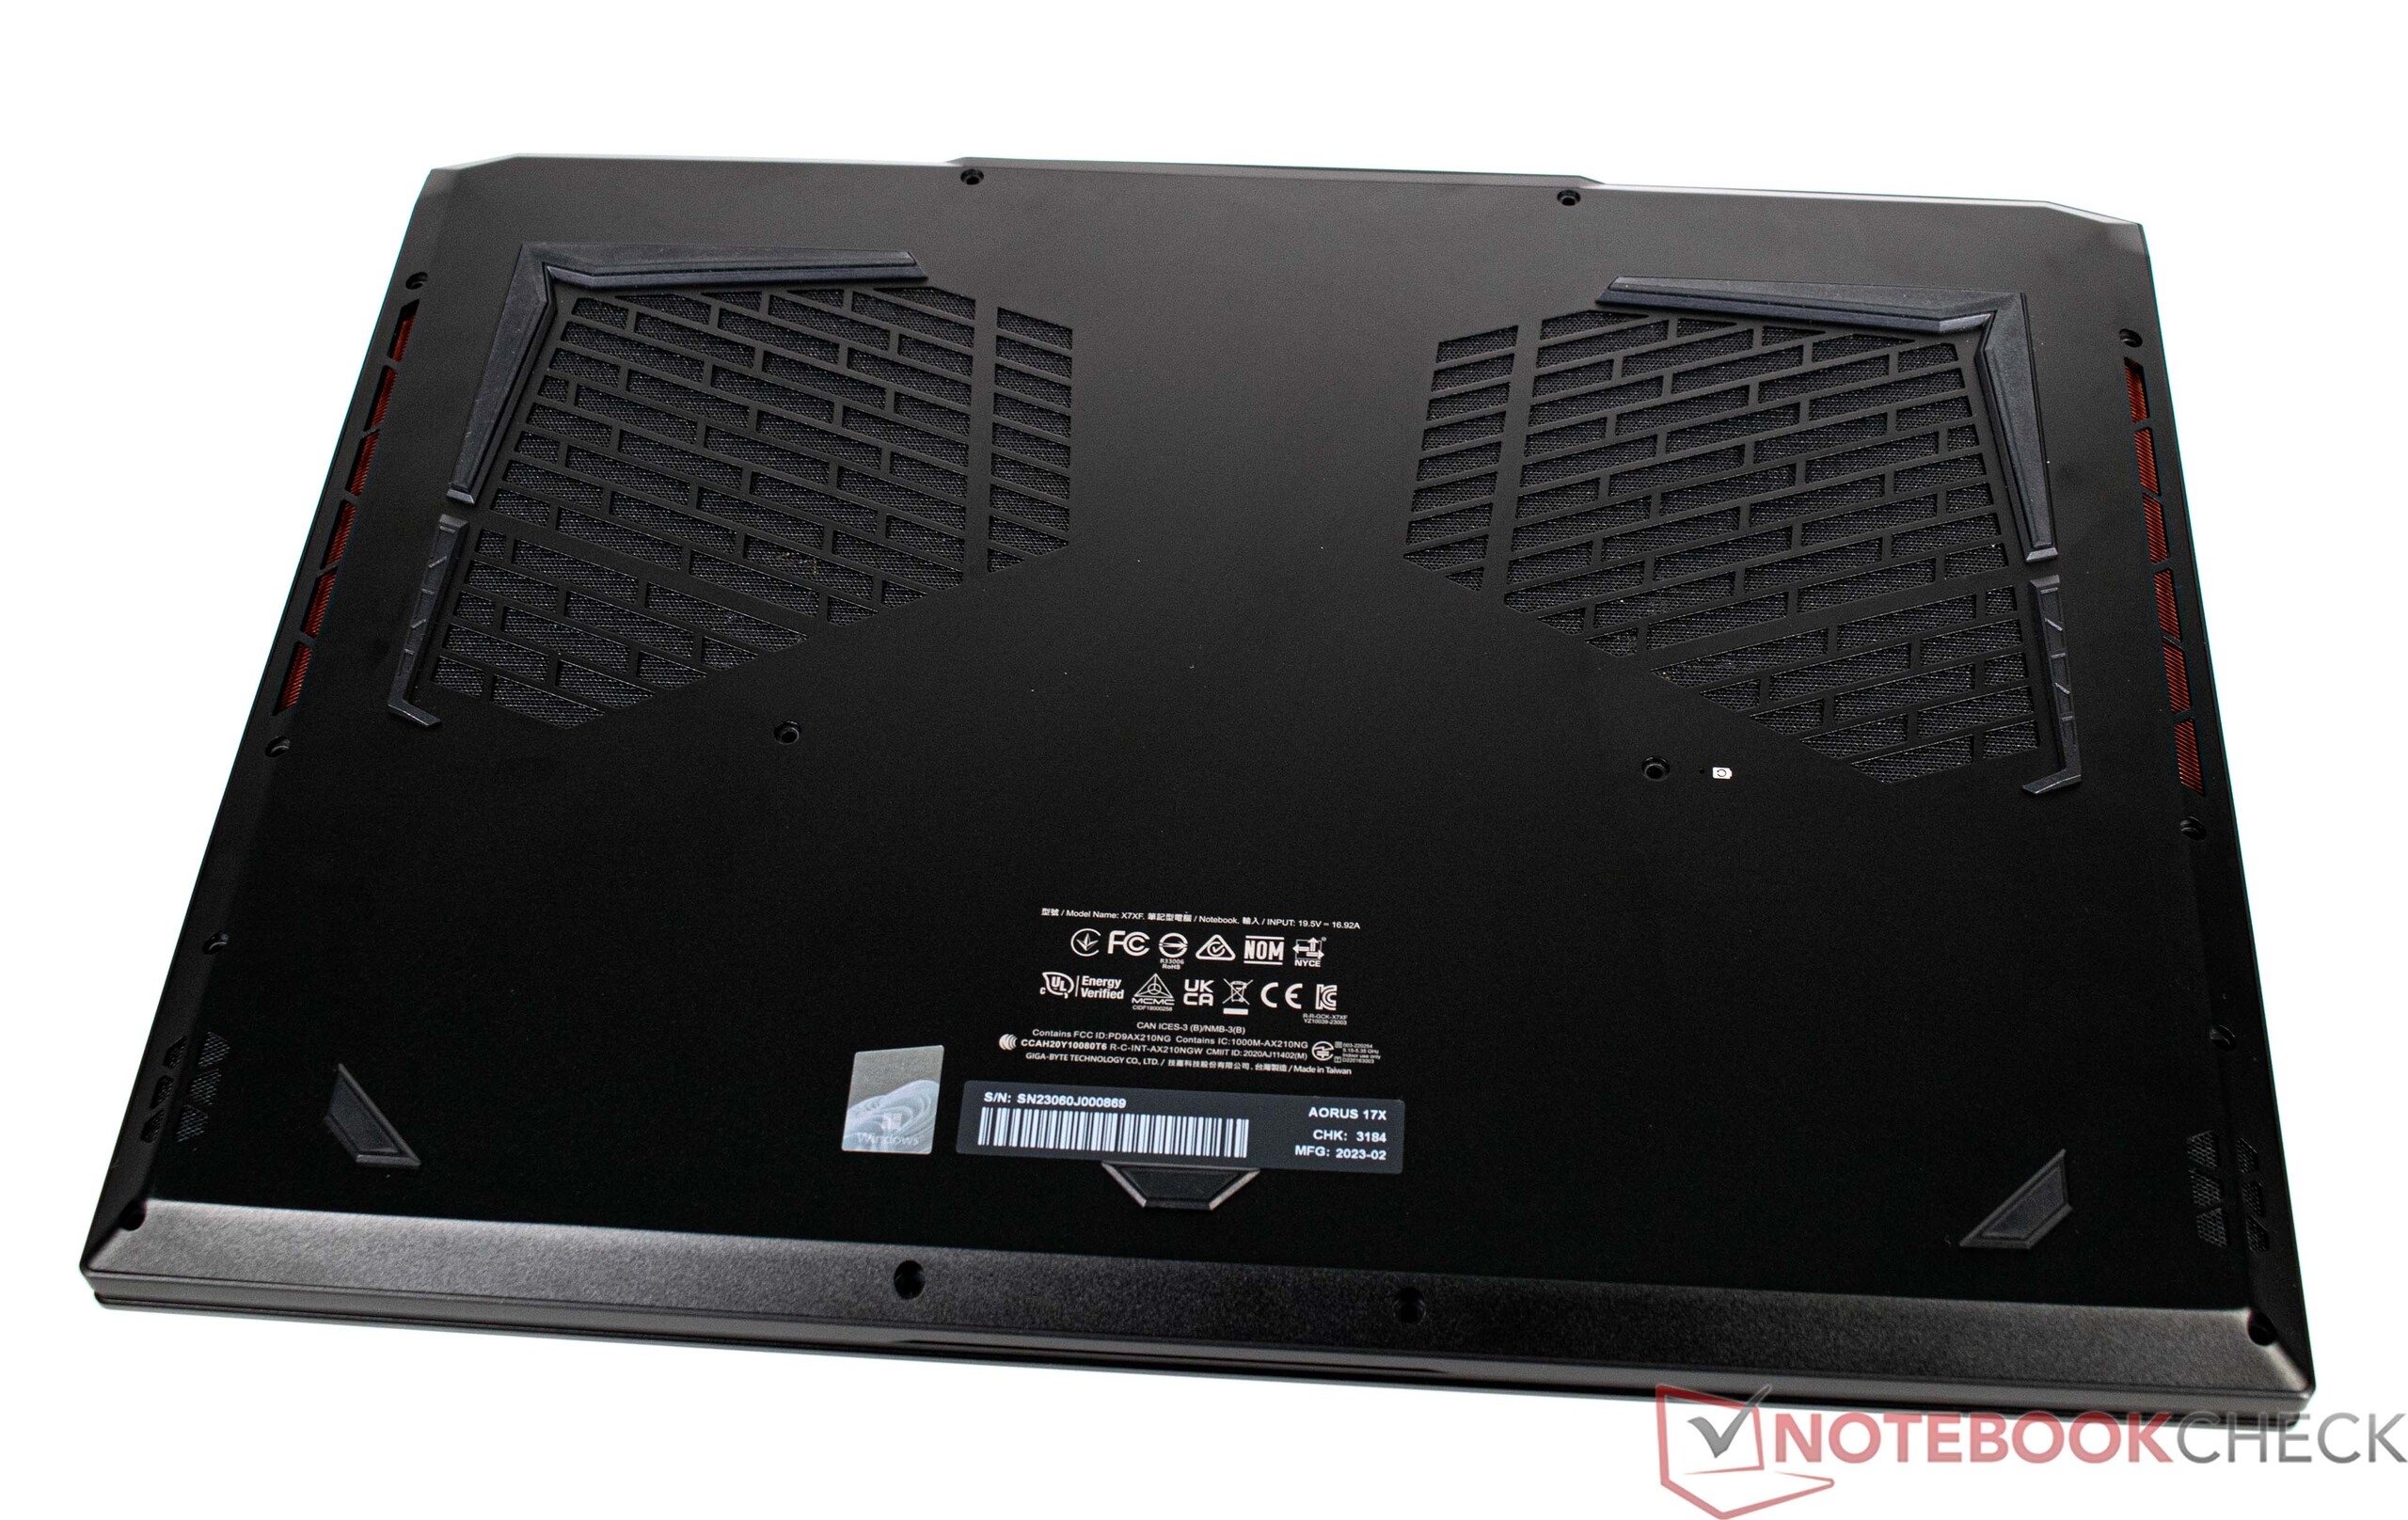
The Aorus 17X is made of mostly aluminum and plastic. This has the advantage of low weight, because at less than 3 kilograms, the device is one of the lighter representatives here in comparison. Only the HP Omen 17 is slightly lighter.
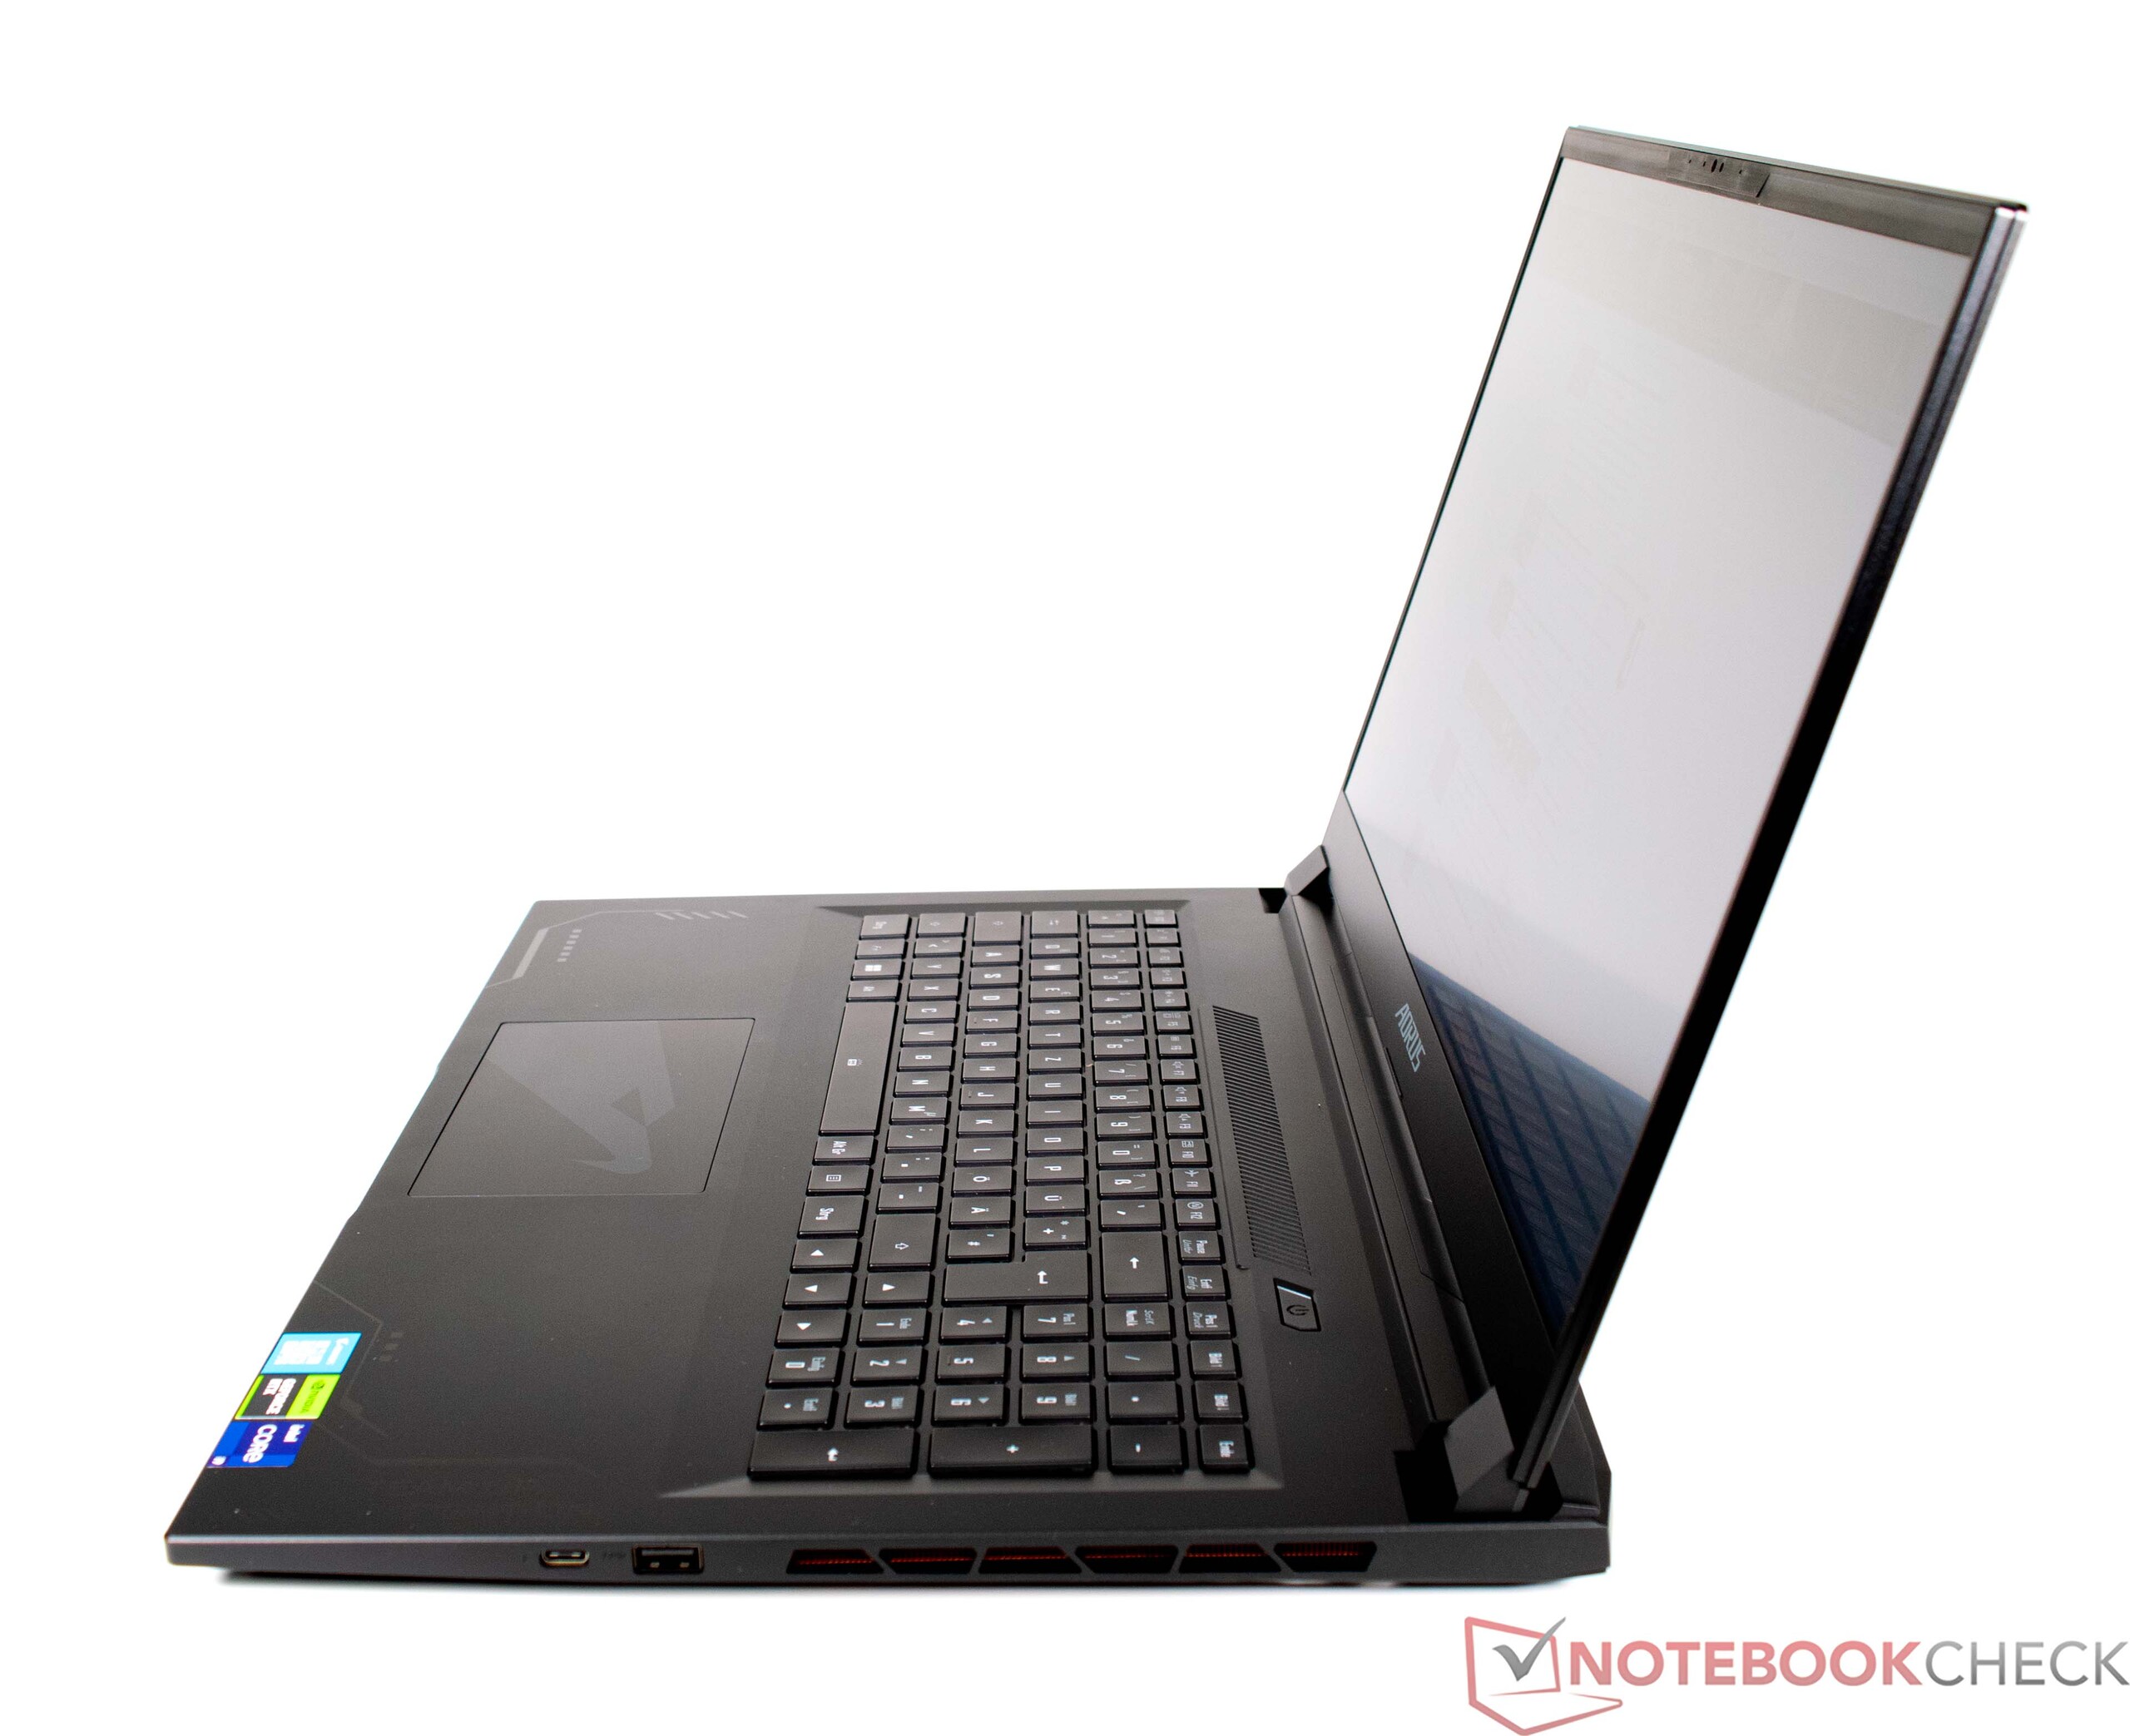
In terms of stability, the choice of materials proves to be somewhat disadvantageous, but still proved to be solid in our pressure test. Manufacturers always have to manage a balancing act between stability and mobility in large 17-inch laptops, which we think has been successful in the Aorus 17X AZF. The display lid, made of aluminum on the upper side, is relatively stable, although it can still be twisted with a little effort. The hinges are also stable, which feel solid and reduce teetering to a minimum. Moreover, one-handed opening of the display is possible.
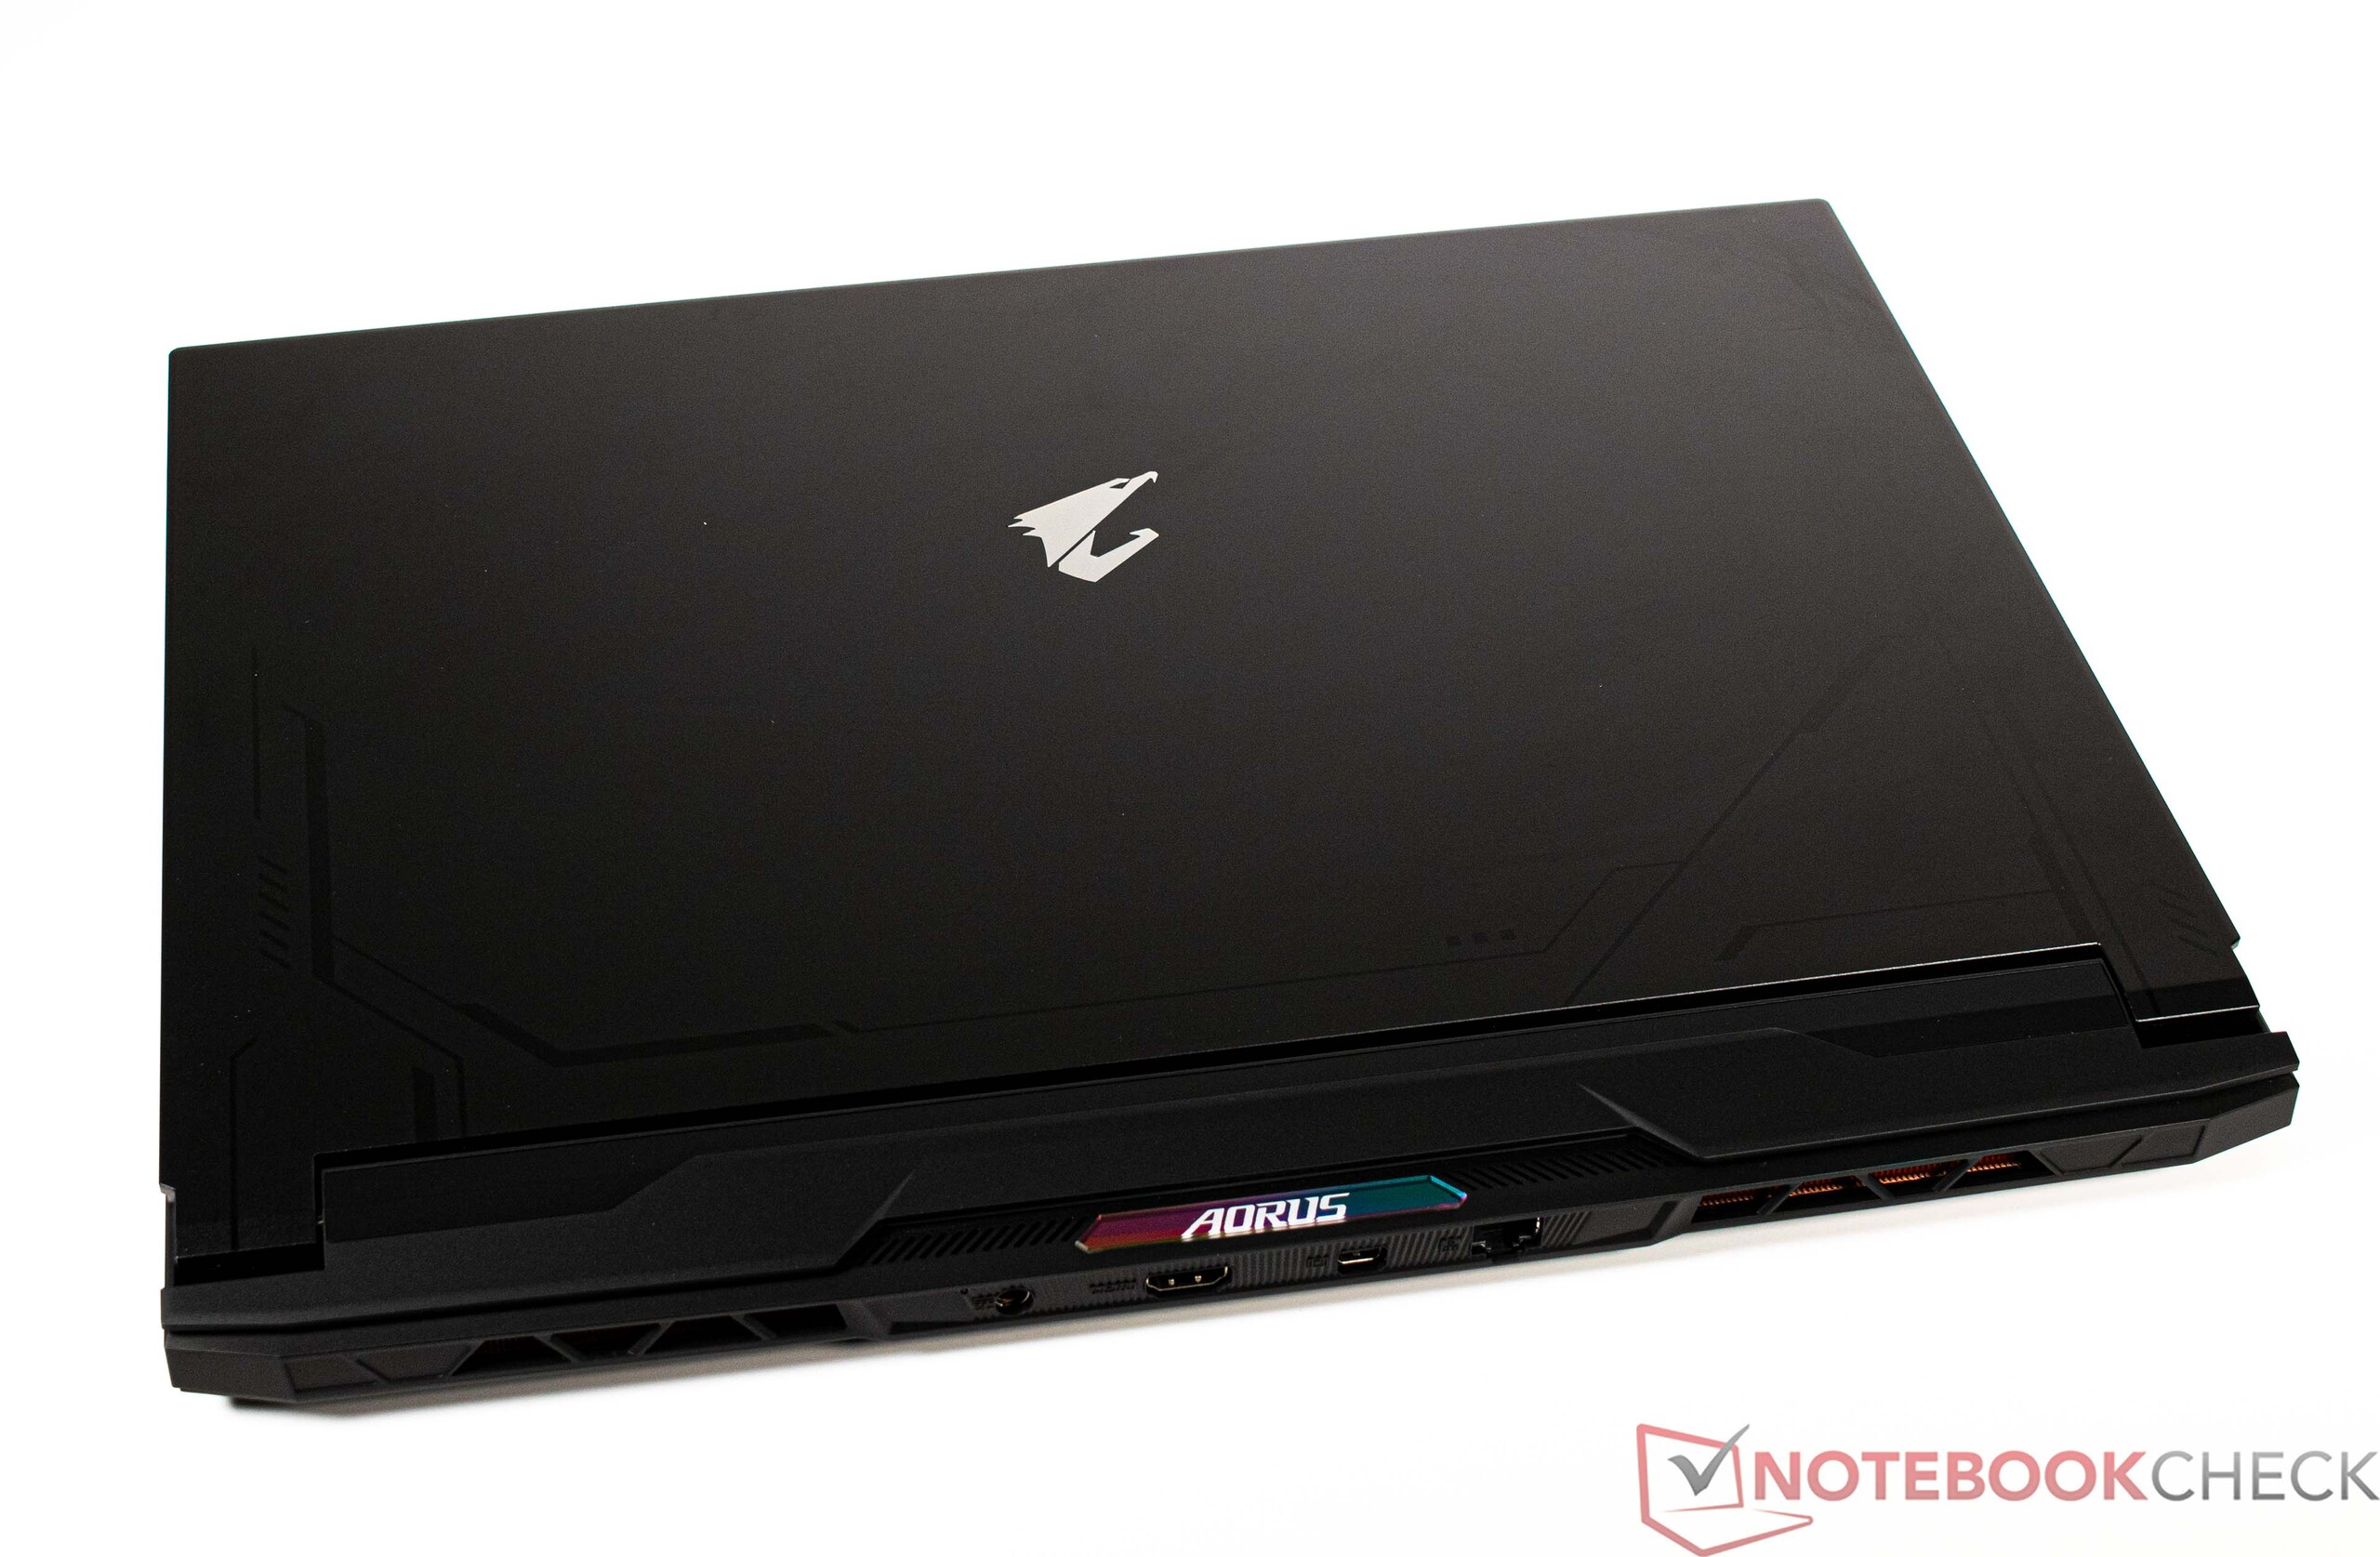
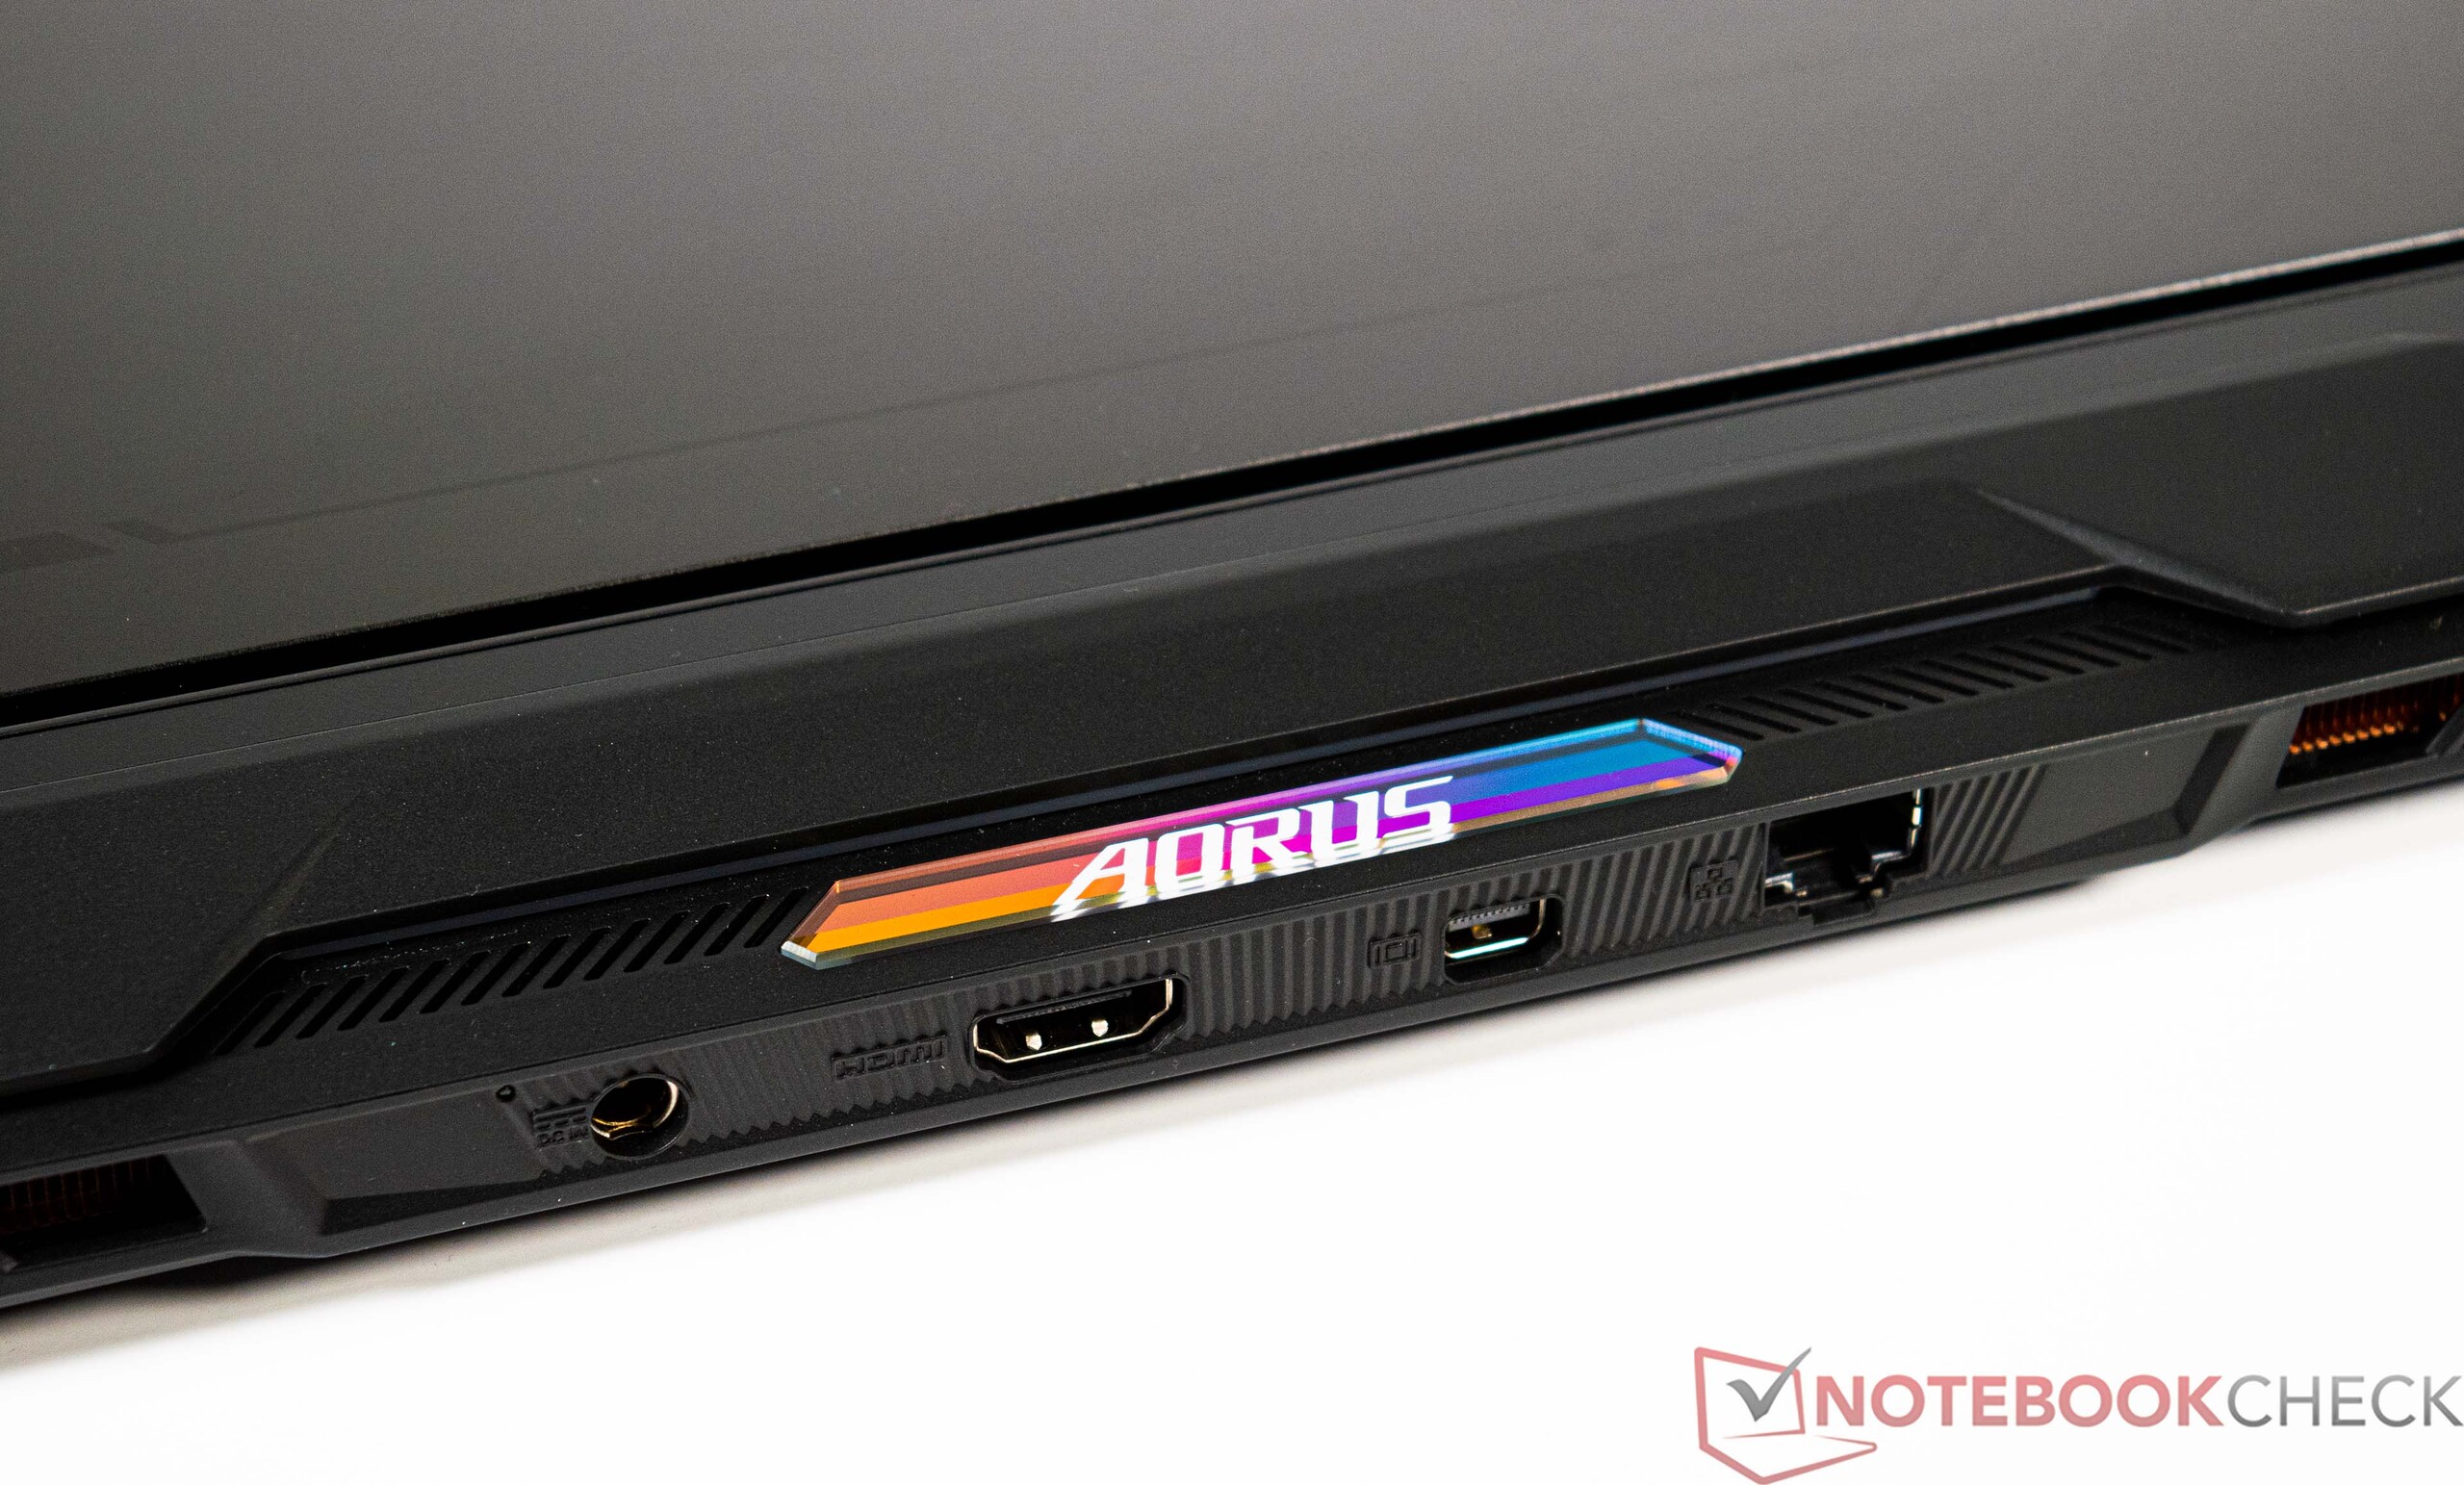
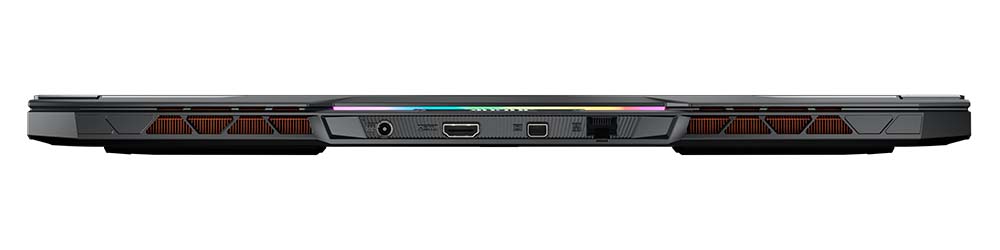
The only color elements are on the back in the form of illuminated Aorus lettering. There is also a silver Aorus logo on the display lid, which breaks ups the monotony of the otherwise completely black device.
Equipment
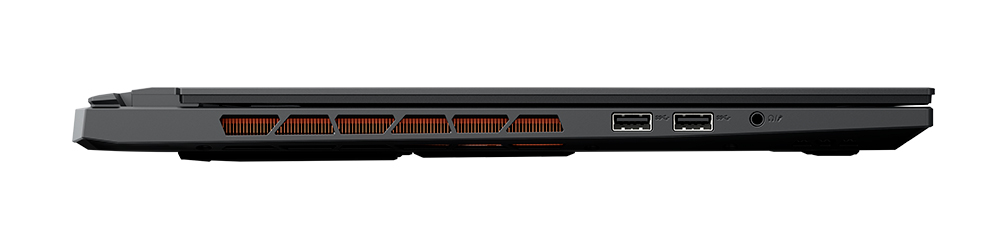
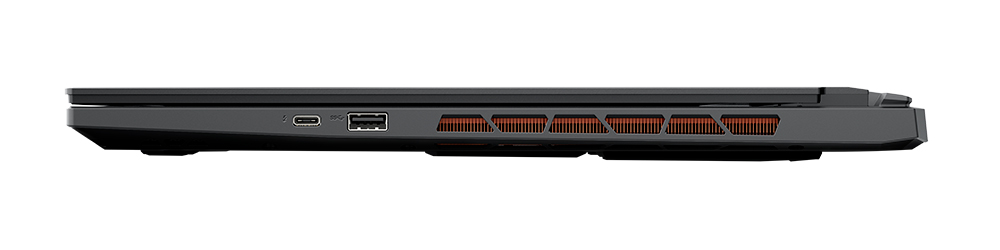
The Aorus 17X AZF unfortunately does not offer such a large selection of ports, but the available interfaces should nevertheless satisfy most users. After all, there is a modern Thunderbolt 4 port with Power Delivery (PD) and three conventional USB ports. Meanwhile, external displays can be connected via HDMI or DisplayPort. The location of the interfaces is decent, although the manufacturer did not have many options due to the expansive heat pipe construction inside.
Communication
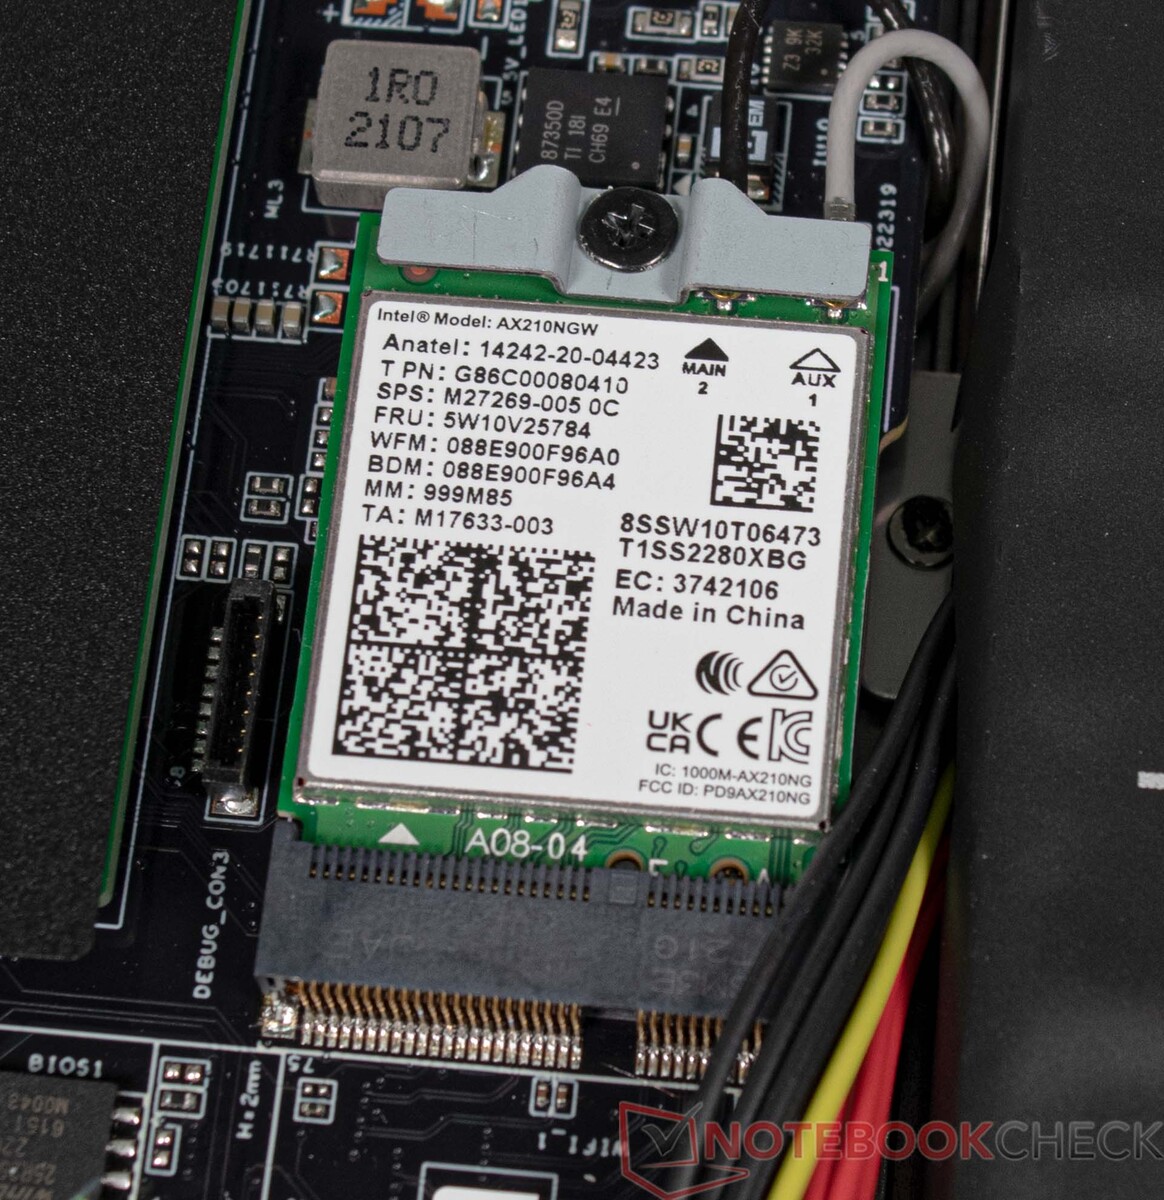
The installed WLAN module delivers good performance, so the Aorus 17X AZF doesn't have to shy away from the competition here. Our Asus ROG Rapture GT-AXE11000 was used as the test router. Alternatively, the Aorus 17X AZF also offers an Ethernet port, which provides rates of up to 2.5 GBit/s.
Webcam
The webcam of the Aorus 17X AZF is FHD capable, making it suitable for simple video telephony. A few points were deducted due to the lack of color fidelity. The dual-array microphone, on the other hand, does a good job, as recordings from different directions are played back at a similar volume.


Maintenance
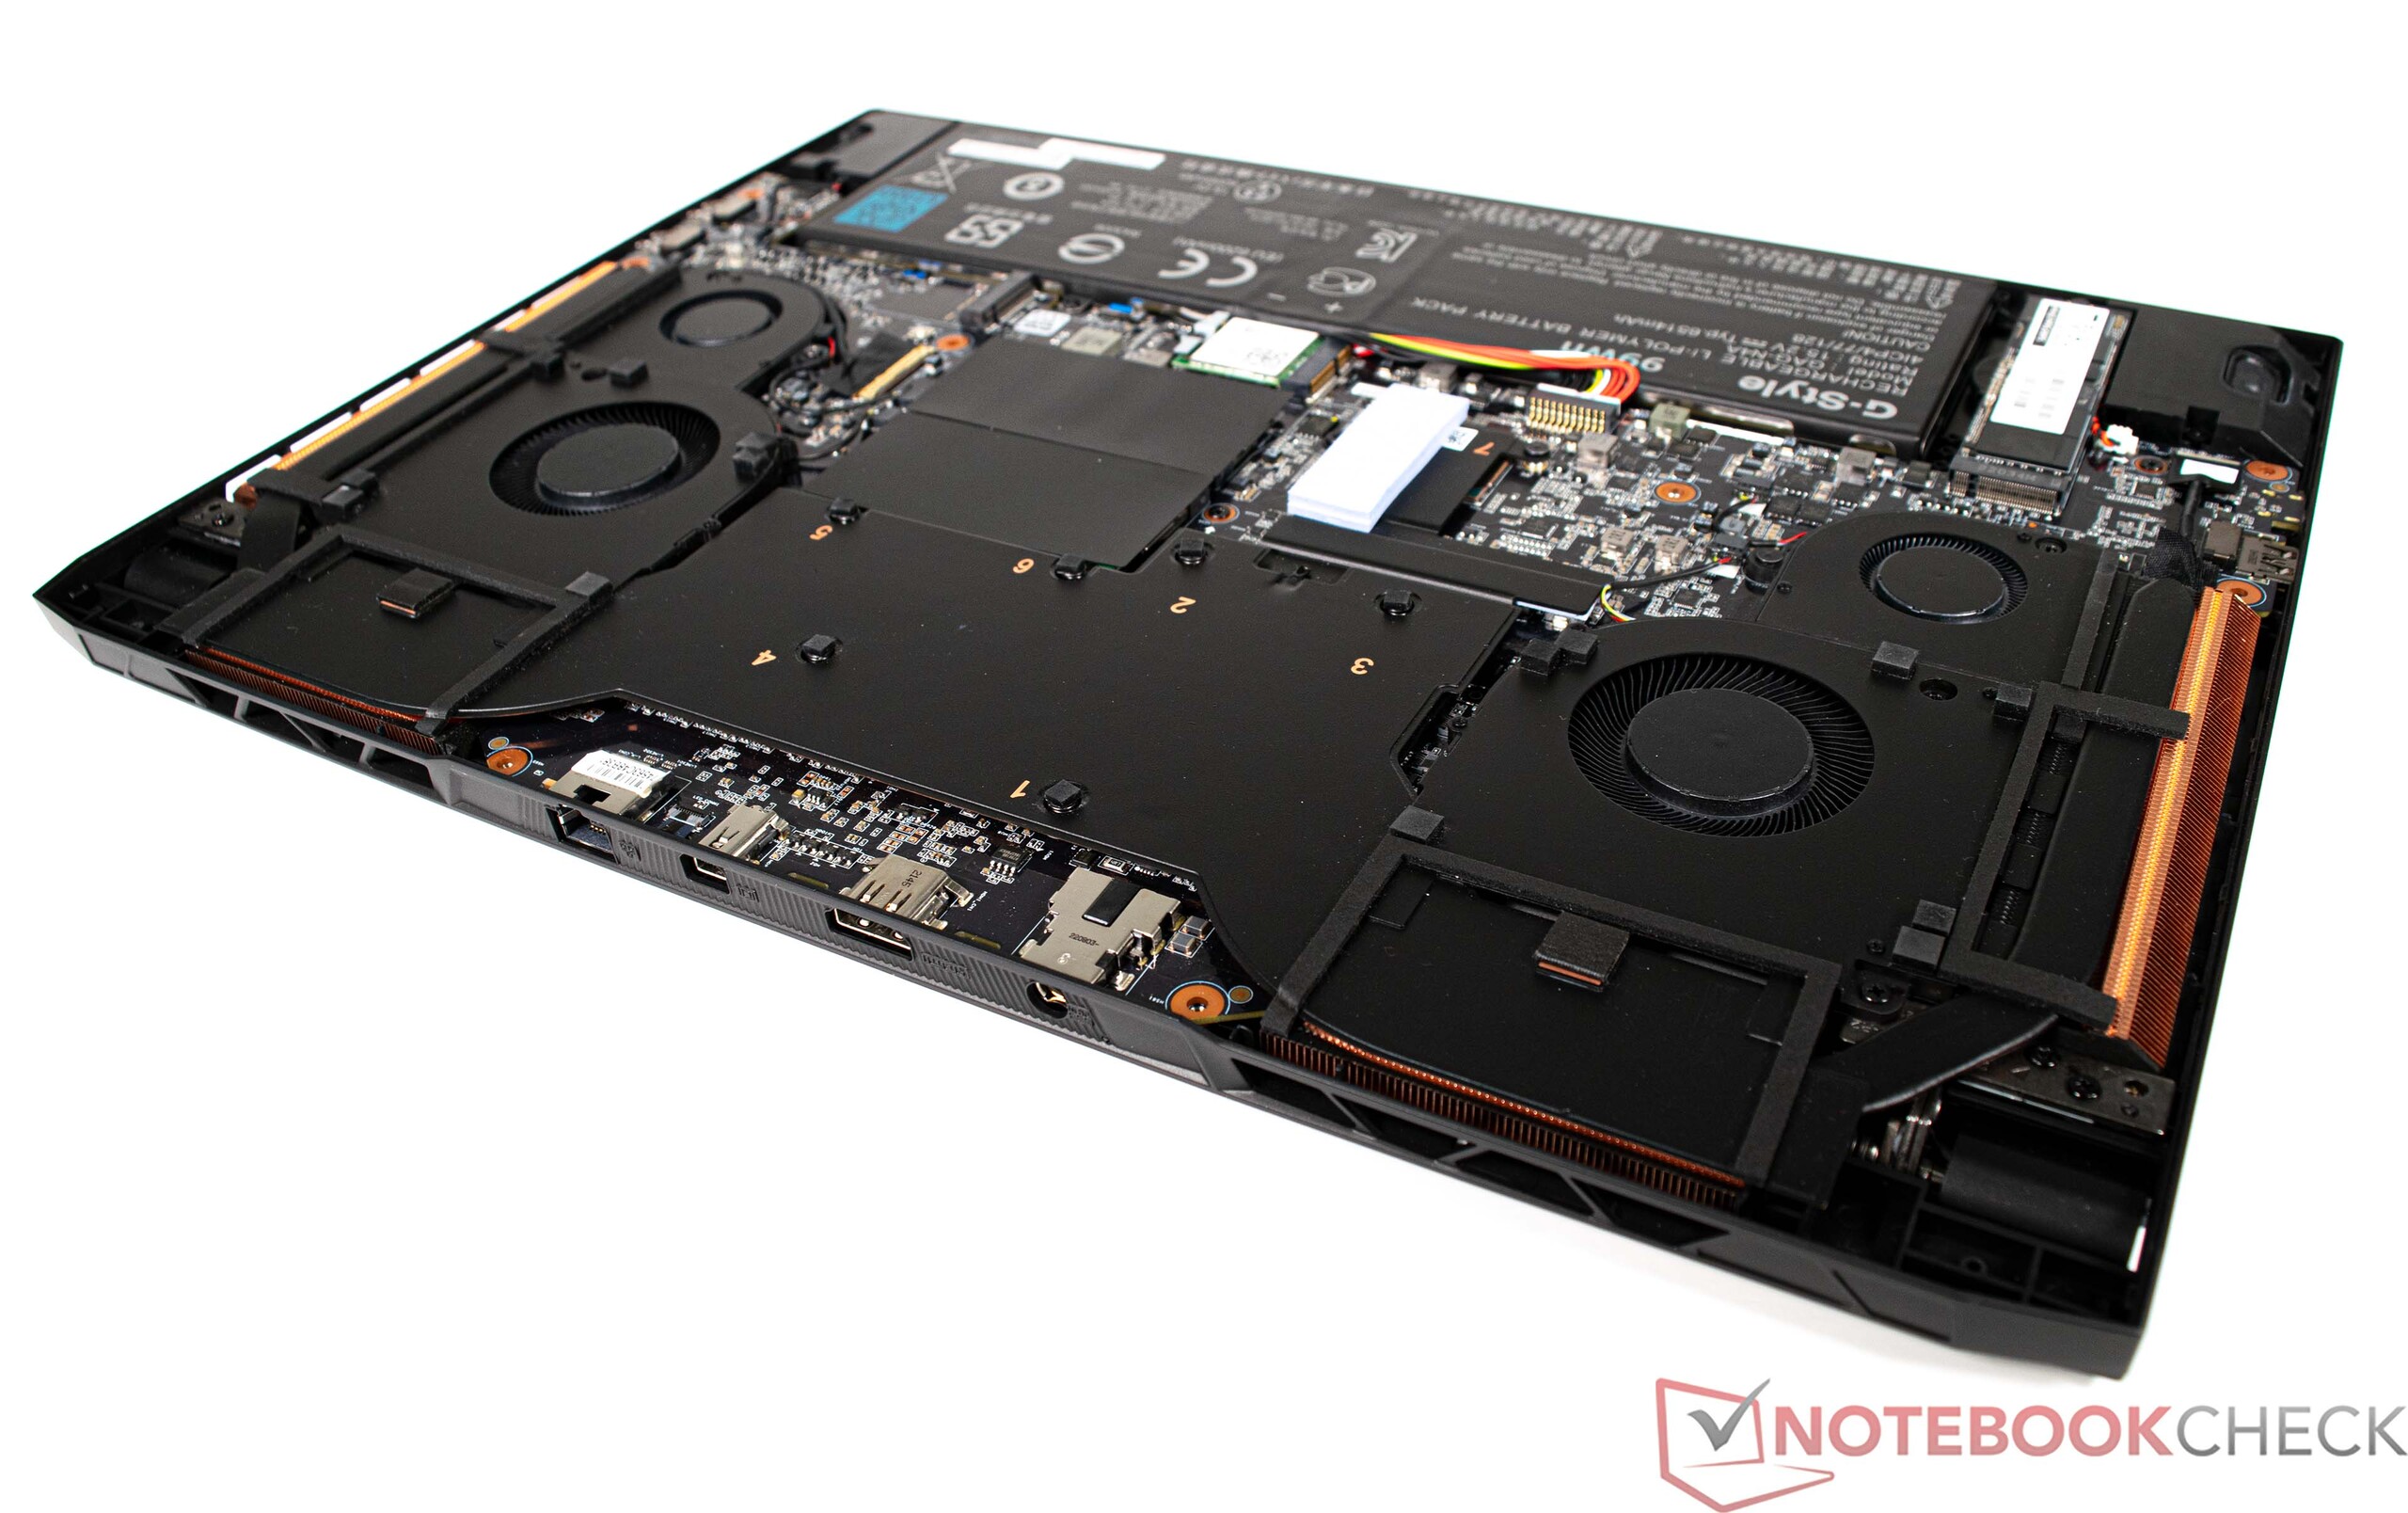
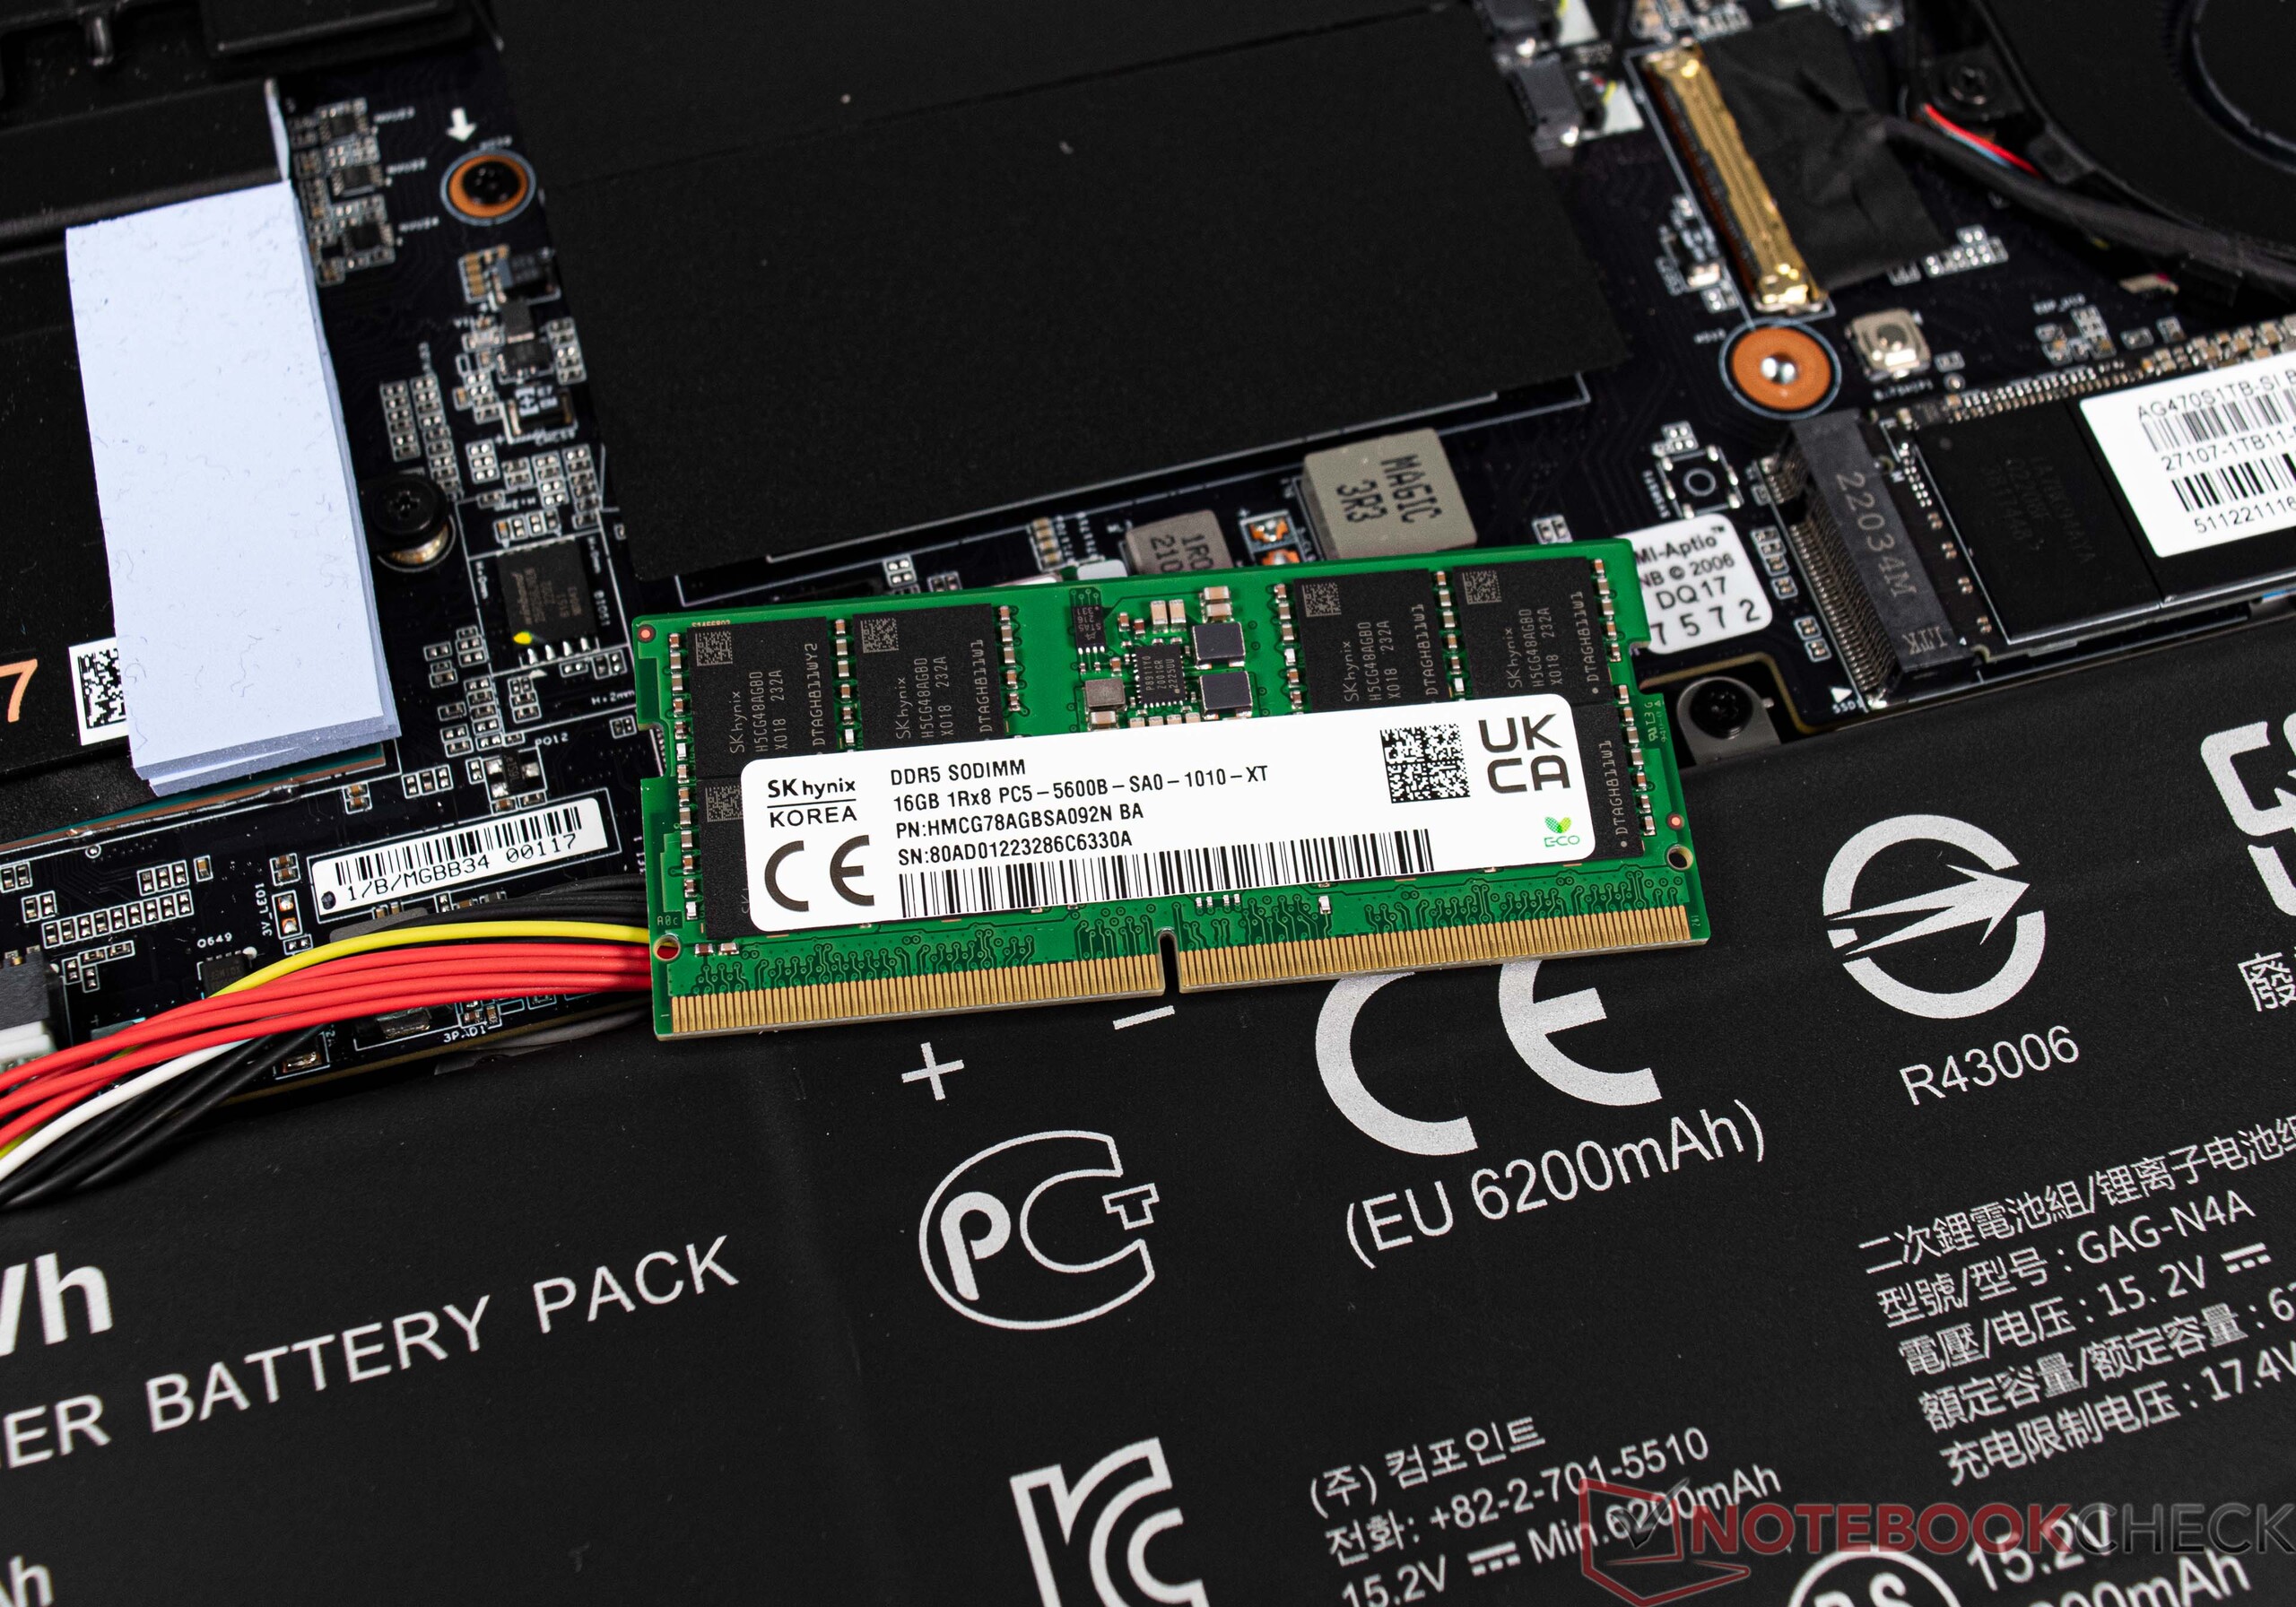
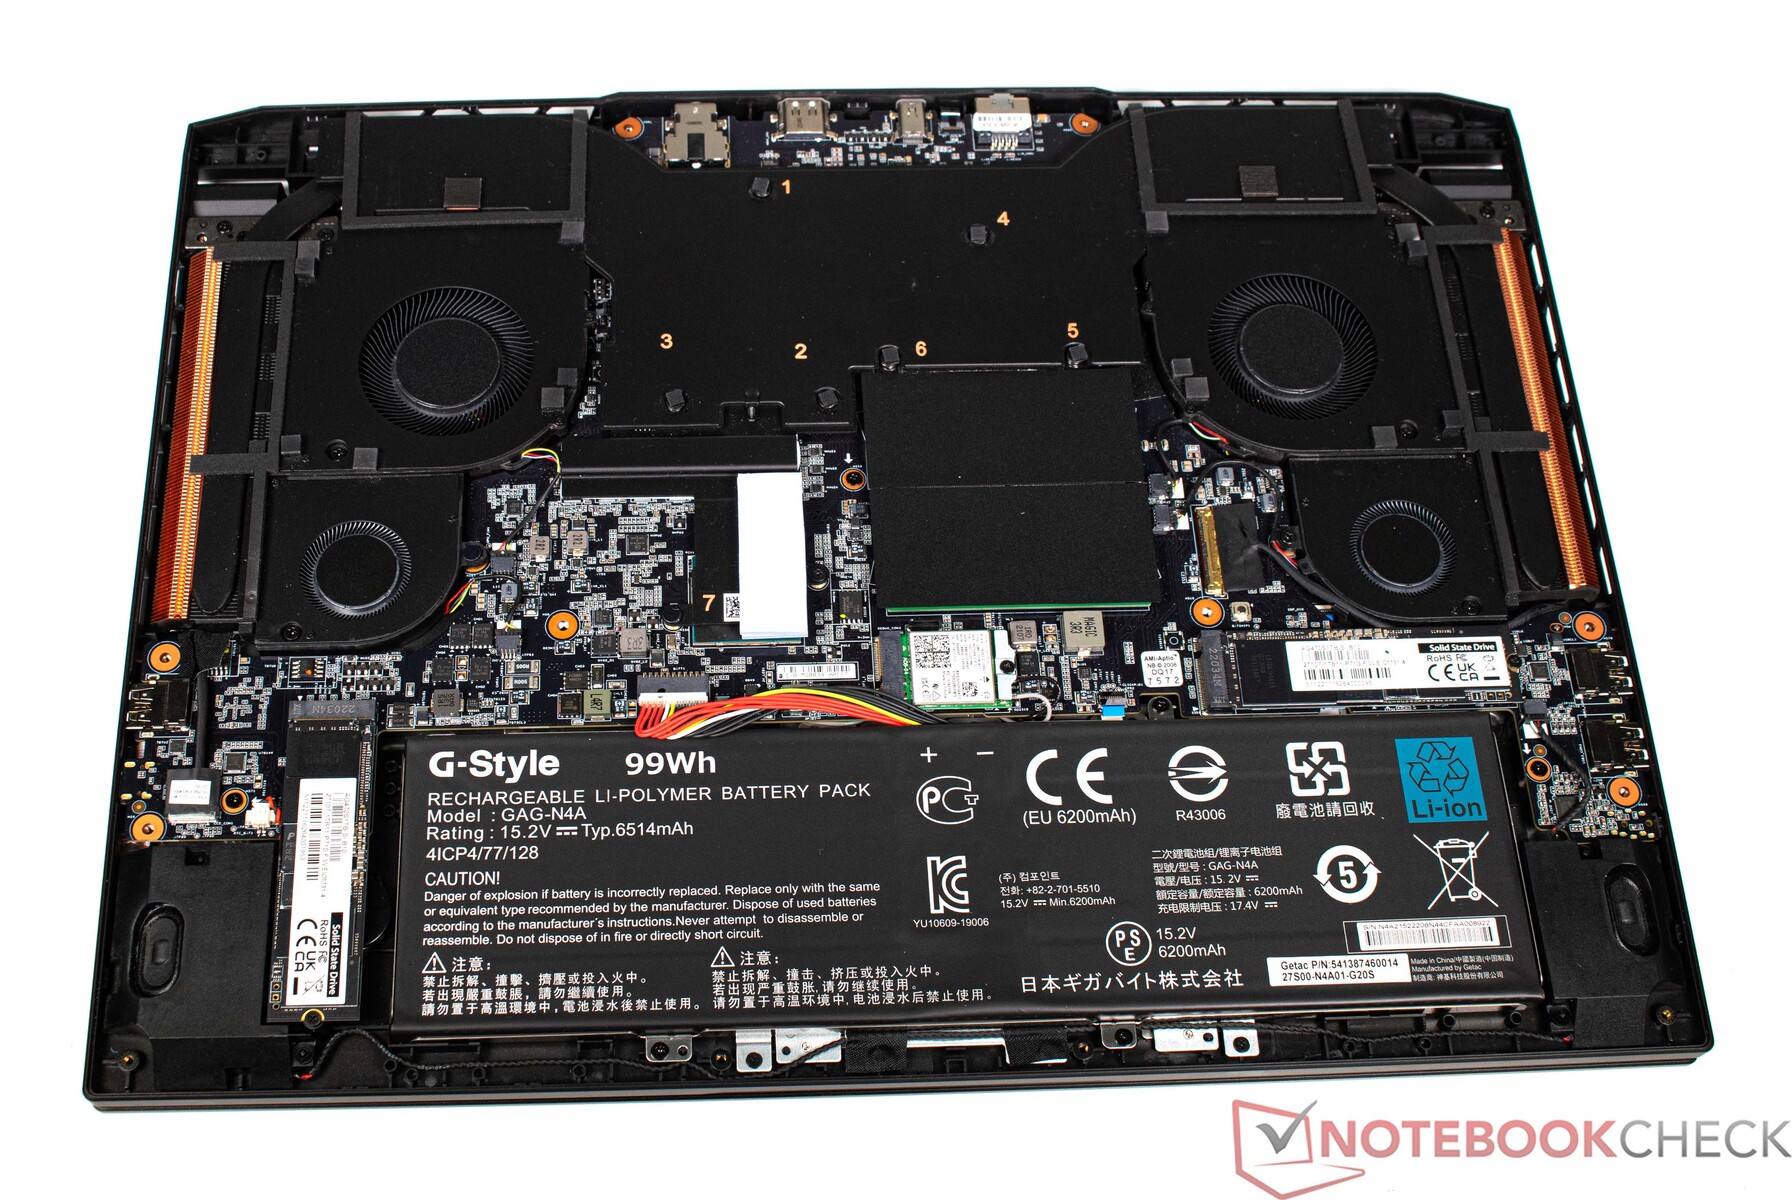
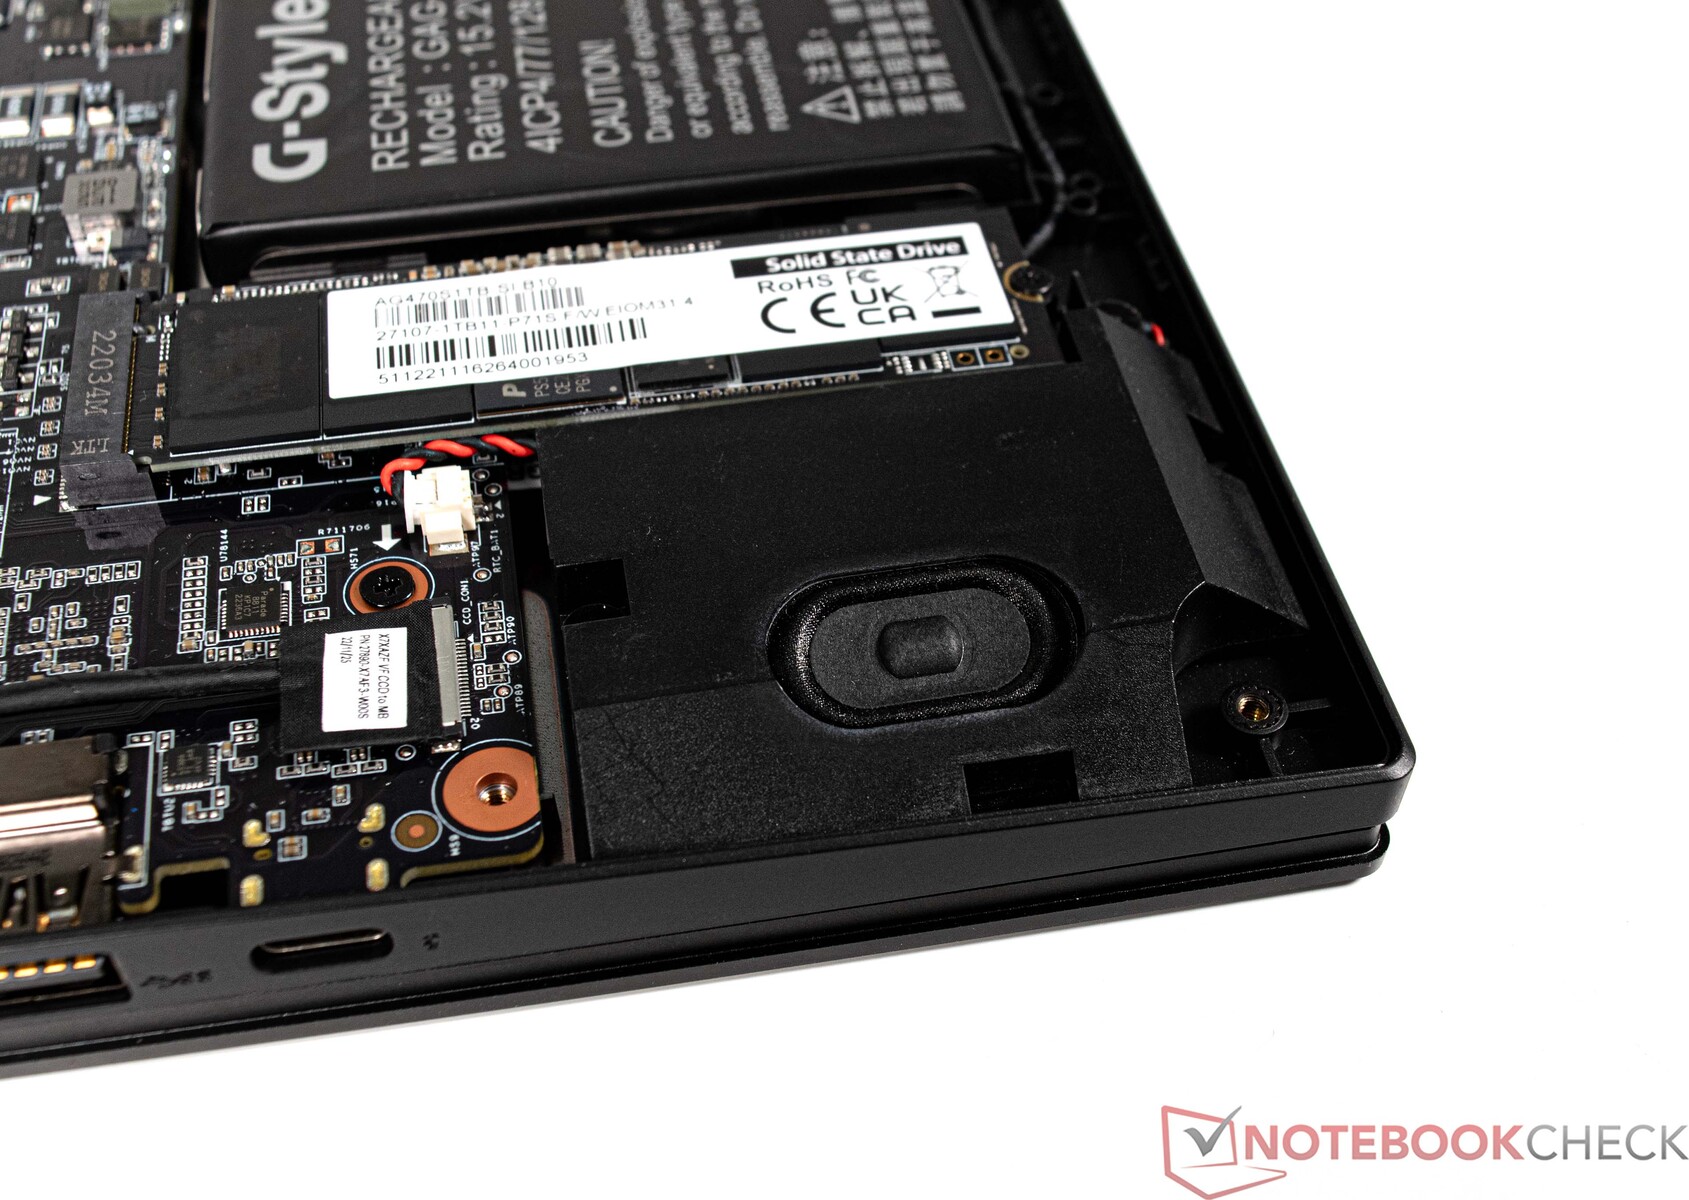
Maintenance work is fundamentally possible on the Aorus 17X AZF. However, the baseplate, which is attached with numerous screws, has to be removed for this. Everything important lies underneath the baseplate, such as the four fans, mass storage and RAM. In our case, the laptop is fully equipped and there are no free slots for RAM or SSD.
Warranty
In Germany, the Aorus 17X AZF comes with a 24-month warranty with pickup and return service included. This, of course, is likely to differ from country to country, so buyers should double-check before purchase.
Software
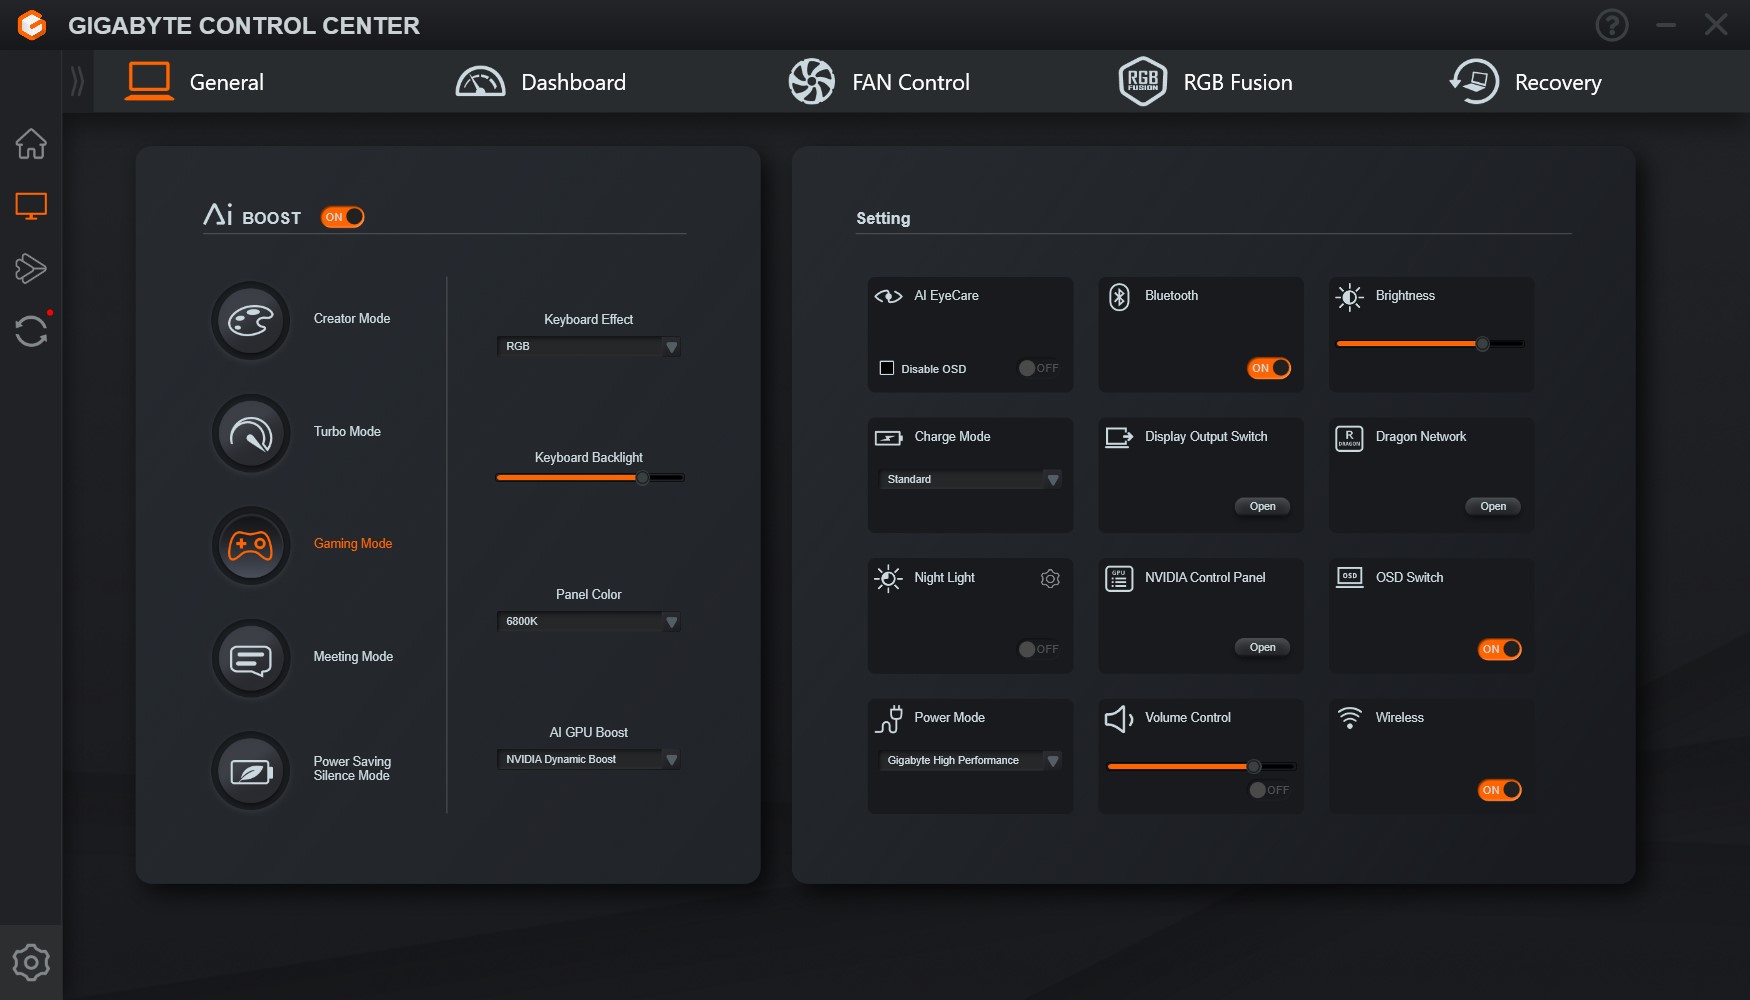
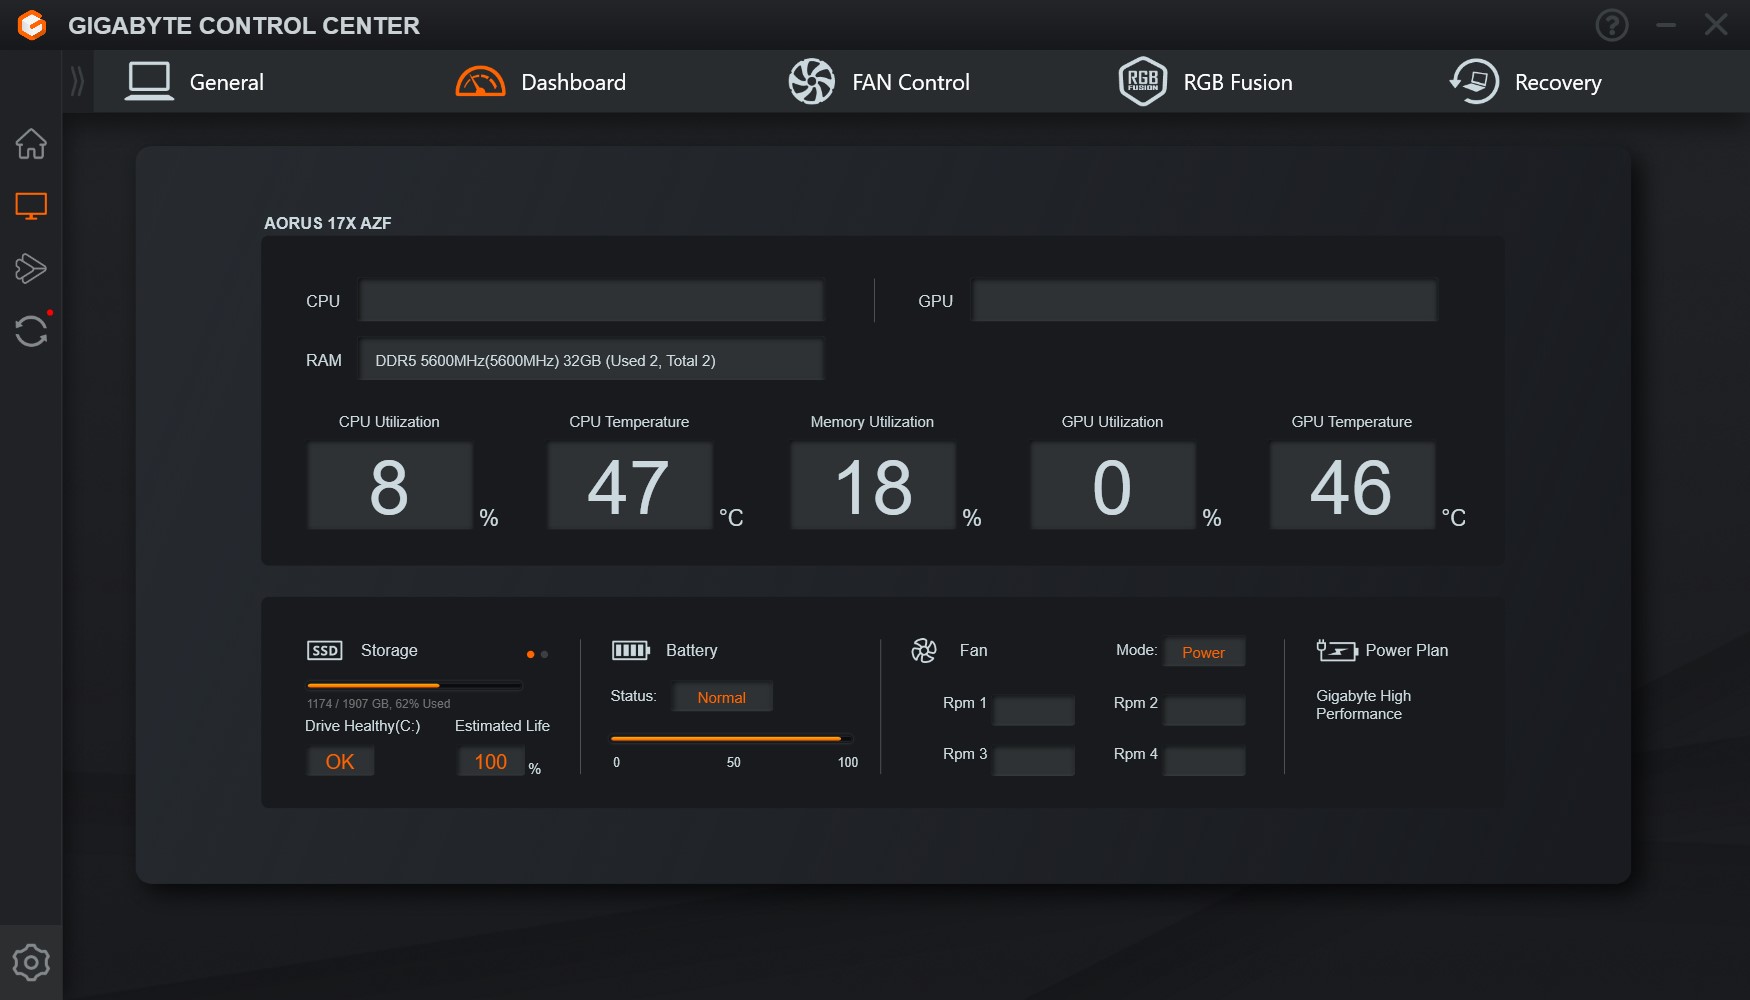
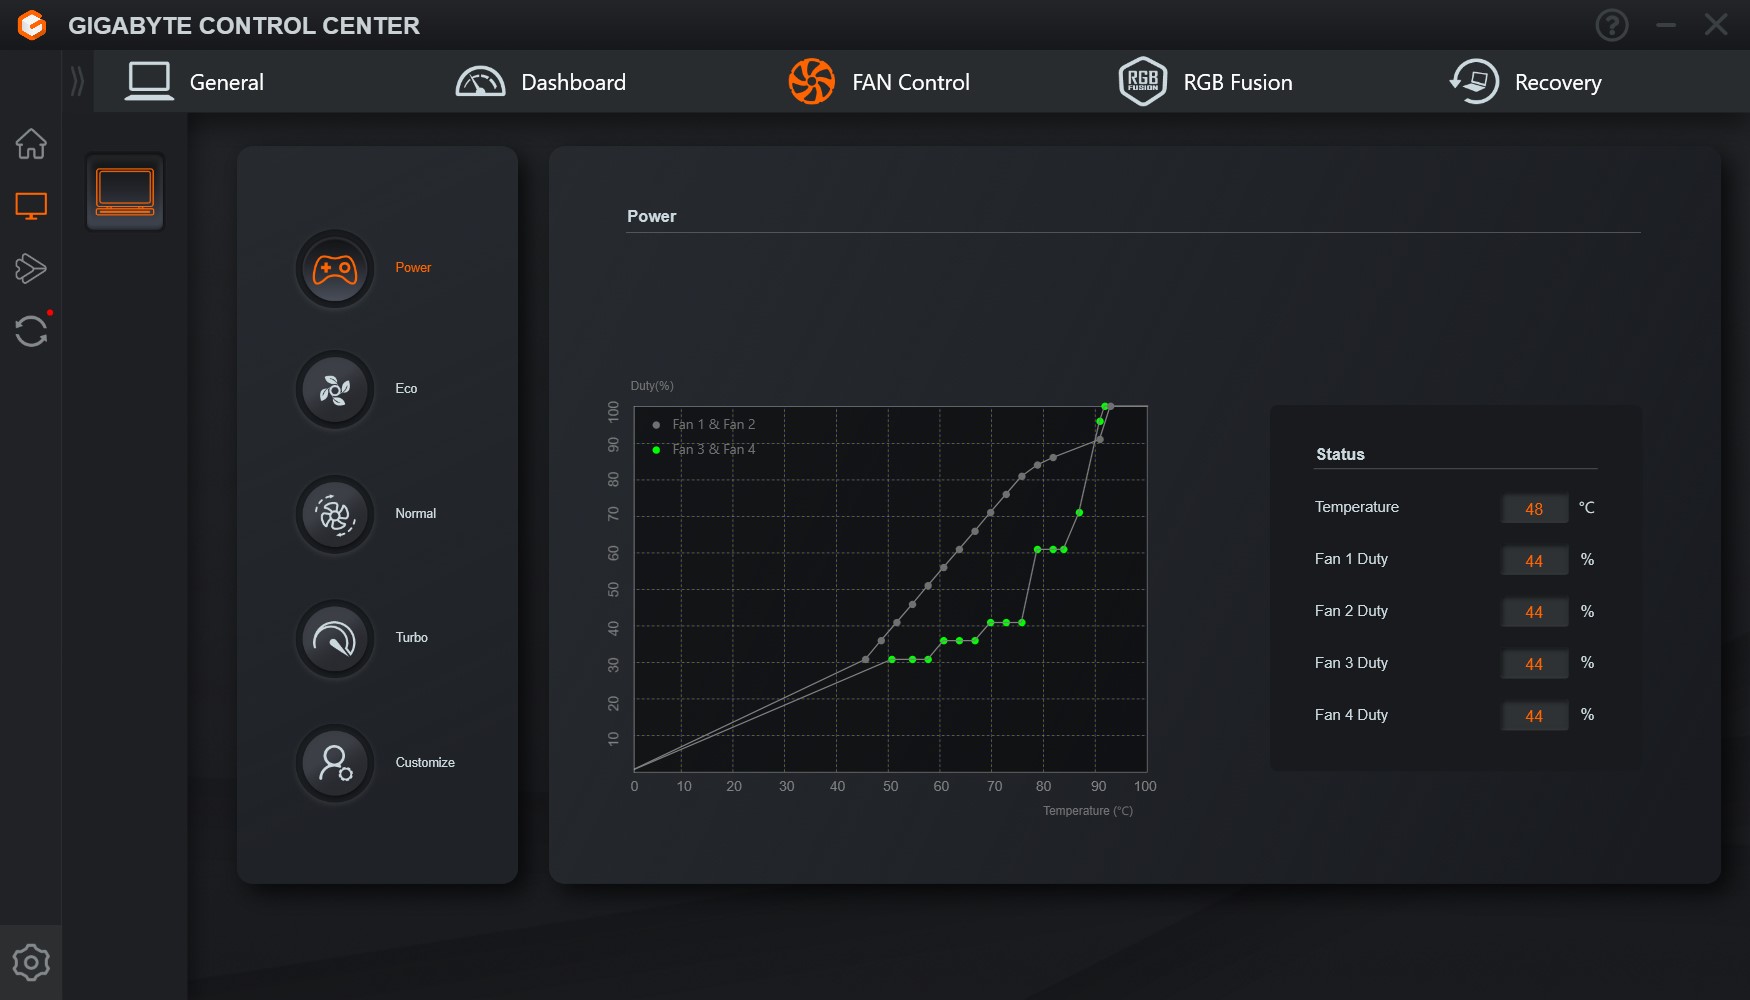
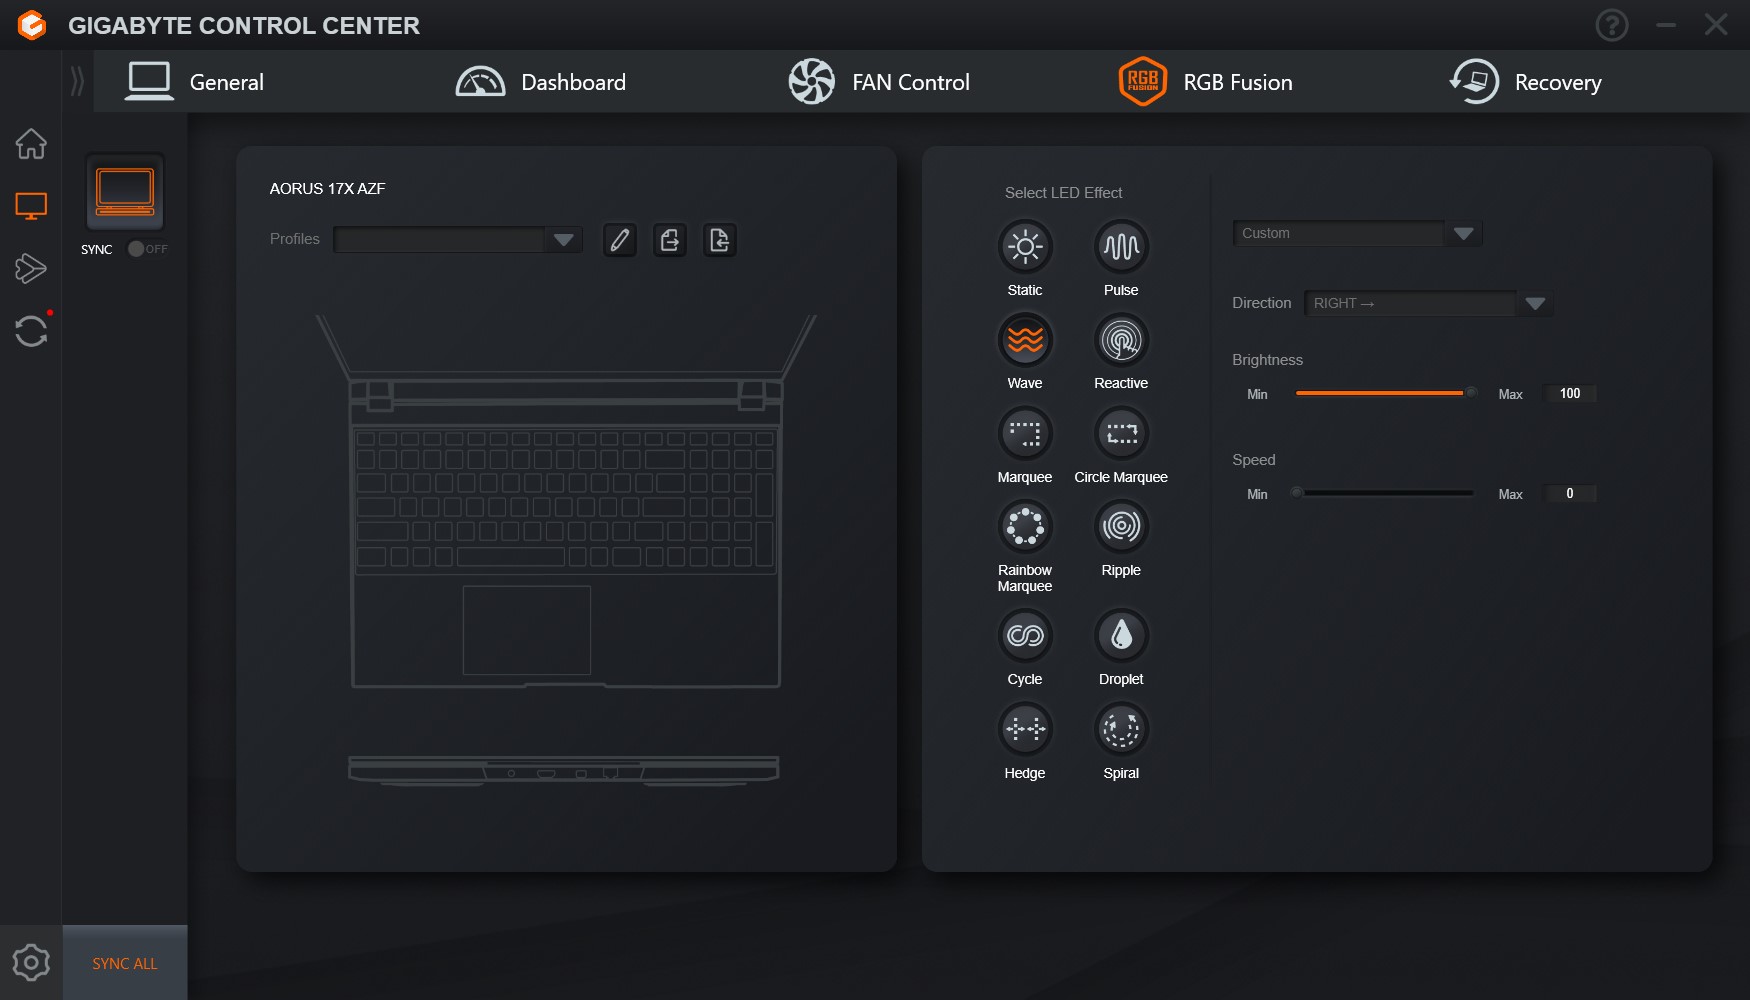
The Gigabyte Control Center (GCC) is used for controlling and monitoring the components of the Aorus 17X AZF. In our tests, no problems were encountered with GCC, which can be used to regulate laptop performance and thus influence background noise. The fan curve can be adjusted a little via the FAN Control tab. Moreover, a large number of backlight effects for the keyboard can be selected.
Input Devices
Keyboard
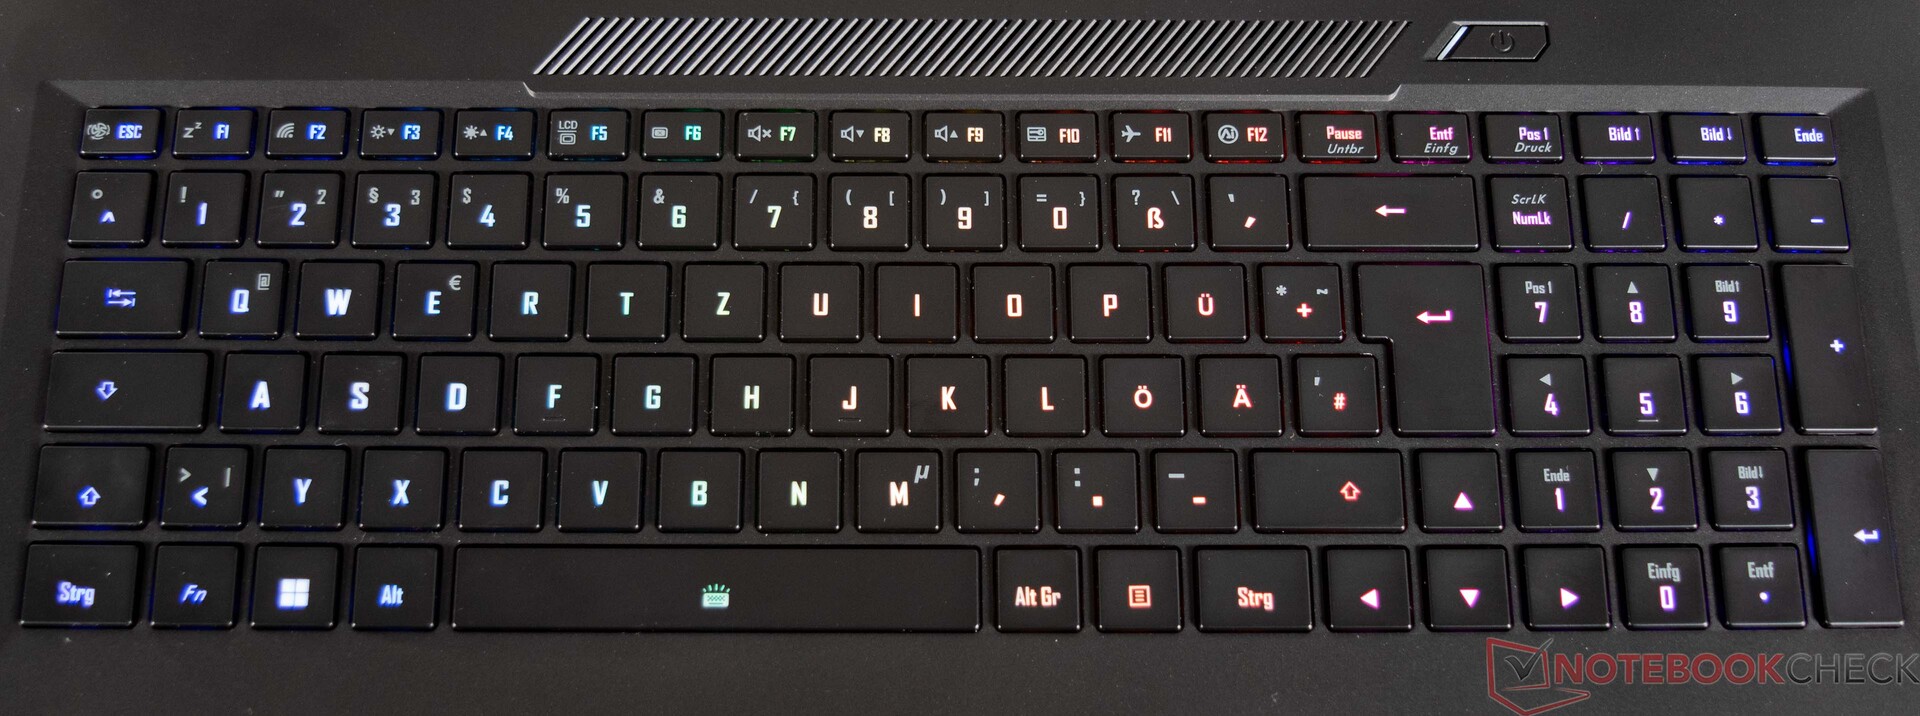
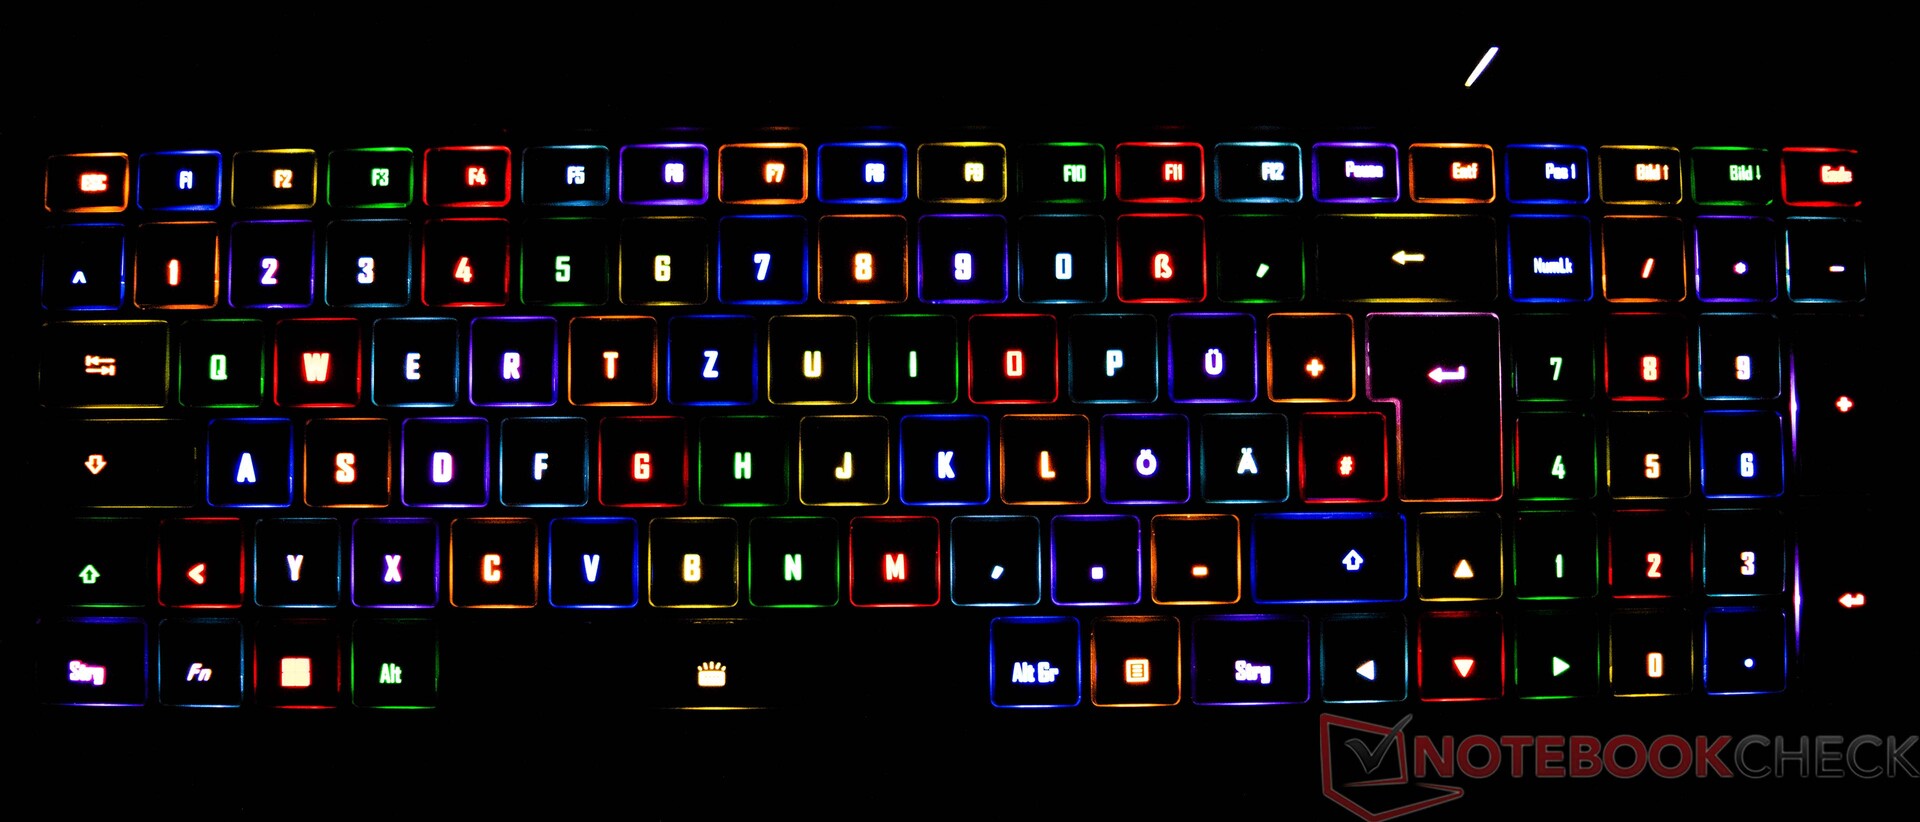
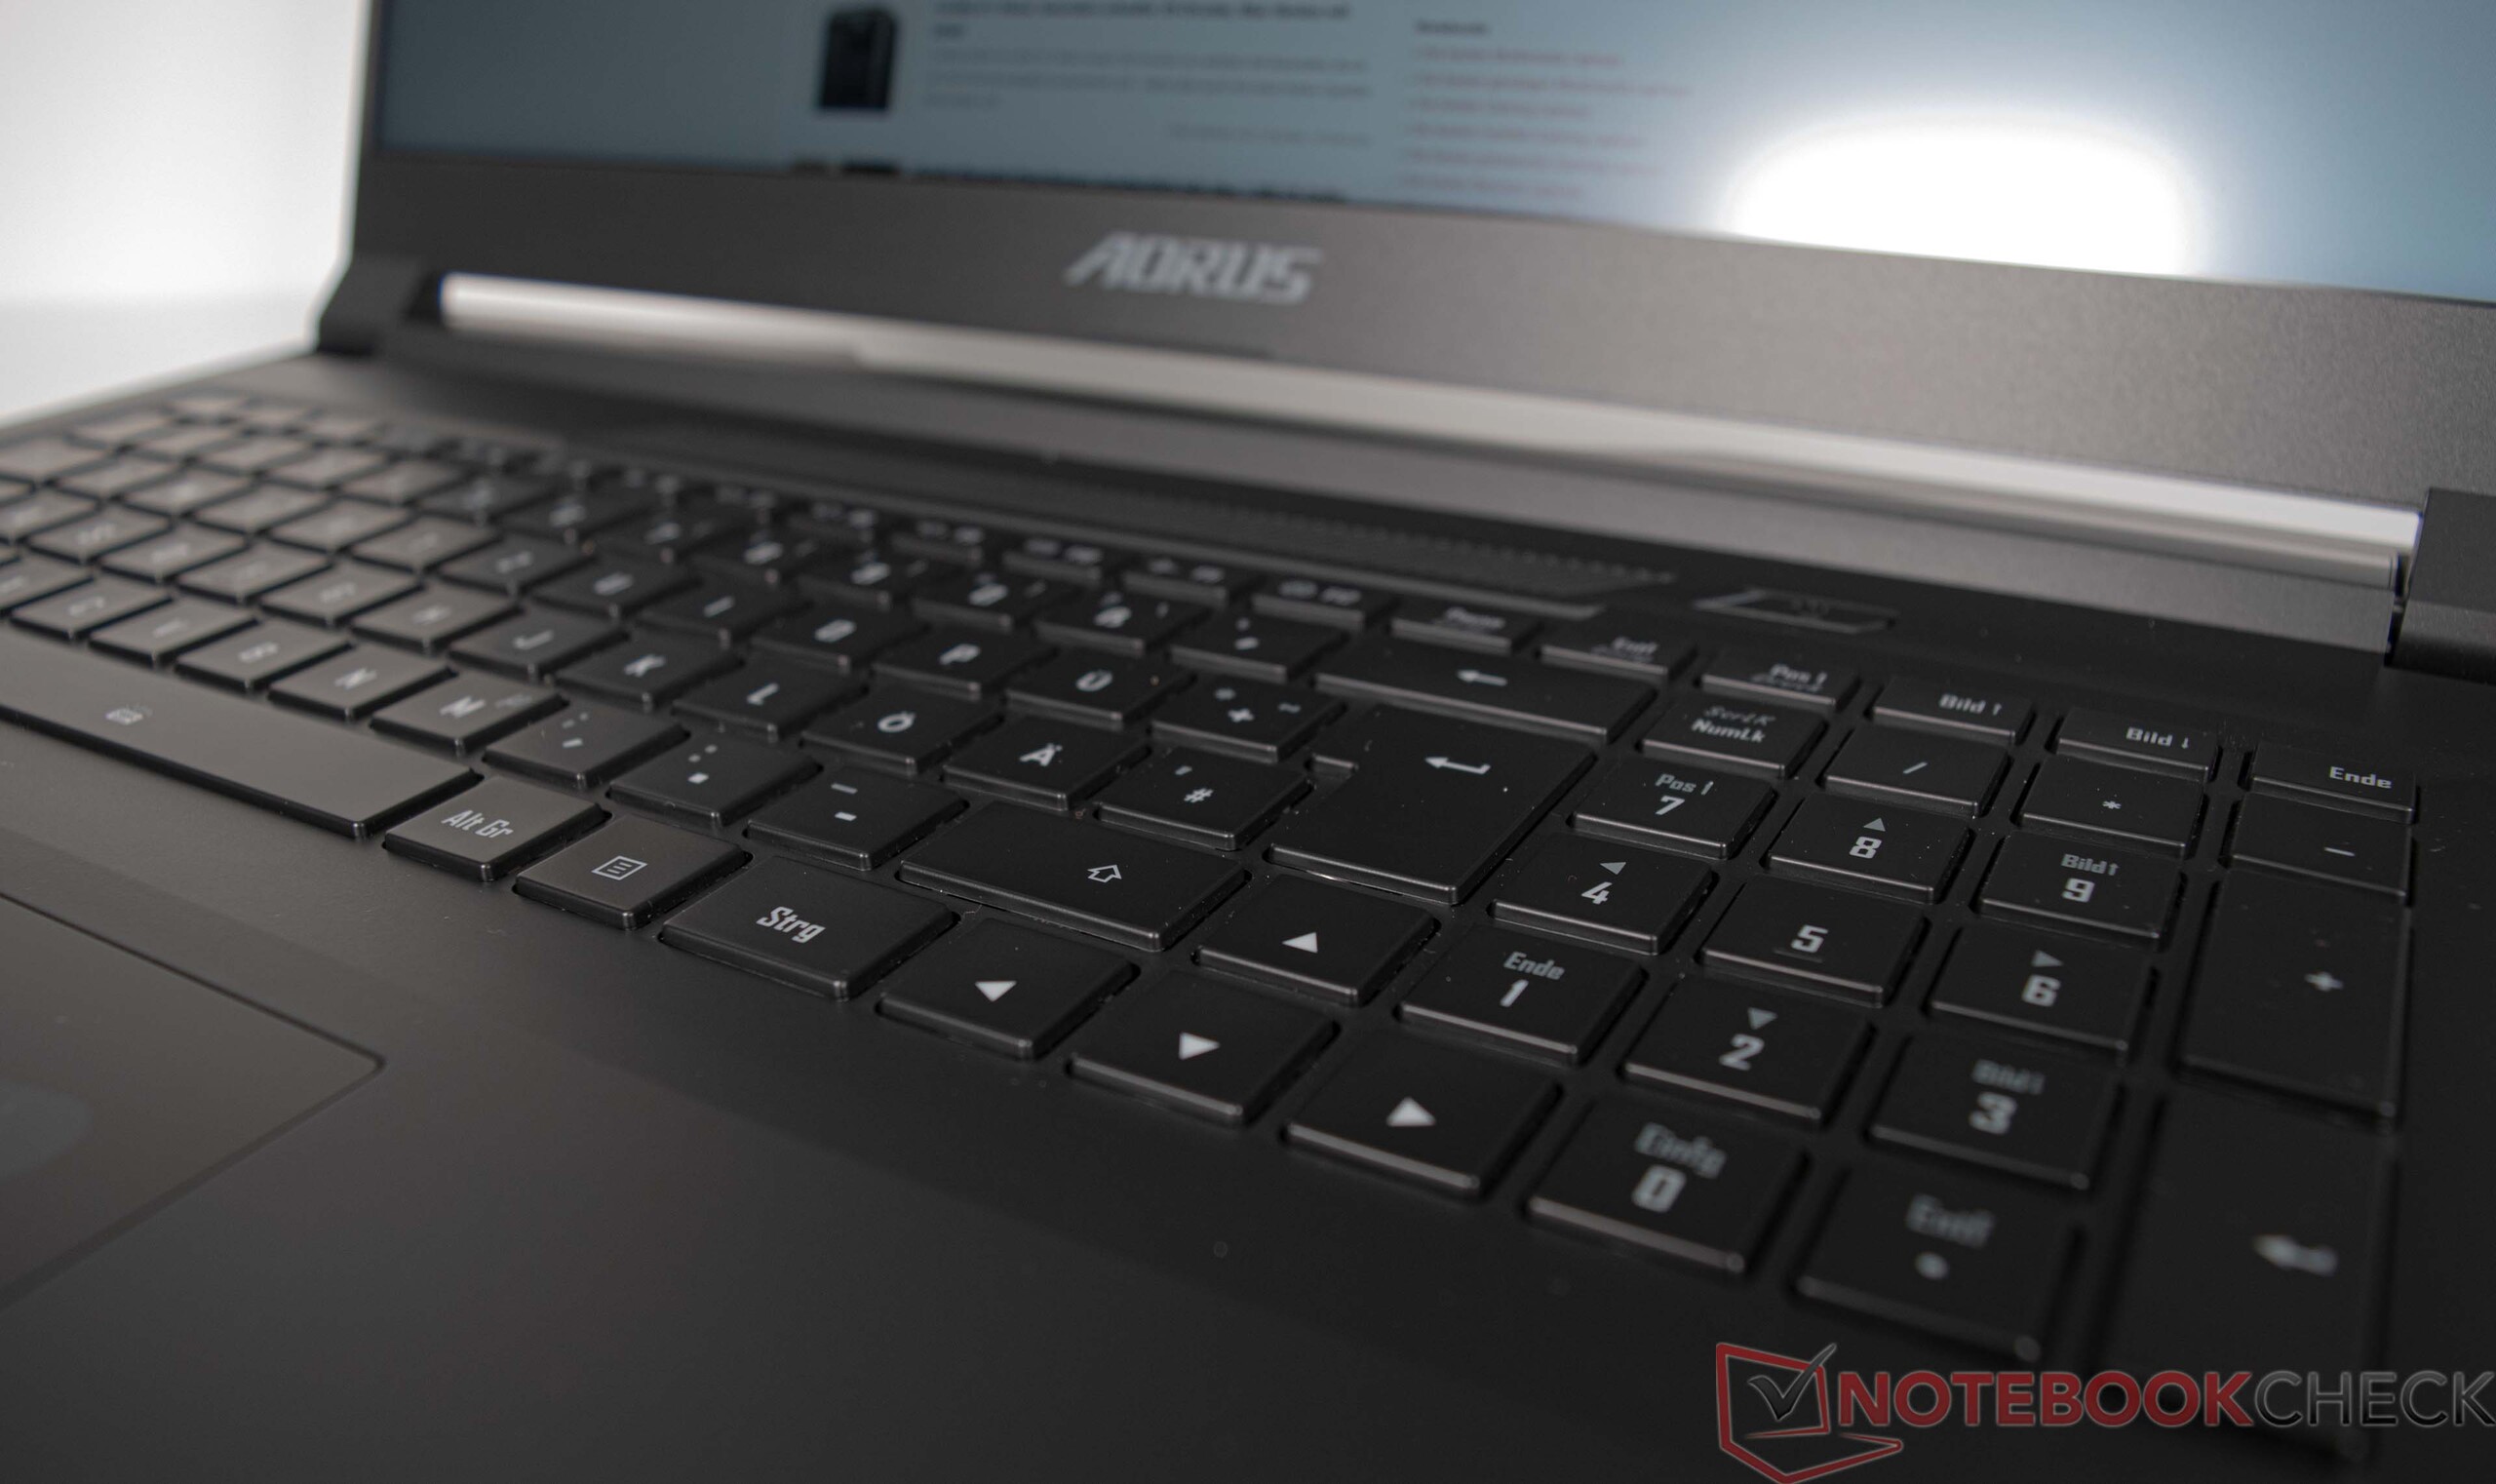
The Aorus 17X AZF comes with a backlit 6-row chiclet keyboard, including a numpad. The smooth keys have medium travel and a clear pressure point. The keyboard yields slightly when typing, but this is not overly pronounced. The backlight can be adjusted at three levels of brightness using a key combination, and there are many more options for lighting effects via the GCC (Gigabyte Control Center).
Touchpad
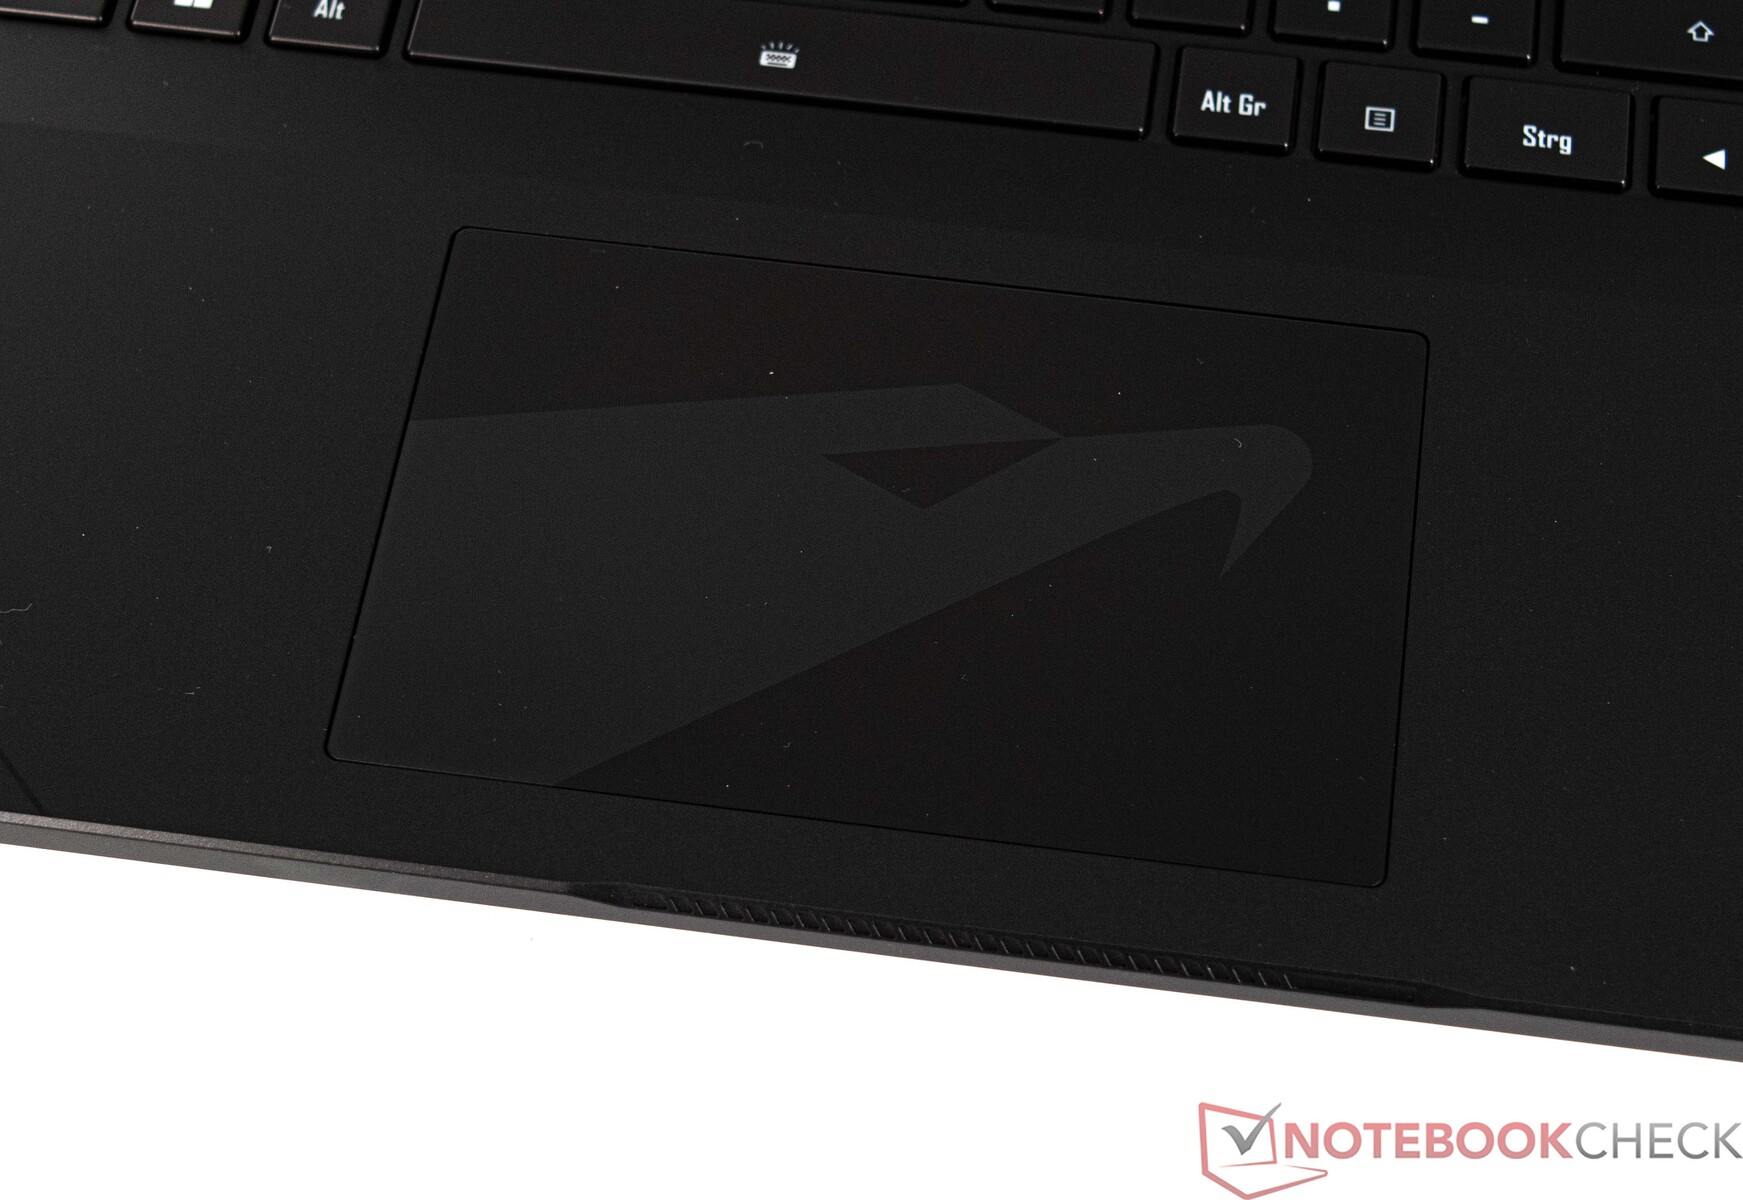
The mouse replacement in the form of a multi-touch ClickPad (approx. 12.1 x 7.6 cm) offers a pleasant size. Aorus has also superimposed its own logo on the toucpad, which is visually pleasing to look at. The ClickPad offers a smooth surface, which allows for smooth finger gliding. The input surface can be used in its entirety and also reacts well in the corners. The pad offers a short stroke for inputs and provides clear feedback thanks to its clear pressure point.
Display

The Aorus 17X AZF comes with a good QHD panel, which should meet the needs of most gamers with a refresh rate of 240 Hz. However, the average brightness of our test unit is clearly weaker compared to the competition. An average of only 276 cd/m² is too low and is only enough for last place. The Aorus 17X AZF also loses important points in the display score with slight halos. No PWM was detected.
Alternative display options, such as a 4K panel, are not intended for the Aorus 17X AZF.
| |||||||||||||||||||||||||
Brightness Distribution: 90 %
Center on Battery: 294 cd/m²
Contrast: 1050:1 (Black: 0.28 cd/m²)
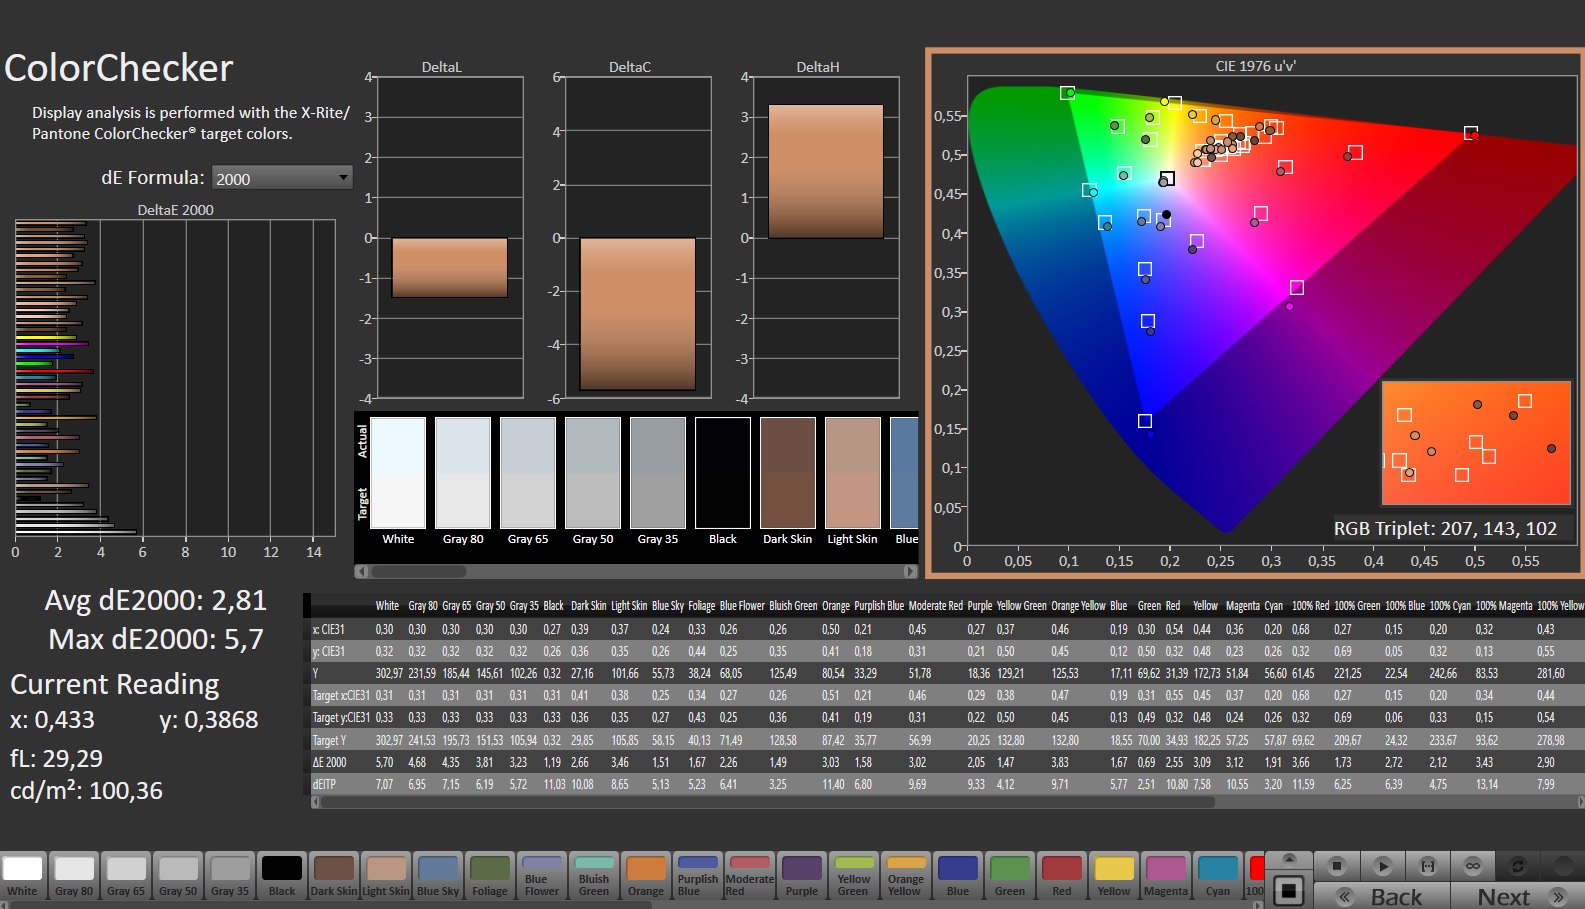
ΔE ColorChecker Calman: 2.81 | ∀{0.5-29.43 Ø4.73}
calibrated: 0.86
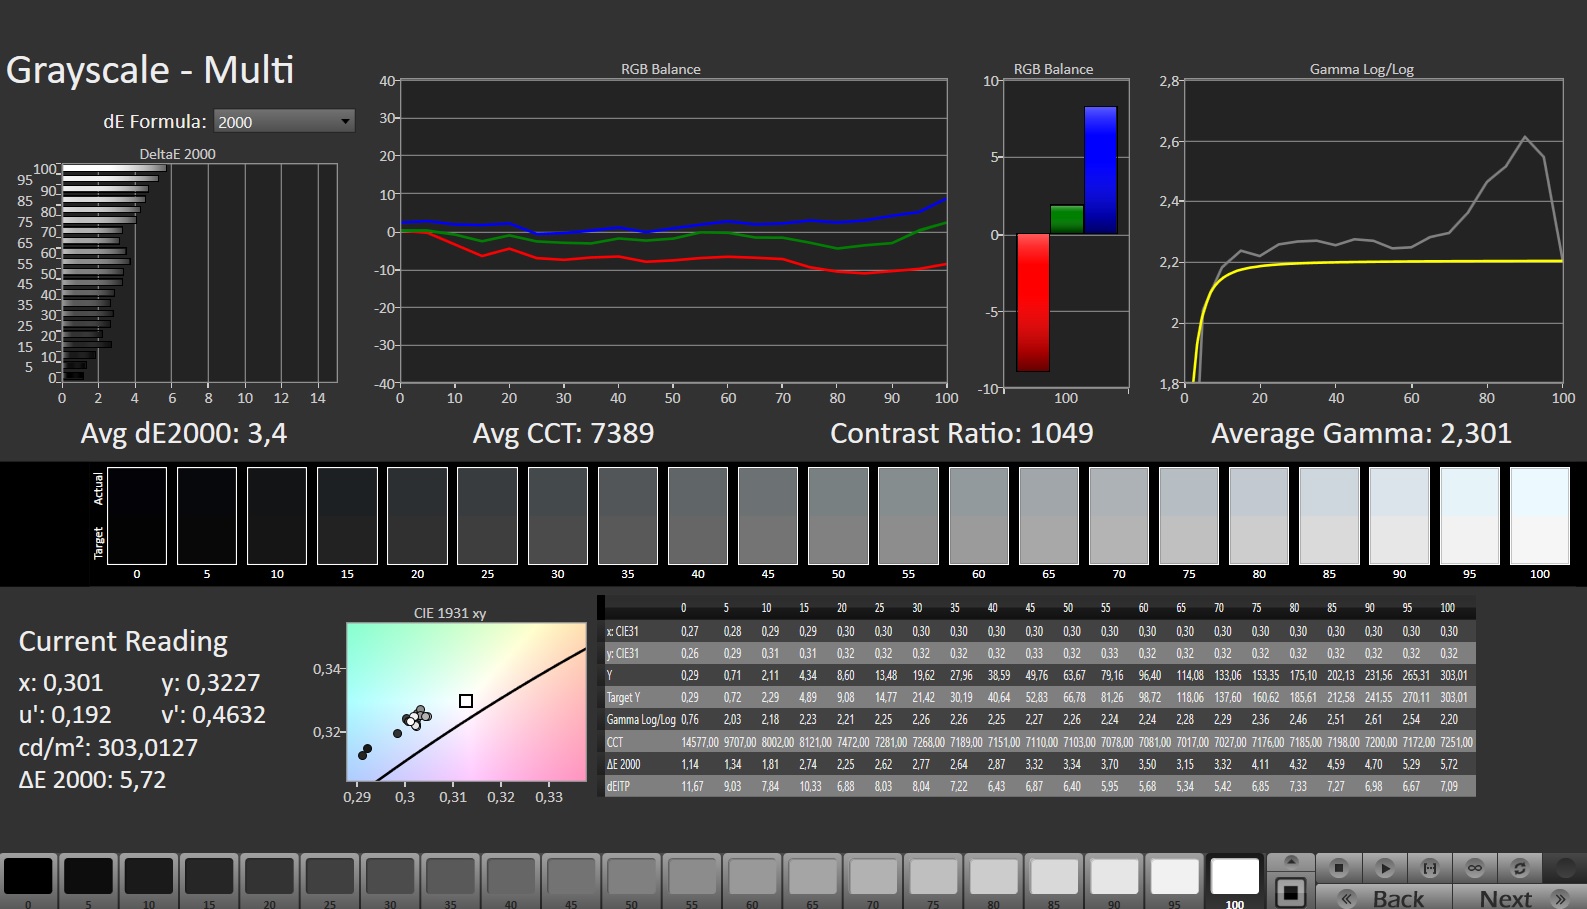
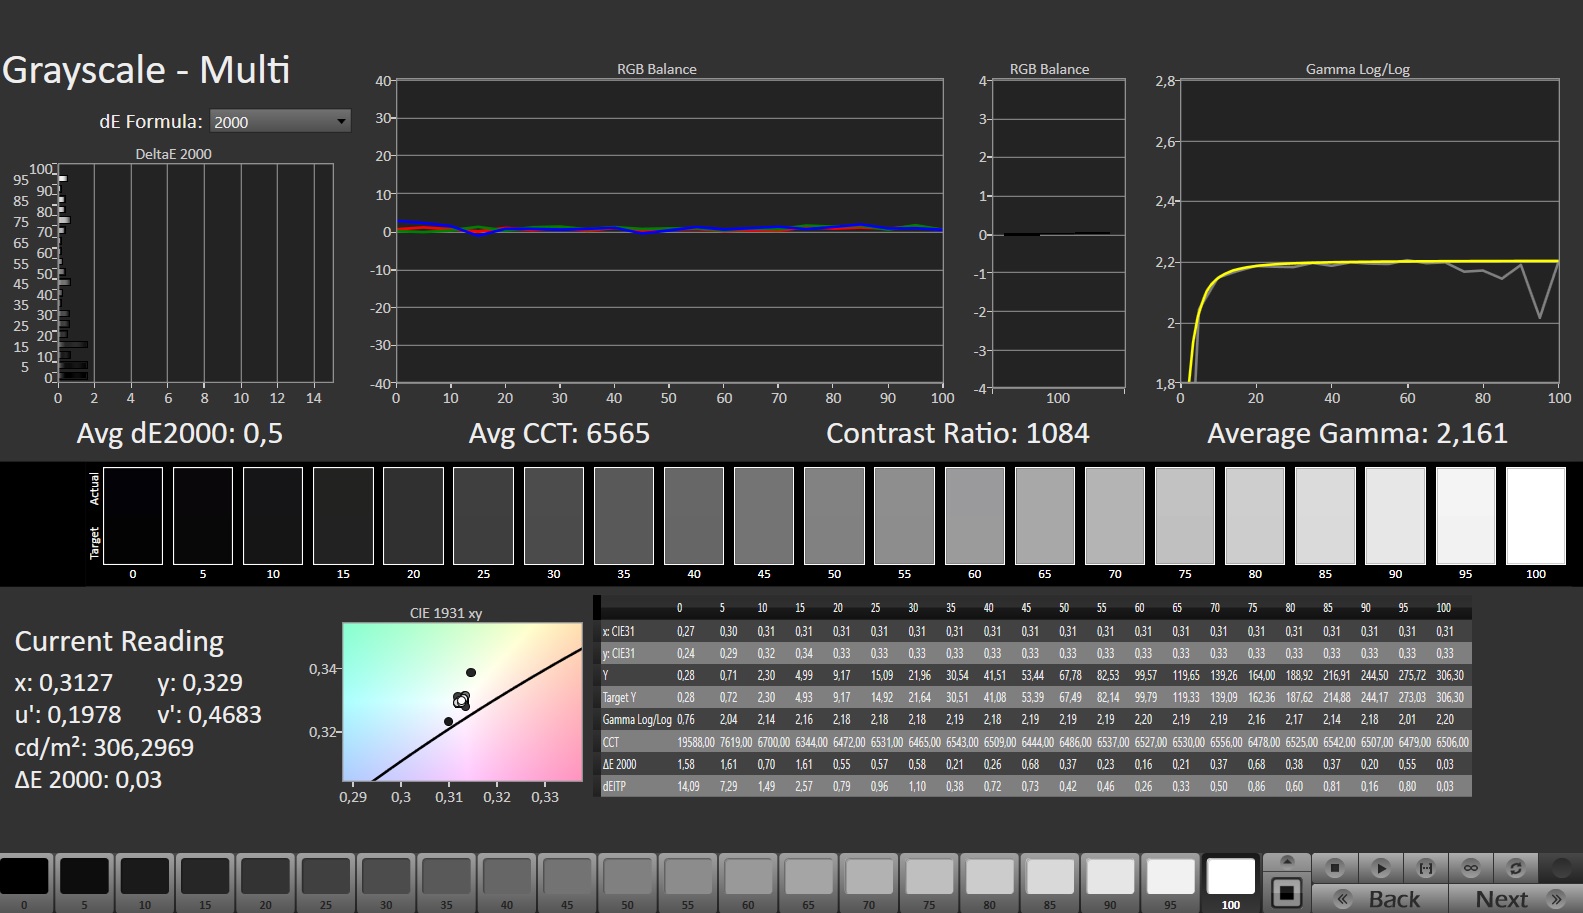
ΔE Greyscale Calman: 3.4 | ∀{0.09-98 Ø4.97}
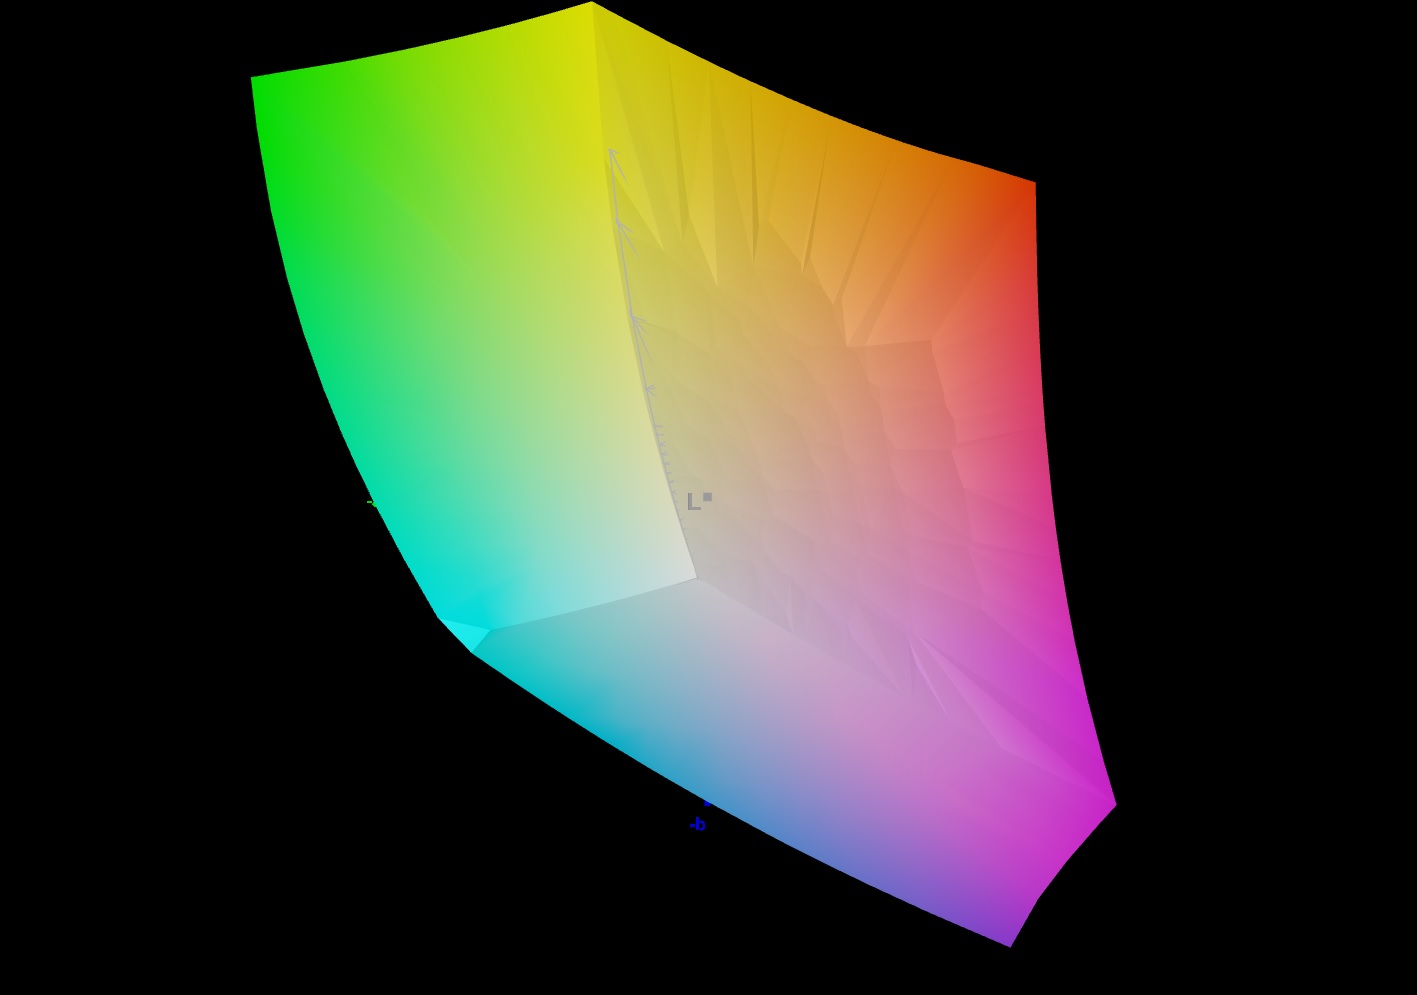
84.5% AdobeRGB 1998 (Argyll 3D)
99.9% sRGB (Argyll 3D)
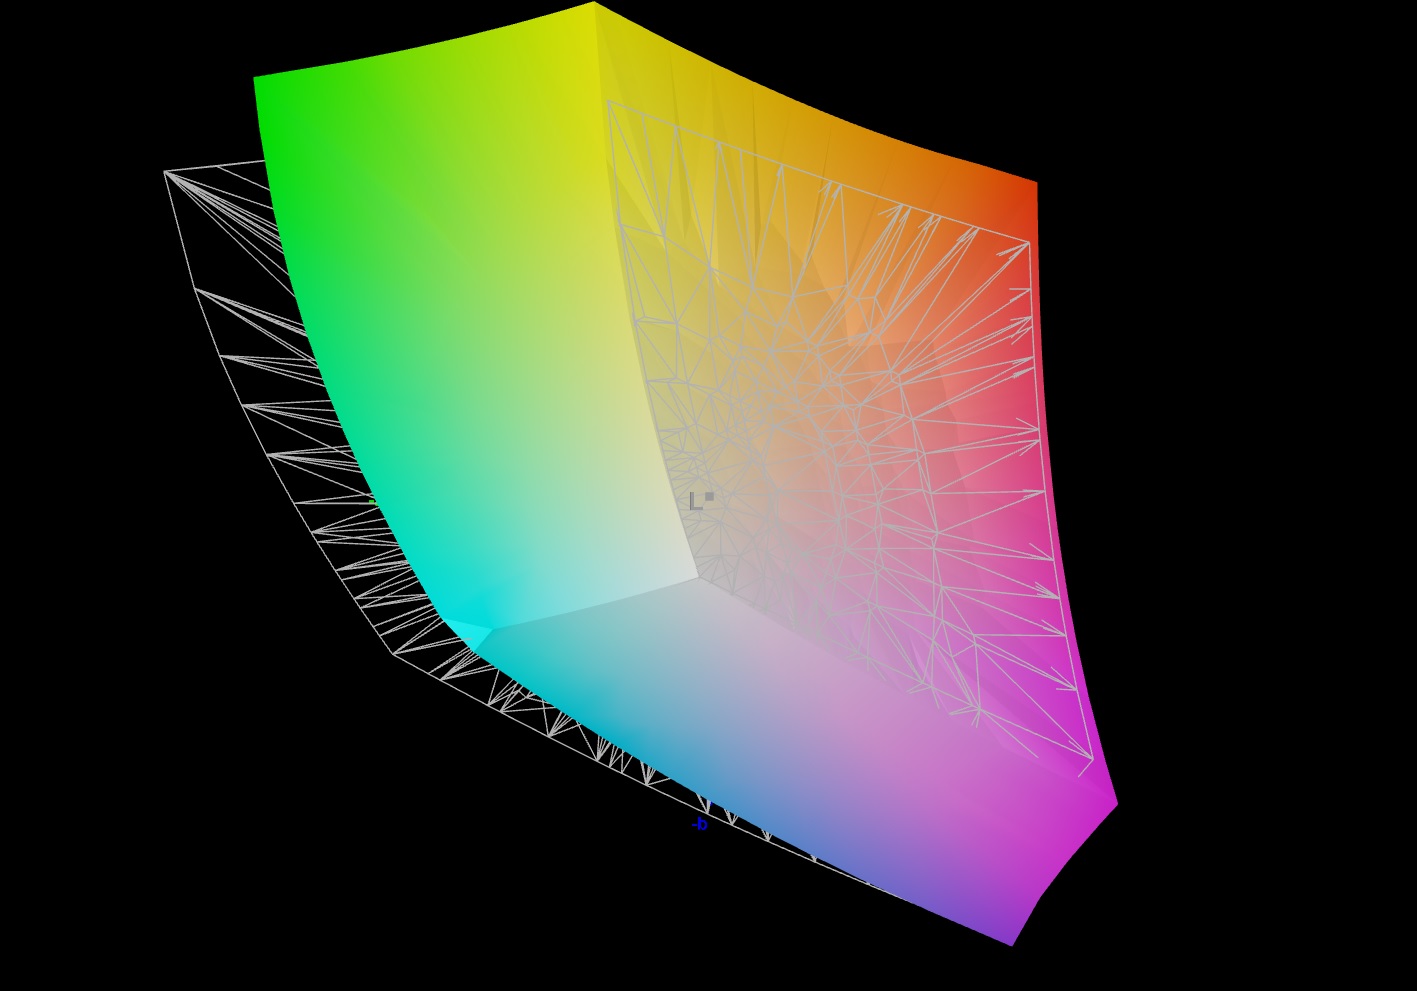
96.7% Display P3 (Argyll 3D)
Gamma: 2.301
CCT: 7389 K
| Aorus 17X AZF BOE09F9, IPS, 2560x1440, 17.3" | Medion Erazer Beast X40 BOE NE170QDM-NZ1, IPS, 2560x1600, 17" | MSI GE78HX 13VH-070US AU Optronics B170QAN01.2, IPS, 2560x1600, 17" | HP Omen 17-ck2097ng BOE BOE09BF, IPS, 2560x1440, 17.3" | MSI Titan GT77 HX 13VI B173ZAN06.C, Mini-LED, 3840x2160, 17.3" | Alienware m18 R1 Chi Mei 180JME, IPS, 1920x1200, 18" | |
|---|---|---|---|---|---|---|
| Display | -16% | 1% | -17% | 2% | 2% | |
| Display P3 Coverage (%) | 96.7 | 68.6 -29% | 97.6 1% | 67.4 -30% | 94.9 -2% | 97.7 1% |
| sRGB Coverage (%) | 99.9 | 99.8 0% | 99.9 0% | 97.6 -2% | 99.9 0% | 100 0% |
| AdobeRGB 1998 Coverage (%) | 84.5 | 69.4 -18% | 86.5 2% | 69.6 -18% | 92.4 9% | 89.8 6% |
| Response Times | 23% | 54% | 1% | -169% | 41% | |
| Response Time Grey 50% / Grey 80% * (ms) | 14 ? | 11.3 ? 19% | 4.2 ? 70% | 15.6 ? -11% | 38.4 ? -174% | 3 ? 79% |
| Response Time Black / White * (ms) | 10.1 ? | 7.5 ? 26% | 6.4 ? 37% | 8.9 ? 12% | 26.6 ? -163% | 9.9 ? 2% |
| PWM Frequency (Hz) | 2380 ? | |||||
| Screen | 11% | -24% | 14% | 64117% | 26% | |
| Brightness middle (cd/m²) | 294 | 384 31% | 398.6 36% | 371 26% | 606 106% | 372.8 27% |
| Brightness (cd/m²) | 276 | 377 37% | 384 39% | 350 27% | 602 118% | 367 33% |
| Brightness Distribution (%) | 90 | 90 0% | 89 -1% | 90 0% | 93 3% | 97 8% |
| Black Level * (cd/m²) | 0.28 | 0.45 -61% | 0.46 -64% | 0.32 -14% | 0.0001 100% | 0.32 -14% |
| Contrast (:1) | 1050 | 853 -19% | 867 -17% | 1159 10% | 6060000 577043% | 1165 11% |
| Colorchecker dE 2000 * | 2.81 | 2.05 27% | 4.05 -44% | 1.74 38% | 4.8 -71% | 1.92 32% |
| Colorchecker dE 2000 max. * | 5.7 | 3.64 36% | 8.68 -52% | 3.59 37% | 8.2 -44% | 3.65 36% |
| Colorchecker dE 2000 calibrated * | 0.86 | 0.74 14% | 1.02 -19% | 1.01 -17% | 1.8 -109% | 0.51 41% |
| Greyscale dE 2000 * | 3.4 | 2.3 32% | 6.5 -91% | 2.8 18% | 6.5 -91% | 1.5 56% |
| Gamma | 2.301 96% | 2.017 109% | 2.11 104% | 2.19 100% | 2.63 84% | 2.34 94% |
| CCT | 7389 88% | 6546 99% | 7518 86% | 6474 100% | 6596 99% | 6607 98% |
| Total Average (Program / Settings) | 6% /
7% | 10% /
-7% | -1% /
5% | 21317% /
41195% | 23% /
23% |
* ... smaller is better
Subjectively, the display quality of the screen is impeccable and there is no visible grain despite the matte surface. In summary, the measured DeltaE-2000 values are relatively close to the target value of 3 in the state of delivery. However, other laptops in the class show that this can be done better. We were able to improve the values considerably via manual calibration. In addition, we were also able to reduce the blue cast a little. Hence, we recommend using the ICC profile linked above if you want to use the device for image editing.
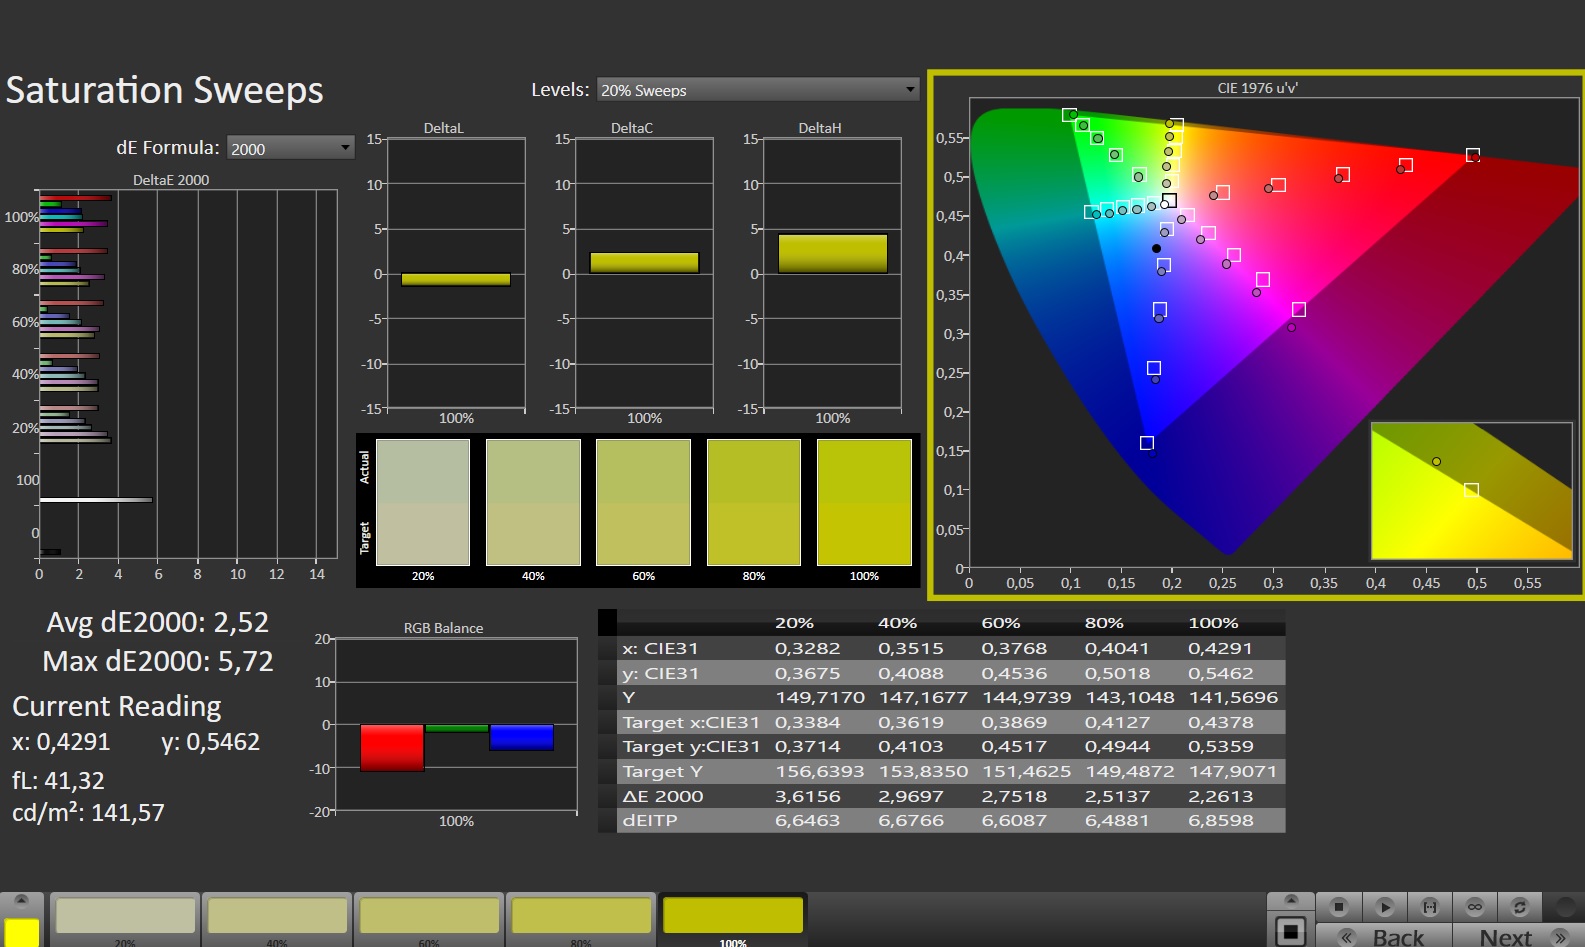
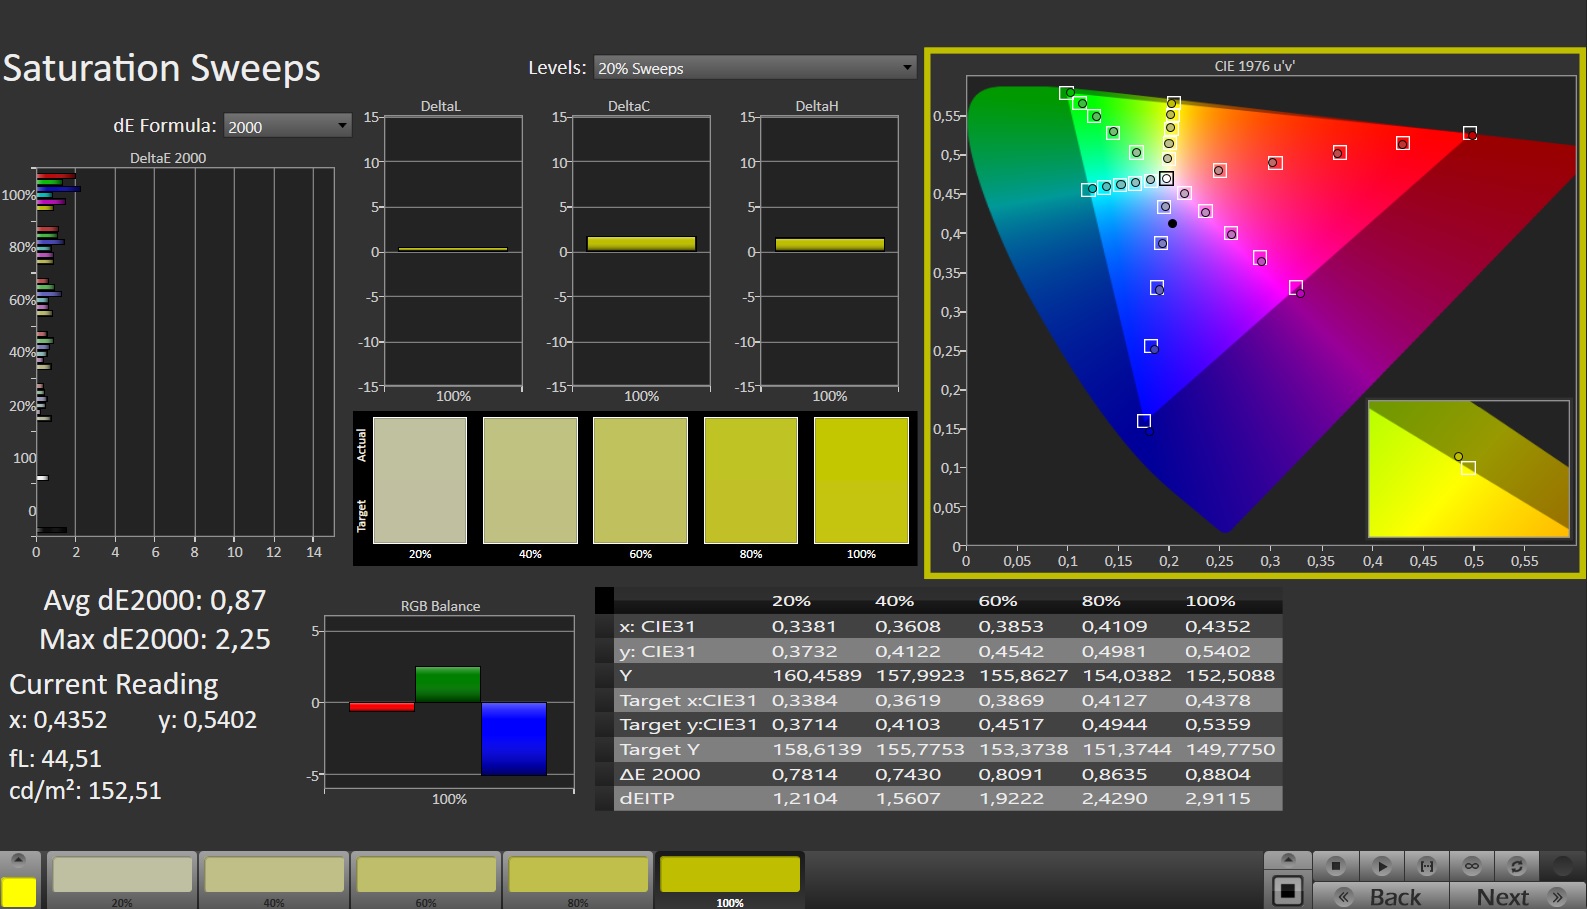
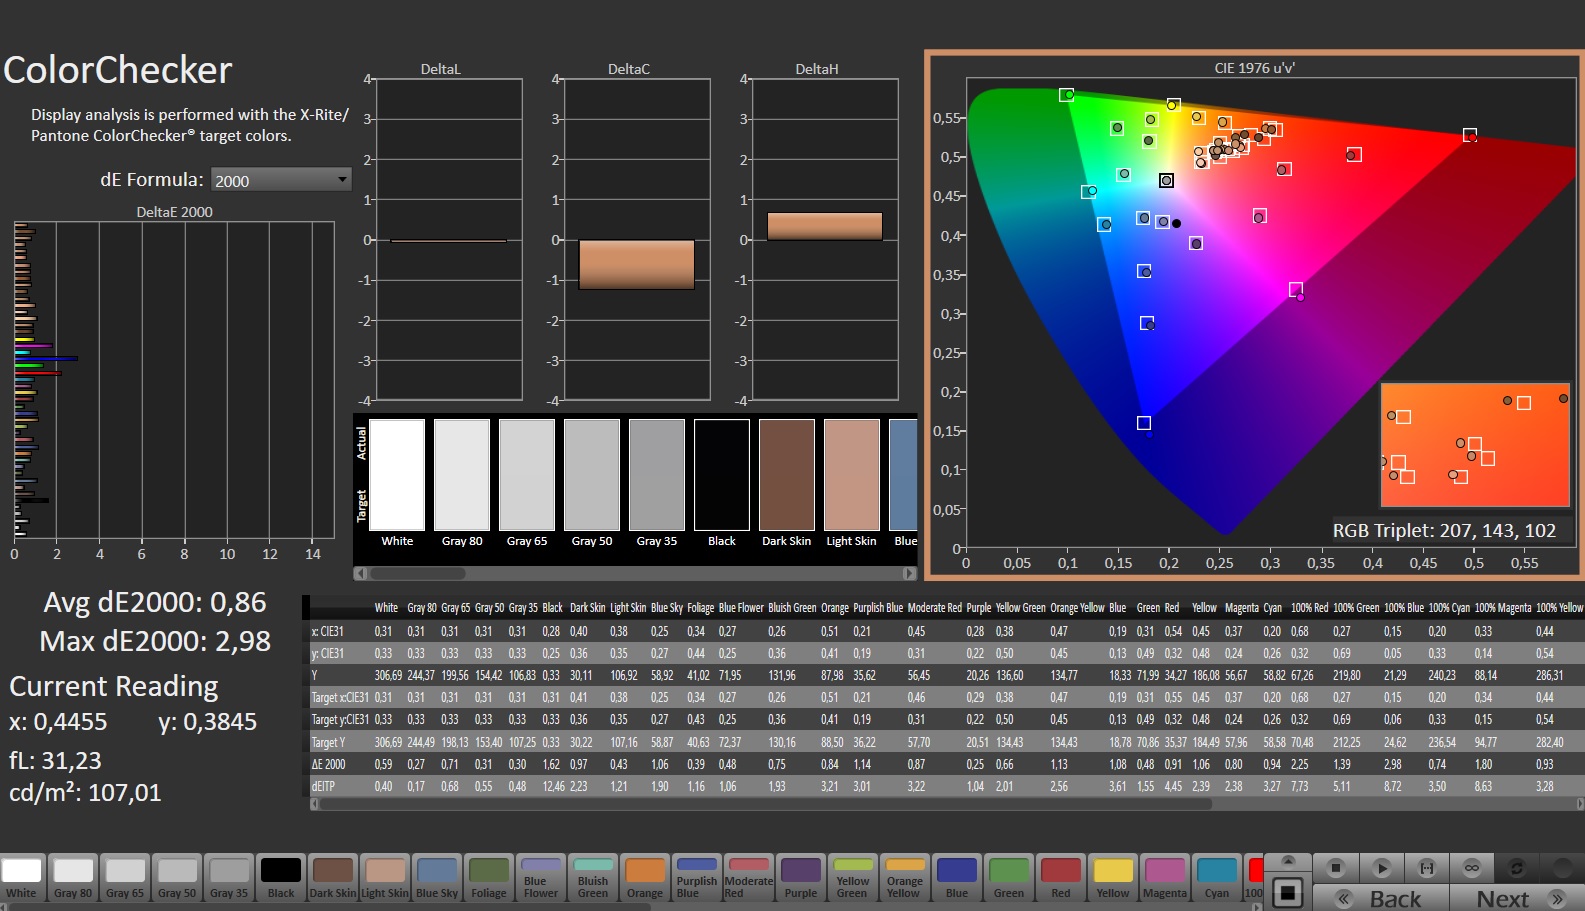
The measured color space coverage is good and the sRGB color space is fully covered at 100%. The extended AdobeRGB color space is sufficiently covered at 84.5 percent and the P3 color space at 96.7 percent.

Display Response Times
| ↔ Response Time Black to White | ||
|---|---|---|
| 10.1 ms ... rise ↗ and fall ↘ combined | ↗ 5.3 ms rise | 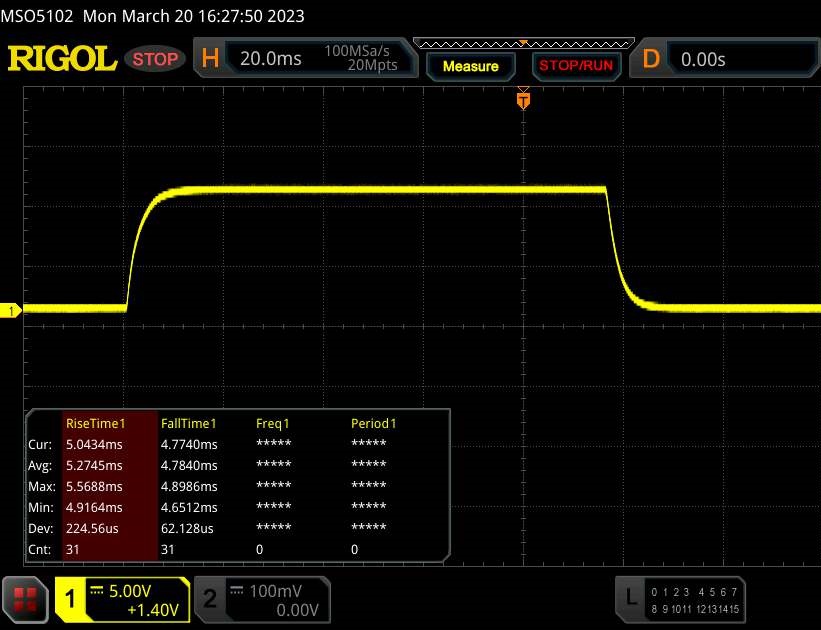 |
| ↘ 4.8 ms fall | ||
| The screen shows good response rates in our tests, but may be too slow for competitive gamers. In comparison, all tested devices range from 0.1 (minimum) to 240 (maximum) ms. » 28 % of all devices are better. This means that the measured response time is better than the average of all tested devices (19.9 ms). | ||
| ↔ Response Time 50% Grey to 80% Grey | ||
| 14 ms ... rise ↗ and fall ↘ combined | ↗ 6.9 ms rise | 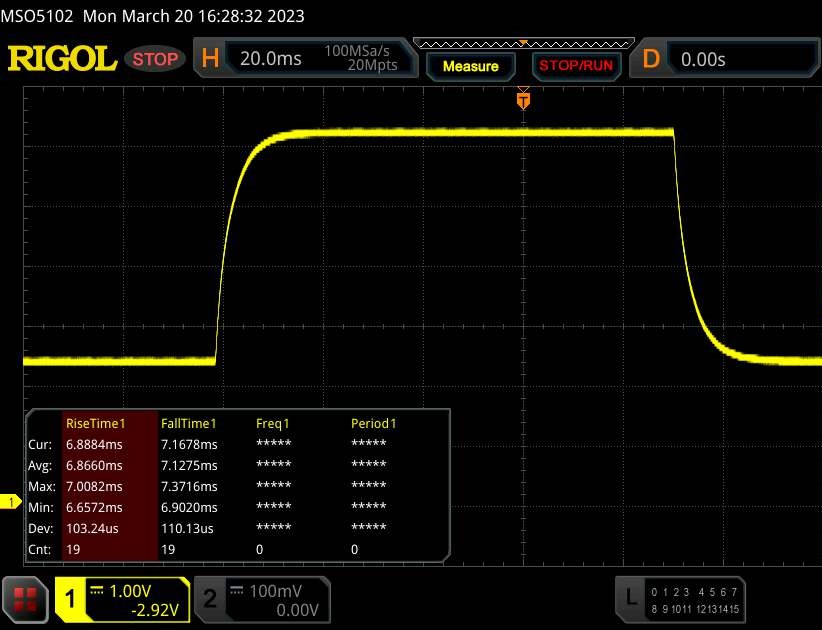 |
| ↘ 7.1 ms fall | ||
| The screen shows good response rates in our tests, but may be too slow for competitive gamers. In comparison, all tested devices range from 0.165 (minimum) to 636 (maximum) ms. » 28 % of all devices are better. This means that the measured response time is better than the average of all tested devices (31.1 ms). | ||
Screen Flickering / PWM (Pulse-Width Modulation)
| Screen flickering / PWM not detected | 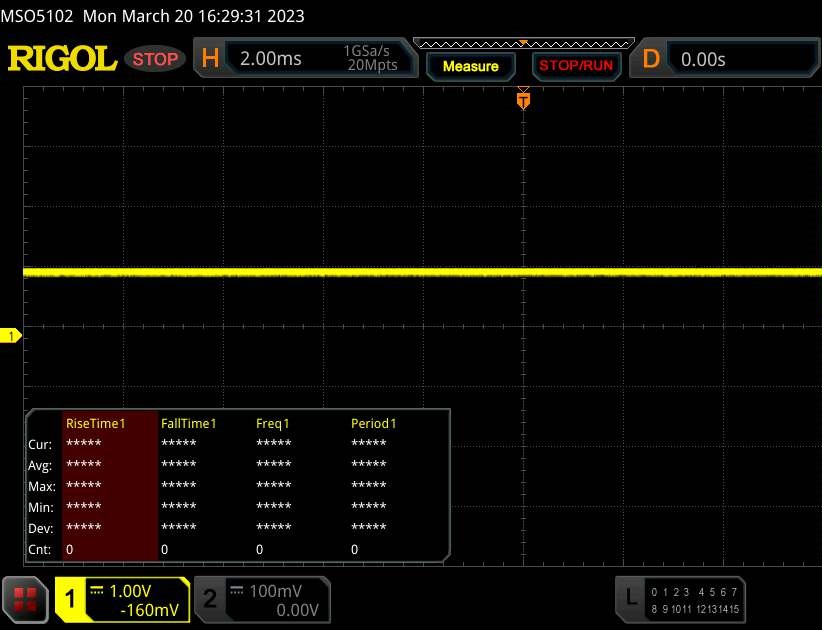 | ||
In comparison: 52 % of all tested devices do not use PWM to dim the display. If PWM was detected, an average of 7801 (minimum: 5 - maximum: 343500) Hz was measured. | |||
The comparatively low display brightness is not conducive to outdoor use. Nevertheless, outdoor work is possible at full brightness, albeit with some limitations. Direct sunlight should be avoided.
The installed IPS panel offers excellent picture quality in normal use. Difficulties in the form of slight fogging only occur in the four corner images.

Performance - Raptor Lake combined with Ada Lovelace
The Aorus 17X AZF is currently one of the most powerful gaming notebooks and offers excellent performance, driven by Raptor Lake and Ada Lovelace. The configuration of this test unit is available for US$3499.99.
Testing Conditions
In addition to the typical performance modes (see table), the control center of the Aorus 17X AZF (Gigabyte Control Center) provides a higher-level AI Boost function that we used. The Control Center then selected the appropriate profile - Gaming mode and Creator mode for the benchmarks, Energy-saving sleep mode for the battery tests.
Turbo mode fires up in individual cases for a small increase in performance, but this comes at a price: The fans constantly work at full power. In Meeting mode the device works very quietly, almost to the point of silence. Performance decreases noticeably as a result, although multi-thread performance is affected more than single-thread performance.
| Creator Modus | Turbo Modus | Gaming Modus | Meeting Modus | Energiespar Ruhemodus | |
|---|---|---|---|---|---|
| Power Limit 1 | 86 Watt | 86 Watt | 86 Watt | 15 Watt | 15 Watt |
| Power Limit 2 | 157 Watt | 157 Watt | 157 Watt | 30 Watt | 30 Watt |
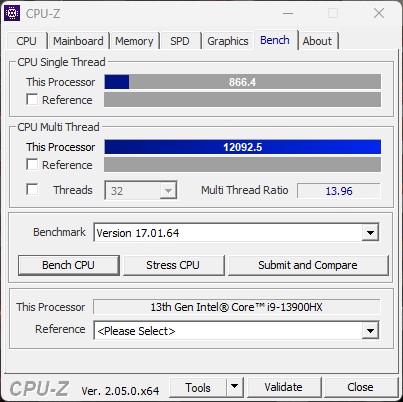
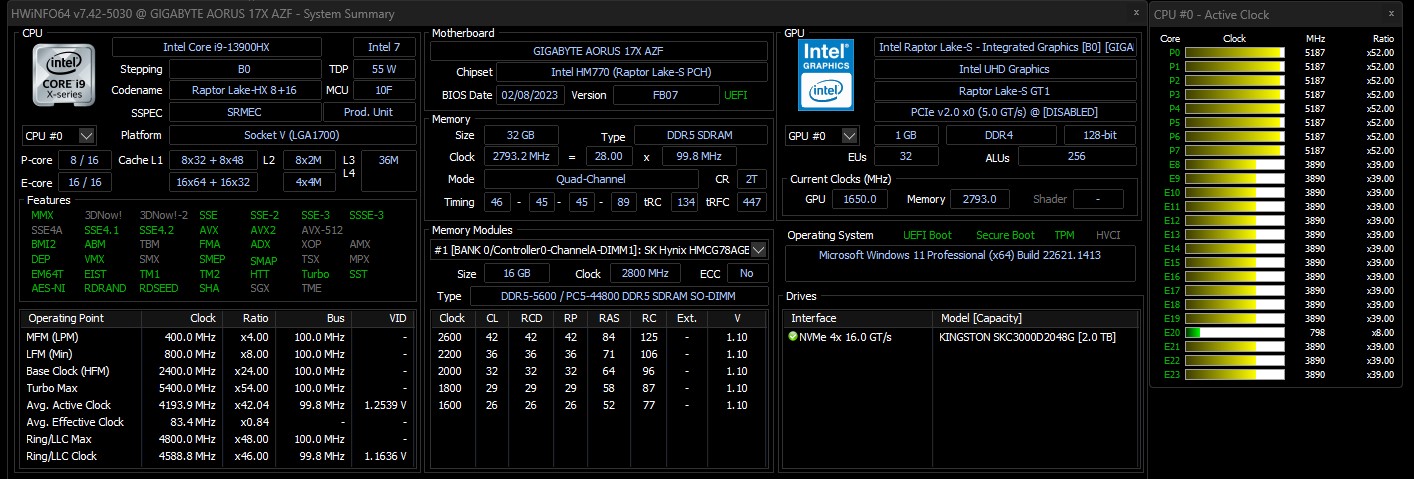
Processor
The Intel Core-i7-13900HX-Prozessor (Raptor Lake) consists of 16 efficient cores (no hyperthreading, 1.6 to 3.9 GHz) and 8 performance cores (hyperthreading, 2.2 to 5.4 GHz). There are 32 logical CPU cores in total, which was accompanied by enormous multi-thread performance in our tests. In the benchmarks, all contenders are in a tight head-to-head race. However, in the CPU performance rating, which represents the mean value from the benchmarks presented, our test unit came in second last place. Only the HP Omen 17, using the same SoC, can be bested here, while the Medion Erazer Beast delivers somewhat better performance. The other competitors fare better due to their slightly faster SoCs. Nevertheless, the gap to the MSI GE78HX is manageable at only 12 percent.
The CB15 loop test shows that CPU boost is utilized only at the beginning. The simulated permanent multi-thread load causes the clock to drop slightly after the first run, although performance remains stable from the third run.
Cinebench R15 Multi Sustained Load
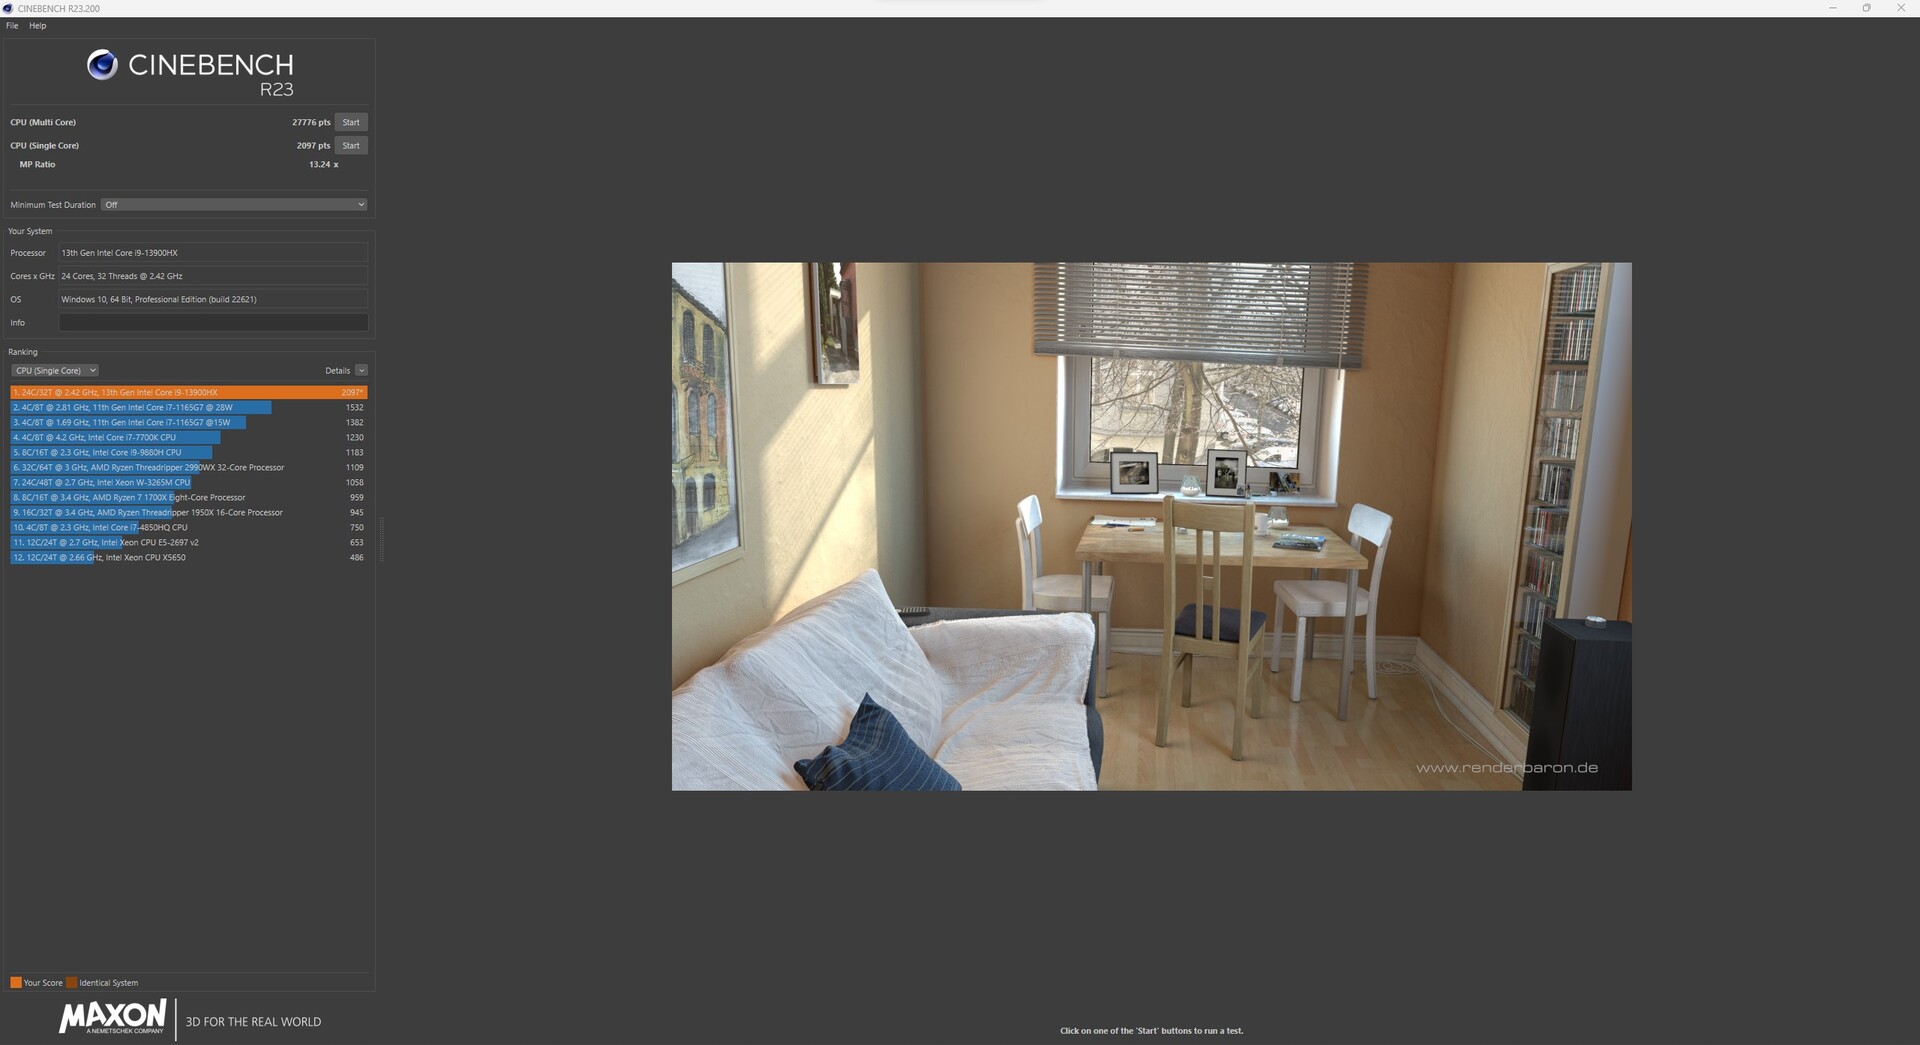
Cinebench R23: Multi Core | Single Core
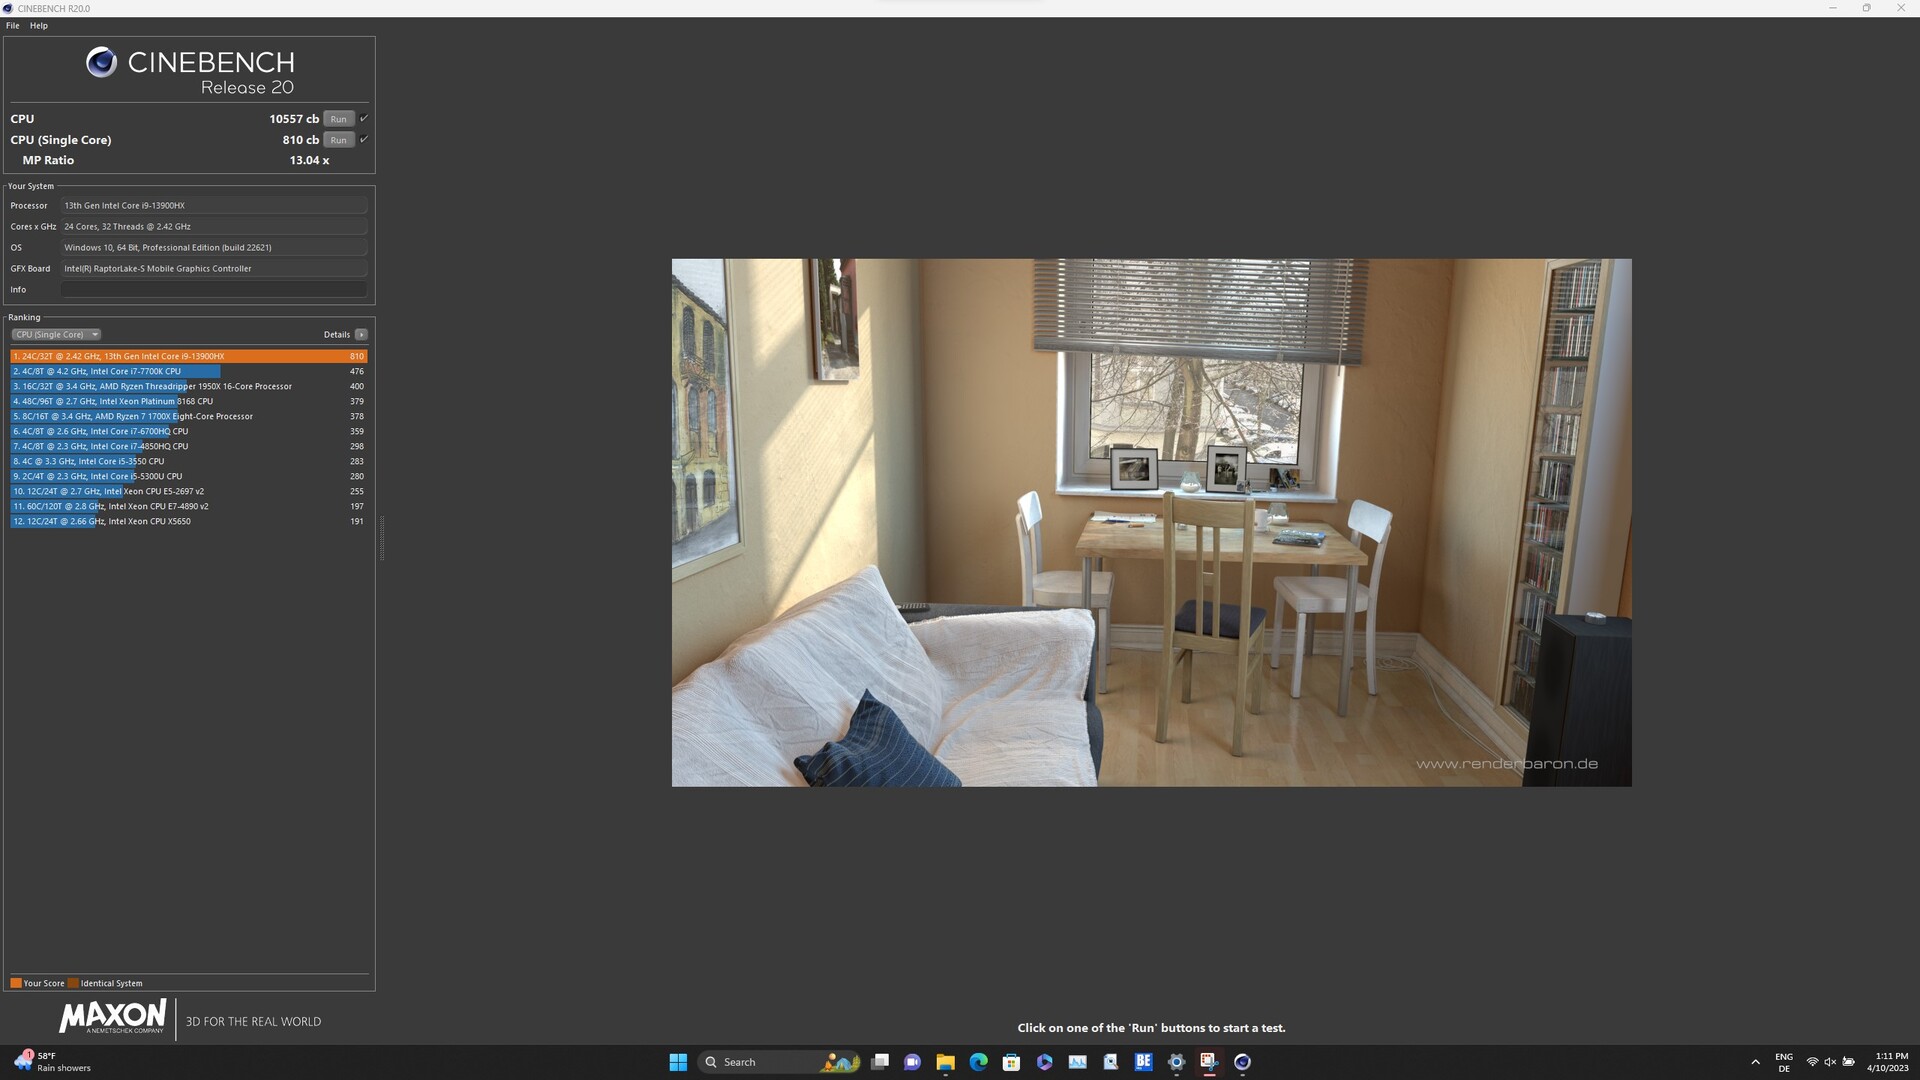
Cinebench R20: CPU (Multi Core) | CPU (Single Core)
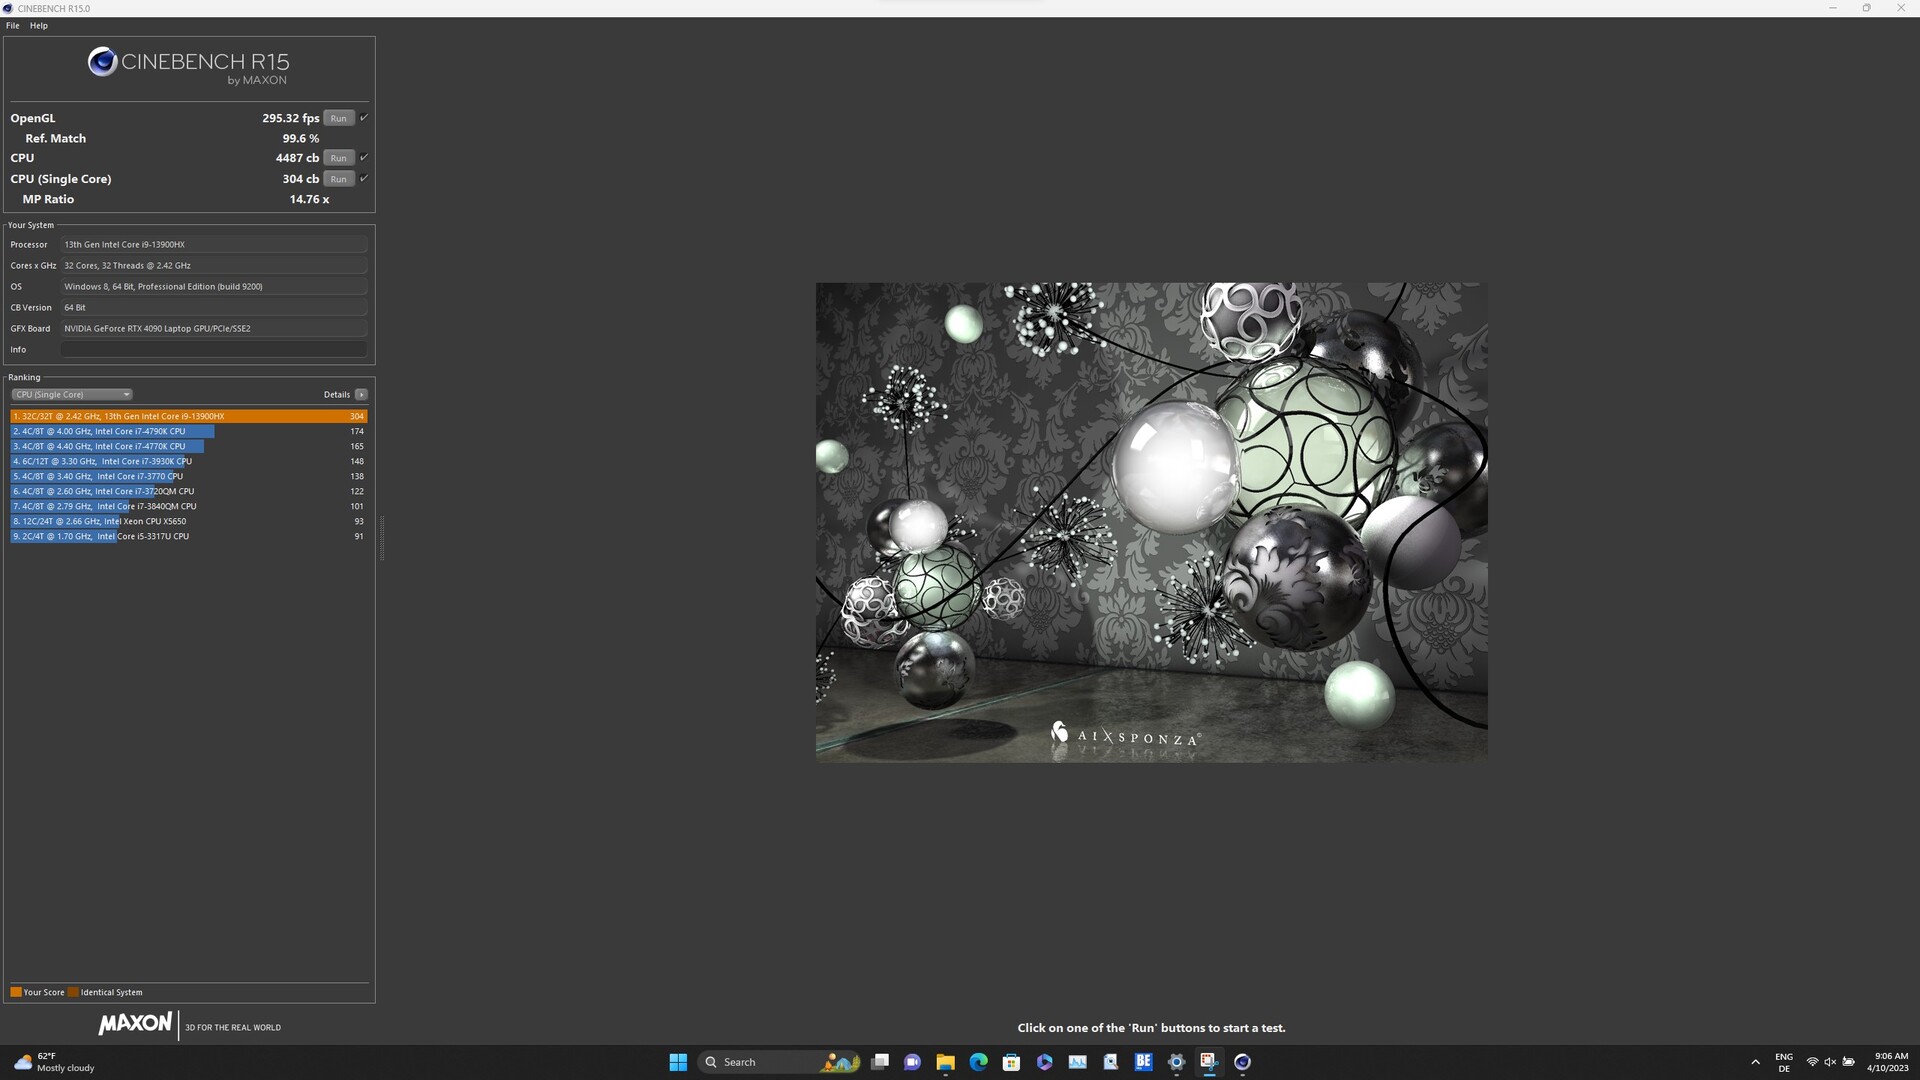
Cinebench R15: CPU Multi 64Bit | CPU Single 64Bit
Blender: v2.79 BMW27 CPU
7-Zip 18.03: 7z b 4 | 7z b 4 -mmt1
Geekbench 5.5: Multi-Core | Single-Core
HWBOT x265 Benchmark v2.2: 4k Preset
LibreOffice : 20 Documents To PDF
R Benchmark 2.5: Overall mean
| CPU Performance rating | |
| MSI GE78HX 13VH-070US | |
| Alienware m18 R1 | |
| MSI Titan GT77 HX 13VI | |
| Medion Erazer Beast X40 | |
| Average Intel Core i9-13900HX | |
| Aorus 17X AZF | |
| HP Omen 17-ck2097ng | |
| Average of class Gaming | |
| Cinebench R23 / Multi Core | |
| MSI Titan GT77 HX 13VI | |
| MSI GE78HX 13VH-070US | |
| Alienware m18 R1 | |
| Medion Erazer Beast X40 | |
| Average Intel Core i9-13900HX (24270 - 32623, n=23) | |
| Aorus 17X AZF | |
| HP Omen 17-ck2097ng | |
| Average of class Gaming (10488 - 40970, n=113, last 2 years) | |
| Cinebench R23 / Single Core | |
| MSI GE78HX 13VH-070US | |
| Alienware m18 R1 | |
| MSI Titan GT77 HX 13VI | |
| Aorus 17X AZF | |
| HP Omen 17-ck2097ng | |
| Average Intel Core i9-13900HX (1867 - 2105, n=20) | |
| Medion Erazer Beast X40 | |
| Average of class Gaming (1166 - 2356, n=113, last 2 years) | |
| Cinebench R20 / CPU (Multi Core) | |
| MSI Titan GT77 HX 13VI | |
| MSI GE78HX 13VH-070US | |
| Alienware m18 R1 | |
| Medion Erazer Beast X40 | |
| Average Intel Core i9-13900HX (9152 - 12541, n=21) | |
| Aorus 17X AZF | |
| HP Omen 17-ck2097ng | |
| Average of class Gaming (4029 - 16108, n=112, last 2 years) | |
| Cinebench R20 / CPU (Single Core) | |
| Aorus 17X AZF | |
| Alienware m18 R1 | |
| HP Omen 17-ck2097ng | |
| MSI Titan GT77 HX 13VI | |
| MSI GE78HX 13VH-070US | |
| Average Intel Core i9-13900HX (722 - 810, n=21) | |
| Medion Erazer Beast X40 | |
| Average of class Gaming (442 - 895, n=112, last 2 years) | |
| Cinebench R15 / CPU Multi 64Bit | |
| MSI Titan GT77 HX 13VI | |
| MSI GE78HX 13VH-070US | |
| Alienware m18 R1 | |
| Medion Erazer Beast X40 | |
| Average Intel Core i9-13900HX (3913 - 4970, n=22) | |
| Aorus 17X AZF | |
| HP Omen 17-ck2097ng | |
| Average of class Gaming (1578 - 6271, n=113, last 2 years) | |
| Cinebench R15 / CPU Single 64Bit | |
| Aorus 17X AZF | |
| MSI GE78HX 13VH-070US | |
| Alienware m18 R1 | |
| HP Omen 17-ck2097ng | |
| MSI Titan GT77 HX 13VI | |
| Medion Erazer Beast X40 | |
| Average of class Gaming (188.8 - 343, n=112, last 2 years) | |
| Average Intel Core i9-13900HX (247 - 304, n=22) | |
| Blender / v2.79 BMW27 CPU | |
| Average of class Gaming (80 - 330, n=110, last 2 years) | |
| HP Omen 17-ck2097ng | |
| Aorus 17X AZF | |
| Average Intel Core i9-13900HX (101 - 153, n=22) | |
| Medion Erazer Beast X40 | |
| MSI GE78HX 13VH-070US | |
| MSI Titan GT77 HX 13VI | |
| Alienware m18 R1 | |
| 7-Zip 18.03 / 7z b 4 | |
| Alienware m18 R1 | |
| MSI Titan GT77 HX 13VI | |
| MSI GE78HX 13VH-070US | |
| Medion Erazer Beast X40 | |
| Average Intel Core i9-13900HX (90675 - 127283, n=21) | |
| HP Omen 17-ck2097ng | |
| Aorus 17X AZF | |
| Average of class Gaming (33491 - 148086, n=111, last 2 years) | |
| 7-Zip 18.03 / 7z b 4 -mmt1 | |
| Aorus 17X AZF | |
| MSI GE78HX 13VH-070US | |
| HP Omen 17-ck2097ng | |
| MSI Titan GT77 HX 13VI | |
| Medion Erazer Beast X40 | |
| Alienware m18 R1 | |
| Average Intel Core i9-13900HX (6340 - 7177, n=21) | |
| Average of class Gaming (4199 - 7436, n=111, last 2 years) | |
| Geekbench 5.5 / Multi-Core | |
| Alienware m18 R1 | |
| MSI GE78HX 13VH-070US | |
| MSI Titan GT77 HX 13VI | |
| HP Omen 17-ck2097ng | |
| Medion Erazer Beast X40 | |
| Average Intel Core i9-13900HX (17614 - 21075, n=22) | |
| Aorus 17X AZF | |
| Average of class Gaming (6460 - 27010, n=111, last 2 years) | |
| Geekbench 5.5 / Single-Core | |
| MSI GE78HX 13VH-070US | |
| HP Omen 17-ck2097ng | |
| Aorus 17X AZF | |
| Alienware m18 R1 | |
| MSI Titan GT77 HX 13VI | |
| Average of class Gaming (986 - 2474, n=111, last 2 years) | |
| Medion Erazer Beast X40 | |
| Average Intel Core i9-13900HX (1345 - 2093, n=22) | |
| HWBOT x265 Benchmark v2.2 / 4k Preset | |
| MSI GE78HX 13VH-070US | |
| Alienware m18 R1 | |
| MSI Titan GT77 HX 13VI | |
| Medion Erazer Beast X40 | |
| Average Intel Core i9-13900HX (23.5 - 34.4, n=22) | |
| Average of class Gaming (11.5 - 44.3, n=111, last 2 years) | |
| HP Omen 17-ck2097ng | |
| Aorus 17X AZF | |
| LibreOffice / 20 Documents To PDF | |
| Average of class Gaming (19 - 88.8, n=111, last 2 years) | |
| MSI GE78HX 13VH-070US | |
| Alienware m18 R1 | |
| MSI Titan GT77 HX 13VI | |
| Aorus 17X AZF | |
| HP Omen 17-ck2097ng | |
| Medion Erazer Beast X40 | |
| Average Intel Core i9-13900HX (32.8 - 51.1, n=21) | |
| R Benchmark 2.5 / Overall mean | |
| Average of class Gaming (0.3439 - 0.759, n=112, last 2 years) | |
| MSI Titan GT77 HX 13VI | |
| Average Intel Core i9-13900HX (0.375 - 0.4564, n=22) | |
| Medion Erazer Beast X40 | |
| Aorus 17X AZF | |
| Alienware m18 R1 | |
| HP Omen 17-ck2097ng | |
| MSI GE78HX 13VH-070US | |
* ... smaller is better
AIDA64: FP32 Ray-Trace | FPU Julia | CPU SHA3 | CPU Queen | FPU SinJulia | FPU Mandel | CPU AES | CPU ZLib | FP64 Ray-Trace | CPU PhotoWorxx
| Performance rating | |
| Alienware m18 R1 | |
| MSI GE78HX 13VH-070US | |
| MSI Titan GT77 HX 13VI | |
| Medion Erazer Beast X40 | |
| Average of class Gaming | |
| Average Intel Core i9-13900HX | |
| Aorus 17X AZF | |
| HP Omen 17-ck2097ng | |
| AIDA64 / FP32 Ray-Trace | |
| Average of class Gaming (10227 - 85542, n=110, last 2 years) | |
| Alienware m18 R1 | |
| MSI Titan GT77 HX 13VI | |
| MSI GE78HX 13VH-070US | |
| Medion Erazer Beast X40 | |
| Average Intel Core i9-13900HX (17589 - 27615, n=22) | |
| Aorus 17X AZF | |
| HP Omen 17-ck2097ng | |
| AIDA64 / FPU Julia | |
| Alienware m18 R1 | |
| MSI Titan GT77 HX 13VI | |
| MSI GE78HX 13VH-070US | |
| Average of class Gaming (51376 - 238426, n=110, last 2 years) | |
| Medion Erazer Beast X40 | |
| Average Intel Core i9-13900HX (88686 - 137015, n=22) | |
| Aorus 17X AZF | |
| HP Omen 17-ck2097ng | |
| AIDA64 / CPU SHA3 | |
| Alienware m18 R1 | |
| MSI Titan GT77 HX 13VI | |
| MSI GE78HX 13VH-070US | |
| Medion Erazer Beast X40 | |
| Average of class Gaming (2180 - 9817, n=110, last 2 years) | |
| Average Intel Core i9-13900HX (4362 - 7029, n=22) | |
| Aorus 17X AZF | |
| HP Omen 17-ck2097ng | |
| AIDA64 / CPU Queen | |
| Alienware m18 R1 | |
| MSI GE78HX 13VH-070US | |
| MSI Titan GT77 HX 13VI | |
| HP Omen 17-ck2097ng | |
| Average Intel Core i9-13900HX (125644 - 141385, n=22) | |
| Medion Erazer Beast X40 | |
| Aorus 17X AZF | |
| Average of class Gaming (49785 - 173351, n=101, last 2 years) | |
| AIDA64 / FPU SinJulia | |
| MSI Titan GT77 HX 13VI | |
| MSI GE78HX 13VH-070US | |
| Alienware m18 R1 | |
| Medion Erazer Beast X40 | |
| Average Intel Core i9-13900HX (12334 - 17179, n=22) | |
| Average of class Gaming (4424 - 33636, n=110, last 2 years) | |
| Aorus 17X AZF | |
| HP Omen 17-ck2097ng | |
| AIDA64 / FPU Mandel | |
| Alienware m18 R1 | |
| MSI Titan GT77 HX 13VI | |
| Average of class Gaming (25115 - 128721, n=110, last 2 years) | |
| MSI GE78HX 13VH-070US | |
| Medion Erazer Beast X40 | |
| Average Intel Core i9-13900HX (43850 - 69202, n=22) | |
| Aorus 17X AZF | |
| HP Omen 17-ck2097ng | |
| AIDA64 / CPU AES | |
| Aorus 17X AZF | |
| Average Intel Core i9-13900HX (89413 - 237881, n=22) | |
| MSI Titan GT77 HX 13VI | |
| Alienware m18 R1 | |
| MSI GE78HX 13VH-070US | |
| Medion Erazer Beast X40 | |
| Average of class Gaming (39258 - 247074, n=110, last 2 years) | |
| HP Omen 17-ck2097ng | |
| AIDA64 / CPU ZLib | |
| MSI GE78HX 13VH-070US | |
| MSI Titan GT77 HX 13VI | |
| Alienware m18 R1 | |
| Medion Erazer Beast X40 | |
| Average Intel Core i9-13900HX (1284 - 1958, n=22) | |
| Average of class Gaming (574 - 2531, n=110, last 2 years) | |
| Aorus 17X AZF | |
| HP Omen 17-ck2097ng | |
| AIDA64 / FP64 Ray-Trace | |
| Average of class Gaming (5509 - 45446, n=110, last 2 years) | |
| Alienware m18 R1 | |
| MSI Titan GT77 HX 13VI | |
| MSI GE78HX 13VH-070US | |
| Medion Erazer Beast X40 | |
| Average Intel Core i9-13900HX (9481 - 15279, n=22) | |
| Aorus 17X AZF | |
| HP Omen 17-ck2097ng | |
| AIDA64 / CPU PhotoWorxx | |
| Alienware m18 R1 | |
| HP Omen 17-ck2097ng | |
| Aorus 17X AZF | |
| MSI GE78HX 13VH-070US | |
| Average Intel Core i9-13900HX (42994 - 51994, n=22) | |
| Average of class Gaming (12271 - 89891, n=110, last 2 years) | |
| Medion Erazer Beast X40 | |
| MSI Titan GT77 HX 13VI | |
System Performance
In the system performance benchmarks, the Aorus 17X AZF ranks similarly as in the CPU tests. Nevertheless, system performance is excellent and well above the class average for gaming laptops over the last two years. In the AIDA64 benchmarks, the Aorus 17X AZF delivers flawless results thanks to fast DDR5 RAM, which puts our review unit in second place behind the Alienware m18 R1.
CrossMark: Overall | Productivity | Creativity | Responsiveness
| PCMark 10 / Score | |
| MSI Titan GT77 HX 13VI | |
| MSI GE78HX 13VH-070US | |
| Alienware m18 R1 | |
| Average Intel Core i9-13900HX, NVIDIA GeForce RTX 4090 Laptop GPU (7690 - 9331, n=8) | |
| Average of class Gaming (5828 - 11574, n=96, last 2 years) | |
| Medion Erazer Beast X40 | |
| Aorus 17X AZF | |
| HP Omen 17-ck2097ng | |
| PCMark 10 / Essentials | |
| HP Omen 17-ck2097ng | |
| MSI Titan GT77 HX 13VI | |
| MSI GE78HX 13VH-070US | |
| Average Intel Core i9-13900HX, NVIDIA GeForce RTX 4090 Laptop GPU (10972 - 11983, n=8) | |
| Medion Erazer Beast X40 | |
| Alienware m18 R1 | |
| Aorus 17X AZF | |
| Average of class Gaming (8810 - 12600, n=100, last 2 years) | |
| PCMark 10 / Productivity | |
| Medion Erazer Beast X40 | |
| Average of class Gaming (6845 - 18766, n=98, last 2 years) | |
| MSI GE78HX 13VH-070US | |
| Average Intel Core i9-13900HX, NVIDIA GeForce RTX 4090 Laptop GPU (9038 - 11680, n=8) | |
| Aorus 17X AZF | |
| Alienware m18 R1 | |
| HP Omen 17-ck2097ng | |
| MSI Titan GT77 HX 13VI | |
| PCMark 10 / Digital Content Creation | |
| MSI Titan GT77 HX 13VI | |
| Alienware m18 R1 | |
| MSI GE78HX 13VH-070US | |
| Average Intel Core i9-13900HX, NVIDIA GeForce RTX 4090 Laptop GPU (10605 - 16395, n=8) | |
| Average of class Gaming (7602 - 19657, n=98, last 2 years) | |
| Medion Erazer Beast X40 | |
| Aorus 17X AZF | |
| HP Omen 17-ck2097ng | |
| CrossMark / Overall | |
| Alienware m18 R1 | |
| Aorus 17X AZF | |
| MSI Titan GT77 HX 13VI | |
| Medion Erazer Beast X40 | |
| Average Intel Core i9-13900HX, NVIDIA GeForce RTX 4090 Laptop GPU (1825 - 2295, n=8) | |
| HP Omen 17-ck2097ng | |
| Average of class Gaming (1366 - 2409, n=98, last 2 years) | |
| MSI GE78HX 13VH-070US | |
| CrossMark / Productivity | |
| Aorus 17X AZF | |
| Alienware m18 R1 | |
| Medion Erazer Beast X40 | |
| MSI Titan GT77 HX 13VI | |
| Average Intel Core i9-13900HX, NVIDIA GeForce RTX 4090 Laptop GPU (1666 - 2166, n=8) | |
| Average of class Gaming (1386 - 2254, n=98, last 2 years) | |
| MSI GE78HX 13VH-070US | |
| HP Omen 17-ck2097ng | |
| CrossMark / Creativity | |
| Alienware m18 R1 | |
| MSI Titan GT77 HX 13VI | |
| Medion Erazer Beast X40 | |
| Average Intel Core i9-13900HX, NVIDIA GeForce RTX 4090 Laptop GPU (2162 - 2514, n=8) | |
| Aorus 17X AZF | |
| HP Omen 17-ck2097ng | |
| Average of class Gaming (1343 - 2729, n=98, last 2 years) | |
| MSI GE78HX 13VH-070US | |
| CrossMark / Responsiveness | |
| Aorus 17X AZF | |
| Alienware m18 R1 | |
| MSI Titan GT77 HX 13VI | |
| Medion Erazer Beast X40 | |
| Average Intel Core i9-13900HX, NVIDIA GeForce RTX 4090 Laptop GPU (1441 - 2275, n=8) | |
| HP Omen 17-ck2097ng | |
| Average of class Gaming (1226 - 2334, n=98, last 2 years) | |
| MSI GE78HX 13VH-070US | |
| PCMark 10 Score | 7690 points | |
Help | ||
| AIDA64 / Memory Copy | |
| Alienware m18 R1 | |
| Aorus 17X AZF | |
| HP Omen 17-ck2097ng | |
| MSI GE78HX 13VH-070US | |
| Average Intel Core i9-13900HX (67716 - 79193, n=22) | |
| Average of class Gaming (21750 - 129946, n=110, last 2 years) | |
| Medion Erazer Beast X40 | |
| MSI Titan GT77 HX 13VI | |
| AIDA64 / Memory Read | |
| Alienware m18 R1 | |
| Aorus 17X AZF | |
| HP Omen 17-ck2097ng | |
| MSI GE78HX 13VH-070US | |
| Average Intel Core i9-13900HX (73998 - 88462, n=22) | |
| Medion Erazer Beast X40 | |
| Average of class Gaming (22956 - 118858, n=110, last 2 years) | |
| MSI Titan GT77 HX 13VI | |
| AIDA64 / Memory Write | |
| Alienware m18 R1 | |
| HP Omen 17-ck2097ng | |
| Aorus 17X AZF | |
| MSI GE78HX 13VH-070US | |
| Average of class Gaming (22297 - 135096, n=110, last 2 years) | |
| Average Intel Core i9-13900HX (65472 - 77045, n=22) | |
| Medion Erazer Beast X40 | |
| MSI Titan GT77 HX 13VI | |
| AIDA64 / Memory Latency | |
| Average of class Gaming (75.3 - 259, n=110, last 2 years) | |
| MSI Titan GT77 HX 13VI | |
| Medion Erazer Beast X40 | |
| Average Intel Core i9-13900HX (75.3 - 91.1, n=22) | |
| HP Omen 17-ck2097ng | |
| MSI GE78HX 13VH-070US | |
| Aorus 17X AZF | |
| Alienware m18 R1 | |
* ... smaller is better
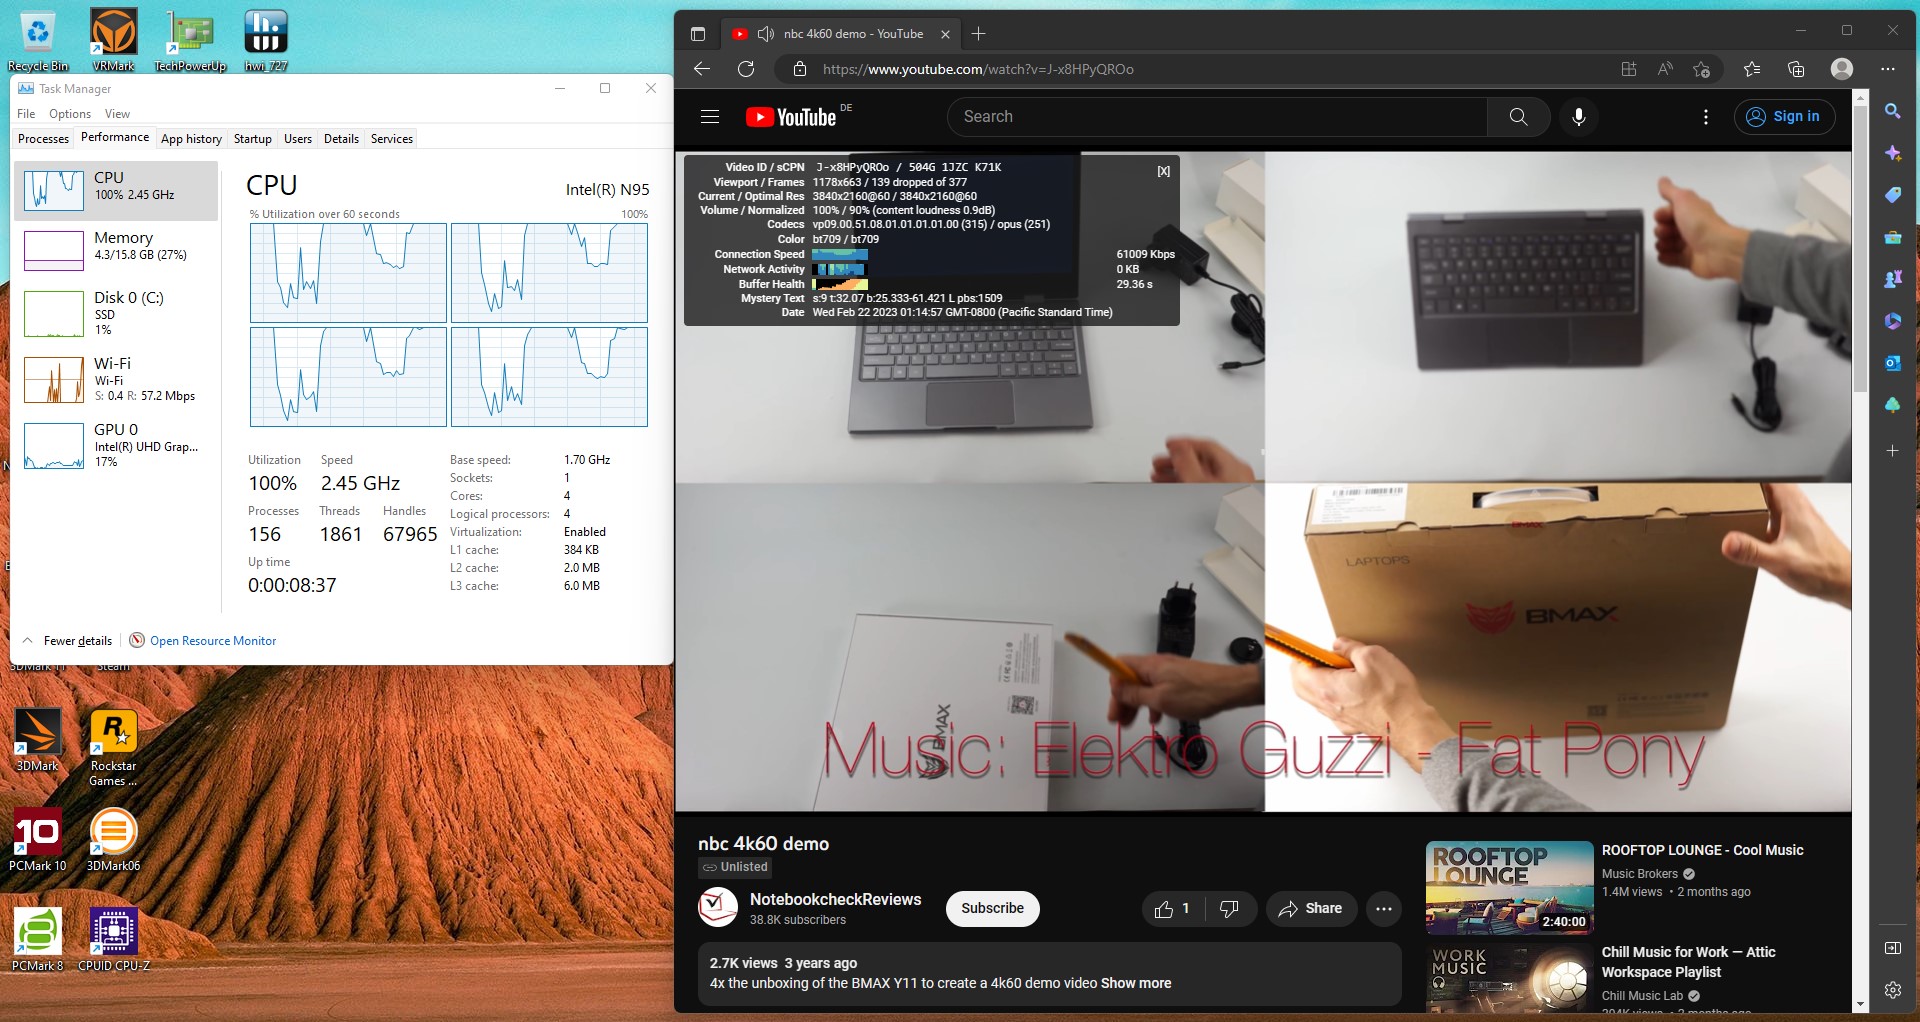
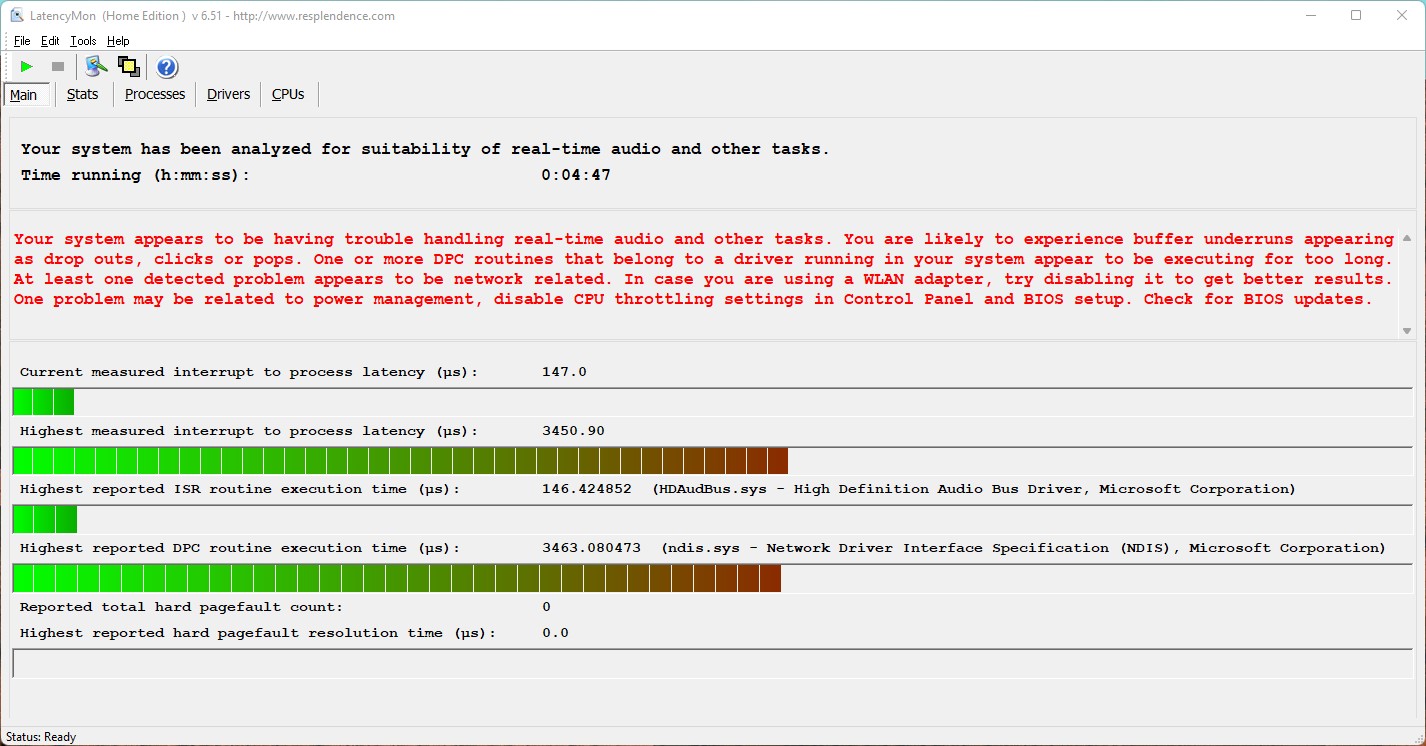
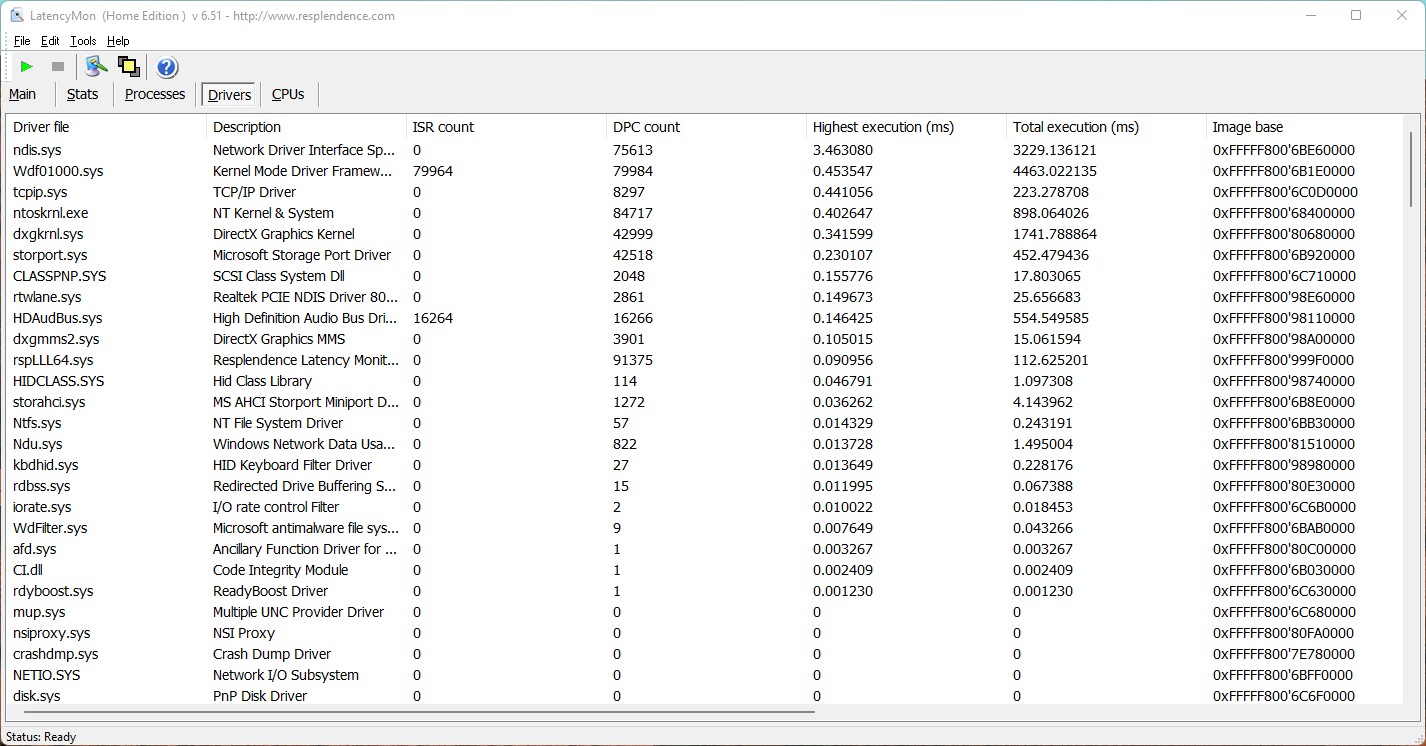
DPC Latencies
Our standardized latency monitor test (web surfing, 4k video playback, Prime95 high-load) reveals extreme values in the Aorus 17X AZF. Future software updates should improve this so that the system is suitable for real-time video and audio editing without limitations.
| DPC Latencies / LatencyMon - interrupt to process latency (max), Web, Youtube, Prime95 | |
| Aorus 17X AZF | |
| MSI Titan GT77 HX 13VI | |
| MSI GE78HX 13VH-070US | |
| Alienware m18 R1 | |
| Medion Erazer Beast X40 | |
| HP Omen 17-ck2097ng | |
* ... smaller is better
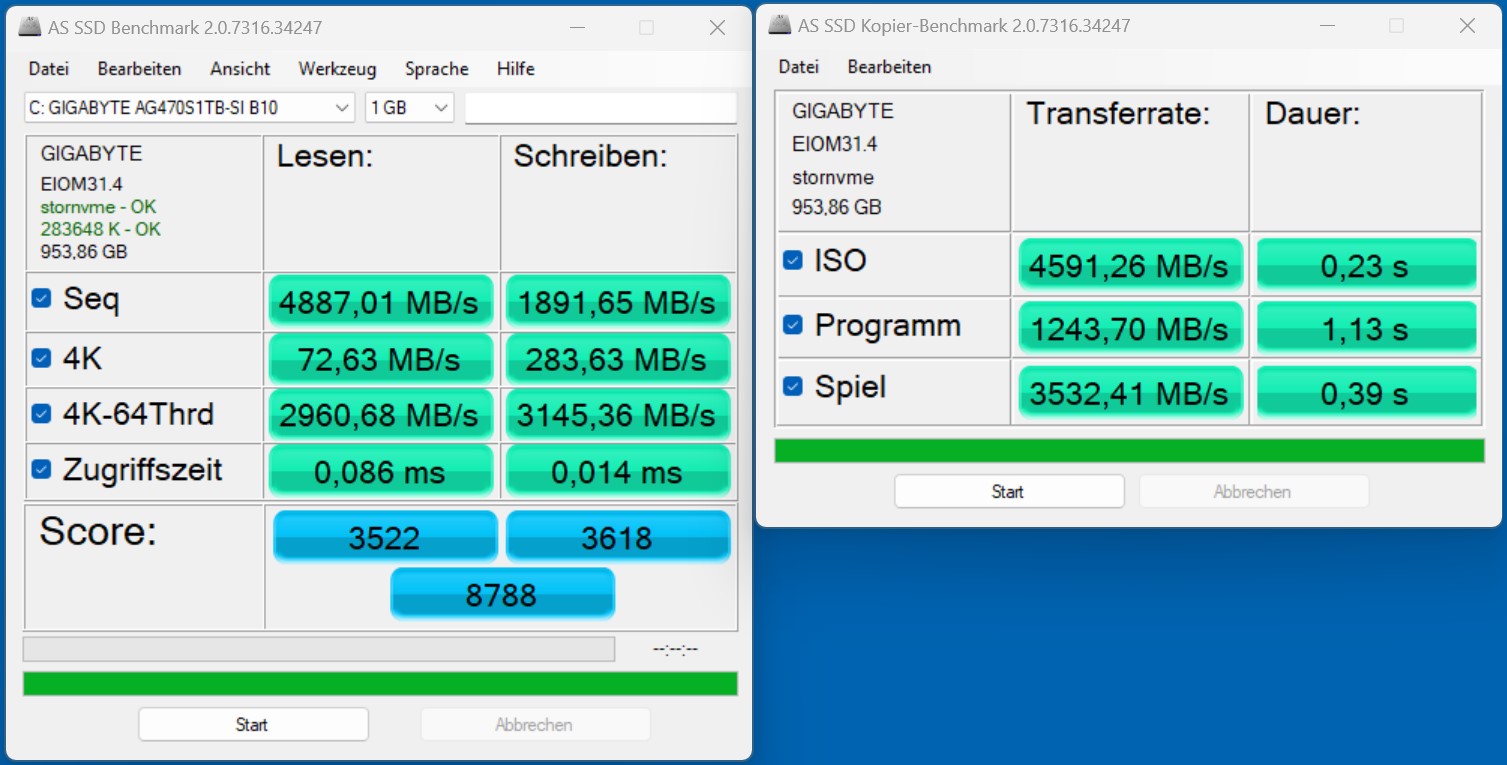
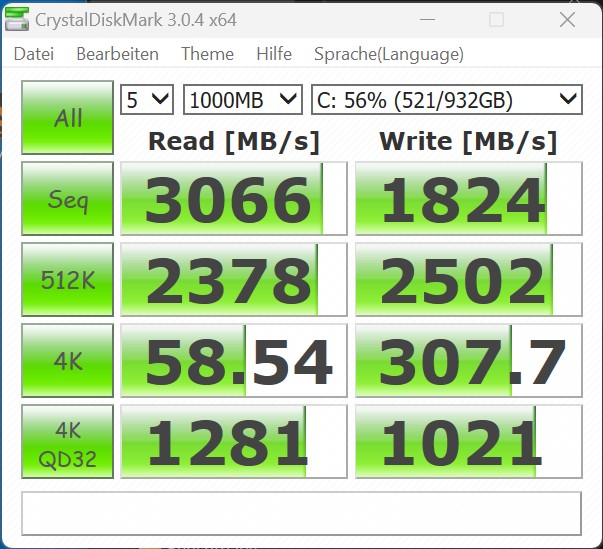
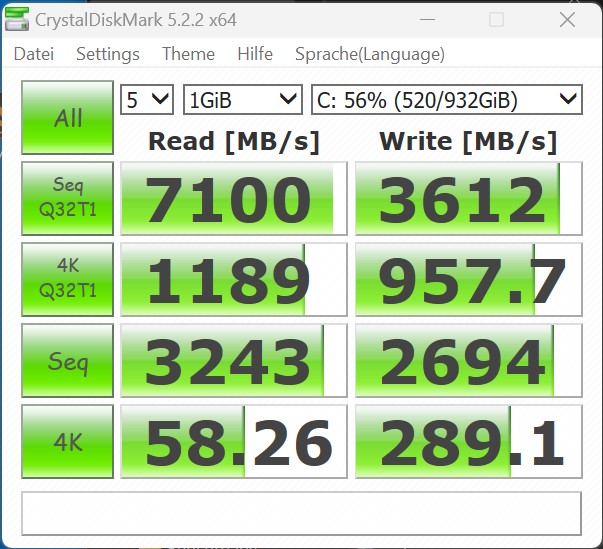
Storage Devices
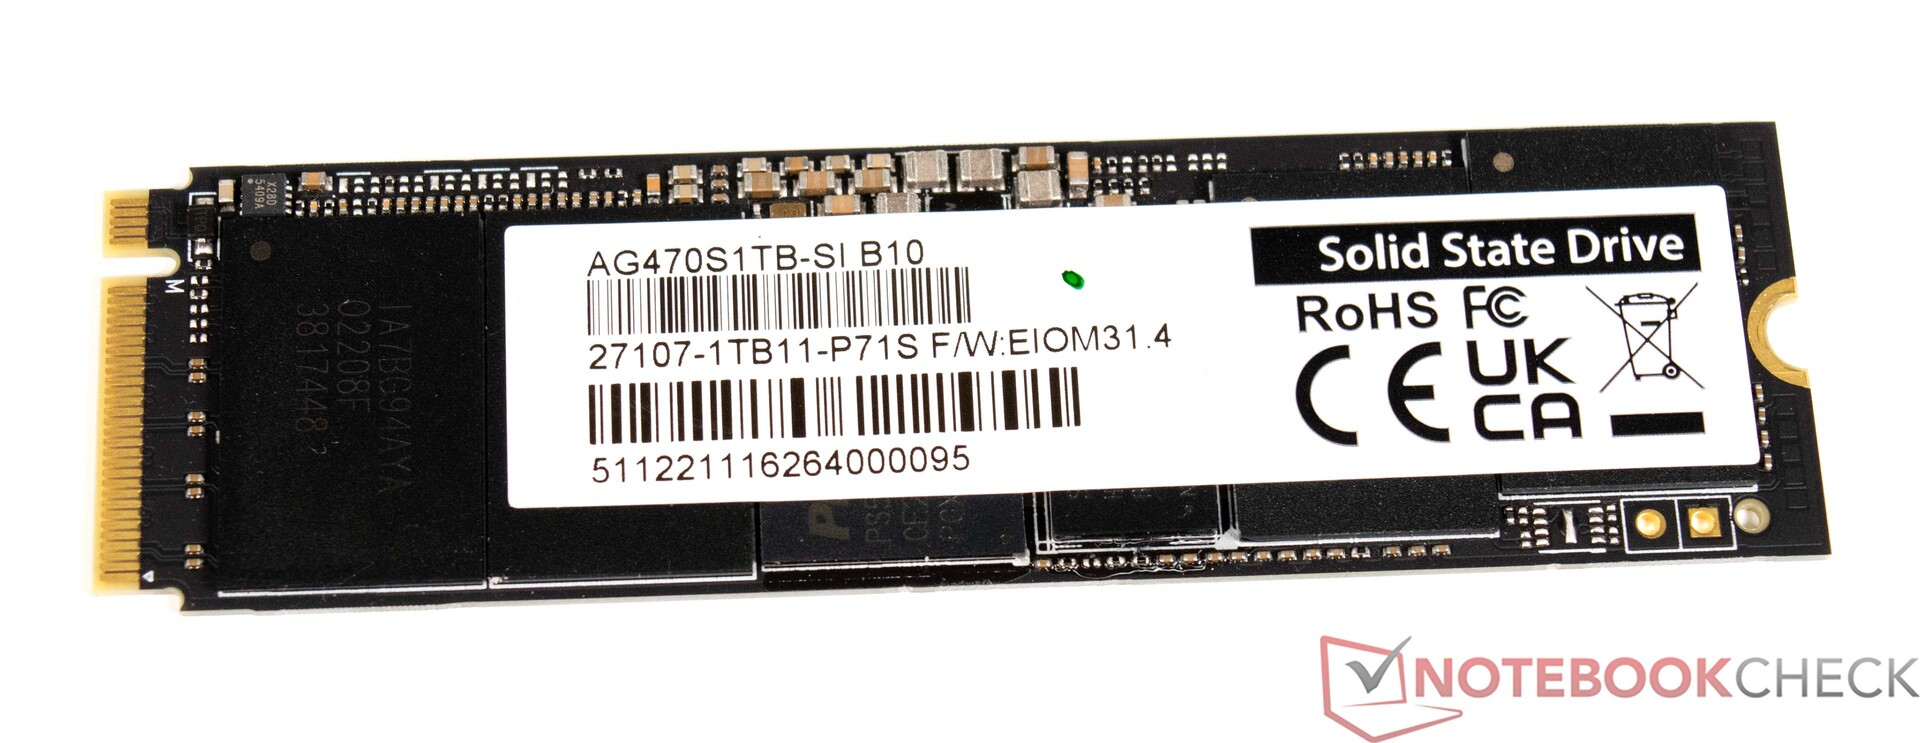
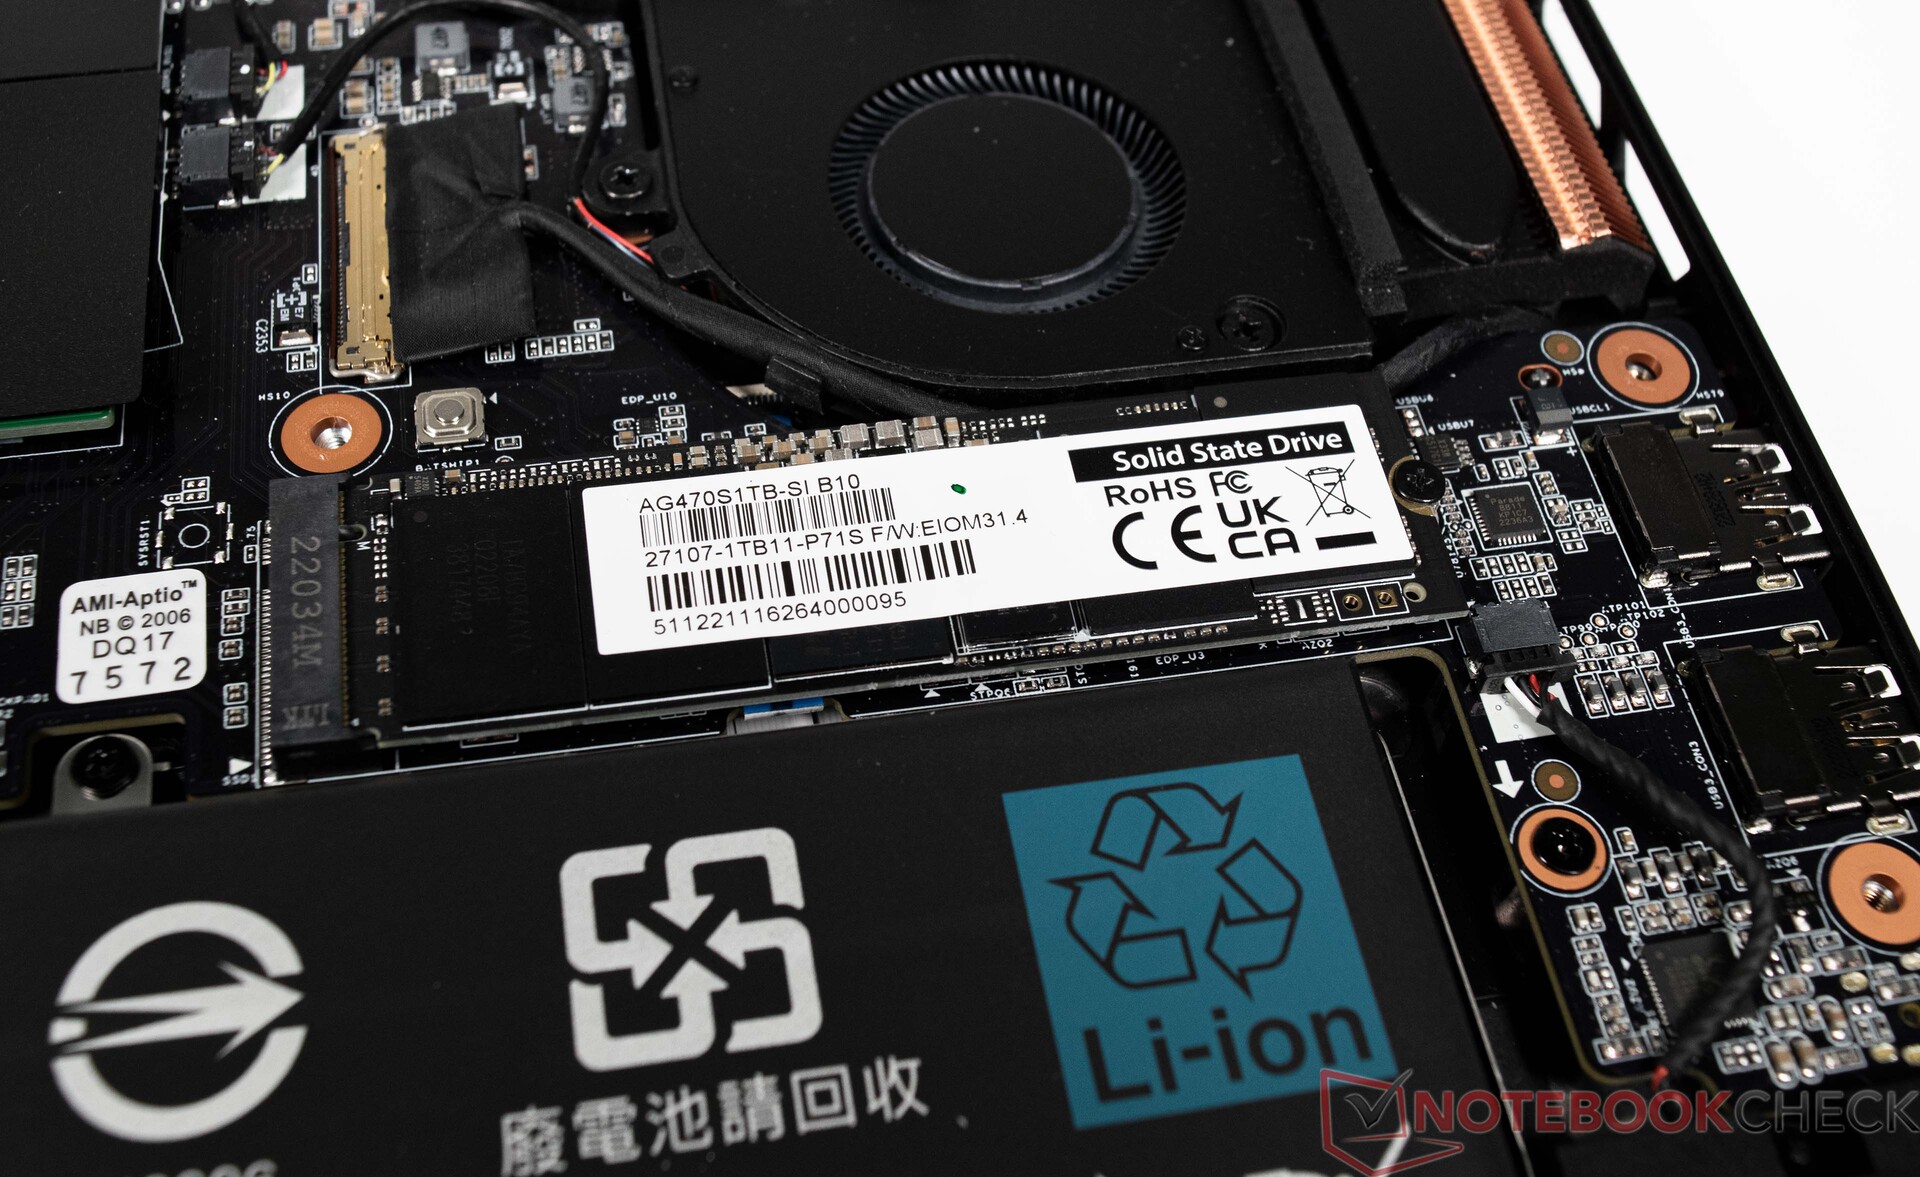
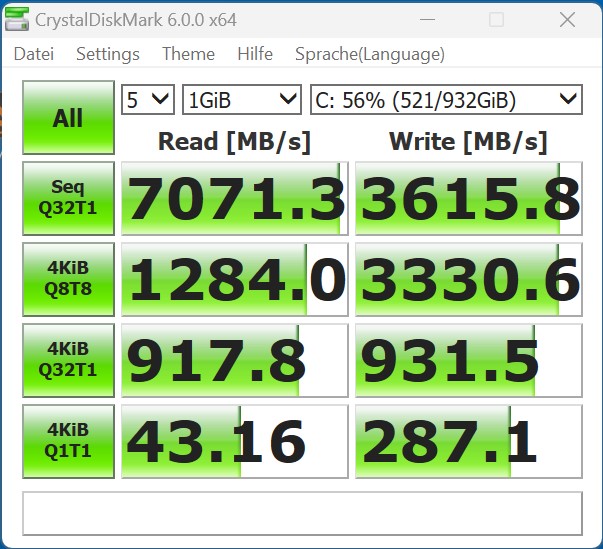
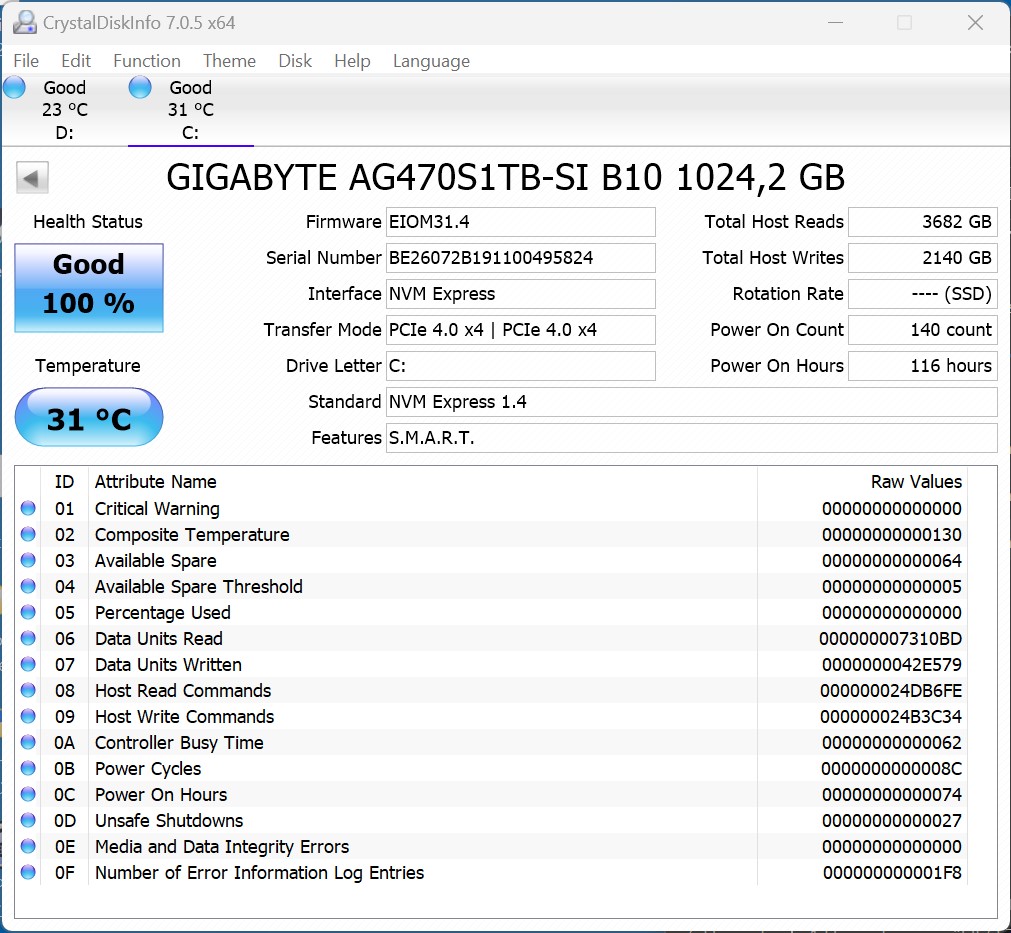
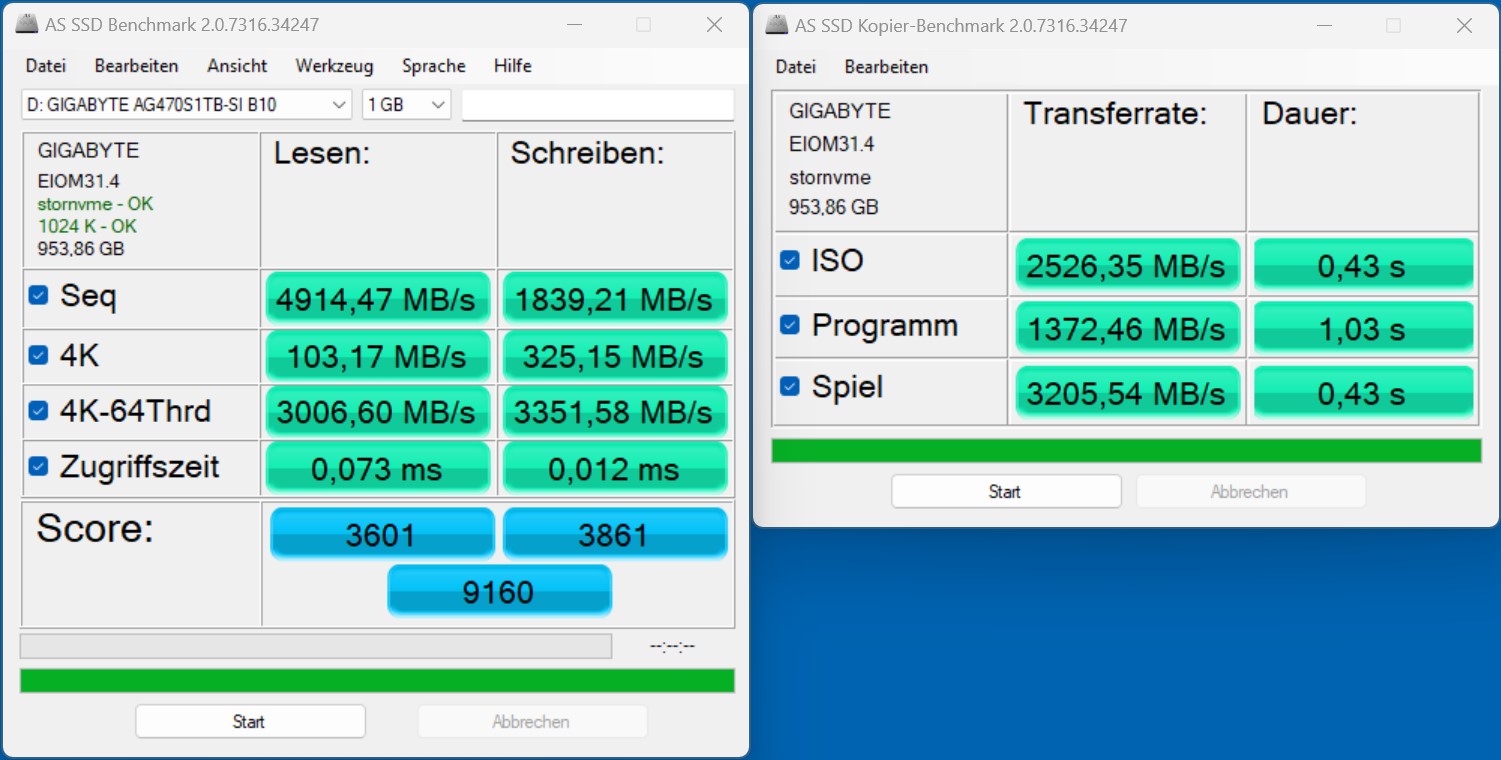
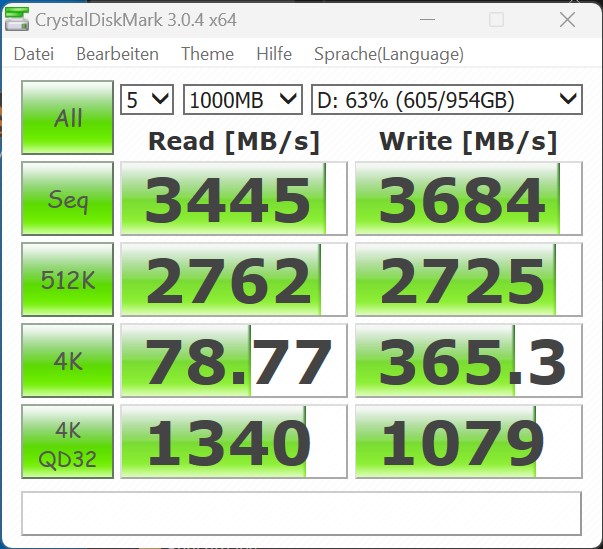
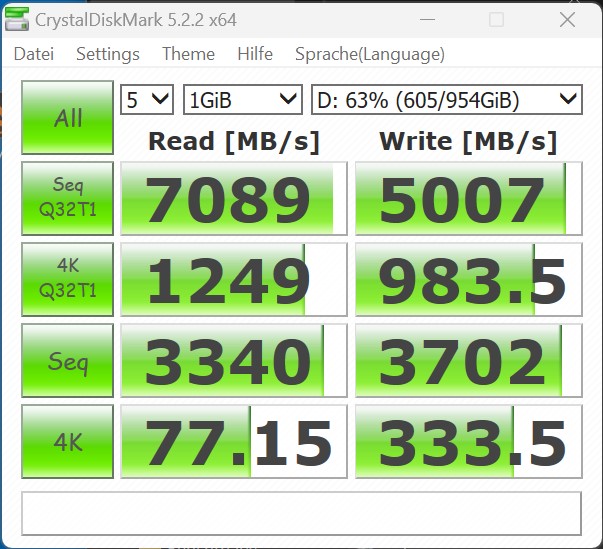
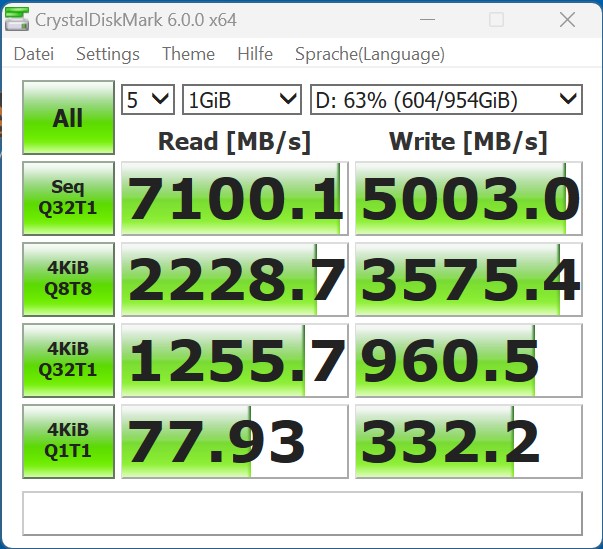
The Aorus 17X AZF uses an in-house SSD. To be more precise, our test unit offers two NVMe SSDs, each with 1 TB of storage space, which is suitable for its intended purpose. Lots of data can thus be stored on the two mass storage devices. The two drives support PCIe 4.0 and are also connected over the full bandwidth with four lanes. Performance is solid, even if several comparison devices display better performance in some cases. However, the Aorus 17X AZF is already fully equipped with two SSDs. Alternatively, 2 TB models can of course also be installed in the device. Meanwhile, the underside of the case is utilized for effective cooling, so the device passed our stress test with flying colors.
For more comparisons and benchmarks, we refer to our comparison chart here.
SSD 1
SSD 2


* ... smaller is better
Sustained Read Performance: DiskSpd Read Loop, Queue Depth 8
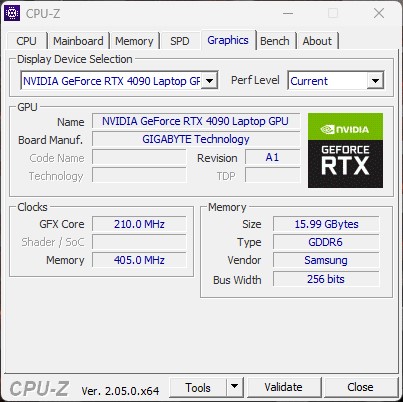
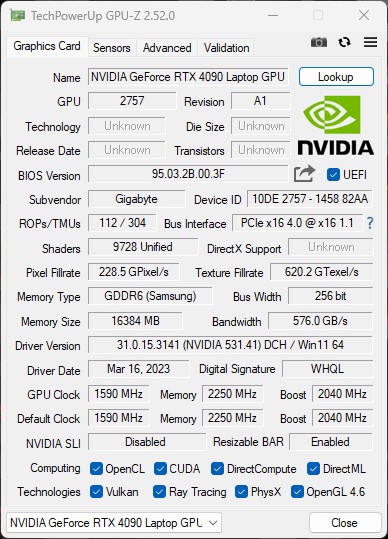
Graphics Card
The Aorus 17X AZF uses a Nvidia GeForce RTX 4090 Laptop GPU, which has a maximum possible TGP of up to 175 watts (150 watts + 25 watts Dynamic Boost). The 3D performance is correspondingly good, although competing laptops with the same graphics card are able to edge out a little more performance. The gap to the Nvidia GeForce RTX 4080 laptop GPU is considerably larger at 9 and 18 percent, respectively. Compared to the Medion Erazer Beast, we practically see the same performance in our Aorus 17X AZF.
More benchmarks for the Nvidia GeForce RTX 4090 laptop GPU can be found here.
| 3DMark 05 Standard | 61850 points | |
| 3DMark 06 Standard Score | 61681 points | |
| 3DMark 11 Performance | 43896 points | |
| 3DMark Ice Storm Standard Score | 247981 points | |
| 3DMark Cloud Gate Standard Score | 58934 points | |
| 3DMark Fire Strike Score | 35428 points | |
| 3DMark Fire Strike Extreme Score | 24235 points | |
| 3DMark Time Spy Score | 20085 points | |
Help | ||
* ... smaller is better
Gaming Performance
The notebook is equipped with a QHD display, meaning that all current titles can be played at maximum details without issue. Sometimes the performance of the Nvidia GeForce RTX 4090 laptop GPU can easily power external 4K displays in native resolution. The 16 GB VRAM is good, future-proof and not a bottleneck, even in QHD. In our gaming tests, the Aorus 17X AZF lands in a solid third place. All representatives that use the Nvidia GeForce RTX 4090 laptop GPU offer similar performance levels.
| Performance rating - Percent | |
| Alienware m18 R1 | |
| MSI Titan GT77 HX 13VI | |
| Aorus 17X AZF | |
| Medion Erazer Beast X40 | |
| MSI GE78HX 13VH-070US | |
| HP Omen 17-ck2097ng | |
| Average of class Gaming | |
| The Witcher 3 - 1920x1080 Ultra Graphics & Postprocessing (HBAO+) | |
| Alienware m18 R1 | |
| Aorus 17X AZF | |
| MSI Titan GT77 HX 13VI | |
| Medion Erazer Beast X40 | |
| MSI GE78HX 13VH-070US | |
| Average of class Gaming (95 - 240, n=8, last 2 years) | |
| HP Omen 17-ck2097ng | |
| GTA V - 1920x1080 Highest AA:4xMSAA + FX AF:16x | |
| Medion Erazer Beast X40 | |
| Alienware m18 R1 | |
| MSI Titan GT77 HX 13VI | |
| Aorus 17X AZF | |
| Average of class Gaming (48.3 - 186.9, n=103, last 2 years) | |
| HP Omen 17-ck2097ng | |
| MSI GE78HX 13VH-070US | |
| Final Fantasy XV Benchmark - 1920x1080 High Quality | |
| Alienware m18 R1 | |
| MSI Titan GT77 HX 13VI | |
| Aorus 17X AZF | |
| Medion Erazer Beast X40 | |
| MSI GE78HX 13VH-070US | |
| HP Omen 17-ck2097ng | |
| Average of class Gaming (41 - 215, n=104, last 2 years) | |
| Strange Brigade - 1920x1080 ultra AA:ultra AF:16 | |
| Aorus 17X AZF | |
| MSI Titan GT77 HX 13VI | |
| Alienware m18 R1 | |
| Medion Erazer Beast X40 | |
| HP Omen 17-ck2097ng | |
| Average of class Gaming (76.3 - 456, n=94, last 2 years) | |
| MSI GE78HX 13VH-070US | |
| Dota 2 Reborn - 1920x1080 ultra (3/3) best looking | |
| Alienware m18 R1 | |
| MSI Titan GT77 HX 13VI | |
| Aorus 17X AZF | |
| Medion Erazer Beast X40 | |
| HP Omen 17-ck2097ng | |
| Average of class Gaming (84.8 - 248, n=113, last 2 years) | |
| MSI GE78HX 13VH-070US | |
| F1 22 - 1920x1080 Ultra High Preset AA:T AF:16x | |
| Alienware m18 R1 | |
| MSI Titan GT77 HX 13VI | |
| Aorus 17X AZF | |
| Medion Erazer Beast X40 | |
| MSI GE78HX 13VH-070US | |
| HP Omen 17-ck2097ng | |
| Average of class Gaming (40.1 - 121.2, n=5, last 2 years) | |
| The Callisto Protocol - 1920x1080 Ultra Preset (without FSR Upscaling) | |
| MSI Titan GT77 HX 13VI | |
| Aorus 17X AZF | |
| Average NVIDIA GeForce RTX 4090 Laptop GPU (102.6 - 150.7, n=6) | |
| Average NVIDIA GeForce RTX 4080 Laptop GPU (111.5 - 120.4, n=2) | |
| HP Omen 17-ck2097ng | |
| Atomic Heart - 1920x1080 Atomic Preset | |
| Average NVIDIA GeForce RTX 4090 Laptop GPU (128.6 - 166, n=3) | |
| Aorus 17X AZF | |
| Medion Erazer Beast X40 | |
| HP Omen 17-ck2097ng | |
| Average NVIDIA GeForce RTX 4080 Laptop GPU (n=1) | |
| Company of Heroes 3 - 1920x1080 Maximum Settings | |
| Aorus 17X AZF | |
| Average NVIDIA GeForce RTX 4090 Laptop GPU (215 - 235, n=2) | |
| Medion Erazer Beast X40 | |
| HP Omen 17-ck2097ng | |
| Average NVIDIA GeForce RTX 4080 Laptop GPU (n=1) | |
| Dead Space Remake - 1920x1080 Ultra Preset AA:T | |
| Aorus 17X AZF | |
| Average NVIDIA GeForce RTX 4090 Laptop GPU (129 - 140.8, n=2) | |
| MSI Titan GT77 HX 13VI | |
| Average NVIDIA GeForce RTX 4080 Laptop GPU (n=1) | |
| Average of class Gaming (n=1last 2 years) | |
| Tiny Tina's Wonderlands - 1920x1080 Badass Preset (DX12) | |
| Alienware m18 R1 | |
| MSI Titan GT77 HX 13VI | |
| Average NVIDIA GeForce RTX 4090 Laptop GPU (141.1 - 189.4, n=14) | |
| Aorus 17X AZF | |
| Average NVIDIA GeForce RTX 4080 Laptop GPU (112.9 - 167.1, n=9) | |
| Average of class Gaming (55 - 159.4, n=5, last 2 years) | |
| High On Life - 1920x1080 Very High Preset | |
| Aorus 17X AZF | |
| Average NVIDIA GeForce RTX 4090 Laptop GPU (180.3 - 185.2, n=2) | |
| Average NVIDIA GeForce RTX 4080 Laptop GPU (n=1) | |
| The Witcher 3 / High Graphics & Postprocessing (Nvidia HairWorks Off) | |
| Alienware m18 R1 | |
| MSI Titan GT77 HX 13VI | |
| Aorus 17X AZF | |
| MSI GE78HX 13VH-070US | |
| Average NVIDIA GeForce RTX 4090 Laptop GPU (290 - 449, n=23) | |
| Medion Erazer Beast X40 | |
| HP Omen 17-ck2097ng | |
| Average of class Gaming (181 - 341, n=3, last 2 years) | |
| The Witcher 3 / Ultra Graphics & Postprocessing (HBAO+) | |
| Alienware m18 R1 | |
| Aorus 17X AZF | |
| MSI Titan GT77 HX 13VI | |
| Average NVIDIA GeForce RTX 4090 Laptop GPU (139.2 - 216, n=35) | |
| Medion Erazer Beast X40 | |
| MSI GE78HX 13VH-070US | |
| Average of class Gaming (95 - 240, n=8, last 2 years) | |
| HP Omen 17-ck2097ng | |
To check whether frame rates remain stable and constant over a longer period of time, we ran "The Witcher 3" for 60 minutes at Full HD resolution and at maximum details. The game character was not moved. The refresh rate is consistent, as is revealed by the chart.
Witcher 3 FPS chart
| low | med. | high | ultra | QHD | 4K | |
|---|---|---|---|---|---|---|
| GTA V (2015) | 187 | 186.1 | 182.2 | 135.3 | 132.9 | 174.3 |
| The Witcher 3 (2015) | 554.3 | 506.7 | 395.8 | 200 | 145.9 | |
| Dota 2 Reborn (2015) | 235.6 | 199.8 | 191.6 | 176.1 | 175.75 | |
| Final Fantasy XV Benchmark (2018) | 222 | 205 | 177.6 | 152.4 | 89.9 | |
| X-Plane 11.11 (2018) | 195.9 | 173.5 | 138.5 | 118.5 | ||
| Far Cry 5 (2018) | 186 | 170 | 161 | 162 | 152 | 98 |
| Strange Brigade (2018) | 527 | 441 | 414 | 386 | 300 | 154.6 |
| Shadow of the Tomb Raider (2018) | 247 | 219 | 210 | 198.6 | 162.5 | 95.2 |
| Far Cry New Dawn (2019) | 170 | 148 | 145 | 131 | 128 | 102 |
| Metro Exodus (2019) | 187.7 | 160.6 | 134.5 | 112.9 | 98 | 68.6 |
| Borderlands 3 (2019) | 208 | 182.1 | 163.6 | 146.5 | 115.8 | 67.9 |
| F1 2020 (2020) | 413 | 354 | 344 | 305 | 253 | 148.7 |
| F1 2021 (2021) | 466 | 421 | 356 | 204 | 182.7 | 107.8 |
| Far Cry 6 (2021) | 175.7 | 154.3 | 136.3 | 128.9 | 115.1 | 73.1 |
| God of War (2022) | 176.8 | 176.7 | 166.8 | 123.6 | 101.5 | 72.7 |
| GRID Legends (2022) | 227 | 209 | 190.1 | 183.2 | 178.9 | 128.6 |
| Tiny Tina's Wonderlands (2022) | 320 | 263 | 194 | 158.3 | 112.5 | 65.7 |
| F1 22 (2022) | 315 | 299 | 283 | 128.9 | 83.5 | 43 |
| The Callisto Protocol (2022) | 193.3 | 168.2 | 166.4 | 131.1 | 101.3 | 61.6 |
| High On Life (2023) | 277 | 246 | 211 | 185.2 | 126.1 | 56.9 |
| Dead Space Remake (2023) | 153.4 | 150.7 | 142.3 | 140.8 | 105.6 | 56.2 |
| Hogwarts Legacy (2023) | 116 | 100.7 | 93.7 | 89.7 | 80.9 | 50.5 |
| Returnal (2023) | 195 | 191 | 176 | 155 | 119 | 70 |
| Atomic Heart (2023) | 217 | 187.1 | 166.6 | 138.5 | 107.8 | 62.7 |
| Company of Heroes 3 (2023) | 308.5 | 280.4 | 239.6 | 235.2 | 194.8 | 117.4 |
| Resident Evil 4 Remake (2023) | 232 | 189.7 | 187.3 | 136.3 | 109.2 | 63.4 |
| The Last of Us (2023) | 113.7 | 110.8 | 109 | 105 | 81.8 | 43.8 |
Emissions - The Aorus 17X AZF can also be quiet
Noise
During idle and everyday use (office and internet), the four fans often spin at low speeds. At up to 34 dB(A), the Aorus 17X AZF is very tolerable. Under load, it can occasionally get very loud with maximum values of 54 dB(A) recorded in our stress test. In addition, the fans produce a high-frequency sound, which subjectively makes the volume even louder.
In principle, the Aorus 17X AZF also allows for near-silent operation. This requires the use of the Meeting mode or Energy-saving sleep mode profiles, which can be selected via the GCC (Gigabyte Control Center). The resulting reduction in CPU power consumption is still sufficient for everyday use.
The GCC can also be used to manually control the fan. Aside from the predefined profiles, you can use your own fan curves.
Noise level
| Idle |
| 28 / 29 / 34 dB(A) |
| Load |
| 51 / 54 dB(A) |
 | ||
30 dB silent 40 dB(A) audible 50 dB(A) loud |
||
min: | ||
| Aorus 17X AZF i9-13900HX, GeForce RTX 4090 Laptop GPU | Medion Erazer Beast X40 i9-13900HX, GeForce RTX 4090 Laptop GPU | MSI GE78HX 13VH-070US i9-13950HX, GeForce RTX 4080 Laptop GPU | HP Omen 17-ck2097ng i9-13900HX, GeForce RTX 4080 Laptop GPU | MSI Titan GT77 HX 13VI i9-13950HX, GeForce RTX 4090 Laptop GPU | Alienware m18 R1 i9-13980HX, GeForce RTX 4090 Laptop GPU | |
|---|---|---|---|---|---|---|
| Noise | 4% | 7% | 4% | 1% | 16% | |
| off / environment * (dB) | 25 | 24 4% | 23.4 6% | 24 4% | 24.6 2% | 22.8 9% |
| Idle Minimum * (dB) | 28 | 25 11% | 24.2 14% | 31 -11% | 29.2 -4% | 23 18% |
| Idle Average * (dB) | 29 | 29 -0% | 25.6 12% | 32 -10% | 29.2 -1% | 23 21% |
| Idle Maximum * (dB) | 34 | 35 -3% | 31 9% | 33 3% | 29.2 14% | 23 32% |
| Load Average * (dB) | 51 | 51 -0% | 43.3 15% | 45 12% | 50.7 1% | 35.6 30% |
| Witcher 3 ultra * (dB) | 57 | 51 11% | 56.3 1% | 45 21% | 53.3 6% | 51.3 10% |
| Load Maximum * (dB) | 54 | 53 2% | 59.1 -9% | 50 7% | 61 -13% | 56.7 -5% |
* ... smaller is better
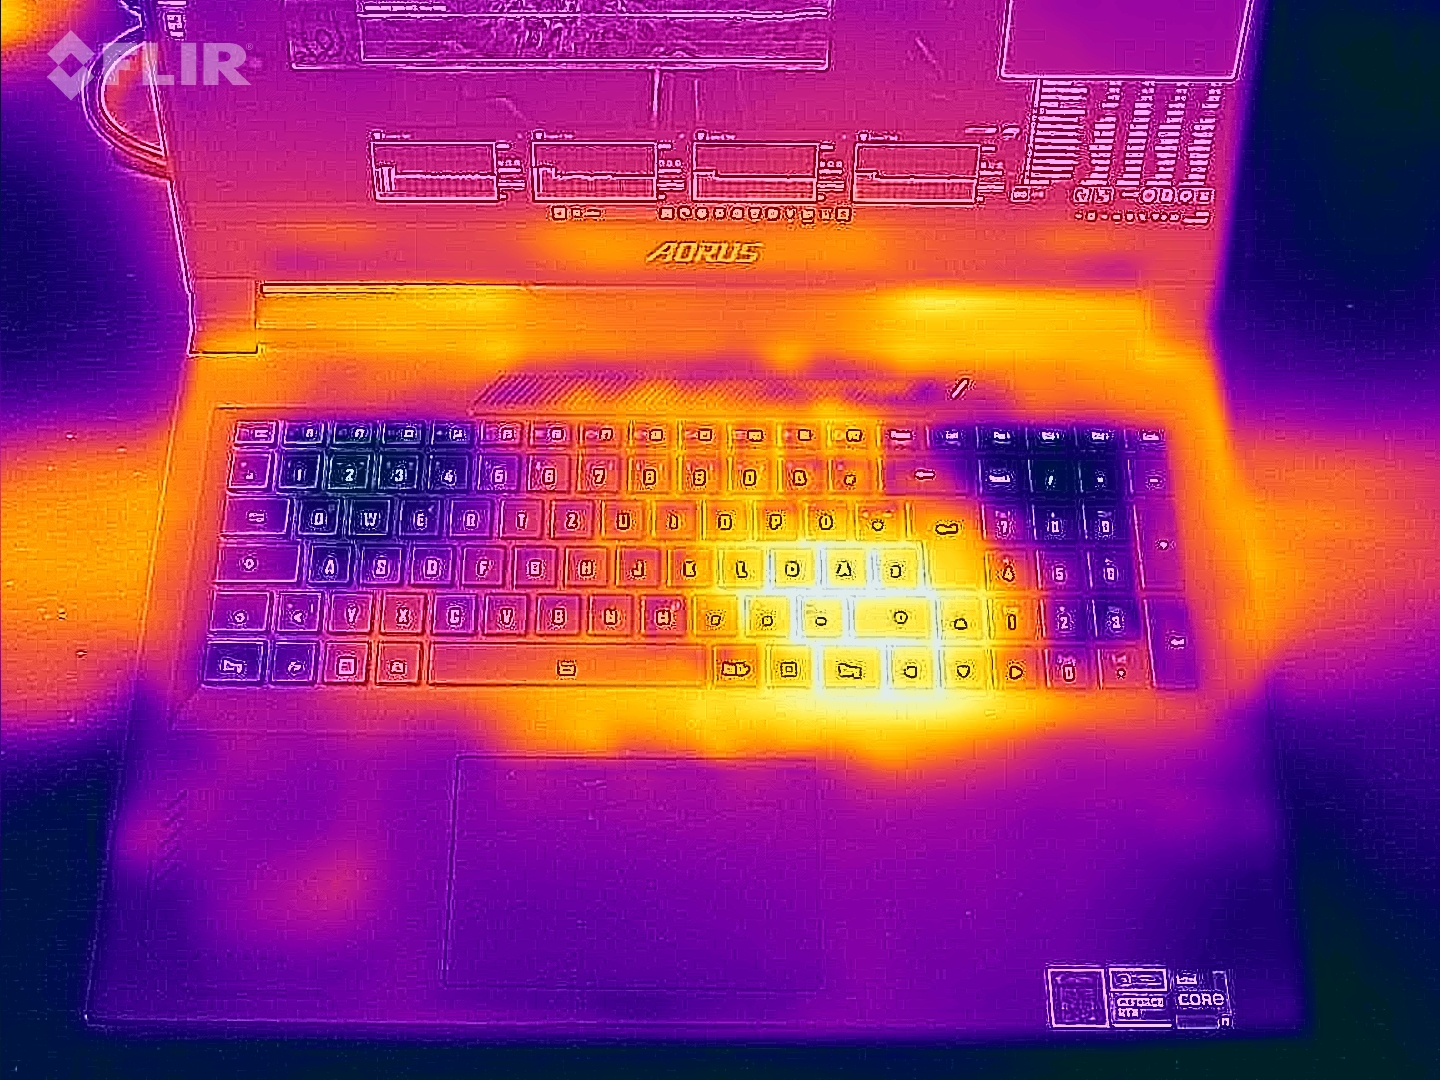
Temperature
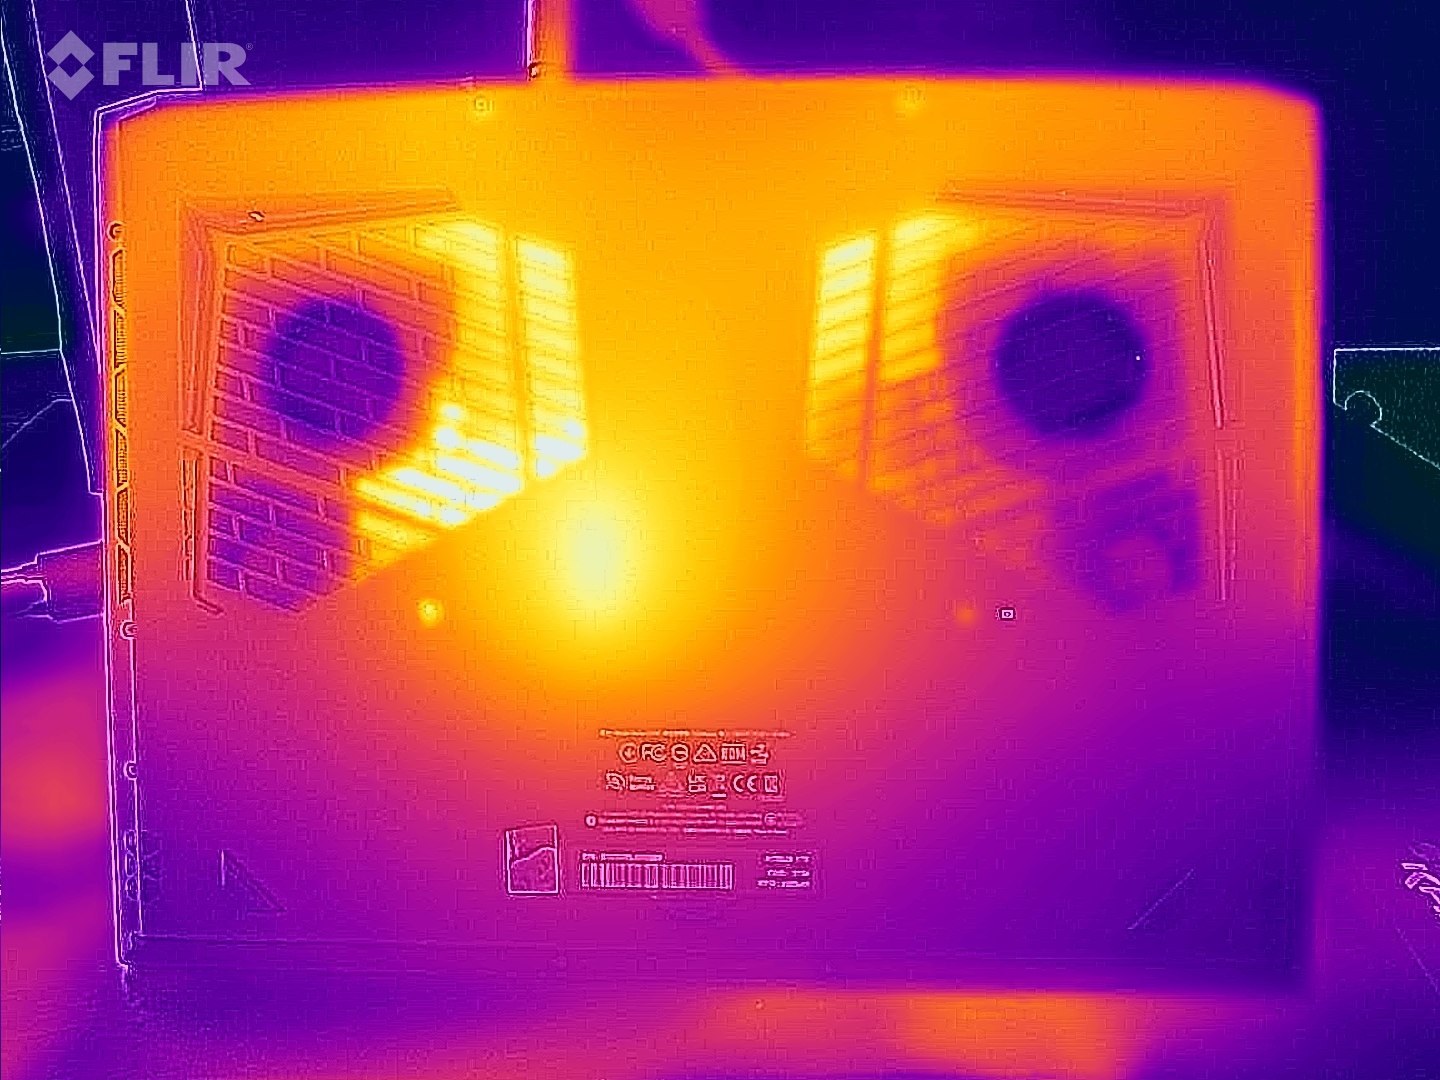
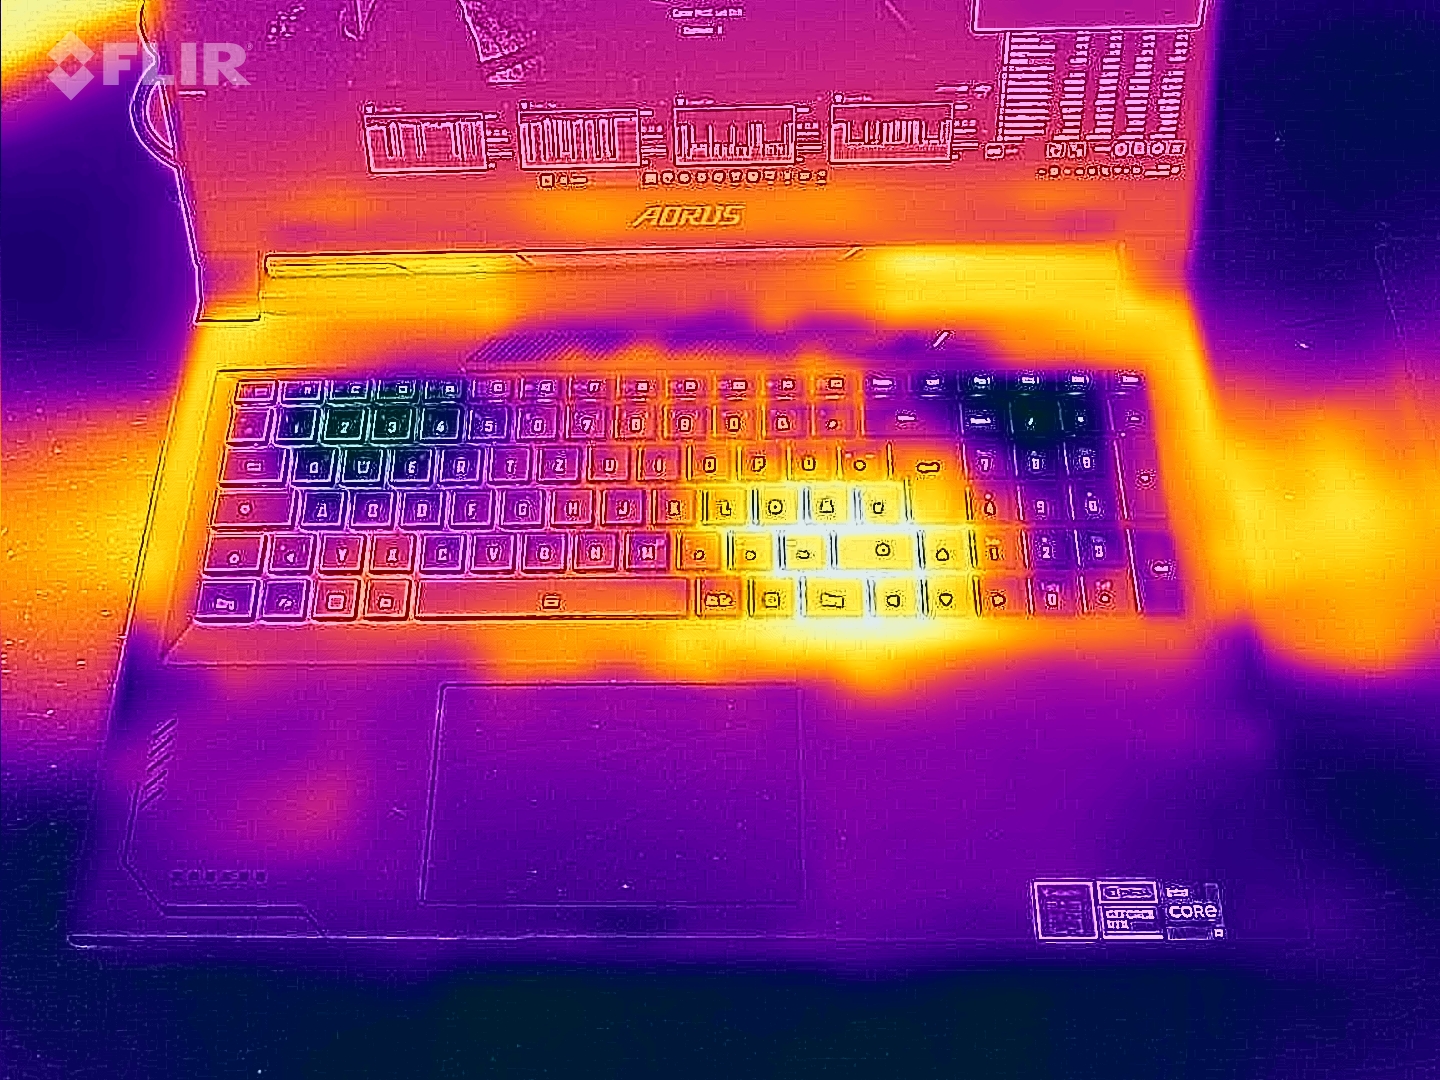
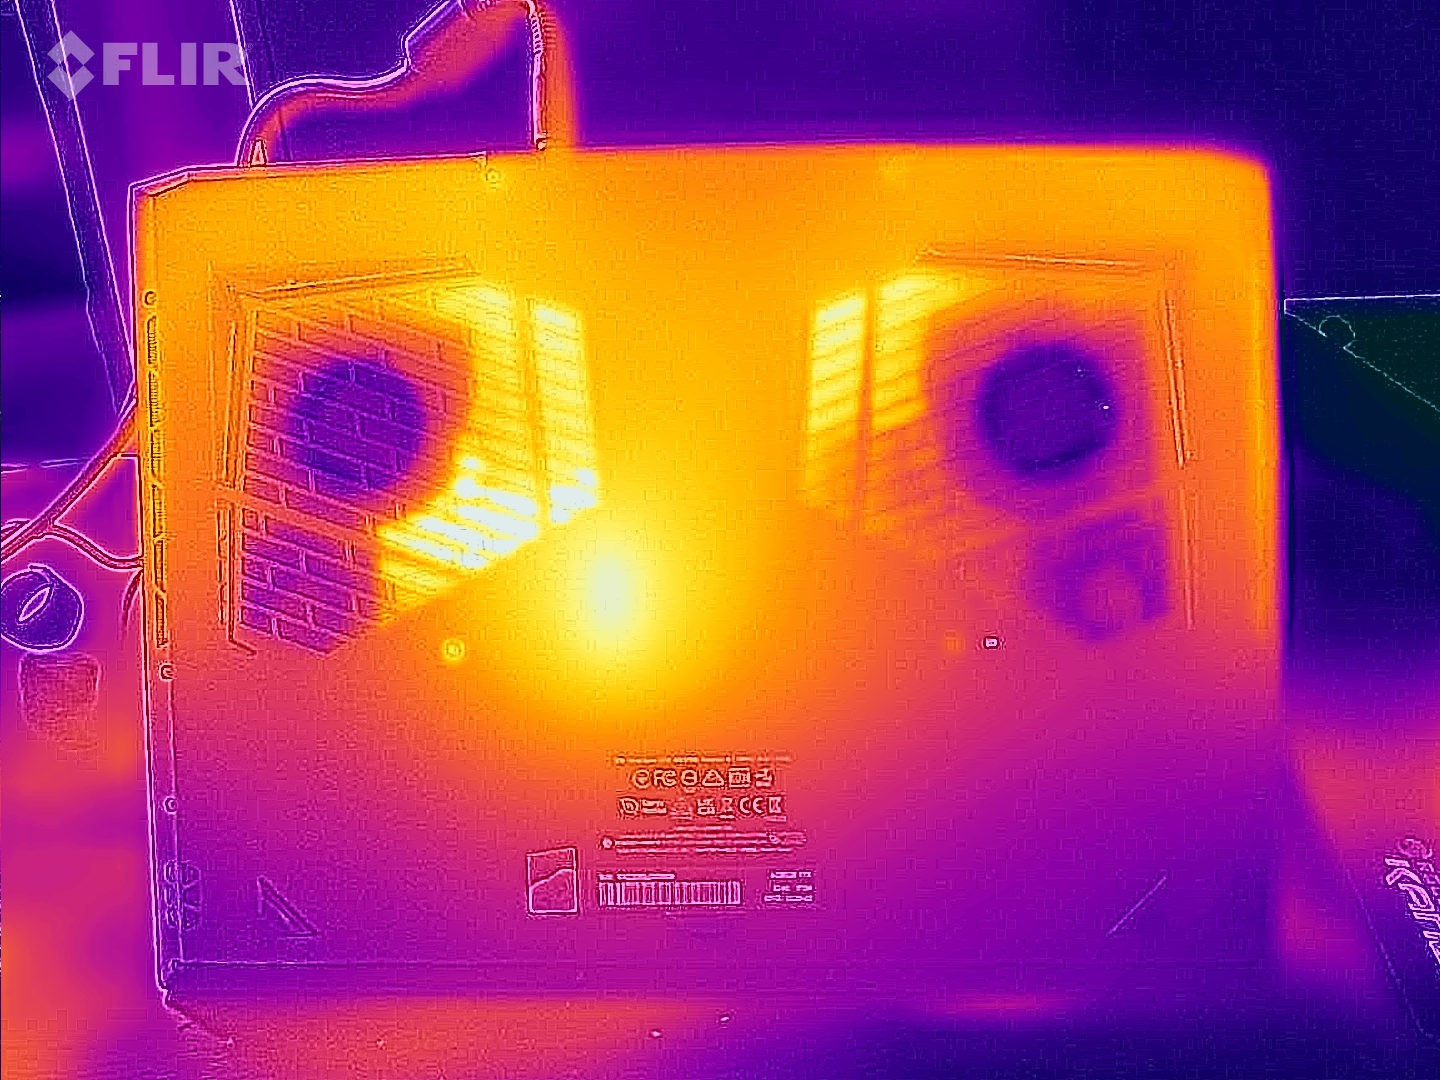
High case temperatures were not observed in simple everyday use in office and internet use. Only under load, such as during stress testing or gaming, does the notebook heat up significantly. We registered the highest rates on the underside and in the area of the fan outlets.
(-) The maximum temperature on the upper side is 47 °C / 117 F, compared to the average of 40.4 °C / 105 F, ranging from 21.2 to 68.8 °C for the class Gaming.
(-) The bottom heats up to a maximum of 51 °C / 124 F, compared to the average of 43.2 °C / 110 F
(+) In idle usage, the average temperature for the upper side is 28.1 °C / 83 F, compared to the device average of 33.9 °C / 93 F.
(±) Playing The Witcher 3, the average temperature for the upper side is 38 °C / 100 F, compared to the device average of 33.9 °C / 93 F.
(+) The palmrests and touchpad are reaching skin temperature as a maximum (34 °C / 93.2 F) and are therefore not hot.
(-) The average temperature of the palmrest area of similar devices was 28.8 °C / 83.8 F (-5.2 °C / -9.4 F).
| Aorus 17X AZF Intel Core i9-13900HX, NVIDIA GeForce RTX 4090 Laptop GPU | Medion Erazer Beast X40 Intel Core i9-13900HX, NVIDIA GeForce RTX 4090 Laptop GPU | MSI GE78HX 13VH-070US Intel Core i9-13950HX, NVIDIA GeForce RTX 4080 Laptop GPU | HP Omen 17-ck2097ng Intel Core i9-13900HX, NVIDIA GeForce RTX 4080 Laptop GPU | MSI Titan GT77 HX 13VI Intel Core i9-13950HX, NVIDIA GeForce RTX 4090 Laptop GPU | Alienware m18 R1 Intel Core i9-13980HX, NVIDIA GeForce RTX 4090 Laptop GPU | |
|---|---|---|---|---|---|---|
| Heat | -1% | 7% | 13% | 12% | 15% | |
| Maximum Upper Side * (°C) | 47 | 48 -2% | 37.4 20% | 41 13% | 40.6 14% | 39 17% |
| Maximum Bottom * (°C) | 51 | 52 -2% | 45 12% | 51 -0% | 41.1 19% | 36.4 29% |
| Idle Upper Side * (°C) | 30 | 30 -0% | 29.8 1% | 24 20% | 26.2 13% | 29.2 3% |
| Idle Bottom * (°C) | 31 | 31 -0% | 32.4 -5% | 25 19% | 30.3 2% | 27.8 10% |
* ... smaller is better
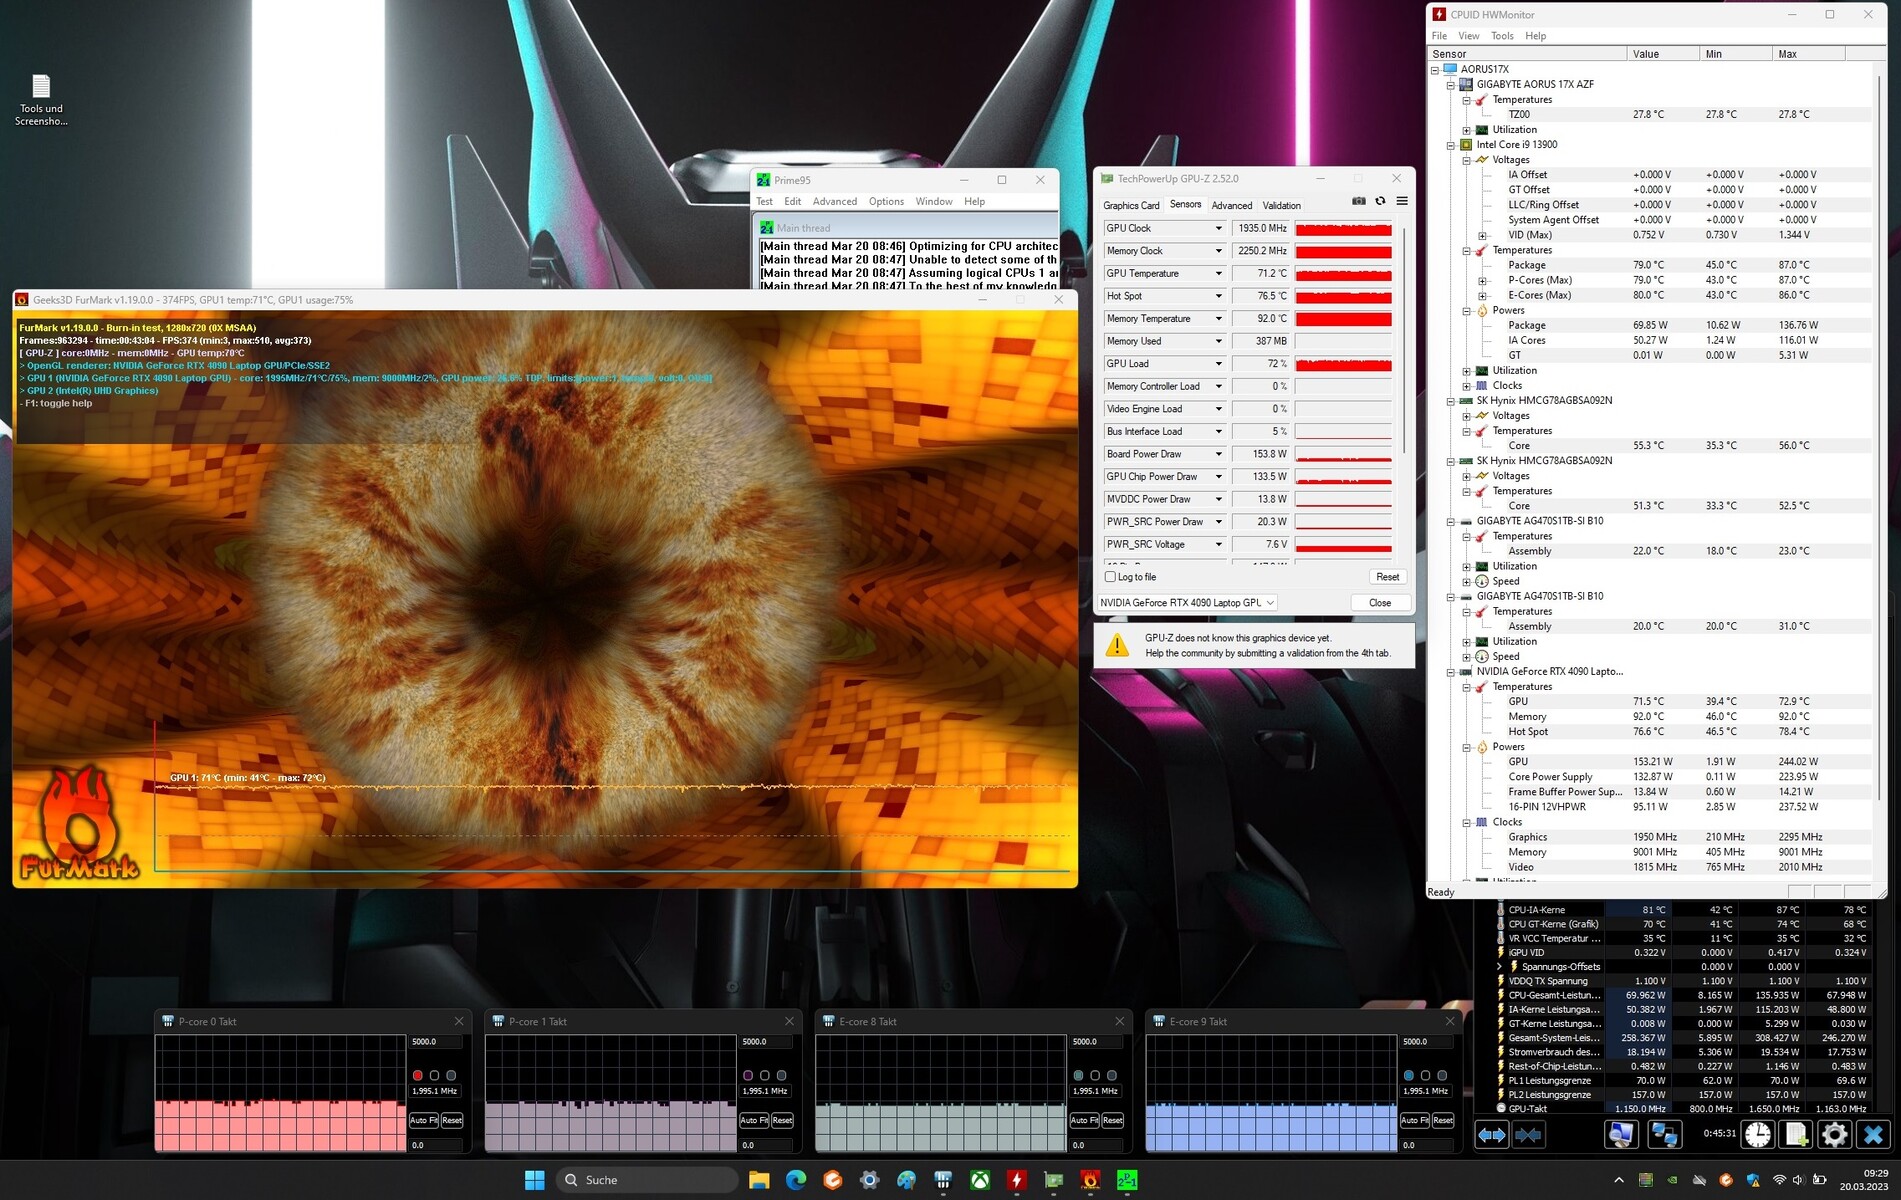
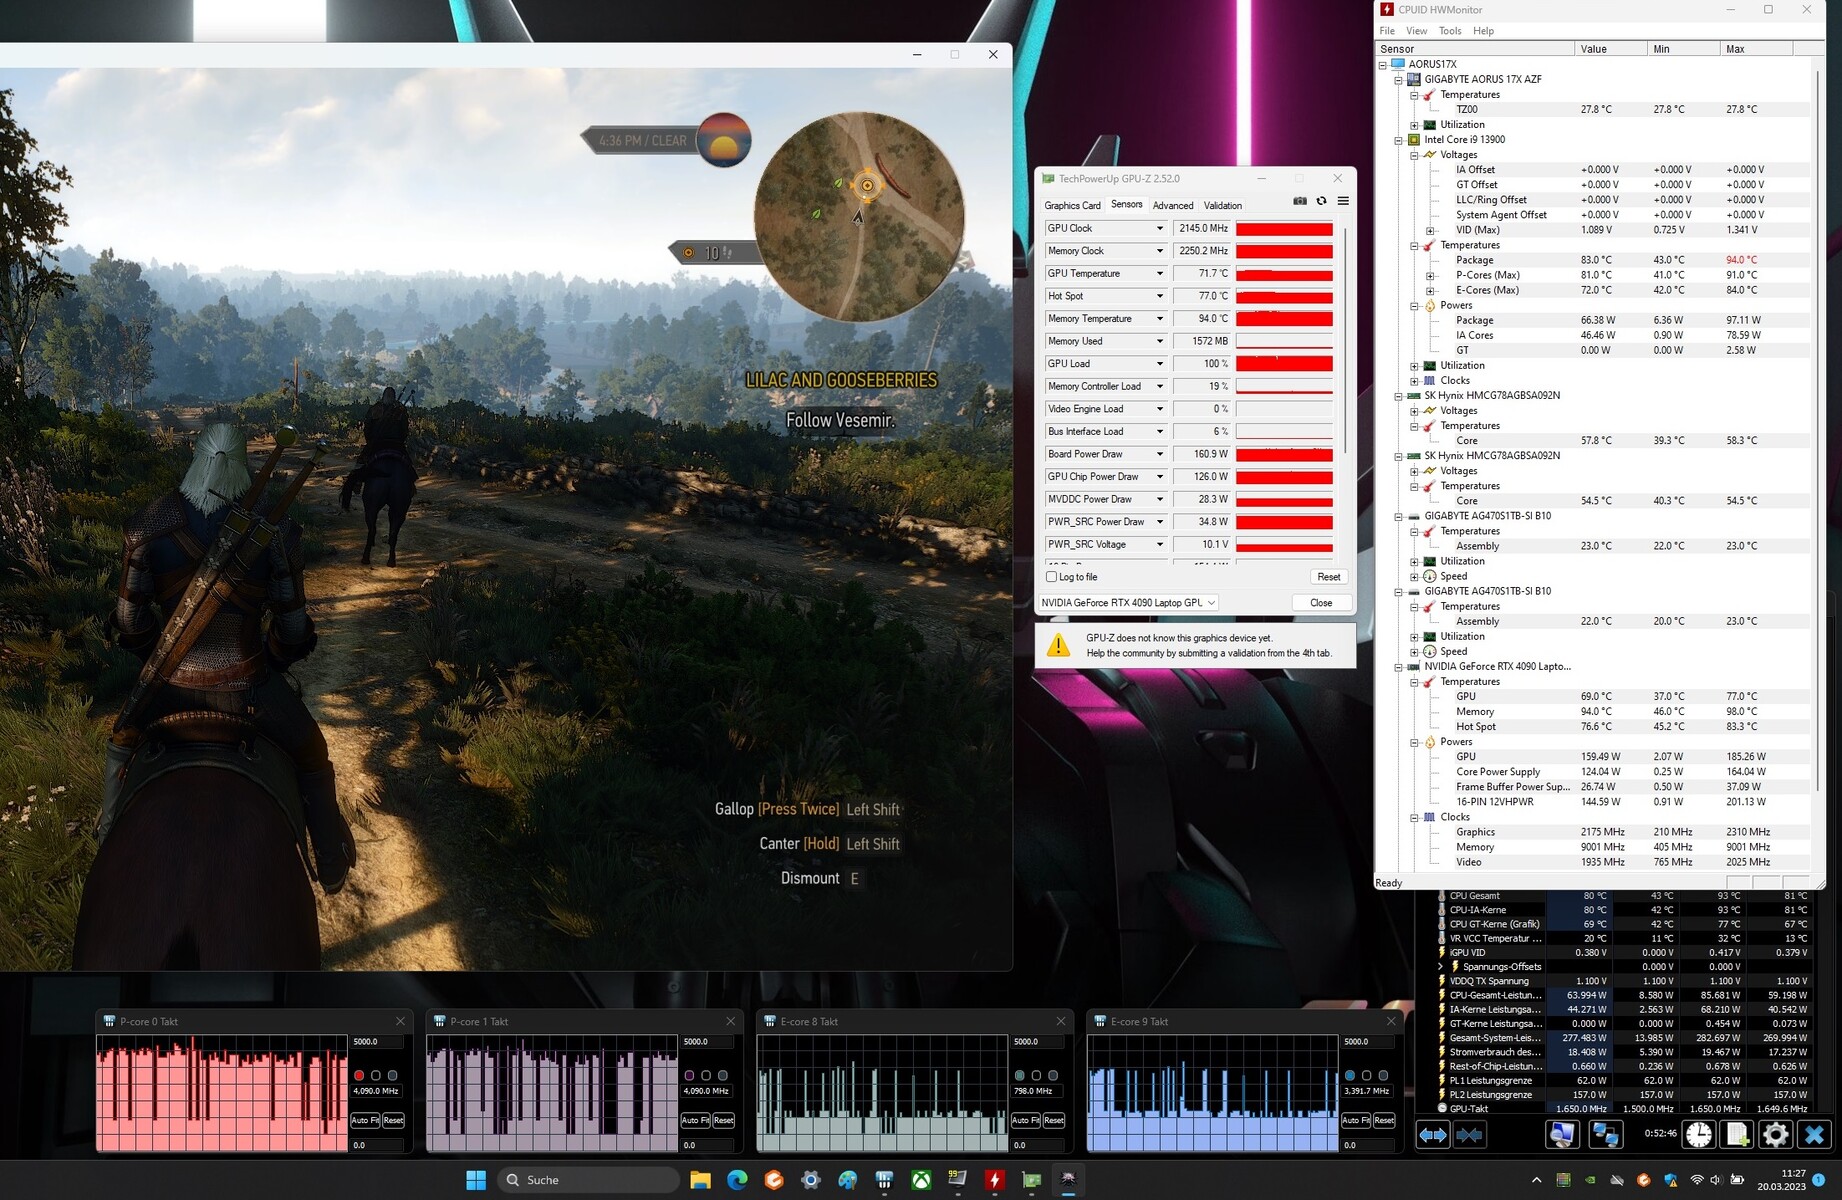
Stress Test
The stress test, which we simulate with Prime95 and Furmark in continuous operation, represents an extreme scenario for checking system stability under full load. The CPU starts with high clock rates, which are throttled after a short time because PL2 cannot be maintained permanently. The P and E cores of the Intel Core i7 13900HX run consistently at just under 2 GHz for long periods of time.
Speakers
The stereo speakers produce solid sound, but the bass is less impressive due to the lack of volume. Headphones or an external speaker system are recommended for better sound experience.
Aorus 17X AZF audio analysis
(+) | speakers can play relatively loud (83 dB)
Bass 100 - 315 Hz
(-) | nearly no bass - on average 27.1% lower than median
(±) | linearity of bass is average (13% delta to prev. frequency)
Mids 400 - 2000 Hz
(+) | balanced mids - only 4.5% away from median
(+) | mids are linear (5% delta to prev. frequency)
Highs 2 - 16 kHz
(+) | balanced highs - only 1.4% away from median
(+) | highs are linear (4.3% delta to prev. frequency)
Overall 100 - 16.000 Hz
(±) | linearity of overall sound is average (17.9% difference to median)
Compared to same class
» 54% of all tested devices in this class were better, 9% similar, 37% worse
» The best had a delta of 6%, average was 18%, worst was 132%
Compared to all devices tested
» 37% of all tested devices were better, 8% similar, 55% worse
» The best had a delta of 4%, average was 24%, worst was 134%
Medion Erazer Beast X40 audio analysis
(+) | speakers can play relatively loud (88 dB)
Bass 100 - 315 Hz
(-) | nearly no bass - on average 20.2% lower than median
(±) | linearity of bass is average (8.4% delta to prev. frequency)
Mids 400 - 2000 Hz
(±) | higher mids - on average 5.5% higher than median
(+) | mids are linear (6.5% delta to prev. frequency)
Highs 2 - 16 kHz
(+) | balanced highs - only 3.1% away from median
(+) | highs are linear (5.8% delta to prev. frequency)
Overall 100 - 16.000 Hz
(±) | linearity of overall sound is average (16.1% difference to median)
Compared to same class
» 39% of all tested devices in this class were better, 6% similar, 54% worse
» The best had a delta of 6%, average was 18%, worst was 132%
Compared to all devices tested
» 26% of all tested devices were better, 5% similar, 69% worse
» The best had a delta of 4%, average was 24%, worst was 134%
Energy Management
Power Consumption
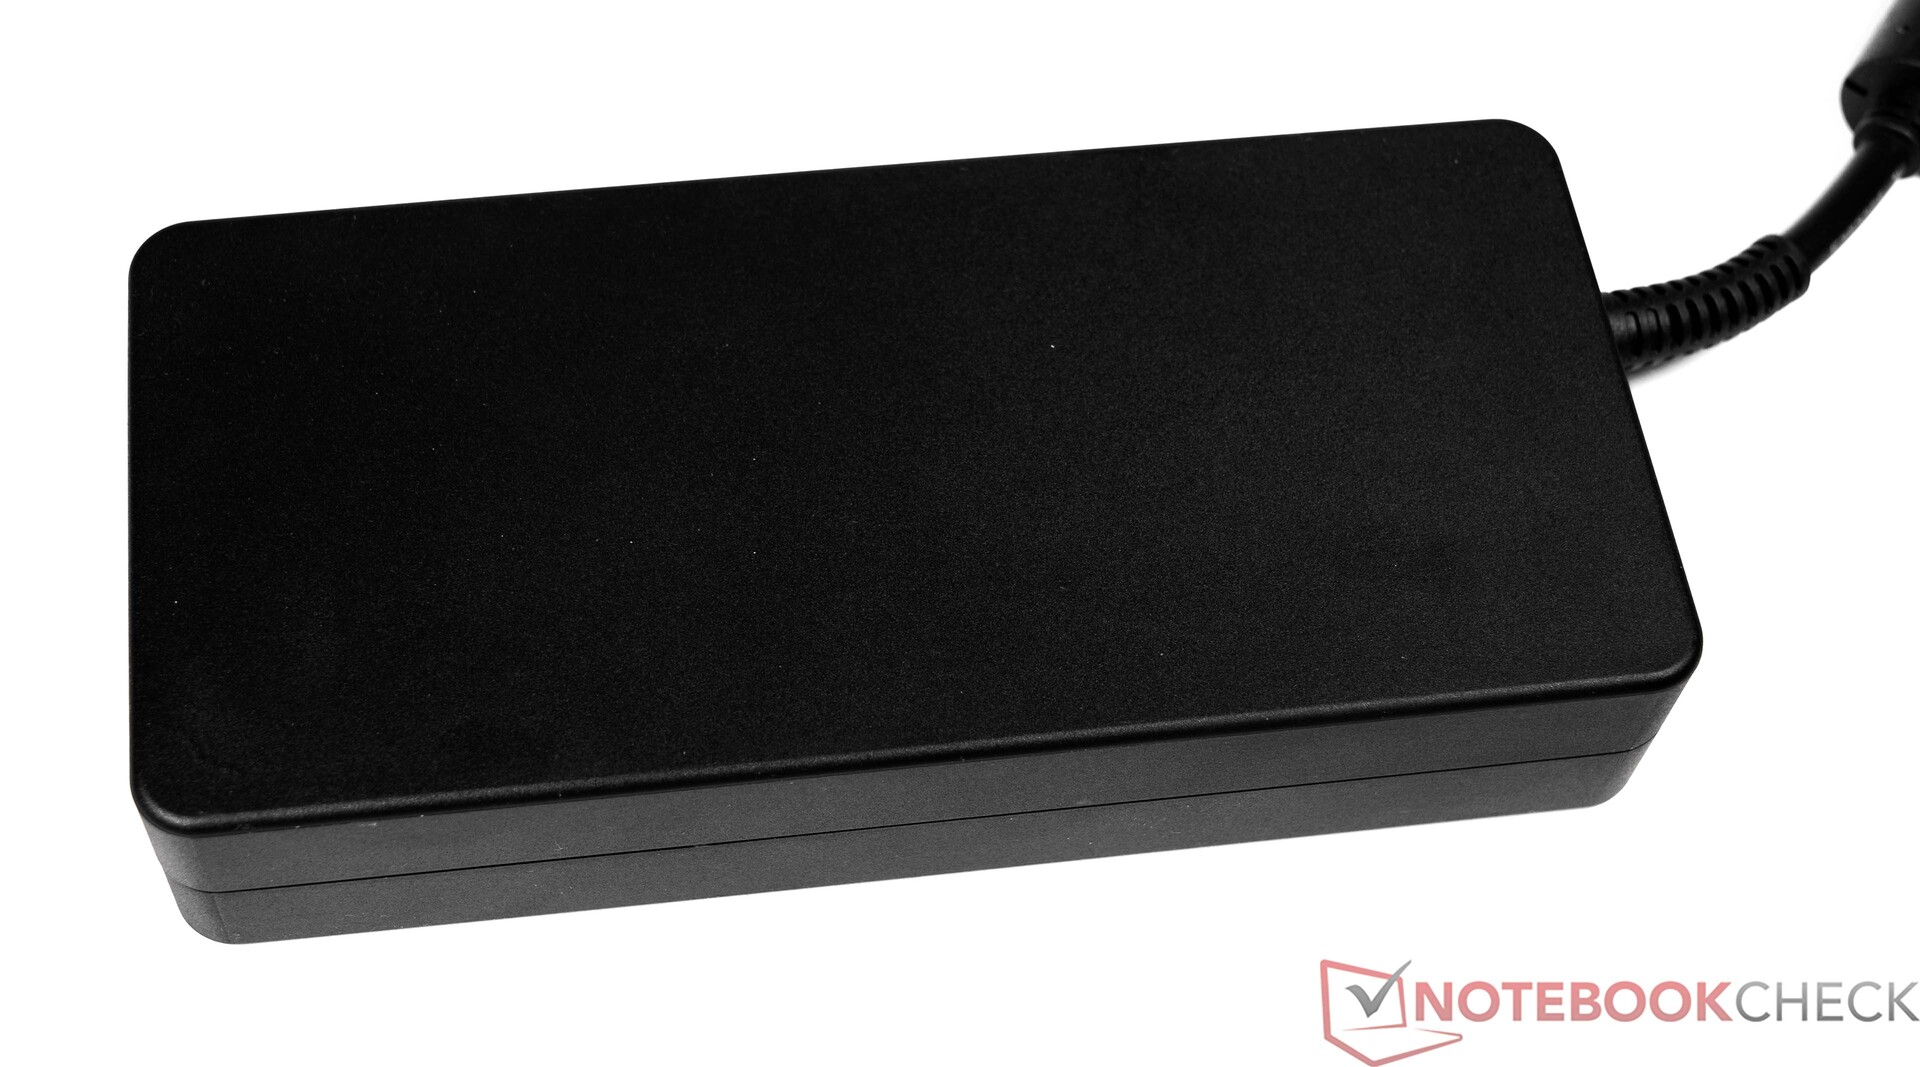
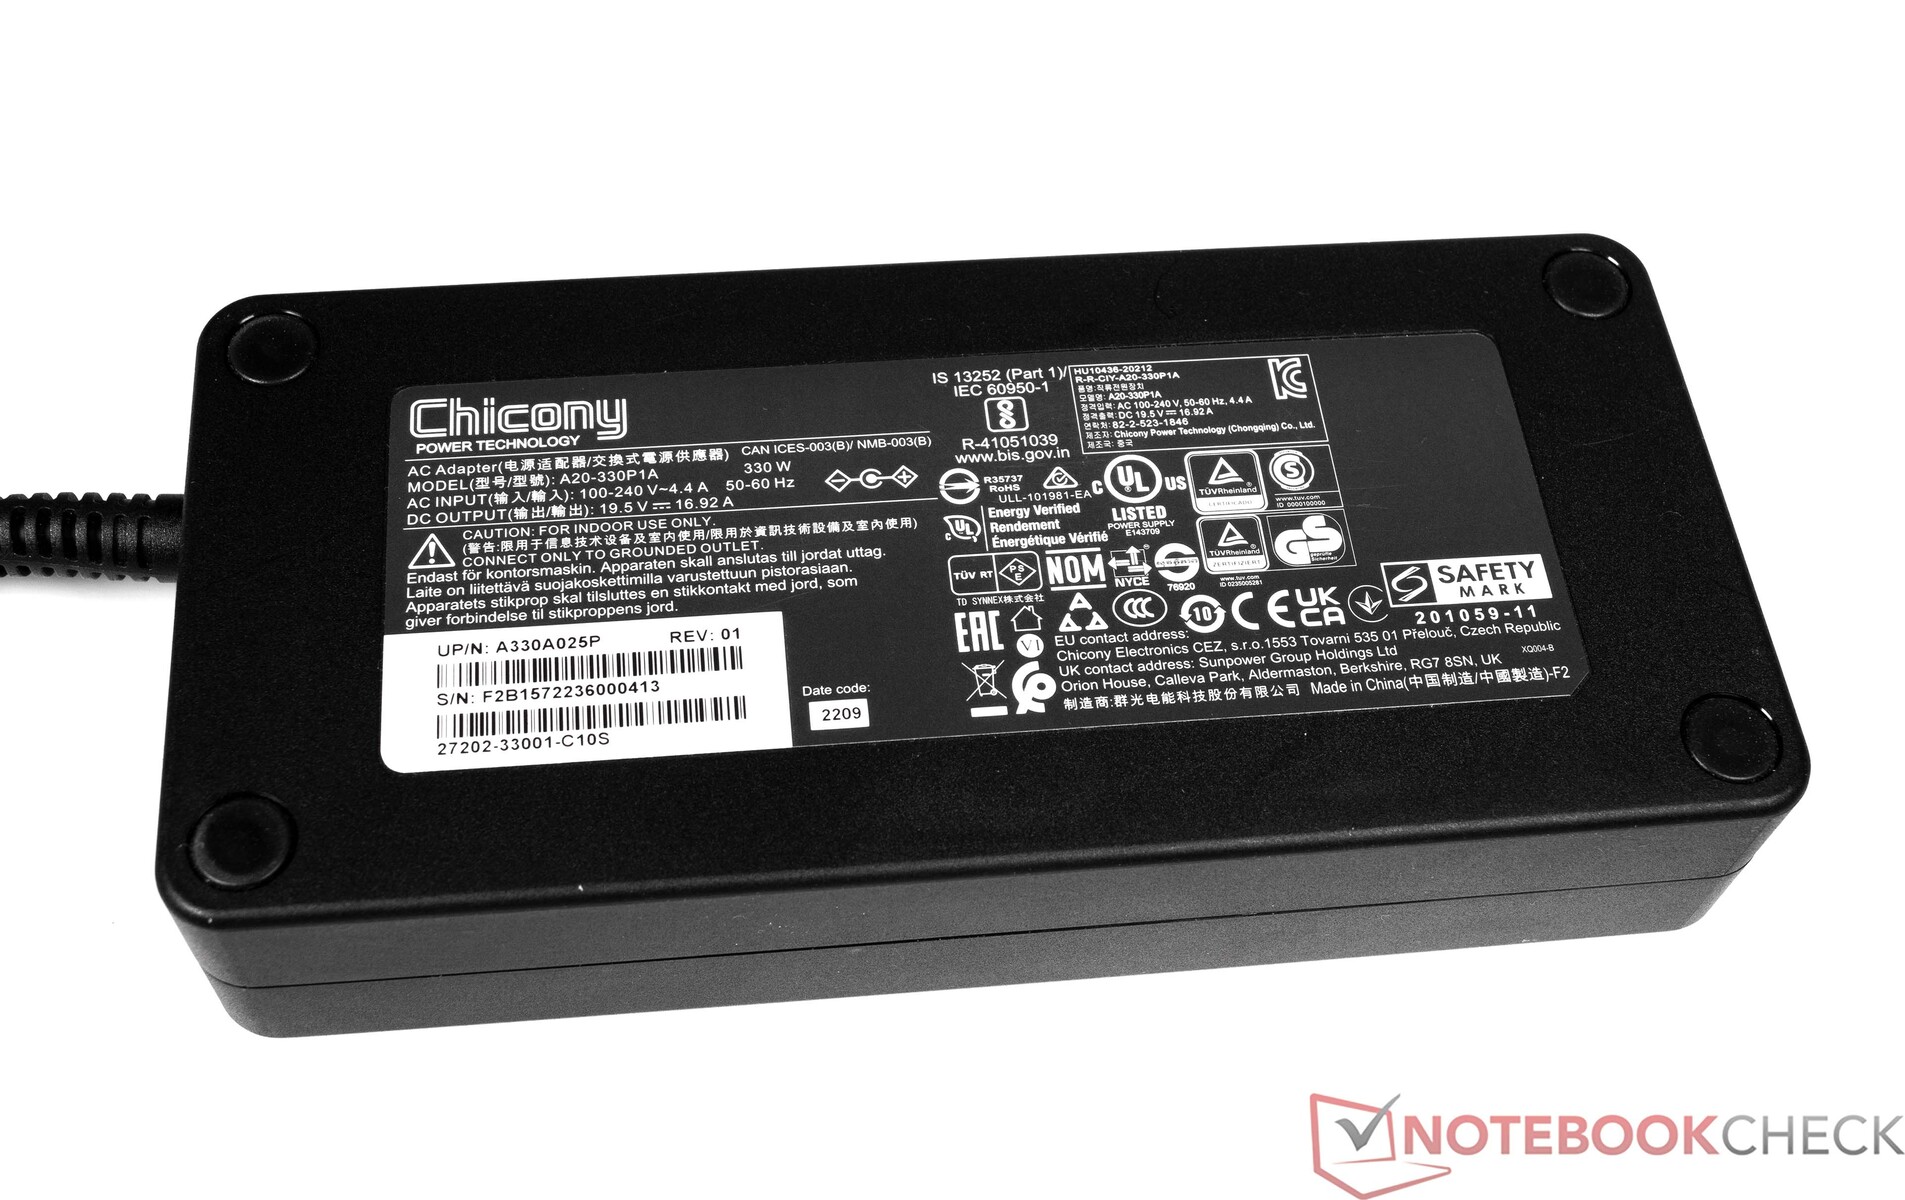
The Aorus 17X AZF does not show any abnormalities in terms of energy consumption. The ascertained values in idle appear quite good and are in some cases significantly better than the competition. We see normal rates under load. The power adapter is sufficiently sized at 330 watts, even if 334 watts is needed for short bursts.
| Off / Standby | |
| Idle | |
| Load |
|
Key:
min: | |
| Aorus 17X AZF i9-13900HX, GeForce RTX 4090 Laptop GPU | Medion Erazer Beast X40 i9-13900HX, GeForce RTX 4090 Laptop GPU | MSI GE78HX 13VH-070US i9-13950HX, GeForce RTX 4080 Laptop GPU | HP Omen 17-ck2097ng i9-13900HX, GeForce RTX 4080 Laptop GPU | MSI Titan GT77 HX 13VI i9-13950HX, GeForce RTX 4090 Laptop GPU | Alienware m18 R1 i9-13980HX, GeForce RTX 4090 Laptop GPU | Average NVIDIA GeForce RTX 4090 Laptop GPU | Average of class Gaming | |
|---|---|---|---|---|---|---|---|---|
| Power Consumption | -3% | -14% | -4% | -9% | -46% | -19% | 5% | |
| Idle Minimum * (Watt) | 11 | 11 -0% | 16.1 -46% | 16 -45% | 14 -27% | 21.6 -96% | 16.2 ? -47% | 13.3 ? -21% |
| Idle Average * (Watt) | 17 | 18 -6% | 24 -41% | 20 -18% | 21.6 -27% | 25.2 -48% | 23.1 ? -36% | 19 ? -12% |
| Idle Maximum * (Watt) | 29 | 30 -3% | 34 -17% | 26 10% | 24.8 14% | 56.7 -96% | 34.2 ? -18% | 24.5 ? 16% |
| Load Average * (Watt) | 134 | 136 -1% | 123.6 8% | 135 -1% | 122.5 9% | 164.1 -22% | 130.5 ? 3% | 108.1 ? 19% |
| Witcher 3 ultra * (Watt) | 278 | 280 -1% | 286 -3% | 215 23% | 265 5% | 311 -12% | ||
| Load Maximum * (Watt) | 334 | 363 -9% | 285.7 14% | 299 10% | 418 -25% | 338.9 -1% | 324 ? 3% | 254 ? 24% |
* ... smaller is better
Power consumption Witcher 3 / Stress test
Power consumption with an external monitor
Battery Life
The Aorus 17X AZF achieved runtimes of 6:29 h and 6:43 h in our WLAN test (calling up websites via a script) and video test (short movie Big Buck Bunny, H.264 encoding, FHD, in a loop), respectively. These are acceptable rates and reflect the average for the gaming laptop class. During both tests, the laptop's energy-saving functions were disabled and the display brightness set to around 150 cd/m². In our case, this meant a 50 percent reduction in brightness.
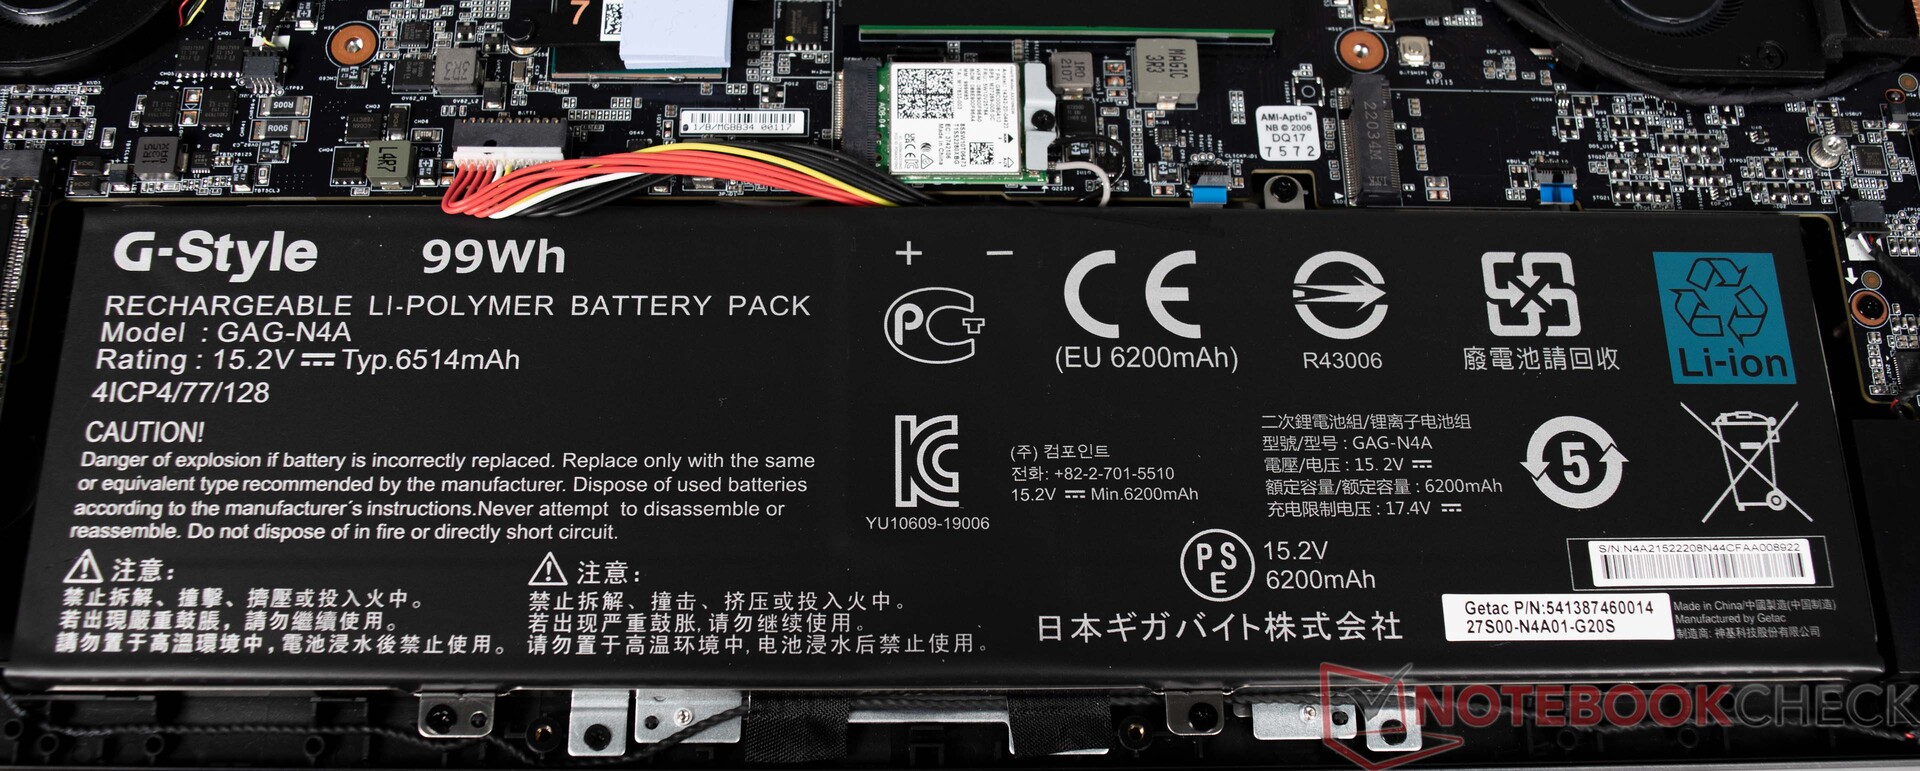
The Aorus 17X AZF is equipped with a large 99 Wh battery, which is also the maximum in a laptop. Almost all comparison devices offer a battery with the same capacity. Only the HP Omen 17 has to make do with a smaller 83 Wh battery and so falls behind noticeably.
| Aorus 17X AZF i9-13900HX, GeForce RTX 4090 Laptop GPU, 99 Wh | Medion Erazer Beast X40 i9-13900HX, GeForce RTX 4090 Laptop GPU, 99.8 Wh | MSI GE78HX 13VH-070US i9-13950HX, GeForce RTX 4080 Laptop GPU, 99 Wh | HP Omen 17-ck2097ng i9-13900HX, GeForce RTX 4080 Laptop GPU, 83 Wh | MSI Titan GT77 HX 13VI i9-13950HX, GeForce RTX 4090 Laptop GPU, 99.9 Wh | Alienware m18 R1 i9-13980HX, GeForce RTX 4090 Laptop GPU, 97 Wh | Average of class Gaming | |
|---|---|---|---|---|---|---|---|
| Battery runtime | -1% | -18% | -44% | -20% | -46% | -1% | |
| Reader / Idle (h) | 9 | 9.4 4% | 7.3 -19% | 4.2 -53% | 5.6 -38% | 8.71 ? -3% | |
| H.264 (h) | 6.7 | 6.9 3% | 3.7 -45% | 6 -10% | 8.26 ? 23% | ||
| WiFi v1.3 (h) | 6.5 | 6.4 -2% | 6.1 -6% | 3.6 -45% | 5.3 -18% | 4.3 -34% | 7.01 ? 8% |
| Load (h) | 2.1 | 1.9 -10% | 1.5 -29% | 1.4 -33% | 1.4 -33% | 0.7 -67% | 1.47 ? -30% |
Pros
Cons
Verdict- Mobile powerhouse for gaming without compromise
The Aorus 17X AZF is a gaming notebook designed for extreme requirements. The 17-incher was able to run all tested games without issue in the native display resolution and without losses in quality. However, one is limited to 1440p gaming, which is fine. Performance reserves are available and can be accessed via external 4K displays. The Nvidia GeForce RTX 4090 laptop GPU offers an enormous amount of performance and is able to maintain this permanently. This is flanked by a powerful Intel Core-i7-13900HX. In a direct comparison with comparable devices, however, the CPU in the Aorus 17X AZF is not always able to assert itself. Nevertheless, the gap is not so large and one is unlikely to notice this in everyday life.
We really like the remaining hardware: 32 GB DDR5 RAM and a total of 2 TB SSD storage make for an excellent system overall so that you won't have to upgrade for a while. The QHD-capable display also fits in well with the laptop and is also suitable for photo and video editing.
On the other hand, there are limitations in the volume, which cannot be ignored during load. Then again, the problem is also common to other gaming laptops and is not unique to the Aorus 17X AZF. The connectivity is also in need of improvement and could be more extensive for a 17-inch device. At least the laptop has a modern Thunderbolt connection.
In terms of mobility, the Aorus 17X AZF is well positioned because the recorded battery runtimes reflect a good class average. The device can even be operated almost silently via the Gigabyte Control Center, which offers numerous adjustment options.
Those looking for a cheaper alternative should take a look at the HP Omen 17, which also delivers excellent performance in 1,440p with the Nvidia GeForce RTX 4080 laptop GPU.
Price and Availability
Interested buyers are advised to check directly via the corresponding product page on Gigabyte's webstore, where a list of official resellers/distributors can be found. In the US, for example, the Aorus 17X AZF is listed on both Amazon and Newegg for $3,499.00 (but currently sold out on both platforms).
Prices are as of 17.04.2023 and are subject to change.
Aorus 17X AZF
- 04/14/2023 v7 (old)
Sebastian Bade
Transparency
The selection of devices to be reviewed is made by our editorial team. The test sample was provided to the author as a loan by the manufacturer or retailer for the purpose of this review. The lender had no influence on this review, nor did the manufacturer receive a copy of this review before publication. There was no obligation to publish this review. As an independent media company, Notebookcheck is not subjected to the authority of manufacturers, retailers or publishers.
This is how Notebookcheck is testing
Every year, Notebookcheck independently reviews hundreds of laptops and smartphones using standardized procedures to ensure that all results are comparable. We have continuously developed our test methods for around 20 years and set industry standards in the process. In our test labs, high-quality measuring equipment is utilized by experienced technicians and editors. These tests involve a multi-stage validation process. Our complex rating system is based on hundreds of well-founded measurements and benchmarks, which maintains objectivity. Further information on our test methods can be found here.
Price comparison

