MSI Titan GT77 HX 13V Review - Ultimate Gaming Laptop with RTX 4090 & Core i9-13950HX
MSI’s Titan GT77 series offers flagship gaming laptops designed for maximum performance. The new 2023 model GT77 HX 13VI continues this concept and uses some of the best mobile components that are available. In addition to the latest Raptor Lake-HX CPUs from Intel, you can also enjoy the brand-new laptop GPUs from Nvidia: GeForce RTX 4080 or GeForce RTX 4090. MSI also equips the new GT77 with a 4K Mini-LED screen with a refresh rate of 144 Hz.
Our review unit is a pre-production unit with the Core i9-13950HX, GeForce RTX 4090, 64 GB RAM, 4 TB SSD storage, and the 4K Mini-LED screen. Retail configurations (GT77 HX 13VI) with the same specs will ship with the Core i9-13980HX (slightly higher clocks, but no vPro support in return) for an RRP of 6599 Euros in Germany ($5299); the SKU with the RTX 4080 and 2 TB SSD storage retails for 5499 Euros (GT77 HX 13VH, $4299).
Update 03/02/2023: We had the chance to take another look at the retail unit of the GT77 with the Core i9-13980HX. The results are available in the CPU section and we also took another look at the SSD performance. Our stress test does not show any differences to the pre-production unit and the cooling performance is still 225W under combined CPU/GPU workloads. The bug of the non-working brightness control in the dGPU mode was fixed by a software update. All in all, the existing results and the rating did not change.
Possible Competitors
Rating | Date | Model | Weight | Height | Size | Resolution | Price |
|---|---|---|---|---|---|---|---|
| 89 % v7 (old) | 02 / 2023 | MSI Titan GT77 HX 13VI i9-13950HX, GeForce RTX 4090 Laptop GPU | 3.5 kg | 23 mm | 17.30" | 3840x2160 | |
| 91.2 % v7 (old) | 02 / 2023 | Razer Blade 16 Early 2023 i9-13950HX, GeForce RTX 4080 Laptop GPU | 2.4 kg | 21.99 mm | 16.00" | 2560x1600 | |
| 86.9 % v7 (old) | 11 / 2022 | Asus ROG Strix Scar 17 SE G733CX-LL014W i9-12950HX, GeForce RTX 3080 Ti Laptop GPU | 2.9 kg | 28.3 mm | 17.30" | 2560x1440 | |
| 88.3 % v7 (old) | 08 / 2022 | MSI Titan GT77 12UHS i9-12900HX, GeForce RTX 3080 Ti Laptop GPU | 3.3 kg | 23 mm | 17.30" | 1920x1080 | |
| 89.2 % v7 (old) | 05 / 2022 | Alienware x17 R2 P48E i9-12900HK, GeForce RTX 3080 Ti Laptop GPU | 3.1 kg | 20.9 mm | 17.30" | 1920x1080 | |
| 87.6 % v7 (old) | 08 / 2022 | Schenker XMG Neo 17 M22 R9 6900HX, GeForce RTX 3080 Ti Laptop GPU | 2.8 kg | 27 mm | 17.00" | 2560x1600 |
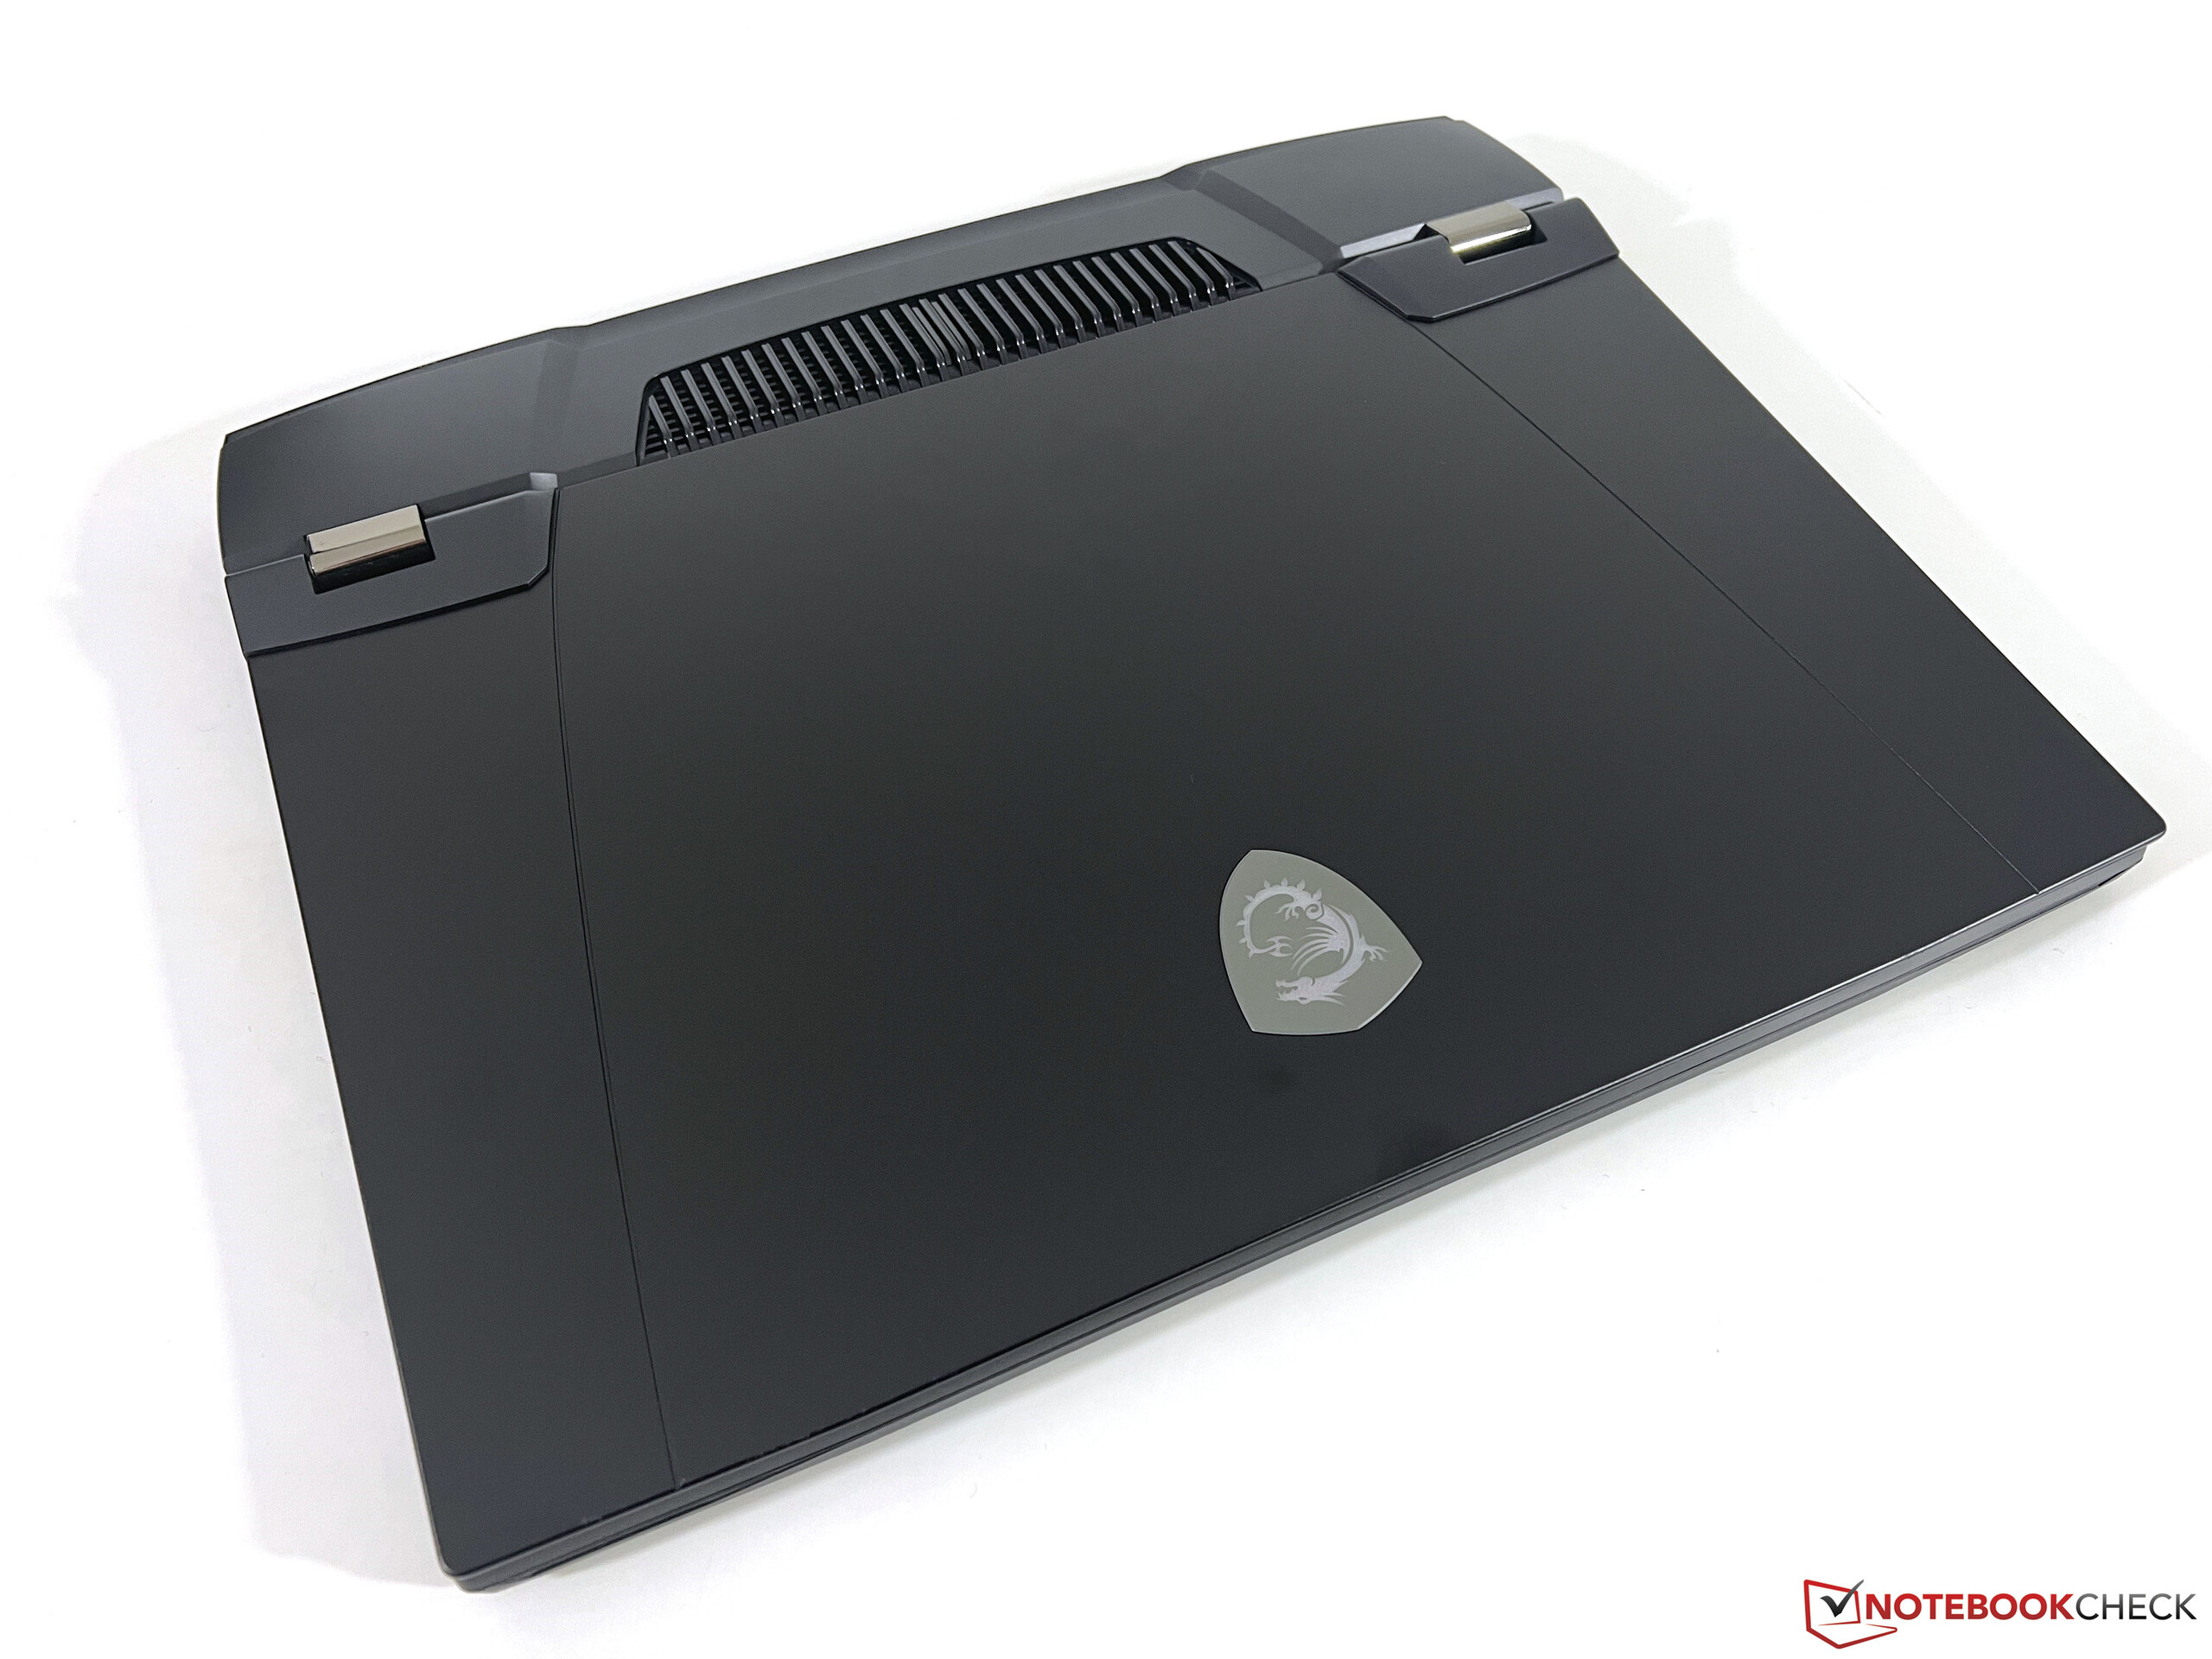
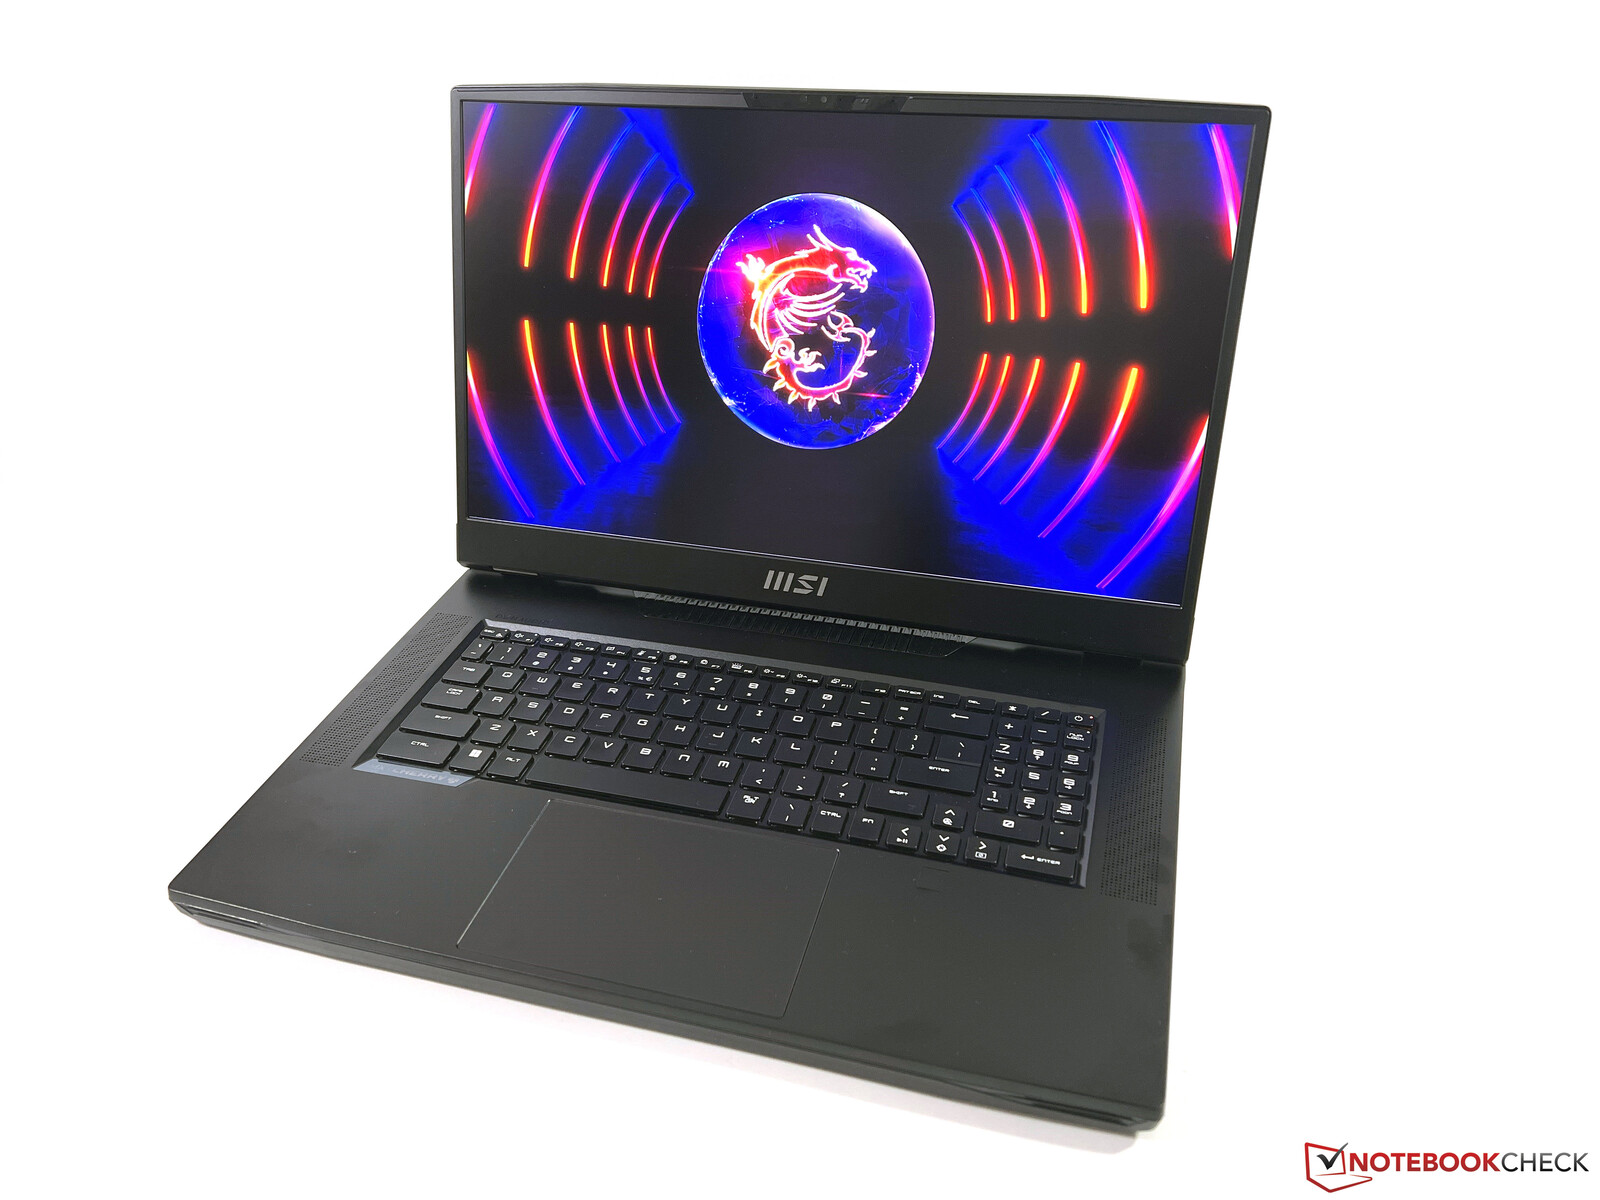
Case - Titan with limited illumination
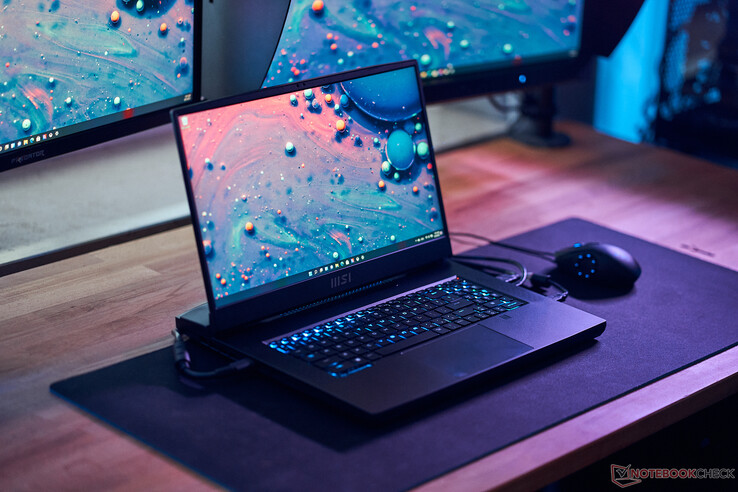
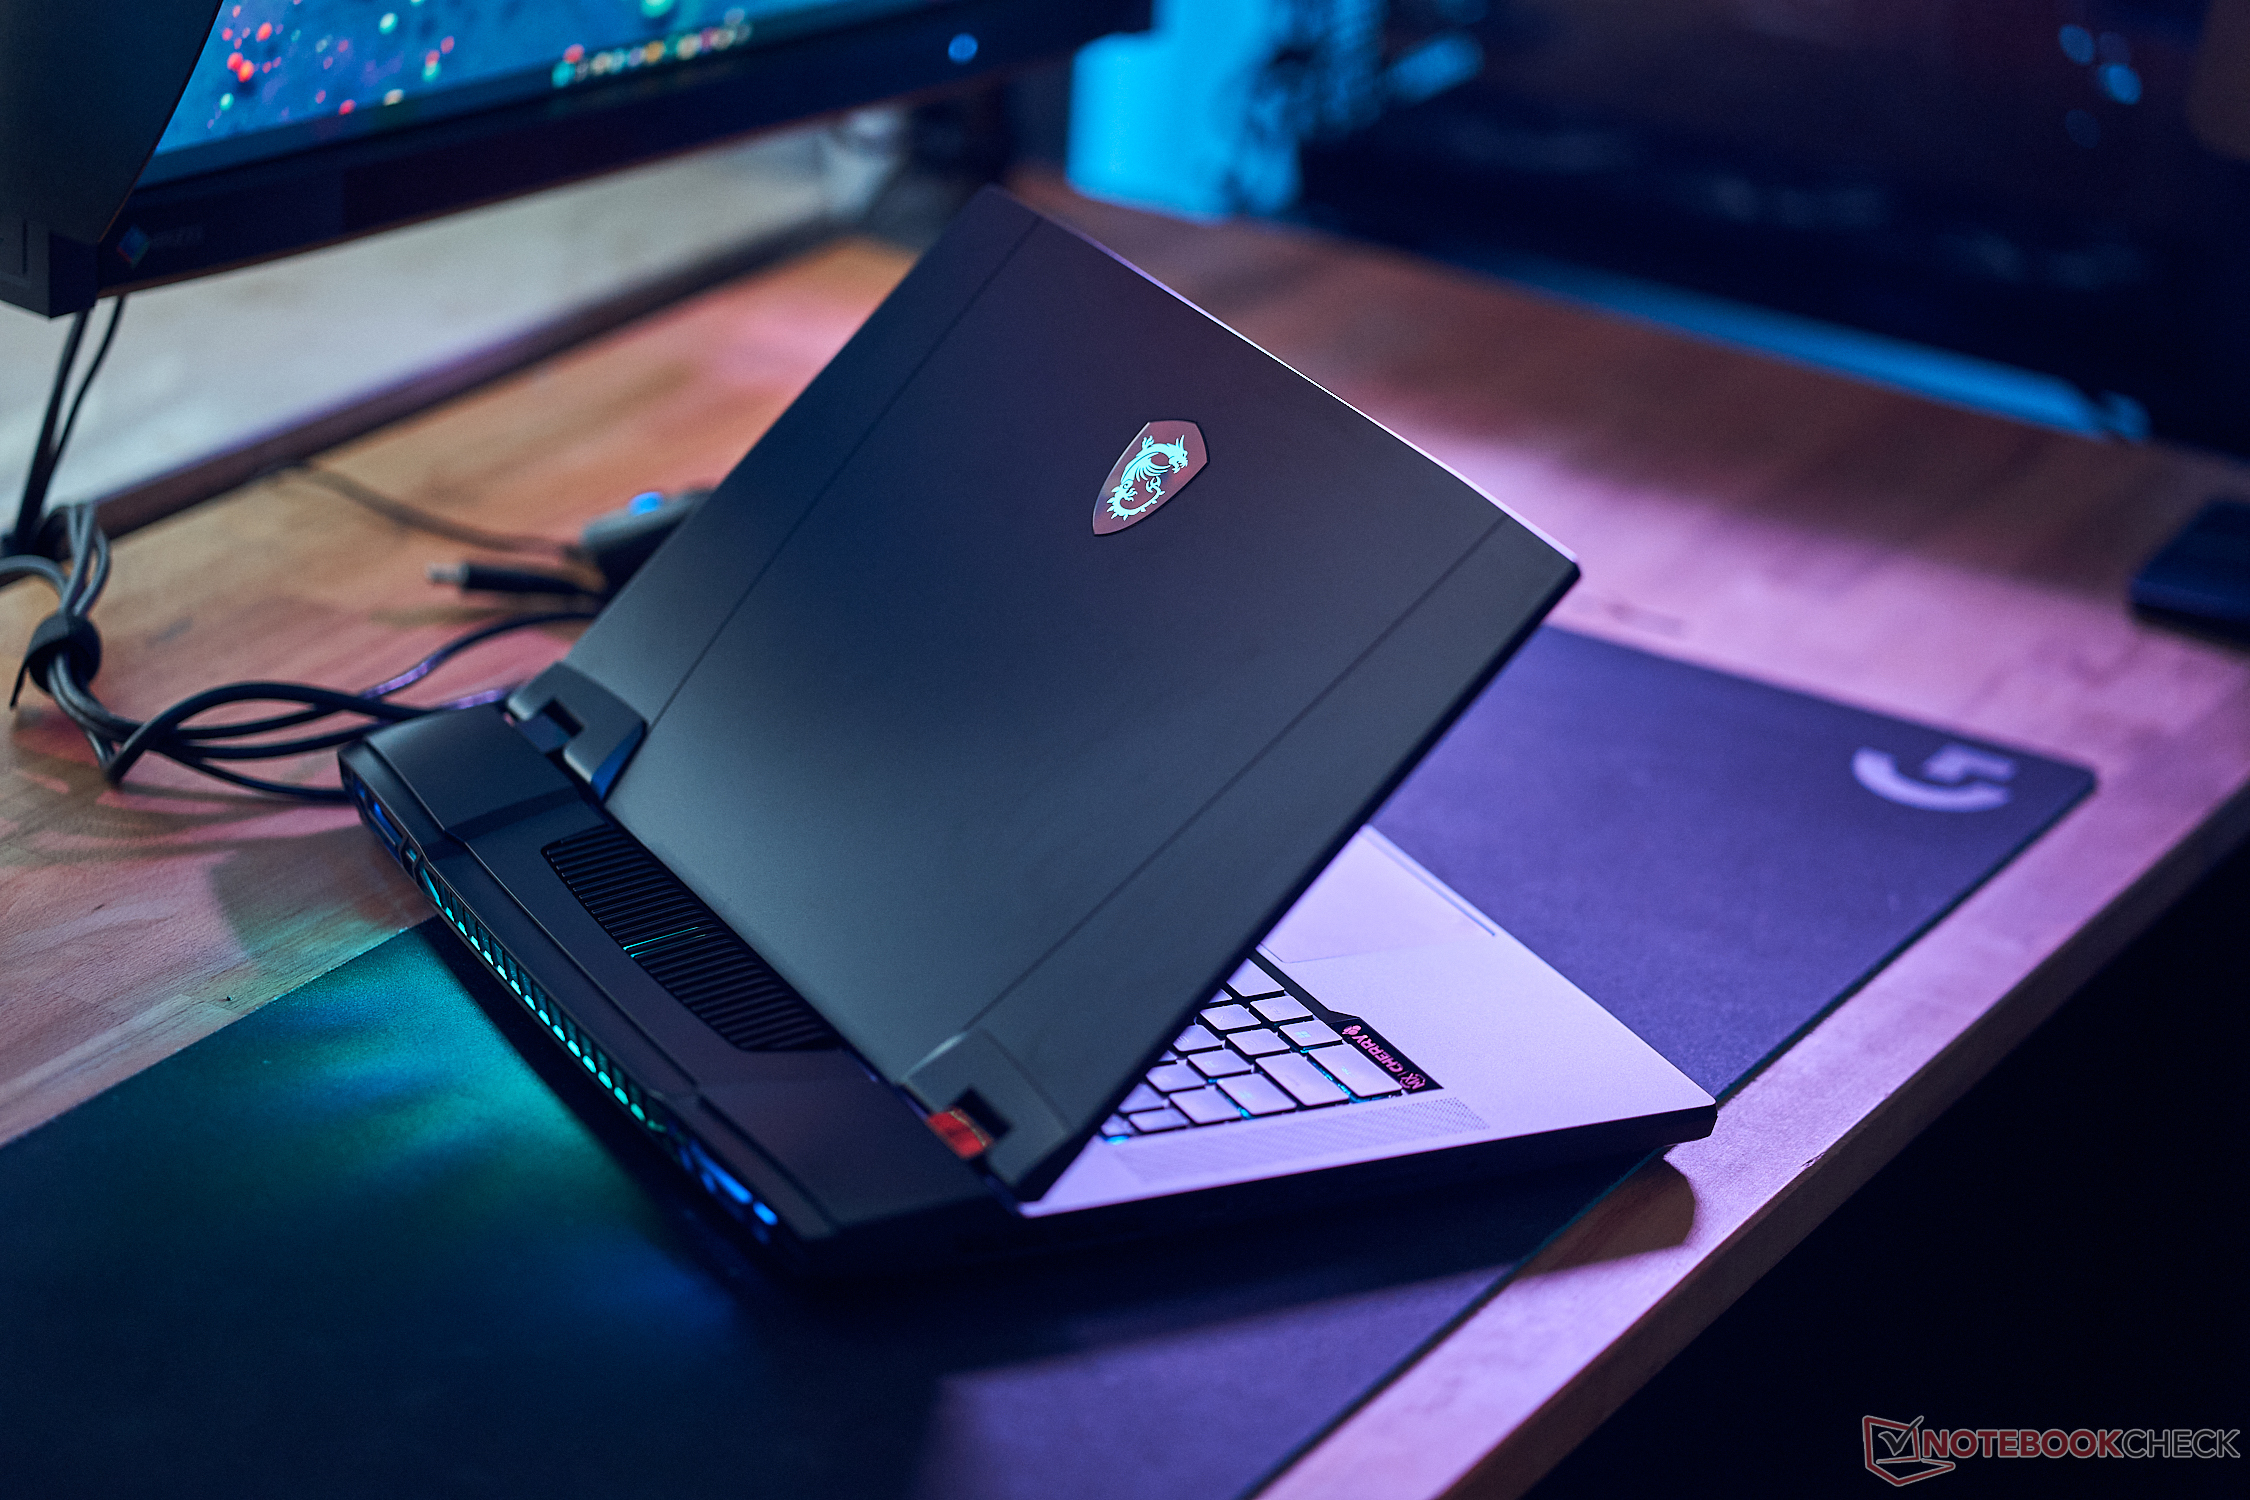
MSI introduced a new chassis design for last year’s Titan GT77, so there are no visual changes for the new model. The black chassis is very restrained for a high-end gamer and the RGB illumination is also limited to the logo on the lid as well as the fan exhausts at the rear. It comes down to personal preferences, but you can at least also use the laptop in professional environments when you turn the illumination off. You will quickly see fingerprints on the smooth surfaces, which require regular cleaning. MSI still uses a 16:9 aspect ratio screen for the 2023 model.
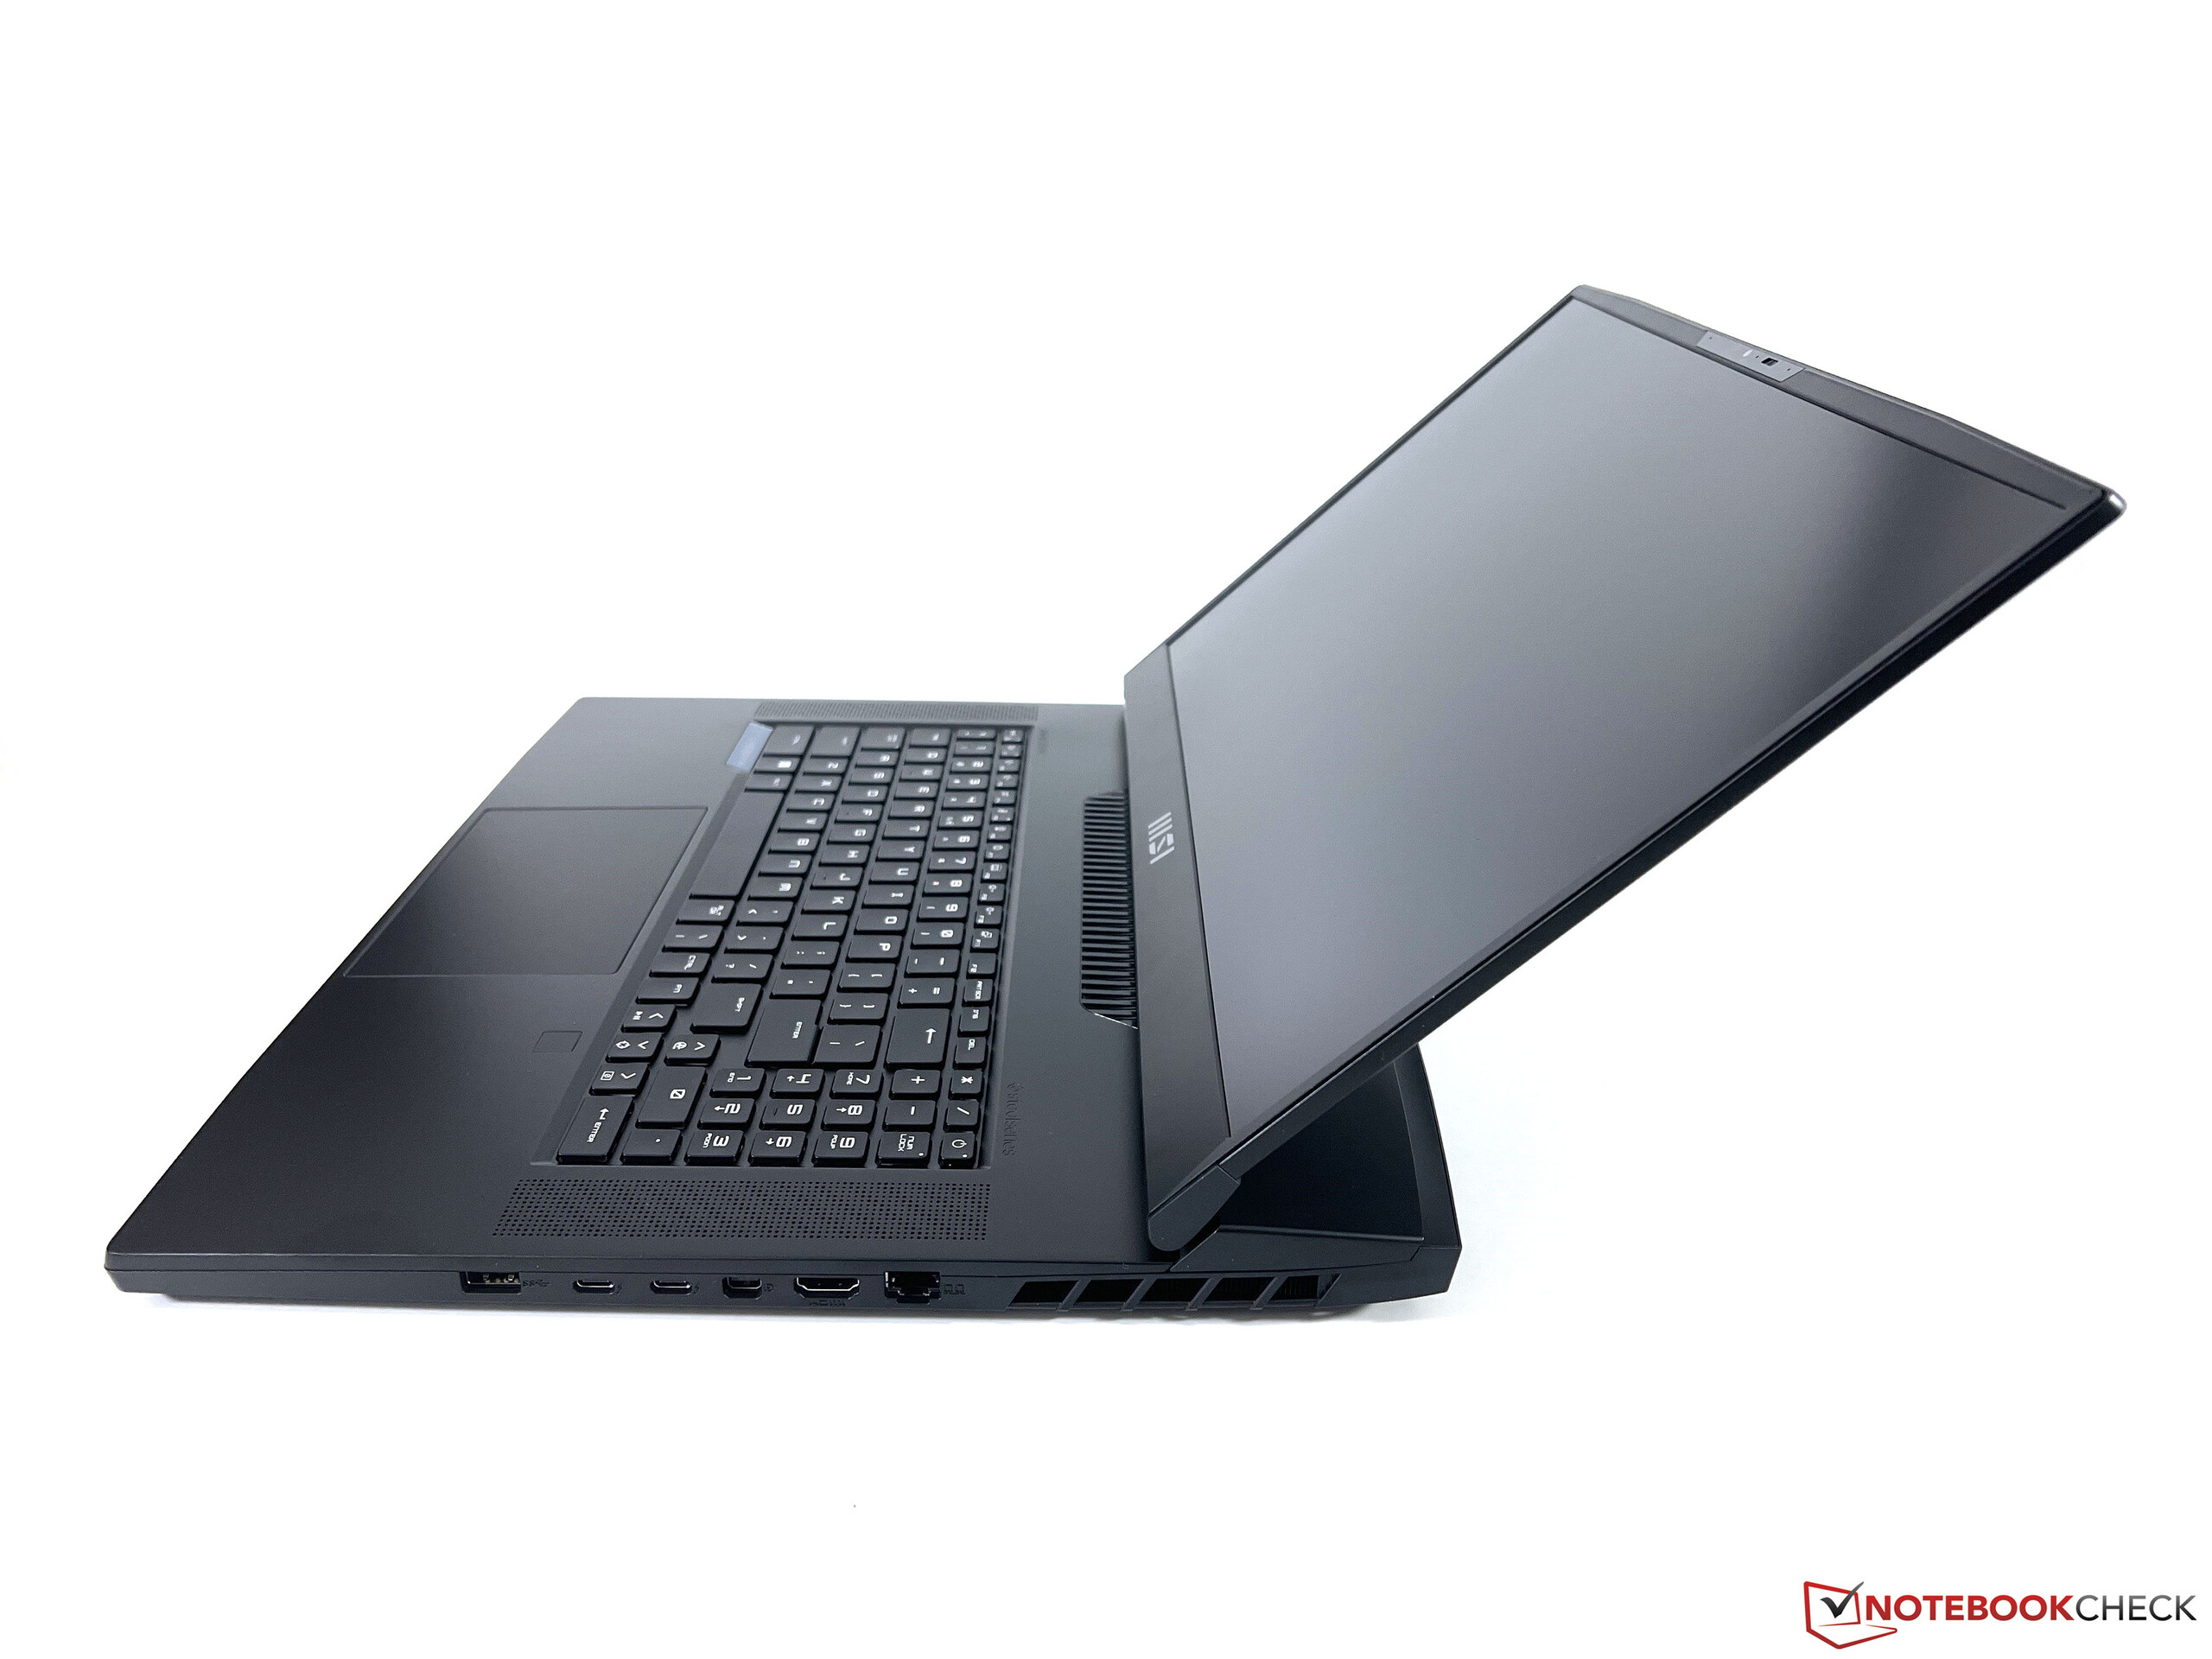
The quality of the chassis is decent, even though it is almost entirely made of plastic. Especially the rough material at the bottom does not really meet the expectations of the high price and could also be uses on a laptop for 500 Euros. The overall build quality is decent though; the base unit is very sturdy and there are only minor creaking sounds. The lid on the other hand is more flexible, but we could not provoke picture distortions. We would have preferred slightly stiffer display hinges and the lid wobbles a bit when you adjust the opening angle (up to ~135 degrees).
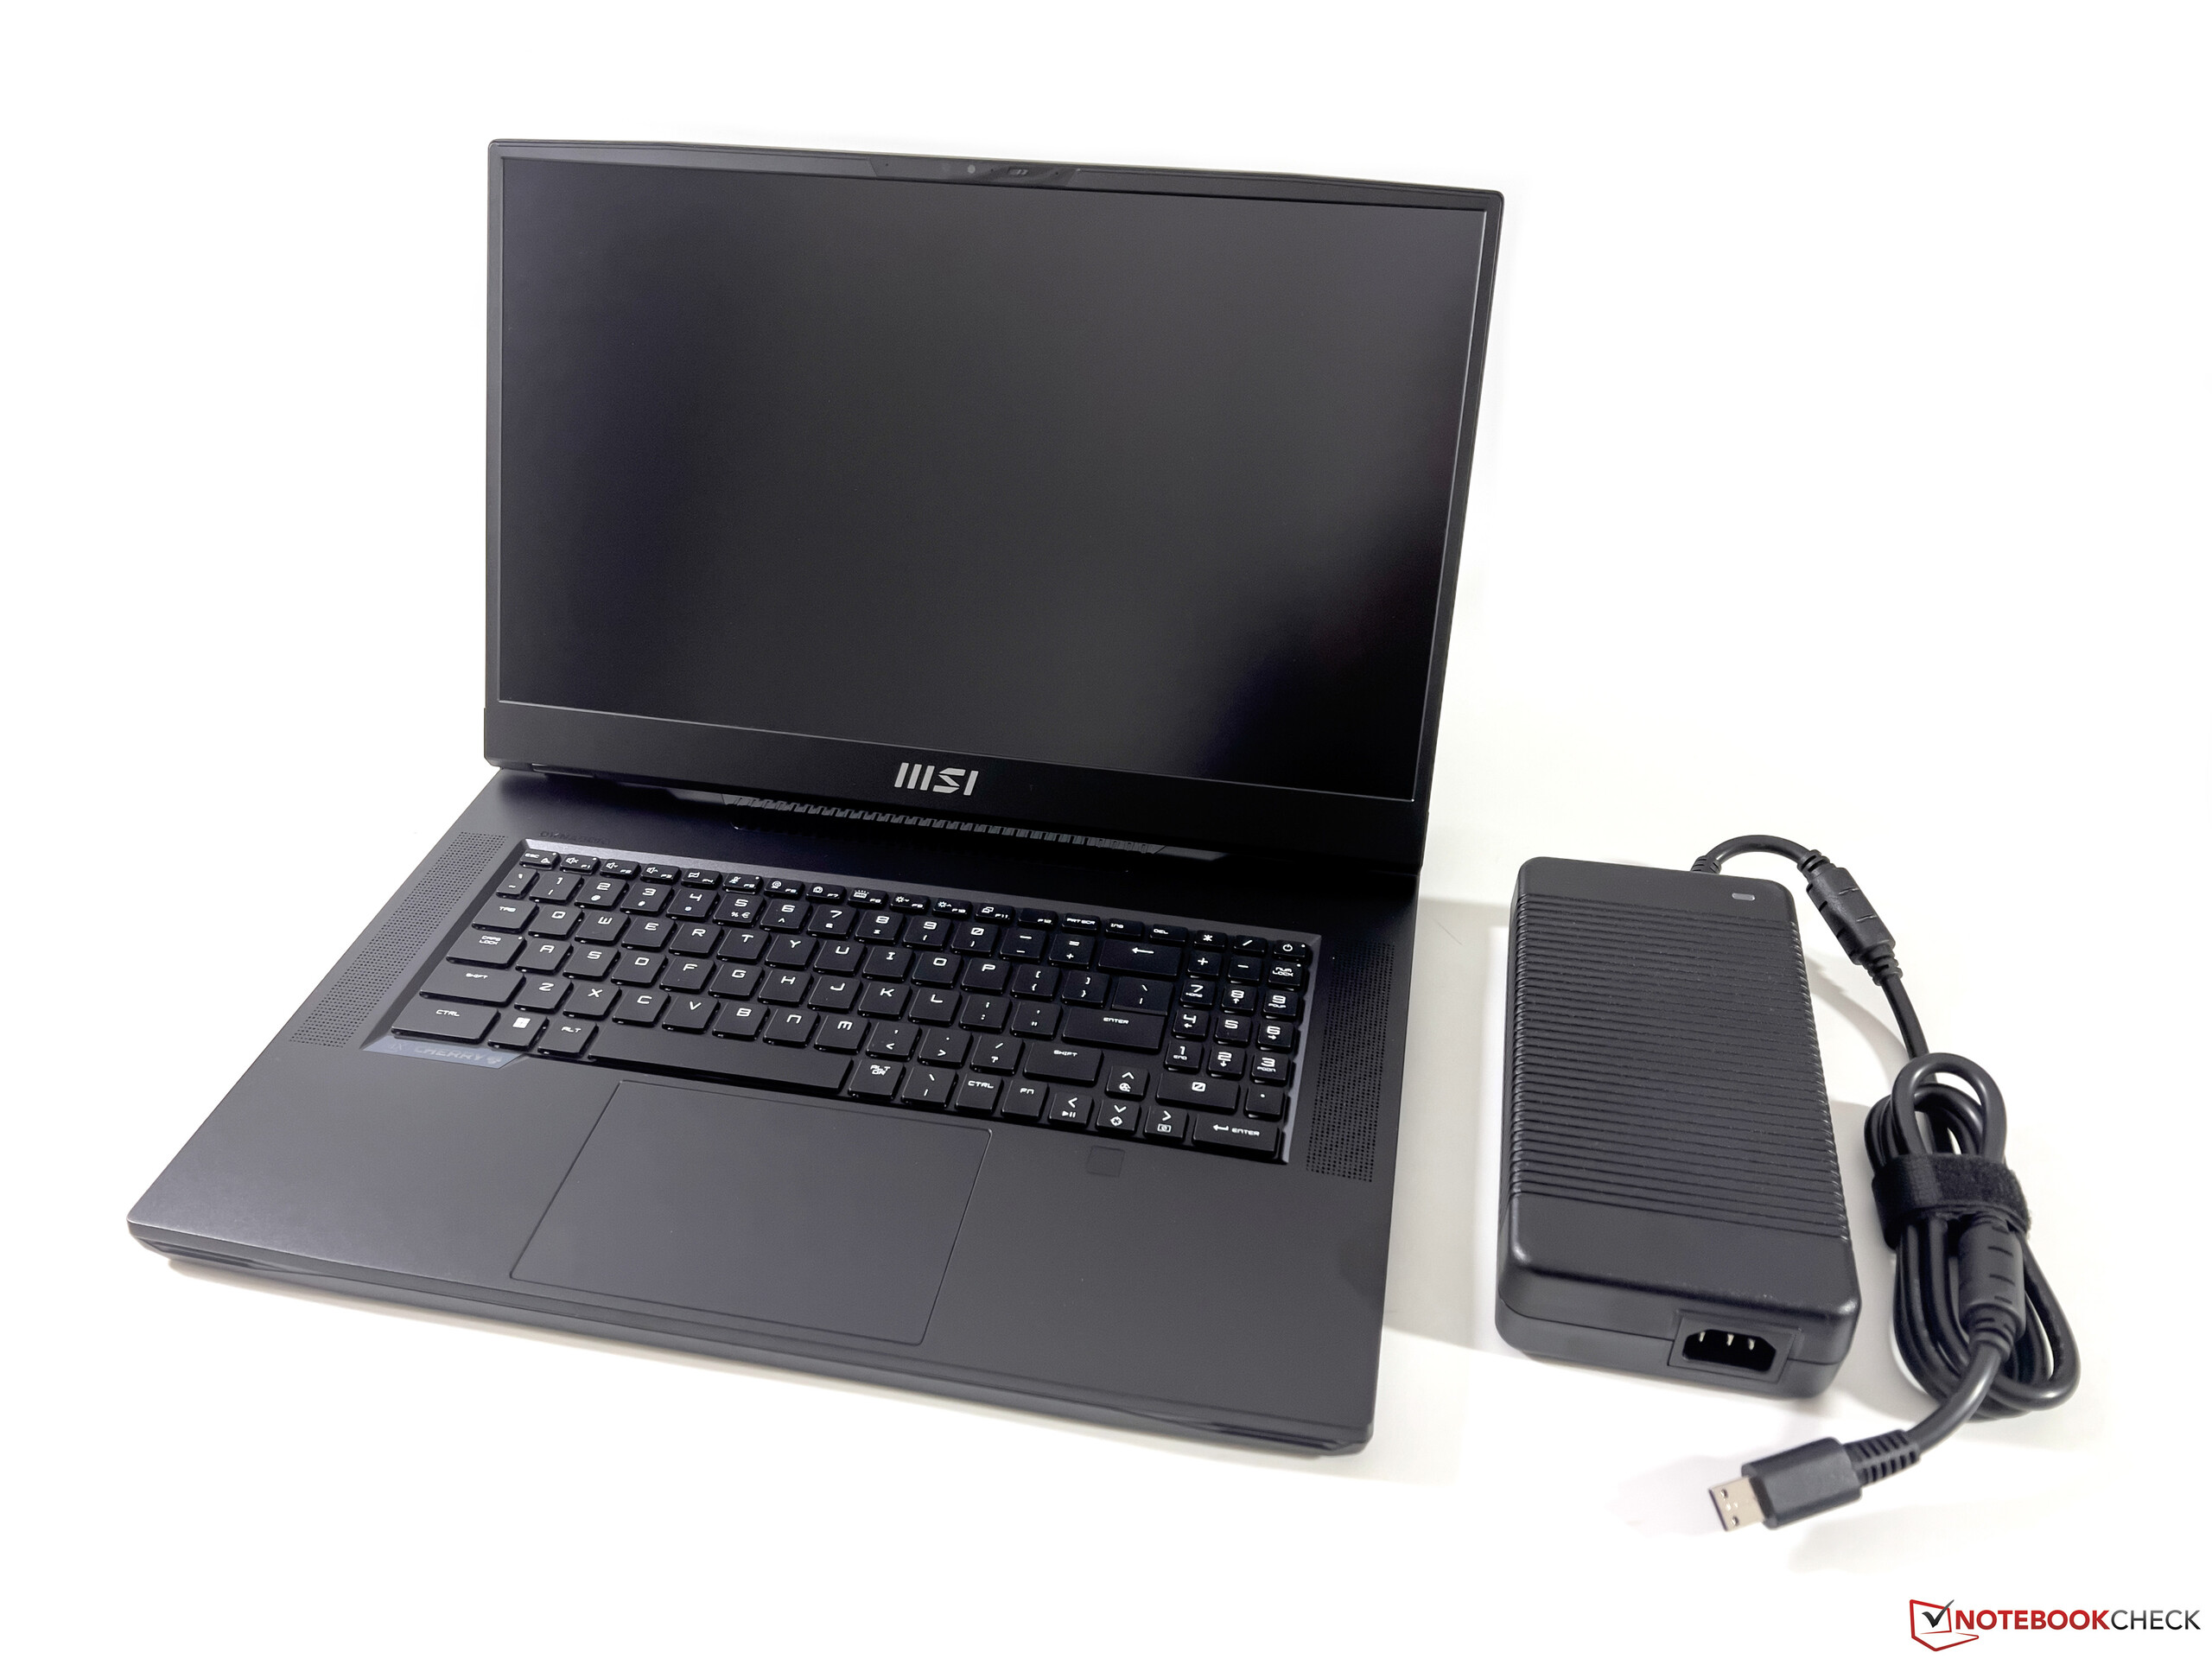
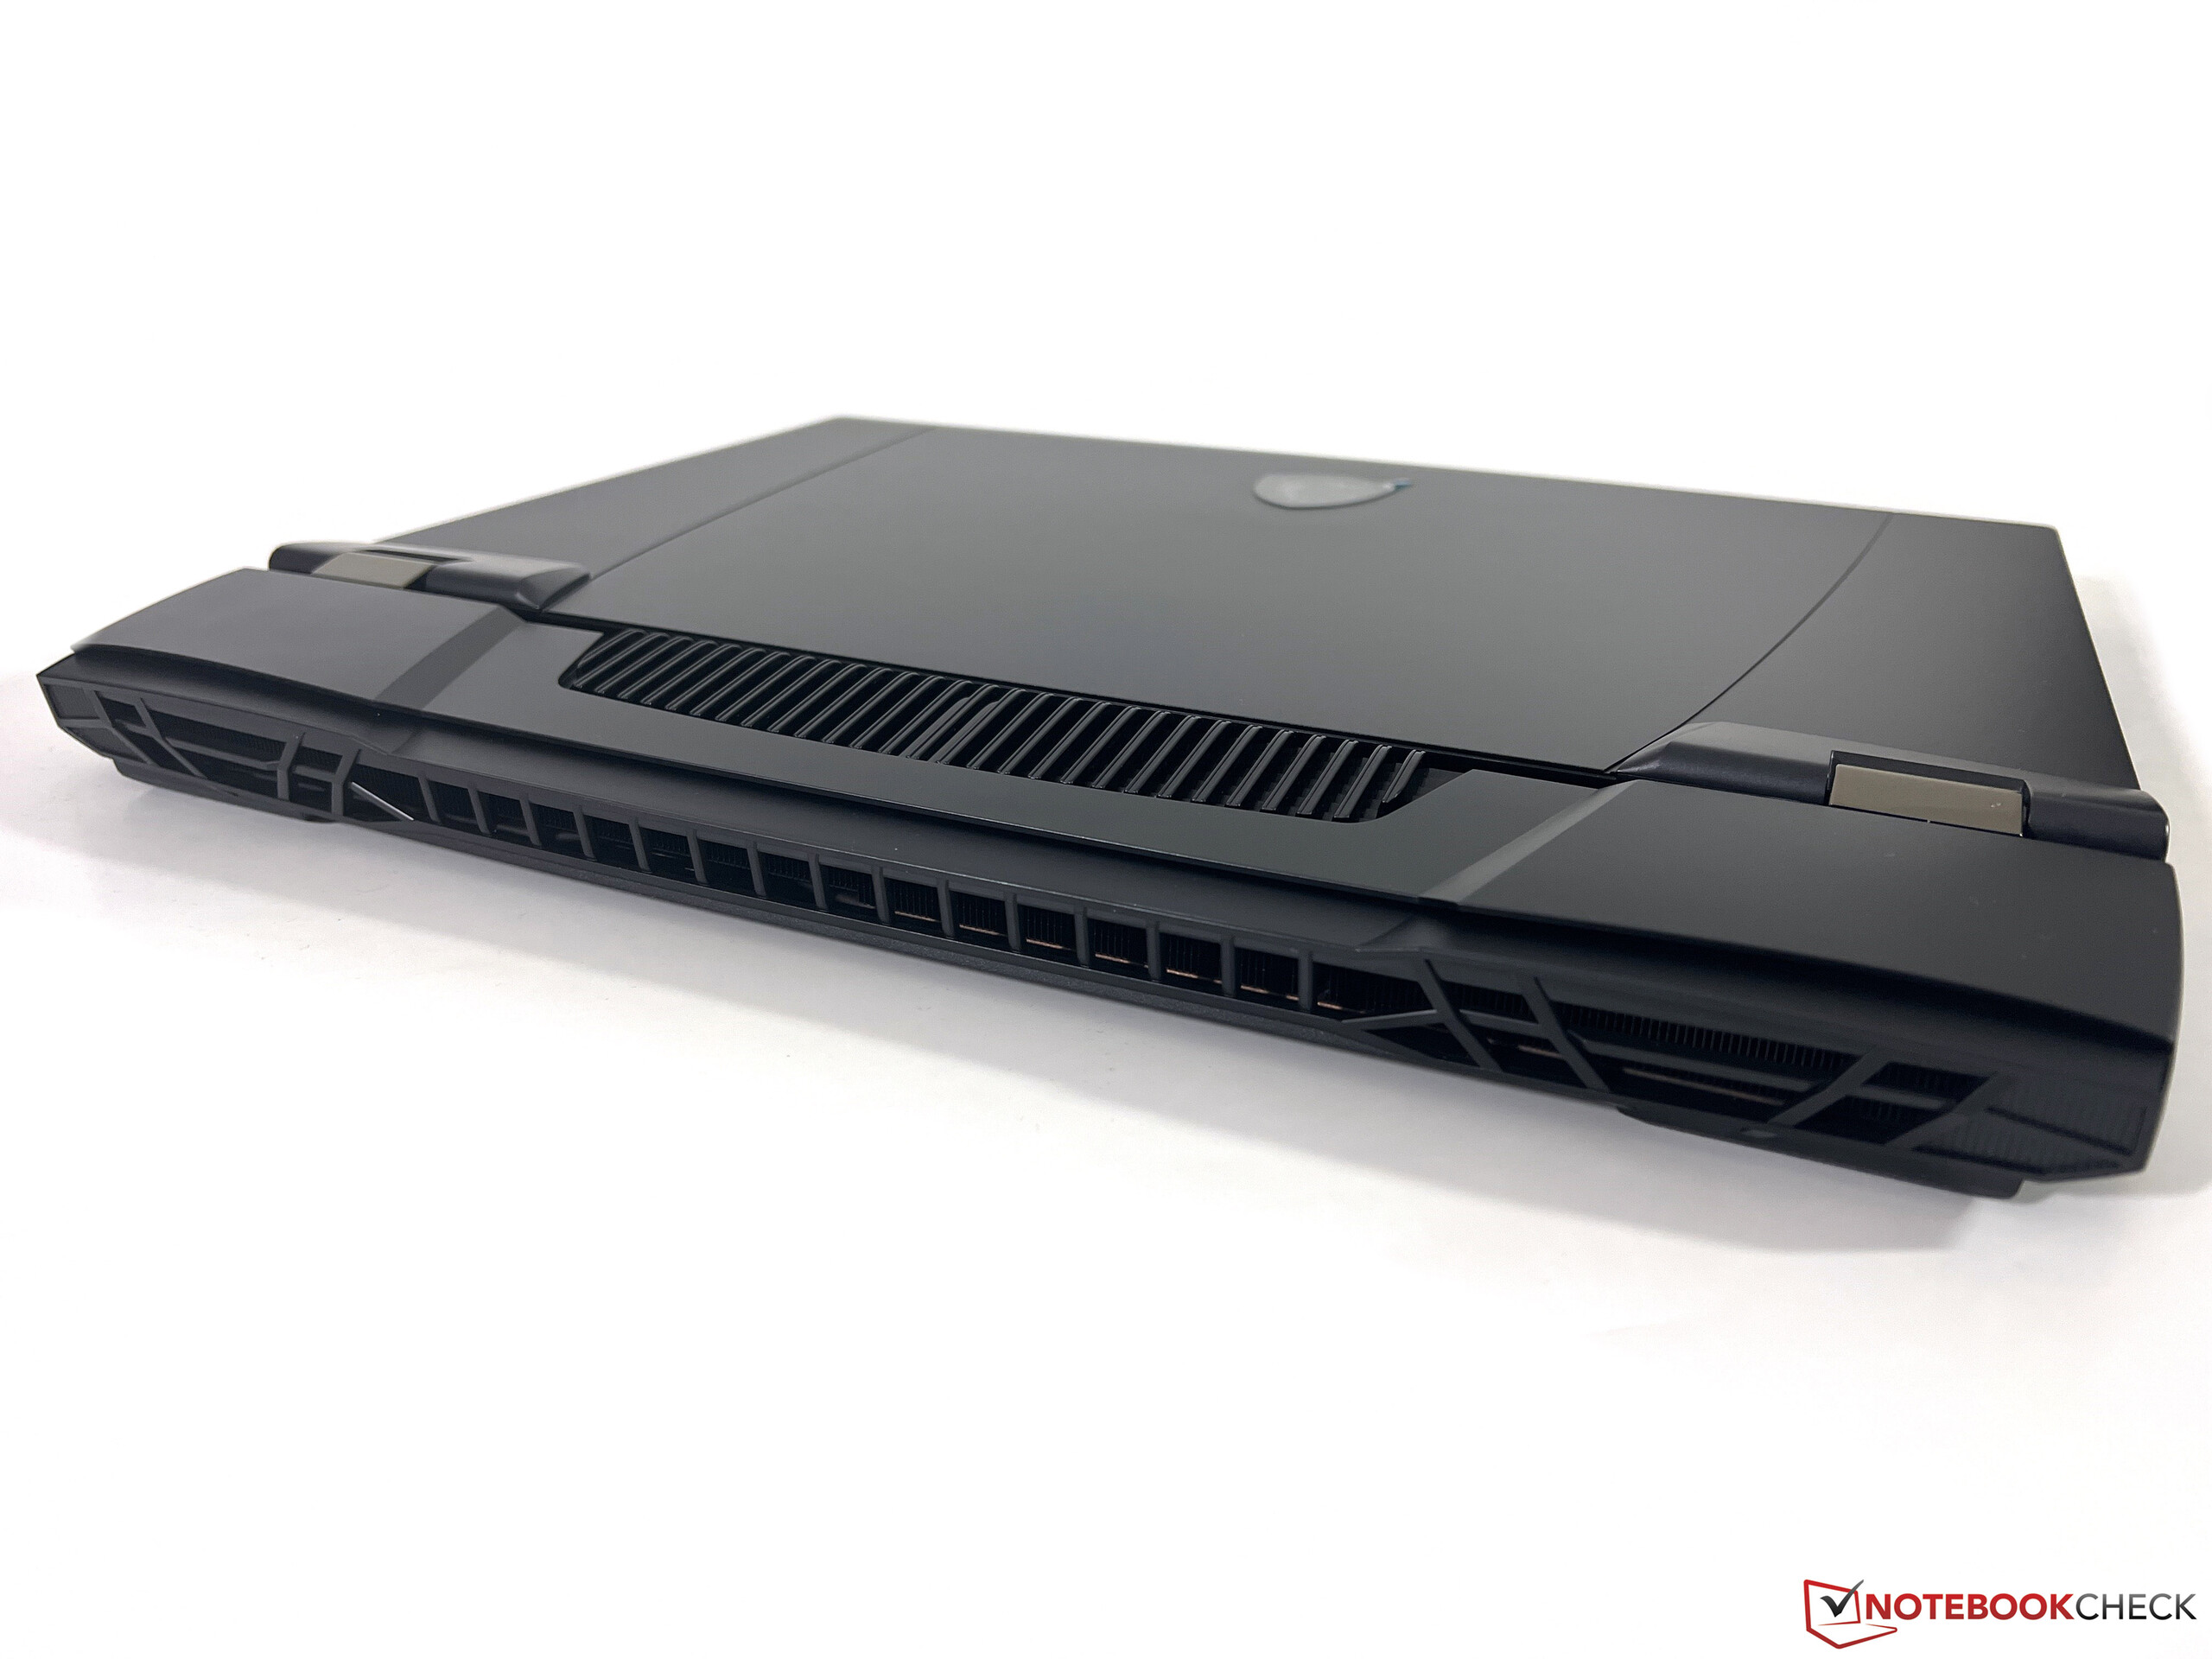
The GT77 is still a comparatively slim machine at 2.3 cm, especially considering the powerful hardware. However, due to large cooling unit at the rear, the notebook is very deep and has a much larger footprint than its rivals. It is also very heavy at almost 3.5 kg and you have to add another 1.4 kg for the bulky 330W power adapter.
Connectivity - Thunderbolt and card reader
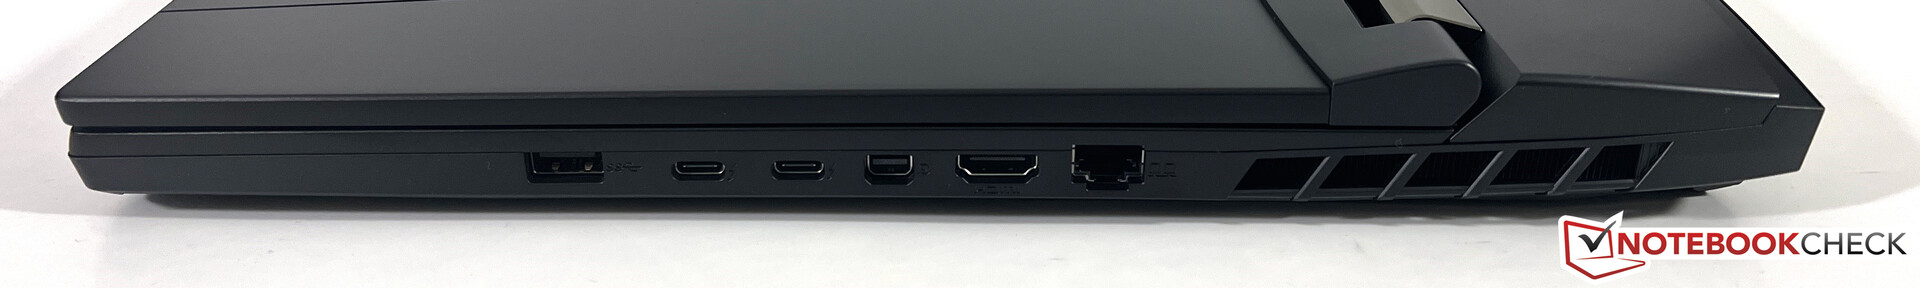
Nothing changed in terms of ports and you still get all important standards. All the ports are located at the two sides since the rear area is exclusively used for cooling. You can also charge the battery at the rear USB-C port, but it requires a 100W power adapter (65W modules did not work).
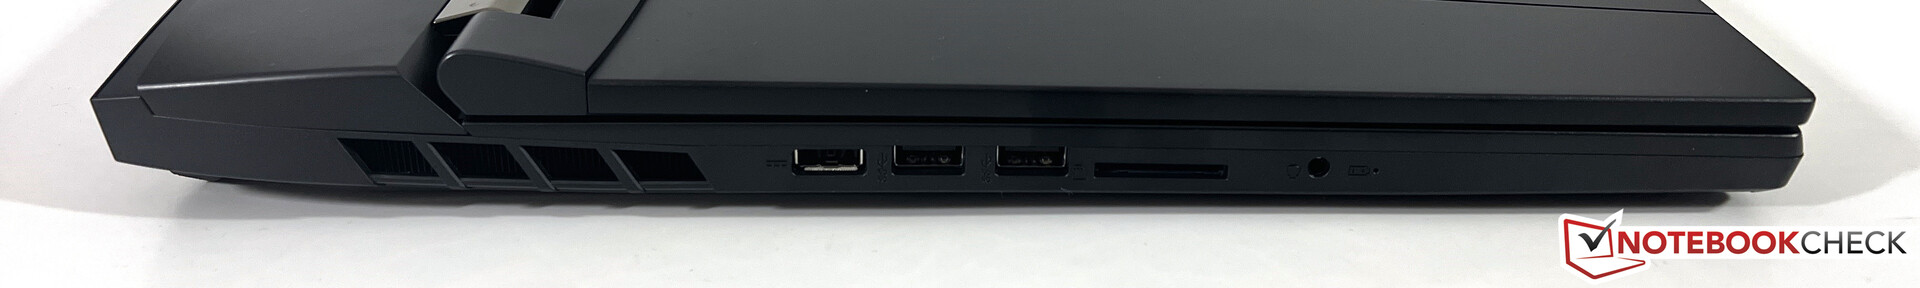
SD Card Reader
The SD-card reader can accommodate full-size memory cards and manages average transfer rates of more than 80 MB/s with our reference card (AV Pro V60).
| SD Card Reader | |
| average JPG Copy Test (av. of 3 runs) | |
| Alienware x17 R2 P48E (AV Pro V60) | |
| Razer Blade 16 Early 2023 (AV PRO microSD 128 GB V60) | |
| Average of class Gaming (20 - 210, n=62, last 2 years) | |
| MSI Titan GT77 HX 13VI (Angelibird AV Pro V60) | |
| MSI Titan GT77 12UHS (AV PRO microSD 128 GB V60) | |
| Schenker XMG Neo 17 M22 (AV PRO microSD 128 GB V60) | |
| maximum AS SSD Seq Read Test (1GB) | |
| Alienware x17 R2 P48E (AV Pro V60) | |
| Razer Blade 16 Early 2023 (AV PRO microSD 128 GB V60) | |
| Average of class Gaming (25.5 - 261, n=59, last 2 years) | |
| MSI Titan GT77 12UHS (AV PRO microSD 128 GB V60) | |
| MSI Titan GT77 HX 13VI (Angelibird AV Pro V60) | |
Communication
MSI equips the new Titan GT77 with the Wi-Fi module Killer AX1690i, which supports the current Wi-Fi 6E standard as well as Bluetooth 5.3. Our U.S. sample did not connect to the 6 GHz of our reference router from Asus, but the signal quality was also very good when we used the 5 GHz network (Wi-Fi 6). You can also use the 2.5 Gbps Ethernet port.
Webcam
The webcam is equipped with a mechanical shutter, but that’s pretty much all the positive aspects. MSI still uses the bad 720p webcam, which does not take good pictures even in good lighting conditions. You can expect more in 2023, especially considering the price.


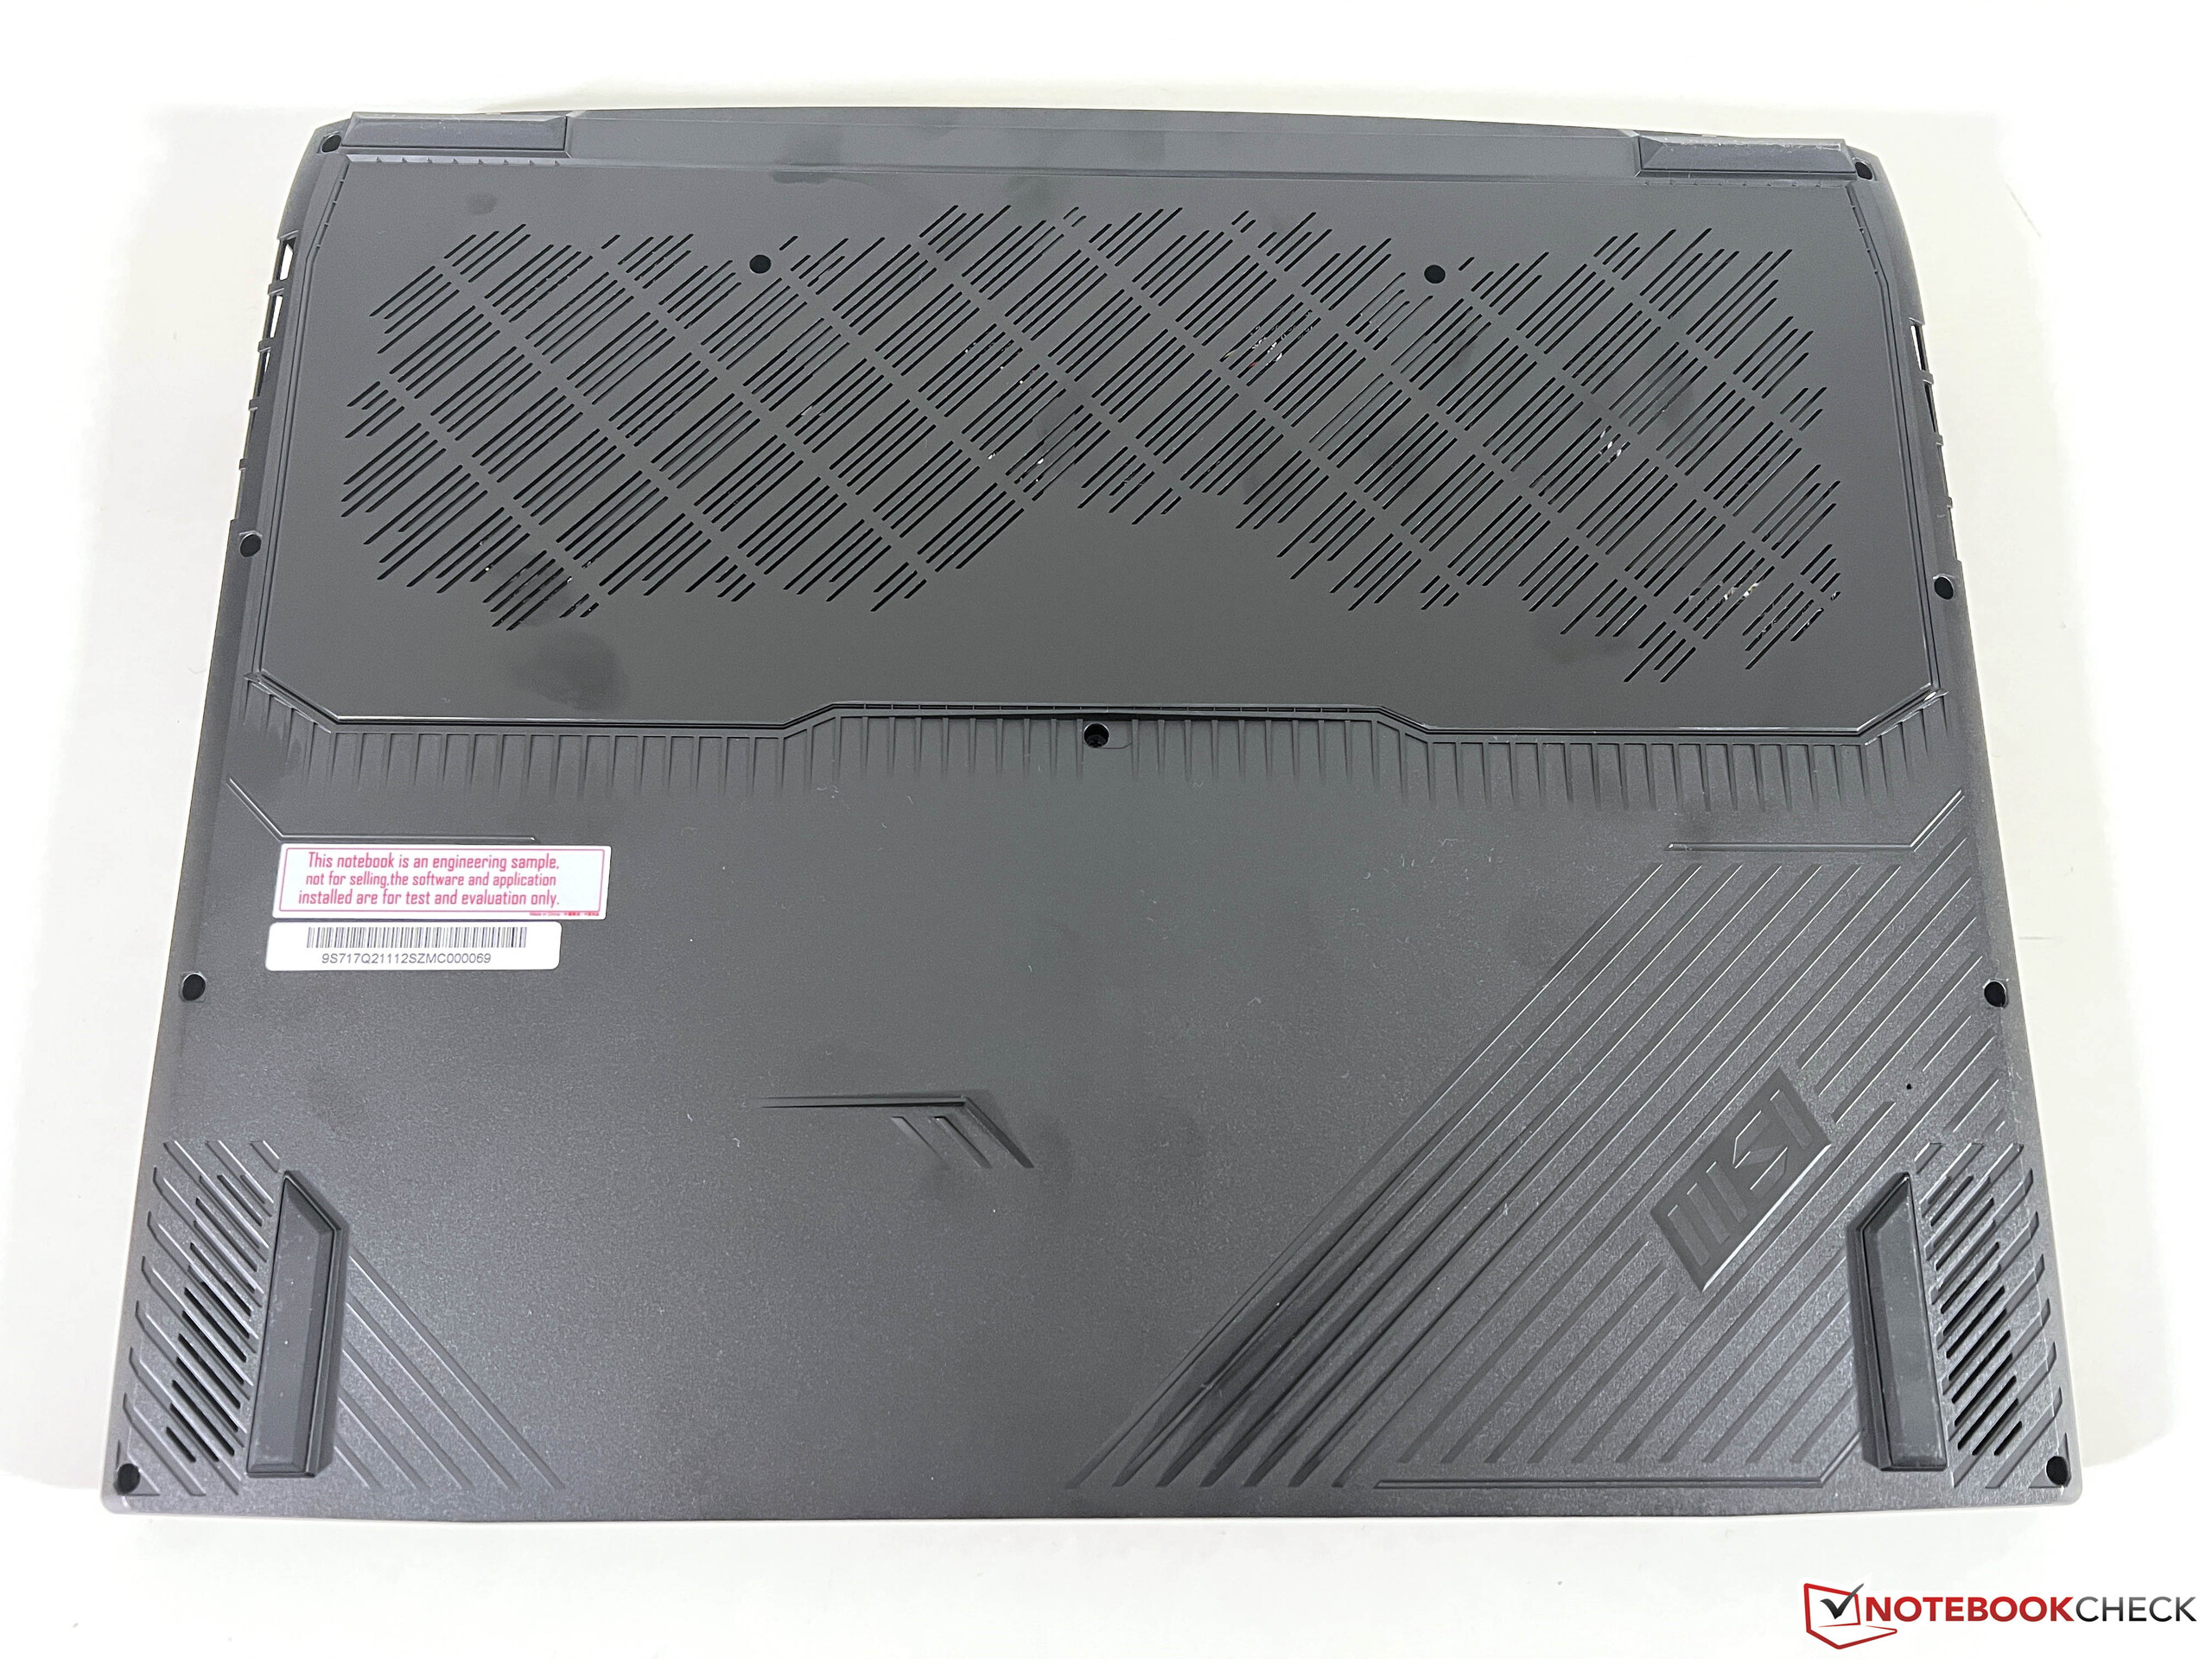
Maintenance
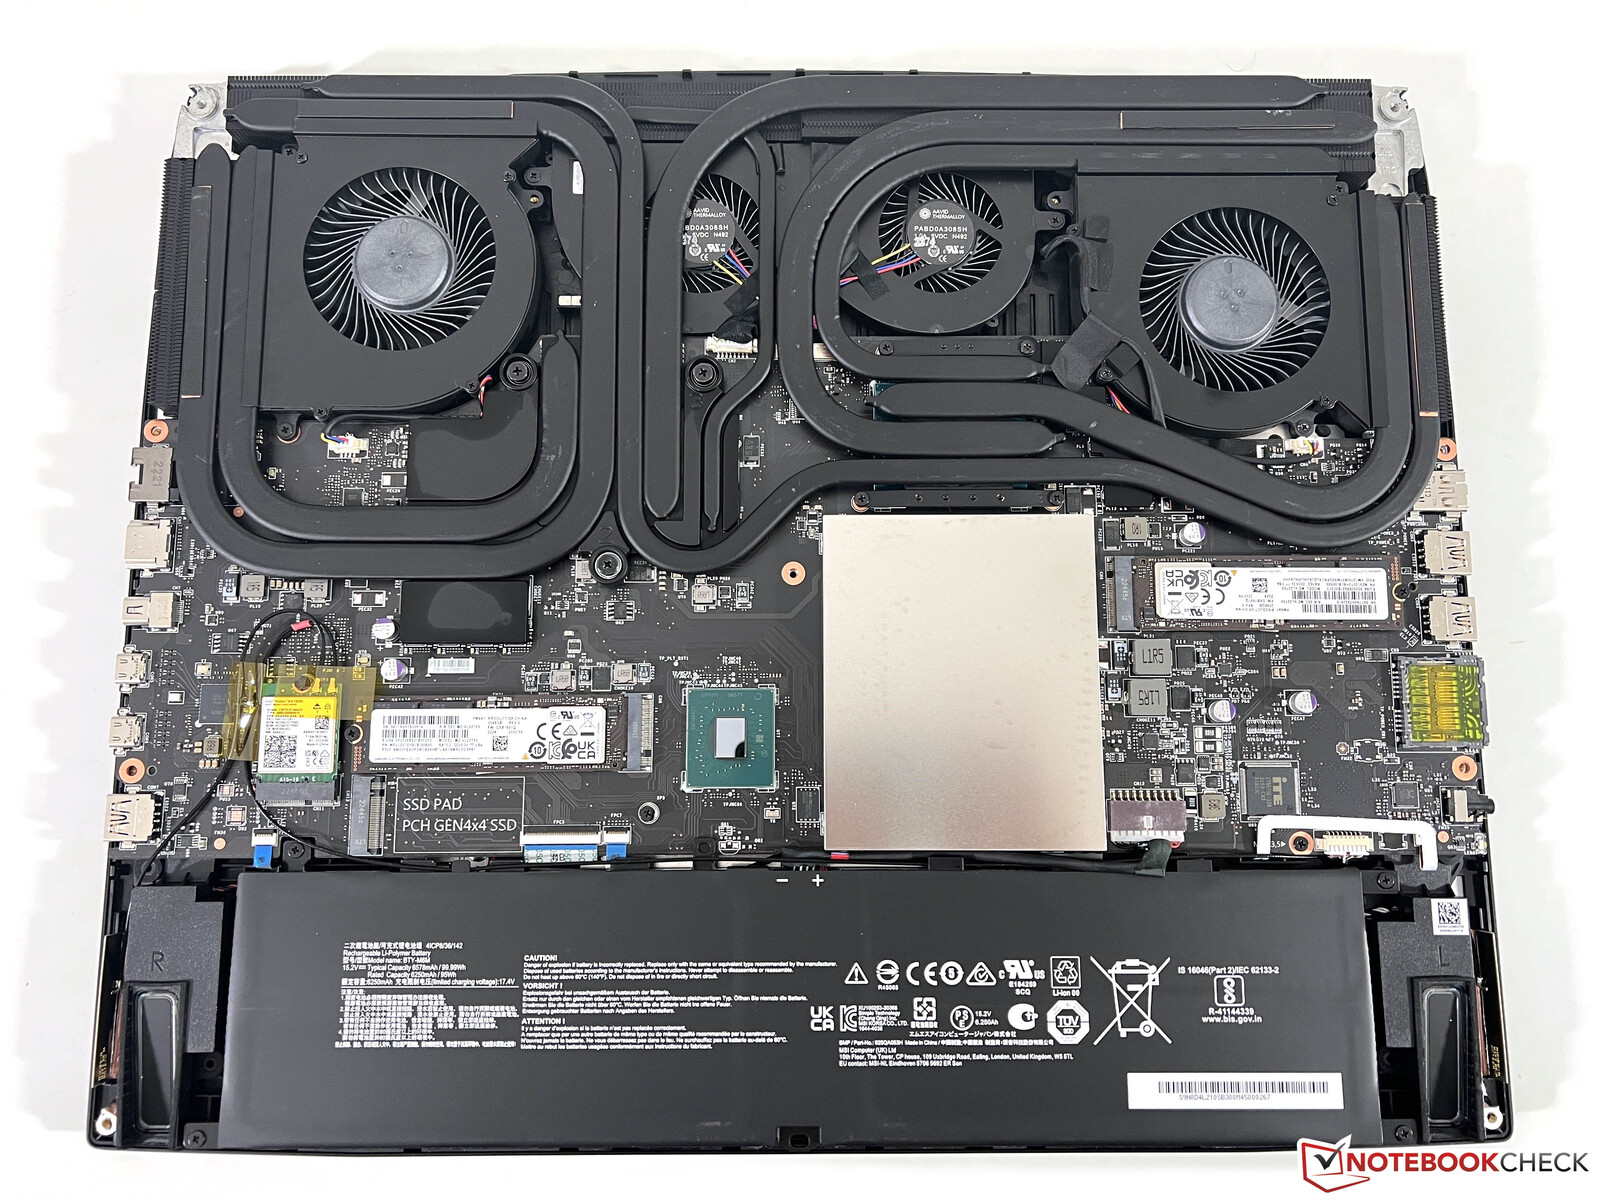
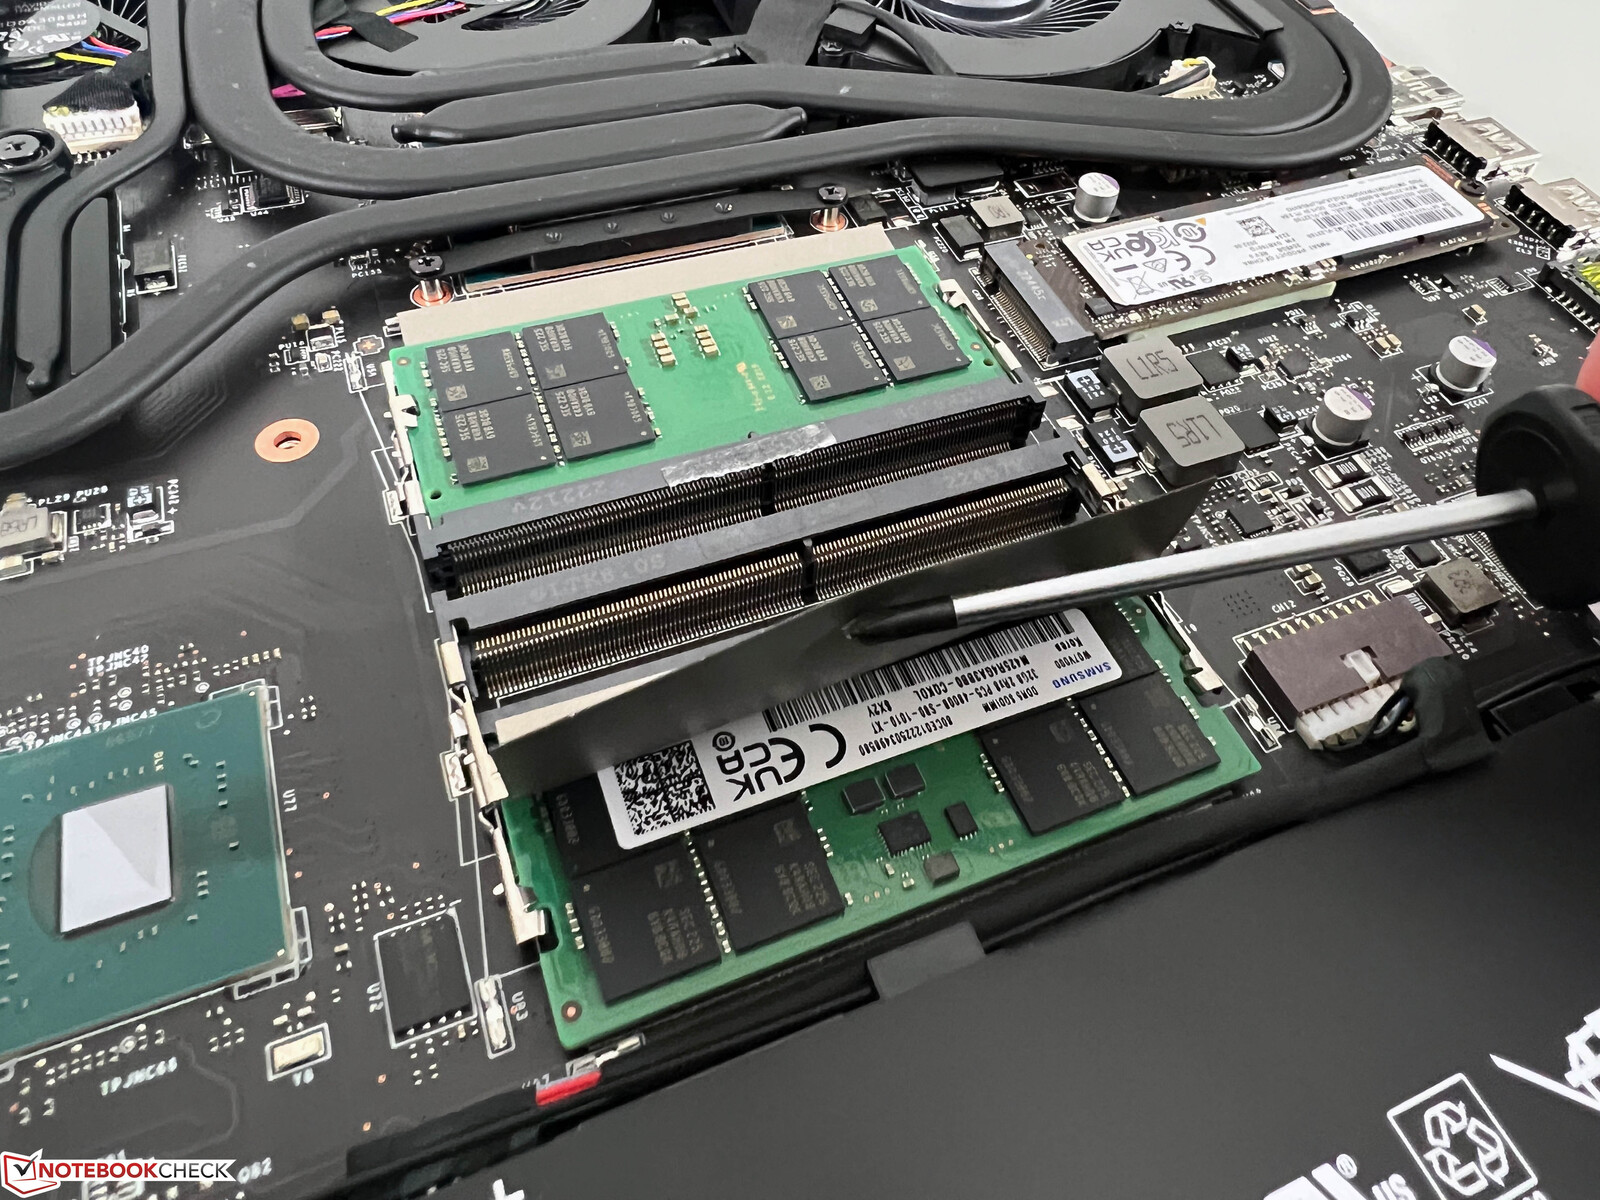
The whole bottom cover is secured by standard Philips screws and can be removed, but the cover is very tightly attached and the process is not easy. In addition to four SO-DIMM slots you can also use three M.2 slots for upgrades. It is also possible to replace the Wi-Fi module and clean the fans. MSI changed the cooling layout and uses more heat pipes compared to the previous model, which means the fourth M.2 slot had to be removed.
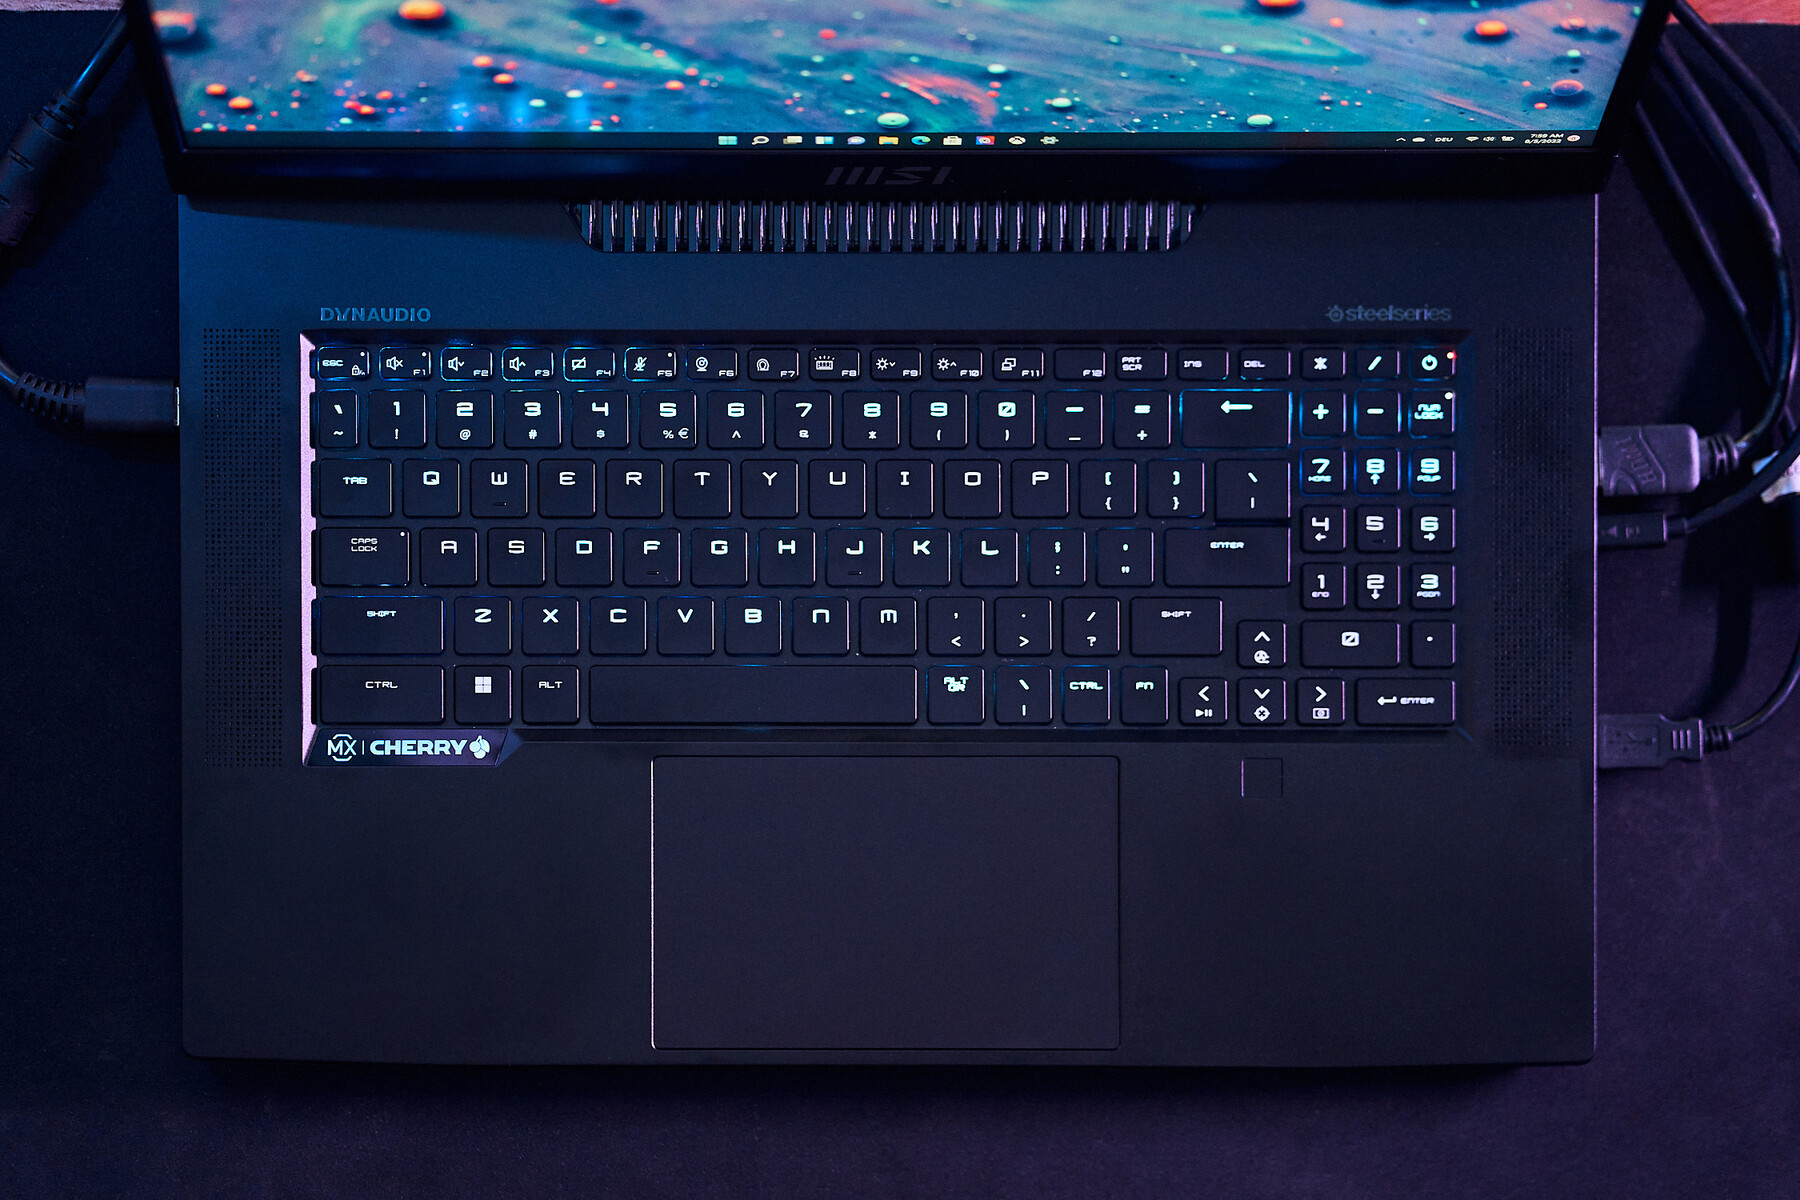
Input Devices - MSI with great mechanical keyboard
We already liked the mechanical keyboard in the previous model and that has not changed. The typing noise is a bit higher compared to conventional rubber dome keyboards, but the Cherry unit is noticeable quieter than the mechanical keyboard you can get for the XMG Neo 17, for example. The arrow keys and the dedicated numpad (which is a bit narrower) uses conventional switches. It is possible to adjust the lighting for every key individually, but you can also choose one inconspicuous color for all keys. The fingerprint scanner is implemented into the palm rest right underneath the arrow keys.
The large clickpad worked well during our review and standard cursor operations are no problem, but the clicking noise is a bit loud. However, most gamers will use an external mouse or gamepad anyway.
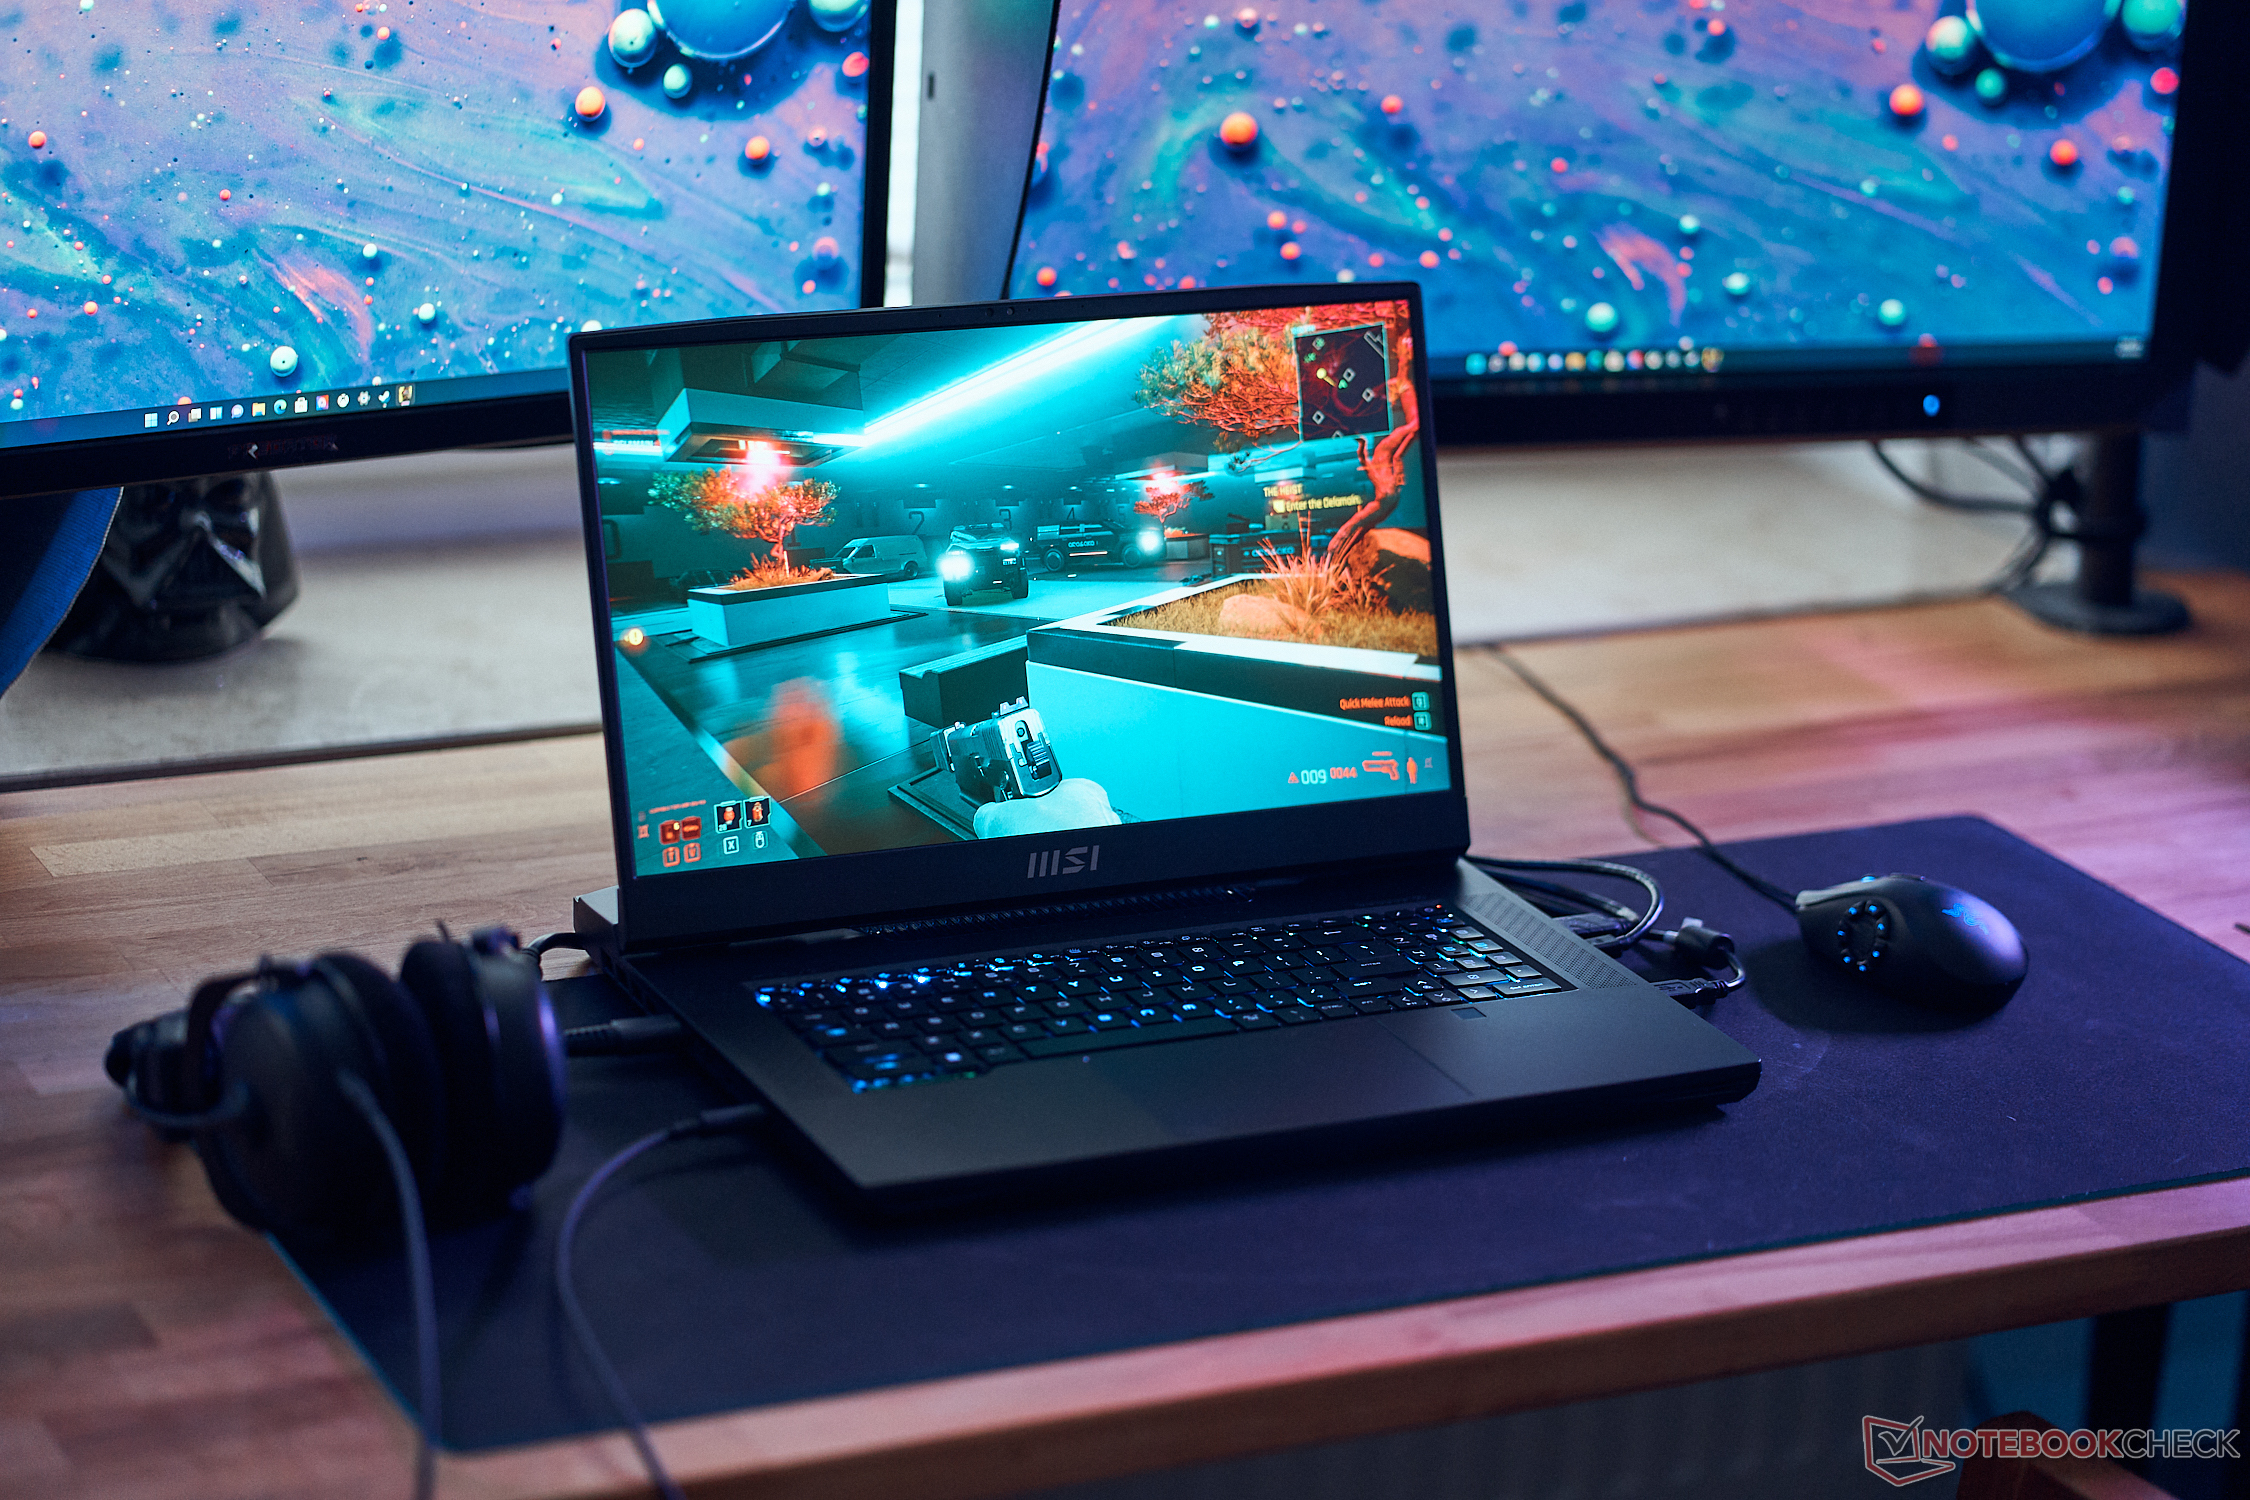
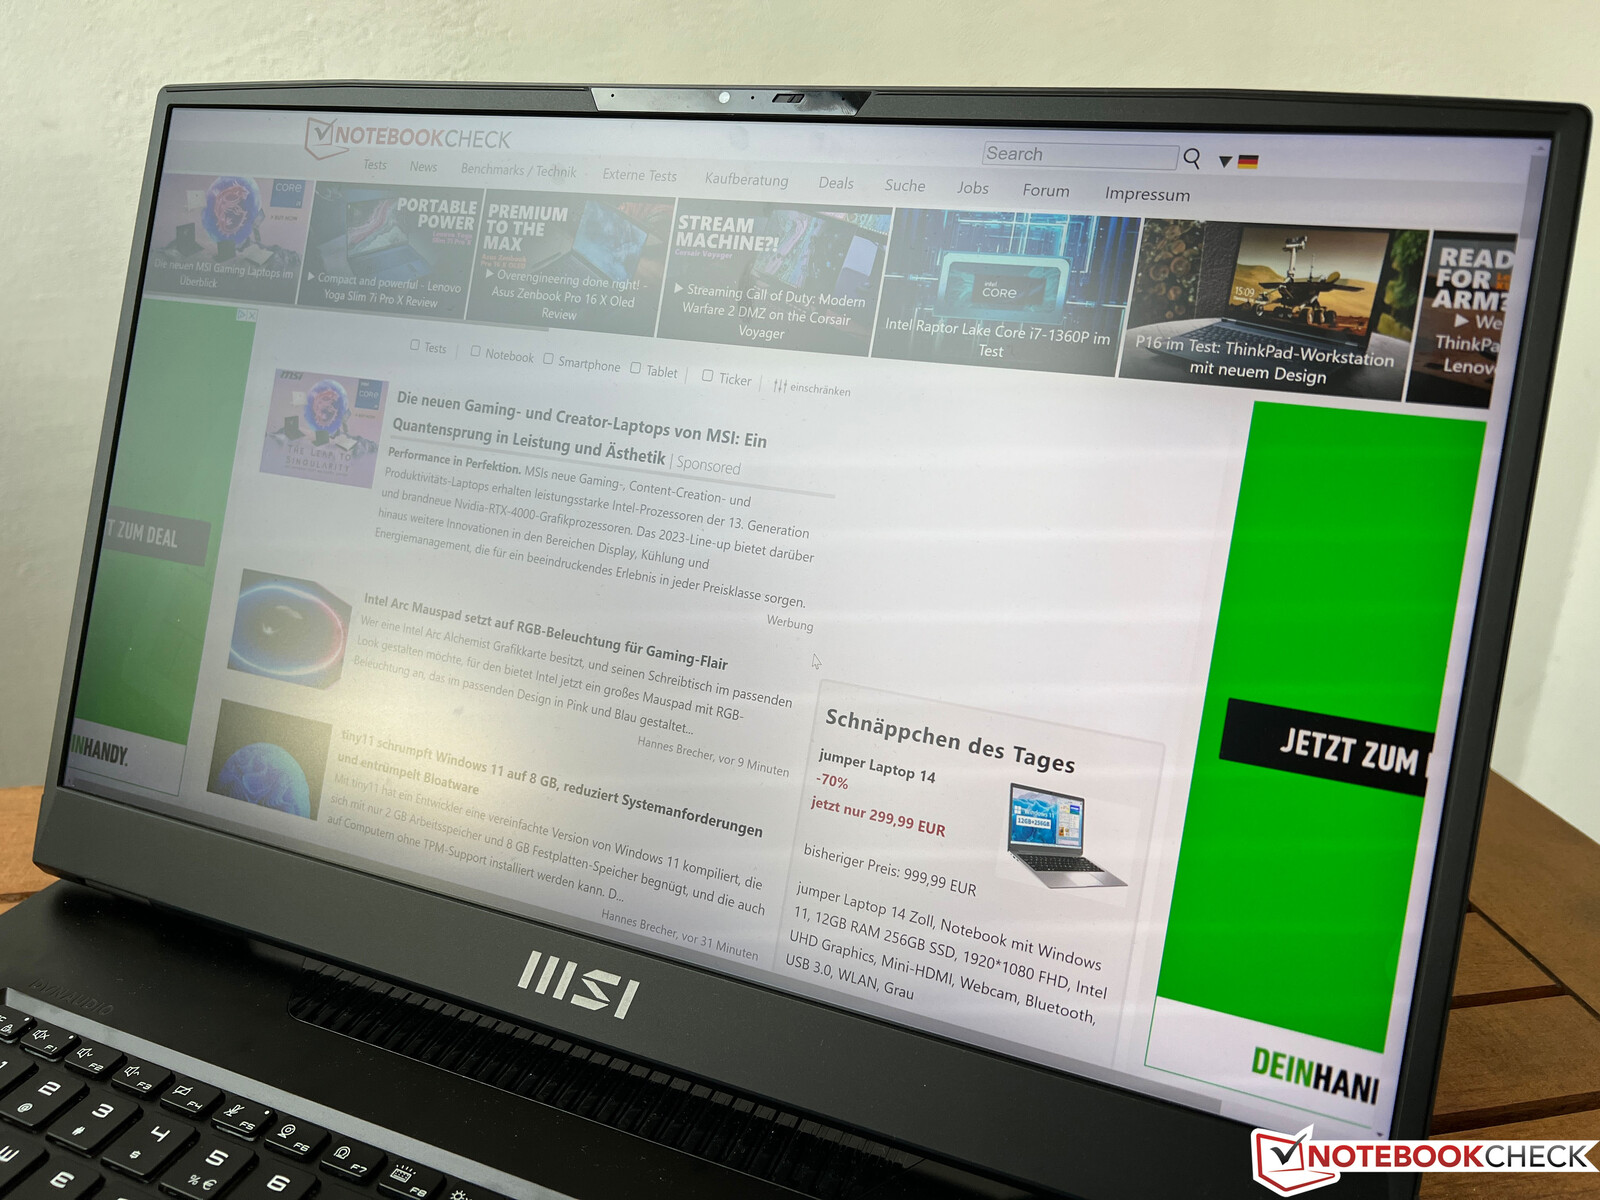
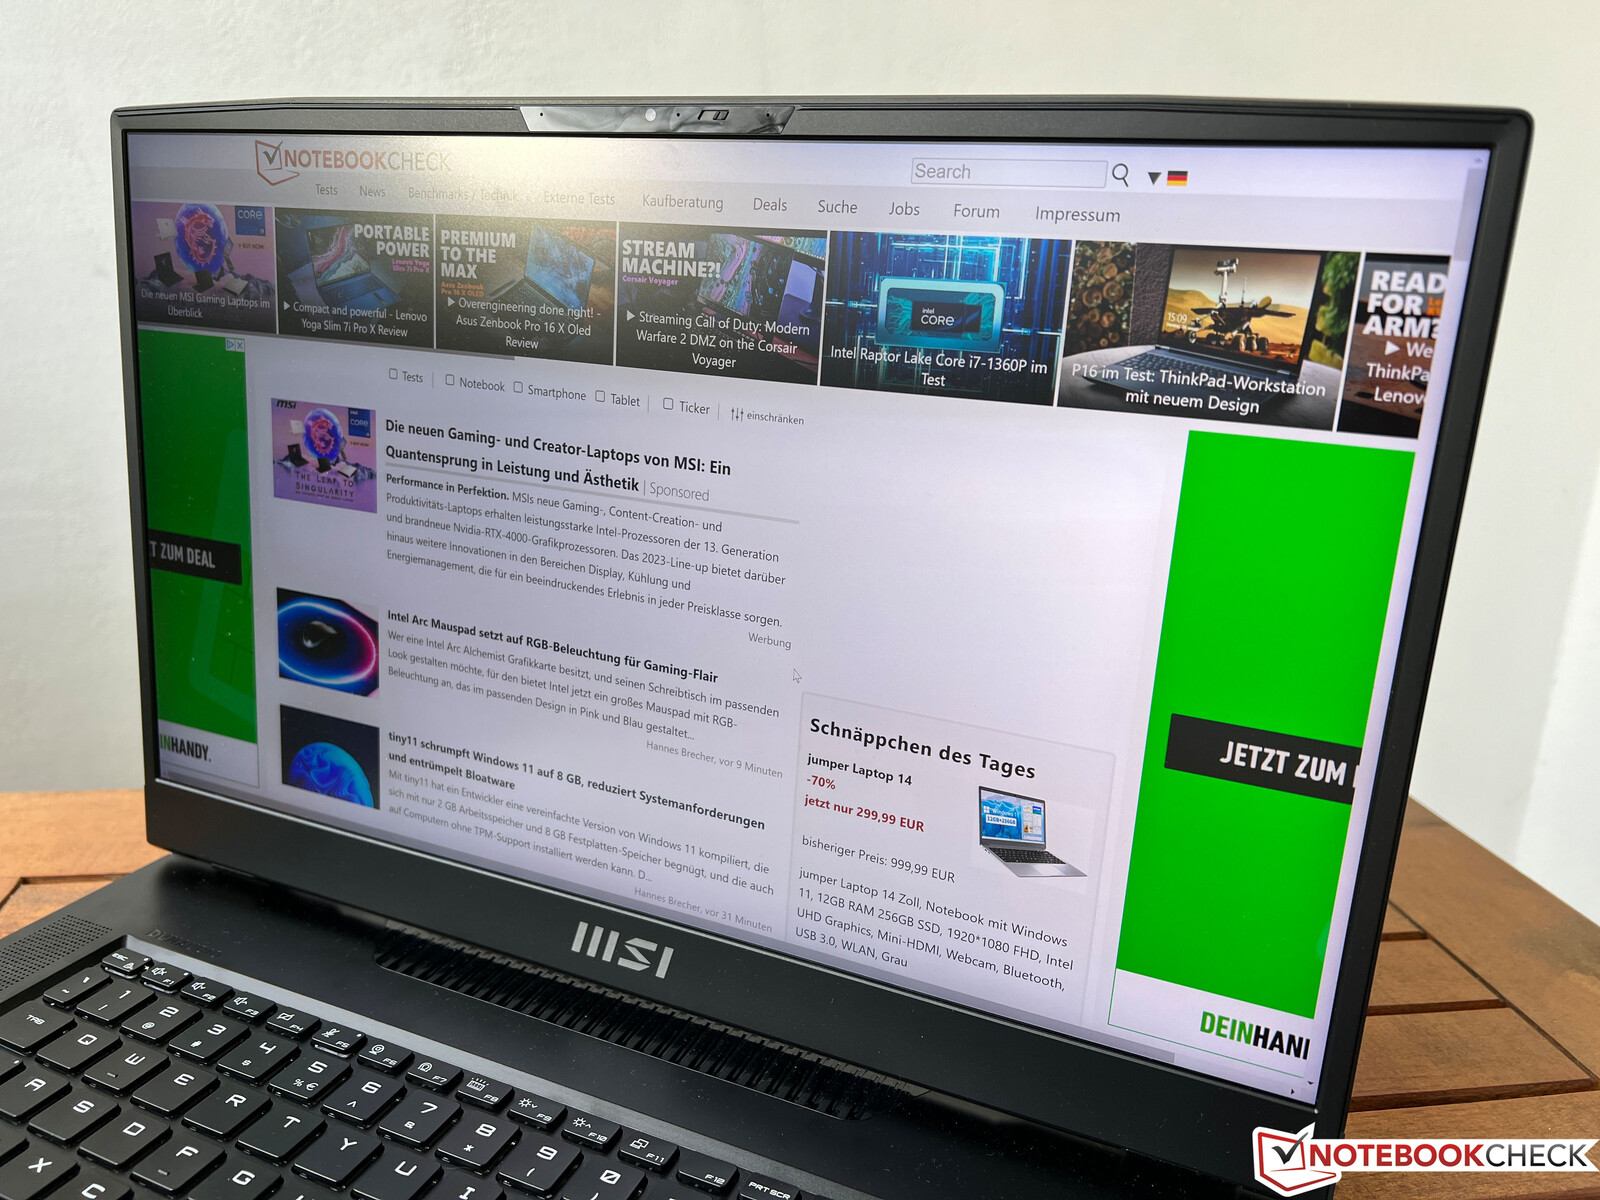
Display - 4K Mini-LED with 144 Hz

MSI does not only use the latest CPU and GPU models, but also offers a brand-new Mini-LED panel with the 4K resolution (16:9, 3840 x 2160 pixels) and a refresh rate of 144 Hz. It is also possible to get a QHD IPS screen with 240 Hz. The subjective picture quality of the matte Mini-LED panel from AU Optronics (B173ZAN06.C) is impressive with razor-sharp contents and rich colors. Black images are actually black and there is no backlight bleeding on Mini-LED screens. MSI advertises more than 1000 dimming zones, but you can still notice blooming. Bright objects on dark backgrounds create bright clouds since the whole dimming zone is illuminated. However, you will only really notice it when logos appear, but we did not notice it during gaming or daily stuff. We measure an average brightness of 600 nits and a very high contrast ratio thanks to the low black value.
The panel supports HDR 1000 and we can confirm a maximum brightness of more than 1000 nits on a completely white image, but the panel does not reach higher values while the Mini-LED panel of the Apple MacBook Pro 16 can reach up to 1600 nits for small parts of the display. The HDR implementation in Windows is still a catastrophe compared to macOS. HDR has to be activated manually, you cannot use any color profiles anymore and you cannot use HDR on battery. We would not be surprised if many users do not use HDR at all considering these problems, which is a shame. The quality of HDR videos is comparable to the MacBook Pro 16 despite the matte surface, and we tested it side by side.
| |||||||||||||||||||||||||
Brightness Distribution: 93 %
Center on Battery: 402 cd/m²
Contrast: 6060000:1 (Black: 0.0001 cd/m²)
ΔE ColorChecker Calman: 4.8 | ∀{0.5-29.43 Ø4.76}
calibrated: 1.8
ΔE Greyscale Calman: 6.5 | ∀{0.09-98 Ø5}
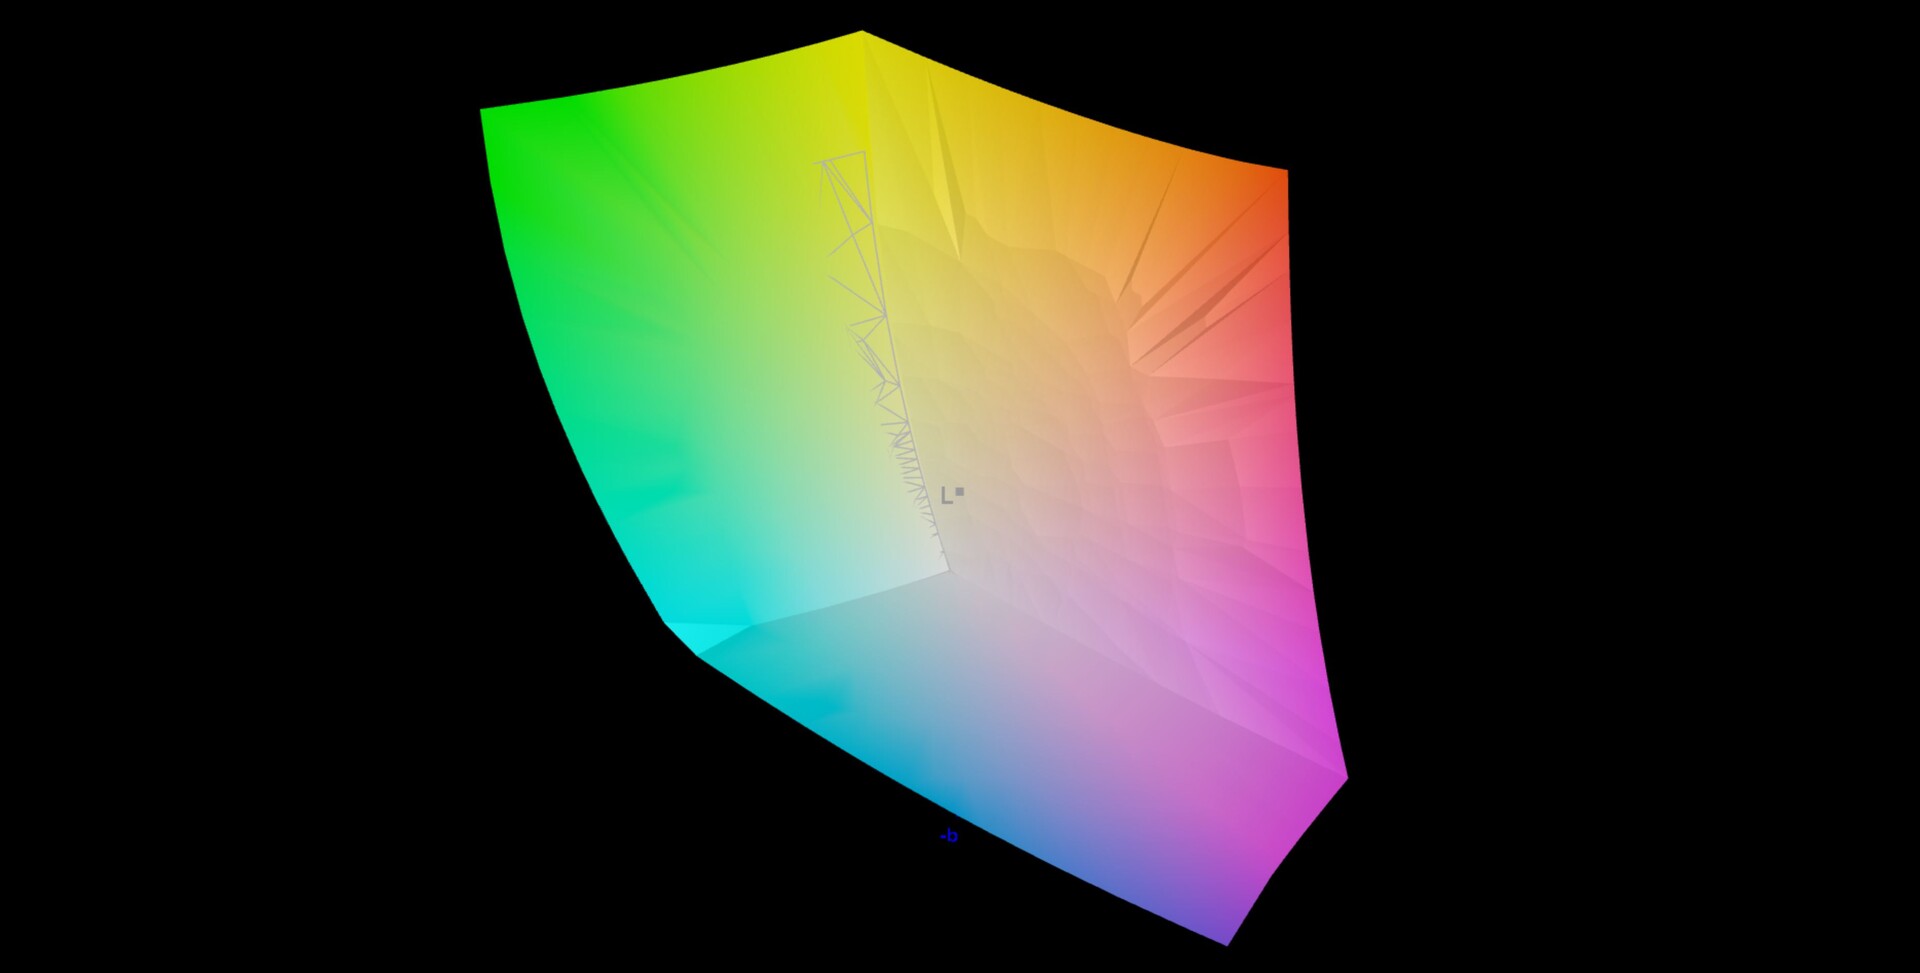
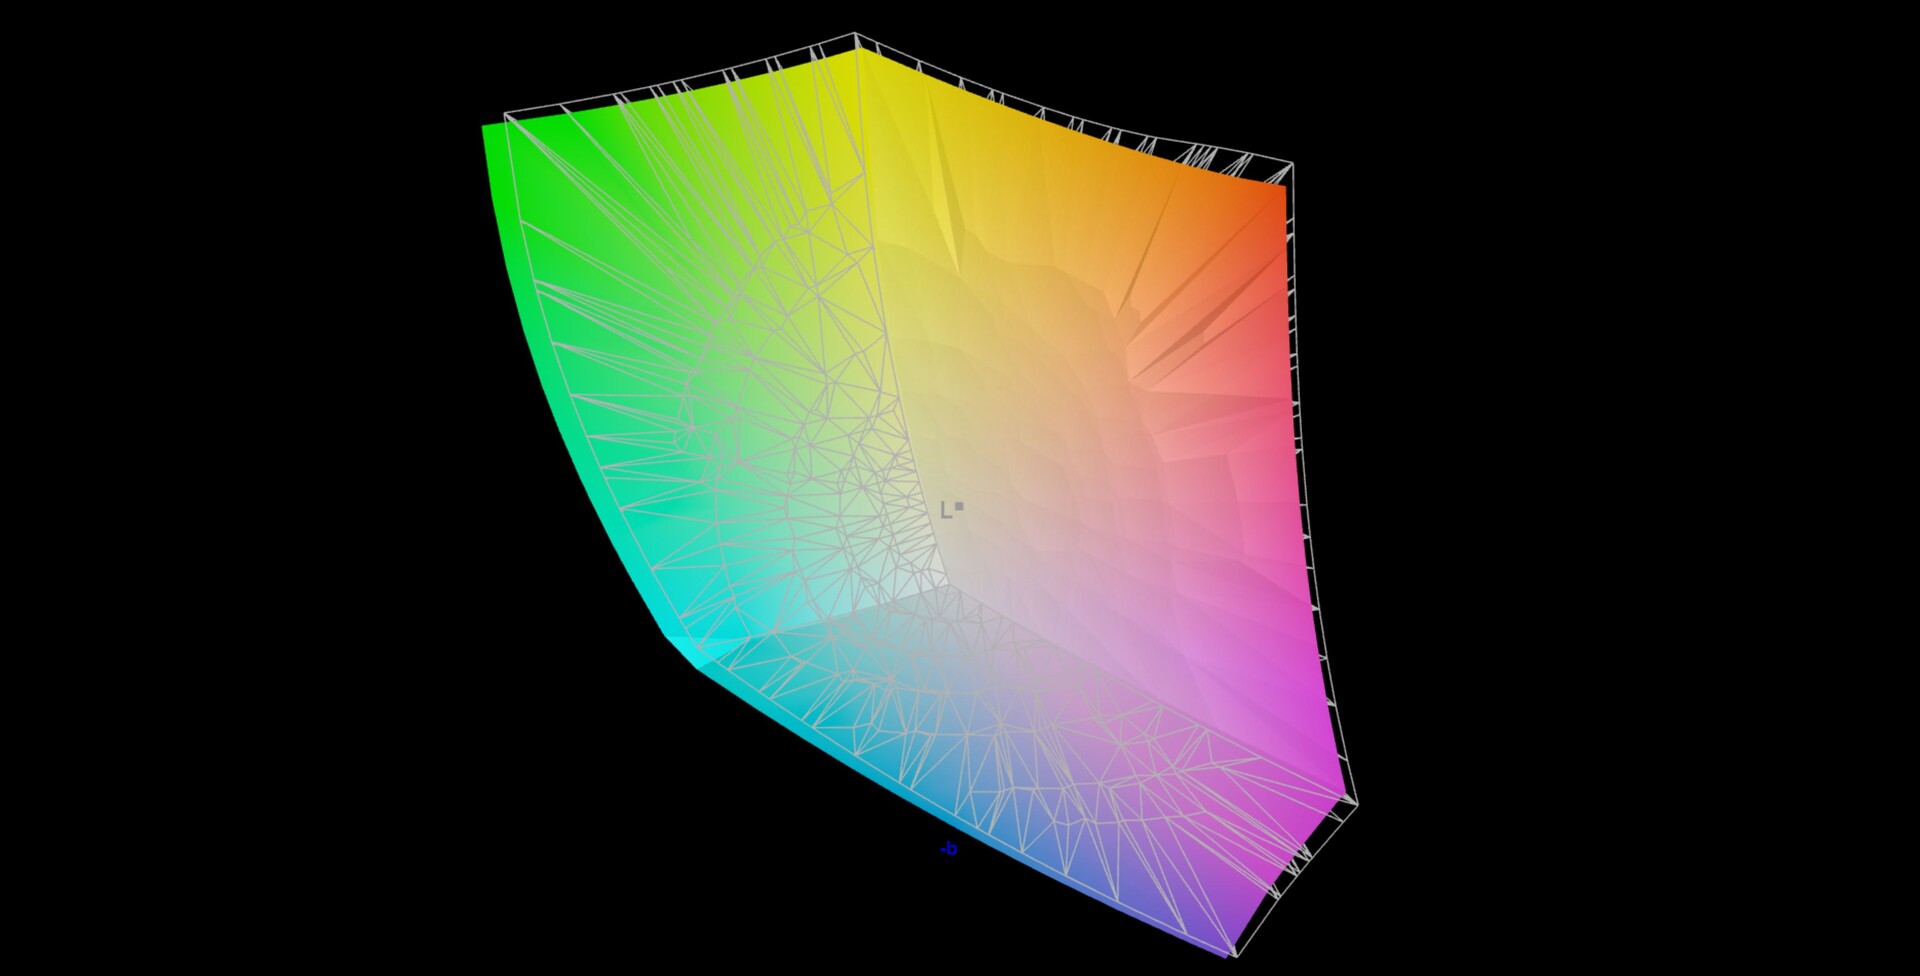
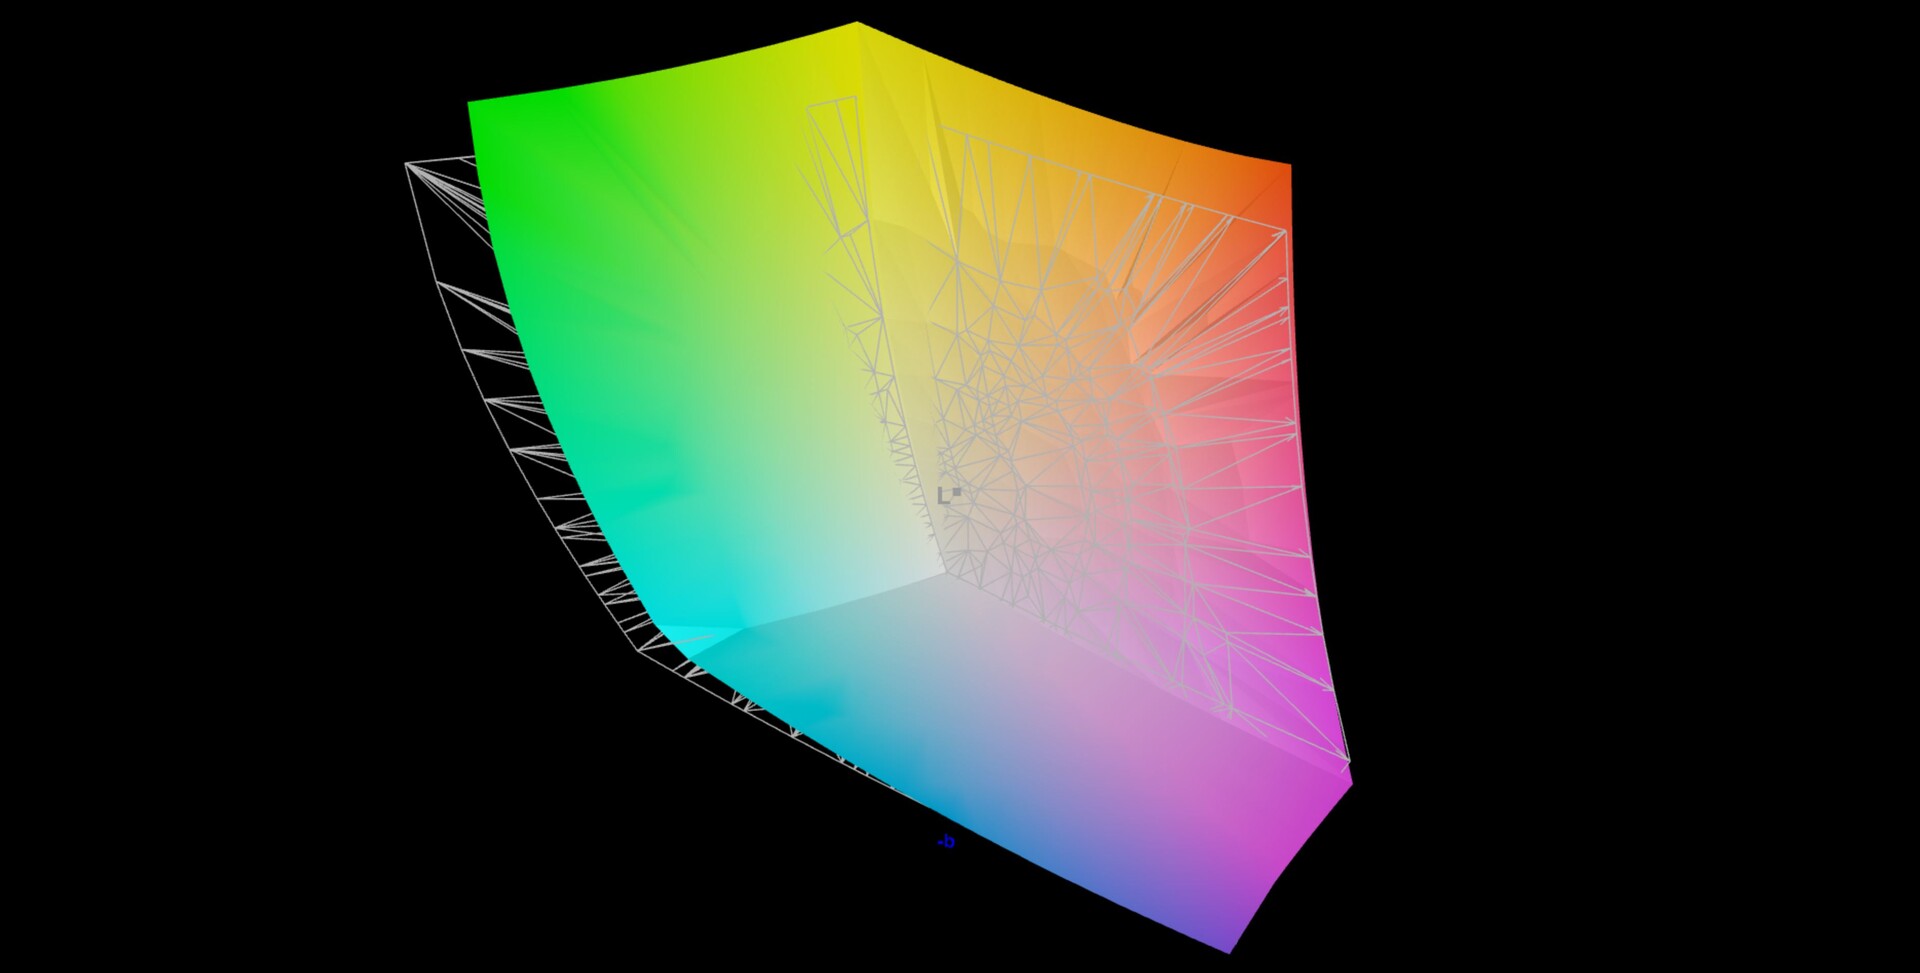
92.4% AdobeRGB 1998 (Argyll 3D)
99.9% sRGB (Argyll 3D)
94.9% Display P3 (Argyll 3D)
Gamma: 2.63
CCT: 6596 K
| MSI Titan GT77 HX 13VI B173ZAN06.C, Mini-LED, 3840x2160, 17.3" | Razer Blade 16 Early 2023 CSOT T3 MNG007DA4-1, IPS, 2560x1600, 16" | Asus ROG Strix Scar 17 SE G733CX-LL014W NE173QHM-NZ2, IPS, 2560x1440, 17.3" | MSI Titan GT77 12UHS Sharp SHP1544 LQ173M1JW08, IPS-Level, 1920x1080, 17.3" | Alienware x17 R2 P48E AU Optronics B173HAN, IPS, 1920x1080, 17.3" | Schenker XMG Neo 17 M22 BOE0A99, IPS, 2560x1600, 17" | |
|---|---|---|---|---|---|---|
| Display | 0% | -2% | -16% | -10% | -17% | |
| Display P3 Coverage (%) | 94.9 | 98.5 4% | 97.1 2% | 70.8 -25% | 79.2 -17% | 69 -27% |
| sRGB Coverage (%) | 99.9 | 100 0% | 99.9 0% | 98.9 -1% | 99.8 0% | 99.8 0% |
| AdobeRGB 1998 Coverage (%) | 92.4 | 89.7 -3% | 84.8 -8% | 73 -21% | 79.6 -14% | 69.6 -25% |
| Response Times | 69% | 74% | 86% | 67% | 75% | |
| Response Time Grey 50% / Grey 80% * (ms) | 38.4 ? | 6.6 ? 83% | 5.7 ? 85% | 3.03 ? 92% | 12.4 ? 68% | 10.8 ? 72% |
| Response Time Black / White * (ms) | 26.6 ? | 12 ? 55% | 10.1 ? 62% | 5.28 ? 80% | 9.2 ? 65% | 6.1 ? 77% |
| PWM Frequency (Hz) | 2380 ? | |||||
| Screen | -38877% | -37485% | -44442% | -32218% | -47756% | |
| Brightness middle (cd/m²) | 606 | 456.8 -25% | 320 -47% | 280 -54% | 365.4 -40% | 415 -32% |
| Brightness (cd/m²) | 602 | 437 -27% | 303 -50% | 275 -54% | 344 -43% | 399 -34% |
| Brightness Distribution (%) | 93 | 83 -11% | 87 -6% | 79 -15% | 85 -9% | 90 -3% |
| Black Level * (cd/m²) | 0.0001 | 0.35 -349900% | 0.3 -299900% | 0.4 -399900% | 0.29 -289900% | 0.43 -429900% |
| Contrast (:1) | 6060000 | 1305 -100% | 1067 -100% | 700 -100% | 1260 -100% | 965 -100% |
| Colorchecker dE 2000 * | 4.8 | 3.7 23% | 1.1 77% | 2.1 56% | 3.17 34% | 1.44 70% |
| Colorchecker dE 2000 max. * | 8.2 | 6.42 22% | 2.7 67% | 5.83 29% | 7.69 6% | 2.33 72% |
| Colorchecker dE 2000 calibrated * | 1.8 | 0.66 63% | 1.58 12% | 0.51 72% | 0.89 51% | |
| Greyscale dE 2000 * | 6.5 | 2.6 60% | 1.1 83% | 3.3 49% | 5.3 18% | 1.8 72% |
| Gamma | 2.63 84% | 2.3 96% | 2.13 103% | 2.13 103% | 2.18 101% | 2.132 103% |
| CCT | 6596 99% | 6108 106% | 6599 98% | 7060 92% | 5879 111% | 6327 103% |
| Total Average (Program / Settings) | -12936% /
-24983% | -12471% /
-23057% | -14791% /
-28561% | -10720% /
-20704% | -15899% /
-30693% |
* ... smaller is better
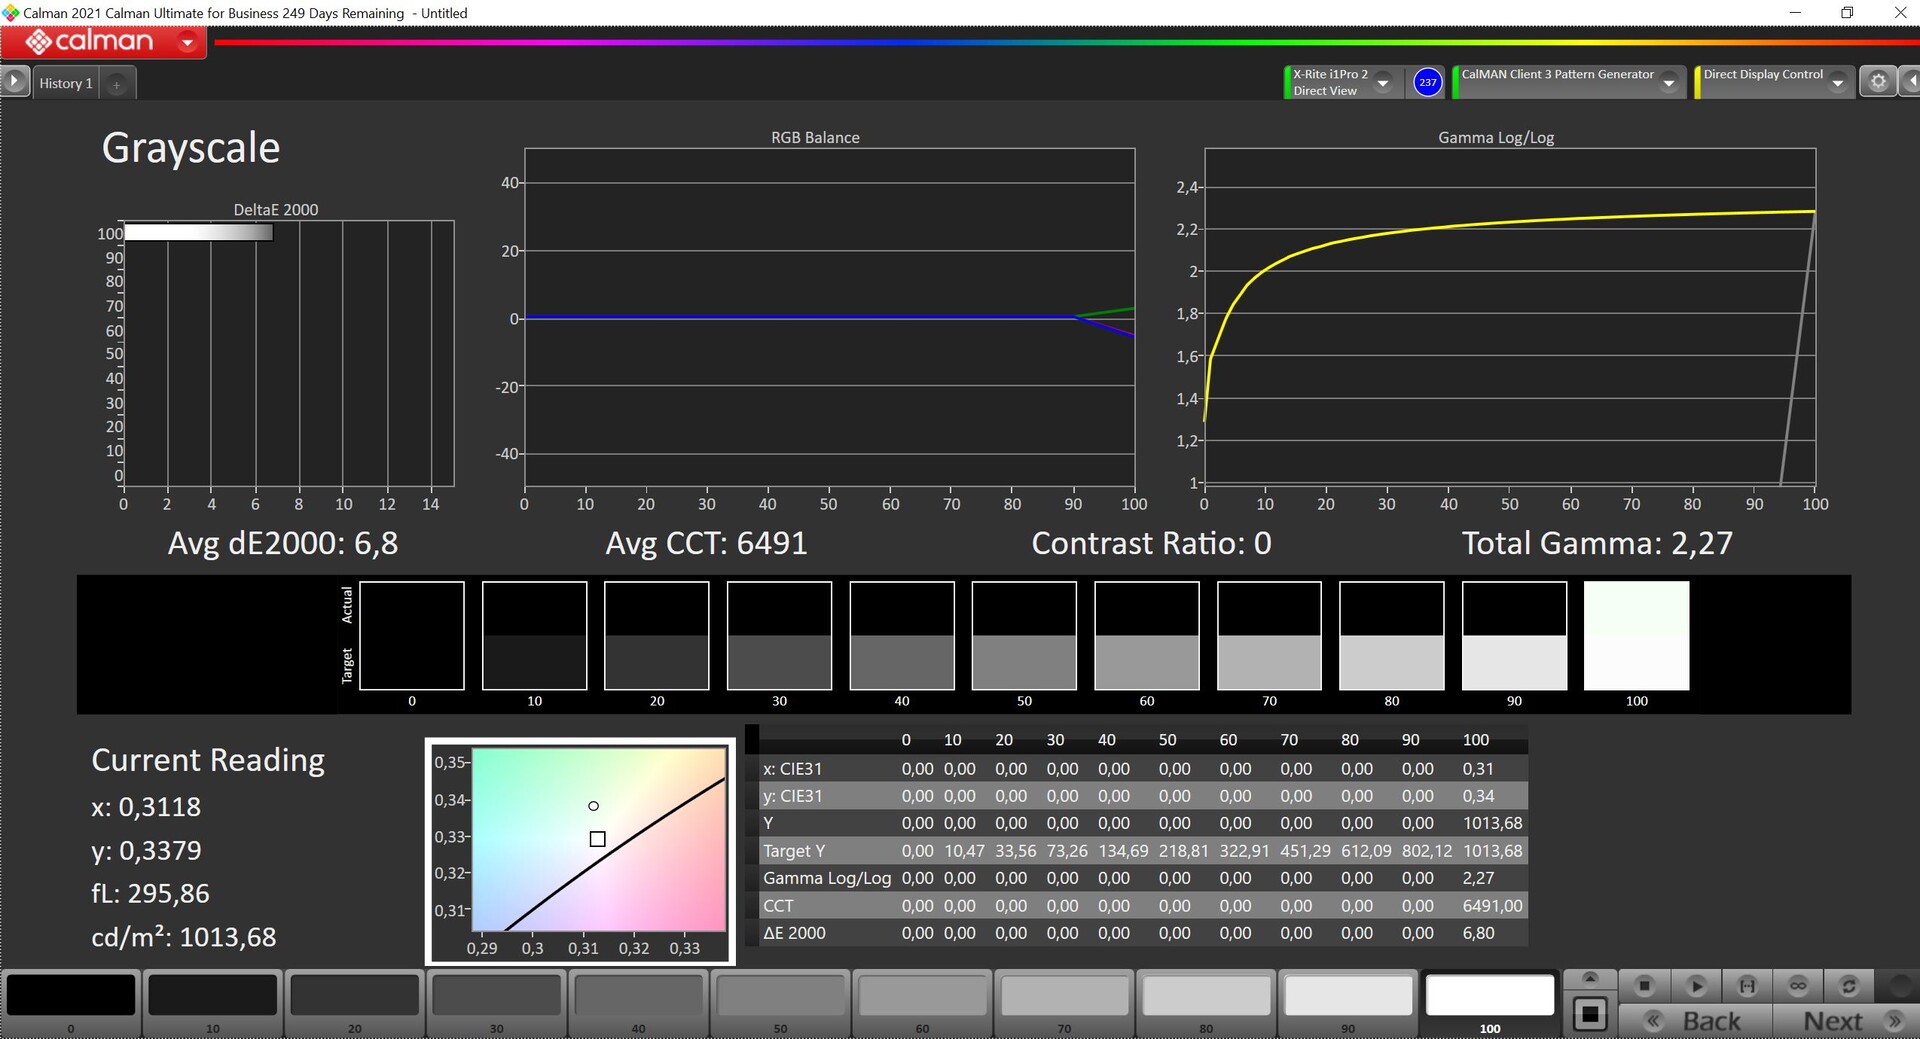
MSI ships the Titan GT77 with the True Color software, which offers different presets for color spaces and scenarios (like Gamer, Office, Movie) and you can even use the software to calibrate the screen. We used the professional CalMAN software in combination with the X-Rite i1 Pro 2 spectrophotometer and the profile Display P3 since the panel is supposed to cover the full P3 gamut.
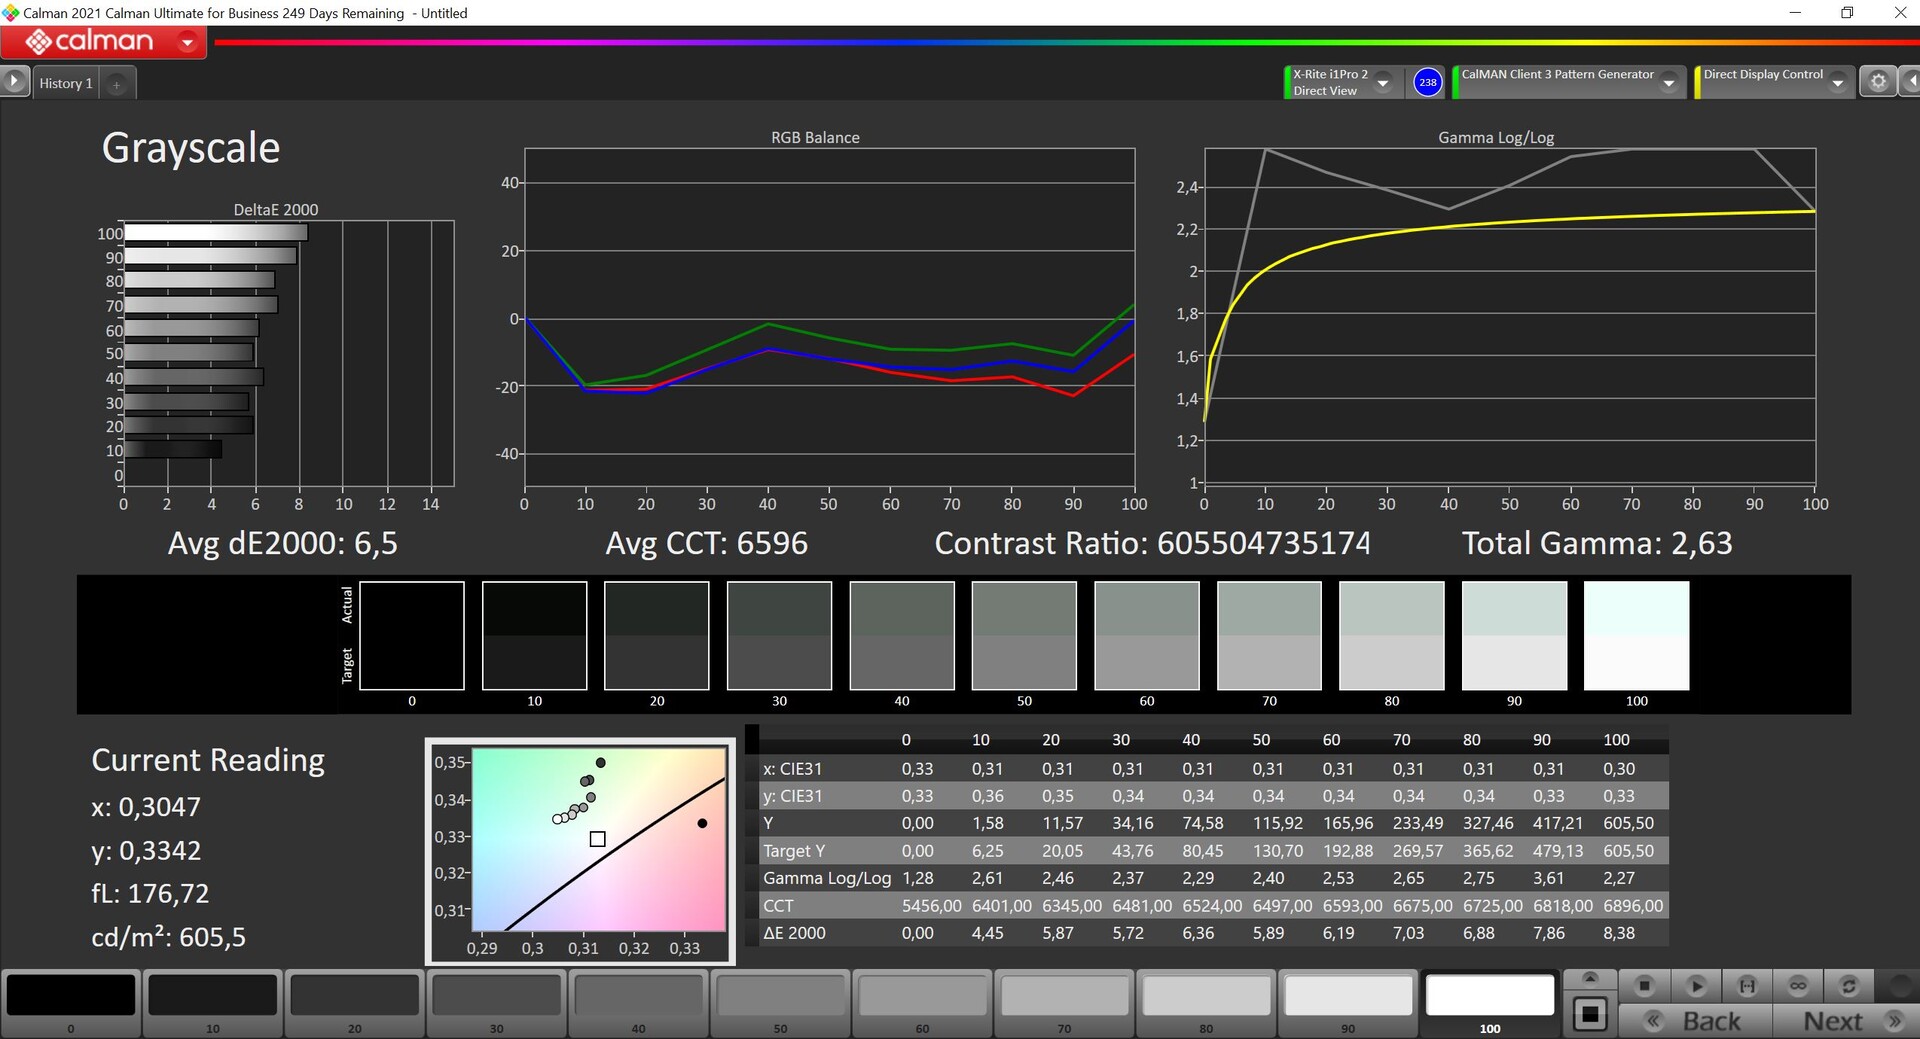
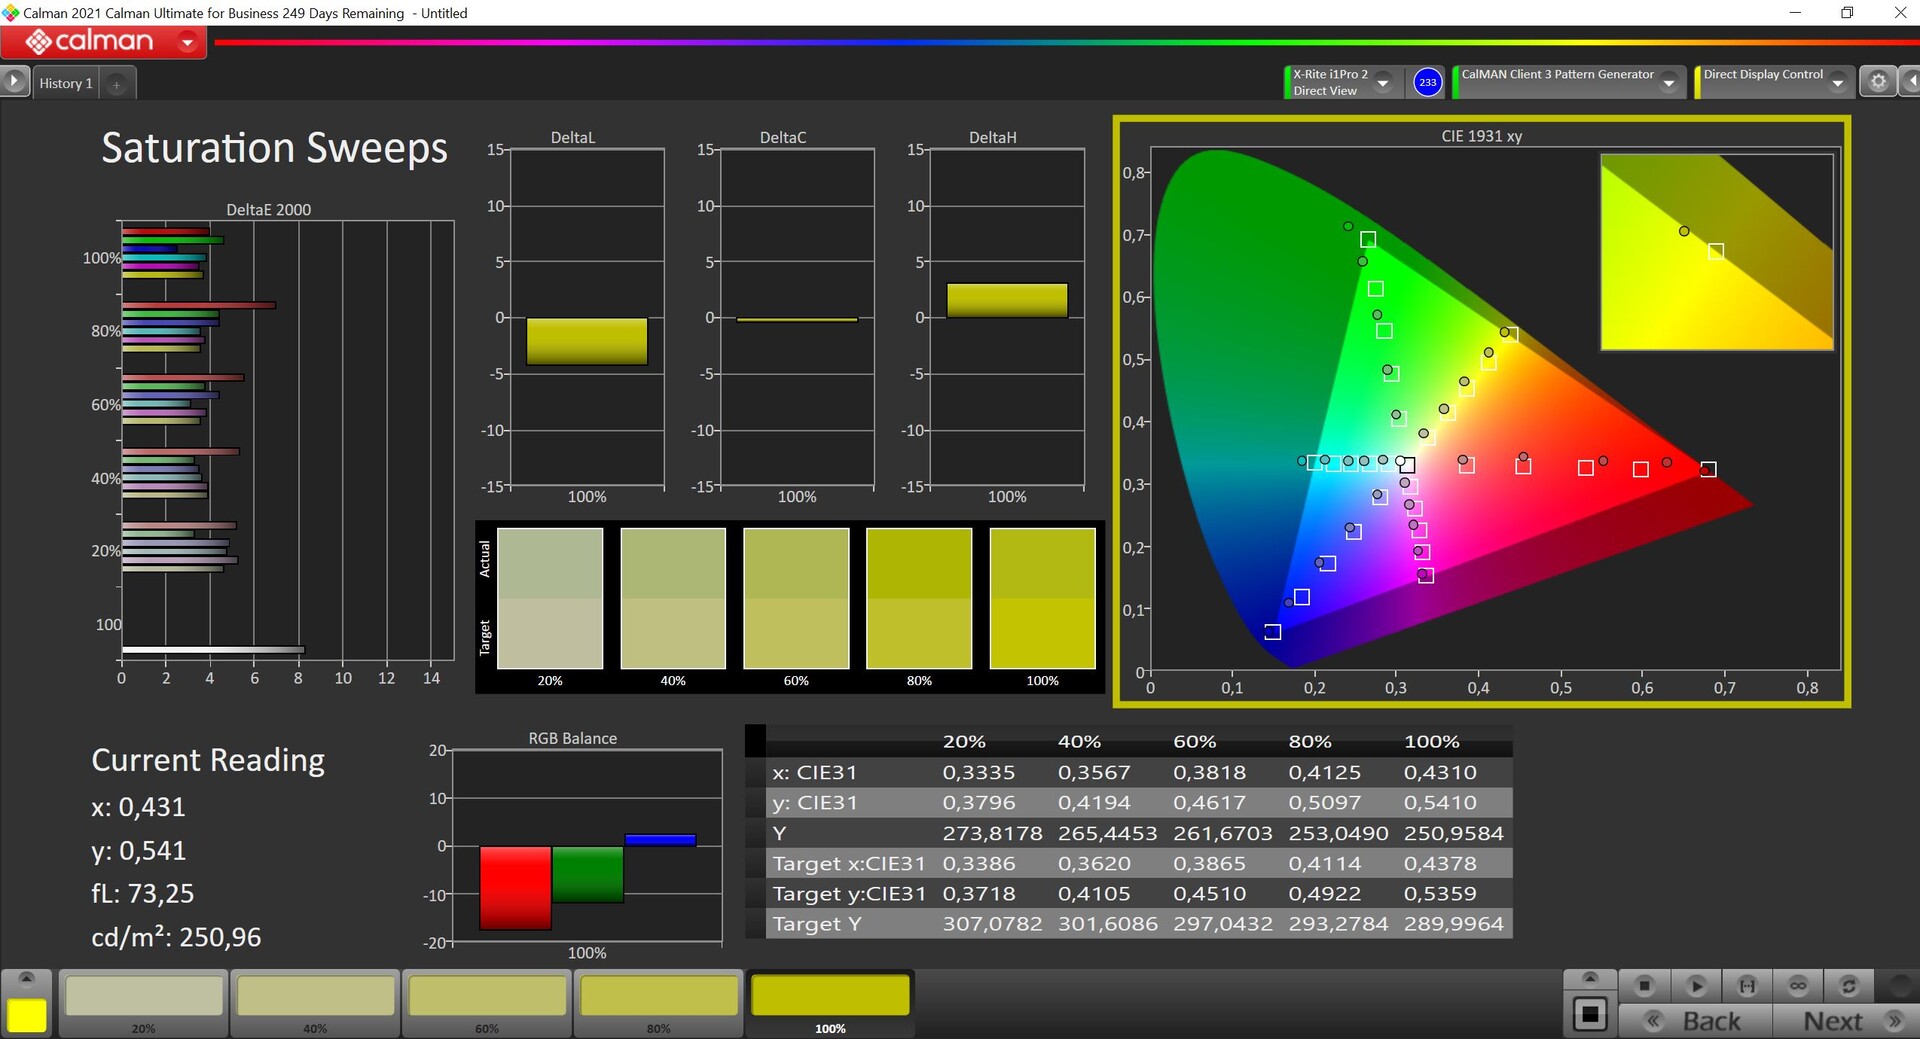
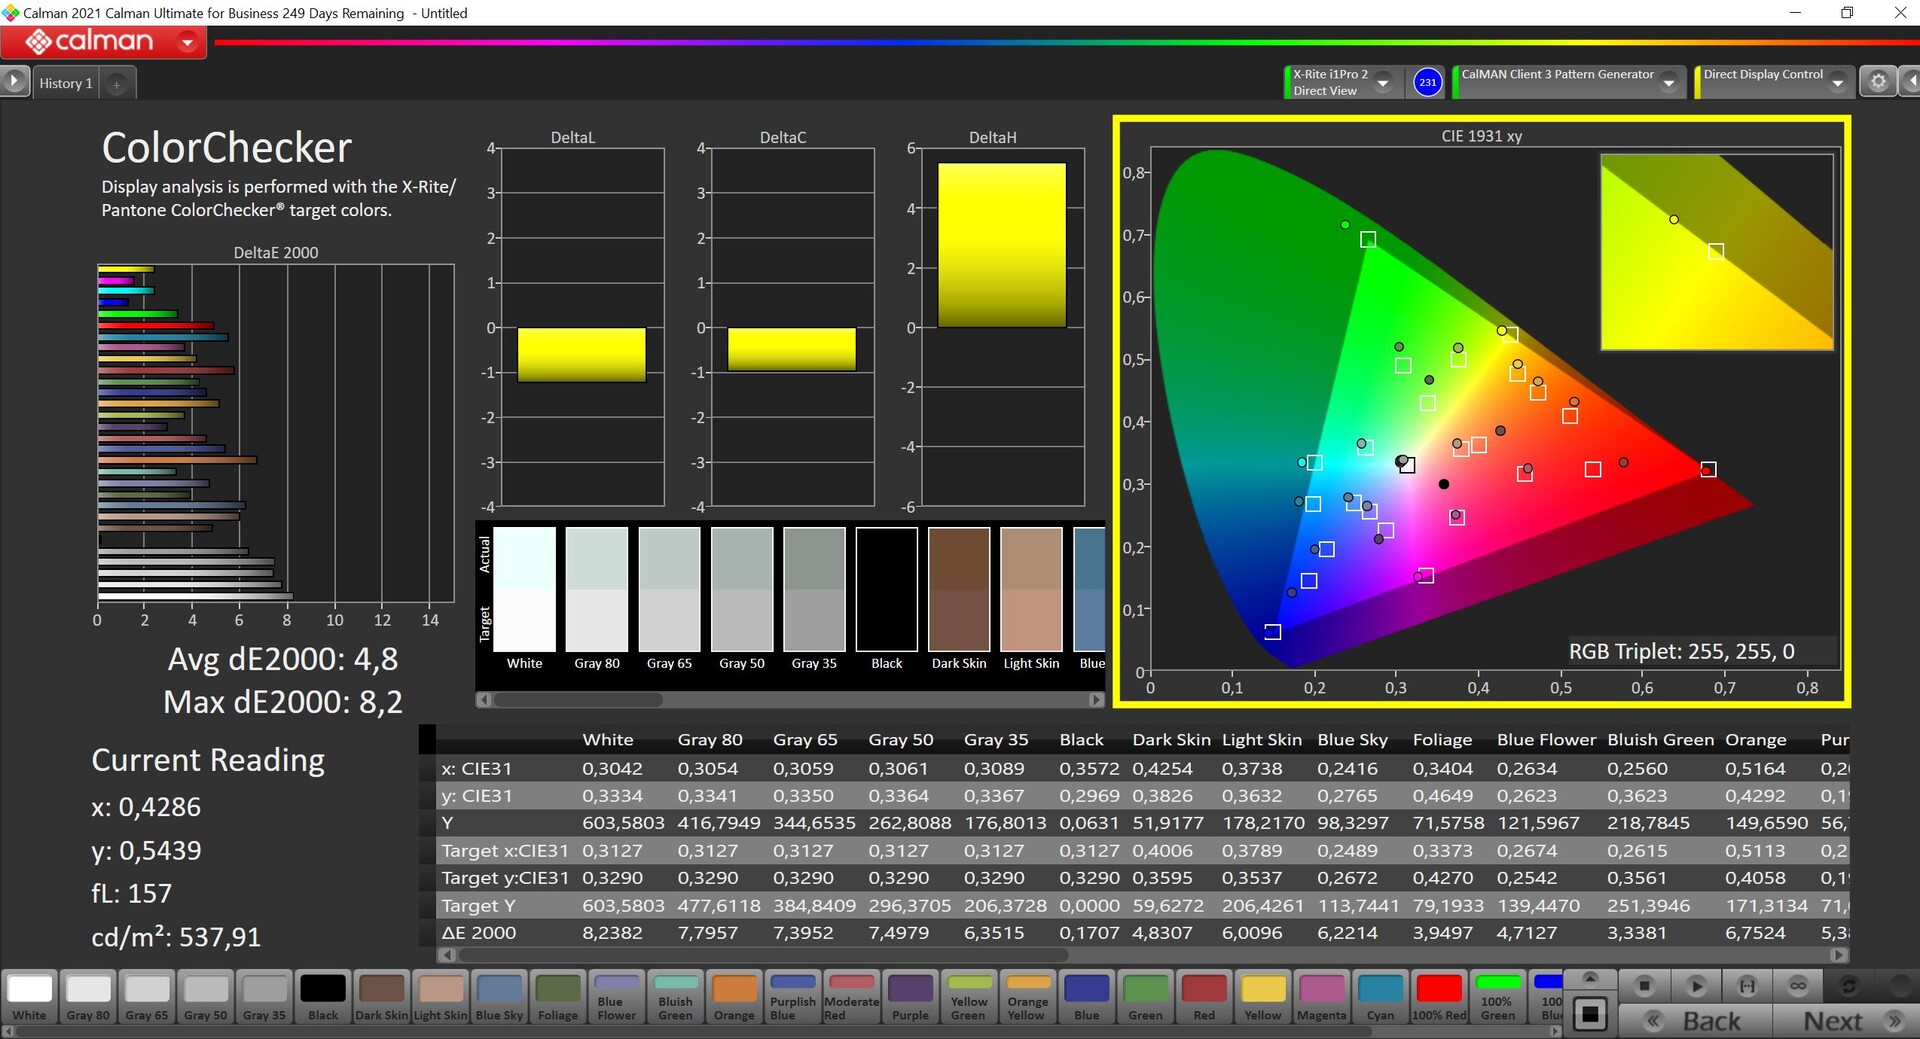
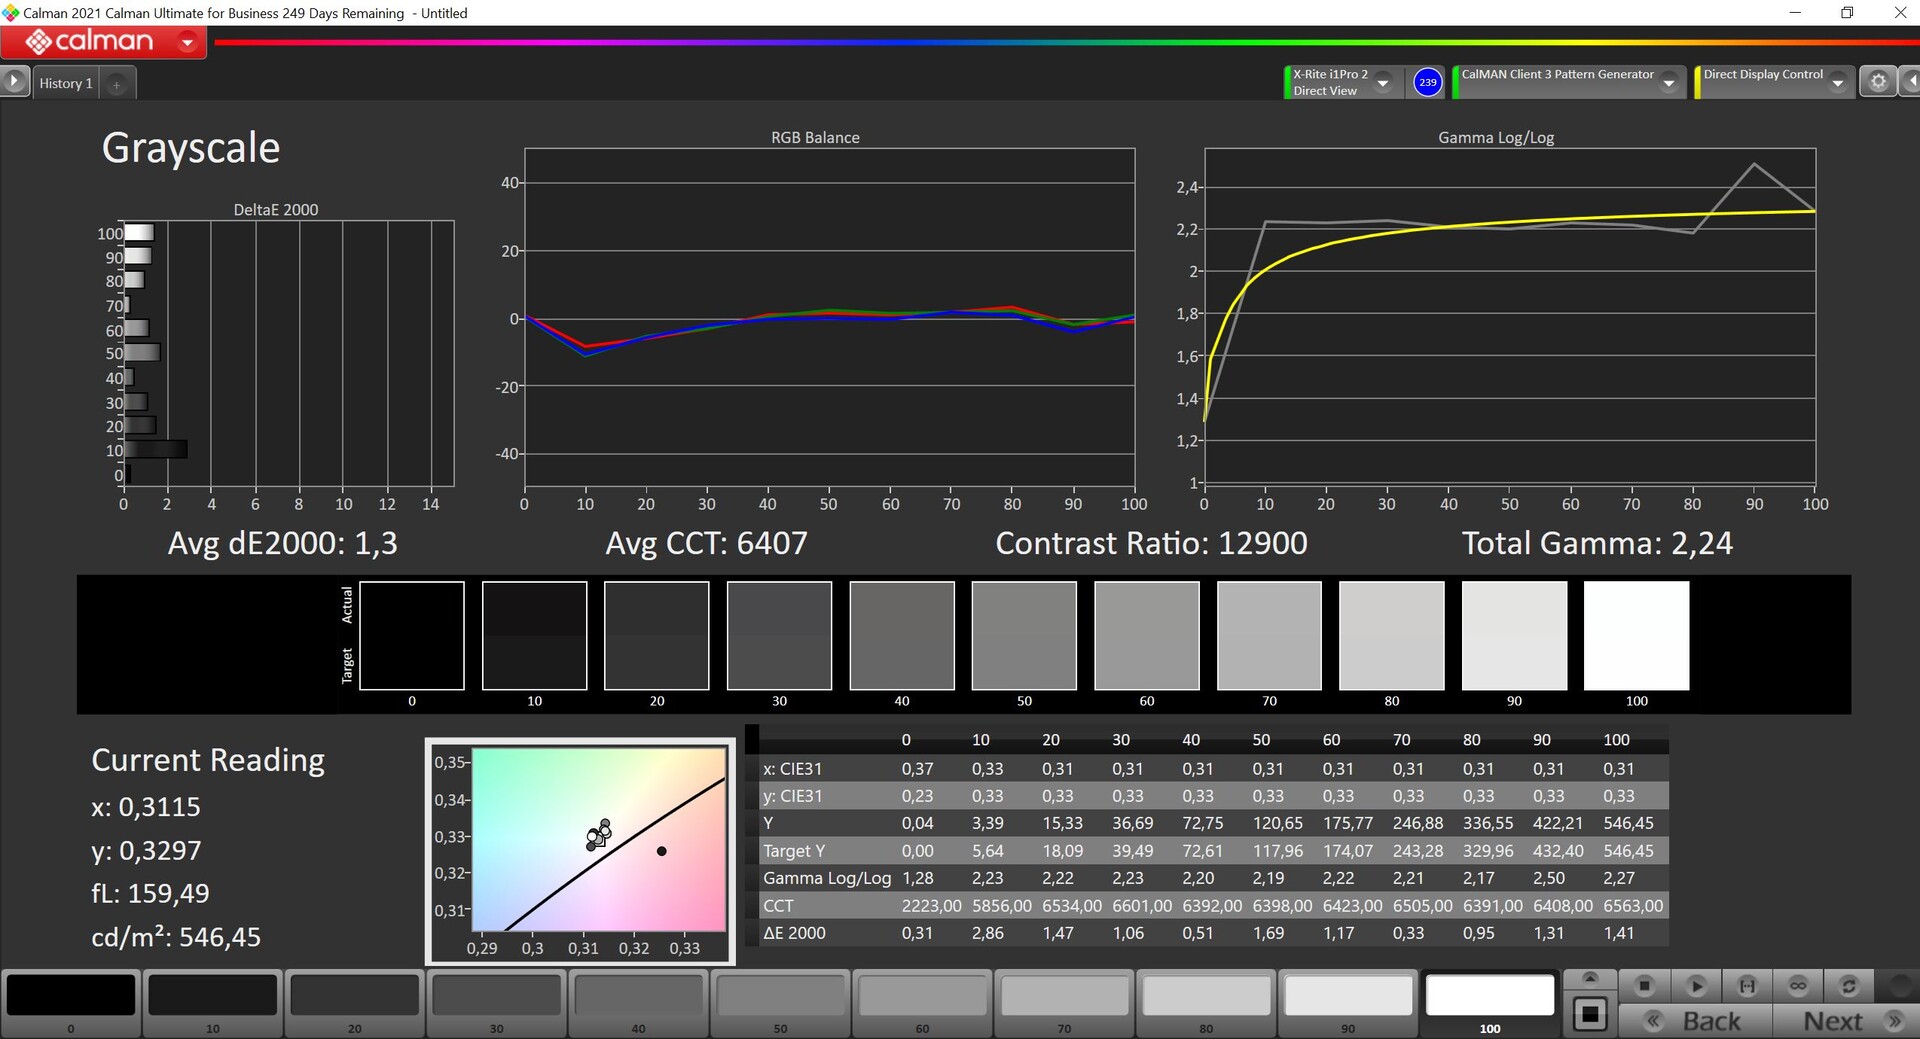
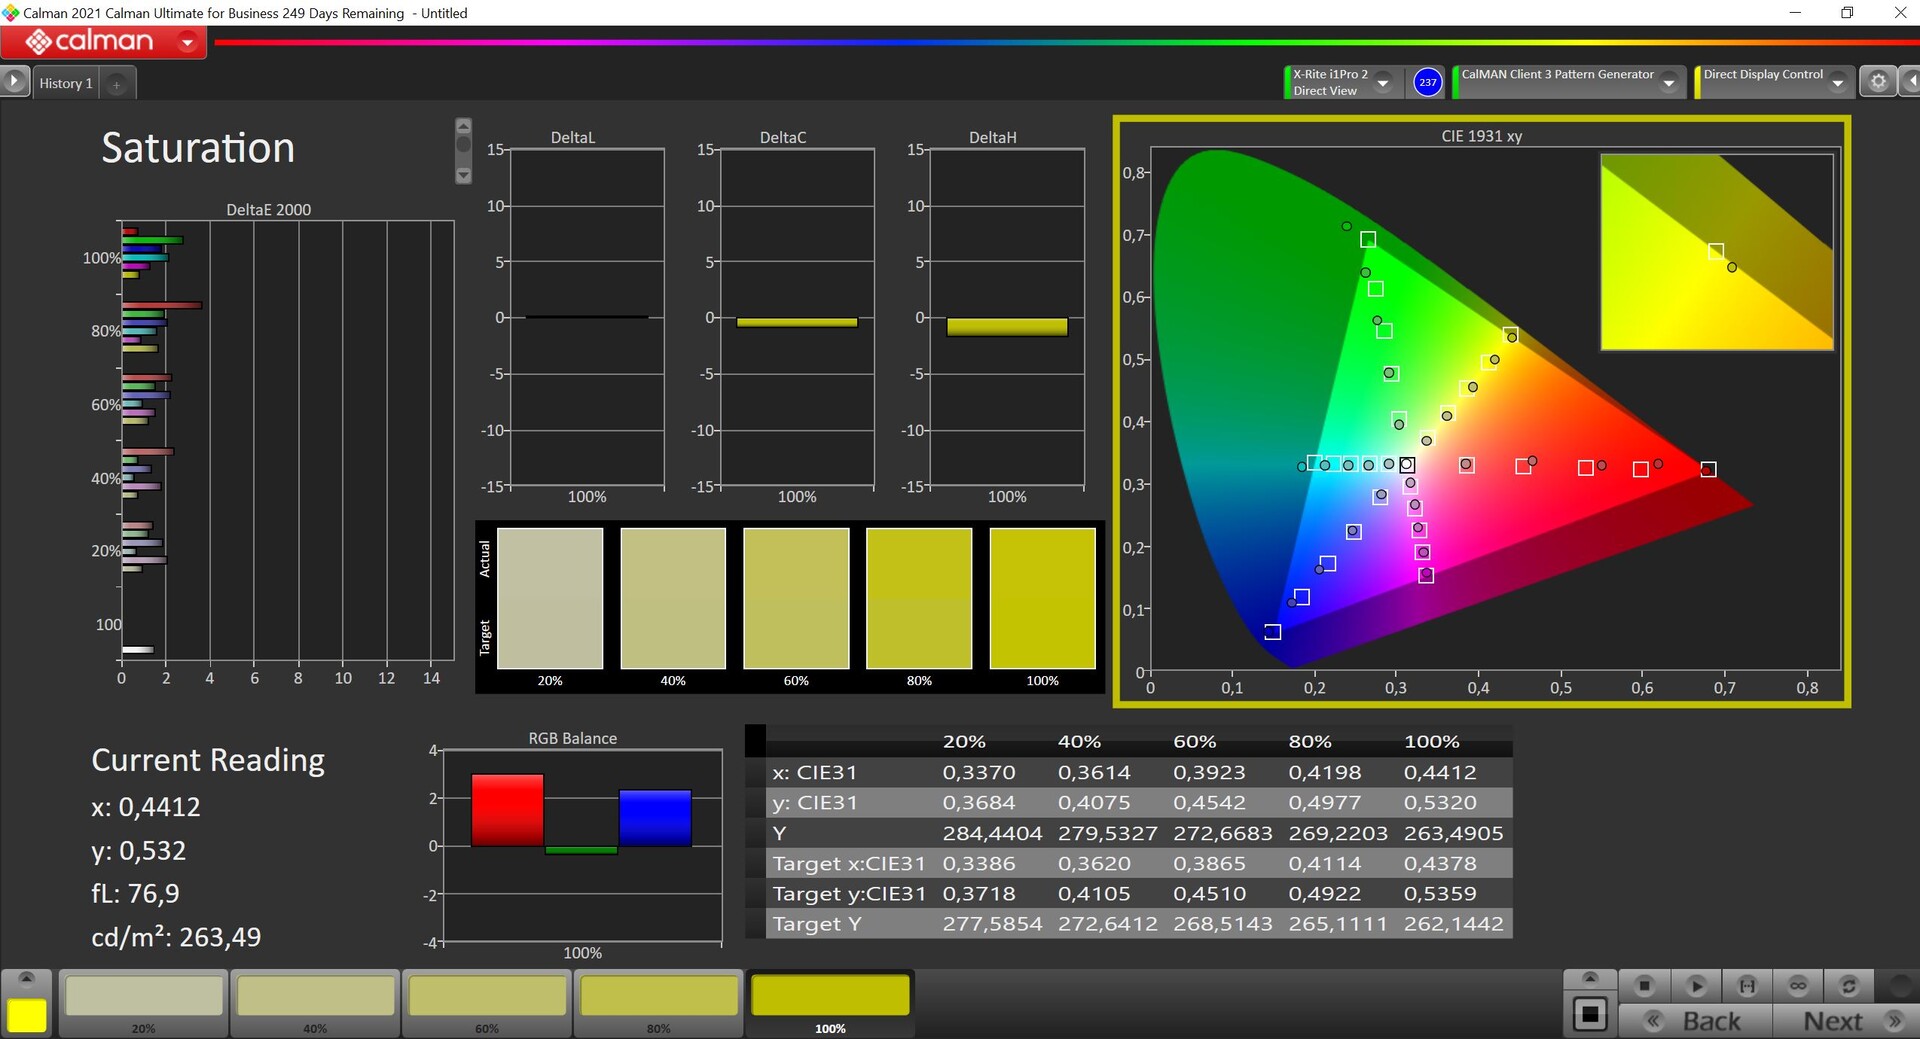
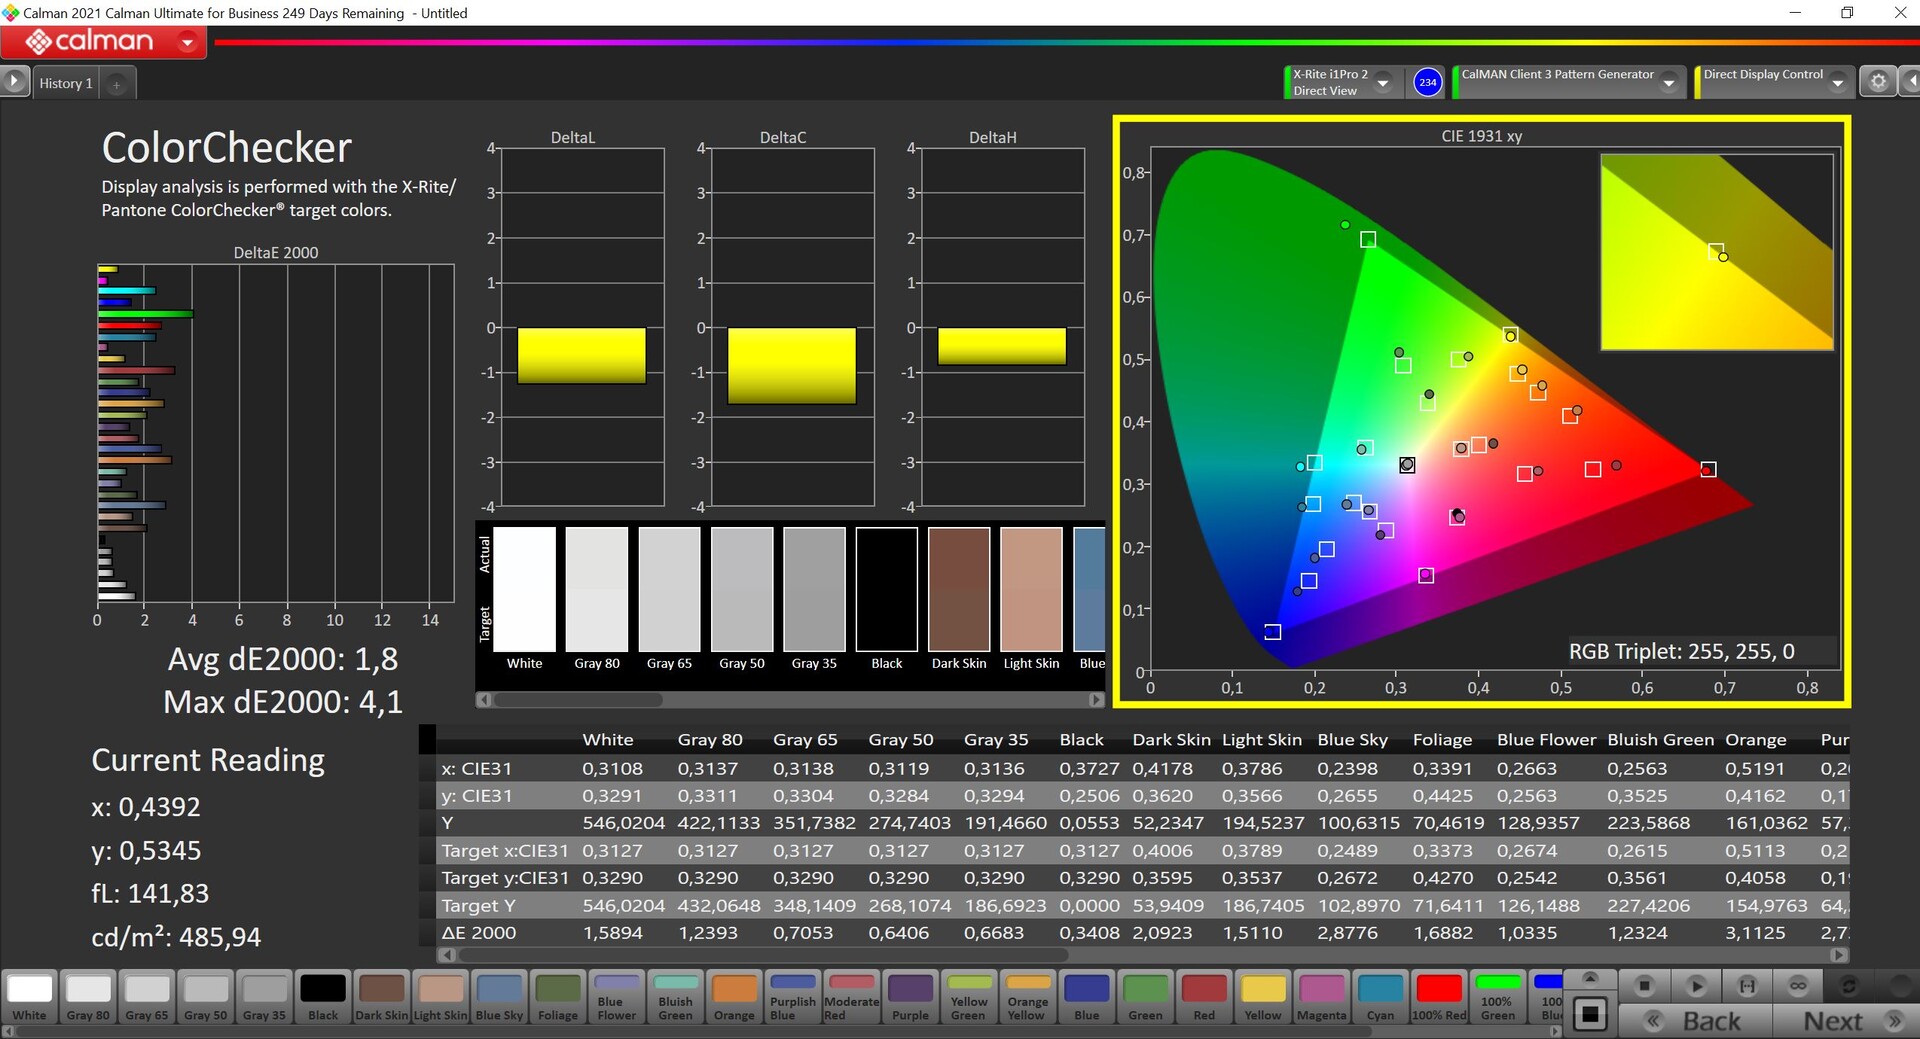
The deviations compared to the P3 reference gamut are very high out of the box, both for the grayscale as well as the colors. Our own calibration (the corresponding profile is available for free in the display box above) improves the color performance noticeably, but also lowers the maximum brightness by around 50 nits. We would still recommend the calibrated profile and it is possible to edit pictures/videos, even though our measurements show that the P3 color space is only covered by 95 %.
Display Response Times
| ↔ Response Time Black to White | ||
|---|---|---|
| 26.6 ms ... rise ↗ and fall ↘ combined | ↗ 9.2 ms rise | 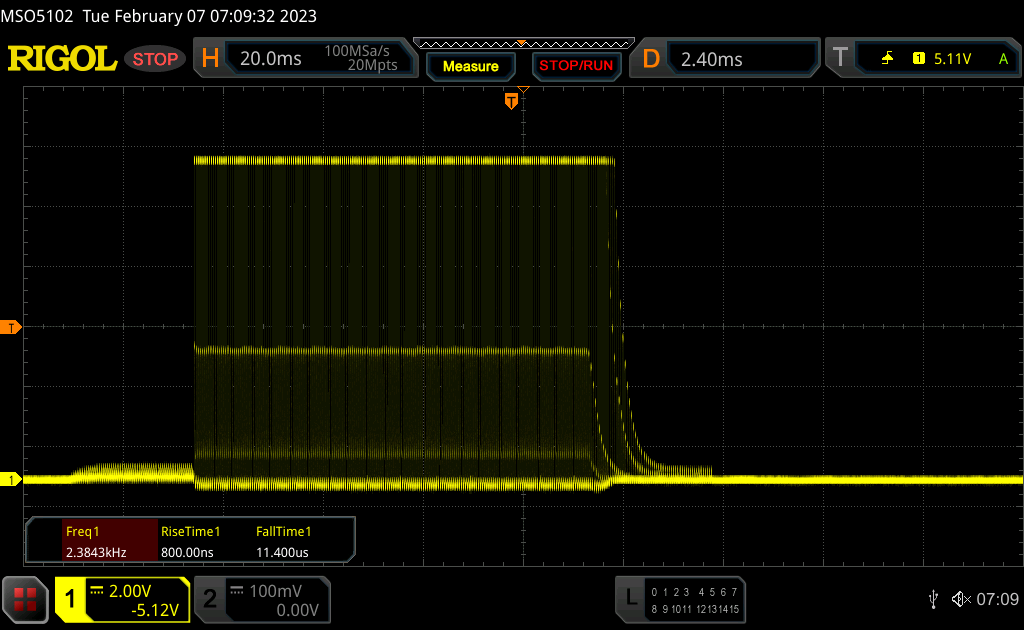 |
| ↘ 17.4 ms fall | ||
| The screen shows relatively slow response rates in our tests and may be too slow for gamers. In comparison, all tested devices range from 0.1 (minimum) to 240 (maximum) ms. » 66 % of all devices are better. This means that the measured response time is worse than the average of all tested devices (20.1 ms). | ||
| ↔ Response Time 50% Grey to 80% Grey | ||
| 38.4 ms ... rise ↗ and fall ↘ combined | ↗ 13.6 ms rise | 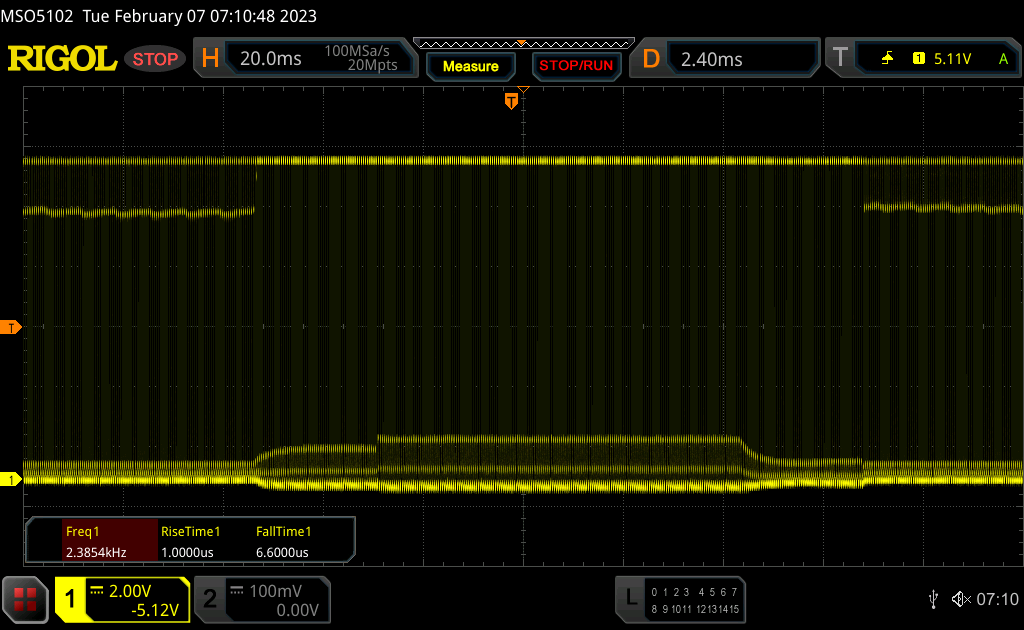 |
| ↘ 24.8 ms fall | ||
| The screen shows slow response rates in our tests and will be unsatisfactory for gamers. In comparison, all tested devices range from 0.165 (minimum) to 636 (maximum) ms. » 57 % of all devices are better. This means that the measured response time is worse than the average of all tested devices (31.4 ms). | ||
Screen Flickering / PWM (Pulse-Width Modulation)
| Screen flickering / PWM detected | 2380 Hz | ≤ 100 % brightness setting | 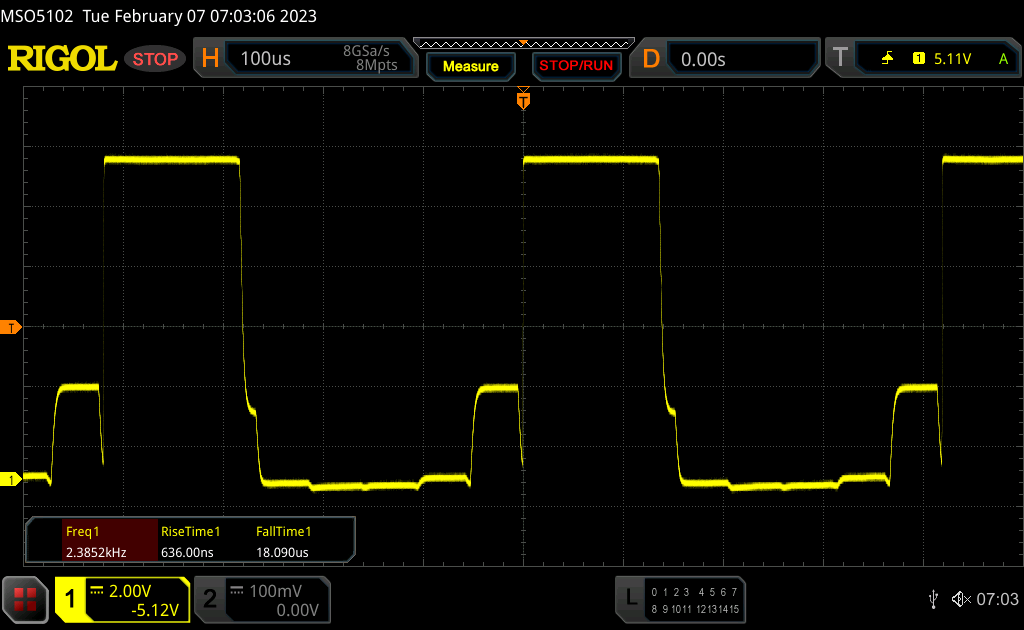 |
The display backlight flickers at 2380 Hz (worst case, e.g., utilizing PWM) Flickering detected at a brightness setting of 100 % and below. There should be no flickering or PWM above this brightness setting. The frequency of 2380 Hz is quite high, so most users sensitive to PWM should not notice any flickering. In comparison: 53 % of all tested devices do not use PWM to dim the display. If PWM was detected, an average of 8002 (minimum: 5 - maximum: 343500) Hz was measured. | |||

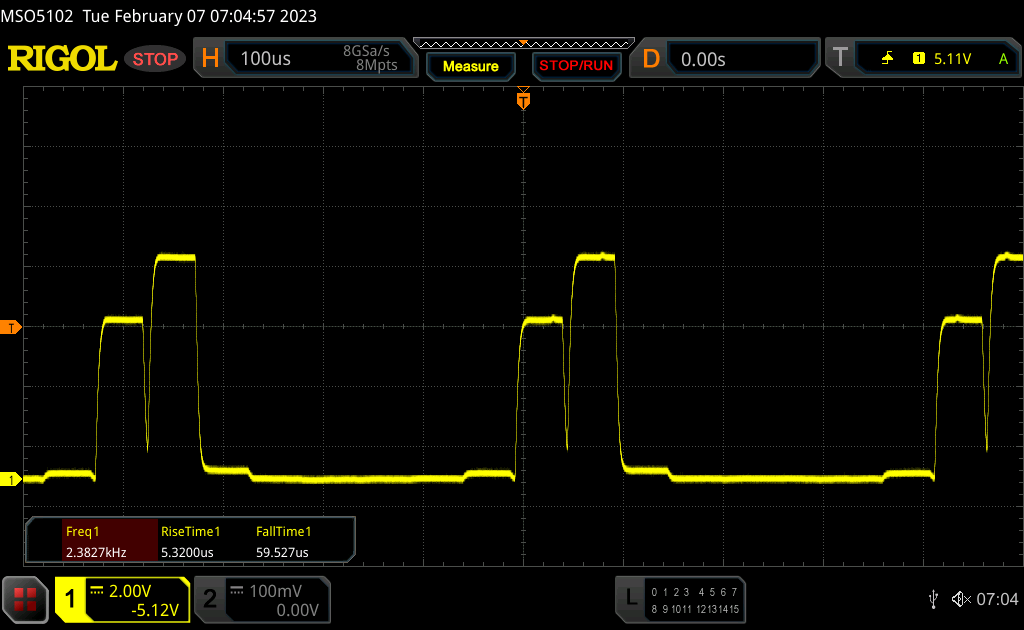

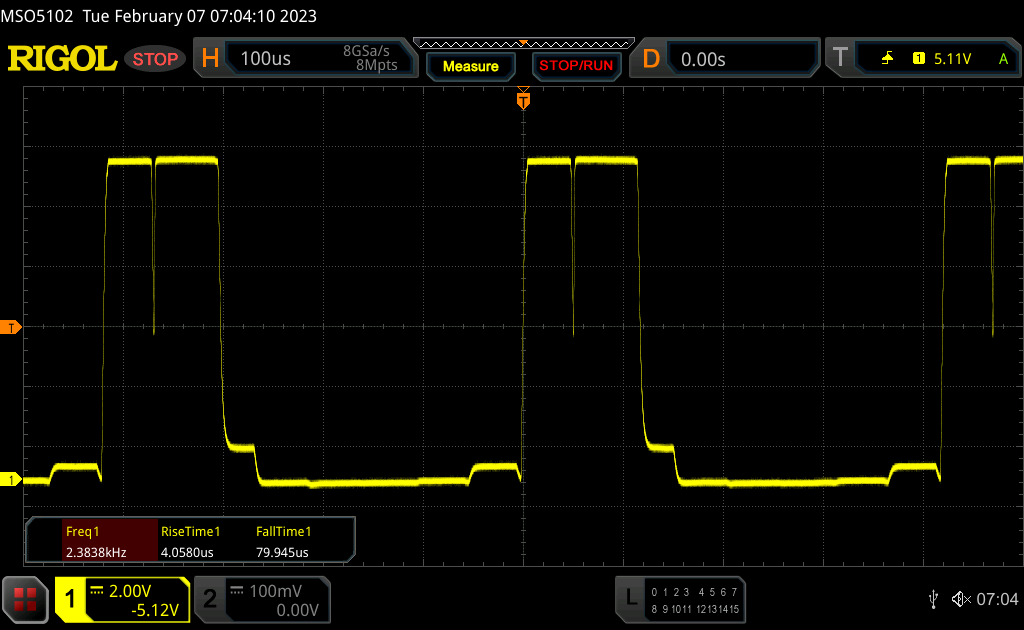
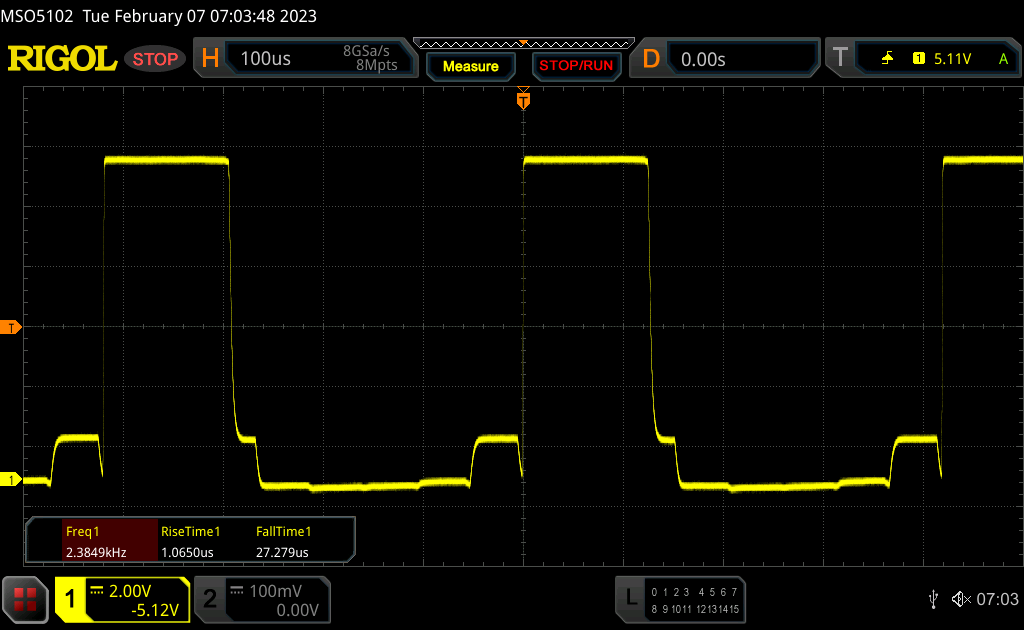
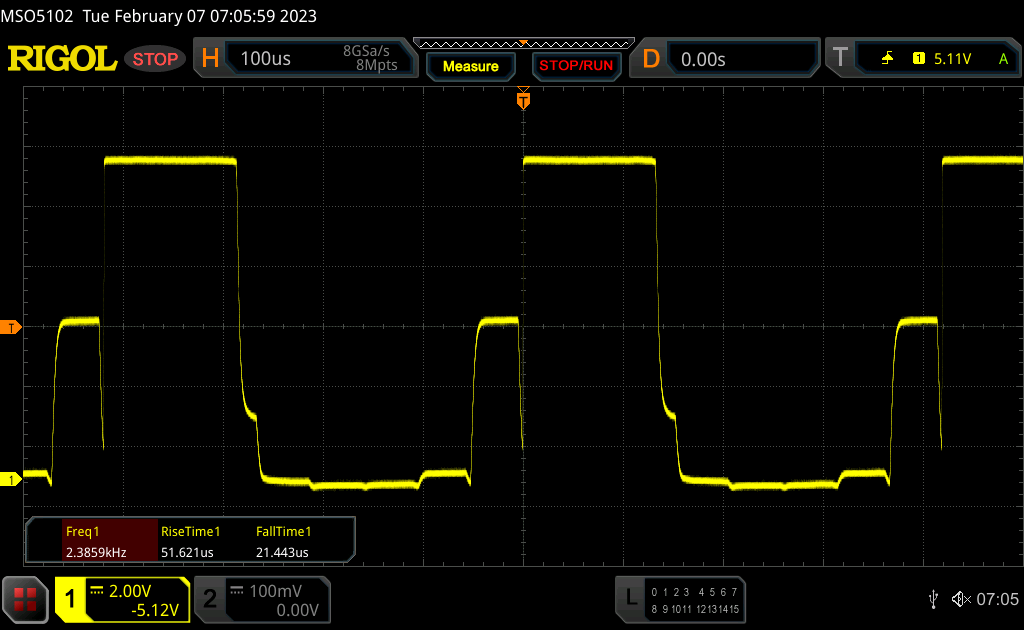
We detect PWM at all brightness levels (even maximum HDR brightness) with a frequency of 2.38 kHz, which makes it really tricky to determine the response times. We determined the values manually and the response times appear rather slow, but you do not notice that in practice where the 144 Hz refresh rate helps.
The matte panel and the high brightness should be great outdoors, but MSI limits the outdoor capabilities of the GT77. HDR is not possible on battery power and the maximum SDR brightness is also lowered from ~600 to ~400 nits as soon as you detach the power adapter. There are no limitations in terms of viewing angle stability.

Performance - Core i9 HX & RTX 4090
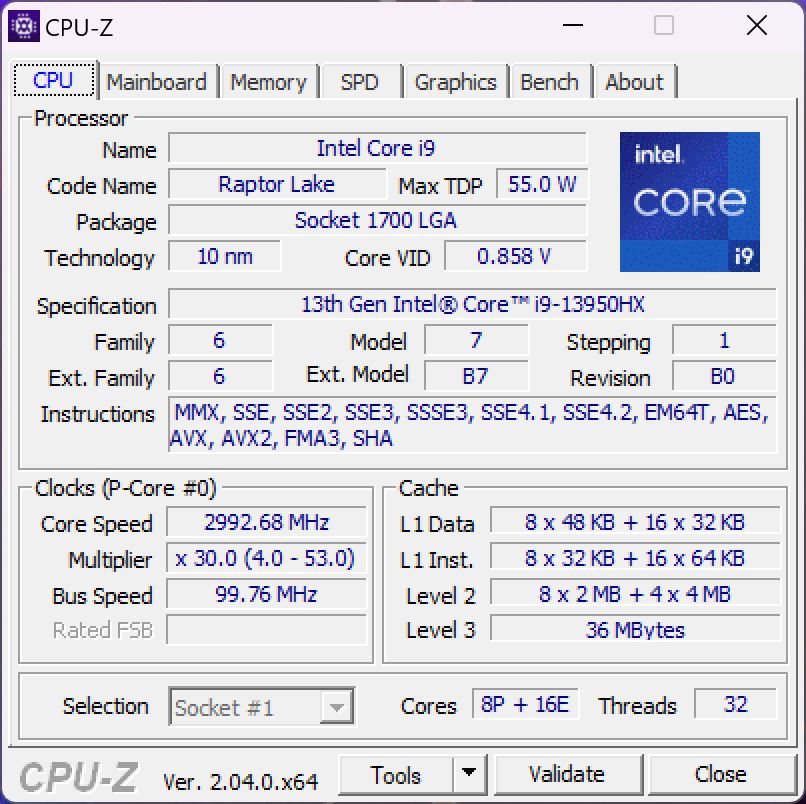
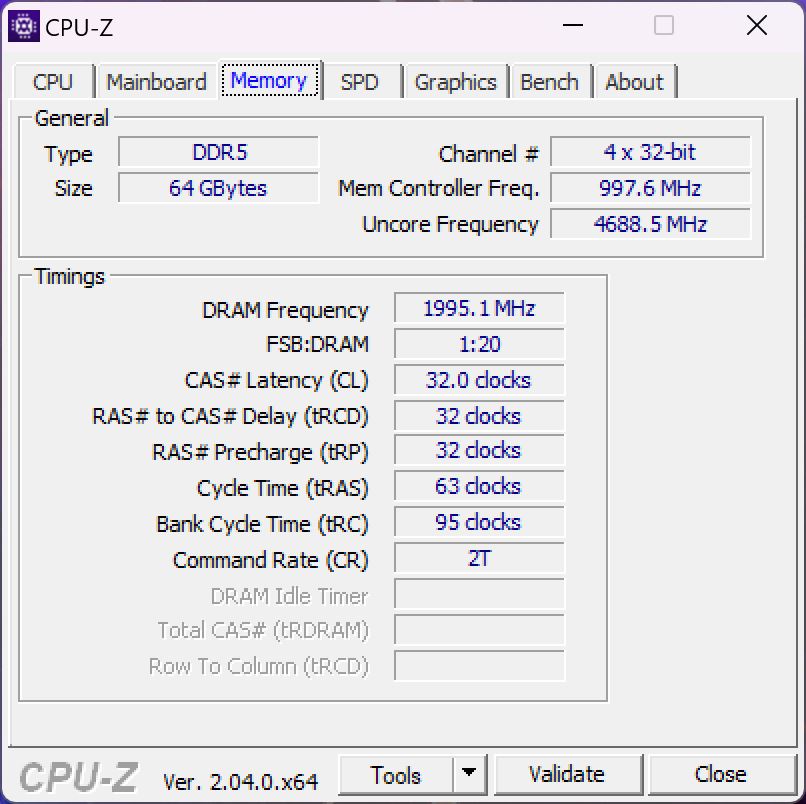
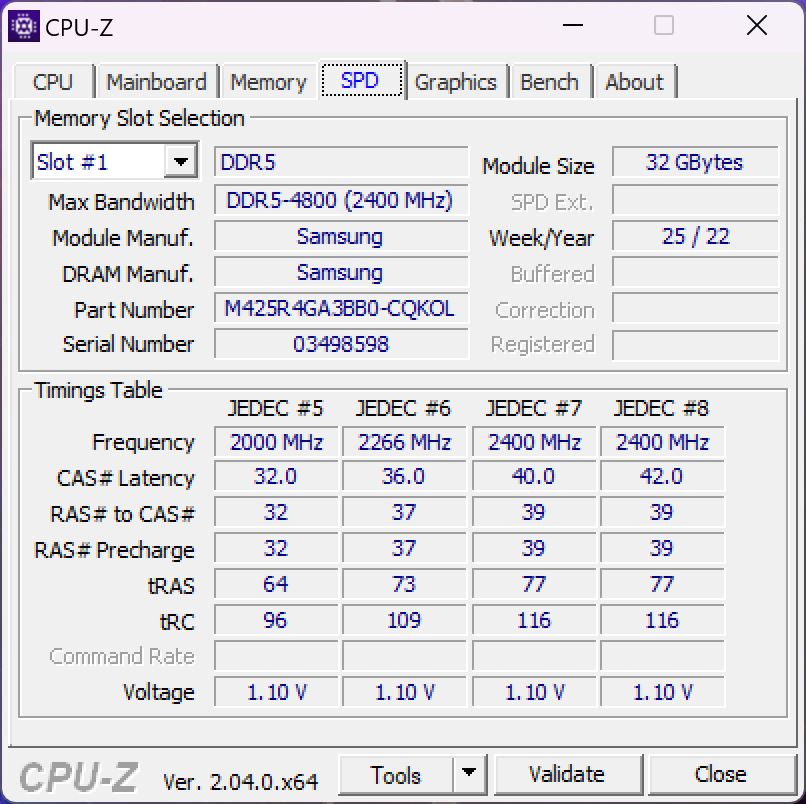
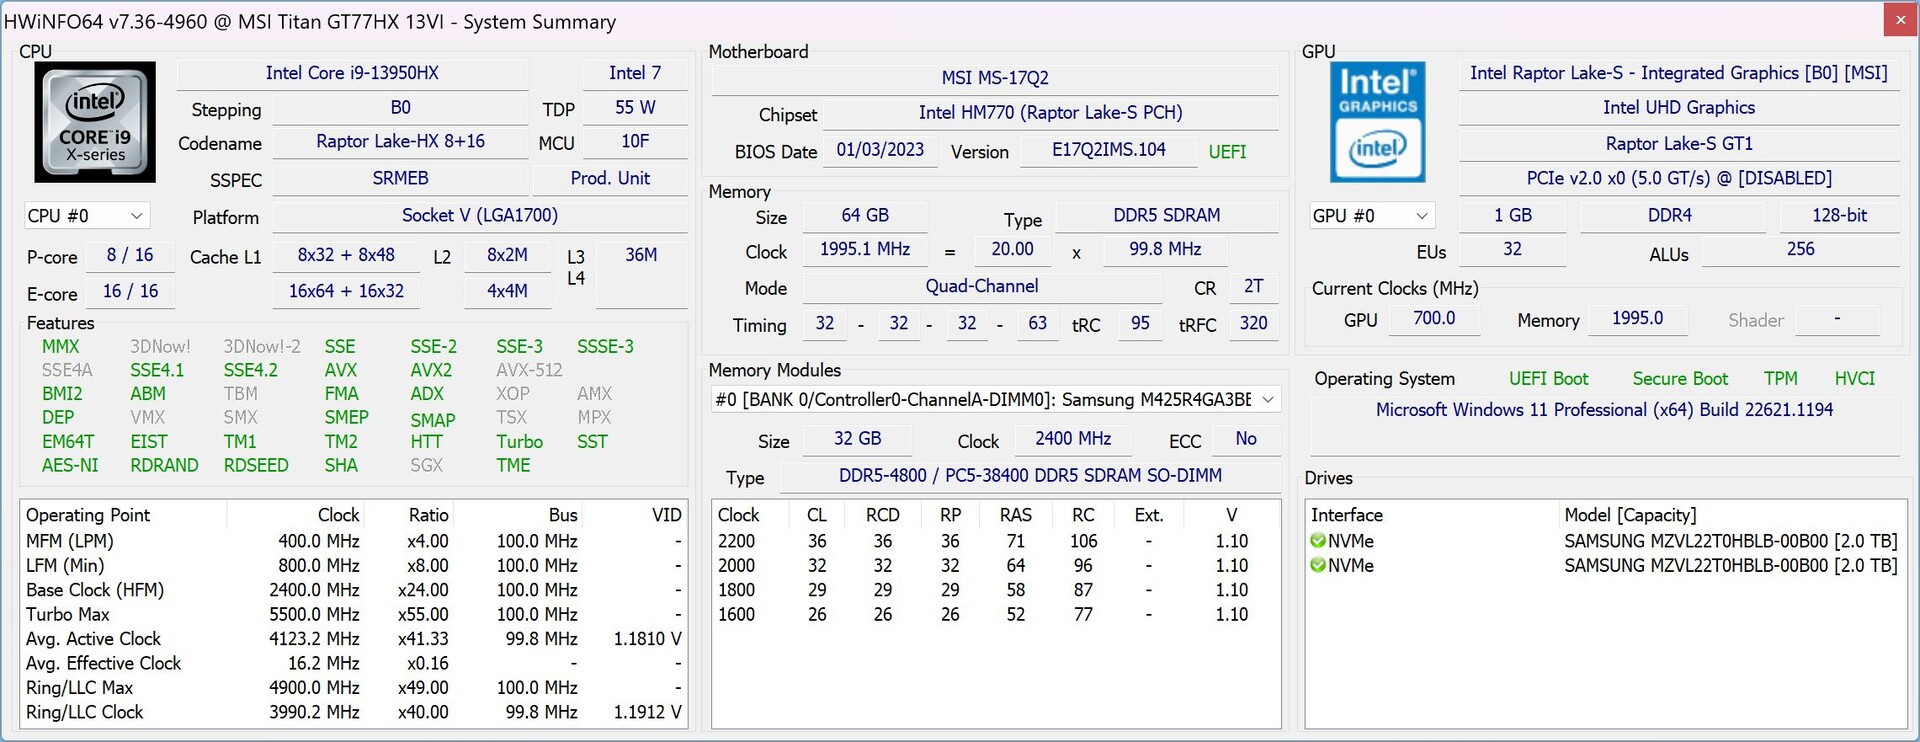
Our review unit is equipped with the Core i9-13950HX, one of the fastest mobile CPUs from Intel. The retail version will be equipped with the Core i9-13980HX, but it only offers a 100 MHz higher maximum clock for the P-cores in favor of vPro support. The latter is not important when you play games, but might be interesting when you plan to use the Titan as a mobile workstation. MSI still uses DDR5-4800 instead of the faster DDR5-5600 and you can either select the new GeForce RTX 4080 or the RTX 4090 for laptops.
Review Settings
The preloaded MSI Center software offers different performance settings with an AI Mode and four additional presets (Extreme Performance, Balanced, Silent, Super Battery). You can also select the graphics mode (hybrid, only dGPU, only iGPU) thanks to a MUX, but there is no supports for Advanced Optimus, which means changes require a restart.
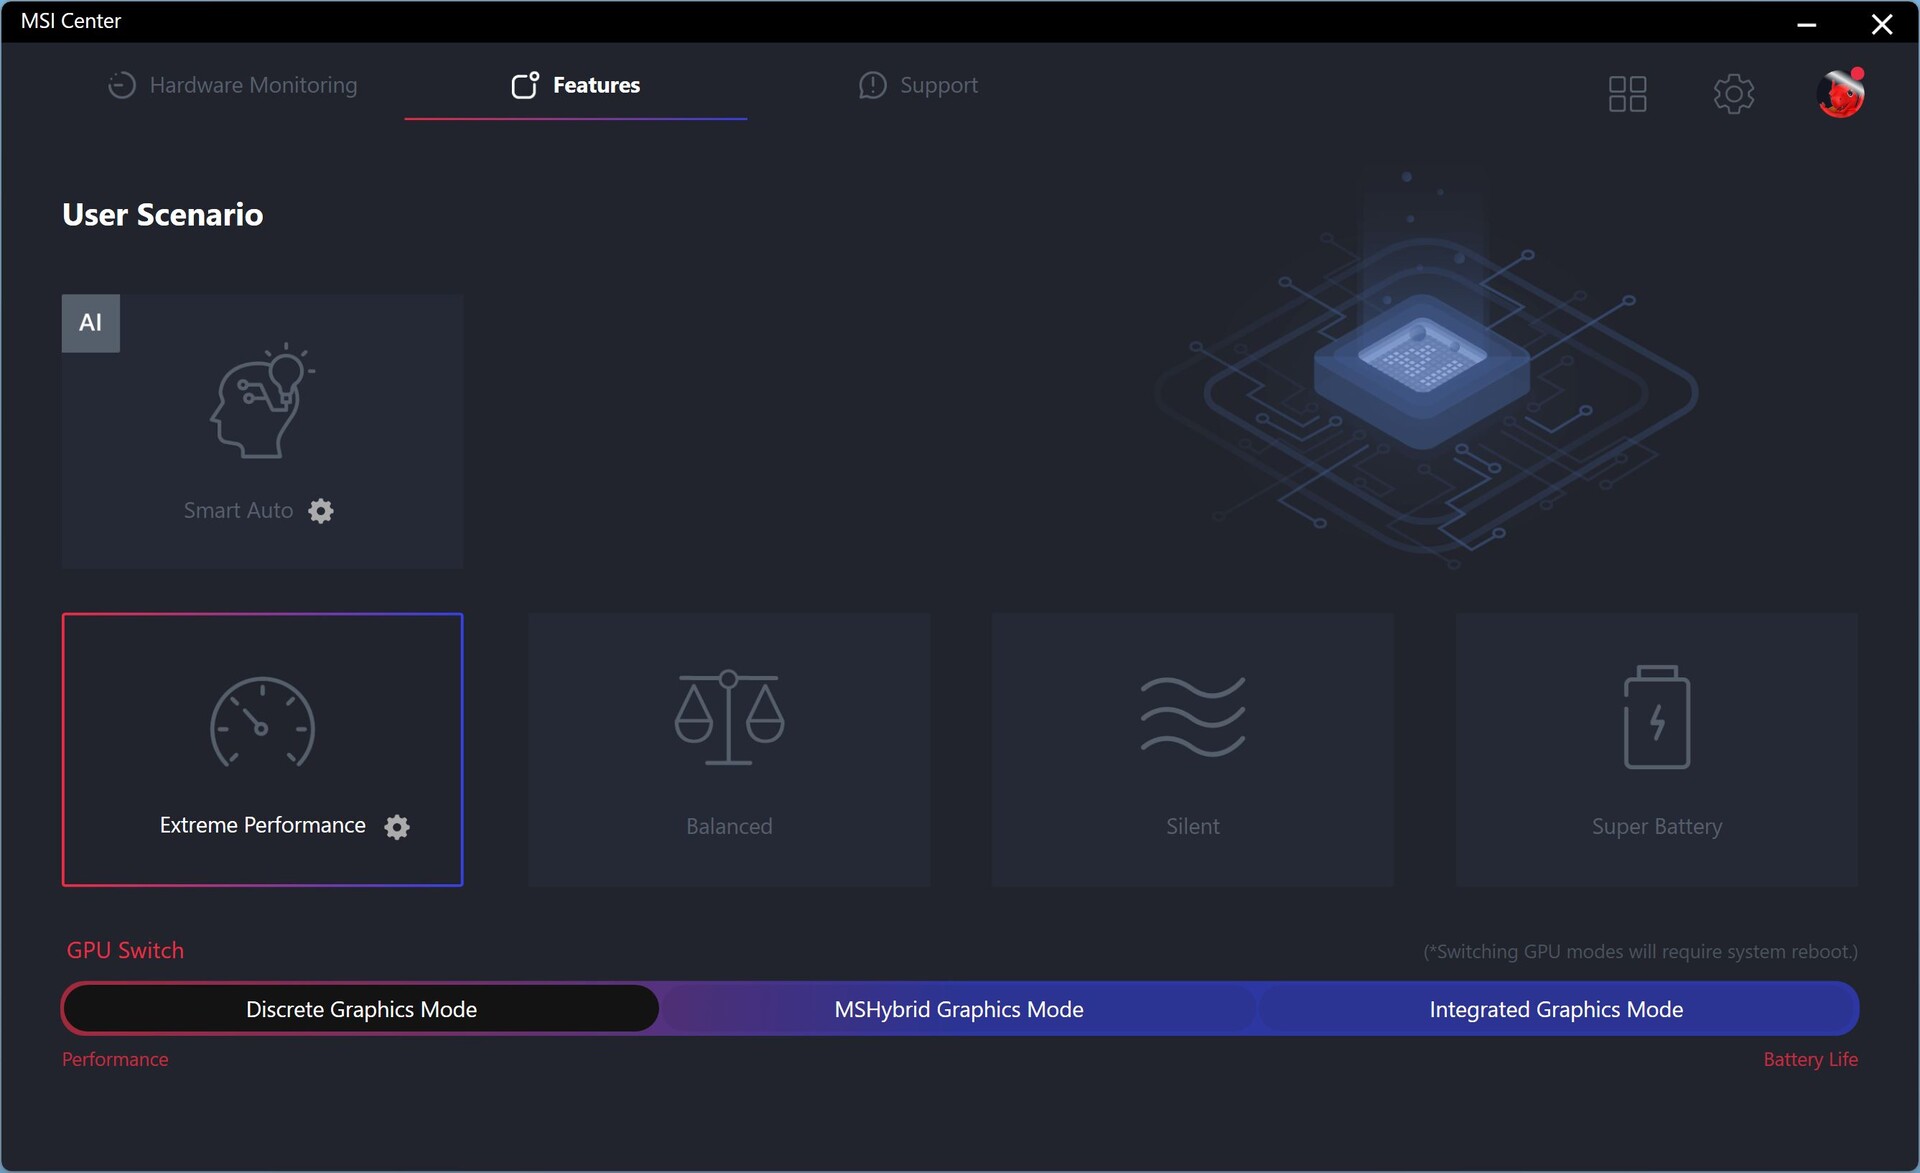
We used the Extreme Performance preset with the discrete GPU mode (iGPU deactivated) for our benchmarks, but we used the iGPU for battery tests. We did not experience any serious issues with the MSI software, but there was one bug with the discrete graphics mode where we could not lower the display brightness. We expect this issue will be fixed on retail units.
Processor - Core i9-13950HX
Contrary to the slower Raptor Lake mobile processors, Intel changed the core configuration for the high-end HX-series chips compared to the old Alder Lake CPUs. The clocks are higher, but there is now also twice the number of efficiency cores (from 8 to 16), which means the CPU can execute up to 32 threads simultaneously (16 E-cores + 8 P-cores with hyper threading).
The performance of the new Core i9-13950HX in the MSI Titan GT77 is excellent thanks to generous power limits. The performance fluctuates a bit, but we can observe a consumption of more than 200W at the start of benchmarks before the chip will settle at around 150W. The performance jump over the old Titan GT77 with the Core i9-12900HX is 22 % across all CPU benchmarks and the Core i9-13950HX in the new Razer Blade 16 is also beaten by 14 %.
As expected, we see the biggest improvements in the multi-core tests, where you just notice the higher number of cores. For example: The new GT77 is 45 % faster than the old GT77 with the Core i9-12900HX in Cinebench R23 Multi. The advantage over other Raptor Lake HX processors also shows that this is a very fast implementation. The new model is also faster in single-core tests, but the advantage is much lower at 6-10 %.
The CPU performance is locked at 25W on battery power, even in the fastest performance mode, which results in a performance deficit of more than 70 % in multi-core scenarios. Additional CPU benchmarks are listed in our tech section.
Cinebench R15 Multi Dauertest
Cinebench R23: Multi Core | Single Core
Cinebench R20: CPU (Multi Core) | CPU (Single Core)
Cinebench R15: CPU Multi 64Bit | CPU Single 64Bit
Blender: v2.79 BMW27 CPU
7-Zip 18.03: 7z b 4 | 7z b 4 -mmt1
Geekbench 5.5: Multi-Core | Single-Core
HWBOT x265 Benchmark v2.2: 4k Preset
LibreOffice : 20 Documents To PDF
R Benchmark 2.5: Overall mean
| CPU Performance rating | |
| MSI Titan GT77 HX 13VI | |
| MSI Titan GT77 HX 13VI | |
| Schenker XMG Neo 16 Raptor Lake | |
| Average Intel Core i9-13950HX | |
| Razer Blade 16 Early 2023 | |
| Average of class Gaming | |
| MSI Titan GT77 12UHS | |
| Asus ROG Strix Scar 17 SE G733CX-LL014W | |
| Alienware x17 R2 P48E | |
| Schenker XMG Neo 17 M22 | |
| Cinebench R23 / Multi Core | |
| MSI Titan GT77 HX 13VI | |
| MSI Titan GT77 HX 13VI | |
| Average Intel Core i9-13950HX (24560 - 33277, n=7) | |
| Schenker XMG Neo 16 Raptor Lake | |
| Schenker XMG Neo 16 Raptor Lake | |
| Schenker XMG Neo 16 Raptor Lake | |
| Razer Blade 16 Early 2023 | |
| Average of class Gaming (9107 - 40970, n=132, last 2 years) | |
| MSI Titan GT77 12UHS | |
| Asus ROG Strix Scar 17 SE G733CX-LL014W | |
| Alienware x17 R2 P48E | |
| Schenker XMG Neo 17 M22 | |
| Cinebench R23 / Single Core | |
| MSI Titan GT77 HX 13VI | |
| MSI Titan GT77 HX 13VI | |
| Average Intel Core i9-13950HX (1952 - 2113, n=7) | |
| Schenker XMG Neo 16 Raptor Lake | |
| Razer Blade 16 Early 2023 | |
| Average of class Gaming (1166 - 2267, n=132, last 2 years) | |
| MSI Titan GT77 12UHS | |
| Alienware x17 R2 P48E | |
| Asus ROG Strix Scar 17 SE G733CX-LL014W | |
| Schenker XMG Neo 17 M22 | |
| Cinebench R20 / CPU (Multi Core) | |
| MSI Titan GT77 HX 13VI | |
| MSI Titan GT77 HX 13VI | |
| Schenker XMG Neo 16 Raptor Lake | |
| Average Intel Core i9-13950HX (8697 - 12648, n=7) | |
| Average of class Gaming (3504 - 16108, n=131, last 2 years) | |
| Razer Blade 16 Early 2023 | |
| MSI Titan GT77 12UHS | |
| Asus ROG Strix Scar 17 SE G733CX-LL014W | |
| Alienware x17 R2 P48E | |
| Schenker XMG Neo 17 M22 | |
| Cinebench R20 / CPU (Single Core) | |
| MSI Titan GT77 HX 13VI | |
| MSI Titan GT77 HX 13VI | |
| Average Intel Core i9-13950HX (742 - 816, n=7) | |
| Average of class Gaming (442 - 870, n=131, last 2 years) | |
| Schenker XMG Neo 16 Raptor Lake | |
| Razer Blade 16 Early 2023 | |
| Asus ROG Strix Scar 17 SE G733CX-LL014W | |
| MSI Titan GT77 12UHS | |
| Alienware x17 R2 P48E | |
| Schenker XMG Neo 17 M22 | |
| Cinebench R15 / CPU Multi 64Bit | |
| MSI Titan GT77 HX 13VI | |
| MSI Titan GT77 HX 13VI | |
| Schenker XMG Neo 16 Raptor Lake | |
| Schenker XMG Neo 16 Raptor Lake | |
| Average Intel Core i9-13950HX (3625 - 5227, n=7) | |
| Razer Blade 16 Early 2023 | |
| Average of class Gaming (1537 - 6271, n=132, last 2 years) | |
| MSI Titan GT77 12UHS | |
| Asus ROG Strix Scar 17 SE G733CX-LL014W | |
| Alienware x17 R2 P48E | |
| Schenker XMG Neo 17 M22 | |
| Cinebench R15 / CPU Single 64Bit | |
| MSI Titan GT77 HX 13VI | |
| MSI Titan GT77 HX 13VI | |
| Schenker XMG Neo 16 Raptor Lake | |
| Schenker XMG Neo 16 Raptor Lake | |
| Average of class Gaming (188.8 - 343, n=131, last 2 years) | |
| Average Intel Core i9-13950HX (274 - 303, n=7) | |
| MSI Titan GT77 12UHS | |
| Asus ROG Strix Scar 17 SE G733CX-LL014W | |
| Razer Blade 16 Early 2023 | |
| Alienware x17 R2 P48E | |
| Schenker XMG Neo 17 M22 | |
| Blender / v2.79 BMW27 CPU | |
| Schenker XMG Neo 17 M22 | |
| Asus ROG Strix Scar 17 SE G733CX-LL014W | |
| Alienware x17 R2 P48E | |
| Average of class Gaming (80 - 334, n=128, last 2 years) | |
| MSI Titan GT77 12UHS | |
| Razer Blade 16 Early 2023 | |
| Average Intel Core i9-13950HX (100 - 137, n=7) | |
| Schenker XMG Neo 16 Raptor Lake | |
| MSI Titan GT77 HX 13VI | |
| MSI Titan GT77 HX 13VI | |
| 7-Zip 18.03 / 7z b 4 | |
| MSI Titan GT77 HX 13VI | |
| MSI Titan GT77 HX 13VI | |
| Schenker XMG Neo 16 Raptor Lake | |
| Average Intel Core i9-13950HX (99351 - 127295, n=7) | |
| Razer Blade 16 Early 2023 | |
| Average of class Gaming (33491 - 148086, n=129, last 2 years) | |
| MSI Titan GT77 12UHS | |
| Asus ROG Strix Scar 17 SE G733CX-LL014W | |
| Alienware x17 R2 P48E | |
| Schenker XMG Neo 17 M22 | |
| 7-Zip 18.03 / 7z b 4 -mmt1 | |
| MSI Titan GT77 HX 13VI | |
| MSI Titan GT77 HX 13VI | |
| Schenker XMG Neo 16 Raptor Lake | |
| Average Intel Core i9-13950HX (6445 - 7064, n=7) | |
| Razer Blade 16 Early 2023 | |
| Average of class Gaming (4199 - 7508, n=129, last 2 years) | |
| MSI Titan GT77 12UHS | |
| Asus ROG Strix Scar 17 SE G733CX-LL014W | |
| Schenker XMG Neo 17 M22 | |
| Alienware x17 R2 P48E | |
| Geekbench 5.5 / Multi-Core | |
| Schenker XMG Neo 16 Raptor Lake | |
| MSI Titan GT77 HX 13VI | |
| MSI Titan GT77 HX 13VI | |
| Average Intel Core i9-13950HX (16776 - 21853, n=7) | |
| Razer Blade 16 Early 2023 | |
| Average of class Gaming (5847 - 27010, n=129, last 2 years) | |
| MSI Titan GT77 12UHS | |
| Asus ROG Strix Scar 17 SE G733CX-LL014W | |
| Alienware x17 R2 P48E | |
| Schenker XMG Neo 17 M22 | |
| Geekbench 5.5 / Single-Core | |
| MSI Titan GT77 HX 13VI | |
| MSI Titan GT77 HX 13VI | |
| Schenker XMG Neo 16 Raptor Lake | |
| Average of class Gaming (986 - 2474, n=129, last 2 years) | |
| Average Intel Core i9-13950HX (1805 - 2097, n=7) | |
| MSI Titan GT77 12UHS | |
| Alienware x17 R2 P48E | |
| Asus ROG Strix Scar 17 SE G733CX-LL014W | |
| Razer Blade 16 Early 2023 | |
| Schenker XMG Neo 17 M22 | |
| HWBOT x265 Benchmark v2.2 / 4k Preset | |
| MSI Titan GT77 HX 13VI | |
| MSI Titan GT77 HX 13VI | |
| Schenker XMG Neo 16 Raptor Lake | |
| Average Intel Core i9-13950HX (26 - 34.5, n=7) | |
| Razer Blade 16 Early 2023 | |
| Average of class Gaming (11 - 44.3, n=129, last 2 years) | |
| MSI Titan GT77 12UHS | |
| Asus ROG Strix Scar 17 SE G733CX-LL014W | |
| Alienware x17 R2 P48E | |
| Schenker XMG Neo 17 M22 | |
| LibreOffice / 20 Documents To PDF | |
| Schenker XMG Neo 17 M22 | |
| Average of class Gaming (19 - 88.8, n=129, last 2 years) | |
| Razer Blade 16 Early 2023 | |
| MSI Titan GT77 HX 13VI | |
| Schenker XMG Neo 16 Raptor Lake | |
| Average Intel Core i9-13950HX (32.8 - 52.1, n=7) | |
| Alienware x17 R2 P48E | |
| MSI Titan GT77 12UHS | |
| MSI Titan GT77 HX 13VI | |
| Asus ROG Strix Scar 17 SE G733CX-LL014W | |
| R Benchmark 2.5 / Overall mean | |
| Schenker XMG Neo 17 M22 | |
| Alienware x17 R2 P48E | |
| Average of class Gaming (0.3439 - 0.759, n=130, last 2 years) | |
| Asus ROG Strix Scar 17 SE G733CX-LL014W | |
| MSI Titan GT77 12UHS | |
| Razer Blade 16 Early 2023 | |
| MSI Titan GT77 HX 13VI | |
| MSI Titan GT77 HX 13VI | |
| Average Intel Core i9-13950HX (0.3823 - 0.4121, n=7) | |
| Schenker XMG Neo 16 Raptor Lake | |
* ... smaller is better
AIDA64: FP32 Ray-Trace | FPU Julia | CPU SHA3 | CPU Queen | FPU SinJulia | FPU Mandel | CPU AES | CPU ZLib | FP64 Ray-Trace | CPU PhotoWorxx
| Performance rating | |
| MSI Titan GT77 HX 13VI | |
| Schenker XMG Neo 16 Raptor Lake | |
| Average of class Gaming | |
| Average Intel Core i9-13950HX | |
| Razer Blade 16 Early 2023 | |
| MSI Titan GT77 12UHS | |
| Asus ROG Strix Scar 17 SE G733CX-LL014W | |
| Schenker XMG Neo 17 M22 | |
| Alienware x17 R2 P48E | |
| AIDA64 / FP32 Ray-Trace | |
| Average of class Gaming (10227 - 85542, n=129, last 2 years) | |
| MSI Titan GT77 HX 13VI | |
| Schenker XMG Neo 16 Raptor Lake | |
| Razer Blade 16 Early 2023 | |
| Razer Blade 16 Early 2023 | |
| Razer Blade 16 Early 2023 | |
| Average Intel Core i9-13950HX (17993 - 28957, n=9) | |
| MSI Titan GT77 12UHS | |
| Asus ROG Strix Scar 17 SE G733CX-LL014W | |
| Schenker XMG Neo 17 M22 | |
| Alienware x17 R2 P48E | |
| AIDA64 / FPU Julia | |
| MSI Titan GT77 HX 13VI | |
| Average of class Gaming (51376 - 238426, n=129, last 2 years) | |
| Schenker XMG Neo 16 Raptor Lake | |
| Razer Blade 16 Early 2023 | |
| Razer Blade 16 Early 2023 | |
| Razer Blade 16 Early 2023 | |
| Average Intel Core i9-13950HX (89362 - 144303, n=9) | |
| MSI Titan GT77 12UHS | |
| Schenker XMG Neo 17 M22 | |
| Asus ROG Strix Scar 17 SE G733CX-LL014W | |
| Alienware x17 R2 P48E | |
| AIDA64 / CPU SHA3 | |
| MSI Titan GT77 HX 13VI | |
| Schenker XMG Neo 16 Raptor Lake | |
| Razer Blade 16 Early 2023 | |
| Razer Blade 16 Early 2023 | |
| Razer Blade 16 Early 2023 | |
| Average of class Gaming (2180 - 9817, n=129, last 2 years) | |
| Average Intel Core i9-13950HX (4518 - 7093, n=9) | |
| MSI Titan GT77 12UHS | |
| Asus ROG Strix Scar 17 SE G733CX-LL014W | |
| Alienware x17 R2 P48E | |
| Schenker XMG Neo 17 M22 | |
| AIDA64 / CPU Queen | |
| MSI Titan GT77 HX 13VI | |
| Schenker XMG Neo 16 Raptor Lake | |
| Average Intel Core i9-13950HX (131931 - 140103, n=8) | |
| Razer Blade 16 Early 2023 | |
| Razer Blade 16 Early 2023 | |
| Average of class Gaming (49785 - 173351, n=129, last 2 years) | |
| Alienware x17 R2 P48E | |
| Asus ROG Strix Scar 17 SE G733CX-LL014W | |
| MSI Titan GT77 12UHS | |
| Schenker XMG Neo 17 M22 | |
| AIDA64 / FPU SinJulia | |
| MSI Titan GT77 HX 13VI | |
| Schenker XMG Neo 16 Raptor Lake | |
| Razer Blade 16 Early 2023 | |
| Razer Blade 16 Early 2023 | |
| Razer Blade 16 Early 2023 | |
| Average Intel Core i9-13950HX (12318 - 17057, n=9) | |
| Average of class Gaming (4424 - 33636, n=129, last 2 years) | |
| MSI Titan GT77 12UHS | |
| Schenker XMG Neo 17 M22 | |
| Asus ROG Strix Scar 17 SE G733CX-LL014W | |
| Alienware x17 R2 P48E | |
| AIDA64 / FPU Mandel | |
| MSI Titan GT77 HX 13VI | |
| Average of class Gaming (25115 - 128721, n=129, last 2 years) | |
| Schenker XMG Neo 16 Raptor Lake | |
| Razer Blade 16 Early 2023 | |
| Razer Blade 16 Early 2023 | |
| Razer Blade 16 Early 2023 | |
| Average Intel Core i9-13950HX (44372 - 71038, n=9) | |
| Schenker XMG Neo 17 M22 | |
| MSI Titan GT77 12UHS | |
| Asus ROG Strix Scar 17 SE G733CX-LL014W | |
| Alienware x17 R2 P48E | |
| AIDA64 / CPU AES | |
| MSI Titan GT77 12UHS | |
| Asus ROG Strix Scar 17 SE G733CX-LL014W | |
| Razer Blade 16 Early 2023 | |
| Razer Blade 16 Early 2023 | |
| Razer Blade 16 Early 2023 | |
| Average Intel Core i9-13950HX (99981 - 204491, n=9) | |
| MSI Titan GT77 HX 13VI | |
| Schenker XMG Neo 17 M22 | |
| Schenker XMG Neo 16 Raptor Lake | |
| Average of class Gaming (39258 - 247074, n=129, last 2 years) | |
| Alienware x17 R2 P48E | |
| AIDA64 / CPU ZLib | |
| MSI Titan GT77 HX 13VI | |
| Schenker XMG Neo 16 Raptor Lake | |
| Razer Blade 16 Early 2023 | |
| Razer Blade 16 Early 2023 | |
| Razer Blade 16 Early 2023 | |
| Average Intel Core i9-13950HX (1263 - 2069, n=9) | |
| Average of class Gaming (574 - 2531, n=129, last 2 years) | |
| MSI Titan GT77 12UHS | |
| Asus ROG Strix Scar 17 SE G733CX-LL014W | |
| Alienware x17 R2 P48E | |
| Schenker XMG Neo 17 M22 | |
| AIDA64 / FP64 Ray-Trace | |
| Average of class Gaming (5509 - 45446, n=129, last 2 years) | |
| MSI Titan GT77 HX 13VI | |
| Schenker XMG Neo 16 Raptor Lake | |
| Razer Blade 16 Early 2023 | |
| Razer Blade 16 Early 2023 | |
| Razer Blade 16 Early 2023 | |
| Average Intel Core i9-13950HX (9649 - 15573, n=9) | |
| MSI Titan GT77 12UHS | |
| Asus ROG Strix Scar 17 SE G733CX-LL014W | |
| Schenker XMG Neo 17 M22 | |
| Alienware x17 R2 P48E | |
| AIDA64 / CPU PhotoWorxx | |
| Razer Blade 16 Early 2023 | |
| Razer Blade 16 Early 2023 | |
| Razer Blade 16 Early 2023 | |
| Average Intel Core i9-13950HX (40233 - 50864, n=9) | |
| Schenker XMG Neo 16 Raptor Lake | |
| Average of class Gaming (10805 - 62916, n=129, last 2 years) | |
| Asus ROG Strix Scar 17 SE G733CX-LL014W | |
| MSI Titan GT77 12UHS | |
| MSI Titan GT77 HX 13VI | |
| Alienware x17 R2 P48E | |
| Schenker XMG Neo 17 M22 | |
Update 03/02/2023: The Core i9-13980HX reaches a 100 MHz higher single-core turbo and shows a small advantage over the pre-production unit. However, both devices are equal in the multi-core tests and the overall difference between the Core i9-13950HX and the Core i9-13980HX is negligible.
System Performance
The subjective performance of the GT77 is excellent and the synthetic benchmark results are also very good, but this is hardly surprising considering the powerful hardware. The rivals are also very fast and you will not notice a big difference between the systems.
CrossMark: Overall | Productivity | Creativity | Responsiveness
| PCMark 10 / Score | |
| MSI Titan GT77 HX 13VI | |
| Average Intel Core i9-13950HX, NVIDIA GeForce RTX 4090 Laptop GPU (7597 - 8884, n=2) | |
| MSI Titan GT77 12UHS | |
| Alienware x17 R2 P48E | |
| Average of class Gaming (5828 - 10060, n=110, last 2 years) | |
| Razer Blade 16 Early 2023 | |
| Asus ROG Strix Scar 17 SE G733CX-LL014W | |
| Schenker XMG Neo 17 M22 | |
| PCMark 10 / Essentials | |
| MSI Titan GT77 HX 13VI | |
| Average Intel Core i9-13950HX, NVIDIA GeForce RTX 4090 Laptop GPU (10903 - 11761, n=2) | |
| Alienware x17 R2 P48E | |
| MSI Titan GT77 12UHS | |
| Razer Blade 16 Early 2023 | |
| Average of class Gaming (8810 - 12600, n=114, last 2 years) | |
| Asus ROG Strix Scar 17 SE G733CX-LL014W | |
| Schenker XMG Neo 17 M22 | |
| PCMark 10 / Productivity | |
| MSI Titan GT77 12UHS | |
| Average of class Gaming (6662 - 16716, n=112, last 2 years) | |
| Alienware x17 R2 P48E | |
| Asus ROG Strix Scar 17 SE G733CX-LL014W | |
| MSI Titan GT77 HX 13VI | |
| Schenker XMG Neo 17 M22 | |
| Average Intel Core i9-13950HX, NVIDIA GeForce RTX 4090 Laptop GPU (8330 - 9851, n=2) | |
| Razer Blade 16 Early 2023 | |
| PCMark 10 / Digital Content Creation | |
| MSI Titan GT77 HX 13VI | |
| Average Intel Core i9-13950HX, NVIDIA GeForce RTX 4090 Laptop GPU (13099 - 16424, n=2) | |
| Razer Blade 16 Early 2023 | |
| Average of class Gaming (7505 - 19351, n=112, last 2 years) | |
| MSI Titan GT77 12UHS | |
| Alienware x17 R2 P48E | |
| Asus ROG Strix Scar 17 SE G733CX-LL014W | |
| Schenker XMG Neo 17 M22 | |
| CrossMark / Overall | |
| MSI Titan GT77 HX 13VI | |
| Asus ROG Strix Scar 17 SE G733CX-LL014W | |
| MSI Titan GT77 12UHS | |
| Average Intel Core i9-13950HX, NVIDIA GeForce RTX 4090 Laptop GPU (2019 - 2139, n=2) | |
| Schenker XMG Neo 16 Raptor Lake | |
| Average of class Gaming (1247 - 2344, n=111, last 2 years) | |
| Alienware x17 R2 P48E | |
| Schenker XMG Neo 17 M22 | |
| Razer Blade 16 Early 2023 | |
| CrossMark / Productivity | |
| MSI Titan GT77 12UHS | |
| MSI Titan GT77 HX 13VI | |
| Asus ROG Strix Scar 17 SE G733CX-LL014W | |
| Average Intel Core i9-13950HX, NVIDIA GeForce RTX 4090 Laptop GPU (1909 - 1977, n=2) | |
| Average of class Gaming (1299 - 2211, n=111, last 2 years) | |
| Schenker XMG Neo 16 Raptor Lake | |
| Alienware x17 R2 P48E | |
| Schenker XMG Neo 17 M22 | |
| Razer Blade 16 Early 2023 | |
| CrossMark / Creativity | |
| MSI Titan GT77 HX 13VI | |
| Schenker XMG Neo 16 Raptor Lake | |
| Asus ROG Strix Scar 17 SE G733CX-LL014W | |
| Average Intel Core i9-13950HX, NVIDIA GeForce RTX 4090 Laptop GPU (2222 - 2423, n=2) | |
| MSI Titan GT77 12UHS | |
| Average of class Gaming (1275 - 2729, n=111, last 2 years) | |
| Alienware x17 R2 P48E | |
| Schenker XMG Neo 17 M22 | |
| Razer Blade 16 Early 2023 | |
| CrossMark / Responsiveness | |
| MSI Titan GT77 12UHS | |
| Asus ROG Strix Scar 17 SE G733CX-LL014W | |
| MSI Titan GT77 HX 13VI | |
| Average Intel Core i9-13950HX, NVIDIA GeForce RTX 4090 Laptop GPU (1792 - 1861, n=2) | |
| Average of class Gaming (1030 - 2330, n=111, last 2 years) | |
| Alienware x17 R2 P48E | |
| Schenker XMG Neo 16 Raptor Lake | |
| Schenker XMG Neo 17 M22 | |
| Razer Blade 16 Early 2023 | |
| PCMark 10 Score | 8884 points | |
Help | ||
| AIDA64 / Memory Copy | |
| Razer Blade 16 Early 2023 | |
| Razer Blade 16 Early 2023 | |
| Razer Blade 16 Early 2023 | |
| Average Intel Core i9-13950HX (61938 - 78813, n=9) | |
| Average of class Gaming (21750 - 108104, n=129, last 2 years) | |
| Schenker XMG Neo 16 Raptor Lake | |
| MSI Titan GT77 12UHS | |
| MSI Titan GT77 HX 13VI | |
| Asus ROG Strix Scar 17 SE G733CX-LL014W | |
| Alienware x17 R2 P48E | |
| Schenker XMG Neo 17 M22 | |
| AIDA64 / Memory Read | |
| Razer Blade 16 Early 2023 | |
| Razer Blade 16 Early 2023 | |
| Razer Blade 16 Early 2023 | |
| Average Intel Core i9-13950HX (62368 - 86831, n=9) | |
| Schenker XMG Neo 16 Raptor Lake | |
| Average of class Gaming (22956 - 104349, n=129, last 2 years) | |
| Asus ROG Strix Scar 17 SE G733CX-LL014W | |
| MSI Titan GT77 HX 13VI | |
| MSI Titan GT77 12UHS | |
| Alienware x17 R2 P48E | |
| Schenker XMG Neo 17 M22 | |
| AIDA64 / Memory Write | |
| Razer Blade 16 Early 2023 | |
| Razer Blade 16 Early 2023 | |
| Razer Blade 16 Early 2023 | |
| Average of class Gaming (22297 - 133486, n=129, last 2 years) | |
| Average Intel Core i9-13950HX (59501 - 80441, n=9) | |
| Schenker XMG Neo 16 Raptor Lake | |
| Asus ROG Strix Scar 17 SE G733CX-LL014W | |
| MSI Titan GT77 HX 13VI | |
| MSI Titan GT77 12UHS | |
| Schenker XMG Neo 17 M22 | |
| Alienware x17 R2 P48E | |
| AIDA64 / Memory Latency | |
| Average of class Gaming (75.3 - 259, n=129, last 2 years) | |
| Razer Blade 16 Early 2023 | |
| Razer Blade 16 Early 2023 | |
| Razer Blade 16 Early 2023 | |
| Alienware x17 R2 P48E | |
| MSI Titan GT77 HX 13VI | |
| Schenker XMG Neo 17 M22 | |
| Schenker XMG Neo 16 Raptor Lake | |
| Average Intel Core i9-13950HX (84.4 - 99.5, n=9) | |
| MSI Titan GT77 12UHS | |
| Asus ROG Strix Scar 17 SE G733CX-LL014W | |
* ... smaller is better
DPC Latency
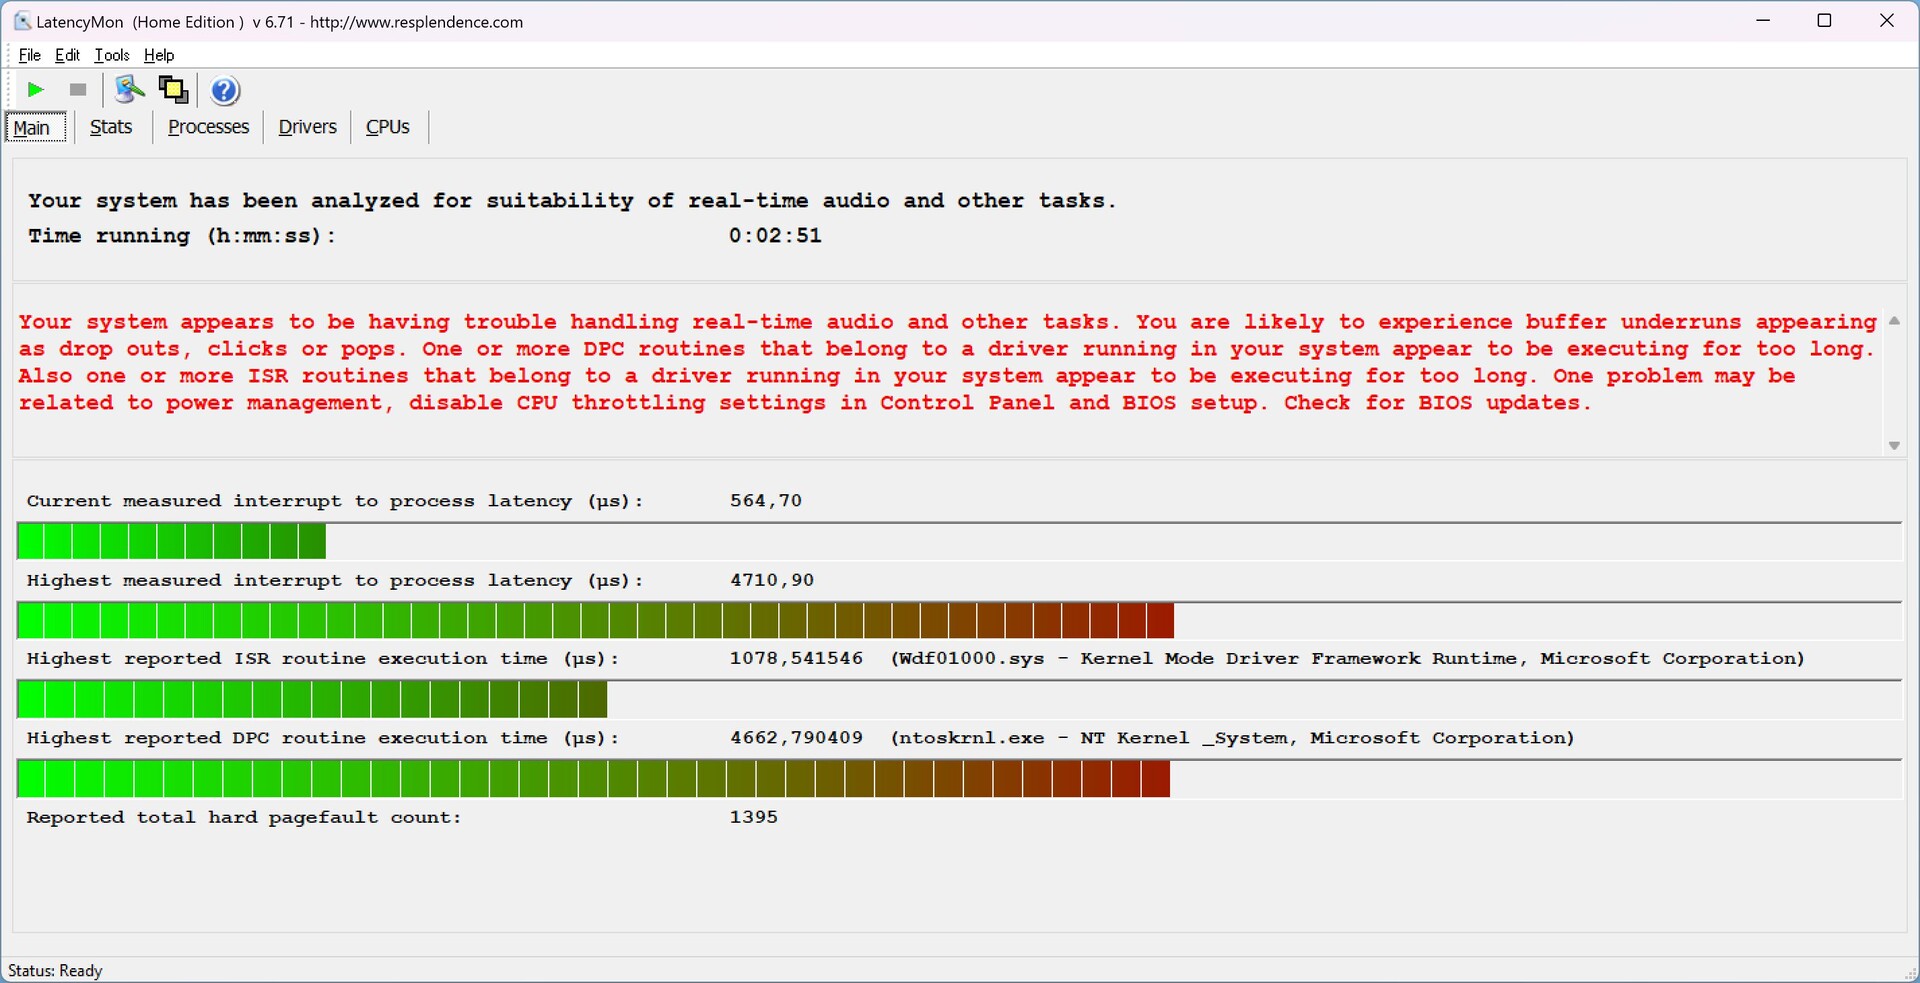
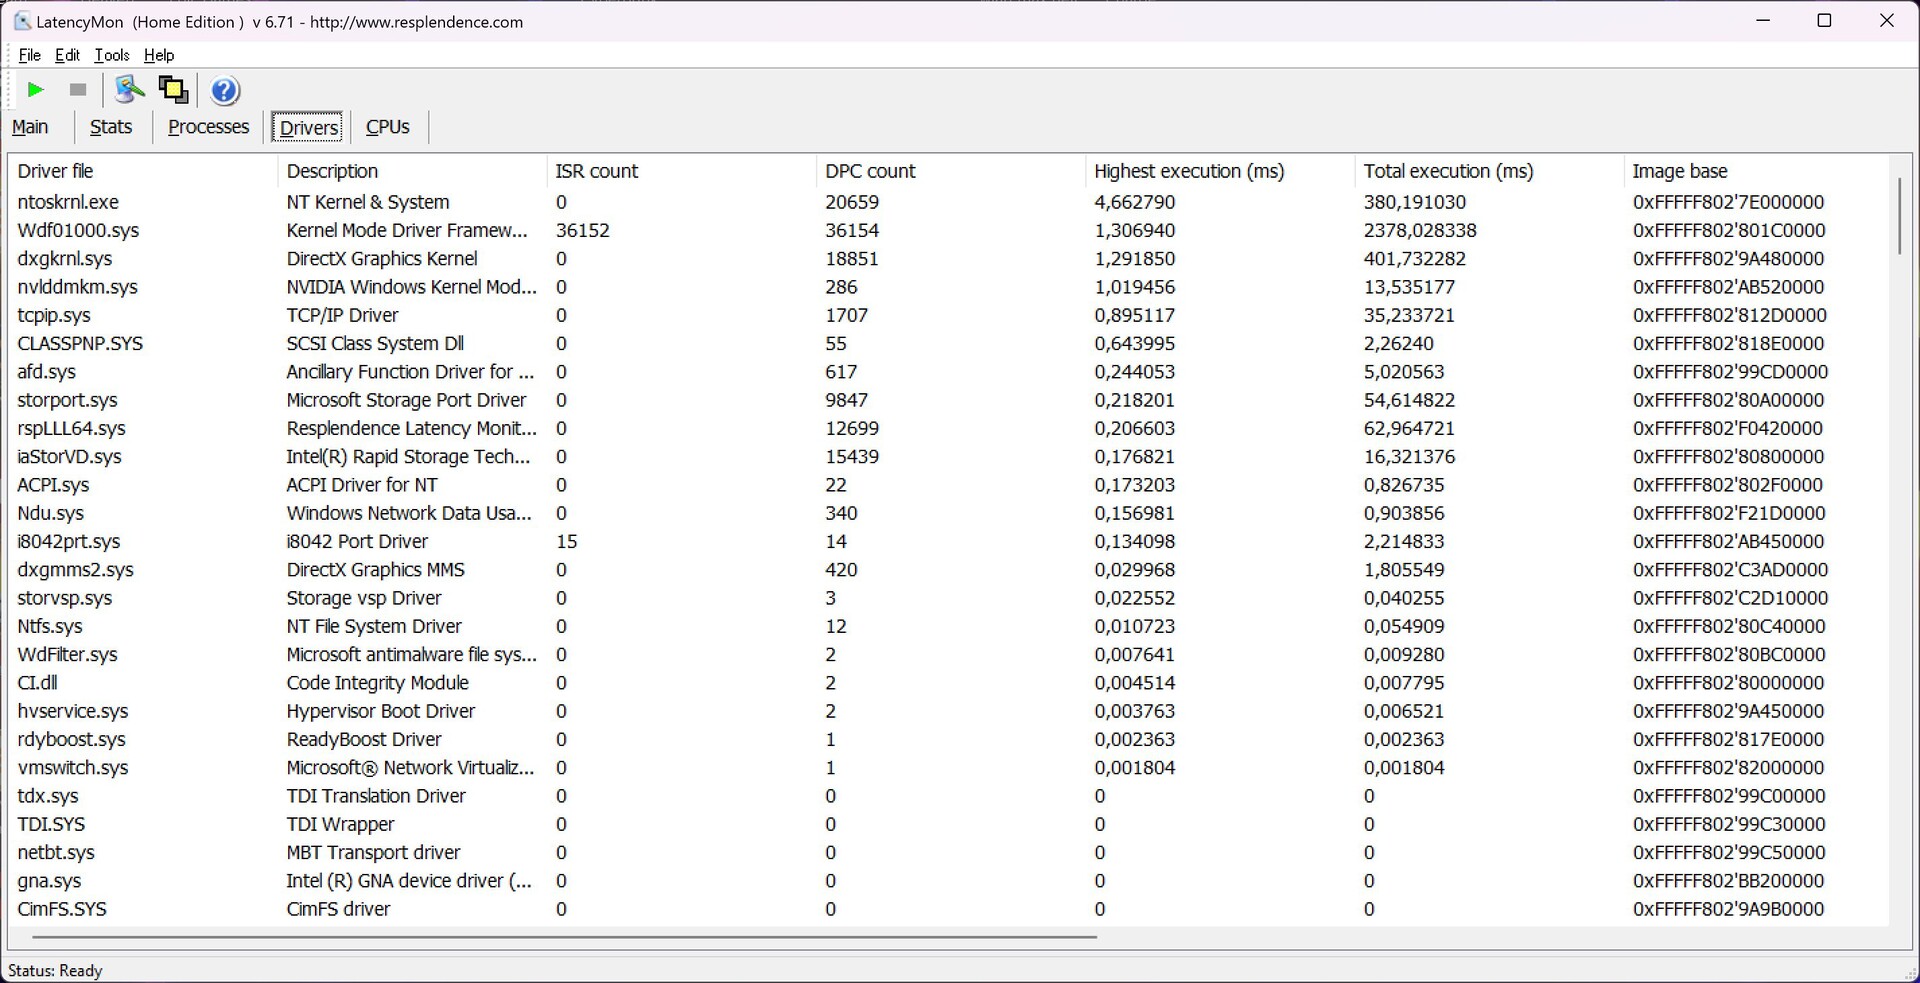
Our standardized latency test (web browsing, 4K YouTube playback, CPU load) shows major limitations for real-time audio applications with the current BIOS version (1.04).
| DPC Latencies / LatencyMon - interrupt to process latency (max), Web, Youtube, Prime95 | |
| MSI Titan GT77 HX 13VI | |
| Schenker XMG Neo 17 M22 | |
| Asus ROG Strix Scar 17 SE G733CX-LL014W | |
| Razer Blade 16 Early 2023 | |
| MSI Titan GT77 12UHS | |
| MSI Titan GT77 12UHS | |
| Alienware x17 R2 P48E | |
* ... smaller is better
Storage Devices
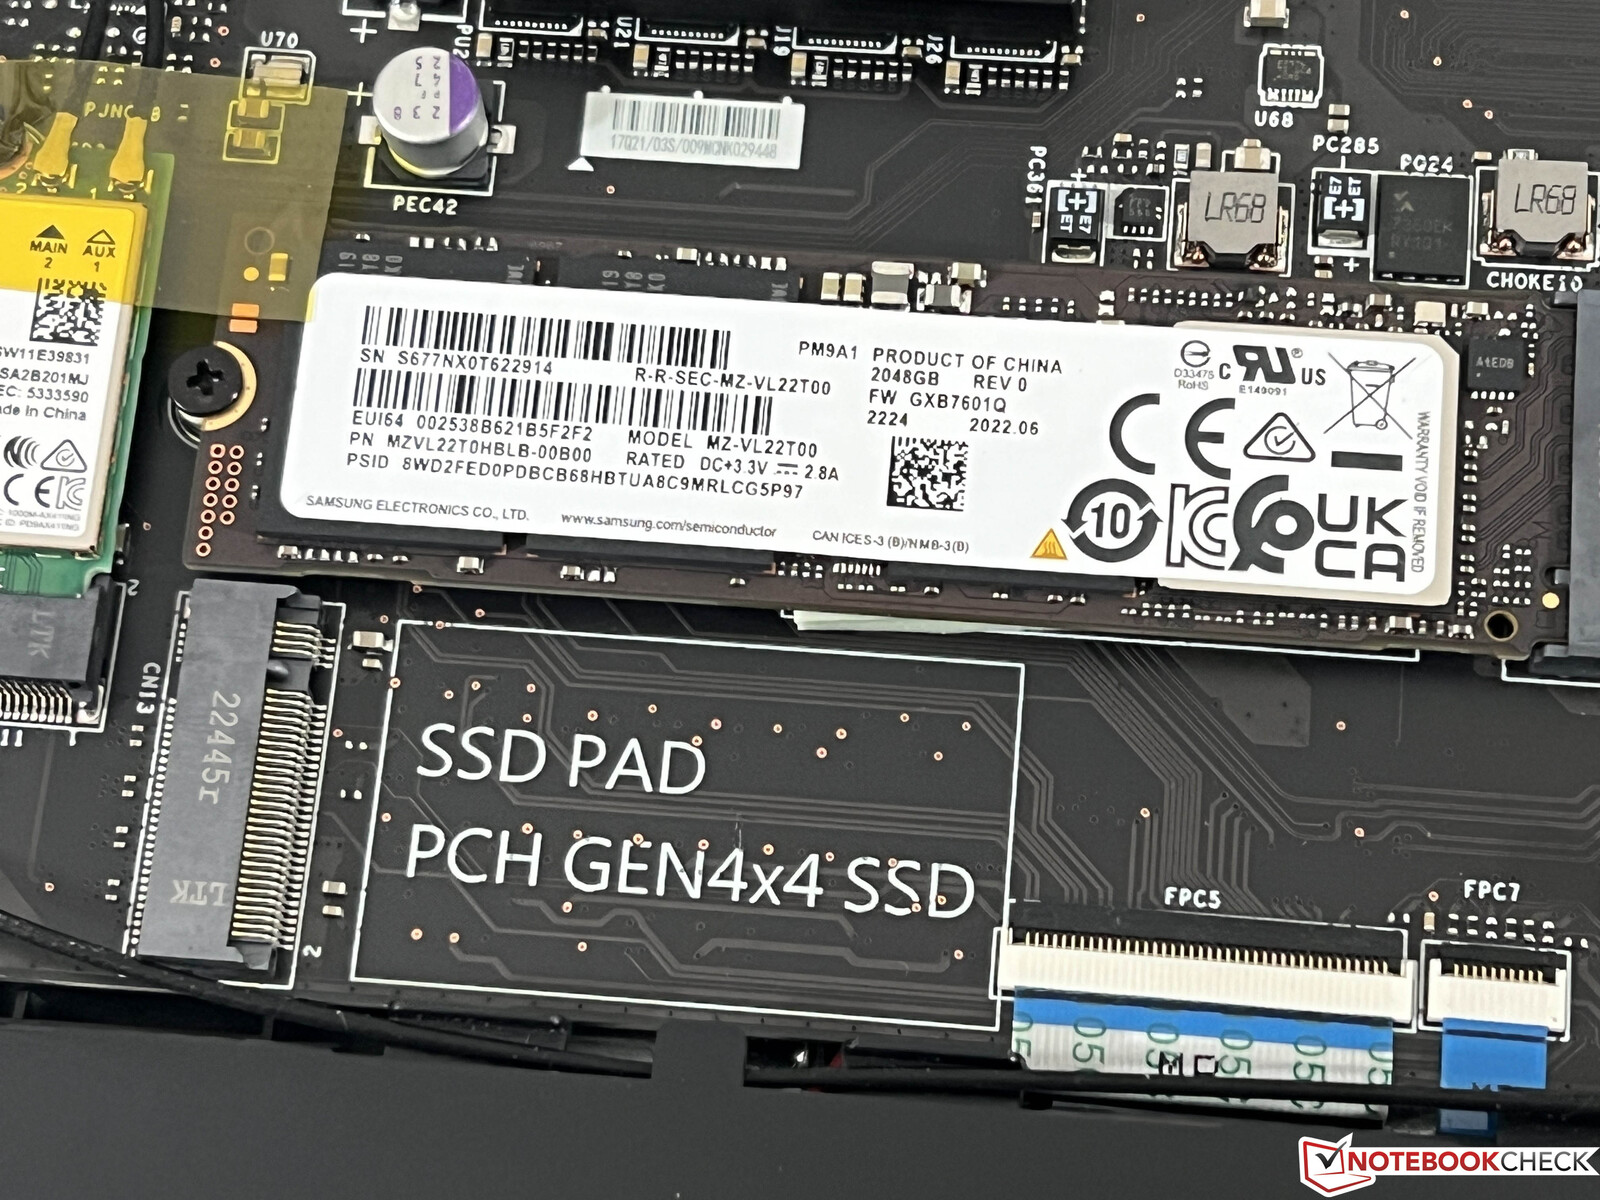
The 2023 Titan is one of the first laptops with a fast PCIe 5.0 interface, but there are hardly any suitable SSDs on the market yet. The other two slots support PCIe 4.0 and our review unit is equipped with two 2 TB SSDs from Samsung (PM9A1, OEM version of the 980 Pro) in a RAID 0 configuration. Besides the sheer capacity of 4 TB (3.97 free for the user) we can also record transfer rates north of 11 GB/s. However, this performance cannot be maintained very long and will drop considerably after a few minutes, so SSD cooler might have been a good idea. More SSD benchmarks are available here.

* ... smaller is better
Disk Throttling: DiskSpd Read Loop, Queue Depth 8
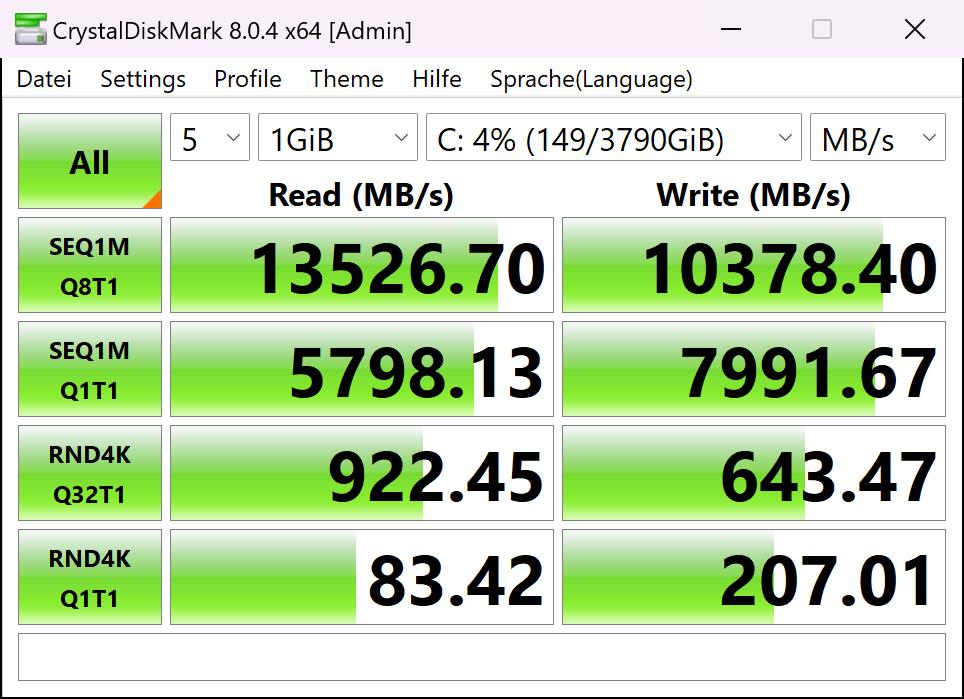
Update 03/02/2023: The overall SSD performance of the retail model is pretty much identical, only the newer CrystalDiskMark 8 shows higher peak transfer rates. Our DiskSpeedTest shows that the initial performance is even a bit lower, but it is steady for a longer period. However, there is a also a significant performance drop after a couple of minutes, which is a result of high drive temperatures.
GPU Performance - RTX 4090 Laptop
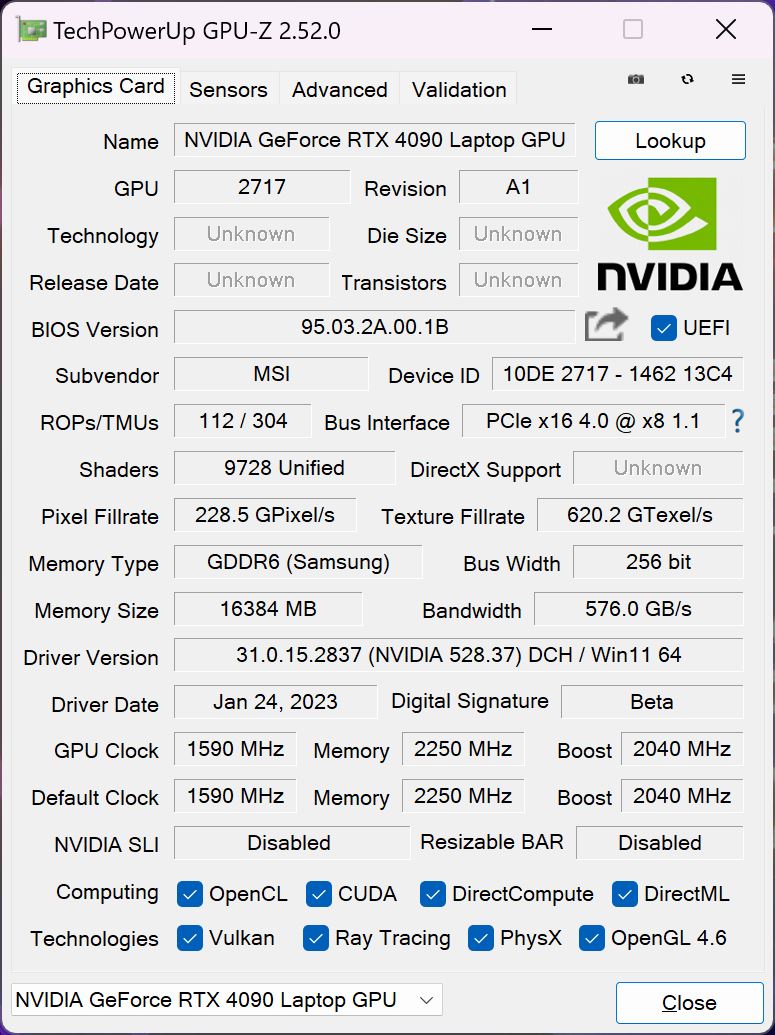
The GeForce RTX 4090 is Nvidia’s new high-end mobile GPU and the GT77 uses the fastest version with a maximum consumption of 175W (150W TGP + 25W Dynamic Boost from the CPU), 16 GB VRAM and a maximum core clock of 2340 MHz.
The graphics performance is excellent and the new RTX 4090 is sitting between the desktop models RTX 3090/RTX 3090 Ti and the desktop models RTX 4070 Ti and RTX 4080 in synthetic benchmarks. The advantage over the old mobile RTX 3080 Ti in the previous GT77 is 40-60 % (depending on the benchmark) despite the same TGP. The mobile RTX 4080 in the Razer Blade 16 is about 17-19 % slower depending on the benchmark.
The new Titan can maintain the graphics performance and the 3dMark Time Spy stress test is easily passed at 99 %. The power consumption is limited to 27W on battery power though, which results in a performance deficit of almost 80 %.
Geekbench 5.5: OpenCL Score
GFXBench: 3840x2160 4K Aztec Ruins High Tier Offscreen | 2560x1440 Aztec Ruins High Tier Offscreen
| 3DMark / Wild Life Extreme Unlimited | |
| NVIDIA GeForce RTX 3090 Ti | |
| NVIDIA GeForce RTX 4090 Laptop GPU | |
| Average NVIDIA GeForce RTX 4090 Laptop GPU (34246 - 44948, n=7) | |
| Average of class Gaming (8144 - 47946, n=22, last 2 years) | |
| NVIDIA GeForce RTX 3080 Ti Laptop GPU | |
| NVIDIA GeForce RTX 3080 Ti Laptop GPU | |
| NVIDIA GeForce RTX 3080 Ti Laptop GPU | |
| Apple M2 Max 38-Core GPU | |
| NVIDIA GeForce RTX 3080 Ti Laptop GPU | |
| 3DMark / Speed Way Score | |
| NVIDIA GeForce RTX 4080 | |
| NVIDIA GeForce RTX 4090 Laptop GPU | |
| NVIDIA GeForce RTX 4090 Laptop GPU | |
| Average NVIDIA GeForce RTX 4090 Laptop GPU (4401 - 5940, n=27) | |
| NVIDIA GeForce RTX 4070 Ti | |
| NVIDIA GeForce RTX 3080 Ti | |
| NVIDIA GeForce RTX 3090 | |
| NVIDIA GeForce RTX 4080 Laptop GPU | |
| Average of class Gaming (116 - 6643, n=48, last 2 years) | |
| NVIDIA GeForce RTX 3080 Ti Laptop GPU | |
| GFXBench / 4K Aztec Ruins High Tier Offscreen | |
| Average NVIDIA GeForce RTX 4090 Laptop GPU (239 - 246, n=3) | |
| NVIDIA GeForce RTX 4090 Laptop GPU | |
| NVIDIA GeForce RTX 4080 Laptop GPU | |
| Apple M2 Max 38-Core GPU | |
| Average of class Gaming (47.1 - 243, n=7, last 2 years) | |
| GFXBench / Aztec Ruins High Tier Offscreen | |
| Average NVIDIA GeForce RTX 4090 Laptop GPU (518 - 550, n=3) | |
| NVIDIA GeForce RTX 4090 Laptop GPU | |
| NVIDIA GeForce RTX 4080 Laptop GPU | |
| Apple M2 Max 38-Core GPU | |
| Average of class Gaming (109 - 507, n=7, last 2 years) | |
| 3DMark 06 Standard Score | 67927 points | |
| 3DMark Vantage P Result | 113387 points | |
| 3DMark 11 Performance | 49253 points | |
| 3DMark Fire Strike Score | 37594 points | |
| 3DMark Fire Strike Extreme Score | 25475 points | |
| 3DMark Time Spy Score | 20862 points | |
Help | ||
Photoshop PugetBench: Filter Score | General Score | GPU Score | Overall Score
Premiere Pro PugetBench: GPU 0.9 | Live Playback 0.9 | Export 0.9 | Overall Score 0.9
| Blender / v3.3 Classroom OPTIX/RTX | |
| Alienware x15 R2 P111F | |
| Asus ROG Strix Scar 17 SE G733CX-LL014W | |
| MSI Titan GT77 12UHS | |
| Average of class Gaming (9 - 32, n=128, last 2 years) | |
| Razer Blade 16 Early 2023 | |
| ASUS TUF Gaming GeForce RTX 3080 Ti OC | |
| Intel Core i5-13400F | |
| Average NVIDIA GeForce RTX 4090 Laptop GPU (9 - 19, n=39) | |
| KFA2 GeForce RTX 4070 Ti SG | |
| MSI Titan GT77 HX 13VI | |
| Schenker XMG Neo 16 Raptor Lake | |
| KFA2 GeForce RTX 4080 SG | |
| Blender / v3.3 Classroom CUDA | |
| Alienware x15 R2 P111F | |
| Asus ROG Strix Scar 17 SE G733CX-LL014W | |
| Average of class Gaming (15 - 228, n=130, last 2 years) | |
| MSI Titan GT77 12UHS | |
| Razer Blade 16 Early 2023 | |
| ASUS TUF Gaming GeForce RTX 3080 Ti OC | |
| Intel Core i5-13400F | |
| Average NVIDIA GeForce RTX 4090 Laptop GPU (16 - 24, n=39) | |
| Schenker XMG Neo 16 Raptor Lake | |
| MSI Titan GT77 HX 13VI | |
| Blender / v3.3 Classroom CPU | |
| Alienware x15 R2 P111F | |
| Intel Core i5-13400F | |
| Apple MacBook Pro 16 2023 M2 Max | |
| Asus ROG Strix Scar 17 SE G733CX-LL014W | |
| MSI Titan GT77 12UHS | |
| Average of class Gaming (122 - 586, n=126, last 2 years) | |
| Razer Blade 16 Early 2023 | |
| Schenker XMG Neo 16 Raptor Lake | |
| Average NVIDIA GeForce RTX 4090 Laptop GPU (144 - 305, n=39) | |
| MSI Titan GT77 HX 13VI | |
| ASUS TUF Gaming GeForce RTX 3080 Ti OC | |
| Blender / v3.3 Classroom METAL | |
| Apple MacBook Pro 16 2023 M2 Max | |
| Photoshop PugetBench / Filter Score | |
| KFA2 GeForce RTX 4080 SG | |
| ASUS TUF Gaming GeForce RTX 3080 Ti OC | |
| KFA2 GeForce RTX 4070 Ti SG | |
| Intel Core i5-13400F | |
| Apple MacBook Pro 16 2023 M2 Max | |
| MSI Titan GT77 HX 13VI | |
| Average NVIDIA GeForce RTX 4090 Laptop GPU (91.9 - 104.6, n=5) | |
| Photoshop PugetBench / General Score | |
| MSI Titan GT77 HX 13VI | |
| Average NVIDIA GeForce RTX 4090 Laptop GPU (151.8 - 168.2, n=5) | |
| Apple MacBook Pro 16 2023 M2 Max | |
| KFA2 GeForce RTX 4080 SG | |
| ASUS TUF Gaming GeForce RTX 3080 Ti OC | |
| KFA2 GeForce RTX 4070 Ti SG | |
| Intel Core i5-13400F | |
| Photoshop PugetBench / GPU Score | |
| KFA2 GeForce RTX 4080 SG | |
| ASUS TUF Gaming GeForce RTX 3080 Ti OC | |
| KFA2 GeForce RTX 4070 Ti SG | |
| Apple MacBook Pro 16 2023 M2 Max | |
| Average NVIDIA GeForce RTX 4090 Laptop GPU (109.1 - 119.4, n=5) | |
| MSI Titan GT77 HX 13VI | |
| Intel Core i5-13400F | |
| Photoshop PugetBench / Overall Score | |
| KFA2 GeForce RTX 4080 SG | |
| ASUS TUF Gaming GeForce RTX 3080 Ti OC | |
| KFA2 GeForce RTX 4070 Ti SG | |
| MSI Titan GT77 HX 13VI | |
| Average NVIDIA GeForce RTX 4090 Laptop GPU (1225 - 1356, n=5) | |
| Apple MacBook Pro 16 2023 M2 Max | |
| Intel Core i5-13400F | |
| Premiere Pro PugetBench / GPU 0.9 | |
| MSI Titan GT77 HX 13VI | |
| Average NVIDIA GeForce RTX 4090 Laptop GPU (75.8 - 109.2, n=3) | |
| KFA2 GeForce RTX 4080 SG | |
| Intel Core i5-13400F | |
| ASUS TUF Gaming GeForce RTX 3080 Ti OC | |
| KFA2 GeForce RTX 4070 Ti SG | |
| Apple MacBook Pro 16 2023 M2 Max | |
| Premiere Pro PugetBench / Live Playback 0.9 | |
| MSI Titan GT77 HX 13VI | |
| Average NVIDIA GeForce RTX 4090 Laptop GPU (91.7 - 118, n=3) | |
| KFA2 GeForce RTX 4080 SG | |
| KFA2 GeForce RTX 4070 Ti SG | |
| ASUS TUF Gaming GeForce RTX 3080 Ti OC | |
| Intel Core i5-13400F | |
| Apple MacBook Pro 16 2023 M2 Max | |
| Premiere Pro PugetBench / Export 0.9 | |
| MSI Titan GT77 HX 13VI | |
| KFA2 GeForce RTX 4070 Ti SG | |
| KFA2 GeForce RTX 4080 SG | |
| ASUS TUF Gaming GeForce RTX 3080 Ti OC | |
| Average NVIDIA GeForce RTX 4090 Laptop GPU (78.4 - 113.4, n=3) | |
| Apple MacBook Pro 16 2023 M2 Max | |
| Intel Core i5-13400F | |
| Premiere Pro PugetBench / Overall Score 0.9 | |
| Apple MacBook Pro 16 2023 M2 Max | |
| MSI Titan GT77 HX 13VI | |
| Average NVIDIA GeForce RTX 4090 Laptop GPU (821 - 1105, n=3) | |
| KFA2 GeForce RTX 4070 Ti SG | |
| KFA2 GeForce RTX 4080 SG | |
| ASUS TUF Gaming GeForce RTX 3080 Ti OC | |
| Intel Core i5-13400F | |
Photoshop PugetBench: Filter Score | General Score | GPU Score | Overall Score
Premiere Pro PugetBench: GPU 0.9 | Live Playback 0.9 | Export 0.9 | Overall Score 0.9
* ... smaller is better
The RTX 4090 does not have special drivers like the workstation GPUs, but the performance is still impressive and the new GeForce GPU can even beat the professional RTX A5500 in some of the SPECviewperf tests (like Maya, SiemensNX). However, the consumer GPU is sometimes also at the bottom, so it depends on your workload, but professional GPUs are not always required.
Gaming Performance
The gaming performance is just amazing and the combination of the Core i9-13950HX and the RTX 4090 handles all tested games smoothly even in 4K with maximum settings. The only exception are extreme cases like Cyberpunk 2077 with the RT Ultra preset in 4K, where you can help with upscaling (more on that later). Our default games we test with every laptop show an average advantage of 26 % over the old RTX 3080 Ti, but the advantage is bigger in newer titles and higher resolutions.
| The Witcher 3 - 1920x1080 Ultra Graphics & Postprocessing (HBAO+) | |
| Schenker XMG Neo 16 Raptor Lake | |
| MSI Titan GT77 HX 13VI | |
| Razer Blade 16 Early 2023 | |
| Average of class Gaming (83.7 - 240, n=33, last 2 years) | |
| MSI Titan GT77 12UHS | |
| Alienware x17 R2 P48E | |
| Schenker XMG Neo 17 M22 | |
| Asus ROG Strix Scar 17 SE G733CX-LL014W | |
The Raytracing performance is also very good and the new RTX 4090 is roughly on par with the desktop RTX 4070 Ti.
| The Witcher 3 v4 - 1920x1080 RT Ultra Preset / On AA:FX | |
| KFA2 GeForce RTX 4070 Ti SG | |
| MSI Titan GT77 HX 13VI | |
| Schenker XMG Neo 16 Raptor Lake | |
| Average NVIDIA GeForce RTX 4090 Laptop GPU (53.1 - 68, n=5) | |
| Average of class Gaming (n=1last 2 years) | |
| The Callisto Protocol - 1920x1080 Ultra Preset (without FSR Upscaling) + Full Ray-Tracing | |
| KFA2 GeForce RTX 4080 SG | |
| KFA2 GeForce RTX 4070 Ti SG | |
| ASUS TUF Gaming GeForce RTX 3080 Ti OC | |
| MSI Titan GT77 HX 13VI | |
| Average NVIDIA GeForce RTX 4090 Laptop GPU (32 - 79.6, n=5) | |
| Schenker XMG Neo 16 Raptor Lake | |
| Spider-Man Miles Morales - 1920x0180 Very High Preset + Ray-Tracing AA:T | |
| KFA2 GeForce RTX 4080 SG | |
| KFA2 GeForce RTX 4070 Ti SG | |
| Schenker XMG Neo 16 Raptor Lake | |
| ASUS TUF Gaming GeForce RTX 3080 Ti OC | |
| MSI Titan GT77 HX 13VI | |
| Average NVIDIA GeForce RTX 4090 Laptop GPU (79.6 - 96.2, n=4) | |
| Watch Dogs Legion - 1920x1080 Ultra Preset + Ultra Ray Tracing (DX12) | |
| Schenker XMG Neo 16 Raptor Lake | |
| Zotac Gaming GeForce RTX 3090 Ti AMP Extreme Holo | |
| Average NVIDIA GeForce RTX 4090 Laptop GPU (84 - 90, n=2) | |
| MSI Titan GT77 HX 13VI | |
| Razer Blade 16 Early 2023 | |
| MSI Titan GT77 12UHS | |
| Alienware x15 R2 P111F | |
| Game | Setting | DLSS off | DLSS on (Balanced) | Difference |
|---|---|---|---|---|
| Spider-Man Miles Morales | 4K Ultra | 83 FPS | 132 FPS | +59 % |
| Witcher 3 4.00 | 4K RT Ultra | 27 FPS | 50 FPS | +85 % |
| Cyberpunk 2077 1.5 | RT 4K | 22 FPS | 95 FPS | +331 % |
| God of War | 4K Ultra | 80 FPS | 111 FPS | +38 % |
| Horizon Zero Dawn | 4K Ultra | 95 FPS | 143 FPS | +51 % |
We usually perform our gaming benchmarks without upscaling technologies like Nvidia DLSS or AMD FSR. However, the performance can benefit a lot when the title supports it and we noticed some major improvements with activated DLSS 3.0 without any visual deficits. Considering these results, the upcoming smaller variants RTX 4060 and RTX 4070 should be able to handle 4K gaming when DLSS is active.
The gaming performance is completely stable, which is also shown by our Witcher 3 loop. However, the performance is once again massively reduced on battery power.
Witcher 3 FPS-Diagramm
We also checked the efficiency of the new GPU with our Witcher 3 test. The influence of the CPU is not very big and we use the values connected to an external screen, so we can eliminate the different types of displays and also compare the results with desktop GPUs. The result of the new RTX 4090 is impressive, because the GPU is around 40 % more efficient than the RTX 3080 Ti Mobile (140W) in the Alienware x15 and the desktop RTX 4080. The new GT77 is also 53 % more efficient than the previous model with the RTX 3080 Ti at the same TGP.
| low | med. | high | ultra | QHD | 4K DLSS | 4K | |
|---|---|---|---|---|---|---|---|
| GTA V (2015) | 184.1 | 182.6 | 140.9 | 138.5 | 175.7 | ||
| The Witcher 3 (2015) | 619 | 546 | 422 | 198.9 | 160 | ||
| Dota 2 Reborn (2015) | 225 | 206 | 194.1 | 185.9 | 178.9 | ||
| Final Fantasy XV Benchmark (2018) | 230 | 221 | 187.4 | 162.9 | 94.7 | ||
| X-Plane 11.11 (2018) | 203 | 177.5 | 134.1 | 114.3 | |||
| Far Cry 5 (2018) | 186 | 173 | 160 | 159 | 113 | ||
| Strange Brigade (2018) | 490 | 396 | 391 | 373 | 309 | 159.3 | |
| Shadow of the Tomb Raider (2018) | 245 | 227 | 219 | 214 | 187 | 103 | |
| Metro Exodus (2019) | 204 | 183 | 153 | 132 | 116 | 81 | |
| Control (2019) | 240 | 232 | 187 | 122 | 63 | ||
| Borderlands 3 (2019) | 201 | 176 | 162 | 151 | 130 | 76 | |
| Horizon Zero Dawn (2020) | 209 | 189 | 174 | 163 | 154 | 131 | 95 |
| Mafia Definitive Edition (2020) | 219 | 189 | 179 | 161 | 93 | ||
| Watch Dogs Legion (2020) | 152 | 144 | 131 | 120 | 109 | 69 | |
| F1 2021 (2021) | 501 | 449 | 417 | 209 | 192.4 | 114.4 | |
| Far Cry 6 (2021) | 167 | 147 | 144 | 135 | 89 | ||
| Forza Horizon 5 (2021) | 220 | 181 | 174 | 124 | 113 | 95 | |
| God of War (2022) | 201 | 200 | 180 | 133 | 115 | 80 | |
| Rainbow Six Extraction (2022) | 378 | 347 | 346 | 314 | 219 | 112 | |
| Dying Light 2 (2022) | 240 | 206 | 174 | 121 | 62 | ||
| GRID Legends (2022) | 254 | 230 | 210 | 199 | 190 | 132 | |
| Cyberpunk 2077 1.6 (2022) | 156 | 144 | 138 | 135 | 98 | 56 | |
| Ghostwire Tokyo (2022) | 237 | 236 | 234 | 231 | 206 | 100 | |
| Tiny Tina's Wonderlands (2022) | 339 | 289 | 224 | 182 | 131 | 70 | |
| F1 22 (2022) | 316 | 294 | 283 | 138.2 | 90.1 | 44.9 | |
| Call of Duty Modern Warfare 2 2022 (2022) | 230 | 215 | 183 | 176 | 135 | 126 | 85 |
| Spider-Man Miles Morales (2022) | 134 | 131 | 118 | 116 | 113 | 83 | |
| The Callisto Protocol (2022) | 195 | 181 | 145 | 144 | 114 | 68 | |
| The Witcher 3 v4 (2023) | 240 | 189 | 173 | 150 | 104 | 50 | |
| Dead Space Remake (2023) | 147 | 141 | 130 | 129 | 100 | 53 |
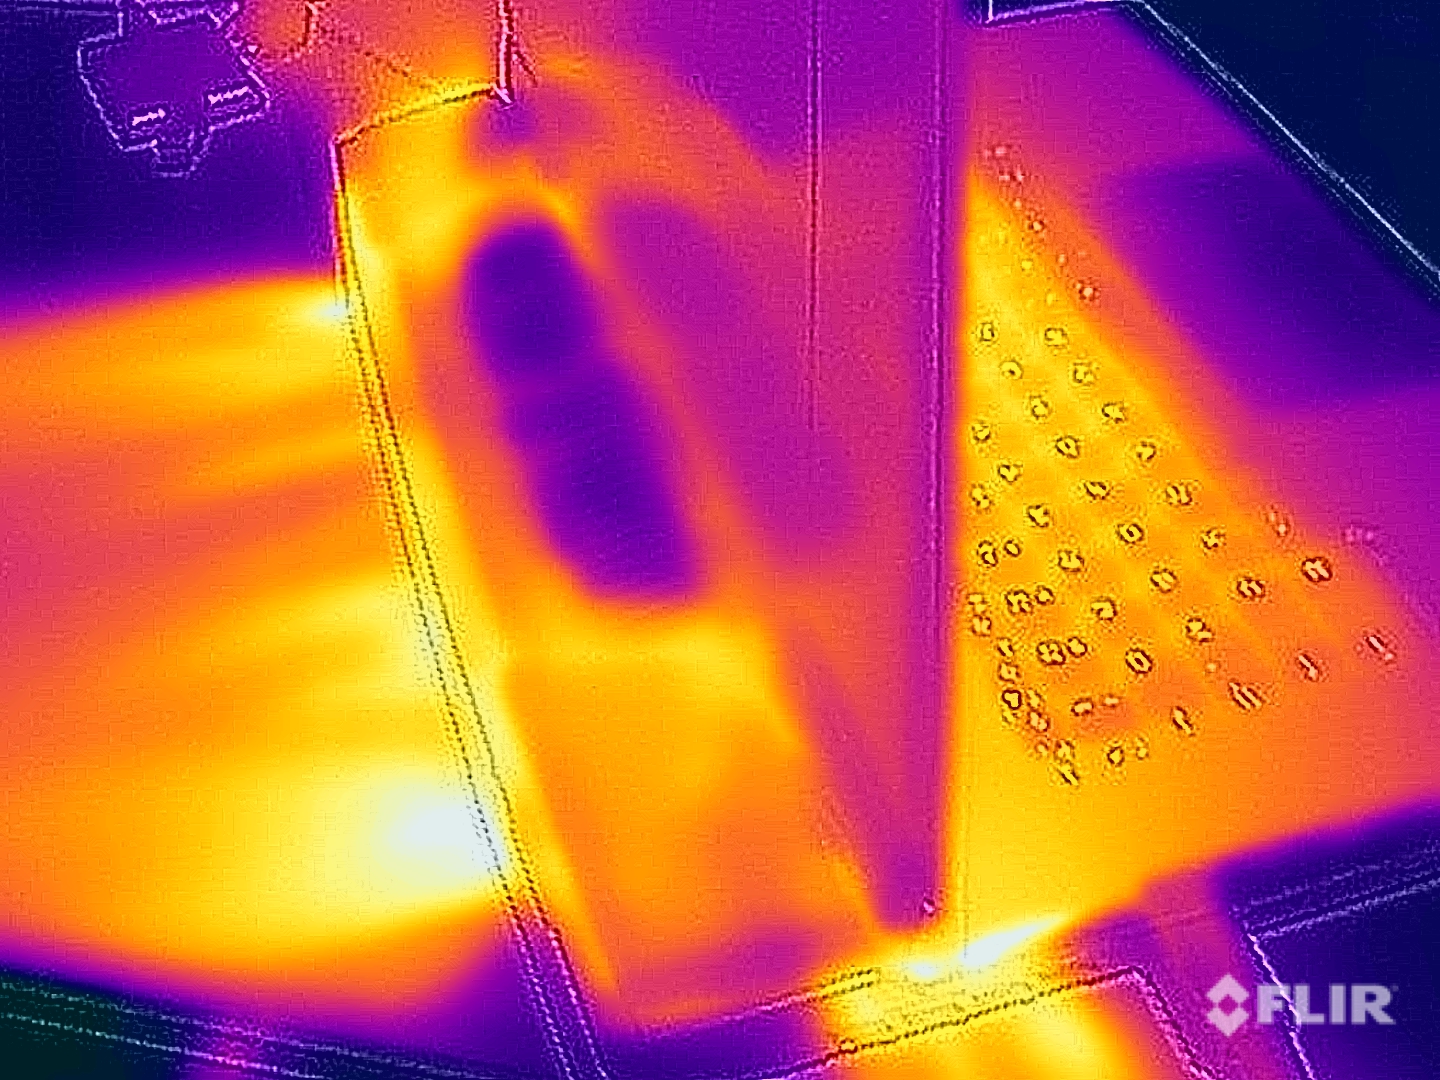
Emissions - GT77 with more heat pipes
System Noise
The Titan GT77 uses four fans and plenty of heat pipes to dissipate all the heat. One of the fans (Fan 1 according to MSI Control) is always spinning at ~1500 rpm independent of the power settings, which results in a murmur of 29.2 dB(A). It is therefore never a silent system and you can sometimes hear electronic noises at 29 dB(A) as well. The constant fan activity means the fans will not spin up during light workloads like web browsing. If you start to stress the CPU or the GPU, however, it will get very noisy very quickly. It is quite interesting that we got the loudest fans during CPU load at 61 dB(A), while the stress test “only” resulted in 53.3 dB(A). The reason is the fan behavior, which can also be seen in the pictures below.
We measured between 53 and 56 dB(A) depending on the title, which is obviously very loud. There are two different approaches here, you can either use a headset (favorably with noise cancelling) or you use the Silent mode, which will limit the fan noise to 39.6 dB(A). The performance will take a hit as well, but most games will still run smoothly thanks to the enormous performance reserves. You can activate the Cooler Boost function manually, which will result in 62.8 dB(A), but we never reached this level during testing.
| Extreme Performance | Balanced | Silent | |
|---|---|---|---|
| Witcher 3 4.00 Ultra 4K | 55.7 dB(A) | 55.7 dB(A) | 39.6 dB(A) |
| Witcher 3 Ultra | 53.3 dB(A) | 53.3 dB(A) | 39.6 dB(A) |
| Dead Space Remake Ultra 4K | 55.7 dB(A) | 53.3 dB(A) | 39.6 dB(A) |
| CB R23 Multi | 61 dB(A) | 55.7 dB(A) | 36.8 dB(A) |
| Furmark | 56.1 dB(A) | 53.3 dB(A) | 39.6 dB(A) |
Noise level
| Idle |
| 29.2 / 29.2 / 29.2 dB(A) |
| Load |
| 50.7 / 61 dB(A) |
 | ||
30 dB silent 40 dB(A) audible 50 dB(A) loud |
||
min: | ||
| MSI Titan GT77 HX 13VI GeForce RTX 4090 Laptop GPU, i9-13950HX, Samsung PM9A1 MZVL22T0HBLB | Razer Blade 16 Early 2023 GeForce RTX 4080 Laptop GPU, i9-13950HX, SSSTC CA6-8D1024 | Asus ROG Strix Scar 17 SE G733CX-LL014W GeForce RTX 3080 Ti Laptop GPU, i9-12950HX, Samsung PM9A1 MZVL22T0HBLB | MSI Titan GT77 12UHS GeForce RTX 3080 Ti Laptop GPU, i9-12900HX, Samsung PM9A1 MZVL21T0HCLR | Alienware x17 R2 P48E GeForce RTX 3080 Ti Laptop GPU, i9-12900HK, 2x Samsung PM9A1 1TB (RAID 0) | Schenker XMG Neo 17 M22 GeForce RTX 3080 Ti Laptop GPU, R9 6900HX, Samsung SSD 980 Pro 1TB MZ-V8P1T0BW | |
|---|---|---|---|---|---|---|
| Noise | 16% | 19% | 10% | 18% | -2% | |
| off / environment * (dB) | 24.6 | 23 7% | 23.9 3% | 21.9 11% | 22.7 8% | 26 -6% |
| Idle Minimum * (dB) | 29.2 | 23 21% | 23.9 18% | 24.53 16% | 23.1 21% | 26 11% |
| Idle Average * (dB) | 29.2 | 23 21% | 23.9 18% | 24.53 16% | 23.1 21% | 29 1% |
| Idle Maximum * (dB) | 29.2 | 23.6 19% | 23.9 18% | 24.53 16% | 23.1 21% | 40 -37% |
| Load Average * (dB) | 50.7 | 39 23% | 34.3 32% | 46.25 9% | 31.9 37% | 47 7% |
| Witcher 3 ultra * (dB) | 53.3 | 51.6 3% | 56.86 -7% | 52.5 2% | 52 2% | |
| Load Maximum * (dB) | 61 | 51.3 16% | 45.9 25% | 54.25 11% | 52.5 14% | 54 11% |
* ... smaller is better
Temperature
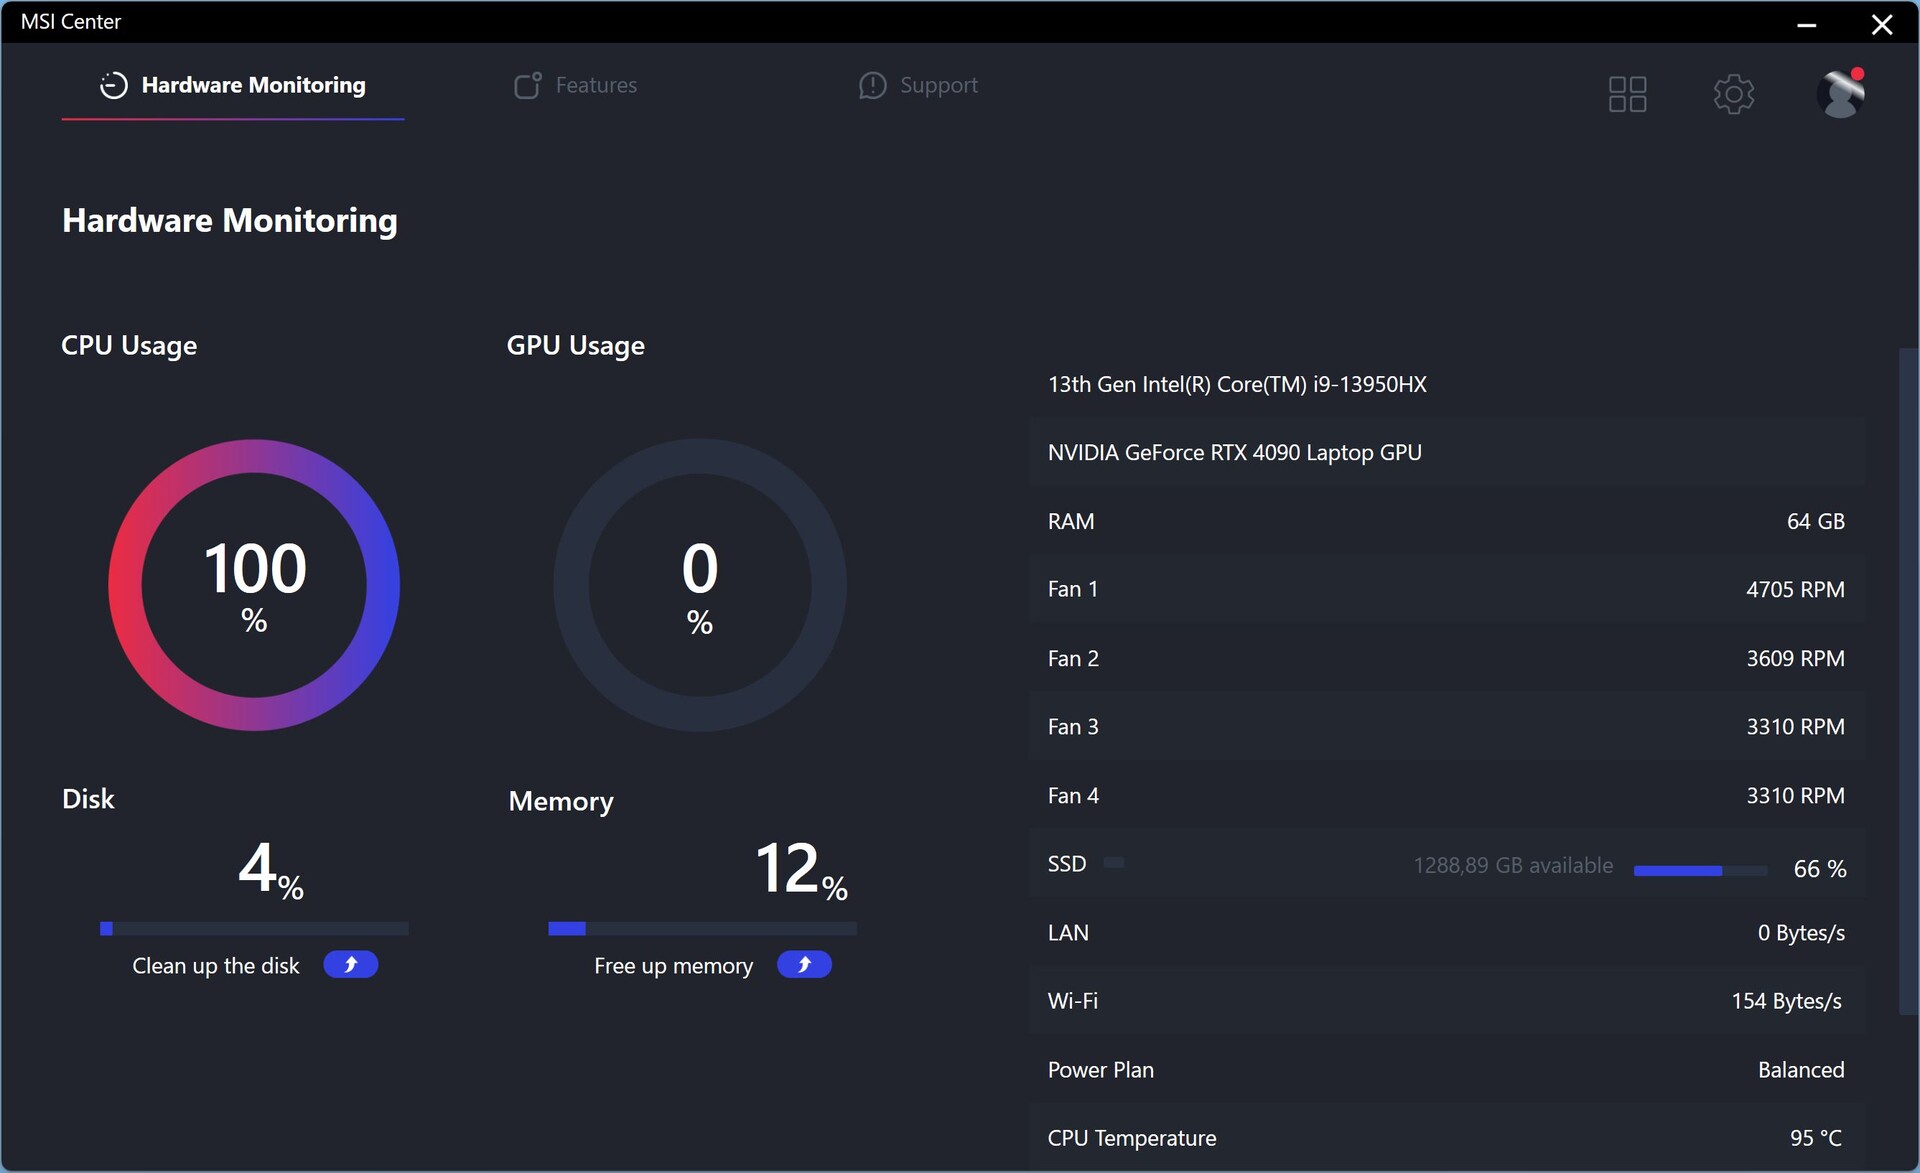
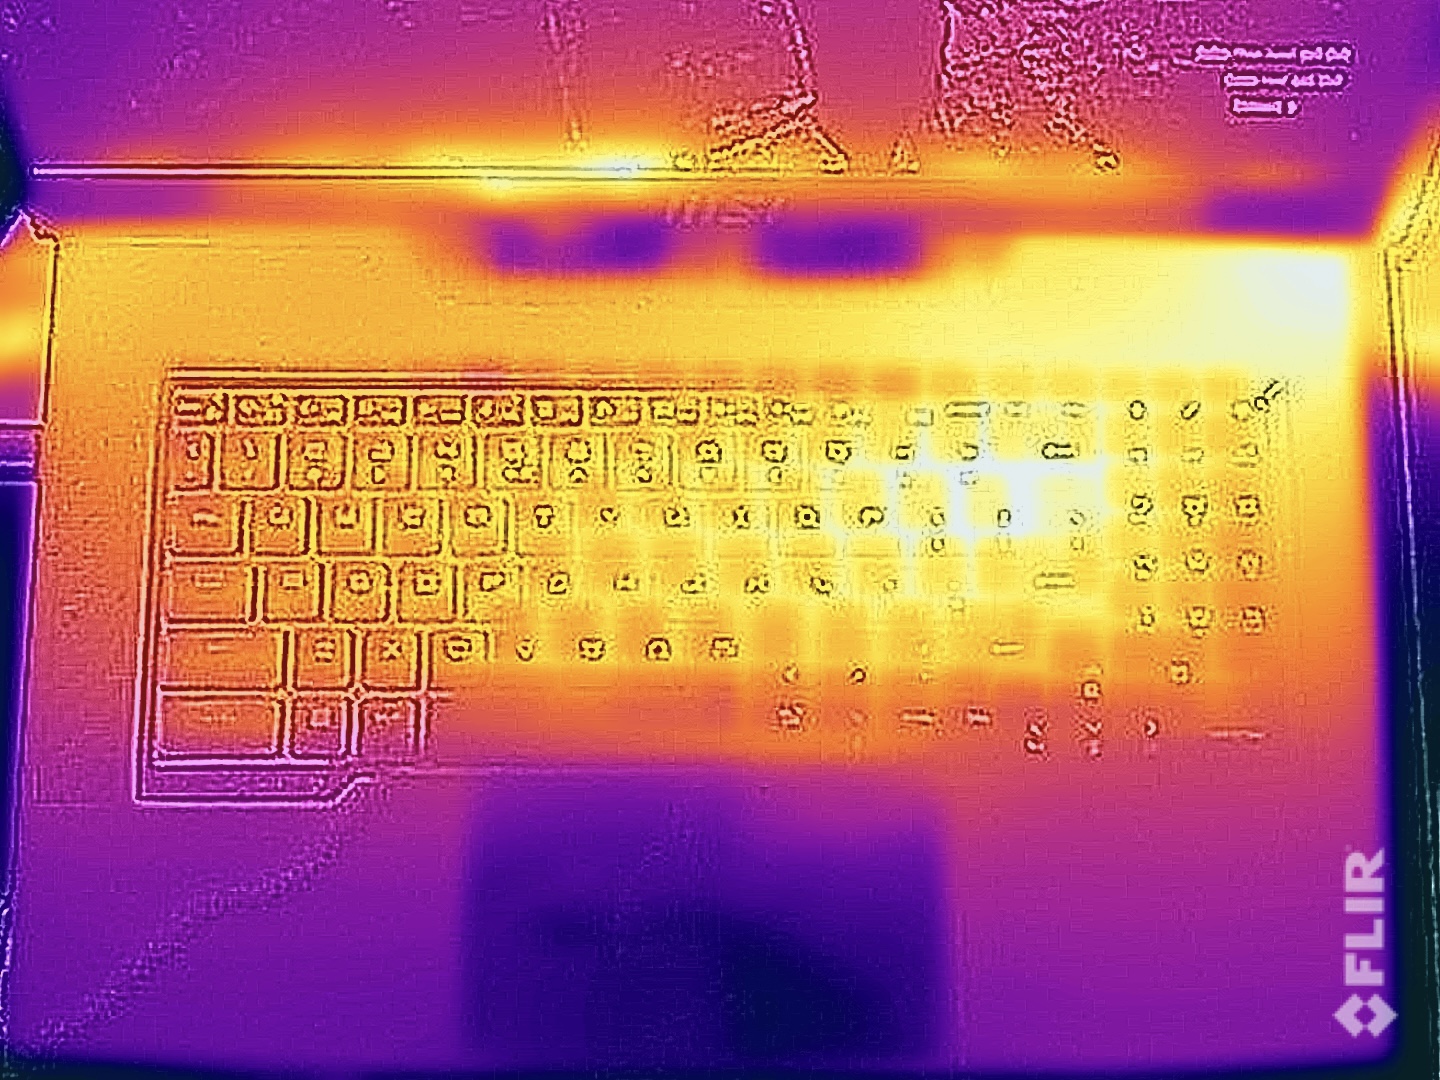
The loud fans have a big advantage, because the surface temperatures are surprisingly low and you can still use the keyboard without any limitations during longer gaming sessions. We checked the results multiple times, but the numbers were the same. We can hardly measure more than 40 °C under load, which is a great result considering the performance.
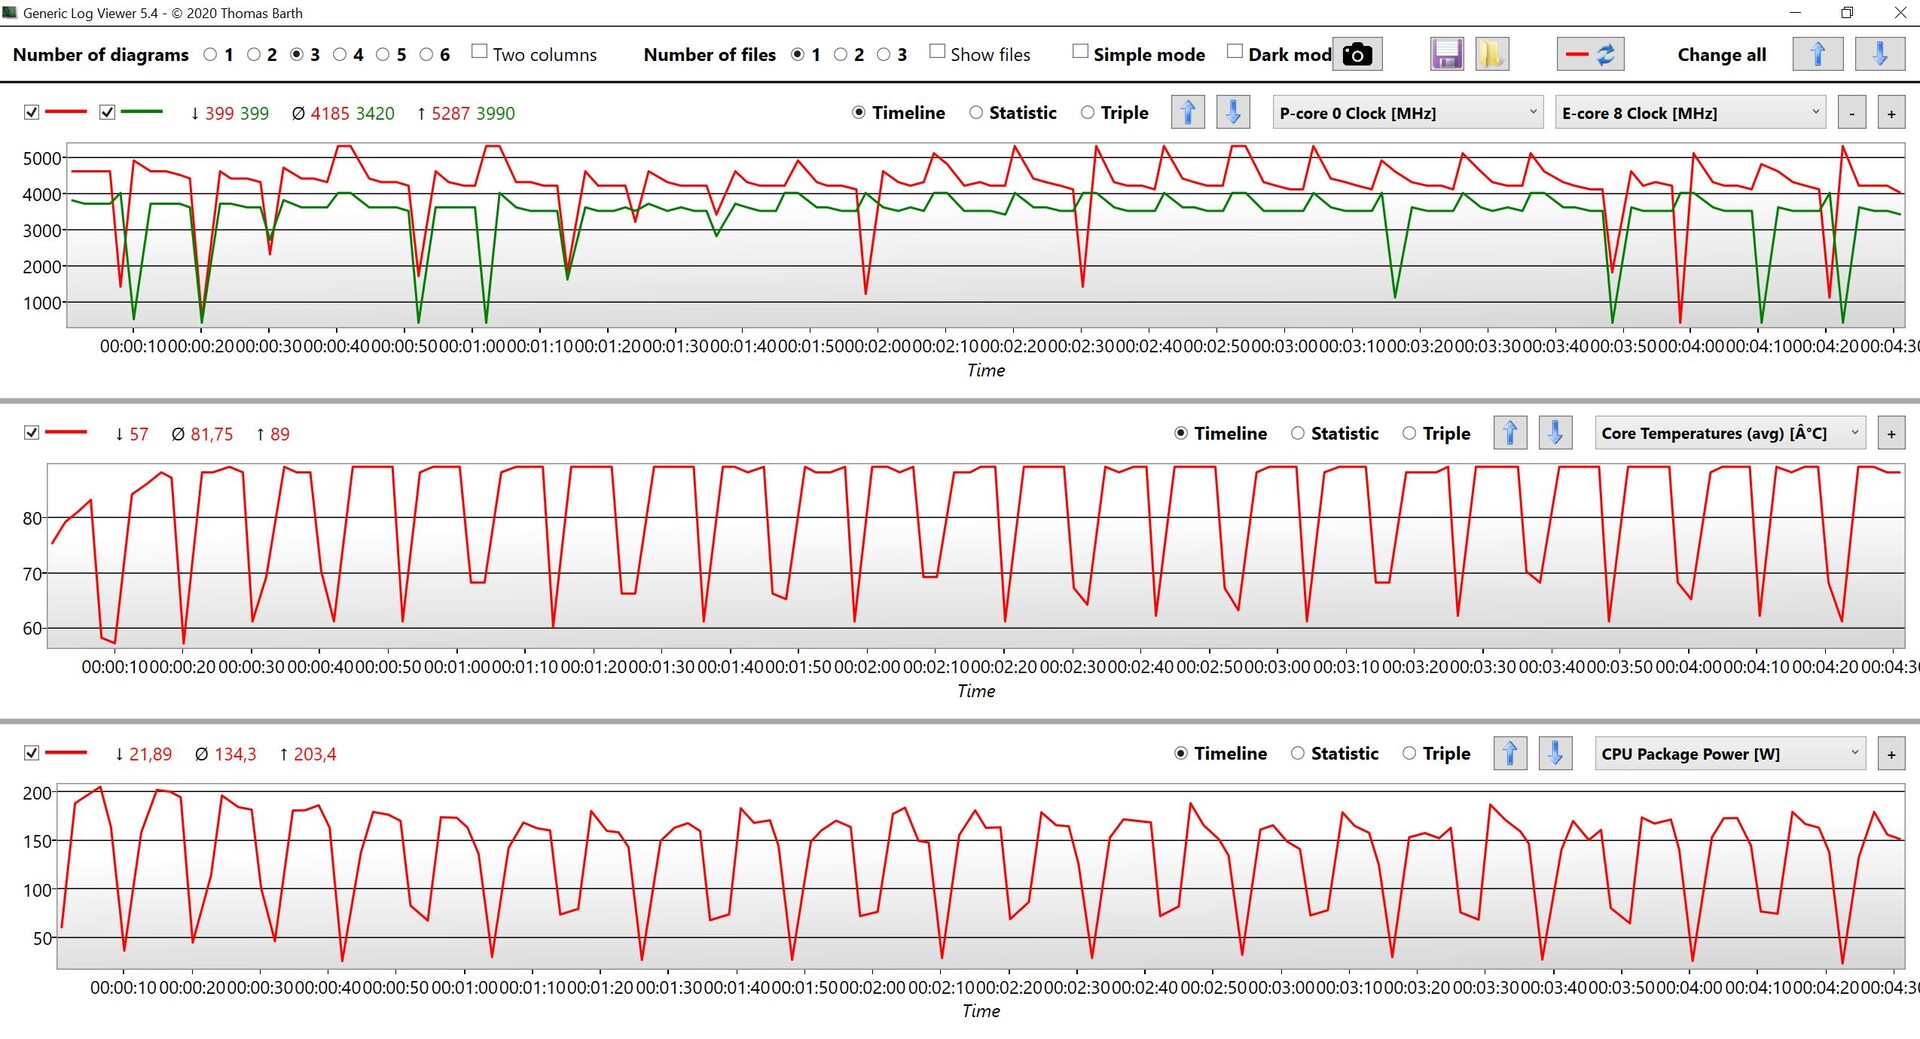
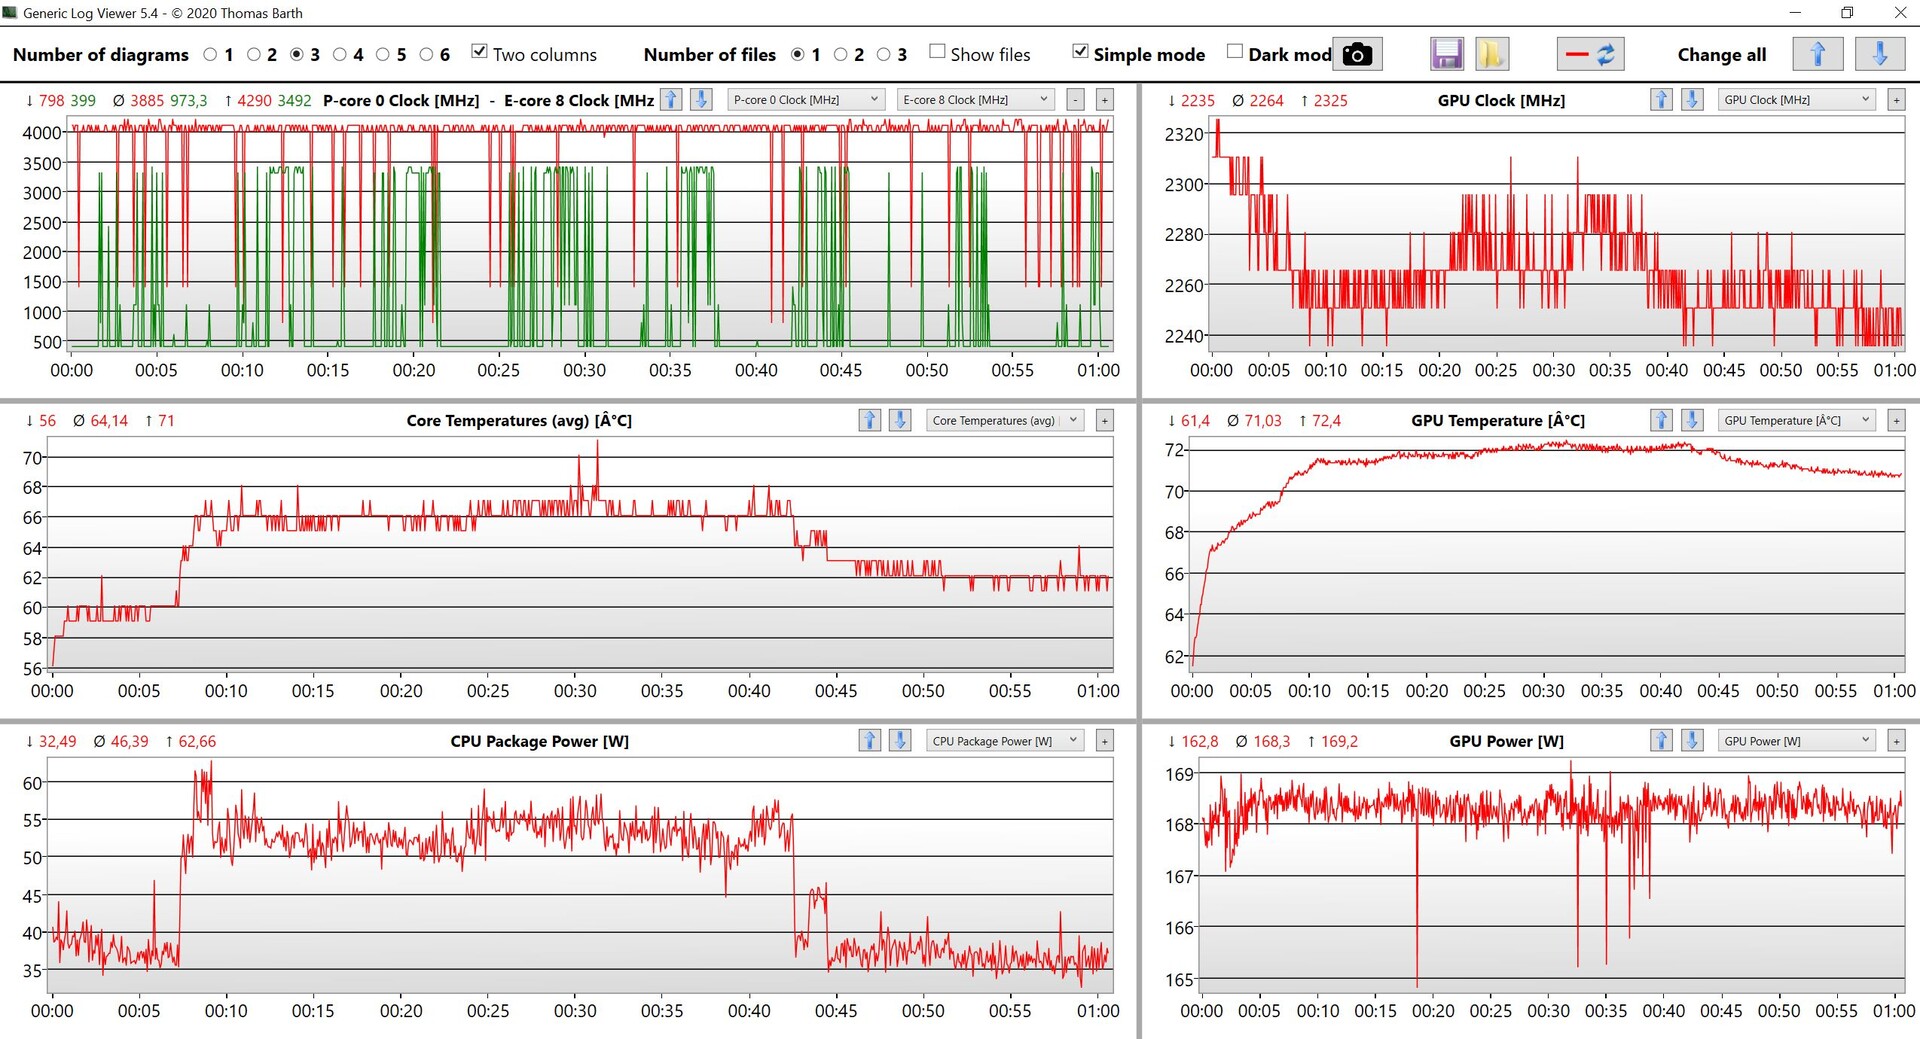
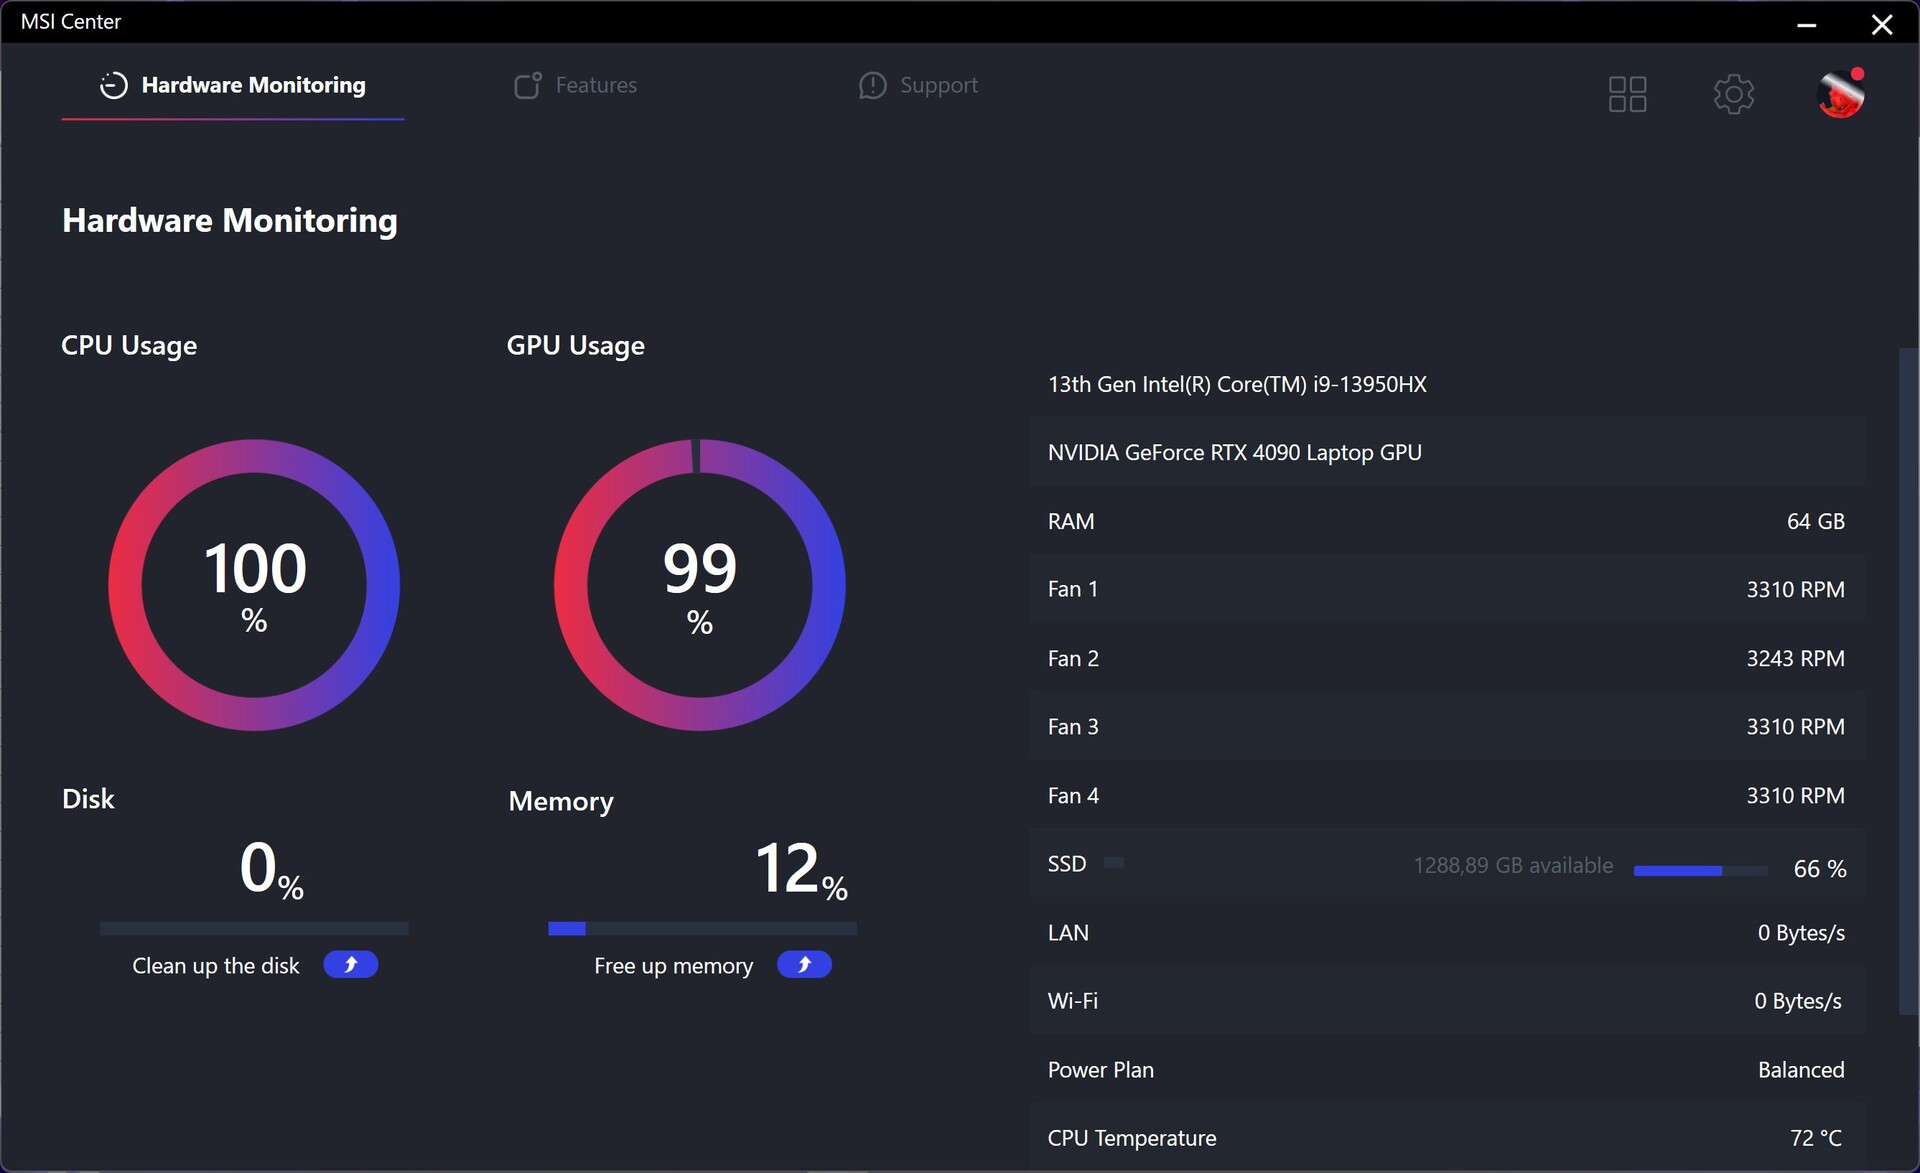
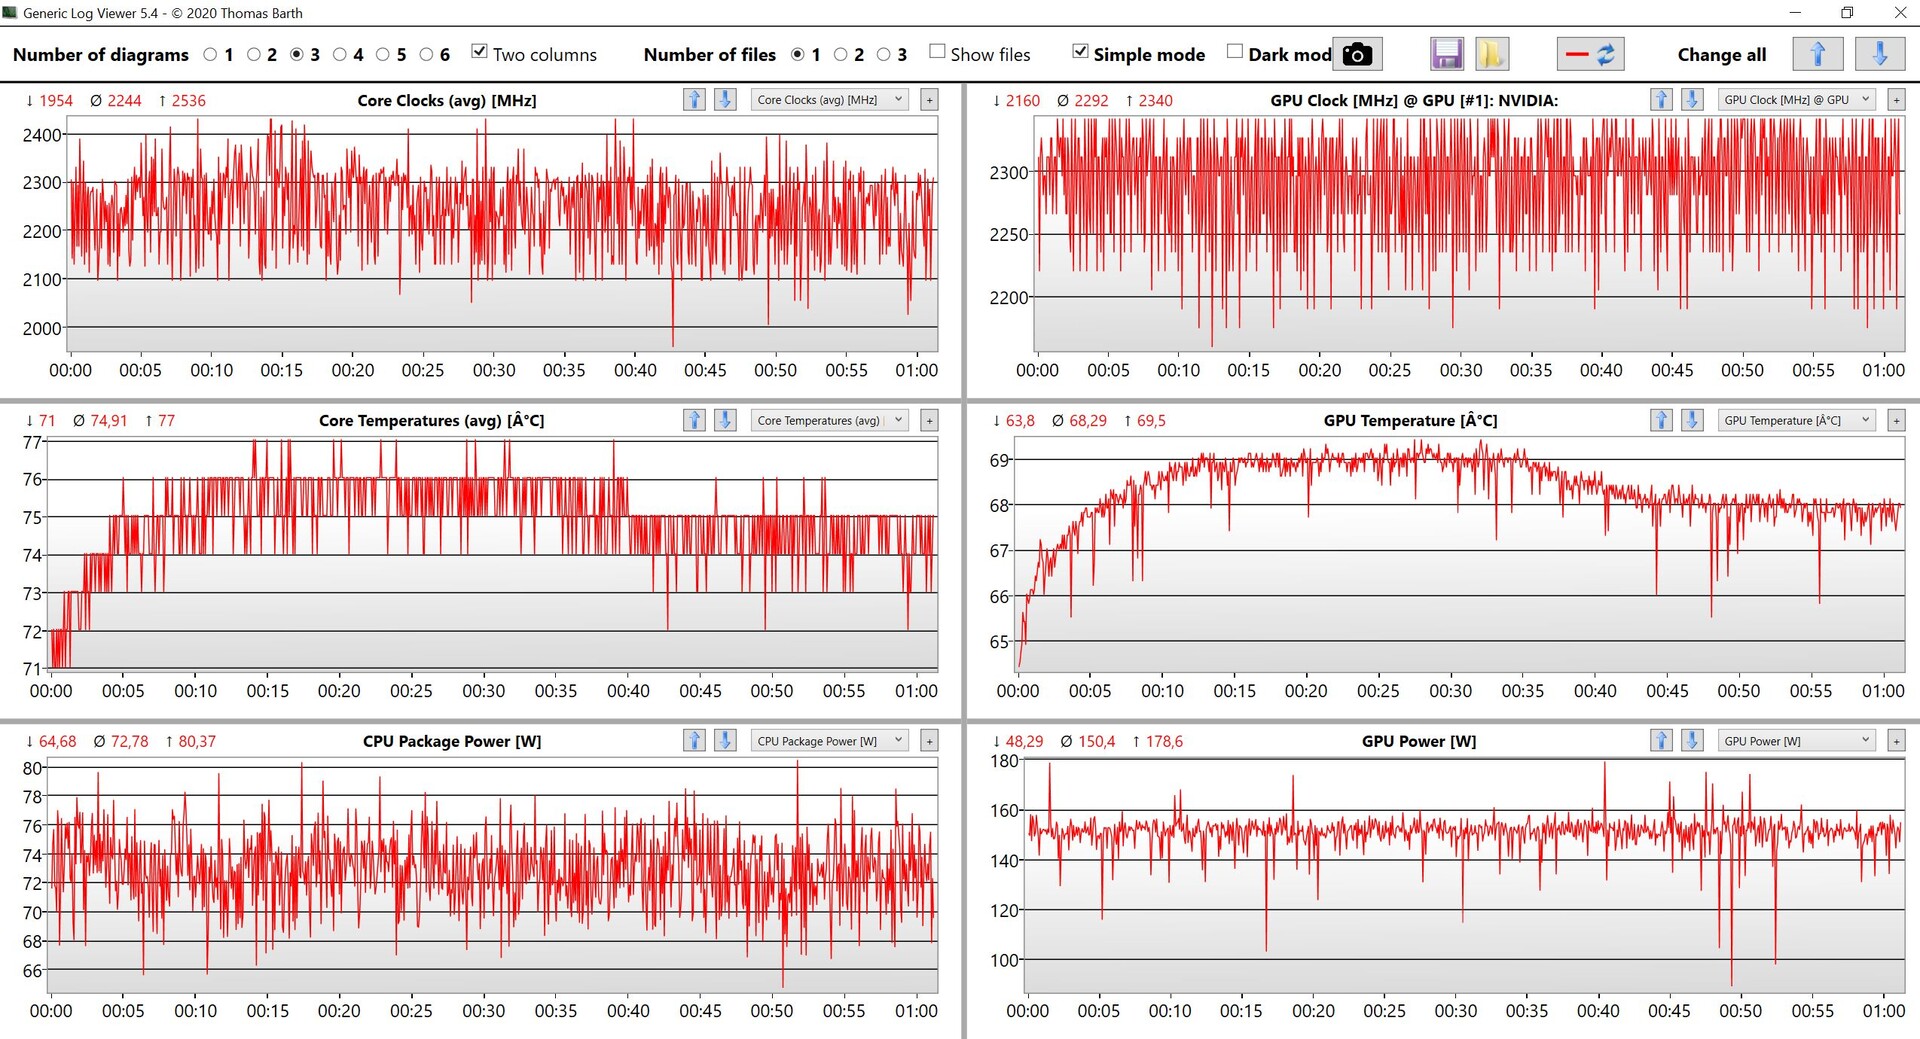
CPU and GPU will quickly level off at 75W and 150W, respectively, during the stress test and the performance is steady. The system cools a total of 225W, but MSI even advertises up to 250W for systems with the Core i9-13980HX, so the temperatures might be a bit higher (we do not really expect even louder fans).
(±) The maximum temperature on the upper side is 40.6 °C / 105 F, compared to the average of 40.4 °C / 105 F, ranging from 21.2 to 68.8 °C for the class Gaming.
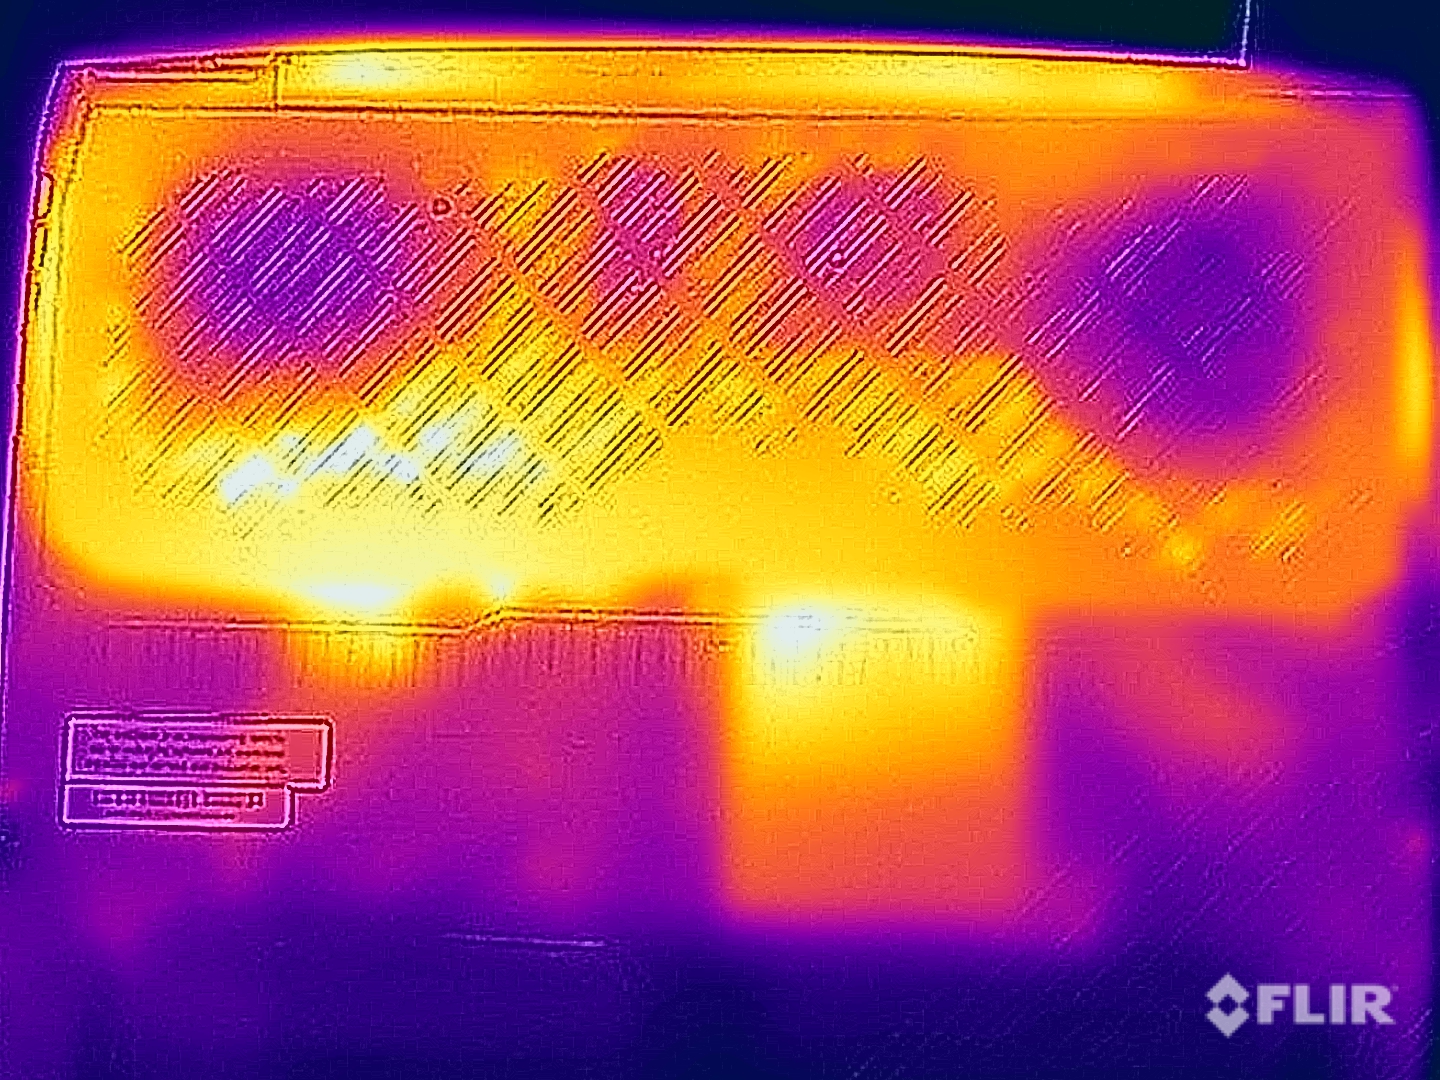
(±) The bottom heats up to a maximum of 41.1 °C / 106 F, compared to the average of 43.3 °C / 110 F
(+) In idle usage, the average temperature for the upper side is 25.2 °C / 77 F, compared to the device average of 33.9 °C / 93 F.
(±) Playing The Witcher 3, the average temperature for the upper side is 36.2 °C / 97 F, compared to the device average of 33.9 °C / 93 F.
(+) The palmrests and touchpad are cooler than skin temperature with a maximum of 29.6 °C / 85.3 F and are therefore cool to the touch.
(±) The average temperature of the palmrest area of similar devices was 28.8 °C / 83.8 F (-0.8 °C / -1.5 F).
| MSI Titan GT77 HX 13VI Intel Core i9-13950HX, NVIDIA GeForce RTX 4090 Laptop GPU | Razer Blade 16 Early 2023 Intel Core i9-13950HX, NVIDIA GeForce RTX 4080 Laptop GPU | Asus ROG Strix Scar 17 SE G733CX-LL014W Intel Core i9-12950HX, NVIDIA GeForce RTX 3080 Ti Laptop GPU | MSI Titan GT77 12UHS Intel Core i9-12900HX, NVIDIA GeForce RTX 3080 Ti Laptop GPU | Alienware x17 R2 P48E Intel Core i9-12900HK, NVIDIA GeForce RTX 3080 Ti Laptop GPU | Schenker XMG Neo 17 M22 AMD Ryzen 9 6900HX, NVIDIA GeForce RTX 3080 Ti Laptop GPU | |
|---|---|---|---|---|---|---|
| Heat | -5% | -19% | -22% | -11% | -18% | |
| Maximum Upper Side * (°C) | 40.6 | 40 1% | 48.8 -20% | 40.8 -0% | 49.6 -22% | 49 -21% |
| Maximum Bottom * (°C) | 41.1 | 37.6 9% | 52.4 -27% | 52.4 -27% | 42.4 -3% | 52 -27% |
| Idle Upper Side * (°C) | 26.2 | 32.4 -24% | 30.4 -16% | 34.6 -32% | 29.2 -11% | 30 -15% |
| Idle Bottom * (°C) | 30.3 | 31.4 -4% | 34.1 -13% | 38.4 -27% | 32 -6% | 33 -9% |
* ... smaller is better
Speakers
The GT77 still offers two good stereo speakers in combination with two woofers, which produce a decent sound. However, you cannot really enjoy during gaming since the fans are just too loud, but the sound system is definitely sufficient for occasional music and video playback.
MSI Titan GT77 HX 13VI audio analysis
(+) | speakers can play relatively loud (90.1 dB)
Bass 100 - 315 Hz
(±) | reduced bass - on average 14.3% lower than median
(±) | linearity of bass is average (7.5% delta to prev. frequency)
Mids 400 - 2000 Hz
(+) | balanced mids - only 3.5% away from median
(+) | mids are linear (3.2% delta to prev. frequency)
Highs 2 - 16 kHz
(+) | balanced highs - only 1.9% away from median
(+) | highs are linear (3.8% delta to prev. frequency)
Overall 100 - 16.000 Hz
(+) | overall sound is linear (11.1% difference to median)
Compared to same class
» 8% of all tested devices in this class were better, 3% similar, 89% worse
» The best had a delta of 6%, average was 18%, worst was 132%
Compared to all devices tested
» 6% of all tested devices were better, 2% similar, 92% worse
» The best had a delta of 4%, average was 24%, worst was 134%
Alienware x17 R2 P48E audio analysis
(+) | speakers can play relatively loud (84.3 dB)
Bass 100 - 315 Hz
(±) | reduced bass - on average 9.7% lower than median
(+) | bass is linear (5.5% delta to prev. frequency)
Mids 400 - 2000 Hz
(+) | balanced mids - only 1.6% away from median
(+) | mids are linear (3% delta to prev. frequency)
Highs 2 - 16 kHz
(±) | higher highs - on average 5% higher than median
(±) | linearity of highs is average (7.6% delta to prev. frequency)
Overall 100 - 16.000 Hz
(+) | overall sound is linear (9.3% difference to median)
Compared to same class
» 3% of all tested devices in this class were better, 2% similar, 95% worse
» The best had a delta of 6%, average was 18%, worst was 132%
Compared to all devices tested
» 3% of all tested devices were better, 1% similar, 96% worse
» The best had a delta of 4%, average was 24%, worst was 134%
Energy Management - Titan with 99.9 Wh battery
Power Consumption
The power consumption of the new GT77 while idling with the iGPU is not too bad and there are no major differences to previous models under load, either, which is impressive considering the performance increase. We can observe a maximum consumption of up to 420W when we start the stress test, but it will quickly drop to ~290W once the components have settled. This means the 330W power adapter is sufficient.
| Off / Standby | |
| Idle | |
| Load |
|
Key:
min: | |
| MSI Titan GT77 HX 13VI i9-13950HX, GeForce RTX 4090 Laptop GPU, Samsung PM9A1 MZVL22T0HBLB, Mini-LED, 3840x2160, 17.3" | Razer Blade 16 Early 2023 i9-13950HX, GeForce RTX 4080 Laptop GPU, SSSTC CA6-8D1024, IPS, 2560x1600, 16" | Asus ROG Strix Scar 17 SE G733CX-LL014W i9-12950HX, GeForce RTX 3080 Ti Laptop GPU, Samsung PM9A1 MZVL22T0HBLB, IPS, 2560x1440, 17.3" | MSI Titan GT77 12UHS i9-12900HX, GeForce RTX 3080 Ti Laptop GPU, Samsung PM9A1 MZVL21T0HCLR, IPS-Level, 1920x1080, 17.3" | Alienware x17 R2 P48E i9-12900HK, GeForce RTX 3080 Ti Laptop GPU, 2x Samsung PM9A1 1TB (RAID 0), IPS, 1920x1080, 17.3" | Schenker XMG Neo 17 M22 R9 6900HX, GeForce RTX 3080 Ti Laptop GPU, Samsung SSD 980 Pro 1TB MZ-V8P1T0BW, IPS, 2560x1600, 17" | Average NVIDIA GeForce RTX 4090 Laptop GPU | Average of class Gaming | |
|---|---|---|---|---|---|---|---|---|
| Power Consumption | -12% | -7% | -30% | -37% | 33% | -9% | 12% | |
| Idle Minimum * (Watt) | 14 | 15.2 -9% | 19.3 -38% | 30.21 -116% | 24.1 -72% | 7 50% | 16.2 ? -16% | 13.7 ? 2% |
| Idle Average * (Watt) | 21.6 | 22.8 -6% | 26.5 -23% | 32.42 -50% | 28.5 -32% | 11 49% | 23.1 ? -7% | 19.4 ? 10% |
| Idle Maximum * (Watt) | 24.8 | 49.8 -101% | 27.1 -9% | 33.7 -36% | 60 -142% | 17 31% | 34.2 ? -38% | 25.3 ? -2% |
| Load Average * (Watt) | 122.5 | 121.2 1% | 141 -15% | 125.09 -2% | 128.7 -5% | 92 25% | 130.5 ? -7% | 110.7 ? 10% |
| Witcher 3 ultra * (Watt) | 265 | 242 9% | 225 15% | 256 3% | 254 4% | 221 17% | ||
| Load Maximum * (Watt) | 418 | 273.7 35% | 307.9 26% | 321.88 23% | 323 23% | 306 27% | 324 ? 22% | 257 ? 39% |
* ... smaller is better
Power consumption Witcher 3 / Stress test
Power consumption external screen
Battery Runtimes
MSI already implements the biggest battery possible with 99.9 Wh, but the battery runtimes are still limited due to the high consumption figures. We already mentioned that the display brightness is reduced on battery power and you cannot use HDR, either, but you can still expect around 5-6 hours at a brightness of 150 nits (69 % of the maximum brightness on our review unit) in practical scenarios. The minimum runtime is 1.5 hours, but we already mentioned that the performance is massively reduced. A full charge takes 158 minutes when the device is turned on; 80 % of the capacity is available after little more than 1.5 hours.
| MSI Titan GT77 HX 13VI i9-13950HX, GeForce RTX 4090 Laptop GPU, 99.9 Wh | Razer Blade 16 Early 2023 i9-13950HX, GeForce RTX 4080 Laptop GPU, 95.2 Wh | Asus ROG Strix Scar 17 SE G733CX-LL014W i9-12950HX, GeForce RTX 3080 Ti Laptop GPU, 90 Wh | MSI Titan GT77 12UHS i9-12900HX, GeForce RTX 3080 Ti Laptop GPU, 99.9 Wh | Alienware x17 R2 P48E i9-12900HK, GeForce RTX 3080 Ti Laptop GPU, 87 Wh | Schenker XMG Neo 17 M22 R9 6900HX, GeForce RTX 3080 Ti Laptop GPU, 99 Wh | Average of class Gaming | |
|---|---|---|---|---|---|---|---|
| Battery runtime | 8% | -21% | 17% | -53% | 36% | 22% | |
| H.264 (h) | 6 | 7.2 20% | 6.6 10% | 7.93 ? 32% | |||
| WiFi v1.3 (h) | 5.3 | 6.1 15% | 4.2 -21% | 6.9 30% | 2 -62% | 9 70% | 6.68 ? 26% |
| Load (h) | 1.4 | 1.4 0% | 1.4 0% | 0.8 -43% | 1.8 29% | 1.502 ? 7% | |
| Witcher 3 ultra (h) | 1.5 | 0.958 ? |
Pros
Cons
Verdict - GT77 with extreme gaming performance and great display
The new MSI Titan GT77 will most likely only reach a very small group of users due to the high price, but it is still an impressive showcase of what is possible. The high-end gamer combines the best components you can currently get in almost every regard and it is a very good overall package, which does not have to hide behind full-fledged desktop systems.
We already know the chassis from the predecessor and it leaves a decent impression, but the lighting options are pretty limited (which can be good or bad depending on your preferences) and the smooth surfaces are very prone to fingerprints. The mechanical keyboard is still excellent and there are sufficient ports. The new HX processor from Intel’s current Raptor Lake generation is about 22 % faster than its predecessor on average, but the new GeForce RTX 4090 is even more impressive. Despite the similar TGP of 175W, it is about 40-60 % faster than the old RTX 3080 Ti and can compete with the desktop versions of the RTX 3090/RTX 3090 Ti. Compared to the current RTX-40xx desktop GPUs, the new RTX 4090 Laptop is sitting right between the RTX 4070 Ti and the RTX 4080.
No gaming laptop offers more performance right now: The MSI GT77 with the Core i9-13950HX and the GeForce RTX 4090 uses the fastest hardware you can get for a laptop. Games also look incredible on the new 4K Mini-LED panel.
The hardware combination does not have any problems with the native 4K resolution of the new Mini-LED screen (144 Hz). The subjective picture quality is excellent and games just look really good. You can also use the panel for picture editing after a calibration, which is possible with the preloaded True Color software. The display also supports HDR with a brightness of more than 1000 nits, but the HDR implementation in Windows is still terrible compared to macOS, where it just works seamlessly.
Considering the powerful hardware, the inconspicuous chassis design, the good display and the excellent keyboard, the Titan GT77 also works really well as a mobile workstation and even the RTX A5500 falls behind in some professional applications.
The cooling works really well with four fans and plenty of heat pipes, and we can hardly measure surface temperatures of more than 40 °C even under load, but the fans are extremely noisy in return. You should expect between 54-57 dB(A) during gaming and even more than 60 dB(A) when you only stress the CPU. The fan noise is very steady, but we would still recommend headphones (preferably with active noise cancellation). It is also possible to use the Silent mode and reduce the fan noise to 40 dB(A). The performance will take a hit, but it will still be more than sufficient in most titles.
The MSI Titan GT77 also has some drawbacks, especially considering the high price. This includes the use of cheap plastic (especially the bottom cover), slow DDR5-4800 Ram and the bad 720p webcam. The performance of the two 2 TB SSDs in a RAID 0 configuration is very high, but not stable. The GT77 is the first 17-inch gaming laptop with the new hardware in our review and we are already eager to test the competition over the next couple of weeks.
Price and Availability
The new MSI Titan GT77 HX 13 VI is available at MSI's store for $5299.
MSI Titan GT77 HX 13VI
- 02/07/2023 v7 (old)
Andreas Osthoff
Transparency
The selection of devices to be reviewed is made by our editorial team. The test sample was provided to the author as a loan by the manufacturer or retailer for the purpose of this review. The lender had no influence on this review, nor did the manufacturer receive a copy of this review before publication. There was no obligation to publish this review. As an independent media company, Notebookcheck is not subjected to the authority of manufacturers, retailers or publishers.
This is how Notebookcheck is testing
Every year, Notebookcheck independently reviews hundreds of laptops and smartphones using standardized procedures to ensure that all results are comparable. We have continuously developed our test methods for around 20 years and set industry standards in the process. In our test labs, high-quality measuring equipment is utilized by experienced technicians and editors. These tests involve a multi-stage validation process. Our complex rating system is based on hundreds of well-founded measurements and benchmarks, which maintains objectivity. Further information on our test methods can be found here.
Price comparison
