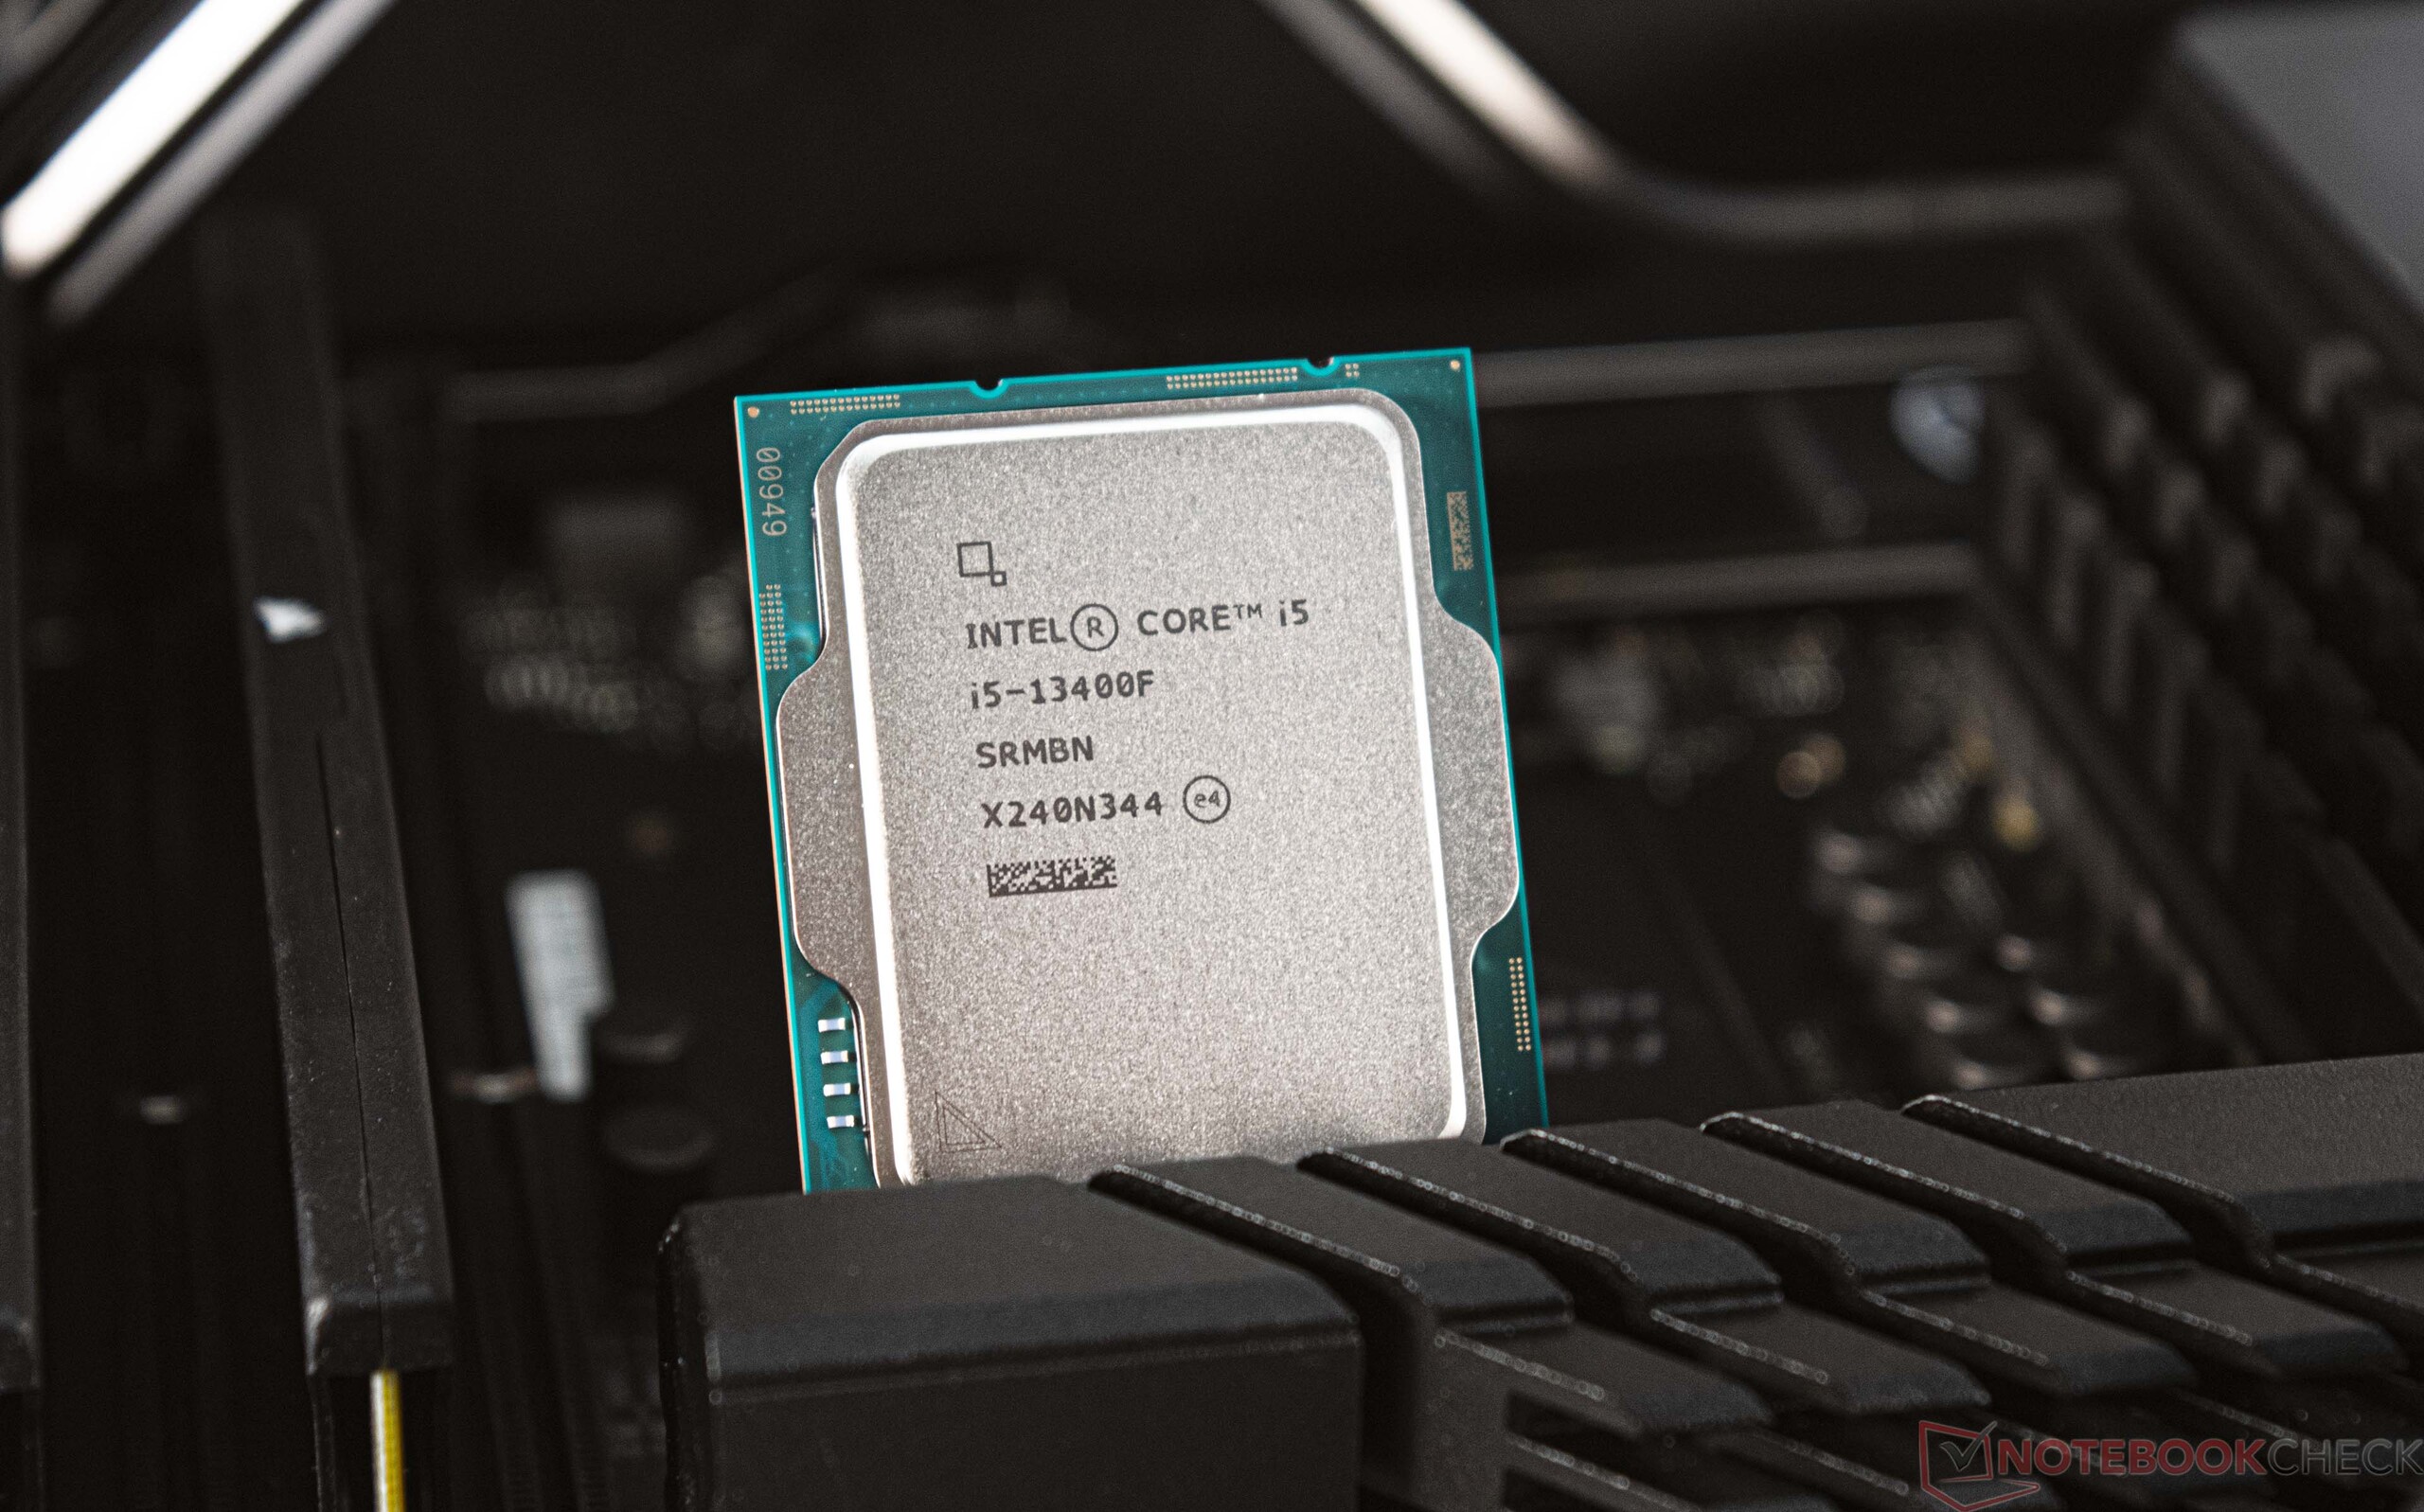
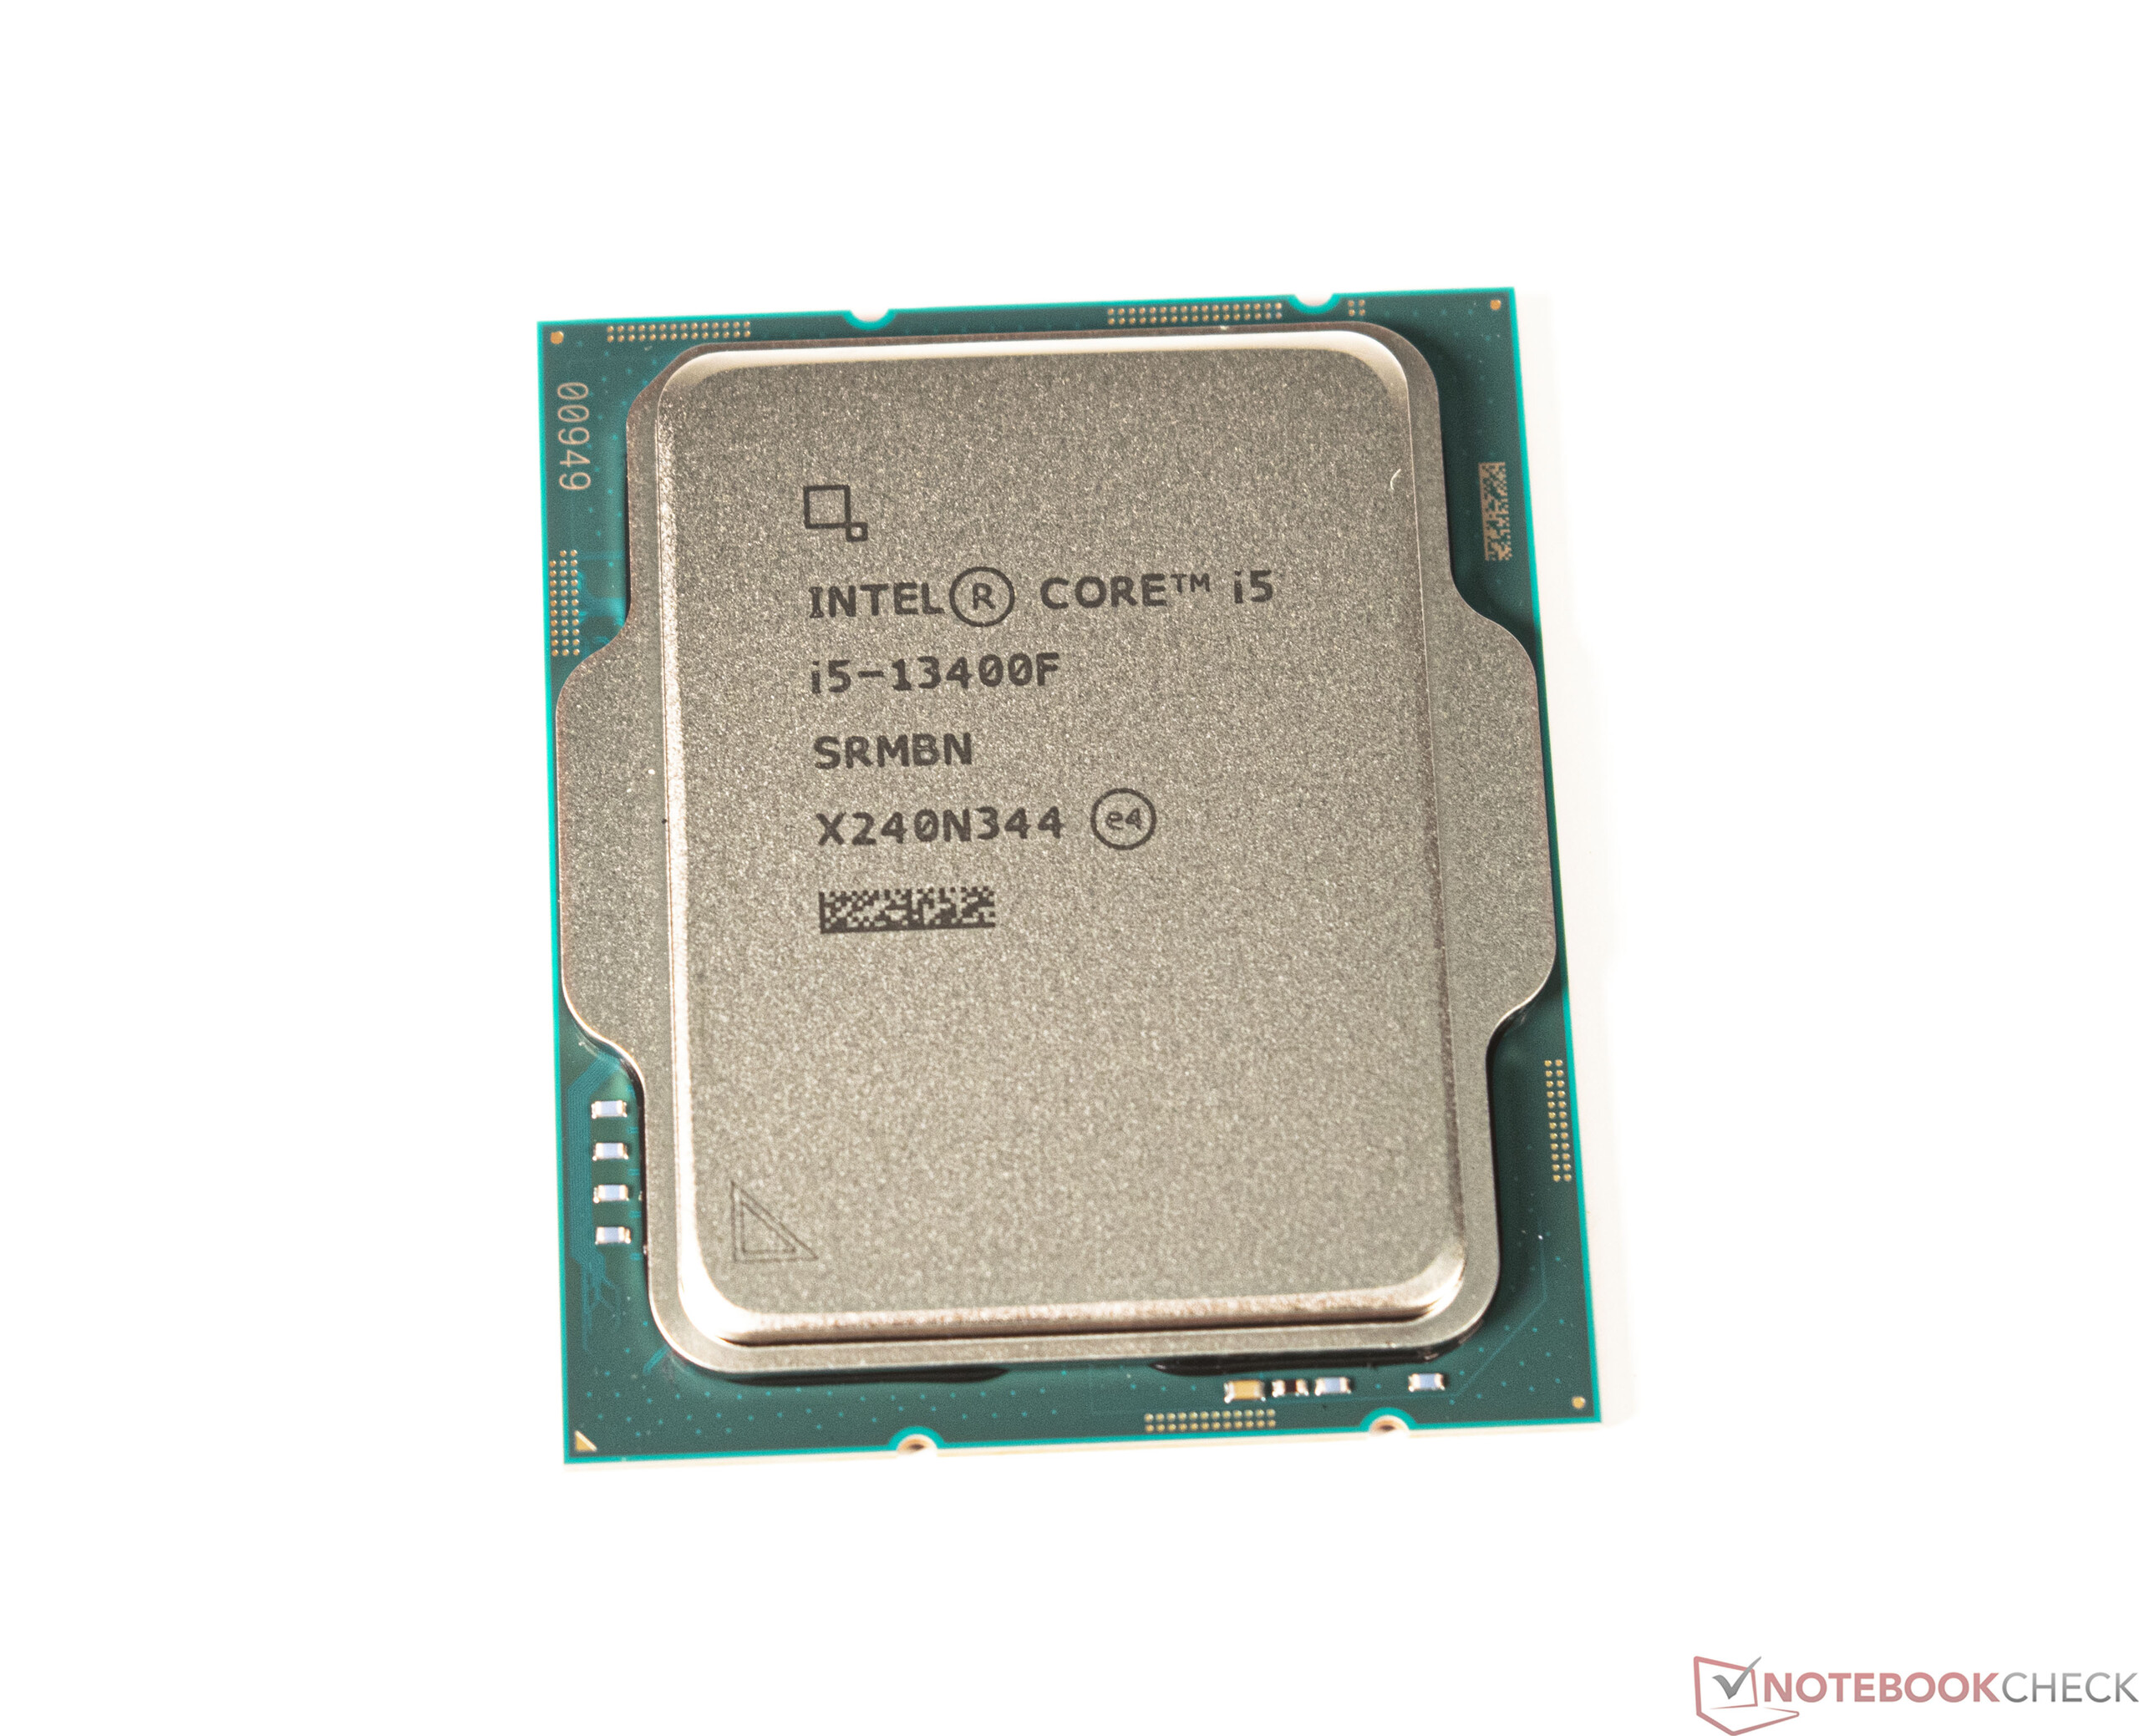
Intel Core i5-13400F desktop CPU in review: Economical and inexpensive 10-core processor for gaming and working

Intel launched the hybrid CPU architecture with the Alder Lake series, which combines the so-called P and E cores under one heat spreader. The E-cores have been omitted from the entry-level CPUs so far, which mainly affected the multi-thread performance. With the 13th Core generation, Intel has finally given the Core i5-13400F 4 more E-cores in addition to the 6 P-cores. Thus, it is now on par with an Intel Core i5-12600K of the Alder Lake series. Nevertheless, these two models differ strongly in their power consumption. However, only a few percentage points separate the two models in terms of performance, which we can reveal at this point.
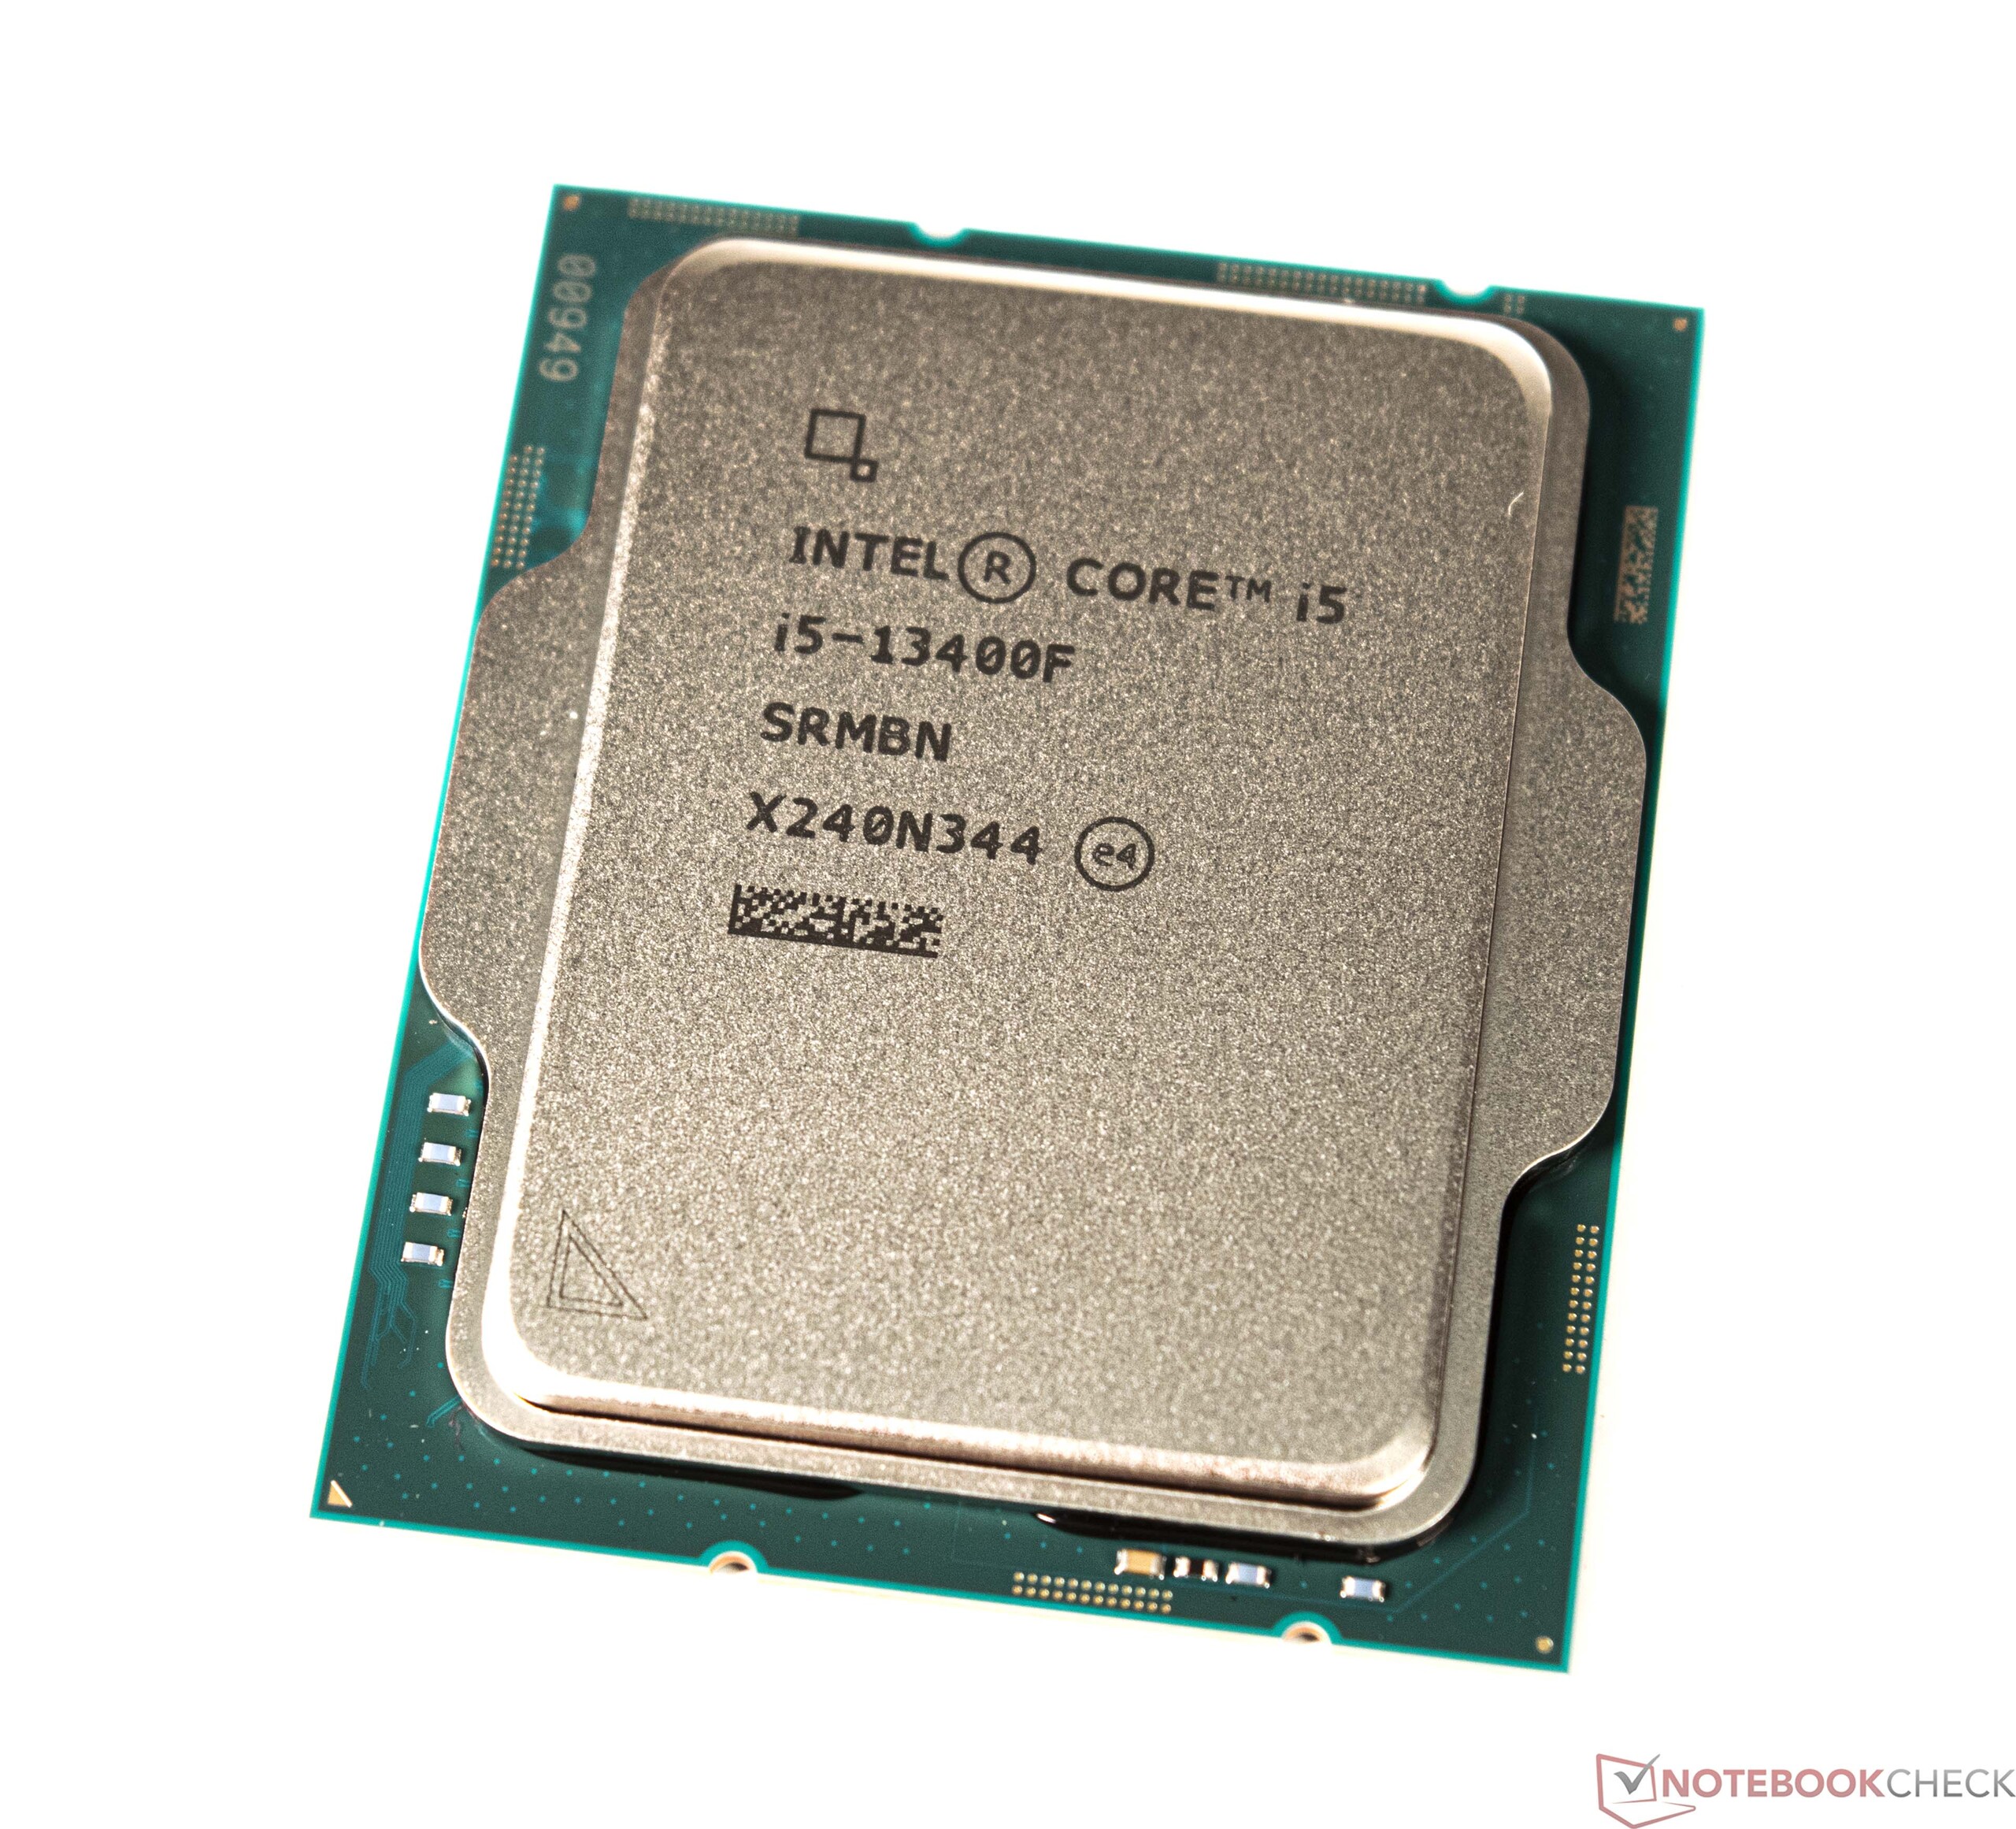
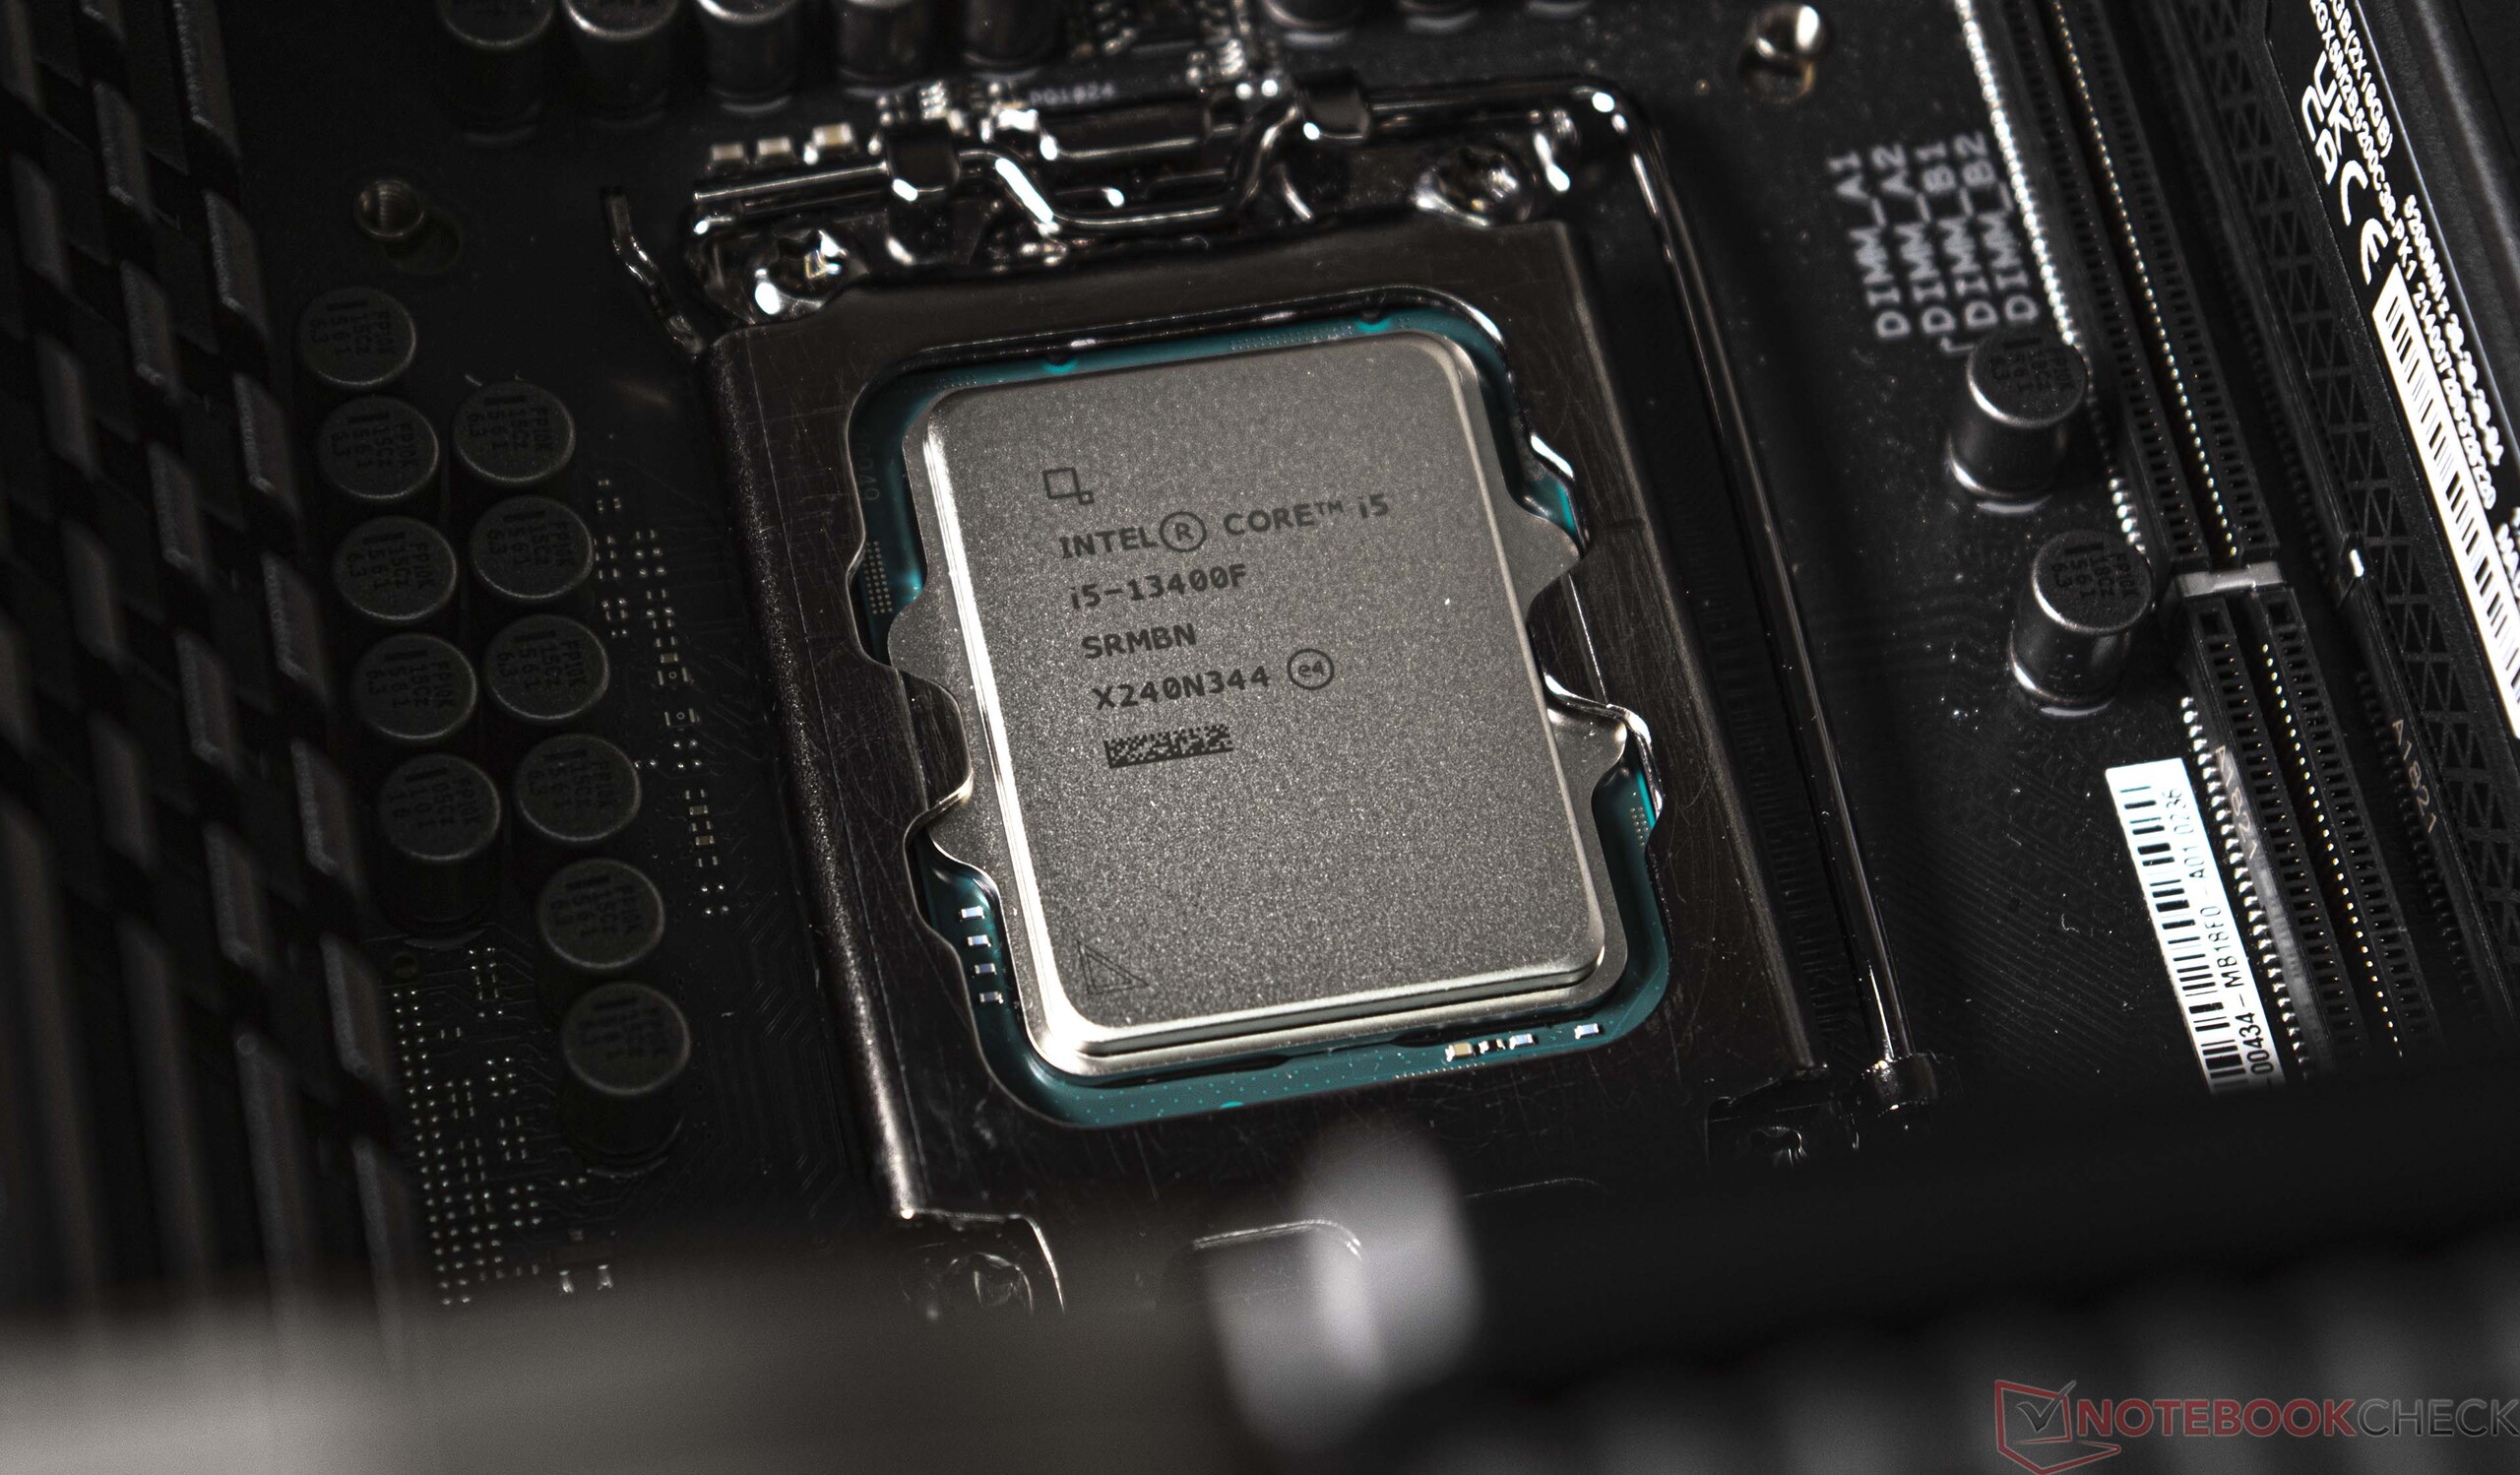
Intel Alder-Lake and Intel Raptor-Lake both share the socket 1700 as a substructure. Thus, all new processors can also be run on the older 600 chip sets. Nevertheless, a BIOS update should be carried out beforehand so that the latest processors are recognized and properly supported. Speaking of Alder-Lake and Raptor-Lake: The Intel Core i5-13400F can be optionally available in B0 or C0 stepping. The B0-stepping refers to a Raptor-Lake DIE, whereas an Alder-Lake DIE is under the heat spreader in the C0-stepping.
In the following table, we have compiled the most important representatives of the new Raptor Lake S family for you. More details about the Intel Core i5-13400F can be found here.
Intel's Core processors in comparison
| Model | Cores / Threads |
Clock P-Core / Turbo | Clock E-Core / Turbo | Cache L2 + L3 | Graphics | PBP | MTB | Price (MSRP) |
| Core i9-13900K | 24 (8P + 16E) /32 | 3.0 GHz / 5.8 GHz | 2.2 GHz / 4.3 GHz | 32 + 36 MB | UHD 770 | 125 Watt | 253 Watt | $ 589 |
| Core i9-13900KF | 16 (8P + 16E) /32 | 3.0 GHz / 5.8 GHz | 2.2 GHz / 4.3 GHz | 32 + 36 MB | - | 125 Watt | 253 Watt | $ 564 |
| Core i9-12900K | 16 (8P + 8E) /24 | 3.2 GHz / 5.1 GHz | 2.4 GHz / 3.9 GHz | 14 + 30 MB | UHD 770 | 125 Watt | 241 Watt | $ 589 |
| Core i9-12900KF | 16 (8P + 8E) /24 | 3.2 GHz / 5.1 GHz | 2.4 GHz / 3.9 GHz | 14 + 30 MB | - | 125 Watt | 241 Watt | $ 564 |
| Core i7-13700K | 16 (8P + 8E) /24 | 3.4 GHz / 5.4 GHz | 2.5 GHz / 4.2 GHz | 24 + 30 MB | UHD 770 | 125 Watt | 253 Watt | $ 409 |
| Core i7-13700KF | 16 (8P + 8E) /24 | 3.4 GHz / 5.4 GHz | 2.5 GHz / 4.2 GHz | 24 + 30 MB | - | 125 Watt | 253 Watt | $ 384 |
| Core i7-12700K | 12 (8P + 4E) /20 | 3.6 GHz / 4.9 GHz | 2.7 GHz / 3.8 GHz | 12 + 25 MB | UHD 770 | 125 Watt | 190 Watt | $ 409 |
| Core i7-12700KF | 12 (8P + 4E) /20 | 3.6 GHz / 4.9 GHz | 2.7 GHz / 3.8 GHz | 12 + 25 MB | - | 125 Watt | 190 Watt | $ 384 |
| Core i5-13600K | 14 (6P + 8E) /20 | 3.5 GHz / 5.1 GHz | 2.6 GHz / 3.9 GHz | 20 + 24 MB | UHD 770 | 125 Watt | 181 Watt | $ 319 |
| Core i5-13600KF | 14 (6P + 8E) /20 | 3.5 GHz / 5.1 GHz | 2.6 GHz / 3.9 GHz | 20 + 24 MB | - | 125 Wat | 181 Watt | $ 294 |
| Core i5-12600K | 10 (6P + 4E) /16 | 3.7 GHz / 4.9 GHz | 2.8 GHz / 3.6 GHz | 9.5 + 20 MB | UHD 770 | 125 Watts | 150 Watts | $ 289 |
| Core i5-12600KF | 10 (6P + 4E) /16 | 3.7 GHz / 4.9 GHz | 2.8 GHz / 3.6 GHz | 9.5 + 20 MB | - | 125 Watt | 150 Watt | $ 264 |
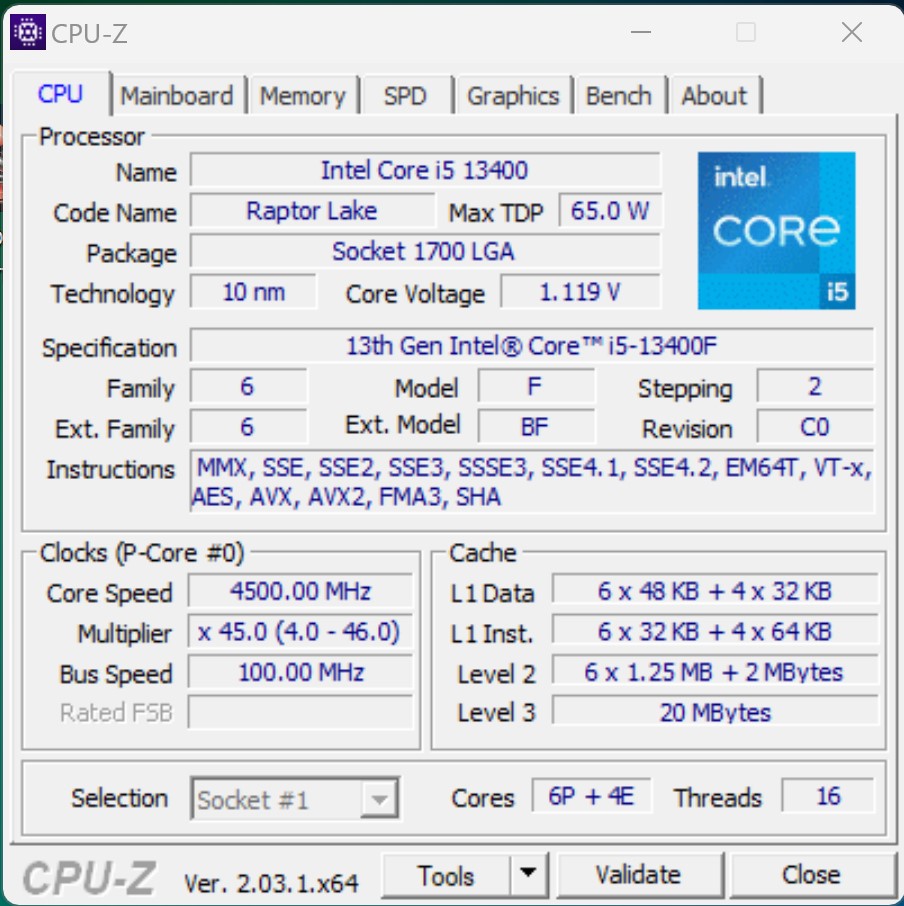
| Core i5-13400F | 10 (6P + 4E) /16 | 2.5 GHz / 4.6 GHz | 1.8 GHz / 3.3 GHz | 9.5 + 20 MB | - | 65 Watt | 148Watt | $ 196 |
| Core i5-12400F | 6 (6P + 0E) /12 | 2.5 GHz / 4.4 GHz | - | 7.5 + 18 MB | - | 65 Watt | 117 Watt | $ 194 |
Details about our test system
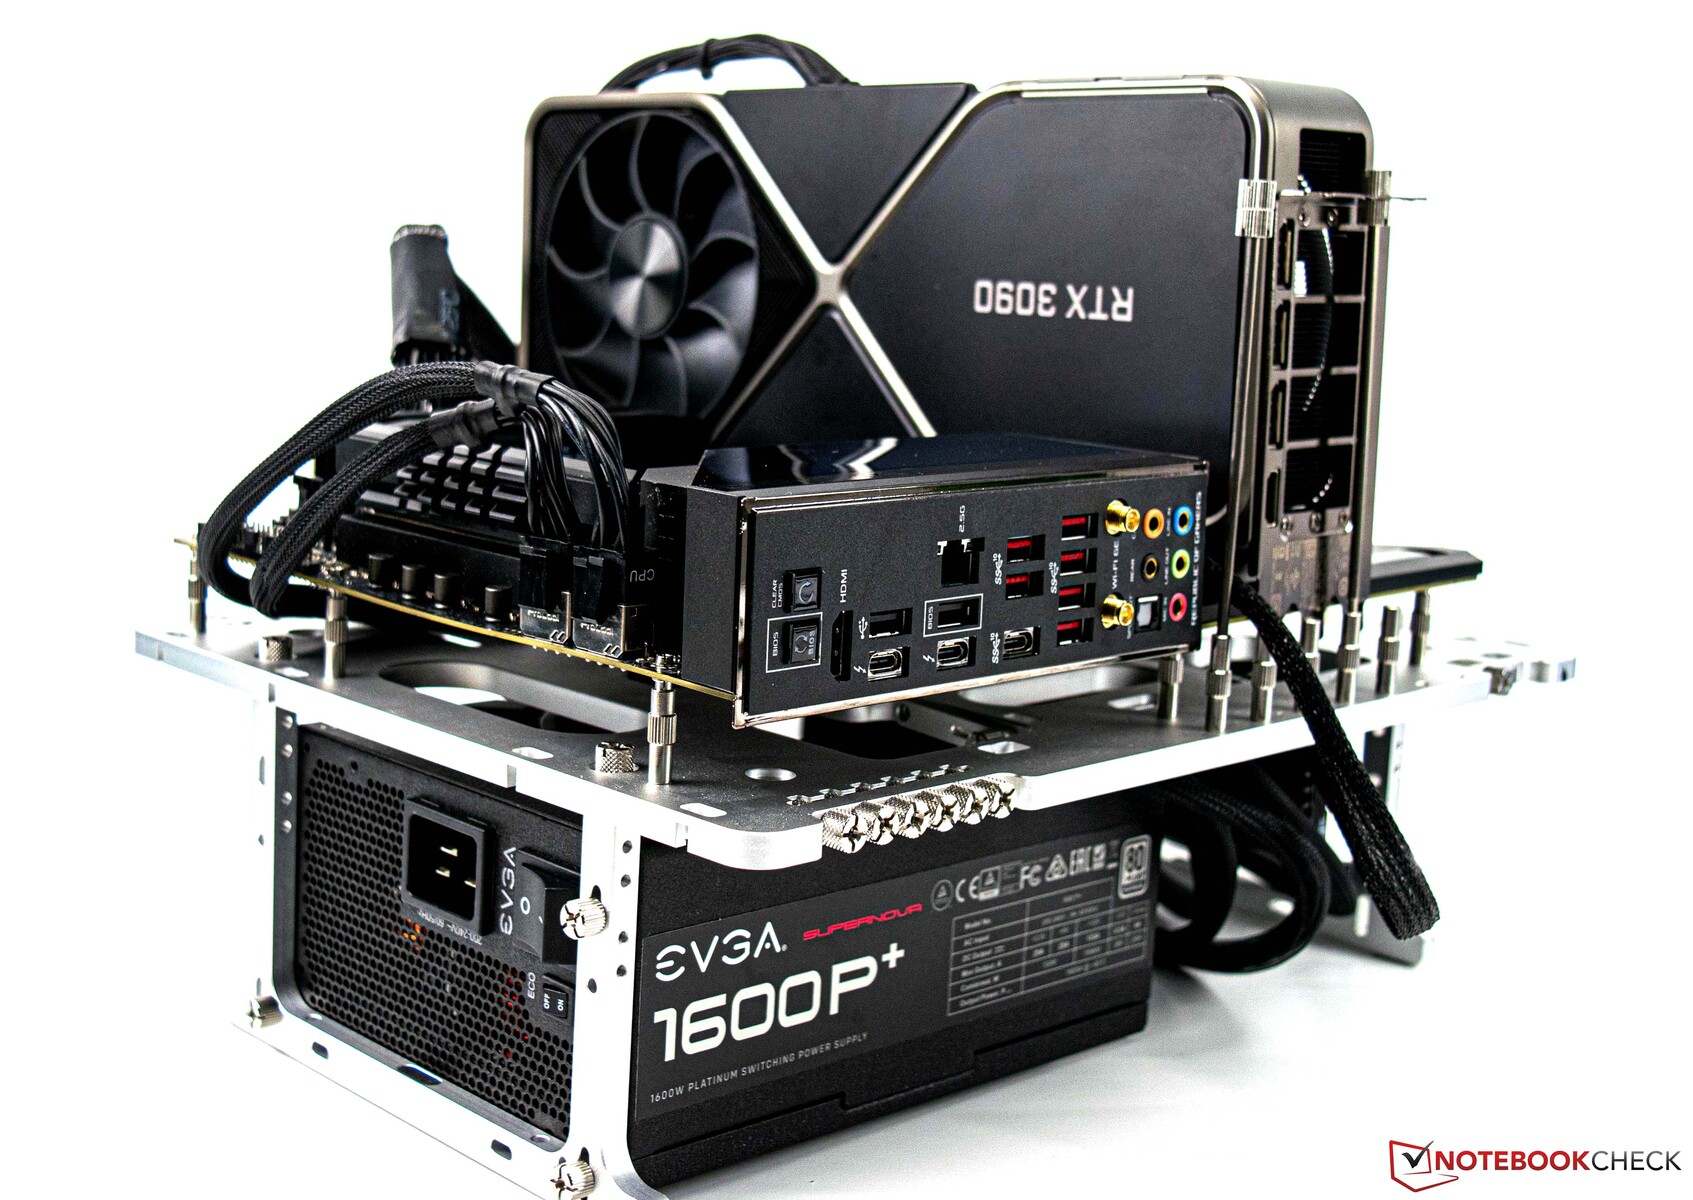
- Streacom BC1 V2 Open Benchtable
- Intel Core i5-13400F
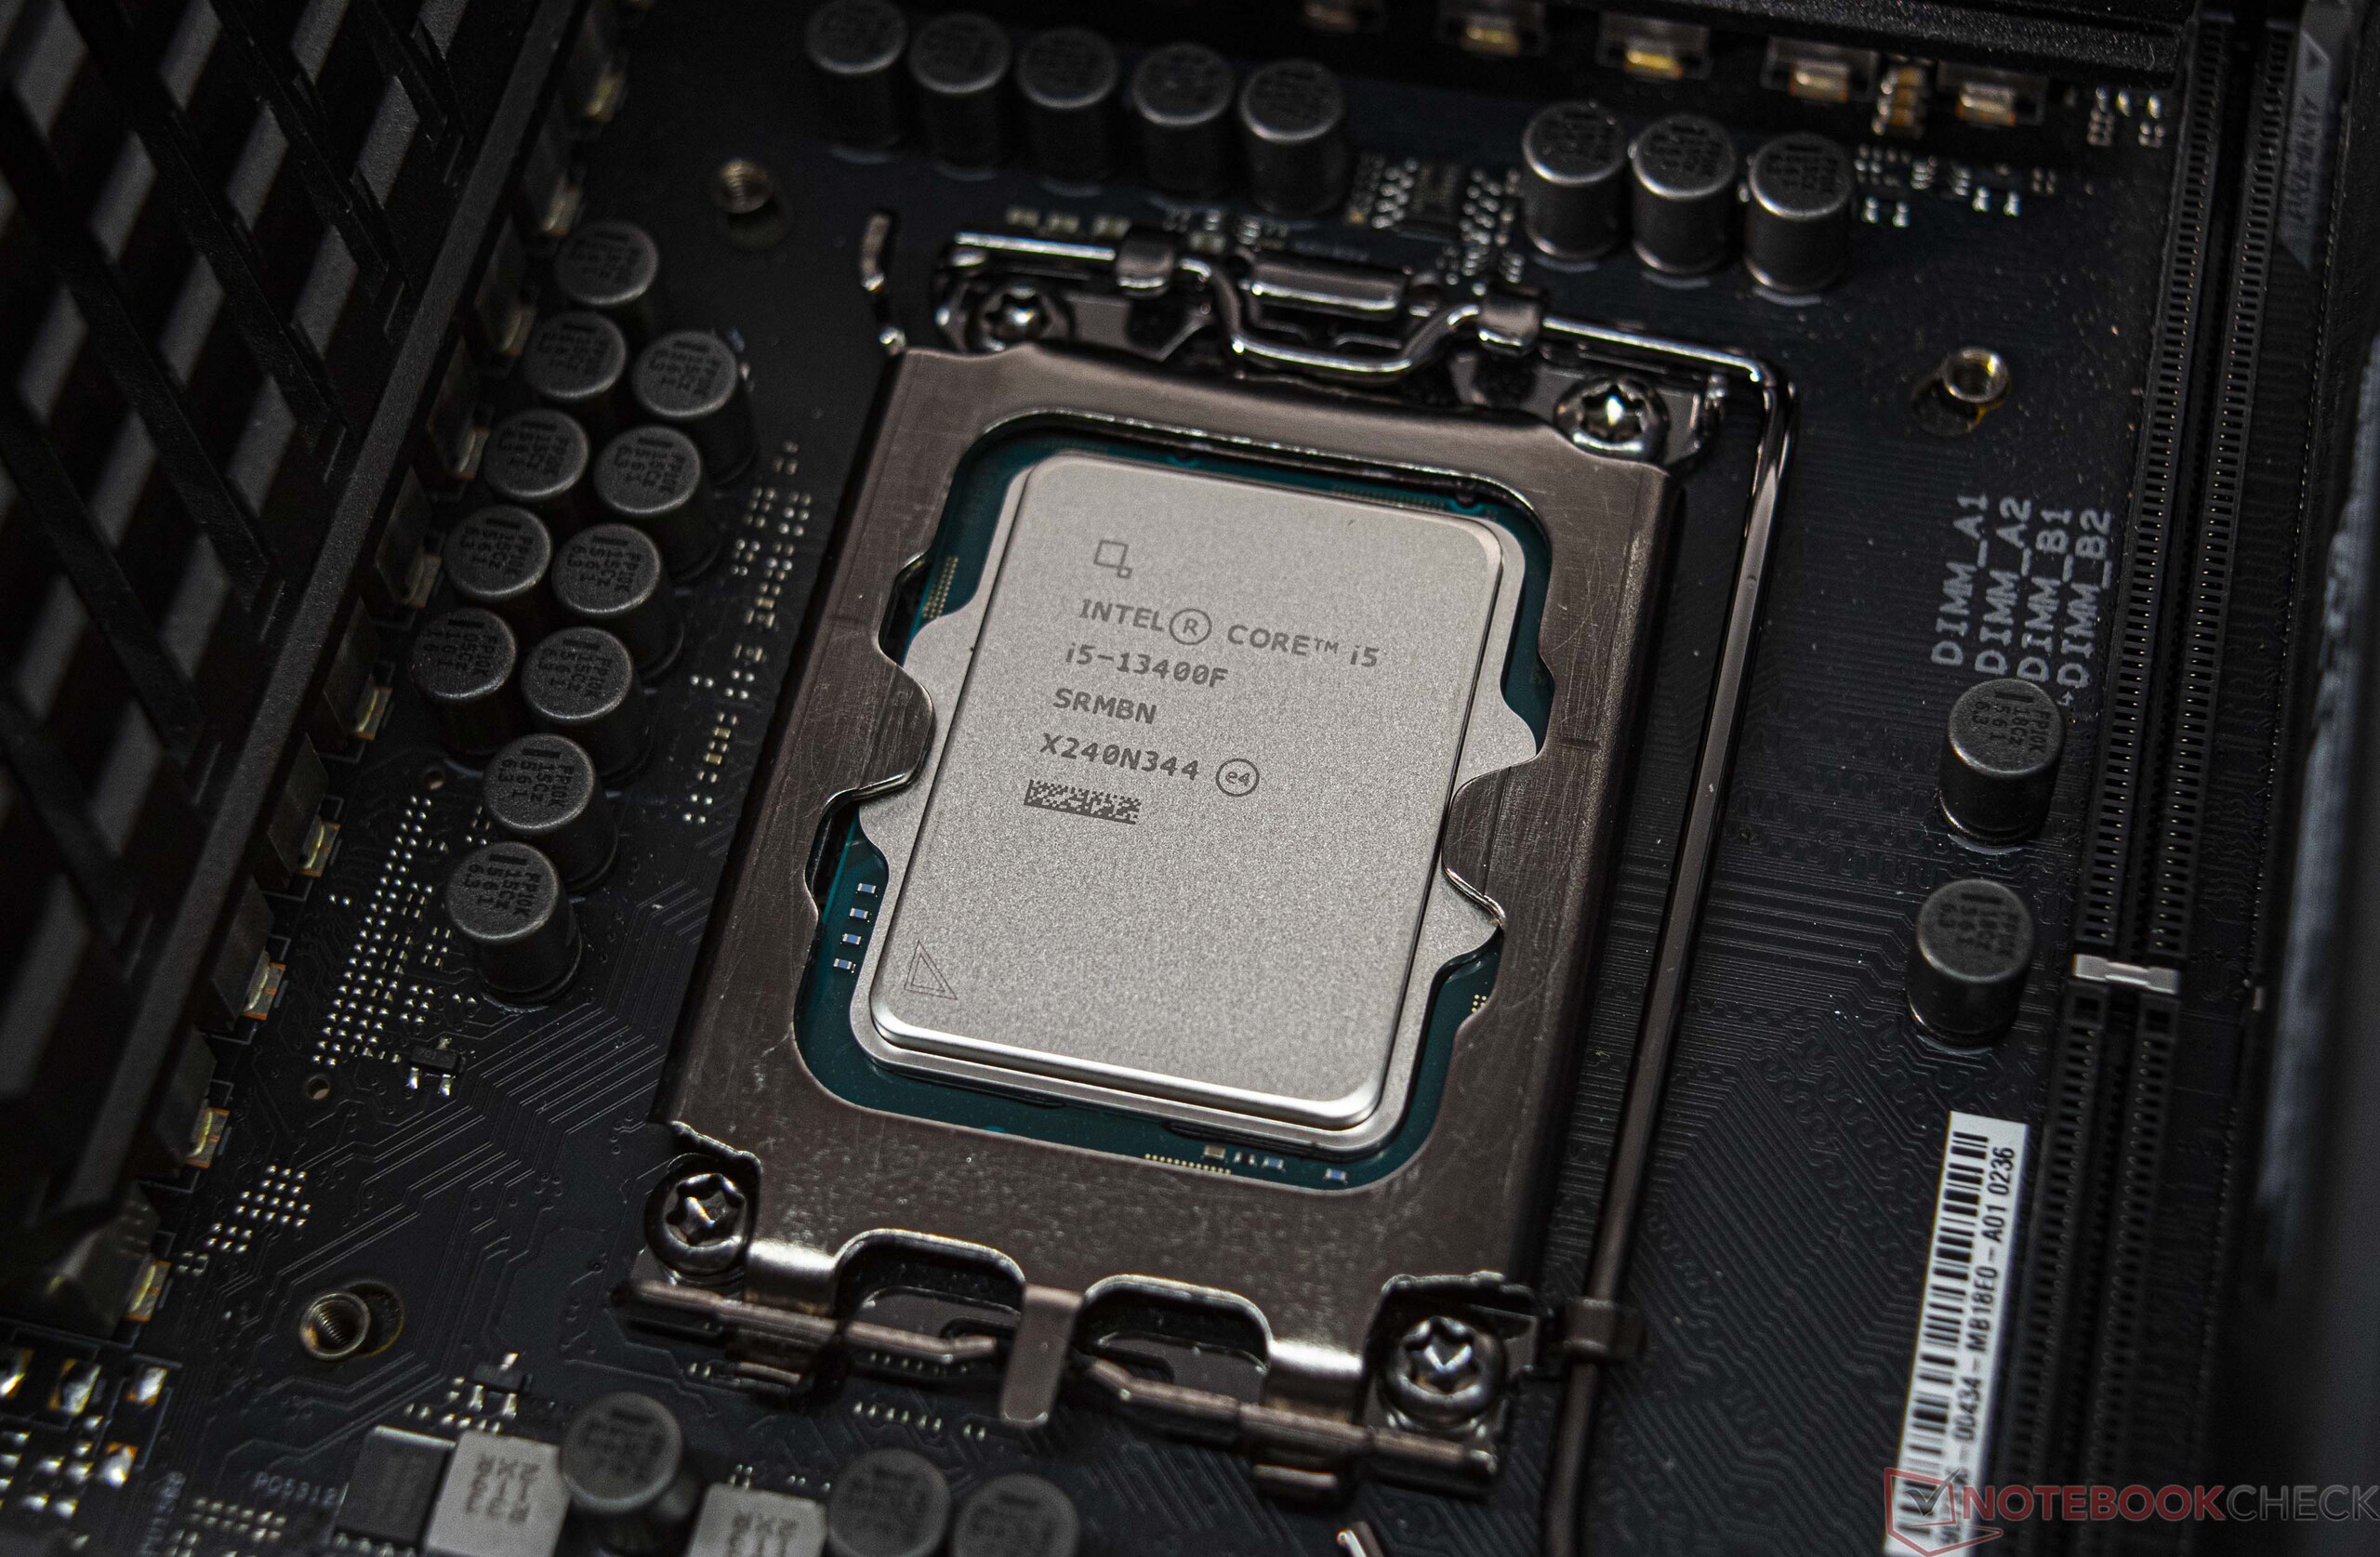
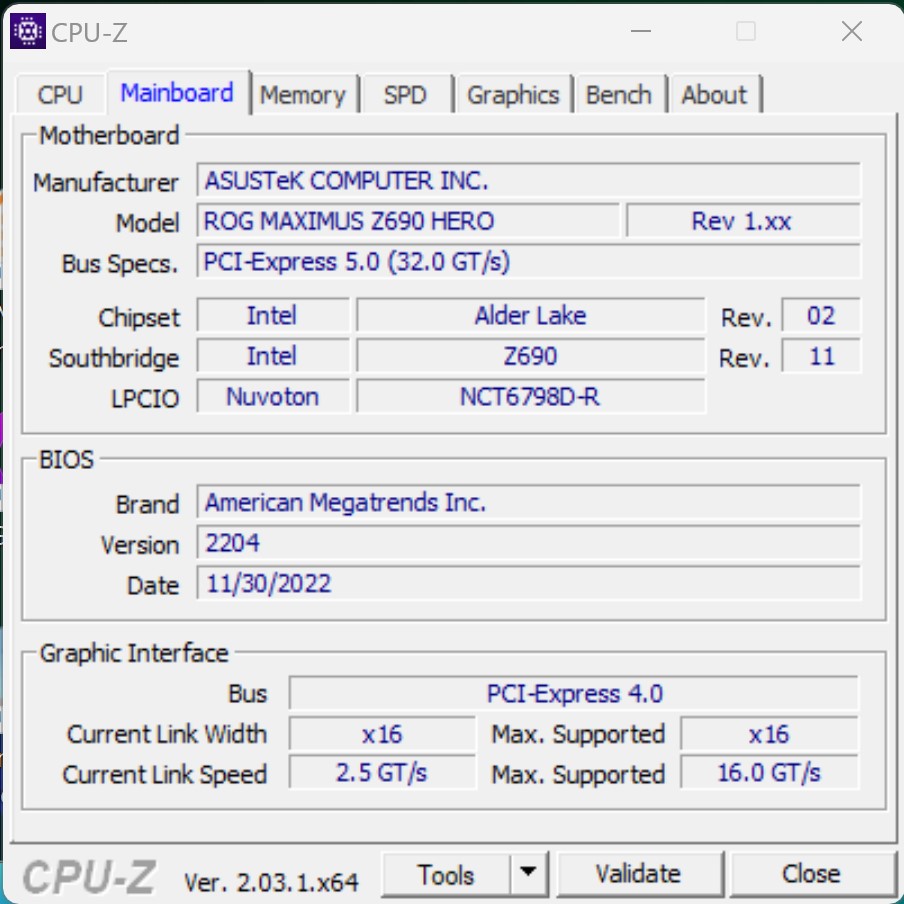
- Asus ROG Maximus Z690 Hero (BIOS v2204)
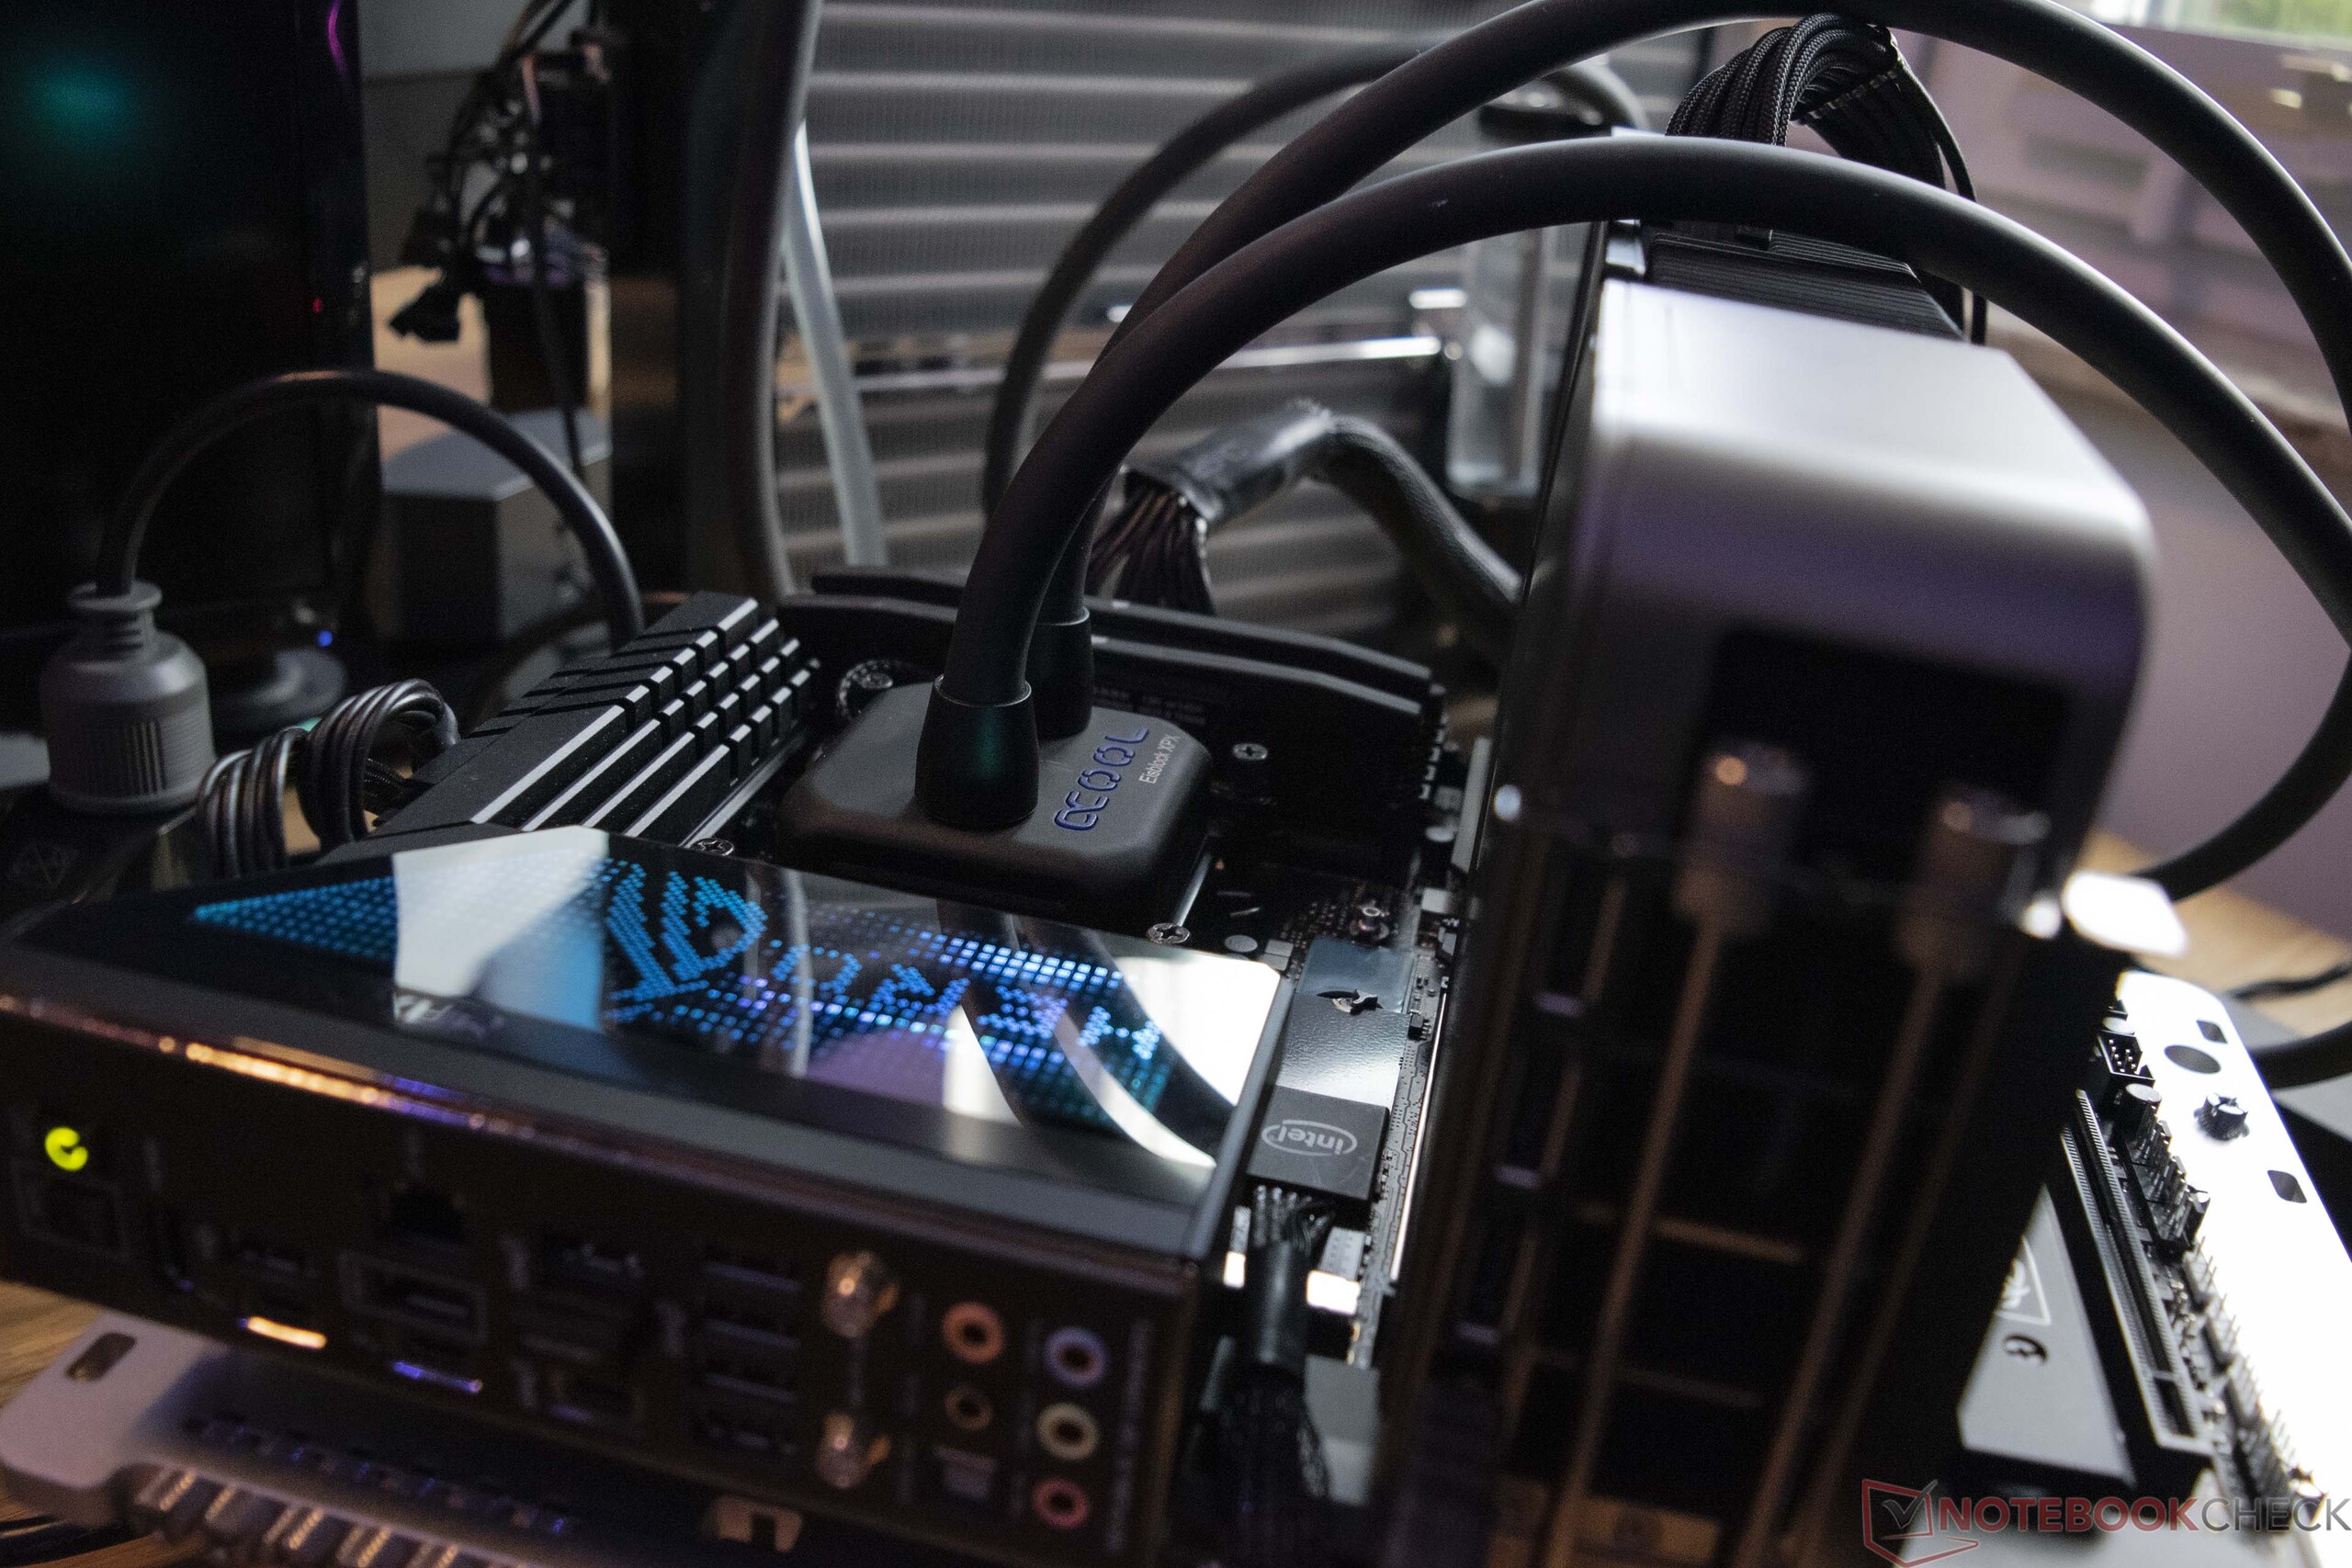
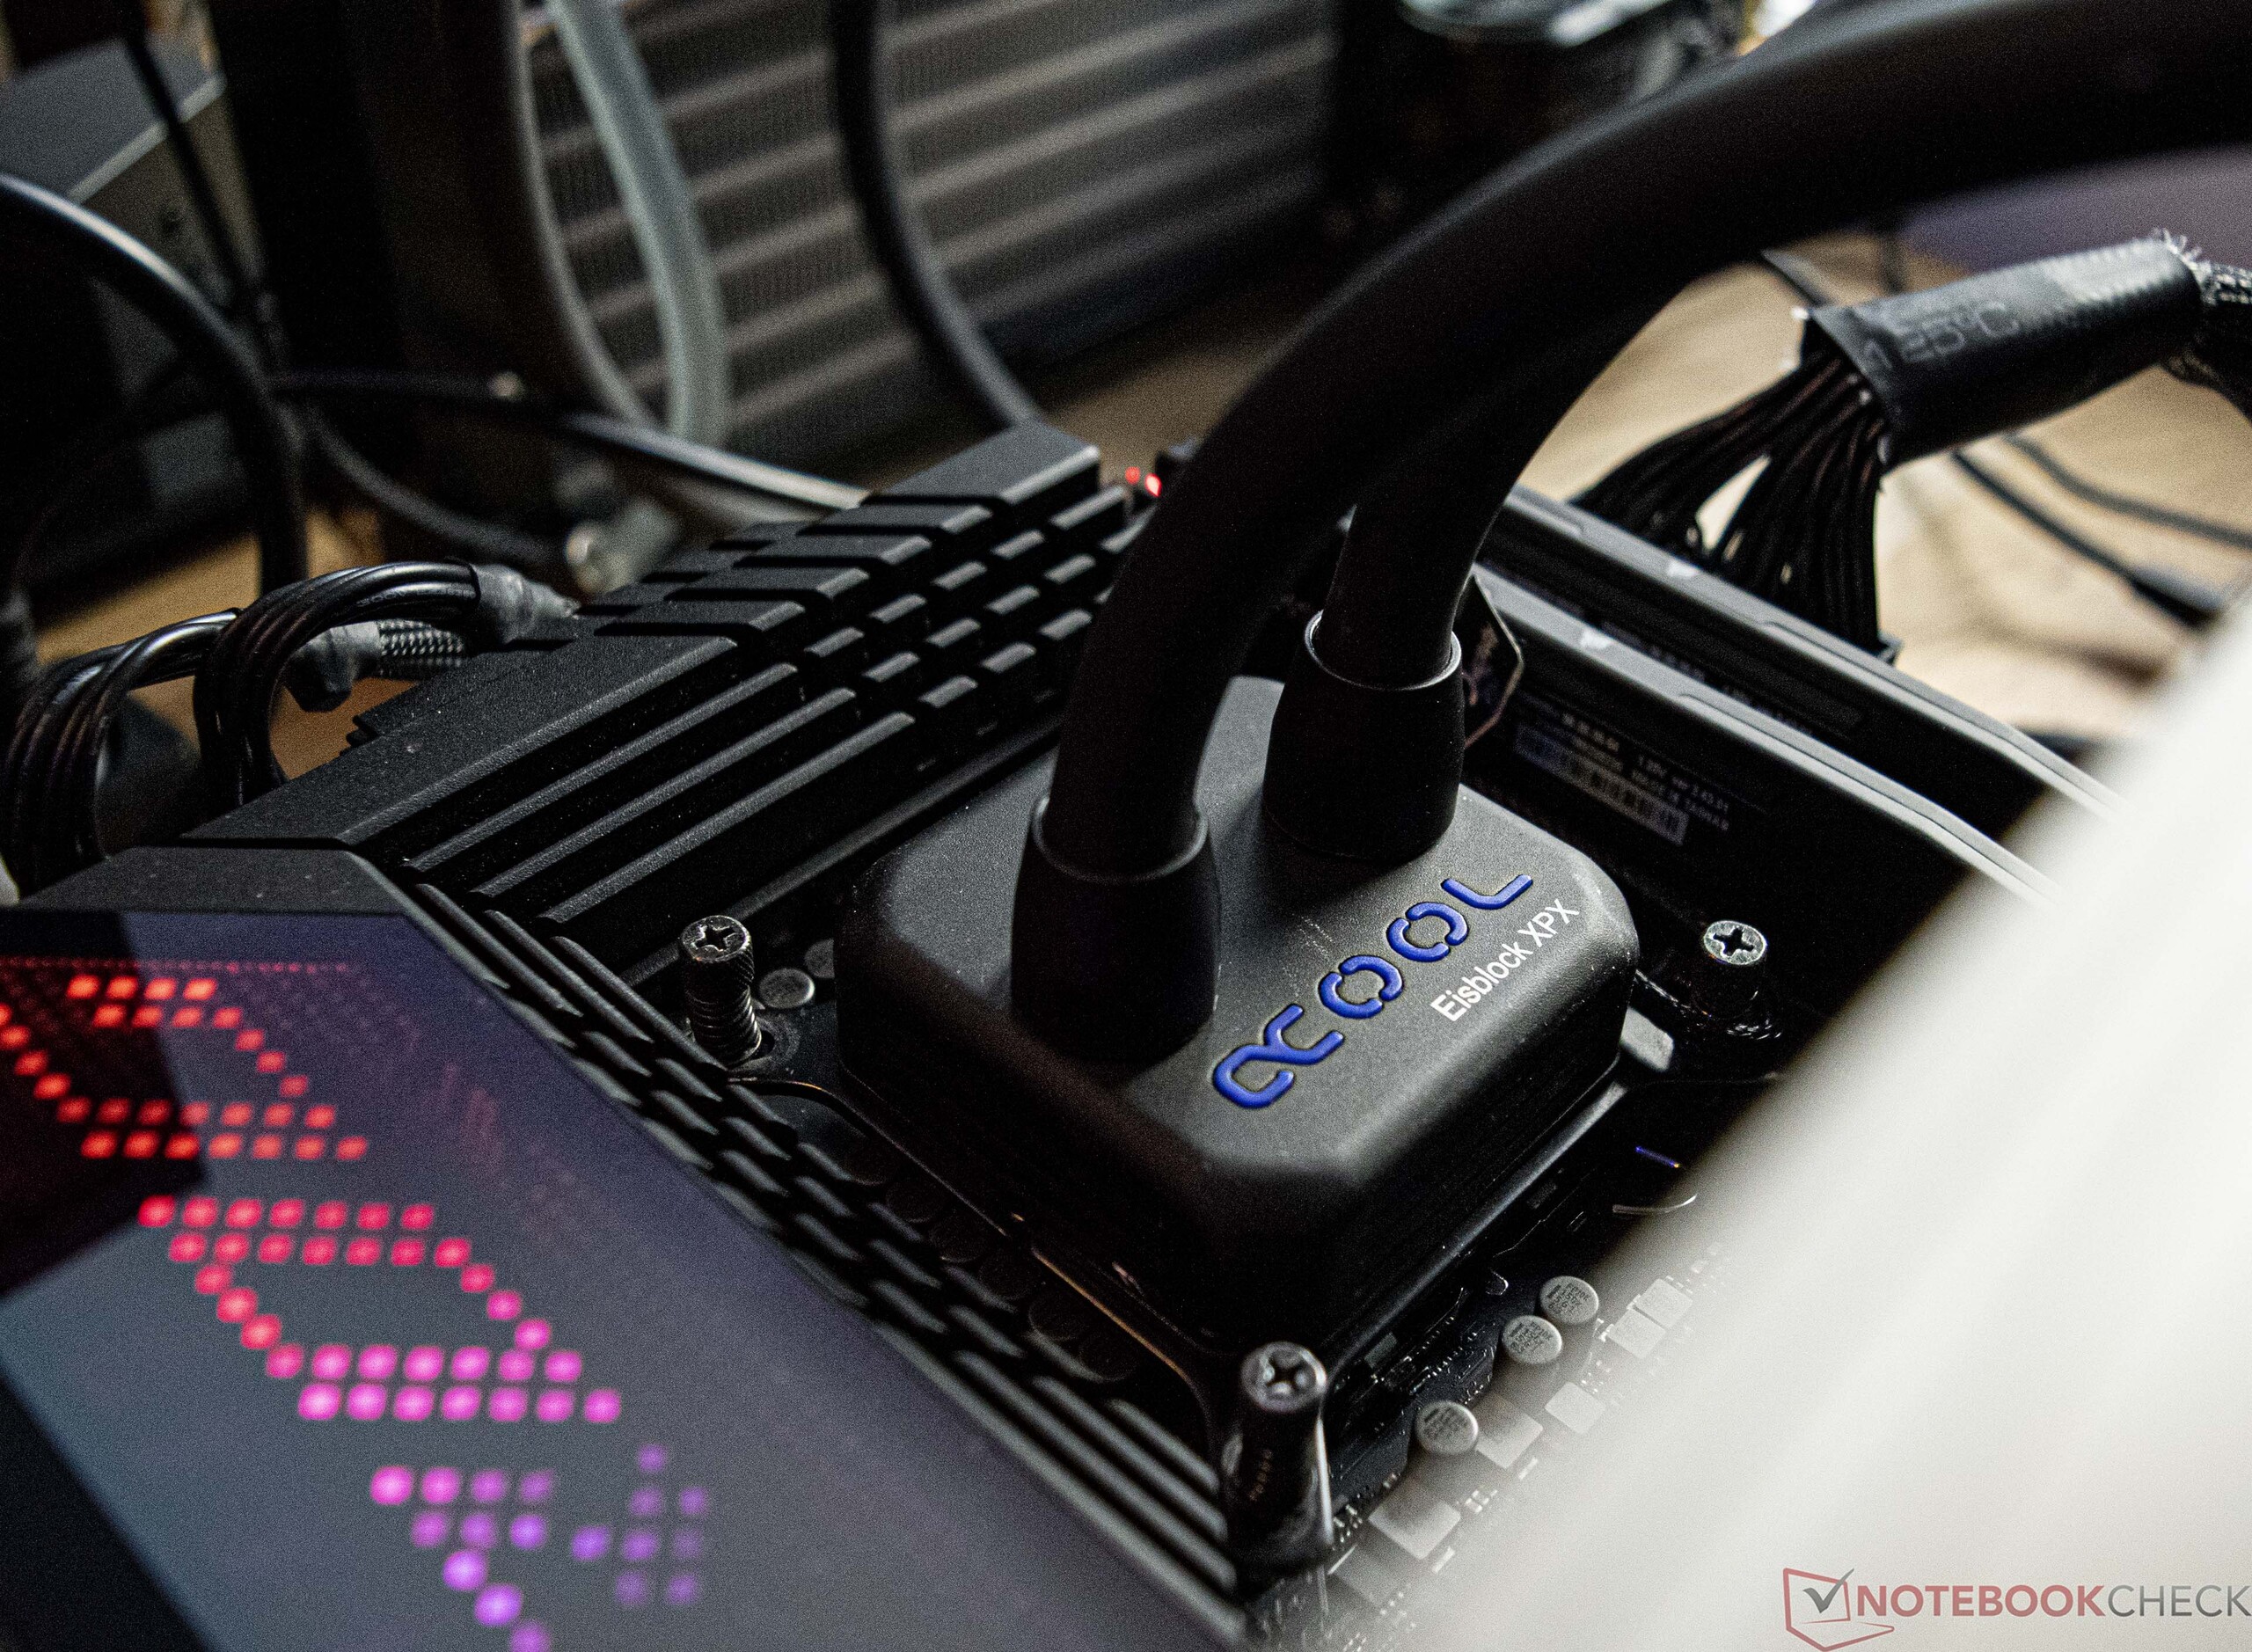
- Custom-Loop Watercooling (Pump: Alphacool Aquastream XT Ultra, Radiator: EK MO-RA3 420 LT BLACK)
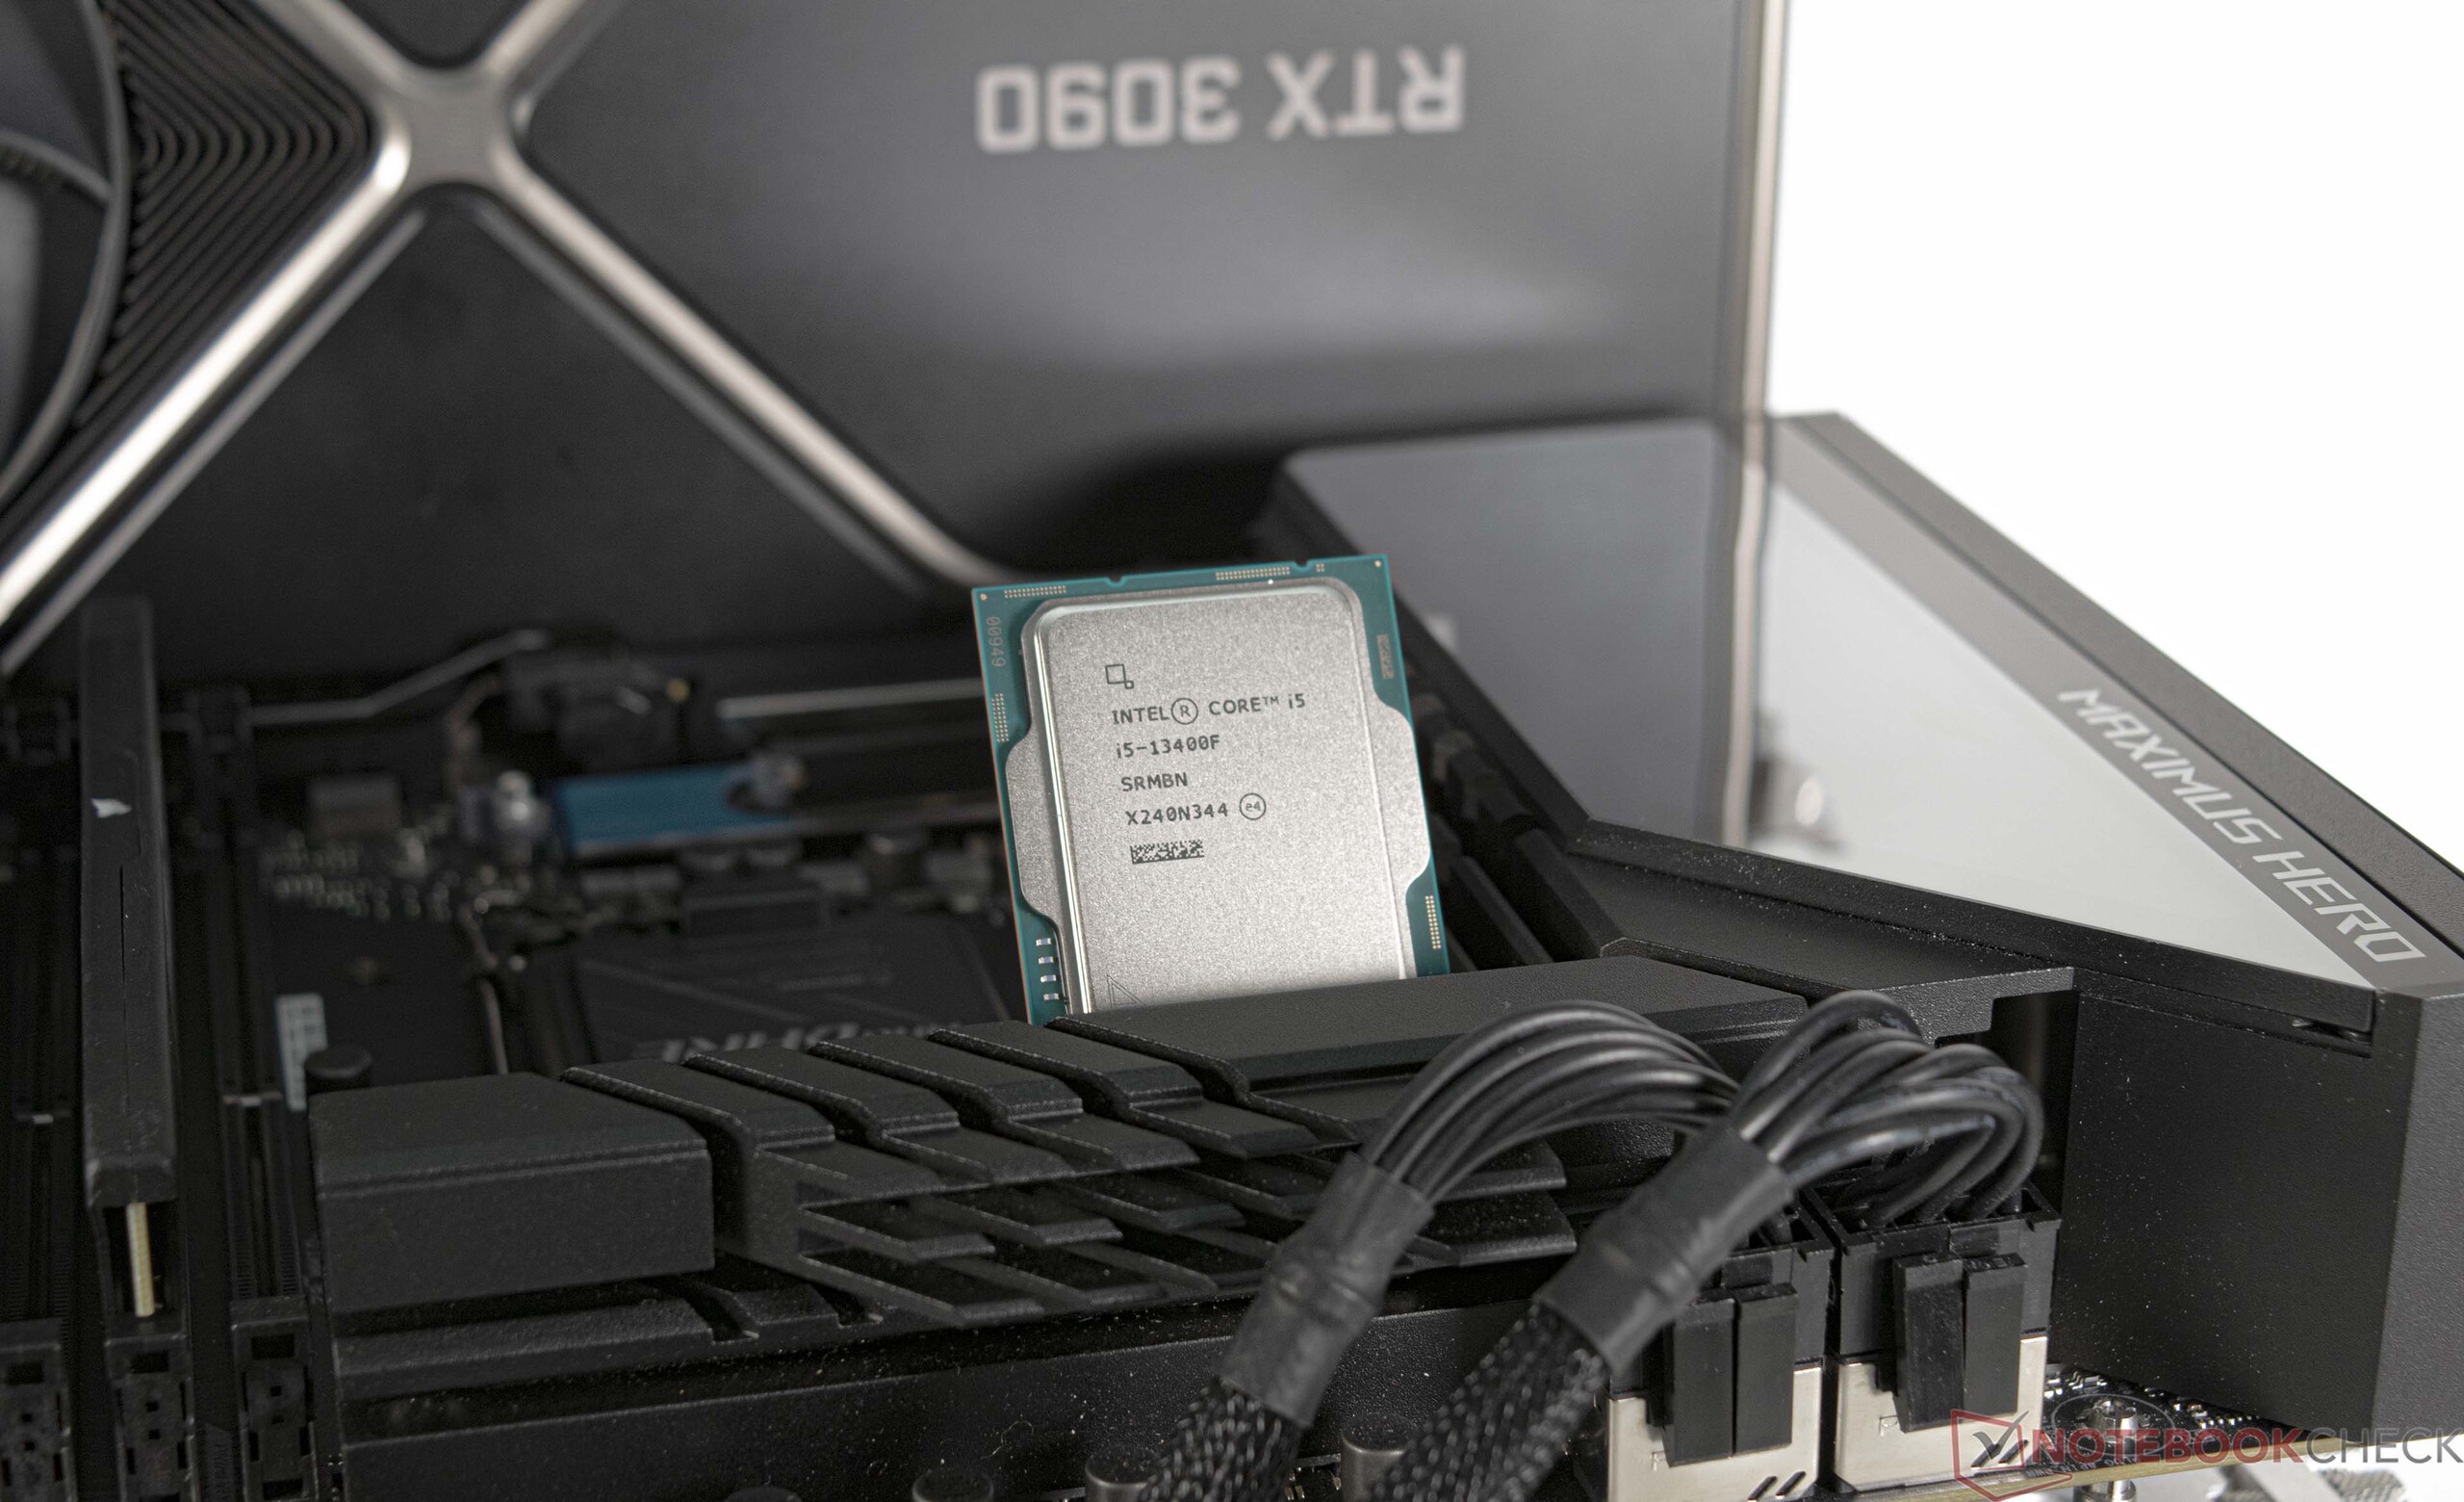
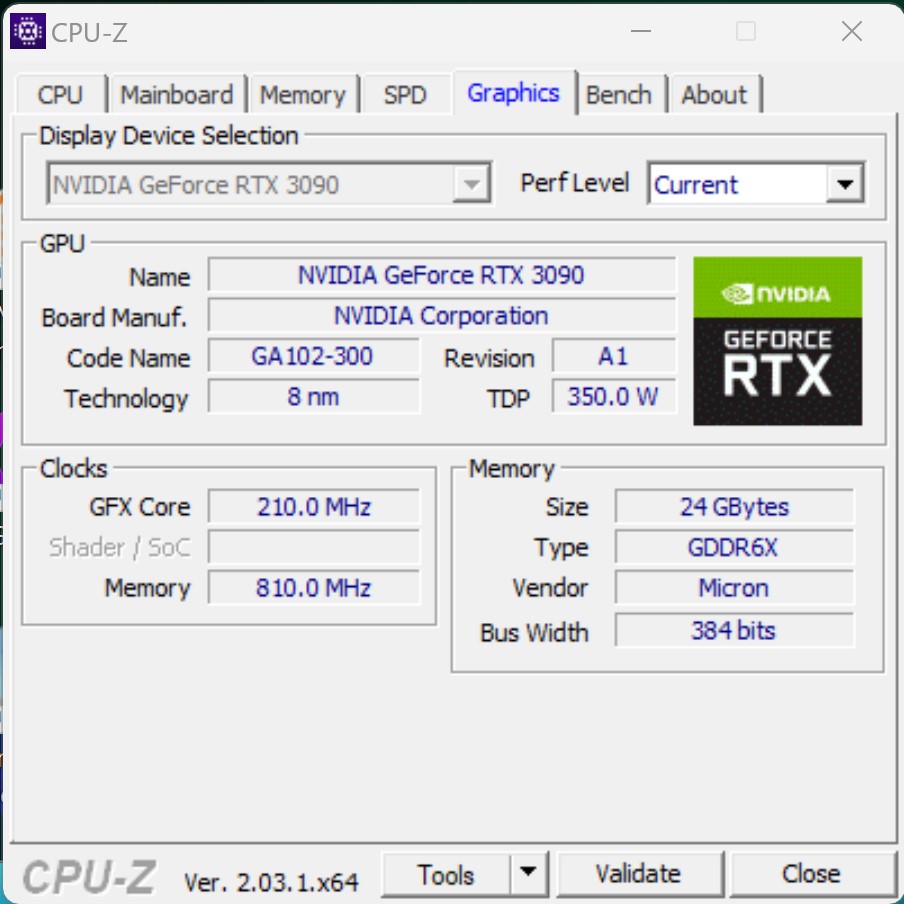
- Nvidia GeForce RTX 3090 Founders Edition (driver: 528.02)
- EVGA SuperNOVA P+ 1600W
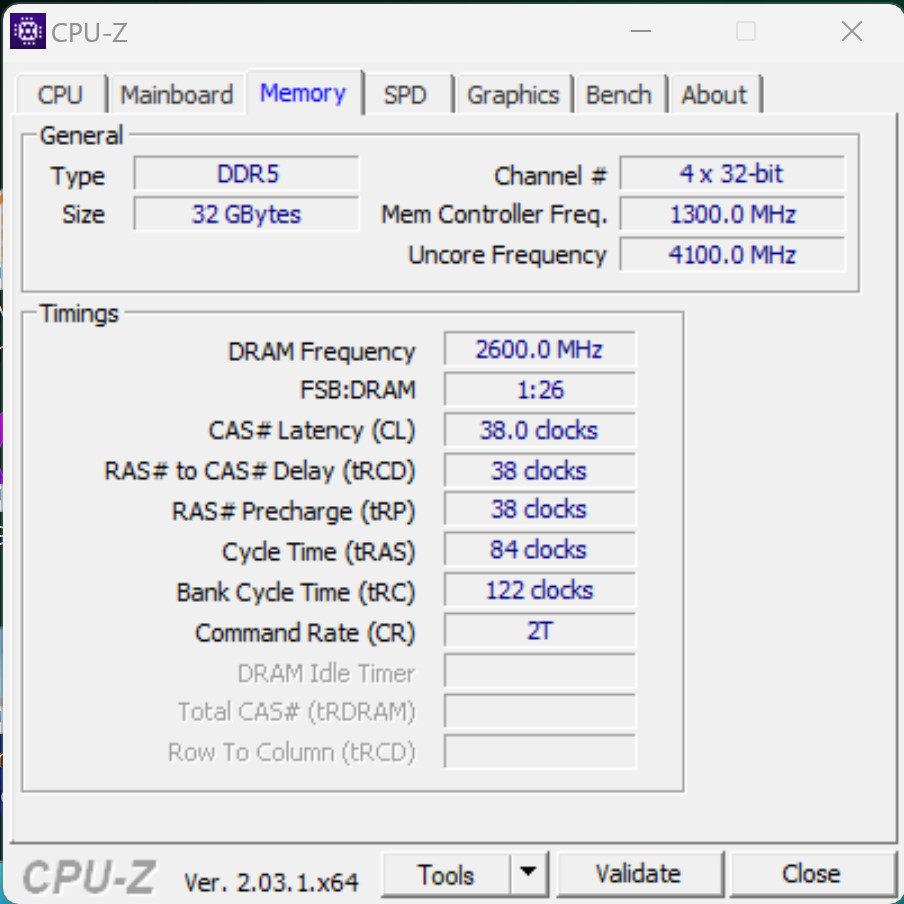
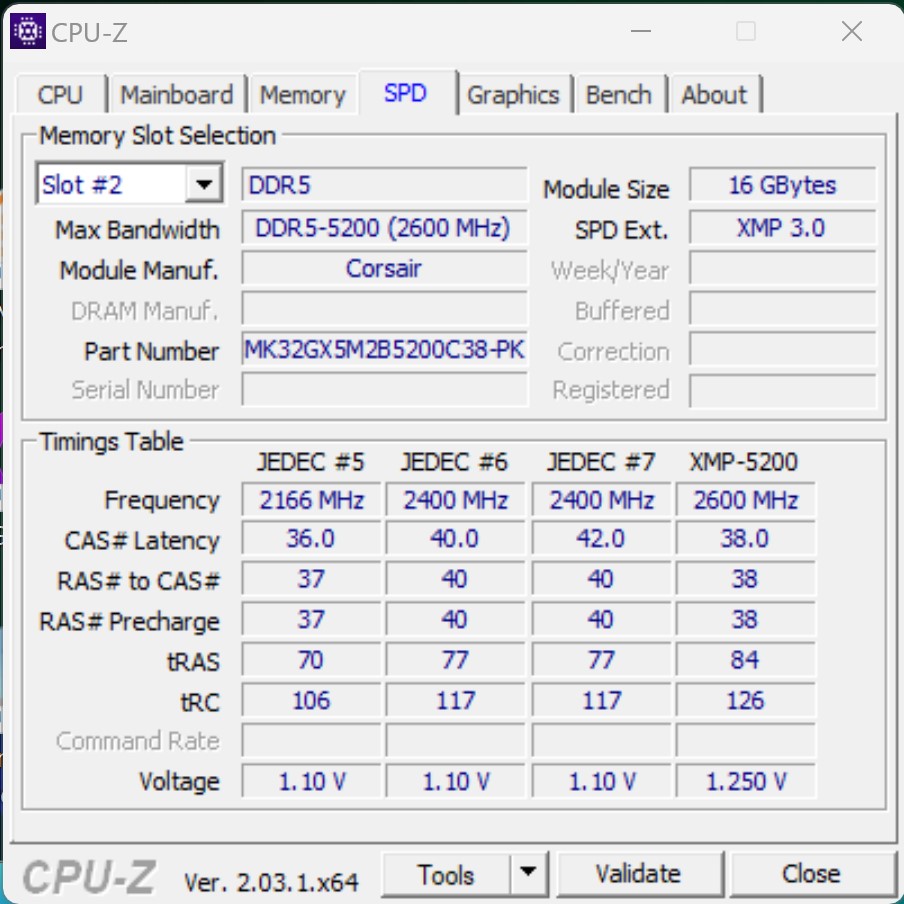
- G.Skill Ripjaws S5 (2x 16 GB - DDR5-5200 MT/s)
- Intel Optane 905p (480 GB system + benchmarks)
- Western Digital SN720 (Games)
- Microsoft Windows 11 Professional 64-bit (version 22H2)
Test conditions - Z690 still usable after BIOS update
We continue to use the Asus ROG Maximus Z690 Hero as the base for this test, which has already been our choice since the introduction of the Alder-Lake processors. After some problems, which we experienced during our test with the Intel Core i9-13900K, there were no complications with Intel Core i5-13400F. The latest BIOS v2204 was installed in order to boot the Intel Core i5-13400F. Fortunately, the Asus ROG Maximus Z690 Hero offers the possibility to update the BIOS without CPU and RAM.
All tests were performed with the latest BIOS and enabled XMP1 profile. In addition, all power limit restrictions were disabled to access the full performance of the processors.
Processor benchmarks
Unfortunately, we cannot make a direct performance comparison with the Intel Core i5-12400F at this point. However, we have many other processors in our database that can be used as a reference. Thus, we see a minimal advantage for the Intel Core i5-13400F compared to an Intel Core i7-12700F. On average, the Intel Core i5-13400F can achieve a better result, although the missing threads definitely lead to a worse score in individual tests. We see an almost identical picture in the direct comparison with the AMD Ryzen 7 5800X. Like the Intel Core i5-13400F, the latter offers 16 threads, but can score better in the pure multi-thread benchmarks.
If you need more performance, you can go for an Intel Core i5-13600K. There is about 20 percent more performance here. The same performance increase can also be achieved with an AMD Ryzen 7 7700X.
More benchmarks about the processors can be found here.

| Blender - v2.79 BMW27 CPU | |
| Intel Core i5-11400F | |
| AMD Ryzen 5 5600X | |
| Intel Core i7-12700F | |
| Intel Core i5-13400F | |
| AMD Ryzen 7 5800X | |
| Intel Core i5-12600K | |
| AMD Ryzen 7 7700X | |
| Intel Core i5-13600K | |
| Intel Core i9-13900K | |
| WinRAR - Result | |
| AMD Ryzen 7 5800X | |
| AMD Ryzen 7 7700X | |
| Intel Core i9-13900K | |
| AMD Ryzen 5 5600X | |
| Intel Core i5-13600K | |
| Intel Core i7-12700F | |
| Intel Core i5-13400F | |
| Intel Core i5-11400F | |
| Intel Core i5-12600K | |
| WebXPRT 3 - Overall | |
| Intel Core i9-13900K | |
| AMD Ryzen 7 7700X | |
| Intel Core i5-13600K | |
| AMD Ryzen 7 5800X | |
| Intel Core i5-13400F | |
| Intel Core i5-12600K | |
| AMD Ryzen 5 5600X | |
| Intel Core i7-12700F | |
| Intel Core i5-11400F | |
| Mozilla Kraken 1.1 - Total | |
| Intel Core i5-11400F | |
| AMD Ryzen 5 5600X | |
| AMD Ryzen 7 5800X | |
| Intel Core i5-13400F | |
| Intel Core i7-12700F | |
| Intel Core i5-12600K | |
| Intel Core i5-13600K | |
| AMD Ryzen 7 7700X | |
| Intel Core i9-13900K | |
* ... smaller is better
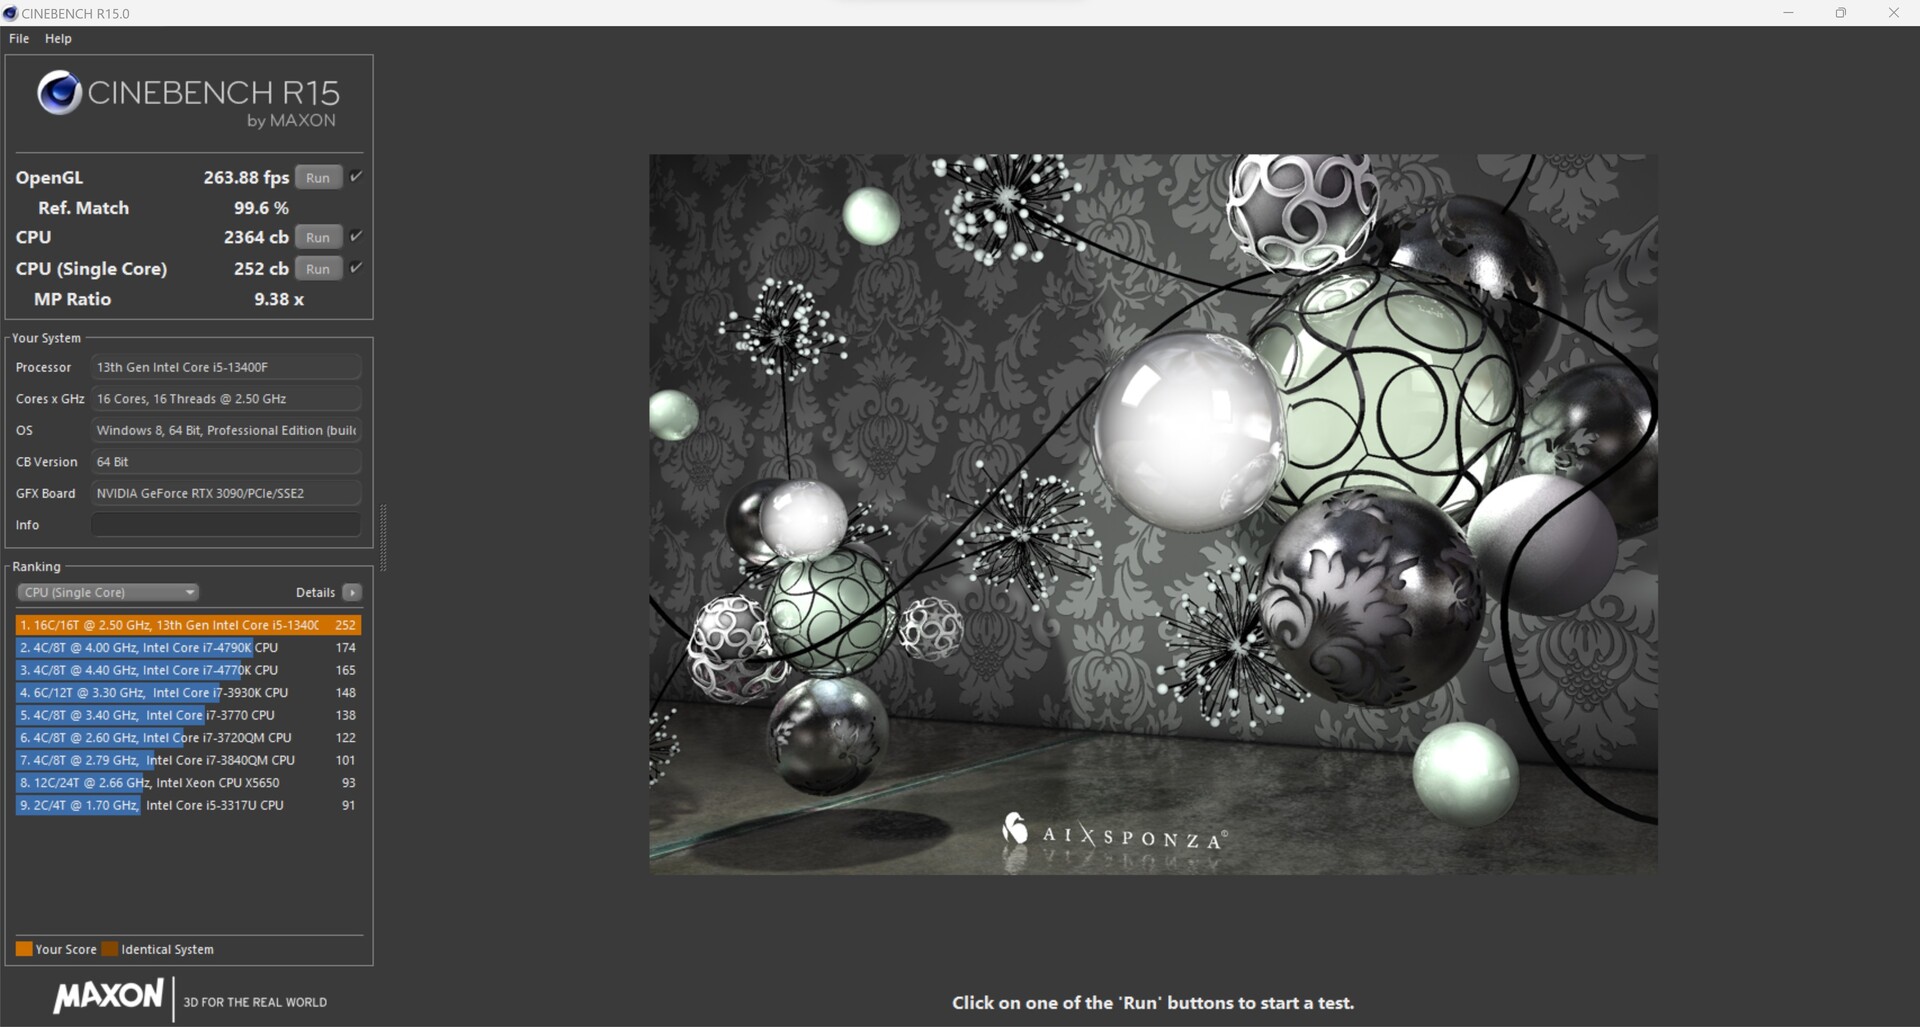
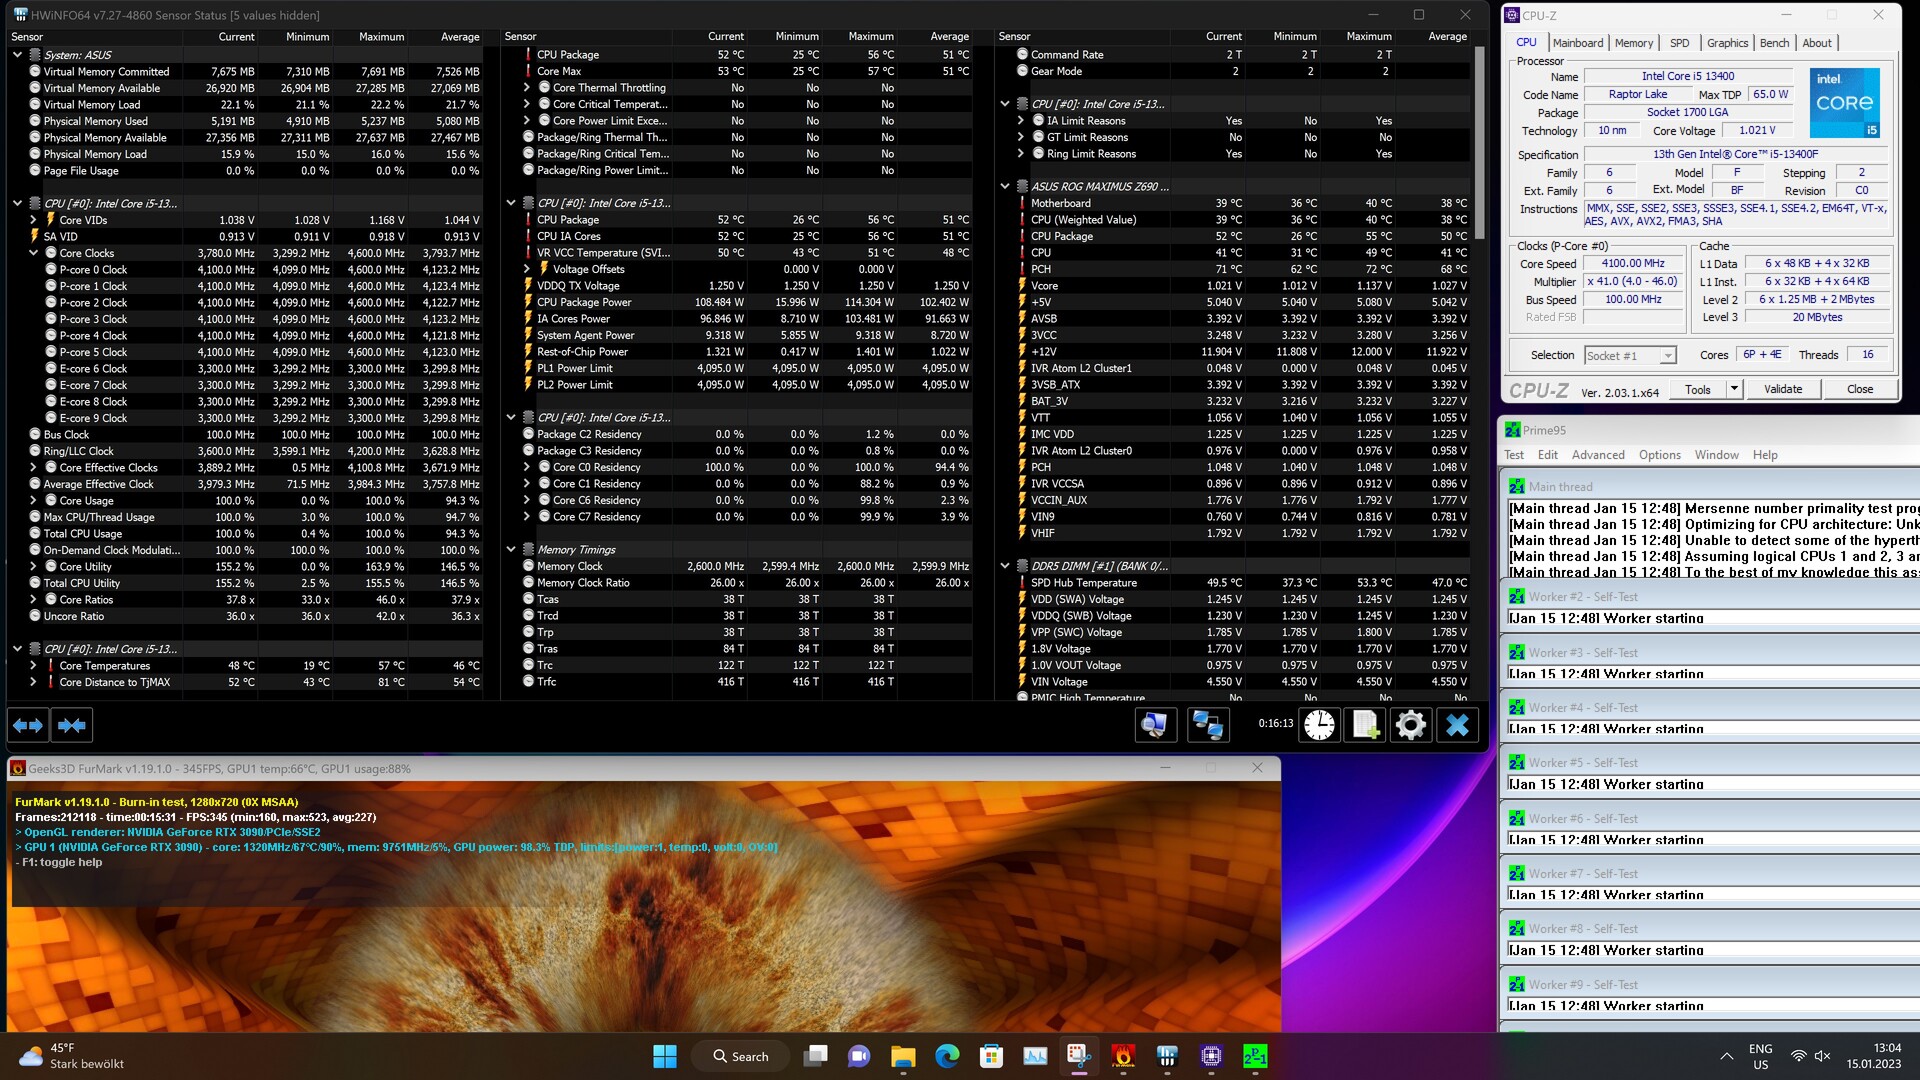
Intel Core i5-13400F vs. Cinebench R15 multi loop
During the stress test, which we run with the Cinebench R15 continuous loop, there are no problems in terms of a stable power development. With a maximum of 148 watts, which Intel allows the Core i5-13400F, the cooling system is not particularly challenged. The Intel Core i5-13400F is only marginally slower than an Intel Core i5-12600K with an average of 2,338 points over all 50 runs Intel Core i5-12600K (2,545 points).
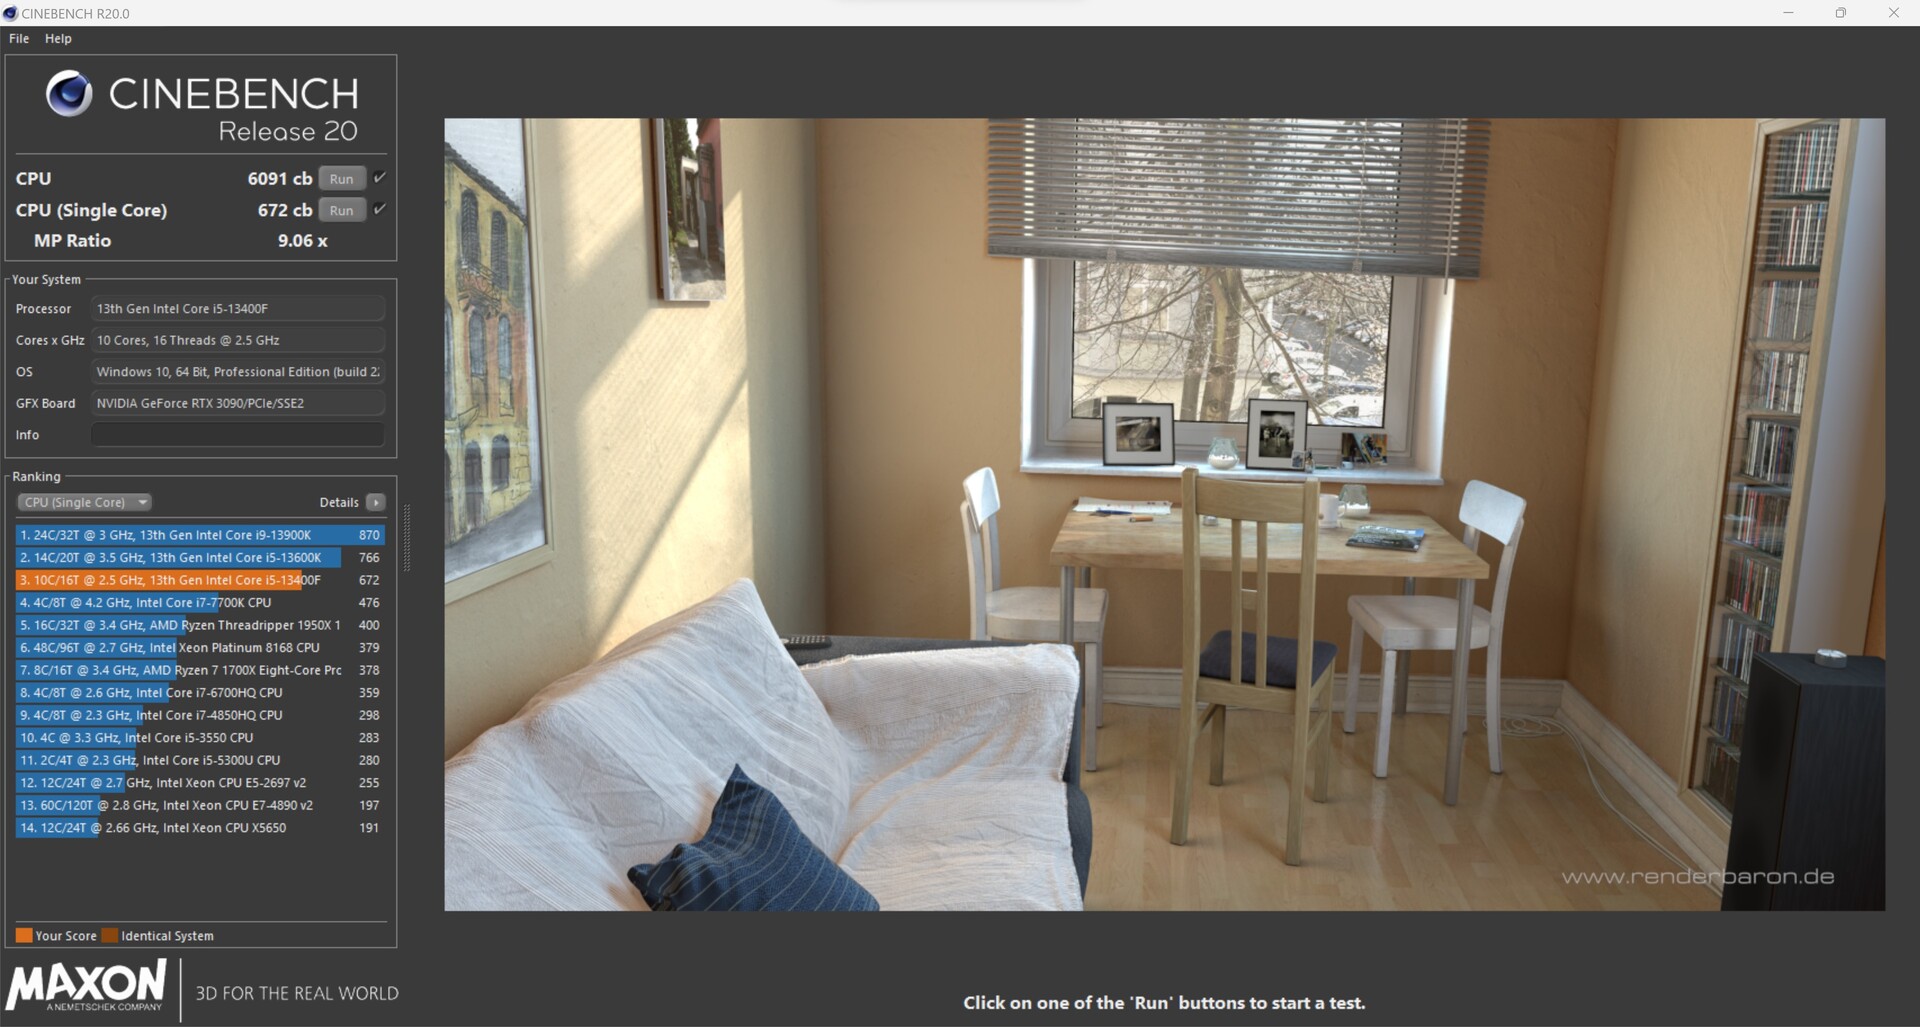
Synthetic benchmarks and application performance
The Intel Core i5-13400F can also score well in the application benchmarks and is equal to an Intel Core i5-12600K in terms of performance. Compared to the K-models of the Raptor-Lake processors listed here, our review sample has to accept a clear deficit, though. Nevertheless, the Intel Core i5-13400F offers a solid performance in everyday use, which is completely sufficient for most applications.
| 3DMark 11 - 1280x720 Performance Physics | |
| Intel Core i9-13900K | |
| Intel Core i5-13600K | |
| Intel Core i9-12900K | |
| AMD Ryzen 5 7600X | |
| AMD Ryzen 9 5950X | |
| Intel Core i5-12600K | |
| Intel Core i5-13400F | |
| Intel Core i7-12700F | |
| Intel Core i9-12900K | |
| AMD Ryzen 9 5900X | |
| AMD Ryzen 5 5600X | |
| Intel Core i5-11400F | |
| CrossMark - Overall | |
| Intel Core i9-13900K | |
| Intel Core i5-13600K | |
| AMD Ryzen 5 7600X | |
| Intel Core i5-13400F | |
| Intel Core i7-12700F | |
| Intel Core i5-12600K | |
| AMD Ryzen 9 5900X | |
| AMD Ryzen 9 5950X | |
| AMD Ryzen 5 5600X | |
| AIDA64 / Memory Copy | |
| Intel Core i9-13900K | |
| Intel Core i5-13600K | |
| Intel Core i5-13400F | |
| Intel Core i5-12600K | |
| AMD Ryzen 9 5900X | |
| AMD Ryzen 5 7600X | |
| AMD Ryzen 9 5950X | |
| AMD Ryzen 5 5600X | |
| Average of class (4514 - 234662, n=2211) | |
| AIDA64 / Memory Read | |
| Intel Core i9-13900K | |
| Intel Core i5-13400F | |
| Intel Core i5-12600K | |
| Intel Core i5-13600K | |
| AMD Ryzen 9 5900X | |
| AMD Ryzen 9 5950X | |
| AMD Ryzen 5 5600X | |
| AMD Ryzen 5 7600X | |
| Average of class (4031 - 271066, n=2173) | |
| AIDA64 / Memory Write | |
| AMD Ryzen 5 7600X | |
| Intel Core i9-13900K | |
| Intel Core i5-12600K | |
| Intel Core i5-13600K | |
| Intel Core i5-13400F | |
| Average of class (3506 - 242868, n=2178) | |
| AMD Ryzen 9 5900X | |
| AMD Ryzen 9 5950X | |
| AMD Ryzen 5 5600X | |
| AIDA64 / Memory Latency | |
| Average of class (6.1 - 536, n=2239) | |
| Intel Core i5-12600K | |
| Intel Core i5-13600K | |
| Intel Core i5-13400F | |
| Intel Core i9-13900K | |
| AMD Ryzen 9 5950X | |
| AMD Ryzen 5 5600X | |
| AMD Ryzen 5 7600X | |
| AMD Ryzen 9 5900X | |
* ... smaller is better
Game benchmarks
As before, our review sample primarily duels with the Intel Core i5-12600K in the gaming tests. In high resolutions and a high preset, the rivals slip closer together. If it's purely about gaming, you certainly won't go wrong with the Intel Core i5-13400F. With its 16 threads, all games are currently playable well with the corresponding graphics card. In our test we used an Nvidia GeForce RTX 3090 Founder Edition in order to compare the performance of our test sample with that of the comparison devices. If you also want to stream at the same time as gaming, we currently recommend an Intel Core i9-13900K or grab an AMD Ryzen 9 7950X.
Gaming Performance
| Performance rating - Percent | |
| Intel Core i9-13900K | |
| AMD Ryzen 9 7900X | |
| AMD Ryzen 5 7600X | |
| Intel Core i9-12900K | |
| Intel Core i5-13600K | |
| Intel Core i5-13400F | |
| Intel Core i5-12600K | |
| F1 22 | |
| 1920x1080 Low Preset AA:T AF:16x | |
| AMD Ryzen 9 7900X | |
| AMD Ryzen 5 7600X | |
| Intel Core i5-13600K | |
| Intel Core i9-13900K | |
| Intel Core i9-12900K | |
| Intel Core i5-13400F | |
| Intel Core i5-12600K | |
| 1920x1080 Ultra High Preset AA:T AF:16x | |
| Intel Core i9-12900K | |
| Intel Core i5-12600K | |
| Intel Core i5-13600K | |
| Intel Core i5-13400F | |
| AMD Ryzen 5 7600X | |
| AMD Ryzen 9 7900X | |
| Intel Core i9-13900K | |
| Far Cry 5 | |
| 1920x1080 Ultra Preset AA:T | |
| Intel Core i9-13900K | |
| Intel Core i5-13600K | |
| Intel Core i9-12900K | |
| AMD Ryzen 9 7900X | |
| AMD Ryzen 5 7600X | |
| Intel Core i5-12600K | |
| Intel Core i5-13400F | |
| 1280x720 Low Preset AA:T | |
| Intel Core i9-13900K | |
| AMD Ryzen 9 7900X | |
| Intel Core i5-13600K | |
| AMD Ryzen 5 7600X | |
| Intel Core i9-12900K | |
| Intel Core i5-12600K | |
| Intel Core i5-13400F | |
| X-Plane 11.11 | |
| 1920x1080 high (fps_test=3) | |
| AMD Ryzen 9 7900X | |
| AMD Ryzen 5 7600X | |
| Intel Core i9-13900K | |
| Intel Core i9-12900K | |
| Intel Core i5-13600K | |
| Intel Core i5-13400F | |
| Intel Core i5-12600K | |
| 1280x720 low (fps_test=1) | |
| Intel Core i9-13900K | |
| AMD Ryzen 5 7600X | |
| AMD Ryzen 9 7900X | |
| Intel Core i9-12900K | |
| Intel Core i5-13600K | |
| Intel Core i5-13400F | |
| Intel Core i5-12600K | |
| Final Fantasy XV Benchmark | |
| 1920x1080 High Quality | |
| AMD Ryzen 9 7900X | |
| Intel Core i5-13600K | |
| Intel Core i9-13900K | |
| AMD Ryzen 5 7600X | |
| Intel Core i9-12900K | |
| Intel Core i5-13400F | |
| Intel Core i5-12600K | |
| 1280x720 Lite Quality | |
| AMD Ryzen 9 7900X | |
| Intel Core i5-13600K | |
| Intel Core i9-13900K | |
| Intel Core i9-12900K | |
| AMD Ryzen 5 7600X | |
| Intel Core i5-13400F | |
| Intel Core i5-12600K | |
| Dota 2 Reborn | |
| 1920x1080 ultra (3/3) best looking | |
| AMD Ryzen 9 7900X | |
| Intel Core i9-13900K | |
| AMD Ryzen 5 7600X | |
| Intel Core i5-13600K | |
| Intel Core i9-12900K | |
| Intel Core i5-12600K | |
| Intel Core i5-13400F | |
| 1280x720 min (0/3) fastest | |
| AMD Ryzen 5 7600X | |
| AMD Ryzen 9 7900X | |
| Intel Core i9-13900K | |
| Intel Core i5-13600K | |
| Intel Core i9-12900K | |
| Intel Core i5-12600K | |
| Intel Core i5-13400F | |
| GTA V | |
| 1920x1080 Highest AA:4xMSAA + FX AF:16x | |
| Intel Core i9-13900K | |
| AMD Ryzen 9 7900X | |
| AMD Ryzen 5 7600X | |
| Intel Core i5-13600K | |
| Intel Core i9-12900K | |
| Intel Core i5-12600K | |
| Intel Core i5-13400F | |
| 1024x768 Lowest Settings possible | |
| Intel Core i9-13900K | |
| AMD Ryzen 9 7900X | |
| AMD Ryzen 5 7600X | |
| Intel Core i5-13600K | |
| Intel Core i9-12900K | |
| Intel Core i5-13400F | |
| Intel Core i5-12600K | |
| low | med. | high | ultra | QHD | 4K | |
|---|---|---|---|---|---|---|
| GTA V (2015) | 187.5 | 187.5 | 187.1 | 161.4 | 151.8 | 182.2 |
| The Witcher 3 (2015) | 773 | 586 | 384 | 188.1 | 156.9 | |
| Dota 2 Reborn (2015) | 293.1 | 257 | 250.4 | 231.65 | 216.7 | |
| Final Fantasy XV Benchmark (2018) | 236 | 231 | 190.8 | 146.6 | 88.8 | |
| X-Plane 11.11 (2018) | 225 | 199.2 | 160.9 | 133.5 | ||
| Far Cry 5 (2018) | 244 | 211 | 203 | 186 | 176 | 110 |
| Strange Brigade (2018) | 741 | 479 | 380 | 329 | 249 | 153.1 |
| Shadow of the Tomb Raider (2018) | 314 | 261 | 251 | 234 | 172.2 | 99.6 |
| Far Cry New Dawn (2019) | 200 | 176 | 169 | 151 | 143 | 109 |
| Metro Exodus (2019) | 311 | 223 | 175.2 | 140.1 | 115.8 | 76.6 |
| Borderlands 3 (2019) | 244 | 213 | 190.8 | 164.1 | 131.6 | 75.3 |
| F1 2020 (2020) | 487 | 403 | 374 | 270 | 218 | 138.8 |
| F1 2021 (2021) | 648 | 548 | 441 | 224 | 175.4 | 105.3 |
| Cyberpunk 2077 1.6 (2022) | 214 | 213 | 174 | 173 | 88 | 46 |
| Tiny Tina's Wonderlands (2022) | 364 | 294 | 212 | 168.5 | 124 | 70.8 |
| F1 22 (2022) | 344 | 361 | 321 | 125.1 | 83.8 | 42.4 |
| The Quarry (2022) | 282 | 216 | 177.7 | 144.4 | 103.6 | 58.9 |
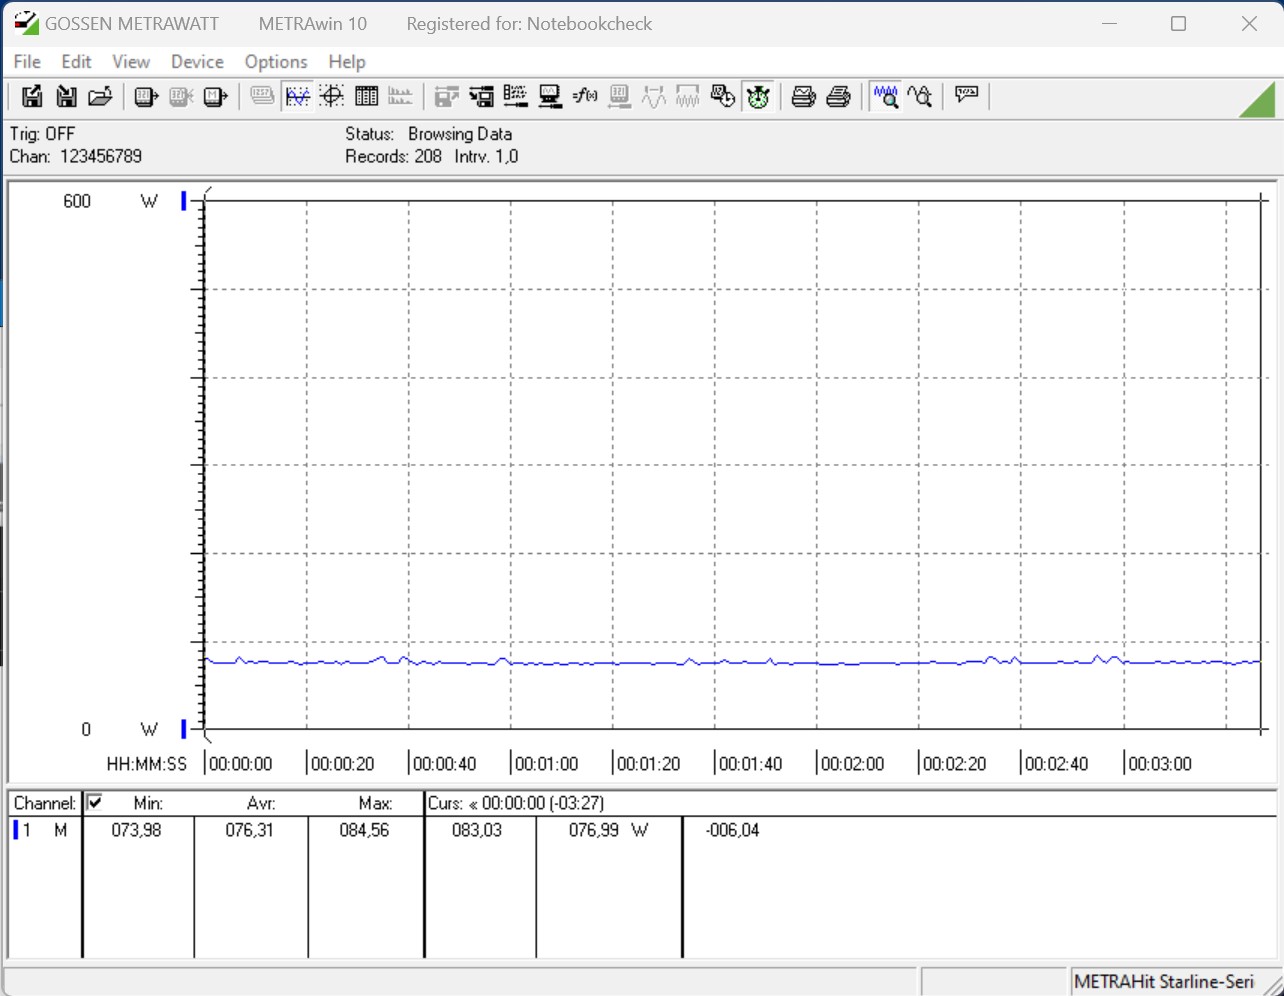
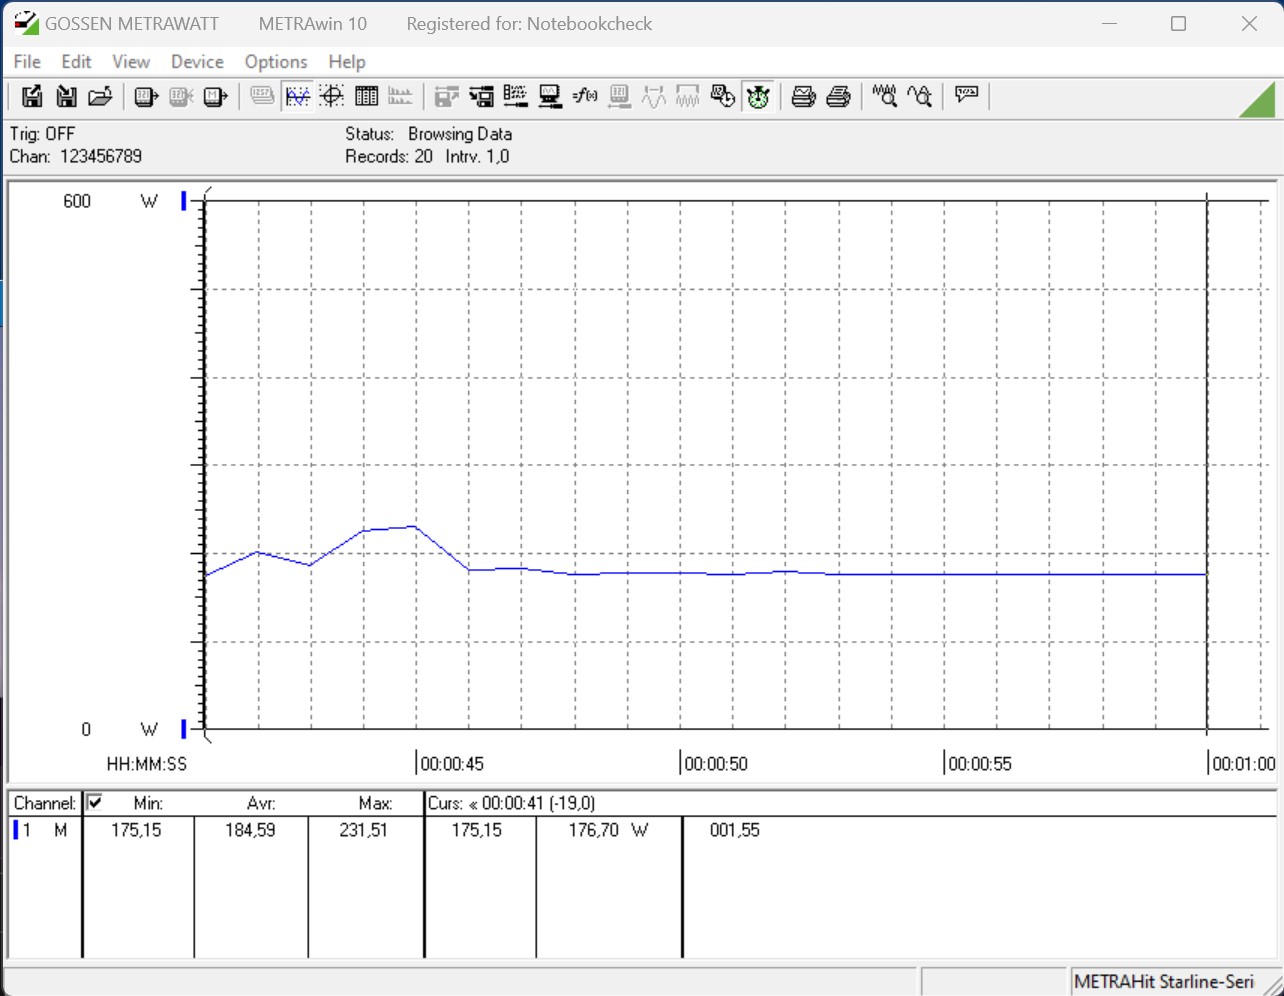
Energy consumption
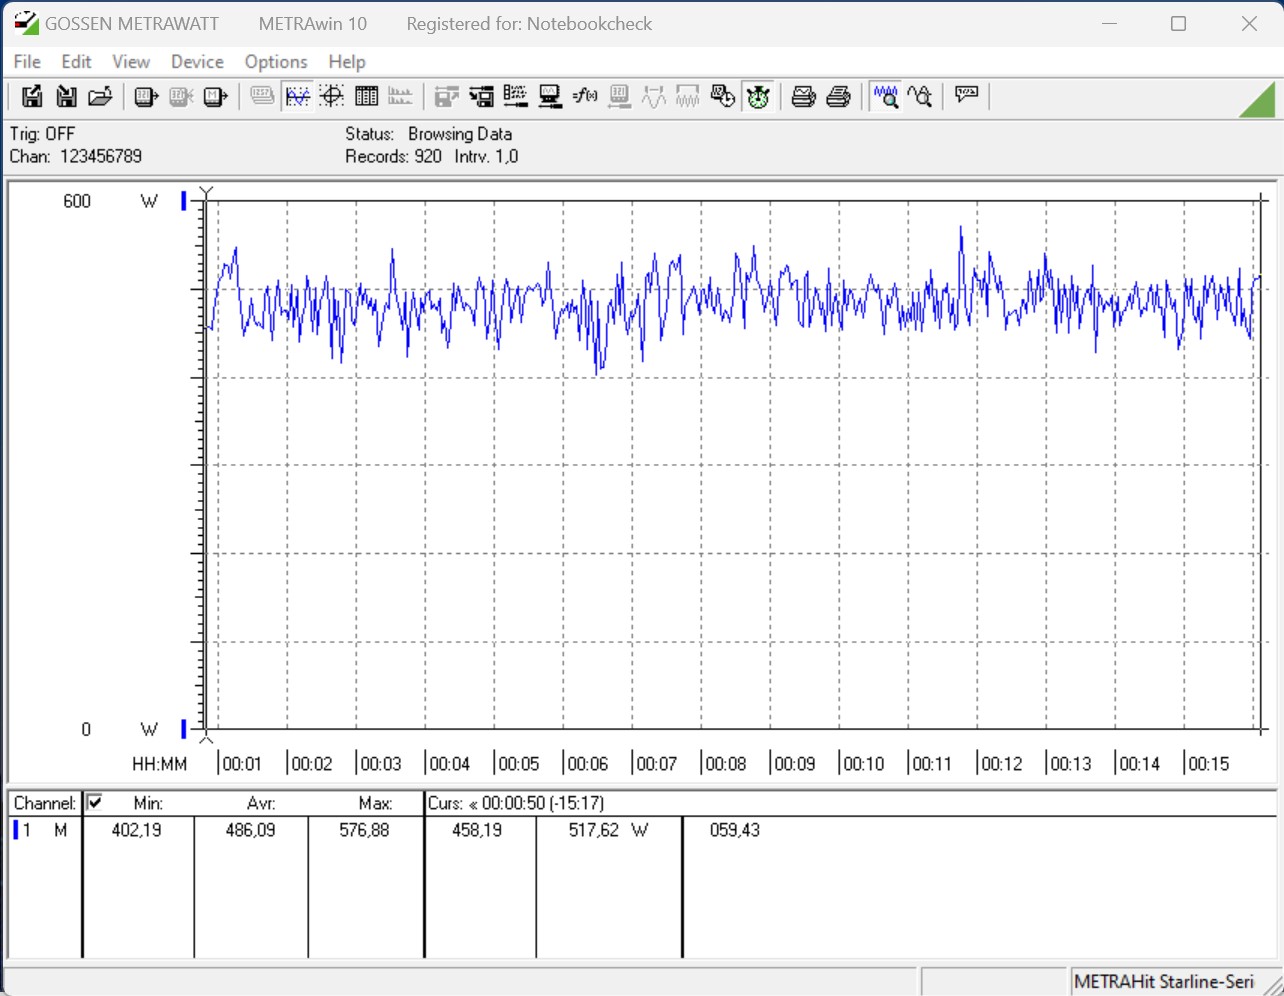
According to the technical specifications of the Intel Core i5-13400F, the power consumption is 65 watts and can reach up to 148 watts under load. If the restrictions of the power consumption for the processor are not limited in the BIOS, the 148 watts are permanently on and are not temporally limited by the dew value. All tests that we did with the processor were performed without any restrictions. We record the test system's power consumption with only 184 watts in the Cinebench R15 multi-test. Thus, the Intel Core i5-13400F is considerably more frugal than an Intel Core i5-12600K, which requires just under 206 watts in our test. We note a bit more with 214 watts in the stress test. Nevertheless, the energy consumption is pleasingly low.
Due to the low power consumption, the Intel Core i5-13400F doesn't need much cooling. Thus, you can safely do without an AiO and a high-quality air cooler is completely sufficient for this CPU.
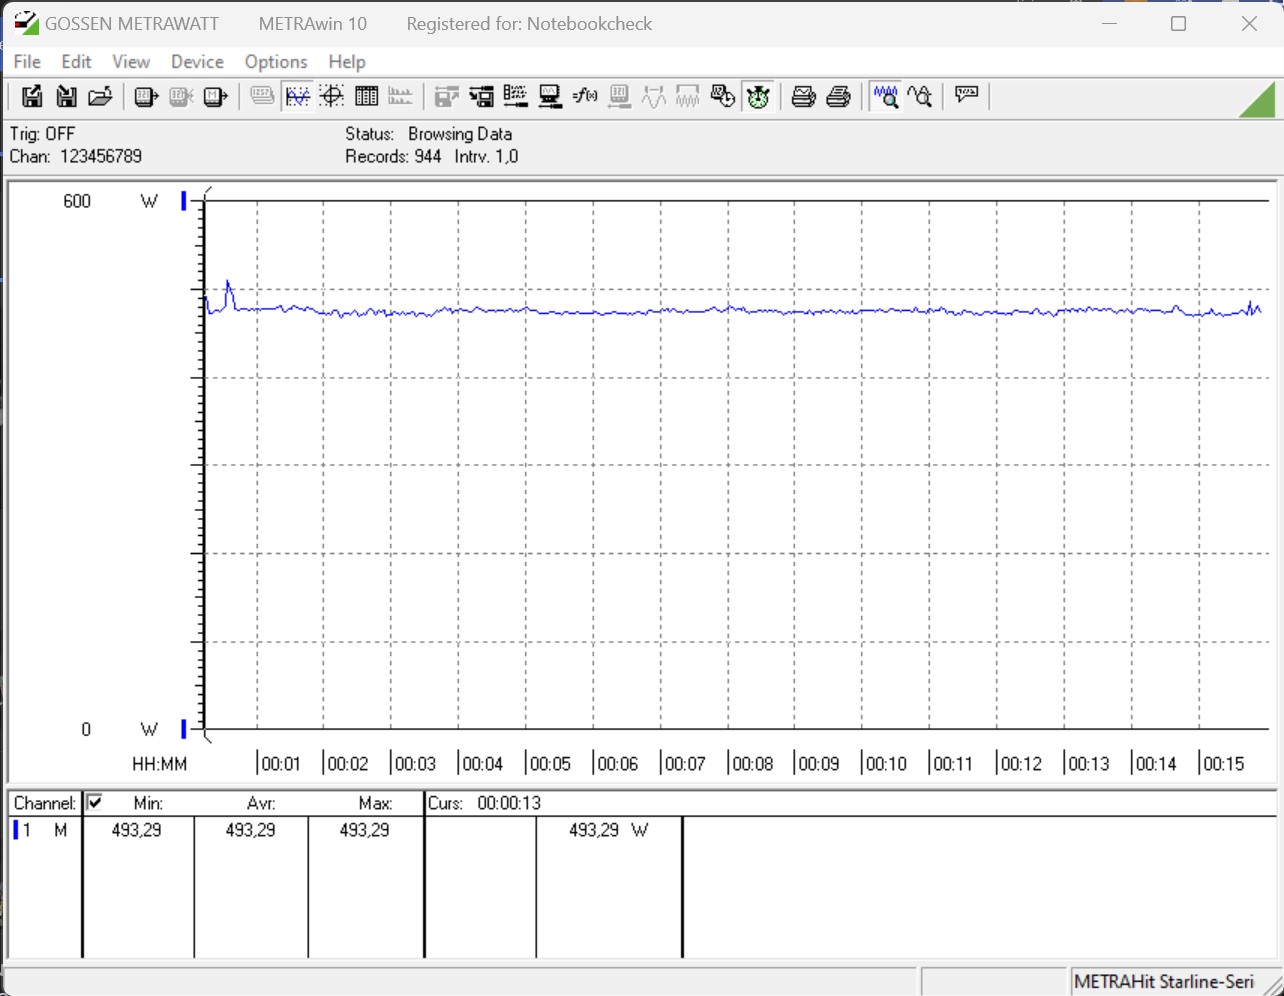
| Power Consumption / Cinebench R15 Multi (external Monitor) | |
| Intel Core i9-13900K | |
| Intel Core i9-12900K (Idle: 70.5 W) | |
| AMD Ryzen 9 7900X | |
| Intel Core i5-13600K | |
| AMD Ryzen 9 5900X (Idle: 78.1 W) | |
| AMD Ryzen 9 5950X (Idle: 78 W) | |
| AMD Ryzen 5 7600X | |
| Intel Core i5-12600K (Idle: 70.45 W) | |
| Intel Core i5-13400F | |
| AMD Ryzen 5 5600X (Idle: 79.23 W) | |
| Power Consumption / Prime95 V2810 Stress (external Monitor) | |
| Intel Core i9-13900K | |
| Intel Core i5-13600K | |
| AMD Ryzen 9 7900X | |
| Intel Core i9-12900K (Idle: 70.5 W) | |
| Intel Core i5-12600K (Idle: 70.45 W) | |
| AMD Ryzen 9 5950X (Idle: 78 W) | |
| AMD Ryzen 9 5900X (Idle: 78.1 W) | |
| AMD Ryzen 5 7600X | |
| Intel Core i5-13400F | |
| AMD Ryzen 5 5600X (Idle: 79.23 W) | |
| Power Consumption / The Witcher 3 ultra (external Monitor) | |
| AMD Ryzen 9 7900X | |
| Intel Core i9-13900K | |
| AMD Ryzen 5 7600X | |
| Intel Core i5-13600K | |
| Intel Core i5-13400F | |
| Nvidia GeForce RTX 3090 Founders Edition (Idle: 91.1 W) | |
| Intel Core i9-12900K (Idle: 70.5 W) | |
| AMD Ryzen 9 5950X (Idle: 78 W) | |
| AMD Ryzen 9 5900X (Idle: 78.1 W) | |
| AMD Ryzen 5 5600X (Idle: 79.23 W) | |
| Intel Core i5-12600K (Idle: 70.45 W) | |
* ... smaller is better
Power Consumption With External Monitor
Pros
Cons
Conclusion - Economical, fast and easy to cool


Intel already sent a venerable successor of the Alder Lake generation into the race with Raptor Lake. The mid-range and entry-level models on the same basis are now gradually arriving. Nevertheless, you have to take a closer look and pay attention to the CPU stepping because it is not always a Raptor Lake CPU. In our case, we have the Intel Core i5-13400F in C0-stepping, which indicates that it is an Alder Lake CPU at the core. Only the B0-stepping indicates a native Raptor-Lake CPU. Both versions are supposed to be available, and we assume that they perform equally well.
Meanwhile, Intel offers a frugal 10-core with the Intel Core i5-13400F, which also has 4 E-cores besides the P-cores. With up to 148 watts, the model is relatively frugal under full load. Furthermore, the temperatures are easy to handle and do not require complex and expensive cooling. In the test, the Intel Core i5-13400F can keep up very well with an Intel Core i5-12600K, the match in terms of energy efficiency is clearly in favor of the more frugal model. AMD's Zen 4 processors cannot be kept up with. Here, the native 10-core of our test rather ranks with an AMD Ryzen 7 5800X, which also has a total of 16 threads.
The Intel Core i5-13400F offers solid performance for everyday use and also masters the latest games. Due to the low TDP, the frugal processor can also be cooled in small cases without any problems.
A motherboard with a 600-series chipset can still be used for the base unit. This does not put too much strain on the wallet when upgrading. Nevertheless, it has to be considered that there won't be a new Intel generation for the socket 1700 anymore. The current rumor mill says that socket 1851 will be introduced with Meteor Lake. This means that a new motherboard will be mandatory again.
Prices and availability
The Intel Core i5-13400F is currently available for 227 Euros (~$247) at Notebooksbilliger.de. For 260 Euros (~$283) you can buy it with an integrated graphics unit, also at Notebooksbilliger.de.

