Acer Predator Orion 3000 desktop PC with Core i7-12700F and RTX 3070 in review
")
The Predator series from Acer has been around for many years and is mainly aimed at gamers. There are various models with this designation for both laptops and desktop PCs. With the current Predator Orion 3000, the manufacturer not only updates the product but also uses a new case compared to the older generation.
An Intel Core i7-12700 or an Intel Core i7-12700F is always used as a basis (Intel Core i7-12700F in our sample). However, there are different models in terms of GPU configuration, although the GeForce RTX 3070 is the top model in this series. When it comes to working memory, DDR4 RAM is always used. Nevertheless, you can choose between 16 GB or 32 GB depending on your budget. The same applies to the storage, which is the minimum in our system with 1 TB that Acer offers in the current Predator Orion 3000.
Possible competitors in comparison
Rating | Date | Model | Weight | Height | Price |
|---|---|---|---|---|---|
v7 (old) | 09 / 2022 | Acer Predator Orion 3000 PO3-640 i7-12700F, GeForce RTX 3070 | 7.4 kg | 377 mm | |
v (old) | 12 / 2021 | Intel Beast Canyon NUC i9-11900KB, GeForce RTX 3060 | 189 mm | ||
v (old) | 06 / 2021 | Zotac Magnus One (ECM73070C) i7-10700, GeForce RTX 3070 | |||
v (old) | 05 / 2022 | Zotac ZBOX Magnus EN173070C i7-11800H, GeForce RTX 3070 Laptop GPU | 1.8 kg | 62.2 mm | |
v (old) | 04 / 2022 | Intel Dragon Canyon NUC - RTX 3060 i9-12900, GeForce RTX 3060 | 189 mm | ||
v (old) | 06 / 2020 | Zotac MEK Mini (RTX 2070 Super) i7-9700, GeForce RTX 2070 Super (Desktop) |
Acer Predator Orion 3000 PO3-640 in detail


Case
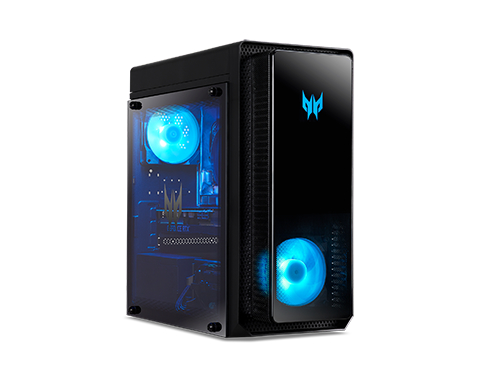
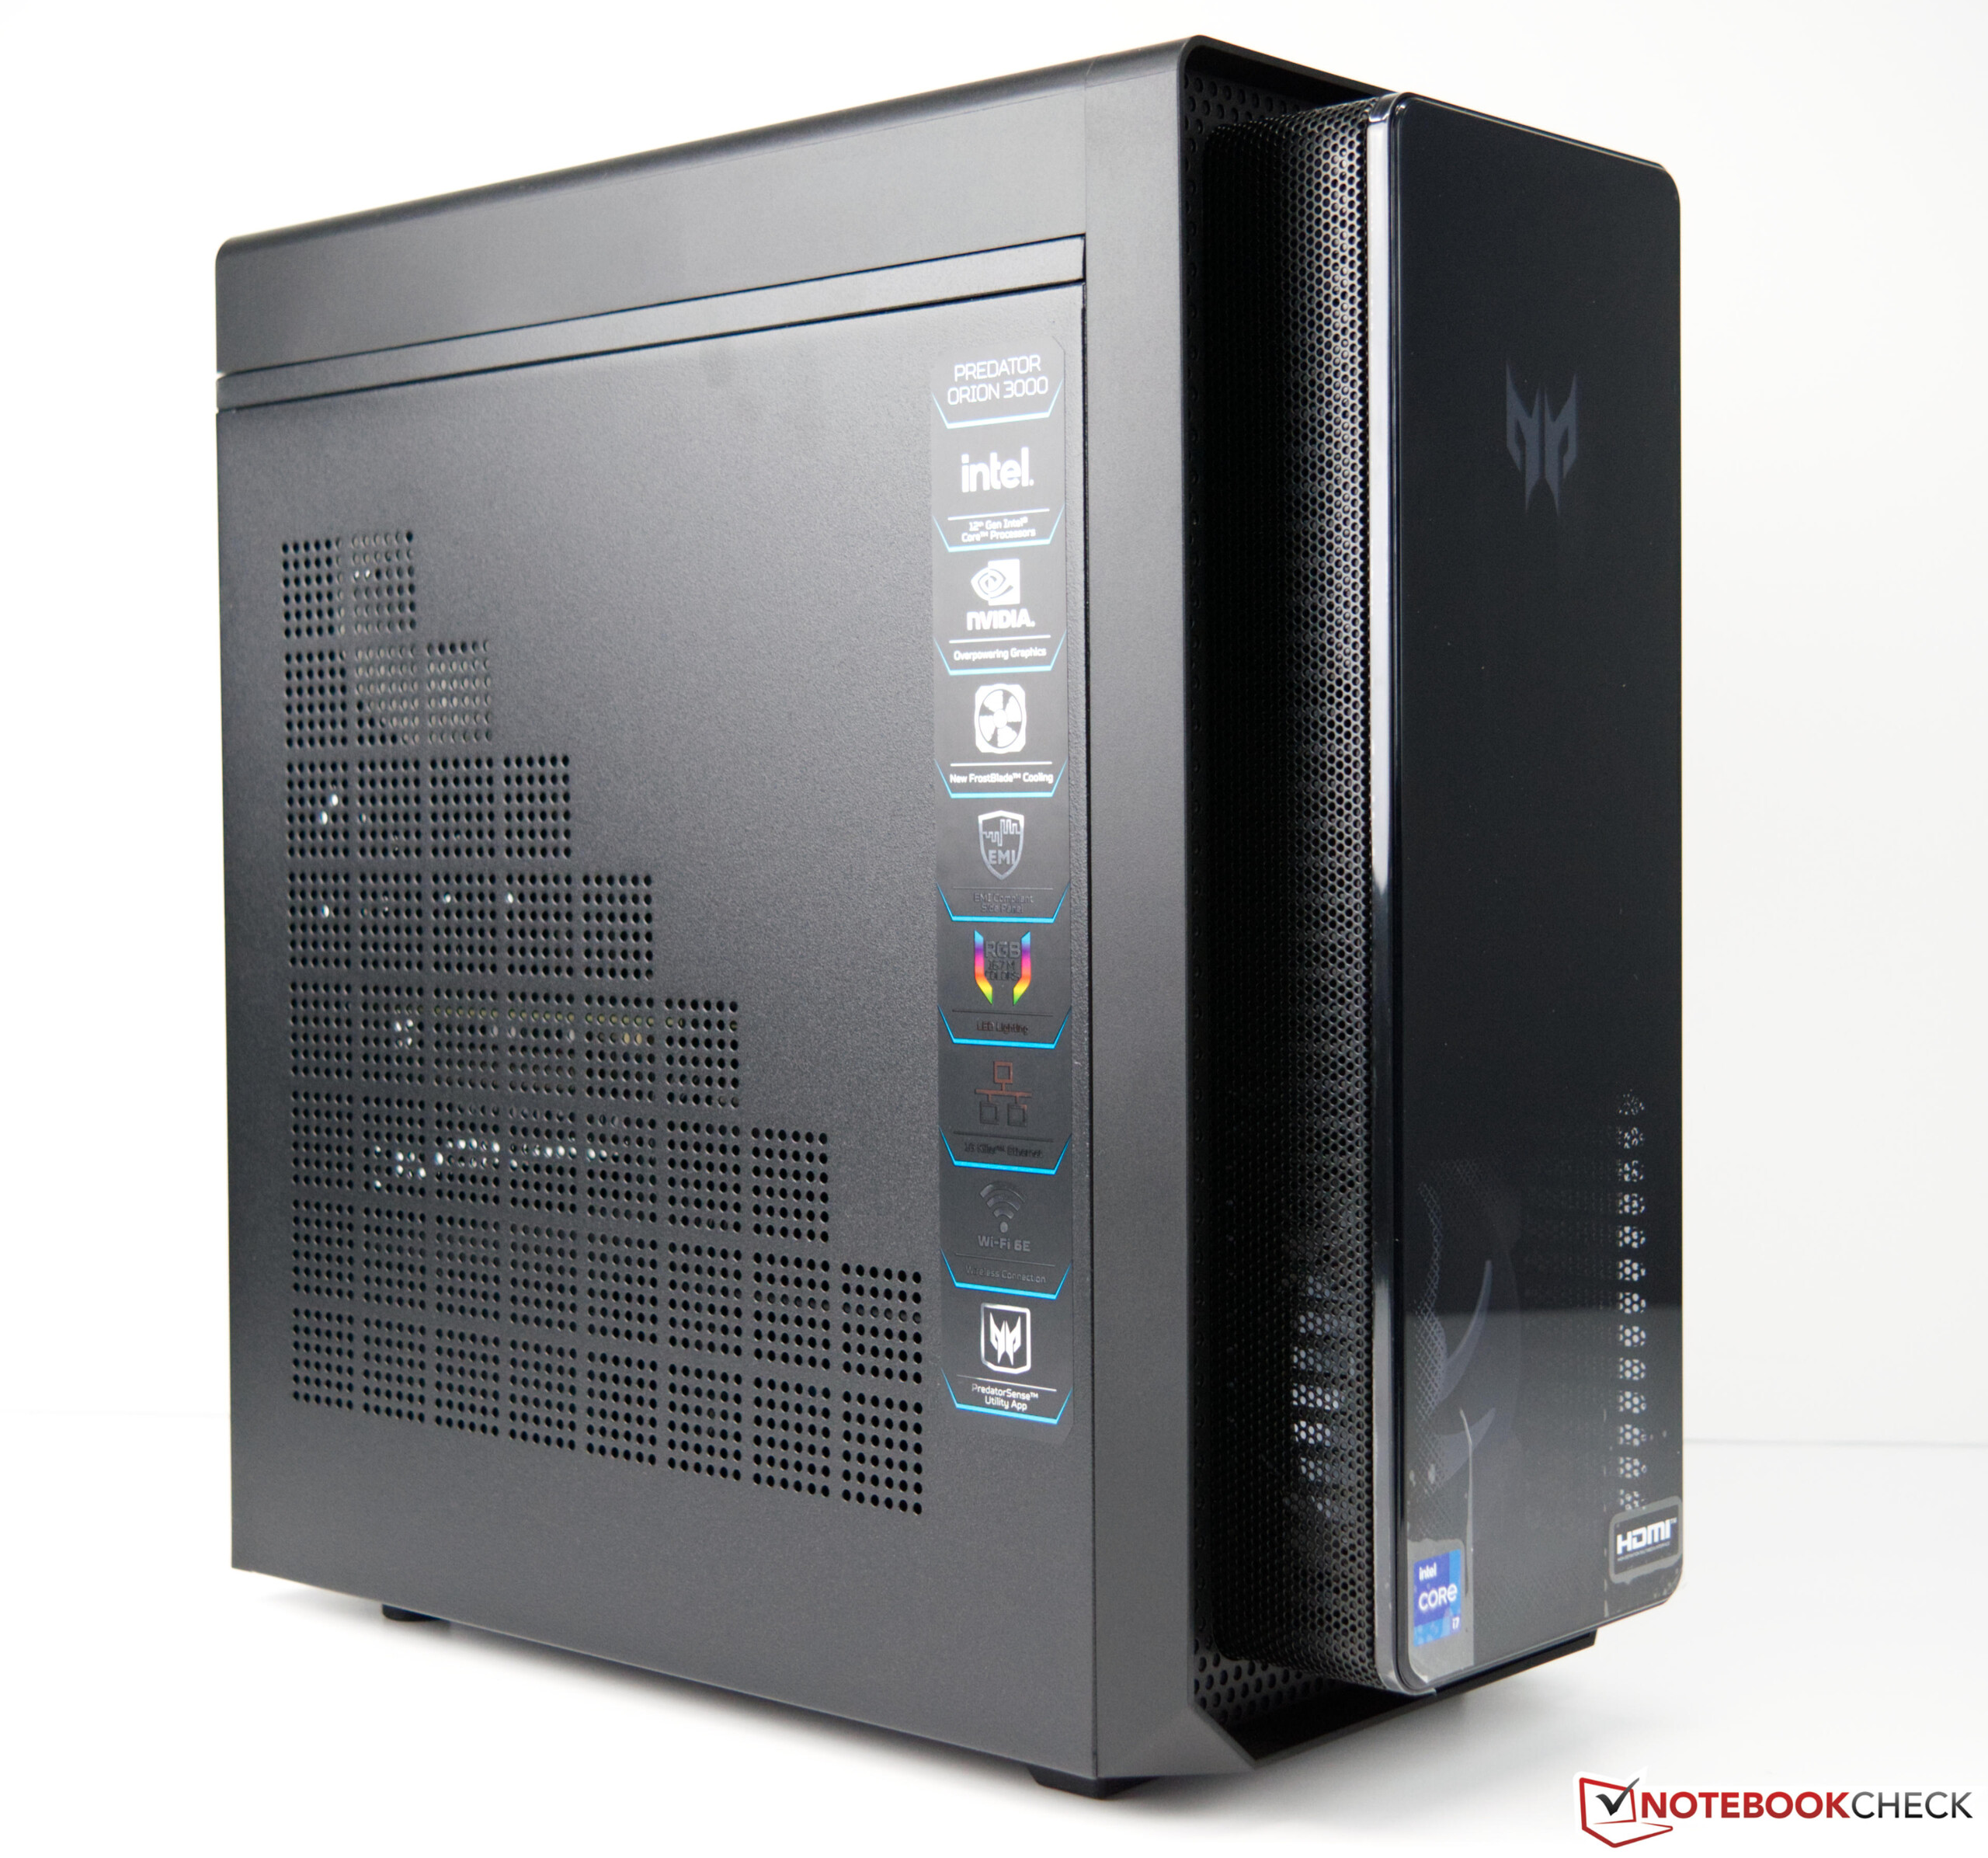
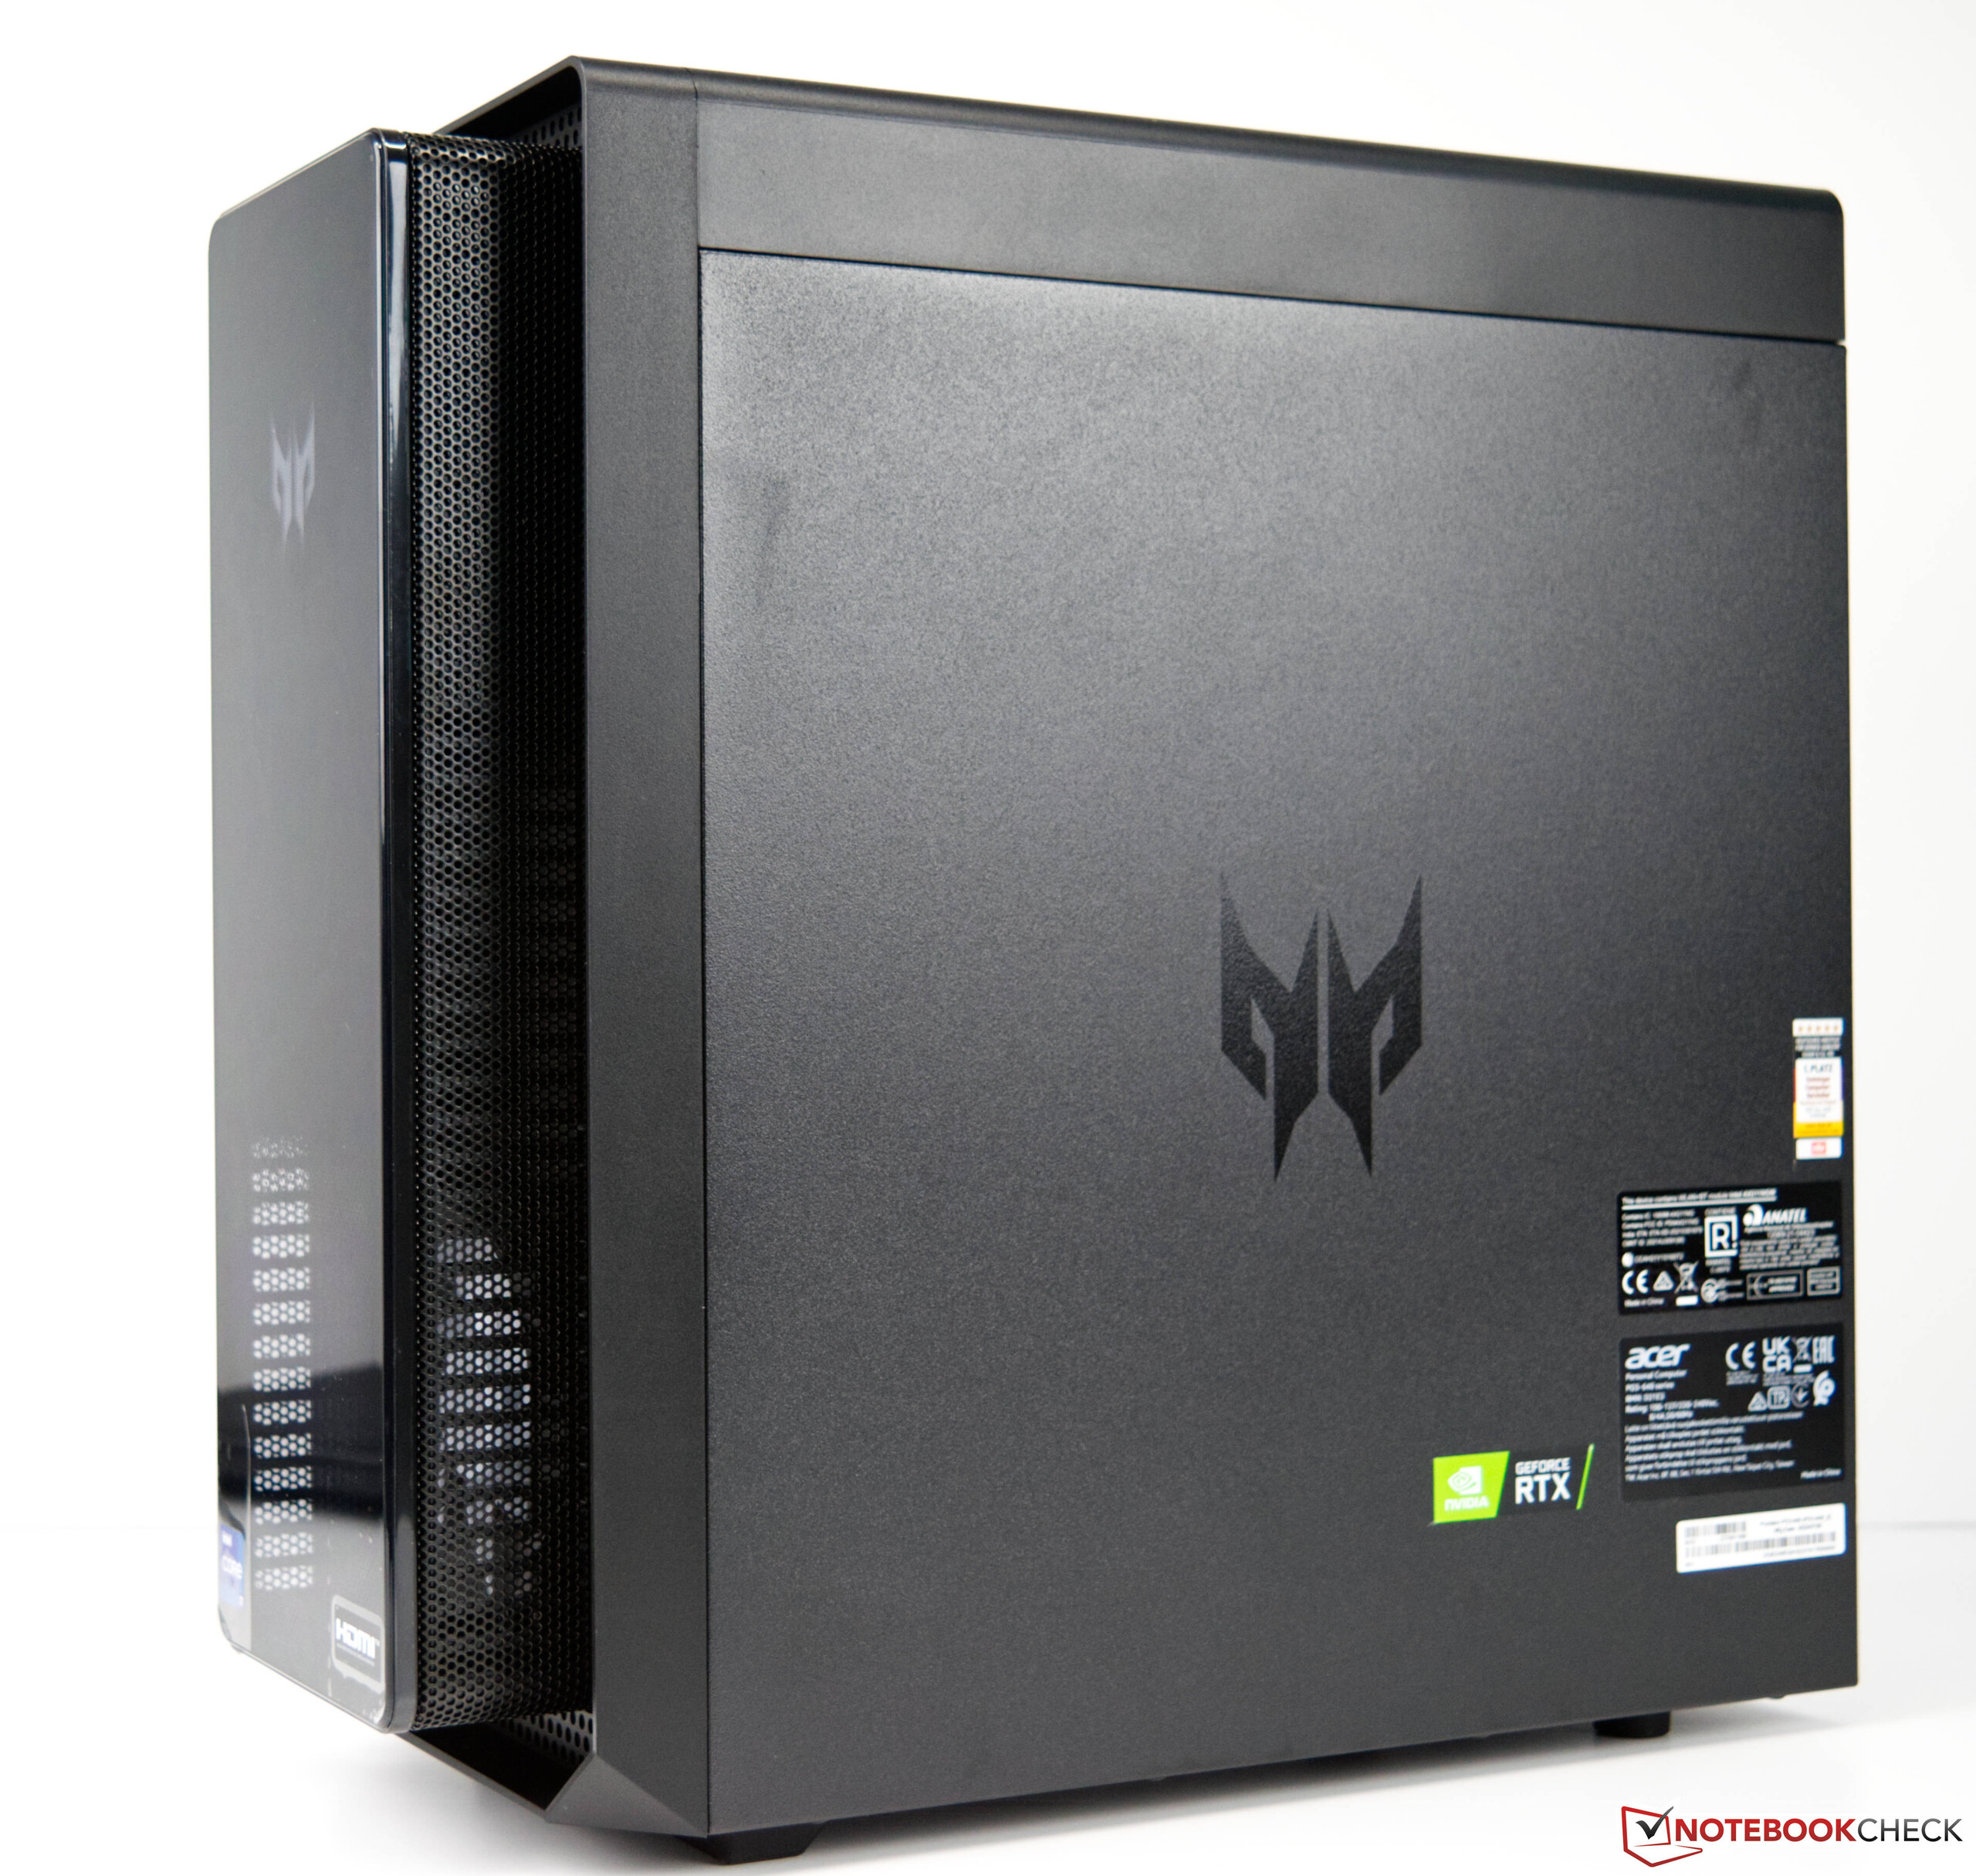
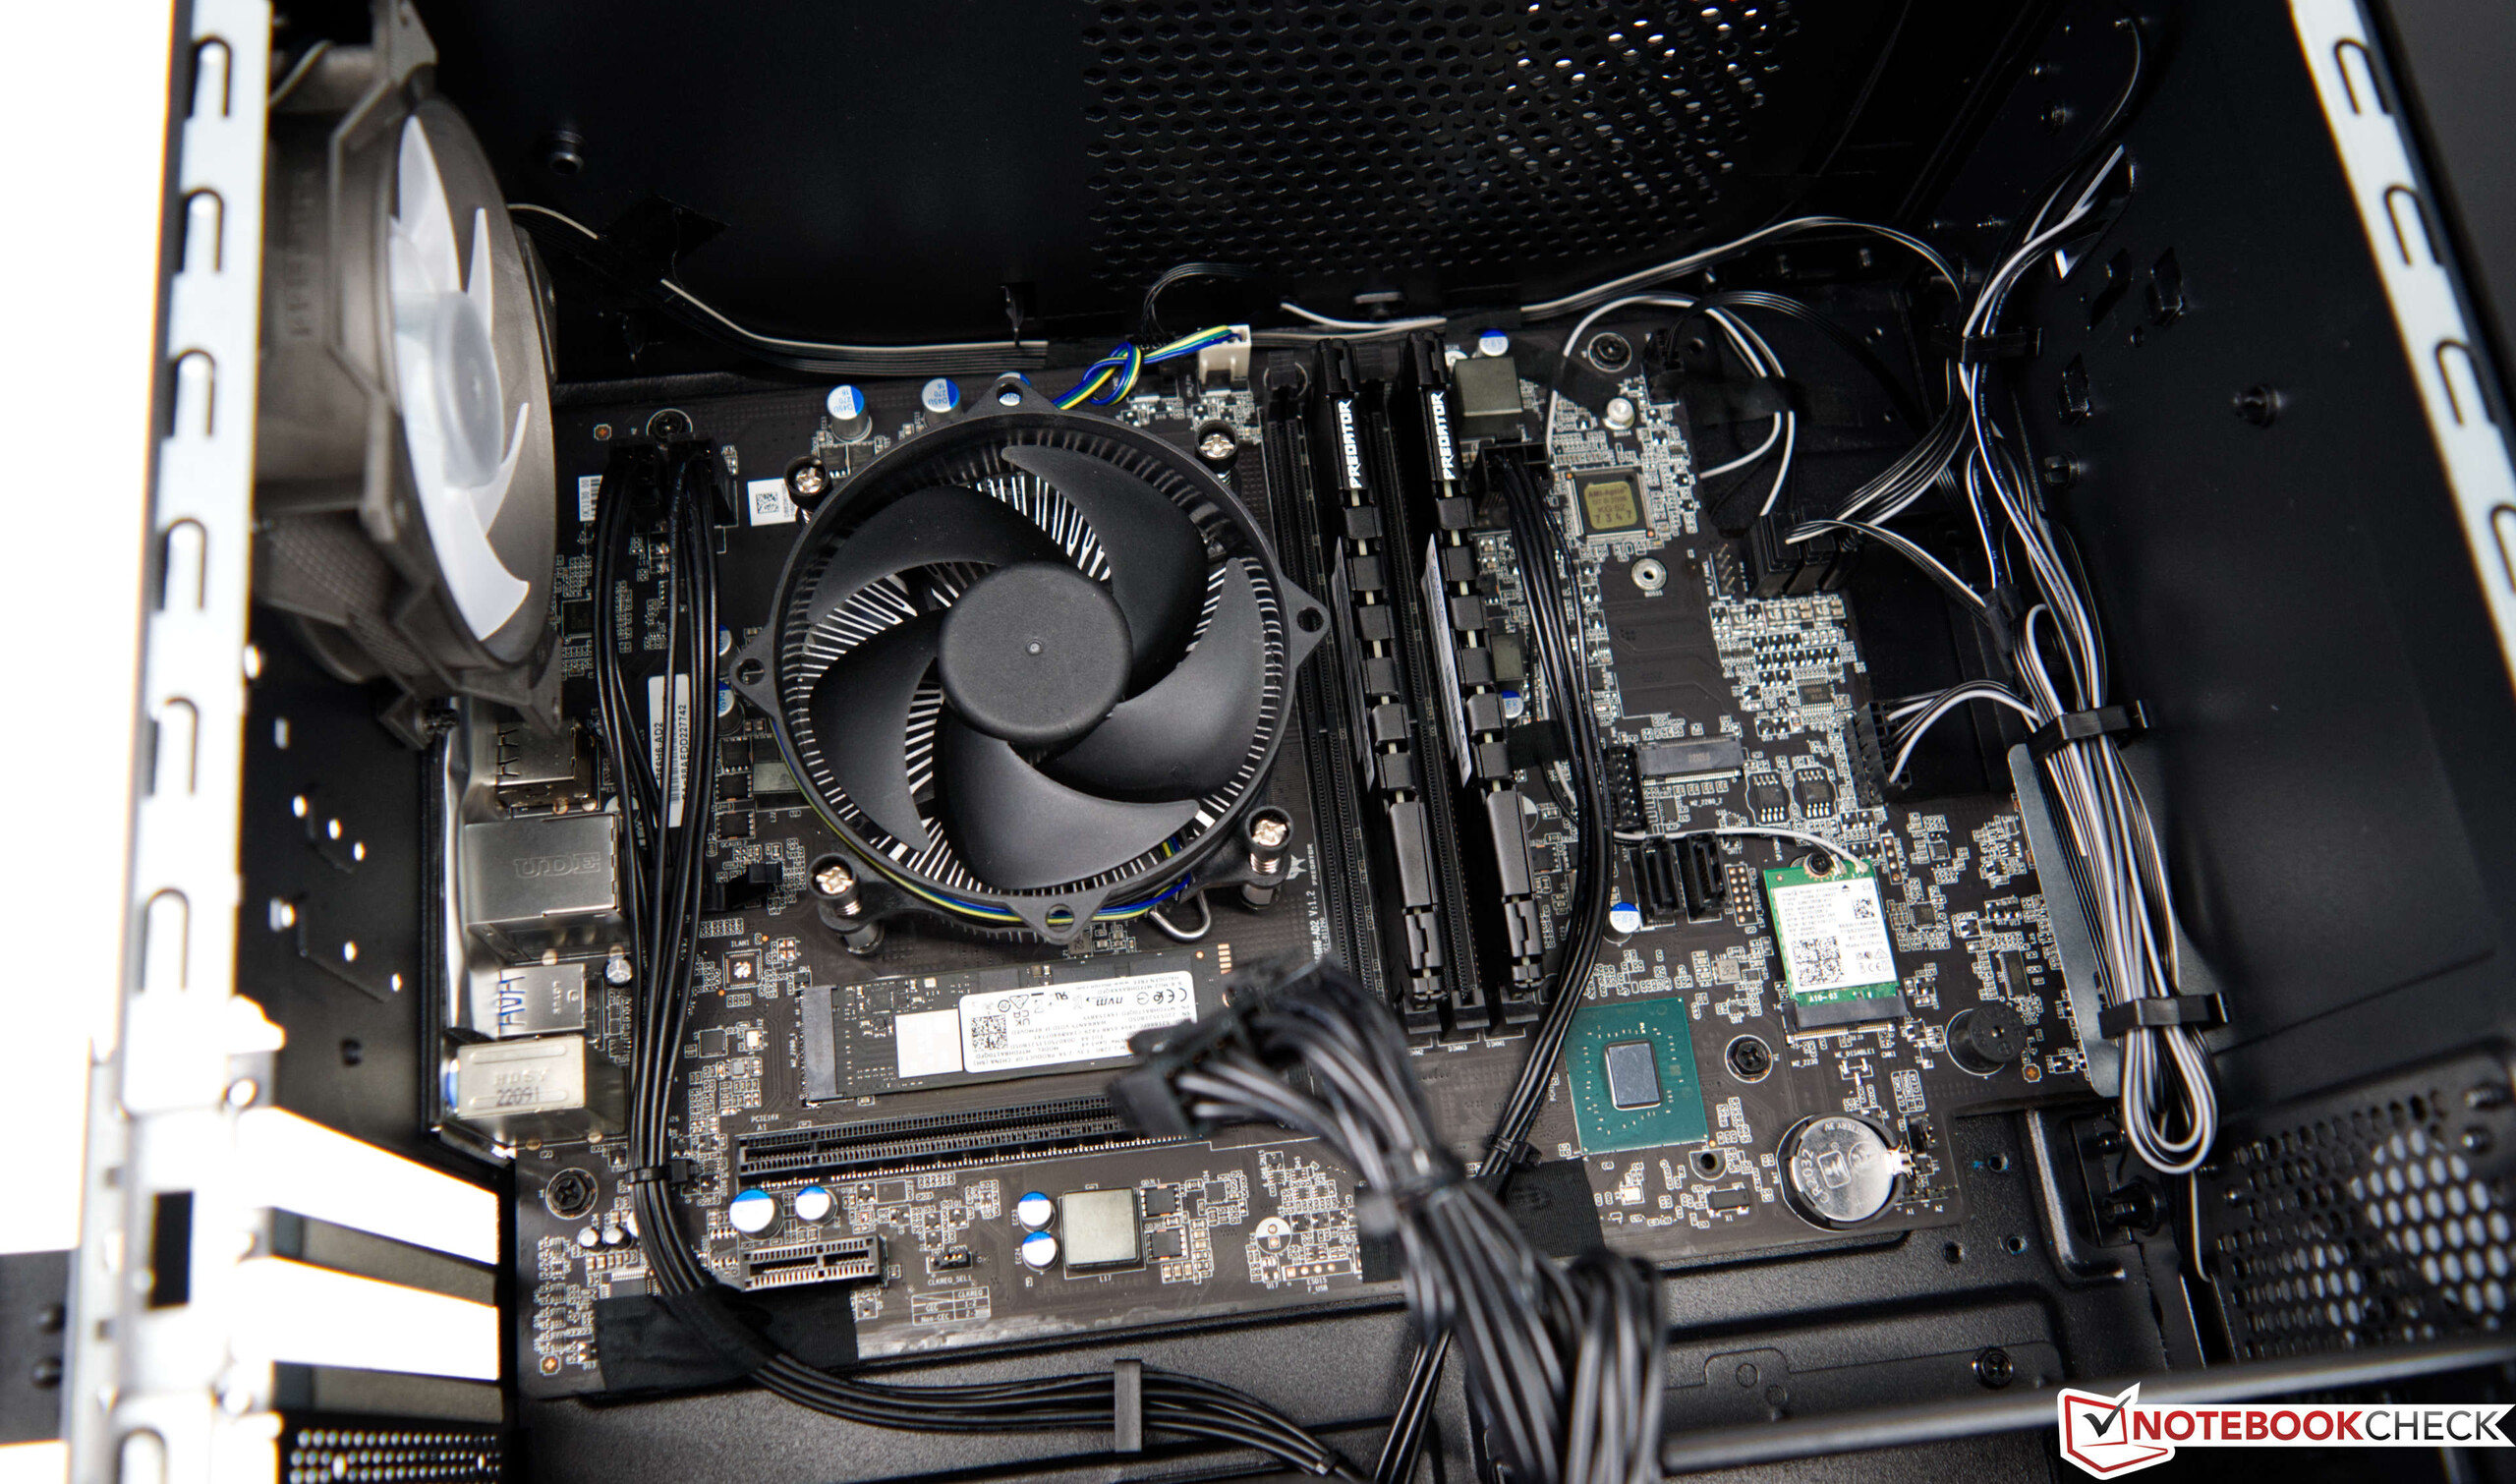
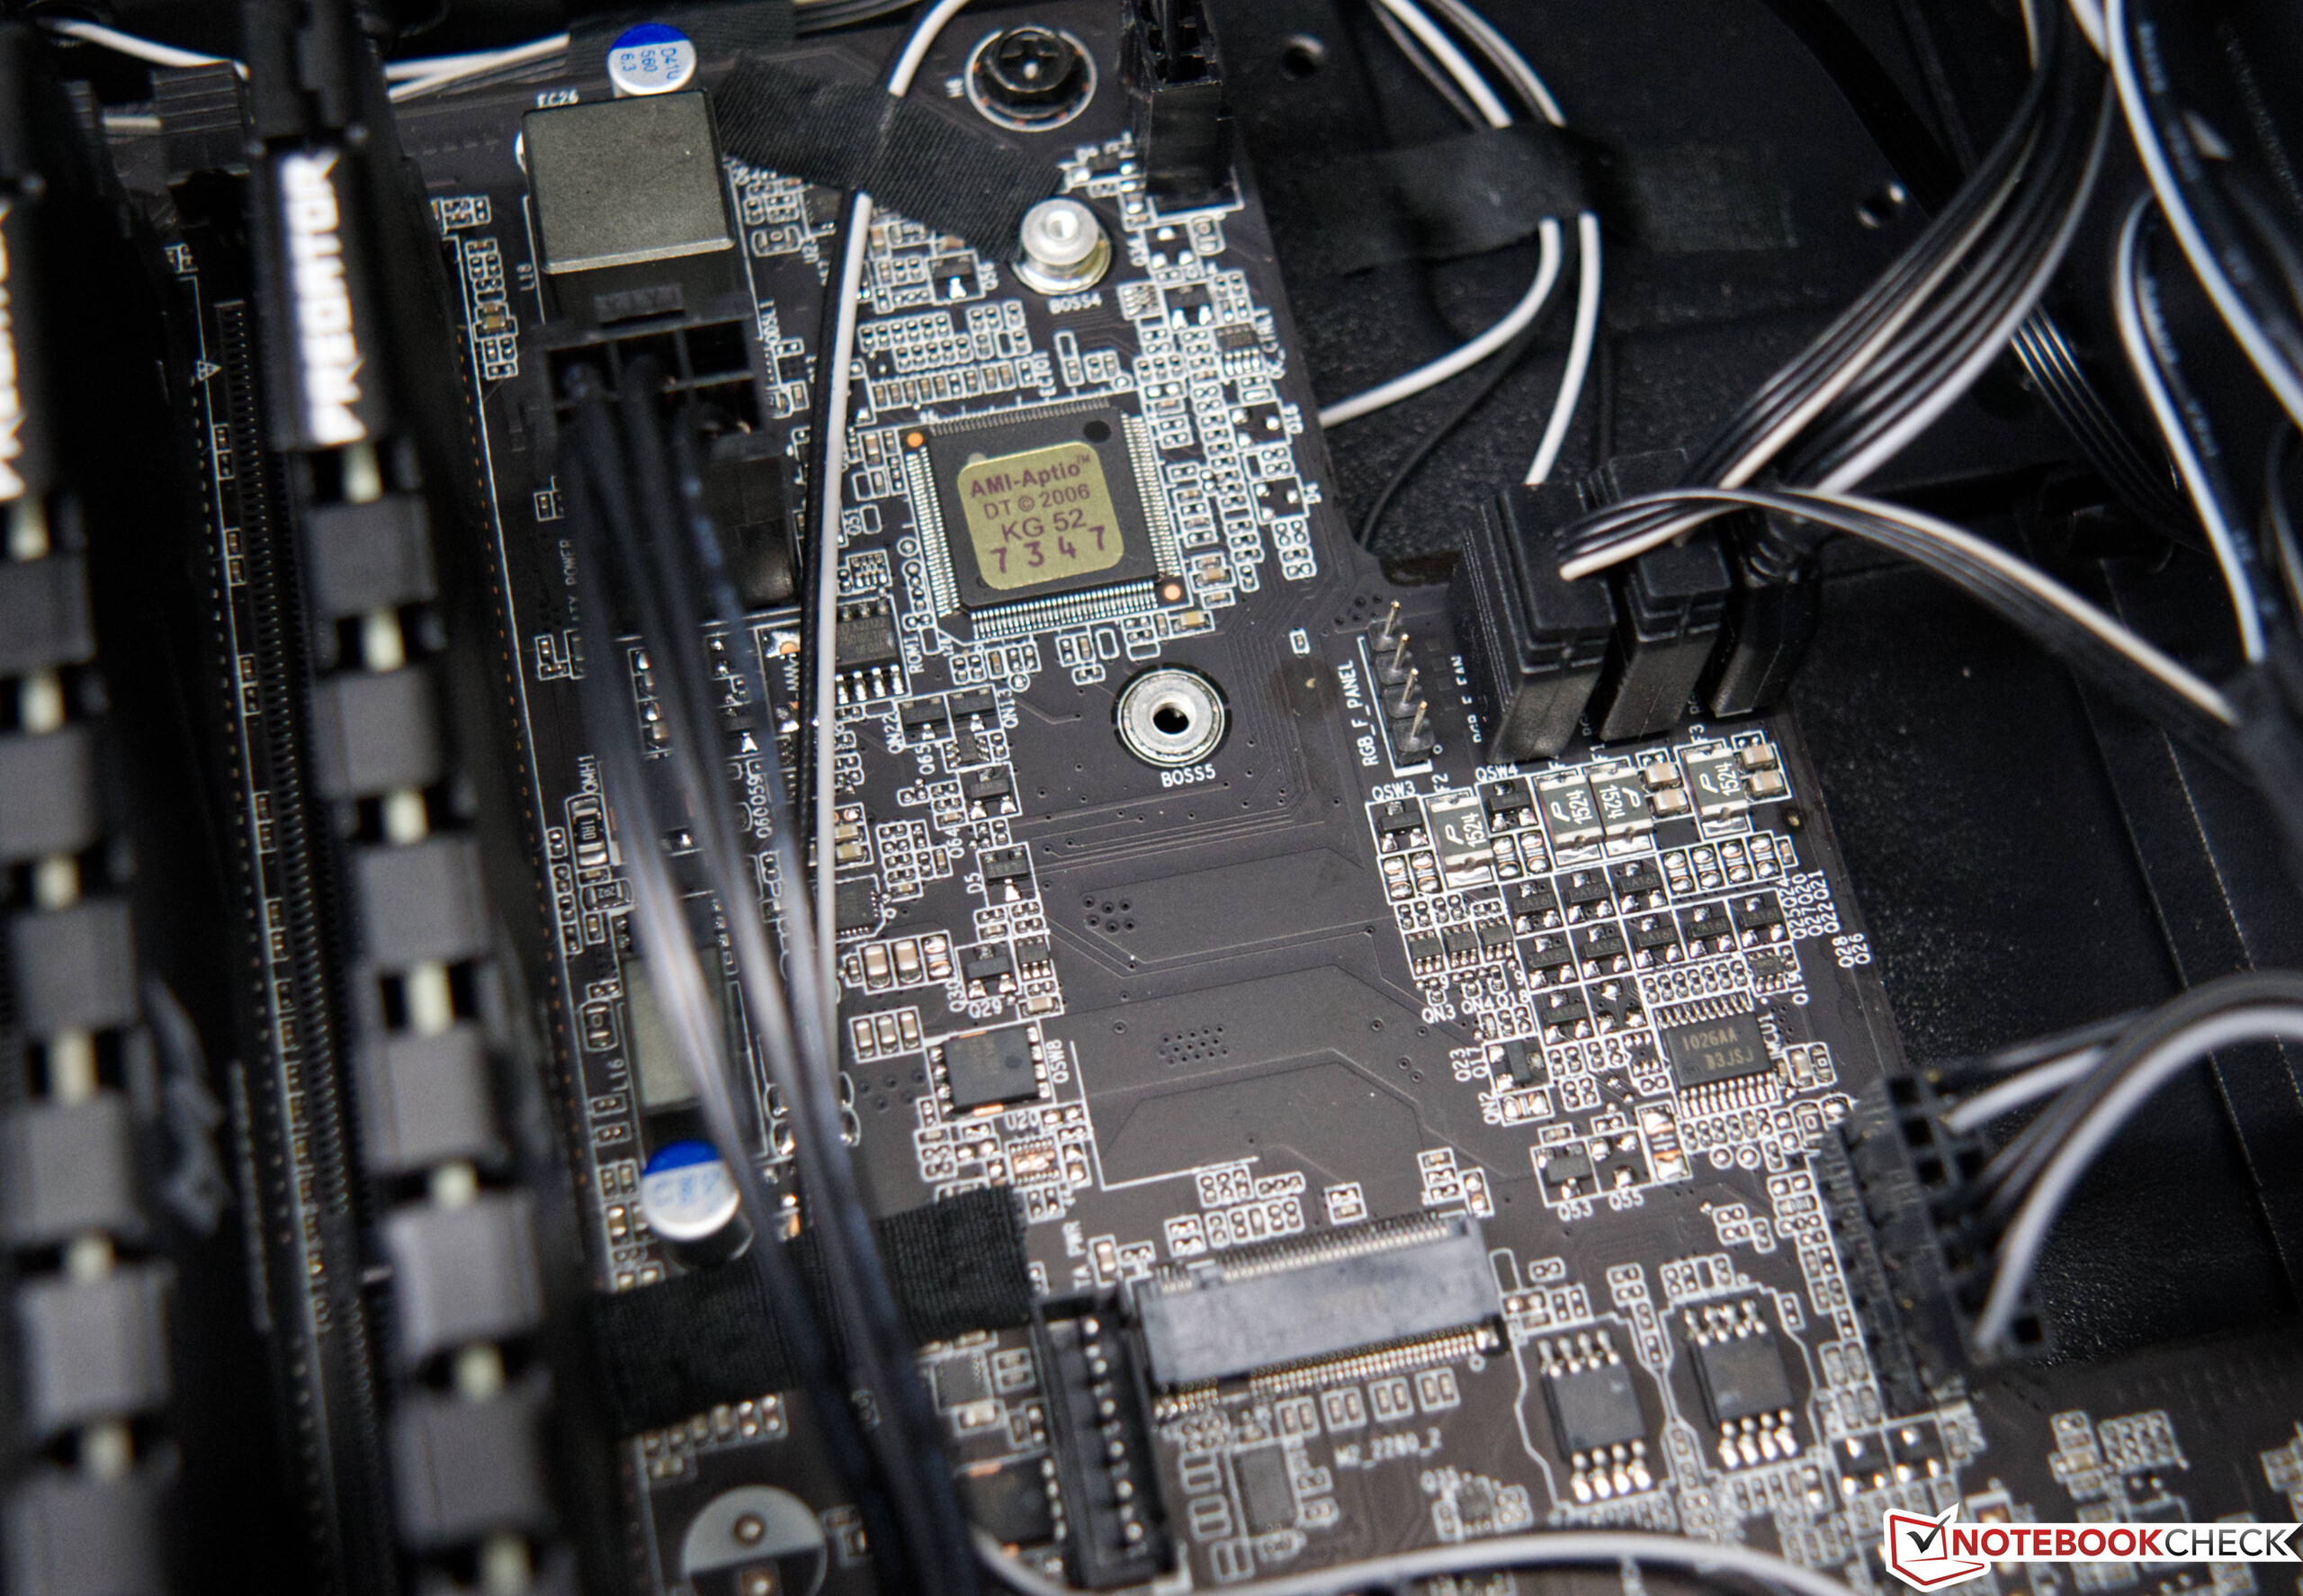
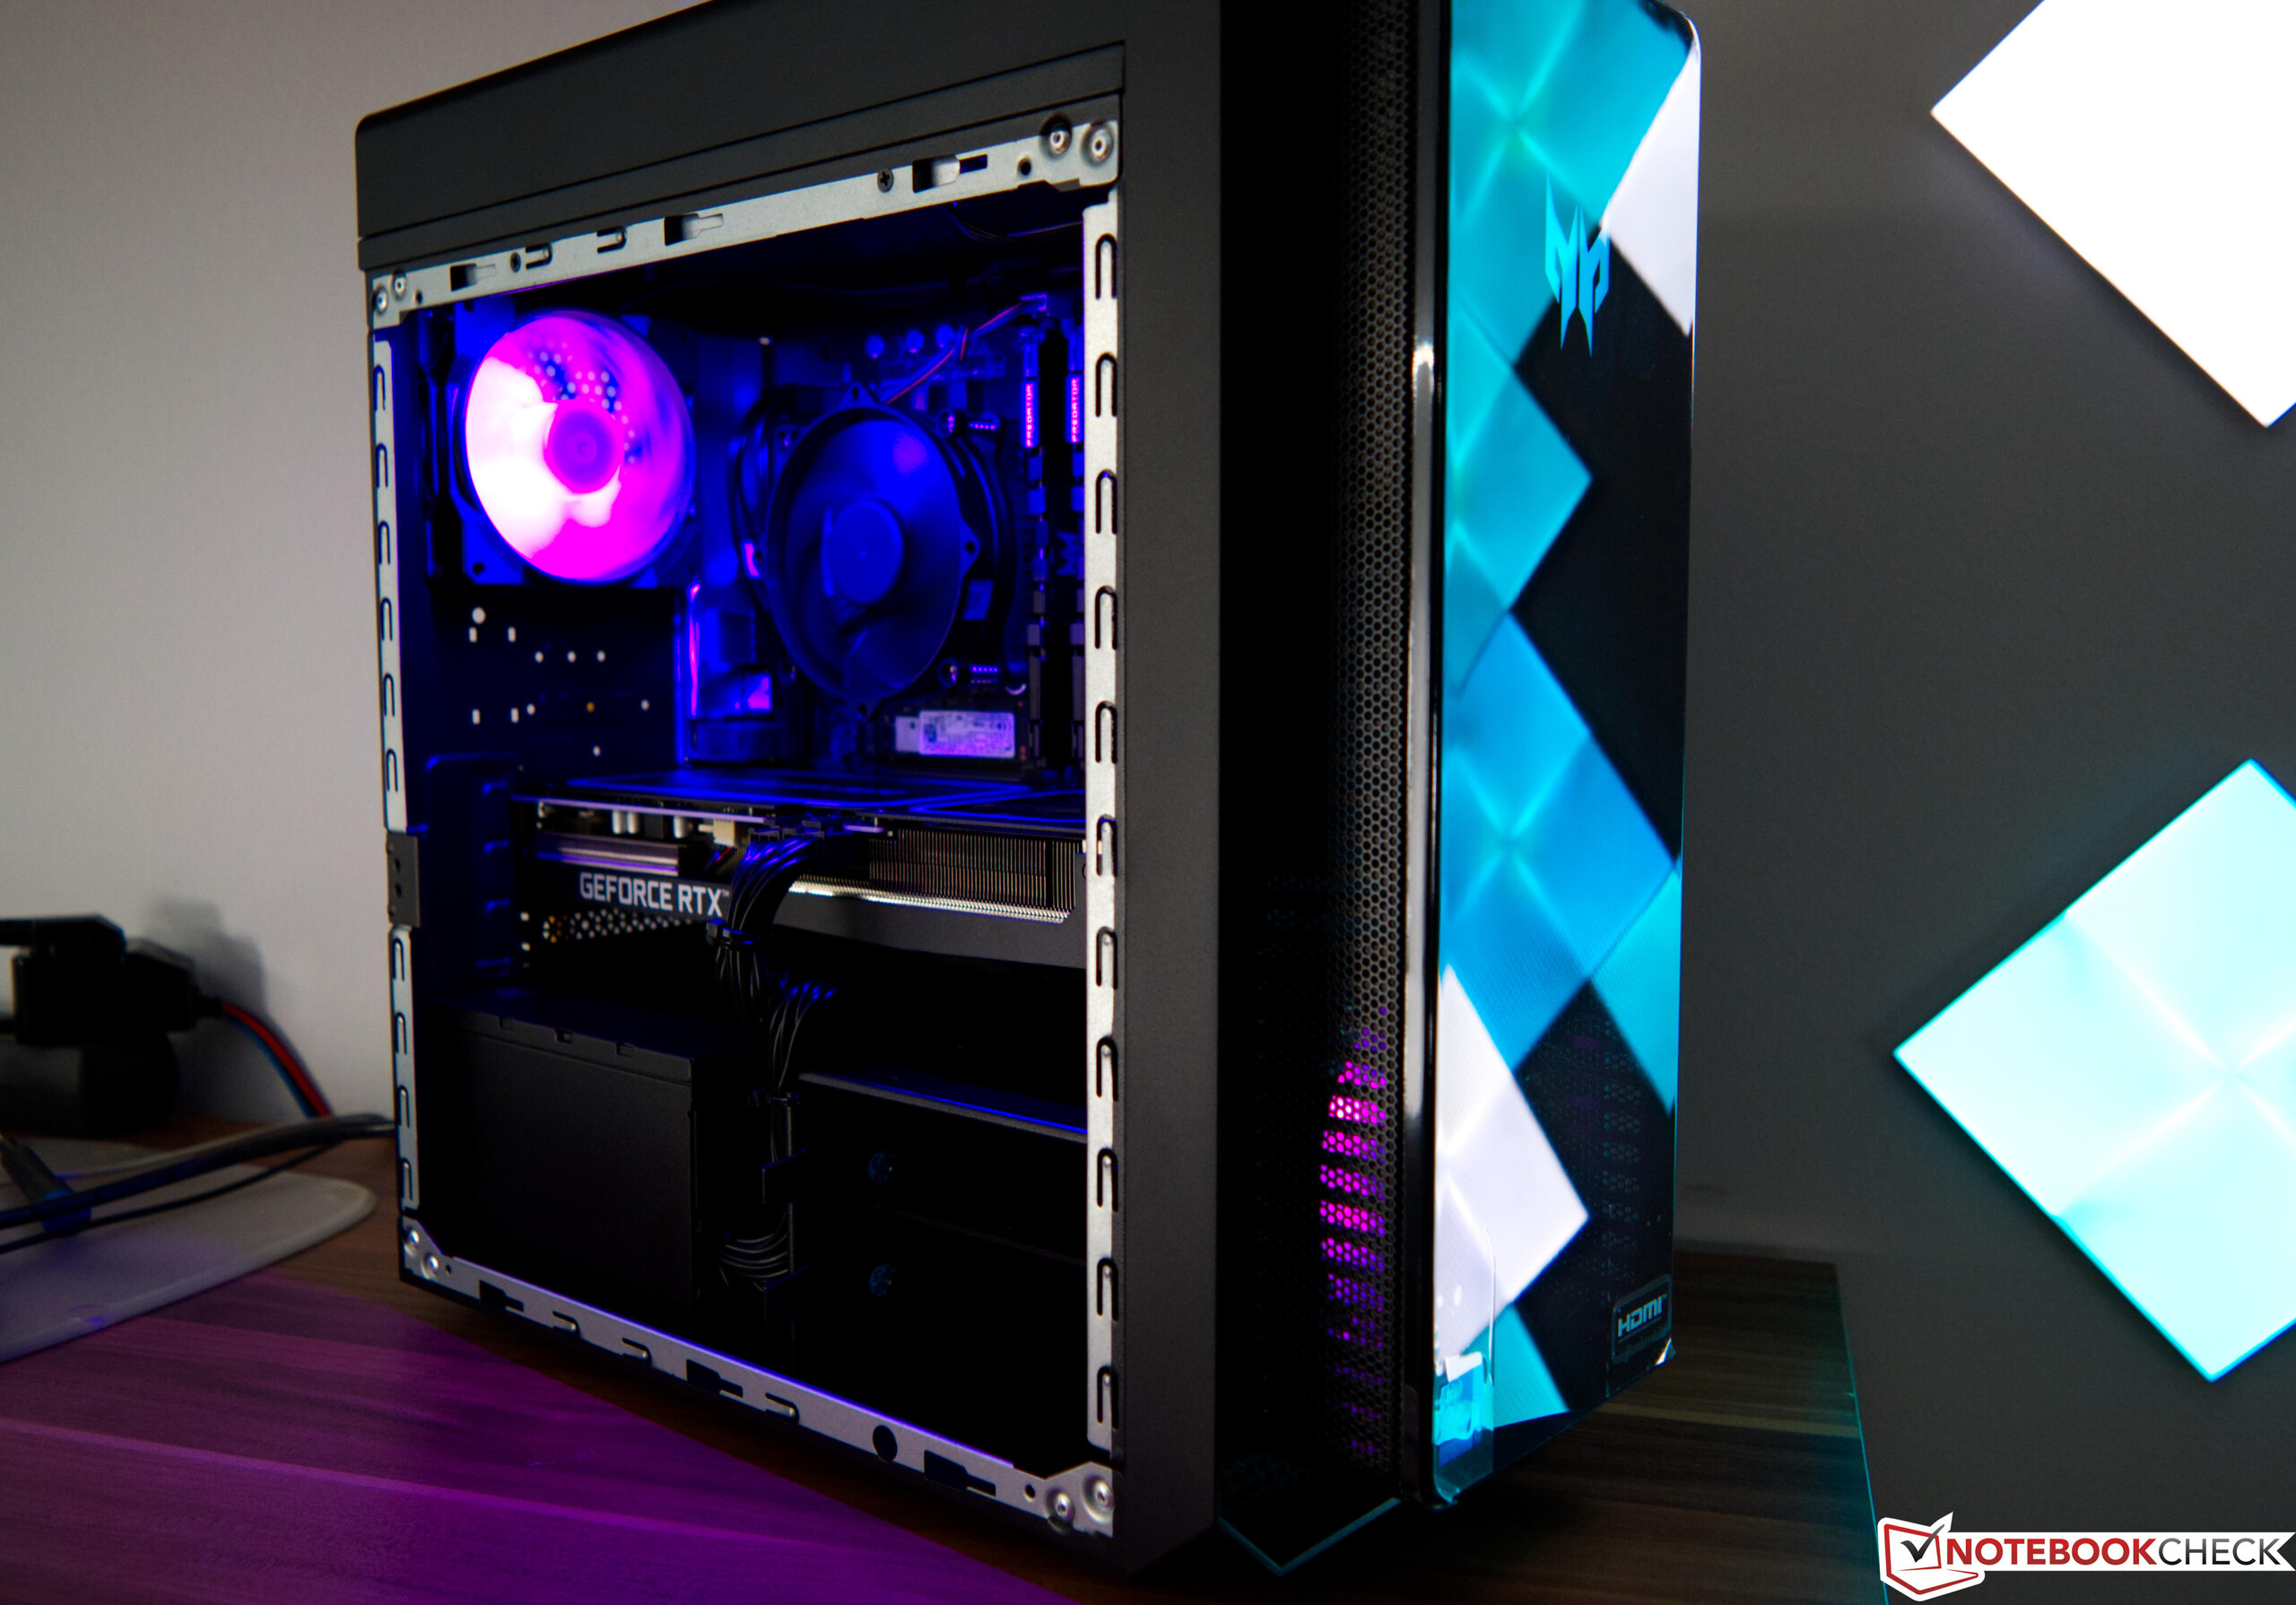
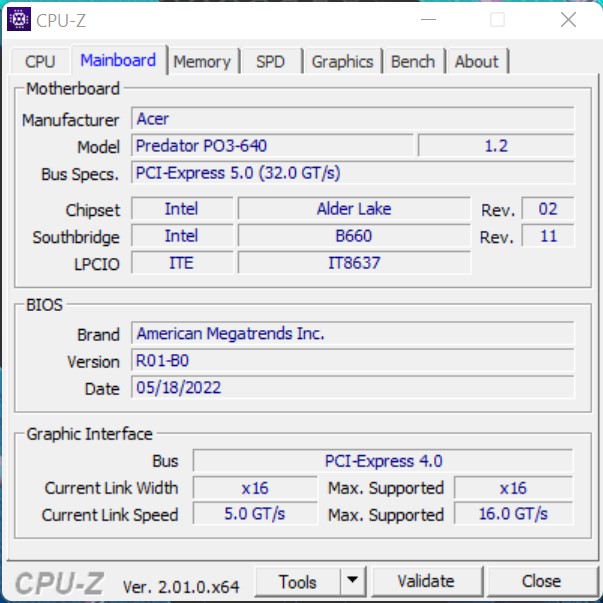
The case of the Acer Predator Orion 3000 PO3-640 looks like a standard ATX case at first glance. However, the manufacturer deviates from the standard here because the front connectors are located directly on the motherboard and are not connected to the motherboard via cable. With such constructions, replacing the motherboard is almost impossible. However, other manufacturers go similar ways and install proprietary motherboards in proprietary cases. The case is well manufactured, although the look is really a matter of taste. The scope of delivery also includes a side panel with a viewing window to better showcase the installed components. However, due to the already very limited airflow, we refrained from using the optically chic side panel during the test. At least the metal cover offers a few holes to suck in the fresh air.
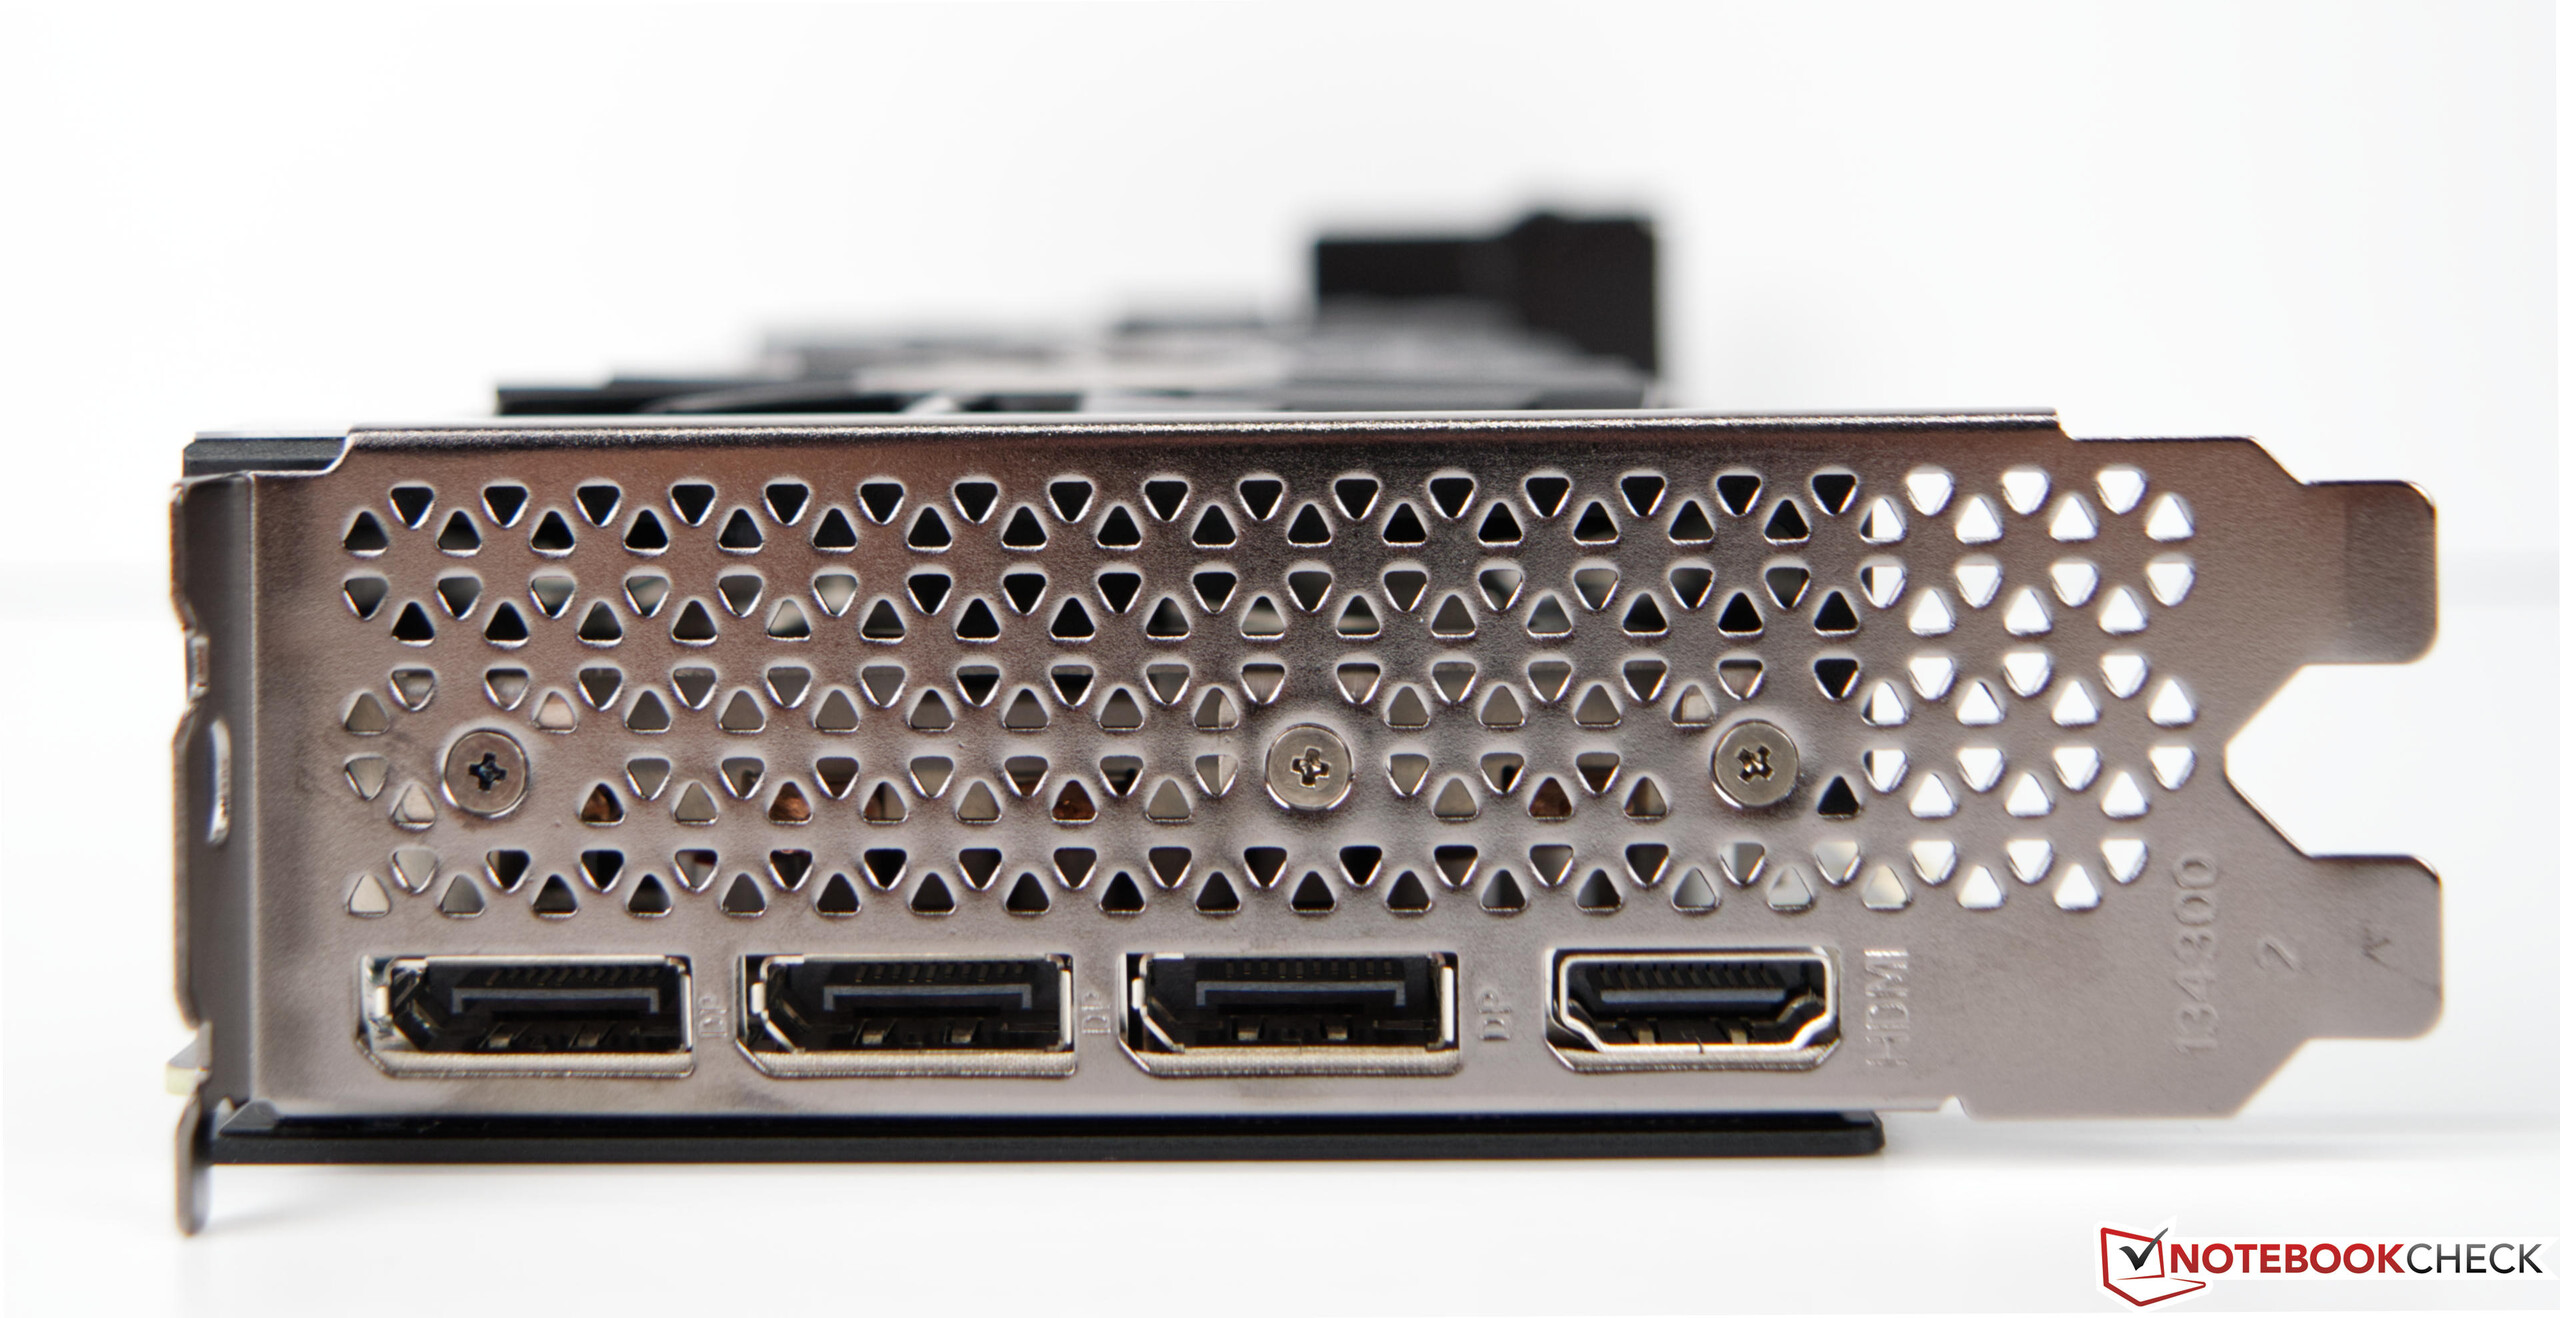
Equipment
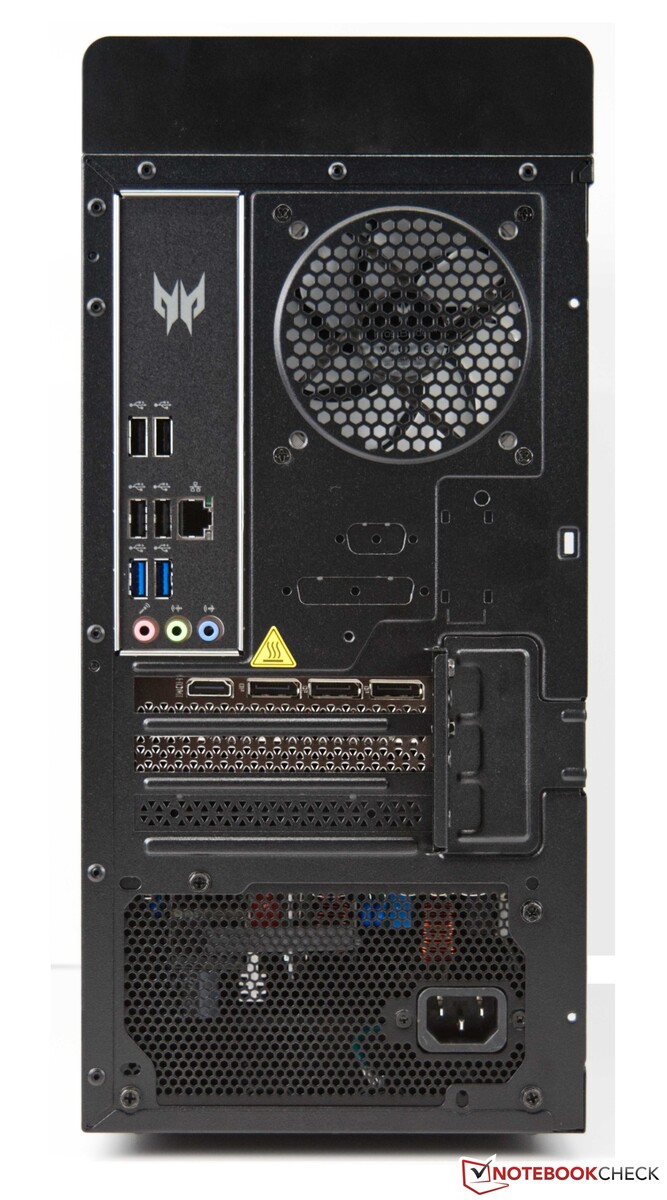
There is not much to criticize in the interface selection. There are a total of 8 USB ports, which are divided into 7 TypeA and 1x Type-C. The GPU offers 3x DisplayPort and HDMI as standard. However, there is only Gigabit LAN as a network interface. We would have wished for a faster 2.5G or 5G LAN port here. You also have to do without an SD card reader. The distribution of ports is typical for a device class. Thus, it is not surprising that most interfaces are found on the back. However, the USB ports on the front are a bit difficult to reach due to the case's build.
Communication
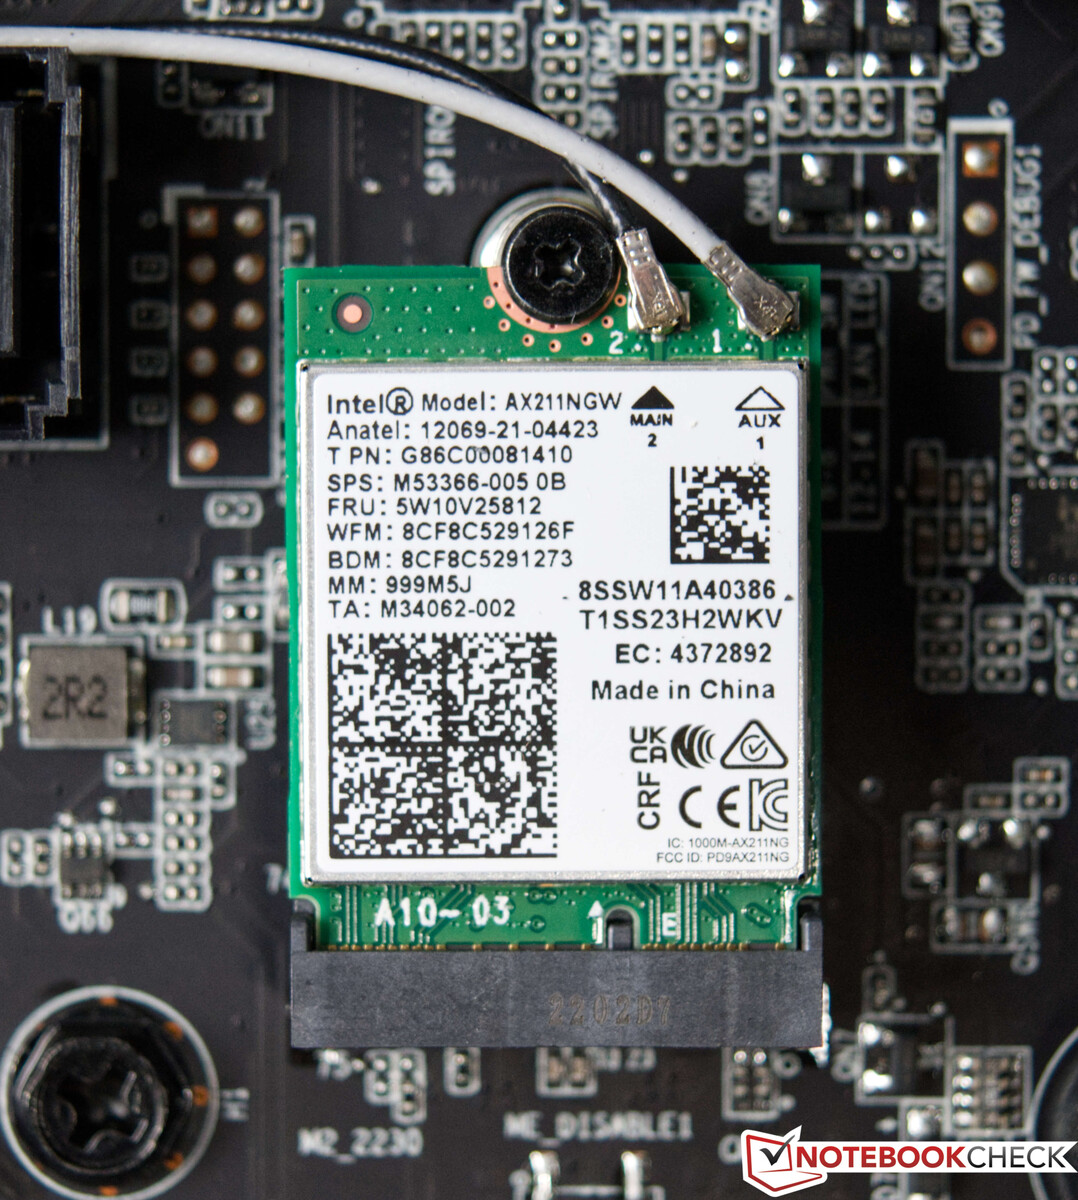
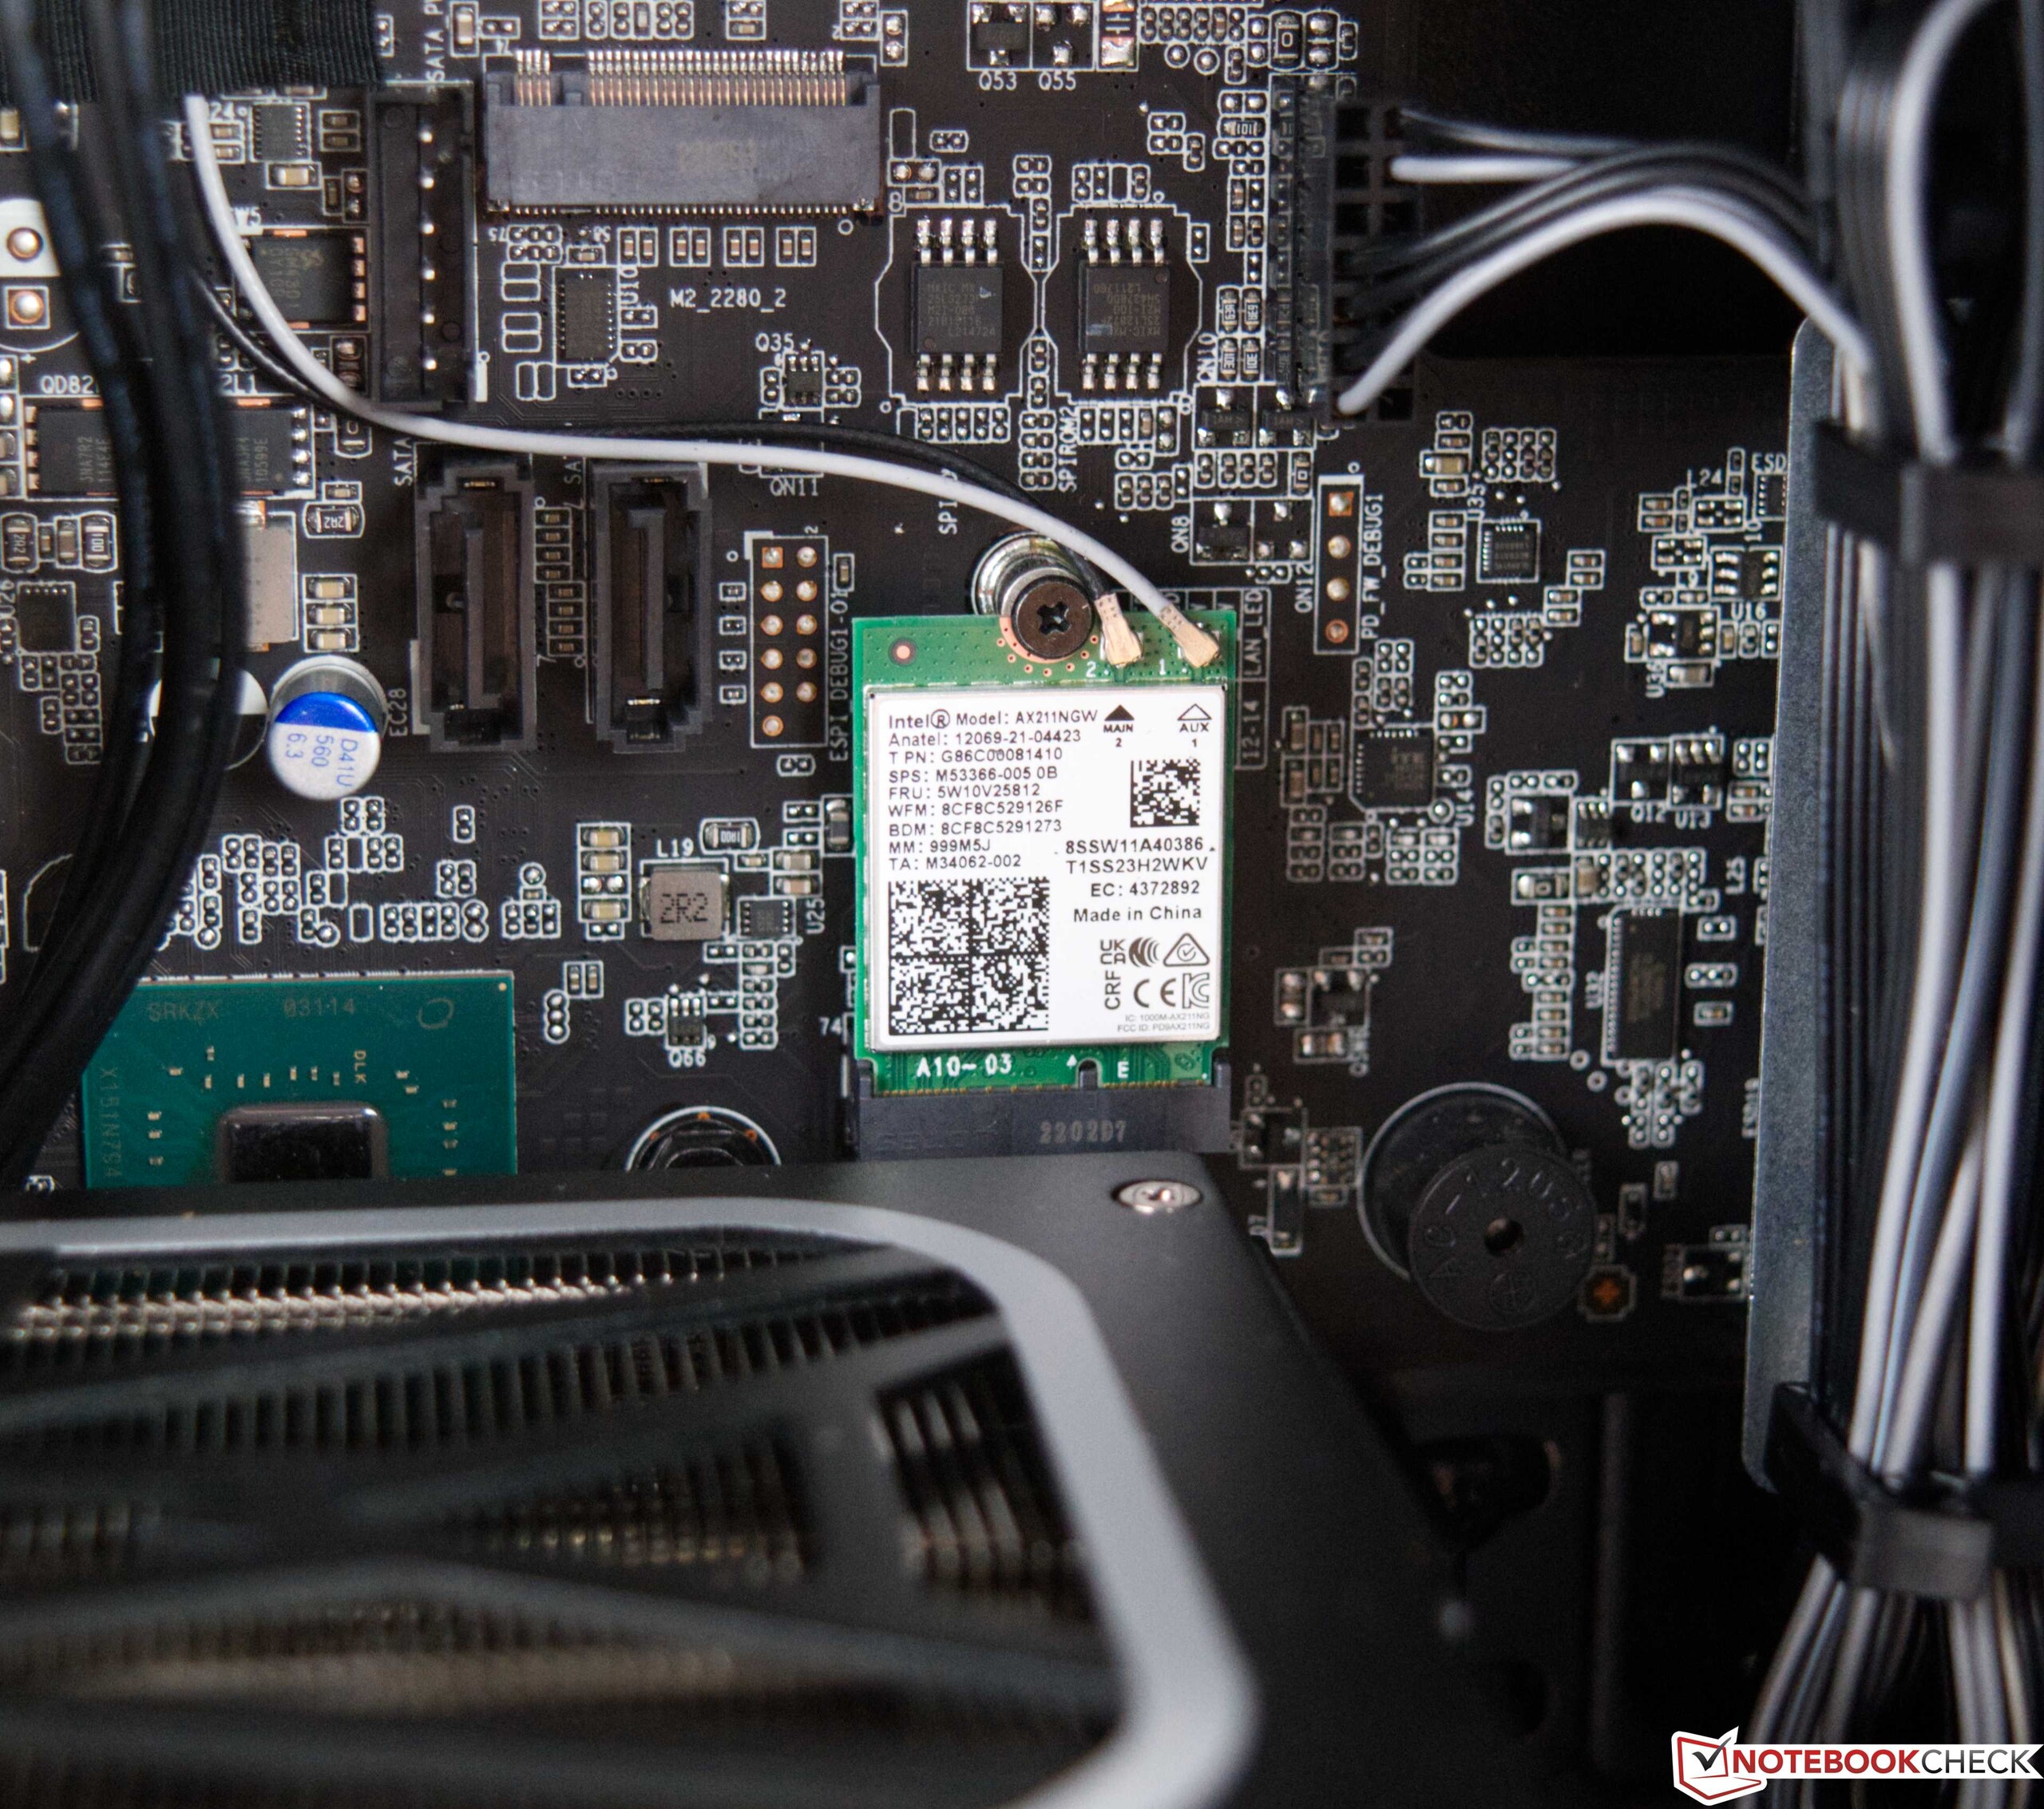
Acer also equips the Predator with an Intel Wi-Fi 6E AX211 module. It is located as an M.2 plug-in card directly on the motherboard and delivers relatively good transfer rates. Nevertheless, the Intel Wi-Fi 6E AX211's performance in data reception cannot keep up with the good rates in transmission. The comparison devices partly deliver better rates here. However, the everyday test showed that you can also manage well with the installed WLAN module. We did not have any problems using the wireless connection. As an alternative, the user can use an RJ45 port that relies on a killer E2600 chip. Unfortunately, this only offers a maximum of 1 GBit/s.
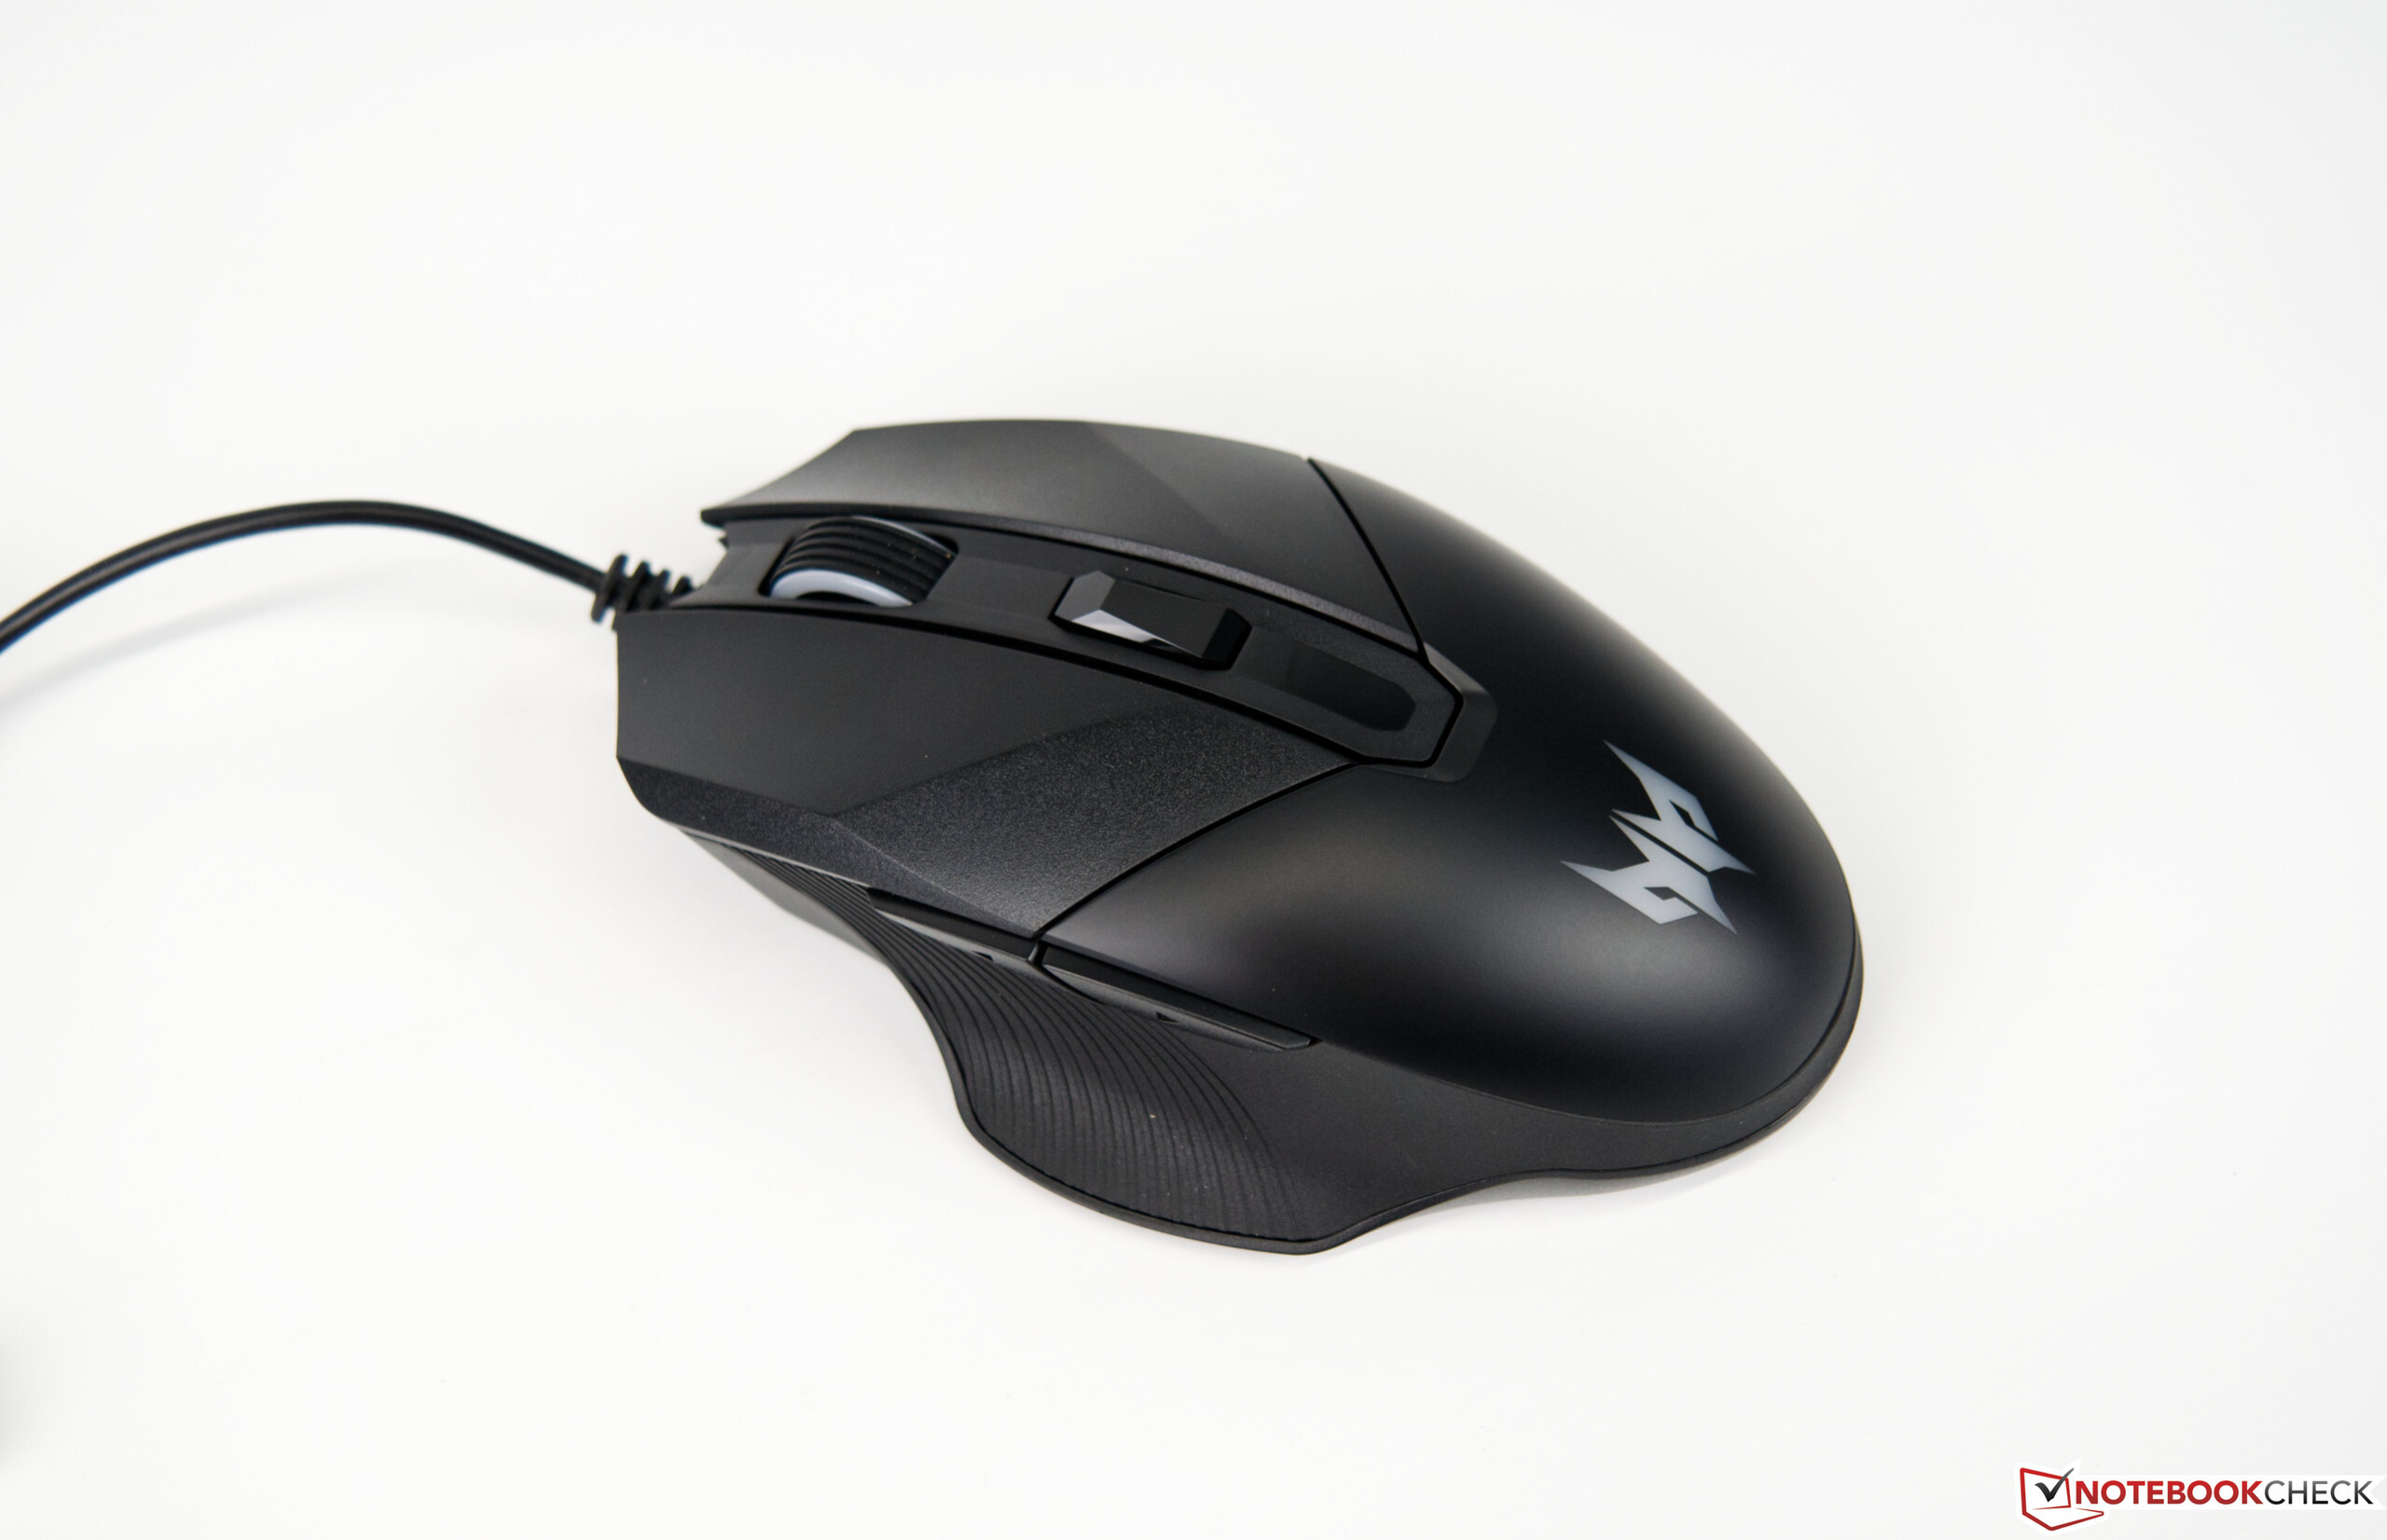
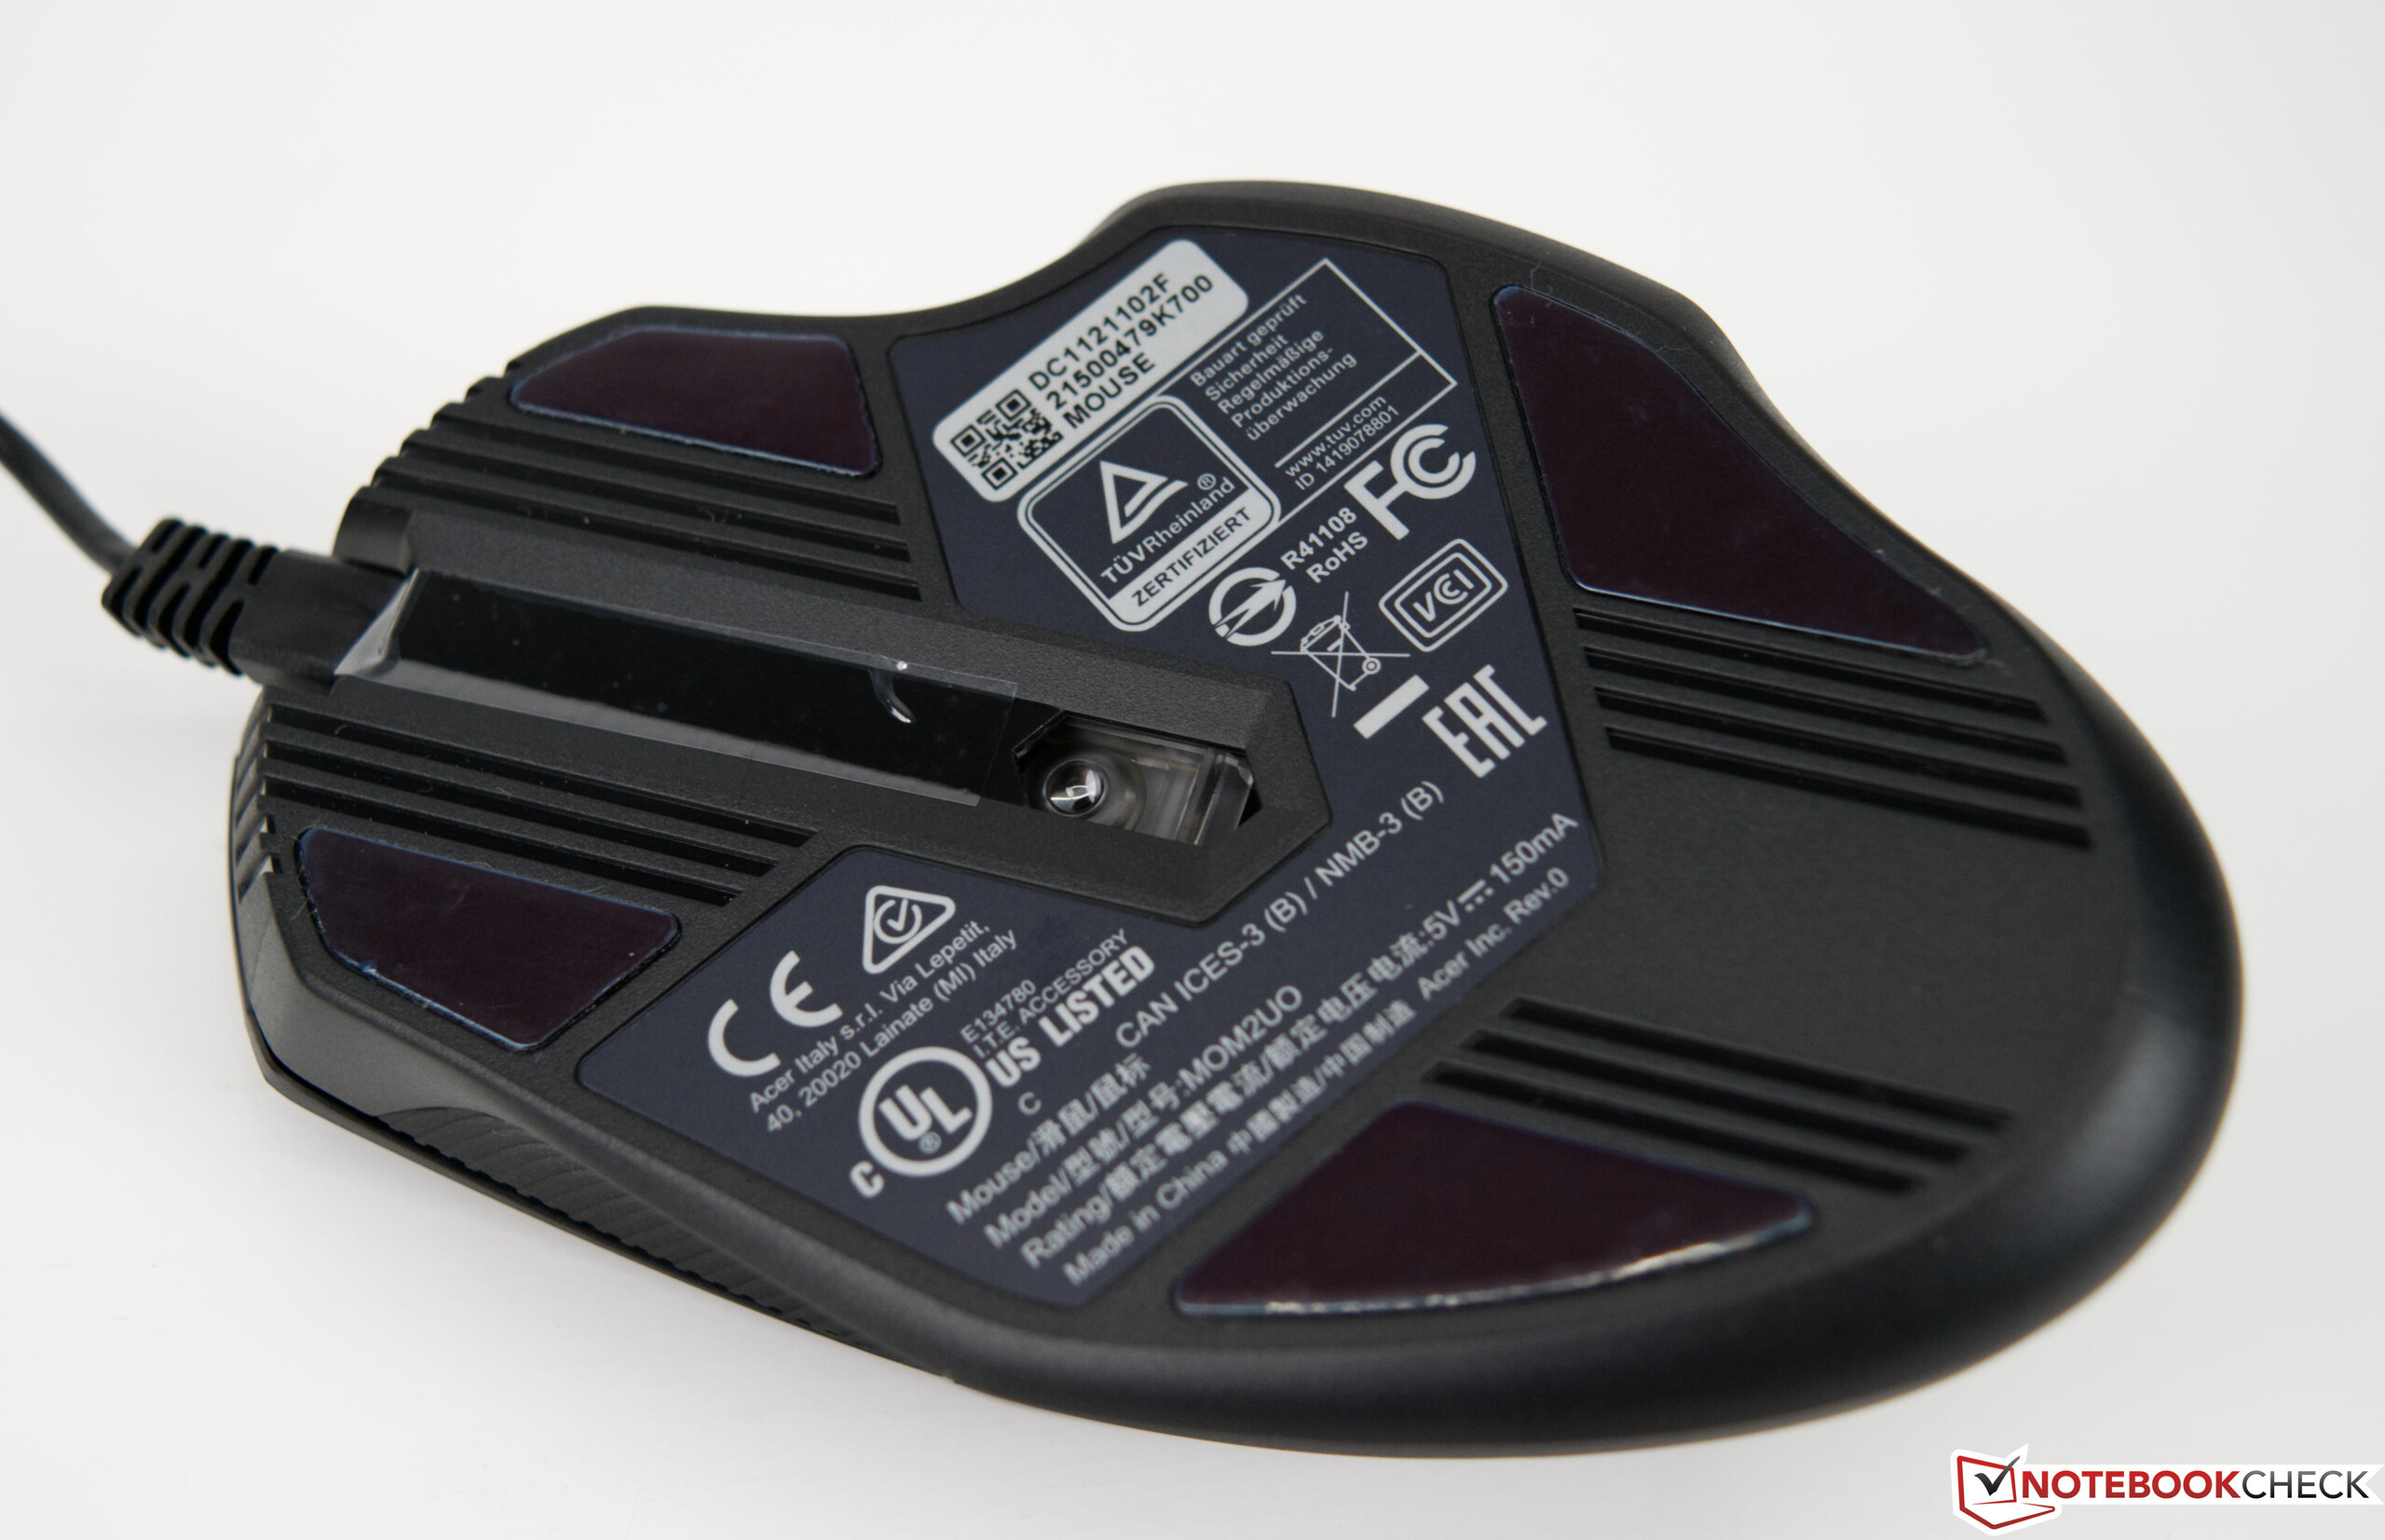
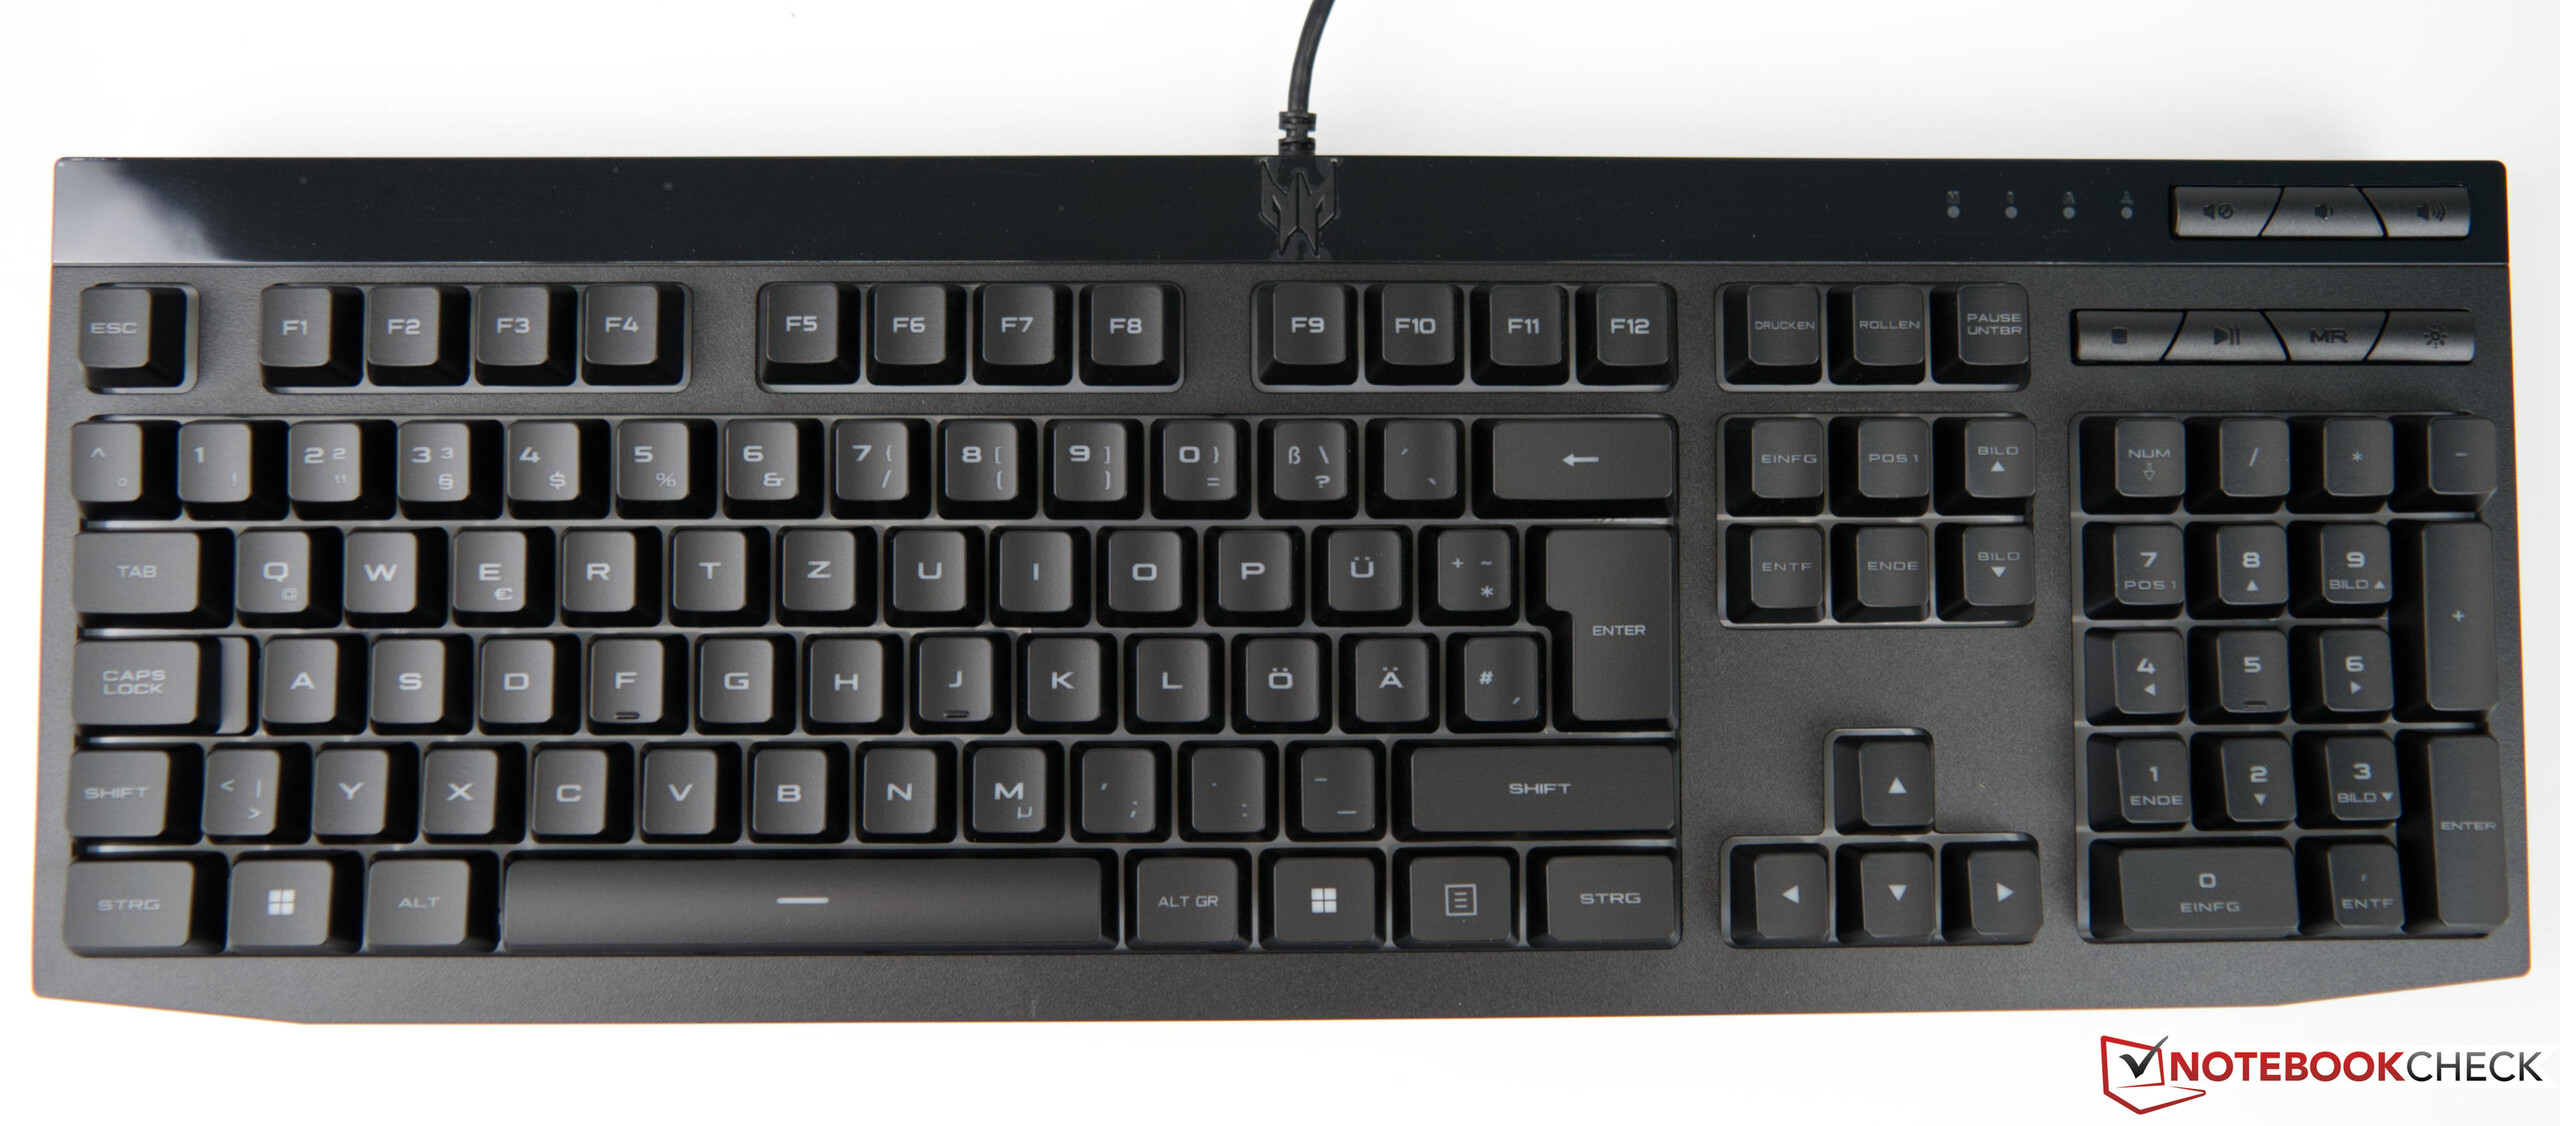
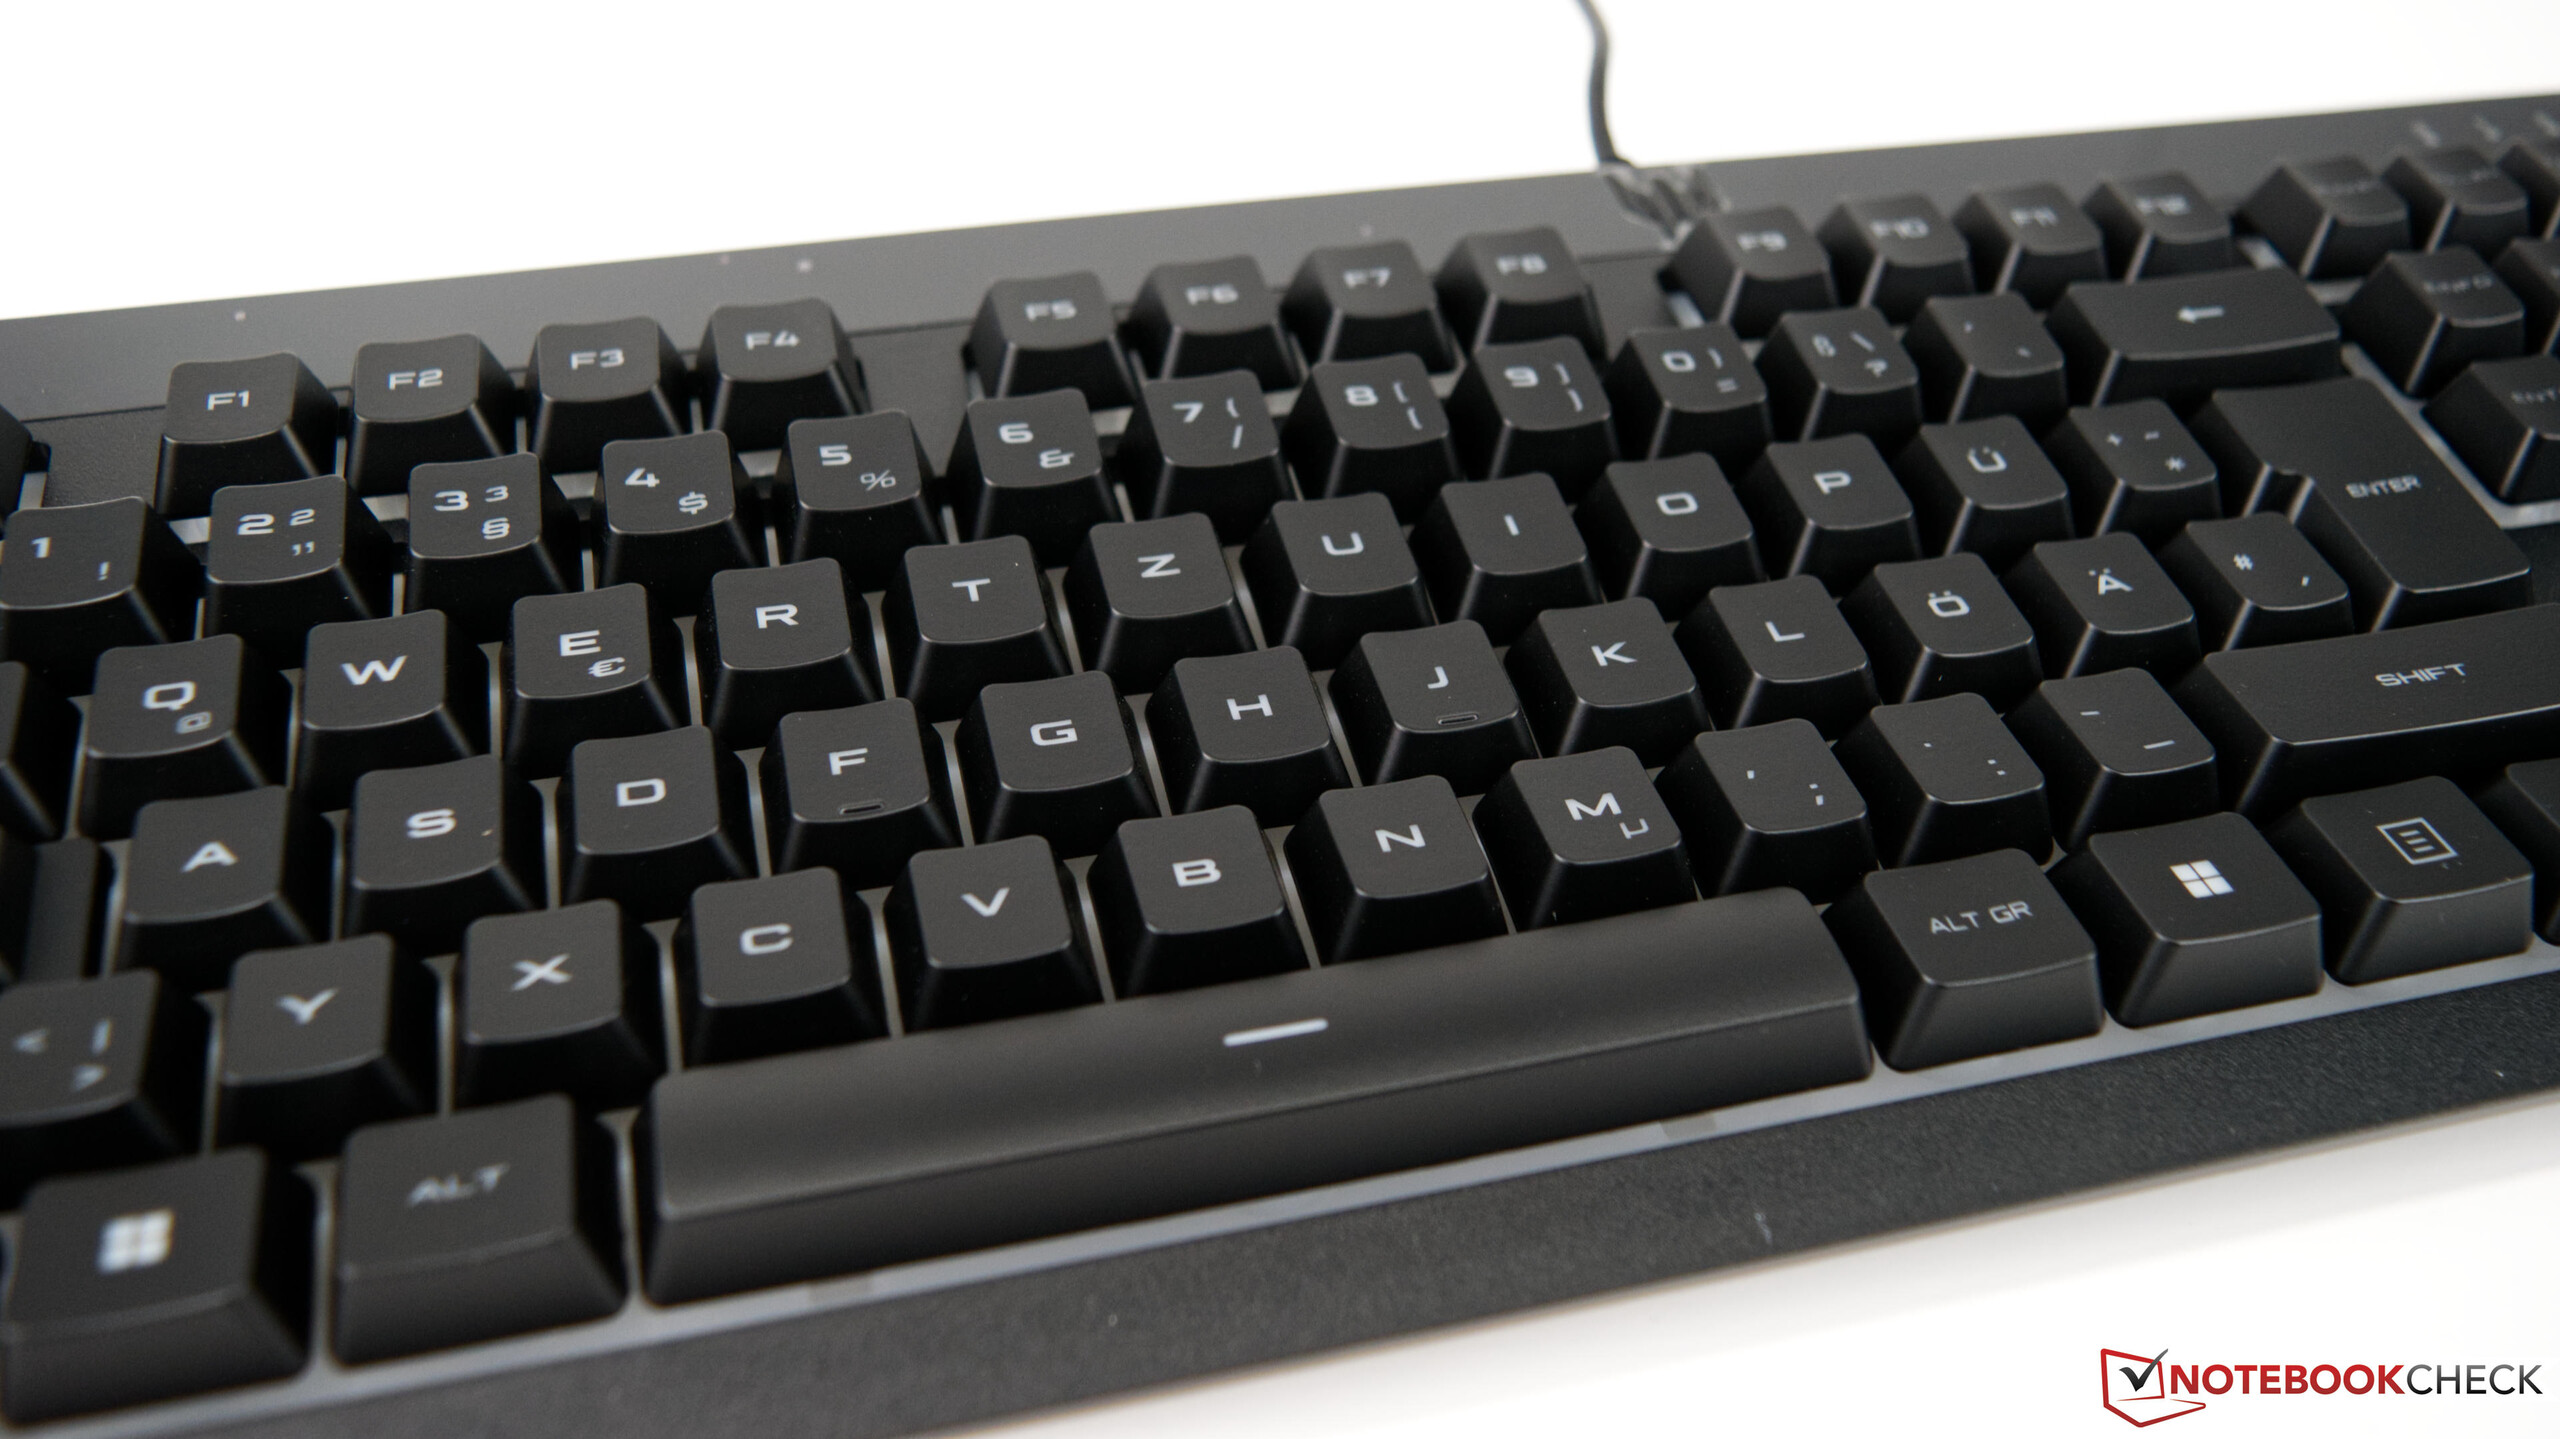
Accessories
If you buy an Acer Predator Orion 3000, you will also get an optically matching keyboard and a gaming mouse, which also comes in Predator style. Thus, you are well prepared for the start and the hardware provides a coherent overall impression. The tower can also be upgraded with the optional side panel including a viewing window. This shows off the built-in RGB lighting to better advantage.
Maintenance
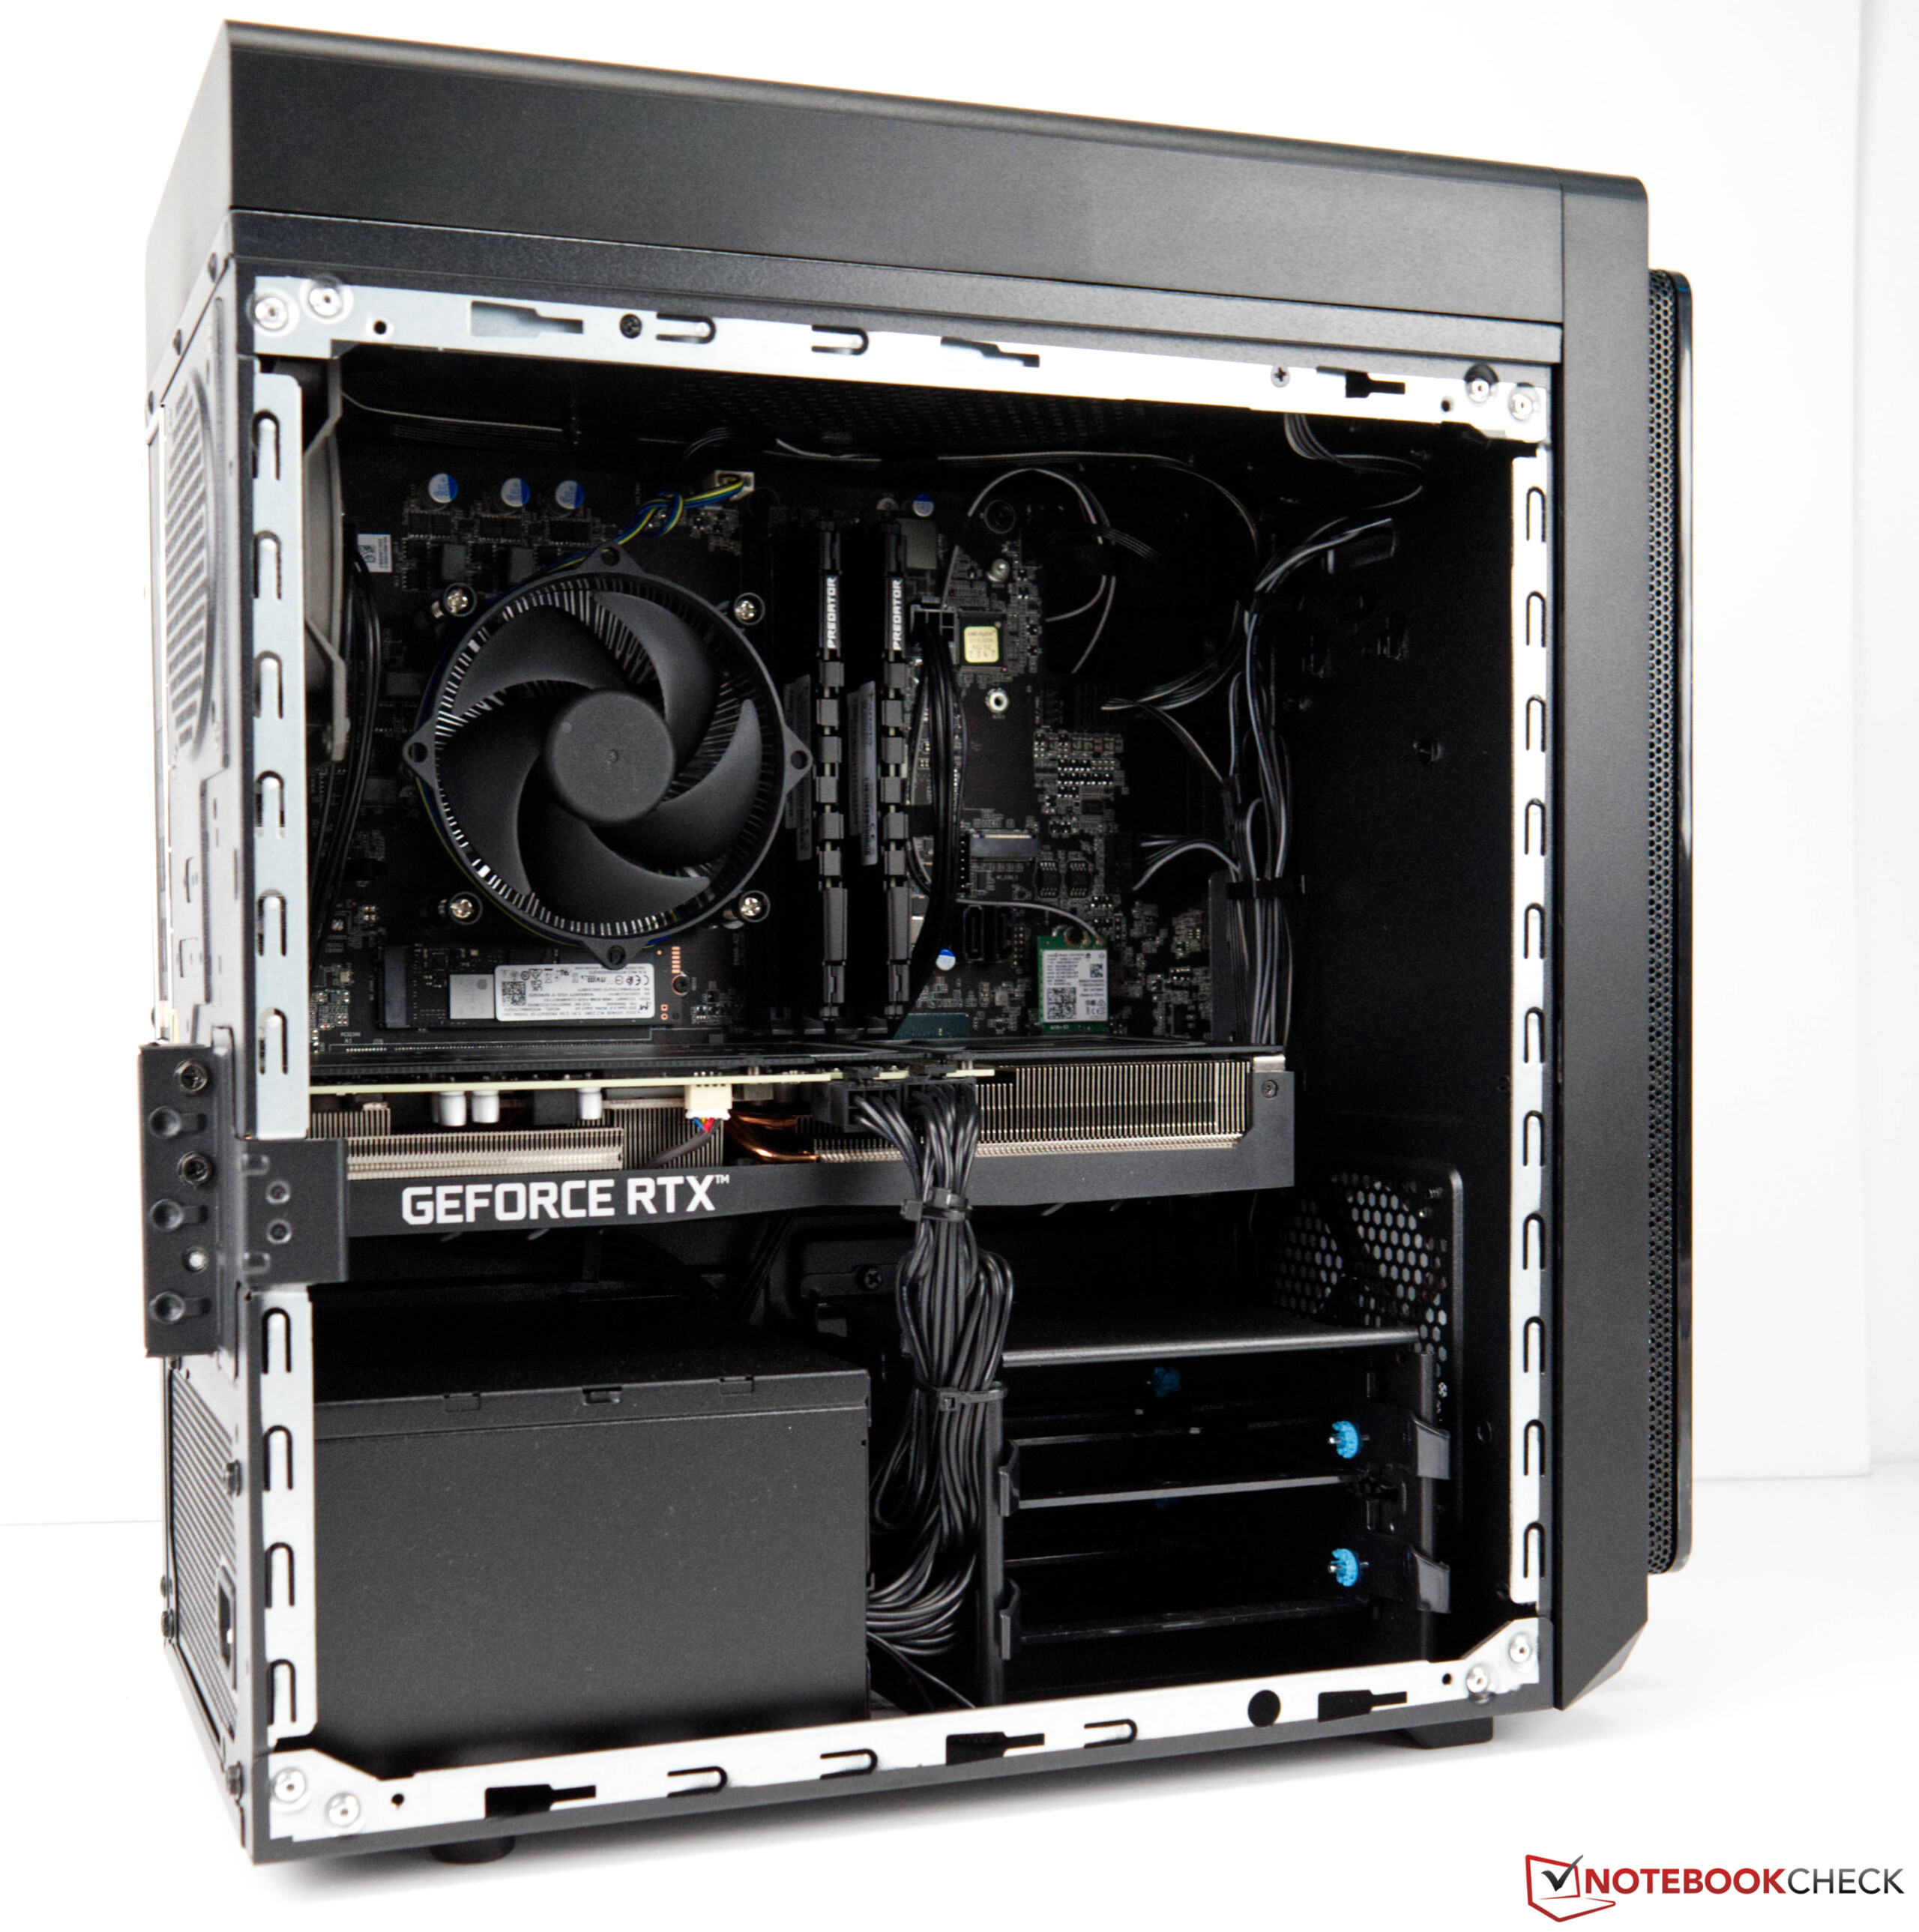
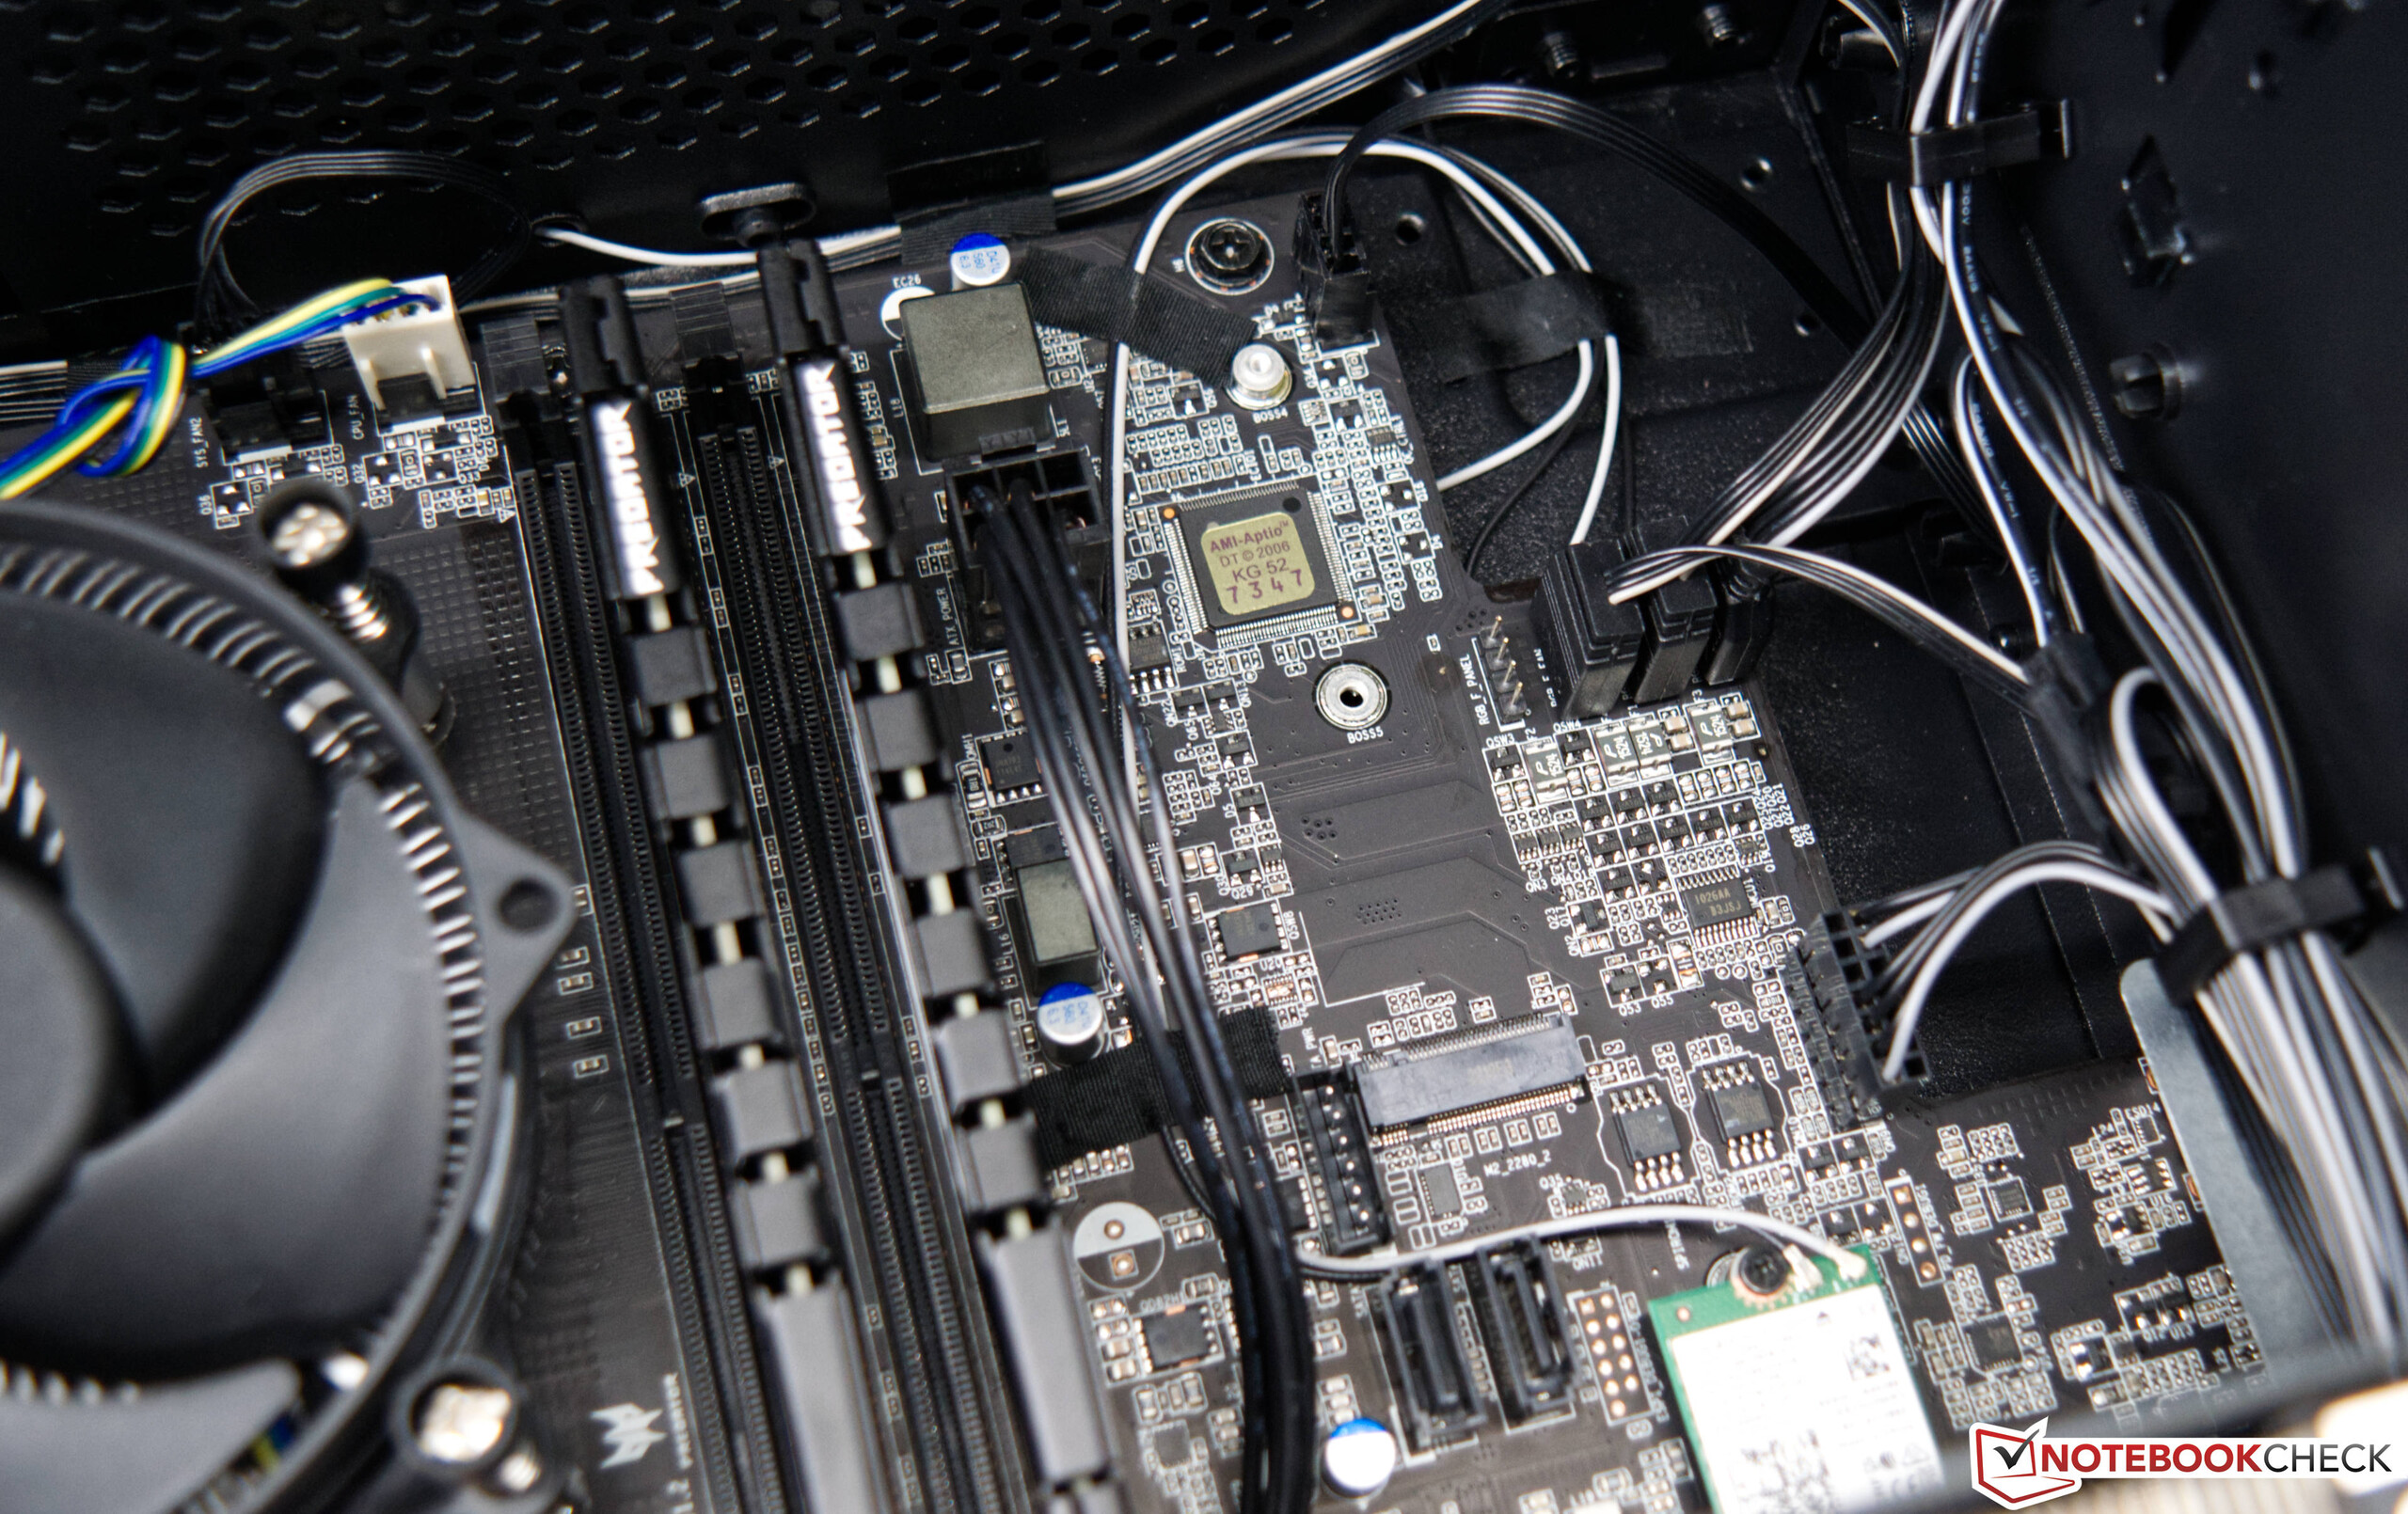
Maintenance is not a big problem for the Acer Predator Orion 3000. The side panel is fixed with two screws and can be removed easily. The internal components are easy to access. For example, the mass storage can be expanded with a second M.2 module. Alternatively, up to two conventional 3.5-inch hard drives can be accommodated.
Performance - Braked-in Core i7-12700F
The current version of Acer's Predator Orion 3000 is always equipped with a frugal 65-watt CPU. Thus, the strongest model is equipped with the Intel Core i7-12700F. This offers very good performance and can always provide the best speed for the respective application thanks to the hybrid architecture with E- and P-cores. In a cheaper configuration, you can also get the Predator Orion 3000 with an Intel Core i5-12400. This also offers a good gaming performance but has to do without the E-cores. As a graphics card, you get at least a GeForce RTX 3060 which is designed for 1080p gaming. More performance is available with the GeForce RTX 3070 which also allows 1440p gaming.

Test conditions
We performed all tests with the energy profile maximum performance
. We also did not use the transparent side panel in the case. The fan speeds can also be configured via the Predator Sense
tool. We kept the auto setting to achieve a good compromise between noise and performance.
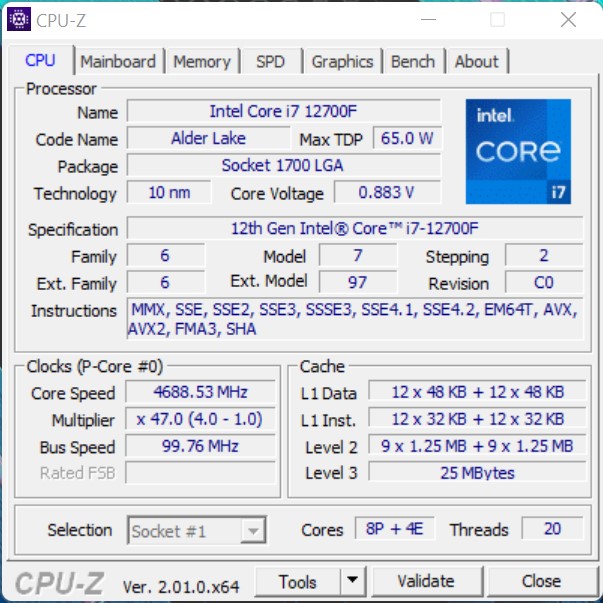
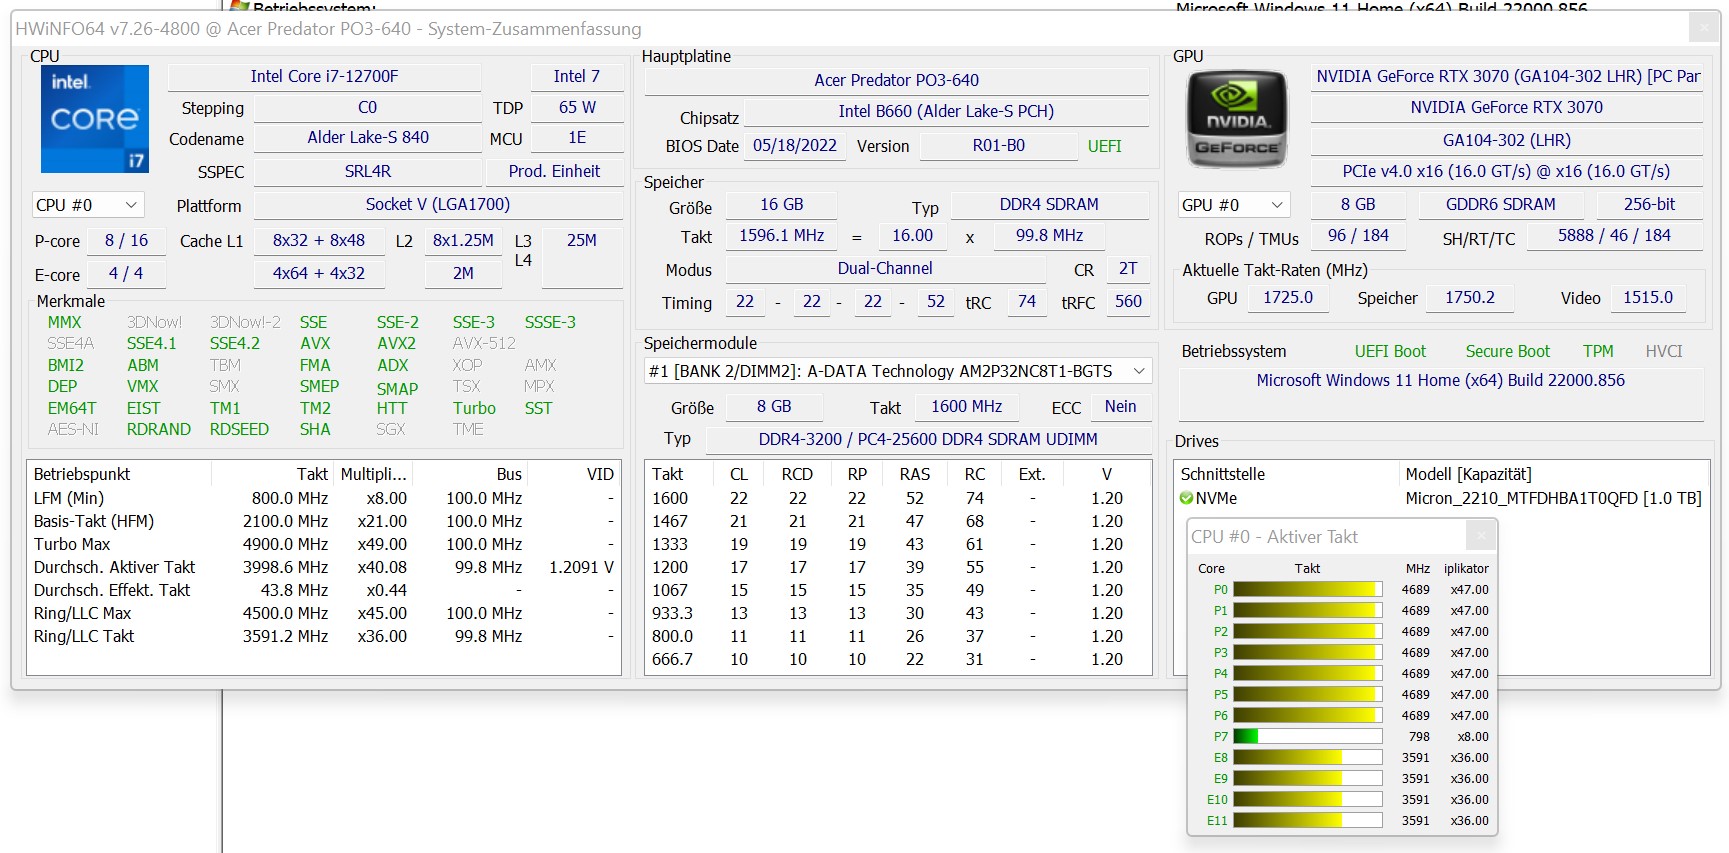
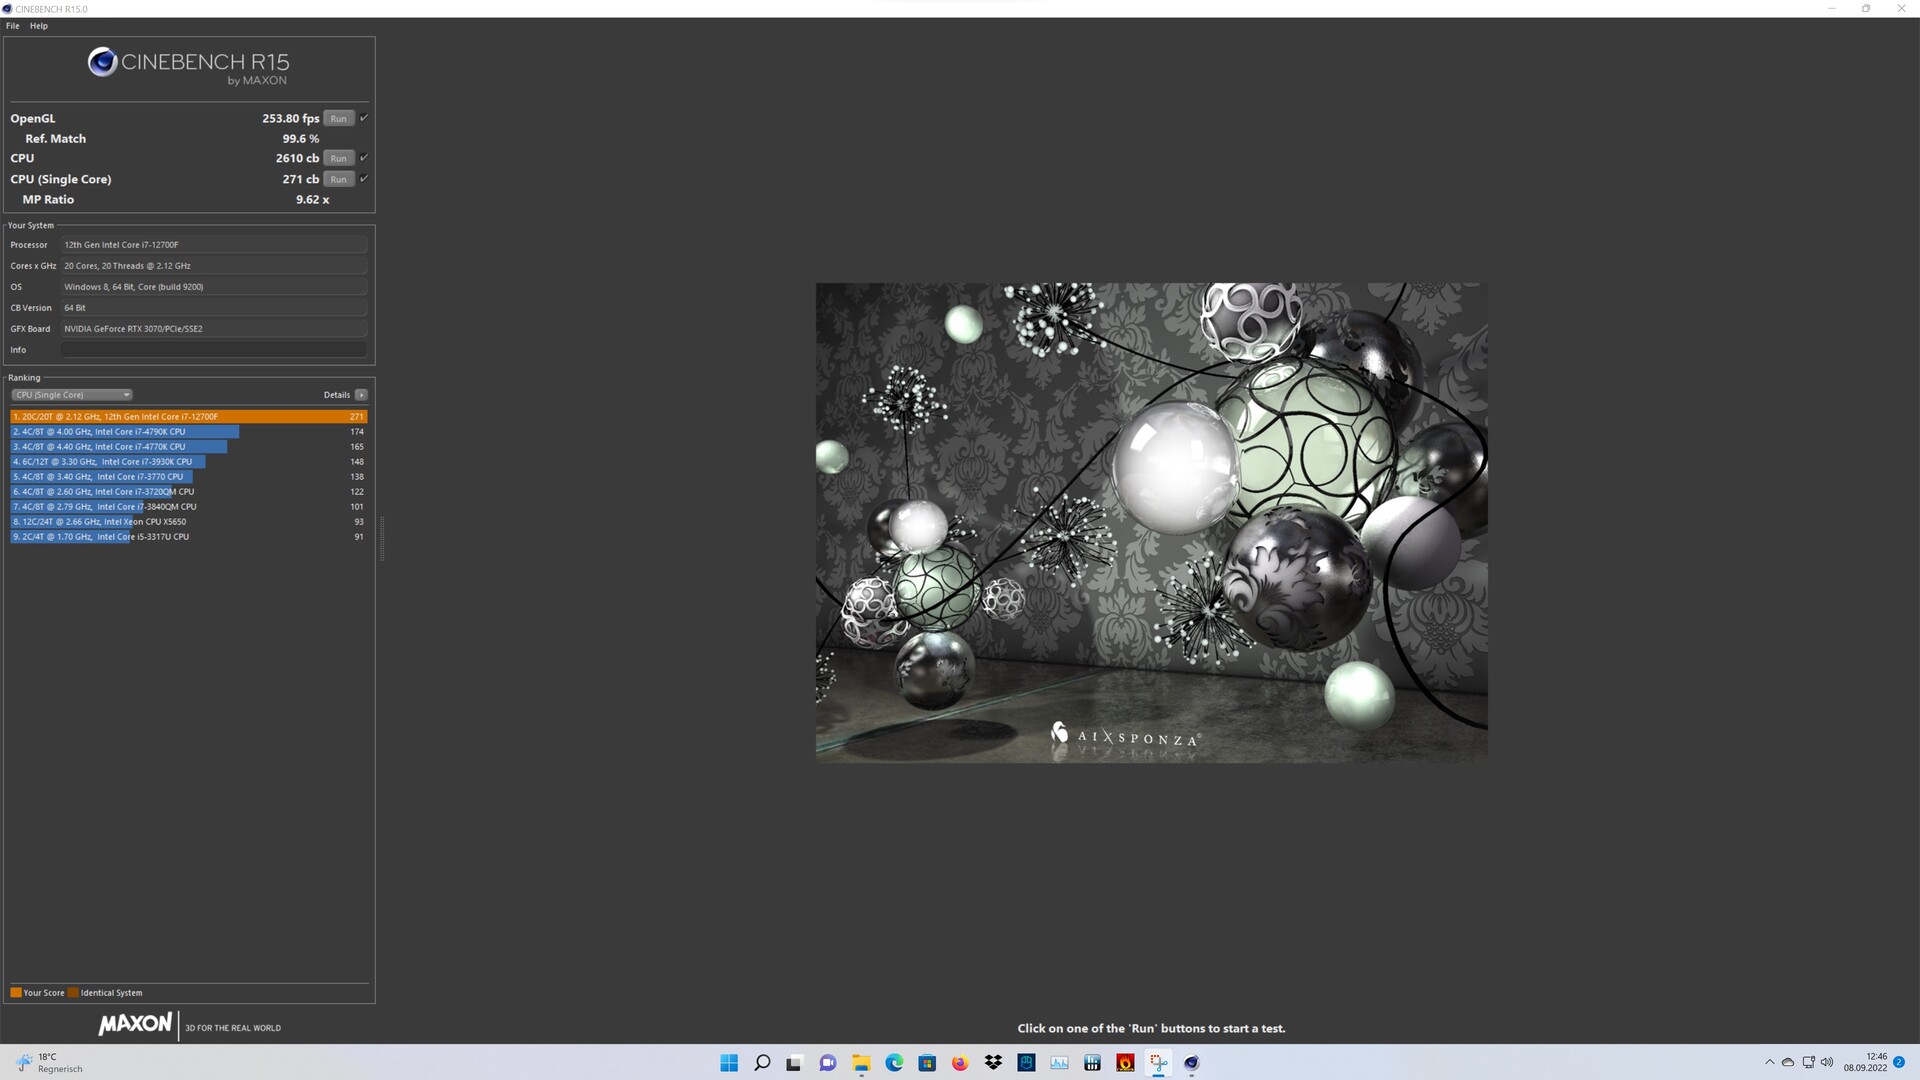
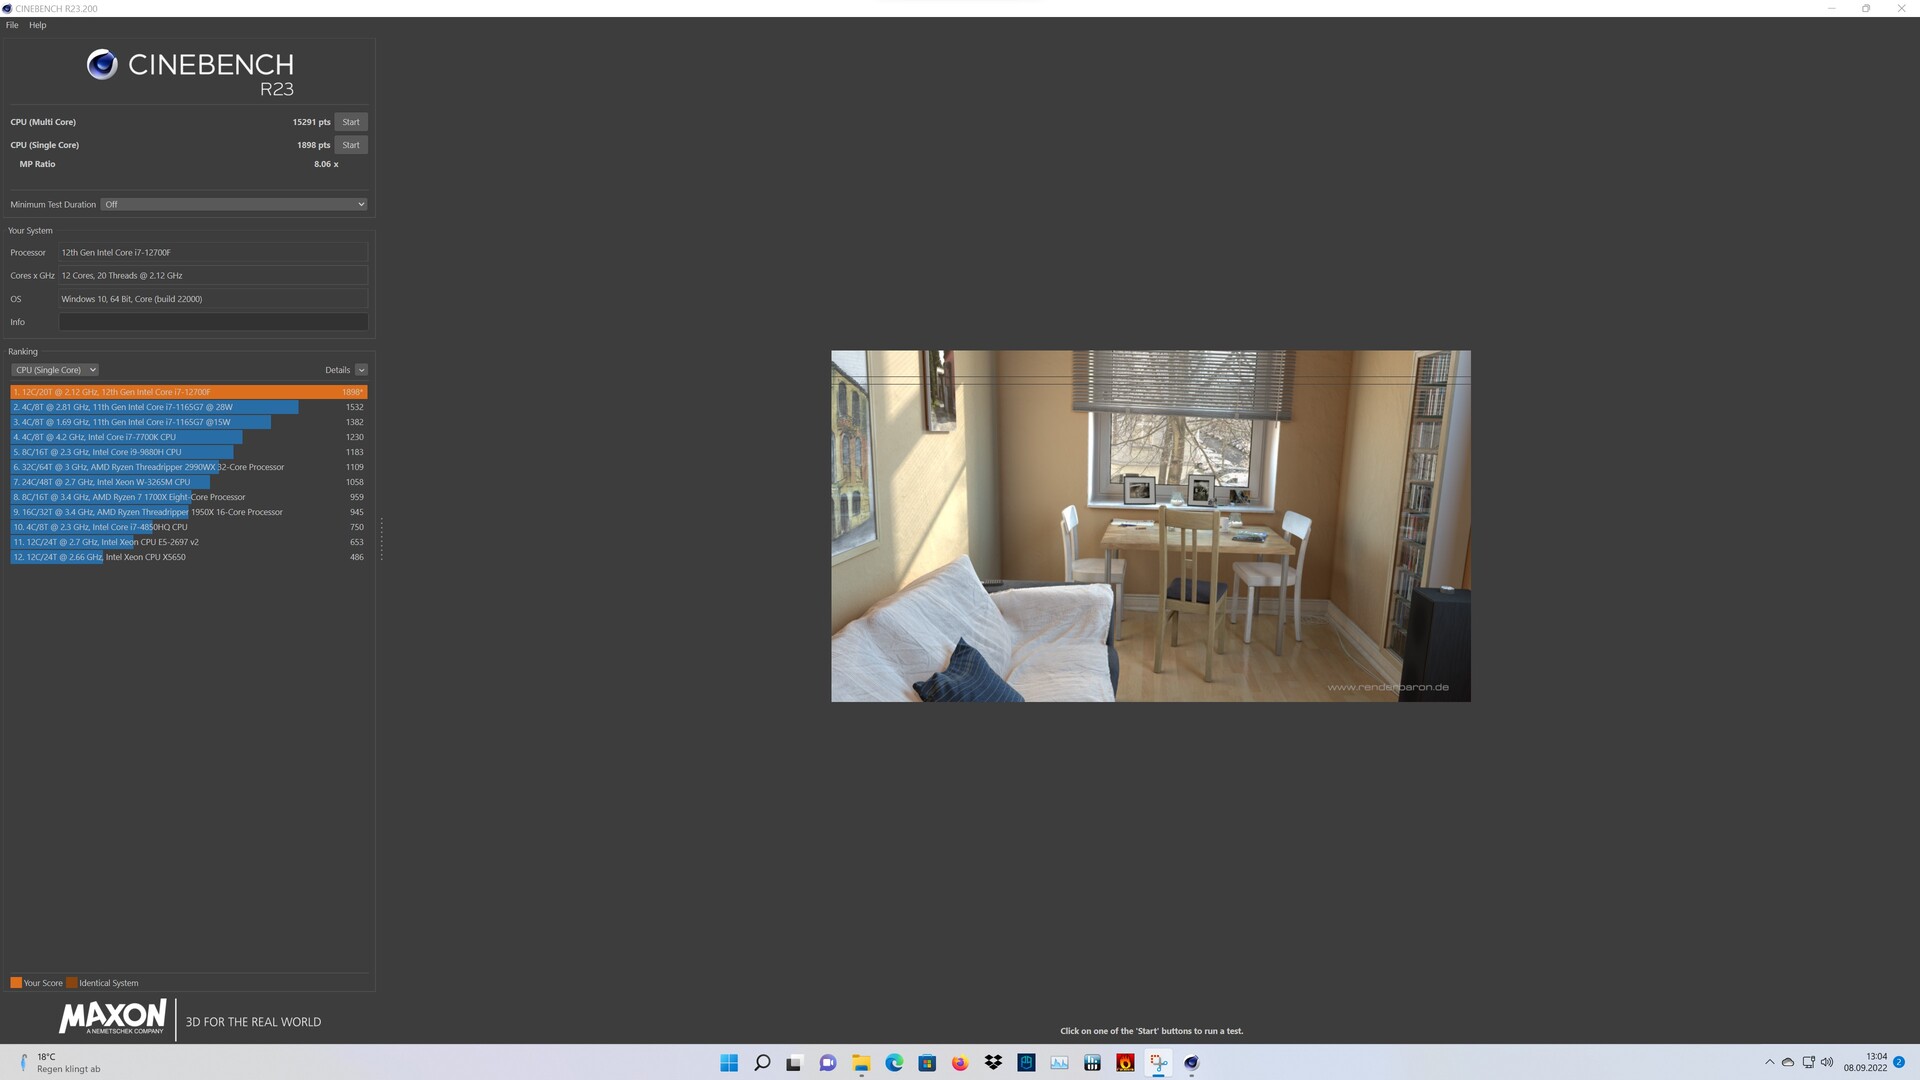
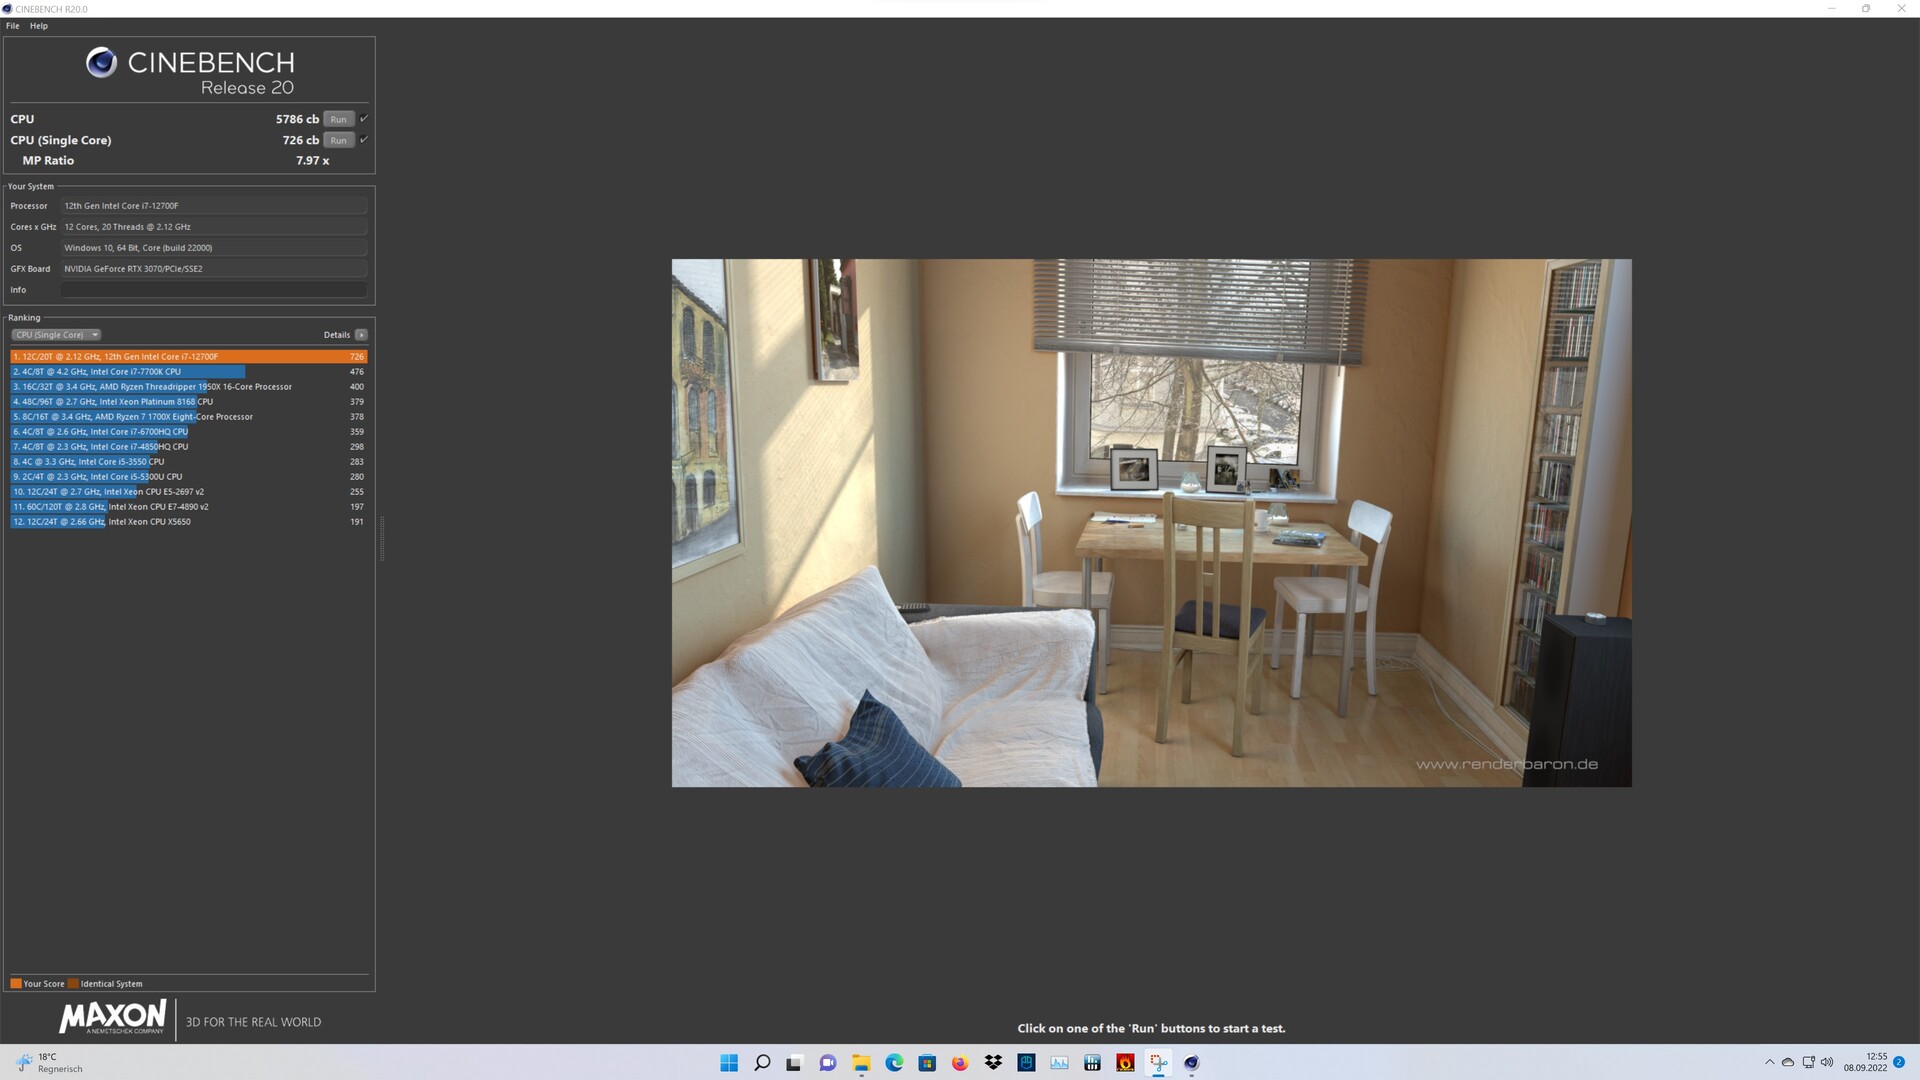
Processor
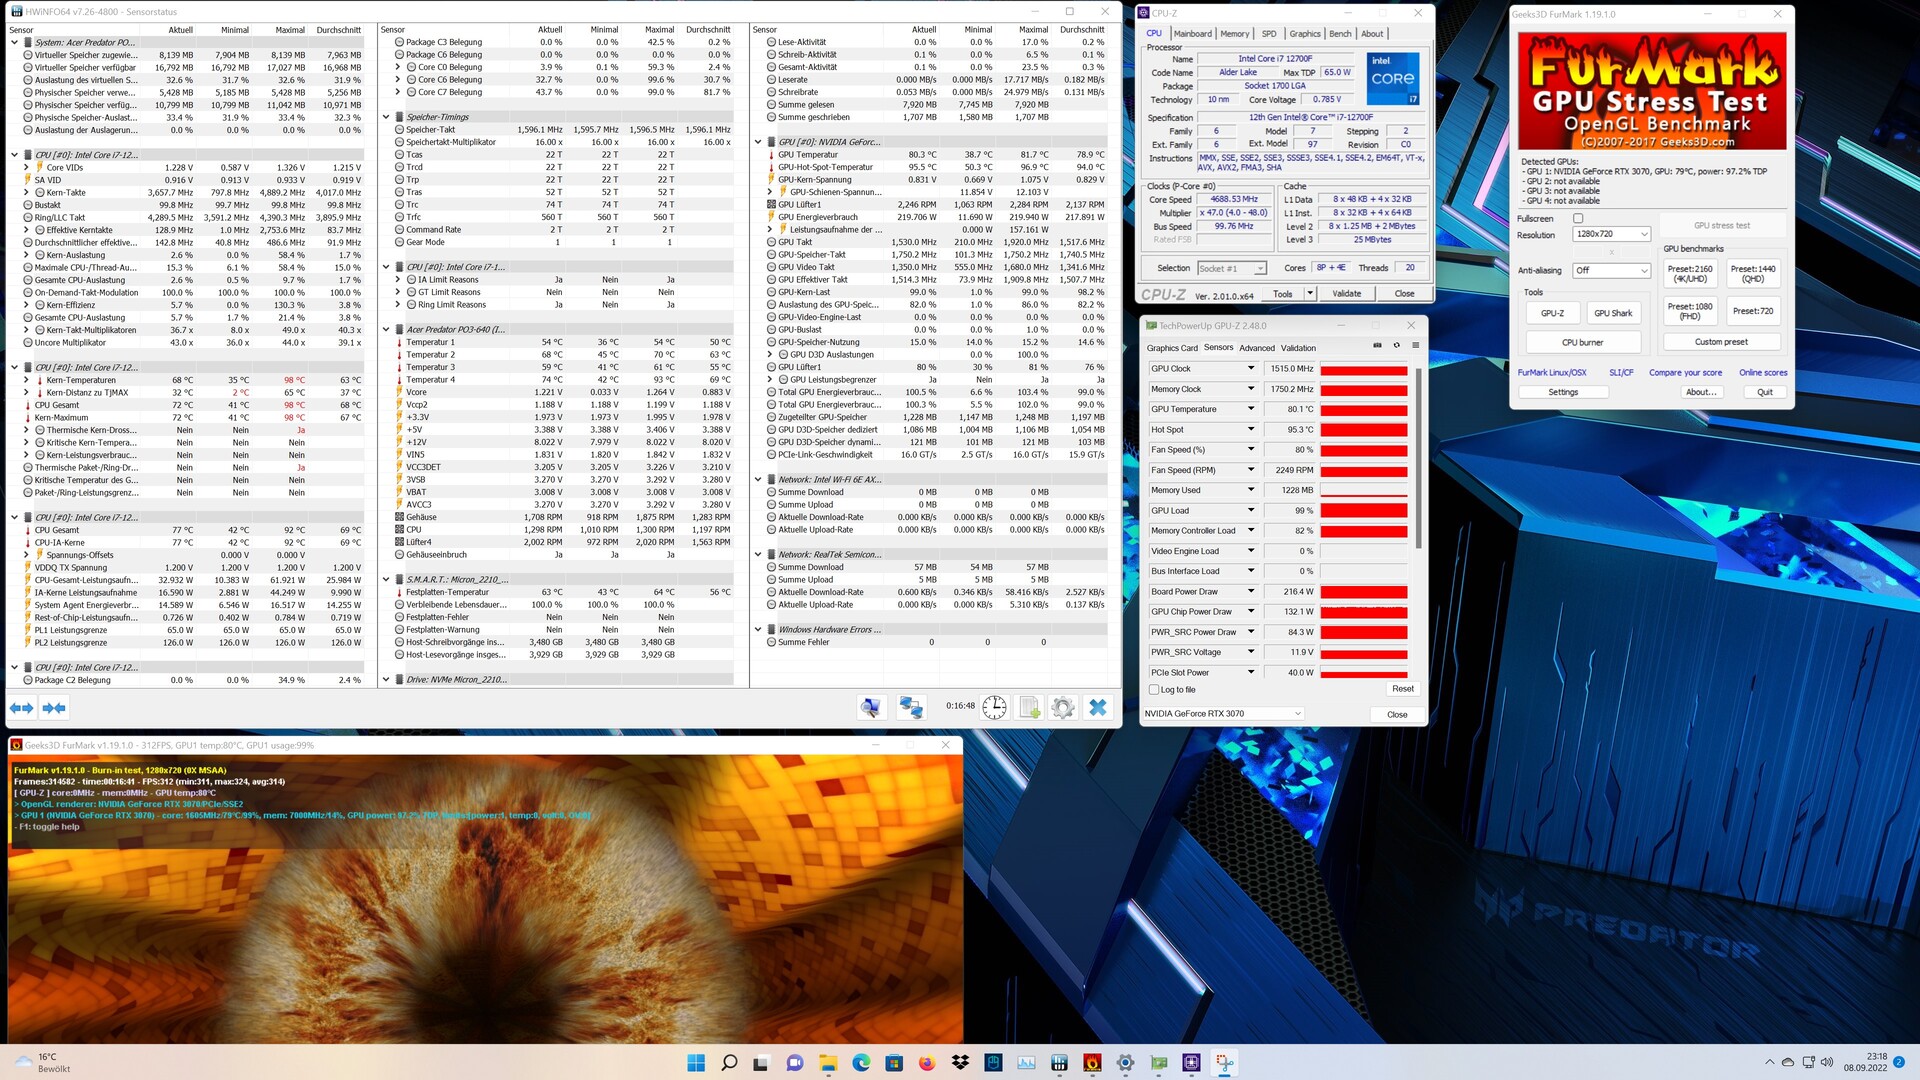
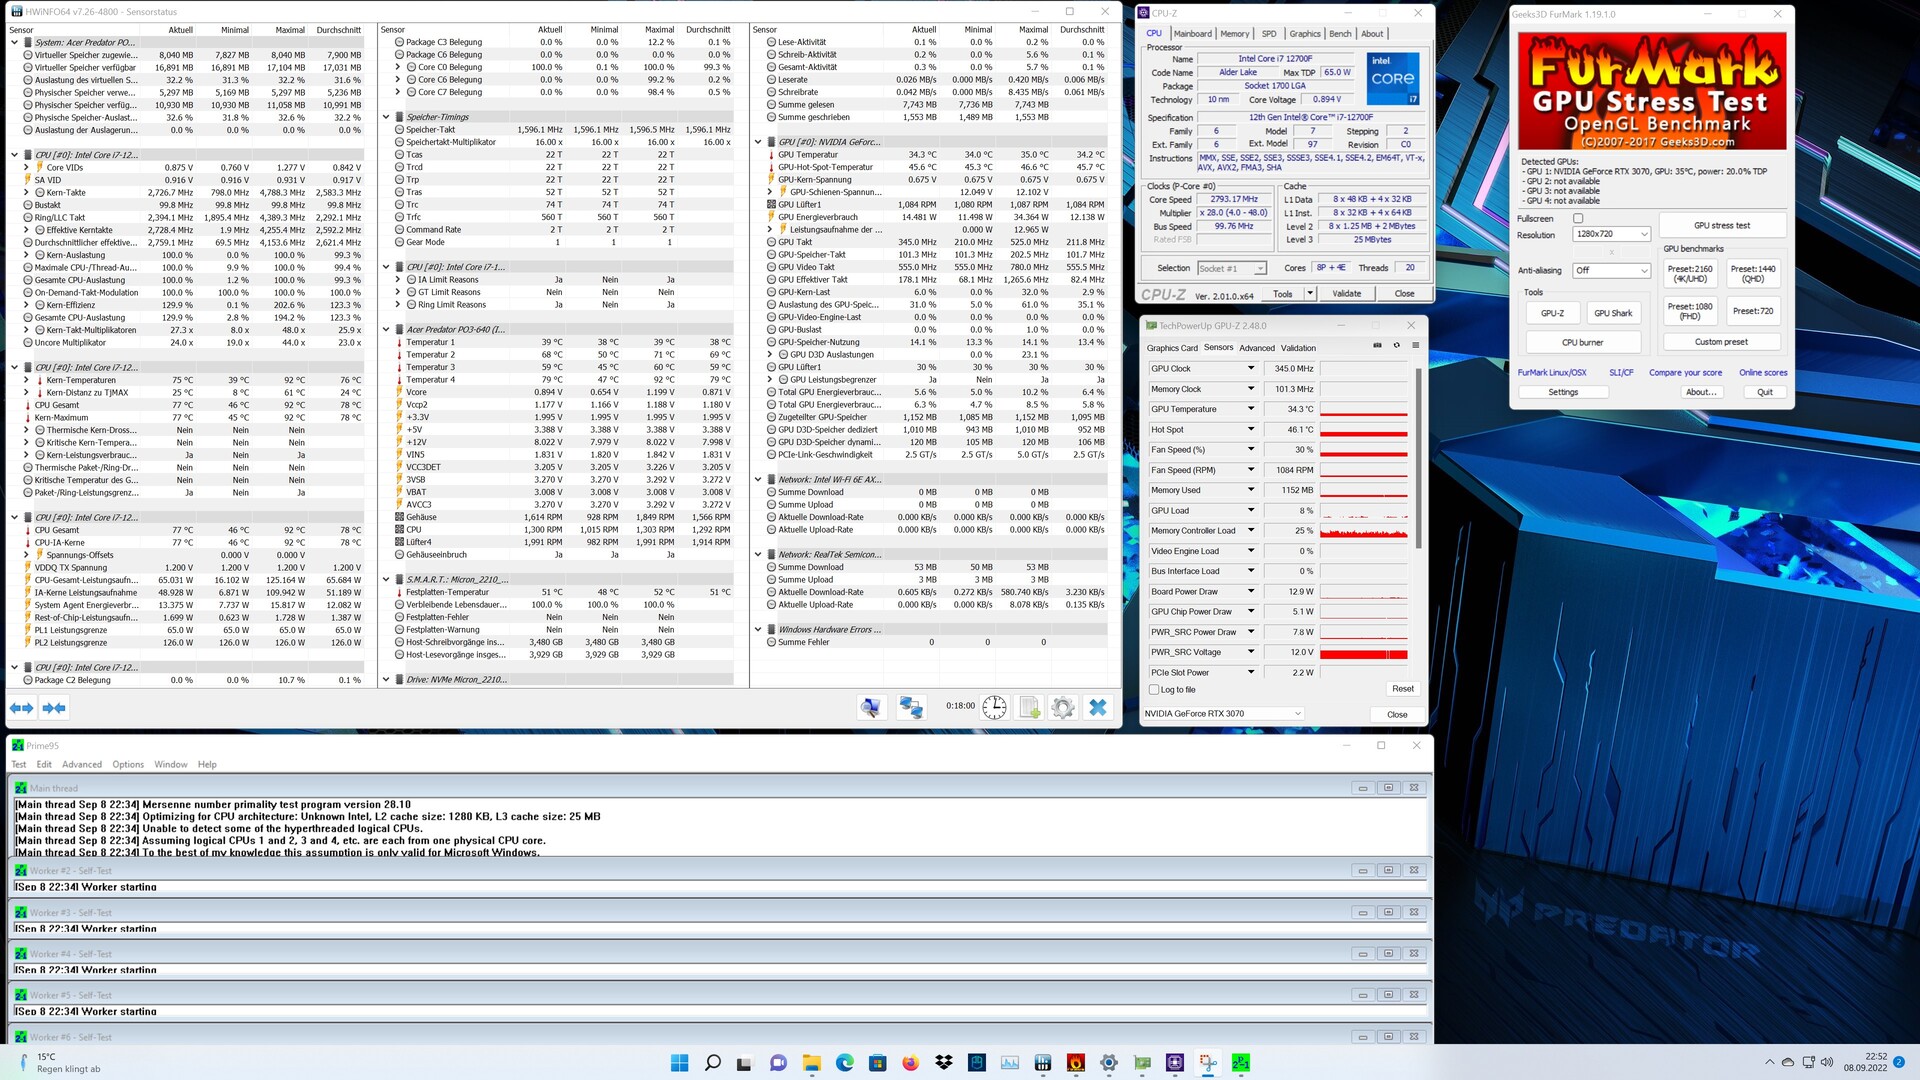
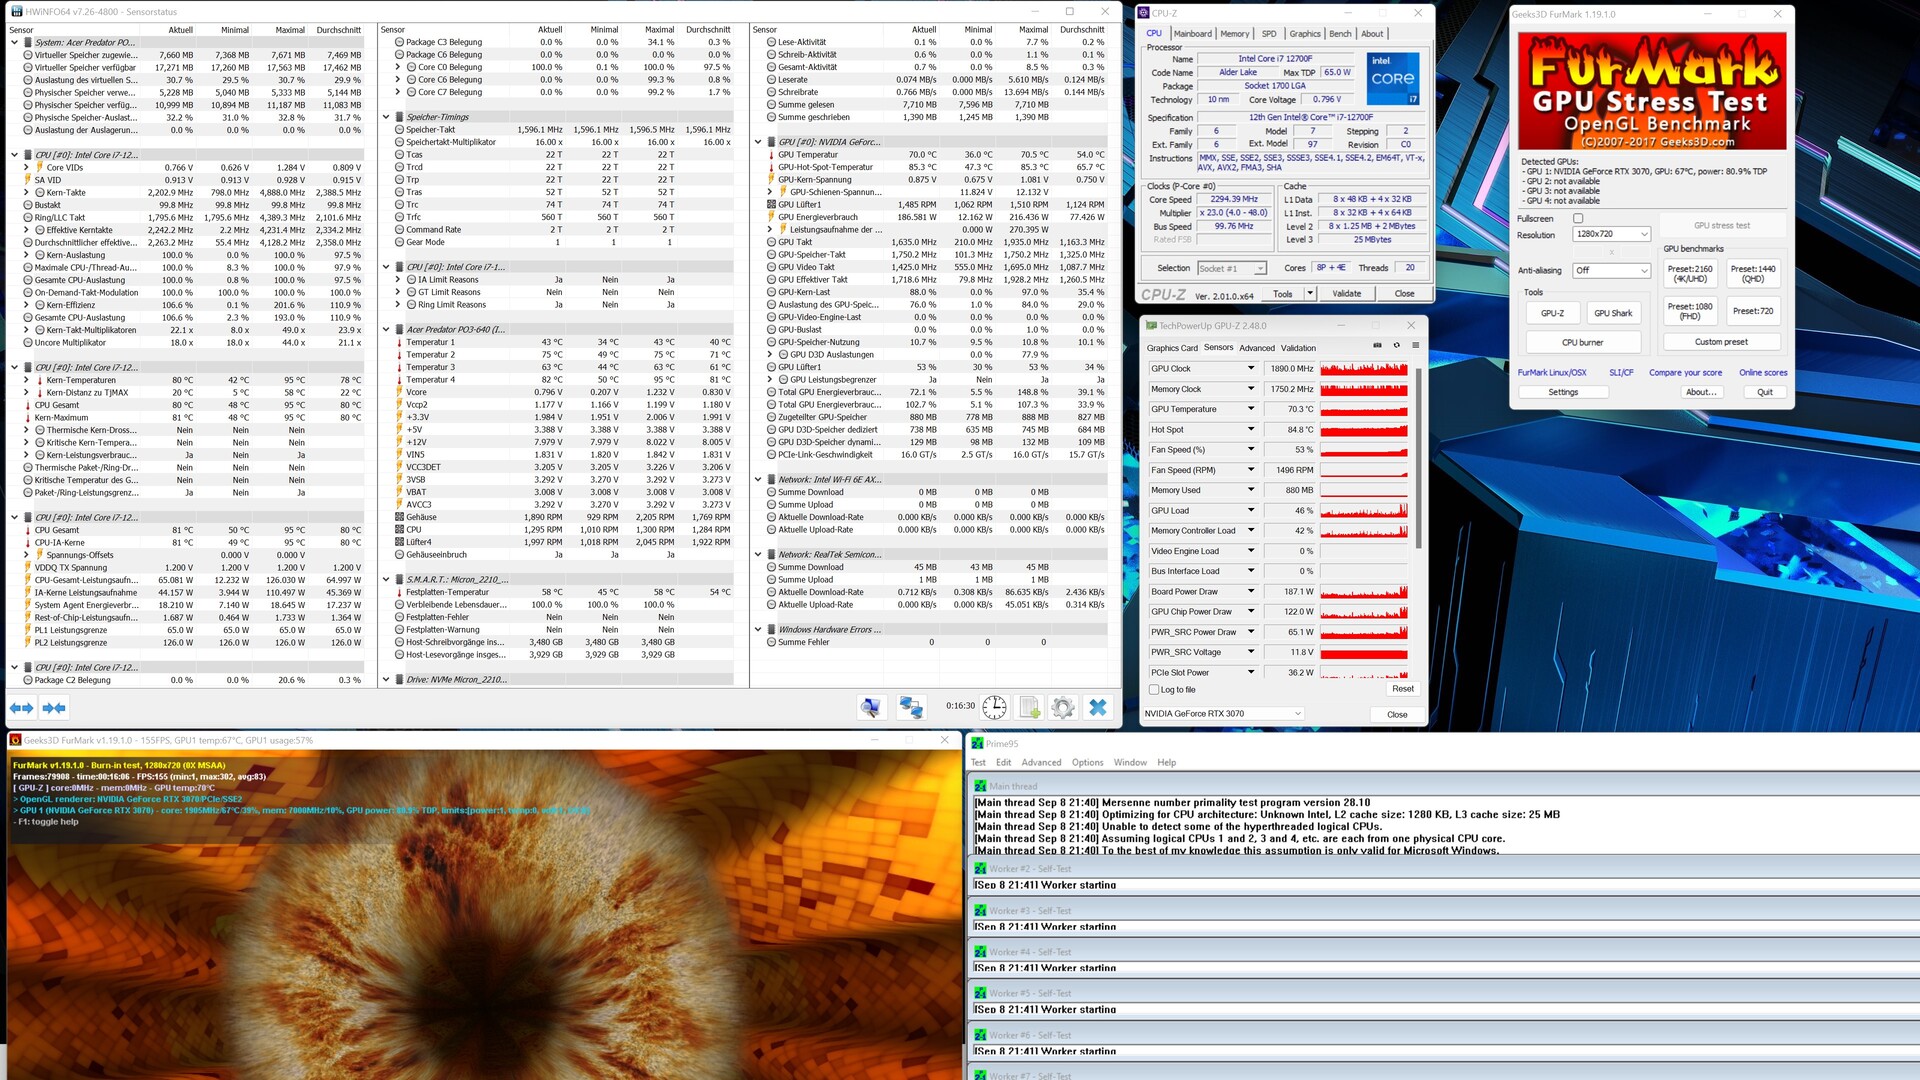
With the Intel Core i7-12700F, the Predator Orion 3000 in this review is equipped with the fastest model that Acer offers for this PC. The 65-watt SoC offers 8 P-cores and 4 E-cores, which together can process up to 20 threads simultaneously. However, Acer restricts the Intel Core i7-12700F somewhat when it comes to maximum power, as the PL2 is normally 180 watts for this model. Acer, on the other hand, limits the maximum power consumption here at 126 watts for a maximum of 28 seconds. Compared to the other comparison devices, the Acer Predator Orion 3000 can still achieve a good result. Nevertheless, the manufacturer gives away performance for a better overall result.
For further comparisons and benchmarks, we refer to our CPU comparison chart.
* ... smaller is better
AIDA64: FP32 Ray-Trace | FPU Julia | CPU SHA3 | CPU Queen | FPU SinJulia | FPU Mandel | CPU AES | CPU ZLib | FP64 Ray-Trace | CPU PhotoWorxx
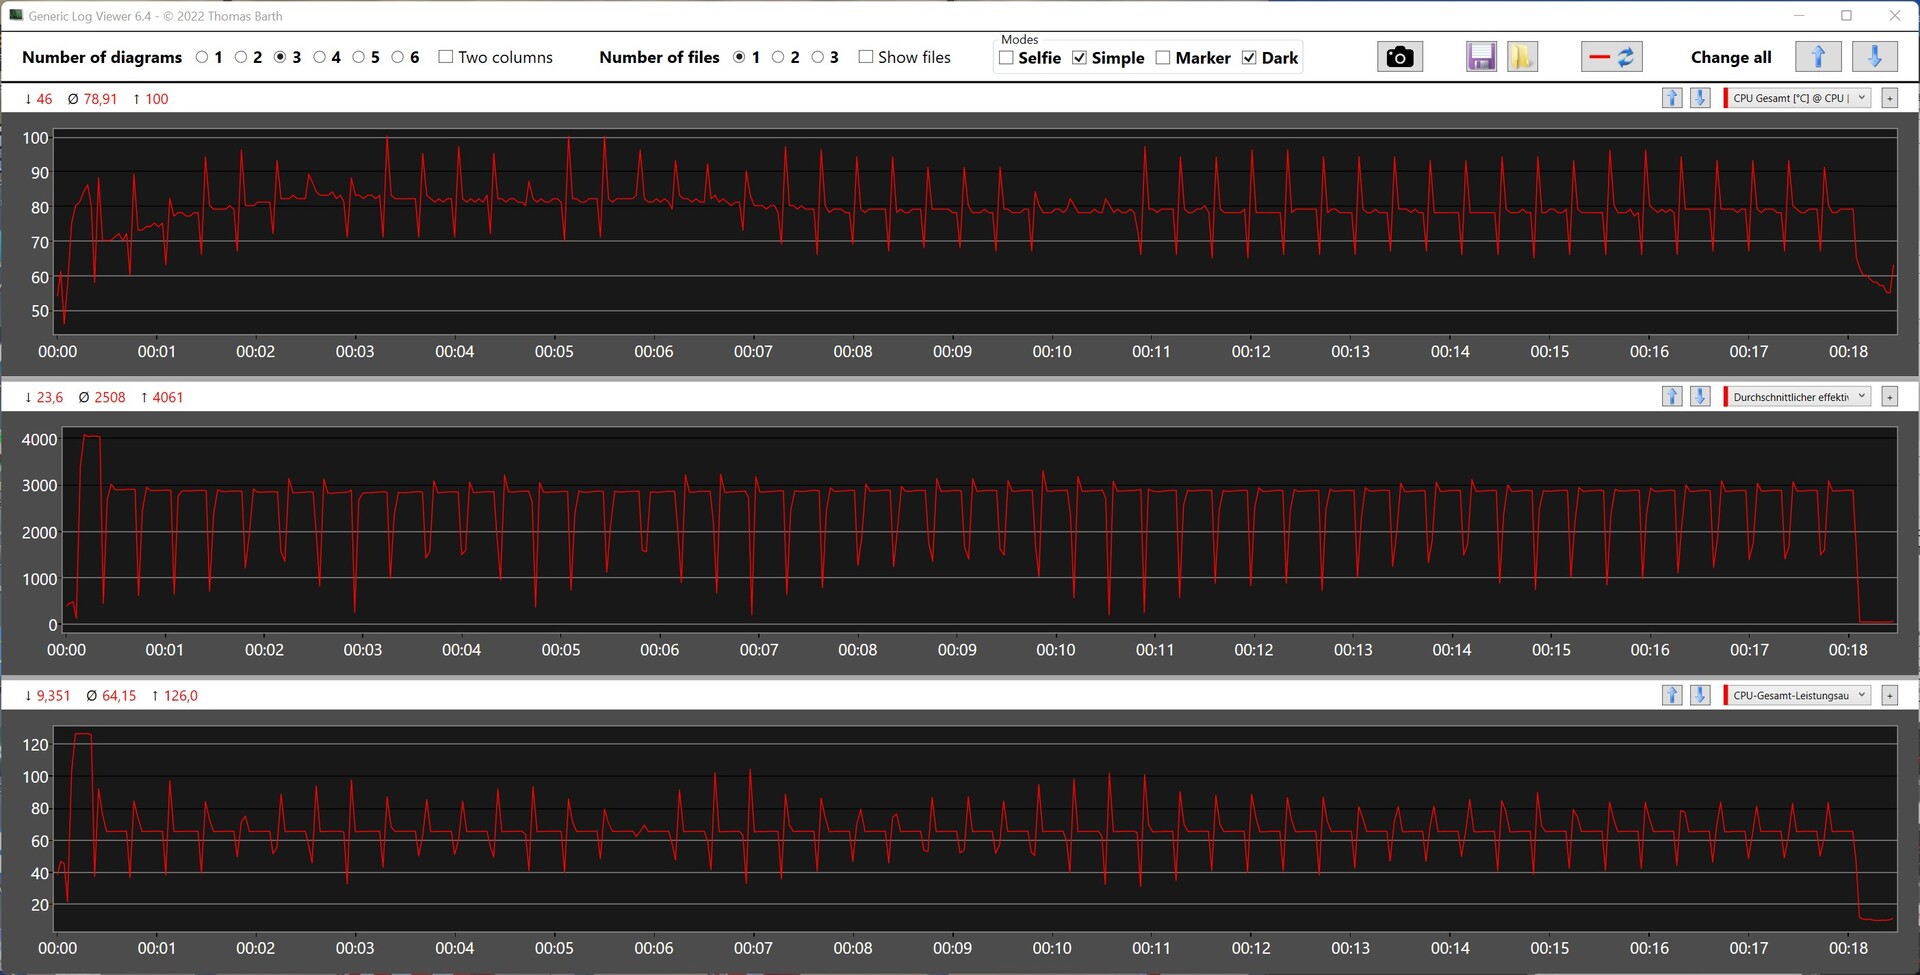
Acer Predator Orion 3000 in the Cinebench R15 multi-loop
We get a good first insight in terms of efficiency in conjunction with the built-in cooling during the Cinebench R15 continuous loop. After the first run, the performance drops drastically because the increased PL2 can only be maintained longer during the first run than during the further runs. The recorded CPU metrics during the test show this very well.
System performance
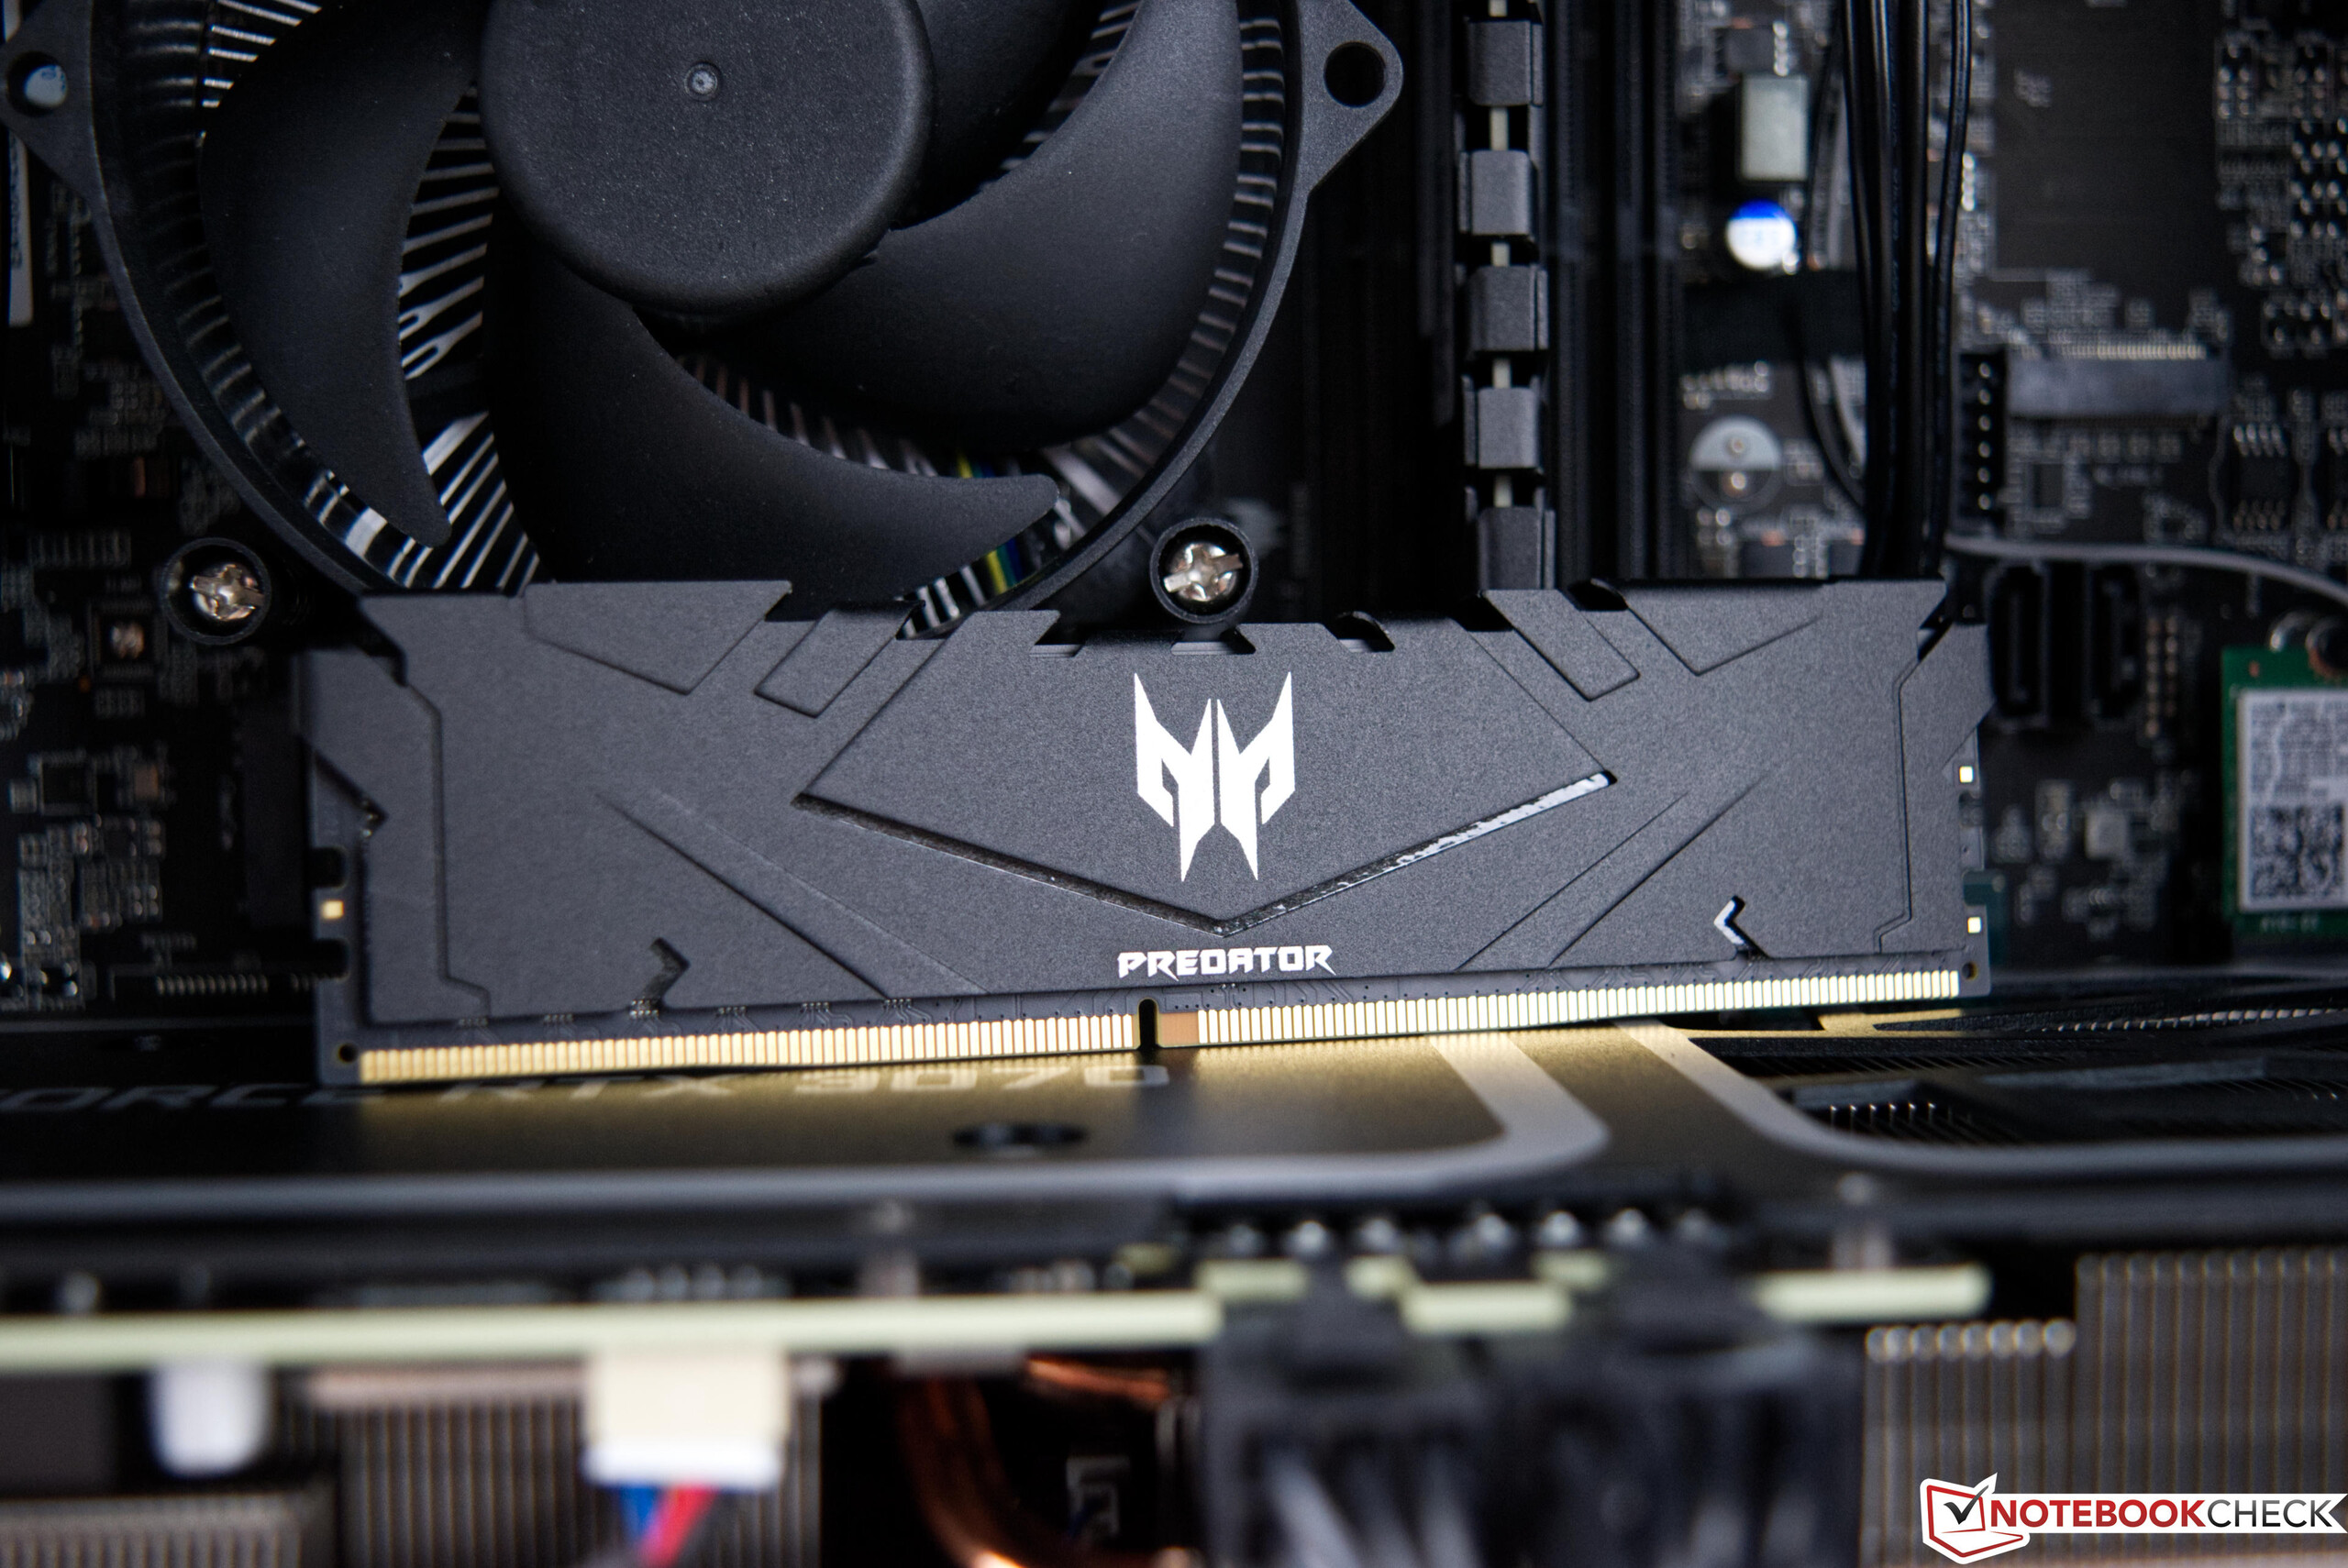
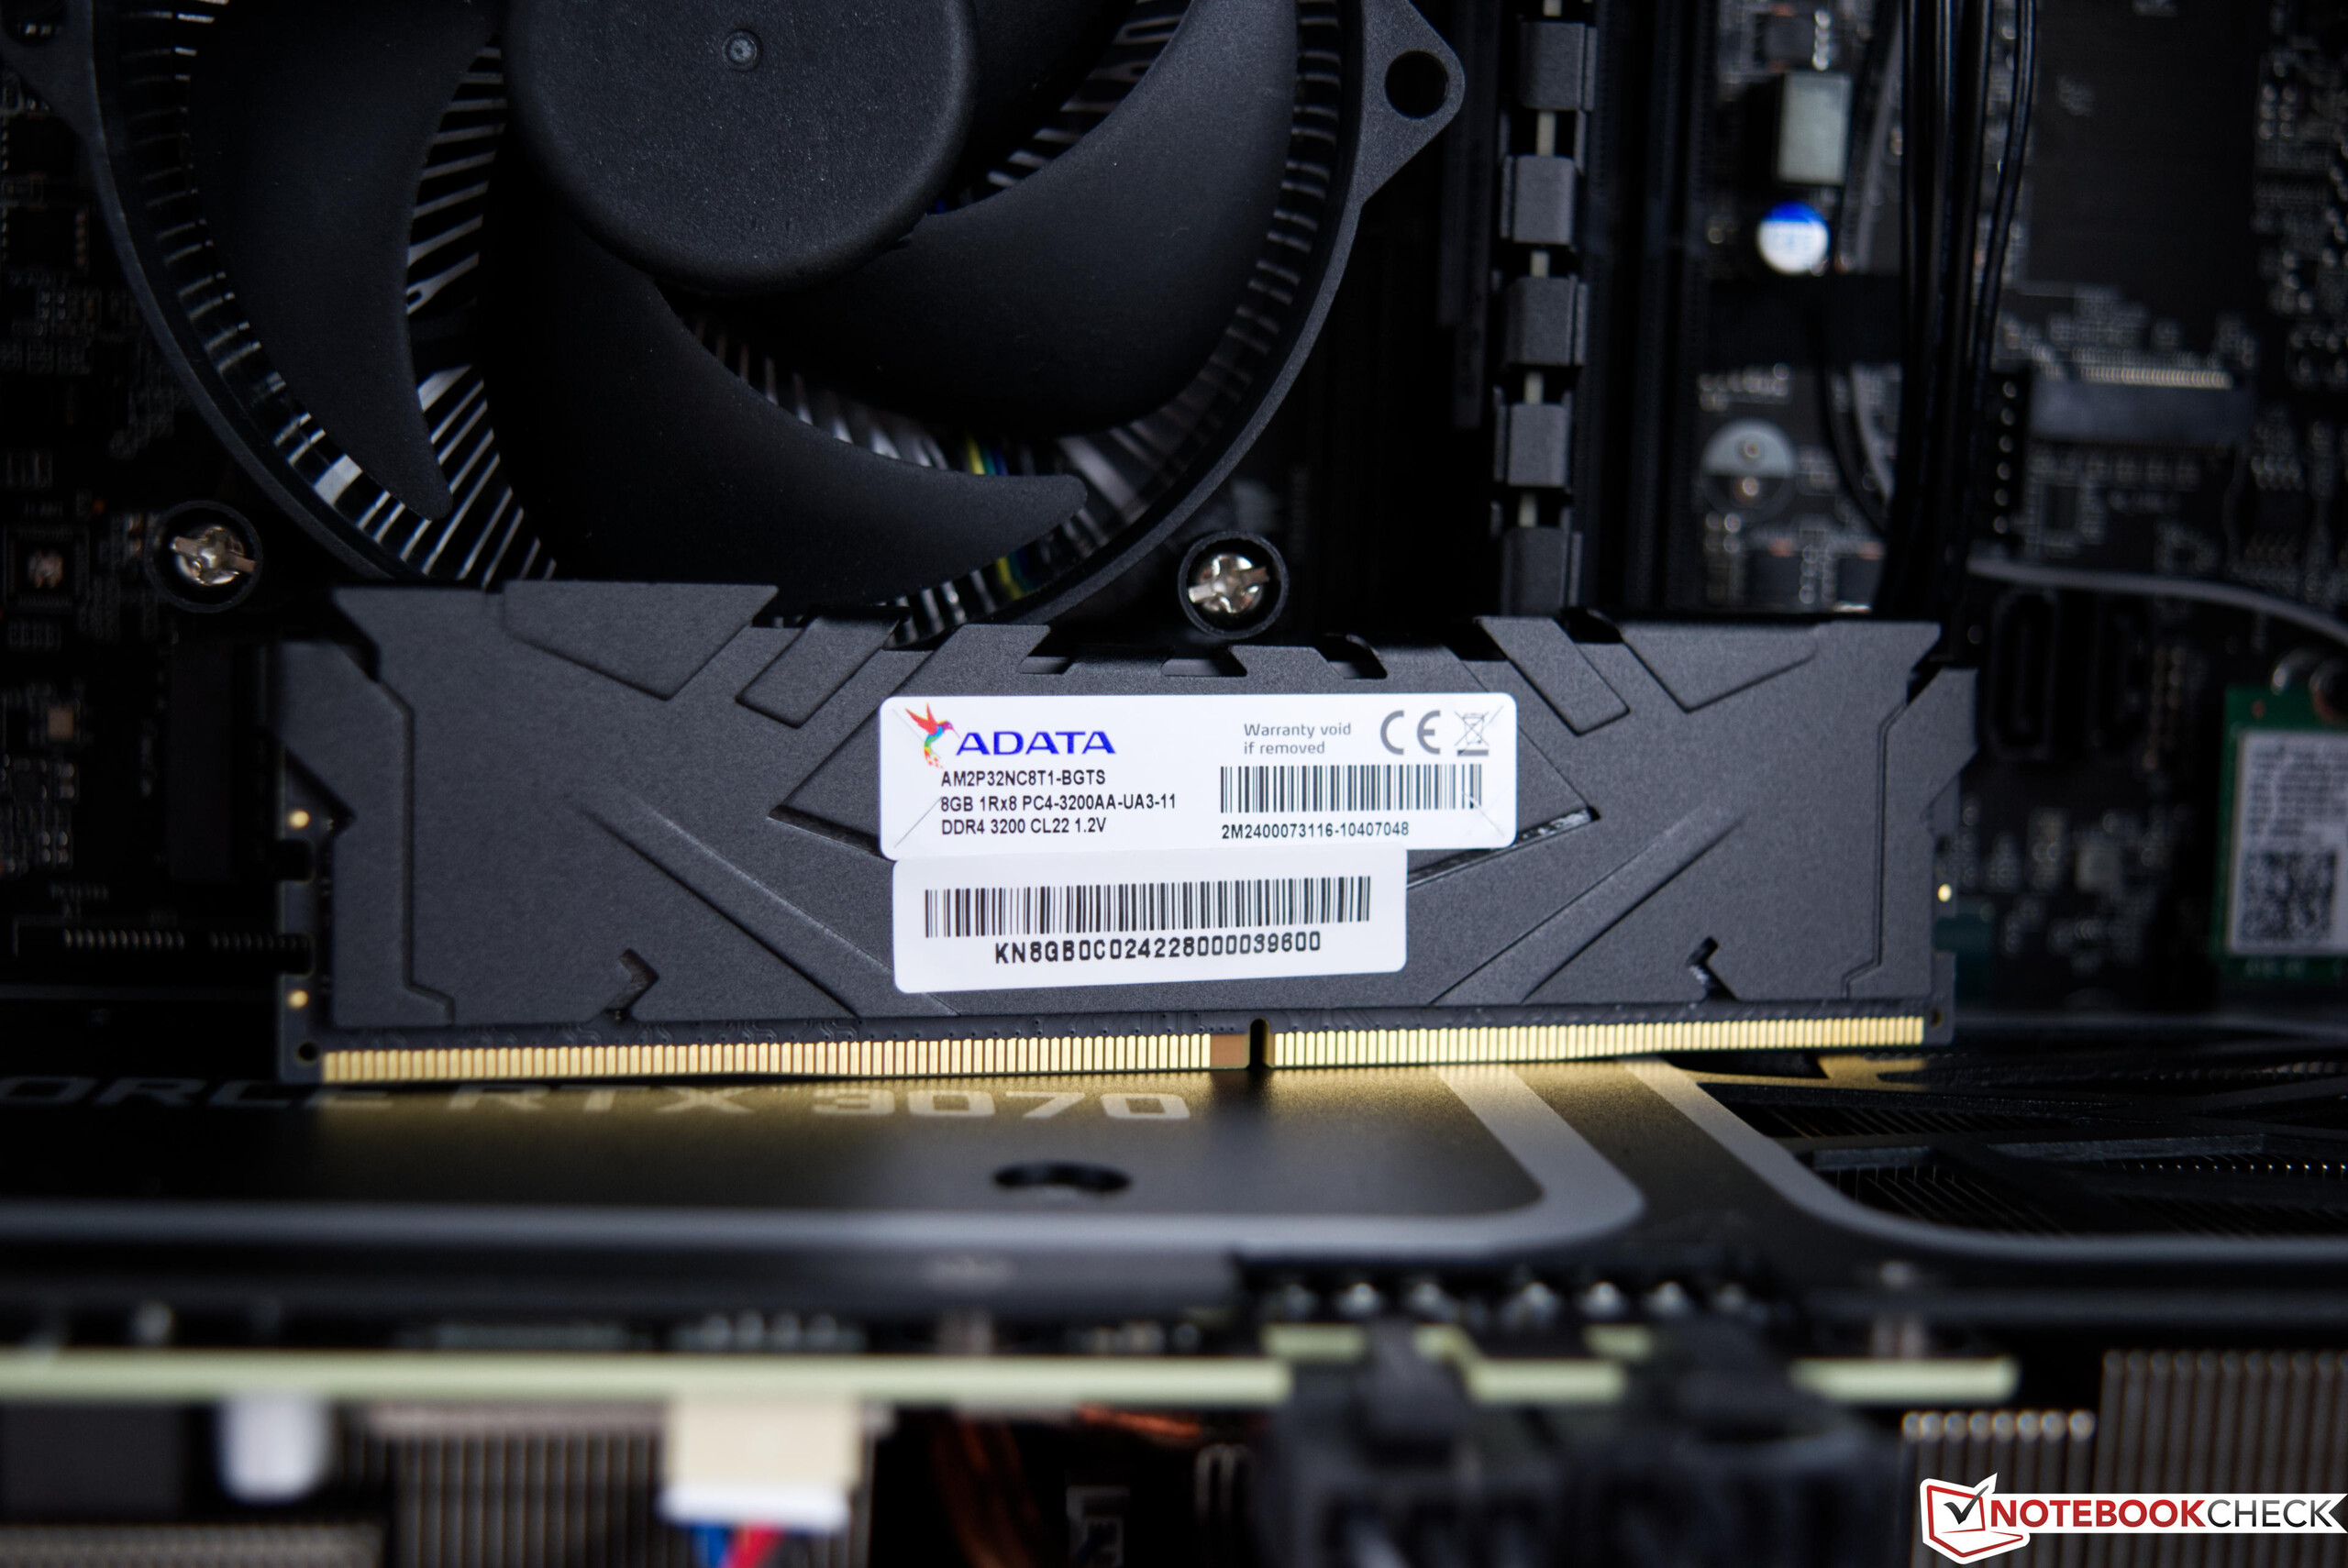
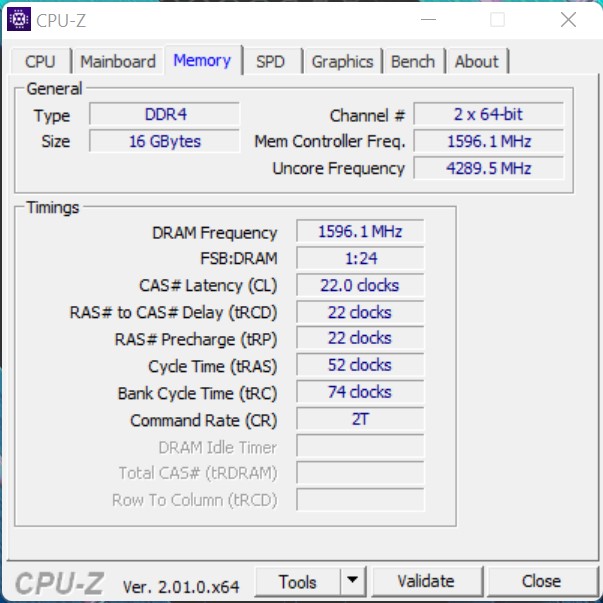
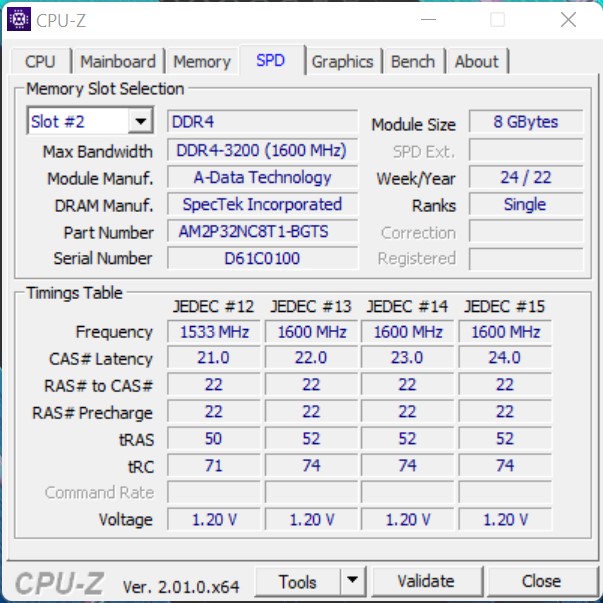
The fact that the system performance benchmarks do not call up the full performance permanently clearly suits the Acer Predator Orion 3000. The results are good and only a few percentage points worse than those of the Intel Dragon Canyon NUC with Intel Core i9-12900. The working memory performs quite well compared to the comparison devices here in the test, although a bit more performance could be achieved with faster RAM and lower latencies.
| AIDA64 / Memory Copy | |
| Average of class Desktop (54743 - 98416, n=21, last 2 years) | |
| Acer Predator Orion 3000 PO3-640 | |
| Average Intel Core i7-12700F (n=1) | |
| Intel Beast Canyon NUC | |
| Intel Dragon Canyon NUC - RTX 3060 | |
| Zotac ZBOX Magnus EN173070C | |
| Zotac MEK Mini (RTX 2070 Super) | |
| AIDA64 / Memory Read | |
| Average of class Desktop (58375 - 110448, n=21, last 2 years) | |
| Zotac ZBOX Magnus EN173070C | |
| Acer Predator Orion 3000 PO3-640 | |
| Average Intel Core i7-12700F (n=1) | |
| Intel Beast Canyon NUC | |
| Intel Dragon Canyon NUC - RTX 3060 | |
| Zotac MEK Mini (RTX 2070 Super) | |
| AIDA64 / Memory Write | |
| Average of class Desktop (60635 - 93889, n=21, last 2 years) | |
| Zotac ZBOX Magnus EN173070C | |
| Intel Beast Canyon NUC | |
| Intel Dragon Canyon NUC - RTX 3060 | |
| Acer Predator Orion 3000 PO3-640 | |
| Average Intel Core i7-12700F (n=1) | |
| Zotac MEK Mini (RTX 2070 Super) | |
| AIDA64 / Memory Latency | |
| Average of class Desktop (68.5 - 168, n=21, last 2 years) | |
| Intel Beast Canyon NUC | |
| Intel Dragon Canyon NUC - RTX 3060 | |
| Zotac ZBOX Magnus EN173070C | |
| Acer Predator Orion 3000 PO3-640 | |
| Average Intel Core i7-12700F (n=1) | |
| Zotac MEK Mini (RTX 2070 Super) | |
* ... smaller is better
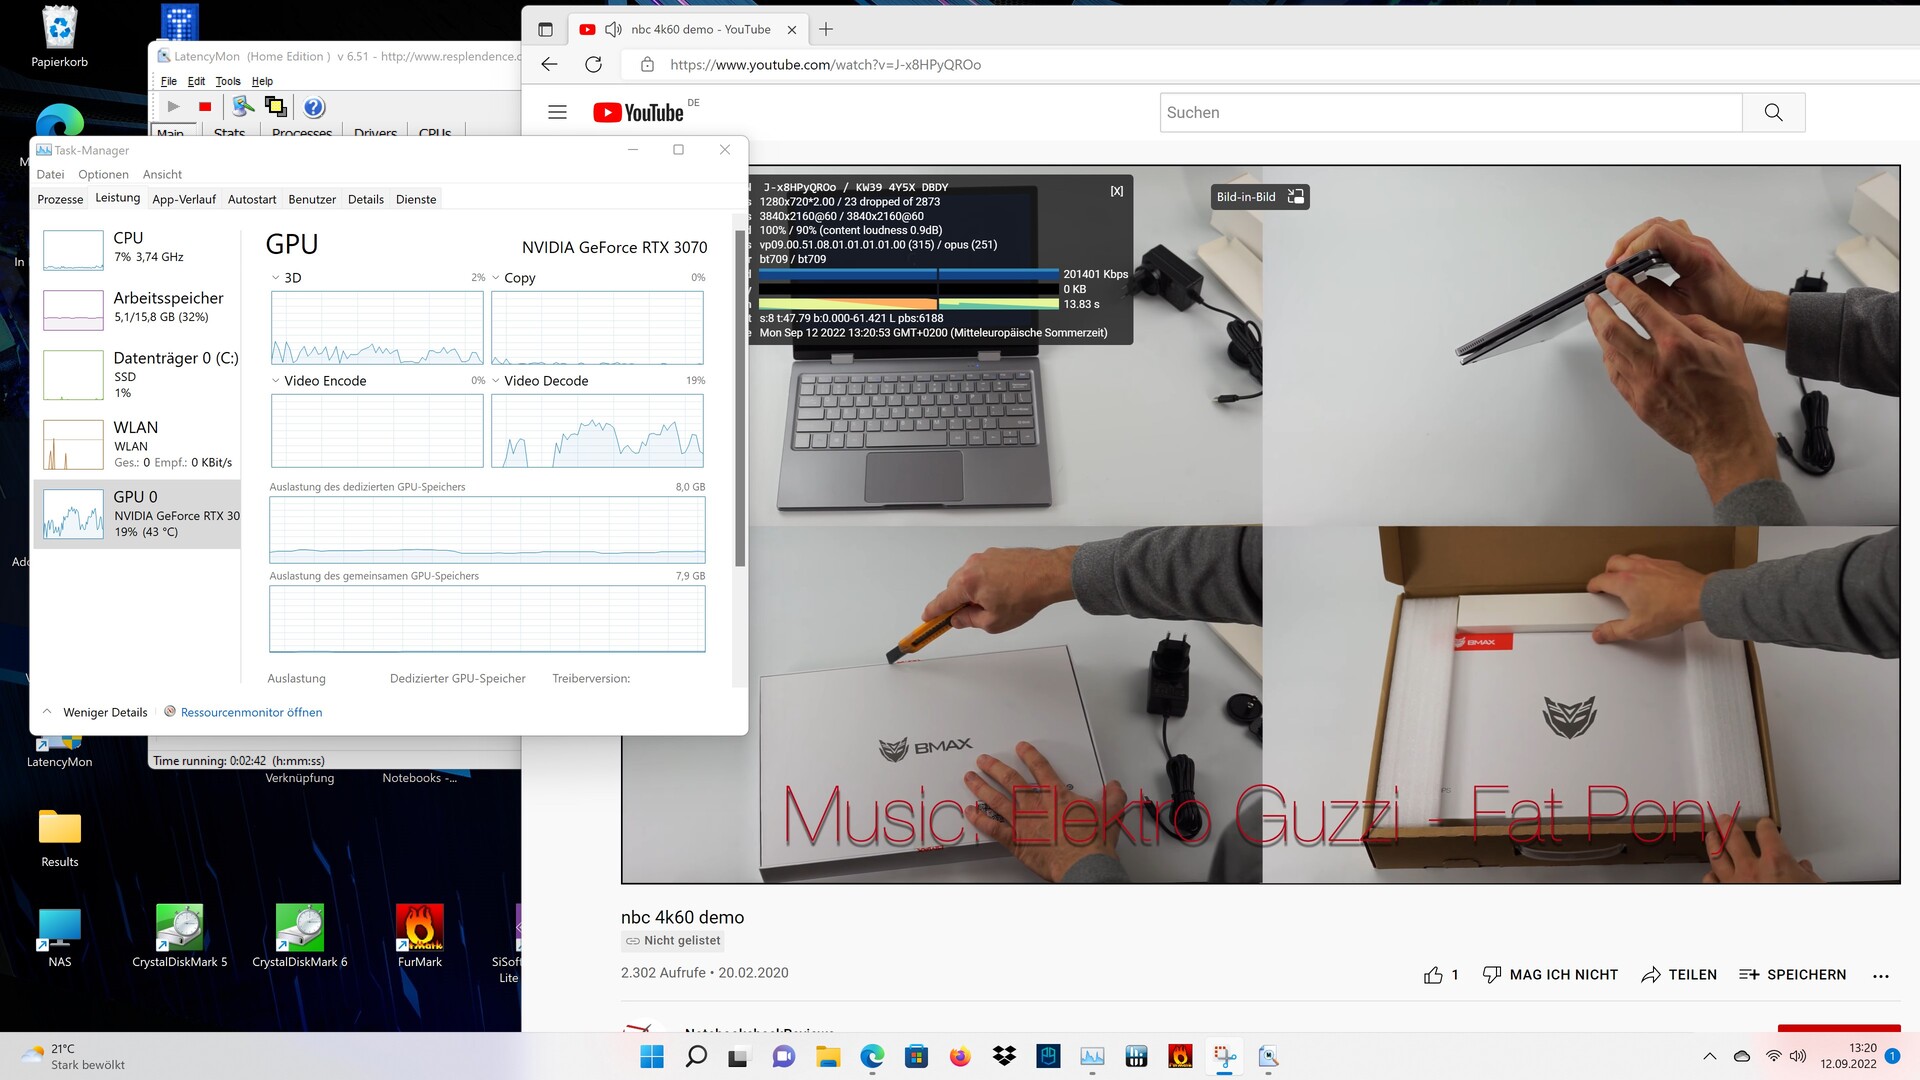
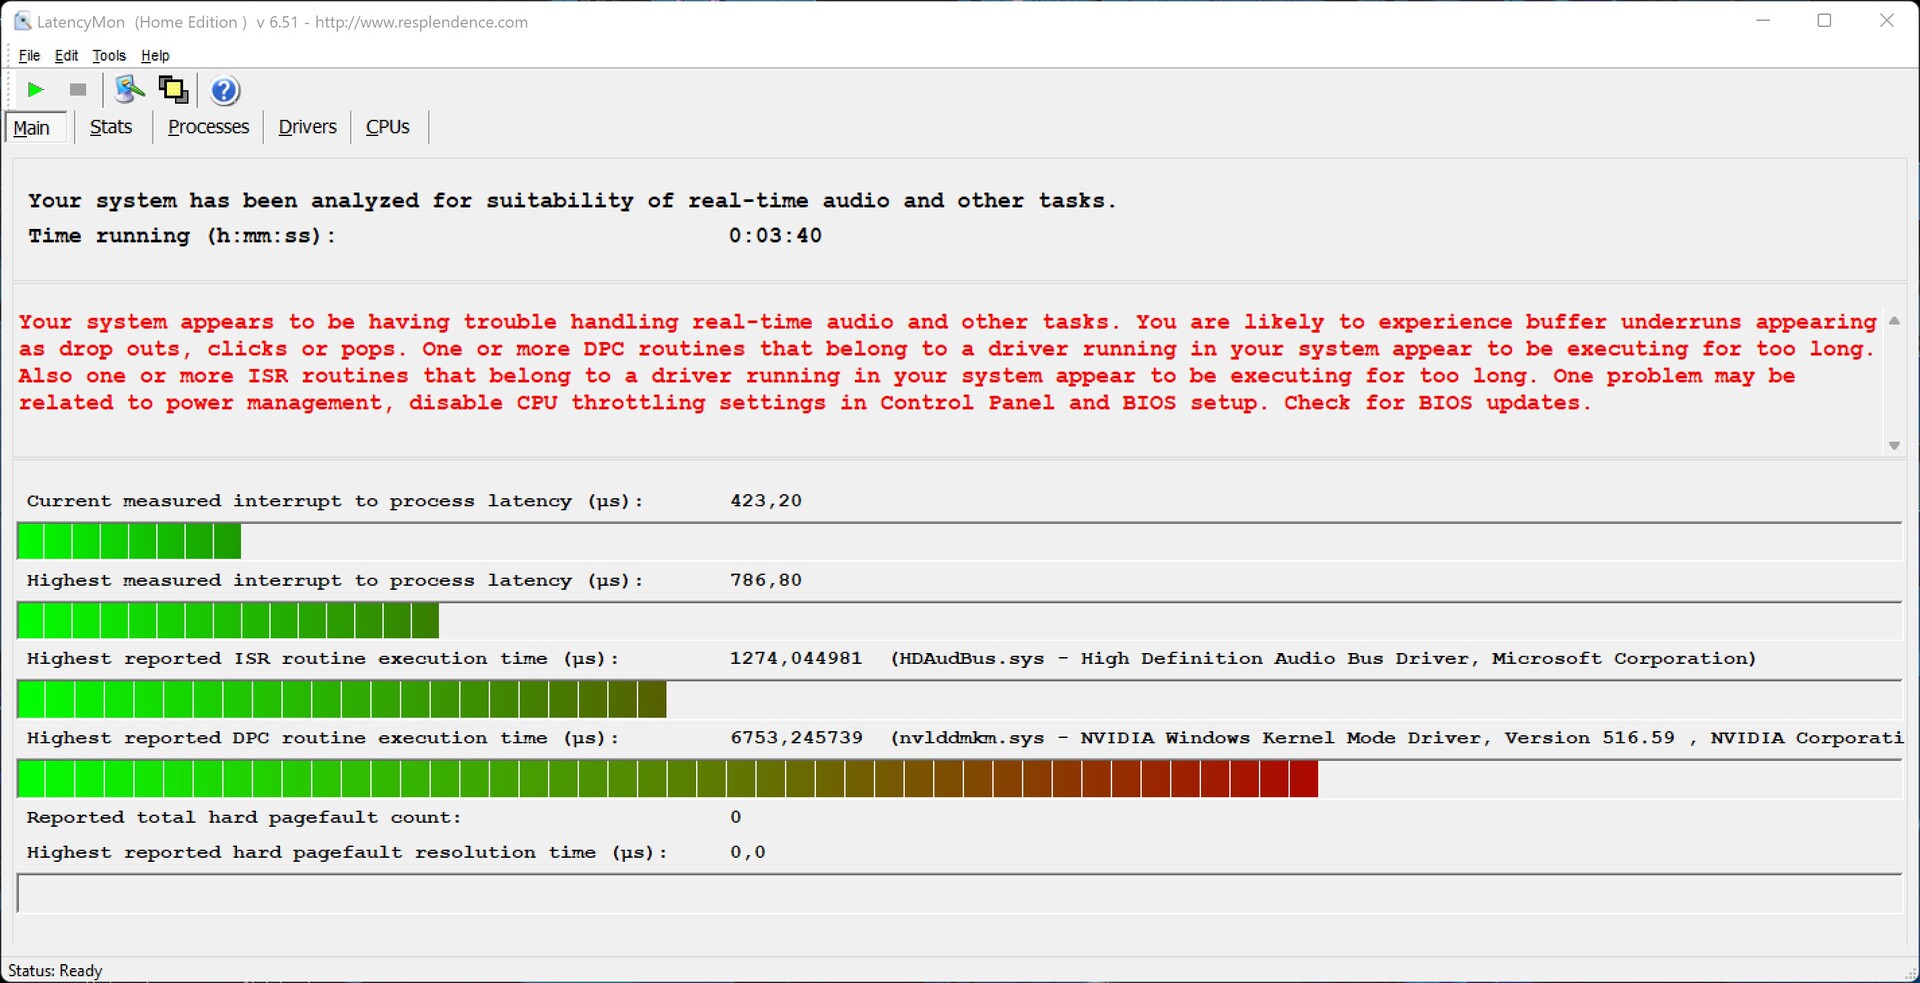
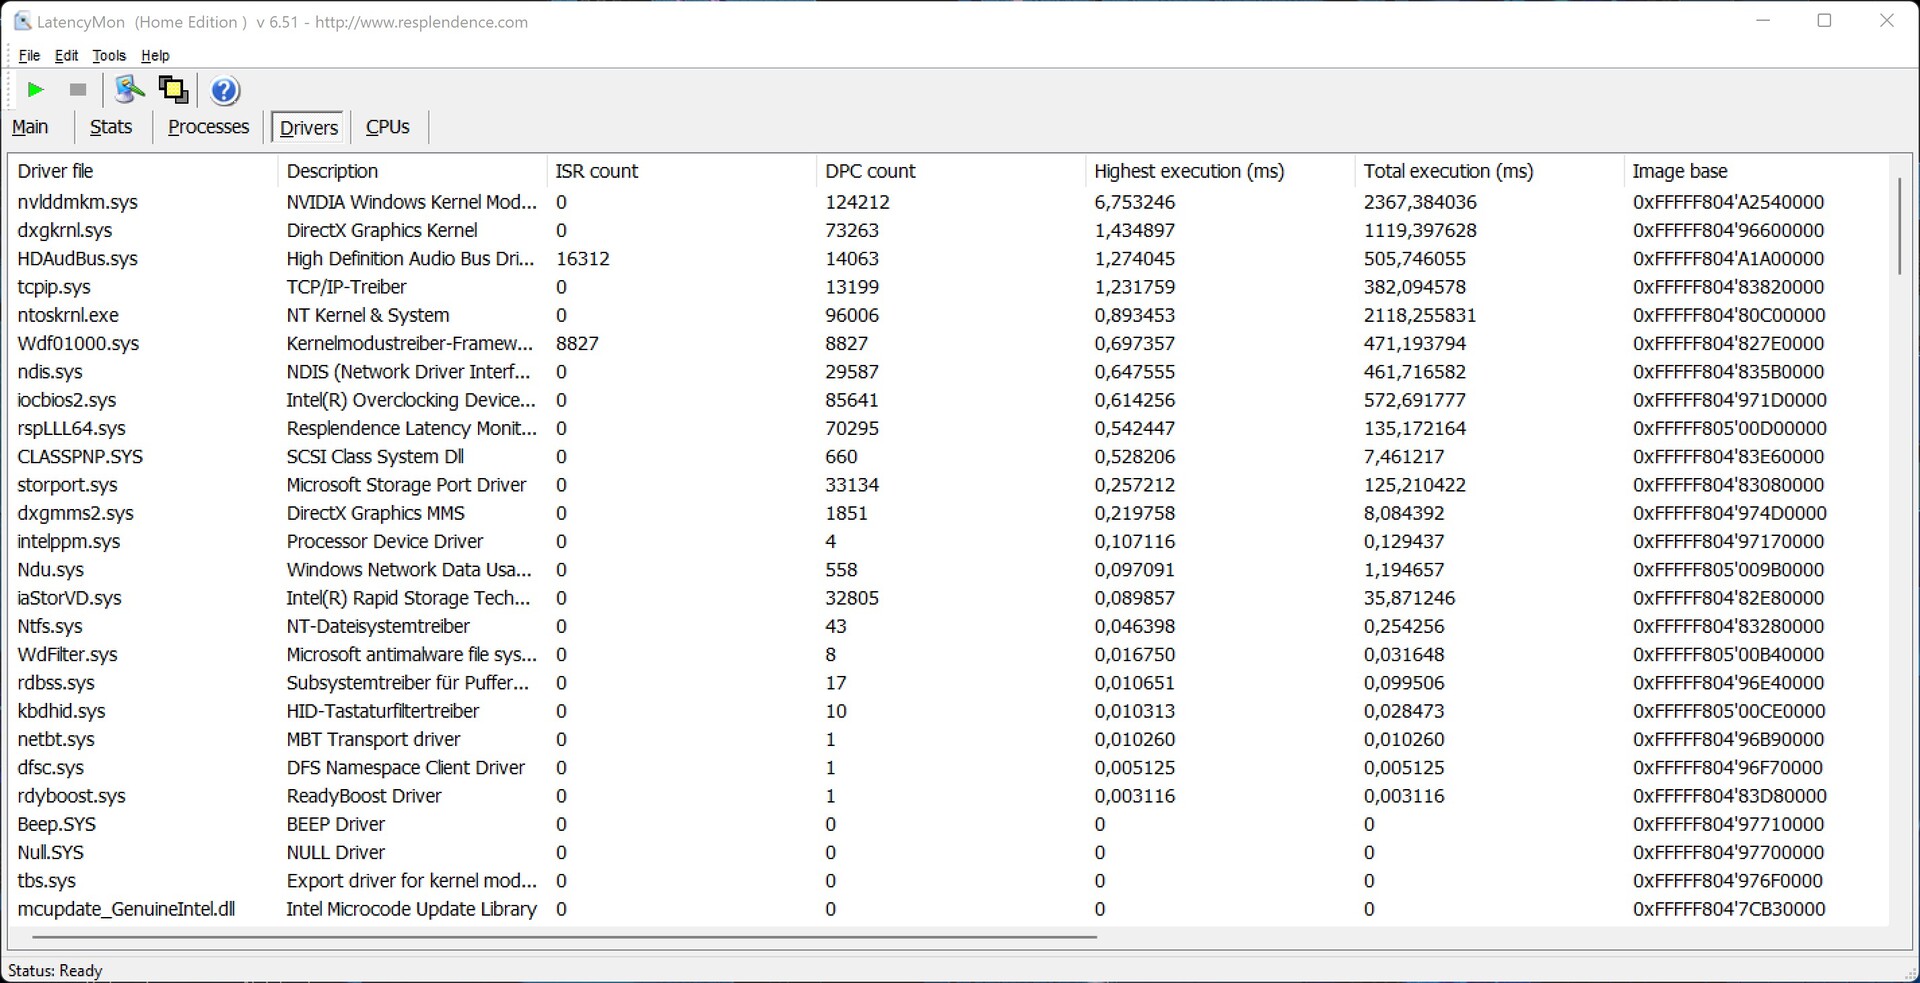
DPC latencies
LatencyMon already reports latency problems when opening multiple tabs in Edge. The drivers do not yet seem to be optimized here.
| DPC Latencies / LatencyMon - interrupt to process latency (max), Web, Youtube, Prime95 | |
| Acer Predator Orion 3000 PO3-640, Intel Core i7-12700F | |
| Minisforum EliteMini B550, AMD Ryzen 7 5700G | |
| Asus ExpertCenter D9 SFF, Intel Core i7-11700 | |
| Zotac ZBOX Magnus EN173070C, Intel Core i7-11800H | |
| Minisforum EliteMini HX90, AMD Ryzen 9 5900HX | |
* ... smaller is better
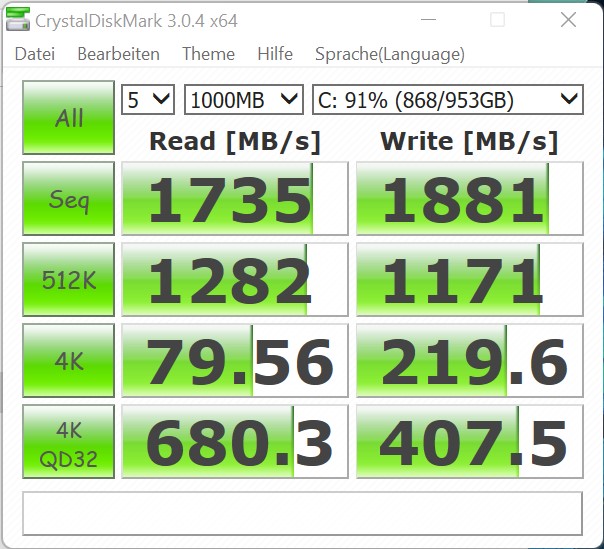
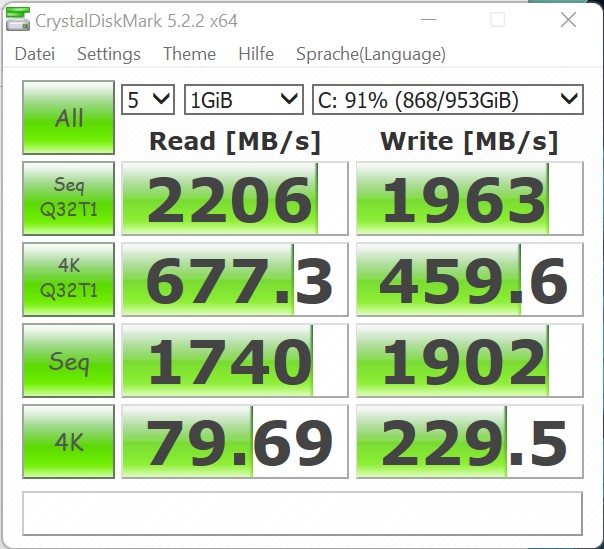
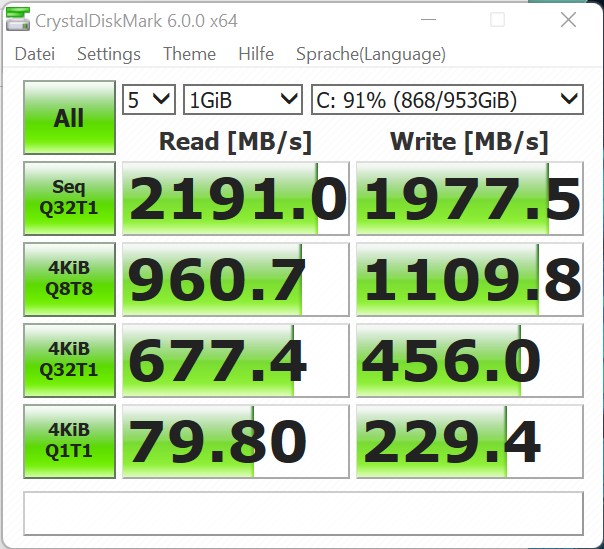
Mass storage
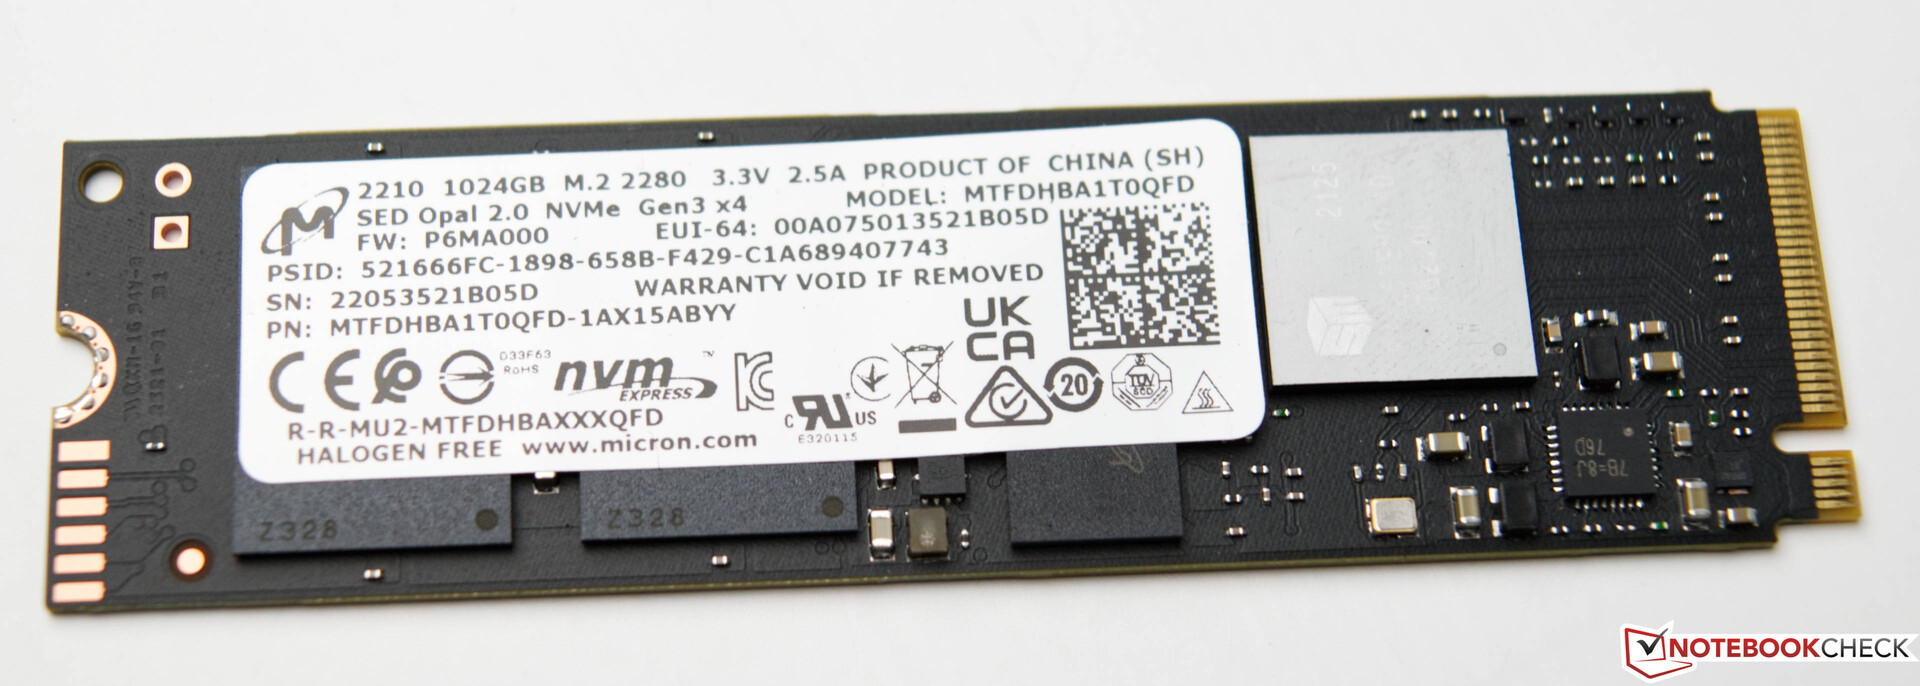
Our test sample is equipped with a 1 TB SSD from Micron. The M.2 module offers good transfer rates, although the maximum values cannot quite keep up with the comparison devices. However, this is hardly noticed in everyday use. The 4K read rate, for example, has a much bigger impact, which turns out very well in the Acer Predator Orion 3000. The storage capacity of 1 TB is sufficient and should not be smaller for a gaming device in our opinion. The mass storage of the Acer Predator Orion 3000 can be expanded relatively easily. A second M.2 module can be installed on the motherboard. Furthermore, there is also room for two 3.5-inch hard drives in the case. All necessary connection cables are included with the device
For further comparisons and benchmarks, please refer to our Comparison chart.


* ... smaller is better
Disk Throttling: DiskSpd Read Loop, Queue Depth 8
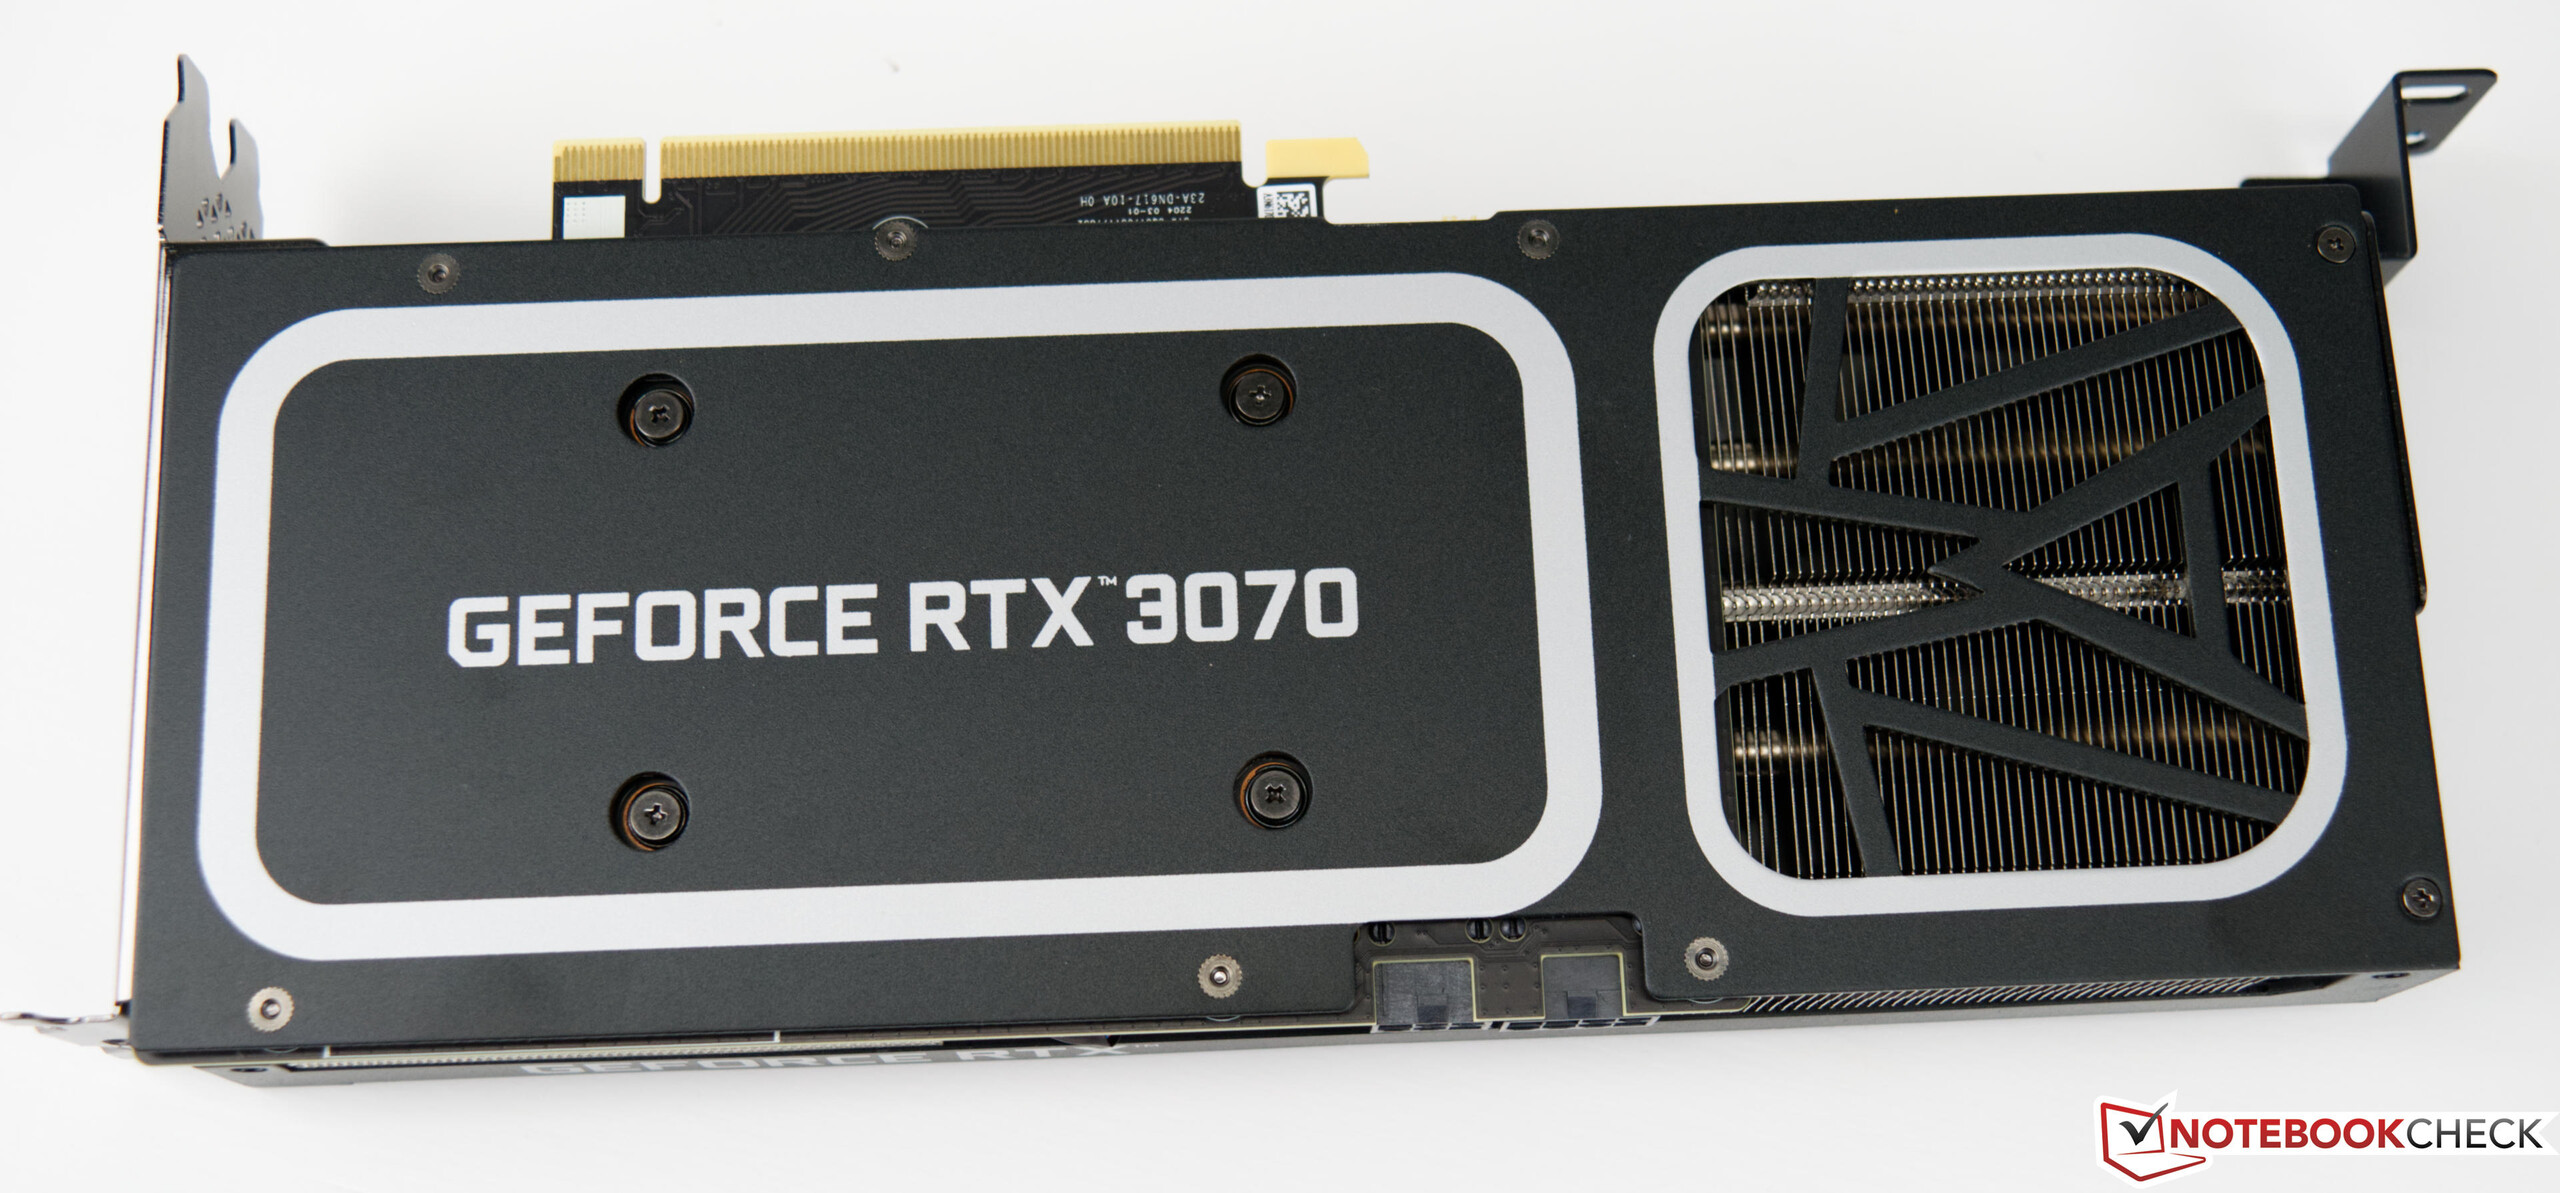
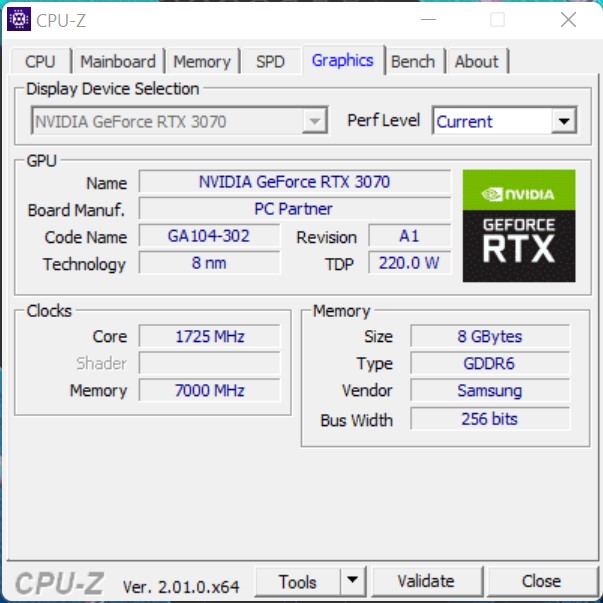
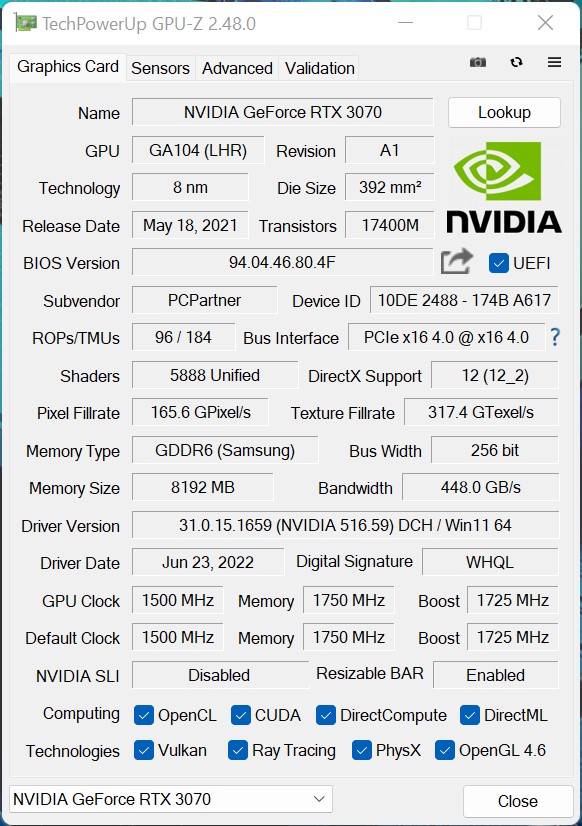
Graphics card
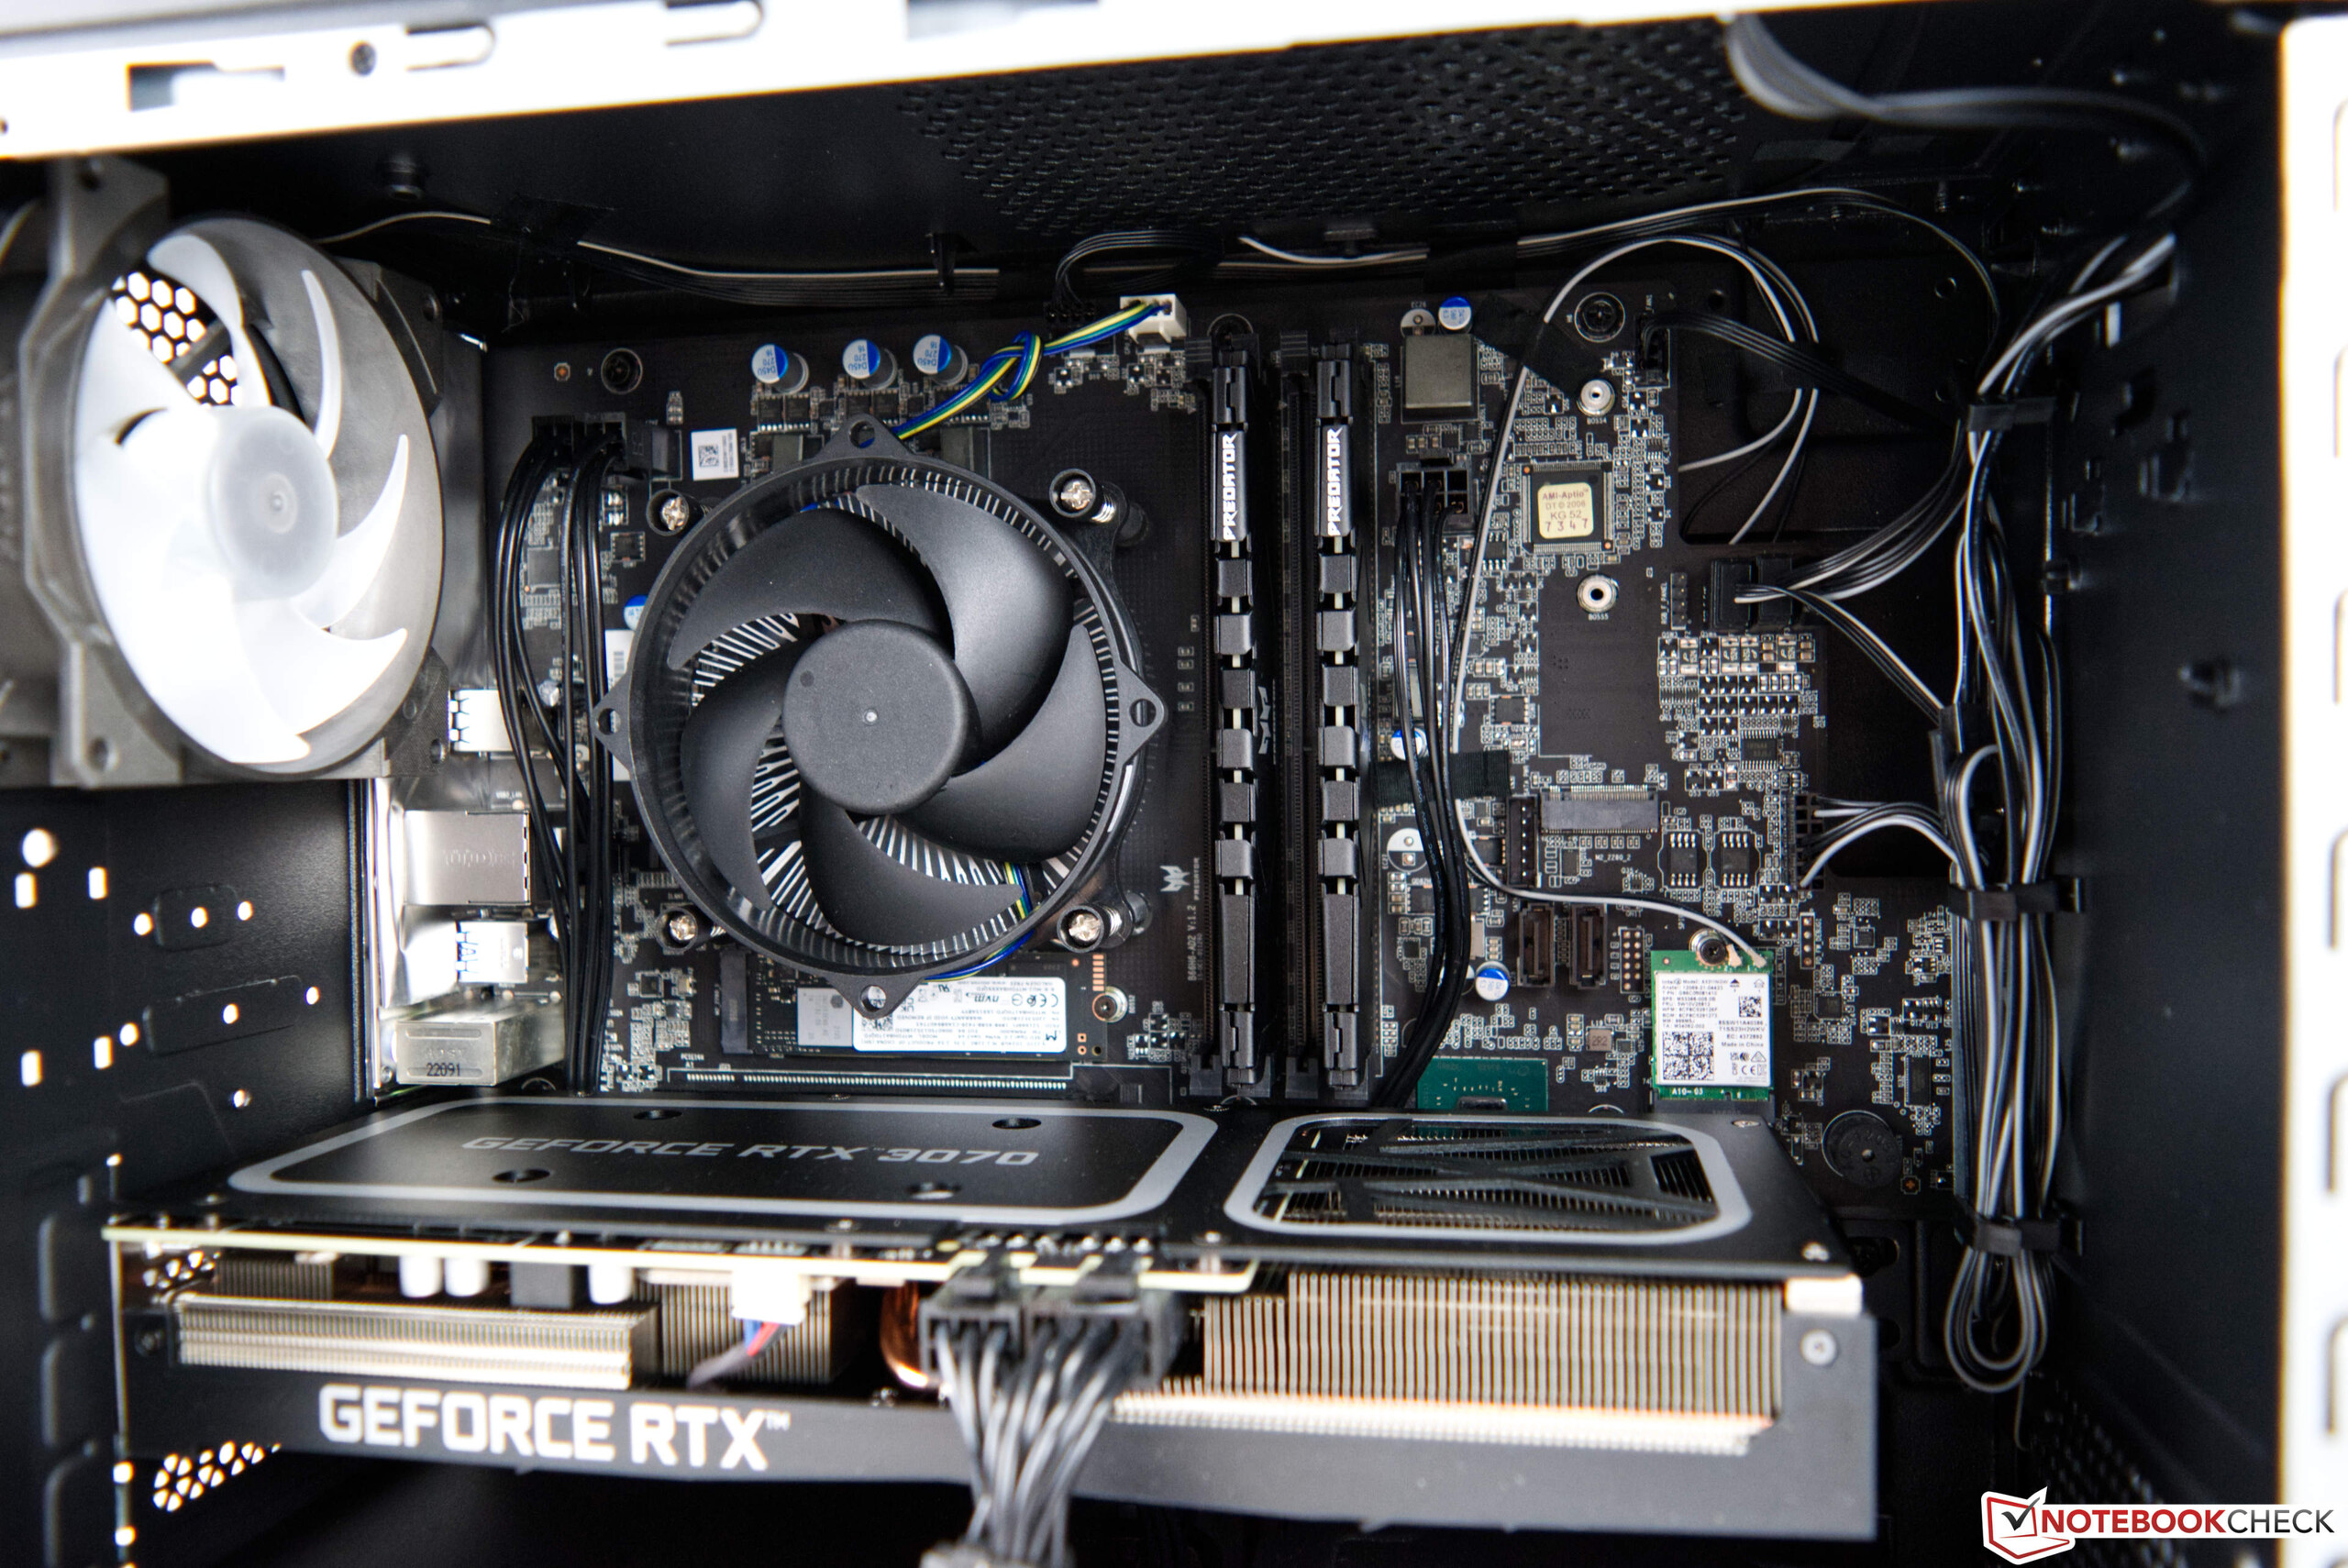
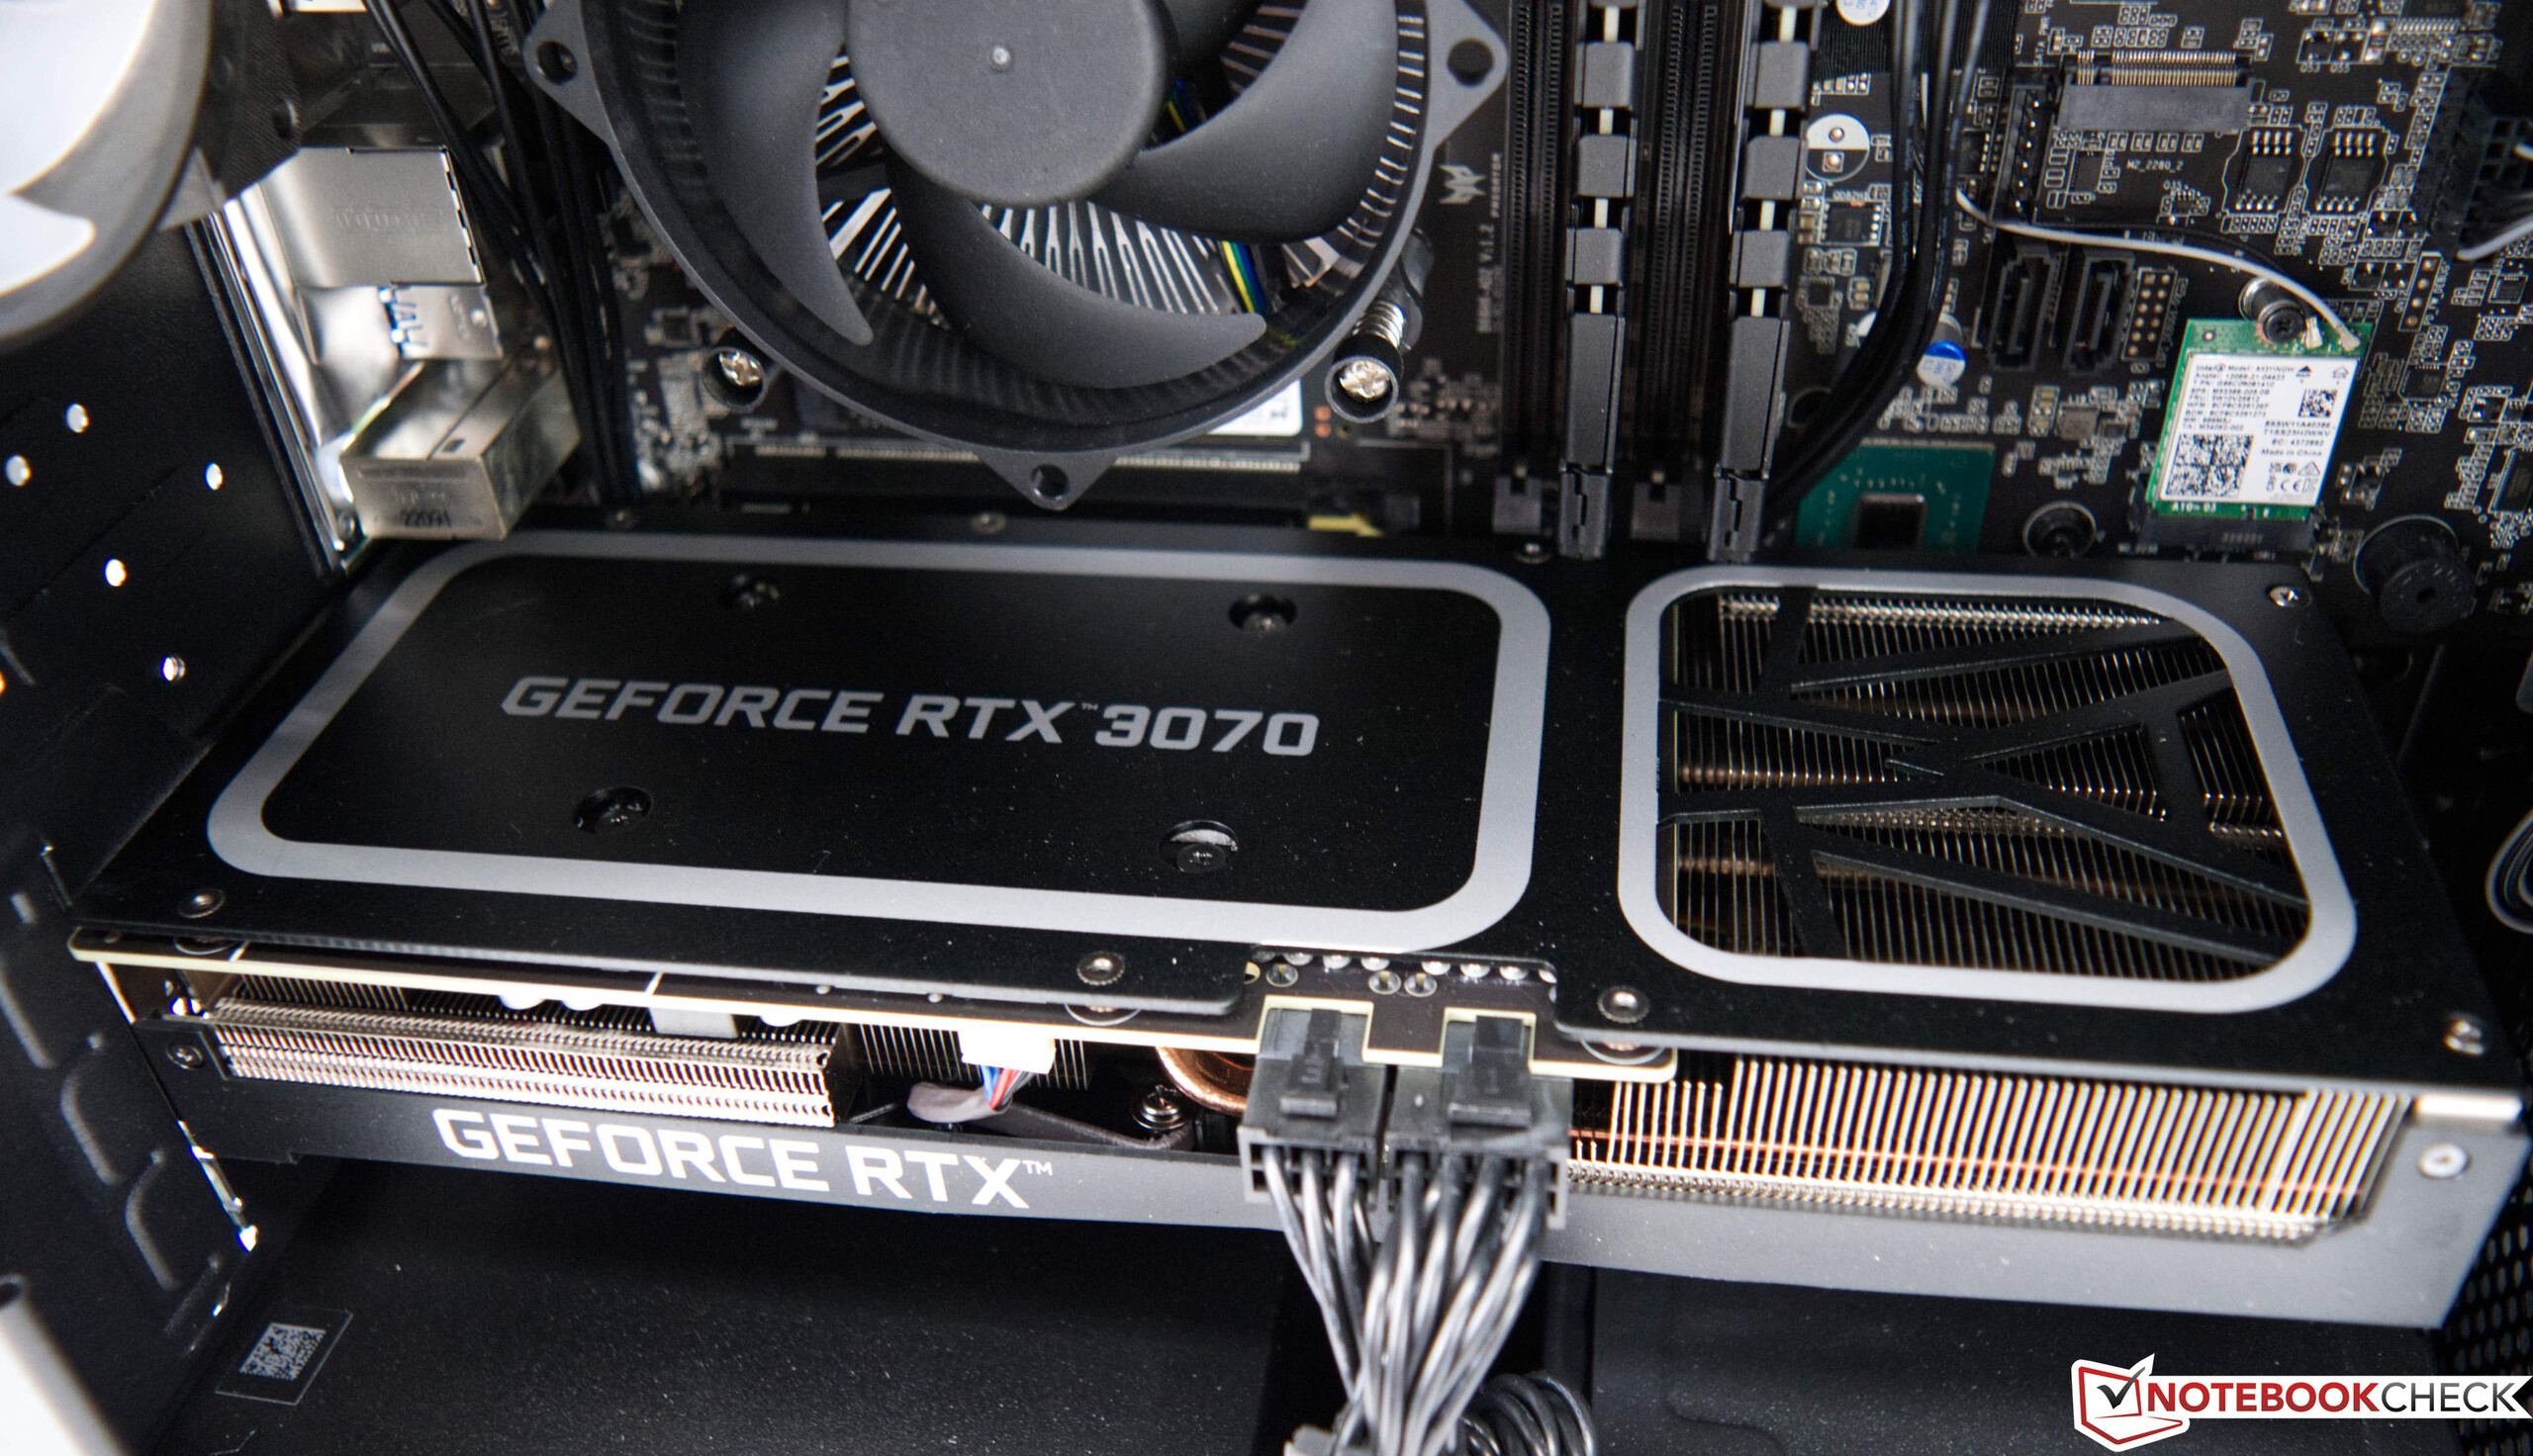
With the Nvidia GeForce RTX 3070, we have the Acer Predator Orion 3000 in the strongest configuration in the test. Considering the somewhat throttled CPU performance, the 3D performance in the synthetic tests turns out very good. The unknown model of the GeForce RTX 3070 works exactly according to the specifications given by Nvidia. That means a GPU clock of 1,500 MHz, which is specified with 1,750 MHz in Boost. As for the VRAM, RTX 3070 typically has 8 GB of GDDR6 and the total power consumption of the installed model is 220 watts. Compared to the Zotac Magnus One the Acer Predator Orion 3000 can prevail due to the better CPU.
More benchmarks of the Nvidia GeForce RTX 3070 can be found here
| Performance rating - Percent | |
| Acer Predator Orion 3000 PO3-640 | |
| Zotac Magnus One (ECM73070C) | |
| Zotac ZBOX Magnus EN173070C | |
| Intel Dragon Canyon NUC - RTX 3060 | |
| Intel Beast Canyon NUC | |
| Unigine Valley 1.0 | |
| 1920x1080 Extreme HD DirectX AA:x8 | |
| Acer Predator Orion 3000 PO3-640 | |
| Zotac Magnus One (ECM73070C) | |
| Zotac ZBOX Magnus EN173070C | |
| Intel Dragon Canyon NUC - RTX 3060 | |
| Intel Beast Canyon NUC | |
| 1920x1080 Extreme HD Preset OpenGL AA:x8 | |
| Acer Predator Orion 3000 PO3-640 | |
| Zotac Magnus One (ECM73070C) | |
| Zotac ZBOX Magnus EN173070C | |
| Intel Dragon Canyon NUC - RTX 3060 | |
| Intel Beast Canyon NUC | |
| 3DMark 05 Standard | 58568 points | |
| 3DMark 06 Standard Score | 59134 points | |
| 3DMark Vantage P Result | 91011 points | |
| 3DMark 11 Performance | 36421 points | |
| 3DMark Ice Storm Standard Score | 237580 points | |
| 3DMark Cloud Gate Standard Score | 59231 points | |
| 3DMark Fire Strike Score | 25739 points | |
| 3DMark Fire Strike Extreme Score | 15841 points | |
| 3DMark Time Spy Score | 12665 points | |
Help | ||
Gaming performance
The Acer Predator Orion 3000 benefits very well from the Alder Lake processor in the gaming tests. This offers a very high performance per clock (IPC, Instructions per Cycle), which leads to a decent boost when gaming. The Predator Orion 3000 can implement this very well despite the TDP limitations since games often do not always require full CPU power. Together with the Nvidia GeForce RTX 3070, even the latest games can be played without problems. You should limit yourself to a 1440p as a maximum resolution, although the GeForce RTX 3070 can also master many games at 2160p. For an overview of the performance of all tested games compared to other models, we refer to our GPU games list.
| GTA V | |
| 1920x1080 Highest AA:4xMSAA + FX AF:16x | |
| KFA2 GeForce RTX 3080 SG | |
| Acer Predator Orion 3000 PO3-640 | |
| Average NVIDIA GeForce RTX 3070 (91.1 - 122.4, n=5) | |
| Zotac ZBOX Magnus EN173070C | |
| Intel Beast Canyon NUC | |
| Intel Dragon Canyon NUC - RTX 3060 | |
| Zotac Magnus One (ECM73070C) | |
| 1920x1080 High/On (Advanced Graphics Off) AA:2xMSAA + FX AF:8x | |
| KFA2 GeForce RTX 3080 SG | |
| Acer Predator Orion 3000 PO3-640 | |
| Intel Beast Canyon NUC | |
| Intel Dragon Canyon NUC - RTX 3060 | |
| Average NVIDIA GeForce RTX 3070 (157 - 177.7, n=5) | |
| Zotac ZBOX Magnus EN173070C | |
| Zotac Magnus One (ECM73070C) | |
| The Witcher 3 | |
| 1920x1080 High Graphics & Postprocessing (Nvidia HairWorks Off) | |
| KFA2 GeForce RTX 3080 SG | |
| Acer Predator Orion 3000 PO3-640 | |
| Zotac Magnus One (ECM73070C) | |
| Average NVIDIA GeForce RTX 3070 (100 - 264, n=8) | |
| Zotac ZBOX Magnus EN173070C | |
| Intel Dragon Canyon NUC - RTX 3060 | |
| Zotac MEK Mini (RTX 2070 Super) | |
| 1920x1080 Ultra Graphics & Postprocessing (HBAO+) | |
| KFA2 GeForce RTX 3080 SG | |
| Acer Predator Orion 3000 PO3-640 | |
| Zotac Magnus One (ECM73070C) | |
| Average NVIDIA GeForce RTX 3070 (52.8 - 132.2, n=7) | |
| Zotac ZBOX Magnus EN173070C | |
| Zotac MEK Mini (RTX 2070 Super) | |
| Intel Dragon Canyon NUC - RTX 3060 | |
| low | med. | high | ultra | QHD | 4K | |
|---|---|---|---|---|---|---|
| GTA V (2015) | 184.7 | 181.6 | 177.7 | 122.4 | 113.1 | 125.9 |
| The Witcher 3 (2015) | 507 | 408 | 264 | 132.2 | 93.9 | |
| Dota 2 Reborn (2015) | 146.5 | 133.9 | 129.3 | 121.4 | 122.7 | |
| Rise of the Tomb Raider (2016) | 376 | 266 | 182.9 | 153.7 | 76.7 | |
| Final Fantasy XV Benchmark (2018) | 195.8 | 172.3 | 129.7 | 99.3 | 58.2 | |
| X-Plane 11.11 (2018) | 150.6 | 137.4 | 111.3 | 98.4 | ||
| Far Cry 5 (2018) | 179 | 159 | 151 | 141 | 125 | 72 |
| Strange Brigade (2018) | 466 | 328 | 268 | 233 | 173.2 | 98.7 |
| Shadow of the Tomb Raider (2018) | 194.8 | 173.8 | 166.8 | 157.1 | 114.8 | 62.6 |
| Far Cry New Dawn (2019) | 162 | 140 | 135 | 121 | 113 | 74 |
| Metro Exodus (2019) | 224 | 156.8 | 121.9 | 97.7 | 78.3 | 49.7 |
| Anno 1800 (2019) | 167.5 | 164.1 | 130.8 | 74.7 | 69.3 | 41.8 |
| Control (2019) | 240 | 167.7 | 124.9 | 81.3 | 40.6 | |
| Borderlands 3 (2019) | 171.5 | 144.7 | 127.9 | 108.9 | 82.9 | 46.3 |
| F1 2020 (2020) | 351 | 302 | 288 | 215 | 162.2 | 92.7 |
| Watch Dogs Legion (2020) | 125 | 123 | 109 | 89 | 67 | 37 |
| Dirt 5 (2020) | 248.1 | 191.8 | 157 | 122.1 | 99 | 65.3 |
| F1 2021 (2021) | 407 | 361 | 304 | 158 | 118 | 67.3 |
| New World (2021) | 166.9 | 139.5 | 128.3 | 117.5 | 95 | 48.9 |
| Far Cry 6 (2021) | 154.9 | 138.3 | 121.1 | 114.2 | 95.9 | 26.4 |
| Forza Horizon 5 (2021) | 247 | 171 | 160 | 115 | 100 | 73 |
| God of War (2022) | 142.3 | 140.5 | 117.8 | 83.5 | 69.3 | 49.8 |
| GRID Legends (2022) | 249 | 224 | 198 | 151 | 127 | 84 |
| Cyberpunk 2077 1.6 (2022) | 146.7 | 145.1 | 136 | 90.3 | 60.6 | 29 |
| Tiny Tina's Wonderlands (2022) | 248 | 204 | 145.8 | 113.9 | 80.7 | 44.4 |
| F1 22 (2022) | 258 | 249 | 228 | 81 | 52 | 25 |
Emissions - Weak cooling system
Noise emissions
The cooling system of the Acer Predator Orion 3000 consists of a fan at the front, which sucks in the fresh air, and a fan at the back, which is supposed to transport the warm air out of the case. In theory, this sounds quite good, but in practice, it turns out that this is not optimal. It is not for nothing that Acer limits the maximum power consumption of the processor in the Predator Orion 3000. However, the PC does not stand out negatively in the test with only 31.6 dB(A) in idle despite the very small CPU cooler. The system is also relatively quiet under load and reaches about 38 dB(A) in the stress test. However, if we let the fans run at full speed (via Predator Sense gaming mode), our measurement device shows 54 dB(A).
Noise level
| Idle |
| 31.5 / 31.6 / 31.6 dB(A) |
| Load |
| 32.7 / 38.1 dB(A) |
 | ||
30 dB silent 40 dB(A) audible 50 dB(A) loud |
||
min: | ||
| Acer Predator Orion 3000 PO3-640 i7-12700F, GeForce RTX 3070 | Zotac Magnus One (ECM73070C) i7-10700, GeForce RTX 3070 | Zotac ZBOX Magnus EN173070C i7-11800H, GeForce RTX 3070 Laptop GPU | Intel Dragon Canyon NUC - RTX 3060 i9-12900, GeForce RTX 3060 | |
|---|---|---|---|---|
| Noise | -18% | -10% | -2% | |
| off / environment * (dB) | 29.8 | 30 -1% | 30.7 -3% | 30.2 -1% |
| Idle Minimum * (dB) | 31.5 | 33.58 -7% | 32.7 -4% | 30.2 4% |
| Idle Average * (dB) | 31.6 | 32.8 -4% | 30.4 4% | |
| Idle Maximum * (dB) | 31.6 | 32.8 -4% | 30.8 3% | |
| Load Average * (dB) | 32.7 | 44.25 -35% | 41.7 -28% | |
| Load Maximum * (dB) | 38.1 | 48.72 -28% | 45.4 -19% | 45.1 -18% |
* ... smaller is better
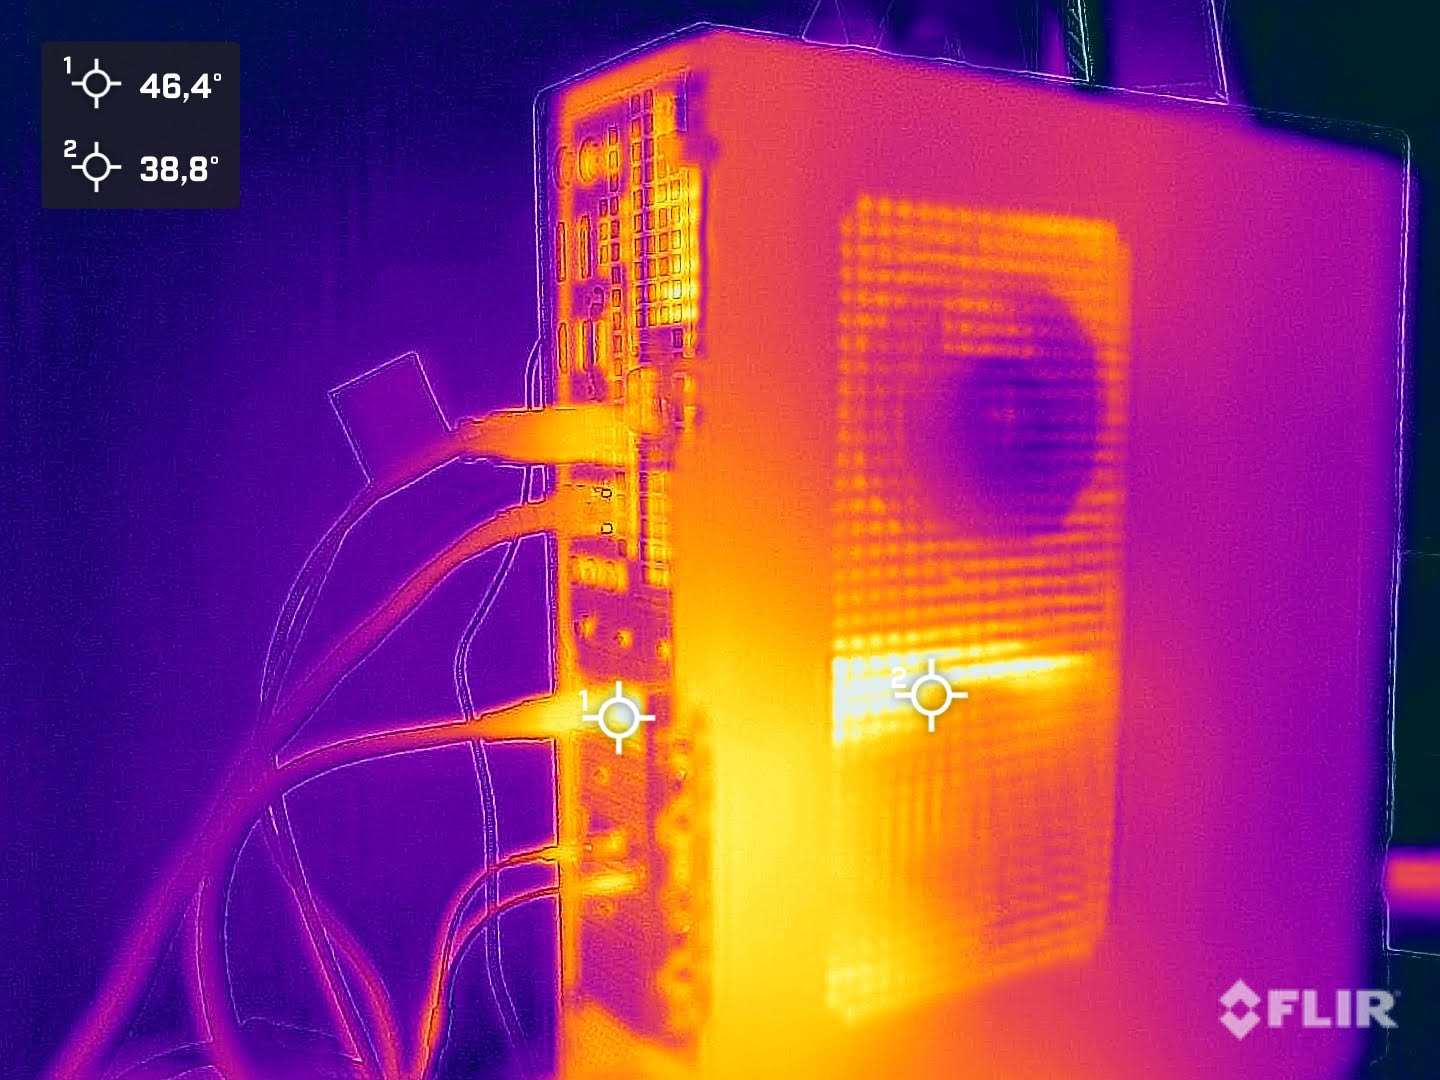
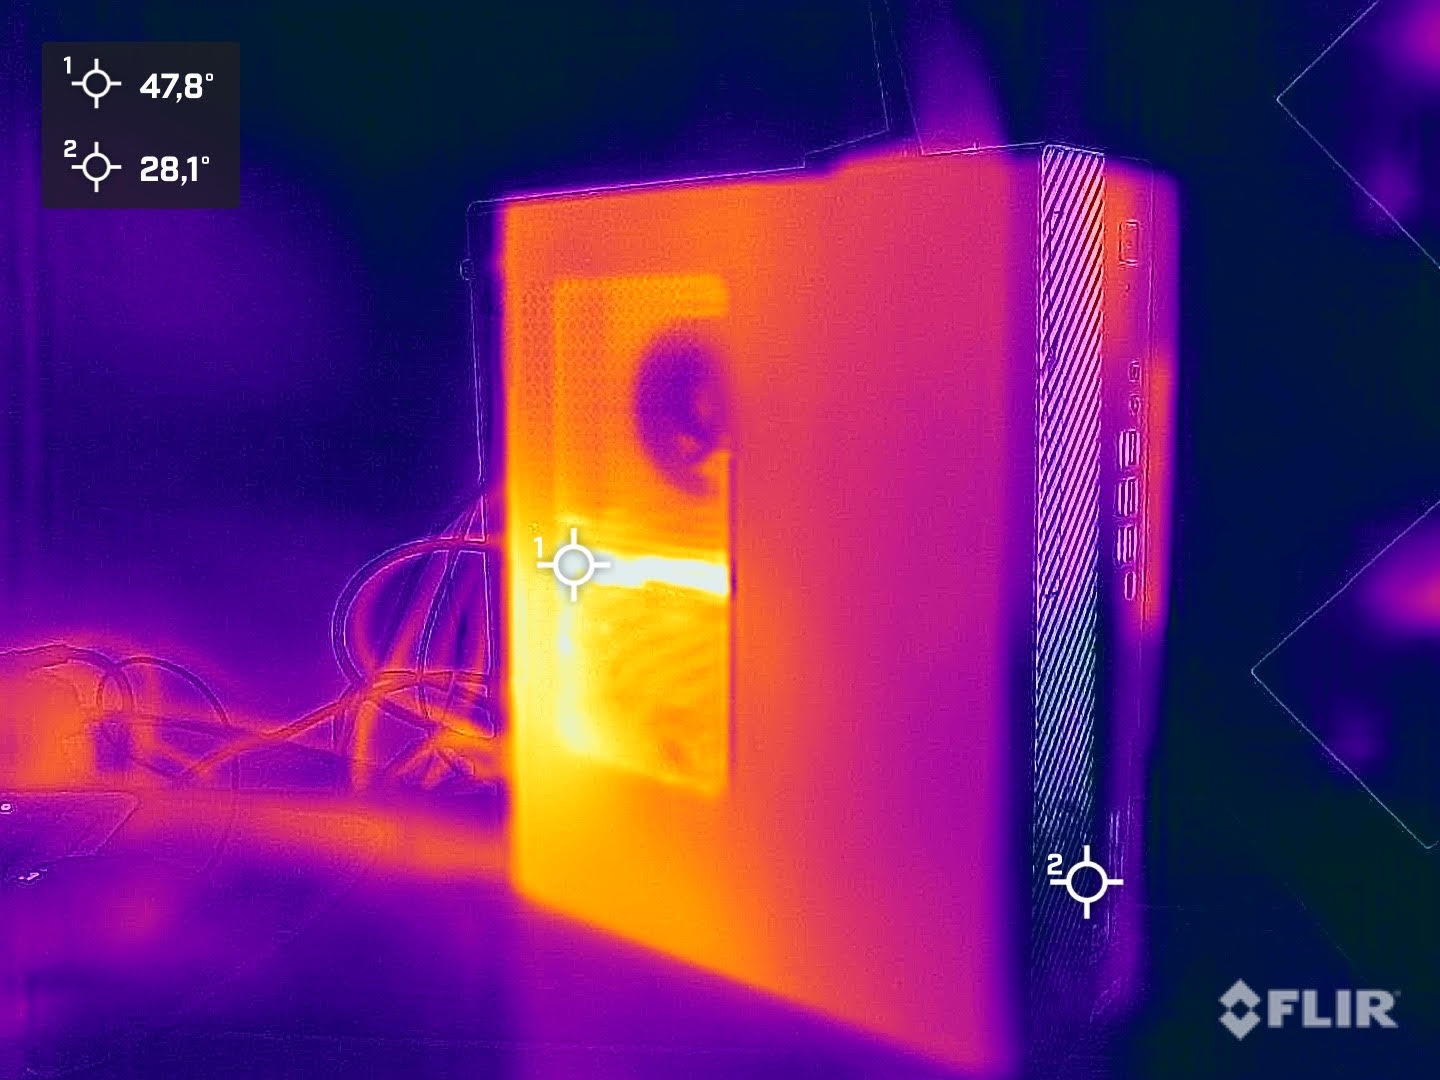
Temperature
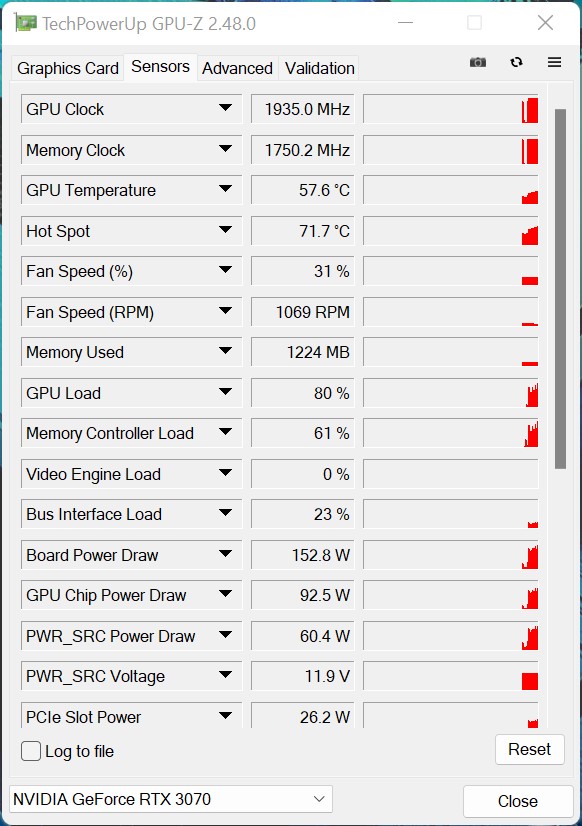
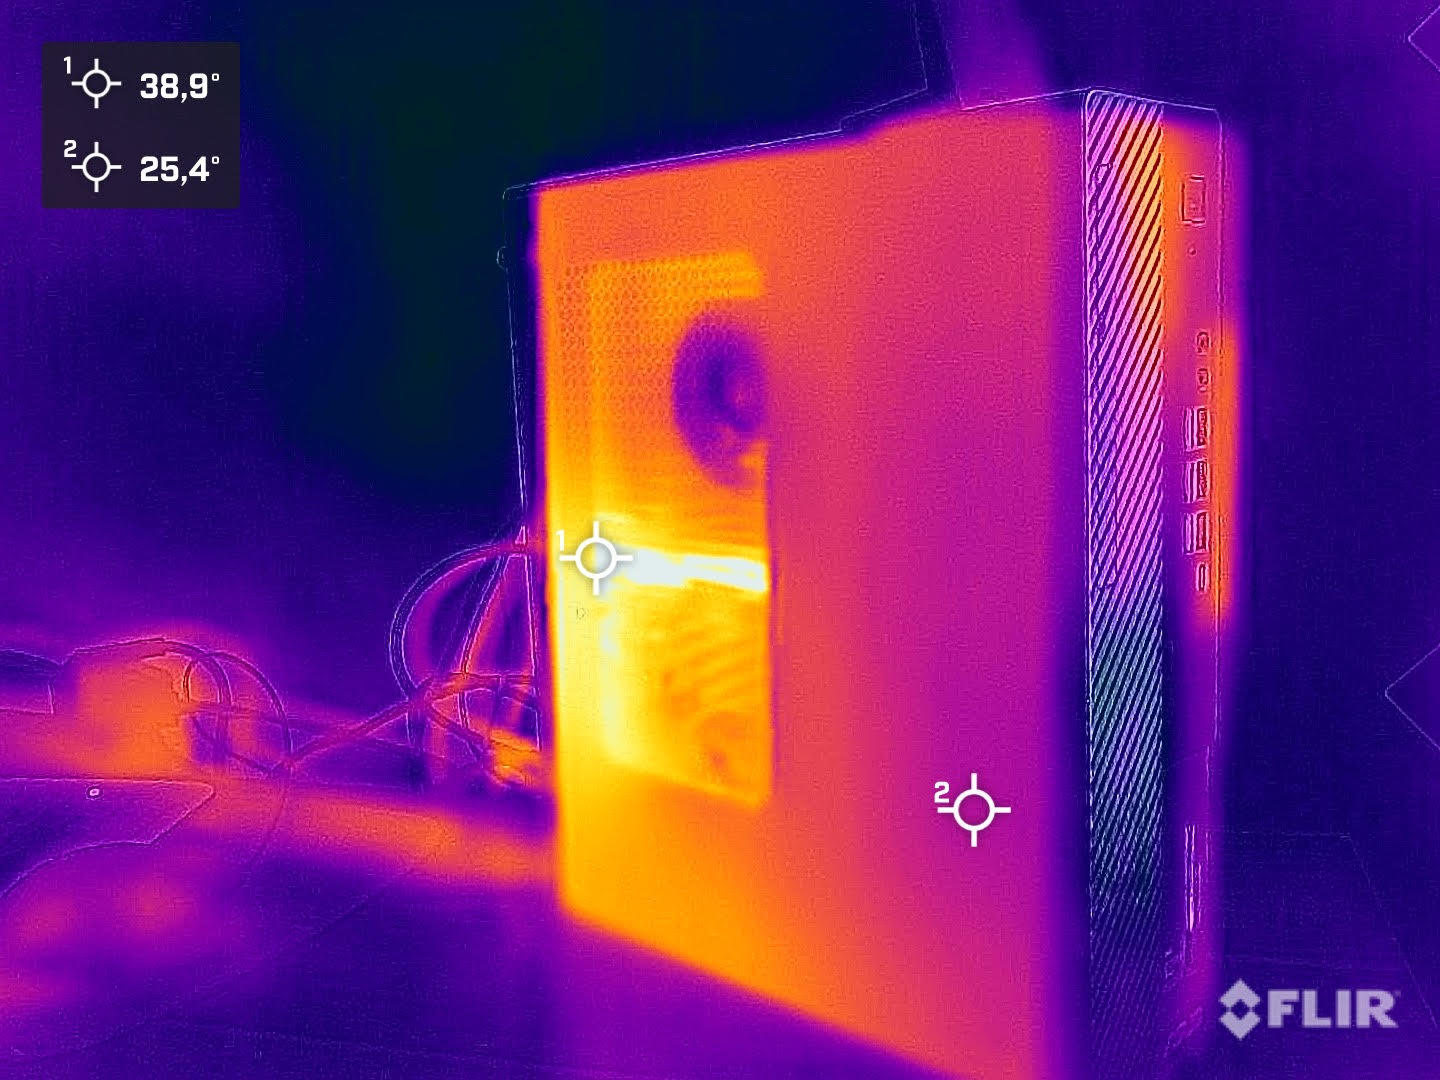
The case of the Acer Predator Orion 3000 heats up a bit under load, but this is not problematic. The single fan on the back, on the other hand, shovels very warm air out of the case. An additional heat dissipation towards the top would be even more effective here. We note the processor's highest value of 98 °C under load. This shows that Acer is already at the limit with the installed cooling, even though the Intel Core i7-12700F would still have reserves. Nevertheless, the Predator Orion 3000 could still deliver a good performance in the test. The maximum temperature of the GPU is considerably lower at 70.5 °C
Energy consumption
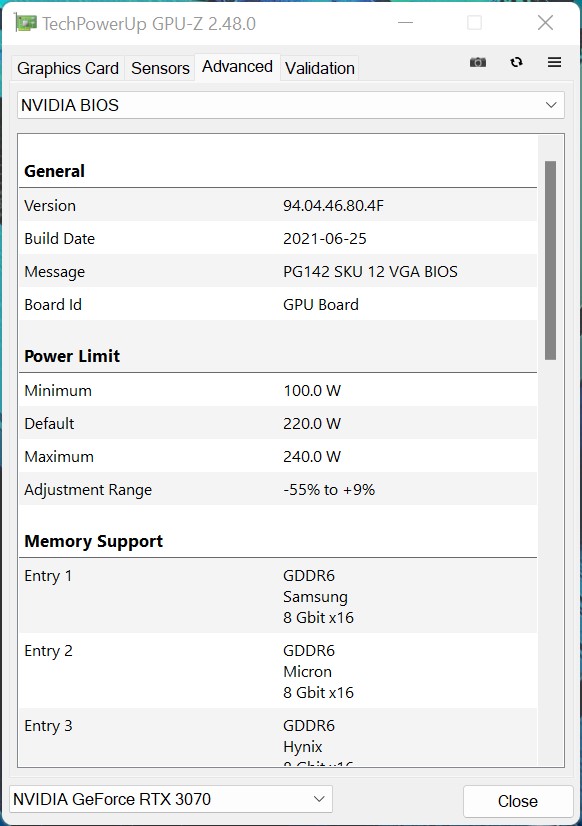
The Acer Predator Orion 3000 is surprisingly frugal when idling and under low load. Our meter only shows just under 30 watts. It is up to 361 watts for a short time in the stress test, although only 186 watts are available on average. This is due to the PL2, which is only allowed for a maximum of 28 seconds. The system's power consumption averages 338 watts during gaming. We documented short-term peaks of up to 364 watts. A 500-watt ATX power supply is installed, which can cope with the hardware requirements.
| Off / Standby | |
| Idle | |
| Load |
|
Key:
min: | |
| Acer Predator Orion 3000 PO3-640 i7-12700F, GeForce RTX 3070 | Zotac ZBOX Magnus EN173070C i7-11800H, GeForce RTX 3070 Laptop GPU | Average NVIDIA GeForce RTX 3070 | Average of class Desktop | |
|---|---|---|---|---|
| Power Consumption | -27% | -93% | -4% | |
| Idle Minimum * (Watt) | 24.6 | 31.3 -27% | 56 ? -128% | 17.9 ? 27% |
| Idle Average * (Watt) | 24.6 | 35.1 -43% | 58.5 ? -138% | 37.2 ? -51% |
| Idle Maximum * (Watt) | 29.6 | 41.6 -41% | 70.5 ? -138% | 41.3 ? -40% |
| Load Average * (Watt) | 124.6 | 214 -72% | 122.1 ? 2% | 96.7 ? 22% |
| Witcher 3 ultra * (Watt) | 338.1 | 193.5 43% | ||
| Load Maximum * (Watt) | 186.1 | 231 -24% | 305 ? -64% | 141.6 ? 24% |
* ... smaller is better
Power Consumption with external Monitor
Pros
Cons
Conclusion - Fast gaming PC with weak cooling

The Acer Predator Orion 3000 is a compact gaming PC and is based on Intel's current CPU generation. The Intel Core i7-12700F offers very good performance and is fast enough to meet the demands of current games despite the PL2 limitation. More could have been achieved here with better cooling. With the Nvidia GeForce RTX 3070, you get a conventional model that corresponds to Nvidia's specifications. However, the model performs well and achieves smooth frame rates with 1440p resolution in current games. The rest of the configuration is rather standard with a 1 TB SSD and 16 GB DDR4 RAM. The use of faster DDR5 RAM would have been future-proof here.
To enhance the Acer Predator Orion 3000's looks, the left side panel can be replaced with a side panel with a viewing window. This is part of the scope of delivery. There is also a keyboard and a mouse, which pick up on the Acer Predator look and thus provide a coherent overall picture
Thanks to the Intel Core i7-12700F and the Nvidia GeForce RTX 3070, the Acer Predator Orion 3000 offers a good basis as a gaming PC. Unfortunately, the cooling system has to accept some compromises.
The biggest point of criticism is the too small cooling of the processor. Nevertheless, it is surprising that the Acer Predator Orion 3000 is not unbearably loud. The manufacturer probably did without higher speeds in auto mode at the expense of higher temperatures. A self-adjusted fan curve can provide slightly better temperatures under load. However, the low noise emissions under load are also a thing of the past.
Prices and availability
The Acer Predator Orion 3000 is available directly from Acer and costs 2,200 euros in our test configuration. Currently, you can also get the device at Computer Universe for only 1,900 euros.
Acer Predator Orion 3000 PO3-640
- 09/13/2022 v7 (old)
Sebastian Bade
Price comparison

