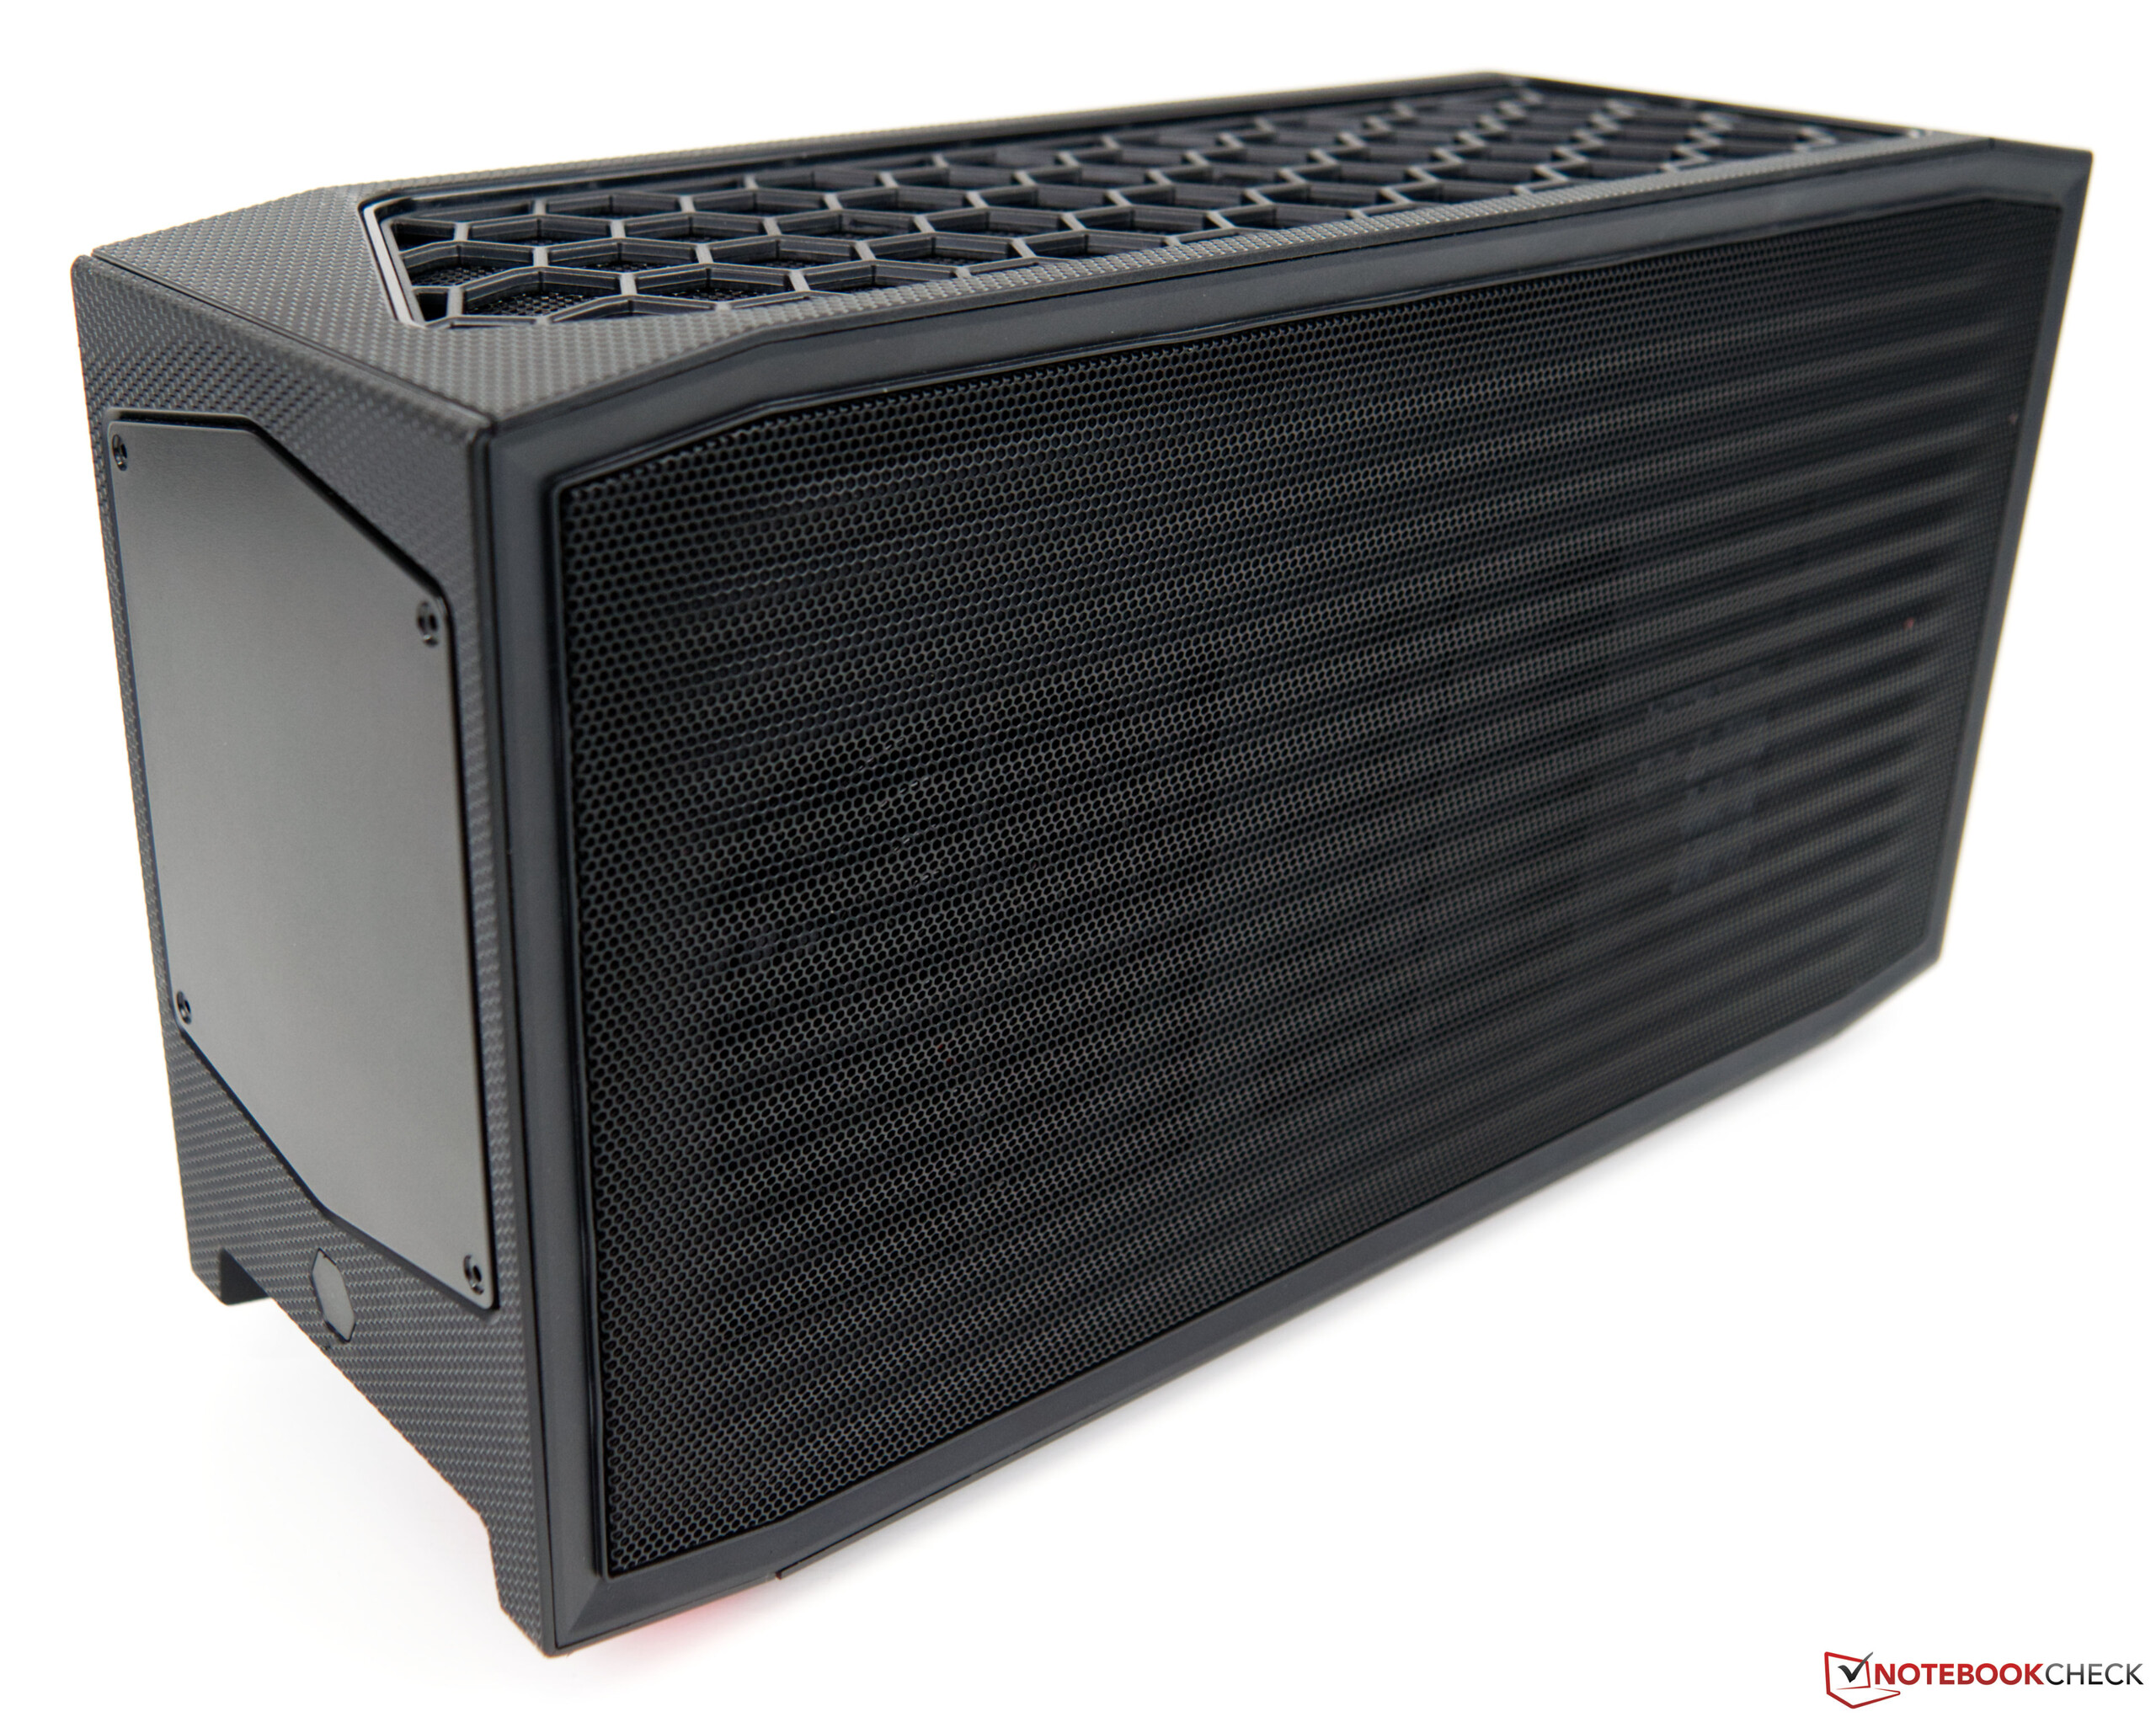
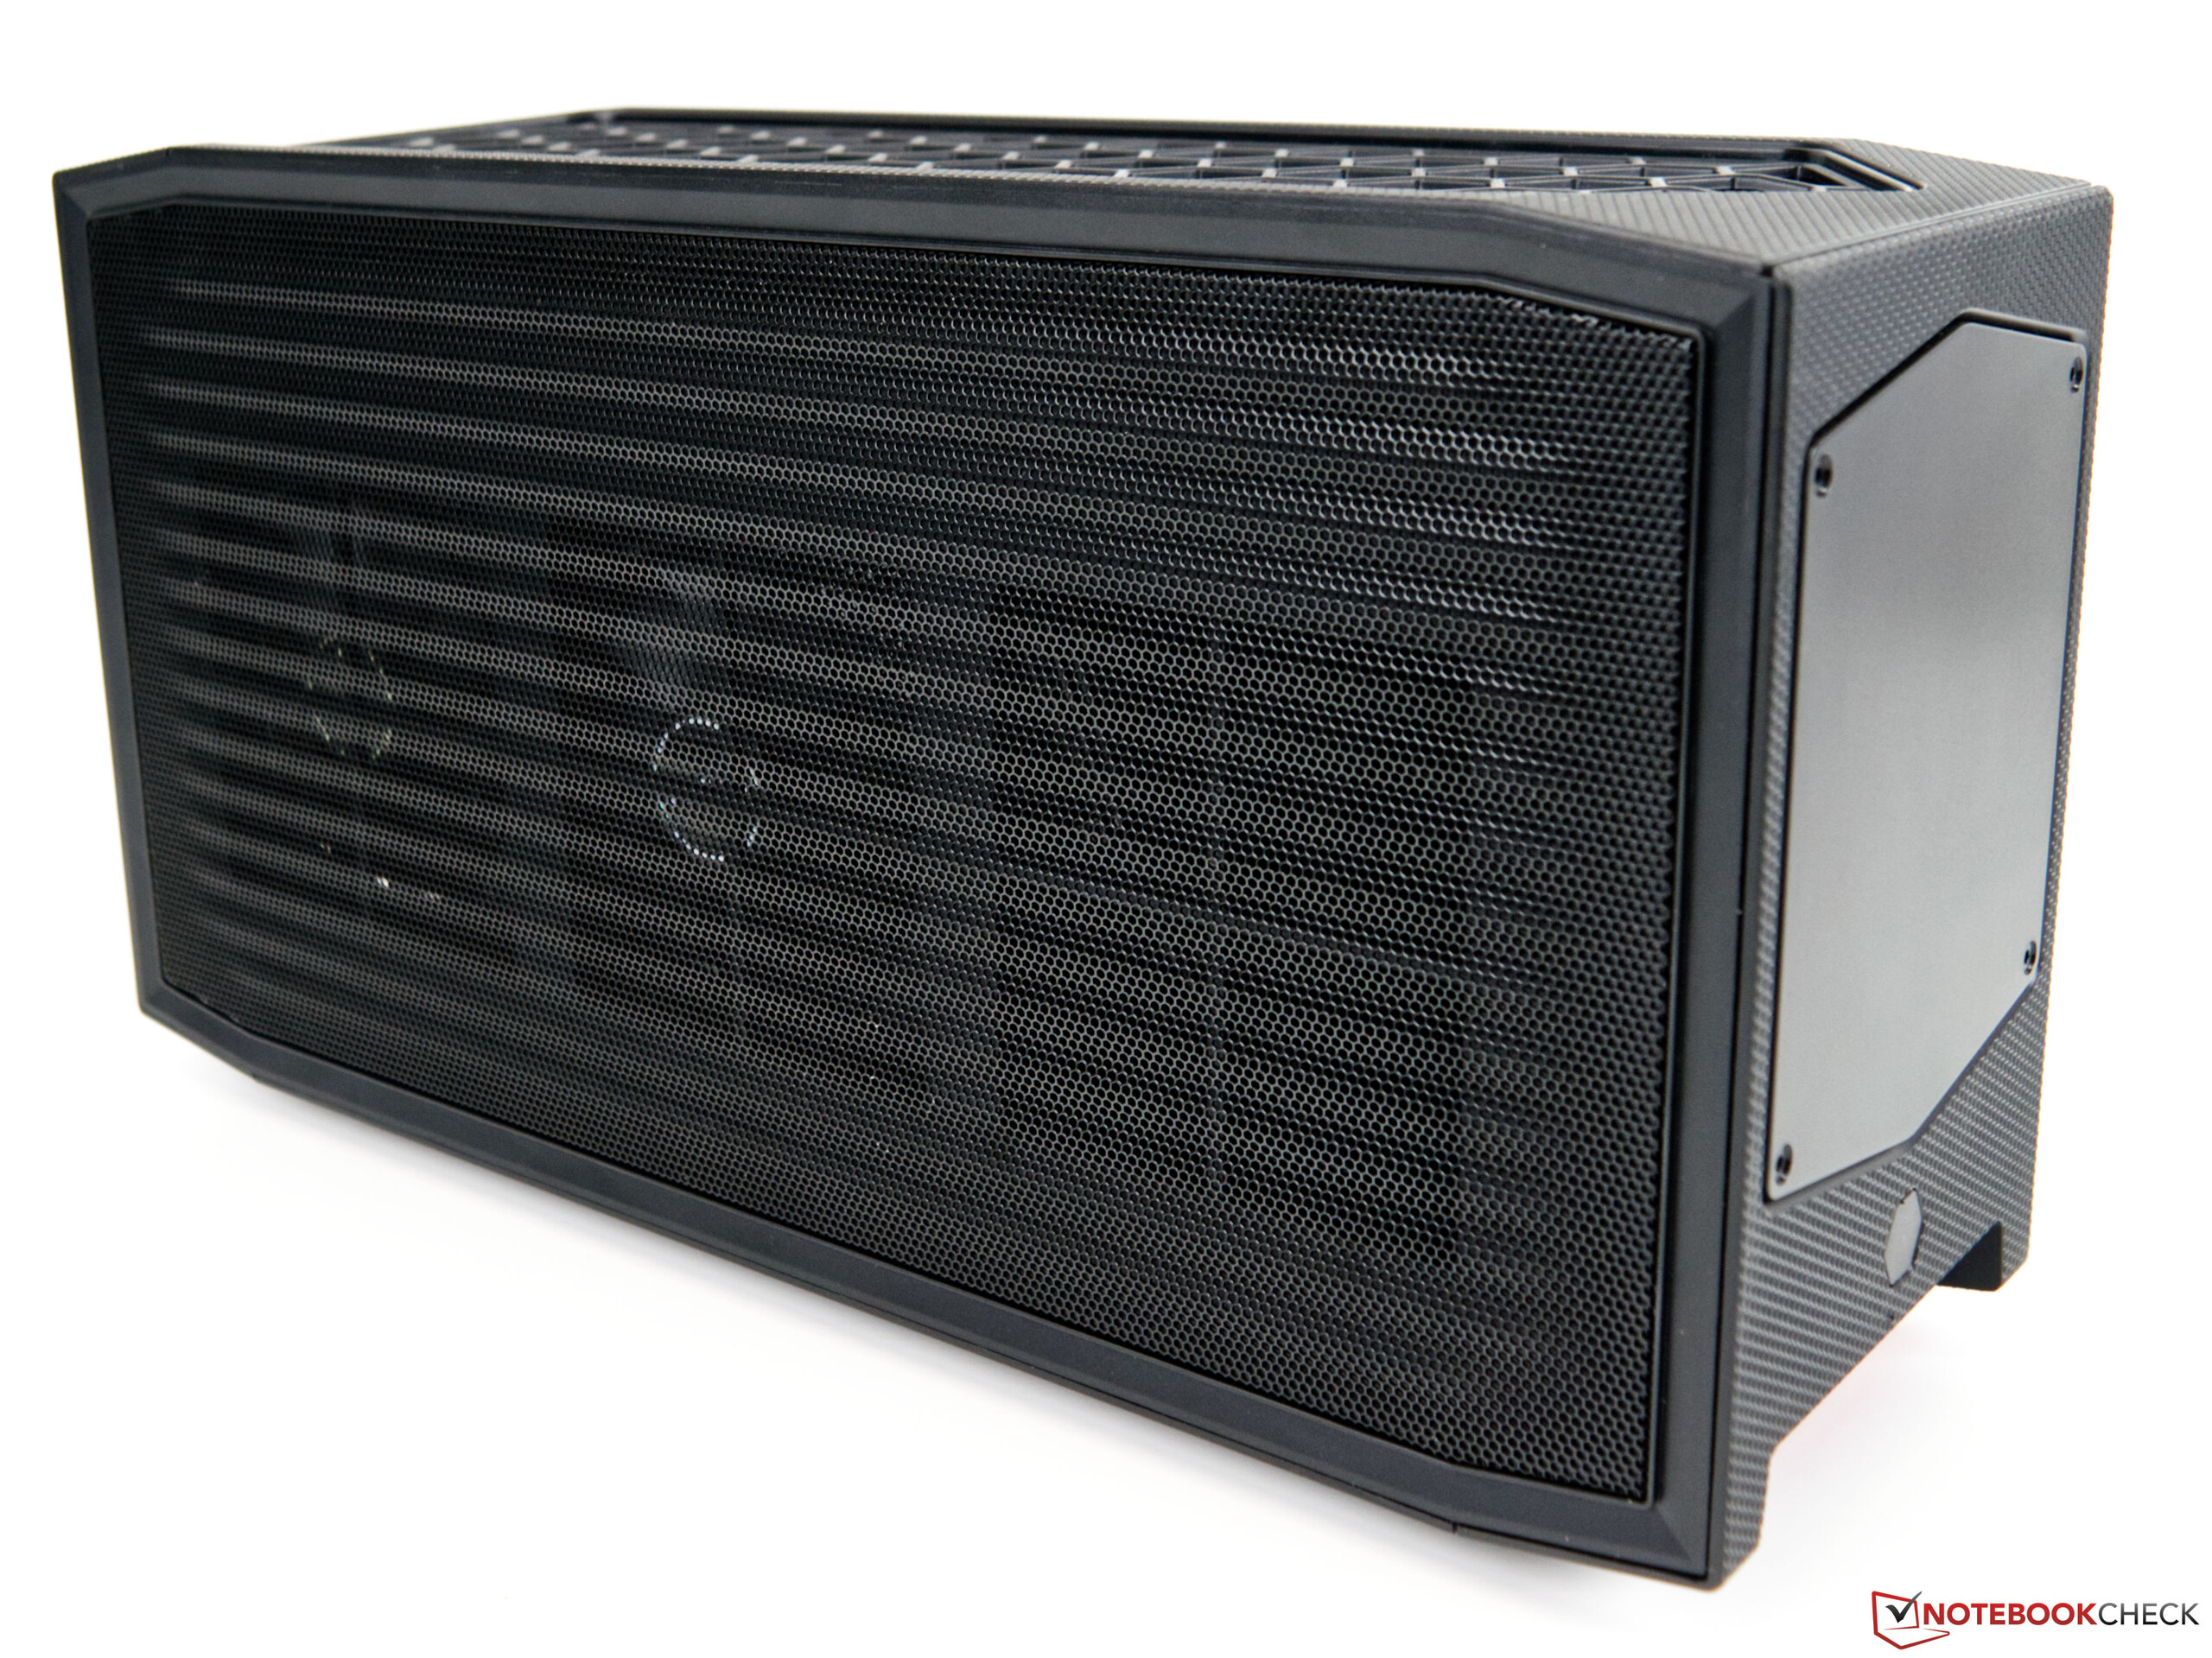
Intel NUC 11 Beast Canyon with Core i9 and RTX 3060 in review

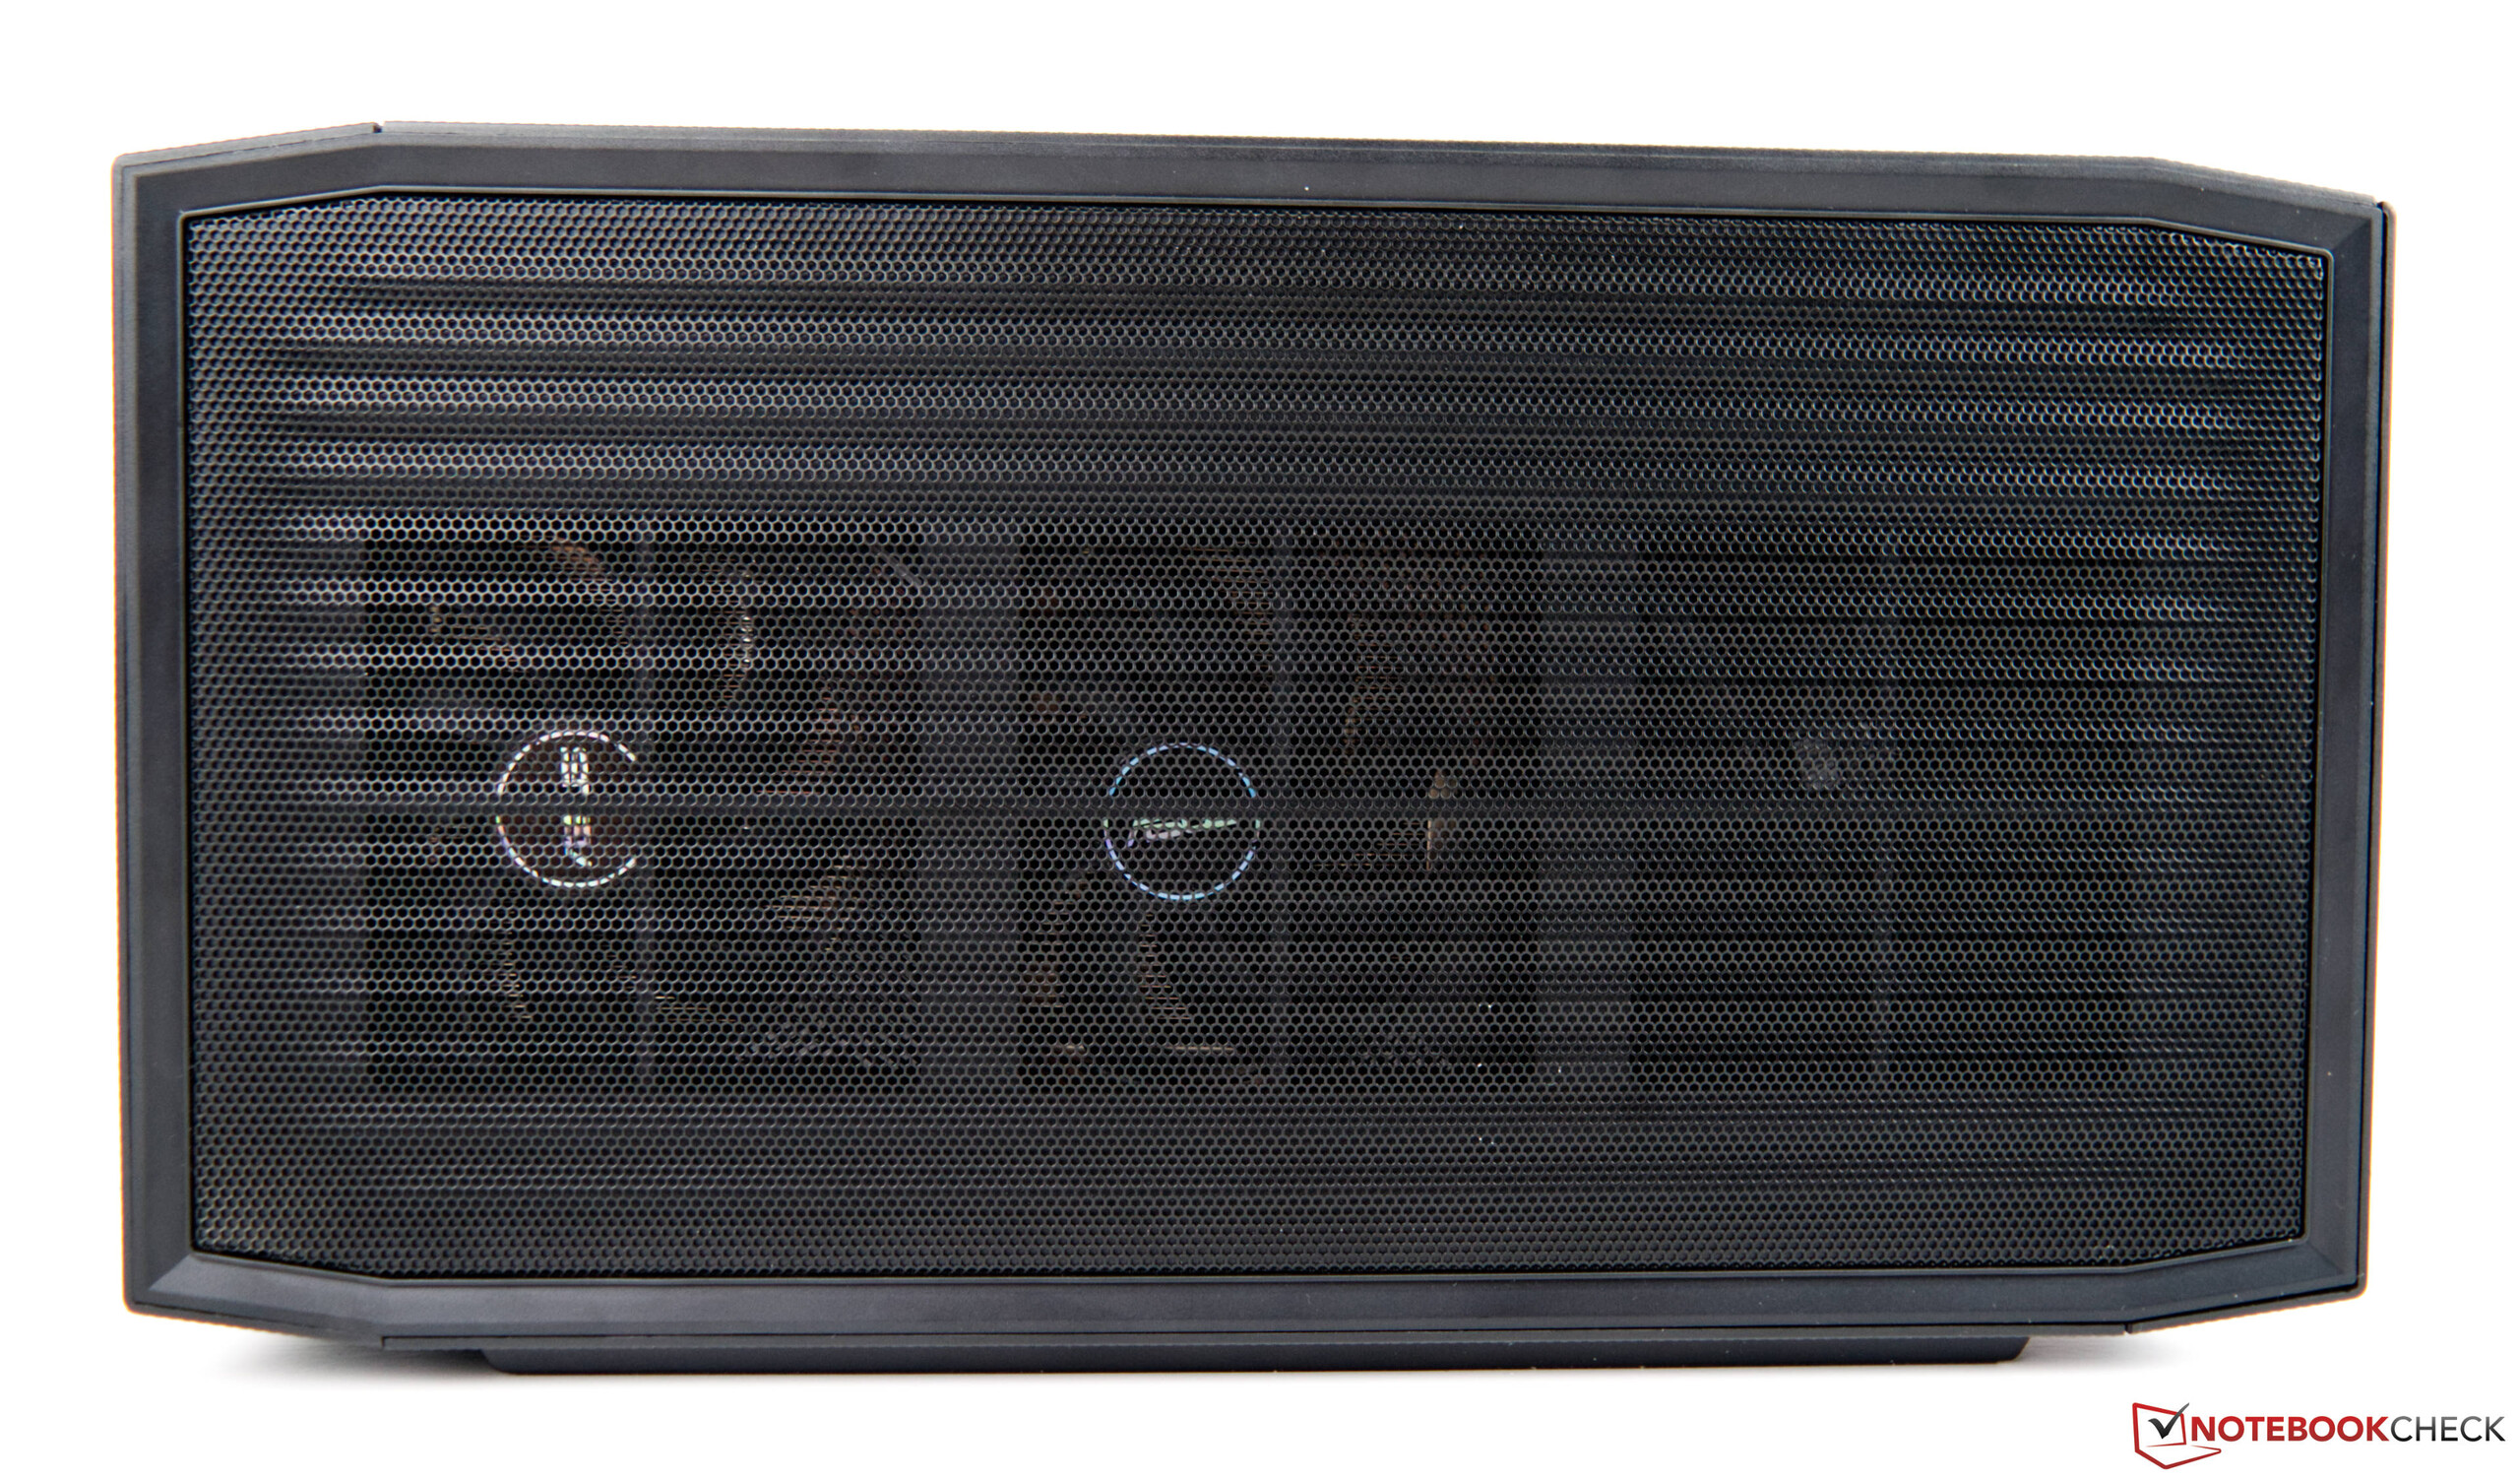
Intel mainly offers compact office systems under the NUC brand. Nevertheless, there are gaming systems from Intel that also carry NUC in their name. Last year, for instance, we were impressed by the performance of the Intel Ghost Canyon NUC. This year, Intel has introduced yet another gaming system based on the specially developed compute element, the Beast Canyon NUC, by taking a slightly different approach.
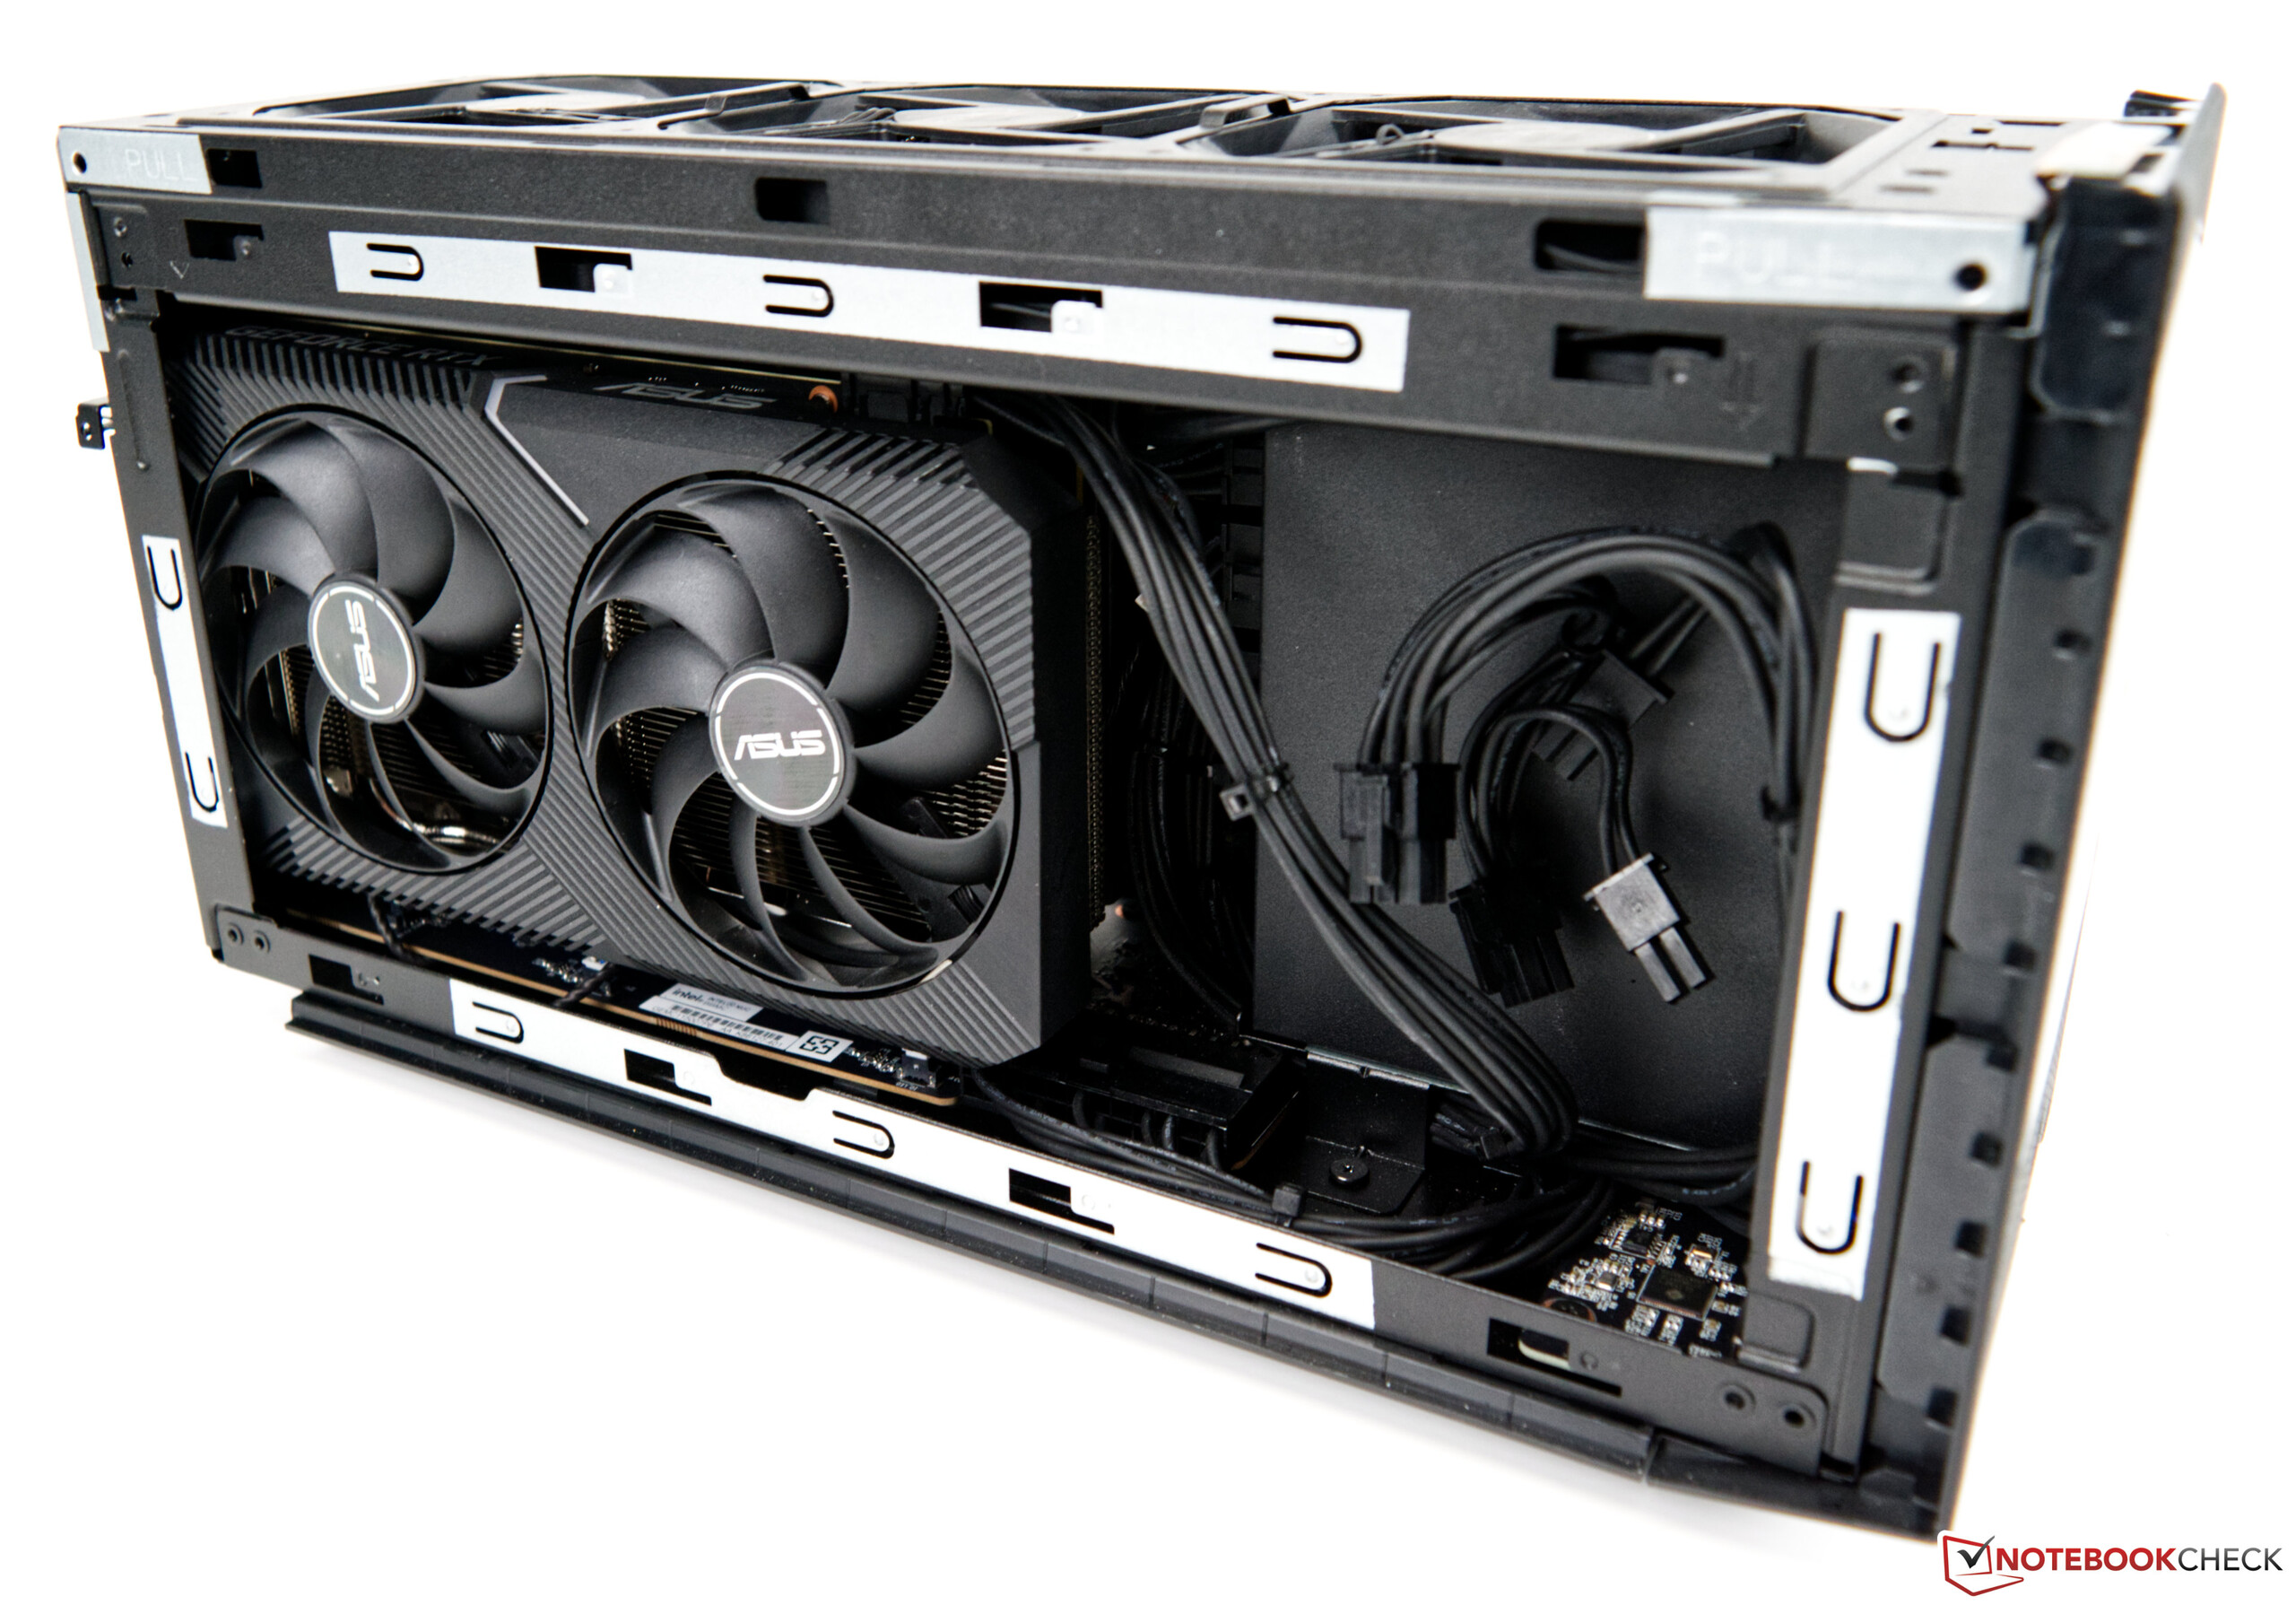
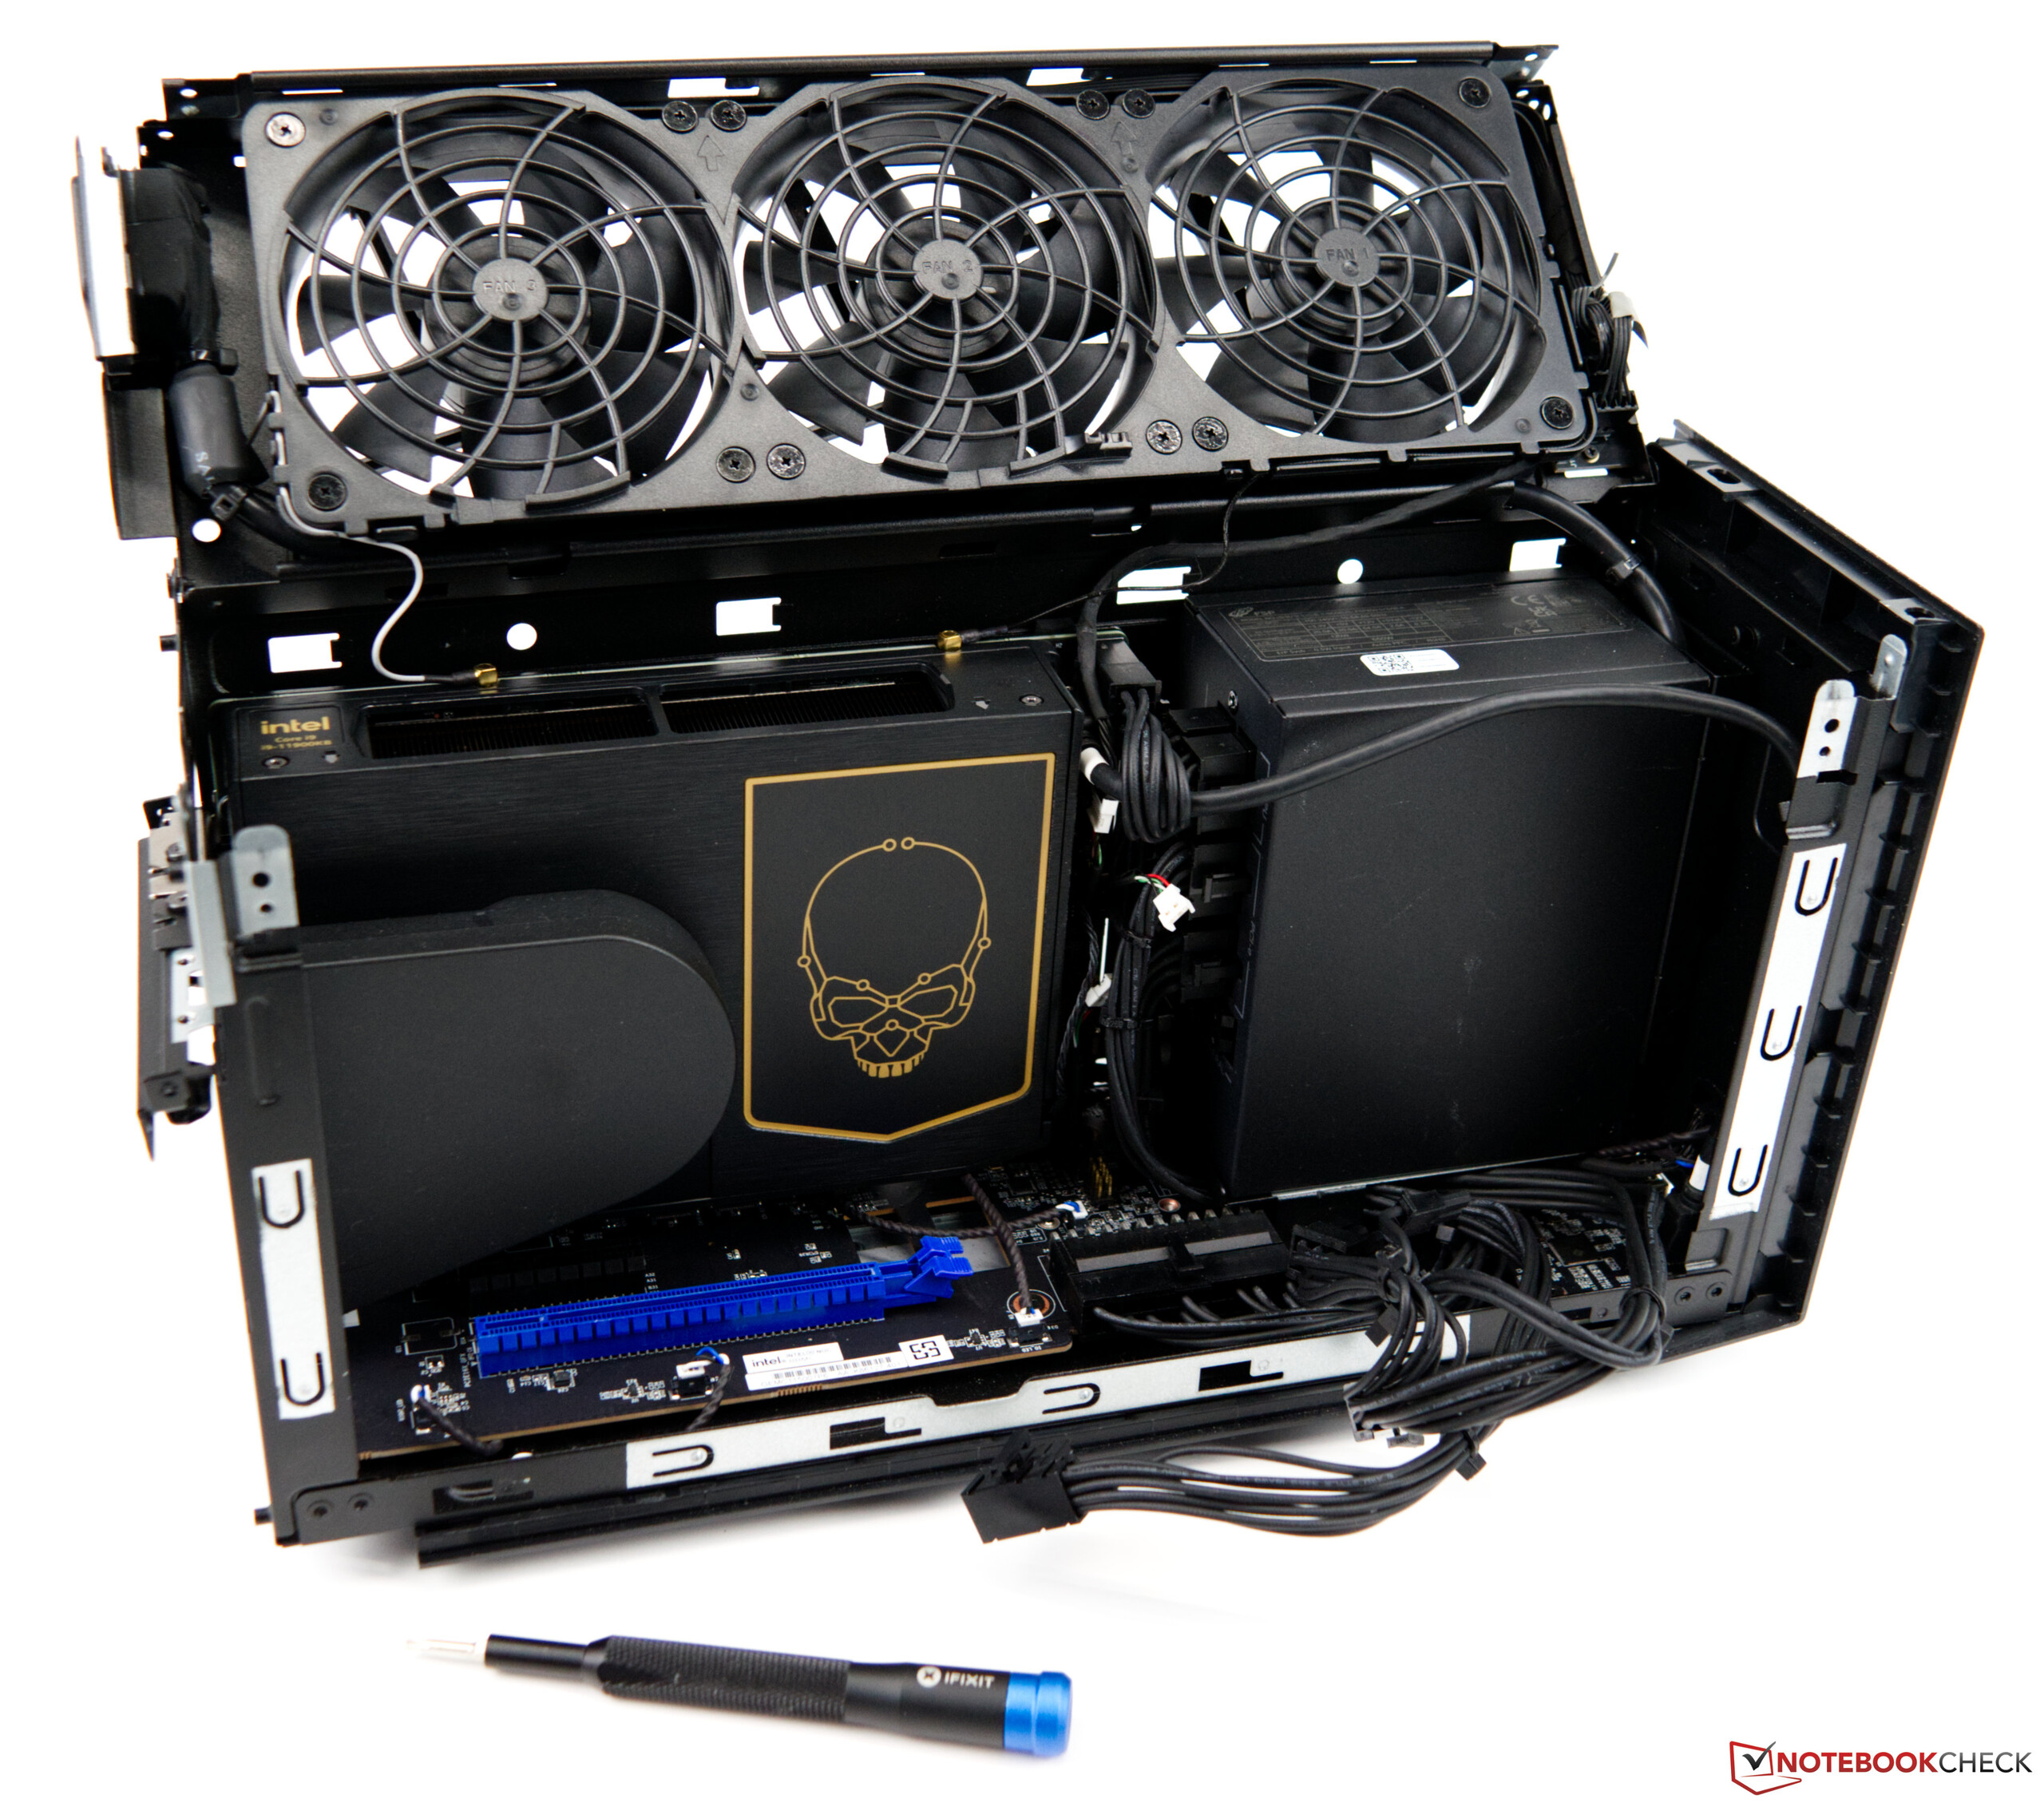
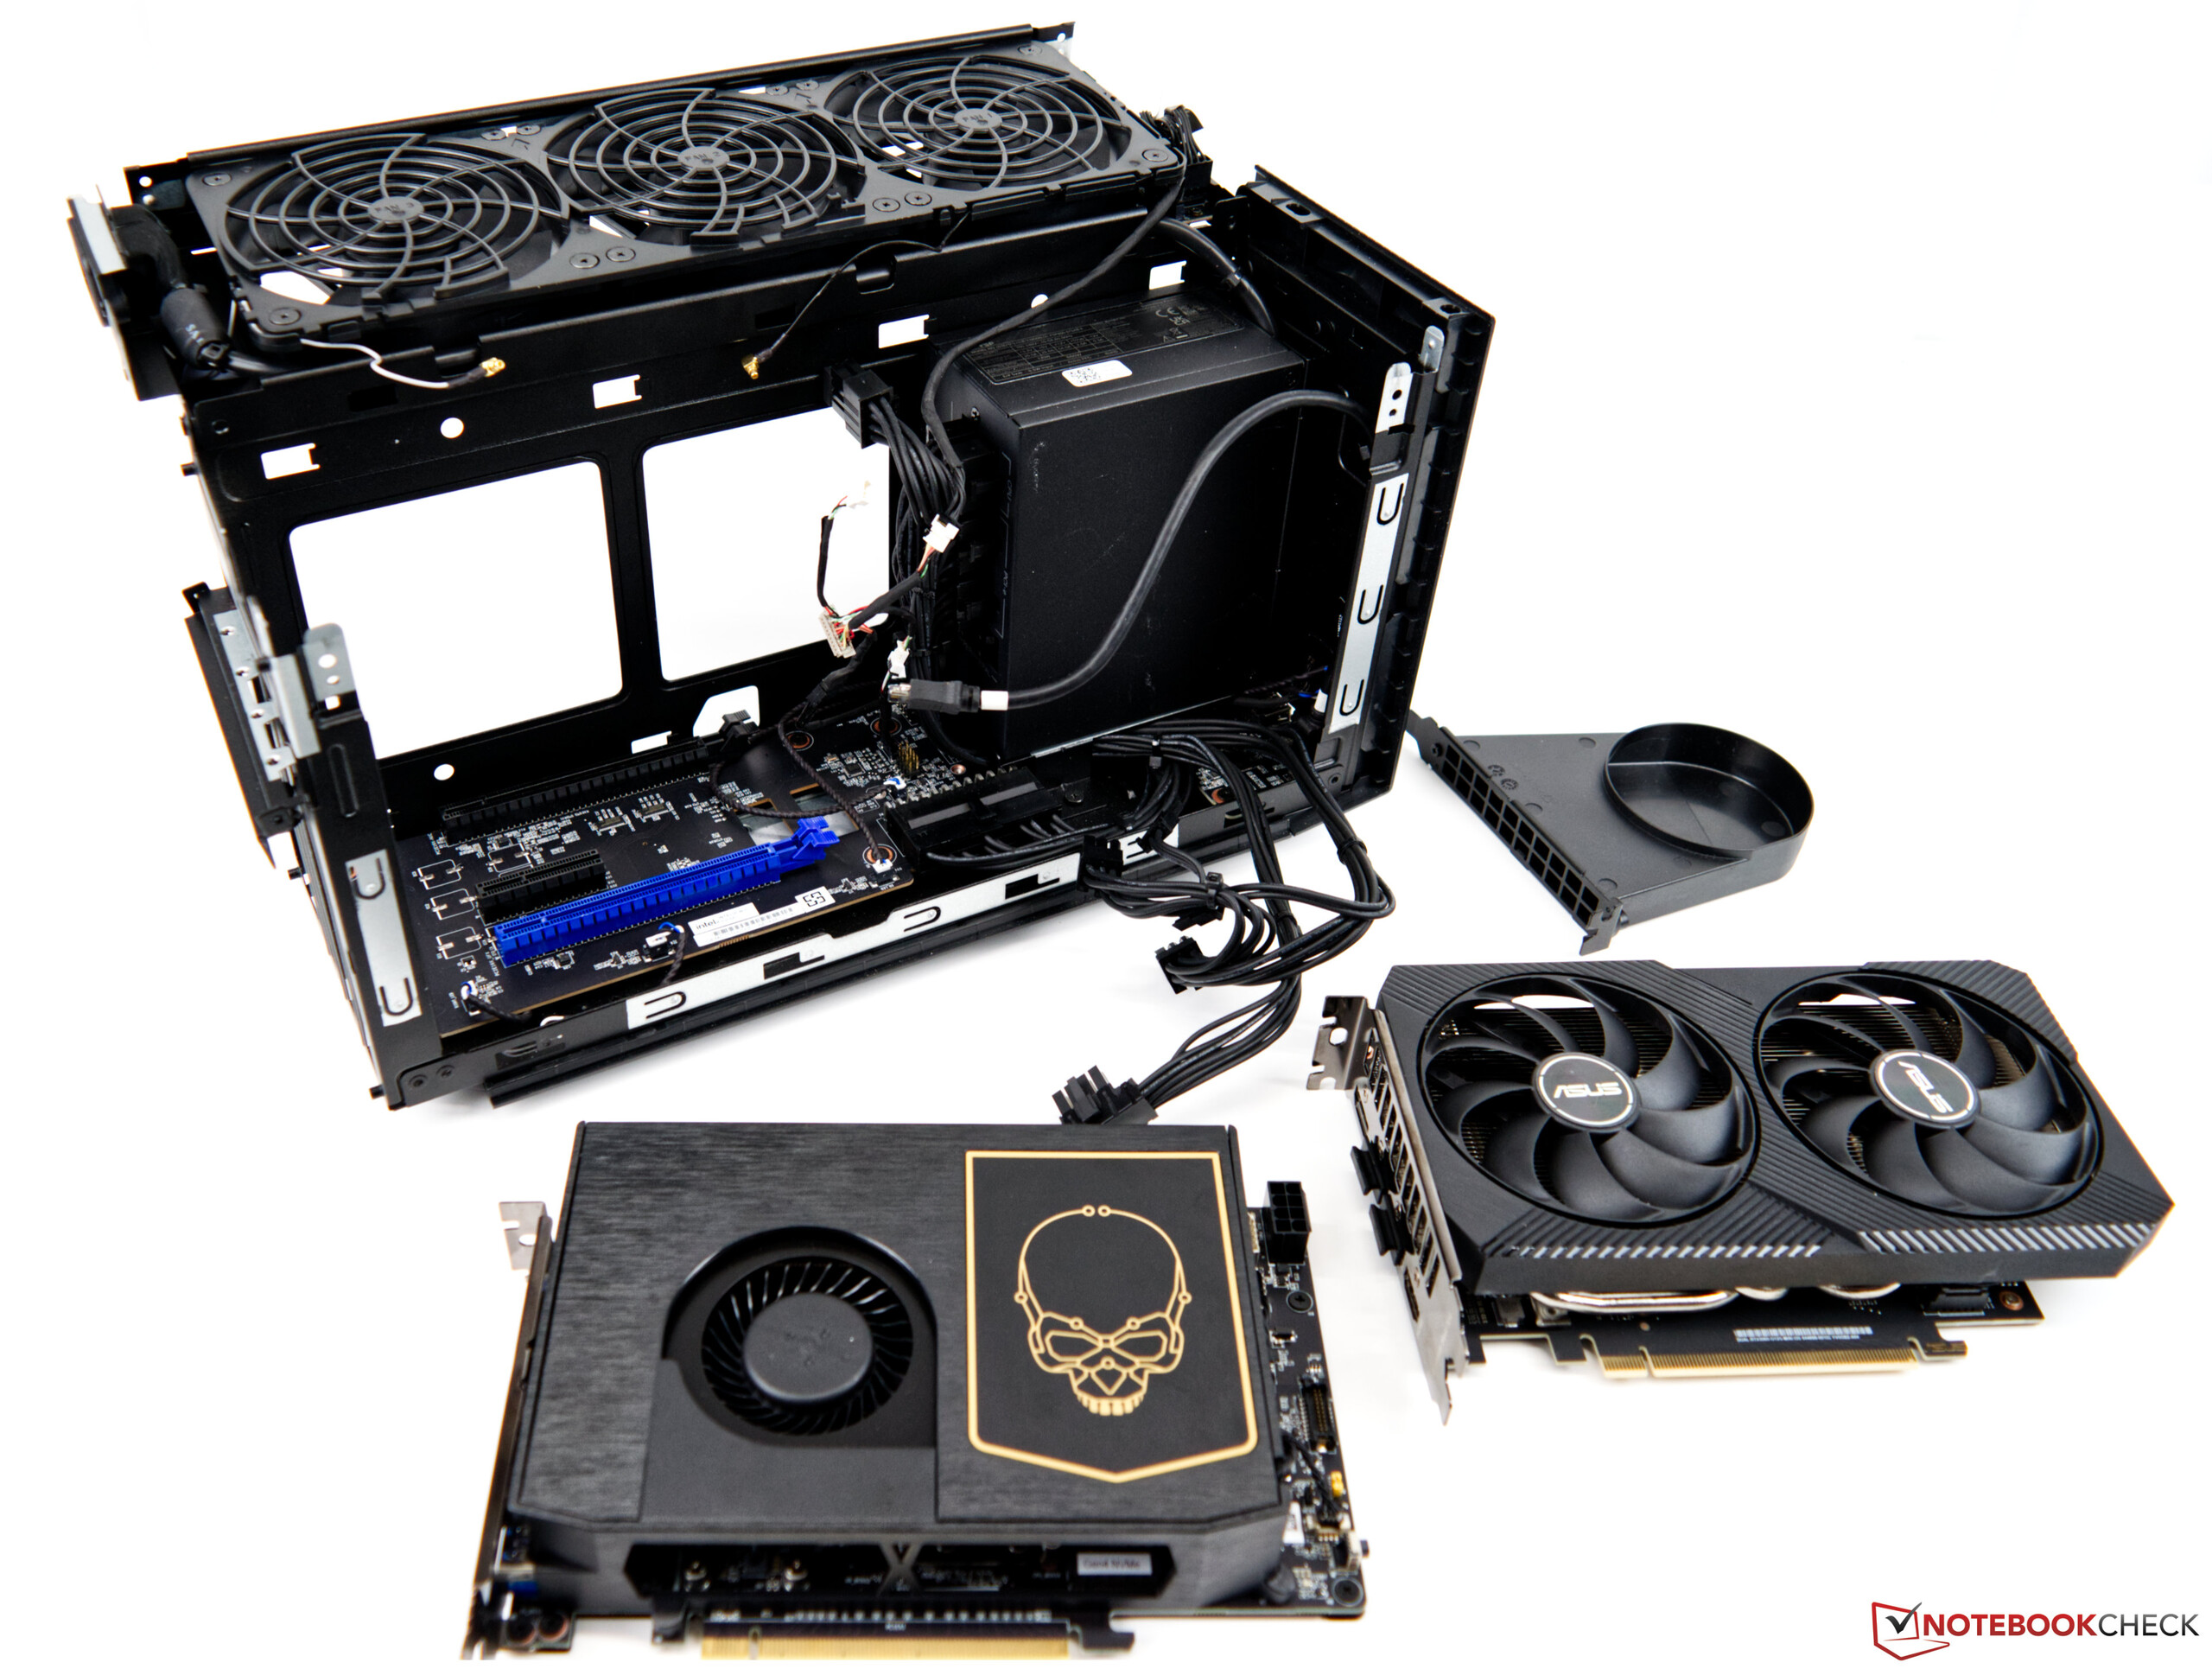
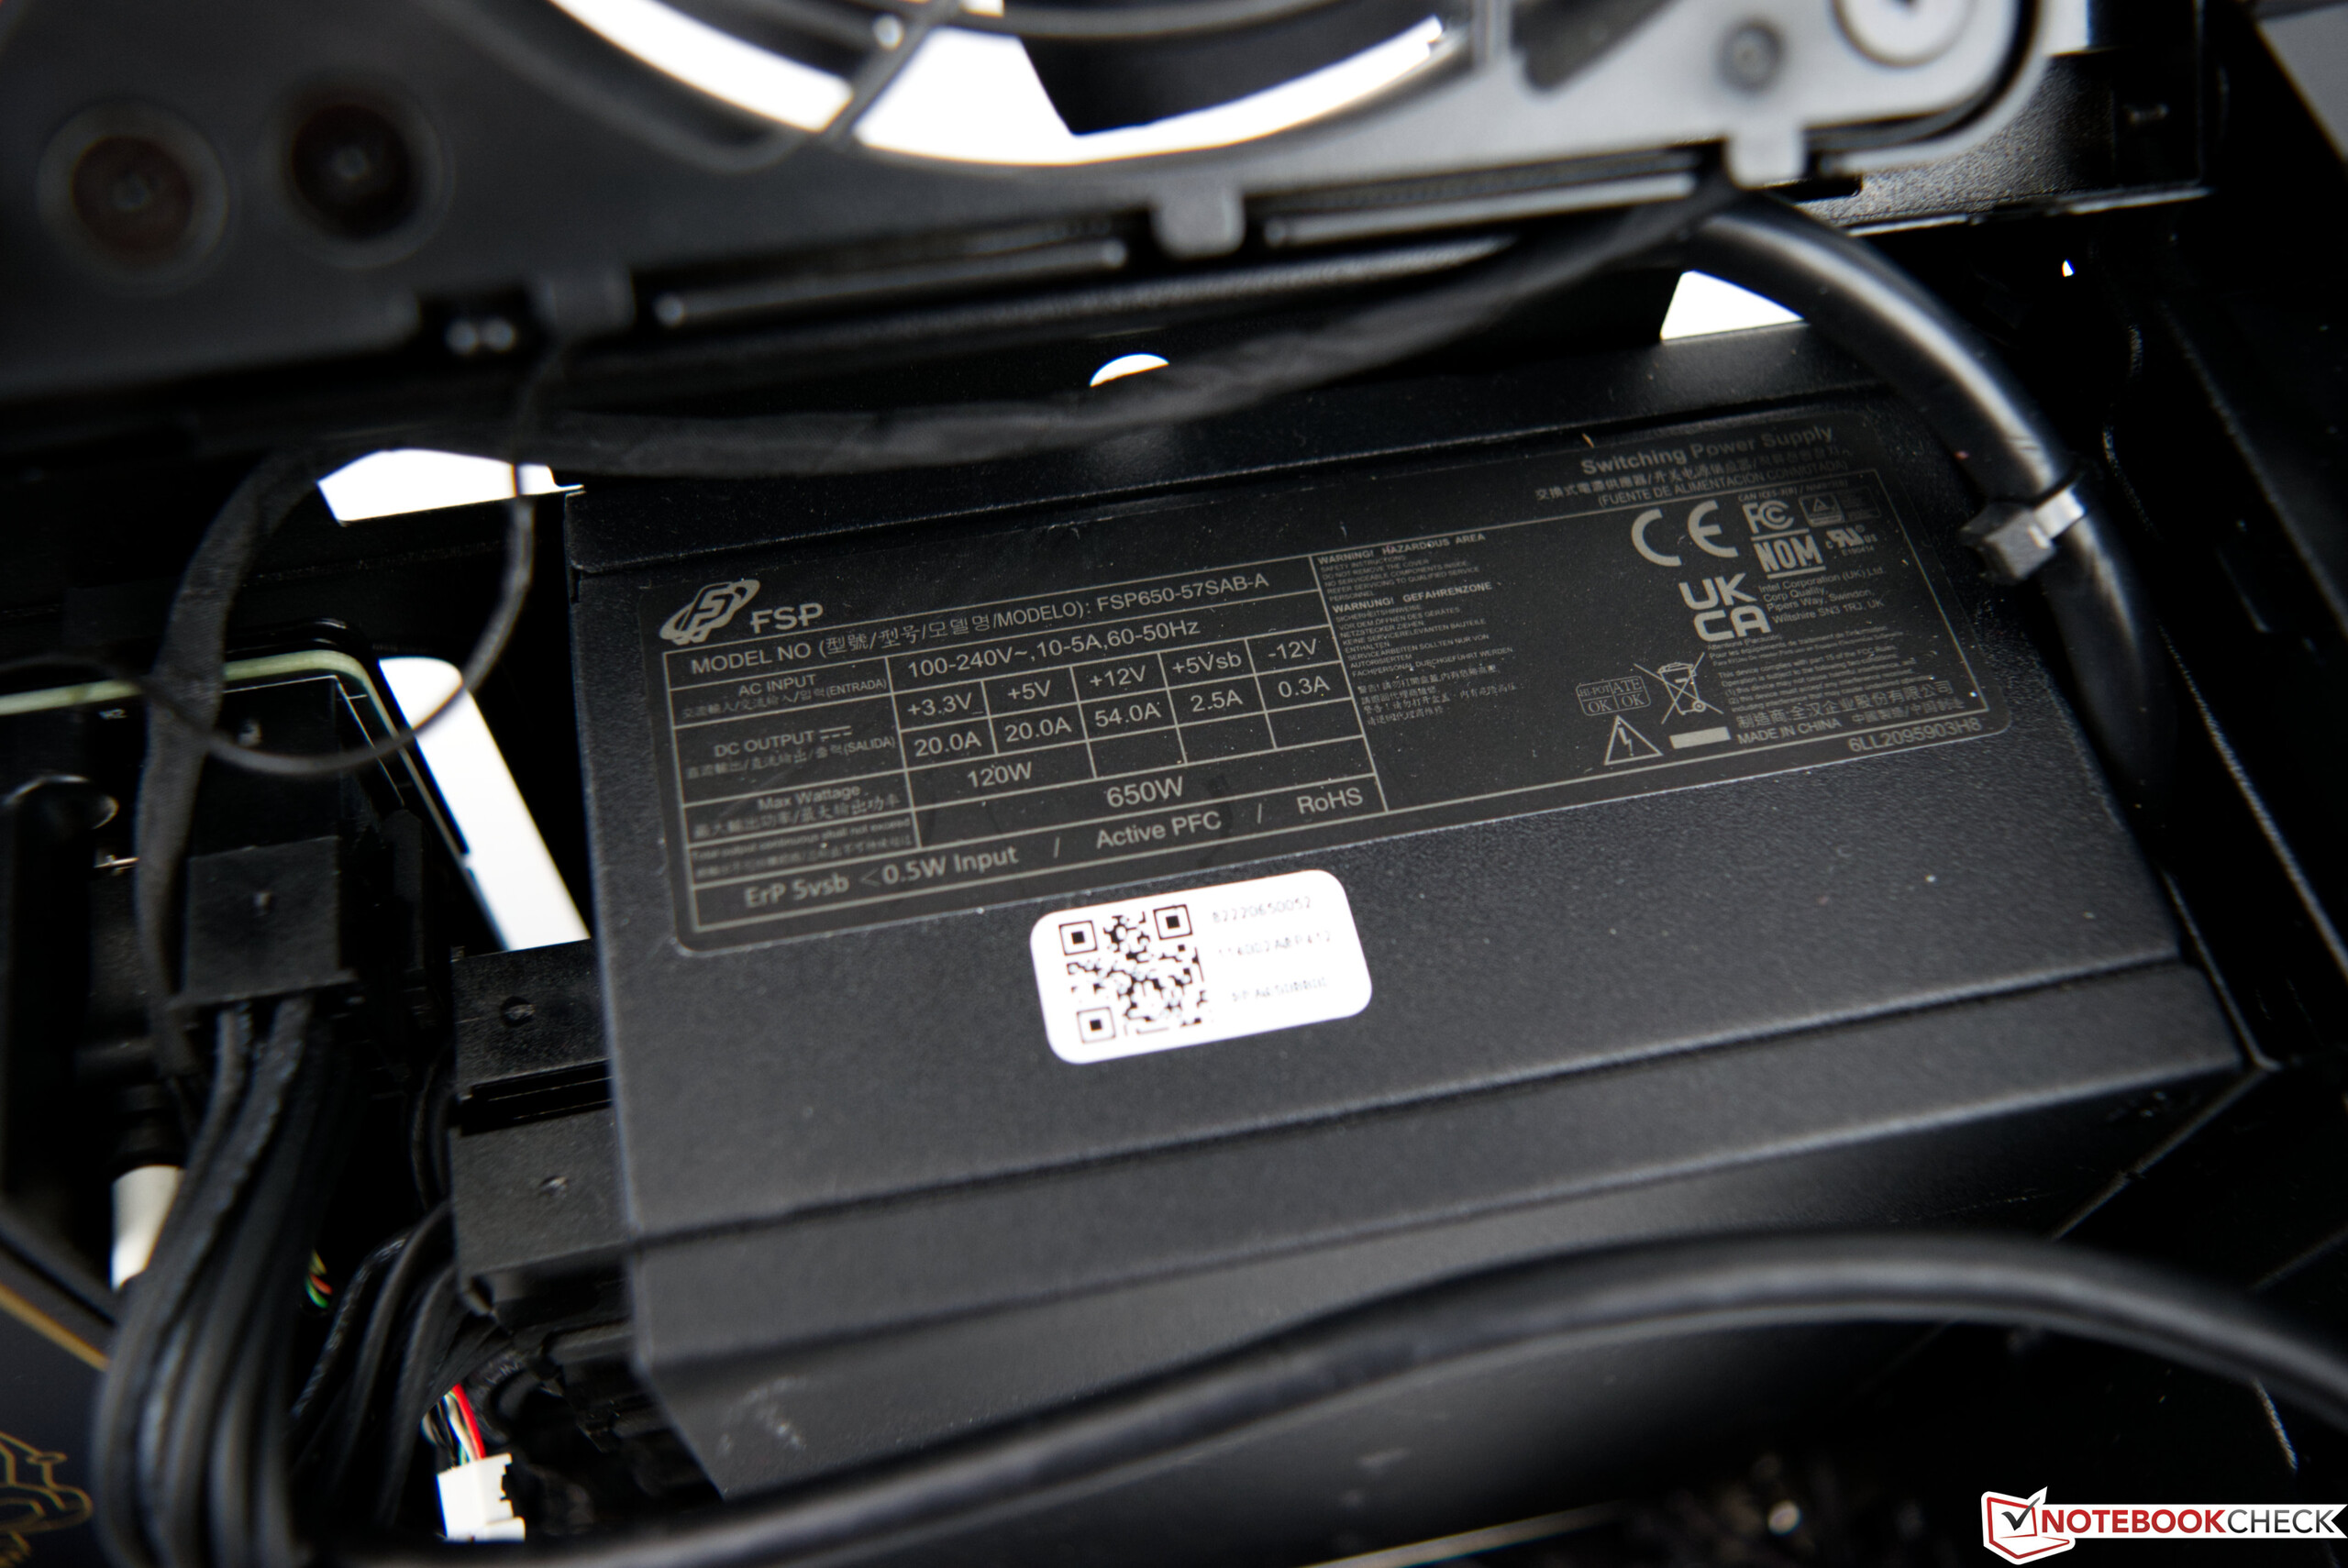
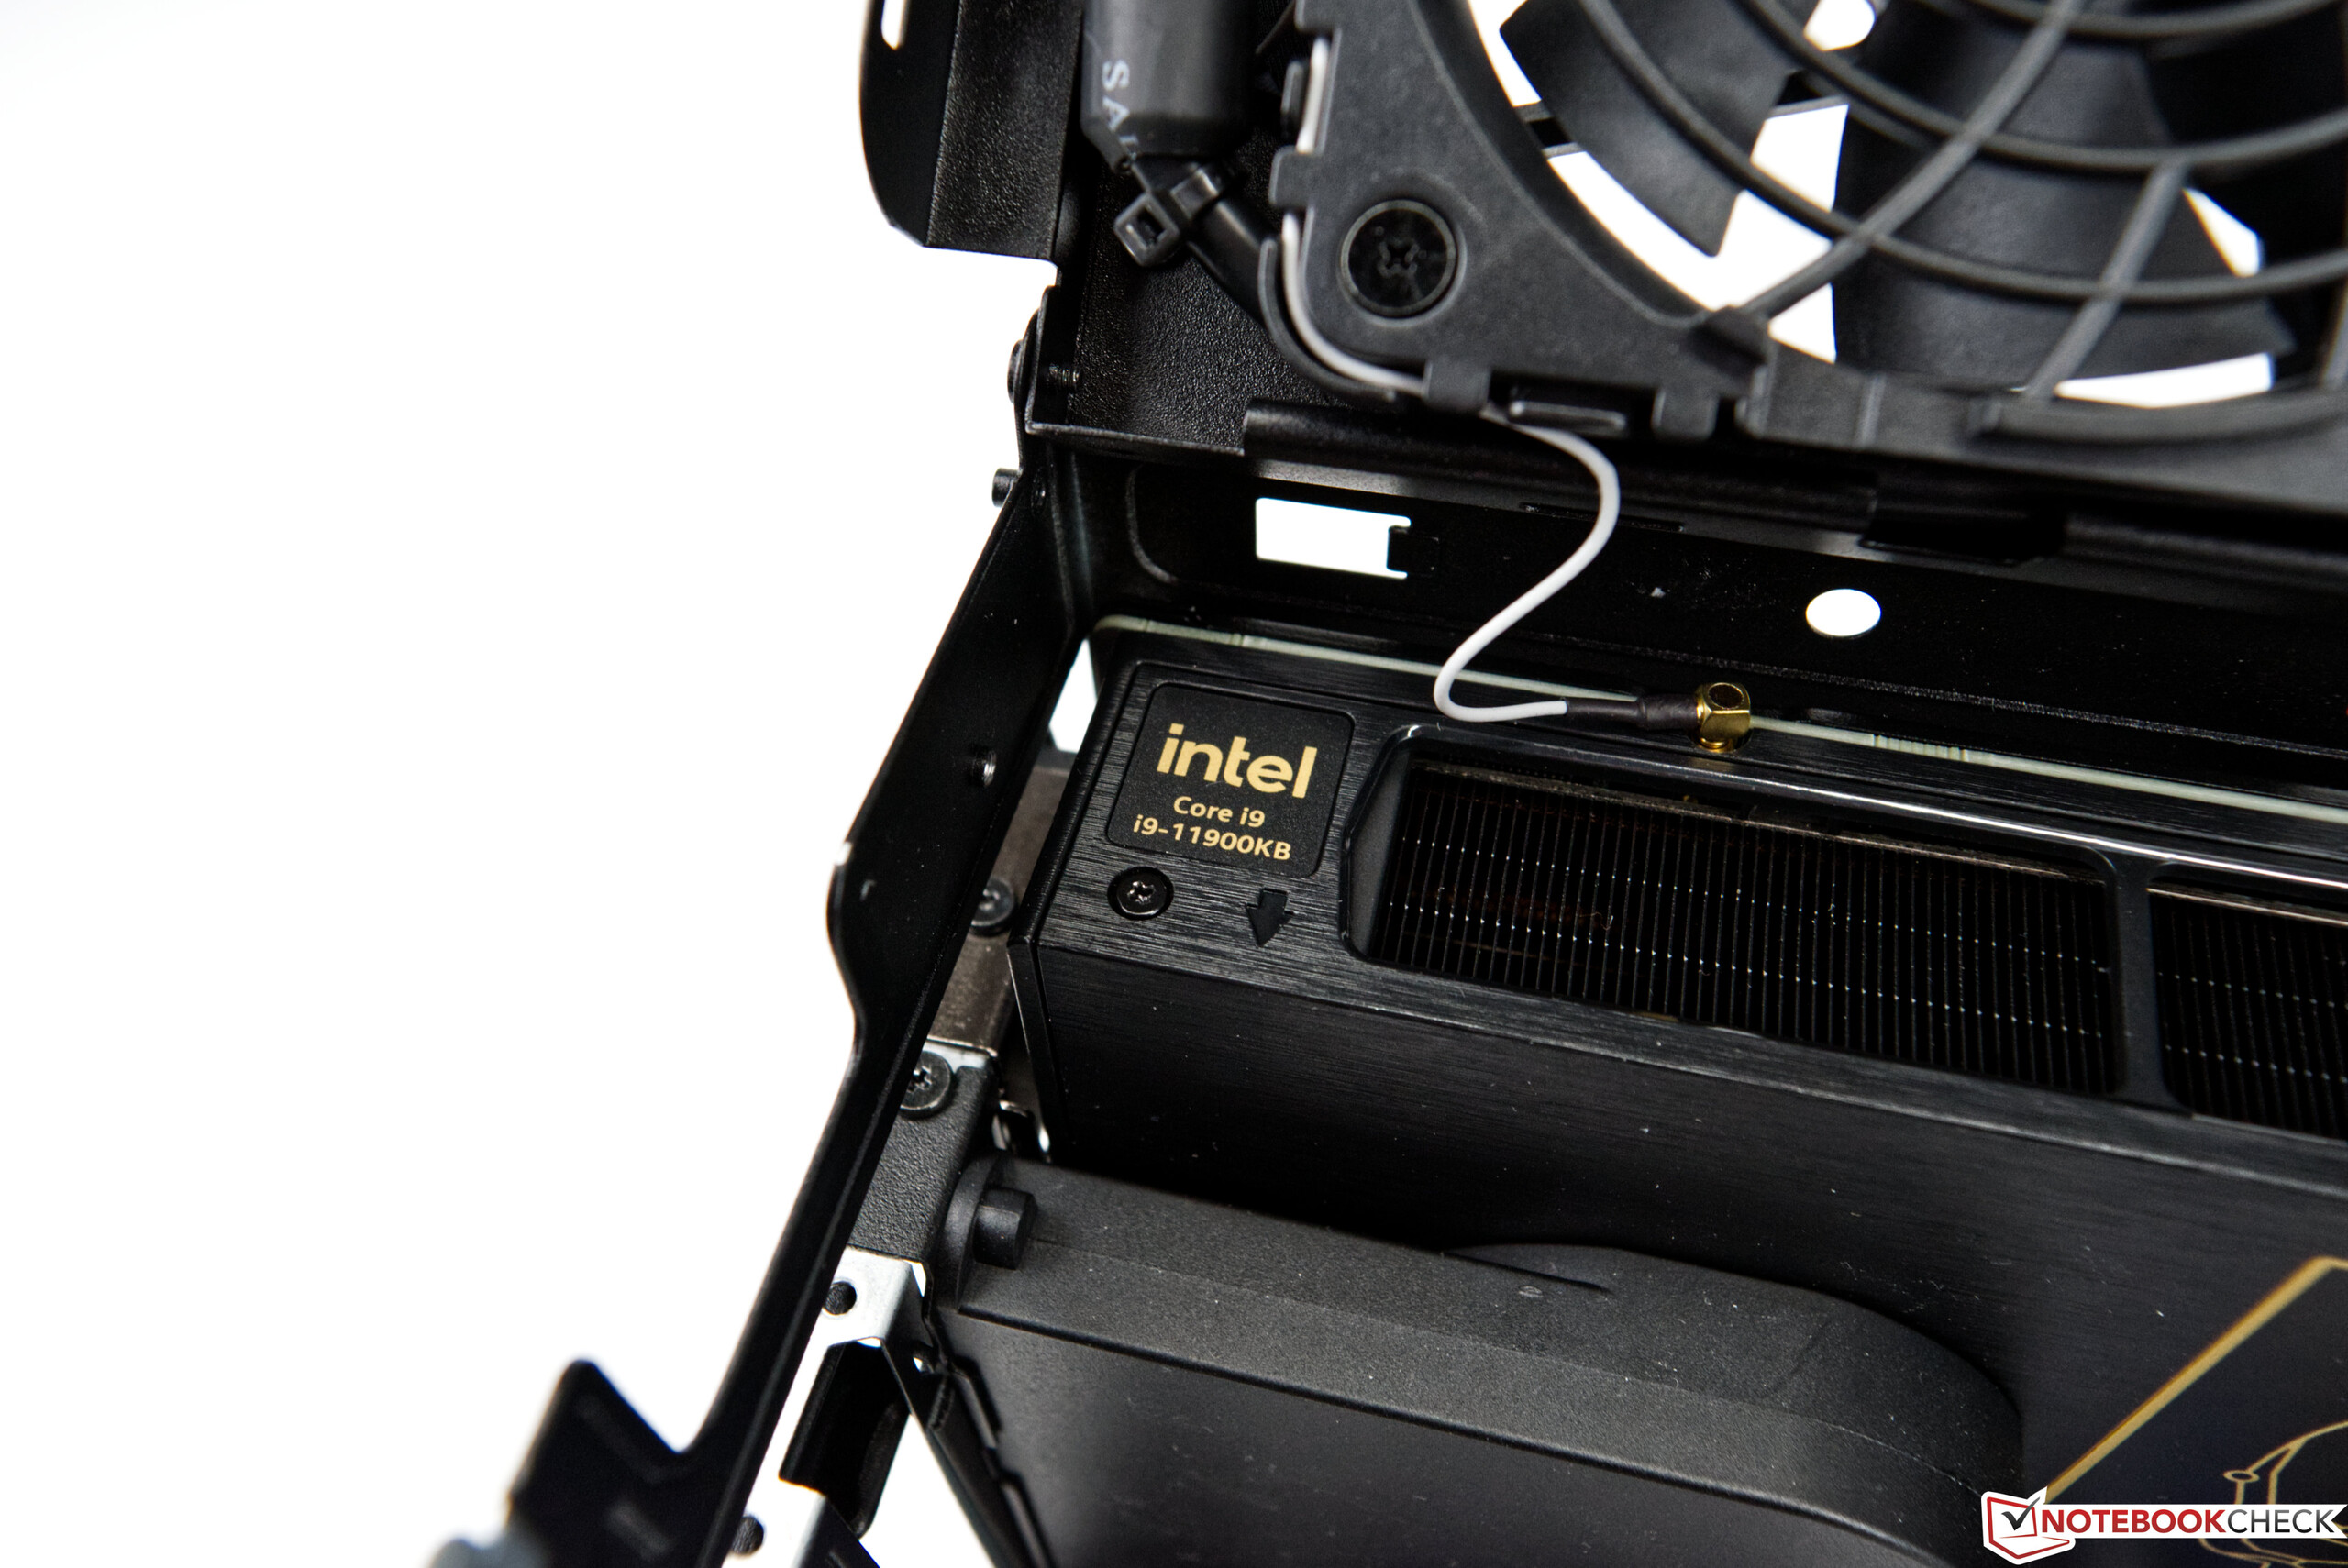
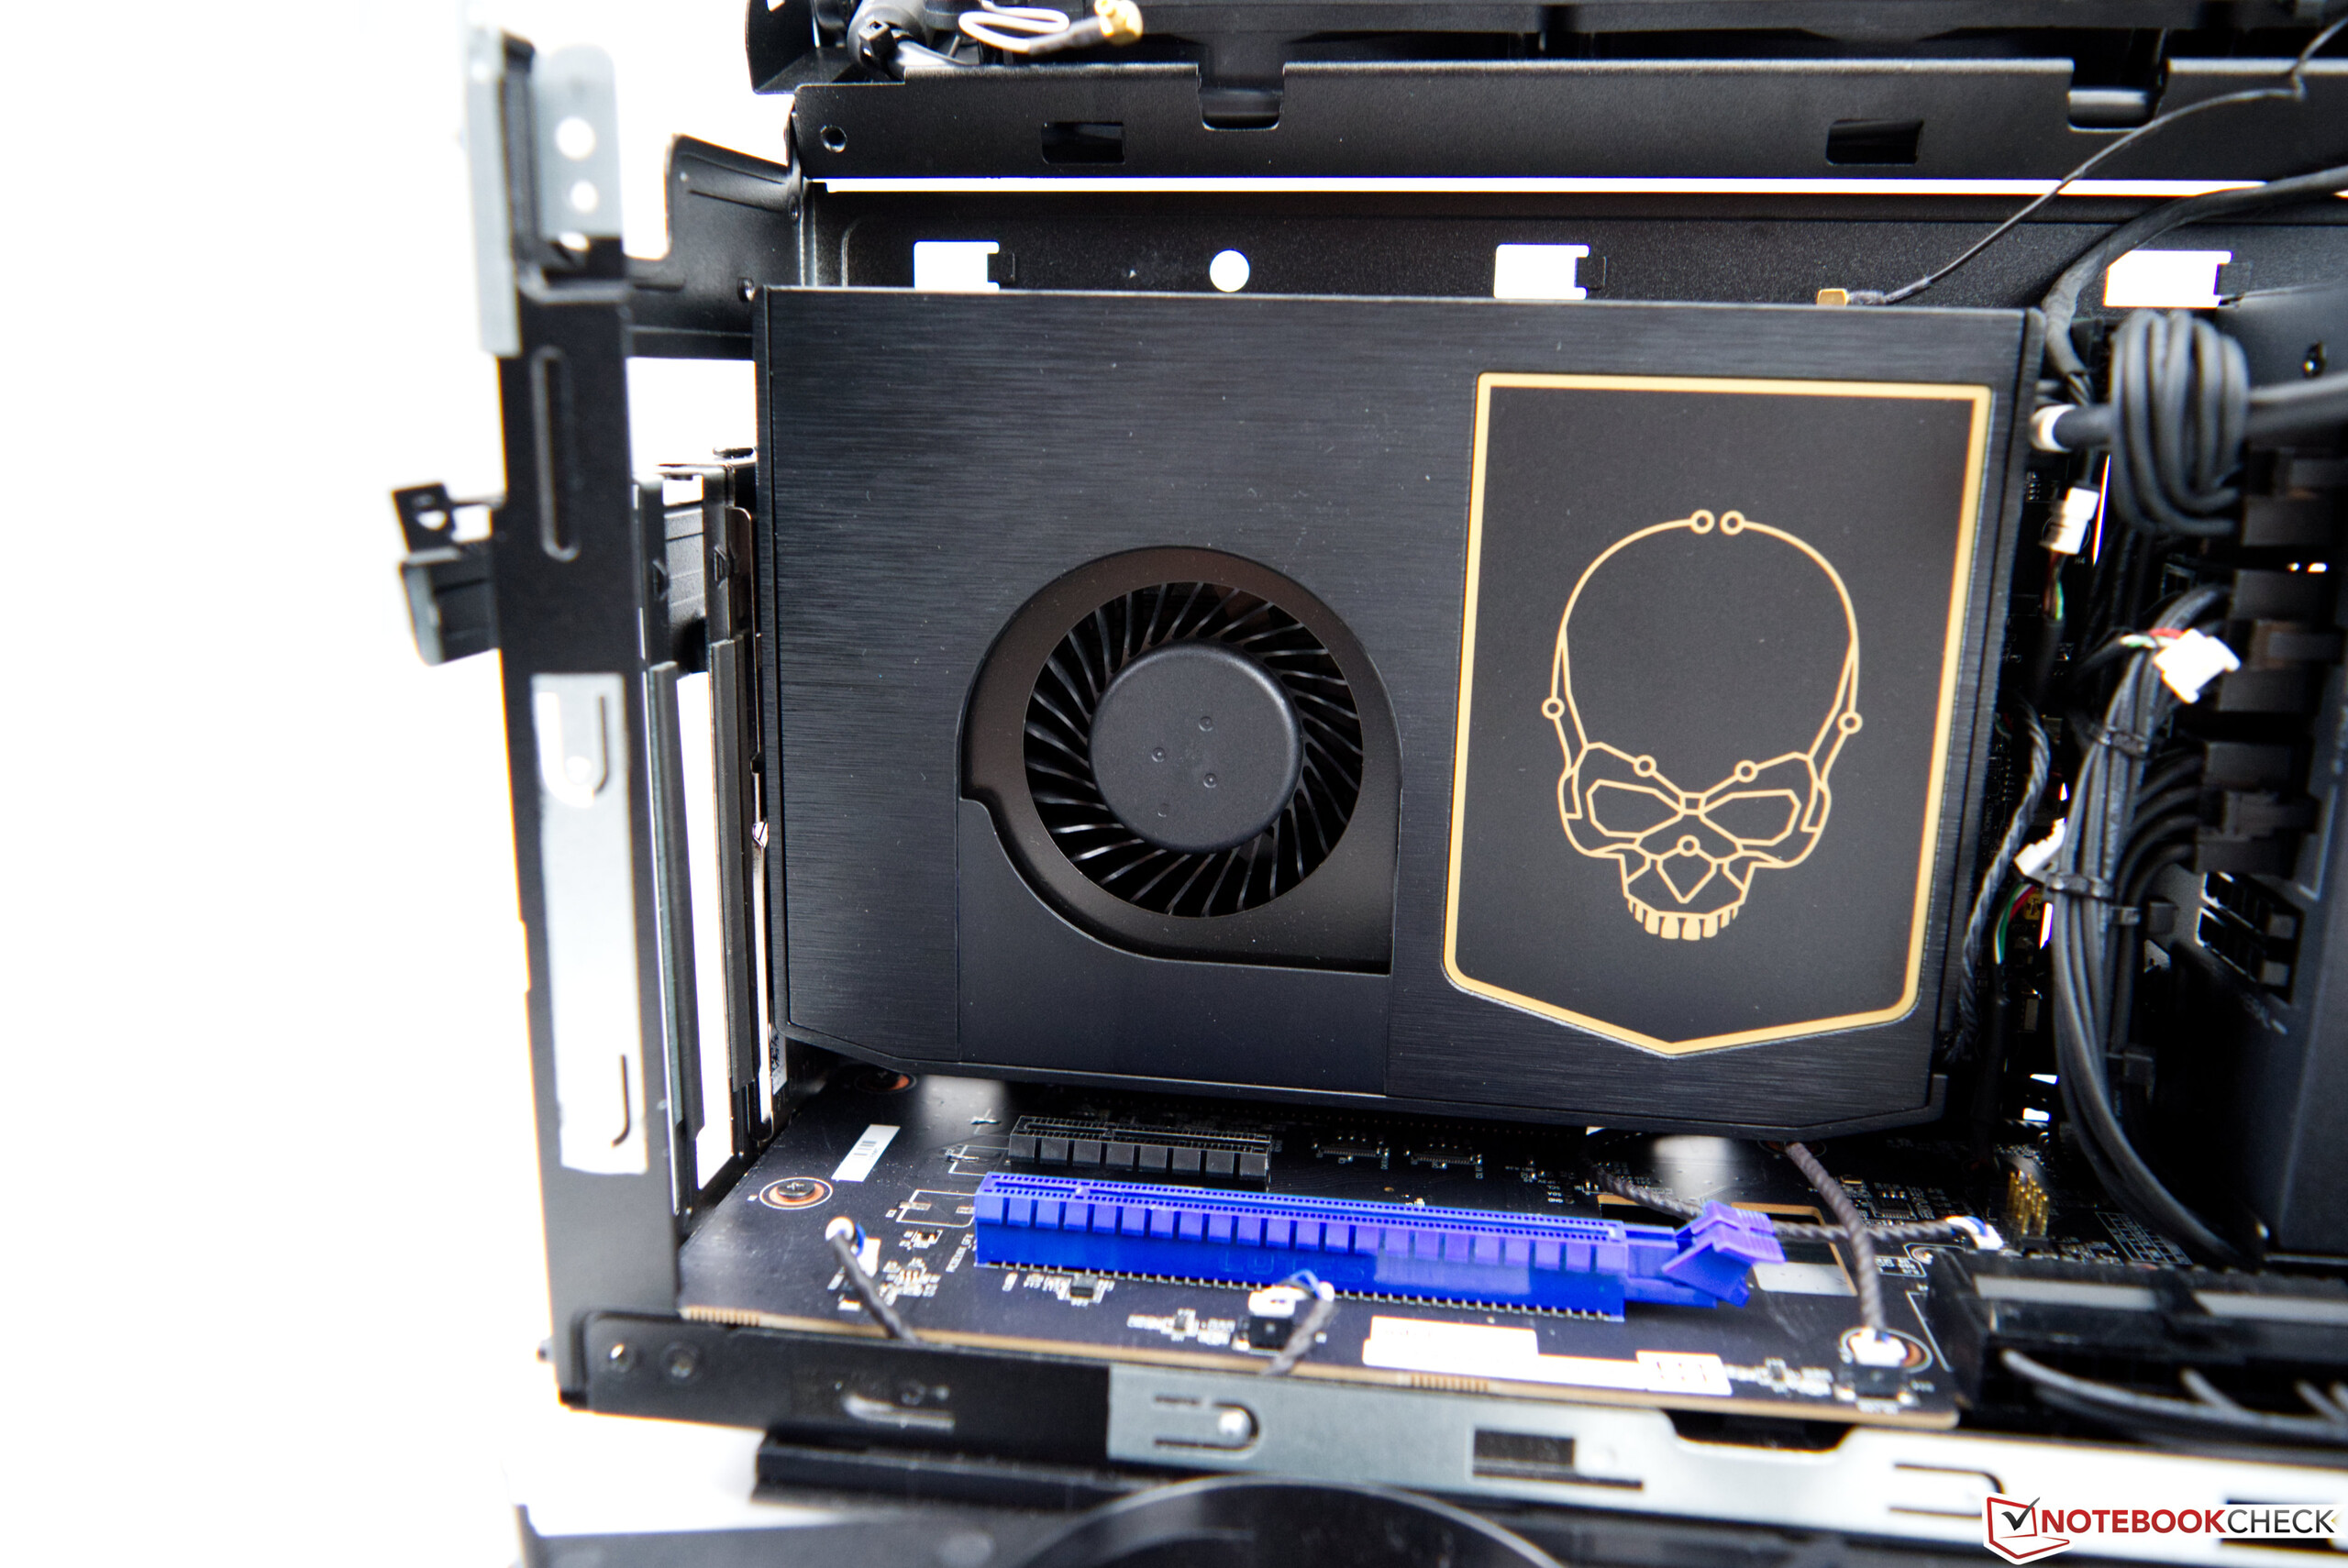
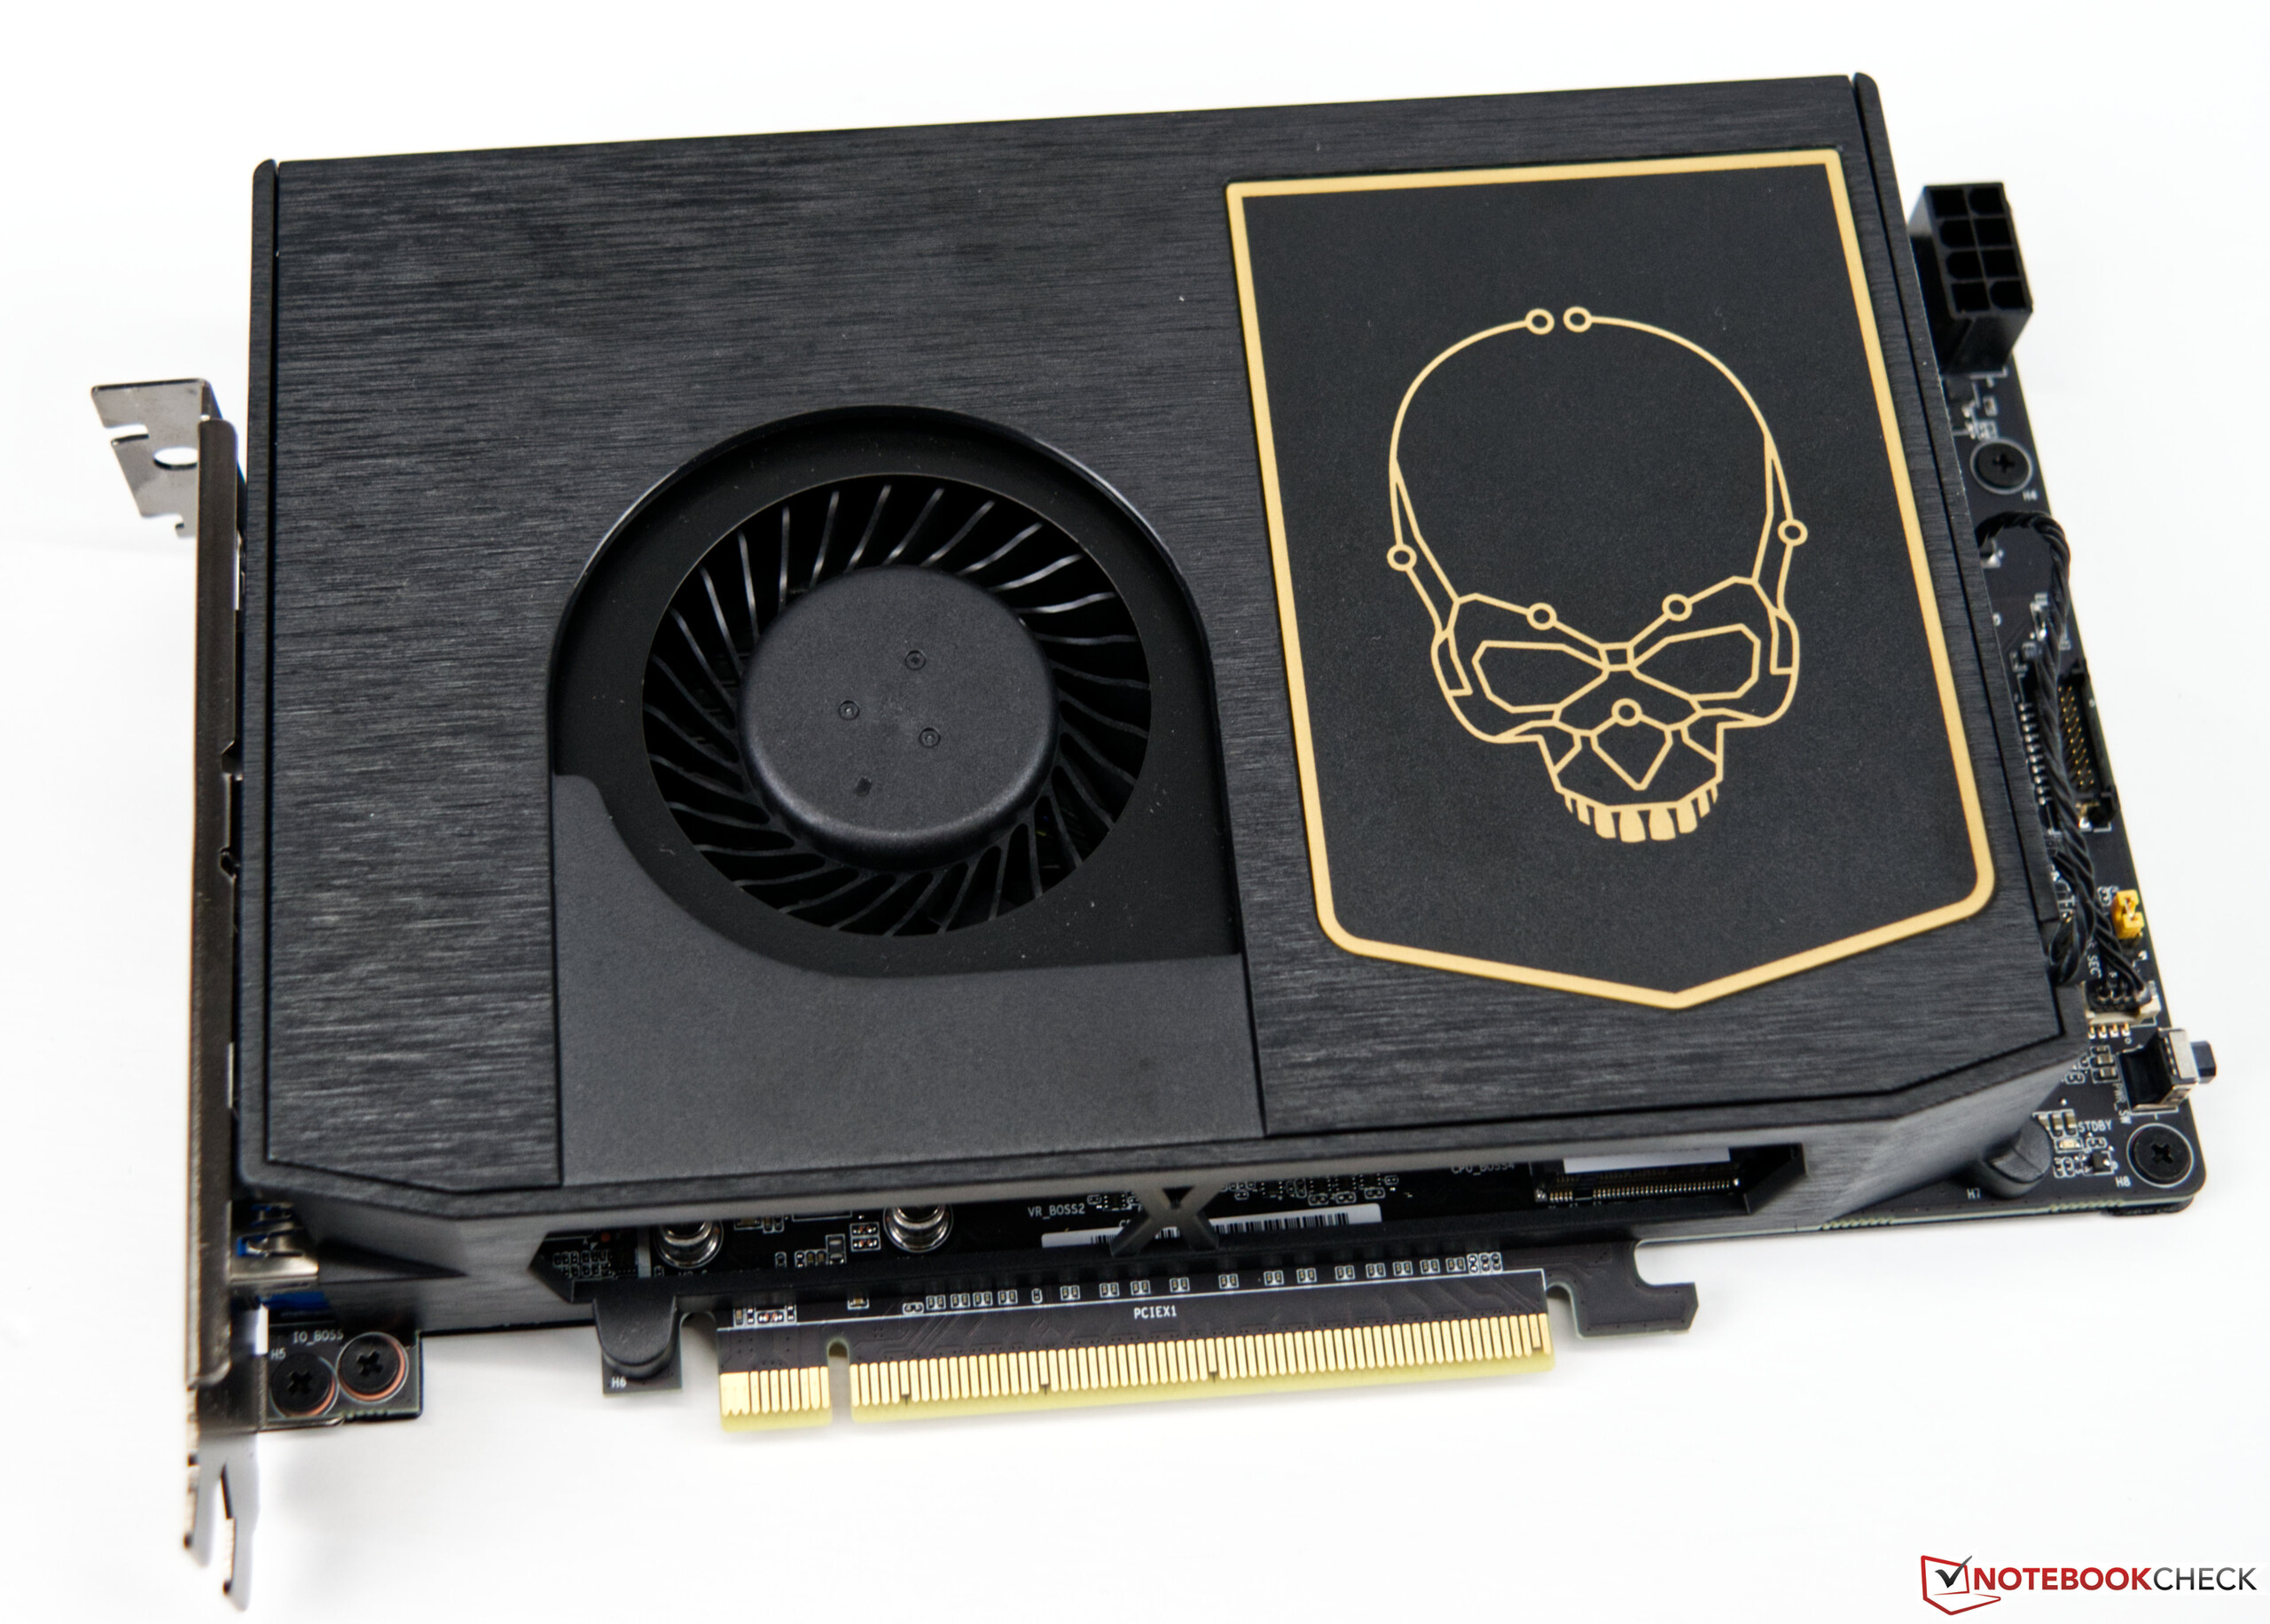
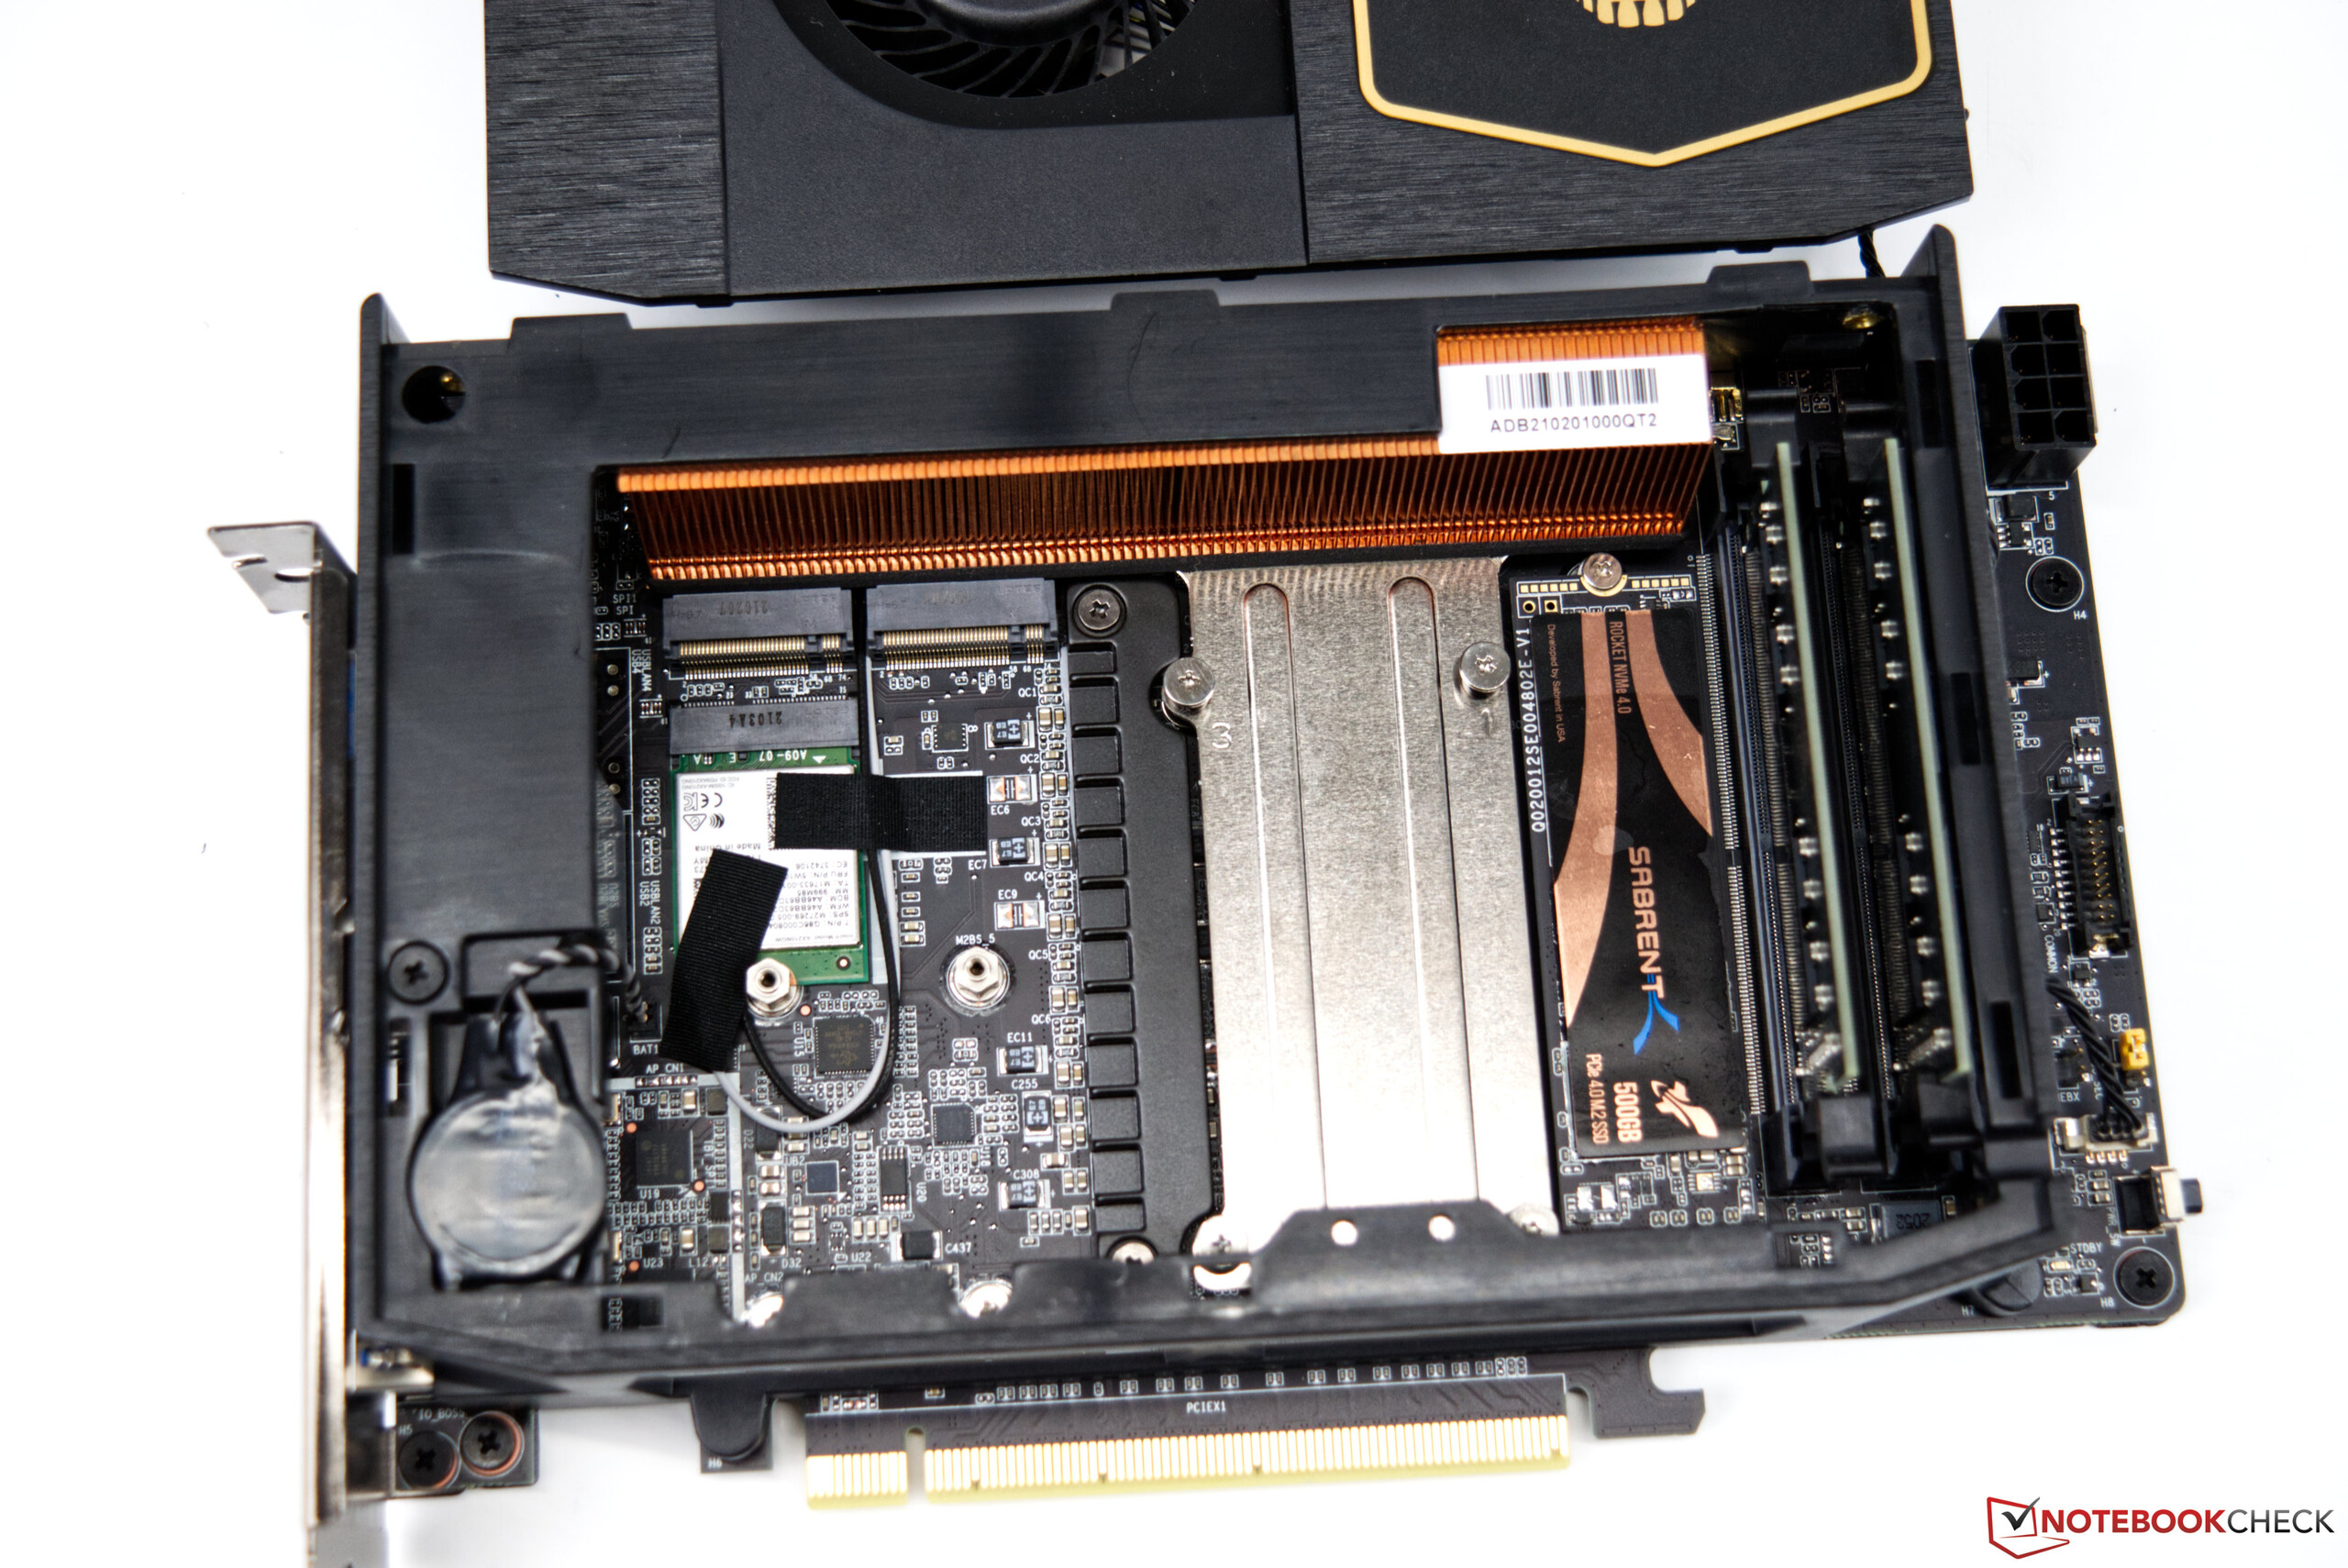
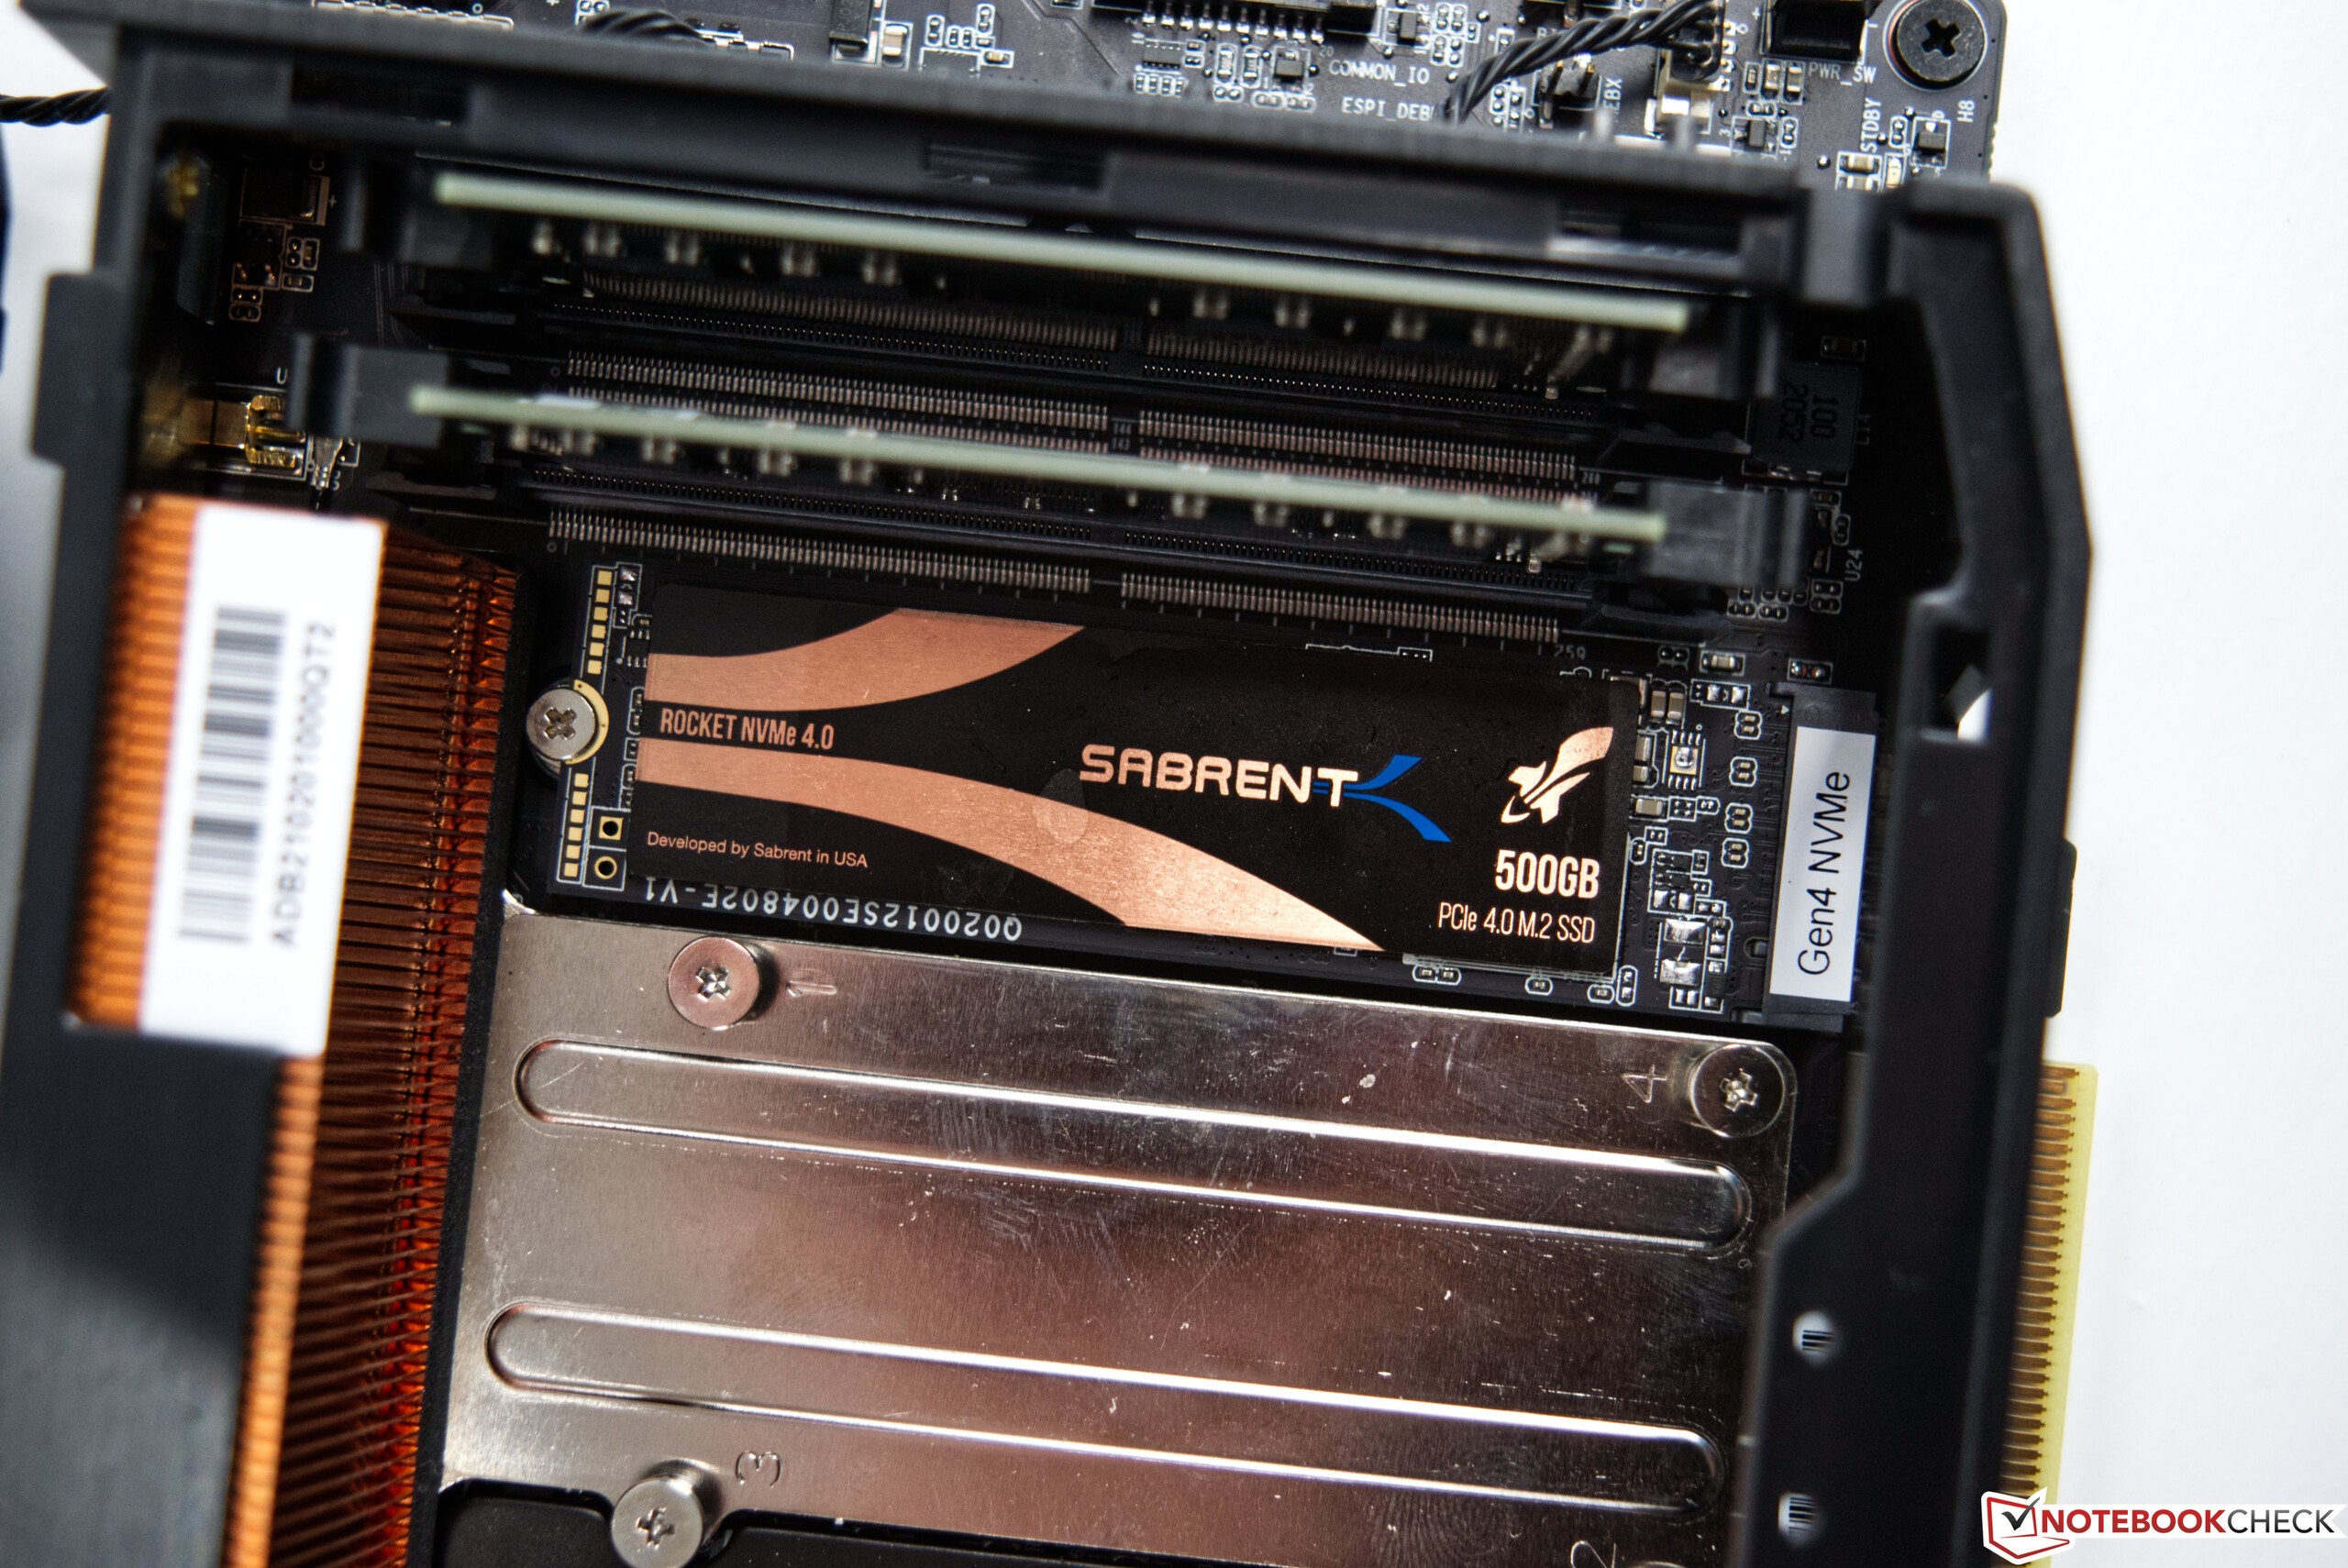
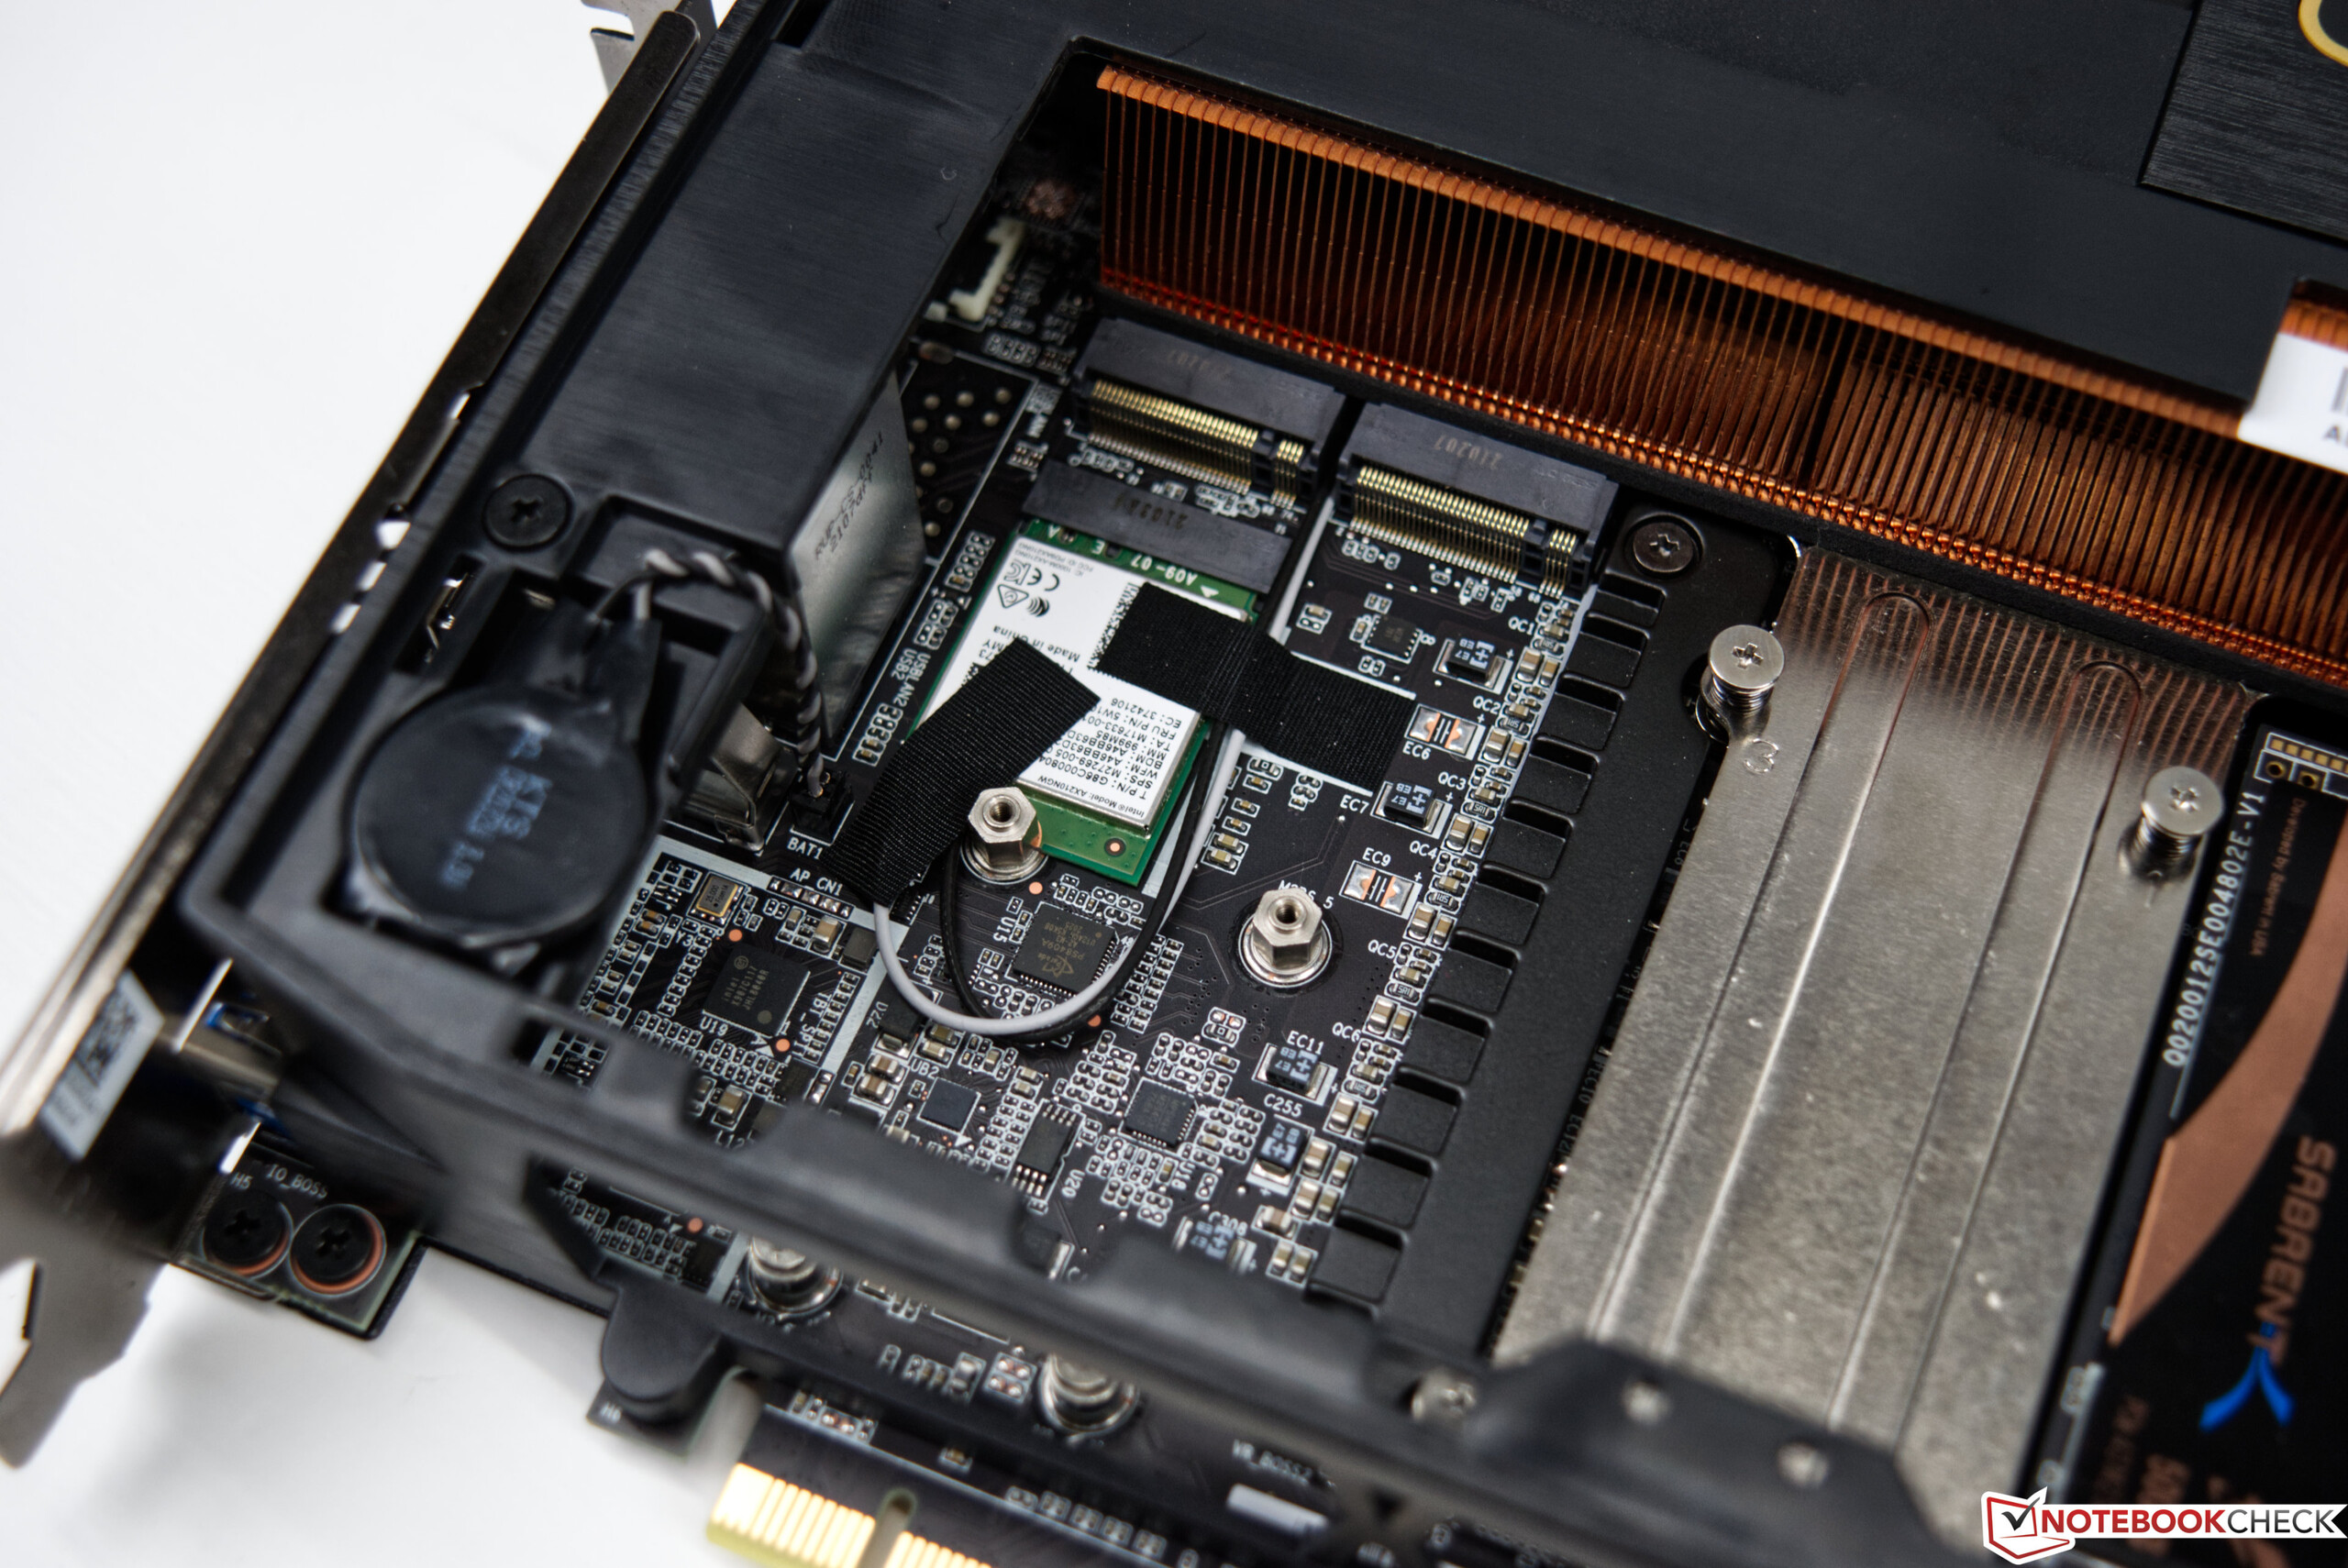
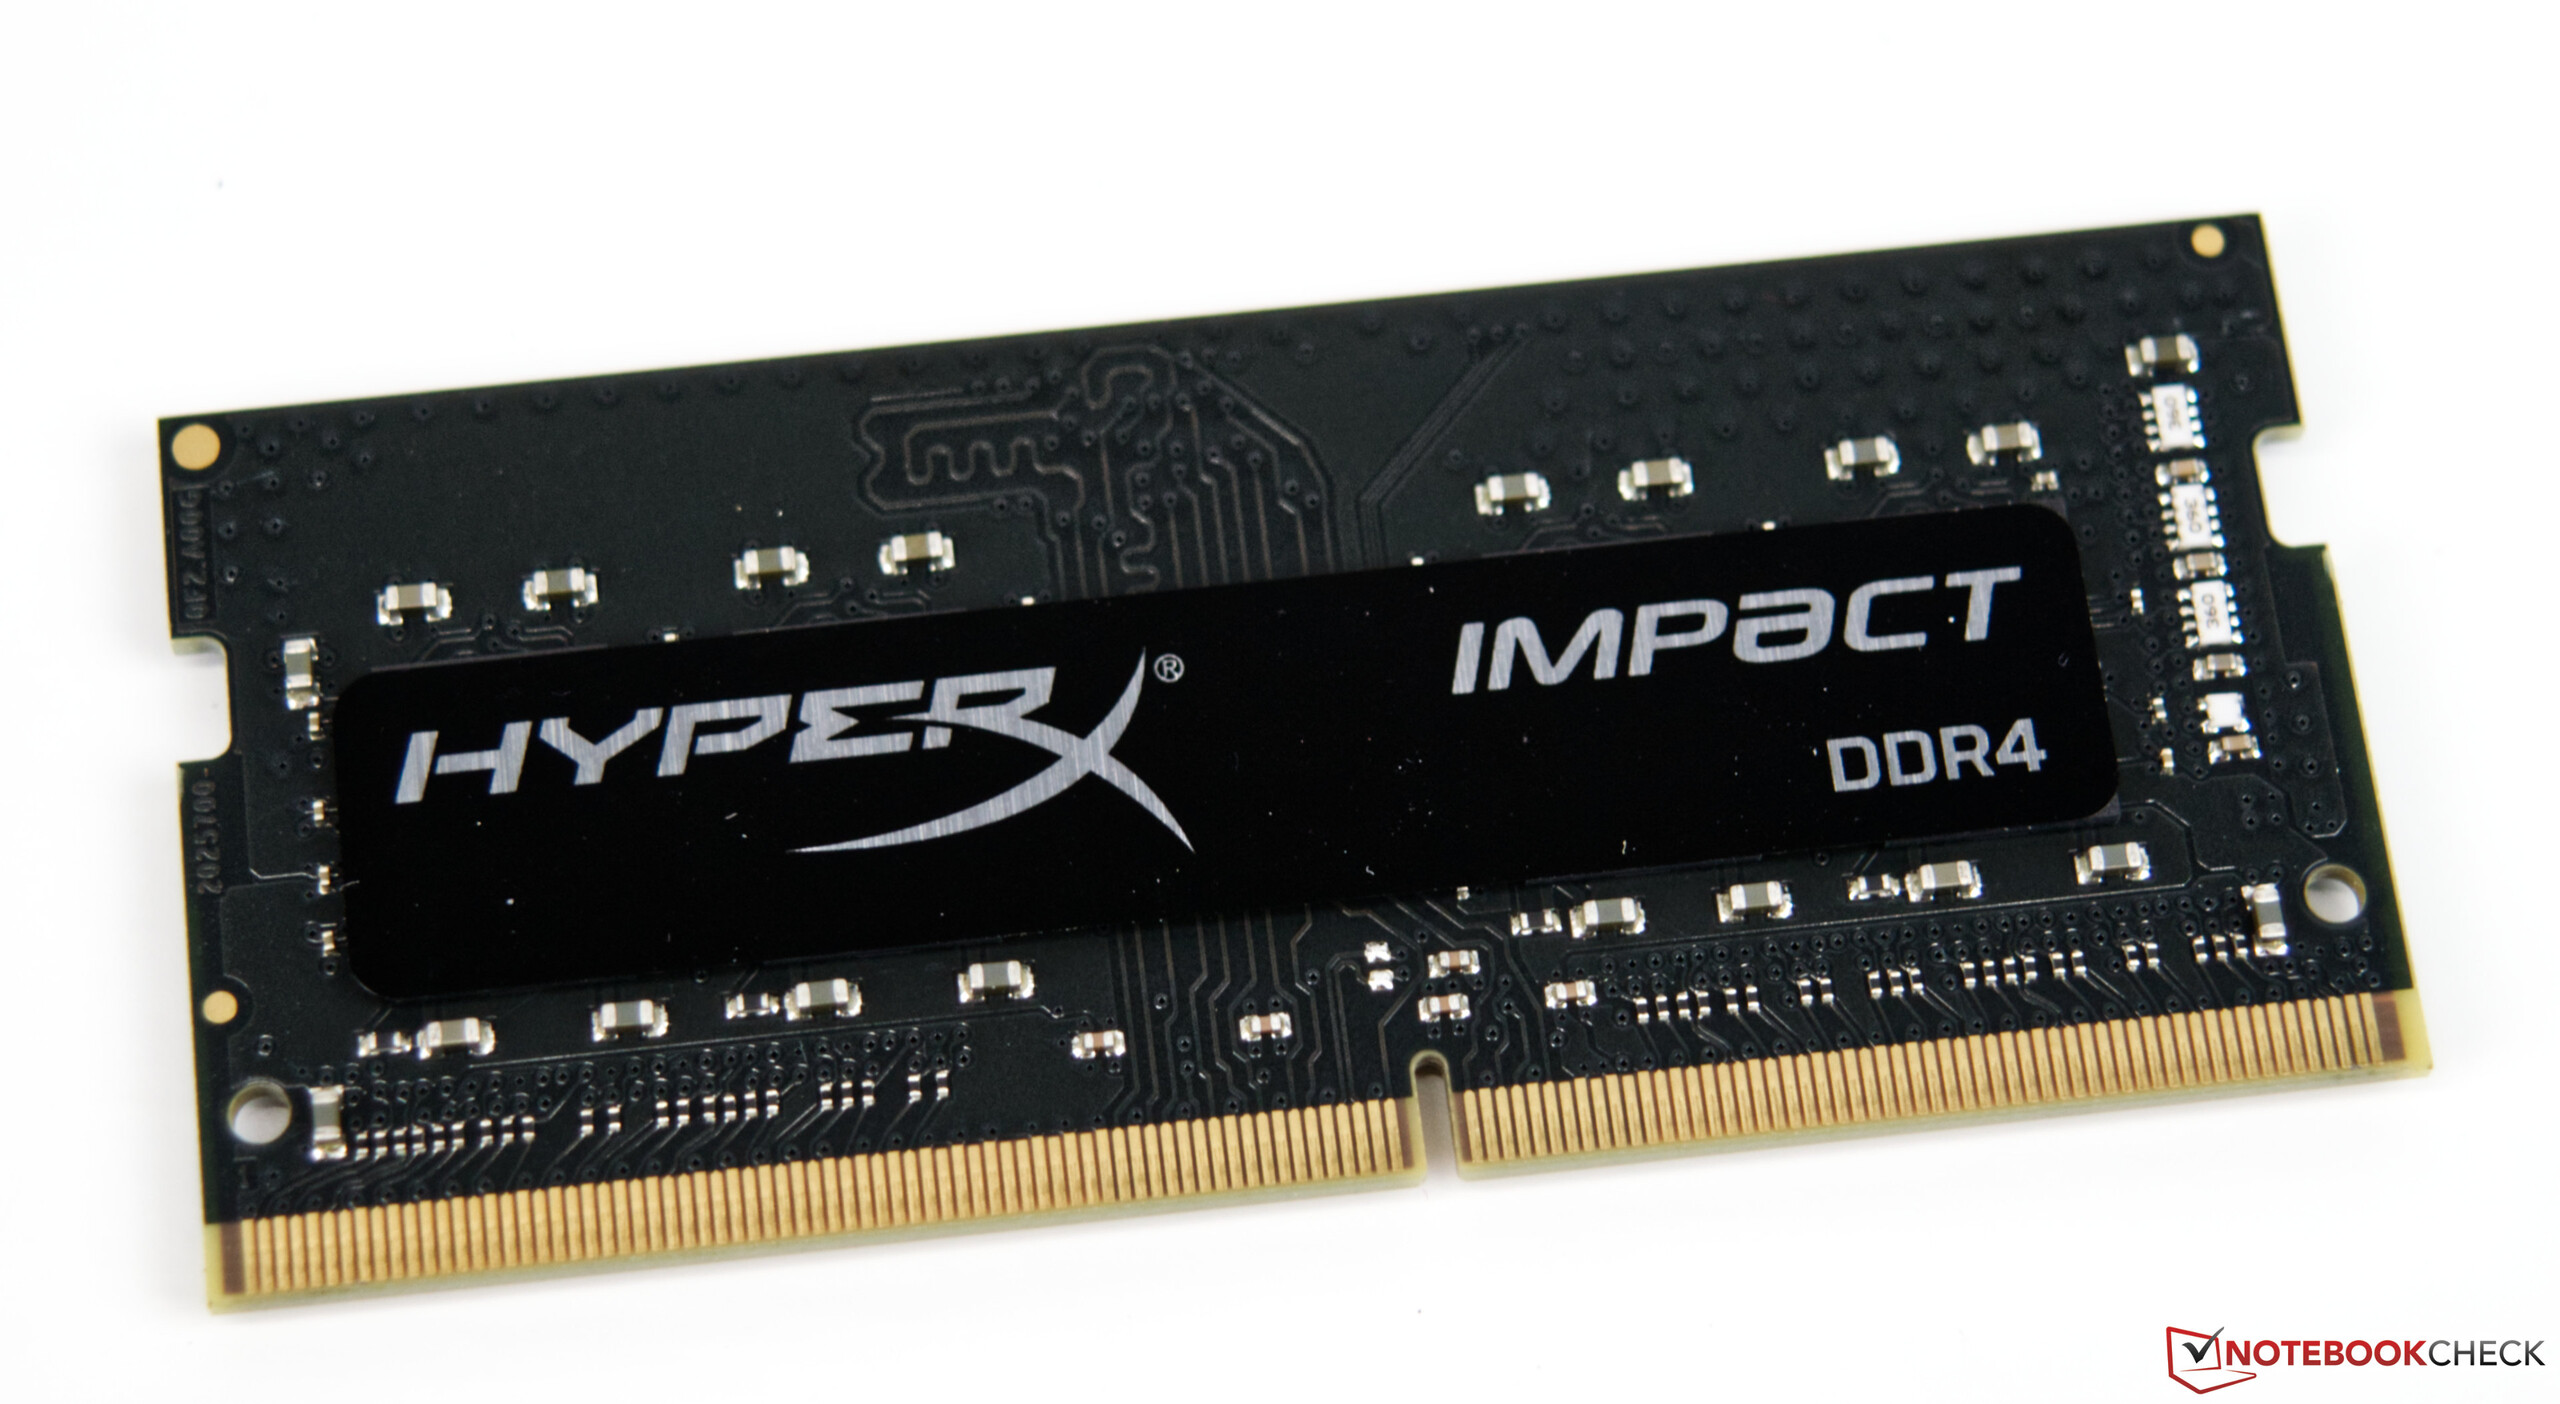
Visually, the two systems differ greatly although the rough internal layout only varies in the arrangement of the components. The power supply is still tucked away in the case and uses the SFX form factor this time, which makes replacement easier in case of a defect. The new compute element is still stowed away as a plug-in card in a PCI Express slot and contains the Intel Core i9-11900KB — a very fast SoC with 8 cores and 16 threads. Furthermore, the NUC 11 Extreme compute element offers space for two SO-DIMM modules and stores up to three M.2 SSD2 in addition to the WLAN module.
The SoC has its own iGPU, which is only suitable for gaming to a limited extent. Instead, the Nvidia GeForce RTX 3060 installed in the Beast Canyon provides a decent gaming performance in combination with the fast SoC.
The pricing of the Beast Canyon is not quite straightforward. Intel itself quotes an MSRP of just under US$1,200 for the Core i9 model, which we have in review here. The Core i7 model (Intel Core i9-11700B) is priced at around US$1,000. It should be noted that these are the prices of the barebone system, which means additional costs for RAM, SSD, and GPU. A rough estimate using our test system as a basis indicates the costs to be well over US$2,000. The current situation for graphics cards is the biggest factor for the additional costs. The installed GeForce RTX 3060 from Asus currently costs ~US$1,000. Costs can be reduced a bit if you choose a cheaper alternative or select a suitable model on your own.
However, those who want to use the Intel NUC 11 Extreme Kit with a dedicated graphics card should pay attention to the dimensions of the card. The cooling unit should not take up more than two PCIe slots. The length of the graphics card is limited to a maximum of 12 inches.


Intel NUC 11 Extreme compute element in detail

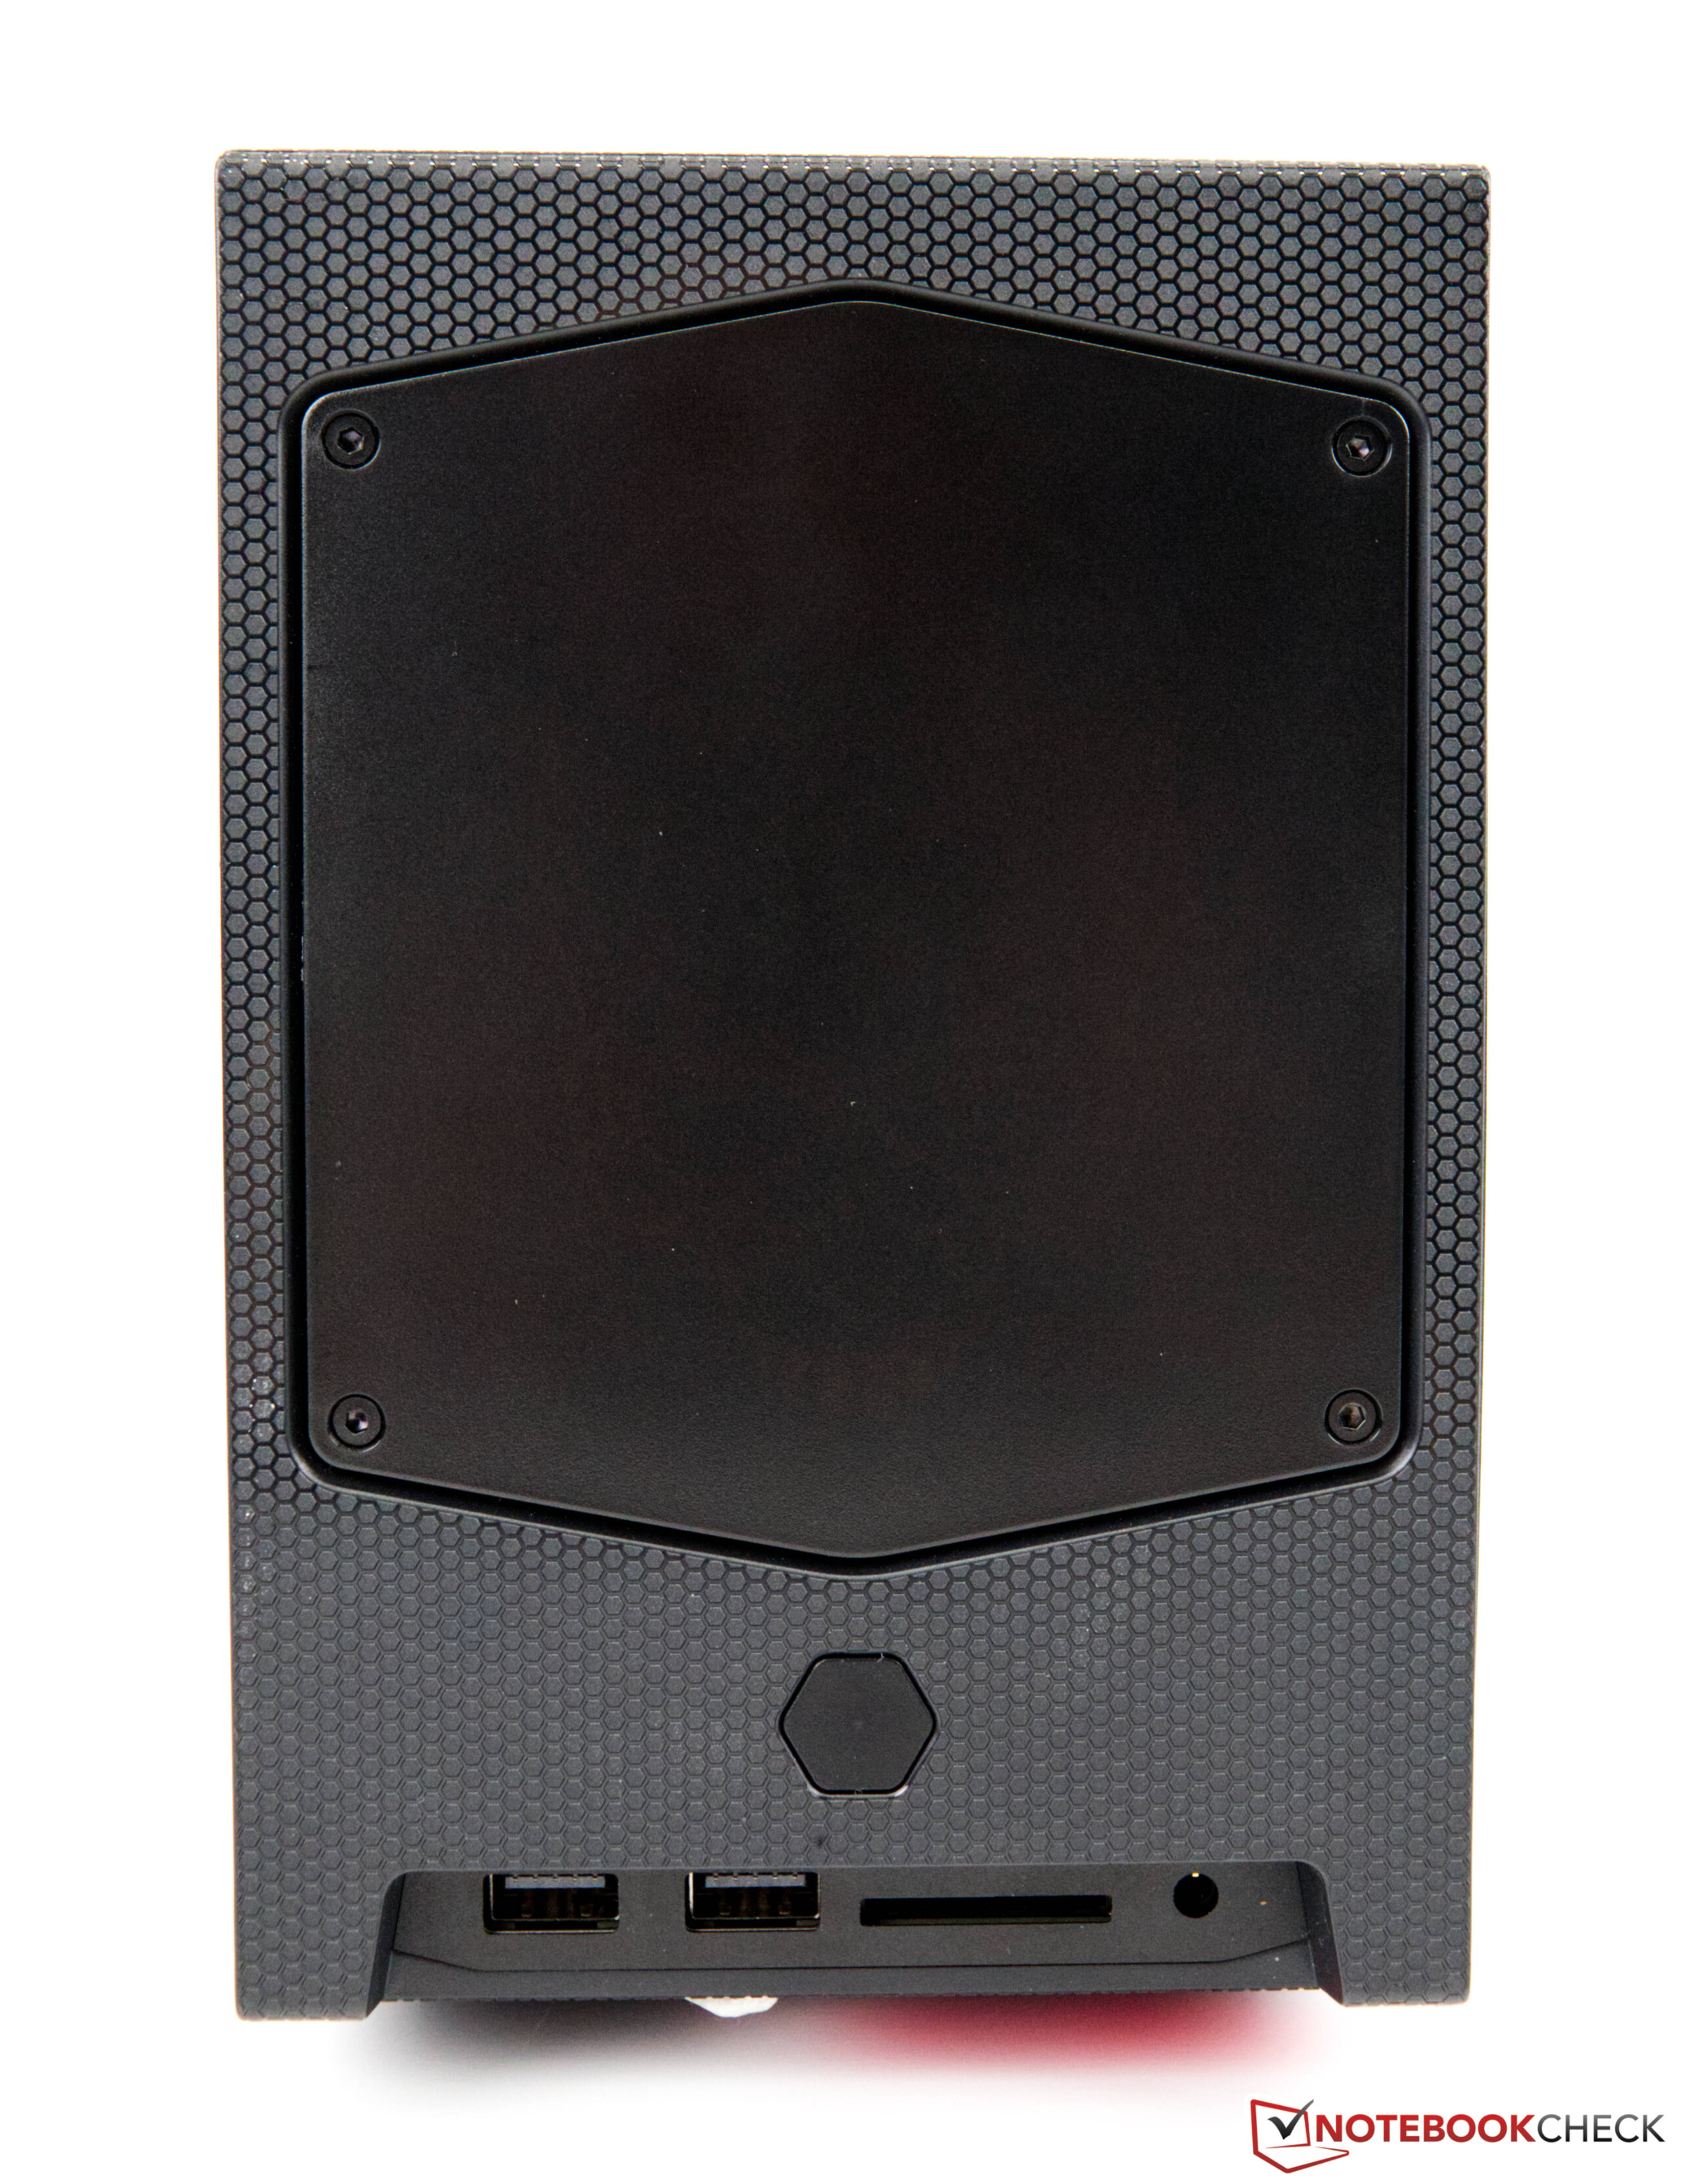
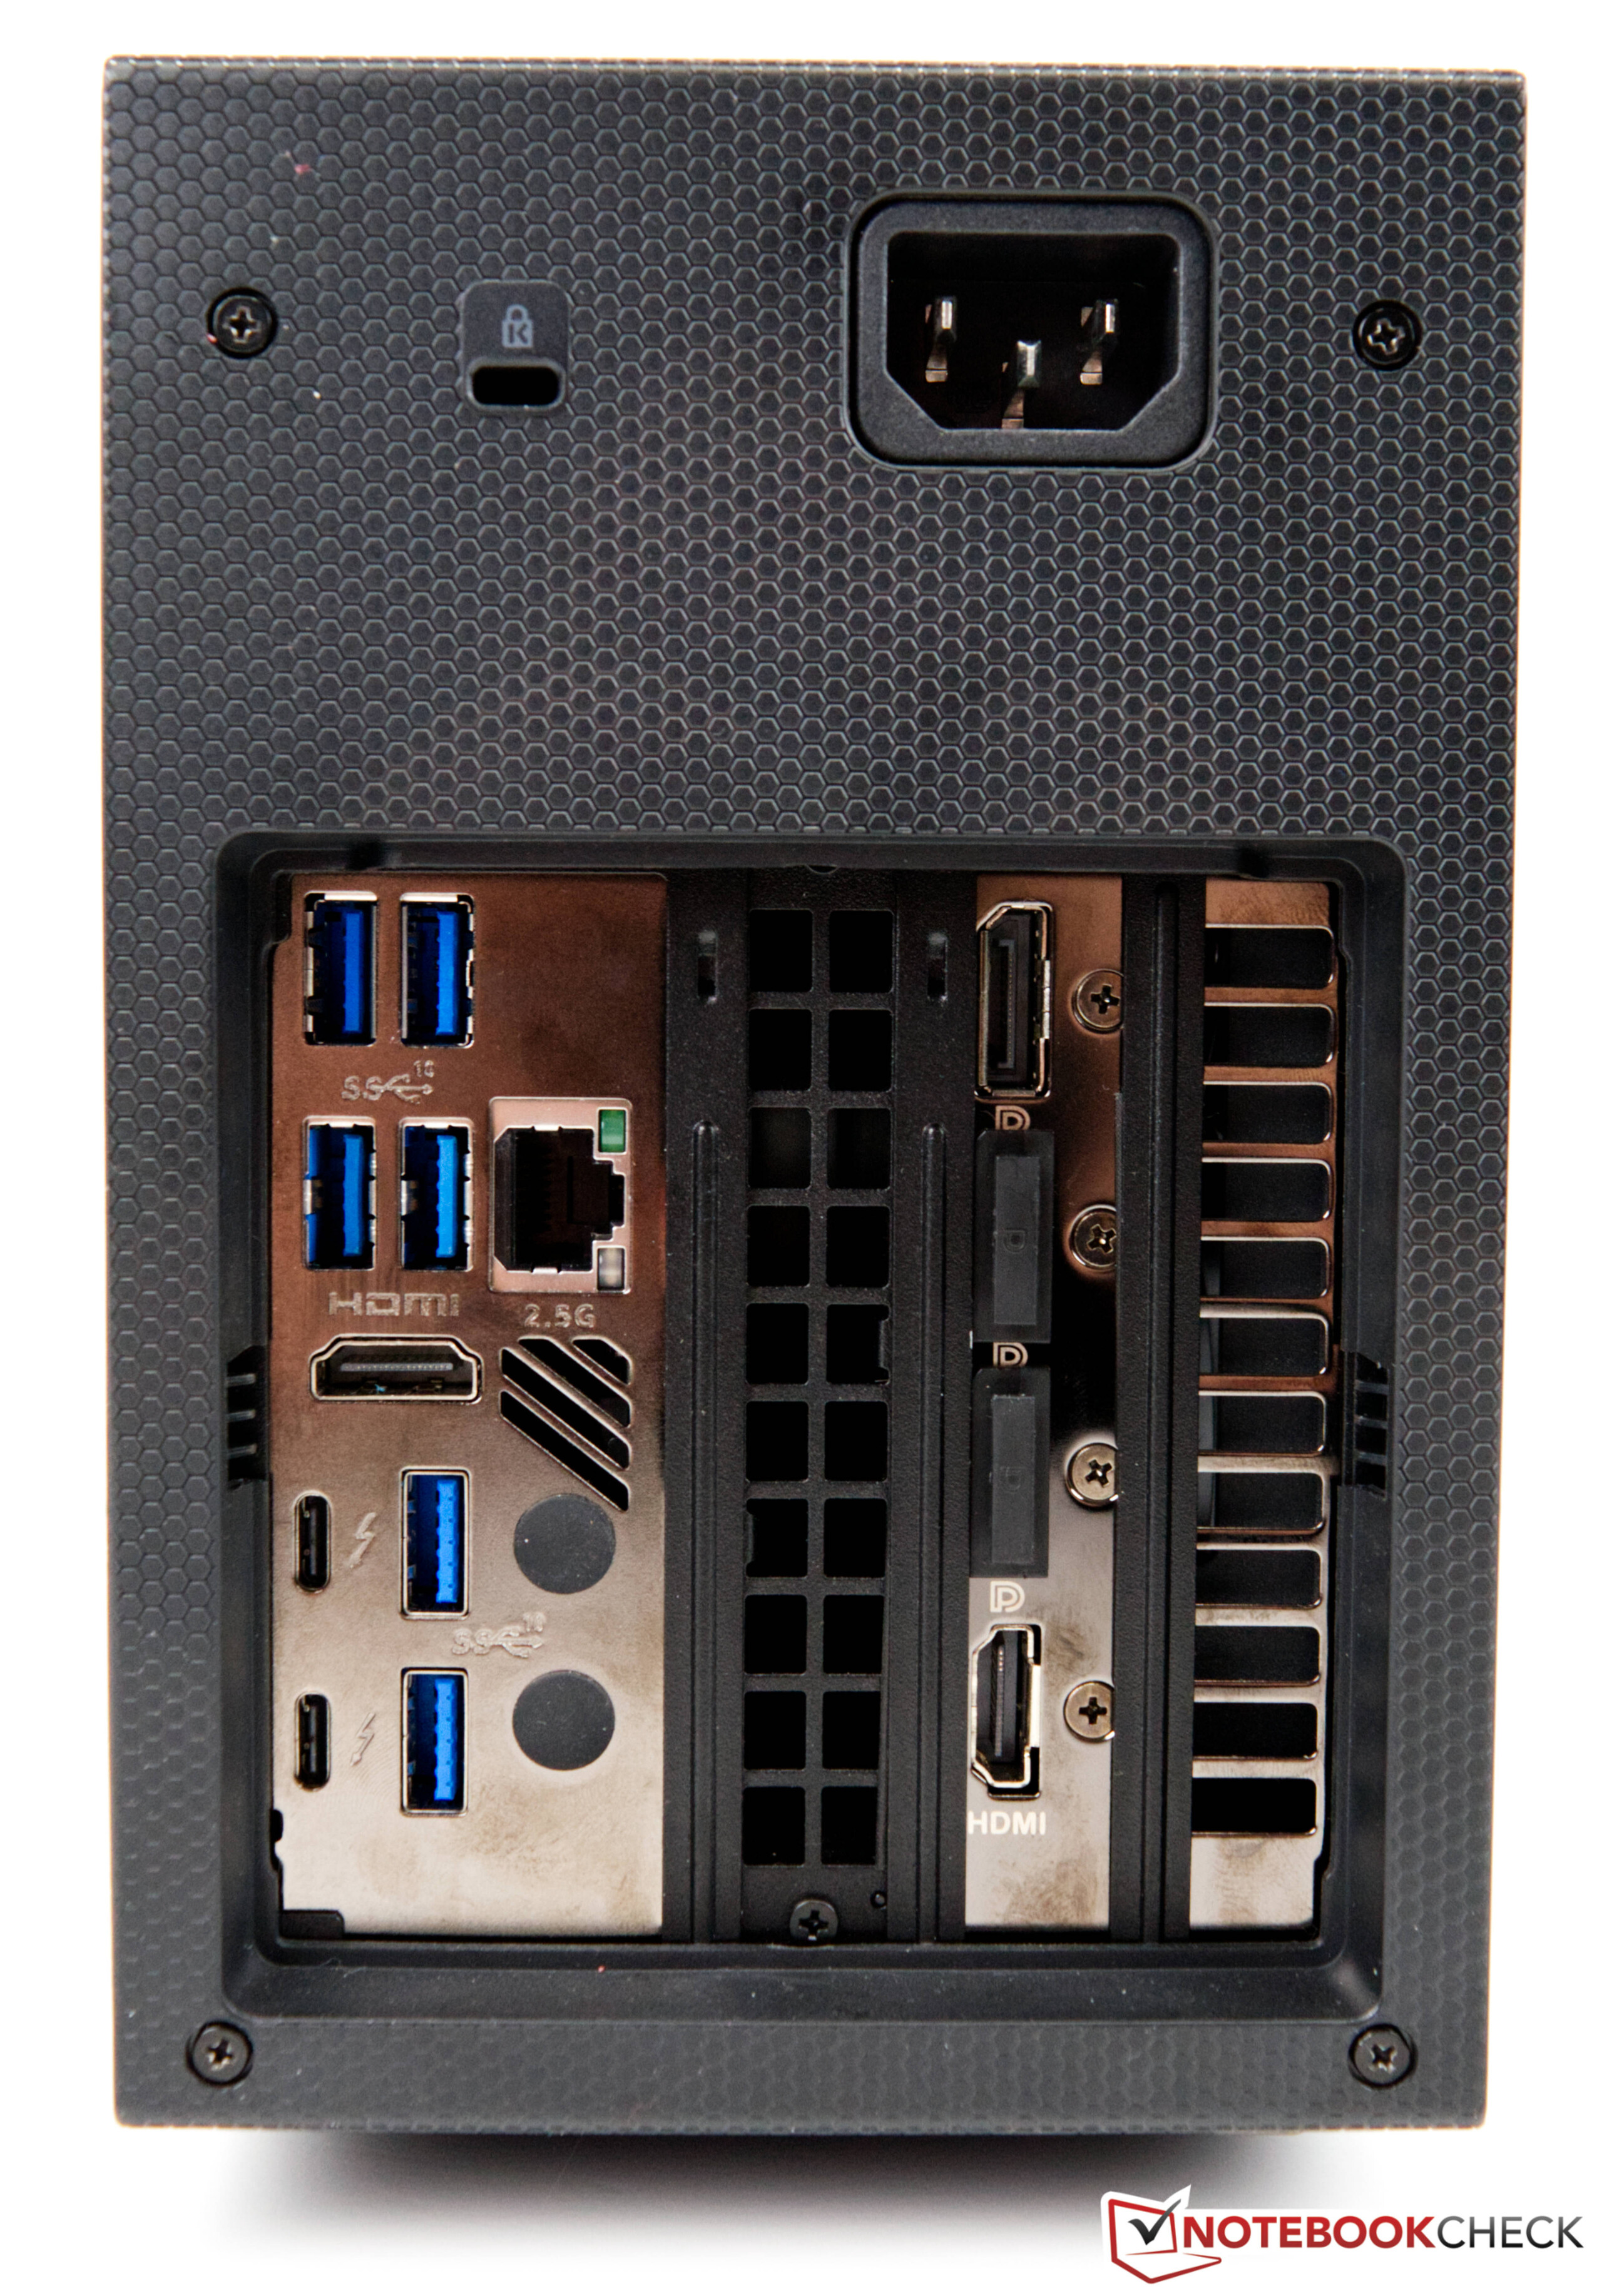
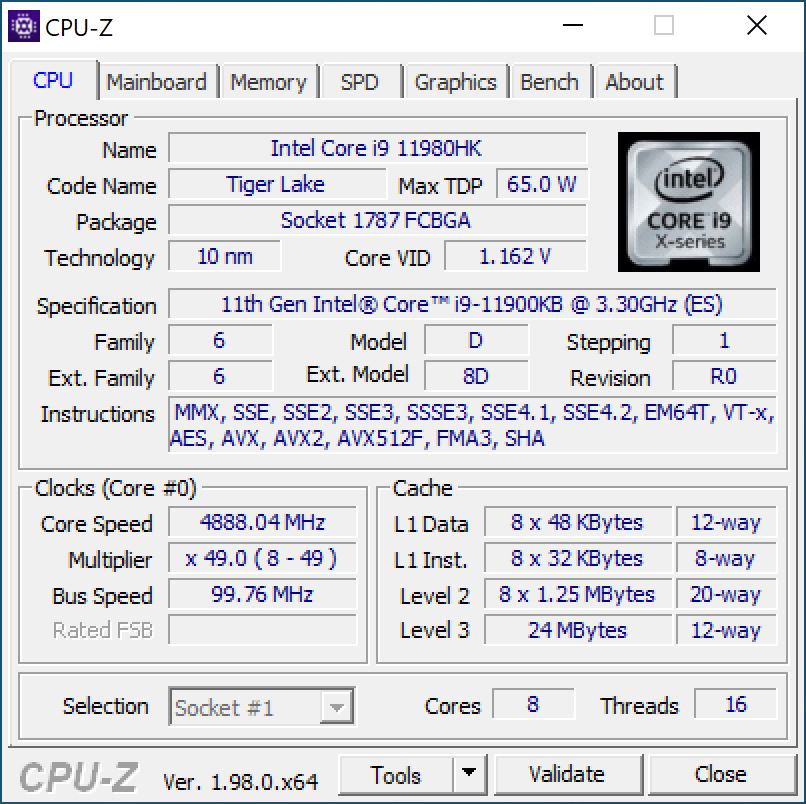
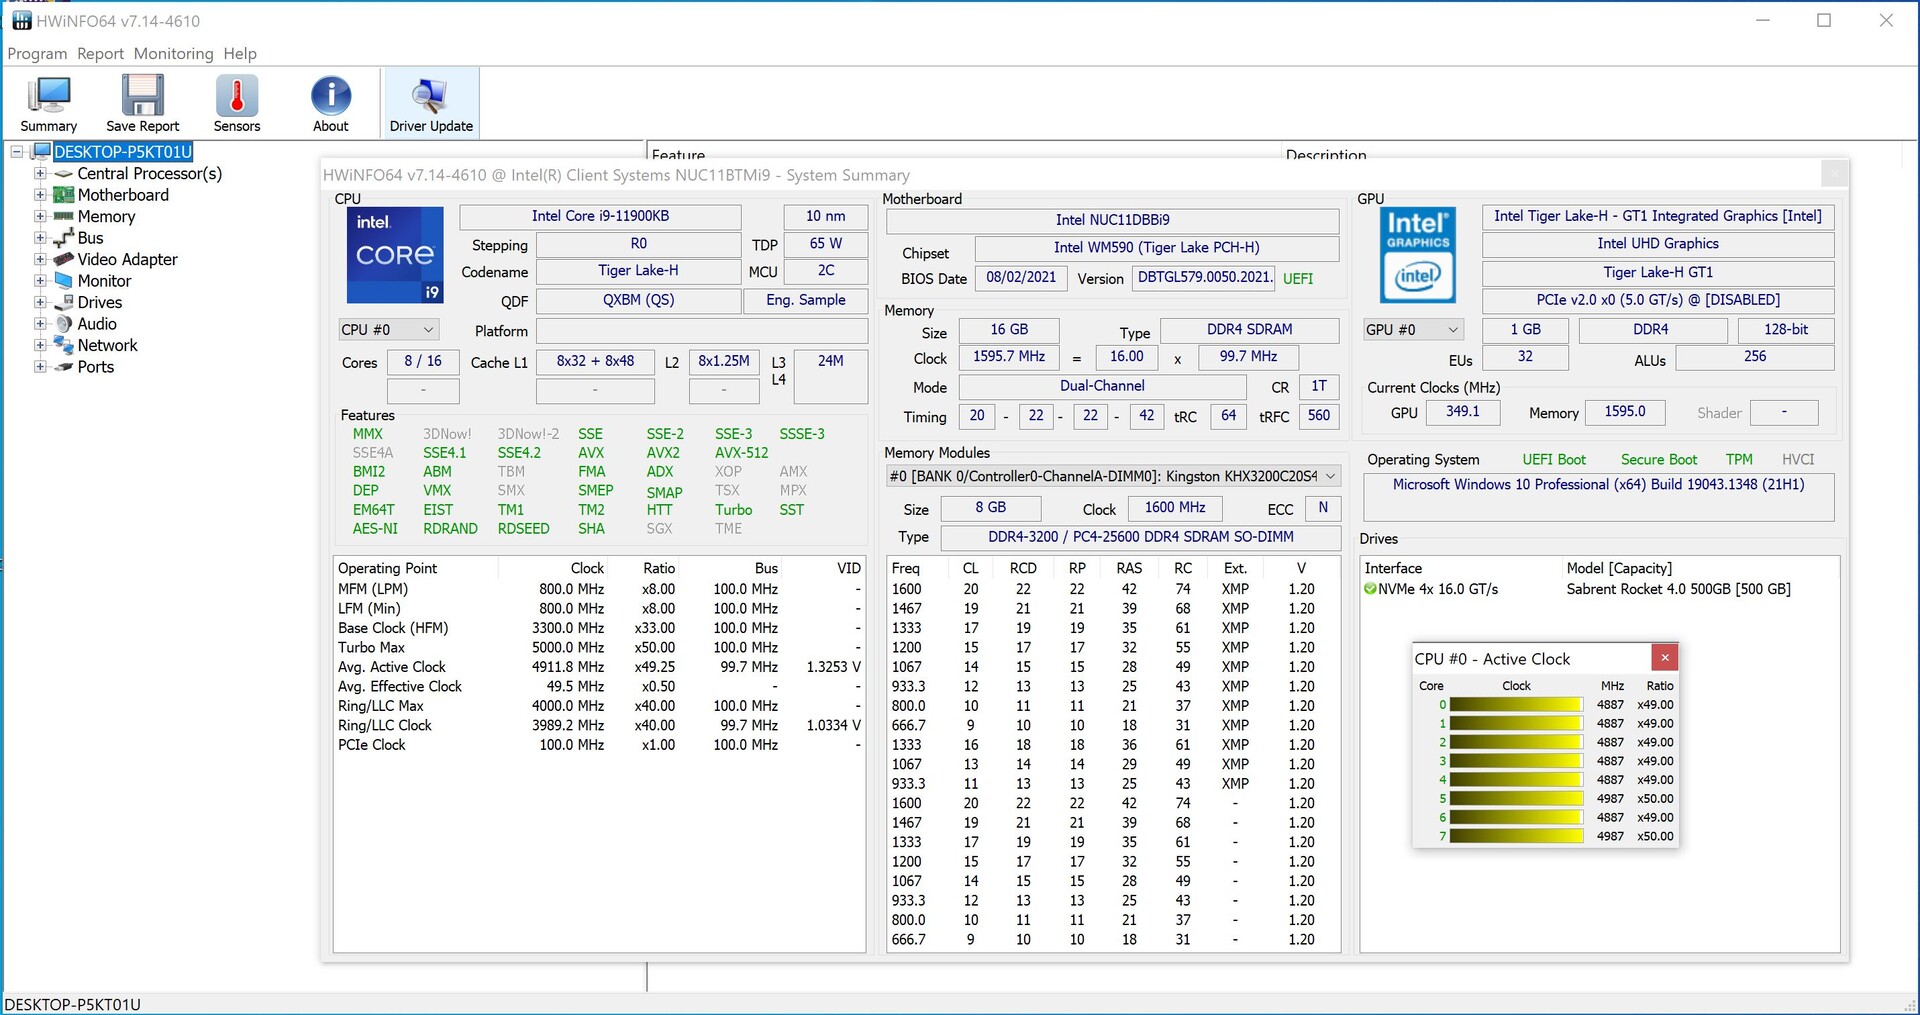
The Intel NUC 11 Extreme offers the Intel Core i9-11900KB — an 8-core SoC with 16 threads based on the Tiger Lake series. The SoC has its roots in mobile form factors and is a good option for small and compact systems due to the low power consumption. Furthermore, all external interfaces are on the Compute Element, which is in the form of a PCI Express plug-in card in the system. Everything important is on board and you don't have to do without anything.
On the back, there are 6x USB 3.1 Gen2 Type-A and two USB-C ports including Thunderbolt 4. Up to three displays can be operated simultaneously via HDMI or USB-C, and there are two different ways to connect the system to the network — WiFi 6E or 2.5 Gbit LAN. Two SO-DIMM RAM modules with a maximum of 32 GB each can be installed in the compute element itself. Furthermore, there is room for three M.2 SSDs.
Processor benchmarks
The Intel Core i9-11900KB is an SoC that has found its way from the laptop to the desktop. Intel installs the SoC in the Compute Element and benefits from the low power consumption of 65 W. However, the maximum CPU package power is limited to 90 W for a short time.
In the test, the SoC shows solid performance and performs somewhat similar to the Intel Core i5-11600K. The Intel Core i9-11900KB is superior to the Core i5-11600K in multi-thread applications due to the two additional computing units. If we compare two 8-core CPUs, our test sample has to admit defeat in comparison with the Intel Core i9-11900K. Nevertheless, the gap is manageable when you look at the energy consumption of these CPUs.
For further comparisons and benchmarks, we refer you to our CPU comparison chart.

* ... smaller is better
Intel NUC 11 Extreme Kit in the Cinebench R15 multi-loop
The first load test with the Cinebench R15 multi-loop shows stable performance. With 1,800 points, the Intel Core i9-11900KB delivers a consistently high performance without performance drops. Nevertheless, a slight performance drop can be noticed after the first two runs.
Application performance
In the application benchmarks, our test sample is only very slightly ahead of the Ghost Canyon NUC. Overall, the newer hardware cannot provide a decent performance gain. Subjectively, however, we can say that both the Ghost Canyon NUC and the Beast Canyon NUC are quite fast in everyday use. Long waiting times were only experienced when downloading large games, but this is due to the internet provider's bandwidth restrictions. Our test sample also does quite well against current test systems, as can be seen in the PCMark 10 results below.
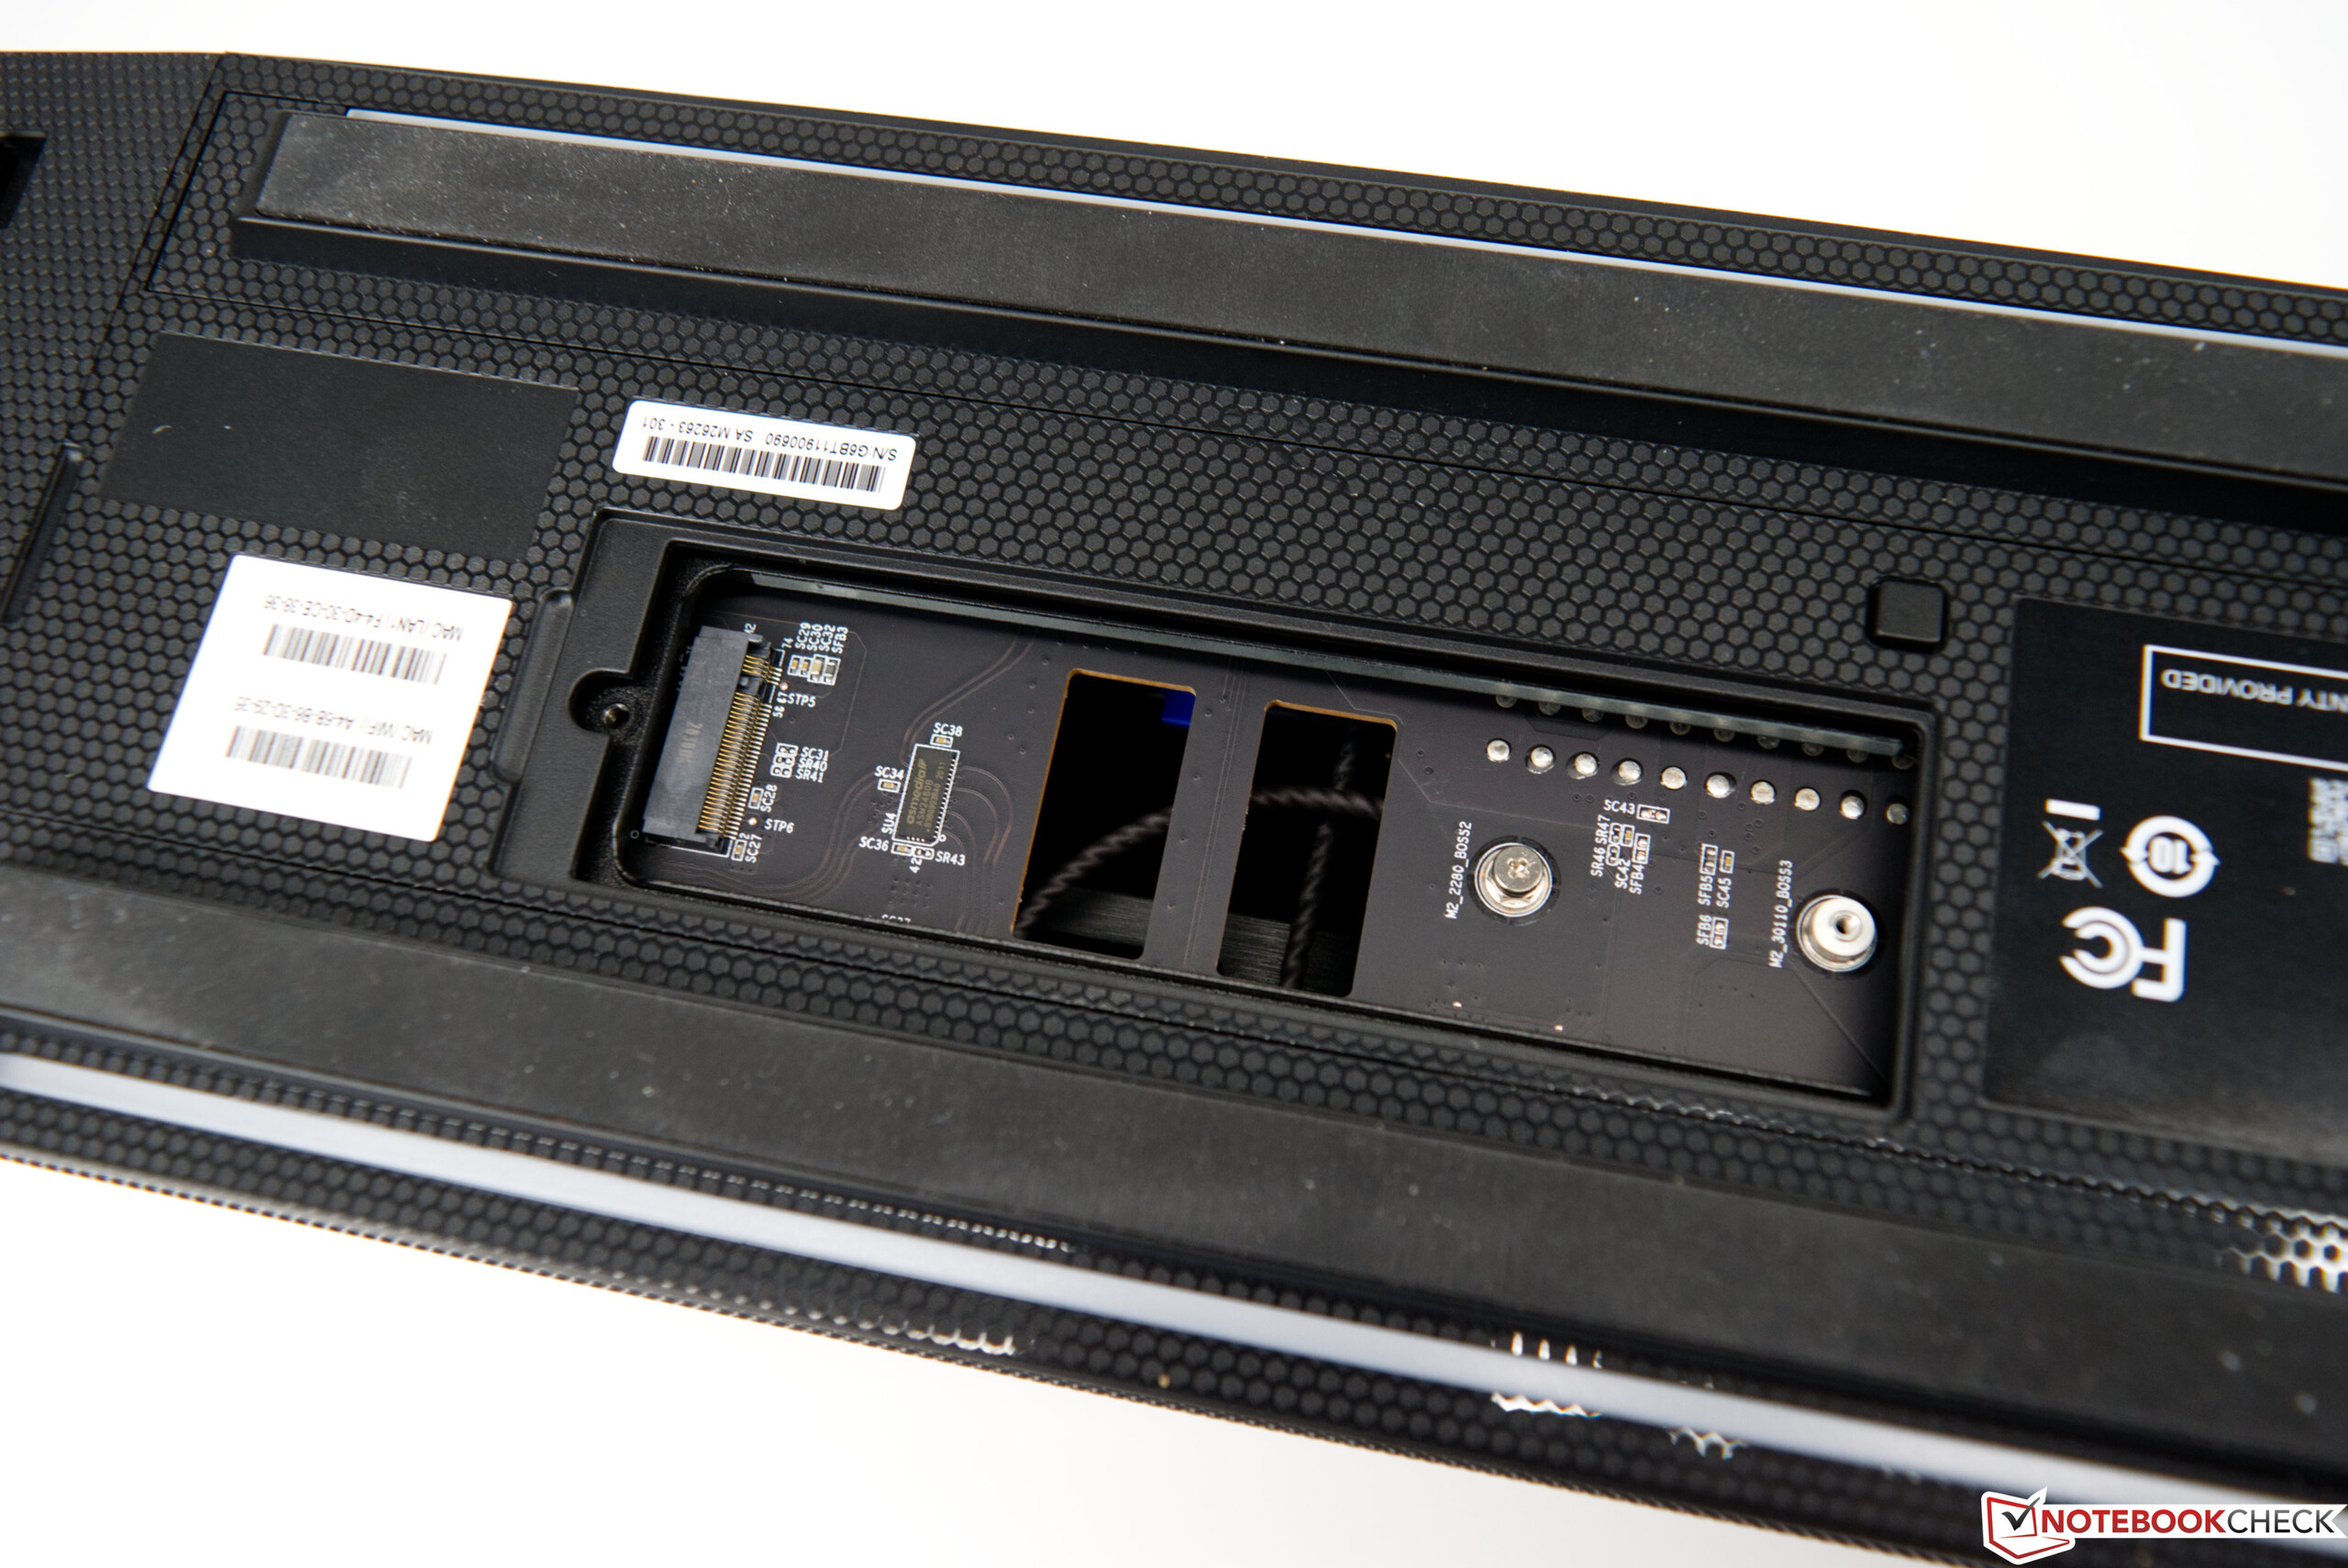
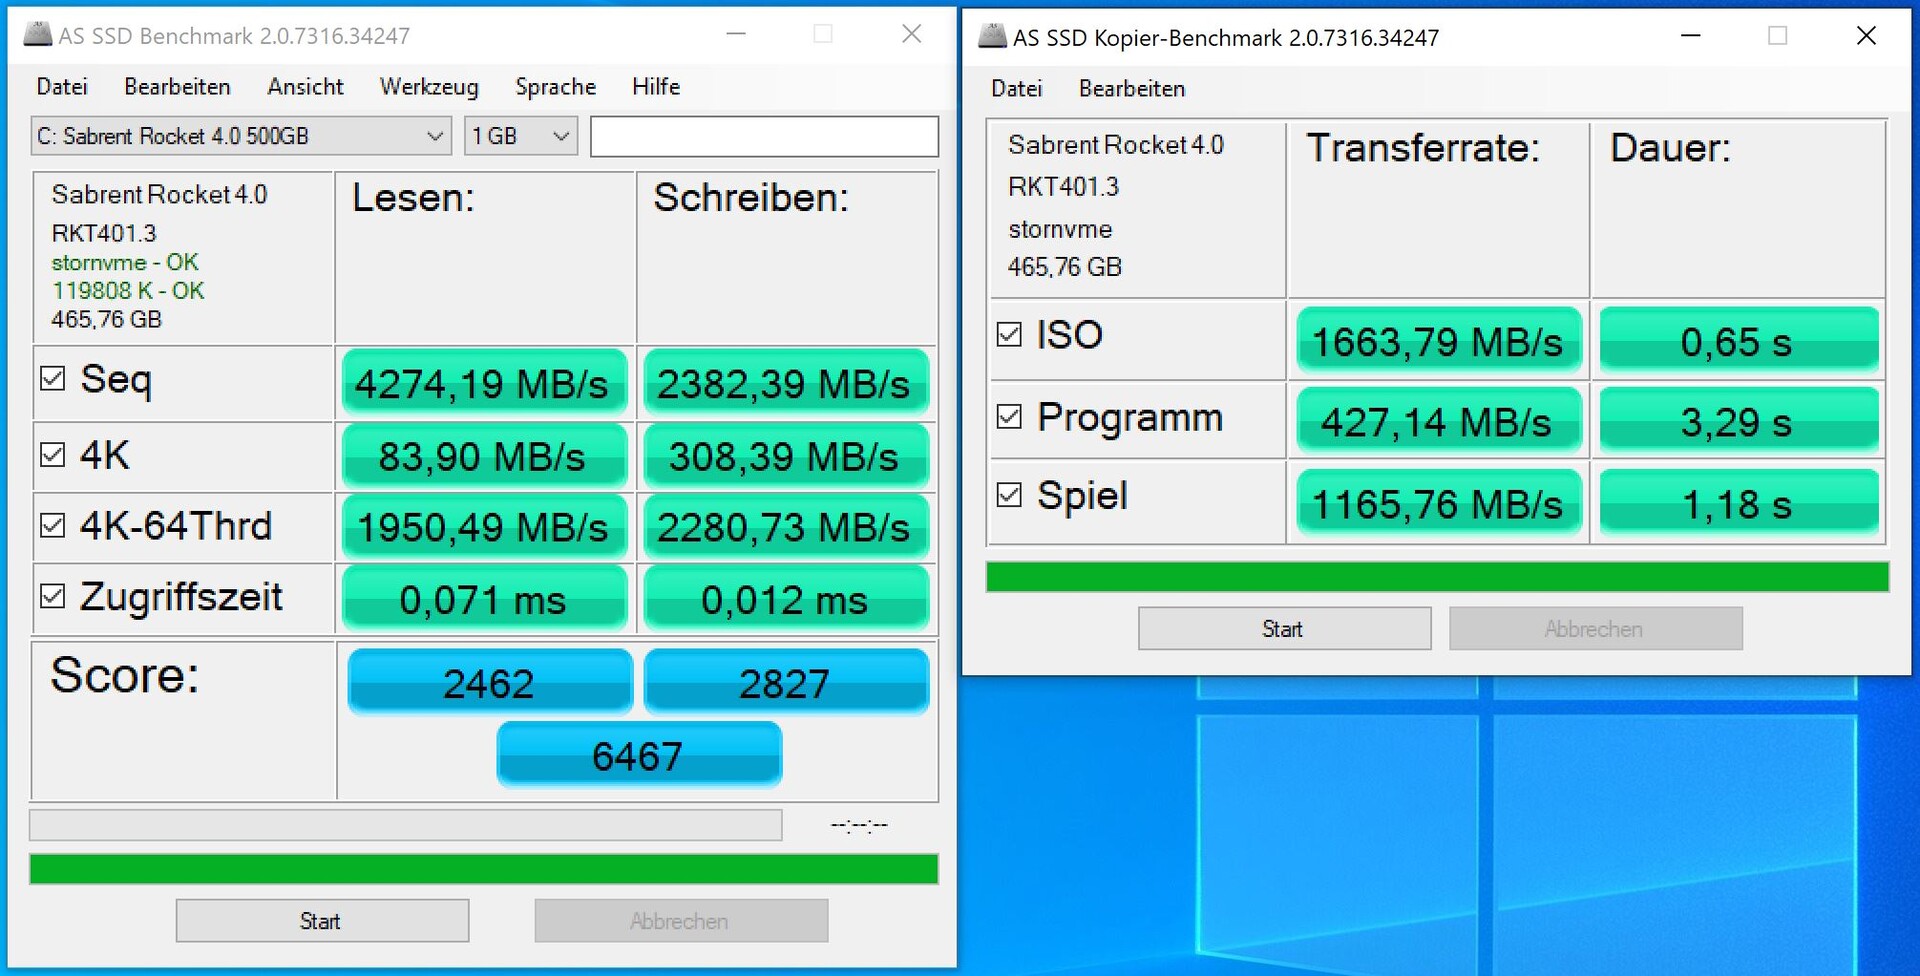
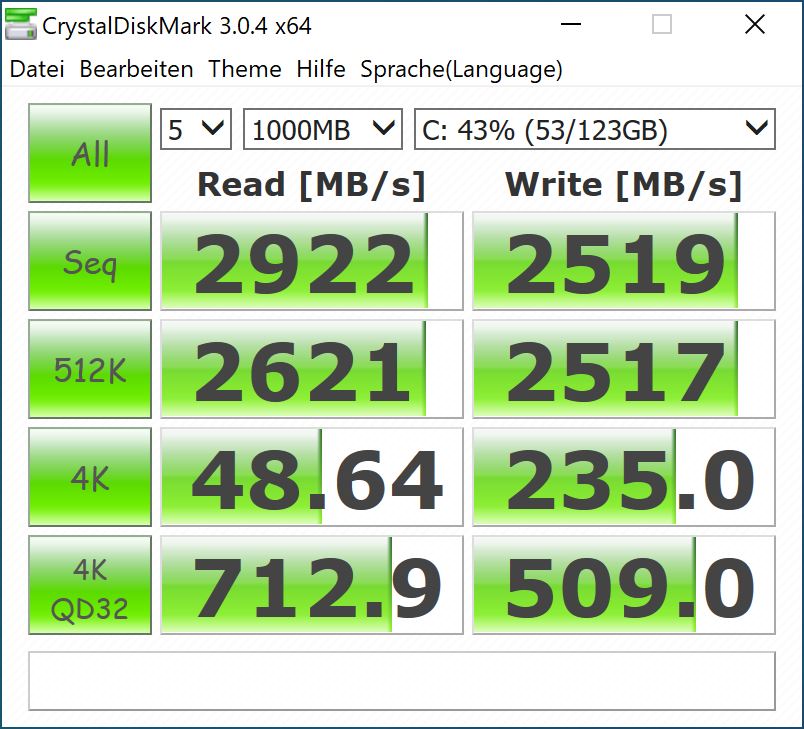
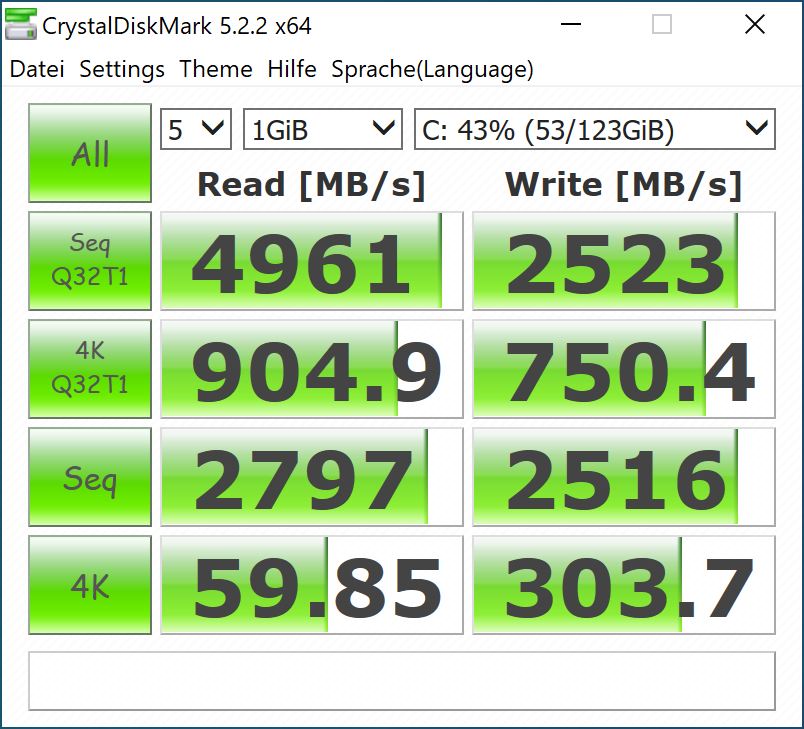
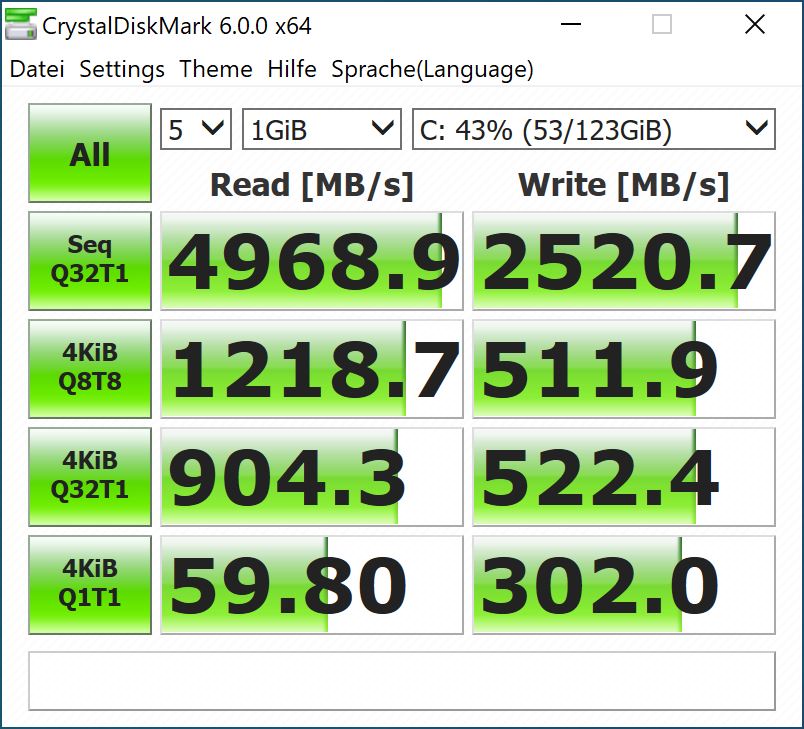
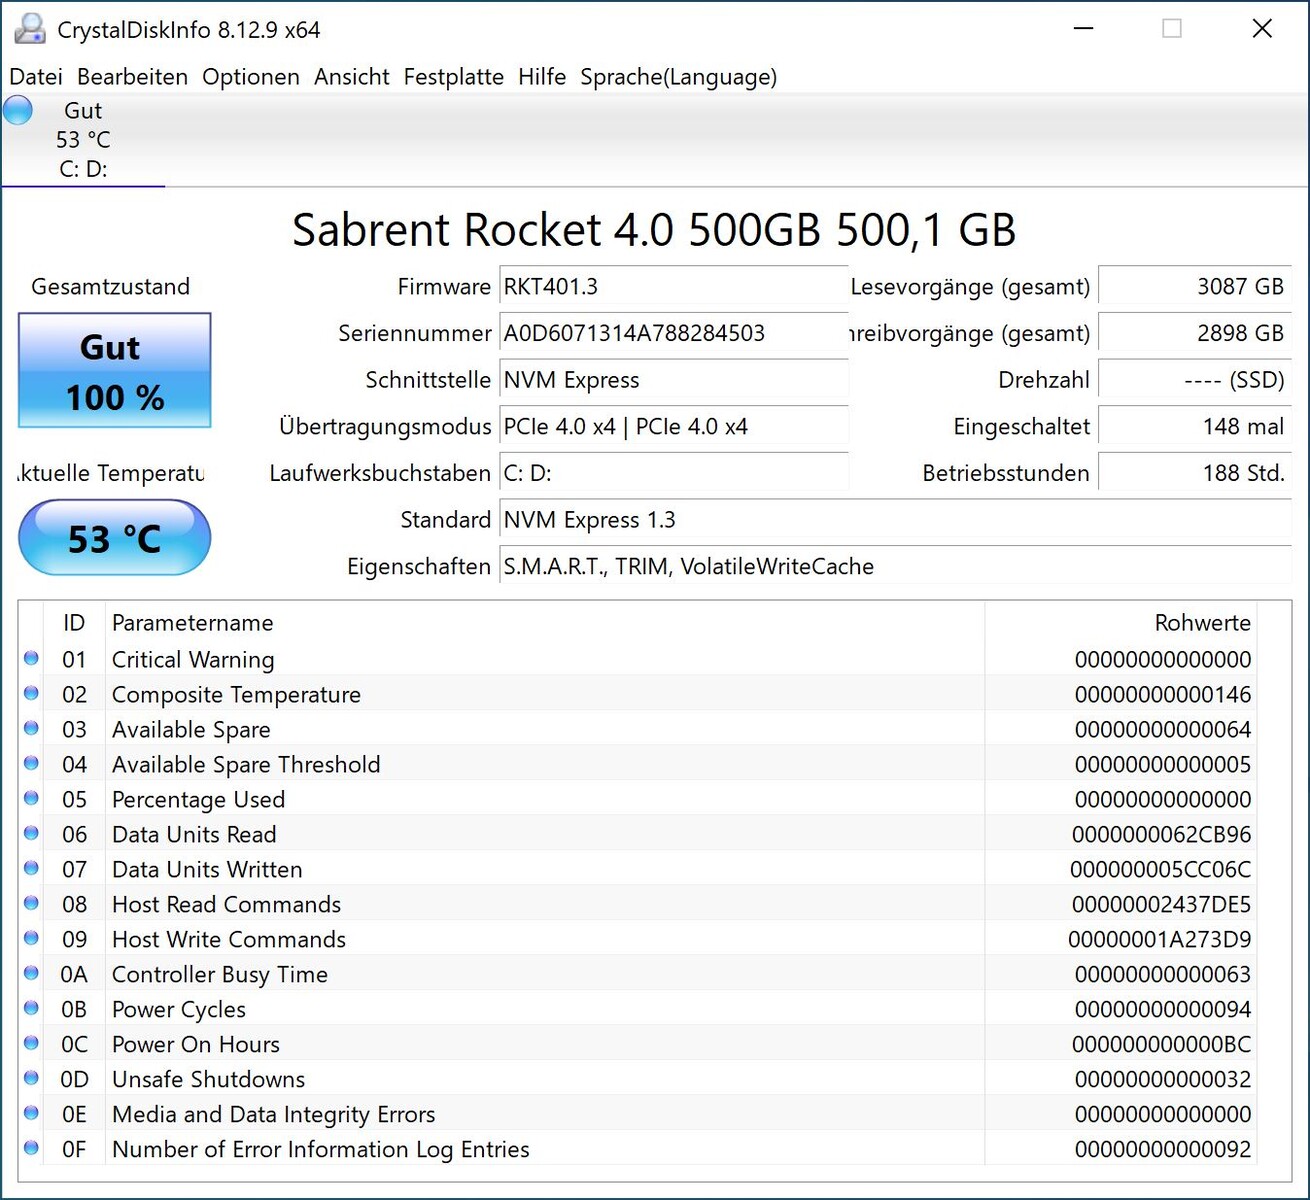
Intel equipped the test sample with a 500 GB SSD, which performed very well in the test. Due to the build, it is possible to only install SSDs in the Beast Canyon NUC. The Compute Element has three M.2-2280 slots and another module can be installed in the case on the underside.
3D performance and gaming performance
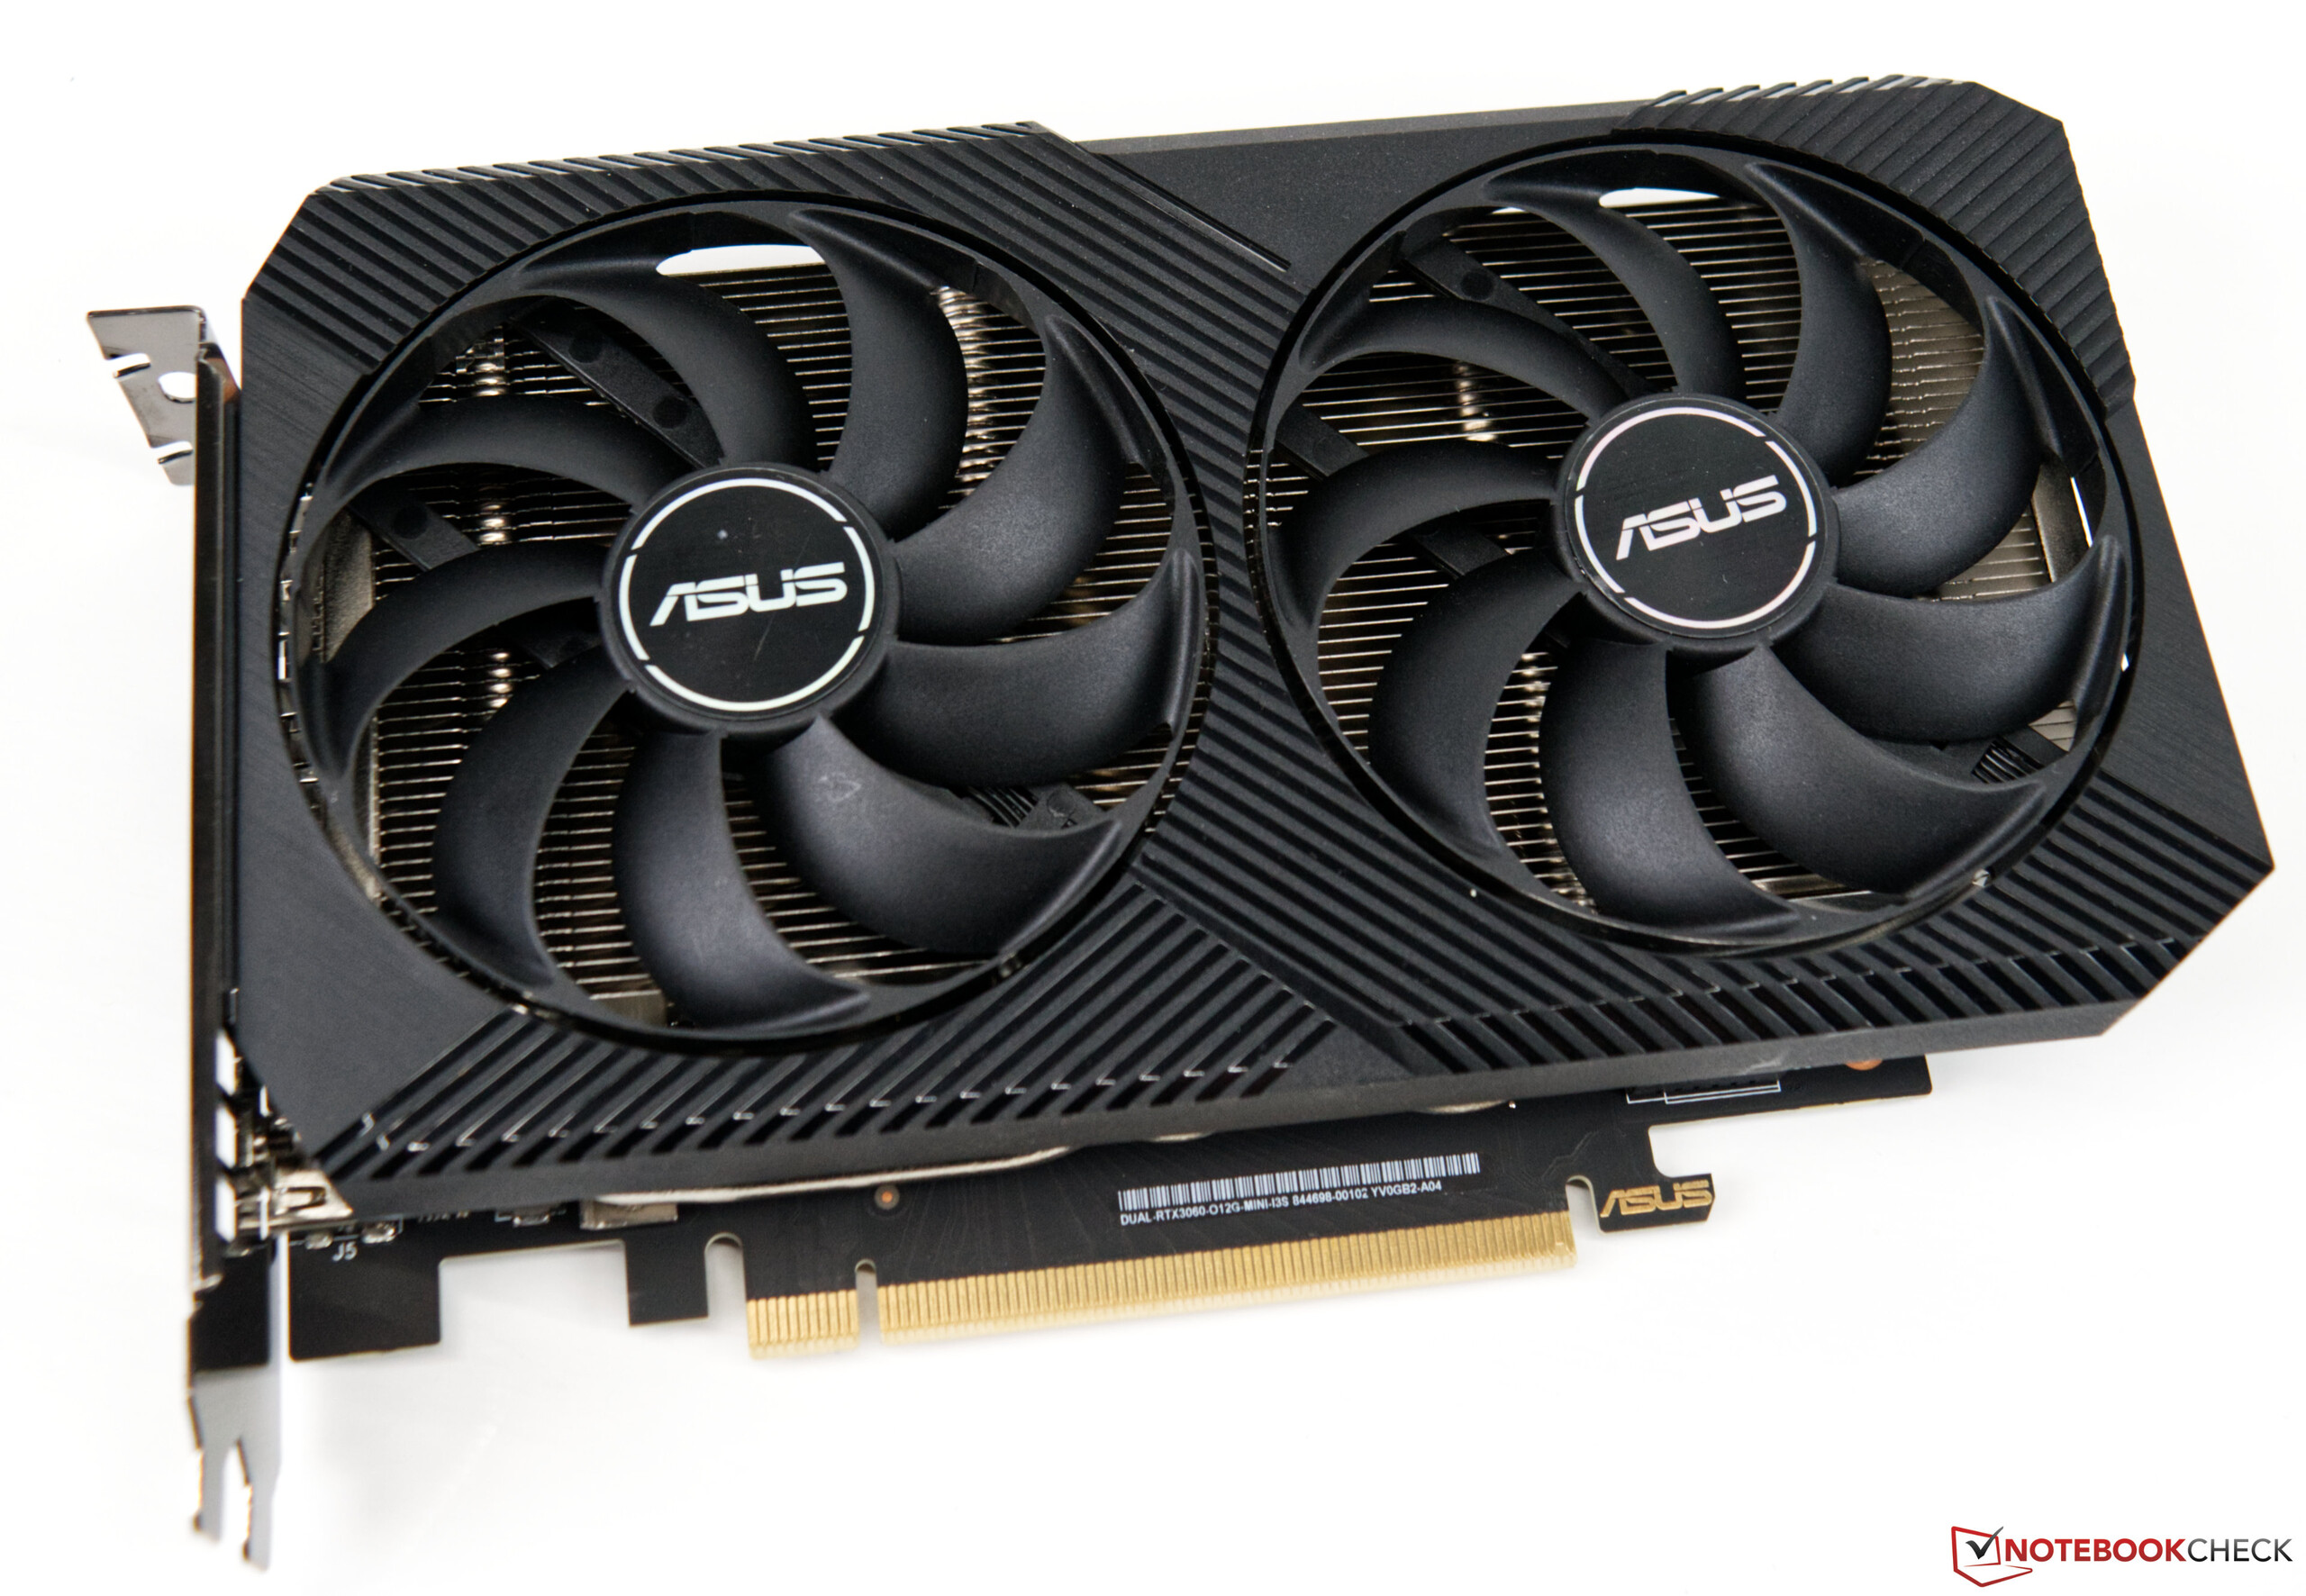
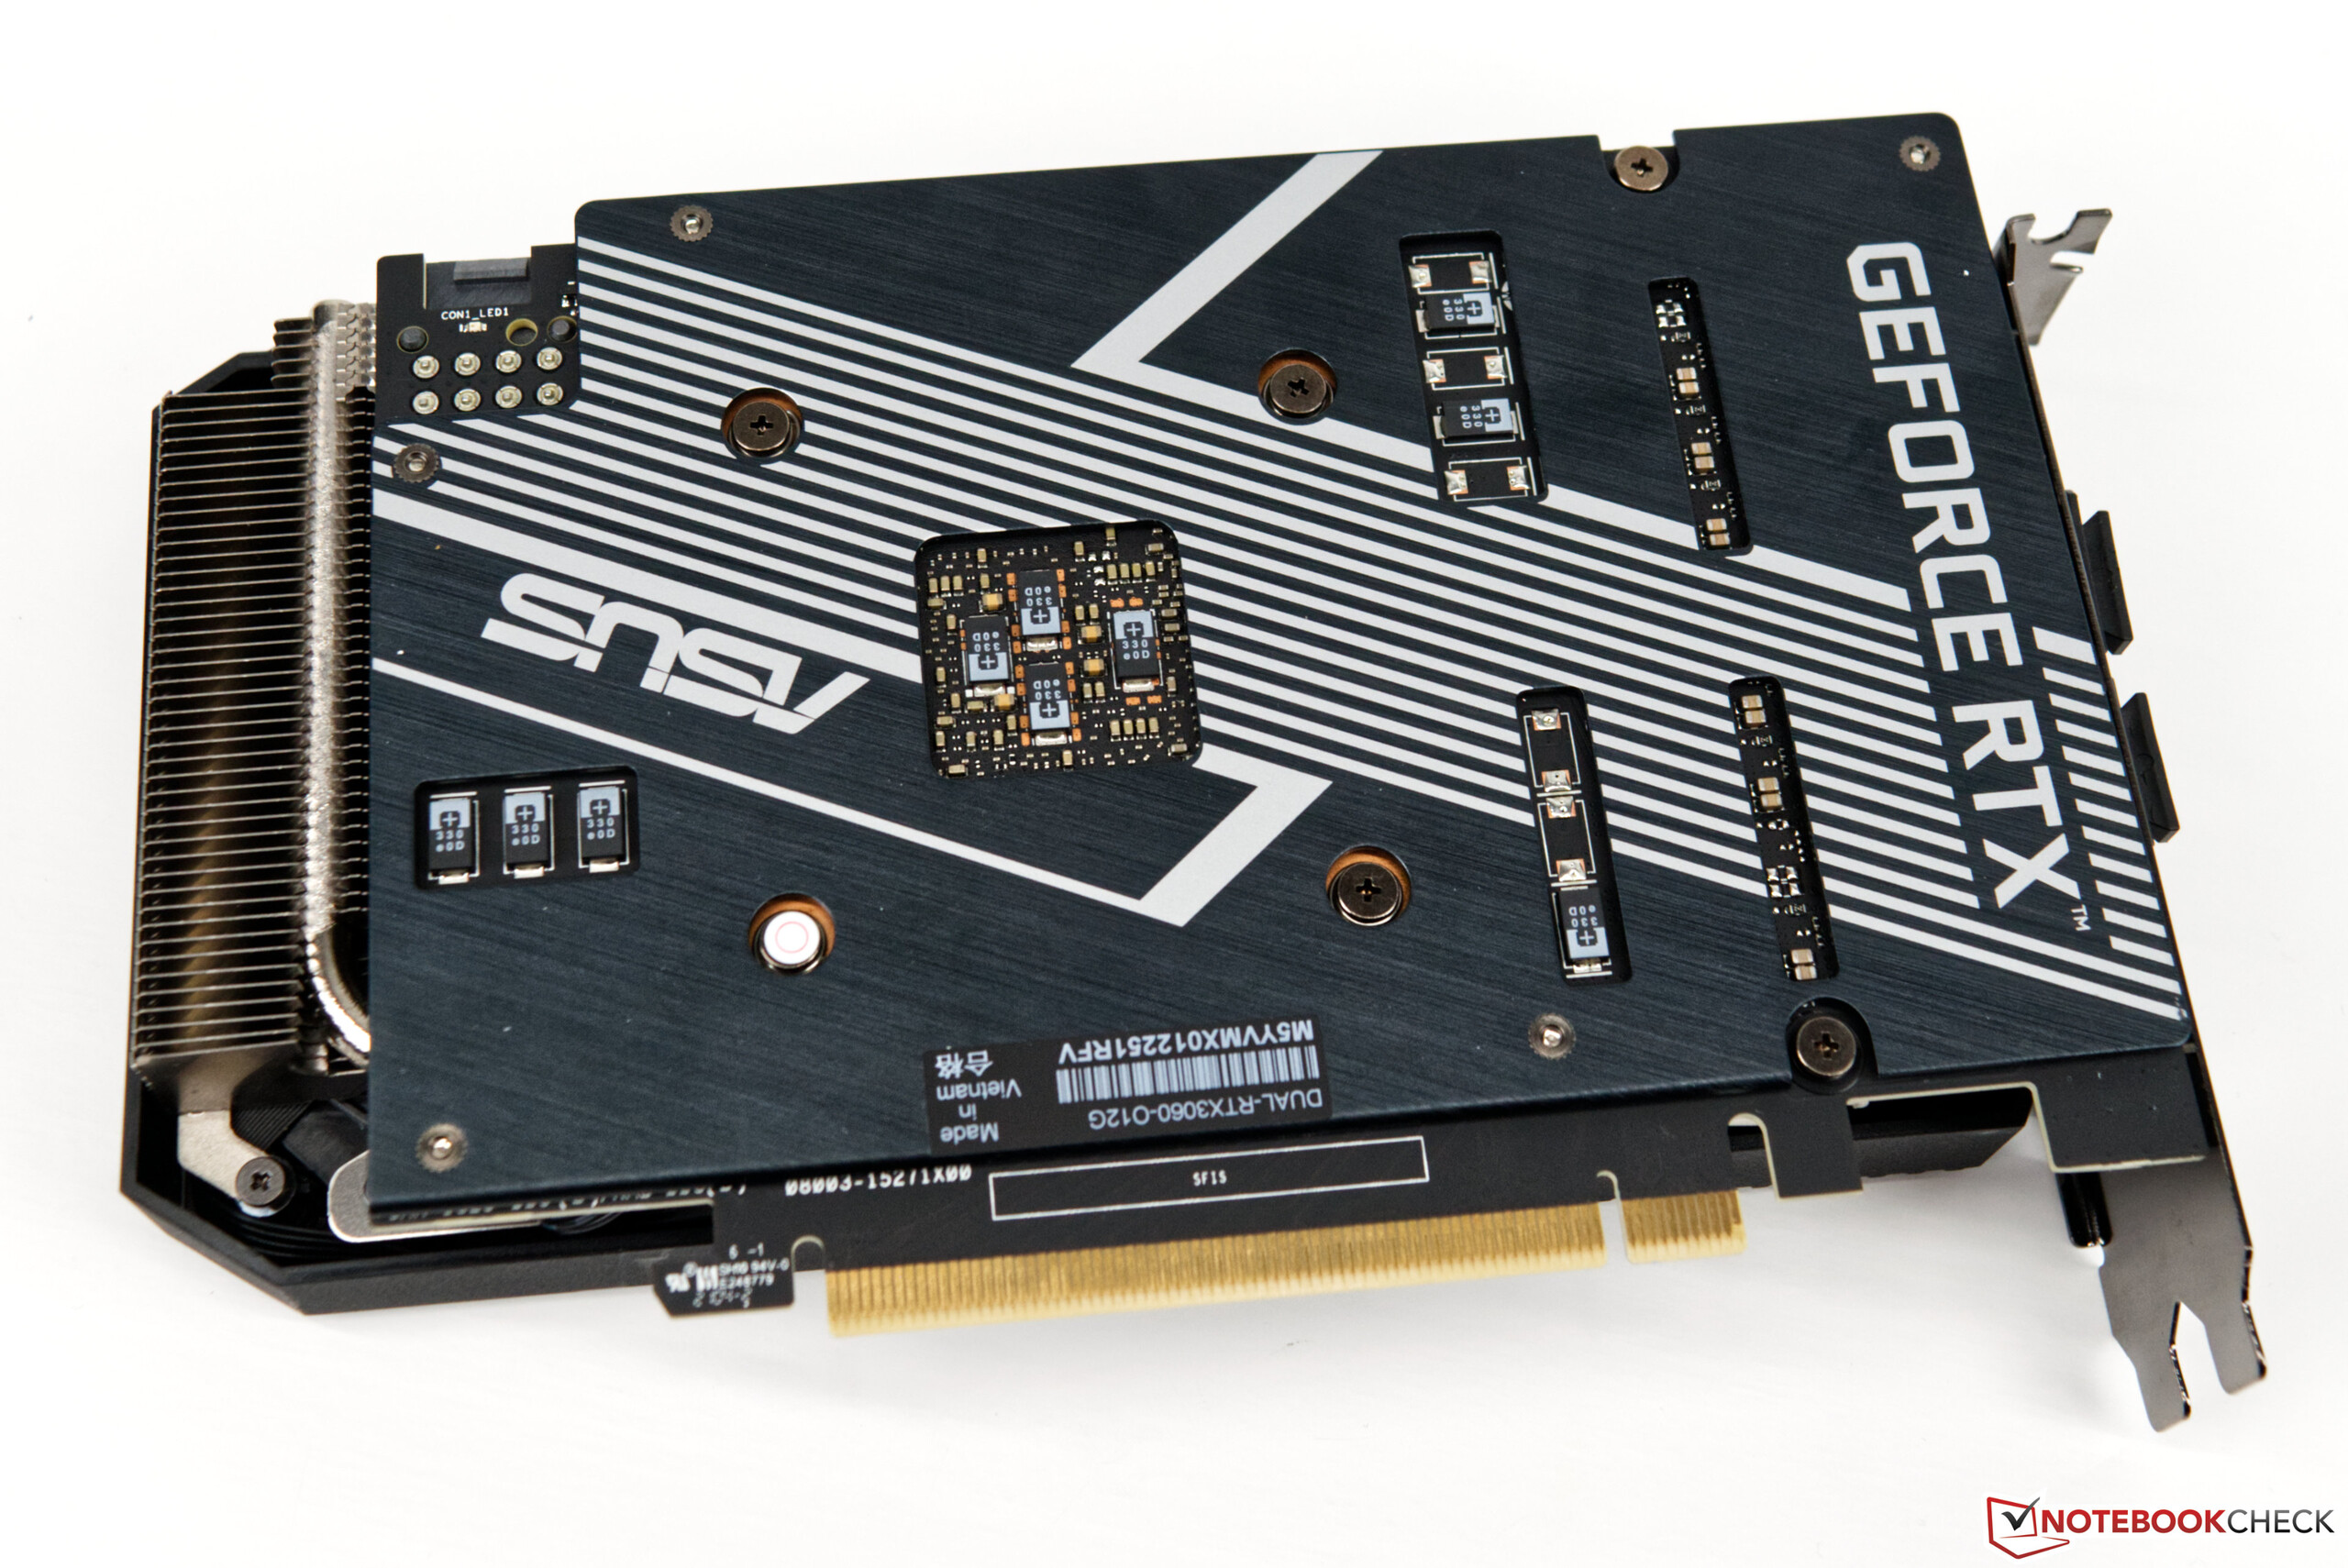
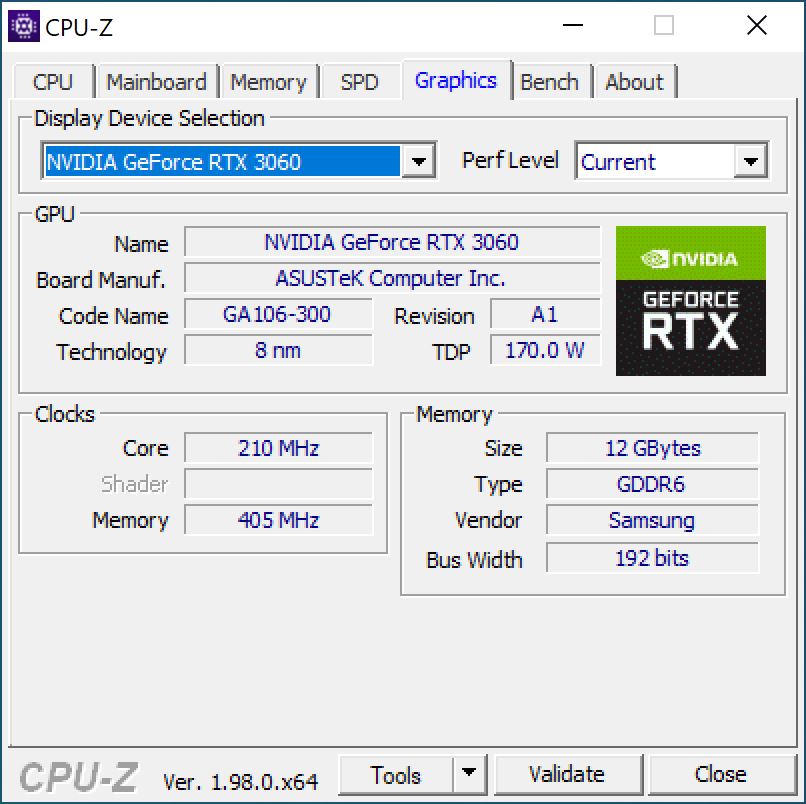
For a good gaming performance, our test system is equipped with an Nvidia GeForce RTX 3060 from Asus. Since the Beast Canyon NUC is sold without a dedicated graphics card, users can decide for themselves what they want to install. The integrated GPU of the Intel Core i9-11900KB is not recommended for gaming. The GeForce RTX 3060 installed here offers solid performance that is mostly sufficient for 1080p as well as 1440p gaming. It is not quite sufficient for consistently smooth 4K gaming, though. Nevertheless, older titles can be rendered smoothly in high resolutions.
For further comparisons and benchmarks, refer to our GPU comparison table.
If you want to install a different graphics card in the Beast Canyon NUC, you should be aware of the GPU's dimensions in advance. The graphics card must not have more than a two-slot cooling design and should have a maximum length of 12 inches.
| Performance rating - Percent | |
| Zotac Magnus One (ECM73070C) | |
| Inno3D GeForce RTX 3060 Twin X2 | |
| Intel Beast Canyon NUC -2! | |
| Intel Ghost Canyon NUC (RTX 2070) | |
| Borderlands 3 | |
| 1280x720 Very Low Overall Quality (DX11) | |
| Inno3D GeForce RTX 3060 Twin X2 | |
| Intel Beast Canyon NUC | |
| Intel Ghost Canyon NUC (RTX 2070) | |
| Zotac Magnus One (ECM73070C) | |
| 1920x1080 Badass Overall Quality (DX11) | |
| Intel Beast Canyon NUC | |
| Zotac Magnus One (ECM73070C) | |
| Inno3D GeForce RTX 3060 Twin X2 | |
| Intel Ghost Canyon NUC (RTX 2070) | |
| Metro Exodus | |
| 1280x720 Low Quality AF:4x | |
| Inno3D GeForce RTX 3060 Twin X2 | |
| Intel Beast Canyon NUC | |
| Intel Ghost Canyon NUC (RTX 2070) | |
| Zotac Magnus One (ECM73070C) | |
| 1920x1080 Ultra Quality AF:16x | |
| Zotac Magnus One (ECM73070C) | |
| Intel Ghost Canyon NUC (RTX 2070) | |
| Intel Beast Canyon NUC | |
| Inno3D GeForce RTX 3060 Twin X2 | |
| Far Cry New Dawn | |
| 1280x720 Low Preset | |
| Inno3D GeForce RTX 3060 Twin X2 | |
| Intel Beast Canyon NUC | |
| Intel Ghost Canyon NUC (RTX 2070) | |
| Zotac Magnus One (ECM73070C) | |
| 1920x1080 Ultra Preset | |
| Inno3D GeForce RTX 3060 Twin X2 | |
| Intel Beast Canyon NUC | |
| Zotac Magnus One (ECM73070C) | |
| Intel Ghost Canyon NUC (RTX 2070) | |
| Far Cry 5 | |
| 1280x720 Low Preset AA:T | |
| Inno3D GeForce RTX 3060 Twin X2 | |
| Intel Beast Canyon NUC | |
| Zotac Magnus One (ECM73070C) | |
| Intel Ghost Canyon NUC (RTX 2070) | |
| 1920x1080 Ultra Preset AA:T | |
| Inno3D GeForce RTX 3060 Twin X2 | |
| Intel Beast Canyon NUC | |
| Zotac Magnus One (ECM73070C) | |
| Intel Ghost Canyon NUC (RTX 2070) | |
| X-Plane 11.11 | |
| 1280x720 low (fps_test=1) | |
| Inno3D GeForce RTX 3060 Twin X2 | |
| Intel Beast Canyon NUC | |
| Intel Ghost Canyon NUC (RTX 2070) | |
| Zotac Magnus One (ECM73070C) | |
| 1920x1080 high (fps_test=3) | |
| Inno3D GeForce RTX 3060 Twin X2 | |
| Intel Beast Canyon NUC | |
| Intel Ghost Canyon NUC (RTX 2070) | |
| Zotac Magnus One (ECM73070C) | |
| Final Fantasy XV Benchmark | |
| 1280x720 Lite Quality | |
| Inno3D GeForce RTX 3060 Twin X2 | |
| Intel Beast Canyon NUC | |
| Intel Ghost Canyon NUC (RTX 2070) | |
| Zotac Magnus One (ECM73070C) | |
| 1920x1080 High Quality | |
| Zotac Magnus One (ECM73070C) | |
| Intel Ghost Canyon NUC (RTX 2070) | |
| Inno3D GeForce RTX 3060 Twin X2 | |
| Intel Beast Canyon NUC | |
| Dota 2 Reborn | |
| 1280x720 min (0/3) fastest | |
| Inno3D GeForce RTX 3060 Twin X2 | |
| Intel Beast Canyon NUC | |
| Zotac Magnus One (ECM73070C) | |
| Intel Ghost Canyon NUC (RTX 2070) | |
| 1920x1080 ultra (3/3) best looking | |
| Inno3D GeForce RTX 3060 Twin X2 | |
| Intel Beast Canyon NUC | |
| Intel Ghost Canyon NUC (RTX 2070) | |
| Zotac Magnus One (ECM73070C) | |
| The Witcher 3 | |
| 1024x768 Low Graphics & Postprocessing | |
| Inno3D GeForce RTX 3060 Twin X2 | |
| Zotac Magnus One (ECM73070C) | |
| Intel Ghost Canyon NUC (RTX 2070) | |
| 1920x1080 Ultra Graphics & Postprocessing (HBAO+) | |
| Zotac Magnus One (ECM73070C) | |
| Intel Ghost Canyon NUC (RTX 2070) | |
| Inno3D GeForce RTX 3060 Twin X2 | |
| 3DMark | |
| Fire Strike Extreme Graphics | |
| Zotac Magnus One (ECM73070C) | |
| Inno3D GeForce RTX 3060 Twin X2 | |
| Intel Beast Canyon NUC | |
| Intel Ghost Canyon NUC (RTX 2070) | |
| 1920x1080 Fire Strike Graphics | |
| Zotac Magnus One (ECM73070C) | |
| Inno3D GeForce RTX 3060 Twin X2 | |
| Intel Beast Canyon NUC | |
| Intel Ghost Canyon NUC (RTX 2070) | |
| 2560x1440 Time Spy Graphics | |
| Zotac Magnus One (ECM73070C) | |
| Intel Ghost Canyon NUC (RTX 2070) | |
| Inno3D GeForce RTX 3060 Twin X2 | |
| Intel Beast Canyon NUC | |
| low | med. | high | ultra | QHD DLSS | QHD | 4K DLSS | 4K | |
|---|---|---|---|---|---|---|---|---|
| GTA V (2015) | 186 | 181 | 177 | 104 | 81.4 | 82.3 | ||
| Dota 2 Reborn (2015) | 178.3 | 161.7 | 155.6 | 147.1 | 116.1 | |||
| Final Fantasy XV Benchmark (2018) | 196 | 123 | 88.6 | 64.8 | 38 | |||
| X-Plane 11.11 (2018) | 151 | 133 | 105 | 88.5 | ||||
| Far Cry 5 (2018) | 170 | 140 | 131 | 122 | 94 | 49 | ||
| Strange Brigade (2018) | 491 | 230 | 180 | 154 | 116 | 66.8 | ||
| Far Cry New Dawn (2019) | 144 | 120 | 115 | 102 | 88 | 50 | ||
| Metro Exodus (2019) | 198 | 105 | 77.4 | 59.8 | 48.6 | 31.3 | ||
| Borderlands 3 (2019) | 156 | 152 | 133 | 100 | 70.2 | 36.8 | ||
| F1 2020 (2020) | 355 | 259 | 208 | 142 | 106 | 60.2 | ||
| F1 2021 (2021) | 419 | 261 | 206 | 96.9 | 72 | 40.9 | ||
| Far Cry 6 (2021) | 136 | 116 | 103 | 90.8 | 68.8 | 38.8 | ||
| Baldur's Gate 3 (2023) | 131 | 100 | 86.7 | 86 | 59 | 30.8 | ||
| Kingdom Come Deliverance 2 (2025) | 81.7 | 66.5 | 46.8 | |||||
| F1 25 (2025) | 209 | 174.7 | 131.4 | 11.5 | 12 | 6.63 | 5.61 | 3.08 |
| Borderlands 4 (2025) | 42.5 | 34.6 | 26.8 | 19.6 |
Energy consumption and heat development of the Intel NUC 11 Beast Canyon

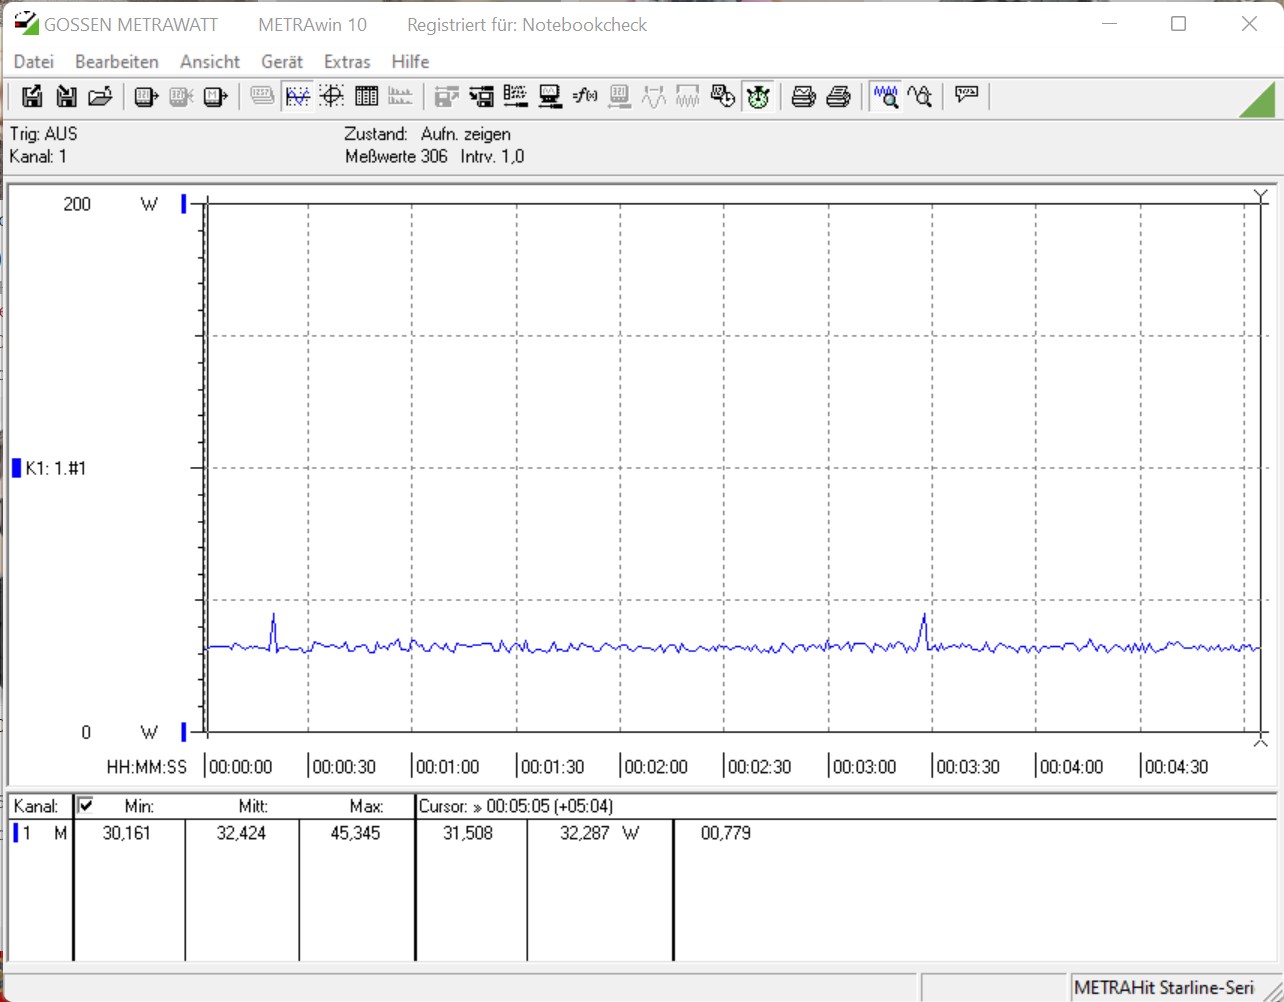
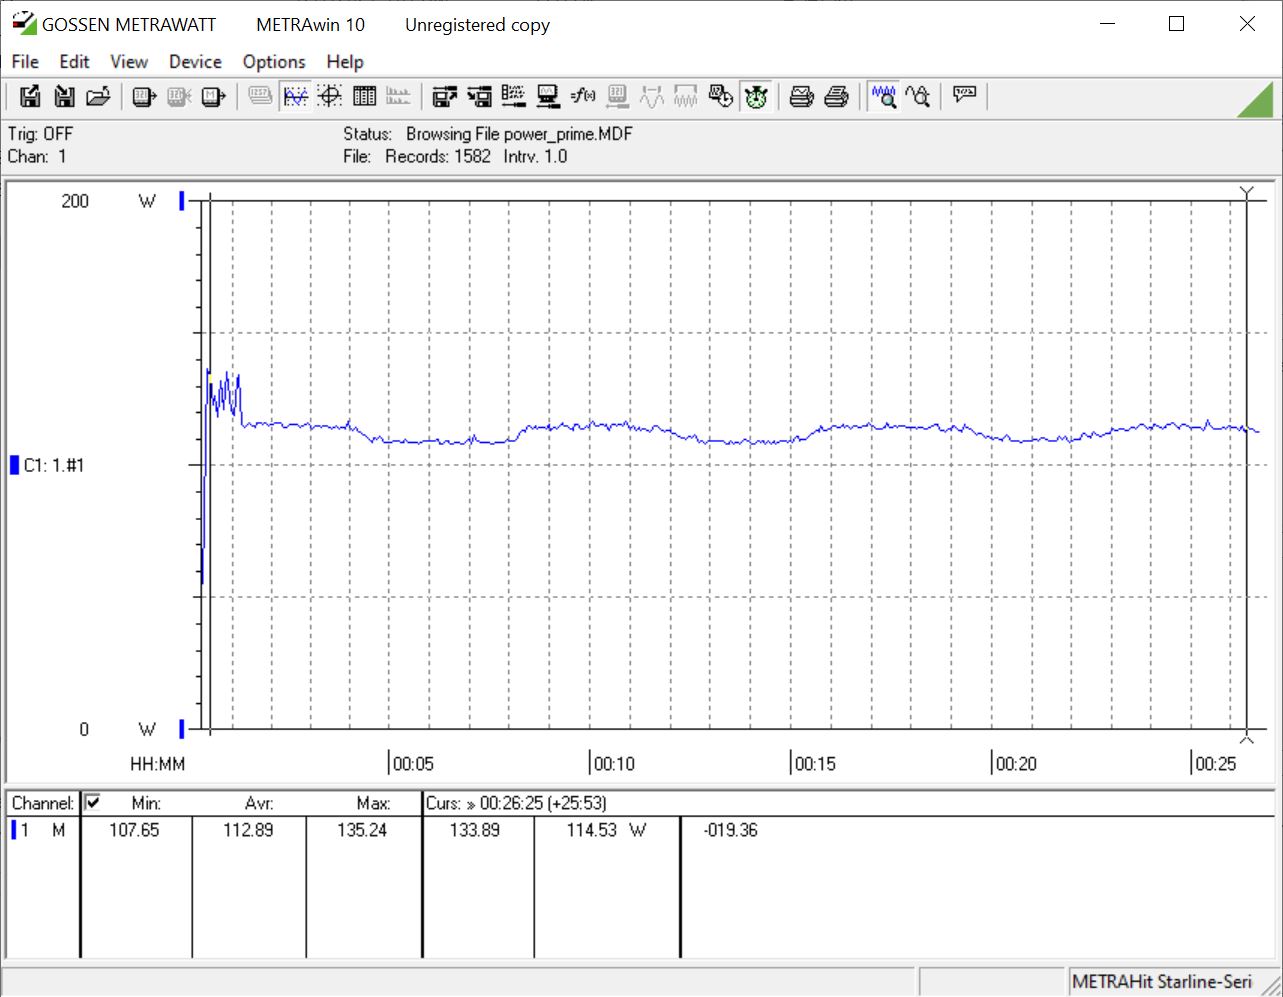
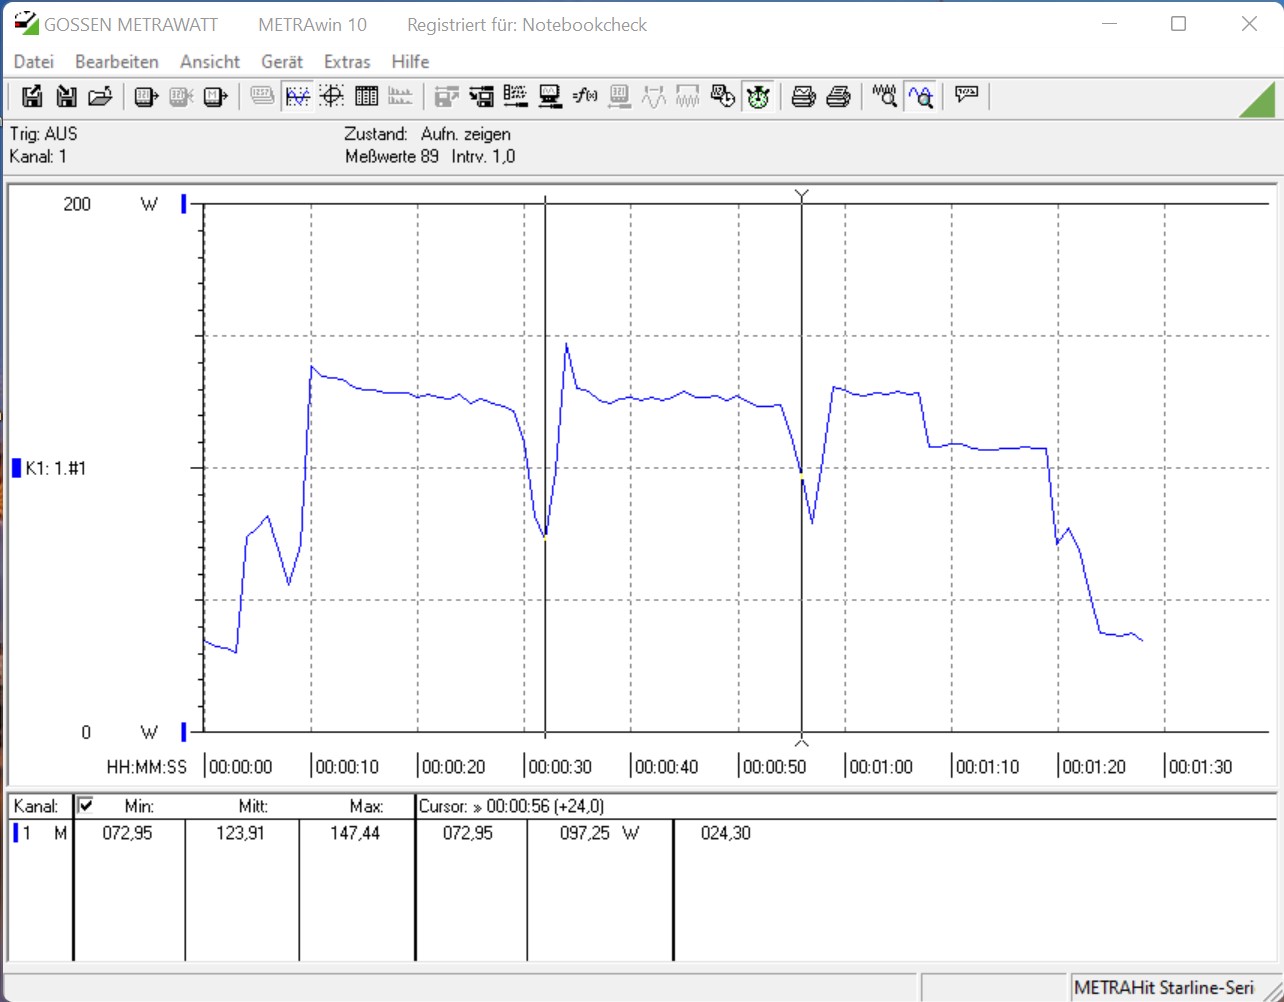
The Intel NUC 11 Extreme's low energy consumption is a source of joy. Due to the frugal SoC, we only note 124 W for the system under load in the Cinebench R15 Multi test. A desktop system based on an Intel Core i5-10600K needs an average of 172.5 W. The test system with the Intel Core i9-10900K consumes ~100 W as well.
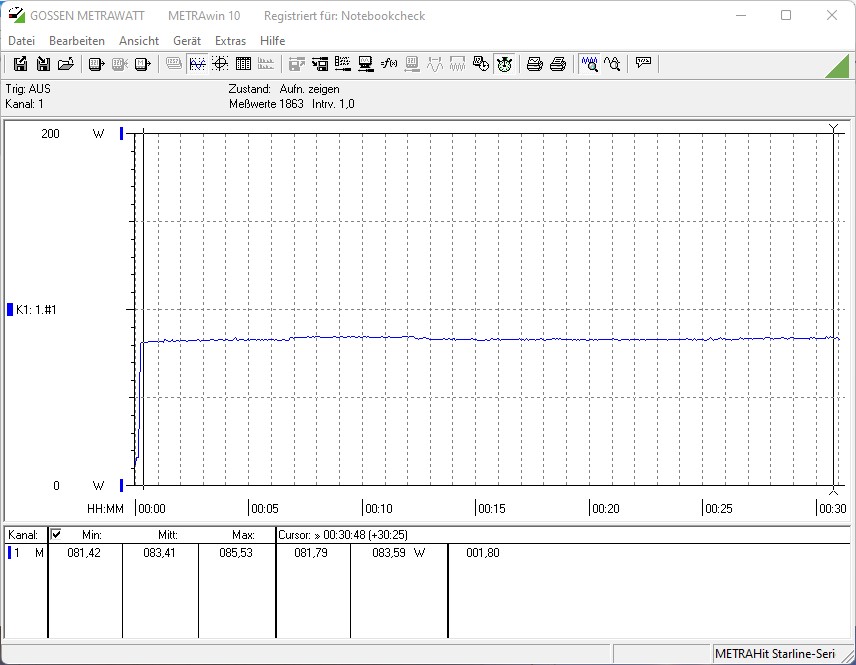
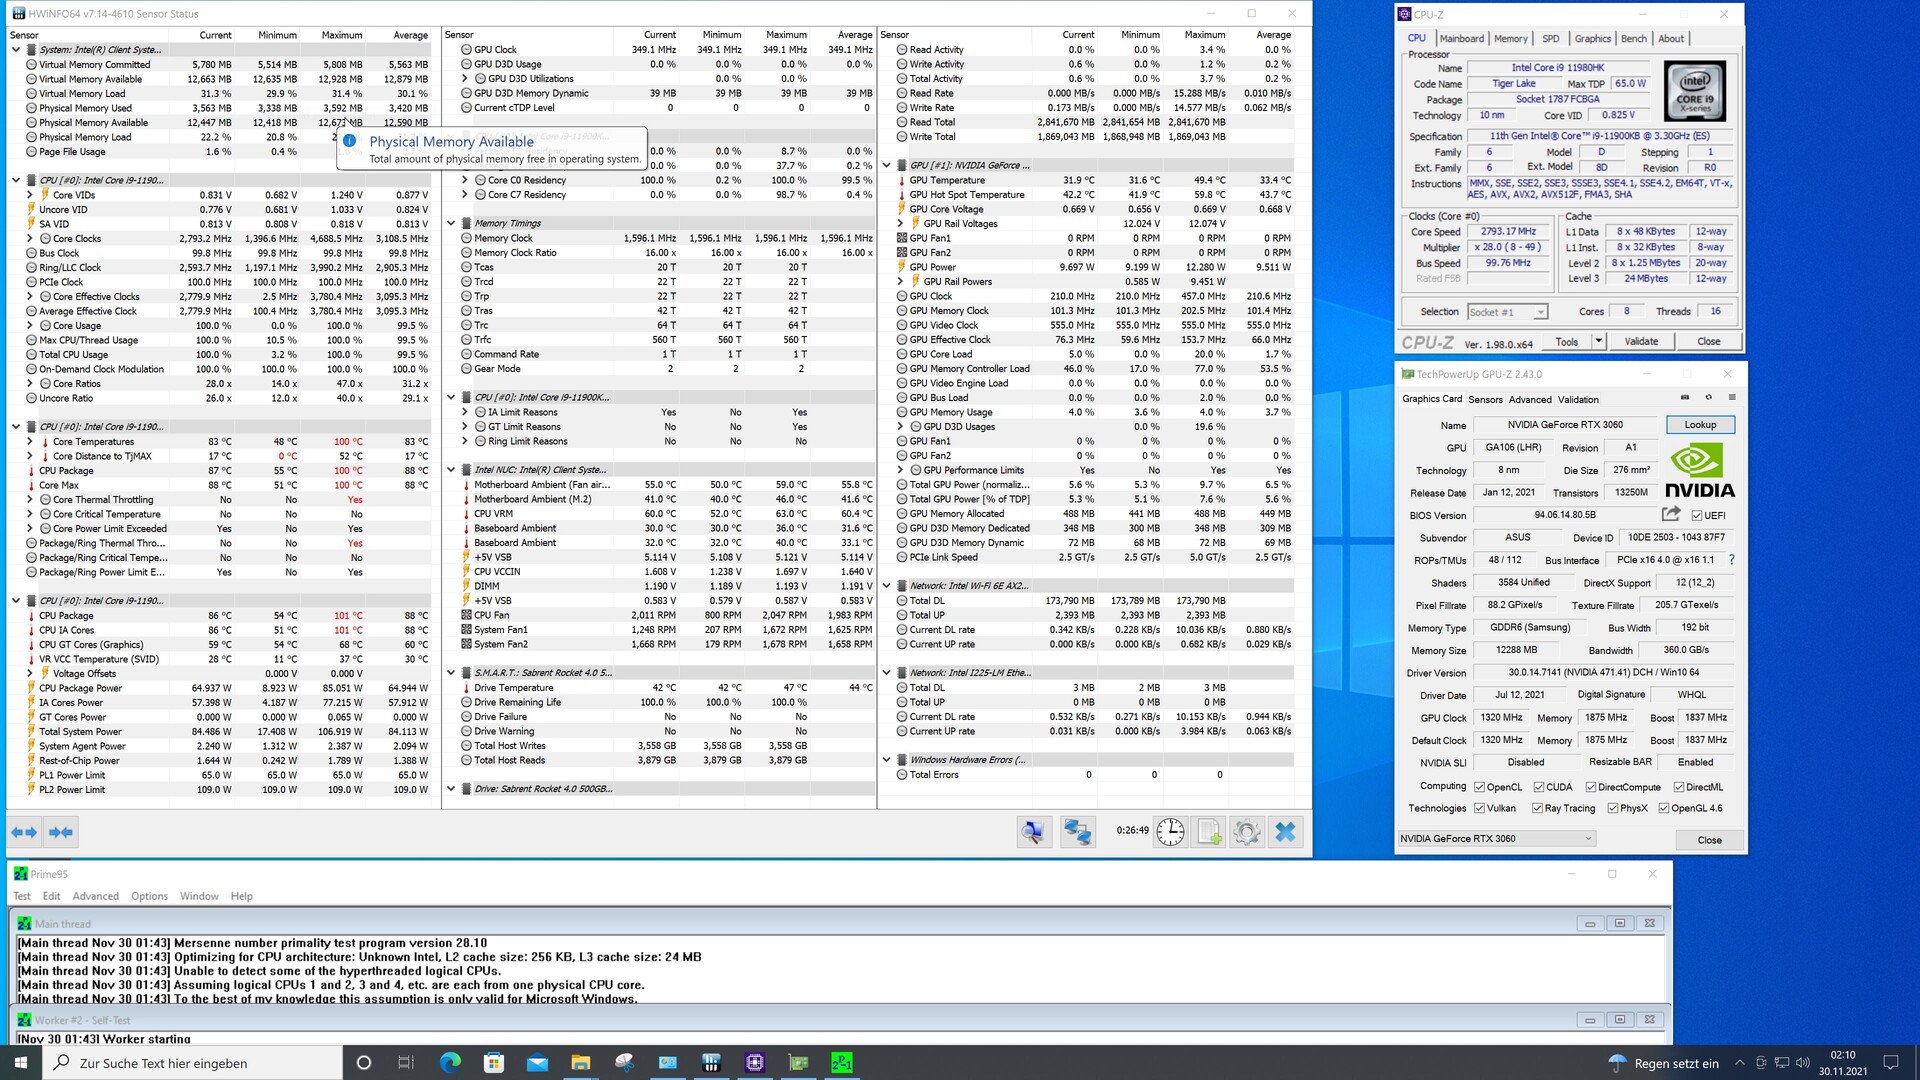
In the stress test, the Intel Core i9-11900KB is a bit hungrier when it comes to power consumption in comparison to the Intel Core i9-9980HK. Nevertheless, the additional demand of only three percent is manageable and also quite good with 113 W on the bottom line.
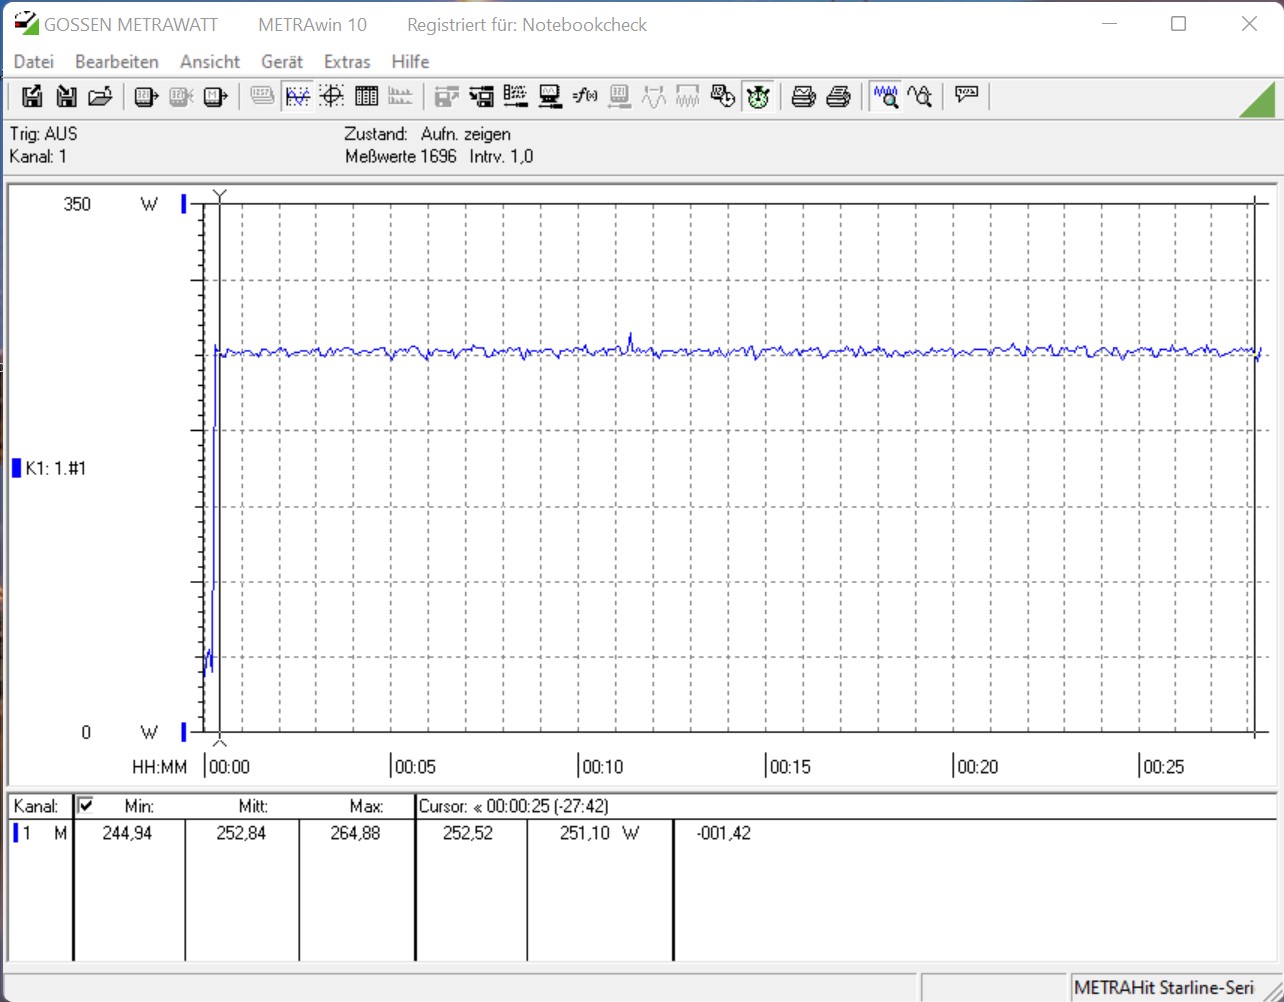
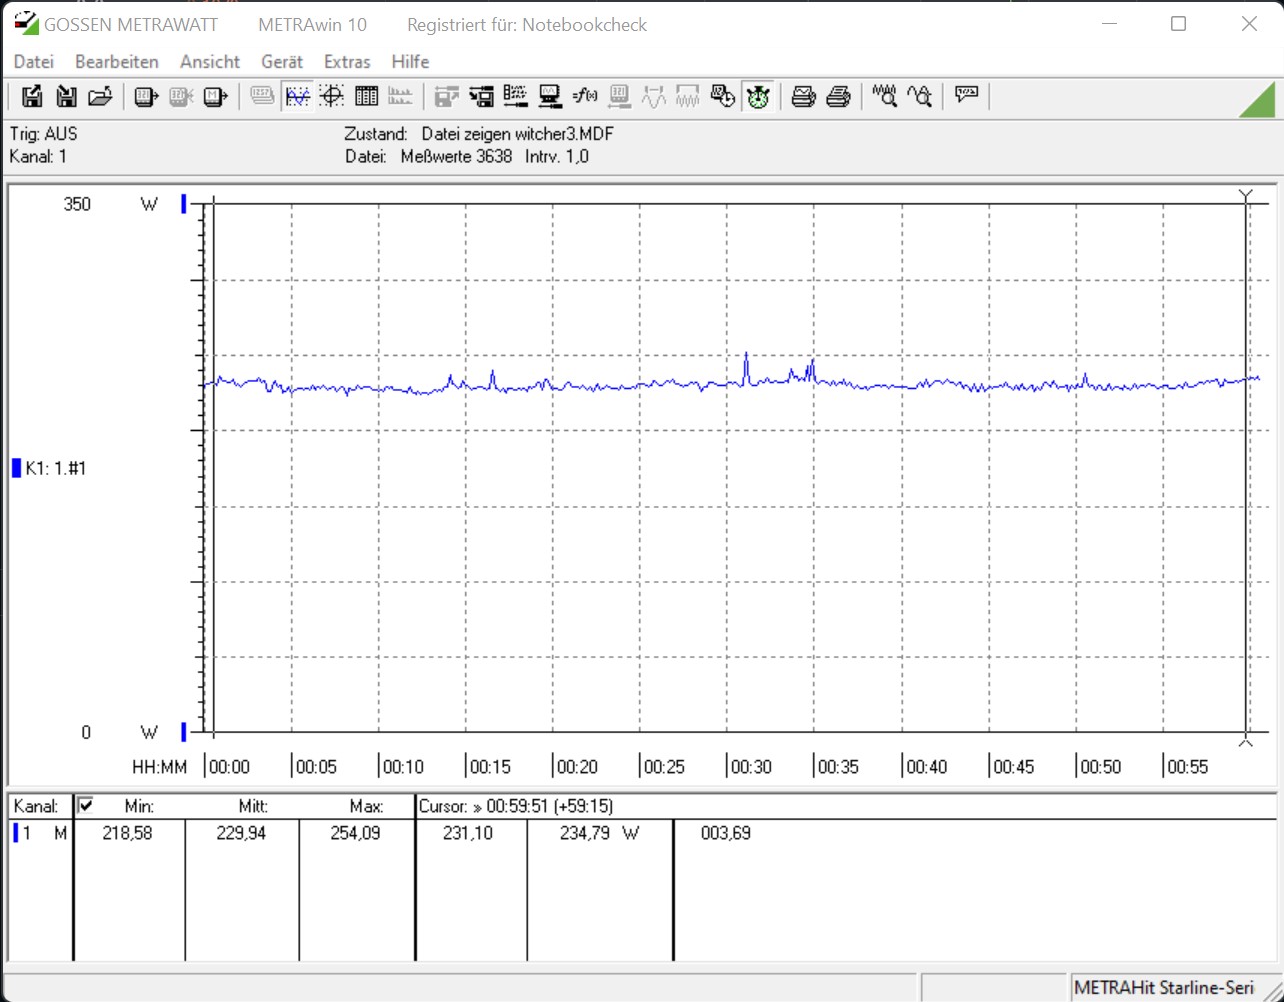
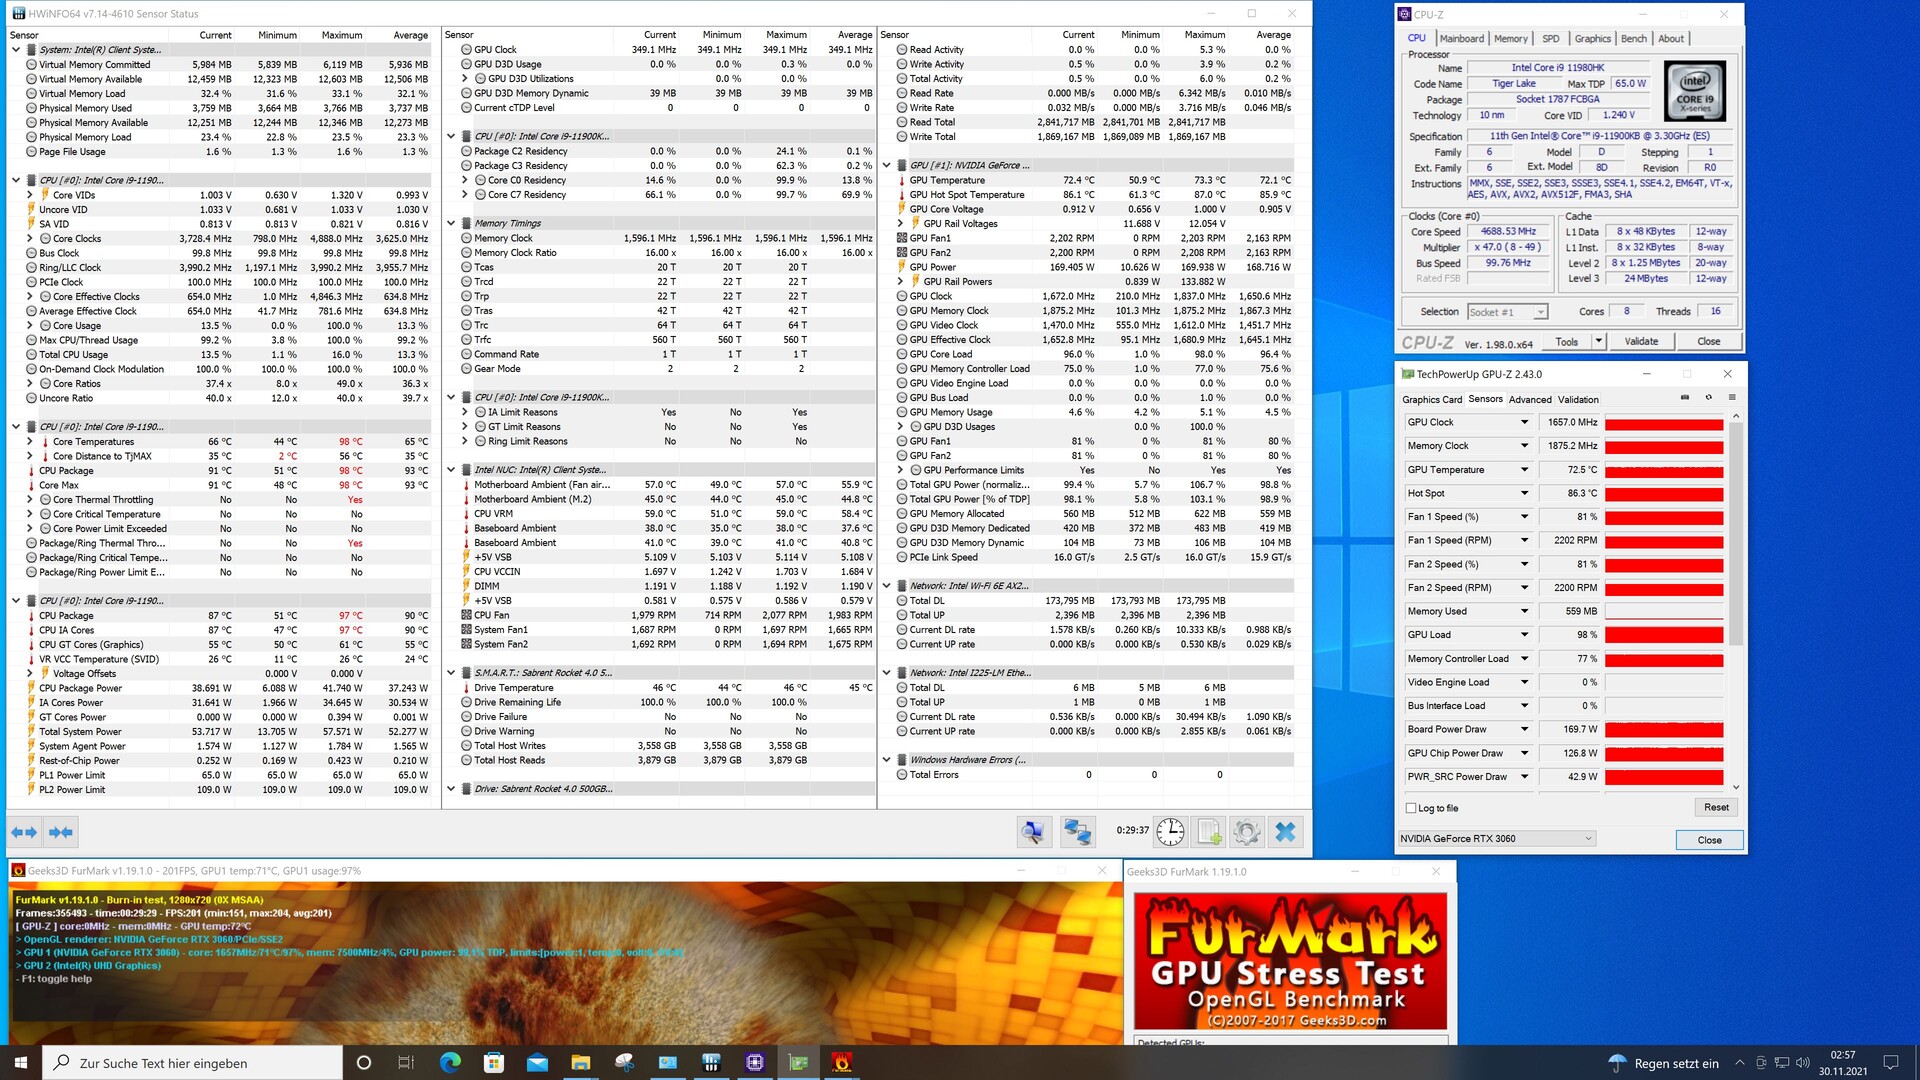
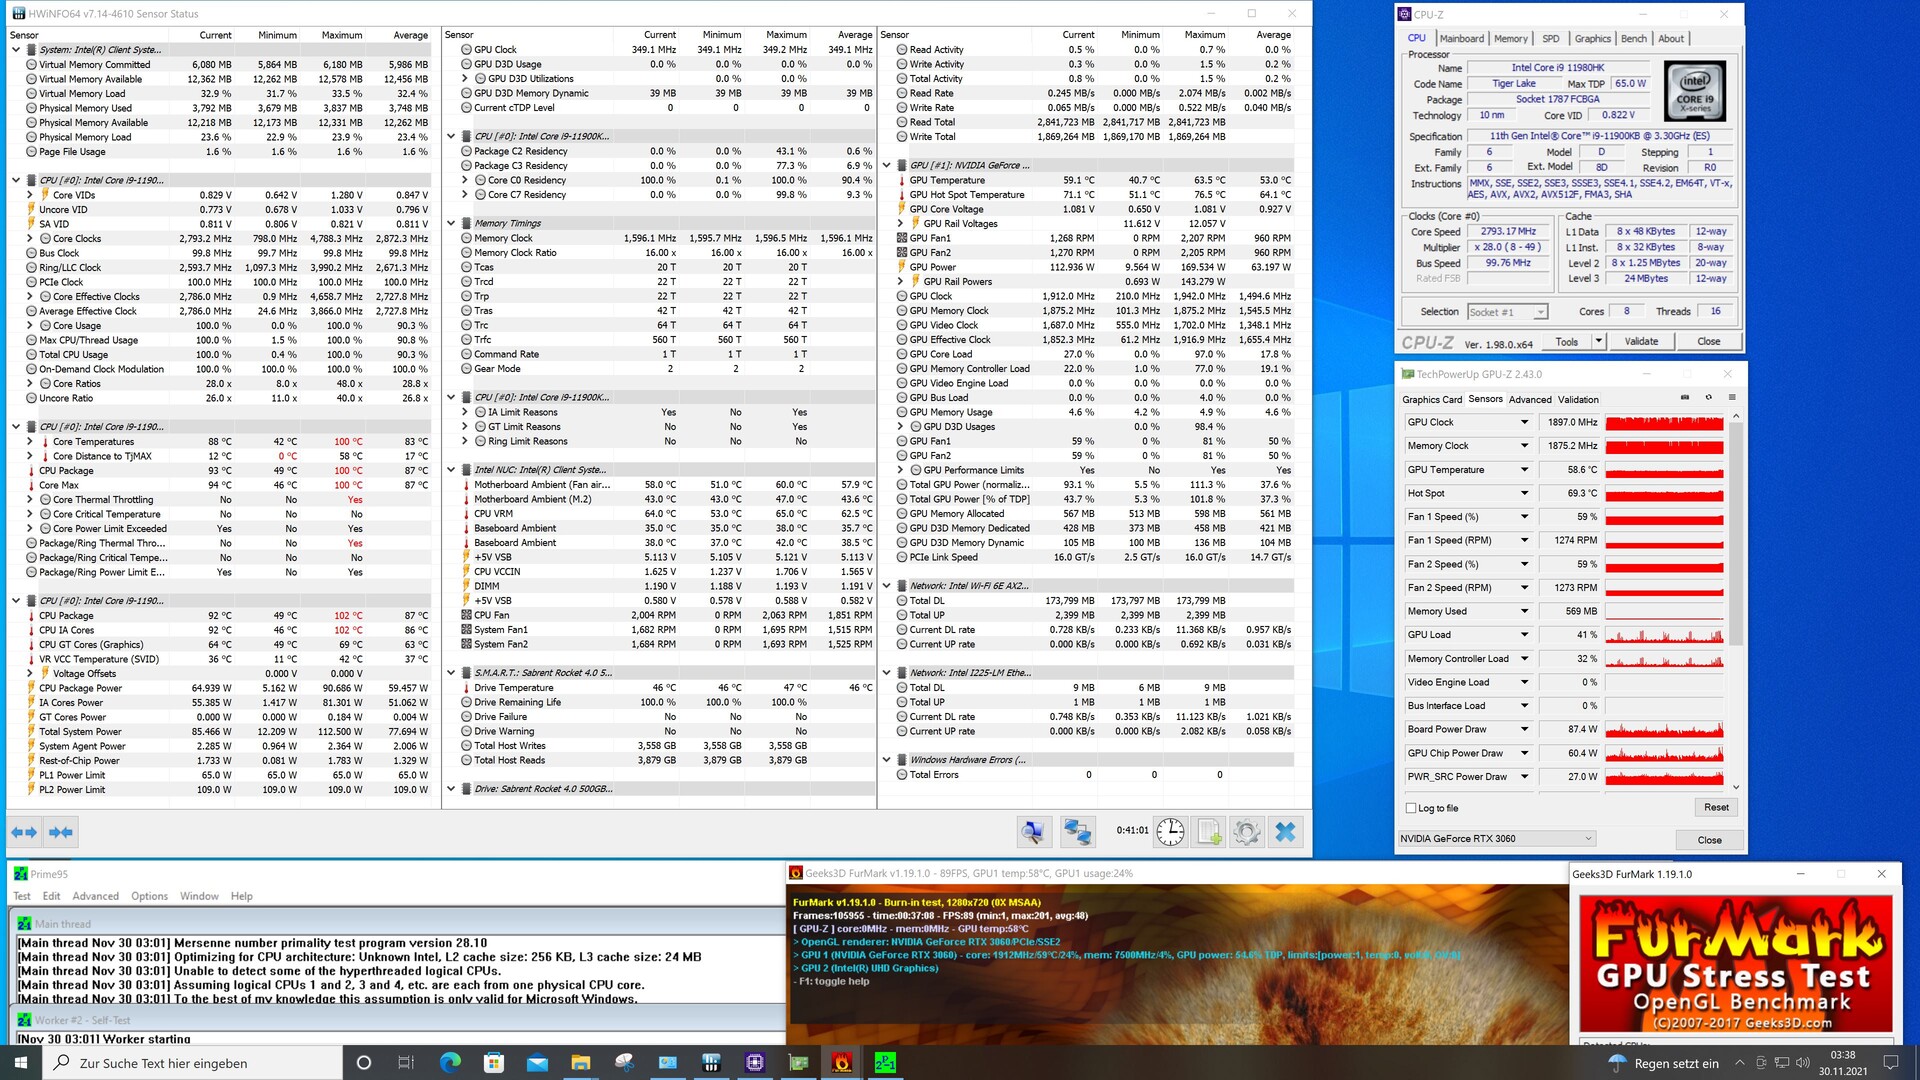
When gaming, the installed graphics card determines the system's energy requirements to a large extent. The Beast Canyon NUC wins the comparison with the Ghost Canyon NUC by a narrow margin, even though the TDP of the GeForce RTX 3060 with 170 W is considerably lower than that of the GeForce RTX 2070 Super (215 W).
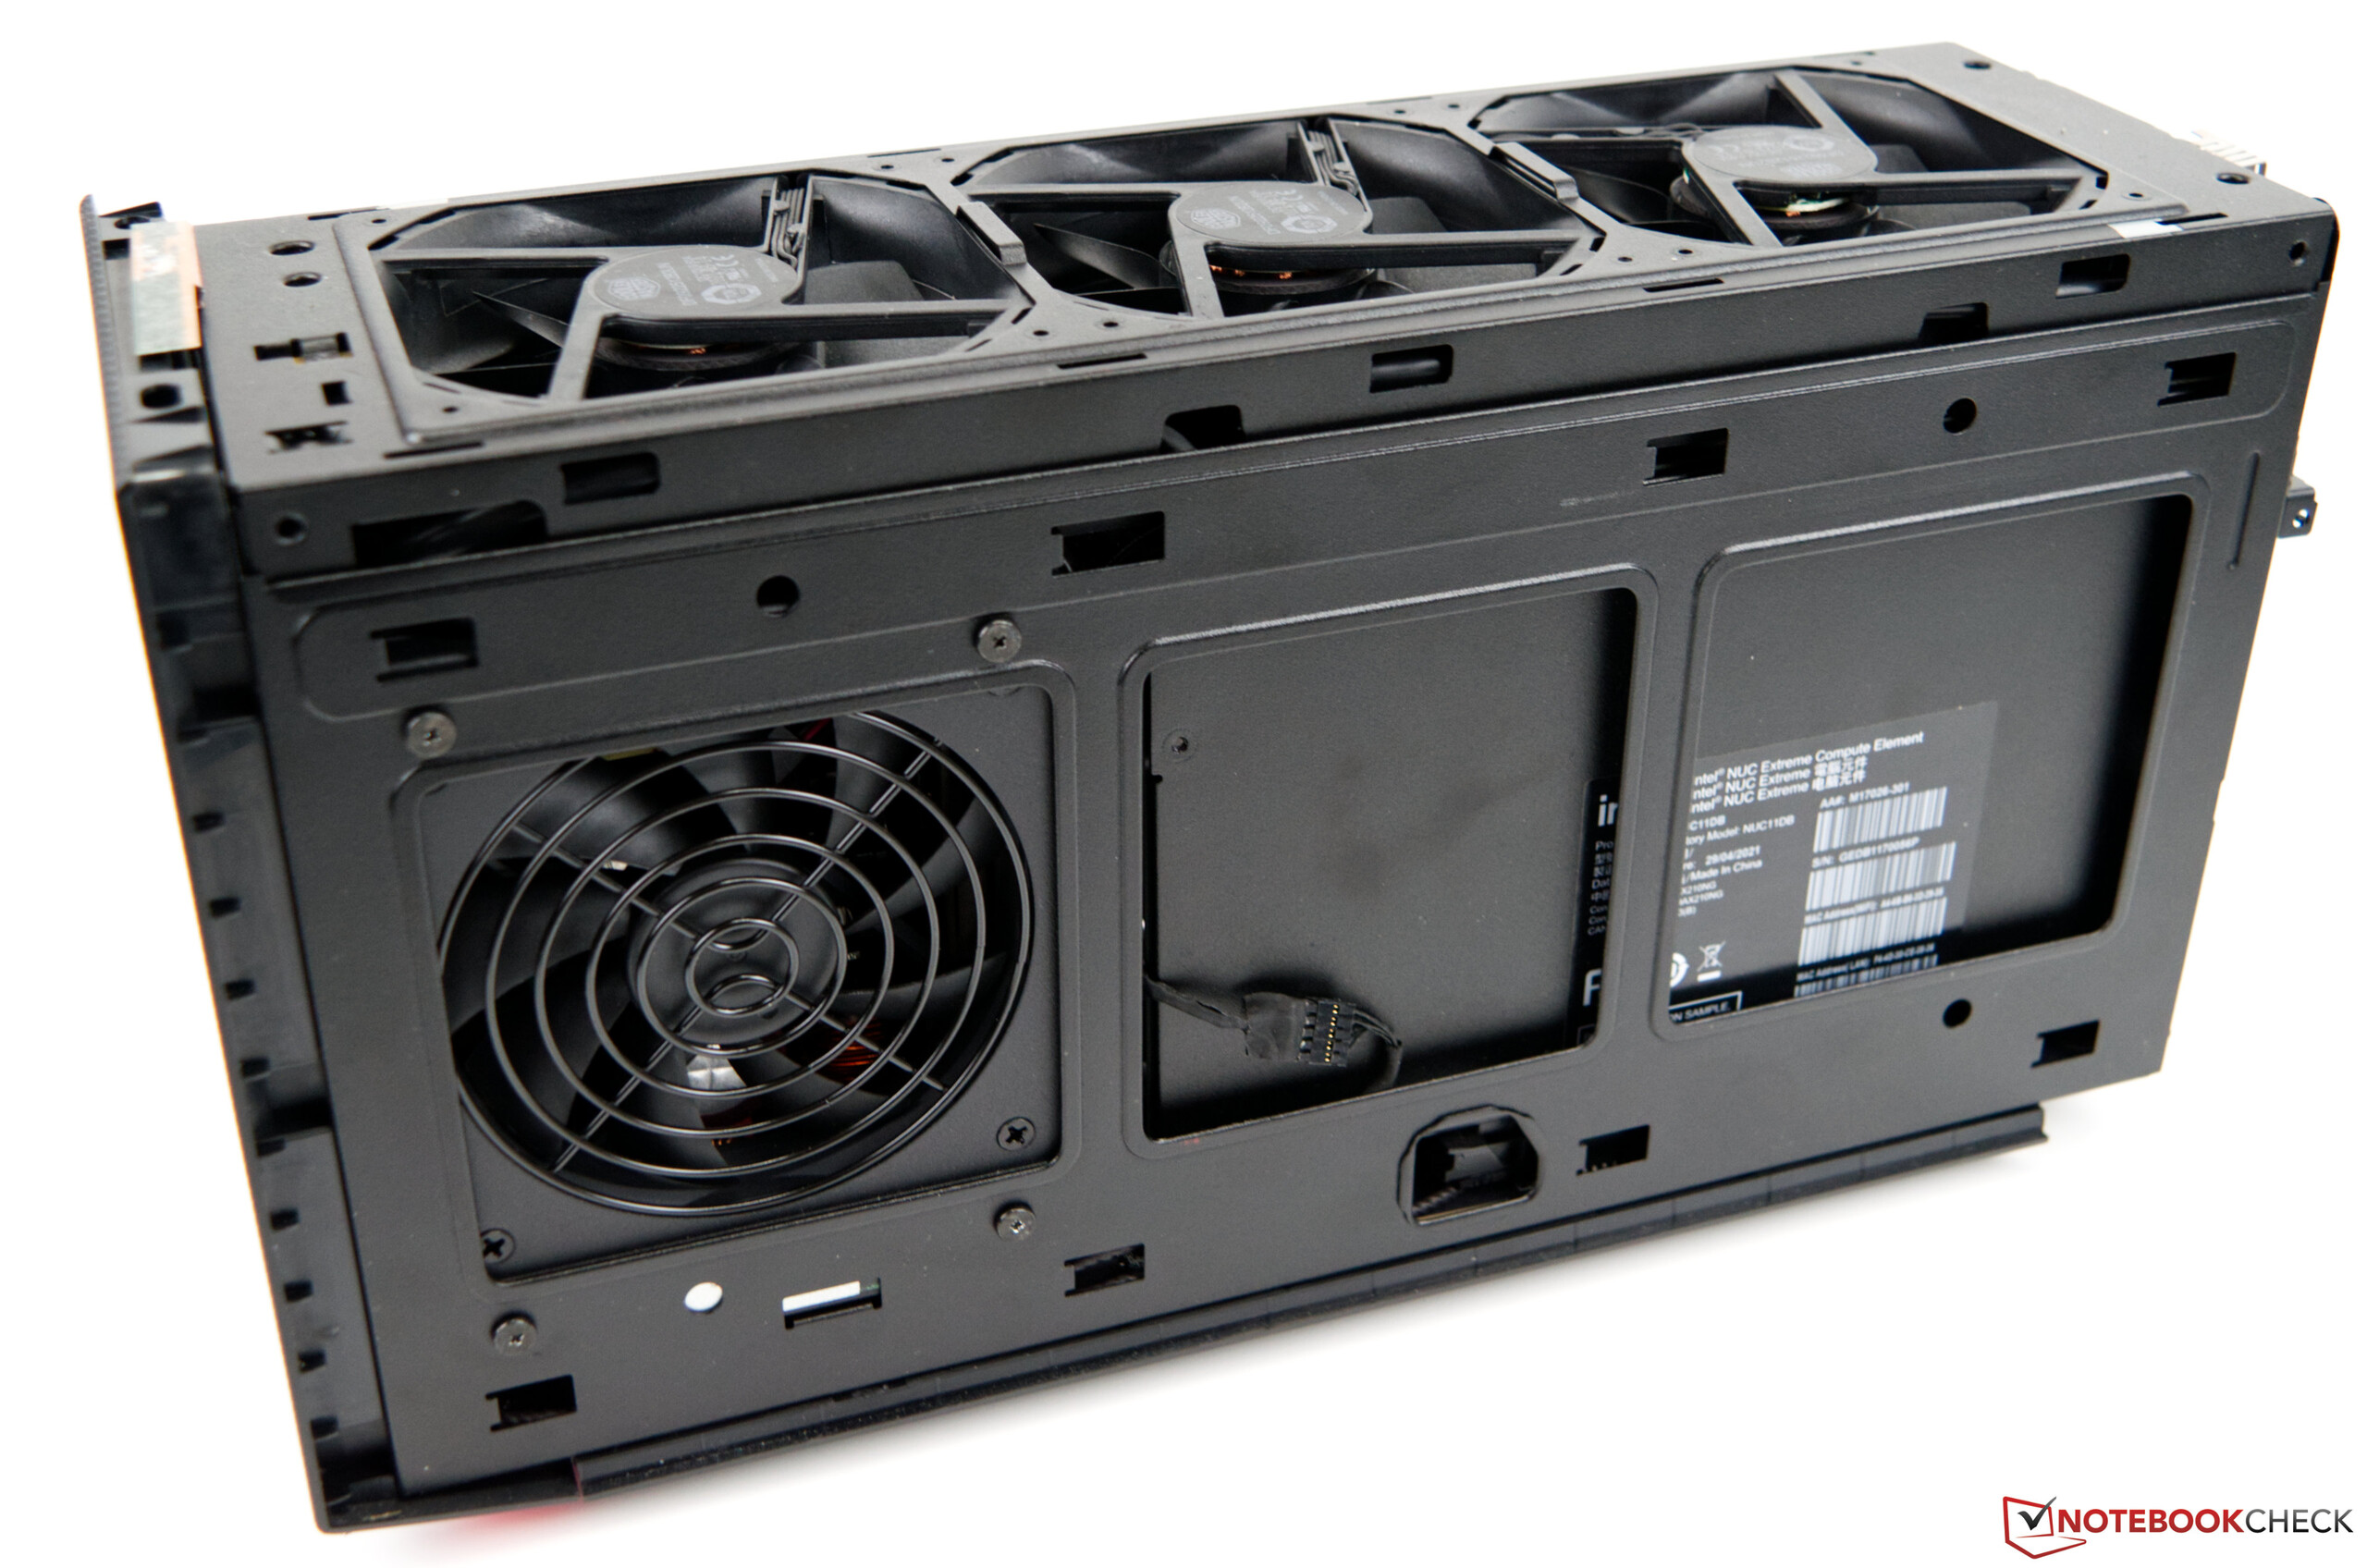
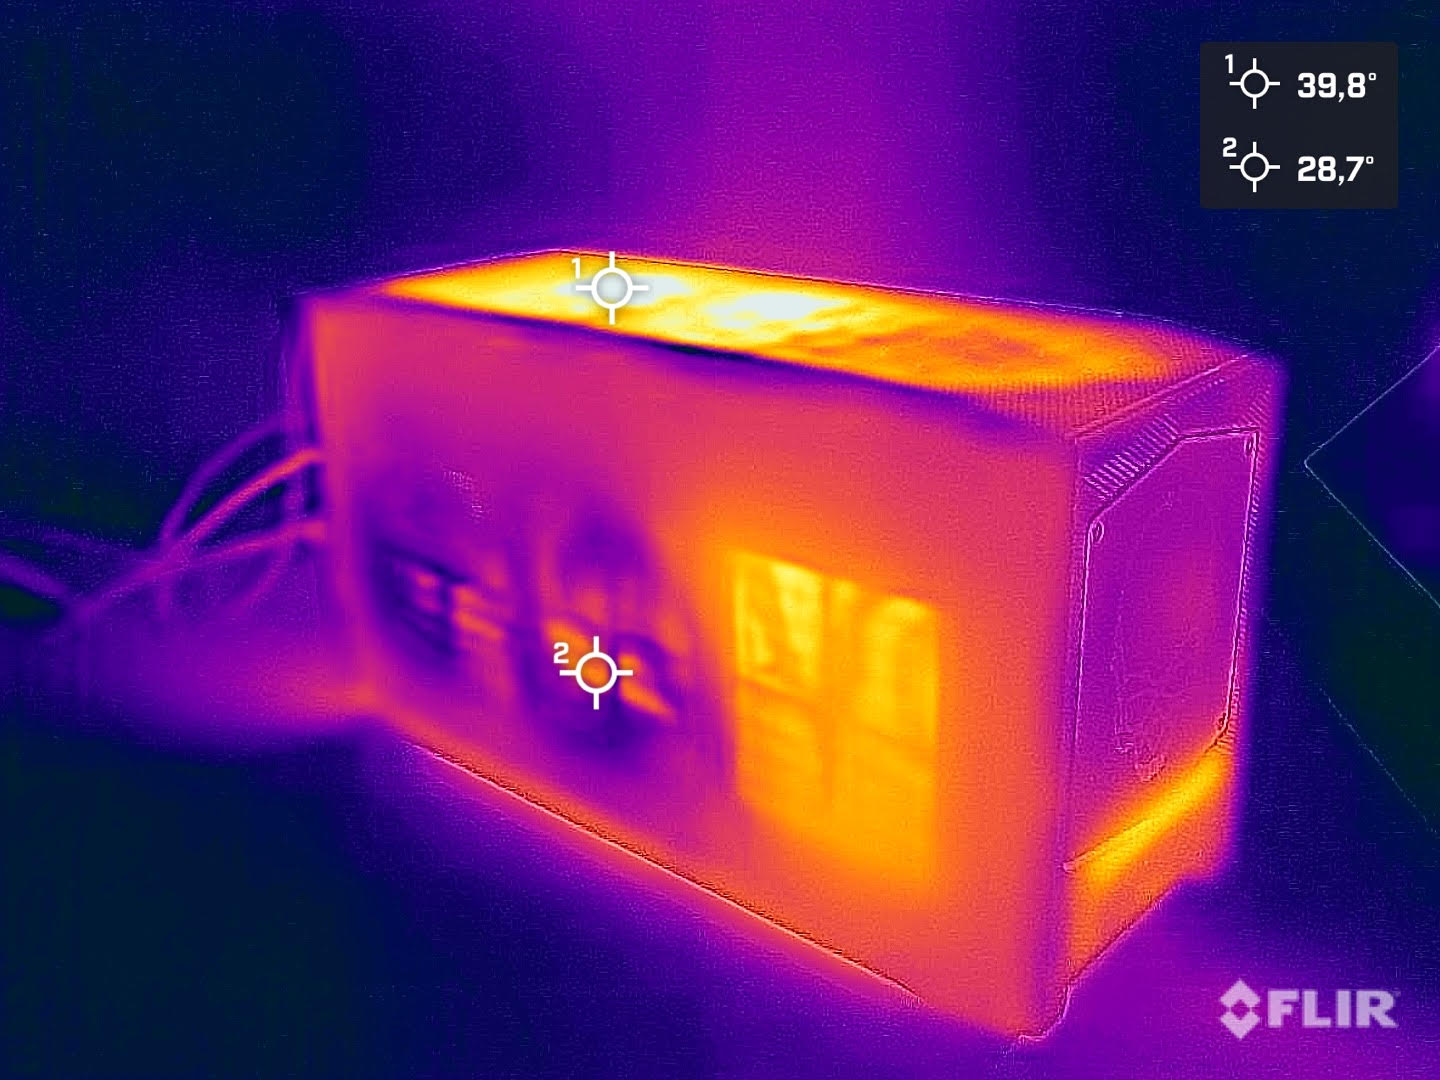
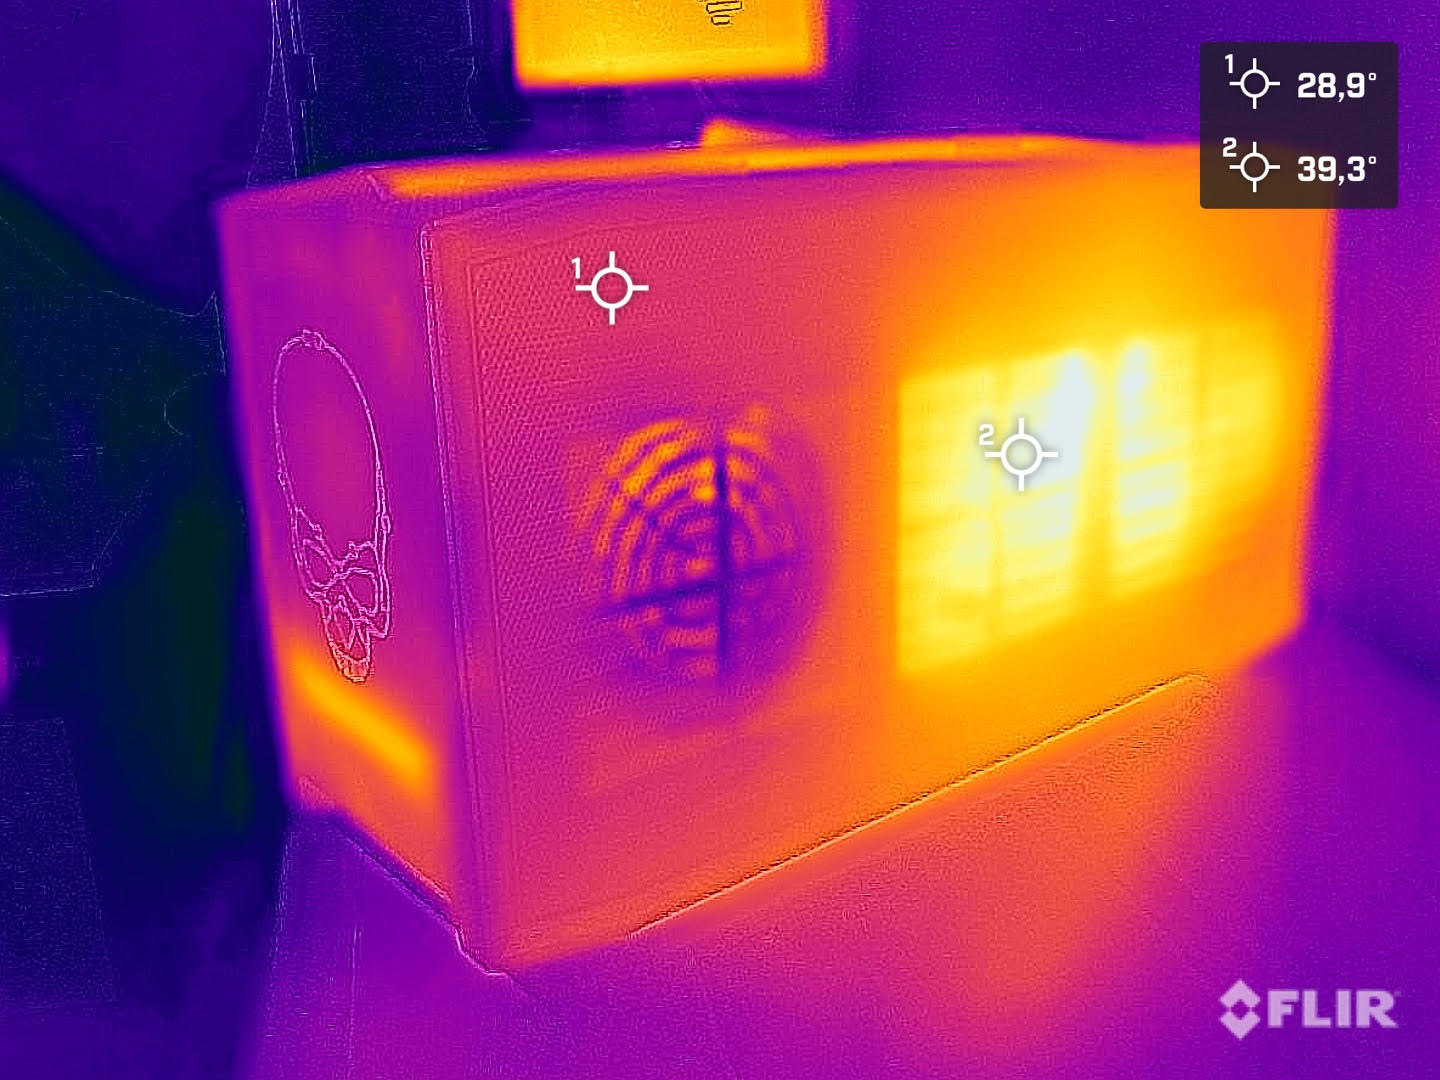
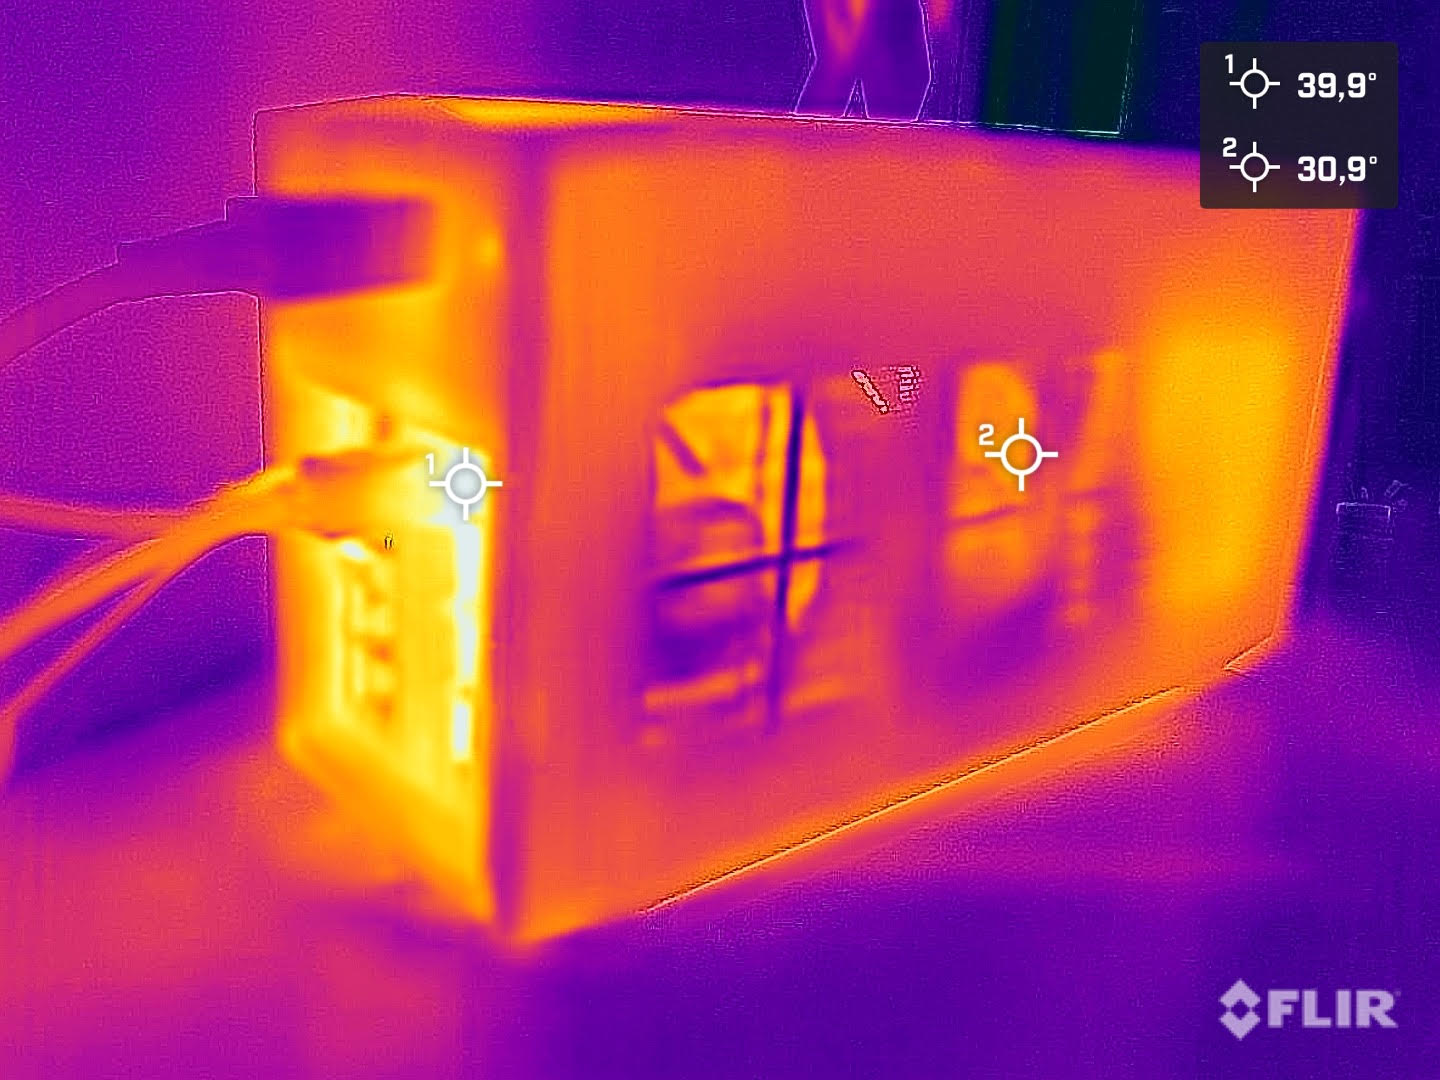
That Intel does not excessively regulate the performance of the Intel Core i9-11900KB can be seen in the temperature readings as soon as performance is demanded. The 100 °C mark can be reached without much issue. However, this could not be associated with a clearly decreasing performance in the performance test. The cooling of the Compute Element is ensured by a small fan, which is supported by three additional case fans in the upper area of the case. The compact design naturally has its share in the temperatures of the components. Accordingly, it also depends upon the dedicated graphics card in the system. If you only want to use the iGPU and do without a dedicated graphics adapter, you can expect a slightly higher performance of the SoC. A drastic performance gain should not be expected, however.
The compact design still has one big drawback though, and it's the noise levels. The Intel NUC 11 Extreme Kit - Beast Canyon is clearly audible and at 36 dB(A), the system is not really quiet even when idling. Thus, it is not surprising that we could measure 50.5 dB(A) during gaming. We determined the noise levels at a distance of 15 cm (~6 inches) from the device. You should notice a bit less background noise as long as you do not place the Intel NUC 11 Extreme Kit - Beast Canyon directly next to you.
| Power Consumption | |
| 1920x1080 The Witcher 3 ultra (external Monitor) | |
| AMD Ryzen 9 3950X (Idle: 95 W) | |
| Intel Core i9-10900K (Idle: 52.3 W) | |
| Intel Core i5-10600K (Idle: 52.2 W) | |
| Corsair One i160 (Idle: 51.5 W) | |
| Intel Ghost Canyon NUC (RTX 2070) (Idle: 33.1 W) | |
| Intel Beast Canyon NUC (Idle: 32 W) | |
| Prime95 V2810 Stress (external Monitor) | |
| Intel Core i9-10900K (Idle: 52.3 W) | |
| Intel Core i5-10600K (Idle: 52.2 W) | |
| AMD Ryzen 9 3950X (Idle: 95 W) | |
| Intel Beast Canyon NUC (Idle: 34 W) | |
| Intel Ghost Canyon NUC (RTX 2070) (Idle: 33.1 W) | |
| Cinebench R15 Multi (external Monitor) | |
| Intel Core i9-10900K (Idle: 52.3 W) | |
| AMD Ryzen 9 3950X (Idle: 95 W) | |
| Intel Core i5-10600K (Idle: 52.2 W) | |
| Intel Beast Canyon NUC (Idle: 32 W) | |
| Temperatures - CPU Temperature Prime95 | |
| Intel Core i9-10900K | |
| AMD Ryzen 9 3950X | |
| Intel Core i5-10600K | |
* ... smaller is better
Pros
Cons
Verdict - Compact, Modern and Fast
The Intel NUC 11 Extreme Kit - Beast Canyon offers very good performance in a small chassis. With the new Compute Element based on the Intel Core i9-11900KB, there is an economical SoC that comes from the laptop segment. The 8 cores and 16 threads provide very good performance in games and productivity due to the high IPC. However, the minimum price of US$1,200 is not a good bargain. A dedicated graphics card, working memory, mass storage and the operating system need to be added on top of this, so you quickly end up north of US$2,000. Comparable desktop systems are currently similarly expensive, so you can definitely consider buying the Intel NUC 11 Extreme Kit - Beast Canyon.
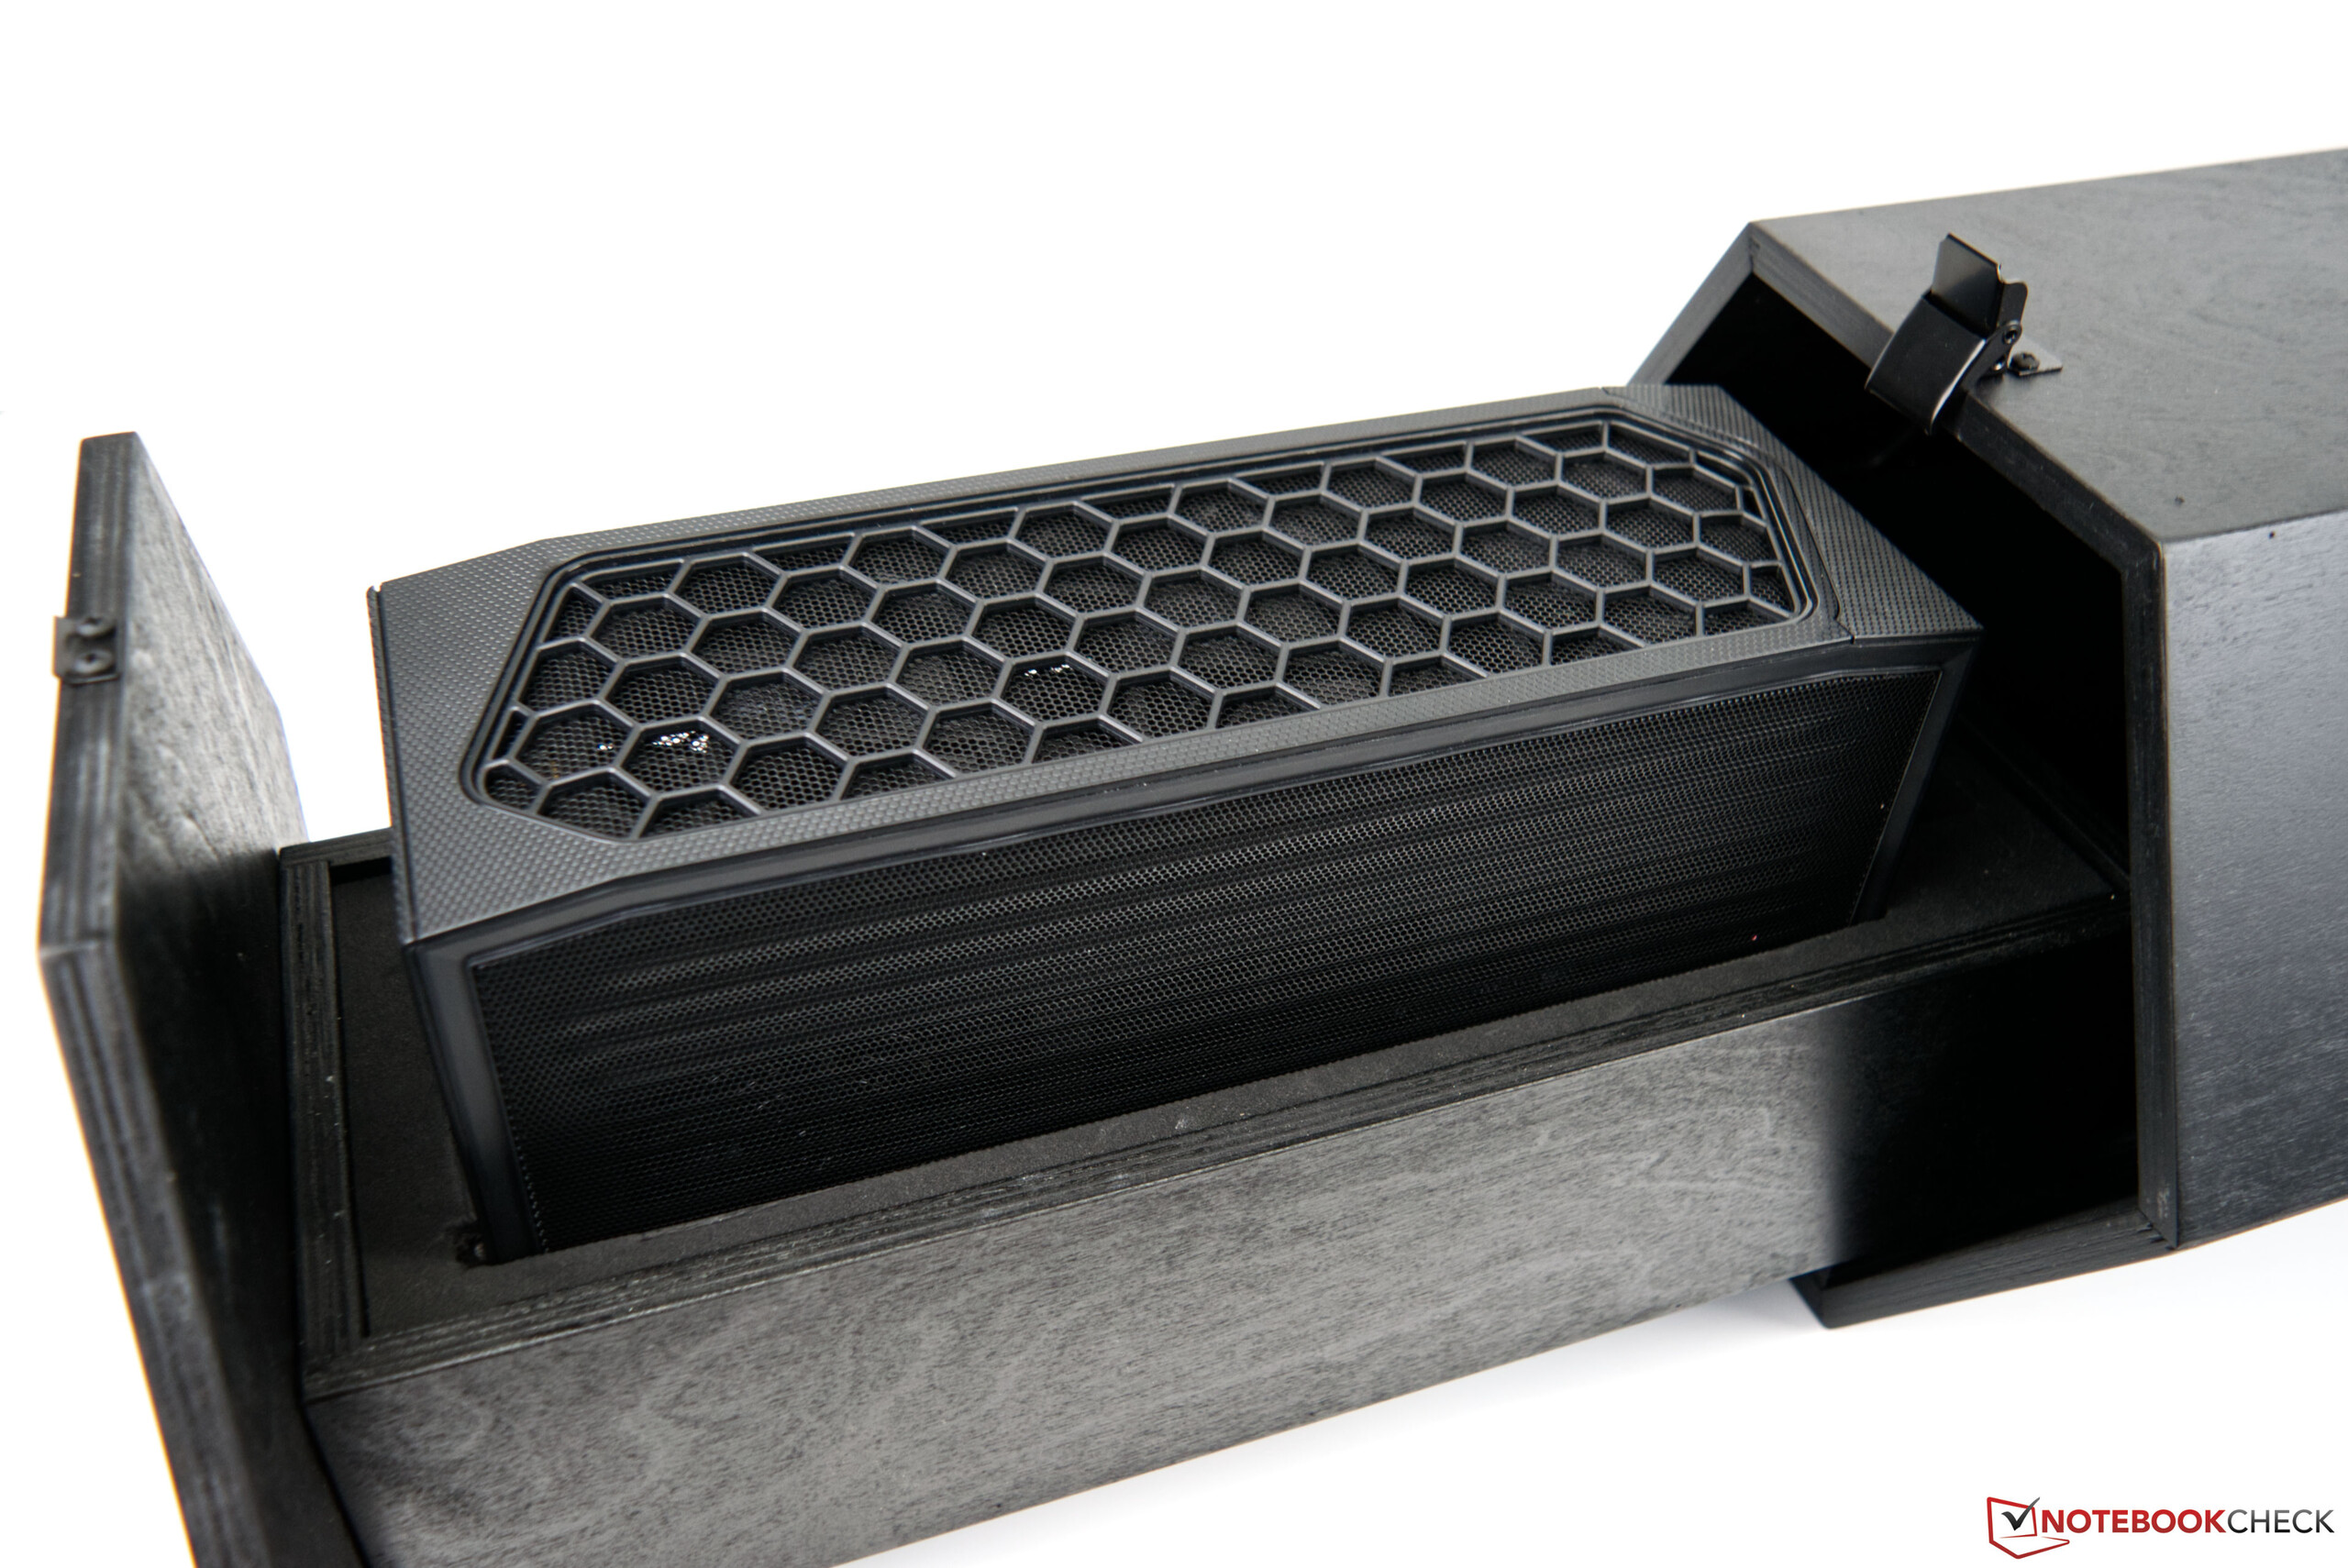
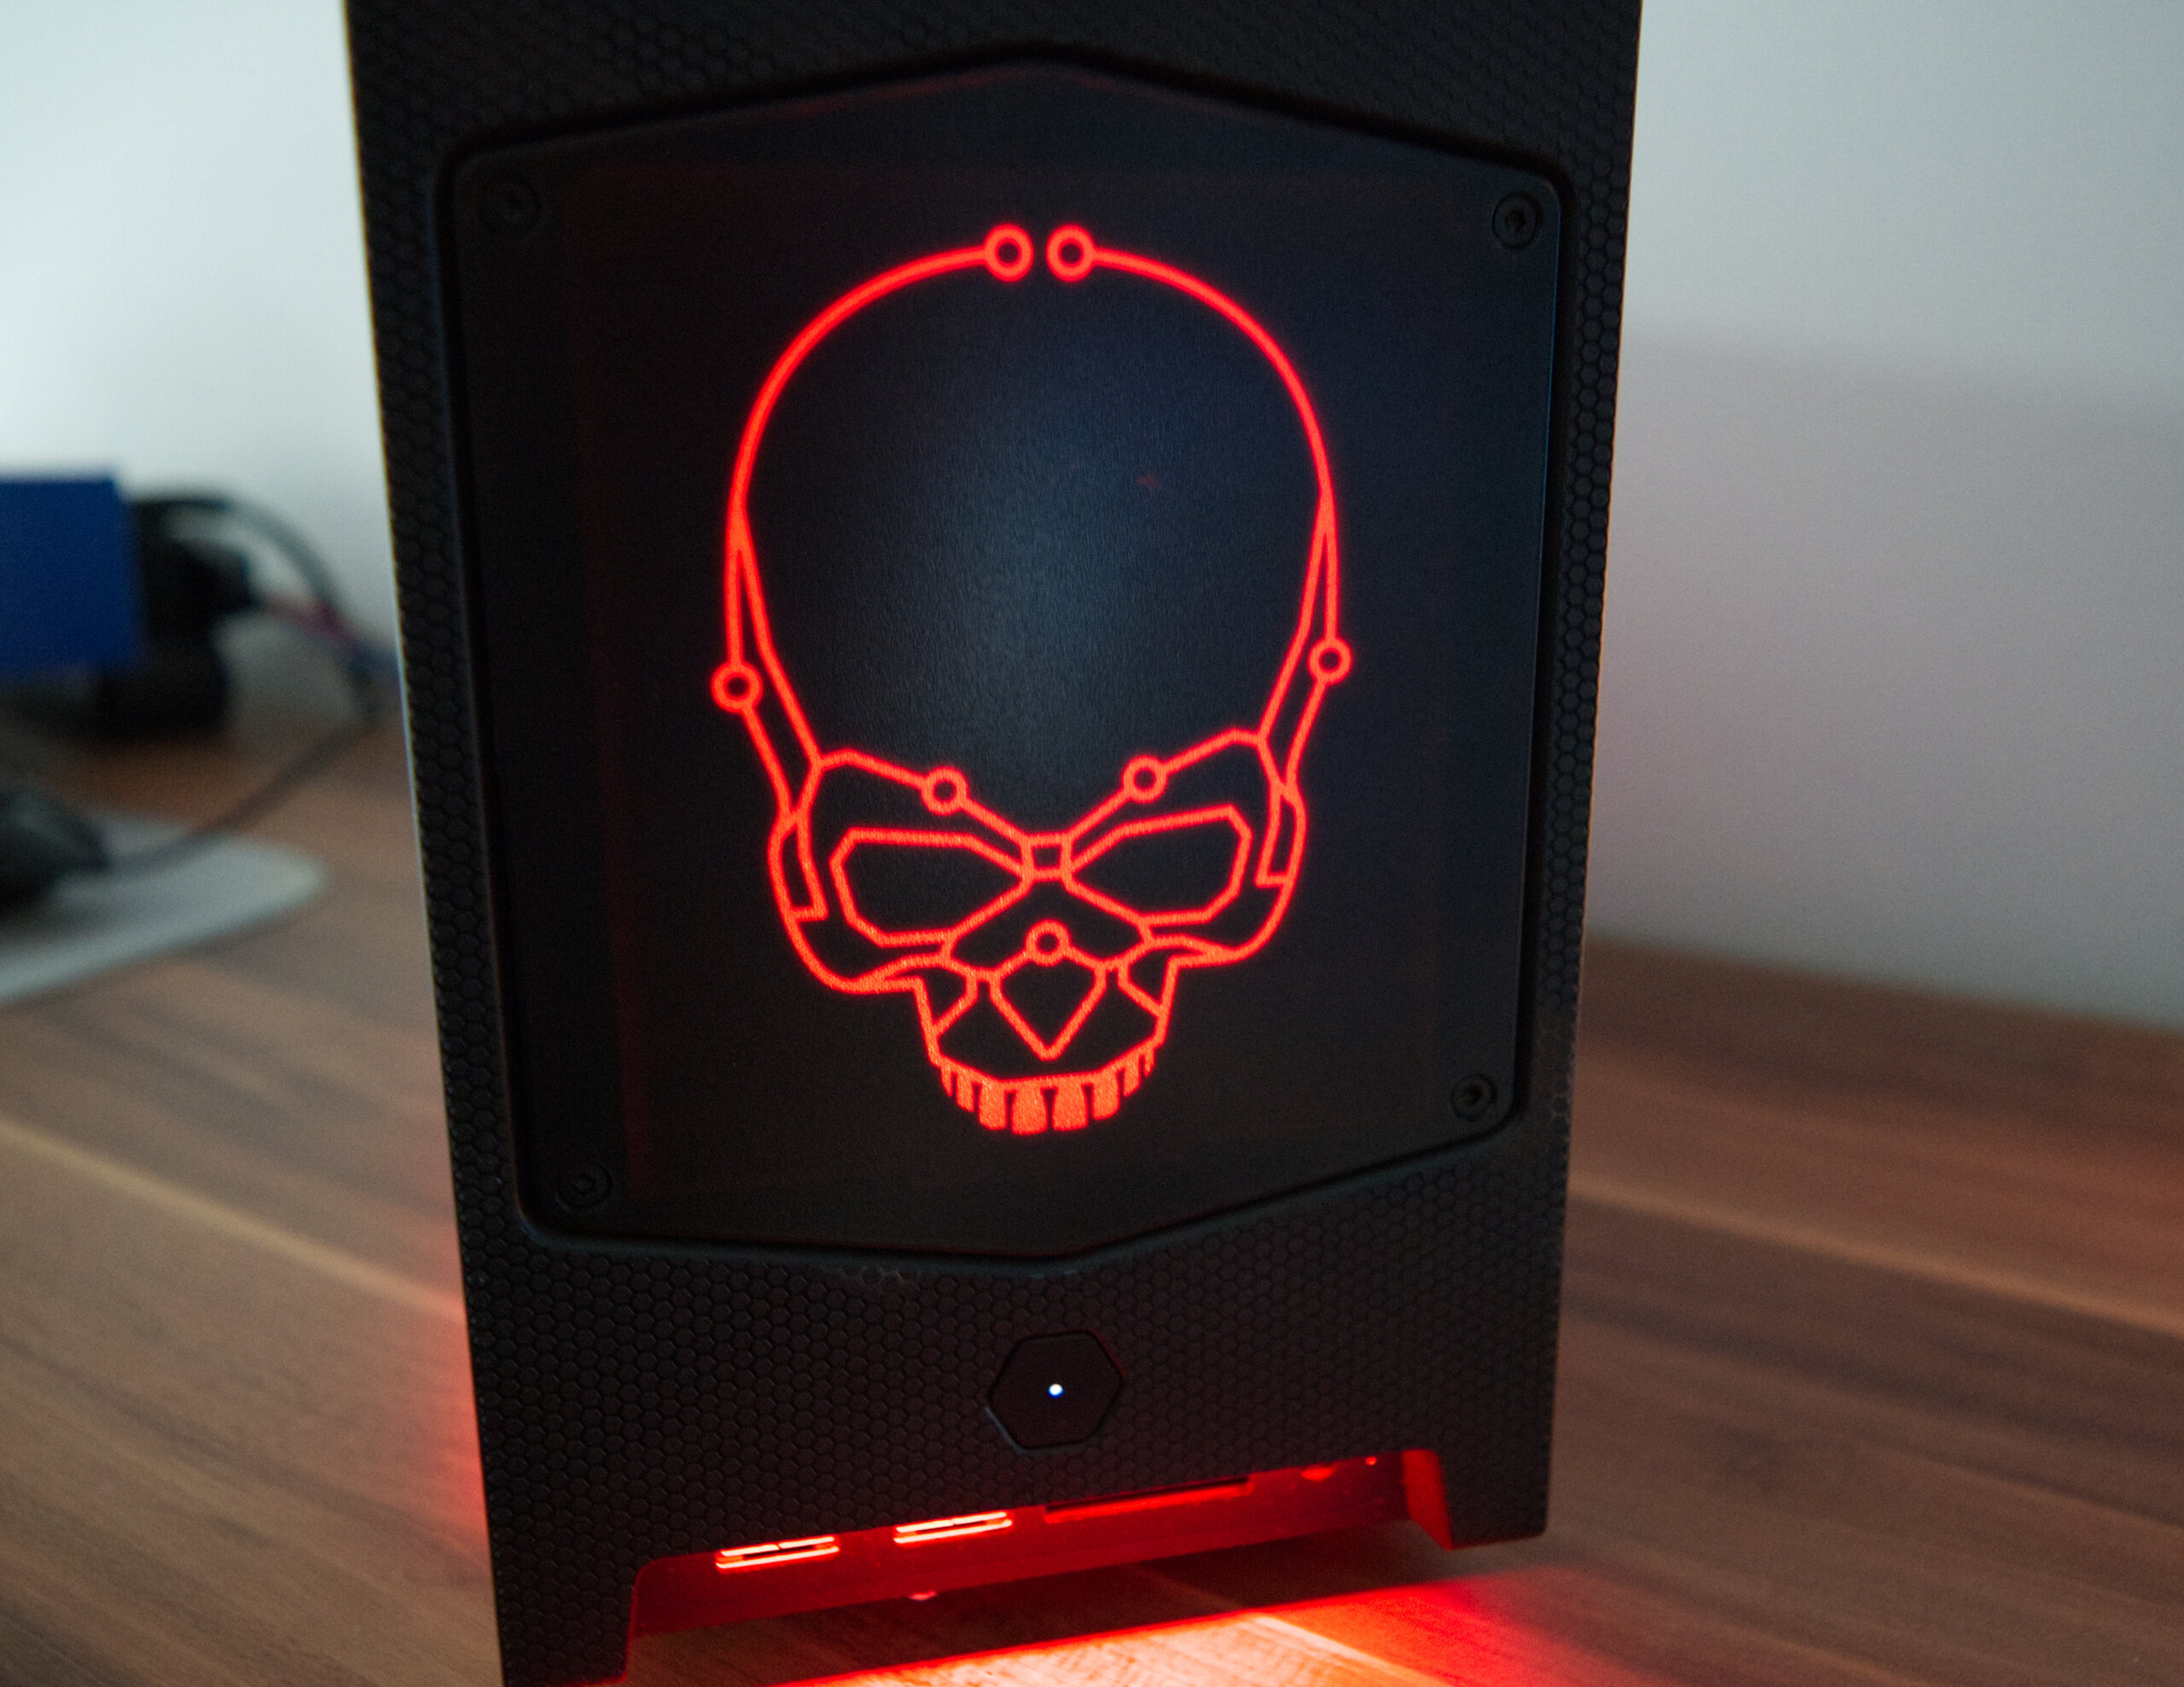
The biggest drawback is probably the high noise levels, which are clearly audible under load. If you can live with the disadvantages of the system and do not want to install the biggest graphics card, you will get a compact system with rarity value with the Intel NUC 11 Extreme Kit - Beast Canyon. The case is not available separately and is an eye-catcher with optical accents.
Intel pushes the performance of its compact devices even further with the Intel NUC 11 Extreme Kit - Beast Canyon.
The selection and number of interfaces is very good. With two Thunderbolt 4 ports, it even has the fastest and most modern future-proof standard. There are also many USB ports for connecting peripherals and even a fast SD card reader with the UHS-II standard is available. Only the lack of a second Ethernet port could be criticized, although that would be complaining on a high level.
The alternative to the Intel NUC 11 Extreme Kit - Beast Canyon would be to assemble a system yourself, which would probably cost the same. The Zotac Magnus One is also a good option when it comes to very compact gaming PCs.

