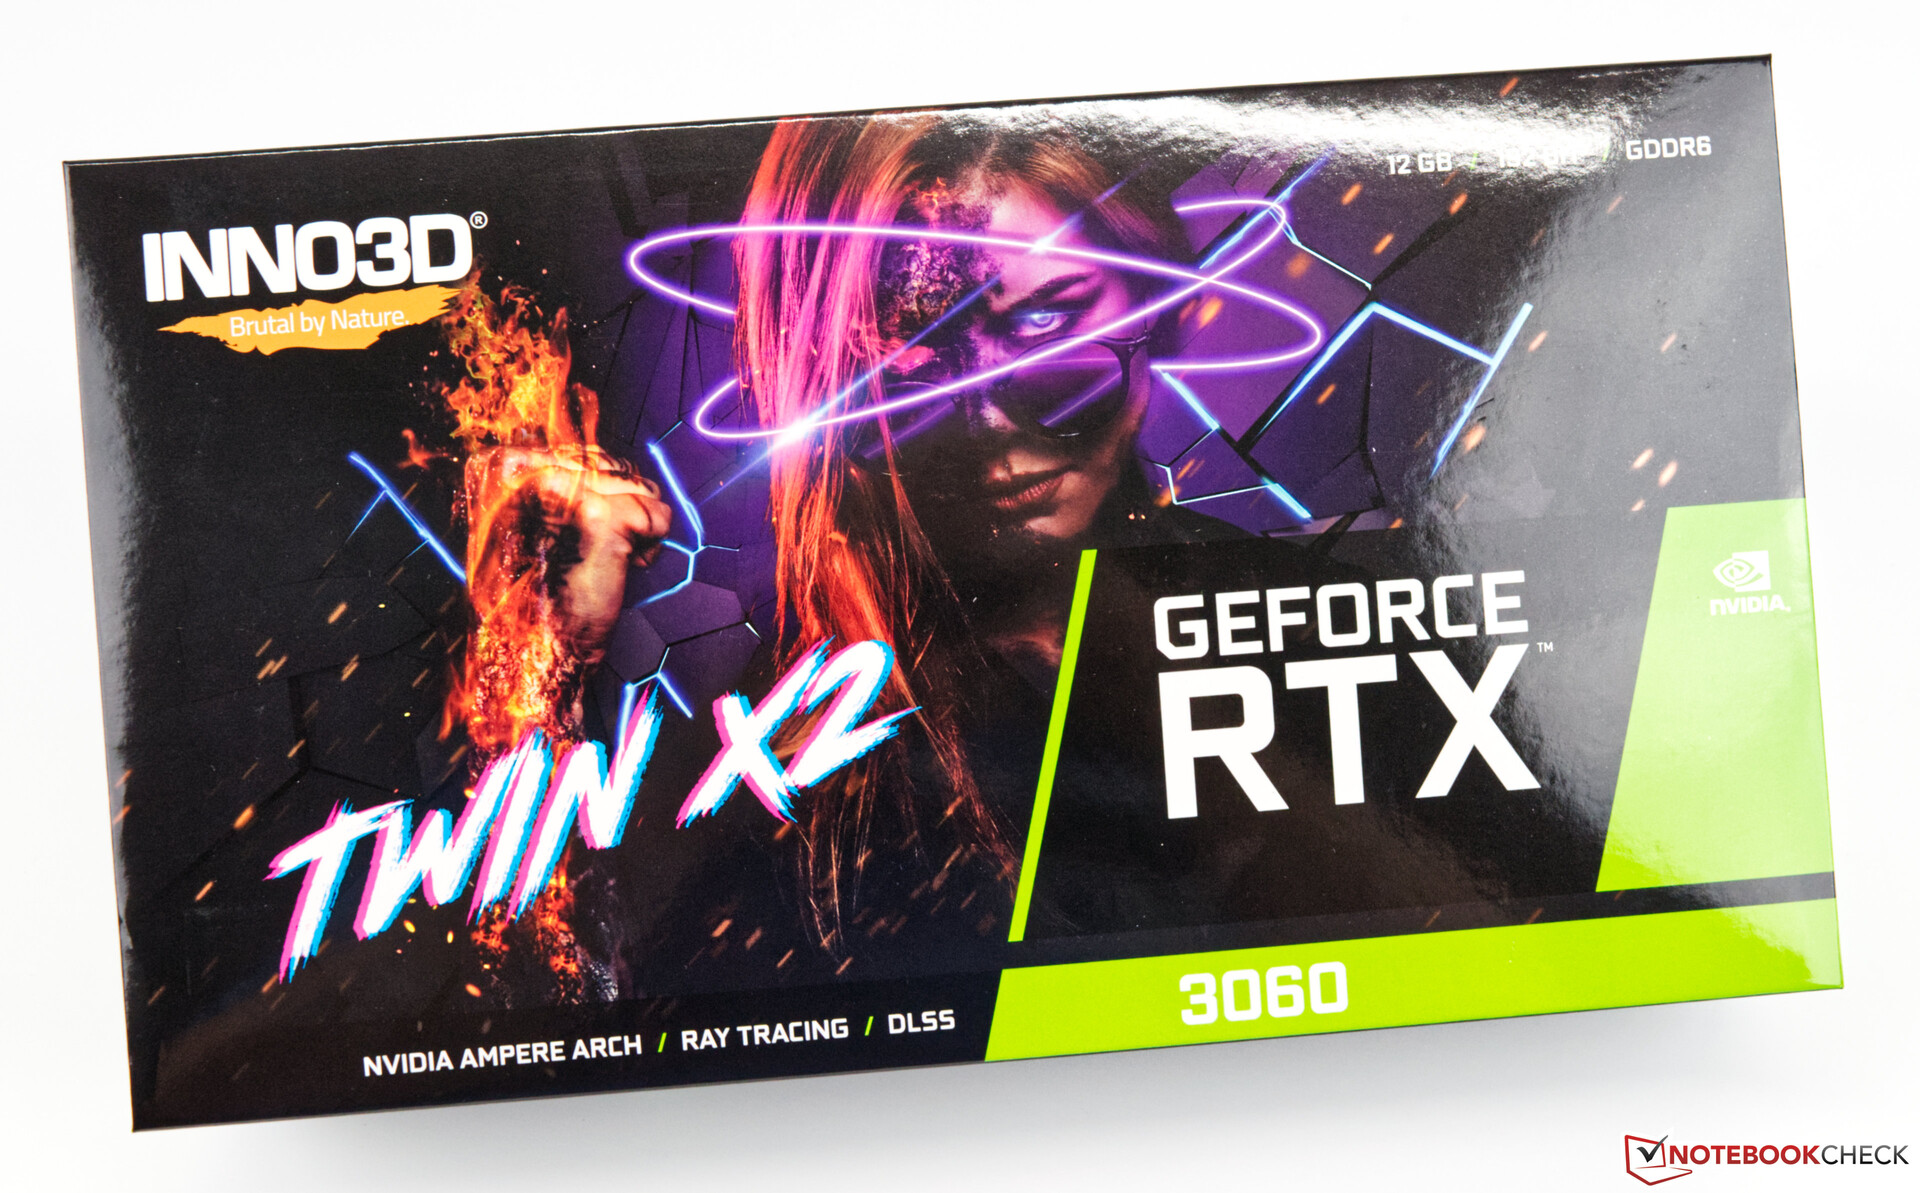
Nvidia GeForce RTX 3060 12GB in review: Affordable entry into the RTX 3000 series?
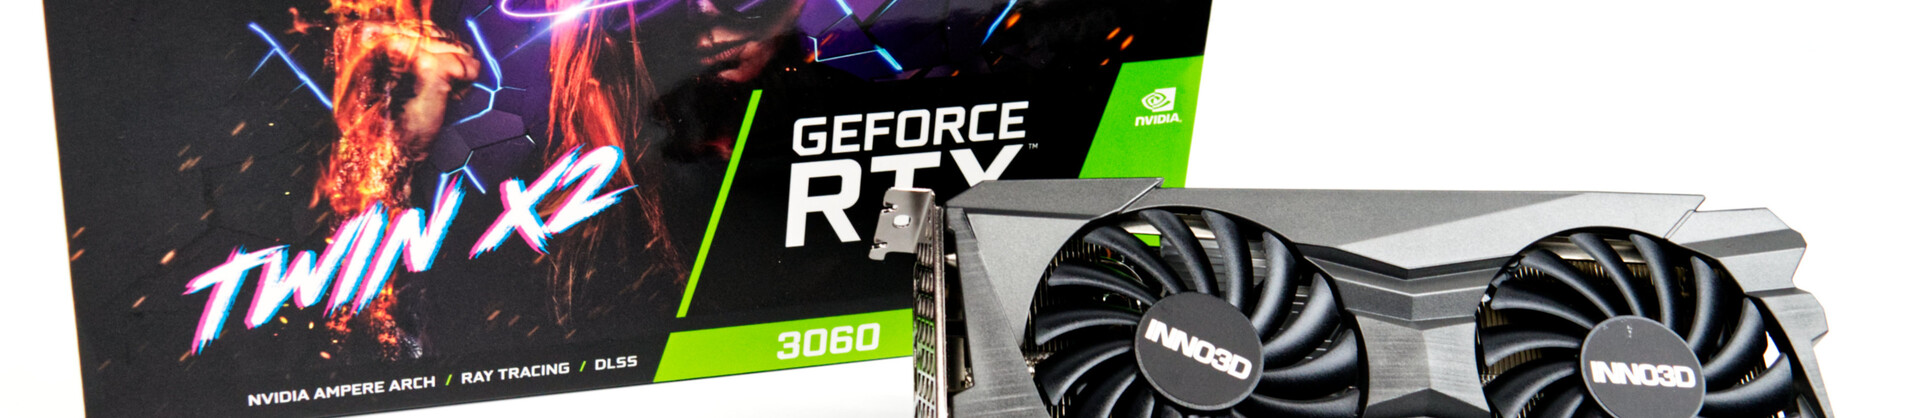
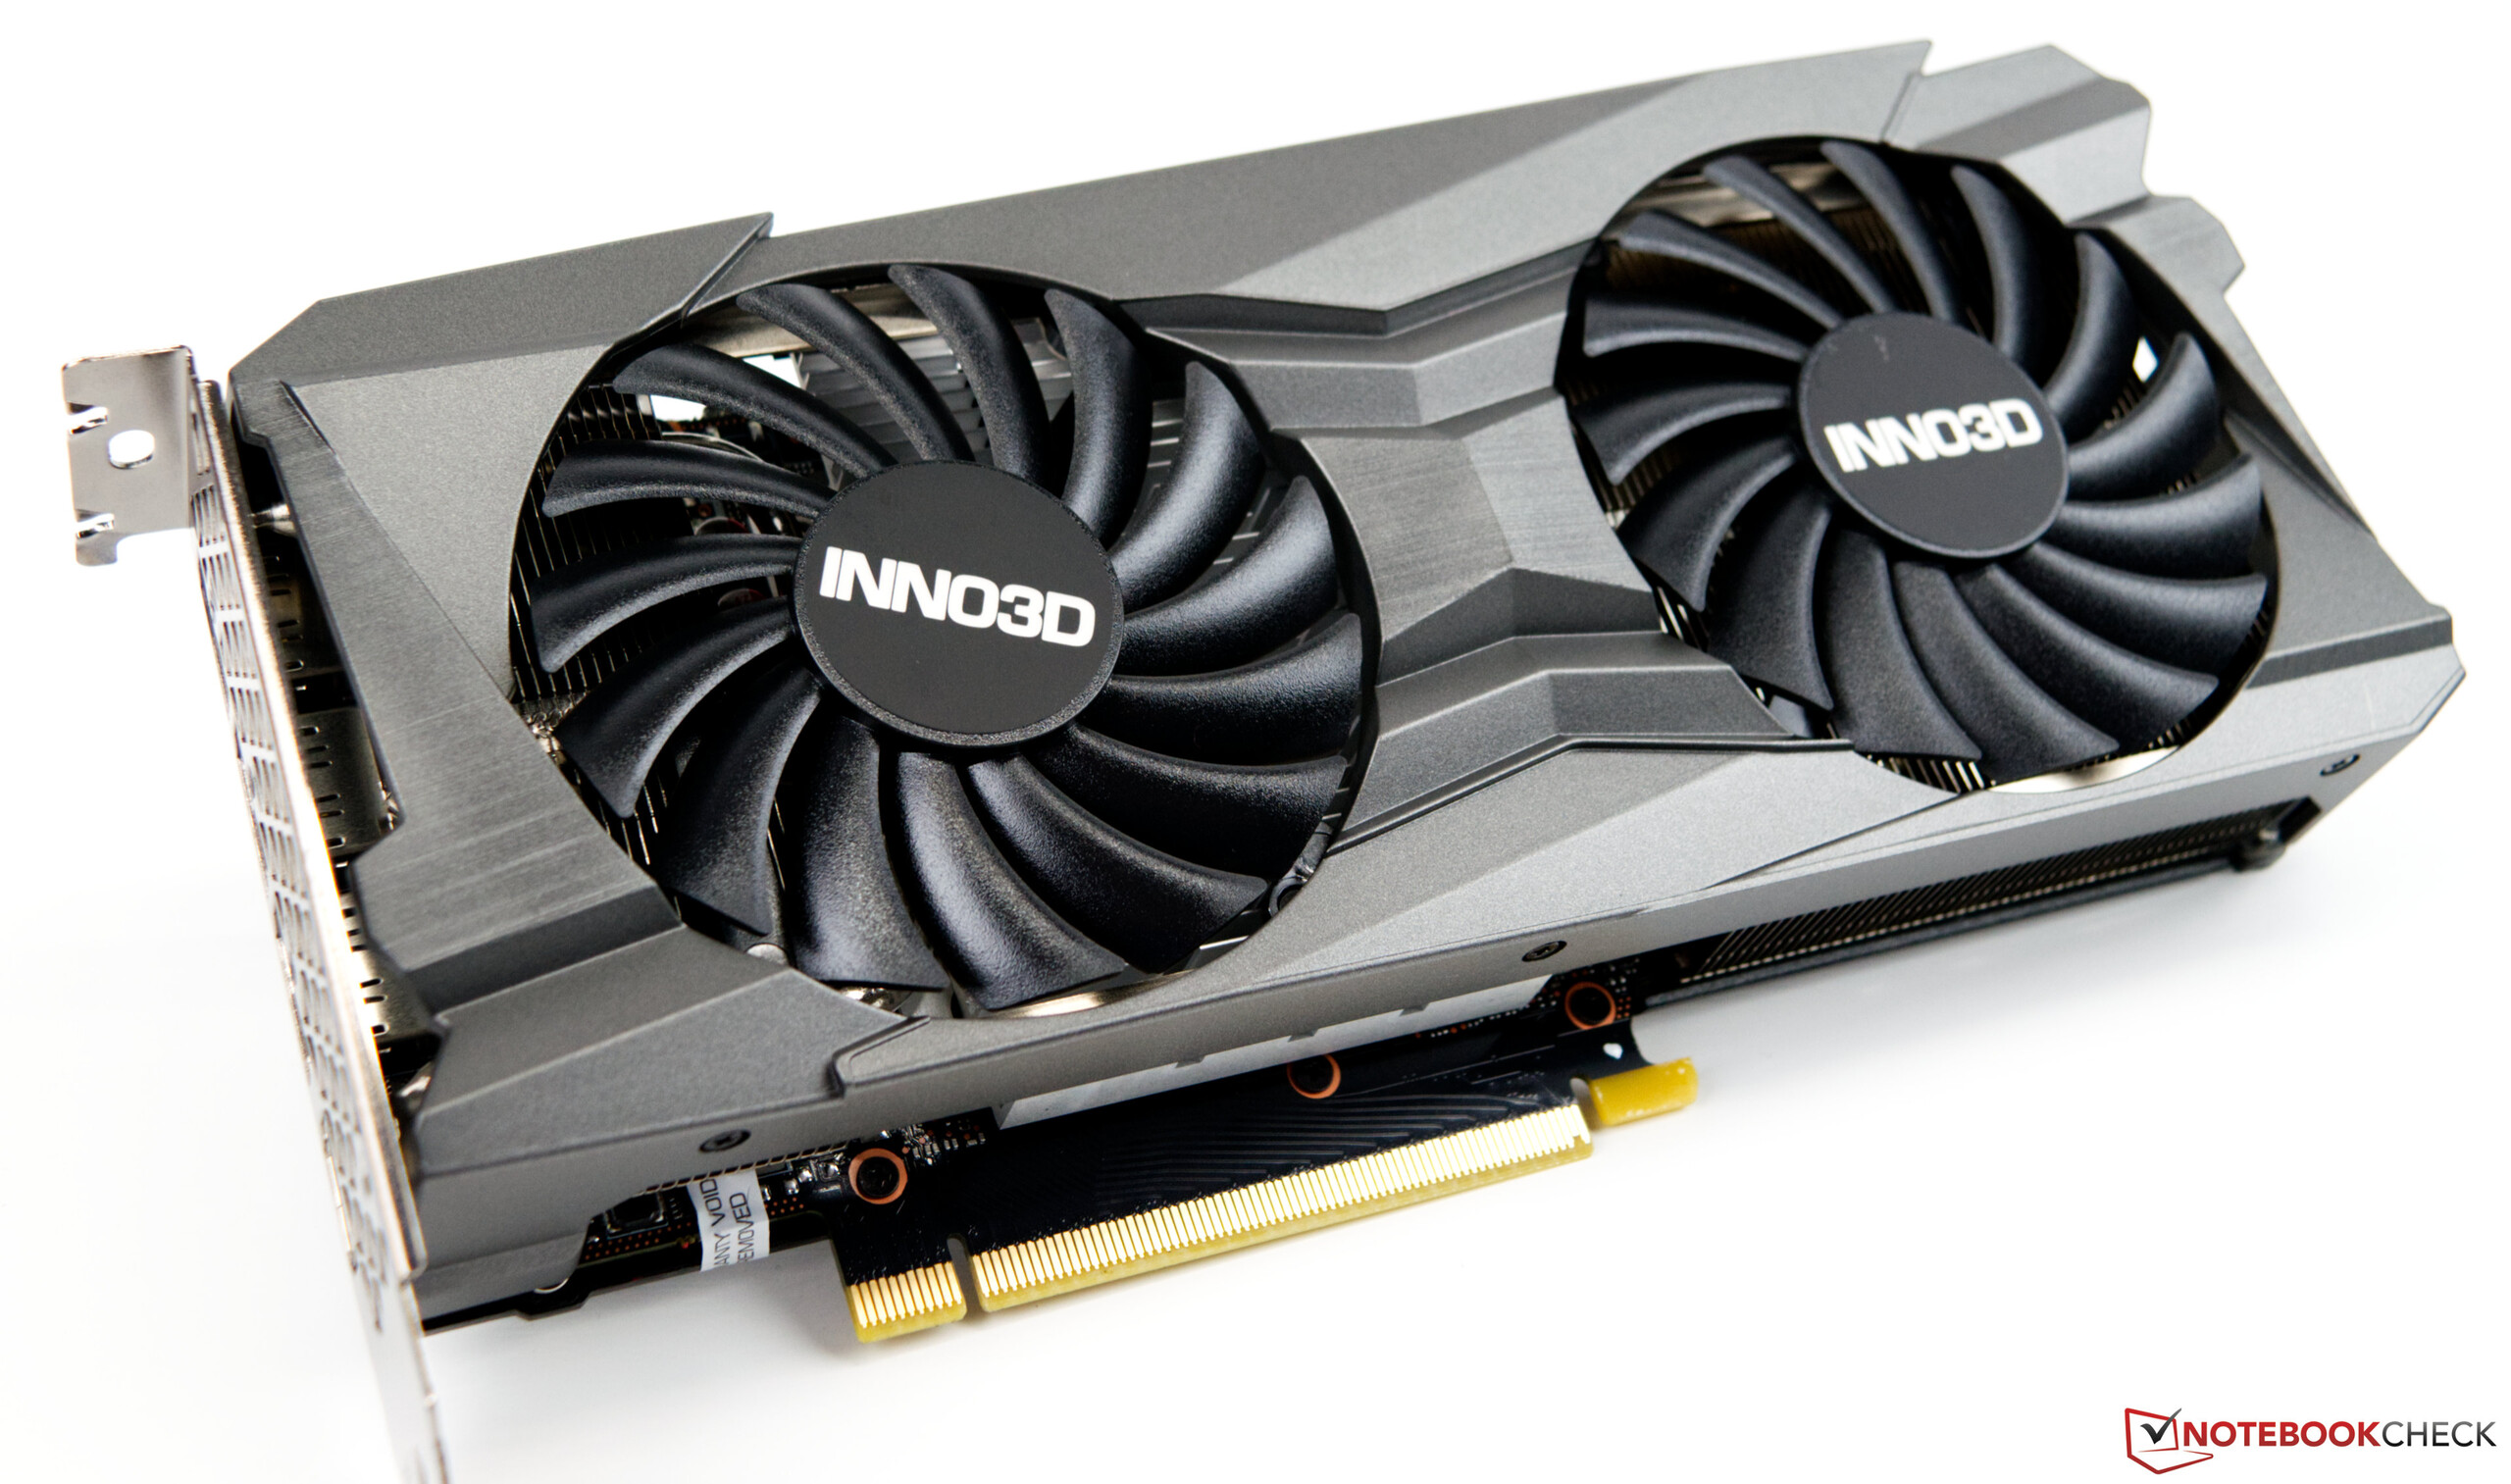
With the current RTX 3000 graphics cards, Nvidia has been able to increase the performance even more compared to the RTX 2000 series. Now we could also convince ourselves of the performance of the GeForce RTX 3060. For this review, we used an INNO3D GeForce RTX 3060 Twin X2 with the newer LHR chip. This addition indicates that it is a graphics card that was specifically slowed down for mining with the ethash algorithm in order to make the graphics card unattractive for so-called crypto mining. Unfortunately, this approach did not have an effect in terms of price, because the models are still listed significantly above the RRP (329 Euros/~$380). At just under 690 Euros (~$798), the INNO3D GeForce RTX 3060 Twin X2 costs more than twice as much. However, this already makes this model one of the cheaper models that are currently available.
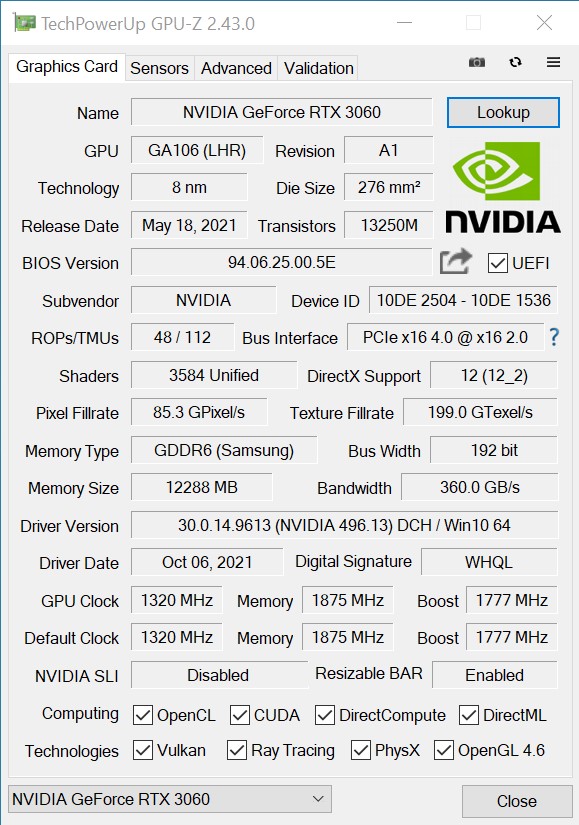
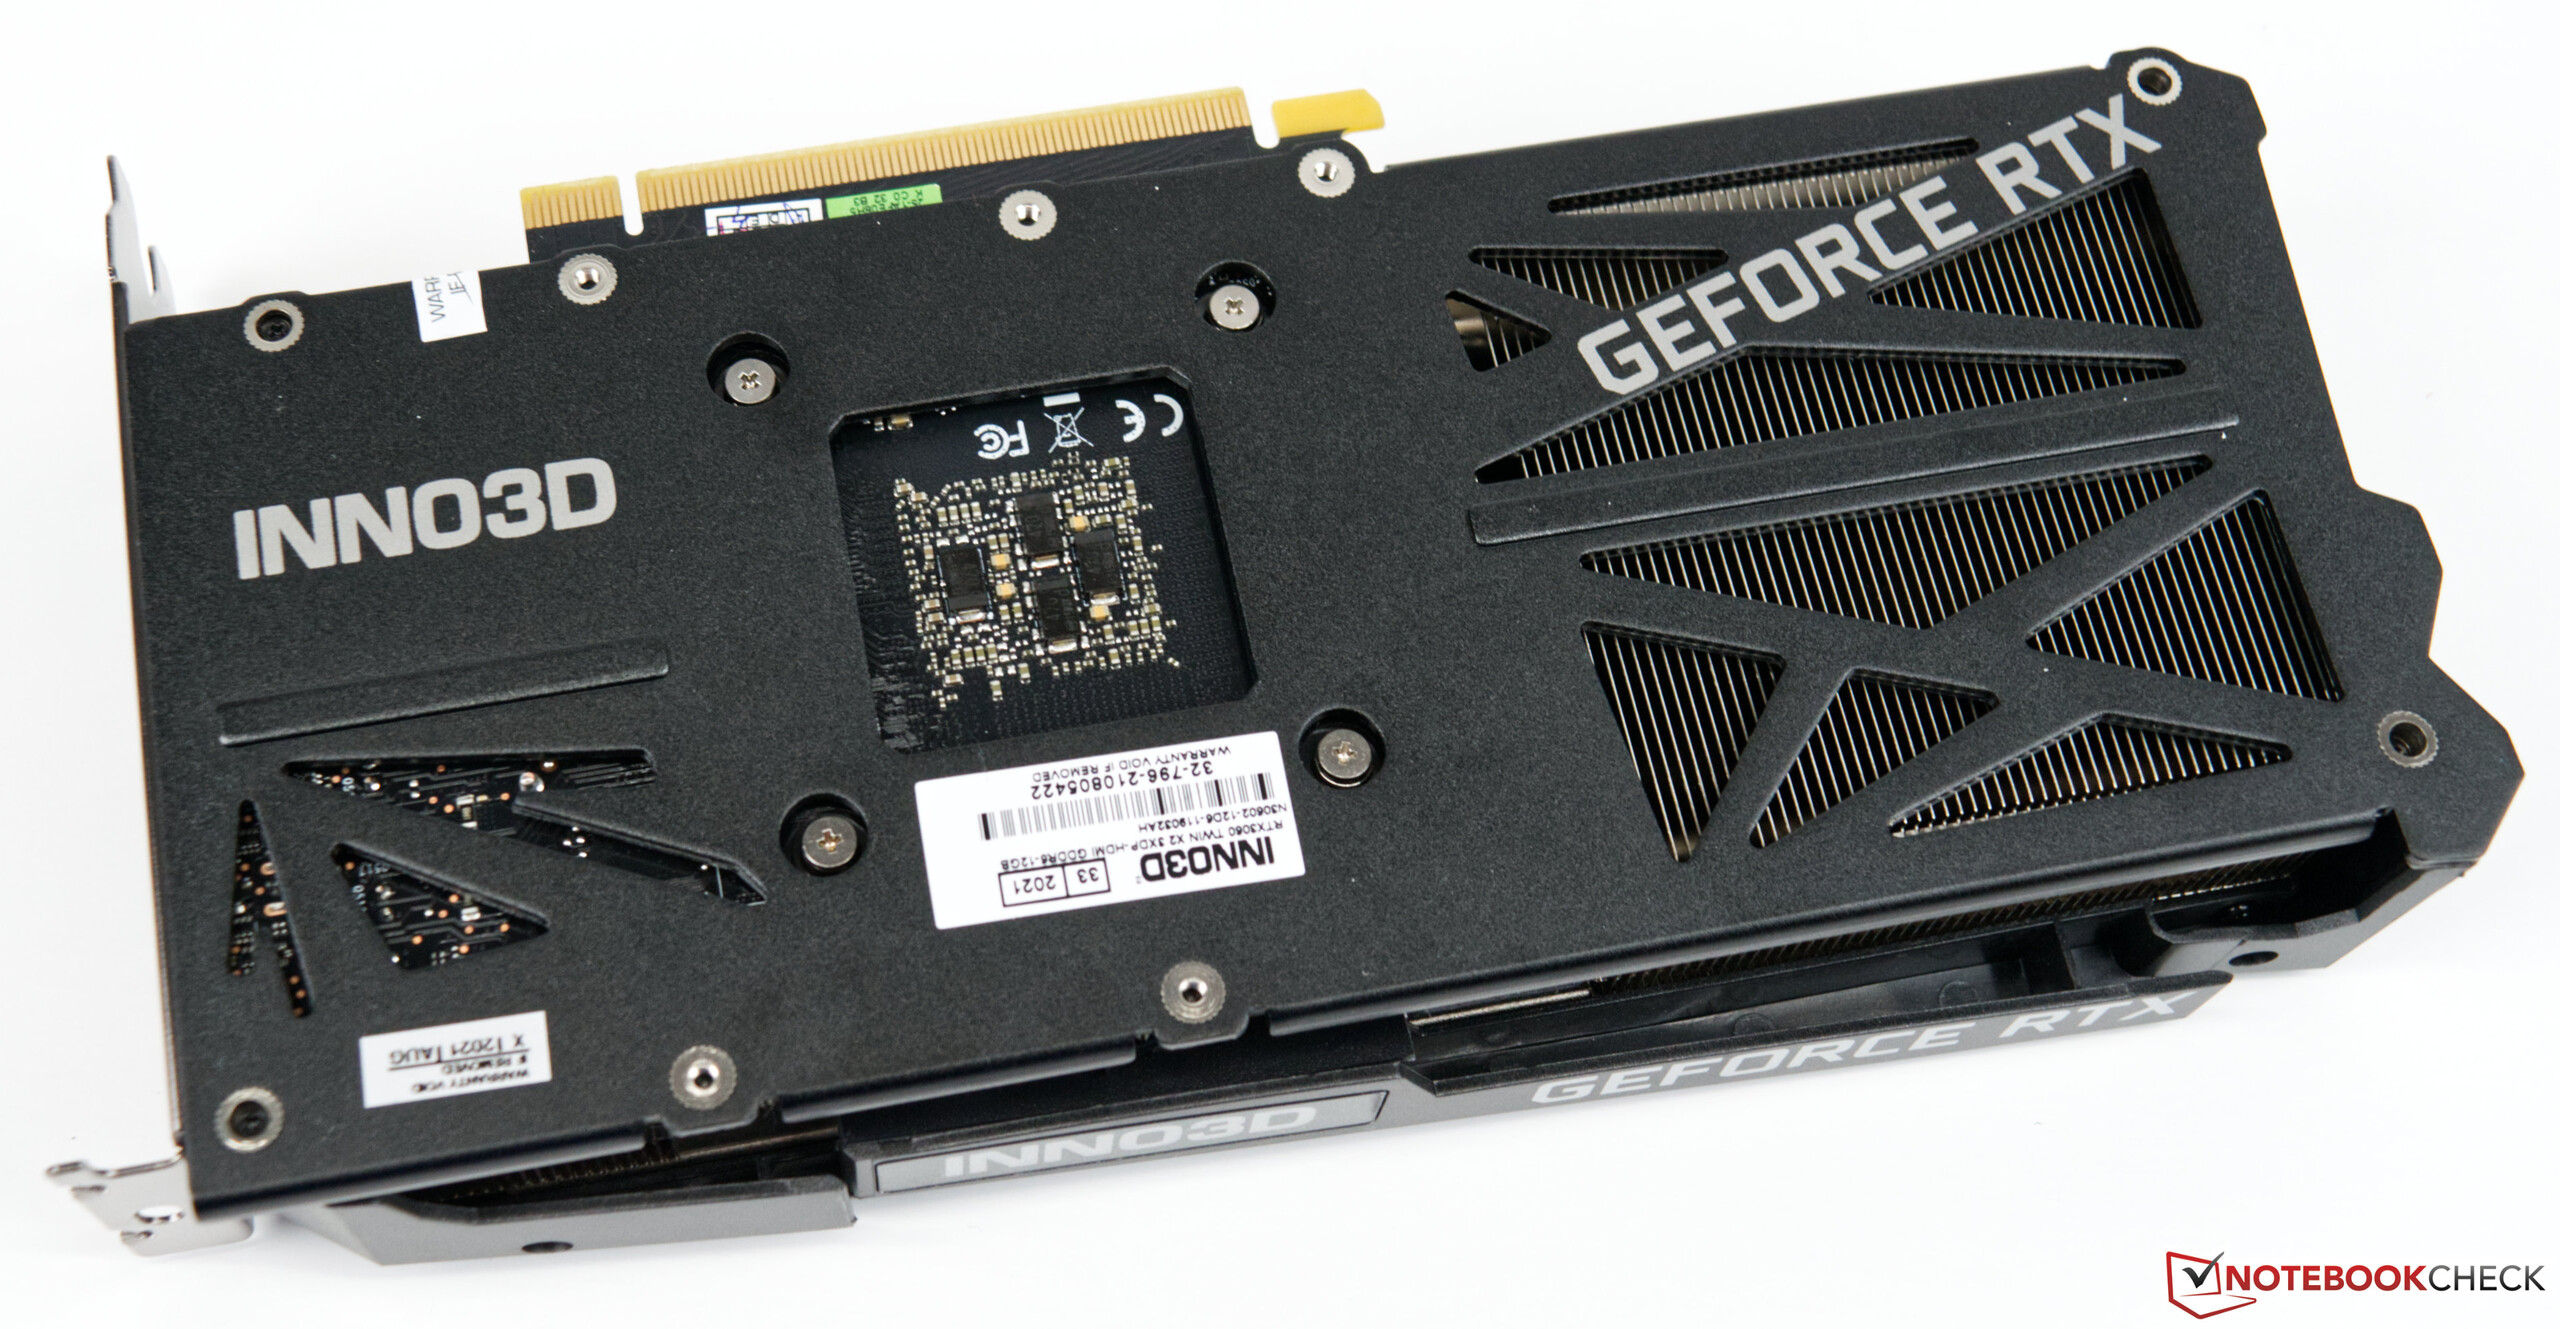
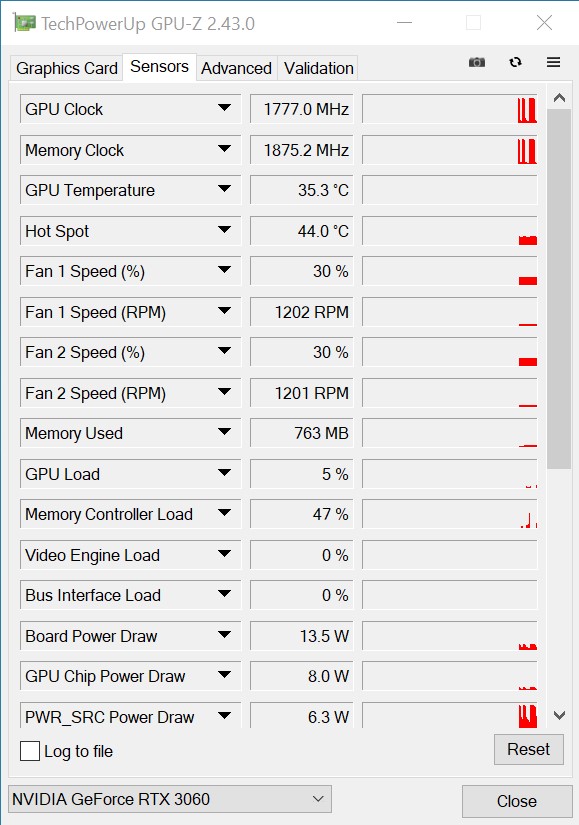
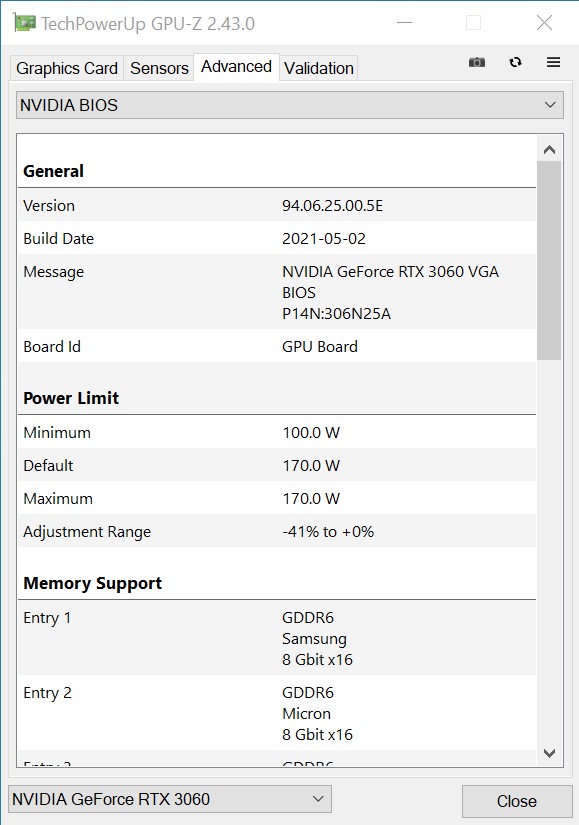
The GA106 graphics chip offers 3,854 shader units and can access 12 GB GDDR6 VRAM. Thus, the smallest model gets the second-largest VRAM of the RTX-3000 series. Due to the memory interface, Nvidia only had the choice between 6 GB or 12 GB. In order not to sell another memory cripple as an entry-level graphics card, the manufacturer made the right decision in our opinion. In the many gaming tests, we could very often determine a VRAM utilization of more than 6 GB. The INNO3D model's power consumption (170 watts) is exactly on the level that Nvidia specifies for the reference design. This also applies to the clock rates of the graphics chip and VRAM.
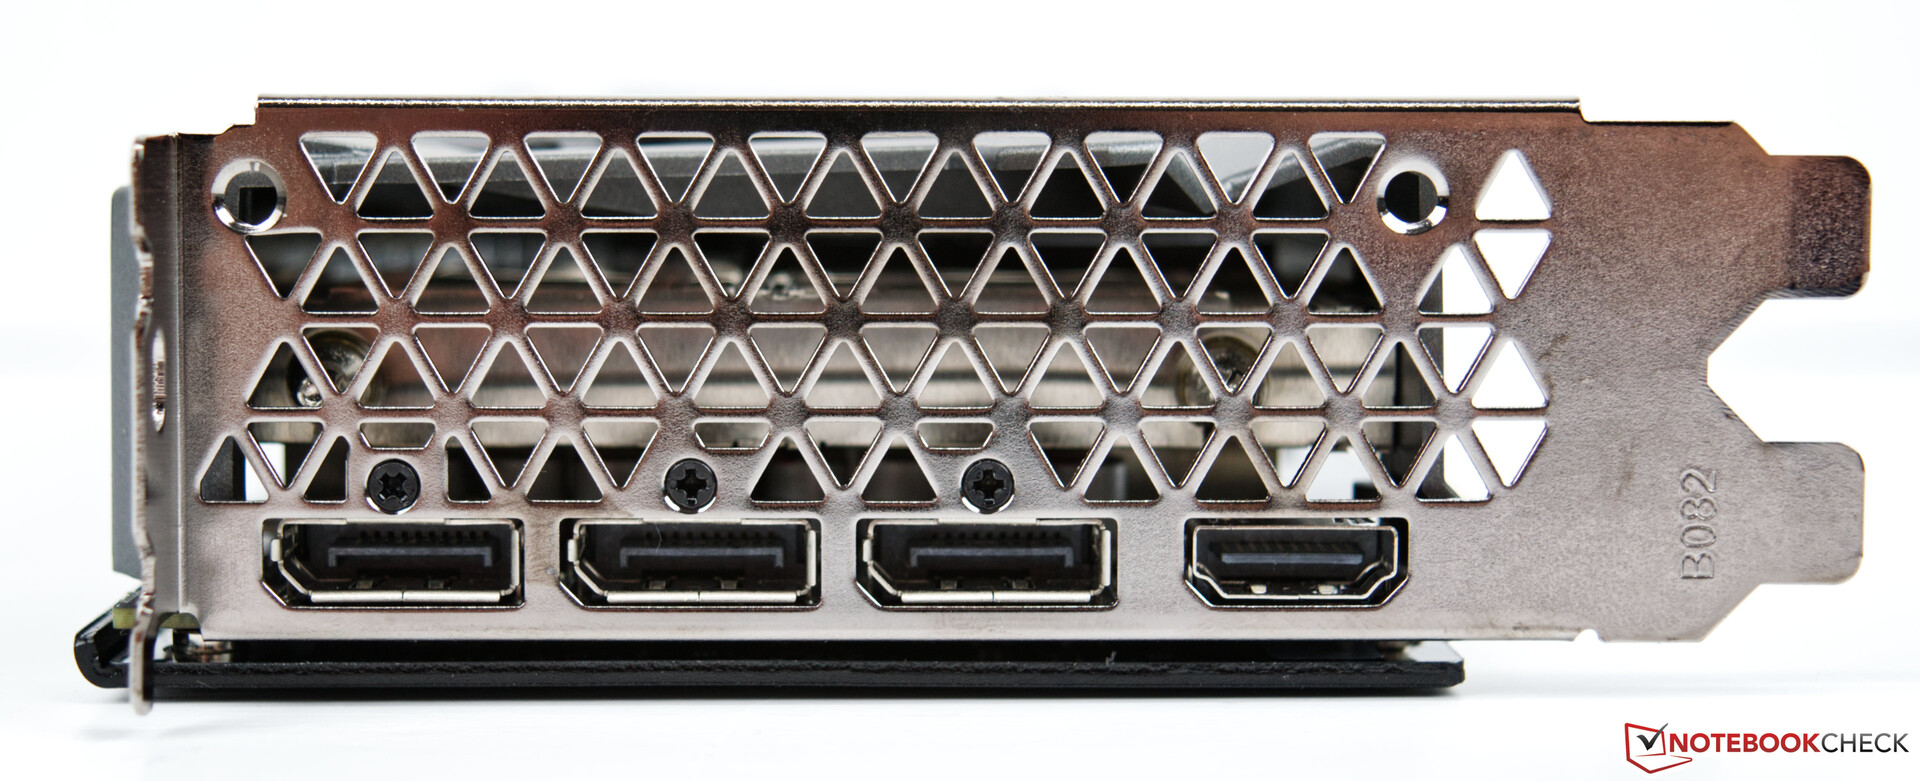
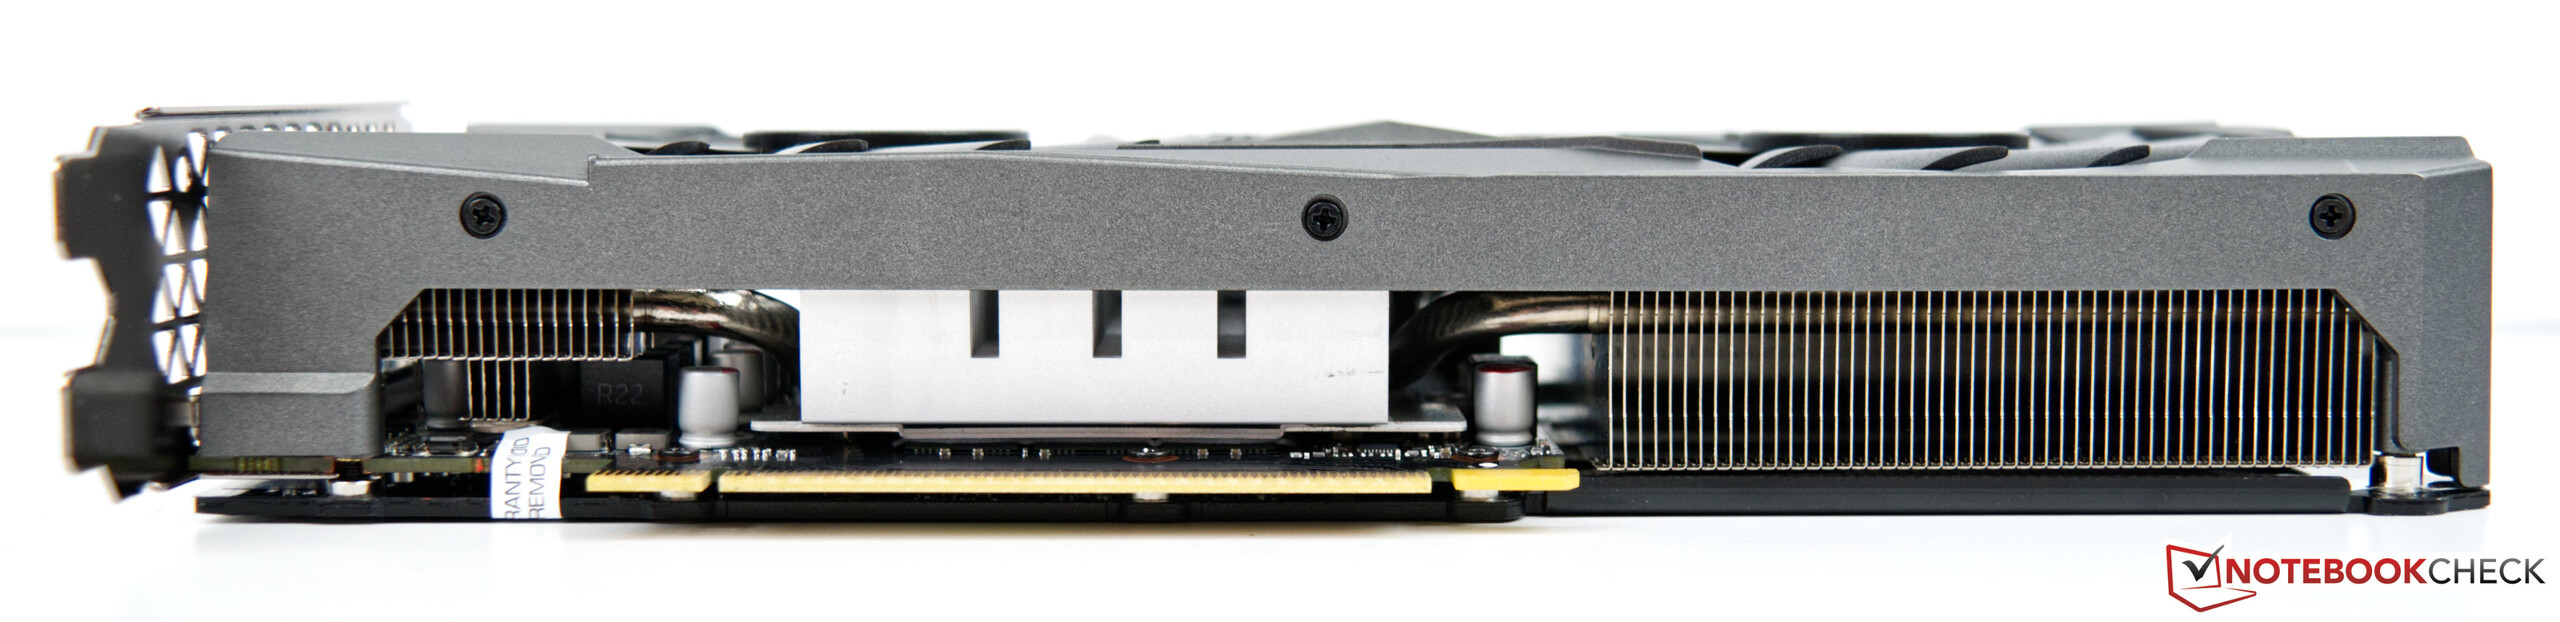
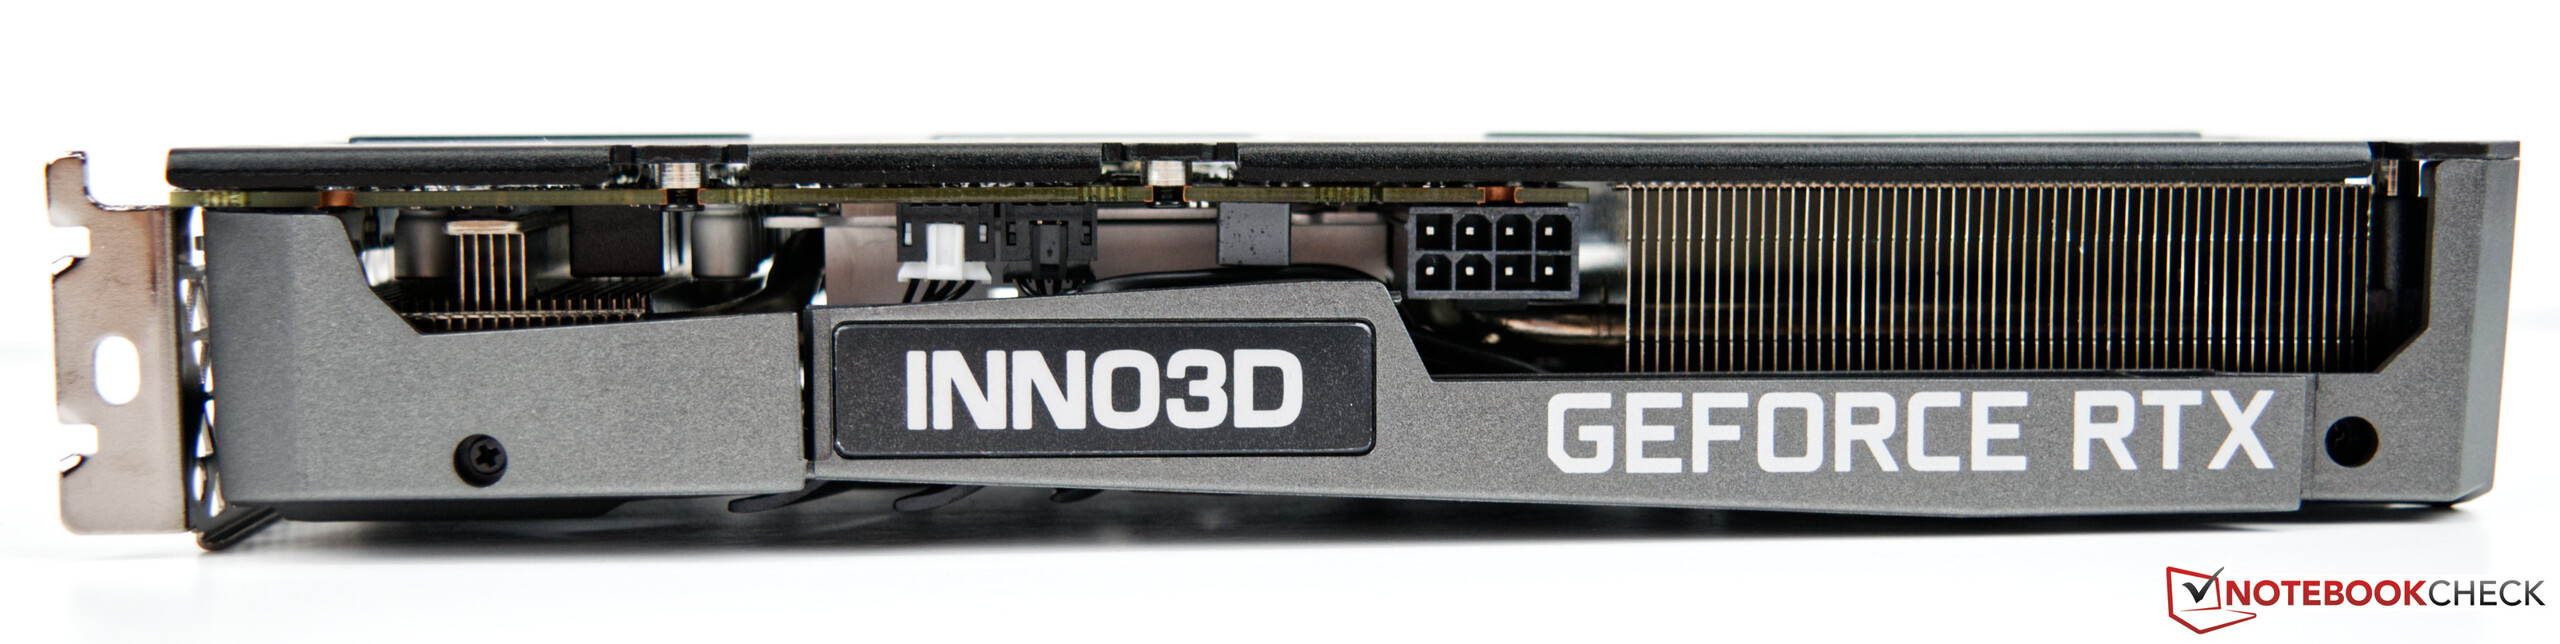
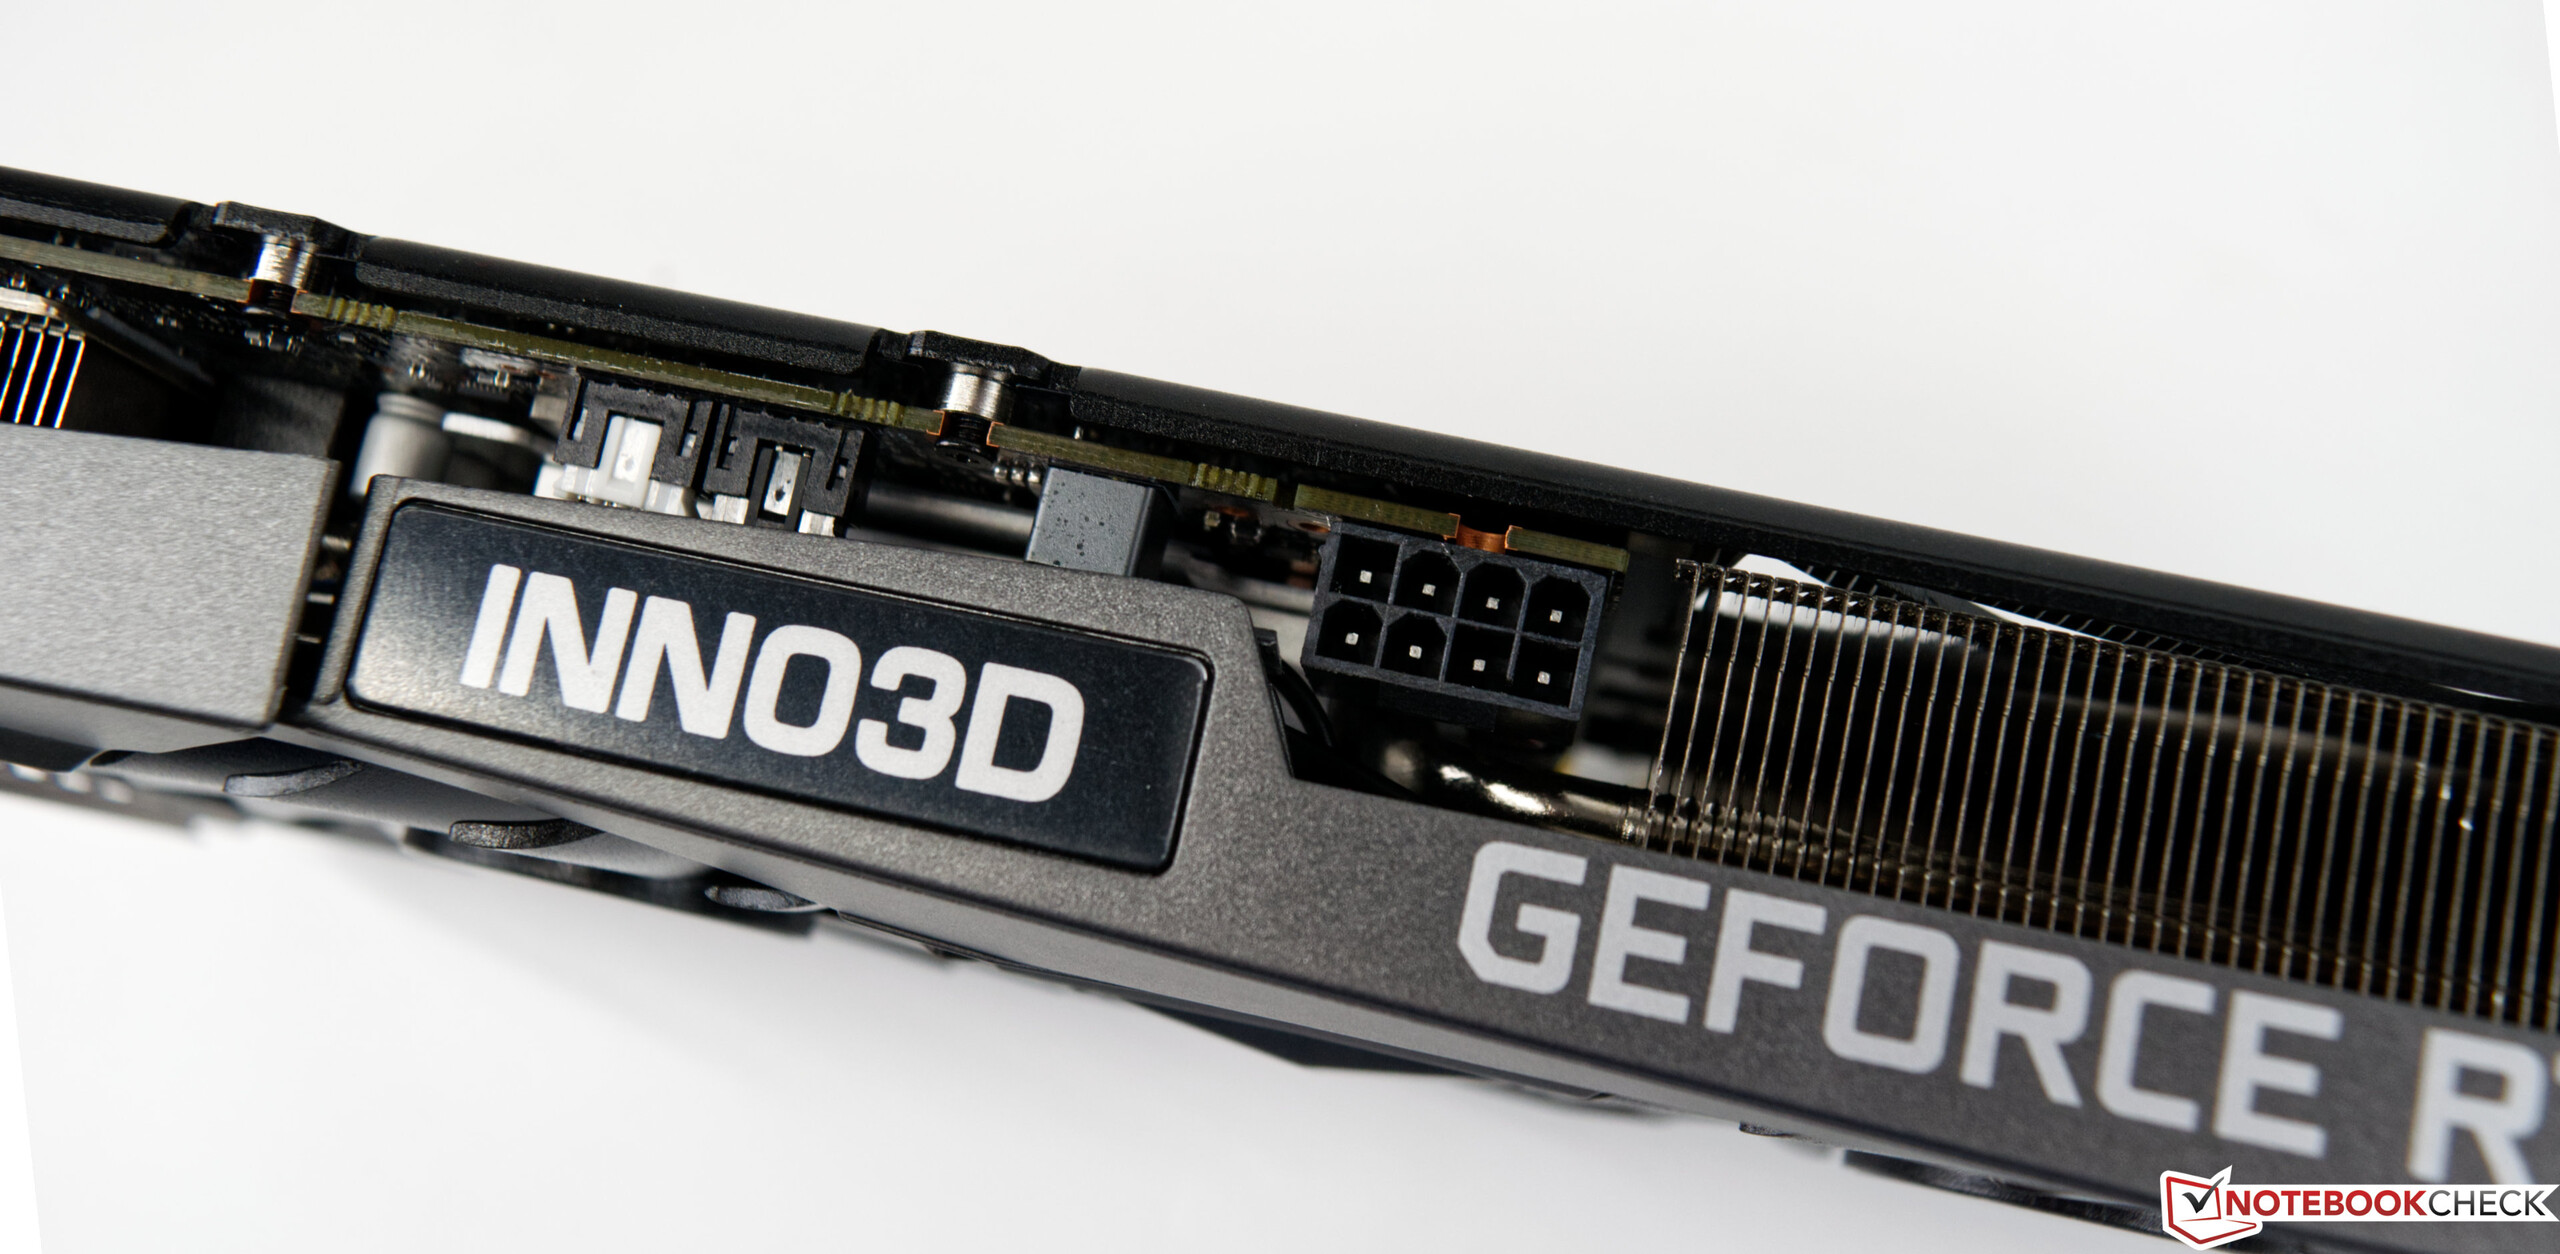
There are no big surprises in the dimensions. With a length of 24 centimeters, the INNO3D GeForce RTX 3060 Twin X2 is a conventional 2-slot graphics card. Furthermore, the INNO3D GeForce RTX 3060 Twin X2 requires an 8 pin power connector. Externally, up to four monitors can be operated simultaneously. For this, there is one HDMI with the latest standard (2.1) and three DisplayPort ports (1.4a).

Comparison of the INNO3D GeForce RTX 3060 Twin X2 with current GPUs
| Equipment | RTX 3090 FE | RTX 3080 FE | RTX 3070 FE | RTX 3060 Ti | INNO3D RTX 3060 | AMD Radeon RX 6600 XT | AMD Radeon RX 6700 XT |
| Chip | GA102 | GA102 | GA104 | GA104 | GA106 | Navi 23 | Navi 22 |
| FinFET Process | 8 nm | 8 nm | 8 nm | 8 nm | 7 nm | 7 nm | |
| CUDA Cores | 10,496 | 8,704 | 5,888 | 4,864 | 3,854 | 2,048 | 2,560 |
| Texture Units | 328 | 272 | 184 | 152 | 112 | 128 | 160 |
| Tensor Cores | 328 3rd Gen. | 272 3rd Gen. | 184 3rd Gen. | 152 3rd Gen. | 112 2nd Gen. | - | - |
| RT Cores | 82 | 68 | 46 | 38 | 28 | 32 | 40 |
| GPU Base Clock | 1,395 MHz | 1,440 MHz | 1,500 MHz | 1,410 MHz | 1,320 MHz | 1,968 MHz | 1,569 MHz |
| GPU Boost Clock | 1,695 MHz | 1,710 MHz | 1,750 MHz | 1,665 MHz | 1,777 MHz | 2,589 MHz | 2,639 MHz |
| Memory Bus | 384 bit | 320 bit | 256 bit | 192 bit | 128 bit | 192 bit | |
| Memory Bandwidth | 936 GB/s | 760 GB/s | 448 GB/s | 360 GB/s | 256 GB/s | 384 GB/s | |
| Video Memory | 24 GB GDDR6X | 10 GB GDDR6X | 8 GB GDDR6 | 8 GB GDDR6 | 12 GB GDDR6 | 8 GB GDDR6 | 12 GB GDDR6 |
| Power consumption | 350 W | 320 W | 220 W | 200 W | 170 W | 160 W | 230 W |
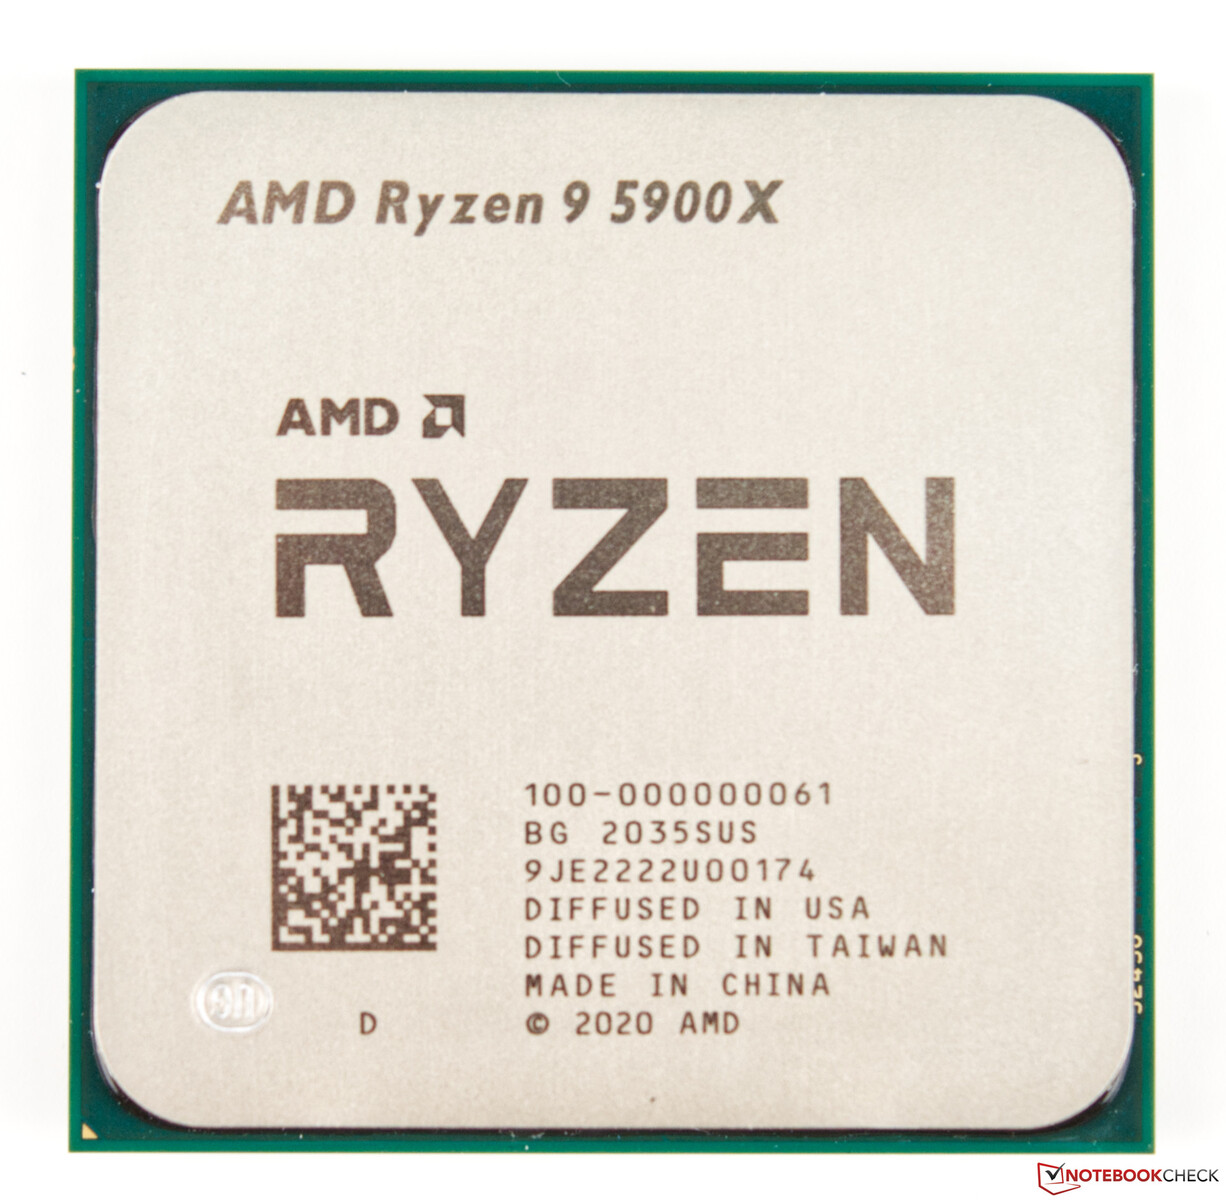
Our test system with AMD Ryzen 9 5900X as the basis
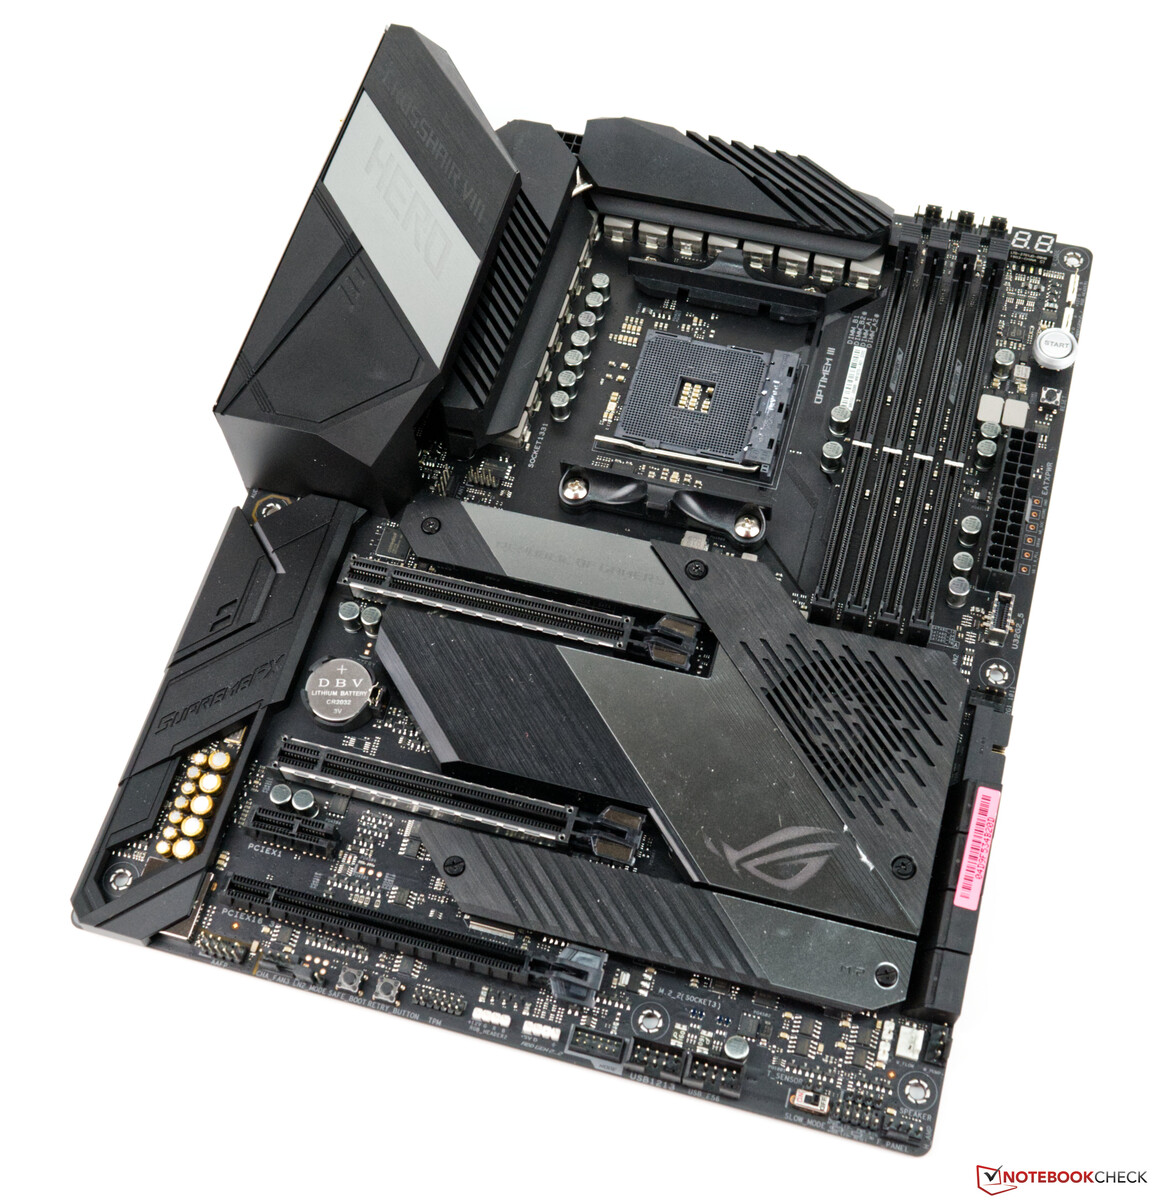
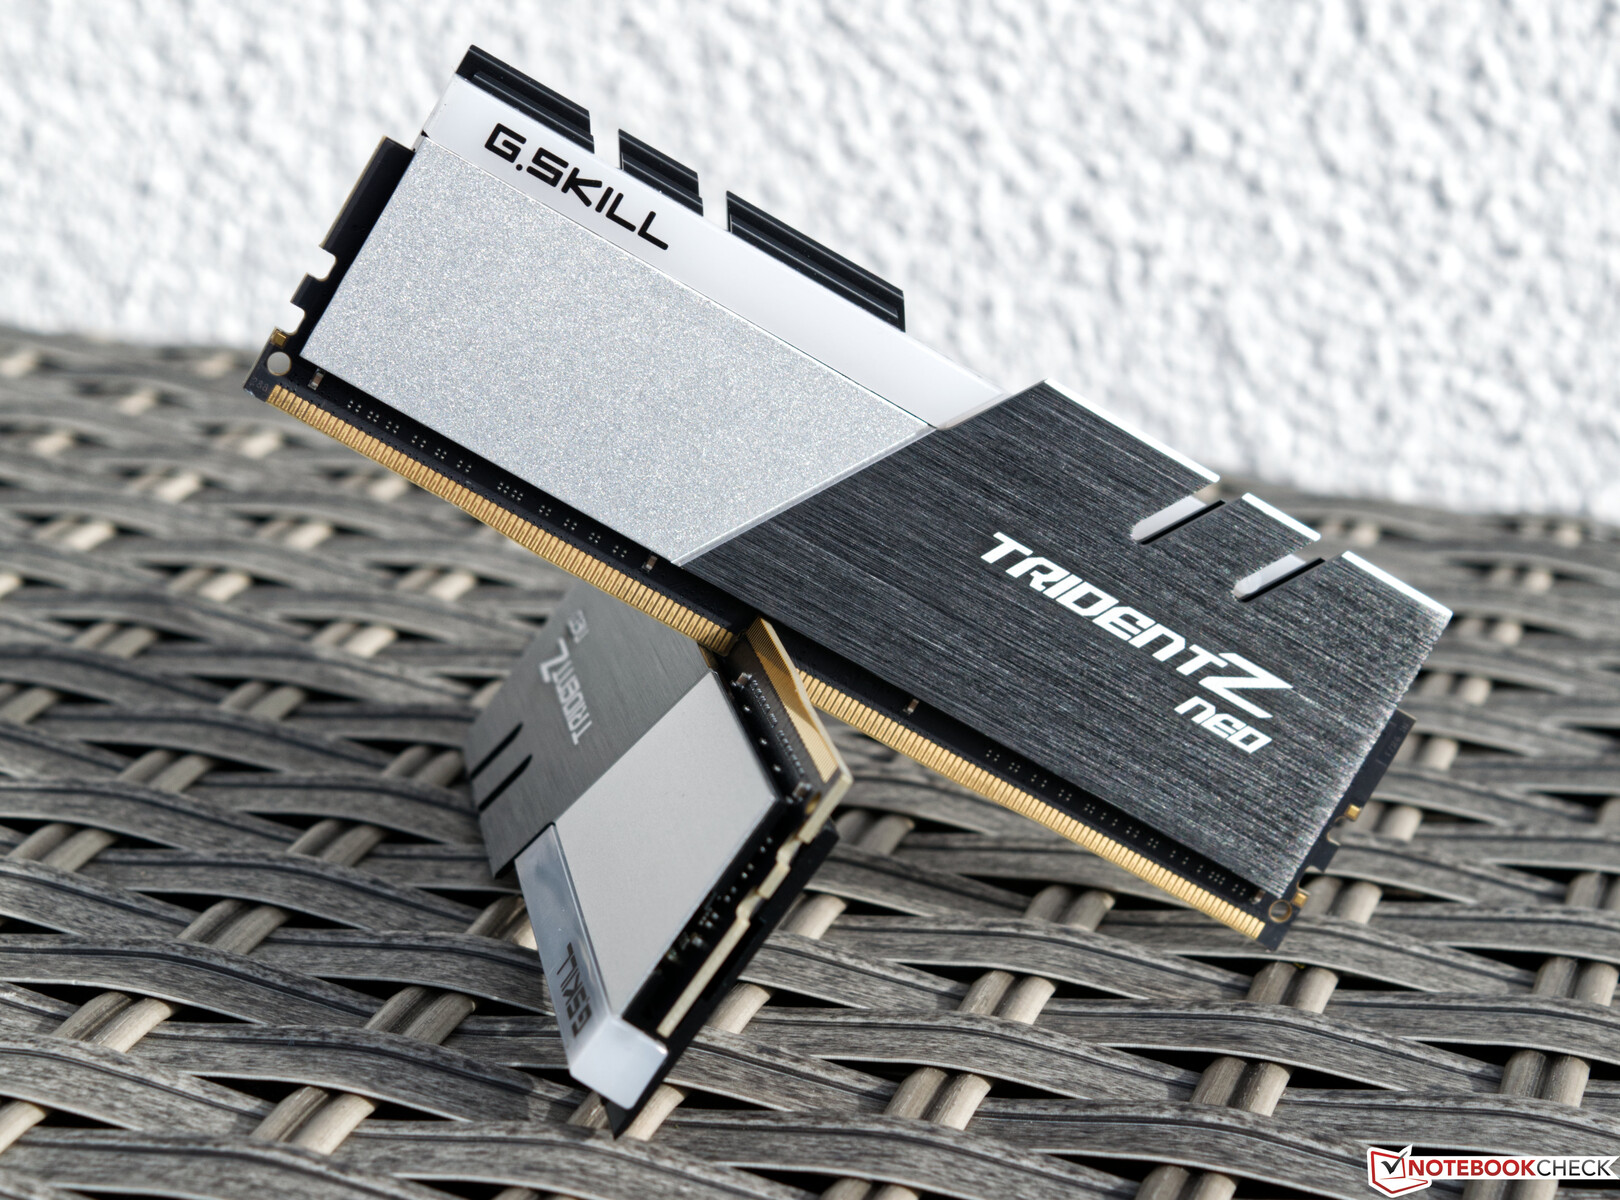
A current AMD platform based on the Asus X570 ROG Crosshair VIII Hero WiFi serves as the test system. The CPU (AMD Ryzen 9 5900X) offers good CPU performance and we use an AiO (G.Skill ENKI 360) as cooling. The 32 GB working memory comes from G.Skill and was also provided to us like the AiO. We use the Acer Predator XB321HK as a monitor, which does not limit us due to its UHD capability. We would like to thank AMD for providing the test platform.
We use the following system for the following benchmarks and tests
- Lian Li O11 Dynamic
- AMD Ryzen 9 5900X
- INNO3D GeForce RTX 3060 Twin X2 (Nvidia 496.13)
- Asus X570 ROG Crosshair VIII Hero WiFi (BIOS 3302, default settings, XMP 1 for DDR4-4000)
- Corsair RM1000X 1000 watt power adapter
- G.Skill Trident Z Neo RGB DDR4-4000 memory kit 2 x 16 GB
- Corsair MP600 2TB M.2 PCIe-4.0 SSD
- Crucial MX500 2TB (for games)
The clock rates of the INNO3D GeForce RTX 3060 Twin X2
As mentioned at the beginning, the clock rates of the INNO3D GeForce RTX 3060 Twin X2 are on par with Nvidia's Founders Edition. The same applies to the power limit, which is 170 watts for the entire graphics card. Furthermore, the power target cannot be increased further in our test sample. Thus, it remains at the maximum of 170 watts, which also limits the overclocking potential somewhat.
Synthetic benchmarks
The first impression of the performance of the INNO3D GeForce RTX 3060 Twin X2 is disillusioning. Our test sample can just about keep up with a GeForce RTX 2060 Super in the 3DMark benchmarks. AMD can gain a lead of up to 29% with the Radeon RX 6600 XT. However, this gap could be narrowed considerably in the other tests.
| Unigine Superposition | |
| 1280x720 720p Low | |
| Titan RTX | |
| Radeon RX 6800 XT | |
| INNO3D GeForce RTX 3060 Twin X2 | |
| Radeon RX 6700 XT | |
| Radeon RX 6600 XT | |
| GeForce RTX 3070 | |
| GeForce RTX 3080 | |
| 1920x1080 1080p High | |
| Radeon RX 6800 XT | |
| GeForce RTX 3080 | |
| Titan RTX | |
| GeForce RTX 3070 | |
| Radeon RX 6700 XT | |
| Radeon RX 6600 XT | |
| INNO3D GeForce RTX 3060 Twin X2 | |
| 1920x1080 1080p Extreme | |
| GeForce RTX 3080 | |
| Radeon RX 6800 XT | |
| Titan RTX | |
| GeForce RTX 3070 | |
| Radeon RX 6700 XT | |
| Radeon RX 6600 XT | |
| INNO3D GeForce RTX 3060 Twin X2 | |
| 3840x2160 4k Optimized | |
| GeForce RTX 3080 | |
| Radeon RX 6800 XT | |
| Titan RTX | |
| GeForce RTX 3070 | |
| Radeon RX 6700 XT | |
| Radeon RX 6600 XT | |
| INNO3D GeForce RTX 3060 Twin X2 | |
| 7680x4320 8k Optimized | |
| GeForce RTX 3080 | |
| Titan RTX | |
| Radeon RX 6800 XT | |
| GeForce RTX 3070 | |
| Radeon RX 6700 XT | |
| INNO3D GeForce RTX 3060 Twin X2 | |
| Radeon RX 6600 XT | |
| 3DMark 05 Standard | 59351 points | |
| 3DMark 06 Standard Score | 47148 points | |
| 3DMark Vantage P Result | 81033 points | |
| 3DMark 11 Performance | 26986 points | |
| 3DMark Ice Storm Standard Score | 218073 points | |
| 3DMark Cloud Gate Standard Score | 61347 points | |
| 3DMark Fire Strike Score | 20911 points | |
| 3DMark Fire Strike Extreme Score | 10165 points | |
| 3DMark Time Spy Score | 9026 points | |
Help | ||
Game benchmarks

Our INNO3D GeForce RTX 3060 Twin X2 cuts a comparatively better figure in our gaming tests. However, it still lags behind AMD's Radeon RX 6600 XT. The larger VRAM is positively noticed in very memory-intensive games, such as Call of Duty Black Ops Cold War. Here, our test sample in 1080p with maximum details can set itself apart by 7%. At even higher resolutions (2160p), the lead can even be increased to up to 15 percent compared to the AMD Radeon RX 6600 XT. Nevertheless, it should be mentioned that the 36.6 FPS on average is not a good gaming experience. Rather, the GeForce RTX 3060 is aimed at gamers who primarily play in 1080p or 1440p. However, the latter is not always smooth even with the RTX 3060 depending on the game. A few games slipped below 40 FPS in the QHD test.
Those who mostly play in 1080p or 1440p will still be happy with the performance of the INNO3D GeForce RTX 3060 Twin X2.
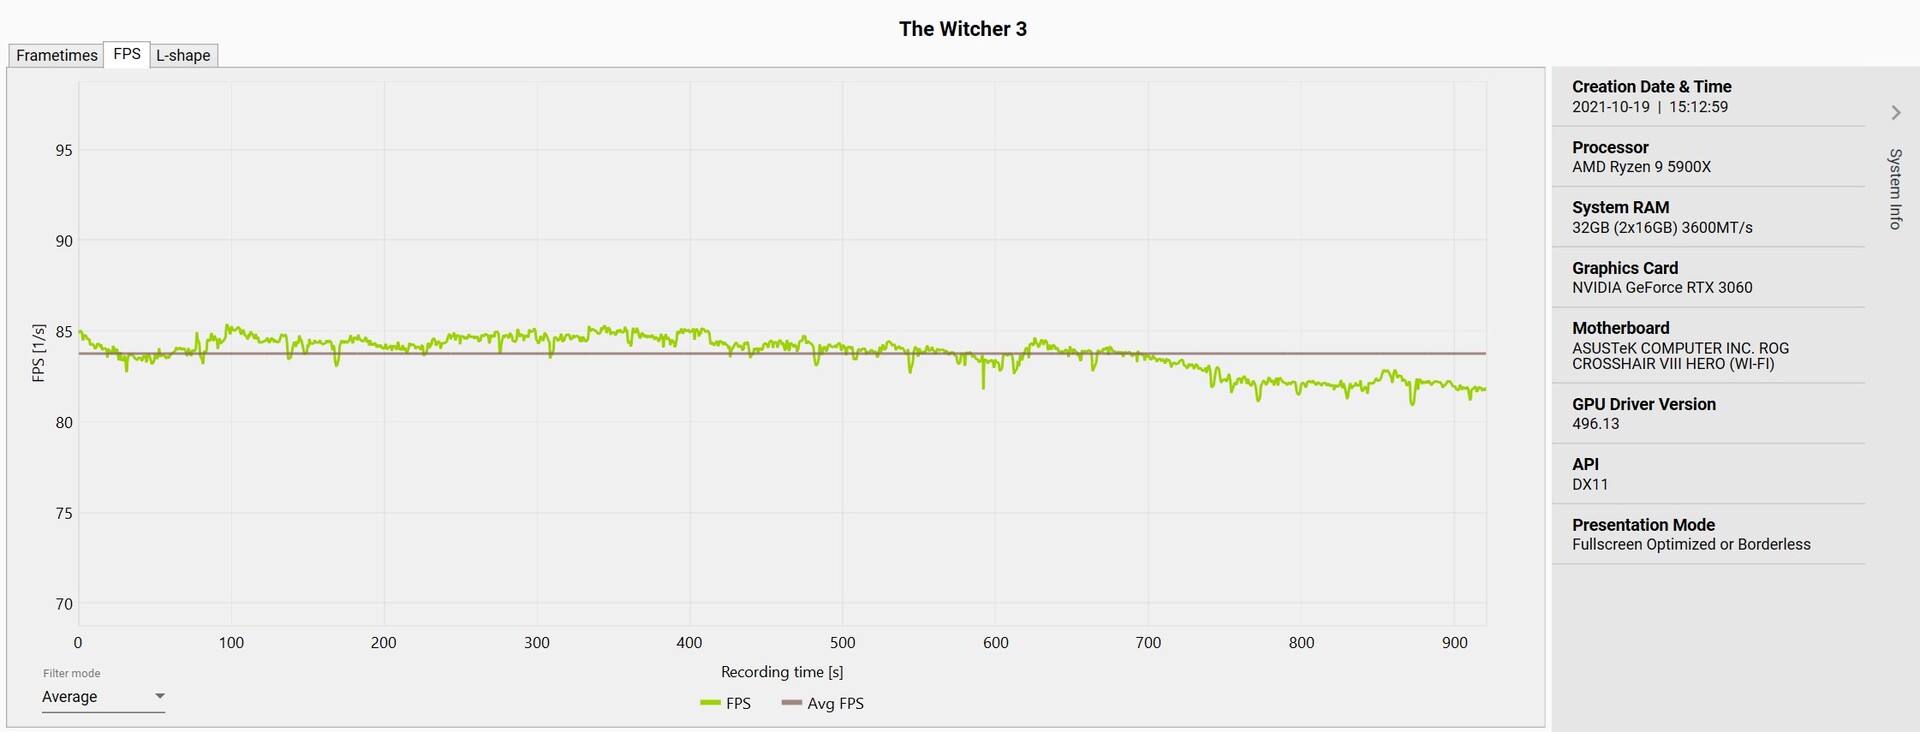
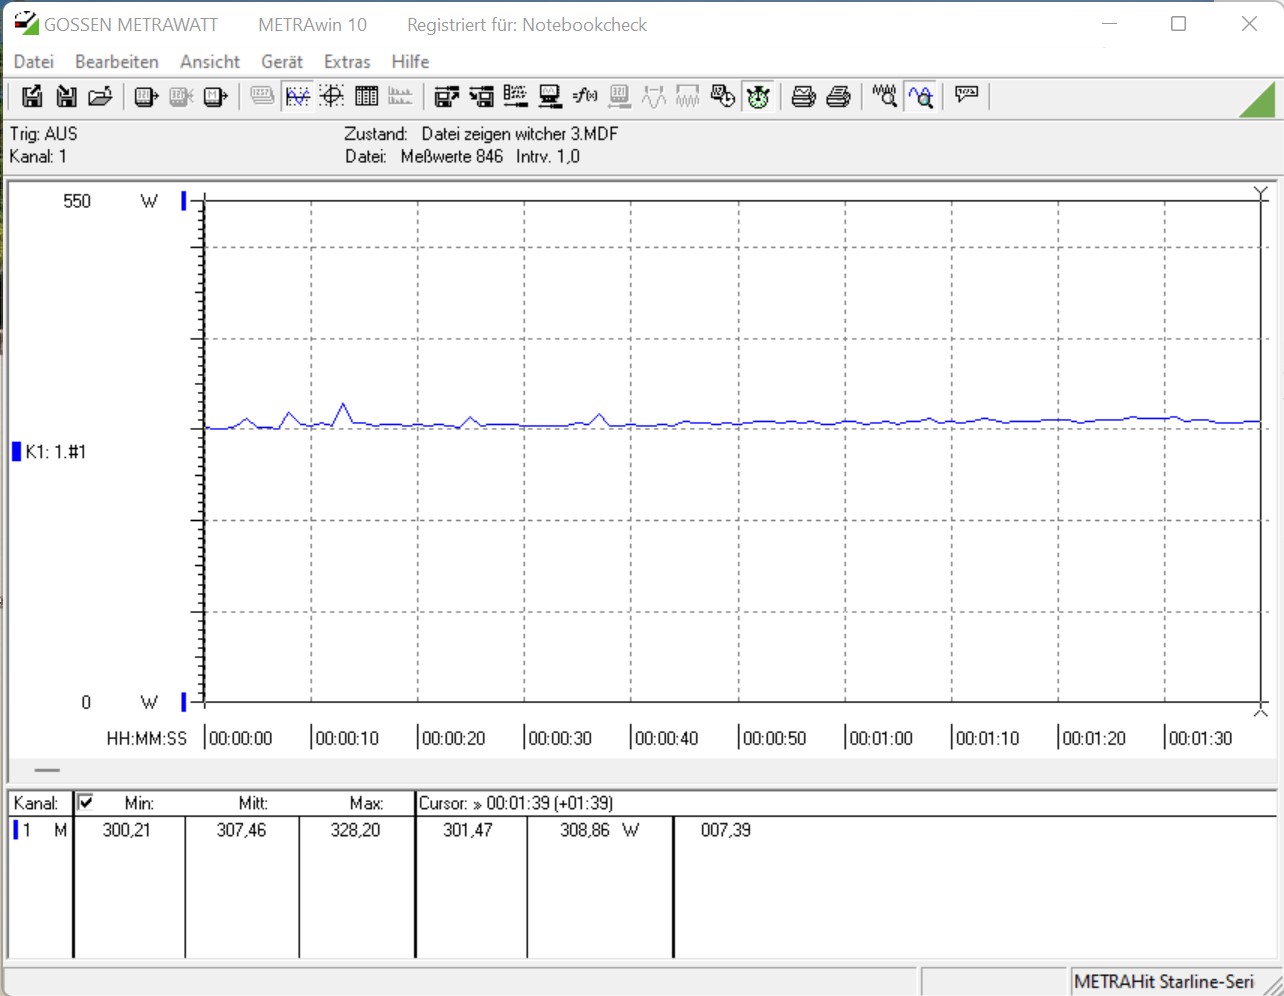
The 12 GB VRAM is good and makes this card more future-proof than comparable models. As always, we use the game The Witcher 3 (1080p Ultra Preset) for the frame times and frame progression. Apart from one outlier, there are no significant latencies that affect the gameplay when recording the data. The frame rate starts at over 85 FPS and drops to 83.8 FPS over the course of the test. This is a minimal performance loss that is negligible.
| Death Stranding | |
| 1920x1080 Very High Preset | |
| AMD Radeon RX 6800 XT, AMD Ryzen 9 5950X | |
| AMD Radeon RX 6700 XT, AMD Ryzen 9 5900X | |
| AMD Radeon RX 6600 XT, AMD Ryzen 9 5900X | |
| NVIDIA GeForce RTX 3060, AMD Ryzen 9 5900X | |
| 3840x2160 Very High Preset | |
| AMD Radeon RX 6800 XT, AMD Ryzen 9 5950X | |
| AMD Radeon RX 6700 XT, AMD Ryzen 9 5900X | |
| AMD Radeon RX 6600 XT, AMD Ryzen 9 5900X | |
| NVIDIA GeForce RTX 3060, AMD Ryzen 9 5900X | |
| 2560x1440 Very High Preset | |
| AMD Radeon RX 6800 XT, AMD Ryzen 9 5950X | |
| AMD Radeon RX 6700 XT, AMD Ryzen 9 5900X | |
| AMD Radeon RX 6600 XT, AMD Ryzen 9 5900X | |
| NVIDIA GeForce RTX 3060, AMD Ryzen 9 5900X | |
| 1280x720 Low Preset | |
| AMD Radeon RX 6700 XT, AMD Ryzen 9 5900X | |
| AMD Radeon RX 6600 XT, AMD Ryzen 9 5900X | |
| AMD Radeon RX 6800 XT, AMD Ryzen 9 5950X | |
| NVIDIA GeForce RTX 3060, AMD Ryzen 9 5900X | |
| 1920x1080 Medium Preset | |
| AMD Radeon RX 6800 XT, AMD Ryzen 9 5950X | |
| AMD Radeon RX 6700 XT, AMD Ryzen 9 5900X | |
| AMD Radeon RX 6600 XT, AMD Ryzen 9 5900X | |
| NVIDIA GeForce RTX 3060, AMD Ryzen 9 5900X | |
| low | med. | high | ultra | QHD | 4K | |
|---|---|---|---|---|---|---|
| GTA V (2015) | 187 | 186 | 180 | 111 | 82.9 | 82.8 |
| The Witcher 3 (2015) | 433 | 295 | 179 | 63.3 | 90.3 | |
| Dota 2 Reborn (2015) | 202.1 | 177.7 | 170.2 | 159.7 | 113.2 | |
| Rise of the Tomb Raider (2016) | 435 | 267 | 150 | 128 | 56.8 | |
| Final Fantasy XV Benchmark (2018) | 210 | 120 | 88.6 | 63.9 | 38.2 | |
| X-Plane 11.11 (2018) | 160 | 141 | 112 | 97 | ||
| Far Cry 5 (2018) | 196 | 152 | 140 | 132 | 93 | 48 |
| Strange Brigade (2018) | 465 | 225 | 177 | 153 | 113 | 66.9 |
| Shadow of the Tomb Raider (2018) | 209 | 143 | 129 | 118 | 79.7 | 42.3 |
| Far Cry New Dawn (2019) | 163 | 133 | 126 | 112 | 90 | 50 |
| Metro Exodus (2019) | 202 | 105 | 78.1 | 55.1 | 49 | 31.6 |
| The Division 2 (2019) | 264 | 160 | 125 | 92 | 63 | 34 |
| Anno 1800 (2019) | 151 | 149 | 105 | 50.7 | 41.5 | 22.8 |
| Control (2019) | 240 | 115 | 84.1 | 54.2 | 26.3 | |
| Borderlands 3 (2019) | 172 | 134.5 | 103 | 78.5 | 55.1 | 29.9 |
| F1 2020 (2020) | 415 | 261 | 208 | 142 | 106 | 60 |
| Death Stranding (2020) | 213 | 144 | 134 | 130 | 92.9 | 51.3 |
| Horizon Zero Dawn (2020) | 198 | 142 | 118 | 100 | 77 | 42 |
| Crysis Remastered (2020) | 281 | 123 | 77.9 | 57.5 | 37.4 | 22.7 |
| Mafia Definitive Edition (2020) | 199 | 113 | 103 | 70.3 | 37 | |
| Star Wars Squadrons (2020) | 473 | 274 | 243 | 230 | 160 | 90.2 |
| Watch Dogs Legion (2020) | 123 | 108 | 94.7 | 59.1 | 45.1 | 26.8 |
| Dirt 5 (2020) | 270 | 136 | 105 | 81 | 65 | 43 |
| Assassin´s Creed Valhalla (2020) | 118 | 102 | 85 | 75 | 60 | 38 |
| Call of Duty Black Ops Cold War (2020) | 229 | 119 | 106 | 95.2 | 66.5 | 36.6 |
| Yakuza Like a Dragon (2020) | 134 | 120 | 116 | 101 | 67.6 | 34.4 |
| Immortals Fenyx Rising (2020) | 142 | 100 | 99 | 91 | 71 | 45 |
| Cyberpunk 2077 1.0 (2020) | 75.7 | 74.9 | 69.5 | 56.3 | 35.5 | 16.4 |
| Outriders (2021) | 122 | 146 | 125 | 104 | 70.2 | 36.9 |
| Resident Evil Village (2021) | 341 | 176 | 164 | 138 | 91.1 | 47.6 |
| Mass Effect Legendary Edition (2021) | 117 | 112 | 114 | 78.8 | ||
| Days Gone (2021) | 203 | 137 | 122 | 89.8 | 64.8 | 36.5 |
| Monster Hunter Stories 2 (2021) | 144 | 144 | 144 | 144 | 125 | |
| F1 2021 (2021) | 464 | 262 | 212 | 104 | 78.1 | 44 |
| Deathloop (2021) | 120 | 102 | 87.3 | 72 | 51.9 | 28 |
| New World (2021) | 161 | 112 | 105 | 95.9 | 65.3 | 33.7 |
| FIFA 22 (2021) | 282 | 311 | 306 | 299 | 282 | 201 |
| Alan Wake Remastered (2021) | 96.1 | 91.6 | 91.4 | 87 | ||
| Far Cry 6 (2021) | 139 | 113 | 101 | 88 | 68 | 38 |
| Back 4 Blood (2021) | 214 | 191 | 178 | 115 | 57.4 | |
| Guardians of the Galaxy (2021) | 140 | 132 | 131 | 127 | 87 | 47 |
| Riders Republic (2021) | 198 | 124 | 102 | 79 | 64 | 36 |
| Call of Duty Vanguard (2021) | 102 | 113 | 96.3 | 86.8 | 62.2 | 35.6 |
| Forza Horizon 5 (2021) | 214 | 126 | 110 | 65 | 56 | 40 |
| Battlefield 2042 (2021) | 144 | 116 | 96.5 | 84.5 | 64.3 | 38.7 |
| Farming Simulator 22 (2021) | 269 | 199 | 151 | 125 | 97.7 | 61.5 |
| Halo Infinite (2021) | 104 | 87.7 | 82.5 | 69.7 | 67.2 | |
| God of War (2022) | 119 | 97.7 | 77.5 | 53.2 | 45.6 | 30.7 |
| Rainbow Six Extraction (2022) | 195 | 162 | 157 | 129 | 85 | 44 |
| Dying Light 2 (2022) | 86 | 68.9 | 59.8 | 42.3 | 22.5 | |
| GRID Legends (2022) | 198.9 | 160.2 | 134.2 | 97.9 | 79.1 | 51.2 |
| Elden Ring (2022) | 60 | 60 | 60 | 59.9 | 56.8 | 35.2 |
| Cyberpunk 2077 1.6 (2022) | 79.1 | 78.1 | 74.8 | 64.2 | 39.1 | 17.7 |
| Elex 2 (2022) | 95.6 | 89.7 | 79.9 | 72.8 | 53.4 | 30.5 |
| Ghostwire Tokyo (2022) | 139.4 | 127.3 | 129.3 | 127.6 | 80.6 | 39 |
| Tiny Tina's Wonderlands (2022) | 165.7 | 134.5 | 92.8 | 72.4 | 52.9 | 28.4 |
| Vampire Bloodhunt (2022) | 341 | 185 | 175.9 | 170.7 | 110.8 | 56.4 |
Compute Performance
In ComputeMark, our GeForce RTX 3060 can often hold its own against the AMD Radeon RX 6600 XT. However, the result looks quite different in the LuxMark test. In the render tests, the normal
desktop graphics cards have clear disadvantages compared to the professional graphics solutions, such as the Quadro or Fire Pro models. Due to adapted drivers, significantly higher performances are to be expected in the compute area. On the whole, our INNO3D GeForce RTX 3060 Twin X2 ranks between a GeForce RTX 2060 and the GeForce RTX 2070.
Emissions of the INNO3D GeForce RTX 3060 Twin X2
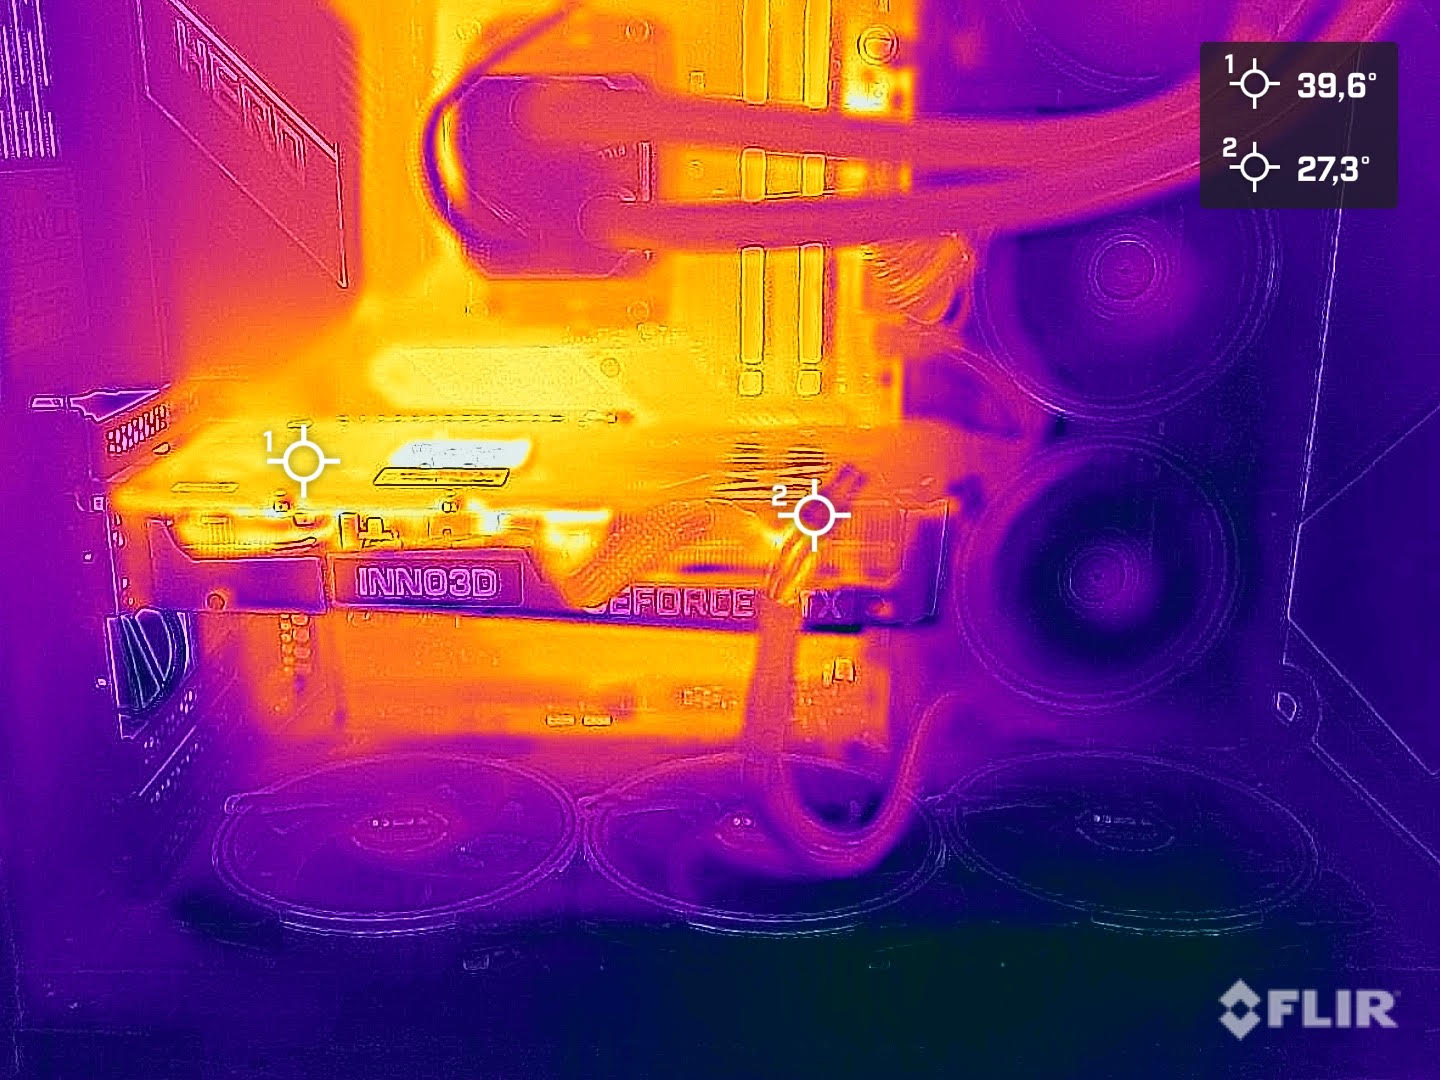
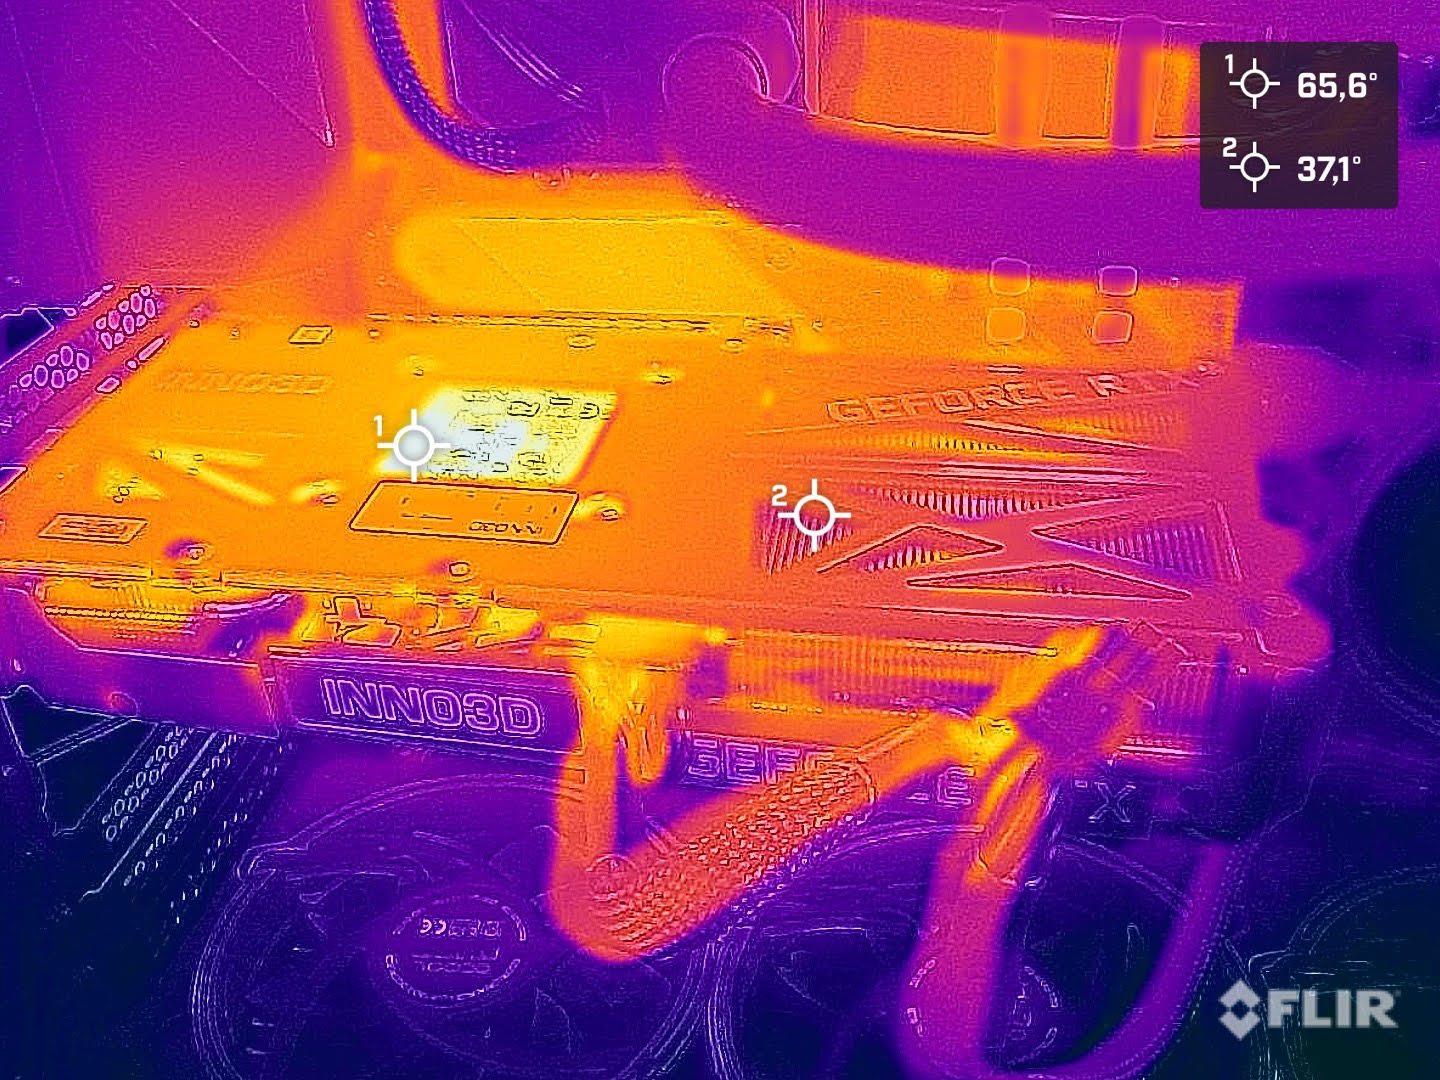
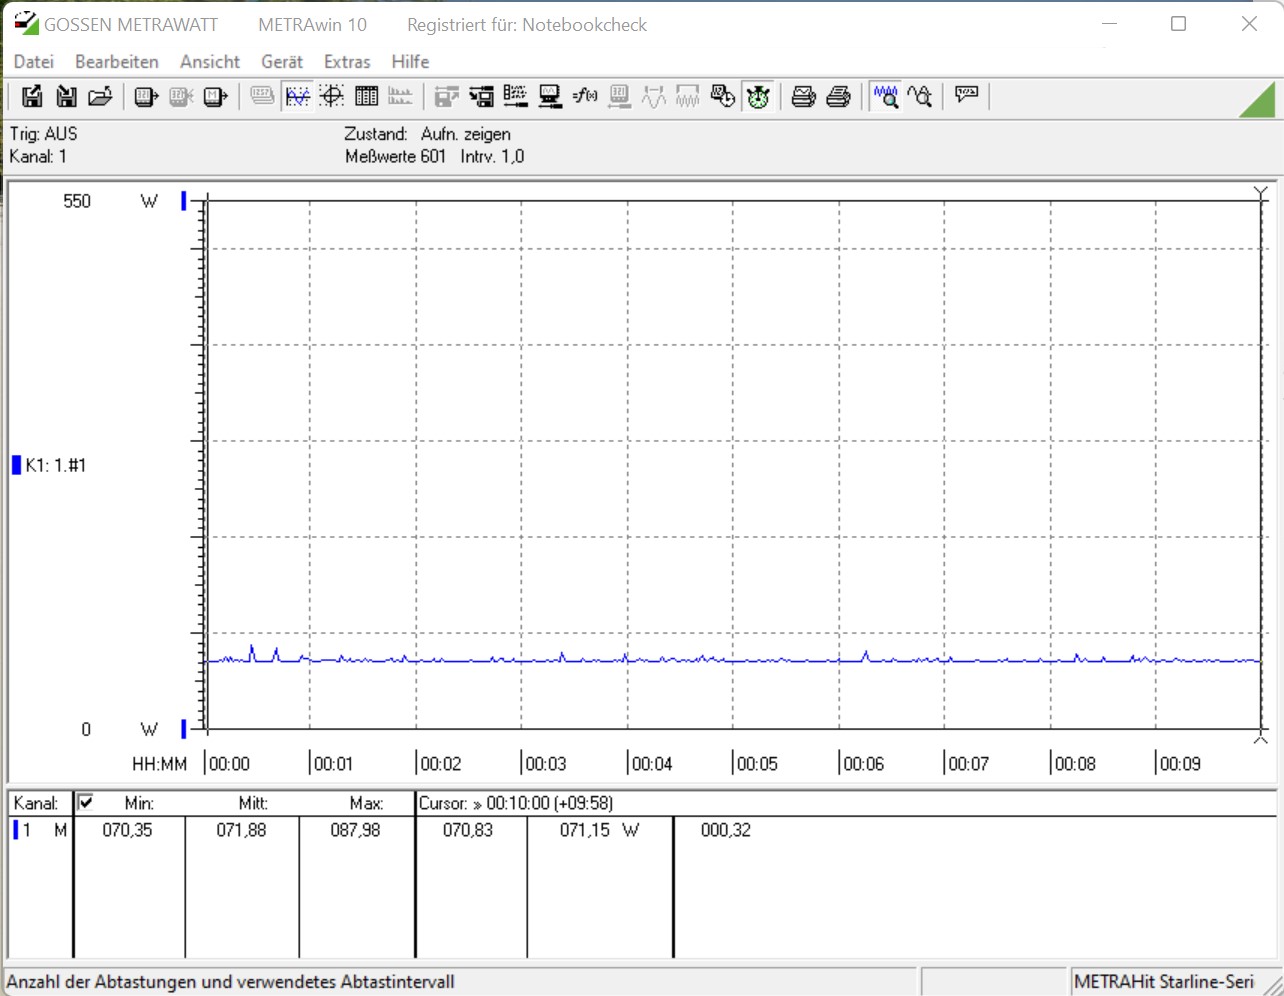
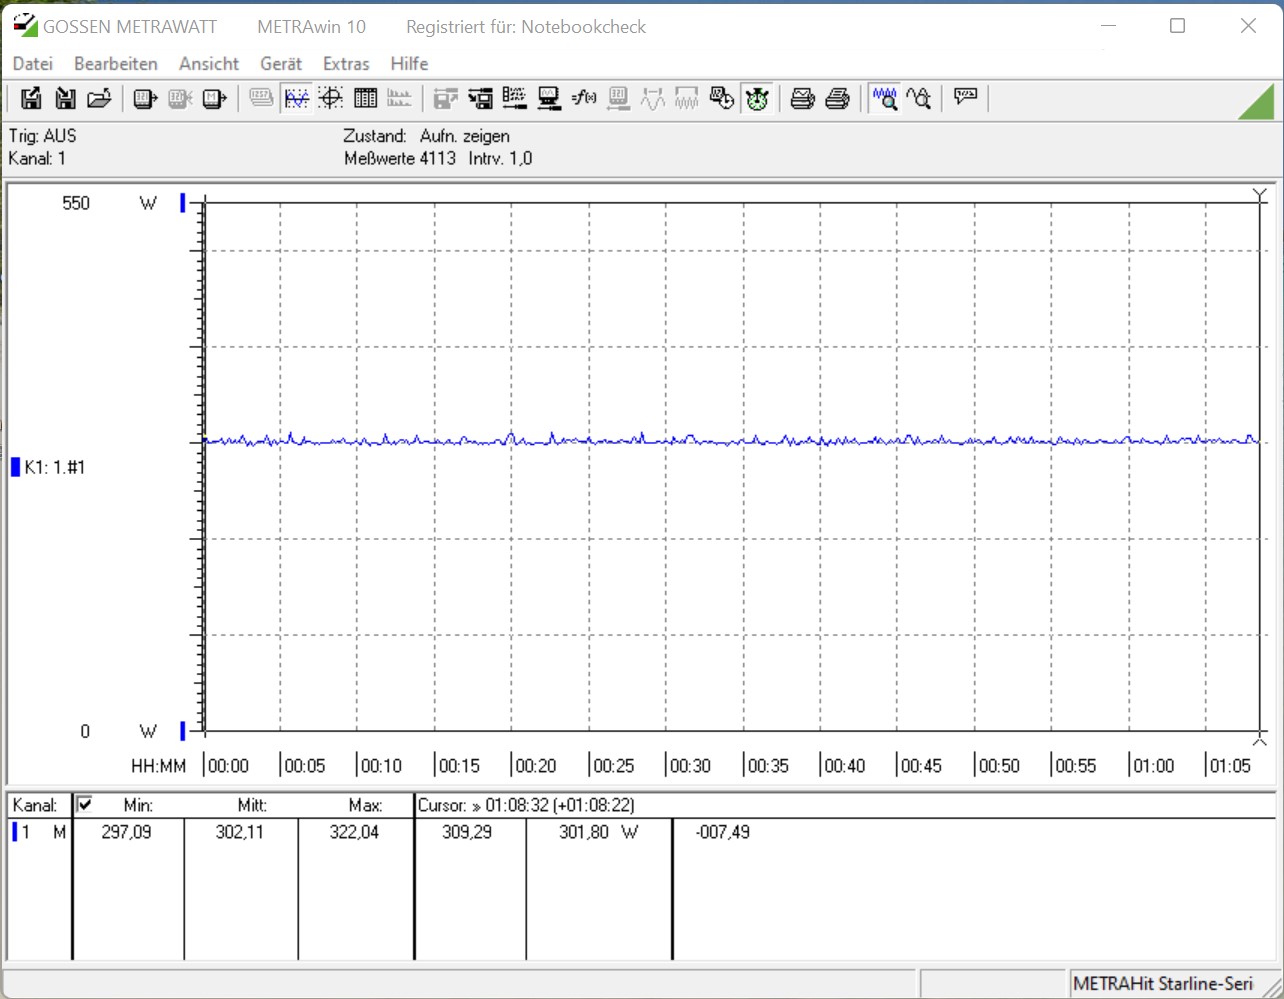
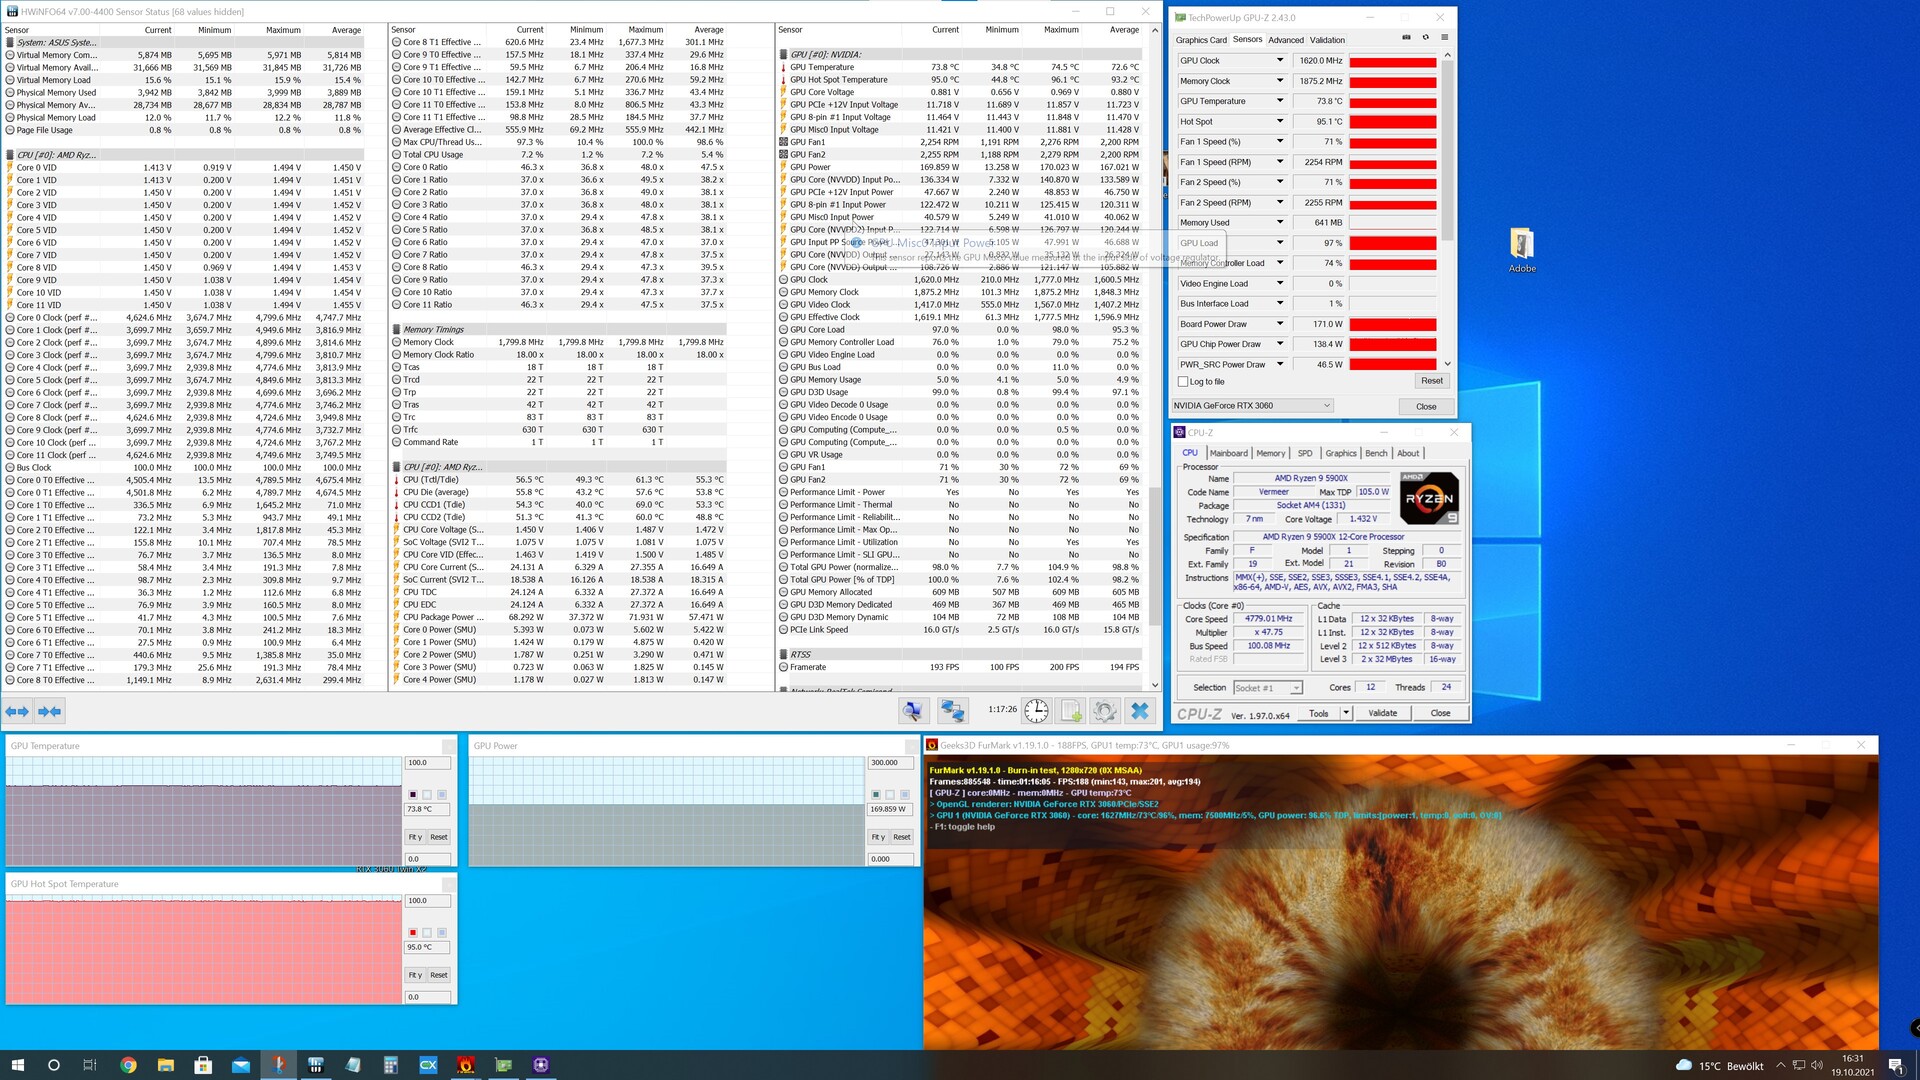
The emissions of the INNO3D GeForce RTX 3060 Twin X2 are acceptable, although the energy requirement is higher compared to the slightly faster AMD Radeon RX 6600 XT. With 302 watts in the stress test (FurMark) and 307 watts in gaming, the power supply has to provide almost 20 watts more in the identical test system. The GeForce RTX 2060 Super was a bit more frugal. Nevertheless, a different base unit based on an AMD Ryzen 7 2700X was used. There are no nasty surprises in terms of temperatures. The graphics chip reaches a maximum of 74.5 °C (166 °F) with a maximum TGP of 170 watts in the stress test. This is also rigorously adhered to.
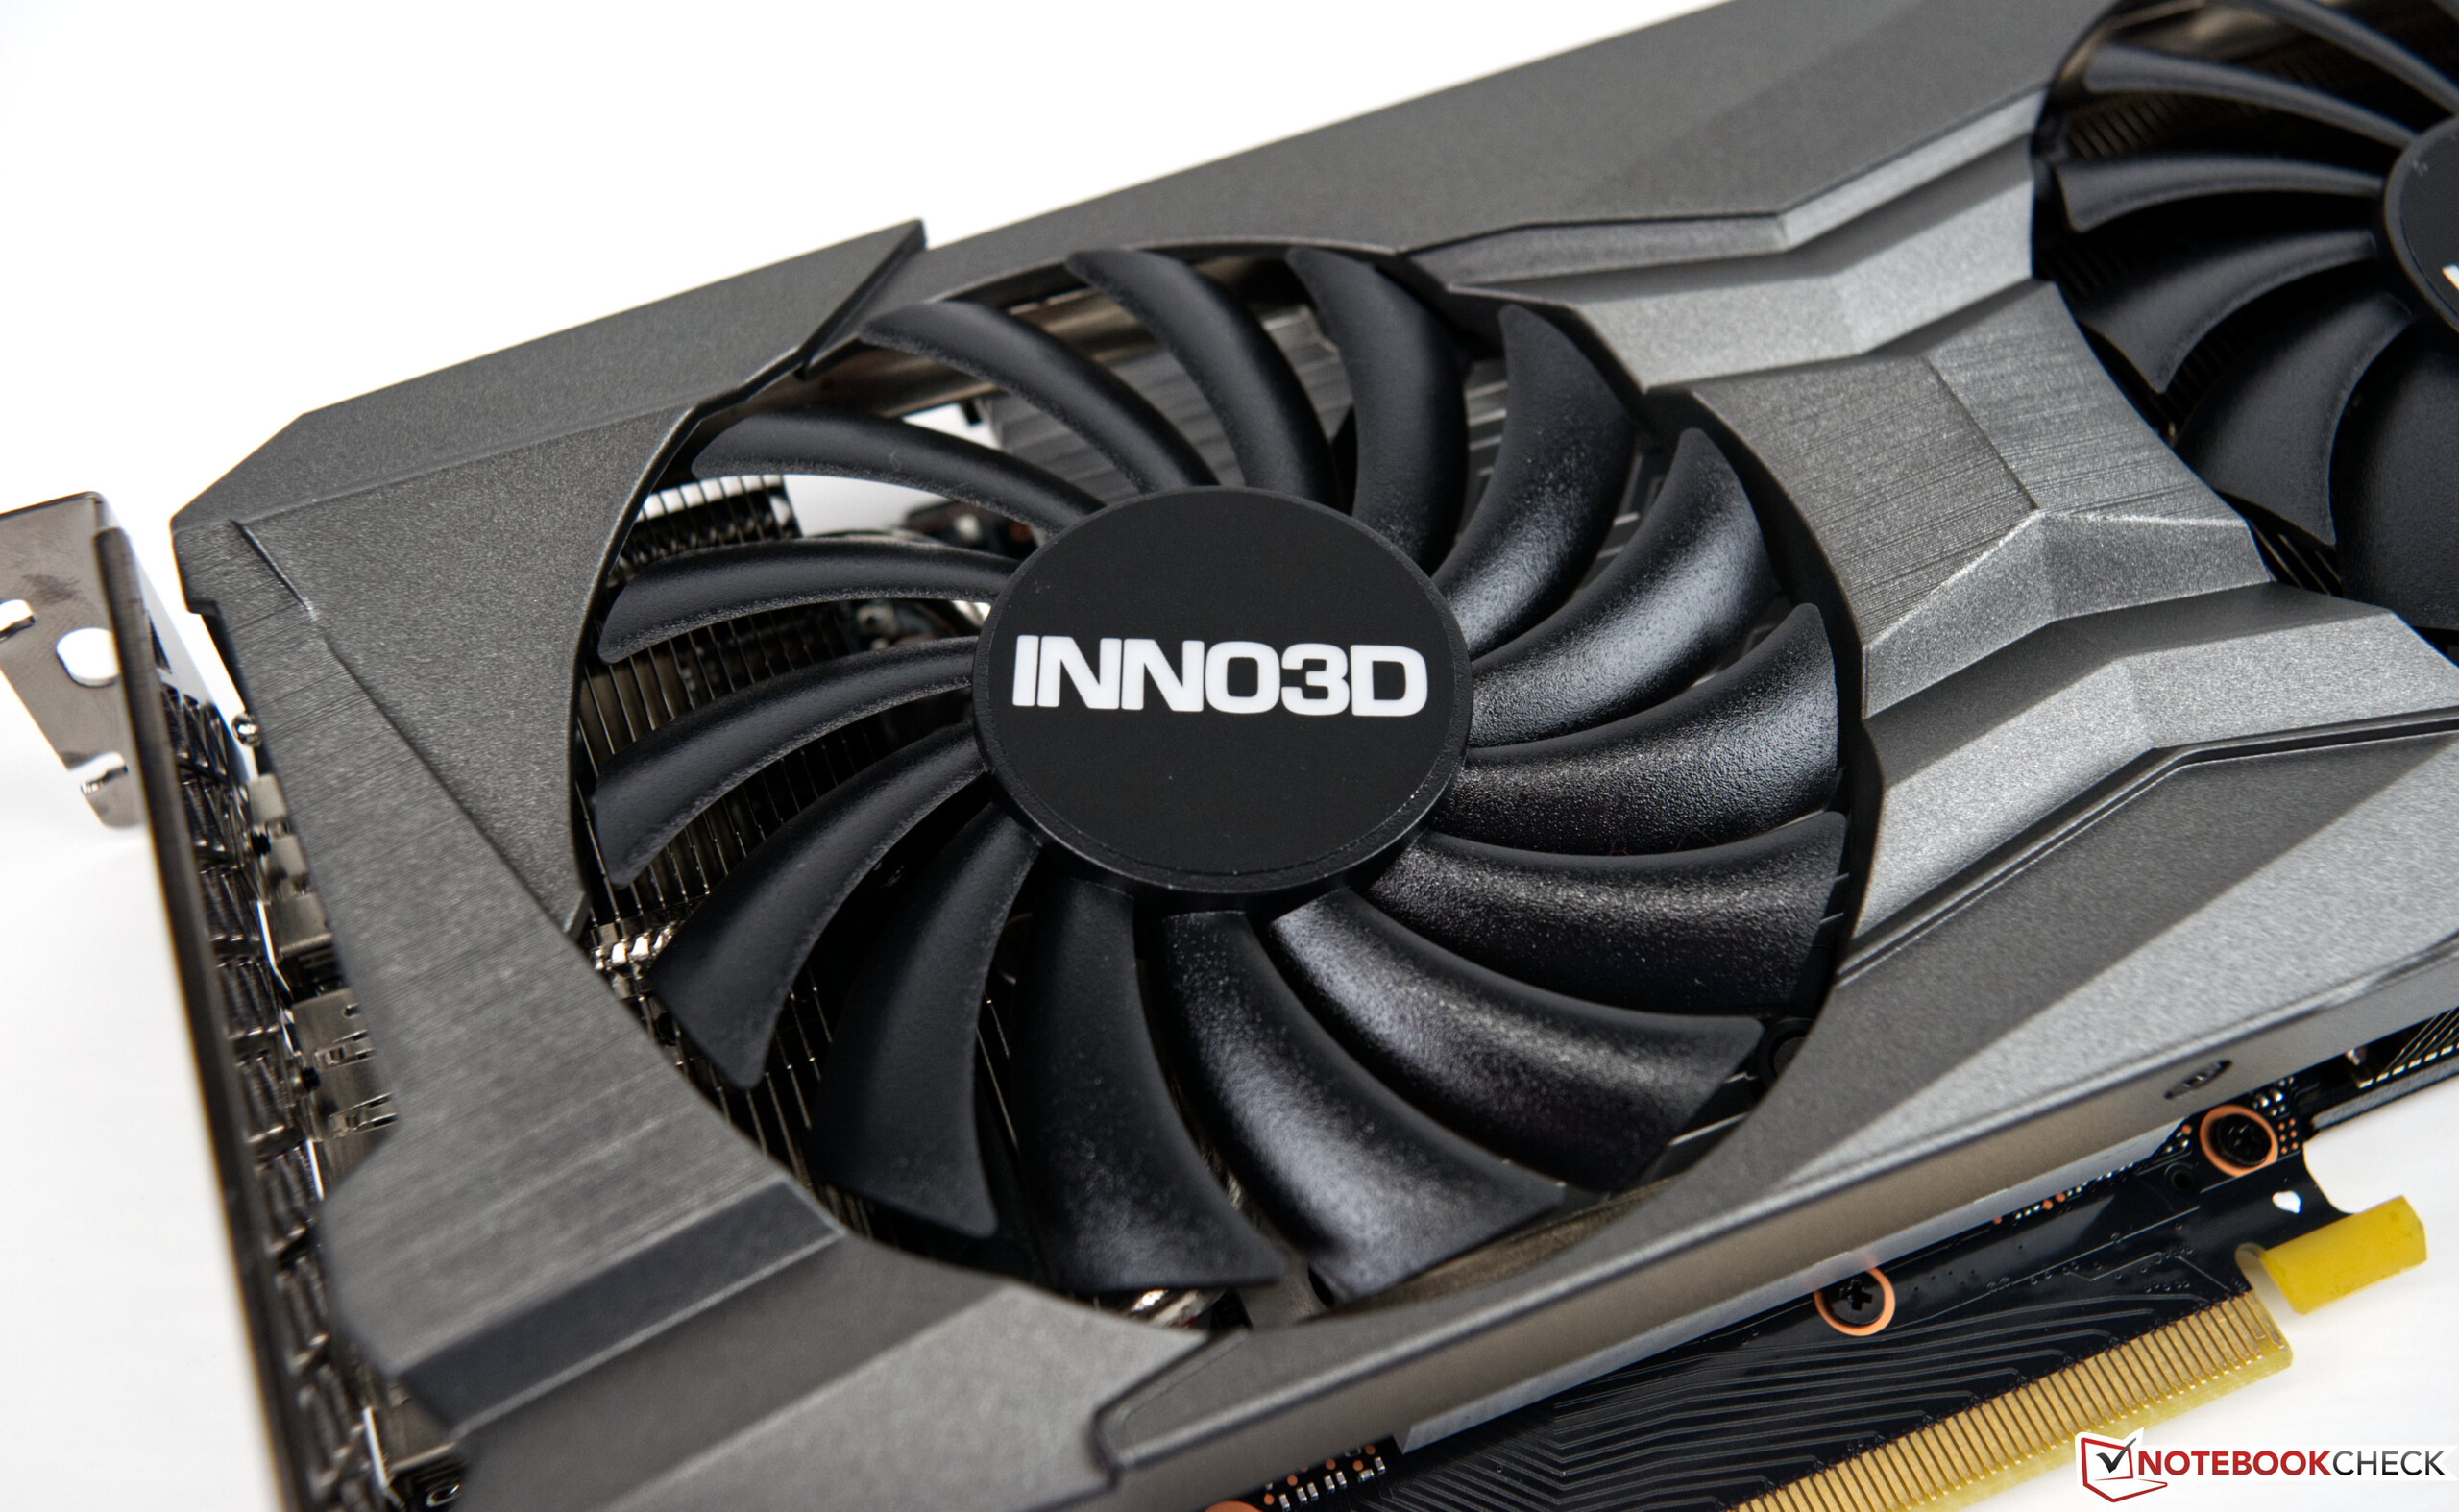
We did not notice any annoying noise emissions from the INNO3D GeForce RTX 3060 Twin X2 coil whine. Whether this also applies to other models from the manufacturer, or we were just lucky, we cannot say conclusively. The graphics card has a fan-stop mode, so we do not hear anything from the graphics card when idling. But even under load, the two fans don't turn up that loud. The graphics card was not audible from the closed case. The installed case fans were louder at all times.
* ... smaller is better
Pros
Cons
Conclusion - Overpriced RTX entry-level model

With the INNO3D GeForce RTX 3060 Twin X2, we had an inexpensive representative of the current GeForce RTX 3060 models in our review. This brings us to the topic, because the current prices of all graphics cards are significantly higher than the RRP. This list price is 329 Euros (~$380) for the GeForce RTX 3060. Currently, you have to pay at least 690 Euros (~$798) for an RTX 3060 model, depending on the manufacturer and configuration. Unfortunately, it does not look different for AMD.
The Nvidia GeForce RTX 3060 is one of the few amp graphics cards that does not skimp on VRAM.
Nevertheless, the comparison of the two rivals is worthwhile, because the AMD Radeon RX 6600 XT is currently available for as little as 600 Euros (~$694). The graphics card is faster in many areas, even if you have to do without 4 GB of VRAM. However, those who still want to remain loyal to Nvidia or see an inexpensive bargain can also confidently go for a GeForce RTX 3060. The performance differences are small and not noticeable. If you need significantly more performance, you should look for a GeForce RTX 3070 or GeForce RTX 3080. But even here, the price is a bit higher.
The INNO3D GeForce RTX 3060 Twin X2 convinced us with its simple, compact design, which does completely without RGB. The performance is sufficient for all current games, if you primarily want to play in Full HD. However, the pixel accelerator also masters many games in QHD resolution at maximum details. The GeForce RTX 3060 increasingly runs out of steam at even higher resolutions, even though the VRAM of 12 GB would be sufficient.
The biggest point of criticism is the current retail price, which is simply too expensive at the moment.
All benchmarks and test rates of the RTX 3060 can be found on the Graphics card page of the GeForce RTX 3060 (continuously updated).

