Zotac MEK MINI desktop PC with Core i7 and GeForce RTX 2070 Super in review
")
")
")
The Zotac MEK MINI, which was presented to the public for the first time at Computex 2018, was developed from a concept study. At that time, still without the RTX Super cards and based on the 8th generation of Intel Core processors, the gaming PC, which is only 9.2 liters in size, celebrated its debut. In the new edition, Zotac has given the compact computer a small performance upgrade with Intel's 9th generation of Core CPUs and the RTX Super cards from Nvidia.
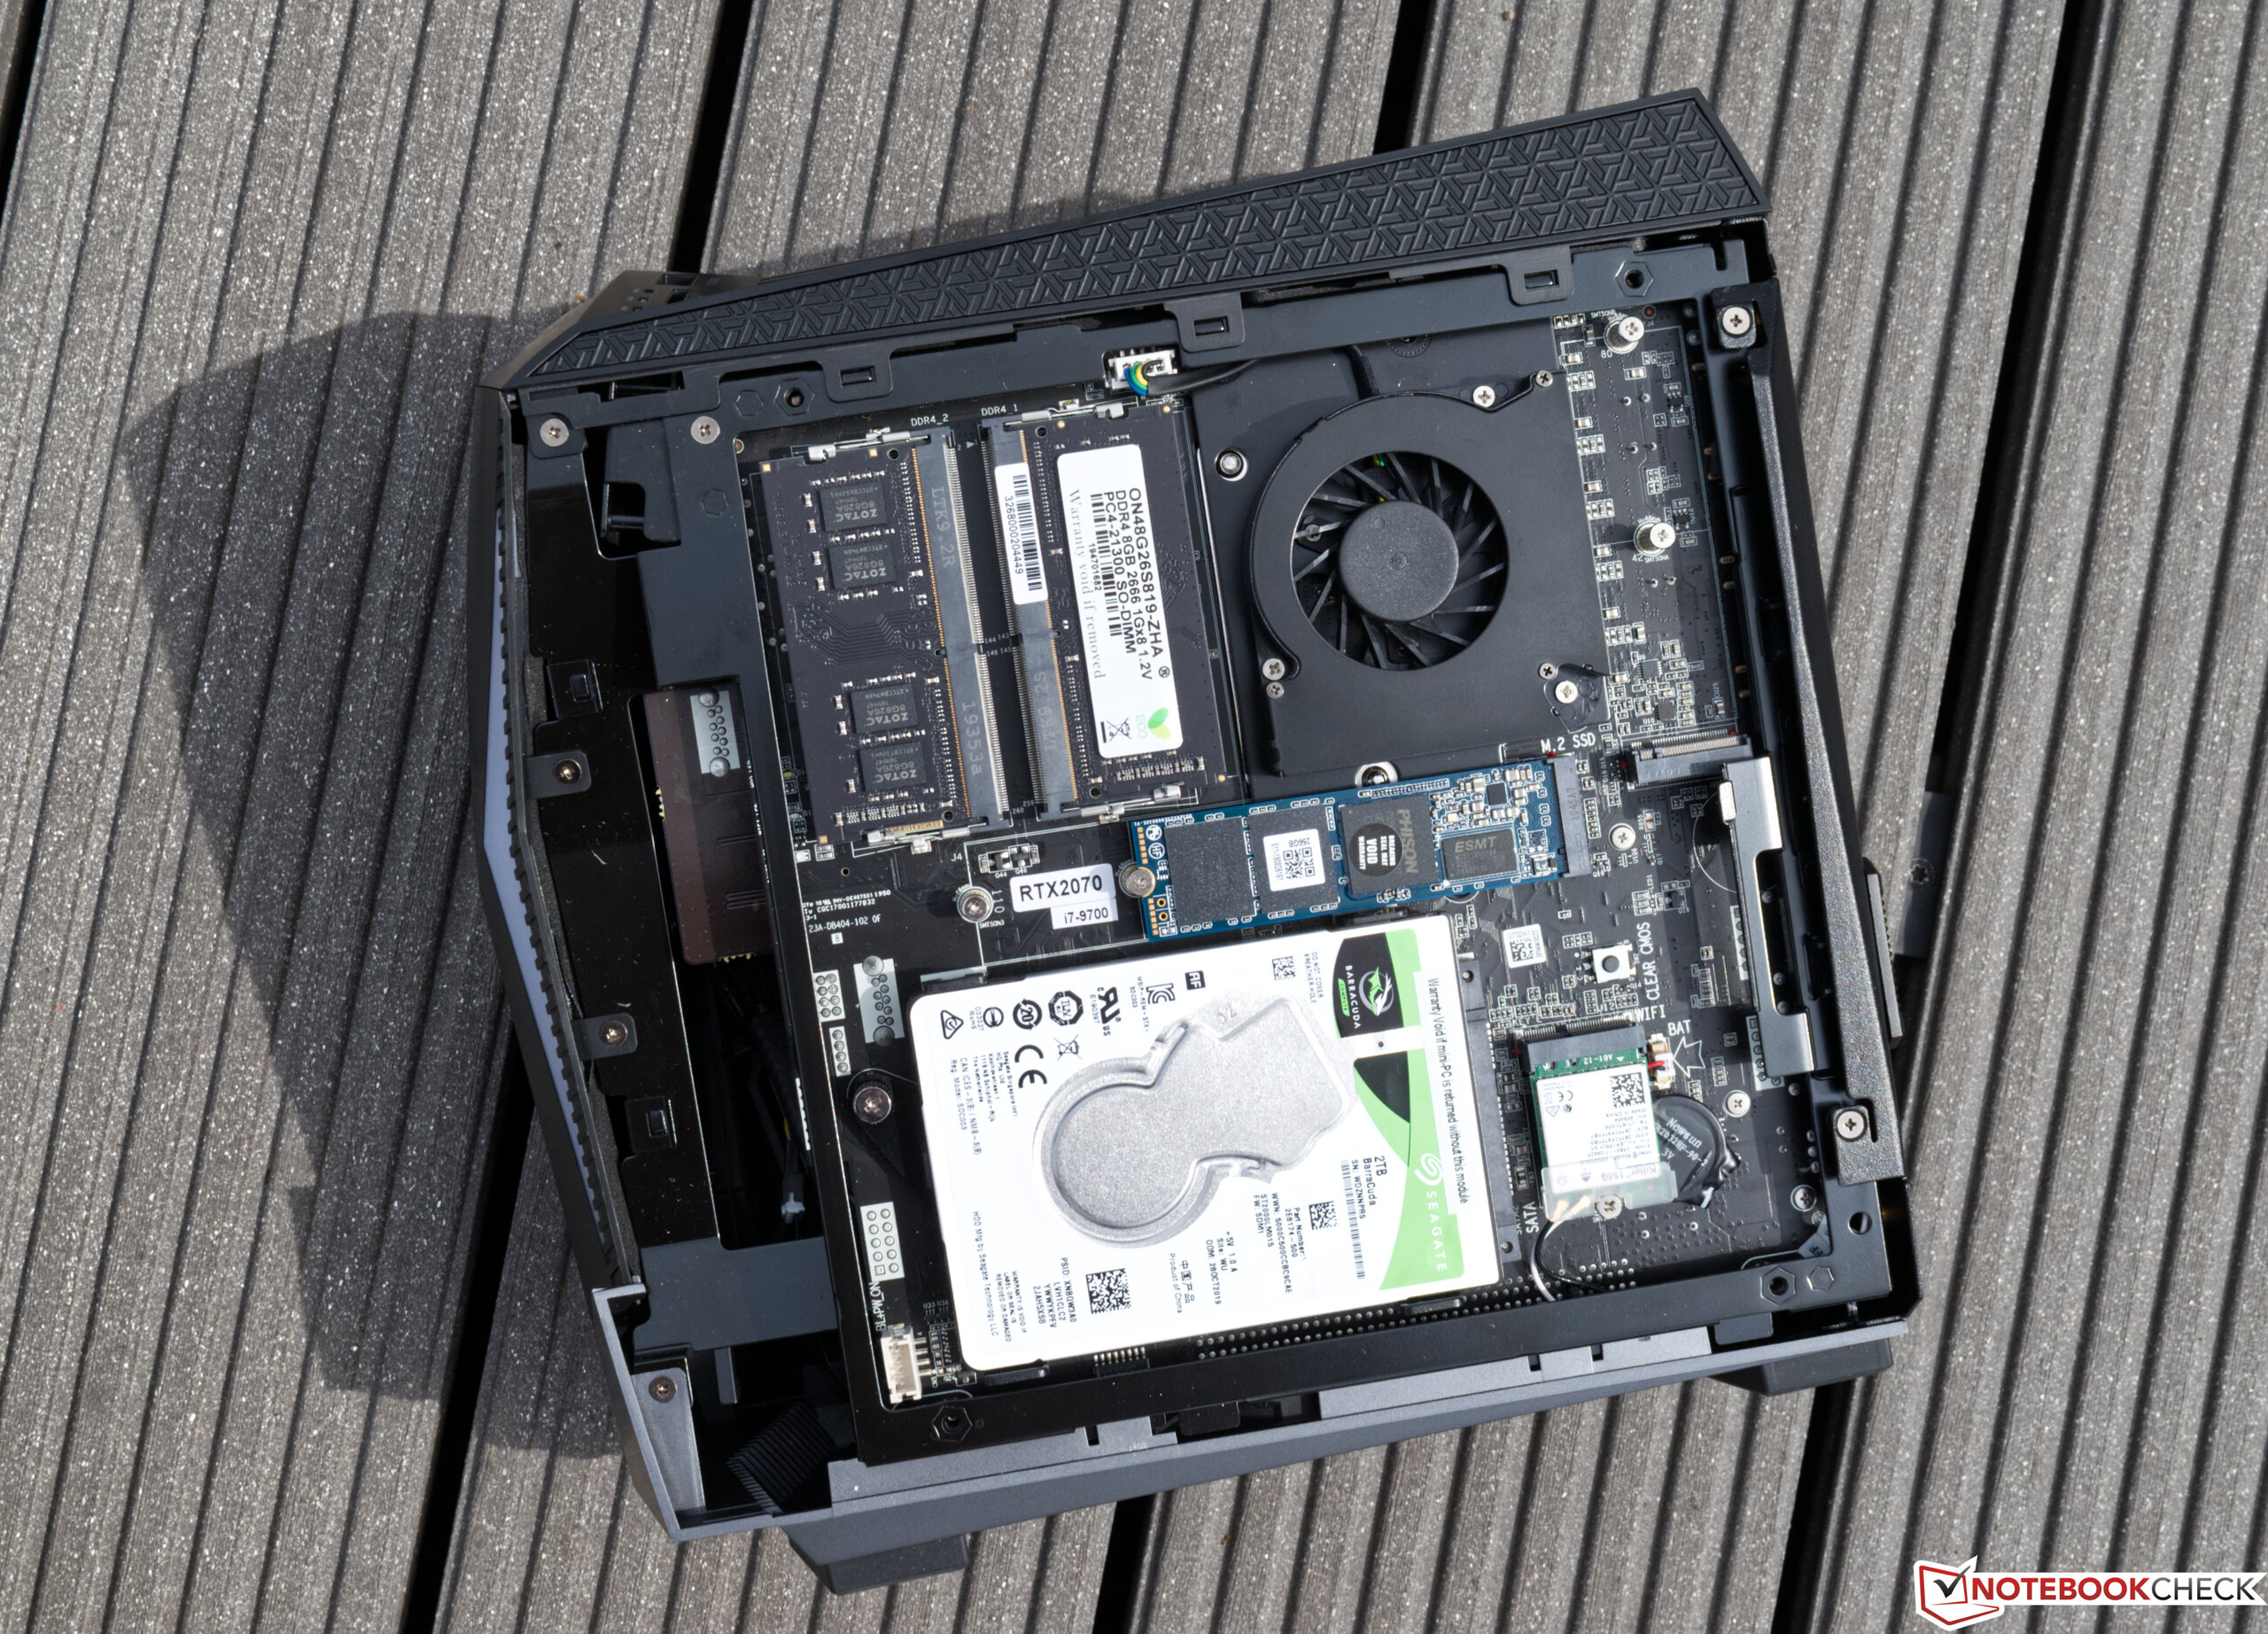
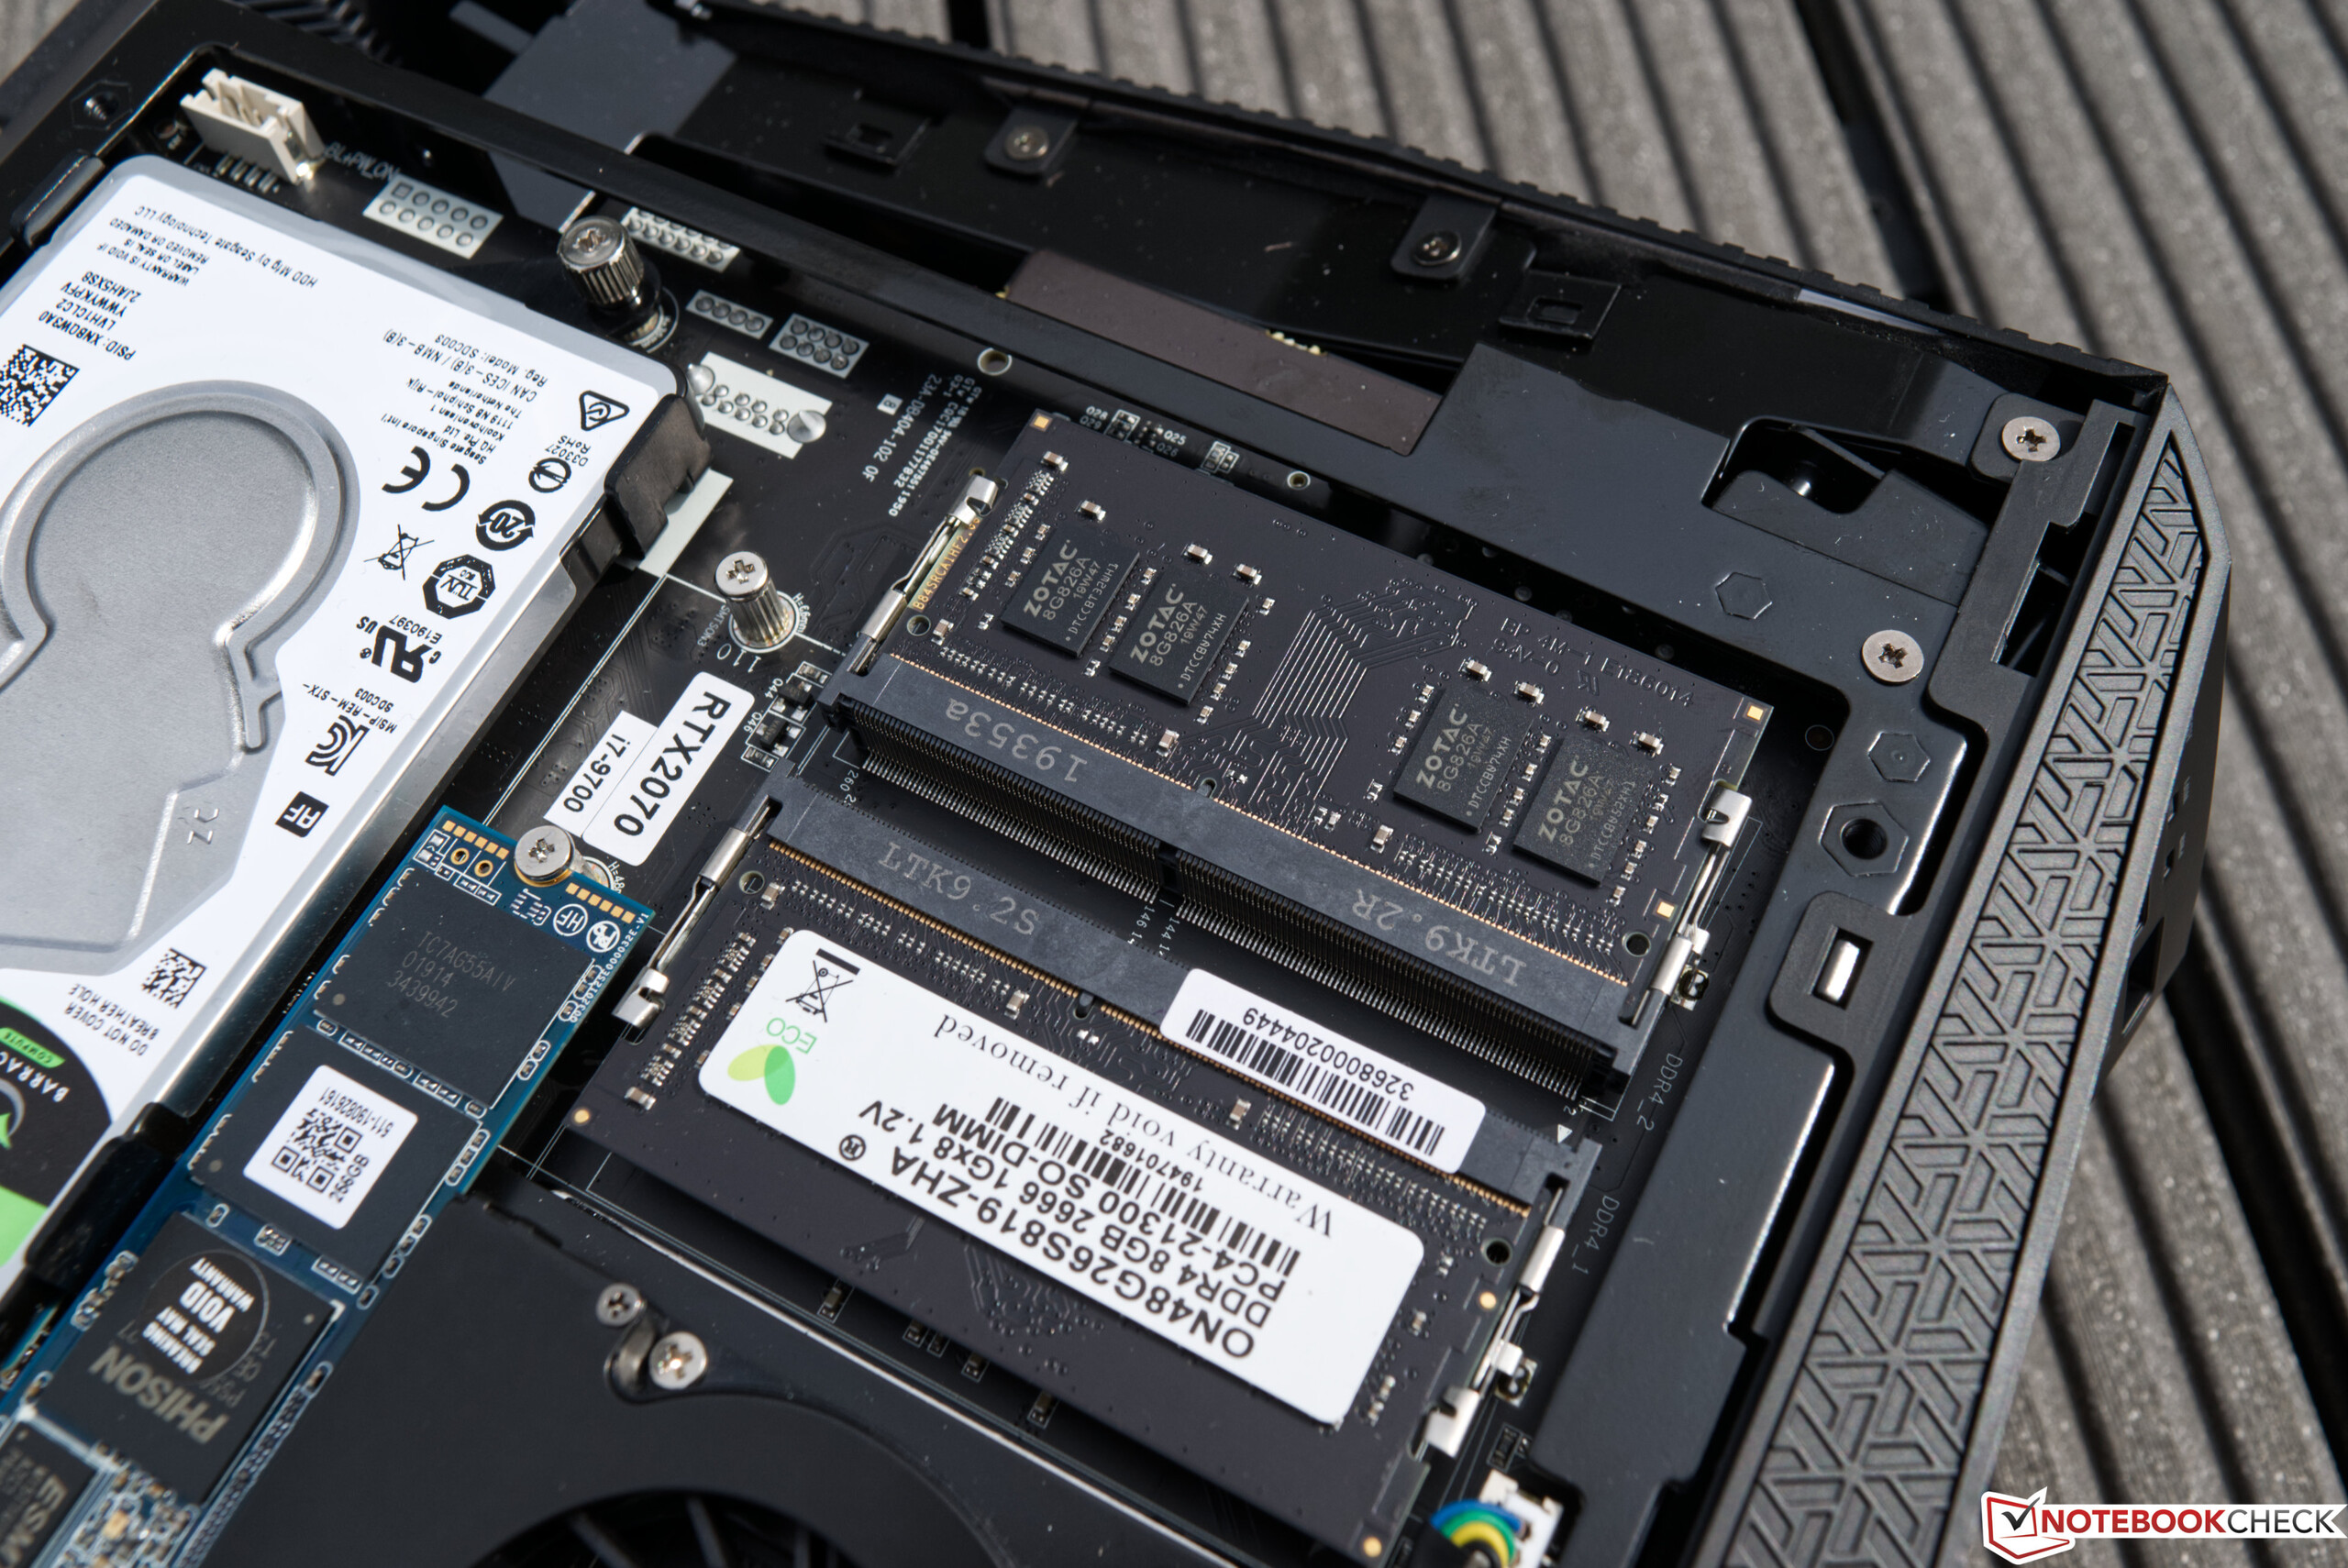
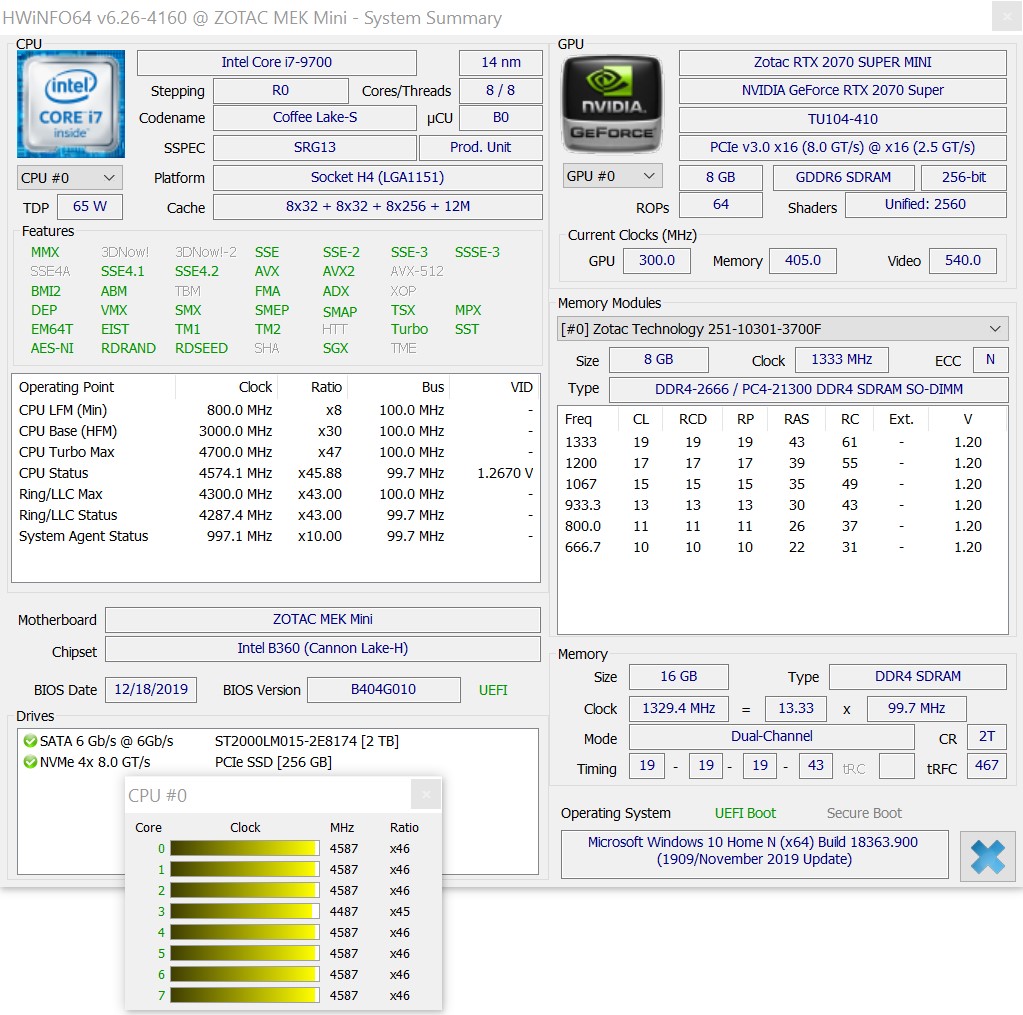
For our test, we have the faster of the two available Zotac MEK MINI models. It is based on an Intel Core i7-9700 and a GeForce RTX 2070 Super, which also comes from Zotac itself as a mini variant. These are desktop components, which can even be upgraded with a little skill. Furthermore, buyers get 16 GB of DDR4 RAM and a storage combination of SSD (240 GB) and HDD (2 TB). In this way, the device is completely ready for operation and doesn't have to be equipped with the most necessary components as with a barebone system. At the time of testing, our review sample costs almost 1,500 Euros (~$1,683). The cheaper version of the MEK MINI is currently priced at 1,100 Euros (~$1,234). Nevertheless, some compromises have to be made in terms of performance and storage.
Zotac MEK MINI in detail
| Manufacturer / Description | Zotac MEK MINI RTX 2070 Super | Zotac MEK Mini RTX 2060 Super |
|---|---|---|
| Price (at the time of testing) | 1,500 Euros | 1,100 Euros |
| Size | 260.8 x 136 x 258.8 mm (W x D x H) 9.18 L | 260.8 x 136 x 258.8 mm (W x D x H) 9.18 L |
| CPU | Intel Core i7-9700 | Intel Core i5-9400F |
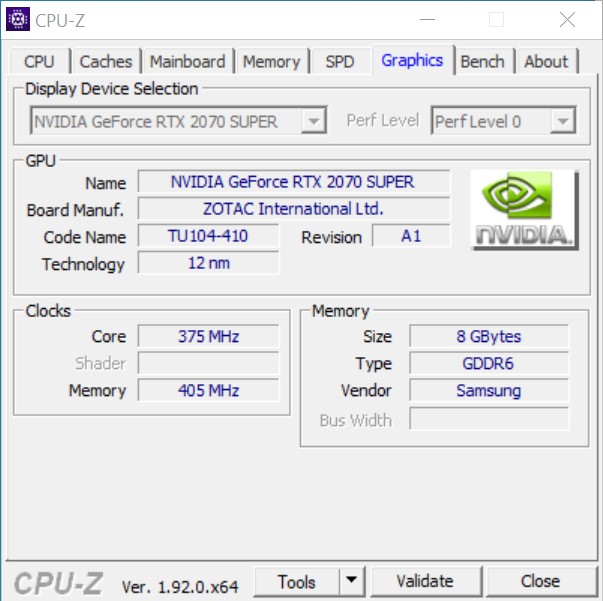
| GPU | Nvidia GeForce RTX 2070 Super | Nvidia GeForce RTX 2060 Super |
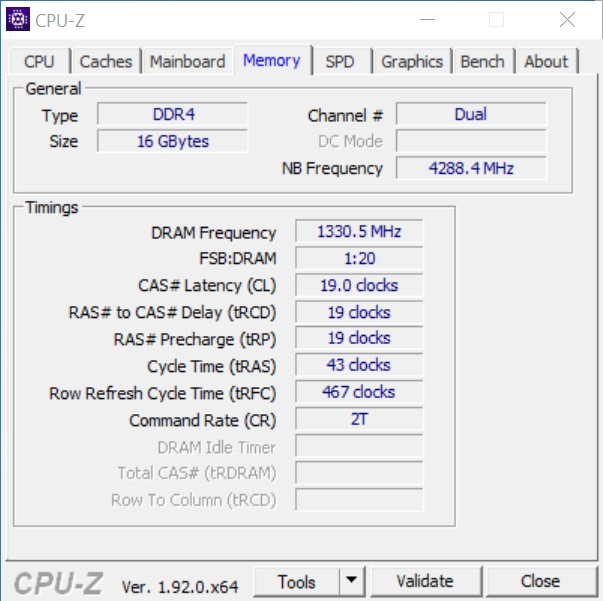
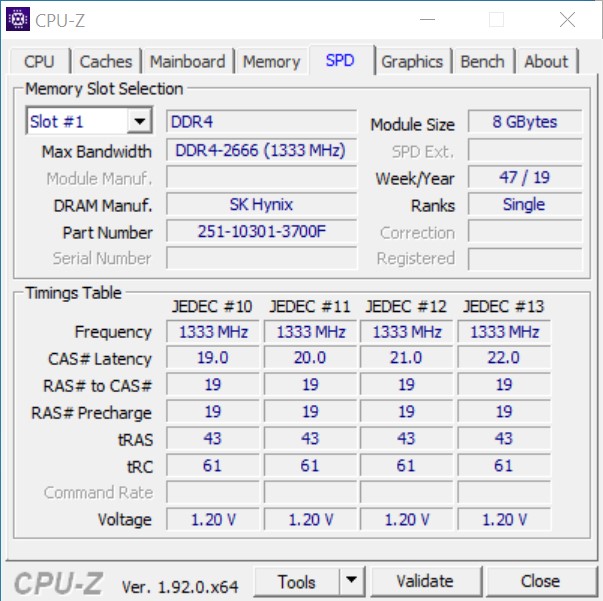
| RAM | 16 GB (2x 8 GB DDR4 2666) | 16 GB (2x 8 GB DDR4 2666) |
| SSD | 1x 240 GB M.2 SSD | 1x 240 GB M.2 SSD |
| HDD | 1x 2 TB 2.5-inch HDD | 1x 1 TB 2.5-inch HDD |
| Power supply | 2x 330 W | 2x 230 W |
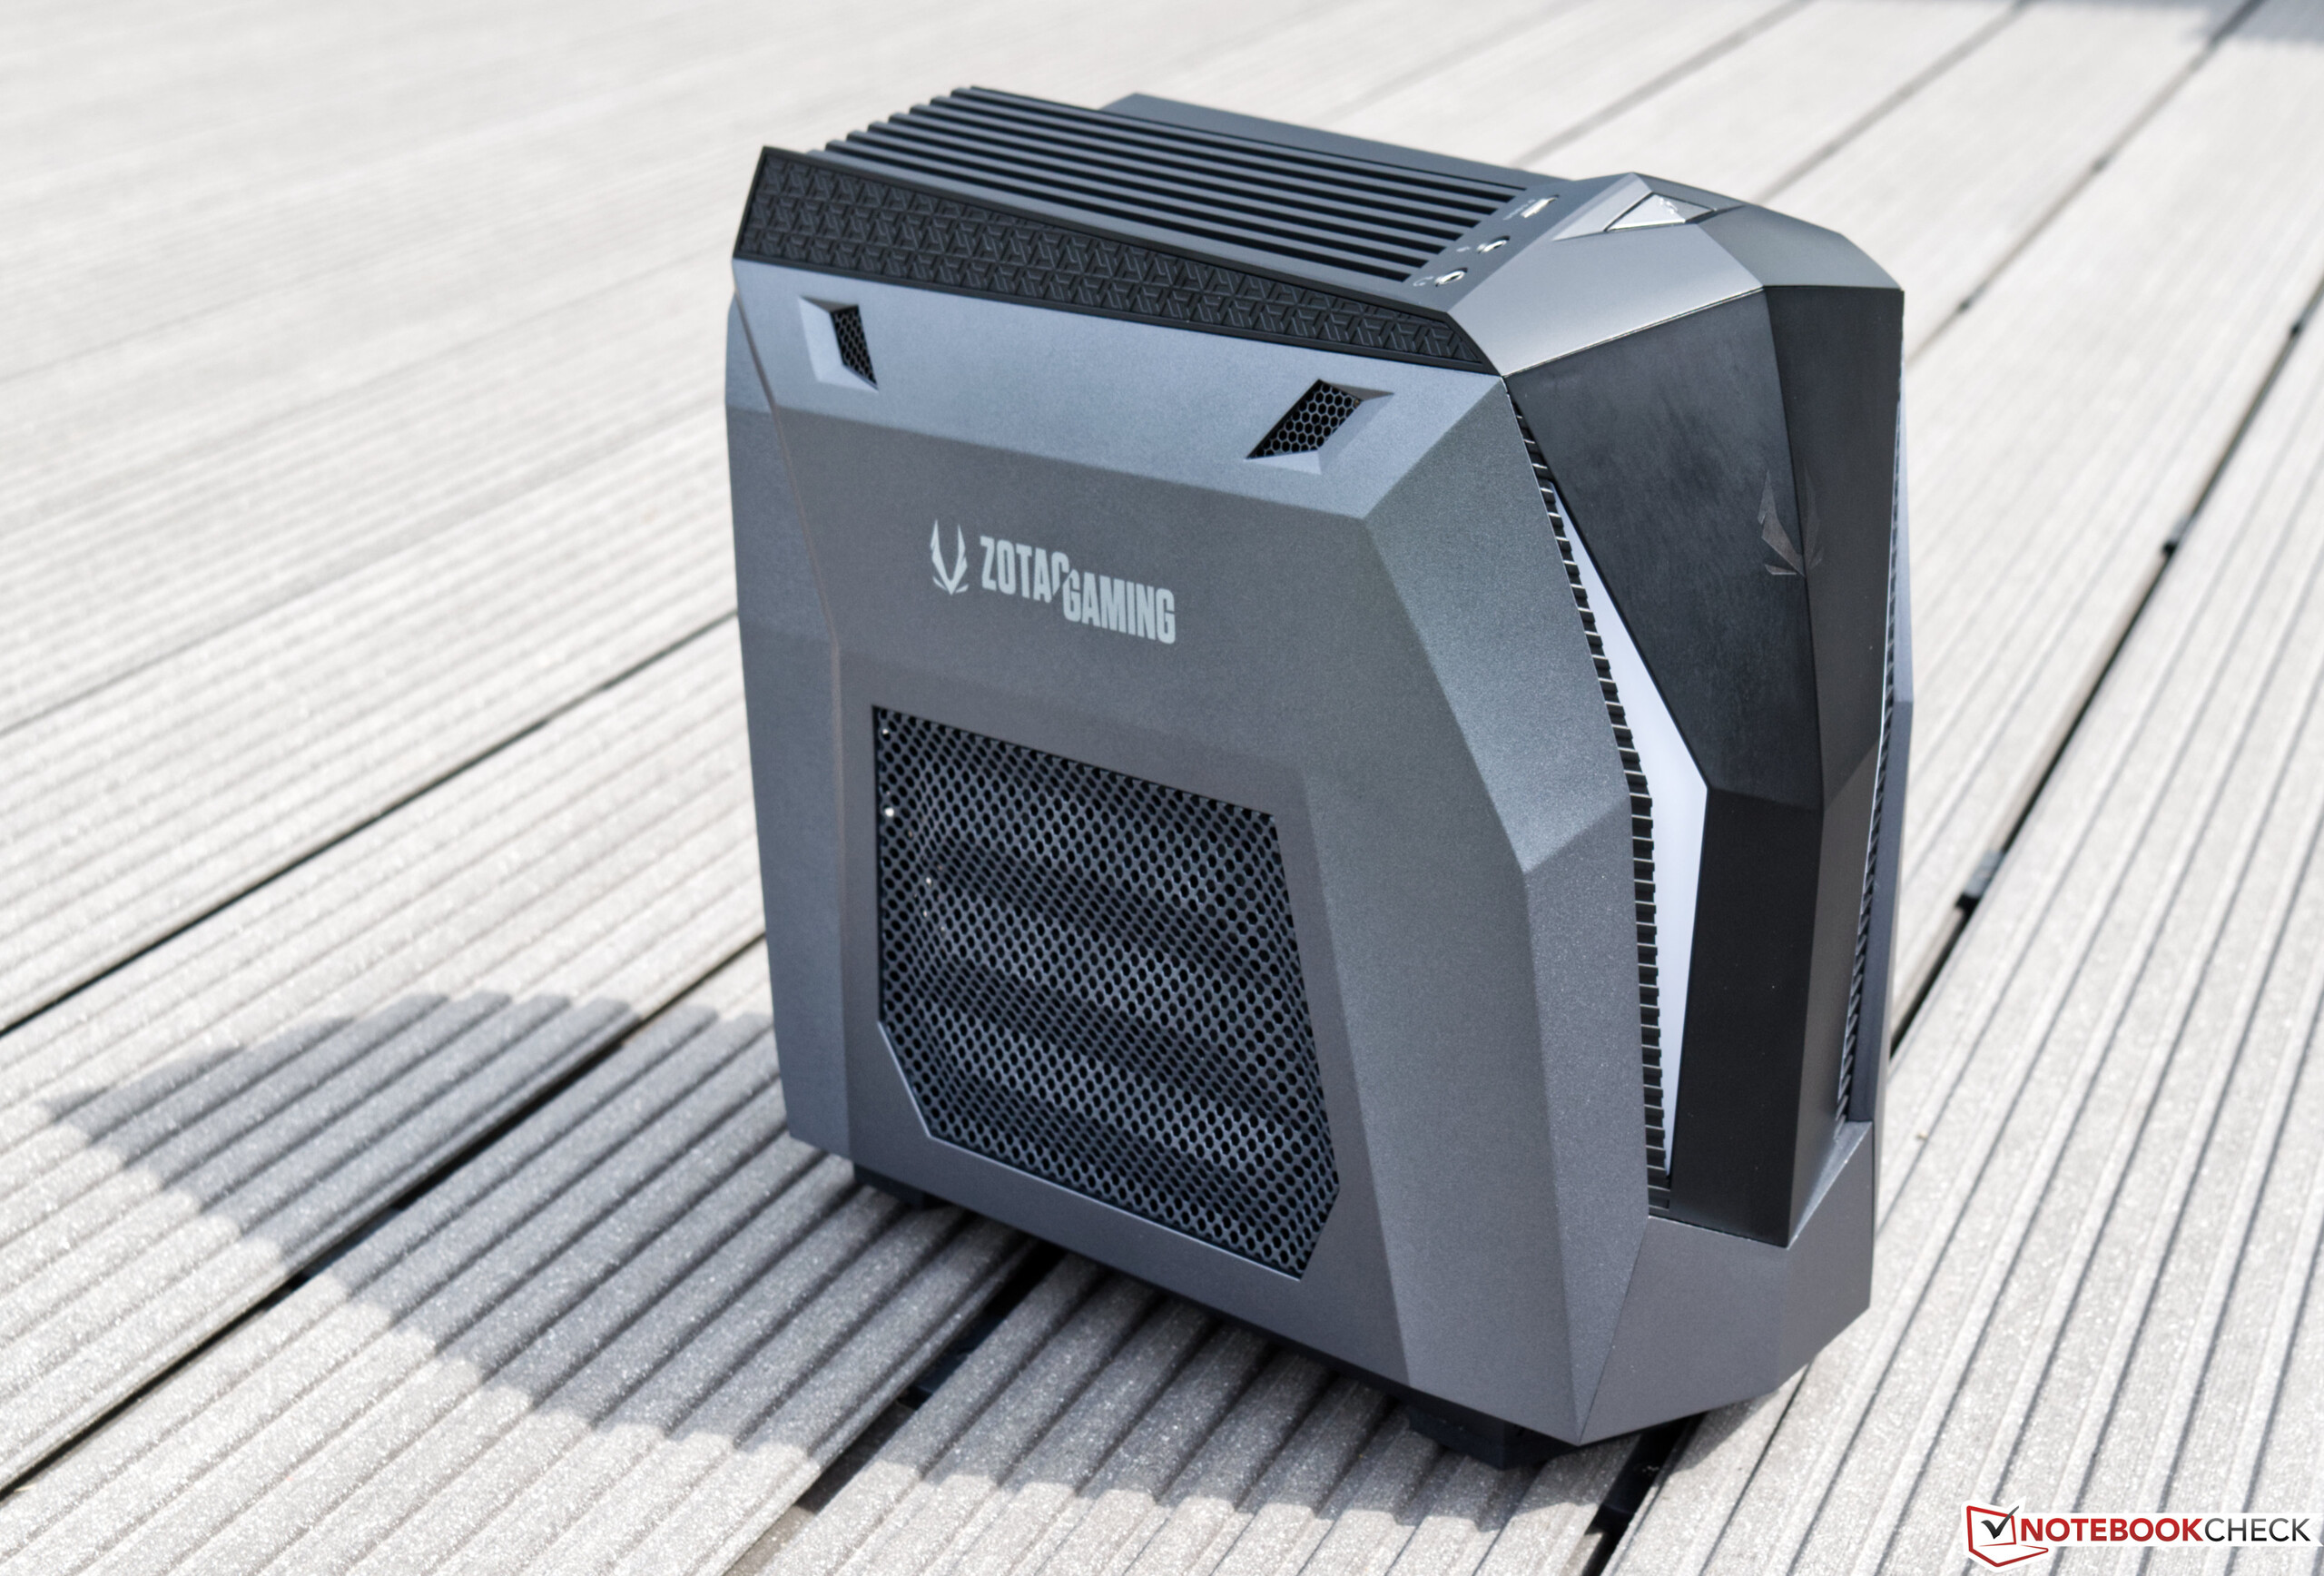
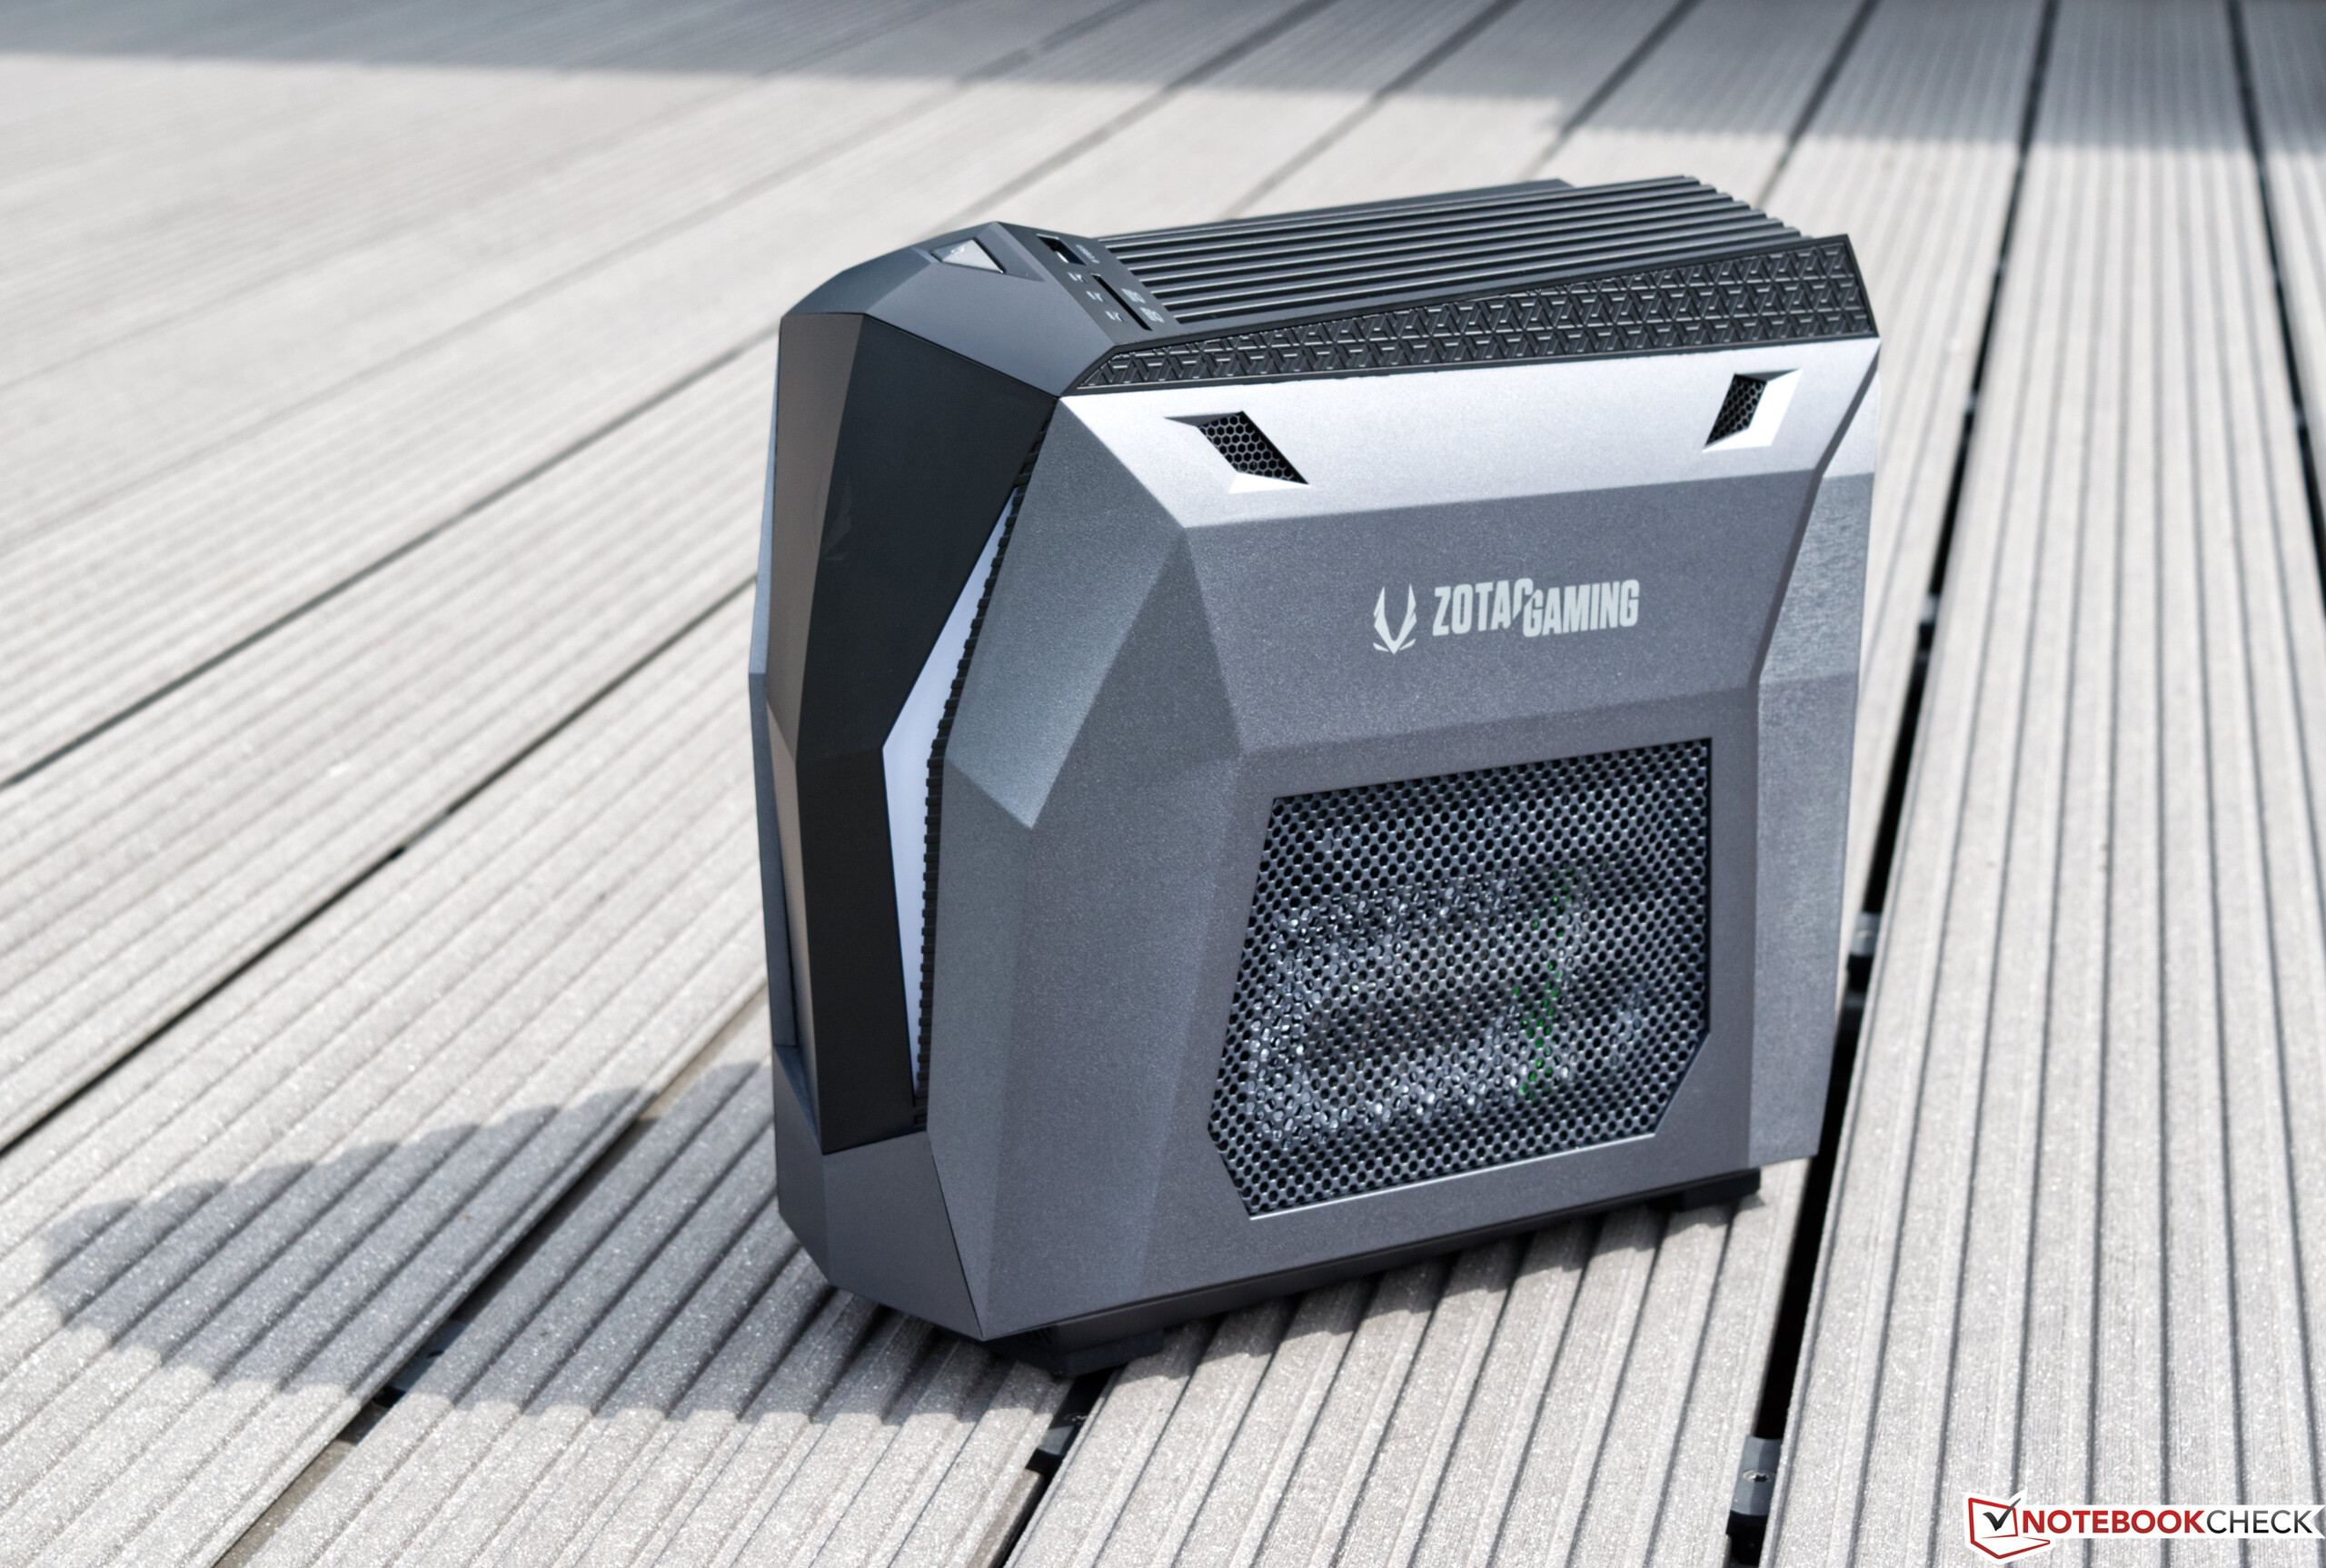
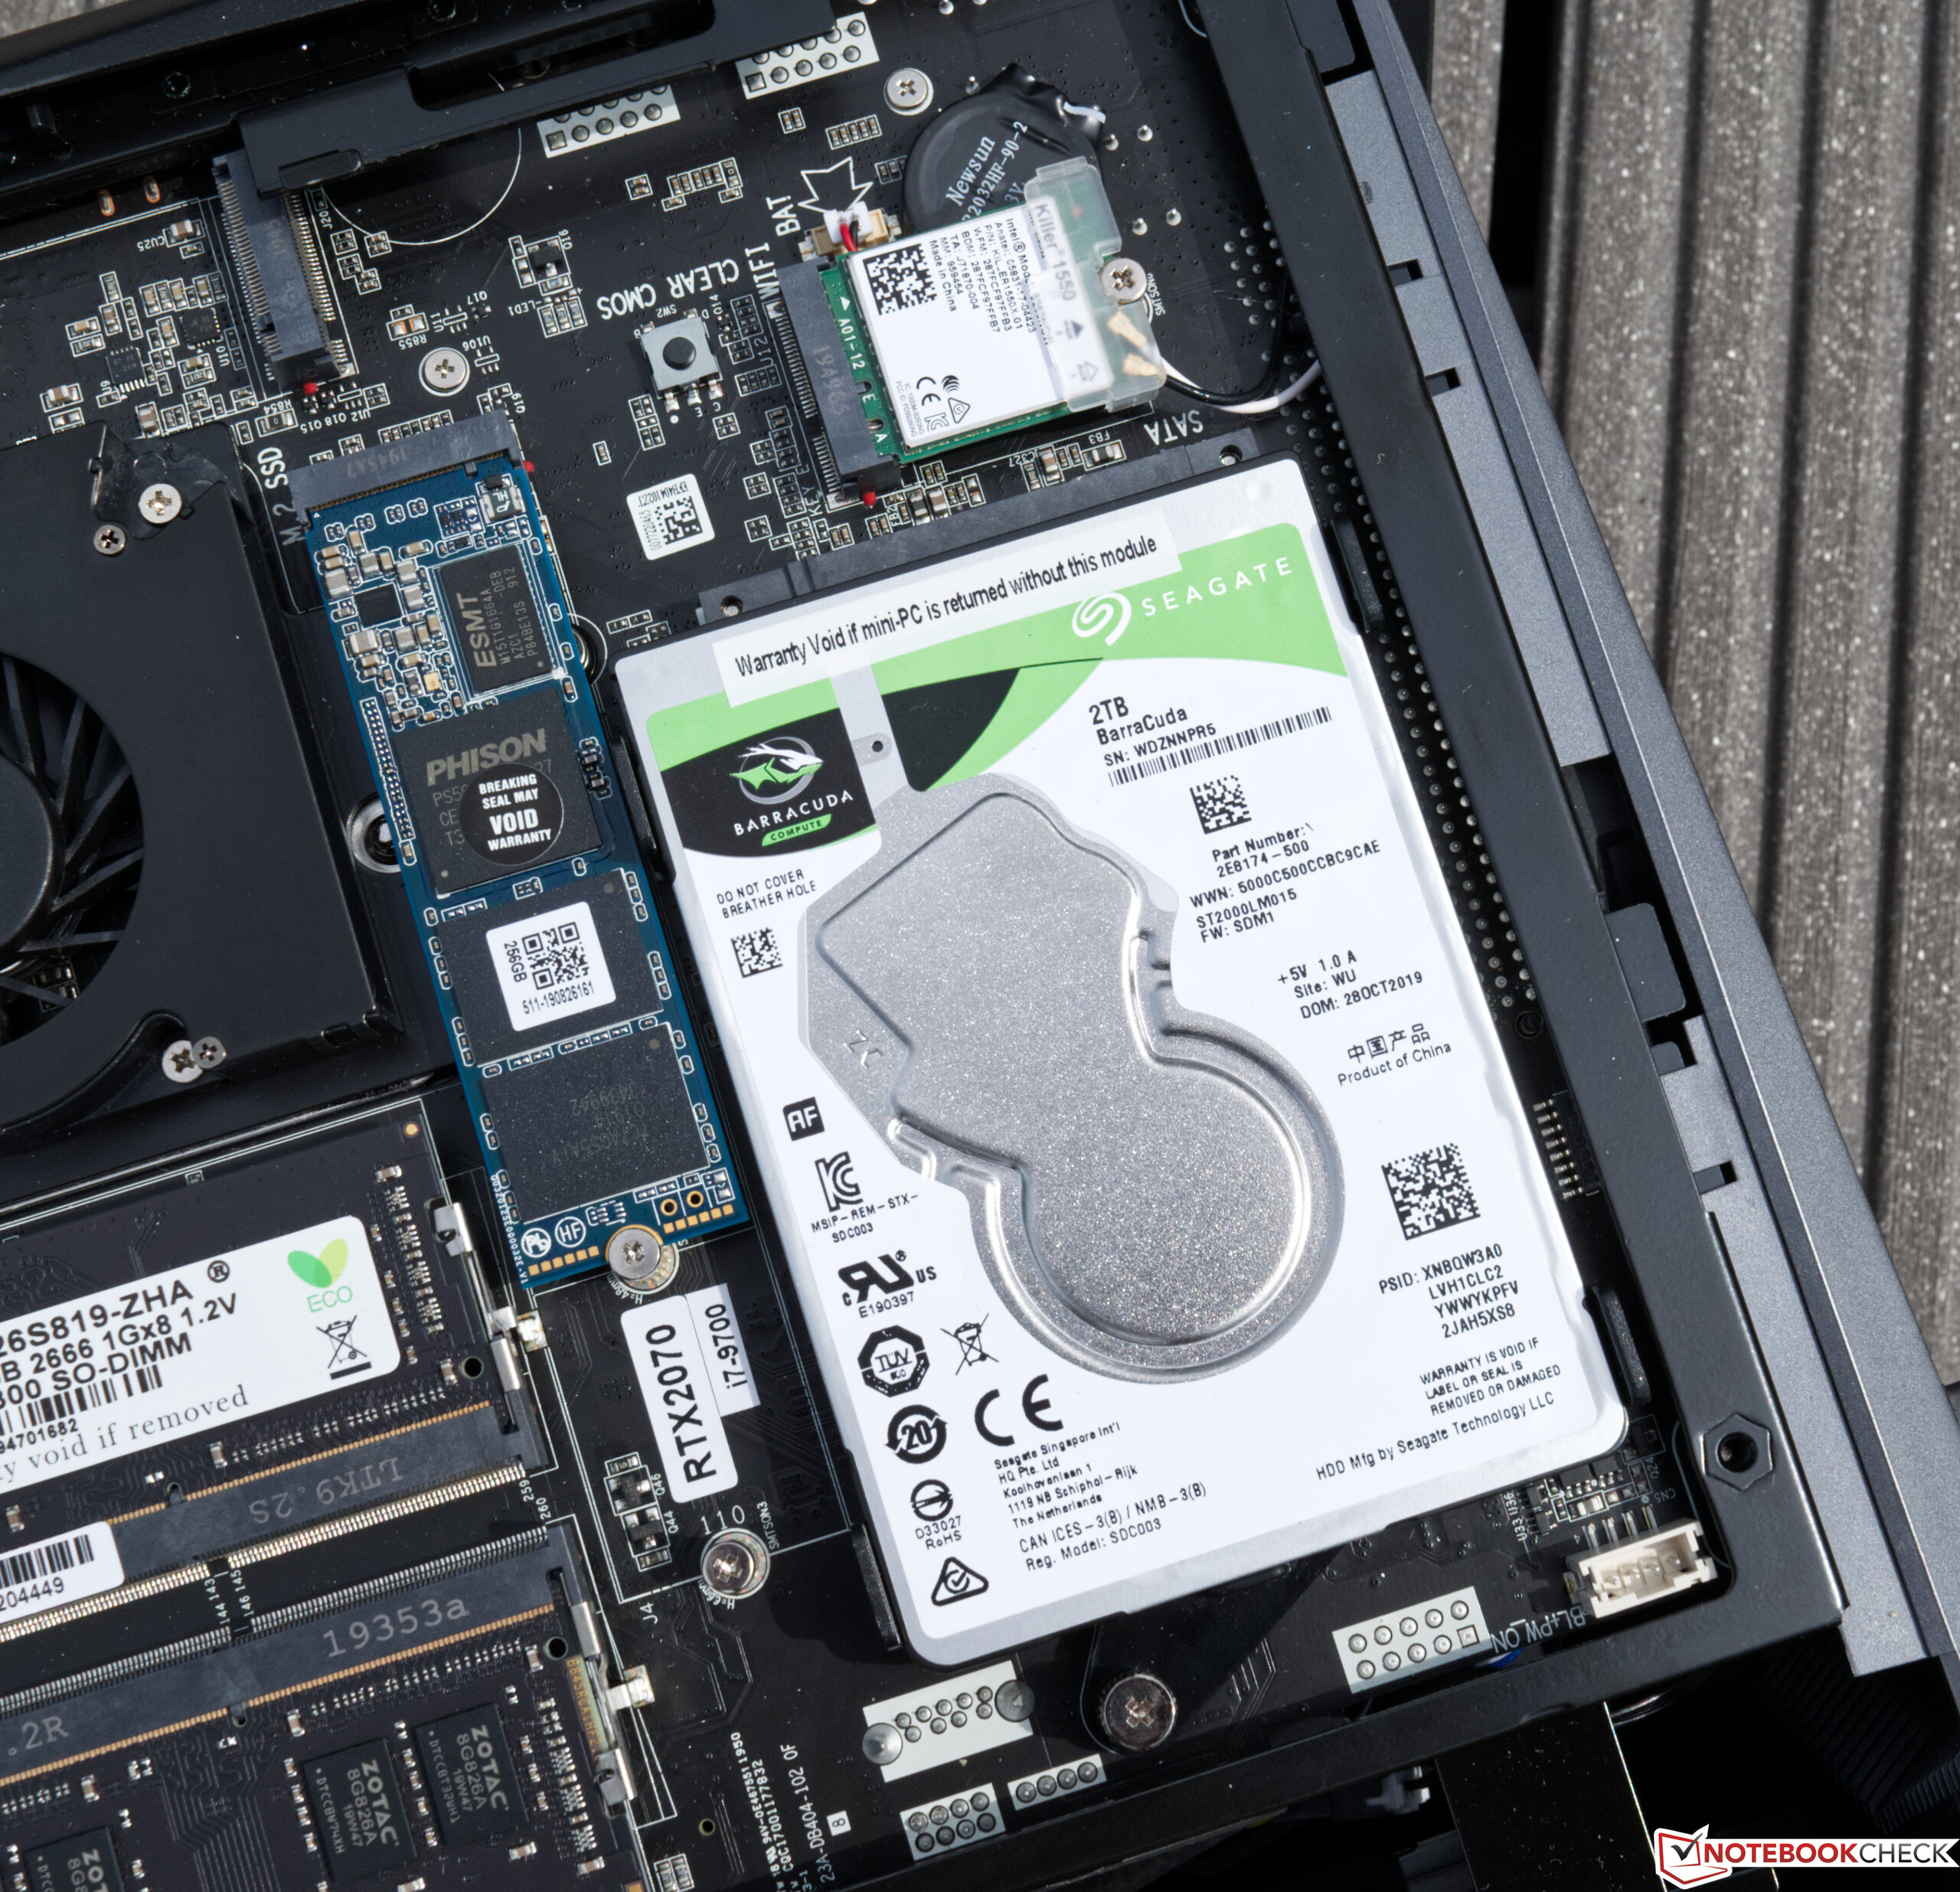
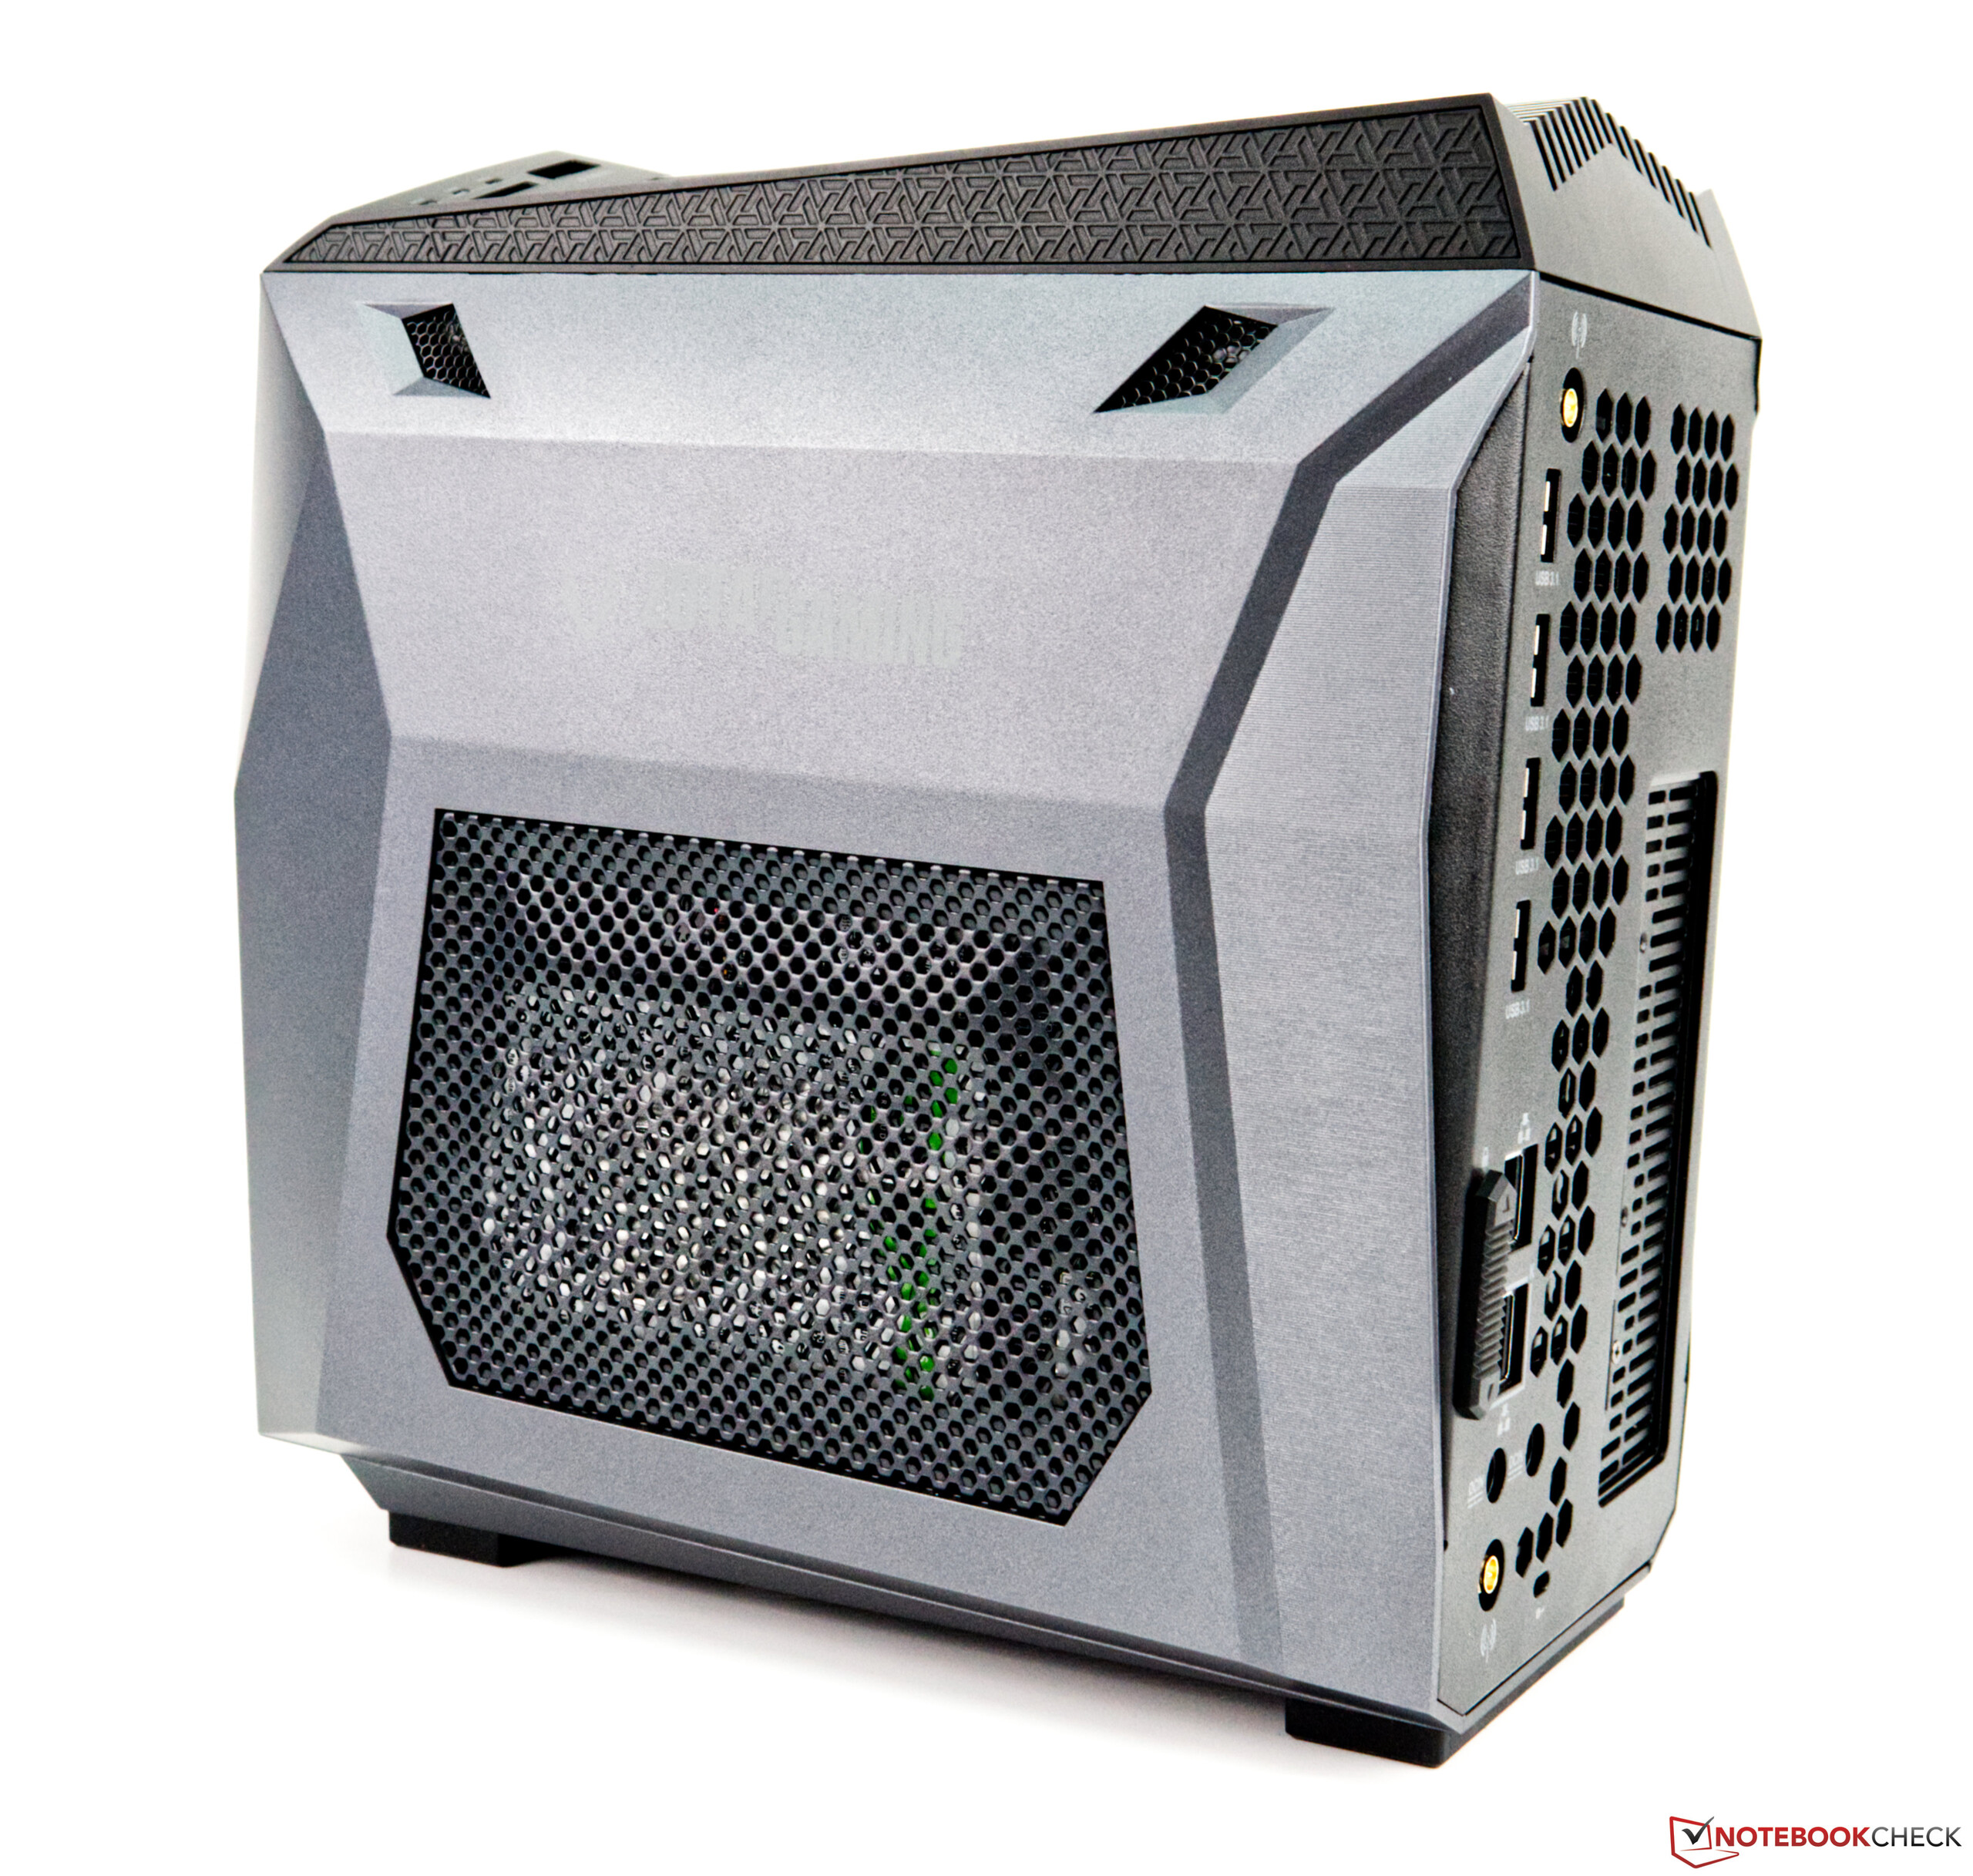
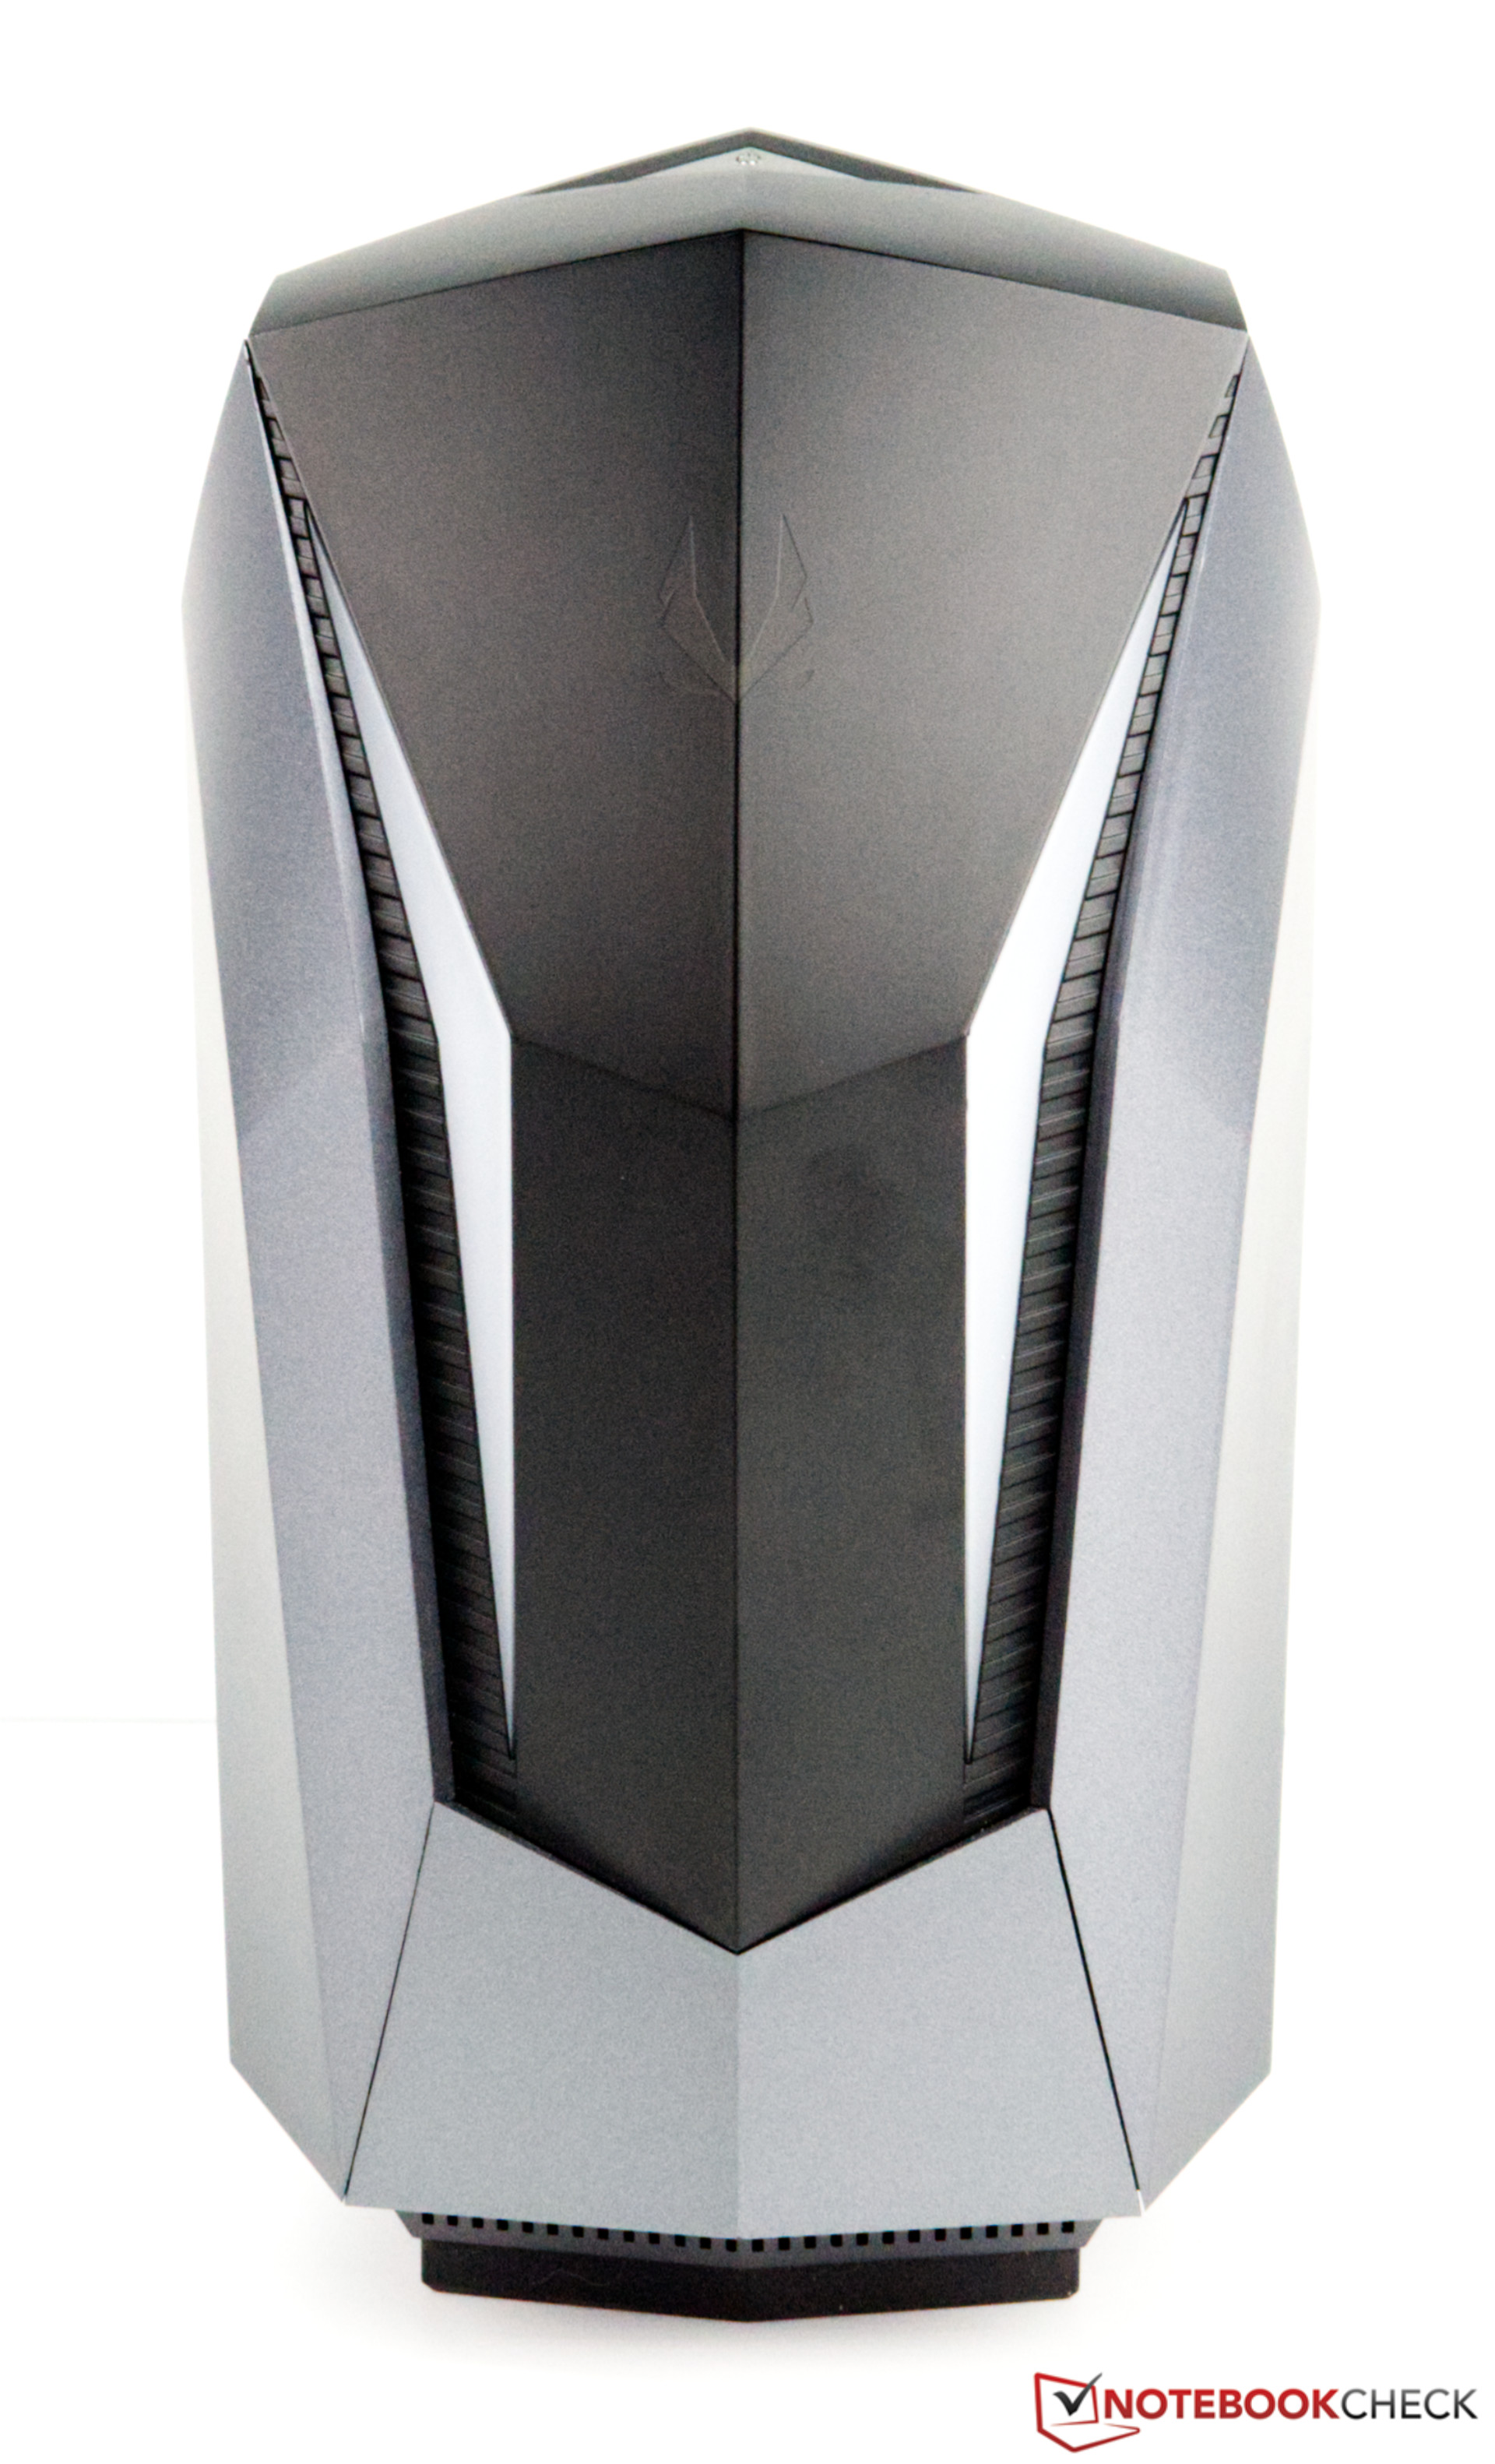
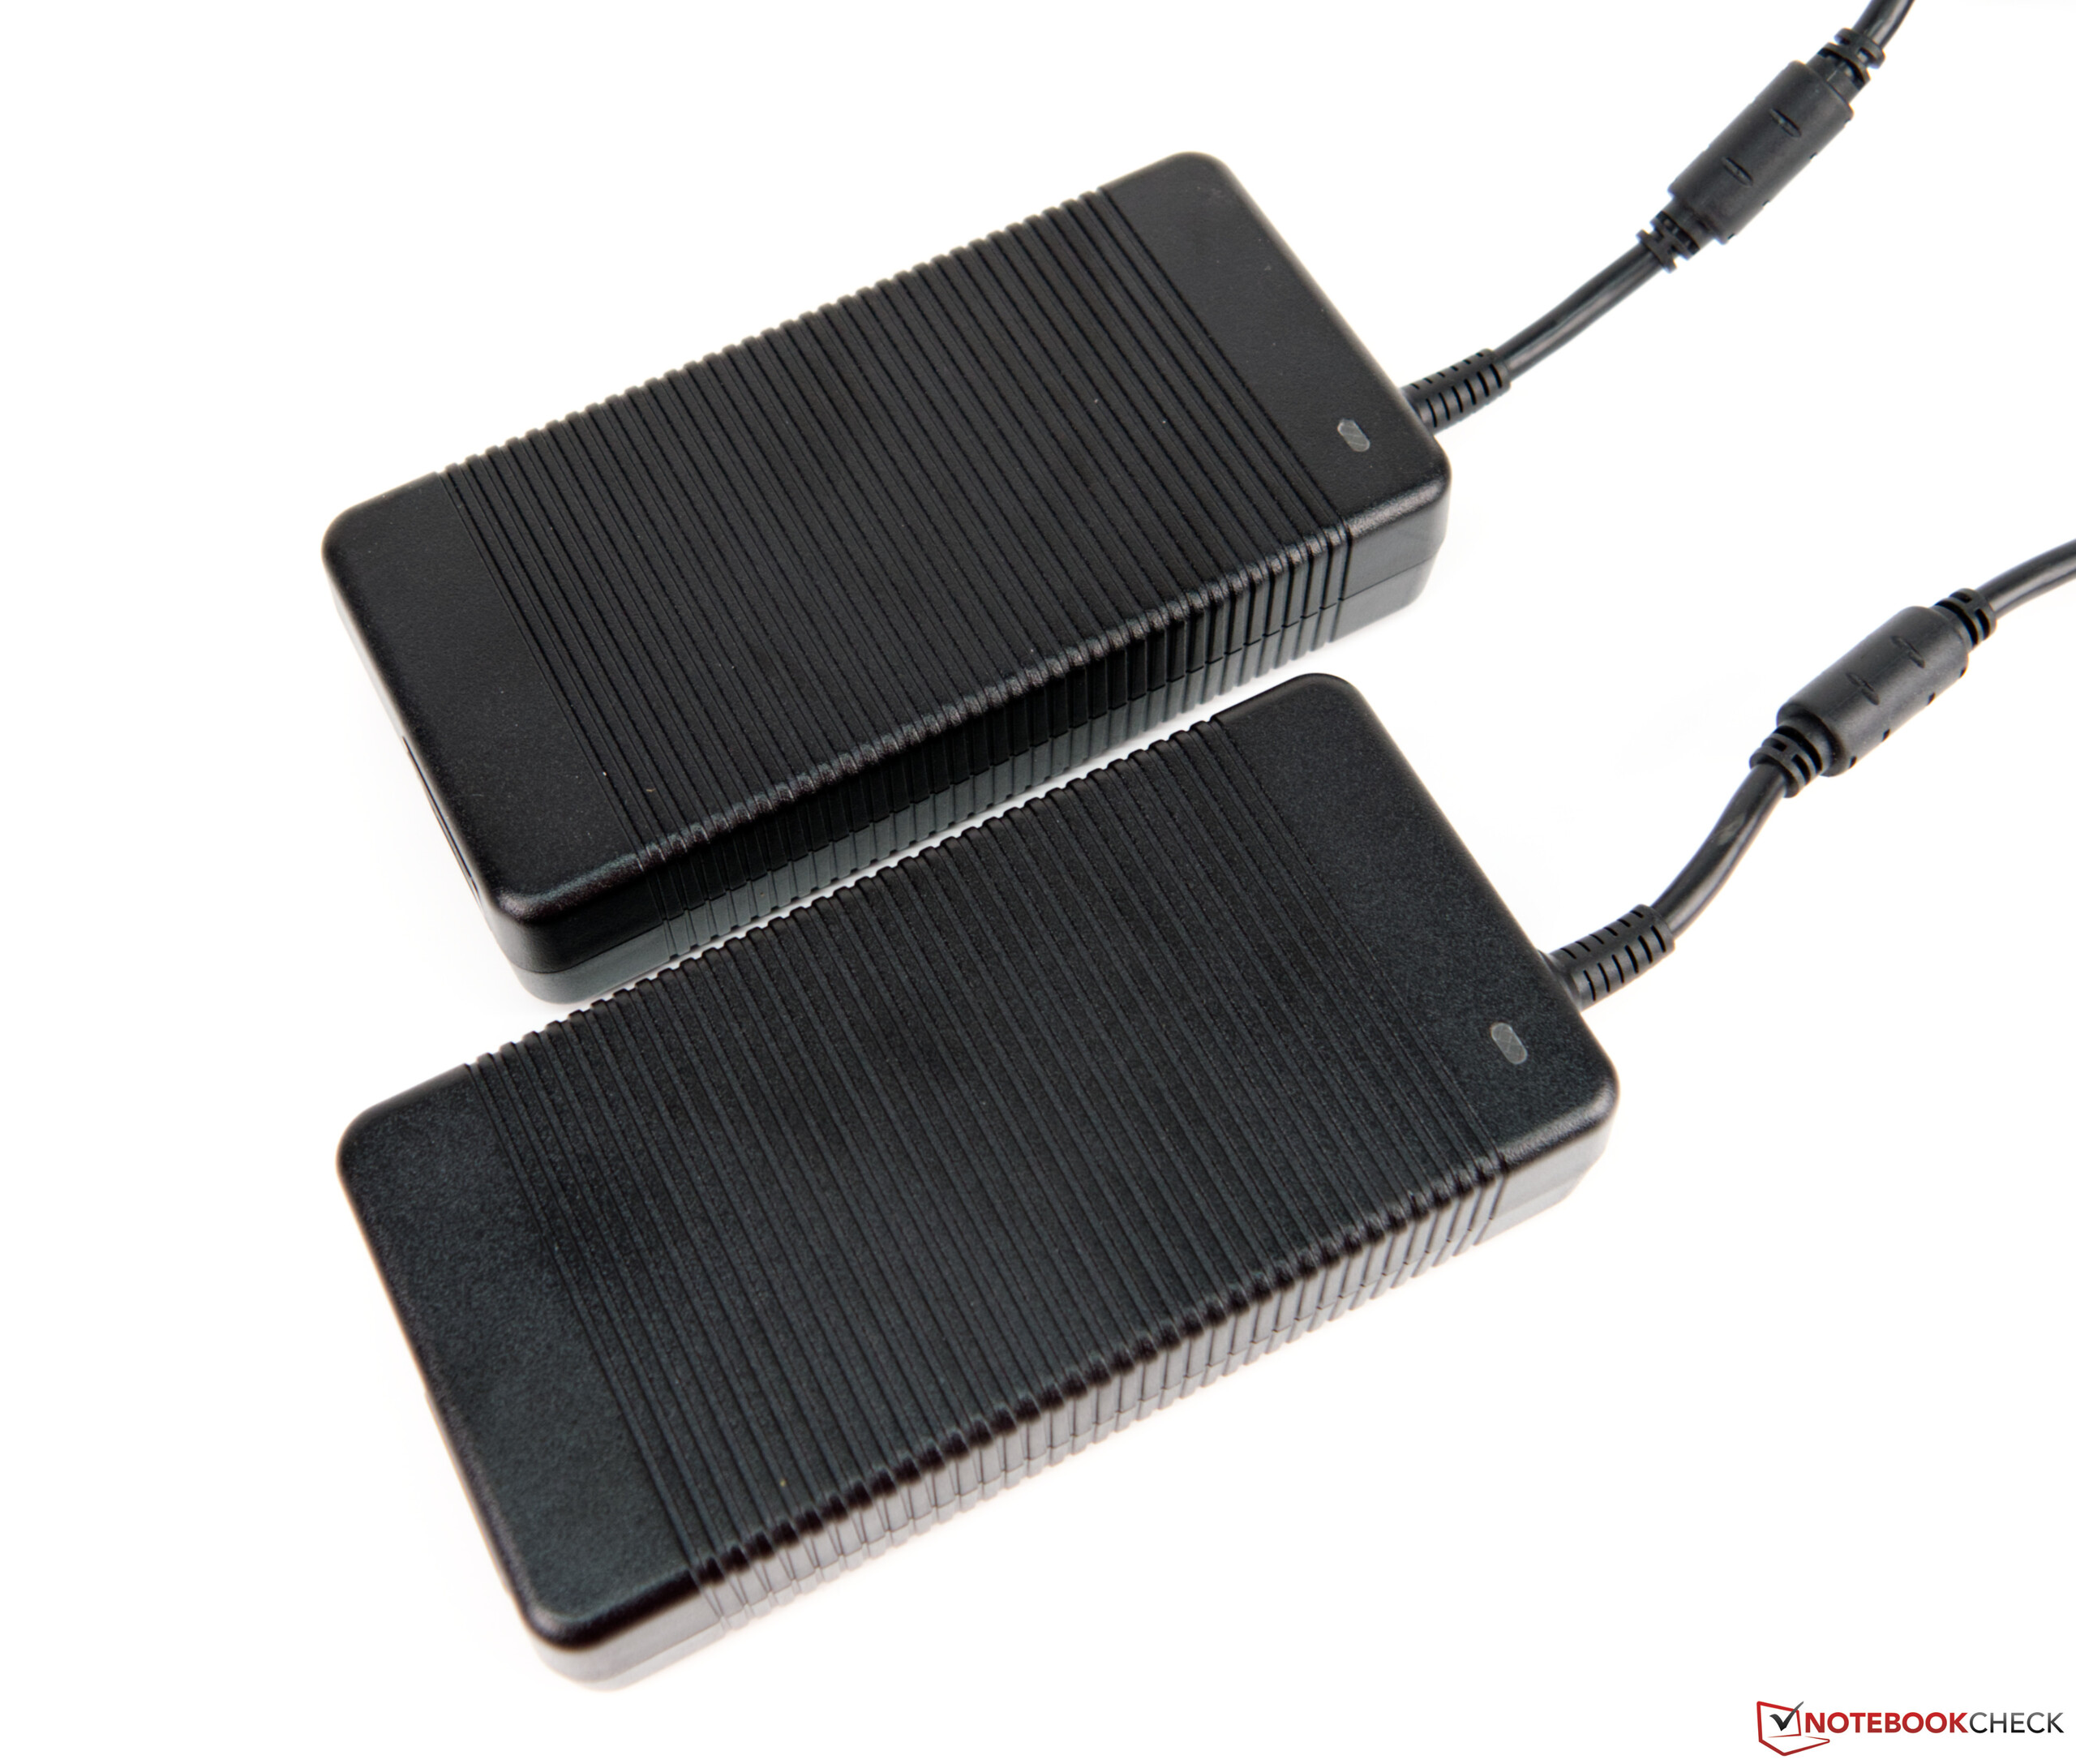
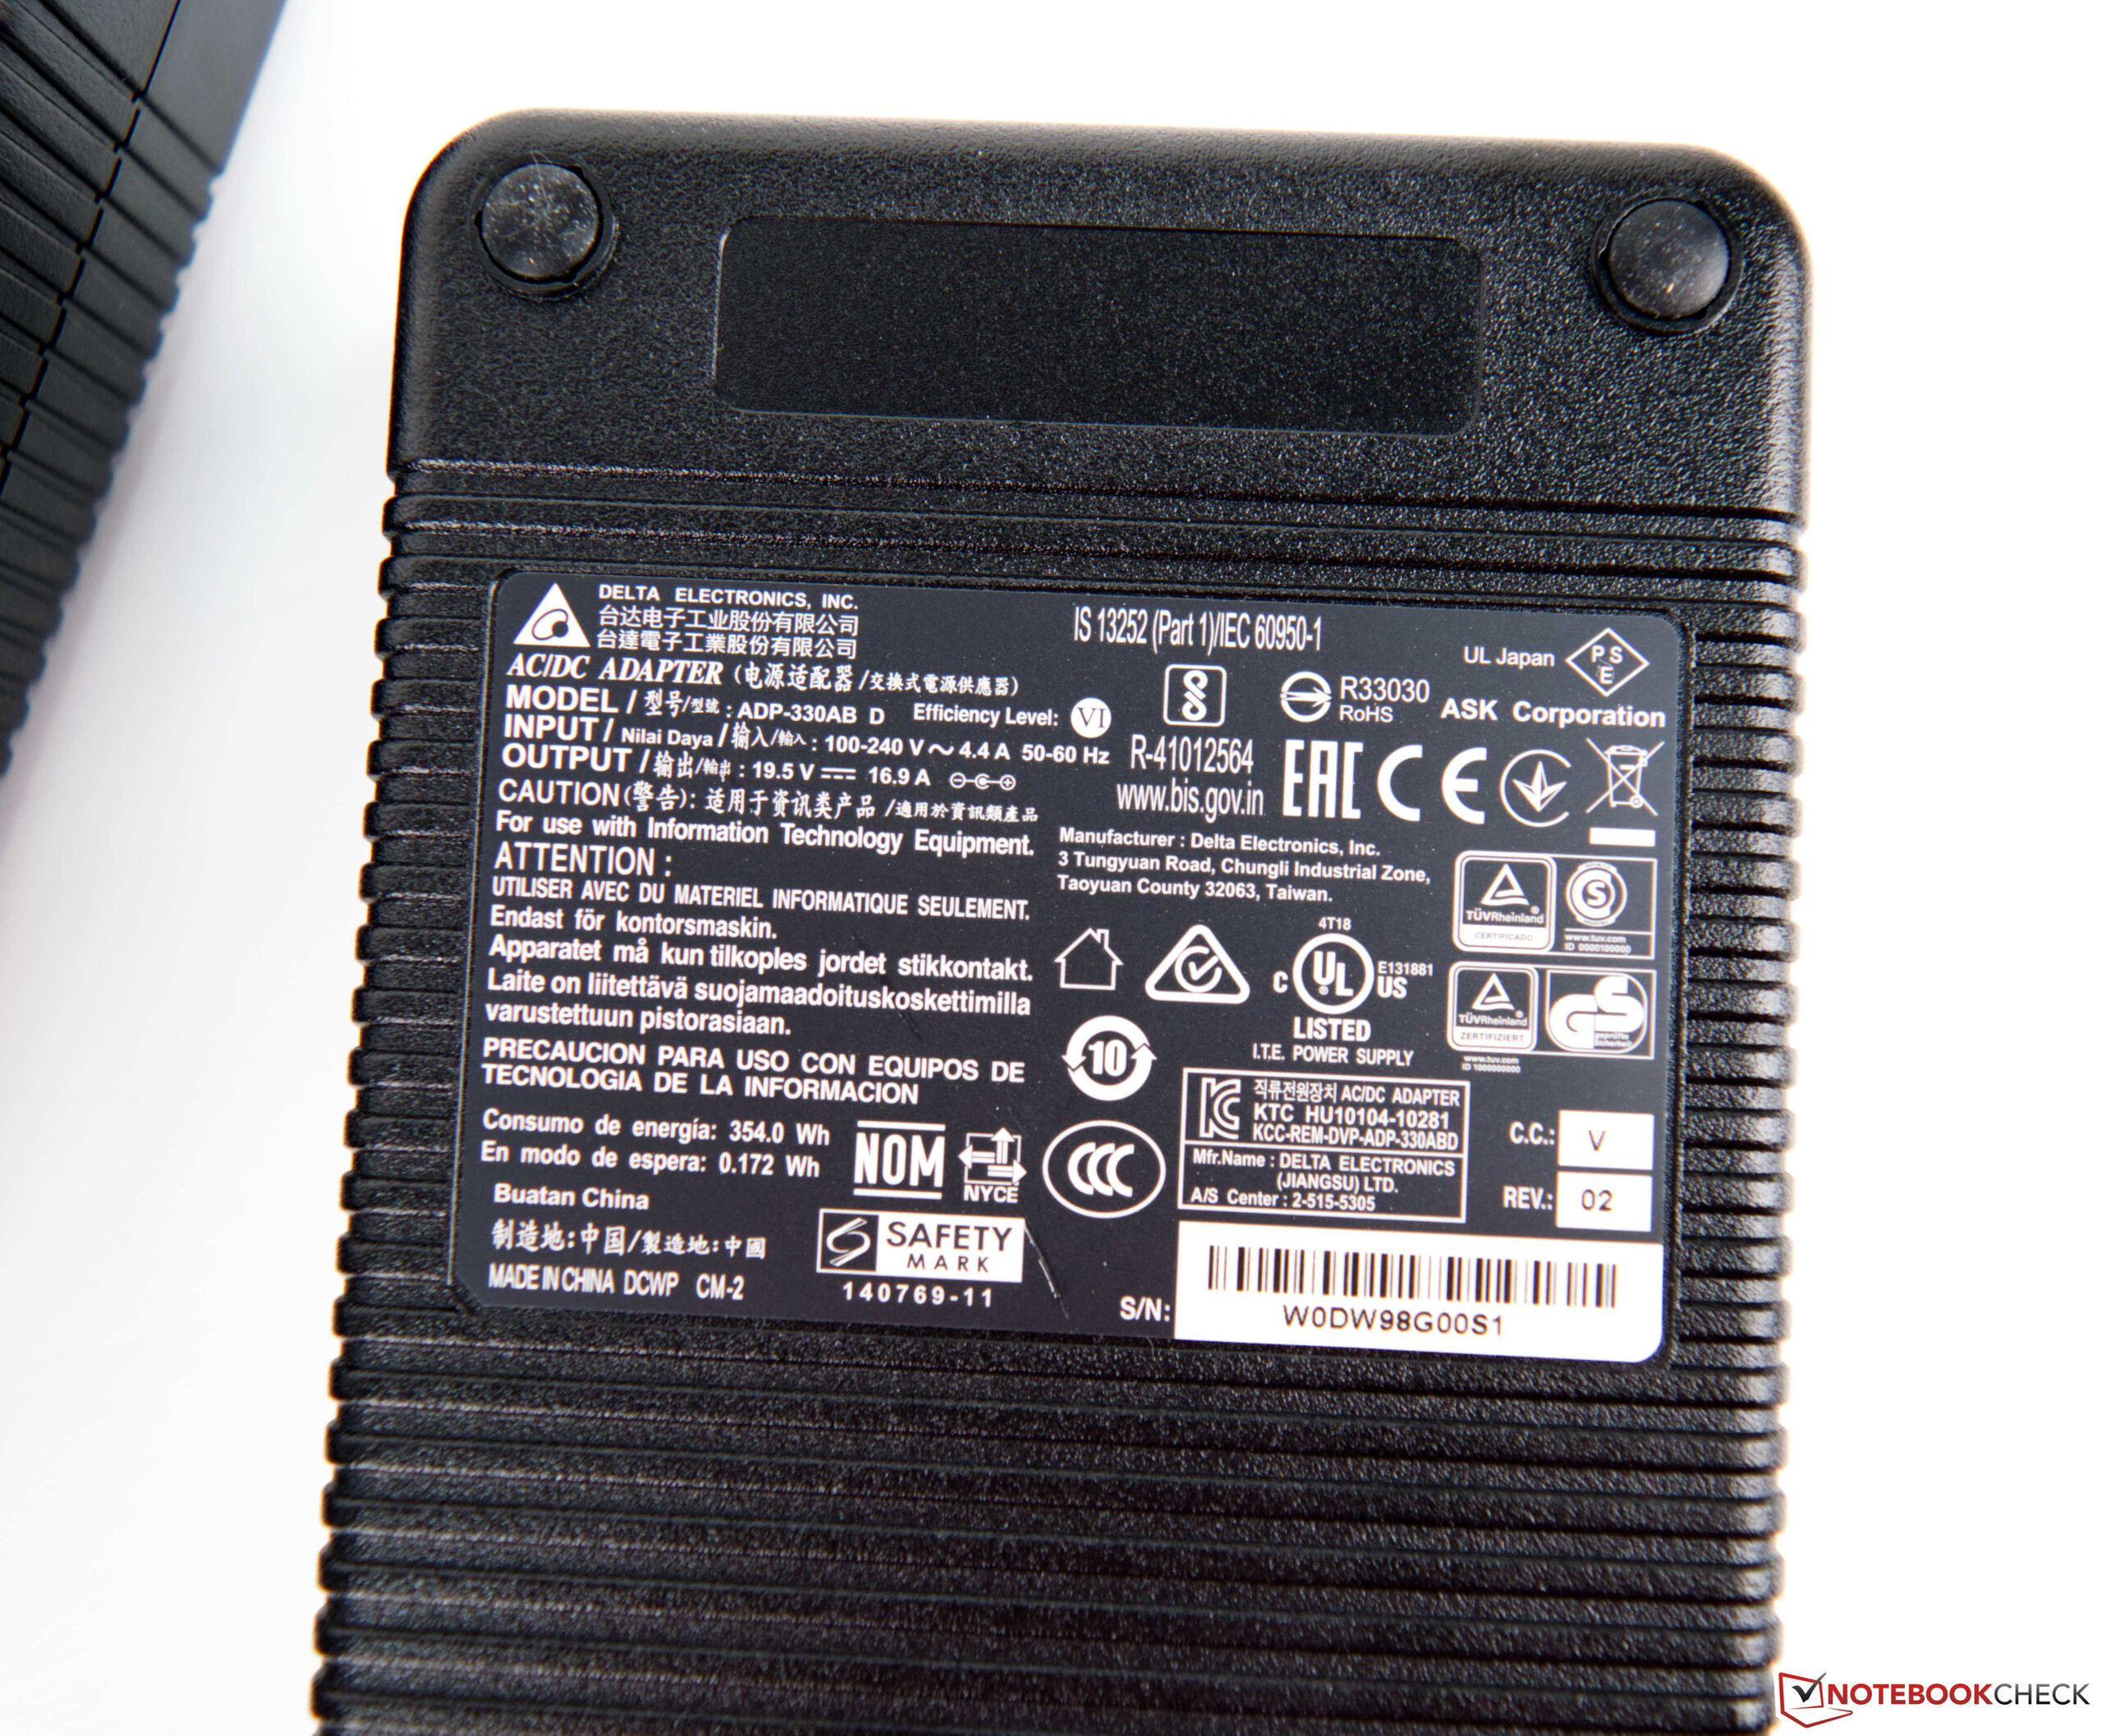
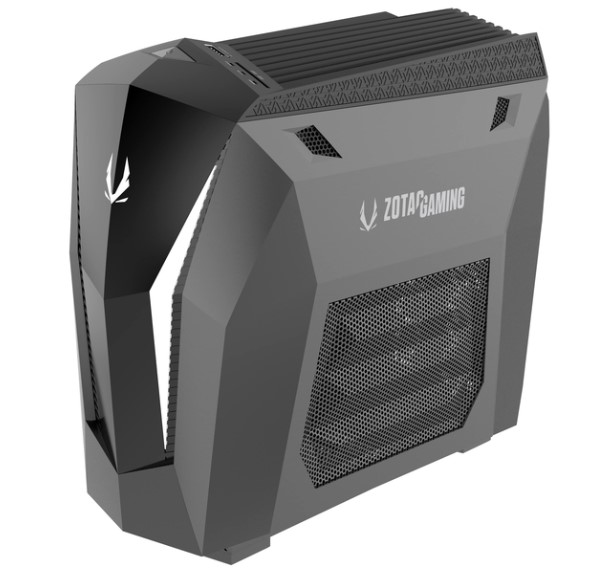
The external dimensions are very small at 136 x 259 x 261 millimeters (W x H x D) if we consider that this is a gaming PC. However, the manufacturer cheats a bit here since there is no power supply built into the case. This is located externally and is also required in a double implementation. Our model comes with two 330-watt power supply units, and the somewhat weaker version of the MEK MINI needs 2x 230 watts. Optically, the device looks modern, and enough fresh air can be sucked in to cool the installed components through the lateral ventilation grilles. Viewed from the front, the right side cover can be easily and quickly removed without tools in order to access the RAM or storage. But those who want to quickly remove the graphics card will be in for a nasty surprise since almost the entire device needs to be disassembled for this.
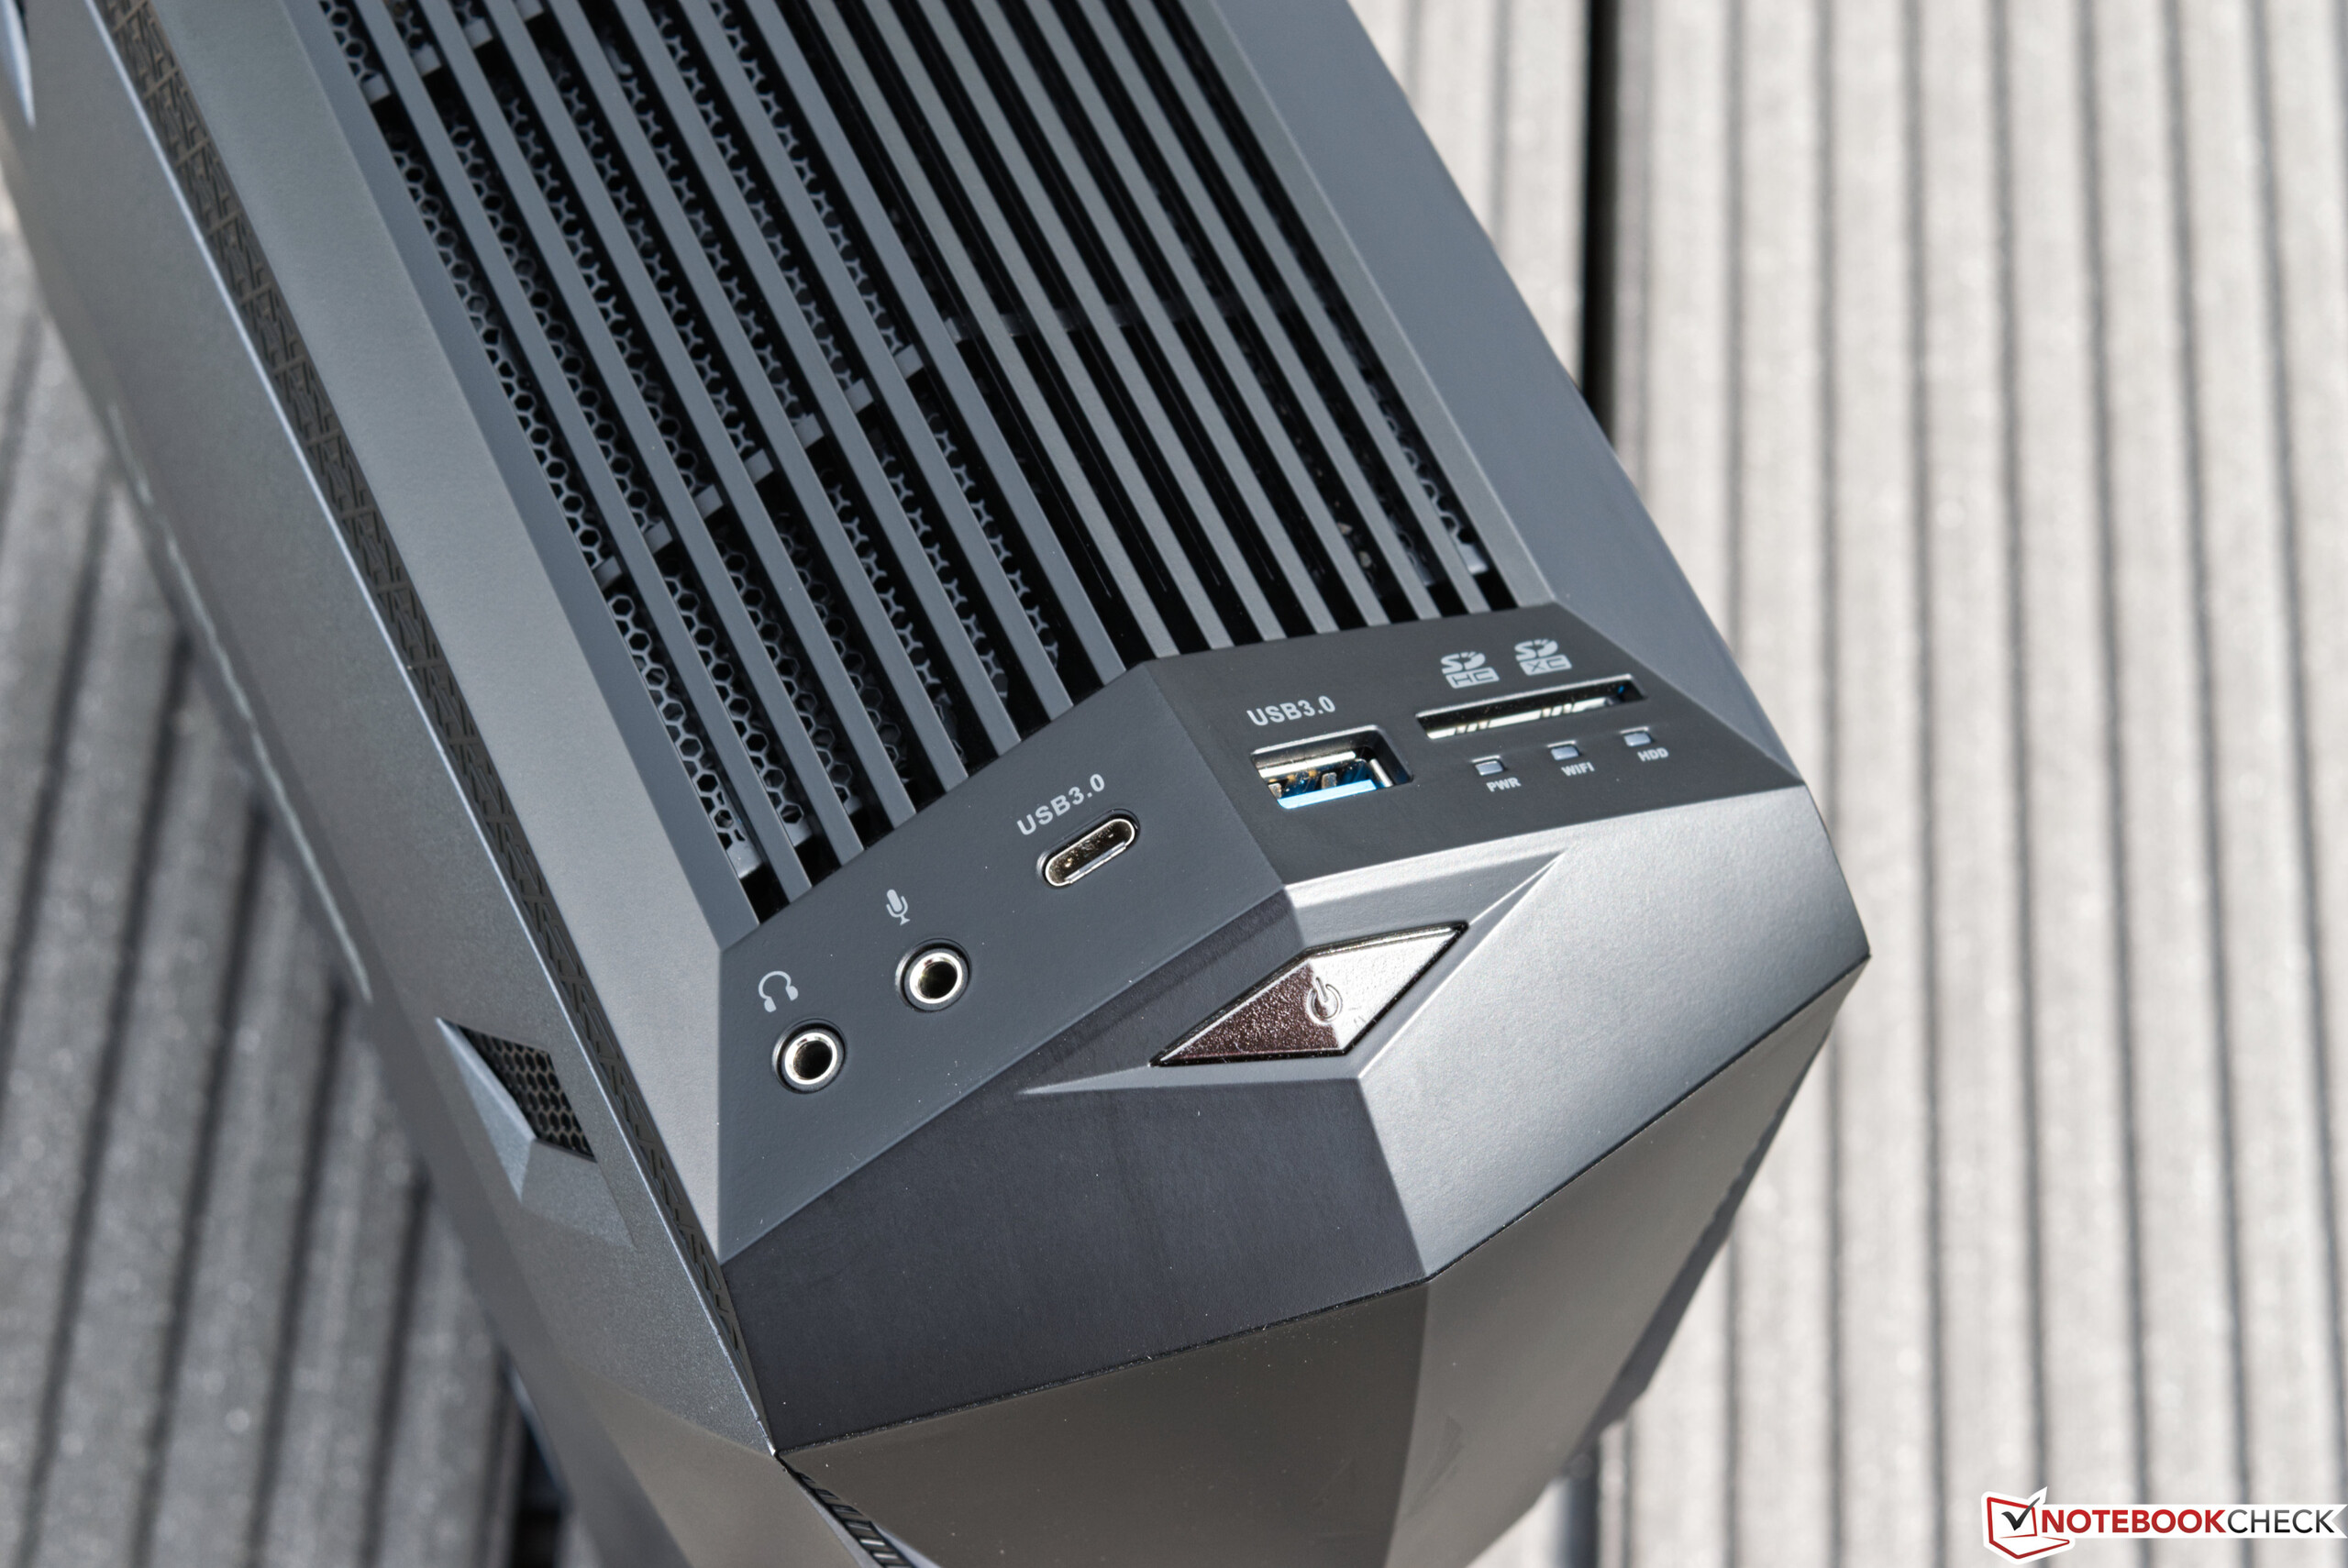
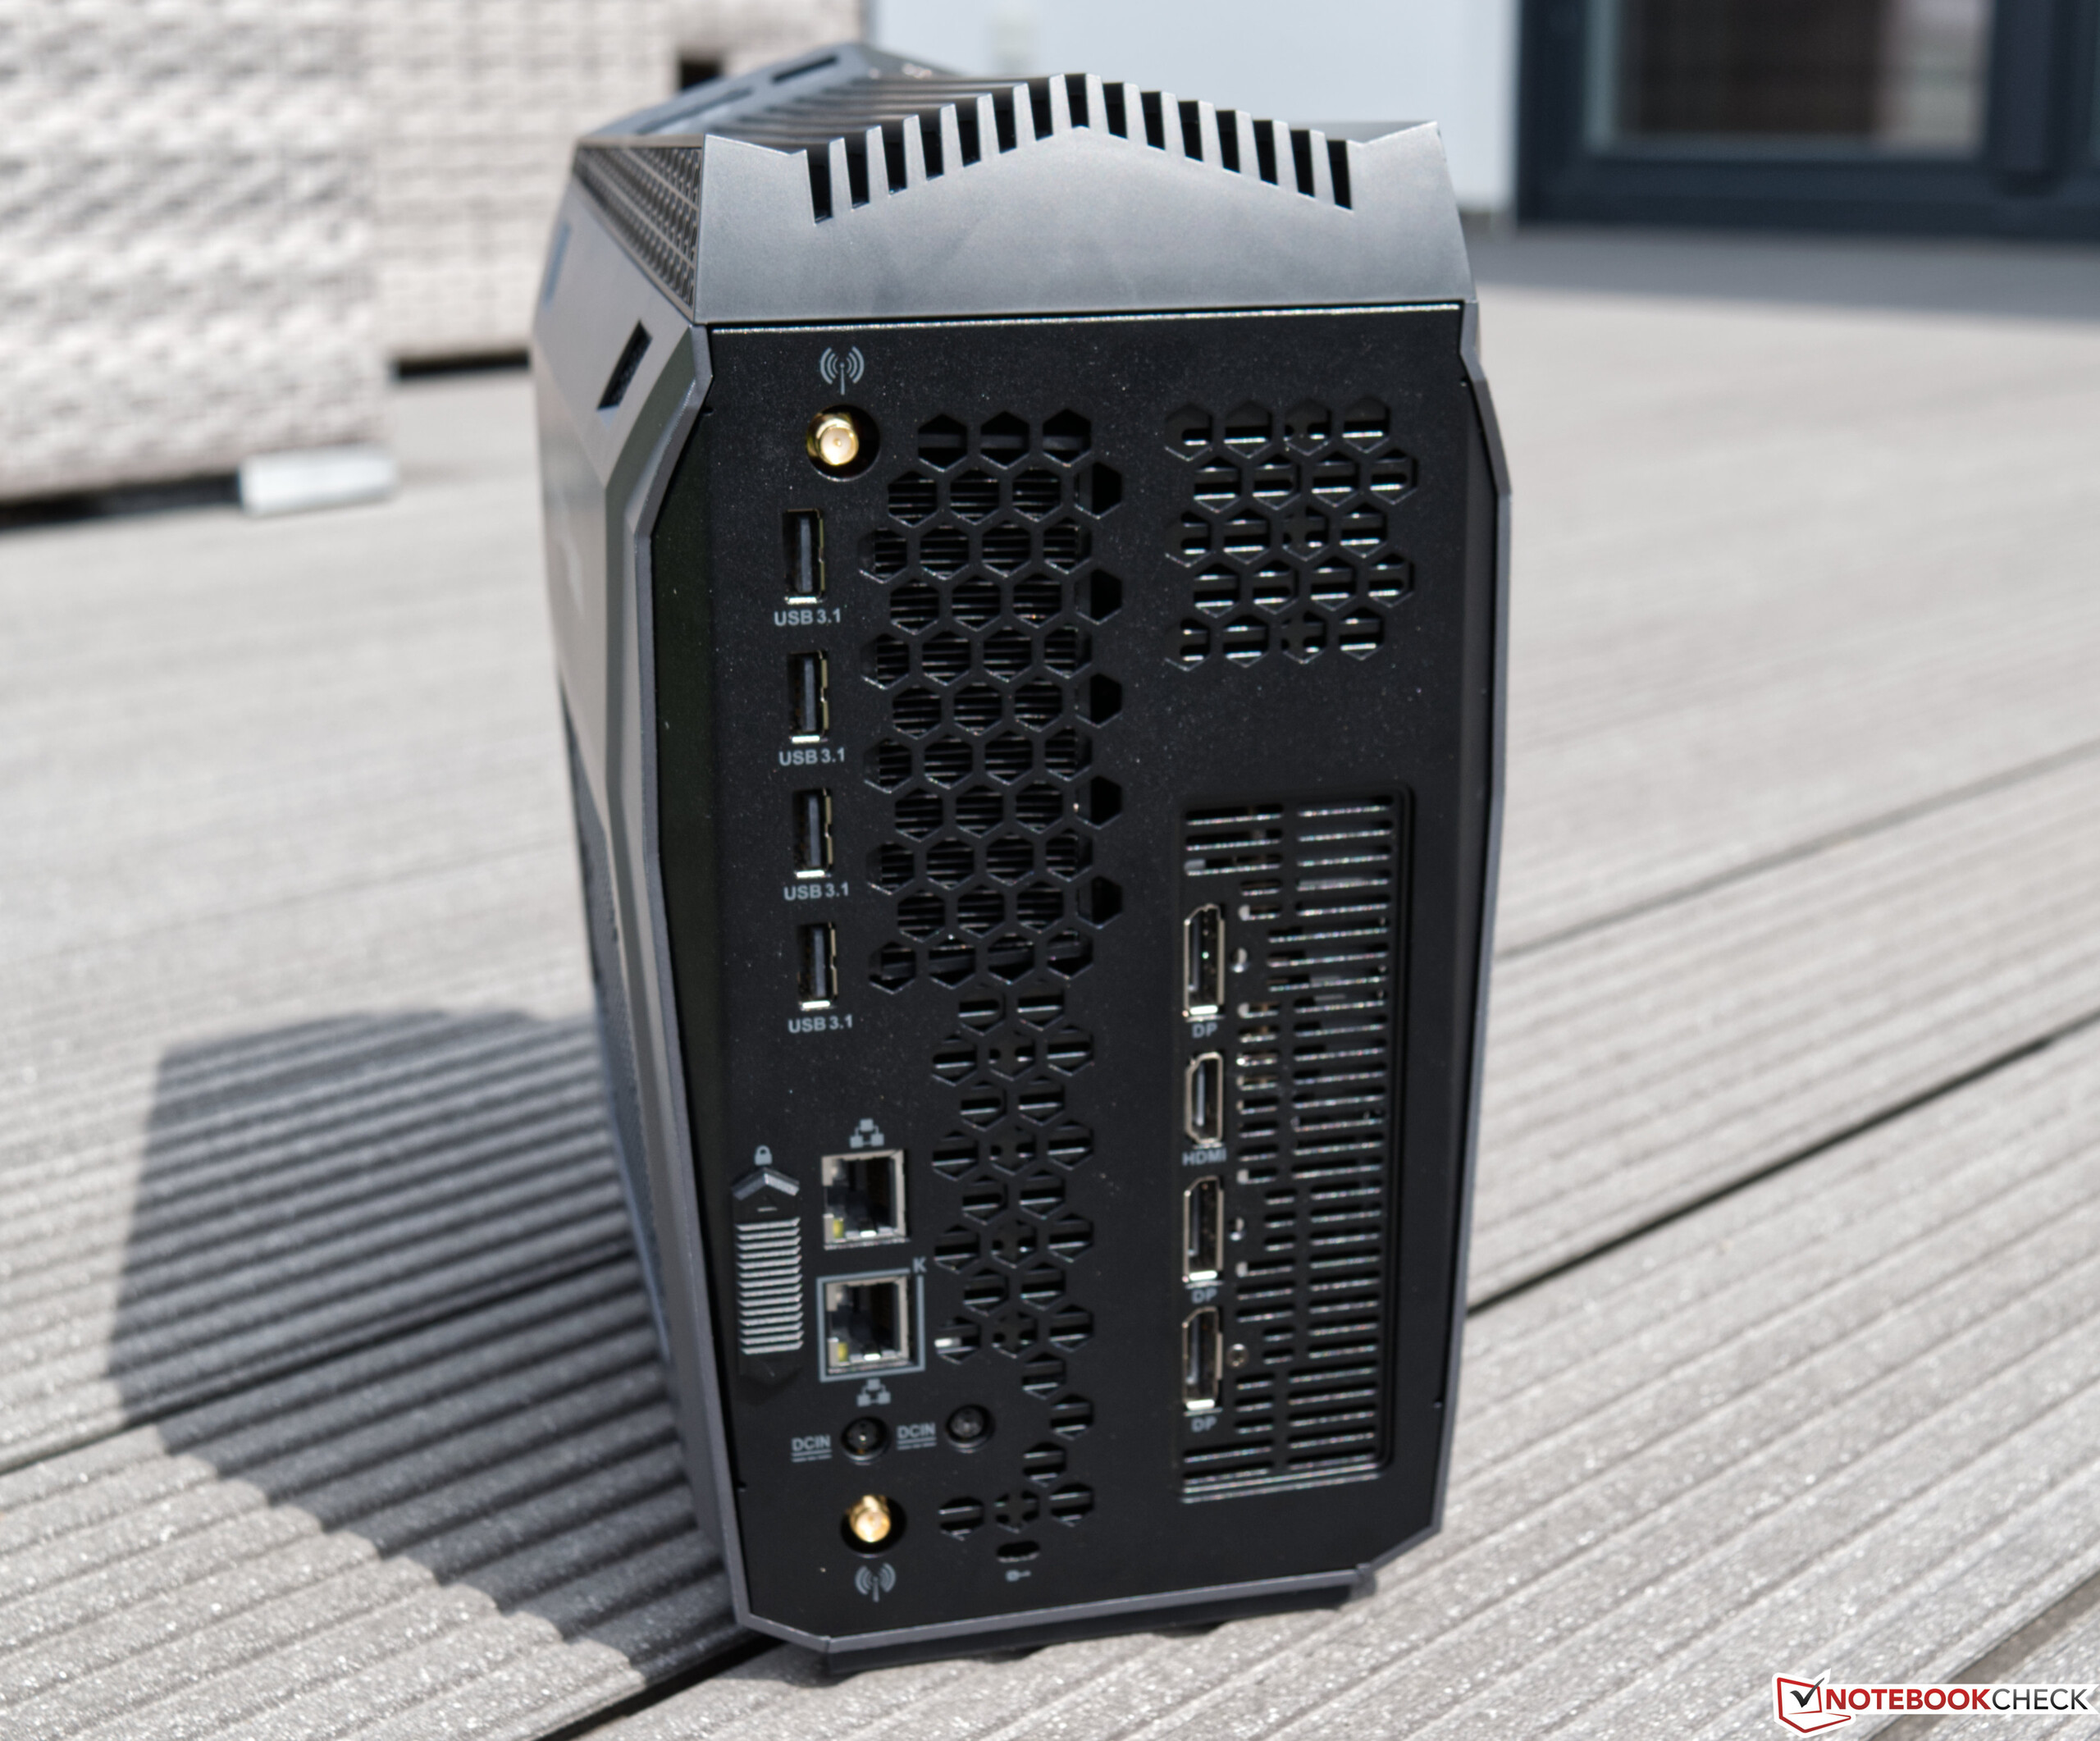
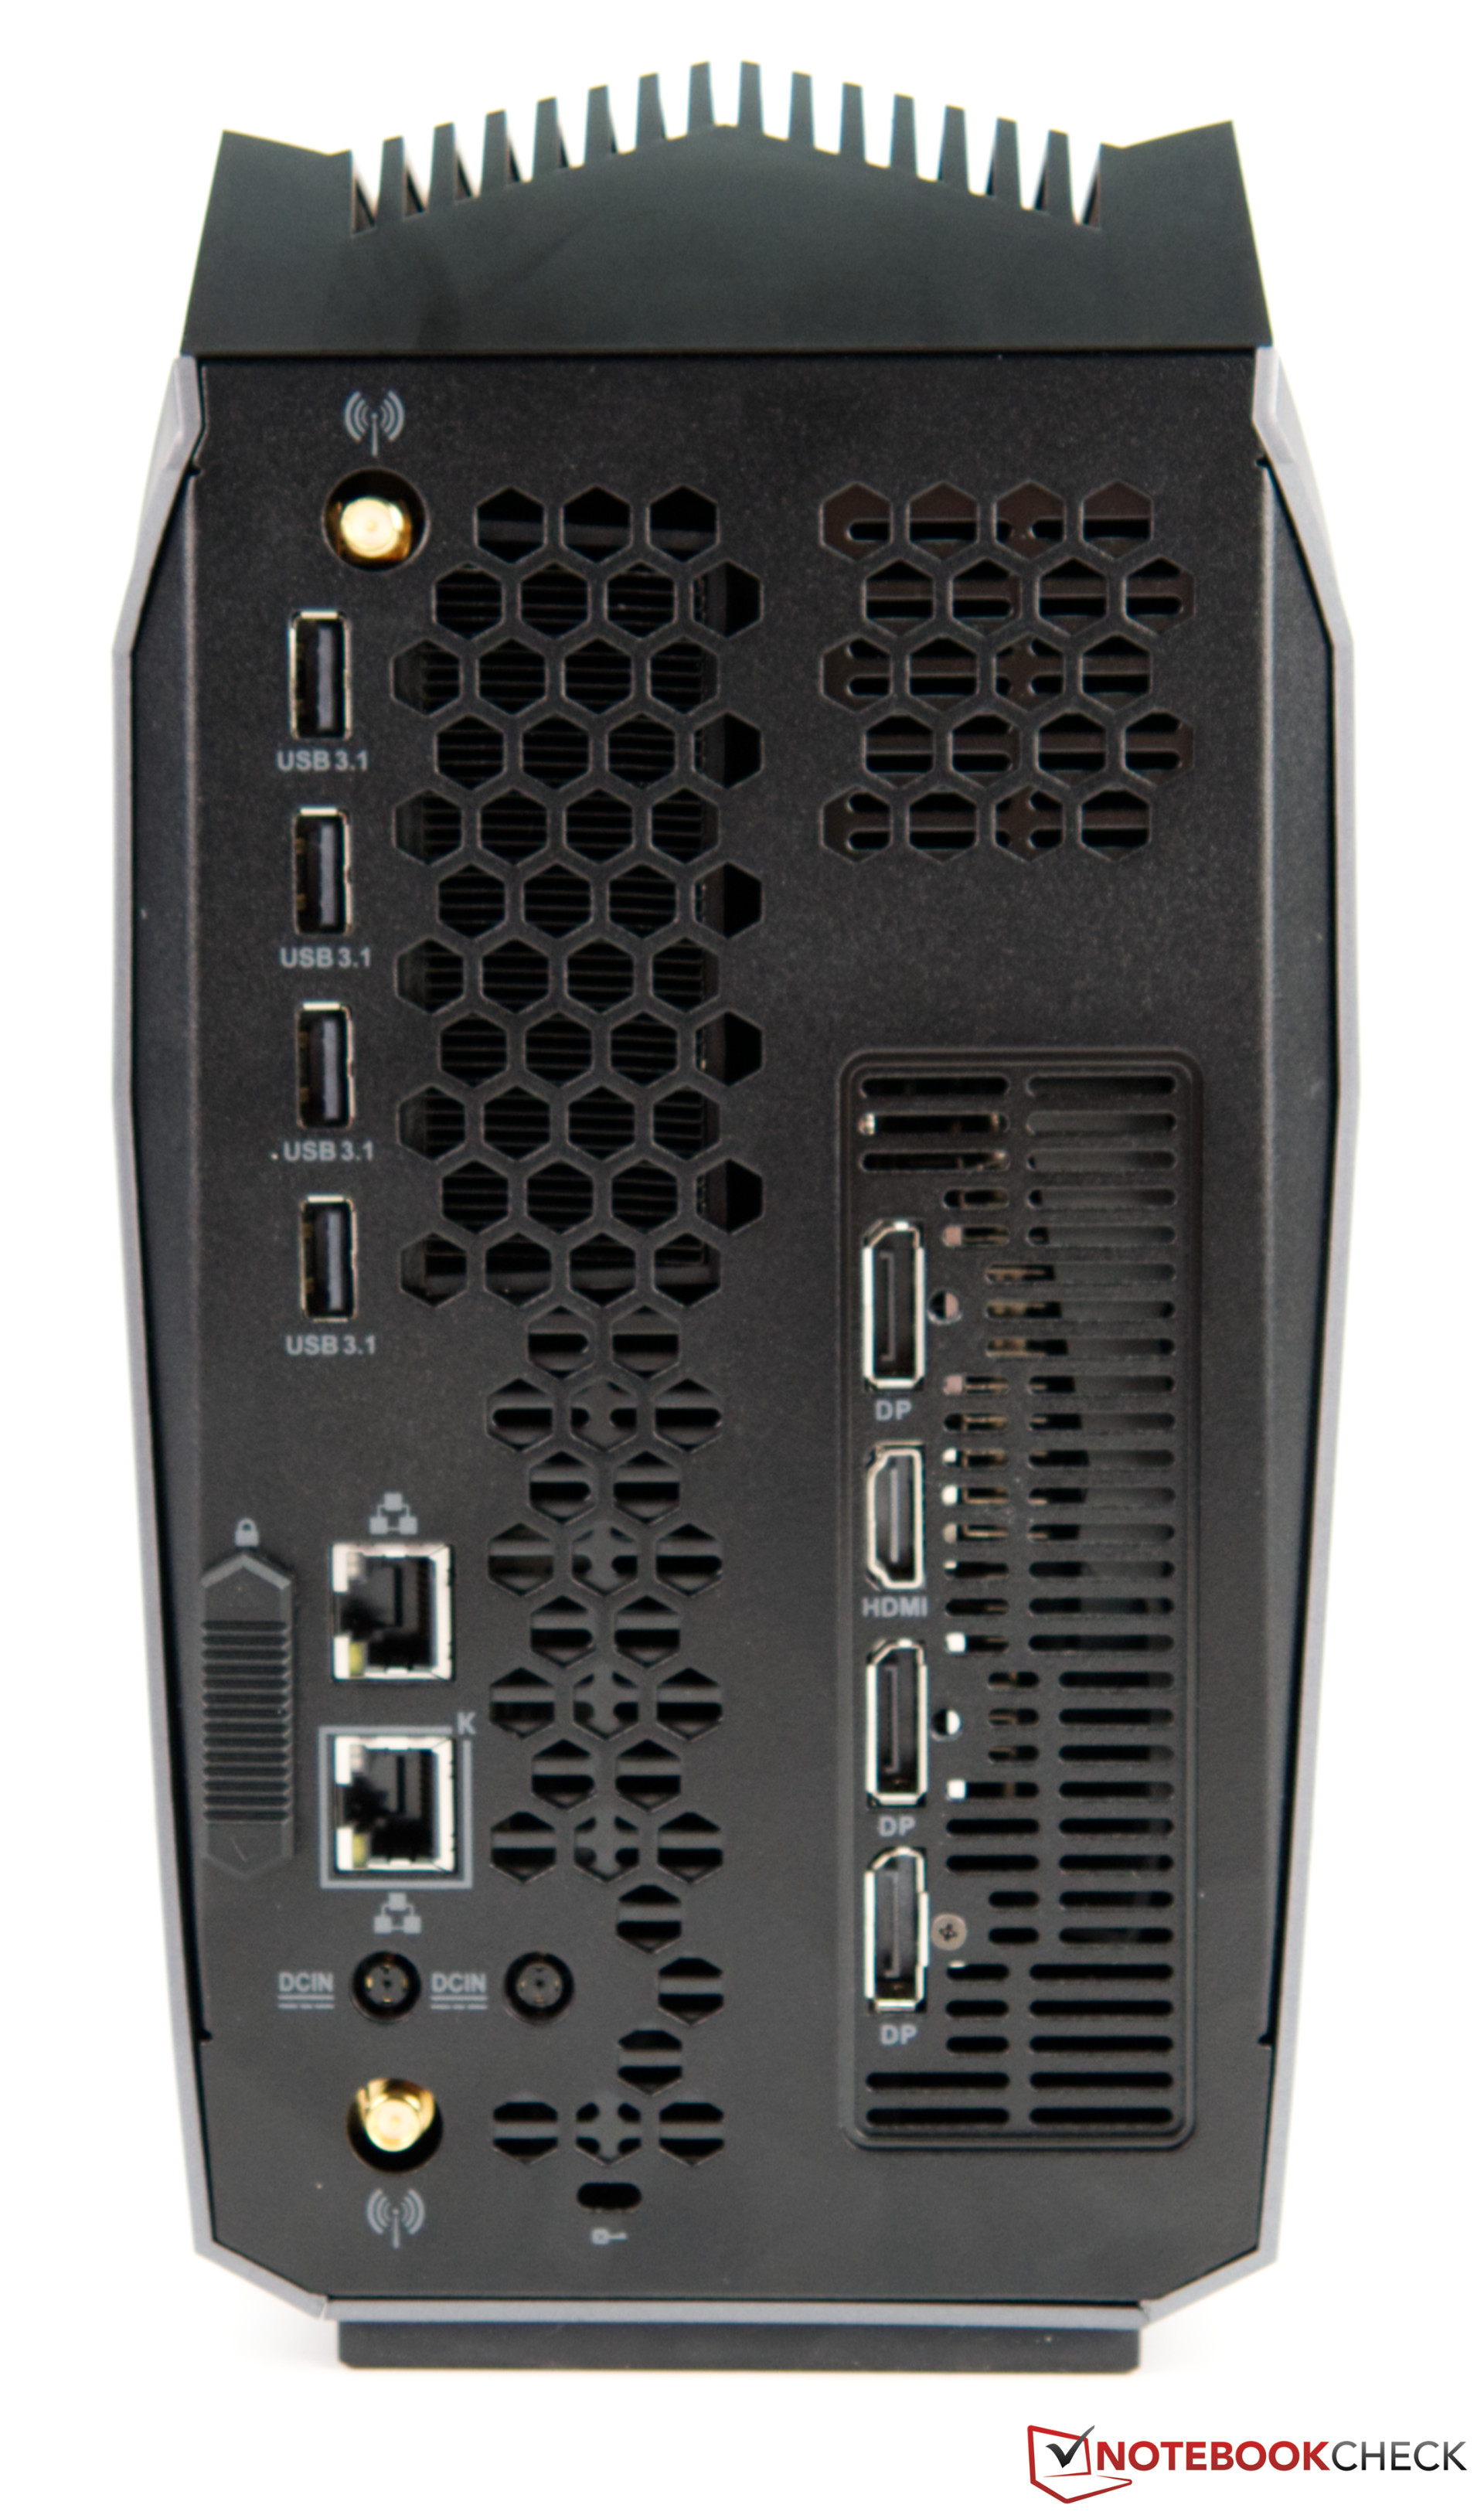
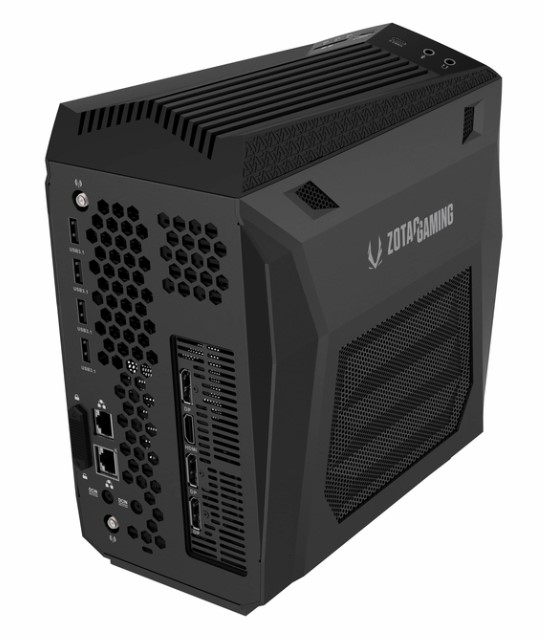
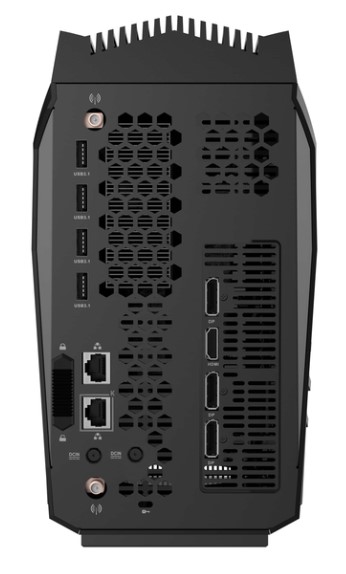
When it comes to the ports, they include everything your heart desires. Most of the external connections are located on the back. But you can also quickly insert a USB stick or SD card on the top of the front side.
Processor benchmarks
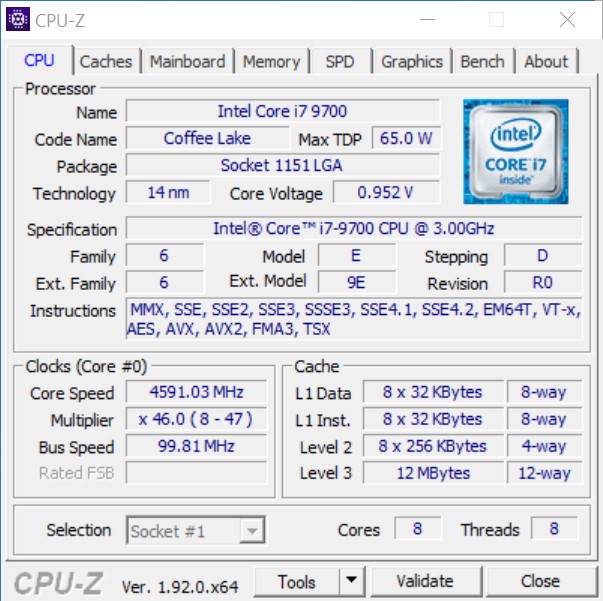
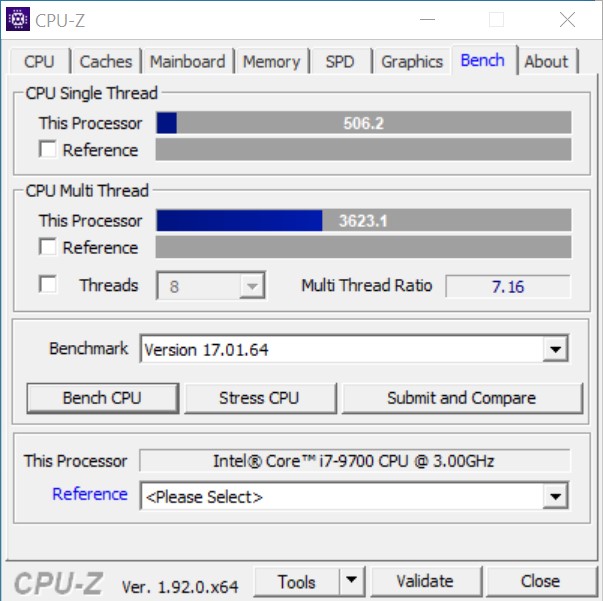
The Intel Core i7-9700 is an octa-core processor with a TDP of 65 watts. The base clock speed is 3.0 GHz, and the maximum boost speed is specified at 4.7 GHz. In our test sample, the Core i7-9700 reaches a result that was to be expected. It's faster than the Intel Core i5-9600K and slightly slower than an Intel Core i7-9700K. Since Zotac offers the MEK MINI in the cheaper configuration with an Intel Core i5-9400F, we have also included it in the comparison. As a result, the performance expected with the cheaper model can be deduced here.
For further comparisons and benchmarks, we point you to our CPU comparison table.
| Cinebench R10 | |
| Rendering Single CPUs 64Bit | |
| Intel Core i9-10900K, Intel Core i9-10900K | |
| AMD Ryzen 9 3950X, AMD Ryzen 9 3950X | |
| Corsair One i160, Intel Core i9-9900K | |
| Zotac MEK Mini (RTX 2070 Super), Intel Core i7-9700 | |
| Intel Core i7-9700K, AMD Radeon RX Vega 64, Intel Core i7-9700K | |
| Intel Core i5-10600K, Intel Core i5-10600K | |
| Intel Core i5-9600K, AMD Radeon RX Vega 64, Intel Core i5-9600K | |
| Intel Core i3 9100F, Intel Core i3-9100F | |
| Intel Core i5 9400F, Intel Core i5-9400F | |
| Rendering Multiple CPUs 64Bit | |
| AMD Ryzen 9 3950X, AMD Ryzen 9 3950X | |
| Intel Core i9-10900K, Intel Core i9-10900K | |
| Corsair One i160, Intel Core i9-9900K | |
| Intel Core i7-9700K, AMD Radeon RX Vega 64, Intel Core i7-9700K | |
| Intel Core i5-10600K, Intel Core i5-10600K | |
| Zotac MEK Mini (RTX 2070 Super), Intel Core i7-9700 | |
| Intel Core i5 9400F, Intel Core i5-9400F | |
| Intel Core i5-9600K, AMD Radeon RX Vega 64, Intel Core i5-9600K | |
| Intel Core i3 9100F, Intel Core i3-9100F | |
| Blender - v2.79 BMW27 CPU | |
| Intel Core i3 9100F, Intel Core i3-9100F | |
| Intel Core i5 9400F, Intel Core i5-9400F | |
| Intel Core i5-9600K, AMD Radeon RX Vega 64, Intel Core i5-9600K | |
| Zotac MEK Mini (RTX 2070 Super), Intel Core i7-9700 | |
| Intel Core i7-9700K, AMD Radeon RX Vega 64, Intel Core i7-9700K | |
| Intel Core i5-10600K, Intel Core i5-10600K | |
| Corsair One i160, Intel Core i9-9900K | |
| Intel Core i9-10900K, Intel Core i9-10900K | |
| AMD Ryzen 9 3950X, AMD Ryzen 9 3950X | |
| Geekbench 5.5 | |
| Multi-Core | |
| AMD Ryzen 9 3950X, AMD Ryzen 9 3950X | |
| Intel Core i9-10900K, Intel Core i9-10900K | |
| Intel Core i7-9700K, AMD Radeon RX Vega 64, Intel Core i7-9700K | |
| Intel Core i5-10600K, Intel Core i5-10600K | |
| Zotac MEK Mini (RTX 2070 Super), Intel Core i7-9700 | |
| Intel Core i5-9600K, AMD Radeon RX Vega 64, Intel Core i5-9600K | |
| Intel Core i5 9400F, Intel Core i5-9400F | |
| Intel Core i3 9100F, Intel Core i3-9100F | |
| Single-Core | |
| Intel Core i9-10900K, Intel Core i9-10900K | |
| Zotac MEK Mini (RTX 2070 Super), Intel Core i7-9700 | |
| AMD Ryzen 9 3950X, AMD Ryzen 9 3950X | |
| Intel Core i7-9700K, AMD Radeon RX Vega 64, Intel Core i7-9700K | |
| Intel Core i5-10600K, Intel Core i5-10600K | |
| Intel Core i5-9600K, AMD Radeon RX Vega 64, Intel Core i5-9600K | |
| Intel Core i3 9100F, Intel Core i3-9100F | |
| Intel Core i5 9400F, Intel Core i5-9400F | |
| Geekbench 4.4 | |
| 64 Bit Single-Core Score | |
| Intel Core i9-10900K, Intel Core i9-10900K | |
| Intel Core i7-9700K, AMD Radeon RX Vega 64, Intel Core i7-9700K | |
| Corsair One i160, Intel Core i9-9900K | |
| Intel Core i5-9600K, AMD Radeon RX Vega 64, Intel Core i5-9600K | |
| Intel Core i5-10600K, Intel Core i5-10600K | |
| Zotac MEK Mini (RTX 2070 Super), Intel Core i7-9700 | |
| AMD Ryzen 9 3950X, AMD Ryzen 9 3950X | |
| Intel Core i5 9400F, Intel Core i5-9400F | |
| Intel Core i3 9100F, Intel Core i3-9100F | |
| 64 Bit Multi-Core Score | |
| AMD Ryzen 9 3950X, AMD Ryzen 9 3950X | |
| Intel Core i9-10900K, Intel Core i9-10900K | |
| Corsair One i160, Intel Core i9-9900K | |
| Intel Core i7-9700K, AMD Radeon RX Vega 64, Intel Core i7-9700K | |
| Intel Core i5-10600K, Intel Core i5-10600K | |
| Zotac MEK Mini (RTX 2070 Super), Intel Core i7-9700 | |
| Intel Core i5-9600K, AMD Radeon RX Vega 64, Intel Core i5-9600K | |
| Intel Core i5 9400F, Intel Core i5-9400F | |
| Intel Core i3 9100F, Intel Core i3-9100F | |
| 3DMark 11 - 1280x720 Performance Physics | |
| Intel Core i9-10900K, Intel Core i9-10900K | |
| AMD Ryzen 9 3950X, AMD Ryzen 9 3950X | |
| Corsair One i160, Intel Core i9-9900K | |
| Intel Core i7-9700K, AMD Radeon RX Vega 64, Intel Core i7-9700K | |
| Intel Core i5-10600K, Intel Core i5-10600K | |
| Zotac MEK Mini (RTX 2070 Super), Intel Core i7-9700 | |
| Intel Core i5-9600K, AMD Radeon RX Vega 64, Intel Core i5-9600K | |
| Intel Core i5 9400F, Intel Core i5-9400F | |
| Intel Core i3 9100F, Intel Core i3-9100F | |
| HWBOT x265 Benchmark v2.2 - 4k Preset | |
| Intel Core i9-10900K, Intel Core i9-10900K | |
| Corsair One i160, Intel Core i9-9900K | |
| AMD Ryzen 9 3950X, AMD Ryzen 9 3950X | |
| Intel Core i7-9700K, AMD Radeon RX Vega 64, Intel Core i7-9700K | |
| Intel Core i5-10600K, Intel Core i5-10600K | |
| Zotac MEK Mini (RTX 2070 Super), Intel Core i7-9700 | |
| Intel Core i5 9400F, Intel Core i5-9400F | |
| Intel Core i5-9600K, AMD Radeon RX Vega 64, Intel Core i5-9600K | |
| Intel Core i3 9100F, Intel Core i3-9100F | |
* ... smaller is better
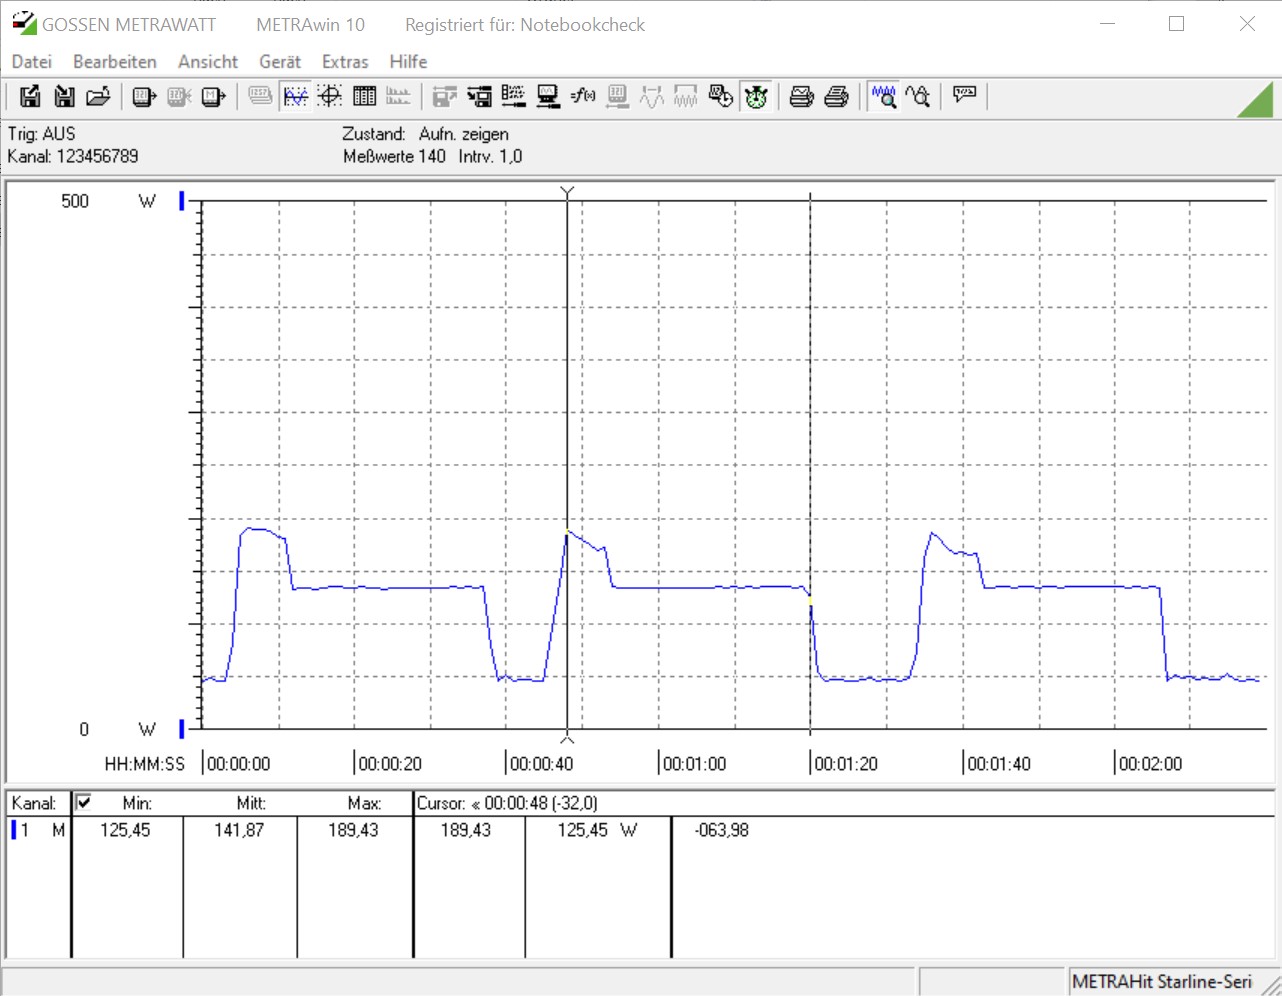
The Zotac MEK MINI in the Cinebench R15 multi-loop
Due to the very compact design, it's very interesting how the Intel Core i7-9700 performs in the Cinebench R15 multi-loop. After the first run, where Turbo could still be fully utilized, the performance gets a bit throttled. Nevertheless, at an average of 1,226 points, the performance is still on a high level.
Application performance
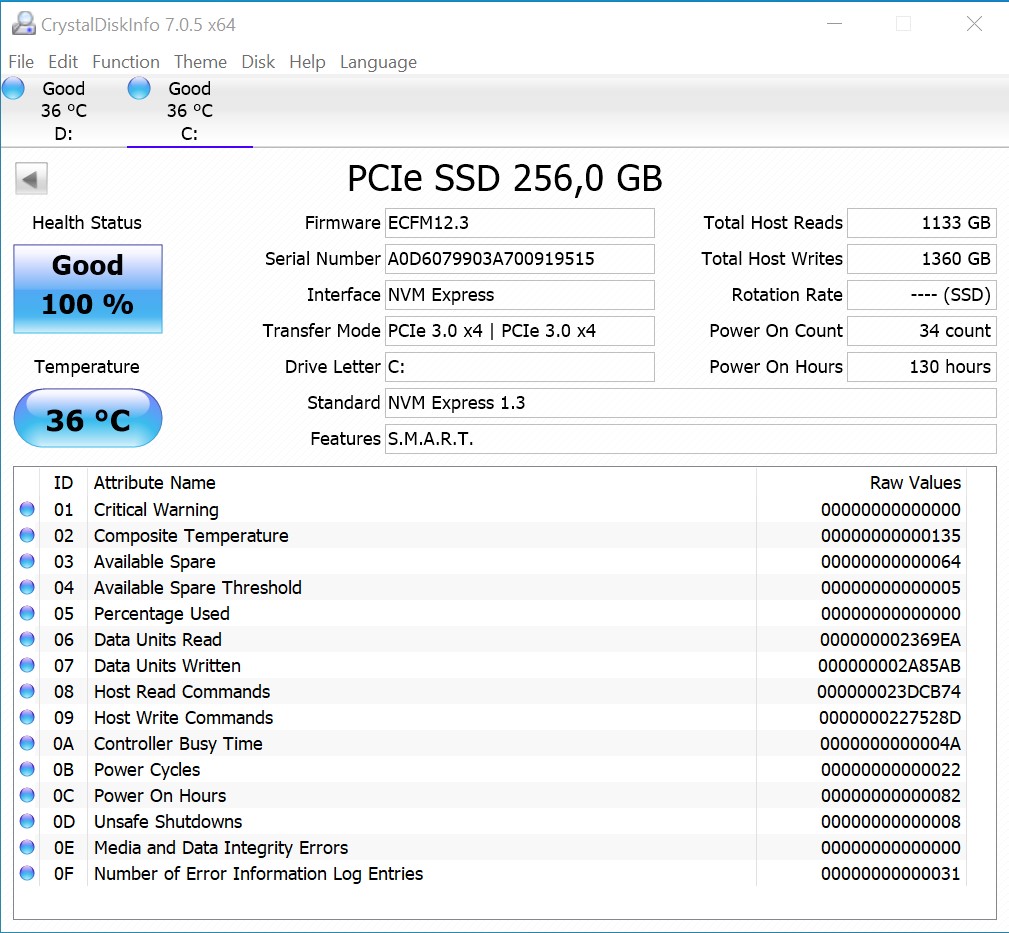
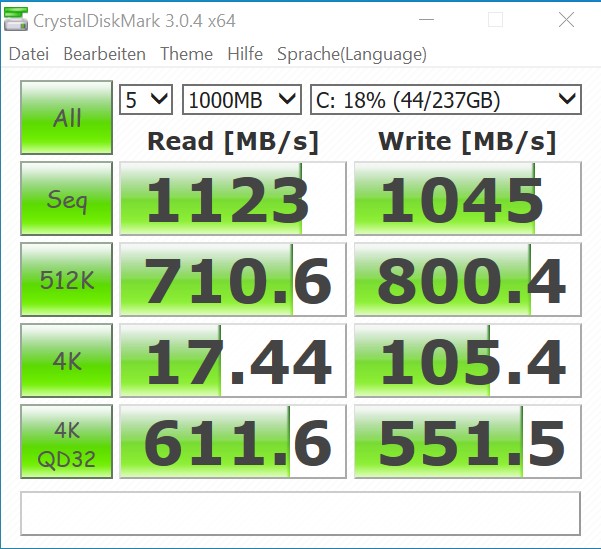
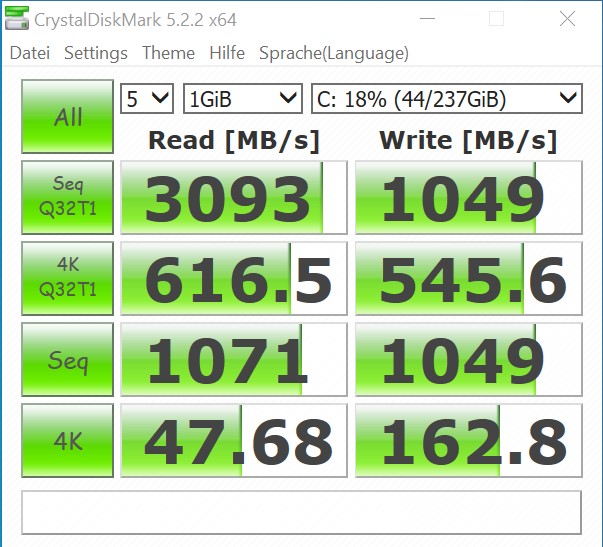
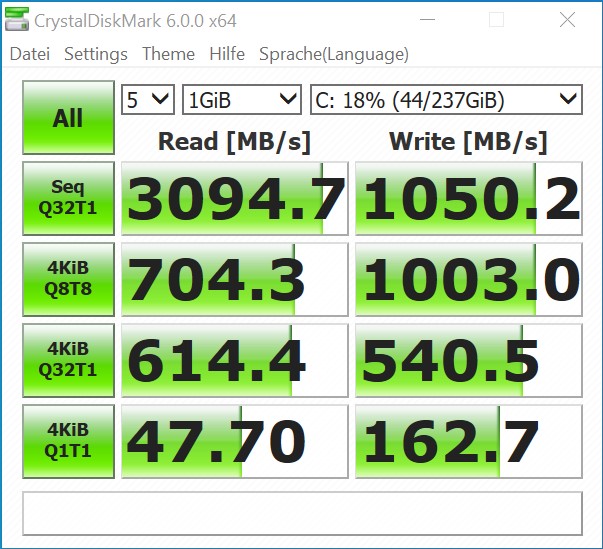
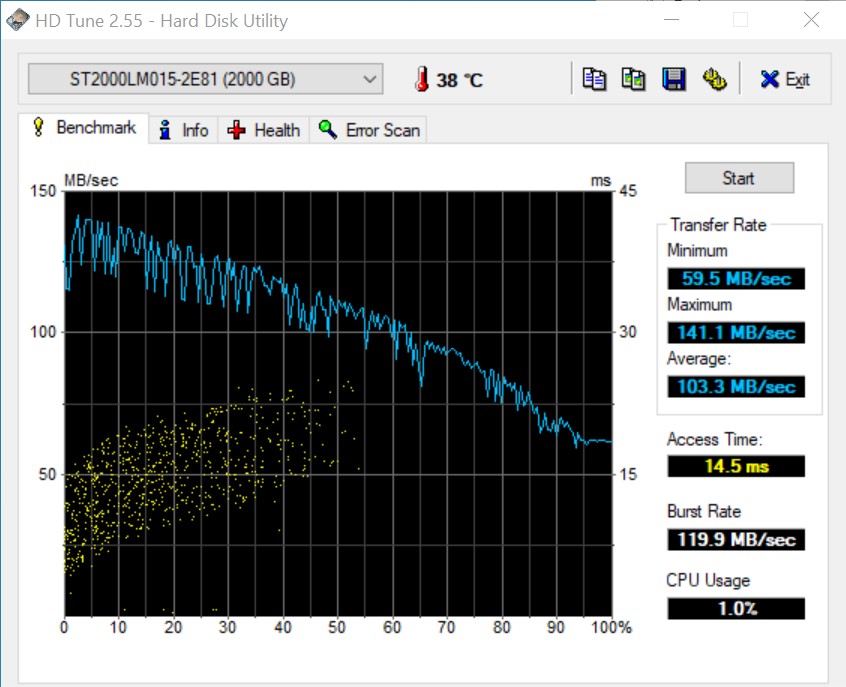
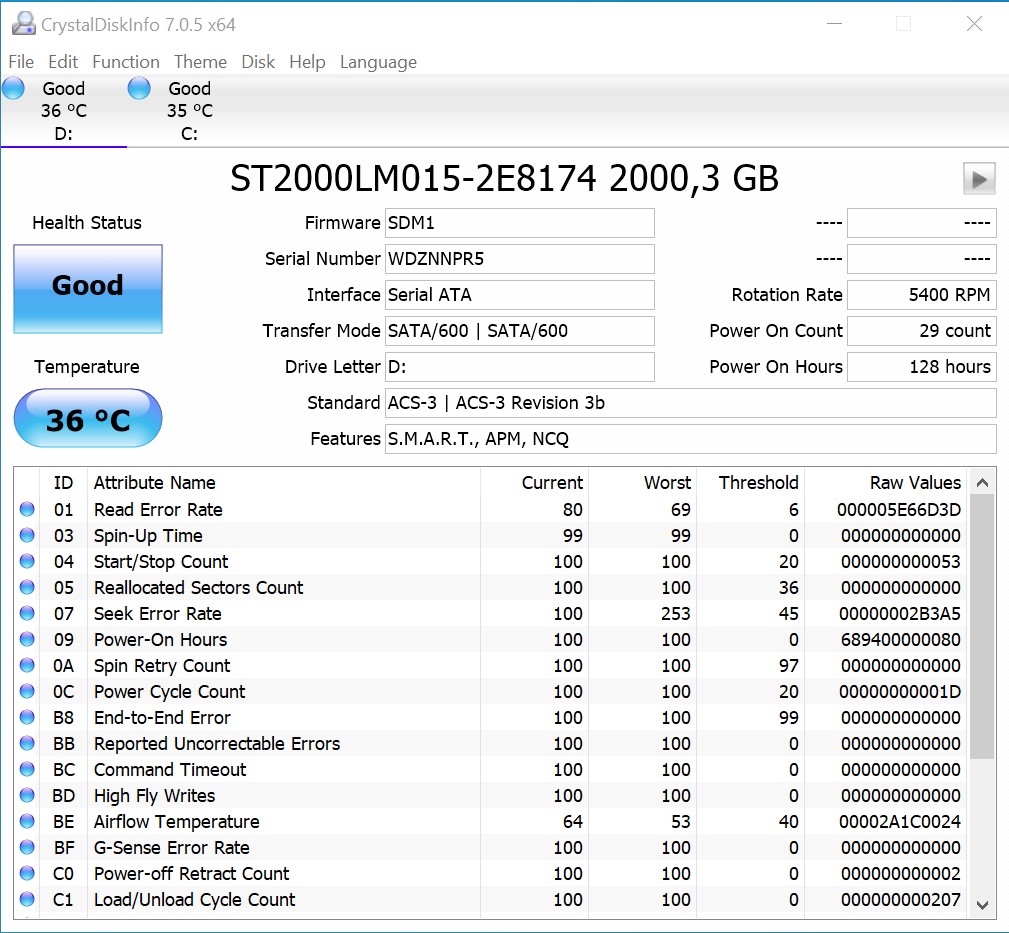
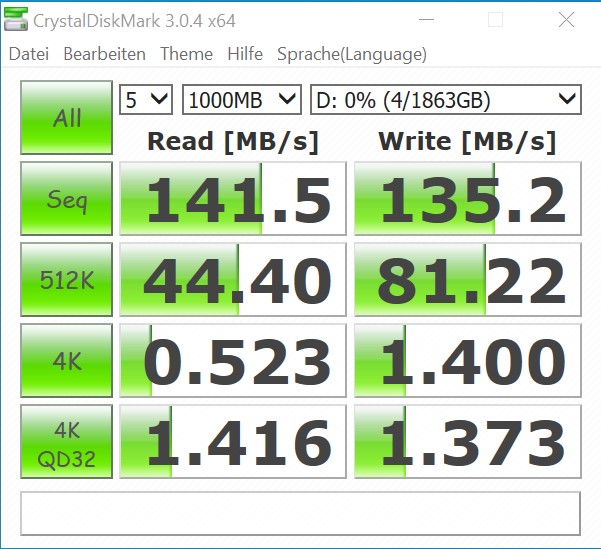
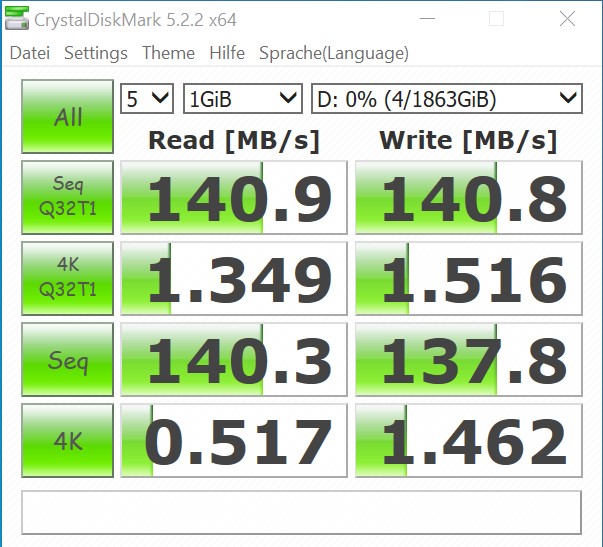
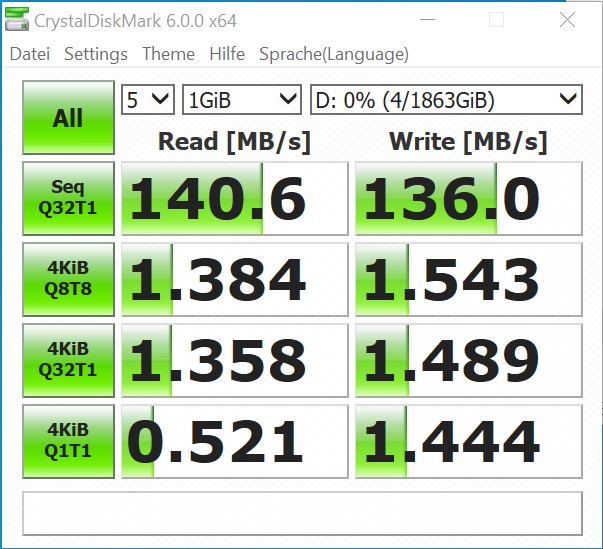
The MEK MINI achieves good values in our application benchmarks even though the other comparison devices deliver better results; this is due to the fact that a much stronger graphics card was used in some cases. Nevertheless, working with the MEK MINI during the test period was enjoyable. Due to the use of an SSD and an HDD, the system is ready for use very quickly and offers, nonetheless, sufficient storage space on the 2 TB HDD. If this is not enough space for you, you can replace the existing storage device or install another M.2 SSD.

3D and gaming performance
The built-in Nvidia GeForce RTX 2070 Super, which is used here in the form of a full-fledged desktop variant, provides for a good 3D performance. More precisely, the built-in model is a mini version, which the manufacturer Zotac also offers in the retail market. When looking at the results, it becomes clear that the mini version of the RTX 2070 Super works at about the same speed as Nvidia's Founders Edition. The model from KFA2, which we also reviewed, is measurably faster. We can't confirm a noticeable performance difference, though. Consequently, if you want to buy a MEK MINI, you can enjoy modern games at QHD resolution and maximum details. If you prefer even higher resolutions, you'll have to live with lower detail levels in order to generate playable frame rates. A resolution of 1080p should be preferred with the somewhat cheaper MEK MINI that comes with the RTX 2060 Super.
If you are considering it and want to swap the graphics card, you should be aware that, first of all, the size is a decisive factor; secondly, the maximum power dissipation specified by the TDP of 250 watts should not be exceeded for the graphics card.
You can find further comparisons and benchmarks in our GPU comparison table.
| Borderlands 3 - 1920x1080 Badass Overall Quality (DX11) | |
| Average NVIDIA GeForce RTX 2070 Super (Desktop) (74.3 - 86, n=5) | |
| Nvidia GeForce RTX 2070 Super | |
| KFA2 GeForce RTX 2070 Super Work The Frames | |
| Zotac MEK Mini (RTX 2070 Super) | |
| Average NVIDIA GeForce RTX 2070 (Desktop) (70.9 - 74.4, n=2) | |
| Average NVIDIA GeForce RTX 2060 Super (Desktop) (68.6 - 74.1, n=4) | |
| The Witcher 3 - 1920x1080 Ultra Graphics & Postprocessing (HBAO+) | |
| Average NVIDIA GeForce RTX 2070 Super (Desktop) (95.6 - 109.6, n=6) | |
| KFA2 GeForce RTX 2070 Super Work The Frames | |
| Nvidia GeForce RTX 2070 Super | |
| Zotac MEK Mini (RTX 2070 Super) | |
| Average NVIDIA GeForce RTX 2060 Super (Desktop) (79 - 91.1, n=5) | |
| Average NVIDIA GeForce RTX 2070 (Desktop) (40.9 - 95, n=5) | |
| low | med. | high | ultra | QHD | 4K | |
|---|---|---|---|---|---|---|
| BioShock Infinite (2013) | 374.6 | 334.9 | 314.5 | 184.2 | ||
| The Witcher 3 (2015) | 335 | 268 | 169 | 95.6 | 65.5 | |
| Dota 2 Reborn (2015) | 147.3 | 134 | 128.7 | 120.4 | 120 | |
| Rise of the Tomb Raider (2016) | 311 | 200 | 169 | 142 | 67 | |
| Final Fantasy XV Benchmark (2018) | 170 | 128 | 96.9 | 41.6 | ||
| X-Plane 11.11 (2018) | 122 | 110 | 91.1 | 79.4 | ||
| Far Cry 5 (2018) | 144 | 122 | 116 | 109 | 93 | 53 |
| Shadow of the Tomb Raider (2018) | 140 | 127 | 122 | 114 | 82 | 44 |
| Forza Horizon 4 (2018) | 202 | 174 | 172 | 153 | 125 | 84 |
| Far Cry New Dawn (2019) | 120 | 93 | 90 | 80 | 83 | 55 |
| Metro Exodus (2019) | 177 | 112 | 87.2 | 68.4 | 54.9 | 36 |
| F1 2019 (2019) | 245 | 215 | 169 | 146 | 115 | 71 |
| Control (2019) | 235 | 114 | 88 | 56.9 | 29.2 | |
| Borderlands 3 (2019) | 129 | 111 | 91.1 | 74.3 | 53.7 | 29.5 |
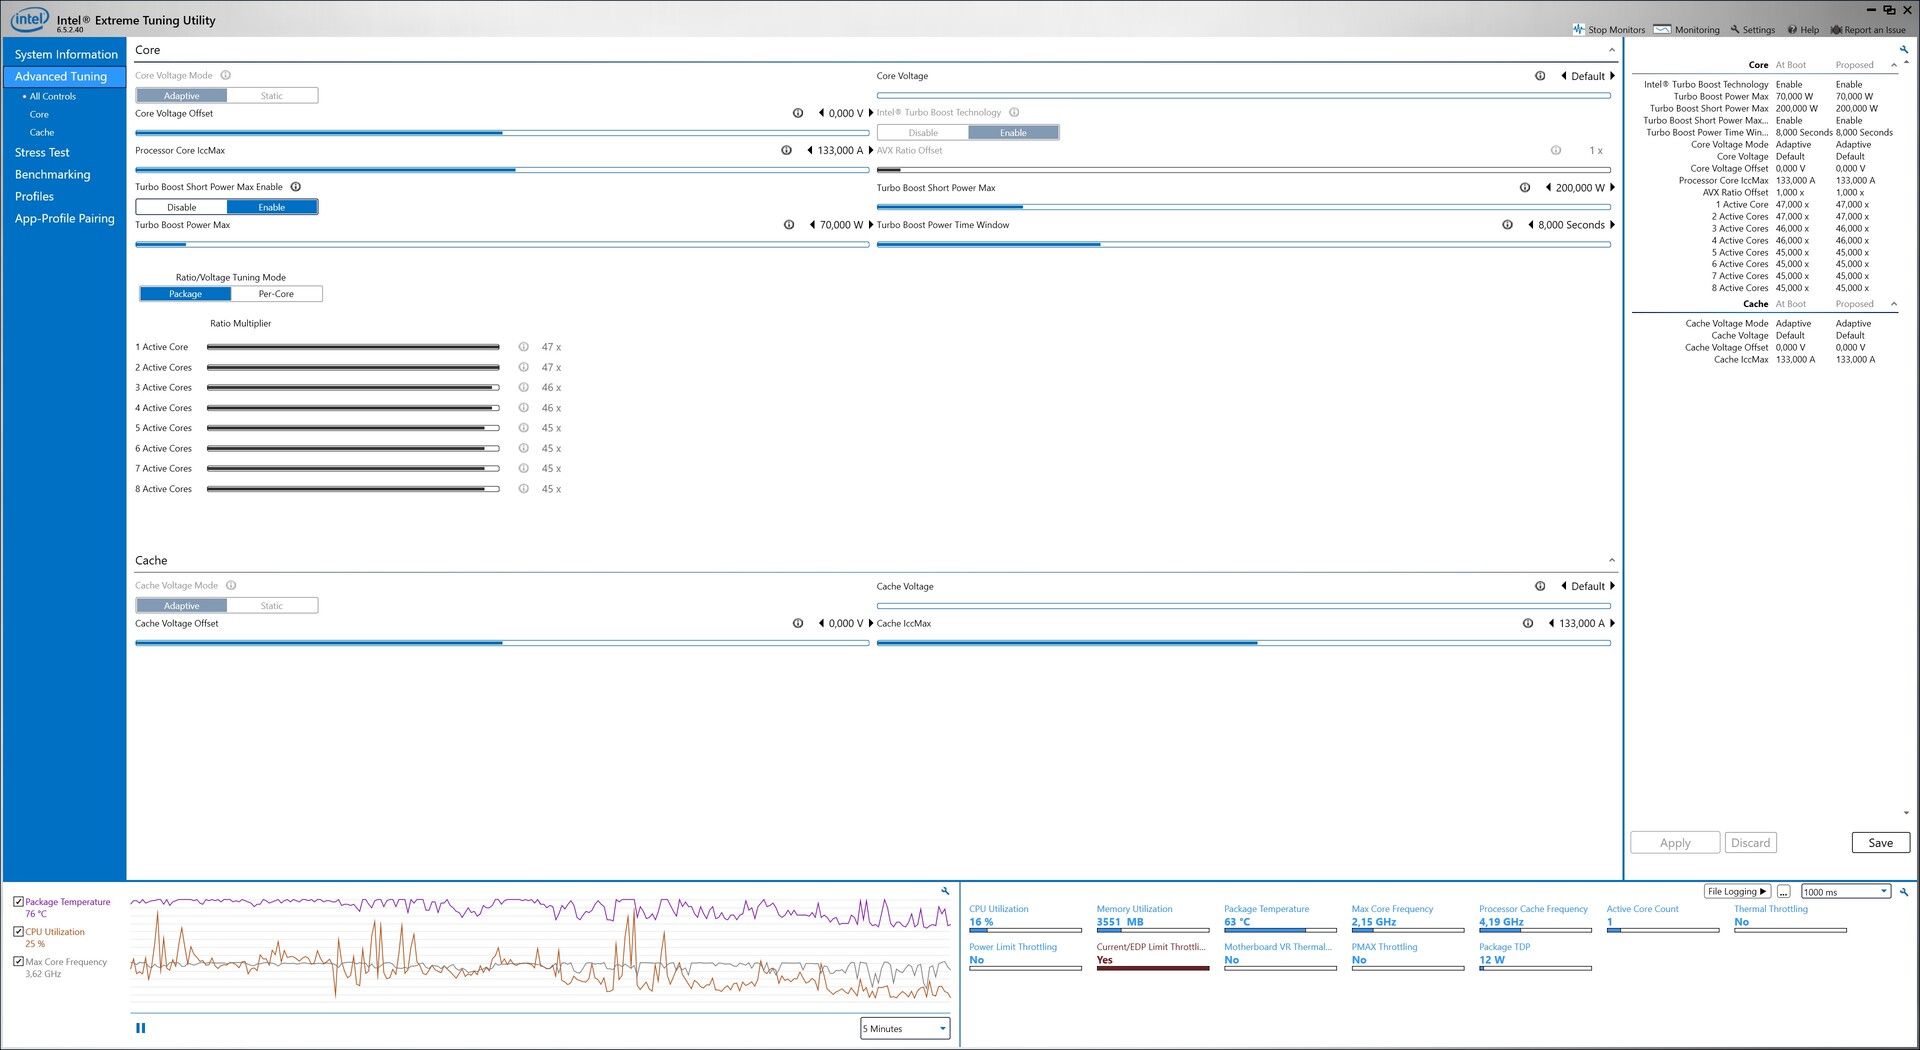
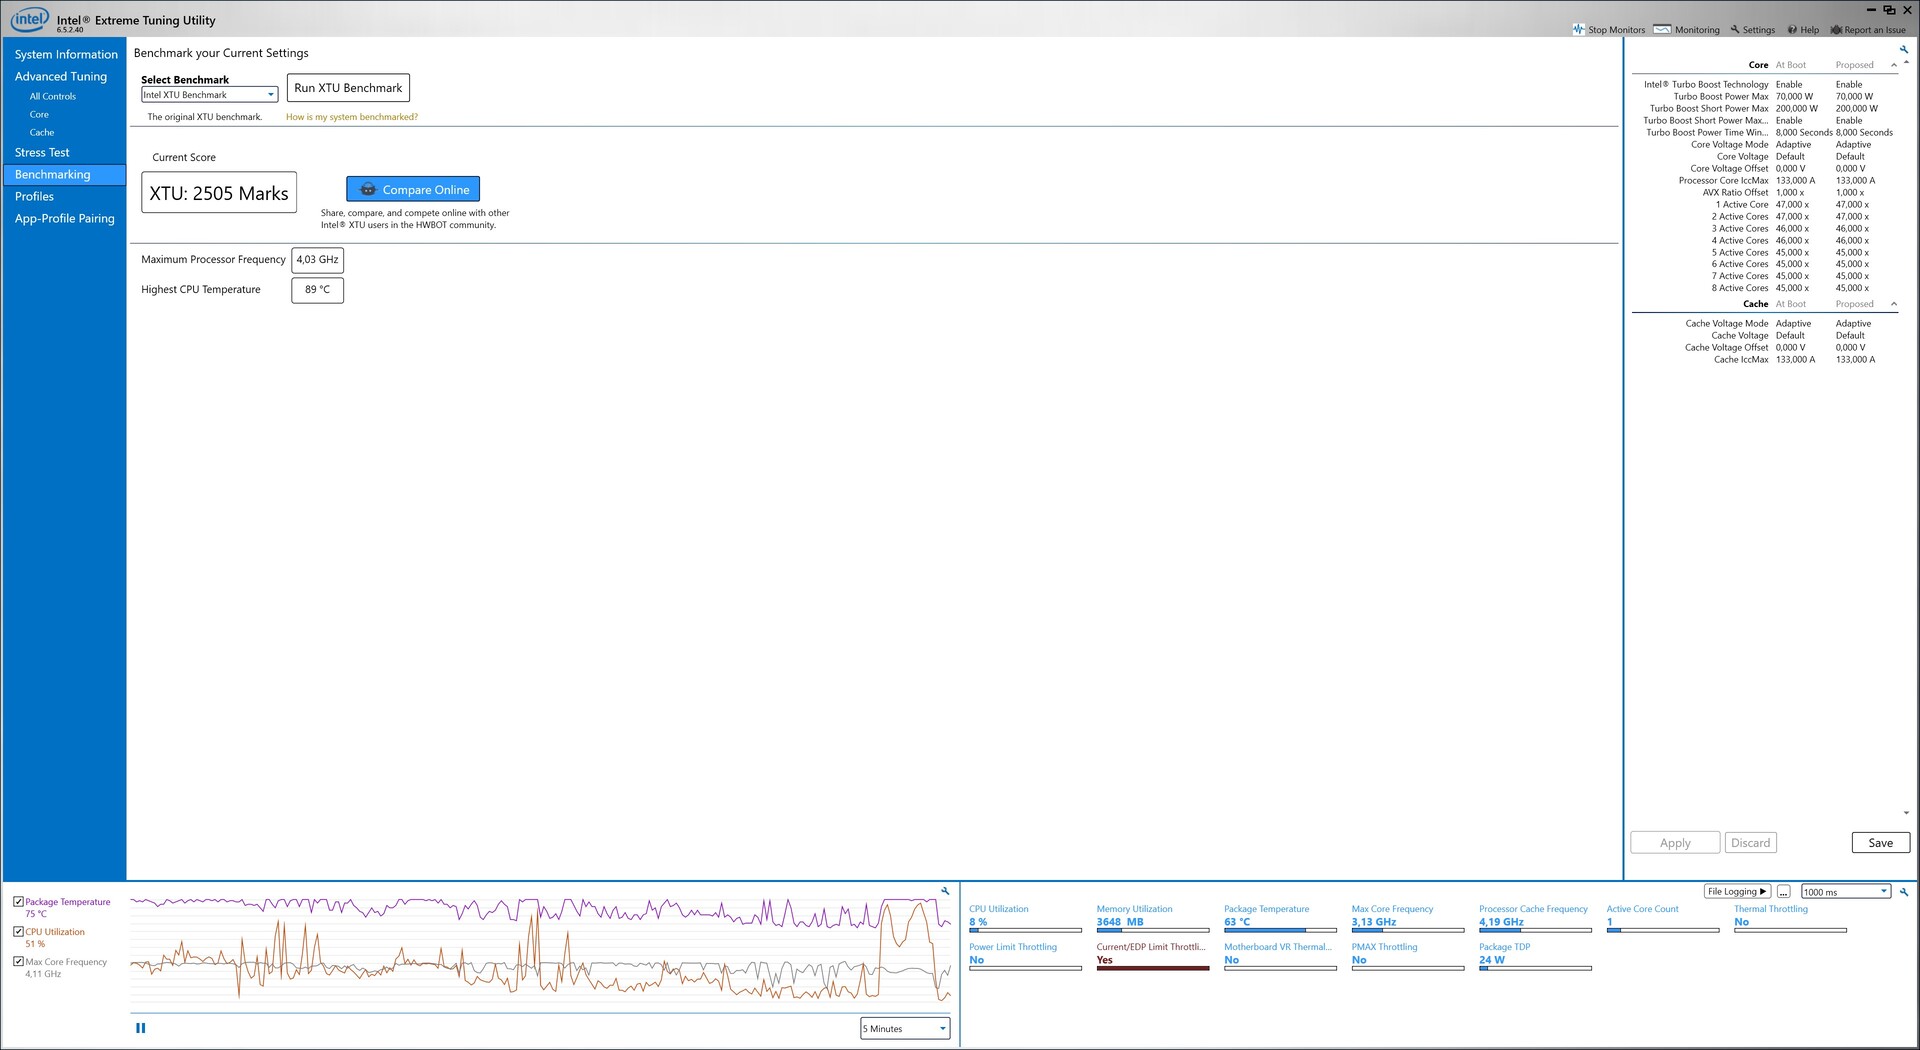
Emissions
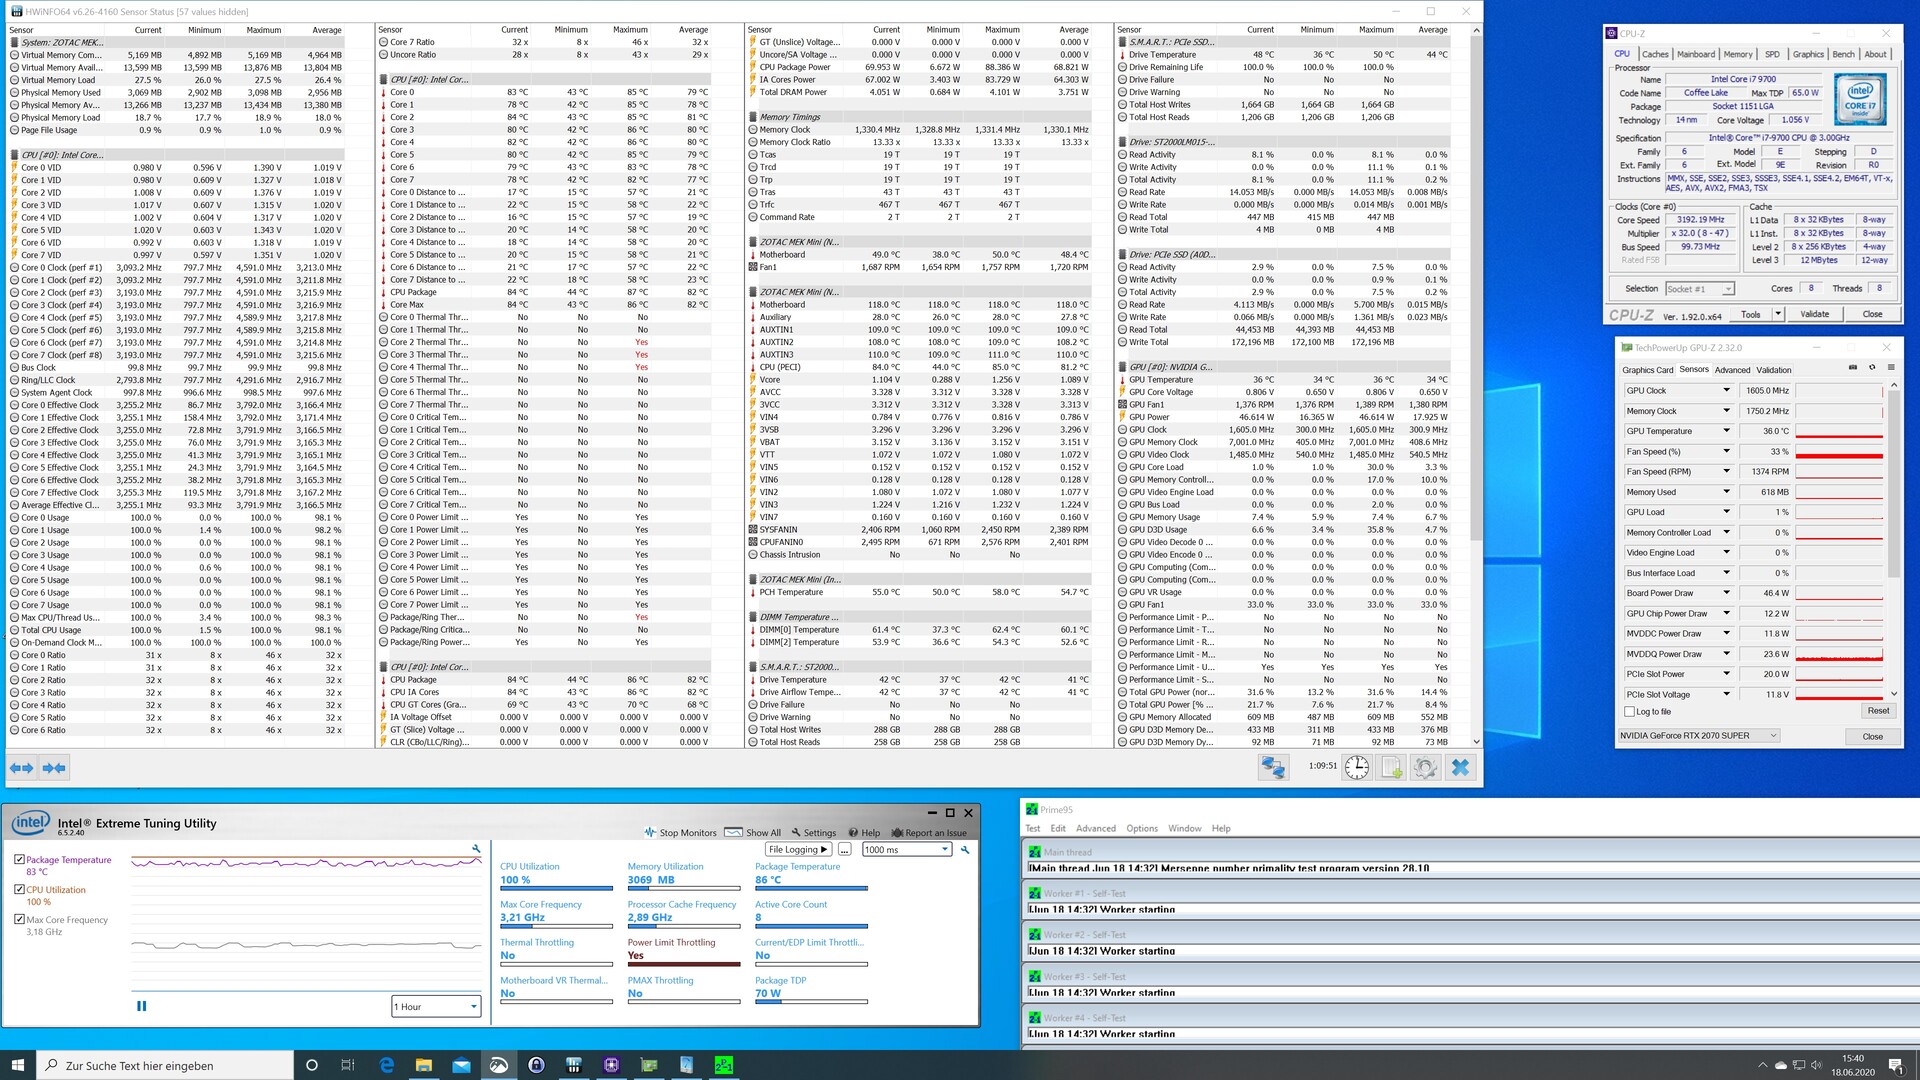
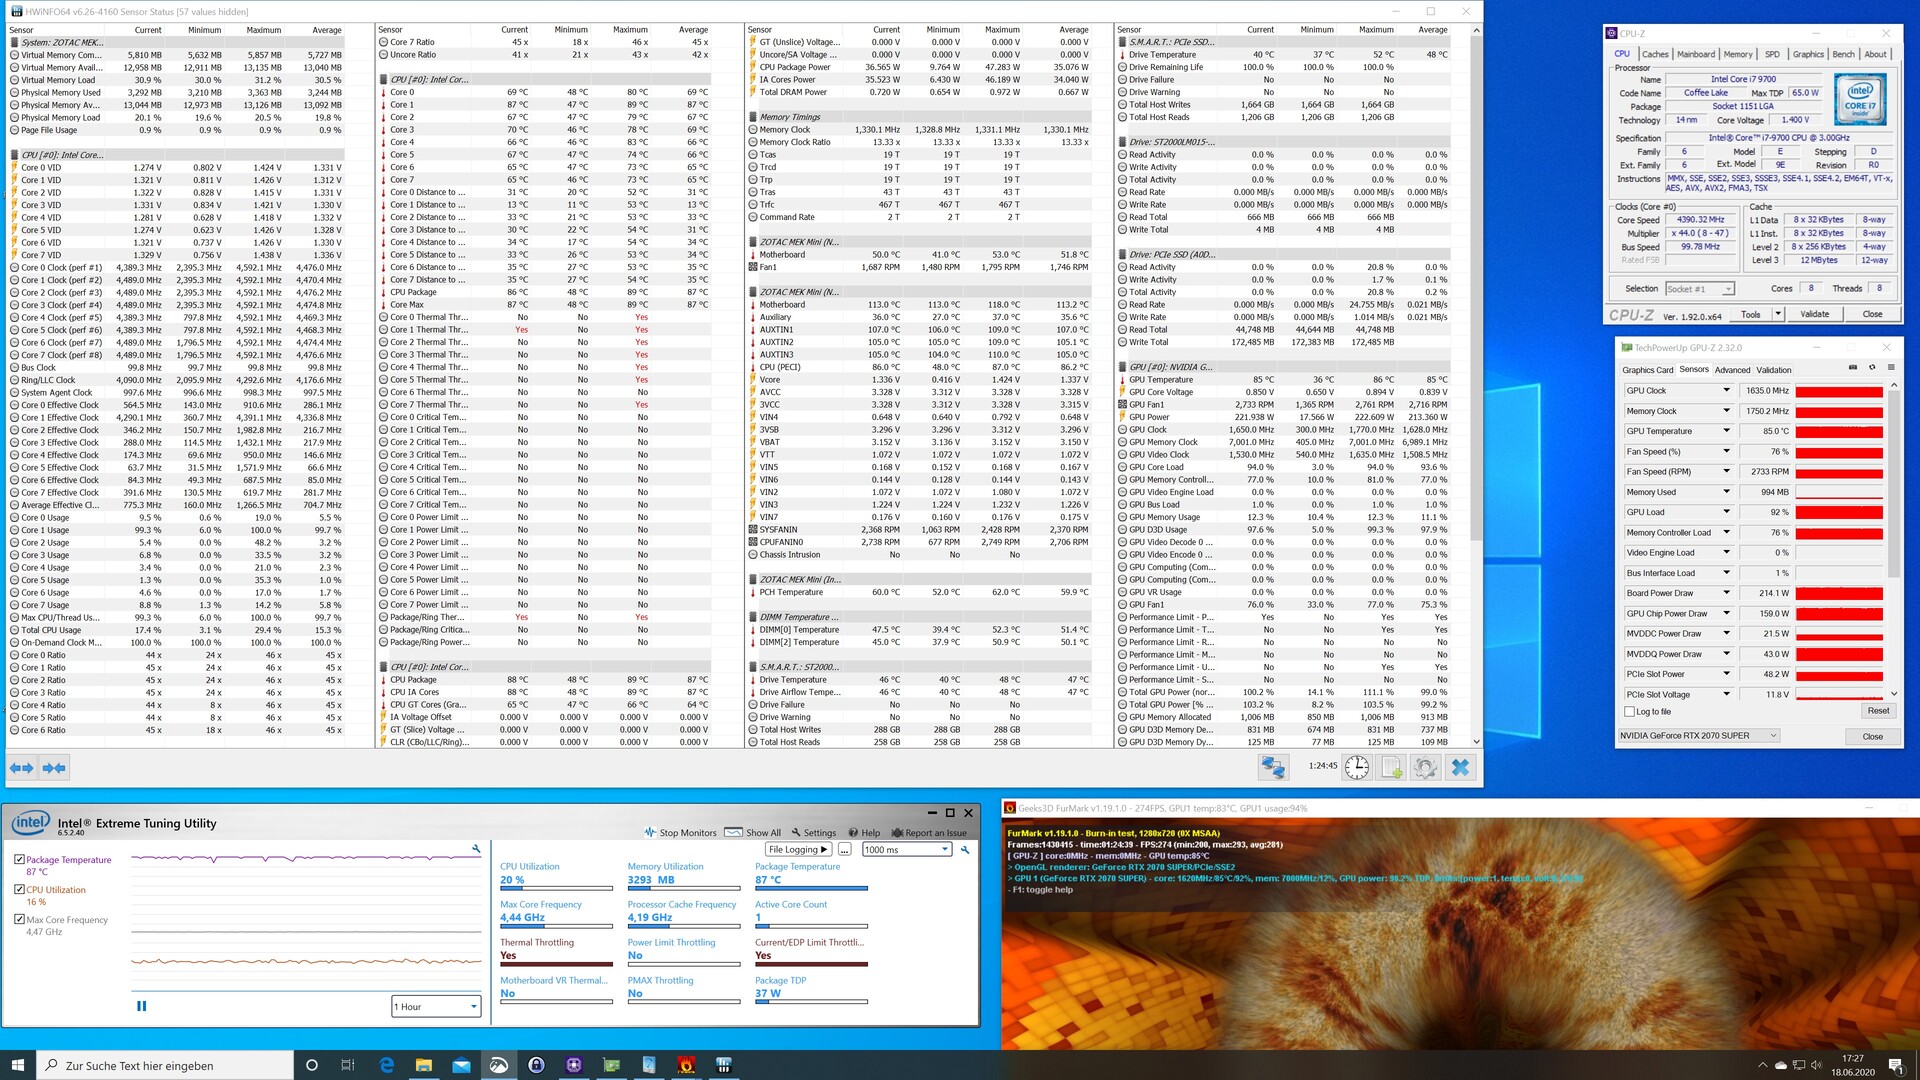
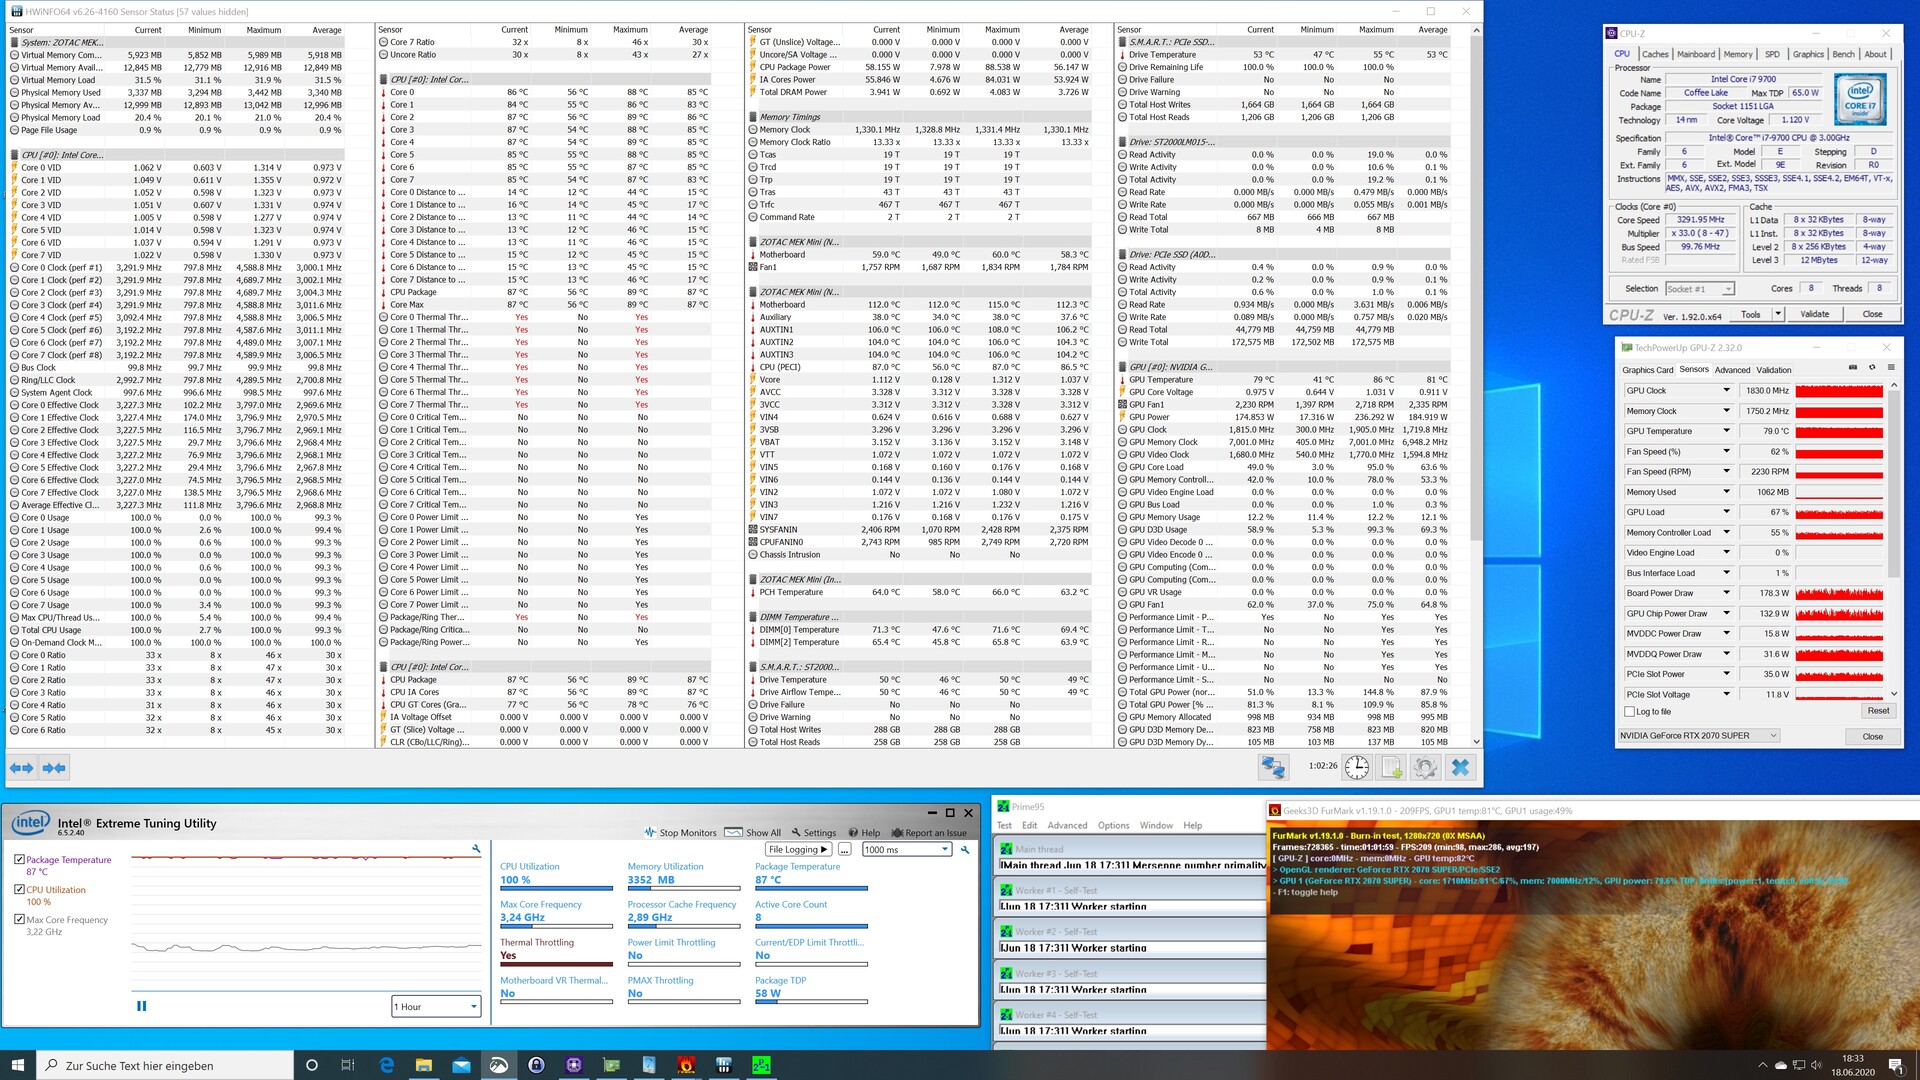
The Zotac MEK MINI in the stress test
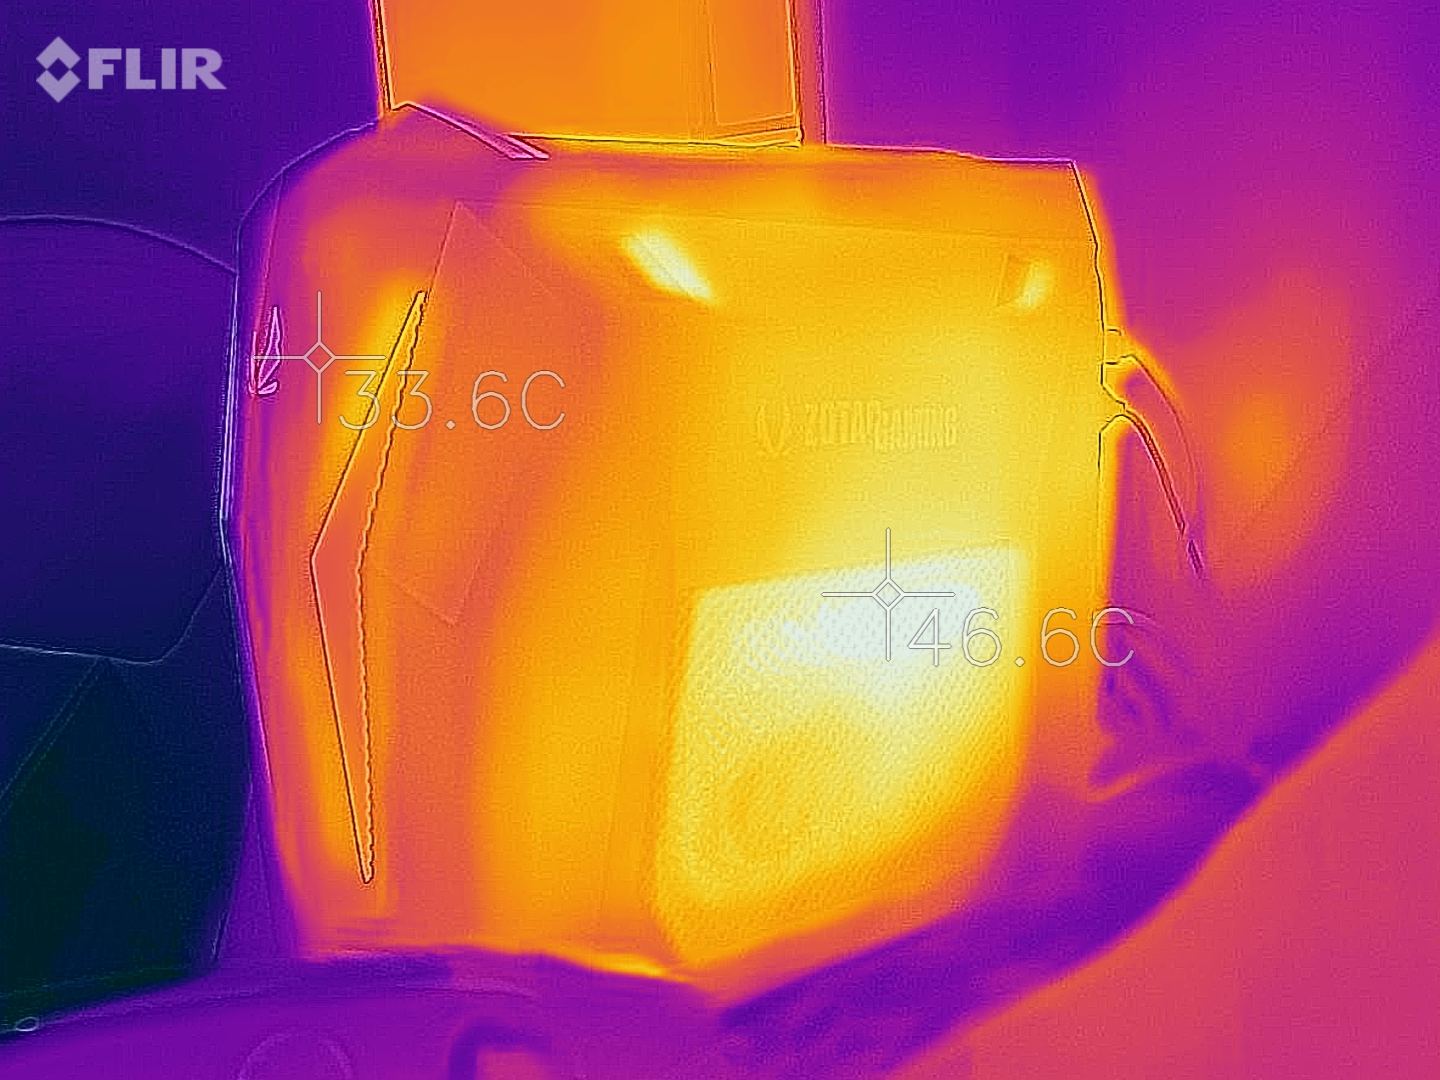
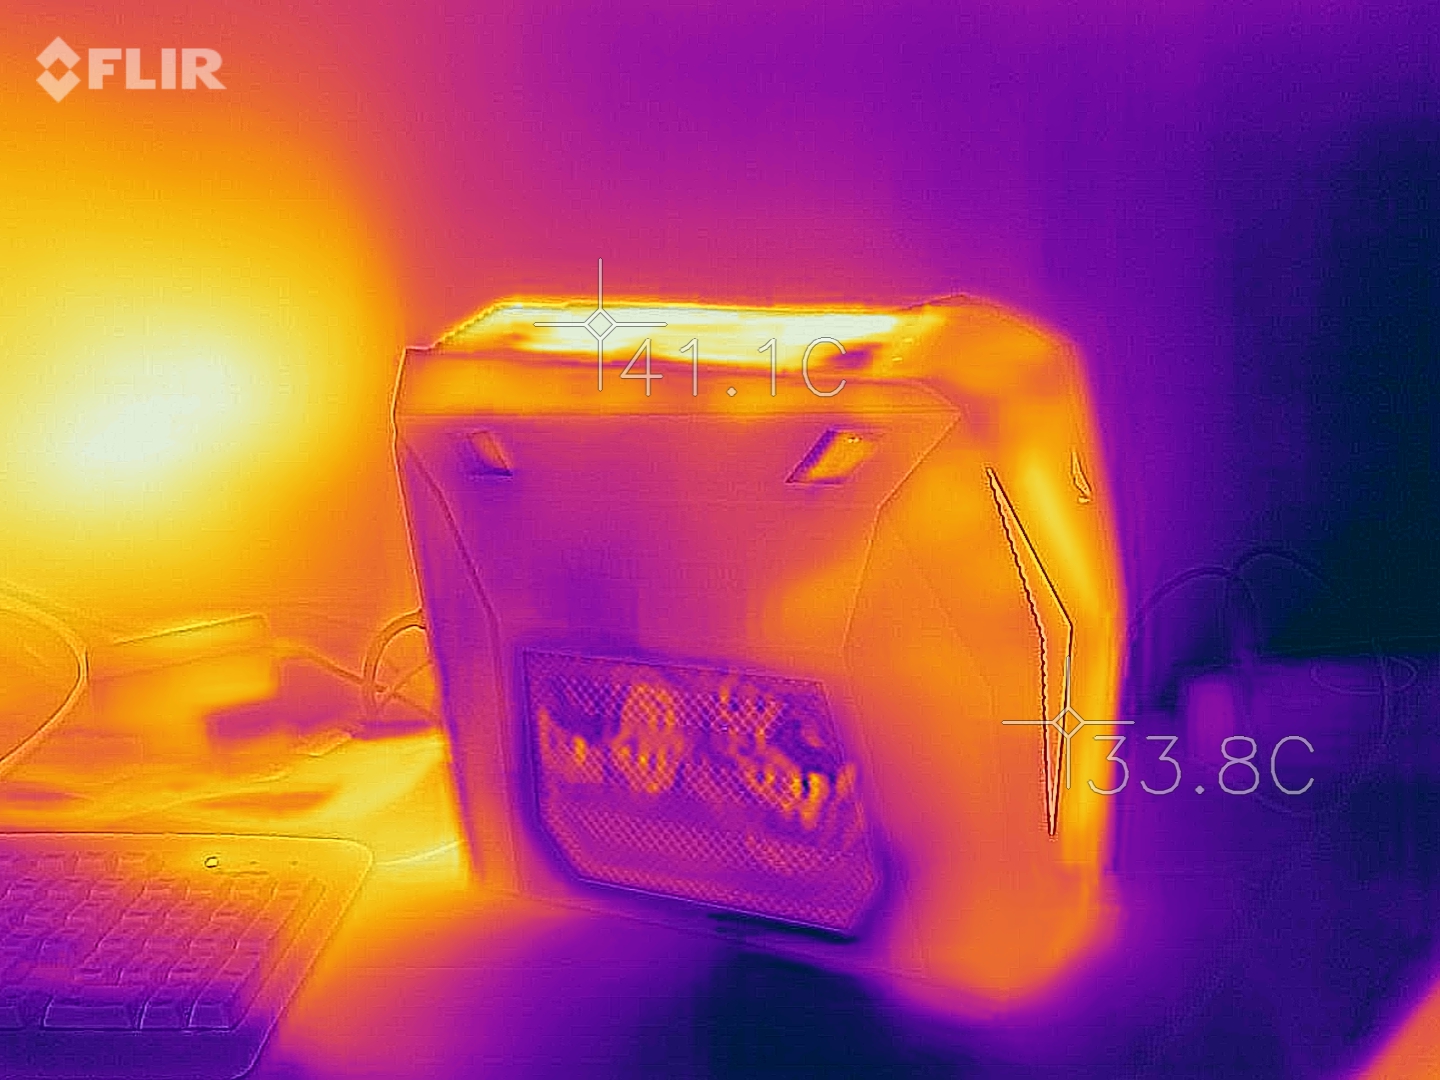
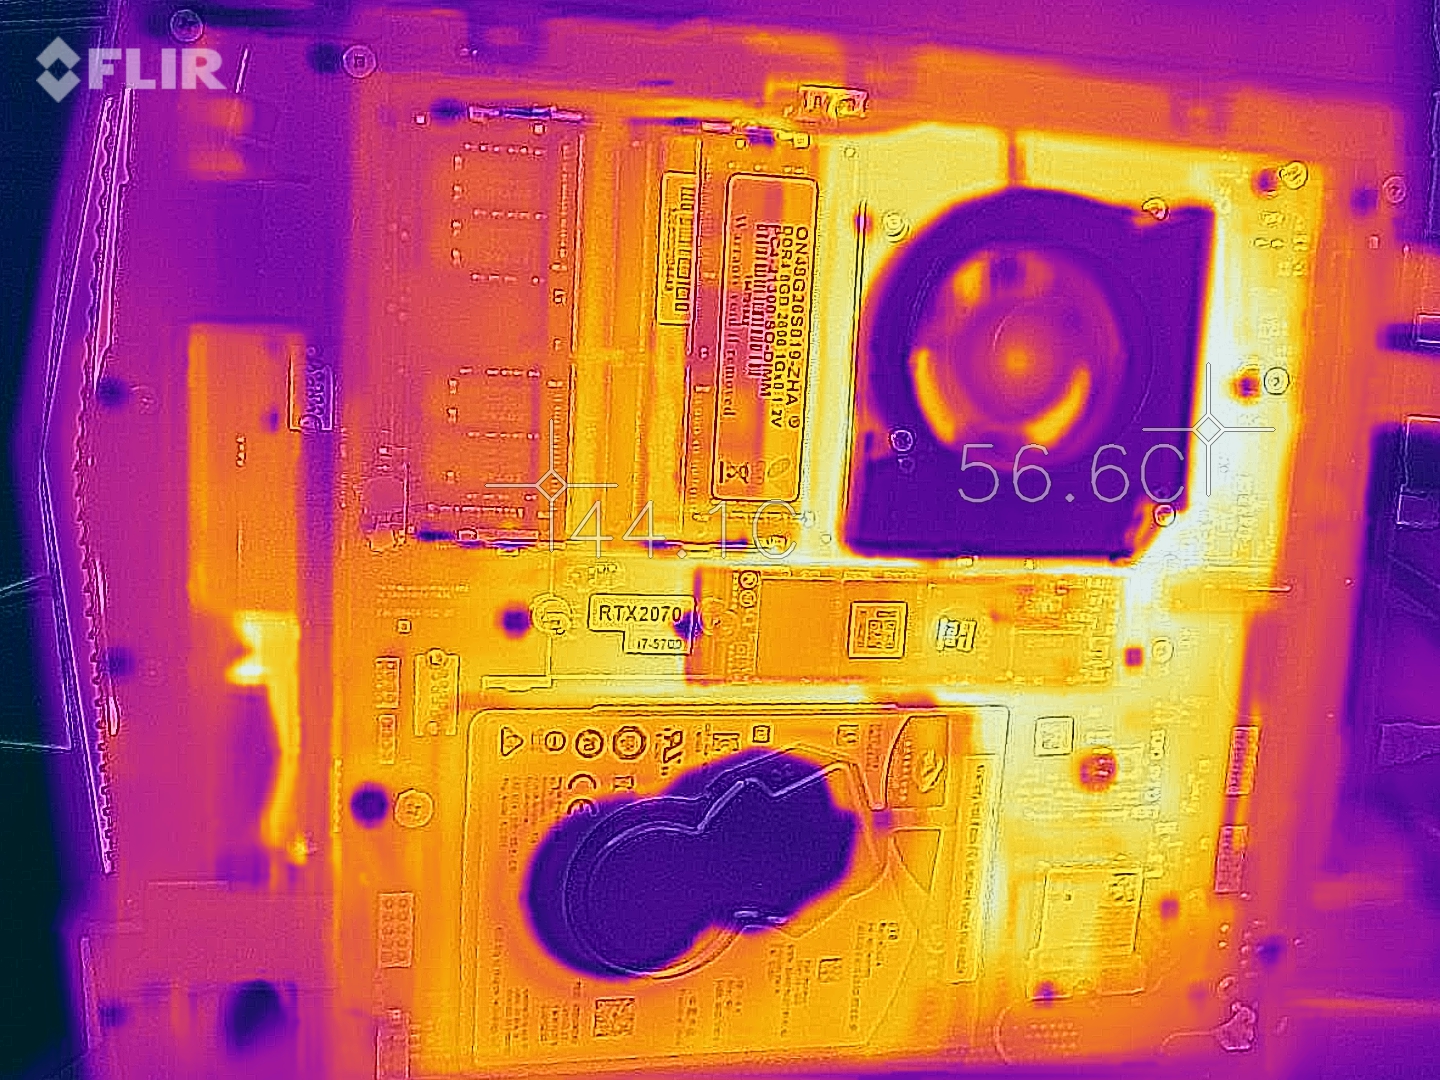
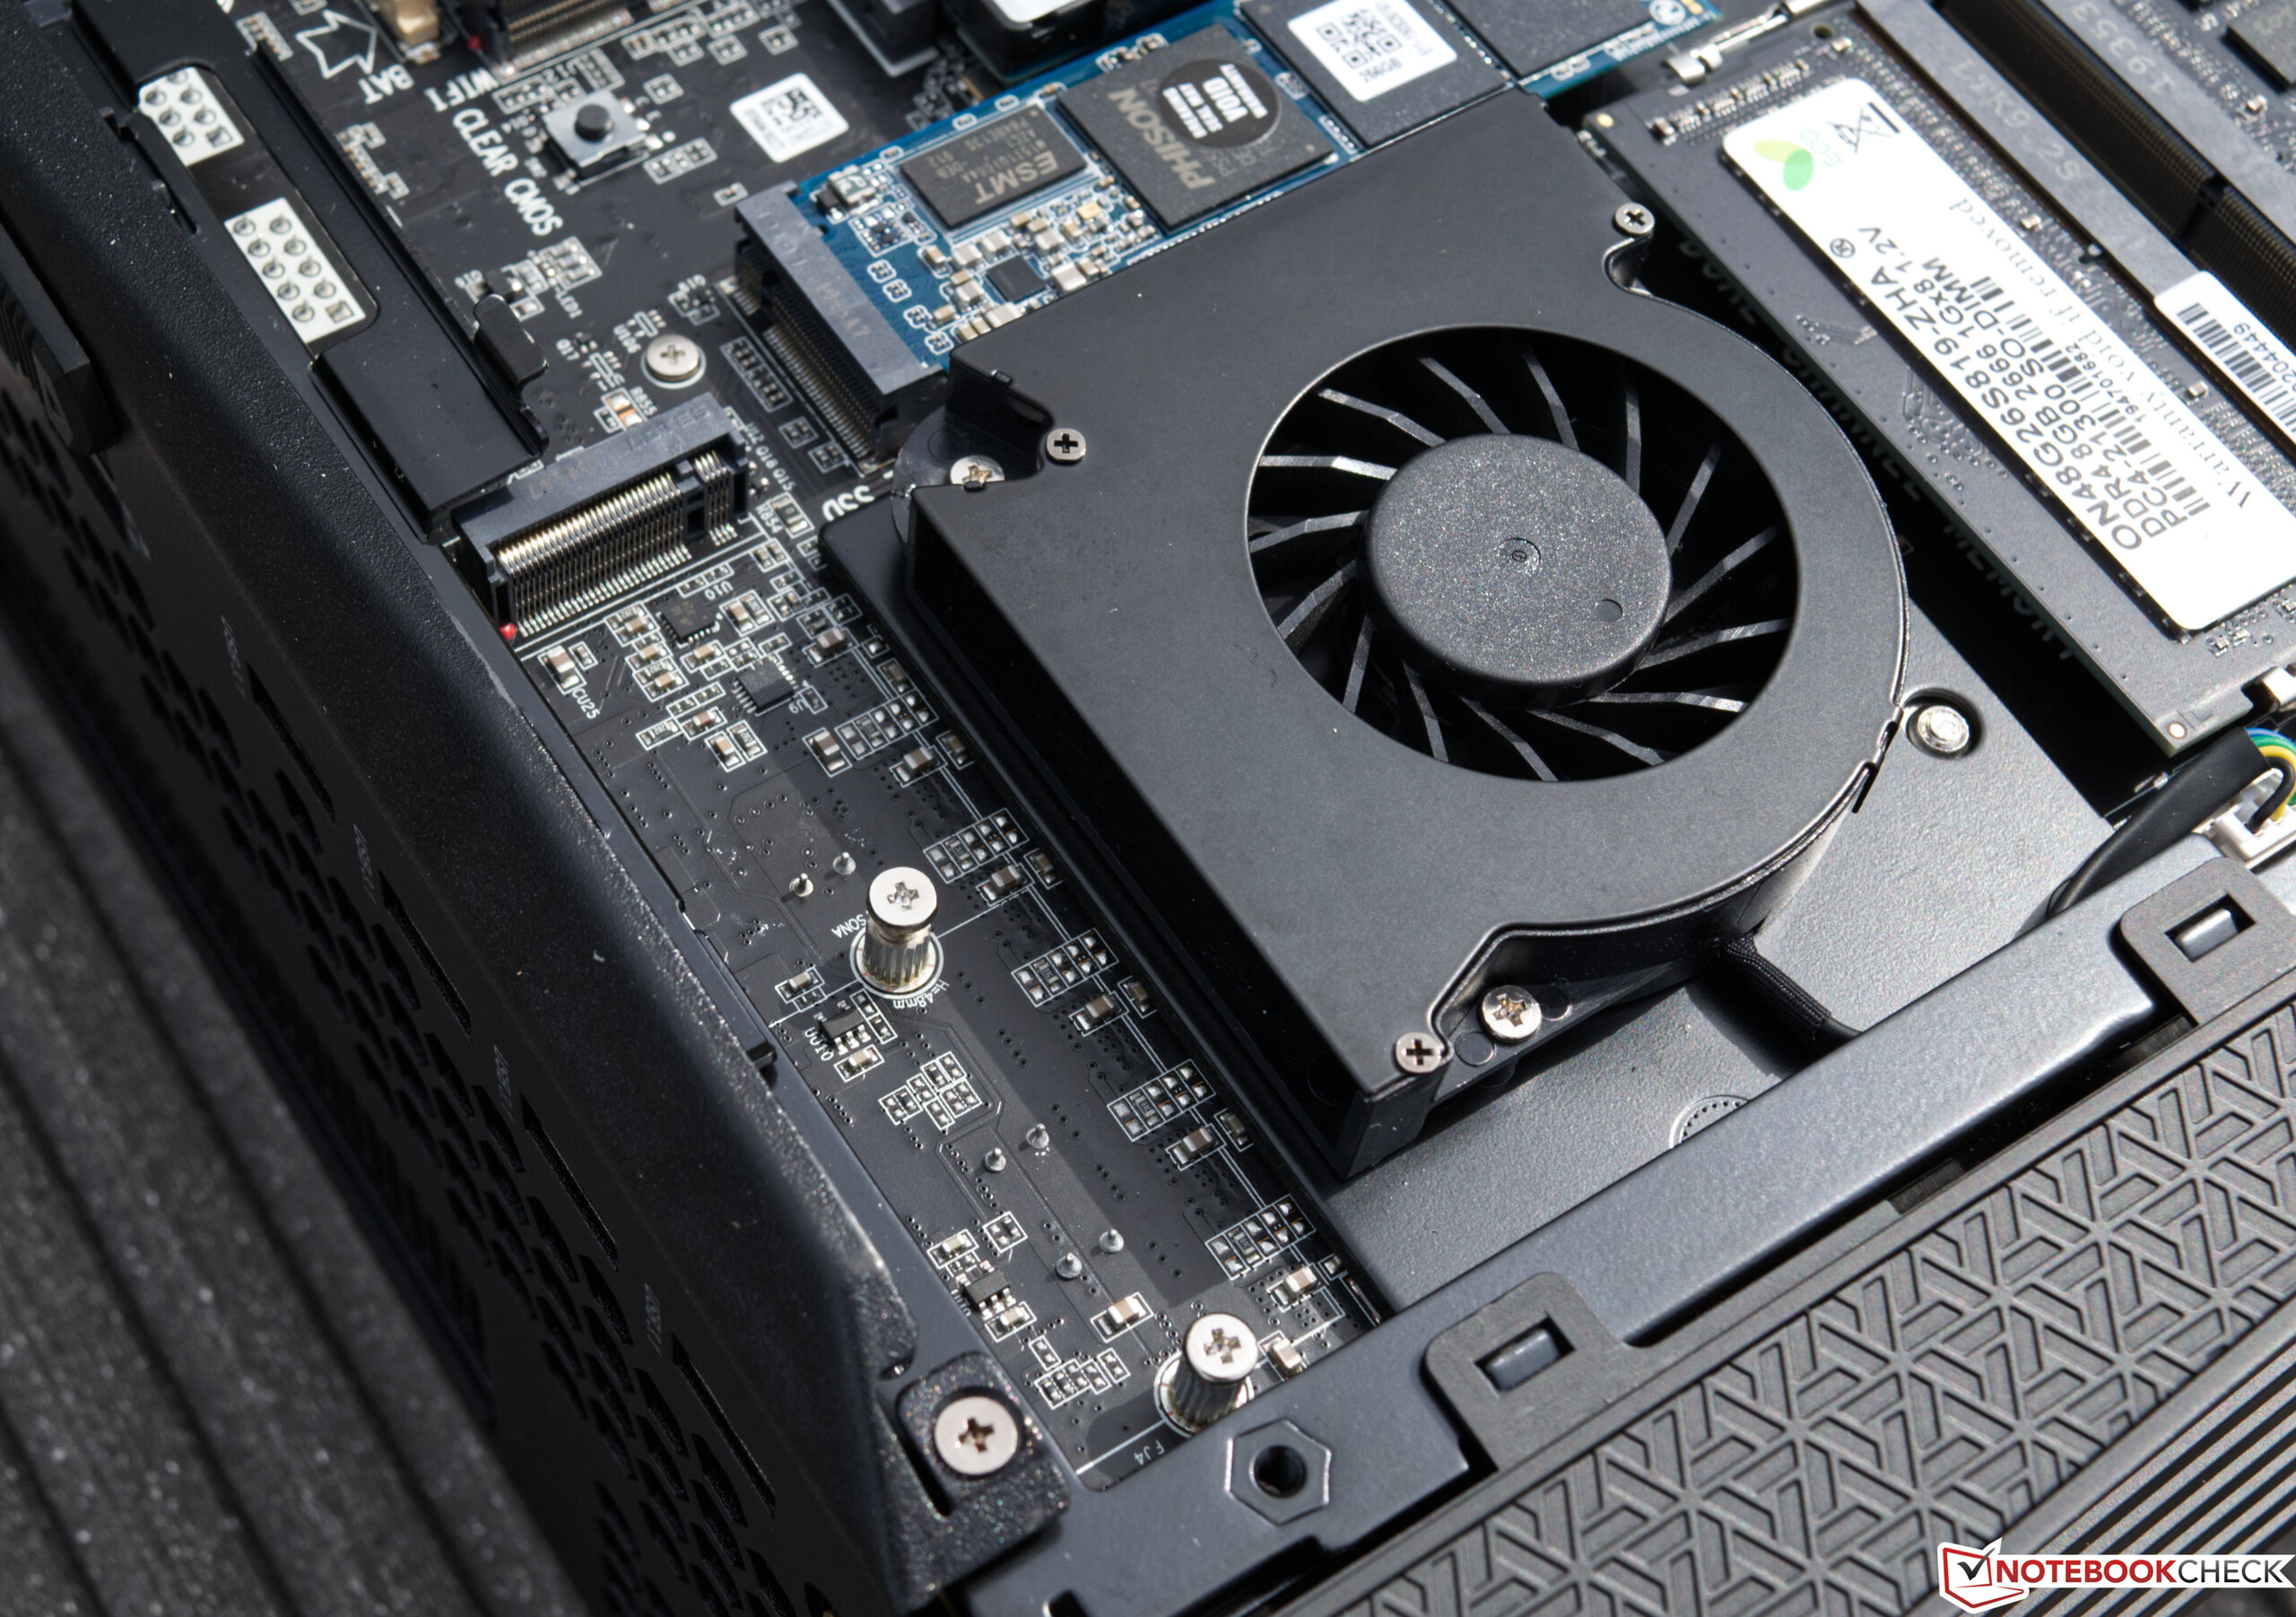
Similar to other small mini PCs, Zotac also makes use of the chimney effect when it comes to cooling. Cool air is sucked in at the bottom and sides and then pushed out again through the top and back. Nevertheless, the Intel Core i7-9700 reaches a temperature of 89 °C (192 °F) in the stress test. The cooling system comes to its limits in this extreme scenario, which is also reflected in the system's overall volume. We noted 53.8 dB(A) in the stress test. As a result, the device is clearly audible even though the fans are quickly slowed back down after the test's completion. The measured volume was only 49.77 dB(A) during gaming. These are values that are otherwise only seen in gaming laptops. Due to the performance in this small case, you unfortunately have to live with an increased noise emission.
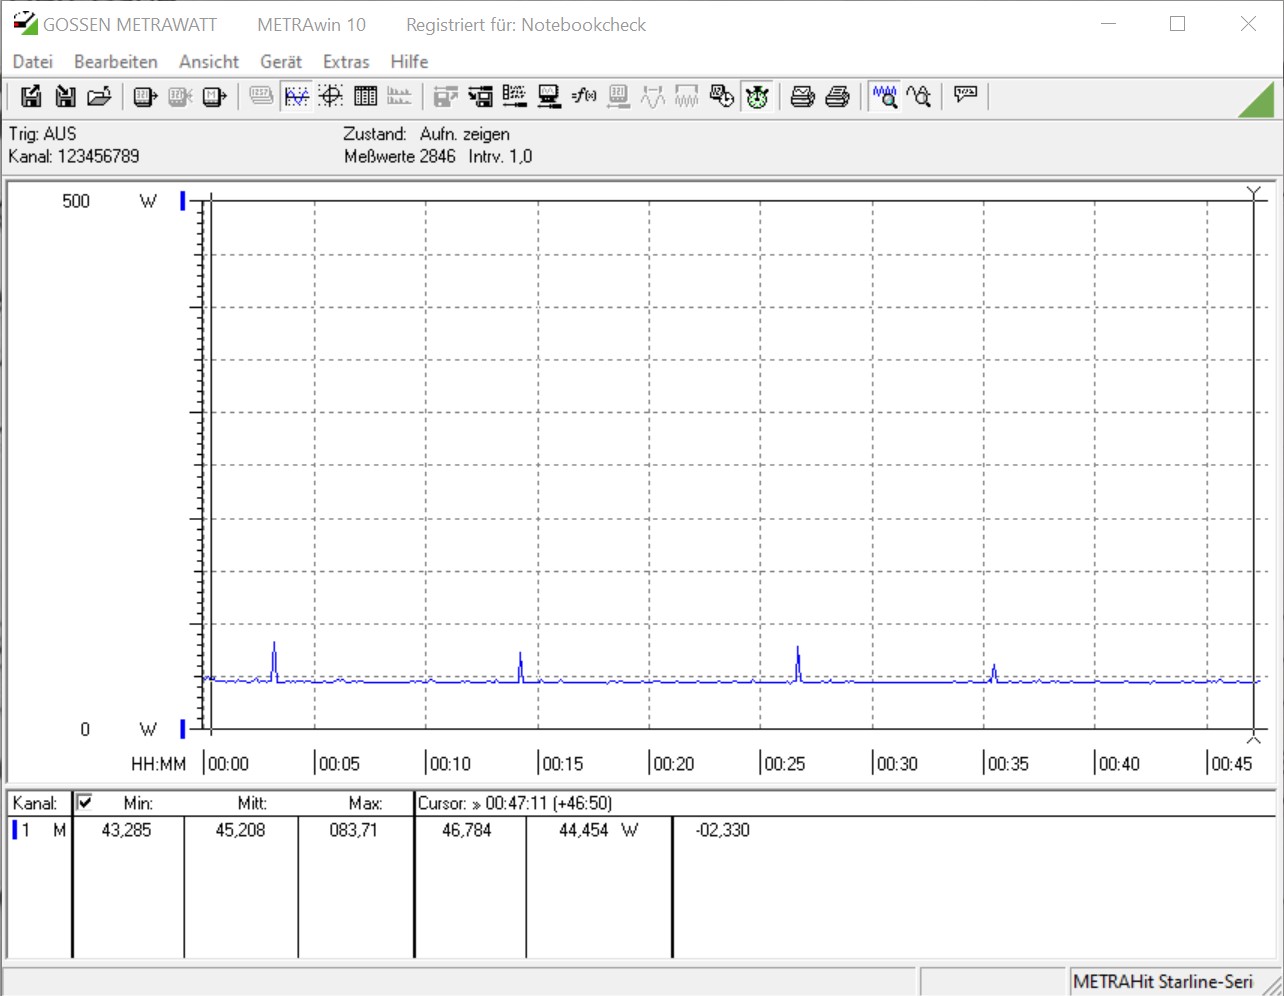
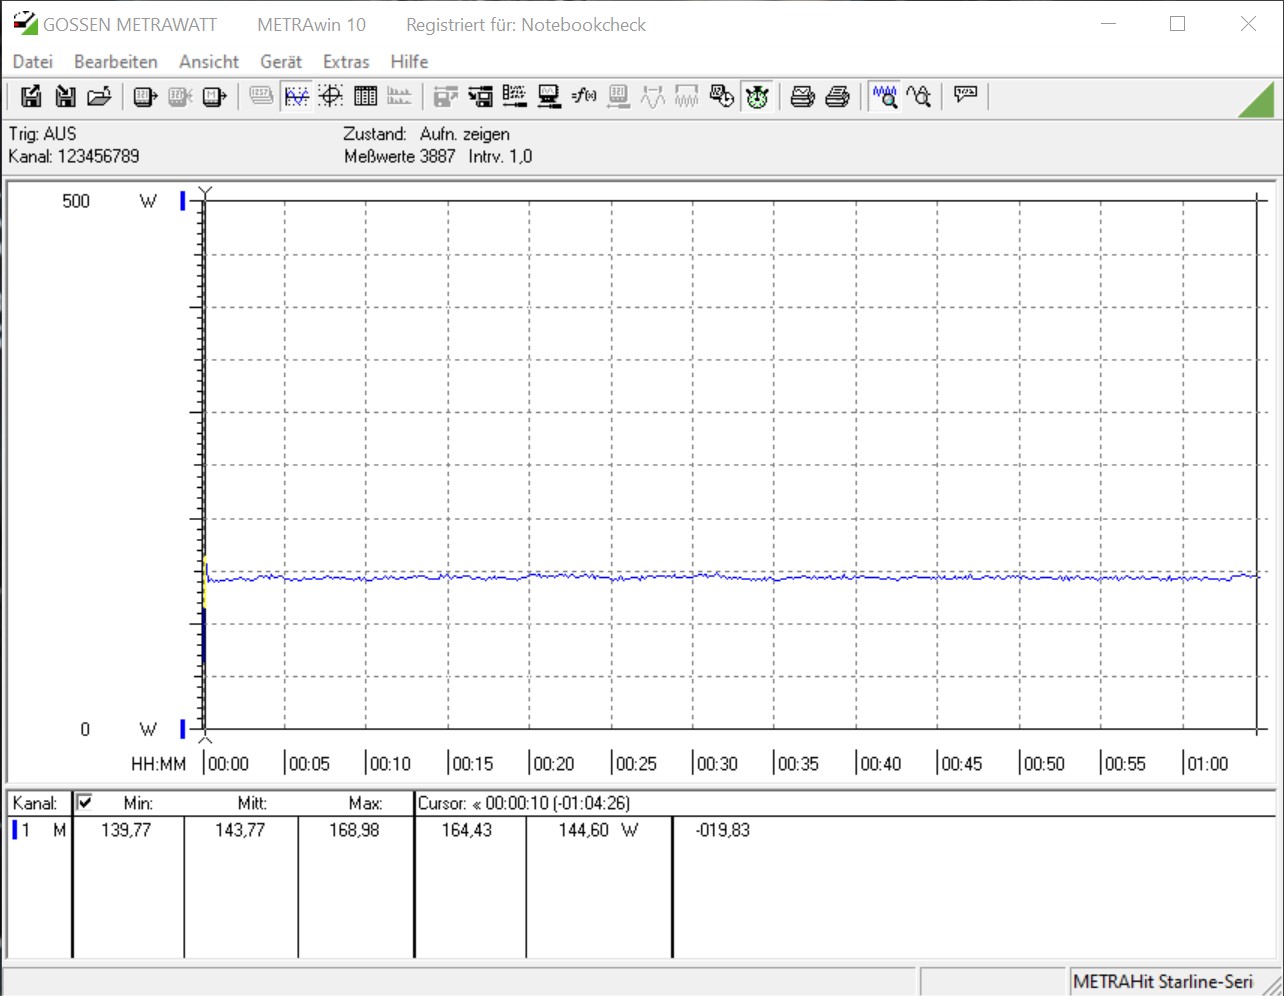
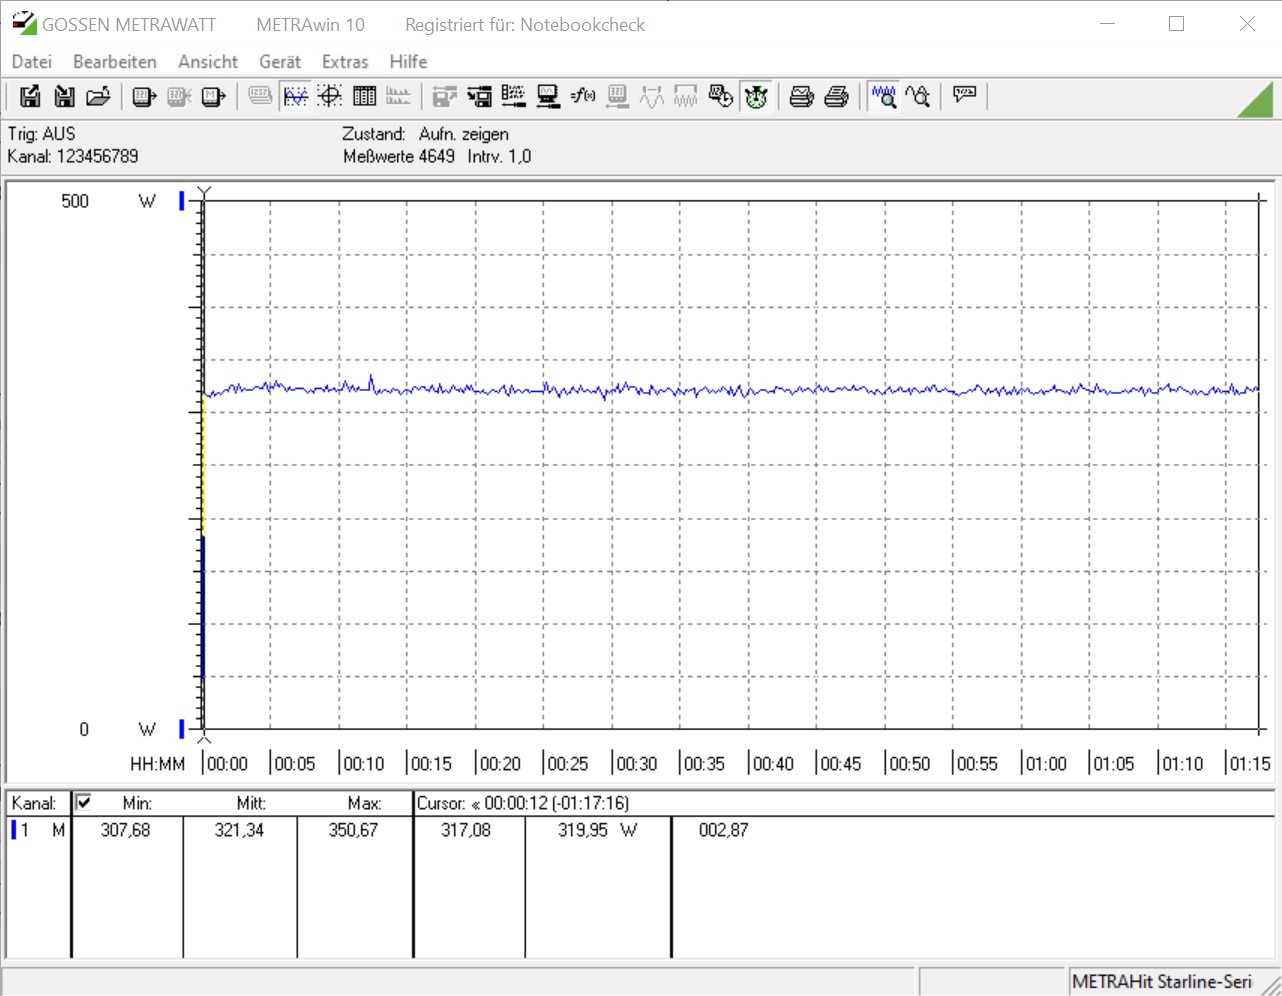
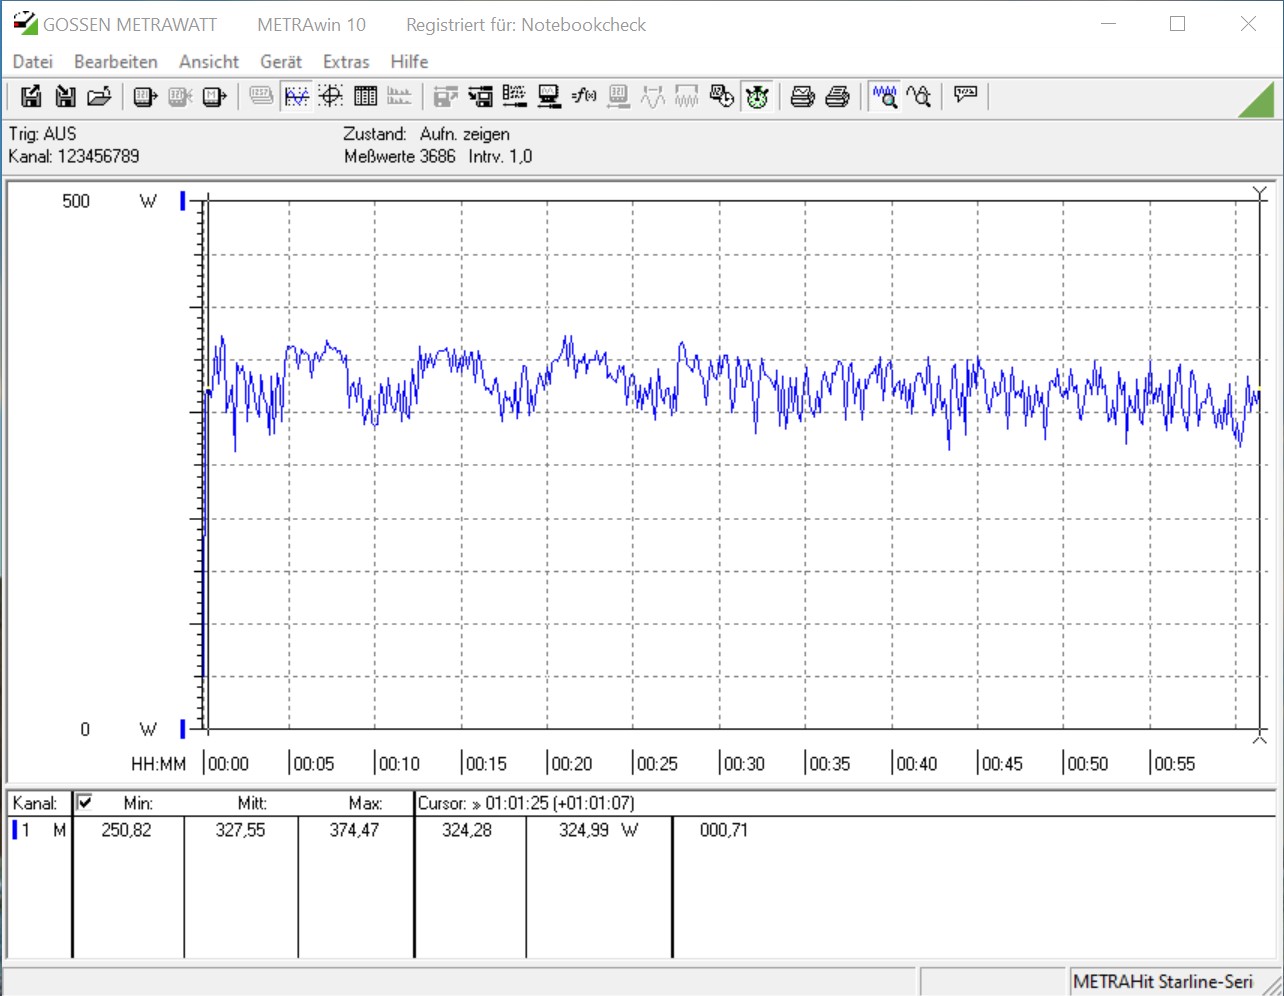
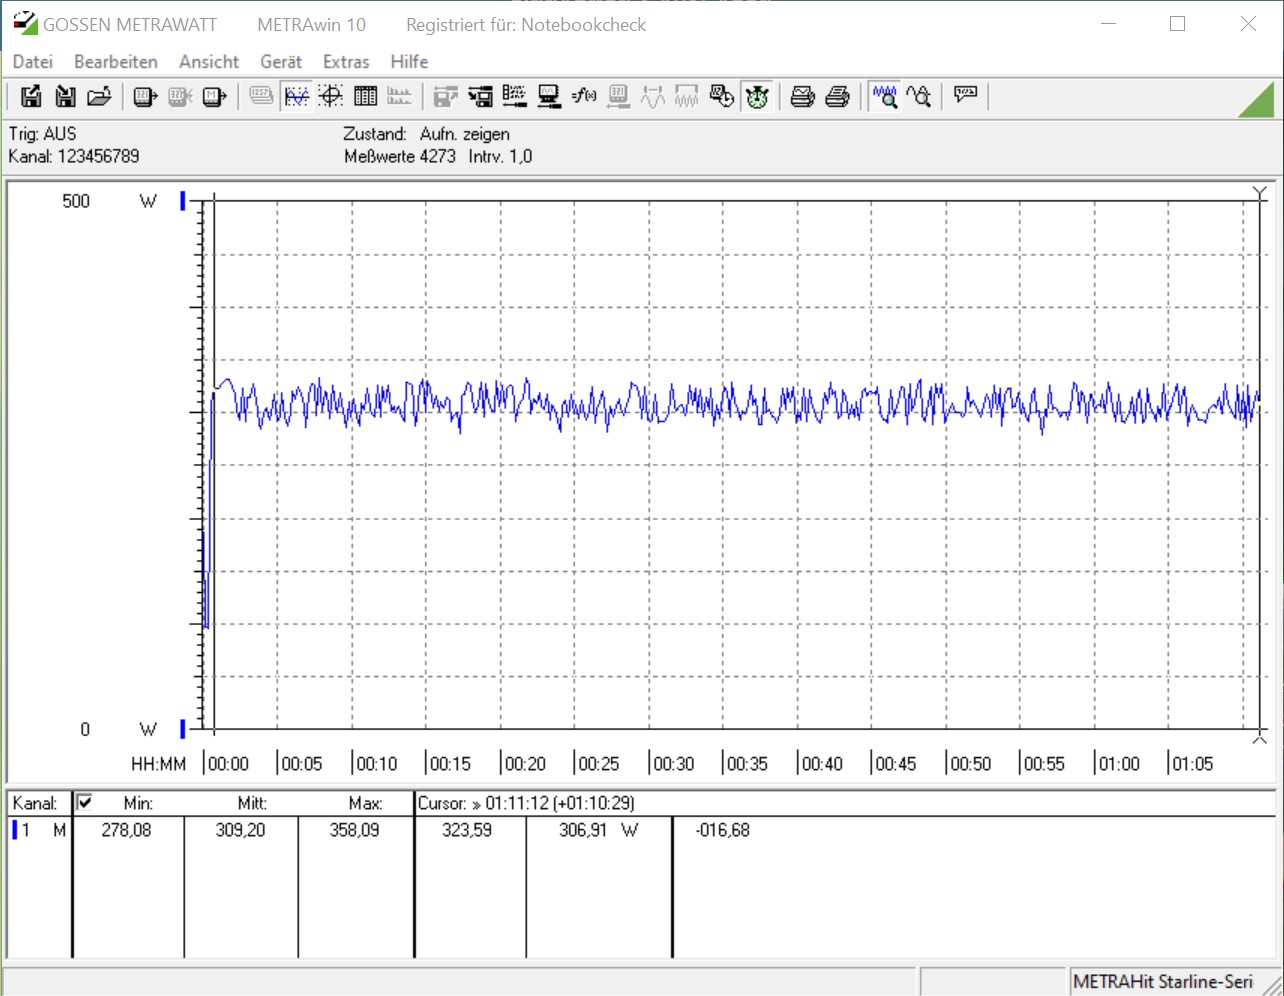
When it comes to energy consumption, the Zotac MEK MINI scores points with a moderate consumption in our tests. The system needs a good 45 watts in idle usage. Nevertheless, this increases to up to 327 watts on average in the stress test. At peak values, we even measure 374 watts, which is no problem for the two 330-watt power supplies, though. At 309 watts when playing games, the system is only minimally more energy-efficient than in the stress test.
When looking at the comparison table, it should be noted that different CPUs and GPUs were used here, which are partly specified at a significantly higher TDP.
| Power Consumption | |
| 1920x1080 The Witcher 3 ultra (external Monitor) | |
| AMD Ryzen 9 3950X (Idle: 95 W) | |
| Intel Core i9-10900K (Idle: 52.3 W) | |
| Intel Core i5-10600K (Idle: 52.2 W) | |
| Intel Core i5 9400F (Idle: 57 W) | |
| Nvidia GeForce RTX 2070 Super (Idle: 92.6 W) | |
| KFA2 GeForce RTX 2070 Super Work The Frames (Idle: 94 W) | |
| Intel Core i3 9100F (Idle: 56 W) | |
| Intel Core i7-9700K, AMD Radeon RX Vega 64 | |
| Intel Core i5-9600K, AMD Radeon RX Vega 64 | |
| Corsair One i160 (Idle: 51.5 W) | |
| Nvidia GeForce RTX 2070 Super (96.8 fps, Idle: 80.5 W) | |
| Zotac MEK Mini (RTX 2070 Super) (Idle: 45.2 W) | |
| Prime95 V2810 Stress (external Monitor) | |
| Intel Core i9-10900K (Idle: 52.3 W) | |
| Intel Core i7-9700K, AMD Radeon RX Vega 64 | |
| Intel Core i5-10600K (Idle: 52.2 W) | |
| AMD Ryzen 9 3950X (Idle: 95 W) | |
| Intel Core i5-9600K, AMD Radeon RX Vega 64 | |
| Zotac MEK Mini (RTX 2070 Super) (Idle: 45.2 W) | |
| Intel Core i3 9100F (Idle: 56 W) | |
| Intel Core i5 9400F (Idle: 57 W) | |
| Cinebench R15 Multi (external Monitor) | |
| Intel Core i9-10900K (Idle: 52.3 W) | |
| AMD Ryzen 9 3950X (Idle: 95 W) | |
| Intel Core i7-9700K, AMD Radeon RX Vega 64 | |
| Intel Core i5-10600K (Idle: 52.2 W) | |
| Zotac MEK Mini (RTX 2070 Super) (Idle: 45.2 W) | |
| Intel Core i5-9600K, AMD Radeon RX Vega 64 | |
| Intel Core i5 9400F (Idle: 57 W) | |
| Intel Core i3 9100F (Idle: 56 W) | |
| Temperatures - CPU Temperature Prime95 | |
| Intel Core i9-10900K | |
| AMD Ryzen 9 3950X | |
| Zotac MEK Mini (RTX 2070 Super) | |
| Intel Core i3 9100F | |
| Intel Core i5-10600K | |
| Intel Core i5 9400F | |
* ... smaller is better
Pros
Cons
Verdict - Strong performance that won't get any style points
With the MEK MINI from Zotac, buyers get a completely carefree package that is ready for use straight out of the box. Unlike various barebone PCs, which still have to be equipped with RAM, storage, and a graphics card, the Zotac model comes in the form of the MEK MINI. As already mentioned, the system is available in two base configurations. Roughly speaking, it can be said that the less-expensive model is rather aimed at gamers who primarily play in 1080p, while the top model offers enough performance for 1440p gaming.
The MEK MINI was able to score points in our test with a solid work and gaming performance, and the lack of volume in the case doesn't negatively affect the small powerhouse in terms of performance. On the contrary, the system's volume, which is clearly audible under load, aids its performance. We normally only achieve these rates in our measurements with gaming laptops.
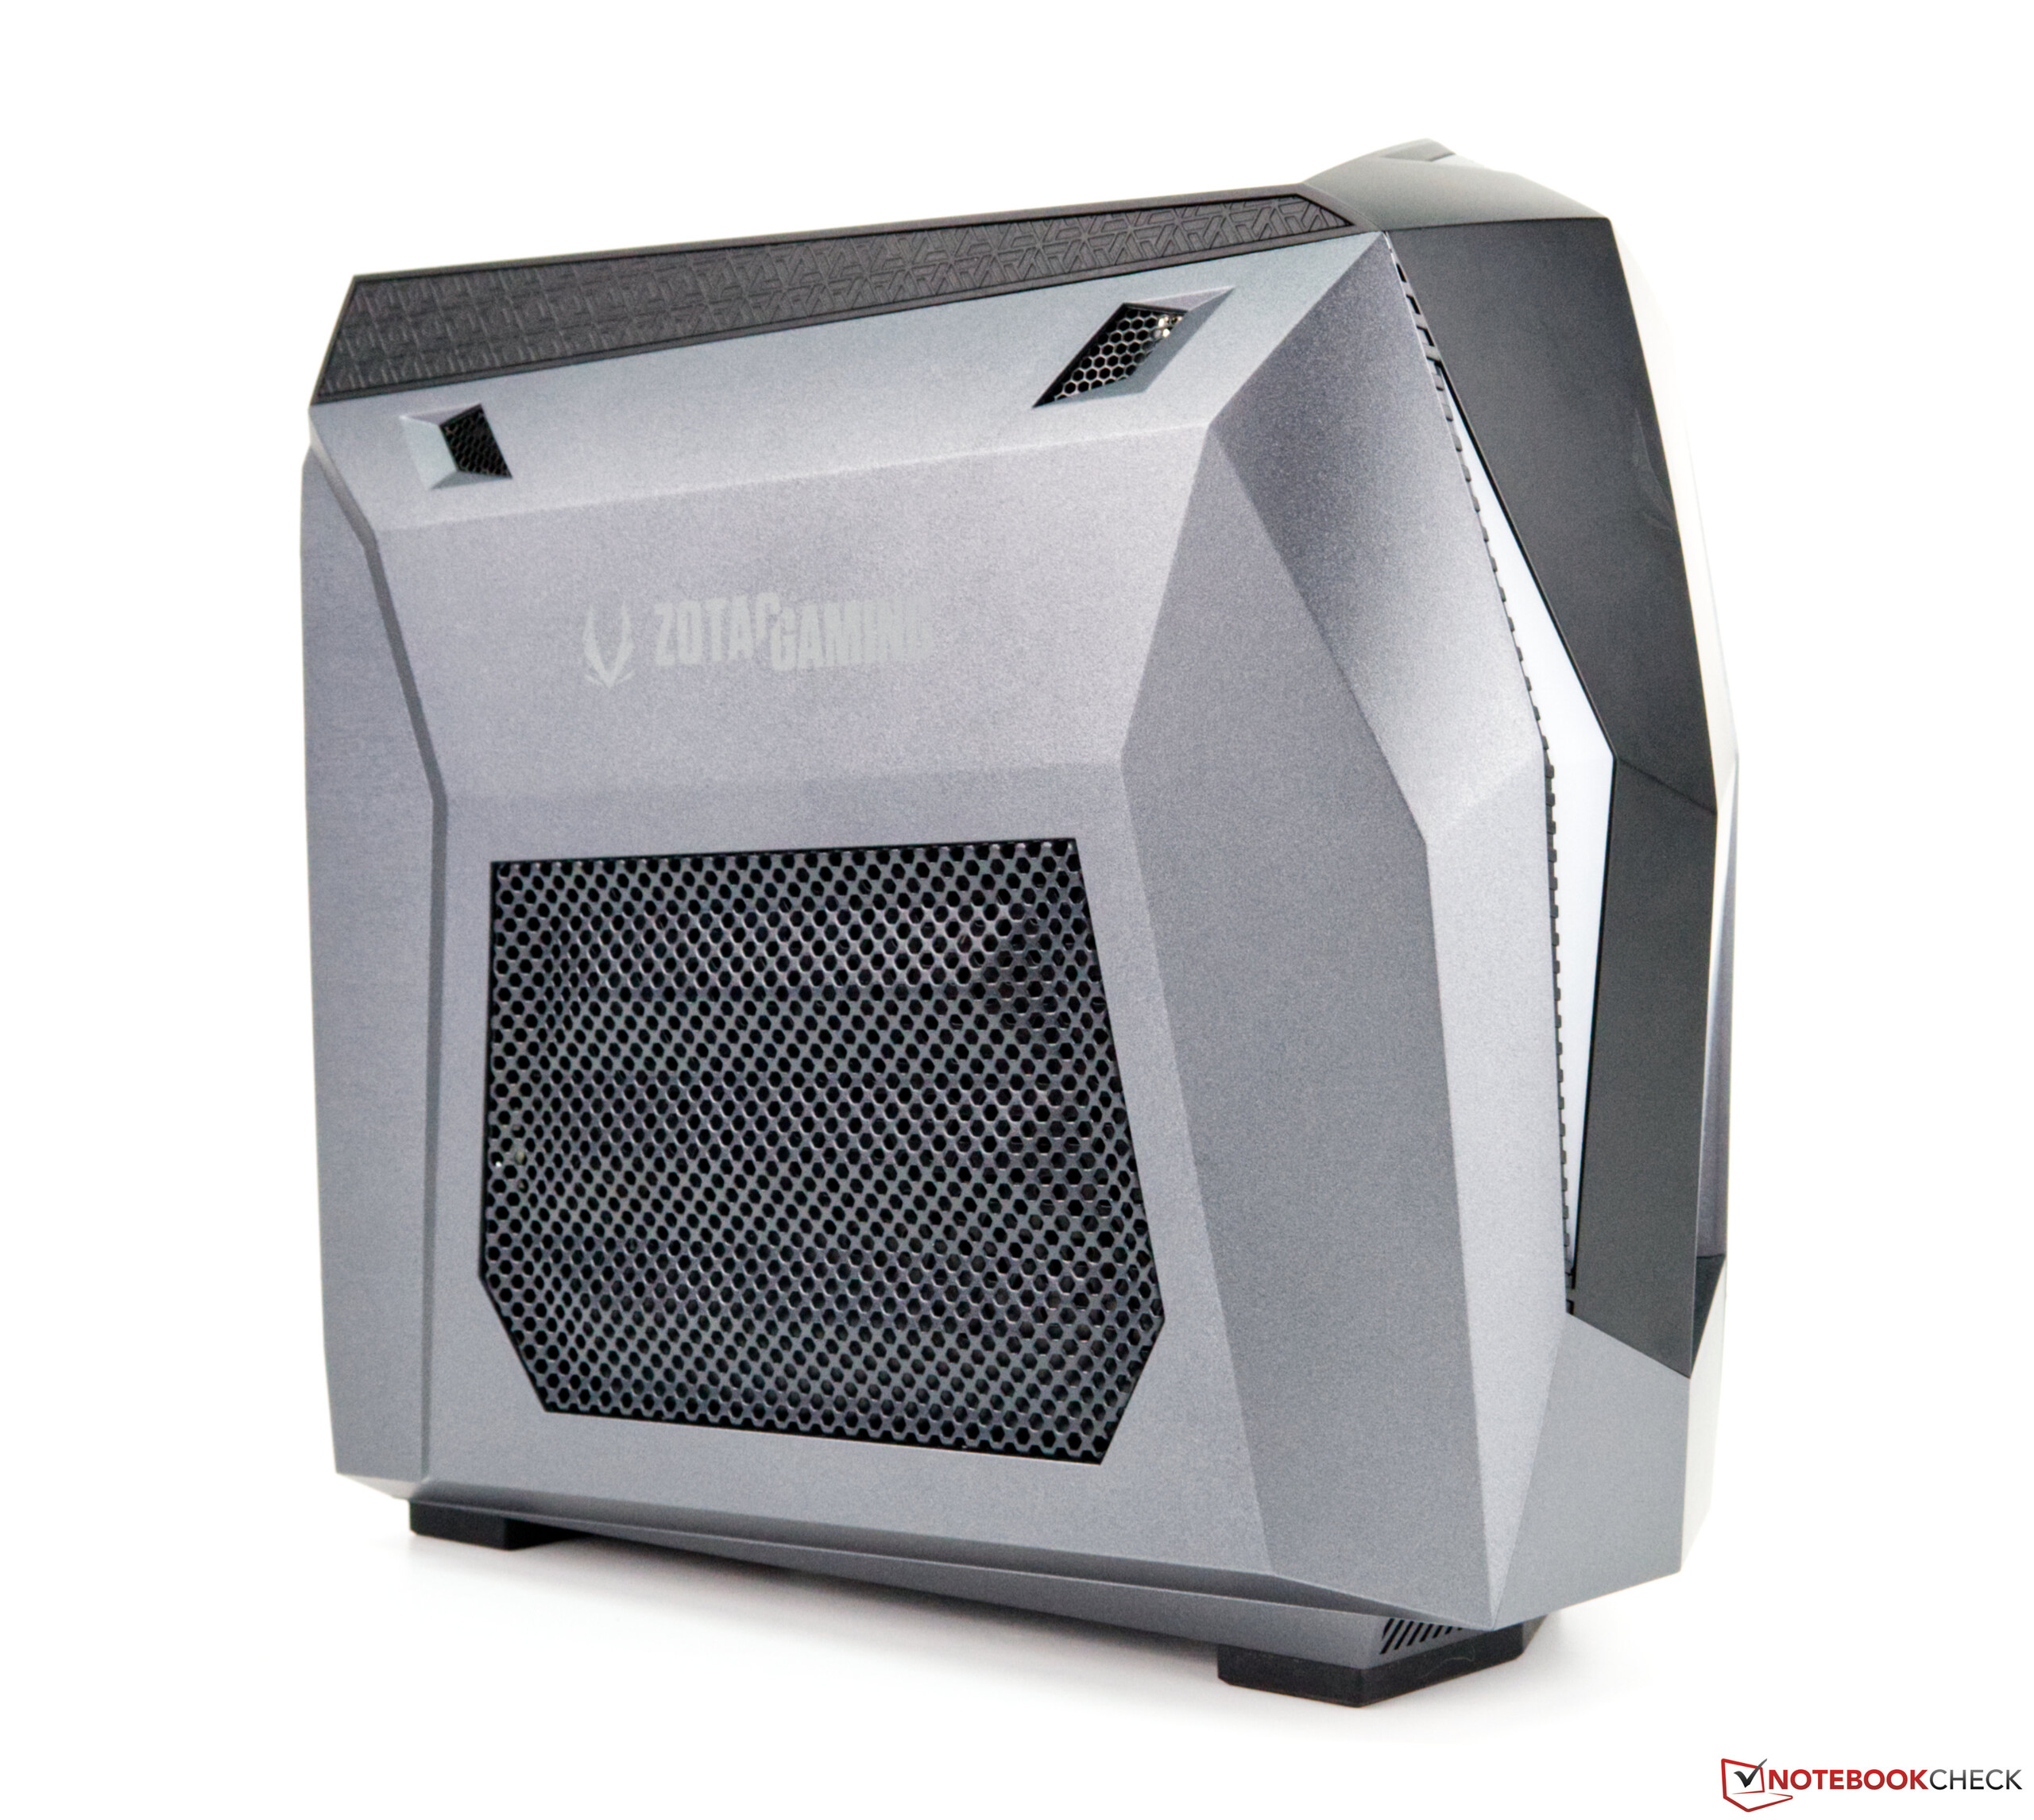
The MEK MINI is visually well done and offers very good gaming performance despite its compact dimensions.
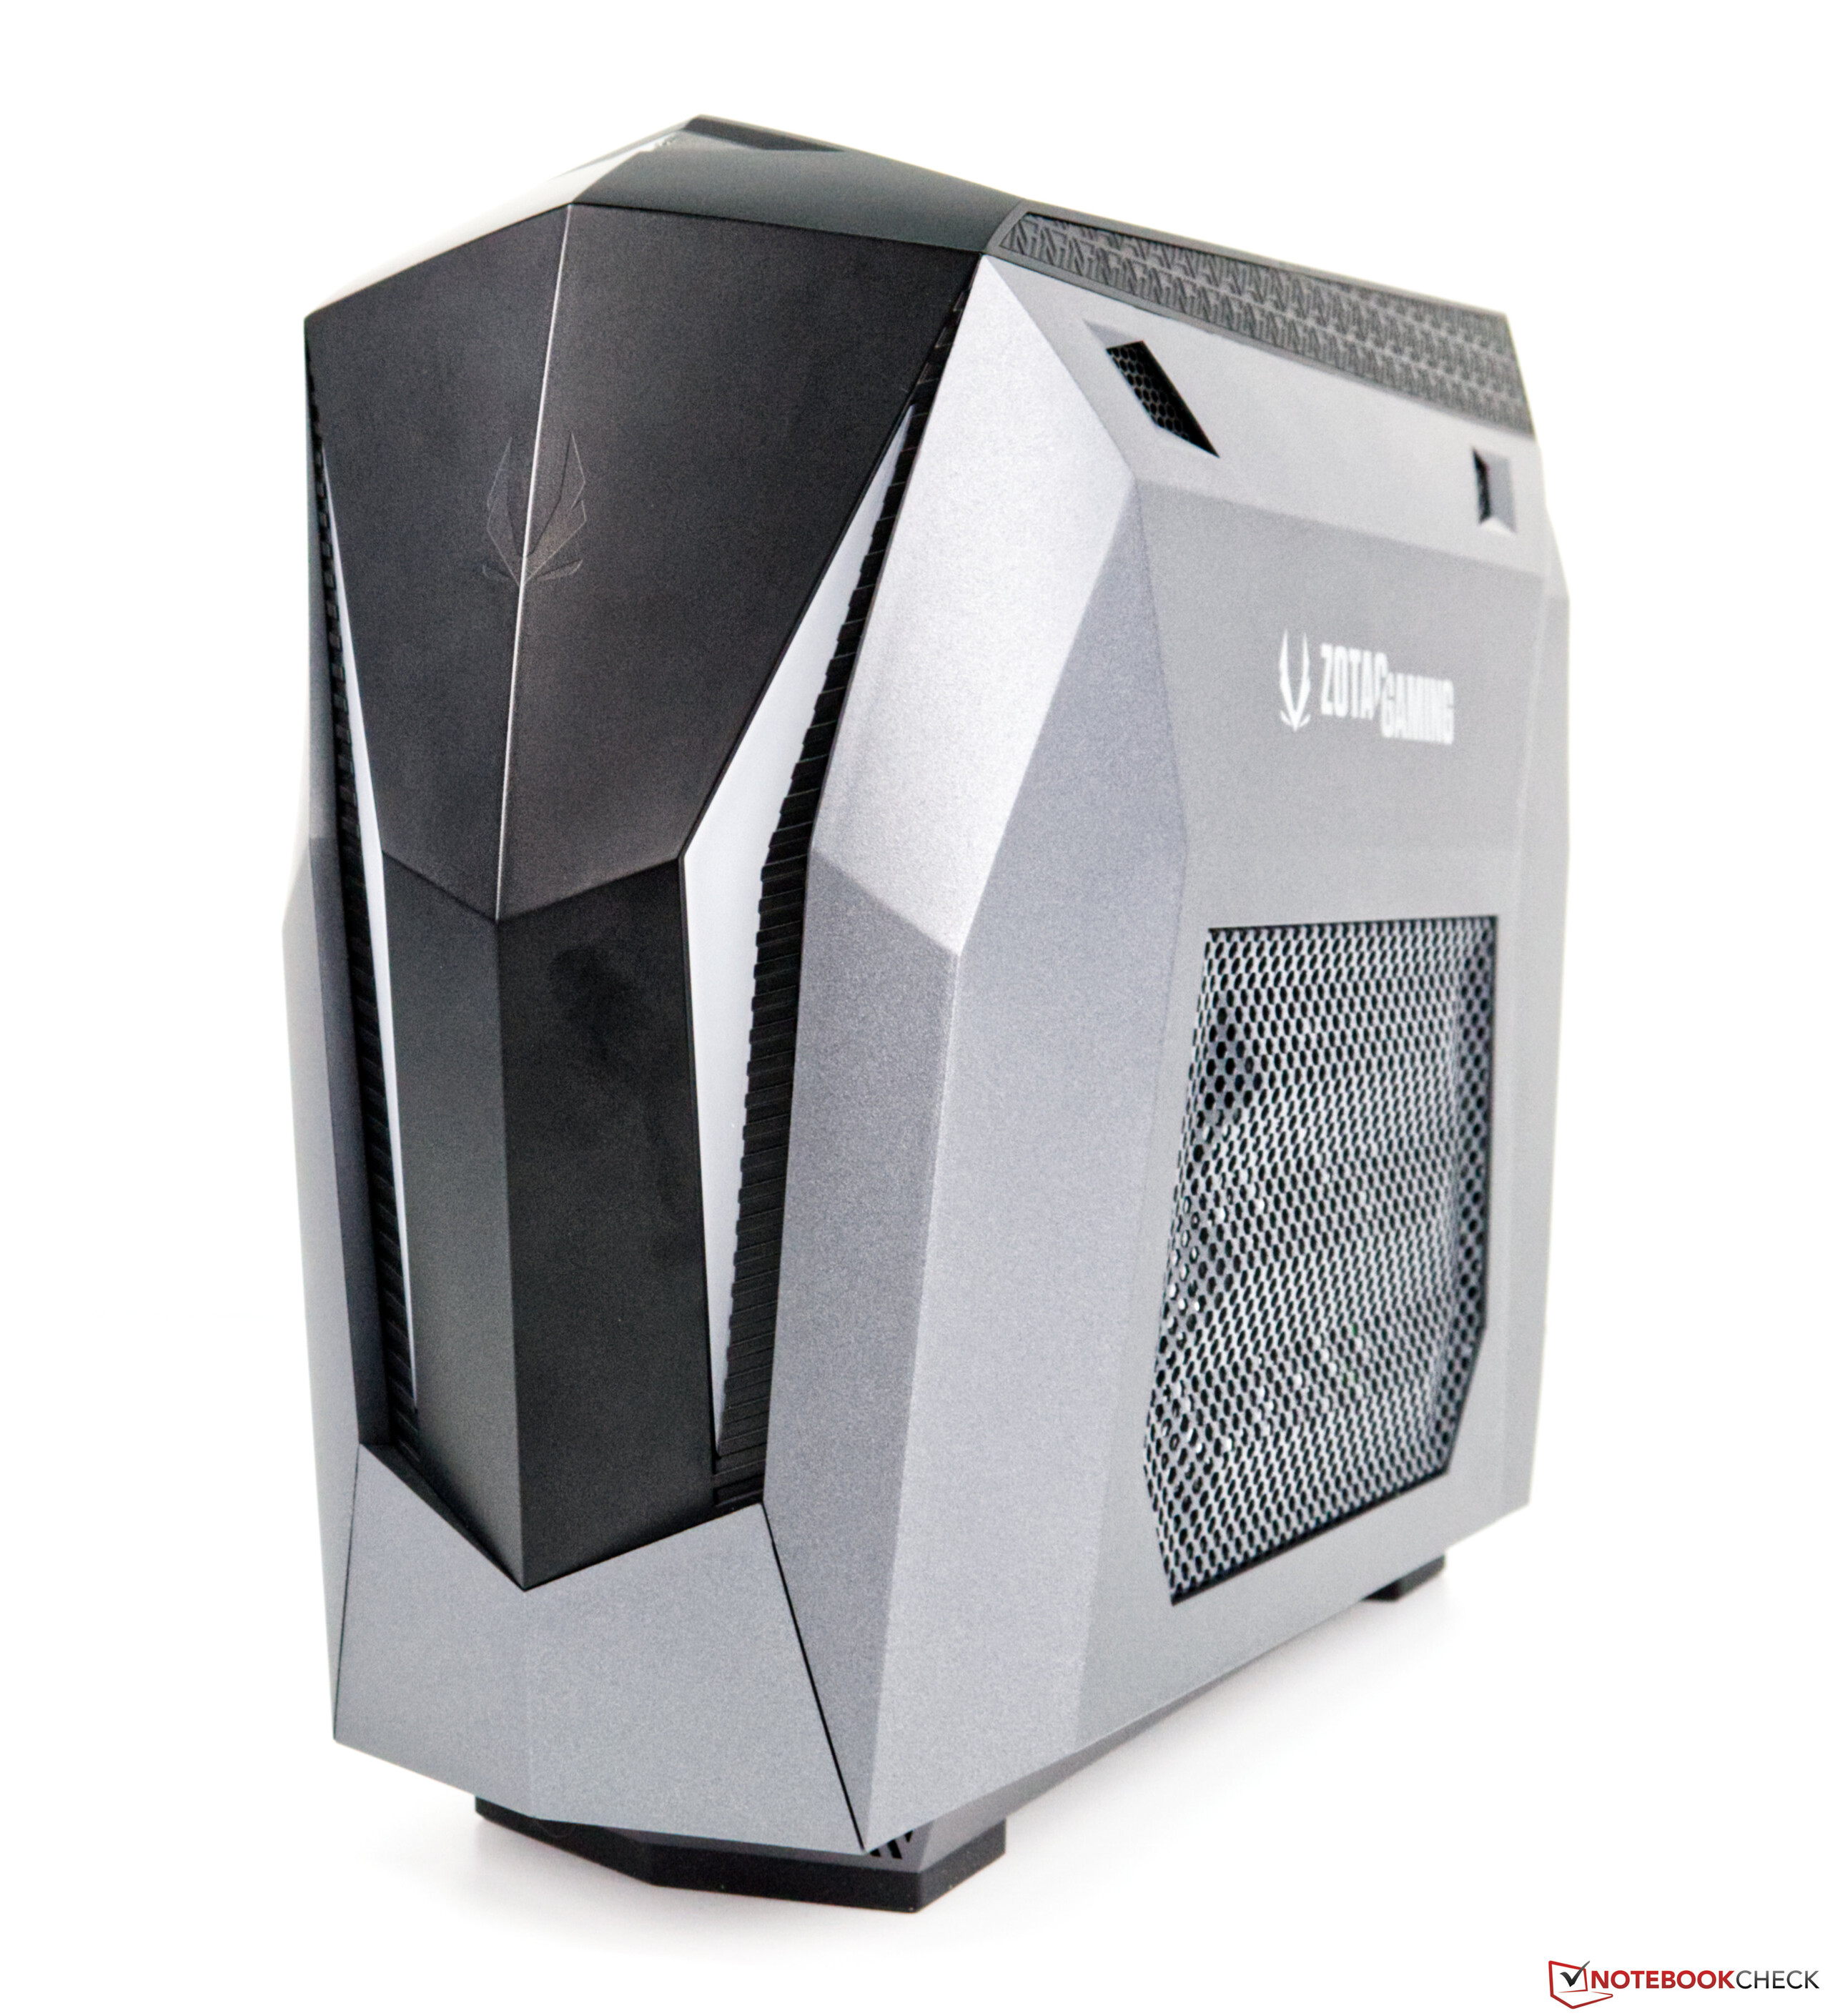
Of course, the looks shouldn't be neglected either, because the small PC quickly attracts attention with its discreet RGB lighting on the front. The 9.18-liter case, which is mainly made of plastic, has a visually appealing design; nevertheless, the maintainability of the PC suffers somewhat because almost the entire device has to be disassembled to get to the graphics card. It would have been much easier if both side covers could be easily removed. This works quite well on the right side in order to access the RAM and storage.
In summary, however, it can be said that Zotac has remained consistent with the MEK MINI and has again managed to offer, alongside the ZBOX models, a pre-built PC suitable for gaming that uses full-fledged desktop components for the CPU and GPU. In addition, the manufacturer provides two useful programs, Spectra and Firestorm, to adjust the fans of the graphics card or control the lighting system on the front. The price of the top model is still within a reasonable range at just under 1,500 Euros (~$1,683), even though one has to accept a small price premium in comparison to a custom build.
Price comparison

